a measurement of b(d+s → φl+ν)b(d+s → φπ+)
TRANSCRIPT

hep-
ph/9
4033
28
21 M
ar 1
994
A MEASUREMENT OF B(D
+
s
! �l
+
�)=B(D
+
s
! ��
+
)
F. Butler,
1
X. Fu,
1
G. Kalb eisch,
1
W.R. Ross,
1
P. Skubic,
1
J. Snow,
1
P.L. Wang,
1
M. Wood,
1
D.N. Brown,
2
J.Fast ,
2
R.L. McIlwain,
2
T. Miao,
2
D.H. Miller,
2
M. Modesitt,
2
D. Payne,
2
E.I. Shibata,
2
I.P.J. Shipsey,
2
P.N. Wang,
2
M. Battle,
3
J. Ernst,
3
Y. Kwon,
3
S. Roberts,
3
E.H. Thorndike,
3
C.H. Wang,
3
J. Dominick,
4
M. Lambrecht,
4
S. Sanghera,
4
V. Shelkov,
4
T. Skwarnicki,
4
R. Stroynowski,
4
I. Volobouev,
4
G. Wei,
4
P. Zadorozhny,
4
M. Artuso,
5
M. Goldberg,
5
D. He,
5
N. Horwitz,
5
R. Kennett,
5
R. Mountain,
5
G.C. Moneti,
5
F. Muheim,
5
Y. Mukhin,
5
S. Playfer,
5
Y. Rozen,
5
S. Stone,
5
M. Thulasidas,
5
G. Vasseur,
5
G. Zhu,
5
J. Bartelt,
6
S.E. Csorna,
6
Z. Egyed,
6
V. Jain,
6
K. Kinoshita,
7
K.W. Edwards,
8
M. Ogg,
8
D.I. Britton,
9
E.R.F. Hyatt,
9
D.B. MacFarlane,
9
P.M. Patel,
9
D.S. Akerib,
10
B. Barish,
10
M. Chadha,
10
S. Chan,
10
D.F. Cowen,
10
G. Eigen,
10
J.S. Miller,
10
C. O'Grady,
10
J. Urheim,
10
A.J. Weinstein,
10
D. Acosta,
11
M. Athanas,
11
G. Masek,
11
H.P. Paar,
11
J. Gronberg,
12
R. Kutschke,
12
S. Menary,
12
R.J. Morrison,
12
S. Nakanishi,
12
H.N. Nelson,
12
T.K. Nelson,
12
C. Qiao,
12
J.D. Richman,
12
A. Ryd,
12
H. Tajima,
12
D. Sperka,
12
M.S. Witherell,
12
M. Procario,
13
R. Balest,
14
K. Cho,
14
M. Daoudi,
14
W.T. Ford,
14
D.R. Johnson,
14
K. Lingel,
14
M. Lohner,
14
P. Rankin,
14
J.G. Smith,
14
J.P. Alexander,
15
C. Bebek,
15
K. Berkelman,
15
K. Bloom,
15
T.E. Browder,
15�
D.G. Cassel,
15
H.A. Cho,
15
D.M. Co�man,
15
P.S. Drell,
15
R. Ehrlich,
15
P. Gaiderev,
15
M. Garcia-Sciveres,
15
B. Geiser,
15
B. Gittelman,
15
S.W. Gray,
15
D.L. Hartill,
15
B.K. Heltsley,
15
C.D. Jones,
15
S.L. Jones,
15
J. Kandaswamy,
15
N. Katayama,
15
P.C. Kim,
15
D.L. Kreinick,
15
G.S. Ludwig,
15
J. Masui,
15
J. Mevissen,
15
N.B. Mistry,
15
C.R. Ng,
15
E. Nordberg,
15
J.R. Patterson,
15
D. Peterson,
15
D. Riley,
15
S. Salman,
15
M. Sapper,
15
F. W�urthwein,
15
P. Avery,
16
A. Freyberger,
16
J. Rodriguez,
16
R. Stephens,
16
S. Yang,
16
J. Yelton,
16
D. Cinabro,
17
S. Henderson,
17
T. Liu,
17
M. Saulnier,
17
R. Wilson,
17
H. Yamamoto,
17
T. Bergfeld,
18
B.I. Eisenstein,
18
G. Gollin,
18
B. Ong,
18
M. Palmer,
18
M. Selen,
18
J. J. Thaler,
18
A.J. Sado�,
19
R. Ammar,
20
S. Ball,
20
P. Baringer,
20
A. Bean,
20
D. Besson,
20
D. Coppage,
20
N. Copty,
20
R. Davis,
20
N. Hancock,
20
M. Kelly,
20
N. Kwak,
20
H. Lam,
20
Y. Kubota,
21
M. Lattery,
21
J.K. Nelson,
21
S. Patton,
21
D. Perticone,
21
R. Poling,
21
V. Savinov,
21
S. Schrenk,
21
R. Wang,
21
M.S. Alam,
22
I.J. Kim,
22
B. Nemati,
22
J.J. O'Neill,
22
H. Severini,
22
C.R. Sun,
22
M.M. Zoeller,
22
G. Crawford,
23
C. M. Daubenmier,
23
R. Fulton,
23
D. Fujino,
23
K.K. Gan,
23
K. Honscheid,
23
H. Kagan,
23
R. Kass,
23
J. Lee,
23
R. Malchow,
23
Y. Skovpen,
23y
M. Sung,
23
and C. White
23
(CLEO Collaboration)
1

1
University of Oklahoma, Norman, Oklahoma 73019
2
Purdue University, West Lafayette, Indiana 47907
3
University of Rochester, Rochester, New York 14627
4
Southern Methodist University, Dallas, Texas 75275
5
Syracuse University, Syracuse, New York 13244
6
Vanderbilt University, Nashville, Tennessee 37235
7
Virginia Polytechnic Institute and State University, Blacksburg, Virginia, 24061
8
Carleton University, Ottawa, Ontario K1S 5B6 and the Institute of Particle Physics, Canada
9
McGill University, Montr�eal, Qu�ebec H3A 2T8 and the Institute of Particle Physics, Canada
10
California Institute of Technology, Pasadena, California 91125
11
University of California, San Diego, La Jolla, California 92093
12
University of California, Santa Barbara, California 93106
13
Carnegie-Mellon University, Pittsburgh, Pennsylvania 15213
14
University of Colorado, Boulder, Colorado 80309-0390
15
Cornell University, Ithaca, New York 14853
16
University of Florida, Gainesville, Florida 32611
17
Harvard University, Cambridge, Massachusetts 02138
18
University of Illinois, Champaign-Urbana, Illinois, 61801
19
Ithaca College, Ithaca, New York 14850
20
University of Kansas, Lawrence, Kansas 66045
21
University of Minnesota, Minneapolis, Minnesota 55455
22
State University of New York at Albany, Albany, New York 12222
23
Ohio State University, Columbus, Ohio, 43210
(January 25, 1994)
Abstract
Using the CLEO II detector at CESR, we have measured the ratio of branch-
ing fractions B(D
+
s
! �e
+
�)=B(D
+
s
! ��
+
) = 0:54 � 0:05 � 0:04. We use
this measurement to obtain a model dependent estimate of B(D
+
s
! ��
+
).
�
Permanent address: University of Hawaii at Manoa
y
Permanent address: INP, Novosibirsk, Russia
2

Most measurements of the D
+
s
meson branching fractions are normalized to the clean
D
+
s
! ��
+
channel. [1] However, the absolute D
+
s
! ��
+
branching fraction is not well
known, and this limits the precision of these measurements. Here we present a mea-
surement of R
s
= B(D
+
s
! �l
+
�)=B(D
+
s
! ��
+
), which can be used to extract the
D
+
s
! ��
+
branching fraction by using the known values for the D !
�
K
�
l� branching
fractions, the D and D
+
s
meson lifetimes and theoretical predictions for the ratio of widths:
�(D
+
s
! �l
+
�)=�(D !
�
K
�
l
+
�).
The data consist of an integrated luminosity of 1.71 fb
�1
of e
+
e
�
collisions recorded with
the CLEO II detector at the Cornell Electron Storage Ring (CESR). A detailed description
of the CLEO II detector can be found in reference [2]. The data sample contains over two
million e
+
e
�
! c�c events taken at center-of-mass energies on the �(4S) resonance and in
the nearby continuum (
p
s � 10:6 GeV).
Due to the undetected neutrino, we cannot fully reconstruct D
+
s
! �l
+
� decays. How-
ever, there are very few processes which produce both a � meson and a lepton contained in
the same jet. Consequently, this correlation can be used to extract a clean D
+
s
! �l
+
� sig-
nal. The backgrounds due to misidenti�ed leptons and from random �{lepton combinations
can be reliably estimated, and the possible contamination from other decay modes is shown
to be negligible.
We identify � candidates by using the decay mode � ! K
+
K
�
. In order to suppress
combinatoric background, � candidates are required to have momenta above 1.1 GeV/c. In
addition, the kaon candidates must have ionization energy loss and time-of- ight consistent
with that expected for a kaon with the measured momentum.
The search for leptons is restricted to the kinematic regions in which the lepton identi�ca-
tion e�ciencies and hadron misidenti�cation rates are well understood. Hence, electron and
muon candidates are required to be in the �ducial regions j cos �j < 0:91 and j cos �j < 0:81,
respectively, where � is the polar angle of the track with respect to the beam-axis. In addi-
tion, electron candidates must have momenta above 0.9 GeV/c and muon candidates above
3

1.4 GeV/c. The only exception is for muons in the region j cos �j > 0:61 which are required
to have momenta above 1.9 GeV/c. Electrons are identi�ed by comparing their ionization
energy loss, time-of- ight, and energy deposited in the electromagnetic calorimeter with that
expected for an electron with the measured momentum. Electrons from photon conversions
and Dalitz decays of �
0
's are rejected by pairing electron candidates with all other oppositely
charged tracks in the event and rejecting those which have both small separation and parallel
trajectories at their point of closest approach. Muons are identi�ed by matching charged
tracks to hits in the muon detectors which lie outside the electromagnetic calorimeter. In
order to be identi�ed as a muon, a track must penetrate at least 5 interaction lengths of
steel. For leptons in the momentum ranges and �ducial regions considered, the identi�cation
e�ciencies are approximately 92% for electrons and 90% for muons.
To reduce further the combinatoric background, we require that the �l
+
momentum
be greater than 2.4 GeV/c. In order to be consistent with having originated from a D
+
s
decay, the �l
+
candidates must have an invariant mass less than 1.9 GeV/c
2
. In order to
suppress the combinatoric background from �(4S) events which tend to be more spherical,
we require that the ratio of Fox-Wolfram moments [3], R
2
= H
2
=H
0
, is greater than 0.30.
This eliminates 77% of the �(4S) background whilst retaining 92% of the signal.
The e�ciencies for reconstructing D
+
s
! �l
+
� decays are obtained from a Monte Carlo
simulation which takes the predictions of the ISGWmodel [4] as input. These events are then
passed through a full simulation of the CLEO II detector and the same event reconstruction
and analysis chain as the real data. Because of the small q
2
value associated with the decay
� ! K
+
K
�
, the kaons tend to overlap in the drift-chamber. This makes it di�cult to
simulate accurately the ionization energy loss measurement. In order to avoid this problem,
the momentum dependent e�ciencies for identifying � mesons are obtained from the data
by comparing the inclusive yield of all �'s before and after particle identi�cation. These
e�ciencies are then combined with the predicted � momentum spectrum from D
+
s
! �l
+
�
decays to give the total � identi�cation e�ciency. Following the above selection criteria, and
4

after correcting for the e�ects of �nal-state radiation from the leptons [5], the e�ciencies for
identifying D
+
s
! �e
+
� decay is 10.5% and for D
+
s
! ��
+
� the e�ciency is 2.9%.
Figs 1(a) and 1(b) show the invariant mass distributions of allK
+
K
�
combinations which
are accompanied by an electron or muon respectively and which pass the above selection cri-
teria. We �t these distributions with a signal and background function. The signal function
is a Gaussian function convoluted with a Breit-Wigner function. The background function
is a phase-space background function [6] which accounts for random K
+
K
�
combinations.
The width of the Breit-Wigner function is �xed to the natural width of the � state [8], and
the mean and sigma of the Gaussian function are �xed to the values extracted from a �t
to all � candidates with momenta above 1.1 GeV/c. Only the overall normalization of the
signal function is allowed to vary in the �ts. The �ts yield 359�22 D
+
s
! �e
+
� and 123�15
D
+
s
! ��
+
� candidates. There are two main sources of background: �'s accompanied by
fake leptons [7], and random �l
+
combinations.
The background due to fake leptons is estimated by �rst using the real data to measure
the momentumdependent probabilities that a hadron will be misidenti�ed as a lepton. These
probabilities are typically 0.3% for electrons and 1.2% for muons. These results are then used
to randomly label tracks (which do not pass the lepton identi�cation criteria described above)
as leptons in the data. With this procedure, we extract the number of �l
+
combinations
due to misidenti�ed hadrons. For electrons this estimate is 46 � 14 events, while for muons
it is 27 � 8. The quoted errors include the contributions from the uncertainties in the
misidenti�cation probabilities. In order to check these estimates, we examine the invariant
mass distribution of all �l
+
candidates. A peak at the D
+
s
mass is seen which is due to
D
+
s
! ��
+
decays in which the pion is misidenti�ed as either an electron or muon. The
technique of randomly labeled hadronic tracks as leptons yields 7:4 � 2:2 �� events where
the � track is misidenti�ed as a lepton. This is in good agreement with the 4:5� 3:6 events
found in the lepton sample.
For the range of lepton momenta considered, random �l
+
combinations come from two
5

sources: from e
+
e
�
! c�c events in which a � is produced in the fragmentation process and is
combined with a lepton from the semileptonic decay of the charmed hadron in the same jet,
and from �(4S) decays in which a � is produced in the decay chain of one of the B mesons
and is combined with a lepton from the semileptonic decay of the other B meson. A � and
lepton which originate from the decay of the same B meson do not contribute since they
tend to be emitted back-to-back and thus have too large an invariant mass. The background
from random �l
+
combinations is estimated using the Monte Carlo simulation. However,
this is complicated by the fact that the � production rate from both fragmentation and B
meson decays is not well known. For this reason, an attempt is made to scale the Monte
Carlo prediction to account for the � production rate observed in the data.
In the continuum, not only the rate of � production, but also the correlation between the �
and the charmed hadron direction is important. The agreement between the data and Monte
Carlo is investigated by considering how often a � is produced in the same hemisphere as a
fully reconstructedD meson. BothD
0
andD
�+
mesons are considered, and are reconstructed
using the following decay chains: D
0
! K
�
�
+
and D
�+
! D
0
�
+
; D
0
! K
�
�
+
. The
reconstructed D mesons are required to have momenta above 2.5 GeV/c in order to account
approximately for the range of D momenta which are expected to contribute leptons in the
momentum range of interest. For this particular study, the � momentum criterion is relaxed
to 0.8 GeV/c in order to provide su�cient statistics. In doing this we have assumed that
the � momentum distribution is well reproduced by the Monte Carlo, and that it is the rate
of � production in the fragmentation process which contributes the greatest uncertainty.
Both the number of D mesons and the number �'s are obtained by �tting their invariant
mass distributions. False combinations due to the D meson combinatoric backgrounds are
accounted for by subtracting the number of �'s found when using the D mesons invariant
mass sidebands. In the real data 0:17 � 0:11 �'s are found for every 1000 reconstructed D
mesons. This is to be compared with 0:16� 0:02 for the e
+
e
�
! c�c Monte Carlo. The ratio
of these two numbers is 1:0 � 0:7, so no correction is applied in this case. The simulation
6

predicts a background of 12 � 8 and 1:8 � 1:2 events for electrons and muons respectively,
where the errors include the uncertainty in the above ratio.
The background from random �l
+
combinations in �(4S) decays is estimated in a similar
manner. In this case the directions of the � and lepton are uncorrelated. For this reason it is
su�cient to compare the number of �'s with momentum above 1.1 GeV/c in the continuum
subtracted �(4S) data with that observed in the �(4S) B
�
B Monte Carlo. In the real data
5:0�0:5 �'s are found per 1000 B
�
B events to be compared with 5:3�0:1 in the Monte Carlo.
This gives a correction factor of 0:95 � 0:08. After applying this correction, the predicted
background is 19 � 2 events for electrons and 9� 1 events for muons.
Figs 2(a) and 2(b) show the number of �'s which fall in each �l
+
invariant mass bin for
electrons and muons respectively; where the number of �'s has been extracted from �ts to the
K
+
K
�
invariant mass distributions. The combined background estimates are also shown,
as well as the simulated predictions for the signal shapes which have been normalized to the
number of candidates extracted from the �ts to the K
+
K
�
invariant mass spectra. It can be
seen that the predicted signal shapes are in good agreement with the data. The background
estimates can be checked by comparing the predicted number of candidates which fall outside
of the signal region with the number actually observed. For electrons we predict 8�1 events
in the region 2:0 < M
�l
+< 3:5 GeV/c
2
and observe 12 � 7, and for muons we predict 7 � 1
and observe 8� 5. Both predictions are in good agreement with the data.
We have also estimated the possible contamination from the decays D
+
! �
�
K
0
l
+
�,
D
+
s
! ��l
+
� and D
+
s
! ���l
+
�. The decay D
+
s
! ��
0
l
+
� is forbidden from conservation
of isospin. The Feynman diagrams for the �rst two processes are shown in Figs. 3(a) and
3(b), respectively. For the �rst decay, we �rst estimate an upper limit on the number of
D
+
! �
�
K
0
l
+
� decays in the data bymaking the conservative assumption: B(D
+
! �
�
K
0
l
+
�)
=B(D
+
!
�
K
0
l
+
�) ' � � B(D
0
! (K
�
�)
�
�
+
�)=B(D
0
! K
�
�
+
�), where � is a suppression
factor because in the �rst numerator it is an s�s pair which must be popped from the vacuum
as opposed to a light-quark pair [9]. This assumption is motivated by the similarity of
7

the decay diagrams. The latter ratio has been measured by the E653 collaboration [10],
B(D
0
! (K
�
�)
�
�
+
�)=B(D
0
! K
�
�
+
�) < 0:04 at the 90% con�dence level. Taking the
number of D
+
!
�
K
0
l
+
� events in our data sample to be 60,000 [11], assuming � = 1=3,
and including the simulated acceptance for D
+
! �
�
K
0
l
+
� decays, we estimate less than
one background event from this source. The contribution from D
+
s
! ��l
+
� decays is
estimated in a similar manner. Here we make use of the same E653 result and assume:
B(D
+
s
! ��l
+
�)=B(D
+
s
! �l
+
�) ' � � � � B(D
0
! (K
�
�)
�
�
+
�)=B(D
0
! K
�
�
+
�), where �
accounts for OZI suppression [12] of the �rst numerator. Making the assumption � = 1=10,
and including the simulated acceptance for D
+
s
! ��l
+
� decays, we again estimate much less
than one background event from this source. The contribution from D
+
s
! ���l
+
� decays
should also be very small for similar reasons. Therefore, it is assumed that the background
from these decay modes is negligible.
After subtracting all backgrounds, we �nd 282�22 D
+
s
! �e
+
� and 85�15 D
+
s
! ��
+
�
candidates which fall in the D
+
s
signal region M
�l
+
< 1:9 GeV/c
2
. After correcting for
the detection e�ciencies in each channel and for the � ! K
+
K
�
branching fraction [8],
the e�ciency corrected yields are 5460 � 430 for electrons and 6000 � 1000 for muons. A
breakdown of the yields in each channel is given in Table I. To combine these two numbers,
we take a weighted average, after �rst correcting for the fact that the muon rate is predicted
to be 5% lower than that for electrons because of the reduced phase-space [13]. Therefore,
our result is given in terms of the e�ective yield in the electron channel which is 5580 � 400
events.
In order to limit the systematic e�ects which stem from the selection criteria, the number
of D
+
s
! ��
+
decays is measured in a similar manner. Again, the � candidates are required
to have momenta above 1.1 GeV/c . To account approximately for the fact that no neutrino
is produced in this decay, we require the ��
+
momentum to be greater than 2.7 GeV/c [14].
We then require the K
+
K
�
�
+
invariant mass to be within �25 MeV/c
2
of the known D
+
s
mass [8]. The e�ciency for detecting D
+
s
! ��
+
decays following these selection criteria is
8

17.4%.
The result of the �t to the K
+
K
�
invariant mass distribution is shown in Fig. 4. We �nd
1049�35 candidates. Also shown is the result of the �t to K
+
K
�
combinations from the D
+
s
mass sidebands, which is used to estimate the contribution from random ��
+
combinations.
We �nd 163 � 18 candidates due to these random combinations. After subtracting this
background, the e�ciency corrected yield is 10; 370 � 460 events.
Finally, since we have already corrected for e�ciencies, the ratio of branching fractions
is,
R
s
=
B(D
+
s
! �e
+
�)
B(D
+
s
! ��
+
)
=
5580 � 400
10; 370 � 460
= 0:54 � 0:05 � 0:04; (1)
where the �rst error is statistical, and the second is an estimate of possible systematic
e�ects. This systematic error includes: the uncertainty in the number of fake leptons (6.3%),
the uncertainty in the level of continuum charm background (2.7%), the uncertainty in
the level of B
�
B background (0.9%), the uncertainty in the lepton identi�cation e�ciency
(2.5%), the uncertainty in the � identi�cation e�ciency (1.0%) and that due to the limited
number of Monte Carlo events which were used for the e�ciency estimates (2.7%). We
have also considered our sensitivity to the D
+
s
production mechanism by using the predicted
e�ciencies for D
+
s
mesons produced in D
�+
s
decays. However, since both the D
+
s
! �l
+
�
and the D
+
s
! ��
+
e�ciencies are a�ected in the same manner, the e�ect is small (0.5%).
For this analysis the ISGW model was used to generate semileptonic decays in the Monte
Carlo simulation. The uncertainty associated with this choice of model was investigated
by adopting the (V � A) prediction for the lepton momentum spectra. From the resulting
change in the predicted D
+
s
! �l
+
� acceptance, we assign a systematic error of 1.8%.
Various background shapes have also been used to extract the number of � mesons. In all
cases R
s
changes by less than 1:1%, which is taken to be the systematic error. After adding
these estimates in quadrature, the total systematic error is 7:6%. Table II compares this
result with those of previous measurements [15{17].
Having measured R
s
, we extract the D
+
s
! ��
+
branching fraction by using the theo-
9

retical value for F
s
= �(D
+
s
! �l
+
�)=�(D !
�
K
�
l
+
�). We can write
B(D
+
s
! �e
+
�) = F
s
� B(D
0
! K
��
e
+
�) �
�
D
+
s
�
D
0
= F
s
�
B(D
0
! K
��
e
+
�)
B(D
0
! K
�
�
+
)
�B(D
0
! K
�
�
+
)�
�
D
+
s
�
D
0
: (2)
where �
D
+
s
and �
D
0are the D
+
s
and D
0
lifetimes, respectively. F
s
is predicted by various
quark models [18,19]. Here we choose to adopt the result of the modi�ed ISGW model
F
s
= 1:00, since to date this is the only model which can account for the measured value for
B(D!
�
K
�
l
+
�)=B(D! Kl
+
�) [19,20]. Past experiments have used F
s
= 0:9 for this ratio.
We use CLEO II measurements for all quantities except the D
0
and D
+
s
lifetimes. In this way
some of the systematic errors cancel and the problems associated with averaging the results
of many di�erent experiments are avoided. We found B(D
0
! K
��
e
+
�)=B(D
0
! K
�
�
+
) =
0:61 � 0:07 [11], and when this is combined with our measurement, B(D
0
! K
�
�
+
) =
(3:91� 0:19)% [21], and with the E687 measurements, �
D
0
= (4:13� 0:05)� 10
�13
s [22] and
�
D
+
s
= (4:75 � 0:21) � 10
�13
s [23], we obtain B(D
+
s
! �e
+
�) = (2:74 � 0:36)%. Using our
measurement of R
s
, we obtain: B(D
+
s
! ��
+
) = (5:1 � 0:4 � 0:4 � 0:7)%, where the �rst
error is from the statistical error on R
s
, the second from the systematic error on R
s
, and
the third from the uncertainty in the D
+
s
! �e
+
� branching fraction. This measurement
is greater than but consistent with previous estimates and upper limits on B(D
+
s
! ��
+
)
[8,24].
In conclusion, we have measured B(D
+
s
! �e
+
�)=B(D
+
s
! ��
+
) = 0:54�0:05�0:04. By
using the theoretical prediction F
s
= 1:00, we �nd B(D
+
s
! ��
+
)= (5:1� 0:4� 0:4� 0:7)%.
We gratefully acknowledge the e�ort of the CESR sta� in providing us with excellent
luminosity and running conditions. J.P.A. and P.S.D. thank the PYI program of the NSF,
I.P.J.S. thanks the YI program of the NSF, G.E. thanks the Heisenberg Foundation, K.K.G.,
I.P.J.S., and T.S. thank the TNRLC, K.K.G., H.N.N., J.D.R., T.S. and H.Y. thank the OJI
program of DOE and P.R. thanks the A.P. Sloan Foundation for support. This work was
supported by the National Science Foundation and the U.S. Dept. of Energy.
10

REFERENCES
[1] For all states described, the charge conjugate state is also implied.
[2] CLEO Collaboration, Y. Kubota et al., Nucl. Inst. and Meth. A320, 66(1992).
[3] G.C. Fox and S. Wolfram, Phys. Rev. Lett. 41, 1581(1978).
[4] N. Isgur et al., Phys. Rev. D 39, 799(1989).
[5] D. Atwood and W.J. Marciano, Phys. Rev. D 41, 1736(1990). Final-state radiation
reduces the D
+
s
! �e
+
� acceptance by 1:1%, and has a negligible e�ect in the muon
channel.
[6] The phase-space background function has the form: a � (m�m
0
)
�
� e
��(m�m
0
)
, where m
is the invariant mass of the K
+
K
�
pair. The parameter m
0
is �rst obtained from a �t
to the inclusive K
+
K
�
invariant mass distribution, and � and � are free parameters.
[7] Fake leptons are either misidenti�ed hadrons or muons from �
+
and K
+
decays in ight.
[8] Particle Data Group, K. Hikasa et al., Review of Particle Properties, Phys. Rev. D 45,
1(1992).
[9] The notation (K
�
�)
�
is used to represent the sum of all possibilities:
�
K
�0
�
�
, K
��
�
0
,
and higher order resonances which decay via these states.
[10] E653 Collaboration, K. Kodama et al., Phys. Lett. B 313, 260(1993).
[11] CLEO Collaboration, J. Alexander et al., Phys. Lett. B 317, 647(1993).
[12] J.L. Rosner, Phys. Rev. Lett. 22, 689(1969).
[13] J.G. K�orner and G.A. Schuler, Z. Phys. C 46, 93(1990).
[14] This should be compared with the requirement p
�l
+
> 2:4 GeV/c which was used to
select D
+
s
! �l
+
� candidates.
11

[15] CLEO Collaboration, J. Alexander et al., Phys. Rev. Lett. 65, 1531(1990).
[16] ARGUS Collaboration, H. Albrecht et al., Phys. Lett. B 255, 634(1991).
[17] E687 Collaboration, P.L. Frabetti et al., Phys. Lett. B 313, 253(1993).
[18] M. Wirbel et al., Z. Phys. C 29, 269(1985). This model predicts 0.83 for the ratio of
�(D
+
s
! �l
+
�)=�(D !
�
K
�
l
+
�).
[19] D. Scora, Nucl. Phys. A 527, 743c(1991); D. Scora, Ph.D. thesis, University of Toronto,
1993.
[20] D. Scora and N. Isgur, Phys. Rev. D 40, 1491(1989).
[21] CLEO Collaboration, D.S. Akerib et al., Phys. Rev. Lett. 71, 3070(1993).
[22] E687 Collaboration, P.L. Frabetti et al., preprint FERMILAB-Pub-93/332-E, submitted
to Phys. Lett. B.
[23] E687 Collaboration, P.L. Frabetti et al., Phys. Rev. Lett. 71, 827(1993).
[24] F. Muheim and S. Stone, preprint HEPSY 93-3, to appear in Phys. Rev. D. They
estimate B(D
+
s
! ��
+
) = (3:5 � 0:6)%.
12

FIGURES
(a)
FIG. 1. Fits to the K
+
K
�
invariant mass distributions for (a) K
+
K
�
e
+
and (b) K
+
K
�
�
+
combinations which lie in the D
+
s
signal region M
K
+
K
�
l
+ < 1:9 GeV/c
2
.
13

(b)
14

(a)
FIG. 2. Invariant mass of (a) �e
+
and (b) ��
+
combinations. The data points are obtained
by �tting the K
+
K
�
invariant mass distributions for each �l
+
invariant mass bin. The solid
histograms show the sums of the predicted backgrounds and the simulated signal shapes. The
dashed histograms show the background contributions.
15

(b)
16

c
s
sΦ
(b)
s
c
d d
s
ν
Φ
K0
(a)
D+
D+ss
η
ν
s
s
s
FIG. 3. Feynman diagrams for the possible background modes. (a) D
+
! �
�
K
0
l
+
�, in which
an s�s pair must be \popped" from the vacuum, and (b) D
+
s
! ��l
+
�, which is OZI suppressed.
17

FIG. 4. Fit to the K
+
K
�
invariant mass distribution for K
+
K
�
�
+
combinations which lie
within �25 MeV/c
2
of the D
+
s
mass. The dashed histogram shows the contribution from the D
+
s
mass sidebands.
18
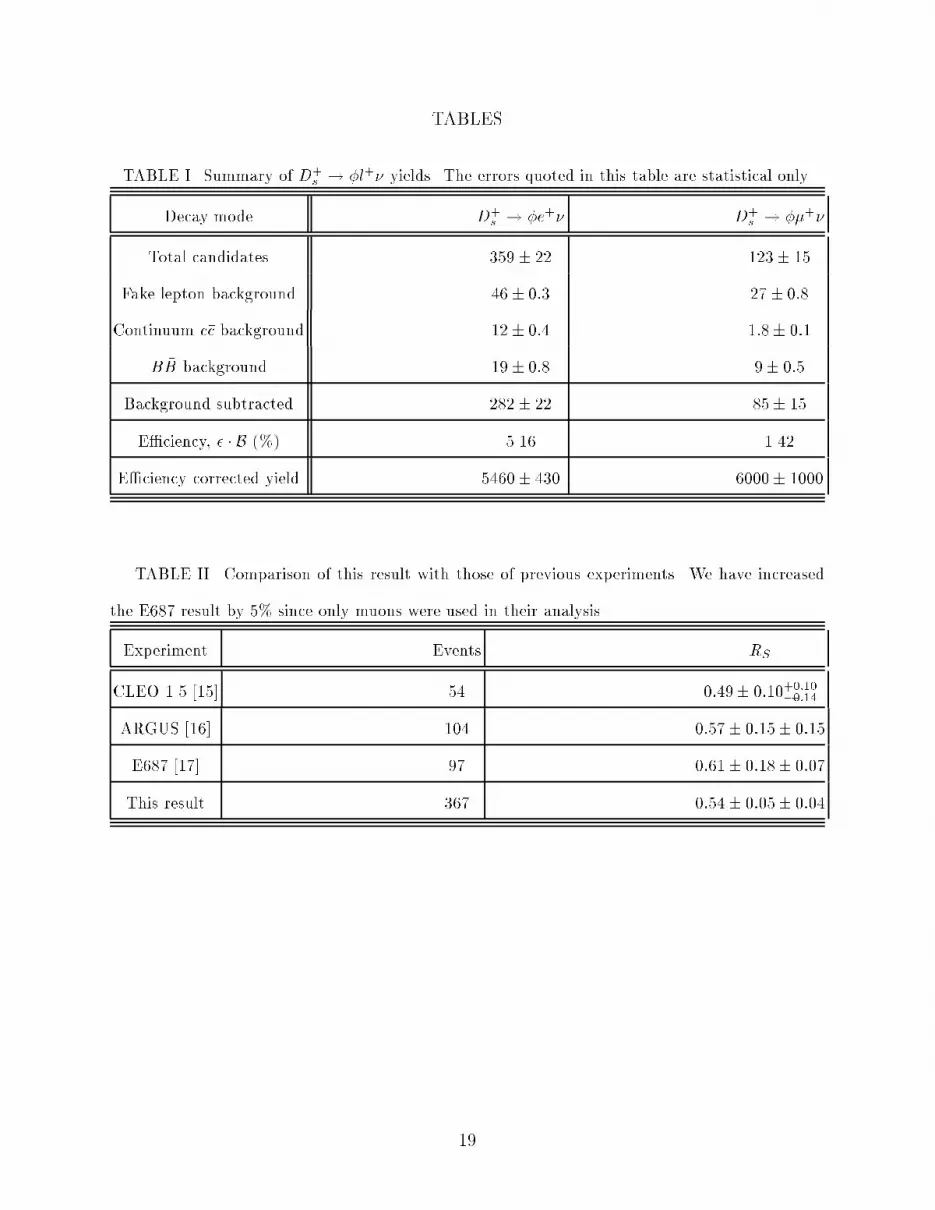
TABLES
TABLE I. Summary of D
+
s
! �l
+
� yields. The errors quoted in this table are statistical only.
Decay mode D
+
s
! �e
+
� D
+
s
! ��
+
�
Total candidates 359� 22 123� 15
Fake lepton background 46� 0:3 27� 0:8
Continuum c�c background 12� 0:4 1:8� 0:1
B
�
B background 19� 0:8 9� 0:5
Background subtracted 282� 22 85� 15
E�ciency, � � B (%) 5.16 1.42
E�ciency corrected yield 5460� 430 6000� 1000
TABLE II. Comparison of this result with those of previous experiments. We have increased
the E687 result by 5% since only muons were used in their analysis.
Experiment Events R
S
CLEO 1.5 [15] 54 0:49� 0:10
+0:10
�0:14
ARGUS [16] 104 0:57� 0:15� 0:15
E687 [17] 97 0:61� 0:18� 0:07
This result 367 0:54� 0:05� 0:04
19

This figure "fig1-1.png" is available in "png" format from:
http://arxiv.org/ps/hep-ph/9403328v1

This figure "fig2-1.png" is available in "png" format from:
http://arxiv.org/ps/hep-ph/9403328v1

This figure "fig1-2.png" is available in "png" format from:
http://arxiv.org/ps/hep-ph/9403328v1

This figure "fig2-2.png" is available in "png" format from:
http://arxiv.org/ps/hep-ph/9403328v1

This figure "fig1-3.png" is available in "png" format from:
http://arxiv.org/ps/hep-ph/9403328v1

This figure "fig2-3.png" is available in "png" format from:
http://arxiv.org/ps/hep-ph/9403328v1