a graphical toolset for simulation modelling of parallel systems
TRANSCRIPT

A Graphical Toolset for Simulation Modelling of ParallelSystemsT. Delaitre, G.R. Justo, F. Spies, S.C. WinterUniversity of WestminsterCentre for Parallel Computing115 New Cavendish StreetLondon W1M 8JSemail: fdelaitt,justog,spiesf,[email protected] this paper, a simulation model for incorporation within a performance-orientedparallel software development environment is presented. This development environ-ment is composed of a graphical design tool, a simulation facility, and a visuali-sation tool. Simulation allows parallel program performance to be predicted anddesign alternatives to be compared. The target parallel system models a virtualmachine composed of a cluster of workstations interconnected by a local area net-work. The simulation model architecture is modular and extensible which allowsre-con�guration of the platform. The model description and the validation experi-ments which have been conducted to assess the correctness and the accuracy of themodel are also presented.1 IntroductionThe key obstacle to the widespread adoption of parallel computing is thedi�culty in program development. Firstly, an application has to be decom-posed into parallel objects (processes, or tasks) according to the computa-tional model underlying the programming language. Secondly, the parallelhardware con�guration has to be speci�ed. Finally, the processes are mappedonto the hardware. The range of design choices available to the parallel pro-gram designer at each of these three stages can be immense. This has led to1This project is funded by an EPSRC PSTPA programme, Grant Number :GR/K40468 and also by EC Contract Num: CIPA-C193-0251, CP-93-5383Preprint submitted to Elsevier Science 18 October 1996

highly-optimised platform-speci�c solutions, which are not easily ported toother platforms.Rapid prototyping is a useful approach to the design of (high-performance)parallel software in that complete algorithms, outline designs, or even roughschemes can be evaluated at a relatively early stage in the development life-cycle, with respect to possible platform con�gurations, and mapping strategies.Modifying the platform con�gurations and mappings will permit the prototypedesign to be re�ned, and this process may continue in an evolutionary fashionthroughout the life-cycle.However, appropriate approaches (techniques) to the evaluation of perfor-mance are required at each iteration. The three main approaches are: mea-surement, analytical modelling and simulation [13]. Measurement can only beapplied to existing systems and the results are a�ected by a range of run-timefactors arising within the system and the measurement process itself. Ana-lytical modelling { the development and study of models whose solutions aretractable by mathematical techniques { enables exact descriptions of a sys-tem behaviour to be developed but restrictions on the system functionalityand workload are usually introduced to make the model solvable, resulting inloss of accuracy. Simulation of models which are often analytically intractableovercomes both these di�culties, enabling the behaviour of arbitrarily complexsoftware and hardware systems to be treated at any level of detail. Modellingabstractions may be necessary to improve the performance of the simulationbut this is generally less restrictive than in the case of the analytical approach.Simulation thus helps the designer to identify those components which limitthe capacity of the system (bottlenecks), and allows performance estimates ofthe application to be obtained at early stages of its development.In the next section, we describe several modelling tools. Section 3 describes thegeneral aspects of our toolset, and Section 4 presents details of the graphicaldesign tool. Our simulation model is described in Section 5. A case study ispresented in Section 6, which illustrates the use of the toolset and the resultsof the validation of the simulation model. Finally, in Section 7, the mainconclusions of the paper and future work are presented.2 Parallel System Performance Modelling ToolsThe current trend in parallel software modelling tools is to support all the soft-ware performance engineering activities in an integrated environment [18]. Atypical toolset should be based on at least three main tools: a graphical designtool, a simulation facility and a visualisation tool. The graphical design tooland the visualisation tool should coexist within the same environment to allow2

information about the program behaviour to be related to its design. Manyexisting toolsets are comprised of only a subset of these tools but visualisationis usually a separate tool. In addition, the target parallel system is typically atransputer-based multiprocessor machine and the modelling of the operatingsystem is usually not addressed (an exception is the PEPS toolset [19]).The Transim/Gecko [11,26] toolset, developed under the Parsifal project atthe University of Westminster, was one of the earliest toolsets for parallel pro-gramming. The designer can rapidly evaluate di�erent designs of an occam-likeprogram running on a transputer-based multiprocessor by using the graphi-cal tool (Gecko) to animate the traces generated by the simulator (Transim).Gecko also allows occam processes to be re-mapped graphically and the ap-plication to be then re-simulated. The Transim/Gecko approach has been aparadigm for other simulation-based environments such as MIMD [24,2], de-veloped at the University of Edinburgh. MIMD (Multiple Instruction stream,Multiple Data stream) is a modelling environment for studying the perfor-mance of parallel programs. MIMD is built on top of DEMOS [1] and Simula.DEMOS is an extension of Simula which contains classes suitable for dis-crete event simulations. MIMD provides classes for modelling message passingparallel programs running on distributed memory architectures. The existingclasses allow occam programs running on Transputer machines to be mod-elled. Both Transim/Gecko and MIMD have similar features except that inMIMD an experimental framework has been de�ned in order to investigatethe e�ects of varying certain parameters characterising a parallel program'srun-time behaviour.A more recent toolset, which supports the development of real-time applica-tions based on transputers (primarily) and PowerPCs, is the HAMLET Appli-cation Development System [20]. It combines graphical design tools, simulationtechniques, and performance traces. In particular, it consists of a design entrysystem (DES), a speci�cation simulator (HASTE), a debugger and monitor(INQUEST), and a trace analysis tool (TATOO). A key feature of HAMLETis the ability to produce a code suitable for the simulator and a code suitablefor real execution from the same graphical design. Also, performance tracesobtained from the simulation and from the monitoring tools have the sameformat, therefore the visualisation tool is suitable for simulation and monitor-ing. The limitation of HAMLET is that its hardware and software librariesare currently restricted to transputers and PowerPCs.The toolsets described above usually assume the target parallel system to bea physical machine. Other toolsets, however, including the one presented inthis paper, incorporate a virtual machine platform such as PVM. The PEPSproject [19] aims to investigate benchmarks, modelling, characterisation, andmonitoring of PVM programs for Transputer-based platforms. The aim ofperformance modelling in PEPS is to develop a tool for the performance eval-3

uation of computer architectures. PEPS uses the Simulog simulation toolsetincluding MODARCH which o�ers a range of software and hardware compo-nents. The library of objects allows PVM programs running on a network oftransputers to be modelled. This particular model of PVM is much simplerthan that of PVM within a heterogeneous distributed computing environ-ment in which all nodes share a single communication medium and wherecontentions occur.Recent projects now include heterogeneous architectures. Usually, they usea message-passing environment as an intermediate layer to achieve this goal.The VPE project [17] objectives are the design and the monitoring of parallelprograms in the same tool. The design is described as a graph in which thenodes represent sequential computation or a reference to another VPE graph.Performance analysis and graph animation are not the targets, but the ap-proach to design is one of the most elaborate. The PARADE project [25] ismainly oriented towards animation aspects. PARADE is divided into a generalanimation environment which is called POLKA, and target-speci�c animationenvironments such as PVaniM (for PVM) and GThreads (for threads). Thisproject does not include graphical design of parallel programs, thus, the pre-de�ned animations and views can decrease the user understanding.In the SEPP project [29,6] (Software Engineering for Parallel Processing) atoolset based on �ve types of tools has been developed. There are static designtools, dynamic support tools, behaviour analysis and simulation tools, andvisualisation tools [14,9,15].3 The EDPEPPS ToolsetThe EDPEPPS (Environment for Design and Performance Evaluation ofPortable Parallel Software) toolset [5] being developed at the University ofWestminster is part of the SEPP toolset, and is illustrated in Figure 1. Itis based on a rapid prototyping philosophy where the designer synthesises amodel of the intended software which may be simulated, and the performancesubsequently analysed using visualisation. The toolset combines a graphi-cal design tool (PVMGraph), a simulation facility, and a visualisation tool(PVMVis). The same design is used to produce a code suitable for simulationand for real execution. The results of the simulation are an event trace �le andsome statistical information about the virtual machine. The graphical designtool is based on the PVM programming model.The simulation, as in Transim, is based on discrete-event modelling which canprovide a remarkable degree of accuracy. The technology is well-established,and sophisticated modelling tools are available commercially. Simulation of4

the PVM platform is built using a state of the art simulation environment,SES/WorkbenchTM [21,22]. SES/Workbench has wide functionality meet-ing the requirements of computer system modelling, and includes a time-saving graphical design interface and animation-based visualisation capabili-ties. Techniques for parallelising discrete-event simulation programs are alsowell-established, thus providing a route for optimising the run-time perfor-mance of the simulator. SES/Workbench has been used both to develop, andsimulate platform models. Thus the simulation engine in SES/Workbench isan intrinsic part of the toolset.4 Graphical Representation Using PVMGraphThere are compelling reasons to represent (program) designs graphically. Oneof them is to expose the software structure as the description of the constituentsoftware components and their patterns of interconnection, which provides aclear and concise level at which to specify and design systems. In terms ofmessage-passing parallel programs, their structures are naturally graphical asparallel activities can be represented by the nodes of a graph and message ow can be denoted by the arcs. This explains the popularity of graphicalrepresentations for parallel systems (for a survey refer to [16]). Furthermore,a clear description of a parallel program is important during the mapping andload balancing which are essential activities in the development of a parallelprogram.The graphical representation developed for EDPEPPS, referred to as PVM-Graph, tries to balance the aspects of design structure and the behaviouraldescription of the components into a single graphical representation. The prin-ciple is that the design of a parallel program consists of nodes (tasks) and arcs(message ow) but the graph must be enriched with special allegories (sym-bols) which correspond to important aspects of the behaviour of the tasks.Since EDPEPPS supports the development of PVM programs, these aspectsrefer to the operations of PVM. In this way, for most of the PVM operationswe have de�ned special symbols. Figure 4 presents the main window of thegraphical editor for the PVMGraph notation. The menu on the left of the win-dow depicts the symbols (icons) used in PVMGraph. An example of a parallelapplication described in PVMGraph is also illustrated in Figure 4.A PVM program design consists basically of a collection of processes (tasks)which interact by message passing. A task is the basic component of the design.A task is denoted by a box with its name; for example, tasks T1, T2 and T3in Figure 4. Note that there are 5 tasks called T2. This means that thesetasks are instances of the same task, and they share the same PVM/C code.Each instance is identi�ed by a di�erent instance number presented below its5

name.Task T1 is represented with double boxes as it denotes a special type oftask, called composed task. A task becomes a composed task when it callsthe pvm spawn operation which is denoted by a small circle and a directeddash-line from the parent task to the spawned task. In Figure 4, T1 points tothe instances of task T2 and to task T3, which means that T1 spawns all theother tasks in the application.The communication between tasks is carried out by calling PVM communi-cation operations to send and receive messages, and each operation has itsown symbol. As explained above, in PVMGraph not only the topology is rep-resented but also part of the tasks' behaviour, described by the way theyinteract with each other. In Figure 4, the tasks use four types of communica-tion operations. Task T1 uses a family of outputs to represent a loop of sends(a for loop containing a pvm send). A family of outputs is denoted by twooverlapped small triangles pointing to outside the box. Similarly, task T3 usesa family of inputs (a for loop containing a pvm recv) which is denoted by twosmall overlapped triangles pointing to inside the box. Task T2 uses two oper-ations, an input (pvm recv), which is denoted by a small triangle pointing toinside the box, and an output (pvm send) denoted by a small triangle pointingto outside the box.Tasks which have compatible interfaces (communication operations) can beconnected. PVMGraph performs di�erent consistency checks when the usertries to connect two tasks. The basic check consists of evaluating the directionof the communication; for example, only inputs can be linked to outputs. Otherchecks will depend on the type of the operation. An interaction is denoted bya solid line connecting the interfaces as illustrated in Figure 4 between tasksT1 and T2, and tasks T2 and T3.The �rst version of the PVMGraph editor has been completed and is undertest.5 The EDPEPPS Simulation ModelThe EDPEPPS simulation model consists of the PVM platform model libraryand the PVM programs for simulation. The PVM platform model is parti-tioned into three layers (Figure 2): the message passing layer, the operatingsystem layer and the hardware layer. Modularity and extensibility are two keycriteria in simulation modelling, therefore layers are decomposed into moduleswhich permit a re-con�guration of the entire PVM platform model. The ini-tial modelled con�guration consists of a PVM environment which uses the6

TCP/IP protocol, and a cluster of heterogeneous workstations connected to asingle 10 Mbit/s Ethernet network.A PVM program generated by the PVMGraph graphical design tool is trans-lated into the SES/Workbench simulation model language and passed to theSES/Workbench simulation engine, where it is integrated with the platformmodel for simulation.5.1 SimPVM { A Simulation Oriented LanguagePVMGraph allows PVM applications to be developed using a combinationof graphical objects and text. From this description, executable and \simu-latable" PVM programs can be generated but annotations must be insertedinto the graphical/textual source to control the simulation. All simulationmodels in EDPEPPS are based on queueing networks. The \simulatable"code generated by PVMGraph is predominantly a description of the softwarerather than the execution platform. It is written in a special intermediarylanguage called SimPVM, which de�nes an interface between PVMGraph andSES/Workbench.To simulate the application, a model of the intended platform must also beavailable. Thus, the simulation model is fundamentally partitioned into twosub-models: a dynamic model described in SimPVM, which consists of theapplication software description and some parameters of the platform (e.g.number and type of hardware nodes) and a static model which representsthe underlying parallel platform. By building the static descriptions into thesimulation system itself, the service is transparent to the application designer,yet provides a virtual, simulation platform for the generated application.There are three available descriptions to de�ne a parallel program. Duringthe early stage of the design, delay functions can be used to simulate a blockof code. Later, the description of this block can be improved by using prob-abilistic evaluation to simulate a conditional loop or branch. Finally, all thesimulation facilities may be replaced by real data and instructions. It is possi-ble to mix these three types of description into the same parallel application,because required accuracy may di�er between blocks of code.The SimPVM language basically contains the following elements:{ the list of processes to be initially executed (exec), and the host (identi�ca-tion) number where they execute;{ the description of processes (process) and functions (function). In this ver-sion, processes cannot be parameterised;{ C instructions for variable declaration, loops (for and while), conditional7

instructions (if else), and assignments;{ PVM functions for process management (e.g. pvm mytid and pvm spawn),bu�er management (e.g. pvm getsbuf) and for point-to-point communica-tion (e.g. pvm send);{ simulation constructs such as computation delay functions, probabilisticevaluation and statistical variables.The time parameter of the delay function is used to represent non-speci�cprocessor use. The probabilistic evaluation function simulates run-time datavalues and is used to analyse performance of general program behaviour ratherthan of execution which depends on a speci�c set of data.SimPVM lies above the LIBPVM level of the platform model, as will be ex-plained in the next section, but some special functions are also provided toallow direct interaction with the kernel model. A SimPVM program is thentranslated into an SES/Workbench simulation model where lines of the pro-gram are interpreted as simulation objects (the SES/Workbench simulationmodel language is graphical).5.2 The PVM Platform ModelThe PVM message-passing layer (Figure 2) models a single (parallel) virtualmachine dedicated to a user. It is composed of a daemon which resides oneach host making up the virtual machine and the library which provides aninterface to PVM services. The daemon acts primarily as a message router. Itis modelled as an automaton or state machine which is a common constructfor handling events. The life-cycle of the state machine corresponds to themain function of the daemon. The LIBPVM library allows a task to interactwith the daemon and other tasks. It contains functions for packing/unpackingmessages, managing multiple bu�ers, message passing and process control. Thelibrary is structured into two layers. The top level layer includes most PVMprogramming interface functions and the bottom level is the communicationinterface with the local daemon and other tasks.The major components in the operating system layer (Figure 2) are the Sys-tem Call Interface, the Process Scheduler, and the Communication Module.The Communication Module is structured into 3 sub-layers: the Socket Layer,the Transport Layer and the Network Layer. The Socket Layer provides acommunications endpoint within a domain. The Transport Layer de�nes thecommunication protocol (either TCP or UDP). The Network Layer imple-ments the Internet Protocol (IP) which acts as a message router.The Hardware Layer (Figure 2) is comprised of hosts and the communica-tions subnet. Each host is modelled as a single server queue with a time-sliced8

round-robin scheduling policy. The communications subnet is Ethernet, whoseperformance depends on the number of active hosts and the packet character-istics. Resource contention is modelled using the CSMA/CD (Carrier SenseMultiple Access with Collision Detection) protocol. The basic notion behindthis protocol is that a broadcast has two phases : propagation and transmis-sion. During propagation, packet collisions can occur. During transmission,the carrier sense mechanism causes the other hosts to hold their packets.5.3 Platform Model Veri�cation and ValidationAfter developing our simulation model, a veri�cation and validation step isnecessary to guarantee that it gives relevant performance evaluation of thereal system. Parts of our model validation have been conducted from thesystem resources layer to the application layer. Validation takes the form ofcomparative measurement. In the case of Ethernet we compared our resultsagainst published measurements [23,4].Functional modelling aims to reproduce the logical ow of the system be-ing modelled (the target system). Functional model veri�cation, whose aimis to ensure that the simulation program performs the target system func-tions correctly, is therefore similar to ordinary program debugging; programtracing and animation are two valuable techniques for this purpose. Once thefunctional model is veri�ed, the next step is to model performance. The pur-pose of performance modelling is to establish timing and other parameters(by measuring the target system). This model is validated by exhaustive ex-perimentation on the target system and the model with the aim of obtainingcomparative measurements between the two.The methodology adopted to validate the PVM platform model was a bottom-up approach. The components of the Hardware Layer were �rst validatedin isolation from the other layers. Then the Operating System Layer wasadded, followed by the Message-Passing Layer. For each layer, appropriateperformance measures were de�ned and statistical components were added ontop of each functional model to form a performance model. Results of thevalidation will be presented in Section 6.6 Case studyThe various layers of the platform simulation model have been validated ex-perimentally, and the results presented in [7]. To validate the platform asa whole, a PVM application, generated from the PVMGraph design tool,9

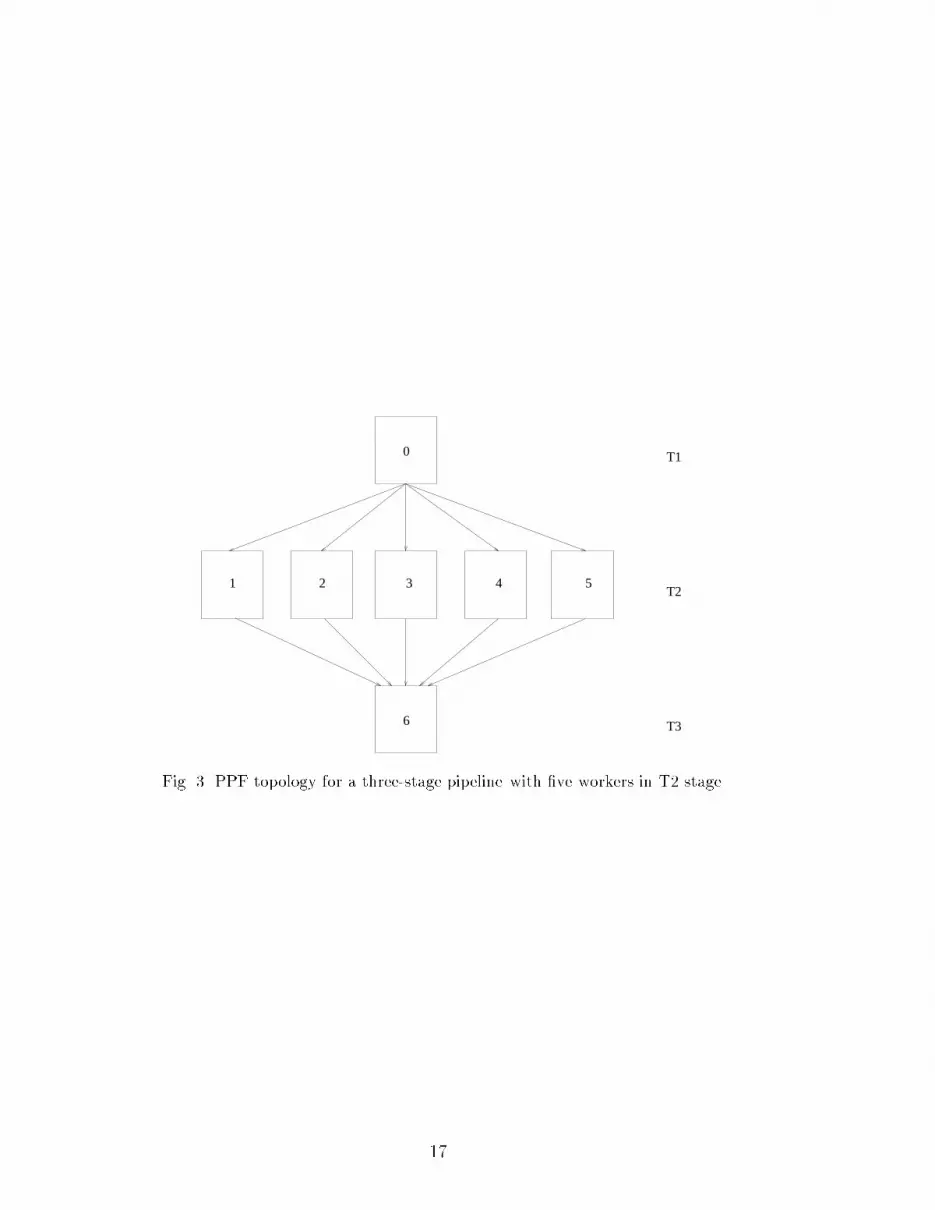
has been developed. The application chosen is the parallel-pipeline model ofa standard image processing algorithm, the H.261 Decoder [3], proposed byDownton et al [8]. The parallel-pipeline { or pipeline processor farm (PPF) {model is a generic approach to parallel algorithm design, which combines twostandard decomposition methods: pipelining and process farming. The H.261algorithm decomposes into a three-stage parallel pipeline: frame initialisation(T1); frame decoder loop (T2); and frame output (T3). The �rst and laststages are inherently sequential, whereas the middle stage contains consider-able data parallelism, and can be decomposed into a parallel farm. Thus, forexample, the PPF topology for a middle stage farm of 5 tasks, is shown inFigure 3. The number of possible topologies which solve a given problem areclearly very large, even for the H.261 algorithm. The PPF model thus implic-itly provides a rich set of experiments for validation of the simulator. Someof these results are described in the following section. The same topologicalvariation in the PPF model leads directly to performance variation in the al-gorithm, which, typically, is only poorly understood at the outset of design.One of the main purposes of the simulation tool in this case is to enable adesigner to identify the optimal topology, quickly and easily, without resortto run-time experimentation.6.1 Designing the PPF with PVMGraphFigure 3 shows the topology of the PPF application which is used as the basisfor the graphical design. However, as explained in Section 4, in PVMGraphnot only the topology is described but also part of the tasks' behaviour.In the PPF topology shown in Figure 3, there are three types of tasks: T1which corresponds to the frame initialisation, T2 which corresponds to theframe decoder loop and T3 which corresponds to the frame output. Thesetasks correspond to the ones represented in PVMGraph in Figure 4. However,task T2 has 5 instances instead of only one. Also, task T1 is represented by acomposed task symbol as it is responsible for spawning the other tasks in theapplication.The tasks' behaviour in the PPF application is represented by four typesof communication operations. Task T1, after spawning the other tasks, dis-tributes the data to each instance of task T2 by sending a message containinga (picture) frame segment. This is done by sending the messages in a loop andcan be represented in PVMGraph by a family of outputs, as shown in Figure4. After that task T1 terminates.Each task T2 receives a message (a frame segment) from task T1. This isdenoted by an input symbol. The connection between task T1's output and10

each instance of task T2 is also described in Figure 4. Each instance of task T2then carries out internal computations which are not represented graphically.After terminating their computations, they send the results to task T3. Thesend operation is denoted by the output symbol. Finally, the behaviour of taskT3 is described by a single family of inputs symbol, denoting the fact that itreceives the results from the instances of task T2 in a loop, and terminates.6.2 The Validation ExperimentsCCITT H.261 is an image encoding algorithm. Passing an image (or frame)through the pipeline processor farm is, in simulation terms, a form of transac-tion. The validation experiments described here are based on two transactionscenarios. In the former, a single image is processed; in the latter, �ve imagesare pipelined through the PPF. Validation is achieved by running the samealgorithm on the simulated platform, and on the corresponding real platform.A frame is a 352 x 288 8-bit image. Each frame is partitioned into 396 pels (a16 x 16 block sub-image). Stages T1 and T3 of the algorithm process wholeimages sequentially. In stage T2, a frame, broken into pels, allows each memberof the farm to work independently in parallel (Single Process, Multiple Data(SPMD) model).The principle architectural variation is in the middle stage of the PPF. Inthe experiments, the number of processors in the middle stage is varied from1 to 5. In every case, the load (ie. the number of pels) is evenly balancedbetween processors. A minor architectural variation is available in the �rstand last tasks (T1 and T3). In this case, because the tasks are felt to berelatively light, T1 and T3 have been mapped onto the same processor. Thus,the experiments are based on an architecture which ranges between 2 and 6processors.The target platform is a heterogeneous network of up to 6 workstations(SUN4's, SuperSparcs and PC's). Timings for the three algorithm stages wereextracted from [8] and inserted as time delays directly into both the simu-lation model, and the execution model. Thus, di�erences in computationalspeed arising from di�erences in CPU speed are not included. However, CPUand architectural di�erences are accounted for in the communication model,which is implicit to the real execution environment, and built into the sim-ulation model. This experiment is suitable for validation purposes (since thesimulated and real trials are identically structured), but may not be appropri-ate for predicting the real performance of the H.261 algorithm, in view of theapproximate nature of the assumed computation times.Figure 5 shows the experimental results. For each transaction scenario, speed-11

up is a normalised measure of execution time referred to a baseline experimentconsisting of a single worker in the middle (T2) stage, ie. a total of 2 processors.It may be observed that speed-up monotonically increases with the number ofworkers in T2, but that the 5-frame scenario performs signi�cantly better (interms of scalable speed-up) than the 1-frame scenario. This is not unexpected,since the pipeline is fuller in the former case. In both scenarios, the simulatortracks the actual performance very well; the di�erence between simulated andreal execution speed-up never exceeding 10% of the real execution time.7 ConclusionThis paper has described the simulation subsystem in EDPEPPS, a toolset tosupport a performance-oriented parallel program design method. The toolsetsupports graphical design, performance prediction through modelling and sim-ulation, and visualisation of predicted program behaviour. The designer is notrequired to leave the graphical design environment to view the program's be-haviour, since the principal visualisation facility is an animation of the graph-ical program description, and the transition between design and visualisationviewpoints is virtually seamless. It is intended that this environment will en-courage a philosophy of program design, based on a rapid synthesis-evaluationdesign cycle, in the emerging breed of parallel programmers.Success of the environment depends critically on the accuracy of the underly-ing simulation system. Preliminary experiments for validating the PVM-basedplatform model have been very encouraging, demonstrating accuracy of themodel below 10%.AcknowledgementWe would like to thank Romain Bigeard for developing part of the experiments.One of the authors (Thierry Delaitre) also wishes to acknowledge the supportand contributions of his PhD supervisor, Dr. Stefan Poslad, in the simulationaspects of the work reported in this paper.References[1] G.M. Birtwistle, Discrete Event Modelling on Simula (McMillan, London,1986). 12

[2] R. Candlin and N. Skilling, A modelling system for the investigation of parallelprogram performance, Computer Performance Evaluation 6(1) (1992) 1{32.[3] CCITT Draft revisions of recommendation H261: video codec for audiovisualservices at p � 64 kbit/s Signal Process, Image Commun. 2(2) (1990) 221{239.[4] D.K. Choi and B.G. Kim, The expected (not worst-case) throughput of theethernet protocol, IEEE Transactions on Computers 40 (1991) 245{252.[5] T. Delaitre, G.R. Justo, F. Spies and S. Winter, An environment for the designand performance evaluation of portable parallel software, Technical Report ofthe EDPEPPS project, EDPEPPS/6, University of Westminster, UK, 1996.[6] T. Delaitre, E. Luque, R. Suppi and S. Taylor, Simulation of parallel systemsin SEPP, in: A. Pataricza, ed., The Eighth Symposium on Microcomputer andMicroprocessor Applications 1 (1994) 294{303.[7] T. Delaitre, F. Spies and S. Winter, Simulation Modelling of Parallel Systems inthe EDPEPPS project, in: C.R. Jesshope and A.V. Shafarenko, ed., UKPAR'96Conference (Springer 1996) 1-13 .[8] A.C. Downton, R.W.S. Tregidgo and A. Cuhadar, Top-down structuredparallelisation of embedded image processing applications, in: IEE Proc.-Vis.Image Signal Process. 141(6) (1994) 431-437.[9] G. Dozsa, T. Fadgyas and P. Kacsuk, A Graphical Programming Language forParallel Programs, in: A. Pataricza, E. Selenyi and A. Somogyi, ed.,Proceedingsof the eighth symposium on Microcomputer and Microprocessor Applications 1(1994) 304{314.[10] A. Geist, A. Begueling, J. Dongarra, W. Jiang, R. Manchek and V. Sunderam,PVM: Parallel Virtual Machine (MIT Press, 1994).[11] E.R. Hart and S.J. Flavell, Prototyping transputer applications, in: H.S.M.Zedan , ed., Real-Time Systems with transputers (IOS Press, Amsterdam, 1990)241{247.[12] J.A. Hupp and J.F. Schoch, Measured performance of an ethernet localnetwork, Comm. of the ACM 23(12) (1980) 711{720.[13] R. Jain, The Art of Computer Systems Performance Analysis (Wiley, 1991).[14] P. Kacsuk, P.Dozsa and T. Fadgyas, Designing Parallel Programs by theGraphical Language GRAPNEL, Microprocessing and Microprogramming 41(1996) 625{643.[15] P. Kacsuk, G. Haring, S. Ferenczi, G. Pigel, G. Dozsa and T. Fadgyas, VisualParallel Programming in Monads-DPV, in: E. L�opez Zapata, ed., Proceedingsof the 4th Euromicro Workshop on Parallel and Distributed Processing (1996)344{351.[16] P. Newton, A graphical retargetable parallel programming environment andits e�cient implementation, Technical Report TR93-28, Dept. of ComputerSciences,University of Texas at Austin, 1993.13

[17] P. Newton, J. Dongara, Overview of VPE: a visual environment for message-passing, Technical Report ut-cs-94-261, Department of Computer Science,University of Tennessee, Knoxville, TN, 1994[18] C.M. Pancake, M.L. Simmons and J.C. Yan, Performance evaluation tools forparallel and distributed systems, Computer November 28 (1995) 16{19.[19] PEPS Partners, PEPS bulletin, the bulletin of the performance evaluation ofparallel systems project, EEC PEPS Esprit 6942, 1993.[20] P. Pouzet, J. Paris and V. Jorrand, Parallel application design: The simulationapproach with HASTE, in: W. Gentzsch and U. Harms. ed., High{PerformanceComputing and Networking, Lecture Notes in Computer Science 797 (Springer-Verlag 1994) 379{393.[21] Scienti�c and Engineering Software Inc, SES/Workbench User's Manual,Release 2.1, Scienti�c Engineering Software Inc. 1992.[22] Scienti�c and Engineering Software Inc. SES/workbench Reference Manual,Release 2.1, Scienti�c Engineering Software Inc., 1992.[23] N. Shacham and V. B. Hunt, Performance evaluation of the CSMA/CD (1-persistent) channel-access protocol in common-channel local networks, in: LocalComputer Network (North-Holland, 1982) 401{414.[24] N. Skilling, MIMD: A multiple instruction stream multiple data streamcomputer simulator, Technical Report TR9107, University of Edinburgh, Dept.of Chemical Engineering, 1991.[25] J.T. Stasko, The PARADE environment for visualizing parallel programexecutions graphics, Technical Report GIT-GVU-95-03, Visualization andUsability Center, Georgia Institute of Technology, Atlanta GA, January 1995[26] M. Stephenson and O. Boudillet, GECKO: A graphical tool for the modellingand manipulation of occam software and transputer hardware topologies, in:C. Askew, ed., Occam and the Transputer{Research and Applications (IOSpress, Amsterdam 1988) 139-144.[27] F. A. Tobagi and V. B. Hunt, Performance analysis of carrier sense multipleaccess detection. Proceedings of the LACN symposium (1979) 217{245.[28] H. Wabnig and G. Haring, PAPS: The parallel program performance predictiontoolset, in: G. Haring and G. Kotsis, ed., 7th International Conference onModelling Techniques and Tools for Computer Performance Evaluation, LectureNotes in Computer Science, 794 (Springer Verlag 1994) 284-304.[29] S. C. Winter and P. Kacsuk, Software engineering for parallel processing, in:A. Pataricza, ed., The Eighth Symposium on Microcomputer and MicroprocessorApplications 1 (1994) 285{293. 14

SimPVMModelling Language
File
SES/Workbench (GUI)SES/WorkbenchSimulation Engine
PVMGraph
SES/WorkbenchGraph File
SimPVM Translator
Trace File
Statistics Fileand
PVMPlatform Model
Graph FilesSystem Resources
OS
LIBPVMPVMD
PVM Application
Fig. 1. The EDPEPPS Architecture.15

Application Layer
Message-passing Layer
Operating System Layer
Hardware Layer
PVM Applications
PVMD LIBPVM
Process
Scheduler
System Call Interface
Socket Layer
Transport Layer
Network Layer
System ResourcesFig. 2. Simulation model architecture.16
4T2
T3
T10
6
21 3 5
Fig. 3. PPF topology for a three-stage pipeline with �ve workers in T2 stage17

Fig. 4. PVMGraph main window.18

0.5
1
1.5
2
2.5
3
3.5
4
4.5
5
0 1 2 3 4 5 6
Spee
dUp
Number of Processors in T2
PPF SpeedUp for 5 & 1 Frames
EDPEPPS Simulator 5 FramesReal Experiments 5 Frames
EDPEPPS Simulator 1 FrameReal Experiments 1 FrameFig. 5. Comparison between performance predictions and real experiments
19