a gis-based system for allocating municipal solid waste incinerator compensatory fund
TRANSCRIPT

Available online at www.sciencedirect.com
www.elsevier.com/locate/wasman
Waste Management 28 (2008) 2690–2701
A GIS-based system for allocating municipal solid wasteincinerator compensatory fund
Pei-Te Chiueh a,b,*, Shang-Lien Lo a,c, Chia-Ling Chang a,d
a Research Center for Environmental Pollution Prevention and Control Technology, National Taiwan University, 71, Chou-Shan Road,
Taipei 106, Taiwan, ROCb Department of Environmental Management, Tung Nan University, No. 152, Section 3, Peishen Road, Shen Keng, Taipei 222, Taiwan, ROC
c Graduate Institute of Environmental Engineering, National Taiwan University, 71, Chou-Shan Road, Taipei 106, Taiwan, ROCd Department of Water Resources Engineering and Conservation, Feng Chia University, No. 100, Wenhwa Rd., Seatwen, Taichung 407,
Taiwan, ROC
Accepted 13 January 2008Available online 4 March 2008
Abstract
To ease the NIMBY (not in my back yard) syndrome of constructing municipal solid waste (MSW) incinerators in Taiwan, compen-satory funding is widely allocated to the impacted communities to gain the acceptance and support of residents living the impacted areas.This paper presents a spatial methodology for distributing a compensatory fund more logically based on the environmental impact oneach neighborhood in Taipei City. This method integrates ten impact factors, which have been proposed by a local committee, to eval-uate all neighborhoods using mathematical models combined with spatial analyses in an analytic hierarchy process. The compensatoryfund is distributed according to the resulting final scores. A GIS (geographic information systems)-based system has been developed toassist in assigning the final scores to the neighborhoods impacted. Results on impact factors and fund distributions are combined; theyare included in an information system and displayed in spatial scales. For Taipei City, the impact of air quality during the incineratoroperating period is the item of greatest concern to the surrounding residents and thus, it receives a relatively higher weight of 0.2894. As aresult, high impact scores were assigned to not only those neighborhoods hosting the incinerators, but also the neighborhoods where themaximum particulate air pollutants occurred. This approach could be applicable to other MSW incinerators with similar environmentalimpact problems and interest in compensation schemes.� 2008 Elsevier Ltd. All rights reserved.
1. Introduction
Municipal solid waste (MSW) incinerators are generallyconsidered to be undesirable infrastructures, because theycause air pollution problems and other adverse environ-mental impacts to the surrounding areas. In addition tomaintaining strict emission standards to alleviate the envi-ronmental pollution, the authority may offer compensatory
0956-053X/$ - see front matter � 2008 Elsevier Ltd. All rights reserved.
doi:10.1016/j.wasman.2008.01.006
* Corresponding author. Address: Department of Environmental Man-agement, Tung Nan University, No. 152, Section 3, Peishen Road, ShenKeng, Taipei 222, Taiwan, ROC. Tel.: +886 2 86625935x405; fax: +886 286625934.
E-mail address: [email protected] (P.-T. Chiueh).
funds to the communities impacted by incinerators toobtain the acceptance of residents. In fact, providing thehost community with adequate compensation has evenbeen identified as one of the factors contributing to the suc-cess of siting waste treatment facilities (Minehart and Zvi-ka, 2002). The compensatory funding system is a popularapproach in Taiwan as a tool of environmental justice tosupport the construction and operation of regional MSWincinerators. The spirit of a compensatory fund is basedon the concept of recovering the welfare loss for the com-munities in the proximity of an undesirable facility. There-fore, distribution of the fund would be mainly carried outin accordance with the impact caused by MSW incineratorson specific areas (Hsu, 2006; Taiwan EPA, 1999).

P.-T. Chiueh et al. / Waste Management 28 (2008) 2690–2701 2691
In Taiwan, all MSW incinerators must pass an Envi-ronmental Impact Assessment (EIA) before they arelicensed to start the construction. Although the EIAreport may consider all potential impacts of constructingand operating an incinerator on the surrounding environ-ment, the predictions may not reflect the actual impacts.The environmental quality and conditions of the sur-rounding areas may be adversely impacted by MSWincinerator operations. A number of studies have beenconducted to evaluate the actual impact of MSW incin-erator operations on the surrounding environment. Forexample, Morselli et al. (2002, 2005) pointed out thatthe heavy metals observed in the atmospheric wet anddry depositions significantly depended on distance fromincinerator. Valberg et al. (1996) evaluated the healthimpact of MSW incinerators by considering the directand indirect exposure pathways of various metals andorganic compounds, and concluded that MSW incinera-tor emissions do not contribute measurably to popula-tion health risks.
Spatially variable correlations between emissions andeffects are crucial to analyses of scenarios of fund distribu-tion. Chang and Chang (2000) have proposed an assess-ment framework for two neighboring towns locatedaround a MSW incinerator in Taipei County. They utilizedthe analytic hierarchy process (AHP) to integrate majorenvironmental impacts caused by a MSW incinerator,and considered relative effects on two neighboring towns,
Fig. 1. The st
but further spatial analysis was not considered in theirstudy.
A geographic information system (GIS) has adequatefunctionalities to capture, store, check, manipulate andprocess spatially referenced data. Furthermore, GIS isoften applied as the integrating framework for spatial anal-ysis and modeling (Dai and Rocke, 2000). Sharholy et al.(2006) reported the use of GIS generated maps to charac-terize and manage MSW. Kontos et al. (2005) describeda MSW landfill siting methodology utilizing the combinedGIS and AHP method. While much work has been devotedto specific pollutant impacts in different waste managementscenarios using GIS, no studies have applied the integratedresults to determine the allocation of MSW incineratorcompensatory funds.
2. Background information
Taipei City is located in northern Taiwan, with longi-tudes between 121�270E and 121�390E and latitudesbetween 24�280N and 25�130N (Fig. 1). The 272 km2 cityis situated in a basin, which is surrounded by a mountainrange of approximately 1000 m. Being a highly developedarea, Taipei has 2.6 million residents or nearly 12% ofthe total population in Taiwan. With regard to the admin-istrative divisions, the city is divided into 12 districts thatare subdivided into a total of 449 ‘‘neighborhoods”. The‘‘neighborhood” is a basic administrative unit but will also
udy area.

2692 P.-T. Chiueh et al. / Waste Management 28 (2008) 2690–2701
be used as the spatial unit for evaluating the environmentalimpact and distributing compensatory funds in this study.
For many years, Taipei has maintained a solid wastemanagement policy that favors incineration over landfillingfor municipal waste disposal. Thus, three incinerationplants, Nei-Hu, Mu-Zha and Bei-Tou, were constructedin 1992, 1995, and 1999, respectively. The installed dailyincineration capacities are 900 tons (300 Tons � 3) forNei-Hu, 1500 Tons (375 Tons � 4) for Mu-Zha, and1800 Tons (450 Tons � 4) for Bei-Tou. Including somegeneral industrial wastes, the actual average daily quanti-ties of solid wastes incinerated are 262, 633, and 946 Tonsfor the three respective incinerators. All these incineratorshave a mechanical grate system, operate in continuousmode, and recover heat energy which is converted into elec-tricity. The waste flue-gas is treated with semi-dry scrub-bers and bag-filters in Nei-Hu and Bei-Tou plants, aswell as electronic precipitator and wet scrubber in Mu-Zha plant (TDEP, 2003).
For compensating the local communities around theincinerators, a statute was adopted in 1994 that specifiesthe target area, application regulations, and distributionmethod of the compensatory fund. Since the distributionmethod only considered the populations and the wastequantities generated by the 12 districts, it drew criticismsand disputes about its fairness between neighborhoodswithin a district. Some districts are so large that severalneighborhoods in these districts may realize different levelsof impacts from the incinerators. The statute was revised in2000 to stipulate that the fund distribution be based on thedegree of impact suffered by each neighborhood (TDEP,2003). According to the revised statute, 20% of the com-pensatory fund should be reserved for the host neighbor-hoods, where the incinerators are located; the remaining80% is allocated to nearby neighborhoods based on theimpacts they receive.
The compensatory fund allotted to the nearby neighbor-hoods of the three incinerators is about US$ 4.5 million (in2003 US dollars). It came from a fixed portion of the dis-posal tax and the revenue from selling electricity generatedby MSW incinerators. The Mu-Zha Incineration Plant and
GOAL
Categories ofimpact
Impactfactors
Air qualityduring
construction0.0709
Envcompen
Construction impactsof incinerators
0.1644
Operation impof incinerato
0.3904
Noiseduring
construction0.0602
Vibrationduring
construction0.0333
Air qualityduring
operation0.2894
op0
Air qualityduring
construction0.0709
Envcompen
Construction impactsof incinerators
0.1644
Operation impof incinerato
0.3904
Noiseduring
construction0.0602
Vibrationduring
construction0.0333
Air qualityduring
operation0.2894
op0
Fig. 2. AHP model for evaluating environmental impact for
the Bei-Tou Incineration Plant each have only one hostneighborhood, while the Nei-Hu Incineration Plant has fivehost neighborhoods that are all close to it. Hence, beforethe incineration plants were constructed, the authorityhad coordinated with local residents to list all seven neigh-borhoods as the host area (Fig. 1).
3. Methodology
The proposed GIS-based model for fund allocationinvolves the assessment and integration of environmentalimpacts. An information system has been developed inESRI Avenue� scripts and ArcView� 3.3 GIS software tosupport the process of making the composite evaluationcriteria, performing the multiple criteria analyses and car-rying out the fund distribution alternatives.
3.1. Evaluating environmental impacts
The problem of evaluating environmental impactsassociated with MSW incineration was structured byextracting key factors from the items related to incinera-tor construction and operation. Specific items for miti-gating the adverse impacts as mentioned in theincinerators’ EIA reports were carefully investigated.The evaluating structure has been adjusted through fre-quent communications with local residents and examina-tion committees such that public concerns over theimpact of incinerators on their intrinsic properties andexternal environment would be addressed. The structurewas decomposed into three levels according to their char-acteristics to formulate a hierarchical model as shown inFig. 2. The topmost level is the focus of the goal, i.e.,the distribution approach of the compensatory fund.The intermediate level corresponds to the major catego-ries of impact, namely the construction impacts of incin-erators, operation impacts of incinerators, transportationimpacts of the MSW collection vehicles and the popula-tion of each neighborhood. The lowest hierarchical levelrepresents ten impact factors to be evaluated on differentscales as will be illustrated in later sections.
ironmental impact forsatory fund distribution
actsrs
Impacts ofcollection vehicles
0.2421
Population0.2031
Noiseduringeration.1010
Noise ofcollectionvehicles0.0764
Vibration ofcollectionvehicles0.0440
Traffic ofcollectionvehicles0.0761
Exhaust ofcollectionvehicles0.0456
ironmental impact forsatory fund distribution
actsrs
Impacts ofcollection vehicles
0.2421
Population0.2031
Noiseduringeration.1010
Noise ofcollectionvehicles0.0764
Vibration ofcollectionvehicles0.0440
Traffic ofcollectionvehicles0.0761
Exhaust ofcollectionvehicles0.0456
compensatory fund of municipal solid waste incinerators.

P.-T. Chiueh et al. / Waste Management 28 (2008) 2690–2701 2693
3.1.1. Construction impacts of incinerators
While the three incinerators had already been operatedfor some time, the construction impacts were still consid-ered in this research. Three factors (Table 1) were selectedto characterize the impacts during the construction periodof incinerators; they were the increment of concentration ofair pollutants, noise (N) and vibration (V).
For air pollution, the ISC3 (USEPA, 2005) model wasused to simulate the dispersion of pollutants emitted duringthe construction period. Only the total suspended particle(TSP) was treated as a major pollutant, and an emissionrate of 4.86 � 10�4 g/m2/s was assumed for the construc-tion area. The evaluation was carried out for the impactedneighborhoods within a radius of 4 km from the center ofthe incinerator.
The noise impact was predicted and analyzed using theSoundPLAN model (SoundPLAN, 2005), which consid-ered each noise source from point, line, and area and theircombined noise levels. In this analysis, the minimum sensi-ble threshold of noise was set to be 45 dB(A) with a5 dB(A) increment between two levels. The grading stan-dard was based on the fading distance and affected areaof maximum noise level calculated using the noise model.
This study only relied on empirical rules to evaluatevibration because no applicable and approved formulahas been proposed for the diverse construction media.The minimum threshold of vibration was set to be 40 dBwith a 5 dB increment between a level and the next higherlevel. As a result of constructing impact, high grading val-ues for these three factors rapidly diminishes for neighbor-hoods away from the construction site. Thus, only theincinerator host neighborhoods and a few nearby neigh-borhoods are affected, as shown in Fig. 3a–c.
3.1.2. Operation impacts of incinerators
The operation impact comprises two factors: air qual-ity and noise. The ISC3 model, which is similar to themodel used for evaluating the construction impacts,was applied to simulate the dispersion of pollutants emit-ted from incinerators. When the incinerators are put intooperation, all neighborhoods in the whole Taipei cityand nearby counties were evaluated because emissionplumes from all three incinerators may affect these areas.
Table 1Grading values for the construction impacts of incinerators
Increment of TSP AQ1
(lg/Nm3)Noise N1
(dB(A))Vibration V1
(dB(A))Gradingvalue
AQ1 < 0.5 N1 < 50 V1 < 40 00.5 5 AQ1 < 1 50 5 N1 < 55 40 5 V1 < 45 11 5 AQ1 < 2 55 5 N1 < 60 45 5 V1<50 22 5 AQ1 < 3 60 5 N1 < 65 50 5 V1 < 55 33 5 AQ1 < 5 65 5 N1 < 70 55 5 V1 < 60 45 5 AQ1 < 10 70 5 N1 < 75 60 5 V1 < 65 510 5 AQ1 < 20 75 5 N1 < 80 65 5 V1 < 70 620 5 AQ1 < 30 80 5 N1 < 85 70 5 V1 < 75 730 5 AQ1 < 40 85 5 N1 < 90 75 5 V1 < 80 840 5 AQ1 90 5 N1 80 5 V1 9
The modeling grid consisted of 2514 receptor points con-sisting of two sizes: 700 m by 700 m for regular areasand 300 m by 300 m for densely populated areas. Thefour major pollutants to be evaluated were sulfur dioxide(SO2), nitrogen dioxide (NO2), hydrogen chloride (HCl)and TSP. Their emission rates for evaluation are basedon design concentrations and capacities of the incinera-tors. The ISC3 Model was used to simulate the yearlyaverage concentrations of these four air pollutants atreceptor points. The GIS ‘‘points in polygon” function(ESRI, 1990) was used to distribute the ISC3 output toevery neighborhood and calculate the neighborhoodaverage. Five levels of even-number grading values wereassigned to neighborhoods based on the increments ofthese four pollutants as shown in Table 2. The assignedvalues for these four pollutants were averaged and usedas the final value for the impact factor of air qualityfor each neighborhood during MSW incinerator opera-tion. The spatial result of this factor, shown in Fig. 4a,indicates that neighborhoods located in southwest Taipeihad higher grading values. Additionally, the synthesizedeffects of these three incinerators were directly affectedby the meteorological conditions of Taipei City, whichis often under the influence of the East Asia monsoonseason with prevailing northeasterly winds most theseason.
Grading values for evaluating the noise impact causedby incinerator operation are carried out using the samemethod as for evaluating the construction impact (Table1). The results show that only the host neighborhoods wereaffected, as demonstrated in Fig. 4b.
3.1.3. Impacts of collection vehicles
There are four impact factors considered for MSW col-lection vehicles: noise, vibration, traffic and exhaust. Thesefactors should be evaluated in accordance with the MSWcollection routes and route characteristics. The collectionroutes in all 12 districts were digitized into the GIS systemfor using ‘‘lines in polygon” analysis to calculate the dis-tance in each neighborhood traveled by the MSW collec-tion vehicles.
SoundPLAN, which is similar to the model used forevaluating construction and operation, was implementedto estimate the noise impact of MSW collection vehicles.The grading values of this factor were determined by con-sidering the sum of background and vehicular noises, andthe contribution of solely vehicular noise. The results wererepresented by a matrix as shown in Table 3 and Fig. 5a.
Evaluating vehicular vibration impact was based onempirical rules and the results of on-site noise analyses.The matrix similar to that for noise assessment was usedfor analyzing the synthetic effect of vibration as shown inTable 4 and Fig. 5b.
Based on GIS route analyses, the mileages traveled byMSW collection vehicles in each neighborhood weresummed up to quantify the traffic impact. Moreover, thequantity of emission from collection vehicles was consid-

Nei-HuNei-Hu
Mu-ZhaMu-Zha
Bei-TouBei-Tou
increment of air pollutant0-22-44-66-88-10
neighborhooddistrictincinerator
3 0 3 Kilometers
N
EW
S
Nei-HuNei-Hu
Mu-ZhaMu-Zha
Bei-TouBei-Tou
Nei-HuNei-Hu
Mu-ZhaMu-Zha
Bei-TouBei-Tou
noise_construction0-22-44-66-88-10
vibration_construction0-22-44-66-88-10
(a) air quality during construction
(b) noise during construction
(c) vibration during construction
Fig. 3. Construction impacts of incinerators.
2694 P.-T. Chiueh et al. / Waste Management 28 (2008) 2690–2701
ered to be proportional to the distance traveled. Therefore,the grading values for traffic impacts were also used forevaluating vehicular emission as shown in Table 5 andFig. 5c. In particular, most neighborhoods experiencing
obvious increments in noise and vibration impact causedby the passing MSW collection vehicles is different fromthe observations for other factors. The impact factors fornoise and vibration have a similar trend of spatial distribu-

Table 2Grading values for the impact of air quality operation of incinerators
Increment of air pollutants (lg/Nm3) Grading value
HC1 (AQ2) NO2 (AQ3) SO2 (AQ4) TSP (AQ5)
AQ2 < 0.04 AQ3 < 0.16 AQ4 < 0.04 AQ5 < 0.032 20.042 5 AQ2 < 0.08 0.162 5 AQ3 < 0.32 0.04 5 AQ4 < 0.08 0.032 5 AQ5 < 0.064 40.08 5 AQ2 < 0.12 0.322 5 AQ3 < 0.48 0.082 5 AQ4 < 0.12 0.064 5 AQ5 < 0.096 60.12 5 AQ2 < 0.16 0.48 5 AQ3 < 0.64 0.122 5 AQ4 < 0.16 0.096 5 AQ5 < 0.128 80.16 5 AQ2 0.64 5 AQ3 0.162 5 AQ4 0.128 5 AQ5 10
airquality_operation0-22-44-66-88-10
neighborhooddistrictincinerator
6 Kilometers
N
EW
S
Nei-HuNei-Hu
Mu-ZhaMu-Zha
Bei-TouBei-Tounoise_operation0-22-44-66-88-10
(a) air quality during operation
(b) noise during operation
Nei-HuNei-Hu
Mu-ZhaMu-Zha
Bei-TouBei-Tou
60
Fig. 4. Operation impacts of incinerators.
Table 3Grading values for the impact of noise of collection vehicles
Overall noise N2 (dB(A)) Grading value
Noise of collection vehicles N3 (dB(A))
N3 6 60 60 < N3 6 65 65 < 32 6 70 70 < N3 6 75 75 < N3
N2 6 75 1 2 3 4 575 < N2 6 80 2 3 4 5 680 < N2 6 85 3 4 5 6 785 < N2 6 90 4 5 6 7 890 < N2 5 6 7 8 9
P.-T. Chiueh et al. / Waste Management 28 (2008) 2690–2701 2695

Nei-HuNei-Hu
Mu-ZhaMu-Zha
Bei-TouBei-Tou
noise_vehicle0-22-44-66-88-10
neighborhooddistrictincinerator
5 0 5 Kilometers
N
EW
S
Nei-HuNei-Hu
Mu-ZhaMu-Zha
Bei-TouBei-Tou
Nei-HuNei-Hu
Mu-ZhaMu-Zha
Bei-TouBei-Tou
vibration_vehicle0-22-44-66-88-10
traffic&exhaust_vehicle0-22-44-66-88-10
(a) noise of collection vehicles
(b) vibration of collection vehicles
(c) traffic and exhaust impact of collection vehicles
Fig. 5. Impacts of collection vehicles.
2696 P.-T. Chiueh et al. / Waste Management 28 (2008) 2690–2701
tion because they share the same database of collectionroutes and are analyzed using similar models (Fig. 5a andb). On the other hand, the traffic and exhaust impacts onneighborhoods were distributed more uniformly than other
factors. Only a few neighborhoods near the incineratorsreceived high grading values because they were on the mainpassing route of MSW collection vehicles as shown inFig. 5c.
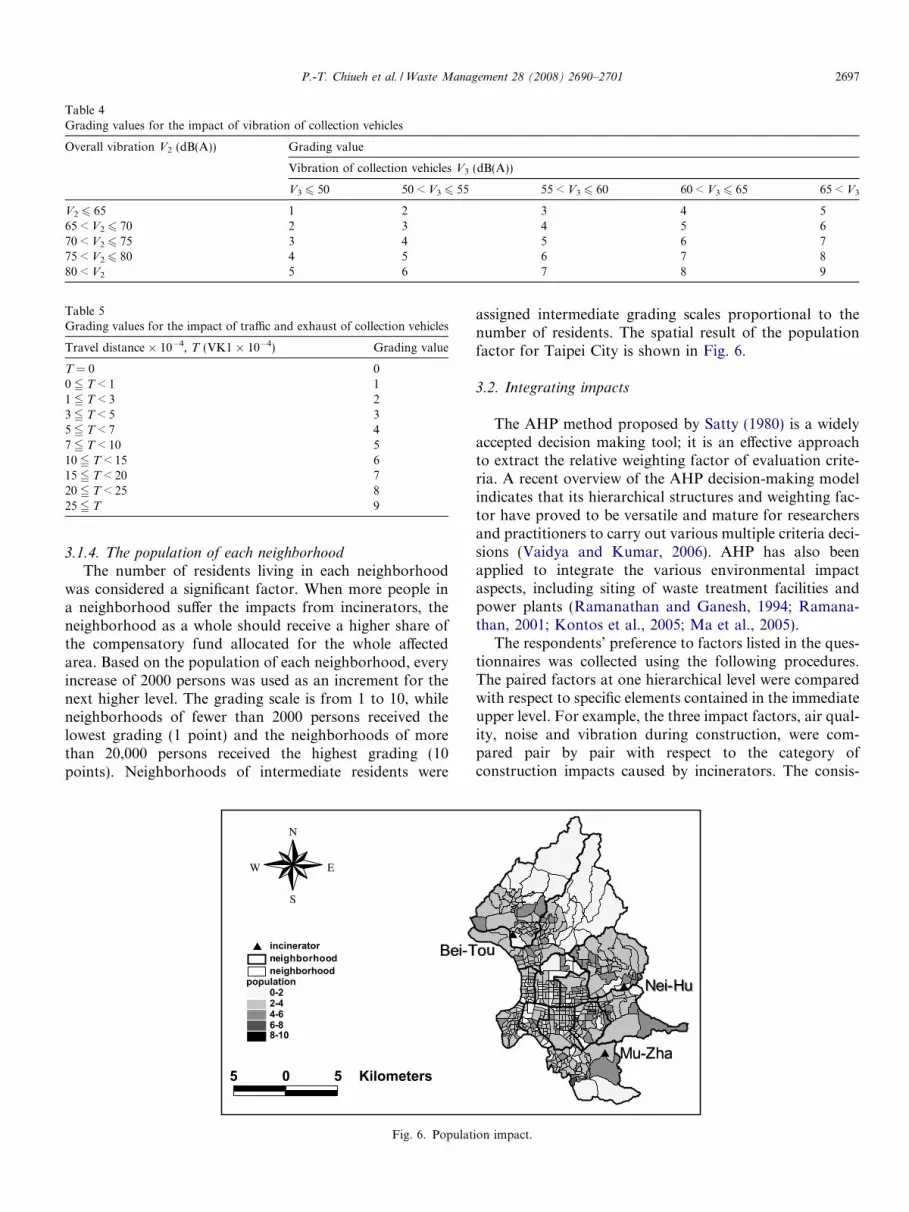
Table 4Grading values for the impact of vibration of collection vehicles
Overall vibration V2 (dB(A)) Grading value
Vibration of collection vehicles V3 (dB(A))
V3 6 50 50 < V3 6 55 55 < V3 6 60 60 < V3 6 65 65 < V3
V2 6 65 1 2 3 4 565 < V2 6 70 2 3 4 5 670 < V2 6 75 3 4 5 6 775 < V2 6 80 4 5 6 7 880 < V2 5 6 7 8 9
Table 5Grading values for the impact of traffic and exhaust of collection vehicles
Travel distance � 10�4, T (VK1 � 10�4) Grading value
T = 0 00 5 T < 1 11 5 T < 3 23 5 T < 5 35 5 T < 7 47 5 T < 10 510 5 T < 15 615 5 T < 20 720 5 T < 25 825 5 T 9
P.-T. Chiueh et al. / Waste Management 28 (2008) 2690–2701 2697
3.1.4. The population of each neighborhoodThe number of residents living in each neighborhood
was considered a significant factor. When more people ina neighborhood suffer the impacts from incinerators, theneighborhood as a whole should receive a higher share ofthe compensatory fund allocated for the whole affectedarea. Based on the population of each neighborhood, everyincrease of 2000 persons was used as an increment for thenext higher level. The grading scale is from 1 to 10, whileneighborhoods of fewer than 2000 persons received thelowest grading (1 point) and the neighborhoods of morethan 20,000 persons received the highest grading (10points). Neighborhoods of intermediate residents were
Bei-TBei-T
population0-22-44-66-88-10
neighborhoodneighborhoodincinerator
5 0 5 Kilometers
N
EW
S
Fig. 6. Populat
assigned intermediate grading scales proportional to thenumber of residents. The spatial result of the populationfactor for Taipei City is shown in Fig. 6.
3.2. Integrating impacts
The AHP method proposed by Satty (1980) is a widelyaccepted decision making tool; it is an effective approachto extract the relative weighting factor of evaluation crite-ria. A recent overview of the AHP decision-making modelindicates that its hierarchical structures and weighting fac-tor have proved to be versatile and mature for researchersand practitioners to carry out various multiple criteria deci-sions (Vaidya and Kumar, 2006). AHP has also beenapplied to integrate the various environmental impactaspects, including siting of waste treatment facilities andpower plants (Ramanathan and Ganesh, 1994; Ramana-than, 2001; Kontos et al., 2005; Ma et al., 2005).
The respondents’ preference to factors listed in the ques-tionnaires was collected using the following procedures.The paired factors at one hierarchical level were comparedwith respect to specific elements contained in the immediateupper level. For example, the three impact factors, air qual-ity, noise and vibration during construction, were com-pared pair by pair with respect to the category ofconstruction impacts caused by incinerators. The consis-
ouou
Mu-ZhaMu-Zha
Nei-HuNei-Hu
ion impact.

2698 P.-T. Chiueh et al. / Waste Management 28 (2008) 2690–2701
tency of the judgmental matrix can be determined based ona measure called ‘‘consistency ratio”. In general, a consis-tency ratio of 0.10 or less is considered acceptable (Rama-nathan, 2001; Brent et al., 2007). Once all comparisons ofpaired factors were carried out at every level and wereproved to be consistent, the judgments could then be syn-thesized to obtain the relative weight of each factor. Theoperation of consistency verification is helpful to measurethe degree of consistency among the comparisons of pairedfactors; this feature is regarded as one of the most desiredadvantages of AHP (Ho, 2007).
The ten experts who were involved in the AHP of thisstudy had been selected from the Commission of Environ-mental Impact Assessment of Taipei Bureau of Environ-mental Protection. The specialized fields of these expertsinclude: transportation (1), air quality (1), noise and vibra-tion (3), incineration plant operation (2) and environmen-tal impact assessment (3). In this study, the resultsobtained by analyzing questionnaires led to a consistencyratio of 0.0746 that conforms to the limit of less than0.10. Fig. 2 shows the weighting factor of the factors in var-ious classes.
Results of evaluating the weighting factors werereported by the ten experts participating in the AHP assess-ment and then approved without modification by the Eval-uation Committee before being used in the subsequentevaluation. In Fig. 2, the category of the incinerator oper-ation received the highest relative weight for the impact(0.3904). Among all factors, the air quality impact factor(0.2894) was the highest, indicating that gaseous emissionsfrom the incinerators’ stacks were perceived as a seriouspollutant source. The impact of collection vehicles, whichwas characterized by noise, vibration, traffic and exhaustof collection vehicles, was also an important category inthe evaluating framework (0.2421). All those four factorswere relevant to the routes of collection vehicles. The pop-ulation in each neighborhood was another major factor, asshown by a relatively high weight (0.2031).
For data aggregation, summation of the 10 weighedscores was used as the final score of each neighborhood(Si):
Si ¼X10
j¼1
ðAij � W jÞ ð1Þ
where Si is the final score of neighborhood i; Aij is the grad-ing value of impact factor j of neighborhood i; Wj is theweight of impact factor j.
3.3. Allocating funds for each neighborhood
The distribution of the compensatory fund was carriedout according to the final scores for neighborhoods (Si)derived from the aggregation of the AHP relative weightsand grading values of impact factors. Of the compensatoryfund, 20% had been reserved for paying the seven hostneighborhoods, and the remaining fund was distributed
to the other 442 neighborhoods. All neighborhoods receiv-ing final scores less than 2 were eliminated from the com-pensatory list.
Distributing the fund according to individual impactscores would be tedious and complicate administrative pro-cedures, and the difference between funds allocated to thetop and the bottom categories was thought likely to leadto objections if funds were proportional to estimatedimpacts. Hence, the Evaluation Committee with membersrepresenting the general public suggested that the neigh-borhoods be divided into five classes according the degreeof impact. It was also agreed that the middle class of thefive would receive the average percentage of the availablefund, the upper two classes would receive 20% and 40%more than the average percentage, while the lower two clas-ses would receive 20% and 40% less than the averagepercentage.
4. Results and discussion
The final scores, which were calculated by evaluating,weighing and aggregating the environmental impacts forthe 449 neighborhoods in Taipei City, range from 0.78 to5.57 (Fig. 7). The spatial distribution of scores from highto low is generally inversely proportional to the distancefrom incinerators. The host neighborhoods of incineratorshave a higher average score of 3.65 (ranging from 2.50 to5.57, see Fig. 7); it conforms to the public’s cognition ofperceiving the incinerator as the major cause of most envi-ronmental impacts. However, some distant neighborhoodsfar from the incinerators, located in southwest Taipei City,also receive high impact scores. Comparison of the spatialdistribution of the ten impact factors, the impact of airquality during the incinerator operation appears to be theprimary cause while the noise and vibration of MSW col-lection vehicles may be of secondary importance (Figs.3a, 4a and b).
According to the final scores, there are 48 neighbor-hoods with scores less than 2 points so that they are elim-inated from compensatory funding list. There are 394neighborhoods remaining on the funding lists (Fig. 8).Except those adjacent to the incinerator host area, neigh-borhoods in southwest Taipei City are also classified asmore seriously affected areas and should receive highercompensatory funds. Moreover, the trend of classificationfor allocating funds is highly consistent with the classifica-tion of neighborhoods based on air quality during inciner-ator operation.
As shown in Table 6, the number of neighborhoods ineach funds class ranges from 77 to 80, because some neigh-borhoods have the same score such that they must beplaced in the same class. Each host neighborhood receives2.86% of the total budgeted fund and the neighborhoods inclass I–V share much less funding; the host neighborhoodswould receive approximately $129,000 each while the classV neighborhoods receive $12,600 each (in 2003 US dollars).

0 Kilometers
Nei-HuNei-Hu
Mu-ZhaMu-Zha
Bei-TouBei-Tou
final score0-11-22-33-44-55-6
2.73
5.57
2.50 2.58
3.47
4.6581
5
4.0295
Fig. 7. Final score of each neighborhood.
P.-T. Chiueh et al. / Waste Management 28 (2008) 2690–2701 2699
The relative weight of an impact factor may affect thefinal score and the subsequent fund distribution for allneighborhoods. Fig. 9 demonstrates the sensitivity of theweights on final scores. If equal weight was adopted foreach factor, the highly affected areas would always be cen-tered on the incinerator or its vicinity. The extra weight onair pollution found through the AHP has led to the greaterspread in weighted effects seen in Fig. 8.
In a previous study, Chang and Chang (2000) evaluatedthe influence of one incinerator on only two neighboringtowns using EIA analyses. This study shows the potentialto extend the EIA analysis to many more neighborhoodsusing GIS. In addition to its capabilities in processing, ana-lyzing and modeling spatial data, GIS also provides good
Bei-TouBei-Tou
Fundclass (score)I (2.02-2.53)II (2.54-2.83)III (2.84-3.24)IV (3.25-3.67)V (3.67-4.88)
villagedistricthost areaincinerator
0 Kilometers
N
EW
S
5
Fig. 8. Classification of compensatory fund distr
visualization tools that can be used effectively to presentthe impact evaluation results graphically.
A number of improvements are needed before themethod used here could be considered a completely fairway to allocate funds. The method points to the impor-tance of air pollution impacts, but does not considerreal-time data of emissions from the incinerators orreal-time monitoring stations in each neighborhood. Inaddition, the method uses a number of effects as a surro-gate for human health impacts without directly examin-ing the human health data. Finally, although thefactors considered in the AHP framework have beenhammered out through numerous discussions with localautonomous committees, other significant impacts, such
Nei-HuNei-Hu
Mu-ZhaMu-Zha
ibution for MSW incinerators in Taipei City.

Table 6Payment scale of the compensatory fund distribution
Class Number ofneighborhoods
Score range Distribution criteria Percentage of total fund perneighborhoodc
I 79 2.02–2.53 60% of averaged funda 0.12%d
II 80 2.54–2.83 80% of averaged fund 0.16%III 79 2.84–3.24 Averaged fund 0.20%IV 77 3.27–3.67 120% of averaged fund 0.24%V 79 3.67–4.88 140% of averaged fund 0.28%
394 (Sum) 3.09 (Average)Host area 7 2.50–5.57 (3.65
Average)Shared out 20% of the total fundequallyb
2.86%
Excluded 39 0.78–2.00 None 0
a Averaged fund is equal to (80% of the total fund � 394).b 20% of the total fund was reserved for the 7 host neighborhoods in advance.c Fund for each neighborhood in % of the total fund.d For example, 0.12% of the total fund = 60% � (80% of the total fund � 394).
N
EW
S
5 0 5 Kilometers
Fund class (score)I (2.02-2.53)II (2.54-2.83)III (2.84-3.24)IV (3.25-3.67)V (3.67-4.88)
villagedistricthost areaincinerator
Nei-HuNei-Hu
Mu-ZhaMu-Zha
Bei-TouBei-Tou
Fig. 9. Sensitivity analysis of impact factor weights (setting equal weight to each factor, 0.1).
2700 P.-T. Chiueh et al. / Waste Management 28 (2008) 2690–2701
as dioxin emission and the risk of ash treatment, werenot included.
References
Brent, A.C., Rogers, D.E.C., Ramabitsa-Siimane, T.S.M., Rohwer, M.B.,
2007. Application of the analytical hierarchy process to establish
health care waste management systems that minimise infection risks in
developing countries. European Journal of Operational Research 181
(1), 403–424.
Chang, N.B., Chang, Y.H., 2000. Assessing the redistribution strategy of
the compensatory fund based on an integrated AHP and EIA
approach for a municipal incinerator. In: Proceedings of the 2nd
International Conference on Solid Waste Management, Taipei, Tai-
wan, ROC, pp. 175–190.
Dai, J., Rocke, D.M., 2000. A GIS-based approach to spatial allocation of
area source solvent emissions. Environmental Modeling and Software
15, 293–302.
ESRI, 1990. Environmental System Research Institute, Inc., Understand-
ing GIS, the ARC/INFO method.
Ho, W., 2007. Integrated analytic hierarchy process. European Journal of
Operational Research. doi:10.1016/j.ejor.2007.01.00.
Hsu, S.H., 2006. NIMBY opposition and solid waste incinerator
siting in democratizing Taiwan. The Social Science Journal 43,
453–459.
Kontos, T.D., Komilis, D.P., Halvadakis, C.P., 2005. Siting MSW
landfills with a spatial multiple criteria analysis methodology. Waste
Management 25, 818–832.
Ma, J., Scott, N.R., DeGloria, S.D., Lembo, A.J., 2005. Siting analysis of
farm-based centralized anaerobic digester systems for distributed
generation using GIS. Biomass and Bio-energy 28, 591–600.
Minehart, D., Zvika, N., 2002. Effective siting of waste treatment
facilities. Journal of Environmental Economics and Management
43, 303–324.
Morselli, L., Bartoli, M., Brusori, B., Passarini, F., 2002. Application of
an integrated environmental monitoring system to an incineration
plant. The Science of the Total Environ 289 (1–3), 177–188.

P.-T. Chiueh et al. / Waste Management 28 (2008) 2690–2701 2701
Morselli, L., Bartoli, M., Bertacchini, M., Brighetti, A., Luzi, J., Passarini,
F., Masoni, P., 2005. Tools for evaluation of impact associated with
MSW incineration: LCA and integrated environmental monitoring
system. Waste Management 25, 191–196.
Ramanathan, R., Ganesh, L.S., 1994. Group preference aggregation
methods employed in AHP: an evaluation and an intrinsic process for
deriving members’ weightages. Europe Journal of Operational
Research 79, 249–265.
Ramanathan, R., 2001. A note on the use of the analytic hierarchy process
for environmental impact assessment. Journal of Environmental
Management 63, 27–35.
Satty, T.L., 1980. The analytic hierarchy process: planning. Priority
Setting and Resource Allocation. McGraw-Hill, New York,
USA.
Sharholy, M., Ahmad, K., Vaishya, R.C., Gupta, R.D., 2006. Municipal
solid waste characteristics and management in Allahabad, India.
Waste Management. Doi:10.1016/j.wasman.2006.03.0 01.
SoundPLAN, 2005. LLC Braunstein + Berndt GmbH, Tutorial Sound-
PLAN, Backnang, Germany. Available from: <http://www.sound-
plan.com/tutor.htm>.
Taiwan, EPA, 1999. Guidelines For Providing Compensatory Fund For
Municipal Refuse Incinerator Operation, Taipei, Taiwan. Available
from: <http://w3.epa.gov.tw/epalaw>.
TDEP, 2003. Department of Environmental Protection, Taipei City
Government, Developing Environmental Impact Model for Municipal
Solid Waste Incinerators in Taipei City, Final Report, Taipei, Taiwan.
USEPA, 2005. User’s Guide for the Industrial Source Complex (ISC3)
Dispersion Models. Available from: <http://www.epa.gov/scram001/
userg/regmod/isc3v2.pdf>.
Vaidya, O.S., Kumar, S., 2006. Analytic hierarchy process: an overview of
applications. Europe Journal of Operational Research 169, 1–29.
Valberg, P.A., Drivas, P.J., McCarthy, S., Watson, A.Y., 1996. Evaluating
the health impacts of incinerator emissions. Journal of Hazardous
Materials 47 (1–3), 205–227.