a framework for practical and rigorous impact monitoring by field managers of marine protected areas
TRANSCRIPT
Environ Monit AssessDOI 10.1007/s10661-010-1805-9
A framework for practical and rigorous impact monitoringby field managers of marine protected areas
Anthony B. Rouphael · Ameer Abdulla ·Yasser Said
Received: 17 July 2010 / Accepted: 22 November 2010© Springer Science+Business Media B.V. 2010
Abstract Monitoring is a crucial component ofconservation in marine protected areas (MPAs)as it allows managers to detect changes to biodi-versity and to infer cause of change. However, thecomplexities of sampling designs and associatedstatistical analyses can impede implementation ofmonitoring by managers. Two monitoring frame-works commonly used in marine environmentsare statistical testing and parameter estimation.For many managers these two approaches failto help them detect change and infer causationfor one or more reasons: the complexity of the
A. B. Rouphael (B)Marine Biodiversity and Conservation Science Group,IUCN Global Marine Program, Perth, Australiae-mail: [email protected]
A. AbdullaMarine Biodiversity and Conservation Science Group,IUCN Global Marine Program, Malaga, Spain
Y. SaidRed Sea Protectorate, Egyptian EnvironmentalAffairs Agency, Hurghada, Egypt
Present Address:A. B. Rouphael5 Birdwood Avenue, Perth, Western Australia, 6152,Australia
statistical test, no decision-making structure anda sampling design that is suboptimal. In collabora-tion with marine park rangers in Egypt, we insti-gated a monitoring framework to detect impactsby snorkelers in a pragmatic but scientifically rig-orous way. First, we used a literature review todefine causal criteria to facilitate inference. Thiswas essential because our sampling design wassuboptimal due to a lack of baseline data andthere was only one impact site. Second, we es-tablished a threshold level of coral damage thatif exceeded would trigger management to reducethe impact of snorkelers. This provided a cleardecision-making structure. Third, we estimatedeffect sizes with confidence intervals to detectchange. For the field managers, this approach todetection was easier to understand than assessinga null hypothesis and provided critical informa-tion for decision making. At no stage during theshort study period did snorkelers cause damagethat exceeded the threshold and thus mitigationwas not required. In situations of technical andfinancial constraints this framework will increasethe implementation of effective impact monitor-ing for many activities in MPAs and enhance man-agement of marine biodiversity.
Keywords Effect size · Levels-of-evidence ·Marine protected areas · Monitoring framework ·Null hypothesis testing · Parameter estimation ·Sampling design
Environ Monit Assess
Introduction
Background
The majority of nations are signatories to theConvention of Biological Diversity and its WorkProgram on Protected Areas, which requires gov-ernments to take action to conserve biodiversity,improve fish yields, support tourism and protectcultural values (De Fontaubert et al. 1996). Fieldmanagers of Marine Protected Areas (MPAs) canprotect species and habitats by introducing fishinggear restrictions, excluding damaging activitiesfrom sensitive areas, restricting visitor numbersand modifying visitor behaviour (Hawkins andRoberts 1994; Marion and Rogers 1994; Salmand Clark 2000). Increasingly, government andfunding agencies are demanding that managersdemonstrate they are meeting their managementobjective in relation to biodiversity conservation(Hocking et al. 2000). Monitoring can help man-agers achieve this objective by detecting changein biodiversity and to identify cause of change(Fabricius and De’ath 2004; Underwood 1989).Only with this information can managers act de-cisively to prevent negative impacts, such as adecline in habitat area, or reliably conclude man-agement is having a positive impact on, for exam-ple, abundances of exploited species.
Unfortunately, detecting and inferring causeof change to biodiversity in MPAs is not sim-ple. Many potentially destructive human activi-ties are legally permitted in some MPAs (Day2002; Preen 1998) and it is not always clearhow biodiversity responds to these activities(Hatcher et al. 1989). Human impact to marinebiodiversity is rarely diagnostic because it can-not always be distinguished from impact causedby natural agents of disturbance (Riegl andVelimirov 1991). In addition, populations ofspecies and distribution of habitats are naturallyvariable (Connell and Sousa 1983; Connell et al.1997; Hatcher et al. 1989). Consequently, separat-ing the effects of humans to biodiversity from nat-ural variability is not straightforward (Green 1979;Osenberg and Schmitt 1996; Underwood 1996).Indicator variables have been promoted as a prag-matic approach for dealing with these challengesin MPAs (Pomeroy et al. 2005, 2007). Pomeroy
et al. (2007) defined an indicator as “a unit ofinformation measured over time that allows youto document changes in specific attributes ofyour MPA”. Used in isolation, however, indicatorvariables have major limitations to interpretation(Hatcher et al. 1989; Rouphael and Hanafy 2007;Underwood and Chapman 1999). Foremost arethe unlikely assumptions that ecological variablesare invariant prior to disturbances and changepredictably in response to human activity (Marsh1995; Oliver 1995). Hence, simply measuring anindicator variable is unlikely to allow managers todetermine with confidence the cause of change.
A more scientifically robust approach to de-tect change in biodiversity and to infer causa-tion is the use of formal scientific frameworks(Fabricius and De’ath 2004; Underwood 2000).There are two frameworks commonly used tomonitor biodiversity in marine environments(Benedetti-Cecchi 2001). The first is point-sourcenull hypothesis testing (hereafter significancetesting) combined with a before/after, control/impact (BACI) sampling design (Green 1979;Underwood 2000). Under more controlled sit-uations, a true experimental design involvingrandom assignment of treatments to replicate ex-perimental units might be available (Manly 2001).With this framework, detection of change is basedon a probabilistic test used to falsify a null hypoth-esis. Interpretation is based on how a responsevariable at impact locations changed from beforeto after the start of a disturbance, and in relationto control locations. Within the second frame-work, detection is based on estimating the differ-ence in a response variable between impact andcontrol locations with a measure of uncertaintysuch as a confidence interval (CI) (Beyers 1998;Fabricius and De’ath 2004; Suter 1996). Withinthis framework (hereafter parameter estimation),the difference between locations can be assessedirrespective of statistical significance. Proponentsof this framework recommend that the causeof impact be inferred using multiple lines-of-evidence (Beyers 1998; Fabricius and De’ath 2004;Suter 1996), which is a process of making a con-clusion based on several pieces of circumstantialevidence.
In this paper, we begin by comparing theneeds of MPA managers in regards to biodiversity
Environ Monit Assess
impact monitoring. We then review statisticaltesting and parameter estimation, focusing ontheir strengths and weaknesses in context of theneeds of managers. We believe that on their owneach will not always be successful in many situ-ations relating to MPAs and may be detrimen-tal if managers do not understand the statisticalapproaches or where resources are invested inpoorly designed protocols with limited capacityfor inference and decision making. We propose amonitoring framework for managers that com-bine the strengths of significance testing andparameter estimation while minimising the riskof inappropriate implementation. We describethe characteristics of this framework and keysteps to implement it, and use a case studyfrom an Egyptian MPA to illustrate how weused this monitoring framework. We believe thisframework will increase the implementation ofeffective impact monitoring for a range of activi-ties in MPAs and enhance management of marinebiodiversity.
Managers and monitoring frameworks
In proposing this framework, we focused on theneeds of field managers to undertake biodiver-sity impact monitoring in MPAs. Field managersface challenges in implementing monitoring pro-grams due to limited access to technical expertise,financial constraints and staff limitations (Abdullaet al. 2008; Buckley et al. 2008; Marshall andAbdulla 2009; Pomeroy et al. 2005). We makethe distinction between scientists and managers ofMPAs because the latter are not always marinescientists (Alder 1996). Instead, many come to therole as environmental generalists or administra-tors and do not always have a strong backgroundin marine ecology, sampling design and inferen-tial statistics. Unlike scientists, field managers willrarely be in a position to make decisions based onthe acceptance or rejection of a null hypothesis(Stewart-Oaten 1996). Further, rarely will theyhave the authority to stop a human activity legallypermitted in a MPA. Instead, they are best posi-tioned to contribute evidence of impact to mem-bers of a management board to make decisions onwhen or how to respond to threats to biodiversity.
Monitoring frameworks currently in use
Strengths and weaknesses of significance testingand parameter estimation have been debated ex-tensively previously (Di Stefano 2004; Fabriciusand De’ath 2004; Suter 1996; Underwood 2000),but not in context of the needs of field managers ofMPAs. This section provides the basis for why webelieve both frameworks, used individually, willcommonly fail to meet the needs of managers ofMPAs.
Significance testing
As stated earlier, with this framework detectionof change is based on test of a null hypothesis.As an example, a manager predicts (proposesa hypothesis) that the mean length of grouper(e.g. Epinephelus sp.) in areas where commercialfishing is permitted will be equal or less than thatin adjacent no-take zones. This is based on thetheory that fishing removes many large groupers,reducing the mean length of grouper in thefishing grounds and no-take zones are effectiveat preventing fishing-related mortality (Russ andAlcala 1989). The mean length of grouper is com-pared between areas open to fishing and replicateno-take zones, which share similar environmen-tal conditions but fishing is not permitted. Ananalysis of variance (ANOVA) is performed andthe null hypothesis, a prediction that there is nodifference in mean length, is rejected with 95%confidence. This result provides support for theoriginal prediction (Underwood 1997), which inturn gives us confidence in our theory relating tothe effectiveness of no-take zones.
A major strength of this approach is that itprovides a clear structure for evaluating compet-ing theories, which are the basis of predictions,and forces managers to consider carefully, beforeinitiating monitoring, how data will be interpreted(Underwood 1997). When the statistical test as-sumptions are met, managers can predict, with aspecified level of confidence, the risk of rejectinga true null hypothesis. Also, with power analy-sis, the error of accepting a false null hypothesiscan be controlled (Cohen 1988). Another benefitis that multivariate approaches to null hypoth-esis testing (Anderson 2001; Clarke 1993) can
Environ Monit Assess
conveniently summarise data comprising largenumbers of response variables (Wonnacott 1987).
Unfortunately, significance testing poses diffi-culties for managers. Foremost is the mechanicsbehind the statistical approaches and concepts(e.g. ANOVA, statistical power, P values andF statistic) are easily misunderstood by inex-perienced practitioners (Perry 1986; Suter 1996;Yoccoz 1991). Selecting appropriate statisticalmodels and ensuring the correct error terms areused in the F ratio tests are not always easy.Calculating power for statistical models involvingcombinations of fixed, random and nested terms iscomplicated (Benedetti-Cecchi 2001; Underwood1997). The need to transform data to fulfil as-sumptions of parametric approaches can furthercomplicate the analysis and interpretation (Benceet al. 1996; Clarke et al. 2006; McDonald et al.2000). Also, with frequent monitoring and multi-ple tests of related response variables there is therisk of inflating the Type I error rate, further com-plicating interpretation (Manly 2001; Underwood1997).
Even for managers familiar with this ap-proach, statistical significance is routinely equatedwith management significance and non-significantresults dismissed as ecologically unimportant(Stewart-Oaten 1996; Wonnacott 1987). These be-liefs are misguided because statistical significanceis, in part, a function of sample size (Johnson1999; Wonnacott 1987). That is, statistically sig-nificant differences are more likely to be detectedbetween two or more treatments (locations orpopulations) if replication is large and less likely,for the same treatments, if replication is small(Yoccoz 1991). Many, if not most, monitoringstudies in MPAs involve inadequate replication,which greatly limits the capacity of managersto detect impacts (Abdulla 2000; Abdulla et al.2008). Further, with an emphasis on the P value,managers commonly avoid discussing effect size,which is an essential piece of information forinterpreting data and making management deci-sions (Stewart-Oaten 1996). An effect size canbe defined quantitatively in a number of ways(Keppel 1991), but the simplest definition isthe raw difference score between two treatmentmeans (x1 − x2). To illustrate, if a survey of thegastropod Trochus in replicate no-take zones and
areas open to harvesting reported 18/200 m2 and10/200 m2, respectively, the effect size between thetwo treatments is eight Trochus.
With significance testing, the ability to con-clude reliably the cause of an observed change inbiodiversity is typically gained through the wayin which measurements/samples are collected inspace and time (the sampling design) (Underwood1997). A randomised experimental sampling de-sign is considered one of the most robust ap-proaches to unambiguously infer cause and effectrelationships in ecological systems (Downes et al.2002; Underwood 1997). With an experimentalsampling design, measurements are taken at anumber of times at locations before the applica-tion of a treatment, say snorkeling or fishing, andat a number of locations, where the treatment isnot applied. Data collected prior to the applica-tion of the treatment are called baseline data. Thelocations where samples are collected, but do notreceive the treatment are called controls. Controllocations are chosen to be as similar as possiblein all respects to the impact location, except forthe presence of the putative impact (Downes et al.2002). Data obtained during the baseline surveyand from controls are used to describe variabilityin a response variable outside the influence of thetreatment. Importantly, the treatment should beapplied to randomly selected experimental units(e.g. locations, reefs or zones) in order to factorout natural processes that may be influencing theresponse variable in the study area. Further, morethan one location receiving the treatment andone control location are necessary in order to de-velop precise estimates of the treatment effect andcontrol condition, and so that individual locationdifferences are not confused with the treatmenteffect. Unfortunately, one or more componentsof an experimental design will usually be absentwhen managers assess the effects of human ac-tivities in MPA (Abdulla 2000; Abdulla et al.2008). Treatment effects are not randomly allo-cated to experimental units because the locationand size of MPAs are still largely influenced by thesocio-economic goals of fishermen (Halpern andWarner 2003; McNeill 1994) or divers are takento locations determined by aesthetic, economicand safety considerations (Tabata 1989). In othersituations there may be no baseline data because
Environ Monit Assess
ecological monitoring was not undertaken priorto the establishment of a MPA (Francis et al.2002). In addition, there may be no replication oftreatment effects because there is, for example, asingle no-take zone.
Parameter estimation
With this framework, detecting change is basedon measuring effect sizes with some measure ofuncertainty (Fabricius and De’ath 2004; Stewart-Oaten 1996; Suter 1996). To illustrate, meandensities of seagrass leaves are estimated andcompared through time from two bays with moor-ing buoys and two bays where anchoring is per-mitted. A CI is calculated for each mean, allowingthe assessment of its level of precision. Precisionrelates to the confidence we have in an estimate ofa parameter (Andrew and Mapstone 1987), withwide CIs equating to low precision. More for-mally, a CI is defined as a range of plausible val-ues for the parameter being estimated (Cummingand Finch 2005). For each survey site, the effectsize (±CI) is then interpreted. A strength of thisframework is that estimation of effect size fo-cuses on the magnitude of treatment differences,rather than on the probability that differenceswere due to random chance (Suter 1996). In ad-dition, an effect size can be understood by eventhose not trained in statistics. However, a weak-ness with parameter estimation is that when donein the absence of a decision-making structurethere is no clear guidance on when managersshould act based on the results of their monitoring(Underwood 1997, 2000). Further, without speci-fying an effect size considered biologically impor-
tant, it is difficult to a priori determine the numberof replicates needed to obtain precise estimates ofmeans, effect sizes and other parameters (Andrewand Mapstone 1987).
With the parameter estimation framework, in-ference is developed based on carefully structuredarguments, a technique referred to as weight ofevidence (Suter 1996), causal argument (Beyers1998; Fabricius and De’ath 2004) or levels-of-evidence (Downes et al. 2002; McArdle 1996).This approach has been used successfully in dis-ciplines where manipulative experimentation isunlikely for ethical reasons, such as assessing theeffects of diseases on humans. Its formal use inecological impact assessment is uncommon andcomparatively recent (Beyers 1998; Downes et al.2002; Fabricius and De’ath 2004). Hill (1965) cate-gorised different types of causal argument intonine criteria for studies into the effects of diseaseson humans. Table 1 lists each of Hill’s causalcriterions and how they relate to ecological im-pact assessment (Beyers 1998). With levels-of-evidence there is a need to seek evidence not onlyto support the impact prediction, but evidence torule out plausible alternative predictions, such asthat the observed difference was due to naturalprocesses (Beyers 1998; Downes et al. 2002).
A strength of levels-of-evidence is that it pro-vides a highly structured approach to facilitateinference (Beyers 1998; Downes et al. 2002).Fabricius and De’ath (2004) also argued thatit is transparent and easy for decision makersto understand. A weakness of this method isthat the evidence is circumstantial because it isbased on correlations (Downes et al. 2002), whichdoes not necessarily imply causation. Proponents
Table 1 Hill’s causal criteria and description in context to ecological impact assessment (after Beyers 1998)
Causal criterion Description
Strength of association A large proportion of individuals are effected in the exposed area relative to control areasConsistency of association The association has been observed by other investigators at other times and placesSpecificity of association The effect is diagnostic of exposureTemporality Exposure must precede the effect in timeBiological gradient The risk of effect is a function of magnitude of exposureBiological plausibility A plausible mechanism of action links cause and effectExperimental evidence A valid experiment provides strong evidence of causationCoherence Similar stressors cause similar effectsAnalogy The causal hypothesis does not conflict with existing knowledge of natural history and biology
Environ Monit Assess
acknowledge that each causal argument is weakindependently, but argue that when combinedmay provide strong support for a conclusion(Downes et al. 2002). However, rarely will allcriterion, listed in Table 1, be useful for any onemonitoring program. For instance, the criterionspecif icity of association will not apply unless theassessment relates to an activity that has a uniqueeffect on the environment.
A monitoring framework for managers
Although both frameworks have limitations formany managers of MPAs, elements of both can becombined to form a monitoring framework thatwill meet the needs of managers yet remain sci-entifically robust. We propose three key compo-nents of an impact monitoring framework for fieldmanagers. First, detecting change in biodiversity
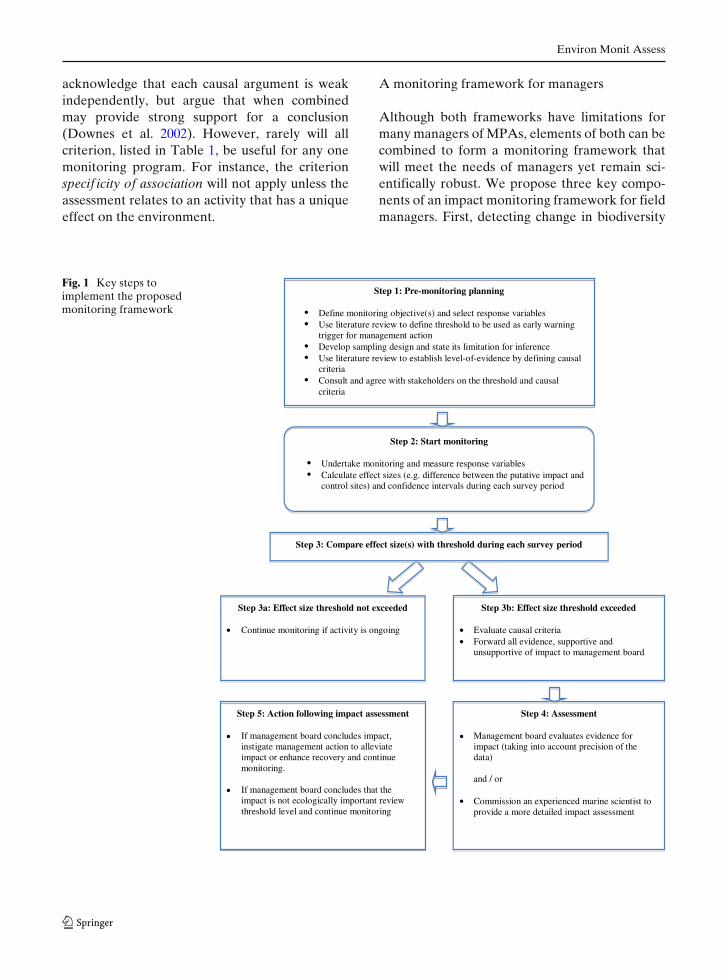
Fig. 1 Key steps toimplement the proposedmonitoring framework
Step 1: Pre-monitoring planning
• Define monitoring objective(s) and select response variables• Use literature review to define threshold to be used as early warning
trigger for management action• Develop sampling design and state its limitation for inference• Use literature review to establish level-of-evidence by defining causal
criteria• Consult and agree with stakeholders on the threshold and causal
criteria
Step 4: Assessment
Management board evaluates evidence forimpact (taking into account precision of thedata)
and / or
Commission an experienced marine scientist toprovide a more detailed impact assessment
Step 2: Start monitoring
• Undertake monitoring and measure response variables•
•
•
•
•
••
•
Calculate effect sizes (e.g. difference between the putative impact and control sites) and confidence intervals during each survey period
Step 5: Action following impact assessment
If management board concludes impact,instigate management action to alleviateimpact or enhance recovery and continuemonitoring.
If management board concludes that theimpact is not ecologically important review threshold level and continue monitoring
Step 3a: Effect size threshold not exceeded
Continue monitoring if activity is ongoing
Step 3b: Effect size threshold exceeded
Evaluate causal criteriaForward all evidence, supportive and unsupportive of impact to management board
Step 3: Compare effect size(s) with threshold during each survey period
Environ Monit Assess
should be based on estimating the magnitude ofan effect (an effect size) between impact andcontrol locations. An effect size is a variable thatis easy to interpret by non-specialists and a CIis an intuitive way to communicate the level ofuncertainty associated with an effect size. Second,inference should be based on both a samplingdesign and levels-of-evidence. Although we be-lieve the sampling design should be the foun-dation for inference, a randomised experimentaldesign will normally be unavailable to managersfor reasons already described. Therefore, infer-ence will need to be supported using levels-of-evidence. Third, a management threshold shouldbe used to determine when action is required tomitigate potential deleterious change in biodiver-sity. A threshold is a pre-determined effect sizethat if exceeded during monitoring would resultin the monitoring data and other evidence ofimpact being reported to a management boardor other decision-making group. Managers needto state the level of change to biodiversity fromhuman activity that would constitute a concernfor management (Oliver 1995; Stankey et al. 1985;Underwood 2000). Theoretically, early-warning ofdetrimental change would allow decision makerssufficient time to assess the ecological, social andeconomic importance of an impact and to considera suitable management response. These three fea-tures provide the basis for a monitoring frame-work that can detect change early, is inferentiallyrobust, has minimal risk of wrong implementationand the results can be communicated easily tonon-specialists. We present a case study wherewe have trialled this framework in order to illus-trate how these three key features were combinedto develop a monitoring framework to assess ifsnorkeling at an Egyptian coral reef was leadingto an unacceptable level of damage to corals.
To assist the reader to conceptualise the ap-proach we took, steps taken to implement theframework are shown in Fig. 1. Most of these stepsare consistent with robust monitoring programsand are explained in detail elsewhere (Downeset al. 2002; Field et al. 2007; Green 1979; Keoughand Mapstone 1995), so are not repeated here.For purposes of this paper, we focus only on
those steps used to detect change, facilitate infer-ence and to determine when the monitoring datashould be reported to decision makers.
Methods
The case study and location
Snorkeling, a popular recreational activity in theEgyptian Red Sea, has been associated with im-pacts to reefs worldwide (Allison 1996; Harriott2002). It is a potential source of chronic mechan-ical damage to corals in shallow water (Plathonget al. 2000). Monitoring the effects of the snorkel-ing in Egyptian MPAs is important because it isone of the fastest growing recreational activitiesin the Egyptian Red Sea (Hawkins and Roberts1994). To trial the monitoring framework, we un-dertook a study at a single coastal resort nearWadi Gemal Hamata National Park (WGHNP).The study area was a section of fringing reefimmediately adjacent to the Shams Alam Resort,about 300 km south of Hurghada, Egypt. The Re-sort lies at the northern boundary of the WGHNP.Preliminary observations revealed that snorkelingwas intense on the fringing reef adjacent to theresort (hereafter the snorkel location), but less soat reefs >300 m either side of it.
Sampling design, sampling approachand response variable
We were greatly constrained in the type of sam-pling design available. A complete experimentalsampling design was impossible because the treat-ment (i.e. snorkeling) was not randomly assignedto reefs and there was only one snorkel (impact)location. A BACI design was impossible becausethere was no opportunity to collect baseline dataprior to the commencement of snorkeling. How-ever, multiple control locations were established,which improved our capacity to separate theeffects of snorkeling on corals from that caused bynatural agents of disturbance (Underwood 1993,1996). We established two controls located 500 mand 1 km south of the resort. To assess the
Environ Monit Assess
relationship between the intensity of snorkelingand amount of damage, the snorkel location wasstratified into three zones of increasing distancefrom where snorkelers entered the water. Fourreplicate transects were placed near the entrypoint, and at 100 and 200 m further along the reef.Transects were placed parallel to the reef crestin water depths ranging from 0.5 to 3 m. Tran-sects were placed in the controls in the same way.Sampling was limited to the reef crest becausewe predicted that only corals in this habitat wereat risk from snorkelers because the water depthover the reef flat was normally too shallow forsnorkelers to access. Further, impacts were pre-dicted not to extend 3 m below sea level becausethis is about the maximum depth at which fins arelikely to contact the reef when snorkelers treadwater (Plathong et al. 2000). A modified versionof the point intercept transect method (Musso andInglis 1998) was used in which divers recordedthe substratum type beneath points spaced 50 cmalong each transect (a 20 m surveyor tape) laid onthe seafloor. When a point overlayed a coral witha branching growth form, we estimated the pro-portion of branches that were broken. We focusedon measuring physical damage to branching coralsas the primary response variable because thisgrowth-form is most sensitive to mechanical dis-turbance (Marshall 2000) and on the assumptionthat an increase in physical damage to a colonywould be a pre-cursor to whole colony mortality(Rouphael and Hanafy 2007). We collected datafor this study during a 3-month period, with sam-pling undertaken once per month during the firstweek of March, April and May 2007. We chosea sampling frequency of 4 weeks as snorkelinghas potential to lead to a rapid increase in coraldamage (Plathong et al. 2000). A lack of fundingdid not permit this study to continue beyond May2007.
Defining causal criteria
Consistent with levels-of-evidence, we used causalcriteria to increase our capacity to infer thatsnorkeling, not a natural agent of disturbance, wasthe cause for an observed breach of our man-agement threshold (defined below). A literaturereview of snorkeling impact studies was under-
taken to help us define causal arguments for andagainst the conclusion that snorkeling was thecause of elevated levels of coral damage at thesnorkel location. We did this by constructing atable with four columns. The first column listedHill’s nine causal criteria. In the second column,we summarised findings of papers relevant to eachcriterion. For example, with the criterion biologi-cal gradient we summarised what researchers hadobserved in relation to the level of coral dam-age with the intensity of snorkeling activity. Inthe third and fourth columns, we described theexpected outcomes during our monitoring pro-gram that would or would not support the notionthat snorkeling had caused the exceedance of thethreshold, respectively. Following Downes et al.(2002), we defined each criterion before the startof monitoring because seeking evidence duringor after the completion of monitoring to inter-pret results is more likely to contribute to biasedconclusions.
Defining a management threshold
A literature review was used to help us define amanagement threshold. The goal was to define aquantitative threshold for the response variablethat would act as an early warning trigger of po-tential deleterious change, such as a decline in thedensity of living coral colonies. To achieve this, wereviewed published literature to determine whatlevel of damage a branching coral colony couldsustain before it resulted in total colony mortality.The threshold would be selected to represent alevel of coral colony damage below that whichwould result in total colony mortality.
Detecting change
The method used to detect change in this studywas estimation of effect sizes ±95% CIs, whichwere compared with the management threshold.After each survey, means and standard errorswere estimated for the response variable at thesnorkel and two control locations. To comparethe monitoring data with the threshold duringeach sampling period, we first calculated effect
Environ Monit Assess
sizes (e.g. x1 − x2) for each of the following threetreatment combinations: between the snorkel lo-cation and control 1; between the snorkel locationand control 2 and between the snorkel locationand the control locations combined (data pooledfor both controls). To recall, the effect size isdefined here as the raw score difference betweenany two treatments (e.g. snorkel location versuscontrol locations) and the CI indicates the preci-sion of the estimate. We then calculated the 95%CI for each effect size and compared these withthe threshold level using error graphs. A 95%CI for an effect size assuming normally distrib-uted errors and two large samples can be definedas (x1 − x2) ± (1.96 SE.diff). The standard error(SE) of the difference between two treatments is
defined as SE.diff =√
S.E.21 + S.E. 22 . Note that
a more cumbersome equation is used for smallsamples (Fowler et al. 1998). Lastly, although weused effects sizes based on means, there maybe circumstances when medians are appropriate,such as when the assumption of normality cannotapply.
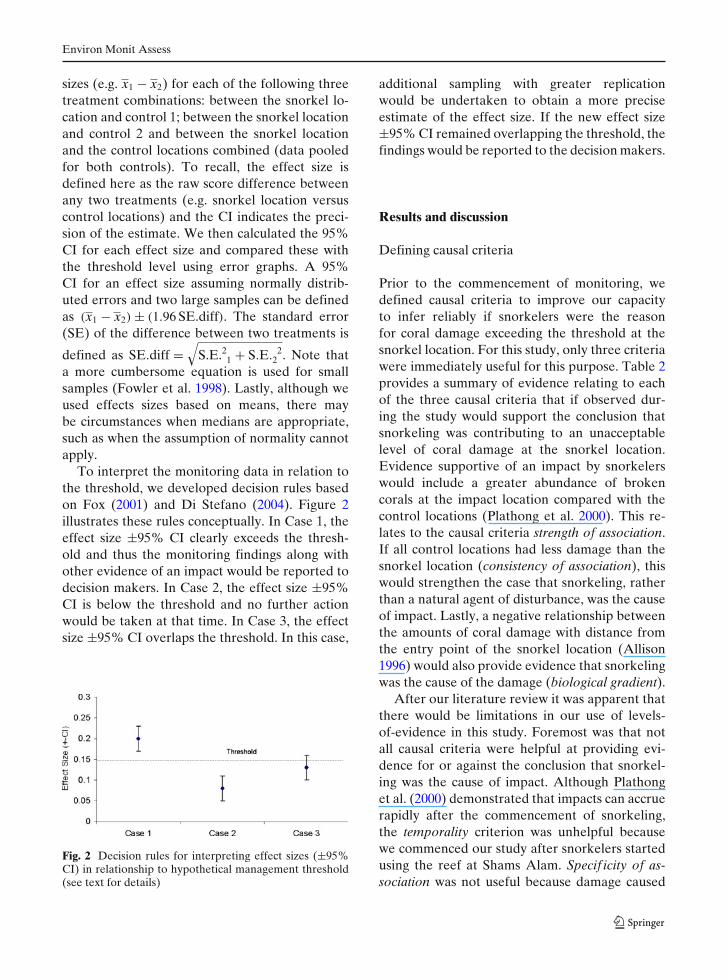
To interpret the monitoring data in relation tothe threshold, we developed decision rules basedon Fox (2001) and Di Stefano (2004). Figure 2illustrates these rules conceptually. In Case 1, theeffect size ±95% CI clearly exceeds the thresh-old and thus the monitoring findings along withother evidence of an impact would be reported todecision makers. In Case 2, the effect size ±95%CI is below the threshold and no further actionwould be taken at that time. In Case 3, the effectsize ±95% CI overlaps the threshold. In this case,
Fig. 2 Decision rules for interpreting effect sizes (±95%CI) in relationship to hypothetical management threshold(see text for details)
additional sampling with greater replicationwould be undertaken to obtain a more preciseestimate of the effect size. If the new effect size±95% CI remained overlapping the threshold, thefindings would be reported to the decision makers.
Results and discussion
Defining causal criteria
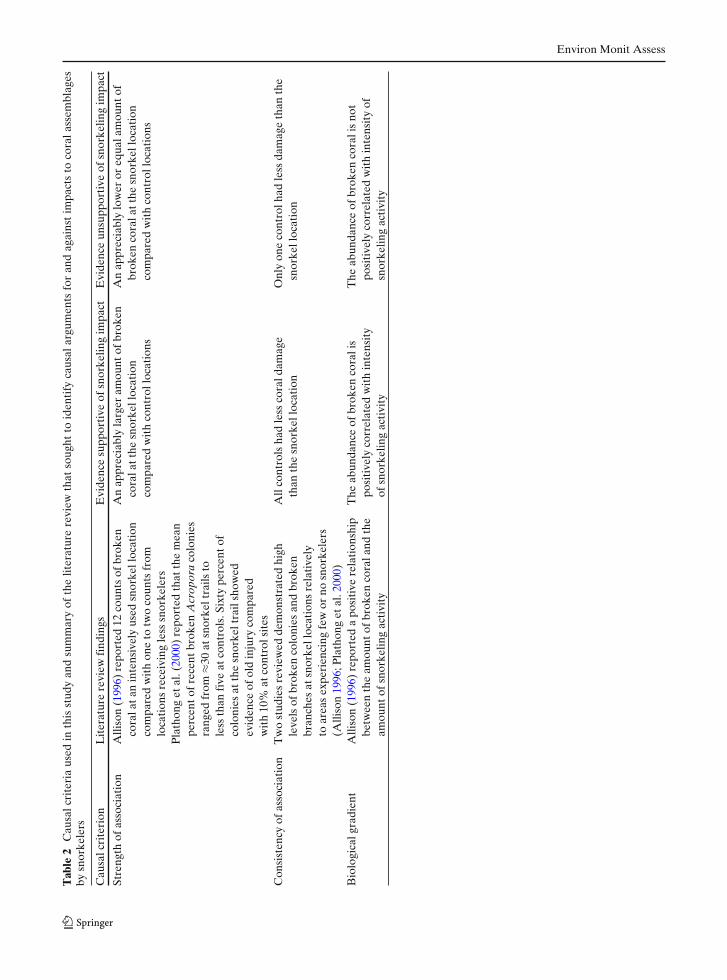
Prior to the commencement of monitoring, wedefined causal criteria to improve our capacityto infer reliably if snorkelers were the reasonfor coral damage exceeding the threshold at thesnorkel location. For this study, only three criteriawere immediately useful for this purpose. Table 2provides a summary of evidence relating to eachof the three causal criteria that if observed dur-ing the study would support the conclusion thatsnorkeling was contributing to an unacceptablelevel of coral damage at the snorkel location.Evidence supportive of an impact by snorkelerswould include a greater abundance of brokencorals at the impact location compared with thecontrol locations (Plathong et al. 2000). This re-lates to the causal criteria strength of association.If all control locations had less damage than thesnorkel location (consistency of association), thiswould strengthen the case that snorkeling, ratherthan a natural agent of disturbance, was the causeof impact. Lastly, a negative relationship betweenthe amounts of coral damage with distance fromthe entry point of the snorkel location (Allison1996) would also provide evidence that snorkelingwas the cause of the damage (biological gradient).
After our literature review it was apparent thatthere would be limitations in our use of levels-of-evidence in this study. Foremost was that notall causal criteria were helpful at providing evi-dence for or against the conclusion that snorkel-ing was the cause of impact. Although Plathonget al. (2000) demonstrated that impacts can accruerapidly after the commencement of snorkeling,the temporality criterion was unhelpful becausewe commenced our study after snorkelers startedusing the reef at Shams Alam. Specif icity of as-sociation was not useful because damage caused
Environ Monit Assess
Tab
le2
Cau
salc
rite
ria
used
inth
isst
udy
and
sum
mar
yof
the
liter
atur
ere
view
that
soug
htto
iden
tify
caus
alar
gum
ents
for
and
agai
nst
impa
cts
toco
rala
ssem
blag
esby
snor
kele
rs
Cau
salc
rite
rion
Lit
erat
ure
revi
ewfi
ndin
gsE
vide
nce
supp
orti
veof
snor
kelin
gim
pact
Evi
denc
eun
supp
orti
veof
snor
kelin
gim
pact
Stre
ngth
ofas
soci
atio
nA
lliso
n(1
996)
repo
rted
12co
unts
ofbr
oken
An
appr
ecia
bly
larg
eram
ount
ofbr
oken
An
appr
ecia
bly
low
eror
equa
lam
ount
ofco
rala
tan
inte
nsiv
ely
used
snor
kell
ocat
ion
cora
latt
hesn
orke
lloc
atio
nbr
oken
cora
latt
hesn
orke
lloc
atio
nco
mpa
red
wit
hon
eto
two
coun
tsfr
omco
mpa
red
wit
hco
ntro
lloc
atio
nsco
mpa
red
wit
hco
ntro
lloc
atio
nslo
cati
ons
rece
ivin
gle
sssn
orke
lers
Pla
thon
get
al.(
2000
)re
port
edth
atth
em
ean
perc
ento
frec
entb
roke
nA
crop
ora
colo
nies
rang
edfr
om≈3
0at
snor
kelt
rails
tole
ssth
anfi
veat
cont
rols
.Six
type
rcen
tof
colo
nies
atth
esn
orke
ltra
ilsh
owed
evid
ence
ofol
din
jury
com
pare
dw
ith
10%
atco
ntro
lsit
esC
onsi
sten
cyof
asso
ciat
ion
Tw
ost
udie
sre
view
edde
mon
stra
ted
high
All
cont
rols
had
less
cora
ldam
age
Onl
yon
eco
ntro
lhad
less
dam
age
than
the
leve
lsof
brok
enco
loni
esan
dbr
oken
than
the
snor
kell
ocat
ion
snor
kell
ocat
ion
bran
ches
atsn
orke
lloc
atio
nsre
lati
vely
toar
eas
expe
rien
cing
few
orno
snor
kele
rs(A
lliso
n19
96;P
lath
ong
etal
.200
0)B
iolo
gica
lgra
dien
tA
lliso
n(1
996)
repo
rted
apo
siti
vere
lati
onsh
ipT
heab
unda
nce
ofbr
oken
cora
lis
The
abun
danc
eof
brok
enco
rali
sno
tbe
twee
nth
eam
ount
ofbr
oken
cora
land
the
posi
tive
lyco
rrel
ated
wit
hin
tens
ity
posi
tive
lyco
rrel
ated
wit
hin
tens
ity
ofam
ount
ofsn
orke
ling
acti
vity
ofsn
orke
ling
acti
vity
snor
kelin
gac
tivi
ty
Environ Monit Assess
by snorkelers cannot readily be distinguished fromthat caused by other agents of mechanical dis-turbance (Riegl and Velimirov 1991). The crite-rion experimental evidence was not used, but hadpotential to assist us with inference if our studyhad continued. Downes et al. (2002) suggestedthat experimental evidence of an impact could bederived if the response variable responded soonafter the disturbance ceased. That is, if we tem-porarily stopped snorkeling at the snorkel locationand the amount of damage declined with time, thiswould help support the conclusion that snorkelingwas the cause of impact. Lastly, the criteria biolog-ical plausibility, coherence and analogy were notused. These criteria are more useful in situationswhen the mechanism of impact is not well under-stood. This is not the case with snorkeling becausethis activity is a well-documented source of me-chanical disturbance to corals with a branchinggrowth form (Allison 1996; Meyer and Holland2008; Plathong et al. 2000).
Management threshold
Before the commencement of monitoring weestablished a management threshold for coraldamage. If this threshold was exceeded duringmonitoring it would lead to the review of causalcriteria and reporting of the results to the manage-ment board. To recall, the management thresholdwas defined as pre-defined effect size of coraldamage between the snorkel and control loca-tions that would constitute a change worthy ofmanagement attention. Unfortunately, definingeffect sizes of important ecological change is notstraightforward (Di Stefano 2004; Keough andMapstone 1995). In our study, we wanted to de-velop a threshold effect size of coral damage that,if observed during a survey, would provide earlywarning of potential major ecological damage,namely a reduction in the density of living coralcolonies. Consequently, we undertook a reviewof published studies that assessed the relation-ship between the level of coral damage and to-tal colony mortality. The review revealed littlepublished information on the level of damage acoral colony with a branching growth form couldsustain before it suffered total mortality. A sum-mary of the review is given here. Loya (1976)
broke ‘some’ branches of 70 Stylophora pistillatacolonies, of which 19 colonies, representing thesmallest, suffered total mortality. Liddle and Kay(1987) damaged coral colonies of three branchingspecies (Acropora palifera, Acropora milleporaand Pocillopora damicornis) to assess their sur-vival to mechanical damage. Horizontal dimen-sions of colonies ranged from 15 to 30 cm. Twomonths after all branches of 14 colonies of eachspecies were removed, all remained alive. Rodgerset al. (2003) experimentally damaged 40 coloniesof four species, three of which were characterisedby a branching growth form. Eleven months afterthe colonies were damaged three had died, buttwo had died also among the control group.
Although our literature review suggested thatcolonies of some species and size classes cansustain considerable damage without being killed(Liddle and Kay 1987; Loya 1976; Rodgers et al.2003), we were unable to establish a definitivelevel of colony damage that, if exceeded, wouldlead to total colony mortality. For this reason,we took a precautionary approach by adopting amoderate level of coral breakage as our thresh-old effect size, but acknowledging this thresholdcould be modified later based on the results ofthe monitoring program or newly published data.We considered that a 0.15 raw unit differencebetween the mean proportion of broken branchesper colonies at the snorkel location relative to thecontrol locations was a difference worthy of fur-ther investigation. To illustrate, this would occurif the mean proportion of broken branches percolony was 0.20 (or 20% of branches per colony)at the snorkel location and 0.05 (5%) averagedfor the control locations (i.e. 0.2 − 0.05 = 0.15).Consequently, a raw unit difference of 0.15 be-tween the impact and control locations would actas the threshold, which if breached during a surveywould trigger the review of the causal criteria andthe reporting of these results to the managementboard. Importantly, triggering of further actionwould apply only in situations where the propor-tion of broken branches was greater at the snorkellocation compared to the controls. Conceivably,a higher level of damage could be observed atthe control locations if a natural agent of physicaldamage affected the control locations, but not thesnorkel location.
Environ Monit Assess
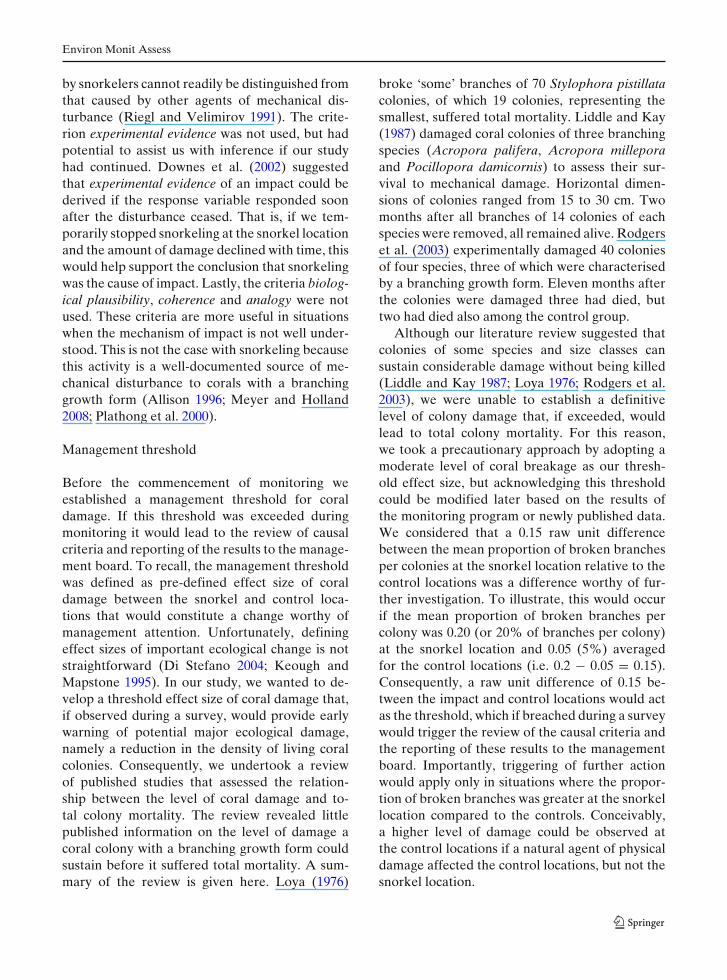
Monitoring results
During the study, three surveys were under-taken in the first weeks of March 2007, April2007 and May 2007. After each survey, effectsizes (±95%CI) for the proportion of brokenbranches were estimated for three treatmentpairs: the snorkel location and control location 1;the snorkel location and control location 2 and thesnorkel location and the average of the two con-trols. Each effect size was than compared to thethreshold (Fig. 3). At no time during the study didany effect size (±95% CI) exceed or overlay thethreshold (Fig. 3) and thus a review of the causalcriteria and reporting to the management boardwas unnecessary. Effect sizes (±95% CI) relatingto the proportion of damaged branches did notexceed 0.12 of branches per colony (mean ± 96%CI), so were below the 0.15 threshold. Anotherfeature of these data was the broad lengths ofsome CI, suggesting that estimates of these effectsizes were imprecise. Given, however, that noCI overlayed the threshold (Fig. 3), it was un-necessary to resample with increased level ofreplication.
Hypothetically, if one or more effect size(±95% CI) had exceeded the threshold, the nextstep would have been to seek additional evidencesupporting the conclusion that snorkeling hadcaused the breach of the threshold. That is, we
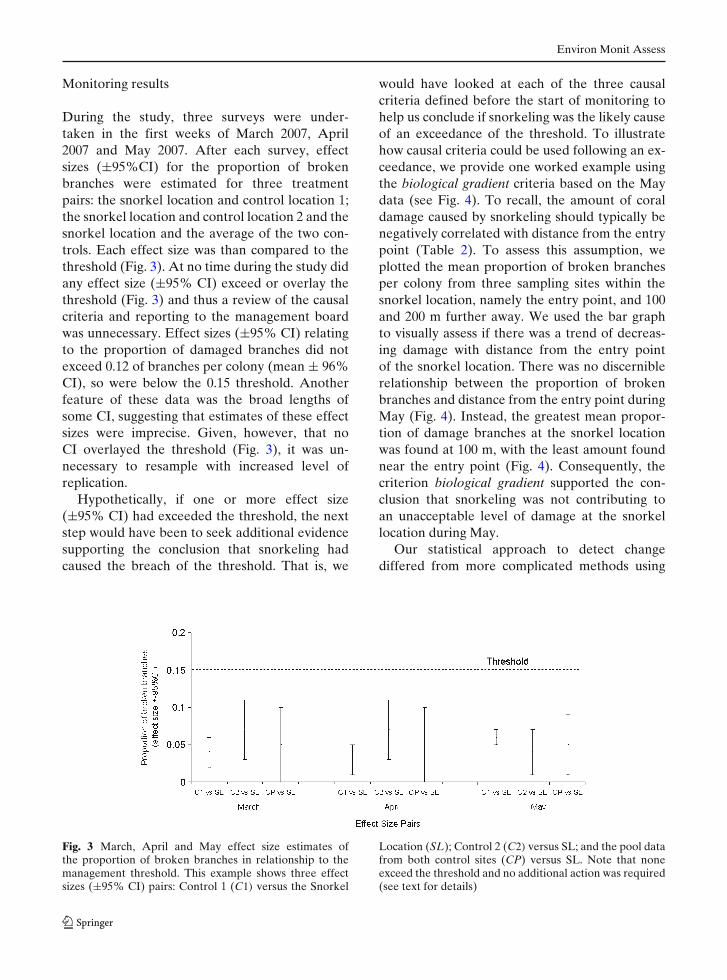
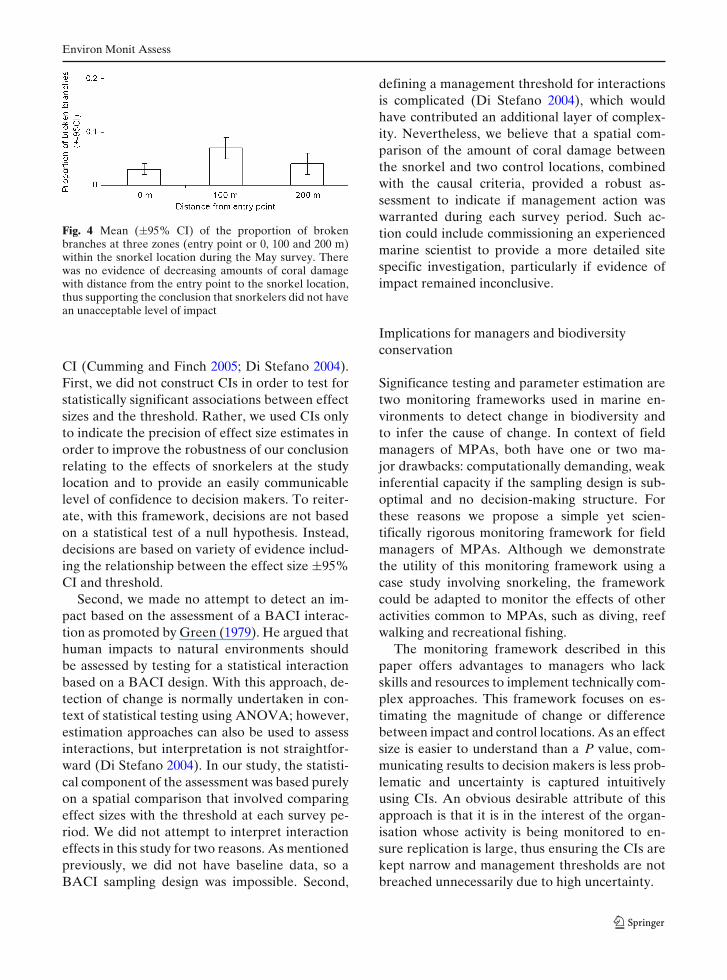
would have looked at each of the three causalcriteria defined before the start of monitoring tohelp us conclude if snorkeling was the likely causeof an exceedance of the threshold. To illustratehow causal criteria could be used following an ex-ceedance, we provide one worked example usingthe biological gradient criteria based on the Maydata (see Fig. 4). To recall, the amount of coraldamage caused by snorkeling should typically benegatively correlated with distance from the entrypoint (Table 2). To assess this assumption, weplotted the mean proportion of broken branchesper colony from three sampling sites within thesnorkel location, namely the entry point, and 100and 200 m further away. We used the bar graphto visually assess if there was a trend of decreas-ing damage with distance from the entry pointof the snorkel location. There was no discerniblerelationship between the proportion of brokenbranches and distance from the entry point duringMay (Fig. 4). Instead, the greatest mean propor-tion of damage branches at the snorkel locationwas found at 100 m, with the least amount foundnear the entry point (Fig. 4). Consequently, thecriterion biological gradient supported the con-clusion that snorkeling was not contributing toan unacceptable level of damage at the snorkellocation during May.
Our statistical approach to detect changediffered from more complicated methods using
Fig. 3 March, April and May effect size estimates ofthe proportion of broken branches in relationship to themanagement threshold. This example shows three effectsizes (±95% CI) pairs: Control 1 (C1) versus the Snorkel
Location (SL); Control 2 (C2) versus SL; and the pool datafrom both control sites (CP) versus SL. Note that noneexceed the threshold and no additional action was required(see text for details)
Environ Monit Assess
Fig. 4 Mean (±95% CI) of the proportion of brokenbranches at three zones (entry point or 0, 100 and 200 m)within the snorkel location during the May survey. Therewas no evidence of decreasing amounts of coral damagewith distance from the entry point to the snorkel location,thus supporting the conclusion that snorkelers did not havean unacceptable level of impact
CI (Cumming and Finch 2005; Di Stefano 2004).First, we did not construct CIs in order to test forstatistically significant associations between effectsizes and the threshold. Rather, we used CIs onlyto indicate the precision of effect size estimates inorder to improve the robustness of our conclusionrelating to the effects of snorkelers at the studylocation and to provide an easily communicablelevel of confidence to decision makers. To reiter-ate, with this framework, decisions are not basedon a statistical test of a null hypothesis. Instead,decisions are based on variety of evidence includ-ing the relationship between the effect size ±95%CI and threshold.
Second, we made no attempt to detect an im-pact based on the assessment of a BACI interac-tion as promoted by Green (1979). He argued thathuman impacts to natural environments shouldbe assessed by testing for a statistical interactionbased on a BACI design. With this approach, de-tection of change is normally undertaken in con-text of statistical testing using ANOVA; however,estimation approaches can also be used to assessinteractions, but interpretation is not straightfor-ward (Di Stefano 2004). In our study, the statisti-cal component of the assessment was based purelyon a spatial comparison that involved comparingeffect sizes with the threshold at each survey pe-riod. We did not attempt to interpret interactioneffects in this study for two reasons. As mentionedpreviously, we did not have baseline data, so aBACI sampling design was impossible. Second,
defining a management threshold for interactionsis complicated (Di Stefano 2004), which wouldhave contributed an additional layer of complex-ity. Nevertheless, we believe that a spatial com-parison of the amount of coral damage betweenthe snorkel and two control locations, combinedwith the causal criteria, provided a robust as-sessment to indicate if management action waswarranted during each survey period. Such ac-tion could include commissioning an experiencedmarine scientist to provide a more detailed sitespecific investigation, particularly if evidence ofimpact remained inconclusive.
Implications for managers and biodiversityconservation
Significance testing and parameter estimation aretwo monitoring frameworks used in marine en-vironments to detect change in biodiversity andto infer the cause of change. In context of fieldmanagers of MPAs, both have one or two ma-jor drawbacks: computationally demanding, weakinferential capacity if the sampling design is sub-optimal and no decision-making structure. Forthese reasons we propose a simple yet scien-tifically rigorous monitoring framework for fieldmanagers of MPAs. Although we demonstratethe utility of this monitoring framework using acase study involving snorkeling, the frameworkcould be adapted to monitor the effects of otheractivities common to MPAs, such as diving, reefwalking and recreational fishing.
The monitoring framework described in thispaper offers advantages to managers who lackskills and resources to implement technically com-plex approaches. This framework focuses on es-timating the magnitude of change or differencebetween impact and control locations. As an effectsize is easier to understand than a P value, com-municating results to decision makers is less prob-lematic and uncertainty is captured intuitivelyusing CIs. An obvious desirable attribute of thisapproach is that it is in the interest of the organ-isation whose activity is being monitored to en-sure replication is large, thus ensuring the CIs arekept narrow and management thresholds are notbreached unnecessarily due to high uncertainty.
Environ Monit Assess
This framework retains a major strength of sta-tistical testing by having a clear decision-makingstructure. This is achieved by specifying in ad-vance, a change in a response variable that wouldconstitute a management concern and, thus, whenaction is warranted. Importantly, change is as-sessed in context of natural variation measuredconcurrently at control locations. It is not basedon an unrealistic assumption that response vari-ables (sensu indicator variables) change unam-biguously in reaction to human activity. Theframework used in this study has considerablepotential for determining the cause of an impactbecause it relies on two inferential approaches:levels-of-evidence and a sampling design. Adopt-ing both inferential approaches will normally be anecessity in context of MPAs because rarely willall elements of an experimental sampling designbe fulfilled, nor will all causal criteria be use-able during monitoring. The use of causal crite-ria has the added advantage of being transparentand easy for non-scientists to understand. Also,defining causal criteria prior to monitoring andin consultation with stakeholders should reducethe risk of conflict, especially if the results proveunfavourable to the organisation responsible forthe activity being monitored. Lastly, this monitor-ing framework aims to detect change well beforethere is deleterious change to biodiversity. This isdone by selecting appropriate response variablesand setting thresholds at levels well below thatwhich would constitute major ecological damage.
We end with some cautionary notes. First, thisframework was adopted to help us detect a changeworthy of management interest and to increaseour confidence that snorkeling, not a naturalagent of disturbance, was the cause of change.The framework was not used to make generali-sations about the effects of snorkeling on coralsor to assess specific management approaches tomitigate snorkeling impacts. Such investigationsrequire experiments, which are complicated toundertake in marine environments (Barker andRoberts 2004; Campbell et al. 2001; Rouphaeland Inglis 2002) and require a high level of ex-pertise. Second, managers need to periodicallyreview their management thresholds based on thefindings of the monitoring results. This wouldhave been essential if our study had continued be-
cause we were unable to establish a clear relation-ship between colony damage and whole colonymortality before monitoring commenced. Third,although we promote this framework as beingless complicated than statistical testing, managersstill require an understanding of CIs to ensurecorrect interpretation of data and communicationof results. Four, with this framework concludingthat an impact is due to human activity rather thana natural event is more subjective compared withstatistical testing. However, this risk is reduced byestablishing causal criteria before monitoring andconstructing CI for parameter estimates. Lastly,this framework does not negate the need for scien-tifically robust sampling. Biased and confoundedparameter estimates will still be uninterpretableirrespective of the framework used.
Acknowledgements The authors wish to acknowledgeJim Stoddart and Michael Marnane for reviewing an earlydraft. Mahmoud Hanafy is thanked for assisting with thelogistics of the study.
References
Abdulla, A. (2000). The role of science within environmen-tal management: A case study of marine impact mon-itoring associated with the Great Barrier Reef marinepark authority. MSc. Thesis, James Cook Universityof North Queensland.
Abdulla, A., Gomei, M., Maison, E., & Piante, C. (2008).Status of marine protected areas in the MediterraneanSea. Malaga: IUCN Technical Series.
Alder, J. (1996). Have tropical marine protected areasworked? An initial analysis of their success. CoastalManagement, 24, 97–114.
Allison, W. R. (1996). Snorkeler damage to reef corals inthe Maldive Islands. Coral Reefs, 15, 215–218.
Anderson, M. J. (2001). A new method for non-parametricmultivariate analysis of variance. Austral Ecology, 26,32–46.
Andrew, N. E., & Mapstone, B. D. (1987). Sampling andthe description of spatial pattern in marine ecology.Oceanography and Marine Biology Annual Review,25, 39–90.
Barker, N. H. L., & Roberts, C. M. (2004). Scuba diverbehaviour and the management of diving impacts oncoral reefs. Biological Conservation, 120, 481–489.
Bence, J. R., Stewart-Oaten, A., & Schroeter, S. C. (1996).Estimating the size of an effect from a before-after-control-impact paired series design. In R. J. Schmitt,& C. W. Osenberg (Eds.), Detecting ecological im-pacts: Concepts and applications in coastal habitats.San Diego: Academic Press.
Environ Monit Assess
Benedetti-Cecchi, L. (2001). Beyond BACI: Optimizationof environmental sampling designs through monitor-ing and simulations. Ecological Applications, 13, 783–799.
Beyers, D. W. (1998). Causal inference in environmentalimpact studies. Journal of the North American Bentho-logical Society, 17, 367–373.
Buckley, R., Robinson, J., Carmody, J., & King, N.(2008). Monitoring for management of conservationand recreation in Australian protected areas. Biodi-versity and Conservation, 17, 3589–3606.
Campbell, R. A., Mapstone, B. D., & Smith, A. D. (2001).Evaluating large-scale experimental designs for man-agement of coral trout on the Great Barrier Reef.Ecological Applications, 11, 1763–1777.
Clarke, K. R. (1993). Non-parametric multivariate analysesof changes in community structure. Australian Journalof Ecology, 18, 117–143.
Clarke, K. R., Somerfield, P. J., Airoldi, L., & Warkwick,R. M. (2006). Exploring interactions by second-stagecommunity analyses. Journal of Experimental MarineBiology and Ecology, 338, 179–192.
Cohen, J. (1988). Statistical power analysis for the behav-ioural sciences (2nd ed.). Hillsdale: Lawrence ErlbaumAssociates.
Connell, J. H., Hughes, T. P., & Wallace, C. C. (1997).A 30-year study of coral abundance, recruitment anddisturbance at several scales in space and time. Eco-logical Monographs, 67, 461–488.
Connell, J. H., & Sousa, W. P. (1983). On the evidenceneeded to judge ecological stability or persistence.American Naturalist, 121, 789–824.
Cumming, G., & Finch, S. (2005). Inference by eye;confidence intervals and how to read pictures of data.American Psychologist, 60, 170–180.
Day, J. C. (2002). Zoning—lessons from the Great BarrierReef marine park. Ocean and Coastal Management,45, 139–156.
De Fontaubert, A. C., Downes, D. R., & Agardy, T. S.(1996). Biodiversity in the seas: Implementing the con-vention on biological diversity in marine and coastalhabitats. Gland: IUCN.
Di Stefano, J. (2004). A confidence interval approach todata analysis. Forest Ecology and Management, 187,173–183.
Downes, B. J., Barmuta, L. A., Fairweather, P. G., Faith,D. P., Keough, M. J., Lake, P. S., et al. (2002).Monitoring ecological impacts: Concepts and practicein f lowing waters. Cambridge: Cambridge UniversityPress.
Fabricius, K. E., & De’ath, G. (2004). Identifying ecologicalchange and its causes: A case study on coral reefs.Ecological Applications, 14, 1448–1465.
Field, S. A., O’Connor, P. J., Tyre, A. J., & Possingham,J. P. (2007). Making monitoring meaningful. AustralEcology, 32, 485–491.
Fowler, J., Cohen, L., & Jarvis, P. (1998). Practical statisticsfor f ield biology (2nd ed.). Chichester: Wiley.
Fox, D. R. (2001). Environmental power analysis—a newperspective. Environmetrics, 12, 437–449.
Francis, J., Nilsson, A., & Waruinge, D. (2002). Marineprotected areas in the eastern African region: Howsuccessful are they? Ambio, 31, 503–511.
Green, H. G. (1979). Sampling design and statistical meth-ods for environmental biologists. Canada: Wiley.
Halpern, B. S., & Warner, R. R. (2003). Matching marinereserve design to reserve objectives. Proceedings of theRoyal Society of London Series B: Biological Sciences,270, 1871–1878.
Harriott, V. J. (2002). Marine tourism impacts and theirmanagement on the Great Barrier Reef. Townsville:CRC Reef Research Centre, CRC Reef ResearchCentre Technical Report No 46.
Hatcher, B. G., Johannes, R. E., & Robertson, A. I. (1989).Review of research relevant to the conservation ofshallow tropical marine ecosystems. OceanographyMarine Biological Annual Review, 27, 337–414.
Hawkins, J. P., & Roberts, C. M. (1994). The growth ofcoastal tourism in the Red Sea: Present and futureeffects on coral reefs. Ambio, 23, 503–508.
Hill, A. B. (1965). The environment and disease: Associa-tion or causation? Proceedings of the Royal Society ofMedicine, 58, 295–300.
Hocking, M., Stolton, S., & Dudley, N. (2000). Evaluatingef fectiveness: A framework for assessing the manage-ment of protected areas. Gland: IUCN.
Johnson, D. H. (1999). The insignificance of statistical sig-nificance testing. Journal of Wildlife Management, 63,763–772.
Keough, M. J., & Mapstone, B. D. (1995). Protocols for de-signing marine ecological monitoring programs associ-ated with BEK Mills. Canberra: CSIRO, Tech. ReportNo. 11, National Pulp Mills Research Program.
Keppel, G. (1991). Design and analysis: A researcher’shandbook. New Jersey: Prentice Hall.
Liddle, M. J., & Kay, A. M. (1987). Resistance, survival andrecovery of trampled corals on the Great Barrier Reef.Biological Conservation, 42, 1–18.
Loya, Y. (1976). Skeletal regeneration in a Red Sea scler-actinian coral population. Nature, 261, 491–492.
Manly, B. F. J. (2001). Statistics for environmental sci-ence and management. Boca Raton: Chapman andHall/CRC.
Marion, J. L., & Rogers, C. S. (1994). The applicability ofterrestrial visitor impact management strategies to theprotection of coral reefs. Ocean and Coastal Manage-ment, 22, 153–163.
Marsh, H. (1995). The limits of detectable change. In G. C.Grigg, P. T. Hale, & D. Lunney (Eds.), Conserva-tion through sustainable use of wildlife (pp. 122–130).Brisbane: University of Queensland.
Marshall, N. A., & Abdulla, A. (2009). Socio-economic andinstitutional challenges to establishment of marine pro-tected areas in the southern and eastern mediterranean.Gland: IUCN Technical Series.
Marshall, P. (2000). Skeletal damage in reef corals: Relat-ing resistance to colony morphology. Marine EcologyProgress Series, 200, 177–189.
McArdle, B. H. (1996). Levels-of-evidence in studies ofcompetition, predation and disease. New ZealandJournal of Ecology, 20, 7–15.
Environ Monit Assess
McDonald, T. L., Erickson, W. P., & McDonald, L. L.(2000). Analysis of count data from before-aftercontrol-impact studies. Journal of Agricultural, Bio-logical and Environmental Statistics, 5, 262–279.
McNeill, S. E. (1994). The selection and design of marineprotected areas: Australia as a case study. Biodiversityand Conservation, 3, 586–605.
Meyer, C. G., & Holland, K. N. (2008). Spatial dynamicsand substrate impacts of recreational snorkelers andSCUBA divers in Hawaiian marine protected areas.Journal of Coastal Conservation, 12, 209–216.
Musso, B. M., & Inglis, G. J. (1998). Developing reliablecoral reef monitoring programs for marine tourism op-erators and community volunteers. Townsville: CRCReef Research Centre, Technical Report No. 24.
Oliver, J. (1995). Is the ‘limit of acceptable change’ con-cept useful for environmental managers?: A case studyfrom the Great Barrier Reef marine park. In G. C.Grigg, P. T. Hale & D. Lunney (Eds.), Conserva-tion through sustainable use of wildlife (pp. 131–139).Brisbane: University of Queensland.
Osenberg, C. W., & Schmitt, R. J. (1996). Detecting eco-logical impacts caused by human activities. In R. J.Schmitt, & C. W. Osenberg (Eds.), Detecting ecolog-ical impacts: Concepts and applications in coastal habi-tats. San Diego: Academic Press.
Perry, J. N. (1986). Multiple-comparison procedures: Adissenting view. Journal of Economic Entomology, 79,1149–1155.
Plathong, S., Inglis, G. J., & Huber, M. E. (2000). Effects ofself-guided snorkelling trails in a tropical marine park.Conservation Biology, 14, 1821–1830.
Pomeroy, R. S., Parks, J. E., & Watson, L. M. (2007).How is your MPA doing? A guidebook of natural andsocial indicators for evaluating marine protected areamanagement ef fectiveness. Gland: IUCN.
Pomeroy, R. S., Watson, L. M., Parks, J. E., & Cid, G. A.(2005). How is your MPA doing? A methodology forevaluating the management effectiveness of marineprotected areas. Ocean and Coastal Management, 48,485–502.
Preen, A. (1998). Marine protected areas and dugong con-servation along Australia’s Indian Ocean coast. Jour-nal Environmental Management, 22, 173–181.
Riegl, B., & Velimirov, B. (1991). How many damagedcorals in Red Sea reef systems? A quantitative survey.Hydrobiologia, 216(217), 249–256.
Rodgers, K., Cox, E., & Newtson, C. (2003). Effectsof mechanical fracturing and experimental tramplingon Hawaiian corals. Environmental Management, 31,377–384.
Rouphael, A. B., & Hanafy, M. (2007). An alterna-tive management framework to limit the impact ofSCUBA divers on coral assemblages. Journal of Sus-tainable Tourism, 15, 91–103.
Rouphael, A. B., & Inglis, G. J. (2002). Increased spatialand temporal variability in coral damage caused by
recreational scuba diving. Ecological Applications, 12,422–440.
Russ, G. R., & Alcala, A. C. (1989). Effects of intensefishing pressure on an assemblage of coral reef fishes.Marine Ecology Progress Series, 56, 13–27.
Salm, R. V., & Clark, J. R. (2000). Marine and coastalprotected areas: A guide for planners and managers.Gland: International Union for the Conservation ofNature.
Stankey, G. H., Cole, D. N., Lucas, R. C., Petersen,M. E., & Frissell, S. S. (1985). The limits of accept-able change (LAC) system for wilderness planning.Ogden: USDA Forest Service Intermountain Forestand Range Experiment Station, General TechnicalReport INT-176.
Stewart-Oaten, A. (1996). Goals in environmental moni-toring. In R. J. Schmitt, & C. W. Osenberg (Eds.), De-tecting ecological impacts: Concepts and applications incoastal habitats. San Diego: Academic Press.
Suter, G. W. (1996). Abuse of hypothesis testing statisticsin ecological risk assessment. Human and EcologicalRisk Assessment, 2, 331–347.
Tabata, R. (1989). The use of nearshore dive sites by recre-ational dive operators in Hawaii. Coastal Zone, 89,2865–2875.
Underwood, A. J. (1989). The analysis of stress in naturalpopulation. Biological Journal of the Linnean Society,37, 51–78.
Underwood, A. J. (1993). The mechanics of spatiallyreplicated sampling programs to detect environmentalimpacts in a variable world. Australian Journal ofEcology, 18, 99–116.
Underwood, A. J. (1996). On beyond BACI: Samplingdesigns that might reliably detect environmental dis-turbance. In R. J. Schmitt, & C. W. Osenberg (Eds.),Detecting ecological impacts: Concepts and applica-tions in coastal habitats. San Diego: Academic Press.
Underwood, A. J. (1997). Experiments in ecology: Theirlogical design and interpretation using analysis of vari-ance. Cambridge: Cambridge University Press.
Underwood, A. J. (2000). Importance of experimental de-sign in detecting and measuring stresses in marinepopulations. Journal of Aquatic Ecosystem Stress andRecovery, 7, 3–24.
Underwood, A. J., & Chapman, M. G. (1999). Problemsand practical solutions for quantitative assessment ofbiodiversity of invertebrates in coastal habitats. InW. Ponder, & D. Lunney (Eds.), The other 99%.The conservation and biodiversity of invertebrates(pp. 19–25). Mosman: Royal Zoological Society ofNew South Wales.
Wonnacott, T. (1987). Confidence intervals or hypothesistesting? Journal of Applied Statistics, 14, 195–201.
Yoccoz, N. G. (1991). Use, overuse and misuse of sig-nificance testing in evolutionary biology and ecology.Bulletin of the Ecological Society of America, 72, 106–111.