a contemplative analysis of thyroid disorders based on ecg
TRANSCRIPT
1
A Contemplative Analysis of Thyroid Disorders based on ECG Signal and Thyroid Test Measure M. Deepika1*, K. Kalaiselvi2
1Research Scholar, Vels Institute of Science, Technology& Advanced Studies (VISTAS), Pallavaram, Chennai-117, India. 2Professor and Head, Vels Institute of Science, Technology& Advanced Studies (VISTAS), Pallavaram, Chennai-117, India. E mails: [email protected], [email protected]
Abstract
Hypothyroidism can influence the heart and circulatory framework in various manners. Inadequate thyroid hormone eases back the pulse. With the goal of forecasting hypothyroid, by utilizing thyroid measures turns out to be high intricacy in order of Hypothyroid and Hyperthyroid. Some of the common clinically most relevant findings explaining hyperthyroidism as well as hypothyroidism are the anatomic symptoms of the disease of Thyroid disease. Data Mining plays a vital role in the process of prediction and classification. The proposed work utilizes the information mining methods, such as the characterization and expectation by adopting parallel tree calculation. A Trust Region method for Nonlinear Minimization streamlining calculation is incorporated in the count of QRS point discovery in electrocardiogram (ECG) signal. This proposed model is re-enacted on the MATLAB R2014b. This analysis is used to assess the relationship among outright thyroxine (T4) and thyrotropin (TSH) levels with ECG parameters.
Keywords: Classification, Data Mining, ECG, Heart rate, Hypothyroid, Hyperthyroid, QRS duration and Thyroid test measures.
Received on 20 July 2020, accepted on 25 August 2020, published on 26 August 2020
Copyright © 2020 M. Deepika et al., licensed to EAI. This is an open access article distributed under the terms of the Creative Commons Attribution license, which permits unlimited use, distribution and reproduction in any medium so long as the original work is properly cited.
doi: 10.4108/eai.1-7-2020.166006
*Corresponding Author: Email: [email protected]
1. Introduction
1.1 Risk of cardiovascular disease
Subclinical thyroid dysfunction is defined as a typical condition, where serum thyrotrophic hormone (TSH) levels is found to be below (hyperthyroidism) or above (hypothyroidism) the reference interval with traditional free thyroxin (FT4) levels. It is commonly prevailing in older girls. Subclinical thyroid pathology is related to alterations in internal organ hemodynamics, like impaired internal organ ability, raised vital sign, pulsation cardiovascular disease, raised left cavum mass, and beat pathology [1]. Data from observational examinations on subclinical thyroid dysfunction, in connection to the complexity of cardiovascular ailments (CVD) are uncertain. Subclinical hyperthyroidism was accounted to
be connected with atrial fibrillation (AF), coronary illness, generally speaking stroke, and heart failure in several studies. Thyroid hormones affect the cardiac performance immediately but not through direct changes in peripheral movement. On the other hand, it has a repercussion on myocardial oxidative metabolism and its association with the cardiac function. Patients holding a history beyond Thyroidectomy for thyroid most cancer provide a unique style to research the cardiac consequences of hypothyroidism. Some cases without cardiac disorder had been examined in the hypothyroid part and moreover after 4-6 weeks they underwent Euthyroid conditions.
EAI Endorsed Transactions on Energy Web Research Article
EAI Endorsed Transactions on Energy Web
01 2021 - 03 2021 | Volume 8 | Issue 32 | e10

2
Altered thyroid fame exerts a prominent effect on the middle. People with hypothyroidism or hyperthyroidism affirmed different alterations in ECG. Moreover, little is understood approximately, as how permutations in thyroid hormone varying inside the ordinary range have an effect on electric powered sports of the coronary heart within the regular populace.
ECG parameters are scaled at the standard 12-lead electrocardiogram. In [2] we observed a tremendous direct affiliation among serum upload as much as T4 degree and pulse rate in men, also an U-form affiliation among T4 and PR period between men and women. TSH degree variation is emphatically related with QRS period interval in men, while a U-form affiliation among QRS and TSH variation is observed in women.
1.2 Electrocardiographic (ECG)
Thyroid hormones may cause electrophysiological and inotropic impacts on the heart and may adjust the peril of making atherosclerosis. People with clear hypothyroidism shows variations in ECG like sinus bradycardia, moo plentifulness QRS buildings, QT interval prolongation, and the changes in T wave morphology, whereas patients with hyperthyroidism show atrial arrhythmias, for instance, atrial sway, sinus tachycardia and atrial fibrillation. Strikingly, both deferred and condensed QT between times has been represented in hyperthyroidism. Though electrocardiogram irregularities in patients with hypothyroidism and hyperthyroidism of tolerably small amount is considered, the collections in thyroid hormone levels inside the common place affect the electrical movement of the heart within the comprehensive community. This analysis is used to assess the relationship among outright thyroxine (T4) and thyrotropin (TSH) levels with ECG parameters (beat, PR intervals, QRS term, QT between times, and JT between times) in a master test of the common US individuals [3].
Table 1. Amplitude values for normal ECG
S.No. Interval Duration 1. PR wave 0.12-0.2 sec 2. QT wave 0.35-0.44 sec 3. ST wave 0.05-0.15 sec 4. P wave interval 0.11 sec
Figure 1. Detection of ECG waveform.
The above table1 represents the ECG signal amplitude for the PR, QT, ST, and P wave with the time duration. The PR, QT, ST, and P wave time duration calculated from the input signal.
1.3 Data mining
It is the way of deriving patterns in tremendous datasets counting procedures converging through machine learning and database systems. It is considered as an intrigue subspace of computer science and measures handling data elimination through efficient methods from a data set. It also modifies the raw data into a comprehensible format for processing further [4].
The actual data mining process is the semi-computerized or programmed study of vast amount of data to extricate in the past unknown, unwanted patterns in businesses of statistics records like cluster evaluation, odd records like anomaly detection, and dependencies such as sequential sample mining and affiliation rule mining. In most extreme cases it also includes adaptation of database approaches beside spatial files. These styles can then be noticed as a framework for the entering records, and may also be used in additional research or, as a case, in framework perusing prescient analytics.
Classification is a more complex knowledge mining method that forces to gather more attributes in combination into discernible categories, which may also draw further conclusions, or serve some function. Finally, comparing data on particular person or customers financial backgrounds, we might be able to classify them as “low,” “medium,” or “high” credit score degrees. The section 2 discusses about the literature survey, section 3 discusses about the Materials and strategies. Finally, section 4 examines about concerning the consequence and conclusion.
M. Deepika and K. Kalaiselvi
EAI Endorsed Transactions on Energy Web
01 2021 - 03 2021 | Volume 8 | Issue 32 | e10

A Contemplative Analysis of Thyroid Disorders based on ECG Signal and Thyroid Test Measure
3
2. Literature Review
K. Vijayalakshmi et al., 2018 [5] rule objective is todevelop a model wise thyroid Prediction System using Biginformation and data mining techniques. This structure candiscover hidden data models and connections identifiedwith the thyroid sickness from a chronicled thyroiddatabase. A Naïve Byes technique to anticipate patientswith Hypothyroid is adopted. The classifier used exhibitedits execution in predicting with the best results inarrangements of exactness and least execution time.
Yan Wang et al., 2019 [6] proposed the hereditary premise of heart infections has continued gradually through linkage examinations, on account of a lot littler impact size inferable from regular changing variations in complex issue. Hypertension positions as the main source of grimness and mortality around the world, adding to CAD, atrial fibrillation, and cardiovascular breakdown. With the objective that the data around the genetic qualities of hypertension or BP may be a critical figure 1 within the analysis, control, and treatment of these heart illnesses. Rafn Benediktsson et al., 2015[7] proposed the term, compensated hypothyroidism (CH) is employed to explain selected combination of thyroid function tests, Especially a raised thyrotrophin (TSH) attention (usually between 3-20 mU/l) in association with normal serum thyroxine (T4). Bernadette Biondi et al., 2002 [8] proposed preload the hemodynamic force given to the ventricular wall during filling and, thus, can be equated with ventricular end-diastolic wall stress. This contributes to the determination of ventricular end-diastolic volume and significantly modulates myocardial performance i.e. it governs the extent and velocity of wall shortening.
Michael Preuss et al., 2013 [9] proposed an ongoing genome-wide affiliation considers (GWAS) of myocardial dead tissue (MI) and different types of coronary supply route ailment (CAD) have prompted the disclosure of in any event 13 hereditary loci. Notwithstanding the impact size, capacity to recognize affiliations is to a great extent driven by test size. Along these lines, to boost the opportunity of discovering novel weakness loci for CAD and MI, the Coronary artery disease Genome-wide Replication and Meta-investigation (cardiogram) consortium was framed.
Hypothyroidism is common worldwide, particularly in iodine-deficient areas like India, characterized by way of a cluster of scientific manifestations attributable to thyroid hormone deficiency or more hardly ever from their impaired task at tissue stage.
Hypothyroidism causes symptoms that cut back the practical status and high quality of lifestyles. Cardiovascular effects of the thyroid hormones are rather powerful and the cardiac abnormalities related to thyroid disorder have attracted an excessive amount of analytical effort.
Hypothyroidism (underactive thyroid) is a state where the thyroid gland fails to produce sufficient hormones. Hypothyroidism may not produce noticeable signs within the early phases. Over time, untreated hypothyroidism may
cause quite a lot of problems, such as obesity, joint pains, and infertility and so on.
Classification Analysis is used to classify certain information in several categories. Classification is similar to clustering in that it additionally segments information records into other segments known as categories. In classification, the structure or identity of the knowledge is understood.
2.1 Aims and Objectives
The objectives of this study are as follows: • To contemplate ECG profile, i.e., pulse (beats/min), P-
R interim (sec), voltage of QRS complex (mv),and S-T fragment changes (T-wave reversal) (mv) inrecently analyzed hypothyroid patients,hypothyroid patients taking treatment for >50 yearsand control group.
• To compare the effect of heart beat >=69 and QRSdetection using the range specified >= 120ms are theconditions for classifying the hypo and hyper thyroiddata.
• The data mining used to order the thyroid stimulatinghormone (TSH) levels below (hyperthyroidism) orabove (hypothyroidism) the reference interim withtypical free thyroxine (FT4) levels.
• The binary tree algorithm used to classify theHypothyroid and Hyperthyroid with the otherTSHLevel, Hyperthyroidism, FT4Levels.
Electrocardiographic changes, for example, bradycardia, low-voltage, and changing degrees of heart beat are usually perceived in hypothyroid patients [5].
Considering the work done using CVS appearances of hypothyroidism such as diminished add up volume, contractility, heart rate (all driving to diminished cardiac yield), expanded systemic vascular resistance (driving to expanded diastolic blood weight), and expanded capillary porousness (driving to pericardial radiation). These changes can be effectively recognized by basic investigative procedure like electrocardiogram (ECG) and complications creating at later stages of hypothyroidism can be anticipated [10].
Thus, the present analysis is undertaken to analyze ECG profile, for example pulse (beats/min), P-R interim (sec), voltage of QRS complex (mv), and S-T section changes (T-wave reversal) (mv) in recently analyzed hypothyroid subjects and hyperthyroid subjects who were at that point getting treatment for more than 50 years and to see whether there was any improvement in these parameters with thyroxine supplementation treatment.
3. Material and Methods
3.1 Material:
EAI Endorsed Transactions on Energy Web
01 2021 - 03 2021 | Volume 8 | Issue 32 | e10

4
The test signal taken from the PhysioBank is a huge and growing archive of physiological information. The test knowledge signal from the PhysioNet-> BankATM-> MIT-BIH Arrhythmia Database (mitdb). The training knowledge analyzed from the associations of genetically lowered thyroid stimulating hormone (TSH) levels, hyperthyroidism, hypothyroidism, and higher FT4 levels with odds ratio (OR) of atrial fibrillation (AF), coronary artery disease (CAD), and ischemic stroke and its subtypes in accordance with knowledge from the Atrial Fibrillation Consortium (AFGen), Coronary Artery Disease Genome-wide Replication and Meta-examination in addition to The Coronary Artery Disease consortiums 1000 Genomes-based GWAS (CARDIoGRAMplusC4D), and MEGASTROKE consortia.
3.2 Methods:
Data Reduction is the foremost process, which aims to decrease the data representation by targeting precision for speedy response that can produce quick summarised answers to queries from exceptionally huge databases. Isolating data for preparing and testing sets is an imperative portion of assessing information mining models.
Primarily, when isolating a data set into a preparing set and testing set, most of the data is utilized for preparing, and a small portion of the data is utilized for testing. Data analysts randomly test the data to assists certainty that the testing and preparing sets are comparative. By utilizing comparative data for preparing and testing that can minimize the impacts of data discrepancies [11].
Figure 2. Block diagram of Hypothyroidism and Hyperthyroidism classification
The above figure 2 shows the test sign taken from the ECG database with the states of the cardiovascular sickness (CVD) signal. The preprocessing of signal expels the commotion contained in the info signal. The component choice requires the QRS location from the ECG signal. The database contains information identified with the other thyroid estimates taken from the thyroid test. The tree order procedure orders the test and preparing information given as the input. The QRS interim planning seconds will be equivalent or more prominent than 120ms. The heart beat (66-69) thumps/minutes. With abundance thyroid hormones in the body, and the pulse greater than 90 beats for every moment (tachycardia) is considered as normal, even when a person is very still or idle and when person is sleeping. Additionally, the ordinary increment in pulse during activity is overstated. Quick pulse detection is one of the most widely recognized indications of hyperthyroidism [12].
3.3 Pre- processing techniques
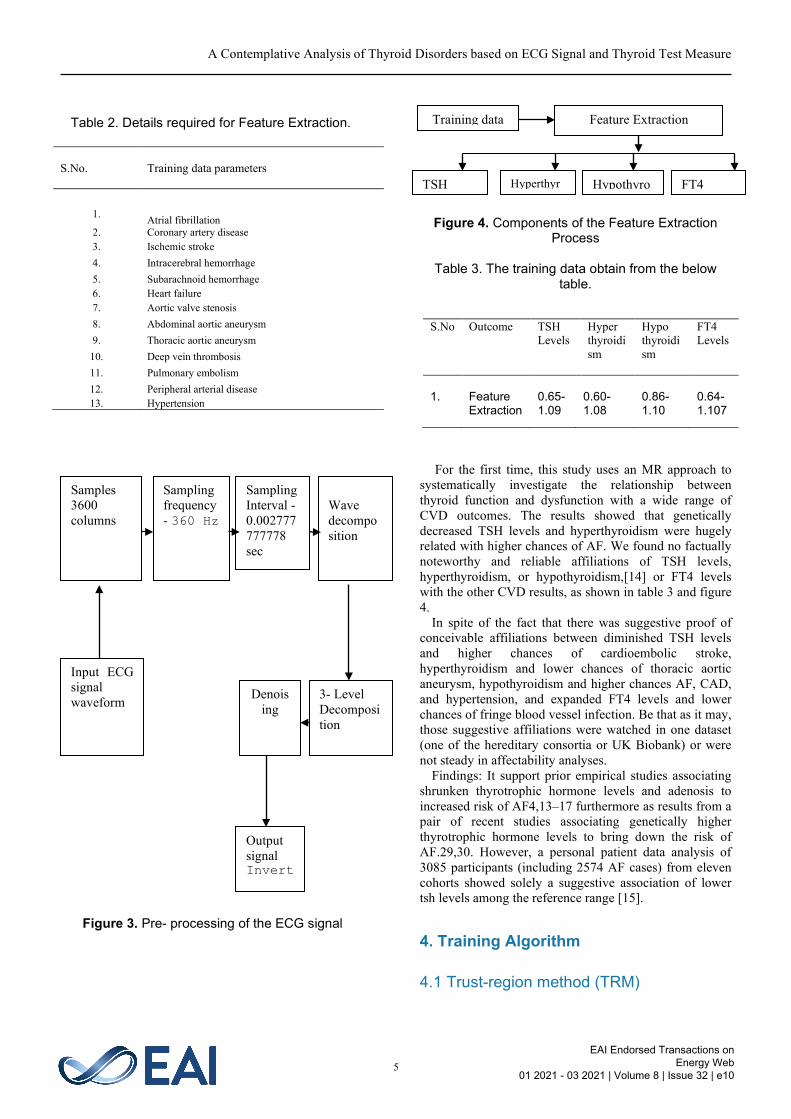
The input test signal details such as the 3600 columns, frequency- 360Hz, and the sampling interval 0.002 sec. The ECG signal can be converted into the wave decomposition. The 3- level decomposition is implemented to remove the noise. The output is evaluated using in the form of Inverse Fourier Transform.
3.3.1 QRS wave calculation: The QRS interval obtained using the PR interval (sec) 0.12±0.00, the maximum peak of the PR wave, QT wave, ST wave and P wave interval [l3].
3.3.2 Heartbeat calculation: The duration of sample in seconds= the total sample /360sec The duration in minutes= Duration of sample in seconds/60. Beat per Minute = Total number of peaks in the signal / duration in minutes.
3.3.3 Training Data: The training data was prepared with the help of TSH and FT4 levels. The results were strong when considering the lead single-nucleotide polymorphism (SNP) of every locus. When barring the 3 loci associated with both hyperthyroidism and hypothyroidism, the ORs of AF (utilizing information from Atrial Fibrillation Consortium 2018 GWAS dataset) were 1.07 (95% CI, 1.04–1.11;
P=3.6×10⁻⁵) for hyperthyroidism and 0.99 (95% CI, 0.95–1.03; P=0.59) for hypothyroidism, as shown in table 2 and figure 3.
M. Deepika and K. Kalaiselvi
EAI Endorsed Transactions on Energy Web
01 2021 - 03 2021 | Volume 8 | Issue 32 | e10
5
Figure 3. Pre- processing of the ECG signal
Table 2. Details required for Feature Extraction.
Figure 4. Components of the Feature Extraction Process
Table 3. The training data obtain from the below table.
For the first time, this study uses an MR approach to systematically investigate the relationship between thyroid function and dysfunction with a wide range of CVD outcomes. The results showed that genetically decreased TSH levels and hyperthyroidism were hugely related with higher chances of AF. We found no factually noteworthy and reliable affiliations of TSH levels, hyperthyroidism, or hypothyroidism,[14] or FT4 levels with the other CVD results, as shown in table 3 and figure 4.
In spite of the fact that there was suggestive proof of conceivable affiliations between diminished TSH levels and higher chances of cardioembolic stroke, hyperthyroidism and lower chances of thoracic aortic aneurysm, hypothyroidism and higher chances AF, CAD, and hypertension, and expanded FT4 levels and lower chances of fringe blood vessel infection. Be that as it may, those suggestive affiliations were watched in one dataset (one of the hereditary consortia or UK Biobank) or were not steady in affectability analyses.
Findings: It support prior empirical studies associating shrunken thyrotrophic hormone levels and adenosis to increased risk of AF4,13–17 furthermore as results from a pair of recent studies associating genetically higher thyrotrophic hormone levels to bring down the risk of AF.29,30. However, a personal patient data analysis of 3085 participants (including 2574 AF cases) from eleven cohorts showed solely a suggestive association of lower tsh levels among the reference range [15].
4. Training Algorithm
4.1 Trust-region method (TRM)
S.No. Training data parameters
1. Atrial fibrillation 2. Coronary artery disease 3. Ischemic stroke 4. Intracerebral hemorrhage 5. Subarachnoid hemorrhage 6. Heart failure 7. Aortic valve stenosis 8. Abdominal aortic aneurysm 9. Thoracic aortic aneurysm
10. Deep vein thrombosis 11. Pulmonary embolism 12. Peripheral arterial disease 13. Hypertension
S.No Outcome TSH Levels
Hyper thyroidism
Hypo thyroidism
FT4 Levels
1. FeatureExtraction
0.65-1.09
0.60-1.08
0.86-1.10
0.64-1.107
Samples 3600 columns
Sampling frequency - 360 Hz
Sampling Interval - 0.002777777778 sec
Wave decomposition
3- LevelDecomposition
Denoising
Output signalInvert
Input ECG signal waveform
Feature Extraction
TSH Hyperthyr
Hypothyro
FT4
Training data
A Contemplative Analysis of Thyroid Disorders based on ECG Signal and Thyroid Test Measure
EAI Endorsed Transactions on Energy Web
01 2021 - 03 2021 | Volume 8 | Issue 32 | e10
M. Deepika and K. Kalaiselvi
6
For solving nonlinear programming (NLP) issues, TRM is considered as primitive numerical optimization strategy. It works by beginning with diagram a locale over the current remarkable solution, wherein a certain form (generally a quadratic show) can to a degree inexact the genuine objective work. Later Trust Region Method progress consistently, with the form that depicts the location.
4.2 Trust-region
In most cases, the trust-region is said to be a spherical region of radius where the trust-place sub problem lies.
4.3 Trust-region Sub problem
On adopting the quadratic method to summarize the first objective function, the optimization problem is decreased for solving trust-region sub problems.
min𝑚𝑚𝑘𝑘 (𝑝𝑝) = 𝑓𝑓𝑘𝑘 + 𝑔𝑔𝑘𝑘𝑇𝑇𝑝𝑝 + 12𝑝𝑝𝑇𝑇𝐵𝐵𝑘𝑘𝑝𝑝 (1)
𝑠𝑠. 𝑡𝑡. ‖𝑝𝑝‖ <= ∆𝑘𝑘 (2)
Here, they believe region radius, is the angle at current point and is the hessian (or a hessian estimation). It is basically used to discover the solution to the trust-region sub issue.
4.4 Predicted reduction and Actual reduction
The basic hidden trust-area technique is to refresh the size of the trust-district at each emphasis. The present emphasis makes a palatable decrease, so we may misuse our model more in the following cycle by setting a bigger value. On the off chance, we just accomplished a constrained improvement after the present emphasis, the sweep of the trust-area at that point does not have any expansion, or at the most pessimistic scenarios, we may diminish the size of the trust by altering the range to a lesser incentive in order to check the models validity [16].
ρk = f(xk)−f(xk+pk)mk(0)−mk(pk)
(3)
Whether to make a progressively driven stride or an increasingly traditionalist one is relied upon the proportion among the genuine decrease, picked up by evident decrease in the first target work and the anticipated decrease expected in the model work.
Observational edge estimations of the proportion help in deciding the size of the trust-region.
4.5 Trust Reduction Algorithm
Even before we implement the true, with-region set of rules, initially we must decide various parameters. The higher bound for the measure of true with region and the limit ranges for comparing the goodness of the quadratic form, results for deciding the trust-vicinity’s length within the consequent generation. A typical set for these values are,
0 =< 𝜂𝜂1 <= 𝜂𝜂2,𝜂𝜂2 = 0.25 and 𝜂𝜂3 = 0.75, 𝑡𝑡1 = 0.25, 𝑡𝑡2 = 2.0
4.6 Pseudo-code
Set the starting point at x0, set the iteration number k=1
for k=1,2
Get the improving step by solving trust-region sub-problem ()
Evaluate pk from equation (4.3)
if ρk < 𝜂𝜂2
∆𝑘𝑘+1= t1∆𝑘𝑘
else
if ρk > 𝜂𝜂3 and pk = ‖∆𝑘𝑘‖ (full step and model is a goodapproximation)
∆𝑘𝑘+1= min(t2 ∆𝑘𝑘,∆𝑚𝑚)
else
∆𝑘𝑘+1= ∆𝑘𝑘
If ρk > 𝜂𝜂1
𝑥𝑥𝑘𝑘+1 = xk + 𝑝𝑝𝑘𝑘
else
𝑥𝑥𝑘𝑘+1 = xk ( the model is not a good approximation and has to unravel another trust-region sub issue inside a littler trust-region)
end
The above algorithm uses the ƞ1 corresponds to (0.65-1.09) values, ƞ2 uses (0.60-1.08) values and ƞ3 focus on the (0.64-1.107) range. The algorithm used to obtain the good approximation values from the training data for the condition of TSH levels, Hypothyroid, Hyperthyroid and FT4 values. Comparison of data from the individual
EAI Endorsed Transactions on Energy Web
01 2021 - 03 2021 | Volume 8 | Issue 32 | e10

7
stages is considered to get the optimized values of TSH levels, Hyperthyroidism, Hypothyroidism values.
4.7 Classification Tree
A Classification Tree represents a decision tree with double elements for characterization. An item of this magnificence can foresee reactions for brand spanking new information using the anticipate approach. The object carries the records applied for getting ready, so it can register substitution expectations.
Pseudo-code Step1: Predictor data
X = mdl.X; % Predictor data Xbinned = zeros(size(X));
Step 2: Choose binary edges edges = mdl.BinEdges;
Step 3: Select indices of binned predictors. idxNumeric =
find(~cellfun(@isempty,edges)); if iscolumn(idxNumeric) idxNumeric = idxNumeric'; end for j = idxNumeric x = X(:,j);
Step 4: Conversion from x to array if x is a table. if istable(x) x = table2array(x); end
Step 5: Using discretize function grouped into xbinned = discretize(x,[-inf; edges{j}; inf]); Xbinned(:,j) = xbinned;
Step 6: End
The decision trees used in data mining depend on two sorts. The first is order tree investigation which is the point at where the anticipated result is the class (discrete) to which the data has a place with the thyroid of TSH levels, Hypothyroidism, Hyperthyroidism and FT4 levels. The second one being the relapse tree examination is the point at which the anticipated result can be viewed as a real number [17].
5. Result Analysis
The PhysicoNet-> Bank ATM-> MIT-BIHArrhythmia Dataset(mitdb), the ECG signal take as the input signal. The input signal is loaded in the MATLAB format. The proposed work implemented using the MARLABR2014b software. The simulation results were given figure 5.
Figure 5. Input signal with the Amplitude Spectrum of the ECG signal.
The input signals are pre-processed. The use of the knowledge pre-processing is crucial step in the data mining process. The pre-processing is carried on by filtering of the ECG signal using n signal processing, the Wiener filter out is used to as objective or subjective process through direct time-invariant (LTI) sifting of an observed loud process, tolerating the known stationary sign and noise spectra, and additive noise. A standard ECG flag comprises of the P-wave, QRS complexes and T-wave. Here each QRS complexes to a Fourier spectrumfrom ECG indicators, the range shifts with theestablishment and conduction path.
The diversifications of quality range are found within the range of 0–20 Hz within the frequency location. In frequency area, seismic trace is described with regards to amplitudes and phases at certain frequencies. To describe seismic trace within the frequency area, it requires both an amplitude spectrum and a section spectrum. The amplitude spectrum merely gives amplitude at every frequency.
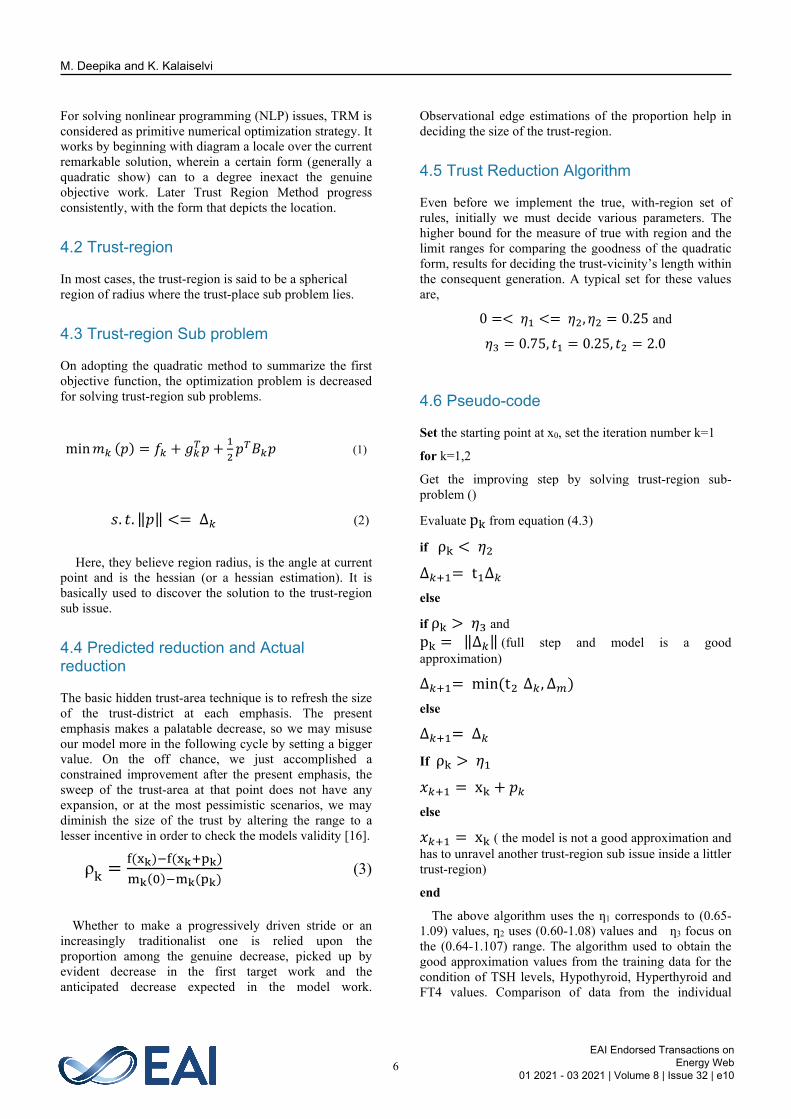
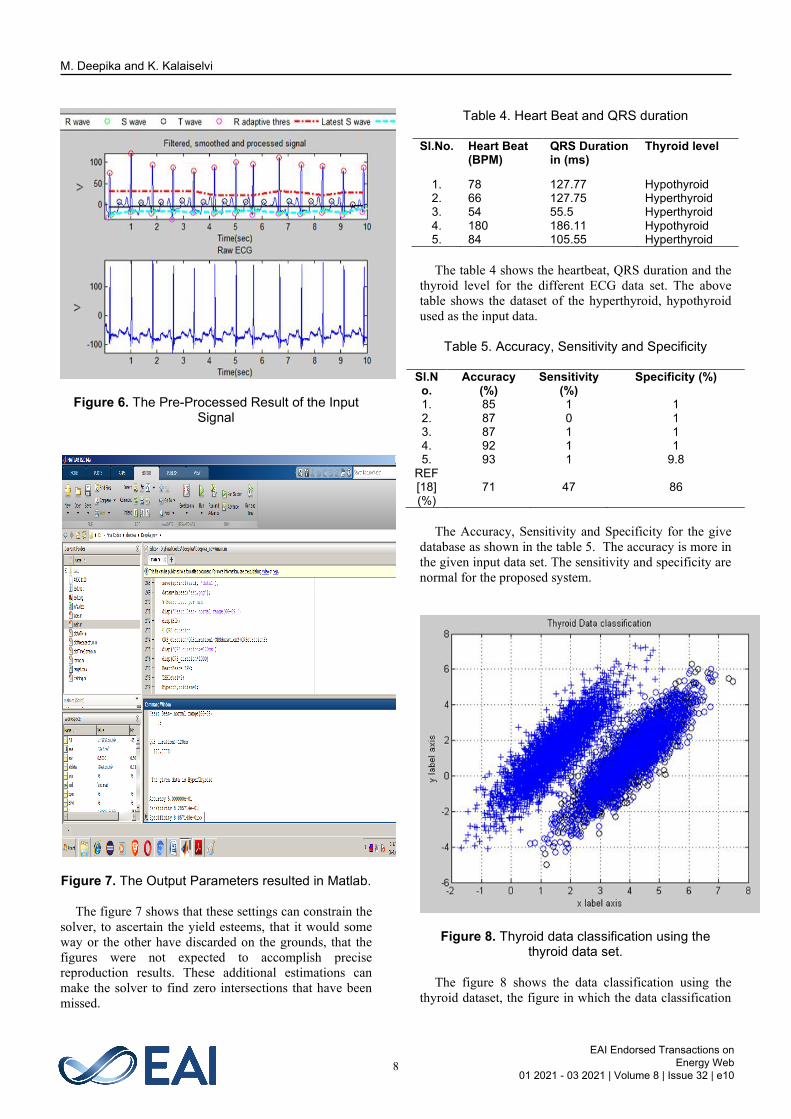
In figure 6 the smoothing algorithms are based on the "move and increase" method, in which unique information are duplicated point-by-point by a set of numbers (coefficients) that characterizes the smooth shape, the items are included and isolated by the coefficients, which gathers to one point of smoothed information, at that point the set of coefficients is shifted one point down to the first information and the method is repeated [17].
A Contemplative Analysis of Thyroid Disorders based on ECG Signal and Thyroid Test Measure
EAI Endorsed Transactions on Energy Web
01 2021 - 03 2021 | Volume 8 | Issue 32 | e10
8
Figure 6. The Pre-Processed Result of the Input Signal
Figure 7. The Output Parameters resulted in Matlab.
The figure 7 shows that these settings can constrain the solver, to ascertain the yield esteems, that it would some way or the other have discarded on the grounds, that the figures were not expected to accomplish precise reproduction results. These additional estimations can make the solver to find zero intersections that have been missed.
Table 4. Heart Beat and QRS duration
Sl.No. Heart Beat (BPM)
QRS Duration in (ms)
Thyroid level
1. 78 127.77 Hypothyroid 2. 66 127.75 Hyperthyroid 3. 54 55.5 Hyperthyroid 4. 180 186.11 Hypothyroid 5. 84 105.55 Hyperthyroid
The table 4 shows the heartbeat, QRS duration and the thyroid level for the different ECG data set. The above table shows the dataset of the hyperthyroid, hypothyroid used as the input data.
Table 5. Accuracy, Sensitivity and Specificity
Sl.No.
Accuracy (%)
Sensitivity (%)
Specificity (%)
1. 85 1 1 2. 87 0 1 3. 87 1 1 4. 92 1 1 5. 93 1 9.8
REF [18] (%)
71 47 86
The Accuracy, Sensitivity and Specificity for the give database as shown in the table 5. The accuracy is more in the given input data set. The sensitivity and specificity are normal for the proposed system.
Figure 8. Thyroid data classification using the thyroid data set.
The figure 8 shows the data classification using the thyroid dataset, the figure in which the data classification
M. Deepika and K. Kalaiselvi
EAI Endorsed Transactions on Energy Web
01 2021 - 03 2021 | Volume 8 | Issue 32 | e10
9
are into two groups for the dataset namely hypothyroid and hyperthyroid. The blue colour star shows the hyperthyroid and black colour circle shows the hypothyroid data set using trust region method for the optimization algorithm.
6. Conclusion
Diagnosis of disease is a very challenging task of health care sector. Many knowledge mining tactics are used in decision making process. The proposed work uses the dimensionality technique to choose the subset of attributes from unique knowledge. Later we have applied C4.5 as a set of rules used to generate a tree, through Ross Quinlan and Classification Tree in data mining process. The classification technique is used to categorize the hypothyroid and hyperthyroid illnesses. The efficiency of classifiers is evaluated using the confusion matrix on the subjects of accuracy, sensitivity, and specificity. The C4.5 algorithm gives 93.58% which is providing better accuracy than determination stump tree accuracy and also C4.5 Algorithm provides very minimum error rate than decision stump. As a future work the same technique is used to apply for other illness datasets corresponding to heart illness and so on, especially in cases which requires both measures like ECG signal as well as haematology (blood test) results.
References [1] Frates MC, Benson CB, Charboneau JW, Cibas ES, Clark
OH, et al. Management of thyroid nodules detected at US:Society of Radiologists in ultrasound consensus conferencestatement. Radiology. 2005; 237:794–800.
[2] Frates MC, Benson CB, Doubilet PM, Kunreuther E,Contreras M, et al. Prevalence and distribution ofcarcinoma in patients with solitary and multiple thyroidnodules on sonography. J Clin Endocrinol Metab. 2006;91:3411–7.
[3] Haugen BR, Alexander EK, Bible KC, Doherty GM,Mandel SJ, et al. 2015 American Thyroid Associationmanagement guidelines for adult patients with thyroidnodules and differentiated thyroid cancer: the AmericanThyroid Association guidelines task force on thyroidnodules and differentiated thyroid cancer. Thyroid. 2016;26:1–133.
[4] K. Vijayalakshmi1, S. Dheeraj2, B.S.S. Deepthi3,”Intelligent Thyroid prediction system using Big data”,Vol.6(1), Jan 2018, E-ISSN: 2347-2693.
[5] Yan Wang Ji-Guang Wang,” Genome-Wide AssociationStudies of Hypertension and Several Other CardiovascularDiseases”, February 5, 2019, DOI: 10.1159/000496150.
[6] Rafn Benediktsson, Anthony D Toft Endocrine Unit,”Management of the unexpected result: compensatedhypothyroidism”, Downloaded from http://pmj.bmj.com/on March 11, 2015 - Published by group.bmj.com.
[7] Bernadette biondi, emiliano a. Palmieri, gaetano lombardi,and serafino fazio,” Effects of Thyroid Hormone onCardiac Function: The Relative Importance of Heart Rate,Loading Conditions, and Myocardial Contractility in the
Regulation of Cardiac Performance in Human Hyperthyroidism”, The Journal of Clinical Endocrinology & Metabolism 87(3):968–974.
[8] Thorleifsson, et. al., ,” Design of the Coronary ARteryDIsease Genome-Wide Replication And Meta-Analysis(CARDIoGRAM) Study”, Circ Cardiovasc Genet isavailable at http://circgenetics.ahajournals.org DOI:10.1161/CIRCGENETICS.109.899443.
[9] Susanna C. Larsson, PhD, Elias Allara, MD Amy M.Mason, PhD Karl Michaëlsson, MD, PhD StephenBurgess, PhD,” Thyroid Function and Dysfunction inRelation to 16 Cardiovascular Diseases”, Circ GenomPrecis Med. 2019;12:e002468. DOI:10.1161/CIRCGEN.118.002468 March 2019.
[10] Yiyi Zhang1,2, Wendy S. Post1,2,3, Alan Cheng3, ElenaBlasco-Colmenares1,2, Gordon F. Tomaselli3, EliseoGuallar1,2,4*,” Thyroid Hormones and lectrocardiographicParameters: Findings from the Third National Health andNutrition Examination Survey”, April 2013 | Volume 8 |Issue 4 | e59489.
[11] Jia Liu1,2,3, Dongmei Zheng1,2,3,8*, Qiang Li4, XuleiTang5, Zuojie Luo6, Zhongshang Yuan7, Ling Gao2,3 andJiajun Zhao1,2,3,” A predictive model of thyroidmalignancy using clinical, biochemical and sonographicparameters for patients in a multi-center setting”, Liu et al.BMC Endocrine Disorders (2018) 18:17https://doi.org/10.1186/s12902-018-0241-7.
[12] Park M, Shin JH, Han BK, Ko EY, Hwang HS, et al.Sonography of thyroid nodules with peripheralcalcifications. J Clin Ultrasound. 2009; 37:324–8.
[13] Stojadinovic A, Peoples GE, Libutti SK, Henry LR,Eberhardt J, et al. Development of a clinical decisionmodel for thyroid nodules. BMC Surg. 2009; 9:12.
[14] Taghipour Zahir S, Binesh F, Mirouliaei M, Khajeh E,Noshad S. Malignancy risk assessment in patients withthyroid nodules using classification and regression trees. JThyroid Res. 2013; 2013:983953.
[15] Koike E, Noguchi S, Yamashita H, Murakami T, OhshimaA, et al. Ultrasonographic characteristics of thyroidnodules: prediction of malignancy. Arch Surg. 2001;136:334–7.
[16] J. Ye, J.-H. Chow, J. Chen, and Z. Zheng, “Stochasticgradient boosted distributed decision trees,” in Proceedingsof the 18th ACM conference on Information andknowledge management. ACM, 2009, pp. 2061– 2064.
A Contemplative Analysis of Thyroid Disorders based on ECG Signal and Thyroid Test Measure
EAI Endorsed Transactions on Energy Web
01 2021 - 03 2021 | Volume 8 | Issue 32 | e10