a concept of risk prioritization in fmea of fluid power ... - mdpi
TRANSCRIPT

Citation: Fabis-Domagala, J.;
Domagala, M. A Concept of Risk
Prioritization in FMEA of Fluid
Power Components. Energies 2022,
15, 6180. https://doi.org/
10.3390/en15176180
Academic Editors: Paolo Casoli and
Massimo Rundo
Received: 28 July 2022
Accepted: 20 August 2022
Published: 25 August 2022
Publisher’s Note: MDPI stays neutral
with regard to jurisdictional claims in
published maps and institutional affil-
iations.
Copyright: © 2022 by the authors.
Licensee MDPI, Basel, Switzerland.
This article is an open access article
distributed under the terms and
conditions of the Creative Commons
Attribution (CC BY) license (https://
creativecommons.org/licenses/by/
4.0/).
energies
Article
A Concept of Risk Prioritization in FMEA of FluidPower ComponentsJoanna Fabis-Domagala † and Mariusz Domagala *,†
Faculty of Mechanical Engineering, Cracow University of Technology, Al. Jana Pawla II 37, 31-864 Cracow, Poland* Correspondence: [email protected]† These authors contributed equally to this work.
Abstract: FMEA is a widely used tool for decades and is also used as an industrial standard. However,there are two main drawbacks of this analysis that have been specified from the beginning. The firstone is risk prioritization, which is expressed by a risk priority number (RPN). The RPN is a productof three factors with equal weight: severity (S), occurrence (O), and detection (D), which may produceequal risk priority for different combinations of S, O, and D. The second is the uncertainties causedby converting linguistic terms into quantitative data. The essential data used in the FMEA stronglydepend on subjective experts’ opinions, knowledge, and experience. For decades, various attemptsof overcoming these weaknesses have been made, not only by academics but also by industry. TheAutomotive Industry Action Group (AIAG) and Verband der Automobilindustrie (VDA) have createdan FMEA handbook that defines action priority (AP) depending on the combination of severity,occurrence, and detection numbers. This study presents an alternative to risk prioritization in FMEAbased on failures of the tasks which analyzed systems perform. The fundamental factors S, O, and Dhave been redefined in a way to minimize uncertainties. The proposed method has been implementedin the flow control valve and can be easily applied in mechanical engineering applications.
Keywords: FMEA; fluid power; flow control valve; risk prioritization
1. Introduction
Fluid power systems are not the latest achievement in engineering but are still widelyused in industrial drive systems. In some cases, they cannot be replaced by other systemsdue to their unique features that are unachievable by other systems. Wide application,mainly in the highly demanding applications in which safety has the highest priority, re-quires improving reliability. Failures of fluid power components have a complex nature dueto the interaction between high-pressure fluid with solid and chemical agent contaminantsand structural parts. The mentioned reasons and the relative elements’ motion make thefluid power component’s likelihood of failure high. The research on failures and reliabilityof fluid power systems or their components is made with the use of various tools andmethods. Ref. [1] presents work on monitoring and modeling gradual failure on a typicalfluid power system. Y. Lee et al. [2] have investigated a failure of the hydraulic systemwhich led to a fire on the wind turbine. Refs. [3–5] deal with the failure of hydraulicpumps. Research on failures, their analysis, and their influence on system operation arealso conducted for fluid power components [6–8]. Watton J. [9] has prepared a completecompendium of analysis of fluid power system failures, while [10] was focused on thereliability of mechanical parts, including the fluid power system’s components, and led tothe base failure rate.
The reliability of fluid power components can be increased by any means, includingfailure modes and effects analysis (FMEA) [11,12], fault tree analysis (FTA) [13], root causeanalysis (RCA) [14], and their extensions or modifications. FMEA is one of the mostcommonly used tools for improving system quality; however, the risk assessment has been
Energies 2022, 15, 6180. https://doi.org/10.3390/en15176180 https://www.mdpi.com/journal/energies

Energies 2022, 15, 6180 2 of 14
criticized [15] and has been found as a method weakness. The traditional FMEA uses a riskpriority number (RPN), which is a product of severity (S), occurrence (O), and detection(D). The equal weight of those factors may give the same results for a different combinationand can be very confused regarding safety. Although the traditional FMEA was formallydefined in the industrial standards in the early 1960s [16], later [17] the industry also noticedthe weakness in the risk evaluation. The 2008 FMEA handbook [18] says that the RPNshould no longer be recommended practice to define the need for action. Additionally,it says that for failure modes with severity numbers 9 or 10, the risk must be adequatelyaddressed. The latest release [19] introduced the action priority (AP) rating table in whichthe AP depends on a combination of S, O, and D, where the severity plays the dominantrole. Table 1 shows AP classification table. The failure modes are classified into threecategories of AP: high risk (H), medium risk (M), and low risk (L) for design or processFMEA.
Table 1. The AP classification [19].
S 9–10 S 7–8 S 4–6
D\O 10 9 8 7 6 5 4 3 2 1 D\O 10 9 8 7 6 5 4 3 2 1 D\O 10 9 8 7 6 5 4 3 2 110 H H H H H H H H H L 10 H H H H H H H M M L 10 H H H M M M M L L L9 H H H H H H H H H L 9 H H H H H H H M M L 9 H H H M M M M L L L8 H H H H H H H H H L 8 H H H H H H H M M L 8 H H H M M M M L L L7 H H H H H H H H H L 7 H H H H H H H M M L 7 H H H M M M M L L L6 H H H H H H H M M L 6 H H H H H M M M M L 6 H H H M M L L L L L5 H H H H H H H M M L 5 H H H H H M M M M L 5 H H H M M L L L L L4 H H H H H H H L L L 4 H H H H H M M L L L 4 M M M M M L L L L L3 H H H H H H H L L L 3 H H H H H M M L L L 3 M M M M M L L L L L2 H H H H H H H L L L 2 H H H H H M M L L L 2 M M M M M L L L L L1 H H H H H M M L L L 1 H H H M M M M L L L 1 M M M L L L L L L L
S 2–3 S 1
D\O 10 9 8 7 6 5 4 3 2 1 D\O 10 9 8 7 6 5 4 3 2 110 M M M L L L L L L L 10 L L L L L L L L L L9 M M M L L L L L L L 9 L L L L L L L L L L8 M M M L L L L L L L 8 L L L L L L L L L L7 M M M L L L L L L L 7 L L L L L L L L L L6 M M M L L L L L L L 6 L L L L L L L L L L5 M M M L L L L L L L 5 L L L L L L L L L L4 L L L L L L L L L L 4 L L L L L L L L L L3 L L L L L L L L L L 3 L L L L L L L L L L2 L L L L L L L L L L 2 L L L L L L L L L L1 L L L L L L L L L L 1 L L L L L L L L L L
It seems to be a step forward from the previous release because it removes the subjec-tiveness of risk assessment. However, even for the highest values of severity (S 9–10), therisk is defined as medium (M) for detection (D 5–6) and occurrence (O 2–3) or low (L) fordetection (D 1–3) and occurrence (O 1-3).
Other drawbacks are the conversion of linguistic terms into quantitative data and un-certainties related to subjective opinions, experience, and knowledge of experts evaluatingsystems.
Different methods and tools are used to overcome the weaknesses mentioned earlier.The traditional risk assessment can be extended with additional factors [20] or relevantweights [21]. Another approach is implementing other perspectives on the risk, such as thecustomer’s [22] or maintenance [23] perspective.
There are numerous methods that are used to minimize the uncertainties of the FMEAprocess. The most common approaches are the grey theory set [24], linguistic theory [25],fuzzy sets [26], and reasoning theory [27].

Energies 2022, 15, 6180 3 of 14
Liu et al. [28], in [28], have prepared a complex and methodical literature review ofmethods and tools currently used in the FMEA in both risk evaluation and eliminationof uncertainties. The recent studies on overcoming traditional FMEA’s drawbacks focuson implementing new methods or combining those mentioned earlier. Ref. [29] presentsan approach of FMEA in which failure modes are classified based on the combination ofrisk factors in pairs: S and O, S and D, and O and D. The risk factors pair results wereanalyzed by using grey relation analysis. Yu et al. [30] have implemented the cloudmodel theory to minimize the linguistic uncertainties and have used the VIKOR modelto determine the risk priority. The authors in [31] have modified the FMEA frameworkfor IT according to the recommendation from the relevant literature review. Ref. [32] hasutilized the cloud model to improve the FMEA. A three-stage fuzzy risk assessment basedon FMEA has been proposed by Yelda et al. [33]. In ref. [34] the authors have proposedan approach in which the FMEA method has been modified by integrating the fuzzy rulebase (FRB) and grey relations theory (GRT) to overcome the traditional FMEA methods’drawbacks. The uncertainty dealt with a different knowledge background of experts hasbeen presented in [35], where prospect theory has been implemented. Another approachto converting linguistic terms into quantitative data is in [36]. The fuzzy numbers andtraditional measurement of alternatives and ranking according to compromise solution(MARCOS) methods have been used. Meanwhile, Shi et al. [37] have proposed integratinghesitant linguistic preference relations (HLPRs) and an extended dynamic consensus modelin FMEA. Another approach to the modification of FMEA is taking into considerationinfluences of failure modes and the attenuation effect of such influences in the system [38].
The drawbacks of FMEA still draw the attention of scholars and remain unsolved.Despite the rich assortment of implemented methods and tools, the risk assessment
in FMEA is still problematic. Approaches available in the literature are excessively com-plicated or too computationally expensive to be able to be used in the industrial standard.The recent practical implementation of FMEA by AIAG and VDA is helpful in removingsubjective decisions in risk assessment. However, the implemented risk ranking maylead to misvalued failure modes in the aspect of safety. The uncertainty linked to thesubjectiveness of experts’ knowledge and background is still high. Our main motivationwas to modify FMEA in a way to be similar to traditional analysis without using complextools and methods and concurrently minimize typical uncertainties. The main idea of ourapproach is the assumption that any system is created to perform the intended task(s) andfailures that can occur may disorganize that process. For that reason, we categorize failuresthat may occur for individual components as those that stop the system from performinga system task and those that still allow the main task to be completed but with major orminor malfunctions. We propose assessing the system’s risk based on the combinationof failures and related components in the aspect of the ability to perform the intendedtask(s). Once the failures for related components are categorized, they are prioritized bythe product of occurrence (O) and detection (D) factors. In the proposed approach, theoccurrence (O) has been defined as a function of subfactors that determine the likelihood offailure occurrences such as the manufacturing process, duty time, and functions performedby individual components. The detection (D) remains the same as in traditional FMEA. Thepresented approach is an extension of our previous work [39], in which a similar approachhas been proposed. The novelty of this approach is the risk categorization and the methodwhich allows for evaluating the occurrence (O) factor. In contrast to our previous study,in which we used a base failure rate to evaluate the occurrence, in this approach, it wasdefined based on functions performed by components. To distinguish those failures whichcan be created for other reasons than during normal operation, we have proposed to useadditional modification subfactors. The occurrence (O) and detection (D) factors are equallyvalued. The proposed method was implemented in the risk assessment for the FMEA ofthe flow control valve.

Energies 2022, 15, 6180 4 of 14
2. Methodology
The presented methodology by principle is very similar to the traditional FMEAframework. Almost all steps are analogical. As presented in our previous studies [40], thepotential failures are typical for fluid power components used in the conventional FMEA.
2.1. Assumptions
The primary purpose of this study was a qualitative analysis of failures and theirend effects on components of fluid power systems. Failures that may occur in them arecomplex, and primary failure may only trigger the final failure. Therefore, we assumeonly primary forms of failure, and the presented analysis was carried out only for primarymechanical failures. We also assume that only a few essential data are available for theinvestigated component. Detailed technical data and manufacturing/assembly processesare inaccessible.
Another assumption is that the failures can be detected without a sophisticated diag-nostic system or disassembly. Only basic measurements such as the pressure and flow rateare available.
2.2. Method
One of the stages of the FMEA is the functional analysis of the system, which includesthe identification of the basic elements of the system, their potential failures, and causes.However, formal rules for this step are not strictly defined and may differ depending onthe considered case. The proposed method assumes that any system is created to fulfill oneor more tasks. Therefore, if any failure occurs, the system may not be able to perform theintended task or only perform it partially with some degradation.
We assume that system S consists of a set of components ci ∈ C, i = {1 . . . n}, whichcan be connected to each other in any way (parallel, series, or series-parallel). Eachcomponent ci performs a specific function or several functions f j ∈ F, j = {1, 2} in thesystem S. The set of component functions fi can be determined as follows:
• f1: main component functions;• f2: auxiliary functions.
Each components ci may have a certain state determined by the failure f a ∈ Fa, fa ={ f c, f m, f n}, which can be determined as follows:
• f c: failures, which stop s component from executing its function;• f m: failures, which allow a component to execute its function with a major degrada-
tion;• f n: failures, which allow a component to execute its function with a minor degrada-
tion.
We introduce the failure importance factor fi as:
fi =
{ 3, for fc2, for fm1, for fn
(1)
Among components ci, when creating a system we can distinguish those:
• that are essential to perform the intended system’s task: main components ce;• that are supplementing main components and ensure the proper system operation:
major components cm;• whose failure has little effect on the main task of the system: minor components cn;• additional components whose failure does not affect the main task of the system ca.
We introduce the component importance factor cim as:

Energies 2022, 15, 6180 5 of 14
cim =
{ 4, for ce3, for cm2, for cn1, for ca
(2)
Additionally, we assume that failures that may appear for some components mayinfluence other components’ failures. For that reason, we have implemented a componentfailure factor cin which can be described as:
cin =kn
(3)
where:k is the number of components that a given component may influence;n is the total number of components.The system severity Se we can define as the ability to perform the intended task. We as-
sume that risk assessment is evaluated primarily by severity Se, which can be expressed as:
Se = (cim + cin) · fi (4)
The severity Se is valued with numbers 1–15.The occurrence O we define as an estimator of failure for corresponding components.
We assumed that the main contributor to the likelihood of component failure is the numberof functions ( f f factor) the component realizes with modification factors λi:
O = α(
f f + ∑ λi
)(5)
where:
f f =∑ f1
∑ f1 + ∑ f2(6)
λi = λmo + λma + λdt + λev (7)
The factors above arise from the analysis of fluid power components [10], which statesthat the reliability of fluid power components depends on:
• relative motion λmo;• tolerances and surface quality which requires more sophisticated manufacturing
processes λma;• duty time λdt;• environmental conditions λev.
Each modification factor λi has equal weight and may reach a maximal value equal to0.25. The function factor f f maximal value is 4. The evaluation of all mentioned factors canbe set arbitrarily and then renormalized to the required range.
Since the mentioned study defines failure rate, it was necessary to introduce a correc-tive factor α, which allows distinguishing failures which occur during regular operation orin other circumstances. The coefficient is valued in the following way:
• normal operation: 2;• operation outside specified specification: 1.5;• maintenance: 1;• assembly: 0.5.
The detection D has been defined and evaluated in the following way:
• detection of failure is almost certain: 1;• detection is very high: 2;• detection is high: 3;• detection is moderately high: 4;

Energies 2022, 15, 6180 6 of 14
• detection is moderate: 5;• detection is low: 6;• detection is very low: 7;• detection is remote: 8;• detection is very remote: 9;• detection is nearly not possible: 10.
According to our primary hypothesis, the risk assessment is realized based on severitySe, which defines whether the system is able to perform intended tasks. The prioritizationof failures inside task failures is performed by product occurrence O and detection D.
3. Case Study
The investigated fluid power component is a two-way flow control valve presented inFigure 1. The valve’s purpose is to maintain a constant flow rate regardless of the pressuredifference between ports A and B. When the pressure line is connected to port A, the flowrate is controlled by the throttling gap between piston C21 and sleeve C3. The solenoid setsthe gap by setting the position of the piston C21. The constant flow rate is provided by apressure compensator (piston C22 and nozzle C4).
Figure 1. Flow control valve: 2-way flow control valve type UDRD6 by Ponar Wadowice: C1—body,C21—piston 1, C22—piston 2, C3—sleeve, C4—nozzle, C5—ball, C6—spring, C7—plug, C8—sealingring, C9—check valve seat, A and B—valve port.
We can distinguish the following components whose failure will disturb the main taskof the valve:
• body (c1);• piston 1 (c21);• piston 2 (c22);• sleeve (c3);• nozzle (c4);• spring (c6);• plug (c7);• sealing ring (c8).
The following components, when failures occur, may still complete the primary task butwith some limitations:

Energies 2022, 15, 6180 7 of 14
• ball (c5);• check valve seat (c9);• oil (c10), it should be understood as a component that transfers pressure energy.
Failures that leave the valve unable to perform the task are:
• fracture ( f c1);• yielding ( f c2);• seizing ( f c3);• aging ( f c4);• hardening ( f c5);• thread stripping ( f c6);• clogging ( f c7);• extreme contamination ( f c8).
Failures that still allow the valve to perform the task but with a major degradation are:
• erosion ( f m1);• wear ( f m2);• aeration ( f m3);• contamination ( f m4);• chemical action ( f m5).
Failures that still allow the valve to perform the task but with a minor degradation are thesame as the aforementioned. The factor which defines whether the failure belongs to majoror minor degradation is its intensity. For simplicity, we will not consider failures withminor degradation. Functions that are performed by individual components are presentedin Table 2.
Table 2. Functions performed by valve components.
Component ci Primary Function f1 Secondary Function f2
body (c1) connecting with the system fixing check valvefixing piston/sleeve position mounting
seals seat for springflow management seat for nozzle
piston 1 (c21) flow rate setting -sealing -
piston 2 (c22) flow rate control -sealing -
sleeve (c3) guiding pistons -sealing -
nozzle (c4) pressure control -
ball (c5) - closing/opening flow
spring (c6) positioning -
plug (c7) closing flow ducts -
sealing ring (c8) sealing -
check valve seat (c9) - guiding ball- guiding spring
oil (c10) energy transfer greasing- cooling
Task failures for the corresponding components are presented in Table 3.

Energies 2022, 15, 6180 8 of 14
Table 3. Task failures.
Valve Function Component Failure
The primary task is not realized
body c1 fracture fc1yielding fc2
thread stripping fc6
piston 1 c21 fracture fc1yielding fc2seizing fc3
piston 2 c22 fracture fc1yielding fc2seizing fc3
sleeve c3 fracture fc1yielding fc2seizing fc3
nozzle c4 fracture fc1clogging fc7
spring c6 fracture fc1yielding fc2
plug c7 fracture fc1thread stripping fc6
sealing ring c8 fracture fc1aging fc4
hardening fc5
oil c10extreme contamination
fc8
The major degradation of the primary task
body c1 erosion fm1piston 1 c21 wear fm2piston 2 c22 chemical action fm5
sleeve c3plug c7
ball c5 fracture fc1seizing fc3erosion fm1
wear fm2chemical action fm5
spring c6 chemical action fm5
sealing ring c8 wear fm2chemical action fm5
check valve seat c9 fracture fc1seizing fc3
yielding fc2thread stripping fc6
erosion fm1wear fm2
chemical action fm5
oil c10 aeration fm3contamination fm4chemical action fm5
4. Results
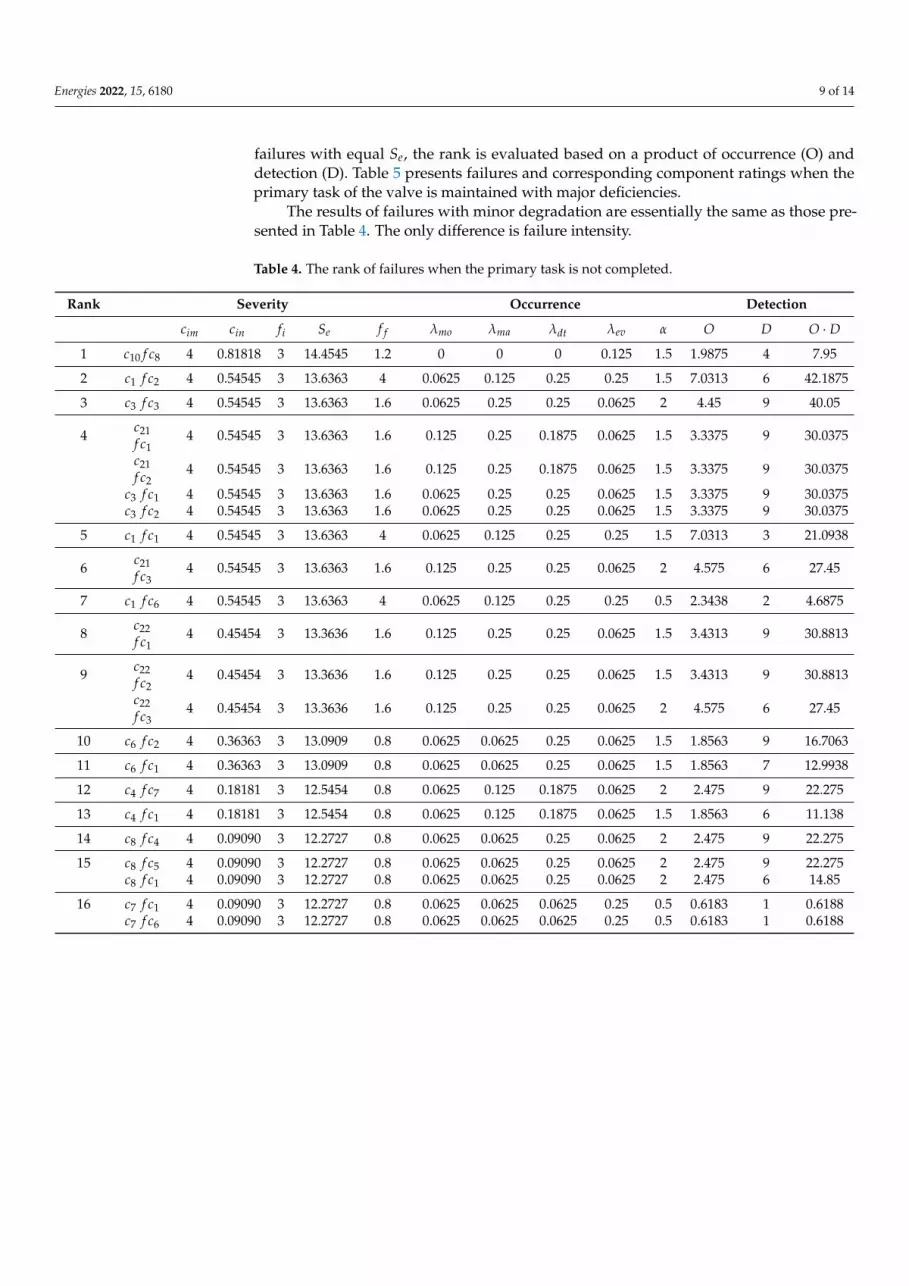
Tables 4 and 5 present the risk assessment of failures and corresponding components.Table 4 presents failures and corresponding component ratings when the primary task ofthe valve is not realized. The rank is created based on the severity number Se. For the
Energies 2022, 15, 6180 9 of 14
failures with equal Se, the rank is evaluated based on a product of occurrence (O) anddetection (D). Table 5 presents failures and corresponding component ratings when theprimary task of the valve is maintained with major deficiencies.
The results of failures with minor degradation are essentially the same as those pre-sented in Table 4. The only difference is failure intensity.
Table 4. The rank of failures when the primary task is not completed.
Rank Severity Occurrence Detection
cim cin fi Se f f λmo λma λdt λev α O D O · D
1 c10 f c8 4 0.81818 3 14.4545 1.2 0 0 0 0.125 1.5 1.9875 4 7.95
2 c1 f c2 4 0.54545 3 13.6363 4 0.0625 0.125 0.25 0.25 1.5 7.0313 6 42.1875
3 c3 f c3 4 0.54545 3 13.6363 1.6 0.0625 0.25 0.25 0.0625 2 4.45 9 40.05
4 c21f c1
4 0.54545 3 13.6363 1.6 0.125 0.25 0.1875 0.0625 1.5 3.3375 9 30.0375
c21f c2
4 0.54545 3 13.6363 1.6 0.125 0.25 0.1875 0.0625 1.5 3.3375 9 30.0375
c3 f c1 4 0.54545 3 13.6363 1.6 0.0625 0.25 0.25 0.0625 1.5 3.3375 9 30.0375c3 f c2 4 0.54545 3 13.6363 1.6 0.0625 0.25 0.25 0.0625 1.5 3.3375 9 30.0375
5 c1 f c1 4 0.54545 3 13.6363 4 0.0625 0.125 0.25 0.25 1.5 7.0313 3 21.0938
6 c21f c3
4 0.54545 3 13.6363 1.6 0.125 0.25 0.25 0.0625 2 4.575 6 27.45
7 c1 f c6 4 0.54545 3 13.6363 4 0.0625 0.125 0.25 0.25 0.5 2.3438 2 4.6875
8 c22f c1
4 0.45454 3 13.3636 1.6 0.125 0.25 0.25 0.0625 1.5 3.4313 9 30.8813
9 c22f c2
4 0.45454 3 13.3636 1.6 0.125 0.25 0.25 0.0625 1.5 3.4313 9 30.8813
c22f c3
4 0.45454 3 13.3636 1.6 0.125 0.25 0.25 0.0625 2 4.575 6 27.45
10 c6 f c2 4 0.36363 3 13.0909 0.8 0.0625 0.0625 0.25 0.0625 1.5 1.8563 9 16.7063
11 c6 f c1 4 0.36363 3 13.0909 0.8 0.0625 0.0625 0.25 0.0625 1.5 1.8563 7 12.9938
12 c4 f c7 4 0.18181 3 12.5454 0.8 0.0625 0.125 0.1875 0.0625 2 2.475 9 22.275
13 c4 f c1 4 0.18181 3 12.5454 0.8 0.0625 0.125 0.1875 0.0625 1.5 1.8563 6 11.138
14 c8 f c4 4 0.09090 3 12.2727 0.8 0.0625 0.0625 0.25 0.0625 2 2.475 9 22.275
15 c8 f c5 4 0.09090 3 12.2727 0.8 0.0625 0.0625 0.25 0.0625 2 2.475 9 22.275c8 f c1 4 0.09090 3 12.2727 0.8 0.0625 0.0625 0.25 0.0625 2 2.475 6 14.85
16 c7 f c1 4 0.09090 3 12.2727 0.8 0.0625 0.0625 0.0625 0.25 0.5 0.6183 1 0.6188c7 f c6 4 0.09090 3 12.2727 0.8 0.0625 0.0625 0.0625 0.25 0.5 0.6183 1 0.6188

Energies 2022, 15, 6180 10 of 14
Table 5. The ranks of functional failures with major degradation.
Rank Severity Occurrence Detection
cim cin fi Se f f λmo λma λdt λev α O D O · D
1 c8 f m2 4 0.0909 3 12.2727 0.8 0.0625 0.0625 0.25 0.0625 2 2.4750 10 24.75c8 f m5 4 0.0909 3 12.2727 0.8 0.0625 0.0625 0.25 0.0625 2 2.4750 10 24.75
2 c10 f m3 4 0.8182 2 9.6364 1.2 0.0625 0.0625 0.25 0.25 2 3.65 4 14.6c10 f m4 4 0.8182 2 9.6364 1.2 0.0625 0.0625 0.25 0.25 2 3.65 4 14.6c10 f m5 4 0.8182 2 9.6364 1.2 0.0625 0.0625 0.25 0.25 2 3.65 4 14.6
3 c1 f m1 4 0.5455 2 9.0909 4 0.0625 0.1250 0.25 0.25 2 9.3750 10 93.75c1 f m2 4 0.5455 2 9.0909 4 0.0625 0.1250 0.25 0.25 2 9.3750 10 93.75c1 f m5 4 0.5455 2 9.0909 4 0.0625 0.1250 0.25 0.25 2 9.3750 10 93.75
4 c21 f m5 4 0.5455 2 9.0909 1.6 0.1250 0.25 0.25 0.0625 2 4.5750 10 45.75
5 c21 f m1 4 0.5455 2 9.0909 1.6 0.1250 0.25 0.1875 0.0625 2 4.45 10 44.5c21 f m2 4 0.5455 2 9.0909 1.6 0.1250 0.25 0.1875 0.0625 2 4.45 10 44.5c3 f m1 4 0.5455 2 9.0909 1.6 0.0625 0.25 0.25 0.0625 2 4.45 10 44.5c3 f m2 4 0.5455 2 9.0909 1.6 0.0625 0.25 0.25 0.0625 2 4.45 10 44.5c3 f m5 4 0.5455 2 9.0909 1.6 0.0625 0.25 0.25 0.0625 2 4.45 10 44.5
6 c22 f m1 4 0.4545 2 8.9091 1.6 0.1250 0.25 0.25 0.0625 2 4.575 10 45.75c22 f m2 4 0.4545 2 8.9091 1.6 0.1250 0.25 0.25 0.0625 2 4.575 10 45.75c22 f m5 4 0.4545 2 8.9091 1.6 0.1250 0.25 0.25 0.0625 2 4.575 10 45.75
7 c6 f m5 4 0.3636 2 8.7273 0.8 0.0625 0.0625 0.125 0.0625 2 2.225 10 22.25
8 c4 f m1 4 0.1818 2 8.3636 0.8 0.0625 0.125 0.1875 0.0625 2 2.475 10 24.75c4 f m2 4 0.1818 2 8.3636 0.8 0.0625 0.125 0.1875 0.0625 2 2.475 10 24.75c4 f m5 4 0.1818 2 8.3636 0.8 0.0625 0.125 0.1875 0.0625 2 2.475 10 24.75
9 c9 f c1 2 0.2727 3 6.8182 0.4 0.0625 0.125 0.125 0.0625 1.5 1.1625 10 11.625c9 f c2 2 0.2727 3 6.8182 0.4 0.0625 0.125 0.125 0.0625 1.5 1.1625 10 11.625
10 c9 f c6 2 0.2727 3 6.8182 0.4 0.0625 0.125 0.125 0.0625 0.5 0.3875 10 3.875
11 c5 f c3 2 0.1818 3 6.5455 0.8 0.1250 0.125 0.125 0.0625 2 2.475 10 24.75
12 c5 f c1 2 0.1818 3 6.5455 0.8 0.1250 0.125 0.125 0.0625 1.5 1.8563 10 18.5625
13 c7 f m1 3 0.0909 2 6.1818 0.8 0.0625 0.0625 0.0625 0.25 2 2.475 10 24.75c7 f m2 3 0.0909 2 6.1818 0.8 0.0625 0.0625 0.0625 0.25 2 2.475 10 24.75c7 f m5 3 0.0909 2 6.1818 0.8 0.0625 0.0625 0.0625 0.0625 2 2.1 10 21
14 c9 f m1 2 0.2727 2 4.5455 0.4 0.0625 0.125 0.125 0.0625 2 1.55 10 15.5c9 f m2 2 0.2727 2 4.5455 0.4 0.0625 0.125 0.125 0.0625 2 1.55 10 15.5c9 f m5 2 0.2727 2 4.5455 0.4 0.0625 0.125 0.125 0.0625 2 1.55 10 15.5
15 c5 f m1 2 0.1818 2 4.3636 0.8 0.1250 0.125 0.125 0.0625 2 2.475 10 24.75c5 f m2 2 0.1818 2 4.3636 0.8 0.1250 0.125 0.125 0.0625 2 2.475 10 24.75c5 f m5 2 0.1818 2 4.3636 0.8 0.1250 0.125 0.125 0.0625 2 2.475 10 24.75c5 f m5 2 0.1818 2 4.3636 0.8 0.1250 0.125 0.125 0.0625 0.5 0.6188 10 6.1875
5. Discussion
The ranking method in this study allowed for the segregation of those failures thatcan potentially occur and leave the valve component unable to perform the intendedtask. However, some failures have the same value of severity (Se) inside the assumedcategories. The adopted product of occurrence (O) and detection (D) as an additionalevaluating criterion did not allow for distinguishing their ranks. This indicates that anotherfactor apart from those presented in this study would need to be employed. Anothersolution might be a modification of the detection factor (D), which remained unchanged,and problems with uncertainties related to linguistic conversion to quantitative data remainrelatively high. The presented method uses factors based on failure history and research ofsimilar but not strictly identical objects; therefore, it is suitable during the design process

Energies 2022, 15, 6180 11 of 14
or initial stage of failure analysis. Additionally, it can be combined with other tools andmethods such as root cause analysis (RCA) or fault tree analysis (FTA). As was mentionedearlier, a ranking for failures with minor degradation of the valve’s intended function isthe same as for major degradation. The only difference is the intensity of failure. As themajority of failures in Table 5 are caused during the normal operational condition, it iscertain the degradation of the valve’s main task will depend on the intensity of wear orerosion of valve components.
Another feature that can be observed is the source of the failures which stop the valvefrom performing its task. All of those failures are mainly caused during assembling, main-tenance work, or operation outside specifications. Analogously, those failures which causemajor or minor degradation of the valve are mainly produced during normal operation.
The presented method can be easily extended to any fluid power components, however,we are unable to perform FMEA for electrical/electronic components. It can be used onlyfor purely mechanical or hydromechanical components. Proposed subfactors in occurrence(O) were defined only as typical for mechanical or hydromechanical failures.
The severity values Se can be set arbitrary with any values; the proposed methods onlyprioritize failures for related components inside categorized failures on those which stopthe valve from performing its task and those which cause a major or minor malfunction.
Comparison with the Traditional FMEA Risk Assessment
The Table 6 presents a risk analysis using the traditional approach for selected failuresand related components by invited experts. The risk has been expressed as the RPN(product of severity (S), occurrence (O), and detection (D)) and by using action priority(AP).
Table 6. The RPN and AP.
Failure/Component S O D RPN AP
c1 f c1 10 3 3 90 Lc7 f c6 10 1 1 10 Lc1 f c2 10 3 6 180 Hc21 fc1 10 3 9 270 Hc21 f c2 10 3 9 270 Hc21 f c3 10 5 6 300 Hc22 f c1 10 3 9 270 Hc22 f c2 10 3 9 270 Hc22 f c3 10 5 6 300 Hc21 f m1 8 7 10 560 Hc21 f m2 8 7 10 560 Hc22 f m1 8 7 10 560 Hc22 f m2 8 7 10 560 H
According to the table, the highest RPN value was reached for failure wear f m2 anderosion f m1 for the components pistons 1 c21 and piston 2 c22. For both, the action priority(AP) is high (H). This is overestimating those failures, which can cause a major or minormalfunction in the valve. In contrast, the failure fracture f c1 for the body c1 and threadstripping f c6 for plug c7 are underestimated. Their RPN values are lower than otherfailures, and action priority (AP) is low (L). Those failures, when they occur, stop thevalve’s operation.
6. Conclusions
Despite the continuous improvement of FMEA and its new standards, many problemsremain unresolved. The proposal of risk assessment presented in this paper and theassessment of the likelihood of potential defects allows minimizing the uncertainty of thegathered data.

Energies 2022, 15, 6180 12 of 14
The proposed method categories failures and relevant components in the aspect oftheir influence on the ability to perform the intended task. The method presented in thispaper is universal and can be used in any component of the fluid power system.
The proposed method also identifies failures that can cause critical failure to thesystem, which would be neglected by the traditional FMEA method or even the latest oneimplemented in the industry.
The proposed methods do not require computationally extensive tools or simulationalmethods. In principle, it is very similar to the traditional FMEA method. The proposedfailures and component categorization make it so the proposed method can be adjusted toindividual needs and valued with arbitrary weights.
The presented method has shown its superiority over the recent AIAG and VDAFMEA standard and the traditional FMEA framework. Some of the failures that can occuron main valve components would not be recognized as critical to the system.
An extension of the presented method might be a redefinition of the detection factorto minimize the still relatively high uncertainties and implement new risk factors such asthe cost of manufacturing or repairs.
Author Contributions: Conceptualization, J.F.-D.; methodology, M.D.; software, M.D.; validation,J.F.-D.; formal analysis, J.F.-D.; investigation, M.D.; resources, M.D.; data curation, M.D.; writing—original draft preparation, M.D.; writing—review and editing, M.D.; visualization, J.F.-D.; supervision,J.F.-D.; project administration, J.F.-D.; funding acquisition, J.F.-D. All authors have read and agreed tothe published version of the manuscript.
Funding: This research received no external funding.
Institutional Review Board Statement: Not applicable.
Informed Consent Statement: Not applicable.
Data Availability Statement: Not applicable.
Conflicts of Interest: The authors declare no conflict of interest.
Abbreviations
The following abbreviations are used in this manuscript:
MDPI Multidisciplinary Digital Publishing InstituteDOAJ Directory of Open Access JournalsFMEA Failure Modes and Effect AnalysisRCA Root Cause AnalysisFTA Fault Tree AnalysisRPN Risk Priority NumberAIAG Automotive Industry Action GroupVDA and der Automobilindustrie VDAAP Action Priority
References1. Zhao, X.; Zhou, C.; Zhao, L.; Zhang, S.; Wen, P.; Jiang, J. Condition evaluation model of fluid power system in gradual failure
based on data envelopment analysis. Comput. Fluids 2015, 110, 219–226. https://doi.org/10.1016/j.compfluid.2014.06.001.2. Lee, Y.; Lee, G.; Yang, J.; Park, J.; Baek, D. Failure analysis of a hydraulic power system in the wind turbine. Eng. Fail. Anal. 2020,
107, 104218. http://doi.org/10.1016/j.engfailanal.2019.104218.3. Ma, Z.; Wang, S.; Shi, J.; Li, T.; Wang, X. Fault diagnosis of an intelligent hydraulic pump based on a nonlinear unknown input
observer. Chin. J. Aeronaut. 2018, 31, 385–394. http://doi.org/10.1016/j.cja.2017.05.004.4. Li, T.; Wang, S.; Zio, E.; Shi, J.; Ma, Z. A numerical approach for predicting the remaining useful life of an avia-
tion hydraulic pump based on monitoring abrasive debris generation. Mech. Syst. Signal Process. 2018, 136, 106519.http://doi.org/10.1016/j.ymssp.2019.106519.
5. Hast, D.; Findeisen, R.; Streif, S. Detection and isolation of parametric faults in hydraulic pumps using a set-based approach andquantitative–qualitative fault specifications. Control Eng. Pract. 2015, 40, 61–70. http://doi.org/10.1016/j.conengprac.2015.01.003.
6. Gianni, N.; Tito, M. Failure of a heavy-duty hydraulic cylinder and its fatigue re-design. Eng. Fail. Anal. 2011, 18, 1030–1036.

Energies 2022, 15, 6180 13 of 14
7. Roquet, P.; Gamez-Montero, P.J.; Castilla, R.; Raush, G.; Codina, E. A Simplified Methodology to Evaluate the Design Specificationsof Hydraulic Components. Appl. Sci. 2018, 8, 1612. http://doi.org/10.3390/app8091612.
8. Guo, Y.; Xiong, G.; Zeng, L.; Li, Q. Modeling and Predictive Analysis of Small Internal Leakage of Hydraulic Cylinder Based onNeural Network. Energies 2021, 14, 2456. http://doi.org/10.3390/en14092456.
9. Watton, J. Modelling, Monitoring and Diagnostic Techniques for Fluid Power Systems; Springer: London, UK, 2007.10. Handbook of Reliability Prediction for Mechanical Equipment; Naval Surface Warfare Center: West Bethesda, MD, USA, 2011.11. Stirrup, T.S.; Chamberlin, H.C.; Curran, K.L.F. Scaled Wind Farm Technology Hydraulic System Failure Modes and Effects Analysis;
Sandia National Laboratories: Albuquerque, NM, USA; Livermore, CA, USA, 2015.12. Fabis-Domagala, J.; Domagala, M.; Momeni, H. A Matrix FMEA Analysis of Variable Delivery Vane Pumps. Energies 2021, 14,
1741. http://doi.org/10.3390/en14061741.13. Zhang, F.; Cheng, L.; Gao, Y.; Xu, X.; Wang, Y. Fault tree analysis of a hydraulic system based on the interval model using latin
hypercube sampling. J. Intell. Fuzzy Syst. 2019, 37, 8345–8355.14. Hemati, A.; Shooshtari, A.A. Gear Pump Root Cause Failure Analysis Using Vibrations Analysis and Signal Processing. J. Fail.
Anal. Preven. 2020, 20, 1815–1818. https://doi.org/10.1007/s11668-020-01008-3.15. Liu, H.C.; Liu, L.; Liu, N. Risk evaluation approaches in failure mode and effects analysis: A literature review. Expert Syst. Appl.
2013, 40, 828–838. http://doi.org/10.1016/j.eswa.2012.08.010.16. MIL-P 1629; USA Military Standard, Procedure for Performing a Failure Mode, Effects and Criticality Analysis (MIL-P 1629,
USA). Military Specifications and Standards: Washington, DC, USA, 1949.17. J1739 200901; Potential Failure Mode and Effects Analysis in Design (Design FMEA), Potential Failure Mode and Effects Analysis
in Manufacturing and Assembly Processes (Process FMEA). SAE International: Warrendale, PA, USA, 2009.18. AIAG. Potential Failure Mode and Effect Analysis (FMAE), 4th ed.; AIAG:Automotive Industry Action Group, 2008. Available
online: https://www.aiag.org/store/publications/details?ProductCode=FMEA-4 (accessed on 20 July 2022).19. AIAG & VDA FMEA Handbook. AIAG: Automotive Industry Action Group. 2019. Available online: https://www.aiag.org/
store/publications/details?ProductCode=FMEAAV-1 (accessed on 20 July 2022).20. Anes, V.; Henriques, E.; Freitas, M.; Reis, L. A new risk prioritization model for failure mode and effects analysis. Qual. Reliab.Eng.
Int. 2018, 34, 516–528. http://doi.org/10.1002/qre.2269.21. Tang, Y.; Zhou, D.; Chan, F.T.S. AMWRPN: Ambiguity Measure Weighted Risk Priority Number Model for Failure Mode and
Effects Analysis. IEEE Access 2018, 6, 27103–27110. http://doi.org/10.1109/ACCESS.2018.2836139.22. Koomsap, P.; Charoenchokdilok, T. Improving risk assessment for customer-oriented FMEA. Total Qual. Manag. Bus. Excell. 2018,
29, 1563–1579. http://doi.org/10.1080/14783363.2016.1274229.23. Pancholi, N., Bhatt M., FMECA-based maintenance planning through COPRAS-G and PSI. J. Qual. Maint. Eng. 2018, 24, 224–243.
https://doi.org/10.1108/JQME-03-2017-0015.24. Li, Z.; Chen, L. A novel evidential FMEA method by integrating fuzzy belief structure and grey relational projection method.
Eng. Appl. Artif. Intell. 2019, 77, 136–147. http://doi.org/10.1016/j.engappai.2018.10.005.25. Shi, S.; Fei, H.; Xu, X. Application of a FMEA method combining interval 2-tuple linguistic variables and grey relational analysis
in preoperative medical service process. IFAC-PapersOnLine 2019, 52, 1242–1247. http://doi.org/10.1016/j.ifacol.2019.11.368.26. Filo, G.; Fabis-Domagala, J.; Domagala, M.; Lisowski, E.; Momeni, H. The idea of fuzzy logic usage in a sheet-based FMEA
analysis of mechanical systems. MATEC Web Conf. 2018, 183, 03009. http://doi.org/10.1051/matecconf/201818303009.27. Qin, J.; Xi, Y.; Pedrycz, W. Failure mode and effects analysis (FMEA) for risk assessment based on interval type-2 fuzzy evidential
reasoning method. Appl. Soft Comput. 2020, 89, 10613. http://doi.org/10.1016/j.asoc.2020.106134.28. Liu, H.C.; Chen, X.; Dua, C.; Wang, Y. Failure mode and effect analysis using multi-criteria decision making methods: A systematic
literature review. Comput. Ind. Eng. 2019, 135, 881–897. http://doi.org/10.1016/j.cie.2019.06.055.29. Ouyang, L.; Che, Y.; Yan, L.; Park, C. Multiple perspectives on analyzing risk factors in FMEA. Comput. Ind. 2022, 141, 103712.
https://doi.org/10.1016/j.compind.2022.103712.30. Yu, J.; Wu, S.; Chen, H.; Yu, Y.; Fan, H.; Liu, J. Risk assessment of submarine pipelines using modified FMEA approach based on
cloud model and extended VIKOR method. Process. Saf. Environ. Prot. 2021, 155, 555–574.31. Apol Pribadi S.; Nina Fadilah N. The consistency analysis of failure mode and effect analysis (FMEA) in information technology
risk assessment. Heliyon 2020, 6, e03161. https://doi.org/10.1016/j.heliyon.2020.e03161.32. Lipeng, W.; Fang, Y.; Fang, W.; Zijun L. FMEA-CM based quantitative risk assessment for process industries—A case study of
coal-to-methanol plant in China. Process. Saf. Environ. Prot. 2021, 149, 299–311. https://doi.org/10.1016/j.psep.2020.10.052.33. Yelda, Y.; Gülin Feryal, C. A FMEA based novel intuitionistic fuzzy approach proposal: Intuitionistic fuzzy advance MCDM and
mathematical modeling integration. Expert Syst. Appl. 2021, 183, 115413. https://doi.org/10.1016/j.eswa.2021.115413.34. Shamsu, H.; Jin, W.; Christos, K.; Musa, B. Modified FMEA hazard identification for cross-country petroleum pipeline using
Fuzzy Rule Base and approximate reasoning. J. Loss Prev. Process. Ind. 2022, 74, 104616. https://doi.org/10.1016/j.jlp.2021.104616.35. Yan, Z.; Chuanhao, F.; Hengjie, Z. From diversity to consensus: Impacts of opinion evolution and psychological behaviours in
failure mode and effect analysis. Appl. Soft Comput. 2022, 128, 109399. https://doi.org/10.1016/j.asoc.2022.109399.36. Soumava, B.; Shankar, C. Failure analysis of CNC machines due to human errors: An integrated IT2F-MCDM-based FMEA
approach. Eng. Fail. Anal. 2021, 130, 105768. https://doi.org/10.1016/j.engfailanal.2021.105768.

Energies 2022, 15, 6180 14 of 14
37. Shi, H.; Liu, Z.; Liu, H.C. A new linguistic preference relation-based approach for failure mode and effect analysis with dynamicconsensus reaching process. Inf. Sci. 2022, 977–993 https://doi.org/10.1016/j.ins.2022.08.043.
38. Qun, W.; Guozhu, J.; Yuning, J.; Wenyan, S. A new approach for risk assessment of failure modes considering risk interaction andpropagation effects. Reliab. Eng. Syst. Saf. 2021, 216, 108044. https://doi.org/10.1016/j.ress.2021.108044.
39. Fabis-Domagala, J.; Domagala, M.; Momeni, H. A Concept of Risk Prioritization in FMEA Analysis for Fluid Power Systems.Energies 2021, 14, 6482. http://doi.org/10.3390/en14206482.
40. Fabis-Domagala, J.; Momeni, H.; Filo, G.; Bikass, S.; Lempa, P. Matrix FMEA Analysis of the flow conrol valve. QPI 2019, 1,590–595. http://10.2478/cqpi-2019-0079.