a combined study of macroseismic data and focal mechanisms applied to the west-bohemian earthquake,...
TRANSCRIPT

PAGEOPH, Vol. 133, No. 1 (1990) 0033-4553/90/010053-1951.50 +0.20/0 �9 1990 Birkh/iuser Verlag, Basel
A C o m b i n e d S tudy o f M a c r o s e i s m i c D a t a and F o c a l M e c h a n i s m s
Applied to the West -Bohemian Ear thquake , Czechoslovakia
J. ZAHRADNiK, 1 M . ANTONINI, 5 G . G R ~ N T H A L 3, J. JANSK~', 1 D . PROCH~ZKOVA, 2
E. SCHMEDES, 4 A. SPI~AK 2 a n d J. ZEDN~K 2
Abstract--The main shock of the West-Bohemian earthquake swarm, Czechoslovakia, (magnitude m = 4.5, depth h = 10 km) exhibits an irregular areal distribution of macroseismic intensities 6 ~ to 7 ~ MSK-64. Four lobes of the 6 ~ isoseismal are found and the maximum observed intensity is located at a distance of 8 km from the instrumentally determined epicentre. This distribution can be explained by the energy flux of the direct S wave generated by a circular source, the hypocentral location and focal mechanism of which are taken from independent instrumental studies. The theoretical intensity, which is assumed to be logarithmically proportional to the integrated squared ground-motion velocity (i.e., ! = const + log S v2(t) dt), fits the observed intensity with an overall root-mean-square error less than 0.5 ~ It is important that the present intensity data can also be equally well explained by the isotropic source. The fit was attained by means of a horizontally layered model though large fault zones and an extended sedimentary basin suggest a significant lateral heterogeneity of the epicentral region. The results encourage a broader application of the simple modelling technique used.
Key words: Macroseismic data, synthetic isoseismals, focal mechanism, earthquake swarm, circular- source model, local geological conditions.
1. Introduction
The present paper deals with the main shock of the 1985/86 West-Bohemian earthquake swarm. Most of the activity lasted from December 1985 to February 1986. Hundreds of shocks were macroseismically felt and instrumentally recorded during that period. The main shock occurred on December 21, 1985, the focal depth being 10 km and the magnitude 4.5. This shock as well as the whole swarm were briefly described by PROCHAZKOVA (1988) and details can be found in PROCH~ZKOWt., ed. (1987).
1 Institute of Geophysics, Charles University, V Hole~ovitkS.ch 2, 180 00 Praha 8, Czechoslovakia. e Geophysical Institute, Czechosl. Academy of Sciences, Botni II, 141 31 Praha 4, Czechoslovakia. 3 Central Institute for Physics of the Earth, Acad. Sci. GDR, Telegrafenberg, Potsdam, GDR-1561. 4 Geophysical Observatory of University of Munich, Ludwigsh6he 8, D-8080 Munich, FRG. 5 Institute of Pure and Applied Geophysics, University of Munich, Theresienstr. 41, D-8000
Munich, FRG.

54 J. Zahradnik e t al. PAGEOPH,
The macroseismic field of the main shock was asymmetrical, intensities I > 6 ~ MSK-64 being encircled by a four-lobe isoseismal. Moreover, the largest intensity (7 ~ occurred at a distance of 8 km from the instrumental epicentre. Elongated isoseismals and locally increased intensities are often reported in the literature and qualitatively interpreted as caused by faults, sedimentary structures and local geological conditions. Thus, the first objective of the present paper was to interpret in such a way the intensities I > 6 ~ for the studied event. It will be shown that there is no simple geometrical relation between the isoseismal lobes and main structural elements of the epicentral region.
The most convenient next step to take would be to formulate a quantitative 3-D structural model and the source model, to compute synthetic isoseismals and to compare them with observations. Unfortunately, there are not enough quantitative structural data for such an undertaking. Instead, the second objective of the paper is to use a highly simplified crustal model without lateral heterogeneities and to concentrate on the source and the intensity modelling. The circular double-couple source is used, with parameters taken from instrumental observations. The intensity is assumed to be logarithmically proportional to the energy flux of direct S waves computed by the ray method. Comparisons between the theoretical and observed intensities are used to investigate the importance of focal parameters in formation of the macroseismic field.
For analogous studies see, for example, PANZA and CuSCITO (1982) and SUHADOLC et al. (1988), where synthetic seismograms corresponding to a point source were computed and their maximum amplitudes were related to the intensity. The mode-summation method, used by these authors, is advantageous for treating interference waves. A finite-dimension source, necessary if larger earthquakes are considered, was used by BOATWRIGHT (1986).
2. Data
Seismic activity and geology. The region of West Bohemia is well-known for the swarm-type earthquake activity. The 1985/86 swarm belongs to the largest earth- quake observed there since the 12th century. The last swarms of a comparable size in terms of duration and energy release occurred in 1903 and 1908. Minor swarms are more frequent and were observed, e.g., in 1929, 1936/37, 1962 and 1973.
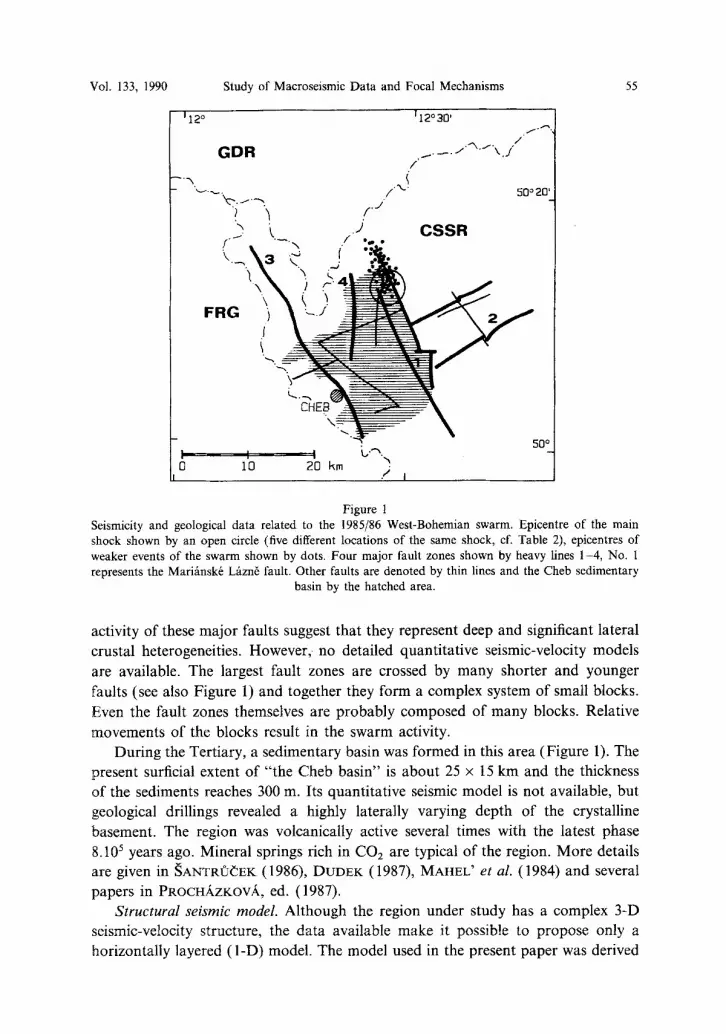
The swarm activity reflects the complex tectonic setting of West Bohemia. Two large fault systems intersect in the region. One of them is orientated roughly NW-SE, the other being nearly perpendicular to the former. Four main faults of these two systems are depicted in Figure 1. The Mari/msk6 Lfizn6 fault (M.L.), denoted by No. 1 in Figure 1, will be discussed in greater detail later in this section. Although the largest faults date back to the Proterozoic era, they were reactivated several times and their activity persists. The age, size and geologically documented
Vol. 133, 1990 Study of Macroseismic Data and Focal Mechanisms 55
J12 o
GDR
FRG
J f .
I 12 ~ 30'
/
�9 -,-'" ~ . j ' ~ . , . " ' \ , f /
/'",-! 50~ ' [ . J '
CSSR
! ~ L "~. 0 i0 20 km
30 ~
Figure 1 Seismicity and geological data related to the 1985/86 West-Bohemian swarm. Epicentre of the main shock shown by an open circle (five different locations of the same shock, cf. Table 2), epicentres of weaker events of the swarm shown by dots. Four major fault zones shown by heavy lines 1-4, No. 1 represents the Mari~nsk~ Lfizn~ fault. Other faults are denoted by thin lines and the Cheb sedimentary
basin by the hatched area.
activity of these major faults suggest that they represent deep and significant lateral crustal heterogeneities. However, no detailed quantitative seismic-velocity models are available. The largest fault zones are crossed by many shorter and younger faults (see also Figure 1) and together they form a complex system of small blocks. Even the fault zones themselves are probably composed of many blocks. Relative movements of the blocks result in the swarm activity.
During the Tertiary, a sedimentary basin was formed in this area (Figure 1). The present surficial extent of "the Cheb basin" is about 25 • 15 km and the thickness of the sediments reaches 300 m. Its quantitative seismic model is not available, but geological drillings revealed a highly laterally varying depth of the crystalline basement. The region was volcanically active several times with the latest phase 8.105 years ago. Mineral springs rich in CO2 are typical of the region. More details are given in SANTRI~(~EK (1986), DUDEK (1987), MAHEL' et al. (1984) and several papers in PROCHAZKOVA, ed. (1987).
Structural seismic model. Although the region under study has a complex 3-D seismic-velocity structure, the data available make it possible to propose only a horizontally layered (I-D) model. The model used in the present paper was derived

56 J. Zahradnik et al. PAGEOPH,
by NOVOTN'~ (1983) and is given in Table 1. Absorption is considered in the simplest approximation of the frequency-independent and spatially invariable qual- ity factor Q of S waves. Due to a lack of direct absorption measurements in the epicentral region, three values of Q were tested--Q = 100, 150 and 200. They are considered together with the predominant frequency f corresponding to macroseis- mic effects. The value of f = 5 Hz was adopted in the calculations. Since the absorption effect is determined by the factor fz/Q, where r is the travel time, the results would be the same for f = 10 Hz and Q = 200, 300 and 400, respectively. All mentioned values of Q seem reasonable for the area under study as indicated by WAHLSTRrM and STRAUCH (1984). The results will be shown to be only weakly sensitive to the uncertain value of Q.
Instrumental earthquake data. Basic data on the main shock are given in Table 2. Five different epicentre determinations are listed there and shown in Figure 1. A part of weaker events of the swarm is also shown in Figure 1 (ZIMOVA and Sv~CAK, 1987). Their epicentre positions follow the M.L. fault, one of the major fault zones of the region. This fault strikes in about N155~ azimuth.
Five fault-plane solutions of the main shock are listed in Table 2 and plotted in Figures 2a,b. All solutions are based on the first-motion P-wave polarities. Mecha- nism No. 1 in Figure 2a (ANToNINI, 1988) was derived from the largest data set consisting of 80 polarities. Only three stations (KOE, BMR and BDE) are not in agreement with this well constrained solution--strike 171 ~ dip 75 ~ and rake -30 ~ It represents a left-lateral normal oblique faulting with a prevailing strike-slip character. Strike 171 ~ does not agree well with that of the M.L. fault which probably controls the swarm activity. Similar and even larger differences are found from focal mechanisms of several weaker events of the 1985/86 swarm (ANTONINI, 1988, ZAHRADNIK et al., 1989). These facts indicate a complex tectonic structure of the M.L. fault itself.
Fault plane solutions Nos. 2-5 (Figure 2b) are alternative interpretations of a smaller data set consisting of 35 polarities (~PI~AK, 1987). Solutions Nos. 2-4 are not satisfied by 5 polarities, solution No. 5 by 4 polarities. Though these solutions
Table 1
Crustal structure (according to NOVOTN~ , 1983)
Layer Thickness P-velocity S-velocity Density No. (km) (km/s) (km/s) (kg/m 3)
I 1 5.6 3.23 2820 2 1 5.8 3.35 2860 3 2 6.0 3.46 2900 4 26 6.5 3.75 3000 5 8 7.0 7.8 4.04-4.50 3100-3260 6 ~ 7.9 4.56 3280

Vol. 133, 1990 Study of Macroseismic Data and Focal Mechanisms 57
Table 2
Basic data on the main shock of the 1985/86 West-Bohemian swarm
Date: December 21, 1985 Origin time: 10 h 16 m (UT) Epicentre coordinates (5 solutions):
No. Lat. N Long. E References and remarks
i 50.21 ~ 12.49 ~ 2 50.22 ~ 12.50 ~ 3 50.23 ~ 12.45 ~ 4 50.22 ~ 12.44 ~ 5 50.20 ~ 12.45 ~
Focal depth: 10 km Scalar moment: ~ 1016 Nm Magnitude: 4.5 Focal mechanism b (5 solutions):
No. Strike Dip Rake
KLiMA and RUPRECHTOV,~ (1987) a KLiMA and RUPRECHTOV,~ (I987) ZIMOV~, and ~PI~AK (1987) a, ANTONtNI (1987) LOKAJi~EK et al. (1987) PROCHAZKOVA et al. (1987b) p. 78
PLE~INGER and VAVRY~UK (1986) KARNiK and ZEDNiK (1987)
References
1 171 ~ 75 ~ -30 ~ ANTONINI (1988) 2 170 ~ 70 ~ --40 ~ ~PI~/~K (1987) 3 175 ~ 80 ~ --35 ~ ~Pl~t K (1987) 4 165 ~ 60 ~ --40 ~ ~PI~,~K (1987) 5 180 ~ 85 ~ -60 ~ ~PI~A.I~ (1987)
Clusters of weak events of the swarm, supposed in the present paper to represent a possible location of the main shock. b Angles defined after AKI and RICHARDS (1980).
are based on fewer data and different crustal models, two of them (Nos. 2 and 3)
are very similar to No. 1. On the other hand, solut ion No. 4 gives the strike closer
to the M.L. fault.
M a c r o s e i s m i c da ta . The main shock was macroseismically felt up to distances of
abou t 300 km southeast and 150 km northwest. The entire macroseismic field was
mapped by PROCHAZKOVA e t al. (1987a). As our in ten t ion is to analyze its
asymmetry in connect ion with the source and tectonic elements of the epieentral
region, we confine ourselves to the highest intensities, i.e., I > 6 ~ For this special
purpose the highest intensities were carefully reevaluated.
All intensi ty evaluat ions in this paper are based on the M S K - 6 4 scale. Thus, no
intensi ty values are assigned to individual reports or observations, e.g., f rom one
building. Instead, the intensi ty corresponding to a certain site results f rom assessing
relative frequencies of different damage types ( 1 - 3 ) in different types of bui ldings
( A - C ) over the whole site. In the case of the ma in shock, such an assessment was
made by inspect ing the major i ty of the sites ul t imately classified by I > 6 ~ in
Czechoslovakia and I > 5 ~ in the G D R . Dur ing these inspections we received an
insight into the connect ions between actual effects and their descriptions in macro-

58 P A G E O P H ,
No. 1
J. Zahradnik et al.
N
~sP /
/ oPRA ! oPRU ! oBMR /
EV / D
0 0 ,," oOMzA WRO [ ] /
P VOY MOA ~" ~A KFA /
WET
- - 171"
Figu re 2a
Focal mechanism of the main shock, solution No. 1. Short period P-wave polarities are shown in the equal-area projection of the lower focal hemisphere. Solid circles--compressions, open circles--dilata- tions. For information on stations, see ISC (1987), DATA (1986) and PROCHAZKOVA, ed. (1987). See
also Table 2.
seismic questionnaires. For several sites the intensities were assigned by means o f
s tandard questionnaires and written reports f rom local authorities, requested by us.
The most serious problems encountered during the intensity evaluat ion were the
following:
i) Problems with the data compatibil i ty f rom the three neighbouring countries
under study. ii) Problems of the absolute level o f the intensity estimates.
In order to guarantee the compatibility, a joint inspection o f selected sites in the

Vol. 133, 1990 Study of Macroseismic Data and Focal Mechanisms 59
Figure 2b
i!iiiiiiii!iiiiiiii!
Focal mechanisms of the main shock, solutions Nos. 2-5. See Table 2.
CSSR and G D R was performed, during which the participating authors agreed on a unified classification. The absolute-level problem was resolved by an independent study in the town of Cheb, the largest (27,000 inhabitants) in the studied region.
A detailed macroseismic survey was organised through seven schools in Cheb. About 4000 questionnaires were distributed and about 2500 usable replies were received. They covered 640 buildings, i.e., roughly one third of the town. Moreover,
we visited several buildings recommended to us by local authorities as typical examples of the individual damage types. We realized during the statistical data processing that the MSK 64 scale offered no possibility of quantifying appropri-
ately those sites with about 20 percent damage of type 1 or 5 percent damage of type 2 in buildings of type B. However, if we apply general classification principles used in the scale, it appears quite natural to add half a degree for the case like this [6.5~ For details see ZAHRADN~K et al. (1987). Likewise, the 6.5 ~ "degree" should be characterized by 20 percent damage of type 2 and 5 percent damage of type 3 in structures of type A. For structures C, the 6.5 ~ value corresponds to 5 percent damage of type 1. Based on our data on brick houses in Cheb, which we consider to be representative of buildings of type B, the adopted classification yields just the intensity 6.5 ~ .

60 J. Zahradnik et al. PAGEOPH,
All sites classified by I > 6 ~ are plotted in Figure 3 and encircled by the 6 ~ isoseismal. This isoseismal has four lobes directed towards E, SE, W and N. Their explanation represents the major objective of the present paper. Moreover, two sites deserve special attention--Skalnfi (S.) and Dolni Zandov (D.Z.). Skalnfi was assigned the largest intensity--7 ~ although it is located as far as 8 km from the instrumental epicentre. Dolni Zandov represents the remotest 6.5 ~ site from the epicentre (25 km). These two "anomalous" sites are studied from the macroseismic point of view in greater detail in ZAHRADNiK et al. (1987).
It is to be pointed out that no geological information was taken into consider- ation in determining intensities. In other words, the discussed intensities reflect the effects of the source, the crustal structure and geological site conditions. On the other hand, the influence of buildings is believed to be reduced through careful usage of the macroseismic scale.
Local conditions at the S. and D.Z. sites are little known. It was found that at the S. site, situated at the boundary of the Cheb basin, a layer of clay increases its thickness rapidly thus forming a pronounced wedge-shaped lateral heterogeneity. At
If2~ X 112030, / '
G D R x x / . - . J . . . . '\.J"
~'~"~'. I.~. ~ oX 50~ �9 . x ~./ o \
~ X X i l ~ " X 0 '~, i ..4 f v t
. . J x ' ~ X - . - * 0
x L , \ } " 2 ; ' 2 o ~ x - - ~ \ / (~ e ~ e ~ l ~ ~ . x
t ,' x,. /x," ~ ~o ~-*-o_-'--~_, !
~ j IL ,,,,, L--- ,,~ ~ 8 " - ~ x - - (3 ! t C S S R
,FRG , o) X oo 0 10 20 Rm )
( I x x
INTENSITY : @ SITES x5 ~ A5.5 ~ O6 ~ �9 ~ []7 ~
Figure 3 The observed macroseismic intensities of the main shock (with special emphasis to I -> 6~ The major
faults and the Cheb sedimentary basin are also shown; cf. Figure 1.

Vol. 133, 1990 Study of Macroseismic Data and Focal Mechanisms 61
the D.Z. site the water level is very high (1 2 m below the surface) over a significant part of the village. Conditions like this could be responsible in principle for ground-motion amplifications (BARD and TUCKER, 1989; DRAVlNSKI and MOSSES- SIAN, 1987; MOCZO et al., 1987; SANCHEZ-SESMA et al., 1988; ZAHRADNiK and HRON, 1987), but we have insufficient quantitative structural data to model them. Moreover, the scattered data available and our inspection revealed that not only these two sites but many others in the epicentral region might have been affected by pronounced local effects. Local effects are not of a primary interest in this paper, nevertheless, the analysis presented in Section 4 will partly touch on this question, too.
A qualitative interpretation of the macroseismicfield (in terms of main structural elements). In Figure 3 major fault zones and the sedimentary basin are plotted together with the intensities. Some relations can be traced by comparing these important structural elements with the isoseismals. However, these relations are by no means simple and unambiguous. Thus, we cannot qualitatively explain the main features of the macroseismic field by the faults and the basin.
This conclusion is not surprising for several reasons. First, although the fault zones represent very pronounced geologic features, we do not know whether they also represent significant heterogeneities in seismic velocities and absorption. Sec- ond, the relation of the main shock to the major faults was probably not simple (e.g., see the preceding discussion about the M.L. fault strike and the focal-mecha- nism strikes). Third, the sedimentary basin is very likely to influence the ground motions. However, as shown e.g., by ZAHRADNiK and HRON (1987), the formation of local surface waves in sedimentary basins is sensitive to the overall bottom geometry; thus basins with complex asymmetrical cross-sections (as the Cheb basin probably is) may easily yield a ground-motion pattern that does not simply correlate with the surface boundaries of the basin.
For particular earthquakes and tectonic regions where special conditions occur (perhaps a pronounced source directivity and/or low-velocity fault zones etc.), faults and other geological elements can be correlated with macroseismic fields. In general, however, connections between geology and the macroseismic field might be very complex thus resulting in weak correlations. This means that some scepticism with respect to frequently reported "elongations of isoseismals along causative faults" is proper.
3. Modelling the Macroseismic Field
The preceding analysis has shown that connections between the macroseismic field and the main tectonic elements (Figure 3) are not very clear. As a suitable 3-D seismic model is available neither in a regional nor a local scale, we shall concen- trate on effects of the seismic source upon the macroseismic field.

62 J. Zahradnik et al. PAGEOPH,
Intensity and ground motion. It is not well understood to date which quantity characterizing the measured or computed ground motion is to be compared with intensity L Peak ground-motion acceleration and velocity (PGA, PGV) and several integral measures, e.g., the root-mean-square acceleration (RMSA) were tested by several authors. For example, CHIARUTTINI and SIRO (1981) found PGA-I rela- tions with standard deviations comparable with the deviations in the currently used regressions between the PGA, the magnitude M, the source-to-site distance D and the site geology. These PGA-M-D relations have standard deviations of the order of 0.1-0.3 logarithmic units of PGA (BOORE and JOYNER, 1982). Surprisingly enough, the scatter in RMSA-M-D relations was not found smaller (MCCANN and BOORE, 1983). On the other hand, MEDVEDEV (1978) reported a smaller scatter in I-PGV regressions as compared with the I-PGA ones. Our opinion is that macro- seismic intensities reflect integral properties of the ground motion, i.e., not only peak values but also the duration and spectral content affect the intensity. We assume that the smallest scatter should be in relations between the intensity and integrated velocities. As far as we know the most extensive study of such relations was made by TRIFUNAC and BRADY (1975), hereafter referred to as T-B. One of their relations was of the form
I = a + b 1Oglo /22(0 dt, (1)
where v(t) is the velocity-time history and the integration is performed over the whole significant duration of v(t). The constants were found to be a - - 1 (for v(t) measured in cm/s) and b "- 0.5 (independently of the units used for v(t)) for both vertical and horizontal components (Eq. 13 in T-B). Figure 2b of T-B shows that for a given value of S v2 dt the uncertainty in I is as high as _+2 for I = 3 ~ to 8 ~
The uncertainty of constants a and b is due to several factors: (i) In studying regressions like that in Eq. (1), one reocrd of v(t) is usually used
for a site (say a village) but the corresponding intensity I is determined from many observations from that village. Thus local geological conditions within the site contribute to the scatter, not differences in local conditions from one village to another.
(ii) No scale completely eliminates the effect of building types and soil-structure interactions.
(iii) Each intensity determination is to some extent dependent on the seismologist's style in applying the macroseismic scale.
Because of factors like these it may even happen that intensity-velocity relations vary from one region to another. It is, of course, quite a different variability than that in PGA-M-D relations that change from region to region due to physical reasons, e.g., different attenuation laws.
Generally speaking, the scatter of intensity-velocity relations should decrease by considering homogeneously determined intensities, regions with similar building

Vol. 133, 1990 Study of Macroseismic Data and Focal Mechanisms 63
types, small regions and narrow intensity bands. If we further confine ourselves only to intensity differences between individual studied sites (governed by constant b only) the uncertainty decreases even more. For example, Figure 2b of T-B shows that for I from 5 ~ to 7 ~ the constant b can be approximated very well by 1. If b = 1 and b = 0.5 are taken as possible limits, the uncertainty of the intensity difference (for a given value of S v2 dt) is about 0.5 ~ only.
Theoretical intensity. In the present paper we compute the ground motion and we need to scale it to make it comparable with the observed intensity. On the basis of the preceding discussion we assume (and a posteriori will verify) that a suitable definition of the theoretical intensity I rH is
I r~ = a + loglo v2(t) dt. (2)
Here b = 1 is used and the constant a remains undetermined since we will confine ourselves only to the intensity difference between individual sites.
Our method of computing I r'v was described in detail in ZAHRADNiK (1989). Here only the most important assumptions and formulas are summarized. We consider the energy flux of shear waves generated by a circular double-couple source. In Eq. (2), v stands for the ground-motion velocity corresponding to the three-component direct S wave; v = ]v]. To express v, the far-field representation is used after Eq. (14.9) of AKI and RICHARDS (1980). The radiation patterns F sv and F sI4 are taken from Eqs. (4.85) and (4.86) of the same book. The geometrical spreading G is computed by the ray-method program based on ~ERVEN? and JANSK'~ (1985). The absorption correction is assumed to be A = exp(nf~/Q) with f , z and Q denoting the predominant frequency, the S-wave travel time and the S-wave quality factor, respectively. The surface correction is applied through S-wave conversion coefficients qx, qy and qz, corresponding to the radial, transverse and vertical components (p. 35 of (2ERVEN'? et al., 1977).
If we assume that macroseismic effects correspond to f = 5 Hz and the S-wave velocity at the source is 3.75 km/s, then the S-wave wavelength at the source 2 = 750 m is comparable (or only slightly smaller) with respect to the characteristic source length of the event under study, Mo ~ 1016 Nm. PLE~INGER and VAVRY(2UK (1986) estimated the effective source radius to be of 1-2 kin. This necessitates a finite source model. A single circular fault seems to be a sufficient approximation.
o o
Energy-flux directivity of the circular source influencing the integral S0 v2(t) dt
of Eq. (2) is weak and simple. It is given by the function e(0) and shown in Figure 14 of BOATWRIGHT (1980). Here 0 denotes the angle between the ray leaving the source and the fault normal. The function e(0) is almost constant with the exception of a narrow cone 0 e(0 ~ 20 ~ centered at the fault normal (0 = 0 ~ where e(0) attains its maximum. This property makes the integral of velocity relatively easy to predict. This is the main idea of our approach, not very widely used until now for the intensity modelling.

The only noncons tan t (spatial ly variable) terms influencing the integral are:
Irl ~o = ~ e(O), F = (FSVqx, FSnqy, FSVq~). (3)
(4)
Our me thod is based on comput ing the quant i ty ~o in a regular square grid o f
"obse rve r" points at the ear th ' s surface. The grid is centered at the epicentre with sides oriented NS (vertical) and W E (horizontal) . The grid used in this pape r covers
the region 55 • 55 km. The compu ted values of ~0 are normal ized with respect to
their m a x i m u m in the gr id--~0 m a x " Then we plot an areal distr ibution o f
~k = INT[ 10(q~/go max)],
v
and call it for simplicity a normal ized energy-flux field. An example o f the plot o f
~k is given in Figure 4. Fo r discussion o f Figure 4 see below. The values o f r between 10 and 1 are contoured and the con tour is called the highest-valued
synthetic isoseismal. The reason for this name stems f rom the fact that if we
1 7 1 , 7 5 , - 3 0 HETER H=10 0=100
64 J. Zahradnik et al. PAGEOPH,
, N
:~?'A~i
I " 1 1 1
/ f i r , ~ ,
A i / 1 i , , , 1 ~
/ I t s
t i l e
r
Figure 4 The normalized energy-flux field computed for the focal depth h = 10 km, Q = 100 and focal mechanism No. 1 (strike 171 ~ dip 75 ~ and rake -30~ Instead of ~ = 10 the star symbol is plotted. The epicentre
is in the middle of the picture. The highest-valued synthetic isoseismal 6 ~ is denoted by a full line.

Vol. 133, 1990 Study of Macroseismic Data and Focal Mechanisms 65
substitute for velocity v into Eq. (2) and denote all spatially invariable terms by
Im rn -- 1, the theoretical intensity becomes
I TH = I TH - ] + lOgl0 ~. (5)
As evident from Eq. (5) values of r decreasing from 10 to 1 correspond to the intensity decrease of one degree, i.e., from Im rn (the maximum theoretical intensity)
to Im T~/-- 1. Notice that our plots do not distinguish values qJ < 1 which are formally displayed as qJ = 0. In other words, the second and next isoseismals are not visualized in this paper.
Remark . The method described above does not require the source radius to be specified. It implicitly enters into the radiated seismic energy and together with other constants influences the absolute intensity values, not their normalized areal
distribution studied here. Of equal advantage is the fact that we do not need to specify the direction of the rupture propagation (a radially rupturing fault is assumed). As a rule, the rupture-propagation direction is not known at routine level of seismological studies. The price we pay for such a simplicity is that our method obviously fails for earthquakes rupturing in a certain predominant direction, i.e., in situations that often arise with larger events.
Quanti tat ive measure o f the f i t . To compare theory with observations, we use the intensity difference with respect to the maximum intensity Irm n given by ID rH _ TH IrI~I _ -- Im -- -- 1 -- log10 ~. Correspondingly, the observed intensity, the maxi- mum observed intensity and the observed intensity difference are denoted by I ~
Im ~ and D os = i o s _ I O S . Subscripts i = l, 2 . . . . . N denote the individual sites for
which I is available. For a description of an overall fit between theory and observations we then use the error
E = ~ ( iD f l4 _ IDOB )2 . (6) i ~ l
Due to reasons discussed in the preceding sections, each value ID ~ can easily deviate from I D T g as much as 0.5 ~ even if the model used for computing v(t) is quite exact (or if v(t) is measured). However, any model differs from the reality which even increases the above-mentioned deviation. Locally for a given i the deviation can very likely exceed 1 ~ For the epicentral region as a whole, the deviations partly cancel each other so that we shall consider the overall fit to be satisfactory for E < 0.5 ~
4. Comparison Between Mode l s and Real i ty
First, the normalized energy-flux fields were generated for the crustal model of Table 1 with no absorption (Q = oo) assuming a trial value of the focal depth

66 J. Zahradnik et al. PAGEOPH,
h = 7.5 km. All five fault-plane solutions of Table 2 were subsequently used. These experiments were described in ZAHRADNfK (1989) and ZAHRADNfK et al. (1988). The best fit to the observed macroseismic field was found for mechanisms Nos. 1 and 3 of Table 2 for which the 6 ~ isoseismal was approximated well and the overall fit was characterized by E = 0.44 ~ The other mechanisms, the synthetic isoseismals of which gave visually a far worse fit, attained E > 0.5 ~ (0.52 ~ 0.53 ~
and 0.51 ~ for models Nos. 2, 4 and 5, respectively). Second, we tried quite an idealized source model for a comparison, i.e., the
isotropic point source formally described by F S V = F S n = 1, e (0 )= 1. The struc-
ture, absorption and free-surface correction remained unchanged. This model also produced a minor error, E = 0.44 ~ Of course, its isoseismal is circular thus failing to explain any lobes. Moreover, the model contradicts the quadrantal distribution
of the first-motion polarities. Nevertheless, the small error of the isotropic source is important to show that the overall "size" of the synthetic 6 ~ isoseismal is good. It gives a partial verification of the structural model, the focal depth and the constant b = 1 in Eq. (2). It also shows that (at least for the studied earthquake) the focal mechanism cannot be easily constrained by macroseismic data. On the other hand, the small value of E for the isotropic (evidently nonrealistic) source also indicates that this quantity is probably not ideal for quantifying the fit of synthetic and observed isoseismals in sufficient detail.
Third, we return to models with focal mechanisms Nos. 1 and 3. Their success, by using parameters h = 7.5 km and Q = ~ , indicates that more realistic ab- sorbing models should probably have a larger focal depth. This indication was confirmed by ANTONINI (1987), who estimated h = 10km. Thus, the following experiments were carried out for h = 10 km together with finite values of Q = 100, 150 and 200 tested for models Nos. 1 and 3. Since these two mechanisms give nearly identical results, we will no longer deal with model No. 3. The case of No. 1 and Q = 100 is presented in Figure 4. The results for Q---150 and 200 differ weakly with respect to that for Q = 100, indicating only slight sensitivity to
uncertainties in the absorption. The energy-flux field of Figure 4 fits the macroseismic field with E = 0.43 ~ The
maximum theoretical intensities (stars) and the synthetic 6 ~ isoseismal are com- pared with the observations in Figure 5. This figure represents the main result of the present paper. It shows that focal mechanism No. 1 based on the largest polarity set, the instrumentally determined hypocentre location and the horizon- tally layered crustal model explain well the main features of the macroseismic field. The overall fit (E = 0.43 ~ is good and also the W, SE and E directed lobes are represented well by the model.
The most obvious misfit between the model and the reality is the N lobe. Although our model explains well the two areas of intensity 6 ~ on the G D R territory, and at least partially suggests why the two areas are separated by

Vol. 133, 1990 Study of Macroseismic Data and Focal Mechanisms 67
112~ ][ / 112030' f . . ~
G D R / x ~ J " " \ J / " " X . / 6 ~
[ -- x ~ ( : y n t h . )
: "~ -~ . . t ~r~":o'~, o x ~0~ i - , X \ x x ~ ~ ~ \ x
o..: x ~. x _ \ . r . o x ~_~ ~ ^ ~ o o \ \
/ X 4 "\ i _~" �9 �9 ~ X
I / ~ x x~. ~)s . �9 �9 �9 x o o'~ . ~ ~ ,.' o-r .q':~'oXO~y.
\ ?Lo~,'o: o\~'o.~ �9 F R G J L , , , - - , ~ . = , . N ~ C H E B g 0 J q ~ d
#J x
^ ~ ~_ ~ - - " ~ - x . . . . 50 I I L.'-'k LI. L. C S S R
0 10 20 km .l i I x x
INTENSITY �9 ~ SITES
x 5 o ^ 5 . 5 ~ o 5 o 0 6 . 5 ~ I~17 o
Figure 5 The comparison between the observed macroseismic field (Figure 3) and synthetic 6 ~ isoseismal of Figure 4. Theoretical maxima (stars) are also shown. The model agrees well with reality although neither lateral
heterogeneities of the crust nor local conditions have been considered in the calculation.
intensities 5 ~ (see the N W minimum of the synthetic isoseismal in Figure 5), the
model predicts deeper elongation of the macroseismic field into the G D R territory as compared to the observations. At present we have no quantitative seismic data to account for this discrepancy.
Surprisingly, Figure 5 also shows that one of the theoretical maxima nearly coincides with the maximum observed intensity at the Skaln/t site (S.). As ex-
plained in Section 2, local geological conditions such as those at S. may have
affected the ground motion, too. Thus our result only indicates that the source
effect should be considered a serious candidate for explaining the S. maximum, but not the only one.
As far as the other "anomaly" of the observations is concerned, the Dolni Zandov site (D.Z.), our model does not explain why 6.5 ~ was observed at such long distance from the epicentre. In that sense the model suggests the D.Z. anomaly to be probably due to local effects.

68 J. Zahradnik et al. PAGEOPH,
5. Conc lu s ion
In this paper, we have analyzed relations between the macroseismic intensities I > 6 ~ of the magnitude 4.5 earthquake in West Bohemia, the crustal structure and the source. Local conditions at two sites were also considered. We have shown that the geological data indicate a complex 3-D laterally heterogeneous structure of the epicentral region. We have also shown that the macroseismic field has some geometrical relation (though not simple and convincing) to the major faults of the region and to the surface boundaries of the Cheb sedimentary basin. Because of the lack of quantitative seismic data for modelling the structural effects, we have studied the source effect by means of a simple horizontally layered crustal model.
The source model was assumed to be circular. Its double-couple focal mecha- nism and the hypocentre location were taken from independent instrumental studies. The intensity was assumed to be logarithmically proportional to the energy flux of a direct S wave. The influence of the earth's surface and the absorption were taken into account approximately. Theoretical intensity distribution was compared with the observed one and the overall fit E < 0.5 ~ was found. In view of the simplifying model assumptions and uncertainties connected with the relations between the intensity and the ground motion, this fit can be considered acceptable. The model fits not only the overall "size" of the 6 ~ isoseismal, but also three of the four observed lobes. The present data can be equally well fitted by the isotropic source, too. This means that (for the earthquake under study) the focal mechanism cannot be easily constrained on the basis of the macroseismic data. Surprisingly, the model also gives its maximum theoretical intensity located close to the observed one regardless of the fact that no local geological conditions were introduced into the computation. These results serve as an important verification of the instrumentally determined source parameters and they also indicate a serious role of the source mechanism in forming the macroseismic field regardless of a significant structural complexity being suggested by geological data.
Last but not least the results encourage a wider application of the simple modelling technique used. Naturally, the method will probably approximate well only macroseismic fields of weak crustal earthquakes, particularly their highest- valued isoseismals, and a perfect fit will be found rarely. Nevertheless, we recom- mend this approach at least for two reasons: First, the method is extremely simple, applicable at a routine level of seismological studies when macroseismic fields and focal parameters need a joint interpretation. Second, discrepancies between macro- seismic fields and their models will yield important guidelines for more sophisticated source-directivity studies and/or studies of lateral crustal heterogeneities and local effects.
Program MACRO for computing theoretical macroseismic fields is available on request from the first-named author.

Vol. 133, 1990 Study of Macroseismic Data and Focal Mechanisms 69
Acknowledgements
We thank Dr. H. Grosser who participated in preliminary focal-mechanism studies and Mrs. R. Zimov~i who drew all figures. Dr. P. Talwani and an anonymous reviewer provided constructive criticisms.
REFERENCES
AKI, K., and RICHARDS, P. G., Quantitative Seismology (W. H. Freeman, San Francisco 1980). ANTONINI, M., Statistics and source parameters of the swarm from digital recordings, In Earthquake
Swarm 1985/86 in Western Bohemia (ed. Prochfizkovfi, D.) (Geophys. Inst. Czechosl. Acad. Sci., Praha 1987) pp. 205-217.
ANTONIN1, M., Variations in the focal mechanisms during the 1985/86 Western Bohemian earthquake sequence--correlation with spatial distribution of foci and suggested geometry of faulting, In Induced Seismicity and Associated Phenomena (ed. Prochfizkovfi, D.) (Geophys. Inst. Czechosl. Acad. Sci., Praha 1988) pp. 250-270.
BARD, P. Y., and TUCKER, B. E. (1989), Predictability of Sediment Site Amplification: A Case Study, Bull. Seismol. Soc. Am. (submitted).
BOATWRIGHT, J. (1980), A Spectral Theory for Circular Seismic Sources; Simple Estimates of Source Dimension, Dynamic Stress Drop, and Radiated Energy, Bull. Seismol. Soc. Am. 70, 1-27.
BOATWRIGHT, J. (1986), Teleseismic Estimates of the Energy Radiated by Shallow Earthquakes, J. Geophys. Res. 91, 2095-2112.
BOORE, D. M., and JOYNER, W. B. (1982), The Empirical Prediction of Ground Motion, Bull. Seismol. Soc. Am. 72, 543-560.
CHIARUTTINI, C., and SXRO, L. (1981), The Correlation of Peak Ground Horizontal Acceleration with Magnitude, Distance, and Seismic Intensity for Friuli and Ancona, Italy, and the Alpide Belt, Bull. Seismol. Soc. Am. 71, 1993 2009.
~ERVEN'~, V., MOLOTKOV, I., and P~EN~IK, I., Ray Method in Seismology (Universita Karlova, Praha 1977).
QERVEN'I', V., and JANSK'~, J. (1985), Fast Computation of Ray Synthetic Seismograms in Vertically Inhomogeneous Media, Studia geoph, et geod. 29, 49-67.
DATA Catalogue of Earthquakes in the FRG and Adjacent Areas 1982 (Bundesanstalt fiir Geowis- senschaften und Rohstoffe, Hannover 1986).
DRAVINSKI, M., and MOSSESSIAN, T. K. (1987), Scattering of Plane Harmonic P, SV, and Rayleigh Waves by Dipping Layers of Arbitrary Shape, Bull. Seismol. Soc. Am. 77, 212-235.
DUDEK, A. (1987), Geology and tectonic pattern of the Western Bohemian seismic area, In Earthquake Swarm 1985/86 in Western Bohemia (ed. Proch~zkov~., D.) (Geophys. Inst. Czechosl. Acad. Sci., Praha 1987) pp. 34 37.
Isc Regional Catalogue of Earthquakes for 1984 July-December, Vol. 21, No. 2 (Newbury 1987). KARNiK, V., and ZEDNiK, J., Amplitudes of Sg (Lg) waves from the largest events of the swarm in West
Bohemia and calibrating curves for near shocks, In Earthquake Swarm 1985/86 in Western Bohemia (ed. Proch~izkov~i, D.) (Geophys. Inst. Czechosl. Acad. Sci., Praha 1987) pp. 255-260.
KLiMA, K., and RUPRECHTOV~., L., The West-Bohemian earthquake swarm 1985/86--standard obser- vatory data processing, In Earthquake Swarm 1985/86 in Western Bohemia (ed. Proch~zkov~i, D.) (Geophys. Inst. Czechosl. Acad. Sci., Praha 1987) pp. 174-189.
LOKAJI~EK, T., JANATKOVA, Z., and PLOMEROVA, J., Travel times of seismic waves of the 1985 86 swarm in Western Bohemia, In Earthquake Swarm 1985/86 in Western Bohemia (ed. Prochfizkov~., D.) (Geophys. Inst. Czechosl. Acad. Sci., Praha. 1987) pp. 236-246.
MAHEL', M., KODYM, O., and MALKOVSK'I ~, M. (1984), Tectonic Map of ~SSR, 1:500000, Geolog- ick~ 6stav Dion~sa gt6ra, Bratislava.

70 J. Zahradnik et al. PAGEOPH,
MCCANN, M. W., and BOORE, D. M. (1983), Variability in Ground Motions: Root-Mean-Square Acceleration and Peak Acceleration for the 1971 San Fernando, California, Earthquake, Bull. Seismol. Soc. Am. 73, 615-632.
MEDVEDEV, S. V. (1978), Determination of the Seismic Intensity (in Russian), Voprosy inzhenyernoy seismologii 19, 108-116.
Moczo, P., BARD, P.-Y., and P~ENt~iK, I. (1987), Seismic Response of Two-dimensional Absorbing Structures by the Ray Method, J. Geophys. 62, 38-49.
NOVOTN~', O. (1983), Theoretical Dispersion Curves for the Seismic Profile Kagperskb Hory (Czechoslo- vakia)--Ksiaz (Poland), Studia geoph, et geod. 27, 157-163.
PANZA, G. F., and CUSCITO, M. (1982), Influence of Focal Mechanism on Shape of Isoseismals: Irpinia Earthquake of November 23, 1980, Pure Appl. Geophys. 120, 577-582.
PLE~INGER, m., and VAVRY~UK, V., Spectral and polarization analysis of broad-band digital recordings of the main shock of Dec. 21, 1985 (in Czech), In Po6ita6ov~ spracovanie ~dajov 6eskoslovenskej seizmickej siete (eds. Mrfizovfi, K., and Ruprechtovfi, L.) (Geophys. Inst. Slovak. Acad. Sci., Bratislava 1986) pp. 108-116.
PROCHAZKOVA., D., ed., Earthquake Swarm 1985/86 in Western Bohemia (Geophys. Inst. Czechosl. Acad. Sci., Praha 1987).
PROCHAZKOVA, D. (1988), 1985/86 Earthquake Swarm in Western Bohemia, Seism. Res. Letters 59, 71-78.
PROCH,~ZKOVA, D., SCHMEDES, E., and DRIMMEL, J., Isoseismal maps of the two strongest events during the earthquake swarm 1985/86 in Western Bohemia, In Earthquake Swarm 1985/86 in Western Bohemia (ed. Proch~zkov~, D.) (Geophys. Inst. Czechosl. Acad. Sci., Praha 1987a) pp. 104-109.
PROCH~,ZKOVA, D., TOaYA~, V., SOUKUP, J., MICHEK, R., and KNAISLOVA, D., List of earthquakes in Westerm Bohemia, 1985-86, In Earthquake Swarm 1985/86 in Western Bohemia (ed. Proch~zkov~, D.) (Geophys. Inst. Czechosl. Acad. Sci., Praha 1987b) pp. suppl. 30 238.
S,~NCHEZ-SESMA, F. J., CH.~VEZ-GARCiA, F. J., and BRAVO, M. A. (1988), Seismic Response of a Class of Alluvial Valleys for Incident SH Waves, Bull. Seismol. Soc. Am. 78, 83-95.
SUHADOLC, P., CERNOBORI, L., PAZZI, G., and PANZA, G. F., Synthetic isoseismals: Applications to Italian earthquakes, In Seismic Hazard in Mediterranean Regions (eds. Bonnin, J., Cara, M., Cister- nas, A., and Fantechi, R.) (Kluwer Academic Publishers, Dordrecht 1988) pp. 205-228.
~ANTRI~t~EK, P., Main structural features of the tertiary Cheb region (in Czech), In Po6ita(ov~ spracovanie fidajav (eskoslovenskej seizmickej siete (eds. Mr~izov~, K., and Ruprechtovh, L.) (Geophys. Inst. Slovak Acad. Sci., Bratislava 1986) pp. 22-30.
~PI~AK, A., Fault plane solutions of 1985 Dec. 21 and 1986 Jan. 20 events, In Earthquake Swarm 1985/86 in Western Bohemia (ed. Proch~zkov~i, D.) (Geophys. Inst. Czechosl. Acad. Sci., Praha 1987) pp. 268-273.
TRIFUNAC, M. D., and BRADY, A. G. (1975), A Study on the Duration of Strong Earthquake Ground Motion, Bull. Seismol. Soc. Am. 65, 581-626.
WAHLSTROM, R., and STRAUCH, W. (1984), A Regional Magnitude Scale for Central Europe Based on Crustal Wave Attenuation, Report No. 3-84, Seismological Department, University of Uppsala, Uppsala.
ZAHRADN1K, J. (1989), Simple Method for Combined Studies of Macroseismic Intensities and Focal Mechanisms, Pure Appl. Geophys. 130, 83-97.
ZAHRADNiK, J., ANTONINI, M., GROSSER, n., GRUNTHAL, G., JANSK~', J., PROCHAZKOVA, D., SCHMEDES, E., ~PI(~/~K, A., and ZEDN[K, J., Joint interpretation of focal mechanisms and macroseis- mic data for the main event of West-Bohemian earthquake swarm 1985/86, In Induced Seismicity and Associated Phenomena (ed. Proch~izkov/t, D.) (Geophys. Inst. Czechosl. Acad. Sci., Praha 1988) pp. 188-210.
ZAHRADNiK, J., and HRON, F. (1987), Seismic Ground Motion of Sedimentary Valleys--Example La Molina, Lima, Peru, J. Geophys. 62, 31-37.
ZAHRADNiK, J., NOVOTN~, O., and ~ADEK, O., Intensity of the main shock of the West-Bohemian swarm 1985/86 in the town of Cheb and other sites close to epicentre, In Earthquake Swarm 1985/86 in Western Bohemia (ed. Prochhzkov~, D.) (Geophys. Inst. Czechosl. Acad. Sci., Praha 1987) pp. 64 67.

Vol. 133, 1990 Study of Macroseismic Data and Focal Mechanisms 71
ZAHRADNiK, J., VAVRY~UK, V., JANSK'{', J., and ZEDNiK, J. (1989), Focal Mechanisms of Selected Events of the West-Bohemian Earthquake Swarm 1985/86 Constrained by P-wave Amplitudes, Revista de Geofisica, in press.
ZIMOVA, R., and ~pi~.h.K, A., 1985/86 earthquake swarm in Western Bohemia--its possible relation to tectonic structure, In Earthquake Swarm 1985/86 in Western Bohemia (ed. Proch~zkovfi, D.) (Geophys. Inst. Czechosl. Acad. Sci., Praha 1987) pp. 375-379.
(Received June 11, 1988, revised May 3, 1989, accepted May 31, 1989)