a 90-day chloroform inhalation study in f-344 rats: profile of toxicity and relevance to cancer...
TRANSCRIPT
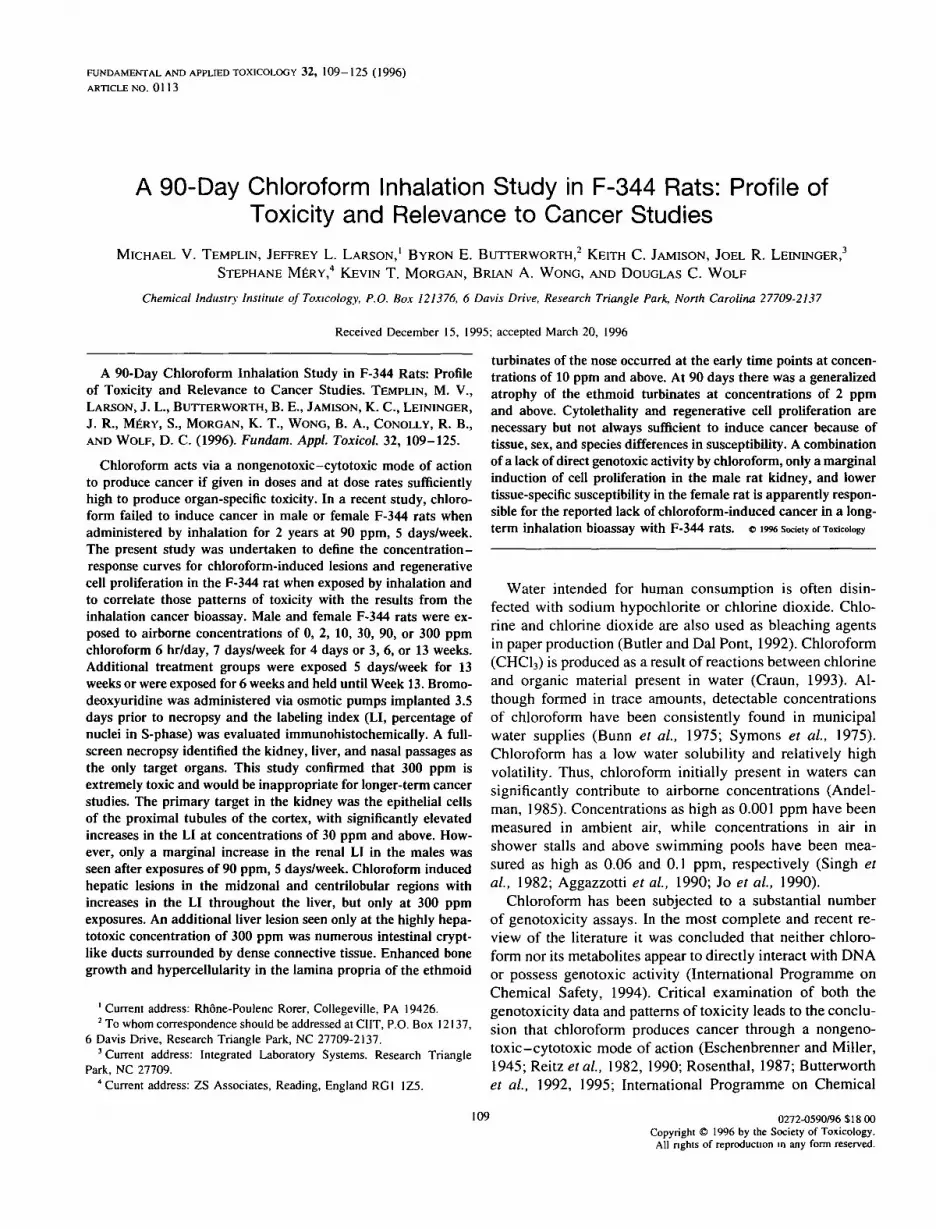
FUNDAMENTAL AND APPLIED TOXICOLOGY 32, 109-125 (1996)ARTICLE NO. 0113
A 90-Day Chloroform Inhalation Study in F-344 Rats: Profile ofToxicity and Relevance to Cancer Studies
MICHAEL V. TEMPLIN, JEFFREY L. LARSON,1 BYRON E. BUTTERWORTH,2 KEITH C. JAMISON, JOEL R. LEININGER,3
STEPHANE MERY,4 KEVIN T. MORGAN, BRIAN A. WONG, AND DOUGLAS C. WOLF
Chemical Industry Institute of Toxicology, P.O. Box 121376, 6 Davis Drive, Research Triangle Park, North Carolina 27709-2137
Received December 15, 1995; accepted March 20, 1996
A 90-Day Chloroform Inhalation Study in F-344 Rats: Profileof Toxicity and Relevance to Cancer Studies. TEMPLIN, M. V.,LARSON, J. L., BUTTERWORTH, B. E., JAMISON, K. C , LEININGER,
J. R., MERY, S., MORGAN, K. T., WONG, B. A., CONOLLY, R. B.,
AND WOLF, D. C. (1996). Fundam. Appl. Toxicol. 32, 109-125.
Chloroform acts via a nongenotoxic-cytotoxic mode of actionto produce cancer if given in doses and at dose rates sufficientlyhigh to produce organ-specific toxicity. In a recent study, chloro-form failed to induce cancer in male or female F-344 rats whenadministered by inhalation for 2 years at 90 ppm, 5 days/week.The present study was undertaken to define the concentration -response curves for chloroform-induced lesions and regenerativecell proliferation in the F-344 rat when exposed by inhalation andto correlate those patterns of toxicity with the results from theinhalation cancer bioassay. Male and female F-344 rats were ex-posed to airborne concentrations of 0, 2, 10, 30, 90, or 300 ppmchloroform 6 hr/day, 7 days/week for 4 days or 3, 6, or 13 weeks.Additional treatment groups were exposed 5 days/week for 13weeks or were exposed for 6 weeks and held until Week 13. Bromo-deoxyuridine was administered via osmotic pumps implanted 3.5days prior to necropsy and the labeling index (LI, percentage ofnuclei in S-phase) was evaluated immunohistochemically. A full-screen necropsy identified the kidney, liver, and nasal passages asthe only target organs. This study confirmed that 300 ppm isextremely toxic and would be inappropriate for longer-term cancerstudies. The primary target in the kidney was the epithelial cellsof the proximal tubules of the cortex, with significantly elevatedincreases in the LI at concentrations of 30 ppm and above. How-ever, only a marginal increase in the renal LI in the males wasseen after exposures of 90 ppm, 5 days/week. Chloroform inducedhepatic lesions in the midzonal and centrilobular regions withincreases in the LI throughout the liver, but only at 300 ppmexposures. An additional liver lesion seen only at the highly hepa-totoxic concentration of 300 ppm was numerous intestinal crypt-like ducts surrounded by dense connective tissue. Enhanced bonegrowth and hypercellularity in the lamina propria of the ethmoid
1 Current address: Rhone-Poulenc Rorer, Collegeville, PA 19426.2 To whom correspondence should be addressed at CUT, P.O. Box 12137,
6 Davis Drive, Research Triangle Park, NC 27709-2137.3 Current address: Integrated Laboratory Systems. Research Triangle
Park, NC 27709.4 Current address: ZS Associates, Reading, England RG1 1Z5.
turbinates of the nose occurred at the early time points at concen-trations of 10 ppm and above. At 90 days there was a generalizedatrophy of the ethmoid turbinates at concentrations of 2 ppmand above. Cytolethality and regenerative cell proliferation arenecessary but not always sufficient to induce cancer because oftissue, sex, and species differences in susceptibility. A combinationof a lack of direct genotoxic activity by chloroform, only a marginalinduction of cell proliferation in the male rat kidney, and lowertissue-specific susceptibility in the female rat is apparently respon-sible for the reported lack of chloroform-induced cancer in a long-term inhalation bioassay with F-344 rats. © 19% society of Toxicology
Water intended for human consumption is often disin-fected with sodium hypochlorite or chlorine dioxide. Chlo-rine and chlorine dioxide are also used as bleaching agentsin paper production (Butler and Dal Pont, 1992). Chloroform(CHC13) is produced as a result of reactions between chlorineand organic material present in water (Craun, 1993). Al-though formed in trace amounts, detectable concentrationsof chloroform have been consistently found in municipalwater supplies (Bunn et al, 1975; Symons et al., 1975).Chloroform has a low water solubility and relatively highvolatility. Thus, chloroform initially present in waters cansignificantly contribute to airborne concentrations (Andel-man, 1985). Concentrations as high as 0.001 ppm have beenmeasured in ambient air, while concentrations in air inshower stalls and above swimming pools have been mea-sured as high as 0.06 and 0.1 ppm, respectively (Singh etal, 1982; Aggazzotti et al, 1990; Jo et al, 1990).
Chloroform has been subjected to a substantial numberof genotoxicity assays. In the most complete and recent re-view of the literature it was concluded that neither chloro-form nor its metabolites appear to directly interact with DNAor possess genotoxic activity (International Programme onChemical Safety, 1994). Critical examination of both thegenotoxicity data and patterns of toxicity leads to the conclu-sion that chloroform produces cancer through a nongeno-toxic-cytotoxic mode of action (Eschenbrenner and Miller,1945; Reitz etal, 1982, 1990; Rosenthal, 1987; Butterworthet al, 1992, 1995; International Programme on Chemical
109 0272-0590/96 $18 00Copyright © 1996 by the Society of Toxicology.
All rights of reproduction in any form reserved.

110 TEMPLIN ET AL.
Safety, 1994; Larson et al, 1993, 1994a,b,c,d, 1995a,b,1996; Templin et al, 1996a,b).
The strength of the evidence that chloroform acts througha nongenotoxic-cytotoxic mode of action (Butterworth etal, 1995) rests on the lack of chloroform DNA reactivityand the observation that cytotoxicity and regenerative cellproliferation precede cancer for every chloroform target site.As early as 1945, researchers noted the close associationbetween the cytotoxicity and carcinogenic activity of chloro-form (Eschenbrenner and Miller, 1945; Reitz et al, 1990).
Chloroform caused a sustained cytolethal and regenerativecell proliferative response in the livers of female and maleB6C3F, mice under gavage dosing conditions similar tothose that lead to cancer (National Cancer Institute, 1976;Larson et al., 1994b,c). Similar daily doses of chloroformadministered in drinking water did not induce hepatocellulardamage, proliferation, or liver tumors (Larson et al., 1994b;Jorgenson et al., 1985). This lack of carcinogenic activitywas probably due to a slower dosing rate (the dose wasfractionated because the animals drank several times duringthe day), resulting in a slower rate of toxic metabolite forma-tion insufficient to kill cells (Larson et al, 1994b). Completeloss of carcinogenic activity in a given target organ simplyby changing the vehicle and dose rate would not be expectedof a mutagenic carcinogen. Mice in the drinking water studywere chronically exposed to massive amounts of chloroform.If chloroform had been directly mutagenic, irreversible mu-tations would have accumulated even if they were formedat a slower rate.
In a long-term study in which male and female BDF, micewere exposed to chloroform atmospheres of 5, 30, or 90 ppmfor 5 days/week, the only significant induction of tumors wasobserved at the highest concentration in the male mousekidney (Yamamoto et al., 1994), which is particularly sensi-tive to the toxic effects of chloroform. In fact, the male BDF,mice in the cancer study had to have exposure concentrationsincreased stepwise starting at 5 ppm over a period of weeksto adapt to the 30 and 90 ppm concentrations. Exposure ofmale BDF, mice directly to atmospheres of 30 or 90 ppmchloroform resulted in significant deaths from acute kidneyfailure (Templin et al., 1996a). Exposure under bioassayconditions produces nephrotoxicity and regenerative cellproliferation at this target site in male but not female BDF,mice, consistent with the pattern of tumor formation (Tem-plin et al., 1996a). Chloroform induces both liver and kidneytoxicity in BDF, and B6C3F, mice. In contrast to BDF,mice, B6C3F, mice carry the hepatocarcinogen sensitivitygene (Hcs) (Drinkwater, 1994), and hepatotoxic doses anddose rates of chloroform produce liver cancer rather thankidney cancer in this strain. This pattern of tumor formationillustrates the important principle that the genetic back-ground and target organ specificity greatly influence tumoroutcome. Thus, induced toxicity and regenerative cell prolif-
eration are necessary but not always sufficient conditions toinduce cancer in a given target organ.
Chloroform given by gavage at the doses that producedkidney cancer in male Osborne- Mendel rats also inducesrenal toxicity and regenerative cell proliferation in the kidneyin this strain of rat (National Cancer Institute, 1976; Templinet al., 1996b). A weak tumor response in the Osborne-Mendel male rat kidney was also seen when chloroformwas given in the drinking water, but only at the highestconcentration of 1800 ppm, which also resulted in a 60%decrease in water consumption and a 25% loss in bodyweight (Jorgenson et al, 1985). Since the highest concentra-tion exceeded the maximum tolerated dose (MTD) and sincethe nutritional status of this high-dose group was uncertain,extrapolating the tumor response to lower doses is question-able. Effects secondary to water deprivation, altered nutri-tion, chloroform nephrotoxicity, or a combination of thesefactors may also have been involved in tumor formation,which complicates interpretation of these results and theability to conduct meaningful mechanistic studies.
The kidney cancer seen in the male Osborne-Mendelrats given chloroform by gavage suggested that the kidneymight also be a target site in the F-344 rat. Cytotoxicityand regenerative cell proliferation occur in the kidney ofF-344 rats administered high doses of chloroform either bygavage or exposed via inhalation (Larson et al, 1994d,1995a,b). A recently completed cancer study reported notumor induction in male or female F-344 rats exposed tochloroform atmospheres of 10, 30, or 90 ppm for 5 days/week for 2 years (Yamamoto et al, 1994). The presentstudy was undertaken to investigate the progression andconcentration-response relationships for chloroform-in-duced lesions and regenerative cell proliferation in maleand female F-344 rats during a 90-day inhalation exposureand to predict the profile of tumor induction that might beexpected with longer-term studies. These data define thetoxicity profile for inhaled chloroform in F-344 rats andprovide mechanistic insights that explain why no tumorswere seen in the long-term inhalation cancer study withthis strain of rat (Yamamoto et al, 1994).
MATERIALS AND METHODS
Animals. This study was conducted under federal guidelines for theuse and care of laboratory animals (National Institutes of Health, 1985) andwas approved by the CUT Institutional Animal Care and Use Committee.Rats were housed in humidity- and temperature-controlled facilities accred-ited by the American Association for Accreditation of Laboratory AnimalCare. Seven-week-old male or female F-344 rats [CDF(F-344)/CrBR] wereobtained from the Charles River Breeding Laboratories, Inc. (Raleigh, NC).Rats were housed one per cage in 8-m3 stainless steel and glass inhalationchambers. Animals were randomized by weight and assigned to control ortreatment groups with separate chambers used for each exposure concentra-tion. Chambers were maintained on a 12-hr light-dark cycle, with the lightcycle beginning at 3:30 AM and the dark cycle at 3:30 PM Rats wereacclimated in the exposure chambers for 2 weeks and were 9 weeks of age

INHALED CHLOROFORM IN F-344 RATS 111
TABLE 1Experimental Design for Male and Female F-344 Rats Exposed to Chloroform Vapors
Groups
Number of rats at each exposure duration
4 days
30*
—
3 weeks 7days/week
30*42"
42"
6 weeks 7days/week
30*42-
—
13 weeks 7days/week
30"60'
30"60'
13 weeks 5days/week
15'24'
15'24'
13 weeks 6-week stop
16'
W
Male rats"UnlabeledBrdU-labeled
Female ratsUnlabeledBrdU-labeled
" Unlabeled rats were used for histopathological evaluation. BrdU-labeled rats were used to evaluate LI and histologic changes. Metabolism rats wereused to evaluate changes in the chloroform metabolic rate.
* n = 5 rats per exposure level of 0, 2, 10, 30, 90, or 300 ppm.' n = 8 rats per exposure level of 30, 90, or 300 ppm." n = 5 rats per exposure level of 30, 90, or 300 ppm.' n = 8 rats per exposure level of 90 or 300 ppm.1 n = 9 rats per exposure level of 0, 10, or 90 ppm.* n — 8 rats per exposure level of 0, 2, 10, or 300 ppm; n = 5 for exposure levels of 90 or 300 ppm.
at the beginning of the exposures. NIH-07 rodent chow (Ziegler Bros.,Gardener, PA) and deionized filtered tap water were available ad libitumthroughout the acclimation and exposure periods. Food was changed daily,immediately following the end of each exposure period. Animals wereweighed prior to the initiation of exposures and then biweekly for theduration of the study. Sentinel animals were housed in the animal facilityas part of an ongoing surveillance program for parasitic, bacterial, and viralinfections and were pathogen-free throughout the study.
Generation and characterization of atmospheres. Exposures were con-ducted in 8-m3 chambers operated with a continuous flow of HEPA- andcharcoal-filtered air at 2000 liters/min and a static pressure of —0.2 in. ofwater relative to the anteroom. The chamber environment was maintainedat 22.2 ± 2°C and 50 ± 10% relative humidity. These parameters weremonitored and controlled by a building management system (Andover Con-trols Corp., Andover, MA) (Wong and Moss, 1994). Temperature, relativehumidity, airflow, and static pressure were monitored continuously through-out the study and recorded every 15 min.
Target exposure concentrations of chloroform were 0, 2, 10, 30, 90, and300 ppm. The exposure atmospheres were generated by a vaporizationtechnique. Chloroform, >99.5% purity and stabilized with 0.006% amy-lenes (Aldrich Chemical Co., Inc., Milwaukee, WI), was stored in 10-gallonstainless steel pressure vessels. The 30, 90, and 300 ppm atmospheres weregenerated using a nonpressurized system. Nitrogen, metered by a mass flowcontroller, was admitted into the vessel through a dip tube in which theopening was located below the surface of the chloroform. The chloroform-containing nitrogen gas flowed through the vessel and into the supply airduct for the exposure chamber. In the 2 and 10 ppm chambers, nitrogenwas used to pressurize the vessel to 5 psi and carry the chloroform intothe chamber through a mass flow controller. Chamber concentrations ofchloroform were monitored using a Miran 1A infrared gas analyzer. Certi-fied gas standards of 2, 10, 30, 90, and 300 ppm (Matheson Gas Co.,Morrow, GA) were used to check the calibration on a monthly basisthroughout the exposures. Average analytical exposure concentrations werealways within 4.5% of the target with standard deviations of no more than2.7% from the mean (Larson et al., 1996).
Experimental design. The number of animals and group designationswithin the experiment are outlined in Table 1. Rats were divided into groupsexposed for periods of 4 days or 3, 6, or 13 weeks for male rats and 3 or
13 weeks for female rats. Daily exposures were conducted for 6 hr, from4:00 to 10:00 AM, 7 days/week. To compare the effects of a 7 days/weekexposure to the conventional 5 days/week schedule, groups of rats wereexposed to 30, 90, or 300 ppm chloroform for 6 hr/day, 5 days/week for13 weeks. To investigate the reversibility of chloroform-induced alterations,additional groups of rats were exposed to 90 or 300 ppm chloroform for 6hr/day, 7 days/week for the first 6 weeks, after which rats were housed inthe control chamber for the remaining 7 weeks (6 weeks exposure, stop, 7weeks holding). Designated subsets of rats were administered BrdU tolabel cells in S-phase (labeled groups) while others did not receive BrdU(unlabeled groups). Tissues from rats that did not receive BrdU were stainedwith hematoxylin and eosin (H & E). Both H & E- and BrdU-stained tissueswere evaluated for histopathological changes.
Rats were administered BrdU via osmotic pumps implanted approxi-mately 3.5 days prior to necropsy (Alzet Model 2ML1, Alzet Corp., PaloAlto, CA). Osmotic pumps contained a solution of 20 mg/ml filter-sterilizedBrdU (Sigma Chemical Co., St. Louis, MO) in phosphate-buffered salineprepared on the day it was to be used. Osmotic pumps were implantedunder aseptic conditions as described in Eldridge et al. (1990).
Tissue collection and preparation. At necropsy, rats in the unlabeledgroups were weighed and anesthetized with isofluorane administered byinhalation and then euthanized by exsanguination. Whole livers and bothkidneys were immediately removed, weighed, and examined macroscopi-cally. Longitudinal sections of the left and median lobes of the liver andtransections of the left and right kidney were fixed in 10% neutral bufferedformalin (NBF). Immediately following removal of the liver and kidneys,the heads of the rats were prepared as described previously (Morgan et al.,1991; Larson et al, 1994d) Nonnasal bones, sternum with rib, vertebrae,tibia, and femur were fixed by immersion in 10% NBF and decalcified asdescribed for the nose.
In rats exposed for 3 or 13 weeks, a complete tissue screen was collectedand immersion-fixed in 10% NBF. Tissues included adrenals, brain, cecum,cervix, colon, duodenum, ear canal, esophagus, eye with harderian gland,femoral-tibial joint, heart, ileum, jejunum, kidneys, larynx, liver, lungs,mesenteric lymph nodes, ovaries, pancreas, parathyroid gland, ribs, prostate,salivary gland, skin with mammary gland, sciatic nerve, seminal vesicles,spinal cord, sternum, stomach, spleen, testes, thigh muscle, thymus, thyroid,trachea, urinary bladder, uterus, vagina, and vertebrae. Tissues were trans-
112 TEMPLIN ET AL.
ferred to 70% ethanol after 48 hr, embedded in paraffin, sectioned at 4 - 5lim, and stained with H & E for microscopic examination.
Rats that received BrdU were anesthetized with 100 mg/kg sodium pento-barbital and the kidneys perfused in situ as described in Larson et al. (1993)using PBS as the buffer solution and 10% NBF as the fixative. The kidneysand liver were then removed, sectioned, and fixed in 10% NBF. Nasalcavities and bones were processed as described by Larson et al. (1994c).A complete tissue screen was collected in rats exposed for 3 or 13 weeks.
Histopathology. Chloroform-induced kidney histologic changes werescored qualitatively for severity as follows: 0 = within normal limits, 1 =minimal, 2 = mild, 3 = moderate, and 4 = severe, where 1 through 4indicate increasing severity of the lesions ranging from enlarged proximaltubule cell nuclei to vacuolation in proximal convoluted tubules and necrosisof individual proximal tubule epithelial cells. Chloroform-induced liverhepatocyte histologic changes were scored qualitatively for severity as fol-lows: 0 = within normal limits, 1 = minimal, 2 = mild, 3 = moderate,and 4 = severe, where 1 through 4 indicate increasing severity of the lesionsranging from diffuse vacuolation of hepatocyte cytoplasm to mitotic figuresand individual and 2 - 3 adjacent hepatocyte necrosis. Chloroform-inducedhistologic changes within the nasal passages were scored qualitatively forseverity as follows: 0 = within normal limits, 1 = minimal, 2 = mild, 3= moderate, and 4 = severe, where 1 through 4 indicate increasing severityof the lesions ranging from edema in the lamina propria to loss of Bowman'sglands, connective tissue proliferation in the lamina propria, mineralizationof the basement membrane, and atrophy of the ethmoid turbinates andoverlying olfactory epithelium.
BrdU immunohistochemistry. BrdU-labeled tissues were mounted onProbeOn Plus Slides (Fisher Scientific, Pittsburgh, PA) to ensure adhesionduring processing. The immunohistochemical detection of BrdU-labeledcells has been previously described (Eldridge et al, 1990). Briefly, sectionswere incubated for 1 hr at room temperature with an anti-BrdU antibody(Becton-Dickinson, Mountain View, CA). After incubation with primaryantibody, the slides were incubated for 30 min at room temperature withbiotinylated horse anti-mouse IgG. Slides were then incubated with anavidin-biotin peroxidase complex (Vectastain ABC peroxidase kit, Burlin-game, CA) for 30 min at room temperature. The BrdU incorporation wasvisualized by a final incubation with the chromagen 3-amino-9-ethylcarba-zole (Zymed, San Francisco, CA) and counterstained with hematoxylin.
Scoring of labeled nuclei. A section of duodenum, representing a tissuewith a relatively high cell turnover rate, was included on each slide toconfirm systemic delivery of BrdU to the tissues. Four regions of the kidney,cortex, outer stripe of the outer medulla, inner stripe of the outer medulla,and inner medulla were counted as described in Larson et al. (1994d). Inliver tissue sections, a minimum of 1000 hepatocellular nuclei in the leftlobe were counted as described previously (Larson et al., 1994b). Thelabeling index (LI, percentage of cells in S-phase) was calculated by divid-ing the number of labeled nuclei by the total number of nuclei countedwith the result expressed as a percentage.
The proximal portion of the dorsal scroll of the first endoturbinate wasselected as the nasal region to be quantified based on histological changesand qualitative assessment of sites of induced cell replication as outlinedin Mery et al. (1994). Labeled cells were counted only in the lamina propriaand adjacent periosteum.
To assess possible alterations in bone growth at other osseous sites, thegrowth plate and periosteum were counted in the tibia or femur, usingwhichever location provided the most complete section on the slide, andthe periosteum of one sternum was also counted. The total number oflabeled cells in the growth plate was determined as well as the growth platewidth in millimeters across the diaphyseal diameter. A 2-mm section ofperiosteum was assessed for labeled cells, starting at the margin of thegrowth plate and progressing toward the diaphysis. The periosteum wasevaluated in the region of the compact bone of the sternum. Labeled cells,from growth plate to growth plate, were recorded and the distance in milli-meters was determined. S-phase counts were expressed as the number of
BrdU-labeled cells/mm of bone following a modification of the unit lengthlabeling index (ULLI) of Monticello et al. (1990).
Statistics. The Williams test was used to determine significant differ-ences in organ weights, body weights, and the LI between treatment andcontrol groups (Williams, 1971, 1972). The Williams test is designed toestablish the lowest dose that is significantly elevated over the control in adose-response study. Student's t test was used to determined statisticaldifferences in body and organ weights and LI between the exposure groupsof 7 and 5 days/week and between the exposure groups of 13-week continu-ous chloroform exposure and 6-week stop.
RESULTS
Animal Health
Signs of mild dehydration were noted in some rats at thesecond week of the study, primarily in the rats receivinghigher exposure concentrations. Slight hair loss, dischargefrom the eyes, and anogenital staining were noted at the latertime points. These observations were primarily confined tothe higher concentration groups, and the observations werenot always found in the same animals on consecutiveweighing periods.
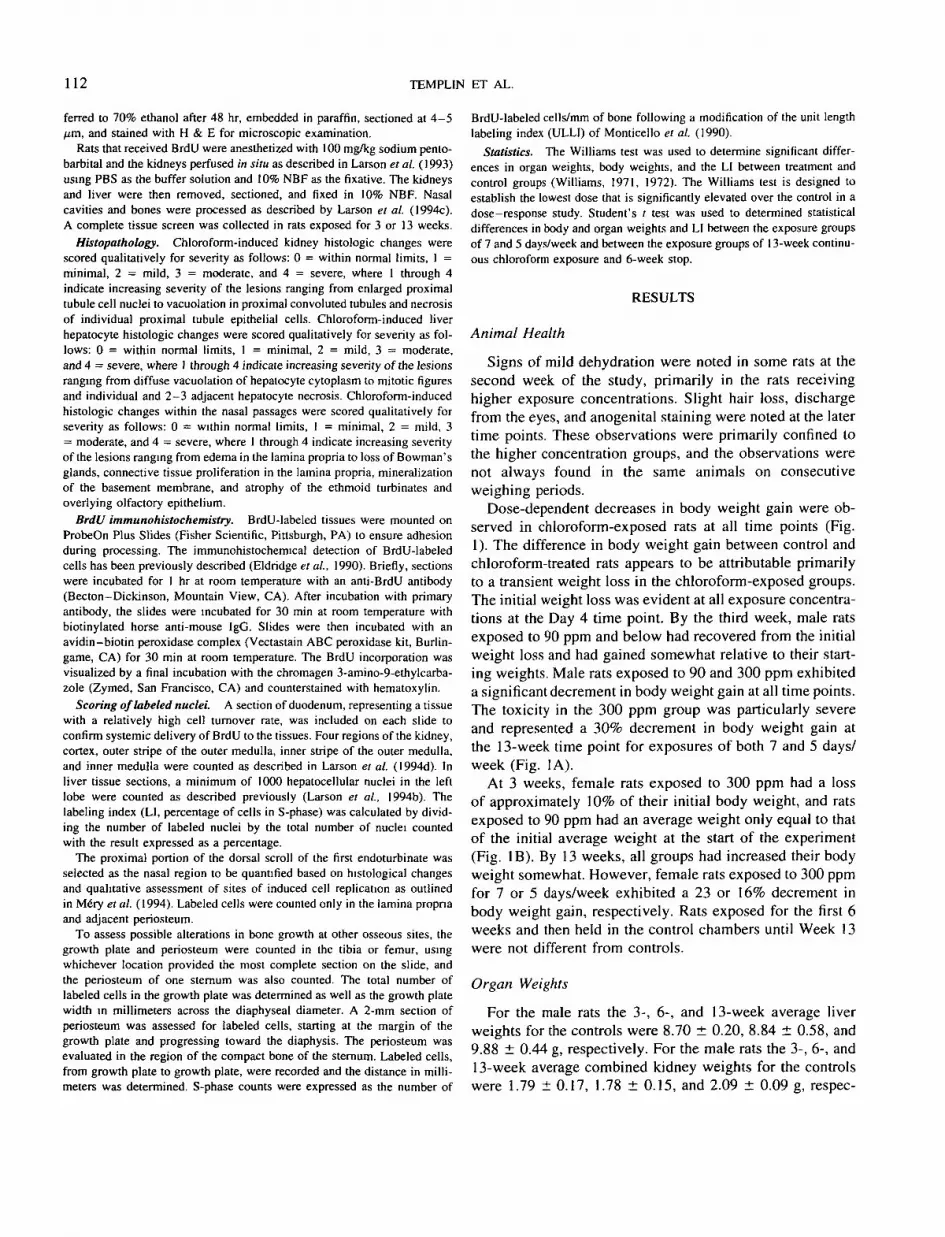
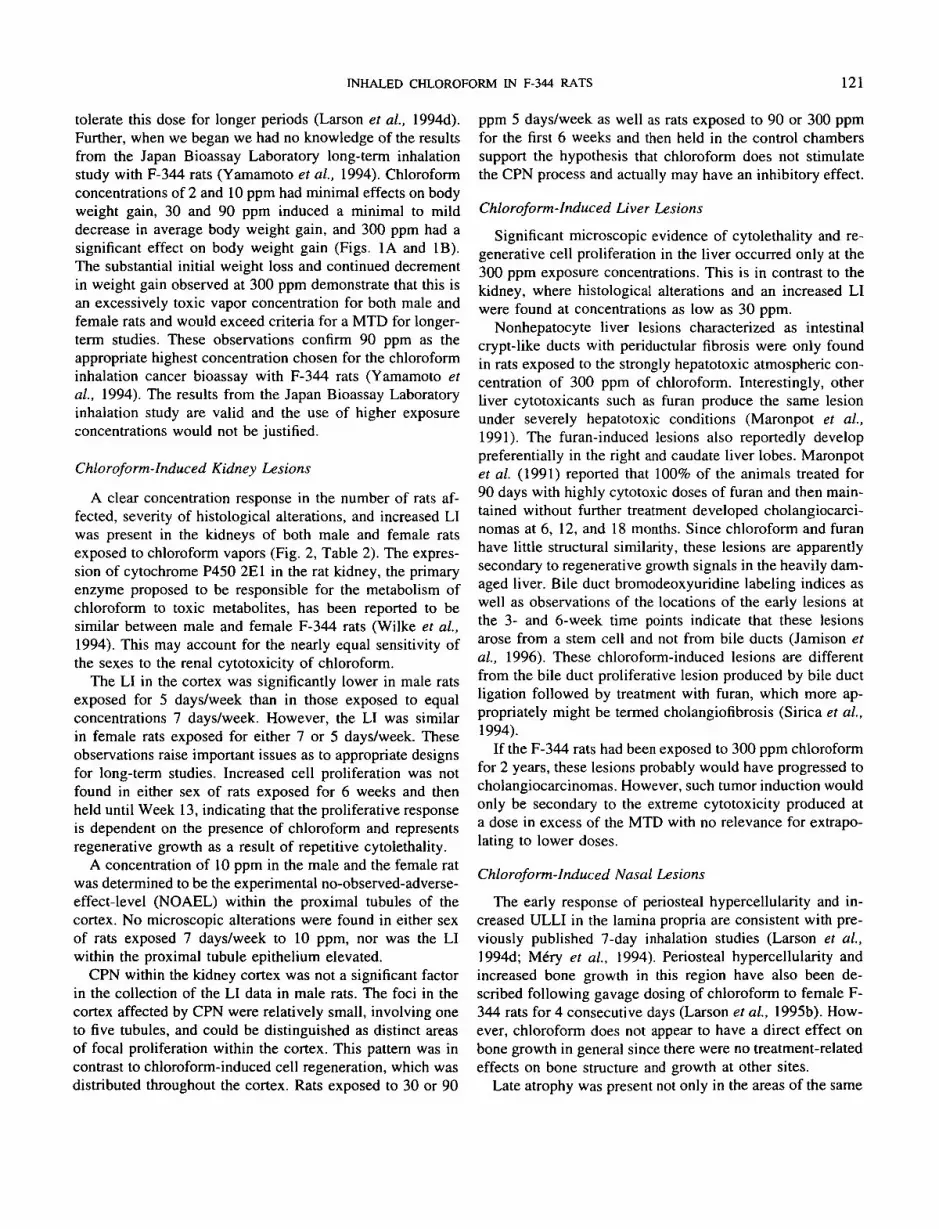
Dose-dependent decreases in body weight gain were ob-served in chloroform-exposed rats at all time points (Fig.1). The difference in body weight gain between control andchloroform-treated rats appears to be attributable primarilyto a transient weight loss in the chloroform-exposed groups.The initial weight loss was evident at all exposure concentra-tions at the Day 4 time point. By the third week, male ratsexposed to 90 ppm and below had recovered from the initialweight loss and had gained somewhat relative to their start-ing weights. Male rats exposed to 90 and 300 ppm exhibiteda significant decrement in body weight gain at all time points.The toxicity in the 300 ppm group was particularly severeand represented a 30% decrement in body weight gain atthe 13-week time point for exposures of both 7 and 5 days/week (Fig. 1A).
At 3 weeks, female rats exposed to 300 ppm had a lossof approximately 10% of their initial body weight, and ratsexposed to 90 ppm had an average weight only equal to thatof the initial average weight at the start of the experiment(Fig. IB). By 13 weeks, all groups had increased their bodyweight somewhat. However, female rats exposed to 300 ppmfor 7 or 5 days/week exhibited a 23 or 16% decrement inbody weight gain, respectively. Rats exposed for the first 6weeks and then held in the control chambers until Week 13were not different from controls.
Organ Weights
For the male rats the 3-, 6-, and 13-week average liverweights for the controls were 8.70 ± 0.20, 8.84 ± 0.58, and9.88 ± 0.44 g, respectively. For the male rats the 3-, 6-, and13-week average combined kidney weights for the controlswere 1.79 ±0.17, 1.78 ±0 .15 , and 2.09 ± 0.09 g, respec-

INHALED CHLOROFORM IN F-344 RATS
180
B
80
180
4 days
3 wk (7 days/wk)
6 wk (7 days/wk)
13 wk (7 days/wk)
13 wk (5 days/wk)
13 wk (6-wk stop)
2 10 30 90Chloroform concentration (ppm)
300
»160-
3 wk (7 days/wk)
13 wk (7 days/wk)
13 wk (5 days/wk)
13 wk (6-wk stop)
2 10 30 90Chloroform concentration (ppm)
300
FIG. 1. Percentage increase in body weight in (A) male or (B) female F-344 rats exposed to chloroform vapors for 4 days or 3, 6, or 13 weeks(males) or 3 or 13 weeks (females). Bars represent the mean increase in body weight ± SD (n = 5-10 rats per group). Increases in body weight aremeasured from the first day of exposure. For male rats the average starting weight for the control group was 193.4 ± 12.6 g. For the female rats theaverage starting weight for the control group was 125.7 ± 8.4 g. Rats were exposed 6 hr/day for 7 or 5 days/week. Additional rats were exposed for 6hr/day, 7 days/week for 6 weeks and then housed in the control chambers for the remaining 7 weeks (6-week stop). Asterisks (*) denote groups thatwere statistically different from exposure- and duration-matched control groups (Williams test, p < 0.05).
tively. No significant changes in liver or kidney weight rela-tive to body weight were noted at concentrations below 90ppm (data not shown). Increases of about 30% in relativeliver weights were observed at 6 and 13 weeks with 300ppm exposures. Increases of about 10% in relative kidneyweight occurred with the 90 ppm and about 30% with the300 ppm exposures at 3, 6, and 13 weeks.
For the female rats the 3- and 13-week average liverweights for the controls were 6.60 ± 0.9 and 5.27 ± 0.33 g,
respectively. For the female rats the 3- and 13-week averagecombined kidney weights for the controls were 1.59 ± 0.13and 1.29 ± 0.11 g, respectively. No significant changes inliver or kidney weight relative to body weight were notedat concentrations below 90 ppm (data not shown). Increasesof about 10% in relative liver weights were observed at 90ppm at 3 and 13 weeks. Increases of about 50% in relativeliver weights were seen with 300 ppm exposures at 3 and 13weeks. These increases were associated with a periductular
114 TEMPLIN ET AL.
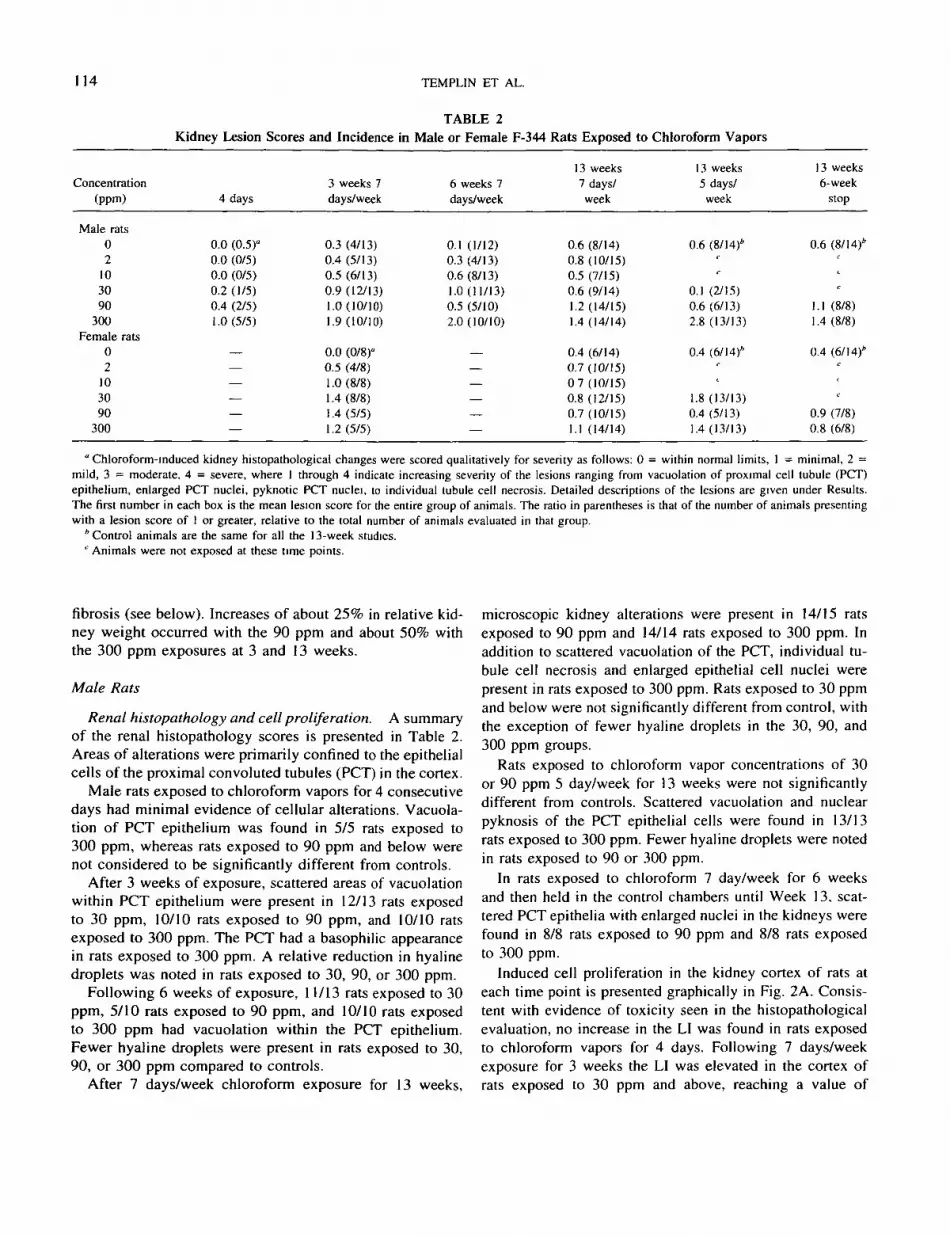
TABLE 2Kidney Lesion Scores and Incidence in Male or Female F-344 Rats Exposed to Chloroform Vapors
Concentration(ppm)
Male rats02
103090
300Female rats
02
103090
300
4 days
0.0 (0.5)°0.0 (0/5)0.0 (0/5)0.2 (1/5)0.4 (2/5)1.0(5/5)
——————
3 weeks 7days/week
0.3 (4/13)0.4 (5/13)0.5(6/13)0.9 (12/13)1.0(10/10)1.9(10/10)
0.0 (0/8)"0.5 (4/8)1.0 (8/8)1.4 (8/8)1.4 (5/5)1.2(5/5)
6 weeks 7days/week
0.1 (1/12)0.3 (4/13)0.6(8/13)1.0 (11/13)0.5 (5/10)2.0 (10/10)
—————
—
13 weeks7 days/week
0.6 (8/14)0.8 (10/15)0.5 (7/15)0.6 (9/14)1.2 (14/15)1.4 (14/14)
0.4 (6/14)0.7 (10/15)0 7(10/15)0.8 (12/15)0.7 (10/15)1.1 (14/14)
13 weeks5 days/week
0.6 (8/14)*r
c
0.1 (2/15)0.6 (6/13)2.8 (13/13)
0.4 (6/14)''
<1.8 (13/13)0.4 (5/13)1.4 (13/13)
13 weeks6-week
stop
0.6 (8/14)*r
c
c
1.1 (8/8)1.4 (8/8)
0.4 (6/14)*c
f
c
0.9 (7/8)0.8 (6/8)
" Chloroform-induced kidney histopathological changes were scored qualitatively for severity as follows: 0 = within normal limits, 1 = minimal, 2 =mild, 3 = moderate, 4 = severe, where 1 through 4 indicate increasing severity of the lesions ranging from vacuolation of proximal cell tubule (PCT)epithelium, enlarged PCT nuclei, pyknotic PCT nuclei, to individual tubule cell necrosis. Detailed descriptions of the lesions are given under Results.The first number in each box is the mean lesion score for the entire group of animals. The ratio in parentheses is that of the number of animals presentingwith a lesion score of I or greater, relative to the total number of animals evaluated in that group.
'Control animals are the same for all the 13-week studies.e Animals were not exposed at these time points.
fibrosis (see below). Increases of about 25% in relative kid-ney weight occurred with the 90 ppm and about 50% withthe 300 ppm exposures at 3 and 13 weeks.
Male Rats
Renal histopathology and cell proliferation. A summaryof the renal histopathology scores is presented in Table 2.Areas of alterations were primarily confined to the epithelialcells of the proximal convoluted tubules (PCT) in the cortex.
Male rats exposed to chloroform vapors for 4 consecutivedays had minimal evidence of cellular alterations. Vacuola-tion of PCT epithelium was found in 5/5 rats exposed to300 ppm, whereas rats exposed to 90 ppm and below werenot considered to be significantly different from controls.
After 3 weeks of exposure, scattered areas of vacuolationwithin PCT epithelium were present in 12/13 rats exposedto 30 ppm, 10/10 rats exposed to 90 ppm, and 10/10 ratsexposed to 300 ppm. The PCT had a basophilic appearancein rats exposed to 300 ppm. A relative reduction in hyalinedroplets was noted in rats exposed to 30, 90, or 300 ppm.
Following 6 weeks of exposure, 11/13 rats exposed to 30ppm, 5/10 rats exposed to 90 ppm, and 10/10 rats exposedto 300 ppm had vacuolation within the PCT epithelium.Fewer hyaline droplets were present in rats exposed to 30,90, or 300 ppm compared to controls.
After 7 days/week chloroform exposure for 13 weeks,
microscopic kidney alterations were present in 14/15 ratsexposed to 90 ppm and 14/14 rats exposed to 300 ppm. Inaddition to scattered vacuolation of the PCT, individual tu-bule cell necrosis and enlarged epithelial cell nuclei werepresent in rats exposed to 300 ppm. Rats exposed to 30 ppmand below were not significantly different from control, withthe exception of fewer hyaline droplets in the 30, 90, and300 ppm groups.
Rats exposed to chloroform vapor concentrations of 30or 90 ppm 5 day/week for 13 weeks were not significantlydifferent from controls. Scattered vacuolation and nuclearpyknosis of the PCT epithelial cells were found in 13/13rats exposed to 300 ppm. Fewer hyaline droplets were notedin rats exposed to 90 or 300 ppm.
In rats exposed to chloroform 7 day/week for 6 weeksand then held in the control chambers until Week 13. scat-tered PCT epithelia with enlarged nuclei in the kidneys werefound in 8/8 rats exposed to 90 ppm and 8/8 rats exposedto 300 ppm.
Induced cell proliferation in the kidney cortex of rats ateach time point is presented graphically in Fig. 2A. Consis-tent with evidence of toxicity seen in the histopathologicalevaluation, no increase in the LI was found in rats exposedto chloroform vapors for 4 days. Following 7 days/weekexposure for 3 weeks the LI was elevated in the cortex ofrats exposed to 30 ppm and above, reaching a value of

INHALED CHLOROFORM IN F-344 RATS 115
3 5 i
I 2 5
o
I"I 1 5
Si.•D
2 5c
4 days
3 wk (7 days/wk)
6 wk (7 days/wk)
13 wk (7 days/wk)
13 wk (5 days/wk)
13wk(6-wkstop)
2 10 30 90Chloroform concentration (ppm)
300
B
8a
I 3 0c
3 wk (7 days/wk)
13 wk (7 days/wk)
13 wk (5 days/wk)
13 wk (6-wk stop)
2 10 30 90Chloroform concentration (ppm)
300
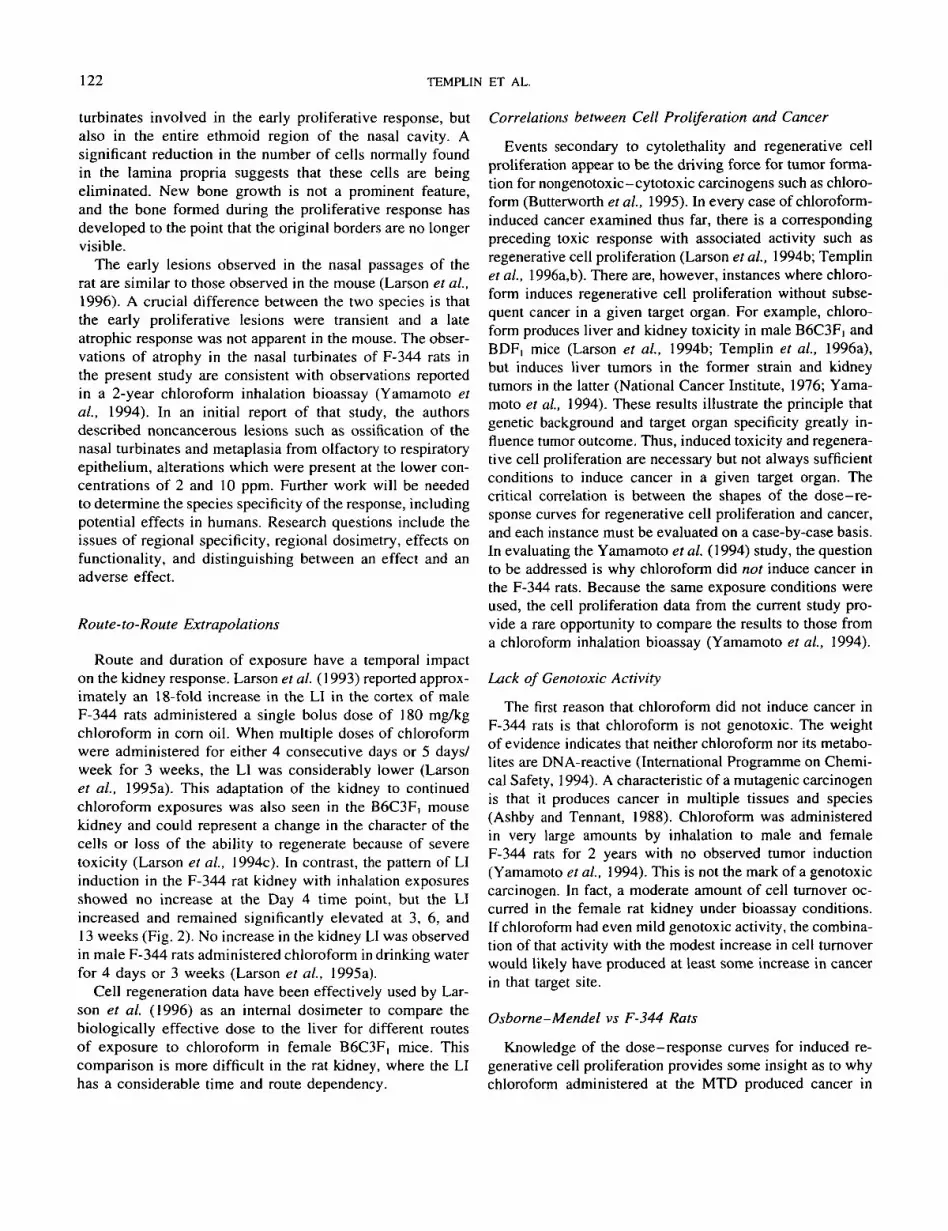
FIG. 2. Labeling index (LI) in the kidney cortex of (A) male or (B) female F-344 rats exposed to chloroform vapors for 4 days or 3, 6, or 13 weeks(males) or 3 or 13 weeks (females). Bars represent the mean LI ± SD (n = 5-10 rats per group). The LI is the percentage of nuclei in S-phase identifiedin histological sections stained immunohistochemically for BrdU. Rats were exposed 6 hr/day for 7 or 5 days/week. Additional rats were exposed for 6hr/day, 7 days/week for 6 weeks and then housed in the control chambers for the remaining 7 weeks (6-week stop). Asterisks (*) denote groups thatwere statistically different from exposure- and duration-matched control groups (Williams test, p < 0.05).
approximately 7-fold over control in rats exposed to 300ppm. The LI in the cortex remained elevated in the ratsexposed to 30, 90, and 300 ppm 7 days/week throughout theremainder of the study, indicating continual cytotoxicity andregenerative cell proliferation. At 6 and 13 weeks, the label-ing index was approximately 2-, 4-, and 10-fold over controlin rats exposed to 30, 90, and 300 ppm, respectively.
The LI in rats exposed to 30 ppm 5 days/week was notdifferent from control rats (Fig. 2A). At 90 ppm, the LI in5 days/week exposed rats was marginally increased relative
to controls, but the increase was less than half that of ratsexposed for 7 days/week. Rats exposed to 300 ppm 5 days/week had a LI approximately 7-fold over control, a responsethat was similar to the 9-fold over control value in ratsexposed 7 days/week. Rats exposed to 90 or 300 ppm chloro-form vapors for 6 weeks and then held in the control cham-bers for 7 weeks were not different from controls.
An increase in the LI was also found in the outer stripeof the outer medulla of rats exposed 7 days/week to 90 or300 ppm for 3, 6, or 13 weeks and in rats exposed to 300

116 TEMPLIN ET AL.
ppm, 5 days/week for 13 weeks (Fig. 2A). The response wasconsistently lower than that found in the cortex. Concentra-tion-dependent increases in the LI were not found in theinner stripe of the outer medulla or the inner medulla. MeanLI values ranged from 0.8 to 1.6 in the inner stripe and 0.1to 0.4 in the inner medulla.
The presence of foci of chronic progressive nephropathy(CPN) within the cortex was a concern in scoring the LI inthe male rats. An area of CPN was defined as having at leasttwo adjacent tubules with a minimum BrdU LI of 30%. Boththe incidence and LI within the foci were determined in themale rats. The area for determining the LI was restricted tothe affected tubules with a two-tubule surrounding border.Using these criteria, the average labeling index for foci ofCPN was 20.0 ± 3.7%. In the 13-week control rats therewas evidence of at least one focus of CPN in 8 of 10 rats.A concentration-dependent decrease in the incidence of fociof CPN in male rats exposed to chloroform vapors was pres-ent in this study with an incidence 6/10, 1/10, 0/10, and 0/4 for the 2, 10, 30, and 90 ppm groups, respectively. At 300ppm foci of CPN could not be determined because of theincreased regenerative cell proliferation throughout the cor-tex at this dose. When a clear distinction of the borders fora CPN foci could be determined the area was excluded fromthe overall cortex LI. Although identifying a focus of CPNat the higher concentrations was sometimes difficult wherethe LI was elevated throughout the cortex, we are confidentthat the LI scores presented are accurate.
A redistribution of the proportion of different cell typeswithin the cortex was a possibility with chronic exposure tochloroform vapors because of potential loss of a sensitivecell type. Proximal tubule cells, the primary target of chloro-form-induced cytotoxicity, accounted for approximately76% of the nuclei in either control or 300 ppm chloroform-treated rats. Distal tubules, connecting tubules, and the non-tubular portion were all present in approximately the sameproportion in control and 300 ppm treated rats.
Liver histopathology and cell proliferation. The inci-dence of hepatic lesions and scores is presented in Table 3.Hepatocyte alterations were primarily confined to the 300ppm exposed rats at all time points and in the 90 ppm ex-posed rats at the later time points. Microscopic findings inthe rats exposed 7 days/week to 300 ppm included scatteredindividual hepatocyte degeneration, mitotic figures, and mid-zonal vacuolation.
By 13 weeks, hepatocyte alterations were found in ratsexposed 7 days/week to 90 or 300 ppm chloroform. In therats exposed to 90 ppm, scattered vacuolated hepatocyteswere found in the livers of 6/15 rats, with the additionaleffect of single to multiple (2-3) hepatocyte necrosis in 9/15rats. Mitotic figures and mild diffuse hepatocyte vacuolationwere noted in 15/15 rats exposed to 300 ppm. Rats exposedto 30 ppm and below were not significantly different fromcontrols.
In rats exposed to chloroform vapors 5 days/week, scora-ble histologic lesions were found in the 90 and 300 ppmgroups. One rat exposed to 90 ppm had scattered vacuolatedhepatocytes and another had foci of single and multiple ( 2 -3) hepatocyte necrosis. Diffuse hepatocyte vacuolation,which was most severe in the centrilobular and midzonalhepatocytes, was found in 13/13 rats exposed to 300 ppm.In two of these rats, degeneration and necrosis of the firstand second layers of hepatocytes were present around thecentral vein and affected approximately 50% of the lobules.In addition, pale eosinophilia of the centrilobular to midzonalhepatocytes was found in some rats exposed to 30 and 90ppm but was not included as a scorable lesion.
Rats exposed to 90 ppm chloroform 7 days/week for 6weeks and then held in the control chambers until Week 13were not different from controls. In rats exposed to 300 ppmfor 6 weeks and then held until Week 13, scattered fociof single or multiple (2-3) hepatocyte necrosis with mildinflammatory cell infiltrate were infrequently found.
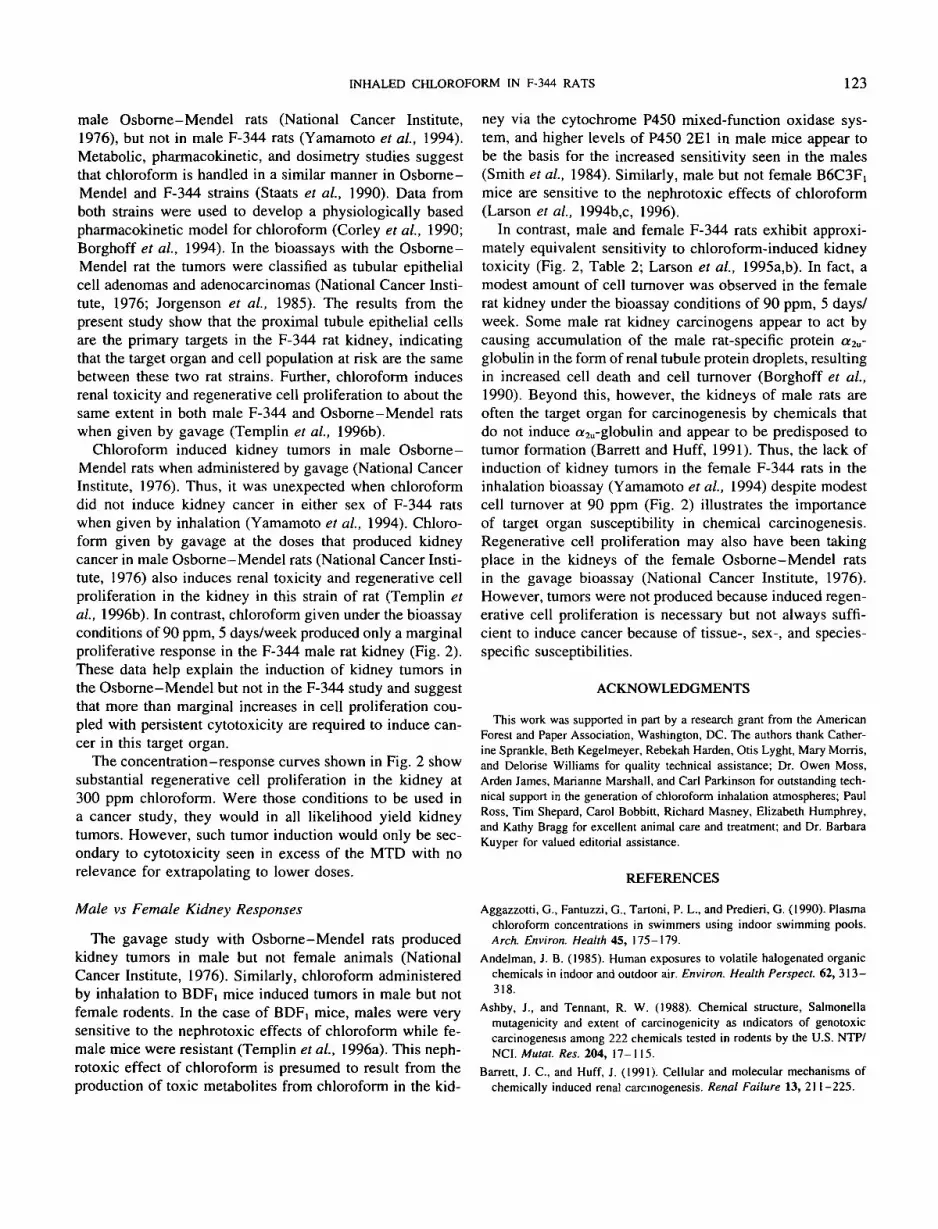
Significant increases in hepatocyte LI were found only inrats exposed to 300 ppm chloroform (Fig. 3A). In the 7days/week exposures the hepatocyte LI was increased byapproximately 10-, 14-, 20-, and 25-fold over controls at 4days and 3, 6, and 13 weeks, respectively. Rats exposed for5 days/week to 300 ppm had a hepatic LI similar to that ofrats exposed for 7 days/week, with a 29-fold increase overcontrols. Rats exposed to chloroform for 6 weeks and al-lowed to recover for 7 weeks did not have an elevated LIrelative to control animals.
In male rats exposed to the highly hepatotoxic concentra-tion of 300 ppm chloroform, an additional nonhepatocytelesion was found within the liver. The prevalence and sever-ity of the lesions were greatest in the right lobe, althoughevidence of the lesion could be found throughout all thelobes examined. These lesions were characterized as glandu-lar structures lined by columnar epithelium and goblet cellsand surrounded by connective tissue. We have termed theselesions intestinal crypt-like ducts with periductular fibrosisto distinguish them from true cholangiofibrosis. This lesionis similar to that seen following treatment with other hepato-toxicants such as furan (Maronpot et al., 1991). This lesionappears to have a non-bile duct origin and a more detaileddescription of this lesion and accompanying proliferativechanges has been presented in a separate manuscript (Jami-son et al., 1996).
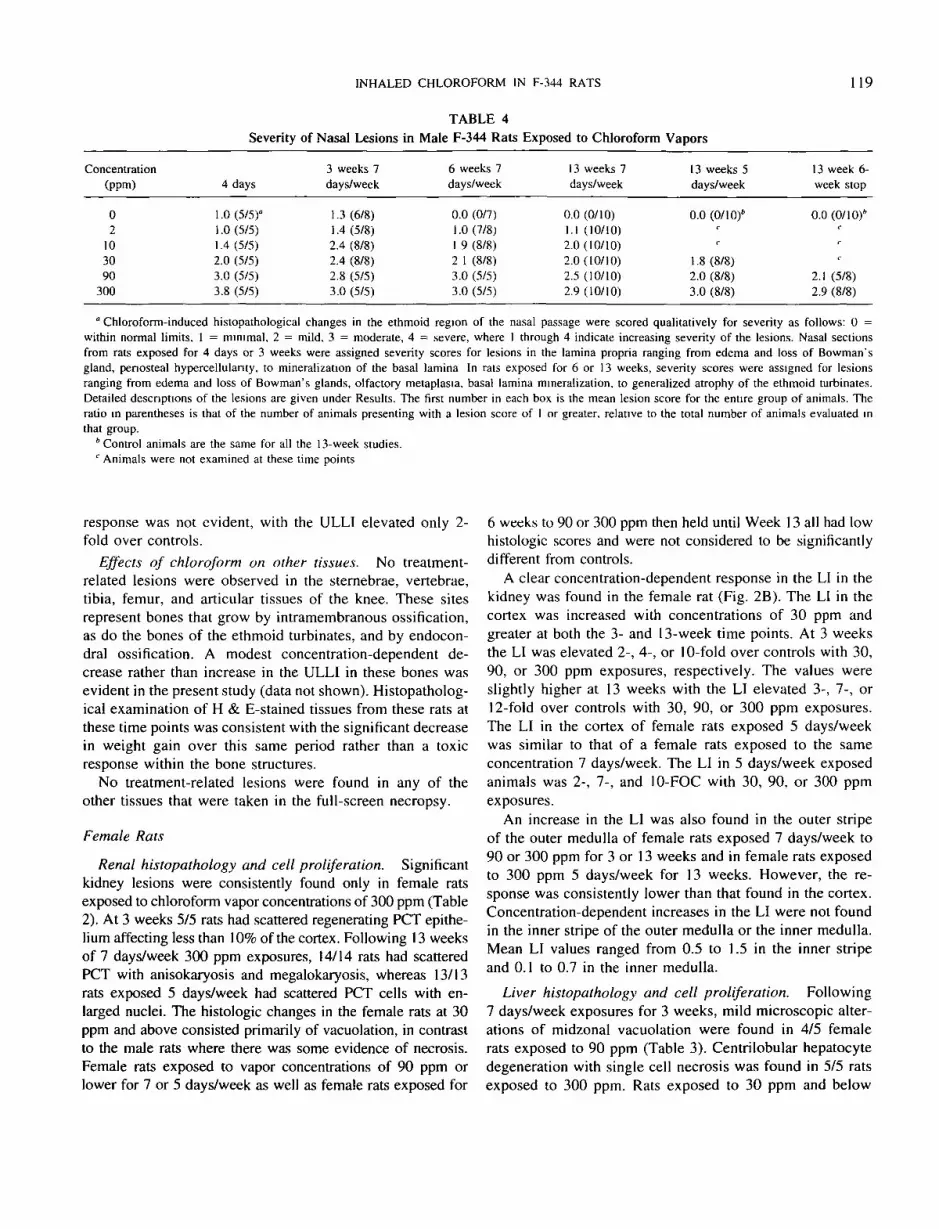
Nasal histopathology and cell proliferation. The sever-ity and type of chloroform-induced nasal lesions were depen-dent on both concentration and duration of exposure (Table4). The lesions were primarily confined to the ethmoid por-tion of the nasal passages lined by olfactory epithelium. Atthe early time points, alterations involved the ventral andlateral regions of the ethmoid turbinates, while the centralaspects of the turbinates and nasal septum were unaffected.

INHALED CHLOROFORM IN F-344 RATS 117
TABLE 3Hepatic Lesion Scores and Incidence in Male or Female F-344 Rats Exposed to Chloroform Vapors
Concentration(ppm)
Male rats02
103090
300Female rats
02
103090
300
4 days
0.0 (0/5)°0.0 (0/5)0.4 (2/5)0.4 (2/5)0.3 (1/4)0.0 (0/5)
——————
3 weeks 7days/week
0.0 (0/13)0.0 (0/13)0.1 (1/13)0.0 (0/13)0.2 (2/10)1.8 (10/10)
0.0 (0/8)°0.0 (0/8)0.0 (0/8)0.4 (3/8)0.8 (4/5)2.0 (5/5)
6 weeks 7days/week
0.2 (2/12)0.1 (4/13)0.2 (3/13)0.0 (0/13)0.3 (3/10)2.0 (10/10)
——————
13 weeks7 days/week
0.1 (1/15)0.2 (3/15)0.0 (0/15)0.1 (2/15)1.0 (14/15)3.9 (15/15)
0.1 (1/15)0/1 (1/15)0.0 (0/14)0.0 (0/15)0.8 (12/15)3.0(15/15)
13 weeks5 days/week
0.1 (1/15)*< •
c
0.0(0/13)0.3 (4/13)2.4 (13/13)
0.1 (1/15)°c
c
0.0 (0/13)0.3 (4/13)2.0(13/13)
13 weeks6-week
stop
0.1 (1/15)°c
c
c
0.0 (0/8)0.0 (0/8)
0.1 (1/15)°c
c
c
0.1 (1/8)0.0 (0/8)
" Chloroform-induced liver histopathological changes were scored qualitatively for severity as follows: 0 = within normal limits, 1 = minimal, 2 =mild, 3 = moderate, 4 = severe, where 1 through 4 indicate increasing severity of the lesions ranging from hepatocyte vacuolation, degenerative changesin hepatocytes, to hepatocyte necrosis. Detailed descriptions of the lesions are given under Results. The first number in each box is the mean lesionscore for the entire group of animals. The ratio in parentheses is that of the number of animals presenting with a lesion score of 1 or greater, relative tothe total number of animals evaluated in that group.
* Control animals are the same for all the 13-week studies.c Animals were not exposed at these time points.
With continued exposure, lesions were present throughoutthe entire ethmoid portion of the nose. Relatively few alter-ations were present in the anterior portions of the nasal cavityor the posterior regions lined by respiratory epithelium. Thetype, severity, and distribution of the lesions were consistentand usually present in all rats within a specific concentration-and duration-exposed group.
Rats examined following 4 days of exposure had lesionswithin the lamina propria characterized by edema, loss ofdeep Bowman's glands, periosteal hypercellularity, and newbone growth in the proximal portions of the ethmoturbinates.The severity and relative distribution of the lesions wereconcentration-dependent, ranging from minimal involve-ment in rats exposed to 10 ppm to moderate to severe effectsin rats exposed to 300 ppm. Focal atrophy of the olfactoryepithelium was noted in rats exposed to 90 or 300 ppm. At3 weeks, the most prevalent lesion in rats exposed to 10ppm and higher was a concentration-dependent loss of thedeep Bowman's glands and a mild to moderate edema inthe lamina propria. Periosteal hypercellularity and new bonegrowth were no longer as apparent, and the recently formedturbinate bones appeared to be differentiating into maturebone. Mineralization of the basal lamina was noted in ratsexposed to 300 ppm. In the olfactory epithelium, focal edemaand changes from olfactory-to respiratory-type epitheliumwere observed. Significant lesions were not observed in thelamina propria or olfactory epithelium of rats exposed to 2ppm for 4 days or 3 weeks.
In addition to the lesions described in rats exposed for 4days or 3 weeks, atrophy of the ethmoid turbinates was notedfollowing 6 weeks of exposure. The appearance of reducedturbinate size was minimally evident at 2 ppm and increasedin severity with higher concentrations. The spaces normallyoccupied by the nerves, glands, and other tissues that com-pose the lamina propria were reduced in size or cell numbersor were displaced by edema. Atrophy of the overlying epithe-lium had reduced the thickness of the epithelial cell layer toapproximately half that of the nonaffected olfactory epithe-lium. At the 13-week time point, the overall effect of thelesions within the lamina propria and the olfactory epithe-lium gave the appearance that the turbinates occupied a re-duced volume in the nasal cavity. Minimal atrophy was ob-served in rats exposed to 2 ppm. The response increased inseverity through the 10, 30, and 90 ppm exposed rats withmoderate to severe effects in rats exposed to 300 ppm.
The type of response and the severity of the lesions wereessentially the same in rats exposed to 30, 90, or 300 ppm,5 days/week as that found in rats exposed 7 days/week. Inrats exposed to 90 or 300 ppm 7 days/week for the first 6weeks and then held in the control chamber until Week 13,the lesions were not reversible, and lesion type and severitywere similar to that found in rats exposed for either 6 or 13weeks.
The ULLI was determined in the proximal portion of thedorsal scroll of the first endoturbinate; this region was aprimary target for the early chloroform-induced lesions in

118 TEMPLIN ET AL.
B
30
I 25
| 2 0oOra „D.15
1 5
5 253
2 20uO
[~] 4 days
[ 3 3 wk (7 days/wk)
H 6 wk (7 days/wk)
• 13 wk (7 days/wk)
• 13 wk (5 days/wk)
• 13 wk (6-wkstop)
*
2 10 30 90Chloroform concentration (ppm)
300
0 3wk(7 days/wk)
B 13 wk (7 days/wk)
[ j | 13 wk (5 days/wk)
• 13 wk (6-wkstop)
2 10 30 90Chloroform concentration (ppm)
300
FIG. 3. Hepatocyte labeling index (LI) in the livers of (A) male or (B) female F-344 rats exposed to chloroform vapors for 4 days or 3. 6. or 13weeks (males) for 3 or 13 weeks (females). Bars represent the mean LI ± SD (n = 5-10 rats per group). The LI is the percentage of nuclei in S-phaseidentified in histological sections stained immunohistochemically for BrdU. Rats were exposed 6 hr/day for 7 or 5 days/week. Additional rats wereexposed for 6 hr/day, 7 days/week for 6 weeks and then housed in the control chambers for the remaining 7 weeks (6-week stop). Asterisks (*) denotegroups that were statistically different from exposure- and duration-matched control groups (Williams test. /; < 0.05).
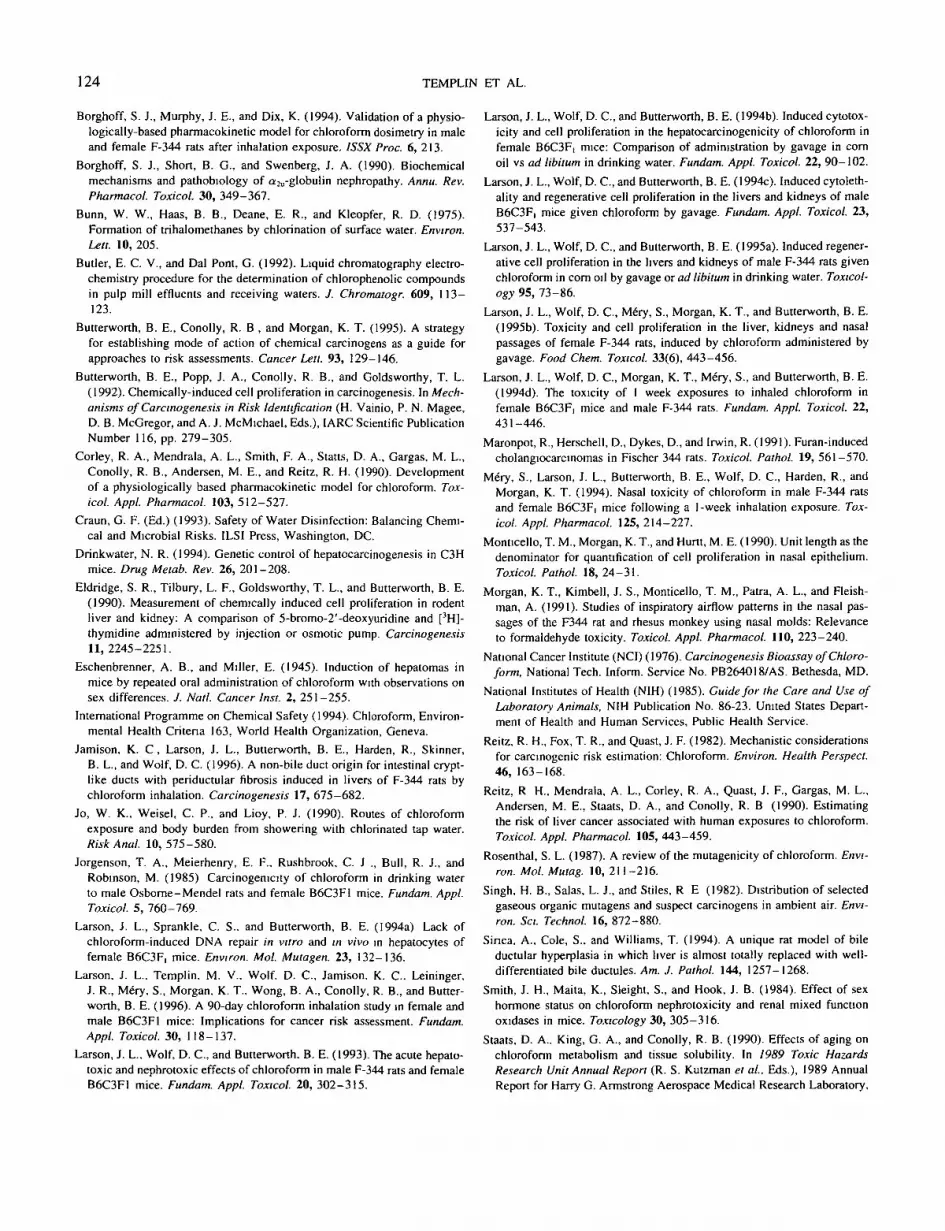
the lamina propria (Mery et al., 1994). A concentration-dependent cell regenerative response was present in rats ex-posed for 4 days to 10, 30, 90, or 300 ppm chloroform (Fig.4). The elevation in the ULLI ranged from an increase ofapproximately 14-fold over the controls in rats exposed to10 ppm to approximately 22-fold over controls in rats ex-posed to 300 ppm. Rats exposed to 2 ppm were consideredto be equal to controls.
At the later time points of 3, 6, or 13 weeks, the ULLIwas considerably lower compared with the values at 4 days,
and a concentration-dependent response was less evident.The ULLI was approximately 6-fold over controls in ratsexposed to 10 ppm and higher for 3 weeks and 4-fold overcontrol in rats exposed to 10 ppm and higher for 6 or 13weeks. Rats exposed to 2 ppm did not have a significantlyelevated ULLI following 3, 6, or 13 weeks of exposure for7 days/week. An increase in the ULLI was found in ratsexposed to 30, 90, or 300 ppm 5 days/week and rats exposedto 90 or 300 ppm 7 days/week for the first 6 weeks. For the5 days/week and 6-week stop groups a clear concentration
INHALED CHLOROFORM IN F-344 RATS 119
TABLE 4Severity of Nasal Lesions in Male F-344 Rats Exposed to Chloroform Vapors
Concentration(ppm)
02
103090
300
4 days
1.0 (5/5)°1.0 (5/5)1.4 (5/5)2.0 (5/5)3.0 (5/5)3.8 (5/5)
3 weeks 7days/week
1.3 (6/8)1.4(5/8)2.4 (8/8)2.4 (8/8)2.8 (5/5)3.0 (5/5)
6 weeks 7days/week
0.0 (0/7)1.0 (7/8)1 9 (8/8)2 1 (8/8)3.0 (5/5)3.0 (5/5)
13 weeks 7days/week
0.0 (0/10)1.1 (10/10)2.0(10/10)2.0(10/10)2.5 (10/10)2.9 (10/10)
13 weeks 5days/week
0.0 (0/10)*C
c
1.8 (8/8)2.0 (8/8)3.0 (8/8)
13 week 6-week stop
0.0(0/10)*c
c
< •
2.1 (5/8)2.9 (8/8)
° Chloroform-induced histopathological changes in the ethmoid region of the nasal passage were scored qualitatively for severity as follows: 0 =within normal limits. 1 = minimal, 2 = mild, 3 = moderate, 4 = severe, where 1 through 4 indicate increasing severity of the lesions. Nasal sectionsfrom rats exposed for 4 days or 3 weeks were assigned severity scores for lesions in the lamina propria ranging from edema and loss of Bowman'sgland, penosteal hypercellulanty. to mineralization of the basal lamina In rats exposed for 6 or 13 weeks, severity scores were assigned for lesionsranging from edema and loss of Bowman's glands, olfactory metaplasia, basal lamina mineralization, to generalized atrophy of the ethmoid turbinates.Detailed descriptions of the lesions are given under Results. The first number in each box is the mean lesion score for the entire group of animals. Theratio in parentheses is that of the number of animals presenting with a lesion score of 1 or greater, relative to the total number of animals evaluated inthat group.
* Control animals are the same for all the 13-week studies.c Animals were not examined at these time points
response was not evident, with the ULLI elevated only 2-fold over controls.
Effects of chloroform on other tissues. No treatment-related lesions were observed in the sternebrae, vertebrae,tibia, femur, and articular tissues of the knee. These sitesrepresent bones that grow by intramembranous ossification,as do the bones of the ethmoid turbinates, and by endocon-dral ossification. A modest concentration-dependent de-crease rather than increase in the ULLI in these bones wasevident in the present study (data not shown). Histopatholog-ical examination of H & E-stained tissues from these rats atthese time points was consistent with the significant decreasein weight gain over this same period rather than a toxicresponse within the bone structures.
No treatment-related lesions were found in any of theother tissues that were taken in the full-screen necropsy.
Female Rats
Renal histopathology and cell proliferation. Significantkidney lesions were consistently found only in female ratsexposed to chloroform vapor concentrations of 300 ppm (Table2). At 3 weeks 5/5 rats had scattered regenerating PCT epithe-lium affecting less than 10% of the cortex. Following 13 weeksof 7 days/week 300 ppm exposures, 14/14 rats had scatteredPCT with anisokaryosis and megalokaryosis, whereas 13/13rats exposed 5 days/week had scattered PCT cells with en-larged nuclei. The histologic changes in the female rats at 30ppm and above consisted primarily of vacuolation, in contrastto the male rats where there was some evidence of necrosis.Female rats exposed to vapor concentrations of 90 ppm orlower for 7 or 5 days/week as well as female rats exposed for
6 weeks to 90 or 300 ppm then held until Week 13 all had lowhistologic scores and were not considered to be significantlydifferent from controls.
A clear concentration-dependent response in the LI in thekidney was found in the female rat (Fig. 2B). The LI in thecortex was increased with concentrations of 30 ppm andgreater at both the 3- and 13-week time points. At 3 weeksthe LI was elevated 2-, 4-, or 10-fold over controls with 30,90, or 300 ppm exposures, respectively. The values wereslightly higher at 13 weeks with the LI elevated 3-, 7-, or12-fold over controls with 30, 90, or 300 ppm exposures.The LI in the cortex of female rats exposed 5 days/weekwas similar to that of a female rats exposed to the sameconcentration 7 days/week. The LI in 5 days/week exposedanimals was 2-, 7-, and 10-FOC with 30, 90, or 300 ppmexposures.
An increase in the LI was also found in the outer stripeof the outer medulla of female rats exposed 7 days/week to90 or 300 ppm for 3 or 13 weeks and in female rats exposedto 300 ppm 5 days/week for 13 weeks. However, the re-sponse was consistently lower than that found in the cortex.Concentration-dependent increases in the LI were not foundin the inner stripe of the outer medulla or the inner medulla.Mean LI values ranged from 0.5 to 1.5 in the inner stripeand 0.1 to 0.7 in the inner medulla.
Liver histopathology and cell proliferation. Following7 days/week exposures for 3 weeks, mild microscopic alter-ations of midzonal vacuolation were found in 4/5 femalerats exposed to 90 ppm (Table 3). Centrilobular hepatocytedegeneration with single cell necrosis was found in 5/5 ratsexposed to 300 ppm. Rats exposed to 30 ppm and below

120 TEMPLIN ET AL.
c
.2 800
2 6005o•ouj
400
\L 200
\~\ 4 days
£3 3 wk (7 days/wk)
|§§ 6 wk (7 days/wk)
• 13 wk (7 days/wk)
• 13 wk (5 days/wk)
• 13 wk (6-wk stop)
2 10 30 90Chloroform concentration (ppm)
300
FIG. 4. Unit length labeling index (ULLI) in the proximal portion of the dorsal scroll of the first endoturbinate of male F-344 rats exposed tochloroform vapors for 4 days or 3, 6, or 13 weeks. Bars represent the mean ULLI ± SD (n = 5 —10 rats per group). The ULLI is the number of nucleiin S-phase in the lamina propria and adjacent periosteum The underlying turbinate bone was used for determination of length. Rats were exposed 6 hr/day for 7 or 5 days/week. Additional rats were exposed for 6 hr/day, 7 days/week for 6 weeks and then housed in the control chambers for the remaining7 weeks (6-week stop). Asterisks (*) denote groups that were statistically different from exposure- and duration-matched control groups (Williams test,p < 0.05).
were not considered to be significantly different from con-trols. At 13 weeks, 12/15 rats exposed to 90 ppm chloroform7 days/week had areas of mild vacuolation in midzonal hepa-tocytes with infrequent hepatocyte degeneration. Centrilobu-lar to midzonal hepatocyte degeneration was found in 15/15 female rats exposed to 300 ppm chloroform 7 days/weekfor 13 weeks.
Rats exposed to 30 or 90 ppm, 5 days/week for 13 weekswere not significantly different from controls. In rats exposedto 300 ppm, 13/13 had enlarged nuclei in midzonal hepato-cytes, centrilobular to midzonal hepatocyte vacuolation, andcentrilobular hepatocyte degeneration with single cell necro-sis. Rats exposed to 90 or 300 ppm 7 days/week for 6 weeksand held until Week 13 were not considered to be signifi-cantly different from controls.
The hepatocyte LI for female rats is given in Fig. 3B. Anincreased LI was found only in the 300 ppm exposures wherethe LI was increased 10-fold over controls at 3 weeks andapproximately 40-fold over controls with either a 7 or 5days/week exposure for 13 weeks. Female rats exposed to300 ppm for 6 weeks and evaluated at 13 weeks were notdifferent from controls.
The lesions characterized by intestinal crypt-like ductswith periductular fibrosis as described above for the malerat liver were dramatically increased in the livers of femalerats exposed to 300 ppm chloroform. These lesions were notseen at lower exposure concentrations of chloroform. Female
rats exposed for 13 weeks 7 days/week had a high densityof variably sized 2- to 5-mm pale foci throughout all lobes.Microscopically, the lesions were characterized as glandularstructures lined by columnar epithelium and goblet cells andsurrounded by connective tissue. The prevalence and sever-ity of the lesions was greatest in the right and caudate lobes.The severity of alterations in livers of the female rats wasgreater than that of the males. A more detailed descriptionof this lesion and accompanying proliferative changes hasbeen presented in a separate article (Jamison et al., 1996).
Nasal histopathology and cell proliferation. The prolif-erative and atrophic alterations induced in the nasal passagesof female rats exposed to chloroform vapor for 3 or 13 weekswere similar to those found in the male rat following 3 or13 weeks of exposure (data not shown).
Effects of chloroform on other tissues. The only treat-ment-related lesions observed in the full-screen microscopictissue examination were in the kidney, liver, and nasal pas-sages. Chloroform-associated lesions were not found in thenonnasal bones, sternebrae, vertebrae, tibia, femur, and artic-ular tissues of the knee, nor were these bone LI consideredto be different from control LI (data not shown).
DISCUSSION
Effects on Health and the Maximum Tolerated Dose
In the study reported here rats were exposed to 300 ppmbecause a pilot study suggested that rats might be able to
INHALED CHLOROFORM IN F-344 RATS 121
tolerate this dose for longer periods (Larson et al, 1994d).Further, when we began we had no knowledge of the resultsfrom the Japan Bioassay Laboratory long-term inhalationstudy with F-344 rats (Yamamoto et al., 1994). Chloroformconcentrations of 2 and 10 ppm had minimal effects on bodyweight gain, 30 and 90 ppm induced a minimal to milddecrease in average body weight gain, and 300 ppm had asignificant effect on body weight gain (Figs. 1A and IB).The substantial initial weight loss and continued decrementin weight gain observed at 300 ppm demonstrate that this isan excessively toxic vapor concentration for both male andfemale rats and would exceed criteria for a MTD for longer-term studies. These observations confirm 90 ppm as theappropriate highest concentration chosen for the chloroforminhalation cancer bioassay with F-344 rats (Yamamoto etal., 1994). The results from the Japan Bioassay Laboratoryinhalation study are valid and the use of higher exposureconcentrations would not be justified.
Chloroform-Induced Kidney Lesions
A clear concentration response in the number of rats af-fected, severity of histological alterations, and increased LTwas present in the kidneys of both male and female ratsexposed to chloroform vapors (Fig. 2, Table 2). The expres-sion of cytochrome P450 2E1 in the rat kidney, the primaryenzyme proposed to be responsible for the metabolism ofchloroform to toxic metabolites, has been reported to besimilar between male and female F-344 rats (Wilke et al.,1994). This may account for the nearly equal sensitivity ofthe sexes to the renal cytotoxicity of chloroform.
The LI in the cortex was significantly lower in male ratsexposed for 5 days/week than in those exposed to equalconcentrations 7 days/week. However, the LI was similarin female rats exposed for either 7 or 5 days/week. Theseobservations raise important issues as to appropriate designsfor long-term studies. Increased cell proliferation was notfound in either sex of rats exposed for 6 weeks and thenheld until Week 13, indicating that the proliferative responseis dependent on the presence of chloroform and representsregenerative growth as a result of repetitive cytolethality.
A concentration of 10 ppm in the male and the female ratwas determined to be the experimental no-observed-adverse-effect-level (NOAEL) within the proximal tubules of thecortex. No microscopic alterations were found in either sexof rats exposed 7 days/week to 10 ppm, nor was the LIwithin the proximal tubule epithelium elevated.
CPN within the kidney cortex was not a significant factorin the collection of the LI data in male rats. The foci in thecortex affected by CPN were relatively small, involving oneto five tubules, and could be distinguished as distinct areasof focal proliferation within the cortex. This pattern was incontrast to chloroform-induced cell regeneration, which wasdistributed throughout the cortex. Rats exposed to 30 or 90
ppm 5 days/week as well as rats exposed to 90 or 300 ppmfor the first 6 weeks and then held in the control chamberssupport the hypothesis that chloroform does not stimulatethe CPN process and actually may have an inhibitory effect.
Chloroform-Induced Liver Lesions
Significant microscopic evidence of cytolethality and re-generative cell proliferation in the liver occurred only at the300 ppm exposure concentrations. This is in contrast to thekidney, where histological alterations and an increased LIwere found at concentrations as low as 30 ppm.
Nonhepatocyte liver lesions characterized as intestinalcrypt-like ducts with periductular fibrosis were only foundin rats exposed to the strongly hepatotoxic atmospheric con-centration of 300 ppm of chloroform. Interestingly, otherliver cytotoxicants such as furan produce the same lesionunder severely hepatotoxic conditions (Maronpot et al.,1991). The furan-induced lesions also reportedly developpreferentially in the right and caudate liver lobes. Maronpotet al. (1991) reported that 100% of the animals treated for90 days with highly cytotoxic doses of furan and then main-tained without further treatment developed cholangiocarci-nomas at 6, 12, and 18 months. Since chloroform and furanhave little structural similarity, these lesions are apparentlysecondary to regenerative growth signals in the heavily dam-aged liver. Bile duct bromodeoxyuridine labeling indices aswell as observations of the locations of the early lesions atthe 3- and 6-week time points indicate that these lesionsarose from a stem cell and not from bile ducts (Jamison etal., 1996). These chloroform-induced lesions are differentfrom the bile duct proliferative lesion produced by bile ductligation followed by treatment with furan, which more ap-propriately might be termed cholangiofibrosis (Sirica et al.,1994).
If the F-344 rats had been exposed to 300 ppm chloroformfor 2 years, these lesions probably would have progressed tocholangiocarcinomas. However, such tumor induction wouldonly be secondary to the extreme cytotoxicity produced ata dose in excess of the MTD with no relevance for extrapo-lating to lower doses.
Chloroform-Induced Nasal Lesions
The early response of periosteal hypercellularity and in-creased ULLI in the lamina propria are consistent with pre-viously published 7-day inhalation studies (Larson et al.,1994d; Mery et al., 1994). Periosteal hypercellularity andincreased bone growth in this region have also been de-scribed following gavage dosing of chloroform to female F-344 rats for 4 consecutive days (Larson et al, 1995b). How-ever, chloroform does not appear to have a direct effect onbone growth in general since there were no treatment-relatedeffects on bone structure and growth at other sites.
Late atrophy was present not only in the areas of the same
122 TEMPLIN ET AL.
turbinates involved in the early proliferative response, butalso in the entire ethmoid region of the nasal cavity. Asignificant reduction in the number of cells normally foundin the lamina propria suggests that these cells are beingeliminated. New bone growth is not a prominent feature,and the bone formed during the proliferative response hasdeveloped to the point that the original borders are no longervisible.
The early lesions observed in the nasal passages of therat are similar to those observed in the mouse (Larson et al,1996). A crucial difference between the two species is thatthe early proliferative lesions were transient and a lateatrophic response was not apparent in the mouse. The obser-vations of atrophy in the nasal turbinates of F-344 rats inthe present study are consistent with observations reportedin a 2-year chloroform inhalation bioassay (Yamamoto etal, 1994). In an initial report of that study, the authorsdescribed noncancerous lesions such as ossification of thenasal turbinates and metaplasia from olfactory to respiratoryepithelium, alterations which were present at the lower con-centrations of 2 and 10 ppm. Further work will be neededto determine the species specificity of the response, includingpotential effects in humans. Research questions include theissues of regional specificity, regional dosimetry, effects onfunctionality, and distinguishing between an effect and anadverse effect.
Route-to-Route Extrapolations
Route and duration of exposure have a temporal impacton the kidney response. Larson et al. (1993) reported approx-imately an 18-fold increase in the LI in the cortex of maleF-344 rats administered a single bolus dose of 180 mg/kgchloroform in corn oil. When multiple doses of chloroformwere administered for either 4 consecutive days or 5 days/week for 3 weeks, the LI was considerably lower (Larsonet al., 1995a). This adaptation of the kidney to continuedchloroform exposures was also seen in the B6C3F| mousekidney and could represent a change in the character of thecells or loss of the ability to regenerate because of severetoxicity (Larson et al., 1994c). In contrast, the pattern of LIinduction in the F-344 rat kidney with inhalation exposuresshowed no increase at the Day 4 time point, but the LIincreased and remained significantly elevated at 3, 6, and13 weeks (Fig. 2). No increase in the kidney LI was observedin male F-344 rats administered chloroform in drinking waterfor 4 days or 3 weeks (Larson et al., 1995a).
Cell regeneration data have been effectively used by Lar-son et al. (1996) as an internal dosimeter to compare thebiologically effective dose to the liver for different routesof exposure to chloroform in female B6C3F, mice. Thiscomparison is more difficult in the rat kidney, where the LIhas a considerable time and route dependency.
Correlations between Cell Proliferation and Cancer
Events secondary to cytolethality and regenerative cellproliferation appear to be the driving force for tumor forma-tion for nongenotoxic-cytotoxic carcinogens such as chloro-form (Butterworth et al, 1995). In every case of chloroform-induced cancer examined thus far, there is a correspondingpreceding toxic response with associated activity such asregenerative cell proliferation (Larson etai, 1994b; Templinetal, 1996a,b). There are, however, instances where chloro-form induces regenerative cell proliferation without subse-quent cancer in a given target organ. For example, chloro-form produces liver and kidney toxicity in male B6C3F, andBDF, mice (Larson et al., 1994b; Templin et al., 1996a),but induces liver tumors in the former strain and kidneytumors in the latter (National Cancer Institute, 1976; Yama-moto et al, 1994). These results illustrate the principle thatgenetic background and target organ specificity greatly in-fluence tumor outcome. Thus, induced toxicity and regenera-tive cell proliferation are necessary but not always sufficientconditions to induce cancer in a given target organ. Thecritical correlation is between the shapes of the dose-re-sponse curves for regenerative cell proliferation and cancer,and each instance must be evaluated on a case-by-case basis.In evaluating the Yamamoto et al. (1994) study, the questionto be addressed is why chloroform did not induce cancer inthe F-344 rats. Because the same exposure conditions wereused, the cell proliferation data from the current study pro-vide a rare opportunity to compare the results to those froma chloroform inhalation bioassay (Yamamoto et al, 1994).
Lack of Genotoxic Activity
The first reason that chloroform did not induce cancer inF-344 rats is that chloroform is not genotoxic. The weightof evidence indicates that neither chloroform nor its metabo-lites are DNA-reactive (International Programme on Chemi-cal Safety, 1994). A characteristic of a mutagenic carcinogenis that it produces cancer in multiple tissues and species(Ashby and Tennant, 1988). Chloroform was administeredin very large amounts by inhalation to male and femaleF-344 rats for 2 years with no observed tumor induction(Yamamoto et al, 1994). This is not the mark of a genotoxiccarcinogen. In fact, a moderate amount of cell turnover oc-curred in the female rat kidney under bioassay conditions.If chloroform had even mild genotoxic activity, the combina-tion of that activity with the modest increase in cell turnoverwould likely have produced at least some increase in cancerin that target site.
Osborne-Mendel vs F-344 Rats
Knowledge of the dose-response curves for induced re-generative cell proliferation provides some insight as to whychloroform administered at the MTD produced cancer in
INHALED CHLOROFORM IN F-344 RATS 123
male Osborne-Mendel rats (National Cancer Institute,1976), but not in male F-344 rats (Yamamoto et al, 1994).Metabolic, pharmacokinetic, and dosimetry studies suggestthat chloroform is handled in a similar manner in Osborne-Mendel and F-344 strains (Staats et al, 1990). Data fromboth strains were used to develop a physiologically basedpharmacokinetic model for chloroform (Corley et al., 1990;Borghoff et al, 1994). In the bioassays with the Osborne-Mendel rat the tumors were classified as tubular epithelialcell adenomas and adenocarcinomas (National Cancer Insti-tute, 1976; Jorgenson et al., 1985). The results from thepresent study show that the proximal tubule epithelial cellsare the primary targets in the F-344 rat kidney, indicatingthat the target organ and cell population at risk are the samebetween these two rat strains. Further, chloroform inducesrenal toxicity and regenerative cell proliferation to about thesame extent in both male F-344 and Osborne-Mendel ratswhen given by gavage (Templin et al., 1996b).
Chloroform induced kidney tumors in male Osborne-Mendel rats when administered by gavage (National CancerInstitute, 1976). Thus, it was unexpected when chloroformdid not induce kidney cancer in either sex of F-344 ratswhen given by inhalation (Yamamoto et al, 1994). Chloro-form given by gavage at the doses that produced kidneycancer in male Osborne-Mendel rats (National Cancer Insti-tute, 1976) also induces renal toxicity and regenerative cellproliferation in the kidney in this strain of rat (Templin etal., 1996b). In contrast, chloroform given under the bioassayconditions of 90 ppm, 5 days/week produced only a marginalproliferative response in the F-344 male rat kidney (Fig. 2).These data help explain the induction of kidney tumors inthe Osborne-Mendel but not in the F-344 study and suggestthat more than marginal increases in cell proliferation cou-pled with persistent cytotoxicity are required to induce can-cer in this target organ.
The concentration-response curves shown in Fig. 2 showsubstantial regenerative cell proliferation in the kidney at300 ppm chloroform. Were those conditions to be used ina cancer study, they would in all likelihood yield kidneytumors. However, such tumor induction would only be sec-ondary to cytotoxicity seen in excess of the MTD with norelevance for extrapolating to lower doses.
Male vs Female Kidney Responses
The gavage study with Osborne-Mendel rats producedkidney tumors in male but not female animals (NationalCancer Institute, 1976). Similarly, chloroform administeredby inhalation to BDF, mice induced tumors in male but notfemale rodents. In the case of BDF, mice, males were verysensitive to the nephrotoxic effects of chloroform while fe-male mice were resistant (Templin et al., 1996a). This neph-rotoxic effect of chloroform is presumed to result from theproduction of toxic metabolites from chloroform in the kid-
ney via the cytochrome P450 mixed-function oxidase sys-tem, and higher levels of P450 2E1 in male mice appear tobe the basis for the increased sensitivity seen in the males(Smith et al, 1984). Similarly, male but not female B6C3F,mice are sensitive to the nephrotoxic effects of chloroform(Larson et al, 1994b,c, 1996).
In contrast, male and female F-344 rats exhibit approxi-mately equivalent sensitivity to chloroform-induced kidneytoxicity (Fig. 2, Table 2; Larson et al, 1995a,b). In fact, amodest amount of cell turnover was observed in the femalerat kidney under the bioassay conditions of 90 ppm, 5 days/week. Some male rat kidney carcinogens appear to act bycausing accumulation of the male rat-specific protein a2a-globulin in the form of renal tubule protein droplets, resultingin increased cell death and cell turnover (Borghoff et al,1990). Beyond this, however, the kidneys of male rats areoften the target organ for carcinogenesis by chemicals thatdo not induce a2u-globulin and appear to be predisposed totumor formation (Barrett and Huff, 1991). Thus, the lack ofinduction of kidney tumors in the female F-344 rats in theinhalation bioassay (Yamamoto et al, 1994) despite modestcell turnover at 90 ppm (Fig. 2) illustrates the importanceof target organ susceptibility in chemical carcinogenesis.Regenerative cell proliferation may also have been takingplace in the kidneys of the female Osborne-Mendel ratsin the gavage bioassay (National Cancer Institute, 1976).However, tumors were not produced because induced regen-erative cell proliferation is necessary but not always suffi-cient to induce cancer because of tissue-, sex-, and species-specific susceptibilities.
ACKNOWLEDGMENTS
This work was supported in part by a research grant from the AmericanForest and Paper Association, Washington, DC. The authors thank Cather-ine Sprankle, Beth Kegelmeyer, Rebekah Harden, Otis Lyght, Mary Morris,and Delorise Williams for quality technical assistance; Dr. Owen Moss,Arden James, Marianne Marshall, and Carl Parkinson for outstanding tech-nical support in the generation of chloroform inhalation atmospheres; PaulRoss, Tim Shepard, Carol Bobbin, Richard Masney, Elizabeth Humphrey,and Kathy Bragg for excellent animal care and treatment; and Dr. BarbaraKuyper for valued editorial assistance.
REFERENCES
Aggazzotti, G., Fantuzzi, G., Tartoni, P. L., and Predieri, G. (1990). Plasmachloroform concentrations in swimmers using indoor swimming pools.Arch. Environ. Health 45, 175-179.
Andelman, J. B. (1985). Human exposures to volatile halogenated organicchemicals in indoor and outdoor air. Environ. Health Perspect. 62, 313—318.
Ashby, J., and Tennant, R. W. (1988). Chemical structure, Salmonellamutagenicity and extent of carcinogenicity as indicators of genotoxiccarcinogenesis among 222 chemicals tested in rodents by the U.S. NTP/NCI. Mutat. Res. 204, 17-115.
Barrett, J. C , and Huff, J. (1991). Cellular and molecular mechanisms ofchemically induced renal carcinogenesis. Renal Failure 13, 211-225.
124 TEMPLIN ET AL.
Borghoff, S. J., Murphy, J. E., and Dix, K. (1994). Validation of a physio-logically-based pharmacokinetic model for chloroform dosimetry in maleand female F-344 rats after inhalation exposure. 1SSX Proc. 6, 213.
Borghoff, S. J., Short, B. G., and Swenberg, J. A. (1990). Biochemicalmechanisms and pathobiology of a2u-globulin nephropathy. Annu. Rev.Pharmacol. Toxicol. 30, 349-367.
Bunn, W. W., Haas, B. B., Deane, E. R., and Kleopfer, R. D. (1975).Formation of trihalomethanes by chlorination of surface water. Environ.Lett. 10, 205.
Butler, E. C. V., and Dal Pont, G. (1992). Liquid chromatography electro-chemistry procedure for the determination of chlorophenolic compoundsin pulp mill effluents and receiving waters. J. Chromatogr. 609, 113-123.
Butterworth, B. E., Conolly, R. B , and Morgan, K. T. (1995). A strategyfor establishing mode of action of chemical carcinogens as a guide forapproaches to risk assessments. Cancer Lett. 93, 129-146.
Butterworth, B. E., Popp, J. A., Conolly, R. B., and Goldsworthy, T. L.(1992). Chemically-induced cell proliferation in carcinogenesis. In Mech-anisms of Carcmogenesis in Risk Identification (H. Vainio, P. N. Magee,D. B. McGregor, and A. J. McMichael, Eds.), IARC Scientific PublicationNumber 116, pp. 279-305.
Corley, R. A., Mendrala, A. L., Smith, F. A., Statts, D. A., Gargas, M. L.,Conolly, R. B., Andersen, M. E., and Reitz, R. H. (1990). Developmentof a physiologically based pharmacokinetic model for chloroform. Tox-icol. Appl. Pharmacol. 103, 512-527.
Craun, G. F. (Ed.) (1993). Safety of Water Disinfection: Balancing Chemi-cal and Microbial Risks. ILSI Press, Washington, DC.
Drinkwater, N. R. (1994). Genetic control of hepatocarcinogenesis in C3Hmice. Drug Metab. Rev. 26, 201-208.
Eldridge, S. R., Tilbury, L. F., Goldsworthy, T. L., and Butterworth, B. E.(1990). Measurement of chemically induced cell proliferation in rodentliver and kidney: A comparison of 5-bromo-2'-deoxyuridine and [3H]-thymidine administered by injection or osmotic pump. Carcinogenesis11,2245-2251.
Eschenbrenner, A. B., and Miller, E. (1945). Induction of hepatomas inmice by repeated oral administration of chloroform with observations onsex differences. / Natl. Cancer Inst. 2, 251-255.
International Programme on Chemical Safety (1994). Chloroform, Environ-mental Health Criteria 163, World Health Organization, Geneva.
Jamison, K. C , Larson, J. L., Butterworth, B. E., Harden, R., Skinner,B. L., and Wolf, D. C. (1996). A non-bile duct origin for intestinal crypt-like ducts with periductular fibrosis induced in livers of F-344 rats bychloroform inhalation. Carcinogenesis 17, 675—682.
Jo, W. K., Weisel, C. P., and Lioy, P. J. (1990). Routes of chloroformexposure and body burden from showering with chlorinated tap water.Risk Anal. 10, 575-580.
Jorgenson, T. A., Meierhenry, E. F., Rushbrook, C. J ., Bull, R. J., andRobinson, M. (1985) Carcinogenicity of chloroform in drinking waterto male Osbome-Mendel rats and female B6C3F1 mice. Fundam. Appl.Toxicol. 5, 760-769.
Larson, J. L., Sprankle, C. S.. and Butterworth, B. E. (1994a) Lack ofchloroform-induced DNA repair in vitro and in vivo in hepatocytes offemale B6C3F, mice. Environ. Mol. Mutagen. 23, 132-136.
Larson. J. L.. Templin. M. V.. Wolf. D. C , Jamison, K. C , Leininger.J. R., Mery, S., Morgan. K. T.. Wong, B. A., Conolly, R. B., and Butter-worth, B. E. (1996). A 90-day chloroform inhalation study in female andmale B6C3F1 mice: Implications for cancer risk assessment. Fundam.Appl. Toxicol. 30, 118-137.
Larson, J. L., Wolf, D. C , and Butterworth, B. E. (1993). The acute hepato-toxic and nephrotoxic effects of chloroform in male F-344 rats and femaleB6C3F1 mice. Fundam. Appl. Toxicol. 20, 302-315.
Larson, J. L., Wolf, D. C , and Butterworth, B. E. (1994b). Induced cytotox-icity and cell proliferation in the hepatocarcinogenicity of chloroform infemale B6C3F| mice: Comparison of administration by gavage in cornoil vs ad libitum in drinking water. Fundam. Appl. Toxicol. 22, 90—102.
Larson, J. L., Wolf, D. C , and Butterworth, B. E. (1994c). Induced cytoleth-ality and regenerative cell proliferation in the livers and kidneys of maleB6C3F, mice given chloroform by gavage. Fundam. Appl. Toxicol. 23,537-543.
Larson, J. L., Wolf, D. C , and Butterworth, B. E. (1995a). Induced regener-ative cell proliferation in the livers and kidneys of male F-344 rats givenchloroform in corn oil by gavage or ad libitum in drinking water. Toxicol-ogy 95, 73-86.
Larson, J. L., Wolf, D. C , Mery, S., Morgan, K. T., and Butterworth, B. E.(1995b). Toxicity and cell proliferation in the liver, kidneys and nasalpassages of female F-344 rats, induced by chloroform administered bygavage. Food Chem. Toxicol. 33(6), 443-456.
Larson, J. L., Wolf, D. C , Morgan, K. T., Mery, S., and Butterworth, B. E.(1994d). The toxicity of 1 week exposures to inhaled chloroform infemale B6C3F, mice and male F-344 rats. Fundam. Appl. Toxicol. 22,431-446.
Maronpot, R., Herschell, D., Dykes, D., and Irwin, R. (1991). Furan-inducedcholangiocarcinomas in Fischer 344 rats. Toxicol. Pathol. 19, 561-570.
Mery, S., Larson, J. L., Butterworth, B. E., Wolf, D. C , Harden, R., andMorgan, K. T. (1994). Nasal toxicity of chloroform in male F-344 ratsand female B6C3F, mice following a 1-week inhalation exposure. Tox-icol. Appl. Pharmacol. 125, 214-227.
Monticello, T. M., Morgan, K. T., and Hum, M. E. (1990). Unit length as thedenominator for quantification of cell proliferation in nasal epithelium.Toxicol. Pathol. 18, 24-31.
Morgan, K. T., Kimbell, J. S., Monticello, T. M., Patra, A. L., and Fleish-man, A. (1991). Studies of inspiratory airflow patterns in the nasal pas-sages of the F344 rat and rhesus monkey using nasal molds: Relevanceto formaldehyde toxicity. Toxicol. Appl. Pharmacol. 110, 223-240.
National Cancer Institute (NCI) (1976). Carcinogenesis Bioassay of Chloro-form, National Tech. Inform. Service No. PB264018/AS. Bethesda, MD.
National Institutes of Health (NIH) (1985). Guide for the Care and Use ofLaboratory Animals, NIH Publication No. 86-23. United States Depart-ment of Health and Human Services, Public Health Service.
Reitz, R. H., Fox, T. R., and Quast, J. F. (1982). Mechanistic considerationsfor carcinogenic risk estimation: Chloroform. Environ. Health Perspect.46, 163-168.
Reitz, R H., Mendrala, A. L., Corley, R. A., Quast, J. F., Gargas, M. L.,Andersen, M. E., Staats, D. A., and Conolly, R. B (1990). Estimatingthe risk of liver cancer associated with human exposures to chloroform.Toxicol. Appl. Pharmacol. 105, 443-459.
Rosenthal, S. L. (1987). A review of the mutagenicity of chloroform. Envi-ron. Mol. Mutag. 10, 211-216.
Singh, H. B., Salas, L. J., and Stiles, R E (1982). Distribution of selectedgaseous organic mutagens and suspect carcinogens in ambient air. Envi-ron. Set. Technol. 16, 872-880.
Sinca, A.. Cole, S.. and Williams, T. (1994). A unique rat model of bileductular hyperplasia in which liver is almost totally replaced with well-differentiated bile ductules. Am. J. Pathol. 144, 1257-1268.
Smith, J. H., Maita, K., Sleight, S., and Hook, J. B. (1984). Effect of sexhormone status on chloroform nephrotoxicity and renal mixed functionoxidases in mice. Toxicology 30, 305-316.
Staats, D. A.. King, G. A., and Conolly, R. B. (1990). Effects of aging onchloroform metabolism and tissue solubility. In 1989 Toxic HazardsResearch Unit Annual Report (R. S. Kutzman el al, Eds.), 1989 AnnualReport for Harry G. Armstrong Aerospace Medical Research Laboratory,
INHALED CHLOROFORM IN F-344 RATS 125
Wright-Patterson Air Force Base, pp. 151 -160. NSI Technology ServicesCorp., Dayton, OH.
Symons, J. M , Bellar, T. A., Carswell, J. K., DeMarco, J., Kropp, K. L.,Robeck, G. G., Seeger, D. R., Slocum, C. J., Smith, B. L., and Stevens,A. A. (1975). National organics reconnaissance survey for halogenatedorganics. J. Am. Water Works. Assoc. 67, 634.
Templin, M. V., Jamison, K. C , Wolf, D. C , and Butterworth, B. E. (1996a)Chloroform-induced cytotoxicity in BDF, mice. Toxicologist 30, 134.
Templin, M. V., Jamison, K. C , Wolf, D. C , Morgan, K. T., and Butter-worth, B. E. (1996b). Chloroform-induced cytotoxicity and kidney cancerin Osbome-Mendel and F-344 rats. Proc. Am. Assoc. Cancer Res. 37,114.
Wilke, A. V., Clay, A. S., and Borghoff, S. J. (1994). Cytochrome P4502E1 (P450 2E1) levels in male and female rat kidney: Implications forxenobiotic metabolism. Toxicologist 14, 73.
Williams, D. A. (1971). A test for differences between treatment meanswhen several dose levels are compared with a zero dose control. Biomet-rics 27, 103-117.
Williams, D. A. (1972). The comparison of several dose levels with a zerodose control. Biometrics 28, 519-531.
Wong, B. A., and Moss, O. R. (1994). Application of a building environ-mental management system to inhalation toxicology exposure control ofgases and vapors. Toxicologist 14, 63.
Yamamoto, S., Aiso, S., Ikawa, N., and Matsushima, T. (1994). JapanBioassay Laboratory, Japan Industrial Safety and Health Association,2445 Ohshibahara Hirasawa Hando Kanagawa, 257 Japan; Carcinogene-sis studies of chloroform in F344 rats and BDF, mice (abstract), Proceed-ings of the Fifty-third Annual Meeting of the Japanese Cancer Associa-tion.