production of functional recombinant chloroform reductive
TRANSCRIPT
1
PRODUCTION OF FUNCTIONAL RECOMBINANT CHLOROFORM REDUCTIVE DEHALOGENASE
Rabeya Rahmatullah
A thesis in fulfilment of the requirements for the degree of
Doctor of Philosophy
School of Biotechnology and Biomolecular Sciences Faculty of Science
The University of New South Wales Sydney, Australia
October 2020

i
ii
iii
iv
v

vi
I
Abstract Organohalides are recalcitrant, toxic environmental pollutants. The presence of these
compounds at elevated levels in soil and aquifers has led to a focus on methods to
remediate these sites. Reductive dehalogenase enzymes (RDases) found in organohalide
respiring bacteria (OHRB) utilise organohalides as electron acceptors for cellular energy
and growth, producing lesser-halogenated compounds that may be more biodegradable
and less toxic. Consequently, microbial reductive dehalogenation via organohalide
respiration represents a promising solution for clean-up of organohalide pollutants and
has been successfully applied in bioremediation of contaminated sites. Therefore, an
understanding of the structure–function relationship of RDases is of considerable
interest. Dehalobacter sp. UNSWDHB is an OHRB capable of respiring highly toxic
chloroform (CF) and converting it to dichloromethane (DCM). TmrA has been identified
as the key RDase responsible for this conversion and different strategies for functional
expression of recombinant TmrA is the focus of this thesis.
There have been several efforts to express recombinant RDases in different host
organisms. In this study, TmrA was recovered from inclusion bodies expressed in E. coli
and refolded in the presence of FeCl3, Na2S and cobalamin. TmrA has been previously
expressed in a soluble and functional form in the corrinoid-producing Bacillus
megaterium. The specific activity estimated for the recombinant TmrA was 11-fold
lower than the activity of the native TmrA. In this study different culture conditions were
screened to improve the specific activity of the recombinant TmrA produced in B.
megaterium. The screenings showed that lowering the concentration of xylose for
induction of TmrA expression increased the specific activity. TmrA was then expressed
in a soluble and active form in Shimwellia blattae. Co-expression with two different
chaperone proteins from the original host did not increase the level of soluble
expression however activity assays showed that removing the TAT signal from TmrA
increases the dechlorination activity compared to when the TAT signal is present. Finally,
TmrA was expressed in a soluble and active form in the H2-oxidizing C. necator H16, a

II
novel host for the expression of RDases. In summary, a range of strategies to
successfully produce recombinant TmrA are presented in this thesis

III
Acknowledgements I would like to express my deepest appreciation to my Supervisor, Christopher Marquis.
Thank you for taking me on as your student even though I came from an entirely
different academic background. I struggled so much with my health and life in general
during my stay in Sydney, it would not have been possible for me to continue my PhD
journey without a kind and compassionate Supervisor like you. Thank you for being so
understanding and patient with me all the time. I am grateful for your endless trust and
motivation which has made my time in your lab a wonderful experience. And special
thanks for your constant supply of chilies throughout the years!
I am deeply indebted to Hélène Lebhar, an awesome mentor, and an amazing friend.
Thank you for all your help in the lab, for being patient with me when I was making silly
mistakes. Thanks for being my shoulder to cry on and my go to person when I needed a
hug!
I would like to thank all the awesome lab mates I have had the pleasure of working with
the past four years. Priyanka, Bat, Miriam, Natalie, Carolin, Nga, Eve and Ismat, you have
all made my time in and out of the lab a fun and enjoyable one. Thanks for all the love
and care you have so generously showered me with. Special thanks to Keaghan for
teaching me all I know about PowerPoint and for always being there to listen to my crazy
rambling when I was having difficult days. I am super grateful to Sam for keeping me
sane during the final months of my PhD. Thank you for all your help, encouragement,
and hugs! I am also indebted to Hasti for helping me format my thesis.
I would like to thank the Australian Government for funding my studies through the
Endeavour Postgraduate Scholarship. I would like to express my gratitude to UNSW for
paying the tuition fee gap and the Postgraduate Research Student Support which funded
my attendance at the FEMS conference in Scotland. I would also like to thank the School
of BABS for offering the BABS Postgraduate Travel Fund and Top-Up Scholarship.

IV
And at last but not the least, I would like to thank my family for their continuous love
and support throughout my journey. I would especially like to thank my sisters, Radia
and Raisa, for being my rock and my biggest cheerleaders!
V
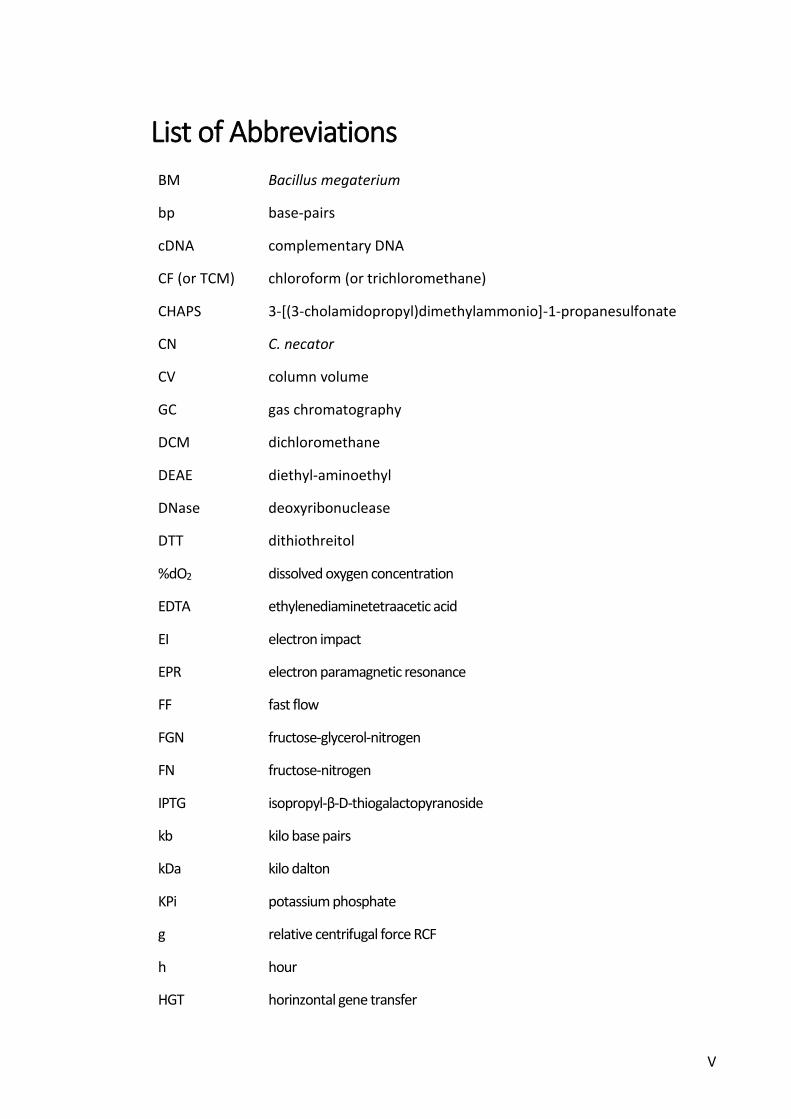
List of Abbreviations BM Bacillus megaterium
bp base-pairs
cDNA complementary DNA
CF (or TCM) chloroform (or trichloromethane)
CHAPS 3-[(3-cholamidopropyl)dimethylammonio]-1-propanesulfonate
CN C. necator
CV column volume
GC gas chromatography
DCM dichloromethane
DEAE diethyl-aminoethyl
DNase deoxyribonuclease
DTT dithiothreitol
%dO2 dissolved oxygen concentration
EDTA ethylenediaminetetraacetic acid
EI electron impact
EPR electron paramagnetic resonance
FF fast flow
FGN fructose-glycerol-nitrogen
FN fructose-nitrogen
IPTG isopropyl-β-D-thiogalactopyranoside
kb kilo base pairs
kDa kilo dalton
KPi potassium phosphate
g relative centrifugal force RCF
h hour
HGT horinzontal gene transfer
VI
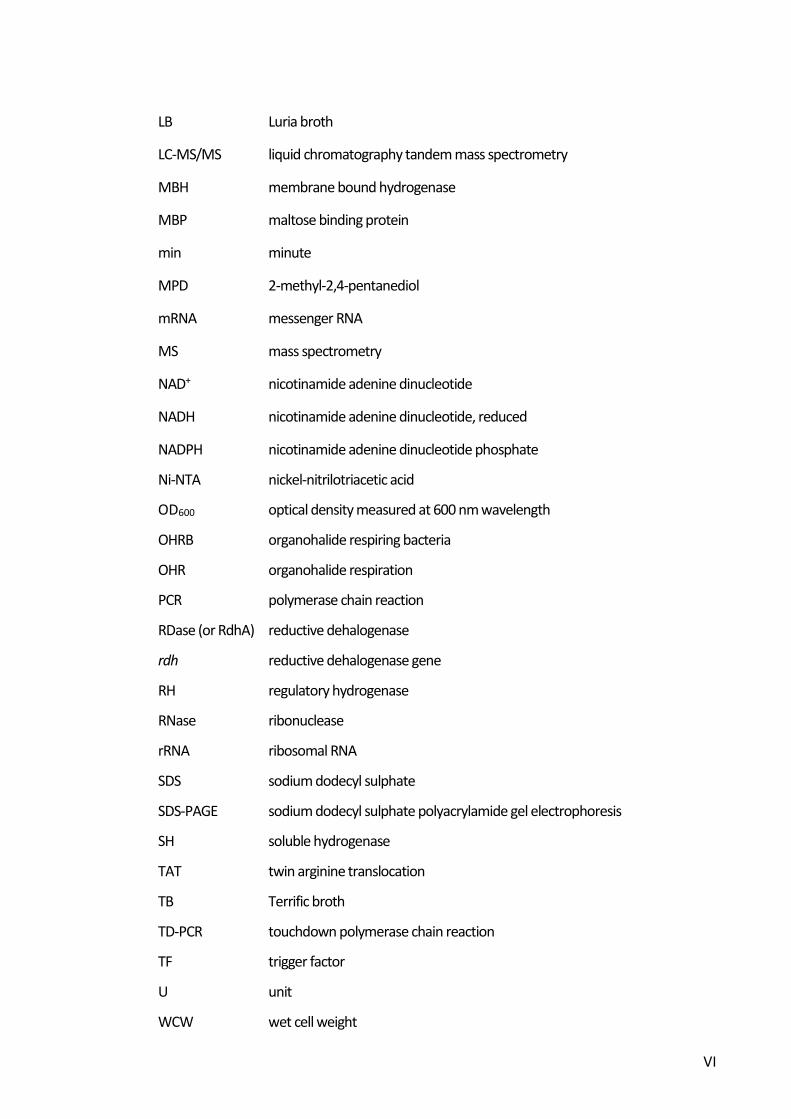
LB Luria broth
LC-MS/MS liquid chromatography tandem mass spectrometry
MBH membrane bound hydrogenase
MBP maltose binding protein
min minute
MPD 2-methyl-2,4-pentanediol
mRNA messenger RNA
MS mass spectrometry
NAD+ nicotinamide adenine dinucleotide
NADH nicotinamide adenine dinucleotide, reduced
NADPH nicotinamide adenine dinucleotide phosphate
Ni-NTA nickel-nitrilotriacetic acid
OD600 optical density measured at 600 nm wavelength
OHRB organohalide respiring bacteria
OHR organohalide respiration
PCR polymerase chain reaction
RDase (or RdhA) reductive dehalogenase
rdh reductive dehalogenase gene
RH regulatory hydrogenase
RNase ribonuclease
rRNA ribosomal RNA
SDS sodium dodecyl sulphate
SDS-PAGE sodium dodecyl sulphate polyacrylamide gel electrophoresis
SH soluble hydrogenase
TAT twin arginine translocation
TB Terrific broth
TD-PCR touchdown polymerase chain reaction
TF trigger factor
U unit
WCW wet cell weight
VII
TABLE OF CONTENTS
Abstract .............................................................................................................................. I
Acknowledgements .......................................................................................................... III
List of Abbreviations ......................................................................................................... V
TABLE OF CONTENTS ....................................................................................................... VII
LIST OF FIGURES .............................................................................................................XIV
CHAPTER ONE: Introduction ............................................................................................. 2
1.1 Organohalides: two sides of a coin ........................................................................................... 3
1.2 Chloroform: the good, the bad and the ugly ............................................................................ 5
1.3 Degradation of organohalides: abiotic and biotic ..................................................................... 8
1.4 Organohalide respiring bacteria (OHRB)................................................................................. 13
1.5 Environmental bioremediation and OHRB ............................................................................. 15
1.6 Key enzyme in reductive dehalogenation: reductive dehalogenases (RDases) .................... 17
1.7 Evolution of organohalide respiration and RDases ................................................................ 18
1.8 Structural characteristics of RDases ........................................................................................ 20
1.9 Types of RDases ....................................................................................................................... 23
1.10 Organisation of RDase gene cluster ...................................................................................... 24
1.11 Transcriptional regulation of RDase genes ........................................................................... 26
1.12 Dehalogenation reaction mechanisms of RDases ................................................................ 28
1.13 Electron transport chain in OHRB ......................................................................................... 30
1.14 Corrinoid cofactors in OHRB ................................................................................................. 34
1.15 Substrate range and specificity of RDases ............................................................................ 37
1.16 Challenges in producing native RDases ................................................................................ 39
VIII
1.17 Heterologous expressions of RDases: limitations and successes ......................................... 49
1.18 Dehalobacter UNSWDHB...................................................................................................... 58
1.19 RDase of Dehalobacter UNSWDHB (TmrA) .......................................................................... 59
1.20 Research aims and thesis outline .......................................................................................... 60
1.21 References ............................................................................................................................. 62
CHAPTER TWO: Recovering functional chloroform reductive dehalogenase from
inclusion bodies in Escherichia coli ................................................................................. 80
2.1 INTRODUCTION ....................................................................................................................... 81
2.2 EXPERIMENTAL PROCEDURES ................................................................................................ 83
2.2.1 Bioreactor fermentation ................................................................................. 83
2.2.2 SDS-PAGE ........................................................................................................ 84
2.2.3 SDS-MPD based system .................................................................................. 84
2.2.4 Aerobic purification and anaerobic cofactor reconstitution method ............ 86
2.2.5 Dechlorination activity assay .......................................................................... 87
2.3 RESULTS ................................................................................................................................... 89
2.3.1 Large-scale heterologous production of TmrA in E. coli ................................. 89
2.3.2 Recovery and refolding of TmrA from inclusion bodies: SDS-MPD based system
................................................................................................................................. 90
2.3.3 Aerobic purification and anaerobic cofactor reconstitution method ............ 92
2.4 DISCUSSION ............................................................................................................................. 95
2.5 CONCLUSIONS ......................................................................................................................... 98
2.6 REFERENCES ............................................................................................................................ 99
CHAPTER THREE: Production of functional recombinant chloroform reductive
dehalogenase in Bacillus megaterium: improving existing findings ............................. 101
IX
3.1 INTRODUCTION ..................................................................................................................... 102
3.2 EXPERIMENTAL PROCEDURES .............................................................................................. 104
3.2.1 Preliminary screening ................................................................................... 104
3.2.2 Second screening: full factorial design ......................................................... 105
3.2.3 SDS-PAGE ...................................................................................................... 106
3.2.4 Western blot analysis ................................................................................... 106
3.2.5 Determination of protein concentration ...................................................... 107
3.2.6 Dechlorination activity assay ........................................................................ 107
3.2.7 Large-scale culture and cell lysis ................................................................... 107
3.2.8 Purification of NHis-TmrA ............................................................................. 108
3.3 RESULTS ................................................................................................................................. 109
3.3.1 Primary screening of culture conditions ....................................................... 109
3.3.2 Second screening of culture conditions ....................................................... 111
3.3.3 Purification of NHis-TmrA ............................................................................. 116
3.4 DISCUSSION ........................................................................................................................... 118
3.5 CONCLUSIONS ....................................................................................................................... 122
3.6 REFERENCES .......................................................................................................................... 123
CHAPTER FOUR: Heterologous expression of chloroform reductive dehalogenase TmrA
in Shimwellia blattae: co-expression with chaperone proteins ................................... 126
4.1 INTRODUCTION ..................................................................................................................... 127
4.2 EXPERIMENTAL PROCEDURES .............................................................................................. 130
4.2.1 Plasmid construction .................................................................................... 130
X
4.2.2 Preparing competent S. blattae cells and transformation ........................... 135
4.2.3 Heterologous expression of CF reductive dehalogenase in S. blattae ......... 137
4.2.4 Cell lysis ......................................................................................................... 138
4.2.5 Dechlorination activity assay ........................................................................ 138
4.2.6 SDS-PAGE ...................................................................................................... 138
4.2.7 Transcript analysis ........................................................................................ 139
4.3 RESULTS ................................................................................................................................. 141
4.3.1 Anhydrotetracycline-inducible expression of TmrA in S. blattae ................. 141
4.3.2 IPTG-inducible expression of TmrA in S. blattae .......................................... 145
4.3.3 Co-expression of TmrA with chaperone proteins ......................................... 147
4.3.4 Transcript analysis ........................................................................................ 150
4.3.5 Dechlorination activity of TmrA expressed in S. blattae .............................. 153
4.4 DISCUSSION ........................................................................................................................... 154
4.5 CONCLUSIONS ....................................................................................................................... 157
4.6 REFERENCES .......................................................................................................................... 158
CHAPTER FIVE: Cupriavidus necator as a chloroform reducing organism: a molecular
biology approach ........................................................................................................... 161
5.1 INTRODUCTION ..................................................................................................................... 162
5.2 EXPERIMENTAL PROCEDURES .............................................................................................. 164
5.2.1 C. necator H16 strain confirmation .............................................................. 164
5.2.2 Chloroform and dichloromethane tolerance test ........................................ 164
5.2.3 Vitamin B12 uptake assay .............................................................................. 165
XI
5.2.4 Expression of native Ni-Fe hydrogenase in C. necator ................................. 166
5.2.5 Cell lysis ......................................................................................................... 167
5.2.6 Hydrogenase activity assay ........................................................................... 167
5.2.7 Hydrogenation-dechlorination activity assay ............................................... 167
5.2.8 Gene cloning ................................................................................................. 168
5.2.9 Transformation of C. necator ........................................................................ 172
5.2.10 Recombinant expression of TmrA in C. necator ......................................... 174
5.2.11 Cell lysis ....................................................................................................... 175
5.2.12 SDS-PAGE .................................................................................................... 175
5.2.13 Dechlorination activity assay ...................................................................... 175
5.2.14 Transcript analysis ...................................................................................... 176
5.3 RESULTS ................................................................................................................................. 177
5.3.1 C. necator chloroform and dichloromethane tolerance test ....................... 177
5.3.2 C. necator vitamin B12 uptake assay ............................................................. 179
5.3.3 Expression of native Ni-Fe hydrogenase in C. necator ................................. 179
5.3.4 Hydrogenation-dechlorination activity assay using cell lysates of C. necator
and B. megaterium ................................................................................................ 180
5.3.5 IPTG-inducible expression of TmrA in C. necator ......................................... 181
5.3.6 Rhamnose-inducible expression of TmrA in C. necator................................ 182
5.4 DISCUSSION ........................................................................................................................... 185
5.5 CONCLUSIONS ....................................................................................................................... 189
XII
5.6 REFERENCES .......................................................................................................................... 190
CHAPTER SIX: General discussion and concluding remarks .......................................... 196
6.1 Reductive dehalogenases in organohalide respiration ........................................................ 197
6.2 Escherichia coli: the recombinant protein expression factory ............................................. 198
6.3 Bacillus megaterium: the big beast ....................................................................................... 198
6.4 Shimwellia blattae: the vitamin B12-producing gut bacteria from cockroach ...................... 199
6.5 Cupriavidus necator: the “knallgas” bacteria ........................................................................ 200
6.6 Comparing the four expression systems .............................................................................. 201
6.7 Standout findings of this study .............................................................................................. 203
6.8 Future research ..................................................................................................................... 204
6.9 References ............................................................................................................................. 206
Appendices ...................................................................................................................... 208
A.1 Vector Maps .......................................................................................................................... 209
A.2 Sequence of genes used in the experiments ....................................................................... 215
A.2.1 tmrA without TAT-signal .................................................................................... 215
A.2.2 tmrA with TAT-signal ......................................................................................... 216
A.2.3 tf104 ............................................................................................................... 217
A.2.4 tf161 ............................................................................................................... 218
A.3 Composition of culture media and buffers .......................................................................... 219
A.4 Dechlorination activity assay calculation data ...................................................................... 220
A.5 Screening of recombinant B. megaterium for expression of TmrA using an anti-His
monoclonal antibody in a Western blot assay ........................................................................... 224
A.6 LC-MS/MS Results to confirm identity of TmrA in excised gel bands .................................. 229

XIII
XIV
LIST OF FIGURES Figure 1.1. Global chlorine cycle ....................................................................................... 4
Figure 1.2. Model of reductive dehalogenase maturation in cells ................................. 21
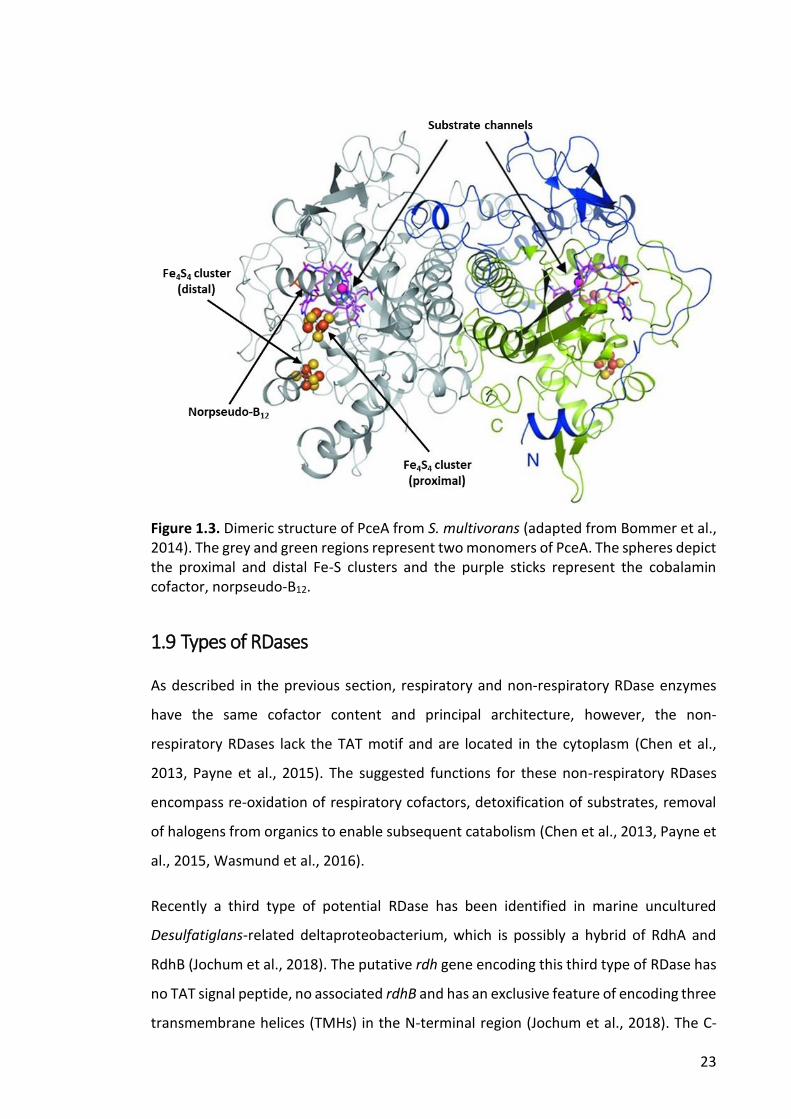
Figure 1.3. Dimeric structure of PceA from S. multivorans ............................................ 23
Figure 1.4. Organisation of RDase gene clusters ............................................................ 25
Figure 1.5. (a) Organocobalt adduct mechanism ............................................................ 28
Figure 1.6. (b) Radical mechanism for reductive dehalogenation .................................. 29
Figure 1.7. (c) Reductive dehalogenation by cobalt–halogen bond formation .............. 30
Figure 1.8. Putative composition, organisation, and function of a quinone-dependent
electron transport chain during catabolic reductive dehalogenation ............................ 32
Figure 1.9. Hypothetical model of organohalide respiration complex ........................... 34
Figure 1.10. The structures of cobalamin-B12 and norspuedocobalamin-B12 ............... 35
Figure 1.11. Full length amino acid sequence of TmrA................................................... 60
Figure 2.1. TmrA fusion constructs with affinity (NHis and CHis) and solubility tags MBP
(Maltose binding protein) and TF (trigger factor), encoded in pOPIN expression vector
......................................................................................................................................... 82
Figure 2.2. Fermentation of BL21(DE3)pLysS cells transformed with pOPIN-TmrA-CHis,
pOPIN-TmrA-MBP and pOPIN-TmrA-TF .......................................................................... 89
Figure 2.3. SDS-PAGE analysis of heterologously expressed TmrA fusion proteins ....... 90
Figure 2.4. Purification of TmrA-CHis by affinity chromatography and anion exchange
chromatography .............................................................................................................. 91
Figure 2.5. Ni-NTA column purification of TmrA-MBP .................................................... 91
XV
Figure 2.6. Purification of TmrA-CHis and TmrA-TF by affinity chromatography ........... 92
Figure 2.7. CF dechlorination .......................................................................................... 94
Figure 3.1. TmrA fusion construct used in B. megaterium expression using pPT7 vector
....................................................................................................................................... 103
Figure 3.2. SDS-PAGE of the soluble protein fractions from cell pellets obtained from the
second screening conditions ......................................................................................... 112
Figure 3.3. Dechlorination of CF with B. megaterium cell lysates ................................ 112
Figure 3. 4. Effect of different culture conditions on specific activity .......................... 113
Figure 3.5. Prediction profiler generated with JMP software. ..................................... 113
Figure 3.6. SDS-PAGE of the soluble protein fractions from cell pellets obtained from
cultures with reduced xylose concentrations ............................................................... 114
Figure 3.7. Effect of culture conditions on specific activity .......................................... 115
Figure 3.8. Prediction profiler generated with JMP for induction with different xylose
concentrations. ............................................................................................................. 115
Figure 4.1. tmrAB operon of Dehalobacter sp. UNSWDHB .......................................... 128
Figure 4.2. PCR products in Gibson assembly of tmrA and pASK-IBA63c-plus ............. 142
Figure 4.3. SDS-PAGE analysis of insoluble and soluble fractions of cell lysate of S. blattae
expressing TmrA ............................................................................................................ 143
Figure 4.4. PCR products for Golden Gate cloning and subsequent colony PCR .......... 144
Figure 4.5. SDS-PAGE analysis of soluble fraction of cell lysates of S. blattae expressing
TmrA .............................................................................................................................. 145
Figure 4.6. PCR products used in Gibson assembly and tmrA from colony PCR. ......... 146
Figure 4.7. SDS-PAGE of cell lysate of S. blattae ........................................................... 147
XVI
Figure 4.8. PCR products in Golden Gate assembly of tf104 into vectors pASK-IBA63c-
plus and pBBR1MCS-2 ................................................................................................... 148
Figure 4.9. PCR products in Golden Gate assembly of tf161 into vectors pASK-IBA63c-
plus and pBBR1MCS-2 ................................................................................................... 149
Figure 4.10. SDS-PAGE analysis of S. blattae cells containing TmrA and chaperone
proteins cloned into pBBR1MCS-2 ................................................................................ 149
Figure 4.11. Transcript analysis of tmrA_full gene expressed in S. blattae .................. 150
Figure 4.12. Transcript analysis of tf104 and with tmrA_full genes cloned in pBBR1MCS-
2 vector and expressed in S. blattae ............................................................................. 151
Figure 4.13. Transcript analysis of tf161 and with tmrA_full genes cloned in pBBR1MCS-
2 vector and expressed in S. blattae ............................................................................. 151
Figure 4.14. Transcript analysis of tf104 and with tmrA_full genes cloned in pASK-IBA63c-
plus vector and expressed in S. blattae. ....................................................................... 152
Figure 4.15. Transcript analysis of tf161 and with tmrA_full genes cloned in pASK-IBA63c-
plus vector and expressed in S. blattae ........................................................................ 152
Figure 4.16. Dechlorination of CF to DCM by S. blattae strains extracts ...................... 153
Figure 4.17. The different plasmid constructs and S. blattae transformants used in the
expression tests............................................................................................................. 155
Figure 5.1. Layout of the Deutz microplates with different concentrations of CF and DCM
for tolerance test. ......................................................................................................... 165
Figure 5.2. OD600 of C. necator grown with various concentrations of chloroform (CF) at
different time points. .................................................................................................... 178
Figure 5.3. OD600 of C. necator grown with different concentrations of dichloromethane
(DCM). ........................................................................................................................... 178
XVII
Figure 5.4. Vitamin B12 uptake assay ............................................................................ 179
Figure 5.5. Reduction of NAD+ to NADH (observed at 340 nm) coupled with H2 oxidation
by soluble hydrogenase from C. necator ...................................................................... 180
Figure 5.6. Transcript analysis of tmrA expressed in C. necator grown in rich media. 181
Figure 5.7. Gene cloning and subsequent colony PCR .................................................. 182
Figure 5.8. SDS-PAGE of rhamnose-inducible expression of TmrA in C. necator ......... 183
Figure 5.9. CF dechlorination assay by A. C. necator .................................................... 184
Figure A1.1. Vector map of plasmid used in E. coli experiments. ................................ 209
Figure A1.2.Vector map of plasmid used in E. coli experiments. ................................. 210
Figure A1.3. Vector map of plasmid used in E. coli experiments. ................................ 211
Figure A1.4. Vector maps of plasmids used for recombinant expression of TmrA in B.
megaterium .................................................................................................................. 212
Figure A1.5. Vector maps of plasmids used in S. blattae experiments. ....................... 213
Figure A1.6. Vector map of the plasmid used in recombinant TmrA expression in C.
necator. ......................................................................................................................... 214
Figure A.4.1. DCM standard curve for dehalogenation activity calculation. ................ 220
Figure A.4.2. CF standard curve for dehalogenation activity calculation. .................... 221
Figure A.5.1. Western blot images of screening conditions ......................................... 224
Figure A.5.2. Western blot images of screening conditions ......................................... 225
Figure A.5.3. Western blot images of screening conditions ......................................... 226
Figure A.5.4. Western blot images of screening conditions.. ....................................... 227
XVIII
Figure A.5.5. Western blot image of pre- and post-induction samples from 1 L culture of
B. megaterium. .............................................................................................................. 228
Figure A.1. LC-MS/MS result for insoluble TmrA-Chis expressed in E. coli. .................. 231
Figure A.2. LC-MS/MS result for insoluble TmrA-Chis expressed in E. coli (continued).
....................................................................................................................................... 232
Figure A.3. LC-MS/MS result for insoluble TmrA-MBP expression in E. coli. ................ 233
Figure A.4. LC-MS/MS result for insoluble TmrA-MBP expression in E. coli (continued).
....................................................................................................................................... 234
Figure A.5. LC-MS/MS data for pASK_TmrA expressed in S. blattae (soluble cell fraction).
....................................................................................................................................... 235
Figure A.6. LC-MS/MS data for pASK_TmrA expressed in S. blattae (insoluble cell
fraction). ........................................................................................................................ 235
Figure A.7 LC-/MS/MS data for pBBR_TmrA expressed in S. blattae (insoluble cell
fraction). ........................................................................................................................ 236
XIX
LIST OF TABLES
Table 1.1 Different biological dehalogenation mechanisms and the enzymes involved 10
Table 1.2 Properties of (partially) purified native RDases .............................................. 40
Table 1.3 Purification methods used for native RDases ................................................. 47
Table 1.4 Heterologous expression of RDases ................................................................ 52
Table 3.1 Culture conditions for primary screening: factors and levels ....................... 105
Table 3.2 Culture conditions for second screening: factors and levels ........................ 106
Table 3.3 Primary screening conditions generated by JMP software .......................... 110
Table 3.4 Second screening conditions ......................................................................... 111
Table 4.1 List of primers used in plasmid construction for soluble expression of TmrA
with and without chaperone proteins in S. blattae and subsequent transcript analysis
studies. .......................................................................................................................... 133
Table 4.2 List of S. blattae transformants created and used in recombinant protein
expression experiments ................................................................................................ 136
Table 5.1 Sample and controls used in the Hydrogenation-dechlorination assay ....... 168
Table 5.2 TD-PCR thermal cycling conditions for linearizing pKRrha plasmid .............. 170
Table 5.3 List of primers used in plasmid construction for rhamnose-inducible expression
of TmrA in C. necator and transcript analysis studies ................................................... 171
Table 5.4 Different culture conditions tested for the IPTG-inducible expression of TmrA
in C. necator .................................................................................................................. 174
Table 5.5 Culture conditions for screening of rhamnose-inducible expression of TmrA in
C. necator ...................................................................................................................... 175
1
Table A.4.1 Raw data for standard curve construction ................................................ 220
Table A.4.3 Raw data for dechlorination activity assay for E. coli samples .................. 221
Table A.4.4 Raw data for dechlorination activity assay for B. megaterium samples ... 222
Table A.4.5 Raw data for dechlorination activity assay for S. blattae samples ............ 222
Table A.4.6 Raw data for dechlorination activity assay for C. necator samples ........... 223

2
CHAPTER ONE: Introduction
3
1.1 Organohalides: two sides of a coin
Organohalides are organic compounds containing one or more carbon-halogen covalent
bonds which can be saturated, unsaturated or cyclic and are one of the largest groups
of chemicals found in the environment (Smidt and Vos, 2004). They are important
components of the halogen biogeochemical cycles (Figure 1.1.). From only 24 in 1968,
the number of identified natural organohalides continue to increase at a rate of 100–
200 per year and till 2014 more than 5000 natural compounds have been identified
which are produced by a multitude of living organisms such as bacteria, fungi,
microalgae, sponges, higher plants, insects and animals or by abiotic processes like
volcanoes, forest fire and other geothermal activities Gribble (2009, 2012, 2015). More
than half of the described natural organohalides contain chlorine, almost half contain
bromine, several hundred contain both chlorine and bromine (Field, 2016), 182 contain
iodine (Wang et al., 2014a) and about 30 contain fluorine (Sato, 2013). However,
organohalides have received much attention because of their anthropogenic origin and
widespread use in daily life and large industrial sectors alike. The negatively charged
halogen renders organohalides thermal and chemical stability and makes them suitable
to be used as refrigerants, water disinfectants, pesticides, solvents, plastics, propellants,
fire retardants and extinguishers, pharmaceuticals and much more. It is estimated that
chlorine is required at some stage of production in 85% of the pharmaceuticals produced
globally (Sasson, 2009). The highest amounts of organohalides produced in the industry
are chloroethanes, chloroethenes, chlorobenzenes, chlorophenols and polychlorinated
biphenyls (Horton et al., 2002).
Organohalides are produced in great quantities; global production of chlorinated
compounds was 56 million metric tonnes in 2010, production of brominated and
fluorinated compounds in 2008 were 0.563 and 5.6 million metric tonnes respectively
(UNEP, 2013). However, organohalides are recalcitrant pollutants and their massive
usage, improper handling and disposal poses threat to human health and the
environment. Because of their high persistency and mobility, organohalides have even
been detected in areas like the Arctic region and Mount Everest where such synthetic
chemicals have never been used (Fawell and Hunt, 1988). Alarming levels of
4
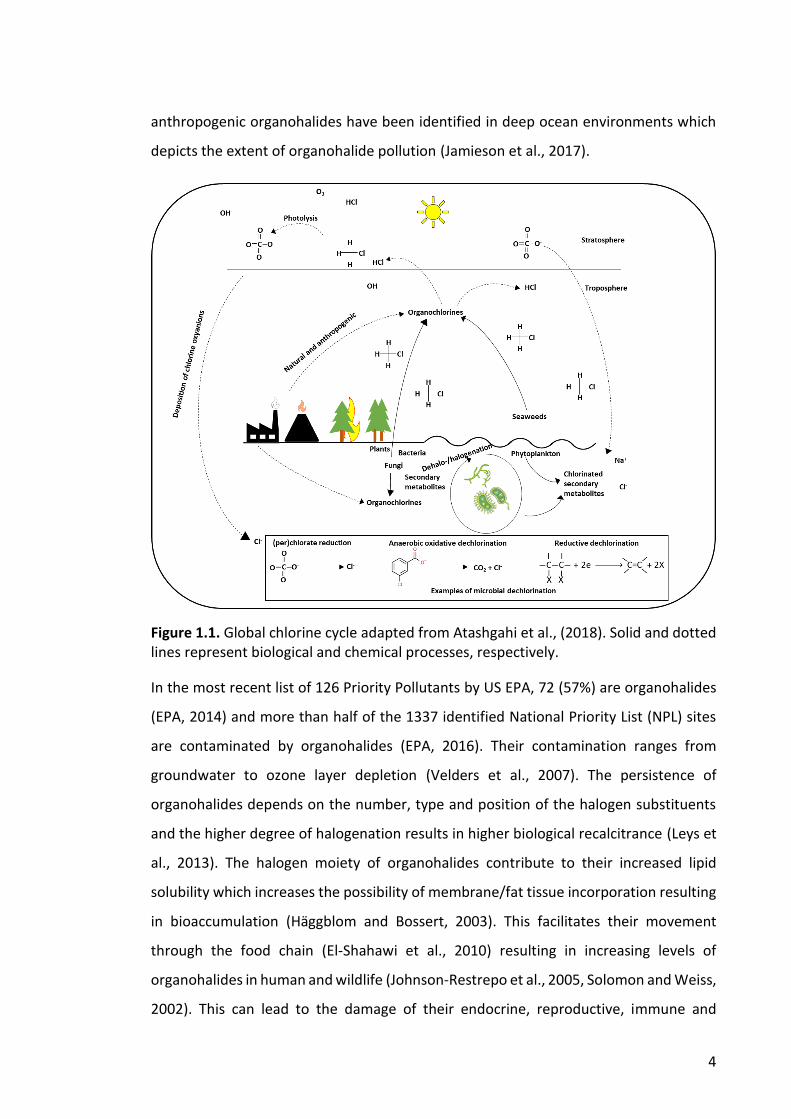
anthropogenic organohalides have been identified in deep ocean environments which
depicts the extent of organohalide pollution (Jamieson et al., 2017).
Figure 1.1. Global chlorine cycle adapted from Atashgahi et al., (2018). Solid and dotted lines represent biological and chemical processes, respectively.
In the most recent list of 126 Priority Pollutants by US EPA, 72 (57%) are organohalides
(EPA, 2014) and more than half of the 1337 identified National Priority List (NPL) sites
are contaminated by organohalides (EPA, 2016). Their contamination ranges from
groundwater to ozone layer depletion (Velders et al., 2007). The persistence of
organohalides depends on the number, type and position of the halogen substituents
and the higher degree of halogenation results in higher biological recalcitrance (Leys et
al., 2013). The halogen moiety of organohalides contribute to their increased lipid
solubility which increases the possibility of membrane/fat tissue incorporation resulting
in bioaccumulation (Häggblom and Bossert, 2003). This facilitates their movement
through the food chain (El-Shahawi et al., 2010) resulting in increasing levels of
organohalides in human and wildlife (Johnson-Restrepo et al., 2005, Solomon and Weiss,
2002). This can lead to the damage of their endocrine, reproductive, immune and
5
nervous systems, leading to allergies, cancer and even death (Lee et al., 2006). Many
organohalides are classified as carcinogens or suspected carcinogens and long-term
exposure may result in developmental defects and chronic illnesses in human (El-
Shahawi et al., 2010). Hence the production and sale of many organohalides are banned
worldwide (Wang et al., 2016) and it is no surprise that now there is more interest in the
destruction of organohalides than their creation. The clean-up of these compounds from
contaminated sites is now a priority.
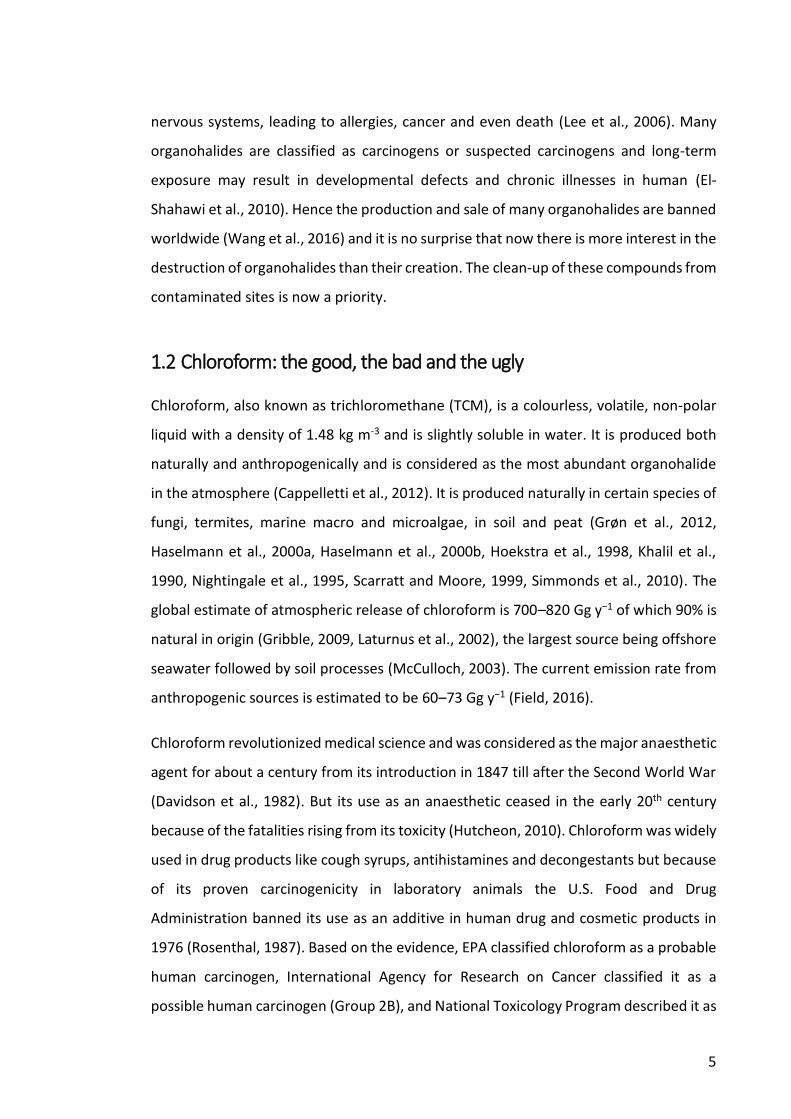
1.2 Chloroform: the good, the bad and the ugly
Chloroform, also known as trichloromethane (TCM), is a colourless, volatile, non-polar
liquid with a density of 1.48 kg m-3 and is slightly soluble in water. It is produced both
naturally and anthropogenically and is considered as the most abundant organohalide
in the atmosphere (Cappelletti et al., 2012). It is produced naturally in certain species of
fungi, termites, marine macro and microalgae, in soil and peat (Grøn et al., 2012,
Haselmann et al., 2000a, Haselmann et al., 2000b, Hoekstra et al., 1998, Khalil et al.,
1990, Nightingale et al., 1995, Scarratt and Moore, 1999, Simmonds et al., 2010). The
global estimate of atmospheric release of chloroform is 700–820 Gg y−1 of which 90% is
natural in origin (Gribble, 2009, Laturnus et al., 2002), the largest source being offshore
seawater followed by soil processes (McCulloch, 2003). The current emission rate from
anthropogenic sources is estimated to be 60–73 Gg y−1 (Field, 2016).
Chloroform revolutionized medical science and was considered as the major anaesthetic
agent for about a century from its introduction in 1847 till after the Second World War
(Davidson et al., 1982). But its use as an anaesthetic ceased in the early 20th century
because of the fatalities rising from its toxicity (Hutcheon, 2010). Chloroform was widely
used in drug products like cough syrups, antihistamines and decongestants but because
of its proven carcinogenicity in laboratory animals the U.S. Food and Drug
Administration banned its use as an additive in human drug and cosmetic products in
1976 (Rosenthal, 1987). Based on the evidence, EPA classified chloroform as a probable
human carcinogen, International Agency for Research on Cancer classified it as a
possible human carcinogen (Group 2B), and National Toxicology Program described it as
6
a substance that may reasonably be anticipated to be carcinogenic in humans. Its
application as an industrial solvent, however, increased twice as much in 1990 than in
1980 (Cappelletti et al., 2012). Nowadays, more than 90% of the total production of
chloroform is used in the manufacture of refrigerant chlorodifluoromethane (HCFC-22)
while the remaining chloroform has diverse applications in production of
fluoropolymers (e.g. polytetrafluoroethylene, fluorinated ethylene-propylene and
others), pesticide formulation, industrial solvent and adhesive, fire extinguishers, dry
cleaning spot remover, intermediate in the preparation of dyes.
Chloroform can be released into the environment as a consequence of its manufacture,
use and water chlorination practices; important sources being pulp and paper mills,
water treatment plants, chemical manufacturing plants, and waste incinerators
(McCulloch, 2003). Spills and leaks from storage and waste sites may result in
chloroform entering water and soil. Abiotic and biotic dechlorination of carbon
tetrachloride which is another common industrial solvent also causes accumulation of
chloroform at contaminated sites (Grostern et al., 2010). Because of inappropriate
disposal practices, chloroform is a pollutant of concern in all developed countries where
it is produced in bulk amounts, particularly USA, Europe and Japan (Rossberg et al.,
2006). It is in the recent list of 126 priority pollutants by EPA, 11th in the CERCLA Priority
List of Hazardous Substances and present in 351 out of 1337 pollutant sites of the
National Priority List in the USA (EPA, 2016). Chloroform is a recalcitrant environmental
pollutant which under purely hydrolytic conditions has an estimated half-life of 3100
years (Mabey and Mill, 1978). When exposed to the environment, chloroform gradually
leaches from soil to groundwater because of its high density, low soil adsorption and
water solubility and remain as subsurface solvent pools known as dense non-aqueous
phase liquid (DNAPL) within subsurface water systems (Lee et al., 2012). Chloroform is
also an inhibitor of microbial processes essential for biogeochemical cycling such as
methanogenesis (Weathers and Parkin, 2000) and organohalide respiration of
chlorinated ethanes and ethenes (McMurdie et al., 2011). Groundwater contaminated
with less than 2.5 mM (0.3 mg l-1) chloroform can inhibit microbial dechlorination of
chlorinated ethenes and cause accumulation of partially dechlorinated toxic
intermediates like cis-dichloroethene and vinyl chloride (Bagley et al., 2000, Duhamel et
7
al., 2002). Perchloroethene (PCE) dechlorination by organohalide respiring bacteria can
be completely inhibited by less than 1 mg l-1 of chloroform (Maymó-Gatell et al., 2001).
Perchloroethene and trichloroethene contaminated sites are frequently observed to be
co-contaminated by chloroform (Grostern et al., 2010). Thus, bioremediation of
contaminated sites where chloroform is also present may require prior removal of the
chloroform (Bagley et al., 2000).
Co-metabolic transformation of chloroform by methanogenic, acetogenic and sulfate-
reducing cultures have been observed (Bouwer and McCarty, 1983, Chung and
Rittmann, 2007, Chung and Rittmann, 2008, Freedman et al., 1995, Guerrero‐Barajas
and Field, 2005, Gupta et al., 1996, Koons et al., 2001, Olivas et al., 2002, Weathers and
Parkin, 1995). However, these processes require costly primary growth substrates such
as volatile fatty acids, methanol or dichloromethane and in some cases the addition of
extraordinarily high amounts of cyanocobalamins or other reduced metallo-coenzymes
are necessary (Becker and Freedman, 1994, Guerrero‐Barajas and Field, 2005), which
renders the process expensive. Metabolic or growth-linked transformation is thus
preferred over co-metabolic transformation for bioremediation because of its higher
efficiency and sustainability (Grostern et al., 2010). Dehalobacter sp. CF,
Desulfitobacterium sp. PR and Dehalobacter sp. UNSWDHB are organohalide respiring
bacteria which have been reported to be capable of chloroform respiration by utilizing
chloroform as terminal electron acceptors in respiration (Jugder et al., 2016b) and have
potential for bioremediation of chloroform (co-)polluted sites (Ding et al., 2014,
Grostern et al., 2010, Lee et al., 2012).
8
1.3 Degradation of organohalides: abiotic and biotic
Resistance to chemical and biological degradation is a quality that has made
organohalides useful in industrial applications but at the same time is also the reason
that makes them recalcitrant environmental pollutants (Häggblom and Bossert, 2003).
Despite their recalcitrance, degradation of these compounds does occur in natural
environments. Removal of halogens from these organohalides produce dehalogenated
compounds that are generally less toxic and have less probability to bioaccumulate
which makes them more susceptible to further microbial breakdown. However, it is
crucial to mention that sometimes the degradation product of dehalogenation can be
even more toxic than their precursors; for example, a degradation product of TCE or PCE
by TceA reductive dehalogenase from Dehalococcoides mccartyi 195 is vinyl chloride
(VC) which has a higher toxicity than the precursor compounds (Duhamel et al., 2002).
Spontaneous abiotic dehalogenation reactions usually happen through chemical
reduction by redox coupled reactions where concentration of reactive minerals is high
(Häggblom and Bossert, 2003). Naturally occurring minerals such as iron sulphide,
pyrite, magnetite and green rusts can degrade organohalides abiotically (Butler and
Hayes, 1999, Tobiszewski and Namieśnik, 2012). Abiotic transformation can also be
mediated by zerovalent iron, corrinoids and chemical oxidation using permanganates or
persulfates (Arnold and Roberts, 2000, Elsner et al., 2008, Glod et al., 1997, Hrapovic et
al., 2005, Krone et al., 1989, Tsitonaki et al., 2010). The degradation product of abiotic
dechlorination by β-elimination is acetylene which is considered to be benign to the
environment (Liang et al., 2007).
One of the key factors that determines the fate of organohalides in the environment is
their microbial degradation and a critical step to that is the cleavage of carbon-halogen
bonds (Häggblom and Bossert, 2003). The natural production and anthropogenic release
of organohalides to the environment has probably been the driving force for the
evolution of an unusually high microbial capacity to dehalogenate different classes of
organohalides (Smidt and Vos, 2004). Microbes generally use halogenated compounds
in four ways: as a carbon source and oxidisable substrate; in fermentative metabolism;
as an electron acceptor in respiration; and in cometabolic transformation related to
9
metabolic processes (Janssen et al., 2001). The inclination of microbes to use
organohalides as energy sources for growth is dependent on their energetic properties
such as bond strength, ionic potential, redox potential and Gibbs free energy of
formation. The use of microbes as the means of remediation is considered more cost
effective and sustainable than other mechanisms and hence this approach has been
studied extensively which has led to the detection and elucidation of a variety of
dehalogenases and dehalogenation mechanisms (Fetzner, 1998, Janssen et al., 1994). A
summary of different dehalogenation mechanisms is represented in Table 1.1.

10
Table 1.1 Different biological dehalogenation mechanisms and the enzymes involved
Name Definition Reaction Mechanism Enzymes involved
Hydrolytic dehalogenation
A halogen on an organic molecule is replaced by a hydroxyl group (Sims et al., 1991)
R-X + H2O → R-OH + HX 2-Haloacid
dehalogenase, haloalkane
dehalogenase
Thiolytic dehalogenation
Chlorine atoms are displaced by the nucleophilic attack of the thiolate anion of glutathione which is catalysed by glutathione S-transferases (Wang et al., 2010)
Glutathione S-transferase
Intramolecular substitution
Intramolecular nucleophilic substitution of a halogen by an adjacent hydroxyl that functions in halohydrins to yield epoxides (van Pée and Unversucht, 2003)
Haloalcohol dehalogenases
11
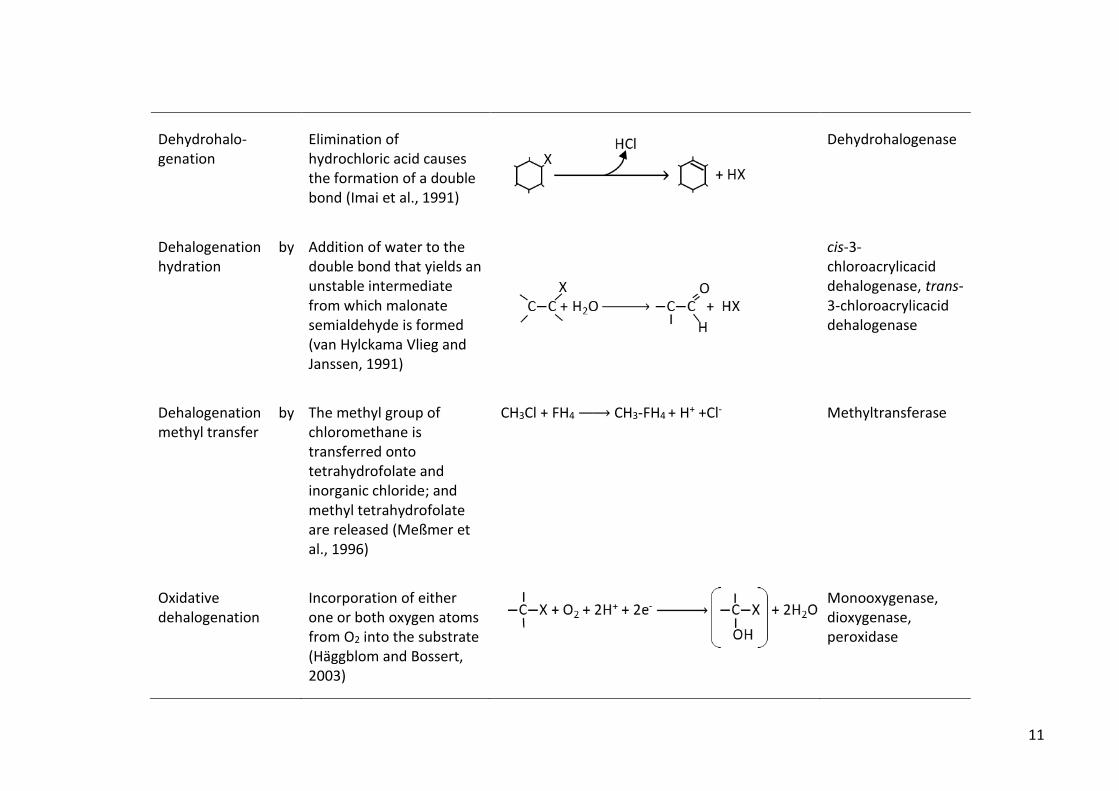
Dehydrohalo-genation
Elimination of hydrochloric acid causes the formation of a double bond (Imai et al., 1991)
Dehydrohalogenase
Dehalogenation by hydration
Addition of water to the double bond that yields an unstable intermediate from which malonate semialdehyde is formed (van Hylckama Vlieg and Janssen, 1991)
cis-3-chloroacrylicacid dehalogenase, trans-3-chloroacrylicacid dehalogenase
Dehalogenation by methyl transfer
The methyl group of chloromethane is transferred onto tetrahydrofolate and inorganic chloride; and methyl tetrahydrofolate are released (Meßmer et al., 1996)
CH3Cl + FH4 → CH3-FH4 + H+ +Cl-
Methyltransferase
Oxidative dehalogenation
Incorporation of either one or both oxygen atoms from O2 into the substrate (Häggblom and Bossert, 2003)
Monooxygenase, dioxygenase, peroxidase
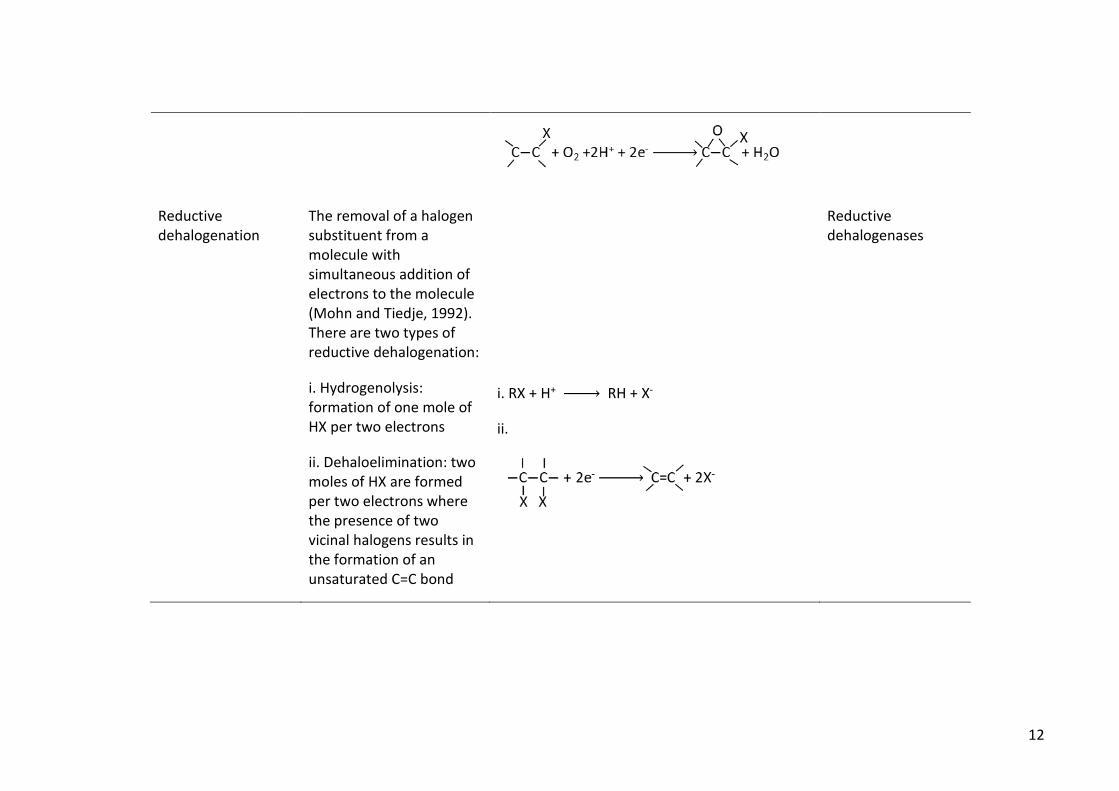
12
Reductive dehalogenation
The removal of a halogen substituent from a molecule with simultaneous addition of electrons to the molecule (Mohn and Tiedje, 1992). There are two types of reductive dehalogenation:
i. Hydrogenolysis: formation of one mole of HX per two electrons
ii. Dehaloelimination: two moles of HX are formed per two electrons where the presence of two vicinal halogens results in the formation of an unsaturated C=C bond
i. RX + H+ → RH + X-
ii.
Reductive dehalogenases
13
1.4 Organohalide respiring bacteria (OHRB)
The occurrence of a large number of naturally synthesized organohalogens suggest that
natural rather than the anthropogenic sources of organohalides governed the
emergence of organohalide respiring bacteria (OHRB). This is also supported by the
global distribution of dehalogenating bacteria in polluted as well as pristine
environments (Atashgahi et al., 2018). OHRB use organohalides as a terminal electron
acceptor in anaerobic respiration and conserve energy from this process (Leys et al.,
2013). The mechanism of energy conservation via reductive dehalogenation is an
unresolved mystery (Buckel and Thauer, 2013). OHRB use molecular hydrogen or other
oxidizable compounds as electron donors and organohalides as electron acceptors in
the respiratory chain where none of the participating compounds themselves provide
energy but yields from the electric potential difference between the participating redox
couples (Adrian and Löffler, 2016). The redox potentials of most of the organohalides
range between +410 to +470 mV. Considering that 70 kJ is required to generate one
mole of ATP in a living cell, such an energy yield would likely result in the formation of
2– 2.5 ATP molecules per molecule of chloride ion released (Schink and Friedrich, 1994).
Hence biomass yields from organohalide respiration are generally low and depending
on the bacteria and the substrate used, may range from 0.3 to 5.6 g dry weight per mole
of chloride produced (Ding et al., 2014). This is potentially because only two moles of
H+ per mole of H2 oxidised are released and three moles of H+ are required to generate
sufficient proton-motive force to produce one mole of ATP (Schumacher and Holliger,
1996).
Organisms that could use organohalides as electron acceptors in an energy-yielding
process were found in the 1980s and Desulfomonile tiedjei was the first isolated OHRB
(DeWeerd et al., 1990). Since then, there has been major advances in sequencing
technology and till February 2020, the number of OHRB genome accessible via
NCBI/Genbank database has reached 75. The average genome size ranges from 2.6 to
3.1 Mb with an average GC content of about 0.44 to 0.45 (Richardson, 2013). OHRBs are
strict anaerobes that are slow-growing and are sensitive to pH and light. They inhabit a
wide range of terrestrial and aquatic environments and the currently known OHRB
14
belong to distinct phylogenetic groups of deeply branching Chloroflexi, Gram-negative
Proteobacteria and Gram-positive Firmicutes (Adrian and Löffler, 2016). To date,
bacteria belonging to the genera Anaeromyxobacter, Comamonas, Geobacter,
Dehalobacter, Dehalococcoides, Dehalogenimonas, Desulfitobacterium, Desulfoluna,
Desulfomonile, Desulfovibrio, Desulfuromonas, Shewanella, and Sulfurospirillum have
shown experimental evidence of reductive dehalogenation (Ahn et al., 2009, Chen et al.,
2013, Christiansen and Ahring, 1996, Holliger et al., 1998a, Krumholz, 1997, Lohner and
Spormann, 2013, Moe et al., 2009, Sanford et al., 2002, Sun et al., 2001, Sung et al.,
2003).
Depending on whether organohalide respiration is their only energy-gaining metabolism
or not, the known OHRB can be divided into facultative and obligate groups (Maphosa
et al., 2010). The facultative OHRB have a more versatile metabolism, growing on a wide
range of electron acceptors, and include Geobacter, Desulfuromonas,
Anaeromyxobacter, Desulfomonile, Desulfovibrio, Desulfoluna, Sulfurospirillum,
Comamonas, Shewanella and Desulfitobacterium (Adrian and Löffler, 2016). On the
other hand, obligate OHRB are restricted to organohalide respiration for energy
conservation and growth and include Dehalococcoides, Dehalogenimonas, and
Dehalobacter (Adrian and Löffler, 2016). The niche specialization of the two groups of
OHRB is also visible in the range of electron donors used; while the facultative OHRB can
use various electron donors, usually the organic end products of primary fermenters,
along with H2 and formate; the obligate OHRB are almost always restricted to H2. In
general, organisms with a diverse metabolism have larger genomes than organisms
inhabiting more restricted ecological niches. Complying with this concept, the obligate
organohalide-respiring D. mccartyi and D. lykanthroporepellens have very small
genomes with an average size of 1.4 Mbp (which is amongst the smallest found in free-
living bacteria) (Kube et al., 2005), whereas facultative OHRB generally have larger
genomes ranging from 3.2 to 6.5 Mbp (Kruse et al., 2016). Furthermore, genome
sequencing reveals that in general, obligate OHRB have large number of genes encoding
reductive dehalogenase homologues (11 to 36 in number) while facultative OHRB carry
a lower number of reductive dehalogenase-encoding genes, only one to seven for
currently available OHRB genomes (Kruse et al., 2016).
15
1.5 Environmental bioremediation and OHRB
The widespread use and disposal of organohalides have rendered them the most
common groundwater contaminants throughout the developed world. Hence, they
have become a primary focus of remediation since the 1980s (Steffan and Schaefer
2016). Early active remediation approaches involved technologies such as pump and
treat or air sparging (Honetschlägerová et al. 2019). In the early 1990s bioremediation
emerged as a potential alternative because of the low cost, low energy consumption
and low environmental impact. Initial bioremediation approaches involved aerobic
cometabolic treatments but the discovery of OHRB brought about a revolutionary
change in bioremediation of organohalide-contaminated sites (Steffan and Schaefer
2016). In situ bioremediation by enhanced reductive dehalogenation has become a
widely applied remediation approach and is accomplished by biostimulation and/or
bioaugmentation to stimulate microbial reductive dehalogenation by organohalide
respiration (Atashgahi et al. 2017).
Biostimulation is possibly the most widely used approach for bioremediation of
organohalide-contaminated aquifers. Biostimulation promotes the growth and activity
of dechlorinating microbes in contaminated environments by nutrient supplementation
and/or adjustment of environmental conditions. In most cases the materials added are
selected to provide a source of H2 and the most common approach is the addition of a
carbon source that can be fermented to H2. A wide variety of organic compounds (e.g.
ethanol, lactate, butyrate, propionate, formate, cyclodextrin, gamma poly-glutamic
acid) have been used to provide energy and electron donors for the dehalogenation
processes (He et al. 2003, Azizian et al. 2008, Wu et al. 2016, Blanford et al. 2018, Sheu
et al. 2018). Direct injection of H2 and electrolytic production of H2 in situ have also been
applied (Ma et al. 2006, Lohner and Tiehm 2009, Lohner et al. 2011, Zhang et al. 2001).
Water-soluble substrates like sodium lactate, molasses, alcohols and glycerol, and a
range of insoluble substrates like emulsified vegetable oils, polylactates, and plant-
based materials are being marketed as commercial electron donor products (Steffan and
Schaefer 2016). Recently thermally enhanced in situ biostimulation has also been
proposed as a sustainable bioremediation strategy for chlorinated ethenes (Slenders et
16
al. 2010, Ni et al. 2016). Němeček et al., (2018) demonstrated substantial improvement
of chlorinated ethene degradation by the combination of increased temperature and
supplementation with a fermentable substrate (whey). Zero-valent iron (ZVI) has a high
reduction potential capable of inducing various dechlorination pathways to reduce the
accumulation of toxic by-products like vinyl chloride and chemical reduction using ZVI
has become one of the most commonly used in situ remediation technologies for
organochlorides (Fu, Dionysiou, and Liu 2014, Guan et al. 2015, Han et al. 2016). The
combination of ZVI and biostimulation is now being considered to be a promising
bioremediation strategy for organochlorines (Sheu et al. 2016, Yang et al. 2018, Wu et
al. 2020).
Bioaugmentation is the practice of adding cultured microbes to speed up the rate of
contaminant degradation. Bioaugmentation studies with D. mccartyi has demonstrated
complete dehalogenation of chlorinated compounds in situ (Harkness et al. 1999, Ellis
et al. 2000, Major et al. 2002, Lendvay et al. 2003, Schaefer et al. 2010). In the United
States alone, more than 1000 applications of bioaugmentation cultures have been
carried out to increase reductive dehalogenation rates and prompt groundwater
remediation (Steffan and Schaefer 2016). Biostimulation together with
bioaugmentation with dechlorinating enrichment cultures containing D. mccartyi
populations and their non-dechlorinating partners has also been showed to be a
successful strategy (Rahm et al. 2006, Perez-de-Mora et al. 2014).
Successful biostimulation and bioaugmentation strategies rely upon molecular tools for
qualitative and quantitative assessment of the dechlorinating bacterial community
(Lebron et al. 2011). Monitoring the presence and abundance of specific biomarker
genes has become a valuable procedure for remediation strategy (Ritalahti et al. 2006,
Holmes et al. 2006, Munro et al. 2017, Nijenhuis, Stollberg, and Lechner 2018, Němeček
et al. 2018). To date, microbial monitoring pertaining to bioremediation have mainly
focused on quantitative PCR (qPCR) based tracking of key OHRB and their rdhA genes
(Lendvay et al. 2003, Scheutz et al. 2008, Lee et al. 2008, Scheutz et al. 2010, Ritalahti et
al. 2010, Révész et al. 2014) and occasionally of related non-dechlorinating microbial
groups (Perez-de-Mora et al. 2014). Recently the potential of developing inexpensive
17
and field deployable detection devices using the novel molecular method called Loop
mediated isothermal amplification (LAMP) has been explored (Stedtfeld et al. 2014,
Kanitkar et al. 2016, Stedtfeld et al. 2016, Kanitkar, Stedtfeld, Hatzinger, Hashsham, and
Cupples 2017, Kanitkar, Stedtfeld, Hatzinger, Hashsham, Cupples, et al. 2017).
1.6 Key enzyme in reductive dehalogenation: reductive dehalogenases (RDases)
The common feature of the broad range of OHRB is the presence of the reductive
dehalogenases. They are a group of metalloprotein enzymes that catalyse reductive
dehalogenation and are the only known terminal respiratory enzymes to be dependent
on a corrinoid cofactor (Dobbek and Leys, 2016). Unlike other corrinoid-dependent
enzymes, reductive dehalogenases do not catalyse carbon rearrangement or methyl
group transfer reactions, rather they catalyse an elimination reaction which makes them
a novel class of cobamide-containing oxidoreductases (Banerjee and Ragsdale, 2003). In
2017 the Nomenclature Committee of the International Union of Biochemistry and
Molecular Biology (NC-IUBMB) classified RDases as EC 1.21.99.5 under the sub-subclass
EC 1.97.1 for oxidoreductases that do not belong in the other subclasses.
The physiologically active mature respiratory RDases are associated with the
cytoplasmic membrane and are located in the exoplasm of the bacterial cells (periplasm
in Gram-negative bacteria) (John et al., 2006, Nijenhuis and Zinder, 2005, Reinhold et
al., 2012); though studies reveal that in some respiratory RDases the membrane
association is weak (John et al., 2006, Suyama et al., 2002). Most of the respiratory
RDase enzymes are known to be oxygen-sensitive with a half-life of approximately one
hour to several hours (Schubert and Diekert, 2016) but oxygen insensitivity has also been
reported for respiratory (Goris et al., 2014) and non-respiratory RDases (Chen et al.,
2013, Payne et al., 2015). Studies demonstrate that pure enzymes are active over a
temperature range of 20 to 55°C but have the highest specific activity at 37-42°C
(Maillard et al., 2003, Neumann et al., 1996) and have the ability to catalyse reactions
at pH 5.5-8.7 with optimum activities at 7.2 to 8.1 (El Fantroussi et al., 1998).
18
1.7 Evolution of organohalide respiration and RDases
Organohalides generally occur naturally in low concentrations in diverse environments,
which explains the widespread distribution of OHRB. rdh genes have been identified
from most natural environments as well as from bacteria associated with other
eukaryotes, even humans (Brouwer et al., 2011). The phylogenetic depth (Hug et al.,
2013b), molecular dating (McMurdie et al., 2011), and distribution of rdh genes deep in
the sub-seafloor (Kawai et al., 2014) suggest that organohalide respiration is an
evolutionary old process. However, the origin of organohalide respiration is still not well
understood; there is evidence in support of the contribution of both vertical and
horizontal gene transfer (HGT) towards the distribution of rdh genes across taxonomic
groups. The distribution of the rdh gene family is not even across the prokaryotic tree of
life, for instance RDases are only present in Dehalococcoidia class but not in any other
members of the phylum Chloroflexi (Hug et al., 2013a, Kaster et al., 2014, Wasmund et
al., 2014). This interspersed distribution of rdh genes makes it difficult to determine if
RDases represent an ancient enzyme family that exhibited a strong pattern of gene loss
through prokaryotic evolution or followed a more taxonomically limited adaptation and
spread through gene duplication and gene transfer (Hug, 2016).
Horizontal gene transfer can be an important evolutionary mechanism for
microorganisms exposed to toxic organohalides to adopt acquired catabolic pathways
from even phylogenetically distinct species to adapt and thrive in contaminated
ecosystems (Jugder et al., 2016a). The available evidence on HGT in rdh genes implies
that it exists widely among various genera of OHRB (Krajmalnik-Brown et al., 2007,
Maillard et al., 2005, McMurdie et al., 2007, McMurdie et al., 2011). Multiple
mechanisms of HGT have been proposed, including transposons, insertion elements,
genomic islands, recombinases and phage-mediated gene movement (Hug, 2016,
Jugder et al., 2016a).
Most of the rdh genes in Dehalococcoides mccartyi strains are located in the two ‘high
plasticity regions’ at either side of the origin of replication, separated by a highly
conserved core region common to all strains (Kube et al., 2005, McMurdie et al., 2009).
These regions serve as evolutionary hotspots with frequent horizontal gene transfers
19
assisting in rapid evolution of D. mccartyi strains, although no mechanism has been
identified yet (McMurdie et al., 2009). Some D. mccartyi genomes harbor prophages
that may play a role in HGT (Pöritz et al., 2013, Zhao et al., 2017). Five out of 24
sequenced strains of D. mccartyi encode CRISPR-Cas (clustered regularly interspaced
short palindromic repeats—CRISPR) systems that protect the host from invading mobile
elements like plasmids, phages, and transposons (Molenda et al., 2019). The role of
these phages and CRISPR-Cas systems in assisting or hindering lateral transfer of rdh
genes among D. mccartyi strains is yet to be identified. HGT has also been reported in
Dehalobacter strains which are also metabolically restricted OHRB (Kruse et al., 2013,
Maphosa et al., 2012). D. lykanthroporepellens BL-DC-9T has 25 rdh genes and 13 of
them are adjacent to insertion sequence elements which implies horizontal acquisition
from an unknown host or hosts (Mukherjee et al., 2014, Siddaramappa et al., 2012).
Fascinating evidence for HGT of rdh genes was the identification of a circularised
transposon containing two identical insertion sequences (ISDha1) surrounding the
pceABCT gene cluster in D. hafniense strain TCE1 (Maillard et al., 2005). The pceABCT
gene cluster of D. hafniense TCE1 shares 100 % sequence identity with those from D.
restrictus and Desulfitobacterium strains PCE-S and Y51, suggesting a more recent
horizontal acquisition rather than vertical inheritance (Maillard et al., 2005). The
distribution of rdh genes in facultative OHRB such as Comamonas, Geobacter and
Shewanella, belonging to phylogenetic groups that mostly comprise non‐OHRB has been
attributed to HGT (Atashgahi et al., 2016). Another example of HGT in opportunistic
OHRB is the loss of OHR capacity of strains of Desulfitobacterium when grown on
alternative electron acceptors. It is suggested that they acquire rdh genes from closely
related obligate OHR strains of Dehalobacter via HGT (Duret et al., 2012). G. lovleyi strain
SZ contains mobile genetic elements such as integrase and transposase genes close to
rdh operon which points towards potential horizontal gene transfer events (Sanford et
al., 2016).
20
1.8 Structural characteristics of RDases
Despite having high sequence variability RDases have similar biochemical features.
RDases generally consist of two subunits: RdhA and RdhB (Futagami et al., 2008). RdhA
is the catalytically active subunit with a molecular weight of ~50-67 kDa (Magnuson et
al., 2000, Neumann et al., 1996, Neumann et al., 1998, van de Pas et al., 1999). All
characterized RDases contain two [4Fe–4S] clusters (either two 4Fe–4S or one 4Fe–4S
and one 3Fe–4S) (Maillard et al., 2003) that are considered to be associated with
electron transfer from the physiological donor to the active site (Fincker and Spormann,
2017). Apart from the single exception of the 3-chlorobenzoate RDase of D. tiedjei,
which contains a heme cofactor (Ni et al., 1995), all RDase enzymes purified and
characterized to date have been shown to harbor a cobalt-containing porphyrin-derived
corrinoid cofactor which is inferred to play an important role in substrate activation and
reduction (Fincker and Spormann, 2017).
RDases have a twin-arginine (TAT) signal sequence (RRXFXK) at the N-terminus (Berks,
1996, Bruschi and Guerlesquin, 1988). This signal is required for the recognition of the
precursor by the TAT export machinery in the membrane (Palmer and Berks, 2012b).
The membrane-integral TAT translocase exports folded and in most cases cofactor-
containing proteins across the cytoplasmic membrane. The two iron–sulfur clusters and
the corrinoid cofactor of the RDases are synthesized in the cell cytoplasm, catalyzed by
a specific set of enzymes and are transferred into the RDase apoprotein possibly in a
fully assembled form (Figure 1.2) (Schubert and Diekert, 2016). The correct folding and
consequent TAT-dependent export of the enzymes is dependent upon the proper
incorporation of the cofactors (Sargent, 2007) and impairment of the proper cofactor
biosynthesis generally leads to the accumulation of the enzyme precursor in the
cytoplasm followed by the degradation of the unfolded apoprotein (Siebert et al., 2002).
The second subunit RdhB (8-10 kDa) is a hydrophobic protein with two to three
transmembrane helices. The rdhB gene can be located either upstream or downstream
of the rdhA gene. The RdhB proteins have 66 to 116 amino acids with minimal amino
acid sequence similarity. However, all of them encode relatively hydrophobic proteins
suggesting that they may have similar three-dimensional structures (Neumann et al.,
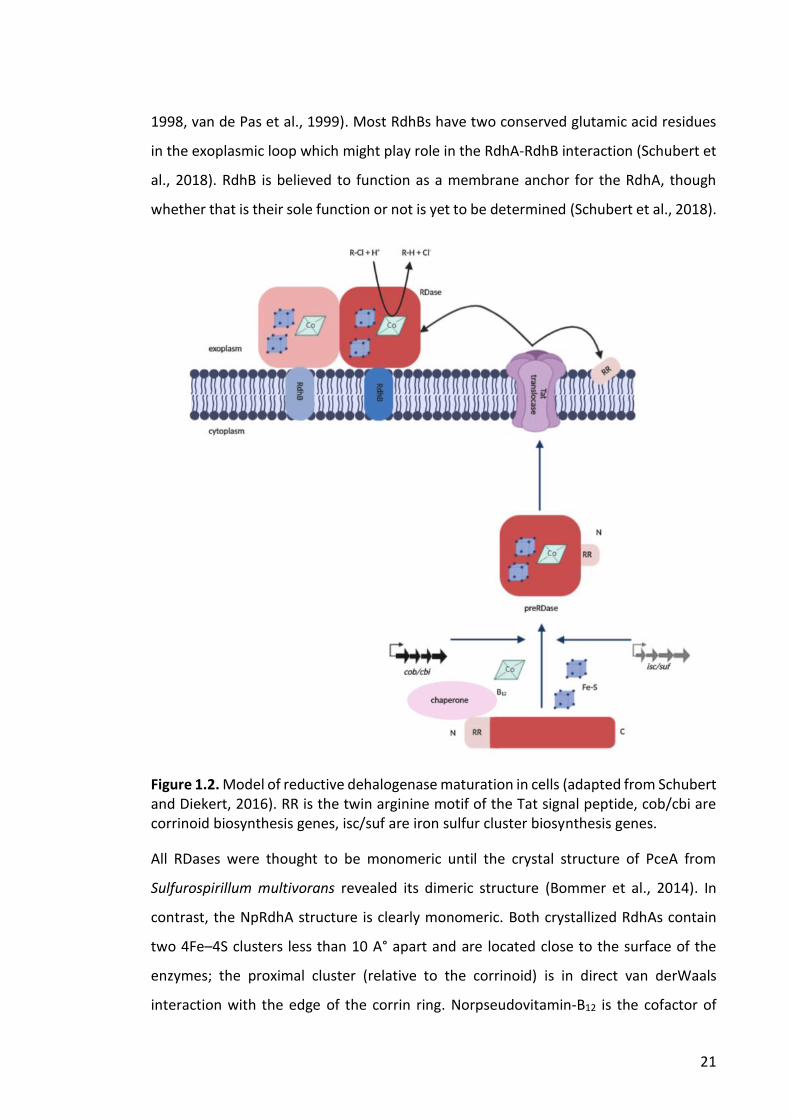
21
1998, van de Pas et al., 1999). Most RdhBs have two conserved glutamic acid residues
in the exoplasmic loop which might play role in the RdhA-RdhB interaction (Schubert et
al., 2018). RdhB is believed to function as a membrane anchor for the RdhA, though
whether that is their sole function or not is yet to be determined (Schubert et al., 2018).
Figure 1.2. Model of reductive dehalogenase maturation in cells (adapted from Schubert and Diekert, 2016). RR is the twin arginine motif of the Tat signal peptide, cob/cbi are corrinoid biosynthesis genes, isc/suf are iron sulfur cluster biosynthesis genes.
All RDases were thought to be monomeric until the crystal structure of PceA from
Sulfurospirillum multivorans revealed its dimeric structure (Bommer et al., 2014). In
contrast, the NpRdhA structure is clearly monomeric. Both crystallized RdhAs contain
two 4Fe–4S clusters less than 10 A° apart and are located close to the surface of the
enzymes; the proximal cluster (relative to the corrinoid) is in direct van derWaals
interaction with the edge of the corrin ring. Norpseudovitamin-B12 is the cofactor of
22
PceA and it is deeply buried inside the internal substrate binding pocket (Figure 1.3). The
corrinoid cofactor for NpRdhA is cobalamin B12 and in both the RDases the cobalamin is
bound in the same base-off conformation. The coordinative binding of the lower bases
is restricted by steric hindrance (Keller et al., 2018). Spectroscopic analyses of other
RDases using electron paramagnetic resonance spectroscopy also showed the cobamide
cofactor in the base-off state (Schumacher et al., 1997, van de Pas et al., 1999). The
structural analysis of the substrate-bound enzyme PceA revealed that the substrate,
TCE, accesses the active site only via a narrow “letterbox” opening followed by a
hydrophobic channel that leads to a tight substrate-binding pocket (Bommer et al.,
2014). The shape, access channel and most of the residues that line the active site are
distinct for the two RdhA structures. This demonstrates the evolutionary distance
between these enzymes and the contrast in their substrate specificity. PceA reduces
small, hydrophobic chlorinated ethenes whereas NpRdhA reduces aromatic
dibromophenols. There are, however, a few residues that are conserved; a tyrosine is
found to point directly towards the cobalt ion in both the RdhA structures. The phenol
group is within hydrogen bonding distance of a second conserved and positively charged
residue (Lys in Pce; Arg in NpRdhA). This RdhA Tyr-Lys/Arg motif is most probably
involved in proton transfer coupled to substrate reduction and can be identified in most
RdhA proteins. In NpRdhA, mutations in either residue suppress enzyme activity (Payne
et al., 2015). Structural studies showed no evidence of involvement of the cobamide
cofactor’s nucleotide loop in the catalytic cycle of RDases, rather it plays a role in
cofactor binding. RDases bind the cofactor with a network of hydrogen bonds deep
inside the protein hence, the varied structure of the cobamide nucleotide loop might
interfere with the incorporation and correct positioning of the cofactor (Keller et al.,
2018).
Interestingly, despite the lack of any obvious sequence similarity both the enzymes
demonstrated the highest structural resemblance with a human B12-processing enzyme
CblC, which is responsible for catalysing the reduction of cyanocobalamin and
alkylcobalamin to form adenosyl- or methylcobalamin (McMurdie et al., 2011). The
similarity in fold and cofactor position as detected from a structural superimposition all
strongly suggest a common ancestry between RDases and CblC.
23
Figure 1.3. Dimeric structure of PceA from S. multivorans (adapted from Bommer et al., 2014). The grey and green regions represent two monomers of PceA. The spheres depict the proximal and distal Fe-S clusters and the purple sticks represent the cobalamin cofactor, norpseudo-B12.
1.9 Types of RDases
As described in the previous section, respiratory and non-respiratory RDase enzymes
have the same cofactor content and principal architecture, however, the non-
respiratory RDases lack the TAT motif and are located in the cytoplasm (Chen et al.,
2013, Payne et al., 2015). The suggested functions for these non-respiratory RDases
encompass re-oxidation of respiratory cofactors, detoxification of substrates, removal
of halogens from organics to enable subsequent catabolism (Chen et al., 2013, Payne et
al., 2015, Wasmund et al., 2016).
Recently a third type of potential RDase has been identified in marine uncultured
Desulfatiglans-related deltaproteobacterium, which is possibly a hybrid of RdhA and
RdhB (Jochum et al., 2018). The putative rdh gene encoding this third type of RDase has
no TAT signal peptide, no associated rdhB and has an exclusive feature of encoding three
transmembrane helices (TMHs) in the N-terminal region (Jochum et al., 2018). The C-
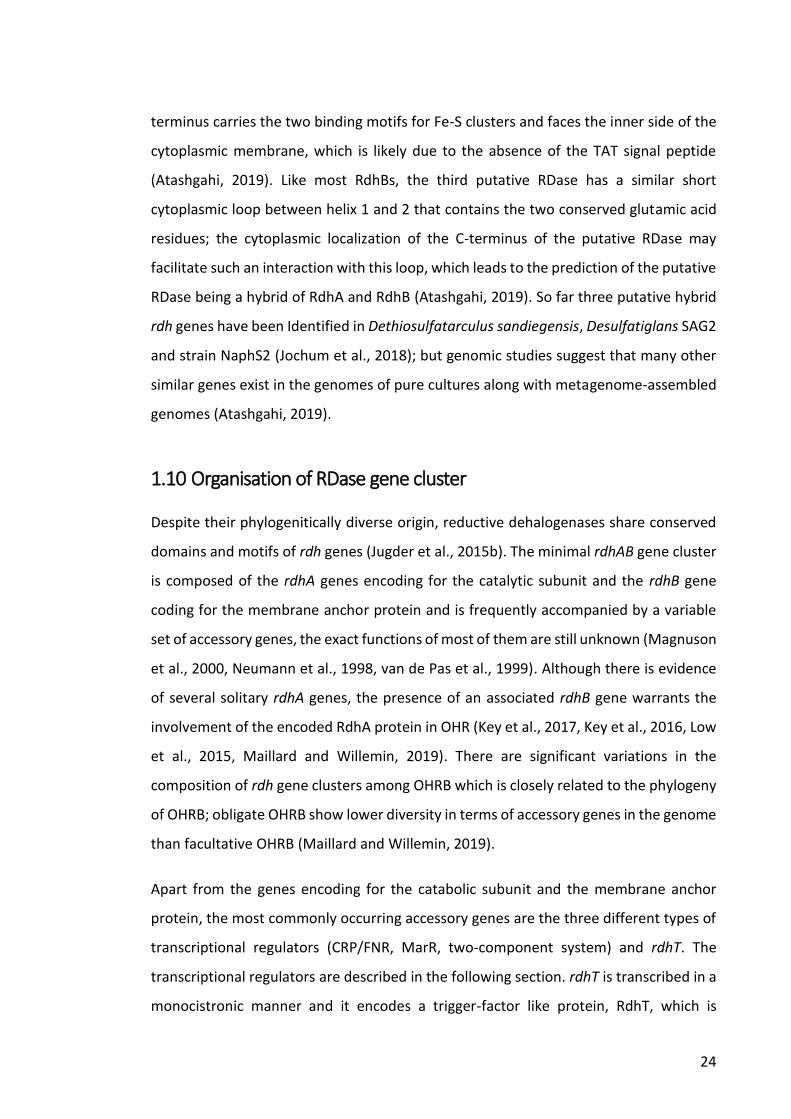
24
terminus carries the two binding motifs for Fe-S clusters and faces the inner side of the
cytoplasmic membrane, which is likely due to the absence of the TAT signal peptide
(Atashgahi, 2019). Like most RdhBs, the third putative RDase has a similar short
cytoplasmic loop between helix 1 and 2 that contains the two conserved glutamic acid
residues; the cytoplasmic localization of the C-terminus of the putative RDase may
facilitate such an interaction with this loop, which leads to the prediction of the putative
RDase being a hybrid of RdhA and RdhB (Atashgahi, 2019). So far three putative hybrid
rdh genes have been Identified in Dethiosulfatarculus sandiegensis, Desulfatiglans SAG2
and strain NaphS2 (Jochum et al., 2018); but genomic studies suggest that many other
similar genes exist in the genomes of pure cultures along with metagenome-assembled
genomes (Atashgahi, 2019).
1.10 Organisation of RDase gene cluster
Despite their phylogenitically diverse origin, reductive dehalogenases share conserved
domains and motifs of rdh genes (Jugder et al., 2015b). The minimal rdhAB gene cluster
is composed of the rdhA genes encoding for the catalytic subunit and the rdhB gene
coding for the membrane anchor protein and is frequently accompanied by a variable
set of accessory genes, the exact functions of most of them are still unknown (Magnuson
et al., 2000, Neumann et al., 1998, van de Pas et al., 1999). Although there is evidence
of several solitary rdhA genes, the presence of an associated rdhB gene warrants the
involvement of the encoded RdhA protein in OHR (Key et al., 2017, Key et al., 2016, Low
et al., 2015, Maillard and Willemin, 2019). There are significant variations in the
composition of rdh gene clusters among OHRB which is closely related to the phylogeny
of OHRB; obligate OHRB show lower diversity in terms of accessory genes in the genome
than facultative OHRB (Maillard and Willemin, 2019).
Apart from the genes encoding for the catabolic subunit and the membrane anchor
protein, the most commonly occurring accessory genes are the three different types of
transcriptional regulators (CRP/FNR, MarR, two-component system) and rdhT. The
transcriptional regulators are described in the following section. rdhT is transcribed in a
monocistronic manner and it encodes a trigger-factor like protein, RdhT, which is
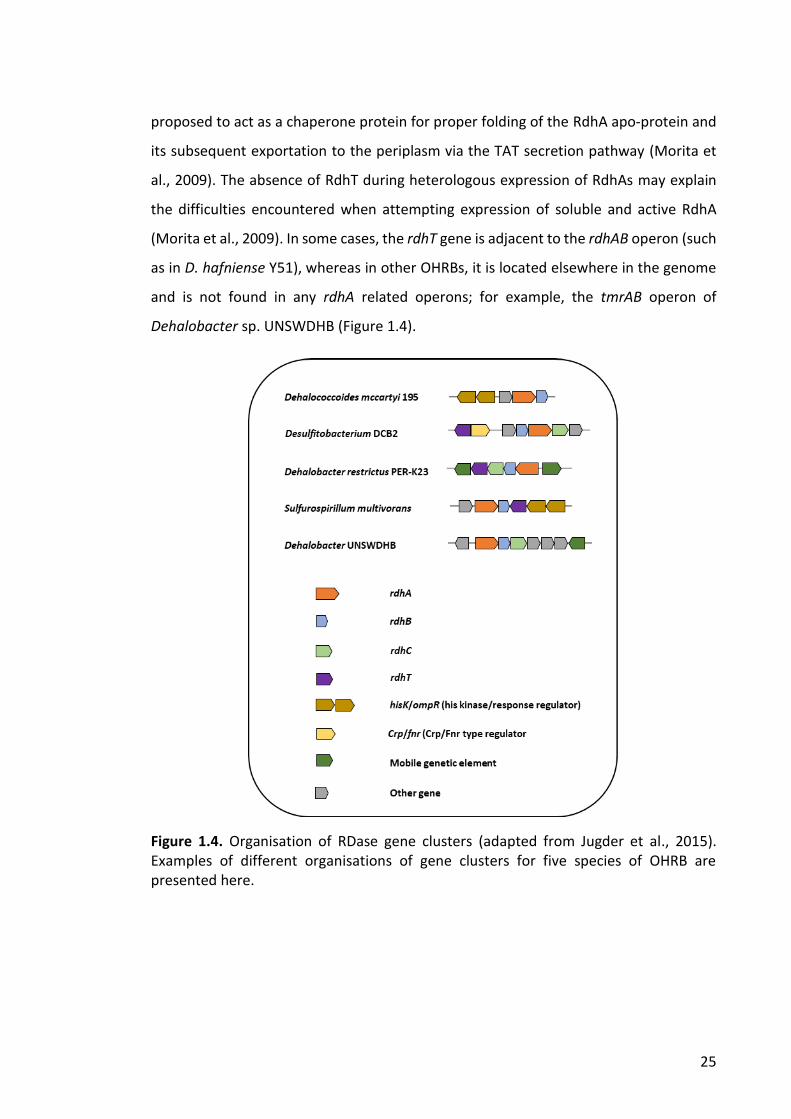
25
proposed to act as a chaperone protein for proper folding of the RdhA apo-protein and
its subsequent exportation to the periplasm via the TAT secretion pathway (Morita et
al., 2009). The absence of RdhT during heterologous expression of RdhAs may explain
the difficulties encountered when attempting expression of soluble and active RdhA
(Morita et al., 2009). In some cases, the rdhT gene is adjacent to the rdhAB operon (such
as in D. hafniense Y51), whereas in other OHRBs, it is located elsewhere in the genome
and is not found in any rdhA related operons; for example, the tmrAB operon of
Dehalobacter sp. UNSWDHB (Figure 1.4).
Figure 1.4. Organisation of RDase gene clusters (adapted from Jugder et al., 2015). Examples of different organisations of gene clusters for five species of OHRB are presented here.
26
1.11 Transcriptional regulation of RDase genes
Understanding the transcriptional regulation of genes involved in OHR is of great
interest to researchers because of the potential it presents as a promising alternative to
uncover the substrate specificity of the reductive dehalogenases that are yet to be
characterized. In the past two decades there has been over 70 studies focusing on the
transcriptional regulations of rdh genes and they reveal that rdh gene transcription
patterns follow two distinct trends: they either respond strongly to specific
organohalides (e.g. Desulfitobacterium sp.) or transcription occurs independently
regardless of the organohalides present/absent (e.g. Dehalococcoides and
Dehalogenimonas sp.) (Maillard and Willemin, 2019).
Transcriptional regulators belonging to three distinct protein families: CRP/FNR, MarR,
two-component system (TCS), have been identified in close vicinity of many rdh gene
clusters, suggesting a tight regulation of their expression. CRP/FNR like regulators are
found in Dehalobacter sp. and Desulfitobacterium sp. (Kruse et al., 2016),
Sulfurospirillum sp. have regulators belonging to TCS (Goris et al., 2017, Goris et al.,
2014) whereas Dehalococcoides sp. and Dehalogenimonas sp. harbor a combination of
TCS and MarR-type regulators (Siddaramappa et al., 2012, Wagner et al., 2013).
The CRP/FNR family was named after the cyclic AMP (cAMP) receptor protein (CRP) and
the fumarate nitrate regulatory protein (FNR). RdhK is used as a general name to
describe this type of regulators involved in OHR (Kruse et al., 2016). RdhK regulators are
characterized by a sequence of 230–250 amino acids, an effector-binding domain
located at the N-terminal and a C-terminal helix-turn-helix (HTH) DNA-binding motif
(Kruse et al., 2016). The regulatory function is carried out by the binding of allosteric
effector molecules to the N-terminal domain followed by a signal transmission to the
DNA-binding domain (Körner et al., 2003). To date, experimental evidence has been
gained for only a small number of RdhK regulators such as CprK from D. dehalogenans
strain JW/IU-DC1; CprK1, CprK2 and CprK4 from D. hafniense strain DCB-2 (Maillard and
Willemin, 2019). Crystal structures of CprK and CprK1 proteins have been revealed and
has improved understanding on the nature of the interactions and the conformational
changes that occur upon binding of the effector (Joyce et al., 2006, Levy et al., 2008).
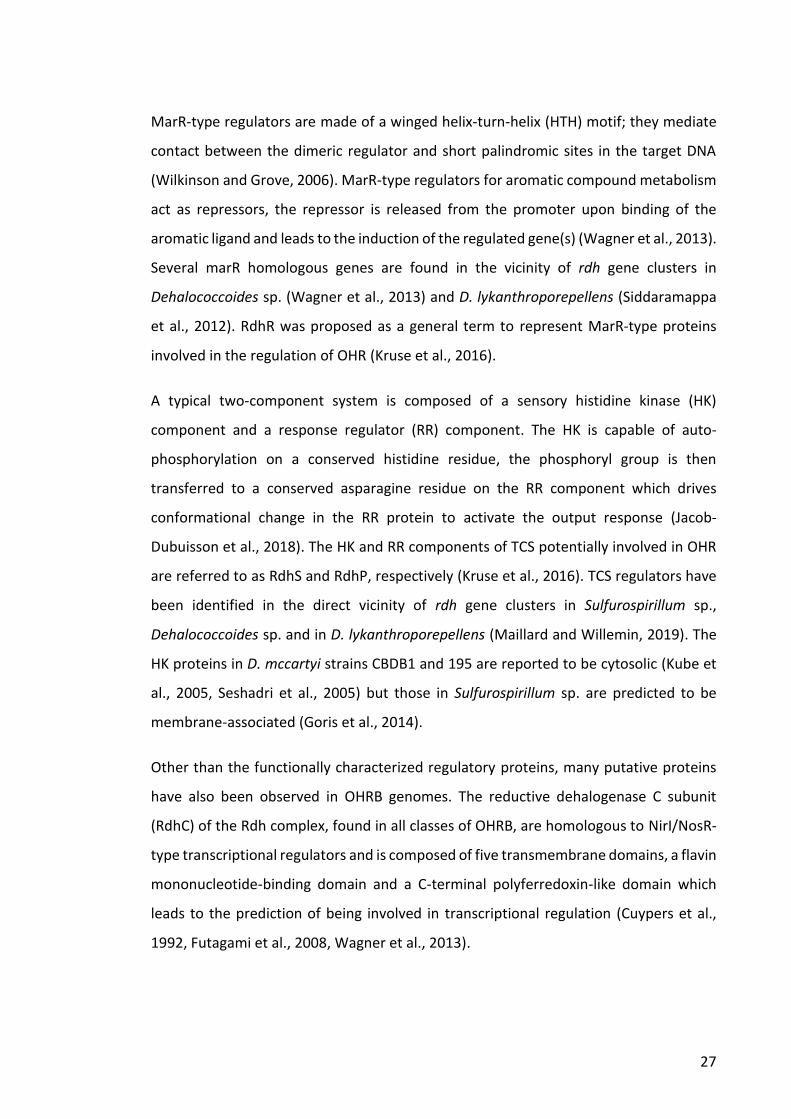
27
MarR-type regulators are made of a winged helix-turn-helix (HTH) motif; they mediate
contact between the dimeric regulator and short palindromic sites in the target DNA
(Wilkinson and Grove, 2006). MarR-type regulators for aromatic compound metabolism
act as repressors, the repressor is released from the promoter upon binding of the
aromatic ligand and leads to the induction of the regulated gene(s) (Wagner et al., 2013).
Several marR homologous genes are found in the vicinity of rdh gene clusters in
Dehalococcoides sp. (Wagner et al., 2013) and D. lykanthroporepellens (Siddaramappa
et al., 2012). RdhR was proposed as a general term to represent MarR-type proteins
involved in the regulation of OHR (Kruse et al., 2016).
A typical two-component system is composed of a sensory histidine kinase (HK)
component and a response regulator (RR) component. The HK is capable of auto-
phosphorylation on a conserved histidine residue, the phosphoryl group is then
transferred to a conserved asparagine residue on the RR component which drives
conformational change in the RR protein to activate the output response (Jacob-
Dubuisson et al., 2018). The HK and RR components of TCS potentially involved in OHR
are referred to as RdhS and RdhP, respectively (Kruse et al., 2016). TCS regulators have
been identified in the direct vicinity of rdh gene clusters in Sulfurospirillum sp.,
Dehalococcoides sp. and in D. lykanthroporepellens (Maillard and Willemin, 2019). The
HK proteins in D. mccartyi strains CBDB1 and 195 are reported to be cytosolic (Kube et
al., 2005, Seshadri et al., 2005) but those in Sulfurospirillum sp. are predicted to be
membrane-associated (Goris et al., 2014).
Other than the functionally characterized regulatory proteins, many putative proteins
have also been observed in OHRB genomes. The reductive dehalogenase C subunit
(RdhC) of the Rdh complex, found in all classes of OHRB, are homologous to NirI/NosR-
type transcriptional regulators and is composed of five transmembrane domains, a flavin
mononucleotide-binding domain and a C-terminal polyferredoxin-like domain which
leads to the prediction of being involved in transcriptional regulation (Cuypers et al.,
1992, Futagami et al., 2008, Wagner et al., 2013).
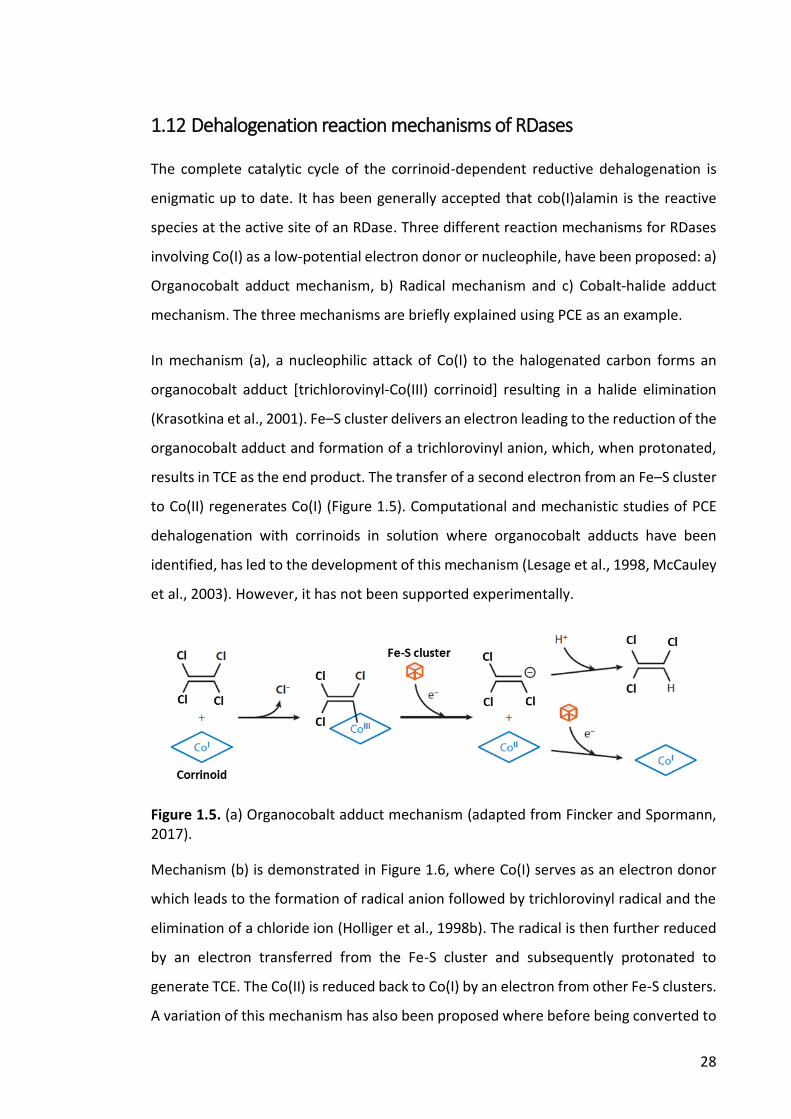
28
1.12 Dehalogenation reaction mechanisms of RDases
The complete catalytic cycle of the corrinoid-dependent reductive dehalogenation is
enigmatic up to date. It has been generally accepted that cob(I)alamin is the reactive
species at the active site of an RDase. Three different reaction mechanisms for RDases
involving Co(I) as a low-potential electron donor or nucleophile, have been proposed: a)
Organocobalt adduct mechanism, b) Radical mechanism and c) Cobalt-halide adduct
mechanism. The three mechanisms are briefly explained using PCE as an example.
In mechanism (a), a nucleophilic attack of Co(I) to the halogenated carbon forms an
organocobalt adduct [trichlorovinyl-Co(III) corrinoid] resulting in a halide elimination
(Krasotkina et al., 2001). Fe–S cluster delivers an electron leading to the reduction of the
organocobalt adduct and formation of a trichlorovinyl anion, which, when protonated,
results in TCE as the end product. The transfer of a second electron from an Fe–S cluster
to Co(II) regenerates Co(I) (Figure 1.5). Computational and mechanistic studies of PCE
dehalogenation with corrinoids in solution where organocobalt adducts have been
identified, has led to the development of this mechanism (Lesage et al., 1998, McCauley
et al., 2003). However, it has not been supported experimentally.
Figure 1.5. (a) Organocobalt adduct mechanism (adapted from Fincker and Spormann, 2017).
Mechanism (b) is demonstrated in Figure 1.6, where Co(I) serves as an electron donor
which leads to the formation of radical anion followed by trichlorovinyl radical and the
elimination of a chloride ion (Holliger et al., 1998b). The radical is then further reduced
by an electron transferred from the Fe-S cluster and subsequently protonated to
generate TCE. The Co(II) is reduced back to Co(I) by an electron from other Fe-S clusters.
A variation of this mechanism has also been proposed where before being converted to
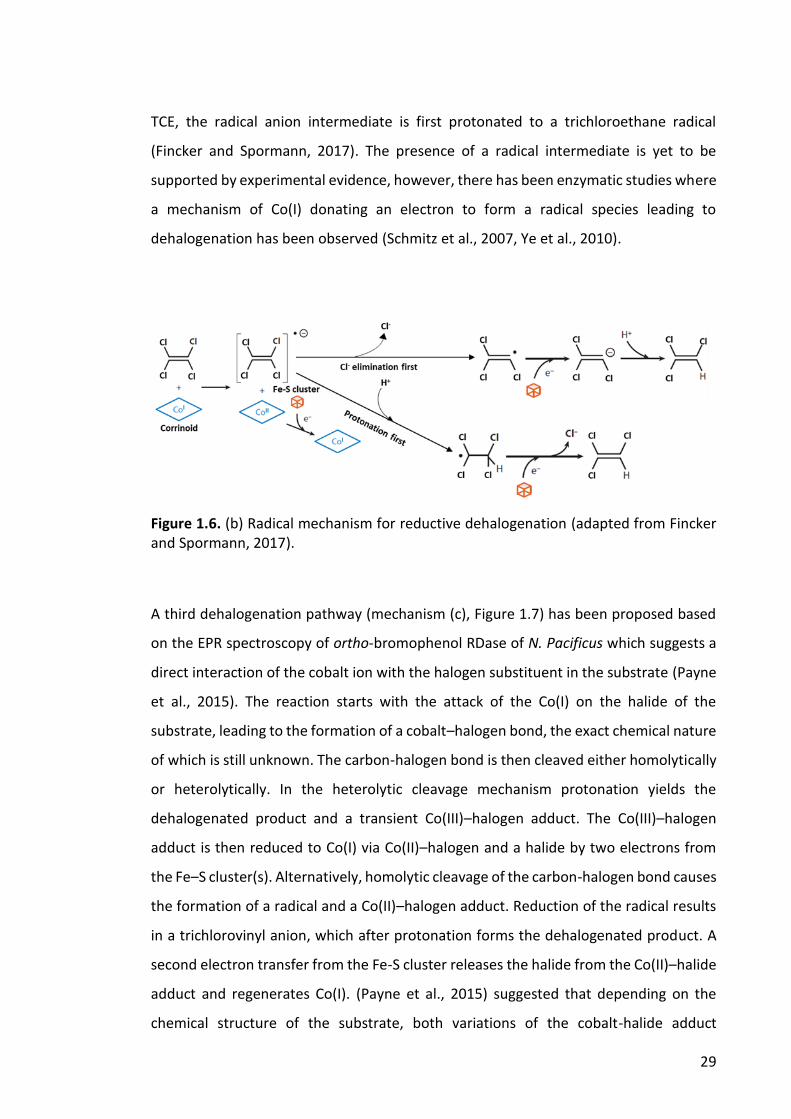
29
TCE, the radical anion intermediate is first protonated to a trichloroethane radical
(Fincker and Spormann, 2017). The presence of a radical intermediate is yet to be
supported by experimental evidence, however, there has been enzymatic studies where
a mechanism of Co(I) donating an electron to form a radical species leading to
dehalogenation has been observed (Schmitz et al., 2007, Ye et al., 2010).
Figure 1.6. (b) Radical mechanism for reductive dehalogenation (adapted from Fincker and Spormann, 2017).
A third dehalogenation pathway (mechanism (c), Figure 1.7) has been proposed based
on the EPR spectroscopy of ortho-bromophenol RDase of N. Pacificus which suggests a
direct interaction of the cobalt ion with the halogen substituent in the substrate (Payne
et al., 2015). The reaction starts with the attack of the Co(I) on the halide of the
substrate, leading to the formation of a cobalt–halogen bond, the exact chemical nature
of which is still unknown. The carbon-halogen bond is then cleaved either homolytically
or heterolytically. In the heterolytic cleavage mechanism protonation yields the
dehalogenated product and a transient Co(III)–halogen adduct. The Co(III)–halogen
adduct is then reduced to Co(I) via Co(II)–halogen and a halide by two electrons from
the Fe–S cluster(s). Alternatively, homolytic cleavage of the carbon-halogen bond causes
the formation of a radical and a Co(II)–halogen adduct. Reduction of the radical results
in a trichlorovinyl anion, which after protonation forms the dehalogenated product. A
second electron transfer from the Fe-S cluster releases the halide from the Co(II)–halide
adduct and regenerates Co(I). (Payne et al., 2015) suggested that depending on the
chemical structure of the substrate, both variations of the cobalt-halide adduct
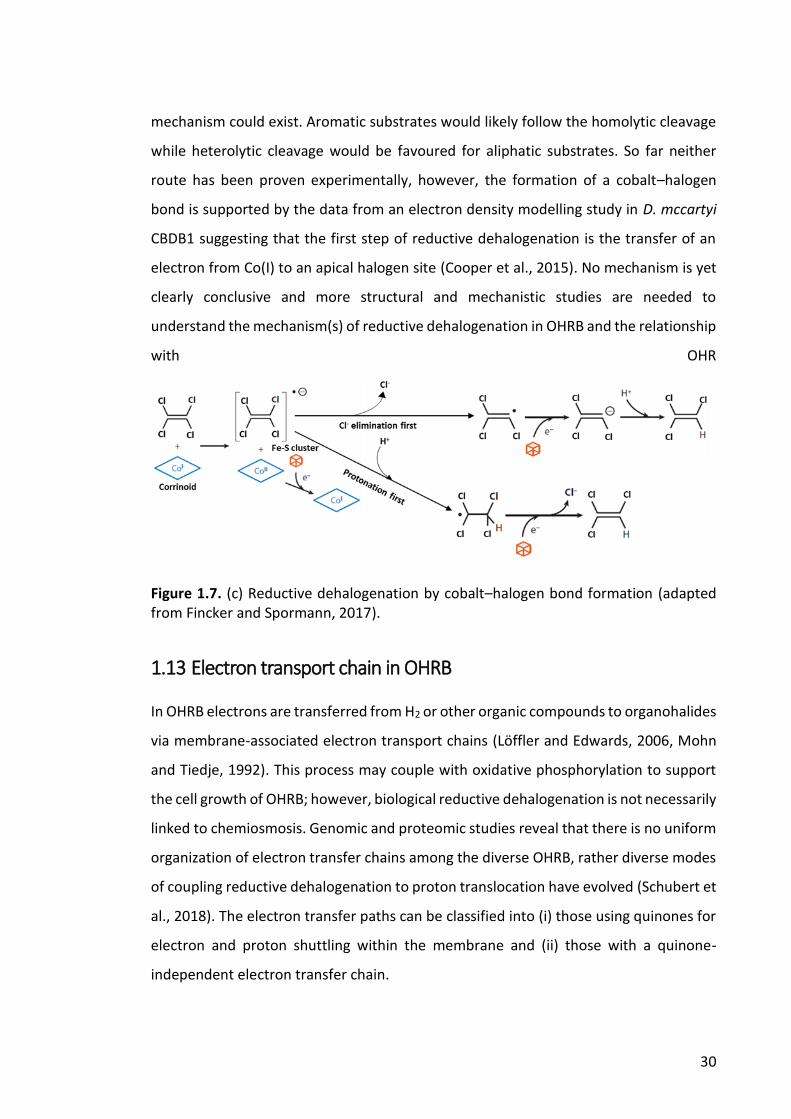
30
mechanism could exist. Aromatic substrates would likely follow the homolytic cleavage
while heterolytic cleavage would be favoured for aliphatic substrates. So far neither
route has been proven experimentally, however, the formation of a cobalt–halogen
bond is supported by the data from an electron density modelling study in D. mccartyi
CBDB1 suggesting that the first step of reductive dehalogenation is the transfer of an
electron from Co(I) to an apical halogen site (Cooper et al., 2015). No mechanism is yet
clearly conclusive and more structural and mechanistic studies are needed to
understand the mechanism(s) of reductive dehalogenation in OHRB and the relationship
with OHR
Figure 1.7. (c) Reductive dehalogenation by cobalt–halogen bond formation (adapted from Fincker and Spormann, 2017).
1.13 Electron transport chain in OHRB
In OHRB electrons are transferred from H2 or other organic compounds to organohalides
via membrane-associated electron transport chains (Löffler and Edwards, 2006, Mohn
and Tiedje, 1992). This process may couple with oxidative phosphorylation to support
the cell growth of OHRB; however, biological reductive dehalogenation is not necessarily
linked to chemiosmosis. Genomic and proteomic studies reveal that there is no uniform
organization of electron transfer chains among the diverse OHRB, rather diverse modes
of coupling reductive dehalogenation to proton translocation have evolved (Schubert et
al., 2018). The electron transfer paths can be classified into (i) those using quinones for
electron and proton shuttling within the membrane and (ii) those with a quinone-
independent electron transfer chain.
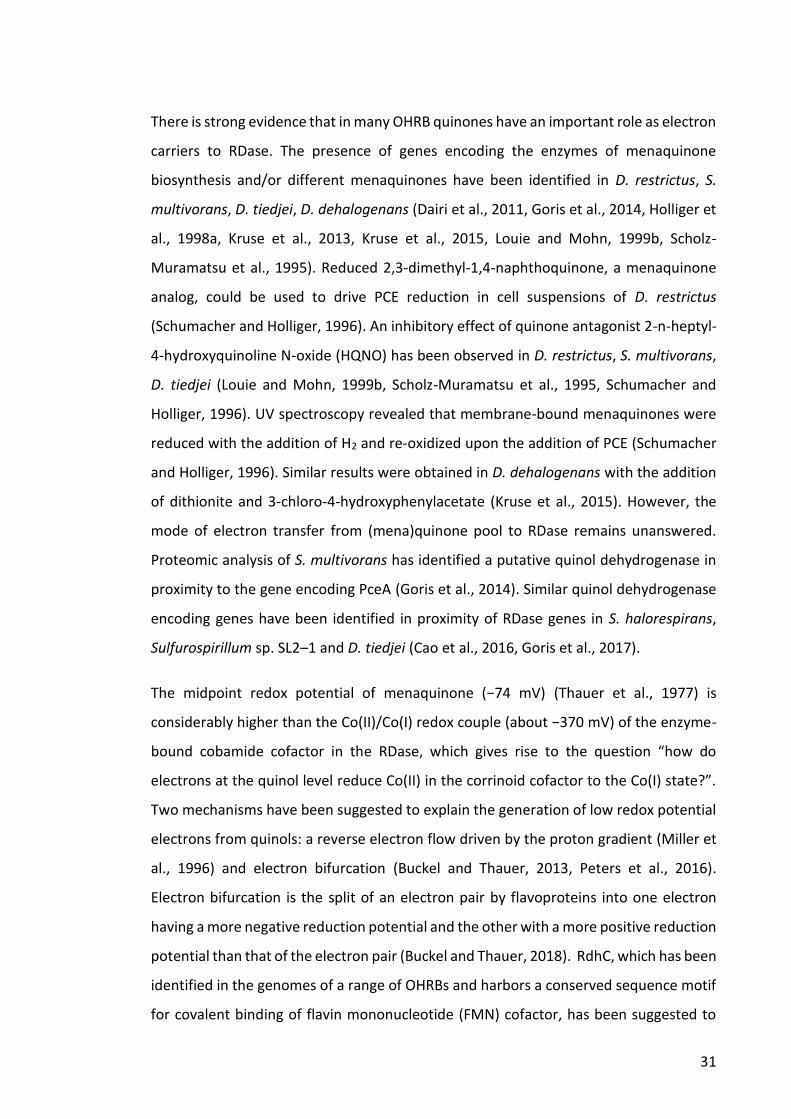
31
There is strong evidence that in many OHRB quinones have an important role as electron
carriers to RDase. The presence of genes encoding the enzymes of menaquinone
biosynthesis and/or different menaquinones have been identified in D. restrictus, S.
multivorans, D. tiedjei, D. dehalogenans (Dairi et al., 2011, Goris et al., 2014, Holliger et
al., 1998a, Kruse et al., 2013, Kruse et al., 2015, Louie and Mohn, 1999b, Scholz-
Muramatsu et al., 1995). Reduced 2,3-dimethyl-1,4-naphthoquinone, a menaquinone
analog, could be used to drive PCE reduction in cell suspensions of D. restrictus
(Schumacher and Holliger, 1996). An inhibitory effect of quinone antagonist 2-n-heptyl-
4-hydroxyquinoline N-oxide (HQNO) has been observed in D. restrictus, S. multivorans,
D. tiedjei (Louie and Mohn, 1999b, Scholz-Muramatsu et al., 1995, Schumacher and
Holliger, 1996). UV spectroscopy revealed that membrane-bound menaquinones were
reduced with the addition of H2 and re-oxidized upon the addition of PCE (Schumacher
and Holliger, 1996). Similar results were obtained in D. dehalogenans with the addition
of dithionite and 3-chloro-4-hydroxyphenylacetate (Kruse et al., 2015). However, the
mode of electron transfer from (mena)quinone pool to RDase remains unanswered.
Proteomic analysis of S. multivorans has identified a putative quinol dehydrogenase in
proximity to the gene encoding PceA (Goris et al., 2014). Similar quinol dehydrogenase
encoding genes have been identified in proximity of RDase genes in S. halorespirans,
Sulfurospirillum sp. SL2–1 and D. tiedjei (Cao et al., 2016, Goris et al., 2017).
The midpoint redox potential of menaquinone (−74 mV) (Thauer et al., 1977) is
considerably higher than the Co(II)/Co(I) redox couple (about −370 mV) of the enzyme-
bound cobamide cofactor in the RDase, which gives rise to the question “how do
electrons at the quinol level reduce Co(II) in the corrinoid cofactor to the Co(I) state?”.
Two mechanisms have been suggested to explain the generation of low redox potential
electrons from quinols: a reverse electron flow driven by the proton gradient (Miller et
al., 1996) and electron bifurcation (Buckel and Thauer, 2013, Peters et al., 2016).
Electron bifurcation is the split of an electron pair by flavoproteins into one electron
having a more negative reduction potential and the other with a more positive reduction
potential than that of the electron pair (Buckel and Thauer, 2018). RdhC, which has been
identified in the genomes of a range of OHRBs and harbors a conserved sequence motif
for covalent binding of flavin mononucleotide (FMN) cofactor, has been suggested to
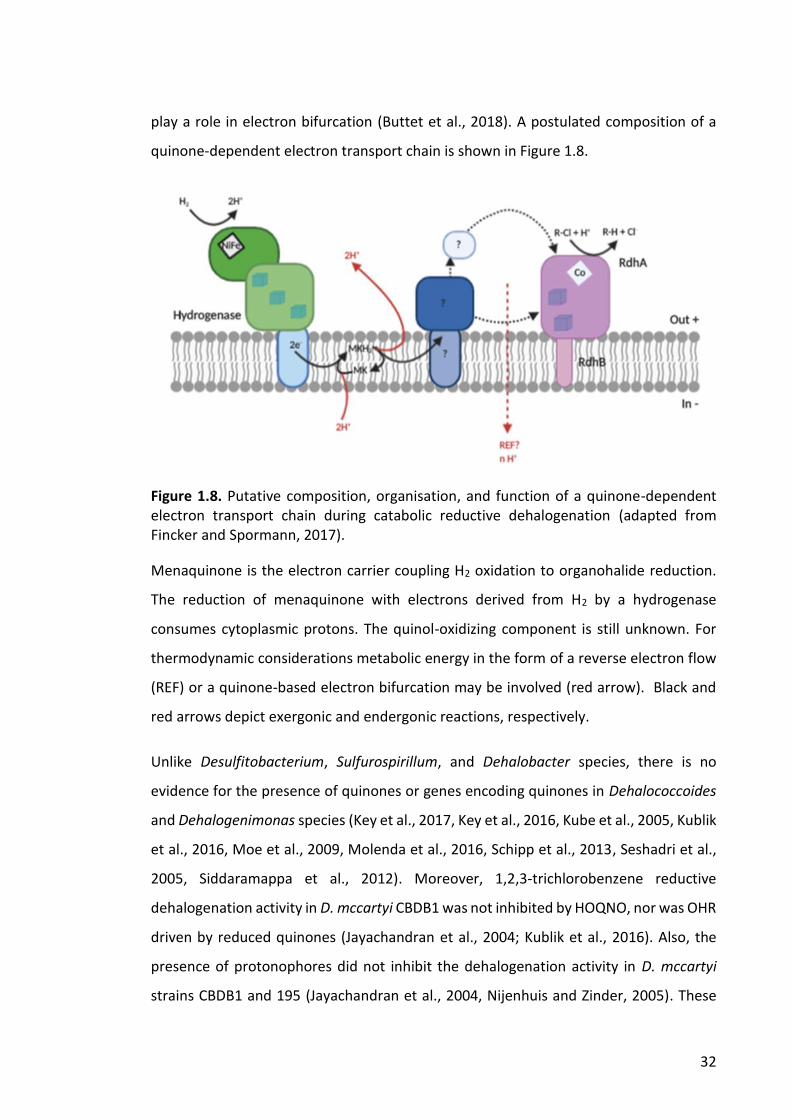
32
play a role in electron bifurcation (Buttet et al., 2018). A postulated composition of a
quinone-dependent electron transport chain is shown in Figure 1.8.
Figure 1.8. Putative composition, organisation, and function of a quinone-dependent electron transport chain during catabolic reductive dehalogenation (adapted from Fincker and Spormann, 2017).
Menaquinone is the electron carrier coupling H2 oxidation to organohalide reduction.
The reduction of menaquinone with electrons derived from H2 by a hydrogenase
consumes cytoplasmic protons. The quinol-oxidizing component is still unknown. For
thermodynamic considerations metabolic energy in the form of a reverse electron flow
(REF) or a quinone-based electron bifurcation may be involved (red arrow). Black and
red arrows depict exergonic and endergonic reactions, respectively.
Unlike Desulfitobacterium, Sulfurospirillum, and Dehalobacter species, there is no
evidence for the presence of quinones or genes encoding quinones in Dehalococcoides
and Dehalogenimonas species (Key et al., 2017, Key et al., 2016, Kube et al., 2005, Kublik
et al., 2016, Moe et al., 2009, Molenda et al., 2016, Schipp et al., 2013, Seshadri et al.,
2005, Siddaramappa et al., 2012). Moreover, 1,2,3-trichlorobenzene reductive
dehalogenation activity in D. mccartyi CBDB1 was not inhibited by HOQNO, nor was OHR
driven by reduced quinones (Jayachandran et al., 2004; Kublik et al., 2016). Also, the
presence of protonophores did not inhibit the dehalogenation activity in D. mccartyi
strains CBDB1 and 195 (Jayachandran et al., 2004, Nijenhuis and Zinder, 2005). These
33
findings strongly support the concept of a quinone-independent respiratory chain in D.
mccartyi and Dehalogenimonas species.
Of the five different putative multi-subunit hydrogenases encoded in D. mccartyi strains
CBDB1 and 195 (Hup, Ech, Hyc, Hym and Vhu), only Hup hydrogenase is predicted to be
localized in the periplasm and to be responsible for transmitting electrons from H2 to
the organohalide-respiratory chain (Kube et al., 2005, Seshadri et al., 2005). The Hup
hydrogenase operon consists of four genes: the large [NiFe]-containing catalytic subunit
(HupL), the small membrane-bound subunit (HupS), the Fe–S cluster-containing subunit
(HupX), and a gene predicted to be involved in hydrogenase maturation (Fincker and
Spormann, 2017). A complex formation between HupSLX, a RDase, and a complex iron–
sulfur molybdoenzyme (CISM) in D. mccartyi strain CBDB1 has been extracted and
shown to catalyze hydrogen-dependent reduction of 1,2,3-trichlorobenzene (Hartwig et
al., 2017, Kublik et al., 2016). The multi-protein reductive dehalogenase complex has
been referred to as the organohalide respiration complex (OHR complex) (Seidel et al.,
2018). The CISM is predicted to act as a critical electron-channeling module between
Hup hydrogenase and the RDase (Schipp et al., 2013). CISM is composed of two proteins:
the organohalide respiration involved molybdoenzyme (OmeA) and its putative
membrane-integrated anchor OmeB (Schubert et al., 2018). Both the Hup and the CISM
are each missing a subunit that the other contains (Mansfeldt et al., 2014), suggesting a
synergistic interaction. The predicted mechanistic model for the complex is that
electrons enter the complex through HupL and are then transferred via the iron-sulfur
clusters in HupS, HupX and OmeA to the RdhA which finally reduces the organohalides
(Seidel et al., 2018). It is still unknown how protons are translocated across the
membrane in the OHR complex. OmeB has a glutamate residue in helix eight which can
possibly be involved in proton pumping (Zinder, 2016). Another possible mechanism
may be an additional protein such as HppA, interacting with the OHR complex to
generate the proton motif force needed for ATP synthesis (Seidel et al., 2018). A
hypothetical model of the organohalide respiration complex is presented in Figure 1.9.
34
Figure 1.9. Hypothetical model of organohalide respiration complex. This figure adapted from (Seidel et al., 2018). The cubes indicate Fe-S clusters, the rhomboid structure indicates the corrinoid cofactor, the blue and green dots represent molybdenum and nickel ions, respectively.
1.14 Corrinoid cofactors in OHRB
Cobalamins are corrinoids consisting of a contracted tetrapyrrole ring system attached
to a nucleotide loop (Lenhert and Hodgkin, 1961). They vary in their structure by
containing different upper and lower axis ligands. Physiologically functional cobalamins
use a methyl group or a 5′-deoxyadenosyl moiety as the upper ligand and one of the 17
known lower ligands which are purine, benzimidazoles and phenols (Renz et al., 1987,
Rondon et al., 1997, Yan et al., 2018). Cobalamin-containing enzymes bind the cofactor
in two different conformations: the base-on mode where the lower base of the
nucleotide loop establishes a coordinative bond with the central cobalt ion or the base-
off conformation where the lower base is displaced from the cobalt (Banerjee and
Ragsdale, 2003, Bridwell-Rabb and Drennan, 2017, Gruber et al., 2011). The structure of
cobalamin-B12 and norpseudocobalamin-B12 is shown in Figure 1.10.
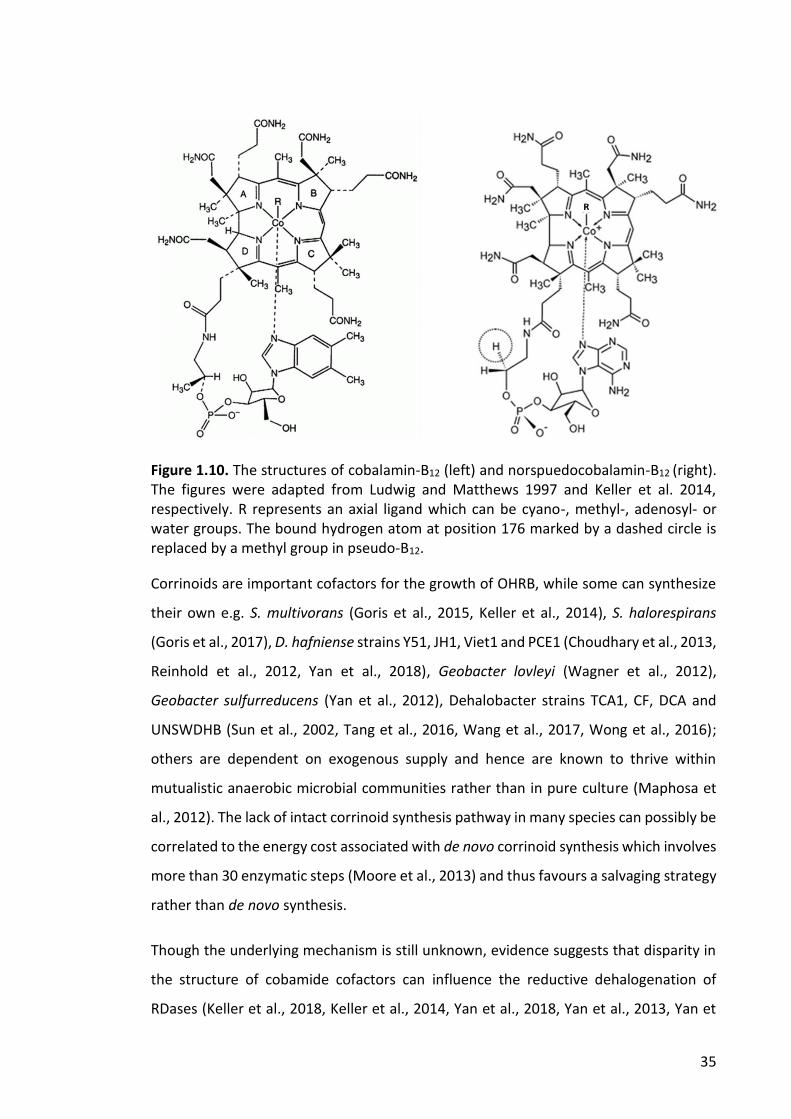
35
Figure 1.10. The structures of cobalamin-B12 (left) and norspuedocobalamin-B12 (right). The figures were adapted from Ludwig and Matthews 1997 and Keller et al. 2014, respectively. R represents an axial ligand which can be cyano-, methyl-, adenosyl- or water groups. The bound hydrogen atom at position 176 marked by a dashed circle is replaced by a methyl group in pseudo‐B12.
Corrinoids are important cofactors for the growth of OHRB, while some can synthesize
their own e.g. S. multivorans (Goris et al., 2015, Keller et al., 2014), S. halorespirans
(Goris et al., 2017), D. hafniense strains Y51, JH1, Viet1 and PCE1 (Choudhary et al., 2013,
Reinhold et al., 2012, Yan et al., 2018), Geobacter lovleyi (Wagner et al., 2012),
Geobacter sulfurreducens (Yan et al., 2012), Dehalobacter strains TCA1, CF, DCA and
UNSWDHB (Sun et al., 2002, Tang et al., 2016, Wang et al., 2017, Wong et al., 2016);
others are dependent on exogenous supply and hence are known to thrive within
mutualistic anaerobic microbial communities rather than in pure culture (Maphosa et
al., 2012). The lack of intact corrinoid synthesis pathway in many species can possibly be
correlated to the energy cost associated with de novo corrinoid synthesis which involves
more than 30 enzymatic steps (Moore et al., 2013) and thus favours a salvaging strategy
rather than de novo synthesis.
Though the underlying mechanism is still unknown, evidence suggests that disparity in
the structure of cobamide cofactors can influence the reductive dehalogenation of
RDases (Keller et al., 2018, Keller et al., 2014, Yan et al., 2018, Yan et al., 2013, Yan et
36
al., 2012, Yan et al., 2016, Yi et al., 2012). Studies show that the lower ligand are
modulators of corrinoid-dependent enzyme functions such as RDases, thus signifying
the importance of understanding enzyme-specific corrinoid cofactor requirements to
predict and if possible, manipulate their catalytic activity (Degnan et al., 2014, Keller et
al., 2014). Cobamide structure can be regulated by guided biosynthesis which is the
feeding of building blocks such as lower base precursors to the growing cells of a
cobamide-producer (Keller et al., 2018, Keller et al., 2014, Mok and Taga, 2013). Guided
cobamide biosynthesis is an effective tool to modulate the structure of cobamide
cofactors in OHRB and to investigate cofactor selectivity of RDases in the native
organism or the host for heterologous production (Schubert et al., 2019).
The obligate OHRB D. mccartyi is a cobamide auxotroph (Löffler et al., 2013). Three types
of corrinoid are functional in D. mccartyi strain 195: 5,6-dimethylbenzimidazolyl-
cobamide, 5-methylbenzimidazolyl-cobamide and 5-methoxybenzimidazolyl-cobamide
(Kruse et al., 2019). However, studies have shown that non-functional corrinoids such
as 5-hydroxybenzimidazolyl-cobamide or 7-adeninyl-cobamide can be remodelled to
functional ones by replacing the lower ligand when 5,6-dimethylbenzimidazole is
provided in the media (Men et al., 2014, Yi et al., 2012). A probable explanation for the
inhibitory effect of specific lower bases on reductive dehalogenation of RDases might be
the incompatibility of the lower base in the cobamide cofactor with the cobamide-
binding site of the particular RDase (Keller et al., 2018).
S. multivorans does not have genes for benzimidazole biosynthesis (Goris et al., 2014)
but it can utilise exogenous dimethylbenzimidazole (DMB) for cobamide biosynthesis.
The presence of DMB in the media can influence the organism's ability to perform
organohalide respiration and elevated levels of DMB can impair the PCE-dependent
growth, PceA activity, and PceA maturation in S. multivorans (Keller et al., 2014). Keller
et al., (2018) showed that S. multivorans can efficiently incorporate exogenously applied
5-methylbenzimidazole (5-MeBza), 5-hydroxybenzimidazole (5-OHBza), and 5-
methoxybenzimidazole (5-OMeBza) as lower bases into norcobamides instead of
adenine which is the original lower base of norpseudo-B12. While 5-OHBza and 5-
OMeBza had no negative effect on the enzyme activity, 5-MeBza reduced the enzyme
37
activity by half, although none of them affected the PCE-dependent growth. Structural
analysis of the norcobamides by NMR spectroscopy revealed a regioselectivity in the
utilization of these precursors for norcobamide biosynthesis.
Guided cobamide biosynthesis experiments in Desulfitobacterium hafniense strain DCB‐
2 showed that reductive dehalogenation of 3‐chloro‐4‐hydroxy‐phenylacetate by RdhA6
and 3,5‐dichlorophenol by RdhA3 was unaffected when exogenous benzimidazoles
(MeBza, Bza, OHBza or OMeBza), azabenzimidazoles (5‐azaBza, 4‐azaBza) and 4,5‐
dimethylimidazole (DMB) were incorporated by the organism into cobamides suggesting
the versatility of both enzymes in cobamide utilisation (Schubert et al., 2019). They also
studied the effect of the alteration of cobamide lower ligand precursors on recombinant
RDases produced in Shimwellia blattae. The recombinant PceAY51 was non-selective
towards different cobamides, however the activity of DcaA of Desulfitobacterium
dichloroeliminans was completely inhibited in cells utilising 5,6‐dimethylbenzimidazolyl,
but considerably increased in cells that incorporated 5‐methoxybenzimidazole into the
cobamide cofactor. This finding suggests that since cobamide cofactor-binding core is
structurally conserved among RDases (Bommer et al., 2014, Payne et al., 2015), it is likely
that only minimal structural changes are sufficient to alter cobamide preferences.
1.15 Substrate range and specificity of RDases
OHRB usually harbor multiple RDases in their genome and the combined substrate
specificities of the RDases encoded in an organism’s genome regulates the range of
halogenated compounds they can utilise as electron acceptors. Characterized RDases
show substrate specificity for different classes of organohalides, including aliphatic
chloro- and bromo- ethenes and ethanes, aromatic polychlorinated and brominated
phenols, and chlorinated benzenes (Fincker and Spormann, 2017). Additionally, the
range of substrates tested have mainly been limited to organohalides present at the
contaminated sites where the microorganisms have been isolated from, so the
possibility of the characterized RDases being capable of utilizing other substrates cannot
be overlooked. Microbial reductive deiodination has also been observed in nature by
Desulfitobacterium chlororespirans (Cupples et al., 2005) and Desulfoluna spongiiphila
38
(Ahn et al., 2009). Dehalococcoides mccartyi strain CBDB1 showed deiodination of
iodinated contrast media (ICM) and 2,3,5- triiodobenzoic acid without correlated cell
growth suggesting decoupling of electron transport from proton translocation (El-
Athman et al., 2019). No RDase tested to date has been observed to dehalogenate
fluorinated organic compounds however, recently an organohalide-respiring microbial
community capable of C‒F bond cleavage via reductive defluorination of two per- and
polyfluoroalkyl substances (PFASs), perfluoro (4-methylpent-2-enoic acid) and 4,5,5,5-
tetrafluoro-4-(trifluoromethyl)-2-pentenoic acid has been reported (Yu et al., 2019).
Substrate specificity of RDases does not depend on their phylogenetic origin or the
similarities between amino acids sequences of RDases. PceA, a tetrachloroethene-
dechlorinating enzyme can be found in five different genera: Shewanella,
Dehalococcoides, Dehalobacter, Sulfurospirillum, and Desulfitobacterium (Lohner and
Spormann, 2013, Magnuson et al., 1998, Maillard et al., 2003, Neumann et al., 1996,
Tsukagoshi et al., 2006). While having an affinity for the same substrate, the PceAs from
these genera share a maximum 29.8 % pairwise identity (Hug et al., 2013b). On the other
hand, CfrA and DcrA enzymes from Dehalobacter strains CF and DCA share 95 %
sequence identity at the amino acid level but their substrate ranges do not overlap (Tang
and Edwards, 2013).
RDases can catalyse dehalogenation of structurally related organohalides at differing
rates, though they usually have high substrate selectivity for only one or two
compounds. Initially it was believed that aliphatic and aromatic organohalides are
dehalogenated by two different types of RDases, however several RDases have showed
the capability to remove halogens from both aromatic and aliphatic halogenated
compounds, such as PcbA1, PcbA4 and PcbA5 from Dehalococcoides mccartyi strains
catalyze chlorine removal from both PCBs and PCE (Wang et al., 2014b). Substrate
specificity in aromatic RDases generally depends on the position of the organohalide
substituent. For example, CprA from Desulfitobacterium sp. PCE-1 and
Desulfitobacterium dehalogenans have a preference for ortho-dechlorination (van de
Pas et al., 2001, van de Pas et al., 1999), while on the other hand, CprA5 from
Desulfitobacterium sp. PCP-1 prefers meta-dehalogenation (Thibodeau et al., 2004).
39
1.16 Challenges in producing native RDases
Reductive dehalogenases can be an important tool for bioremediation of recalcitrant
organohalides. Identification and characterization of reductive dehalogenases is
required for the understanding of their structure, reaction mechanisms and substrate
specificity thus, paving the way to developing effective bioremediation strategies.
Research into how organohalides are used as an energy or carbon source is also
important for deciphering microbial biochemical interactions in the environment
(Schubert et al., 2018). Over 2000 putative reductive dehalogenase genes have so far
been identified but only a handful have been characterized (Adrian and Löffler, 2016). A
single OHRB may have several RdhA enzymes which make it difficult to identify a specific
substrate range for a single rdhA gene product and further hinder the functional
assignment (Mac Nelly et al., 2014, Schubert and Diekert, 2016). It is difficult to predict
substrate specificity based on gene sequence (Hug et al., 2013b) and it has been
concluded that sequence similarity and substrate specificity are generally not correlated
(Buttet et al., 2013). Thus, functional assays require the isolation and purification of the
native enzyme which has so far proven to be very difficult and to date only 20 RDases
have been purified partially or to apparent homogeneity (Table 1.2).
Purification of RDases from the native hosts and the subsequent characterization is
hindered by several factors, the major ones being the slow growth of the OHRB and
associated low cell yield (Hug et al., 2013b), especially the obligate OHRB which cannot
be cultured with alternative electron acceptors. The small cell sizes (<0.5 µm in some
cases), the oxygen sensitivity of the organisms and the low water solubility of the
organohalides serving as the terminal electron acceptors are also important obstacles.
The enzymes themselves also impose restrictions to the process because of their
membrane association, oxygen intolerance and requirement for cobalamin and Fe-S
cluster cofactors, thus making the production of the enzymes from native sources
impractical in large scale (Maphosa et al., 2012).
.
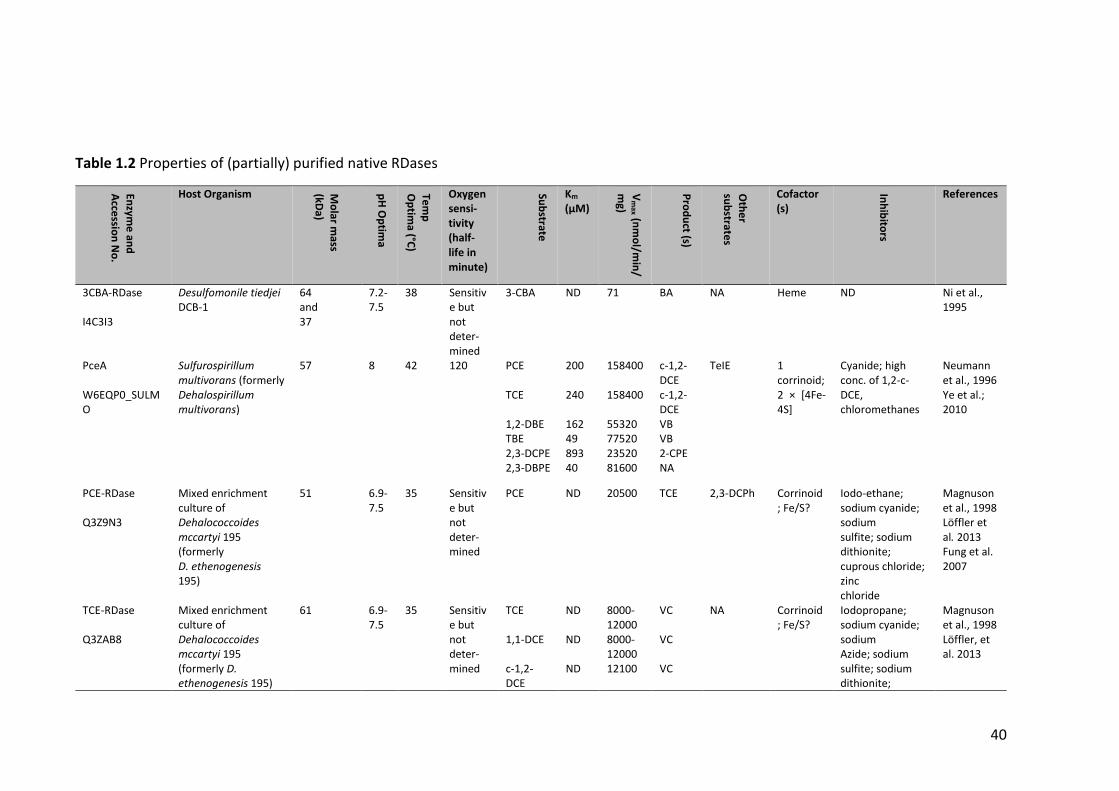
40
Table 1.2 Properties of (partially) purified native RDases
Enzym
e an
d
Acce
ssion
No
.
Host Organism Mo
lar mass
(kDa)
pH
Op
tima
Tem
p
Op
tima (°C
)
Oxygen sensi- tivity (half-life in minute)
Sub
strate
Km (µM)
Vm
ax (n
mo
l/min
/
mg)
Pro
du
ct (s)
Oth
er
sub
strates
Cofactor (s)
Inh
ibito
rs
References
3CBA-RDase I4C3I3
Desulfomonile tiedjei DCB-1
64 and 37
7.2-7.5
38 Sensitive but not deter-mined
3-CBA ND 71 BA NA Heme ND Ni et al., 1995
PceA W6EQP0_SULMO
Sulfurospirillum multivorans (formerly Dehalospirillum multivorans)
57 8 42 120 PCE 200 158400 c-1,2-DCE
TeIE 1 corrinoid; 2 × [4Fe-4S]
Cyanide; high conc. of 1,2-c-DCE, chloromethanes
Neumann et al., 1996 Ye et al.; 2010
TCE 240 158400 c-1,2-DCE
1,2-DBE 162 55320 VB TBE 49 77520 VB 2,3-DCPE 893 23520 2-CPE 2,3-DBPE 40 81600 NA
PCE-RDase Q3Z9N3
Mixed enrichment culture of Dehalococcoides mccartyi 195 (formerly D. ethenogenesis 195)
51 6.9-7.5
35 Sensitive but not deter-mined
PCE ND 20500 TCE 2,3-DCPh Corrinoid; Fe/S?
Iodo-ethane; sodium cyanide; sodium sulfite; sodium dithionite; cuprous chloride; zinc chloride
Magnuson et al., 1998 Löffler et al. 2013 Fung et al. 2007
TCE-RDase Q3ZAB8
Mixed enrichment culture of Dehalococcoides mccartyi 195 (formerly D. ethenogenesis 195)
61 6.9-7.5
35 Sensitive but not deter-mined
TCE ND 8000-12000
VC NA Corrinoid; Fe/S?
Iodopropane; sodium cyanide; sodium Azide; sodium sulfite; sodium dithionite;
Magnuson et al., 1998 Löffler, et al. 2013
1,1-DCE ND 8000-12000
VC
c-1,2-DCE
ND 12100 VC
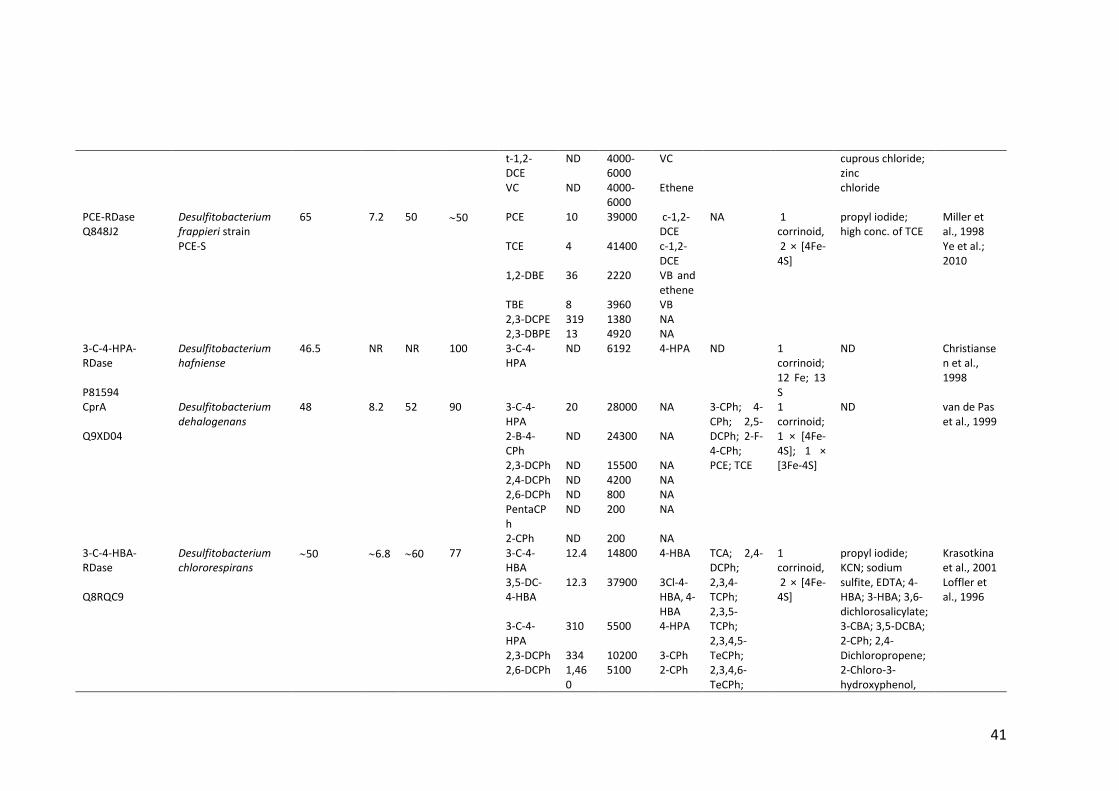
41
t-1,2-DCE
ND 4000-6000
VC cuprous chloride; zinc chloride VC ND 4000-
6000 Ethene
PCE-RDase Q848J2
Desulfitobacterium frappieri strain PCE-S
65 7.2 50 50 PCE 10 39000 c-1,2-DCE
NA 1 corrinoid, 2 × [4Fe-4S]
propyl iodide; high conc. of TCE
Miller et al., 1998 Ye et al.; 2010
TCE 4 41400 c-1,2-DCE
1,2-DBE 36 2220 VB and ethene
TBE 8 3960 VB 2,3-DCPE 319 1380 NA 2,3-DBPE 13 4920 NA
3-C-4-HPA- RDase P81594
Desulfitobacterium hafniense
46.5 NR NR 100 3-C-4-HPA
ND 6192 4-HPA ND 1 corrinoid; 12 Fe; 13 S
ND Christiansen et al., 1998
CprA Q9XD04
Desulfitobacterium dehalogenans
48 8.2 52 90 3-C-4-HPA
20 28000 NA 3-CPh; 4-CPh; 2,5-DCPh; 2-F-4-CPh; PCE; TCE
1 corrinoid; 1 × [4Fe-4S]; 1 × [3Fe-4S]
ND van de Pas et al., 1999
2-B-4-CPh
ND 24300 NA
2,3-DCPh ND 15500 NA 2,4-DCPh ND 4200 NA 2,6-DCPh ND 800 NA PentaCPh
ND 200 NA
2-CPh ND 200 NA 3-C-4-HBA-RDase Q8RQC9
Desulfitobacterium chlororespirans
50 6.8 60 77 3-C-4-HBA
12.4 14800 4-HBA TCA; 2,4-DCPh; 2,3,4-TCPh; 2,3,5-TCPh; 2,3,4,5-TeCPh; 2,3,4,6-TeCPh;
1 corrinoid, 2 × [4Fe-4S]
propyl iodide; KCN; sodium sulfite, EDTA; 4-HBA; 3-HBA; 3,6-dichlorosalicylate; 3-CBA; 3,5-DCBA; 2-CPh; 2,4-Dichloropropene; 2-Chloro-3-hydroxyphenol,
Krasotkina et al., 2001 Loffler et al., 1996
3,5-DC-4-HBA
12.3 37900 3Cl-4-HBA, 4-HBA
3-C-4-HPA
310 5500 4-HPA
2,3-DCPh 334 10200 3-CPh 2,6-DCPh 1,46
0 5100 2-CPh
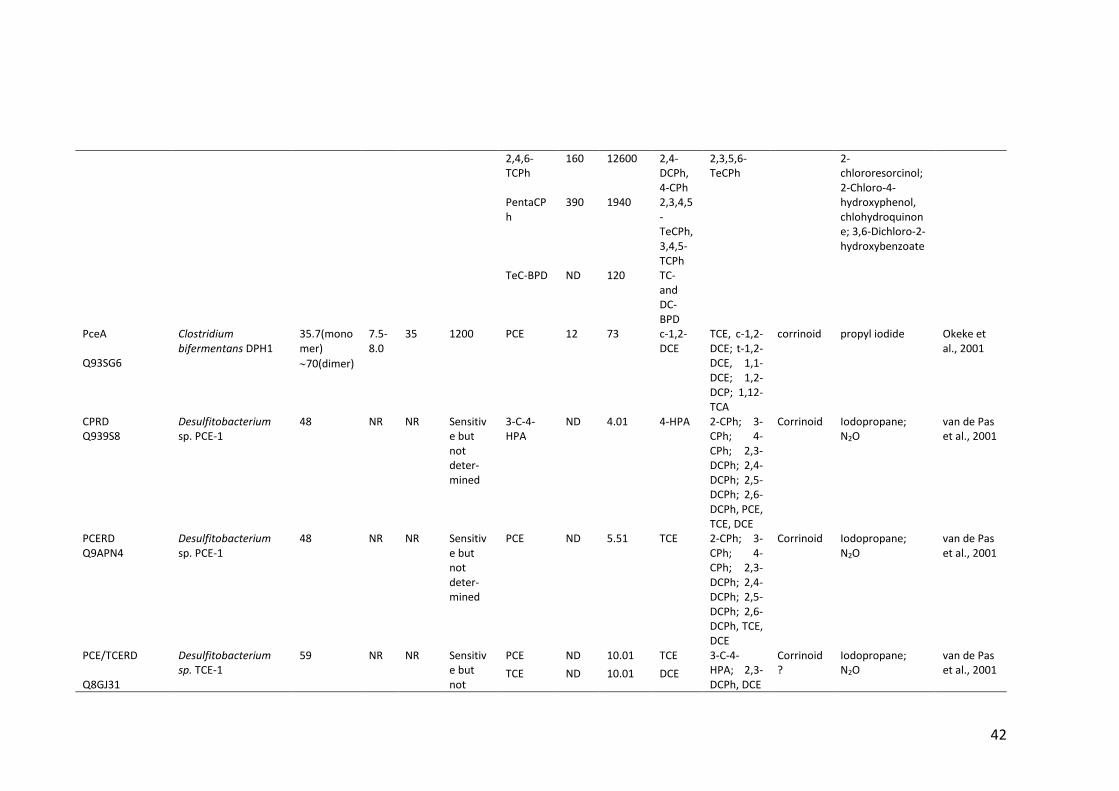
42
2,4,6-TCPh
160 12600 2,4-DCPh, 4-CPh
2,3,5,6-TeCPh
2-chlororesorcinol; 2-Chloro-4-hydroxyphenol, chlohydroquinone; 3,6-Dichloro-2-hydroxybenzoate
PentaCPh
390 1940 2,3,4,5-TeCPh, 3,4,5-TCPh
TeC-BPD ND 120 TC- and DC-BPD
PceA Q93SG6
Clostridium bifermentans DPH1
35.7(monomer)
70(dimer)
7.5-8.0
35 1200 PCE 12 73 c-1,2-DCE
TCE, c-1,2-DCE; t-1,2-DCE, 1,1-DCE; 1,2-DCP; 1,12-TCA
corrinoid propyl iodide Okeke et al., 2001
CPRD Q939S8
Desulfitobacterium sp. PCE-1
48 NR NR Sensitive but not deter-mined
3-C-4-HPA
ND 4.01 4-HPA 2-CPh; 3-CPh; 4-CPh; 2,3-DCPh; 2,4-DCPh; 2,5-DCPh; 2,6-DCPh, PCE, TCE, DCE
Corrinoid Iodopropane; N2O
van de Pas et al., 2001
PCERD Q9APN4
Desulfitobacterium sp. PCE-1
48 NR NR Sensitive but not deter-mined
PCE ND 5.51 TCE 2-CPh; 3-CPh; 4-CPh; 2,3-DCPh; 2,4-DCPh; 2,5-DCPh; 2,6-DCPh, TCE, DCE
Corrinoid Iodopropane; N2O
van de Pas et al., 2001
PCE/TCERD Q8GJ31
Desulfitobacterium sp. TCE-1
59 NR NR Sensitive but not
PCE ND 10.01 TCE 3-C-4-HPA; 2,3-DCPh, DCE
Corrinoid?
Iodopropane; N2O
van de Pas et al., 2001 TCE ND 10.01 DCE
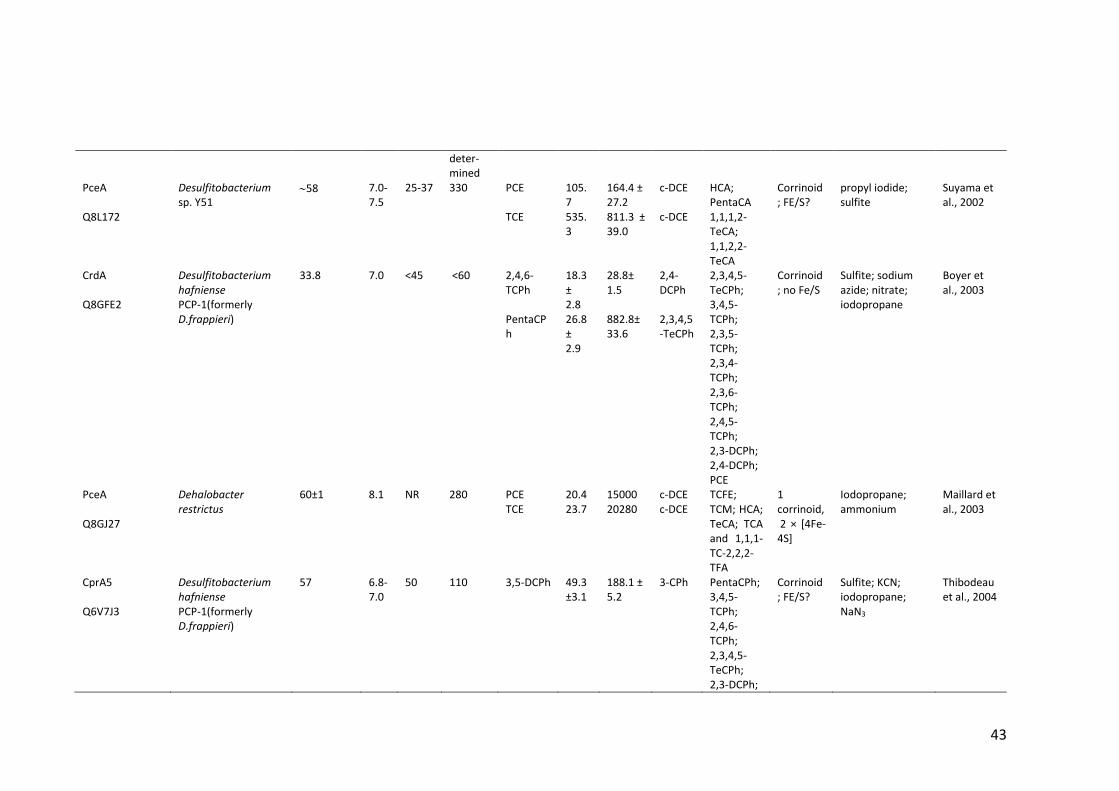
43
deter-mined
PceA Q8L172
Desulfitobacterium sp. Y51
58 7.0-7.5
25-37 330 PCE 105.7
164.4 ± 27.2
c-DCE HCA; PentaCA 1,1,1,2-TeCA; 1,1,2,2-TeCA
Corrinoid; FE/S?
propyl iodide; sulfite
Suyama et al., 2002
TCE 535.3
811.3 ± 39.0
c-DCE
CrdA Q8GFE2
Desulfitobacterium hafniense PCP-1(formerly D.frappieri)
33.8 7.0 <45 <60 2,4,6-TCPh
18.3± 2.8
28.8± 1.5
2,4-DCPh
2,3,4,5-TeCPh; 3,4,5-TCPh; 2,3,5-TCPh; 2,3,4-TCPh; 2,3,6-TCPh; 2,4,5-TCPh; 2,3-DCPh; 2,4-DCPh; PCE
Corrinoid; no Fe/S
Sulfite; sodium azide; nitrate; iodopropane
Boyer et al., 2003
PentaCPh
26.8± 2.9
882.8± 33.6
2,3,4,5-TeCPh
PceA Q8GJ27
Dehalobacter restrictus
60±1 8.1 NR 280 PCE 20.4 15000 c-DCE TCFE; TCM; HCA; TeCA; TCA and 1,1,1-TC-2,2,2- TFA
1 corrinoid, 2 × [4Fe-4S]
Iodopropane; ammonium
Maillard et al., 2003 TCE 23.7 20280 c-DCE
CprA5 Q6V7J3
Desulfitobacterium hafniense PCP-1(formerly D.frappieri)
57 6.8-7.0
50 110 3,5-DCPh 49.3 ±3.1
188.1 ± 5.2
3-CPh PentaCPh; 3,4,5-TCPh; 2,4,6-TCPh; 2,3,4,5-TeCPh; 2,3-DCPh;
Corrinoid; FE/S?
Sulfite; KCN; iodopropane; NaN3
Thibodeau et al., 2004
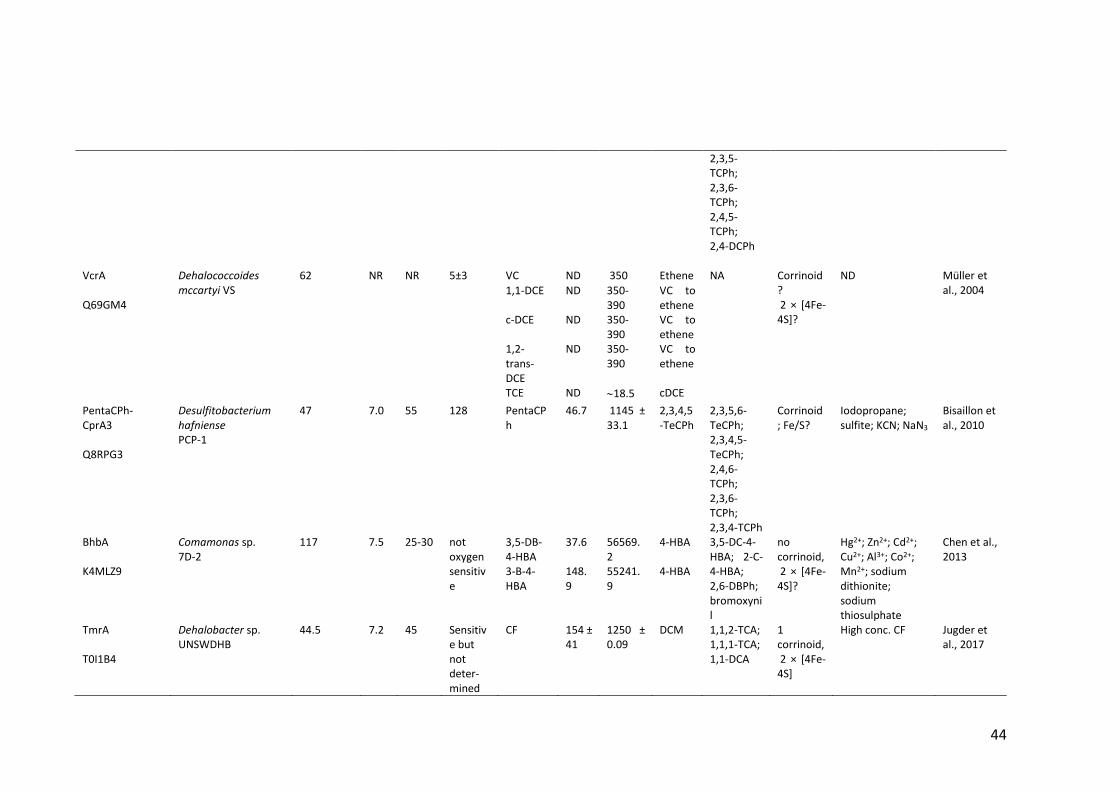
44
2,3,5-TCPh; 2,3,6-TCPh; 2,4,5-TCPh; 2,4-DCPh
VcrA Q69GM4
Dehalococcoides mccartyi VS
62 NR NR 5±3 VC ND 350 Ethene NA Corrinoid? 2 × [4Fe-4S]?
ND Müller et al., 2004 1,1-DCE ND 350-
390 VC to ethene
c-DCE ND 350-390
VC to ethene
1,2-trans-DCE
ND 350-390
VC to ethene
TCE ND 18.5 cDCE
PentaCPh- CprA3 Q8RPG3
Desulfitobacterium hafniense PCP-1
47 7.0 55 128 PentaCPh
46.7 1145 ± 33.1
2,3,4,5-TeCPh
2,3,5,6-TeCPh; 2,3,4,5-TeCPh; 2,4,6-TCPh; 2,3,6-TCPh; 2,3,4-TCPh
Corrinoid; Fe/S?
Iodopropane; sulfite; KCN; NaN3
Bisaillon et al., 2010
BhbA K4MLZ9
Comamonas sp. 7D-2
117 7.5 25-30 not oxygen sensitive
3,5-DB-4-HBA
37.6 56569.2
4-HBA 3,5-DC-4-HBA; 2-C-4-HBA; 2,6-DBPh; bromoxynil
no corrinoid, 2 × [4Fe-4S]?
Hg2+; Zn2+; Cd2+; Cu2+; Al3+; Co2+; Mn2+; sodium dithionite; sodium thiosulphate
Chen et al., 2013
3-B-4-HBA
148.9
55241.9
4-HBA
TmrA T0I1B4
Dehalobacter sp. UNSWDHB
44.5 7.2 45 Sensitive but not deter-mined
CF 154 ± 41
1250 ± 0.09
DCM 1,1,2-TCA; 1,1,1-TCA; 1,1-DCA
1 corrinoid, 2 × [4Fe-4S]
High conc. CF Jugder et al., 2017
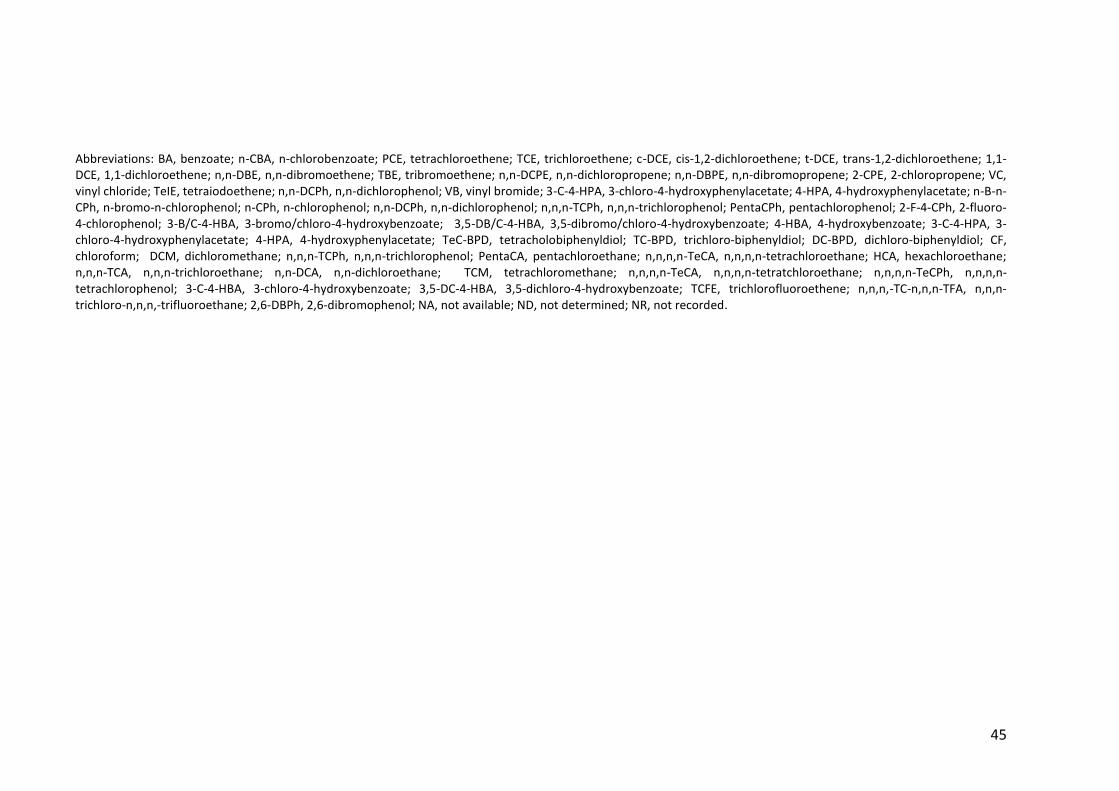
45
Abbreviations: BA, benzoate; n-CBA, n-chlorobenzoate; PCE, tetrachloroethene; TCE, trichloroethene; c-DCE, cis-1,2-dichloroethene; t-DCE, trans-1,2-dichloroethene; 1,1-DCE, 1,1-dichloroethene; n,n-DBE, n,n-dibromoethene; TBE, tribromoethene; n,n-DCPE, n,n-dichloropropene; n,n-DBPE, n,n-dibromopropene; 2-CPE, 2-chloropropene; VC, vinyl chloride; TeIE, tetraiodoethene; n,n-DCPh, n,n-dichlorophenol; VB, vinyl bromide; 3-C-4-HPA, 3-chloro-4-hydroxyphenylacetate; 4-HPA, 4-hydroxyphenylacetate; n-B-n-CPh, n-bromo-n-chlorophenol; n-CPh, n-chlorophenol; n,n-DCPh, n,n-dichlorophenol; n,n,n-TCPh, n,n,n-trichlorophenol; PentaCPh, pentachlorophenol; 2-F-4-CPh, 2-fluoro-4-chlorophenol; 3-B/C-4-HBA, 3-bromo/chloro-4-hydroxybenzoate; 3,5-DB/C-4-HBA, 3,5-dibromo/chloro-4-hydroxybenzoate; 4-HBA, 4-hydroxybenzoate; 3-C-4-HPA, 3-chloro-4-hydroxyphenylacetate; 4-HPA, 4-hydroxyphenylacetate; TeC-BPD, tetracholobiphenyldiol; TC-BPD, trichloro-biphenyldiol; DC-BPD, dichloro-biphenyldiol; CF, chloroform; DCM, dichloromethane; n,n,n-TCPh, n,n,n-trichlorophenol; PentaCA, pentachloroethane; n,n,n,n-TeCA, n,n,n,n-tetrachloroethane; HCA, hexachloroethane; n,n,n-TCA, n,n,n-trichloroethane; n,n-DCA, n,n-dichloroethane; TCM, tetrachloromethane; n,n,n,n-TeCA, n,n,n,n-tetratchloroethane; n,n,n,n-TeCPh, n,n,n,n-tetrachlorophenol; 3-C-4-HBA, 3-chloro-4-hydroxybenzoate; 3,5-DC-4-HBA, 3,5-dichloro-4-hydroxybenzoate; TCFE, trichlorofluoroethene; n,n,n,-TC-n,n,n-TFA, n,n,n-trichloro-n,n,n,-trifluoroethane; 2,6-DBPh, 2,6-dibromophenol; NA, not available; ND, not determined; NR, not recorded.
46
Various endeavours to produce native RDases have been reported since mid-1990s, they
involve the use of different cell lysis methods followed by different solubilization
techniques and chromatographic separation, mostly resulting in partially purified
proteins with varied specific activity (Jugder et al., 2016a). The important steps involved
in the purification of native enzymes that has so far been isolated are summarized in
Table 1.3.
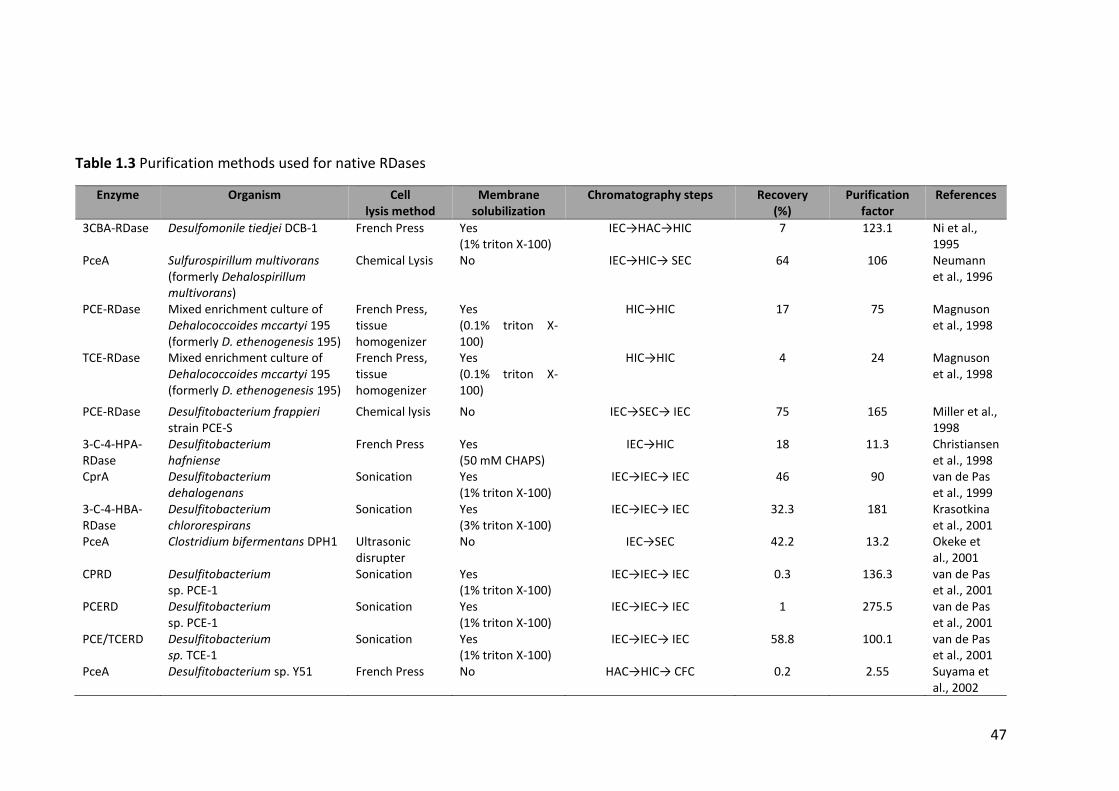
47
Table 1.3 Purification methods used for native RDases
Enzyme Organism Cell lysis method
Membrane solubilization
Chromatography steps Recovery (%)
Purification factor
References
3CBA-RDase Desulfomonile tiedjei DCB-1 French Press Yes (1% triton X-100)
IEC→HAC→HIC 7 123.1 Ni et al., 1995
PceA Sulfurospirillum multivorans (formerly Dehalospirillum multivorans)
Chemical Lysis No IEC→HIC→ SEC 64 106 Neumann et al., 1996
PCE-RDase Mixed enrichment culture of Dehalococcoides mccartyi 195 (formerly D. ethenogenesis 195)
French Press, tissue homogenizer
Yes (0.1% triton X-100)
HIC→HIC 17 75 Magnuson et al., 1998
TCE-RDase Mixed enrichment culture of Dehalococcoides mccartyi 195 (formerly D. ethenogenesis 195)
French Press, tissue homogenizer
Yes (0.1% triton X-100)
HIC→HIC 4 24 Magnuson et al., 1998
PCE-RDase Desulfitobacterium frappieri strain PCE-S
Chemical lysis No IEC→SEC→ IEC 75 165 Miller et al., 1998
3-C-4-HPA- RDase
Desulfitobacterium hafniense
French Press Yes (50 mM CHAPS)
IEC→HIC 18 11.3 Christiansen et al., 1998
CprA Desulfitobacterium dehalogenans
Sonication Yes (1% triton X-100)
IEC→IEC→ IEC 46 90 van de Pas et al., 1999
3-C-4-HBA-RDase
Desulfitobacterium chlororespirans
Sonication Yes (3% triton X-100)
IEC→IEC→ IEC 32.3 181 Krasotkina et al., 2001
PceA Clostridium bifermentans DPH1 Ultrasonic disrupter
No IEC→SEC 42.2 13.2 Okeke et al., 2001
CPRD Desulfitobacterium sp. PCE-1
Sonication Yes (1% triton X-100)
IEC→IEC→ IEC 0.3 136.3 van de Pas et al., 2001
PCERD Desulfitobacterium sp. PCE-1
Sonication Yes (1% triton X-100)
IEC→IEC→ IEC 1 275.5 van de Pas et al., 2001
PCE/TCERD Desulfitobacterium sp. TCE-1
Sonication Yes (1% triton X-100)
IEC→IEC→ IEC 58.8 100.1 van de Pas et al., 2001
PceA Desulfitobacterium sp. Y51 French Press No HAC→HIC→ CFC 0.2 2.55 Suyama et al., 2002
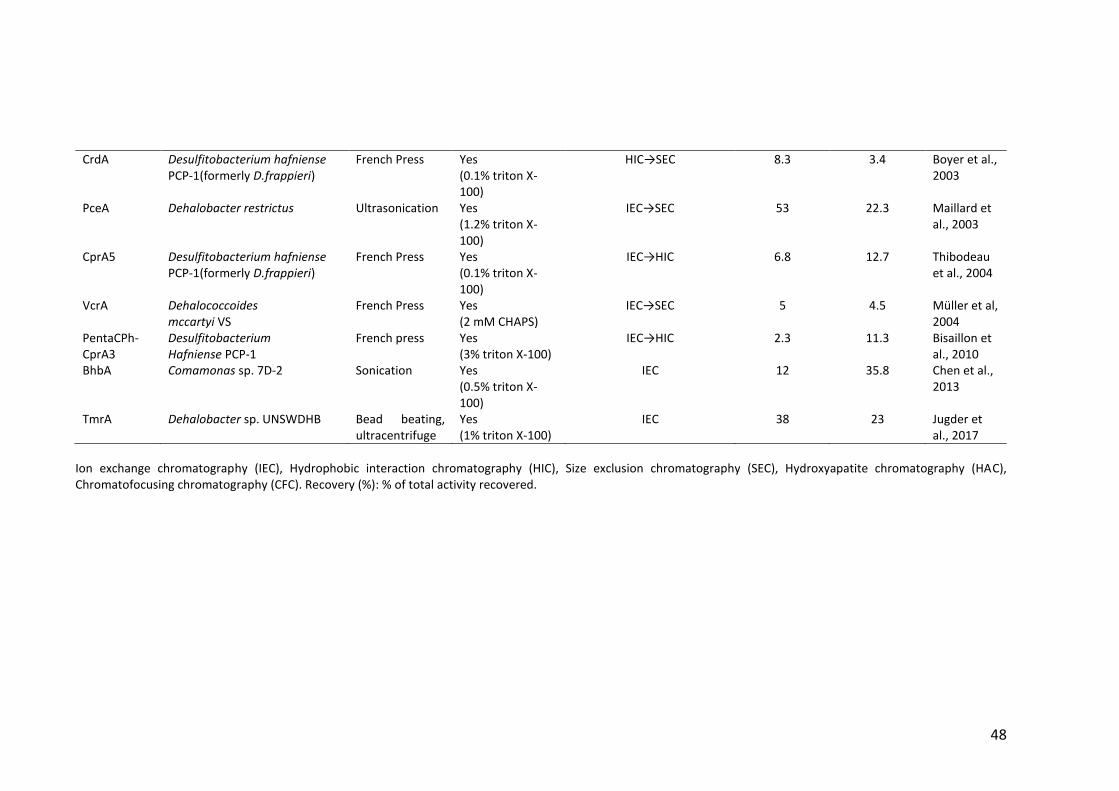
48
CrdA Desulfitobacterium hafniense PCP-1(formerly D.frappieri)
French Press Yes (0.1% triton X-100)
HIC→SEC 8.3 3.4 Boyer et al., 2003
PceA Dehalobacter restrictus Ultrasonication Yes (1.2% triton X-100)
IEC→SEC 53 22.3 Maillard et al., 2003
CprA5 Desulfitobacterium hafniense PCP-1(formerly D.frappieri)
French Press Yes (0.1% triton X-100)
IEC→HIC 6.8 12.7 Thibodeau et al., 2004
VcrA Dehalococcoides mccartyi VS
French Press Yes (2 mM CHAPS)
IEC→SEC 5 4.5 Müller et al, 2004
PentaCPh- CprA3
Desulfitobacterium Hafniense PCP-1
French press Yes (3% triton X-100)
IEC→HIC 2.3 11.3 Bisaillon et al., 2010
BhbA Comamonas sp. 7D-2 Sonication Yes (0.5% triton X-100)
IEC 12 35.8 Chen et al., 2013
TmrA Dehalobacter sp. UNSWDHB Bead beating, ultracentrifuge
Yes (1% triton X-100)
IEC 38 23 Jugder et al., 2017
Ion exchange chromatography (IEC), Hydrophobic interaction chromatography (HIC), Size exclusion chromatography (SEC), Hydroxyapatite chromatography (HAC), Chromatofocusing chromatography (CFC). Recovery (%): % of total activity recovered.
49
1.17 Heterologous expressions of RDases: limitations and successes
With the continued advancement of genetic engineering tools, production of
recombinant proteins in microbial systems has become an attractive alternative to
protein extraction from natural sources. Escherichia coli is the most extensively used
prokaryotic host for heterologous expression of protein; efforts have been made over
the last two decades to produce RDases heterologously in E. coli. So far, no respiratory
RDase has been expressed recombinantly in E. coli in a soluble and catalytically active
form. Though some of these efforts resulted in the over-expression of the protein in
interest, they were catalytically inactive, aggregated as inclusion bodies in the cytoplasm
(Jugder et al., 2018, Kimoto et al., 2010, Neumann et al., 1998, Sjuts et al., 2012, Suyama
et al., 2002). The formation of inactive RDases was mainly credited to the fact that E.
coli is incapable of synthesizing corrinoids de novo and hence there were insufficient
amounts of cobamide cofactor in the cells (Neumann et al., 1998, Suyama et al., 2002).
Experiments using different solubility tags and reconstitution of corrinoid cofactors and
Fe-S clusters also failed possibly because of the use of the improper and insufficient
cobalamin cofactor and incomplete reconstitution of the two Fe-S clusters (Jugder et al.,
2018, Sjuts et al., 2012). The first success story reported in E. coli was the over-
expression of vinyl chloride reducing VcrA from Dehalococcoides mccartyi strain VS and
subsequent in vitro reconstitution by the incorporation of a corrinoid cofactor and two
iron-sulfur clusters, thus producing a functional protein (Parthasarathy et al., 2015).
Collin (2017) over-expressed active catabolic reductive dehalogenase, NpRdhA, a
phylogenetically distinct and aerobic RdhA from Nitratireductor pacificus strain pht-3B
in a vitamin-B12 transporter btuB over-expressing E. coli. Nakamura et al., (2018) over-
expressed tetrachloroethene reducing PceA from Geobacter sp. in E. coli, purified and
denatured the protein under aerobic conditions. Consequently, they refolded PceA in
the presence of FeCl3, Na2S and cobalamin under anaerobic conditions and the
reconstituted protein demonstrated dechlorination of tetrachloroethene. Very recently,
Halliwell et al., (2021) over-expressed NpRdhA in E. coli HMS174(DE3), they also co-
expressed NpRdhA with a vitamin-B12 transporter btuB in E. coli HMS174(DE3). (Halliwell
et al., 2021) The same group expressed NpRdhA in a commercial strain of Vibrio
50
natrigenes, Vmax™, a host that has not been previously reported as an expression host
for RDases. V. natrigenes cannot synthesis vitamin B12 de novo, rather it salvages
cobalamin/cobinamide via an aerobic pathway (Agarwal et al., 2019).
The production of catalytically active RDases is made complex by their need of
cobamides and Fe–S clusters; the synthesis and proper insertion of the cofactors hinders
recombinant expression approaches. Hence, the corrinoid-producing Gram-negative
gammaproteobacterium Shimwellia blattae and the Gram-positive Bacillus megaterium
have been identified as suitable hosts for heterologous production of functional RDases
(Mac Nelly et al., 2014, Payne et al., 2015). B. megaterium produces 5,6-
dimethylbenzimidazolyl cobamide, the standard-type B12 cofactor, and S. blattae
synthesizes pseudo-B12, adeninyl cobamide de novo (Mac Nelly et al., 2014, Wolf and
Brey, 1986). The PceA from Desulfitobacterium hafniense strain Y51 and RdhA3 of strain
DCB-2 were produced in Shimwellia blattae where co-expression of the respective
chaperone proteins PceT and RdhT improved over-expression of the functional enzymes
(Mac Nelly et al., 2014). Raising the intracellular corrinoid level by adding exogenous
corrinoid hydroxocobalamin and the precursor of the corrinoid’s lower ligand base (5,6-
dimethylbenzimidazole) to the growth media and using glycerol as the growth substrate
for S. blattae also increased the formation of active RDases (Mac Nelly et al., 2014). A
similar protocol was followed to produce functional DcaA from D. dichloroeliminans
DCA1 in S. blattae; co-expression of dedicated chaperone DcaT resulted in increased
dechlorination activity (Kunze et al., 2017). Halliwell et al., (2021) expressed active
NpRdhA in S. blattae.
The NpRdhA was first heterologously expressed in Bacillus megaterium by using C-
terminal His-tagged NpRdhA and inducing its xylose-inducible promoter (Payne et al.,
2015). The TmrA protein of Dehalobacter strain UNSWDHB has also recently been
expressed in a catalytically active form in Bacillus megaterium with an N-terminal His-
tag and devoid of the TAT signal peptide to exclude any requirement for co-expression
of chaperone protein to facilitate membrane dislocation of TmrA (Jugder et al., 2018).
These efforts now allow the production of reductive dehalogenase preparations in mg-
scale which makes the structural and functional studies possible. A summary of the

51
attempted and successful heterologous expression of RDases that have been reported
so far is presented in Table 1.4.
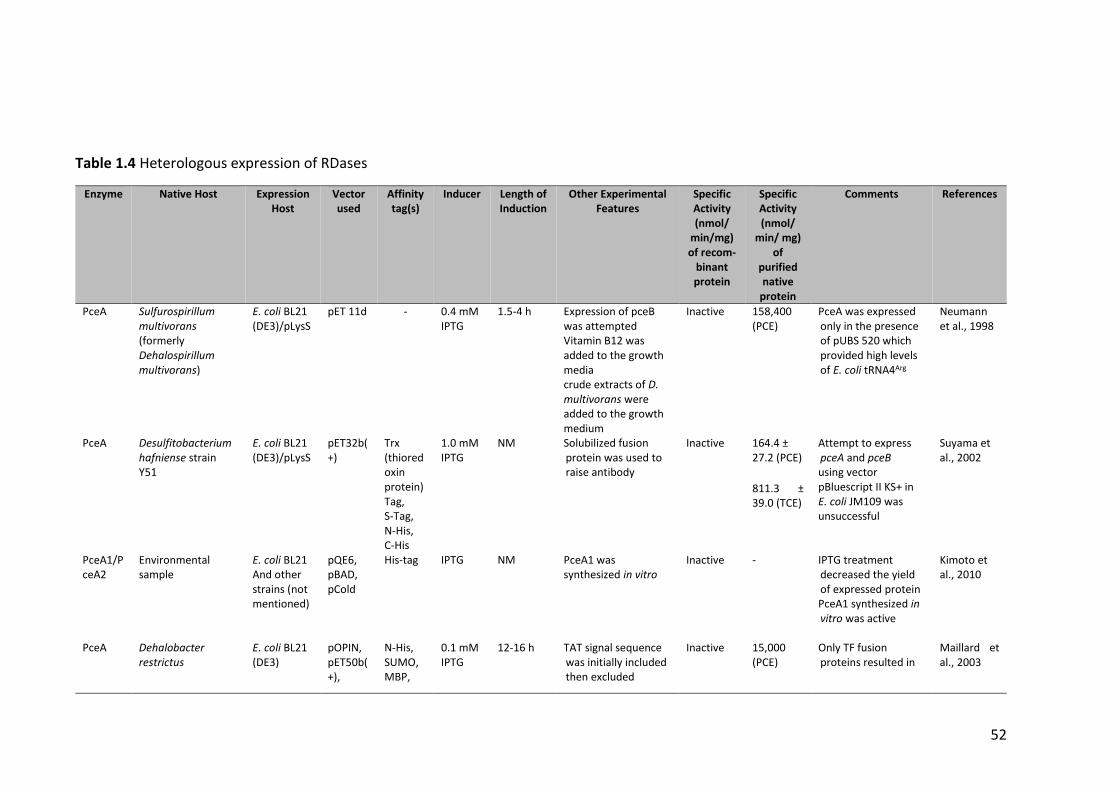
52
Table 1.4 Heterologous expression of RDases
Enzyme Native Host Expression Host
Vector used
Affinity tag(s)
Inducer Length of Induction
Other Experimental Features
Specific Activity (nmol/
min/mg) of recom-
binant protein
Specific Activity (nmol/
min/ mg) of
purified native
protein
Comments References
PceA Sulfurospirillum multivorans (formerly Dehalospirillum multivorans)
E. coli BL21 (DE3)/pLysS
pET 11d - 0.4 mM IPTG
1.5-4 h Expression of pceB was attempted Vitamin B12 was added to the growth media crude extracts of D. multivorans were added to the growth medium
Inactive 158,400 (PCE)
PceA was expressed only in the presence of pUBS 520 which provided high levels of E. coli tRNA4Arg
Neumann et al., 1998
PceA Desulfitobacterium hafniense strain Y51
E. coli BL21 (DE3)/pLysS
pET32b(+)
Trx (thioredoxin protein) Tag, S-Tag, N-His, C-His
1.0 mM IPTG
NM Solubilized fusion protein was used to raise antibody
Inactive 164.4 ± 27.2 (PCE)
Attempt to express pceA and pceB using vector pBluescript II KS+ in E. coli JM109 was unsuccessful
Suyama et al., 2002
811.3 ± 39.0 (TCE)
PceA1/PceA2
Environmental sample
E. coli BL21 And other strains (not mentioned)
pQE6, pBAD, pCold
His-tag IPTG NM PceA1 was synthesized in vitro
Inactive - IPTG treatment decreased the yield of expressed protein PceA1 synthesized in vitro was active
Kimoto et al., 2010
PceA Dehalobacter restrictus
E. coli BL21 (DE3)
pOPIN, pET50b(+),
N-His, SUMO, MBP,
0.1 mM IPTG
12-16 h TAT signal sequence was initially included then excluded
Inactive 15,000 (PCE)
Only TF fusion proteins resulted in
Maillard et al., 2003
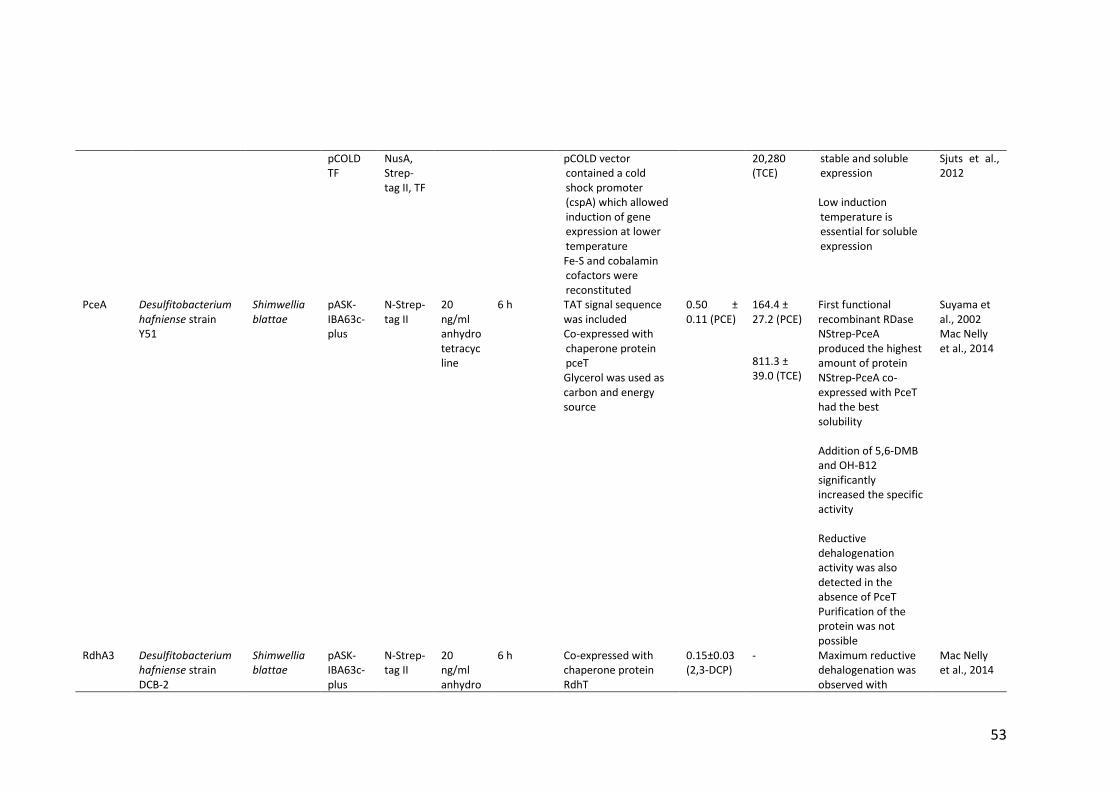
53
pCOLD TF
NusA, Strep-tag II, TF
pCOLD vector contained a cold shock promoter (cspA) which allowed induction of gene expression at lower temperature Fe-S and cobalamin cofactors were reconstituted
20,280 (TCE)
stable and soluble expression Low induction temperature is essential for soluble expression
Sjuts et al., 2012
PceA Desulfitobacterium hafniense strain Y51
Shimwellia blattae
pASK-IBA63c-plus
N-Strep-tag II
20 ng/ml anhydrotetracycline
6 h TAT signal sequence was included Co-expressed with chaperone protein pceT Glycerol was used as carbon and energy source
0.50 ± 0.11 (PCE)
164.4 ± 27.2 (PCE)
First functional recombinant RDase NStrep-PceA produced the highest amount of protein NStrep-PceA co-expressed with PceT had the best solubility Addition of 5,6-DMB and OH-B12 significantly increased the specific activity Reductive dehalogenation activity was also detected in the absence of PceT Purification of the protein was not possible
Suyama et al., 2002 Mac Nelly et al., 2014
811.3 ± 39.0 (TCE)
RdhA3 Desulfitobacterium hafniense strain DCB-2
Shimwellia blattae
pASK-IBA63c-plus
N-Strep-tag II
20 ng/ml anhydro
6 h Co-expressed with chaperone protein RdhT
0.15±0.03 (2,3-DCP)
- Maximum reductive dehalogenation was observed with
Mac Nelly et al., 2014
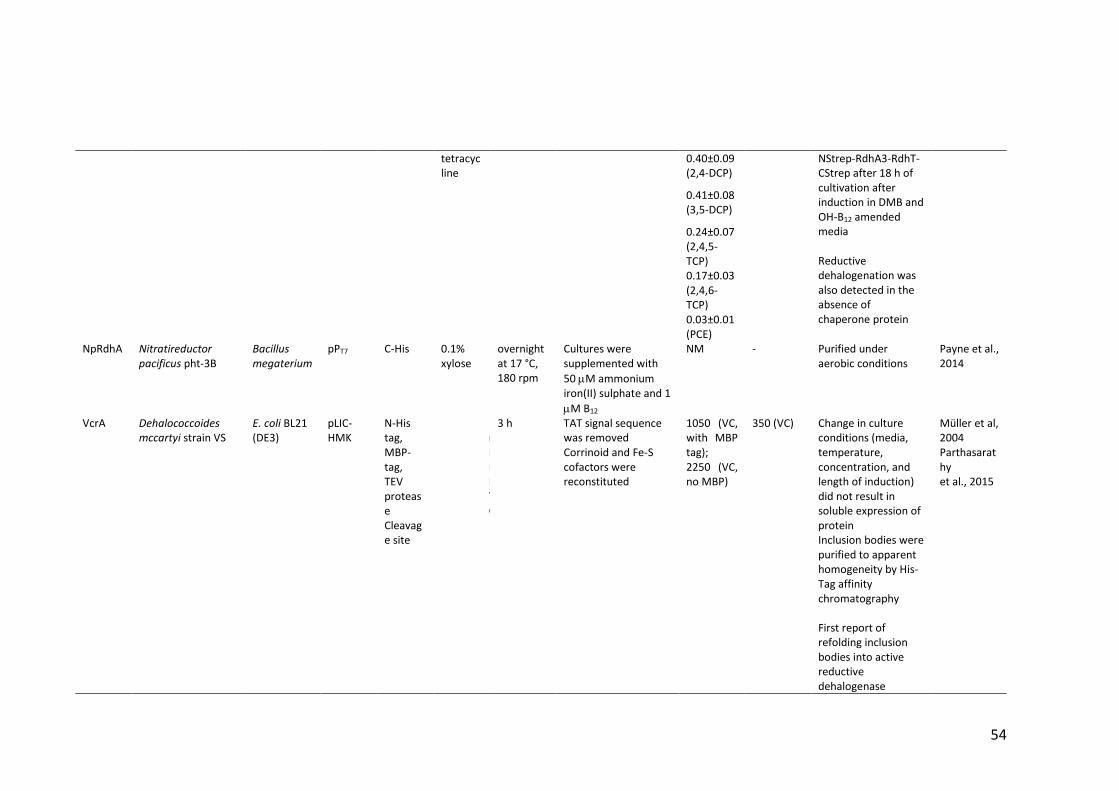
54
tetracycline
0.40±0.09 (2,4-DCP)
NStrep-RdhA3-RdhT-CStrep after 18 h of cultivation after induction in DMB and OH-B12 amended media Reductive dehalogenation was also detected in the absence of chaperone protein
0.41±0.08 (3,5-DCP)
0.24±0.07 (2,4,5-TCP) 0.17±0.03 (2,4,6-TCP) 0.03±0.01 (PCE)
NpRdhA Nitratireductor pacificus pht-3B
Bacillus megaterium
pPT7 C-His 0.1% xylose
overnight at 17 °C, 180 rpm
Cultures were supplemented with
50 M ammonium iron(II) sulphate and 1
M B12
NM - Purified under aerobic conditions
Payne et al., 2014
VcrA Dehalococcoides mccartyi strain VS
E. coli BL21 (DE3)
pLIC-HMK
N-His tag, MBP-tag, TEV protease Cleavage site
1 mM IPTG
3 h TAT signal sequence was removed Corrinoid and Fe-S cofactors were reconstituted
1050 (VC, with MBP tag);
350 (VC) Change in culture conditions (media, temperature, concentration, and length of induction) did not result in soluble expression of protein Inclusion bodies were purified to apparent homogeneity by His-Tag affinity chromatography First report of refolding inclusion bodies into active reductive dehalogenase
Müller et al, 2004 Parthasarathy et al., 2015
2250 (VC, no MBP)
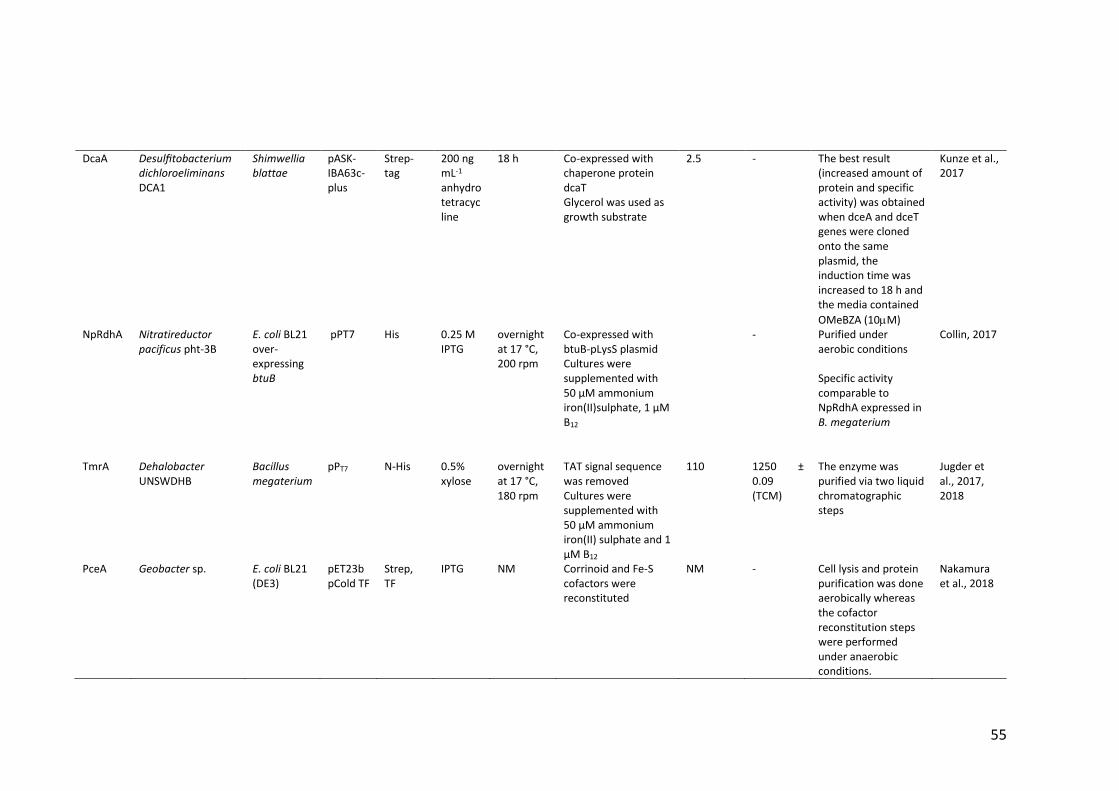
55
DcaA Desulfitobacterium dichloroeliminans DCA1
Shimwellia blattae
pASK-IBA63c-plus
Strep-tag
200 ng mL-1 anhydrotetracycline
18 h Co-expressed with chaperone protein dcaT Glycerol was used as growth substrate
2.5 - The best result (increased amount of protein and specific activity) was obtained when dceA and dceT genes were cloned onto the same plasmid, the induction time was increased to 18 h and the media contained
OMeBZA (10M)
Kunze et al., 2017
NpRdhA Nitratireductor pacificus pht-3B
E. coli BL21 over-expressing btuB
pPT7 His 0.25 M IPTG
overnight at 17 °C, 200 rpm
Co-expressed with btuB-pLysS plasmid Cultures were supplemented with 50 μM ammonium iron(II)sulphate, 1 μM B12
- Purified under aerobic conditions Specific activity comparable to NpRdhA expressed in B. megaterium
Collin, 2017
TmrA Dehalobacter UNSWDHB
Bacillus megaterium
pPT7 N-His 0.5% xylose
overnight at 17 °C, 180 rpm
TAT signal sequence was removed Cultures were supplemented with 50 µM ammonium iron(II) sulphate and 1 μM B12
110 1250 ± 0.09 (TCM)
The enzyme was purified via two liquid chromatographic steps
Jugder et al., 2017, 2018
PceA Geobacter sp. E. coli BL21 (DE3)
pET23b pCold TF
Strep, TF
IPTG NM Corrinoid and Fe-S cofactors were reconstituted
NM - Cell lysis and protein purification was done aerobically whereas the cofactor reconstitution steps were performed under anaerobic conditions.
Nakamura et al., 2018
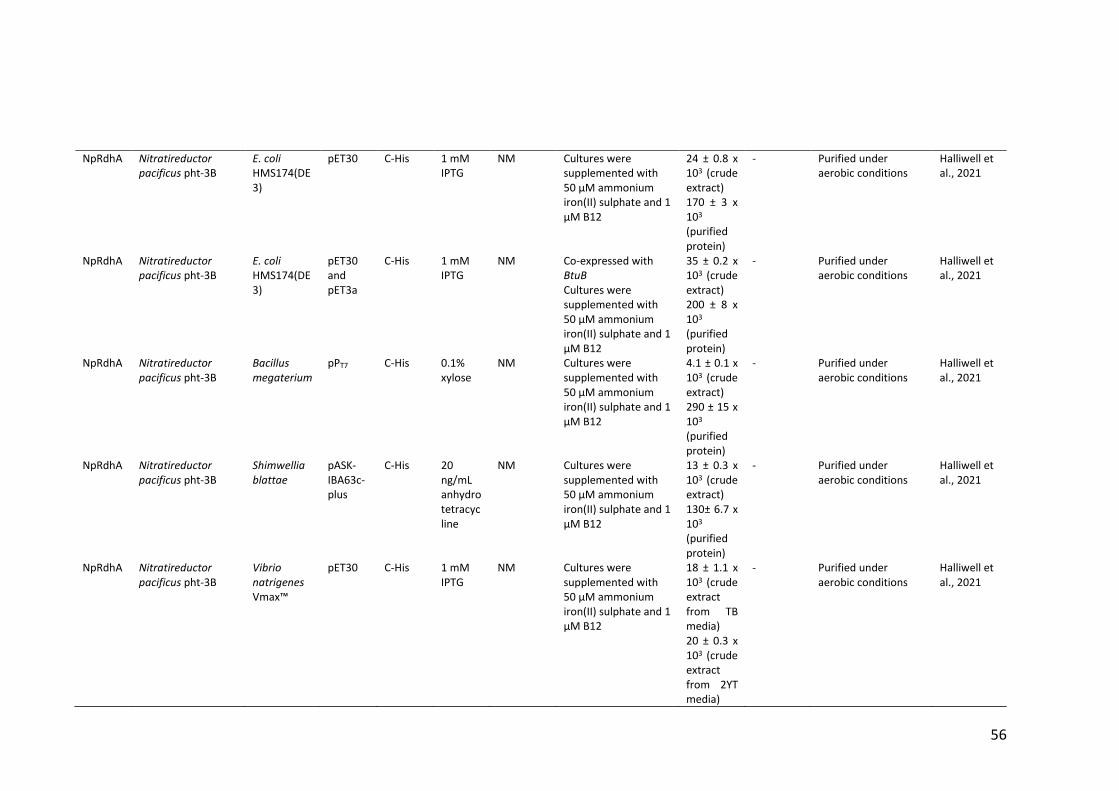
56
NpRdhA Nitratireductor pacificus pht-3B
E. coli HMS174(DE3)
pET30 C-His 1 mM IPTG
NM Cultures were supplemented with 50 μM ammonium iron(II) sulphate and 1 μM B12
24 ± 0.8 x 10³ (crude extract) 170 ± 3 x 10³ (purified protein)
- Purified under aerobic conditions
Halliwell et al., 2021
NpRdhA Nitratireductor pacificus pht-3B
E. coli HMS174(DE3)
pET30 and pET3a
C-His 1 mM IPTG
NM Co-expressed with BtuB Cultures were supplemented with 50 μM ammonium iron(II) sulphate and 1 μM B12
35 ± 0.2 x 10³ (crude extract) 200 ± 8 x 10³ (purified protein)
- Purified under aerobic conditions
Halliwell et al., 2021
NpRdhA Nitratireductor pacificus pht-3B
Bacillus megaterium
pPT7 C-His 0.1% xylose
NM Cultures were supplemented with 50 μM ammonium iron(II) sulphate and 1 μM B12
4.1 ± 0.1 x 10³ (crude extract) 290 ± 15 x 103 (purified protein)
- Purified under aerobic conditions
Halliwell et al., 2021
NpRdhA Nitratireductor pacificus pht-3B
Shimwellia blattae
pASK-IBA63c-plus
C-His 20 ng/mL anhydrotetracycline
NM Cultures were supplemented with 50 μM ammonium iron(II) sulphate and 1 μM B12
13 ± 0.3 x 10³ (crude extract) 130± 6.7 x 10³ (purified protein)
- Purified under aerobic conditions
Halliwell et al., 2021
NpRdhA Nitratireductor pacificus pht-3B
Vibrio natrigenes Vmax™
pET30 C-His 1 mM IPTG
NM Cultures were supplemented with 50 μM ammonium iron(II) sulphate and 1 μM B12
18 ± 1.1 x 10³ (crude extract from TB media) 20 ± 0.3 x 10³ (crude extract from 2YT media)
- Purified under aerobic conditions
Halliwell et al., 2021
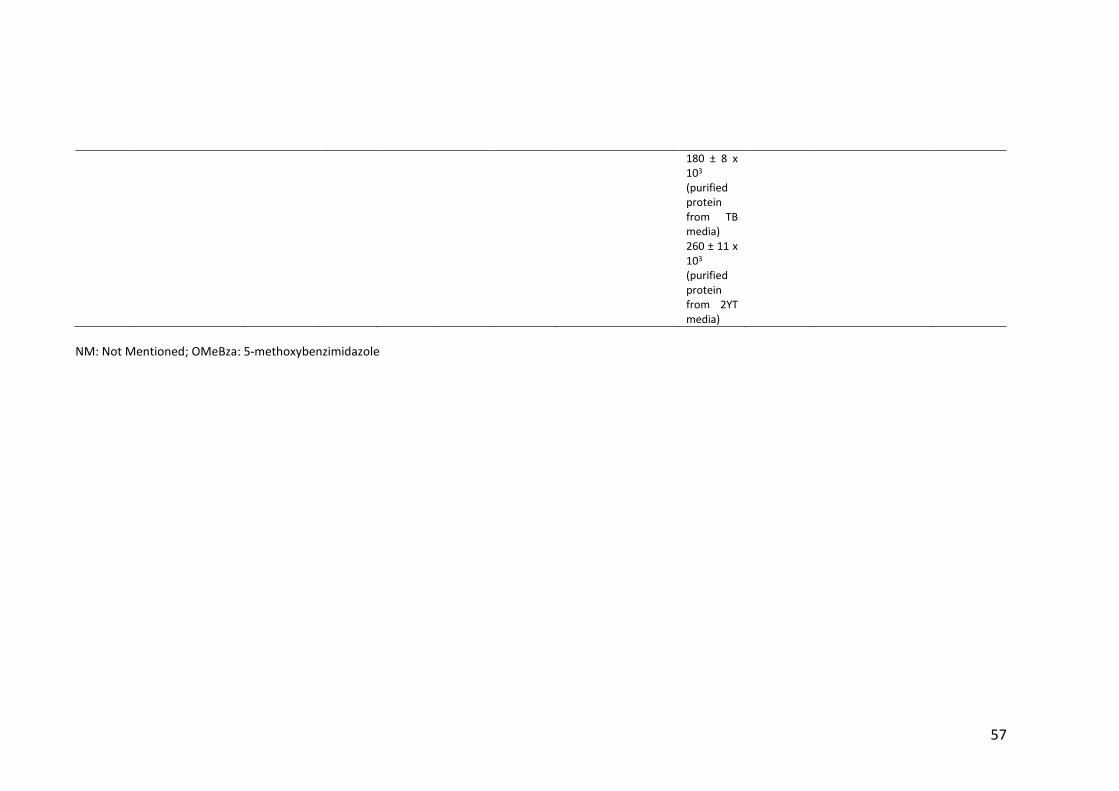
57
180 ± 8 x 10³ (purified protein from TB media) 260 ± 11 x 103 (purified protein from 2YT media)
NM: Not Mentioned; OMeBza: 5-methoxybenzimidazole
58
1.18 Dehalobacter UNSWDHB
The genus Dehalobacter belongs to the phylum Firmicutes, class Clostridia, order
Clostridiales and family Peptococcaceae (Holliger et al., 1998a). Strain UNSWDHB of
Dehalobacter sp. was isolated in Australia from subsurface soil microbial community
from a chloroform contaminated aquifer near Sydney (Lee et al., 2012, Wong et al.,
2016). D. UNSWDHB is a gram negative, obligate anaerobic and organohalide-respiring
bacterium. Phase-contrast and fluorescence microscopy of the pure culture shows
uniform cell morphology, cells are planktonic, and rod shaped. Transmission electron
microscopy (TEM) reveals a cell dimension of 2 µm length and 0.3–0.5 µm diameter
along with the presence of a lateral flagellum.
Wong et al. (2016) carried out extensive studies on the isolation and characterization of
Dehalobacter sp. UNSWDHB. The strain uses molecular hydrogen as the sole external
electron donor and can reductively dechlorinate trichloromethane, 1,1,2-
trichloroethane, 1,1,1-trichloroethane and 1,1-dichloroethane which are utilised as
electron acceptors. Unlike other OHRB, it has a high tolerance to trichloromethane
(TCM) because it does not affect the RDase and can dechlorinate up to 4 mM TCM to
dichloromethane (DCM) at a rate of 0.1 mM per day. It can dechlorinate 1,1,2-
trichloroethane (1 mM, 0.1 mM per day) to vinyl chloride (VC) and 1,2-dichloroethane
(1,2-DCA) at a ratio of 1:1.7. 1,1,1-trichloroethane and 1,1-dichloroethane are slowly
utilized and cannot be removed completely under growth conditions, with initial
dechlorination rates of 5 and 1 mM per day. Enzyme kinetic experiments also confirm
strong substrate affinity for TCM and 1,1,2-trichloroethane (Km = 30 and 62 µM
respectively) and poor substrate affinity for 1,1,1-trichloroethane and 1,1-
dichloroethane (Km = 238 and 837 µM respectively). Cell yields per mole of chloride
released in response to TCM, 1,1,2-TCA, 1,1,1-TCA and 1,1-DCA were recorded to be
(6.3±0.5) x 1012, (4.3±0.5) x 1012, (3.4±1.6) x 1012 and (6.3±0.6) x 1012 respectively.
D.UNSWDHB has a genome size of ca. 3.2 Mb, GC content of 44.9%, 3041 genes along
with 17 rdhA genes (Deshpande et al., 2013). The strain lacks the proteins involved in
corrinoid salvage or transport and unlike other Dehalobacter sp. UNSWDHB can grow
59
without exogenous supply of cobalamin which confirms the presence of a fully
functional cobalamin synthesis pathway (Wong et al., 2016). The genome of strain
UNSWDHB encodes a complete Wood–Ljungdahl pathway (WLP) and with the addition
of TCM, the WLP proteins show a comparatively high abundance though the functions
of these pathways are still unresolved (Jugder et al., 2016d). Additionally, the TCM-
induced upregulation of genes encoding nine hydrogenases, ATP synthase, NADH-
ubiquinone oxidoreductase, proton-translocating respiration complex I, a proton-
pumping inorganic pyrophosphatase, pyruvate phosphate dikinase and a complete
menaquinone biosynthesis pathway reveal the metabolic diversity of the strain
UNSWDHB (Jugder et al., 2016b).
1.19 RDase of Dehalobacter UNSWDHB (TmrA)
The UNSWDHB strain genome includes 17 full-length and three truncated rdhA genes
distributed in 16 gene clusters (Deshpande et al., 2013). The TCM RDase (TmrA)
expressed by strain UNSWDHB (Accession Number EQB21016) is encoded by 1368
nucleotides transcribed into 456 amino acids and has a predicted molecular weight of
50 kDa. The full-length amino acid sequence of TmrA is shown in Figure 1.11. TmrA
shows 95% amino acid identity with CfrA (RDase of Dehalobacter strain CF) and CtrA
(RDase of Desulfitobacterium strain PR) with six important substitutions or deletions
which hinders its ability to efficiently dechlorinate 1,1,1-TCA or 1,1-DCA like the other
two (Wong et al. 2016). The tmrA gene cluster contains genes encoding the membrane
anchor protein (TmrB) and a putative transcriptional regulator protein (TmrC) while the
gene encoding the trigger factor protein (TmrT) is located downstream of tmrABC. A
proteomic study revealed significant upregulation of TmrA, TmrB and TmrC during TCM
respiration (Jugder et al. 2016b). Jugder et al., (2017) purified native TmrA from
Dehalobacter sp. UNSWDHB which displayed a specific activity of (1.27 ± 0.04) × 103
units mg of protein-1 in vitro. The UV-visible spectrometric analysis revealed the
presence of a corrinoid and two [4Fe-4S] clusters.
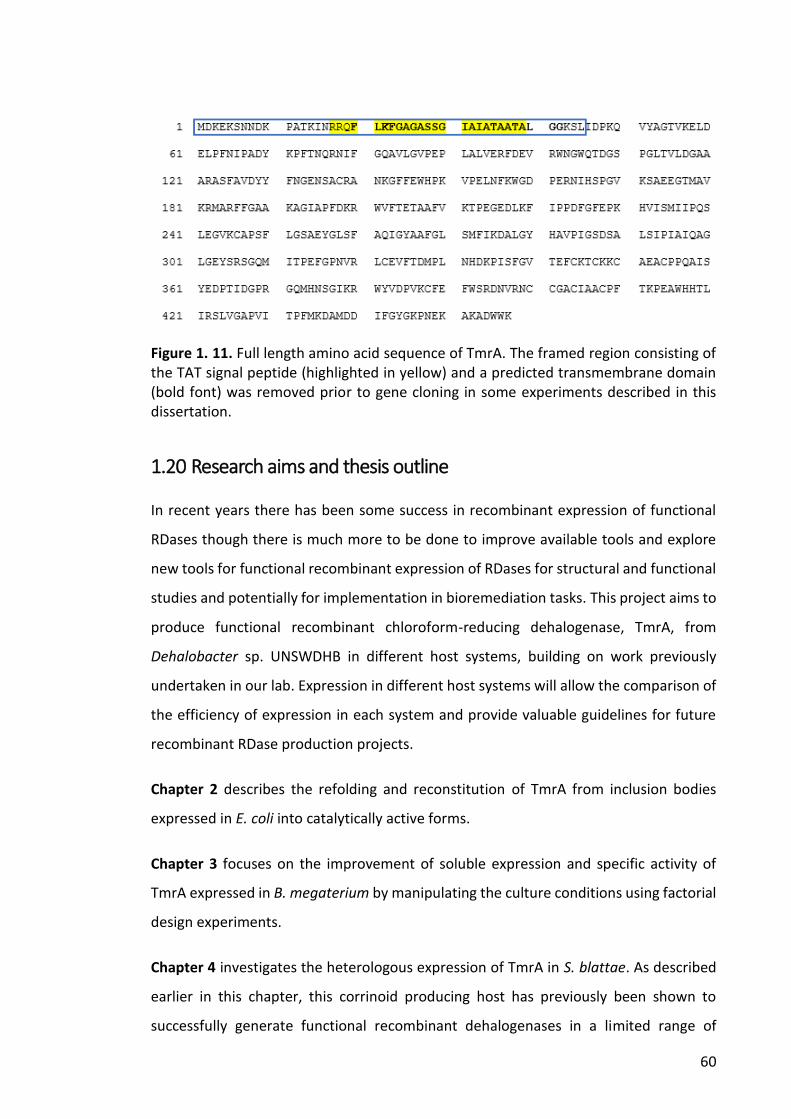
60
Figure 1. 11. Full length amino acid sequence of TmrA. The framed region consisting of the TAT signal peptide (highlighted in yellow) and a predicted transmembrane domain (bold font) was removed prior to gene cloning in some experiments described in this dissertation.
1.20 Research aims and thesis outline
In recent years there has been some success in recombinant expression of functional
RDases though there is much more to be done to improve available tools and explore
new tools for functional recombinant expression of RDases for structural and functional
studies and potentially for implementation in bioremediation tasks. This project aims to
produce functional recombinant chloroform-reducing dehalogenase, TmrA, from
Dehalobacter sp. UNSWDHB in different host systems, building on work previously
undertaken in our lab. Expression in different host systems will allow the comparison of
the efficiency of expression in each system and provide valuable guidelines for future
recombinant RDase production projects.
Chapter 2 describes the refolding and reconstitution of TmrA from inclusion bodies
expressed in E. coli into catalytically active forms.
Chapter 3 focuses on the improvement of soluble expression and specific activity of
TmrA expressed in B. megaterium by manipulating the culture conditions using factorial
design experiments.
Chapter 4 investigates the heterologous expression of TmrA in S. blattae. As described
earlier in this chapter, this corrinoid producing host has previously been shown to
successfully generate functional recombinant dehalogenases in a limited range of
61
studies. This required the development of a number of molecular cloning tools, and the
development of a bioprocess to obtain soluble and catalytically active TmrA.
Chapter 5 focuses on attempts to engineer Cupriavidus necator, a Gram-negative,
hydrogen-oxidizing bacteria capable of growing at the interphase of anaerobic and
aerobic environments, into a chloroform-reducing bacterium. The use of this host to
express functional RDases has not previously been described in the literature.
Chapter 6 brings together the data and information obtained in the previous chapters
and discusses how this thesis has deepened our understanding of heterologous
expression of RDases and in turn the reductive dehalogenation process using chloroform
dehalogenation to dichloromethane as a model. The methods and insights gained from
the work presented in this thesis provide a platform for future protein structure-
function studies, protein engineering for examining substrate specificity and improved
activity and potentially engineering studies for eventual bioremediation applications.
62
1.21 References
ADRIAN, L. & LÖFFLER, F. E. 2016. Organohalide-Respiring Bacteria—An Introduction. In: ADRIAN, L. & LÖFFLER, F. E. (eds.) Organohalide-Respiring Bacteria. Berlin, Heidelberg: Springer Berlin Heidelberg.
AGARWAL, S., DEY, S., GHOSH, B., BISWAS, M. & DASGUPTA, J. 2019. Mechanistic basis of vitamin B12 and cobinamide salvaging by the Vibrio species. Biochimica et Biophysica Acta - Proteins and Proteomics, 1867(2): 140-151.
AHN, Y.-B., KERKHOF, L. J. & HÄGGBLOM, M. M. 2009. Desulfoluna spongiiphila sp. nov., a dehalogenating bacterium in the Desulfobacteraceae from the marine sponge Aplysina aerophoba. International Journal of Systematic Evolutionary Microbiology, 59(9): 2133-2139.
ARNOLD, W. A. & ROBERTS, A. L. 2000. Pathways and kinetics of chlorinated ethylene and chlorinated acetylene reaction with Fe(0) particles. Environmental Science & Technology, 34(9): 1794-1805.
ATASHGAHI, S. 2019. Discovered by genomics: putative reductive dehalogenases with N-terminus transmembrane helixes. FEMS Microbiology Ecology, 95(5): fiz048.
ATASHGAHI, S., HÄGGBLOM, M. M. & SMIDT, H. 2018. Organohalide respiration in pristine environments: implications for the natural halogen cycle. Environmental Microbiology, 20(3): 934-948.
ATASHGAHI, S., LU, Y. & SMIDT, H. 2016. Overview of known organohalide-respiring bacteria—phylogenetic diversity and environmental distribution. In: ADRIAN, L. & LÖFFLER, F. E. (eds.) Organohalide-Respiring Bacteria. Berlin, Heidelberg: Springer Berlin Heidelberg.
BAGLEY, D. M., LALONDE, M., KASEROS, V., STASIUK, K. E. & SLEEP, B. E. 2000. Acclimation of anaerobic systems to biodegrade tetrachloroethene in the presence of carbon tetrachloride and chloroform. Water Research, 34(1): 171-178.
BANERJEE, R. & RAGSDALE, S. W. 2003. The many faces of vitamin B12: Catalysis by cobalamin-dependent enzymes. Annual Review of Biochemistry, 72(1): 209-247.
BECKER, J. G. & FREEDMAN, D. L. 1994. Use of cyanocobalamin to enhance anaerobic biodegradation of chloroform. Environmental Science & Technology, 28(11): 1942-1949.
BERKS, B. C. 1996. A common export pathway for proteins binding complex redox cofactors? Molecular Microbiology, 22(3): 393-404.
BISAILLON, A., BEAUDET, R., LÉPINE, F., DÉZIEL, E. & VILLEMUR, R. 2010. Identification and characterization of a novel CprA reductive dehalogenase specific to highly chlorinated phenols from Desulfitobacterium hafniense strain PCP-1. Applied and Environmental Microbiology, 76(32): 7536-7540.
BOMMER, M., KUNZE, C., FESSELER, J., SCHUBERT, T., DIEKERT, G. & DOBBEK, H. 2014. Structural basis for organohalide respiration. Science, 346(6208): 455-458.
BOUWER, E. J. & MCCARTY, P. L. 1983. Transformations of 1-and 2-carbon halogenated aliphatic organic compounds under methanogenic conditions. Applied and Environmental Microbiology, 45(4): 1286-1294.
BOYER, A., PAGÉ-BÉLANGER, R., SAUCIER, M., VILLEMUR, R., LEPINE, F., JUTEAU, P. & BEAUDET, R. 2003. Purification, cloning and sequencing of an enzyme mediating
63
the reductive dechlorination of 2, 4, 6-trichlorophenol from Desulfitobacterium frappieri PCP-1. Biochemical Journal, 373(1): 297-303.
BRIDWELL-RABB, J. & DRENNAN, C. L. 2017. Vitamin B12 in the spotlight again. Current Opinion in Chemical Biology, 37, 63-70.
BROUWER, M. S., WARBURTON, P. J., ROBERTS, A. P., MULLANY, P. & ALLAN, E. 2011. Genetic organisation, mobility and predicted functions of genes on integrated, mobile genetic elements in sequenced strains of Clostridium difficile, PloS One 6(8): e23014.
BRUSCHI, M. & GUERLESQUIN, F. 1988. Structure, function and evolution of bacterial ferredoxins. FEMS Microbiology Letters, 54(2), 155-175.
BUCKEL, W. & THAUER, R. K. 2013. Energy conservation via electron bifurcating ferredoxin reduction and proton/Na+ translocating ferredoxin oxidation. Biochimica et Biophysica Acta -Bioenergetics, 1827(2): 94-113.
BUCKEL, W. & THAUER, R. K. 2018. Flavin-based electron bifurcation, ferredoxin, flavodoxin, and anaerobic respiration with protons (Ech) or NAD+ (Rnf) as electron acceptors: A historical review. Frontiers in Microbiology, 9, 401.
BUTLER, E. C. & HAYES, K. F. 1999. Kinetics of the transformation of trichloroethylene and tetrachloroethylene by iron sulfide. Environmental Science & Technology, 33(12): 2021-2027.
BUTTET, G. F., HOLLIGER, C. & MAILLARD, J. 2013. Functional genotyping of Sulfurospirillum spp. in mixed cultures allowed the identification of a new tetrachloroethene reductive dehalogenase. Applied and Environmental Microbiology, 79(22): 6941-6947.
BUTTET, G. F., WILLEMIN, M. S., HAMELIN, R., RUPAKULA, A. & MAILLARD, J. 2018. The membrane-bound C subunit of reductive dehalogenases: topology analysis and reconstitution of the FMN-binding domain of PceC. Frontiers in Microbiology, 9, 755.
CAO, J., MAIGNIEN, L., SHAO, Z., ALAIN, K. & JEBBAR, M. 2016. Genome sequence of the piezophilic, mesophilic sulfate-reducing bacterium Desulfovibrio indicus J2T. Genome Announcements 4(2): e00214-16.
CAPPELLETTI, M., FRASCARI, D., ZANNONI, D. & FEDI, S. 2012. Microbial degradation of chloroform. Applied Microbiology and Biotechnology, 96(6): 1395-1409.
CHEN, K., HUANG, L., XU, C., LIU, X., HE, J., ZINDER, S. H., LI, S. & JIANG, J. 2013. Molecular characterization of the enzymes involved in the degradation of a brominated aromatic herbicide. Molecular Microbiology, 89(6): 1121-1139.
CHOUDHARY, P. K., DURET, A., ROHRBACH-BRANDT, E., HOLLIGER, C., SIGEL, R. K. & MAILLARD, J. J. 2013. Diversity of cobalamin riboswitches in the corrinoid-producing organohalide respirer Desulfitobacterium hafniense. Journal of Bacteriology, 195(22): 5186-5195.
CHRISTIANSEN, N. & AHRING, B. K. 1996. Desulfitobacterium hafniense sp. nov., an anaerobic, reductively dechlorinating bacterium. International Journal of Systematic Evolutionary Microbiology, 46(2): 442-448.
CHRISTIANSEN, N., AHRING, B. K., WOHLFARTH, G. & DIEKERT, G. 1998. Purification and characterization of the 3-chloro-4-hydroxy-phenylacetate reductive dehalogenase of Desulfitobacterium hafniense. 436(2): 159-162.
64
CHUNG, J. & RITTMANN, B. 2007. Bio‐reductive dechlorination of 1, 1, 1‐trichloroethane and chloroform using a hydrogen‐based membrane biofilm reactor. Biotechnology and Bioengineering, 97(1): 52-60.
CHUNG, J. & RITTMANN, B. 2008. Simultaneous bio-reduction of trichloroethene, trichloroethane, and chloroform using a hydrogen-based membrane biofilm reactor. Water Science and Technology, 58(3): 495-501.
COLLINS, F. A. 2017. A biochemical study of a catabolic reductive dehalogenase. PhD, Manchester University.
COOPER, M., WAGNER, A., WONDROUSCH, D., SONNTAG, F., SONNABEND, A., BREHM, M., SCHUURMANN, G., ADRIAN, L. 2015. Anaerobic microbial transformation of halogenated aromatics and fate prediction using electron density modeling. Environmental Science and Technology, 49(10): 6018-6028.
CUPPLES, A. M., SANFORD, R. A. & SIMS, G. K. 2005. Dehalogenation of the herbicides bromoxynil (3, 5-dibromo-4-hydroxybenzonitrile) and ioxynil (3, 5-diiodino-4-hydroxybenzonitrile) by Desulfitobacterium chlororespirans. Applied and Environmental Microbiology, 71(7): 3741-3746.
CUYPERS, H., VIEBROCK-SAMBALE, A. & ZUMFT, W. G. J. 1992. NosR, a membrane-bound regulatory component necessary for expression of nitrous oxide reductase in denitrifying Pseudomonas stutzeri. Journal of Bacteriology, 174(16): 5332-5339.
DAIRI, T., KUZUYAMA, T., NISHIYAMA, M. & FUJII, I. 2011. Convergent strategies in biosynthesis. Natural Product Reports, 28(6): 1054-1086.
DAVIDSON, I., SUMNER, D. D., PARKER, J. C. 1982. Chloroform: a review of its metabolism, teratogenic, mutagenic, and carcinogenic potential. Drug Chemical Toxicology, 5(1): 1-87.
DEGNAN, P. H., TAGA, M. E. & GOODMAN, A. L. 2014. Vitamin B12 as a modulator of gut microbial ecology. Cell Metabolism, 20(5): 769-778.
DESHPANDE, N. P., WONG, Y. K., MANEFIELD, M., WILKINS, M. R. & LEE, M. 2013. Genome sequence of Dehalobacter UNSWDHB, a chloroform-dechlorinating bacterium. Genome Announcements, 1(5): e00720-13.
DEWEERD, K. A., MANDELCO, L., TANNER, R. S., WOESE, C. R. & SUFLITA, J. M. 1990. Desulfomonile tiedjei gen. nov. and sp. nov., a novel anaerobic, dehalogenating, sulfate-reducing bacterium. Archives of Microbiology, 154(1): 23-30.
DING, C., ZHAO, S. & HE, J. 2014. A Desulfitobacterium sp. strain PR reductively dechlorinates both 1, 1, 1‐trichloroethane and chloroform. Environmental Microbiology, 16(11): 3387-3397.
DOBBEK, H. & LEYS, D. 2016. Insights into Reductive Dehalogenase Function Obtained from Crystal Structures. In: ADRIAN, L. & LÖFFLER, F. E. (eds.) Organohalide-Respiring Bacteria. Berlin, Heidelberg: Springer Berlin Heidelberg.
DUHAMEL, M., WEHR, S. D., YU, L., RIZVI, H., SEEPERSAD, D., DWORATZEK, S., COX, E. E. & EDWARDS, E. A. 2002. Comparison of anaerobic dechlorinating enrichment cultures maintained on tetrachloroethene, trichloroethene, cis-dichloroethene and vinyl chloride. Water Research, 36(17): 4193-4202.
DURET, A., HOLLIGER, C. & MAILLARD, J. 2012. The physiological opportunism of Desulfitobacterium hafniense strain TCE1 towards organohalide respiration with tetrachloroethene. Applied and Environmental Microbiology, 78(17): 6121-6127.
65
EL-ATHMAN, F., ADRIAN, L., JEKEL, M., PUTSCHEW, A. 2019. Deiodination in the presence of Dehalococcoides mccartyi strain CBDB1: comparison of the native enzyme and co-factor vitamin B12. Environmental Science and Pollution Research, 26(31): 32636-32644.
EL-SHAHAWI, M., HAMZA, A., BASHAMMAKH, A. & AL-SAGGAF, W. T. 2010. An overview on the accumulation, distribution, transformations, toxicity and analytical methods for the monitoring of persistent organic pollutants. Talanta, 80(5): 1587-1597.
EL FANTROUSSI, S., NAVEAU, H. & AGATHOS, S. N. 1998. Anaerobic dechlorinating bacteria. Biotechnology Progress, 14(2): 167-188.
ELSNER, M., CHARTRAND, M., VANSTONE, N., LACRAMPE COULOUME, G. & SHERWOOD LOLLAR, B. 2008. Identifying abiotic chlorinated ethene degradation: characteristic isotope patterns in reaction products with nanoscale zero-valent iron. Environmental Science & Technology, 42(16): 5963-5970.
EPA. 2014. EPA Priority pollutant list. EPA. 2016. Superfund Enterprise Management System (SEMS) database. FAWELL, J. K. & HUNT, S. 1988. Environmental toxicology: organic pollutants, E.
Horwood. FETZNER, S. 1998. Bacterial dehalogenation. Applied Microbiology and Biotechnology,
50(6): 633-657. FIELD, J. A. 2016. Natural production of organohalide compounds in the environment.
In: ADRIAN, L. & LÖFFLER, F. E. (eds.) Organohalide-Respiring Bacteria. Berlin, Heidelberg: Springer Berlin Heidelberg.
FINCKER, M. & SPORMANN, A. M. 2017. Biochemistry of catabolic reductive dehalogenation. Annual Review of Biochemistry, 86, 357-386.
FREEDMAN, D. L., HASHSHAM, S., LASECKI, M. & SCHOLZE, R. 1995. Accelerated biotransformation of carbon tetrachloride and chloroform by sulfate-reducing enrichment cultures. Battelle Press, Columbus, OH (United States).
FUNG, J. M., MORRIS, R. M., ADRIAN, L. & ZINDER, S. H. 2007. Expression of reductive dehalogenase genes in Dehalococcoides ethenogenes strain 195 growing on tetrachloroethene, trichloroethene, or 2, 3-dichlorophenol. Applied and Environmental Microbiology, 73(14): 4439-4445.
FUTAGAMI, T., GOTO, M. & FURUKAWA, K. 2008. Biochemical and genetic bases of dehalorespiration. Chemical Record, 8, 1-12.
GLOD, G., ANGST, W., HOLLIGER, C. & SCHWARZENBACH, R. P. 1997. Corrinoid-mediated reduction of tetrachloroethene, trichloroethene, and trichlorofluoroethene in homogeneous aqueous solution: reaction kinetics and reaction mechanisms. Environmental Science & Technology, 31(1): 253-260.
GORIS, T., SCHENZ, B., ZIMMERMANN, J., LEMOS, M., HACKERMÜLLER, J., SCHUBERT, T. & DIEKERT, G. 2017. The complete genome of the tetrachloroethene-respiring Epsilonproteobacterium Sulfurospirillum halorespirans. Journal of Biotechnology, 255, 33-36.
GORIS, T., SCHIFFMANN, C. L., GADKARI, J., SCHUBERT, T., SEIFERT, J., JEHMLICH, N., VON BERGEN, M. & DIEKERT, G. 2015. Proteomics of the organohalide-respiring Epsilonproteobacterium Sulfurospirillum multivorans adapted to tetrachloroethene and other energy substrates. Scientific Reports, 5, 13794.
66
GORIS, T., SCHUBERT, T., GADKARI, J., WUBET, T., TARKKA, M., BUSCOT, F., ADRIAN, L. & DIEKERT, G. 2014. Insights into organohalide respiration and the versatile catabolism of Sulfurospirillum multivorans gained from comparative genomics and physiological studies. Environmental Microbiology, 16(11): 3562-3580.
GRIBBLE, G. W. 2009. Naturally occurring organohalogen compounds-a comprehensive update, Springer Science & Business Media.
GRIBBLE, G. W. 2012. Recently discovered naturally occurring heterocyclic organohalogen compounds. Heterocycles, 84(1): 157-207.
GRIBBLE, G. W. 2015. A recent survey of naturally occurring organohalogen compounds. Environmental Chemistry, 12(4): 396-405.
GRØN, C., LATURNUS, F., JACOBSEN, O. S. 2012. Reliable test methods for the determination of a natural production of chloroform in soils. Environmental Monitoring and Assessment, 184(3): 1231-1241.
GROSTERN, A., DUHAMEL, M., DWORATZEK, S. & EDWARDS, E. A. 2010. Chloroform respiration to dichloromethane by a Dehalobacter population. Environmental Microbiology, 12(4): 1053-1060.
GRUBER, K., PUFFER, B. & KRÄUTLER, B. 2011. Vitamin B12-derivatives—enzyme cofactors and ligands of proteins and nucleic acids. Chemical Society Reviews, 40(8): 4346-4363.
GUERRERO‐BARAJAS, C. & FIELD, J. A. 2005. Riboflavin‐and cobalamin‐mediated biodegradation of chloroform in a methanogenic consortium. Biotechnology and Bioengineering, 89(5): 539-550.
GUPTA, M., SHARMA, D., SUIDAN, M. T. & SAYLES, G. D. 1996. Biotransformation rates of chloroform under anaerobic conditions—I. Methanogenesis. Water Research, 30(6): 1377-1385.
HÄGGBLOM, M. M. & BOSSERT, I. D. 2003. Halogenated Organic Compounds - A Global Perspective. In: HÄGGBLOM, M. M. & BOSSERT, I. D. (eds.) Dehalogenation: Microbial Processes and Environmental Applications. Boston, MA: Springer US.
HALLIWELL, T., FISHER, K., PAYNE, K. A. P., RIGBY, S. E. J. & LEYS, D. 2021. Heterologous expression of cobalamin dependent class-III enzymes. Protein Expression and Purification, 177, 105743.
HARTWIG, S., DRAGOMIROVA, N., KUBLIK, A., TÜRKOWSKY, D., VON BERGEN, M., LECHNER, U., ADRIAN, L. & SAWERS, R. G. 2017. A H2‐oxidizing, 1, 2, 3‐trichlorobenzene‐reducing multienzyme complex isolated from the obligately organohalide‐respiring bacterium Dehalococcoides mccartyi strain CBDB1. Environmental Microbiology Reports 9, 618-625.
HASELMANN, K. F., KETOLA, R. A., LATURNUS, F., LAURITSEN, F. R. & GRØN, C. 2000a. Occurrence and formation of chloroform at Danish forest sites. Atmospheric Environment, 34(2): 187-193.
HASELMANN, K. F., LATURNUS, F., SVENSMARK, B. & GRØN, C. 2000b. Formation of chloroform in spruce forest soil–results from laboratory incubation studies. Chemosphere, 41(11): 1769-1774.
HOEKSTRA, E. J., VERHAGEN, F. J., FIELD, J. A., DE LEER, E. W. & UDO, A. 1998. Natural production of chloroform by fungi. Phytochemistry, 49(1): 91-97.
HOLLIGER, C., HAHN, D., HARMSEN, H., LUDWIG, W., SCHUMACHER, W., TINDALL, B., VAZQUEZ, F., WEISS, N. & ZEHNDER, A. J. B. 1998a. Dehalobacter restrictus gen. nov. and sp. nov., a strictly anaerobic bacterium that reductively dechlorinates
67
tetra-and trichloroethene in an anaerobic respiration. Archives of Microbiology, 169(4): 313-321.
HOLLIGER, C., WOHLFARTH, G. & DIEKERT, G. 1998b. Reductive dechlorination in the energy metabolism of anaerobic bacteria. FEMS Microbiology Reviews, 22(5): 383-398.
HORTON, D. K., BERKOWITZ, Z., KAYE, W. E. 2002. The public health consequences from acute chlorine releases, 1993–2000. Journal of Occupational Environmental Medicine, 44(10): 906-913.
HRAPOVIC, L., SLEEP, B. E., MAJOR, D. J. & HOOD, E. D. 2005. Laboratory study of treatment of trichloroethene by chemical oxidation followed by bioremediation. Environmental Science & Technology, 39(8): 2888-2897.
HUG, L. A. 2016. Diversity, evolution, and environmental distribution of reductive dehalogenase genes. In: ADRIAN, L. & LÖFFLER, F. E. (eds.) Organohalide-Respiring Bacteria. Berlin, Heidelberg: Springer Berlin Heidelberg.
HUG, L. A., CASTELLE, C. J., WRIGHTON, K. C., THOMAS, B. C., SHARON, I., FRISCHKORN, K. R., WILLIAMS, K. H., TRINGE, S. G. & BANFIELD, J. F. 2013a. Community genomic analyses constrain the distribution of metabolic traits across the Chloroflexi phylum and indicate roles in sediment carbon cycling. Microbiome, 1(1): 22.
HUG, L. A., MAPHOSA, F., LEYS, D., LÖFFLER, F. E., SMIDT, H., EDWARDS, E. A. & ADRIAN, L. 2013b. Overview of organohalide-respiring bacteria and a proposal for a classification system for reductive dehalogenases. Philosophical Transactions of the Royal Society B: Biological Sciences, 368(1616): 20120322.
HUTCHEON, D. E. 2010. Chloroform anesthesia and the Saville Kent murder in 1860. American Journal of Therapeutics, 17(2): 226-231.
IMAI, R., NAGATA, Y., FUKUDA, M., TAKAGI, M. & YANO, K. 1991. Molecular cloning of a Pseudomonas paucimobilis gene encoding a 17-kilodalton polypeptide that eliminates HCl molecules from gamma-hexachlorocyclohexane. Journal of Bacteriology, 173(21): 6811.
JACOB-DUBUISSON, F., MECHALY, A., BETTON, J.-M. & ANTOINE, R. 2018. Structural insights into the signalling mechanisms of two-component systems. Nature Reviews Microbiology, 16(10): 585-593.
JAMIESON, A. J., MALKOCS, T., PIERTNEY, S. B., FUJII, T. & ZHANG, Z. 2017. Bioaccumulation of persistent organic pollutants in the deepest ocean fauna. Nature Ecology and Evolution, 1(3): 1-4.
JANSSEN, D. B., OPPENTOCHT, J. E. & POELARENDS, G. J. 2001. Microbial dehalogenation. Current Opinion in Biotechnology, 12(3): 254-258.
JANSSEN, D. B., PRIES, F. & VAN DER PLOEG, J. R. 1994. Genetics and biochemistry of dehalogenating enzymes. Annual Review of Microbiology, 48, 163-191.
JAYACHANDRAN, G., GÖRISCH, H. & ADRIAN, L. 2004. Studies on hydrogenase activity and chlorobenzene respiration in Dehalococcoides sp. strain CBDB1. Archives of Microbiology, 182(6): 498-504.
JOCHUM, L. M., SCHREIBER, L., MARSHALL, I. P., JØRGENSEN, B. B., SCHRAMM, A. & KJELDSEN, K. U. 2018. Single-cell genomics reveals a diverse metabolic potential of uncultivated Desulfatiglans-related Deltaproteobacteria widely distributed in marine sediment. Frontiers in Microbiology, 9, 2038.
68
JOHN, M., SCHMITZ, R. P. H., WESTERMANN, M., RICHTER, W. & DIEKERT, G. 2006. Growth substrate dependent localization of tetrachloroethene reductive dehalogenase in Sulfurospirillum multivorans. Archives of Microbiology, 186(2): 99-106.
JOHNSON-RESTREPO, B., KANNAN, K., ADDINK, R., ADAMS, D. H. 2005. Polybrominated diphenyl ethers and polychlorinated biphenyls in a marine foodweb of coastal Florida. Environmental Science & Technology, 39(21): 8243-8250.
JOYCE, M. G., LEVY, C., GÁBOR, K., POP, S. M., BIEHL, B. D., DOUKOV, T. I., RYTER, J. M., MAZON, H., SMIDT, H., VAN DEN HEUVEL, R. H., RAGSDALE S. W., VAN DER OOST J., LEYS D. 2006. CprK crystal structures reveal mechanism for transcriptional control of halorespiration. Journal of Biological Chemistry, 281(38): 28318-28325.
JUGDER, B.-E., ERTAN, H., BOHL, S., LEE, M., MARQUIS, C. P. & MANEFIELD, M. 2016a. Organohalide respiring bacteria and reductive dehalogenases: key tools in organohalide bioremediation. Frontiers in Microbiology, 7, 249.
JUGDER, B.-E., ERTAN, H., LEE, M., MANEFIELD, M. & MARQUIS, C. P. 2015. Reductive dehalogenases come of age in biological destruction of organohalides. Trends in Biotechnology, 33(10): 595-610.
JUGDER, B.-E., PAYNE, K. A., FISHER, K., BOHL, S., LEBHAR, H., MANEFIELD, M., LEE, M., LEYS, D. & MARQUIS, C. P. 2018. Heterologous production and purification of a functional chloroform reductive dehalogenase. ACS Chemical Biology, 13(3): 548-552.
JUGDER, B. E., ERTAN, H., WONG, Y. K., BRAIDY, N., MANEFIELD, M., MARQUIS, C. P. & LEE, M. 2016b. Genomic, transcriptomic and proteomic analyses of Dehalobacter UNSWDHB in response to chloroform. Environmental Microbiology Reports, 8(5): 814-824.
KASTER, A.-K., MAYER-BLACKWELL, K., PASARELLI, B. & SPORMANN, A. M. 2014. Single cell genomic study of Dehalococcoidetes species from deep-sea sediments of the Peruvian Margin. ISME, 8(9): 1831-1842.
KAWAI, M., FUTAGAMI, T., TOYODA, A., TAKAKI, Y., NISHI, S., HORI, S., ARAI, W., TSUBOUCHI, T., MORONO, Y. & UCHIYAMA, I. 2014. High frequency of phylogenetically diverse reductive dehalogenase-homologous genes in deep subseafloor sedimentary metagenomes. Frontiers in Microbiology, 5, 80.
KELLER, S., KUNZE, C., BOMMER, M., PAETZ, C., MENEZES, R. C., SVATOŠ, A., DOBBEK, H. & SCHUBERT, T. 2018. Selective utilization of benzimidazolyl-norcobamides as cofactors by the tetrachloroethene reductive dehalogenase of Sulfurospirillum multivorans. Journal of Bacteriology, 200(8): e00584-17.
KELLER, S., RUETZ, M., KUNZE, C., KRÄUTLER, B., DIEKERT, G. & SCHUBERT, T. 2014. Exogenous 5, 6‐dimethylbenzimidazole caused production of a non‐functional tetrachloroethene reductive dehalogenase in Sulfurospirillum multivorans. Environmental Microbiology, 16(11): 3361-3369.
KEY, T. A., BOWMAN, K. S., LEE, I., CHUN, J., ALBUQUERQUE, L., DA COSTA, M. S., RAINEY, F. A., MOE, W. M. 2017. Dehalogenimonas formicexedens sp. nov., a chlorinated alkane-respiring bacterium isolated from contaminated groundwater. International Journal of Systematic Evolutionary Microbiology, 67(5): 1366-1373.
KEY, T. A., RICHMOND, D. P., BOWMAN, K. S., CHO, Y.-J., CHUN, J., DA COSTA, M. S., RAINEY, F. A. & MOE, W. M. 2016. Genome sequence of the organohalide-
69
respiring Dehalogenimonas alkenigignens type strain (IP3-3 T). Standards in Genomic Sciences, 11(1): 44.
KHALIL, M., RASMUSSEN, R., FRENCH, J. & HOLT, J. A. 1990. The influence of termites on atmospheric trace gases: CH4, CO2, CHCl3, N2O, CO, H2, and light hydrocarbons. Journal of Geophysical Research, 95(D4), 3619– 3634.
KIMOTO, H., SUYE, S.-I., MAKISHIMA, H., ARAI, J.-I., YAMAGUCHI, S., FUJII, Y., YOSHIOKA, T., TAKETO, A. 2010. Cloning of a novel dehalogenase from environmental DNA. Bioscience, Biotechnology, and Biochemistry, 74(6): 1290-1292.
KOONS, B. W., BAESEMAN, J. L., NOVAK, P. J. 2001. Investigation of cell exudates active in carbon tetrachloride and chloroform degradation. Biotechnology & Bioengineering, 74(1): 12-17.
KÖRNER, H., SOFIA, H. J. & ZUMFT, W. G. 2003. Phylogeny of the bacterial superfamily of Crp-Fnr transcription regulators: exploiting the metabolic spectrum by controlling alternative gene programs. FEMS Microbiology Reviews, 27(5): 559-592.
KRAJMALNIK-BROWN, R., SUNG, Y., RITALAHTI, K. M., MICHAEL SAUNDERS, F. & LÖFFLER, F. E. 2007. Environmental distribution of the trichloroethene reductive dehalogenase gene (tceA) suggests lateral gene transfer among Dehalococcoides. FEMS Microbiology Ecology, 59(1): 206-214.
KRASOTKINA, J., WALTERS, T., MARUYA, K. A. & RAGSDALE, S. W. 2001. Characterization of the B12-and Iron-Sulfur-containing reductive dehalogenase from Desulfitobacterium chlororespirans. Journal of Biological Chemistry, 276(44): 40991-40997.
KRONE, U. E., THAUER, R. K. & HOGENKAMP, H. P. C. 1989. Reductive dehalogenation of chlorinated C1-hydrocarbons mediated by corrinoids. Biochemistry, 28(11): 4908-4914.
KRUMHOLZ, L. R. 1997. Desulfuromonas chloroethenica sp. nov. uses tetrachloroethylene and trichloroethylene as electron acceptors. International Journal of Systematic Evolutionary Microbiology, 47(4): 1262-1263.
KRUSE, S., TUERKOWSKY, D., BIRKIGT, J., MATTURRO, B., FRANKE, S., JEHMLICH, N., VON BERGEN, M., WESTERMANN, M., ROSSETTI, S. & NIJENHUIS, I. 2019. Interspecies metabolite transfer in a co-culture of Dehalococcoides and Sulfurospirillum leads to rapid and complete tetrachloroethene dechlorination. Biorxiv, 526210.
KRUSE, T., MAILLARD, J., GOODWIN, L., WOYKE, T., TESHIMA, H., BRUCE, D., DETTER, C., TAPIA, R., HAN, C. & HUNTEMANN, M. 2013. Complete genome sequence of Dehalobacter restrictus PER-K23 T. Standards in Genomic Sciences, 8(3): 375.
KRUSE, T., SMIDT, H. & LECHNER, U. 2016. Comparative genomics and transcriptomics of organohalide-respiring bacteria and regulation of rdh gene transcription. In: ADRIAN, L. & LÖFFLER, F. E. (eds.) Organohalide-Respiring Bacteria. Berlin, Heidelberg: Springer Berlin Heidelberg.
KRUSE, T., VAN DE PAS, B. A., ATTEIA, A., KRAB, K., HAGEN, W. R., GOODWIN, L., CHAIN, P., BOEREN, S., MAPHOSA, F. & SCHRAA, G. 2015. Genomic, proteomic, and biochemical analysis of the organohalide respiratory pathway in Desulfitobacterium dehalogenans. Journal of Bacteriology, 197(5): 893-904.
KUBE, M., BECK, A., ZINDER, S. H., KUHL, H., REINHARDT, R. & ADRIAN, L. 2005. Genome sequence of the chlorinated compound–respiring bacterium Dehalococcoides species strain CBDB1. Nature Biotechnology, 23(10): 1269-1273.
70
KUBLIK, A., DEOBALD, D., HARTWIG, S., SCHIFFMANN, C. L., ANDRADES, A., VON BERGEN, M., SAWERS, R. G. & ADRIAN, L. 2016. Identification of a multi‐protein reductive dehalogenase complex in Dehalococcoides mccartyi strain CBDB 1 suggests a protein‐dependent respiratory electron transport chain obviating quinone involvement. Environmental Microbiology, 18(9): 3044-3056.
KUNZE, C., DIEKERT, G. & SCHUBERT, T. 2017. Subtle changes in the active site architecture untangled overlapping substrate ranges and mechanistic differences of two reductive dehalogenases. FEBS Journal, 284(20): 3520-3535.
LATURNUS, F., HASELMANN, K. F., BORCH, T. & GRØN, C. 2002. Terrestrial natural sources of trichloromethane (chloroform, CHCl3)–An overview. Biogeochemistry, 60(2): 121-139.
LEE, D.-H., LEE, I.-K., SONG, K., STEFFES, M., TOSCANO, W., BAKER, B. A. & JACOBS, D. R. 2006. A strong dose-response relation between serum concentrations of persistent organic pollutants and diabetes: results from the National Health and Examination Survey 1999–2002. Diabetes Care, 29(7): 1638-1644.
LEE, M., LOW, A., ZEMB, O., KOENIG, J., MICHAELSEN, A. & MANEFIELD, M. 2012. Complete chloroform dechlorination by organochlorine respiration and fermentation. Environmental Microbiology, 14(4): 883-894.
LENHERT, P. G. & HODGKIN, D. C. 1961. Structure of the 5, 6-dimethylbenzimidazolylcobamide coenzyme. Nature, 192(4806): 937-938.
LESAGE, S., BROWN, S., MILLAR, K. 1998. A different mechanism for the reductive dechlorination of chlorinated ethenes: Kinetic and spectroscopic evidence. Environmental Science & Technology, 32(15): 2264-2272.
LEVY, C., PIKE, K., HEYES, D. J., JOYCE, M. G., GABOR, K., SMIDT, H., VAN DER OOST, J. & LEYS, D. 2008. Molecular basis of halorespiration control by CprK, a CRP‐FNR type transcriptional regulator. Molecular Microbiology, 70(1): 151-167.
LEYS, D., ADRIAN, L. & SMIDT, H. 2013. Organohalide respiration: microbes breathing chlorinated molecules. Philosophical Transactions of the Royal Society B, 368(1616): 20120316.
LIANG, X., DONG, Y., KUDER, T., KRUMHOLZ, L. R., PHILP, R. P. & BUTLER, E. C. 2007. Distinguishing abiotic and biotic transformation of tetrachloroethylene and trichloroethylene by stable carbon isotope fractionation. Environmental Science & Technology, 41(20): 7094-7100.
LÖFFLER, F. E. & EDWARDS, E. A. 2006. Harnessing microbial activities for environmental cleanup. Current Opinion in Biotechnology, 17(3): 274-284.
LOFFLER, F. E., SANFORD, R. A. & TIEDJE, J. M. 1996. Initial characterization of a reductive dehalogenase from Desulfitobacterium chlororespirans Co23. Applied and Environmental Microbiology, 62(10): 3809-3813.
LÖFFLER, F. E., YAN, J., RITALAHTI, K. M., ADRIAN, L., EDWARDS, E. A., KONSTANTINIDIS, K. T., MÜLLER, J. A., FULLERTON, H., ZINDER, S. H., SPORMANN, A. M. 2013. Dehalococcoides mccartyi gen. nov., sp. nov., obligately organohalide-respiring anaerobic bacteria relevant to halogen cycling and bioremediation, belong to a novel bacterial class, Dehalococcoidia classis nov., order Dehalococcoidales ord. nov. and family Dehalococcoidaceae fam. nov., within the phylum Chloroflexi. International Journal of Systematic Evolutionary Microbiology, 63(2): 625-635.
71
LOHNER, S. T. & SPORMANN, A. 2013. Identification of a reductive tetrachloroethene dehalogenase in Shewanella sediminis. Philosophical Transactions of the Royal Society B: Biological Sciences, 368(1616): 20120326.
LOUIE, T. M. & MOHN, W. W. 1999. Evidence for a chemiosmotic model of dehalorespiration in Desulfomonile tiedjei DCB-1. Journal of Bacteriology, 181(1): 40-46.
LOW, A., SHEN, Z., CHENG, D., ROGERS, M. J., LEE, P. K. & HE, J. 2015. A comparative genomics and reductive dehalogenase gene transcription study of two chloroethene-respiring bacteria, Dehalococcoides mccartyi strains MB and 11a. Scientific Reports, 5(1): 1-12.
MABEY, W. & MILL, T. 1978. Critical review of hydrolysis of organic compounds in water under environmental conditions. Journal of Physical Chemical Reference Data, 7(2): 383-415.
MAC NELLY, A., KAI, M., SVATOŠ, A., DIEKERT, G. & SCHUBERT, T. 2014. Functional heterologous production of reductive dehalogenases from Desulfitobacterium hafniense strains. Applied and Environmental Microbiology, 80(14): 4313-4322.
MAGNUSON, J. K., ROMINE, M. F., BURRIS, D. R. & KINGSLEY, M. T. 2000. Trichloroethene reductive dehalogenase from Dehalococcoides ethenogenes: sequence of tceA and substrate range characterization. Applied and Environmental Microbiology, 66(12): 5141-5147.
MAGNUSON, J. K., STERN, R. V., GOSSETT, J. M., ZINDER, S. H. & BURRIS, D. R. 1998. Reductive dechlorination of tetrachloroethene to ethene by a two-component enzyme pathway. Applied and Environmental Microbiology, 64(4): 1270-1275.
MAILLARD, J., REGEARD, C. & HOLLIGER, C. 2005. Isolation and characterization of Tn‐Dha1, a transposon containing the tetrachloroethene reductive dehalogenase of Desulfitobacterium hafniense strain TCE1. Environmental Microbiology, 7(1): 107-117.
MAILLARD, J., SCHUMACHER, W., VAZQUEZ, F., REGEARD, C., HAGEN, W. R. & HOLLIGER, C. 2003. Characterization of the corrinoid iron-sulfur protein tetrachloroethene reductive dehalogenase of Dehalobacter restrictus. Applied and Environmental Microbiology, 69(8): 4628.
MAILLARD, J. & WILLEMIN, M. S. 2019. Regulation of organohalide respiration. Advances in Microbial Physiology, 74, 191-238.
MANSFELDT, C. B., ROWE, A. R., HEAVNER, G. L., ZINDER, S. H. & RICHARDSON, R. E. 2014. Meta-analyses of Dehalococcoides mccartyi strain 195 transcriptomic profiles identify a respiration rate-related gene expression transition point and interoperon recruitment of a key oxidoreductase subunit. Applied and Environmental Microbiology, 80(19): 6062-6072.
MAPHOSA, F., DE VOS, W. M. & SMIDT, H. 2010. Exploiting the ecogenomics toolbox for environmental diagnostics of organohalide-respiring bacteria. Trends in Biotechnology, 28(6): 308-316.
MAPHOSA, F., VAN PASSEL, M. W., DE VOS, W. M. & SMIDT, H. 2012. Metagenome analysis reveals yet unexplored reductive dechlorinating potential of Dehalobacter sp. E1 growing in co‐culture with Sedimentibacter sp. Environmental Microbiology Reports, 4(6): 604-616.
72
MAYMÓ-GATELL, X., NIJENHUIS, I., ZINDER, S. H. 2001. Reductive dechlorination of cis-1, 2-dichloroethene and vinyl chloride by “Dehalococcoides ethenogenes”. Environmental Science & Technology, 35(3): 516-521.
MCCAULEY, K. M., WILSON, S. R. & VAN DER DONK, W. A. 2003. Characterization of chlorovinylcobalamin, a putative intermediate in reductive degradation of chlorinated ethylenes. Journal of the American Chemical Society, 125(15): 4410-4411.
MCCULLOCH, A. 2003. Chloroform in the environment: occurrence, sources, sinks and effects. Chemosphere, 50(10): 1291-1308.
MCMURDIE, P. J., BEHRENS, S. F., HOLMES, S. & SPORMANN, A. M. 2007. Unusual codon bias in vinyl chloride reductase genes of Dehalococcoides species. Applied and Environmental Microbiology, 73(8): 2744-2747.
MCMURDIE, P. J., BEHRENS, S. F., MÜLLER, J. A., GÖKE, J., RITALAHTI, K. M., WAGNER, R., GOLTSMAN, E., LAPIDUS, A., HOLMES, S. & LÖFFLER, F. E. 2009. Localized plasticity in the streamlined genomes of vinyl chloride respiring Dehalococcoides. PLoS Genetics, 5(11): e1000714.
MCMURDIE, P. J., HUG, L. A., EDWARDS, E. A., HOLMES, S. & SPORMANN, A. M. 2011. Site-specific mobilization of vinyl chloride respiration islands by a mechanism common in Dehalococcoides. BMC Genomics, 12(1): 287.
MEN, Y., SETH, E. C., YI, S., ALLEN, R. H., TAGA, M. E. & ALVAREZ-COHEN, L. 2014. Sustainable growth of Dehalococcoides mccartyi 195 by corrinoid salvaging and remodeling in defined lactate-fermenting consortia. Applied and Environmental Microbiology, 80(7): 2133-2141.
MEßMER, M., REINHARDT, S., WOHLFARTH, G. & DIEKERT, G. 1996. Studies on methyl chloride dehalogenase and O-demethylase in cell extracts of the homoacetogen strain MC based on a newly developed coupled enzyme assay. Archives of Microbiology, 165(1): 18-25.
MILLER, E., WOHLFARTH, G. & DIEKERT, G. 1996. Studies on tetrachloroethene respiration in Dehalospirillum multivorans. Archives of Microbiology, 166(6): 379-387.
MILLER, E., WOHLFARTH, G. & DIEKERT, G. 1998. Purification and characterization of the tetrachloroethene reductive dehalogenase of strain PCE-S. Archives of Microbiology, 169(6): 497-502.
MOE, W. M., YAN, J., NOBRE, M. F., DA COSTA, M. S., RAINEY, F. A. 2009. Dehalogenimonas lykanthroporepellens gen. nov., sp. nov., a reductively dehalogenating bacterium isolated from chlorinated solvent-contaminated groundwater. International Journal of Systematic Evolutionary Microbiology, 59(11): 2692-2697.
MOHN, W. W. & TIEDJE, J. M. 1992. Microbial reductive dehalogenation. Microbiological Reviews, 56(3): 482.
MOK, K. C. & TAGA, M. E. 2013. Growth inhibition of Sporomusa ovata by incorporation of benzimidazole bases into cobamides. Journal of Bacteriology, 195(9): 1902-1911.
MOLENDA, O., QUAILE, A. T. & EDWARDS, E. A. 2016. Dehalogenimonas sp. strain WBC-2 genome and identification of its trans-dichloroethene reductive dehalogenase, TdrA. Applied and Environmental Microbiology, 82(1): 40-50.
73
MOLENDA, O., TANG, S., LOMHEIM, L., GAUTAM, V. K., LEMAK, S., YAKUNIN, A. F., MAXWELL, K. L. & EDWARDS, E. A. 2019. Extrachromosomal circular elements targeted by CRISPR-Cas in Dehalococcoides mccartyi are linked to mobilization of reductive dehalogenase genes. ISME, 13(1): 24-38.
MOORE, S. J., LAWRENCE, A. D., BIEDENDIECK, R., DEERY, E., FRANK, S., HOWARD, M. J., RIGBY, S. E. & WARREN, M. J. 2013. Elucidation of the anaerobic pathway for the corrin component of cobalamin (vitamin B12). Proceedings of the National Academy of Sciences, 110(37): 14906-14911.
MORITA, Y., FUTAGAMI, T., GOTO, M., FURUKAWA, K. 2009. Functional characterization of the trigger factor protein PceT of tetrachloroethene-dechlorinating Desulfitobacterium hafniense Y51. Applied Microbiology & Biotechnology, 83(4): 775-781.
MUKHERJEE, K., BOWMAN, K. S., RAINEY, F. A., SIDDARAMAPPA, S., CHALLACOMBE, J. F. & MOE, W. M. 2014. Dehalogenimonas lykanthroporepellens BL-DC-9T simultaneously transcribes many rdhA genes during organohalide respiration with 1, 2-DCA, 1, 2-DCP, and 1, 2, 3-TCP as electron acceptors. FEMS Microbiology Letters, 354(2): 111-118.
MÜLLER, J. A., ROSNER, B. M., VON ABENDROTH, G., MESHULAM-SIMON, G., MCCARTY, P. L. & SPORMANN, A. M. 2004. Molecular identification of the catabolic vinyl chloride reductase from Dehalococcoides sp. strain VS and its environmental distribution. Applied and Environmental Microbiology, 70(8): 4880-4888.
NAKAMURA, R., OBATA, T., NOJIMA, R., HASHIMOTO, Y., NOGUCHI, K., OGAWA, T. & YOHDA, M. 2018. Functional expression and characterization of tetrachloroethene dehalogenase from Geobacter sp. Frontiers in Microbiology, 9, 1774.
NEUMANN, A., WOHLFARTH, G. & DIEKERT, G. 1998. Tetrachloroethene dehalogenase from Dehalospirillum multivorans: cloning, sequencing of the encoding genes, and expression of the pceA gene in Escherichia coli. Journal of Bacteriology, 180(16): 4140-4145.
NEUMANN, A., WOHLFARTH, G. & DIEKERT, G. 1996. Purification and characterization of tetrachloroethene reductive dehalogenase from Dehalospirillum multivorans. Journal of Biological Chemistry, 271(28): 16515-16519.
NI, S., FREDRICKSON, J. K. & XUN, L. 1995. Purification and characterization of a novel 3-chlorobenzoate-reductive dehalogenase from the cytoplasmic membrane of Desulfomonile tiedjei DCB-1. Journal of Bacteriology, 177(17): 5135-5139.
NIGHTINGALE, P., MALIN, G., LISS, P. S. 1995. Production of chloroform and other low molecular‐weight halocarbons by some species of macroalgae. Limnology and Oceanography, 40(4): 680-689.
NIJENHUIS, I. & ZINDER, S. H. 2005. Characterization of hydrogenase and reductive dehalogenase activities of Dehalococcoides ethenogenes strain 195. Applied and Environmental Microbiology, 71(3): 1664.
OKEKE, B. C., CHANG, Y. C., HATSU, M., SUZUKI, T. & TAKAMIZAWA, K. 2001. Purification, cloning, and sequencing of an enzyme mediating the reductive dechlorination of tetrachloroethylene (PCE) from Clostridium bifermentans DPH-1. Canadian Journal of Microbiology, 47(5): 448-456.
74
OLIVAS, Y., DOLFING, J., SMITH, G. B. 2002. The influence of redox potential on the degradation of halogenated methanes. Environmental Toxicology Chemistry: An International Journal, 21(3): 493-499.
PALMER, T. & BERKS, B. C. 2012. The twin-arginine translocation (Tat) protein export pathway. Nature Reviews Microbiology, 10(7): 483-496.
PARTHASARATHY, A., STICH, T. A., LOHNER, S. T., LESNEFSKY, A., BRITT, R. D. & SPORMANN, A. M. 2015. Biochemical and EPR-spectroscopic investigation into heterologously expressed vinyl chloride reductive dehalogenase (VcrA) from Dehalococcoides mccartyi strain VS. Journal of the American Chemical Society, 137(10): 3525-3532.
PAYNE, K. A. P., QUEZADA, C. P., FISHER, K., DUNSTAN, M. S., COLLINS, F. A., SJUTS, H., LEVY, C., HAY, S., RIGBY, S. E. J. & LEYS, D. 2015. Reductive dehalogenase structure suggests a mechanism for B12-dependent dehalogenation. Nature, 517(7535): 513-516.
PETERS, J. W., MILLER, A.-F., JONES, A. K., KING, P. W. & ADAMS, M. W. W. 2016. Electron bifurcation. Current Opinion in Chemical Biology, 31, 146-152.
PÖRITZ, M., GORIS, T., WUBET, T., TARKKA, M. T., BUSCOT, F., NIJENHUIS, I., LECHNER, U. & ADRIAN, L. 2013. Genome sequences of two dehalogenation specialists–Dehalococcoides mccartyi strains BTF08 and DCMB5 enriched from the highly polluted Bitterfeld region. Blackwell Publishing Ltd Oxford, UK.
REINHOLD, A., WESTERMANN, M., SEIFERT, J., VON BERGEN, M., SCHUBERT, T. & DIEKERT, G. 2012. Impact of vitamin B12 on formation of the tetrachloroethene reductive dehalogenase in Desulfitobacterium hafniense strain Y51. Applied and Environmental Microbiology, 78(22): 8025.
RENZ, P., BLICKLE, S. & FRIEDRICH, W. 1987. Two new vitamin B12 factors from sewage sludge containing 2-methylsulfinyladenine or 2-methylsulfonyladenine as base component. European Journal of Biochemistry, 163(1): 175-179.
RICHARDSON, R. E. 2013. Genomic insights into organohalide respiration. Current Opinion in Biotechnology, 24(3): 498-505.
RONDON, M. R., TRZEBIATOWSKI, J. R., ESCALANTE-SEMERENA, J. C. 1997. Biochemistry and molecular genetics of cobalamin biosynthesis. Progress in Nucleic Acid Research Molecular Biology, 56, 347-384.
ROSENTHAL, S. L. 1987. A review of the mutagenicity of chloroform. Environmental Molecular Mutagenesis, 10(2): 211-226.
ROSSBERG, M., LENDLE, W., PFLEIDERER, G., TÖGEL, A., DREHER, E.-L., LANGER, E., RASSAERTS, H., KLEINSCHMIDT, P., STRACK, H., COOK, R., BECK, U., LIPPER, K.-A., TORKELSON, T. R., LÖSER, E., BEUTEL, K. K. & MANN, T. 2006. Ullmann's Encyclopedia of Industrial Chemistry, Wiley Online Library.
SANFORD, R. A., CHOWDHARY, J. & LÖFFLER, F. E. 2016. Organohalide-respiring deltaproteobacteria. In: ADRIAN, L. & LÖFFLER, F. E. (eds.) Organohalide-Respiring Bacteria. Berlin, Heidelberg: Springer Berlin Heidelberg.
SANFORD, R. A., COLE, J. R. & TIEDJE, J. M. 2002. Characterization and description of Anaeromyxobacter dehalogenans gen. nov., sp. nov., an aryl-halorespiring facultative anaerobic myxobacterium. Applied and Environmental Microbiology, 68(2): 893-900.
SARGENT, F. 2007. Constructing the wonders of the bacterial world: biosynthesis of complex enzymes. Microbiology, 153(3): 633-651.
75
SASSON, Y. 2009. Formation of carbon–halogen bonds (Cl, Br, I). PATAI'S Chemistry of Functional Groups. Z. Rappoport (Ed.).
SATO, K. 2013. Naturally occurring organic fluorine compounds. TCIMAIL. SCARRATT, M. & MOORE, R. 1999. Production of chlorinated hydrocarbons and methyl
iodide by the red microalga Porphyridium purpureum. Limnology and Oceanography, 44(3): 703-707.
SCHINK, B. & FRIEDRICH, M. 1994. Energetics of syntrophic fatty acid oxidation. FEMS Microbiology Reviews, 15(2-3): 85-94.
SCHIPP, C. J., MARCO-URREA, E., KUBLIK, A., SEIFERT, J. & ADRIAN, L. 2013. Organic cofactors in the metabolism of Dehalococcoides mccartyi strains. Philosophical Transactions of the Royal Society B: Biological Sciences, 368(1616): 20120321.
SCHMITZ, R. P., WOLF, J., HABEL, A., NEUMANN, A., PLOSS, K., SVATOS, A., BOLAND, W., DIEKERT, G. 2007. Evidence for a radical mechanism of the dechlorination of chlorinated propenes mediated by the tetrachloroethene reductive dehalogenase of Sulfurospirillum multivorans. Environmental Science & Technology, 41(21): 7370-7375.
SCHOLZ-MURAMATSU, H., NEUMANN, A., MEßMER, M., MOORE, E. & DIEKERT, G. 1995. Isolation and characterization of Dehalospirillum multivorans gen. nov., sp. nov., a tetrachloroethene-utilizing, strictly anaerobic bacterium. Archives of Microbiology, 163(1): 48-56.
SCHUBERT, T., ADRIAN, L., SAWERS, R. G. & DIEKERT, G. 2018. Organohalide respiratory chains: composition, topology and key enzymes. FEMS Microbiology Ecology, 94(4): fiy035.
SCHUBERT, T. & DIEKERT, G. 2016. Comparative Biochemistry of Organohalide Respiration. In: ADRIAN, L. & LÖFFLER, F. E. (eds.) Organohalide-Respiring Bacteria. Berlin, Heidelberg: Springer Berlin Heidelberg.
SCHUBERT, T., VON REUß, S. H., KUNZE, C., PAETZ, C., KRUSE, S., BRAND‐SCHÖN, P., NELLY, A. M., NÜSKE, J. & DIEKERT, G. 2019. Guided cobamide biosynthesis for heterologous production of reductive dehalogenases. Microbial Biotechnology, 12(2): 346-359.
SCHUMACHER, W., HOLLIGER, C., ZEHNDER, A. J. & HAGEN, W. R. 1997. Redox chemistry of cobalamin and iron‐sulfur cofactors in the tetrachloroethene reductase of Dehalobacter restrictus. FEBS Letters, 409(3): 421-425.
SCHUMACHER, W. & HOLLIGER, C. 1996. The proton/electron ration of the menaquinone-dependent electron transport from dihydrogen to tetrachloroethene in "Dehalobacter restrictus". Journal of Bacteriology, 178(8): 2328-2333.
SEIDEL, K., KÜHNERT, J. & ADRIAN, L. 2018. The complexome of Dehalococcoides mccartyi reveals its organohalide respiration-complex is modular. Frontiers in Microbiology, 9, 1130.
SESHADRI, R., ADRIAN, L., FOUTS, D. E., EISEN, J. A., PHILLIPPY, A. M., METHE, B. A., WARD, N. L., NELSON, W. C., DEBOY, R. T. & KHOURI, H. M. 2005. Genome sequence of the PCE-dechlorinating bacterium Dehalococcoides ethenogenes. Science, 307(5706): 105-108.
SIDDARAMAPPA, S., CHALLACOMBE, J. F., DELANO, S. F., GREEN, L. D., DALIGAULT, H., BRUCE, D., DETTER, C., TAPIA, R., HAN, S. & GOODWIN, L. 2012. Complete genome sequence of Dehalogenimonas lykanthroporepellens type strain (BL-DC-
76
9 T) and comparison to “Dehalococcoides” strains. Standards in Genomic Sciences, 6(2): 251.
SIEBERT, A., NEUMANN, A., SCHUBERT, T. & DIEKERT, G. 2002. A non-dechlorinating strain of Dehalospirillum multivorans: evidence for a key role of the corrinoid cofactor in the synthesis of an active tetrachloroethene dehalogenase. Archives of Microbiology, 178(6): 443-449.
SIMMONDS, P., DERWENT, R., MANNING, A., O'DOHERTY, S. & SPAIN, G. 2010. Natural chloroform emissions from the blanket peat bogs in the vicinity of Mace Head, Ireland over a 14-year period. Atmospheric Environment, 44(10): 1284-1291.
SIMS, J. L., SUFLITA, J. M. & RUSSELL, H. H. 1991. Reductive dehalogenation of organic contaminants in soils and ground water. Robert S. Kerr Environmental Research Laboratory, Superfund Technology Support Center for Ground Water.
SJUTS, H., FISHER, K., DUNSTAN, M. S., RIGBY, S. E., LEYS, D. 2012. Heterologous expression, purification and cofactor reconstitution of the reductive dehalogenase PceA from Dehalobacter restrictus. Protein Expression and Purification, 85(2): 224-229.
SMIDT, H. & DE VOS, W. M. 2004. Anaerobic Microbial Dehalogenation. Annual Review of Microbiology, 58(1), 43-73.
SOLOMON, G. M. & WEISS, P. M. 2002. Chemical contaminants in breast milk: time trends and regional variability. Environmental Health Perspectives, 110(6): A339-A347.
SUN, B., COLE, J. R., TIEDJE, J. M. 2001. Desulfomonile limimaris sp. nov., an anaerobic dehalogenating bacterium from marine sediments. International Journal of Systematic Evolutionary Microbiology, 51(2): 365-371.
SUN, B., GRIFFIN, B. M., AYALA-DEL-RıO, H. L., HASHSHAM, S. A. & TIEDJE, J. M. 2002. Microbial dehalorespiration with 1, 1, 1-trichloroethane. Science, 298(5595): 1023-1025.
SUNG, Y., RITALAHTI, K. M., SANFORD, R. A., URBANCE, J. W., FLYNN, S. J., TIEDJE, J. M. & LÖFFLER, F. E. 2003. Characterization of two tetrachloroethene-reducing, acetate-oxidizing anaerobic bacteria and their description as Desulfuromonas michiganensis sp. nov. Applied and Environmental Microbiology, 69(5): 2964-2974.
SUYAMA, A., YAMASHITA, M., YOSHINO, S. & FURUKAWA, K. 2002. Molecular Characterization of the PceA reductive dehalogenase of Desulfitobacterium sp. strain Y51. Journal of Bacteriology, 184(13): 3419.
TANG, S. & EDWARDS, E. A. 2013. Identification of Dehalobacter reductive dehalogenases that catalyse dechlorination of chloroform, 1, 1, 1-trichloroethane and 1, 1-dichloroethane. Philosophical Transactions of the Royal Society B: Biological Sciences, 368 (1616): 20120318.
TANG, S., WANG, P. H., HIGGINS, S. A., LÖFFLER, F. E. & EDWARDS, E. A. 2016. Sister Dehalobacter genomes reveal specialization in organohalide respiration and recent strain differentiation likely driven by chlorinated substrates. Frontiers in Microbiology, 7, 100.
THAUER, R. K., JUNGERMANN, K. & DECKER, K. 1977. Energy conservation in chemotrophic anaerobic bacteria. Bacteriological Reviews, 41(1): 100-180.
THIBODEAU, J., GAUTHIER, A., DUGUAY, M., VILLEMUR, R., LÉPINE, F., JUTEAU, P. & BEAUDET, R. 2004. Purification, cloning, and sequencing of a 3, 5-dichlorophenol
77
reductive dehalogenase from Desulfitobacterium frappieri PCP-1. Applied and Environmental Microbiology, 70(8): 4532-4537.
TOBISZEWSKI, M. & NAMIEŚNIK, J. 2012. Abiotic degradation of chlorinated ethanes and ethenes in water. Environmental Science Pollution Research, 19(6): 1994-2006.
TSITONAKI, A., PETRI, B., CRIMI, M., MOSBÆK, H., SIEGRIST, R. L. & BJERG, P. L. 2010. In Situ Chemical Oxidation of Contaminated Soil and Groundwater Using Persulfate: A Review. Critical Reviews in Environmental Science and Technology, 40(1): 55-91.
TSUKAGOSHI, N., EZAKI, S., UENAKA, T., SUZUKI, N., KURANE, R. 2006. Isolation and transcriptional analysis of novel tetrachloroethene reductive dehalogenase gene from Desulfitobacterium sp. strain KBC1. Applied Microbiology & Biotechnology, 69(5): 543-553.
UNEP 2013. Global Chemicals Outlook - Towards Sound Management of Chemicals. 2013 ed.
VAN DE PAS, B. A., GERRITSE, J., DE VOS, W. M., SCHRAA, G. & STAMS, A. J. 2001. Two distinct enzyme systems are responsible for tetrachloroethene and chlorophenol reductive dehalogenation in Desulfitobacterium strain PCE1. Archives of Microbiology, 176(3): 165-169.
VAN DE PAS, B. A., SMIDT, H., HAGEN, W. R., VAN DER OOST, J., SCHRAA, G., STAMS, A. J. & DE VOS, W. M. 1999. Purification and Molecular Characterization ofortho-Chlorophenol Reductive Dehalogenase, a Key Enzyme of Halorespiration in Desulfitobacterium dehalogenans. Journal of Biological Chemistry, 274(29): 20287-20292.
VAN HYLCKAMA VLIEG, J. E. T. & JANSSEN, D. B. 1991. Bacterial degradation of 3-chloroacrylic acid and the characterization of cis- and trans-specific dehalogenases. Biodegradation, 2(3): 139-150.
VAN PÉE, K.-H. & UNVERSUCHT, S. 2003. Biological dehalogenation and halogenation reactions. Chemosphere, 52(2): 299-312.
VELDERS, G. J., ANDERSEN, S. O., DANIEL, J. S., FAHEY, D. W. & MCFARLAND, M. 2007. The importance of the Montreal Protocol in protecting climate. Proceedings of the National Academy of Sciences, 104(12): 4814-4819.
WAGNER, A., SEGLER, L., KLEINSTEUBER, S., SAWERS, G., SMIDT, H. & LECHNER, U. 2013. Regulation of reductive dehalogenase gene transcription in Dehalococcoides mccartyi. Philosophical Transactions of the Royal Society B: Biological Sciences, 368(1616): 20120317.
WAGNER, D. D., HUG, L. A., HATT, J. K., SPITZMILLER, M. R., PADILLA-CRESPO, E., RITALAHTI, K. M., EDWARDS, E. A., KONSTANTINIDIS, K. T. & LÖFFLER, F. E. 2012. Genomic determinants of organohalide-respiration in Geobacter lovleyi, an unusual member of the Geobacteraceae. BMC Genomics, 13(1): 200.
WANG, G., LI, R., LI, S. & JIANG, J. 2010. A novel hydrolytic dehalogenase for the chlorinated aromatic compound chlorothalonil. Journal of Bacteriology, 192(11): 2737.
WANG, L., ZHOU, X., FREDIMOSES, M., LIAO, S. & LIU, Y. 2014a. Naturally occurring organoiodines. RSC Advances, 4(110): 57350-57376.
WANG, P.-H., TANG, S., NEMR, K., FLICK, R., YAN, J., MAHADEVAN, R., YAKUNIN, A. F., LÖFFLER, F. E. & EDWARDS, E. A. 2017. Refined experimental annotation reveals
78
conserved corrinoid autotrophy in chloroform-respiring Dehalobacter isolates. ISME, 11(3): 626-640.
WANG, S., CHEN, S., WANG, Y., LOW, A., LU, Q. & QIU, R. 2016. Integration of organohalide-respiring bacteria and nanoscale zero-valent iron (Bio-nZVI-RD): A perfect marriage for the remediation of organohalide pollutants? Biotechnology Advances, 34(8): 1384-1395.
WANG, S., CHNG, K. R., WILM, A., ZHAO, S., YANG, K.-L., NAGARAJAN, N. & HE, J. 2014b. Genomic characterization of three unique Dehalococcoides that respire on persistent polychlorinated biphenyls. Proceedings of the National Academy of Sciences, 111(33): 12103-12108.
WASMUND, K., COOPER, M., SCHREIBER, L., LLOYD, K. G., BAKER, B. J., PETERSEN, D. G., JØRGENSEN, B. B., STEPANAUSKAS, R., REINHARDT, R. & SCHRAMM, A. 2016. Single-cell genome and group-specific dsrAB sequencing implicate marine members of the class Dehalococcoidia (Phylum Chloroflexi) in Sulfur Cycling. MBio, 7(3): e00266-16.
WASMUND, K., SCHREIBER, L., LLOYD, K. G., PETERSEN, D. G., SCHRAMM, A., STEPANAUSKAS, R., JØRGENSEN, B. B. & ADRIAN, L. 2014. Genome sequencing of a single cell of the widely distributed marine subsurface Dehalococcoidia, phylum Chloroflexi. ISME, 8(2): 383-397.
WEATHERS, L. J. & PARKIN, G. F. 1995. Metallic iron-enhanced biotransformation of carbon tetrachloride and chloroform under methanogenic conditions. Battelle Press, Columbus, OH (United States).
WEATHERS, L. J. & PARKIN, G. F. 2000. Toxicity of chloroform biotransformation to methanogenic bacteria. Environmental Science & Technology, 34(13): 2764-2767.
WILKINSON, S. P. & GROVE, A. 2006. Ligand-responsive transcriptional regulation by members of the MarR family of winged helix proteins. Current Issues in Molecular Biology, 8(1): 51.
WOLF, J. B. & BREY, R. N. 1986. Isolation and genetic characterizations of Bacillus megaterium cobalamin biosynthesis-deficient mutants. Journal of Bacteriology, 166(1): 51-58.
WONG, Y. K., HOLLAND, S. I., ERTAN, H., MANEFIELD, M. & LEE, M. 2016. Isolation and characterization of Dehalobacter sp. strain UNSWDHB capable of chloroform and chlorinated ethane respiration. Environmental Microbiology, 18(3): 3092-3105.
YAN, J., BI, M., BOURDON, A. K., FARMER, A. T., WANG, P.-H., MOLENDA, O., QUAILE, A. T., JIANG, N., YANG, Y. & YIN, Y. 2018. Purinyl-cobamide is a native prosthetic group of reductive dehalogenases. Nature Chemical Biology, 14(1): 8.
YAN, J., IM, J., YANG, Y. & LÖFFLER, F. E. 2013. Guided cobalamin biosynthesis supports Dehalococcoides mccartyi reductive dechlorination activity. Philosophical Transactions of the Royal Society B: Biological Sciences, 368(1616): 20120320.
YAN, J., RITALAHTI, K. M., WAGNER, D. D. & LÖFFLER, F. E. 2012. Unexpected specificity of interspecies cobamide transfer from Geobacter spp. to organohalide-respiring Dehalococcoides mccartyi strains. Applied and Environmental Microbiology, 78(18): 6630-6636.
YAN, J., ŞIMŞIR, B., FARMER, A. T., BI, M., YANG, Y., CAMPAGNA, S. R. & LÖFFLER, F. E. 2016. The corrinoid cofactor of reductive dehalogenases affects dechlorination
79
rates and extents in organohalide-respiring Dehalococcoides mccartyi. ISME, 10(5): 1092-1101.
YE, L., SCHILHABEL, A., BARTRAM, S., BOLAND, W. & DIEKERT, G. 2010. Reductive dehalogenation of brominated ethenes by Sulfurospirillum multivorans and Desulfitobacterium hafniense PCE‐S. Environmental Microbiology, 12(2): 501-509.
YI, S., SETH, E. C., MEN, Y.-J., STABLER, S. P., ALLEN, R. H., ALVAREZ-COHEN, L. & TAGA, M. E. 2012. Versatility in corrinoid salvaging and remodeling pathways supports corrinoid-dependent metabolism in Dehalococcoides mccartyi. Applied and Environmental Microbiology, 78(21): 7745-7752.
YU, Y., ZHANG, K., LI, Z., REN, C., LIU, J. & MEN, Y. 2019. Microbial cleavage of C‒F bonds in per-and polyfluoroalkyl substances via dehalorespiration. ChemRxiv.
ZHAO, S., DING, C. & HE, J. 2017. Genomic characterization of Dehalococcoides mccartyi strain 11a5 reveals a circular extrachromosomal genetic element and a new tetrachloroethene reductive dehalogenase gene. FEMS Microbiology Ecology, 93(4): fiw235.
ZINDER, S. H. 2016. Dehalococcoides has a dehalogenation complex. Environmental Microbiology, 18(9): 2773-2775.
80
CHAPTER TWO: Recovering functional chloroform reductive dehalogenase from inclusion bodies in Escherichia coli
81
2.1 INTRODUCTION
Dehalobacter sp. UNSWDHB is a gram negative, obligate anaerobic and organohalide-
respiring bacterium which was isolated in Australia from a chloroform contaminated
aquifer near Sydney (Wong et al., 2016). Since its isolation (Lee et al., 2012) and genome
sequencing (Deshpande et al., 2013), several studies have been carried out to decipher
the biochemical properties of the strain and corresponding reductive dehalogenases
and their potential role in bioremediation. Wong et al., (2016) conducted preliminary
biochemical studies on Dehalobacter sp. UNSWDHB. Jugder et al. (2016) reported a
proteomic and transcriptomic analysis of the organism in response to chloroform
following a short period of starvation, identifying a range of genes upregulated in
response to chloroform presence. The same authors also purified the native TmrA from
the UNSWDHB strain and undertook characterisation of the enzyme, including an
estimation of the specific activity of TmrA (Jugder et al., 2017). Finally, they reported
successful expression of functional purified recombinant TmrA in Bacillus megaterium
(Jugder et al., 2018). This was the first membrane associated respiratory RDase to be
heterologously expressed in a soluble and active form.
E. coli has proven to be a successful expression host for a vast number of protein classes,
for overexpression in soluble and functional forms. Because of the wealth of available
knowledge and success stories, E. coli is the first choice for recombinant expression for
most proteins. Several attempts have been made to express RDases in E. coli but no
respiratory RDase has been expressed in a soluble and catalytically active form so far.
The endeavour of Jugder et al., (2018) to express the RDase of the UNSWDHB strain in
a soluble and functional form in E. coli was similarly unsuccessful. He removed the TAT
signal and the predicted membrane spanning regions from the tmrA gene with the
intention of directing the expression of the periplasmic RDases toward the cytoplasm.
Rhamnose-inducible heterologous expression of TmrA under the control of an
adjustable rhaBAD promoter was not tightly regulated and resulted in insoluble
expression. The use of IPTG-inducible pOPIN vector system with a T7 inducible promoter
and affinity/solubility fusion tags (N/C-terminal His, SUMO, Trx, NusA, MBP, and TF)
resulted in overexpression of TmrA as inclusion bodies. Despite attempts to generate
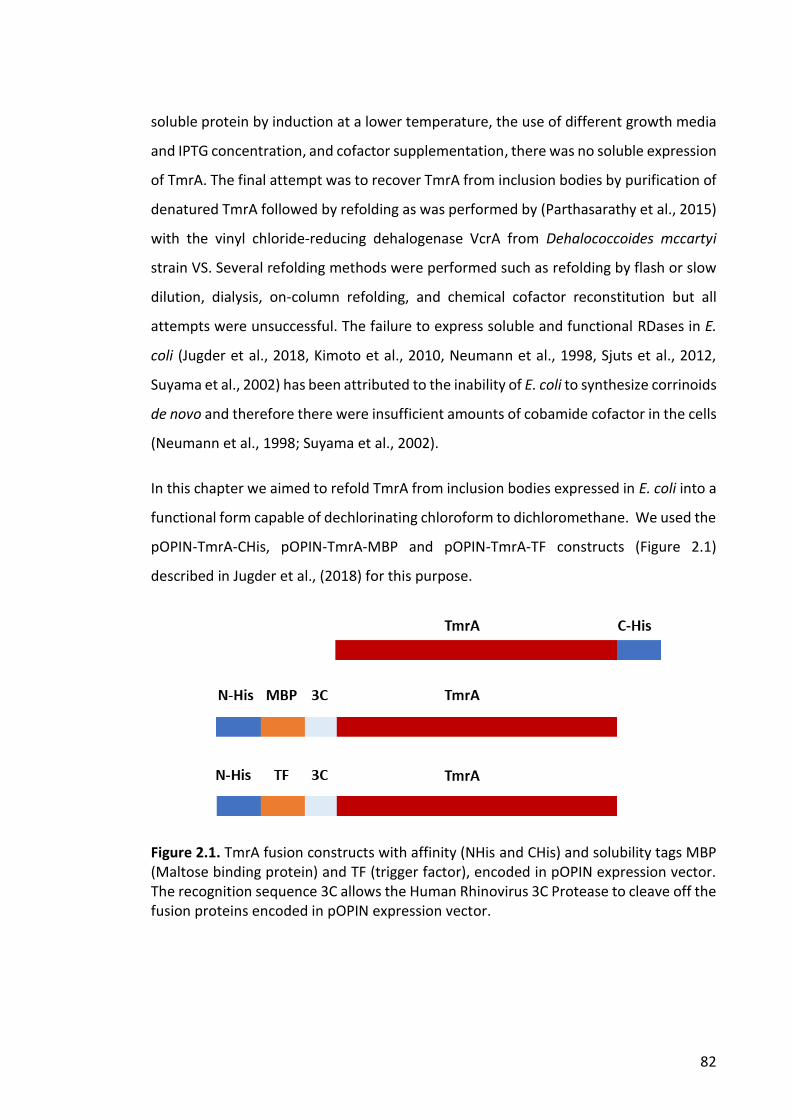
82
soluble protein by induction at a lower temperature, the use of different growth media
and IPTG concentration, and cofactor supplementation, there was no soluble expression
of TmrA. The final attempt was to recover TmrA from inclusion bodies by purification of
denatured TmrA followed by refolding as was performed by (Parthasarathy et al., 2015)
with the vinyl chloride-reducing dehalogenase VcrA from Dehalococcoides mccartyi
strain VS. Several refolding methods were performed such as refolding by flash or slow
dilution, dialysis, on-column refolding, and chemical cofactor reconstitution but all
attempts were unsuccessful. The failure to express soluble and functional RDases in E.
coli (Jugder et al., 2018, Kimoto et al., 2010, Neumann et al., 1998, Sjuts et al., 2012,
Suyama et al., 2002) has been attributed to the inability of E. coli to synthesize corrinoids
de novo and therefore there were insufficient amounts of cobamide cofactor in the cells
(Neumann et al., 1998; Suyama et al., 2002).
In this chapter we aimed to refold TmrA from inclusion bodies expressed in E. coli into a
functional form capable of dechlorinating chloroform to dichloromethane. We used the
pOPIN-TmrA-CHis, pOPIN-TmrA-MBP and pOPIN-TmrA-TF constructs (Figure 2.1)
described in Jugder et al., (2018) for this purpose.
Figure 2.1. TmrA fusion constructs with affinity (NHis and CHis) and solubility tags MBP (Maltose binding protein) and TF (trigger factor), encoded in pOPIN expression vector. The recognition sequence 3C allows the Human Rhinovirus 3C Protease to cleave off the fusion proteins encoded in pOPIN expression vector.
83
2.2 EXPERIMENTAL PROCEDURES
Initially a non-conventional refolding method described by Roussel et al. (2013) for
recovering TmrA from inclusion bodies was attempted. The method is based on the
association of the ionic detergent Sodium Dodecyl Sulphate (SDS) with a co-solvent
featuring a diol-type pattern, the 2-Methyl-2,4-pentanediol (MPD). A suitable
concentration ratio of SDS and MPD leads to the refolding of the protein previously
denatured with SDS concentrations above the critical micelle concentration (CMC)
(Michaux et al., 2016). The second method pursued in this study included an aerobic
chromatographic step followed by the refolding of TmrA under anaerobic conditions in
the presence of FeCl3, Na2S and cobalamin to facilitate cofactor reconstitution as
described by (Nakamura et al., 2018).
2.2.1 Bioreactor fermentation
The constructs pOPIN-TmrA-Chis and pOPIN-TmrA-MBP were selected for the SDS-MPD
based protein refolding system and for the second refolding method, pOPIN-TmrA-Chis
and pOPIN-TmrA-TF constructs were chosen. The reasoning behind selecting these
constructs is described in the Discussion section. To produce sufficient biomass, batch
fermentation of E. coli BL21(DE3)pLysS cells containing pOPIN-TmrA-CHis, pOPIN-TmrA-
MBP and pOPIN-TmrA-TF was carried out in a laboratory-scale 7 L glass bioreactor
(Applikon, The Netherlands). Cell growth was monitored by measuring OD600nm. 5 L of
2YT media with 50 μg/mL ampicillin and 17 μg/mL chloramphenicol was inoculated with
an overnight pre-culture at an OD600 of 0.2. The culture was maintained at 37 °C, 500
rpm with dissolved oxygen concentration (%dO2) regulation at 30%. Protein expression
was induced at OD600 of 1.2 with 0.5 mM IPTG for 3 hours. Cells were harvested by
centrifugation at 8,000 g and 4 °C for 10 min, washed with 1X PBS solution, and stored
at -20 °C for further processing. Pre- and post-induction samples were collected to
confirm TmrA expression by SDS-PAGE.

84
2.2.2 SDS-PAGE
Samples collected before and after induction were normalised according to an OD600
of 1.0 and checked for soluble expression using BugBuster Protein Extraction Reagent
(Merck Millipore) following the manufacturer’s instructions. Proteins were separated on
a Bolt 4-12% Bis-Tris Plus polyacrylamide precast gel (Thermo Scientific). SeeBlue Plus2
Prestained Standard (Thermo Scientific) was used as the molecular weight marker and
the gel was stained with GelCode Blue Stain Reagent (Thermo Scientific).
2.2.3 SDS-MPD based system
All the buffers used purged with N2 gas and unless mentioned otherwise, the procedures
were carried out inside an anaerobic chamber (Baker Ruskinn Concept).
2.2.3.1 Cell Lysis
Cell pellets obtained from the 5 L fermentation (pOPIN-TmrA-Chis and pOPIN-TmrA-
MBP) were thawed and resuspended in a lysis buffer (50mM Tris–HCl pH 8, 17mM NaCl,
PMSF tablets, 250 μg/mL lysozyme) with a wet cell weight (WCW) to buffer ratio of 1:5
for 20 minutes at 25 °C. Cells were further broken by addition of 1 mg/mL of sodium
deoxycholate for 60 min at 37 °C with constant shaking, and 25 μg/mL of DNase I (Sigma
Aldrich D5025) for 60 minutes at 25 °C. The cell suspension was then centrifuged at
14,000 g for 20 minutes at 4 °C. The resulting pellet was resuspended in a washing buffer
(2 M urea, 20 mM Tris-HCl pH 8, 500 mM NaCl, 2% Triton X-100) and centrifuged at
14,000 g for 20 minutes at 4 °C.
2.2.3.2 Purification of TmrA from insoluble fraction
The inclusion bodies were solubilized with 50 mL of solubilization buffer (50mMTris–HCl
pH 8, 17mM NaCl, 8M urea), centrifuged at 5,000 g, 4 °C for 10 minutes, and filtered
through a 0.22 μm membrane. Affinity chromatography and anion exchange
chromatography were carried out as two separate processes for TmrA-CHis. Only affinity
chromatography was done for TmrA-MBP. The inclusion body preparation was loaded
85
onto a 1 mL Ni-NTA Superflow Cartridge using a peristaltic pump (Gilson Minipuls 2)
calibrated to a flowrate of 1 mL/min. The column was previously equilibrated with 20
CV of buffer A (100 mM Tris-HCl pH 8, 150 mM NaCl, 10% glycerol, 8 M urea). Gradient
elution of the protein was performed with elution buffer containing varying
concentrations of imidazole (buffer A + 10/50/250 mM imidazole).
Anion exchange chromatography was performed using a HiTrap™ DEAE FF 1 mL column.
The column was equilibrated with 10 CV of start buffer (100 mM Tris, pH 8, 10% glycerol)
after which the inclusion body preparation was loaded at a flowrate of 1 mL/min. The
protein was eluted with 5 CVs of an elution buffer containing 1 M NaCl.
2.2.3.3 Cofactor reconstitution
Prior to cofactor reconstitution, the concentrated refolded protein solution was reduced
with 5 mM β-mercaptoethanol and incubated at room temperature for 30 minutes for
complete reduction. Protein concentration was determined spectroscopically at 280 nm
using a molar extinction coefficient value of 72,140 M-1 cm-1 (calculated from the
primary amino acid sequence using ProtParam-ExPaSy). Anoxic solutions of 250 mM
FeCl3 and 100 mM Na2S were added at five-fold and ten-fold molar excess over protein
to the solution which was then incubated at 30 °C for 90 minutes followed by
centrifugation at 5,000 g for 5 minutes. Cyanocobalamin was then added to the
supernatant at a final concentration of 10 mg/mL and incubated at room temperature
for 30 minutes.
2.2.3.4 Refolding of denatured TmrA fusion proteins
The eluted fractions from section 2.2.3.3 were loaded onto PD-10 columns for buffer
exchange. The columns were previously equilibrated with a buffer containing 150 mM
NaCl, 50 mM Tris-HCl pH 8, and 120 mM SDS. SDS-unfolded protein was then diluted 1:1
in a refolding buffer (50 mM Tris-HCl pH 8, 150 mM NaCl, 3 M MPD). The protein solution
was incubated at room temperature for 24, 48, 72 and 96 h and then stored at -20 °C to
86
stop the refolding reaction. The same was done for cofactor reconstituted TmrA from
section 2.2.3.3.
2.2.4 Aerobic purification and anaerobic cofactor reconstitution method
This method requires anaerobic manipulation only during the cofactor reconstitution
and refolding steps. Cell lysis and TmrA purification steps were carried out under
ambient conditions in the presence of oxygen.
2.2.4.1 Cell lysis
Cell pellets (pOPIN-TmrA-Chis and pOPIN-TmrA-TF) were resuspended in a suspension
buffer containing 50 mM potassium phosphate pH 8.0, 0.5 M NaCl, 20% glycerol and
EDTA-free Protease Inhibitor Cocktail tablet at a ratio of 1:10. The suspension was
sonicated intermittently (2 sec pulse-on and 2 sec pulse-off) for 8 min at an amplitude
of 50% using BRANSON Digital Sonifier (Emerson Industrial, Australia) and centrifuged
for 15 min at 14,000 g, 4 °C. The supernatant was discarded, and the pellet was
resuspended in denaturation buffer (suspension buffer + 8 M urea). After a second
round of sonication, the suspension was stirred on ice for 1 h to solubilize the pellet. The
remaining insoluble material was removed by centrifugation for 15 min at 14,000 g and
4 °C.
2.2.4.2 Purification of TmrA
The supernatants containing denatured TmrA-CHis and TmrA-TF respectively were
loaded onto the Ni-affinity column (His-Trap FF, GE Healthcare, Buckinghamshire,
United Kingdom), which had been washed with five column volumes of the denaturation
buffer and eluted with four column volumes of 250 mM imidazole in the denaturation
buffer.
87
2.2.4.3 Cofactor reconstitution
The reconstitution of TmrA-Chis and TmrA-TF was done inside an anaerobic chamber.
All buffers were purged with N2 gas before use. Denatured TmrA-CHis was reduced by
mixing with a reduction buffer (100 mM Tris-HCl pH 7.5, 200 mM DTT) to 5 mM of DTT.
After incubation at room temperature for 30 min with stirring, iron buffer (100 mM Tris-
HCl pH 7.5, 100 mM FeCl3) and sulfide buffer (100 mM Tris-HCl pH 7.5, 30 mM Na2S)
were added up to 50 mol excess of Fe and S to TmrA-CHis. Following a 90 min incubation
with stirring cyanocobalamin was added to a final concentration of 10 mg/ml. Next,
TmrA-CHis solution was applied to a PD-10 column (GE Healthcare) previously
equilibrated with the refolding buffer containing 50 mM Tris-HCl pH 8.0, 0.5 M NaCl,
20% glycerol, 0.2% CHAPS, and 10 mM DTT. The reconstituted TmrA-Chis and TmrA-TF
containing fractions were collected and stored at -20 ᵒC for future analysis.
2.2.5 Dechlorination activity assay
Standard enzyme assays were performed anoxically in the anaerobic chamber, as
previously described by (Jugder et al., 2017). where titanium (III) citrate and methyl
viologen was used as electron donors. A mastermix was prepared by adding titanium
(III) citrate and methyl viologen to a washing buffer (100 mM Tris-HCl buffer, 150 mM
NaCl, pH 7.5) to reach a final concentration of 2mM and 1 mM, respectively. All reactions
were carried out in 2 mL amber GC vials. The required amount of mastermix, protein
extract and CF added to the crimp sealed GC vials leaving no headspace. Samples were
prepared in triplicate. The vials were incubated at 30 °C for 3 hours inside the anaerobic
chamber. After incubation, the enzymatic reaction was stopped by transferring 1 mL of
each reaction mixture to 10 mL headspace vials containing 0.5 g of anhydrous sodium
sulphate and 1 mL of 1 M sulphuric acid. The headspace of each of the vials was then
analysed with a Focus DSQ II GC/MS equipped with a TrisPlus autosampler (Thermo
Scientific). Each vial was heated at 80 °C for 2.0 min whilst being intermittently agitated
(10s on, 10s off), the autosampler injections were made with a syringe heated to 80 °C.
An injection volume of 0.5 mL was used with a variable split ratio of between 150:1 and
38:1 dependent of analyte concentration, an inlet temperature of 175°C, transfer line
88
and source temperature of 220°C, with helium used as the carrier gas at a constant flow
of 1.9 mL per min vacuum compensated. A RESTEK Rt-Q-BOND column (30 m × 0.32
mm, 10 µm) to separate analytes of interest. Separation was carried out at a
temperature gradient of 100°C for 1 min followed by 4 min ramping with 30°C/min to
reach a final temperature of 220°C. Data was acquired in positive EI using a full mass
scan from 50 to 150 Da. CF and DCM standards (0.025 mM, 0.05 mM, 0.075 mM, 0.1
mM, 0.15 mM, 0.2 mM, 0.5 mM) were prepared fresh on the day of the analysis and
treated the same way as the samples. The total GC/MS analysis time was 8.0 minutes,
with DCM and CF retention times at 4.0 min and 5.0 min (± 0.2 min), respectively. Data
analysis was carried out using the qual browser function of the XCalibur software
(Thermo Scientific). Enzyme specific activity was described as the formation of nmol
DCM per mg of protein per minute. The protein concentration was determined
spectroscopically at 280 nm with a nanodrop spectrophotometer using the molar
extinction coefficient value of 72,140 M-1cm-1 as described in section 2.2.3.3. Heat-
deactivated (incubated at 100°C for 20 min) enzymes were assayed as negative controls
to eliminate the possibility of non-enzymatic CF reductive activity.
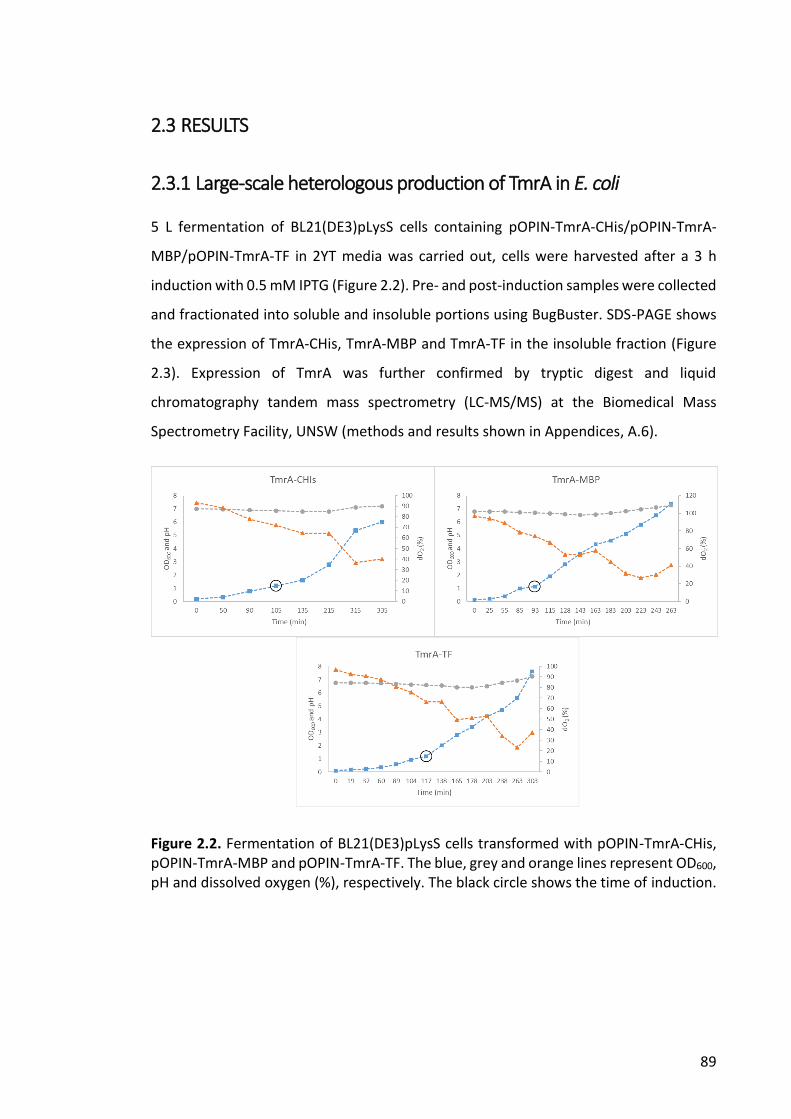
89
2.3 RESULTS
2.3.1 Large-scale heterologous production of TmrA in E. coli
5 L fermentation of BL21(DE3)pLysS cells containing pOPIN-TmrA-CHis/pOPIN-TmrA-
MBP/pOPIN-TmrA-TF in 2YT media was carried out, cells were harvested after a 3 h
induction with 0.5 mM IPTG (Figure 2.2). Pre- and post-induction samples were collected
and fractionated into soluble and insoluble portions using BugBuster. SDS-PAGE shows
the expression of TmrA-CHis, TmrA-MBP and TmrA-TF in the insoluble fraction (Figure
2.3). Expression of TmrA was further confirmed by tryptic digest and liquid
chromatography tandem mass spectrometry (LC-MS/MS) at the Biomedical Mass
Spectrometry Facility, UNSW (methods and results shown in Appendices, A.6).
Figure 2.2. Fermentation of BL21(DE3)pLysS cells transformed with pOPIN-TmrA-CHis, pOPIN-TmrA-MBP and pOPIN-TmrA-TF. The blue, grey and orange lines represent OD600, pH and dissolved oxygen (%), respectively. The black circle shows the time of induction.
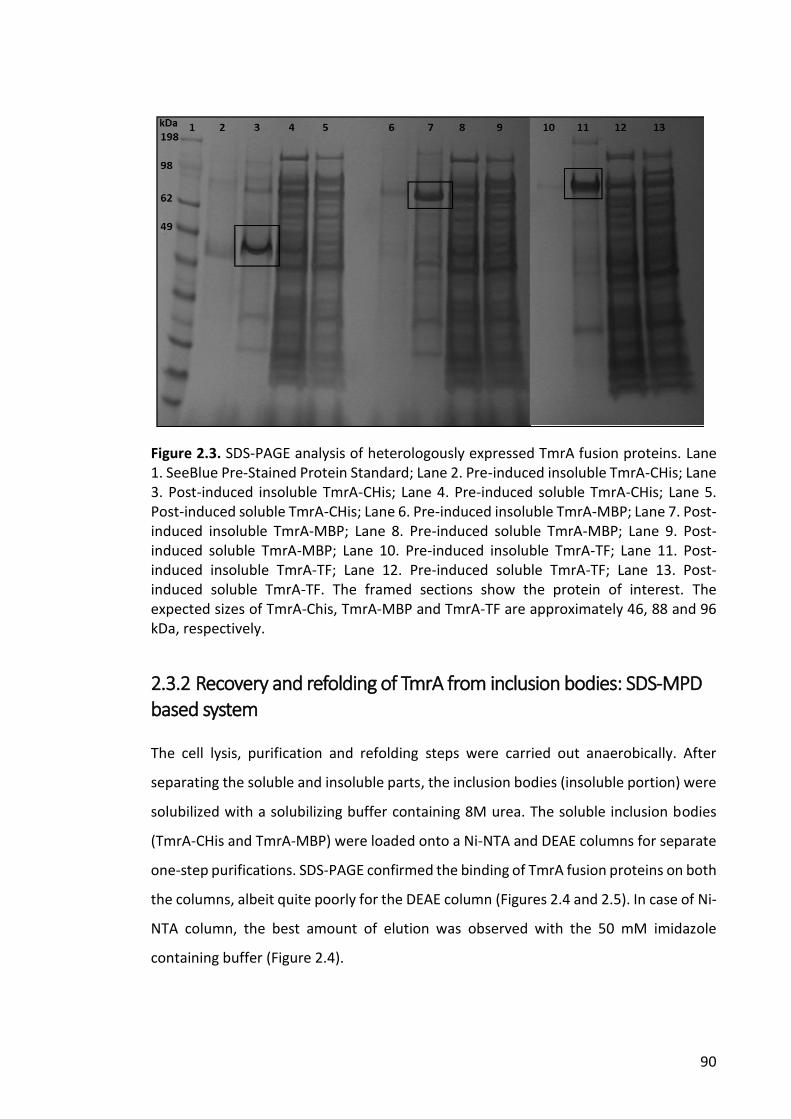
90
Figure 2.3. SDS-PAGE analysis of heterologously expressed TmrA fusion proteins. Lane 1. SeeBlue Pre-Stained Protein Standard; Lane 2. Pre-induced insoluble TmrA-CHis; Lane 3. Post-induced insoluble TmrA-CHis; Lane 4. Pre-induced soluble TmrA-CHis; Lane 5. Post-induced soluble TmrA-CHis; Lane 6. Pre-induced insoluble TmrA-MBP; Lane 7. Post-induced insoluble TmrA-MBP; Lane 8. Pre-induced soluble TmrA-MBP; Lane 9. Post-induced soluble TmrA-MBP; Lane 10. Pre-induced insoluble TmrA-TF; Lane 11. Post-induced insoluble TmrA-TF; Lane 12. Pre-induced soluble TmrA-TF; Lane 13. Post-induced soluble TmrA-TF. The framed sections show the protein of interest. The expected sizes of TmrA-Chis, TmrA-MBP and TmrA-TF are approximately 46, 88 and 96 kDa, respectively.
2.3.2 Recovery and refolding of TmrA from inclusion bodies: SDS-MPD based system
The cell lysis, purification and refolding steps were carried out anaerobically. After
separating the soluble and insoluble parts, the inclusion bodies (insoluble portion) were
solubilized with a solubilizing buffer containing 8M urea. The soluble inclusion bodies
(TmrA-CHis and TmrA-MBP) were loaded onto a Ni-NTA and DEAE columns for separate
one-step purifications. SDS-PAGE confirmed the binding of TmrA fusion proteins on both
the columns, albeit quite poorly for the DEAE column (Figures 2.4 and 2.5). In case of Ni-
NTA column, the best amount of elution was observed with the 50 mM imidazole
containing buffer (Figure 2.4).
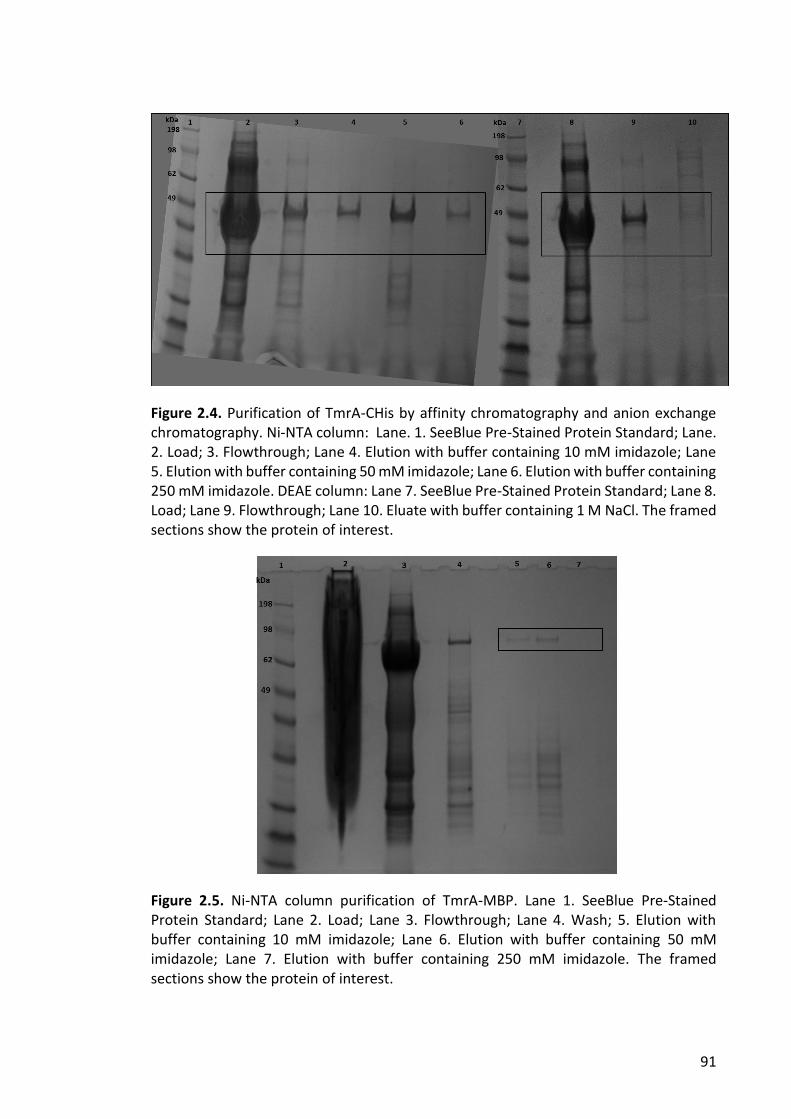
91
Figure 2.4. Purification of TmrA-CHis by affinity chromatography and anion exchange chromatography. Ni-NTA column: Lane. 1. SeeBlue Pre-Stained Protein Standard; Lane. 2. Load; 3. Flowthrough; Lane 4. Elution with buffer containing 10 mM imidazole; Lane 5. Elution with buffer containing 50 mM imidazole; Lane 6. Elution with buffer containing 250 mM imidazole. DEAE column: Lane 7. SeeBlue Pre-Stained Protein Standard; Lane 8. Load; Lane 9. Flowthrough; Lane 10. Eluate with buffer containing 1 M NaCl. The framed sections show the protein of interest.
Figure 2.5. Ni-NTA column purification of TmrA-MBP. Lane 1. SeeBlue Pre-Stained Protein Standard; Lane 2. Load; Lane 3. Flowthrough; Lane 4. Wash; 5. Elution with buffer containing 10 mM imidazole; Lane 6. Elution with buffer containing 50 mM imidazole; Lane 7. Elution with buffer containing 250 mM imidazole. The framed sections show the protein of interest.
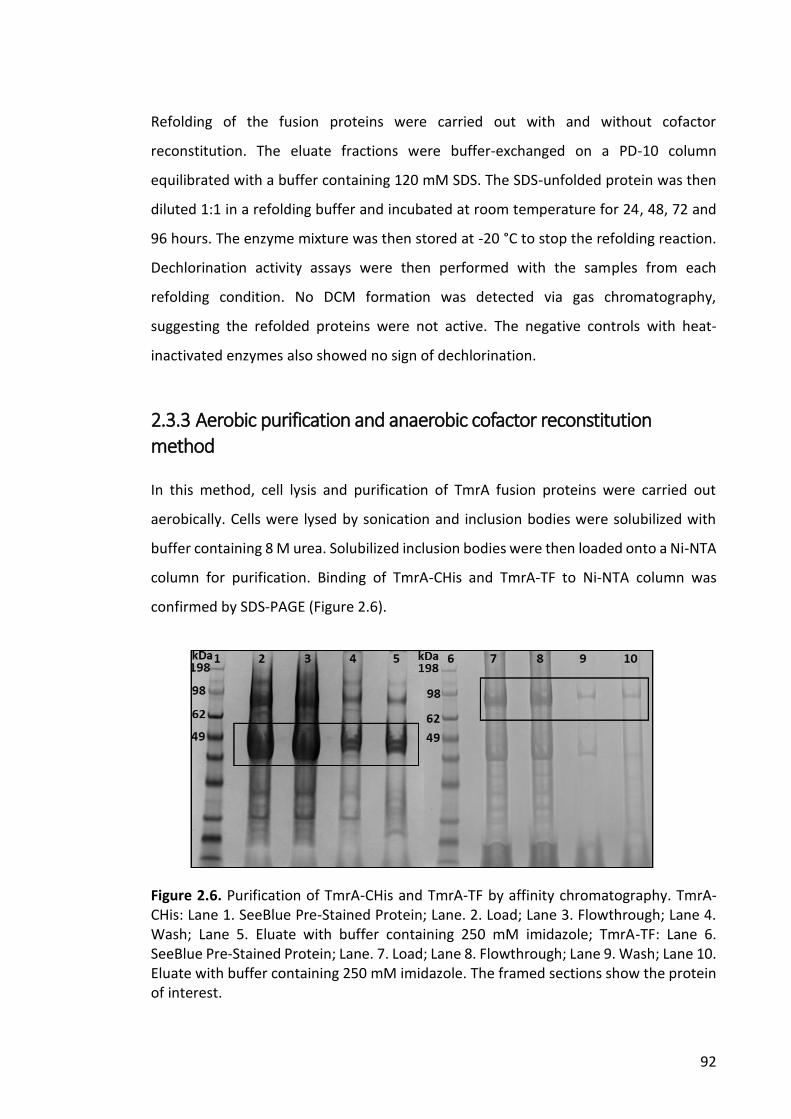
92
Refolding of the fusion proteins were carried out with and without cofactor
reconstitution. The eluate fractions were buffer-exchanged on a PD-10 column
equilibrated with a buffer containing 120 mM SDS. The SDS-unfolded protein was then
diluted 1:1 in a refolding buffer and incubated at room temperature for 24, 48, 72 and
96 hours. The enzyme mixture was then stored at -20 °C to stop the refolding reaction.
Dechlorination activity assays were then performed with the samples from each
refolding condition. No DCM formation was detected via gas chromatography,
suggesting the refolded proteins were not active. The negative controls with heat-
inactivated enzymes also showed no sign of dechlorination.
2.3.3 Aerobic purification and anaerobic cofactor reconstitution method
In this method, cell lysis and purification of TmrA fusion proteins were carried out
aerobically. Cells were lysed by sonication and inclusion bodies were solubilized with
buffer containing 8 M urea. Solubilized inclusion bodies were then loaded onto a Ni-NTA
column for purification. Binding of TmrA-CHis and TmrA-TF to Ni-NTA column was
confirmed by SDS-PAGE (Figure 2.6).
Figure 2.6. Purification of TmrA-CHis and TmrA-TF by affinity chromatography. TmrA-CHis: Lane 1. SeeBlue Pre-Stained Protein; Lane. 2. Load; Lane 3. Flowthrough; Lane 4. Wash; Lane 5. Eluate with buffer containing 250 mM imidazole; TmrA-TF: Lane 6. SeeBlue Pre-Stained Protein; Lane. 7. Load; Lane 8. Flowthrough; Lane 9. Wash; Lane 10. Eluate with buffer containing 250 mM imidazole. The framed sections show the protein of interest.
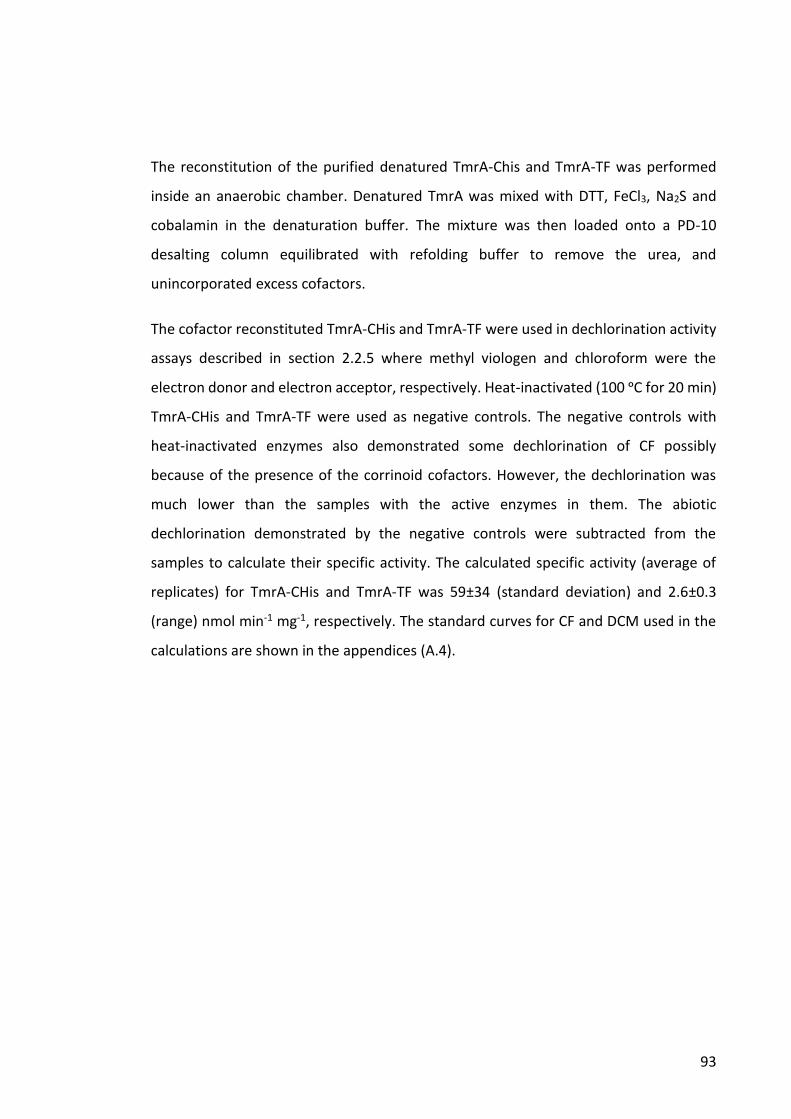
93
The reconstitution of the purified denatured TmrA-Chis and TmrA-TF was performed
inside an anaerobic chamber. Denatured TmrA was mixed with DTT, FeCl3, Na2S and
cobalamin in the denaturation buffer. The mixture was then loaded onto a PD-10
desalting column equilibrated with refolding buffer to remove the urea, and
unincorporated excess cofactors.
The cofactor reconstituted TmrA-CHis and TmrA-TF were used in dechlorination activity
assays described in section 2.2.5 where methyl viologen and chloroform were the
electron donor and electron acceptor, respectively. Heat-inactivated (100 ᵒC for 20 min)
TmrA-CHis and TmrA-TF were used as negative controls. The negative controls with
heat-inactivated enzymes also demonstrated some dechlorination of CF possibly
because of the presence of the corrinoid cofactors. However, the dechlorination was
much lower than the samples with the active enzymes in them. The abiotic
dechlorination demonstrated by the negative controls were subtracted from the
samples to calculate their specific activity. The calculated specific activity (average of
replicates) for TmrA-CHis and TmrA-TF was 59±34 (standard deviation) and 2.6±0.3
(range) nmol min-1 mg-1, respectively. The standard curves for CF and DCM used in the
calculations are shown in the appendices (A.4).
94
Figure 2.7. CF dechlorination by A. TmrA-CHis, B. heat-inactivated TmrA-CHis, C. TmrA-TF, D. heat-inactivated TmrA-TF. The arrows indicate CF and DCM in the chromatogram. The circles show CF and DCM in the scan. DCM was detected in all four cases, but the amounts were significantly higher with the active enzymes than the heat-inactivated ones.
95
2.4 DISCUSSION
The potential use of OHRB in bioremediation endeavours has propelled the study of
these microbes and their respective RDases in great detail. Over the past two decades a
number of efforts have been made to produce recombinant RDases in E. coli, the most
commonly used prokaryotic host for heterologous protein expression. Expression of
soluble and active respiratory RDase in E. coli has not been successful so far. Some
efforts have led to the over-expression of the RDase in interest, but they were
aggregated as inactive and misfolded inclusion bodies in the cytoplasm (Sjuts et al.,
2012, Jugder et al., 2018). E. coli cannot synthesize corrinoids de novo, the insufficient
amounts of cobamide cofactor in the cells presumably result in the formation of inactive
RDases (Suyama et al., 2002). However, two RDases have been recovered from inclusion
bodies expressed in E. coli: the vinyl chloride reducing VcrA from Dehalococcoides
mccartyi strain VS (Parthasarathy et al., 2015) and tetrachloroethene reducing PceA
from Geobacter sp. (Nakamura et al., 2018).
In this study no attempt was made to express soluble TmrA in E. coli; the sole focus was
to recover TmrA in a catalytically active form from the inclusion bodies expressed in E.
coli. The IPTG-inducible pOPIN vector constructs pOPIN-TmrA-CHis, pOPIN-TmrA-MBP
and pOPIN-TmrA-TF described in Jugder et al., (2018) were used for the purpose of
expressing the enzyme. The tmrA gene cloned into the pOPIN vector was devoid of the
TAT signal and predicted membrane spanning regions. The pOPIN-TmrA-CHis was
chosen because of the lack of an additional solubility tag. Maltose Binding Protein (MBP)
is one of the most frequently used fusion tags used to increase the solubility of
expressed recombinant proteins (Ki and Pack, 2020). There are reports where the fusion
of MBP tag to the protein of interest did not hinder the formation of inclusion bodies
but enhanced the recovery of soluble protein after refolding (Sachdev and Chirgwin,
1998a, Sachdev and Chirgwin, 1998b); hence pOPIN-TmrA-MBP construct was also
chosen for this study. A previously reported success in recovering a Trigger Factor (TF)-
tagged PceA from inclusion bodies to a catalytically active form (Nakamura et al., 2018)
prompted the choice of the pOPIN-TmrA-TF construct for this study.
96
Recombinant protein expression in bacterial hosts frequently results in the formation of
non-functional inclusion bodies. Recovery of functional protein typically involves
solubilisation of inclusion bodies with high concentrations of a chaotropic agent such as
urea or guanidine hydrochloride, and subsequent protein refolding by chromatographic
and non-chromatographic methods (Swietnicki, 2006). Another method involves
denaturing protein with the highly effective anionic detergent, sodium dodecyl sulfate
(SDS) and its subsequent removal with an amphipathic diol solvent 2-methyl-2, 4-
pentanediol (MPD) (Michaux et al., 2008a, Michaux et al., 2008b). The presence of MPD
enables the denatured protein to detach from the SDS molecules and refold into the
native state (Roussel et al., 2013). The SDS-MPD system has been successfully employed
in recovering proteins from inclusion bodies for membrane proteins, PagP and Omp2a;
enzymes such as human carbonic anhydrase II and lysozyme; single-peptide proteins,
Tryptophan-Cage (TrpCage) and Tryptophan Zipper 1 (TrpZip); viral capsid protein HBc-
MAGE3 II and Grapevine fanleaf virus (GFLV)-coat protein; voltage-dependent anion
channel protein, VDAC36 from plant cells (Lopes‐Rodrigues et al., 2020, Michaux et al.,
2008a, Michaux et al., 2008b, Michaux et al., 2016, Roussel et al., 2013, Yazdani et al.,
2019, Zhang et al., 2020).
The refolding efficiency of the SDS/MPD system is mainly influenced by temperature,
pH, protein concentration, SDS/MPD ratio and ionic strength (Roussel et al., 2013). In
the current study, refolding of both the pOPIN-TmrA-CHis and pOPIN-TmrA-MBP
constructs using the SDS-MPD system was unsuccessful. It has been established that a
high concentration of MPD is needed to alter the SDS denaturing effect on protein
(Michaux et al., 2016). In this study 3 M MPD was used to counter the denaturing effects
of 120 mM SDS which failed to produce positive outcomes. Roussel et al., (2013)
demonstrated full refolding of Omp2a trimeric membrane porin within four days of
incubation at 20 ᵒC. In the current study incubating TmrA in the refolding buffer at room
temperature up to 96 h yielded no dechlorination activity. Even incorporating a cofactor
reconstitution step with FeCl3, Na2S and cobalamin did not induce functionality. The
possible causes for the lack of proper refolding and/or catalytic activity could be the use
of an improper ratio of SDS/MPD, unsuitable ionic strength and/or improper
97
incorporation of Fe-S cofactors. Hence, further study screening these factors is required
for the MBP and TF- tagged TmrA enzyme.
The second method undertaken in this study involved a chromatographic step in the
presence of oxygen followed by an anaerobic cofactor reconstitution. A similar method
established by Nakamaru et al., (2018) resulted in active PceA from Geobacter sp. In the
current study, both pOPIN-TMrA-CHis and pOPIN-TmrA-TF constructs were successfully
refolded into catalytically active forms. The success of this method over the previously
described attempt could be attributed to the proper incorporation of the iron and sulfur
cofactors. In the previous method, where FeCl3 and Na2S buffers were added in 5- and
10-fold molar excess respectively, the resulting refolded TmrA remained inactive. In this
experiment FeCl3 and Na2s were added in 50-fold molar excess and the refolded TmrA
showed distinct dechlorination activity. The negative controls with the heat-inactivated
TmrA also showed dechlorination, possibly due to the presence of cobalamin in the
sample, which is capable of abiotic dechlorination, but it was significantly lower (p <
0.05) than the non heat-inactivated enzymatic dechlorination samples. An extended
incubation of the dechlorination reaction mixtures for over 12 h showed that both CF
and DCM diminished (data not shown), hinting at further breakdown of DCM.
One of the major limitations of studying RDases is their sensitivity towards oxygen. In
this experiment the cell lysis and purification were carried out under aerobic conditions,
but the enzyme still retained dechlorination activity after cofactor reconstitution inside
an anaerobic chamber. Studies have reported that oxygen sensitivity of Fe-S cluster
containing enzymes is attributed to the destruction of their catalytically active [4Fe-4S]
cluster (Bruska et al., 2013, Flint et al., 1993a, Flint et al., 1993b, Khademian and Imlay,
2020). Oxygen converts exposed Fe‐S clusters to unstable forms which releases iron and
renders the enzyme inactive (Imlay, 2006). In this study, the Fe-S reconstitution took
place under anaerobic conditions which likely contributed to the recovery of active
enzyme despite being purified under aerobic conditions.
98
2.5 CONCLUSIONS
For the past two decades, heterologous expression of soluble and functional RDase in E.
coli has proven to be a difficult task. A number of studies have failed to produce soluble
RDase in E. coli although over-expression in the form of inclusion bodies has been a
common outcome. Recovery of active RDase from inclusion bodies have proven to be
difficult because of the improper and insufficient incorporation of cofactors.
Maintaining anaerobic conditions during all steps after cell harvest requires purging all
puffers used with N2 and the use of an anaerobic chamber which adds to the complexity
of the procedure. The current study demonstrates successful recovery of active TmrA
from inclusion bodies expressed in E. coli. Only two other recombinant RDases have
been previously recovered from inclusion bodies expressed in E. coli. The cell lysis and
purification of RDase in presence of oxygen in this study makes the process much less
complicated and more achievable. Future work regarding this system could include
condition optimization for cofactor reconstitution, kinetic studies of the successfully
refolded and active recombinant TmrA, use of additional protein-free controls to
conclusively demonstrate the difference between protein activity and abiotic
dechlorination, incubation for longer periods to determine the fate of DCM, the level of
which was demonstrated to decline over time in the current study, other
characterization of the reconstituted TmrA such as estimation of cofactor content and
oxygen sensitivity. This method can also be extended to other expression hosts such as
B. megaterium and S. blattae in which successful soluble expression of RDases has been
reported but also where the majority of the recombinant enzyme is produced as
insoluble inclusion bodies. This aerobic purification and anaerobic cofactor
reconstitution strategy could also be employed to the recombinant production of similar
proteins which are otherwise arduous to express heterologously.
99
2.6 REFERENCES
BRUSKA, M. K., STIEBRITZ, M. T. & REIHER, M. 2013. Analysis of differences in oxygen sensitivity of Fe–S clusters. Dalton Transactions, 42(24): 8729-8735.
DESHPANDE, N. P., WONG, Y. K., MANEFIELD, M., WILKINS, M. R. & LEE, M. 2013. Genome sequence of Dehalobacter UNSWDHB, a chloroform-dechlorinating bacterium. Genome Announcements, 1(5).
FLINT, D. H., SMYK-RANDALL, E., TUMINELLO, J. F., DRACZYNSKA-LUSIAK, B. & BROWN, O. R. 1993a. The inactivation of dihydroxy-acid dehydratase in Escherichia coli treated with hyperbaric oxygen occurs because of the destruction of its Fe-S cluster, but the enzyme remains in the cell in a form that can be reactivated. Journal of Biological Chemistry, 268(34): 25547-25552.
FLINT, D. H., TUMINELLO, J. & EMPTAGE, M. 1993b. The inactivation of Fe-S cluster containing hydro-lyases by superoxide. Journal of Biological Chemistry, 268(30): 22369-22376.
IMLAY, J. A. 2006. Iron‐sulphur clusters and the problem with oxygen. Molecular Microbiology, 59(4): 1073-1082.
JUGDER, B.-E., PAYNE, K. A., FISHER, K., BOHL, S., LEBHAR, H., MANEFIELD, M., LEE, M., LEYS, D. & MARQUIS, C. P. 2018. Heterologous production and purification of a functional chloroform reductive dehalogenase. ACS Chemical Biology, 13(3): 548-552.
JUGDER, B. E., BOHL, S., LEBHAR, H., HEALEY, R. D., MANEFIELD, M., MARQUIS, C. P. & LEE, M. 2017. A bacterial chloroform reductive dehalogenase: Purification and biochemical characterization. Microbial Biotechnology, 10(6): 1640-1648.
JUGDER, B. E., ERTAN, H., WONG, Y. K., BRAIDY, N., MANEFIELD, M., MARQUIS, C. P. & LEE, M. 2016. Genomic, transcriptomic and proteomic analyses of Dehalobacter UNSWDHB in response to chloroform. Environmental Microbiology Reports, 8(5): 814-824.
KHADEMIAN, M. & IMLAY, J. A. 2020. Do reactive oxygen species or does oxygen itself confer obligate anaerobiosis? The case of Bacteroides thetaiotaomicron. Molecular Microbiology, 114(2): 333-347.
KI, M.-R. & PACK, S. P. 2020. Fusion tags to enhance heterologous protein expression. Applied Microbiology Biotechnology, 104(6): 2411-2425.
KIMOTO, H., SUYE, S.-I., MAKISHIMA, H., ARAI, J.-I., YAMAGUCHI, S., FUJII, Y., YOSHIOKA, T. & TAKETO, A. 2010. Cloning of a novel dehalogenase from environmental DNA. Bioscience, Biotechnology, Biochemistry, 74(6): 1290-1292.
LEE, M., LOW, A., ZEMB, O., KOENIG, J., MICHAELSEN, A. & MANEFIELD, M. 2012. Complete chloroform dechlorination by organochlorine respiration and fermentation. Environmental Microbiology, 14(4): 883-894.
LOPES‐RODRIGUES, M., MATAGNE, A., ZANUY, D., ALEMÁN, C., PERPÈTE, E. A. & MICHAUX, C. 2020. Structural and functional characterization of Solanum tuberosum VDAC36. Proteins: Structure, Function, Bioinformatics, 88(6): 729-739.
MICHAUX, C., POMROY, N. C. & PRIVÉ, G. G. 2008a. Refolding SDS-denatured proteins by the addition of amphipathic cosolvents. Journal of Molecular Biology, 375(5): 1477-1488.
100
MICHAUX, C., POUYEZ, J., WOUTERS, J. & PRIVÉ, G. G. 2008b. Protecting role of cosolvents in protein denaturation by SDS: a structural study. BMC Structural Biology, 8(1): 29.
MICHAUX, C., ROUSSEL, G., LOPES‐RODRIGUES, M., MATAGNE, A. & PERPÈTE, E. 2016. Unravelling the mechanisms of a protein refolding process based on the association of detergents and co‐solvents. Journal of Peptide Science, 22(7): 485-491.
NAKAMURA, R., OBATA, T., NOJIMA, R., HASHIMOTO, Y., NOGUCHI, K., OGAWA, T. & YOHDA, M. 2018. Functional expression and characterization of tetrachloroethene dehalogenase from Geobacter sp. Frontiers in Microbiology, 9, 1774.
NEUMANN, A., WOHLFARTH, G. & DIEKERT, G. 1998. Tetrachloroethene dehalogenase from Dehalospirillum multivorans: cloning, sequencing of the encoding genes, and expression of the pceA gene in Escherichia coli. Journal of Bacteriology, 180(16): 4140-4145.
PARTHASARATHY, A., STICH, T. A., LOHNER, S. T., LESNEFSKY, A., BRITT, R. D. & SPORMANN, A. M. 2015. Biochemical and EPR-spectroscopic investigation into heterologously expressed vinyl chloride reductive dehalogenase (VcrA) from Dehalococcoides mccartyi strain VS. Journal of the American Chemical Society, 137(10): 3525-3532.
ROUSSEL, G., PERPÈTE, E. A., MATAGNE, A., TINTI, E. & MICHAUX, C. 2013. Towards a universal method for protein refolding: the trimeric beta barrel membrane Omp2a as a test case. Biotechnology Bioengineering, 110(2): 417-423.
SACHDEV, D. & CHIRGWIN, J. M. 1998a. Order of Fusions between Bacterial and Mammalian Proteins Can Determine Solubility in Escherichia coli. Biochemical Biophysical Research Communications, 244(3): 933-937.
SACHDEV, D. & CHIRGWIN, J. M. 1998b. Solubility of proteins isolated from inclusion bodies is enhanced by fusion to maltose-binding protein or thioredoxin. Protein Expression and Purification, 12(1): 122-132.
SJUTS, H., FISHER, K., DUNSTAN, M. S., RIGBY, S. E. & LEYS, D. 2012. Heterologous expression, purification and cofactor reconstitution of the reductive dehalogenase PceA from Dehalobacter restrictus. Protein Expression Purification, 85(2): 224-229.
SUYAMA, A., YAMASHITA, M., YOSHINO, S. & FURUKAWA, K. 2002. Molecular characterization of the PceA reductive dehalogenase of Desulfitobacterium sp. strain Y51. Journal of Bacteriology, 184(13): 3419.
SWIETNICKI, W. 2006. Folding aggregated proteins into functionally active forms. Current Opinion in Biotechnology, 17(4): 367-372.
WONG, Y. K., HOLLAND, S. I., ERTAN, H., MANEFIELD, M. & LEE, M. 2016. Isolation and characterization of Dehalobacter sp. strain UNSWDHB capable of chloroform and chlorinated ethane respiration. Environmental Microbiology, 18(9): 3092-3105.
YAZDANI, R., ARAB, S. S., HASSANI-MEHRABAN, A. & SHAMS-BAKHSH, M. 2019. Solubilization and refolding of inclusion body of Grapevine fanleaf virus-coat protein produced in E. coli Agricultural Biotechnology Journal, 11(1): 151-167.
ZHANG, Y., YIN, S., ZHANG, B., BI, J., LIU, Y. & SU, Z. 2020. HBc-based virus-like particle assembly from inclusion bodies using 2-methyl-2, 4-pentanediol. Process Biochemistry, 89 233-237.
101
CHAPTER THREE: Production of functional recombinant chloroform reductive dehalogenase in Bacillus megaterium: improving existing findings
102
3.1 INTRODUCTION
The failure to express soluble and functional RDases in E. coli (Jugder et al., 2018, Kimoto
et al., 2010, Neumann et al., 1998, Sjuts et al., 2012, Suyama et al., 2002) has been
attributed to the inability of E. coli to synthesize corrinoids de novo and therefore there
were insufficient amounts of cobamide cofactor in the cells to support RDase expression
(Neumann et al., 1998; Suyama et al., 2002). Gram-positive Bacillus megaterium
produces 5,6-dimethylbenzimidazolyl cobamide, the standard-type B12 cofactor,
through an oxygen-independent adenosylcobalamin pathway and has been identified as
a suitable host for heterologous production of functional RDases (Eppinger et al., 2011,
Payne et al., 2015, Wolf and Brey, 1986a).
B. megaterium is a rod-shaped, Gram-positive, mainly aerobic spore-forming bacterium.
It is commonly regarded as a soil bacterium though it can be found in diverse habitats
(Vary et al., 2007). With the dimension of 4 x 1.5 µm, B. megaterium is one of the biggest
known bacteria (Bunk et al., 2010). The ability to grow on different carbon sources and
over a wide range of temperatures has made this non-pathogenic bacterium an
important industrial organism for the production of different vitamins, enzymes and
drugs for decades (Goswami et al., 2018, Grage et al., 2017, Korneli et al., 2012, Vary et
al., 2007). The stable plasmid replication system, absence of endotoxins, lack of alkaline
proteases and protein secretion capacity makes B. megaterium an amenable host for
producing recombinant proteins (Gamer et al., 2009, Korneli et al., 2013).
The first report of soluble and functional expression of reductive dehalogenase in B.
megaterium was described by Payne et al., (2015). NpRdhA is an oxygen-tolerant ortho-
dibromophenol reductase from Nitratireductor pacificus pht-3B. It is a soluble
cytoplasmic enzyme lacking both the twin-arginine signal and the associated
transmembrane rdhB protein. Payne et al., (2015) expressed NpRdhA in B. megaterium
MS941 containing pT7-RNAP plasmid which allows xylose-inducible expression of T7
polymerase.
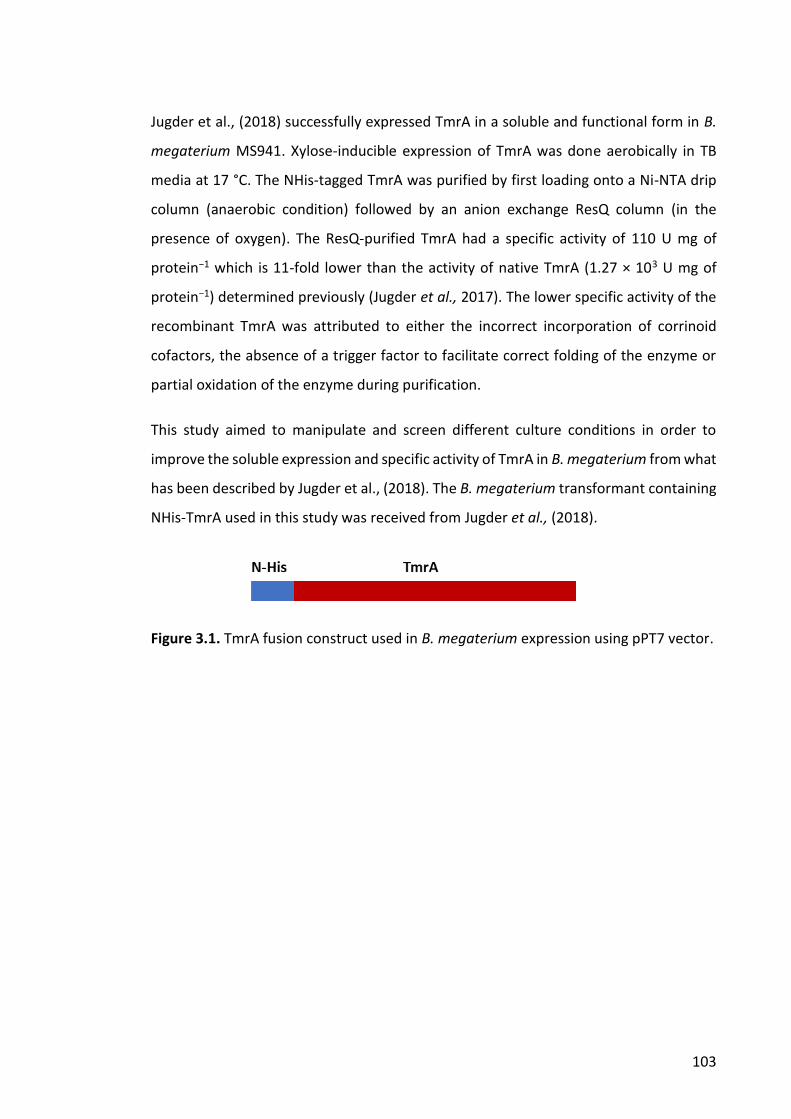
103
Jugder et al., (2018) successfully expressed TmrA in a soluble and functional form in B.
megaterium MS941. Xylose-inducible expression of TmrA was done aerobically in TB
media at 17 °C. The NHis-tagged TmrA was purified by first loading onto a Ni-NTA drip
column (anaerobic condition) followed by an anion exchange ResQ column (in the
presence of oxygen). The ResQ-purified TmrA had a specific activity of 110 U mg of
protein−1 which is 11-fold lower than the activity of native TmrA (1.27 × 10³ U mg of
protein−1) determined previously (Jugder et al., 2017). The lower specific activity of the
recombinant TmrA was attributed to either the incorrect incorporation of corrinoid
cofactors, the absence of a trigger factor to facilitate correct folding of the enzyme or
partial oxidation of the enzyme during purification.
This study aimed to manipulate and screen different culture conditions in order to
improve the soluble expression and specific activity of TmrA in B. megaterium from what
has been described by Jugder et al., (2018). The B. megaterium transformant containing
NHis-TmrA used in this study was received from Jugder et al., (2018).
Figure 3.1. TmrA fusion construct used in B. megaterium expression using pPT7 vector.
104
3.2 EXPERIMENTAL PROCEDURES
In the study of Jugder et al., (2018) B. megaterium cell transformants were cultured in
Terrific Broth (TB) at 37°C/180 rpm, at an OD578 nm of 0.4-1.0. The culture was
supplemented with 50 μM ammonium iron (II) sulfate, 1 μM B12 and induced with 0.5%
xylose. After growing overnight at 17°C/180 rpm, the culture was harvested by
centrifugation (4°C, 7,000 g for 10 min). In the current study, different culture conditions
were screened to determine if they had any significant influence on the soluble
expression and specific activity of the TmrA expressed in B. megaterium. The screening
conditions were determined after reviewing literature on recombinant protein
expression in B. megaterium. The screenings were carried out in factorial design
experiments. A full factorial design considers all the possible combinations with all levels
of all the factors screened whereas a fractional factorial design consists of a carefully
considered subset of a full factorial design.
3.2.1 Preliminary screening
The different factors and levels considered in this step are described in Table 3.1. A
fractional factorial design was generated using the JMP software shown in the result
section (Table 3.3). The 20 different combinations of culture conditions were each done
in duplicate and the culture volume was 25 mL carried out in 250 mL baffled flasks. The
pre-induction cultures of all the conditions were maintained at 37 °C/180 rpm. At the
end of the culture cell pellets were harvested by centrifugation at 8,000 g for 10 min at
4 ᵒC, washed with 1 x PBS buffer and stored at -20 °C for future use.
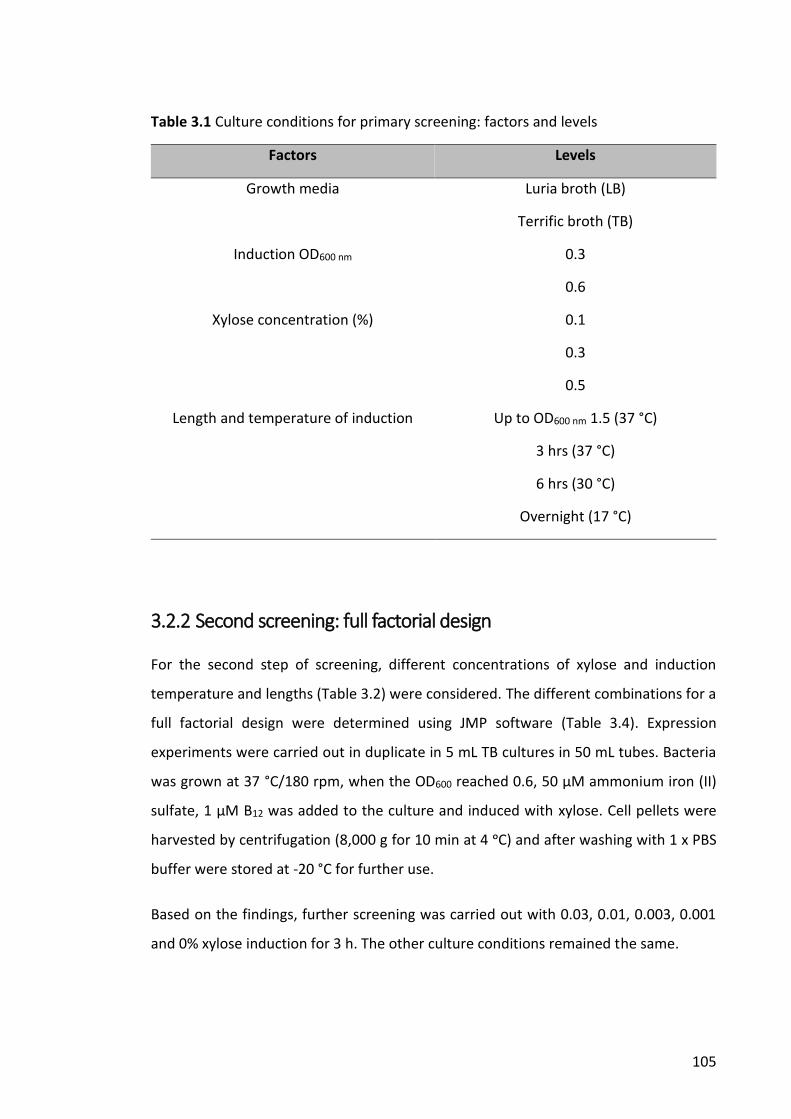
105
Table 3.1 Culture conditions for primary screening: factors and levels
Factors Levels
Growth media Luria broth (LB)
Terrific broth (TB)
Induction OD600 nm 0.3
0.6
Xylose concentration (%) 0.1
0.3
0.5
Length and temperature of induction Up to OD600 nm 1.5 (37 °C)
3 hrs (37 °C)
6 hrs (30 °C)
Overnight (17 °C)
3.2.2 Second screening: full factorial design
For the second step of screening, different concentrations of xylose and induction
temperature and lengths (Table 3.2) were considered. The different combinations for a
full factorial design were determined using JMP software (Table 3.4). Expression
experiments were carried out in duplicate in 5 mL TB cultures in 50 mL tubes. Bacteria
was grown at 37 °C/180 rpm, when the OD600 reached 0.6, 50 μM ammonium iron (II)
sulfate, 1 μM B12 was added to the culture and induced with xylose. Cell pellets were
harvested by centrifugation (8,000 g for 10 min at 4 ᵒC) and after washing with 1 x PBS
buffer were stored at -20 °C for further use.
Based on the findings, further screening was carried out with 0.03, 0.01, 0.003, 0.001
and 0% xylose induction for 3 h. The other culture conditions remained the same.
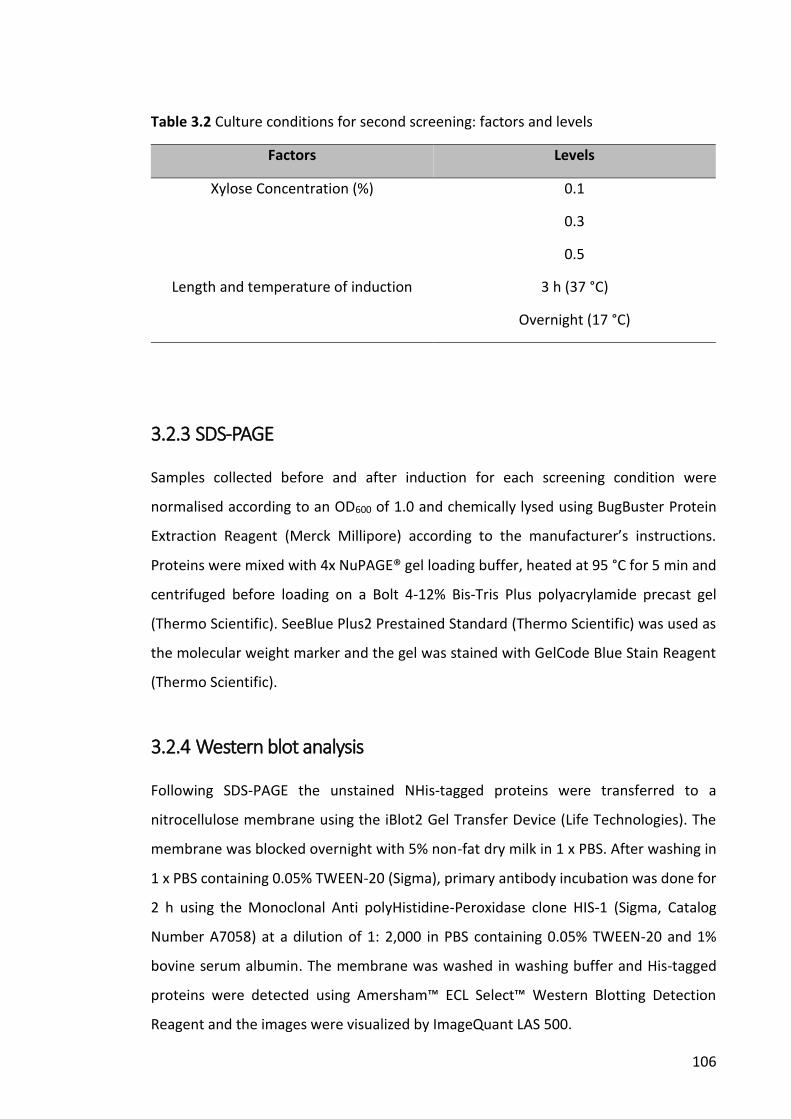
106
Table 3.2 Culture conditions for second screening: factors and levels
Factors Levels
Xylose Concentration (%) 0.1
0.3
0.5
Length and temperature of induction 3 h (37 °C)
Overnight (17 °C)
3.2.3 SDS-PAGE
Samples collected before and after induction for each screening condition were
normalised according to an OD600 of 1.0 and chemically lysed using BugBuster Protein
Extraction Reagent (Merck Millipore) according to the manufacturer’s instructions.
Proteins were mixed with 4x NuPAGE® gel loading buffer, heated at 95 °C for 5 min and
centrifuged before loading on a Bolt 4-12% Bis-Tris Plus polyacrylamide precast gel
(Thermo Scientific). SeeBlue Plus2 Prestained Standard (Thermo Scientific) was used as
the molecular weight marker and the gel was stained with GelCode Blue Stain Reagent
(Thermo Scientific).
3.2.4 Western blot analysis
Following SDS-PAGE the unstained NHis-tagged proteins were transferred to a
nitrocellulose membrane using the iBlot2 Gel Transfer Device (Life Technologies). The
membrane was blocked overnight with 5% non-fat dry milk in 1 x PBS. After washing in
1 x PBS containing 0.05% TWEEN-20 (Sigma), primary antibody incubation was done for
2 h using the Monoclonal Anti polyHistidine-Peroxidase clone HIS-1 (Sigma, Catalog
Number A7058) at a dilution of 1: 2,000 in PBS containing 0.05% TWEEN-20 and 1%
bovine serum albumin. The membrane was washed in washing buffer and His-tagged
proteins were detected using Amersham™ ECL Select™ Western Blotting Detection
Reagent and the images were visualized by ImageQuant LAS 500.
107
3.2.5 Determination of protein concentration
The concentration of the soluble cell fractions was measured using absorbance at 280
nm by a NanoDrop One (Thermo Fisher Scientific). The molar extinction coefficient
ε280nm of 72,140 M-1cm-1 was calculated from the primary amino acid sequence using
ProtParam-ExPaSy.
3.2.6 Dechlorination activity assay
The activity assay was performed as described in section 2.2.5. TmrA dechlorination of
CF by the soluble protein fractions was measured by GC/MS using titanium (III) citrate
and methyl viologen as electron donors. Heat-inactivated TmrA (100 °C for 20 min) was
used as a negative control.
3.2.7 Large-scale culture and cell lysis
1 L cultures were carried out under the finally decided upon conditions. TB media
containing 10 µg/mL tetracycline and 4.5 µg/mL chloramphenicol was inoculated to a
cell density (OD600) of 0.1 with B. megaterium containing NHis-TmrA. The culture was
maintained at 37 ᵒC and 180 rpm. When the OD600 reached 0.6 the culture was
supplemented with 50 μM ammonium iron (II) sulfate and 1 μM B12 and induced with
0.03% xylose. After 3h, the cells were harvested by centrifugation at 8,000 g for 10 min
at 4 ᵒC. The cells were washed with 1 x PBS and stored at -20 ᵒC until further processing.
The cells were lysed chemically under anaerobic conditions; all the buffers used were
purged with N2, addition of buffer and chemicals to the cell pellet and decanting of
soluble portions were done inside the anaerobic chamber. The cell pellet was
resuspended in a lysis buffer (50mM Tris–HCl pH 8, 17mM NaCl, PMSF tablets, 250
μg/mL lysozyme) purged with N2 at a ratio of 1:5 for 20 minutes at 25 °C. For further cell
breakdown, 1 mg/mL of sodium deoxycholate was added to the cell suspension and
incubated at 37 °C for 60 min with constant shaking, followed by the addition of 25
μg/mL of DNase I (Sigma Aldrich D5025) for 60 minutes at 25 °C. The cell suspension was
then centrifuged at 14,000 g for 20 minutes at 4 °C to collect the soluble fraction.
108
3.2.8 Purification of NHis-TmrA
For purification of NHis-TmrA from the soluble fraction of B. megaterium, affinity
chromatography with 1 mL Ni-NTA Superflow column and anion exchange
chromatography with 1 mL HiTrap™ Q FF were carried out. The purification was done
inside an anaerobic chamber (Baker Ruskinn Concept) and all buffers were made anoxic
by purging with N2.
The soluble fraction was loaded onto a 1 mL Ni-NTA Superflow Column using a peristaltic
pump (Gilson Minipuls 2) calibrated to a flowrate of 1 mL/min. The column was
previously equilibrated with 10 CV of buffer A (50 mM NaH2PO4, 300 mM NaCl, 10 mM
imidazole, pH 8.0). Following a wash step with 10 CV of Buffer B (50 mM NaH2PO4, 300
mM NaCl, 20 mM imidazole, pH 8.0), NHis-TmrA was eluted with 5 CV of Buffer C (50
mM NaH2PO4, 300 mM NaCl, 250 mM imidazole, pH 8.0).
For anion exchange chromatography, a 1 mL HiTrap™ Q FF column was equilibrated with
10 CV of buffer A (100 mM Tris, pH 8, 10% glycerol). The soluble fraction was then loaded
onto the column, followed by a wash step with 10 CV of the same buffer. Gradient
elution of the protein was performed with buffer containing 0 to 1 M NaCl. The flowrate
was always maintained at 1 mL/min by using a peristaltic pump.
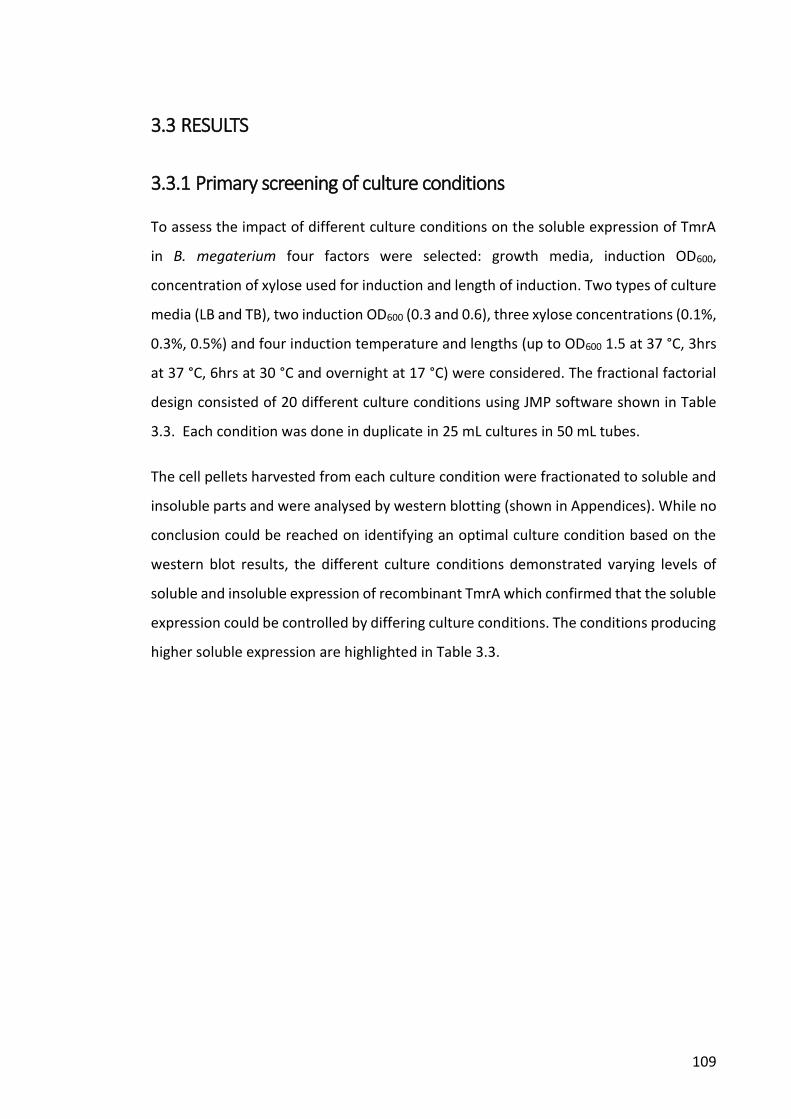
109
3.3 RESULTS
3.3.1 Primary screening of culture conditions
To assess the impact of different culture conditions on the soluble expression of TmrA
in B. megaterium four factors were selected: growth media, induction OD600,
concentration of xylose used for induction and length of induction. Two types of culture
media (LB and TB), two induction OD600 (0.3 and 0.6), three xylose concentrations (0.1%,
0.3%, 0.5%) and four induction temperature and lengths (up to OD600 1.5 at 37 °C, 3hrs
at 37 °C, 6hrs at 30 °C and overnight at 17 °C) were considered. The fractional factorial
design consisted of 20 different culture conditions using JMP software shown in Table
3.3. Each condition was done in duplicate in 25 mL cultures in 50 mL tubes.
The cell pellets harvested from each culture condition were fractionated to soluble and
insoluble parts and were analysed by western blotting (shown in Appendices). While no
conclusion could be reached on identifying an optimal culture condition based on the
western blot results, the different culture conditions demonstrated varying levels of
soluble and insoluble expression of recombinant TmrA which confirmed that the soluble
expression could be controlled by differing culture conditions. The conditions producing
higher soluble expression are highlighted in Table 3.3.
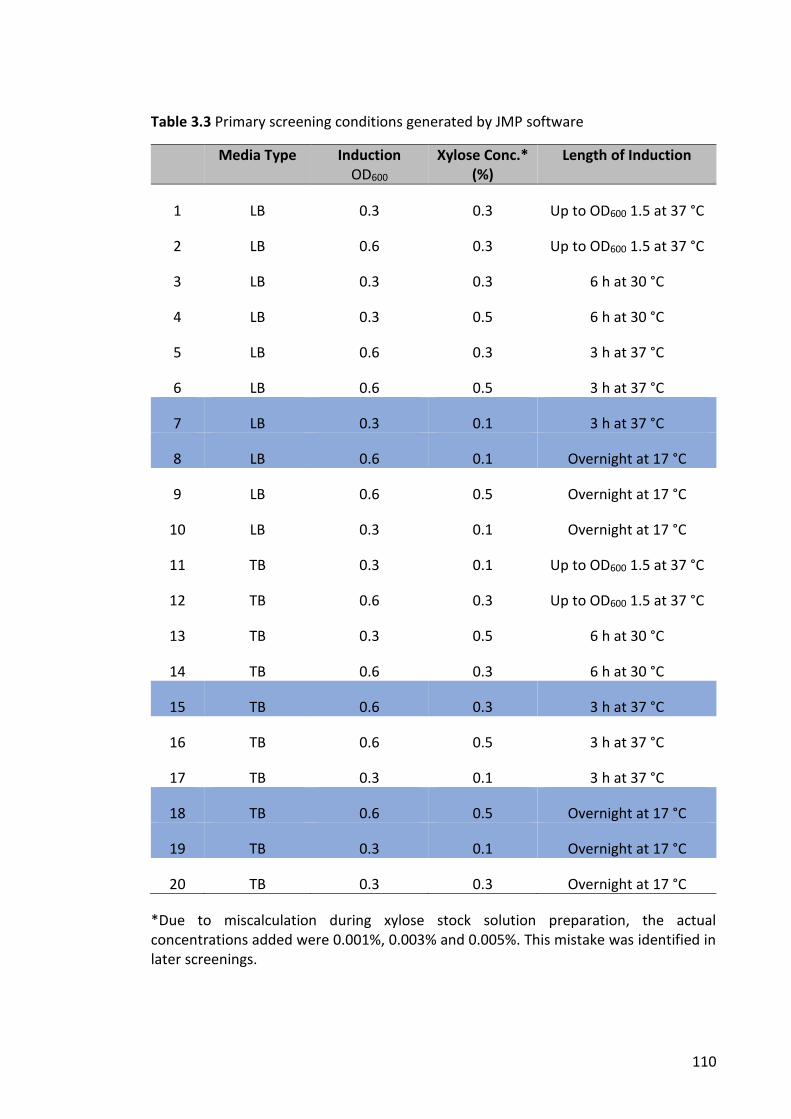
110
Table 3.3 Primary screening conditions generated by JMP software
Media Type Induction OD600
Xylose Conc.* (%)
Length of Induction
1 LB 0.3 0.3 Up to OD600 1.5 at 37 °C
2 LB 0.6 0.3 Up to OD600 1.5 at 37 °C
3 LB 0.3 0.3 6 h at 30 °C
4 LB 0.3 0.5 6 h at 30 °C
5 LB 0.6 0.3 3 h at 37 °C
6 LB 0.6 0.5 3 h at 37 °C
7 LB 0.3 0.1 3 h at 37 °C
8 LB 0.6 0.1 Overnight at 17 °C
9 LB 0.6 0.5 Overnight at 17 °C
10 LB 0.3 0.1 Overnight at 17 °C
11 TB 0.3 0.1 Up to OD600 1.5 at 37 °C
12 TB 0.6 0.3 Up to OD600 1.5 at 37 °C
13 TB 0.3 0.5 6 h at 30 °C
14 TB 0.6 0.3 6 h at 30 °C
15 TB 0.6 0.3 3 h at 37 °C
16 TB 0.6 0.5 3 h at 37 °C
17 TB 0.3 0.1 3 h at 37 °C
18 TB 0.6 0.5 Overnight at 17 °C
19 TB 0.3 0.1 Overnight at 17 °C
20 TB 0.3 0.3 Overnight at 17 °C
*Due to miscalculation during xylose stock solution preparation, the actual concentrations added were 0.001%, 0.003% and 0.005%. This mistake was identified in later screenings.
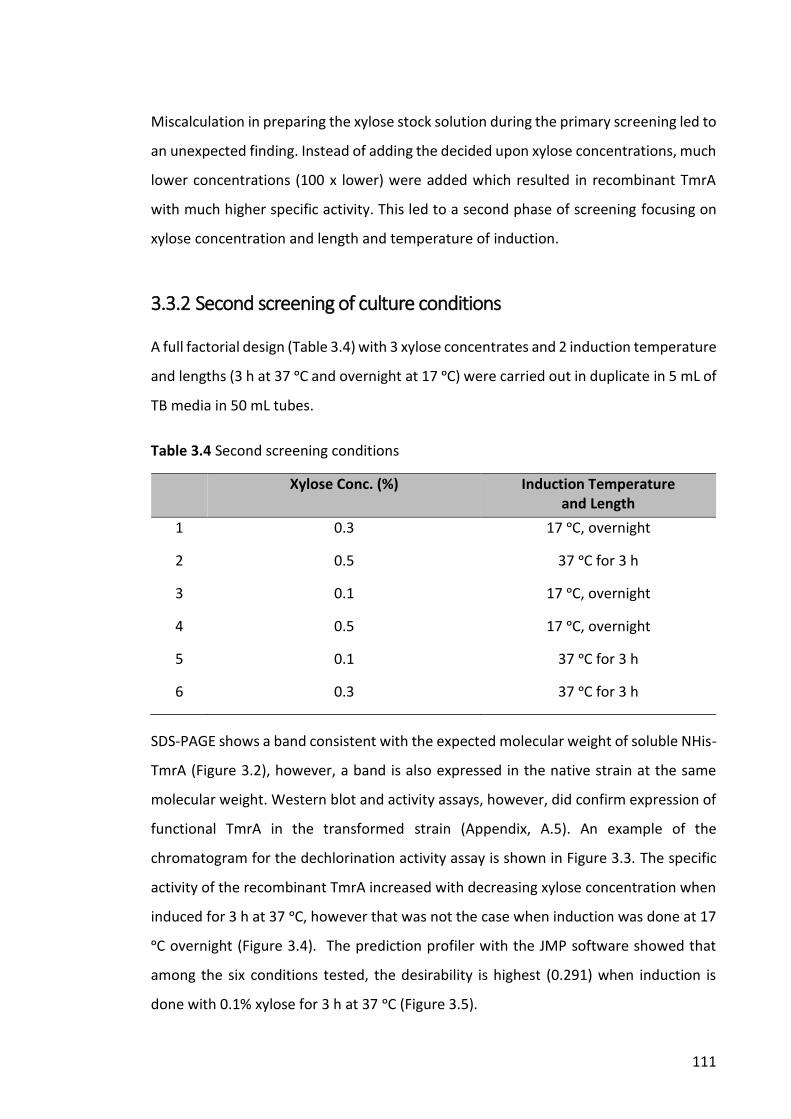
111
Miscalculation in preparing the xylose stock solution during the primary screening led to
an unexpected finding. Instead of adding the decided upon xylose concentrations, much
lower concentrations (100 x lower) were added which resulted in recombinant TmrA
with much higher specific activity. This led to a second phase of screening focusing on
xylose concentration and length and temperature of induction.
3.3.2 Second screening of culture conditions
A full factorial design (Table 3.4) with 3 xylose concentrates and 2 induction temperature
and lengths (3 h at 37 ᵒC and overnight at 17 ᵒC) were carried out in duplicate in 5 mL of
TB media in 50 mL tubes.
Table 3.4 Second screening conditions
Xylose Conc. (%) Induction Temperature and Length
1 0.3 17 ᵒC, overnight
2 0.5 37 ᵒC for 3 h
3 0.1 17 ᵒC, overnight
4 0.5 17 ᵒC, overnight
5 0.1 37 ᵒC for 3 h
6 0.3 37 ᵒC for 3 h
SDS-PAGE shows a band consistent with the expected molecular weight of soluble NHis-
TmrA (Figure 3.2), however, a band is also expressed in the native strain at the same
molecular weight. Western blot and activity assays, however, did confirm expression of
functional TmrA in the transformed strain (Appendix, A.5). An example of the
chromatogram for the dechlorination activity assay is shown in Figure 3.3. The specific
activity of the recombinant TmrA increased with decreasing xylose concentration when
induced for 3 h at 37 ᵒC, however that was not the case when induction was done at 17
ᵒC overnight (Figure 3.4). The prediction profiler with the JMP software showed that
among the six conditions tested, the desirability is highest (0.291) when induction is
done with 0.1% xylose for 3 h at 37 ᵒC (Figure 3.5).
112
Figure 3.2. SDS-PAGE of the soluble protein fractions from cell pellets obtained from the second screening conditions. Lane 1. SeeBlue Pre-Stained Protein Standard; Lane 2. Native B. megaterium; Lane 3. Pre-induction sample; Lane 4. 0.1% xylose, 3 h induction; Lane 5. 0.1% xylose, overnight induction; Lane 6. 0.3% xylose, 3 h induction; Lane 7. 0.3% xylose, overnight induction; Lane 8. 0.5% xylose, 3 h induction; Lane 9. 0.5% xylose, overnight induction. The framed section shows the protein of interest.
Figure 3.3. Dechlorination of CF with B. megaterium cell lysates. All of the 0.5 mM CF added was converted to DCM in this experiment.
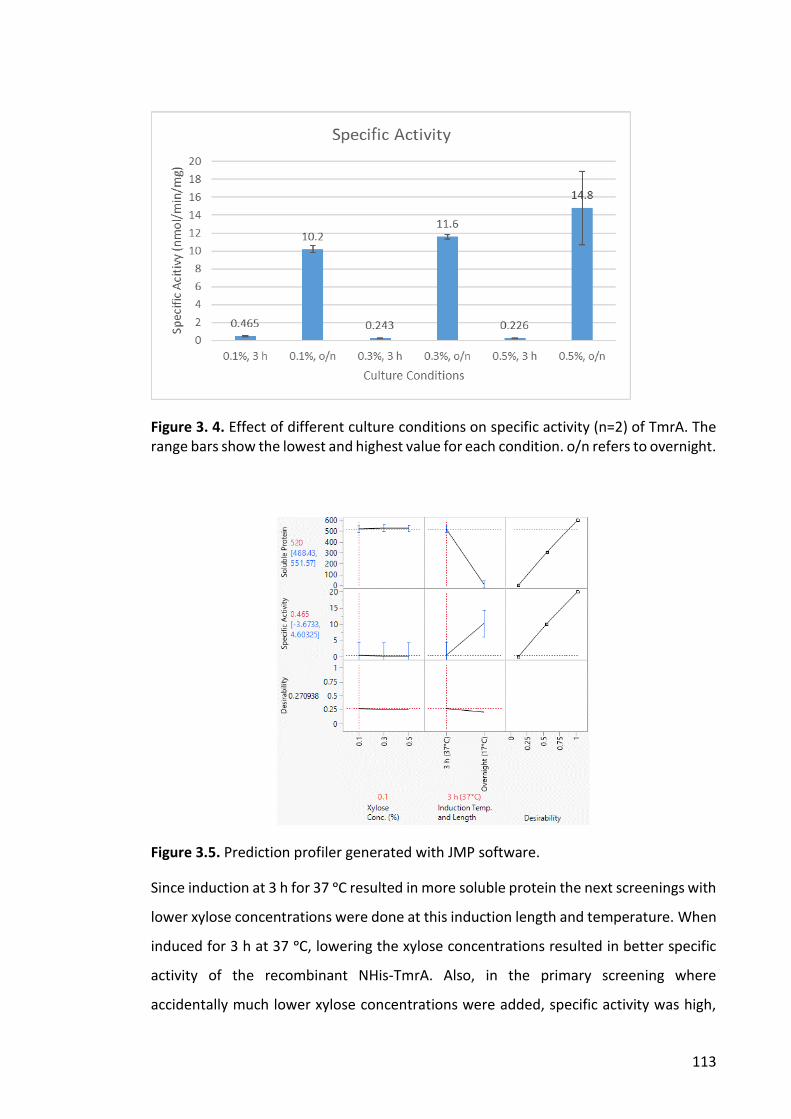
113
Figure 3. 4. Effect of different culture conditions on specific activity (n=2) of TmrA. The range bars show the lowest and highest value for each condition. o/n refers to overnight.
Figure 3.5. Prediction profiler generated with JMP software.
Since induction at 3 h for 37 ᵒC resulted in more soluble protein the next screenings with
lower xylose concentrations were done at this induction length and temperature. When
induced for 3 h at 37 ᵒC, lowering the xylose concentrations resulted in better specific
activity of the recombinant NHis-TmrA. Also, in the primary screening where
accidentally much lower xylose concentrations were added, specific activity was high,
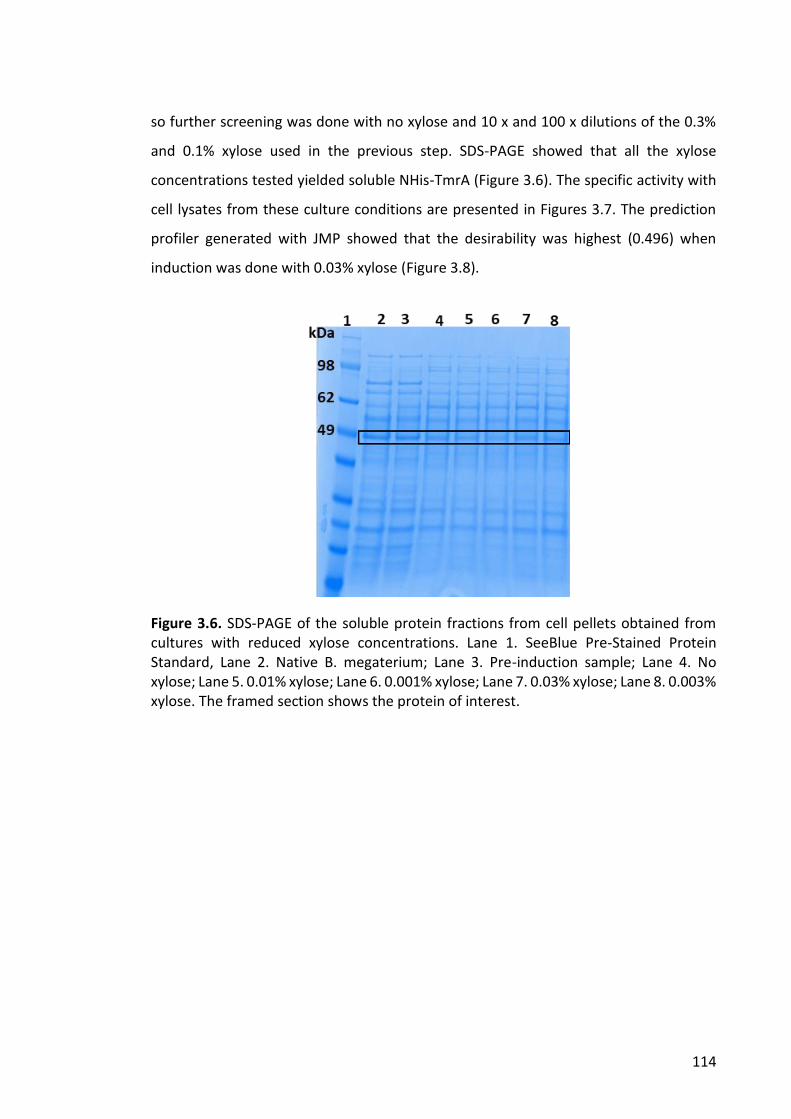
114
so further screening was done with no xylose and 10 x and 100 x dilutions of the 0.3%
and 0.1% xylose used in the previous step. SDS-PAGE showed that all the xylose
concentrations tested yielded soluble NHis-TmrA (Figure 3.6). The specific activity with
cell lysates from these culture conditions are presented in Figures 3.7. The prediction
profiler generated with JMP showed that the desirability was highest (0.496) when
induction was done with 0.03% xylose (Figure 3.8).
Figure 3.6. SDS-PAGE of the soluble protein fractions from cell pellets obtained from cultures with reduced xylose concentrations. Lane 1. SeeBlue Pre-Stained Protein Standard, Lane 2. Native B. megaterium; Lane 3. Pre-induction sample; Lane 4. No xylose; Lane 5. 0.01% xylose; Lane 6. 0.001% xylose; Lane 7. 0.03% xylose; Lane 8. 0.003% xylose. The framed section shows the protein of interest.
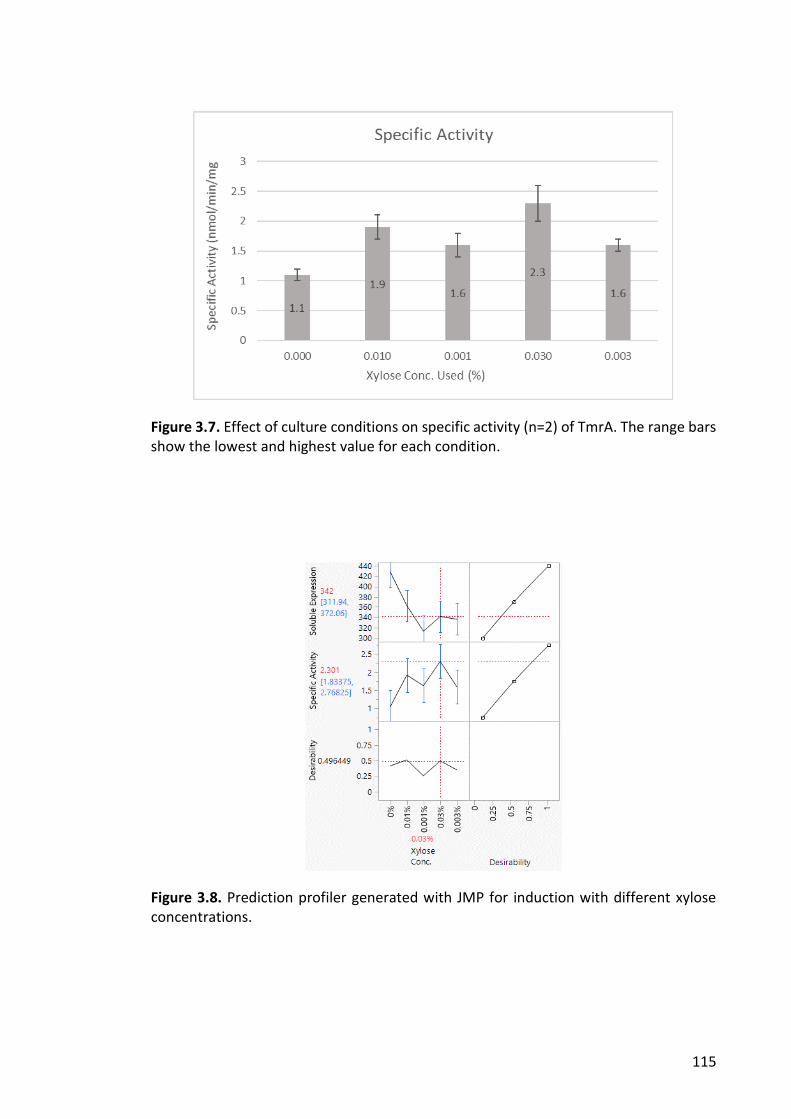
115
Figure 3.7. Effect of culture conditions on specific activity (n=2) of TmrA. The range bars show the lowest and highest value for each condition.
Figure 3.8. Prediction profiler generated with JMP for induction with different xylose concentrations.
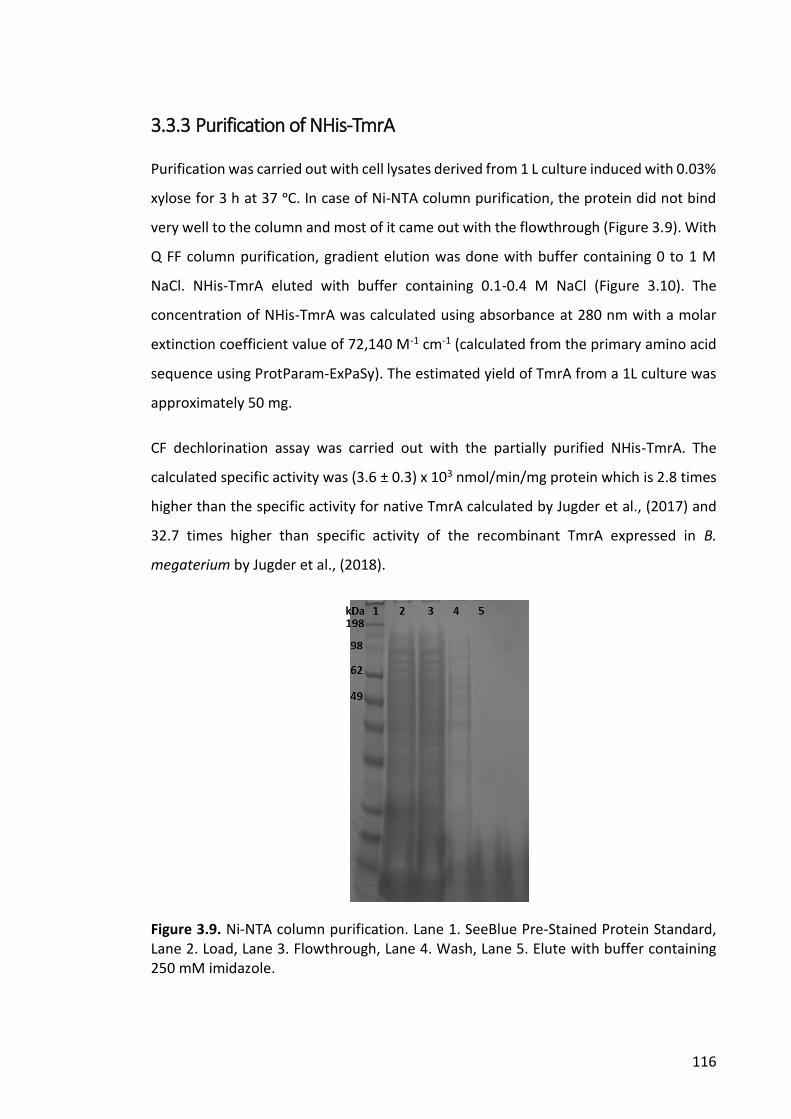
116
3.3.3 Purification of NHis-TmrA
Purification was carried out with cell lysates derived from 1 L culture induced with 0.03%
xylose for 3 h at 37 ᵒC. In case of Ni-NTA column purification, the protein did not bind
very well to the column and most of it came out with the flowthrough (Figure 3.9). With
Q FF column purification, gradient elution was done with buffer containing 0 to 1 M
NaCl. NHis-TmrA eluted with buffer containing 0.1-0.4 M NaCl (Figure 3.10). The
concentration of NHis-TmrA was calculated using absorbance at 280 nm with a molar
extinction coefficient value of 72,140 M-1 cm-1 (calculated from the primary amino acid
sequence using ProtParam-ExPaSy). The estimated yield of TmrA from a 1L culture was
approximately 50 mg.
CF dechlorination assay was carried out with the partially purified NHis-TmrA. The
calculated specific activity was (3.6 ± 0.3) x 103 nmol/min/mg protein which is 2.8 times
higher than the specific activity for native TmrA calculated by Jugder et al., (2017) and
32.7 times higher than specific activity of the recombinant TmrA expressed in B.
megaterium by Jugder et al., (2018).
Figure 3.9. Ni-NTA column purification. Lane 1. SeeBlue Pre-Stained Protein Standard, Lane 2. Load, Lane 3. Flowthrough, Lane 4. Wash, Lane 5. Elute with buffer containing 250 mM imidazole.
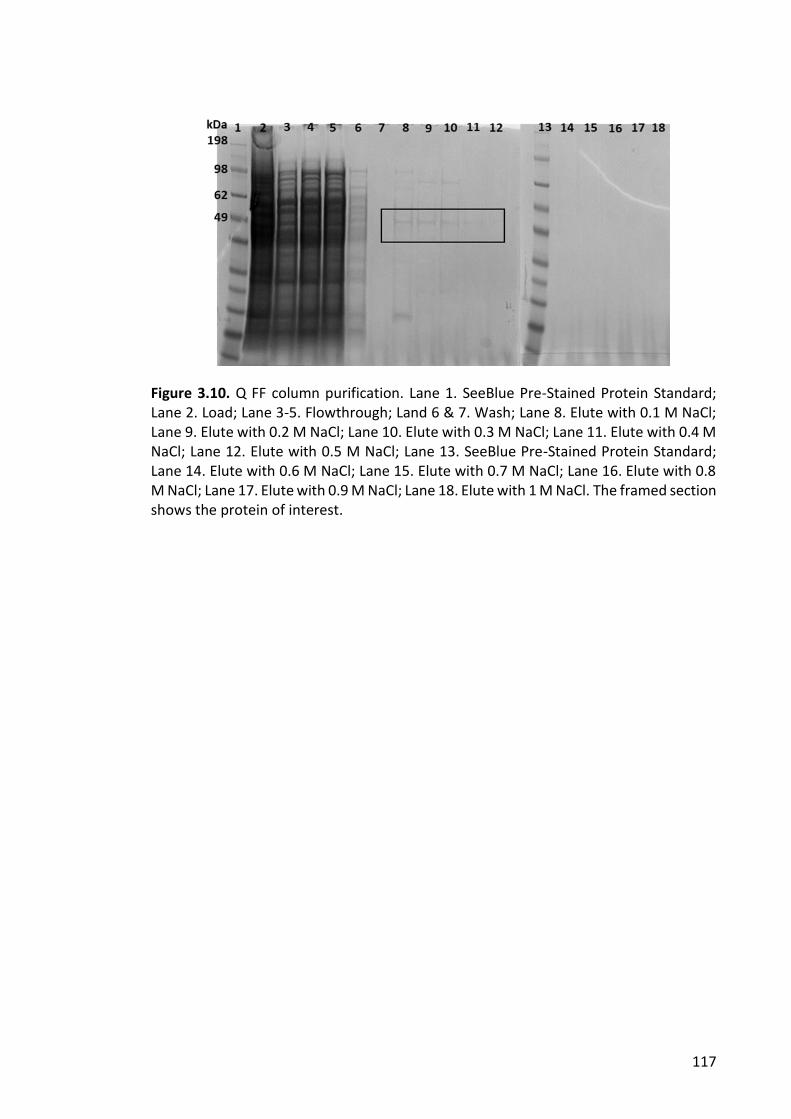
117
Figure 3.10. Q FF column purification. Lane 1. SeeBlue Pre-Stained Protein Standard; Lane 2. Load; Lane 3-5. Flowthrough; Land 6 & 7. Wash; Lane 8. Elute with 0.1 M NaCl; Lane 9. Elute with 0.2 M NaCl; Lane 10. Elute with 0.3 M NaCl; Lane 11. Elute with 0.4 M NaCl; Lane 12. Elute with 0.5 M NaCl; Lane 13. SeeBlue Pre-Stained Protein Standard; Lane 14. Elute with 0.6 M NaCl; Lane 15. Elute with 0.7 M NaCl; Lane 16. Elute with 0.8 M NaCl; Lane 17. Elute with 0.9 M NaCl; Lane 18. Elute with 1 M NaCl. The framed section shows the protein of interest.
118
3.4 DISCUSSION
CF reductive dehalogenase, TmrA, has been successfully produced heterologously in a
soluble and active form in B. megaterium by Jugder et al., (2018). He cloned a tmrA gene
devoid of the TAT signal and membrane spanning region, with a His-tag at the N-
terminal, into a pPT7 plasmid and transformed into B. megaterium MS941 already
containing a pT7-RNAP plasmid that allows xylose-inducible expression of T7
polymerase. Their study resulted in the soluble expression of TmrA with the specific
activity of 110 U/mg of protein with was 11-fold lower than the specific activity of the
native TmrA (1.27 x 10³ U/mg of protein) measured by Jugder et al. (2017). In the present
study the B. megaterium MS941 transformant produced by Jugder et al., (2018) was
used in multiple screening experiments with an aim to improve the productivity of the
process with respect to protein yield and potentially improve the specific activity of the
expressed recombinant protein.
In the xylose-inducible plasmid system used in B. megaterium, the gene of interest is
under the control of the xylose inducible promoter PxylA with a down-stream multiple
cloning site (Korneli et al., 2013). PxylA is located upstream of the operon consisting of
genes for xylose isomerase XylA, xylulokinase XylB, and xylose permease XylT (Rygus and
Hillen, 1991). XylA and XylB are responsible for the phosphorylation of xylose to form
xylose-5-phosphate, XylT aids in transporting xylose into the cell (Biedendieck et al.,
2011). The gene encoding the repressor protein XylR is divergently oriented upstream
of the operon, resulting in an overlap of the promoter regions of xylR and xylABT operon
(Biedendieck et al., 2010). In the absence of xylose, XylR binds to the operator sequences
located in PxylA and inhibits transcription of the xylABT operon (Gärtner et al., 1988).
When xylose is present, it binds to the repressor XylR causing a conformational change
of XylR which prevents promoter binding (Biedendieck et al., 2011). In the double vector
system used in the present study, the t7 rnap gene is under the control of the strong
PxylA promoter and pPT7 controls the T7 RNAP-dependent expression of the target gene
(Gamer et al., 2009, Korneli et al., 2012). The stable plasmid replication system of B.
megaterium aids in the stable co-existence of the two vectors (Rygus and Hillen, 1991).
119
Although Gamer et al., (2009) demonstrated a tight regulation of xylose-inducible
promoter in the double vector system, in the current study expression of soluble TmrA
without xylose induction was fairly high (the concentration was about 429 mg/mL in cell
lysate), indicating leaky expression. The dechlorination of CF using the cell lysates of
non-induced samples was higher compared to the frequently used xylose concentration
of 5 g/L described in literature (data not shown). Stammen et al. (2010a), (2010b)
reported leaky expression of GFP in B. megaterium before the addition of xylose.
(Marchand and Collins, 2013) described leaky expression from xylose-inducible
promoter controlling the expression of genes agrC (gene encoding transmembrane
histidine kinase receptor in Staphylococcus aureus) and agrA (gene encoding
transcriptional activator in S. aureus) in B. megaterium.
The most frequently described xylose concentration used for the induction of
recombinant protein expression in B. megaterium ranges from 0.1 to 0.5 % (Biedendieck
et al., 2011, Biedendieck et al., 2010, Burger et al., 2003, Gamer et al., 2009, Nehru et
al., 2020, Payne et al., 2015). However, in the current study using much lower
concentrations produced more soluble and active TmrA. The best results were obtained
when induced with 0.03% xylose (much lower than the most commonly used
concentration of 0.5%) for 3 h. However, protein expression under xylose inducible
promotors with very low xylose concentrations have been reported in B. subtilis.
(Bhavsar et al., 2001) developed a xylose-inducible promotor for B. subtilis where the
xyl system-controlled protein expression over a xylose concentration range of 0.0002 to
0.63%. Xylose-inducible expression of protein with very little xylose concentration (0.1
to 10 mM) have been reported in Staphylococcus carnosus (Wieland et al., 1995),
Caulobacter crescentus (Meisenzahl et al., 1997), Hypocrea jecorina (Mach-Aigner et al.,
2010), Aspergillus niger (Mach-Aigner et al., 2012).
The recombinant TmrA expressed in this study had a His-tag at the N-terminal to
facilitate purification via affinity chromatography. However, there was little to no
binding of NHis-TmrA to the Ni-NTA column even though Western Blot analysis
confirmed the presence of the His-tag in the protein prior to loading the cell lysate onto
the column (Figure in Appendices, A.5.5). The NHis-TmrA produced in B. megaterium by
120
Jugder et al., (2018) was purified by affinity chromatography using a Ni-NTA column,
followed by anion exchange chromatography using a ResQ column. The failure of NHis-
TmrA produced in the current study to bind to the Ni-NTA column might be attributed
to a difference in the folding of TmrA after translation due to the shorter induction
period at a higher temperature (3 h at 37 ᵒC in contrast to overnight at 17 ᵒC) which
might have made the His-tag inaccessible to the Ni-NTA column. The effect of
temperature on protein folding has been described by multiple authors (Jagielska and
Scheraga, 2007, Tikhonov et al., 2002, Xu et al., 2012). In this study, TmrA was partially
purified via anion exchange chromatography using a Q FF column. Gradient elution
showed that elution mostly occurred with 100 – 400 mM NaCl. Purification was
performed under anaerobic conditions, at no point of processing, from cell lysis to
dechlorination assay, was TmrA exposed to air.
The calculated specific activity of purified TmrA in this study was (3.6 ± 0.3) x 103
nmol/min/mg of protein which is 2.8 times higher than the specific activity calculated
for native TmrA (1.27 x 10³ nmol/min/mg of protein). Similar results were described by
Parthasarathy et al. (2015) where the recombinant VcrA recovered from inclusion
bodies expressed in E. coli, exhibited higher specific activity than the native VcrA from
Dehalococcoides sp. Strain VS. The enhanced specific activity of the recombinant TmrA
might be attributed to the lack of the TAT signal at the N-terminal and the resulting
conformational changes it causes. Enhanced lytic activity upon removal of the binding
domain has been reported for multiple enzymes (Fenton et al., 2010) A truncated
derivative of the phage endolysin LysK exhibited two-fold higher lytic activity than the
native enzyme (Horgan et al., 2009). The specific activity of recombinant TmrA in this
study is 32.7-fold higher the specific activity of recombinant TmrA expressed in B.
megaterium by Jugder et al., (2018). This might be attributed to the oxygen-sensitivity
of the enzyme. In the study by Jugder and co-workers, cell lysis was done using a French
press whereas in the current study the cells were lysed chemically which offered more
control in maintaining anaerobic conditions. More importantly in the previous study the
second purification step was done aerobically; in the current study the single
purification step was carried out inside an anaerobic chamber. The maintenance of

121
anaerobic conditions throughout the entire process in this study ensured that activity
loss due to oxygen-sensitivity was minimized.
122
3.5 CONCLUSIONS
B. megaterium is proving to be a suitable host for the expression of soluble and
catalytically active RDases. Both respiratory and catabolic RDases have been successfully
expressed in B. megaterium. This study is first to report the screening of culture
conditions for the recombinant expression of RDases in B. megaterium. The findings
clearly demonstrate that varying the culture conditions impact both the level of soluble
expression and the specific activity of the expressed RDase. The recombinant TmrA
expressed in this study had a specific activity higher than the native enzyme which is a
vast improvement than the previous attempts. Further studies might include enzyme
kinetics of the recombinant TmrA, finer tuning of the xylose-inducible promotor to
reduce the non-inducible expression and elucidation of the role of the removal of the
TAT signal on the structure and function of RDases.
123
3.6 REFERENCES
BHAVSAR, A. P., ZHAO, X. & BROWN, E. D. 2001. Development and characterization of a xylose-dependent system for expression of cloned genes in Bacillus subtilis: Conditional complementation of a teichoic acid mutant. Applied and Environmental Microbiology, 67(1): 403-410.
BIEDENDIECK, R., BORGMEIER, C., BUNK, B., STAMMEN, S., SCHERLING, C., MEINHARDT, F., WITTMANN, C. & JAHN, D. 2011. Systems biology of recombinant protein production using Bacillus megaterium. Methods in Enzymology. Elsevier.
BIEDENDIECK, R., BUNK, B., FÜRCH, T., FRANCO-LARA, E., JAHN, M. & JAHN, D. 2010. Systems biology of recombinant protein production in Bacillus megaterium. Biosystems Engineering I. Springer.
BUNK, B., SCHULZ, A., STAMMEN, S., MÜNCH, R., WARREN, M. J., JAHN, D. & BIEDENDIECK, R. 2010. A short story about a big magic bug. Bioengineered Bugs, 1(2): 85-91.
BURGER, S., TATGE, H., HOFMANN, F., GENTH, H., JUST, I. & GERHARD, R. 2003. Expression of recombinant Clostridium difficile toxin A using the Bacillus megaterium system. Biochemical Biophysical Research Communications, 307(3): 584-588.
EPPINGER, M., BUNK, B., JOHNS, M. A., EDIRISINGHE, J. N., KUTUMBAKA, K. K., KOENIG, S. S., CREASY, H. H., ROSOVITZ, M., RILEY, D. R. & DAUGHERTY, S. 2011. Genome sequences of the biotechnologically important Bacillus megaterium strains QM B1551 and DSM319. Journal of Bacteriology, 193(16): 4199-4213.
FENTON, M., MCAULIFFE, O., O’MAHONY, J. & COFFEY, A. 2010. Recombinant bacteriophage lysins as antibacterials. Bioengineered Bugs, 1(1): 9-16.
GAMER, M., FRÖDE, D., BIEDENDIECK, R., STAMMEN, S. & JAHN, D. 2009. A T7 RNA polymerase-dependent gene expression system for Bacillus megaterium. Applied Microbiology & Biotechnology, 82(6): 1195.
GÄRTNER, D., GEISSENDÖRFER, M. & HILLEN, W. 1988. Expression of the Bacillus subtilis xyl operon is repressed at the level of transcription and is induced by xylose. Journal of Bacteriology, 170(7): 3102-3109.
GOSWAMI, G., PANDA, D., SAMANTA, R., BORO, R. C., MODI, M. K., BUJARBARUAH, K. M. & BAROOAH, M. 2018. Bacillus megaterium adapts to acid stress condition through a network of genes: Insight from a genome-wide transcriptome analysis. Scientific Reports, 8(1):1-12.
GRAGE, K., MCDERMOTT, P. & REHM, B. H. 2017. Engineering Bacillus megaterium for production of functional intracellular materials. Microbial Cell Factories, 16(1): 211.
HORGAN, M., O’FLYNN, G., GARRY, J., COONEY, J., COFFEY, A., FITZGERALD, G. F., ROSS, R. P. & MCAULIFFE, O. 2009. Phage lysin LysK can be truncated to its CHAP domain and retain lytic activity against live antibiotic-resistant staphylococci. Applied and Environmental Microbiology, 75(3): 872-874.
JAGIELSKA, A. & SCHERAGA, H. A. 2007. Influence of temperature, friction, and random forces on folding of the B‐domain of staphylococcal protein A: All‐atom molecular dynamics in implicit solvent. Journal of Computational Chemistry, 28(6): 1068-1082.
124
JUGDER, B.-E., PAYNE, K. A., FISHER, K., BOHL, S., LEBHAR, H., MANEFIELD, M., LEE, M., LEYS, D. & MARQUIS, C. P. 2018. Heterologous production and purification of a functional chloroform reductive dehalogenase. ACS Chemical Biology, 13(3): 548-552.
JUGDER, B. E., BOHL, S., LEBHAR, H., HEALEY, R. D., MANEFIELD, M., MARQUIS, C. P. & LEE, M. 2017. A bacterial chloroform reductive dehalogenase: purification and biochemical characterization. Microbial Biotechnology, 10(6): 1640-1648.
KIMOTO, H., SUYE, S.-I., MAKISHIMA, H., ARAI, J.-I., YAMAGUCHI, S., FUJII, Y., YOSHIOKA, T. & TAKETO, A. 2010. Cloning of a novel dehalogenase from environmental DNA. Bioscience, Biotechnology, Biochemistry, 74(6):1290-1292.
KORNELI, C., BIEDENDIECK, R., DAVID, F., JAHN, D. & WITTMANN, C. 2013. High yield production of extracellular recombinant levansucrase by Bacillus megaterium. Applied Microbiology & Biotechnology, 97(8): 3343-3353.
KORNELI, C., BOLTEN, C. J., GODARD, T., FRANCO‐LARA, E. & WITTMANN, C. 2012. Debottlenecking recombinant protein production in Bacillus megaterium under large‐scale conditions—targeted precursor feeding designed from metabolomics. Biotechnology and Bioengineering, 109(6): 1538-1550.
MACH-AIGNER, A. R., OMONY, J., JOVANOVIC, B., VAN BOXTEL, A. J. & DE GRAAFF, L. H. 2012. D-Xylose concentration-dependent hydrolase expression profiles and the function of CreA and XlnR in Aspergillus niger. Applied and Environmental Microbiology, 78(9): 3145-3155.
MACH-AIGNER, A. R., PUCHER, M. E. & MACH, R. L. 2010. D-Xylose as a repressor or inducer of xylanase expression in Hypocrea jecorina (Trichoderma reesei). Applied and Environmental Microbiology, 76(6): 1770-1776.
MARCHAND, N. & COLLINS, C. H. 2013. Peptide‐based communication system enables Escherichia coli to Bacillus megaterium interspecies signaling. Biotechnology and Bioengineering, 110(11): 3003-3012.
MEISENZAHL, A. C., SHAPIRO, L. & JENAL, U. 1997. Isolation and characterization of a xylose-dependent promoter from Caulobacter crescentus. Journal of Bacteriology, 179(3): 592-600.
NEHRU, G., TADI, S. R. R., LIMAYE, A. M. & SIVAPRAKASAM, S. 2020. Production and characterization of low molecular weight heparosan in Bacillus megaterium using Escherichia coli K5 glycosyltransferases. International Journal of Biological Macromolecules, 160, 69-76.
NEUMANN, A., WOHLFARTH, G. & DIEKERT, G. 1998. Tetrachloroethene dehalogenase from Dehalospirillum multivorans: cloning, sequencing of the encoding genes, and expression of the pceA gene in Escherichia coli. Journal of Bacteriology, 180(16): 4140-4145.
PARTHASARATHY, A., STICH, T. A., LOHNER, S. T., LESNEFSKY, A., BRITT, R. D. & SPORMANN, A. M. 2015. Biochemical and EPR-spectroscopic investigation into heterologously expressed vinyl chloride reductive dehalogenase (VcrA) from Dehalococcoides mccartyi strain VS. Journal of the American Chemical Society, 137(10): 3525-3532.
PAYNE, K. A. P., QUEZADA, C. P., FISHER, K., DUNSTAN, M. S., COLLINS, F. A., SJUTS, H., LEVY, C., HAY, S., RIGBY, S. E. J. & LEYS, D. 2015. Reductive dehalogenase structure suggests a mechanism for B12-dependent dehalogenation. Nature, 517(7525): 513-516.
125
RYGUS, T. & HILLEN, W. 1991. Inducible high-level expression of heterologous genes in Bacillus megaterium using the regulatory elements of the xylose-utilization operon. Applied Microbiology & Biotechnology, 35(5): 594-599.
SJUTS, H., FISHER, K., DUNSTAN, M. S., RIGBY, S. E. & LEYS, D. 2012. Heterologous expression, purification and cofactor reconstitution of the reductive dehalogenase PceA from Dehalobacter restrictus. Protein Expression Purification, 85(2): 224-229.
STAMMEN, S., MÜLLER, B. K., KORNELI, C., BIEDENDIECK, R., GAMER, M., FRANCO-LARA, E. & JAHN, D. 2010a. High-yield intra-and extracellular protein production using Bacillus megaterium. Applied and Environmental Microbiology, 76(12): 4037-4046.
STAMMEN, S., SCHULLER, F., DIETRICH, S., GAMER, M., BIEDENDIECK, R. & JAHN, D. 2010b. Application of Escherichia coli phage K1E DNA-dependent RNA polymerase for in vitro RNA synthesis and in vivo protein production in Bacillus megaterium. Applied Microbiology & Biotechnology, 88(2): 529-539.
SUYAMA, A., YAMASHITA, M., YOSHINO, S. & FURUKAWA, K. 2002. Molecular Characterization of the PceA Reductive Dehalogenase of Desulfitobacterium sp. Strain Y51. Journal of Bacteriology, 184(13): 3419.
TIKHONOV, R. V., PECHENOV, S. E., BELACHEU, I. A., YAKIMOV, S. A., KLYUSHNICHENKO, V. E., TUNES, H., THIEMANN, J. E., VILELA, L. & WULFSON, A. N. 2002. Recombinant human insulin IX. Investigation of factors, influencing the folding of fusion protein-S-sulfonates, biotechnological precursors of human insulin. Protein Expression and Purification, 26(2): 187-193.
VARY, P. S., BIEDENDIECK, R., FUERCH, T., MEINHARDT, F., ROHDE, M., DECKWER, W.-D. & JAHN, D. 2007. Bacillus megaterium—from simple soil bacterium to industrial protein production host. Applied Microbiology & Biotechnology, 76(5): 957-967.
WIELAND, K.-P., WIELAND, B. & GÖTZ, F. 1995. A promoter-screening plasmid and xylose-inducible, glucose-repressible expression vectors for Staphylococcus carnosus. Gene, 158(1): 91-96.
WOLF, J. B. & BREY, R. N. 1986. Isolation and genetic characterizations of Bacillus megaterium cobalamin biosynthesis-deficient mutants. Journal of Bacteriology, 166(1): 51-58.
XU, W., LAI, Z., OLIVEIRA, R. J., LEITE, V. B. & WANG, J. 2012. Configuration-dependent diffusion dynamics of downhill and two-state protein folding. The Journal of Physical Chemistry B, 116(17): 5152-5159.
126
CHAPTER FOUR: Heterologous expression of chloroform reductive dehalogenase TmrA in Shimwellia blattae: co-expression with chaperone proteins
127
4.1 INTRODUCTION
Shimwellia blattae is an enteric bacterium isolated from the hindgut of a cockroach
(Burgess et al., 1973). S. blattae can uptake and synthesize B12 de novo aerobically and
anaerobically and the molecular tools and techniques developed for Escherichia coli can
be used with this organism (Andres et al., 2004). Hence, S. blattae has been identified
as a promising alternative to the standard host E. coli for expressing cobalamin
containing proteins. S. blattae has been successfully employed in expressing
recombinant proteins where otherwise the requirement of adding high-cost vitamin B12
are considered as major drawbacks (Andreeßen et al., 2014, Heinrich et al., 2013, Sato
et al., 2015, Urano et al., 2015).
The failure to express soluble and functional reductive dehalogenases (RDases) in E. coli
(Jugder et al., 2018, Kimoto et al., 2010, Neumann et al., 1998, Sjuts et al., 2012, Suyama
et al., 2002) led to the use of expression hosts capable of producing corrinoids de novo.
The first demonstration of heterologous expression of soluble and active RDase was
PceA from Desulfitobacterium hafniense strain Y51 and RdhA3 of strain DCB-2 produced
in Shimwellia blattae (Mac Nelly et al., 2014). Co-expression of the RDases with their
respective chaperone proteins, PceT and RdhT improved over-expression of the
functional enzymes. Adding the corrinoid hydroxocobalamin and 5,6-
dimethylbenzimidazole to the growth media and using glycerol as the growth substrate
for S. blattae also increased the formation of active RDases. Kunze et al. (2017) produced
functional DcaA from D. dichloroeliminans DCA1 in S. blattae, increased dechlorination
activity was achieved by co-expression of chaperone protein, DcaT.
The minimal rdhAB gene cluster in OHRB is frequently associated with a varied set of
accessory genes, the exact function of most of them still unknown. One of these genes
is the rdhT which encodes a trigger factor-like protein presumed to assist in folding and
maturation of RdhA (Smidt et al., 2000). The PceT from D. hafniense Y51 and TCE1 binds
specifically to the TAT signal sequence of PceA which possibly delays the translocation
of PceA and allows the proper folding and incorporation of cofactors (Maillard et al.,
2011, Morita et al., 2009). RdhT lacks the N-terminal ribosome-binding domain of a
classical trigger factor chaperone protein and thus evolves toward a specific substrate,
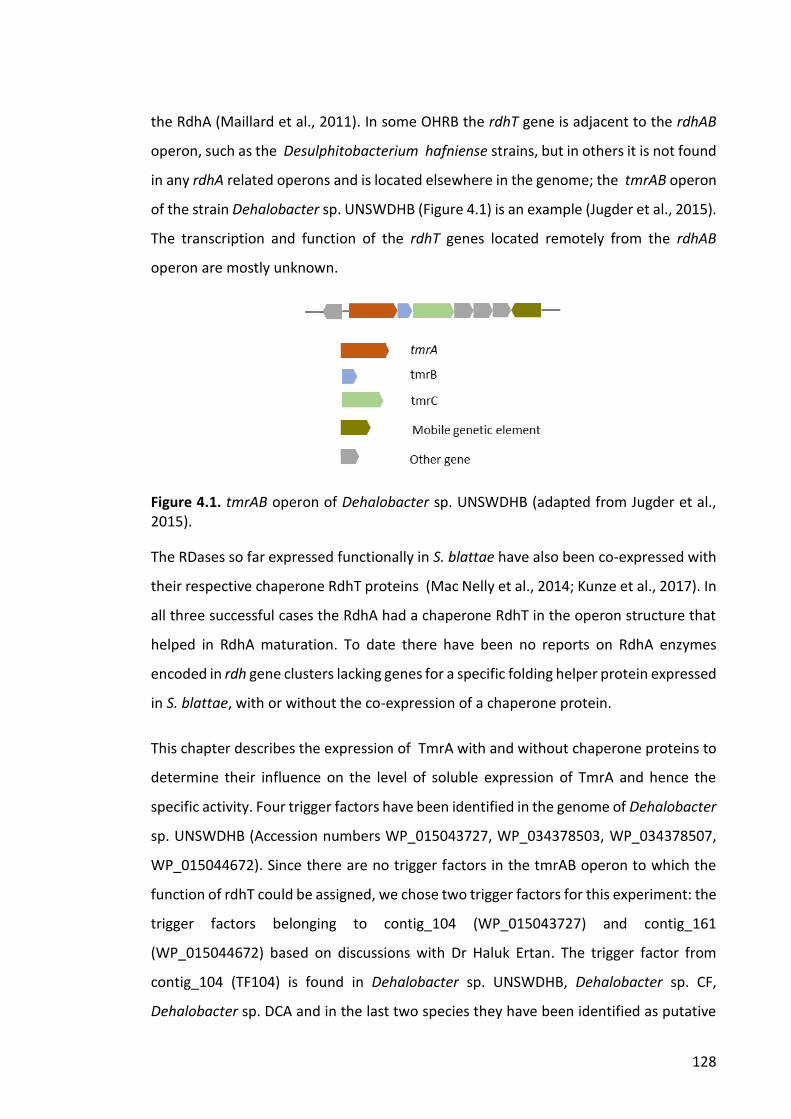
128
the RdhA (Maillard et al., 2011). In some OHRB the rdhT gene is adjacent to the rdhAB
operon, such as the Desulphitobacterium hafniense strains, but in others it is not found
in any rdhA related operons and is located elsewhere in the genome; the tmrAB operon
of the strain Dehalobacter sp. UNSWDHB (Figure 4.1) is an example (Jugder et al., 2015).
The transcription and function of the rdhT genes located remotely from the rdhAB
operon are mostly unknown.
Figure 4.1. tmrAB operon of Dehalobacter sp. UNSWDHB (adapted from Jugder et al., 2015).
The RDases so far expressed functionally in S. blattae have also been co-expressed with
their respective chaperone RdhT proteins (Mac Nelly et al., 2014; Kunze et al., 2017). In
all three successful cases the RdhA had a chaperone RdhT in the operon structure that
helped in RdhA maturation. To date there have been no reports on RdhA enzymes
encoded in rdh gene clusters lacking genes for a specific folding helper protein expressed
in S. blattae, with or without the co-expression of a chaperone protein.
This chapter describes the expression of TmrA with and without chaperone proteins to
determine their influence on the level of soluble expression of TmrA and hence the
specific activity. Four trigger factors have been identified in the genome of Dehalobacter
sp. UNSWDHB (Accession numbers WP_015043727, WP_034378503, WP_034378507,
WP_015044672). Since there are no trigger factors in the tmrAB operon to which the
function of rdhT could be assigned, we chose two trigger factors for this experiment: the
trigger factors belonging to contig_104 (WP_015043727) and contig_161
(WP_015044672) based on discussions with Dr Haluk Ertan. The trigger factor from
contig_104 (TF104) is found in Dehalobacter sp. UNSWDHB, Dehalobacter sp. CF,
Dehalobacter sp. DCA and in the last two species they have been identified as putative
129
PceT. The trigger factor in contig_161 (TF161) is also found in the same three
Dehalobactor species and is identical to the cell division trigger factors in the respective
species. The cell division trigger factor in Dehalobactor sp. UNSWDHB and Dehalobacter
sp. CF is upregulated during chloroform respiration (Jugder et al., 2016, Tang and
Edwards, 2013).
130
4.2 EXPERIMENTAL PROCEDURES
4.2.1 Plasmid construction
For heterologous expression of TmrA in S. blattae both the tmrA gene including the TAT
signal (NCBI Reference Sequence: WP_034377773.1 GI:736352001), which will be
refered to as tmrA_full throughout the study, and the TAT signal removed tmrA as used
in the previous two chapters, were used. Codon optimized gBlocks of tmrA_full, tf104
and tf161 were ordered from Integrated DNA Technologies. The pD864-TmrA construct
described in (Jugder et al., 2018) was used as the DNA template for the TAT signal
removed tmrA.
Two expression vectors were used in this study: pASK-IBA63c-plus, where the expression
cassette is under the transcriptional control of tetracycline promotor and pBBR1MCS-2
controlled by Lac promoter. Both vectors have been previously described for
heterlogous gene expression in S.blattae. The vector maps for both plasmids are found
in the Appendices.
4.2.1.1 PCR
The vectors used in this experiment were linearized using a polymerase chain reaction
(PCR). The insert genes were amplified to include required overhangs and restriction
sites to facilitate assembly. Each reaction volume of 25 µL contained 12.5 µL Q5 High-
Fidelity 2X Master Mix (New England Biolabs, Ipswich, MA, USA), 0.5 µM of forward and
reverse primers, ~100 ng of template DNA and the required amount of nuclease-free
water to make up the reaction volume. The amplification reactions were carried out in
a BIO-RAD C1000 TouchTM Thermal Cycler using the following cycling conditions: Initial
denaturation at 98 °C for 30 s, 35 cycles of 10 s denaturation at 98 °C, 30 s at respective
annealing temperature (the annealing temperature was determined using the NEB Tm
calculator, https://tmcalculator.neb.com/) and 30 s per kb extension at 72 °C, followed
by a final extension of 3 min at 72 °C. Where the annealing temperature determined by
NEB Tm calculator failed to generate the desired gene product or resulted in unwanted
131
non-specific bindings, temperature gradients were used to determine the best
annealing temperature.
The primers used in different PCR reactions used in this study are listed in Table 4.1.
Primers were purchased from Sigma-Aldrich.
4.2.1.2 PCR purification
All PCR products went through a purification step to remove primers and impurities
using a PCR purification Kit (Qiagen) following the manufacturer’s instructions.
4.2.1.3 DpnI digestion
The purified PCR products were treated with DpnI (NEB) to remove the methylated
template DNA. Digestion was carried out in 1X CutSmart® Buffer for 1 h at 37 °C followed
by an enzyme inactivation step at 80 °C for 20 min.
4.2.1.4 Gibson assembly
The tmrA gene without the TAT signal was cloned into vectors pASK-IBA63c-plus and
pBBR1MCS-2 using a Gibson assembly method (Gibson et al., 2010, Gibson et al., 2009).
A Gibson assembly kit from NEB was used for this purpose. A 20 µL reaction mixture
consisting of 0.02–0.5 pmols DNA (2 to 5-fold molar excess of insert than vector was
used), 10 μl of Gibson Assembly Master Mix (2X) and the required amount of deionized
H2O was incubated at 50 °C for 1 h. 2-4 µL of assembled plasmid was used to transfer
competent E . coli JM109 (Promega) cells by heat shock according to the manufacturer’s
instructions.
132
4.2.1.5 Golden Gate cloning
For cloning the tmrA_full gene (tmrA with TAT signal) into the pASK-IBA63c-plus vector
and cloning putative trigger factor genes tf104 and tf161 into both pASK-IBA63c-plus
and pBBR1MCS-2 vectors, Golden Gate cloning was performed (Engler et al., 2009,
Engler et al., 2008). The type IIS restriction enzyme BsaI and T4 DNA ligase from NEB was
used for these reactions. A 20 μL reaction volume consisted of 2 μL 10X CutSmart buffer,
2 μL 10 mM ATP, 0.5 μL BsaI enzyme, 0.25 μL T4 DNA ligase, 5:1 ratio of insert to plasmid
and deionized H2O. The reaction mixture was incubated at 37 °C for 20 min. After
incubation 2-4 µL of the reaction mix was used to transfer competent E . coli JM109 cells
by heat shock.
4.2.1.6 Colony PCR
A suitable number of colonies were selected to screen for successful transformation of
recombinant plasmids. Each colony to be screened was boiled in 15 μL of lysis buffer (TE
buffer + 0.1% Triton-X100) for 5 min, then cooled on ice for another 5 min. The lysates
were then centrifuged at 13,000 g for 10 min and 2-4 μL of the supernatant was used as
template for colony PCR. The PCR protocol was the same as described in section 4.2.1.1.
Primers no. 3,4, 19-28 in Table 4.1 were used in the respective PCR reactions.
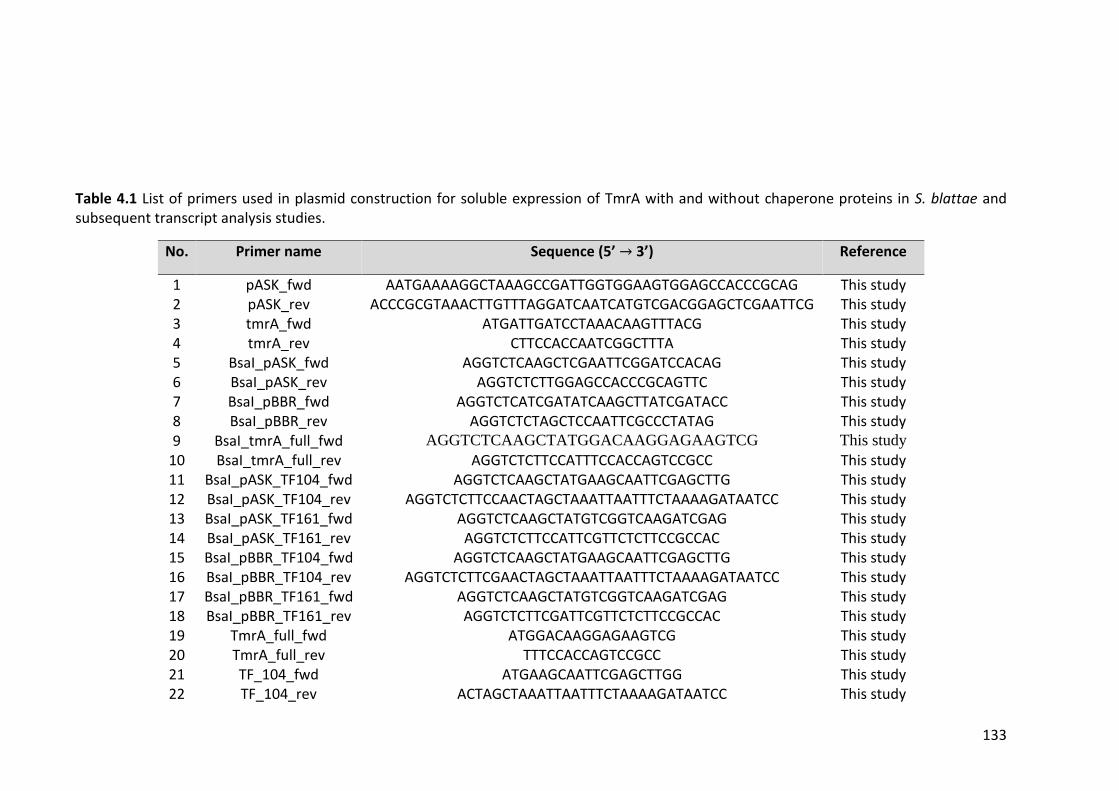
133
Table 4.1 List of primers used in plasmid construction for soluble expression of TmrA with and without chaperone proteins in S. blattae and subsequent transcript analysis studies.
No. Primer name Sequence (5’ → 3’) Reference
1 pASK_fwd AATGAAAAGGCTAAAGCCGATTGGTGGAAGTGGAGCCACCCGCAG This study 2 pASK_rev ACCCGCGTAAACTTGTTTAGGATCAATCATGTCGACGGAGCTCGAATTCG This study 3 tmrA_fwd ATGATTGATCCTAAACAAGTTTACG This study 4 tmrA_rev CTTCCACCAATCGGCTTTA This study 5 BsaI_pASK_fwd AGGTCTCAAGCTCGAATTCGGATCCACAG This study 6 BsaI_pASK_rev AGGTCTCTTGGAGCCACCCGCAGTTC This study 7 BsaI_pBBR_fwd AGGTCTCATCGATATCAAGCTTATCGATACC This study 8 BsaI_pBBR_rev AGGTCTCTAGCTCCAATTCGCCCTATAG This study 9 BsaI_tmrA_full_fwd AGGTCTCAAGCTATGGACAAGGAGAAGTCG This study
10 BsaI_tmrA_full_rev AGGTCTCTTCCATTTCCACCAGTCCGCC This study 11 BsaI_pASK_TF104_fwd AGGTCTCAAGCTATGAAGCAATTCGAGCTTG This study 12 BsaI_pASK_TF104_rev AGGTCTCTTCCAACTAGCTAAATTAATTTCTAAAAGATAATCC This study 13 BsaI_pASK_TF161_fwd AGGTCTCAAGCTATGTCGGTCAAGATCGAG This study 14 BsaI_pASK_TF161_rev AGGTCTCTTCCATTCGTTCTCTTCCGCCAC This study 15 BsaI_pBBR_TF104_fwd AGGTCTCAAGCTATGAAGCAATTCGAGCTTG This study 16 BsaI_pBBR_TF104_rev AGGTCTCTTCGAACTAGCTAAATTAATTTCTAAAAGATAATCC This study 17 BsaI_pBBR_TF161_fwd AGGTCTCAAGCTATGTCGGTCAAGATCGAG This study 18 BsaI_pBBR_TF161_rev AGGTCTCTTCGATTCGTTCTCTTCCGCCAC This study 19 TmrA_full_fwd ATGGACAAGGAGAAGTCG This study 20 TmrA_full_rev TTTCCACCAGTCCGCC This study 21 TF_104_fwd ATGAAGCAATTCGAGCTTGG This study 22 TF_104_rev ACTAGCTAAATTAATTTCTAAAAGATAATCC This study
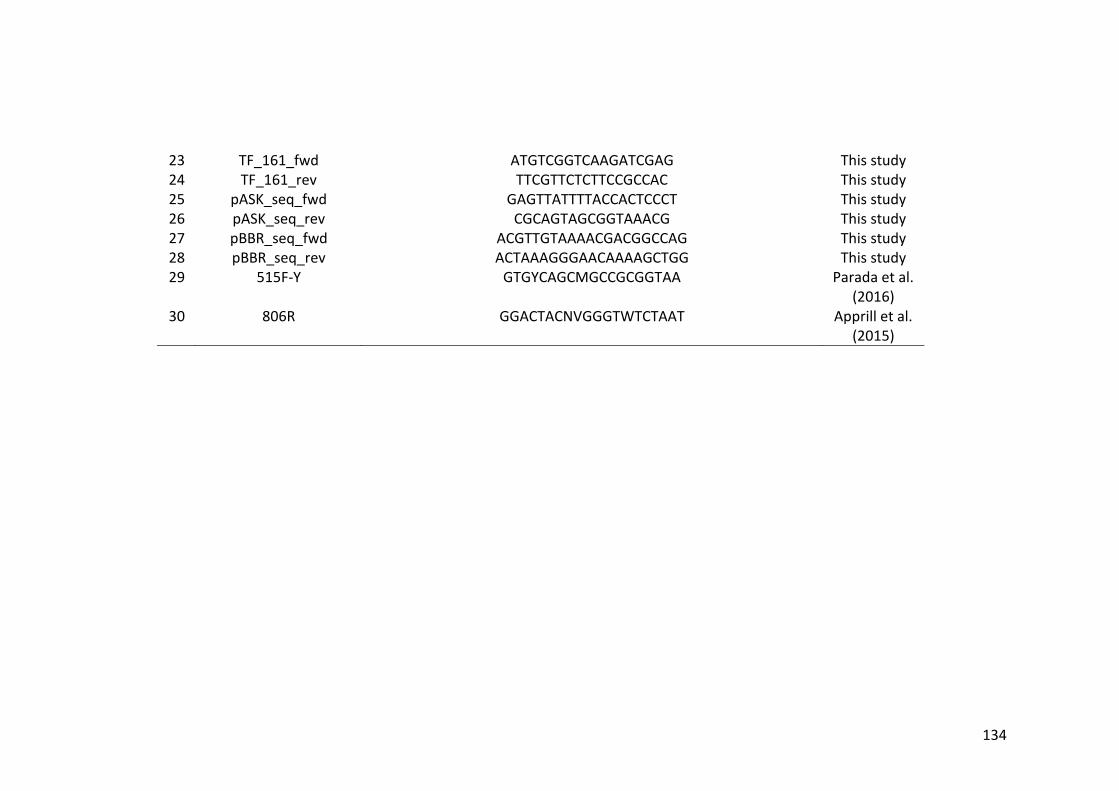
134
23 TF_161_fwd ATGTCGGTCAAGATCGAG This study 24 TF_161_rev TTCGTTCTCTTCCGCCAC This study 25 pASK_seq_fwd GAGTTATTTTACCACTCCCT This study 26 pASK_seq_rev CGCAGTAGCGGTAAACG This study 27 pBBR_seq_fwd ACGTTGTAAAACGACGGCCAG This study 28 pBBR_seq_rev ACTAAAGGGAACAAAAGCTGG This study 29 515F-Y GTGYCAGCMGCCGCGGTAA Parada et al.
(2016) 30 806R GGACTACNVGGGTWTCTAAT Apprill et al.
(2015)
135
4.2.1.7 Sequencing
Plasmid DNA was isolated from overnight cultures of E. coli using a QIAprep Spin
Miniprep Kit (Qiagen) using the manufacturer’s instructions. The quality (A260/A280 and
A260/A230) and quantity (ng/ μL) of the extracted DNA were measured using a NanoDrop
One and a Qubit™ 4 Fluorometer from Thermo Fisher Scientific respectively. Samples
were prepared according to the guidelines described in
http://www.ramaciotti.unsw.edu.au and sent to the Ramaciotti Center for Genomics at
UNSW for Sanger sequencing.
4.2.2 Preparing competent S. blattae cells and transformation
4.2.2.1 Chemically competent cells
An overnight culture of S. blattae in LB media was sub-cultured (1:100) in LB media. After
they reached an OD600 of 0.5 - 0.7, cells were collected in sterile 50 mL tubes by
centrifugation at 8,000 g, 4 °C for 10 min. Cells were washed once with ice-cold 30 mM
CaCl2 and then resuspended in the same. Competent cells were then transformed with
1-4 µL of assembly product by heat shock and were plated on LB agar supplemented
with suitable antibiotics. Aliquots of 50 μL were stored at -80 °C for future use.
4.2.2.2 Electrocompetent cells
An overnight culture of S. blattae was sub-cultured in SOB media. When the OD600
reached a value of 0.5 - 0.7 the culture was placed on ice for 15 min. From this point
forward the cells were kept ice cold. Cells were harvested by centrifugation at 5,000 g
for 10 min at 4 °C. Cells were then washed two times with sterile ice-cold 10% glycerol
solution. Cells were resuspended in a suitable volume of sterile 10% glycerol solution
and stored at -80 °C in aliquots of 100 μL.
For electroporation 2-4 μL of plasmid was mixed with 100 μL of electrocompetent cells
and transferred into an ice-cooled 2 mm electroporation cuvette. The cells were
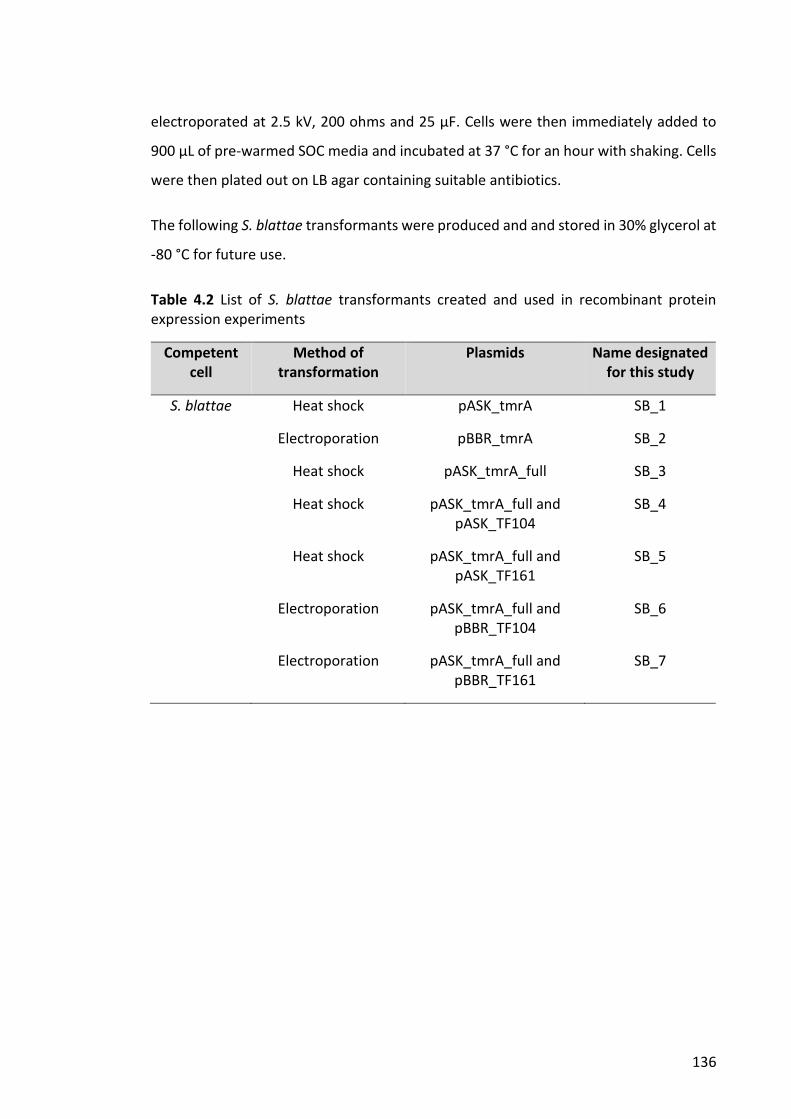
136
electroporated at 2.5 kV, 200 ohms and 25 µF. Cells were then immediately added to
900 μL of pre-warmed SOC media and incubated at 37 °C for an hour with shaking. Cells
were then plated out on LB agar containing suitable antibiotics.
The following S. blattae transformants were produced and and stored in 30% glycerol at
-80 °C for future use.
Table 4.2 List of S. blattae transformants created and used in recombinant protein expression experiments
Competent cell
Method of transformation
Plasmids Name designated for this study
S. blattae Heat shock pASK_tmrA SB_1
Electroporation pBBR_tmrA SB_2
Heat shock pASK_tmrA_full SB_3
Heat shock pASK_tmrA_full and pASK_TF104
SB_4
Heat shock pASK_tmrA_full and pASK_TF161
SB_5
Electroporation pASK_tmrA_full and pBBR_TF104
SB_6
Electroporation pASK_tmrA_full and pBBR_TF161
SB_7
137
4.2.3 Heterologous expression of CF reductive dehalogenase in S. blattae
4.2.3.1 Anhydrotetracycline-inducible expression
For the heterologous production of the TmrA, S. blattae strains were cultivated
anaerobically in a defined mineral medium described by Kunze et al., (2017). The recipe
of the media is described in the Appendices (A.3). For each transformant, LB-grown pre-
culture cultivated aerobically overnight at 28 °C was used for inoculation of a second 20
mL LB pre-culture which was grown aerobically at 28 °C for 7–8 h. This second culture
was used as an inoculum (initial OD600 of 0.1) for a third pre-culture grown anaerobically
at 24 °C in the defined mineral medium. When the OD600 of this pre-culture reached a
value of 1.2–2.1, it was used to inoculate the main anaerobic culture of S. blattae
transformant at an initial OD600 of 0.02. The main culture was supplemented with 1 μM
vitamin B12. The cells were cultured at 18 °C up to an OD600 of 0.2–0.4 and were then
induced by the addition of 200 ng/mL anhydrotetracycline. S. blattae strains were
harvested after 6 h by centrifugation at 10,000 g at 4 °C for 10 min under aerobic
conditions.
4.2.3.2 IPTG-inducible expression
A single colony of transformant S. blattae was incubated overnight in 5 mL LB with 50
µg/mL kanamycin. The next day the overnight culture was diluted 1:50 in fresh LB media.
The culture was maintained at 28 °C and agitated at 180 rpm until it reached an OD600
of 0.4. The culture was then inducted with 1 mM IPTG for 3 hours at the same
temperature and agitation speed.
For anaerobic expression, an overnight culture of S. blattae was used to inoculate anoxic
defined media (recipe in the Appendices, A.3) at OD600 of 0.1. The culture was
maintained at 30° C without shaking and induced with 1 mM IPTG when the OD600
reached 0.6. The cells were harvested under aerobic conditions after 6 h of induction.
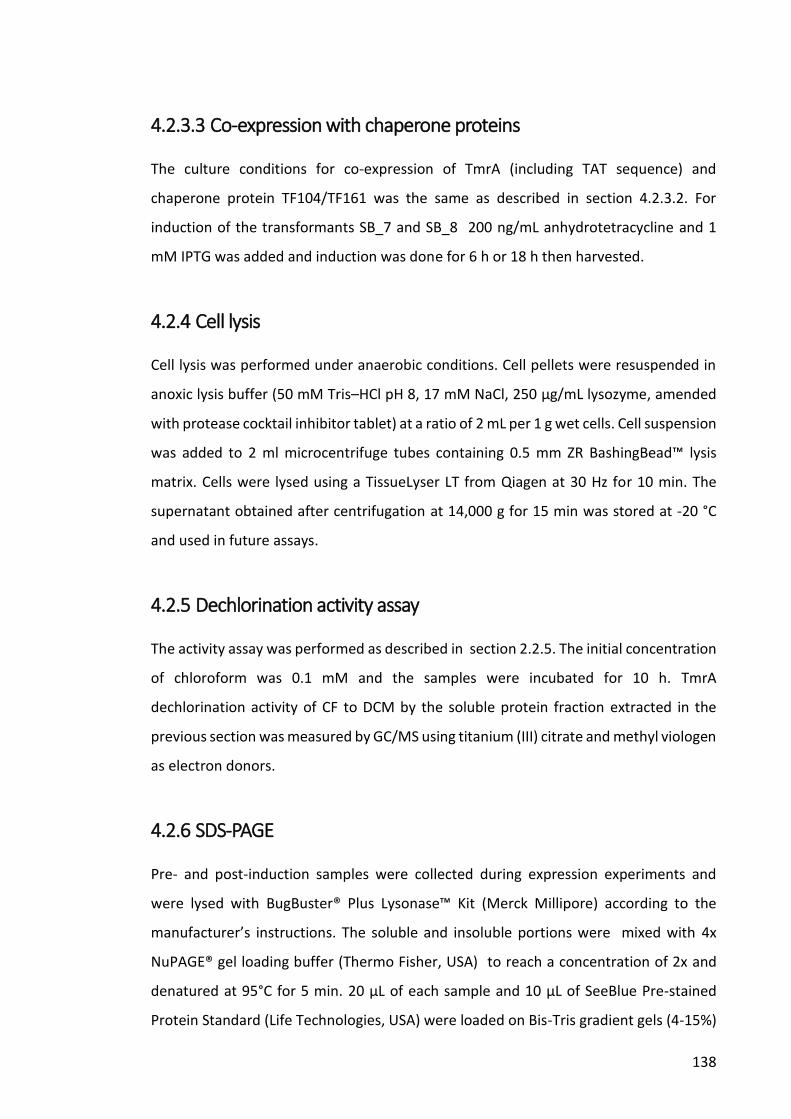
138
4.2.3.3 Co-expression with chaperone proteins
The culture conditions for co-expression of TmrA (including TAT sequence) and
chaperone protein TF104/TF161 was the same as described in section 4.2.3.2. For
induction of the transformants SB_7 and SB_8 200 ng/mL anhydrotetracycline and 1
mM IPTG was added and induction was done for 6 h or 18 h then harvested.
4.2.4 Cell lysis
Cell lysis was performed under anaerobic conditions. Cell pellets were resuspended in
anoxic lysis buffer (50 mM Tris–HCl pH 8, 17 mM NaCl, 250 μg/mL lysozyme, amended
with protease cocktail inhibitor tablet) at a ratio of 2 mL per 1 g wet cells. Cell suspension
was added to 2 ml microcentrifuge tubes containing 0.5 mm ZR BashingBead™ lysis
matrix. Cells were lysed using a TissueLyser LT from Qiagen at 30 Hz for 10 min. The
supernatant obtained after centrifugation at 14,000 g for 15 min was stored at -20 °C
and used in future assays.
4.2.5 Dechlorination activity assay
The activity assay was performed as described in section 2.2.5. The initial concentration
of chloroform was 0.1 mM and the samples were incubated for 10 h. TmrA
dechlorination activity of CF to DCM by the soluble protein fraction extracted in the
previous section was measured by GC/MS using titanium (III) citrate and methyl viologen
as electron donors.
4.2.6 SDS-PAGE
Pre- and post-induction samples were collected during expression experiments and
were lysed with BugBuster® Plus Lysonase™ Kit (Merck Millipore) according to the
manufacturer’s instructions. The soluble and insoluble portions were mixed with 4x
NuPAGE® gel loading buffer (Thermo Fisher, USA) to reach a concentration of 2x and
denatured at 95°C for 5 min. 20 μL of each sample and 10 μL of SeeBlue Pre-stained
Protein Standard (Life Technologies, USA) were loaded on Bis-Tris gradient gels (4-15%)
139
(Life Technologies, USA) in NuPAGE® MES running buffer (Invitrogen, USA) and
separated at 150 V for 40 min. After washing and staining with GelCode™ Blue Stain
Reagent (Thermo Fisher, USA) gels were imaged using a Gel Doc™ XR+ Imager (BIORAD).
The relevant proteins were identified by LC-MS/MS performed at the Biomedical Mass
Spectrometry Facility, UNSW.
4.2.7 Transcript analysis
Bacterial cell pellets were analysed for the presence of transcripts corresponding to
tmrA, tmrA_full, tf104 and tf161 genes. Cells were lysed for RNA extraction by adding 1
mL of TRI Reagent® (Sigma-Aldrich, St. Louis, MO, USA) to approx. 107 bacterial cells and
pipetting. Lysates were stored at -80°C until needed.
Cell lysates were thawed, and RNA was extracted using Direct-zol™ RNA MiniPrep Kit
(Zymo Research, Irvine, CA, USA) following the manufacturers’ instruction. The RNA
extracts were checked for DNA contamination by 16s rRNA gene PCR amplification using
515F–806R primer pair. 25 µL reactions contained 12.5 µL Q5 High-Fidelity 2X Master
Mix (New England Biolabs, Ipswich, MA, USA), 0.5 µM of respective primers, ~100 ng of
template DNA and required amount of nuclease-free water to make up the reaction
volume. The PCR reactions were performed in a thermocycler using the following cycling
conditions: Initial denaturation at 98 °C for 30 s, 35 cycles of 10 s denaturation at 98 °C,
30 s annealing at 60 °C (the annealing temperature was determined using the NEB Tm
calculator, https://tmcalculator.neb.com/) and 30 s per kb extension at 72 °C, followed
by a final extension of 3 min at 72 °C. PCR products were analysed using E-Gel Precast
Agarose Electrophoresis System (Thermo Fisher Scientific). If the gels showed presence
of DNA contamination in the RNA extracts, the residual DNA was removed using
Ambion® Turbo DNA-free™ Kit (Life Technologies, Carlsbad, CA, USA) as described by
the manufacturer.
DNA-free RNA extracts were used for cDNA synthesis using ProtoScript® II First Strand
cDNA Synthesis Kit (New England Biolabs, Ipswich, MA, USA). Reactions were performed
following the standard protocol supplied by the manufacturer using the Random Primer
Mix. Successful cDNA synthesis was verified via 16S rRNA gene PCR amplification as

140
described above. The presence of transcripts of interest was detected by amplifying the
genes of interest using specific primer pairs (Table 4.1). The PCR reactions and product
analysis were performed as described above.
141
4.3 RESULTS
Several different approaches were tested and compared for heterologous expression of
functional TmrA in cobalamin-synthesizing S. blattae. Anhydrotetracycline-inducible and
IPTG-inducible expression systems were used. Initially tmrA gene devoid of a TAT signal
and predicted membrane spanning regions was expressed. For co-expression with
chaperone proteins tmrA gene including the TAT signal (tmrA_full) was synthesized.
4.3.1 Anhydrotetracycline-inducible expression of TmrA in S. blattae
4.3.1.1 Expression of TmrA without the TAT-signal
The tmrA gene cloned into pD864 vector obtained from Jugder et al., (2018) was excised
by PCR and used as the insert (Figure 4.2). pASK-IBA63c-plus vector was linearized by
PCR using a primer pair that contained the relevant overhangs (Figure 4.2) to facilitate
Gibson assembly as described by Gibson et al., (2009). pASK-IBA63c-plus vector includes
a strep-tag sequence, the tmrA gene was cloned into the vector so that the strep-tag
was fused to the C-terminus. The strep-tag could facilitate in immunological detection
using Strep-tag-specific antibody and purification with strep-tactin columns. The correct
assembly after cloning was confirmed by colony PCR (Figure 4.2) and also Sanger
sequencing. Purified vector was then used to transform competent S. blattae cells.
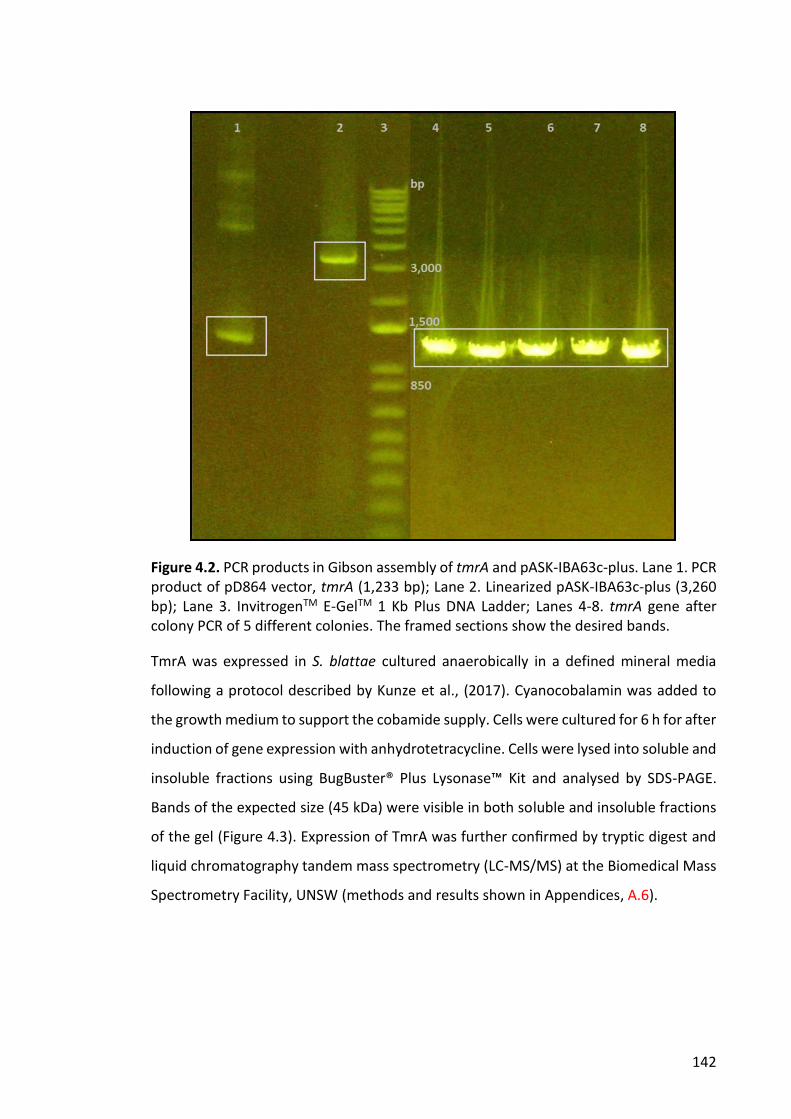
142
Figure 4.2. PCR products in Gibson assembly of tmrA and pASK-IBA63c-plus. Lane 1. PCR product of pD864 vector, tmrA (1,233 bp); Lane 2. Linearized pASK-IBA63c-plus (3,260 bp); Lane 3. InvitrogenTM E-GelTM 1 Kb Plus DNA Ladder; Lanes 4-8. tmrA gene after colony PCR of 5 different colonies. The framed sections show the desired bands.
TmrA was expressed in S. blattae cultured anaerobically in a defined mineral media
following a protocol described by Kunze et al., (2017). Cyanocobalamin was added to
the growth medium to support the cobamide supply. Cells were cultured for 6 h for after
induction of gene expression with anhydrotetracycline. Cells were lysed into soluble and
insoluble fractions using BugBuster® Plus Lysonase™ Kit and analysed by SDS-PAGE.
Bands of the expected size (45 kDa) were visible in both soluble and insoluble fractions
of the gel (Figure 4.3). Expression of TmrA was further confirmed by tryptic digest and
liquid chromatography tandem mass spectrometry (LC-MS/MS) at the Biomedical Mass
Spectrometry Facility, UNSW (methods and results shown in Appendices, A.6).
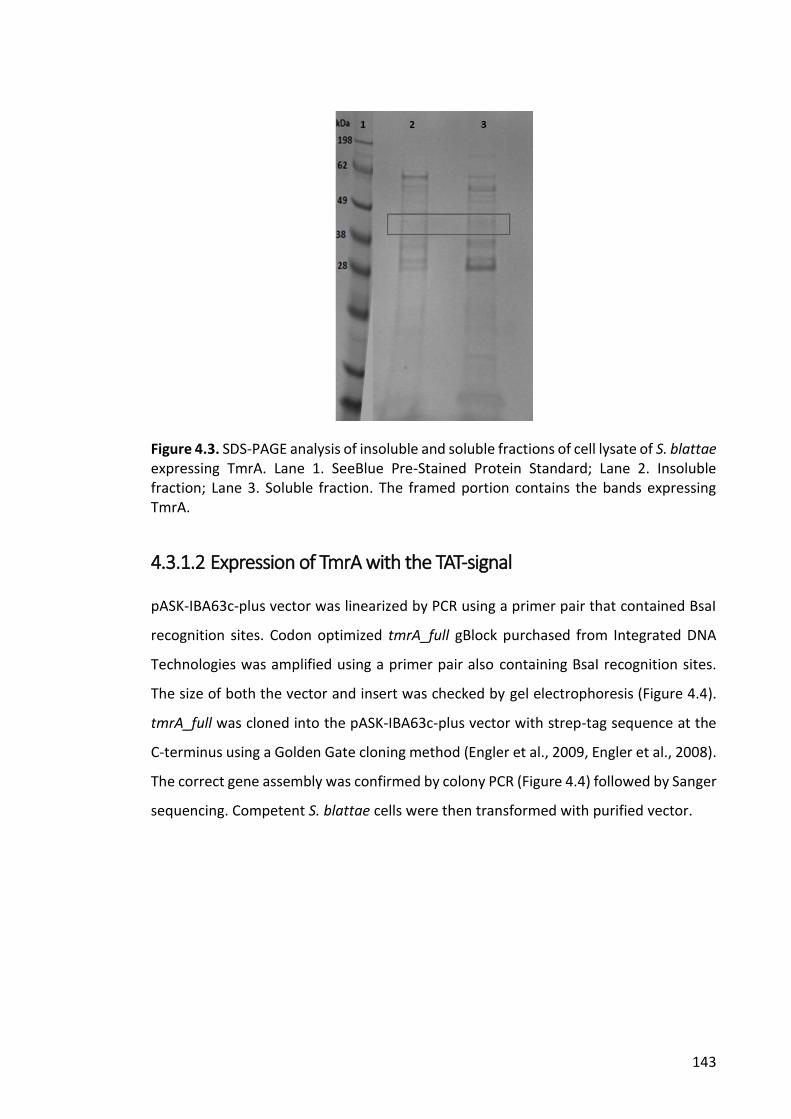
143
Figure 4.3. SDS-PAGE analysis of insoluble and soluble fractions of cell lysate of S. blattae expressing TmrA. Lane 1. SeeBlue Pre-Stained Protein Standard; Lane 2. Insoluble fraction; Lane 3. Soluble fraction. The framed portion contains the bands expressing TmrA.
4.3.1.2 Expression of TmrA with the TAT-signal
pASK-IBA63c-plus vector was linearized by PCR using a primer pair that contained BsaI
recognition sites. Codon optimized tmrA_full gBlock purchased from Integrated DNA
Technologies was amplified using a primer pair also containing BsaI recognition sites.
The size of both the vector and insert was checked by gel electrophoresis (Figure 4.4).
tmrA_full was cloned into the pASK-IBA63c-plus vector with strep-tag sequence at the
C-terminus using a Golden Gate cloning method (Engler et al., 2009, Engler et al., 2008).
The correct gene assembly was confirmed by colony PCR (Figure 4.4) followed by Sanger
sequencing. Competent S. blattae cells were then transformed with purified vector.

144
Figure 4.4. PCR products for Golden Gate cloning and subsequent colony PCR. Lane 1. InvitrogenTM E-GelTM 1 Kb Plus DNA Ladder; Lane 2. Linearized pASK-IBA63c-plus; Lane 3. tmrA_full; Lanes 4-13. Colony PCR products from colonies 1-10 (Colony 6 in Lane 9 shows the correct band, albeit very faint); Lane 14. InvitrogenTM E-GelTM 1 Kb Plus DNA Ladder; Lane 15. tmrA_full (Plasmid was harvested by a mini-prep protocol from the colony with the correct gene insert. PCR using the plasmid as template showed strong band at correct position). Framed sections show the desired bands.
TmrA including the TAT sequence was expressed in S. blattae cultured anaerobically
following the same protocol described in section 4.3.1.1. Cell lysates were analysed on
SDS-PAGE gel (Figure 4.5.). However, distinct bands of the expected size (~50 kDa) were
not distinguishable. Expression of TmrA was confirmed by dehalogenation of CF to DCM
described further in section 4.3.5.
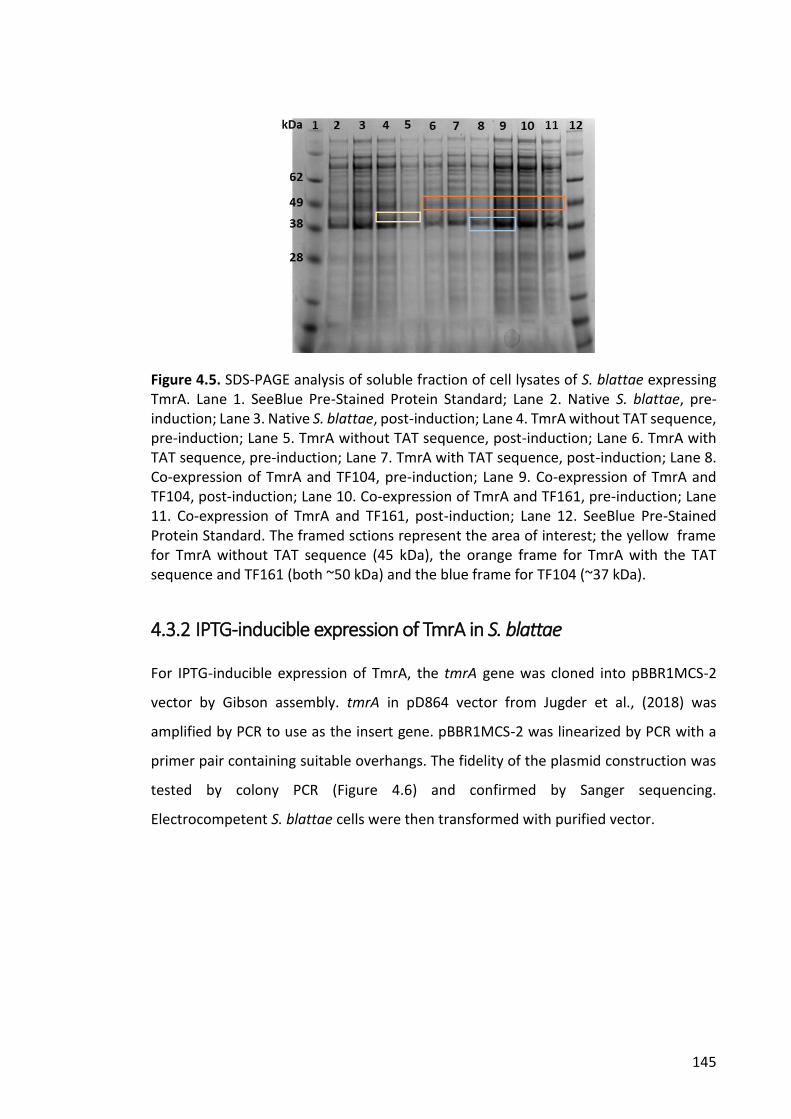
145
Figure 4.5. SDS-PAGE analysis of soluble fraction of cell lysates of S. blattae expressing TmrA. Lane 1. SeeBlue Pre-Stained Protein Standard; Lane 2. Native S. blattae, pre-induction; Lane 3. Native S. blattae, post-induction; Lane 4. TmrA without TAT sequence, pre-induction; Lane 5. TmrA without TAT sequence, post-induction; Lane 6. TmrA with TAT sequence, pre-induction; Lane 7. TmrA with TAT sequence, post-induction; Lane 8. Co-expression of TmrA and TF104, pre-induction; Lane 9. Co-expression of TmrA and TF104, post-induction; Lane 10. Co-expression of TmrA and TF161, pre-induction; Lane 11. Co-expression of TmrA and TF161, post-induction; Lane 12. SeeBlue Pre-Stained Protein Standard. The framed sctions represent the area of interest; the yellow frame for TmrA without TAT sequence (45 kDa), the orange frame for TmrA with the TAT sequence and TF161 (both ~50 kDa) and the blue frame for TF104 (~37 kDa).
4.3.2 IPTG-inducible expression of TmrA in S. blattae
For IPTG-inducible expression of TmrA, the tmrA gene was cloned into pBBR1MCS-2
vector by Gibson assembly. tmrA in pD864 vector from Jugder et al., (2018) was
amplified by PCR to use as the insert gene. pBBR1MCS-2 was linearized by PCR with a
primer pair containing suitable overhangs. The fidelity of the plasmid construction was
tested by colony PCR (Figure 4.6) and confirmed by Sanger sequencing.
Electrocompetent S. blattae cells were then transformed with purified vector.
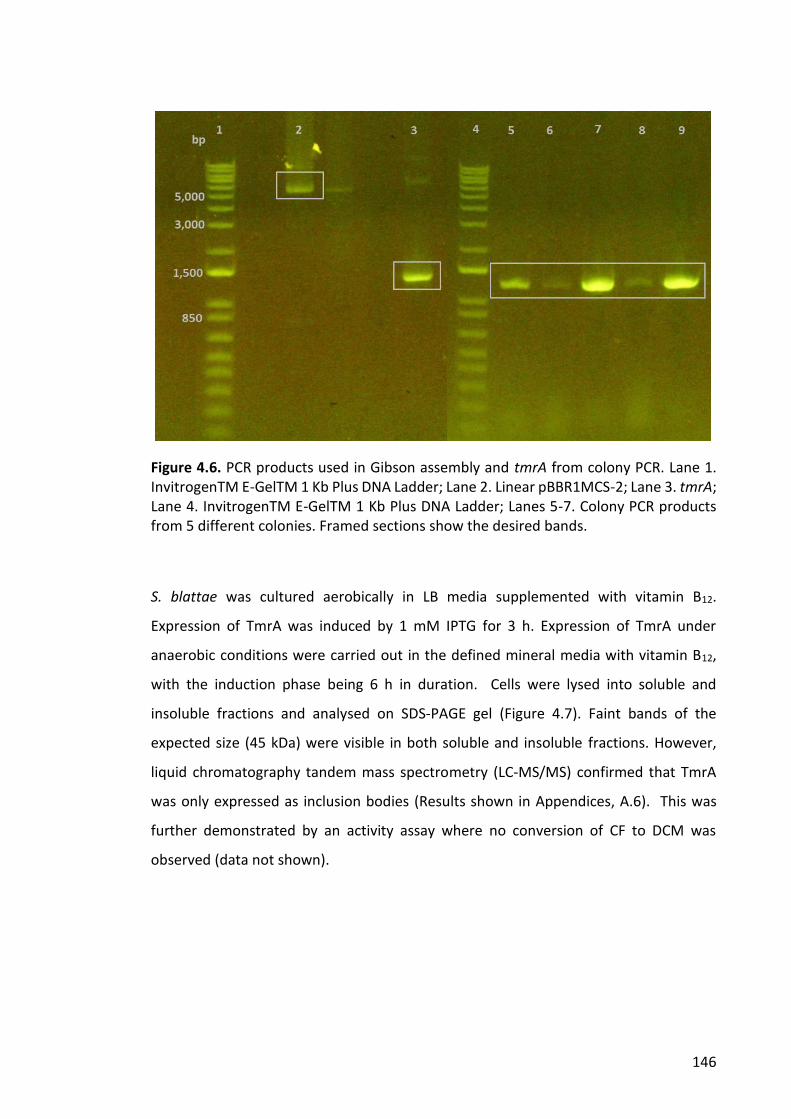
146
Figure 4.6. PCR products used in Gibson assembly and tmrA from colony PCR. Lane 1. InvitrogenTM E-GelTM 1 Kb Plus DNA Ladder; Lane 2. Linear pBBR1MCS-2; Lane 3. tmrA; Lane 4. InvitrogenTM E-GelTM 1 Kb Plus DNA Ladder; Lanes 5-7. Colony PCR products from 5 different colonies. Framed sections show the desired bands.
S. blattae was cultured aerobically in LB media supplemented with vitamin B12.
Expression of TmrA was induced by 1 mM IPTG for 3 h. Expression of TmrA under
anaerobic conditions were carried out in the defined mineral media with vitamin B12,
with the induction phase being 6 h in duration. Cells were lysed into soluble and
insoluble fractions and analysed on SDS-PAGE gel (Figure 4.7). Faint bands of the
expected size (45 kDa) were visible in both soluble and insoluble fractions. However,
liquid chromatography tandem mass spectrometry (LC-MS/MS) confirmed that TmrA
was only expressed as inclusion bodies (Results shown in Appendices, A.6). This was
further demonstrated by an activity assay where no conversion of CF to DCM was
observed (data not shown).
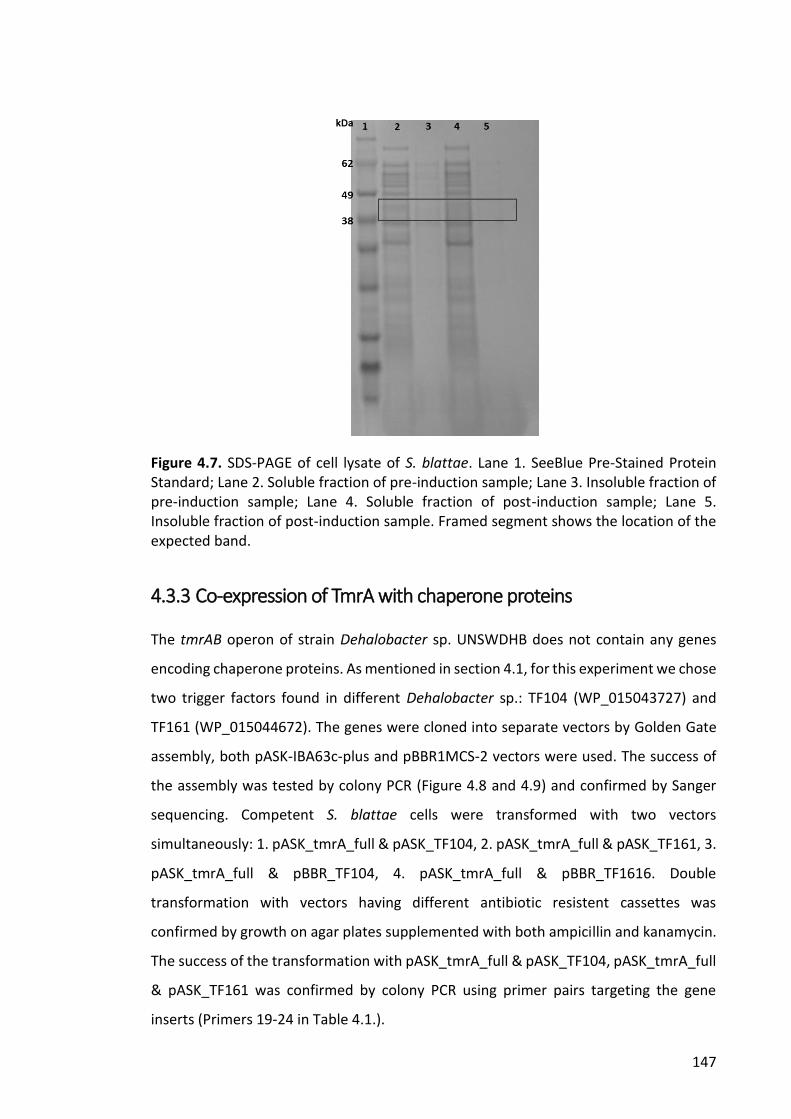
147
Figure 4.7. SDS-PAGE of cell lysate of S. blattae. Lane 1. SeeBlue Pre-Stained Protein Standard; Lane 2. Soluble fraction of pre-induction sample; Lane 3. Insoluble fraction of pre-induction sample; Lane 4. Soluble fraction of post-induction sample; Lane 5. Insoluble fraction of post-induction sample. Framed segment shows the location of the expected band.
4.3.3 Co-expression of TmrA with chaperone proteins
The tmrAB operon of strain Dehalobacter sp. UNSWDHB does not contain any genes
encoding chaperone proteins. As mentioned in section 4.1, for this experiment we chose
two trigger factors found in different Dehalobacter sp.: TF104 (WP_015043727) and
TF161 (WP_015044672). The genes were cloned into separate vectors by Golden Gate
assembly, both pASK-IBA63c-plus and pBBR1MCS-2 vectors were used. The success of
the assembly was tested by colony PCR (Figure 4.8 and 4.9) and confirmed by Sanger
sequencing. Competent S. blattae cells were transformed with two vectors
simultaneously: 1. pASK_tmrA_full & pASK_TF104, 2. pASK_tmrA_full & pASK_TF161, 3.
pASK_tmrA_full & pBBR_TF104, 4. pASK_tmrA_full & pBBR_TF1616. Double
transformation with vectors having different antibiotic resistent cassettes was
confirmed by growth on agar plates supplemented with both ampicillin and kanamycin.
The success of the transformation with pASK_tmrA_full & pASK_TF104, pASK_tmrA_full
& pASK_TF161 was confirmed by colony PCR using primer pairs targeting the gene
inserts (Primers 19-24 in Table 4.1.).
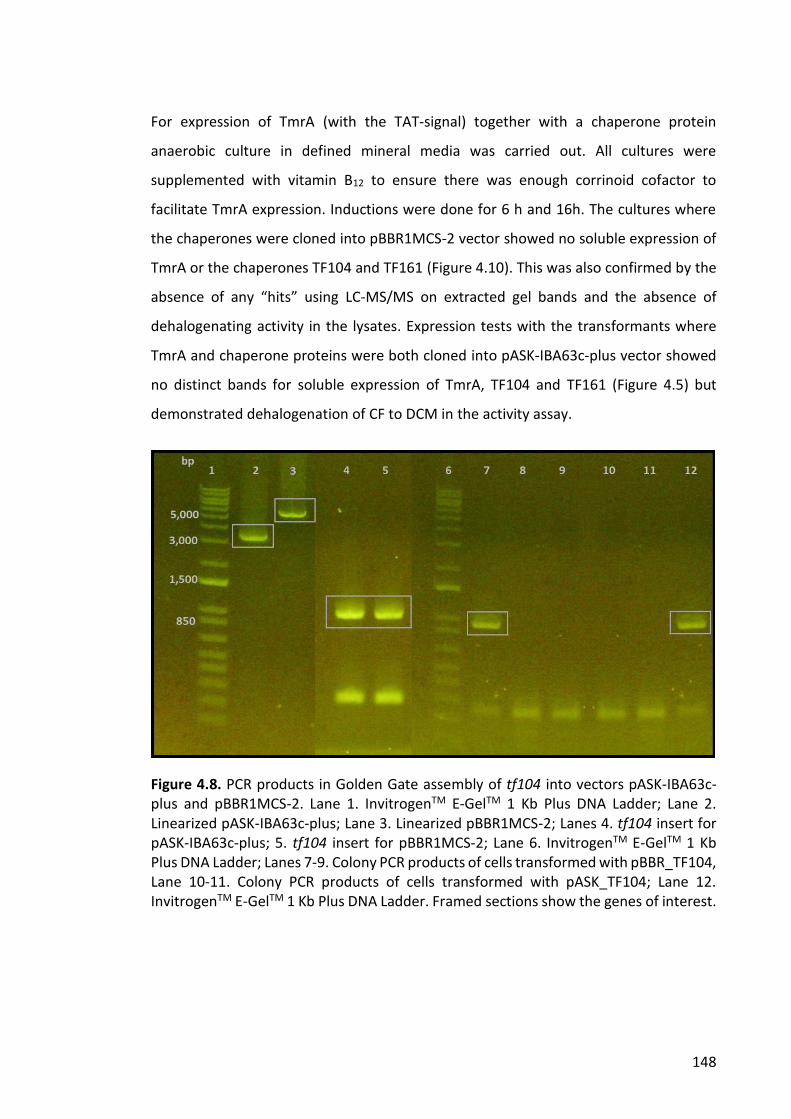
148
For expression of TmrA (with the TAT-signal) together with a chaperone protein
anaerobic culture in defined mineral media was carried out. All cultures were
supplemented with vitamin B12 to ensure there was enough corrinoid cofactor to
facilitate TmrA expression. Inductions were done for 6 h and 16h. The cultures where
the chaperones were cloned into pBBR1MCS-2 vector showed no soluble expression of
TmrA or the chaperones TF104 and TF161 (Figure 4.10). This was also confirmed by the
absence of any “hits” using LC-MS/MS on extracted gel bands and the absence of
dehalogenating activity in the lysates. Expression tests with the transformants where
TmrA and chaperone proteins were both cloned into pASK-IBA63c-plus vector showed
no distinct bands for soluble expression of TmrA, TF104 and TF161 (Figure 4.5) but
demonstrated dehalogenation of CF to DCM in the activity assay.
Figure 4.8. PCR products in Golden Gate assembly of tf104 into vectors pASK-IBA63c-plus and pBBR1MCS-2. Lane 1. InvitrogenTM E-GelTM 1 Kb Plus DNA Ladder; Lane 2. Linearized pASK-IBA63c-plus; Lane 3. Linearized pBBR1MCS-2; Lanes 4. tf104 insert for pASK-IBA63c-plus; 5. tf104 insert for pBBR1MCS-2; Lane 6. InvitrogenTM E-GelTM 1 Kb Plus DNA Ladder; Lanes 7-9. Colony PCR products of cells transformed with pBBR_TF104, Lane 10-11. Colony PCR products of cells transformed with pASK_TF104; Lane 12. InvitrogenTM E-GelTM 1 Kb Plus DNA Ladder. Framed sections show the genes of interest.
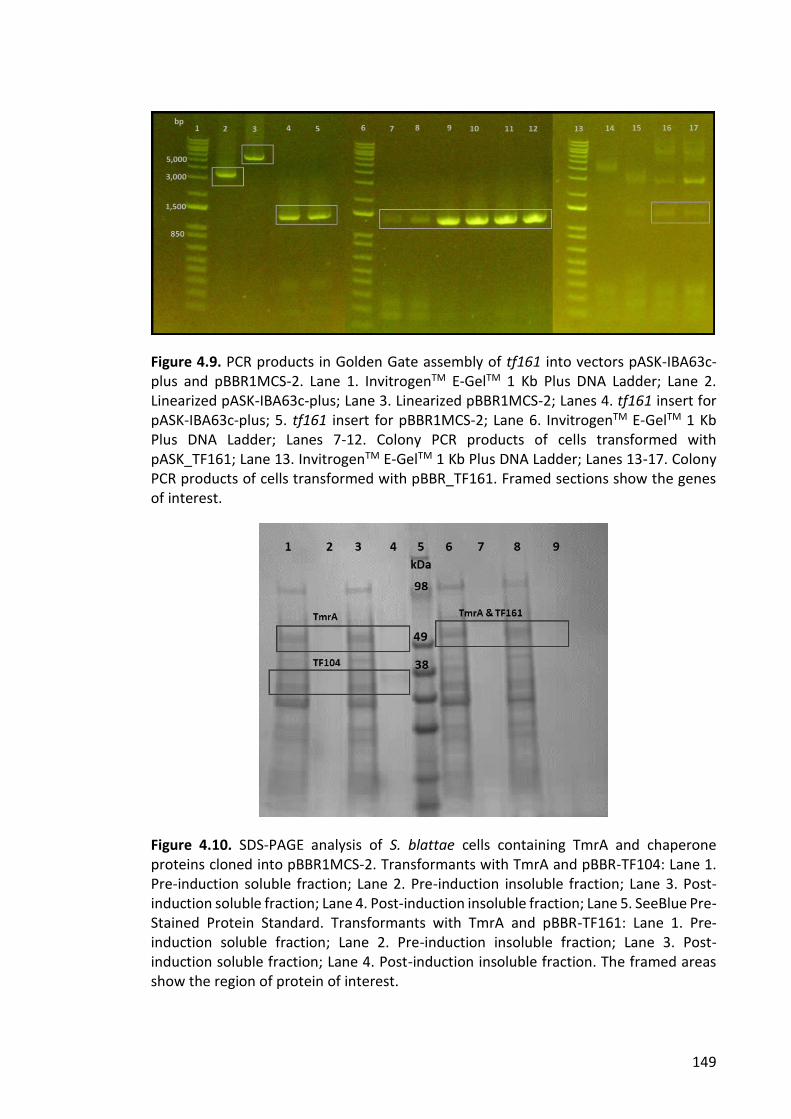
149
Figure 4.9. PCR products in Golden Gate assembly of tf161 into vectors pASK-IBA63c-plus and pBBR1MCS-2. Lane 1. InvitrogenTM E-GelTM 1 Kb Plus DNA Ladder; Lane 2. Linearized pASK-IBA63c-plus; Lane 3. Linearized pBBR1MCS-2; Lanes 4. tf161 insert for pASK-IBA63c-plus; 5. tf161 insert for pBBR1MCS-2; Lane 6. InvitrogenTM E-GelTM 1 Kb Plus DNA Ladder; Lanes 7-12. Colony PCR products of cells transformed with pASK_TF161; Lane 13. InvitrogenTM E-GelTM 1 Kb Plus DNA Ladder; Lanes 13-17. Colony PCR products of cells transformed with pBBR_TF161. Framed sections show the genes of interest.
Figure 4.10. SDS-PAGE analysis of S. blattae cells containing TmrA and chaperone proteins cloned into pBBR1MCS-2. Transformants with TmrA and pBBR-TF104: Lane 1. Pre-induction soluble fraction; Lane 2. Pre-induction insoluble fraction; Lane 3. Post-induction soluble fraction; Lane 4. Post-induction insoluble fraction; Lane 5. SeeBlue Pre-Stained Protein Standard. Transformants with TmrA and pBBR-TF161: Lane 1. Pre-induction soluble fraction; Lane 2. Pre-induction insoluble fraction; Lane 3. Post-induction soluble fraction; Lane 4. Post-induction insoluble fraction. The framed areas show the region of protein of interest.
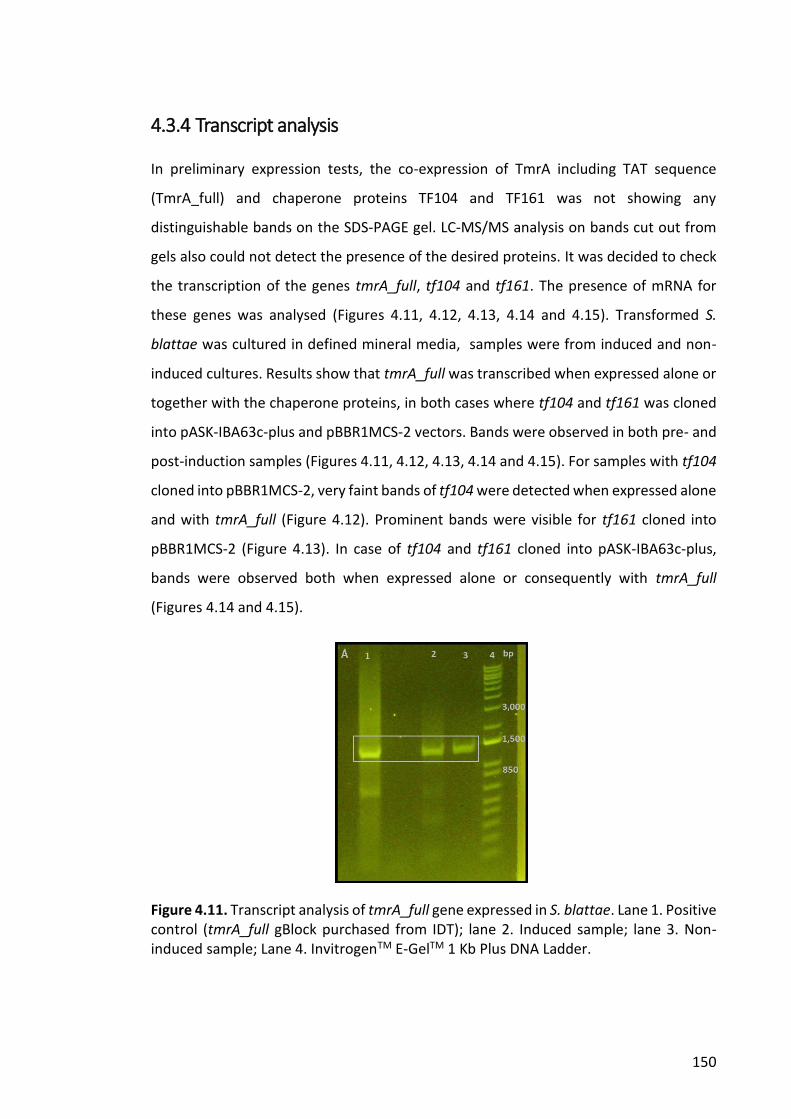
150
4.3.4 Transcript analysis
In preliminary expression tests, the co-expression of TmrA including TAT sequence
(TmrA_full) and chaperone proteins TF104 and TF161 was not showing any
distinguishable bands on the SDS-PAGE gel. LC-MS/MS analysis on bands cut out from
gels also could not detect the presence of the desired proteins. It was decided to check
the transcription of the genes tmrA_full, tf104 and tf161. The presence of mRNA for
these genes was analysed (Figures 4.11, 4.12, 4.13, 4.14 and 4.15). Transformed S.
blattae was cultured in defined mineral media, samples were from induced and non-
induced cultures. Results show that tmrA_full was transcribed when expressed alone or
together with the chaperone proteins, in both cases where tf104 and tf161 was cloned
into pASK-IBA63c-plus and pBBR1MCS-2 vectors. Bands were observed in both pre- and
post-induction samples (Figures 4.11, 4.12, 4.13, 4.14 and 4.15). For samples with tf104
cloned into pBBR1MCS-2, very faint bands of tf104 were detected when expressed alone
and with tmrA_full (Figure 4.12). Prominent bands were visible for tf161 cloned into
pBBR1MCS-2 (Figure 4.13). In case of tf104 and tf161 cloned into pASK-IBA63c-plus,
bands were observed both when expressed alone or consequently with tmrA_full
(Figures 4.14 and 4.15).
Figure 4.11. Transcript analysis of tmrA_full gene expressed in S. blattae. Lane 1. Positive control (tmrA_full gBlock purchased from IDT); lane 2. Induced sample; lane 3. Non-induced sample; Lane 4. InvitrogenTM E-GelTM 1 Kb Plus DNA Ladder.
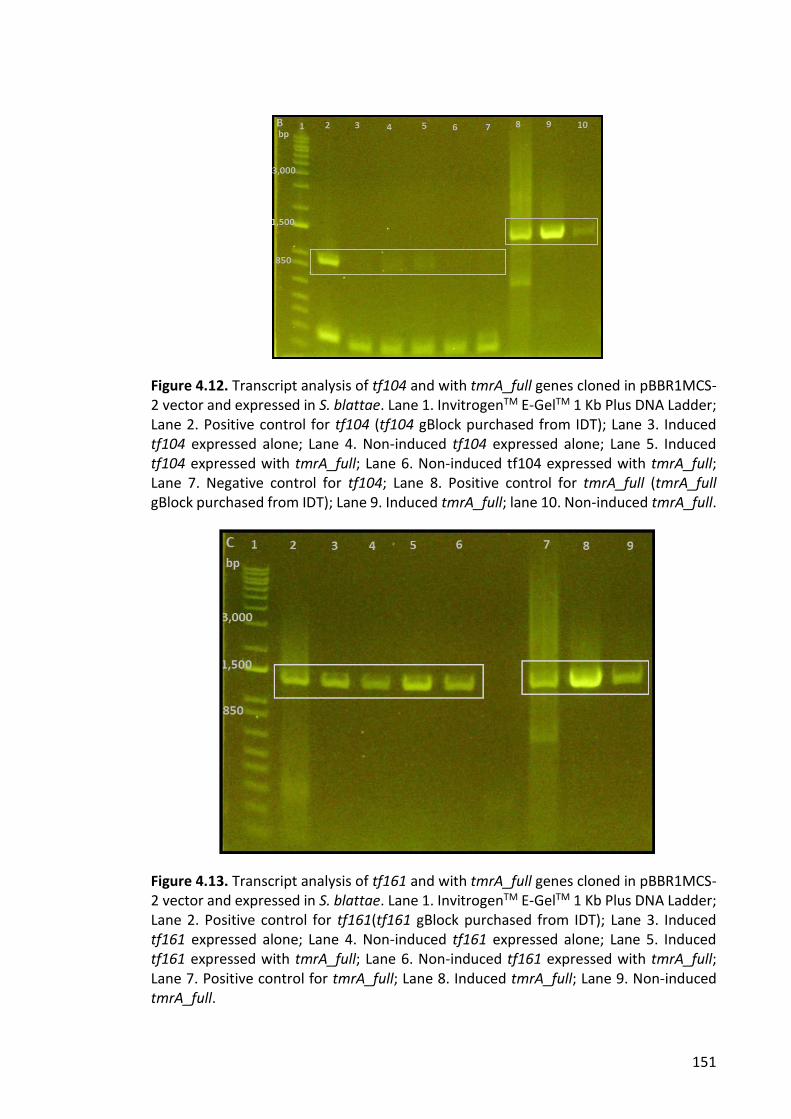
151
Figure 4.12. Transcript analysis of tf104 and with tmrA_full genes cloned in pBBR1MCS-2 vector and expressed in S. blattae. Lane 1. InvitrogenTM E-GelTM 1 Kb Plus DNA Ladder; Lane 2. Positive control for tf104 (tf104 gBlock purchased from IDT); Lane 3. Induced tf104 expressed alone; Lane 4. Non-induced tf104 expressed alone; Lane 5. Induced tf104 expressed with tmrA_full; Lane 6. Non-induced tf104 expressed with tmrA_full; Lane 7. Negative control for tf104; Lane 8. Positive control for tmrA_full (tmrA_full gBlock purchased from IDT); Lane 9. Induced tmrA_full; lane 10. Non-induced tmrA_full.
Figure 4.13. Transcript analysis of tf161 and with tmrA_full genes cloned in pBBR1MCS-2 vector and expressed in S. blattae. Lane 1. InvitrogenTM E-GelTM 1 Kb Plus DNA Ladder; Lane 2. Positive control for tf161(tf161 gBlock purchased from IDT); Lane 3. Induced tf161 expressed alone; Lane 4. Non-induced tf161 expressed alone; Lane 5. Induced tf161 expressed with tmrA_full; Lane 6. Non-induced tf161 expressed with tmrA_full; Lane 7. Positive control for tmrA_full; Lane 8. Induced tmrA_full; Lane 9. Non-induced tmrA_full.
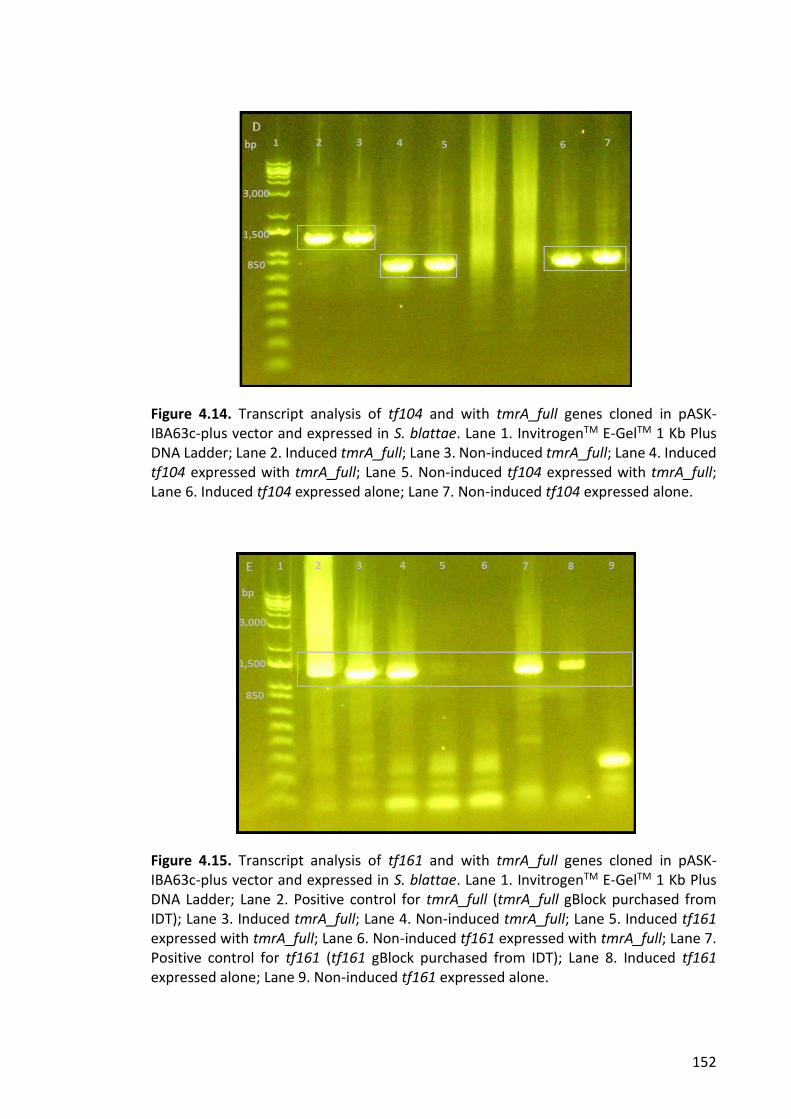
152
Figure 4.14. Transcript analysis of tf104 and with tmrA_full genes cloned in pASK-IBA63c-plus vector and expressed in S. blattae. Lane 1. InvitrogenTM E-GelTM 1 Kb Plus DNA Ladder; Lane 2. Induced tmrA_full; Lane 3. Non-induced tmrA_full; Lane 4. Induced tf104 expressed with tmrA_full; Lane 5. Non-induced tf104 expressed with tmrA_full; Lane 6. Induced tf104 expressed alone; Lane 7. Non-induced tf104 expressed alone.
Figure 4.15. Transcript analysis of tf161 and with tmrA_full genes cloned in pASK-IBA63c-plus vector and expressed in S. blattae. Lane 1. InvitrogenTM E-GelTM 1 Kb Plus DNA Ladder; Lane 2. Positive control for tmrA_full (tmrA_full gBlock purchased from IDT); Lane 3. Induced tmrA_full; Lane 4. Non-induced tmrA_full; Lane 5. Induced tf161 expressed with tmrA_full; Lane 6. Non-induced tf161 expressed with tmrA_full; Lane 7. Positive control for tf161 (tf161 gBlock purchased from IDT); Lane 8. Induced tf161 expressed alone; Lane 9. Non-induced tf161 expressed alone.
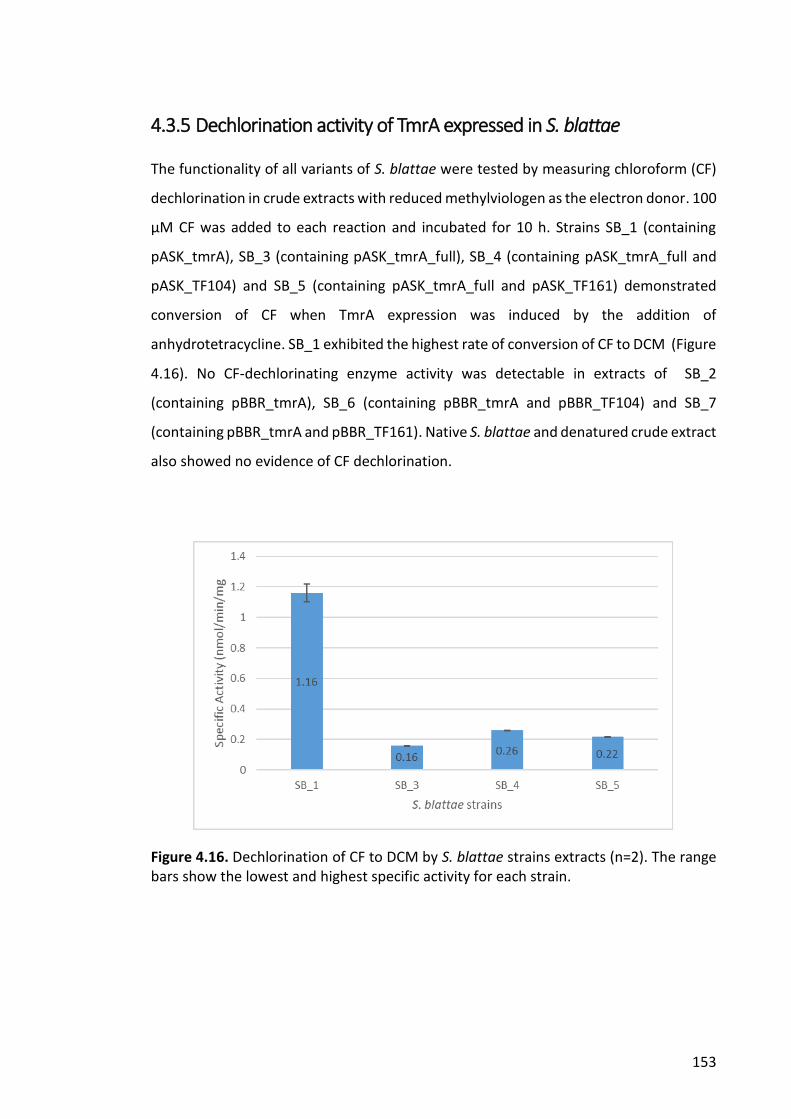
153
4.3.5 Dechlorination activity of TmrA expressed in S. blattae
The functionality of all variants of S. blattae were tested by measuring chloroform (CF)
dechlorination in crude extracts with reduced methylviologen as the electron donor. 100
µM CF was added to each reaction and incubated for 10 h. Strains SB_1 (containing
pASK_tmrA), SB_3 (containing pASK_tmrA_full), SB_4 (containing pASK_tmrA_full and
pASK_TF104) and SB_5 (containing pASK_tmrA_full and pASK_TF161) demonstrated
conversion of CF when TmrA expression was induced by the addition of
anhydrotetracycline. SB_1 exhibited the highest rate of conversion of CF to DCM (Figure
4.16). No CF-dechlorinating enzyme activity was detectable in extracts of SB_2
(containing pBBR_tmrA), SB_6 (containing pBBR_tmrA and pBBR_TF104) and SB_7
(containing pBBR_tmrA and pBBR_TF161). Native S. blattae and denatured crude extract
also showed no evidence of CF dechlorination.
Figure 4.16. Dechlorination of CF to DCM by S. blattae strains extracts (n=2). The range bars show the lowest and highest specific activity for each strain.
154
4.4 DISCUSSION
S. blattae was chosen as an expression host for TmrA because of its capability to
synthesize vitamin B12 de novo and its compatibility with the molecular tools developed
for E. coli. The corrinoid cofactor is an intricate part of RDase structure and is buried
inside a substrate binding pocket of the active site of properly folded proteins (Bommer
et al., 2014, Payne et al., 2015). The lack of proper corrinoid cofactor and their improper
incorporation has been attributed as the reason behind the failure of numerous
heterologous expression studies in E. coli. S. blattae has proven to be one solution to
this issue; so far three RDases have been reported to be produced heterologously in a
catalytically active state in S. blattae: the tetrachloroethene RDase of D. hafniense strain
Y51 (PceAY51), the 3,5-dichlorophenol RDase of D. hafniense strain DCB-2 (RdhA3) and
the 1,2-dichloroethane RDase of Desulfitobacterium dichloroeliminans (DcaA) (Mac
Nelly et al., 2014; Kunze et al., 2017).
For soluble and functional expression of TmrA, S. blattae was cultured anaerobically in
a defined mineral media described by Kunze et al., (2017). Glycerol was used as the sole
energy and carbon source. Approximately 1% of the genome of a typical B12-producing
enteric bacterium is involved in B12 biosynthesis and transportation (Roth et al., 1996).
de novo corrinoid synthesis involves more than 30 enzymatic steps (Moore et al., 2013).
Regardless of this large genetic expense only five B12-dependent enzymes are found in
one or more species of enteric bacteria. In S. blattae DSM 4481 metH is the only gene
encoding a functional B12-dependent enzyme, methionine synthase. Unlike S. blattae
strains ATCC 33429 and ATCC 33430, strain DSM 4481 does not harbour glycerol
dehydratase which is essential for the fermentation of glycerol (Daniel et al., 1998,
Toraya et al., 1980). The insertion of a prophage (MuEb) in the dha regulon encoding
glycerol dehydratase in strain DSM 4481 is the reason for the loss of the functional
enzyme (Andres et al., 2004). Roth et al., (1996) suggested that the MuEb insertion
maybe a step towards the loss of the B12 synthetic ability of strain DSM 4481 in the
future. To ensure the continual production of B12 to support the expression of RDases,
Mac Nelly et al., (2014) used glycerol as the carbon source in the culture media.
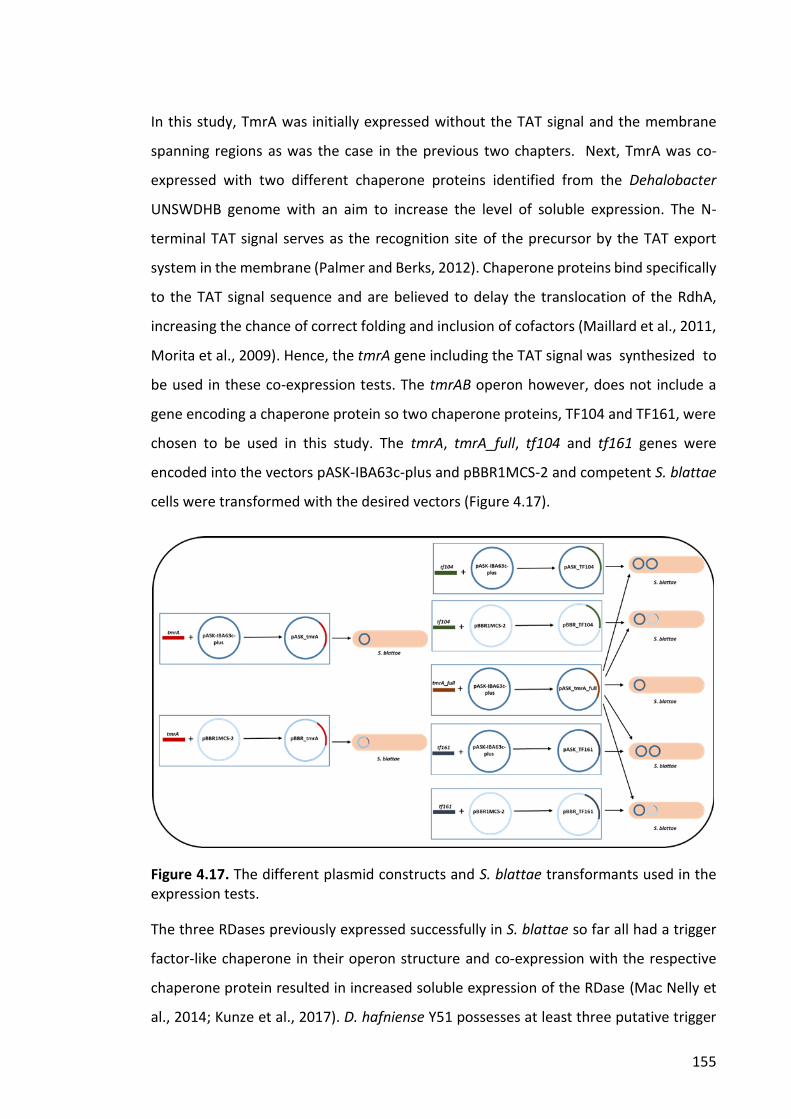
155
In this study, TmrA was initially expressed without the TAT signal and the membrane
spanning regions as was the case in the previous two chapters. Next, TmrA was co-
expressed with two different chaperone proteins identified from the Dehalobacter
UNSWDHB genome with an aim to increase the level of soluble expression. The N-
terminal TAT signal serves as the recognition site of the precursor by the TAT export
system in the membrane (Palmer and Berks, 2012). Chaperone proteins bind specifically
to the TAT signal sequence and are believed to delay the translocation of the RdhA,
increasing the chance of correct folding and inclusion of cofactors (Maillard et al., 2011,
Morita et al., 2009). Hence, the tmrA gene including the TAT signal was synthesized to
be used in these co-expression tests. The tmrAB operon however, does not include a
gene encoding a chaperone protein so two chaperone proteins, TF104 and TF161, were
chosen to be used in this study. The tmrA, tmrA_full, tf104 and tf161 genes were
encoded into the vectors pASK-IBA63c-plus and pBBR1MCS-2 and competent S. blattae
cells were transformed with the desired vectors (Figure 4.17).
Figure 4.17. The different plasmid constructs and S. blattae transformants used in the expression tests.
The three RDases previously expressed successfully in S. blattae so far all had a trigger
factor-like chaperone in their operon structure and co-expression with the respective
chaperone protein resulted in increased soluble expression of the RDase (Mac Nelly et
al., 2014; Kunze et al., 2017). D. hafniense Y51 possesses at least three putative trigger
156
factor proteins, the PceT-encoding gene is located in the pce operon and recombinant
expression experiments suggest that PceT is a specific trigger factor for PceA (Morita et
al., 2009). Maillard et al., (2011) hypothesized that by lacking the N-terminal ribosome-
binding domain, RdhT distinguishes from generic trigger factor proteins and establishes
itself as the dedicated chaperone for RdhAs. Sjuts et al., (2012) demonstrated soluble,
albeit non-functional expression of D. restrictus PceA when in E. coli when fused with E.
coli trigger factor. This has been the first attempt to co-express a RDase with a
chaperone that does not belong to rdhAB operon or the host organism. However, co-
expression with the chaperones TF104 and TF161 seemingly had no impact on the level
of soluble expression. This suggests the need for defined chaperone proteins for the
increase of soluble expression of TmrA.
In terms of specific activity, the truncation of the TAT-signal seemed to have a significant
effect (p<0.05) on the dechlorinating activity of the enzyme. In the previous two
chapters TmrA devoid of the TAT signal and predicted membrane spanning regions was
expressed. This strategy was attempted to navigate expression of the originally
periplasmic RDases toward the cytoplasm (Jugder et al., 2018, Parthasarathy et al.,
2015). The studies of Parthasarathy et al., (2015) however did not result in a soluble
cytoplasmic expression of recombinant VcrA. Jugder et al., (2018) on the other hand
expressed soluble TmrA in B. megaterium but no comments were made on the role of
the lack of TAT sequence. In this chapter when the expression of TmrA both with and
without the twin-arginine sequence was carried out, a difference in their dechlorination
activity was observed. While in both cases the TmrA was expressed in a soluble and
active form, the dechlorination rate was much higher without the TAT sequence. It can
be postulated that the lack of the twin-arginine sequence effects the folding of TmrA
and in turn modulates the dechlorination activity. Signal peptides not only play roles in
the membrane translocation of the target proteins but also impact their folding kinetics
and stability (Freudl, 2018, Punginelli et al., 2004). Another possible explanation could
be that when the TAT signal is included it makes the active site of TmrA less accessible
to the substrate, CF.
157
4.5 CONCLUSIONS
This is the first report of expression of a functional RDase encoded in a rdh operon
lacking a specific chaperone protein in S. blattae. While the RDase alone (both with and
without the TAT signal) was expressed in a soluble and functional state, co-expression
with two other trigger factor proteins did not have much effect on the level of soluble
expression or the dechlorination activity. The expression of TmrA without the TAT signal
sequence and the membrane spanning region however resulted in soluble expression
exhibiting a significantly higher dechlorination activity (p < 0.05). This strategy can be
utilized in expressing RDases lacking a definite chaperone protein in their rdh gene
cluster. Further studies need to be carried out on the role of the TAT signal when RDases
are expressed recombinantly. The co-expression of chaperon protein with TmrA
excluding the TAT signal would also aid in the clarification of the role of the TAT signal.
158
4.6 REFERENCES
ANDREEßEN, B., JOHANNINGMEIER, B., BURBANK, J. & STEINBÜCHEL, A. 2014. Influence of the operon structure on poly (3-hydroxypropionate) synthesis in Shimwellia blattae. Applied Microbiology and Biotechnology, 98(17): 7409-7422.
ANDRES, S., WIEZER, A., BENDFELDT, H., WASCHKOWITZ, T., TOECHE-MITTLER, C. & DANIEL, R. 2004. Insights into the genome of the enteric bacterium Escherichia blattae: cobalamin (B12) biosynthesis, B12-dependent reactions, and inactivation of the gene region encoding B12-dependent glycerol dehydratase by a new mu-like prophage. Journal of Molecular Microbiology & Biotechnology, 8(3): 150-168.
APPRILL, A., MCNALLY, S., PARSONS, R. & WEBER, L. 2015. Minor revision to V4 region SSU rRNA 806R gene primer greatly increases detection of SAR11 bacterioplankton. Aquatic Microbial Ecology, 75(2): 129-137.
BOMMER, M., KUNZE, C., FESSELER, J., SCHUBERT, T., DIEKERT, G. & DOBBEK, H. 2014. Structural basis for organohalide respiration. Science, 346(6208): 455-458.
BURGESS, N., MCDERMOTT, S. & WHITING, J. 1973. Aerobic bacteria occurring in the hind-gut of the cockroach, Blatta orientalis. Epidemiology Infection, 71(1): 1-8.
DANIEL, R., BOBIK, T. A. & GOTTSCHALK, G. 1998. Biochemistry of coenzyme B12-dependent glycerol and diol dehydratases and organization of the encoding genes. FEMS Microbiology Reviews, 22(5): 553-566.
ENGLER, C., GRUETZNER, R., KANDZIA, R. & MARILLONNET, S. 2009. Golden gate shuffling: a one-pot DNA shuffling method based on type IIs restriction enzymes. PloS One, 4(5): e5553.
ENGLER, C., KANDZIA, R. & MARILLONNET, S. 2008. A one pot, one step, precision cloning method with high throughput capability. PloS One, 3(11): e3647.
FREUDL, R. 2018. Signal peptides for recombinant protein secretion in bacterial expression systems. Microbial Cell Factories, 17(1): 52.
GIBSON, D. G., GLASS, J. I., LARTIGUE, C., NOSKOV, V. N., CHUANG, R.-Y., ALGIRE, M. A., BENDERS, G. A., MONTAGUE, M. G., MA, L., MOODIE, M. M., MERRYMAN, C., VASHEE, S., KRISHNAKUMAR, R., ASSAD-GARCIA, N., ANDREWS-PFANNKOCH, C., DENISOVA, E. A., YOUNG, L., QI, Z.-Q., SEGALL-SHAPIRO, T. H., CALVEY, C. H., PARMAR, P. P., HUTCHISON, C. A., SMITH, H. O. & VENTER, J. C. 2010. Creation of a bacterial cell controlled by a chemically synthesized genome. Science, 329(5987): 52.
GIBSON, D. G., YOUNG, L., CHUANG, R. Y., VENTER, J. C., HUTCHISON, C. A., 3RD & SMITH, H. O. 2009. Enzymatic assembly of DNA molecules up to several hundred kilobases. Nature Methods, 6(5): 343-5.
HEINRICH, D., MADKOUR, M. H., AL-GHAMDI, M. A., SHABBAJ, I. I. & STEINBÏ, A. 2013. From waste to plastic: synthesis of poly (3-hydroxypropionate) in Shimwellia blattae. Applied and Environmental Microbiology, 79(12): 3582-3589.
JUGDER, B.-E., ERTAN, H., LEE, M., MANEFIELD, M. & MARQUIS, C. P. 2015. Reductive dehalogenases come of age in biological destruction of organohalides. Trends in Biotechnology, 33(10): 595-610.
JUGDER, B.-E., PAYNE, K. A., FISHER, K., BOHL, S., LEBHAR, H., MANEFIELD, M., LEE, M., LEYS, D. & MARQUIS, C. P. 2018. Heterologous production and purification of a
159
functional chloroform reductive dehalogenase. ACS Chemical Biology, 13(3): 548-552.
JUGDER, B. E., ERTAN, H., WONG, Y. K., BRAIDY, N., MANEFIELD, M., MARQUIS, C. P. & LEE, M. 2016. Genomic, transcriptomic and proteomic analyses of Dehalobacter UNSWDHB in response to chloroform. Environmental Microbiology Reports, 8(5): 814-824.
KIMOTO, H., SUYE, S.-I., MAKISHIMA, H., ARAI, J.-I., YAMAGUCHI, S., FUJII, Y., YOSHIOKA, T. & TAKETO, A. 2010. Cloning of a novel dehalogenase from environmental DNA. Bioscience, Biotechnology & Biochemistry, 74(6): 1290-1292.
KUNZE, C., DIEKERT, G. & SCHUBERT, T. 2017. Subtle changes in the active site architecture untangled overlapping substrate ranges and mechanistic differences of two reductive dehalogenases. FEBS, 284(20): 3520-3535.
MAC NELLY, A., KAI, M., SVATOŠ, A., DIEKERT, G. & SCHUBERT, T. 2014. Functional Heterologous Production of Reductive Dehalogenases from Desulfitobacterium hafniense Strains. Applied and Environmental Microbiology, 80(14): 4313.
MAILLARD, J., GENEVAUX, P. & HOLLIGER, C. 2011. Redundancy and specificity of multiple trigger factor chaperones in Desulfitobacteria. Microbiology, 157(8): 2410-2421.
MOORE, S. J., LAWRENCE, A. D., BIEDENDIECK, R., DEERY, E., FRANK, S., HOWARD, M. J., RIGBY, S. E. & WARREN, M. J. 2013. Elucidation of the anaerobic pathway for the corrin component of cobalamin (vitamin B12). Proceedings of the National Academy of Sciences, 110(37): 14906-14911.
MORITA, Y., FUTAGAMI, T., GOTO, M. & FURUKAWA, K. 2009. Functional characterization of the trigger factor protein PceT of tetrachloroethene-dechlorinating Desulfitobacterium hafniense Y51. Applied Microbiology & Biotechnology, 83(4): 775-781.
NEUMANN, A., WOHLFARTH, G. & DIEKERT, G. 1998. Tetrachloroethene dehalogenase from Dehalospirillum multivorans: cloning, sequencing of the encoding genes, and expression of the pceA gene in Escherichia coli. Journal of Bacteriology, 180(16): 4140-4145.
PALMER, T. & BERKS, B. C. 2012. The twin-arginine translocation (Tat) protein export pathway. Nature Reviews Microbiology, 10(7): 483-496.
PARADA, A. E., NEEDHAM, D. M. & FUHRMAN, J. A. 2016. Every base matters: assessing small subunit rRNA primers for marine microbiomes with mock communities, time series and global field samples. Environmental Microbiology, 18(5): 1403-1414.
PARTHASARATHY, A., STICH, T. A., LOHNER, S. T., LESNEFSKY, A., BRITT, R. D. & SPORMANN, A. M. 2015. Biochemical and EPR-spectroscopic investigation into heterologously expressed vinyl chloride reductive dehalogenase (VcrA) from Dehalococcoides mccartyi strain VS. Journal of the American Chemical Society, 137(10): 3525-3532.
PAYNE, K. A. P., QUEZADA, C. P., FISHER, K., DUNSTAN, M. S., COLLINS, F. A., SJUTS, H., LEVY, C., HAY, S., RIGBY, S. E. J. & LEYS, D. 2015. Reductive dehalogenase structure suggests a mechanism for B12-dependent dehalogenation. Nature, 517(7535): 513-516.
PUNGINELLI, C., IZE, B., STANLEY, N. R., STEWART, V., SAWERS, G., BERKS, B. C. & PALMER, T. 2004. mRNA secondary structure modulates translation of Tat-
160
dependent formate dehydrogenase N. Journal of Bacteriology, 186(18): 6311-6315.
ROTH, J. R., LAWRENCE, J. & BOBIK, T. 1996. Cobalamin (coenzyme B12): synthesis and biological significance. Annual Review of Microbiology, 50(1): 137-181.
SATO, S., ANDREEßEN, B. & STEINBÜCHEL, A. 2015. Strain and process development for poly (3HB-co-3HP) fermentation by engineered Shimwellia blattae from glycerol. AMB Express, 5(1): 18.
SJUTS, H., FISHER, K., DUNSTAN, M. S., RIGBY, S. E. & LEYS, D. 2012. Heterologous expression, purification and cofactor reconstitution of the reductive dehalogenase PceA from Dehalobacter restrictus. Protein Expression and Purification, 85(2): 224-229.
SMIDT, H., VAN LEEST, M., VAN DER OOST, J. & DE VOS, W. M. 2000. Transcriptional regulation of the cpr gene cluster in ortho-chlorophenol-respiring Desulfitobacterium dehalogenans. Journal of Bacteriology, 182(20): 5683-5691.
SUYAMA, A., YAMASHITA, M., YOSHINO, S. & FURUKAWA, K. 2002. Molecular Characterization of the PceA Reductive Dehalogenase of Desulfitobacterium sp. Strain Y51. Journal of Bacteriology, 184(13): 3419.
TANG, S. & EDWARDS, E. A. 2013. Identification of Dehalobacter reductive dehalogenases that catalyse dechlorination of chloroform, 1, 1, 1-trichloroethane and 1, 1-dichloroethane. Philosophical Transactions of the Royal Society B: Biological Sciences, 368(1616): 20120318.
TORAYA, T., KUNO, S. & FUKUI, S. 1980. Distribution of coenzyme B12-dependent diol dehydratase and glycerol dehydratase in selected genera of Enterobacteriaceae and Propionibacteriaceae. Journal of Bacteriology, 141(3): 1439-1442.
URANO, N., FUJII, M., KAINO, H., MATSUBARA, M. & KATAOKA, M. 2015. Fermentative production of 1-propanol from sugars using wild-type and recombinant Shimwellia blattae. Applied Microbiology & Biotechnology, 99(4): 2001-2008.
161
CHAPTER FIVE: Cupriavidus necator as a chloroform reducing organism: a molecular biology approach
162
5.1 INTRODUCTION
The isolation of Desulfomonile tiedjei, which demonstrated growth by coupling
oxidation of formate or hydrogen to the reduction of 3-chlorobenzoate, shed light on a
previously unknown respiratory process, organohalide respiration, where reductive
dehalogenation of organohalides is coupled to a chemiosmotic mechanism (Dolfing and
Tiedje, 1987, Louie and Mohn, 1999a, Shelton and Tiedje, 1984). Since then, numerous
bacterial strains capable of OHR have been isolated and studied in detail. Though
considerable progress has been made in understanding the phylogenetic, physiological,
genomic, and biochemical features, the molecular composition of the organohalide
respiratory electron transport chains in OHRB is an area that still requires extensive
study. RDases are the enzymes directly catalyzing dechlorination reactions; the redox
partners and mechanism for proton translocation however is yet to be fully determined
for respiratory RDases. This is not the case for non-respiratory RDases. The NpRdhA
gene in the N. pacificus genome is located in a putative operon consisting of a
ferredoxin-NADPH oxidoreductase and [4Fe−4S] and [2Fe−2S] ferredoxins (Lai et al.,
2012). The BhbA in Comamonas sp. 7D-2 has a ferredoxin reductase-like NAD(H)-binding
domain and an iron-binding domain (Chen et al., 2013). These features in the non-
respiratory RDases link substrate reduction to NADPH oxidation. Collins et al. (2018)
demonstrated in vitro and in vivo reconstitution of a NADPH-dependent reducing system
for NpRdhA expressed in B. megaterium. They showed that a non-physiological system
consisting of E. coli flavodoxin reductase (EcFldr) and spinach ferredoxin (SpFd) was able
to support NADPH-dependent 3,5-dibromo-4-hydroxybenzoic acid reduction by
NpRdhA.
Molecular hydrogen is the sole electron donor in Dehalobacter sp. UNSWDHB, as is the
case for other obligate OHRB. H2 is presumably oxidized by membrane associated uptake
hydrogenases. Five hydrogenases showed increased abundance in the genome of
Dehalobacter sp. UNSWDHB in response to CF; one Hup-type (Hya) Ni-Fe hydrogenase,
two membrane associated energy-conserving Ech and Hyc-type Ni-Fe hydrogenases and
two cytoplasmic Fe-Fe hydrogenases; suggesting their roles in electron transfer (Jugder
et al., 2016c). Heterologous reconstitution of the oxidation-reduction of H2/CF by uptake
163
hydrogenase and TmrA would require the recombinant expression of both the enzymes.
However, recombinant expression of functional hydrogenases has proven to be difficult
due to the complexity and enzyme specificity of the post-translational maturation
process (English et al., 2009, Jugder, 2013).
C. necator H16 is a Gram-negative lithoautotrophic β-proteobacterium. It is found in soil
and freshwater habitats and can grow at the interface of anoxic and oxic environments
(Yu and Munasinghe, 2018). The organism can acclimate between heterotrophic and
autotrophic lifestyles utilizing organic compounds and hydrogen respectively as energy
source (Pohlmann et al., 2006). C. necator has three O2-tolerant hydrogenases which are
encoded on the mega-plasmid pHG1; a membrane-bound hydrogenase (MBH), a soluble
hydrogenase (SH) and a regulatory hydrogenase (RH)(Burgdorf et al., 2005, Schwartz et
al., 2003). Growth under autotrophic conditions induces the expression of the uptake
hydrogenases MBH and SH in the environment. Culture in heterotrophic media
promotes MBH and SH expression with a higher specific activity (Jugder et al., 2015,
Lauterbach and Lenz, 2013). Culture in minimal medium FGN (fructose-glycerol-
nitrogen) is characterized by initial growth on the preferred carbon source, fructose,
which represses hydrogenase expression; fructose depletion leads to growth on the less-
preferred substrate glycerol, thus stimulating de-repression of hydrogenase expression
(Friedrich et al., 1981, Jugder et al., 2016b).
In this chapter the feasibility of C. necator H16 as an expression host for expression of
soluble active chloroform reductive dehalogenase (TmrA) is assessed. The potential to
utilize the uptake Ni-Fe hydrogenases of C. necator as redox partners and induce in vivo
and in vitro dehalogenation of CF is also evaluated. An important consideration for
recombinant expression of any RDase is the capacity of the host to synthesize/uptake
vitamin B12. C. necator H16 cannot synthesize B12 de novo but has the ability to assimilate
cobalamin and its precursors (Pohlmann et al., 2006).
164
5.2 EXPERIMENTAL PROCEDURES
5.2.1 C. necator H16 strain confirmation
C. necator H16 strain DSM 428 was retrieved from -80 °C freezer and was plated on LB
agar and incubated at 30 °C for 48 h. The culture was originally obtained from Deutsche
Sammlung von Mikroorganismen und Zellkulturen GmbH (Germany) in 2013 as a freeze-
dried culture, rehydrated according to the manufacturer’s instructions and glycerol
stocks were made.
5.2.1.1 Genomic DNA extraction of C. necator
A single colony was picked from the LB plate and grown in 5 mL LB broth at 30 °C for 24
h. The cells were harvested by centrifugation and genomic DNA (gDNA) was extracted
using Invitrogen™ PureLink™ Genomic DNA Mini Kit (Thermo Fisher Scientific) as
described by the manufacturer.
5.2.1.2 16s rRNA sequencing
Samples were prepared according to the guidelines described in
http://www.ramaciotti.unsw.edu.au and sent to the Ramaciotti Center for Genomics at
UNSW for 16S rRNA gene sequencing. The 515F–806R primer pair was used for the
purpose of validating the identity of the organism.
5.2.2 Chloroform and dichloromethane tolerance test
Prior to contemplating the ultimate goal of engineering C. necator to perform as a
recombinant chloroform dehalogenating organism, it was necessary to determine the
tolerance of C. necator against different concentrations of chloroform and
dichloromethane. An overnight culture of C. necator was used to inoculate LB media
and was maintained at 30 °C, 200 rpm until it reached the log phase of growth. The
tolerance test was carried out in two separate 24-well deep well Deutz microplates for
CF and DCM. The concentrations of CF and DCM tested were 0, 0.83, 1.67 and 2.5 mM.
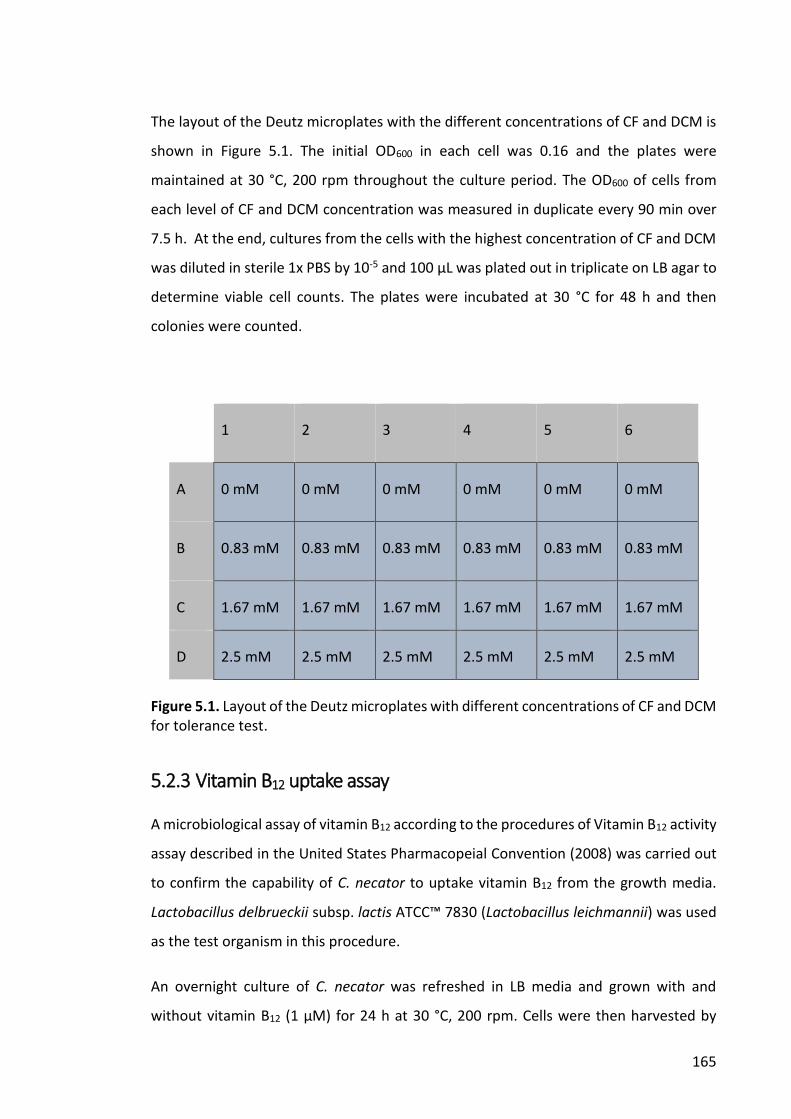
165
The layout of the Deutz microplates with the different concentrations of CF and DCM is
shown in Figure 5.1. The initial OD600 in each cell was 0.16 and the plates were
maintained at 30 °C, 200 rpm throughout the culture period. The OD600 of cells from
each level of CF and DCM concentration was measured in duplicate every 90 min over
7.5 h. At the end, cultures from the cells with the highest concentration of CF and DCM
was diluted in sterile 1x PBS by 10-5 and 100 μL was plated out in triplicate on LB agar to
determine viable cell counts. The plates were incubated at 30 °C for 48 h and then
colonies were counted.
1 2 3 4 5 6
A 0 mM 0 mM 0 mM 0 mM 0 mM 0 mM
B 0.83 mM 0.83 mM 0.83 mM 0.83 mM 0.83 mM 0.83 mM
C 1.67 mM 1.67 mM 1.67 mM 1.67 mM 1.67 mM 1.67 mM
D 2.5 mM 2.5 mM 2.5 mM 2.5 mM 2.5 mM 2.5 mM
Figure 5.1. Layout of the Deutz microplates with different concentrations of CF and DCM for tolerance test.
5.2.3 Vitamin B12 uptake assay
A microbiological assay of vitamin B12 according to the procedures of Vitamin B12 activity
assay described in the United States Pharmacopeial Convention (2008) was carried out
to confirm the capability of C. necator to uptake vitamin B12 from the growth media.
Lactobacillus delbrueckii subsp. lactis ATCC™ 7830 (Lactobacillus leichmannii) was used
as the test organism in this procedure.
An overnight culture of C. necator was refreshed in LB media and grown with and
without vitamin B12 (1 µM) for 24 h at 30 °C, 200 rpm. Cells were then harvested by
166
centrifugation at 10,000 g, 4 °C for 10 min, washed three times in sterile 1 x PBS and
resuspended in 0.5 mL of the same buffer. The cells were lysed by a freeze-thaw method
using liquid nitrogen and a water bath maintained at 37 °C. The lysates were centrifuged
at 4 °C, 10,000 g for 10 min and the supernatant was collected to use in the vitamin B12
assay. Sterile conditions were maintained at every step to eliminate the possibility of
contamination.
Lactobacillus leichmannii was cultured overnight at 37 °C, 200 rpm in MRS broth (De
Man, Rogosa, Sharpe) from Thermo Scientific. The cells were harvested by
centrifugation at 4 °C, 10,000 g for 10 min, washed three times in sterile saline and
resuspended in 10 mL of the same buffer.
Difco™ B12 Assay Medium from BD diagnostics was prepared according to the
manufacturer’s instruction. The media was aliquoted to sterile glass tubes, 5 mL each.
Standards and samples were prepared by adding required amounts of vitamin B12 (final
concentrations of 0, 10, 20, 40 and 50 pg/mL for standards) and previously prepared cell
lysates of C. necator grown with and without vitamin B12 to the B12 Assay Medium. Each
standard and sample were done in duplicate. 50 µL of Lactobacillus leichmannii cell
suspension was added to all the standards and samples and cultured at 37 °C, 100 rpm
for 24 h. Cultures were visually observed for turbidity to assess cell growth.
5.2.4 Expression of native Ni-Fe hydrogenase in C. necator
To induce the expression of the native soluble Ni-Fe hydrogenase, C. necator was grown
heterotrophically in minimal medium FGN (Fructose-Glycerol-Nitrogen) which facilitates
substrate shift from fructose to glycerol and thereby resulting in the de-repression of
hox regulon containing the hydrogenase structural and auxiliary genes. The recipe of the
media is illustrated in the Appendices (A.3). Overnight cultures of C. necator were used
to inoculate fresh FGN media at an OD600 of 0.1. The culture was maintained at 30 ᵒC,
250 rpm for 48 h. The culture was sampled periodically to check the OD600. Cells were
harvested by centrifugation at 10,000 g for 15 min at 4 °C and washed with 50 mM KPi
buffer (pH 7.0). The cell pellets were stored at -80 °C for future assays. A control culture
was carried out under the same conditions in FN (Fructose-Nitrogen) media (A.3).
167
5.2.5 Cell lysis
The cell pellets were thawed and resuspended in 50 mM KPi buffer containing EDTA-
free Protease inhibitor and DNAse I (20 µg/ml) at a ratio of cell wet weight and
resuspension buffer of 1:5. The cell suspensions were sonicated using a Branson Digital
Sonifier equipped with 1/8” Tapered Microtip (Branson Ultrasonics Corporation, USA)
at 50% amplitude with 0.5 sec pulse on and 0.5 sec pulse off for 8 minute/g of cell pellet.
The supernatant was separated by centrifugation at 20,000 x g for 50 min at 4 ᵒC.
5.2.6 Hydrogenase activity assay
The protocol described by Jugder et al. (2016b) was followed to confirm the activity of
the soluble hydrogenase in the C. necator lysates. The assay was carried out under
anaerobic conditions. In a septum-sealed special optical glass cuvette, 100 µL of cell
lysate from the previous step was added to 2.9 mL of reaction mixture containing 50
mM H2-saturated KPi buffer (pH 7.0) and 1 mM NAD+ (the electron acceptor). The
formation of NADH was monitored using a Cary-100 UV-Visible Spectrophotometer with
continual incubation at 30 ᵒC for 10 min at 0.5 min intervals at 340 nm.
5.2.7 Hydrogenation-dechlorination activity assay
In vitro dehalogenation of CF utilizing the active soluble hydrogenase expressed in native
C. necator and recombinant active TmrA expressed in B. megaterium was tested. C.
necator and B. megaterium pellets were separately resuspended in lysis buffer at a ratio
of 1:5. C. necator was lysed by sonication (section 5.2.5) and B. megaterium was lysed
chemically as described in section 3.2.6.
The activity assay was set up inside the anaerobic chamber. B. megaterium and C.
necator cell lysates containing active TmrA and Ni-Fe hydrogenase was added at 1:1 ratio
to a 10 mL headspace vial containing H2 saturated KPi buffer and 0.1 mM chloroform,
this was done in duplicate. The vials were incubated at 30 °C for 12 h. After incubation,
the enzymatic reaction was quenched by transferring 1 mL of each reaction mixture
(done in triplicate) to a 10 mL headspace flask containing anhydrous sodium sulphate
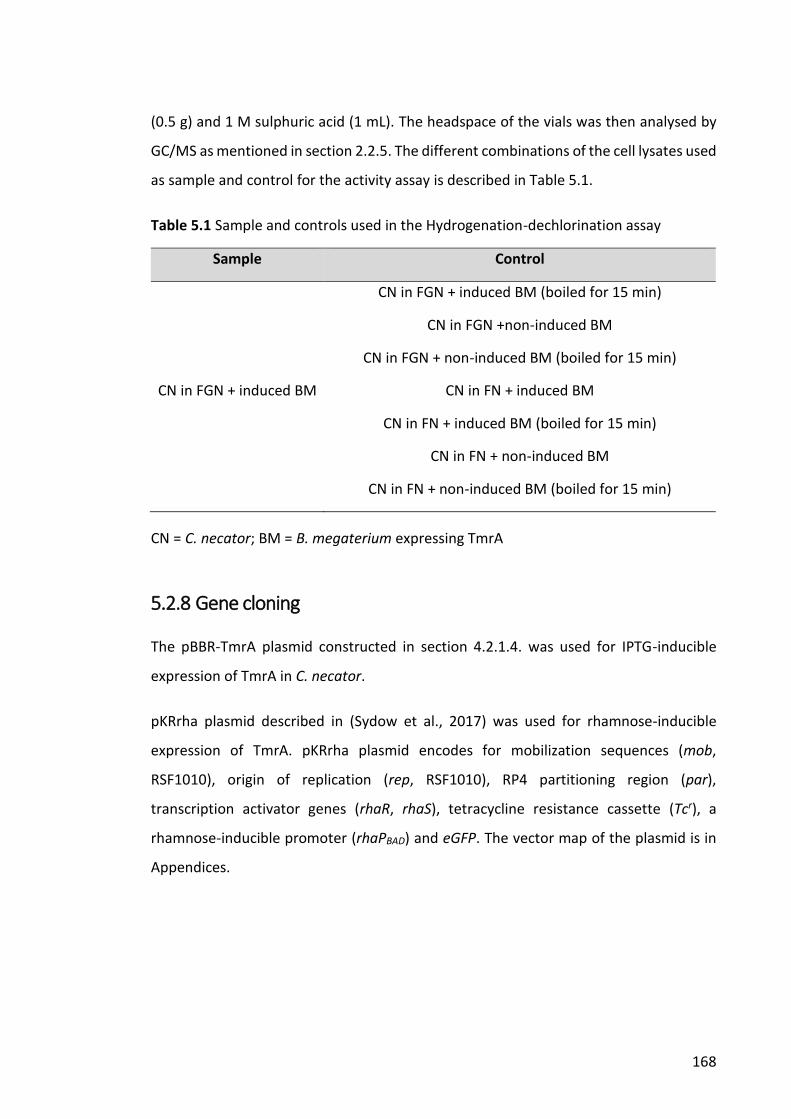
168
(0.5 g) and 1 M sulphuric acid (1 mL). The headspace of the vials was then analysed by
GC/MS as mentioned in section 2.2.5. The different combinations of the cell lysates used
as sample and control for the activity assay is described in Table 5.1.
Table 5.1 Sample and controls used in the Hydrogenation-dechlorination assay
Sample Control
CN in FGN + induced BM (boiled for 15 min)
CN in FGN +non-induced BM
CN in FGN + non-induced BM (boiled for 15 min)
CN in FGN + induced BM CN in FN + induced BM
CN in FN + induced BM (boiled for 15 min)
CN in FN + non-induced BM
CN in FN + non-induced BM (boiled for 15 min)
CN = C. necator; BM = B. megaterium expressing TmrA
5.2.8 Gene cloning
The pBBR-TmrA plasmid constructed in section 4.2.1.4. was used for IPTG-inducible
expression of TmrA in C. necator.
pKRrha plasmid described in (Sydow et al., 2017) was used for rhamnose-inducible
expression of TmrA. pKRrha plasmid encodes for mobilization sequences (mob,
RSF1010), origin of replication (rep, RSF1010), RP4 partitioning region (par),
transcription activator genes (rhaR, rhaS), tetracycline resistance cassette (Tcr), a
rhamnose-inducible promoter (rhaPBAD) and eGFP. The vector map of the plasmid is in
Appendices.
169
5.2.8.1 PCR
The insert tmrA gene (TAT signal removed) was amplified from pD864-TmrA plasmid
described in (Jugder et al., 2018) to include BsaI recognition sites to facilitate assembly.
Linearization of pKRrha plasmid and insertion of BsaI recognition sites were carried out
by a touchdown polymerase chain reaction (TD-PCR). 25 µL reaction mixture contained
12.5 µL Q5 High-Fidelity 2X Master Mix (New England Biolabs, Ipswich, MA, USA), 0.5
µM of forward and reverse primers, 3 ng of template DNA and required amount of
nuclease-free water to make up the reaction volume. The amplification reactions were
carried out in a BIO-RAD C1000 TouchTM Thermal Cycler. The cycling conditions for the
insert gene was as following: Initial denaturation at 98 °C for 30 s, 35 cycles of 10 s
denaturation at 98 °C, annealing at 61 °C for 30 s and 30 s per kb extension at 72 °C,
followed by a final extension of 5 min at 72 °C. The cycling conditions for the TD-PCR is
described in Table 5.2.
The primers used in different PCR reactions used in this study are listed in Table 5.3.
Primers were purchased from Sigma-Aldrich.
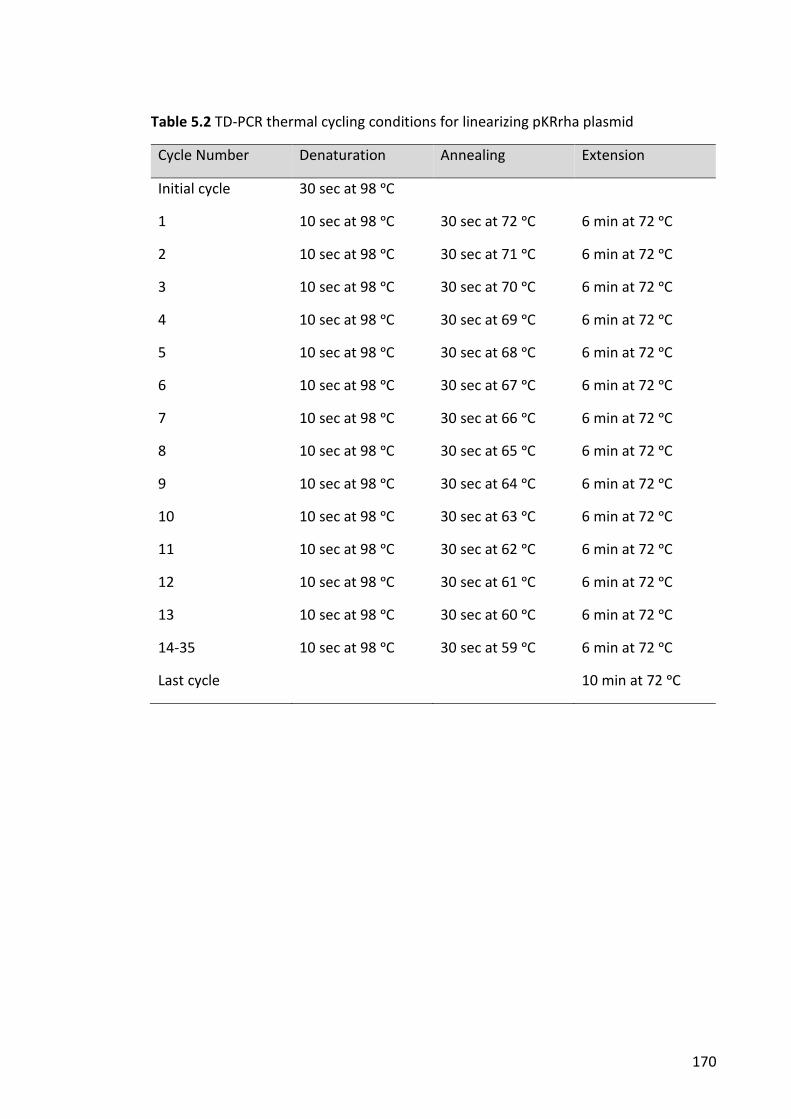
170
Table 5.2 TD-PCR thermal cycling conditions for linearizing pKRrha plasmid
Cycle Number Denaturation Annealing Extension
Initial cycle 30 sec at 98 ᵒC
1 10 sec at 98 ᵒC 30 sec at 72 ᵒC 6 min at 72 ᵒC
2 10 sec at 98 ᵒC 30 sec at 71 ᵒC 6 min at 72 ᵒC
3 10 sec at 98 ᵒC 30 sec at 70 ᵒC 6 min at 72 ᵒC
4 10 sec at 98 ᵒC 30 sec at 69 ᵒC 6 min at 72 ᵒC
5 10 sec at 98 ᵒC 30 sec at 68 ᵒC 6 min at 72 ᵒC
6 10 sec at 98 ᵒC 30 sec at 67 ᵒC 6 min at 72 ᵒC
7 10 sec at 98 ᵒC 30 sec at 66 ᵒC 6 min at 72 ᵒC
8 10 sec at 98 ᵒC 30 sec at 65 ᵒC 6 min at 72 ᵒC
9 10 sec at 98 ᵒC 30 sec at 64 ᵒC 6 min at 72 ᵒC
10 10 sec at 98 ᵒC 30 sec at 63 ᵒC 6 min at 72 ᵒC
11 10 sec at 98 ᵒC 30 sec at 62 ᵒC 6 min at 72 ᵒC
12 10 sec at 98 ᵒC 30 sec at 61 ᵒC 6 min at 72 ᵒC
13 10 sec at 98 ᵒC 30 sec at 60 ᵒC 6 min at 72 ᵒC
14-35 10 sec at 98 ᵒC 30 sec at 59 ᵒC 6 min at 72 ᵒC
Last cycle 10 min at 72 ᵒC
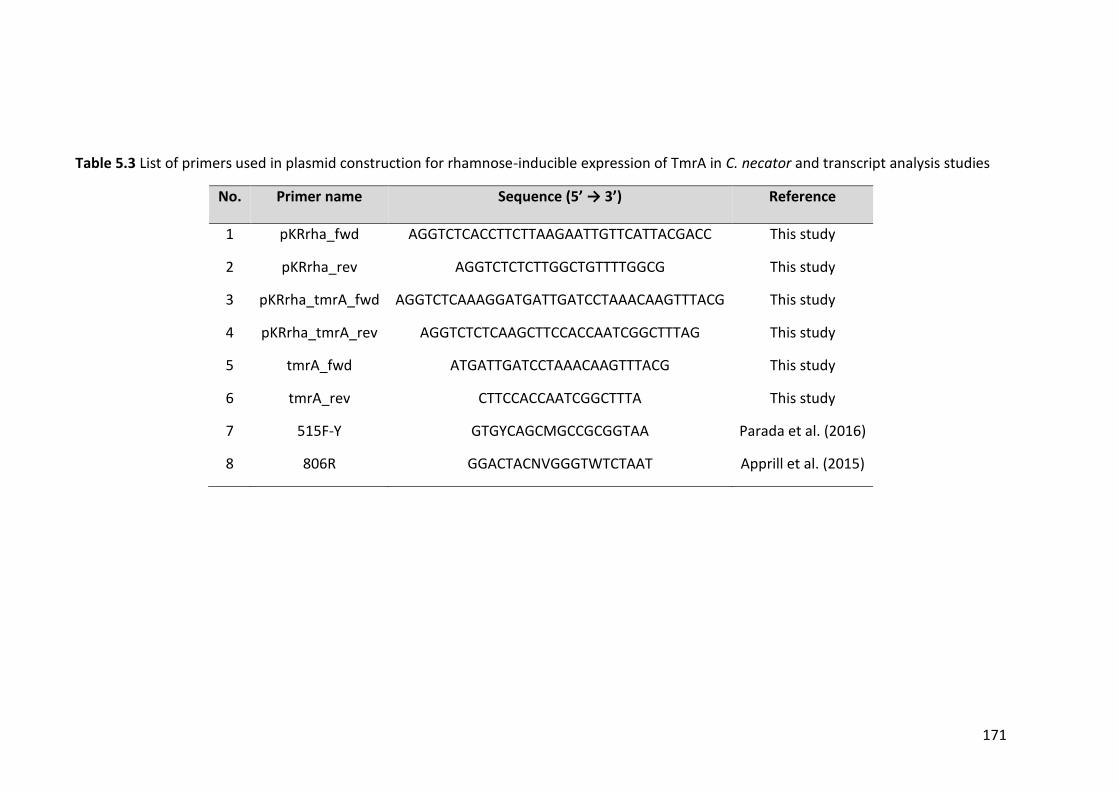
171
Table 5.3 List of primers used in plasmid construction for rhamnose-inducible expression of TmrA in C. necator and transcript analysis studies
No. Primer name Sequence (5’ → 3’) Reference
1 pKRrha_fwd AGGTCTCACCTTCTTAAGAATTGTTCATTACGACC This study
2 pKRrha_rev AGGTCTCTCTTGGCTGTTTTGGCG This study
3 pKRrha_tmrA_fwd AGGTCTCAAAGGATGATTGATCCTAAACAAGTTTACG This study
4 pKRrha_tmrA_rev AGGTCTCTCAAGCTTCCACCAATCGGCTTTAG This study
5 tmrA_fwd ATGATTGATCCTAAACAAGTTTACG This study
6 tmrA_rev CTTCCACCAATCGGCTTTA This study
7 515F-Y GTGYCAGCMGCCGCGGTAA Parada et al. (2016)
8 806R GGACTACNVGGGTWTCTAAT Apprill et al. (2015)
172
5.2.8.2 Golden Gate cloning
After PCR product purification using a PCR purification kit (Qiagen) and DpnI digestion
(NEB), TAT signal removed tmrA gene was cloned into pKRrha plasmid using a Golden
Gate cloning protocol described in section 4.2.1.5.
5.2.8.3 Colony PCR
A suitable number of colonies were screened for successful transformation with the
assembled plasmid following the protocol of colony PCR described in section 4.2.1.4.
5.2.8.4 Sequencing
QIAprep Spin Miniprep Kit (Qiagen) was used to extract plasmid DNA from overnight
cultures of E. coli. DNA samples were then prepared according to the guidelines
described in http://www.ramaciotti.unsw.edu.au by adding the desired amount of DNA
and primer to each sample and sent to the Ramaciotti Center for Genomics at UNSW for
Sanger sequencing.
5.2.9 Transformation of C. necator
5.2.9.1 Preparation of competent C. necator cells
A pre-culture of C. necator in LB media was grown till late exponential phase (~18-20
hours). This pre-culture was used to inoculate a 50 mL culture in LB media to an OD600
of approximately 0.05 - 0.1. When the growth reached an OD600 of 0.5-0.7 the culture
was transferred to a sterile 50 ml centrifuge tube and incubated on ice for 15 minutes.
The culture was then centrifuged at 5,000 g, 4 °C for 10 minutes using a pre-cooled rotor.
The cell pellet was washed three times with cold and sterile 10% glycerol. After the final
wash, the pellet was resuspended in 500 μL 10% glycerol and aliquoted in 100 μL
volumes in pre-cooled sterile Eppendorf tubes.
173
5.2.9.2 Electroporation
For electroporation, 2 µl DNA (50-100 ng/µL) was added to 100 μL of electrocompetent
cells and transferred to a pre-cooled 2mm electroporation cuvette. The cuvette was
pulsed with 2500 V, 25 μF und 400 Ω and 900 µL LB medium was immediately added
and mix well inside the cuvette. The mixture was transferred to a 1.5 mL Eppendorf tube
and was cultured at 30 °C for 3h (with shaking). The cells were then centrifuged at 14,000
g for 2 min, 700 µL of the supernatant was removed and the pellet was resuspended in
the remaining supernatant. Finally, the cells were plated on LB agar plates containing
200 ng/mL kanamycin and incubated at 30 °C for 36-40 hours.
5.2.9.3 Conjugation
E. coli S17-1(ATCC 47055) cells were made chemically competent following the protocol
described in section 4.2.2.1 and were transformed with 1-4 µL of Golden Gate assembly
product by heat shock and were plated on LB agar supplemented with tetracycline.
Plasmids were then transferred to the recipient C. necator H16 by conjugation. E. coli
S17-1 strain (containing pKRrha_tmrA) and C. necator were cultured until exponential
to early stationary phase. For each strain, 25 mL culture was harvested, and cell pellets
were washed once in the same volume of 0.9% NaCl. Cells were then resuspended
together in 0.2 mL of 0.9% NaCl and dropped in the middle of a LB agar plate. Following
24 h incubation at 30 °C for mating, cells were scrapped off the agar plate with 1 mL
0.9% NaCl and plated on selective M9 agar supplemented with tetracycline and
gentamicin for the selection of trans-conjugants. Single colonies were purified by sub-
cultivation on selective LB agar.
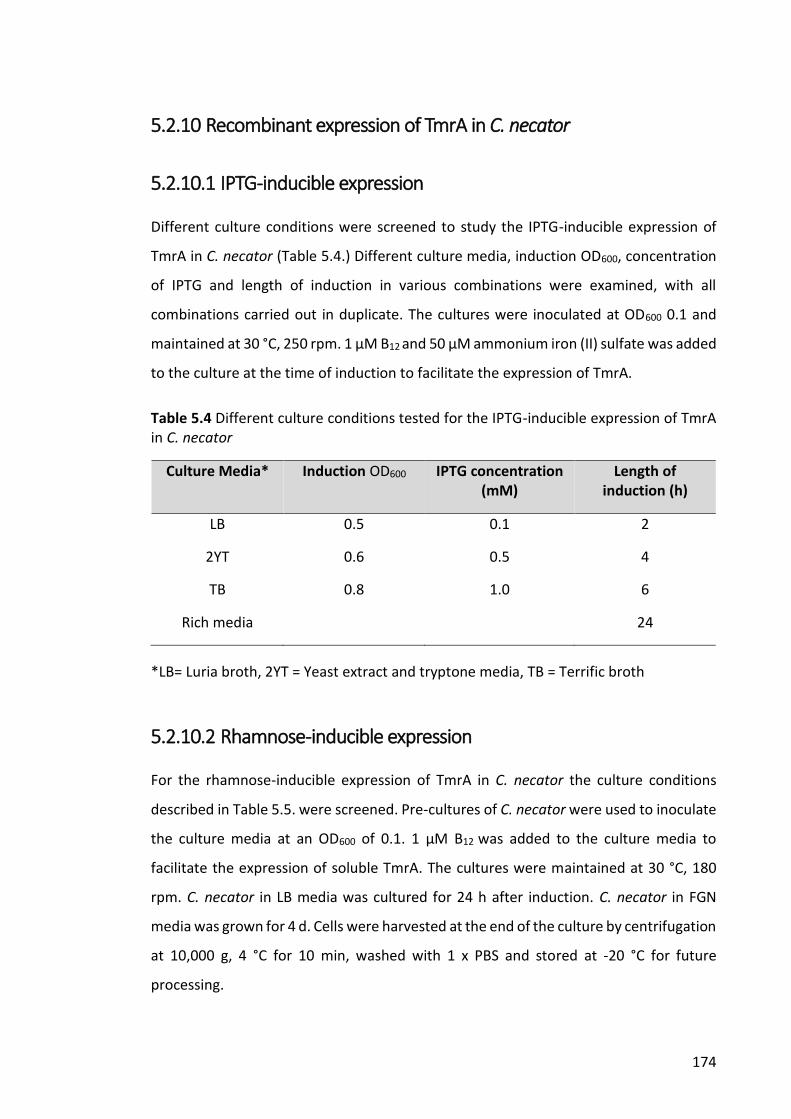
174
5.2.10 Recombinant expression of TmrA in C. necator
5.2.10.1 IPTG-inducible expression
Different culture conditions were screened to study the IPTG-inducible expression of
TmrA in C. necator (Table 5.4.) Different culture media, induction OD600, concentration
of IPTG and length of induction in various combinations were examined, with all
combinations carried out in duplicate. The cultures were inoculated at OD600 0.1 and
maintained at 30 °C, 250 rpm. 1 μM B12 and 50 μM ammonium iron (II) sulfate was added
to the culture at the time of induction to facilitate the expression of TmrA.
Table 5.4 Different culture conditions tested for the IPTG-inducible expression of TmrA in C. necator
Culture Media* Induction OD600 IPTG concentration (mM)
Length of induction (h)
LB 0.5 0.1 2
2YT 0.6 0.5 4
TB 0.8 1.0 6
Rich media 24
*LB= Luria broth, 2YT = Yeast extract and tryptone media, TB = Terrific broth
5.2.10.2 Rhamnose-inducible expression
For the rhamnose-inducible expression of TmrA in C. necator the culture conditions
described in Table 5.5. were screened. Pre-cultures of C. necator were used to inoculate
the culture media at an OD600 of 0.1. 1 μM B12 was added to the culture media to
facilitate the expression of soluble TmrA. The cultures were maintained at 30 °C, 180
rpm. C. necator in LB media was cultured for 24 h after induction. C. necator in FGN
media was grown for 4 d. Cells were harvested at the end of the culture by centrifugation
at 10,000 g, 4 °C for 10 min, washed with 1 x PBS and stored at -20 °C for future
processing.
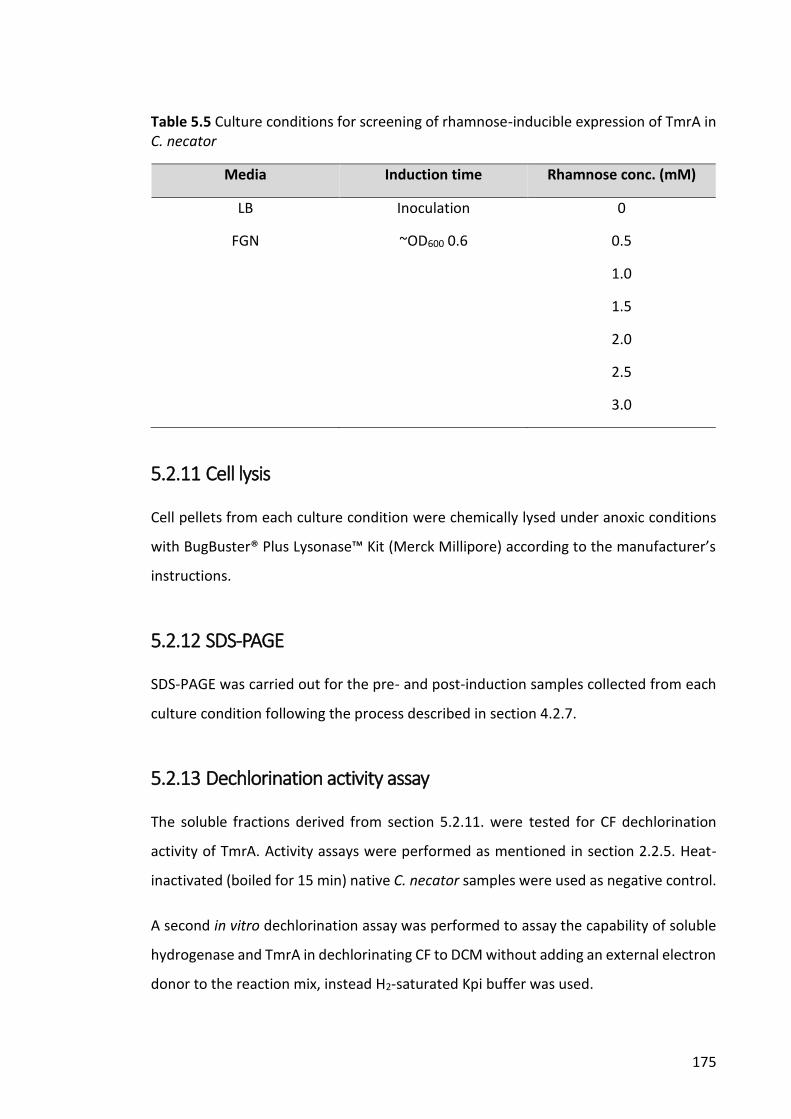
175
Table 5.5 Culture conditions for screening of rhamnose-inducible expression of TmrA in C. necator
Media Induction time Rhamnose conc. (mM)
LB Inoculation 0
FGN ~OD600 0.6 0.5
1.0
1.5
2.0
2.5
3.0
5.2.11 Cell lysis
Cell pellets from each culture condition were chemically lysed under anoxic conditions
with BugBuster® Plus Lysonase™ Kit (Merck Millipore) according to the manufacturer’s
instructions.
5.2.12 SDS-PAGE
SDS-PAGE was carried out for the pre- and post-induction samples collected from each
culture condition following the process described in section 4.2.7.
5.2.13 Dechlorination activity assay
The soluble fractions derived from section 5.2.11. were tested for CF dechlorination
activity of TmrA. Activity assays were performed as mentioned in section 2.2.5. Heat-
inactivated (boiled for 15 min) native C. necator samples were used as negative control.
A second in vitro dechlorination assay was performed to assay the capability of soluble
hydrogenase and TmrA in dechlorinating CF to DCM without adding an external electron
donor to the reaction mix, instead H2-saturated Kpi buffer was used.
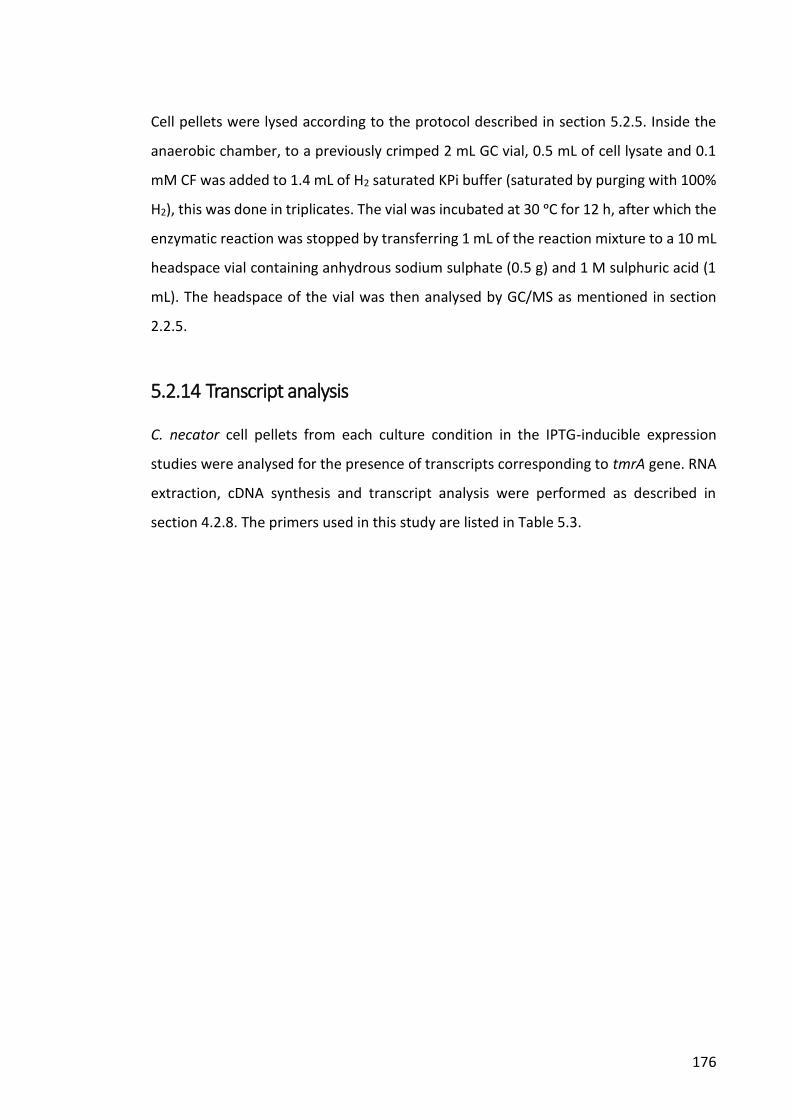
176
Cell pellets were lysed according to the protocol described in section 5.2.5. Inside the
anaerobic chamber, to a previously crimped 2 mL GC vial, 0.5 mL of cell lysate and 0.1
mM CF was added to 1.4 mL of H2 saturated KPi buffer (saturated by purging with 100%
H2), this was done in triplicates. The vial was incubated at 30 ᵒC for 12 h, after which the
enzymatic reaction was stopped by transferring 1 mL of the reaction mixture to a 10 mL
headspace vial containing anhydrous sodium sulphate (0.5 g) and 1 M sulphuric acid (1
mL). The headspace of the vial was then analysed by GC/MS as mentioned in section
2.2.5.
5.2.14 Transcript analysis
C. necator cell pellets from each culture condition in the IPTG-inducible expression
studies were analysed for the presence of transcripts corresponding to tmrA gene. RNA
extraction, cDNA synthesis and transcript analysis were performed as described in
section 4.2.8. The primers used in this study are listed in Table 5.3.
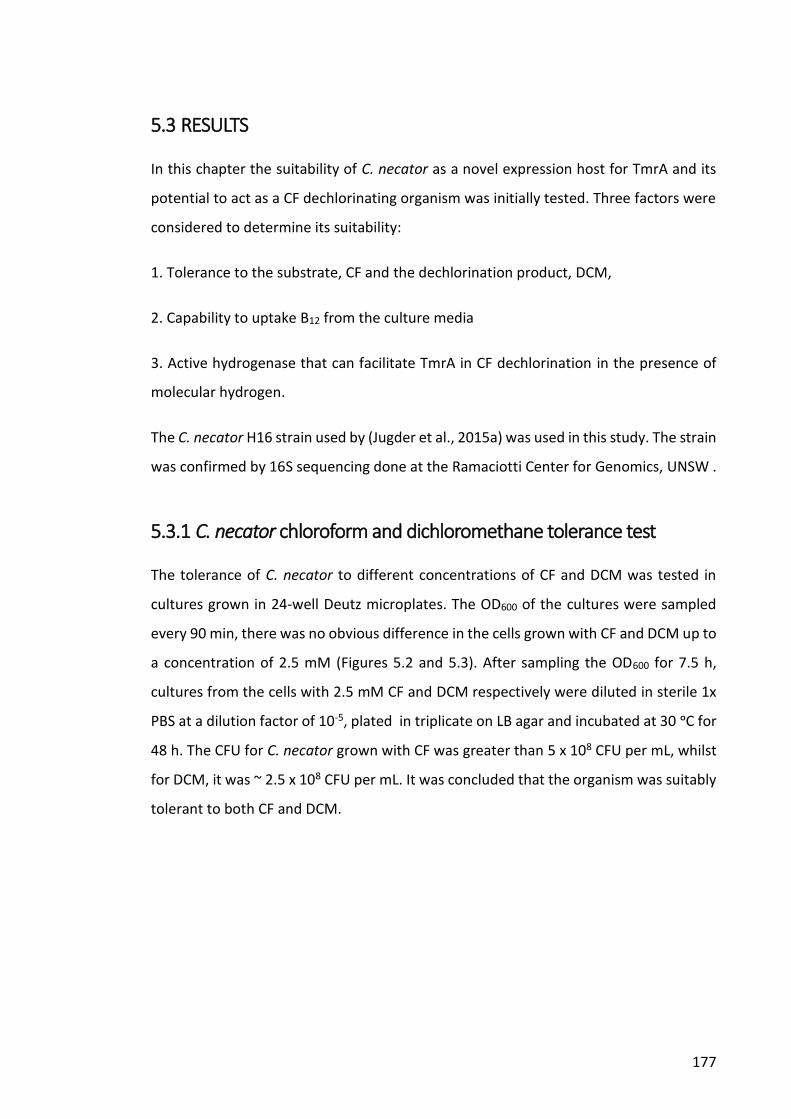
177
5.3 RESULTS
In this chapter the suitability of C. necator as a novel expression host for TmrA and its
potential to act as a CF dechlorinating organism was initially tested. Three factors were
considered to determine its suitability:
1. Tolerance to the substrate, CF and the dechlorination product, DCM,
2. Capability to uptake B12 from the culture media
3. Active hydrogenase that can facilitate TmrA in CF dechlorination in the presence of
molecular hydrogen.
The C. necator H16 strain used by (Jugder et al., 2015a) was used in this study. The strain
was confirmed by 16S sequencing done at the Ramaciotti Center for Genomics, UNSW .
5.3.1 C. necator chloroform and dichloromethane tolerance test
The tolerance of C. necator to different concentrations of CF and DCM was tested in
cultures grown in 24-well Deutz microplates. The OD600 of the cultures were sampled
every 90 min, there was no obvious difference in the cells grown with CF and DCM up to
a concentration of 2.5 mM (Figures 5.2 and 5.3). After sampling the OD600 for 7.5 h,
cultures from the cells with 2.5 mM CF and DCM respectively were diluted in sterile 1x
PBS at a dilution factor of 10-5, plated in triplicate on LB agar and incubated at 30 ᵒC for
48 h. The CFU for C. necator grown with CF was greater than 5 x 10⁸ CFU per mL, whilst
for DCM, it was ~ 2.5 x 10⁸ CFU per mL. It was concluded that the organism was suitably
tolerant to both CF and DCM.
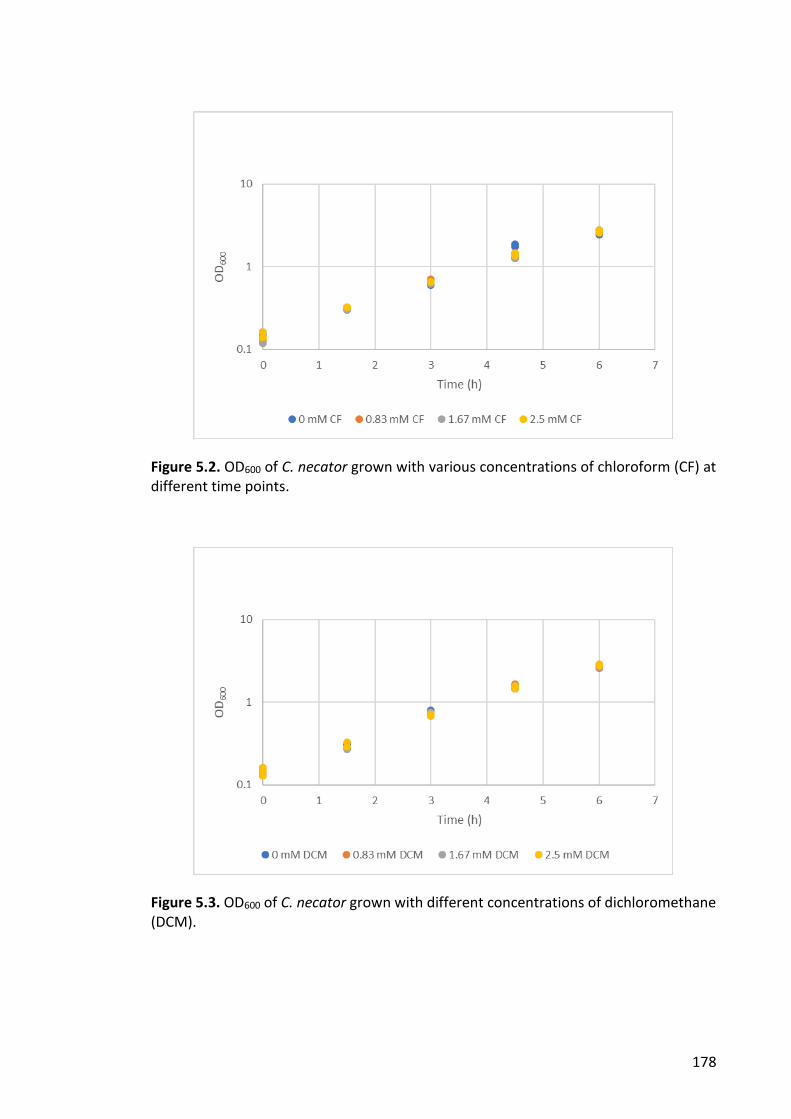
178
Figure 5.2. OD600 of C. necator grown with various concentrations of chloroform (CF) at different time points.
Figure 5.3. OD600 of C. necator grown with different concentrations of dichloromethane (DCM).
179
5.3.2 C. necator vitamin B12 uptake assay
Vitamin B12 activity assay described in the United States Pharmacopeial Convention was
carried out to check the capability of C. necator to uptake vitamin B12 from the growth
media. No quantification of vitamin B12 uptake was done, just the visual difference
between the cells grown with and without vitamin B12 was observed. Lactobacillus
leichmannii grew to higher densities with lysates from C. necator grown with B12 than
without B12. It was concluded that C. necator, could successfully uptake vitamin B12 as
expected from the literature.
Figure 5.4. Vitamin B12 uptake assay. A. Standards containing 0, 10, 20, 30, 40 and 50 pg/mL vitamin B12 from left to right; B. Lactobacillus leichmannii grown with C. necator samples: Tubes 1 and 2 were grown with lysates of C. necator without B12 supplementation, tubes 3 and 4 on the right are grown with lysates of C. necator with B12 supplied in the growth media.
5.3.3 Expression of native Ni-Fe hydrogenase in C. necator
NAD+ as used as the electron acceptor in the H2 oxidation assay. NADH formation was
observed at 340 nm using a Cary 100 UV-Visible Spectrophotometer (Figure 5.5). The
enzyme activity was not calculated, the reduction of NAD+ to NADH was monitored with
continual incubation for 10 min at 340 nm using lysates from cells grown in FGN media
and FN media as control. Cell lysates from FN media culture also demonstrated
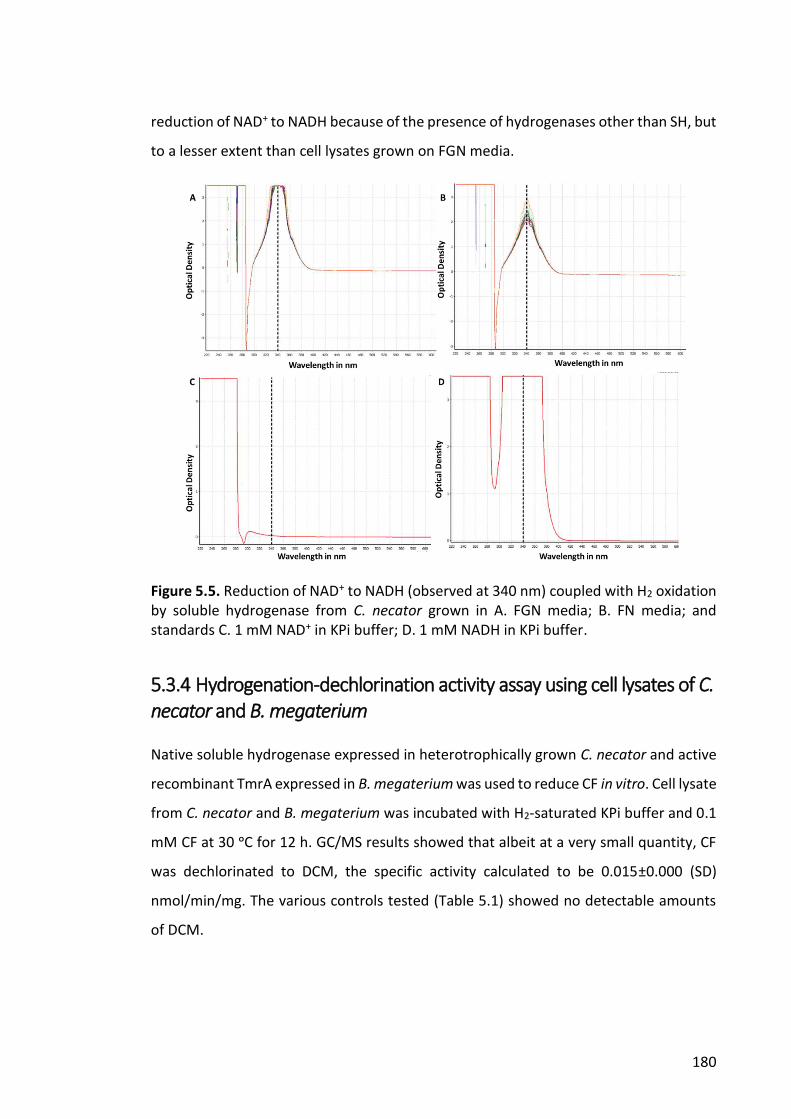
180
reduction of NAD+ to NADH because of the presence of hydrogenases other than SH, but
to a lesser extent than cell lysates grown on FGN media.
Figure 5.5. Reduction of NAD+ to NADH (observed at 340 nm) coupled with H2 oxidation by soluble hydrogenase from C. necator grown in A. FGN media; B. FN media; and standards C. 1 mM NAD+ in KPi buffer; D. 1 mM NADH in KPi buffer.
5.3.4 Hydrogenation-dechlorination activity assay using cell lysates of C. necator and B. megaterium
Native soluble hydrogenase expressed in heterotrophically grown C. necator and active
recombinant TmrA expressed in B. megaterium was used to reduce CF in vitro. Cell lysate
from C. necator and B. megaterium was incubated with H2-saturated KPi buffer and 0.1
mM CF at 30 ᵒC for 12 h. GC/MS results showed that albeit at a very small quantity, CF
was dechlorinated to DCM, the specific activity calculated to be 0.015±0.000 (SD)
nmol/min/mg. The various controls tested (Table 5.1) showed no detectable amounts
of DCM.
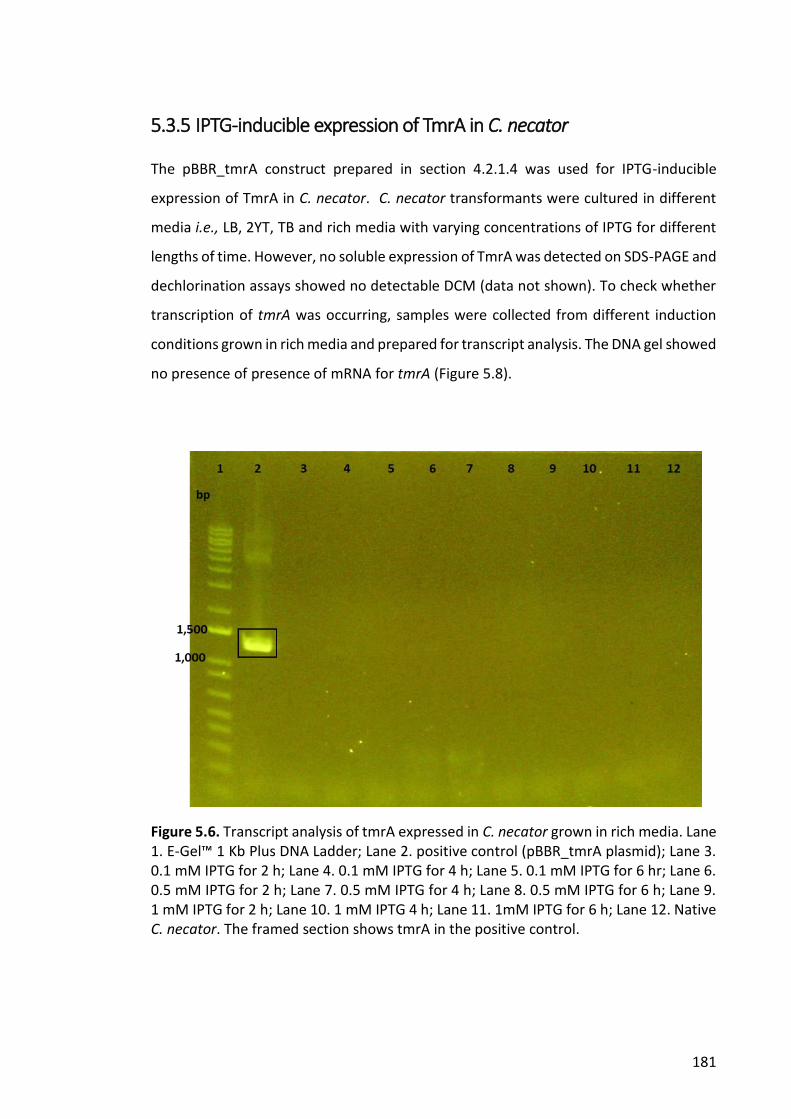
181
5.3.5 IPTG-inducible expression of TmrA in C. necator
The pBBR_tmrA construct prepared in section 4.2.1.4 was used for IPTG-inducible
expression of TmrA in C. necator. C. necator transformants were cultured in different
media i.e., LB, 2YT, TB and rich media with varying concentrations of IPTG for different
lengths of time. However, no soluble expression of TmrA was detected on SDS-PAGE and
dechlorination assays showed no detectable DCM (data not shown). To check whether
transcription of tmrA was occurring, samples were collected from different induction
conditions grown in rich media and prepared for transcript analysis. The DNA gel showed
no presence of presence of mRNA for tmrA (Figure 5.8).
Figure 5.6. Transcript analysis of tmrA expressed in C. necator grown in rich media. Lane 1. E-Gel™ 1 Kb Plus DNA Ladder; Lane 2. positive control (pBBR_tmrA plasmid); Lane 3. 0.1 mM IPTG for 2 h; Lane 4. 0.1 mM IPTG for 4 h; Lane 5. 0.1 mM IPTG for 6 hr; Lane 6. 0.5 mM IPTG for 2 h; Lane 7. 0.5 mM IPTG for 4 h; Lane 8. 0.5 mM IPTG for 6 h; Lane 9. 1 mM IPTG for 2 h; Lane 10. 1 mM IPTG 4 h; Lane 11. 1mM IPTG for 6 h; Lane 12. Native C. necator. The framed section shows tmrA in the positive control.
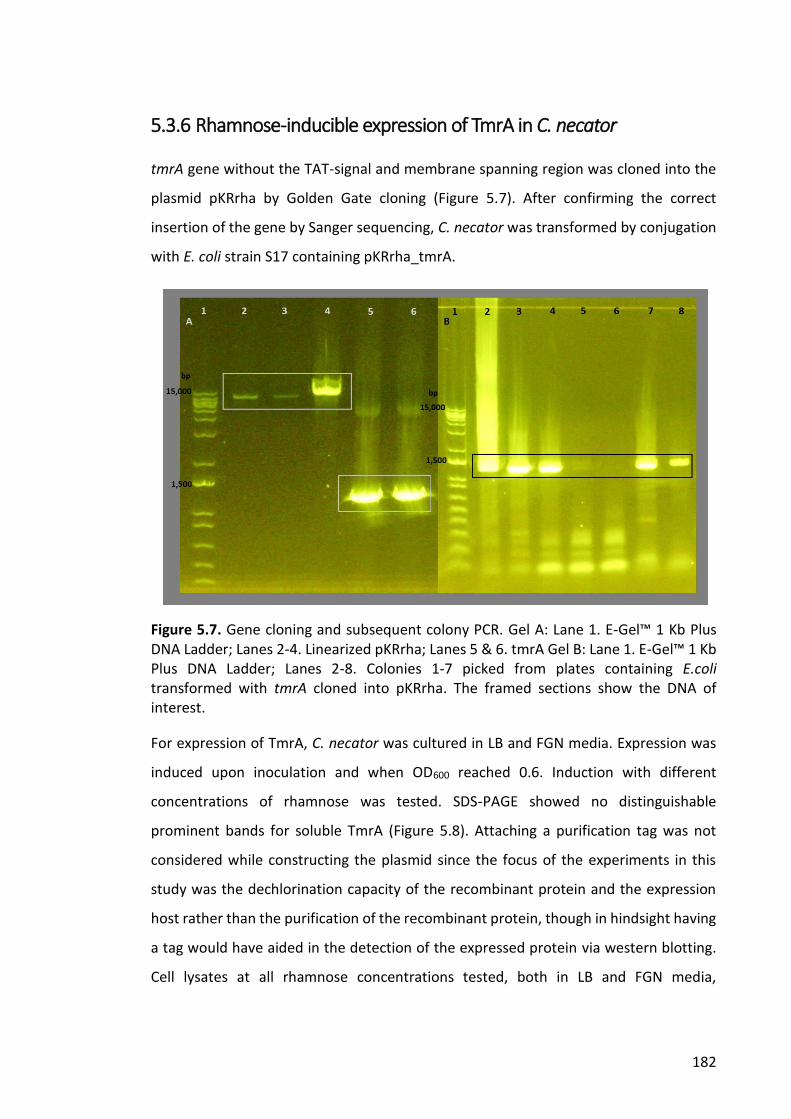
182
5.3.6 Rhamnose-inducible expression of TmrA in C. necator
tmrA gene without the TAT-signal and membrane spanning region was cloned into the
plasmid pKRrha by Golden Gate cloning (Figure 5.7). After confirming the correct
insertion of the gene by Sanger sequencing, C. necator was transformed by conjugation
with E. coli strain S17 containing pKRrha_tmrA.
Figure 5.7. Gene cloning and subsequent colony PCR. Gel A: Lane 1. E-Gel™ 1 Kb Plus DNA Ladder; Lanes 2-4. Linearized pKRrha; Lanes 5 & 6. tmrA Gel B: Lane 1. E-Gel™ 1 Kb Plus DNA Ladder; Lanes 2-8. Colonies 1-7 picked from plates containing E.coli transformed with tmrA cloned into pKRrha. The framed sections show the DNA of interest.
For expression of TmrA, C. necator was cultured in LB and FGN media. Expression was
induced upon inoculation and when OD600 reached 0.6. Induction with different
concentrations of rhamnose was tested. SDS-PAGE showed no distinguishable
prominent bands for soluble TmrA (Figure 5.8). Attaching a purification tag was not
considered while constructing the plasmid since the focus of the experiments in this
study was the dechlorination capacity of the recombinant protein and the expression
host rather than the purification of the recombinant protein, though in hindsight having
a tag would have aided in the detection of the expressed protein via western blotting.
Cell lysates at all rhamnose concentrations tested, both in LB and FGN media,
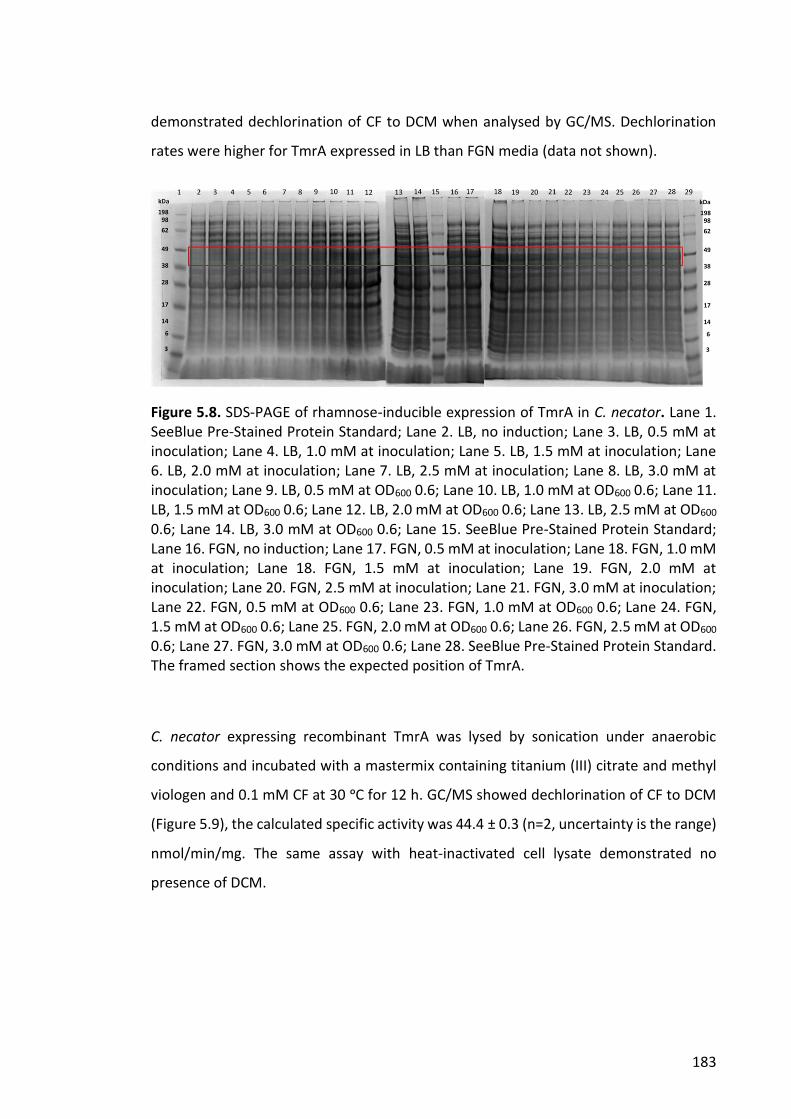
183
demonstrated dechlorination of CF to DCM when analysed by GC/MS. Dechlorination
rates were higher for TmrA expressed in LB than FGN media (data not shown).
Figure 5.8. SDS-PAGE of rhamnose-inducible expression of TmrA in C. necator. Lane 1. SeeBlue Pre-Stained Protein Standard; Lane 2. LB, no induction; Lane 3. LB, 0.5 mM at inoculation; Lane 4. LB, 1.0 mM at inoculation; Lane 5. LB, 1.5 mM at inoculation; Lane 6. LB, 2.0 mM at inoculation; Lane 7. LB, 2.5 mM at inoculation; Lane 8. LB, 3.0 mM at inoculation; Lane 9. LB, 0.5 mM at OD600 0.6; Lane 10. LB, 1.0 mM at OD600 0.6; Lane 11. LB, 1.5 mM at OD600 0.6; Lane 12. LB, 2.0 mM at OD600 0.6; Lane 13. LB, 2.5 mM at OD600 0.6; Lane 14. LB, 3.0 mM at OD600 0.6; Lane 15. SeeBlue Pre-Stained Protein Standard; Lane 16. FGN, no induction; Lane 17. FGN, 0.5 mM at inoculation; Lane 18. FGN, 1.0 mM at inoculation; Lane 18. FGN, 1.5 mM at inoculation; Lane 19. FGN, 2.0 mM at inoculation; Lane 20. FGN, 2.5 mM at inoculation; Lane 21. FGN, 3.0 mM at inoculation; Lane 22. FGN, 0.5 mM at OD600 0.6; Lane 23. FGN, 1.0 mM at OD600 0.6; Lane 24. FGN, 1.5 mM at OD600 0.6; Lane 25. FGN, 2.0 mM at OD600 0.6; Lane 26. FGN, 2.5 mM at OD600 0.6; Lane 27. FGN, 3.0 mM at OD600 0.6; Lane 28. SeeBlue Pre-Stained Protein Standard. The framed section shows the expected position of TmrA.
C. necator expressing recombinant TmrA was lysed by sonication under anaerobic
conditions and incubated with a mastermix containing titanium (III) citrate and methyl
viologen and 0.1 mM CF at 30 ᵒC for 12 h. GC/MS showed dechlorination of CF to DCM
(Figure 5.9), the calculated specific activity was 44.4 ± 0.3 (n=2, uncertainty is the range)
nmol/min/mg. The same assay with heat-inactivated cell lysate demonstrated no
presence of DCM.
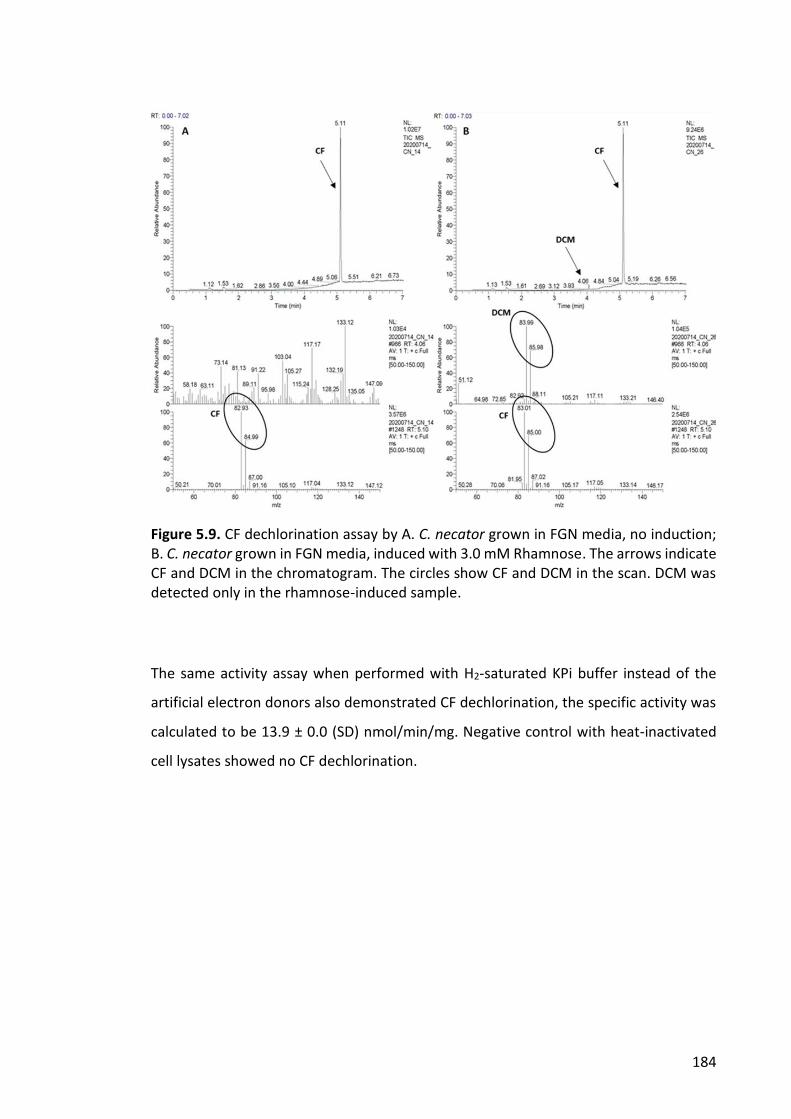
184
Figure 5.9. CF dechlorination assay by A. C. necator grown in FGN media, no induction; B. C. necator grown in FGN media, induced with 3.0 mM Rhamnose. The arrows indicate CF and DCM in the chromatogram. The circles show CF and DCM in the scan. DCM was detected only in the rhamnose-induced sample.
The same activity assay when performed with H2-saturated KPi buffer instead of the
artificial electron donors also demonstrated CF dechlorination, the specific activity was
calculated to be 13.9 ± 0.0 (SD) nmol/min/mg. Negative control with heat-inactivated
cell lysates showed no CF dechlorination.
185
5.4 DISCUSSION
In this chapter, the potential for C. necator to be a novel host for recombinant expression
of soluble and functional reductive dehalogenases was evaluated. The CF RDase, TmrA,
was successfully expressed heterologously in this host. The feasibility to utilize the
uptake Ni-Fe hydrogenases of C. necator as redox partners and induce in vivo and in vitro
dehalogenation of CF was also tested and yielded promising results.
C. necator has gained increasing attention in many biotechnological applications in the
recent years. It is well known for the production of biodegradable plastic (Atlić et al.,
2011, Reinecke and Steinbuechel, 2009) and has provided a platform for the production
of fuels (Bi et al., 2013), industrial chemicals (Crépin et al., 2016, Fei et al., 2013,
Grousseau et al., 2014, Lee et al., 2016, Li et al., 2012, Müller et al., 2013, Nybo et al.,
2015), polymers (Przybylski et al., 2015) and proteins (Barnard et al., 2005, Srinivasan et
al., 2003). The accessibility of its genome sequence (Pohlmann et al., 2006), flexible
metabolism (Alagesan et al., 2018a, Cramm, 2009, Fukui et al., 2014a, Riedel et al.,
2014), fast growth up to high biomass densities (more than 200 g/liter of biomass) when
cultured under heterotrophic conditions (Reinecke and Steinbuechel, 2009, Srinivasan
et al., 2002) and availability of genetic tools (Aboulnaga et al., 2018, Alagesan et al.,
2018b, Arikawa and Matsumoto, 2016, Bi et al., 2013, Fukui et al., 2011, Gruber et al.,
2016, Hanko et al., 2017, Li and Liao, 2015, Sydow et al., 2017) make it an ideal
expression host.
An important requirement for the recombinant expression of RDases is the availability
of sufficient corrinoid cofactors in the host cell. A number of attempts at expressing
RDases in soluble and active form in E. coli has failed presumably because of its inability
to synthesize corrinoids de novo leading to insufficient levels of corrinoid available in the
cells to support RDase expression (Jugder et al., 2018, Neumann et al., 1998, Suyama et
al., 2002). E. coli utilizes vitamin B12 as coenzyme in enzymes such as ethanolamine
ammonia-lyase (Scarlett and Turner, 1976) and methionine synthetase (Roth et al.,
1996). E. coli uptakes vitamin B12 from the environment to meet its requirements. The
transport of vitamin B12 across the outer membrane of E. coli is facilitated by the
186
transmembrane receptor protein BtuB belonging to the family of TonB–dependent
transporters (Pieńko and Trylska, 2020). However, the presence of B12 in the growth
media represses the expression of Btub; the level of intracellular, rather than
extracellular B12 regulates the repression (Kadner, 1978). In this experiment the vitamin
B12 uptake capability of C. necator was demonstrated by undertaking a vitamin B12 assay
using Lactobacillus leichmannii. Soluble and active expression of TmrA in C. necator in
this study also suggests that it has sufficient levels of corrinoid available in the cells to
support expression of RDases. This finding aligns with the results of Black et al. (2018).
They reported the enhanced expression of isobutanol, whose activity is highly
dependent on the presence of vitamin B12 in the cytoplasm, when 1 mM of vitamin B12
was added to the culture media.
To consider C. necator as a dechlorinating organism, it is imperative that the bacterium
is tolerant to both the substrate and product organochloride, at least to some extent.
Chloroform and dichloromethane both are toxic organic compounds. Chloroform is a
widespread groundwater contaminant and is known to inhibit many microbial processes
such as methanogenesis (Weathers and Parkin, 2000), organohalide respiration of
chlorinated ethanes and ethenes (McMurdie et al., 2011), gene transcription in
Desulfitobacterium species (Futagami et al., 2013). Chloroform can inhibit microbial
activity at concentrations as low as 10 mg/L by interfering with membrane function
(Chidthaisong and Conrad, 2000). The genotoxic effects of DCM on bacterial strains are
also well documented (Gisi et al., 1999, Kayser et al., 2000, Kayser and Vuilleumier, 2001,
Vuilleumier, 2002). In this study C. necator grew in media containing up to 2.5 mM
chloroform and dichloromethane without any visible negative impact on growth. At the
end of 48 h incubation, the number of CFU on plates with C. necator growing with 2.5
mM CF and DCM was evaluated. High viable counts were observed in both cases, albeit
lower in the presence of DCM compared to CF.
In this study, the expression of TmrA in C. necator was first attempted with an IPTG-
inducible expression system. The tmrA gene cloned into pBBR1MCS-2 vector,
constructed in chapter four, was used for this purpose. Expression was attempted using
various concentrations of IPTG, over varying lengths of time, in different culture media.
187
However, no soluble expression of TmrA was observed. Transcript analysis of cells
cultured in rich media with various concentrations of IPTG over 2 to 6 h showed no
evidence of TmrA mRNA. This was possibly due to poor plasmid stability; plasmid loss
has been previously reported for C. necator cells carrying expression plasmid with a
pBBR1 origin of replication (Fukui et al., 2014b, Gruber et al., 2014, Voss and
Steinbüchel, 2006). After the failure to express TmrA under the IPTG-inducible
expression system, tmrA (devoid of the TAT-signal and the membrane spanning region)
was cloned into the pKRrha plasmid described by Sydow et al. (2017) which had a
tetracycline resistance cassette (Tcr) and a rhamnose-inducible promoter (rhaPBAD).
Soluble and active TmrA was expressed with all the rhamnose concentrations tested (0.5
to 3 mM) in both LB and FGN media. Sydow et al. (2017) observed high tunability of
eGFP expressions with 0.4 to 1 mM rhamnose in different media, the highest level of
protein expression was achieved with 11 mM rhamnose; expression was increased 140-
fold in LB medium and around 60-fold in minimal medium. Similar to the observations
of Sydow and co-workers, the expression of TmrA in this study was tightly regulated and
expression was better in complex media than defined media.
Obligate OHRB such as Dehalobacter strain UNSWDHB are almost always restricted to
H2 as electron donors, however, the redox partners for the terminal RDases are still
unknown. The non-respiratory RDases on the other hand, are linked to genes encoding
putative redox partners or are fused to a redox module which links substrate reduction
to NADPH oxidation (Collins et al., 2018). Genomic, transcriptional, and biochemical
studies have postulated the involvement of membrane-bound hydrogenases in electron
transport in OHRB (Kruse et al., 2017, Kruse et al., 2015, Kube et al., 2005, Mansfeldt et
al., 2014, Morris et al., 2006, Nonaka et al., 2006). In this study, heterologous
reconstitution of oxidation-reduction of H2/CF by uptake hydrogenase from and TmrA
was evaluated.
Recombinant expression of hydrogenases is complex and arduous, so the native O2-
tolerant soluble hydrogenase (SH) of C. necator which is encoded on the mega-plasmid
pHG1 was chosen for this study. Culture of C. necator in minimal medium FGN facilitates
initial growth on the preferred carbon source, fructose and represses hydrogenase
188
expression; fructose depletion switches to growth on glycerol and stimulate de-
repression of hydrogenase expression (Jugder et al., 2016b). Growth on heterotrophic
media also promotes expression of membrane-bound hydrogenase (Jugder et al., 2015,
Lauterbach and Lenz, 2013). In this study, C. necator was cultured in FGN media to
promote expression of SH, the functionality of which was tested by the activity assay
described by (Jugder et al., 2016b). When C. necator cell lysate containing functional SH
was mixed with B. megaterium cell lysate containing active recombinant TmrA and
incubated with H2-saturated KPi buffer and CF at 30 ᵒC for 12 h, very little dechlorination
of CF to DCM (specific activity 0.014 ± 0.000 nmol/min/mg) could be detected by GC/MS.
The various negative controls tested showed no sign of dechlorination. This could
suggest that the C. necator hydrogenase oxidized H2 which made electron available to
TmrA for the reduction of CF.
When recombinant TmrA was expressed in C. necator cultured in FGN media, both SH
and recombinant TmrA were active, the activity was confirmed for both by separate
assays. The specific activity for SH was not calculated whereas the specific activity for
recombinant TmrA was 44.4 ± 0.3 nmol/min/mg when titanium (III) citrate reduced
methyl viologen was used as the electron donor. Activity assay with the heat inaed cell
lysate showed no DCM formation. Incubation of cell lysate from C. necator cultured in
FGN media expressing recombinant TmrA with H2-saturated KPi buffer and CF at 30 ᵒC
showed dechlorination of CF to DCM which was detected by GC/MS, the calculated
specific activity was 13.9 ± 0.0 nmol/min/mg. The same assay carried out with heat-
inactivated cell lysate showed no dechlorination. The small amount of dechlorination in
the activity assays might be because of lack of sufficient levels of H2 in the assay mixture.
Due to infrastructural limitations the hydrogenation of KPi buffer was done at a different
location to where the activity assay was set up. H2 loss from the buffer could have
occurred during transportation or over the 12 h incubation period. Despite the various
experimental limitations, this novel study has demonstrated that a non-physiological
hydrogenase can support a H2-dependent organohalide reduction by TmrA. Due to time
constraints in vivo dechlorination by recombinant C. necator could not be tested.
189
5.5 CONCLUSIONS
This is the first report of C. necator being used as an expression host for recombinant
RDases after confirming its capacity to uptake exogenous Vitamin B12. TmrA has been
successfully expressed in a soluble and functional form in C. necator. The soluble
expression of TmrA in this host also refutes the notion that RDases cannot be expressed
in hosts incapable of synthesizing vitamin B12 de novo. C. necator expressing
recombinant TmrA has also demonstrated in vitro dechlorination of CF with H2 as the
electron donor, instead of the artificial electron donor methyl viologen which is
commonly used otherwise. The tolerance of C. necator to both substrate (CF) and
dechlorination product (DCM) was also confirmed. Further studies will be needed for
the optimization of H2 oxidation coupled reduction of CF by TmrA and to test the
potential of in vivo CF dechlorination by recombinant C. necator. The findings in this
chapter will provide a platform to better understand the redox partners of RDases and
demonstrate prospects for engineering C. necator into a dechlorinating organism to be
used in bioremediation applications.
190
5.6 REFERENCES
ABOULNAGA, E. A., ZOU, H., SELMER, T. & XIAN, M. 2018. Development of a plasmid-based, tunable, tolC-derived expression system for application in Cupriavidus necator H16. Journal of Biotechnology, 274, 15-27.
ALAGESAN, S., HANKO, E. K., MALYS, N., EHSAAN, M., WINZER, K. & MINTON, N. P. 2018a. Functional genetic elements for controlling gene expression in Cupriavidus necator H16. Applied and Environmental Microbiology, 84(19): e00878-18.
ALAGESAN, S., MINTON, N. P. & MALYS, N. 2018b. 13 C-assisted metabolic flux analysis to investigate heterotrophic and mixotrophic metabolism in Cupriavidus necator H16. Metabolomics, 14(1): 9.
APPRILL, A., MCNALLY, S., PARSONS, R. & WEBER, L. 2015. Minor revision to V4 region SSU rRNA 806R gene primer greatly increases detection of SAR11 bacterioplankton. Aquatic Microbial Ecology, 75(2): 129-137.
ARIKAWA, H. & MATSUMOTO, K. 2016. Evaluation of gene expression cassettes and production of poly (3-hydroxybutyrate-co-3-hydroxyhexanoate) with a fine modulated monomer composition by using it in Cupriavidus necator. Microbial Cell Factories, 15(1): 184.
ATLIĆ, A., KOLLER, M., SCHERZER, D., KUTSCHERA, C., GRILLO-FERNANDES, E., HORVAT, P., CHIELLINI, E. & BRAUNEGG, G. 2011. Continuous production of poly ([R]-3-hydroxybutyrate) by Cupriavidus necator in a multistage bioreactor cascade. Applied Microbiology & Biotechnology, 91(2): 295-304.
BARNARD, G. C., MCCOOL, J. D., WOOD, D. W. & GERNGROSS, T. U. 2005. Integrated recombinant protein expression and purification platform based on Ralstonia eutropha. Applied and Environmental Microbiology, 71(10): 5735-5742.
BI, C., SU, P., MÜLLER, J., YEH, Y.-C., CHHABRA, S. R., BELLER, H. R., SINGER, S. W. & HILLSON, N. J. 2013. Development of a broad-host synthetic biology toolbox for Ralstonia eutropha and its application to engineering hydrocarbon biofuel production. Microbial Cell Factories, 12(1): 107.
BLACK, W. B., ZHANG, L., KAMOKU, C., LIAO, J. C. & LI, H. 2018. Rearrangement of coenzyme A-acylated carbon chain enables synthesis of isobutanol via a novel pathway in Ralstonia eutropha. ACS Synthetic Biology, 7(3): 794-800.
BURGDORF, T., LENZ, O., BUHRKE, T., VAN DER LINDEN, E., JONES, A. K., ALBRACHT, S. P. & FRIEDRICH, B. 2005. [NiFe]-hydrogenases of Ralstonia eutropha H16: modular enzymes for oxygen-tolerant biological hydrogen oxidation. Journal of Molecular Microbiology& Biotechnology, 10(2-4): 181-196.
CHEN, K., HUANG, L., XU, C., LIU, X., HE, J., ZINDER, S. H., LI, S. & JIANG, J. 2013. Molecular characterization of the enzymes involved in the degradation of a brominated aromatic herbicide. Molecular Microbiology, 89(6): 1121-1139.
CHIDTHAISONG, A. & CONRAD, R. 2000. Specificity of chloroform, 2-bromoethanesulfonate and fluoroacetate to inhibit methanogenesis and other anaerobic processes in anoxic rice field soil. Soil Biology and Biochemistry, 32(7): 977-988.
COLLINS, F. A., FISHER, K., PAYNE, K. A., GAYTAN MONDRAGON, S., RIGBY, S. E. & LEYS, D. 2018. NADPH-driven organohalide reduction by a nonrespiratory reductive dehalogenase. Biochemistry, 57(25): 3493-3502.
191
CRAMM, R. 2009. Genomic view of energy metabolism in Ralstonia eutropha H16. Journal of Molecular Microbiology & Biotechnology, 16(1-2): 38-52.
CRÉPIN, L., LOMBARD, E. & GUILLOUET, S. E. 2016. Metabolic engineering of Cupriavidus necator for heterotrophic and autotrophic alka (e) ne production. Metabolic Engineering, 37, 92-101.
DOLFING, J. & TIEDJE, J. 1987. Growth yield increase linked to reductive dechlorination in a defined 3-chlorobenzoate degrading methanogenic coculture. Archives of Microbiology, 149(2): 102-105.
ENGLISH, C. M., ECKERT, C., BROWN, K., SEIBERT, M. & KING, P. W. 2009. Recombinant and in vitro expression systems for hydrogenases: new frontiers in basic and applied studies for biological and synthetic H2 production. Dalton Transactions, 45: 9970-9978.
FEI, Q., BRIGHAM, C. J., LU, J., FU, R. & SINSKEY, A. J. 2013. Production of branched-chain alcohols by recombinant Ralstonia eutropha in fed-batch cultivation. Biomass and Bioenergy, 56, 334-341.
FRIEDRICH, C. G., FRIEDRICH, B. & BOWIEN, B. 1981. Formation of enzymes of autotrophic metabolism during heterotrophic growth of Alcaligenes eutrophus. Microbiology, 122(1): 69-78.
FUKUI, T., CHOU, K., HARADA, K., ORITA, I., NAKAYAMA, Y., BAMBA, T., NAKAMURA, S. & FUKUSAKI, E. 2014a. Metabolite profiles of polyhydroxyalkanoate-producing Ralstonia eutropha H16. Metabolomics, 10(2): 190-202.
FUKUI, T., MUKOYAMA, M., ORITA, I. & NAKAMURA, S. 2014b. Enhancement of glycerol utilization ability of Ralstonia eutropha H16 for production of polyhydroxyalkanoates. Applied Microbiology & Biotechnology, 98(17): 7559-7568.
FUKUI, T., OHSAWA, K., MIFUNE, J., ORITA, I. & NAKAMURA, S. 2011. Evaluation of promoters for gene expression in polyhydroxyalkanoate-producing Cupriavidus necator H16. Applied Microbiology & Biotechnology, 89(5): 1527-1536.
FUTAGAMI, T., FUKAKI, Y., FUJIHARA, H., TAKEGAWA, K., GOTO, M. & FURUKAWA, K. 2013. Evaluation of the inhibitory effects of chloroform on ortho-chlorophenol-and chloroethene-dechlorinating Desulfitobacterium strains. AMB Express, 3(1): 30.
GISI, D., LEISINGER, T. & VUILLEUMIER, S. 1999. Enzyme-mediated dichloromethane toxicity and mutagenicity of bacterial and mammalian dichloromethane-active glutathione S-transferases. Archives of Toxicology, 73(2): 71-79.
GROUSSEAU, E., LU, J., GORRET, N., GUILLOUET, S. E. & SINSKEY, A. J. 2014. Isopropanol production with engineered Cupriavidus necator as bioproduction platform. Applied Microbiology & Biotechnology, 98(9): 4277-4290.
GRUBER, S., HAGEN, J., SCHWAB, H. & KOEFINGER, P. 2014. Reprint of “Versatile and stable vectors for efficient gene expression in Ralstonia eutropha H16”. Journal of Biotechnology, 192, 410-418.
GRUBER, S., SCHWENDENWEIN, D., MAGOMEDOVA, Z., THALER, E., HAGEN, J., SCHWAB, H. & HEIDINGER, P. 2016. Design of inducible expression vectors for improved protein production in Ralstonia eutropha H16 derived host strains. Journal of Biotechnology, 235, 92-99.
HANKO, E. K. R., MINTON, N. P. & MALYS, N. 2017. Characterisation of a 3-hydroxypropionic acid-inducible system from Pseudomonas putida for
192
orthogonal gene expression control in Escherichia coli and Cupriavidus necator. Scientific Reports, 7(1): 1724.
JUGDER, B.-E. 2013. Production of a soluble hydrogenase from R. eutropha H16. Master of Science - Biotechnology, The University of New South Wales.
JUGDER, B.-E., CHEN, Z., PING, D. T. T., LEBHAR, H., WELCH, J. & MARQUIS, C. P. 2015. An analysis of the changes in soluble hydrogenase and global gene expression in Cupriavidus necator (Ralstonia eutropha) H16 grown in heterotrophic diauxic batch culture. Microbial Cell Factories, 14(1): 42.
JUGDER, B.-E., LEBHAR, H., AGUEY-ZINSOU, K.-F. & MARQUIS, C. P. 2016a. Production and purification of a soluble hydrogenase from Ralstonia eutropha H16 for potential hydrogen fuel cell applications. MethodsX, 3, 242-250.
JUGDER, B.-E., PAYNE, K. A., FISHER, K., BOHL, S., LEBHAR, H., MANEFIELD, M., LEE, M., LEYS, D. & MARQUIS, C. P. 2018. Heterologous production and purification of a functional chloroform reductive dehalogenase. ACS Chemical Biology, 13(3): 548-552.
JUGDER, B.-E., WELCH, J., BRAIDY, N. & MARQUIS, C. P. 2016b. Construction and use of a Cupriavidus necator H16 soluble hydrogenase promoter (PSH) fusion to gfp (green fluorescent protein). PeerJ, 4, e2269.
JUGDER, B. E., ERTAN, H., WONG, Y. K., BRAIDY, N., MANEFIELD, M., MARQUIS, C. P. & LEE, M. 2016c. Genomic, transcriptomic and proteomic analyses of Dehalobacter UNSWDHB in response to chloroform. Environmental Microbiology Reports, 8(5): 814-824.
KADNER, R. J. 1978. Repression of synthesis of the vitamin B12 receptor in Escherichia coli. Journal of Bacteriology, 136(3): 1050-1057.
KAYSER, M. F., STUMPP, M. T. & VUILLEUMIER, S. 2000. DNA Polymerase I Is Essential for Growth of Methylobacterium dichloromethanicum DM4 with Dichloromethane. Journal of Bacteriology, 182(19): 5433-5439.
KAYSER, M. F. & VUILLEUMIER, S. 2001. Dehalogenation of dichloromethane by dichloromethane dehalogenase/glutathiones-transferase leads to formation of DNA adducts. Journal of Bacteriology, 183(17): 5209-5212.
KRUSE, S., GORIS, T., WOLF, M., WEI, X. & DIEKERT, G. 2017. The NiFe hydrogenases of the tetrachloroethene-respiring Epsilonproteobacterium Sulfurospirillum multivorans: biochemical studies and transcription analysis. Frontiers in Microbiology, 8, 444.
KRUSE, T., VAN DE PAS, B. A., ATTEIA, A., KRAB, K., HAGEN, W. R., GOODWIN, L., CHAIN, P., BOEREN, S., MAPHOSA, F. & SCHRAA, G. 2015. Genomic, proteomic, and biochemical analysis of the organohalide respiratory pathway in Desulfitobacterium dehalogenans. Journal of Bacteriology, 197(5): 893-904.
KUBE, M., BECK, A., ZINDER, S. H., KUHL, H., REINHARDT, R. & ADRIAN, L. 2005. Genome sequence of the chlorinated compound–respiring bacterium Dehalococcoides species strain CBDB1. Nature Biotechnology, 23(10): 1269-1273.
LAI, Q., LI, G. & SHAO, Z. 2012. Genome sequence of Nitratireductor pacificus type strain pht-3B. Journal of Bacteriology, 194(24): 9658.
LAUTERBACH, L. & LENZ, O. 2013. Catalytic production of hydrogen peroxide and water by oxygen-tolerant [NiFe]-hydrogenase during H2 cycling in the presence of O2. Journal of the American Chemical Society, 135(2): 17897-17905.
193
LEE, H.-M., JEON, B.-Y. & OH, M.-K. 2016. Microbial production of ethanol from acetate by engineered Ralstonia eutropha. Biotechnology Bioprocess Engineering, 21(3): 402-407.
LI, H. & LIAO, J. C. 2015. A synthetic anhydrotetracycline-controllable gene expression system in Ralstonia eutropha H16. ACS Synthetic Biology, 4(2): 101-106.
LI, H., OPGENORTH, P. H., WERNICK, D. G., ROGERS, S., WU, T.-Y., HIGASHIDE, W., MALATI, P., HUO, Y.-X., CHO, K. M. & LIAO, J. C. 2012. Integrated electromicrobial conversion of CO2 to higher alcohols. Science, 335(6076): 1596-1596.
LOUIE, T. M. & MOHN, W. W. 1999. Evidence for a Chemiosmotic Model of Dehalorespiration in Desulfomonile tiedjei DCB-1. Journal of Bacteriology, 181(1): 40-46.
MANSFELDT, C. B., ROWE, A. R., HEAVNER, G. L., ZINDER, S. H. & RICHARDSON, R. E. 2014. Meta-analyses of Dehalococcoides mccartyi strain 195 transcriptomic profiles identify a respiration rate-related gene expression transition point and interoperon recruitment of a key oxidoreductase subunit. Applied and Environmental Microbiology, 80(19): 6062-6072.
MCMURDIE, P. J., HUG, L. A., EDWARDS, E. A., HOLMES, S. & SPORMANN, A. M. 2011. Site-specific mobilization of vinyl chloride respiration islands by a mechanism common in Dehalococcoides. BMC Genomics, 12(1): 287.
MORRIS, R., SOWELL, S., BAROFSKY, D., ZINDER, S. & RICHARDSON, R. 2006. Transcription and mass‐spectroscopic proteomic studies of electron transport oxidoreductases in Dehalococcoides ethenogenes. Environmental Microbiology, 8(9): 1499-1509.
MÜLLER, J., MACEACHRAN, D., BURD, H., SATHITSUKSANOH, N., BI, C., YEH, Y.-C., LEE, T. S., HILLSON, N. J., CHHABRA, S. R. & SINGER, S. W. 2013. Engineering of Ralstonia eutropha H16 for autotrophic and heterotrophic production of methyl ketones. Applied and Environmental Microbiology, 79(14): 4433-4439.
NEUMANN, A., WOHLFARTH, G. & DIEKERT, G. 1998. Tetrachloroethene dehalogenase from Dehalospirillum multivorans: cloning, sequencing of the encoding genes, and expression of the pceA gene in Escherichia coli. Journal of Bacteriology, 180(16): 4140-4145.
NONAKA, H., KERESZTES, G., SHINODA, Y., IKENAGA, Y., ABE, M., NAITO, K., INATOMI, K., FURUKAWA, K., INUI, M. & YUKAWA, H. 2006. Complete genome sequence of the dehalorespiring bacterium Desulfitobacterium hafniense Y51 and comparison with Dehalococcoides ethenogenes 195. Journal of Bacteriology, 188(6): 2262-2274.
NYBO, S. E., KHAN, N. E., WOOLSTON, B. M. & CURTIS, W. R. 2015. Metabolic engineering in chemolithoautotrophic hosts for the production of fuels and chemicals. Metabolic Engineering, 30, 105-120.
PARADA, A. E., NEEDHAM, D. M. & FUHRMAN, J. A. 2016. Every base matters: assessing small subunit rRNA primers for marine microbiomes with mock communities, time series and global field samples. Environmental Microbiology, 18(5): 1403-1414.
PIEŃKO, T. & TRYLSKA, J. 2020. Extracellular loops of BtuB facilitate transport of vitamin B12 through the outer membrane of E. coli. PLOS Computational Biology, 16(7): e1008024.
194
POHLMANN, A., FRICKE, W. F., REINECKE, F., KUSIAN, B., LIESEGANG, H., CRAMM, R., EITINGER, T., EWERING, C., PÖTTER, M., SCHWARTZ, E., STRITTMATTER, A., VOSS, I., GOTTSCHALK, G., STEINBÜCHEL, A., FRIEDRICH, B. & BOWIEN, B. 2006. Genome sequence of the bioplastic-producing "Knallgas" bacterium Ralstonia eutropha H16. Nature Biotechnology, 24(10): 1257-62.
PRZYBYLSKI, D., ROHWERDER, T., DILßNER, C., MASKOW, T., HARMS, H. & MÜLLER, R. H. 2015. Exploiting mixtures of H2, CO2, and O2 for improved production of methacrylate precursor 2-hydroxyisobutyric acid by engineered Cupriavidus necator strains. Applied Microbiology & Biotechnology, 99(5): 2131-2145.
REINECKE, F. & STEINBUECHEL, A. 2009. Ralstonia eutropha strain H16 as model organism for PHA metabolism and for biotechnological production of technically interesting biopolymers. Journal of Molecular Microbiology & Biotechnology, 16(1-2): 91-108.
RIEDEL, S. L., LU, J., STAHL, U. & BRIGHAM, C. J. 2014. Lipid and fatty acid metabolism in Ralstonia eutropha: relevance for the biotechnological production of value-added products. Applied Microbiology & Biotechnology, 98(4): 1469-1483.
ROTH, J. R., LAWRENCE, J. & BOBIK, T. 1996. Cobalamin (coenzyme B12): synthesis and biological significance. Annual Review of Microbiology, 50(1): 137-181.
SCARLETT, F. A. & TURNER, J. 1976. Microbial metabolism of amino alcohols. Ethanolamine catabolism mediated by coenzyme B12-dependent ethanolamine ammonia-lyase in Escherichia coli and Klebsiella aerogenes. Microbiology, 95(1): 173-176.
SCHWARTZ, E., HENNE, A., CRAMM, R., EITINGER, T., FRIEDRICH, B. & GOTTSCHALK, G. 2003. Complete nucleotide sequence of pHG1: a Ralstonia eutropha H16 megaplasmid encoding key enzymes of H2-based lithoautotrophy and anaerobiosis. Journal of Molecular Biology, 332(2): 369-383.
SHELTON, D. R. & TIEDJE, J. M. 1984. Isolation and partial characterization of bacteria in an anaerobic consortium that mineralizes 3-chlorobenzoic acid. Applied and Environmental Microbiology, 48(4): 840-848.
SRINIVASAN, S., BARNARD, G. C. & GERNGROSS, T. U. 2002. A novel high-cell-density protein expression system based on Ralstonia eutropha. Applied and Environmental Microbiology, 68(12): 5925-5932.
SRINIVASAN, S., BARNARD, G. C. & GERNGROSS, T. U. 2003. Production of recombinant proteins using multiple‐copy gene integration in high‐cell‐density fermentations of Ralstonia eutropha. Biotechnology and Bioengineering, 84(1): 114-120.
SUYAMA, A., YAMASHITA, M., YOSHINO, S. & FURUKAWA, K. 2002. Molecular Characterization of the PceA Reductive Dehalogenase of Desulfitobacterium sp. Strain Y51. Journal of Bacteriology, 184(13): 3419.
SYDOW, A., PANNEK, A., KRIEG, T., HUTH, I., GUILLOUET, S. E. & HOLTMANN, D. 2017. Expanding the genetic tool box for Cupriavidus necator by a stabilized L-rhamnose inducible plasmid system. Journal of Biotechnology, 263, 1-10.
UNITED STATES PHARMACOPEIAL CONVENTION, INC. 2008. The United States pharmacopeia 31/The national formulary 26, Supp. 1, 8-1-08, online. United States Pharmacopeial Convention, Inc., Rockville, Md
VOSS, I. & STEINBÜCHEL, A. 2006. Application of a KDPG-aldolase gene-dependent addiction system for enhanced production of cyanophycin in Ralstonia eutropha strain H16. Metabolic Engineering, 8(1): 66-78.
195
VUILLEUMIER, S. 2002. Coping with a halogenated one-carbon diet: aerobic dichloromethane-mineralising bacteria. Biotechnology for the Environment: Strategy and Fundamentals. Springer.
WEATHERS, L. J. & PARKIN, G. F. 2000. Toxicity of chloroform biotransformation to methanogenic bacteria. Environmental Science and Technology, 34(13): 2764-2767.
YU, J. & MUNASINGHE, P. 2018. Gas fermentation enhancement for chemolithotrophic growth of Cupriavidus necator on carbon dioxide. ChemRxiv, 4, 63.

196
CHAPTER SIX: General discussion and concluding remarks
197
Dehalobacter sp. strain UNSWDHB is an obligate OHRB capable of respiring CF to DCM.
The sole electron donor for CF respiration is H2, which is oxidised by a membrane-bound
hydrogenase and the electrons are utilised by the reductive dehalogenase, TmrA for the
reductive dechlorination of CF. In this thesis, TmrA has been expressed in four different
expression hosts, Escherichia coli BL21(DE3)pLysS, Bacillus megaterium MS941,
Shimwellia blattae and Cupriavidus necator H16 strain DSM 428, with an aim to
compare the different expression systems and provide useful guidelines for future
recombinant RDase studies.
6.1 Reductive dehalogenases in organohalide respiration
Since the discovery of OHRB in the 1980s, extensive research has been carried out to
reveal the ecological, genomic, physiological, and biochemical features of this
taxonomically diverse group of bacteria. Research over the past two decades on OHRB
and their RDases has vastly improved our understanding of organohalide respiration and
their potential for application in bioremediation of organohalide-contaminated sites.
The discovery of the crystal structure of the respiratory PceA from Sulfurospirillum
multivorans and the catabolic NpRdhA from Nitratireductor pacificus has shed light on
the catalytic mechanism of RDases (Bommer et al., 2014, Payne et al., 2015).
Breakthroughs such as this opens doors for new paradigms to be explored and
understood. However, there are still many unanswered questions and many knowledge
gaps to be filled, such as 1) what are the biophysical and chemical properties that govern
substrate specificity of different RDases? 2) what factors govern the difference in
reaction mechanisms of RDases? 3) what are the different electron transfer steps in OHR
and why do they vary among OHRB? To answer these important questions, it is
imperative to produce sufficient amounts of RDases to conduct further studies. Isolation
of native RDases has many drawbacks; oxygen sensitivity and slow growth of OHRB, low
biomass and protein yield, the difficulty of working with membrane proteins are among
the major hurdles. Hence, efforts have been made to produce RDases heterologously.
However, the oxygen intolerance of respiratory RDases and their requirement for
cobalamin and Fe-S cluster cofactors complicate the process and not very many success
stories have been reported so far.
198
6.2 Escherichia coli: the recombinant protein expression factory
E. coli is the most commonly used prokaryotic host for heterologous expression of
protein (Jia and Jeon, 2016). However, the soluble expression of RDases, particularly
respiratory RDases, in E. coli has not been very successful so far, though recovery from
inclusion bodies by in vitro reconstitution of cofactors has been possible for VcrA from
Dehalococcoides mccartyi strain VS and PceA from Geobacter sp. (Nakamura et al., 2018,
Parthasarathy et al., 2015). The incapability of E. coli to synthesize corrinoids de novo
resulting in insufficient amounts of cobamide cofactor in the cells to support RDase
expression has been suggested as the reason behind the failures (Neumann et al., 1998,
Suyama et al., 2002). The catabolic RDase, NpRdhA, from Nitratireductor pacificus has
been expressed in a soluble and active form in E. coli strains BL21 and HMS174(DE3) by
co-expression with a vitamin-B12 transporter btuB (Collins, 2017, Halliwell et al., 2021).
In this study, TmrA was recovered in a catalytically active form from inclusion bodies
expressed in E. coli BL21(DE3)pLysS. The refolding and cofactor reconstitution methods
used in the experiments reveal that successful refolding depends on the availability of
proper cofactors to assist in the correct refolding. Lack of sufficient cofactors in SDS-
MPD refolding method attempted in this study resulted in inactive TmrA. The most
promising aspect of this study was the revelation that the TmrA inclusion bodies could
be purified in the presence of air prior to the cofactor reconstitution and resume activity
when the reconstitution is done under anaerobic conditions. Protein purification inside
an anaerobic chamber is complicated and laborious. Long hours of working inside an
anaerobic chamber at a stretch is also not very ergonomic for the technician. The
method of aerobic purification and anaerobic cofactor reconstitution described in this
study offers a sustainable production pipeline for RDases and other similar proteins.
6.3 Bacillus megaterium: the big beast
The corrinoid producing Gram-positive Bacillus megaterium has been identified as a
suitable host for the expression of soluble and functional RDases. Both respiratory and
catabolic RDases have been successfully expressed in B. megaterium (Jugder et al., 2018,
Payne et al., 2015). Jugder and co-workers (2018) successfully expressed TmrA, the
199
RDase of interest in this thesis, in B. megaterium. However, the recombinant TmrA had
an 11-fold lower specific activity than that calculated for the native enzyme (Jugder et
al., 2017). In this experiment various culture and induction conditions were screened to
improve the soluble expression and specific activity of recombinant TmrA in B.
megaterium. A serendipitous find was that adding much lower concentrations of xylose
than what is conventionally used, particularly when induction is done at 37 °C for 3 h,
leads to higher specific activity of the recombinant TmrA. Screening experiments done
by full factorial design supported this assertion. The best induction conditions revealed
by the screening experiments were induction with 0.03% xylose for 3 h at 37 °C.
Statistical analysis by JMP of the soluble expression and specific activity of recombinant
TmrA supports this finding, the desirability function (0.5) was the highest for this
condition. The desirability function endeavours to determine the best compromise
among all the responses involved in a process (Candioti et al., 2014). The overall
desirability for all responses (soluble expression and specific activity in this study) is
interpreted as the geometric mean of the desirability functions for the individual
responses. Recombinant TmrA purified from B. megaterium induced with 0.03% xylose
for 3 h at 37 °C had a specific activity of (3.6 ± 0.3) x 103 nmol/min/mg protein which is
32.7 times higher than specific activity of the recombinant TmrA expressed in B.
megaterium by Jugder et al., (2018) and 2.8 times higher than the specific activity for
native TmrA calculated by Jugder et al., (2017).
6.4 Shimwellia blattae: the vitamin B12-producing gut bacteria from cockroach
The corrinoid-producing Gram-negative gammaproteobacterium Shimwellia blattae has
been used as an expression host for the soluble expression of three respiratory RDases;
PceA from Desulfitobacterium hafniense strain Y51, RdhA3 from Desulfitobacterium
hafniense strain DCB-2, and DceA from Desulfitobacterium dichloroeliminans DCA1 and
also the catabolic RDase NpRdhA from Nitratireductor pacificus (Halliwell et al., 2021,
Kunze et al., 2017, Mac Nelly et al., 2014). In cases of all three respiratory RDases, co-
expression of the respective chaperone protein resulted in higher soluble expression
and specific activity of the recombinant RDase. TmrA does not have a specific chaperone
200
in the tmrAB operon. To co-express TmrA with a chaperone protein, two chaperones
(WP_015043727 and WP_015044672) were chosen from the genome of Dehalobacter
sp. UNSWDHB, they were referred to as TF104 and TF161 in this study. TmrA was
expressed in S. blattae in different forms and combinations: TmrA without the TAT
signal, TmrA including the TAT signal, co-expression of TAT signal included TmrA with
TF104 and co-expression of TAT signal included TmrA with TF161. All these experiments
resulted in the soluble and functional expression of TmrA in S. blattae. However, the
results were not what was expected. Co-expression with the chaperone proteins did not
seem to have any apparent effect on the soluble expression level, however, the
TmrA devoid of the TAT signal displayed the highest specific activity amongst them all.
These findings give rise to an interesting puzzle; the three respiratory RDases previously
expressed in S. blattae were all expressed with their TAT signal intact, and all of them
exhibited soluble expression alone while co-expression with their respective chaperone
proteins increased their soluble expression, they, however, were not expressed without
their TAT signals. The questions that arise here are: 1. Would eliminating the TAT signal
from the other three respiratory RDases increase their specific activity? 2. Do the TF104
and TF161 chaperones co-expressed in this study compete/interact/antagonise with the
native S. blattae chaperones? The answer to these questions would assist in developing
an ideal recombinant RDase expression system in S. blattae and other expression hosts
alike.
6.5 Cupriavidus necator: the “knallgas” bacteria
In this study C. necator was introduced as a novel host for recombinant RDase
expression. The broader and longer-term aim was to engineer C. necator into a
dechlorinating organism. The preliminary studies done to verify its suitability as a
dechlorinating organism were: 1. The capability to uptake vitamin B12 from the media;
2. Tolerance to substrate, CF and breakdown product, DCM; 3. The suitability of the C.
necator soluble hydrogenase to oxidize the electron donor H2 to support CF reduction
by TmrA. C. necator demonstrated favourable results in all three experiments. TmrA was
expressed in a soluble and active form in C. necator. The specific activity was higher
201
when expressed in LB media than in FGN media but culture in the heterotrophic FGN
media promotes expression of the soluble hydrogen which is required for the cellular
dechlorination of CF in a reductive dehalogenation process. In vitro activity assay with
cell lysates of the recombinant C. necator using H2 as the electron donor demonstrated
dechlorination of CF albeit at very small quantities and high amount of background
noise. Due to time constraints this dechlorination system could not be optimized and in
vivo dechlorination assays could not be tested. However, the results obtained
demonstrate C. necator as a potential expression host for recombinant RDases.
6.6 Comparing the four expression systems
To-date no single respiratory RDase has been successfully expressed in multiple
expression hosts, so the comparison of the available expression systems for RDases
could not be compared. Very recently Halliwell et al., (2021) published a comparative
study of the heterologous expression of a catabolic reductive dehalogenase, NpRdhA,
from Nitratireductor pacificus strain pht-3B in Bacillus megaterium, Escherichia coli
HMS174(DE3), Shimwellia blattae and a commercial strain of Vibrio natrigenes. In this
study CF RDase from Dehalobacter sp. UNSWDHB was expressed in a soluble and active
form in four expression hosts Escherichia coli BL21(DE3)pLysS, Bacillus megaterium
MS941, Shimwellia blattae and Cupriavidus necator H16 strain DSM 428; albeit to a
varying degree of success. Halliwell et al., (2021) reported that recombinant NpRdhA
expressed in B. megaterium had the highest specific activity while the recombinant
NpRdhA in S. blattae had the lowest specific activity. In this study, the highest specific
activity of recombinant TmrA was achieved by B. megaterium, matching the findings of
Halliwell et al., (2021).
Halliwell and co-workers attempted to optimize the culture conditions for all the
expression hosts tested, however, that was always not possible since different host
organisms have different growth requirements, e.g., V. natrigenes gave better results
when cultured in 2YT media instead of TB media; S. blattae was induced under anaerobic
conditions. In the current study, the best growth and expression conditions
recommended in literature for each expression host was used. In terms of complexity of
202
the expression system, culture and protein expression in S. blattae and C. necator was
much more complicated that the other two hosts. Expression in S. blattae required three
pre-culture steps and the main culture was anaerobic which was difficult to maintain
compared to the other systems and also resulted in low yield of cells. Due to time
limitations, purification of recombinant TmrA expressed in S. blattae could not be done
but the previous studies with the respiratory RDases by Mac Nelly et al., (2014) and
Kunze et al., (2017) were not very successful in terms of protein purification. Expression
in C. necator requires a long induction period whereas TmrA expression in E. coli and B.
megaterium can be accomplished in one day. Based on the findings of this study, B.
megaterium demonstrated the best results in terms of production process, soluble
expression, and specific activity. However, a major limitation of the B. megaterium
expression system is the 3-day transformation protocol (Collins, 2017).
203
6.7 Standout findings of this study
The expression of recombinant TmrA in a soluble and catalytically active form was
successful in all four expression hosts tested in this study. The most important findings
of this study are summarised below:
Purification of inclusion bodies expressed in E. coli in presence of air does not render
them inactive after cofactor reconstitution. This is a very important finding in terms of
optimizing the recombinant protein production pipeline. The functional and structural
studies of RDases requires the production of a suitable biomass of purified protein.
Purification of protein under anaerobic conditions is complicated, expensive, and not to
mention not very ergonomic. Additionally, purification using an ÄKTA or similar system
would provide a much better control over the purification step than manual injection or
using a peristaltic pump.
Xylose concentrations much lower than the conventionally used amounts increase
specific activity of recombinant TmrA. The xylose concentration used to induce
recombinant RDase production in B. megaterium was 0.1% for NpRdhA and 0.5% for
TmrA. Literature review revealed that similar concentrations have been used for the
expression of other recombinant proteins in B. megaterium. Miscalculations while
preparing the xylose stock solution prompted expression screening with 10 x and 100 x
lower than the conventionally used xylose concentrations. Induction with 0.03% xylose
for 3 h at 37 °C produced recombinant TmrA with a specific activity which is more than
30% higher than that measured in the previous study.
Excluding the TAT signal increases specific activity. In this study recombinant TmrA was
produced in all four expression hosts without the TAT signal and the membrane
spanning region. In S. blattae recombinant TmrA was expressed both with and without
the TAT signal and the TmrA without the TAT signal demonstrated significantly higher
(p<0.05) specific activity than when expressed with the TAT signal. These results brought
to light that removing the TAT signal of the RDase of interest for recombinant expression
could potentially improve their specific activity. The recombinant TmrA expressed in B.
megaterium without the TAT signal showed approximately 3 times higher specific
204
activity than that calculated for the native enzyme. Recombinant expression of VcrA
from Dehalococcoides mccartyi strain VS in E. coli was also done devoid of the TAT signal
and demonstrated high specific activity (Parthasarathy et al., 2015).
Non-native hydrogenases can support CF dechlorination by TmrA. The activity assays
done for all the native and recombinant RDases are done using artificial electron donors
such a methyl viologen. The only exceptions are the 3-Chlorobenzoate-RDase from
Desulfomonile tiedjei DCB-1 in which case a partially purified native hydrogenase was
used in the assay mixture alongside methyl viologen (Ni et al., 1995) and the
recombinant catabolic NpRdhA where NADPH, spinach ferredoxin and E. coli flavodoxin
reductase was used. In this study the recombinant TmrA expressed in C. necator
demonstrated dechlorination of CF using H2 as the electron donor which was oxidized
by the hydrogenases of the expression host. These results will provide a platform to
study or even replicate the electron transport chain of RDases in non-native hosts.
6.8 Future research
The structural and functional studies of RDases require their production in sufficient
amounts to support comprehensive biochemical and biophysical studies. This
dissertation provides a comprehensive study on various recombinant expression
systems for one RDase, TmrA from Dehalobacter sp. UNSWDHB. Future studies based
on the findings presented in this document could be
• Optimizing the cofactor reconstitution and refolding protocol described for E.
coli expression
• Determining the oxygen-sensitivity level for TmrA and other RDases which will
aid in designing optimum protein purification protocols
• Studying the kinetics of the recombinant TmrA produced in different hosts and
see how it compares to the native enzyme
• Carry out further investigation into the impact of the TAT signal on the
expression and specific activity of recombinant RDases
• Optimizing the use of non-native redox partners in activity assays for RDases

205
• Optimizing the recombinant RDase expression system in C. necator
• In vivo CF dechlorination assay with recombinant C. necator grown under
autotrophic and heterotrophic conditions
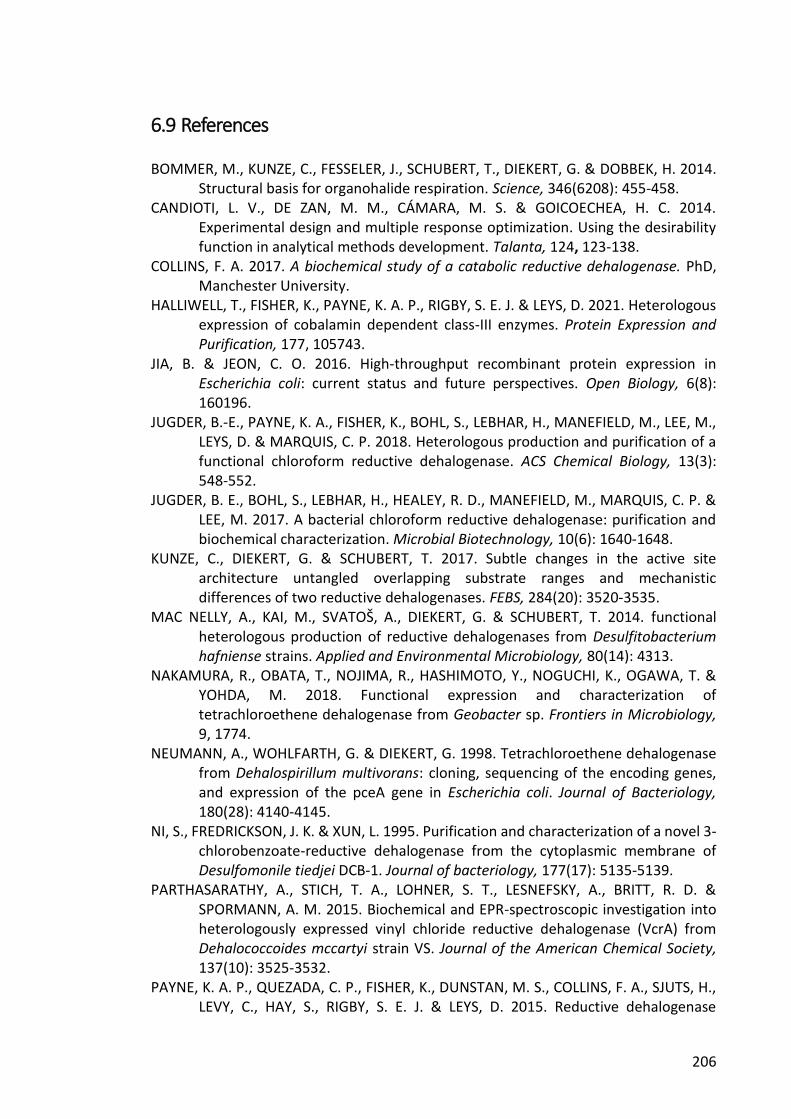
206
6.9 References
BOMMER, M., KUNZE, C., FESSELER, J., SCHUBERT, T., DIEKERT, G. & DOBBEK, H. 2014. Structural basis for organohalide respiration. Science, 346(6208): 455-458.
CANDIOTI, L. V., DE ZAN, M. M., CÁMARA, M. S. & GOICOECHEA, H. C. 2014. Experimental design and multiple response optimization. Using the desirability function in analytical methods development. Talanta, 124, 123-138.
COLLINS, F. A. 2017. A biochemical study of a catabolic reductive dehalogenase. PhD, Manchester University.
HALLIWELL, T., FISHER, K., PAYNE, K. A. P., RIGBY, S. E. J. & LEYS, D. 2021. Heterologous expression of cobalamin dependent class-III enzymes. Protein Expression and Purification, 177, 105743.
JIA, B. & JEON, C. O. 2016. High-throughput recombinant protein expression in Escherichia coli: current status and future perspectives. Open Biology, 6(8): 160196.
JUGDER, B.-E., PAYNE, K. A., FISHER, K., BOHL, S., LEBHAR, H., MANEFIELD, M., LEE, M., LEYS, D. & MARQUIS, C. P. 2018. Heterologous production and purification of a functional chloroform reductive dehalogenase. ACS Chemical Biology, 13(3): 548-552.
JUGDER, B. E., BOHL, S., LEBHAR, H., HEALEY, R. D., MANEFIELD, M., MARQUIS, C. P. & LEE, M. 2017. A bacterial chloroform reductive dehalogenase: purification and biochemical characterization. Microbial Biotechnology, 10(6): 1640-1648.
KUNZE, C., DIEKERT, G. & SCHUBERT, T. 2017. Subtle changes in the active site architecture untangled overlapping substrate ranges and mechanistic differences of two reductive dehalogenases. FEBS, 284(20): 3520-3535.
MAC NELLY, A., KAI, M., SVATOŠ, A., DIEKERT, G. & SCHUBERT, T. 2014. functional heterologous production of reductive dehalogenases from Desulfitobacterium hafniense strains. Applied and Environmental Microbiology, 80(14): 4313.
NAKAMURA, R., OBATA, T., NOJIMA, R., HASHIMOTO, Y., NOGUCHI, K., OGAWA, T. & YOHDA, M. 2018. Functional expression and characterization of tetrachloroethene dehalogenase from Geobacter sp. Frontiers in Microbiology, 9, 1774.
NEUMANN, A., WOHLFARTH, G. & DIEKERT, G. 1998. Tetrachloroethene dehalogenase from Dehalospirillum multivorans: cloning, sequencing of the encoding genes, and expression of the pceA gene in Escherichia coli. Journal of Bacteriology, 180(28): 4140-4145.
NI, S., FREDRICKSON, J. K. & XUN, L. 1995. Purification and characterization of a novel 3-chlorobenzoate-reductive dehalogenase from the cytoplasmic membrane of Desulfomonile tiedjei DCB-1. Journal of bacteriology, 177(17): 5135-5139.
PARTHASARATHY, A., STICH, T. A., LOHNER, S. T., LESNEFSKY, A., BRITT, R. D. & SPORMANN, A. M. 2015. Biochemical and EPR-spectroscopic investigation into heterologously expressed vinyl chloride reductive dehalogenase (VcrA) from Dehalococcoides mccartyi strain VS. Journal of the American Chemical Society, 137(10): 3525-3532.
PAYNE, K. A. P., QUEZADA, C. P., FISHER, K., DUNSTAN, M. S., COLLINS, F. A., SJUTS, H., LEVY, C., HAY, S., RIGBY, S. E. J. & LEYS, D. 2015. Reductive dehalogenase

207
structure suggests a mechanism for B12-dependent dehalogenation. Nature, 517(7535): 513-516.
SUYAMA, A., YAMASHITA, M., YOSHINO, S. & FURUKAWA, K. 2002. Molecular characterization of the PceA reductive dehalogenase of Desulfitobacterium sp. strain Y51. Journal of Bacteriology, 184(13): 3419.

208
Appendices
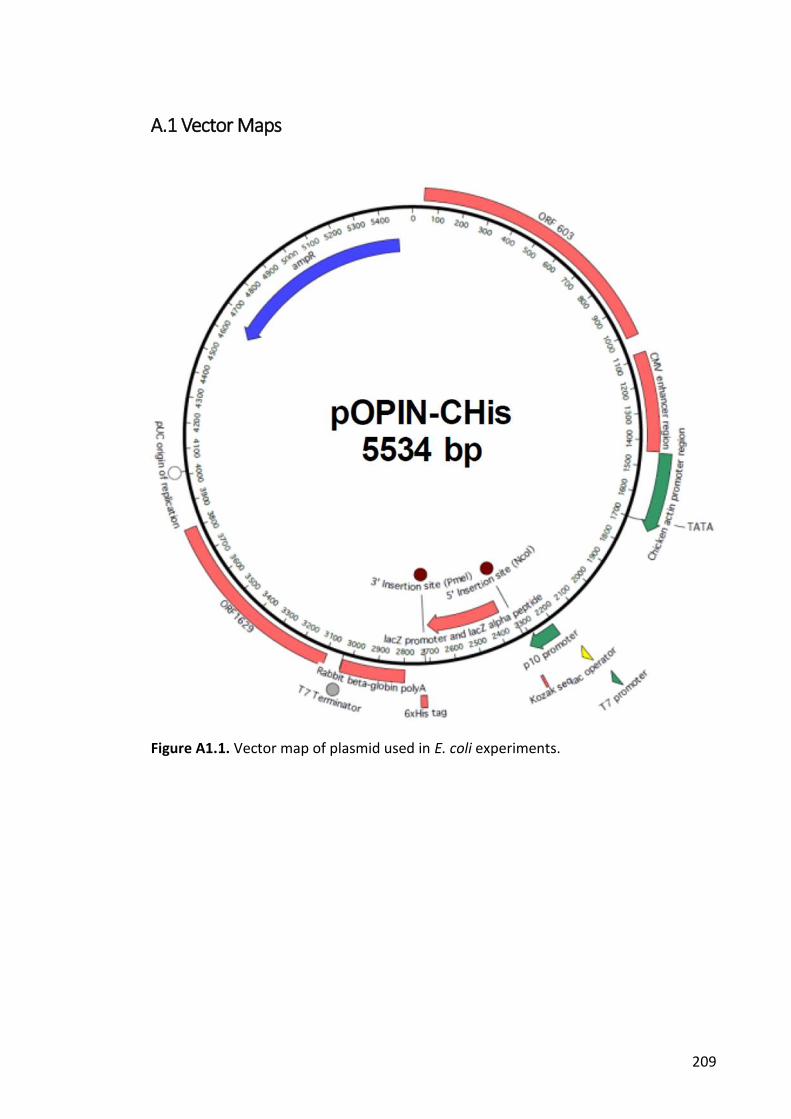
209
A.1 Vector Maps
Figure A1.1. Vector map of plasmid used in E. coli experiments.
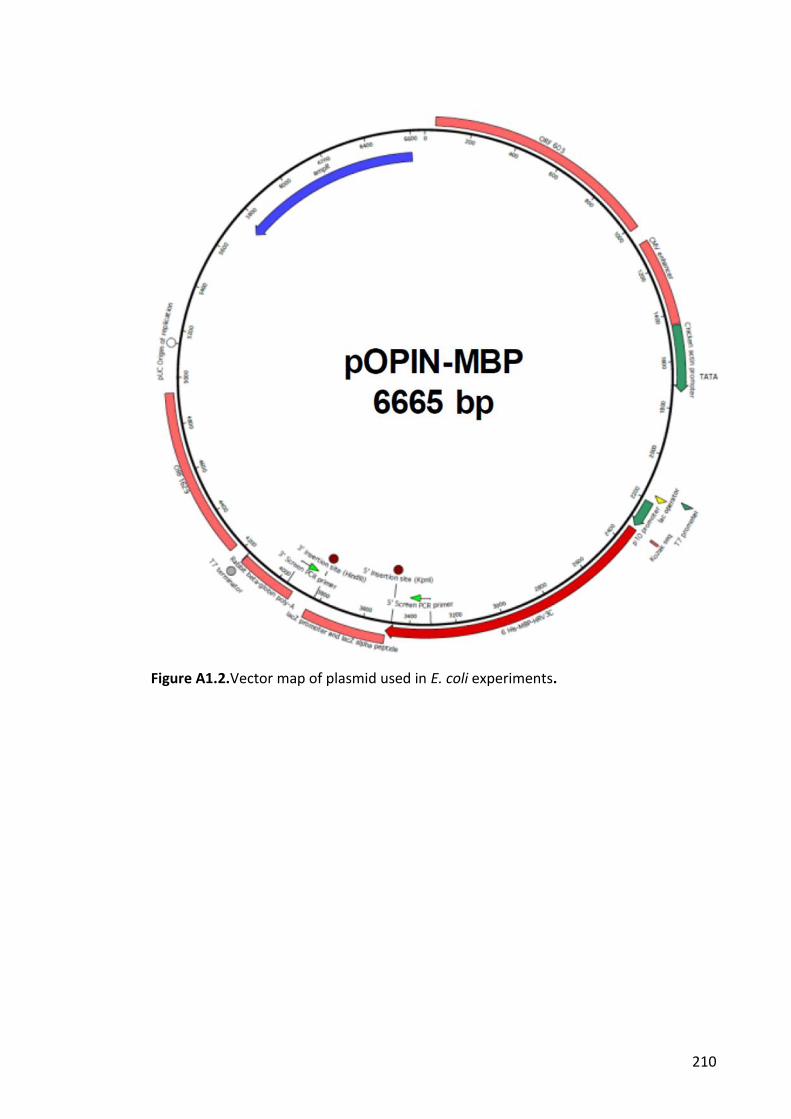
210
Figure A1.2.Vector map of plasmid used in E. coli experiments.
211
Figure A1.3. Vector map of plasmid used in E. coli experiments.
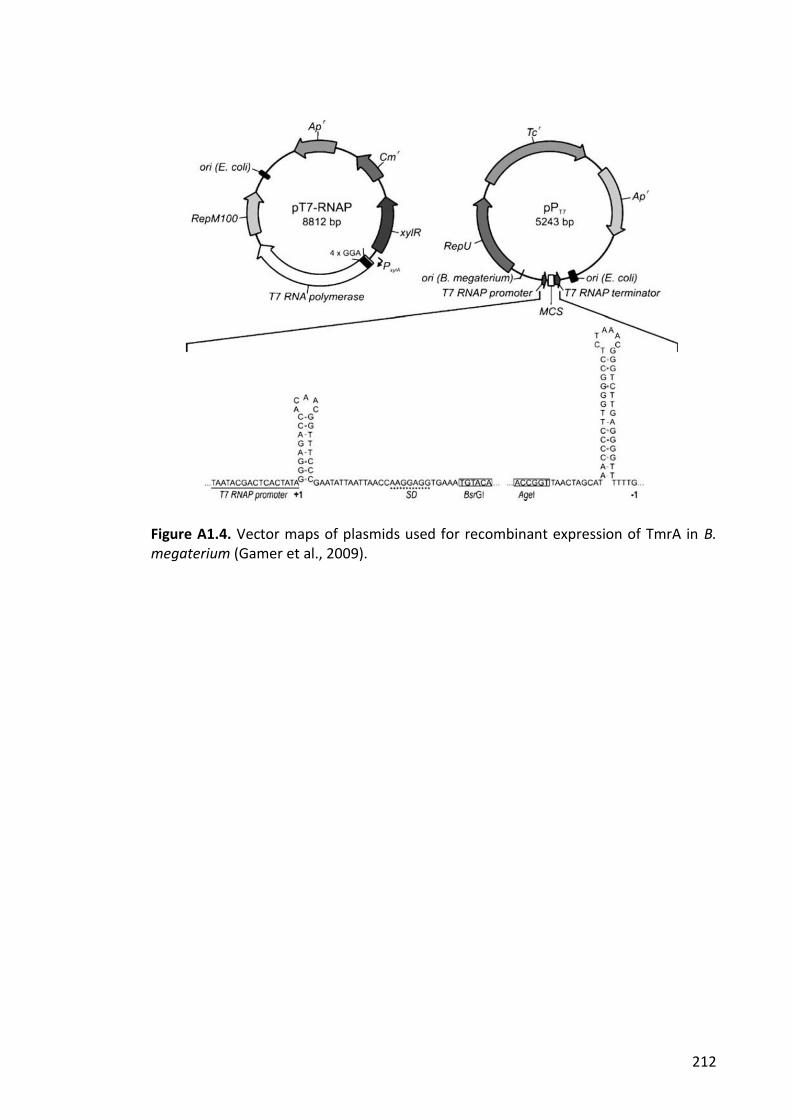
212
Figure A1.4. Vector maps of plasmids used for recombinant expression of TmrA in B. megaterium (Gamer et al., 2009).
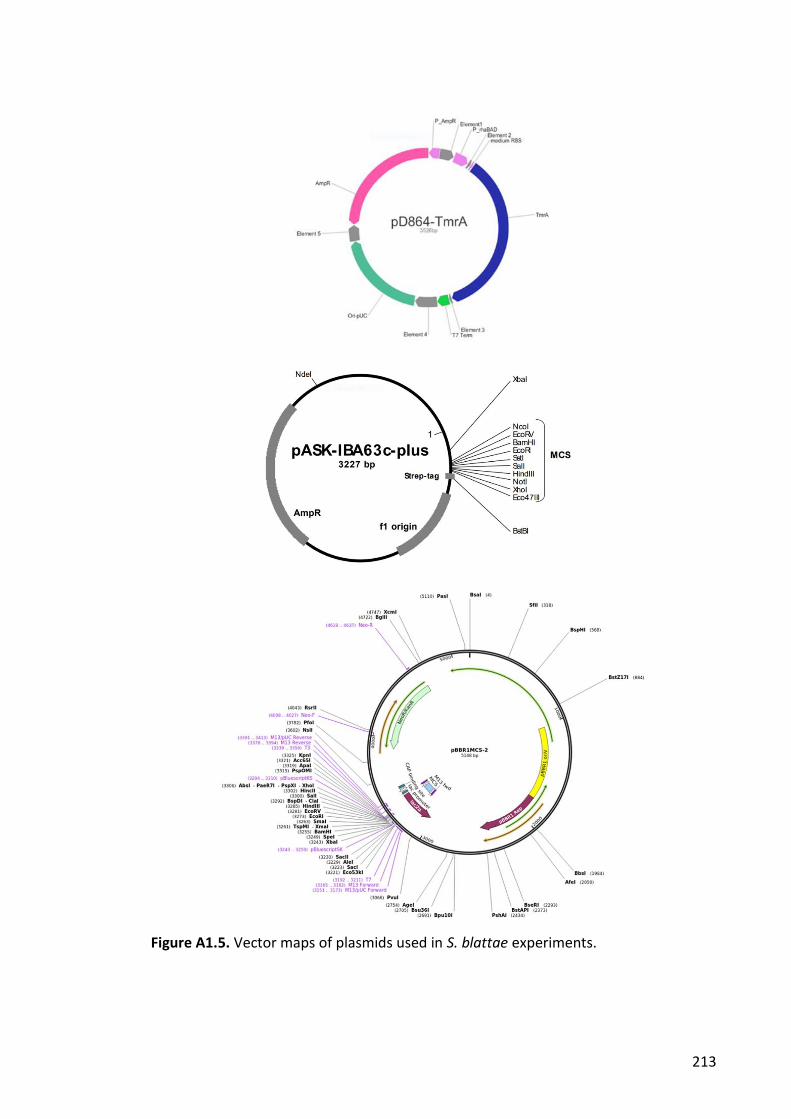
213
Figure A1.5. Vector maps of plasmids used in S. blattae experiments.
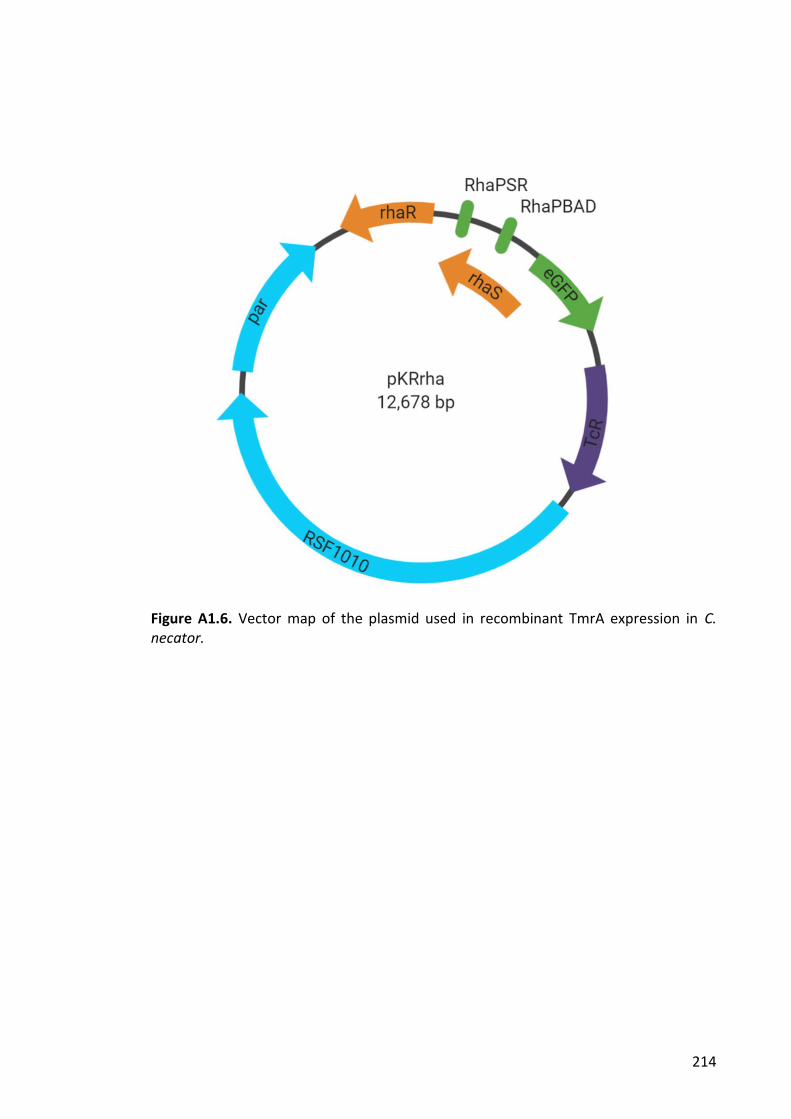
214
Figure A1.6. Vector map of the plasmid used in recombinant TmrA expression in C. necator.
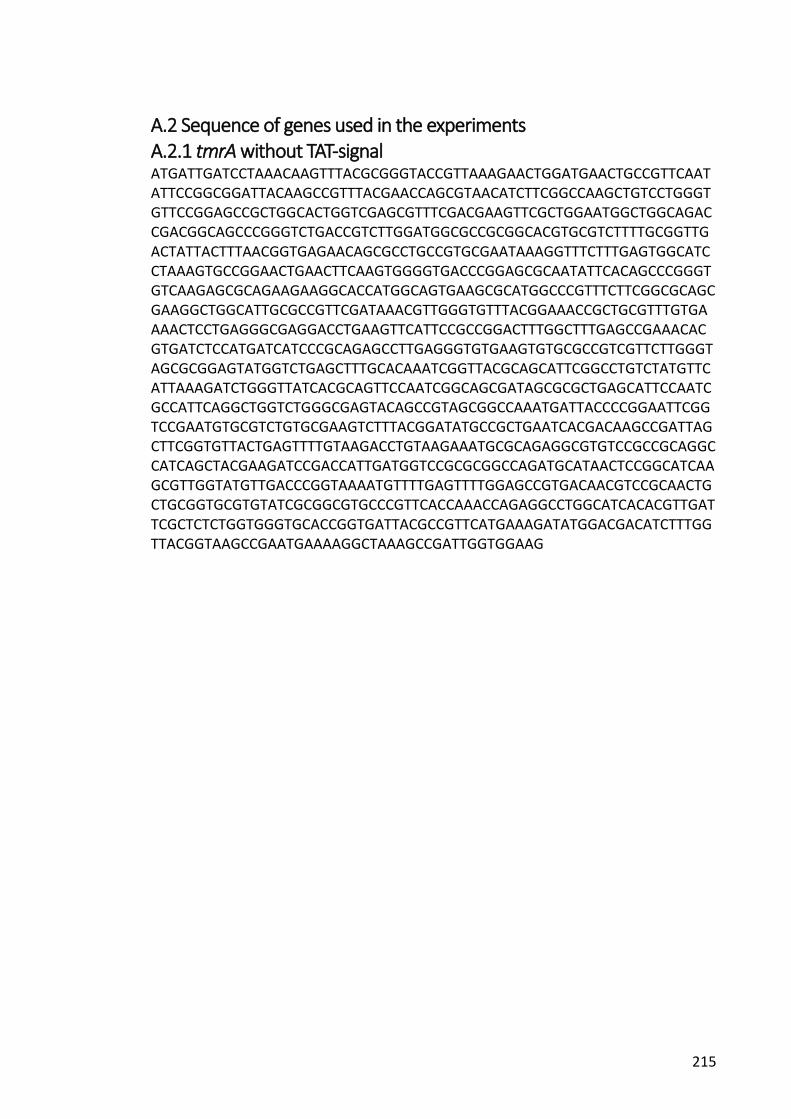
215
A.2 Sequence of genes used in the experiments A.2.1 tmrA without TAT-signal ATGATTGATCCTAAACAAGTTTACGCGGGTACCGTTAAAGAACTGGATGAACTGCCGTTCAATATTCCGGCGGATTACAAGCCGTTTACGAACCAGCGTAACATCTTCGGCCAAGCTGTCCTGGGTGTTCCGGAGCCGCTGGCACTGGTCGAGCGTTTCGACGAAGTTCGCTGGAATGGCTGGCAGACCGACGGCAGCCCGGGTCTGACCGTCTTGGATGGCGCCGCGGCACGTGCGTCTTTTGCGGTTGACTATTACTTTAACGGTGAGAACAGCGCCTGCCGTGCGAATAAAGGTTTCTTTGAGTGGCATCCTAAAGTGCCGGAACTGAACTTCAAGTGGGGTGACCCGGAGCGCAATATTCACAGCCCGGGTGTCAAGAGCGCAGAAGAAGGCACCATGGCAGTGAAGCGCATGGCCCGTTTCTTCGGCGCAGCGAAGGCTGGCATTGCGCCGTTCGATAAACGTTGGGTGTTTACGGAAACCGCTGCGTTTGTGAAAACTCCTGAGGGCGAGGACCTGAAGTTCATTCCGCCGGACTTTGGCTTTGAGCCGAAACACGTGATCTCCATGATCATCCCGCAGAGCCTTGAGGGTGTGAAGTGTGCGCCGTCGTTCTTGGGTAGCGCGGAGTATGGTCTGAGCTTTGCACAAATCGGTTACGCAGCATTCGGCCTGTCTATGTTCATTAAAGATCTGGGTTATCACGCAGTTCCAATCGGCAGCGATAGCGCGCTGAGCATTCCAATCGCCATTCAGGCTGGTCTGGGCGAGTACAGCCGTAGCGGCCAAATGATTACCCCGGAATTCGGTCCGAATGTGCGTCTGTGCGAAGTCTTTACGGATATGCCGCTGAATCACGACAAGCCGATTAGCTTCGGTGTTACTGAGTTTTGTAAGACCTGTAAGAAATGCGCAGAGGCGTGTCCGCCGCAGGCCATCAGCTACGAAGATCCGACCATTGATGGTCCGCGCGGCCAGATGCATAACTCCGGCATCAAGCGTTGGTATGTTGACCCGGTAAAATGTTTTGAGTTTTGGAGCCGTGACAACGTCCGCAACTGCTGCGGTGCGTGTATCGCGGCGTGCCCGTTCACCAAACCAGAGGCCTGGCATCACACGTTGATTCGCTCTCTGGTGGGTGCACCGGTGATTACGCCGTTCATGAAAGATATGGACGACATCTTTGGTTACGGTAAGCCGAATGAAAAGGCTAAAGCCGATTGGTGGAAG
216
A.2.2 tmrA with TAT-signal ATGGACAAGGAGAAGTCGAATAATGATAAGCCGGCAACAAAGATCAACCGTCGCCAGTTCCTGAAATTTGGGGCCGGGGCTTCTTCCGGTATTGCGATTGCGACGGCGGCCACGGCCCTGGGAGGAAAGAGCCTTATCGATCCGAAACAGGTGTACGCGGGAACAGTTAAGGAGCTGGACGAATTGCCCTTCAATATTCCTGCAGATTACAAACCTTTCACCAATCAGCGTAACATCTTCGGACAAGCAGTATTAGGCGTACCAGAACCGTTAGCCCTGGTCGAGCGTTTCGACGAAGTACGTTGGAATGGATGGCAAACAGACGGAAGTCCCGGTCTGACTGTGTTAGATGGGGCAGCCGCGCGTGCCTCGTTTGCAGTGGATTATTATTTTAATGGGGAGAACTCTGCGTGTCGTGCCAACAAAGGGTTCTTTGAATGGCACCCAAAAGTCCCGGAACTTAATTTCAAATGGGGAGATCCAGAGCGCAATATTCACTCACCGGGAGTTAAATCAGCGGAAGAAGGCACCATGGCGGTAAAACGTATGGCTCGCTTTTTCGGGGCGGCCAAAGCTGGCATCGCTCCATTCGATAAACGCTGGGTGTTTACCGAAACGGCTGCGTTCGTCAAGACGCCTGAGGGGGAAGACTTGAAATTCATTCCACCCGATTTTGGTTTTGAGCCTAAACACGTAATCTCTATGATTATTCCACAAAGCTTAGAAGGCGTCAAGTGTGCCCCTAGTTTCCTTGGCTCTGCCGAGTATGGTCTTTCCTTCGCGCAGATCGGATATGCAGCTTTCGGTCTTTCTATGTTCATTAAAGATTTAGGCTATCATGCGGTACCGATCGGTAGTGATTCGGCTTTATCCATCCCCATTGCTATTCAGGCCGGACTGGGCGAGTATTCTCGTTCTGGTCAGATGATCACTCCGGAGTTCGGACCTAACGTGCGCTTATGTGAGGTATTTACAGATATGCCATTAAACCACGATAAGCCGATTTCATTCGGTGTAACAGAATTCTGCAAAACTTGTAAAAAATGCGCAGAGGCGTGCCCGCCACAGGCTATTTCCTACGAAGACCCCACGATCGACGGTCCTCGTGGCCAAATGCATAACTCGGGGATTAAGCGCTGGTATGTTGATCCCGTCAAGTGTTTTGAGTTCTGGAGTCGCGATAACGTCCGTAATTGCTGCGGTGCTTGCATTGCGGCATGTCCCTTCACAAAACCTGAGGCTTGGCACCATACCCTTATTCGTTCCTTGGTAGGAGCGCCAGTGATCACTCCGTTTATGAAAGACATGGACGACATCTTTGGGTACGGTAAGCCTAACGAGAAGGCAAAGGCGGACTGGTGGAAA
217
A.2.3 tf104 ATGAAGCAATTCGAGCTTGGACAATACAAGGGGCTTAATGTCAAACGCTTTGATACTACGGTTCAAGAGGAAGAAATTCAGCAGGCGCTTGATTACATTATTGGTAGTTTTGACGAAATCGAAGAAGAAAAACGTAATGAGCCCATTAAGACAAATGACTATGTTATTGTCGACATTGACGGTTTTGAGAAGGACGCGACGGTTCCTGTCATTCGCTCGCTGGACACCAAGCTTCGCGTCGGTTCAGAGGGCGTGTTTCAGGAAGTAAGCGCTAACTTATTAGGCAAAAAAATGGGAGACACTGTTACTTTCGAGGCCGTCATCCAGCCTGACGCTTTAGAGTTCCAGCGCTGGTGGGGTTCCGAAATCCGCTTCACAGTGAAGATCAAGTCTGTGTTTGTAGTGAAGAAGTCGGAACTTACAGAGGAGTTAATTCGCAAGATCGAGCCGGACCTTAAGAACTTGGAAGACTTAAAAAATATGTTGGCATTGAAGATCACGCACGAGAAGGAAGGCAAAGAGCGCGAAGCCAACATCTTGCTGATCTTCCAAGCTTTGGTGAAACAGTGTAAATATGAATTTGACGAAGAGGAACTTGACTCTGCGGCGGAAGACCTTTACAAAAAGTTTACCGAGGAGTTAAAGATCGTCGACGACATGGAGTTAATGGAGTACCTGATCCACCGTAAAATTACAGCCGATCAACTTTTAGTAGAATGCAAGGAGGAAGCTAGTCGCCGTATCTTGTGGGAACTTATGATCAACTCAGTCATTGAGAAAGAGGAAATCAATCTTACCCCTGATGAGATCAAATACTTGGAGAAACGTATTAATGAATCGCGTCAGAATGGTCAATTACCGGAAGAATTCATGGATATTAATTTTCTTCAAGCACCCTATCTGCGCAAAAAGACCATGGATTATCTTTTAGAAATTAATTTAGCTAGT
218
A.2.4 tf161 ATGTCGGTCAAGATCGAGAAGAAGAACAATAACATTTATGAGATGGAGATCATGGTAGGCGTAGAAGAGGTCTCAGCAGCATTTGACCGCGTGATGAAGCGCGCGGGCCAGGGTTTGAGTATTCCAGGGTTTCGTAAAGGAAAGGCACCAAAGCATATTATTGAACGTTATGTGGATAAAGACGCAGTGAATAATGAGGTCATGGAGCAAGTATCATATCCTGCTTTATTTGAAGCTTATAAAGAACACAGCATTACACCTGTTTCCCGCCCAGCTATGCAGGTCGTCCAATTTGAGGCAGACAAGGACTTGATCTTCAAAGTAACTGTGGAGACAAAACCTGATGTCGAACTTGGCCAATACAAAGGCTTAGGCATTGAAAAGCAAGCGGTAGAGGTCACGGATGAACAGGTAGCCGAGGAGTTGGAGCGTCGTCAAAATCGTCACGCTAAATTGATTCCCGTAGAAGACGGAGAAATCATTGATCAGGATATTGTCACCATCGACTTCGAGGGTTTCCTGGGCGATGTCCCGTTTGAAGGTGGTAAGGGAGAGAACCACGAGTTGACCATCGGATCAGGAACTTTTATTCCGGGATTTGAGGAGCAGATTAAAGGCTCCAAGAATGGACAAGAACTGGAAATTAACGTTAAGTTCCCGGAGGGTTATCACAGCGAGGAACTGTCTGGGAAGGATGCAATTTTCAAGGTTAAGATTAATGGCATCAAACGTAAGGAATTAGCCGCGTTGGACGACGAGTTTGCAAAAGACGTCTCCGAATTTGACACCCTTGAGGAACTTAAGCAGGACATCCGTGAGAAGATGATCTCAGCCGCTGAGACTCGTCGTGATAATGAATACAAAACTGAAGTAATCAAGAAGGTAGCCGAGAACGCGGTTTGCGAAATCCCTGAGGGTATGAAGCAAGAGCGTATTGACGCGCTTATGGAGGATCTTCAACAGAATATGTCCTATCAAGGAATCTCGATGGAGCAGTATTGCCAGTATGTCAATACGAGTCGCGAAGCACTTCGTGAATCGTTCTCTCAGCAAGCTACGGATGGCTTGAAAACCGAACTTGTATTAGAAGCGATCGCAGAAAAAGAGGGGATCACGGTCACGGACGAGGAAATTGAAAGTGAGATCAACCGTATGGCGATGCAATATGGACGTACTGCGGAAGAGTTGAAGAGTGCTCTTGAAGCGCGTGGCGAGATGCAGATGTTCAAAATTTCTCTTACAAGCGAGCATACTGTGGACTTCTTAGTAAAAAATAATGGCGCGGGTCAAGAATCTGCAGCCGCCCAAAATACCGACTCCGAGTCTAATGTGGCGGAAGAGAACGAA
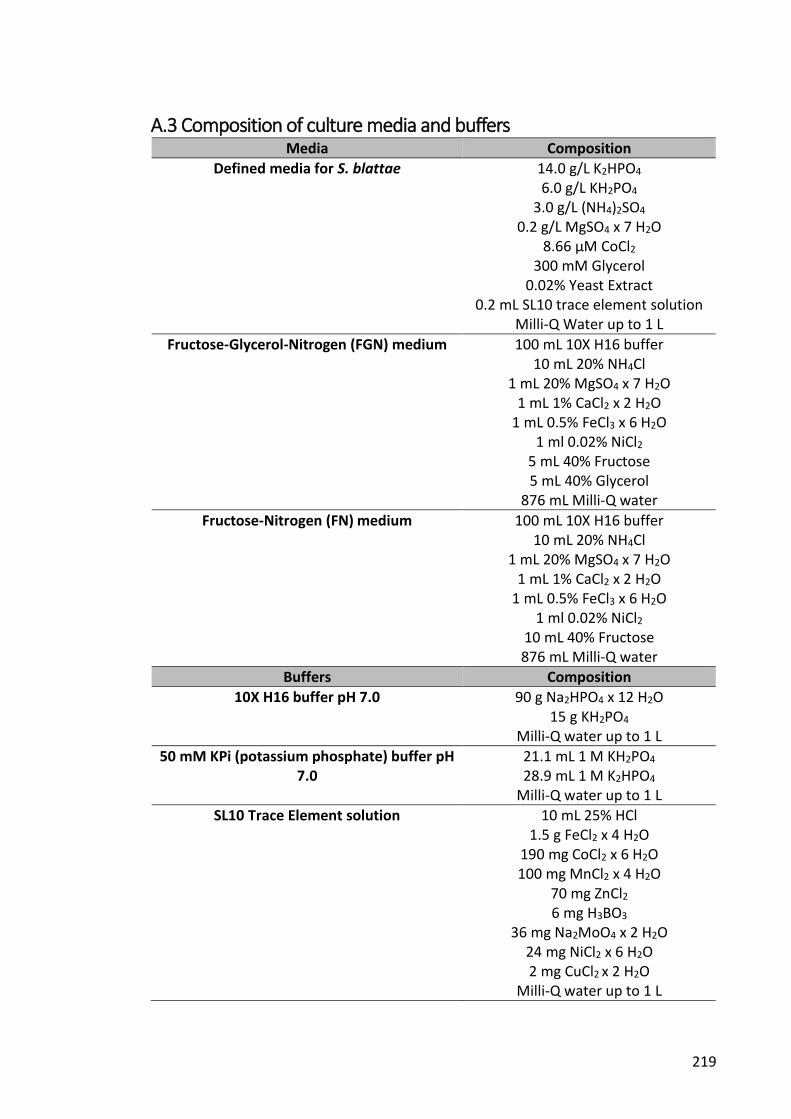
219
A.3 Composition of culture media and buffers Media Composition
Defined media for S. blattae 14.0 g/L K2HPO4 6.0 g/L KH2PO4 3.0 g/L (NH4)2SO4 0.2 g/L MgSO4 x 7 H2O 8.66 µM CoCl2 300 mM Glycerol 0.02% Yeast Extract 0.2 mL SL10 trace element solution Milli-Q Water up to 1 L
Fructose-Glycerol-Nitrogen (FGN) medium 100 mL 10X H16 buffer 10 mL 20% NH4Cl 1 mL 20% MgSO4 x 7 H2O 1 mL 1% CaCl2 x 2 H2O 1 mL 0.5% FeCl3 x 6 H2O 1 ml 0.02% NiCl2 5 mL 40% Fructose 5 mL 40% Glycerol 876 mL Milli-Q water
Fructose-Nitrogen (FN) medium 100 mL 10X H16 buffer 10 mL 20% NH4Cl 1 mL 20% MgSO4 x 7 H2O 1 mL 1% CaCl2 x 2 H2O 1 mL 0.5% FeCl3 x 6 H2O 1 ml 0.02% NiCl2 10 mL 40% Fructose 876 mL Milli-Q water
Buffers Composition
10X H16 buffer pH 7.0 90 g Na2HPO4 x 12 H2O 15 g KH2PO4 Milli-Q water up to 1 L
50 mM KPi (potassium phosphate) buffer pH 21.1 mL 1 M KH2PO4 7.0 28.9 mL 1 M K2HPO4
Milli-Q water up to 1 L
SL10 Trace Element solution 10 mL 25% HCl 1.5 g FeCl2 x 4 H2O 190 mg CoCl2 x 6 H2O 100 mg MnCl2 x 4 H2O 70 mg ZnCl2 6 mg H3BO3 36 mg Na2MoO4 x 2 H2O 24 mg NiCl2 x 6 H2O 2 mg CuCl2 x 2 H2O Milli-Q water up to 1 L
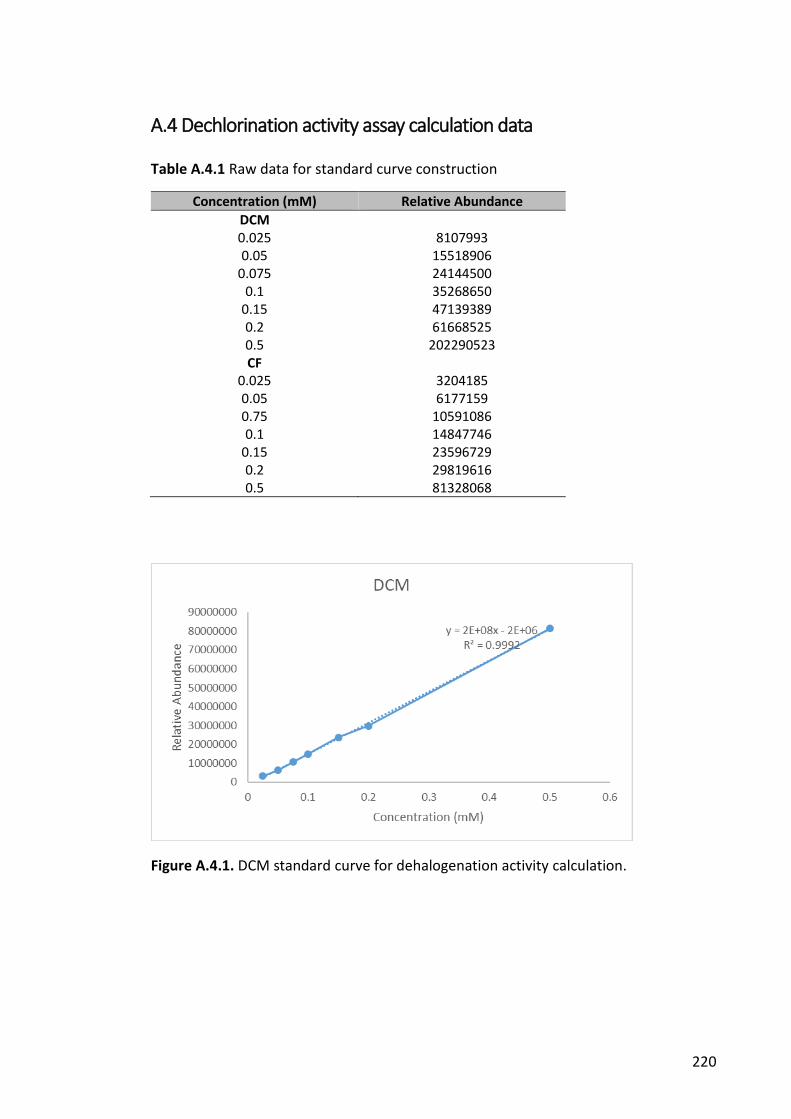
220
A.4 Dechlorination activity assay calculation data
Table A.4.1 Raw data for standard curve construction
Concentration (mM) Relative Abundance
DCM 0.025 8107993 0.05 15518906
0.075 24144500 0.1 35268650
0.15 47139389 0.2 61668525 0.5 202290523 CF
0.025 3204185 0.05 6177159 0.75 10591086 0.1 14847746
0.15 23596729 0.2 29819616 0.5 81328068
Figure A.4.1. DCM standard curve for dehalogenation activity calculation.
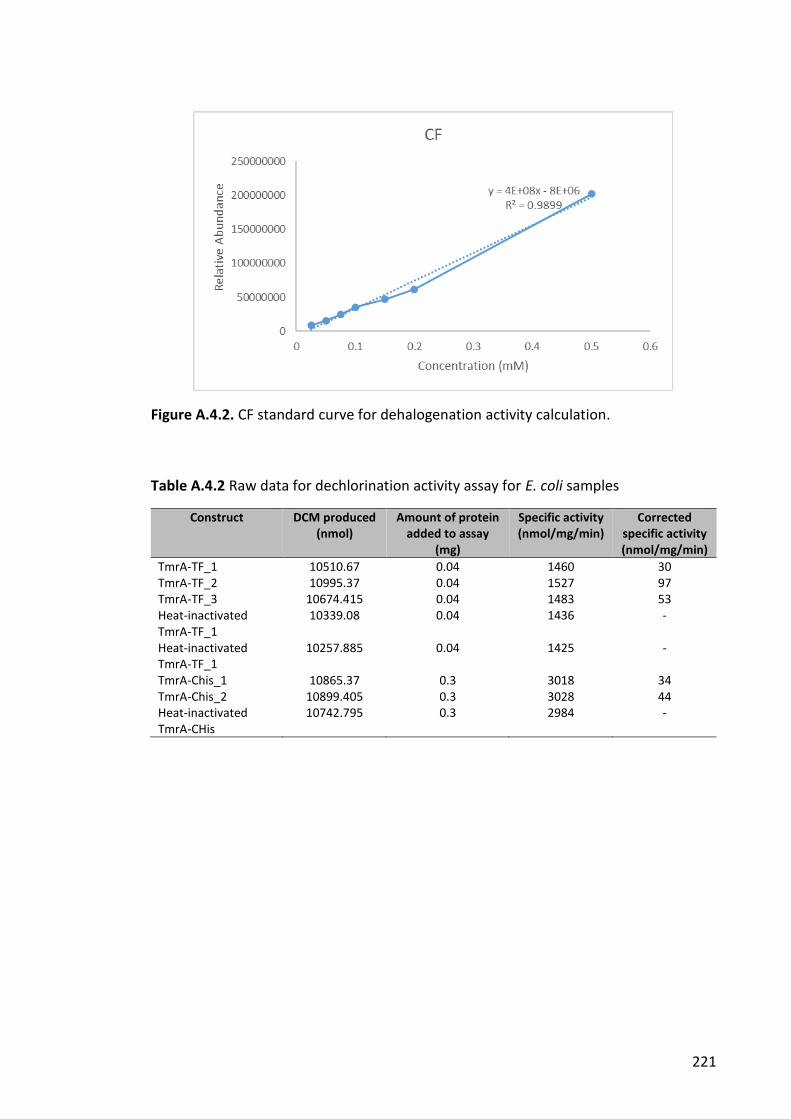
221
Figure A.4.2. CF standard curve for dehalogenation activity calculation.
Table A.4.2 Raw data for dechlorination activity assay for E. coli samples
Construct DCM produced (nmol)
Amount of protein added to assay
(mg)
Specific activity (nmol/mg/min)
Corrected specific activity (nmol/mg/min)
TmrA-TF_1 10510.67 0.04 1460 30 TmrA-TF_2 10995.37 0.04 1527 97 TmrA-TF_3 10674.415 0.04 1483 53 Heat-inactivated TmrA-TF_1
10339.08 0.04 1436 -
Heat-inactivated TmrA-TF_1
10257.885 0.04 1425 -
TmrA-Chis_1 10865.37 0.3 3018 34 TmrA-Chis_2 10899.405 0.3 3028 44 Heat-inactivated TmrA-CHis
10742.795 0.3 2984 -
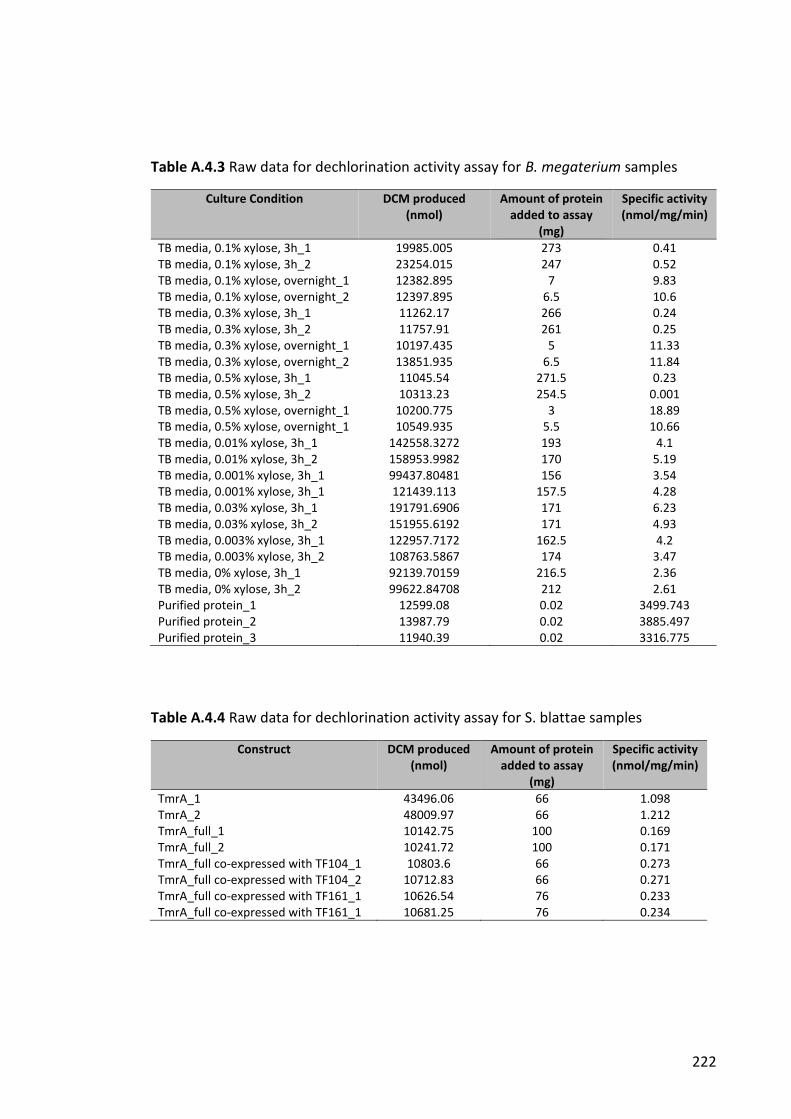
222
Table A.4.3 Raw data for dechlorination activity assay for B. megaterium samples
Culture Condition DCM produced (nmol)
Amount of protein added to assay
(mg)
Specific activity (nmol/mg/min)
TB media, 0.1% xylose, 3h_1 19985.005 273 0.41 TB media, 0.1% xylose, 3h_2 23254.015 247 0.52 TB media, 0.1% xylose, overnight_1 12382.895 7 9.83 TB media, 0.1% xylose, overnight_2 12397.895 6.5 10.6 TB media, 0.3% xylose, 3h_1 11262.17 266 0.24 TB media, 0.3% xylose, 3h_2 11757.91 261 0.25 TB media, 0.3% xylose, overnight_1 10197.435 5 11.33 TB media, 0.3% xylose, overnight_2 13851.935 6.5 11.84 TB media, 0.5% xylose, 3h_1 11045.54 271.5 0.23 TB media, 0.5% xylose, 3h_2 10313.23 254.5 0.001 TB media, 0.5% xylose, overnight_1 10200.775 3 18.89 TB media, 0.5% xylose, overnight_1 10549.935 5.5 10.66 TB media, 0.01% xylose, 3h_1 142558.3272 193 4.1 TB media, 0.01% xylose, 3h_2 158953.9982 170 5.19 TB media, 0.001% xylose, 3h_1 99437.80481 156 3.54 TB media, 0.001% xylose, 3h_1 121439.113 157.5 4.28 TB media, 0.03% xylose, 3h_1 191791.6906 171 6.23 TB media, 0.03% xylose, 3h_2 151955.6192 171 4.93 TB media, 0.003% xylose, 3h_1 122957.7172 162.5 4.2 TB media, 0.003% xylose, 3h_2 108763.5867 174 3.47 TB media, 0% xylose, 3h_1 92139.70159 216.5 2.36 TB media, 0% xylose, 3h_2 99622.84708 212 2.61 Purified protein_1 12599.08 0.02 3499.743 Purified protein_2 13987.79 0.02 3885.497 Purified protein_3 11940.39 0.02 3316.775
Table A.4.4 Raw data for dechlorination activity assay for S. blattae samples
Construct DCM produced (nmol)
Amount of protein added to assay
(mg)
Specific activity (nmol/mg/min)
TmrA_1 43496.06 66 1.098 TmrA_2 48009.97 66 1.212 TmrA_full_1 10142.75 100 0.169 TmrA_full_2 10241.72 100 0.171 TmrA_full co-expressed with TF104_1 10803.6 66 0.273 TmrA_full co-expressed with TF104_2 10712.83 66 0.271 TmrA_full co-expressed with TF161_1 10626.54 76 0.233 TmrA_full co-expressed with TF161_1 10681.25 76 0.234
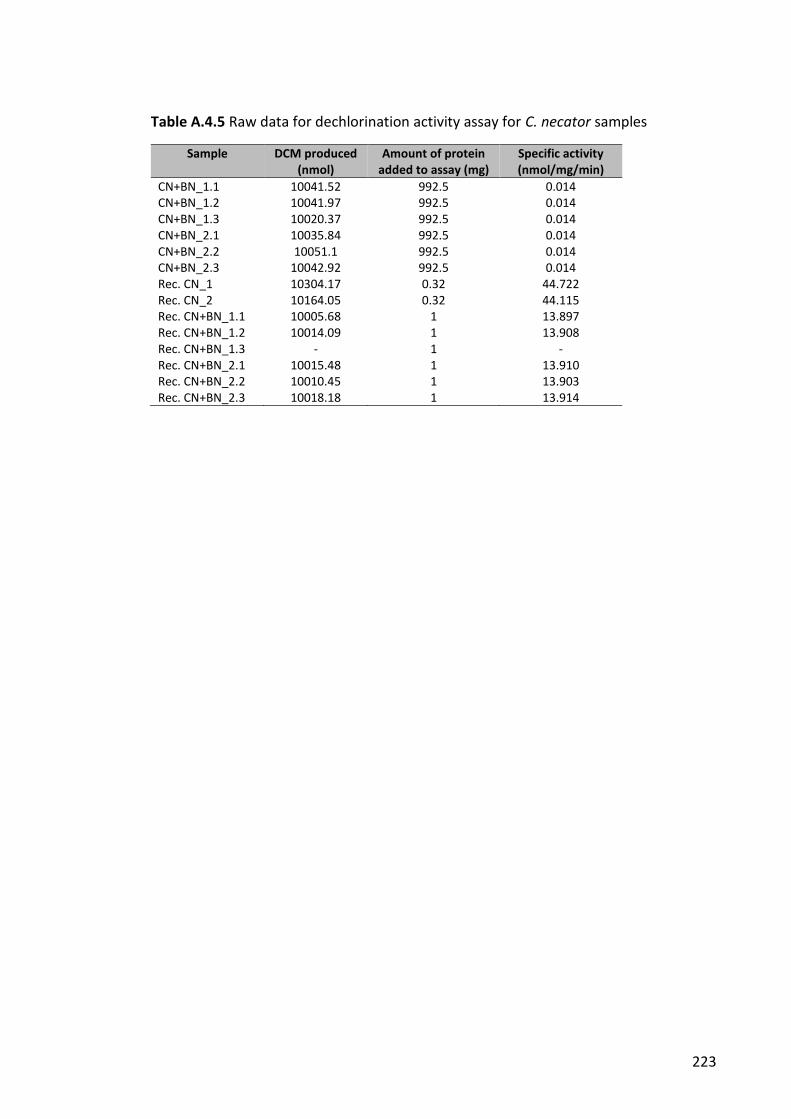
223
Table A.4.5 Raw data for dechlorination activity assay for C. necator samples
Sample DCM produced (nmol)
Amount of protein added to assay (mg)
Specific activity (nmol/mg/min)
CN+BN_1.1 10041.52 992.5 0.014 CN+BN_1.2 10041.97 992.5 0.014 CN+BN_1.3 10020.37 992.5 0.014 CN+BN_2.1 10035.84 992.5 0.014 CN+BN_2.2 10051.1 992.5 0.014 CN+BN_2.3 10042.92 992.5 0.014 Rec. CN_1 10304.17 0.32 44.722 Rec. CN_2 10164.05 0.32 44.115 Rec. CN+BN_1.1 10005.68 1 13.897 Rec. CN+BN_1.2 10014.09 1 13.908 Rec. CN+BN_1.3 - 1 - Rec. CN+BN_2.1 10015.48 1 13.910 Rec. CN+BN_2.2 10010.45 1 13.903 Rec. CN+BN_2.3 10018.18 1 13.914
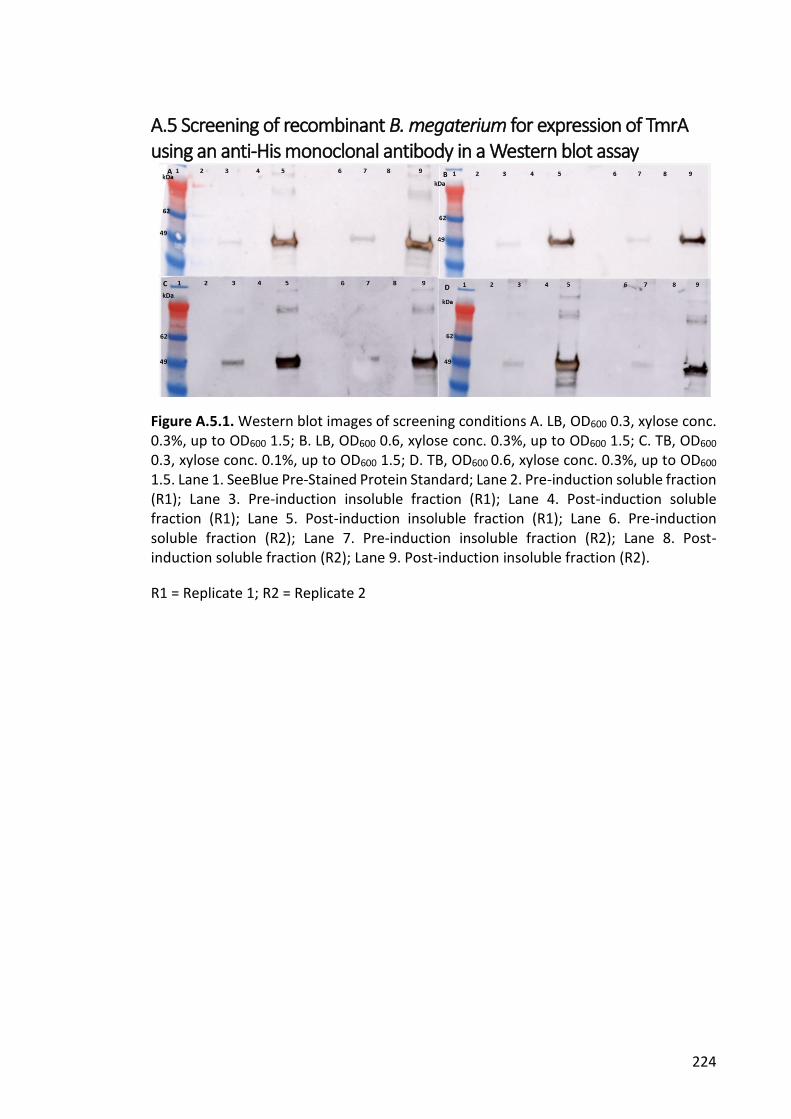
224
A.5 Screening of recombinant B. megaterium for expression of TmrA using an anti-His monoclonal antibody in a Western blot assay
Figure A.5.1. Western blot images of screening conditions A. LB, OD600 0.3, xylose conc. 0.3%, up to OD600 1.5; B. LB, OD600 0.6, xylose conc. 0.3%, up to OD600 1.5; C. TB, OD600 0.3, xylose conc. 0.1%, up to OD600 1.5; D. TB, OD600 0.6, xylose conc. 0.3%, up to OD600 1.5. Lane 1. SeeBlue Pre-Stained Protein Standard; Lane 2. Pre-induction soluble fraction (R1); Lane 3. Pre-induction insoluble fraction (R1); Lane 4. Post-induction soluble fraction (R1); Lane 5. Post-induction insoluble fraction (R1); Lane 6. Pre-induction soluble fraction (R2); Lane 7. Pre-induction insoluble fraction (R2); Lane 8. Post-induction soluble fraction (R2); Lane 9. Post-induction insoluble fraction (R2).
R1 = Replicate 1; R2 = Replicate 2
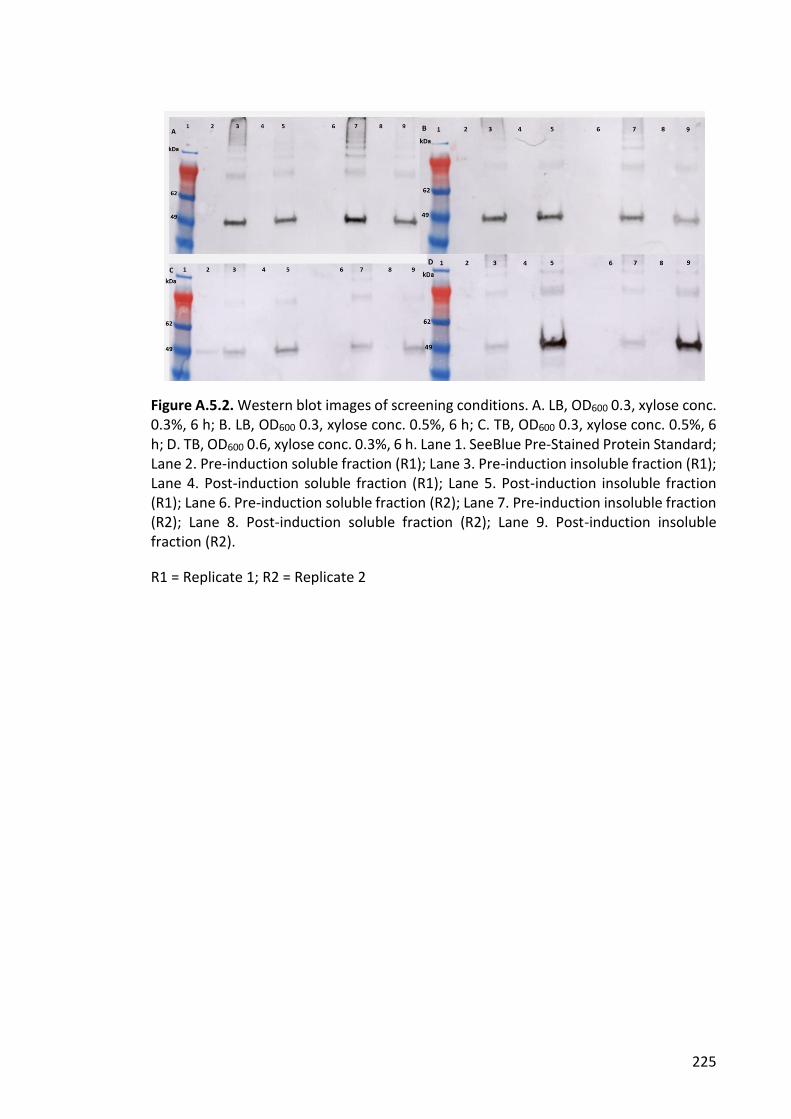
225
Figure A.5.2. Western blot images of screening conditions. A. LB, OD600 0.3, xylose conc. 0.3%, 6 h; B. LB, OD600 0.3, xylose conc. 0.5%, 6 h; C. TB, OD600 0.3, xylose conc. 0.5%, 6 h; D. TB, OD600 0.6, xylose conc. 0.3%, 6 h. Lane 1. SeeBlue Pre-Stained Protein Standard; Lane 2. Pre-induction soluble fraction (R1); Lane 3. Pre-induction insoluble fraction (R1); Lane 4. Post-induction soluble fraction (R1); Lane 5. Post-induction insoluble fraction (R1); Lane 6. Pre-induction soluble fraction (R2); Lane 7. Pre-induction insoluble fraction (R2); Lane 8. Post-induction soluble fraction (R2); Lane 9. Post-induction insoluble fraction (R2).
R1 = Replicate 1; R2 = Replicate 2
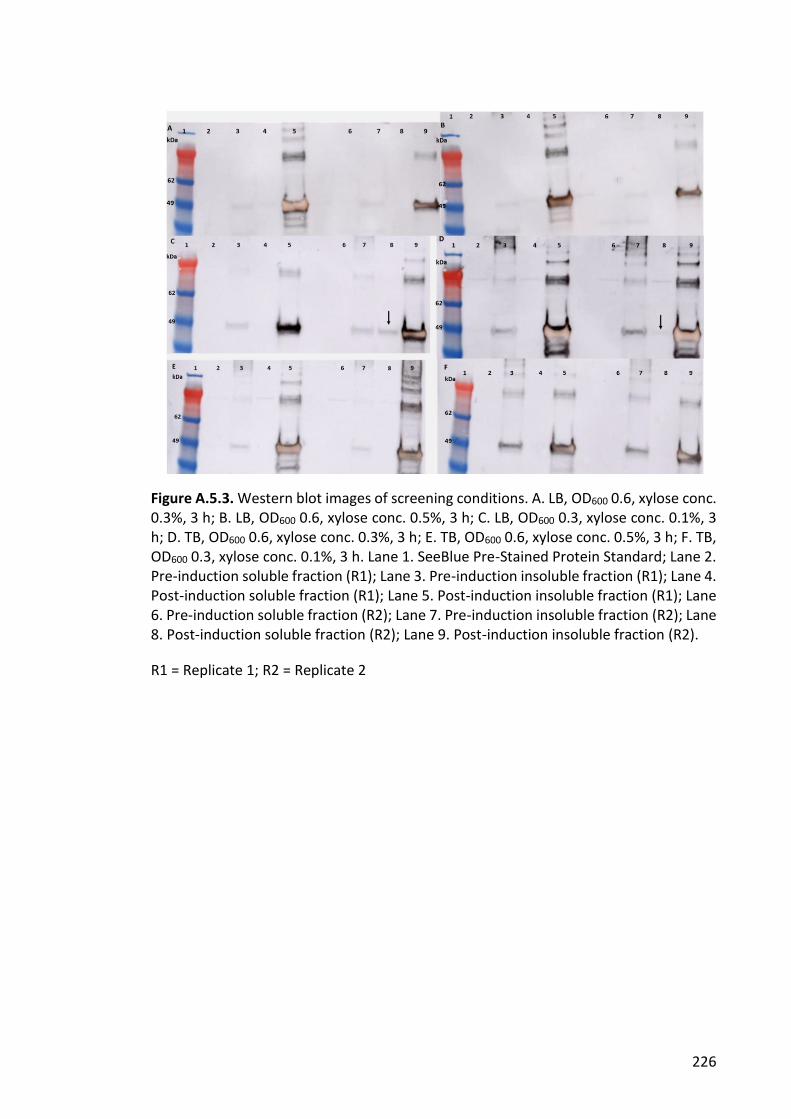
226
Figure A.5.3. Western blot images of screening conditions. A. LB, OD600 0.6, xylose conc. 0.3%, 3 h; B. LB, OD600 0.6, xylose conc. 0.5%, 3 h; C. LB, OD600 0.3, xylose conc. 0.1%, 3 h; D. TB, OD600 0.6, xylose conc. 0.3%, 3 h; E. TB, OD600 0.6, xylose conc. 0.5%, 3 h; F. TB, OD600 0.3, xylose conc. 0.1%, 3 h. Lane 1. SeeBlue Pre-Stained Protein Standard; Lane 2. Pre-induction soluble fraction (R1); Lane 3. Pre-induction insoluble fraction (R1); Lane 4. Post-induction soluble fraction (R1); Lane 5. Post-induction insoluble fraction (R1); Lane 6. Pre-induction soluble fraction (R2); Lane 7. Pre-induction insoluble fraction (R2); Lane 8. Post-induction soluble fraction (R2); Lane 9. Post-induction insoluble fraction (R2).
R1 = Replicate 1; R2 = Replicate 2
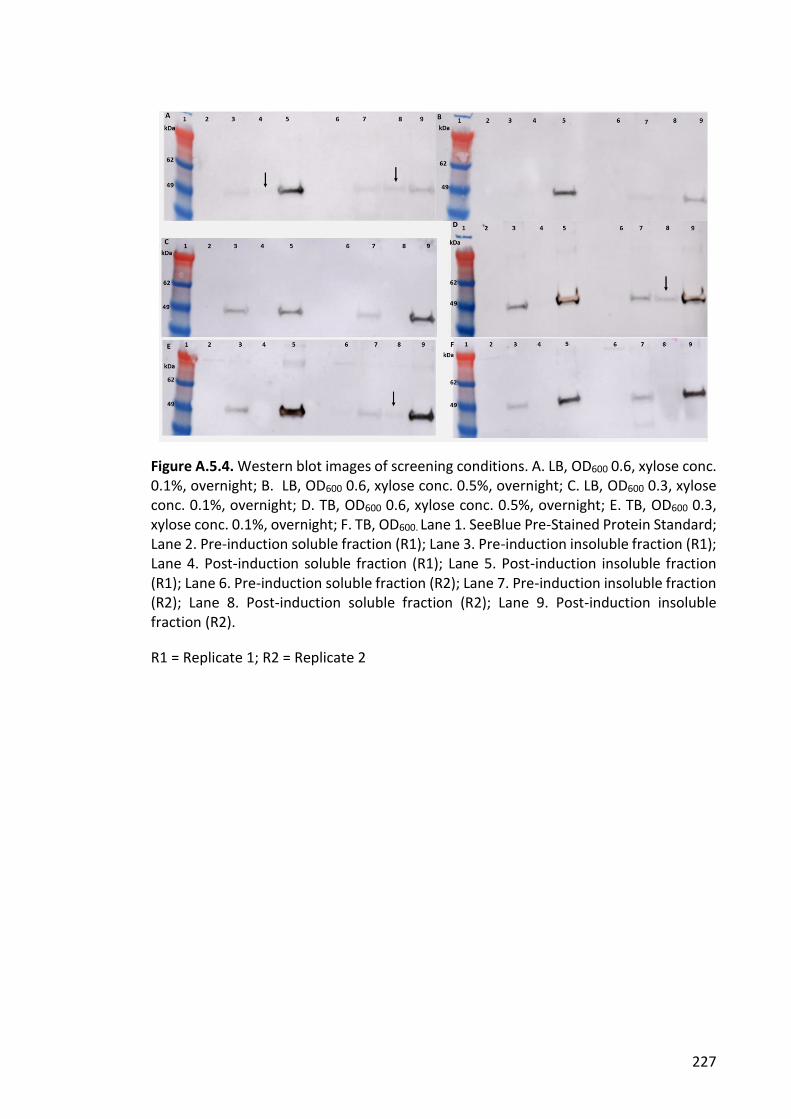
227
Figure A.5.4. Western blot images of screening conditions. A. LB, OD600 0.6, xylose conc. 0.1%, overnight; B. LB, OD600 0.6, xylose conc. 0.5%, overnight; C. LB, OD600 0.3, xylose conc. 0.1%, overnight; D. TB, OD600 0.6, xylose conc. 0.5%, overnight; E. TB, OD600 0.3, xylose conc. 0.1%, overnight; F. TB, OD600. Lane 1. SeeBlue Pre-Stained Protein Standard; Lane 2. Pre-induction soluble fraction (R1); Lane 3. Pre-induction insoluble fraction (R1); Lane 4. Post-induction soluble fraction (R1); Lane 5. Post-induction insoluble fraction (R1); Lane 6. Pre-induction soluble fraction (R2); Lane 7. Pre-induction insoluble fraction (R2); Lane 8. Post-induction soluble fraction (R2); Lane 9. Post-induction insoluble fraction (R2).
R1 = Replicate 1; R2 = Replicate 2
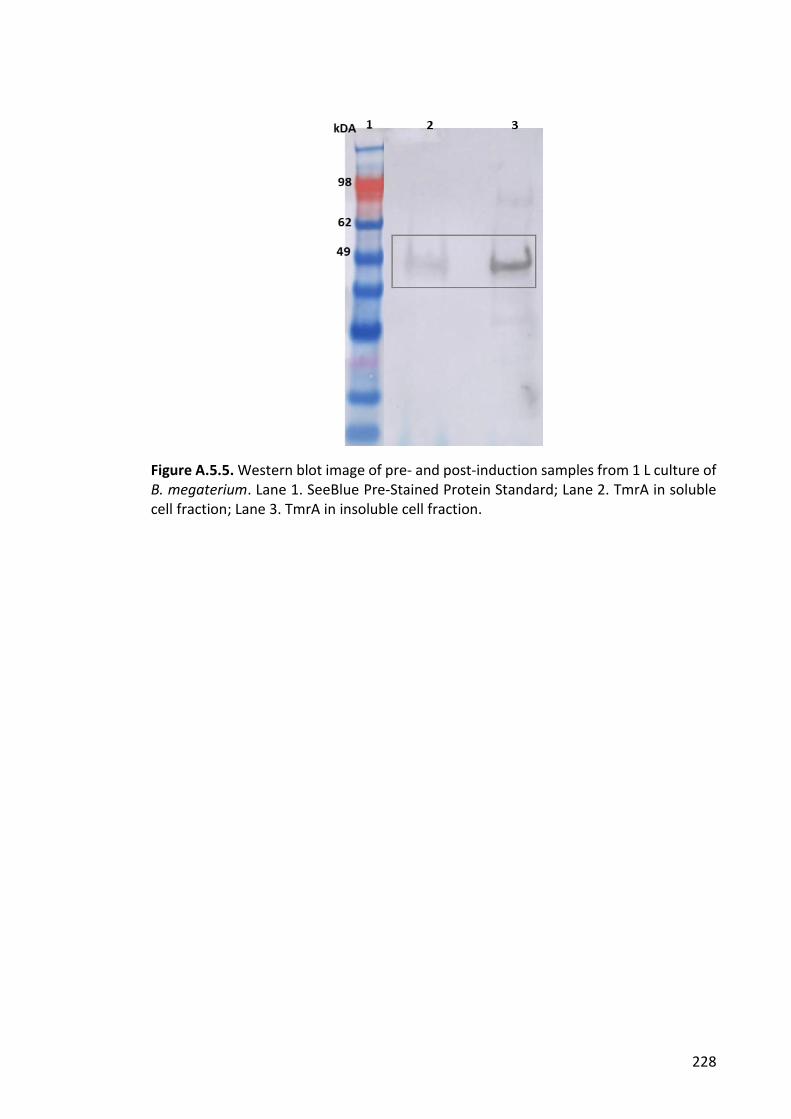
228
Figure A.5.5. Western blot image of pre- and post-induction samples from 1 L culture of B. megaterium. Lane 1. SeeBlue Pre-Stained Protein Standard; Lane 2. TmrA in soluble cell fraction; Lane 3. TmrA in insoluble cell fraction.
229
A.6 LC-MS/MS Results to confirm identity of TmrA in excised gel bands
Mass spectrometric analysis for this work was carried out at the Bioanalytical Mass
Spectrometry Facility, UNSW and was supported in part by infrastructure funding from
the New South Wales Government as part of its coinvestment in the National
Collaborative Research Infrastructure Strategy”.
Digest peptides were separated by nano-LC using an Ultimate 3000 HPLC and
autosampler system (Dionex, Amsterdam, Netherlands). Samples (2.5 µl) were
concentrated and desalted onto a micro C18 precolumn (300 µm x 5 mm, Dionex) with
H2O:CH3CN (98:2, 0.05 % TFA) at 15 µl/min. After a 4 min wash the pre-column was
switched (Valco 10 port valve, Dionex) into line with a fritless nano column (75µ x
~10cm) containing C18 media (1.9 µ, 120Å, Dr Maisch, Ammerbuch-Entringen Germany)
manufactured according to Gatlin et al. (1998). Peptides were eluted using a linear
gradient of H2O:CH3CN (98:2, 0.1 % formic acid) to H2O:CH3CN (64:36, 0.1 % formic
acid) at 200 nl/min over 30 min. High voltage 2000 V) was applied to low volume tee
(Upchurch Scientific) and the column tip positioned ~ 0.5 cm from the heated capillary
(T=275°C) of an Orbitrap Velos (Thermo Electron, Bremen, Germany) mass
spectrometer. Positive ions were generated by electrospray and the Orbitrap operated
in data dependent acquisition mode (DDA).
A survey scan m/z 350-1750 was acquired in the Orbitrap (Resolution = 30,000 at m/z
400, with an accumulation target value of 1,000,000 ions) with lockmass enabled. Up to
the 10 most abundant ions (>4,000 counts) with charge states > +2 were sequentially
isolated and fragmented within the linear ion trap using collisionally induced
dissociation with an activation q = 0.25 and activation time of 30 ms at a target value of
30,000 ions. M/z ratios selected for MS/ MS were dynamically excluded for 30 seconds.
All MS/MS spectra were searched against NCBI database using MASCOT (version 2.3)
with the following search criteria: enzyme specificity was trypsin; precursor and product
ion tolerances were at 4 ppm and ± 0.4 Da, respectively; variable modification of
methionine oxidation; and one missed cleavage was allowed. The ions score significance
230
threshold was set to 0.5 and each protein was provided with a probability based Mowse
(Molecular Weight Search) score (Pappin et al., 1993). Mass spectrometric analysis was
carried out at the Bioanalytical Mass Spectrometry Facility, University of New South
Wales, Australia.
PAPPIN, D.J.C, HOJRUP, P., BLEASBY, A.J. 1993. Rapid identification of proteins by
peptide-mass fingerprinting. Current Biology, 3(6): 327-332.
GATLIN, C., KLEEMANN, G., HAYS, L., LINK, A., YATES, JR. 1998. Protein identification at
the low femtomole level from silver-stained gels using a new fritless electrospray
interface for liquid chromatrography-microspray and nanospray mass
spectrometry. Analytical Biochemistry, 263(1): 93–101.
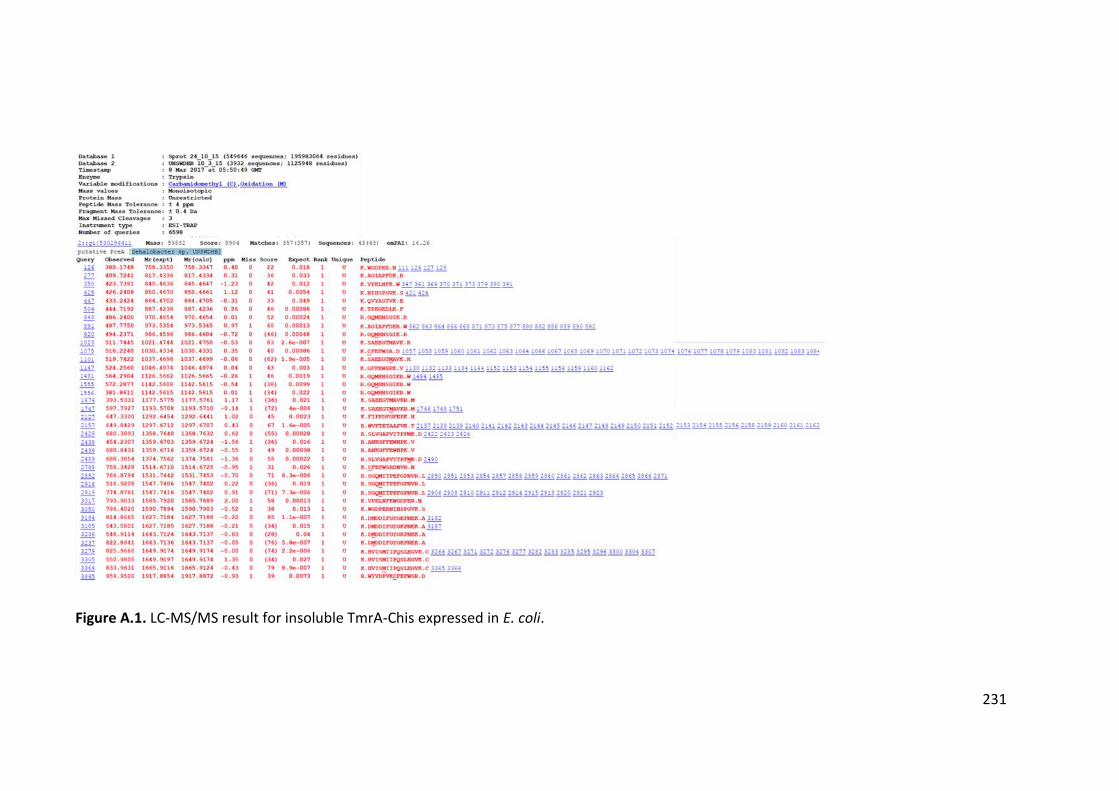
231
Figure A.1. LC-MS/MS result for insoluble TmrA-Chis expressed in E. coli.
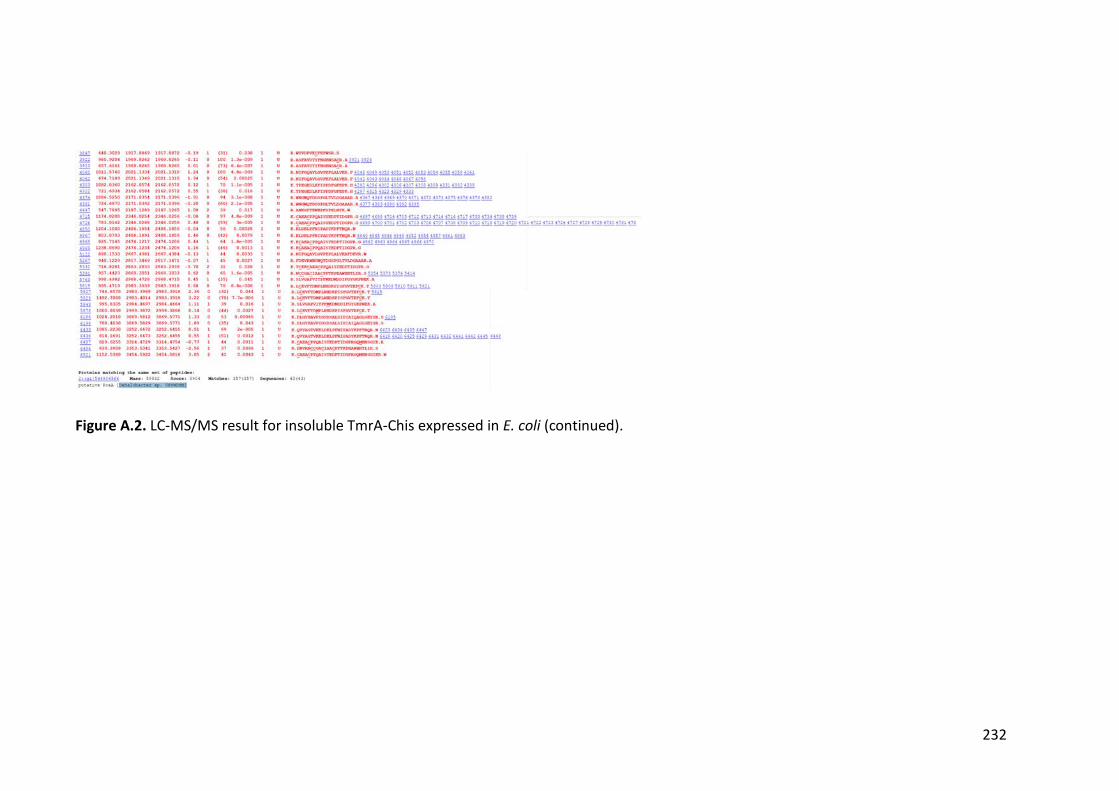
232
Figure A.2. LC-MS/MS result for insoluble TmrA-Chis expressed in E. coli (continued).
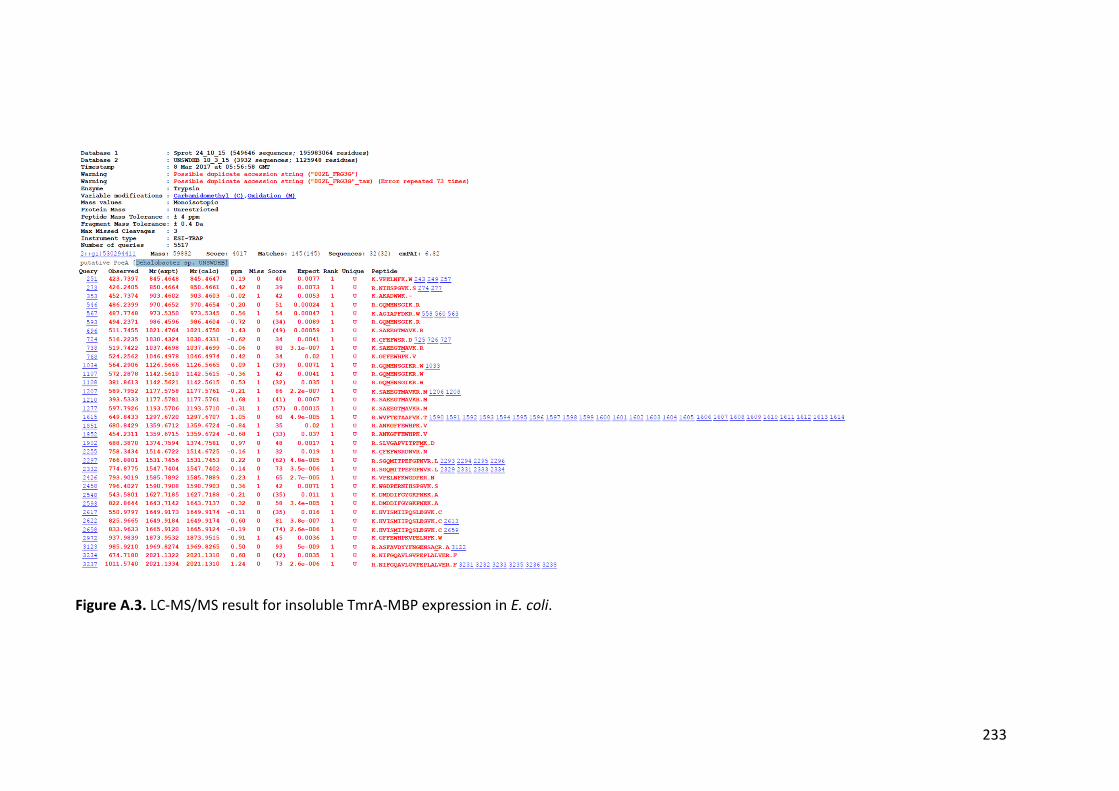
233
Figure A.3. LC-MS/MS result for insoluble TmrA-MBP expression in E. coli.
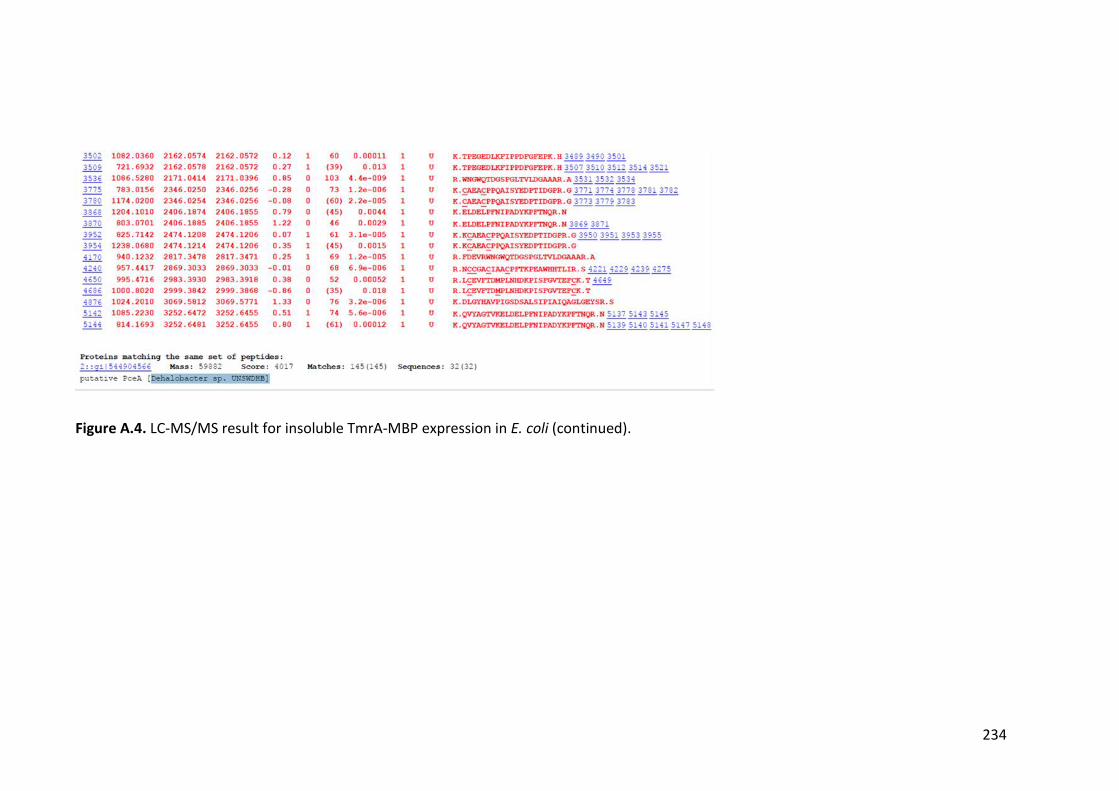
234
Figure A.4. LC-MS/MS result for insoluble TmrA-MBP expression in E. coli (continued).
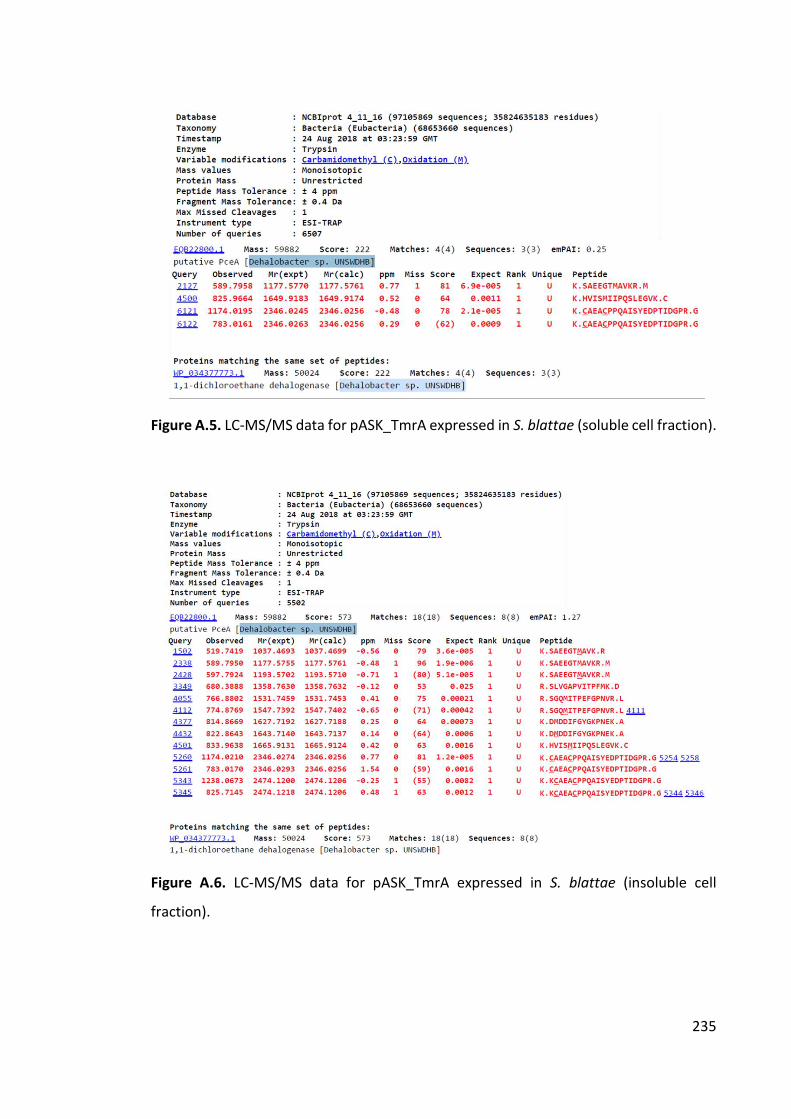
235
Figure A.5. LC-MS/MS data for pASK_TmrA expressed in S. blattae (soluble cell fraction).
Figure A.6. LC-MS/MS data for pASK_TmrA expressed in S. blattae (insoluble cell
fraction).
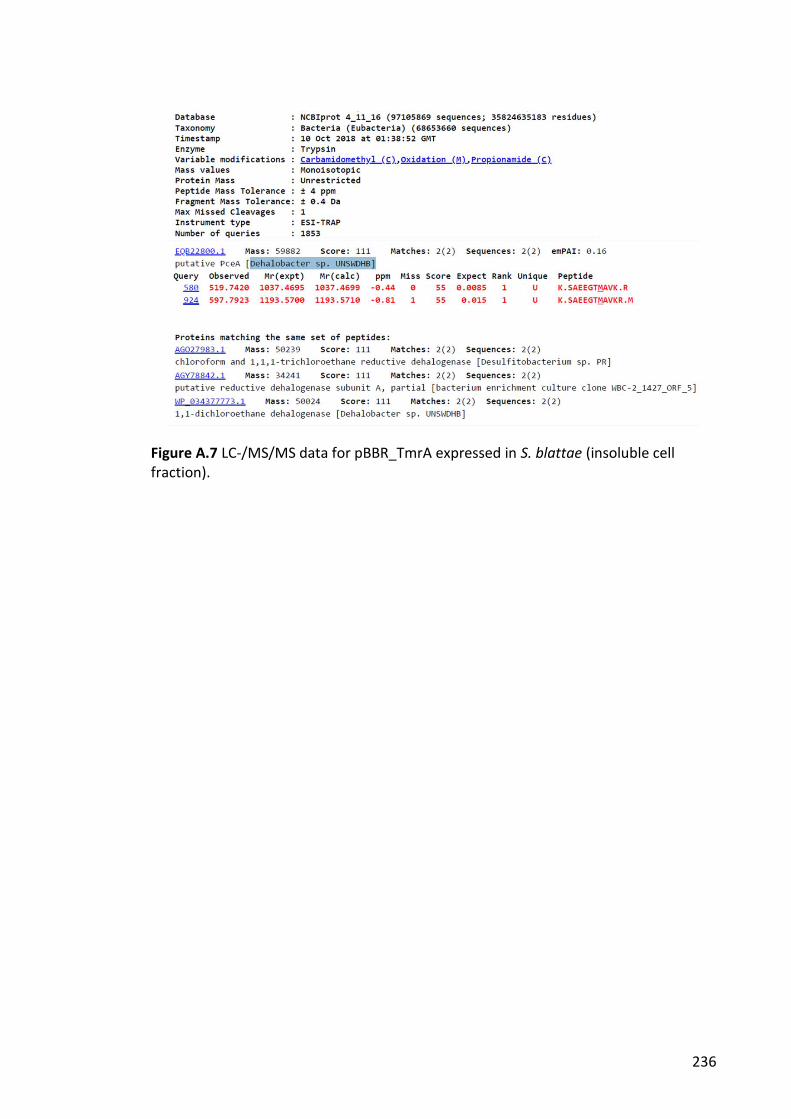
236
Figure A.7 LC-/MS/MS data for pBBR_TmrA expressed in S. blattae (insoluble cell fraction).