9i17 ijaet1117384 v6 iss5 2021 2032
TRANSCRIPT
International Journal of Advances in Engineering & Technology, Nov. 2013.
©IJAET ISSN: 22311963
2021 Vol. 6, Issue 5, pp. 2021-2032
ESTIMATION OF PRESSURE DROP FOR FLOW OF CMC IN
AQUEOUS SOLUTION USING ARTIFICIAL NEURAL NETWORK
Shekhar Pandharipande1, Rachana S. Ranshoor2 1Associate Professor, Department of Chemical Engineering, Laxminarayan Institute of
Technology, RTM Nagpur University, Nagpur, India 2M.Tech Third Semester, Laxminarayan Institute of Technology, Nagpur, India.
ABSTRACTS Estimation of behavior of Non-Newtonian fluids is a complex phenomenon & conventional models have
deviated & shown non consistency. Present work has addressed to the problem of pressure drop estimation for
flow of CMC-water solution having different concentrations in a pipeline. Experimental runs are conducted &
the data generated is divided into two parts; one for developing the model& another for testing .Two Artificial
Neural Network models S1 & C1 are developed having RMSE values for training data set of 0.021 & 0.013
respectively. The corresponding values for test data set are 0.035 & 0.08. The claim of high accuracy is
substantiated further & the percentage relative error values are within ±10% for training data set & around
±20% for test data set for both the models. Thus the present work has successfully demonstrated the potential
that need to be further explored in development of ANN models for predicting behavior of Non-Newtonian
fluids.
KEYWORDS: Artificial Neural Network, CMC-Water Solution, Pressure Drop Estimation, Non-Newtonian
Fluid.
I. INTRODUCTION
A fluid is defined as a substance that deforms continuously under the action of shear stress. When a
fluid is at rest, there can be no shear stresses. Fluids are broadly classified as Newtonian & Non-
Newtonian fluids. Newtonian fluids are those having a constant viscosity that is dependent on
temperature but independent of the applied shear rate & the curve of stress versus strain rate is linear
and passes through origin. Air, water, honey etc. are the examples following in this category. In a
Non-Newtonian fluid, the relation between the shear stress and the shear rate is different, and can
even be time-dependent. Therefore a constant coefficient of viscosity cannot be defined. Examples of
substances exhibiting Non-Newtonian fluid behaviour are beer, animal waste slurries from cattle
farms, biological fluids such as blood, saliva, bitumen, cement paste & slurries, chocolates, coal
slurries, cosmetics & personal care products like lotion & creams, shampoos, toothpaste. Dairy
products & dairy waste streams like cheese, butter, fresh cream, yogurt, whey, drilling mud, food
stuffs that include purees, sauces, jams, ice creams, egg white, bread mixes. Greases & lubricating
oils, molten lava & magmas, paints, polishes & varnishes, paper & pulp suspensions, peat & lignite
slurries, polymer melts & solutions, reinforced plastics & rubber, printing colours & inks,
pharmaceutical products, sewages sludge, wet beach sand, waxy crude oils, etc, also fall in the
category of Non-Newtonian fluids[1].
Carboxymethyl cellulose (CMC) has wide application in industries & is a Non-Newtonian fluid. CMC
has its innumerable application in oil & gas drilling, textile, printing & dyeing industries, paper
industry, daily chemical industry, ceramic industry, construction industry, food industry, mining
floatation industry, etc.
Artificial neural network (ANN) has been emerging as a powerful tool for predicting values which
have practically importance. The base of artificial neural network is biological neural network. ANN
International Journal of Advances in Engineering & Technology, Nov. 2013.
©IJAET ISSN: 22311963
2022 Vol. 6, Issue 5, pp. 2021-2032
is a black box modelling tool whose working principle is similar to a Biological Neural Network. It
consists of input, hidden & output layers. Input & output layer consist a definite number of neurons
that depends on the number of variable to be correlated, where as there could be any number of
hidden layers with appropriate numbers of neurons depending upon the complexity of the modelling
process.
There are several types of the arrangement of the neurons with each other & error back propagation is
most common for chemical processes. In this architecture, every node in every layer is connected to
all the nodes in the succeeding layers by means of the connectionist constants, also called as weights.
The output from each neuron in the input layer is altered by a multiplication factor or weight and
every node in the next layer receives the summation of the product of the outputs of the nodes from
the preceding layer. The resulting signal received by the node is further transformed by using
functions like sigmoid function & the resulting signal acts as an input for the nodes in the next layer.
The power of EBP is in its training & the algorithm suggested by Rummelhart [17] is popular among
workers.
The paper is presented in sections, starting with the introduction to non Newtonian fluids with special
reference to CMC-water solution & Artificial Neural Network (ANN). The next section takes a stock
of the related papers published, followed by discussing the details of experimental setup & topology
of ANN models developed. The accuracy of the prediction of ANN models developed is compared at
length in result & discussion section. The paper concludes with highlighting the findings of the
present work & indicating the possible areas for further work that need to be explored.
II. LITERATURE SURVEY
In last few years, CMC were used as Non-Newtonian fluids by researchers for various studies.
F.T.Pinho [2] et al, studied the pressure drop of shear thinning in laminar flow across a sudden
expansion. Bart C.H. Venneker [3] et al studied about the turbulent flow of shear thinning fluid in
stirred tank. Diego Gomez-Diaz & Jose M. Navaza [4] studied the apparent viscosity & the influence
of shear rate on different polymer concentration in aqueous solution of CMC, & also the effect of
temperature on rheological behaviour. He has reported that the behaviour parameter, n, decreased
when CMC concentration increased.
Determination of total head loss & friction factor corresponding to pressure drop& loss coefficient
caused by fittings & valves, using CMC aqueous solution was studied by Adelson Balizario Leal S [5]
et al. F.T.Pinho & J.H.Whitelaw [6] had well discussed about the delay in transition from laminar to
turbulent flow caused by shear thinning, where experiment were carried out by using CMC. Shankar
.P, Himanshu Vyas, Kalaichelvi .P and Muthamizhi.K [7] studied mixing characteristics of 0.5%CMC
in double jet mixer. Vesna Hegeduš, Zoran Herceg and Suzana Rimac [8] studied Rheological
Properties of CMC and Whey Model Solutions before and after Freezing. A. Bombac, M. zumer, and
I. Zun [9] reported about their findings on Power Consumption in Mixing and Aerating of Shear
Thinning Fluid (CMC) in a Stirred Vessel.
Several applications of ANN in modelling of various processes is reported in literature. Study o
Pawan P Singh & Vinod K Jindal [10] made the comparison of the viscometric characterization of
selected foods, consist CMC as one of the item, based on tube & rotational viscometers for estimating
pressure drop & also made neurals networks for estimating pressure drop. Artificial neural network
application for model in calculation of pressure drop of nanofluid was made by Mahmoud S. Youssef,
Ayman A. Aly, and El-Shafei B. Zeidan [11]. Nirjhar Bar & Sudip Kumar Das [12] used multilayer
perceptron for pressure drop prediction for flow of Gas-Non-Newtonian liquid. ANN is used to detect
leak in pipelines [13]. ANN is also used for the estimation of pressure drop of packed column [14].
Work has done for Optimizing topology in developing artificial neural network model for estimation
of hydrodynamics of packed column [15]. S.L. Pandharipande with his co-workers has utilized the
power of Artificial Neural Network for Estimation of Composition of a Ternary Liquid Mixture with
its Physical Properties such as Refractive Index, pH and Conductivity [18], for Modeling of
Equilibrium Relationship for Partially Miscible Liquid-Liquid Ternary System [19] and for Modeling
of Packed Bed Using Artificial Neural Network [20].
III. MATERIALS & METHODS
International Journal of Advances in Engineering & Technology, Nov. 2013.
©IJAET ISSN: 22311963
2023 Vol. 6, Issue 5, pp. 2021-2032
Experimental runs are conducted & the generated data is divided into two parts. One part is called as
training data set & is used in developing ANN models. The other data set is called as test data set & is
used in validating the model developed.
Two ANN models are developed to predict output parameters i.e. head loss & pressure drop. These
developed models are then compared based on their predicted results for future application. Water is
Newtonian fluid whereas addition of CMC in water diverts behaviour of system to Non-Newtonian.
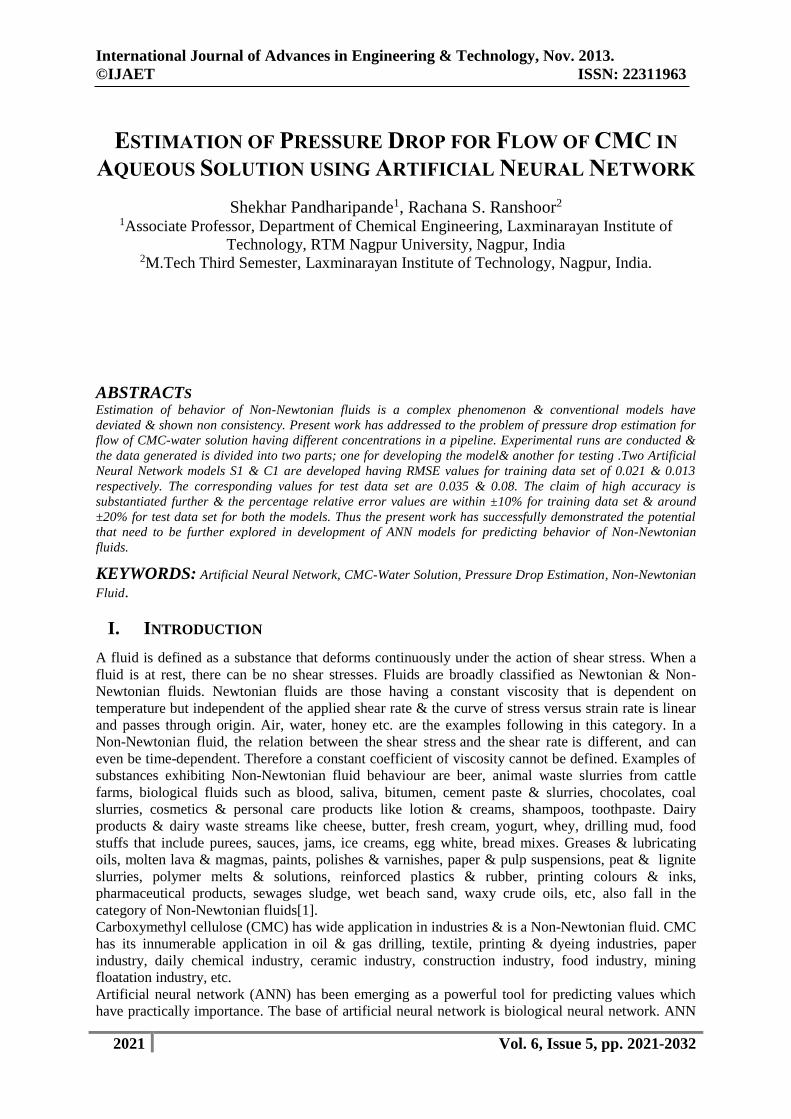
Figure 1 shows the schematic of the experimental setup. It consists of a reservoir tank, with
60 liters capacity, a centrifugal pump of 1HP & 9 feet long experimental acrylic pipe having
25 mm diameter.
CMC solution of concentrations 0.192%, 0.29%, 0.392%, 0.492%, & 0.592% by wt are
prepared by weighing CMC powder using electronic weighing balance & then vigorously
mixing it in known amount of water to make the desired concentration.
Experiments are performed by pumping homogenous solution into the pipe & noting pressure
drops for varying flow rates conditions.
Pressure drops are measured by using an inverted manometer, whose limbs are 3 feet apart &
flow rates are measured by weighing the solution collected for known interval of time.
D
C
E
B
Figure 1: Schematic of the Experimental set up
A→ storage tank; B→ centrifugal pump; C→ acrylic pipe of diameter 25mm;D→ inverted U tube
manometer, whose limbs are 1m apart; E→ valve to control flow rate.
The data generated is divided in two parts; one part containing 42 data points as training set and the
other with 9 data points as test set. Two ANN models S1 & C1 having different topologies are
developed using elite-ANN© [16].The graphs are plotted for the comparison of actual & predicted
values for output parameters i.e. head loss and pressure drop for the training & test data set for these
ANN models
The topology of the ANN models S1 & C1developed in the present work is given in table 1.
Table 1. Neural network topology for ANN models
Name
of ANN
models
Numbers of neurons Data points RMSE Iteration
s Input
layer
1st
hidden
layer
2nd
hidden
layer
3rd
hidden
layer
Output
layer
Training
data set
Test
data
set
Trainin
g data
set
Test
data
set
S1 2 0 5 5 2 42 9 0.021 0.035 50000
C1 2 10 10 10 2 42 9 0.013 0.08 50000
A
International Journal of Advances in Engineering & Technology, Nov. 2013.
©IJAET ISSN: 22311963
2024 Vol. 6, Issue 5, pp. 2021-2032
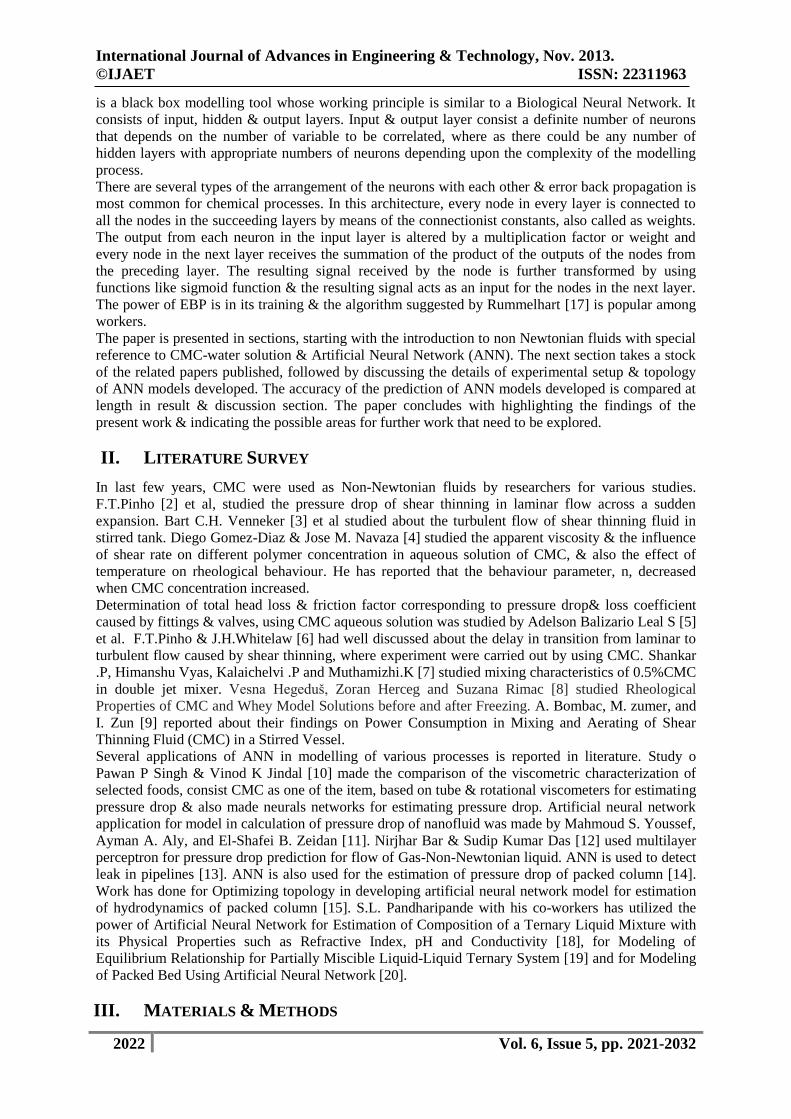
The architecture of ANN topology for ANN models S1 & C1are shown in figure number 2.
Hidden layers
Input layer Output layer
Velocity head loss
Concentration pressure drop
Density
Figure 2.Neural network architecture
IV. OBSERVATIONS
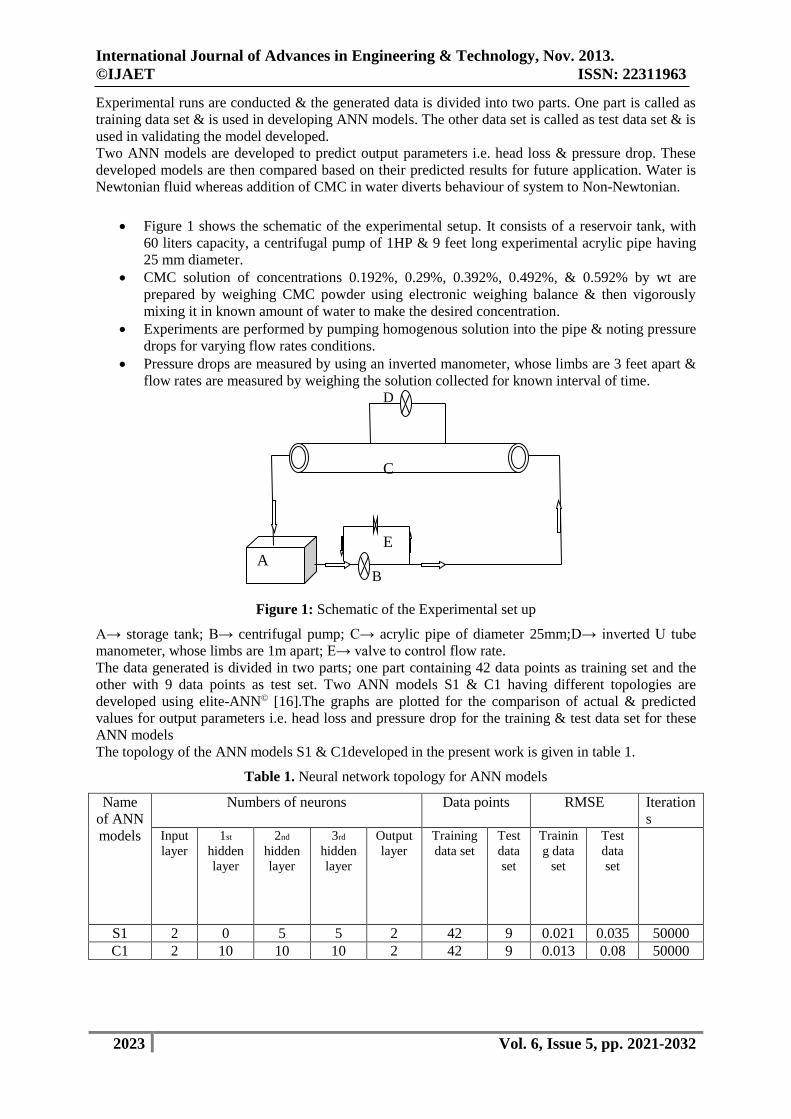
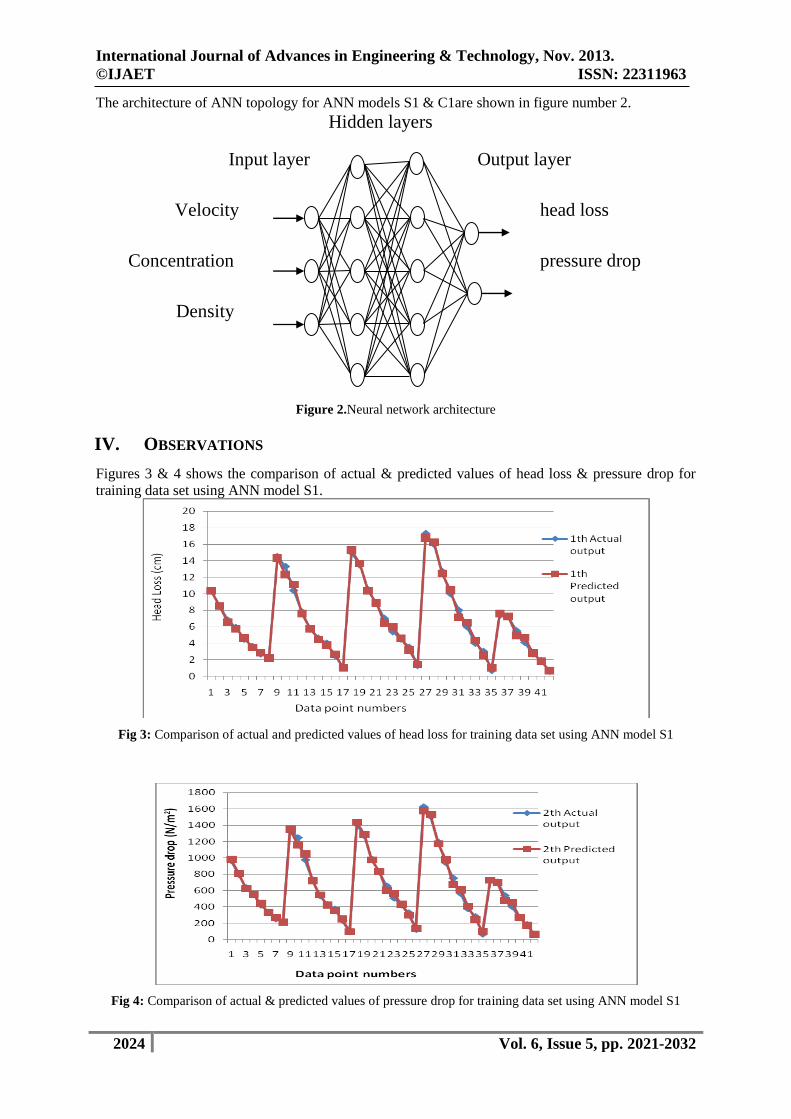
Figures 3 & 4 shows the comparison of actual & predicted values of head loss & pressure drop for
training data set using ANN model S1.
Fig 3: Comparison of actual and predicted values of head loss for training data set using ANN model S1
Fig 4: Comparison of actual & predicted values of pressure drop for training data set using ANN model S1
International Journal of Advances in Engineering & Technology, Nov. 2013.
©IJAET ISSN: 22311963
2025 Vol. 6, Issue 5, pp. 2021-2032
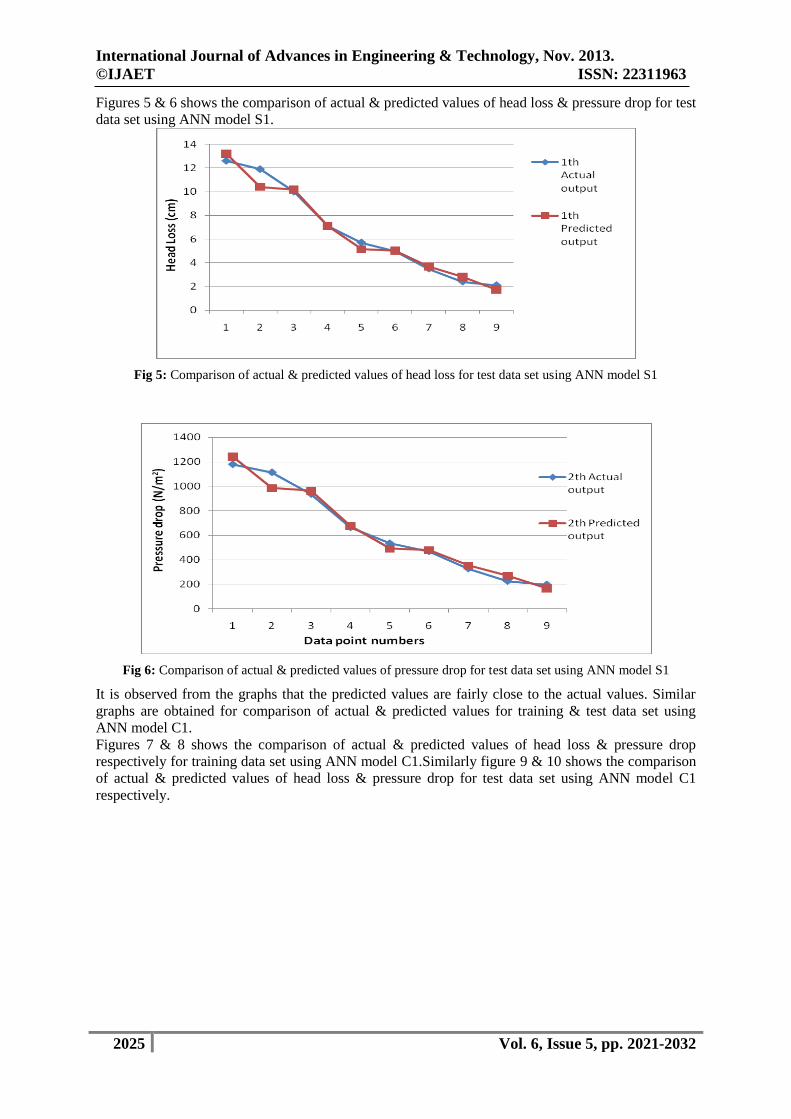
Figures 5 & 6 shows the comparison of actual & predicted values of head loss & pressure drop for test
data set using ANN model S1.
Fig 5: Comparison of actual & predicted values of head loss for test data set using ANN model S1
Fig 6: Comparison of actual & predicted values of pressure drop for test data set using ANN model S1
It is observed from the graphs that the predicted values are fairly close to the actual values. Similar
graphs are obtained for comparison of actual & predicted values for training & test data set using
ANN model C1.
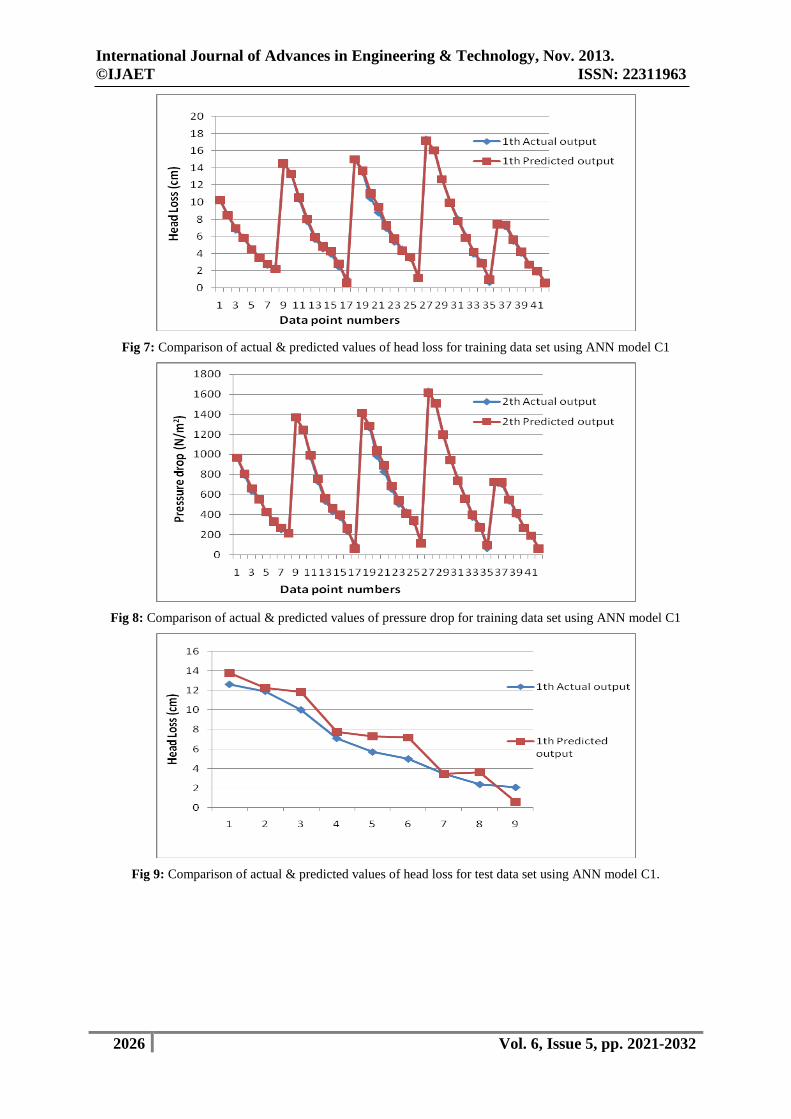
Figures 7 & 8 shows the comparison of actual & predicted values of head loss & pressure drop
respectively for training data set using ANN model C1.Similarly figure 9 & 10 shows the comparison
of actual & predicted values of head loss & pressure drop for test data set using ANN model C1
respectively.
International Journal of Advances in Engineering & Technology, Nov. 2013.
©IJAET ISSN: 22311963
2026 Vol. 6, Issue 5, pp. 2021-2032
Fig 7: Comparison of actual & predicted values of head loss for training data set using ANN model C1
Fig 8: Comparison of actual & predicted values of pressure drop for training data set using ANN model C1
Fig 9: Comparison of actual & predicted values of head loss for test data set using ANN model C1.
International Journal of Advances in Engineering & Technology, Nov. 2013.
©IJAET ISSN: 22311963
2027 Vol. 6, Issue 5, pp. 2021-2032
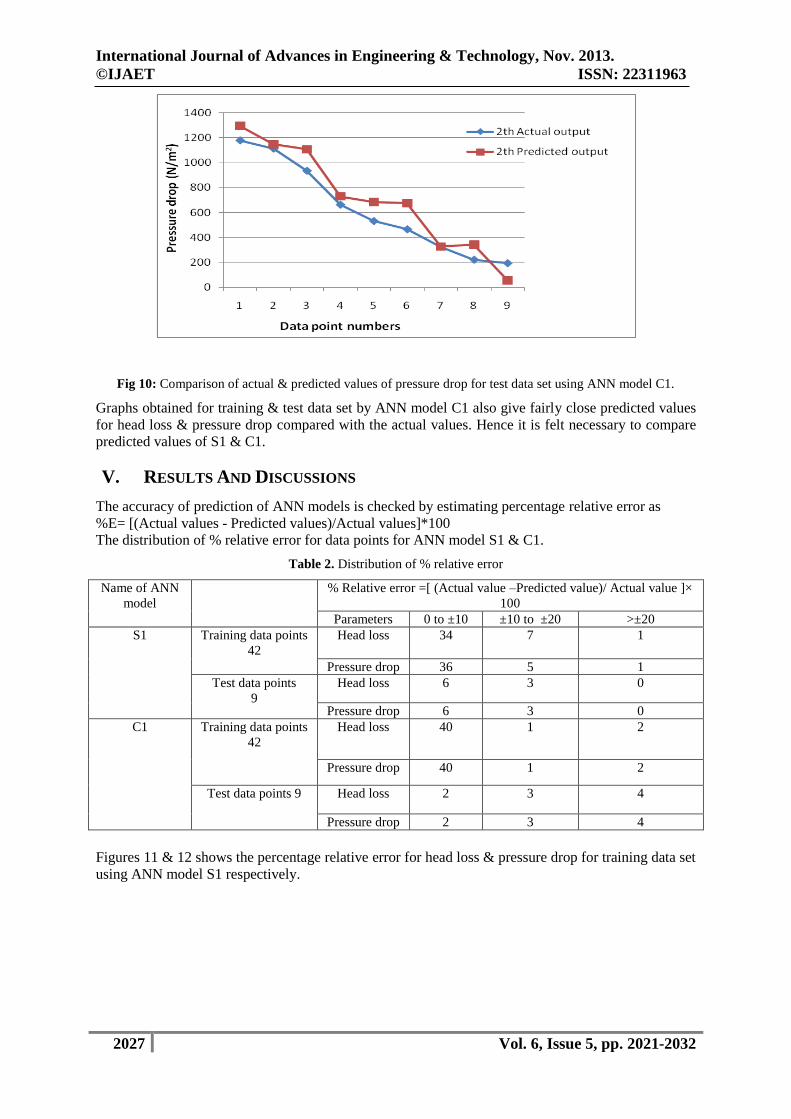
Fig 10: Comparison of actual & predicted values of pressure drop for test data set using ANN model C1.
Graphs obtained for training & test data set by ANN model C1 also give fairly close predicted values
for head loss & pressure drop compared with the actual values. Hence it is felt necessary to compare
predicted values of S1 & C1.
V. RESULTS AND DISCUSSIONS
The accuracy of prediction of ANN models is checked by estimating percentage relative error as
%E= [(Actual values - Predicted values)/Actual values]*100
The distribution of % relative error for data points for ANN model S1 & C1.
Table 2. Distribution of % relative error
Name of ANN
model
% Relative error =[ (Actual value –Predicted value)/ Actual value ]×
100
Parameters 0 to ±10 ±10 to ±20 >±20
S1 Training data points
42
Head loss 34 7 1
Pressure drop 36 5 1
Test data points
9
Head loss 6 3 0
Pressure drop 6 3 0
C1 Training data points
42
Head loss 40 1 2
Pressure drop 40 1 2
Test data points 9 Head loss 2 3 4
Pressure drop 2 3 4
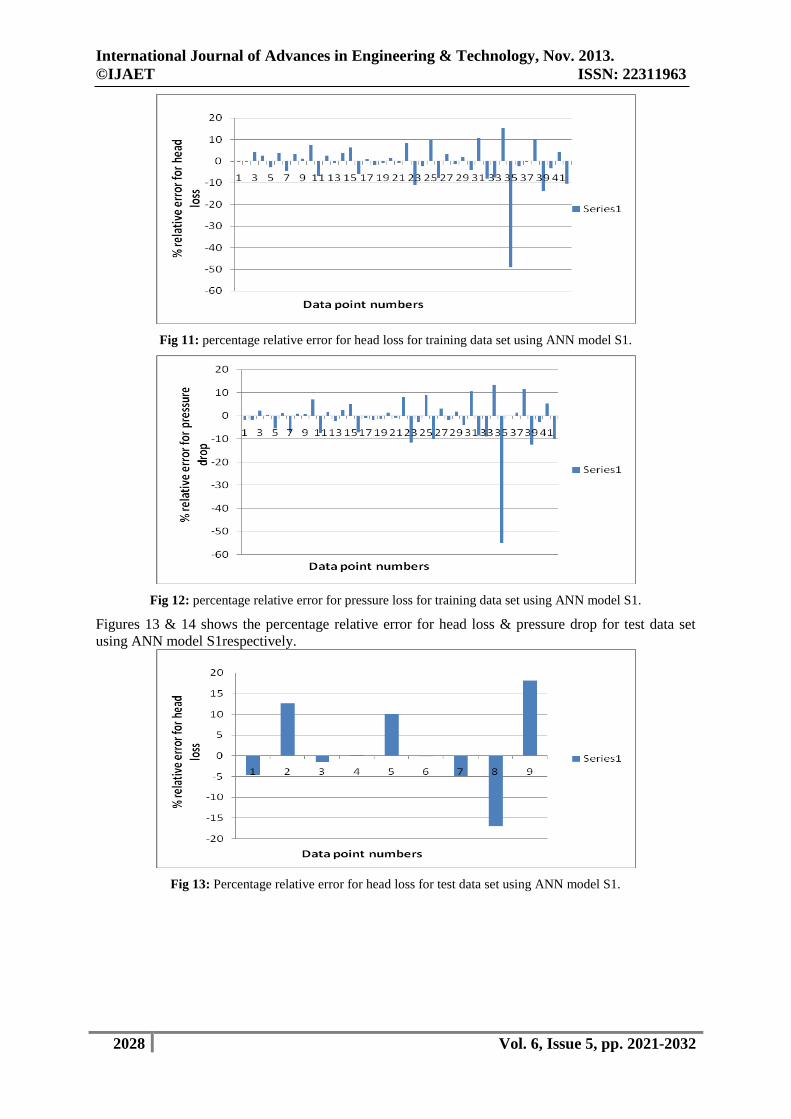
Figures 11 & 12 shows the percentage relative error for head loss & pressure drop for training data set
using ANN model S1 respectively.
International Journal of Advances in Engineering & Technology, Nov. 2013.
©IJAET ISSN: 22311963
2028 Vol. 6, Issue 5, pp. 2021-2032
Fig 11: percentage relative error for head loss for training data set using ANN model S1.
Fig 12: percentage relative error for pressure loss for training data set using ANN model S1.
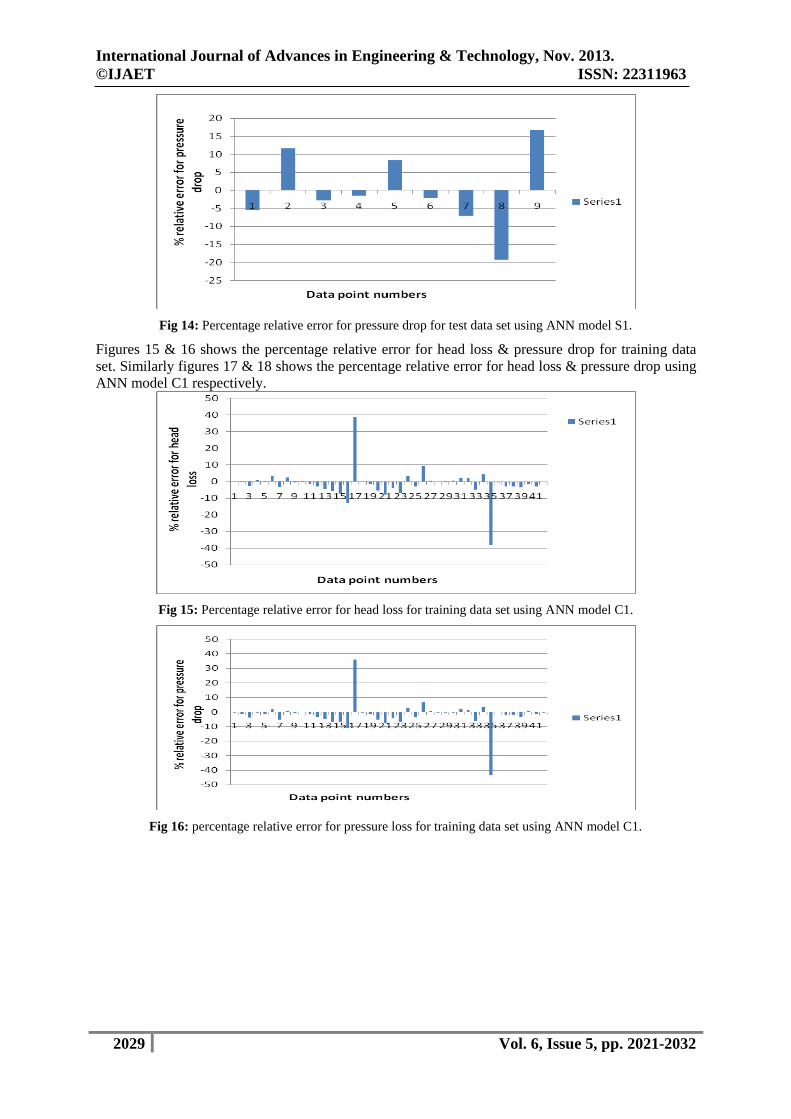
Figures 13 & 14 shows the percentage relative error for head loss & pressure drop for test data set
using ANN model S1respectively.
Fig 13: Percentage relative error for head loss for test data set using ANN model S1.
International Journal of Advances in Engineering & Technology, Nov. 2013.
©IJAET ISSN: 22311963
2029 Vol. 6, Issue 5, pp. 2021-2032
Fig 14: Percentage relative error for pressure drop for test data set using ANN model S1.
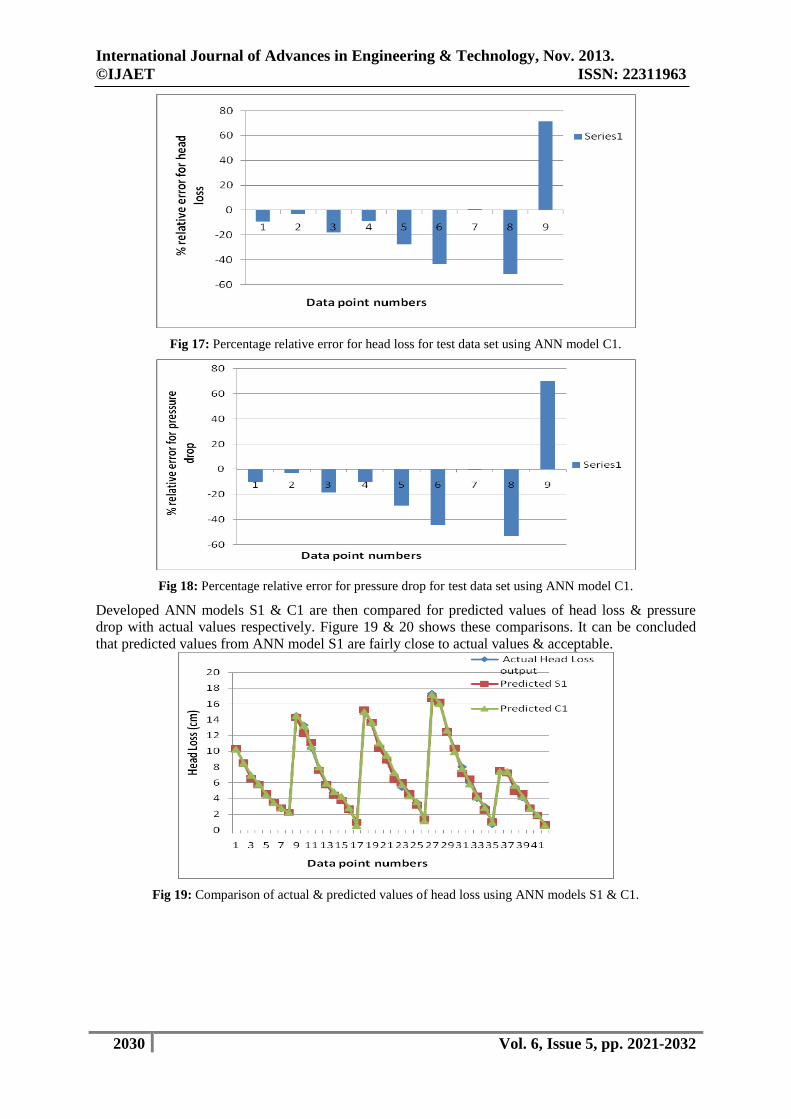
Figures 15 & 16 shows the percentage relative error for head loss & pressure drop for training data
set. Similarly figures 17 & 18 shows the percentage relative error for head loss & pressure drop using
ANN model C1 respectively.
Fig 15: Percentage relative error for head loss for training data set using ANN model C1.
Fig 16: percentage relative error for pressure loss for training data set using ANN model C1.
International Journal of Advances in Engineering & Technology, Nov. 2013.
©IJAET ISSN: 22311963
2030 Vol. 6, Issue 5, pp. 2021-2032
Fig 17: Percentage relative error for head loss for test data set using ANN model C1.
Fig 18: Percentage relative error for pressure drop for test data set using ANN model C1.
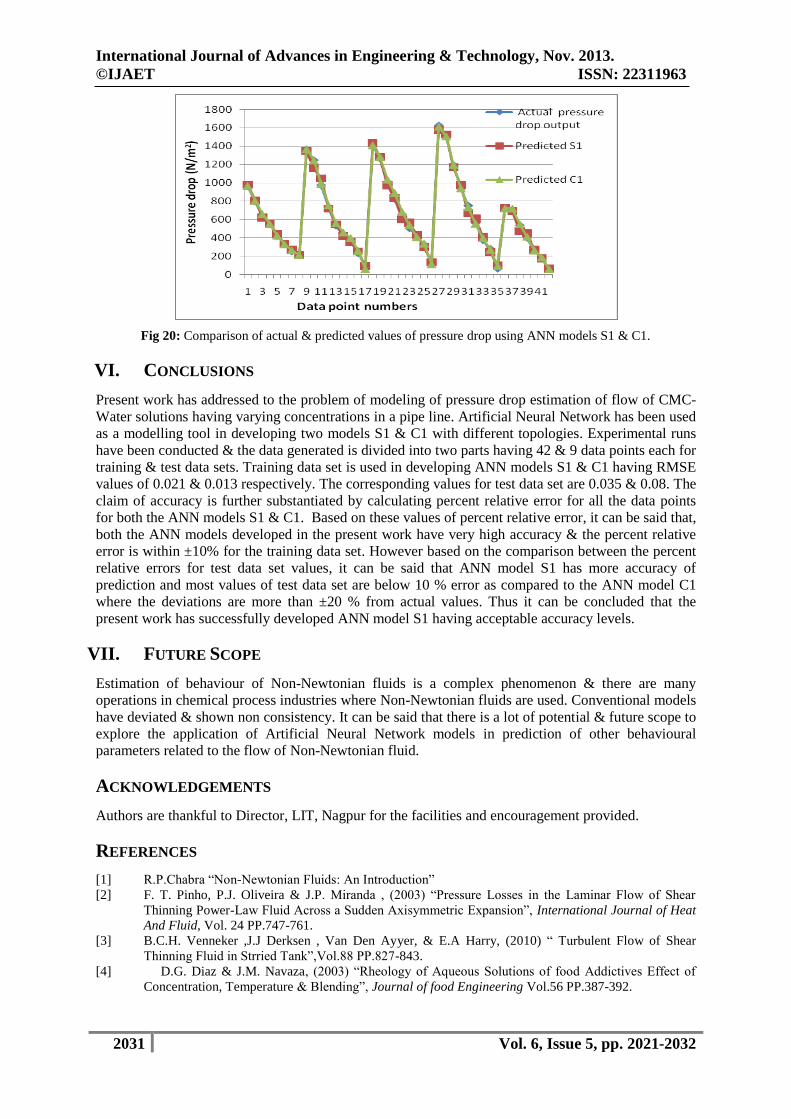
Developed ANN models S1 & C1 are then compared for predicted values of head loss & pressure
drop with actual values respectively. Figure 19 & 20 shows these comparisons. It can be concluded
that predicted values from ANN model S1 are fairly close to actual values & acceptable.
Fig 19: Comparison of actual & predicted values of head loss using ANN models S1 & C1.
International Journal of Advances in Engineering & Technology, Nov. 2013.
©IJAET ISSN: 22311963
2031 Vol. 6, Issue 5, pp. 2021-2032
Fig 20: Comparison of actual & predicted values of pressure drop using ANN models S1 & C1.
VI. CONCLUSIONS
Present work has addressed to the problem of modeling of pressure drop estimation of flow of CMC-
Water solutions having varying concentrations in a pipe line. Artificial Neural Network has been used
as a modelling tool in developing two models S1 & C1 with different topologies. Experimental runs
have been conducted & the data generated is divided into two parts having 42 & 9 data points each for
training & test data sets. Training data set is used in developing ANN models S1 & C1 having RMSE
values of 0.021 & 0.013 respectively. The corresponding values for test data set are 0.035 & 0.08. The
claim of accuracy is further substantiated by calculating percent relative error for all the data points
for both the ANN models S1 & C1. Based on these values of percent relative error, it can be said that,
both the ANN models developed in the present work have very high accuracy & the percent relative
error is within ±10% for the training data set. However based on the comparison between the percent
relative errors for test data set values, it can be said that ANN model S1 has more accuracy of
prediction and most values of test data set are below 10 % error as compared to the ANN model C1
where the deviations are more than ±20 % from actual values. Thus it can be concluded that the
present work has successfully developed ANN model S1 having acceptable accuracy levels.
VII. FUTURE SCOPE
Estimation of behaviour of Non-Newtonian fluids is a complex phenomenon & there are many
operations in chemical process industries where Non-Newtonian fluids are used. Conventional models
have deviated & shown non consistency. It can be said that there is a lot of potential & future scope to
explore the application of Artificial Neural Network models in prediction of other behavioural
parameters related to the flow of Non-Newtonian fluid.
ACKNOWLEDGEMENTS
Authors are thankful to Director, LIT, Nagpur for the facilities and encouragement provided.
REFERENCES
[1] R.P.Chabra “Non-Newtonian Fluids: An Introduction”
[2] F. T. Pinho, P.J. Oliveira & J.P. Miranda , (2003) “Pressure Losses in the Laminar Flow of Shear
Thinning Power-Law Fluid Across a Sudden Axisymmetric Expansion”, International Journal of Heat
And Fluid, Vol. 24 PP.747-761.
[3] B.C.H. Venneker ,J.J Derksen , Van Den Ayyer, & E.A Harry, (2010) “ Turbulent Flow of Shear
Thinning Fluid in Strried Tank”,Vol.88 PP.827-843.
[4] D.G. Diaz & J.M. Navaza, (2003) “Rheology of Aqueous Solutions of food Addictives Effect of
Concentration, Temperature & Blending”, Journal of food Engineering Vol.56 PP.387-392.
International Journal of Advances in Engineering & Technology, Nov. 2013.
©IJAET ISSN: 22311963
2032 Vol. 6, Issue 5, pp. 2021-2032
[5] A.B. Leal, L.A. Calcada & C.M. Scheid, 2nd Mercosur Congress on Chemical Engineering, 4th
Mercosur Congress on Process Systems Engineering, Proceeding in ENPROMER.
[6] F .T. Pinho & J.H. Whitelaw, (1990) “Flow of Non-Newtonian Fluid in Pipe”, Journal of Non-
Newtonian Mechanics, Vol.34 PP. 129-144.
[7] P. Shankar ,H. Vyas ,P. Kalaichelvi & K. Muthamizhi , (2012) “Experimental Analysis of Mixing
Characteristics of Carboxymethyl Cellulose Solutions in a Doube Jet Mixer”, International Journal of
Chemical & Environmental Engineering , Vol.3No. 4.
[8] V. Hegedusic, Z. Herceg & S.Rimac, (2000) “Rheological Properties of Carboxymethyl Cellulose &
Whey Model Solutions before & After Freezing”, Food Technology Biotechnology, Vol.38 No. 1
PP.19-26.
[9] A. Bombac, M. Zumer & I.Zun, (2007) “Power Consumption in Mixing & Aerating of Shear Thinning
Fluid in a Strried Vessel”, Chemical Biochemical Engineering, Vol. 21 PP. 131-138.
[10] P. P. Singh & V. K. Jindal, (2003) “Pressure Drop Estimation in Tube Flow of Non-Newtonian Fluid
Foods by Neural Network”, Journal of Food Process Engineering, Vol.26 PP.49-65.
[11] M.S. Youssef, A. A. Aly & El-Shafei B. Zeidan, (2013) “Application of Artificial Neural Network
Model in Calculation of Pressure Drop of Values of Nanofliuid”, International Journal of Engineering
& Technology, Vol.3 No.5.
[12] N. Bar & S. K. Das (2012) “Gas- Non-Newtonian Liquid Flow Through Horizontal Pipe-Gas Holdup
& Pressure Drop Prediction Using Multilayer Perceptron”, American Journal of Fluid Dynamics, Vol.2
No.3 PP.7-16.
[13] S.L. Pandharipande & Y.P. Badhe, (2003) “Modelling of Artificial Neural Network for Leak Detection
in Pipe Line” Chemical Engineering World PP.70-72.
[14] S.L. Pandharipande & Ankit Singh, “Estimation of Pressure Drop of Packed Column Using Artificial
Neural Network”, International Journal of Advanced Engineering Research and Studies
[15] S.L. Pandharipande & Ankit Singh , (2012) “Optimizing Topology In Developing Artificial Neural
Network Model For Estimation Of Hydrodynamics Of Packed Column”, International Journal of
Computer Applications Vol. 58– No.3
[16] S.L. Pandharipande & Y.P. Badhe, (2004) elite-Ann©, ROC No SW-1471.
[17] Rumelhart D E & McClleland, (1986) “Back Propagation Training Algorithm Processing”, M.I.T
Press, Cambridge Massachusett
[18] S.L. Pandharipande, AM Shah, H Tabassum, (2012) “Artificial Neural Network Modeling for
Estimation of Composition of a Ternary Liquid Mixture with its Physical Properties such as Refractive
Index, pH and Conductivity”, International Journal of Computer Applications
[19] S.L. Pandharipande, Y Moharkar, (2012) “Artificial Neural Network Modeling of Equilibrium
Relationship for Partially Miscible Liquid-Liquid Ternary System”, International Journal of Computer
Applications
[20] S.L. Pandharipande, SA Mandavgane, (2004) “Modeling of Packed Bed Using Artificial Neural
Network”, Indian Journal of Chemical Technology
AUTHORS
Shekhar Pandharipande is working as associate professor in Chemical Engineering
department of Laxminarayan Institute of Technology, Rashtrasant Tukadoji Maharaj
Nagpur University, Nagpur. He did his masters in 1985 & joined LIT as a Lecturer. He has
coauthored three books titled ‘Process Calculations’, ‘Principles of Distillation’ &
‘Artificial Neural Network’. He has two copyrights ‘elite-ANN’ & ‘elite-GA’ to his credit
as coworker & has more than 50 papers published in journals of repute.
Rachana Sadan Ranshoor received the Bachelor of Technology in Chemical Engineering
in 2012 from Priyadarshini Institute of Engineering & Technology, Rashtrasant Tukadoji
Maharaj Nagpur University, Nagpur. She is currently pursuing the M. Tech. (Chemical
Engineering) from Laxminarayan Institute of Technology, Nagpur.