72 chimp spider bes
TRANSCRIPT
Behav Ecol Sociobiol (1995) 36:59-70 C Springer-Verlag 1995
Colin A. Chapman* Richard W. Wrangham Lauren J. Chapman
Ecological constraints on group size: an analysis of spider monkey and chimpanzee subgroups
Received: 30 December 1993 / Accepted after revision: 25 September 1994
Abstract The social organization of spider monkeys (Ateles geoffroyi) and chimpanzees (Pan troglodytes) ap- pear remarkably similar. In this paper, field studies of these two species were used to (1) test a model of ecolog- ical constraints on animal group size which suggests that group size is a function of travel costs and (2) assess ecological and social factors underlying the social orga- nization of these two species. Spider monkeys were studied over a 6-year period in Santa Rosa National Park, Costa Rica, and chimpanzees were studied for 6 years in Kibale National Park, Uganda. Adults of both species spent their time in small subgroups that fre- quently changed size and composition. Thus, unlike most primate species, spider monkeys and chimpanzees were not always in a spatially cohesive social group; each individual had the option of associating in sub- groups of a different size or composition. Both species relied on ripe fruit from trees that could be depleted through their feeding activity. However, spider monkey food resources tended to occur at higher densities, were more common, less temporally variable, and did not reach the low levels experienced by chimpanzees. Analyses of the relationship between subgroup size and the density and distribution of their food resources sug- gested that travel costs limit subgroup size. However, these ecological factors did not influence all age/sex classes equally. For example, the number of adult males in a subgroup was a function of food density and travel costs. However, this was not the case for female chim- panzees, suggesting that the benefits of being in a sub- group for females did not exceed the costs, even when ec(logical conditions appeared to minimize subgroup foraging costs. Therefore, it seems likely that social
C.A. Chapman (1) L.J. Chapman Department of Zoology, University of Florida, Gainesville, FL 32611, USA
R.W. Wrangham Peabody Museum, Harvard University, Cambridge, MA 02138, USA
strategies influenced the relationship between food re- source variables and subgroup size.
Key words Group size Spider monkeys Chimpanzees Social organization* Primates Frugivores
Introduction
The determinants of group size have been extensively discussed in terms of costs and benefits (Altmann 1974; Bradbury and Vehrencamp 1977; Milton 1984). Various authors have suggested that grouping confers such pre- dictable benefits that differences in group size can be explained by the disadvantages (Clutton-Brock and Harvey 1977; Terborgh and Janson 1986). It is widely accepted that a major cost of grouping is reduced forag- ing efficiency (Terborgh and Janson 1986). Animals must forage over an area that can meet their energetic and nutritional requirements, and normally an increase in group size will increase the area that must be traveled to find adequate food supplies (Terborgh 1983; Chap- man 1990a). Thus, individuals travel further and spend more energy if they are in a large group, than if they forage in a smaller group or alone. Accordingly, group size is affected by increased travel costs associated with the addition of new group members (Wrangham et al. 1993).
This paper examines specific hypotheses suggested by these general ecological considerations using data on two distantly related primate species with similar fis- sion-fusion grouping patterns. We suggest that when an- imals rely on food items found in depleting patches, group size will be constrained by the size, density, and distribution of food patches, since these variables large- ly determine travel costs.
Theoretically, a patch may be considered depleted when the feeding activity of the consumer has led to the disappearance of all food items. However, once food
60
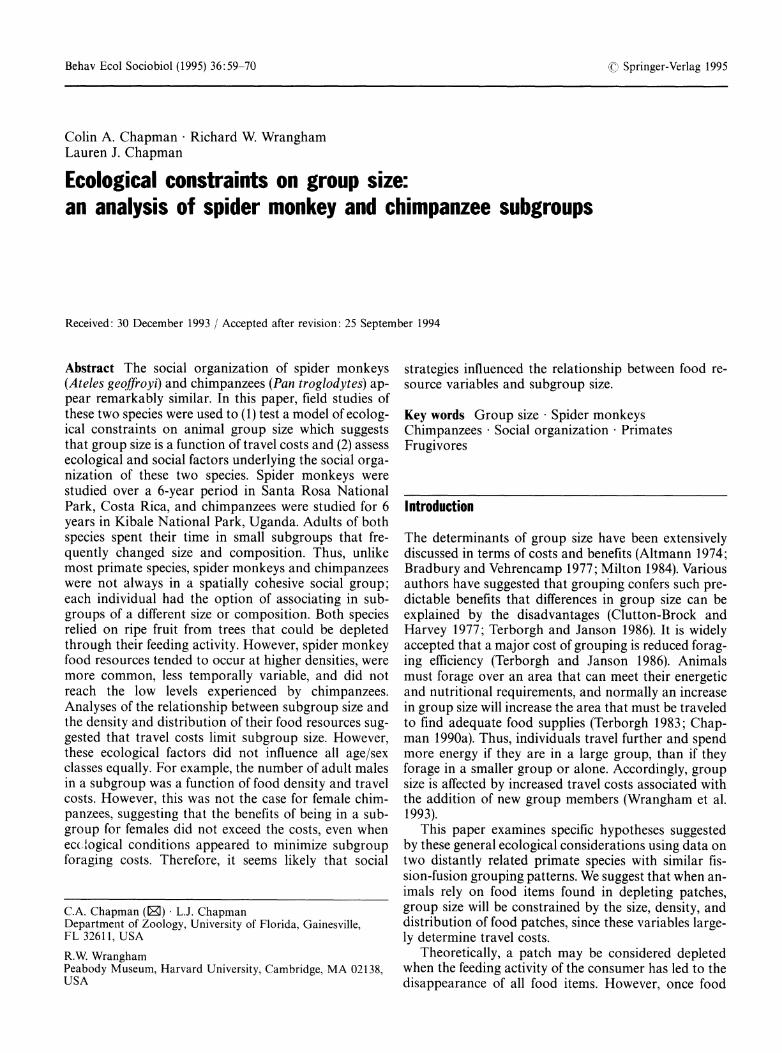
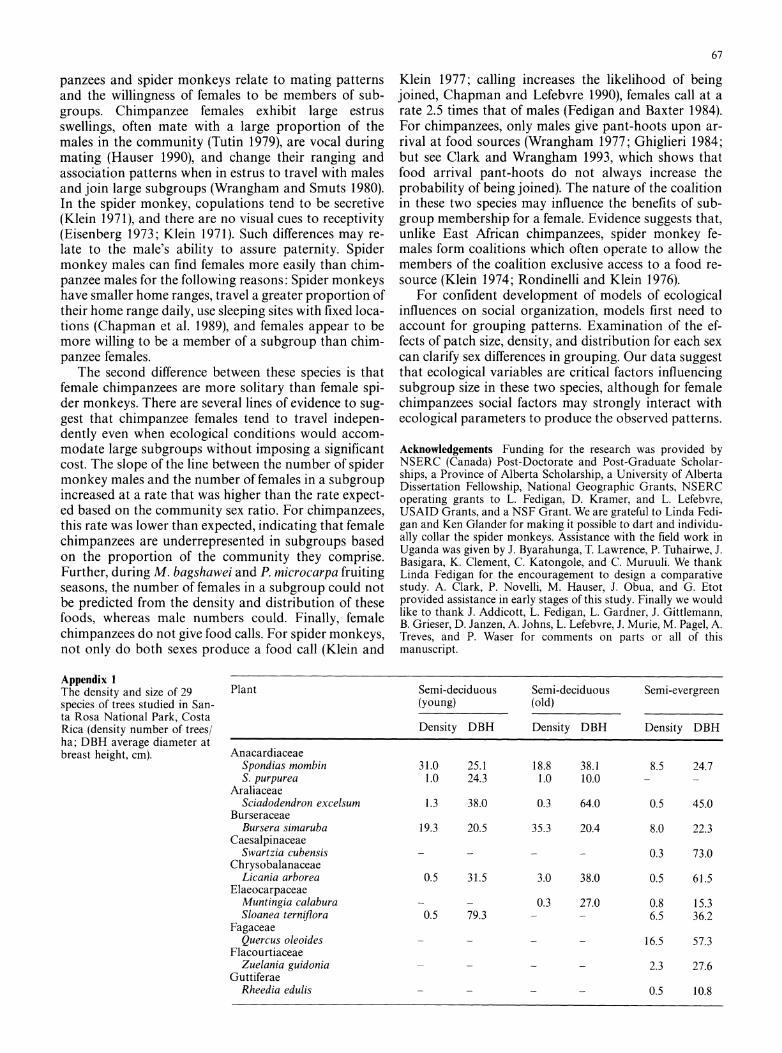
(A) PATCHES DEPLETING / UNIFORM PATCH SIZE
SMALL LARGE
HIGH _ GROUP GROUP
PATCH SIZE = LARGE SIZE = LARGE DENSITY
LOW GROUP GROUP
_SIZE = SMALL SIZE = SMALL
(B) PATCHES DEPLETING / CLUMPED PATCH SIZE
SMALL LARGE
*0
HIGH GROUP GROUP
PATCH SIZE = LARGE SIZE = LARGE DENSITY
LOW GROUP GROUP SIZE = LARGE SIZE = LARGE
Fig. 1A,B Hypothesized associations between food states (distri- bution, patch size, and patch density) and group size. Two classes are considered: A uniformly distributed depleting patches and B clumped depleting patches. Within these classes each square repre- sents a different patch size - patch density combination, with circle sizes representing patch size. The predicted group size is indicated in the box. This figure represents extremes of the parameters, and should not be considered to represent all situa- tions an animal could experience. The important aspect is to visu- alize how the size, density, and distribution of patches could influ- ence travel costs and thereby constrain group size
items become rare within a tree, they become progres- sively harder to obtain, and thus a patch will be func- tionally depleted before all of the food items are eaten. From this perspective, patches can be considered deplet- ed when the rate of intake of food items drops to a level that would be equal to the average intake of the envi- ronment (Charnov 1976; Stephens and Krebs 1986). For depleting patches, patch size determines the amount of time that can be spent feeding in the patch by a group of a given size. A large group spends less time in a patch of a given size than a smaller group, because it depletes the patch faster. If animals travel between patches once they have depleted them, then the density and distribution of patches will determine the travel costs incurred.
Although it is reasonable to assume that the size, density, and distribution of food patches are not likely to have independent effects on travel costs, previous studies have tended to focus on a subset of these vari- ables. In this study, we consider how all three of these variables can interact to influence groups of different
sizes. To do so, we treat each tree as a patch, and assume that patch size, density, and distribution can each vary along a continuum from low to high (size and density) or uniform to clumped (distribution). However, if one considers these variables dichotomously, the conditions that animals could typically experience when exploiting depleting patches can be expressed diagramatically by the simple, general model expressed in Fig. IA and B.
1. Depleting, uniform - when food patches are uniform- ly distributed, regardless of their size, we expect density to be the key determinant of group size. When patches are dense, animals can congregate because the nature of their food resources does not impose increased travel costs that cannot easily be recovered (Fig. la). When such patches are rare, small groups are favored. Here individuals minimize travel costs by being in small groups that can feed in a single patch for long periods, since there are few mouths to feed, and patches are de- pleted slowly. Similarly, when depleting patches are uni- formly distributed, large, but rare, small groups will be advantageous. 2. Depleting, clumped - when large or small food patch- es are clumped and abundant, the distance to the next patch is small (Fig. lb), travel costs are low, and animals can therefore form large groups. At such times, any ad- ditional cost associated with being a member of a large group, such as the need to visit many patches, can be easily recovered. If food patches are clumped, scarce, and found in either large or small patches, animals will similarly not be constrained from being in large groups, unless they have to move between clumps which may impose high travel costs. 3. Non-depleting patches - non-depleting patches that meet all of the nutritional and energetic requirements of the animals are expected to permit large groups. Under these conditions, travel costs are minimally influenced by group size. Single non-depleting patches are rare, but have occasionally been reported. For example, one pop- ulation of Canis aureus, which is typically found in pairs, has been observed in a group of 25 members at a site where the group obtained 92% of its food from one provisioning site (MacDonald 1979). Some animal pop- ulations may have access to a non-depleting resource, but require a mixed diet. If the animals must forage away from a non-depleting patch to obtain a complete diet, we expect their group size, when away from that patch, to be determined by the nature of these sec- ondary resources.
We examine relationships between food resouirce variables and subgroup size using data from two field studies, each of 6 years: one of spider monkeys (Ateles geoffroyi) in Costa Rica and the second of chimpanzees (Pan troglodytes) in Uganda. Data are presented on forest composition, diet, and patch use, and used to evaluate assumptions and to provide a basis for testing the hypothesis that subgroup size changes as a function of the density and distribution of food resources. The fission-fusion social organization of these two species is
61
ideal for the examination of factors governing animal group size. In both species, adults spend their time in small subgroups that frequently change size and compo- sition (spider monkeys: Klein 1972; Chapman 1990a,b; chimpanzees: Goodall 1986). All the individuals in these subgroups are members of a single community. Thus, unlike most primate species, spider monkeys and chim- panzees do not form spatially cohesive social groups. Rather, each individual has the option of associating in subgroups of different size and/or composition (Chap- man and Lefebvre 1990). This flexibility in association pattern provides the natural variation in subgroup size necessary to examine how ecological factors influence subgroup size. Previous work has suggested that the size of the subgroups is influenced by ecological variables such as patch size (chimpanzees: White and Wrangham 1988; spider monkeys: Chapman 1990a,b; Symington 1988), patch density (Wrangham et al. 1992; spider mon- keys: Chapman 1990a,b), and the distribution of patch- es (spider monkeys Chapman 1990a,b). Here, we inte- grate previous results with new data so as to provide a comprehensive analysis examining how food patch size, density, and distribution, which are all factors suggested to determine a groups travel cost, constrain group size. We also examine whether males and females respond differently to changes in these ecological conditions.
Methods Study area: Santa Rosa National Park, Costa Rica
Spider monkeys were studied in Santa Rosa National Park, for 38 months, over a 6-year period (July and August 1983, January to August 1984, January to July 1985, February to August 1986, April 1987 to April 1988, and July and August 1989). Santa Rosa is located in the northwest corner of Costa Rica (100 50'N, 85? 39'W). Annual rainfall at the study site has averaged 1527 mm (range = 915-2440 mm/year, 1980-1987; D. Janzen personal communication). On average, 98% of the rain falls in the wet season from May to November (1980 to 1987, range = 96.2- 99.2%). During the dry season, the majority of the non-riparian trees in the successional areas lose their leaves. The vegetation of the park is a mosaic of grassland (Hyparrhenia rufa) and forest, in which trees such as Bursera simaruba (18.0% of 29 enumerated spider monkey food tree species ? 5 cm diameter at breast height, DBH), Luehea speciosa (17.2%), Spondias mombin (8.7%), Manilkara chicle (8.5%), and Cecropia peltata (6.6%) are common. The spider monkey community used three sections of forest with different histories of human use: an area of relatively pristine semi-evergreen forest, an area of old successional semi-deciduous forest partially cleared 75-100 years ago, and a younger succes- sional area of semi-deciduous forest partially cleared for fence posts 45 years ago.
,1.
Study area: Kibale National Park, Uganda
The Kibale National Park, located in western Uganda (00 13'-0? 41' N and 300 19'-30? 32' E) near the base of the Ruwenzori Mountains, is a moist, evergreen forest (Skorupa 1988). Of the 766 km2 park 60% is characterized by tall, closed-canopy, forest. The remainder of the area is comprised of a mosaic of swamp, grassland, plantations of pine, thicket, and colonizing forest (Bu- tynski 1990). The study site, Kanyawara, is situated at an eleva- tion of 1500 m. Mean annual rainfall (1987-1991) has averaged
1832 mm (range = 1607 mm-1952 mm). The chimpanzees of the Kanyawara area primarily used three areas characterized by dif- ferent histories of logging. The K30 forestry compartment is a relatively undisturbed and mature forest. The K14 compartment had approximately 5.1 stems/ha of 23 species removed between May and December of 1969. The K15 forest compartment was logged between September 1968 and April 1969, and a total of 7.4 stems/ha of 18 species were extracted (Skorupa 1988). In the study area, a system of approximately 166 km of trails provided access to an area of approximately 11 km2. Diospyros abyssinica (12.3% of 2111 enumerated trees, > 10 cm DBH), Markhamia platycalyx (11.8%), Celtis durandii (10.9%), Uvariopsis congensis (9.8%), and Bosqueia phoberos (8.7%) are common in the area.
Focal animal observations
Focal animal observations (10-min sessions) were made at both sites using identical methods. The subject chosen for observation was selected according to a fixed rotation between individuals and/or age/sex classes. Whenever the focal animal was feeding, the food item (e.g., ripe fruit, seed, young leaf) and plant species were recorded, and the size (DBH) of the tree was either measured or visually estimated (consistently done by one observer). The error in visually estimating DBH was 3.7% (n = 46). Feeding rate was estimated as the number of food items entering the mouth in a 60-s period when the focal animal was clearly in view. At Kibale, focal animal observations were made over 24 months (November - December 1989, March - December 1990, May - October 1991, May - October 1992; by CC and LC), producing a total of 229 h of observations. At Santa Rosa focal observations were made over 38 months (July - August 1983, January - August 1984, January - July 1985, February - August 1986, April 1987- April 1988, July - August 1989 by CC and LC) producing a total of 596 h.
Diet
To evaluate the applicability of the concepts being considered, an understanding of the nature of the diet is important. For example, the food resources used by these animals must be located in de- pletable patches and there must be month to month variability in the nature of what is available to be eaten. For both species, we report the percentage of the observed feeding time spent eating each type of food, but because these data may be biased, we in- clude additional sources. In particular, when chimpanzees were feeding on the ground, it was more difficult to collect feeding data than when the group was feeding in a large fruiting tree. Comple- menting this problem, chimpanzees were more easily discovered when eating tree fruits because they returned repeatedly to the same tree and often made loud calls there. To check that observa- tional biases did not distort our view of chimpanzee diet, we ana- lyzed dung samples. Each dung sample was weighed, and all of the seeds were separated. For large-seeded species (> 2 mm), we counted the exact number of seeds in the dung. For small seeds, abundance was ranked as rare, common, or abundant (calibration to actual counts presented in Wrangham et al. 1994). When possi- ble, the species identity of the seeds was determined. From this analysis, three food types were considered: fruits, as determined from discovering seeds and fruit remains in the dung; leaves, as indicated by green leaf fragments; and terrestrial piths, indicated by long fibrous strands (see Wrangham et al. 1991 for quantifica- tion of the fibrous food component of chimpanzee diet).
Subgroup composition
Subgroup composition is a difficult parameter to quantify accu- rately (Chapman et al. 1993). For spider monkeys, the composi- tion of the subgroup being followed was monitored continuously. With small groups, it was relatively easy to see all of the individu- als at one time, because they were rarely in more than one tree at
62
a time. However, as subgroup size increased it became difficult to document all departures and arrivals since the subgroup often spread out into a number of trees. Thus, when large subgroups were being followed, one observer stopped recording behavioural data, and would identify all individuals in the subgroup every half hour. Data on spider monkey subgroup size and composition were recorded during all field seasons.
For chimpanzees, the quantification of subgroup size can be- come difficult when large subgroups are on the ground in dense vegetation or are spread throughout a number of trees (Chapman et al. 1993). We therefore used three different methods to estimate subgroup size and membership. First, a scan was taken every 15 min of visible animals. Second, subgroup size and composition were recorded only when a change occurred (i.e., if a subgroup fed in a tree for 2 h, its size would have been recorded once, whereas in the previous method it would have been recorded eight times). Finally, subgroups were estimated as the number of individuals in the subgroup at the time of observation or in the hour preceding or subsequent to the observation. We refer to this last estimate as "acoustic" subgroup size, since individuals seen within 1 h of the census time were expected to be within calling range. We suggest that acoustic subgroup size is the most useful depiction of chim- panzee association patterns since calling is frequent in large sub- groups, and replies often indicate that other animals are in the area, but are out of sight of the observer. These individuals who are out of visual contact, but within auditory contact, frequently travel in a coordinated fashion between fruiting trees, often over a number of kilometers. Data on chimpanzee subgroup size were collected every month from December 1987 to September 1992 (data were collected by R.W, C.C., L.C. and field assistants; n = 55 months).
Ecological monitoring
Monitoring of the density and distribution of food resources was used to examine how variation in subgroup size related to tempo- ral changes in food resources. At Santa Rosa, three grids which consisted of 400 cells (10 m by 10 m) were built in each of the habitats used by the spider monkeys (total = 4.0 ha per grid). Corners of the cells were marked with individually labeled steel posts (Chapman and Chapman 1990). All spider monkey food trees (? 5 cm DBH) were monitored. Chimpanzees used a larger area than spider monkeys. Therefore, to increase the sampling effectiveness, 26 sampling transects were established throughout the trail system (logged n = 9, valley bottom n = 3, unlogged n = 14). Each transect was 200 m by 10 m, providing a total sam- pling area of 5.2 ha. Each tree 2 10 cm DBH within 5 m of each side of the trail was individually marked with a numbered alu- minum tag, and DBH was measured (n = 29 months).
At both sites, phenological information was recorded once a month (Santa Rosa: 26 of the months that observers were in the field; Kibale: 29 months, January 1990 to June 1992 continuous monthly monitoring). We documented the stage of leaf develop- ment (leaf bud, young leaves, mature leaves) and noted the pres- ence or absence of flowers and ripe fruits. Patch size was indexed by DBH (Leighton and Leighton 1982; Peters et al. 1988). To verify the validity of using DBH as an index of fruit production, we measured the DBH of a sample of fruiting trees species in Kibale. Subsequently, we collected and weighed all the fruits on these trees. For all species, DBH was positively correlated with fruit biomass (Chapman et al. 1992). The coefficient of dispersion (CD) (Sokal and Rohlf 1981) using the number of food trees on a transect or in a grid cell as the unit, was employed to quantify the pattern of tree distribution. The value of the CD is greater than 1 when the distribution pattern is clumped, less than 1 if the pattern is uniform, and equal to 1 if the pattern is random (Sokal and Rohlf 1981). For regressions of subgroup size with these ecological variables, food abundance (patch density and patch size) was in- dexed as the sum of the DBHs of the trees providing food in a given month, and the distribution of food resources was indexed as the CD using the transect or the cell as a unit.
Results
Food availability in the two forests
The density of the spider monkey food trees was the lowest in the young successional semi-deciduous forest (80.4/ha), highest in the older successional forest (154.8/ ha), and intermediate in the pristine semi-evergreen forest (140.3/ha; Appendix 1; a food tree was any species that was fed upon, regardless of the importance of that food item in their diet). In Kibale, the density of chim- panzee food trees was 59.4/ha in the logged forest and 145.6/ha in the unlogged forest (Appendix 2). Food tree density was therefore similar for the two species, albeit slightly lower for chimpanzees.
A second index of food abundance was calculated by weighting the density of food trees by the size (DBH) of the individual trees. This index assumes that regardless of tree species, fruit production of a tree will increase linearly with its size and that the slope of the increase is similar across species. Using this weighted index, less food was available in the young successional semi-de- ciduous forest of Santa Rosa (1925 cm DBH/ha), than either the older successional forest (3353 cm DBH/ha), or the pristine semi-evergreen forest (4010 cm DBH/ha). In Kibale, the density of food trees weighted by DBH was also higher in the unlogged forest (3822 cm DBH/ ha) than in the logged forest (1446 cm DBH/ha). Again, food tree abundance was similar for the two species, though slightly less for chimpanzees.
Although the number and size of the food trees used by these two species was similar, one must consider the biomass (kg/km2) of animals that the area is supporting. Such an analysis assumes that the two study areas have comparable biomasses of competitors. Considering the community composition (assuming an adolescent to be half the weight of an adult), the weight of males and females of each species, and the home range size of the two communities (chimpanzees: 14.9 km2, Chapman and Wrangham 1993; spider monkeys: 2.5 kM2, Chap- man l990a,b minimum area polygon), we calculated the biomass of chimpanzees in the study area to be 96 kg/ km2 and the biomass of spider monkeys to be 90 kg/ km2. This suggests that the biomass per unit area is also similar for the two species.
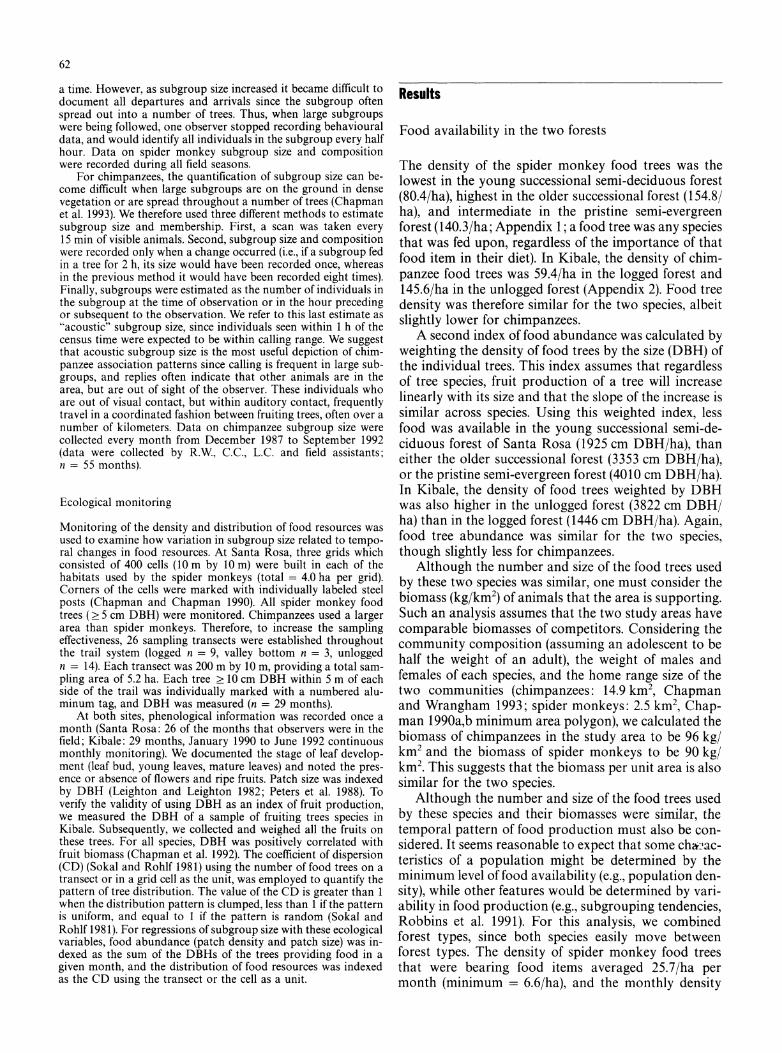
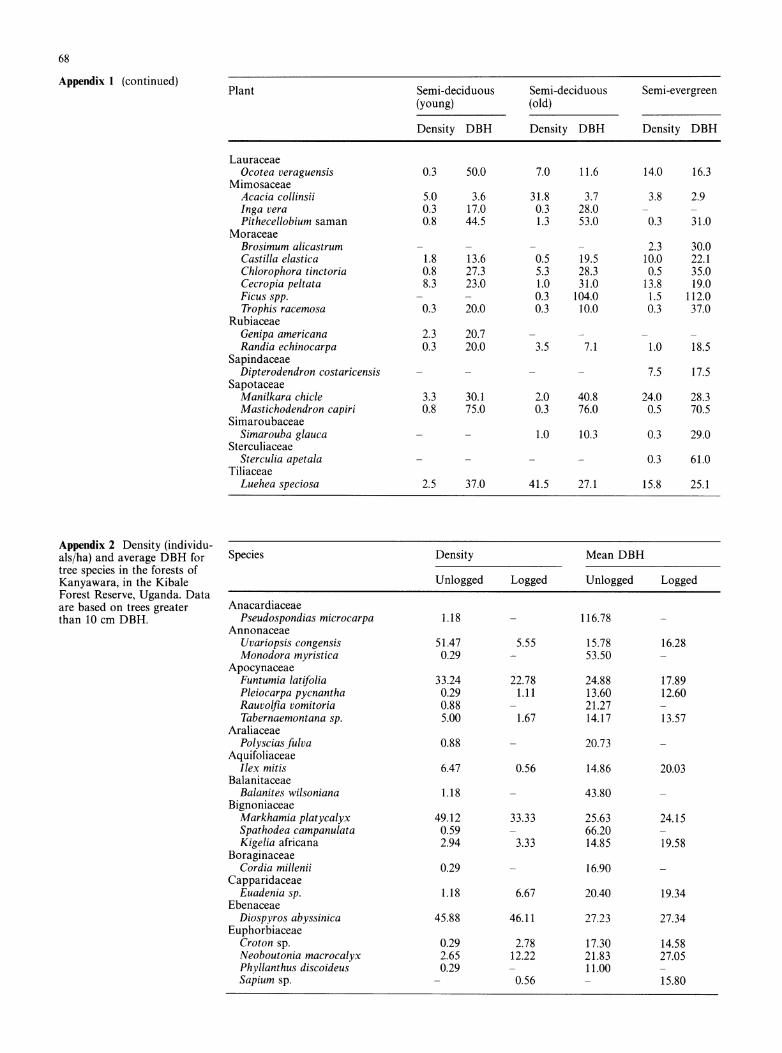
Although the number and size of the food trees used by these species and their biomasses were similar, the temporal pattern of food production must also be con- sidered. It seems reasonable to expect that some chac-ac- teristics of a population might be determined by the minimum level of food availability (e.g., population den- sity), while other features would be determined by vari- ability in food production (e.g., subgrouping tendencies, Robbins et al. 1991). For this analysis, we combined forest types, since both species easily move between forest types. The density of spider monkey food trees that were bearing food items averaged 25.7/ha per month (minimum = 6.6/ha), and the monthly density
63
Fig. 2 The average monthly 60 variation in the density of the _ food trees bearing food items 50 SPIDER MONKEYS (trees/ha) and the density of 4 - trees weighted by their size I 40 (diameter at breast height, DBH) for spider monkeys of U 30 -
Santa Rosa National Park, W CHIMPANZEES 1990 Costa Rica (April 1987 to 1_ 20 -
April 1988) and the chim- panzees of Kibale National 10 CHIMPANZEES 1991 Park, Uganda (Jan 1990 to A A
JAN FEB MAR APR MAY JUN JUL AUG SEP OCT NOV DEC
1000 SPIDER MONKEYS
800
600
0 \CHIMPANZEES 1990 E400 \/ /\
200 X.HIMPANZEES 1991
0 JAN FEB MAR APR MAY JUN JUL AUG SEP OCT NOV DEC
weighted by tree size averaged 665 cm DBH/ha (mini- mum = 248 cm DBH/ha). In contrast, the density of chimpanzee food trees available each month averaged 3.3/ha (for 1990 and 1991, minimum = 0.2/ha) or 114.2 cm DBH/ha (minimum 8 cm DBH/ha; Fig. 2). Thus, the density of food resources available at any one time was typically greater for spider monkeys than chimpanzees (Fig. 2). This suggests that individual fruit trees at Kibale generally fruit less frequently than do trees at Santa Rosa.
The month to month variability in the availability of tree food resources was greater for chimpanzees (CV in food-bearing trees/ha = 164%; CV in cm DBH/ ha = 99.5%) than spider monkeys (CV in food-bearing trees/ha = 54%; CV in cm DBH/ha = 43%, all months; Fig. 2). The peak of tree-fruit availability for the chimpanzees is sometimes caused by the syn- chronous fruiting of common tree species. For example, the peak in the number of chimpanzee food trees/ha in June and July of 1990 was a result of the synchronous fruiting of groves of Uvariopsis congensis which occurs at 51.5 stems (< 10 cm DBH) per hectare in the un- logged areas of Kibale. In summary, our data indicate that the tree-food resources used by the spider monkeys were more common and less temporally variable than thez of chimpanzees, and did not reach the low levels experienced by chimpanzees.
Diet and patch use
To examine patch depletion, diet type was first evaluat- ed. Spider monkeys spent 71.4% of their feeding time eating fruit. Flowers were eaten for 14.0% of the time, leaves were eaten for 12.5% (mature 2.7%, young 7.0%,
leaf buds 2.8), and insects for 2.1% (n = 3576, 10-min focal sessions). The five most important foods based on feeding time were Ficus spp. fruit (30.5%), Muntingia calabura fruit (11.9%), Mastichodendron capiri fruit (8.1%), Spondias mombin fruit (7.2%), and Manilkara chicle flowers (5.6%). There was considerable month-to- month variability in the use of the food categories. The percentage of time spent eating fruit in a month ranged from 13.7% to 100%, the percentage of time spent eat- ing leaves ranged from 0% to 86.3%, and the percentage of time devoted to eating insects ranged from 0% to 30.2% (Chapman 1987,1988).
Ripe tree-fruit also dominated the chimpanzee diet (80% of the diet; based on behavioural observations (CC/LC) over 24 months; n = 1374 10-min focal obser- vations). Terrestrial herbs accounted for 12% of their feeding time, and tree leaves for 8%. Similar results have been found in independently collected samples (Wrang- ham et al. 1991). Seeds occurred in 98.5% of the 1128 dung samples, confirming the heavy reliance on fruit suggested by behavioural observations. 77.3% of the samples had large seeds (> 2 mm). For seeds of this size, the number of seed species averaged 2.92 per sample (SD = 1.43, range 0-8). Fig seeds were found in 89.9% of the samples. Unlike spider monkeys, chimpanzees al- so ate foods from the ground. For example, seeds of Aframomum spp. were found in 42.9% of the samples. For 839 dung samples, we scored the fraction of herba- ceous piths. 93.8% of the samples had identifiable fi- brous strands, indicating frequent consumption of ground layer piths.
The mean DBH of the trees in which the chim- panzees fed was 75.1 cm (range = 15-200 cm, n = 146). In contrast, the mean size of trees spider monkeys fed in was 43.1 cm DBH (range = 7-185 cm, n = 147). The
64
time that a subgroup spent feeding in patch (% of the focal sessions recorded from a particular patch that in- volved feeding) was 88.5 min for chimpanzees and 13.5 min for spider monkeys. For spider monkeys, the average time spent moving from one food tree to anoth- er was 703 s (range = 5-3660 s, n = 172 movements). Less than 15% of these between patch movements were less than 1 min in duration, and 76% of these short travel bouts occurred when they were feeding on Muntingia calabura trees which grow in clumps. Com- parable information is not available for chimpanzees because we often arrived at a food tree well after the animals had started feeding.
Two lines of evidence suggest that both species tend to deplete the ripe fruit in a tree during a single feeding bout. For spider monkeys, the rate of intake of food items during a feeding bout in a single patch was 46% higher at the start of the bout than at the end (paired t-test t = 4.32, P <0.001; n = 147 trees of 19 species). It is possible that this decrease represents satiation, not patch depletion. However, such a drop in feeding rate in one tree would be followed by another feeding session in a different tree of the same species or in a series of trees. For example, spider monkeys often fed in four or five Sloanea terniflora trees in succession, and the average time spent moving between trees was only 13 min, too short for significant digestion and stomach emptying (Milton 1981). In each newly entered tree, the sub- group's feeding rate generally started high and subse- quently dropped. For example, in one episode when spi- der monkeys moved from one Sloanea terniflora to the next, their feeding rate started at 6.6 fruits/minute (n = 4 feeding rate observations) in the first tree, but was 3.9 when the group left. In the next tree the feeding rate started at 7.1, ended at 3.6; and was 5.8 when they entered a third tree but was only 4.2 when they stopped feeding. In addition, satiation is an unlikely explanation since feeding rates did not tend to drop in some tree species. This would not be expected if the animals were always satiated towards the end of feeding bouts. For example, the rate of intake of figs did not decrease (t = 0.39, P = 0.359, n = 17), but feeding rates did de- crease for Bursera simaruba (t = 11.0 P = 0.029, n = 23), Muntingia calabura (t = 9.00, P = 0.035, n = 17), and Dipterodendron costaricensis (t = 6.43, P = 0.012, n = 12). This suggests that spider monkeys may be depleting the fruits in some species of trees, but not in fig trees. For chimpanzees, the available evidence also suggests a drop in feeding rate (mean of the first three feeding rates contrasted to the last three feeding rates: Wilcoxon z = -1.82, P = 0.068, paired t-test t = 2.15, P = 0.068, n = 8 all non-fig trees).
There is an additional line of evidence suggesting that both species were depleting the available ripe fruit in a patch. If patches were depleted by exploitation, one would expect the time spent feeding in a patch to be a function of the size of the patch and the number of ani- mals using the patch. A multiple regression predicting the time animals spend feeding in a patch based on the
Table 1 The types of subgroups and their percentage of occur- rence for the spider monkeys of Santa Rosa and the chimpanzees of Kibale Forest
Chimpanzee Spider monkey
Solitary Male 2.0% 2.0% Female 0.7% 4.7% Subadult male 1.8% 0.5% Subadult female 0.1% 1.0%
Total 4.6% 8.2% All male 16.6% 2.3% All female without young 0.1% 1.8% Mixed sex with young 40.3% 13.7% Mixed sex without young 10.4% 0.8% One female with infant 18.3% 27.1% > I Female with infants 5.4% 46.0% Remaining 4.3% 0.1%
number of individuals feeding and the size of the patch (DBH) was significant for both spider monkeys (r2 = 0.421, P<0.001) and chimpanzees (r2 = 0.657, P<0.0001). In summary, both species tended to eat from discrete depleting fruit patches.
Subgroup composition
Spider monkeys and chimpanzees differed with respect to the frequency of occurrence of different types of sub- groups (Table 1). For example, sightings that involved mixed-sex subgroups, with or without young, occurred more frequently in chimpanzees than in spider mon- keys. In contrast, the percentage of the observations in- volving all male subgroups was less for spider monkeys than chimpanzees. Both of these findings are, at least partially, a result of the difference in adult sex ratios between the two study communities (chimpanzees, 1 male to 1.9 females; spider monkeys, 1 male to 4.5 fe- males). In addition, however, the costs and benefits of group membership may vary for different age and sex classes.
Ecological factors influencing subgroup size
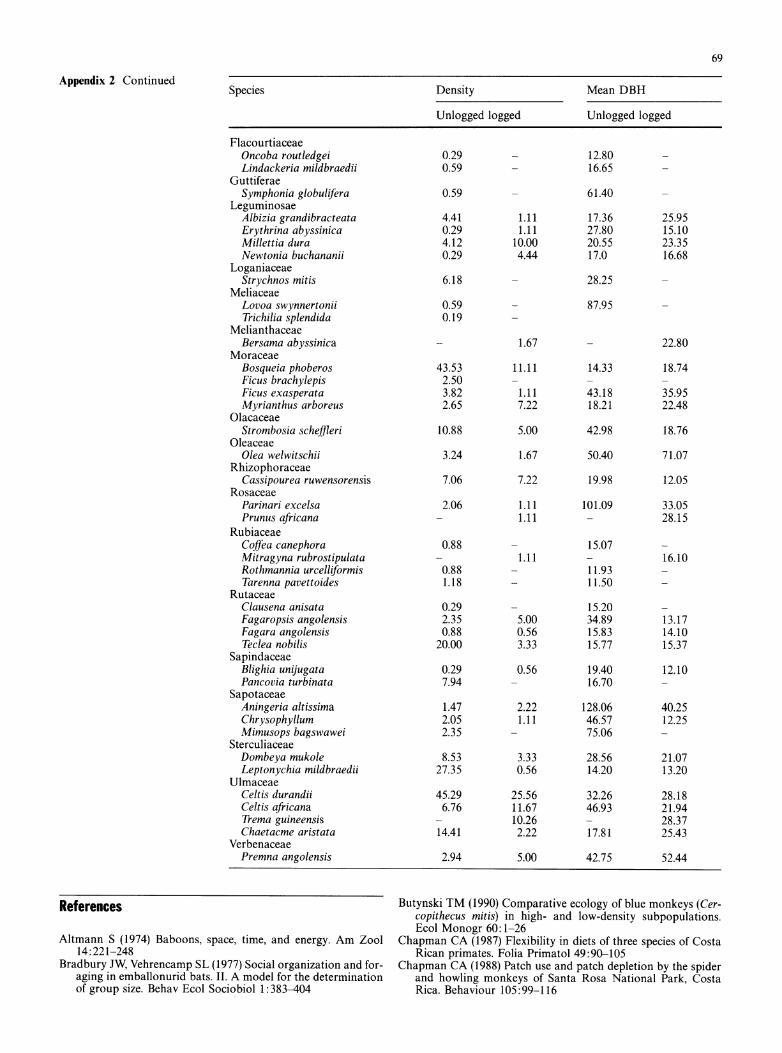
Spider monkey subgroup size (adult and adolescent) ranged from 1 to 35 individuals, with a mean of 4.94 individuals (SD = 4.18, mode = 3, n = 1018, Fig. 3a). Mean subgroup size varied between the monthly sam- pling periods from 2.3 to 14.4 individuals (n =,26 months). For chimpanzees, the mean subgroup size in each 15-min scan was 5.07. Using the second method (subgroup size recorded when a change in membership occurred), mean subgroup size was 5.11. Finally, repre- senting subgroup size as the acoustic subgroup, mean subgroup size was 7.13 (Fig. 3b). Again, there was con- siderable variability in the mean monthly subgroup size (all 15 min scans 1.48-14.92; all unique subgroups 1.22- 12.26; acoustic subgroups 1.5-14.06, n = 55 months).
65
25
cn SPIDER MONKEYS 0 20 -
15 0
0
>15 -
cZ
0
X 10 _
0 LL. 05
5
0 2 4 6 8 10 12 14 16 18 20 22 24 26 28 30 32 34
SUBGROUP SIZE
Fig. 3 The frequency histogram of the size of the spider monkey subgroups (above) seen in Santa Rosa National Park, Costa Rica and the chimpanzee subgroups (below) observed in Kibale Na- tional Park, Uganda
For both species, we predicted that this variability in subgroup size would relate to changes in the density and distribution of the food resources. Accordingly, we ex- amined the relationship between mean monthly sub- group size and the weighted density (sum of the DBH of food trees, representing the size and density of food trees) and the distribution of food resources calculated from the ecological monitoring. For spider monkeys, 5000O of the variance in subgroup size was explained in a multiple regression of subgroup size on the density of food resources and the distribution of these patches
(= 0.503, p= 0.0037, ii 26 months; Y-~0.29 log distribution of food resources + 0.45 log density of food resources -0.24). For chimpanzees, subgroup size was also related to the density and distribution of their food resources, but less strongly (r^2 =0.215, P =0.04 n = 29 months; Y = 1.85 log density of food resources + 0.01 log distribution of food resources -1.3 3).
Partial correlation analyses were used to determine the relationships between each of the two independent variables and group size when the linear effects of the other variable were removed. For spider monkeys, the density of food resources was positively correlated with group size, when the effects of food distribution were
removed (partial r = 0.67, P = 0.002). However, the distribution of food resources showed no significant correlation with group size when the effects of density were removed (partial r = 0.28, P = 0.26). For chim- panzees, neither food density (partial r = 0.16, P = 0.43) nor distribution (partial r 0.21, P = 0.29) were significant in partial correlation analyses, suggest- ing that both variables predict the same variance. It is likely that both the density and distribution of food re- sources contributed to the monthly variation in sub- group size for chimpanzees.
Variance in subgroup size that is not accounted for by the density and distribution of food resources may be the result of individuals of different age or sex classes being differentially affected by ecological constraints. For both species, as the number of males found in a subgroup increased, so did the number of females (chim- panzees r = 0.383, P<0.0001, spider monkeys r 0.185, P<0.0001). If both sexes had similar tenden- cies to be members of subgroups, one would expect the slope of the relationship between the number of males and the number of females in a subgroup to equal the sex ratio of the community. This was not the case for either species. The number of spider monkey females in a subgroup increased faster than expected based on the community sex ratio (t = 10.93, P < 0.0001). In contrast, the number of female chimpanzees increased at a rate that was lower than expected based on the community composition (t = 4.06, P<0.0001), suggesting that fe- male chimpanzees had a lower tendency to join groups than males.
We used two periods when chimpanzees were feeding almost exclusively on one species of fruiting tree to ex- amine in more detail how food density and distribution affects sex classes. During March and April of 1991, the chimpanzees were primarily feeding on Mimusops bagshawei fruits (66% of their feeding time in those months), while between July and early September of 1991, they were feeding primarily on Pseudospondias mi- crocarpa fruits (890 o of the feeding time in those months). During these periods, a change in the density of food resources was indexed as change in the number of fruiting trees and the amount of ripe fruit on the trees (visually ranked on a 0-4 scale). Travel costs were in- dexed by the number of trees that had any ripe fruit, which should reflect changes in the distance that an an- imal would have to travel between trees. These parame- ters changed slowly over the fruiting cycle and were measured once every 2 weeks (producing a total of eight sample periods). The mean bi-weekly subgroup size dur- ing these two periods was 4.61, but varied between weeks from 3.0 to 6.7 members. The average size of chimpanzee subgroups at these times was related to the density of food and to travel costs. In a multiple regres- sion, 77%0 of the variance in subgroup size could be explained by changes in these two variables (r2 = 0.769, P = 0.026; n = 8, Y= 0.313 log travel costs + 0.778 log food density - 2.85). The number of adult male chim- panzees in a subgroup was a function of food density
66
and travel costs (r2 = 0.854, P = 0.008; n = 8, Y = 0.235 log travel costs + 0.695 log food density - 2.60). The number of adolescent males was weakly relat- ed to these variables (r2 = 0.588, P = 0.109; n = 8, Y= 0.147 log travel costs + 0.391 log food density - 1.38). However, the number of adult females in a sub- group could not be predicted from a multiple regression of food density and travel costs (r2 = 0.038, P = 0.909; n = 8, Y = 0.009 log travel costs - 0.108 log food densi- ty + 0.79).
Previous studies have reported significant relation- ships between the size of animal groups and the size of the feeding tree (e.g., Leighton and Leighton 1982; Strier 1989). Although the number of animals feeding in a tree is obviously limited by the physical space provided by the tree, the concepts presented in the introduction do not necessitate that large trees permit large groups. In fact, we found that there was no relationship between the size of the M. bagshawei tree (DBH) and the average number of animals feeding in that tree on a given day (r = 0.139, P = 0.212, n = 82). On many occasions a relationship may exist between the size of the trees in which animals feed and habitat-wide food availability, because large trees of a given species are relatively com- mon and fruit synchronously. In this situation habitat- wide levels of food abundance will be high permitting the formation of large groups. However, the model pre- sented illustrates situations where large patches will cor- respond to large groups (e.g., clumped large patches), and situations (e.g., widely spaced large patches), where they will not.
Discussion
Identifying ecological factors underlying the social or- ganization of animals has been a central theme in be- havioural ecological studies. As a result, interspecific and intraspecific comparisons have become increasingly important for the development of hypotheses relating ecology and behaviour (Struhsaker and Leland 1979; Struhsaker 1980; Butynski 1990). The detailed be- havioural observations feasible for a variety of primate species have enabled researchers to quantify rigorously behavioural parameters under natural conditions. However, the comparative analyses required to test the generality of hypotheses relating ecology and behaviour have been limited by the lack of standardized methods and by relying on information from studies that differ in duration, precision, and detail (Struhsaker and Leland 1979). One successful approach at standardization for cross-species comparisons has been to study a number of species inhabiting the same study site (Struhsaker and Leland 1979; Terborgh 1983). However, the generality of the results from such studies is limited by the fact that species inhabiting the same region tend to be of the same phylogenetic lineage or are species occupying dif- ferent ecological niches.
Spider monkeys and chimpanzees have long been recognized to be similar in their social organization and dietary niche (Klein and Klein 1977; Wrangham 1977;
Fedigan and Baxter 1984; Symington 1990). Yet these taxa are almost as distantly related as is possible for two anthropoid primates. These two species therefore offer a unique opportunity to examine how ecological factors influence animal social organization in a comparative setting with minimal phylogenetic complication. We have demonstrated that both species rely on ripe fruit from trees that can be depleted through their feeding activity. The fact that patches are depleted by the ani- mal's foraging activity suggests that the addition of an extra animal to a subgroup will result in added competi- tion for food and higher travel costs. In addition, there exists month-to-month variability in the resource base that could affect the costs and benefits of grouping.
Competition for food is viewed as an unavoidable consequence of group living in animals (Janson and van Schaik 1988) and has been illustrated in some case stud- ies to have clear fitness effects, including increased mor- tality (Dittus 1979) and lower female reproductive rates (Whitten 1983). We have demonstrated the potential ef- fects of intraspecific competition on group size by quan- tifying the relationship between variation in the density and distribution of food resources and subgroup size for spider monkeys and chimpanzees. Following the logic presented in the Introduction we have documented that when access to food resources required long travel dis- tances between patches, spider monkeys and chim- panzees tended to be found in small subgroups. This fits our theoretical framework in that small subgroup size at these times decreases the rate at which patches are de- pleted, minimizing travel costs. When food resources were of the size, density, and distribution that permitted low travel costs, even when they were in a big group, our observations demonstrated that the average subgroup size increased. Thus, the results obtained from this com- parative field study suggest that group size is a function of travel costs that can be indexed by the size, density, and distribution of food resources.
Spider monkeys and chimpanzees differed in the way the density and distribution of food resources accounted for variation in group size. For spider monkeys, the den- sity, but not the distribution of food correlated with group size. For chimpanzees, it is likely that both distri- bution and density contributed to variation in group size. These differences may relate to the overall availability of food resources for the two species. In gen- eral, the density of food for the spider monkeys was higher than for the chimpanzees. It is likely that under conditions of high food densities, distribution may be less significant, since travel distance between patsches will be short. Spider monkeys were often observed to trapline between several close food patches over the day where they would seldom encounter a second subgroup. Chimpanzees were also observed to move readily be- tween patches over the day, but inter-patch distances were generally farther, and other subgroups were often encountered as different patches were visited.
Many of the differences in the response of the two species to their food resources and subgroup member- ship may relate to differences in their reproductive strategies. The most notable differences between chim-
67
panzees and spider monkeys relate to mating patterns and the willingness of females to be members of sub- groups. Chimpanzee females exhibit large estrus swellings, often mate with a large proportion of the males in the community (Tutin 1979), are vocal during mating (Hauser 1990), and change their ranging and association patterns when in estrus to travel with males and join large subgroups (Wrangham and Smuts 1980). In the spider monkey, copulations tend to be secretive (Klein 1971), and there are no visual cues to receptivity (Eisenberg 1973; Klein 1971). Such differences may re- late to the male's ability to assure paternity. Spider monkey males can find females more easily than chim- panzee males for the following reasons: Spider monkeys have smaller home ranges, travel a greater proportion of their home range daily, use sleeping sites with fixed loca- tions (Chapman et al. 1989), and females appear to be more willing to be a member of a subgroup than chim- panzee females.
The second difference between these species is that female chimpanzees are more solitary than female spi- der monkeys. There are several lines of evidence to sug- gest that chimpanzee females tend to travel indepen- dently even when ecological conditions would accom- modate large subgroups without imposing a significant cost. The slope of the line between the number of spider monkey males and the number of females in a subgroup increased at a rate that was higher than the rate expect- ed based on the community sex ratio. For chimpanzees, this rate was lower than expected, indicating that female chimpanzees are underrepresented in subgroups based on the proportion of the community they comprise. Further, during M. bagshawei and P. microcarpa fruiting seasons, the number of females in a subgroup could not be predicted from the density and distribution of these foods, whereas male numbers could. Finally, female chimpanzees do not give food calls. For spider monkeys, not only do both sexes produce a food call (Klein and
Klein 1977; calling increases the likelihood of being joined, Chapman and Lefebvre 1990), females call at a rate 2.5 times that of males (Fedigan and Baxter 1984). For chimpanzees, only males give pant-hoots upon ar- rival at food sources (Wrangham 1977; Ghiglieri 1984; but see Clark and Wrangham 1993, which shows that food arrival pant-hoots do not always increase the probability of being joined). The nature of the coalition in these two species may influence the benefits of sub- group membership for a female. Evidence suggests that, unlike East African chimpanzees, spider monkey fe- males form coalitions which often operate to allow the members of the coalition exclusive access to a food re- source (Klein 1974; Rondinelli and Klein 1976).
For confident development of models of ecological influences on social organization, models first need to account for grouping patterns. Examination of the ef- fects of patch size, density, and distribution for each sex can clarify sex differences in grouping. Our data suggest that ecological variables are critical factors influencing subgroup size in these two species, although for female chimpanzees social factors may strongly interact with ecological parameters to produce the observed patterns.
Acknowledgements Funding for the research was provided by NSERC (Canada) Post-Doctorate and Post-Graduate Scholar- ships, a Province of Alberta Scholarship, a University of Alberta Dissertation Fellowship, National Geographic Grants, NSERC operating grants to L. Fedigan, D. Kramer, and L. Lefebvre, USAID Grants, and a NSF Grant. We are grateful to Linda Fedi- gan and Ken Glander for making it possible to dart and individu- ally collar the spider monkeys. Assistance with the field work in Uganda was given by J. Byarahunga, T. Lawrence, P. Tuhairwe, J. Basigara, K. Clement, C. Katongole, and C. Muruuli. We thank Linda Fedigan for the encouragement to design a comparative study. A. Clark, P. Novelli, M. Hauser, J. Obua, and G. Etot provided assistance in early stages of this study. Finally we would like to thank J. Addicott, L. Fedigan, L. Gardner, J. Gittlemann, B. Grieser, D. Janzen, A. Johns, L. Lefebvre, J. Murie, M. Pagel, A. Treves, and P. Waser for comments on parts or all of this manuscript.
Appendix 1 The density and size of 29 Plant Semi-deciduous Semi-deciduous Semi-evergreen species of trees studied in San- (young) (old) ta Rosa National Park, Costa Rica (density number of trees/ Density DBH Density DBH Density DBH ha; DBH average diameter at breast height, cm). Anacardiaceae
Spondias mombin 31.0 25.1 18.8 38.1 8.5 24.7 S. purpurea 1.0 24.3 1.0 10.0 - -
Araliaceae Sciadodendron excelsum 1.3 38.0 0.3 64.0 0.5 45.0
Burseraceae Bursera simaruba 19.3 20.5 35.3 20.4 8.0 22.3
Caesalpinaceae Swartzia cubensis - - - - 0.3 73.0
Chrysobalanaceae Licania arborea 0.5 31.5 3.0 38.0 0.5 61.5
Elaeocarpaceae Muntingia calabura - - 0.3 27.0 0.8 15.3 Sloanea terniflora 0.5 79.3 - - 6.5 36.2
Fagaceae Quercus oleoides - - - - 16.5 57.3
Flacourtiaceae Zuelania guidonia - - - - 2.3 27.6
Guttiferae Rheedia edulis - - - - 0.5 10.8
68
Appendix 1 (continued) Plant Semi-deciduous Semi-deciduous Semi-evergreen
(young) (old)
Density DBH Density DBH Density DBH
Lauraceae Ocotea veraguensis 0.3 50.0 7.0 11.6 14.0 16.3
Mimosaceae Acacia collinsii 5.0 3.6 31.8 3.7 3.8 2.9 Inga vera 0.3 17.0 0.3 28.0 - - Pithecellobium saman 0.8 44.5 1.3 53.0 0.3 31.0
Moraceae Brosimum alicastrum - - - - 2.3 30.0 Castilla elastica 1.8 13.6 0.5 19.5 10.0 22.1 Chlorophora tinctoria 0.8 27.3 5.3 28.3 0.5 35.0 Cecropia peltata 8.3 23.0 1.0 31.0 13.8 19.0 Ficus spp. - - 0.3 104.0 1.5 112.0 Trophis racemosa 0.3 20.0 0.3 10.0 0.3 37.0
Rubiaceae Genipa americana 2.3 20.7 - -
Randia echinocarpa 0.3 20.0 3.5 7.1 1.0 18.5 Sapindaceae
Dipterodendron costaricensis - - - - 7.5 17.5 Sapotaceae
Manilkara chicle 3.3 30.1 2.0 40.8 24.0 28.3 Mastichodendron capiri 0.8 75.0 0.3 76.0 0.5 70.5
Simaroubaceae Simarouba glauca - - 1.0 10.3 0.3 29.0
Sterculiaceae Sterculia apetala - - - - 0.3 61.0
Tiliaceae Luehea speciosa 2.5 37.0 41.5 27.1 15.8 25.1
Appendix 2 Density (individu- als/ha) and average DBH for Species Density Mean DBH tree species in the forests of Kanyawara, in the Kibale Unlogged Logged Unlogged Logged Forest Reserve, Uganda. Data are based on trees greater Anacardiaceae than 10 cm DBH. Pseudospondias microcarpa 1.18 - 116.78
Annonaceae Uvariopsis congensis 51.47 5.55 15.78 16.28 Monodora myristica 0.29 - 53.50 -
Apocynaceae Funtumia latifolia 33.24 22.78 24.88 17.89 Pleiocarpa pycnantha 0.29 1.11 13.60 12.60 Rauvolfia vomitoria 0.88 - 21.27 -
Tabernaemontana sp. 5.00 1.67 14.17 13.57 Araliaceae
Polyscias fulva 0.88 - 20.73 -
Aquifoliaceae Ilex mitis 6.47 0.56 14.86 20.03
Balanitaceae Balanites wilsoniana 1.18 - 43.80 -
Bignoniaceae Markhamia platycalyx 49.12 33.33 25.63 24.15 Spathodea campanulata 0.59 - 66.20 -
Kigelia africana 2.94 3.33 14.85 19.58 Boraginaceae
Cordia millenii 0.29 - 16.90 -
Capparidaceae Euadenia sp. 1.18 6.67 20.40 19.34
Ebenaceae Diospyros abyssinica 45.88 46.11 27.23 27.34
Euphorbiaceae Croton sp. 0.29 2.78 17.30 14.58 Neoboutonia macrocalyx 2.65 12.22 21.83 27.05 Phyllanthus discoideus 0.29 - 11.00- Sapium sp. - 0.56 - 15.80
69
Appendix 2 Continued Species Density Mean DBH
Unlogged logged Unlogged logged
Flacourtiaceae Oncoba routledgei 0.29 - 12.80 Lindackeria mildbraedii 0.59 - 16.65
Guttiferae Symphonia globulifera 0.59 - 61.40 -
Leguminosae Albizia grandibracteata 4.41 1.11 17.36 25.95 Erythrina abyssinica 0.29 1.11 27.80 15.10 Millettia dura 4.12 10.00 20.55 23.35 Newtonia buchananii 0.29 4.44 17.0 16.68
Loganiaceae Strychnos mitis 6.18 - 28.25 -
Meliaceae Lovoa swynnertonii 0.59 - 87.95 -
Trichilia splendida 0.19 Melianthaceae
Bersama abyssinica - 1.67 - 22.80 Moraceae
Bosqueia phoberos 43.53 11.11 14.33 18.74 Ficus brachylepis 2.50 - - - Ficus exasperata 3.82 1.11 43.18 35.95 Myrianthus arboreus 2.65 7.22 18.21 22.48
Olacaceae Strombosia scheffleri 10.88 5.00 42.98 18.76
Oleaceae Olea welwitschii 3.24 1.67 50.40 71.07
Rhizophoraceae Cassipourea ruwensorensis 7.06 7.22 19.98 12.05
Rosaceae Parinari excelsa 2.06 1.11 101.09 33.05 Prunus africana - 1.11 - 28.15
Rubiaceae Coffea canephora 0.88 - 15.07 -
Mitragyna rubrostipulata - 1.11 - 16.10 Rothmannia urcelliformis 0.88 - 11.93 -
Tarenna pavettoides 1.18 - 11.50 Rutaceae
Clausena anisata 0.29 - 15.20 -
Fagaropsis angolensis 2.35 5.00 34.89 13.17 Fagara angolensis 0.88 0.56 15.83 14.10 Teclea nobilis 20.00 3.33 15.77 15.37
Sapindaceae Blighia unijugata 0.29 0.56 19.40 12.10 Pancovia turbinata 7.94 - 16.70 -
Sapotaceae Aningeria altissima 1.47 2.22 128.06 40.25 Chrysophyllum 2.05 1.11 46.57 12.25 Mimusops bagswawei 2.35 - 75.06 -
Sterculiaceae Dombeya mukole 8.53 3.33 28.56 21.07 Leptonychia mildbraedii 27.35 0.56 14.20 13.20
Ulmaceae Celtis durandii 45.29 25.56 32.26 28.18 Celtis africana 6.76 11.67 46.93 21.94 Trema guineensis - 10.26 - 28.37 Chaetacme aristata 14.41 2.22 17.81 25.43
Verbenaceae Premna angolensis 2.94 5.00 42.75 52.44
References
Altmann S (1974) Baboons, space, time, and energy. Am Zool 14:221-248
Bradbury JW, Vehrencamp SL (1977) Social organization and for- aging in emballonurid bats. II. A model for the determination of group size. Behav Ecol Sociobiol 1: 383-404
Butynski TM (1990) Comparative ecology of blue monkeys (Cer- copithecus mitis) in high- and low-density subpopulations. Ecol Monogr 60:1-26
Chapman CA (1987) Flexibility in diets of three species of Costa Rican primates. Folia Primatol 49:90-105
Chapman CA (1988) Patch use and patch depletion by the spider and howling monkeys of Santa Rosa National Park, Costa Rica. Behaviour 105:99-116
70
Chapman CA (1990a) Association patterns of spider monkeys: The influence of ecology and sex on social organization. Behav Ecol Sociobiol 26:409-414
Chapman CA (1990b) Ecological constraints on group size in three species of neotropical primates. Folia Primatol 55:1-9
Chapman CA, Chapman LJ (1990) Density and growth rate of some tropical dry forest trees: Comparisons between succes- sional forest types. Bull Torrey Bot Club 117:226-231
Chapman CA, Lefebvre L (1990) Manipulating foraging group size: Spider monkey food calls at fruiting trees. Anim Behav 39:891-896
Chapman CA, Wrangham RW (1993) Range use of the forest chimpanzees of Kibale: Implications for the evolution of chim- panzee social organization. Am J Primatol 31:263-273
Chapman CA, Chapman LJ, McLaughlin RL (1989) Multiple central place foraging by spider monkeys: travel consequences of usinlg many sleeping sites. Oecologia 79:506-511
Chapmani CA, Chapman LJ, Wrangham RW, Hunt K, Gebo D, Gardner L (1992) Estimators of fruit abundance of tropical trees. Biotropica 24:527-531
Chapman CA, White FJ, Wrangham RW (1993) Defining sub- group size in fission-fusion societies. Folia Primatol 61:31-34
Charnov EL (1976) Optimal foraging: the marginal value theo- rem. Theor Popul Biol 9:129-136
Clark A, Wrangham R (1993) Acoustic analysis of wild chim- panzee pant hoots: do Kibale forest chimpanzees have an acoustically distinct food arrival pant hoot? Am J Primatol 31:99-109
Clutton-Brock TH, Harvey PH (1977). Primate ecology and social organization. J Zool 183:1-39
Dittus W (1979) The evolution of behaviour regulating density and age-specific sex ratios in a primate population. Behaviour 69:265-302
Eisenberg JF (1973) Reproduction in two species of spider mon- keys Ateles fusciceps and Ateles geoffroyi. J Mammal 54:955- 957
Fedigan LM, Baxter MJ (1984) Sex differences and social organi- zation in free-ranging spider monkeys (Ateles geoffroyi). Pri- mates 25:279-294
Ghiglieri MP (1984) The chimpanzee of Kibale Forest. Columbia University Press, New York
Goodall J (1986) The chimpanzees of Gombe. Harvard University Press, Cambridge
Hauser MD (1990) Do chimpanzee copulatory calls incite male- male competition? Anim Behav 39:596-597
Janson CH, Schaik CP van (1988) Recognizing the many faces of primate food competition: Methods. Behaviour 105:165-186
Klein LL (1971) Observations on copulation and seasonal repro- duction of two species of spider monkeys, Ateles belzebuth and A. geoqffroyi. Folia Primatol 15:233-248
Klein LL (1972) The ecology and social organization of spider monkeys Ateles belzebuth. Ph.D. Dissertation, University of California, Berkeley
Klein LL (1974) Agonistic behaviour in neotropical primates. In: Holloway L (ed) Primate aggression, territoriality, and xeno- phobia. Academic Press, New York, pp 77-122
Klein LL, Klein DB (1977) Feeding behaviour of the Columbian spider monkey, Ateles belzebuth. In: Clutton-Brock TH (ed) Primate ecology. Academic Press, London, pp 153-181
Leighton M, Leighton DR (1982) The relationship of size and feeding aggregate to size of food patch: Howler monkeys (Alouatta palliata) feeding in Tr ichilia cipo fruit trees on Barro Colorado Island. Biotropica 14:81-90
MacDonald DW (1979) The flexible social system of the golden jackal, Canis aureus. Behav Ecol Sociobiol 5:17-38
Milton K (1981) Food choice and digestive strategies of two sym- patric primate species. Am Nat 117:496-505
Milton K (1984) Habitat, diet, and activity patterns of free-rang- ing wooly spider monkeys (Brachyteles arachnoides E. Geof- froyi 1806). Int J Primatol 5:491-514
Peters R, Cloutier S, Dube D, Evans A, Hastings P, Kohn D, Sawer-Foner B (1988) The ecology of the weight of fruit on trees and shrubs in Barbados. Oecologia 74:612-616
Robbins D, Chapman CA, Wrangham RW (1991) Group size and stability: Why do gibbons and spider monkeys differ? Pri- mates 32:301-305
Rondinelli R, Klein LL (1 976) An analysis of adult social spacing tendencies and related social interactions in a colony of spider monkeys (Ate/e.s geoffroyi) at the San Francisco Zoo. Folia Primatol 25:122-142
Skorupa J (1988) The effect of selective timber harvesting on rain- forest primates in Kibale Forest, Uganda. Ph.D. Dissertation, University of California, Davis
Sokal R, Rohlf F (1981) Biometry. Freeman, San Francisco Stephens DW, Krebs JR (1986) Foraging theory. Princeton Uni-
versity Press, Princeton Strier KB (1989) Effects of patch size on feeding associations in
muriquis (Brachyteles arachnioides). Folia Primatol 52:70-77 Struhsaker TT (1980) Comparison of the behaviour and ecology
of red colobus and redtail monkeys in the Kibale Forest, Uganda. Afr J Ecol 18:33-51
Struhsaker TT, Leland L (1979) Socioecology of five sympatric monkey species in the Kibale Forest, Uganda. Adv Study Be- hav 9:159-227
Symington M (1988) Demography, ranging patterns, and activity budgets of black spider monkeys (Ateles paniscus chamnek) in the Manu National Park, Peru. Am J Primatol 15:45-67
Symington M (1990) Fission-fusion social organization in Ateles and Pan1. Int J Primatol 11:47-61
Terborgh J (1983) Five new world primates. Princeton University Press, Princeton
Terborgh J, Janson CH (1986) The socioecology of primate groups. Annu Rev Ecol Syst 17:111-135
Tutin CEG (1979) Mating patterns and reproductive strategies in a community of wild chimpanzees (Pan troglodytes schweini- furthii). Behav Ecol Sociobiol 6:29-38
White FJ, Wrangham RW (1988) Feeding competition and patch size in the chimpanzee species Pani paniscus and Pan t0oglodytes. Behaviour 105:148-164
Whitten PL (1983) Diet and dominance among female vervet monkeys (Cer-copithecus aethiops). Am J Primatol 5:139-159
Wrangham RW (1977) Feeding behaviour of chimpanzees in Gombe National Park, Tanzania. In: Clutton-Brock TH (ed) Primate ecology. Academic Press, London, pp 504-538
Wrangham RW, Smuts BB (1980) Sex differences in the be- havioural ecology of chimpanzees in the Gombe National Park, Tanzania. J Reprod Fert 28:13-31
Wrangham RW, Conklin NL, Chapman CA, Hunt KD (1991) The significance of fibrous foods for Kibale Forest chimpanzees. Phil Trans R Soc London 334:171-178
Wrangham RW, Clark AP, Isabirye-Basuta G (1992) Female so- cial relationships and social organization of Kibale Forest Chimpanzees. In: Nishida T, McGrew WC, Marler P, Pickford M, Waal F de (eds) Human origins. Tokyo University Press, Tokyo, pp 81-98
Wrangham RW, Gittleman JL, Chapman CA (1993) Constraints on group size in primates and carnivores: population density and day-range as assays of exploitation competition. Behav Ecol Sociobiol 32:199-210
Wrangham RW, Chapman CA, Chapman LJ (1994) Seed disper- sal by forest chimpanzees. J Trop Ecol 10:355-368
Communicated by M.A. Elgar