70-6861 reed, james frederick,1925 - ohiolink etd center
TRANSCRIPT
This dissertation has been 70-6861microfilmed exactly as received
REED, James Frederick,1925- DETERMINATION OF THE COMPLEXITY CONSTANTS OF TRANSITION METAL HALIDES AND POLYPHOSPHATES.
The Ohio State University, Ph.D., 1969 Chemistry, analytical
University Microfilms, Inc., Ann Arbor, Michigan
DETERMINATION OF THE COMPLEXITY CONSTANTS OF
TRANSITION METAL HALIDES AND POLYPHOSPHATES>
DISSERTATION
Presented in Partial Fulfillment of the Requirements for the Degree Doctor of Philosophy in the Graduate
School of The Ohio State University
By
James Frederick Reed, B.S., M.A.
* * * * *
The Ohio State University 1969
Approved by
ACKNOWLEDGMENTS
To all who have helped make this work possible, I especially wish to thank the following:
My preceptor, Dr. James I. Watters, who was always ready with helpful suggestions as my work continued at The Ohio State University;
the National Science Foundation which gave me the opportunity to study and review chemistry before I returned to graduate school;
Dr. Richard Wynne, of Westinghouse Electric Corporation, who inspired me to continue in the field of analytical chemistry;
Dr. Walter A. Kearney, of the McKeesport Campus, Pennsylvania State University, who gave me the chance to enter the academic field and encouraged me to return to graduate school;
Mrs. Laura Beach, who drew most of the figures and graphs;
Mrs. June Reed, my wife, who typed most of this report.
ii
UVITA
Birth:
Education:
Industrialand
TeachingExperience:
March 3, 1925, New Castle, Pennsylvania
High School, Kingwood, West Virginia, 1942
Westminster College, New Wilmington, Pennsylvania B.C. in Chemistry, 1946
The Ohio State University, Columbus, Ohio,M.A. in Analytical Chemistry, 1948
National Science Foundation Study Grant,Emory University, Atlanta, Georgia, Summer, 1965
Graduate Study at The Ohio State University in Analytical Chemistry, 1966-1969
Westinghouse Electric Corporation, Research Laboratories, Pittsburgh, Pennsylvania} Inorganic Analysis, 1948-1962
Pennsylvania State University, McKeesport Campus; General and Analytical Chemistry, 1962-1966
The Ohio State University, Columbus; Lecturing in Quantitative Analysis, 1966-1969
iii
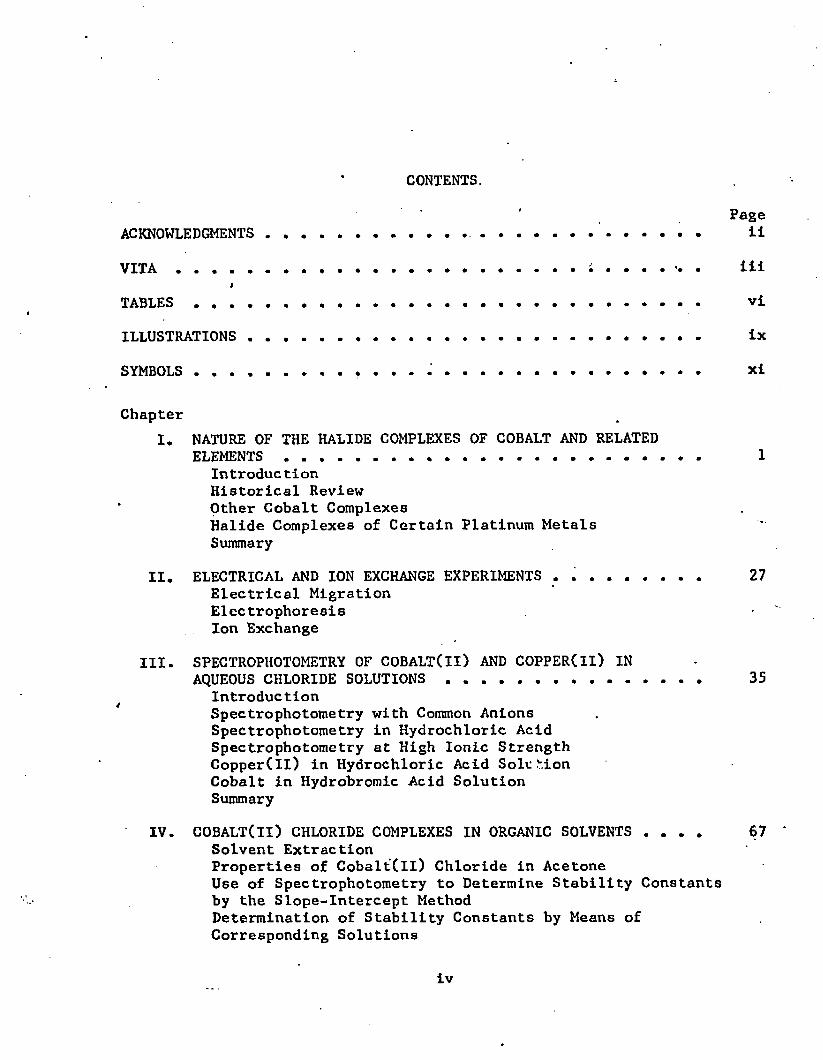
CONTENTS.
PageACKNOWLEDGMENTS ........................ ............. . . . . . . 11
V I T A ............................................... .. . . . . . . Ill;
T A B L E S ............................................................ vi
ILLUSTRATIONS ...................................................... ix
SYMBOLS................... . . . xi
ChapterI. NATURE OF THE HALIDE COMPLEXES OF COBALT AND RELATED
ELEMENTS ................................................. 1Introduction Historical Review Other Cobalt ComplexesHalide Complexes of Certain Platinum Metals Summary
II. ELECTRICAL AND ION EXCHANGE EXPERIMENTS . ............ 27Electrical Migration Electrophoresis Ion Exchange
III. SPECTROPHOTOMETRY OF COBALT(ll) AND COPPER(ll) INAQUEOUS CHLORIDE SOLUTIONS .............................. 35
IntroductionSpectrophotometry with Common Anions Spectrophotometry in Hydrochloric Acid Spectrophotometry at High Ionic Strength Copper(ll) in Hydrochloric Acid Solt .ion Cobalt in Hydrobromic Acid Solution Summary
IV. COBALT(II) CHLORIDE COMPLEXES IN ORGANIC SOLVENTS . . . . 67Solvent ExtractionProperties of Cobalt(ll) Chloride in AcetoneUse of Spectrophotometry to Determine Stability Constantsby the Slope-Intercept MethodDetermination of Stability Constants by Means of Corresponding Solutions
iv
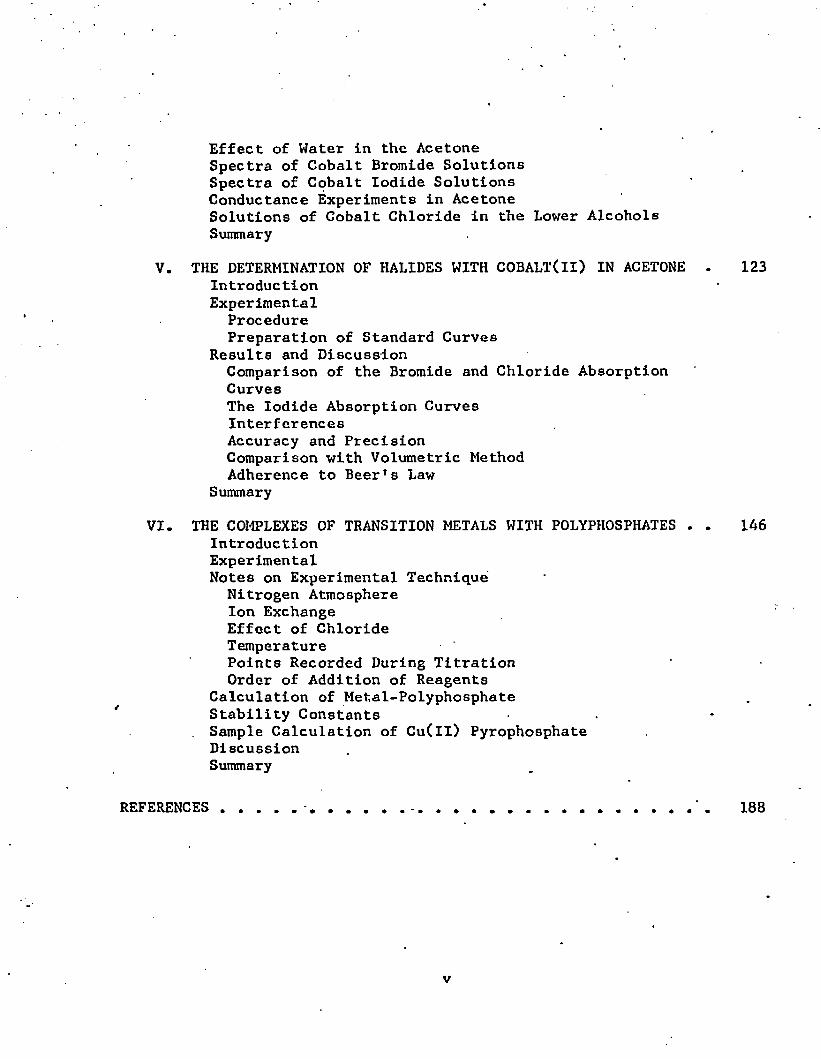
Effect of Water in the AcetoneSpectra of Cobalt Bromide SolutionsSpectra of Cobalt Iodide SolutionsConductance Experiments in AcetoneSolutions of Cobalt Chloride in the Lower AlcoholsSummary
V. THE DETERMINATION OF HALIDES WITH COBALT(ll) IN ACETONE . 123Introduction Experimental
ProcedurePreparation of Standard Curves
Results and DiscussionComparison of the Bromide and Chloride Absorption CurvesThe Iodide Absorption Curves Interferences Accuracy and Precision Comparison with Volumetric Method Adherence to Beer's Law
SummaryVI. THE COMPLEXES OF TRANSITION METALS WITH POLYPHOSPHATES . . 146
Introduction ExperimentalNotes on Experimental Technique
Nitrogen Atmosphere Ion Exchange Effect of Chloride TemperaturePoints Recorded During Titration Order of Addition of Reagents
Calculation of Metal-Polyphosphate Stability ConstantsSample Calculation of Cu(ll) PyrophosphateDiscussionSummary
REFERENCES.........•............ - ' . 188
v
4
7
9
14
15
30
49
52
53
54
56
60
61
61
64
65
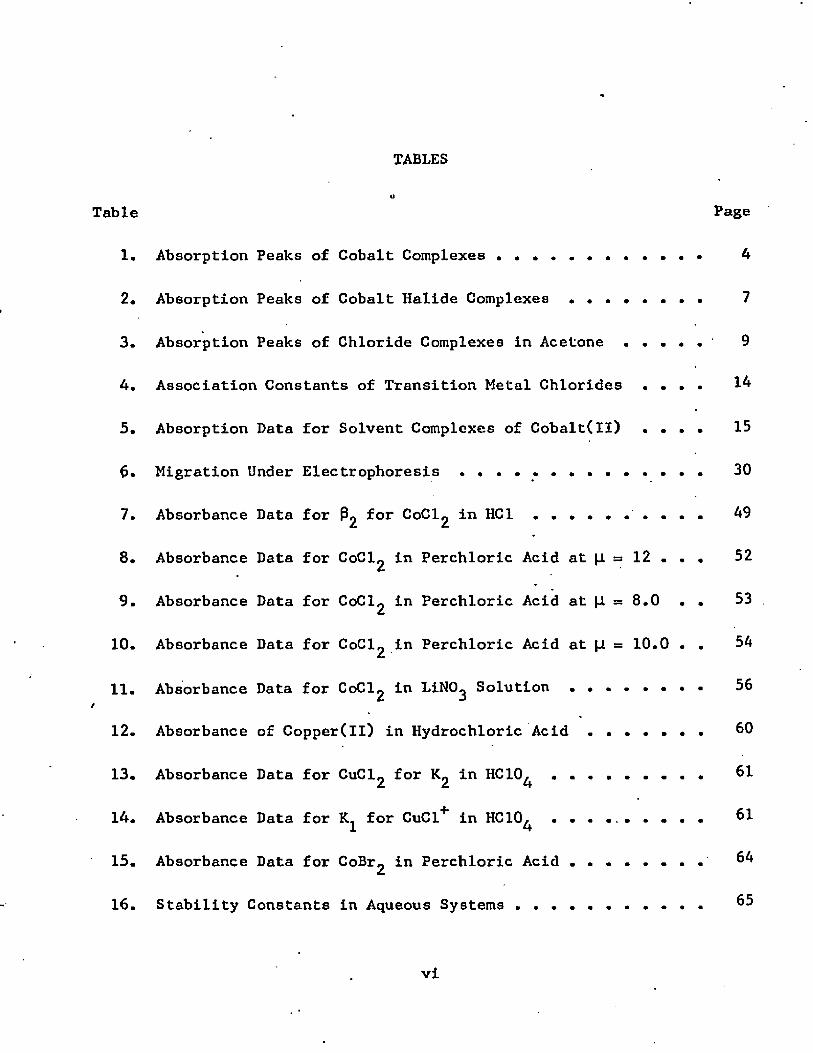
TABLES
u
Absorption Peaks of Cobalt Complexes . . . . . . . . . .
Absorption Peaks of Cobalt Halide Complexes . . . . . .
Absorption Peaks of Chloride Complexes in Acetone . . .
Association Constants of Transition Metal Chlorides . .
Absorption Data for Solvent Complexes of Cobalt(ll) . .
Migration Under Electrophoresis . . . . . . . . . . . .
Absorbance Data for for CoClg in HC1 . . . . . . . .
Absorbance Data for CoCl^ in Perchloric Acid at (i s 12 .
Absorbance Data for C o C ^ in Perchloric Acid at [i = 8.0
Absorbance Data for C o C ^ in Perchloric Acid at (i = 10.0
Absorbance Data for C o C ^ in LiNO^ Solution ■ • • • • •
Absorbance of Copper(II) in Hydrochloric Acid . . . . .
Absorbance Data for CuCl^ for in HCIO^ . . . . . . .
Absorbance Data for K, for CuCl+ in HC10. . . . . . . . .1 4
Absorbance Data for C o B ^ in Perchloric Acid . . . . . .
Stability Constants in Aqueous Systems ......... . . . .
vi
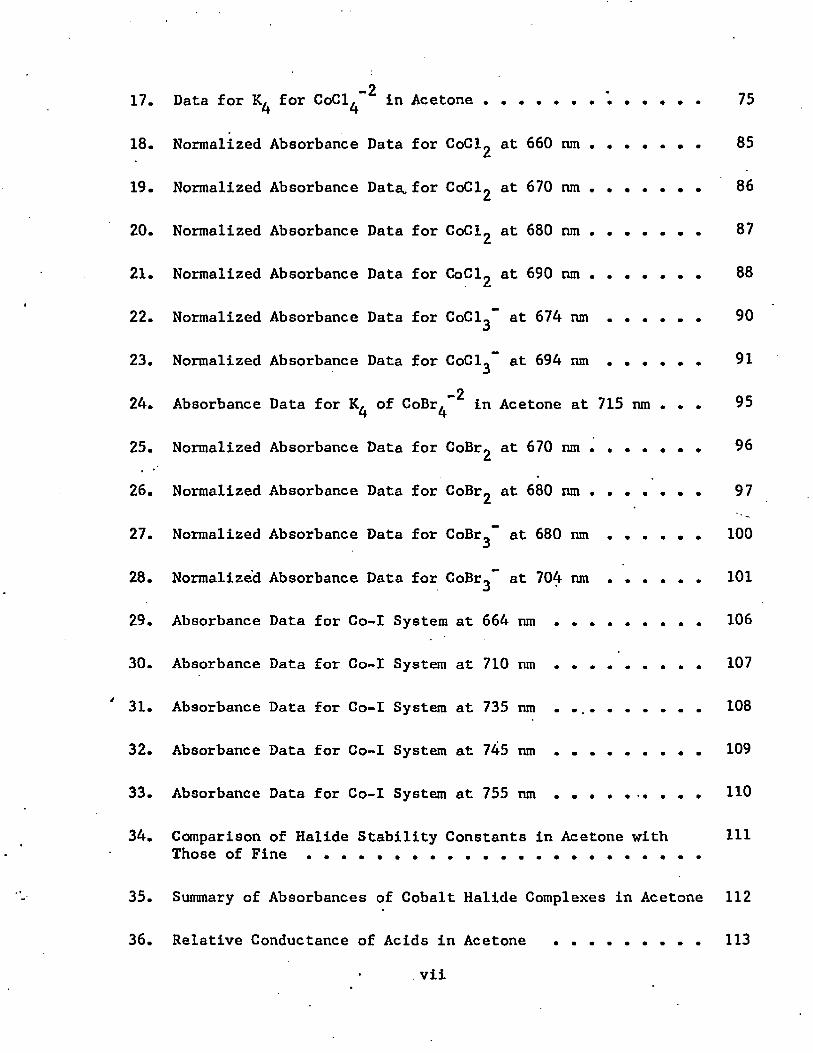
-217. Data for for CoCl^ in Acetone .......... 75
18. Normalized Absorbance Data for CoCl^ at 660 n m. . . . . . . 85
19. Normalized Absorbance Data* for C o C ^ at 670 n m .............. 86
20. Normalized Absorbance Data for CoCl^ at 680 n m . . . . . . . 87
21. Normalized Absorbance Data for CoCl^ at 690 n m . . . . . . . 88
22. Normalized Absorbance Data for CoCl^"" at 674 n m ........... 90
23. Normalized Absorbance Data for CoCl^ at 694 nm ........... 91_224. Absorbance Data for K. of CoBr, in Acetone at 715 nm . . . 954 4
25. Normalized Absorbance Data for CoBrg at 670 n m. . . . . . . 96
26. Normalized Absorbance Data for CoBrg at 680 n m ............ 97
27. Normalized Absorbance Data for GoBr^ at 680 nm . . . . . . 100
28. Normalized Absorbance Data for CoBr^" at 704 n m ........... 101
29. Absorbance Data for Co-I System at 664 nm . . . . . . . . . 106
30. Absorbance Data for Co-I System at 710 nm . . . . . . . . . 107
31. Absorbance Data for Co-I System at 735 nm . . . . . . . . . . 108
32. Absorbance Data for Co-I System at 745 nm . . . . . . . . . 109
33. Absorbance Data for Co-I System at 755 nm 110
34. Comparison of Halide Stability Constants in Acetone with 111Those of Fine . . . . . . . . . . . . . . . . . . . . . . .
35. Summary of Absorbances of Cobalt Halide Complexes in Acetone 112
36. Relative Conductance of Acids in Acetone ................. 113
vii
37. Relative Conductance of Salts in Acetone 115
38. Absorbance Data for CoCl^ in Methanol ..................118
39. Absorbance Data for 0^ f°r CoCl,, in Ethanol at 662 nm . . . 120
AO. Absorbance Data for for CoCl^in Ethanol at 603 nm . . . 120
-2Al. Absorbance Data for for CoCl^ in Ethanol at 689 nm . . 121
A2. 'Summary of Stability Constants of CobaltHalides in Organic S o l v e n t s ................ 122
A3. Effect of Other Anions on the Determination of Halides . . . 141
AA. Summary of Chloride Results . . . . . . . . . . . 142
45. Summary of Bromide Results ............ 143
46. Comparison of CoCl^ Method with AgNO^ Titration . . . . . . 144
47. Comparison of Titrations in Chloride and Nitrate Solutions . 160
48. Titration of Copper Pyrophosphate . . . . . . . . . . . . . 167
49. Titration Data for Polyphosphates . . . . . . . . . . . . . 172
50. Comparison of Results with Those of Other Workers . . . . . 174
51. Metal-Polyphosphate Constants . . . . . . . . . . . . . . . 180
52. Effect of Concentration on Stability Constant Calculationsof Nickel Pyrophosphate 183
53. Effect of Concentration on Stability Constant Calculationsof Cobalt(ll) Triphosphate ........... • . . . . . 184
54. Effect of Concentration on Stability Constant Calculationsof Cobalt(ll) Tetraphosphate..................... 184
viii
ILLUSTRATIONSI)
Figure
1. Electrical Migration Apparatus . ........... . . . . . . .
2. Absorbance of Co(ll) in HNO^ . . . . . . . . . . . . . . .
3. Absorbance of Co(ll) in . . . . . . . . . . . . . .
4. Absorbance of Co(ll) in Concentrated H C 1. . . . . . . . .
5. Absorbance of Co(ll) in 500-700 nm Region . . ^ . . . . .
6. Absorbance of Various Concentrations of Cobalt in 12F HC1 at 694 nm .................... . . . . . . . . . . . . . .
7. Absorbance of 0.002M Co++ in HC1 of Varying Concentrations at 694 n m ..................................... ..
8. Graph for 0,, for CoCl^ in H C 1 ............. ...............
9. Graph for f°r CoCl^ at p. = 1 0 ....................
10. Absorbance of Cu(ll) in HC1 . . . . . . . . . . . . . . ./
11. Absorbance of Co(ll) in HBr ............... . . . . . . .
12. Extraction of Cobalt Chloride with n-Heptanol from 12F HC1
13. Absorbance Spectrum of Co(ll) in Acetone with Added LiCl
14. Absorbance of Co(ll) in Acetone with Added Cl at Selected Wavelengths . . .................... ........... . . . . . .
-215. K. for CoCl. in A c e t o n e ............................ ..4 4
16. Absorbance Curves of Two Corresponding Solutions in Cobalt-Iodide System
17. Series of Corresponding Solutions for Cobalt Chloride . . .
18. Absorbance of Cobalt Chloride in Various Solvents . . . . . 92
19. Absorbance of Co(ll) in Acetone with Added Lithium Bromide . 94
20. Corresponding Solutions for C o B ^ in Acetone at 670 nm . . . 98
21. Absorbance of Co(ll) Iodides in Acetone . . . . . . . . . . 103
22. Corresponding Solutions for Co-I System in Acetone at 735 nm 104
23. Absorbance of Co(ll) + LiCl in Methanol 116
24. Absorbance of Co(ll) + LiCl in Ethanol . ' . ............ 119
25. Determination of Chloride in Acetone at 675 n m .......... 132
26. Determination of Bromide in Acetone at 677 nm . . . . . . . 133
27. Absorbance of CoX^ in Acetone . . . . . . . . . . ......... 135
28. Absorbance of Cobalt Iodide in Acetone at Constant Iodide Concentration 137
4
29. Absorbance of Cobalt Iodide in Acetone at Constant CobaltConcentration........................ 138
30. Effect of Nitrate Ion on the Absorbance of Cobalt Chloride . 140
31. Titration of M(ll) Tetraphosphates in 1:1 R a t i o .............. 154
32. Titration of M(ll) Triphosphates . . . . . . . . . . . . . . 155
33. Titration of M(ll) Pyrophosphates . . . . . . . . . . . . . 156
34. Titration of Various Ratios of Zn and Triphosphate......... 186
x
DEFINITIONS OF SYMBOLSO
percent transmission of radiant energy through medium
ebc = absorbance of radiant energy by a solution
the absorbance coefficient or absorptivity
the light path in centimeters
the concentration in moles per liter
the total or analytical concentration of X in moles per liter
the concentration of X in the indicated form
the activity of H as measured on a pH meter
the activity coefficient
2 2 2the d orbitals, z and x -y , which point directly toward octahedrally bound ligands
the d orbitals, xy, xz, and yz, which point between octahedrally bound ligands
the energy transition between e and t„ orbitalsg . 2g
A/10
the heat of a reaction, usually in kilocalories per mole at 25°C
the entropy of a reaction in entropy units per degree per mole . 9mfl = 10 meter
xi
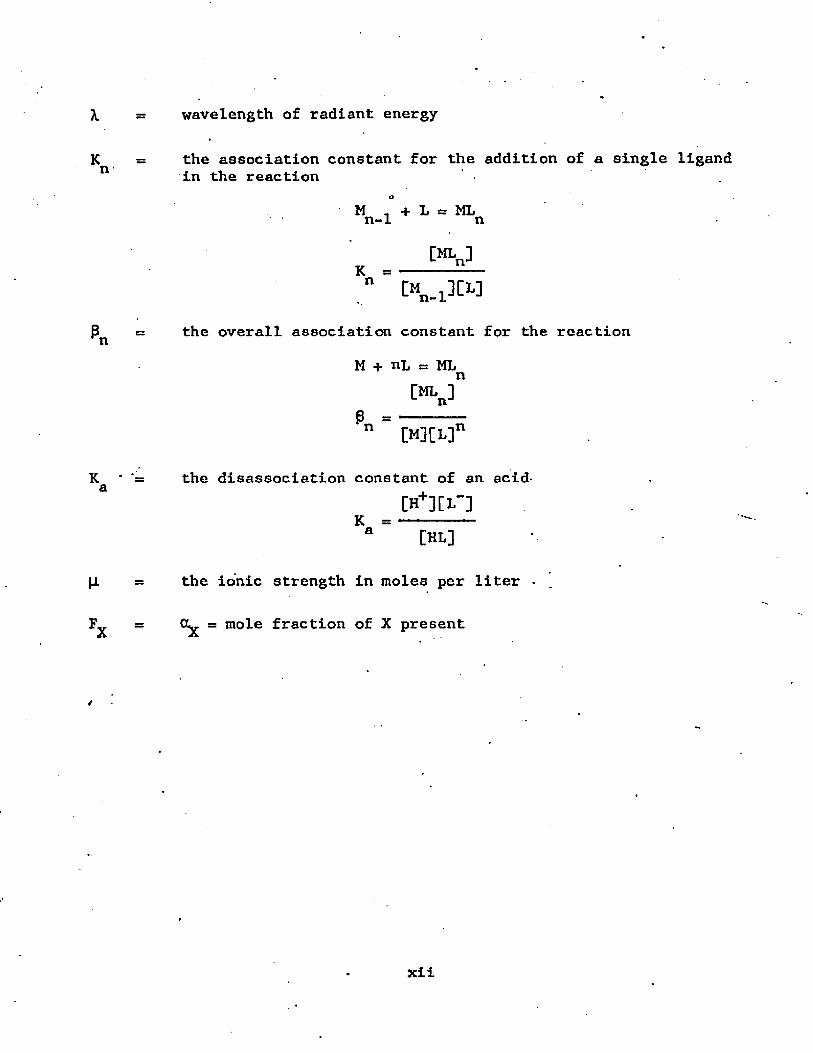
wavelength of radiant energy
the association constant for the addition of a single ligand in the reaction
oM - + L = ML n-1 n
[MLn]K =-
the overall association constant for the reaction
M + nL « ML [MLn]n
Pn " ------ «n M M *
the disassociation constant of an acid-T+-DTDtL-]
K = a [HL]
the ionic strength in moles per liter
s= mole fraction of X present
xii
CHAPTER I
NATURE OF THE HALIDE COMPLEXES OF COBALT AND RELATED ELEMENTS
Introduction
The objective of this study was to determine the formula and
stability of the blue cobalt chloride complex in concentrated hydrochlo
ric acid. Because of its blue color and absorption of the relatively
weak red end of the spectrum, most scientists have assumed the complex
to be tetrahedral. The formulas CoC^, CoCl^**, or CoCl^” , have been
assigned without proof to the colored complex by various researchers.
There is a great amount' of literature on the chloride complexes
of cobalt(ll), but much of it is contradictory. Most assume the formula
of the pink hydrated ion to be Co(H2 0 )g++ and its structure to be octa
hedral. In concentrated hydrochloric acid a blue color develops due to
the formation of a complex assumed to be tetrahedral, CoCl^C^O)^
where n can be any number from 1 to 4; the charge is 2-n. The same blue
color develops in organic solvents containing cobalt and chloride ions,
but the cloride concentration can be very much smaller. Complexes of
cobalt(lll) and chloride are not sufficiently stable in aqueous solution
to prevent the oxidation of chloride to chlorine by cobalt(lll). Partial
replacement of other ligands such as ammonia with chloride can occur.
1
2
Historical Review
When cobalt(ll) forms a halide complex, there is a shift in
the absorbance maximum to a longer wavelength and the absorptivity
increases very greatly. This indicates a definite change in structure
as the hydrated ion is changed to a halide complex. For metals in the
second and third long rows of the periodic chart, there are only small
changes in the absorbance maximum and absorptivity because the basic
structure remains the same, usually octahedral. In the case of cobalt
the absorbance maximum for the octahedral hydrated ion, CoC^O)^**, is
at 514 nanometers, and the molar absorptivity is 4.555 (Jorgensen 1954).-2In nitromethane, where tetrahedral CoCl^ is presumed to form, the
absorbance maximum is at 693 nm and the molar absorptivity is 653 (Gill
and Nyholm 1959). The conversion of only a small fraction of the cobalt
to the tetrahedral chloride complex makes the solution appear blue,
green, or violet.
Cobalt(ll) is chemically more similar to its horizontal than
its vertical neighbors in the periodic chart. All the divalent metal
ions from manganese to zinc form tetrachloro complexes in the solid
state. In aqueous solution only Fe(lll), Co(ll), and Cu(ll) form
tetrahedral chloro complexes. The stabilities of the halide complexes
In organic solvents are intermediate and depend upon the dielectric
constant and donor strength of the solvent (Katzin 1962). Copper(ll)
is unusual in that it forms both square-planar and tetrahedral halide
complexes In glacial acetic acid (Eswien et al. 1967A). In aqueous
solutions the complex appears to be square-planar. Copper, like cobalt,
3
undergoes a large increase in absorptivity when the coordination number
changes from six to four. However, the absorbance maximum moves toward
shorter wavelengths.
Since the spectra of crystalline cobalt tetrachlorides, such as
CSgCoCl^, are very similar to that of cobalt(ll) in concentrated hydro-‘ - 2 chloric acid, many researchers have assumed that the CoCl^ ion occurs
in both. Few have even tried other means of measurement, such as
electrophoresis, chromatography, and electrical conductivity. Some have
measured the magnetic moment, but this evidence is complicated by the
fact that both tetrahedral and octahedral complexes of cobalt(ll) have
three unpaired electrons.
The cobalt(II) ion has a 3d^ electronic structure. Since there
are three unpaired electrons, all d orbitals are occupied. Bonding with
the small highly electonegative atoms, oxygen and nitrogen, is usually
octahedral. The larger chlorine and heavier halogen atoms seem to prefer
to arrange tetrahedrally around a cobalt ion. Magnetic measurements
still show three electrons (Gill and Nyholm 1959), and the bonding may
be sp . Some of the negative charge of the chloride ions is transferred
to the central cobalt ion.-2The electronic transition in CoCl^ is apparently from 3d to
4p, and this is permitted by electronic energy rules (Gill and Nyholm
1959). This transition for the tetrahedral cobalt(ll) ion has been
measured as 14,400 cm”^. The absorbance of the hydrated ion, Co^gO)g++,
is weak because a "forbidden" d-d electronic transition is involved.
However, more energy, 19,500 cm , is required for the transition..
4
Gill and Nyholm's work (1959), indicates that spectrophotometry
is a better tool for further investigation than magnetic susceptibility
measurements.
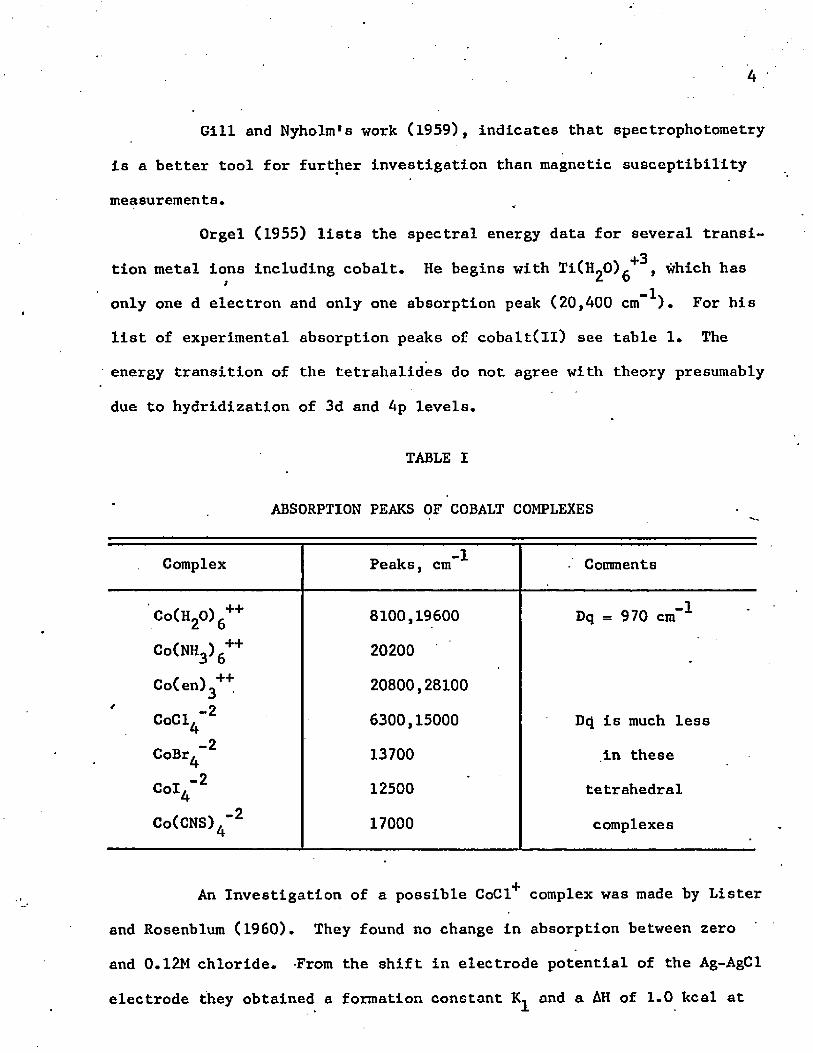
Orgel (1955) lists the spectral energy data for several transi-
tion metal ions including cobalt. He begins with Ti(H20)g } which has
only one d electron and only one absorption peak (20,400 cm”*). For his
list of experimental absorption peaks of cobalt(ll) see table 1. The
energy transition of the tetrahalides do not agree with theory presumably
due to hydridization of 3d and 4p levels.
TABLE I
ABSORPTION PEAKS OF COBALT COMPLEXES
Complex Peaks, cm”* - Comments
Co(H20)6++ 8100,19600 Dq = 970 cm”*
Co (NH3)6++ 20200 .
Co(en)3++ 20800,281004 -2 CoCl4 £ 6300,15000 Dti is much less
_2CoBr4 13700 in these
c » v z 12500 tetrahedralCo(CNS)4"2 17000 complexes
An Investigation of a possible CoCl complex was made by Listet
and Rosenblum (1960). They found no change in absorption between zero
and 0.12M chloride. From the shift in electrode potential of the Ag-AgCl
electrode they obtained a formation constant and a AH of 1-0 kcal at
25°C for the reaction, Co++ + Cl" ^ CoCl+ . The ionic strength was
adjusted to 2.0 with NaClO^. It is possible that the absorbance involves
charge transfer from Cl to Co++.“ Smithson and Williams (1958) also
studied ion-association complexes with various anions. These have only
slight affect on the absorbance. Association complexes were found with
chloride, nitrate, and sulfate, but there was no measurable association
with perchlorate. On the basis of the slight change in absorbance, they
developed a slope-intercept equation, and reported a value of 0.37 for
the chloride constant, K^. The ionic strength was adjusted to 7.0 with
LiClO^, and the temperature was 20°. Thiosulfate and thiocyanate formed
more "stable complexes, but these probably contained direct cobalt-ligand
bonds. The thiocyanate had a charge transfer band in the ultraviolet at-2275 run. These authors assumed that CoCl^ is completely formed in 10F
LiCl. Concentrations of CoCl^ and CoCl^" were said to be negligible
because they are unstable in either an octahedral or a tetrahedral
environment.
Ballhausen and Jorgensen (1955) ran reflectance spectra onVsolid CoCl^*2H20 and CoCO^. In both cases the maximum absorption occurred
at 530 nm. The lower wavelength or higher energy indicates an octahedral
environment for cobalt. The same authors assumed the ion in 12F' HC1 to be -2CoCl^ . In concentrated hydrochloric acid they reported absorbance peaks
at 690 nm and 530 nm with molar absorptivities of 600 and 9.5 respectively.
The absorption at 530 nm indicates that some of the cobalt, possibly the
monochloro complex or the simple hydrated ion, is still octahedral.
Cotton and his coworkers have contributed much to the knowledge
of the chemistry of cobalt. Blake and Cotton (1963) made a series of
Born-Haber-type calculations and found the AH for the reaction,—2Co++(g) + Cl“(g) -* CoCl^~ (g), to be approximately -625 kcal per mole at
25°C. The solid compound, Cs2CoCl^, was used as the basis of this cal-- 2culation. It was concluded that the CoCl^ ion should be thermodynam
ically stable in the solid and gaseous state.
Cotton and the Goodgames (1961, p. 4690), compared the spectra
of [(C^Hg^N^CoCl^, solid and dissolved in methylene chloride, with the
spectra of cobalt chloride in concentrated hydrochloric acid. Since the
spectra were somewhat different, they concluded that the chief ion in
hydrochloric acid solution is tetrahedral 00(^0)01^ . They also found
that cobalt forms a.blue hydroxide complex in 50% sodium hydroxide
solution. __
Holm and Cotton (1959) measured the reflectance spectra and
magnetic moments of solid cobalt halides, such as the following cesium
and quinoline complex salts, Cs^CoCl^ and (CgHgN)^CoCl^. Maximum absorp
tion of the tetrachloro complex occurred at 700 nm; of the tetrabromo
complex, at 740 nm; and of the tetraiodo complex, at 800 nm. Magnetic
Susceptibility ranged from about 4.7 B.M. for the chlorides to 5.0 for
the iodides. The susceptibility of octahedral cobalt compounds ranged
from 4.8 to 5.3 B.M. (Gill and Nyholm 1959). Note that this overlaps
the tetrahedral range, and in any case shows three unpaired electrons
with spin-orbit coupling.
Katzin (1954) also compared the spectrum of solid Cs^CoCl^ with
that of cobalt chloride in concentrated hydrochloric acid. Both compounds_2have similar spectra; so both were assumed to contain CoCl^ groups.
However, one of the peaks listed for the complex formed by CoCl^ in HC1
is at 533 nm, which is in the octahedral range.
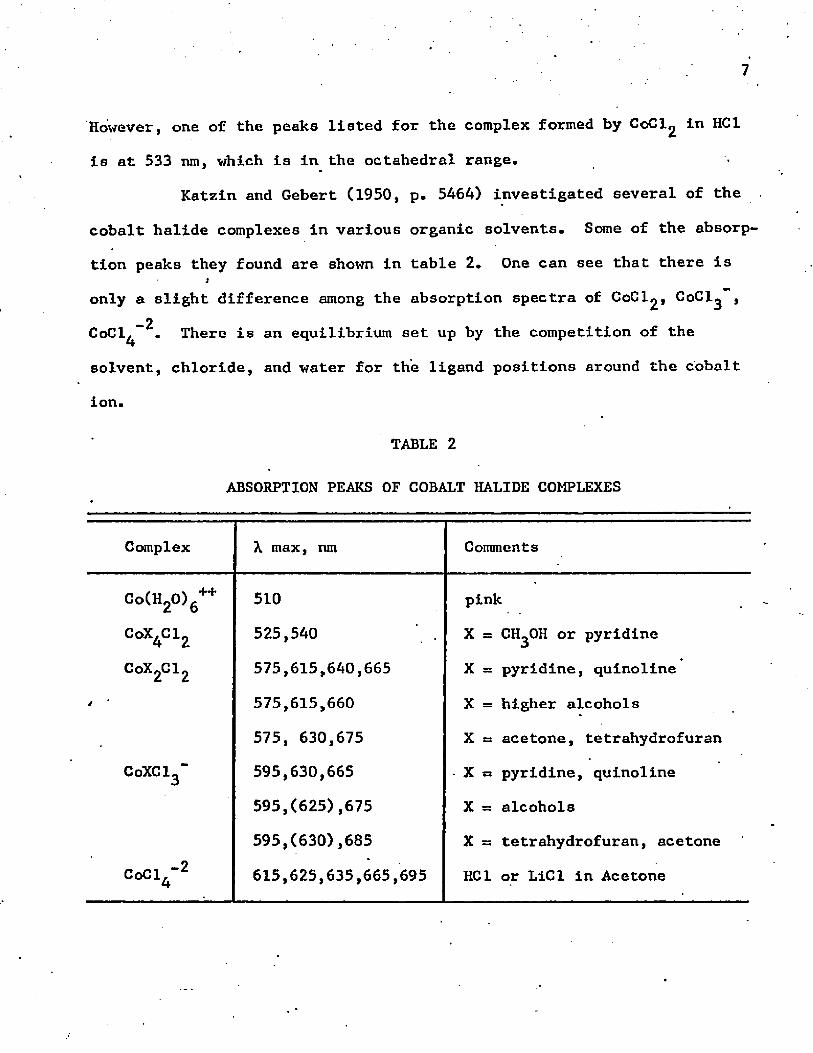
Katzin and Gebert (1950, p. 5464) investigated several of the
cobalt halide complexes in various organic solvents. Some of the absorp
tion peaks they found are shown in table 2. One can see that there isS
only a slight difference among the absorption spectra of CoCl2 , CoCl^ ,_oCoCl^ . There is an equilibrium set up by the competition of the
solvent, chloride, and water for the ligand positions around the cobalt
ion.
TABLE 2
ABSORPTION PEAKS OF COBALT HALIDE COMPLEXES
Complex \ max, nm Comments
Co (H20)6++ 510 pink
CoX4C12 525,540 X = CH^OH or pyridine
CoX2Cl2 575,615,640,665 X = pyridine, quinoline
575,615,660 X = higher alcohols
575, 630,675 X = acetone, tetrahydrofuran
CoXCl3~ 595,630,665 - X = pyridine, quinoline
595,(625),675 X = alcohols
595,(630),685 X = tetrahydrofuran, acetoneCoCl4“2 615,625,635,665,695 HC1 or LiCl in Acetone
8
Katzin (1952) also made some spectral measurements in the ultra
violet region. In isopropanol containing a tenfold excess of LiCl, he
assumed that two complexes of cobalt, CoCl* and CoCl^, were formed, but
his figure 3 shows only one type of absorbance curve- at the chloride con
centrations where these complexes would be expected. Spectra of thio-
cyanates indicated a higher complex, CoCCNS)^ because absorptivity and
the wavelength of maximum absorption increased as lithium thiocyanate wasoadded. In acetone the additional complex, Co(CNS)^ , was obtained. The
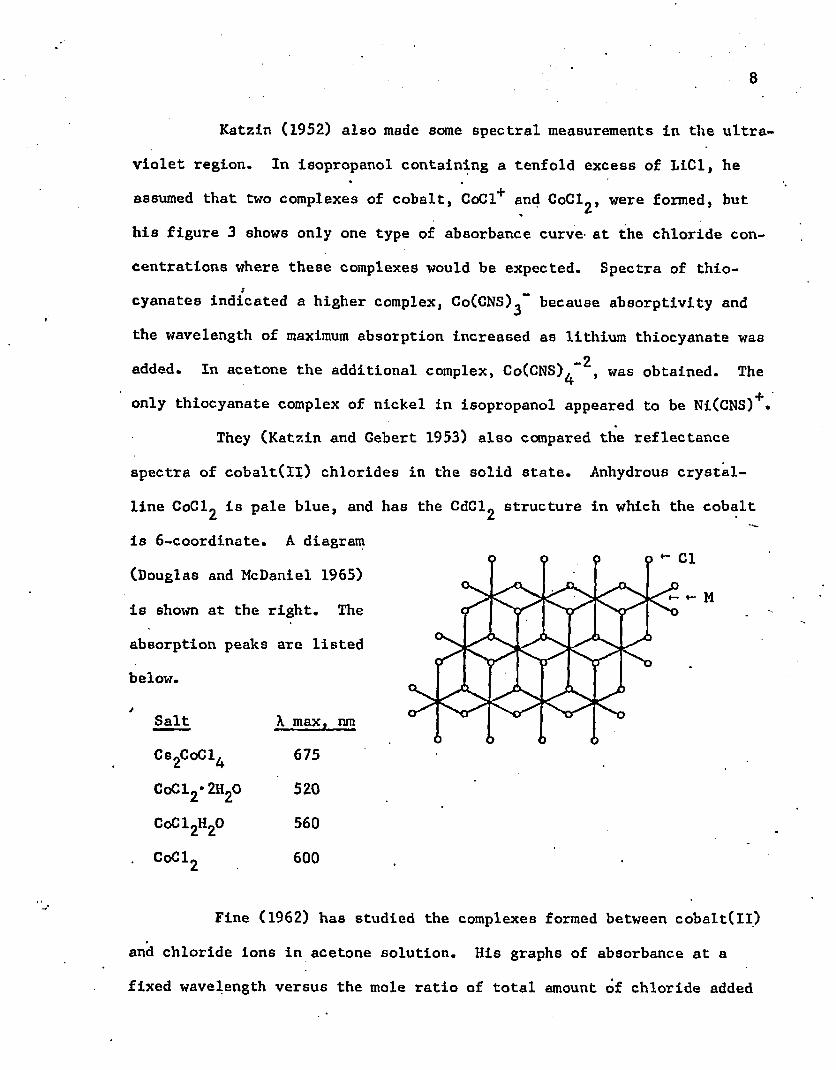
4*only thiocyanate complex of nickel in isopropanol appeared to be Ni(CNS) • They (Katzin and Gebert 1953) also compared the reflectance
spectra of cobalt(Il) chlorides in the solid state. Anhydrous crystal
line CoCl^ is pale blue, and has the CdCl^ structure in which the cobalt
is 6-coordinate. A diagram
(Douglas and McDaniel 1965)
is shown at the right. The
absorption peaks are listed
below.
Salt
CsgCoCl CoCl2-2H20
CoC12H20 CoC1_
X max, nm
675
520
560
600
Cl
Fine (1962) has studied the complexes formed between cobalt(Il)
and chloride ions in acetone solution. His graphs of absorbance at a
fixed wavelength versus the mole ratio of total amount of chloride added
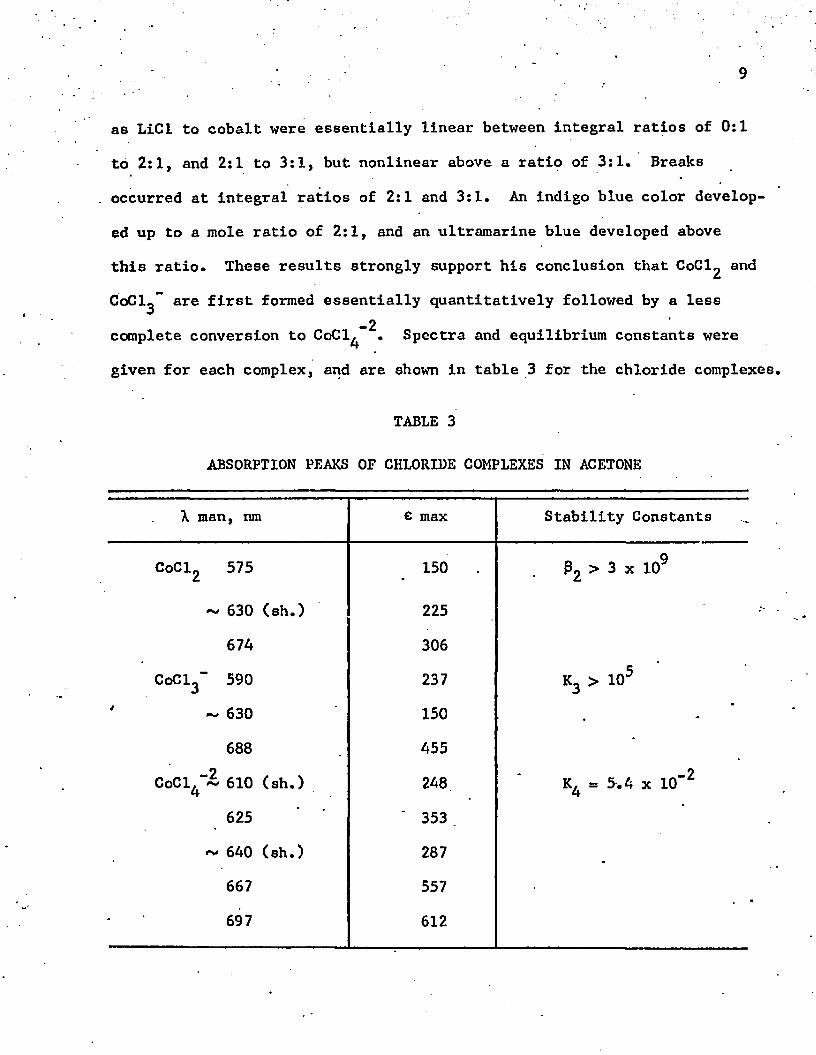
as LiCl to cobalt were essentially linear between integral ratios of 0:1
to 2:1, and 2:1 to 3:1, but nonlinear above a ratio of 3:1. Breaks
occurred at integral ratios of 2:1 and 3:1. An indigo blue color develop
ed up to a mole ratio of 2:1, and an ultramarine blue developed above
this ratio. These results strongly support his conclusion that CoCl^ and
0 0 0 1 2 " are first formed essentially quantitatively followed by a less_2complete conversion to CoCl^ . Spectra and equilibrium constants were
given for each complex, and are shown in table 3 for the chloride complexes
TABLE 3
ABSORPTION PEAKS OF CHLORIDE COMPLEXES IN ACETONE
X man, nm C max Stability Constants
CoCl2 575 150 P2 > 3 x 10⁹
** 630 (sh.) 225
674 306
CoCl3" 590 237 k 3 > 105
~ 630 150 •
688 455 *
CoCl4"~ 610 (sh.) 248 K4 = 5.4 x 10"2
625 ' 353 .
640 (sh.) 287
667 557
697 612
10
The equilibrium constants were calculated from concentrations,
not activities. The basis for his calculations of the first two constants
is not clear since the data were not included. He also included curvess
for the calculated € versus wavelength in both the visible and very near
infrared region below 2.5 microns.
: Magor and Smith (1968) report that the addition of HgCl^ to an
acetonitrile solution of C o C ^ changes the color from blue to pink. The
authors state that octahedral CoCl(CH^CN)^+ is formed, and that the blue
color reforms upon heating. The di- and trichloro complexes of cobalt
are assumed to be tetrahedral because the spectra are similar to that of
the tetrachloride. The absorbance peaks and absorptivities of the three
complexes in acetonitrite are similar to those in acetone listed by Fine
(1962).
Fine (1965) also has investigated the halide complexes of
nickel in acetone. He found that the tetrabromide complex of nickel canibe prepared in acetone, provided excess LiBr is added. The stability
- • ‘ - -2constant for the final step, NiBr^ + Br ** NiBr^ , as determined by the-2slope-intercept method is 1.0 x 10 . The only bromide complex in
aqueous solution is octahedral Ni(H2 0 ),-Br+.
Nickel, like cobalt, forms tetrahedral chloride complexes, such
as (R^lOgNiCl^, in the solid state (Cotton, Goodgame, and Goodgame 1961,
p. 4161). In polar solvents, even nitromethane, these complexes disso
ciate. Magnetic measurements show two unpaired electron's.
Peter Pauling (1966) prepared the tetrahedral nickel complex, *
[(CgHs)^CH^AsJ2^ iC1^, which is stable and soluble in nonpolar organic
solvents. Similar compounds were made from divalent manganese, iron,
11
cobalt, copper, and zinc. All are isomorphous with the nickel complex
except the copper compound. Thus it is shown that the first row of
divalent transition metals all can form tetrachloro complexes. In theUsolid state the copper complex can exist in the square-planar as well as
the tetrahedral form (Willett and Liles 1967).
Cotton and his coworkers also made spectrophotometrie measure
ments on the solid tetrahedral complexes of cobalt pseudohalides, such as
the thiocyanates (Cotton et al. 1961, p. 4157); cyanates and azides
(Cotton and M. Goodgame 1961, p. 1777); and selenocyanates (Cotton et al.
1962, p. 565). The absorption spectra and magnetic moments are similar
to those of the tetrahalides.
Very few references mention any use of electrical measurements
for determining the nature of cobalt chloride complexes. However, Miss
Wormser (1948), by using a modified Job’s method (1928), showed that in
acetone there was maximum conductivity when the ratio of LiCl to CoCl^ was
1:1. This suggested the presence of the complex, Li^CoCl^ . In hydrochor--i I ,|, wic acid the ions, Co , CoCl , and CoCl^ , but not CoCl,,, were assumed to
be present. The blue color was assumed to be due to the anion, CoCl^".
During electrolysis of HC1 solution, cobalt moved toward both the anode
and cathode, but much more toward the cathode.
Other inconclusive electrical measurements were performed by
Moore and Kraus (1952). First they found that the maximum absorption of
cobalt on the anion exchange resin, Dowex 1, occurred from 9F HC1 solution.
Here the concentration of CoCl^” was thought to be at its highest. In
electrophoresis experiments, cobalt(ll) began to migrate to the anode at
concentrations of HC1 above 8F, but no data were given.
12
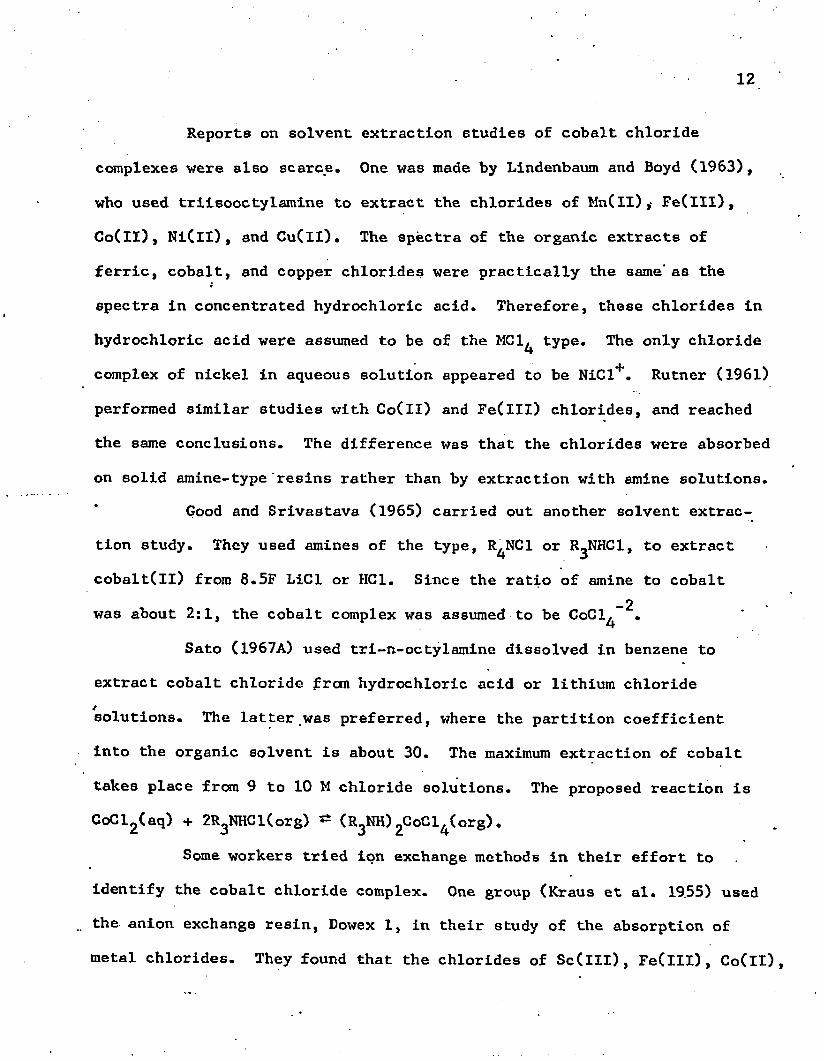
Reports on solvent extraction studies of cobalt chloride
complexes were also scarce. One was made by Lindenbaum and Boyd (1963),
who used tri isooctyl amine to extract the chlorides of Mn(Il),- Fe(lll),
Co(ll), Ni(ll), and Cu(ll). The spectra of the organic extracts of
ferric, cobalt, and copper chlorides were practically the same’ as the;
spectra in concentrated hydrochloric acid. Therefore, these chlorides in
hydrochloric acid were assumed to be of the MCl^ type. The only chloride
complex of nickel in aqueous solution appeared to be NiCl+. Rutner (1961)
performed similar studies with Co(ll) and Fe(lll) chlorides, and reached
the same conclusions. The difference was that the chlorides were absorbed
on solid amine-type resins rather than by extraction with amine solutions.Good and Srivastava (1965) carried out another solvent extrac
tion study. They used amines of the type, R^NCl or R^NHCl, to extract
cobalt(ll) from 8.5F LiCl or HC1. Since the ratio of amine to cobalt-2was about 2:1, the cobalt complex was assumed to be CoCl^
Sato (1967A) used tri-n-octylamine dissolved in benzene to
extract cobalt chloride from hydrochloric acid or lithium chloride
solutions. The latter was preferred, where the partition coefficient
into the organic solvent is about 30. The maximum extraction of cobalt
takes place from 9 to 10 M chloride solutions. The proposed reaction is
CoCl2(aq) + 2R3NHCl(org) ** (R3NH)2CoCl4(org).
Some workers tried ion exchange methods in their effort to
identify the cobalt chloride complex. One group (Kraus et al. 19.55) used
the anion exchange resin, Dowex 1, in their study of the absorption of
metal chlorides. They found that the chlorides of Sc(lll), Fe(lll), Co(ll),
13
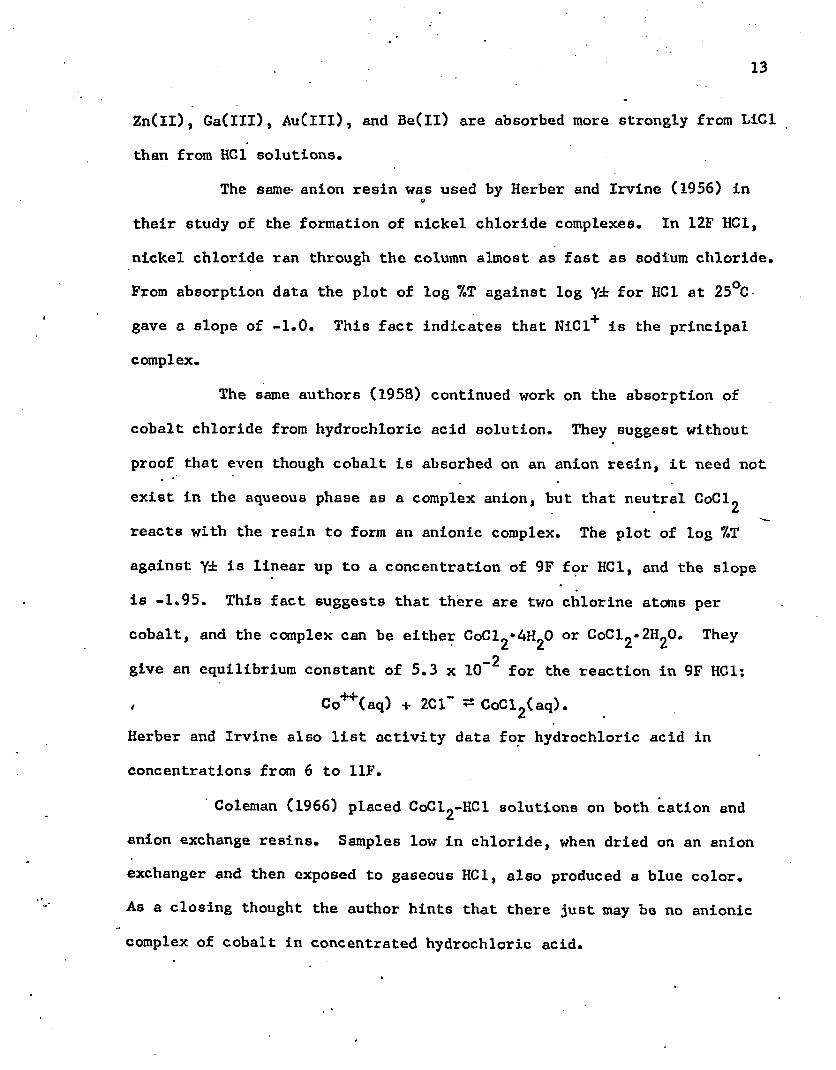
Zn(ll), Ga(lll), Au(lll), and Be(ll) are absorbed more strongly from LiCl
than from HG1 solutions.
The same- anion resin was used by Herber and Irvine (1956) ino
their study of the formation of nickel chloride complexes. In 12F HC1,
nickel chloride ran through the column almost as fast as sodium chloride.
From absorption data the plot of log 7.T against log Y± for HC1 at 25°C
gave a slope of -1.0. This fact indicates that NiCl+ is the principal
complex.
The same authors (1958) continued work on the absorption of
cobalt chloride from hydrochloric acid solution. They suggest without
proof that even though cobalt is absorbed on an anion resin, it need not
exist in the aqueous phase as a complex anion, but that neutral CoCl^
reacts with the resin to form an anionic complex. The plot of log %T
against Y^ is linear up to a concentration of 9F for HC1, and the slope
is -1.95. This fact suggests that there are two chlorine atoms percobalt, and the complex can be either CoCl^'AH^O or CoCl^^^O. They
_2give an equilibrium constant of 5.3 x 10 for the reaction in 9F HC1:
Co'H '(aq) + 2C1" ^ CoCl2(aq).Herber and Irvine also list activity data for hydrochloric acid in
concentrations from 6 to 11F.
Coleman (1966) placed CoCl^-HCl solutions on both cation and
anion exchange resins. Samples low in chloride, when dried on an anion
exchanger and then exposed to gaseous HC1, also produced a blue color.As a closing thought the author hints that there just may be no anionic
complex of cobalt in concentrated hydrochloric acid.
14
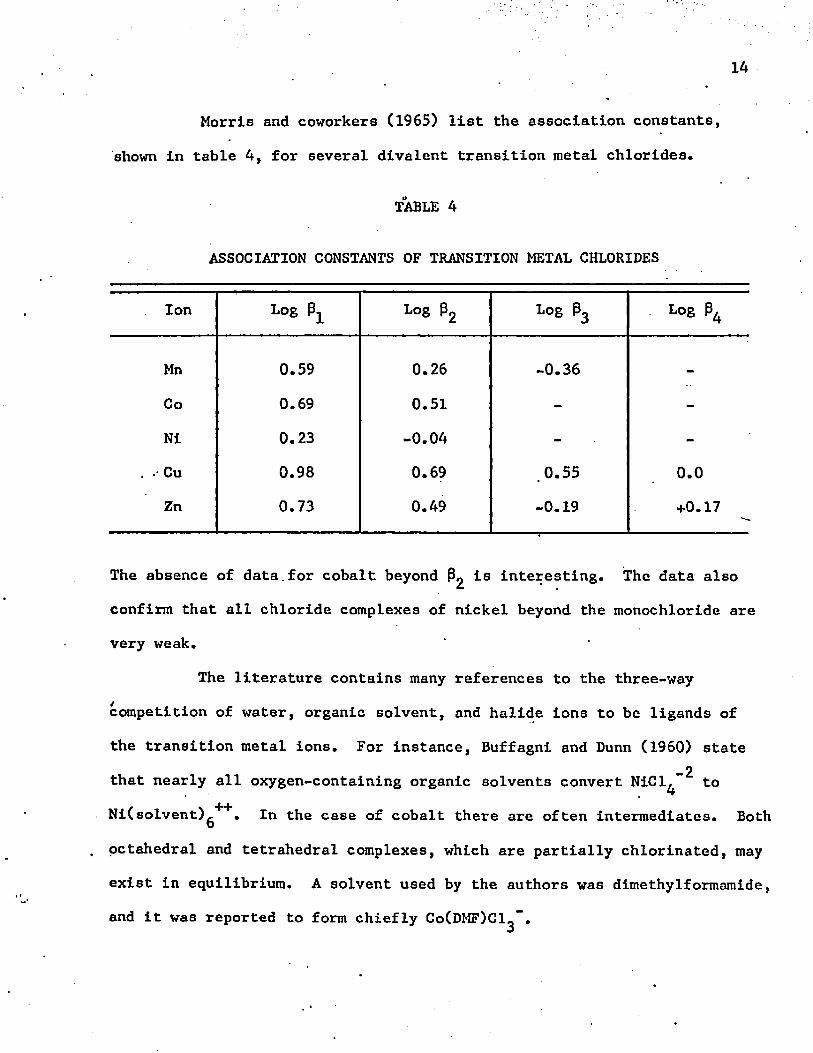
Morris and coworkers (1965) list the association constants,
shown in table 4, for several divalent transition metal chlorides.
TABLE 4
ASSOCIATION CONSTANTS OF TRANSITION METAL CHLORIDES
Ion Log 0 ^ Log 02 Log 03 Log 0^
Mn 0.59 0.26 -0.36 -
Co 0.69 0.51 - -Ni 0.23 -0.04 - -
. - Cu 0.98 0.69 .0.55 0.0Zn 0.73 0.49 -0.19 +0.17
The absence of data.for cobalt beyond P2 1® interesting. The data also
confirm that all chloride complexes of nickel beyond the monochloride are very weak.
The literature contains many references to the three-way
competition of water, organic solvent, and halide ions to be ligands of
the transition metal ions. For instance, Buffagni and Dunn (1960) state_2that nearly all oxygen-containing organic solvents convert NiCl^ to
Ni(solvent)g++. In the case of cobalt there are often intermediates. Both
octahedral and tetrahedral complexes, which are partially chlorinated, may
exist in equilibrium. A solvent used by the authors was dimethylformamide,
and it was reported to form chiefly Co^ffOCl^”.
15
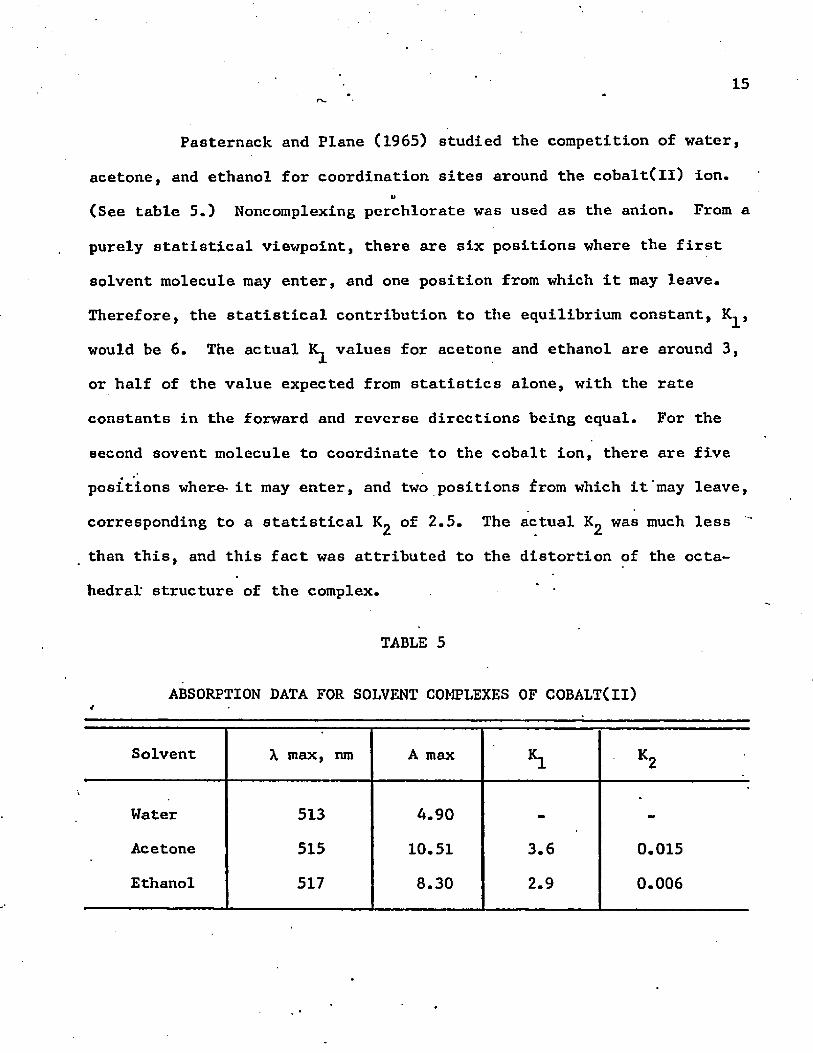
Pasternack and Plane (1965) studied the competition of water,
acetone, and ethanol for coordination sites around the cobalt(ll) ion.u
(See table 5.) Noncomplexing perchlorate was used as the anion. From a
purely statistical viewpoint, there are six positions where the first
solvent molecule may enter, and one position from which it may leave.
Therefore, the statistical contribution to the equilibrium constant, K^,
would be 6. The actual values for acetone and ethanol are around 3,
or half of the value expected from statistics alone, with the rate
constants in the forward and reverse directions being equal. For the
second sovent molecule to coordinate to the cobalt ion, there are five
positions wher-e- it may enter, and two positions from which it may leave,
corresponding to a statistical of 2.5. The actual Kg was much less
than this, and this fact was attributed to the distortion of the octa
hedral- structure of the complex. *
TABLE 5
ABSORPTION DATA FOR SOLVENT COMPLEXES OF COBALT(II)4
Solvent X max, nm A max *L K2
Water 513 A.90 -» -Acetone 515 10.51 3.6 0.015
Ethanol 517 8.30 2.9 0.006
* 16
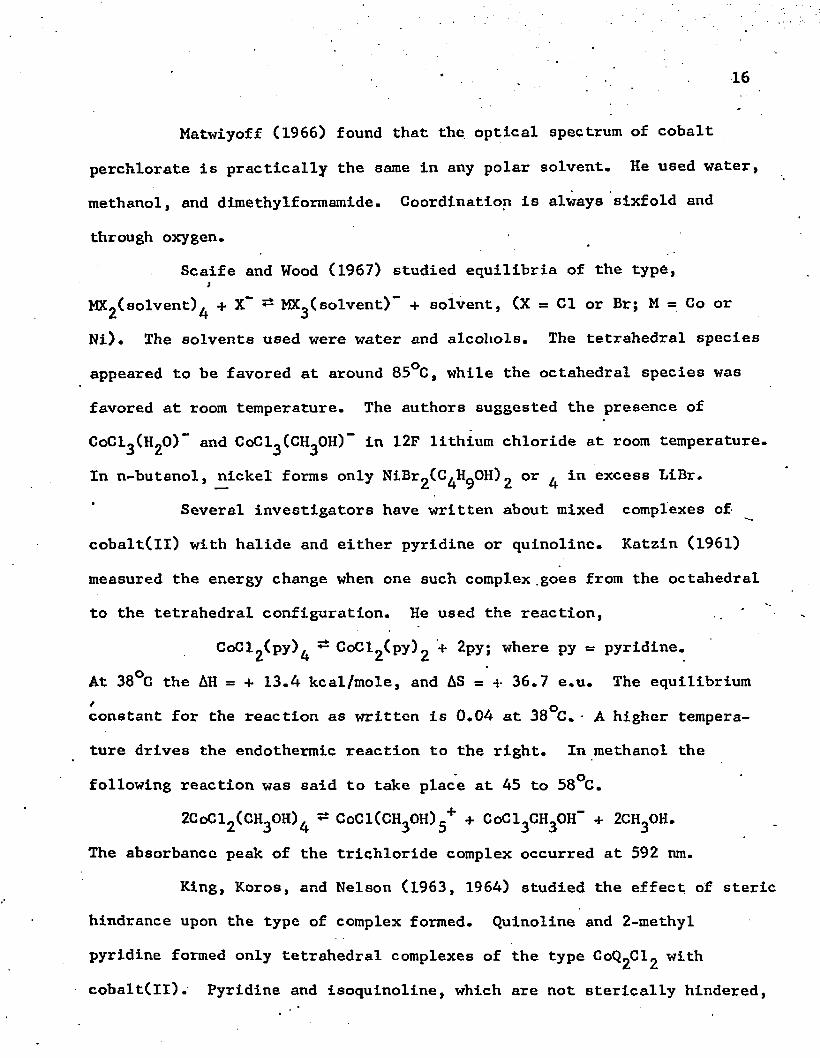
Matwiyoff (1966) found that the optical spectrum of cobalt
perchlorate is practically the same in any polar solvent. He used water,
methanol, and dimethylformamide. Coordination is always sixfold and
through oxygen.Scaife and Wood (1967) studied equilibria of the type,
tsolvent)^ + X" ^ WXg(solvent)" + solvent, (X = Cl or Br; M = Co or
Ni). The solvents used were water and alcohols. The tetrahedral species
appeared to be favored at around 85°C, while the octahedral species was
favored at room temperature. The authors suggested the presence of
CoCl^HgO)*" and CoCl^CH^OH)“ In 12F lithium chloride at room temperature.
In n-butanol, nickel forms only NiBrg^^H^OH) or ^ in excess LiBr.
Several investigators have written about mixed complexes of
cobalt(ll) with halide and either pyridine or quinoline. Katzin (1961)
measured the energy change when one such complex .goes from the octahedral
to the tetrahedral configuration. He used the reaction, '
CoCl^py)^ 54 C o C l g ^ y ^ + 2py; where py = pyridine.
At 38°C the AH = + 13.4 kcal/mole, and AS = •}• 36.7 e.u. The equilibrium oconstant for the reaction as written is 0.04 at 38 C. - A higher tempera
ture drives the endothermic reaction to the right. In methanol the
following reaction was said to take place at 45 to 58°C.
2CoClo(CH-0H). ** CoCl(CH„0H)c+ + CoCl-CH.OH" + 2CH.0H.2 3 4 3 5 3 3 3The absorbance peak of the trichloride complex occurred at 592 nm.
King, Koros, and Nelson (1963, 1964) studied the effect of steric
hindrance upon the type of complex formed. Quinoline and 2-methyl
pyridine formed only tetrahedral complexes of the type C 0Q 2CI2 with
cobalt(ll). Pyridine and isoquinoline, which are not sterically hindered,
17
can form either CoCpy^0^ or Co^Py^4C12* The latter is octahedral. Increasing the size of the halide ion also favors the.stability of the
tetrahedral complex.The Goodgames (1963, p. 207) prepared mixed halide-quinoline
complexes of nickel and cobalt with the general formula, The
cobalt(ll) complexes tested are all tetrahedral. The blue chloride and
bromide complexes of nickel are assumed to be tetrahedral because they
are paramagnetic. There is also an insoluble yellow chloride complex
which has become a polymer due to chloride bridging. It appears to be
octahedral. The iodide appears to be square-planar because it is
diamagnetic.
Clark and Williams (1965) also worked with pyridine complexes.
They prepared both tetrahedral and octahedral pyridine-chloride complexes
of cobalt(ll).
Bertrand and Plymale (1964) made an interesting study of a
pyridine N-oxide complex. The empirical formula is CoL^Cl^, where
L = C^Ht-NO. This was first thought to be (CoL^Cl)+Cl . However, spectra
$nd magnetic measurements (4.75 B.M.) indicated a tetrahedral structure
with all of the chloride (or bromide) bound to cobalt. Infrared measure
ments suggested octahedrally bound, organic ligands. They concluded that
the compound is (CoL^)(CoCl^). An analogous cadmium bromide, (CoL^)(CdBr^)
was prepared, and this helped to confirm that the anion was a tetrahalide complex.
Cotton, Faut, and Mague (1964) prepared some mixed halide-
thiourea complexes, such as Co^SNgH^^Clg and Co^SNgH^gBr^, in which
the coordination is through sulfur. Both are tetrahedral and are
nonconductors when dissolved In nitromethane.Apparently, the only known fluoride complexes of cobalt are
found in the solid state. In the only literature reference noted
(Crocket and Grossman 1964), there is mentioned the formation of
where M may be divalent Mn, Co, Ni, Zn, or Cd.
Some work In fused chloride systems was done by Gruen and his
coworkers (0ye and Gruen 1964, 0ye and Gruen 1965, Angell and Gruen 1967).
In fused potassium chloride both nickel and cobalt are reported to be
four-coordinate or tetrahedral. In fused aluminum chloride nickel and■f*3cobalt are six-coordinate or octahedral. The small A1 Ion takes some of
the negative ctfarge away from the chlorides, so that the chlorine atoms
do not repel each other so much, and more of them can gather around the
transition metal cation. In fused zinc chloride in which the polarity is
intermediate, cobalt ion is tetrahedral, while nickel is octahedral in
that solvent salt. When equimolar amounts of KC1 and AlCl^ are mixed, a
eutectic, KAICI^ is formed. Cobalt chloride precipitates from this
eutectic. If more KC1 is added, tetrahedral I^CoCl^ is formed.
Other Cobalt Complexes
Up to this point only tetrahedral and octahedral complexes of •
cobalt(ll) have been discussed. In general, cobalt forms six bonds with
oxygen or nitrogen-containing ligands. The larger halogen atoms usually
permit room for only four bonds. The negative charge on the halide ions
also tends to push them apart. Under certain conditions cobalt can also
form five-and eight-coordinate complexes.
19
Four-coordinate square-planar complexes of cobalt(ll) are
unusual, but they do form when the geometry of the ligand demands it,
as in porphyrins. Even here weaker bonds are formed in the trans posi-*
tions with anions or solvent. One example of a square-planar complex is
with o-phenylenebisdimethylarsine (Rodley and Smith 1967A, Einstein and
Rodley 1967). Anions including perchlorate and nitrate occupy the trans
positions to form an octahedral complex in the crystalline state. The
anions break away and ionize in a polar solvent.
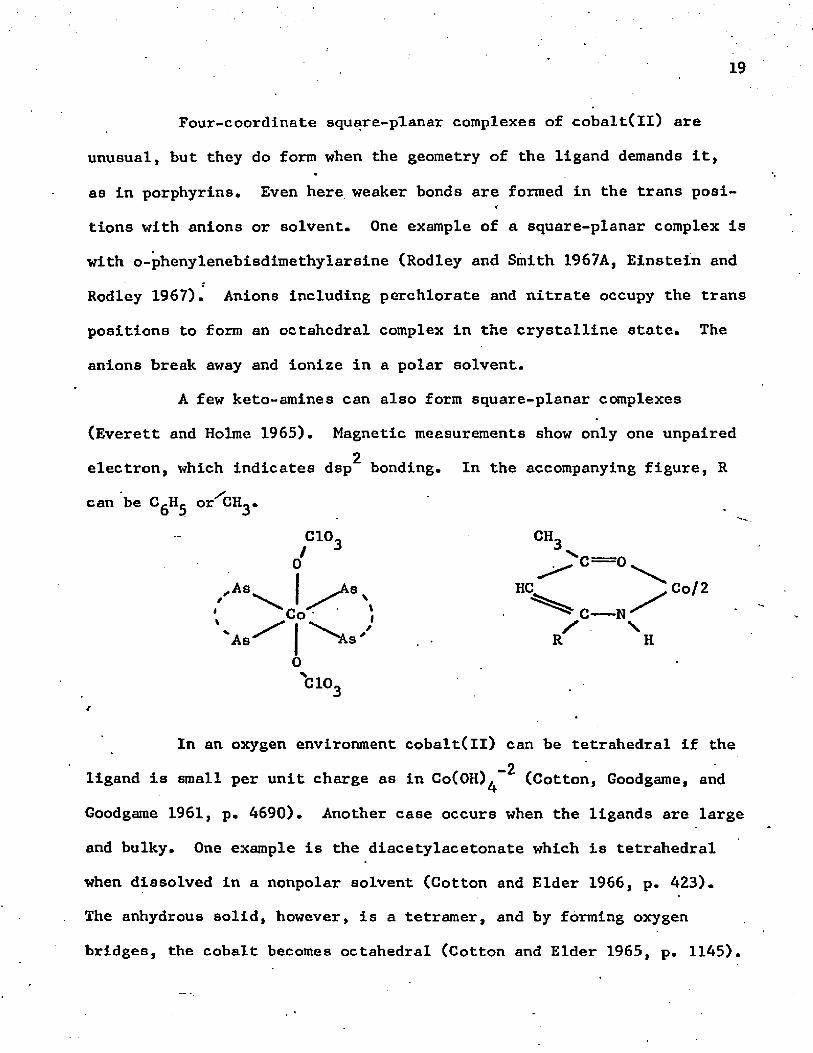
A few keto-amines can also form square-planar complexes
(Everett and Holme 1965). Magnetic measurements show only one unpaired2electron, which indicates dsp bonding. In the accompanying figure, R
can be or^H^.
CIO, CH_/ ^0 . 'sc— o
/Ask 8 v HC^ ^ Co/2iCo ^ C N/ \A s^ I "As' R H
'cio3
In an oxygen environment cobalt(ll) can be tetrahedral if the_2ligand is small per unit charge as in Co(OH)^ (Cotton, Goodgame, and
Goodgame 1961, p. 4690). Another case occurs when the ligands are large
and bulky. One example is the diacetylacetonate which is tetrahedral
when dissolved in a nonpolar solvent (Cotton and Elder 1966, p. 423).
The anhydrous solid, however, is a tetramer, and by forming oxygen
bridges, the cobalt becomes octahedral (Cotton and Elder 1965, p. 1145).
20
Another tetrahedral complex with cobalt-oxygen bonds is
[(CgHij^As^CoCOgCCF^)^ (-Bergman and Cotton 1960, p. 1420). Here the
ligand is only monodentate, but the bulky trifluoracetate ligands and
large cations help to stabilize the tetrahedral structure.
One of the few examples of a five-coordinated cobalt(ll)
complex is described by Bertrand and Plymale (1966, p. 879). Dibromo-
trls(diphenylphosphine)cobalt(ll) is described as having a trigonal
bypyramid structure. Both bromides and one phosphorus are in the
equatorial plane. Magnetic measurements show one unpaired electron,3which indicates dsp bonding.
Some of the most interesting complexes of cobalt are the
nitrates. Cotton and his coworkers have investigated many of them, and
find that the nitrate ion is often bidentate. One example is a nitrate-
phosphine oxide complex, Co[(CH3)3P0]2(N03)2 (Cotton, D. M. L. Goodgame,
and Soderburg 1963, p. 1162). This compound is nonconducting and soluble
in nonpolar solvents such as chloroform. X-ray studies show six-oxygen
atoms around each cobalt. The maximum absorption occurs around 550 nm.
This is a second indication that the compound is octahedral, and that
each nitrate group supplies two oxygen atoms for bonds with cobalt.
Other nitrate complexes investigated were [(CH^^N^CodtfO^)^
(Cotton and Dunne 1962, p. 2013) and [(CgH3)^As]2Co(N03)^ (Bergman and
Cotton 1966, p. 1208). Both compounds are soluble in nitromethane. The
former has a maximum absorption at 530 nm, and may be octahedral. The
latter was shown to contain cobalt with a coordination number of eight
so each nitrate group must be bidentate.
21
The investigators, Addison and Sutton (1964), discovered the
complexes, CoCNO-^N^O^ and CoCNO^^CN^O^)^. The former structurally is
N0 +Co(N0 2 )3 ~» which is octahedral with bidentate nitrate.ligands. The
compound decomposes at about 105°C to anhydrous cobalt nitrate, which is
ionic.The formation of nitrate association complexes was investigated
by Katzin and Gebert (1950, pp. 5451 and 5455). Part of the water of
hydration could be replaced by an organic solvent, but the total,
coordination number remained at six. In anhydrous acetone or alcohol
the final compound seemed to be neutral CoOTO^^C s o l v e n t ) T h e addition
of tetrabutylammonium nitrate produced evidence of a Co^Og)^ complex (Katzin and Gebert 1950, p. 5455). Their method used spectral data,
which was analyzed by methods developed by Job (1928) and Vosburgh and
Cooper (1941). Observe that only polar solvents were used. Biagetti and
Haendler (1966, p. 383) prepared complex pyridine nitrates of cobalt(ll).
The most stable was Co(py)^(N0 ^ ) 2 which was octahedral and contained one
mono and one bidentate nitrate ligand. The compound was soluble in
chloroform. Adding more pyridine formed C0 (py)^(N0 ^ ) 2 and Co(py)g(N0 2 )2 «
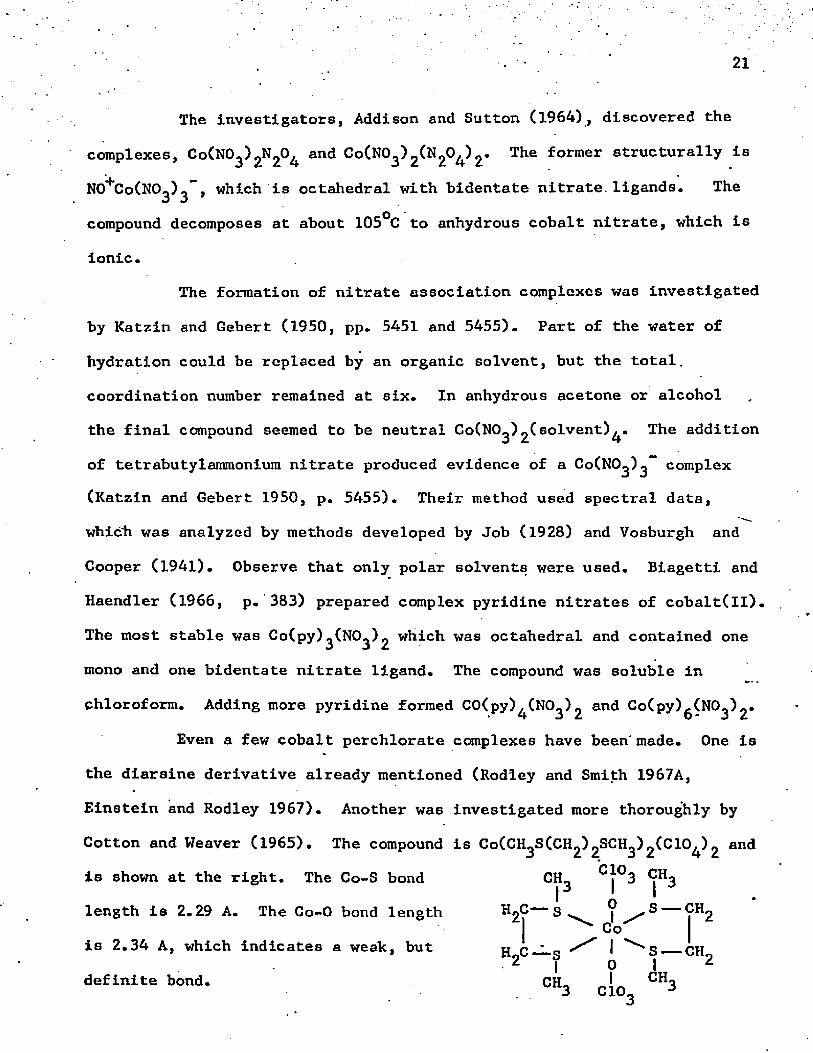
Even a few cobalt perchlorate complexes have been' made. One is
the diarsine derivative already mentioned (Rodley and Smith 1967A,
Einstein and Rodley 1967). Another was investigated more thoroughly by
Cotton and Weaver (1965). The compound is C o ^ H ^ S ^ ^ ) 2801^ ) 2 (0 1 0 ^) 2 and is shown at the right. The Co-S bond CH_ C }°3 9H 3
|3 I Ilength is 2.29 A. The Co-0 bond length 3 ?^2
1 ^ Co 1is 2.34 A, which indicates a weak, but h C ~ q 1 " ^ S __ CH
2 | 0 1 2definite bond. CH^ ^ 3
22
Cobalt can also form complexes in the +1 and zero oxidation
states. These are generally with TT-bonding ligands such as carbon monox
ide and isonitriles. One example' is pentakis(methylisonitrile)cobalt(l)
(Cotton, Dunne, and Wood 1965, p. 318), which has the trigonal bipyramid
structure. The Co-C bonds have a bond order of about 1.5.
Halide Complexes of Certain Platinum Metals
Although cobalt is more like its horizontal neighbors in the
periodic chart, it was thought that a literature study of the halide
complexes of the vertical neighbors might throw light upon the composi
tion of cobalt halides. The elements below cobalt, rhodium and iridium,
are somewhat different in that the most stable oxidation state is +3.
Since the ions are larger, higher coordination numbers may be expected.
The most complete report on the chloride complexes of rhodium(lll)
was written by Wolsey, Reynolds, and Kleinberg (1963, p. 463). They+3 —3prepared all of the mononuclear complexes from Rl^^O)^ to RhCl^” • The
yellow hydrated rhodium(lll) ion may be prepared by dissolving Rh(OH)^ in
dilute perchloric acid. The addition of each chloride causes a slight
increase.in the wavelength of the absorption band. The hexachloride
anion is dark red. The authors (Wolsey, Reynolds, and Kleinberg 1963)
prepared the various chloride complexes by boiling the perchlorate
solution with hydrochloric acid of the required concentration, which is
given in their paper. Rhodium(lll) is like chromium(lll) and cobalt(lll)
in that it is changed very slowly at room temperature from one complex to
another. Kristjanson and Lederer (1959, p. 245) reported the presence of_5
polynuclear complexes, such as Rh^Cl^ in 6F hydrochloric acid.
Rhodium also forms complexes with sulfate (Shukla and Lederer
1959, p. 255) and oxalate (Shukla 1959, p. 333). The oxalate complex is
a yellow anion, which forms the salt, K^Rh(C^O^)^. In sulfate solution
rhodium forms both yellow cationic and red anionic complexes, the latter
being formed only by boiling with concentrated sulfuric acid. Rhodium(lll)
forms alums similar to those of chromium(lll).
Rhodium(l) and iridium(l) form several square-planar complexes
with TT-bonding ligands such as carbon monoxide. Examples (Vallarino 1965)
are the dimer, [Rl^Co^Cl],, wi-bh chloride bridges, and the anion,
RhCCO^Clg”. The chloride can be substituted with bridges of oxygen atoms
contributed from acetate or nitrate (Lawson and Wilkinson 1965, p. 1900).
The bridges can be broken with triaryl phosphines and certain amines.
Iridium(l) can even form a complex with molecular nitrogen, IrL^Cl^, where
L is triphenyl phosphine (Coilman 1968).
The most thorough quantitative work on iridium(lll) chloride
complexes has been done by Garner and coworkers (Paulsen and Garner 1962,
p. 2032; Chang and Garner 1965, p. 209; El-Awady, Bounsall, and Garner
1967, p. 79). They first (Paulsen and Garner 1962) started with the-3 -2reaction, IrCl^ + 1^0 ** Ir(H20)Cl^ + Cl , which was slow even in
boiling water. The second and third papers dealt with the replacement of
the second and third chlorides, respectively, with water. The final
product was neutral I^H^O^Cl^- Liberated chloride ion was easily
determined by titration with silver nitrate. Kinetics of these reactions
were discussed in some detail. The presence of nitrate seemed to hasten
the replacement of chloride, so perhaps an intermediate nitrate complex
was formed. As each cloride was replaced by water, there was a shift in
• . . . 24*
absorption toward shorter wavelengths. Oxidation to Ir(lV) caused the
complexes to have absorption of greater magnitude and at higher wave
lengths.Another indication of the high stability of iridium chloride
complexes is that they are not reduced completely to the metal by zinc
or magnesium even after the solution is boiled for one hour (Beamish 1966
p. 57). Rhodium(lll) is reduced under these conditions.
MacNevin and his coworkers (MacNevin and Crummett 1954,' p. 323;
MacNevin and McKay 1957, p. 1220; MacNevin and Dunton 1957, p. 1806)
separated some of the complexes of the platinum metals by means of ion
exchange. In neutral solution rhodium forms an insoluble hydroxide and
does not move on an ion exchange resin. Platinum forms an anionic-2hydroxy complex, Pt(OH)^ . The addition of EDTA forms an anionic
-2 -3complex, probably PdY or PdYOH - , with palladium. The very stable-3iridium chloride complex, IrCl^ , apparently remains unchanged. During
electrophoresis (1957, p. 1806) in neutral solution containing EDTA, the
rate of migration toward the anode is of the order Ir > Pt > Pd > Rh.
In dilute acid, pH 2.8, only rhodium forms a stable cation in chloride
solution. MacNevin and his coworkers (1954, p. 323; 1957, p. 1806) made
the qualitative assumption that the chlorides of irldium(lll) are less
reactive kinetically than those of rhodium(lll).
Lederer (1958), p. 279) and Shukla (1958, p. 457) also used
electrophoresis and ion exchange in their work. Lederer showed that
upon aging in dilute HC1 or HBr, a mixture of cation and anion complexes
of rhodium were formed. In nitric acid there were two complex cations; .
the chief *one was Rh(Ho0)_NO_++ with some Rh(H„0),+^. Rhodium(lll)Z o o Z o
. . ' 25
cations were said to form irreversible complexes with the sulfonic acid
groups of Dowex 50 resin, but no data were given. Electrophosesis (Shukla
1958, p. 457) of rhodium(lll) in dilute perchloric acid resulted in three
bands. The largest was the hydrated ion, RhCl^O)^**^. The others were the
mono and dihydroxy complexes. Apparently no perchlorate complex was
formed.
Careful experiments on palladium chlorides were performed by
Mrs. Weed (1964) in these laboratories. By means of spectrophotometry,
she determined the four individual constants as four chlorides were
successively added to palladium(ll).. The first three constants were
determined by using Bjerrum's (1944) method of corresponding solutions.
The fourth stability constant, K^, was determined by one of the modifi
cations of the slope-intercept method (Whiteker and Davidson 1953).
Palladium(ll) is different from cobalt(ll) in that there is only a
gradual change in color as each chloride is added. The chief reason is
that the structure remains the same, namely square-planar.
Summary/
It appears that cobalt(ll) can form an amazing variety of
complexes. Although tetrahedral and octahedral are the most common, there
are examples of square-planar, trigonal bypyramid, and even eight-
coordinate complexes. Cobalt(ll) usually bonds through oxygen, but there
are many ligands which bond to cobalt through nitrogen, carbon, sulfur, phosphorus, and halogens.
The only agreement in the literature about the nature of the
chloride complexes in concentrated hydrochloric acid seems to be that they
26
are blue and absorb in the 650-700 nm range. Various complexes listed
are Co(H20)3C1+ , Co(H20)5C1+ , CoCl2(aq), CoCl+CoCl3" , Co(H20)C13", and _ 2CoCl, . Most investigators agree that the blue color is fully develop-
ed in 9-10F HC1 or LiCl. Then some add that there is also absorption at
525-530 nm, a fact which indicates that an octahedral complex is still
present. Bromide and iodide complexes absorb in the 700-800 nm range.
Nitrates, perchlorates, sulfates, and dilute solution of chlorides
absorb in the 515-530 nm range. The complex is said to be the hydrated
ion Co(H20)g . Oxygen-containing organic solvents may replace water as
a ligand.
CHAPTER II
ELECTRICAL AND ION EXCHANGE EXPERIMENTS
sIn view of the fact that there are so many conflicting
interpretations about the structure of the blue cobalt chloride complex,
it was thought that electrical migration and related experiments could
determine if the complex is positive, negative, or neutral. Then it
should be easier to interpret the complicated changes in absorption
spectra.During electrical migration an ion may move to a new environ
ment. In this new environment complications often arise because the ion
or complex is equilibrating to the new conditions. The^e new equilibrium
conditions can form a new complex with a different charge, and thus
change the rate of migration. For instance a spot of cobalt chloride
moving in electrophoresis is moving into an environment containing no
Cobalt ion. If the cobalt chloride complex were binuclear, the complex
would tend to dissociate where no cobalt is present. The following is a-2 -hypothetical reaction: Co^l^ “* 2CoC1'2 . The singly charged mononu
clear complex would move only half as fast as the binuclear complex. The
following is a possibility if the chloride concentration is reduced,
possibly by evaporation of hydrochloric acid: CoCl^” **♦ C o C ^ + Cl“. The
neutral CoCl^ would not move at all under an electrical potential. It is
the movement at the beginning of the experiment that shows the charge of
the original complex.27
28
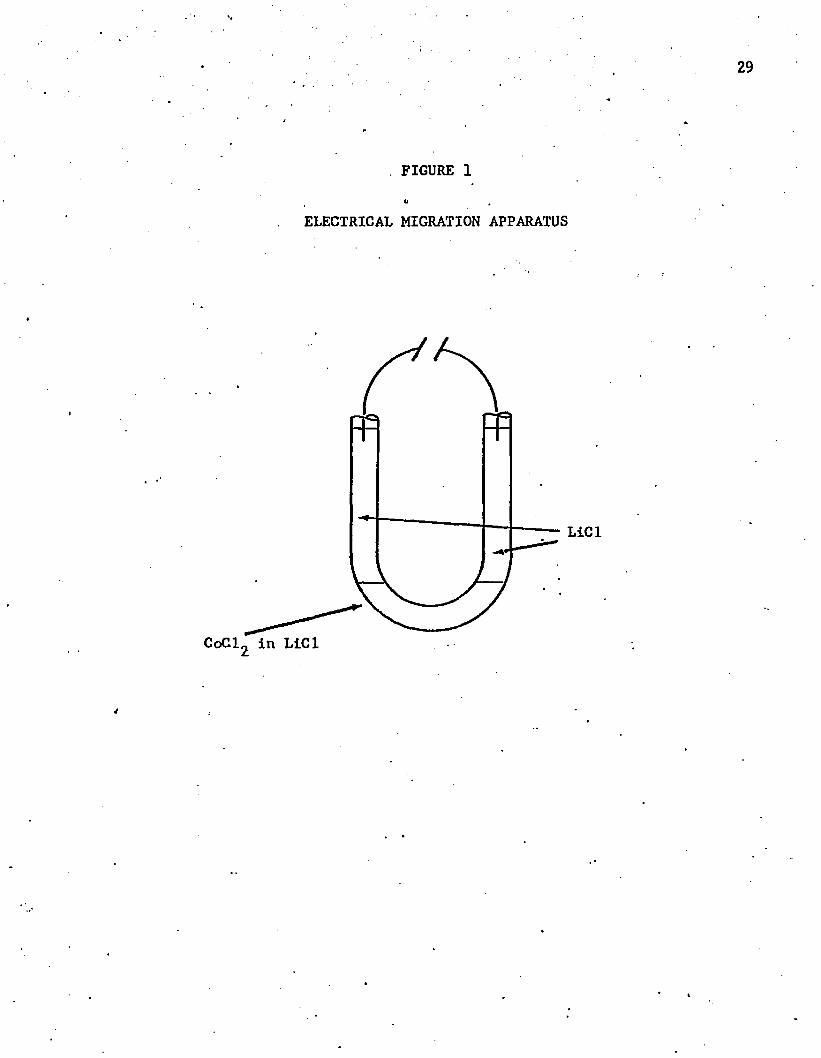
Electrical Migration Experiment
In this experiment a solution of CoCl^ in 12F LiCl was
dispersed in an agar gel at the bottom of a glass U-tube as shown in
figure 1. The side arms were filled with 12F LiCl, and platinum wires
connected to the terminals of a lead storage battery were immersed in
the solutions. After two hours of electrolysis the absorbance in the
anode compartment at 700 nm was 0.014. In the cathode compartment it
was nearly six times as great or 0.080. This observation indicates++ 4*the presence of some cationic complex, probably Co or CoCl , but
very little anionic complex. When there was no current, there was no
detectable diffusion of cobalt ion from the agar gel into the lithium
chloride solution.
Electrophoresis
A second study of electrical migration was that of electro
phoresis on paper. Two dishes containing electrolyte were place at
the ends of a water-filled tank 29 cm long and kept at 25°C. A
platinum wire was placed in each solution and each wire was connected
to one of the terminals from a high-voltage direct-current power source.
Two spots, one of cobalt and one of copper chloride, were placed on the
center of a strip of No. 1 Whatman paper. Then the paper was wet with
the electrolyte. The ends were dipped into the two solutions, and this
completed the electrical circuit. A cover was then placed over the
whole apparatus except the power source. After two hours of electro
phoresis at a current of 50 milliamperes, the position of each colored
29
. FIGURE 1o
ELECTRICAL MIGRATION APPARATUS
CoCl„ in LiCl
LiCl
. - ■ . . . 30
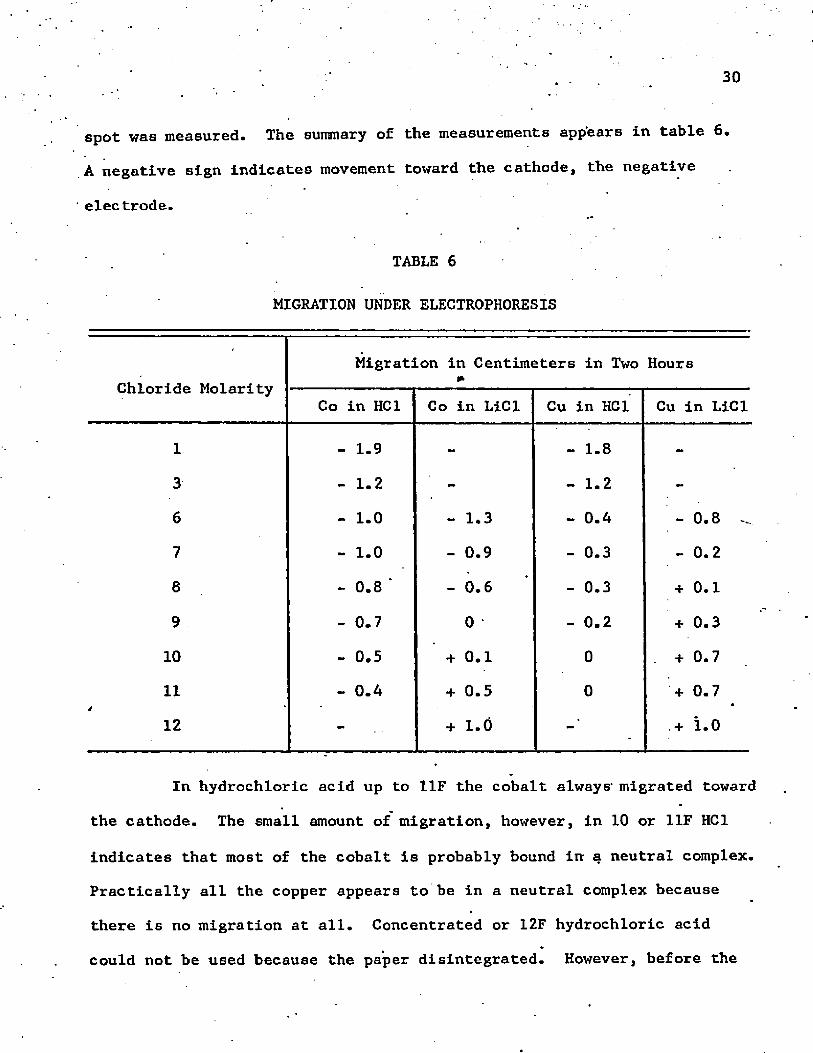
spot was measured. The summary of the measurements appears in table 6.
A negative sign indicates movement toward the cathode, the negative
■ electrode.
TABLE 6
MIGRATION UNDER ELECTROPHORESIS
Chloride MolarityMigration in Centimeters in Two Hours
Co in HC1 Co in LiCl Cu in HC1 Cu in LiCl
1 - 1.9 - - 1 . 8 -
3 - 1 . 2 - - 1 . 2 -
6 - 1 . 0 - 1.3 - 0.4 - 0 . 8
7 - 1 . 0 - 0.9 - 0.3 - 0 . 2
8 - 0 . 8 ‘ - 0 . 6 - 0.3 + 0 . 1
9 - 0.7 0 - 0 . 2 + 0.3
1 0 - 0.5 + 0 . 1 0 . + 0.7
11 - 0.4 + 0.5 0 + 0.7
1 2 - + 1 . 0 .+ 1 . 0
In hydrochloric acid up to 11F the cobalt always- migrated toward
the cathode. The small amount of migration, however, in 10 or 11F HC1
indicates that most of the cobalt is probably bound in a neutral complex.
Practically all the copper appears to be in a neutral complex because
there is no migration at all. Concentrated or 12F hydrochloric acid
could not be used because the paper disintegrated. However, before the
31
disintegration both cobalt and copper started to migrate toward the
anode. Thus, some anionic complex appears to exist in concentrated
hydrochloric acid.In lithium chloride above 10F both cobalt and copper(II)
complexes migrate toward the anode. It appears that some anionic
complex is present in LiCl but not in HC1 at these concentrations.
For cobalt the absorption in the 650 to 700 nm range (described in
detail in chapter three) is somewhat greater in HC1 than in LiCl of the
same concentration. For copper there is a slight difference in the
spectrum around 380 nm, so two different complexes may be present. The
neutral complex, where there is little or no movement, is probably
MClg^gO^- The cobalt complex is presumed to be tetrahedral, but the
copper complex may be square-planar (Eswien et al. 1967A).
The movement toward the anode in 11 and 12F lithium chloride
solutions is probably due to the trichloro complex, MCl^I^O)”. In no
case did any metal spot divide into two. The movement appeared to
represent an average movement of all complexes present.
During the electrophosesis experiments it was noted that the
migration distance is not a linear function of*time. About 75% of the
migration took place during the first hour. After the current was
shut off at the end of the second hour, the spot often moved two or
three millimeters in the reverse direction, but the reason was not
investigated. However, no spot ever reversed its direction as long
as the current was on. The final measurement was .recorded before the
power was turned off.
It should be mentioned that because of evaporation, the
chloride concentration in the paper may not have been the same as in
the electrolyte. Volatile hydrogen chloride leaves 10F solutions before
water does, so the actual acid concentration in the paper was probably
less than 10F. In the case of lithium chloride, the alkali salt does
not evaporate, but the water does. Therefore, the salt concentration
in the paper may have been more than the nominal amount. This may
explain the discrepancy of the difference in migration in the two
electrolytes. The differences in hydration and the activity of the
hydrogen and lithium ions may also have been factors.Because of these complications, the data cannot be considered
quantitative. Their chief significance is to determine the sign of
the electrical charge of the complex that migrates.
In summary it appears that in 10F chloride solution copper
is present mostly as a neutral dichloro complex. Cobalt appears to be
present mostly as a neutral complex, but a cationic complex is also
present in small amounts. When the chloride concentration is less
'than 10F, copper and cobalt exist partially as cationic complexes.
Electrophoresis alone does not tell whether these are hydrated M++ or
MCI . When the chloride concentration is more' than 10F, a little
anionic complex appears to be present.
Ion Exchange Experiments
Ion exchange is another tool which may show whether a complex
is positive or negative. Both anion (Bio-Rad Ag 1-X8) and cation
(Dowex 50W-X8) exchange resins were tried. In general the flow of a
33*
cationic complex is retarded by a cation exchange resin, while an anion
is- retarded by an anion exchange resin. Anions are attracted to,the
quaternary ammonium cations, which are fixed in the resin by organic
chemical bonds. The fixed group in a cation exchange resin is usually
a sulfonic acid group, SO^H, which is bound to the organic skeleton of
the resin. The hydrogen may ionize as a solvated proton and thus be
exchanged for a metal cation. . As in electrical migration, one must
remember that an ion is moving to a new environment and the new equili
bria established may change the rate of flow through the resin. A
neutral group usually flows through either resin unchanged, but it may
be retarded if it is polar.
In the ion exchange experiments a few drops of copper or
cobalt chloride were placed on the column, which had already been washed
with 10F hydrochloric acid. The colored metal complex could be followed
as a band through the column. With cobalt(ll) on a cation exchange
column, part of the green complex remained right on top of the column.
Some of the green color moved several centimeters down the column as 10F /HC1 was added. Thus some of the cobalt appears to be ‘present as a
cationic complex, but there is an equilibrium which produces neutral or
even anionic complexes. On an anion exchange resin the green band moved
slowly down the column, and there was no division. There apparently is
no strong anionic complex in 10F HC1, but there may be a weak one.
For the yellow copper chloride complex on a cation exchange
resin, the color moved the equivalent of one milliliter for every 20 ml
of 10F HC1 that was added. This could indicate a neutral complex or a
. 34
weak cationic one. In the anion exchange column the yellow band hardly
moved at all, and this fact suggests an anionic complex.
Since most ion exchange work is still empirical, only generalo
conclusions can be drawn from these experiments. However, in 10F
hydrochloric acid, cobalt(ll) appears to show an equilibrium between a
cationic complex and a neutral one. The presence of an unstable anionic
complex cannot be ruled out. In the case of copperCII) there are hints
of both cationic and anionic properties, so probably the principal
species is neutral. These facts agree with the electrophoresis
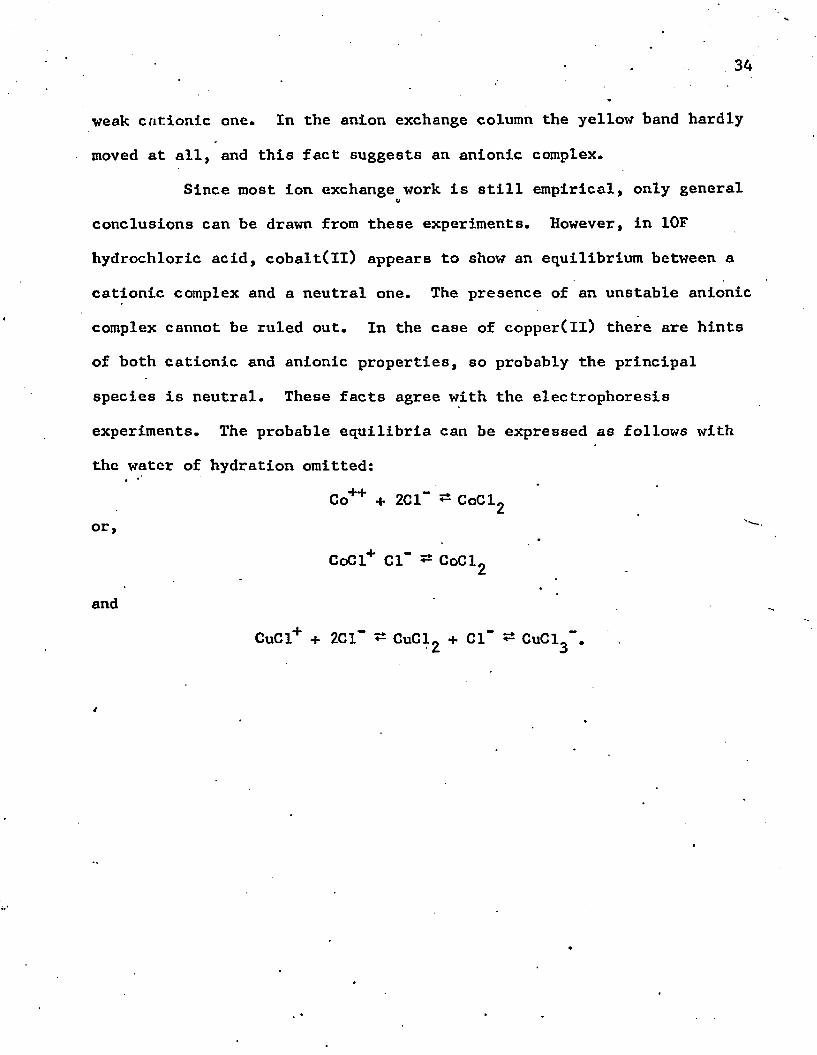
experiments. The probable equilibria can be expressed as follows with
the water of hydration omitted:
Co++ + 2Cl"" ** CoCl2
or,
CoCl+ Cl" 5s CoCl2
and
CuCl+ + 2C1" ^ CuCl2 + Cl" 5* CuCl3".
CHAPTER III*
SPECTROPHOTOMETRY OF COBALT(ll) AND COPPER(II)IN AQUEOUS CHLORIDE SOLUTIONS
Introduction
For studying inorganic compounds and complexes, one generally
uses the visible and ultraviolet portions of the spectrum. Here the
energy transitions are electronic. Energy is absorbed as an electron is
raised to a higher orbital, such as from 3d to 4p, or from a bonding to
an antibonding orbital. Each transition occurs at a specific wave
length, but the absorption peaks are rounded due to variable interatomic
forces and because vibrational and, in the case of gases, rotational
transitions are superimposed on the electronic transitions.
With transition metal ions electronic transitions are of two
general types. In the first, the absorption is relatively weak, ‘and
the color is rather pale. The transition occurs between two d levels
which have been split by adjacent ions or polar molecules. The absorp
tion is weak because the energy transition between two d levels is
"forbidden." A second type of electronic energy transition, known as
"charge transfer," occurs where an electron jumps from one atom to
another. This is permitted in accordance with electronic energy
selection rules, and it often causes strong absorption and deep colors.
35
- ' ' 36
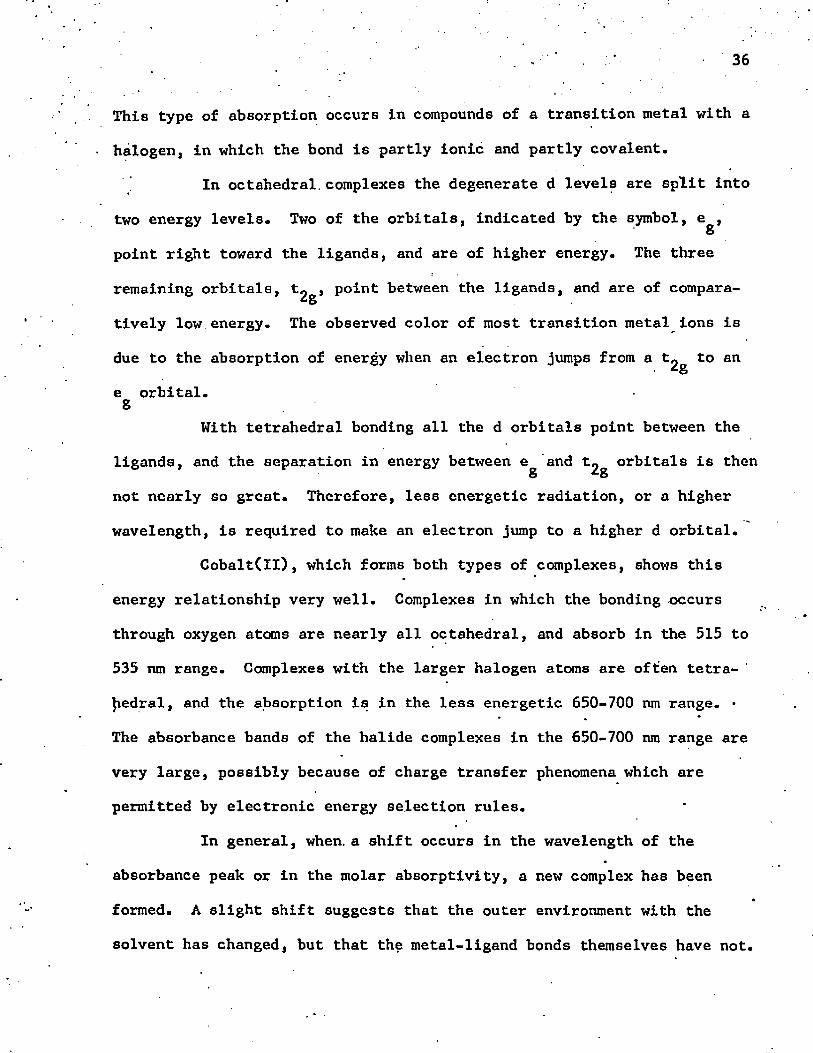
This type of absorption occurs in compounds of a transition metal with a
halogen, in which the bond is partly ionic and partly covalent.
In octahedral, complexes the degenerate d levels are split into
two energy levels. Two of the orbitals, indicated by the symbol, e ,Spoint right toward the ligands, and are of higher energy. The three
remaining orbitals, fc2g» P°int between the ligands, and are of compara
tively low energy. The observed color of most transition metal ions is
due to the absorption of energy when an electron jumps from a tg^ to an
e orbital.8
With tetrahedral bonding all the d orbitals point between the
ligands, and the separation in energy between e^ and t2 ^ orbitals is then
not nearly so great. Therefore, less energetic radiation, or a higher
wavelength, is required to make an electron jump to a higher d orbital.
Cobalt(ll), which forms both types of complexes, shows this
energy relationship very well. Complexes in which the bonding occurs
through oxygen atoms are nearly all octahedral, and absorb in the 515 to
535 nm range. Complexes with the larger halogen atoms are often tetra-
jiedral, and the absorption is in the less energetic 650-700 nm range. ■* . •
The absorbance bands of the halide complexes in the 650-700 nm range are
very large, possibly because of charge transfer phenomena which are
permitted by electronic energy selection rules.
In general, when, a shift occurs in the wavelength of the
absorbance peak or in the molar absorptivity, a new complex has been
formed. A slight shift suggests that the outer environment with the
solvent has changed, but that the metal-ligand bonds themselves have not.
37
Two instruments, the Cary 14 and the Beckman DB, were used for
obtaining absorbance data. The Cary 14, when available, was used to plot
the entire visible, and sometimes- the ultraviolet spectrum. When the
Beckman DB was used, the absorbance was recorded at intervals of about
25 nm. When a maximum or minimum was observed, this point was also
recorded. Afterwards, the points were graphed. The zero absorbance was
adjusted with blanks at one end of the significant spectrum. The refer
ence cell was filled with pure solvent or acid. Usually a one-centimeter
cell was used, except when dilute solutions or those of low absorbance
required a ten-centimeter cell. The temperature was 25 dh 1°C.
Spectrophotometry With Common Anions
Dilute solutions of cobalt(ll) salts with all common inorganic
anions have the same absorbance curves. The absprbance maximum is at
515 nm and the molar absorptivity is 4.9. The hydrated ion, CoCl^COg**
is assumed to be present. The pink color is visual evidence that the
cobalt is octahedral, because it takes more energetic light (green) to
force a t^ electron to the higher e^ energy level.
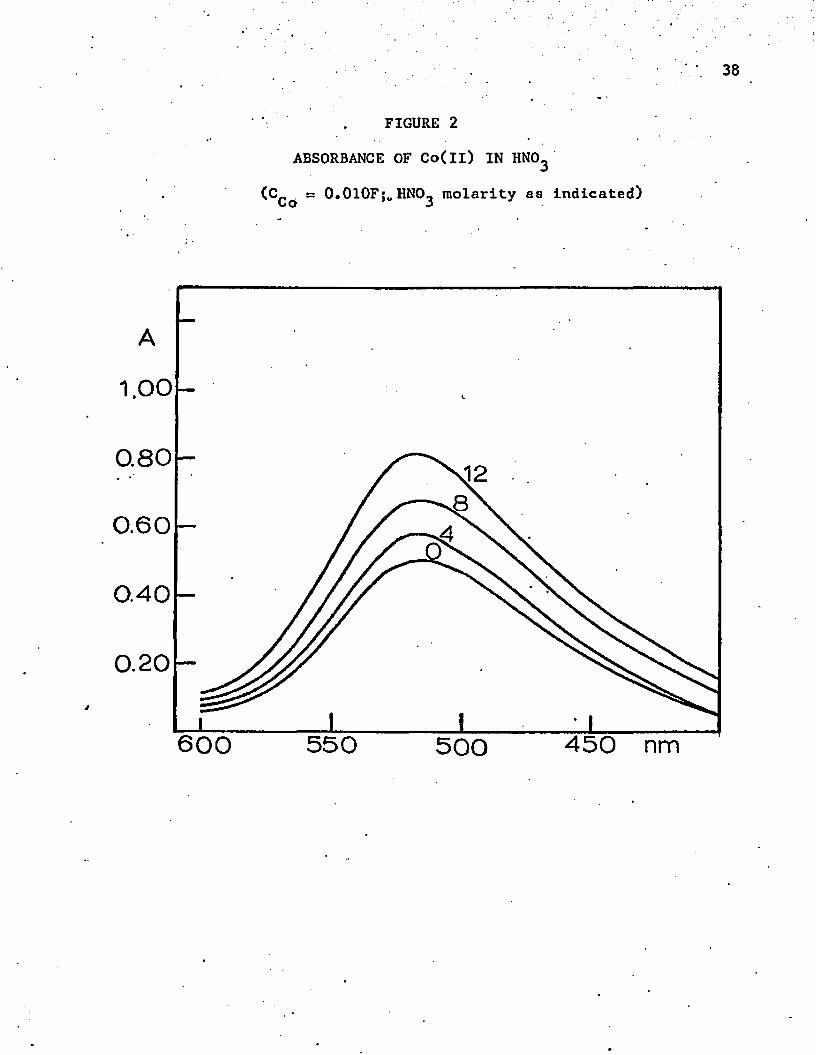
In the presence of inorganic acids, other than hydrochloric,
there is only a slight change in the absorbance curve. Curves in the
presence of nitric and sulfuric acids are shown in figures 2 and 3. With
nitric, perchloric, and sulfuric acids, there is practically no change in
absorbance up to a concentration of about 3M. When these acids become
about 4M, the absorbance begins to increase slightly and the effect of all
three acids on the absorbance of cobalt(ll) is the same until their concen*
tretion reaches 9M. At this point the water content of perchloric and
38
FIGURE 2
ABSORBANCE OF Co(ll) IN HN03
(C . ss 0.010F;o HNO^ molarity as indicated)
1.00
0.80
0.60
0.40
0.20
600 450 nm550 500
39
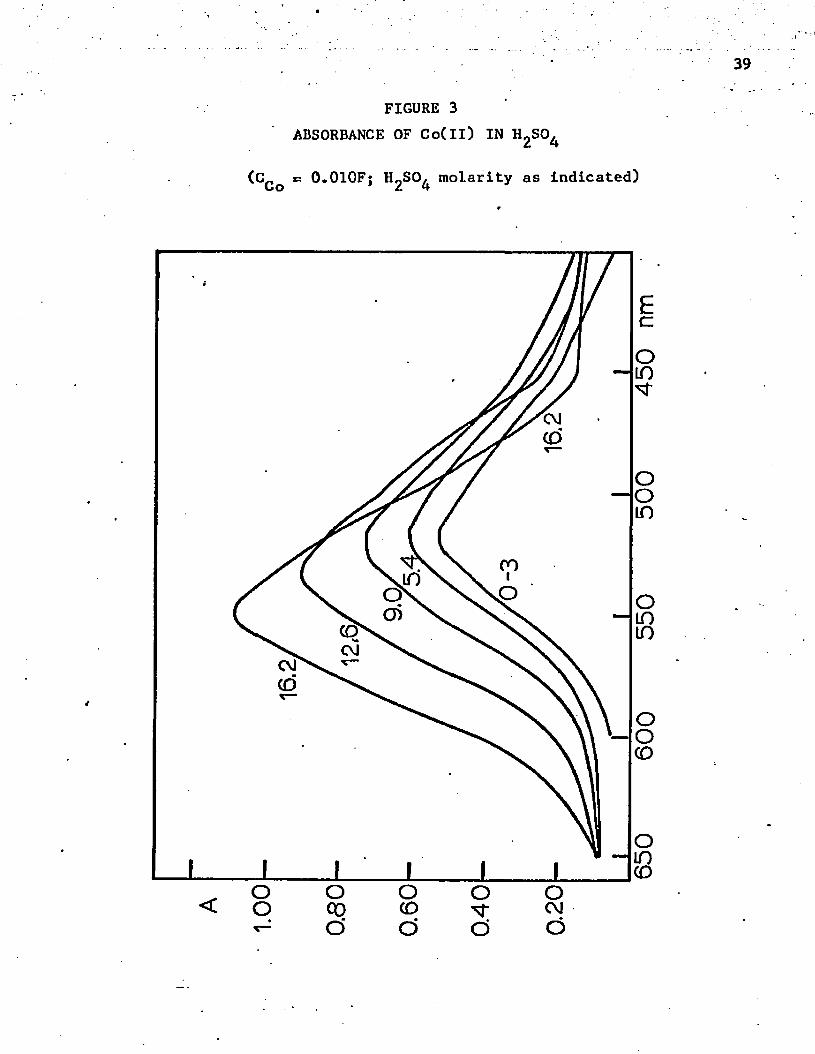
FIGURE 3 ABSORBANCE OF Co(ll) IN I^SO^
(CCo =5 0.010F; H^SO^ molarity as indicated)
OJ
00
OJOJ
OO O o o
650
600
550
500
450
nm
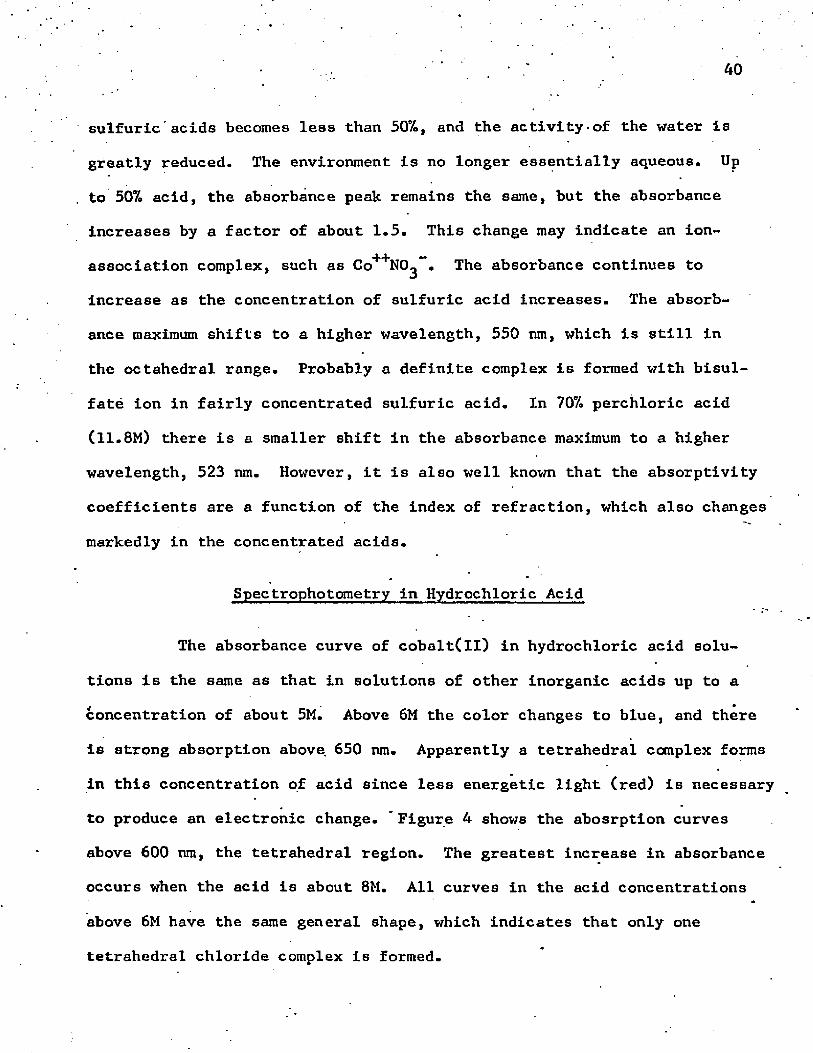
sulfuric acids becomes less than 50%, and the activity-of the water Is
greatly reduced. The environment is no longer essentially aqueous. Up
to 507. acid, the absorbance peak remains the same, but the absorbance
increases by a factor of about 1.5. This change may indicate an ion-
association complex, such as Co^NO^ • The absorbance continues to
Increase as the concentration of sulfuric acid increases. The absorb
ance maximum shifts to a higher wavelength, 550 nm, which is still in
the octahedral range. Probably a definite complex is formed with bisul
fate ion in fairly concentrated sulfuric acid. In 70% perchloric acid
(1 1 .8 M) there is a smaller shift in the absorbance maximum to a higher
wavelength, 523 nm. However, it is also well known that the absorptivity
coefficients are a function of the index of refraction, which also changes
markedly in the concentrated acids.
Spectrophotometry in Hydrochloric Acid
The absorbance curve of cobalt(ll) in hydrochloric acid solu
tions is the same as that in solutions of other inorganic acids up to a/ *concentration of about 5M. Above 6M the color changes to blue, and there
is strong absorption above 650 nm. Apparently a tetrahedral complex forms
in this concentration of acid since less energetic light (red) is necessary
to produce an electronic change. Figure 4 shows the abosrption curves
above 600 nm, the tetrahedral region. The greatest increase in absorbance
occurs when the acid is about 8M. All curves in the acid concentrations
above 6M have the same general shape, which indicates that only one
tetrahedral chloride complex is formed.
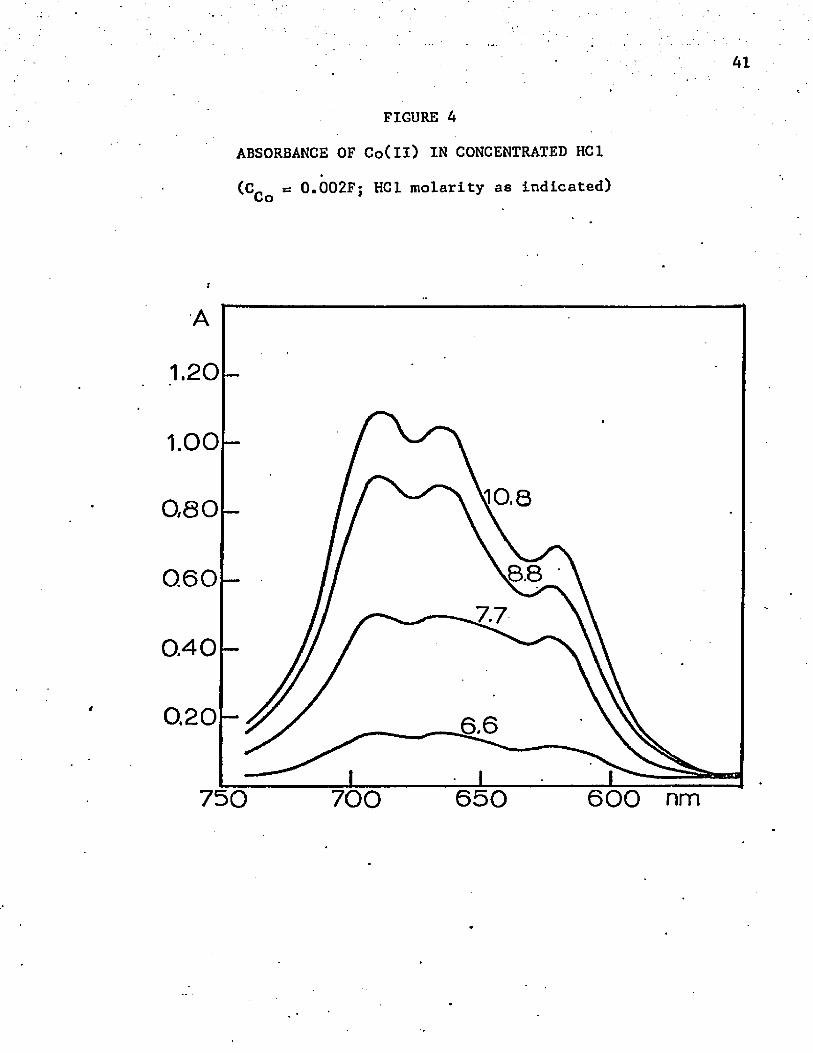
FIGURE A
ABSORBANCE OF Co(ll) IN CONCENTRATED HC1
(C_ s= 0.002F; HC1 molarity as indicated) Co
1.20
1.00(tO,8080
SB0.6077
0.40
0.20 6.6
750 650 600 nm700
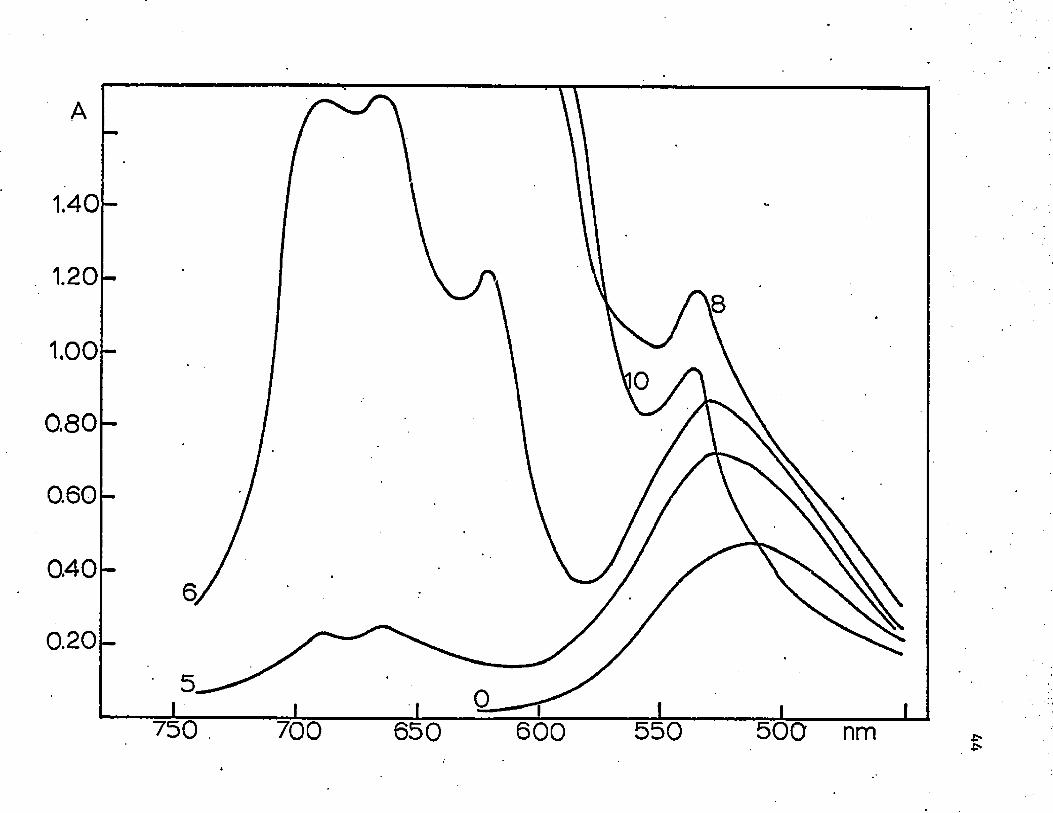
Another interesting effect, shown in figure 5, is that the
absorbance at around 530 nm, the octahedral region, also increases as
the acid concentration increases up to about 8M. Thus an octahedral
complex, such as CoCl^cOg** or CoClCl^O),-+ , is still present in signifi
cant amounts when the acid concentration is less than 8 M. Above this
acid concentration the octahedral complex appears to be changed to a
tetrahedral complex.
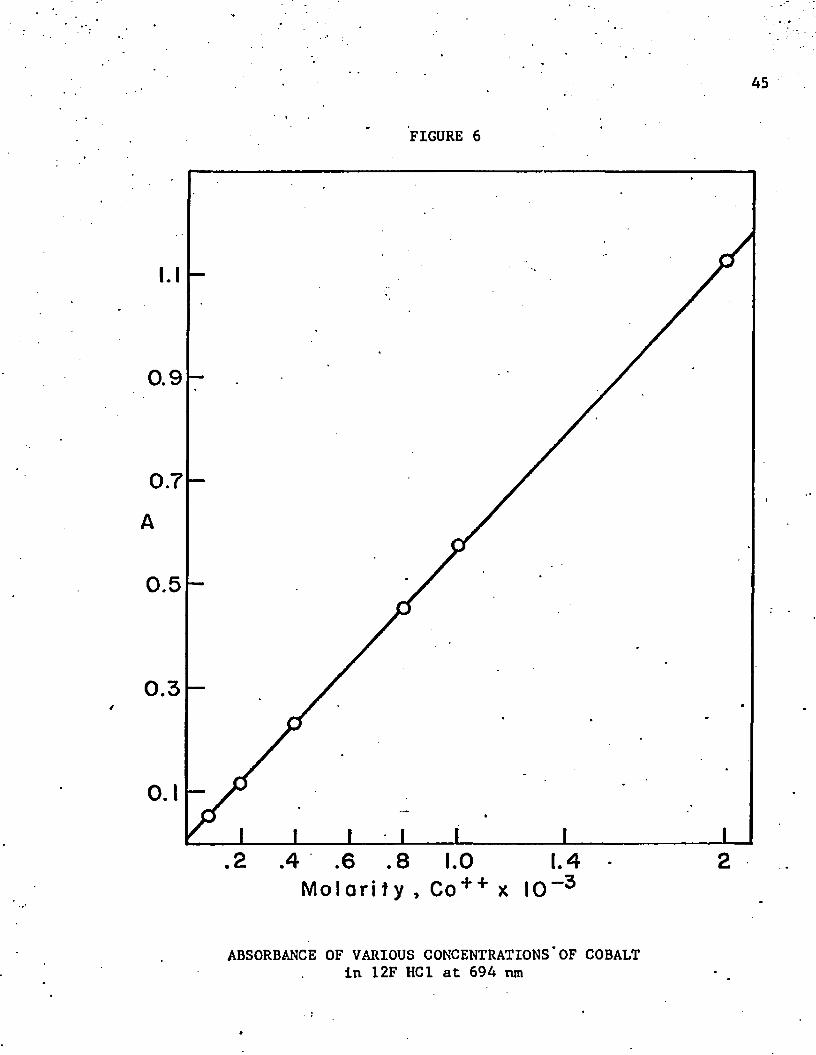
Another experiment involved changing the cobalt concentration
and keeping the hydrochloric acid concentration at 12M. The linear rela
tionship of absorbance and cobalt concentration is shown in figure 6 .
The typical Beer’s Law curve shows that cobalt can be determined quanti
tatively as well as qualitatively in concentrated hydrochloric acid.
Ion-association complexes containing more than one cobalt atom, such as
CoCl^CoCl^ , are ruled out because these would dissociate increasingly
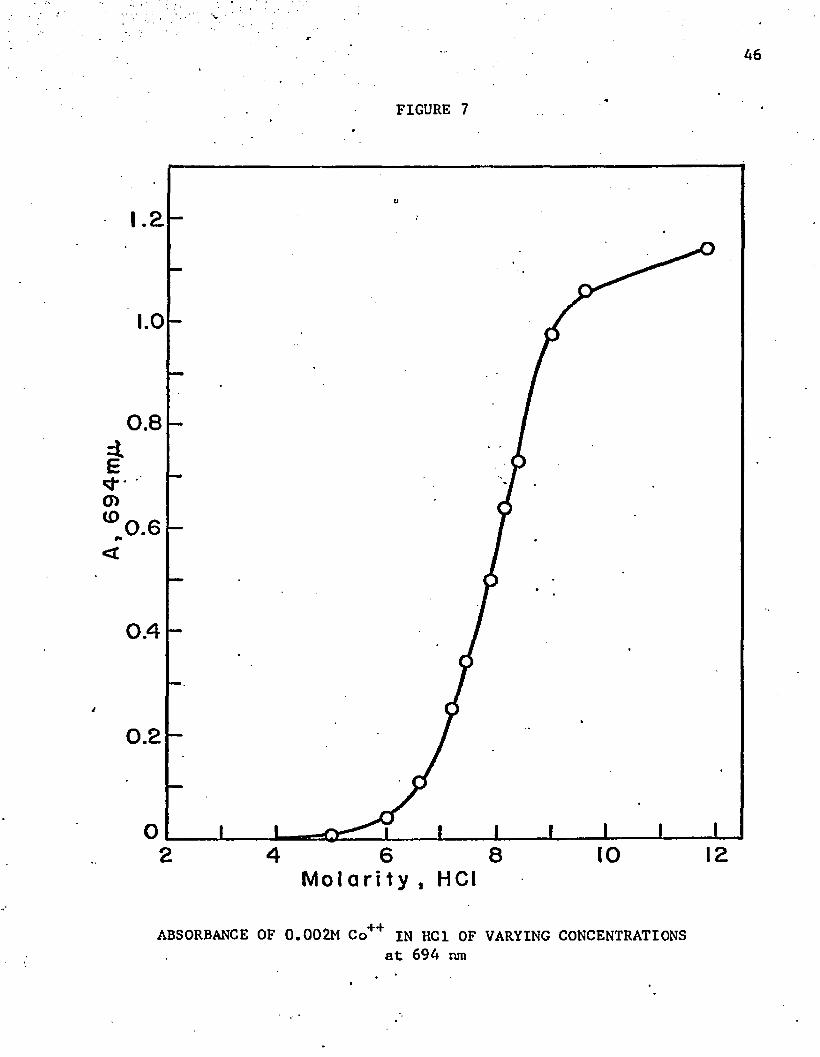
during dilution, and Beer’s Law would not be followed. The sharpness of
the increase in absorbance with increasing acid concentration is shown in
figure 7.
4 Since electrophoresis and solvent extraction.experiments -
indicated the presence of a neutral complex, there was an effort to show
if the equilibrium constant is a function of the square of- the chloride
concentration. A modification of a method developed by Ramette (1963)
was used for the determination of a stability constant from absorbance
measurements. Since a one-centimeter cell was used, the term, "b," the
length of the light path, was omitted from the calculations.
FIGURE 5
ABSORBANCE OF Co(ll) IN 500-700 run REGION (C^o ss 0.10F; HC1 molarity as indicated)
1.40
1.20
1.00
0.80
0.60
040
0.20U
750
!0
600 550 500 nm
45
FIGURE 6
0.9
0.7
0.5
0.3
.2 .4 .6 .8 1.0 1.4 - 2M o l a r i t y , Co + + x I 0 “ 3
ABSORBANCE OF VARIOUS CONCENTRATIONS*OF COBALT in 12F HC1 at 694 nm
, 69
4mju
,FIGURE 7
1.0
0.8
<
0.4
0.2
1 0 IE2 84 6M o l a r i t y , HCI
ABSORBANCE OF 0.002M Co++ IN HCI OF VARYING CONCENTRATIONSat 694 nm
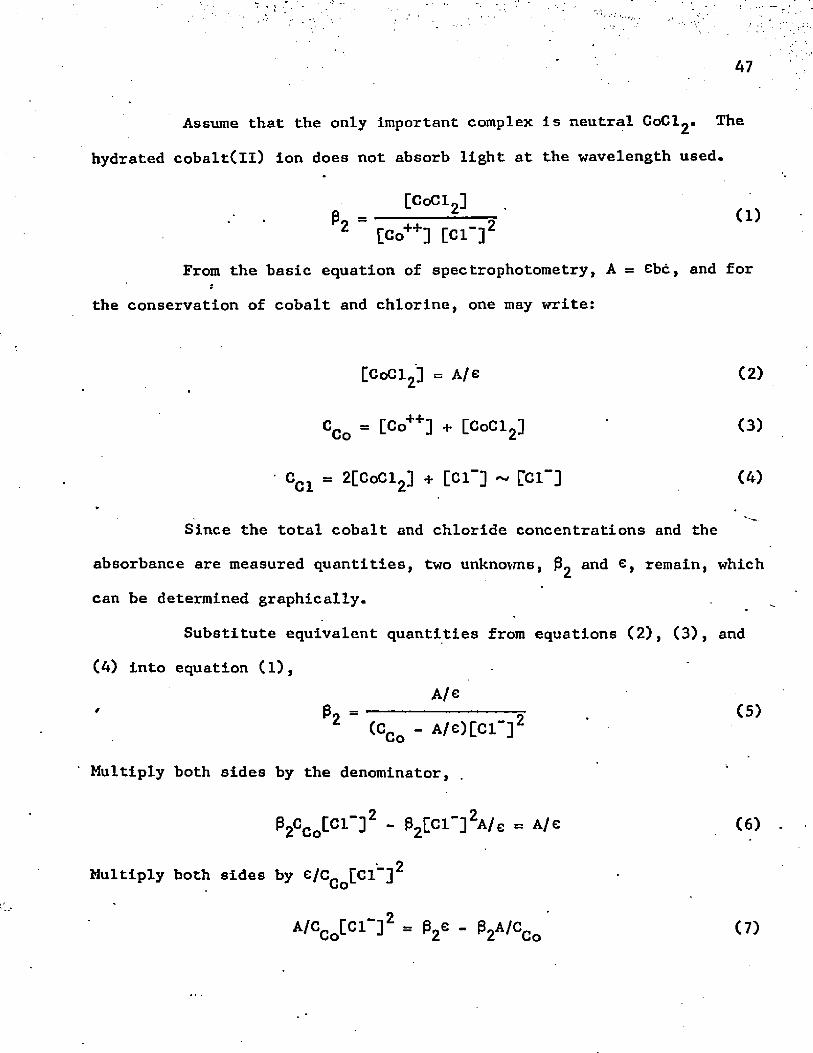
47
Assume that the only important complex is neutral CoCl2< The
hydrated cobalt(ll) ion does not absorb light at the wavelength used.
[GoCi 3h + ♦ ' — (1)2 [co++] [Cl y
From the basic equation of spectrophotometry, A » ebc, and fori
the conservation of cobalt and chlorine, one may write:
[CoCl2] = A/e (2)
CCo = tco++] + [CoCl2] (3)
ccl « 2[CoCl2] + [Cl-] ~ [bl-] (4)*
Since the total cobalt and chloride concentrations and the
absorbance are measured quantities, two unknowns, 0 2 and e, remain, which
can be determined graphically.
Substitute equivalent quantities from equations (2), (3), and
(4) into equation Cl),A/e
P, = ----------------- 2 • <5)(CCo - A/e)[cl”]
Multiply both sides by the denominator,
P2CCo[Cl" ] 2 - P2 [Cl“]2A/e = A/g (6 )
Multiply both sides by e/CCo[Cl” ] 2
A/C0 o[Cl- ] 2 = P2C - P2A/CCo (7)
48
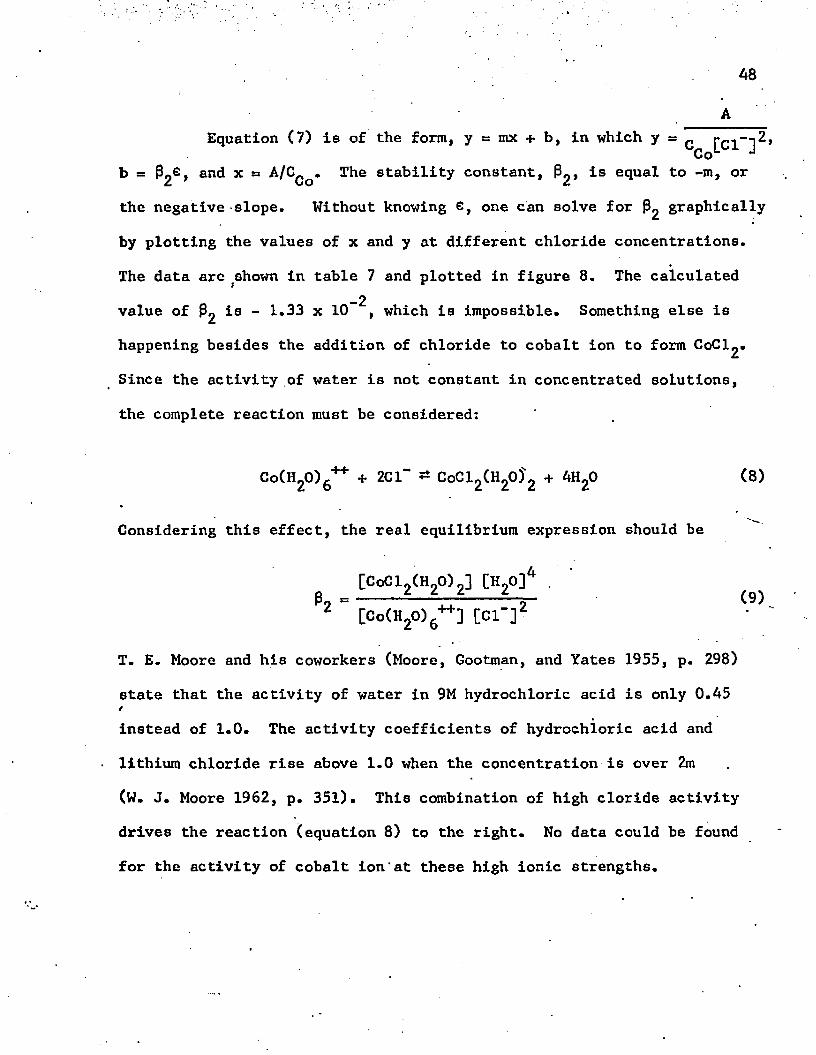
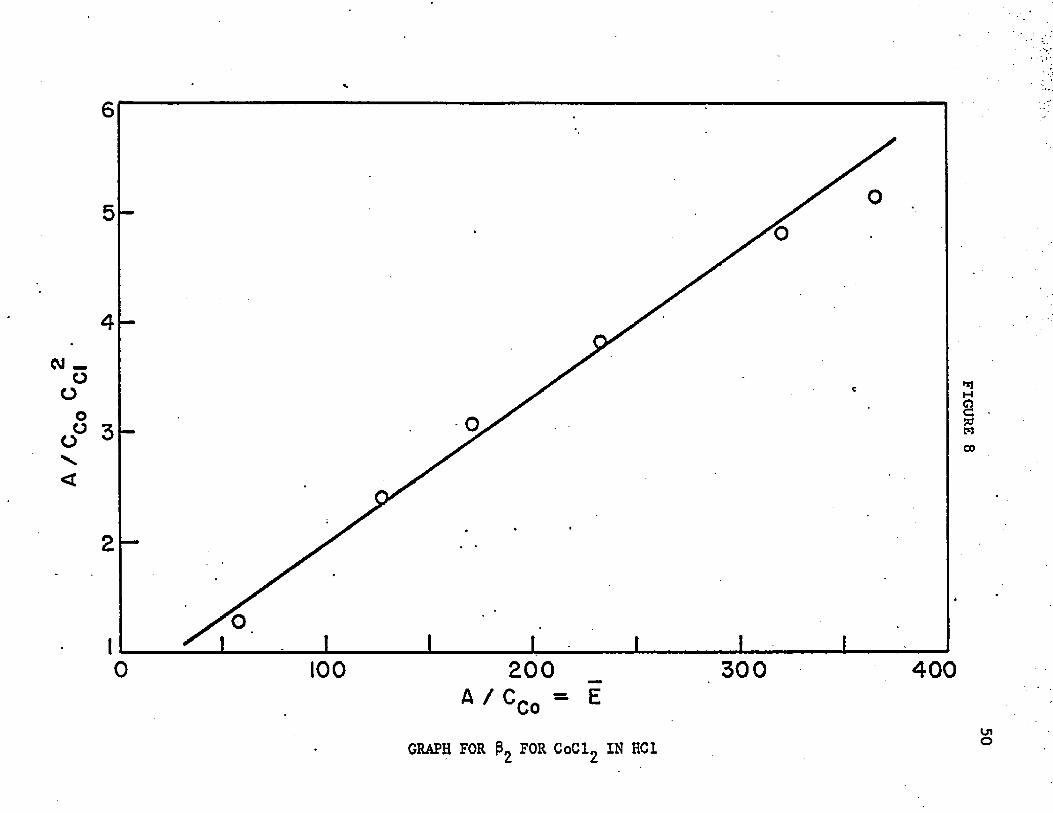
Equation (7) is of the form, y = mx + b, in which y = c [c l- ] 2
b s= p2G > atlc* x “ A ^ C o * *r^e 8tability constant, P2 , equal to -m, or
the negative slope. Without knowing e, one can solve for P2 graphically
by plotting the values of x and y at different chloride concentrations.
The data are shown in table 7 and plotted in figure 8. The calculated_2value of $ 2 *-s " 1«33 x 10 , which is impossible. Something else is
happening besides the addition of chloride to cobalt ion to form CoCl2.
Since the activity of water is not constant in concentrated solutions,
the complete reaction must be considered:
C o (H20)6++ + 2C1“ ^ CoCl2(H20y2 + 4H20 (8)
Considering this effect, the real equilibrium expression should be
[CoC1,(H90)9] [h 9o ]a .p = “ T C9)2 [ C o C H ^ ) ^ ] [Cl"]2
T. E. Moore and his coworkers (Moore, Gootman, and Yates 1955, p. 298)
state that the activity of water in 9M hydrochloric acid is only 0.45
instead of 1.0. The activity coefficients of hydrochloric acid and
lithium chloride rise above 1.0 when the concentration is over 2m
(W. J. Moore 1962, p. 351). This combination of high cloride activity
drives the reaction (equation 8) to the right. No data could be found
for the activity of cobalt ion'at these high ionic strengths.
49
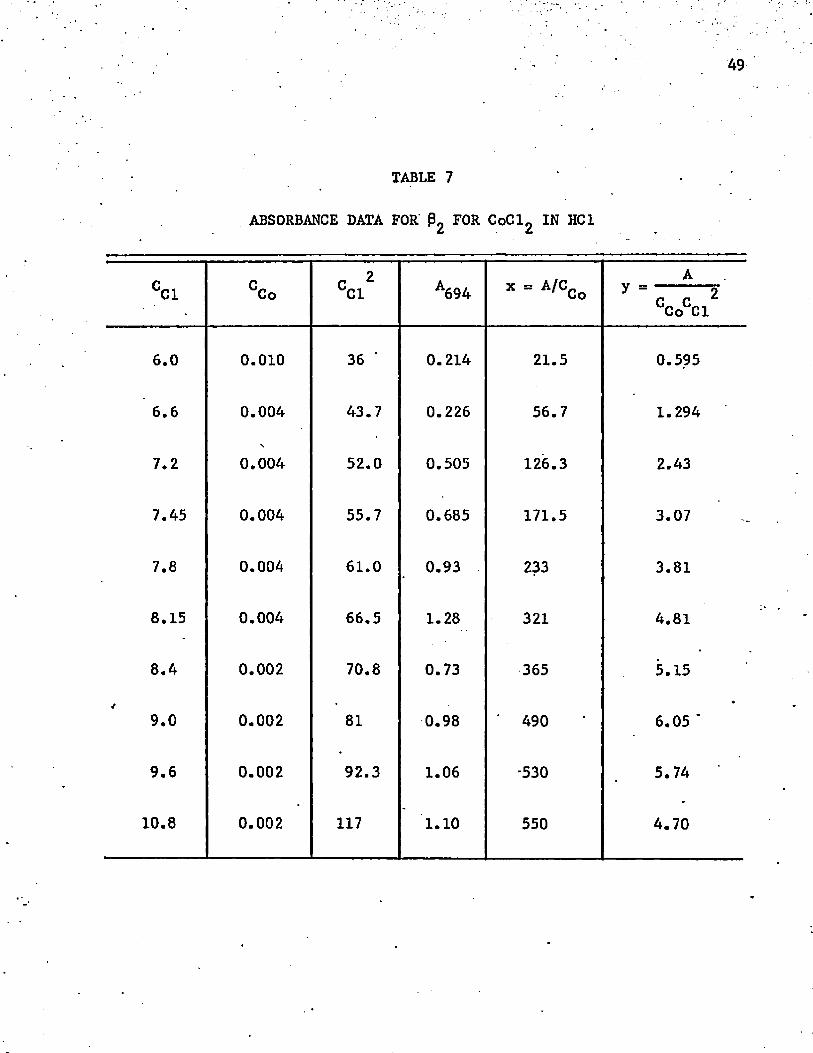
TABLE 7
ABSORBANCE DATA FOR P2 FOR CoCl2 IN HCI
CC1 CCo cci2 A694 x = A'CCoA
y - 2 CCoCCl
6.0 0.010 36 ‘ 0.214 21.5 0.595
6.6 0.004 43.7 0.226 56.7 1.294
7.2 0.004 52.0 0.505 126.3 2.43
7.45 0.004 55.7 0.685 171.5 3.07
7.8 0.004 61.0 0.93 233 3.81
8.15 0.004 66.5 1.28 321 4.81
8.4 0.002 70.8 0.73 365 5.15
9.0 0.002 81 0.98 490 6.05 '
9.6 0.002 92.3 1.06 -530 5.74
10.8 0.002 117 1.10 550 4.70
6
OJ _ o
o
o's.<
5
4
3
2
I 100 200 A / C
300 400'Co
GRAPH FOR P2 FOR CoCl2 IN HCI o
FIGURE 8
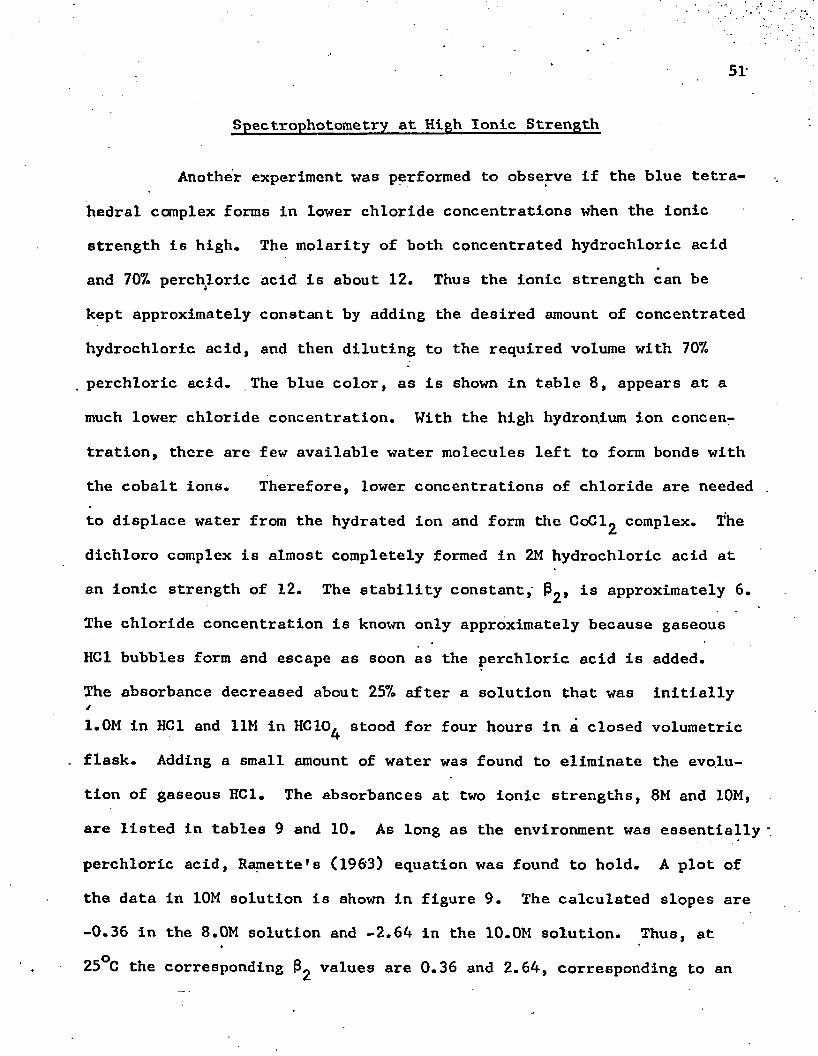
Spectrophotometry at High Ionic Strength
51
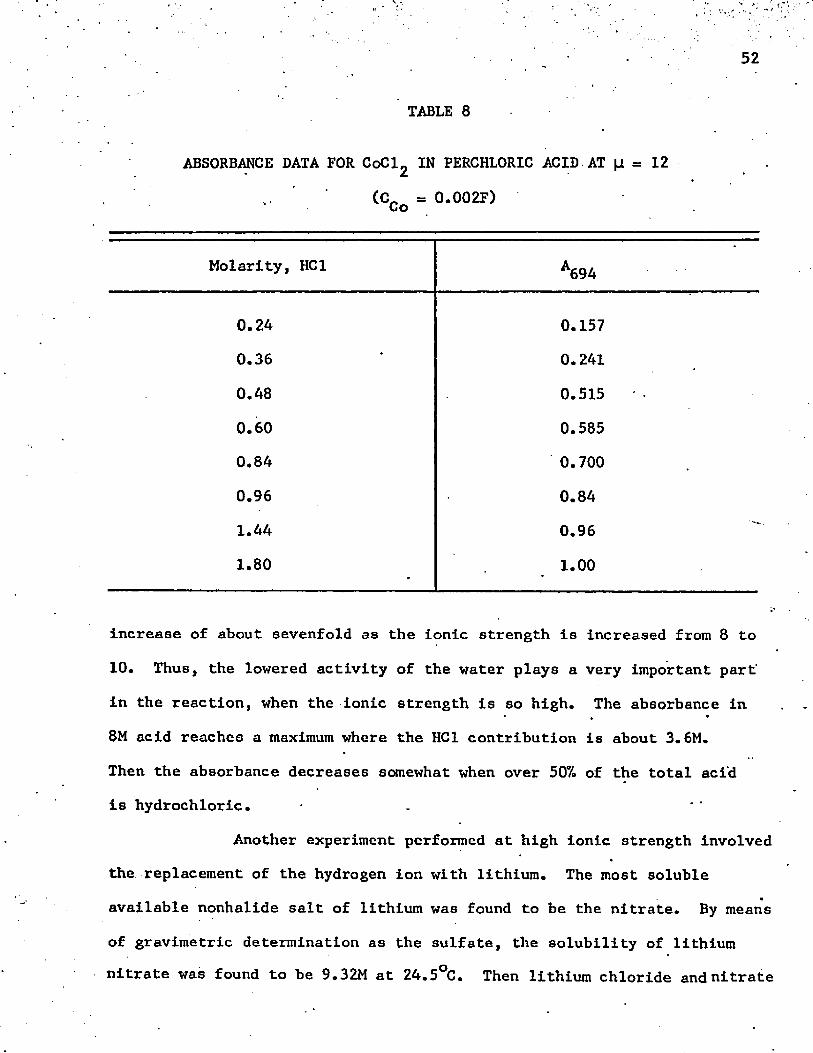
Another experiment was performed to observe if the blue tetra
hedral complex forms in lower chloride concentrations when the ionic
strength is high. The molarity of both concentrated hydrochloric acid
and 707. perchloric acid is about 12. Thus the ionic strength can be
kept approximately constant by adding the desired amount of concentrated
hydrochloric acid, and then diluting to the required volume with 70%
perchloric acid. The blue color, as is shown in table 8, appears at a
much lower chloride concentration. With the high hydron,ium ion concen
tration, there are few available water molecules left to form bonds with
the cobalt ions. Therefore, lower concentrations of chloride are needed .
to displace water from the hydrated ion and form the CoCl^ complex. The
dichloro complex is almost completely formed in 2M hydrochloric acid at
an ionic strength of 12. The stability constant,' approximately 6.
The chloride concentration is known only approximately because gaseous
HCI bubbles form and escape as soon as the perchloric acid is added.
The absorbance decreased about 257. after a solution that was initially
1.0M in HCI and 11M in HCIO^ stood for four hours in a closed volumetric
flask. Adding a small amount of water was found to eliminate the evolu
tion of gaseous HCI. The absorbances at two ionic strengths, 8M and 10M,
are listed in tables 9 and 10. As long as the environment was essentially ■
perchloric acid, Ramette’s (1963) equation was found to hold. A plot of
the data in 10M solution is shown in figure 9. The calculated slopes are
-0.36 in the 8.0M solution and -2.64 in the 10.0M solution. Thus, at
25°C the corresponding values are 0.36 and 2.64, corresponding to an
• 52
TABLE 8
ABSORBANCE DATA FOR CoCl2 IN PERCHLORIC ACID AT [i = 12
(CCo a 0.002F)
Molarity, HCI A694
0.24 0.1570.36 0.241
0.48 0.515
0.60 0.5850.84 0.700
0.96 0.84
1.44 0.96
1.80 1.00*
increase of about sevenfold as the ionic strength is increased from 8 to
10. Thus, the lowered activity of the water plays a very important part'
in the reaction, when the ionic strength is so high. The absorbance in
8M acid reaches a maximum where the HCI contribution is about 3.6M.
Then the absorbance decreases somewhat when over 507. of the total acid is hydrochloric. -
Another experiment performed at high ionic strength involved the replacement of the hydrogen ion with lithium. The most soluble
available nonhalide salt of lithium was found to be the nitrate. By means
of gravimetric determination as the sulfate, the solubility of lithium nitrate was found to be 9.32M at 24.5°C. Then lithium chloride and nitrate
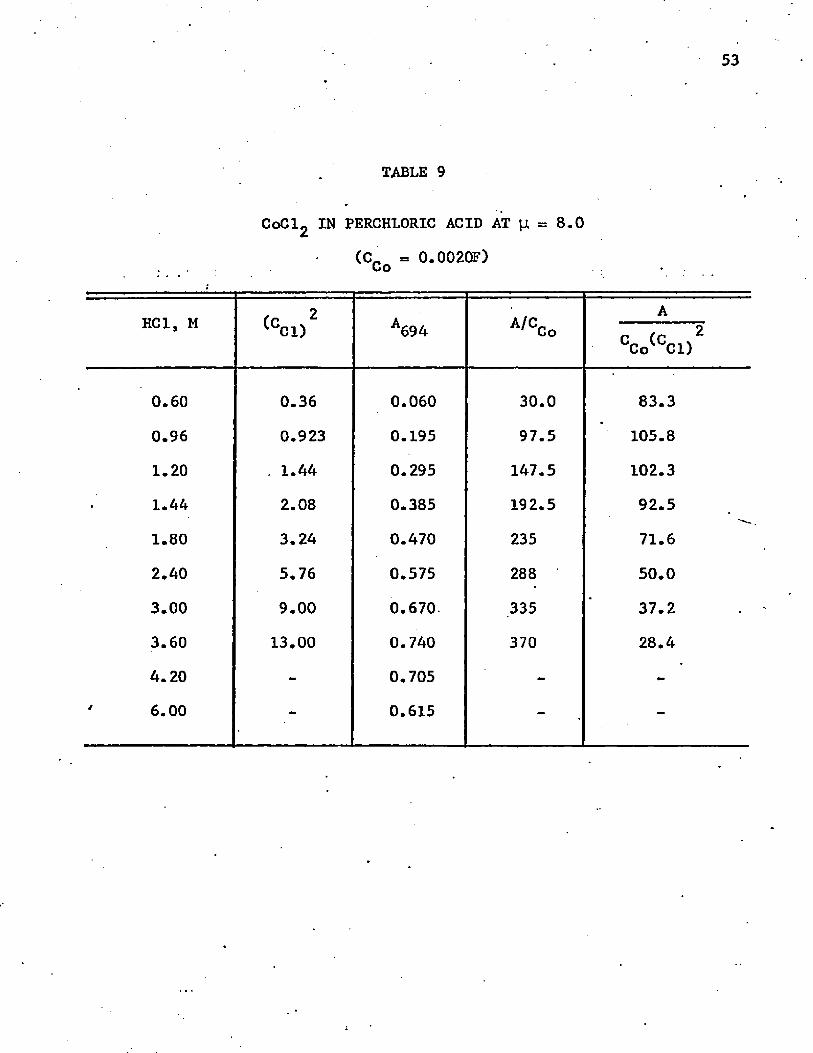
53
TABLE 9
CoCl2 IN PERCHLORIC ACID AT (i = 8.0
(C_ = 0.002GF)uO
HCI, M (CC1)2 A 694 A'CCoA
CCo(CCl)2
0.60 0.36 0.060 30.0 83.3
0.96 0.923 0.195 97.5 105.8
1.20 . 1.44 0.295 147.5 102.3
1.44 2.08 0.385 192.5 92.5
1.80 3.24 0.470 235 71.6
2.40 5.76 0.575 288 50.0
3.00 9.00 0.670- 335 37.2
3.60 13.00 0.740 370 28.4
4.20 - 0.705 - -6.00 - 0.615 - -
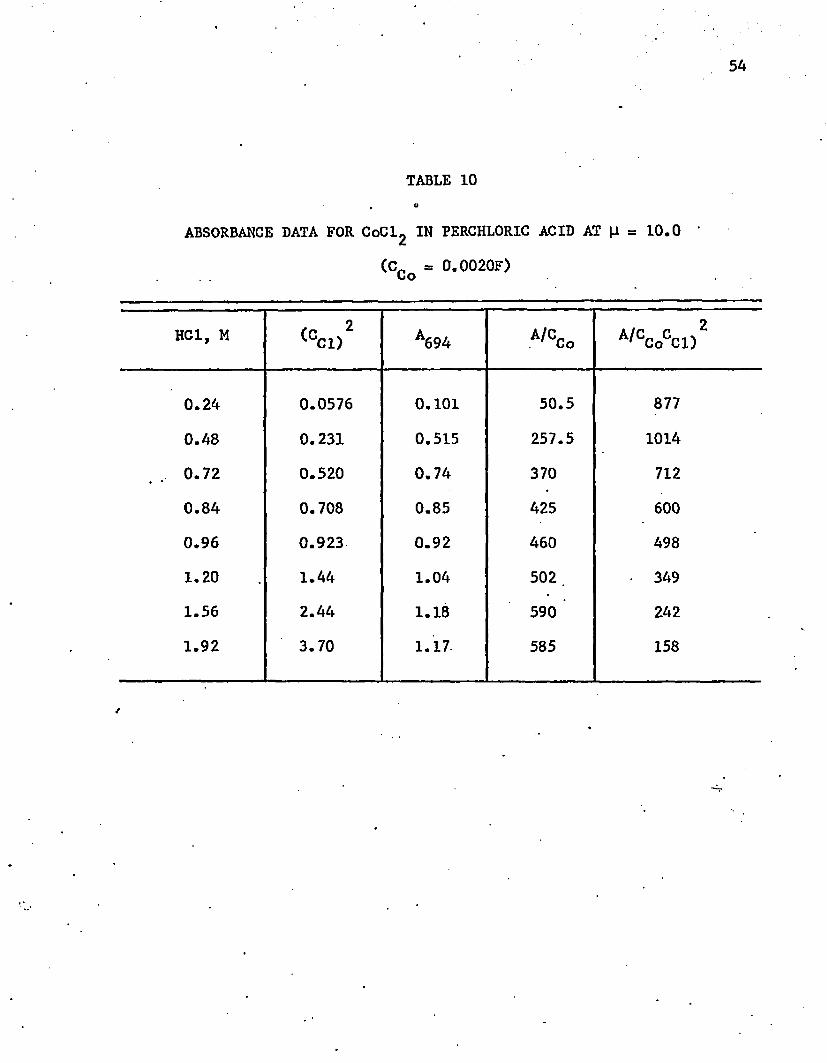
54
TABLE 10
ABSORBANCE DATA FOR CoClg IN PERCHLORIC ACID AT (-1 = 10.0 '
(CCo = 0.0020F)
HCI, M <cci)2 A694 A'CCo A'cc0cci)2
0.24 0.0576 0.101 50.5 877
0.48 0.231 0.515 257.5 1014
0.72 0.520 0.74 370 712
0.84 0.708 0.85 425 600
0.96 0.923 0.92 460 498
1.20 1.44 1.04 502 . • 349
1.56 2.44 1.18 590 * 242
1.92 3.70 1.17. 585 158
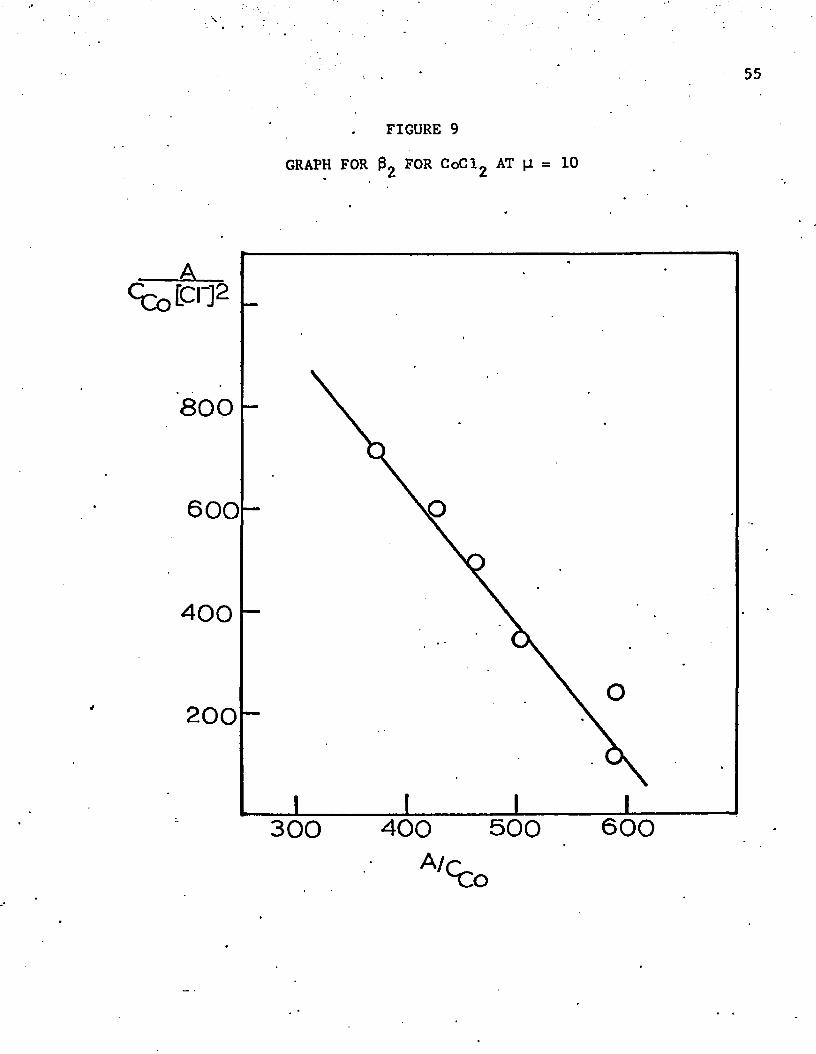
55
FIGURE 9
GRAPH FOR 02 FOR CoCl2 AT \1 = 10
800
600
400
4 200
600500400300
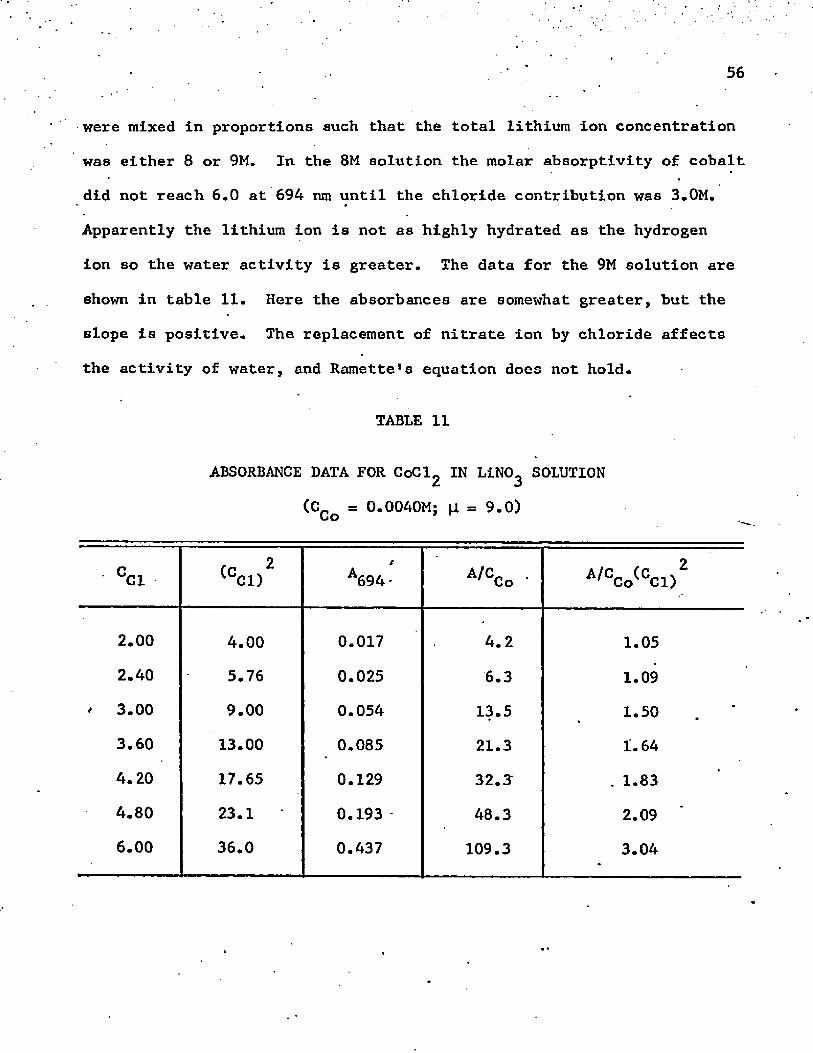
56
were mixed in proportions such that the total lithium ion concentration
was either 8 or 9M. In the 8M solution the molar absorptivity of cobalt
did not reach 6.0 at 694 nm until the chloride contribution was 3.0M.
Apparently the lithium ion is not as highly hydrated as the hydrogen
ion so the water activity is greater. The data for the 9M solution are
shown in table 11. Here the absorbances are somewhat greater, but the
slope is positive. The replacement of nitrate ion by chloride affects
the activity of water, and Ramette's equation does not hold.
TABLE 11
ABSORBANCE DATA FOR CoCl2 IN LiNO^ SOLUTION
(CCo = 0.0040M; |J = 9.0)
CC1 Ccci)2 A694- A 'CCo ‘ A 'CCo(0Cl>2
2.00 4.00 0.017 4.2 1.052.40 5.76 0.025 6.3 1.09
/ 3.00 9.00 0.054 13.5 1.503.60 13.00 0.085 21.3 1.644.20 17.65 0.129 32.3" . 1.834.80 23.1 0.193 48.3 2.096.00 36.0 0.437 109.3 3.04
57
Copper(II) in Hydrochloric Acid Solution
Like cobalt, copper also forms a complex in hydrochloric acid
having a color different from that of the hydrated ion. The absorbance
of the hydrated copper(II) ion occurs above 700 nm. This absorbance,
like that of the cobalt ion, increases slightly as any common acid is
added. By analogy with cobalt, it would appear that copper also forms
an ion association complex, such as CuCH^O)^ NO^ • More stable complex
es must form in dilute solutions of chloride because then the absorbance
of copper(ll) is quite different in the ultraviolet, as shown in figure
10. At around 250 nm absorption is evident even in 0.10M chloride
solution. The absorbance increases with chloride concentration up to
12M, but not in a linear fashion. When the chloride concentration is ^
over 2M, the absorbance maximum begins to shift from 248 to 274 nm. At
the same time a new maximum begins to develop at 383 nm and a shoulder at
238 nm. From 7.8 to 9.6M chloride the absorbance at 274 nm is constant,
and the molar absorptivity is 4,500. Since there is no apparent movement
during electrolsis in 9M HCI, the neutral complex, CuCl^, is probably
present. The lack of a 383 nm peak and the shift of the 248 nm peak to
274 nm indicate that a lower chloride complex, probably CuCl+ , is
present when the chloride concentration is less than 2M. The high
absorptivity of copper chloride in the ultraviolet is generally assumed
to be due to charge-transfer.
When the chloride concentration is raised above 10M, subtle
changes occur in the absorbance curve. Perhaps the most significant is
that the absorption at 274 nm begins to rise again. The shoulder that
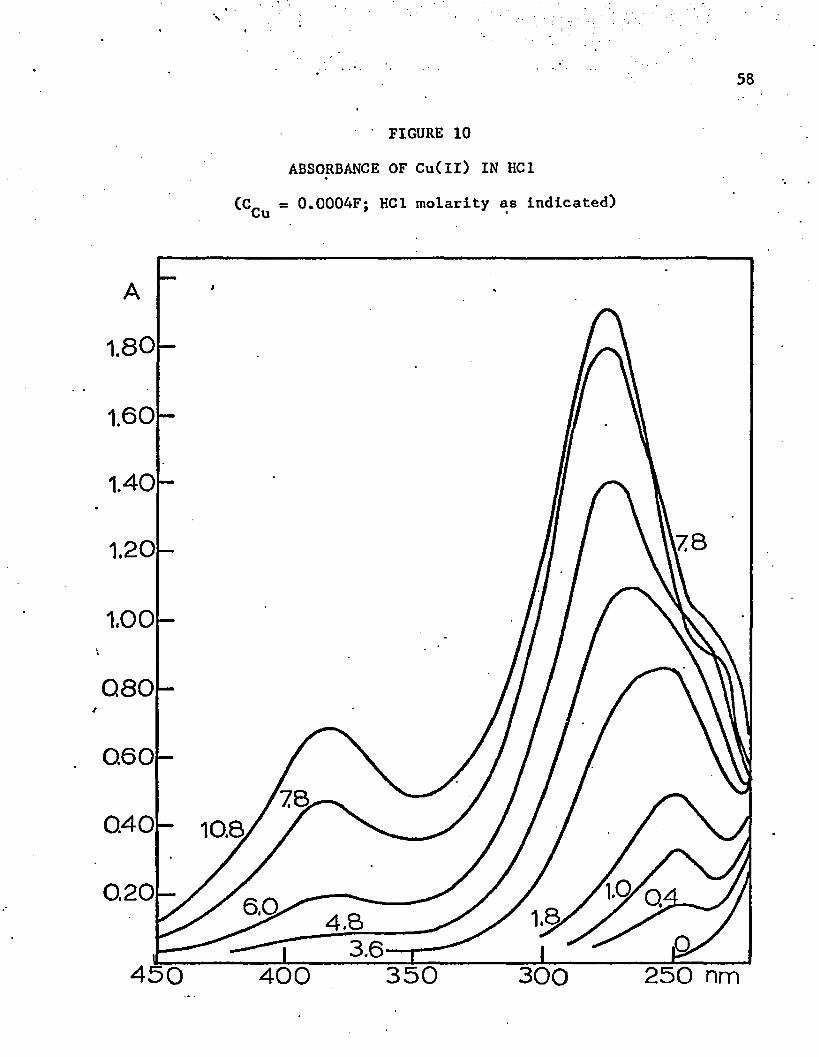
58
FIGURE 10
ABSORBANCE OF Cu(ll) IN HCI
(C„ = 0.0004F; HCI molarity as indicated)Cu
1.80
1.60
1.40
l7 81.20
1.00
Q80/
06078
0.40 10.8
0.20 6.0 4.83.6
450 350400 300 250 nm
was at 238 nm in 7.8M chloride shifts to 233 nm, and the absorbance in
this region decreases slightly. The absorbance at 383 nm continues to
increase in an almost linear fashion, and the wavelength of maximum
absorption shifts about four nanometers toward the ultraviolet. This
Indicates that a higher complex, probably CuCl^", is being formed at
these high chloride concentrations. The presence of a complex anion
in 12M hydrochloric acid was also confirmed by electrophoresis since
the spot was moving toward the anode when the paper disintegrated in
the concentrated acid.
More detailed data at the two maxima are listed in table 12.
These are enough to calculate (Ramette 1963) the first stability
constant: = 0.65. The absorbance at 248 nm was corrected for the
slight absorbance of copper(II) as perchlorate. ■
As with cobalt, either Kg or Pg for copper chloride could not
be determined unless the ionic strength was held constant by means of
an indifferent electrolyte. Perchloric acid was used to maintain the
ionic strength at 8.0, and the absorbance data are listed in table 13.
The calculated Kg from the slope is 0.64. Note that Kg is for the
reaction involving the addition of the second chloride to copper:
CuCl+ + Cl" CuClg.
The addition of the first chloride may be regarded as complete because
the absorptivity of copper in a solution, 0.12M in HCI and 7.88 M in
HCIO^, was greater than 2,000 at 248 nm. (See table 14.) At this
chloride concentration the absorbance at 383 nm was barely perceptible.t
The data for the calculation of for copper chloride in 8M perchloric acid are shown in table 14. At these low chloride ,
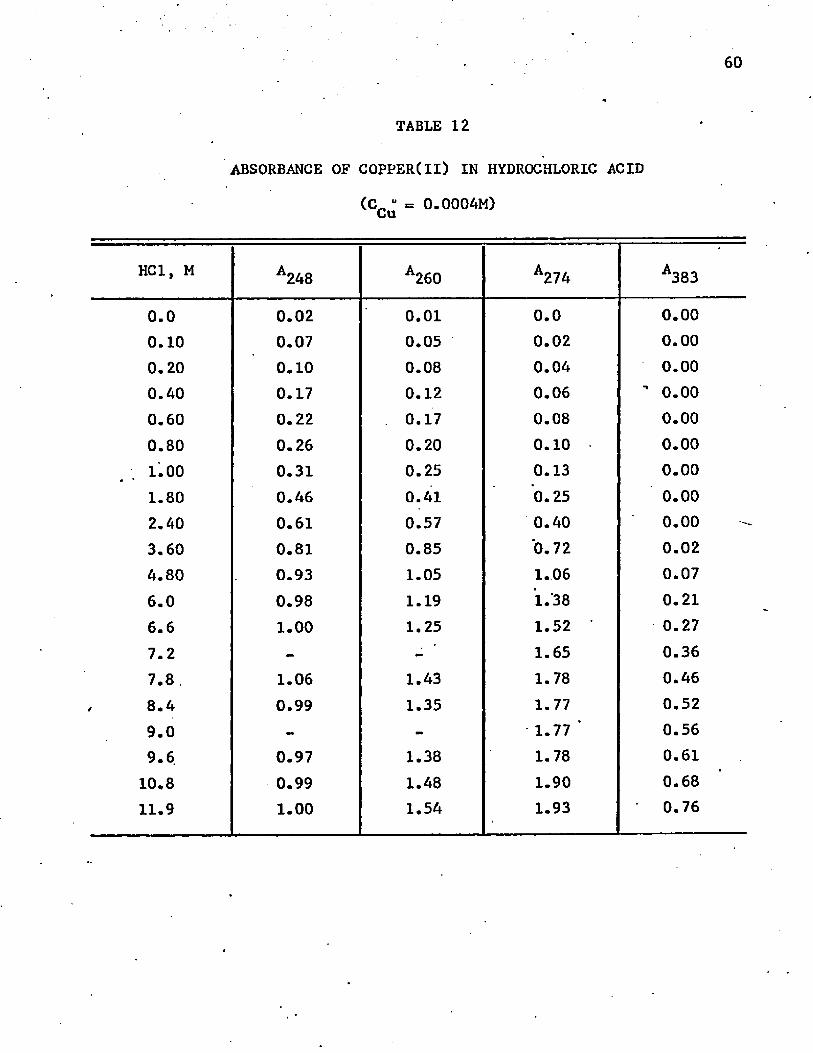
60
TABLE 12
ABSORBANCE OF COPPER(ll) IN HYDROCHLORIC ACID
(C„u = 0.0004M) Cu
HCI, M A248 A260 A274 A383
0.0 0.02 0.01 0.0 0.000.10 0.07 0.05 0.02 0.000.20 0.10 0.08 0.04 0.000.40 0.17 0.12 0.06 ' 0.000.60 0.22 . 0.17 0.08 0.000.80 0.26 0.20 0.10 0.001.00 0.31 0.25 0.13 0.001.80 0.46 0.41 0.25 0.002.40 0.61 0.57 0.40 0.003.60 0.81 0.85 0.72 0.024.80 0.93 1.05 1.06 0.076.0 0.98 1.19 1.38 0.216.6 1.00 1.25 1.52 0.277.2 - - 1.65 0.367.8. 1.06 1.43 1.78 0.468.4 0.99 1.35 1.77 0.529.0 - - 1.77 ‘ 0.569.6 0.97 1.38 1.78 0.6110.8 0.99 1.48 1.90 0.6811.9 1.00 1.54 1.93
'
0.76
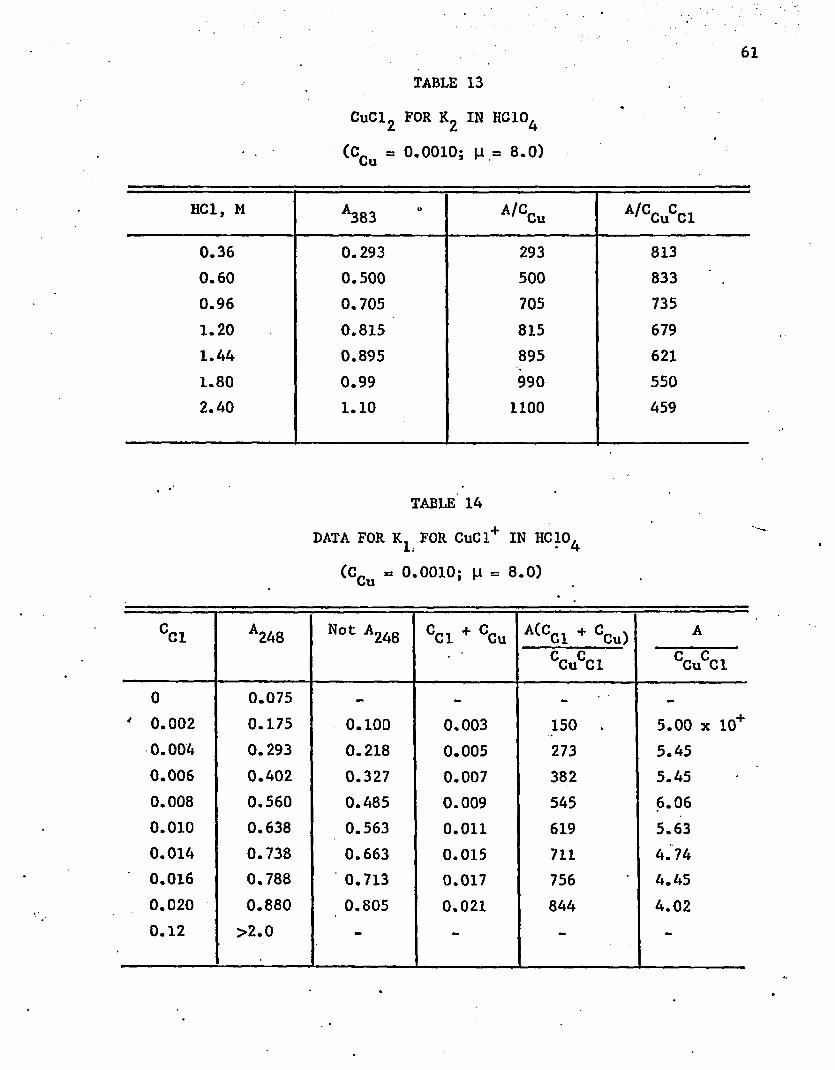
TABLE 13
CuCl2 FOR K2 IN HC104
(C- = O.OOIO; |i = 8.0)Cu
HCI, M A o383 A 'CCu A'CCuCCl
0.36 0.293 293 8130.60 0.500 500 8330.96 0.705 705 7351.20 0.815 815 6791.44 0.895 895 6211.80 0.99 990 5502.40 1.10 1100 459
TABLE 14
DATA FOR K, FOR CuCl+ IN HC10 1: * 1(cCu = 0.0010; H = 8.0)
CC1 A248 Not A248 CC1 + CCu ACCC1 + CCu) A
CCuCCl CCuCCl
0 0.075 - - - -
' 0.002 0.175 0.100 0.003 150 . 5.00 x 10+0.004 0.293 0.218 0.005 273 5.450.006 0.402 0.327 0.007 382 5.450.008 0,560 0.485 0.009 545 6.060.010 0.638 0.563 0.011 619 5.630.014 0.738 0.663 0.015 711 4.740.016 0.788 0.713 0.017 756 4.450.020 0.880 0.805 0.021 844 4.020.12 >2.0 - - - -
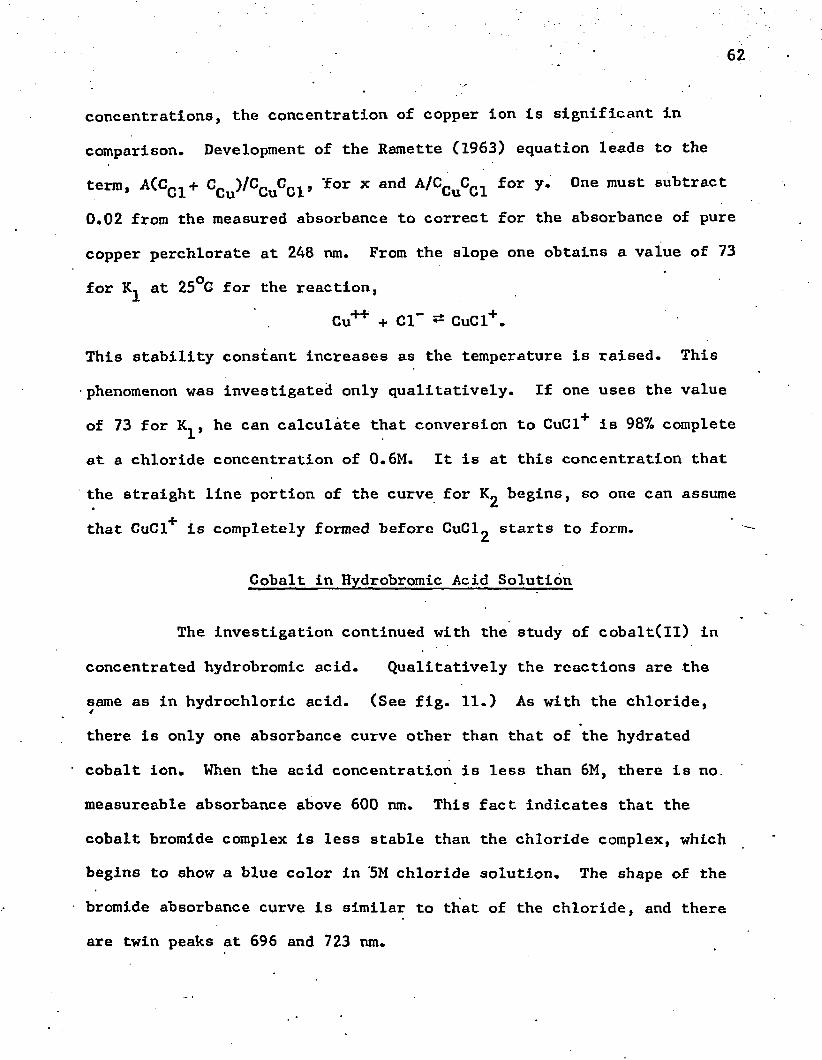
concentrations, the concentration of copper ion is significant in
comparison. Development of the Ramette (1963) equation leads to the
terra, A(CC1+ CCu>/GCuccl» 'for x and A/CCuCcl for y. One must subtract 0.02 from the measured absorbance to correct for the absorbance of pure
copper perchlorate at 248 nm. From the slope one obtains a value of 73
for at 25°G for the reaction,
Cu** + Cl" - CuCl+ .
This stability constant increases as the temperature is raised. This
phenomenon was investigated only qualitatively. If one uses the value
of 73 for K^, he can calculate that conversion to CuCl+ is 987. complete
at a chloride concentration of 0.6M. It is at this concentration that
the straight line portion of the curve for begins, so one can assume
that CuCl+ is completely formed before C u C ^ starts to form.
Cobalt in Hydrobromic Acid Solution
The investigation continued with the study of cobalt(ll) in
concentrated hydrobromic acid. Qualitatively the reactions are -the
same as in hydrochloric acid. (See fig. 11.) As with the chloride,
there is only one absorbance curve other than that of the hydrated
cobalt ion. When the acid concentration is less than 6M, there is no.
measureable absorbance above 600 nm. This fact indicates that the
cobalt bromide complex Is less stable than the chloride complex, which
begins to show a blue color in ‘5M chloride solution. The shape of the
bromide absorbance curve is similar to that of the chloride, and there
are twin peaks at 696 and 723 nm.
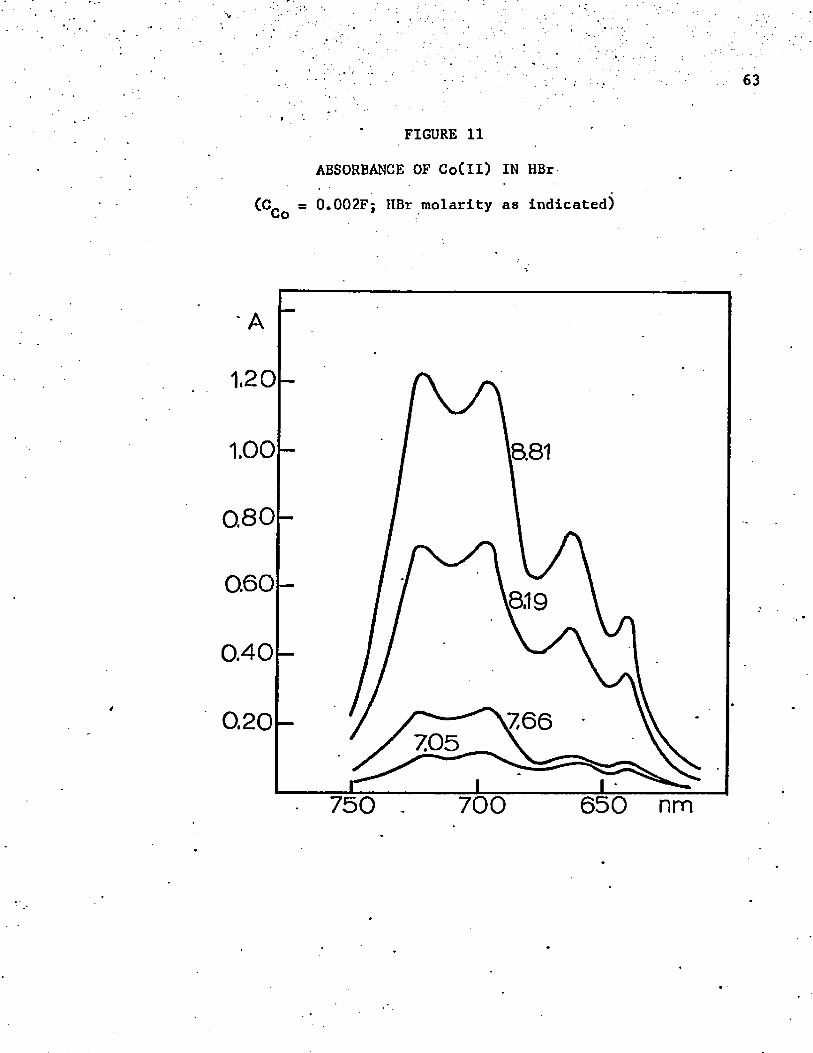
63
FIGURE 11
ABSORBANCE OF Co(Il) IN HBr
(Cj, =s 0.002F; HBr molarity as indicated)
1,20
1.00 18.81
0.80
0.608,19
0.40
0.20705
700 650 nm
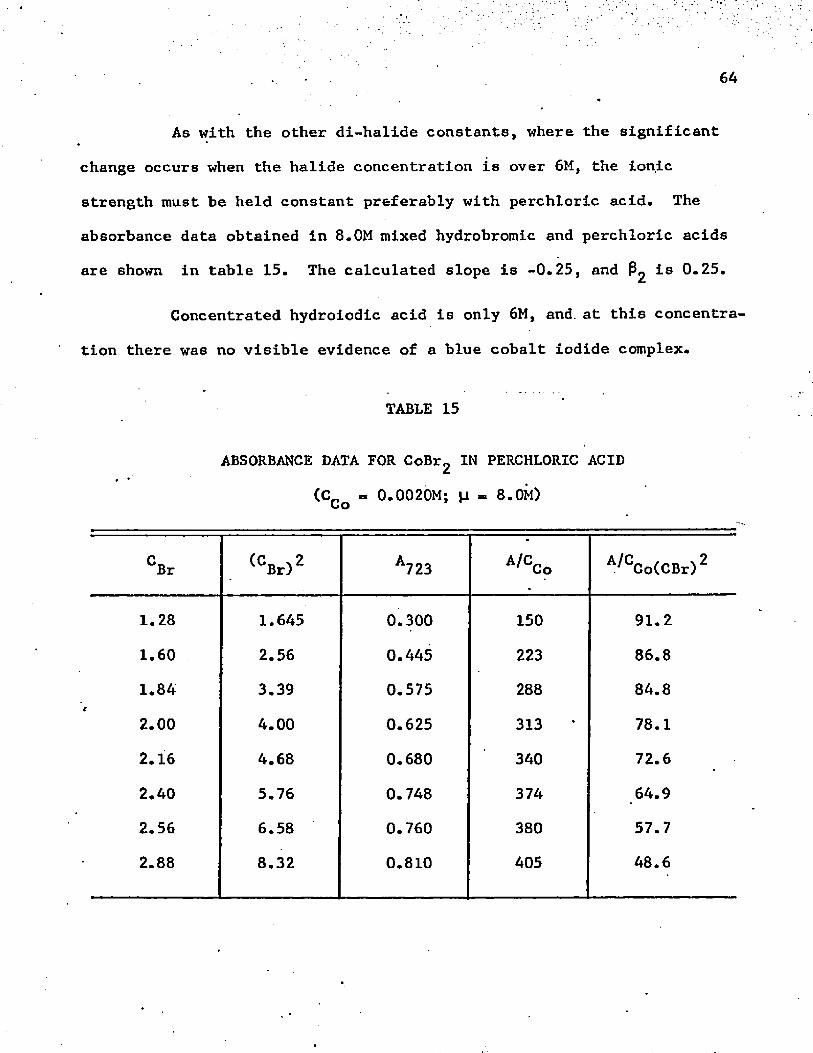
64
As with the other di-halide constants, where the significant
change occurs when the halide concentration is over 6M, the ionic
strength must be held constant preferably with perchloric acid. The
absorbance data obtained in 8.0M mixed hydrobromic and perchloric acids
are shown in table 15. The calculated slope is -0.25, and *-8 0-25.
Concentrated hydroiodlc acid is only 6M, and. at this concentra
tion there was no visible evidence of a blue cobalt iodide complex.
TABLE 15
ABSORBANCE DATA FOR CoBr2 IN PERCHLORIC ACID
(CCq = 0.0020M; \1 = 8.0M)
CBr . CCBr)2 A723 A'CCo A^CCo(CBr)2
1.28 1.645 0.300 150 91.2
1.60 2.56 0.445 223 86.8
1.84 3.39 0.575 288 84.8
2.00 4.00 0.625 313 • 78.1
2.16 4.68 0.680 340 72.6
2.40 5.76 0.748 374 64.9
2.56 6.58 0.760 380 57.7
2.88 8.32 0.810 405 48.6
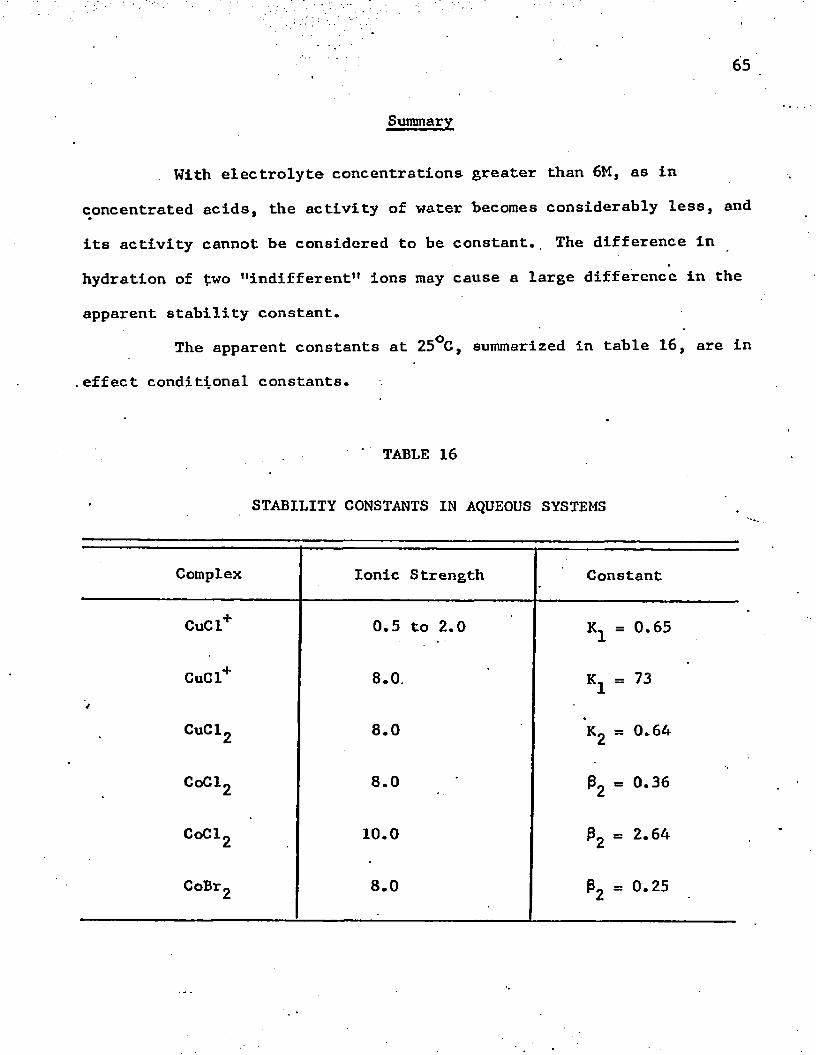
Summary
65
With electrolyte concentrations greater than 6M, as in
concentrated acids, the activity of water becomes considerably less, and
its activity cannot be considered to be constant.. The difference in
hydration of two "indifferent” ions may cause a large difference in the
apparent stability constant.The apparent constants at 25°C, summarized in table 16, are in
.effect conditional constants.
' TABLE 16
STABILITY CONSTANTS IN AQUEOUS SYSTEMS
Complex Ionic Strength Constant
CuCl+ 0.5 to 2.0 ^ = 0.65
CuCl+ 8.0. Kx = 734
CuCl2 8.0 K 2 = 0.64
CoCl2 8.0 P2 = 0.36
CoCl2 10.0 02 = 2.64
CoBr2 8.0 02 = 0 . 2 5
66
From spectrophotometry alone the highest and only cobalt
chloride complex found in aqueous solution appears to be neutral
CoC^CHgO^- Electrical migration, electrophoresis, and solvent
extraction experiments to be discussed in chapter four suggest that
much of the cobalt is present in concentrated hydrochloric acid- as at
neutral complex. However, the electrical migration and ion exchange
experiments hint that both positive and negative 6pecies are in
equilibrium with the neutral complex.
CHAPTER IV
COBALT(II) CHLORIDE COMPLEXES IN ORGANIC SOLVENTS
Electrical migration experiments suggested but did not confirm
that the principal cobalt(ll) chloride complex in concentrated hydro
chloric acid in neutral CoCl^* Often solvent extraction can indicate
whether a metal complex is neutral or a charged ion. However, the rule
Is not infallible since an ion-association complex, which is neutral,
can be formed and is extracted by an organic solvent. Thus in the ether
extraction of iron(III) chloride, it is (C^H^JgOH^eCl^- that is
extracted.
Simple solubility experiments were tried first. Cobalt(ll)
chloride was found to be insoluble in nonpolar solvents such as benzene
and chloroform. The solution in ethyl ether has a faint blue color and-5the molar solubility is about 6 x 10 if one assumes the same absorp
tivity as in acetone in which e = 200. In ketones and alcohols, cobalt
and copper(ll) chlorides are very soluble. Except for methanol in
which a solution of cobalt chloride is pink, all of these solvents
produce a blue solution. Since no excess chloride was added, the
solution probably does not contain anionic complexes, such as CoCl^ in any high concentrations.
67
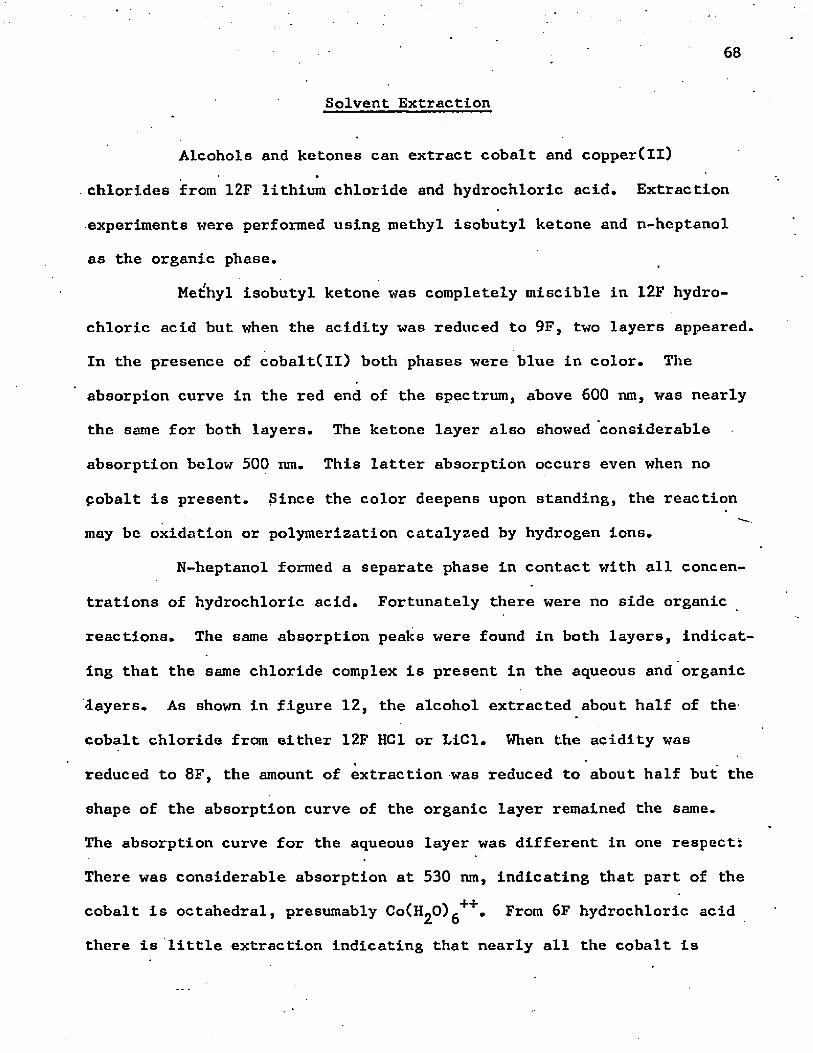
68
Solvent Extraction
Alcohols and ketones can extract cobalt and copper(II)
. chlorides from 12F lithium chloride and hydrochloric acid. Extraction
experiments were performed using methyl isobutyl ketone and n-heptanol
as the organic phase.
Metfhyl isobutyl ketone was completely miscible in 12F hydro
chloric acid but when the acidity was reduced to 9F, two layers appeared.
In the presence of cobalt(ll) both phases were blue in color. The
absorpion curve in the red end of the spectrum, above 600 nm, was nearly
the same for both layers. The ketone layer also showed considerable
absorption below 500 nm. This latter absorption occurs even when no
pobalt is present. Since the color deepens upon standing, the reaction
may be oxidation or polymerization catalyzed by hydrogen ions.
N-heptanol formed a separate phase in contact with all concen
trations of hydrochloric acid. Fortunately there were no side organic
reactions. The same absorption peaks were found in both layers, indicat
ing that the same chloride complex is present in the aqueous and organic
layers. As shown in figure 12, the alcohol extracted about half of the-
cobalt chloride from either 12F HG1 or LiCl. When the acidity was
reduced to 8F, the amount of extraction was reduced to about half but the
shape of the absorption curve of the organic layer remained the same.
The absorption curve for the aqueous layer was different in one respect:
There was considerable absorption at 530 nm, indicating that part of the
cobalt is octahedral, presumably C o C ^ O ) ^ * . From 6F hydrochloric acid
there is little extraction indicating that nearly all the cobalt is
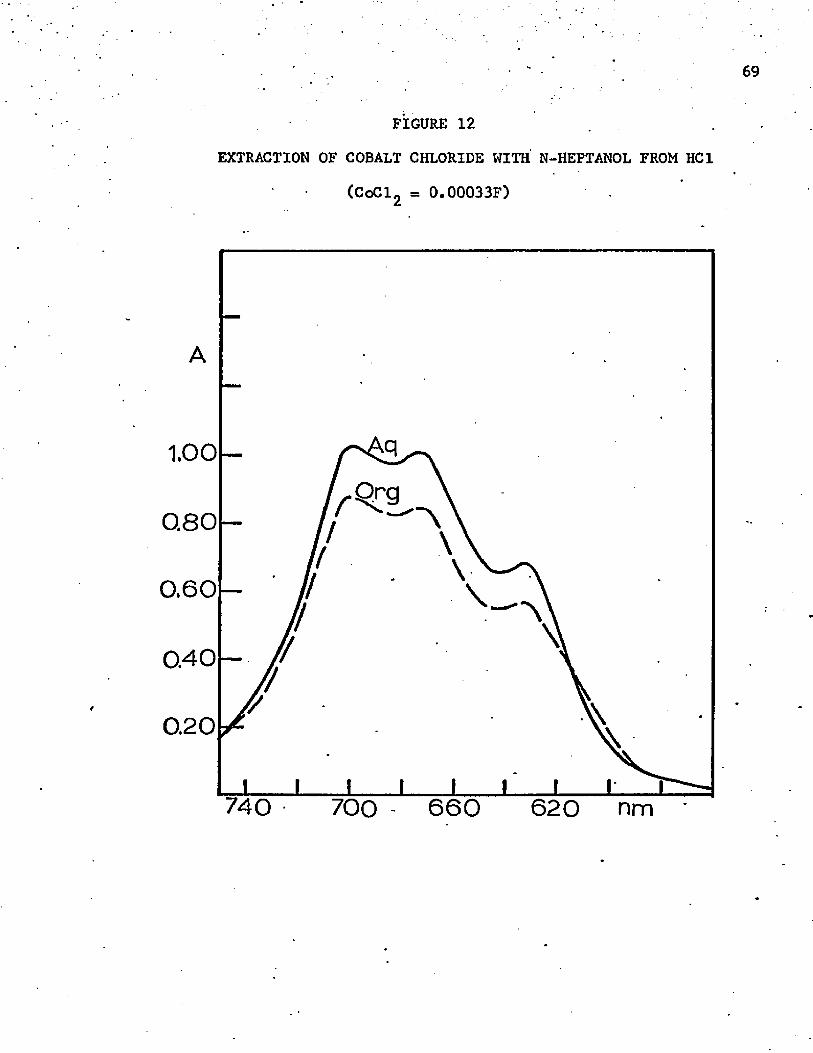
FIGURE 12
EXTRACTION OF COBALT CHLORIDE WITH N-HEPTANOL FROM HC1
(CoCl2 = 0.00033F)
1.00
0.80
0.60
0.40
0.20
740 700 660 620 nm
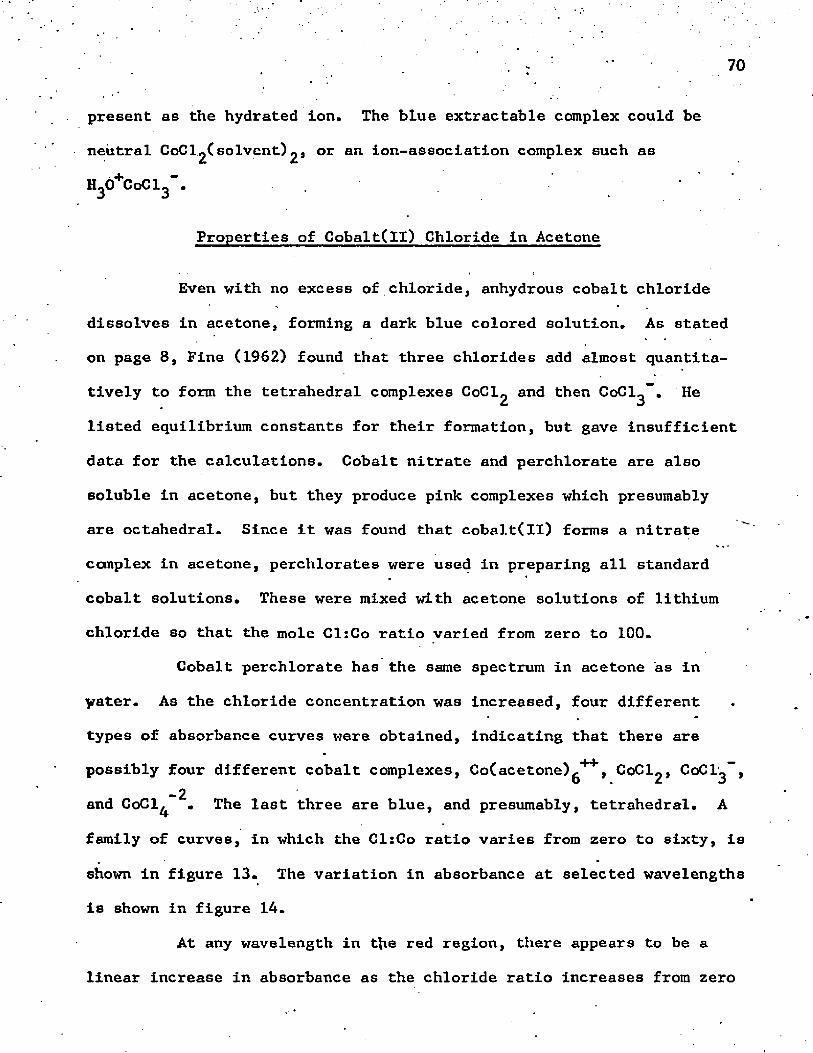
70
present as the hydrated ion. The blue extractable complex could be
neutral CoCl^Csol v e n t ) o r an ion-association complex such as
H30+CoC13".
Properties of Cobalt(ll) Chloride In Acetone
Even with no excess of chloride, anhydrous cobalt chloride
dissolves in acetone, forming a dark blue colored solution. As stated
on page 8, Fine (1962) found that three chlorides add almost quantita
tively to form the tetrahedral complexes CoCl^ and then CoCl3” . He
listed equilibrium constants for their formation, but gave insufficient
data for the calculations. Cobalt nitrate and perchlorate are also
soluble in acetone, but they produce pink complexes which presumably
are octahedral. Since it was found that cobalt(ll) forms a nitrate
complex in acetone, perchlorates were used in preparing all standard
cobalt solutions. These were mixed with acetone solutions of lithium
chloride so that the mole Cl:Co ratio varied from zero to 100.
Cobalt perchlorate has the same spectrum in acetone as in
yrater. As the chloride concentration was increased, four different
types of absorbance curves were obtained, indicating that there are
possibly four different cobalt complexes, Co(acetone)g++, CoClg, CoCl'3~, - 2and CoCl^ . The last three are blue, and presumably, tetrahedral. A
family of curves, in which the Cl:Co ratio varies from zero to sixty, is
shown in figure 13. The variation in absorbance at selected wavelengths
is shown in figure 14.
At any wavelength in tfre red region, there appears to be a
linear increase in absorbance as the chloride ratio increases from zero
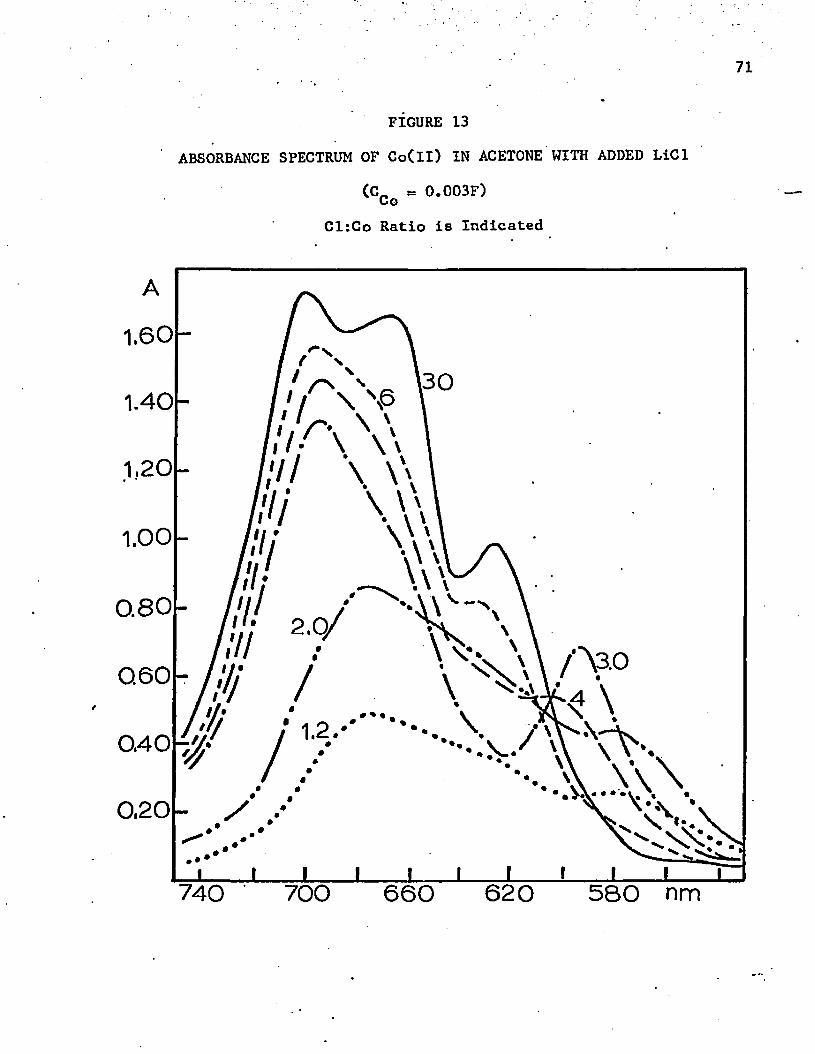
71
FIGURE 13
ABSORBANCE SPECTRUM OF Co(Il) IN ACETONE WITH ADDED LiCl
<CCG « 0.003F)
Cl:Co Ratio is Indicated
1.00 - I
V\0/
V /0.80-
0.60-
0.40
0,20
740 700 660 620 580 nm
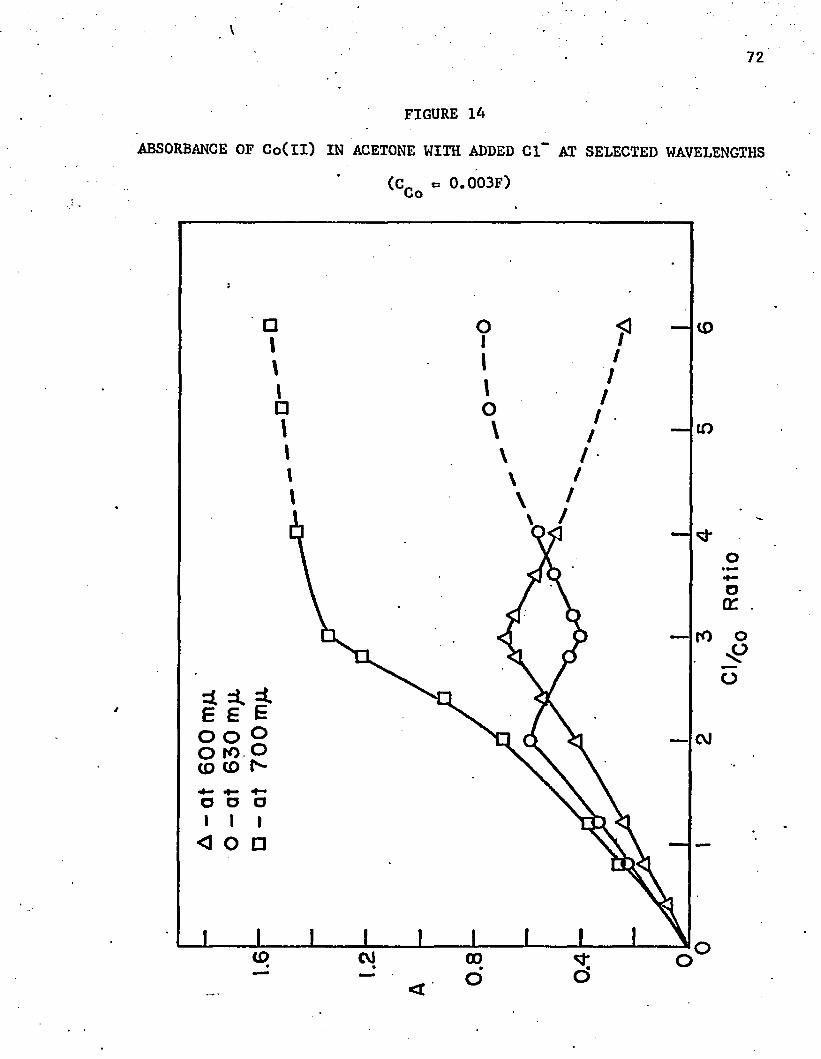
V72
FIGURE 14
ABSORBANCE OF Co(ll) IN ACETONE WITH ADDED Cl" AT SELECTED WAVELENGTHS(C„ = 0.003F)Co
=* * £ B B E° o 2O r o O CD CD r**
< O □
oa:
O
<3 '
■ '• ■' 73
to two. The absorption at 520 run also disappears as the two chlorides
are added. This evidence indicates that no appreciable concentration
of the CoCl+. complex is present at equilibrium. Since the complex is
probably tetrahedral, the following reaction probably occurs:
c0(c3h6o) 6++ + 2 c i" -* co(c3h6o) 2c i 2 + 4c3h6o
The addition of two chlorine atoms to cobalt was shown to be essentially
quantitative. At constant cobalt concentration the absorbance is a
linear function of the chloride concentration. This was the basis for a
new method for the quantitative determination of chloride, which will be
described in detail in chapter five.
After the first two chlorine atoms have been added, a third is
added almost quantitatively, and the absorbance curve changes. The most
prominent feature of the absorbance curve for 0 0 0 1 2 " is a deep minimum
at 620 nm. This minimum disappears as still more chloride is added but
the addition of the fourth chloride is not quantitative. Not until the
mole Cl:Co ratio is 30:1 does the absorbance become essentially constant.
Use of Spectrophotometry to Determine Stability/ Constants by the Slope-Intercept Method
The final stability constant, K^, which refers to the reaction, CoCl3“ +. Cl" - CoCl4"2
may be determined from absorbance measurements by the slope-intercept
method (Whiteker and Davidson 1953). The slope-intercept formula has
two basic forms, when the equilibrium involves the addition of only one
ligand. * .
If the addition of the first ligand is considered,the equation
has the following form:
[L] /
It can be solved graphically. For the addition of the final ligand, the
following form is often more useful.
x - X - i + (H ' x 1 M K n < n )
Equation (11), was used in the present study. The measured
absorbance, A, is the sum of the absorbances of the two main components,
and
S - eMLN_1b[MLN-l] + = EbCH Cl2)
where 6 indicates the molar absorbance coefficient; b is the length of the light path in centimeters; concentrations are. expressed in moles per
liter, and is the total concentration of metal ion in any form.
The concentrations are related by the stability constant K.
= --- 3---- (13)
A = SbCM = 5b[MLN_1] + eb[MLN_1]KN (14)
ebCML,,^] + eCML^^CL]!^ . e b C M L ^ ] + (15)N-l
Cancel out the terms b and [ML^ ^3 and rearrange.
• 75
Since A = one can obta*-n equation (11), and plot the mea
sured absorbance as y, and (A^ ^ - A)[L] as x. The intercept is A ^
and the slope gives the stability constant, K^. In the acetone solutions
of cobalt halides, it will be evident that N = 4. One obtains A ^ by4
saturating the solution with the lithium halide. The free halide
concentration is first estimated by subtracting the halide needed to
form ML^ from the total halide concentration. Then a rough calculation
is made, and a further correction made for the halide needed to form ML,.4The data for the calculation of for the tetrachloro complex
in acetone are shown in table 17, and the curve in figure 15. The slope,
which is equal to K^, is calculated to be 215.
TABLE 17
DATA FOR K, FOR CoCl “2 IN ACETONE 4 4
(Determine at 625 nm; CCq = 0.003M; A ^ = 1«00)4
CC1 ^625 ^ 4 APreliminary
FML4Corrected
[L] (am l 4"A)CL] [L] (Am -A>[L] • 4
0.036 0.87 0.13 0.027 0.0035 0.78 0.0247. 0.0032 ‘
0.018 0.76 0.24' 0.009 0.0022 0.59 0.0072 0.00174
0.0156 0.72 0.28 0.0066 0.00185 0.51 0.0051 0.00143
0.0120 0.58 0.42 0.0030 0.00126 0.29 0.0021 0.00088
0.0108 0.53 0.47 0.0018 0.00084 0.20 0.0012 0.00056
0.0096 0.44 0.56 0.0006 • 0.00034 0.05 • 0.0005 0.00028
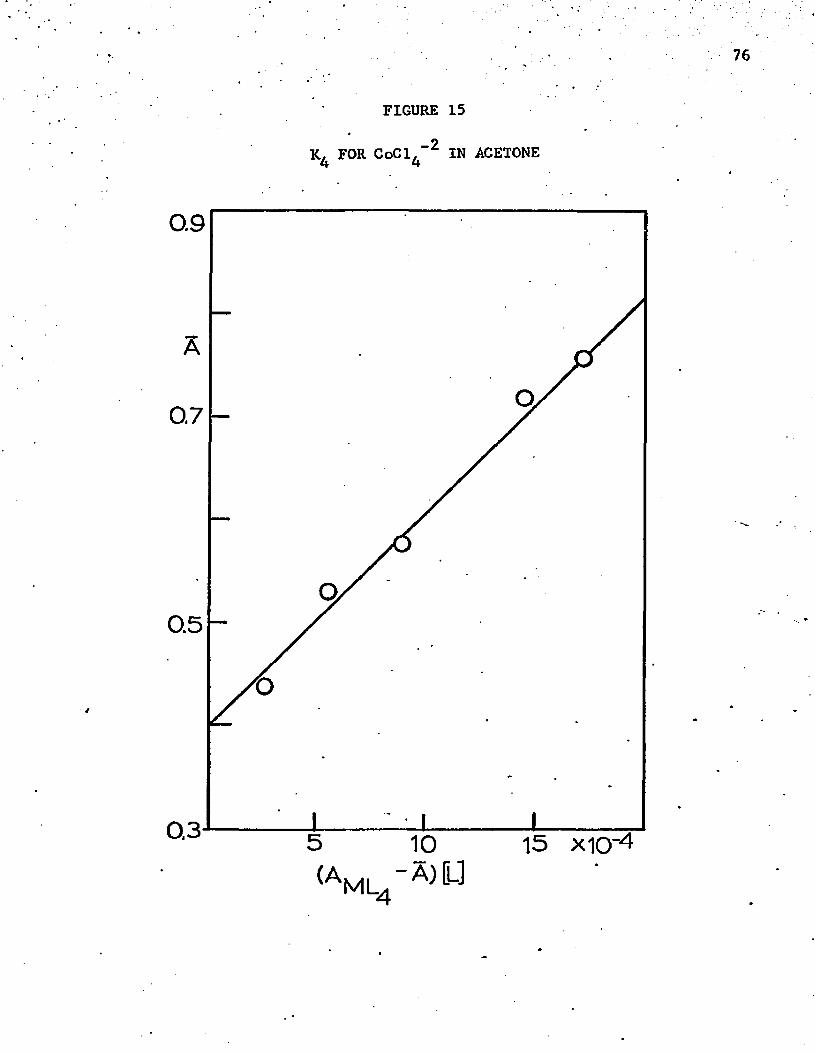
FIGURE 15
K, FOR CoCl "2 IN ACETONE 4 4
0.9
0.7
0.5
0.3
ML.-S)U
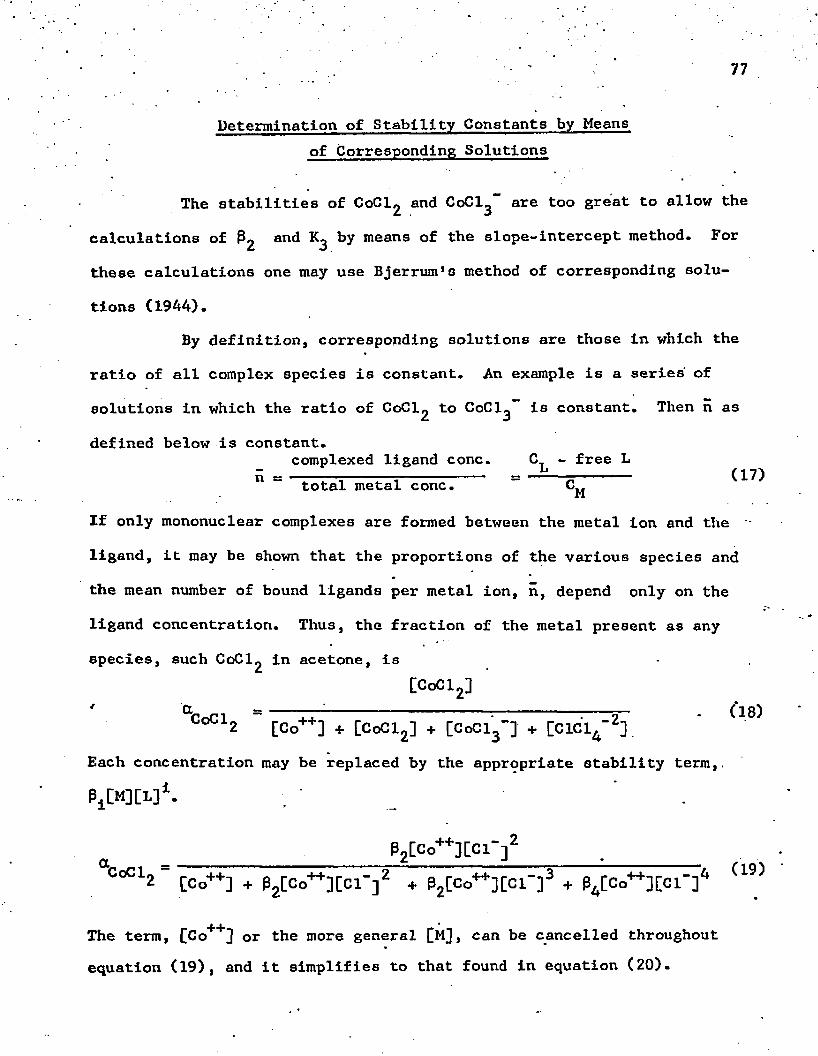
77
Determination of Stability Constants by Means of Corresponding Solutions
The stabilities of CoCl^ and CoCl^” are too great to allow the
calculations of P2 and by means of the slope-intercept method. For
these calculations one may use Bjerrum’s method of corresponding solu
tions (1944).By definition, corresponding solutions are those in which the
ratio of all complex species is constant. An example is a series of
solutions in which the ratio of CoCl2 to CoCl^ is constant. Then n as
defined below is constant.complexed ligand conc. - free L
n = total metal conc. (17)
If only mononuclear complexes are formed between the metal ion and the
ligand, it may be shown that the proportions of the various species and
the mean number of bound ligands per metal ion, n, depend only on the
ligand concentration. Thus, the fraction of the metal present as any
species, such CoCl^ in acetone, is[CoCl2]
2 [Co'1"r] + [CoCl2] + [CoCl3~] + [ClCl4_t]aCoCl0 “ ++-. • - • -2- • (18)
Each concentration may be replaced by the appropriate stability term,.
o __________________ P ^ C o ^ H C !-]2__________
0cC12 " [Co++] + P2[Co++] [ c r ] 2 + P2[Co++][Cl"]3 + P4[Co++][Cl"]4 (I9)
The term, CCo++] or the more general C*G, can be cancelled throughout equation (19), and it simplifies to that found in equation (20).
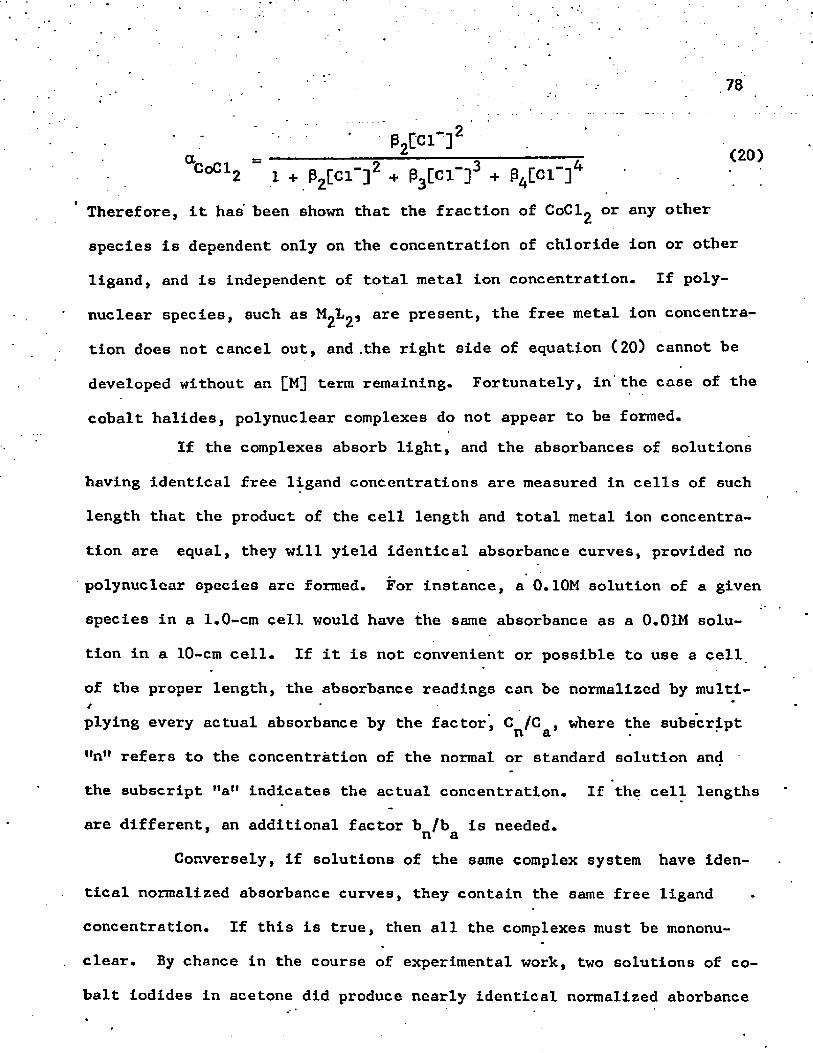
Therefore, It has been shown that the fraction of CoC]^ or any other
species is dependent only on the concentration of chloride ion or other
ligand, and is independent of total metal ion concentration. If poly-
nuclear species, such as 1*2^ 2 ’ are present, the free metal ion concentra
tion does not cancel out, and .the right side of equation (2 0 ) cannot be
developed without an [M] term remaining. Fortunately, in the case of the
cobalt halides, polynuclear complexes do not appear to be formed.If the complexes absorb light, and the absorbances of solutions
having identical free ligand concentrations are measured in cells of such
length that the product of the cell length and total metal ion concentra
tion are equal, they will yield identical absorbance curves, provided no
polynuclear species are formed. For instance, a 0.10M solution of a given
species in a 1 .0 -cm cell would have the same absorbance as a 0 .0 1M solu
tion in a 10-cm cell. If it is not convenient or possible to use a cell
of the proper length, the absorbance readings can be normalized by multi- / ‘plying every actual absorbance by the factor, C /C , where the subscriptn &"n" refers to the concentration of the normal or standard solution and
the subscript "a" indicates the actual concentration. If the cell lengths
are different, an additional factor b /b is needed.n aConversely, if solutions of the same complex system have iden
tical normalized absorbance curves, they contain the same free ligand
concentration. If this is true, then all the complexes must be mononu
clear. By chance in the course of experimental work, two solutions of co
balt iodides in acetone did produce nearly identical normalized aborbance
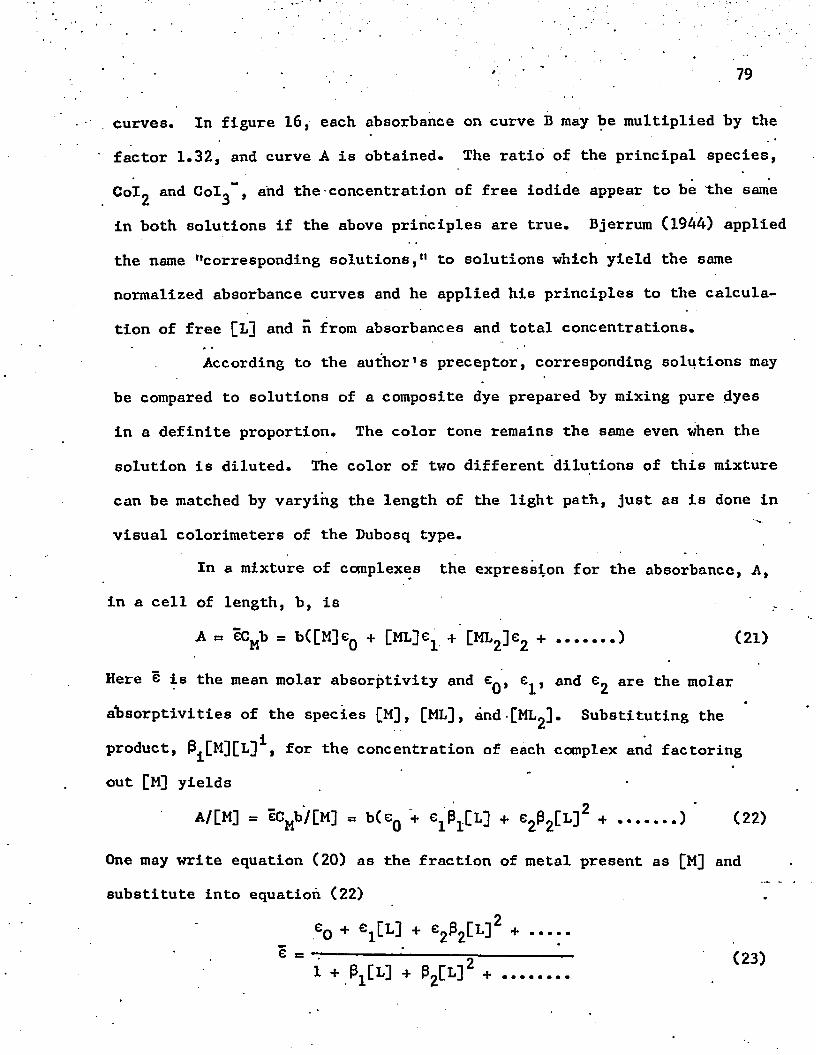
curves. In figure 16, each absorbance on curve B may be multiplied by the
factor 1.32, and curve A is obtained. The ratio of the principal species,
C 0 I2 and Col^*", and the concentration of free iodide appear to be 1:he same
in both solutions if the above principles are true. Bjerrum (1944) applied
the name "corresponding solutions,11 to solutions which yield the same
normalized absorbance curves and he applied his principles to the calcula
tion of free [L] and n from absorbances and total concentrations.
According to the author’s preceptor, corresponding solutions may
be compared to solutions of a composite dye prepared by mixing pure dyes
in a definite proportion. The color tone remains the same even when the
solution is diluted. The color of two different dilutions of this mixture
can be matched by varying the length of the light path, just as is done In
visual colorimeters of the Dubosq type.
In a mixture of complexes the expression for the absorbance, A, in a cell of length, b, is _
A « ecMb = b([M ]e0 + [ML]er + [ML2 ]e2 + .......) (2 1 )
Here e is the mean molar absorptivity and e^, e^, and e2 are the molar
absorptivities of the species [M], [ML], and[ML2], Substituting the
product, Pi[M][L]i, for the concentration of each complex and factoring out [M] yields
A / M = ecMb/[M ] = b(eQ + el P1[L ] + e ^ L ] 2 ...............) (22)
One may write equation (20) as the fraction of metal present as [M] and
substitute into equation (2 2 )
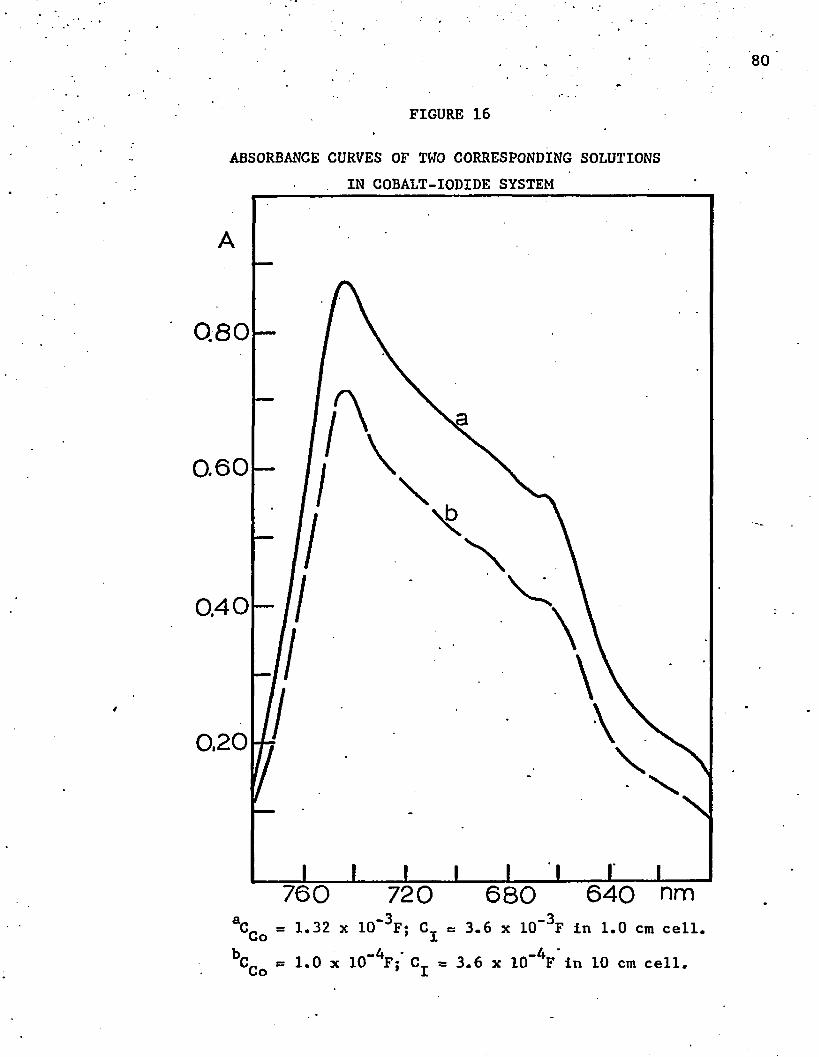
80
FIGURE 16
ABSORBANCE CURVES OF TWO CORRESPONDING SOLUTIONS IN COBALT-IODIDE SYSTEM
0.80
0.60 —
0.40
0.20
f \
\
\\\
_ _ II___!_____ I760 720 680 640 nm
aCCo = 1.32 x 1Q”^F; C . = 3.6 x 10”^F in 1.0 cm cell,
= 1.0 x 10”^F; Cj. = 3.6 x 10”^F in 10 cm cell.
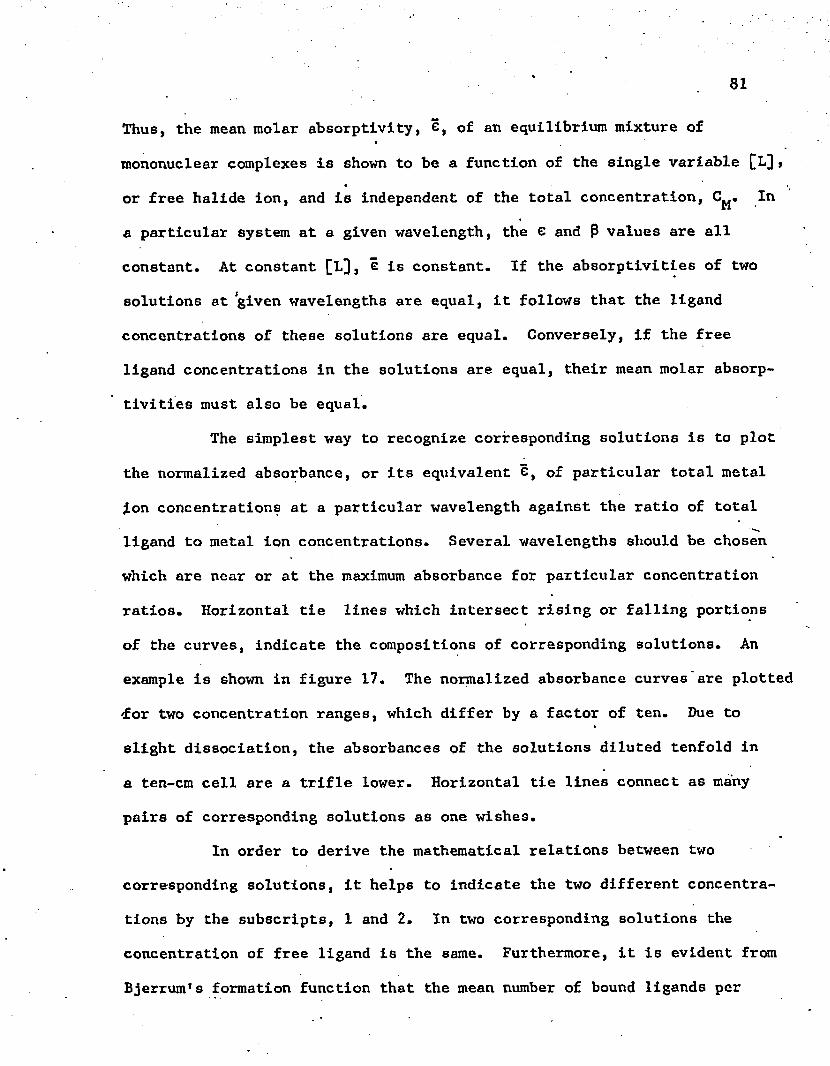
81
Thus, the mean molar absorptivity, e, of an equilibrium mixture of
mononuclear complexes is shown to be a function of the single variable [L],
or free halide ion, and is independent of the total concentration, C^. In
a particular system at a given wavelength, the e and P values are all
constant. At constant [L], e is constant. If the absorptivities of two
solutions at given wavelengths are equal, it follows that the ligand
concentrations of these solutions are equal. Conversely, if the free
ligand concentrations in the solutions are equal, their mean molar absorp
tivities must also be equal.
The simplest way to recognize corresponding solutions is to plot
the normalized absorbance, or its equivalent e, of particular total metal
Ion concentrations at a particular wavelength against the ratio of total
ligand to metal ion concentrations. Several wavelengths should be chosen
which are near or at the maximum absorbance for particular concentration
ratios. Horizontal tie lines which intersect rising or falling portions
of the curves, indicate the compositions of corresponding solutions. An
example is shown in figure 17. The normalized absorbance curves are plotted
<for two concentration ranges, which differ by a factor of ten. Due to
slight dissociation, the absorbances of the solutions diluted tenfold in
a ten-cm cell are a trifle lower. Horizontal tie lines connect as many
pairs of corresponding solutions as one wishes.
In order to derive the mathematical relations between two
corresponding solutions, it helps to indicate the two different concentra
tions by the subscripts, 1 and 2. In two corresponding solutions the
concentration of free ligand is the same. Furthermore, it is evident from
Bjerrum1s formation function that the mean number of bound ligands per
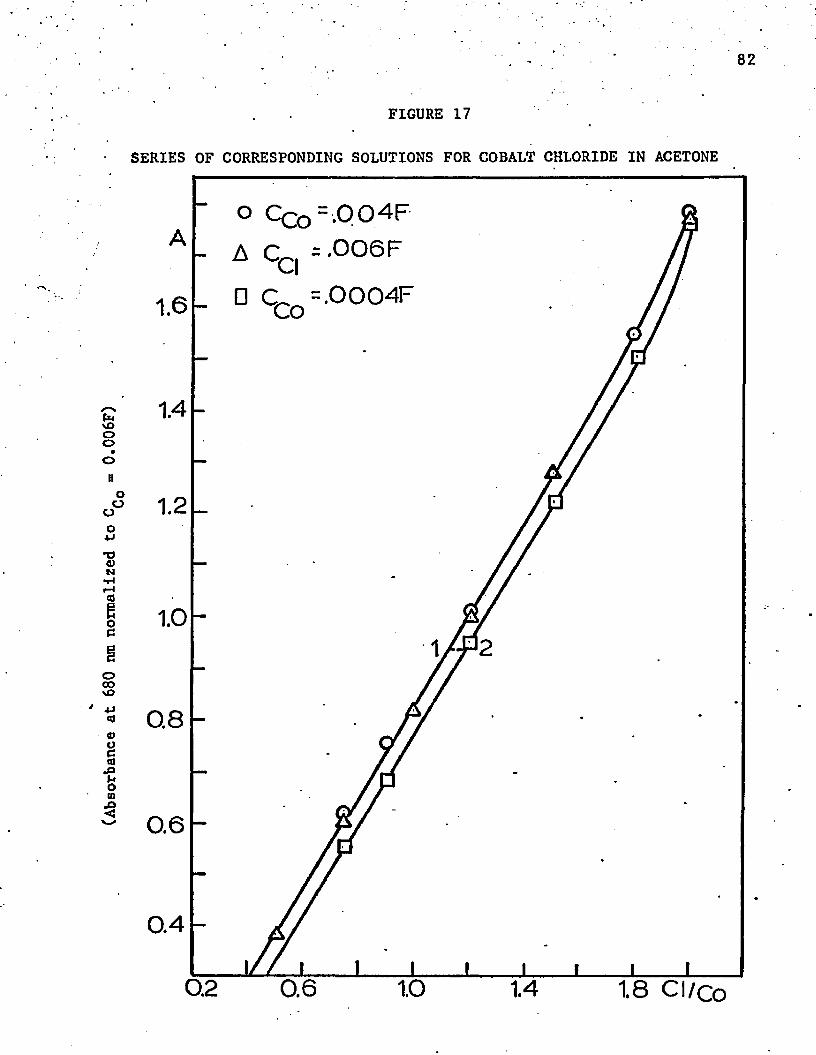
(Absorbance
at 680
nm normalized
to C_
as 0.006F)
82
FIGURE 17
SERIES OF CORRESPONDING SOLUTIONS FOR COBALT CHLORIDE IN ACETONE
O CCo=.004F A CQ = -006F
□ C, =.0004F Co1.6
1.2
1.0
0.8
0.6
0.4
0.2 0.6 1.0 1.4 1.8 Cl/co
metal Ion, n, Is the same for both solutions, since it.depends only on
[L] and the complex equilibrium constants. From the definition of n
(see equation 17), one may write the following for two correspondingsolutions M _ [L]
5 = ---- = (24)Ml M2
By eliminating ii and solving for [L], one obtains
[L] - ^ (25)Ml " M2
Hence, it is possible to solve for [L] in these two corresponding solutions. This value of [L] may be substituted in either of the n equations
(24), and a value of n can also be calculated. The method is roost satis
factory when the differences between the two and two terns are
large. When the differences are small, the errors in reading the absor
bance or neglecting a cell blank can become so serious that the results
are meaningless.Any of a variety of methods can be used for the calculation of
the equilibrium constants after values are obtained for [L] and n. The /
simplest, which is sati.sfactory for most purposes, is* to plot n against pL.
Then one assumes that the‘individual constants, K^, Kg, K^, etc., are equal
to the corresponding [L] values at n = 1/2, 3/2, 5/2, etc. There is an
analogy for a weak acid when it is half titrated, that is n for H+ is
equal to 1/2, that pK = pH. The method fails when the •equilibria
overlap. The extreme example occurs in the cobalt chloride system in
acetone, where the first two chlorides appear to add simultaneously or
not at all. Individual values for and Kg are meaningless, and 0g is- 2calculated as 1/[C1 ] at n = 1.0. For cases of moderate overlap,
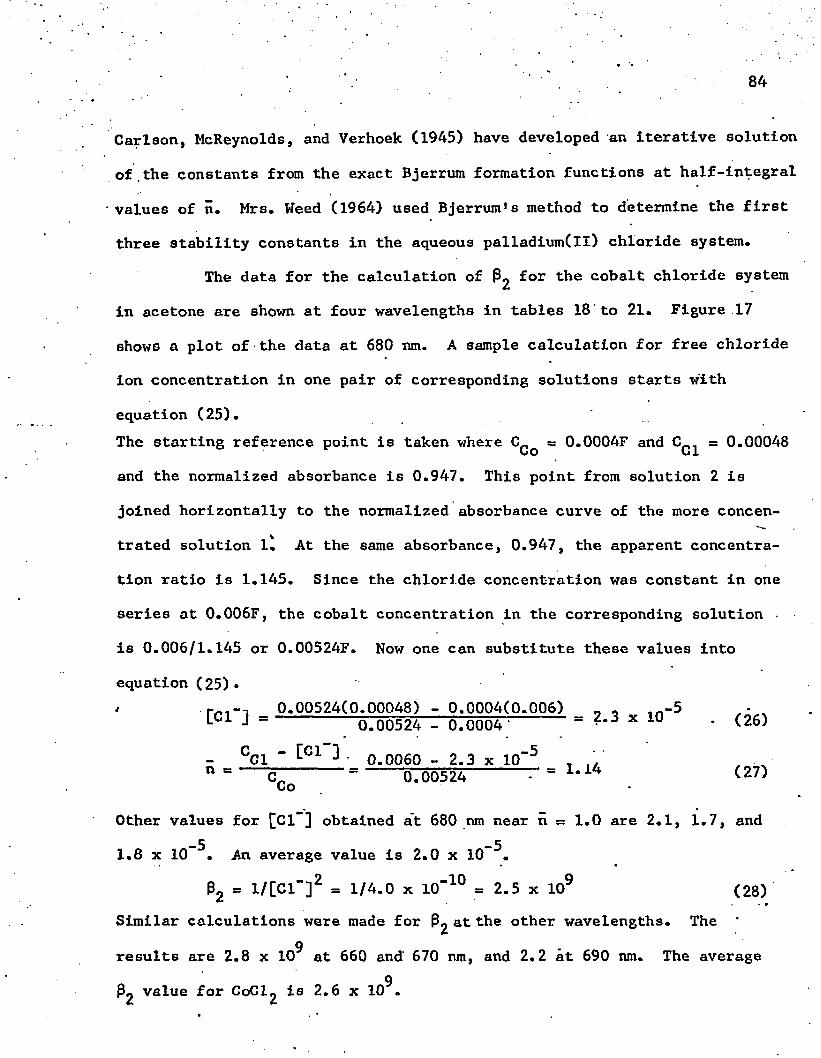
84
Carlson, McReynolds, and Verhoek (1945) have developed an iterative solution
of.the constants from the exact Bjerrum formation functions at half-integral
values of n. Mrs. Weed (1964) used Bjerrum1s method to determine the first
three stability constants in the aqueous palladium(ll) chloride system.
The data for the calculation of P2 ^or the c°kalt chloride system
in acetone are shown at four wavelengths in tables 18'to 21. Figure 17
shows a plot of the data at 680 nm. A sample calculation for free chloride
ion concentration in one pair of corresponding solutions starts with
equation (25).The starting reference point is taken where C = 0.0004F and C , = 0.00048UO bland the normalized absorbance is 0.947. This point from solution 2 is
joined horizontally to the normalized absorbance curve of the more concen
trated solution 1^ At the same absorbance, 0.947, the apparent concentra
tion ratio is 1.145. Since the chloride concentration was constant in one
series at 0.006F, the cobalt concentration in the corresponding solution -
is 0.006/1.145 or 0.00524F. Now one can substitute these values into
equation ( 25) •0.00524(0.00048) - 0.0004(0.006) „ „ ,rt-5 .
LC 1 ] = --------- 0.00524 - 6:0004-'------ = ? *3 x 1 0 * (26)
- CC1 " £C 1 ' 0.0060 - 2.3 x 10" 5 . ■n e — -------= -----0 7 0 0 5 2 4 ----------- 1-14 (27)Co
Other values for [Cl“] obtained at 680 nm near ii = 1.0 are 2.1, 1.7, and-5 -51.8 x 10 . An average value is 2.0 x 10 .
P2 = 1/[C1" ] 2 = 1/4.0 x 10- 1 0 = 2.5 x 10⁹ (28)Similar calculations were made for at wavelengths. The
9results are 2.8 x 10 at 660 and 670 nm, and 2.2 at 690 nm. The averageg
$ 2 value for C o C ^ is 2 . 6 x 1 0 .
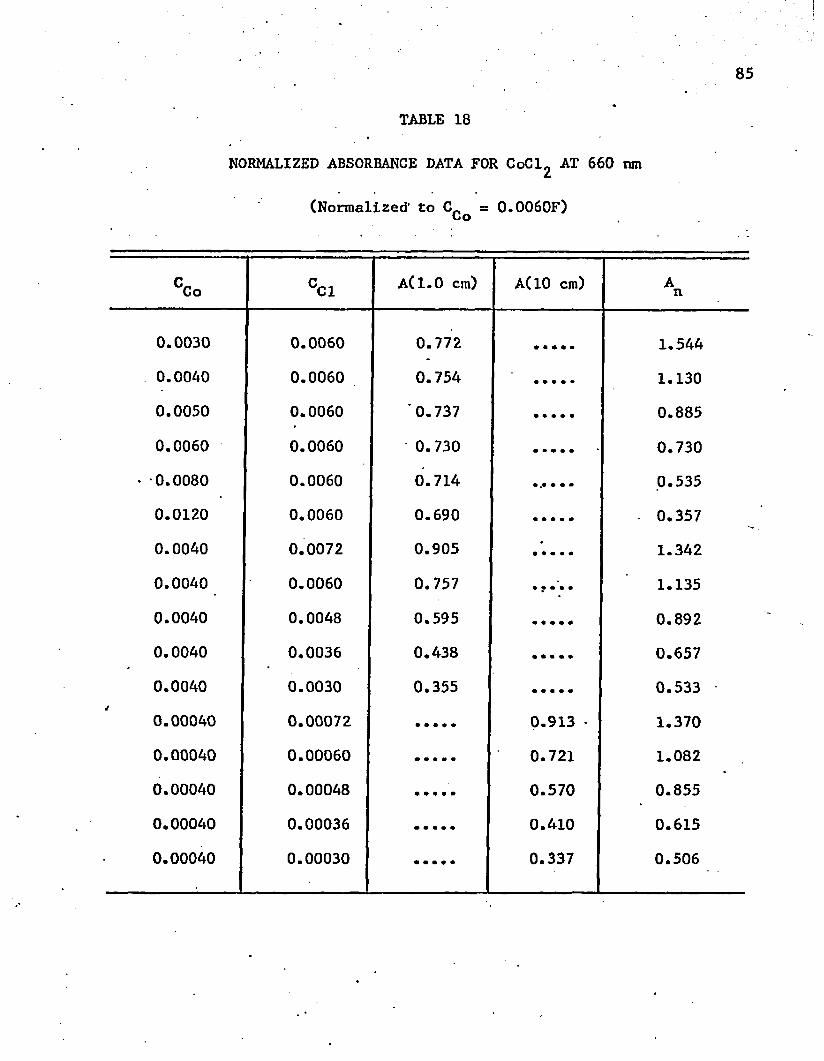
85
TABLE 18
NORMALIZED ABSORBANCE DATA FOR CoCl2 AT 660 nm
(Normalized’ to C = 0.0060F)
CCo CC1 A(1.0 cm) A(10 cm) An
0.0030 0.0060 0.772 • • • • • 1.5440.0040 0.0060 0.754 • • • • • 1.1300.0050 0.0060 0.737 • • • • • 0.885
0.0060 0.0060 0.730 0.730• 0.0080 0.0060 0.714 .0.535
0.0120 0.0060 0.690 • • • ■ • 0.3570.0040 0.0072 0.905 • • • • « 1.3420.0040 0.0060 0.757 t • * ■ • 1.1350.0040 0.0048 0.595 « • • t • 0.8920.0040 0.0036 0.438 • * • * * 0.6570.0040 0.0030 0.355 • • « • m 0.533 -0.00040 0.00072 0.913 • 1.3700.00040 0.00060 0.721 1.082
0.00040 0.00048 0.570 0.855
0.00040 0.00036 0.410 0.615
0.00040 0.00030 0.337 0.506
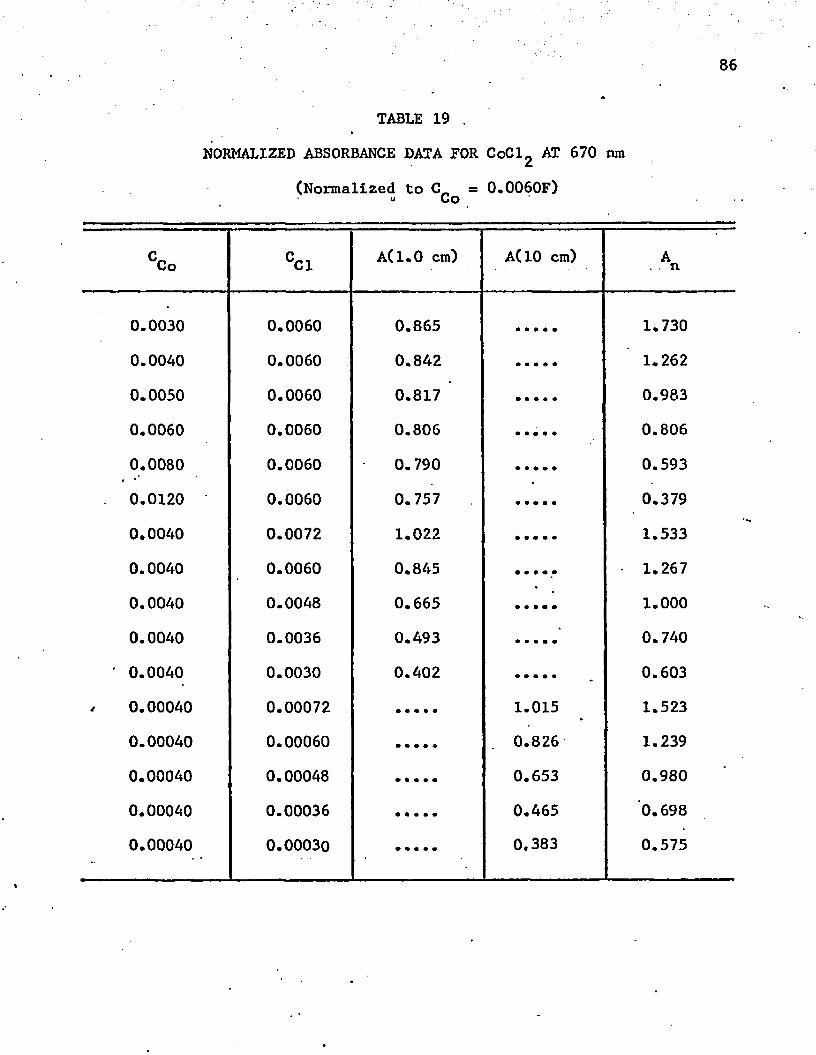
86
TABLE 19 ,
NORMALIZED ABSORBANCE DATA FOR CoCl2 AT 670 tun
(Normalized to C_ = 0.0060F)r*
CCo CC 1 A(1.0 cm) A(10 cm) A . n
0.0030 0.0060 0.865 1.730
0.0040 0.0060 0.842 1.262
0.0050 0.0060 0.817 0.983
0.0060 0.0060 0.806 0.806
0.0080 0.0060 0.790 0.593
0 . 0 1 2 0 0.0060 0.757 0.379
0.0040 0.0072 1 . 0 2 2 1.533
0.0040 0.0060 0.845 • • • • • 1.267
0.0040 0.0048 0.665 1 . 0 0 0
0.0040 0.0036 0.493 0.740
' 0.0040 0.0030 0.402 • • • m • 0.603
0.00040 0.00072 1.015 1.523
0.00040 0.00060 . 0.826 1.239
0.00040 0.00048 0.653 0.980
0.00040 0.00036 0.465 0.698
0.00040 0.00030 0.383 0.575
87
TABLE 20
NORMALIZED ABSORBANCE DATA FOR CoCl2 AT 680 nm
(Normalized to Cn = 0.00060F)
CCo CC1 A(1.0 cm) A(10 cm) A . n
0.0030 0.0060 0.875 1.750
0.0040 0.0060 0.845 1.267
0.0050 0.0060 0.8.25 0.990
0.0060 .0.0060 0.805 0.805
0.0080 0.0060 0.790 0.593
0 . 0 1 2 0 0.0060 0.750 0.375
0.0040 0.0072 1.040 1.560
0.0040 0.0060 0.845 1.267
0.0040 0.0048 0.665 1 . 0 0 0
0.0040 0.0036 0.493 0.740
0.0040 0.0030 0.398 • * * • • 0.597
0.00040 0.00072 1.015 1.522
0.00040 0.00060 0.820 1.230
0.00040 0.00048 0.635 0.952
0.00040 0.00036 0.460 0.690
0.00040 0.00030 0.377 0.565
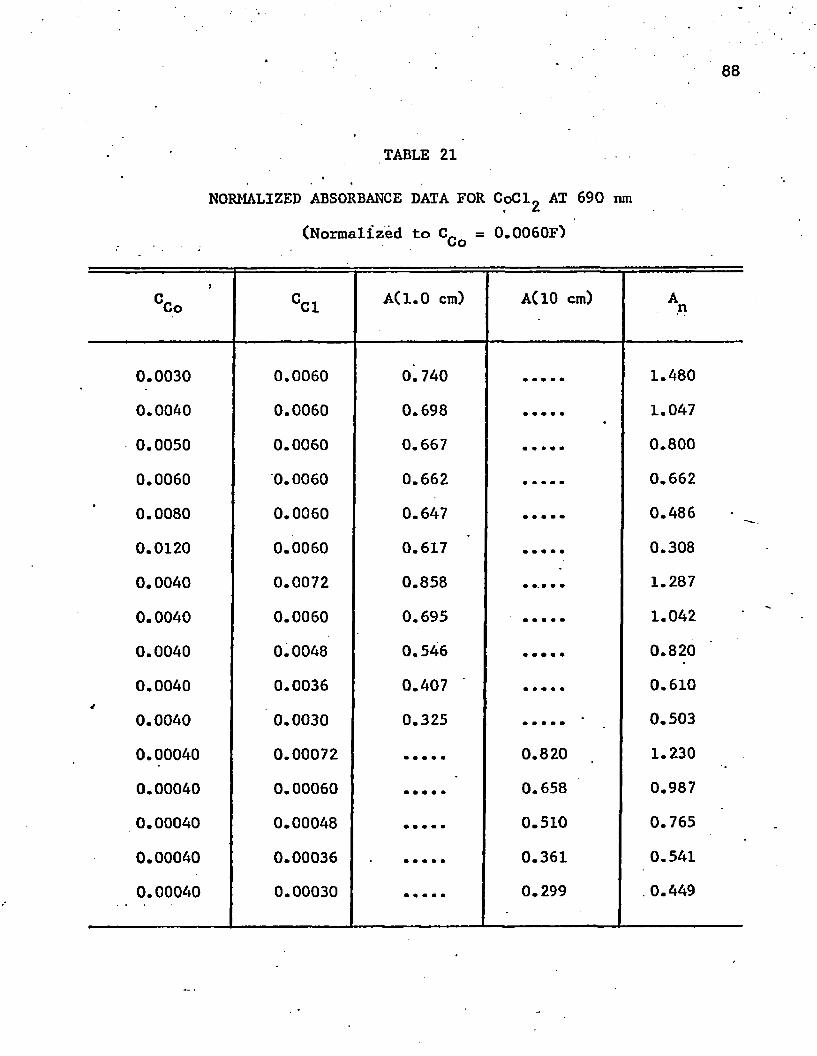
88
TABLE 21
NORMALIZED ABSORBANCE DATA FOR CoCl2 AT 690 nm
(Normalized to = 0.0060F)
CCo CC 1 A(1.0 cm) A(10 cm) An
0.0030 0.0060 0.740 1.480
0.0040 0.0060 0.698 1.047
0.0050 0.0060 0.667 0.800
0.0060 0.0060 0.662 0.662
0.0080 0.0060 0.647 0.486
0 . 0 1 2 0 0.0060 0.617 0.308
0.0040 0.0072 0.858 1.287
0.0040 0.0060 0.695 1.042
0.0040 0.0048 0.546 0.820
0.0040 0.0036 0.407 0.610
0.0040 0.0030 0.325 ..... 0.503
0.00040 0.00072 0.820 1.230
0.00040 0.00060 0.658 0.987
0.00040 0.00048 0.510 0.765
0.00040 0.00036 0.361 0.541
0.00040 0.00030 0.299 .0.449
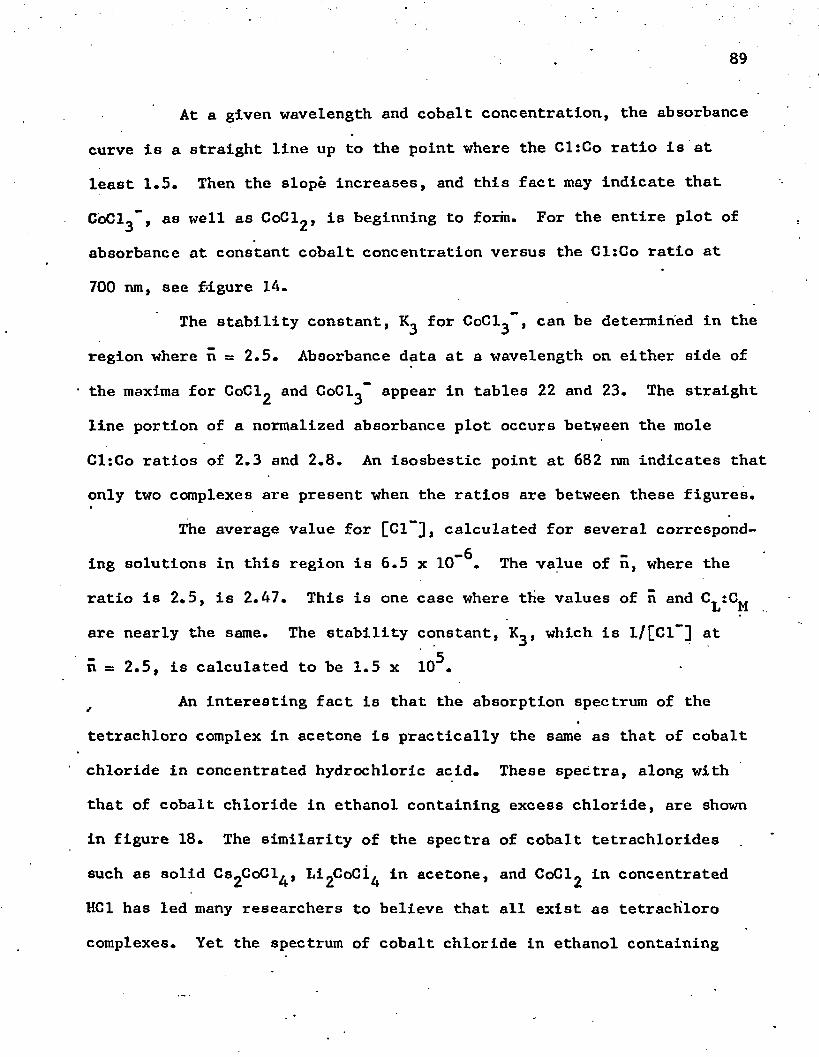
89
At a given wavelength and cobalt concentration, the absorbance
curve is a straight line up to the point where the Cl:Co ratio is at
least 1.5. Then the slope increases, and this fact may indicate that
CoCl^” , as well as CoCl^, is beginning to form. For the entire plot of
absorbance at constant cobalt concentration versus the Cl:Co ratio at
700 nm, see figure 14.
The stability constant, for CoCl^” , can be determined in the
region where n = 2.5. Absorbance data at a wavelength on either side of
• the maxima for CoClg and CoCl^- appear in tables 22 and 23. The straight
line portion of a normalized absorbance plot occurs between the mole
Cl:Co ratios of 2.3 and 2.8. An isosbestic point at 682 nm indicates that
only two complexes are present when the ratios are between these figures.
The average value for [Cl~3, calculated for several correspond
ing solutions in this region is 6.5 x 10”^. The value of n, where the
ratio is 2.5, is 2.47. This is one case where tbe values of n and C, :C,.L Mare nearly the same. The stability constant, K^, which is 1/[C1*"] at
n = 2.5, is calculated to be 1.5 x 1CT*.
An interesting fact is that the absorption spectrum of the
tetrachloro complex in acetone is practically the same as that of cobalt
chloride in concentrated hydrochloric acid. These spectra, along with
that of cobalt chloride in ethanol containing excess chloride, are shown
in figure 18. The similarity of the spectra of cobalt tetrachlorides
such as solid Cs2CoCl^, Li2CoCi^ in acetone, and C o C ^ in concentrated
HC1 has led many researchers to believe that all exist as tetrachloro
complexes. Yet the spectrum of cobalt chloride in ethanol containing
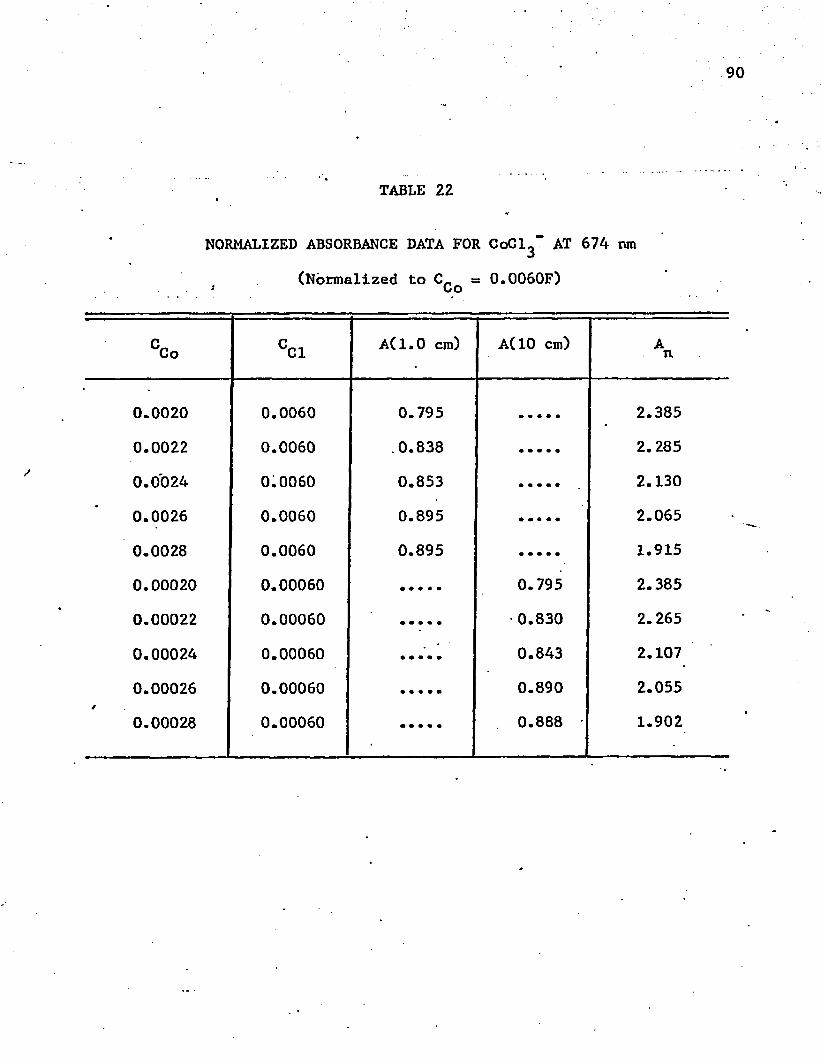
90
TABLE 22
NORMALIZED ABSORBANCE DATA FOR CoCl3 AT 674 nm
(Normalized to C„ = 0.0060F)1 oo
CCo CC1 A(1.0 cm) A(10 cm) An
0 . 0 0 2 0 0.0060 0.795 2.385
0 . 0 0 2 2 0.0060 .0.838 2.285
0.0024 0.0060 0.853 2.130
0.0026 0.0060 0.895 2.065
0.0028 0.0060 0.895 1.915
0 . 0 0 0 2 0 0.00060 0.795 2.385
0 . 0 0 0 2 2 0.00060 ■0.830 2.265
0.00024 0.00060 0.843 2.107
0.00026 0.00060 0.890 2.055
0.00028 0.00060 0 . 8 8 8 1.902
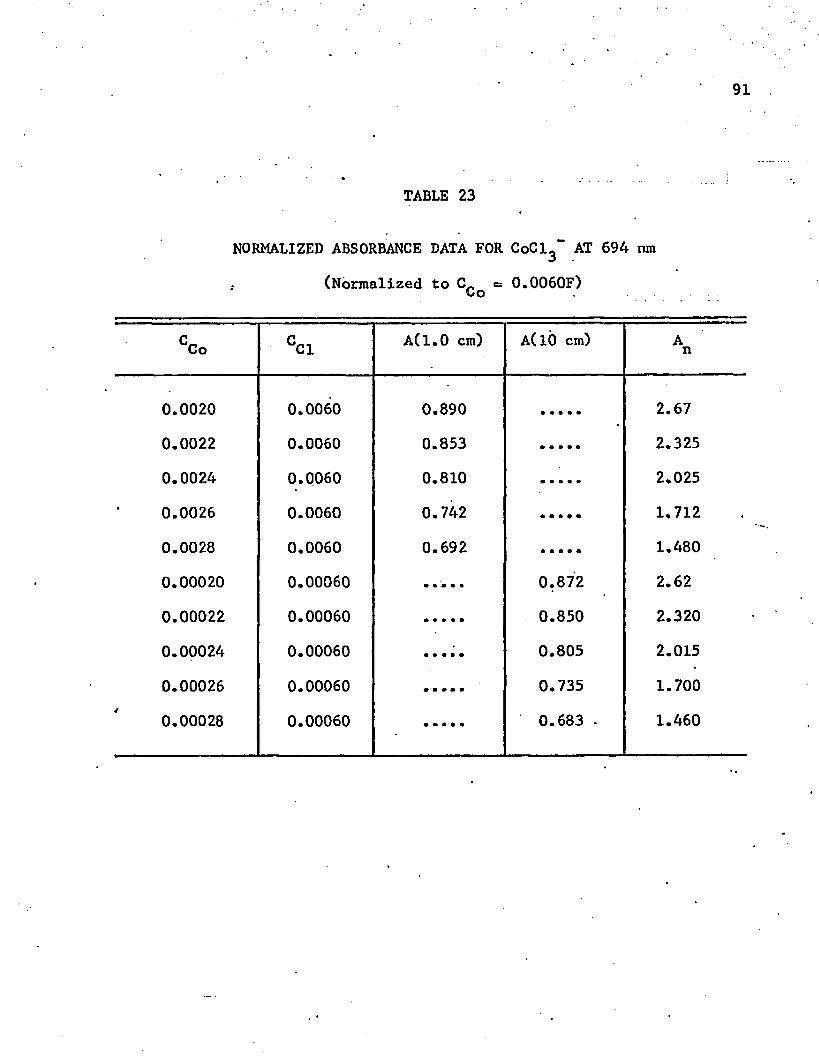
91
TABLE 23
NORMALIZED ABSORBANCE DATA FOR CoCl3“ AT 694 ran
t (Normalized to = 0.0060F)
CCo CC1 ACl.O cm) A(10 cm) An
0 . 0 0 2 0 0.0060 0.890 2.67
0 . 0 0 2 2 0.0060 0.853 2.325
0.0024 0.0060 0.810 2.025
0.0026 0.0060 0.742 1.712
0.0028 0.0060 0.692 1.480
0 . 0 0 0 2 0 0.00060 0.872 2.62
0 . 0 0 0 2 2 0.00060 0.850 2.320
0.00024 0.00060 0.805 2.015
0.00026 0.00060 0.735 1.700
0.00028 0.00060 0.683 • 1.460
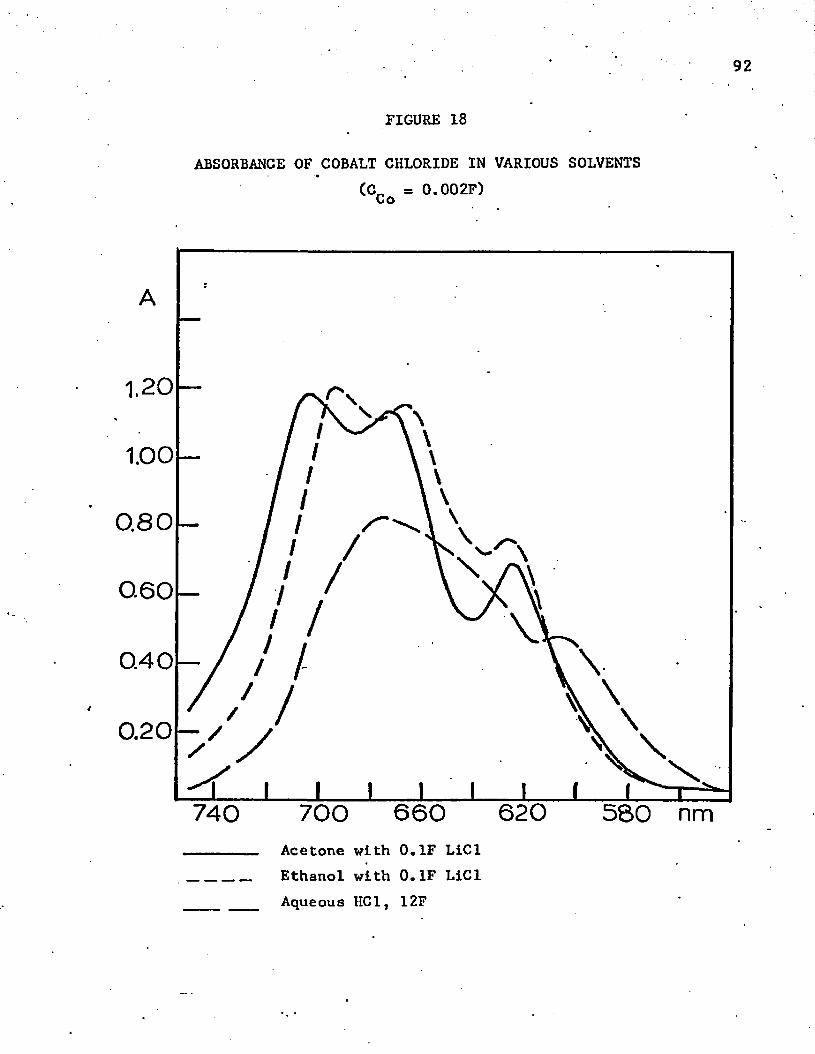
FIGURE 18
92
ABSORBANCE OF COBALT CHLORIDE IN VARIOUS SOLVENTS(C_ = 0.002F)
1.20
1.00
0.80
0.60
0.40/
0.20 — /
740 700 660 620 580 nmAcetone with 0.1F LiCl Ethanol with 0.1F LiCl Aqueous HC1, 12F
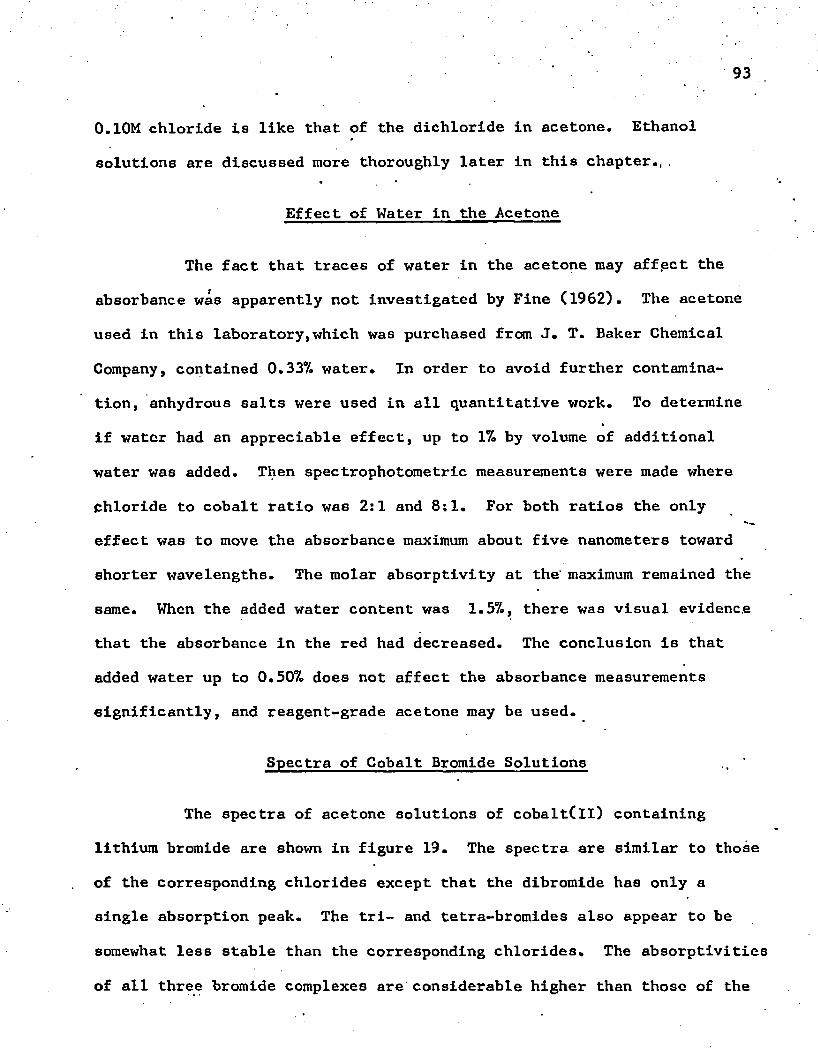
93
0.10M chloride is like that of the dichloride in acetone. Ethanol
solutions are discussed more thoroughly later in this chapter., .
Effect of Water in the Acetone
The fact that traces of water in the acetone may affect the
absorbance was apparently not investigated by Fine (1962). The acetone
used in this laboratory,which was purchased from J. T. Baker Chemical
Company, contained 0.337. water. In order to avoid further contamina
tion, anhydrous salts were used in all quantitative work. To determine
if water had an appreciable effect, up to 17. by volume of additional
water was added. Then spectrophotometric measurements were made where
Chloride to cobalt ratio was 2:1 and 8:1. For both ratios the only
effect was to move the absorbance maximum about five nanometers toward
shorter wavelengths. The molar absorptivity at the' maximum remained the
same. When the added water content was 1.57., there was visual evidence
that the absorbance in the red had decreased. The conclusion is that
added water up to 0.507. does not affect the absorbance measurements
significantly, and reagent-grade acetone may be used.
Spectra of Cobalt Bromide Solutions
The spectra of acetone solutions of cobalt(ll) containing
lithium bromide are shown in figure 19. The spectra are similar to those
of the corresponding chlorides except that the dibromide has only a
single absorption peak. The tri- and tetra-bromides also appear to be
somewhat less stable than the corresponding chlorides. The absorptivities
of all three bromide complexes are considerable higher than those of the
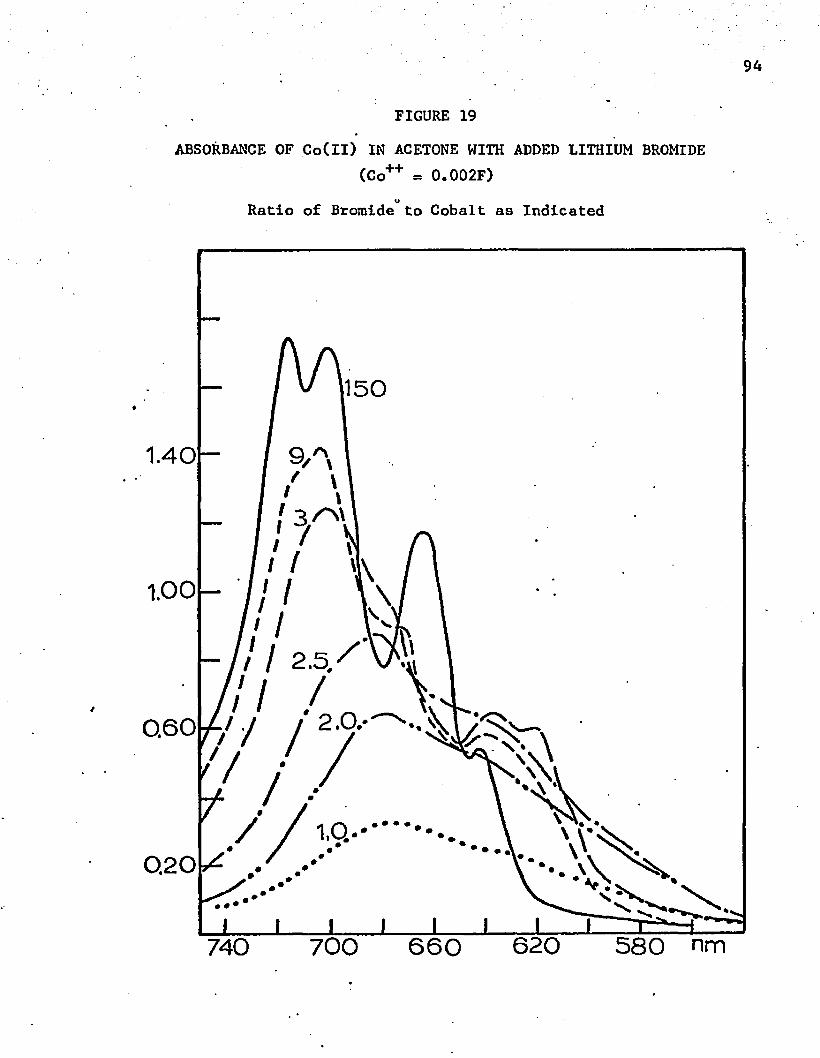
94
FIGURE 19
ABSORBANCE OF Co(ll) IN ACETONE WITH ADDED LITHIUM BROMIDE(Co++ = 0.002F)
Ratio of Bromide to Cobalt as Indicated
1.40-
1.00 -
0.60
0.20
\//// ,
740 700 660 620 580 nm
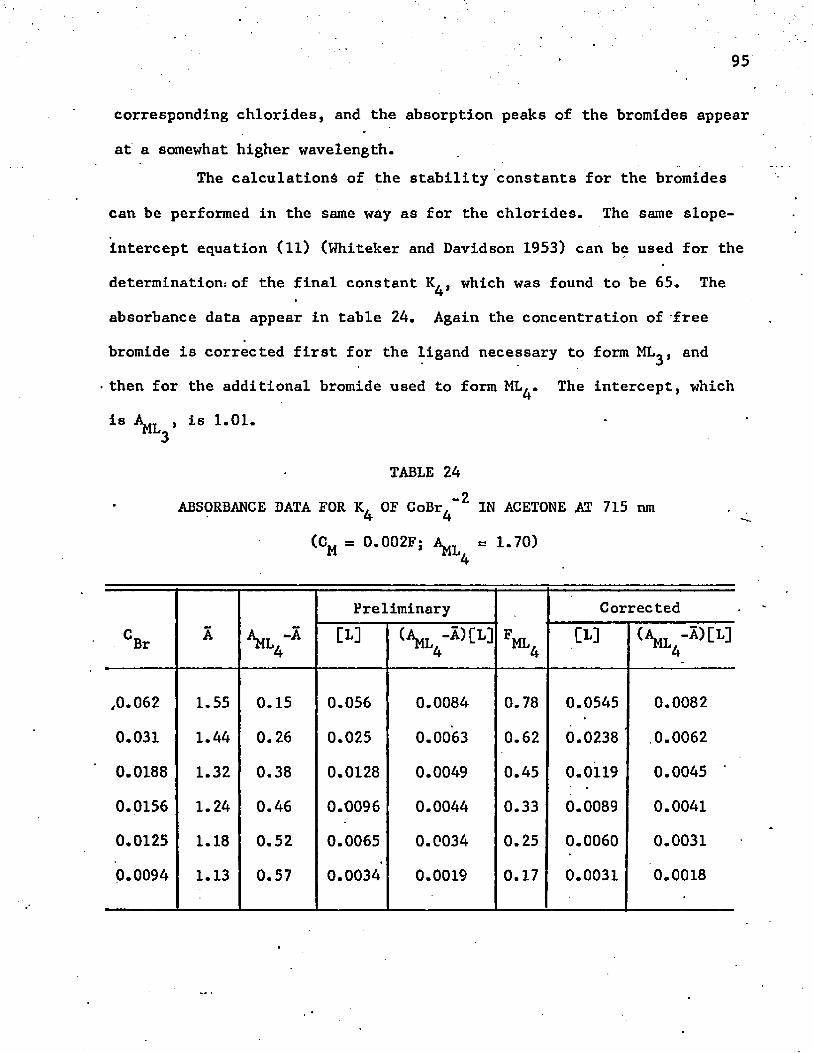
95
corresponding chlorides, and the absorption peaks of the bromides appear
at a somewhat higher wavelength.The calculations of the stability constants for the bromides
can be performed in the same way as for the chlorides. The same slope-
intercept equation (11) (Whiteker and Davidson 1953) can be used for the
determination.- of the final constant K^, which was found to be 65. The
absorbance data appear in table 24. Again the concentration of free
bromide is corrected first for the ligand necessary to form ML^, and
then for the additional bromide used to form ML^. The intercept, which
is , is 1 .0 1 .
TABLE 24
ABSORBANCE DATA FOR K. OF CoBr.**2 IN ACETONE AT 715 nm4 4 ^(CM = 0.002F; Am l = 1.70)
CBr A v z4
PreliminaryFML.4
Corrected[L]
4
1-1
1i_i
;
(ah l -A)[L] 4
,0.062 1.55 0.15 0.056 0.0084 0.78 0.0545 0.0082
0.031 1.44 0.26 0.025 0.0063 0.62 0.0238 0.0062
0.0188 1.32 0.38 0.0128 0.0049 0.45 0.0119 0.0045
0.0156 1.24 0.46 0.0096 0.0044 0.33 0.0089 0.0041
0.0125 1.18 0.52 0.0065 0.0034 0.25 0.0060 0.0031
0.0094 1.13 0.57 0.0034 0.0019 0.17 0.0031 0.0018
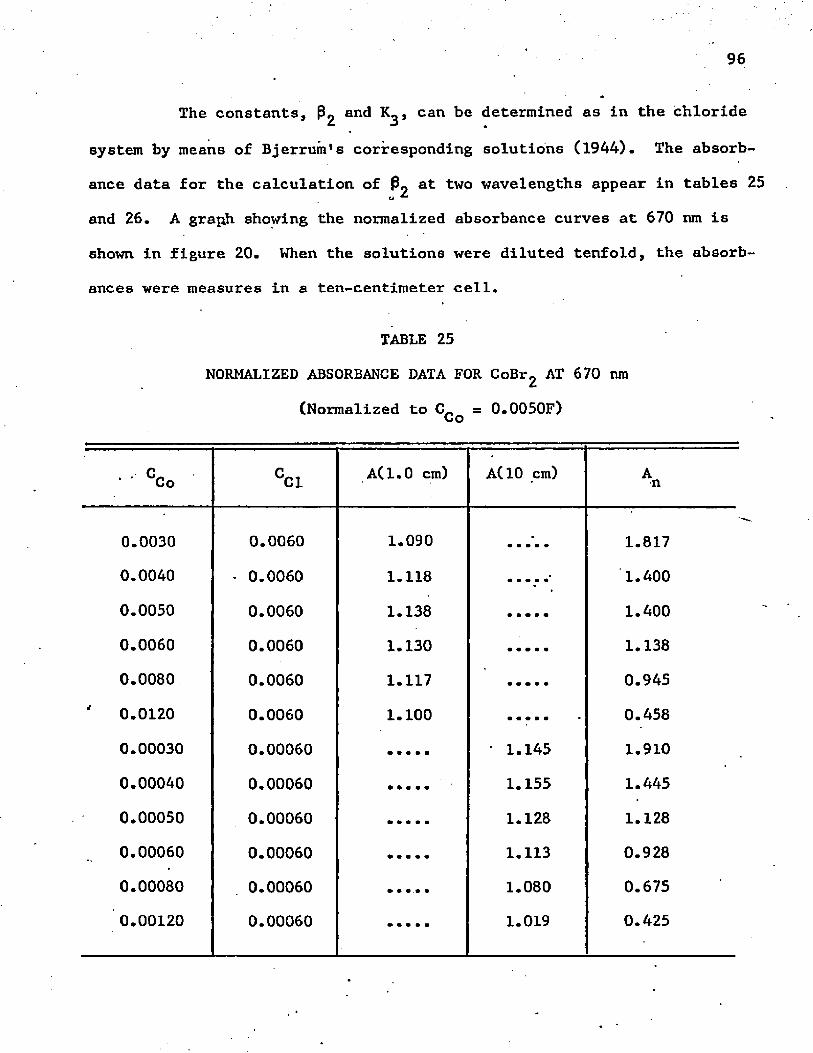
96
The constants, P2 ant* ^3 * can be determined as in the chloride
system by means of Bjerrum's corresponding solutions (1944). The absorb
ance data for the calculation of fL at two wavelengths appear in tables 25u ^
and 26. A graph showing the normalized absorbance curves at 670 nm is
shown in figure 20. When the solutions were diluted tenfold, the absorb
ances were measures in a ten-centimeter cell.
TABLE 25
NORMALIZED ABSORBANCE DATA FOR CoBr2 AT 670 nm
(Normalized to C_ = 0.0050F)to
000
CC1 A(1.0 cm) A(10 cm) An
0.0030 0.0060 1.090 • 1.8170.0040 • 0.0060 1.118 1.400
0.0050 0.0060 1.138 1.400
0.0060 0.0060 1.130 1.138
0.0080 0.0060 1.117 0.945
' 0 . 0 1 2 0 0.0060 1 . 1 0 0 ..... 0.458
0.00030 0.00060 • 1.145 1.910
0.00040 0.00060 1.155 1.445
0.00050 0.00060 1.128 1.128
0.00060 0.00060 1.113 0.928
0.00080 0.00060 1.080 0.675
0 . 0 0 1 2 0 0.00060 1.019 0.425
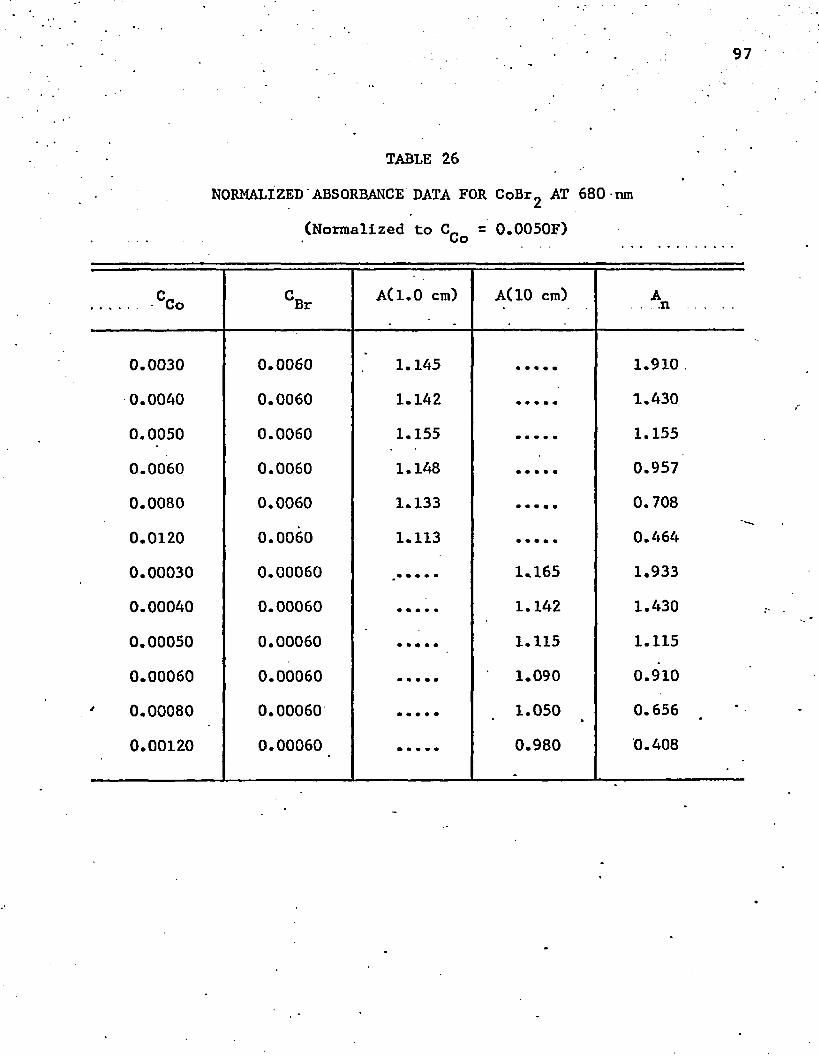
97
TABLE 26
NORMALIZED ABSORBANCE DATA FOR CoBr2 AT 680 nm
(Normalized to C^o = 0.0050F)
..... CCo CBr A(1.0 cm) A(10 cm) A. n .....
0.0030 0.0060 1.145 1.910 .
0.0040 0.0060 1.142 1.430
0.0050 0.0060 1.155 1.155
0.0060 0.0060 1.148 0.957
0.0080 0.0060 1.133 0.708
0.0120 0.0060 1.113 0.464
0.00030 0.00060 .•••** 1.165 1.933
0.00040 0.00060 1.142 1.430
0.00050 0.00060 1.115 1.115
0.00060 0.00060 1.090 0.910
0.00080 0.00060 1.050 0.656
0.00120 0.00060 0.980 0.408
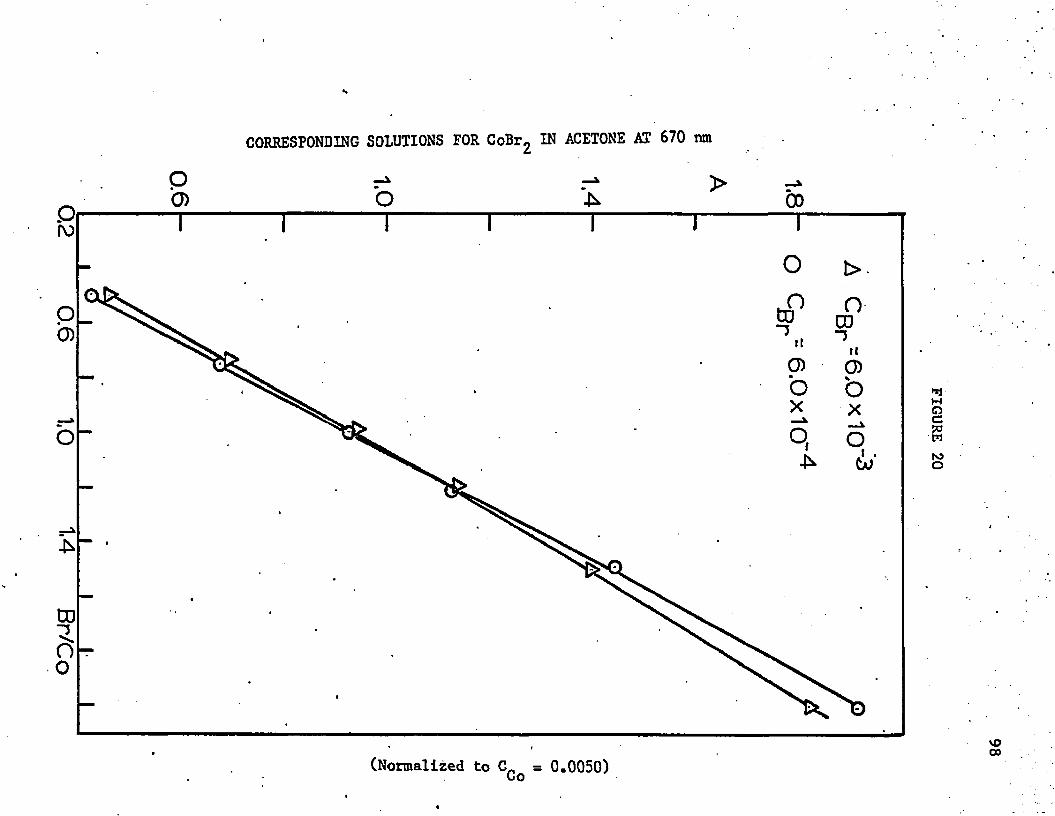
0.6 10
1-4 Br/Co
CORRESPONDING SOLUTIONS FOR CoBr2 IN ACETONE AT 670 nm
(Normalized to C* = 0.0050) oo
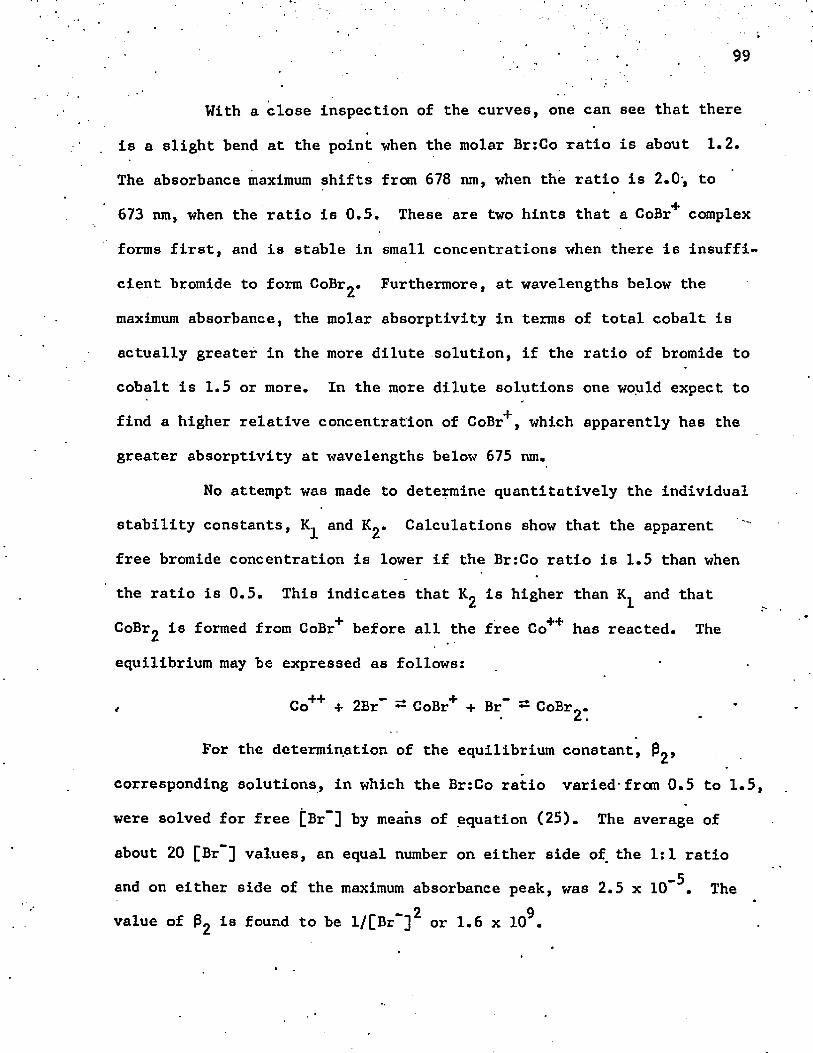
. ■ . 99
With a close inspection of the curves, one can see that there
is a slight bend at the point when the molar Br:Co ratio is about 1.2.
The absorbance maximum shifts from 678 nm, when the ratio is 2.0‘, to*4*673 nm, when the ratio is 0.5. These are two hints that a CoBr complex
forms first, and is stable in small concentrations when there is insuffi
cient bromide to form CoBrg. Furthermore, at wavelengths below the
maximum absorbance, the molar absorptivity in terms of total cobalt is
actually greater in the more dilute solution, if the ratio of bromide to
cobalt is 1.5 or more. In the more dilute solutions one would expect to
find a higher relative concentration of CoBr+ , which apparently has the
greater absorptivity at wavelengths below 675 nm.
No attempt was made to determine quantitatively the individual
stability constants, and Kg. Calculations show that the apparent
free bromide concentration is lower if the Br:Co ratio is 1.5 than when
the ratio is 0.5. This indicates that Kg is higher than and that
CoBrg is formed from CoBr+ before all the free Co++ has reacted. The
equilibrium may be expressed as follows:
t Co++ + 2Br” 51 CoBr+ + Br~ ** CoBrg.
For the determination of the equilibrium constant, Pg,
corresponding solutions, in which the Br:Co ratio varied-from 0.5 to 1.5,
were solved for free [Br""] by means of equation (25). The average of
about 20 [Br ] values, an equal number on either side of the 1:1 ratio_5and on either side of the maximum absorbance peak, was 2.5 x 10 . The
- 2 9value of Pg is found to be l/[Br ] or 1.6 x 10 .
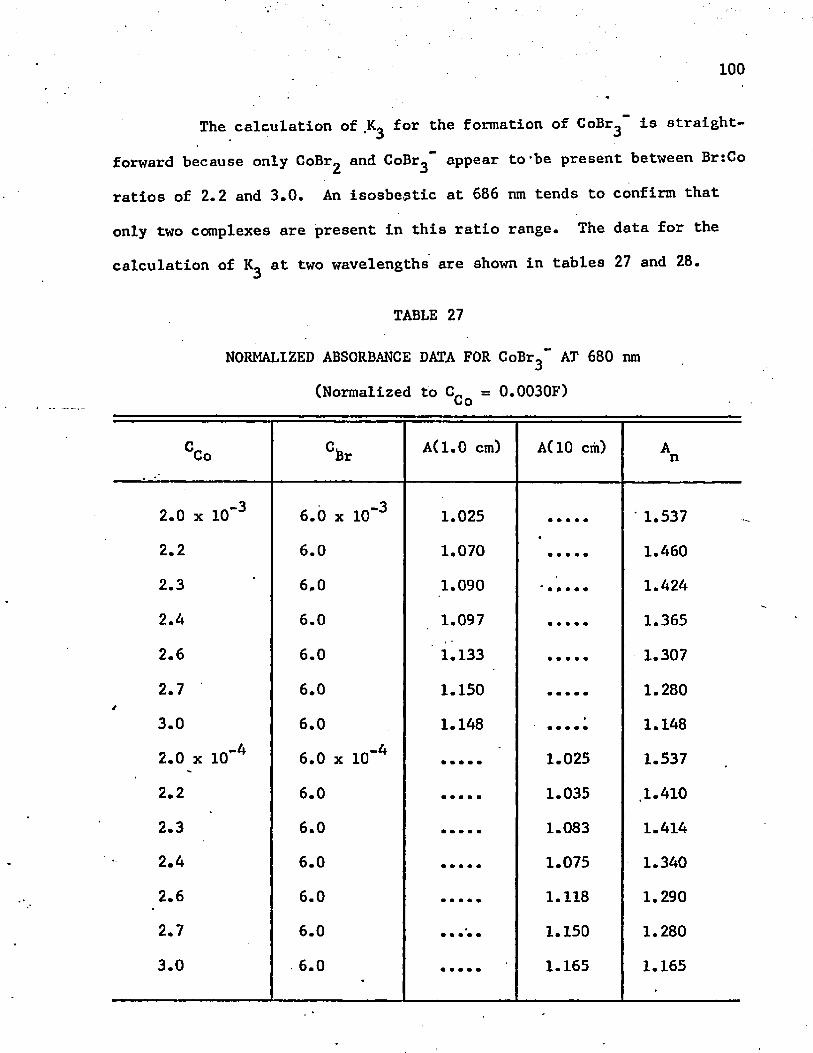
100
The calculation of for the formation of CoBr^ is straight
forward because only CoBr2 and CoBr^ appear to 'be present between B n C o
ratios of 2.2 and 3.0. An isosbestic at 6 8 6 nm tends to confirm that
only two complexes are present in this ratio range. The data for the
calculation of at two wavelengths are shown in tables 27 and 28.
TABLE 27
NORMALIZED ABSORBANCE DATA FOR CoBr3” AT 680 nm
(Normalized to C„ = 0.0030F)Vj O
CCo Gfer A(1.0 cm) A(10 cm) An
2 . 0 x 1 0 " 3 6 . 0 x 1 0 " 3 1.025 1.5372 . 2 6 . 0 1.070 1.4602.3 6 , 0 1.090 1.424
2.4 6 . 0 1.097 1.365
2 . 6 6 . 0 1.133 1.307
2.7 6 . 0 1.150 1.280
3.0 6 . 0 1.148 • 1.148
2 . 0 x 1 0 " 4 6 . 0 x 1 0 ” 4 1.025 1.537
2 . 2 6 . 0 1.035 .1.410
2.3 6 . 0 1.083 1.414
2.4 6 . 0 1.075 1.340
2 . 6 6 . 0 1.118 1.290
2.7 6 . 0 1.150 1.280
3.0 ■ 6 . 0 1.165 1.165
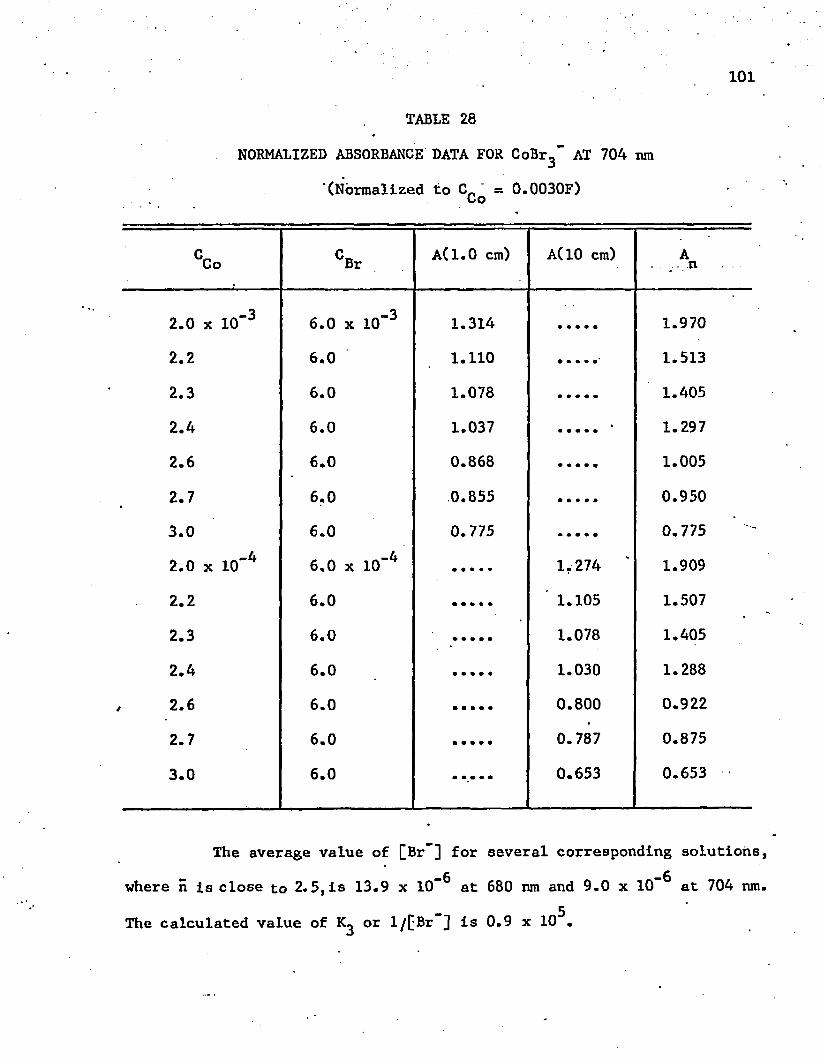
101
TABLE 28
NORMALIZED ABSORBANCE DATA FOR CoBr3" AT 704 nm
"(Normalized to C„ ' = 0.0030F)
CCo °Br A(1.0 cm) A(10 cm) A.......n
2 . 0 x 1 0 ” 3 6 . 0 x 1 0 “ 3 1..314 1.970
2 . 2 6 . 0 1 . 1 1 0 1.513
2.3 6 . 0 1.078 1.405
2.4 6 . 0 1.037 . . . . • 1.297
2 . 6 6 . 0 0 . 8 6 8 1.005
2.7 6 . 0 0.855 0.950
3.0 6 . 0 0.775 0.775
2 . 0 x 1 0 ” 4 6 . 0 x 1 0 " 4 1.274 1.909
2 . 2 6 . 0 ’ 1.105 1.507
2.3 6 . 0 1.078 1.405
2.4 6 . 0 1.030 1.288
2 . 6 6 . 0 0.800 0.922
2.7 6 . 0 0.787 0.875
3.0 6 . 0 0.653 0.653
The average value of [Br~] for several corresponding solutions
where n is close to 2.5 , is 13.9 x 10” at 680 nm and 9.0 x 10” at 704 nm
The calculated value of or l/[Br“] is 0.9 x 10"*.
Spectra of Cobalt Iodide Solutions
The spectra of cobalt Iodides In acetone, are shown in figure 21.
„ It will be shown that, of the halides, iodide alone appears to form a sig
nificant concentration of monohalide complex. Within the solubility limits
of potassium iodide in acetone there appears to be no tetraiodide complex
formed. Absorptivities in the red continue to rise as the halide ion
becomes heavier, and the absorbance peaks move to higher wavelengths. The
iodides all show considerable absorption around 400 nm. This is probably
due to a charge transfer phenomenon, which is often more prominent with
metal iodides. The extreme case occurs with copper(ll) in aqueous solu
tion. The electron does not jump back and forth between the cation and
anion, but stays on the cupric ion, and the copper(ll) is reduced to
copper(l).
It is possible to determine three stability constants, K^, 1^,
and for cobalt iodides. The first two overlap, but not as completely
as the corresponding chloride and bromide constants. All three constants
can be determined by the method of corresponding solutions. One example
of corresponding solutions from actual experimental absorbance curves has
already been presented in figure 16. Curves for normalized absorbance
data at two iodide concentrations are shown in figure 22.' At 735 nm or
any other wavelength above 700 nm, two definite changes of slope can be
detected. These occur where the iodide to cobalt ratios, are approximately
1.2 and 2.3. These slope changes just beyond integral values indicate
that three complexes, CoI+ , Colg, and Col^” , are formed. The slope
decreases after the ratio reaches 3.0 as the formation of Col^"" is
gradually completed.
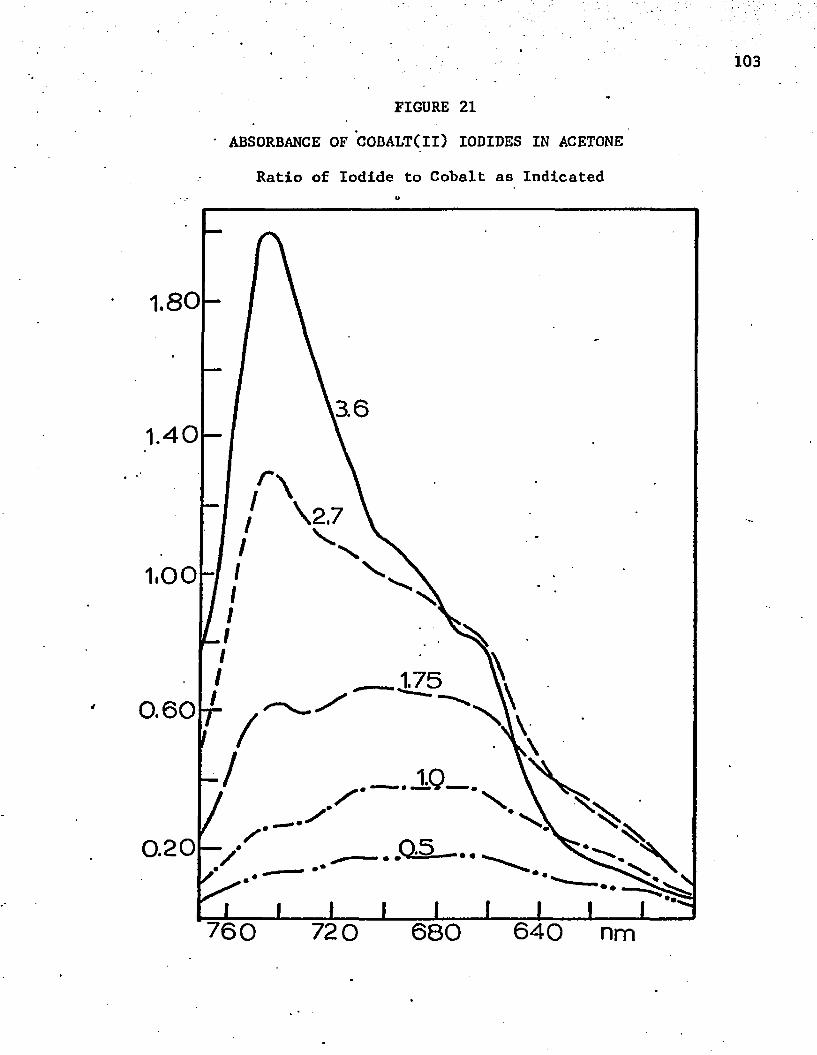
FIGURE 21
ABSORBANCE OF COBALT(ll) IODIDES IN ACETONE
Ratio of Iodide to Cobalt as Indicated
1.80
3.61.40
\2 .7
1.00
.1,750.60
0.20
760 640 nm720 680
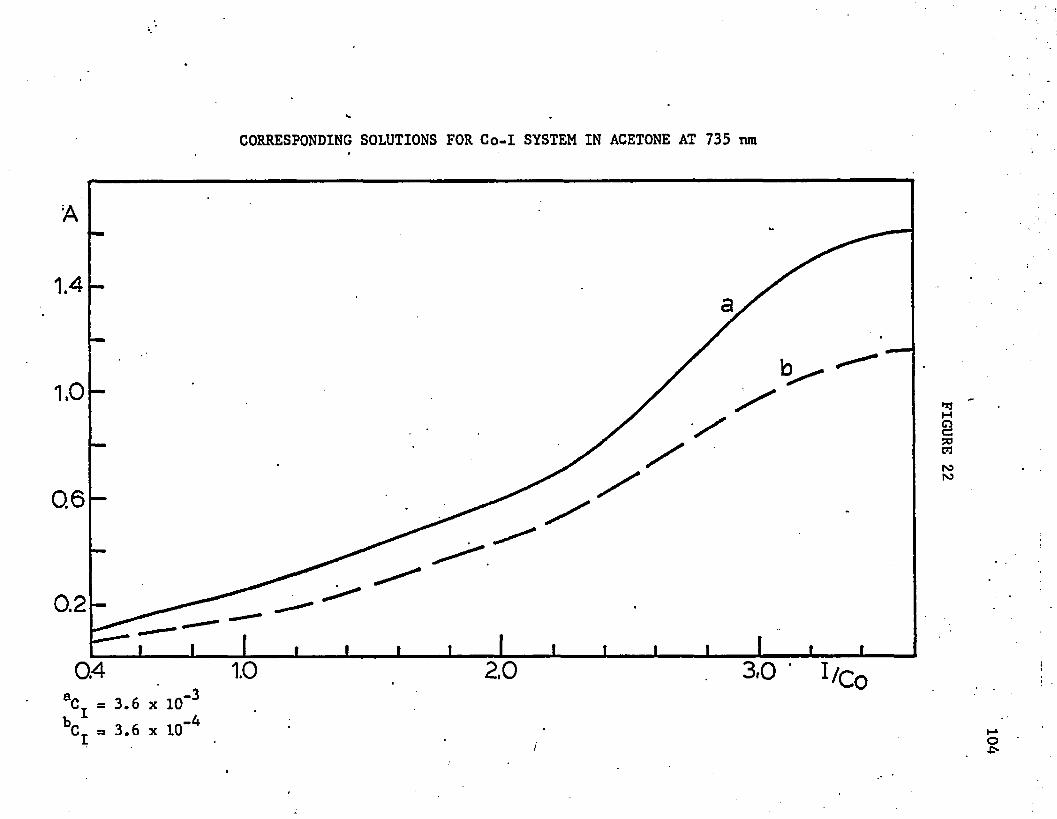
CORRESPONDING SOLUTIONS FOR Co-I SYSTEM IN ACETONE AT 735 nm
1.4
0.6
0.2
2,00.4
-4
FIGURE 22
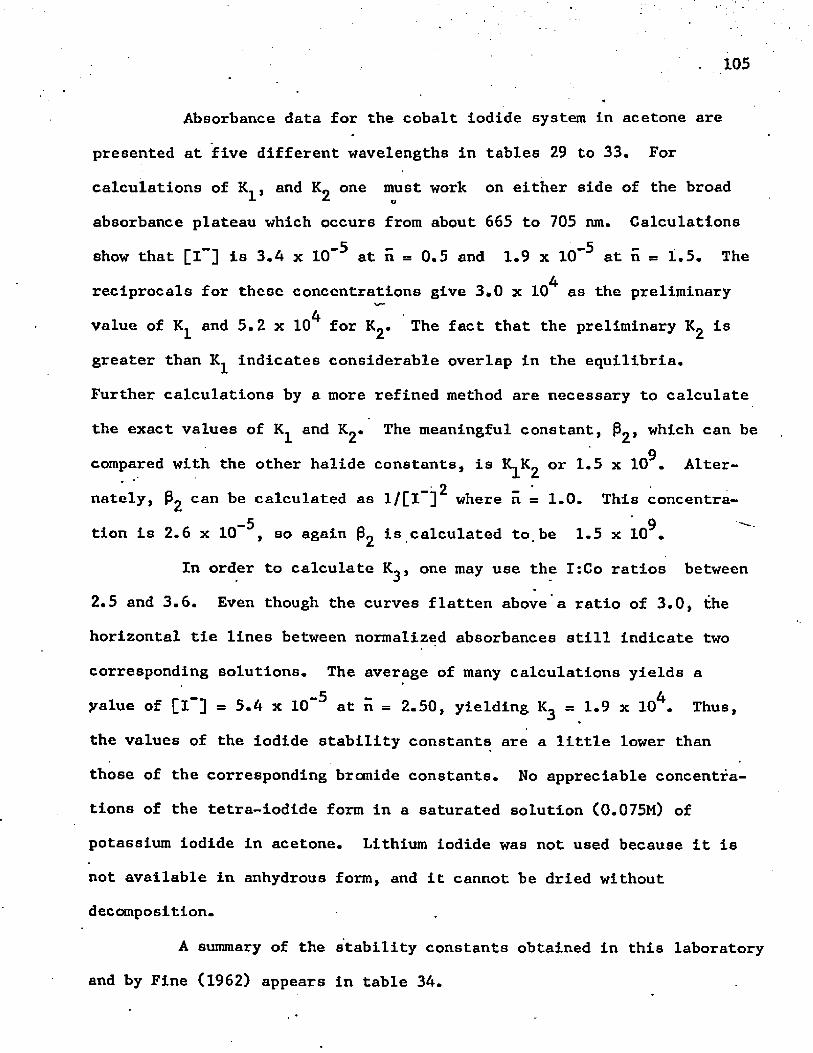
Absorbance data for the cobalt iodide system in acetone are
presented at five different wavelengths in tables 29 to 33. For
calculations of K^, and Kg one must work on either side of the broad
absorbance plateau which occurs from about 665 to 705 nm. Calculations
show that [l~] is 3.4 x 10”^ at ii = 0.5 and 1.9 x 10”^ at n c 1.5. The4reciprocals for these concentrations give 3.0 x 10 as the preliminary
4value of K^ and 5.2 x 10 for Kg. The fact that the preliminary Kg is
greater than K^ indicates considerable overlap in the equilibria.
Further calculations by a more refined method are necessary to calculate
the exact values of K^ and Kg. The meaningful constant, ^2 , which can be9compared with the other halide constants, is K^Kg or 1.5 x 10 . Alter-
2 - 'nately, f3g can be calculated as l/[l ] where ii = 1.0. This concentra--5 9tion is 2.6 x 10 , so again (3g is calculated to.be 1.5 x 10 •
In order to calculate K^, one may use the I:Co ratios between
2.5 and 3.6. Even though the curves flatten above a ratio of 3.0, the
horizontal tie lines between normalized absorbances still indicate two
corresponding solutions. The average of many calculations yields a
yalue of [I ] = 5.4 x 10 ^ at n = 2.50, yielding K^ = 1.9 x 10^. Thus,
the values of the iodide stability constants are a little lower than
those of the corresponding bromide constants. No appreciable concentra
tions of the tetra-iodide form in a saturated solution (0.075M) of
potassium iodide in acetone. Lithium iodide was not used because it is
not available in anhydrous form, and it cannot be dried without decomposition.
A summary of the stability constants obtained in this laboratory
and by Fine (1962) appears in table 34.
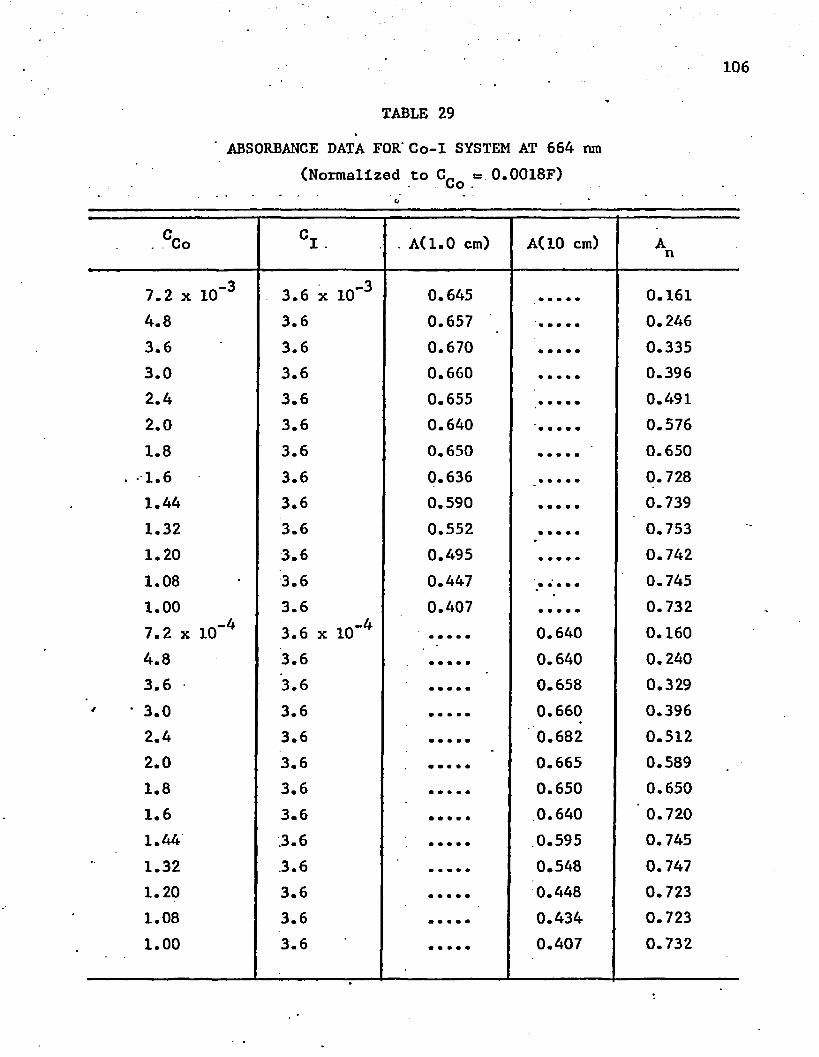
106
TABLE 29
' ABSORBANCE DATA FOR' Co-I SYSTEM AT 664 nm(Normalized to C *= 0.0018F) t»o .
. CCo CI. . A(1.0 cm) A(10 cm) An
7.2 x 10" 3 3.6 x 10" 3 0.645 0.1614.8 3.6 0.657 0.2463.6 3.6 0.670 0.3353.0 3.6 0.660 0.3962.4 3.6 0.655 0.4912 . 0 3.6 0.640 0.5761 . 8 3.6 0.650 0.650
. 1 . 6 3.6 0.636 0.7281.44 3.6 0.590 0.7391.32 3.6 0.552 0.7531 . 2 0 3.6 0.495 0.7421.08 3.6 0.447 0.7451 . 0 0 3.6 0.407 • • • • • 0.7327.2 x 10“ 4 3.6 x 10” 4 0.640 0.1604.8 3.6 0.640 0.2403.6 3.6 0.658 0.329
* 3.0 3.6 0.660 0.3962.4 3.6 0.682 0.5122 . 0 3.6 0.665 0.5891 . 8 3.6 0.650 0.6501 . 6 3.6 0.640 ' 0.7201.44 3.6 0.595 0.7451.32 3.6 0.548 0.7471 . 2 0 3.6 0.448 0.7231.08 3.6 0.434 0.7231 . 0 0 3.6 0.407 0.732
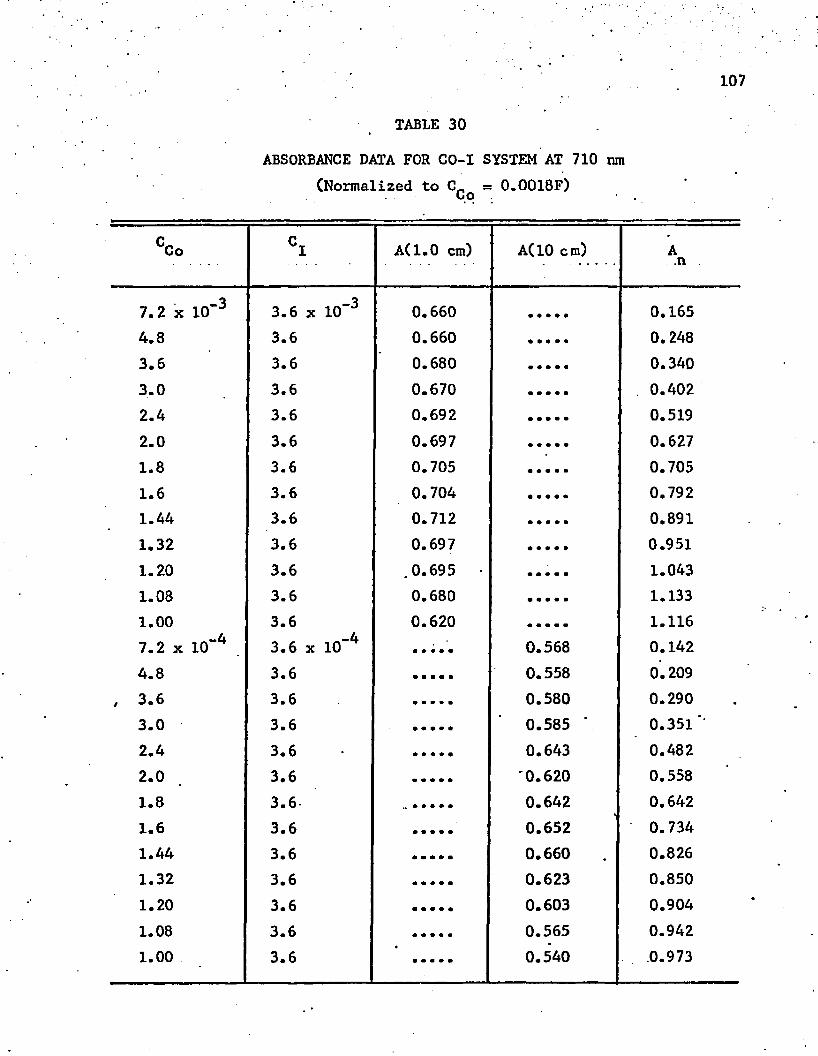
107
TABLE 30
ABSORBANCE DATA FOR CO-I SYSTEM AT 710 ran(Normalized to C_ = 0.0018F)Oo
CCo CI A(1.0 cm) A(10 cm) A.n
7.2 x 10~ 3 3.6 x 10" 3 0.660 0.1654.8 3.6 0.660 0.2483.6 3.6 0.680 0.3403.0 3.6 0.670 . 0.4022.4 3.6 0.692 0.5192 . 0 3.6 0.697 0.6271 . 8 3.6 0.705 0.7051 . 6 3.6 0.704 0.7921.44 3.6 0.712 0.8911.32 3.6 0.697 0.9511 . 2 0 3.6 .0.695 1.0431.08 3.6 0.680 1.1331 . 0 0 3.6 0.620 m • • m m 1.1167.2 x 10**4 , 3.6 x 10 4 0.568 0.1424.8 3.6 0.558 0.209
, 3.6 3.6 0.580 0.2903.0 3.6 0.585 ' 0.351*2.4 3.6 0.643 0.4822 . 0 3.6 '0.620 0.5581 . 8 3.6- 0.642 0.6421 . 6 3.6 0.652 0.7341.44 3.6 0.660 0.8261.32 3.6 0.623 0.8501 . 2 0 3.6 0.603 0.9041.08 3.6 0.565 0.9421 . 0 0 3.6 0.540 .0.973

TABLE 31
ABSORBANCE DATA FOR Co-I SYSTEM AT 735 nm(Normalized to C = 0.0018F) .......... Co
°Co CI A(1.0 cm) A(10 cm) An
7.2 x 10" 3 3.6 x 10“ 3 0.487 0 . 1 2 2
4.8 3.6 0.493 0.1853.6 3.6 0.500 .0.2503.0 3.6 0.504 0.3022.4 3.6 0.560 0.4202 . 0 3.6 0.608 0.5471 . 8 3.6 0.613 0.6131 . 6 3.6 0.633 0.7221.44 3.6 0.728 0.9111.32 3.6 0.803 1.0951 . 2 0 3.6 0.918 1.3771.08 3.6 * 0.935 • 1.5581 . 0 0 3.6 0.898 • • • • * 1.6177.2 x 10" 4 3.6 x 10 4 0.270 0.0684.8 3.6 0.272 0 . 1 0 2
3.6 3.6 0.300 0.150' 3.0 3.6 0.303 . 0.182.
2.4 3.6 0.360 .0.2702 . 0 3.6 .0.395 0.3551 . 8 3.6 0.435 0.4351 . 6 .3.6 0.491 0.5521.44 3.6 0.580 0.7261.32 3.6 0.605 0.8261 . 2 0 3.6 0.656 0.9841.08 3.6 0.658 1.097.1 . 0 0 3.6 ■ .... 0.653 1.175
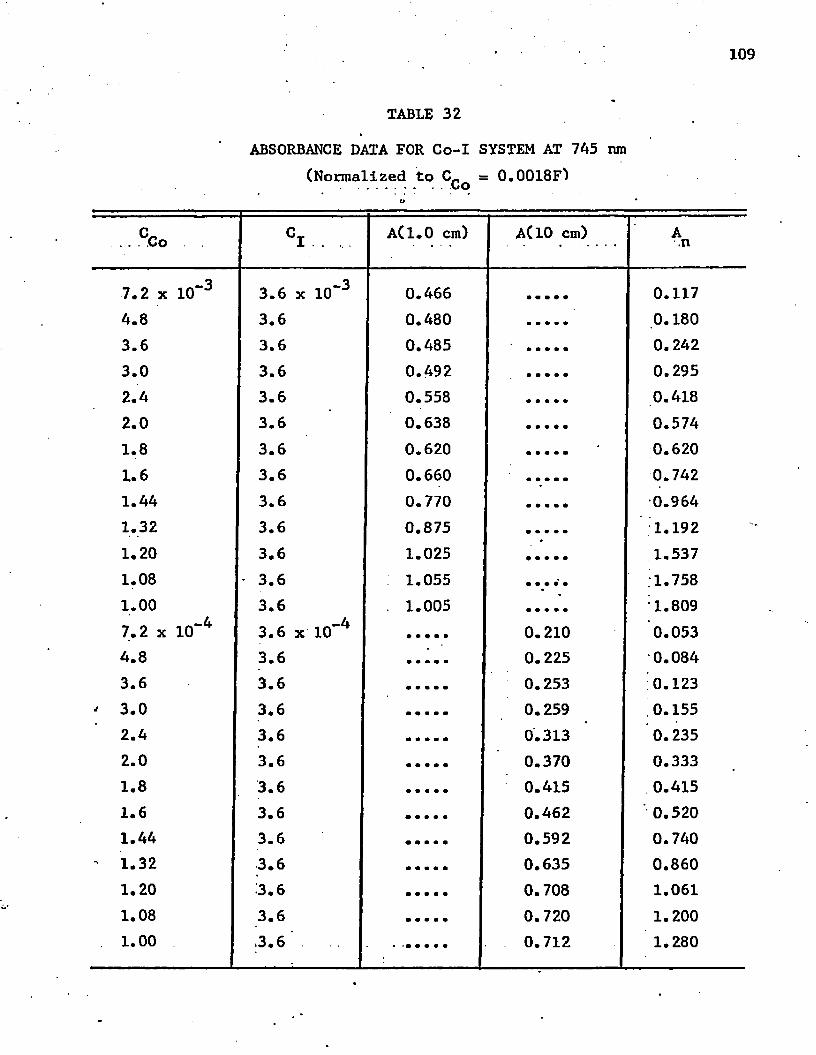
109
TABLE 32
ABSORBANCE DATA FOR Co-I SYSTEM AT 745 ran(Normalized to C„ = 0.0018F) , - uo
o
. CCo CI.. . . .A(1.0 cm) A(l0 cm) A.n
7.2 x 1 0 “ 3 3.6 x 1 0 " 3 0.466 0.1174.8 3.6 0.480 0.1803.6 3.6 0.485 0.2423.0 3.6 0.492 0.2952.4 3.6 0.558 0.4182 . 0 3.6 0.638 0.5741 . 8 3.6 0.620 0.6201 . 6 3.6 0.660 0.7421.44 3.6 0.770 0.9641.32 3.6 0.875 1.1921 . 2 0 3.6 1.025 1.5371.08 3.6 1.055 ; 1.7581 . 0 0 3.6 . 1.005 • • • • • 1.8097.2 x 10“ 4 3.6 x 10~ 4 0 . 2 1 0 0.0534.8 3.6 0.225 0.0843.6 3.6 0.253 0.123
' 3.0 3.6 0.259 0.1552.4 3.6 0.313 0.2352 . 0 3.6 0.370 0.3331 . 8 3.6 0.415 0.4151 . 6 3.6 0.462 '■ 0.5201.44 3.6 0.592 0.740
- 1.32 3.6 0.635 0.8601 . 2 0 3.6 0.708 1.0611.08 3.6 0.720 1 . 2 0 0
1 . 0 0 .3.6 • '••••• 0.712 1.280
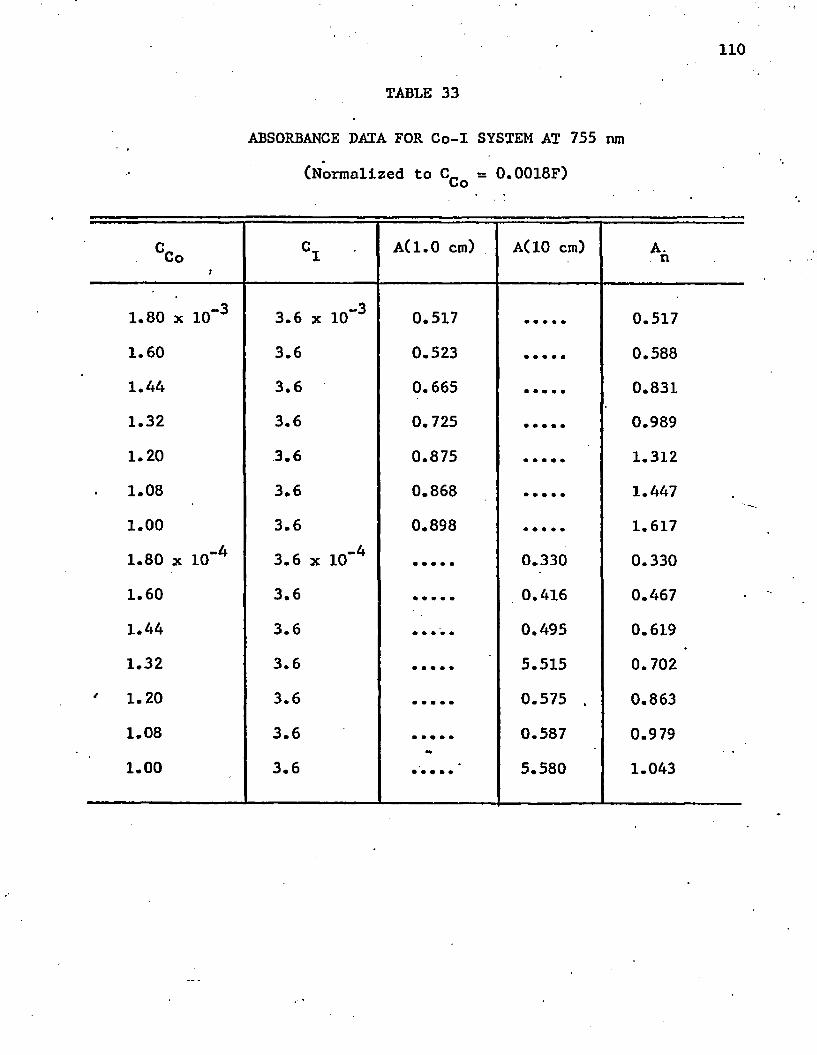
110
TABLE 33
ABSORBANCE DATA FOR Co-I SYSTEM AT 755 nm
(Normalized to C = 0.0018F)oo
°Co J CI A(1.0 cm) A(10 cm) A.n
1.80 x 1 0 “ 3 3.6 x 10“ 3 0.517 0.517
1.60 3.6 0.523 0.5881.44 3.6 0.665 0.8311.32 3.6 0.725 0.989
1 . 2 0 3.6 0.875 1.312
1.08 3.6 0 . 8 6 8 1.447
1 . 0 0 3.6 0.898 1.617
1.80 x 1 0 " 4 3.6 x 10” 4 0.330 0.330
1.60 3.6 . 0.416 0.467
1.44 3.6 0.495 0.6191.32 3.6 5.515 0.7021 . 2 0 3.6 0.575 . 0.8631.08 3.6 0.587 0.9791 . 0 0 3.6 5.580 1.043
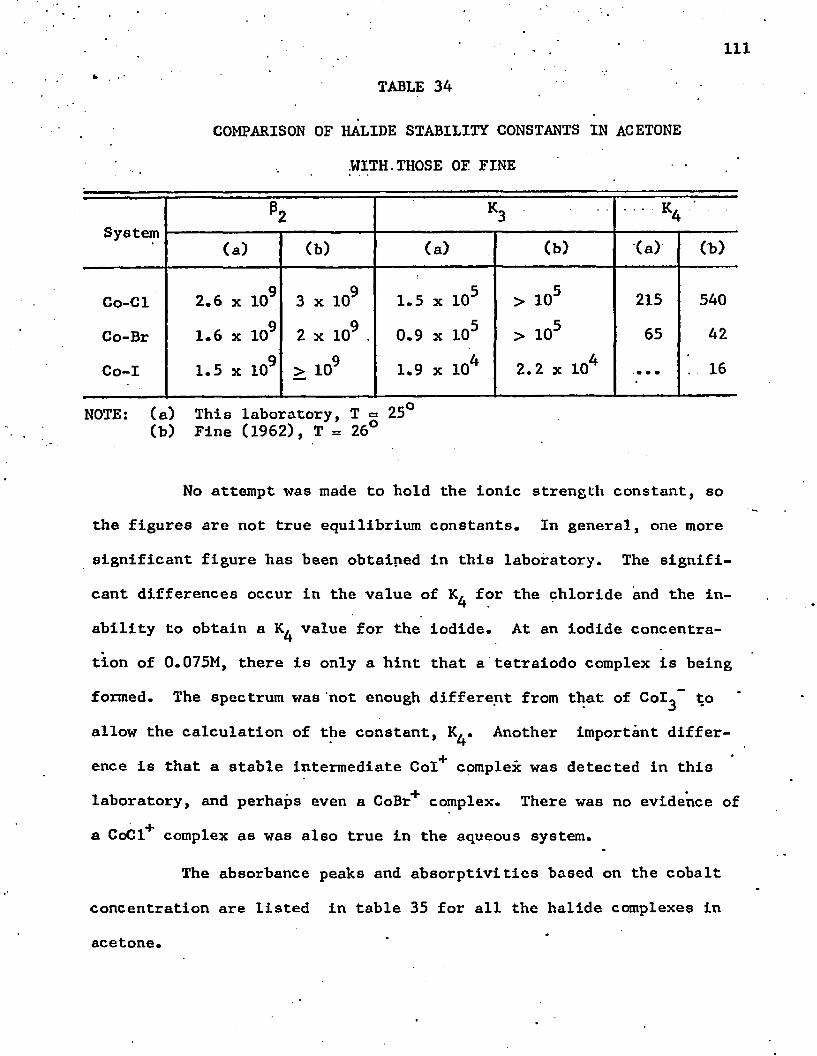
Ill
TABLE 34
COMPARISON OF HALIDE STABILITY CONSTANTS IN ACETONE
.WITH.THOSE OF FINE *
System
CMGO. k3 ■ k4 ‘
(a) (b) (a) (b) (a) Cb)
Co-Cl
Co-Br
Co-I
2 . 6 x 1 0 9
1 . 6 x 1 0 9
1.5 x 10⁹
93 x 10
2 x 1 0 9 .
> 1 0 9
1.5 x 10⁵
0.9 x 10⁵
1.9 x 10⁴
> io5
> 1 0 5
2 . 2 x 1 0 4
215
65
. • • •
540
42
. 16
NOTE: (a) This laboratory, T = 25° (b) Fine (1962), T = 26°
No attempt was made to hold the Ionic strength constant, so
the figures are not true equilibrium constants. In general, one more
significant figure has been obtained in this laboratory. The signifi
cant differences occur in the value of for the chloride and the in
ability to obtain a value for the iodide. At an iodide concentra
tion of 0.075M, there is only a hint that a tetraiodo complex is being
formed. The spectrum was not enough different from that of Col^” to
allow the calculation of the constant, K^. Another important differ-
ence is that a stable intermediate Col complex was detected in this+ * laboratory, and perhaps even a CoBr complex. There was no evidence of
a CoCl+ complex as was also true In the aqueous system.
The absorbance peaks and absorptivities based on the cobalt
concentration are listed in table 35 for all the halide complexes In
acetone.
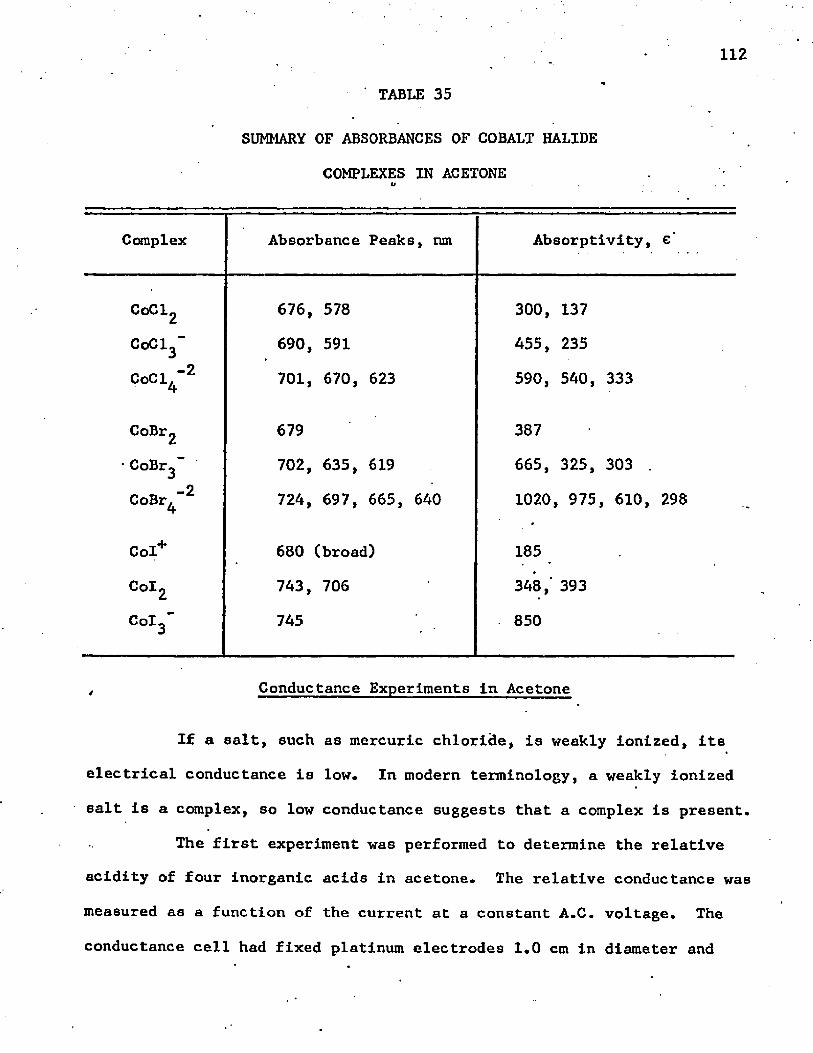
112
TABLE 35
SUMMARY OF ABSORBANCES OF COBALT HALIDE
COMPLEXES IN ACETONE
Complex Absorbance Peaks, nm Absorptivity, e'
CoCl2 676, 578 300, 137
CoCl3" 690, 591 455, 235C o C l " 2A 701, 670, 623 590, 540, 333
CoBr2 679 387
■CoBr^” 702, 635, 619 665, 325, 303 .
CoBr,4 724, 697, 665, 640 1 0 2 0 975 610, 298
CoI+ 680 (broad) 185
CoI2 743, 706 348,' 393
CoI3" 745 850
Conductance Experiments In Acetone
If a salt, such as mercuric chloride, is weakly ionized, its
electrical conductance is low. In modern terminology, a weakly ionized
salt is a complex, so low conductance suggests that a complex is present.
The first experiment was performed to determine the relative
acidity of four inorganic acids in acetone. The relative conductance was
measured as a function of the current at a constant A.C. voltage. The
conductance cell had fixed platinum electrodes 1 . 0 cm in diameter and
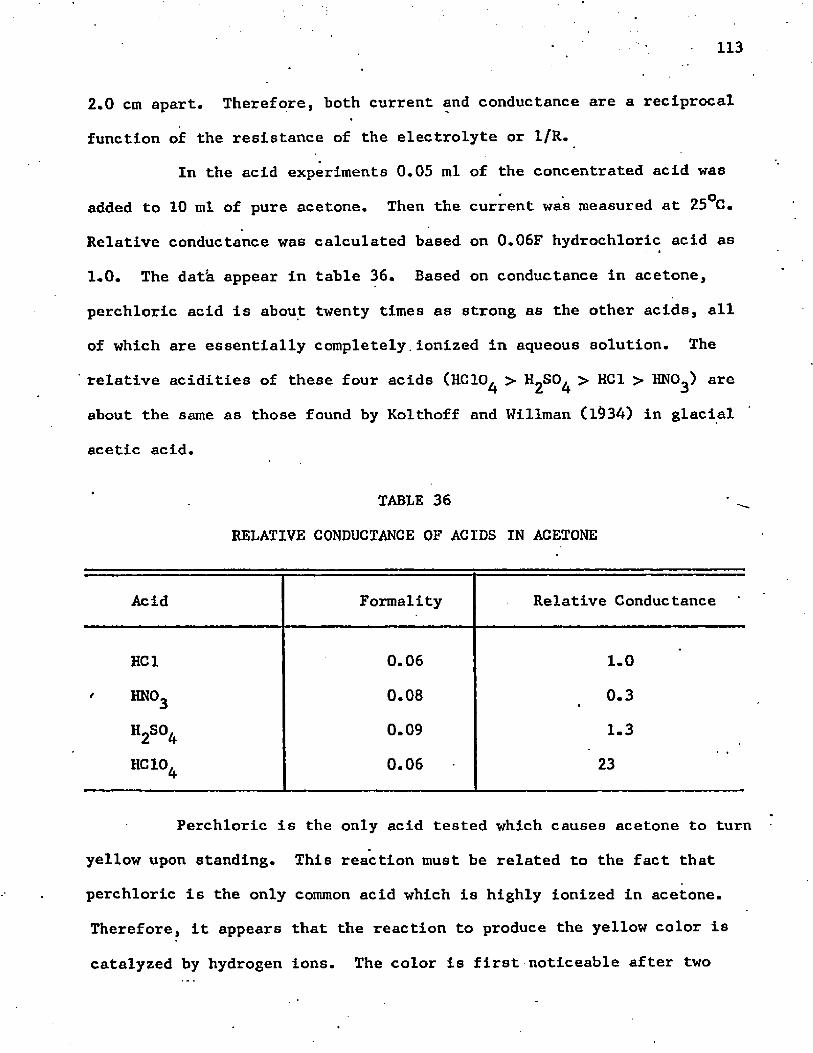
113
2.0 cm apart. Therefore, both current and conductance are a reciprocal
function of the resistance of the electrolyte or 1 /R.
In the acid experiments 0.05 ml of the concentrated acid was
added to 10 ml of pure acetone. Then the current was measured at 25°C.
Relative conductance was calculated based on 0.06F hydrochloric acid as
1.0. The data appear in table 36. Based on conductance in acetone,
perchloric acid is about twenty times as strong as the other acids, all
of which are essentially completely.ionized in aqueous solution. The
' relative acidities of these four acids (HCIO^ > > HC1 > HNO^) are
about the same as those found by Kolthoff and Willman (l934) in glacial
acetic acid.
TABLE 36
RELATIVE CONDUCTANCE OF ACIDS IN ACETONE
Acid Formality Relative Conductance
HC1 0.06 1 . 0
hno3 0.08 0.3*
h 2 so4 0.09 1.3
HC10.4 0.06 23
Perchloric is the only acid tested which causes acetone to turn
yellow upon standing. This reaction must be related to the fact that
perchloric is the only common acid which is highly ionized in acetone.
Therefore, it appears that the reaction to produce the yellow color is
catalyzed by hydrogen ions. The color is first noticeable after two
hours, so it is not due to the simple addition of a proton to the
carbonyl group. The reaction still proceeds under a nitrogen atmosphere,
so air oxidation is not the primary cause. The color slowly disappearsu
when a salt, such as sodium sulfate, of an acid which is weak in acetone
is added, so the reaction is reversible. The most likely explanation of
the color reaction is that the acid catalyzes a polymerization reaction.
As a practical note, it is important that acetone solutions of perchlo
rates should not contain any free perchloric acid. A saturated solution
of magnesium perchlorate did not produce any color.
Another set of conductance experiments waB run with cobalt
salts and lithium chloride. The results are shown in table 37, where
the conductance of 0.004F CoClg is arbitrarily set at 1.0. One can
observe that cobalt chloride, cobalt nitrate, and lithium chloride are ‘
all comparatively weak electrolytes in acetone. However, they are
stronger than the corresponding acids. This is another confirmation that
nitrate as well as chloride forms a complex with cobalt(ll) in acetone.
The mixing of LiCl and CoCl^ in a 1:1 ratio increases the conductance
above that of either salt alone, so an ionic complex, Li+CoCl- , appears/ Jto form. Addition of more lithium chloride to give a *Cl:Co ratio of 4:1
does not change the conductance much. The conclusion is that the chiefA _species present are still Li CoCl^ and excess LiCl.
The conductance experiments tend to confirm that the complexes,
CoCl^ and CoCl^ , form almost quantitatively in acetone. The tetrachloro
complex does not form quantitatively.
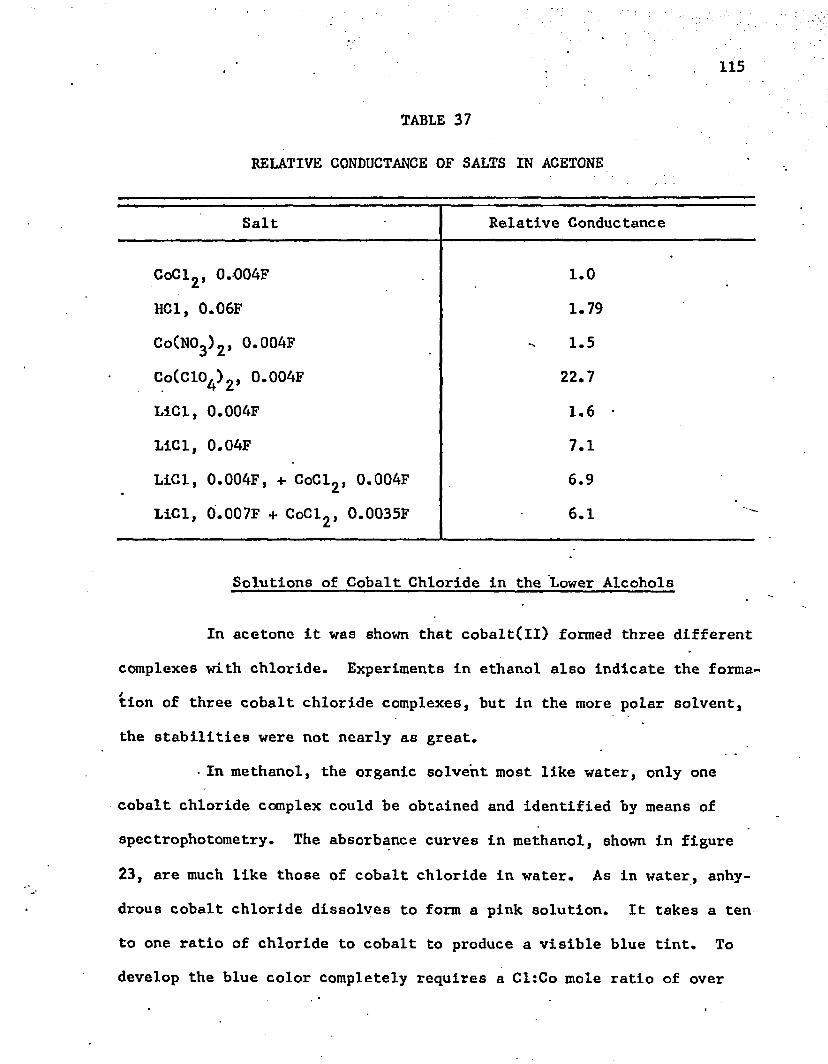
115
TABLE 37
RELATIVE CONDUCTANCE OF SALTS IN ACETONE
Salt Relative Conductance
CoClg, 0.004F 1 . 0
HC1, 0.06F 1.79
Co(N03)2, 0.004F 1.5
Co(C104)2, 0.004F 22.7
LiCl, 0.004F 1 . 6 •LiCl, 0.04F 7.1
LiCl, 0.004F, + CoCl2, 0.004F 6.9LiCl, 0.007F + CoCl2, 0.0035F 6 . 1
Solutions of Cobalt Chloride In the Lower Alcohols
In acetone it was shown that cobalt(ll) formed three different
complexes with chloride. Experiments in ethanol also indicate the forma
tion of three cobalt chloride complexes, but in the more polar solvent,
the stabilities were not nearly as great.
• In methanol, the organic solvent most like water, only one
cobalt chloride complex could be obtained and identified by means of
spectrophotometry. The absorbance curves in methanol, shown in figure
23, are much like those of cobalt chloride in water. As in water, anhy
drous cobalt chloride dissolves to form a pink solution. It takes a ten
to one ratio of chloride to cobalt to produce a visible blue tint. To
develop the blue color completely requires a Cl:Co mole ratio of over
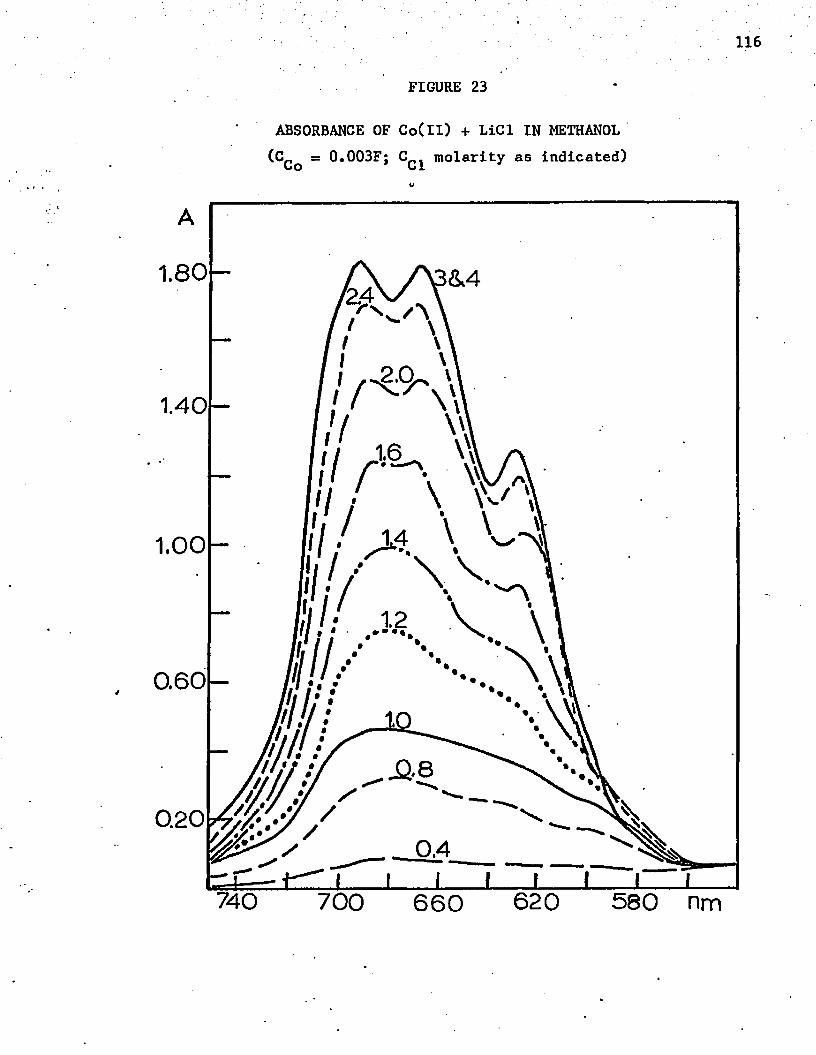
116
FIGURE 23
ABSORBANCE OF Co(ll) + LiCl IN METHANOL (CCq =s 0.003F; CC 1 molarity as indicated)
/
\/v \
I \\m
'A
0.60-
0.20
740 700 660 620 580 nm
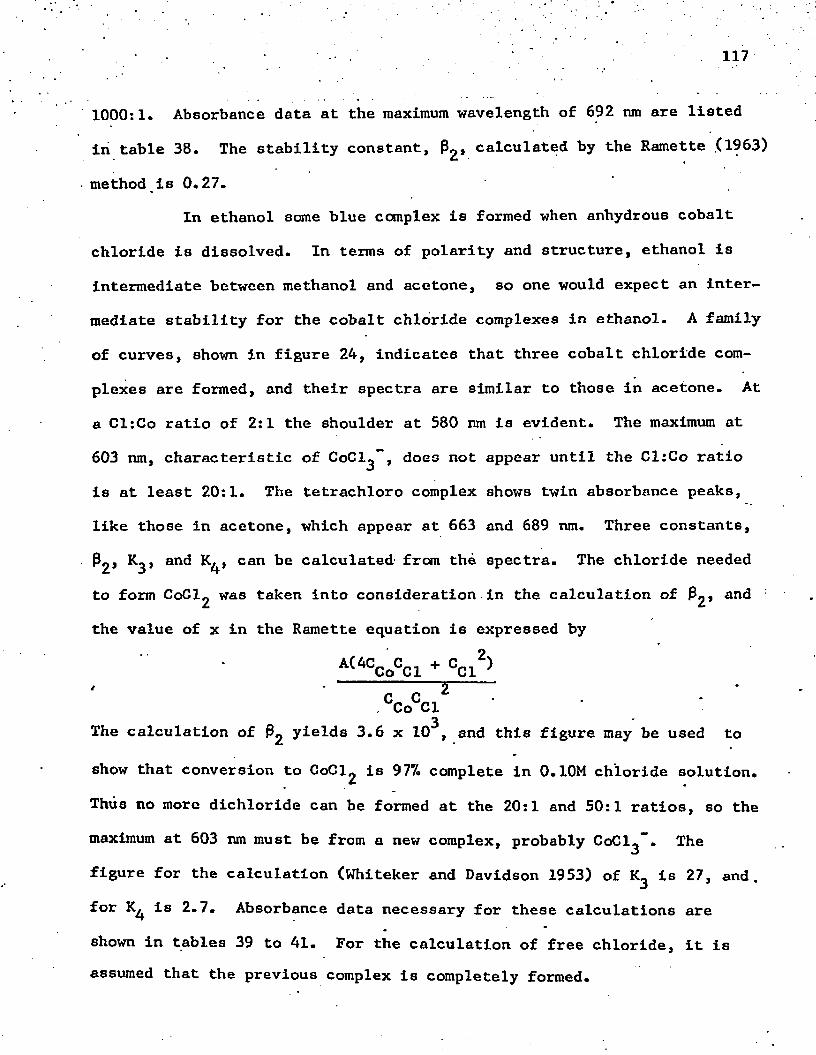
117
1000:1. Absorbance data at the maximum wavelength of 692 nm are listed
in table 38. The stability constant, calculated by the Ramette (1963)
method is 0*27.In ethanol some blue complex is formed when anhydrous cobalt
chloride is dissolved. In terms of polarity and structure, ethanol is
intermediate between methanol and acetone, so one would expect an inter
mediate stability for the cobalt chloride complexes in ethanol. A family
of curves, shown In figure 24, indicates that three cobalt chloride com
plexes are formed, and their spectra are similar to those In acetone. At
a Cl:Co ratio of 2:1 the shoulder at 580 nm Is evident. The maximum at
603 nm, characteristic of CoCl^"", does not appear until the Cl:Co ratio
is at least 20:1. The tetrachloro complex shows twin absorbance peaks,
like those in acetone, which appear at 663 and 689 nm. Three constants,
P2» K3» and K4» can be calculated- from the spectra. The chloride needed
to form CoCl^ was taken into consideration In the calculation of 3 ^ r
the value of x in the Ramette equation is expressed by
A W C CoCCl - CC12), . g ■
CCoCCl3The calculation of ^ yields 3.6 x 10 , and this figure may be used to
show that conversion to C o C ^ is 977. complete In 0.10M chloride solution.
Thus no more dichloride can be formed at the 20:1 and 50:1 ratios, so the
maximum at 603 nm must be from a new complex, probably CoCl^”. The
figure for the calculation (Whiteker and Davidson 1953) of K3 is 27, and.
for is 2.7. Absorbance data necessary for these calculations are
shown in tables 39 to 41. For the calculation of free chloride, it is assumed that the previous complex is completely formed.
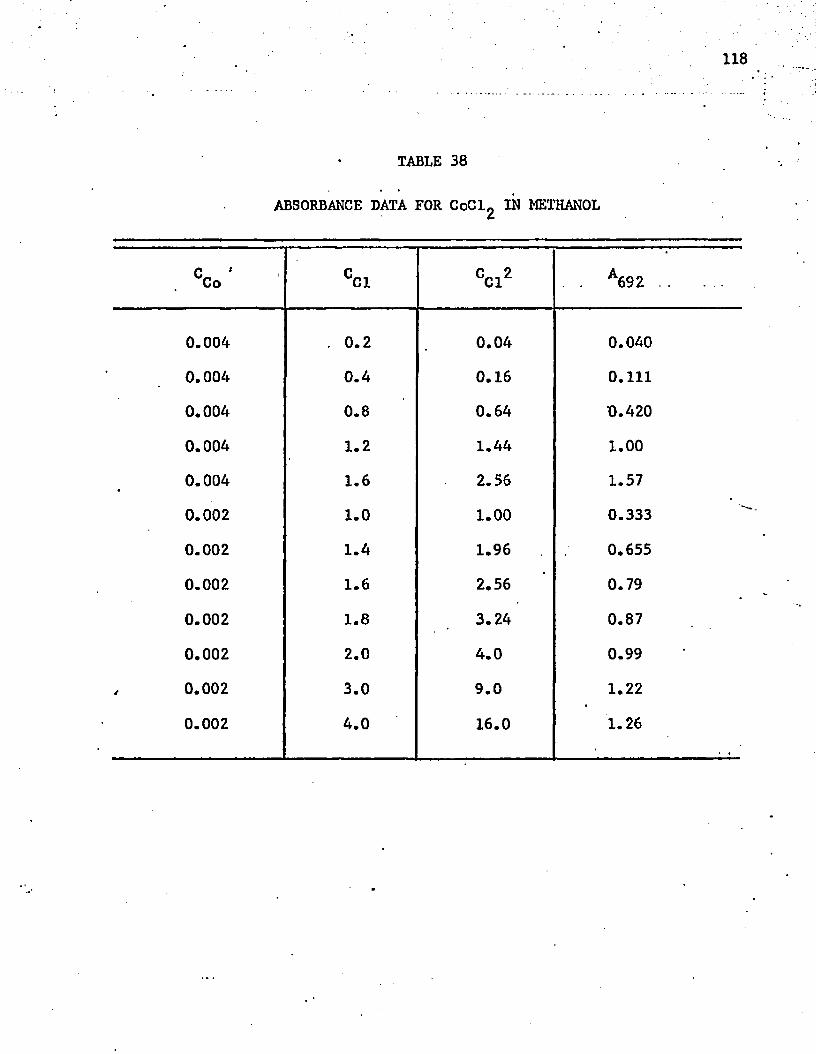
1X8
TABLE 38
ABSORBANCE DATA FOR CoClg IN METHANOL
C ' Co CC1 cc i 2 . A692 .......
0.004 . 0.2 0.04 0.0400.004 0.4 0.16 0.111
0.004 0.8 0.64 0.4200.004 1.2 1.44 1.000.004 1.6 2.56 1.570.002 1.0 1.00 0.3330.002 1.4 1.96 0.6550.002 1.6 2.56 0.790.002 1.8 3.24 0.870.002 2.0 4.0 0.990.002 3.0 9.0 1.220.002 4.0 16.0 1.26
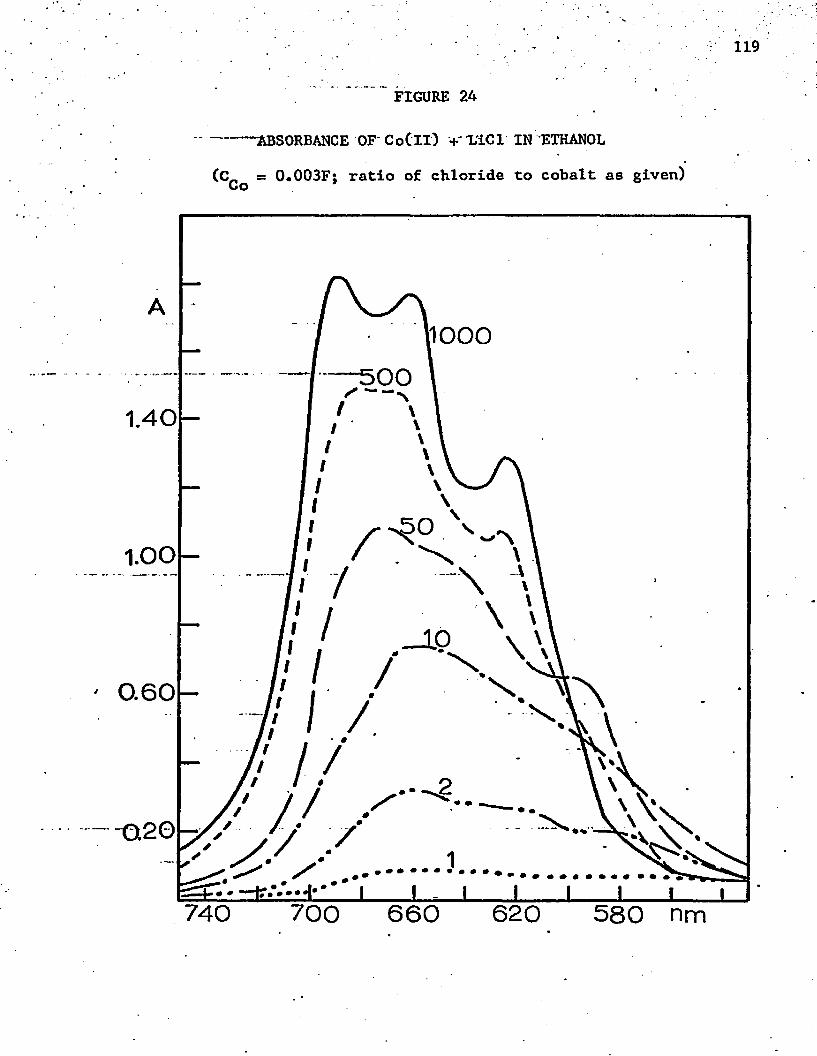
FIGURE 24
119
ABSORBANCE OF CoCll) +' X1C1 IN ETHANOL
(C = 0.003F; ratio of chloride to cobalt as given) Co
1.40-
1000
//
/ \
/ /
1.0 0 -
0.60-
-020
740 700 660 620 580 nm
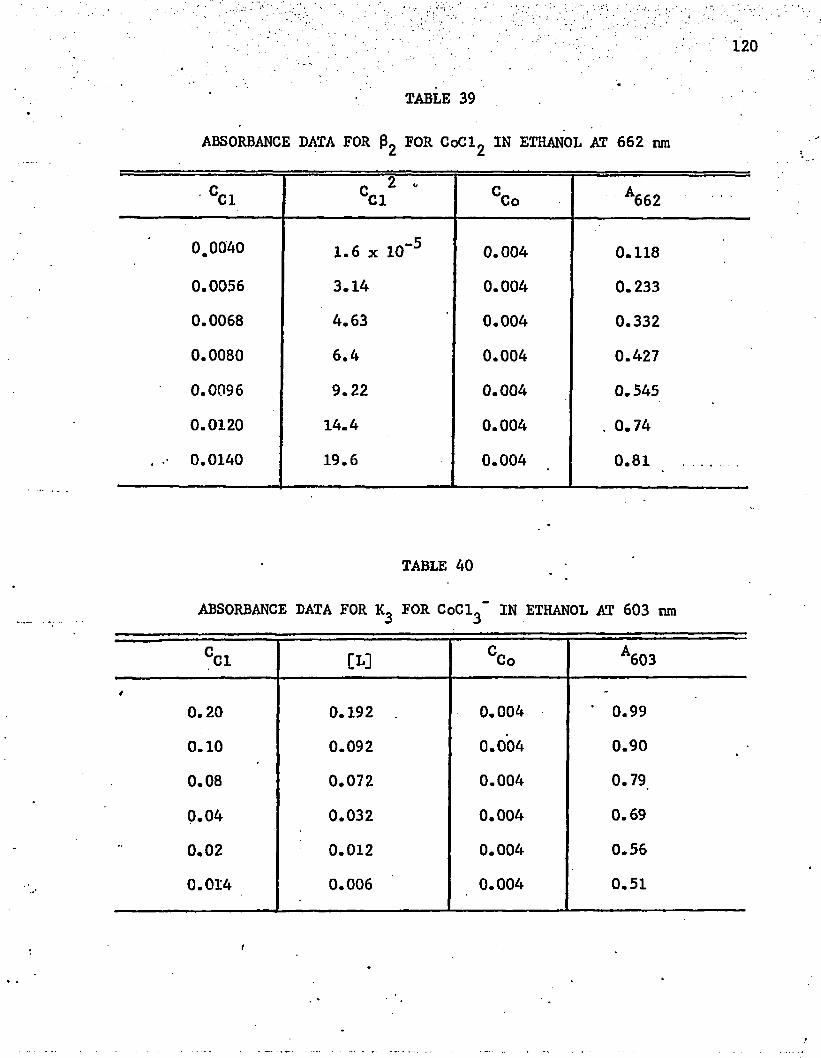
120
TABLE 39
ABSORBANCE DATA FOR 02 FOR CoCl2 IN ETHANOL AT 662 nm
CC1 c 2 -Cl CCo A662
0.0040 1 . 6 x 1 0 “ 5 0.004 0.1180.0056 3.14 0.004 0.233
0.0068 4.63 0.004 0.332
0.0080 6.4 0.004 0.427
0.0096 9.22 0.004 0.545
0 . 0 1 2 0 14.4 0.004 . 0.74
0.0140 19.6 0.004 0.81
TABLE 40
ABSORBANCE DATA FOR K3 FOR CoCl3" IN ETHANOL AT 603 nm
°C1 CCo A603t
0 . 2 0 0.192 . 0.004 • 0.99
0 . 1 0 0.092 0.004 0.90
0.08 0.072 0.004 0.79
0.04 0.032 0.004 0.69
0 . 0 2 0 . 0 1 2 0.004 0.56
0.014 0.006 0.004 0.51
t
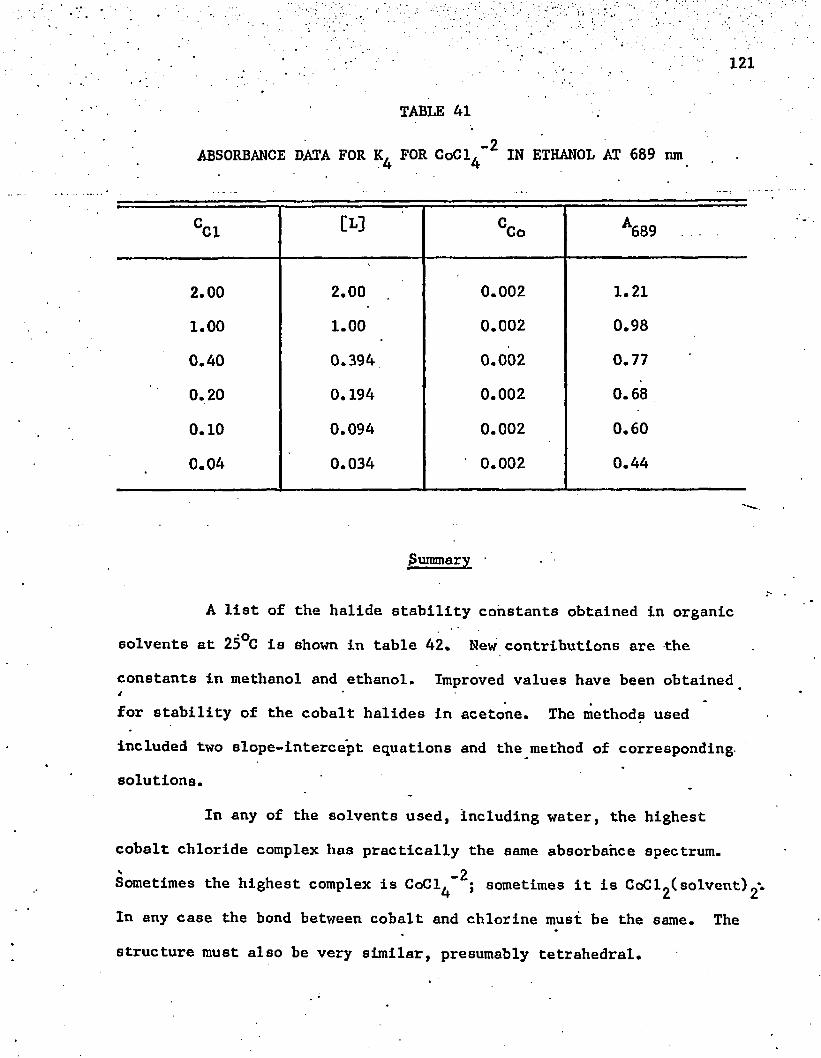
TABLE 41
ABSORBANCE DATA FOR K. FOR C o C l " 2 IN ETHANOL AT 689 nm4 4
CC1 i—i f i_i CCo A689
2 . 0 0 2 . 0 0 0 . 0 0 2 1 . 2 1
1 . 0 0 1 . 0 0 0 . 0 0 2 0.98
0.40 0.394 0 . 0 0 2 0.77
0 . 2 0 0.194 0 . 0 0 2 0 . 6 8
0 . 1 0 0.094 0 . 0 0 2 0.60
0.04 0.034 0 . 0 0 2 0.44
ffummary ■
A list of the halide stability constants obtained in organic
solvents at 25°C is shown in table 42. New contributions are the
constants in methanol and ethanol. Improved values have been obtainedi
for stability of the cobalt halides in acetone. The methods used
included two slope-intercept equations and the method of corresponding- solutions.
In any of the solvents used, including water, the highest
cobalt chloride complex has practically the same absorbance spectrum.<■ _2Sometimes the highest complex is CoCl^ ; sometimes it is CoClgCsolvent)
In any case the bond between cobalt and chlorine must be the same. The
structure must also be very similar, presumably tetrahedral.
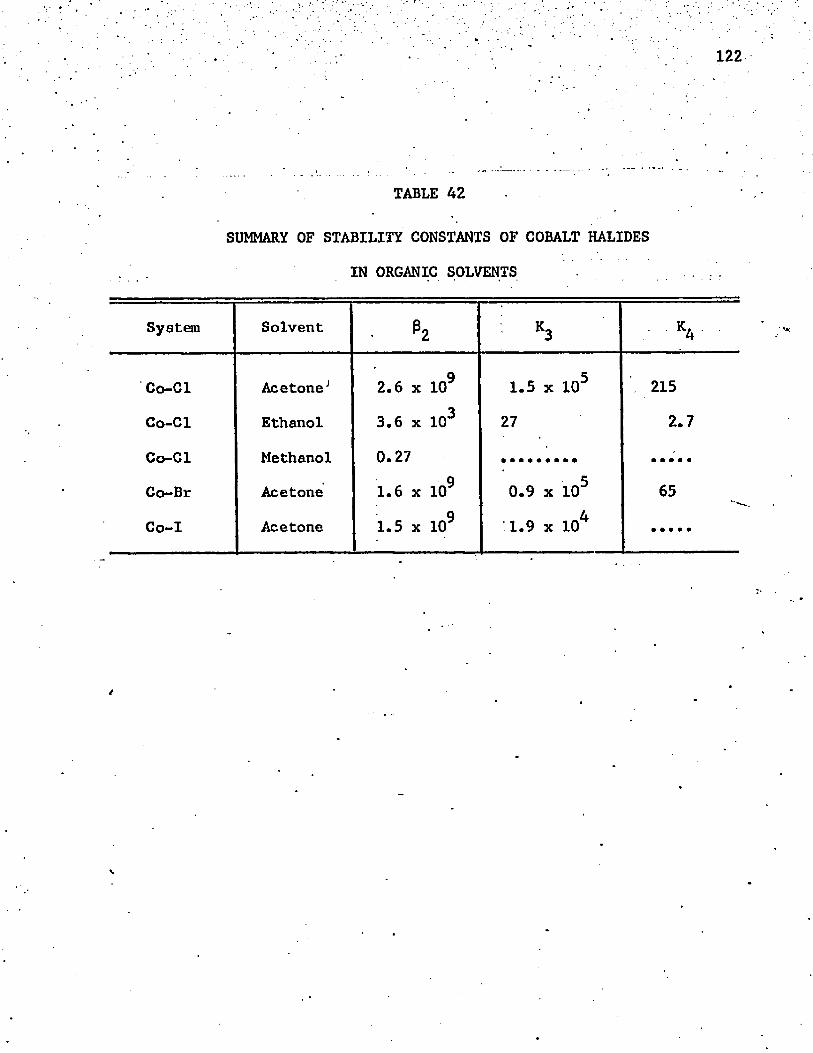
122
TABLE 42
SUMMARY OF STABILITY CONSTANTS OF COBALT HALIDES
IN ORGANIC SOLVENTS
System Solvent • h K3 K4
Co-Cl Acetone1 2 . 6 x 1 0 9 1.5 x 10⁵ . 215
Co-Cl Ethanol 3.6 x 10³ 27 2.7
Co-Cl Methanol 0.27
Co-Br Acetone 1 . 6 x 1 0 9 0.9 x 10⁵ 65
Co-I Acetone 1.5 x 10⁹ 1.9 x 10⁴
CHAPTER V . *
THE DETERMINATION OF HALIDES WITH COBALT(ll) IN ACETONE
Introduction
Fine (1962, p. 1139) In his spectrophotometric experiments with
the halides of cobalt(ll) in acetone noticed that there is a linear
relationship between absorbance and the halide to cobalt ratio. There
is almost quantitative conversion to the dihalide, and then the third
halide ion in turn adds nearly quantitatively. Stability constants
determined by Fine and in chapter four of this work indicate that there
is about 1.5% dissociation when the cobalt concentration Is around
0.005M, the most practical concentration for spectrophotometric
determinations.
The possibility of applying this absorbance to a quantitative
method' for the determination of halides apparently was not suggested by
Fine (1962). In this application it became important to determine Iftthe slight dissociation was enough to Interfere with a quantitative
determination under practical experimental conditions.• *
Early experiments in this laboratory indicated that within
experimental error absorbance in the red is a linear function of the
chloride content as long as the Cl:Co mole ratio is less than 2:1.V >Bromide ion in the presence of cobalt(ll) in acetone behaves in a similar
123
124
manner. The absorption peaks are 675 run for chloride and 677 nm for
bromide. These results indicate that either chloride or bromide forms
CoX^ without the formation of any measurable intermediate, CoX+ .
The results with iodide are somewhat different. Relatively
small concentrations of iodide give a broad peak at 680 nm, probably due
to Col . As the I:Co ratio approaches 2:1, the absorption peak shifts
to over 700 nm, probably due to Col^*
If the cobalt concentration is constant, one should be able to
measure the chloride or bromide concentration by this new method.
Apparently the sensitivity is superior to that of most other spectro
photometric and volumetric methods for halides.
The classical reagent, silver nitrate, has been adapted for the
determination of chloride in many ranges and matrices. Macro amounts may
be determined either gravimetrically as AgCl or by titration with
standard AgNO^. New methods and reagents offer little improvement,
except that potentiometric titrations with a recorder save operator time
in routine analysis. Complexometric titrations with mercuric nitrate to
form HgCl^ may be superior because there is no precipitate to obscure a
visual end point (Dubsky and Trtilek 1933, Cheng 1959)'.
Quick routine approximate determinations of chloride have been
made by determining pCl with a AgCl-Ag electrode, by determining the
potential* versus that of a calomel reference electrode (Malmstadt, Fett,
and Winefordner 1956; Stern et al. 1958), using an ordinary pH meter.
Recently Van Loon (1968) has developed a solid-state membrane-type AgCl
electrode for rapid determinations of chloride (10”^ to 10”^M). Bromide .
and iodide do not interfere if first oxidized by chromic acid. An AgBr-Ag
125
_5electrode has been used for measuring as little, as 10 M bromide (Pflaum,
Frohliger, and Berge 1962),Cathodic stripping has also been applied. Chloride is deposited
oas Hg^Cl^ on a mercury (Ball, Manning, and Menis 1960) or as AgCl on a
silver (Laitinen and Lin 1963) anode. In either case the polarity is
then reserved, and the metal chloride contributes to the cathodic current
as the metal ion from the precipitate is reduced.Some indirect color methods are based on the use of silver ion
as a reagent. One example is the spectrophotometric determination of the
chromate ion (Boltz 1958) released in the reaction,-2Ag2CrO^ + 2C1 -♦ 2AgCl + CrO^ .
An even more indirect method involves the reaction of chloride with silver
phosphate (Boltz 1958). The released phosphate ion is determined as the
molybdenum blue complex.
The silver chloride nephelometric method is sensitive to micro
gram amounts of chloride (Boltz 1958). The amount of absorption is not
reproducible, for it varies widely with ionic strength and temperature.
i There are also several indirect color methods based on the use
of mercury(II) as a reagent. The mercury(II) ions react with chloride
ions to form soluble but slightly dissociated HgC^. Excess mercuric
ions can be determined colorimetrically as the diphenylcarbazone complex (Gerlach and Frazier 1958), where the sensitivity is great (e = 19,000),
but the complex decomposes after two minutes. Measurement of the color
vof chloranilic acid, freed from mercuric chloranilate by chloride (Barney
and Bertolocini 1957), is another method. Sensitivity is said to be about one part per million.
Many analysts have used the mercuric thiocyanate-ferric ion
reaction (Iwasaki, Utsumi, and Ozawa 1952; Elsheimer, Johnston, and
Kochen 1966; Rowe 1965;.Bergman and Sanik 1957). Chloride ion releases
thiocyanate ion from HgCSCN^ to form HgCl^. The thiocyanate ion in
turn forms the familiar red complex, Fe(SCN)++, with ferric ion.
A quite different approach involves gas chromatography
(Bergman and Martin 1962). Acid gases are distilled from 80% sulfuric
acid, and they reach the detector in the order: CO,,* ®2^* an<* HBr.One of the most sensitive methods of all is neutron activation
analysis. By this method Cosgrove and coworkers (1958) could detect-3iodide and chloride down to one microgram and bromide to 1 0 microgram.
Bromide can be concentrated even further by precipitating it as silver
bromide, and then irradiating it with neutrons (Filby 1964; Ballaux, Dams,81and Hoste 1967). Bromine has a high nuclear cross section, 3.1 barns,
82forming Br , which has a fairly long half life of 35.9 hours. By an ( ‘
even more sophisticated method, Hull and Gilmore (1964) used nuclear
activation and then an IBM 7094 computer to sort out the peaks' of chlorine
jind other elements in lubricating oils. A big advantage of neutron
activation is that usually no prelimianry separation of the-constituent
to be determined is needed.
References for the direct analysis of halides by measuring the
color of metal halide complexes are few. One is the measurement of an
FeCl++ complex (West and Coll 1956) in perchloric acid at 350 nm. The
.measurement must be carried out in 8 F perchloric acid, and the sensitivity
is not very great. Halide complexes are also formed with Pd(ll), where
the absorbance of the monochloride or bromide complex is made at 230 nm
'*■ ' ..." 127
(Chapman and Sherwood 1957; Weed 1964). Again measurements are only
moderately sensitive, and many other Ions, which absorb in the ultra
violet, interfere.O '
Bromide and iodide may be oxidized to the free elements,
extracted with carbon tetrachloride, and the color measured in the
organic layer. Iodide may first be oxidized with nitrite, and then
bromide with potassium permanganate (Filby 1964).By a novel method Rudolph and Nadalin (1964) concentrated
chloride from titanium sponge as AgCl and then determined it by X-ray
fluorescence of the silver. Garska (1968) modified the method for
determining raicrogram amounts of chloride in silver catalysts.
Another reagent which may be adapted to indirect volumetric
analysis of halides is mercuric oxycyanide (Vieb’ock 1932; Belcher,MacDonald, and Nutten 1954). Halides react as follows:
*
HgO.Hg(CN) 2 + 2X" + HgO - HgX2 .Hg(CN) 2 + 20H-.
The liberated base is then titrated with HgSO^.
In all of these studies no one has mentioned using the forma
tion of a colored halide complex in an organic solvent, although organic /
solvents were sometimes added to depress the ionization of mercury and
silver halides. Therefore, the use of a cobalt halide complex in acer-
tone appears to be the basis of a new analytical method.
In the determination of halide in an actual aqueous sample,
evaporating away the water presents no problem in dilute solutions of •
alkali halides. The dry halides are extracted with an acetone solution
of cobalt perchlorate, and for chloride the absorption of the blue CoCl2
complex is measured at 675 nm.
• . }
128
In addition to aqueous solutions of halides, one should be able
to decompose organic substances containing halides. Most organic halides
can be converted to alkali saltslu so that the final determination is
essentially inorganic.Fortunately, there have also been advances in methods for the
decomposition of organic compounds for analysis. Fusion with sodium
peroxide in a Parr bcmb results in complex decomposition, but extraction
of traces of sodium chloride with acetone from the large mass of other
salts seems impossible. The reduction with sodium or potassium metal
Btill adds too many alkali salts. However, two methods of destruction
add nothing but oxygen and water. One involves the burning of the organic
compound in a tube furnace in a manner similar to the combustion method
for carbon and hydrogen (Belcher and Ingram 1952; Haspanti 1967). The
disadvantage of .this method is that the halides are oxidized mostly to
the free halogens. In the Schoniger method the combustion with oxygen
is performed in a closed flask (Sch'oniger 1955 and 1956).
With the newer adaptation of electrical firing, the Schoniger
bombustion is easy to carry out. The small amounts of chlorine formed
can be reduced with (Schoniger 1955). • Bromine may be reduced with
nitrite (Awad et al. 1966) or bisulfite (Belcher and Fildes 1961).
Thus chlorine and bromine in most organic compounds can be
converted to the simple halide ions. Iodine is oxidized mostly to
iodate, which is more conveniently determined by an iodometric titra
ction. Carbon and hydrogen burn to harmless carbon dioxide and water.
Sulfur burns mostly to sulfur dioxide, which is helpful in that it reduces
halogens to halides. Phosphorus burns mostly to P4°10 and finally forms
129
phosphoric acid which does not interfere. The behavior of nitrogen
--depends upon how it is combined in the organic compound (Fildes and
MacDonald 1961). Amines are converted to harmless nitrogen gas. Nitro4
groups become NC^ gas, which is converted to a mixture of nitrites andO*nitrates in water. Most heavy metals form oxides, which are insoluble
in dilute alkali, the absorbent for the combustion gases. These remain
in the flask while the absorbent is decanted away. .
Of the above substances likely to be present after the combus
tion of an organic compound, only nitrates and zinc were shown to inter
fere with the halide determination. Though not tested, cadmium and mer
cury may be presumed to interfere also due to complex chloride formation.
Fluoride does not form a complex with cobalt in acetone and is harmless.
There would be mutual interference if more than one halide were present.
Alkali must be added to the absorbent to keep the halides in
solution during the evaporation step. Lithium hydroxide is preferred
because its chloride is the most soluble in acetone.
The cobalt chloride in acetone method appears to be practical
for two types of samples: aqueous solutions and most organic compounds
where only one halogen is present. Except for a spectrophotometer,
which is available in nearly every analytical laboratory, no expensive
or complicated equipment is needed.
Experimental
Apparatus: Spectrophotometer, preferably with an infrered photo-detector
for measurements at 675 nm. The Beckman DB Spectrophotometer was used. Schoniger combustion flasks with attachments for electrical firing.
, . 130
Reagents; Lithium hydroxide, 0.02N, in water
Cobalt perchlorate, 0.005F in acetone. This should not contain free
perchloric acid. u
Standard halide solutions, 0.01F in water; make from sodium or potassium
salts.
Reducing agent, 307., for chlorides; and NaHSO^, 0.01F, for bromides.
Pure oxygen gas.
Procedure: Take a sample containing from 5 to 50 micromoles (for chloride,
0.2 to 2.0 mg) of either chloride or bromide. Larger samples may be used
if the final dilution is proportionately greater. Water samples, if acid,
should be treated with alkali to prevent loss of halogen acids during the
evaporation step. Organic samples must be burned in such a way as to add
no large quantity of alkali salts, preferably by the Schoniger combustion
method. Liquids may be weighed in a gelatin capsule, but a blank must be
run on an empty capsule.
Weigh an organic sample and wrap it in filter paper. Place the
^aper and sample in the platinum basket which hangs from the stopper of
the flask. Make a rough calculation of all salts that will be present,
and then add to the flask 1.5 times the amount of lithium hydroxide
solution necessary to combine with all anions. The final volume should
be at least 10 ml. Replace the air in the flask with oxygen. Stopper
the flask, and fire according to the directions given for the equipment used.
After firing and cooling, transfer the flask's contents into a
small beaker. Rinse with dis.tilled water, and add the rinsings to the
131
~ beaker. To determine chlorides, add two drops of 30% hydrogen peroxide
as .a.jreducing agent for hypochlorites. To determine bromides, add an
equimolar quantity of sodium bisulfite. If the organic compound alreadyo
contains sulfur, no additional reducing agent is necessary.
Evaporate the solution to dryness at moderate heat, about 90°C.
Let the beaker cool, and add 5 ml of cobalt perchlorate in acetone.
Swirl the solution a few times, and allow to stand for ten minutes. Do
not try to break up the salts mechanically, for colloidal hi.^0^ will
.become -dispersed in the acetone and will interfere with the absorption
measurements. Transfer the acetone solution to a 10-ml volumetric flask.
Place another 4 ml of cobalt perchlorate solution in the beaker, and
allow another ten minutes for extraction of the halides. Transfer to the
same volumetric flask. Rinse the beaker with one milliliter of cobalt
perchlorate and transfer. Usually a few more drops of solution will be
necessary "to'rieach- the mark of the volumetric flask.
Transfer some of the solution to a one-centimeter spectro
photometric cell. Measure the absorbance at 675 nm for chloride and at
-677-nm for bromide. Compare this absorbance with those obtained from
— standard halide solutions. Use distilled water in the reference cell.
Preparation of standard curves; From 0.01F solutions make a.series of
samples containing from 5 to 60 micromoles of halide. To each add 1.5
times the number of moles of lithium hydroxide. No reducing agent is
needed. Evaporate to dryness and carry through the procedure as out
lined above. The standard curves are shown in figures 25 and 26.
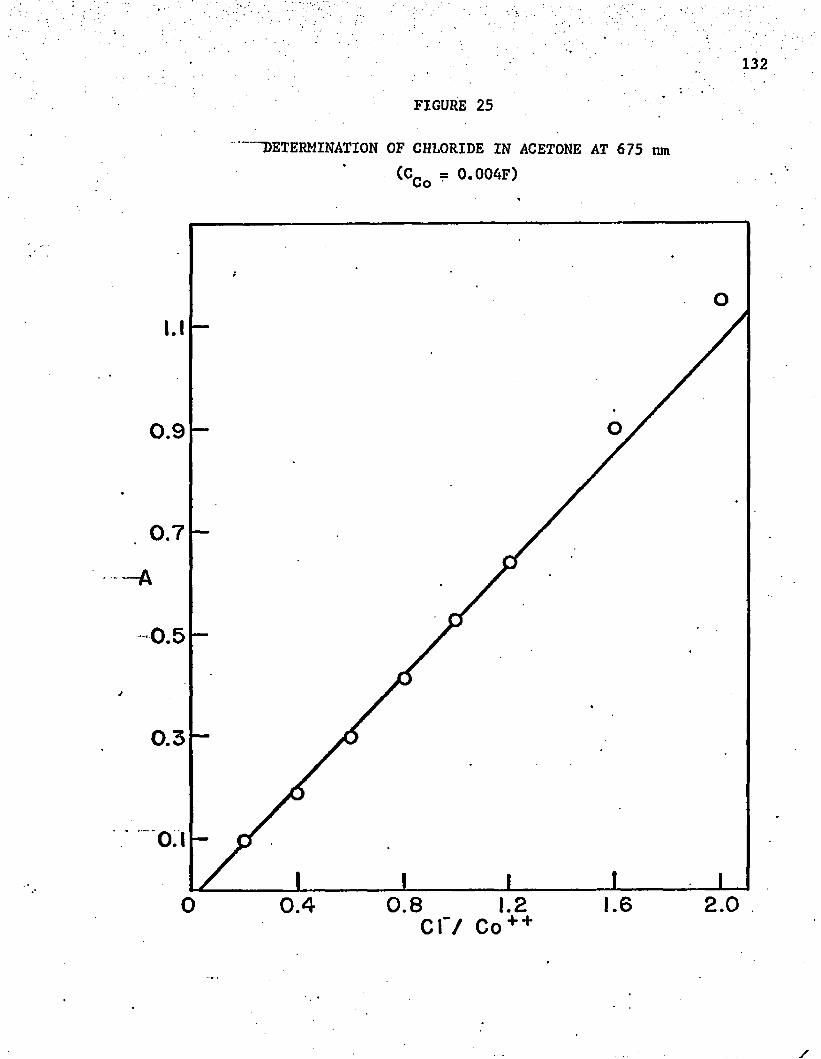
132
FIGURE 25
DETERMINATION OF CHLORIDE IN ACETONE AT 675 ran (cCo = 0.004F)
0.9
0.7
-----A
0.5
0.3
2.01.60.8 1.2O 0.4C l'/ Co + +
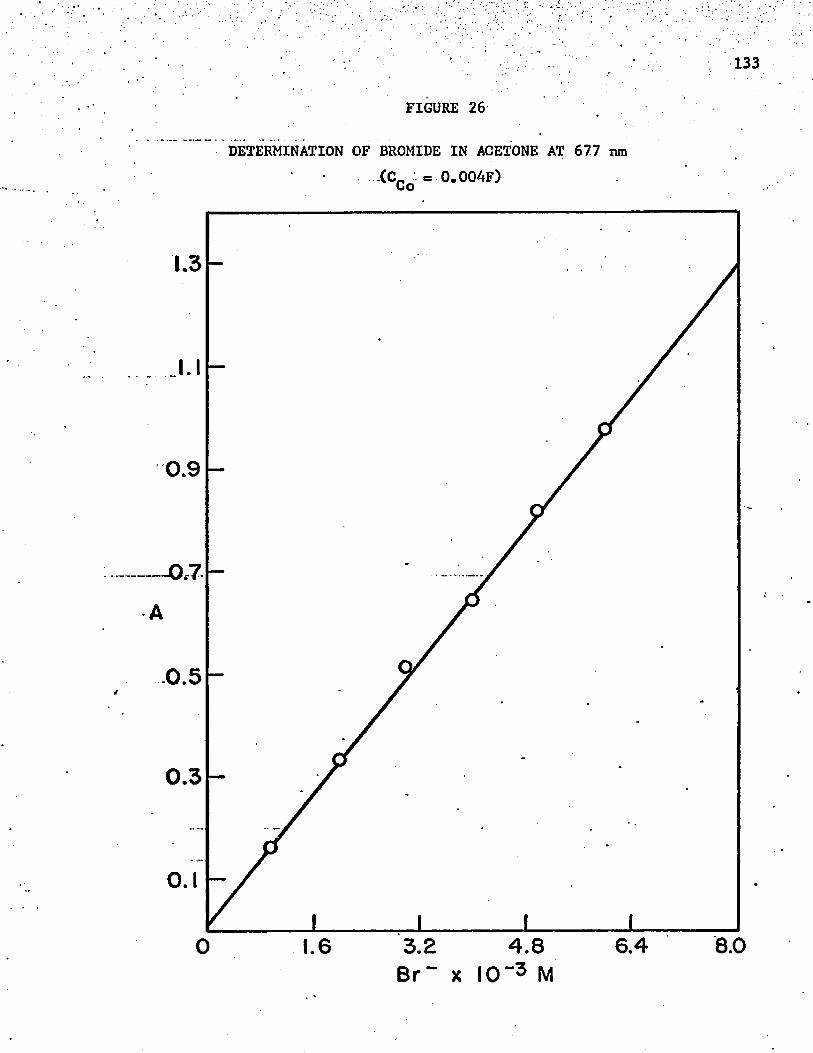
• '133
FIGURE 26
DETERMINATION OF BROMIDE IN ACETONE AT 677 nm(CCo = 0,004F)
1.3
0.9
0.7
0.5
0.3
6.4 8.03.2 Br “
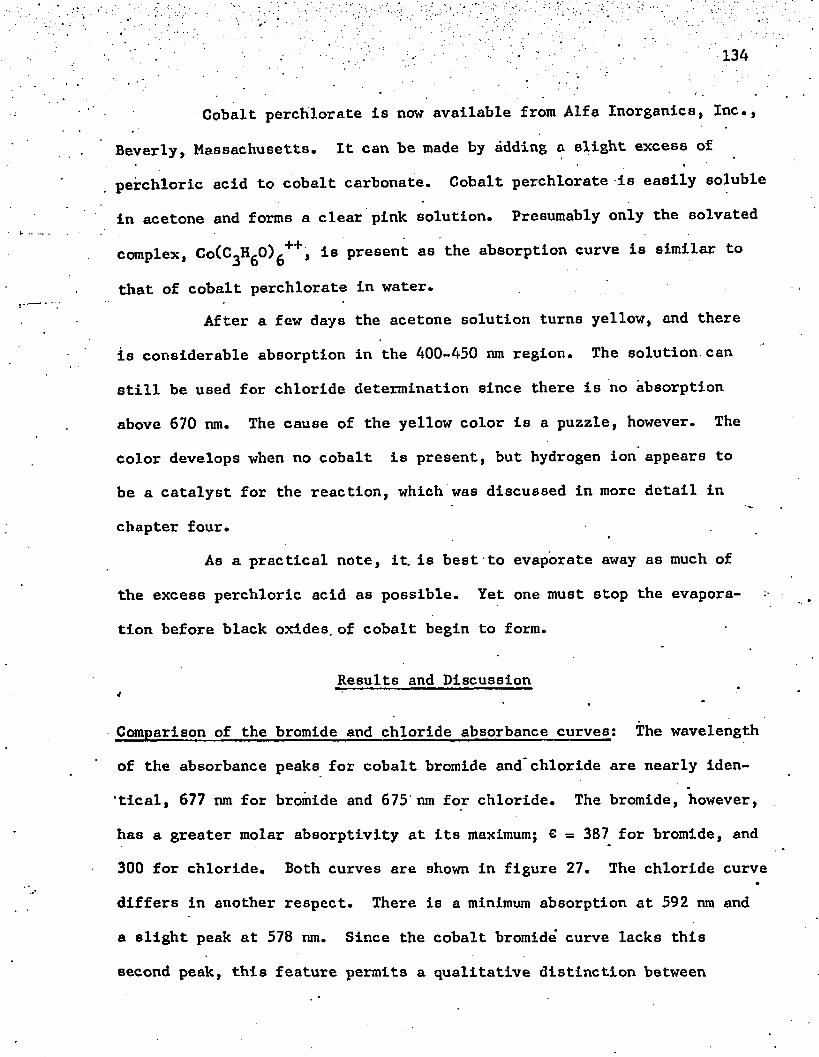
Cobalt perchlorate is now available from Alfa Inorganics, Inc.,
Beverly, Massachusetts. It can be made by adding a slight excess of
perchloric acid to cobalt carbonate. Cobalt perchlorate is easily soluble
in acetone and forms a clear pink solution. Presumably only the solvated
complex, Co(C3H 6 0 )g++, is present as the absorption curve is similar to
that of cobalt perchlorate in water.After a few days the acetone solution turns yellow, and there
is considerable absorption in the 400-A50 nm region. The solution can
still be used for chloride determination since there is no absorption
above 670 nm. The cause of the yellow color is a puzzle, however. The
color develops when no cobalt is present, but hydrogen ion appears to
be a catalyst for the reaction, which was discussed in more detail in
chapter four.As a practical note, it. is best to evaporate away as much of
the excess perchloric acid as possible. Yet one must stop the evapora
tion before black oxides, of cobalt begin to form.
Results and Discussion
Comparison of the bromide and chloride absorbance curves; The wavelength
of the absorbance peaks for cobalt bromide and chloride are nearly iden-
'tical, 677 nm for bromide and 675‘nm for chloride. The bromide, however,
has a greater molar absorptivity at its maximum; e = 387 for bromide, and
300 for chloride. Both curves are shown in figure 27. The chloride curve
differs in another respect. There is a minimum absorption at 592 nm and
a slight peak at 578 nm. Since the cobalt bromide' curve lacks this
second peak, this feature permits a qualitative distinction between
135
. FIGURE 27
ABSORBANCE OF CoXg IN ACETONE (CCo = 0.004F; Cx = 0.005F)
/////7
\ 740
700
660
620
580
540
■ . ■' _ • 136- "4
chloride and bromide. The curves hold to the previously described shape
only as long as the mole ratio of halide to cobalt is 2:1 or less. More
halide produces the complexes CoX^” and CciX^ , which are discussed in
chapter four.
The iodide absorbance curves: Iodide appears to form both a mono- and a
di-iodide complex with cobalt. The mono-iodide has a distinct peak at
665 nm and a broad peak between 690 and 702 nm. As the iodide to cobalt
ratio passes 1:1, the peak at 665 nm becomes a shoulder, but the plateau
around 700 nm remains. A new peak at 742 nm appears. The curves are
shown in figure 28, where the iodide concentration is held constant.
The absorbance curves of cobalt iodide form an isosbestic point
at 675 nm and this point can be used for approximate iodide results. A"~
family of curves for solutions in which the cobalt concentration was
kept constant is shown in figure 29. However, either iodine or iodate is
difficult to reduce quantitatively in neutral or alkaline solution, and
there are probably better ways for determining this element.
‘ The oxidation of iodide to iodine by iodate yields six equiv
alents of iodine for every equivalent of iodide originally present
through the reaction,
103" + 51* + 6H+ -• 3I2 + 3H20.
The liberated iodine may be determined colorimetrically by the familiar
starch-iodide method. Larger quantities of iodine are titrated with
thiosulfate.
Interferences: Unfortunately, nitrates interfere. Nitrate ion also forms
an acetone-soluble complex with cobalt, and there Is competition between
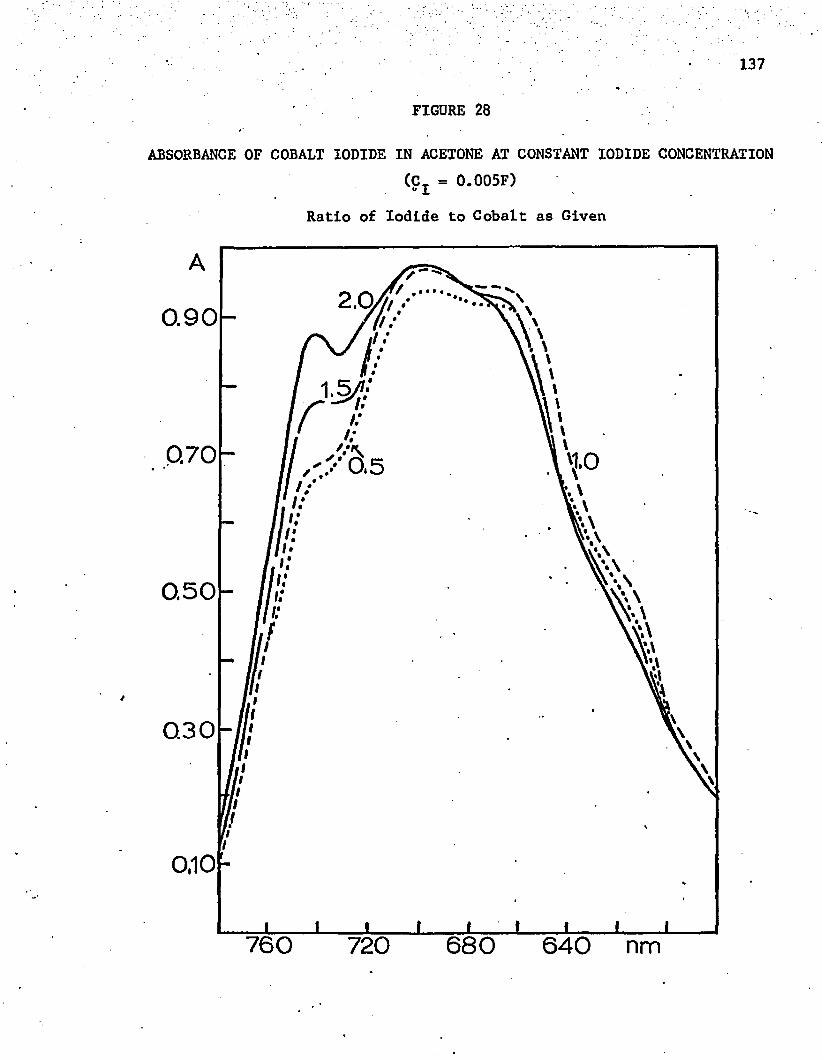
137
FIGURE 28
ABSORBANCE OF COBALT IODIDE IN ACETONE AT CONSTANT IODIDE CONCENTRATION(C_ = 0.005F)" I
Ratio of Iodide to Cobalt as Given
2.Q0.90
0.70 0.5
0.50
0.30
0.10
760 720 680 640 nm
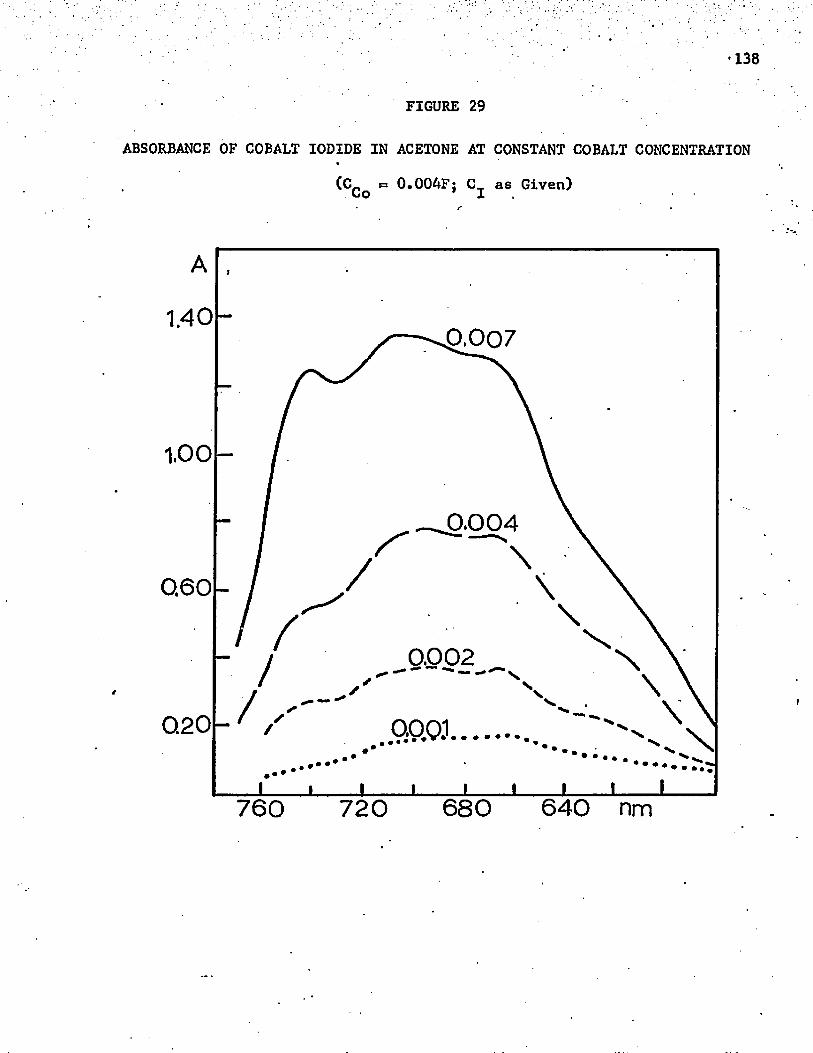
•138
FIGURE 29
ABSORBANCE OF COBALT IODIDE IN ACETONE AT CONSTANT COBALT CONCENTRATION
(C^o = 0.004F; Cj as Given)
1.0 0 -
0.007
0.004
// 0.002/
QP.03........... \.............
0.60-
Q20-
760 720 680 640 nm
nitrate and halide ions for cobalt. Some absorbance curves for cobalt
chloride in the presence of nitrate are shown in figure 30. Mixed
complexes result with absorption maxima anywhere between 570 and'630 run,
depending on the relative amounts of halide and ni'trate present. Other
evidence for the formation of a cobalt nitrate complex is that for the
pure salt in acetone, the absorption maximum is at 536 nm and 6 — 52.
For fresh cobalt perchlorate solution, the absorption maximum is at
518 nm and e = 12. Fortunately, most organic nitrogen becomes nitrogen
gas after combustion (Fildes and MacDonald 1961), and thus causes no
interference.
Other common inorganic anions do not interfere unless the
total salt concentration is too high. Some data are presented in table
43. Sulfate, sulfite, and phosphate do not interfere as long as the
molar ratio of oxy-anion to halide is 1:1 or less. On a weight basis
five milligrams of the sodium salt can be present. The molar ratio of
fluoride to other halide may be as much as 2:1. The alkali metals,
alkaline earths, and ammonium ion do not interfere. Most heavy metals
precipitate as oxides during the alkaline evaporation, and thus are*
removed from further reaction. Zinc, cadmium, mercury, and- silver
interfere by forming their own complexes or precipitates with chloride.
Accuracy and precision: Varying concentrations of standard halide
solutions were taken as samples and analyzed according to the suggested
procedure. The results are shown in tables 44 and 45. The accuracy
and precision are as good as those for other known methods. For instance
a relative standard deviation of 2 .8% at the 1 . 0 mg level for chloride is
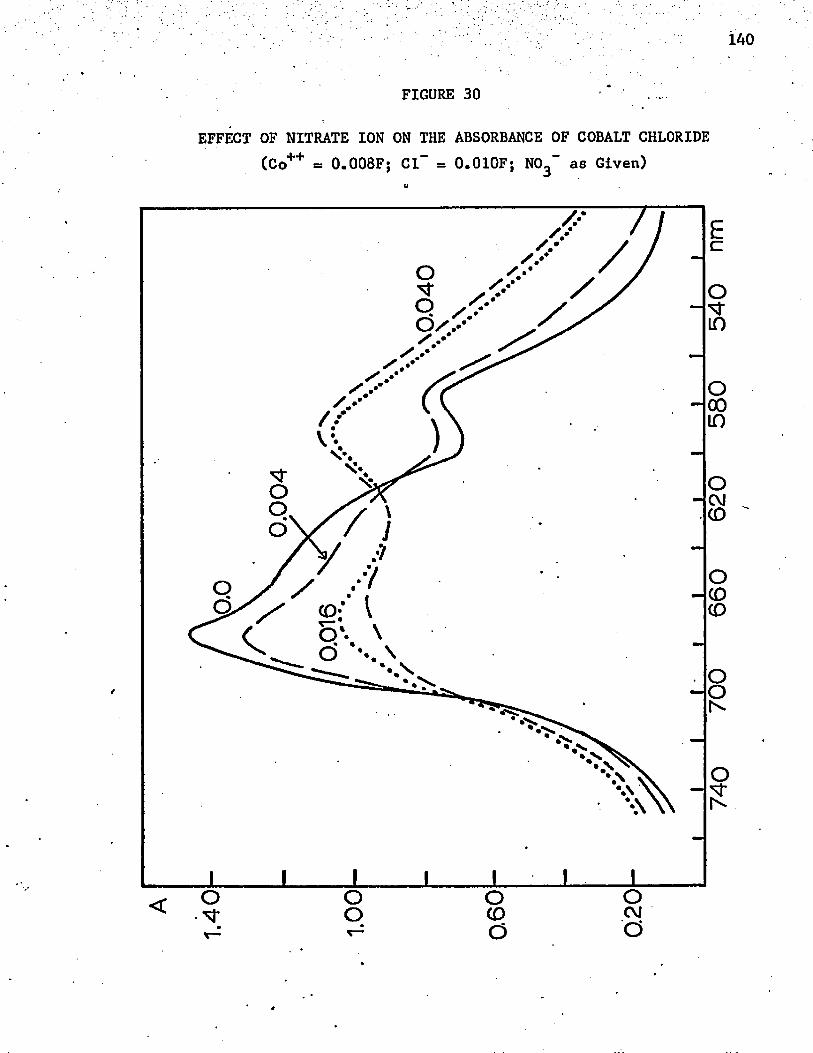
140
FIGURE 30
EFFECT OF NITRATE ION ON THE ABSORBANCE OF COBALT CHLORIDE (Co++ = 0.008F; Cl" = 0.010F; N03" as Given)
•-N
Ec
O oo
oCDo
oOJa
740
700
660
620
580
540
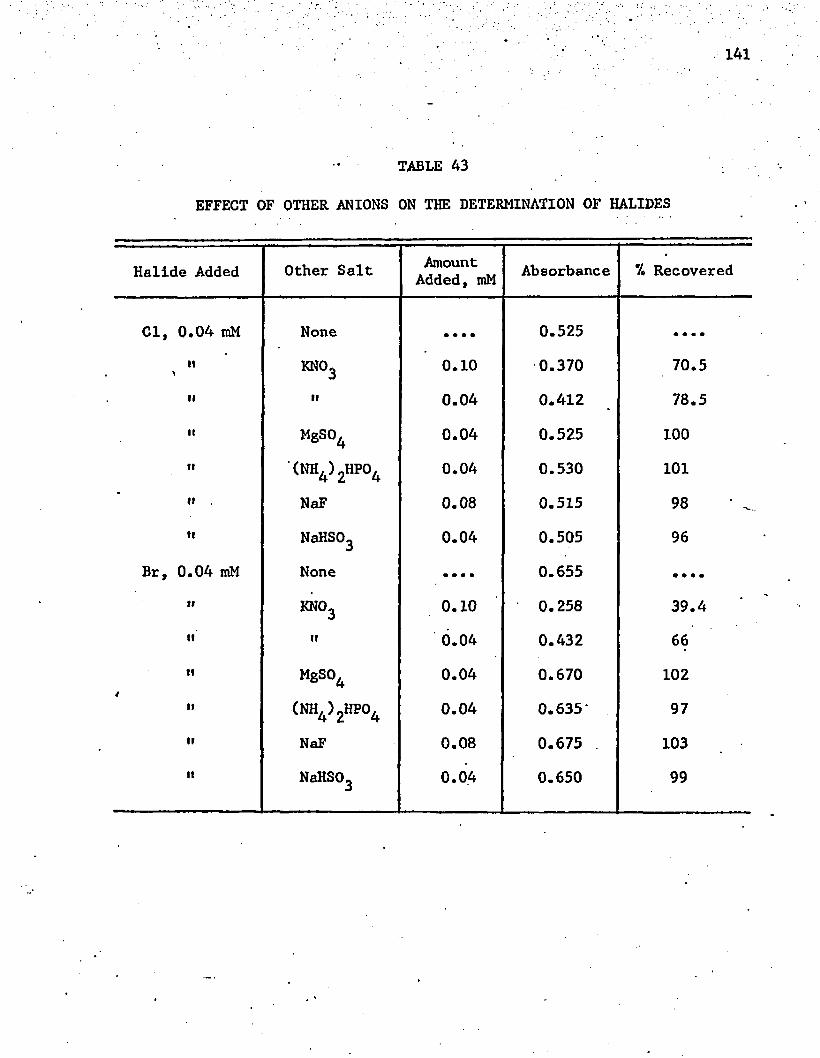
141
TABLE 43
EFFECT OF OTHER ANIONS ON THE DETERMINATION OF HALIDES
Halide Added Other Salt Amount Added, mM Absorbance % Recovered
Cl, 0.04 mM None • • • • 0.525 • • « •
i t KN03 0 . 1 0 0.370 70.5i t II 0.04 0.412 78.5i t MgS04 0.04 0.525 1 0 0
i t (nh4 )2hpo4 0.04 0.530 1 0 1
it NaF 0.08 0.515 98i t NaHS03 0.04 0.505 96
Br, 0.04 mM None • • • • 0.655 • • • •
ti kno3 0 . 1 0 0.258 39.4i t It 0.04 0.432 6 6
i t MgS04 0.04 0.670 1 0 2
n (nh4 )2hpo4 0.04 0.635* 97i t NaF 0.08 0.675 . 103i t NaHS03 0.04 0.650 99
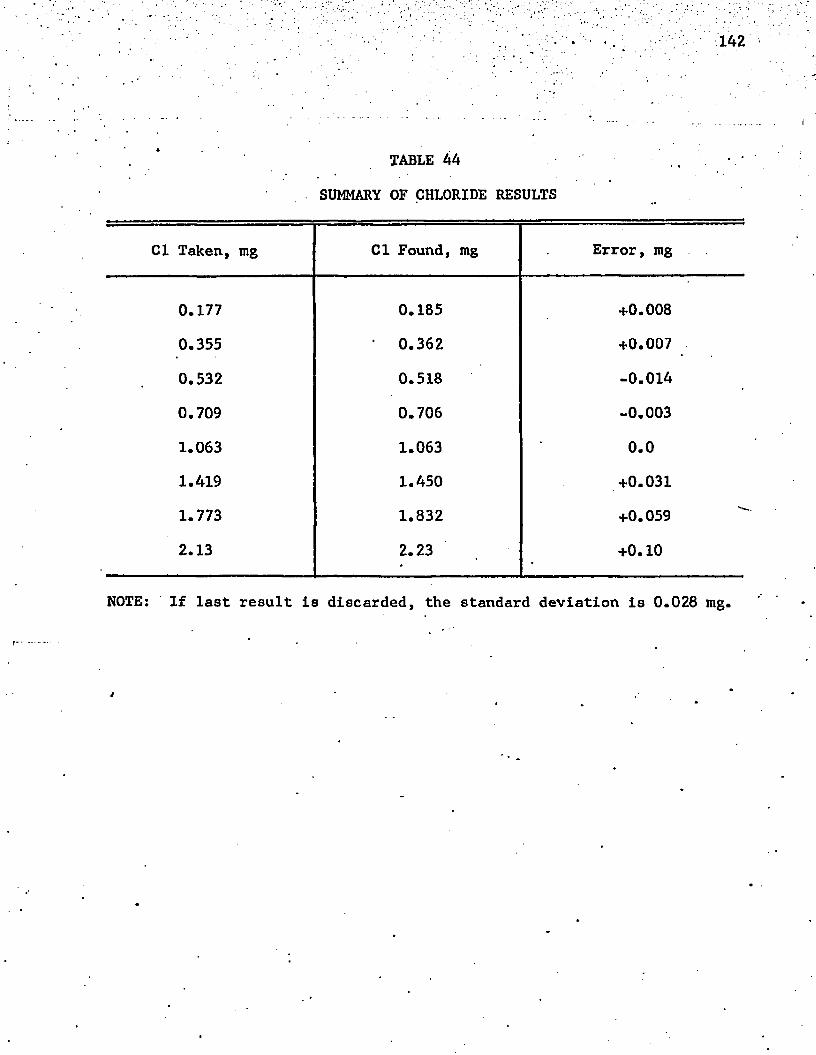
142
TABLE 44
SUMMARY OF CHLORIDE RESULTS
Cl Taken, mg Cl Found, mg Error, mg
0.177 0.185 +0.008
0.355 0.362 +0.007
0.532 0.518 -0.014
0.709 0.706 -0.003
1.063 1.063 0 . 0
1.419 1.450 +0.031
1.773 1.832 +0.059
2.13 2.23 +0 . 1 0
NOTE: If last result is discarded, the standard deviation is 0.028 mg.
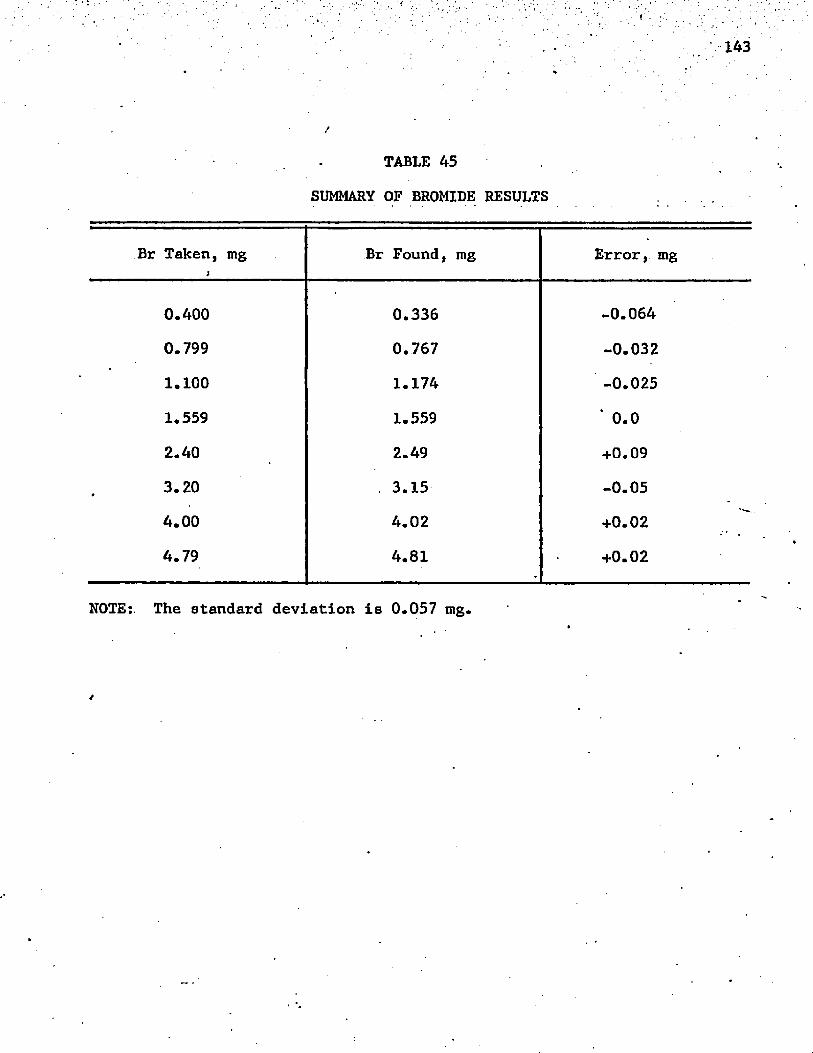
X43
TABLE 45
SUMMARY OF BROMIDE RESULTS
Br Taken, mgi
Br Found, mg Error, mg
0.400 0.336 -0.064
0.799 0.767 -0.032
1 . 1 0 0 1.174 -0.025
1.559 1.559 ‘ 0 . 0
2.40 2.49 +0.09
3.20* 3.15 -0.05
4.00 4.02 +0 . 0 2
4.79 4.81 +0 . 0 2
NOTE:. The standard deviation is 0.057 mg.
4
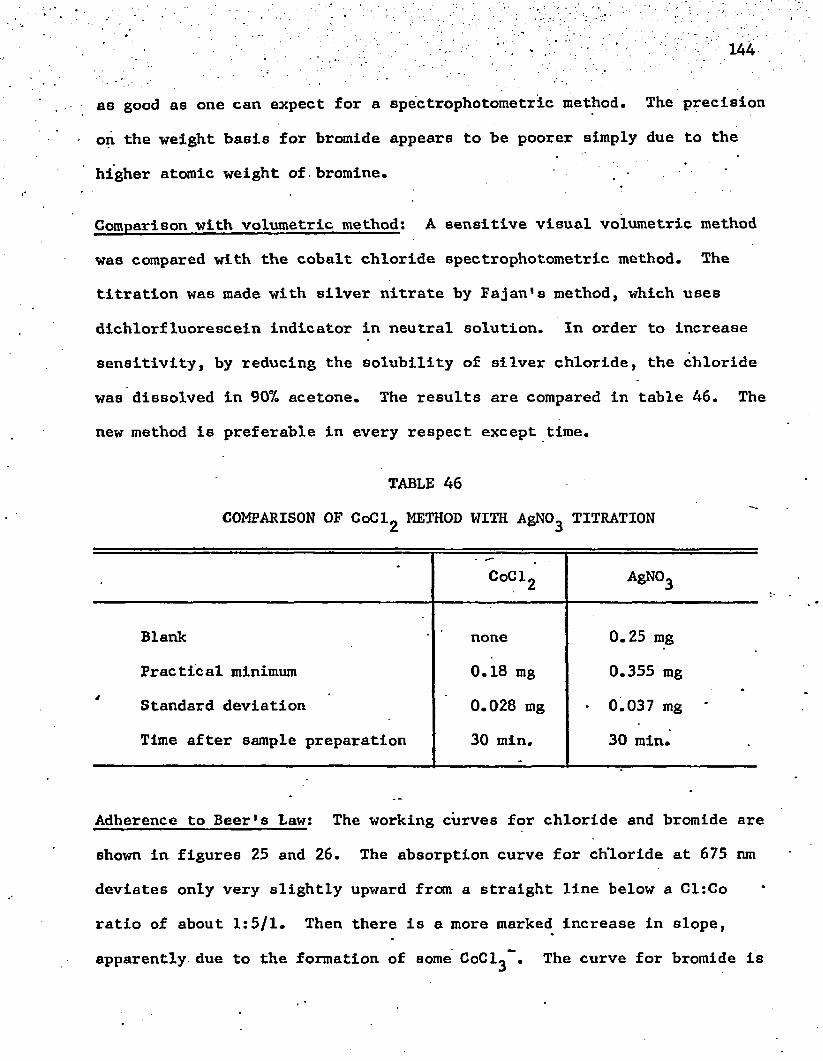
as good as one can expect for a spectrophotometrie method. The precision
on the weight basis for bromide appears to be poorer simply due to the
higher atomic weight of.bromine.
Comparison with volumetric method: A sensitive visual volumetric method
was compared with the cobalt chloride spectrophotometrie method. The
titration was made with silver nitrate by Fajan’s method, which uses
dichlorfluorescein indicator in neutral solution. In order to increase
sensitivity, by reducing the solubility of silver chloride, the chloride
was dissolved in 907. acetone. The results are compared in table 46. The
new method is preferable in every respect except time.
TABLE 46
COMPARISON OF CoCl2 METHOD WITH AgNO^ TITRATION
* CoCl2 AgN03
Blank none 0.25 mg
Practical minimum 0.18 mg 0.355 mg
Standard deviation 0.028 mg 0.037 mg
Time after sample preparation 30 min. 30 min.
Adherence to Beer's Law: The working curves for chloride and bromide are
shown in figures 25 and 26. The absorption curve for chloride at 675 nm
deviates only very slightly upward from a straight line below a Cl:Co
ratio of about 1:5/1. Then there is a more marked increase in slope,
apparently due to the formation of some CoCl^*". The curve for bromide is
145
very close to a straight line below a Br:Co ratio of 1.5:1* Above this
ratio there is a decrease in the slope. The CoBr^ , which is presumed
to form, absorbs more strongly, but the absorption shifts to longer
wavelengths.
Additional details about the more highly halogenated complexes of3
cobalt were discussed in chapter four.
Summary
A new spectrophotometric method has been developed for the deter
mination of chloride and bromide based on the absorbance of the CoCl^
complex in acetone. ' With a one-centimeter cell, the sensitivity to
chloride is about 1 0 parts per million on a weight basis in the acetone
solution. This compares favorably with the most sensitive volumetric
methods, and is more sensitive than any other known direct color or
spectrophometrie method. If the original sample is a water solution,
there is no limit to the volume that one can evaporate to dryness. The
The nephelometric silver chloride method is more sensitive, but its /poor reproducibility limits its practical use to qualitative or semi- quantitative work.
CHAPTER VI
u 'THE COMPLEXES OP TRANSITION METALS WITH POLYPHOSPHATES
Introductlon
The polyphosphates of transition metal complexes have been
Incompletely explored. This is especially true of the tetraphosphates
because of the difficulty of obtaining pure crystalline tetraphosphate
salts.
Many investigators have worked with pyrophosphates and tri
phosphates, which are available commercially. Considerable interest
in polyphosphates has been spurred by the fact that adenosine di- and
tri-phosphates, ADF and ATP, and even the tetraphosphate are important
in biological oxidation and reduction reactions.' Metal complexes with
ADP and ATP often function as catalysts or as part of a larger enzyme
molecule. Miller and Westheimer (1966) studied the hydrolysis of Y-
^phenylpropyl di- and tri-phosphates, and found the reactions to be
similar to those, of ADP and ATP. In their first paper they studied
acid and base catalysis, and in the second they used an enzyme. They
observed that the hydrolysis of ATP mixed with luciferin produces light, while Y-ph®nlypropyl triphosphate does not.
Since an important part of the work in the study in this
laboratory concerns divalent-metal tetraphosphates, one of the problems
was the preparation of a pure crystalline tetraphosphate. Thilo and
146
. .. - • . 147
Ratz (1949) were able to prepare sodium tetraphosphate by alkaline
hydrolysis of sodium tetrametaphosphate, which is commercially available.
Their hydrolysis took 100 hours at 40°C. Unfortunately they could not
crystallize sodium tetraphosphate from solution.
Westman and Scott (1951) shortened the hydrolysis time by
raising the temperature to 70°C, but lower polyphosphates were also
formed due to further hydrolysis. They separated and identified the
various phosphate hydrolysis products by means of paper chromatography.
Quimby (1954) lowered the temperature for hydrolysis to 25-28°C
and used a 1007. excess of sodium hydroxide. The reaction took three
weeks, but stopped at the tetraphosphate.Pa012“A + 20H" - PA0 1 3 ~ 6 + H20
Quimby first prepared a crystalline tetraphosphate, namely
guanidinium tetraphosphate monohydrate, by precipitation from aqueous
formamide solution.
Several researchers (Griffith 1964, Schulz 1956, and Osterheld
and Langguth 1955) have been able to prepare solid lead tetraphosphate,
irhich is insoluble in water. For example, Griffith (1964) mixed lead
carbonate and 85% phosphoric acid, and heated the mixture to 550°C.
Then he prepared ammonium tetraphosphate by mixing the lead tetraphosphate
with ammonium sulfide. The insoluble lead sulfide was filtered off.
Thin (HH4 )6P4 0 1 3 -6H 20 was precipitated by adding an equal volume of
methanol.* The crystals of the ammonium salt were stable at room tempera
ture for a year, but they decomposed at 50°C to lower polyphosphates.
Schultz (1956) also prepared solid bismuth tetraphosphate by heating
148
together bismuth oxide and phosphoric acid In a molar ratio of 1:4 at a
final temperature of 700°C.
Matsumoto (Watters and Matsumoto 1964) and Machen (1967) made
minor modifications in Quimby*s method (1954) of preparation of
guanidinium tetraphosphate. Machen (1967) also converted the guanidlnium
salt to the tetramethy1-ammonium salt by means of ion exchange. The
latter was stable for several weeks at 5°C as a concentrated solution.
Its use avoided the formation of guanidinium complexes with tetraphos
phate.
Watters and his coworkers determined the acidity constants of
tetraphosphoric acid (Watters, Sturrock, and Simonaitis 1963). These,
especially and are necessary if one wishes to determine the
stability constants with metals by means of the pH lowering. Tetraphos
phate, like other chain phosphates, forms complexes even with the alkali
metal ions. Matsumoto determined the stability constants of tetraphos
phate with guanidinium (Watters and Matsumoto 1964) and with lithium,
sodium, and potassium (Watters and Matsumoto 1967).t If one can determine the free metal ion concentration in the
presence of a complexing ligand, he has a valuable tool for determining
the complexity constant. This was done by Machen (1967) by means of a
calcium-ion sensitive electrode. The polarograph was used by Watters
and his coworkers to determine the stability of raercury(l) (Watters and
Simonaitis 1964) and various copper(ll) polyphosphates (Schupp, Sturrock,
and Watters 1963; Watters and Matsumoto 1966; Sturrock, Loughran, and
Watters 1962). This is one of the few examples of a mercurous complex,
which normally forms only ionic complexes. Covalently bound ligands
149
would probably break the relatively weak s-p hybrid bond between the two
mercury atoms- The known stability constants of the copper(il) poly
phosphates can be used in the indirect determination of the stability of
other metal phosphates, which are not'reversibly reduced at the dropping
mercury electrode.
Polyphosphates with more than four phosphorus atoms can be
prepared, but hydrolysis is too rapid at room temperature to permit the
isolation of any one of them in a pure state. Griffith and Buxton (1965
and 1967) have prepared long-chain polyphosphoric acids simply by
heating 857. H^PO^ to 400°C. After neutralization, a hexametaphosphate
(Griffith and Buxton 1965), Na^Pg O ^ g ^ ^ O could be extracted and crystal
lized. Linear polyphosphates (Griffith and Buxton 1967) up to the octa-
phosphate were separated and identified by means of chromatography. The
average chain length was five. Decomposition was observed to occur in
two ways. A terminal FOg group, or less frequently, a trimetaphosphate
group split away. The pyro-, tri-,’and tetra-phosphates are stable in
neutral or alkaline solution, but hydrolyze slowly in acid. Longer-
<chain polyphosphates show significant decomposition within an hour at
any pH.
Gill and Riaz (1969) studied the kinetics of the degradation
of long-chain polyphosphates. They started with pure sodium "long-
chain11 polyphosphate, known as Graham1s salt. The coiled structure,
determined by X-ray diffraction, contains repeating units of three PO^
tetrahedra. These can form tridentate bonds with a metal cation, which
catalyzes the removal of a tremetaphosphate ring from the middle of a
chain. The rate of this reaction and the splitting off of a terminal
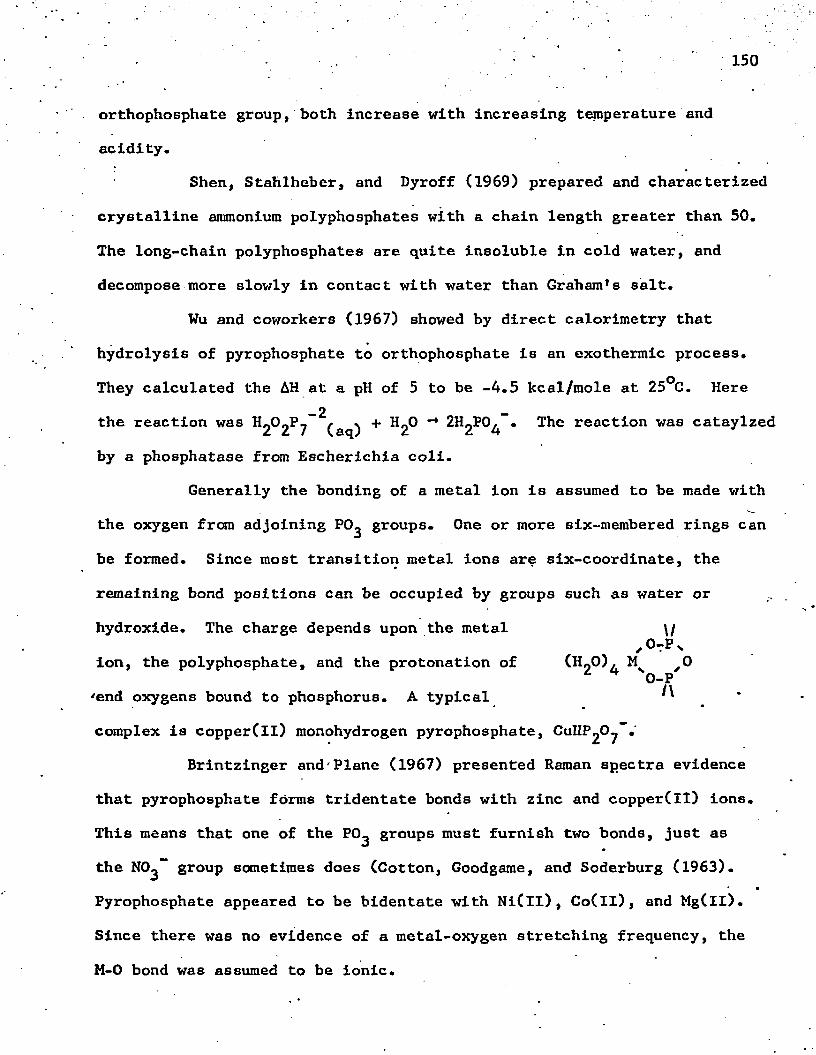
• ’ 150
orthophosphate group, both increase with increasing temperature and
acidity.Shen, Stahlheber, and Dyroff (1969) prepared and characterized
crystalline ammonium polyphosphates with a chain length greater than 50.
The long-chain polyphosphates are quite insoluble in cold water, and
decompose more slowly in contact with water than Graham’s salt.
Wu and coworkers (1967) showed by direct calorimetry that
hydrolysis of pyrophosphate to orthophosphate is an exothermic process.
They calculated the AH at a pH of 5 to be -4.5 kcal/mole at 25°C. Here-2the reaction was ^ O ^ P ^ (aq) + ^ 2° ^ 2 ^ 4 * 'r e react*on was cataylzed
by a phosphatase from Escherichia coli.
Generally the bonding of a metal ion is assumed to be made with
the oxygen from adjoining PO^ groups. One or more six-membered rings can
be formed. Since most transition metal ions are six-coordinate, the
remaining bond positions can be occupied by groups such as water or
hydroxide. The charge depends upon the metal \/,0TP,
ion, the polyphosphate, and the protonation of (H„0), M f0* 0-P
'end oxygens bound to phosphorus. A typical ^
complex is copper(II) monohydrogen pyrophosphate, CuHP^O^”.'Brintzinger and'Plane (1967) presented Raman spectra evidence
that pyrophosphate forms tridentate bonds with zinc and copper(ll) ions.
This means that one of the PO^ groups must furnish two bonds, just as
the NO^"* group sometimes does (Cotton, Goodgame, and Soderburg (1963).
Pyrophosphate appeared to be bidentate with Ni(ll), Co(ll), and Mg(ll).
Since there was no evidence of a metal-oxygen stretching frequency, the
M-0 bond was assumed to be ionic.
151
Experimental
The general method of obtaining data to calculate the stability
of a metal polyphosphate complex was to form the complex, and then
titrate it with standard acid. This titration curve was compared with
the one obtained when pure tetramethylammonium polyphosphate was titrated.
The degree of pH lowering during the titration was a measure of the
stability of the metal polyphosphate complex. These data were subjected
to a mathematical treatment, in which a slope-intercept equation was
developed for determining the two most important stability constants. To
eliminate activity coefficient effects, the ionic strength was kept
constant at 1 . 0 with tetramethylammonium chloride or nitrate.
Complexes of three linear polyphosphates were studied. Two,
the pyrophosphate and triphosphate, are available commercially as the
sodium salts. The third, tetraphosphate, had to be prepared in the
laboratory as the guanidinium salt.
The starting material for preparing guanidinium tetraphosphate,
was sodium tetrametaphosphate, which is available,
^from Victor Chemical Works as "Cyclophos." This was hydrolyzed and
converted to the guanidinium salt by the method described by Quimby (1954)
and Machen (1967). The crystalline guanidinium salt is stable indefinite
ly at room temperature.
Machen*s method (1967) for the conversion of crystalline poly
phosphate to the tetramethylammonium salt was modified somewhat. Two
millimoles of the sodium or guanidinium salt were carefully weighed and
dissolved in 20 ml of water. This solution was run through a 5-cm cation
. . 152
exchange column, Dowex 50W-X8, and the polyphosphate was converted to
the tetramethylammonium salt. The polyphosphate was eluted from the
column with 25 ml of 2M tetramethylammonium chloride. Enough tetra
methylammonium hydroxide was added to bring the pH to 10.0 for the
pyrophosphate and triphosphate, and to 9.0 for the tetraphosphate. The
solution was finally diluted to 50 ml, and the ionic strength was adjusted
to 1 .0 .The next step was to add an equal number of moles of a metal
chloride or nitrate, Iron(ll) was added as solid FeCl^'^H^O. All other
metals were added as 0.10M solutions. Mixing caused the 1:1 metal-
polyphosphate complex to form, and the drop in pH was a qualitative
measure of the stability of the complex because the metal ion displaces
hydrogen ion in forming the complex.
The metal salt solutions were standardized as follows:
Magnesium, manganese, zinc, and lead were titrated with EDTA in a
buffered solution at pH 10 using the indicator, Eriochromeblack T. Iron
and aluminum were preciptitated with ammonium hydroxide and ignited to
the trivalent oxide. Nickel, cobalt, and copper were electroplated
on a platinum cathode, and weighed as the pure metal. Nickel was also
checked gravimetrically with dime thy lglyoxime..
After the metal polyphosphate was formed, it was titrated
with standard acid, usually 0.1N HC1 or HNO^. (The acid was standard
ized against pure sodium carbonate.) At frequent intervals the pH was
recorded. The instrument used was a Beckman Research pH Meter, on
which one can read three decimal places. A Beckman glass electrode,
no. 40498, and a saturated calomel reference electrode were used.

. ' . 153
Titration curves, shown In figures 31, 32, and 33, were
obtained for some of the metal polyphosphates and the tetramethyl
ammonium polyphosphates. One may observe that there is only a slight
difference in pH after two equivalents of acid are added per mole of
polyphosphate. The ratio between the numbers of equivalents of acid
added and moles of polyphosphate is defined as "a." The pH in the
solution containing copper is slightly displaced because the copper-3nitrate solution itself contained a little hydrogen ion (2 . 2 x 1 0
moles per liter).
The final volume after the titration was about 56 ml. This
included 50 ml of the original polyphosphate solution, 2.0 ml of the
metal salt solution, and 4.0 ml of the standard acid for titrating until
a = 2. A median total volume, or 53 ml, was used in the calculations.
Since the increase in volume during the titration was less than 87., the
effect of this change, which was largely cancelled, was considered to
be insignificant for most calculations.
The temperature during the titration was 25.0 ± 0.5°C, and was
^maintained by means of a water bath. All reagents were dissolved in .
doubly distilled and deionized water.
The possible formation of other complexes must be considered.
‘An example already mentioned is the formation of weak sodium polyphos
phate complexes. These are avoided by conversion to the tetramethyl
ammonium polyphosphate. The same conversion eleiminates guanidinium ion,
which,because of its similarity to ammonia, may complex transition
metals, and is known to form tetraphosphate complexes (Watters and
Matsumoto 1964). The chloride portion of this work showed that the
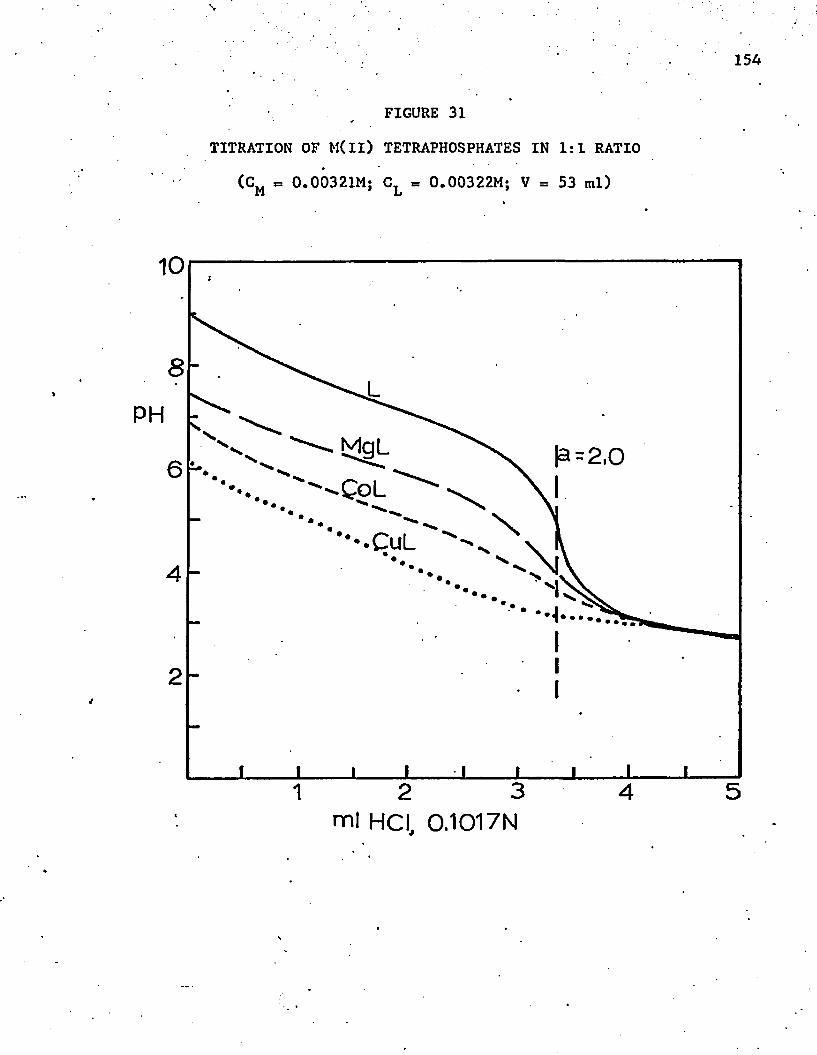
154
FIGURE 31
TITRATION OF M(ll) TETRAPHOSPHATES IN 1:1 RATIO
(CM « 0.00321M; C_ = 0.00322M; V = 53 ml)M L
10
8PH
MgL6
CuL4
2
31 2 4 5ml HCI, 0.1017N
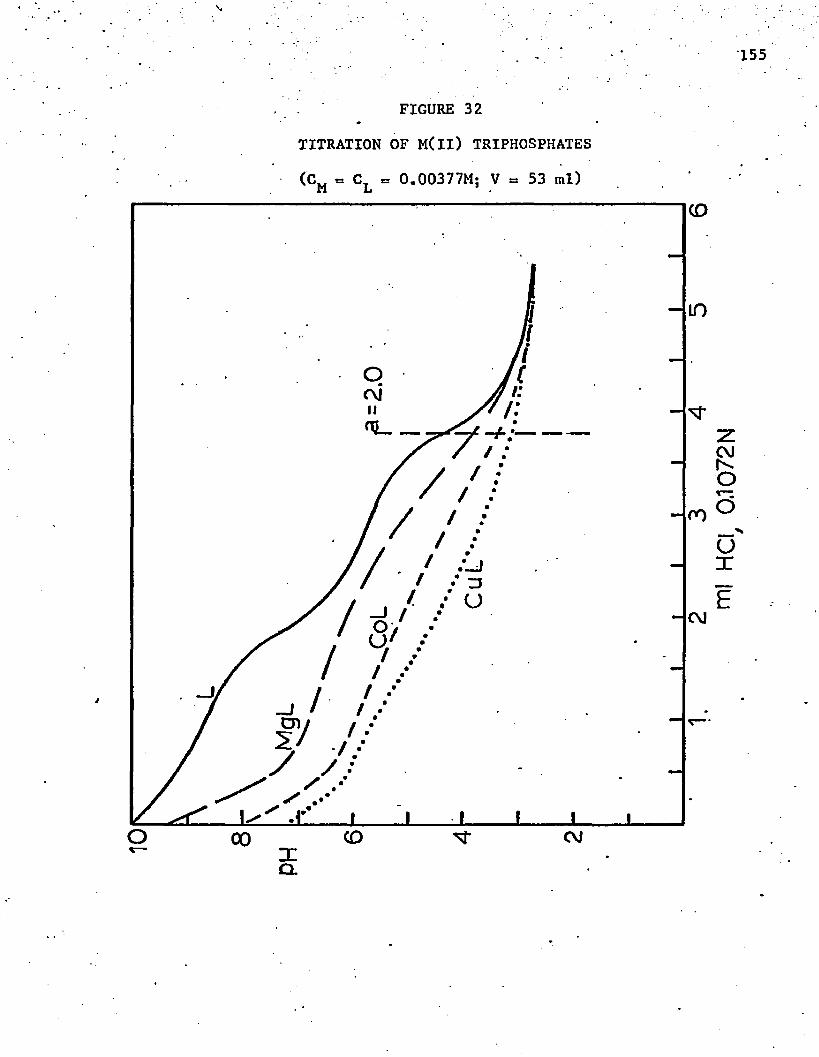
155
FIGURE 32
TITRATION OF M(ll) TRIPHOSPHATES
(C„ = CT = 0.00377M; V = 53 ml)M L *
co
o CD C\JQ.
ml
HCI
0.10
72N
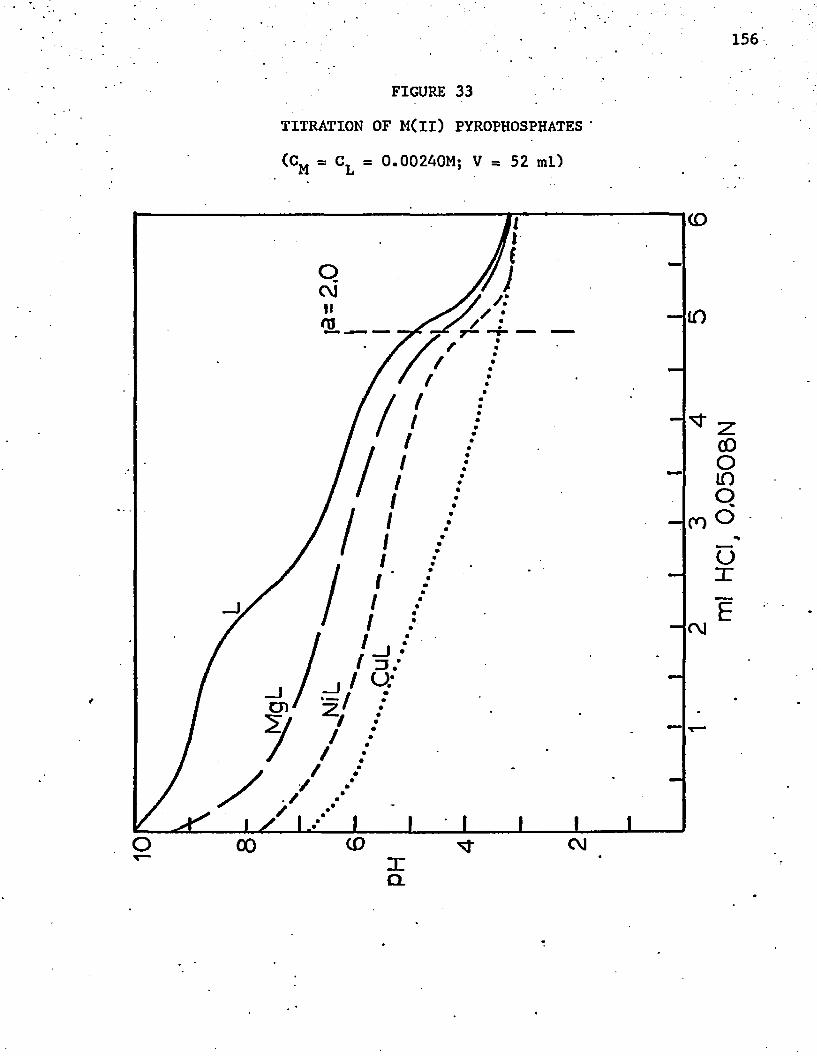
FIGURE 33
TITRATION OF M(ll) PYROPHOSPHATES
(CM = CL = 0.00240M; V = 52 ml)
156
C\J
O CD
CO
to
CO
c\]
Q.
ml
HCI,
0.05
08N
157
chloride complexes of cobalt(ll) and copper(II) are not stable in 1M
chloride solution. This is not true of ironClIl)^ and the stability of
zinc chloride was not tested. Therefore, the background electrolyteu
was changed to tetramethylammonium nitrate when iron(lll) and zinc
polyphosphates were titrated, and standard nitric acid was substituted
for hydrochloric acid.
Tetramethylammonium nitrate, which is not available commercial
ly, was prepared as follows: four-hundred and sixteen grams of tetra-
methylammonium hydroxide, a 24% solution in methanol from Matheson,
Coleman, and Bell, were weighed. Slowly, boiled nitric acid was poured
in until the solution was acidic to methyl red. Then carbon dioxide and
most of the alcohol were removed by boiling. Next the pH was adjusted
to 7.0 with tetramethylammonium hydroxide, and the solution was diluted
to one liter. The final concentration was 1.1M.
In some cases, especially with pyrophosphates, there was
precipitation before or during the titration. This problem sometimes
could be avoided simply by diluting all solutions to one-half or one-
^fourth of the concentrations suggested earlier. The practical minimum
of metal ion and polyphosphate is about 0.001F. In any case, the ionic
strength was maintained at 1.0. Another precipitate was iron(lll)
hydroxide or hydroxypolyphosphate, but in all studies except with pyro
phosphate, this precipitate dissolved after a short time. Owing to the
precipitation of pyrophosphates of cobalt, iron(ll) and (III), manganese,
and zinc, only approximate values could be obtained for the stability con
stants of these pyrophosphate complexes. Lead ion formed a precipitate
even with triphosphate; further work with this element was not performed.
• 158
Notes on Experimental Technique
Nitrogen Atmosphere: Passing nitrogen gas through the solution removes
two undesirable gases, oxygen and carbon dioxide. Oxygen, of course,
must be removed when there is danger of air oxidation. In the presence
of oxygen iron(ll) is oxidized to iron(lll), and the difference in the
titration is several tenths of a pH unit. In order to eliminate oxygen,
nitrogen was bubbled through ferrous solutions for about ten minutes
before the titration began and then continued during the titration.
The other undesirable gas, carbon dioxide, reacts as an acid
and lowers the pH. In the case of nickel and cobalt polyphosphates, the
titration curves were the same whether nitrogen was used or not. There
fore it was assumed that not enough CO,, was present to affect the titra
tion. All solutions were made in water which had been initially freed
of carbon dioxide. -
Ion Exchange; The polyphosphates must be weighed as the sodium or guan
idinium salts. Both of these cations form complexes with polyphosphates
,and may change the pH by as much as 0.5 unit. This is especially true, in
the case of magnesium, whose complexes are only a little stronger than
those of sodium.The problem was to remove the alkali metal and still have a
known concentration of polyphosphate in a small volume. A short cation
(Dowex 50W-X8) exchange column removed the sodium and let the polyphos
phate. pass through. A concentrated (1 or 2F) solution of tetramethyl
ammonium chloride converted the polyphosphate to a form in which the
cation is noncomplexing. At the same time the total ionic strength was
159
adjusted to 1.0, Enough sodium ion remained to give the yellow flame
test, but no difference'in the titration curve was detected.
Effect of chloride: Another ion which complexes certain transition
metals is chloride. Yet because of its availability and greater
stability, it is more convenient to use tetramethylammonium chloride as
the background electrolyte. In the case of iron(lll) there is no choice.
One has to use a nitrate or perchlorate solution. The chloride portion
of this work has indicated that it should be safe to use 1M chloride in
the presence of cobalt(ll) but perhaps not for copper(ll). Data shown in
table 47 indicate that there is no significant difference between the
titrations in chloride and nitrate solutions. Perhaps the explanation
.is that there is so little copper ion uncomplexed by polyphosphate, that
the additional complexing by chloride affects the potential measurements
only insignificantly. The same titrating solution, standard nitric acid,
was used in all cases. Nickel was used as the reference metal because it
forms chloride complexes only in nonaqueous solvents.
Temperature: Since nearly all equilibrium data in this country are given/
at 25°C, this temperature was chosen for the titrations. In one case,
aluminum tetraphosphate, titrations were run at 24.5° and 27.5°c. Since
the two titrations curves were essentially identical, temperature effects
within a few degrees of 25°C appear to be negligible.
Points recorded during titration: After the addition of every 0.2 to 0.5
ml of standard acid, the pH was recorded. Later the points were plotted
on linear graph paper. Then the difference between the titration of the
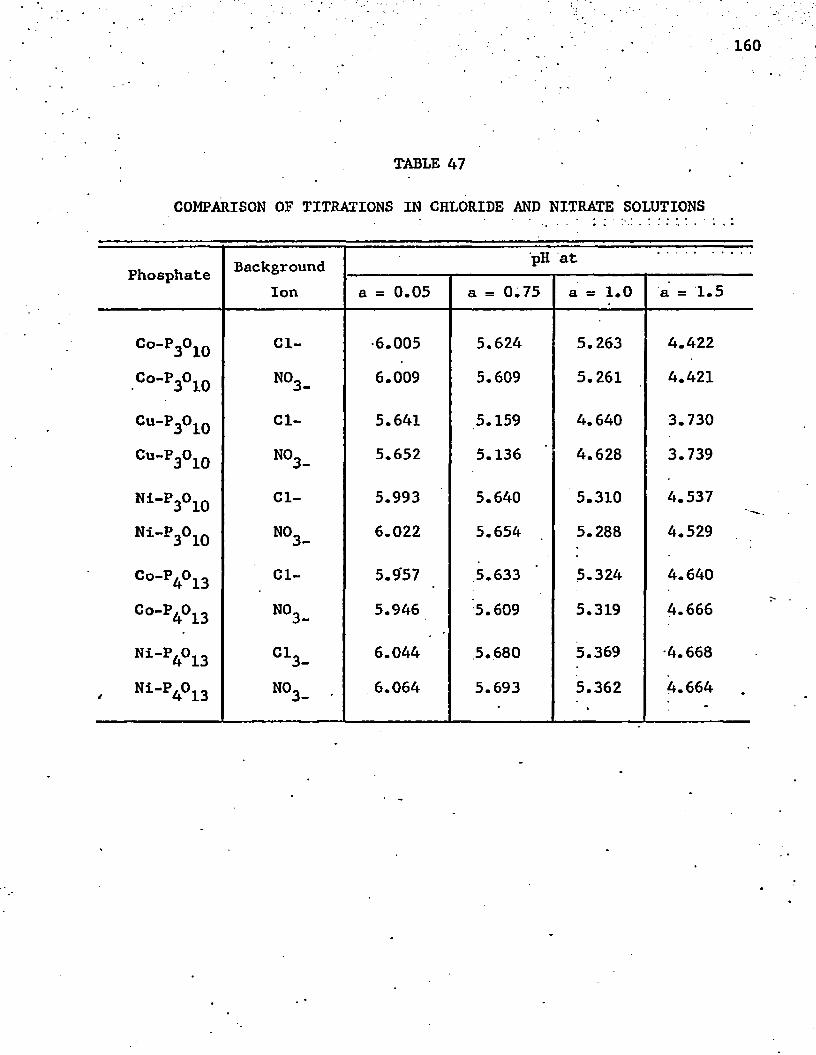
160
TABLE 47
COMPARISON OF TITRATIONS IN CHLORIDE AND NITRATE SOLUTIONS
Phosphate BackgroundIon
pH at
a = 0.05 a = 0.75 a = 1 . 0 a = 1.5
Oo-P3°10 Cl- •6.005 5.624 5.263 4.422
■Co-P3°10 N0 3_ 6.009 5.609 5.261 4.421
Cu-P3°10 Cl- 5.641 5.159 4.640 3. 730
Cu-p3°10 N°3_ 5.652 5.136 4.628 3.739
N 1-P3°10 Cl- 5.993 5.640 5.310 4.537
Ni-P3°10 3 O U) 1 6 . 0 2 2 5.654 5.288 4.529
Co"P4°13 Cl- 5.9*57 5.633 5.324 4.640
Oo-p4°13 N0 3- 5.946 5.609 5.319 4.666
Nl-P4°13 C 13- 6.044 5.680 5.369 -4.668
, Ni-P4 0 1 3 N°3_ 6.064 5.693 5.362 4.664 .
• • 161
metal polyphosphate and of the polyphosphate Ion could be seen at a
glance. For'calculation one really needs only three points. These occur
at a = 0.5, 0.75, and 1.5. In any case the titration was stopped at
a « 2,5 or 3.
It may be noted that the titration of uncomplexed pyrophos
phate and triphosphate gives two breaks. These occur at a = 1 and a s 2.
The.titration.of tetraphosphate gives only one break, where a = 2. In
any case all but the last two.hydrogens react like those of a fairly
strong acid. One weakly acid proton is located at each end of the poly
phosphate chain. Metaphosphoric acids, which are cylic, have no weakly
acid proton. In fact, metaphosphoric acids are too strong for the metal
complex constants to be determined in the manner described here.
Order of addition of reagents: The first step is to prepare the
tetramethylammonium polyphosphate and adjust the pH. to 9 or 10 depending
upon the phosphate. The metal salt solution must be added slowly while
the polyphosphate solution is stirred. Otherwise a precipitate may form.
The solution should be clear before the titration is started.f ‘
Calculation of Metal-Polyphosphate Stability Constants
A variety of methods differing in mathematical detail are used
for determining metal-ligand stability constants from pH measurements
recorded during a titration. Several of these are summarized in a
recent publication from this laboratory (Watters and Machen 1968). For __
the cases in which an excess of metal ion results in precipitation it is
usually assumed that only the 1:1 complex is formed. On this basis
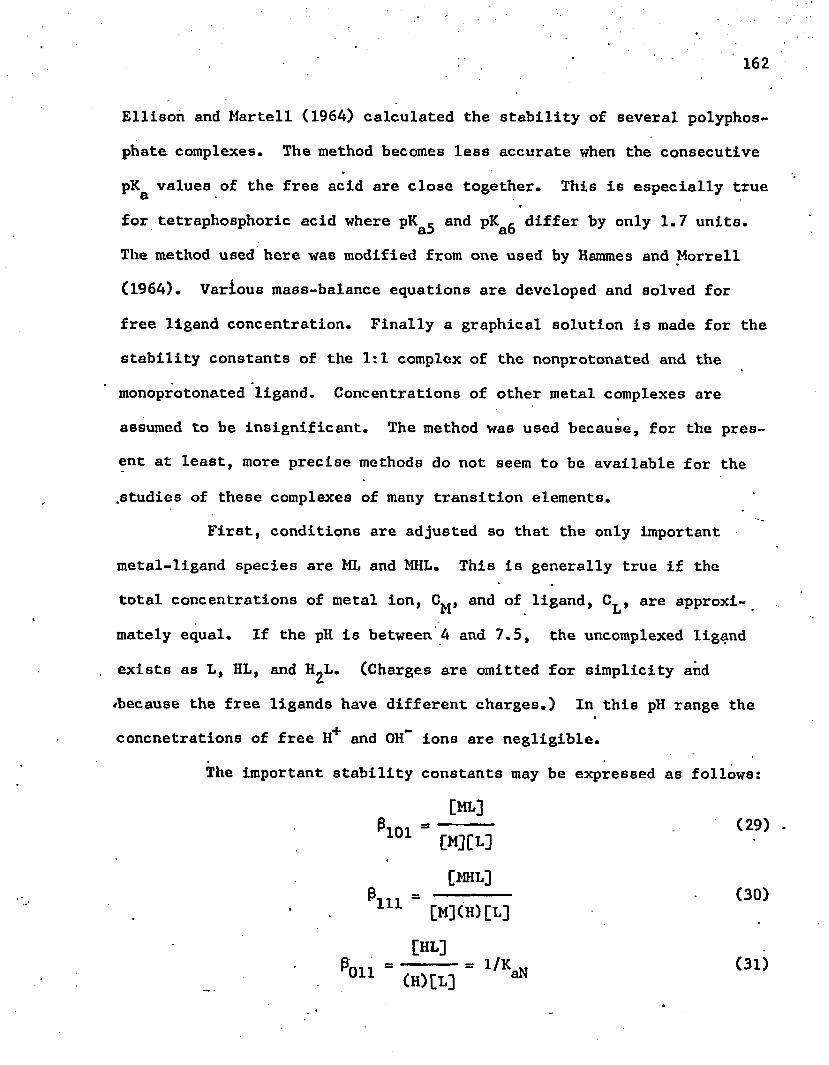
162
Ellison and Martell (1964) calculated the stability of several polyphos
phate complexes. The method becomes less accurate when the consecutive
pK& values of the free acid are close together. This is especially true
for tetraphosphoric acid where pKflij and differ by only 1.7 units.
The method used here was modified from one used by Hammes and Morrell
(1964). Various mass-balance equations are developed and solved for
free ligand concentration. Finally a graphical solution is made for the
stability constants of the 1 : 1 complex of the nonprotonated and the
monoprotonated ligand. Concentrations of other metal complexes are
assumed to be insignificant. The method was used because, for the pres
ent at least, more precise methods do not seem to be available for the
.studies of these complexes of many transition elements.
First, conditions are adjusted so that the only important
metal-ligand species are ML and MHL. This is generally true if the
total concentrations of metal ion, C^, and of ligand, C^, are approxi
mately equal. If the pH is between 4 and 7.5, the uncomplexed ligand
exists as L, HL, and ^ L . (Charges are omitted for simplicity and
'because the free ligands have different charges.) In this pH range the
concnetrations of free H and OH ions are negligible.
The important stability constants may be expressed as follows:
[ML]Pioi “ ------- (29)1 0 1 [M][L]
[MHL]P1 U = --- :----- (30)Aii [M](H)[L]
[HL]Pnn ------ = 1/K„ (31)0 1 1 (H) [L] *
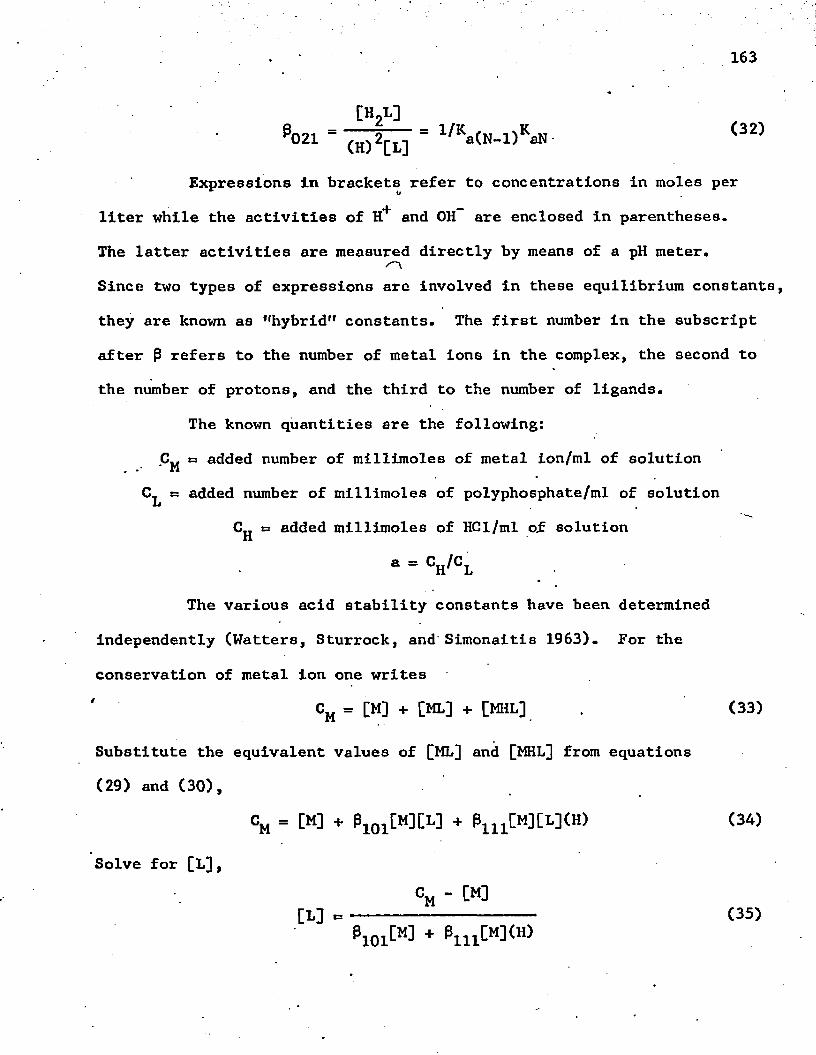
Expressions in brackets refer to concentrations in moles per
liter while the activities of H+ and OH are enclosed in parentheses.
The latter activities are measured directly by means of a pH meter.
Since two types of expressions are involved in these equilibrium constants,
they are known as ’'hybrid1' constants. The first number in the subscript
after P refers to the number of metal ions in the complex, the second to
the number of protons, and the third to the number of ligands.
The known quantities are the following:
C„ = added number of millimoles of metal ion/ml of solution. ’ M
CT = added number of millimoles of polyphosphate/ml of solution LC„ » added millimoles of HCl/ml of solutionII
* - V ° L
The various acid stability constants have been determined
independently (Watters, Sturrock, and Simonaitis 1963). For the
conservation of metal ion one writes
CM = [M] + [ML] + [MHL] . (33)
Substitute the equivalent values of [ML] and [MHL] from equations
(29) and (30),
CM = [M] + P1 0 1 [M][L] + PU 1 [M][L](H) (34)
Solve for [L],
- M[L] = ---------------------- (35)
PjOjM + Pm [M](H)
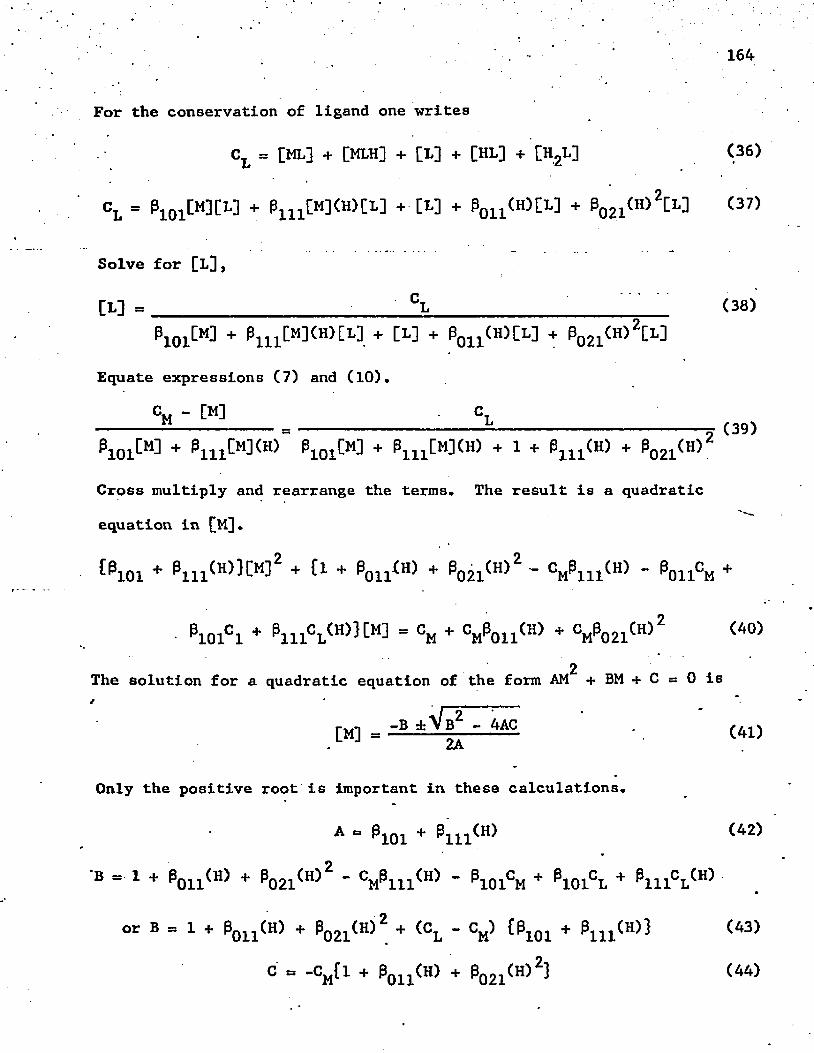
For the conservation of ligand one writes
CL = [M L ] + [M LH] + [ L ] + [H L ] + [H g L ] ( 3 6 )
CL " P l o i M m + P U 1 [M ](H )Q L ] + [ L ] + P0 U ( H ) [ L ] + { ^ ( H ) 2 [ L ] ( 3 7 )
Solve for [L],
[ L ] = .................................................. CL...................... ( 3 8 )
P 1 0 1 [M ] + P 1 1 1 [ M ] ( H ) [ L ] + [ L ] + Pq 1 1 (H)[L] + P0 2 l ( H ) 2 [ L ]
Equate expressions (7) and (10).
cm - M c l(39)
P lO iC M ] + P m [M ](H ) P 1 0 1 [M ] + P i n [M ] ( H ) + 1 + P X 11(H ) + PQ 2 1 ( H ) 2
Cross multiply and rearrange the terms. The result is a quadratic
equation in [M].
^ 1 0 1 + + Cl + Pq 11^H + ^ 0 2 1 ^ " CM ^ 1 1 1 ^ ** ^011CM +
^101C 1 + “ CM + CM ^ 0 1 1 ^ + CM ^ 0 2 1 ^2The solution for a quadratic equation of the form AM + BM + C = 0 is
DO - ~B ~ 4~ (4i)2A
Only the positive root is important in these calculations
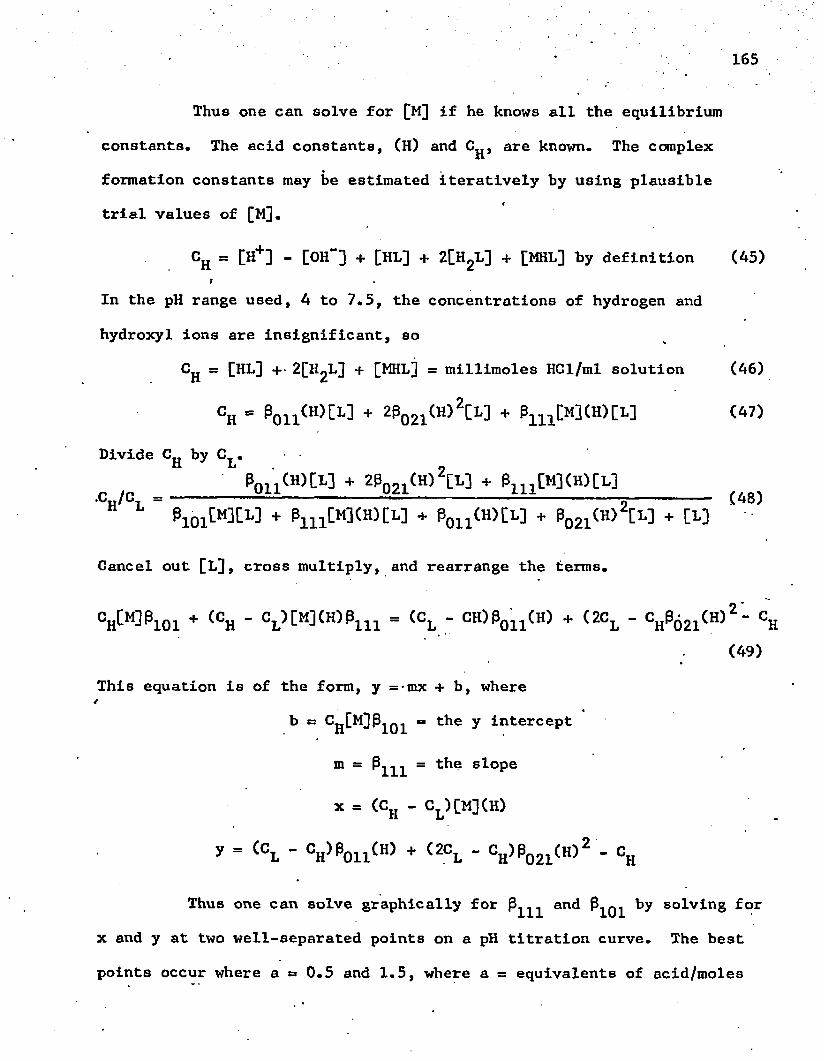
165
Thus one can solve for [M] if he knows all the equilibrium
constants. The acid constants, (H) and C^, are known. The complex
formation constants may be estimated iteratively by using plausible
trial values of [M],
CH = [H+] - [OH”] + [HL] + 2[H2L] + [MHL] by definition (45)
In the pH range used, 4 to 7.5, the concentrations of hydrogen and
hydroxyl ions are insignificant, so
CH 8 [HL] +•2[H2L] + [MHL] = millimoles HCl/ml solution (46)
CH - Pq u ( H ) [ L ] + 2 P 0 2 1 < 1I)2 [ L ] + P1 U [M ]C H ) [L ] ( 4 7 )
Divide Cjj by C^. ■ •. ___________P0 1 1 <H> C ^ + 2 Pq2 1 ^H * Pu 1 [m](h)[l]
M ' i = 1' <5 1 ^ 0 /P i b i M M + P1 i;l[M](H)[L] + Pq1 1 (H)[L] + P0 2 1 (H) [L] + W
Cancel out [L], cross multiply, and rearrange the terms.
V M P l O l + (CH - Cl) M CH)PU 1 - (CL - CK)P0 U <H) + (2Cl - C ^ O O 2 Cg(49)
This equation is of the form, y =-mx + b, where
b « C^[M]Pioi = the y intercept
m = P j ^ = the slope
x = (CH - Cl )[M](H>
y = (CL - cH)Poil^H) + (2CL “ CH)P021^H ^ 2 ” CH
Thus one can solve graphically for P j ^ and P ] ^ hy solving for
x and y at two well-separated points on a pH titration curve. The best
points occur where a s 0.5 and 1.5, where a = equivalents of acid/moles
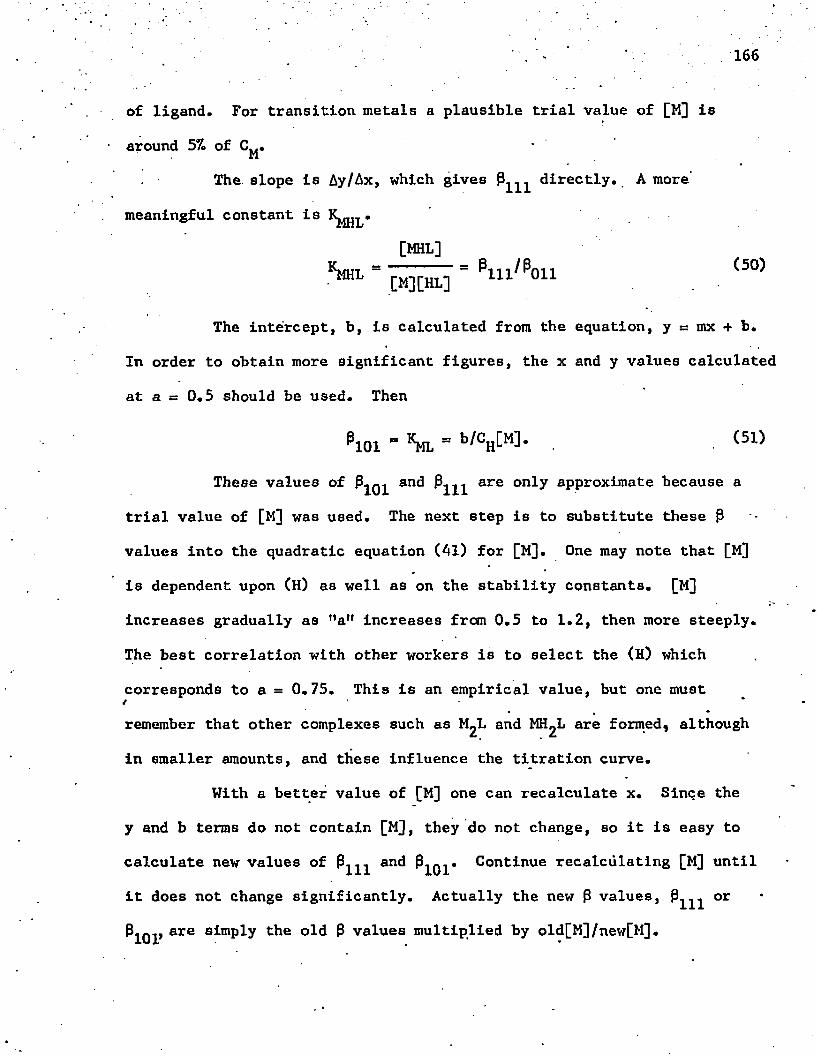
166
of ligand. For transition metals a plausible trial value of [M] is
around 57. of C^.The. slope is Ay/Ax, which gives P ^ directly. A more’
meaningful constant is
[MHL]
V = “ Plu/P°u (50)
The intercept, b, is calculated from the equation, y as mx + b.
In order to obtain more significant figures, the x and y values calculated
at a = 0.5 should be used. Then
^101 ~ KML =
These values of and P ^ are only approximate because a
trial value of [M] was used. The next step is to substitute these 0
values into the quadratic equation (41) for [M], One may note that [M]
is dependent upon (H) as well as on the stability constants. [M]
increases gradually as ’’a" increases from 0.5 to 1.2, then more steeply.
The best correlation with other workers is to select the (H) which
corresponds to a = 0.75. This is an empirical value, but one must /
remember that other complexes such as MgL and are form.ed» although
in smaller amounts, and these influence the titration curve.
With a better value of [M] one can recalculate x. Since the
y and b terms do not contain [M], they do not change, so it is easy to
calculate new values of P j ^ and P^q j - Continue recalculating [M] until
it does not change significantly. Actually the new 0 values, P^^^ or
^101* are simP1y t*ie old 0 values multiplied by old[M]/new[M],
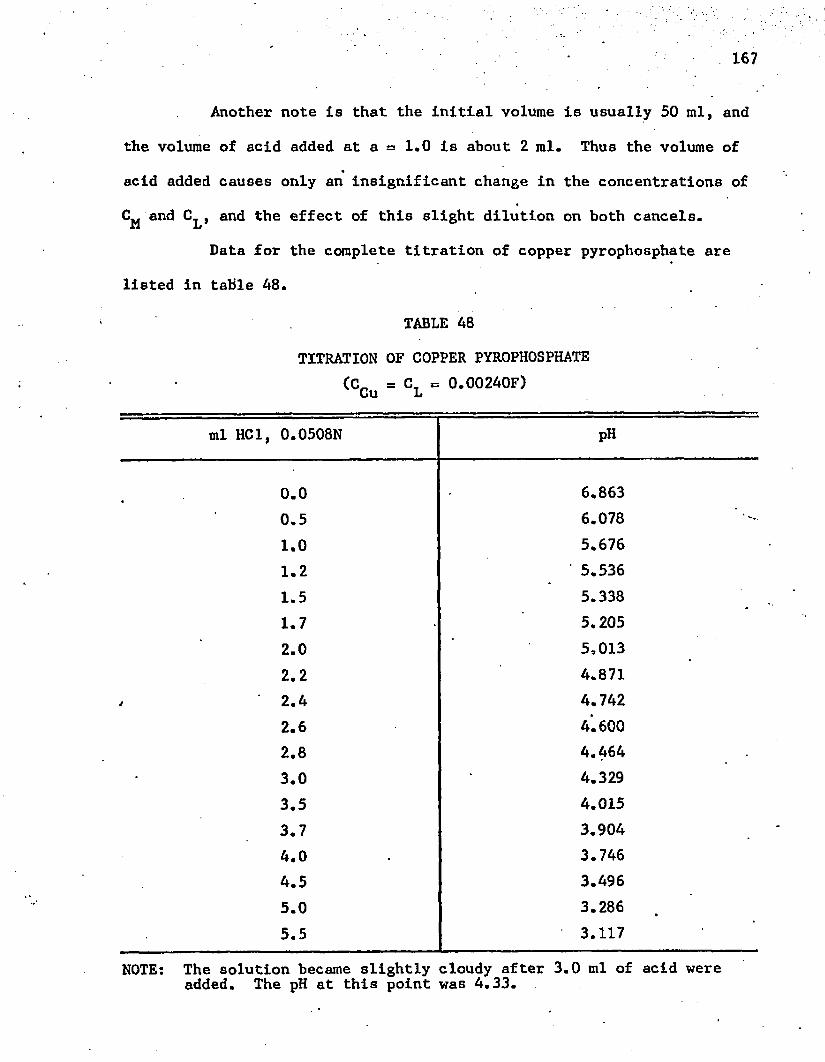
Another note is that the initial volume is usually 50 ml, and
the volume of acid added at a » 1.0 is about 2 ml. Thus the volume of
acid added causes only an insignificant change in the concentrations of
and CL , and the effect of this slight dilution on both cancels.
Data for the complete titration of copper pyrophosphate are
listed in table 48.
TABLE 48
TITRATION OF COPPER PYROPHOSPHATE(n = CT = 0.00240F)Cu L
ml HC1, 0.0508N pH
0 . 0 6.8630.5 6.0781 . 0 5.6761 . 2 ' 5.5361.5 5.3381.7 5.2052 . 0 5,0132 . 2 4.8712.4 4.7422 . 6 4.6002 . 8 4.4643.0 4.3293.5 4.0153.7 3.9044.0 3.7464.5 3.4965.0 3.2865.5 3.117
NOTE: The solution became slightly cloudy after 3.0 ml of acid wereadded. The pH at this point was 4.33.
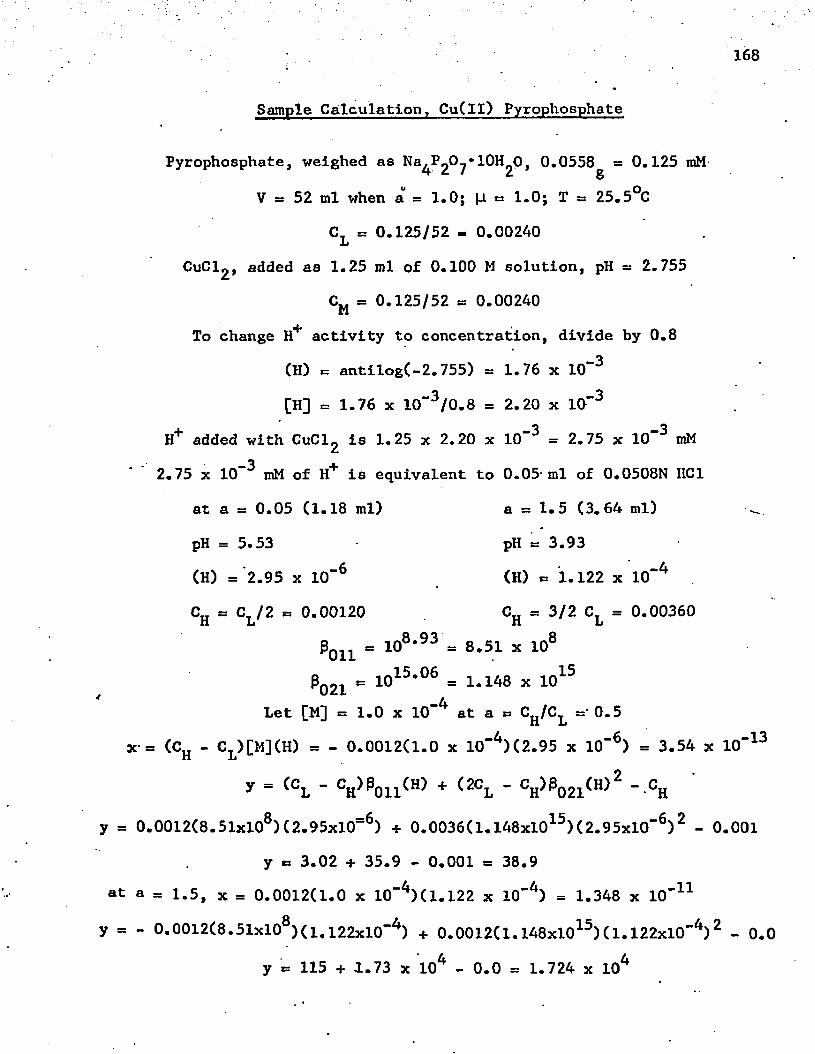
X' :
y = o
at a
y = -
168
Sample Calculation, Cu(ll) Pyrophosphate
Pyrophosphate, weighed as Na^P^O^*lOH^O, 0.0558^ = 0.125 iriM
V = 52 ml when a = 1.0; \1 ~ 1.0; T = 25.5°C
C_ = 0.125/52 = 0.00240JjCuCl^, added as 1.25 ml of 0.100 M solution, pH = 2.755
CM = 0.125/52 = 0.00240j,To change H activity to concentration, divide by 0.8
(H) = antilog(-2.755) = 1.76 x 10" 3
[H] = 1.76 x 10“3 /0.8 = 2.20 x 10' 3
H+ added with CuCl^ is 1.25 x 2.20 x 10” 3 = 2.75 x 10 3 mM
2.75 x 10~ 3 mM of H+ is equivalent to 0.05-ml of 0.0508N HC1
at a = 0.05 (1.18 ml) a = 1.5 (3.64 ml)
pH = 5.53 pH = 3.93
(H) = 2 . 9 5 x 10" 6 (H) = 1.122 x 10‘ 4
CH = Cl/2 = 0.00120 CH = 3/2 = 0.00360
PQ 1 1 = 108 -9 3 = 8.51 x 10⁸
|3q 2 i = 101 5 -0 6 = 1.148 x 101 5 Let [M] = 1.0 x 10“ 4 at a = C^/C^ =* 0.5
= (CH - CL)[M](H) = - 0.0012(1.0 x 10⁻⁴ )(2.95 x 10“6) = 3.54 x 10" 1 3
y = (CL - Ch)Pq u (H) + C2Cl - Ch)P0 2 1 (H) 2 - Ch.0012(8.51x10⁸)(2.95x10=6) + 0.0036(1.I48xl015)(2.95xl0'6)2 - 0.001
y = 3.02 + 35.9 - 0.001 = 38.9
= 1.5, x = 0.0012(1.0 x 10“4 )(1.122 x 10'4) = 1.348 x 10’ 1 1
0.0012(8.5lxl08 )(i.i22xl0"4) + 0.0012(1.I48xl015)(1.122xl0"4)2 - 0 . 0
y = 115 + 1.73 x 10⁴ - 0.0 = 1.724 x 10⁴
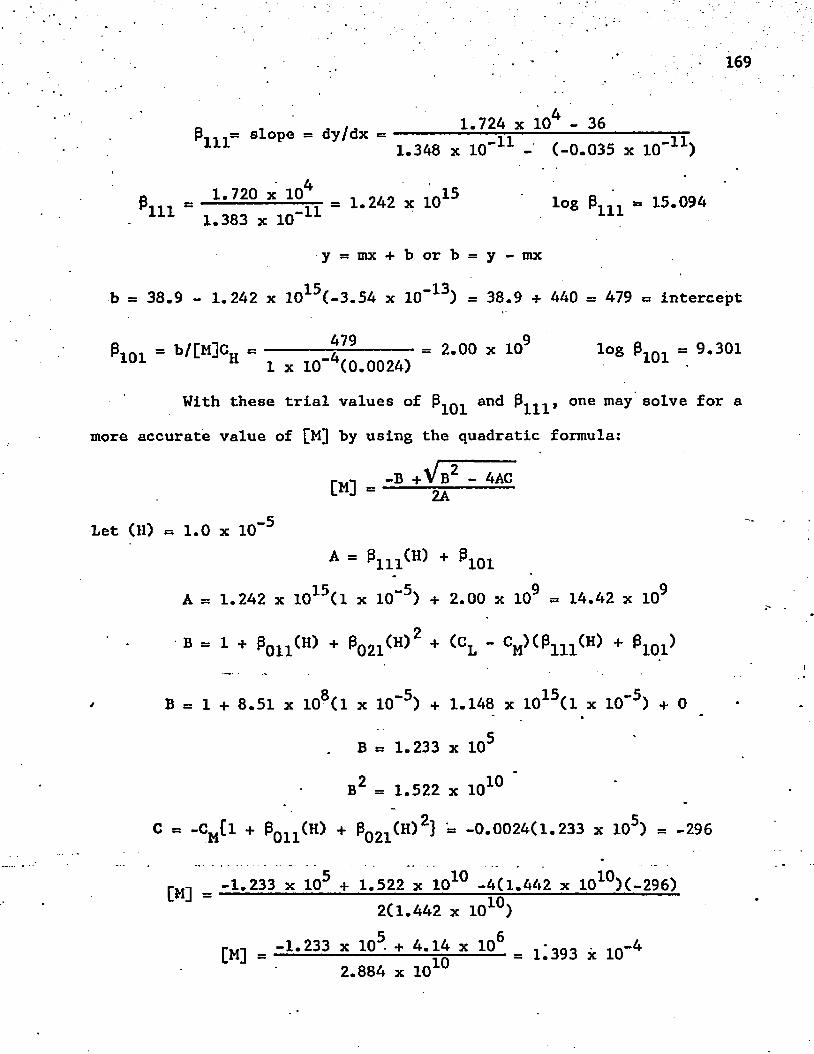
169
, 1.724 x 10⁴ - 36slope = dy/dx =------ m — :-------itl1 1 1 1.348 X 10 lL - (-0.035 x 10 Ll)
P 1‘72Q x AP* . = 1.242 x 1 0 1 5 log P--, = 15.094. 1 1 1 1.383 x lO- 1 1
y = mx + b or b = y - mx
b = 38.9 - 1.242 x 101 5 (-3.54 x 10"13) = 38.9 + 440 = 479 = intercept
P 1 0 1 = b/ M CH " ------- V 1 ------- = 2 -0 0 x 1 q 9 1 o 8 P1 0 1 = 9.3011 0 1 H 1 x 10 (0.0024) 1 U 1 ■
With these trial values of P- q ^ an<l one may solve for amore accurate value of [M] by using the quadratic formula:
-B + V B2 - 4AC[M] =Let (H) = 1.0 x 10
2A -5
A ” ^111^ + ^101 A = 1.242 x 10¹⁵(1 x 10“5) + 2.00 x 109 = 14.42 x 10⁹
B = 1 + eo u CH) + Po n (H) 2 + (CL - CM)CPl n (H) + Pl01)
B = 1 + 8.51 x 10⁸(1 x 10“5) + 1.148 x 10¹⁵(1 x 10"5) + 0
B = 1.233 x 10⁵
2 1 0 B b 1.522 x 10
C = -CM (l + P0 1 1 (H) + P0 Z1 (H)2} b -0.0024(1.233 x 10⁵) = -296
r.,-, -1.233 x 10⁵ + 1.522 x 101 0 -4(1.442 x 10¹⁰)(-296)W = --------------------------------rn--------------------
2(1.442 x 10iU)
-1.233 x 10⁵- + 4.14 x 10⁶ , • ,„-4[M] = ------------------ tv:------ = 1.393 x 102.884 x 10 U
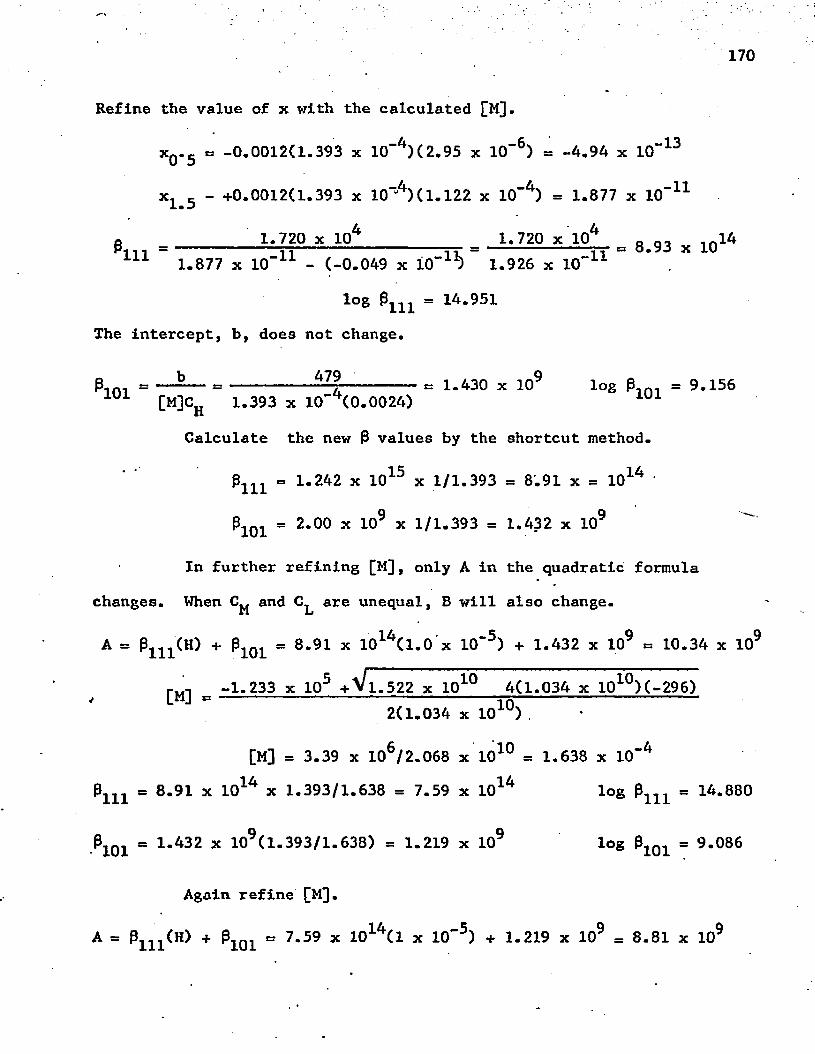
170
Refine the value of x with the calculated [lQ.
x0 . 5 = -0.0012(1.393 x 10"4 )(2.95 x 10"6) = -4.94 x 10" 1 3
x x 5 - +0.0012(1.393 x 10“4 )(1.122 x 10“4) = 1.877 x 10- 1 1
1.720 x 10⁴ 1.720 X 10⁴ 0 ,rt14p = ------------ rr----------------- = --------------- rr = 8.93 x 10LLL 1.877 x 10 u - (-0.049 x lO-11) 1.926 x 10" 1 1
l°g P11]L = 14.951
The intercept, b, does not change.
p =------- ------------*Z|_--------c i.4 3 o x 109 log Pi m = 9.156[M]Cr 1.393 x 10 (0.0024)
Calculate the new 3 values by the shortcut method.
Pm = 1.242 x 101 5 x 1/1.393 « 8.91 x » 101 4
PlOi = 2.00 x 109 x 1/1.393 = 1.432 x 10⁹
In further refining [M], only A in the quadratic formula
changes. When CR and are unequal, B will also change.
A = 0i n <H) + P1 Q 1 « 8.91 x 101 4 (1.0 x 10“5) + 1.432 x 10⁹ « 10.34 x 10S
-1.233 x 1 0 5 +Vl.522 x 1 0 1 0 4(1.034 x l010)(-296)* LMJ = ------------------------------------------------------T7)-----------------------------------
2(1.034 x 10xu) .
[M] = 3.39 x 10⁶/2.068 x 101 0 = 1.638 x 10" 4
Pm « 8.91 x 101 4 x 1.393/1.638 = 7.59 x 101 4 log 0m « 14.880
PlOi = 1.432 x 10⁹(1.393/1.638) = 1.219 x 10⁹ log 01 Q 1 = 9.086
Again refine [M].
A = 31 U <H> + P1 0 1 « 7-59 x 1014(1 x 10'5) + 1.219 x 109 = 8.81 x 10⁹
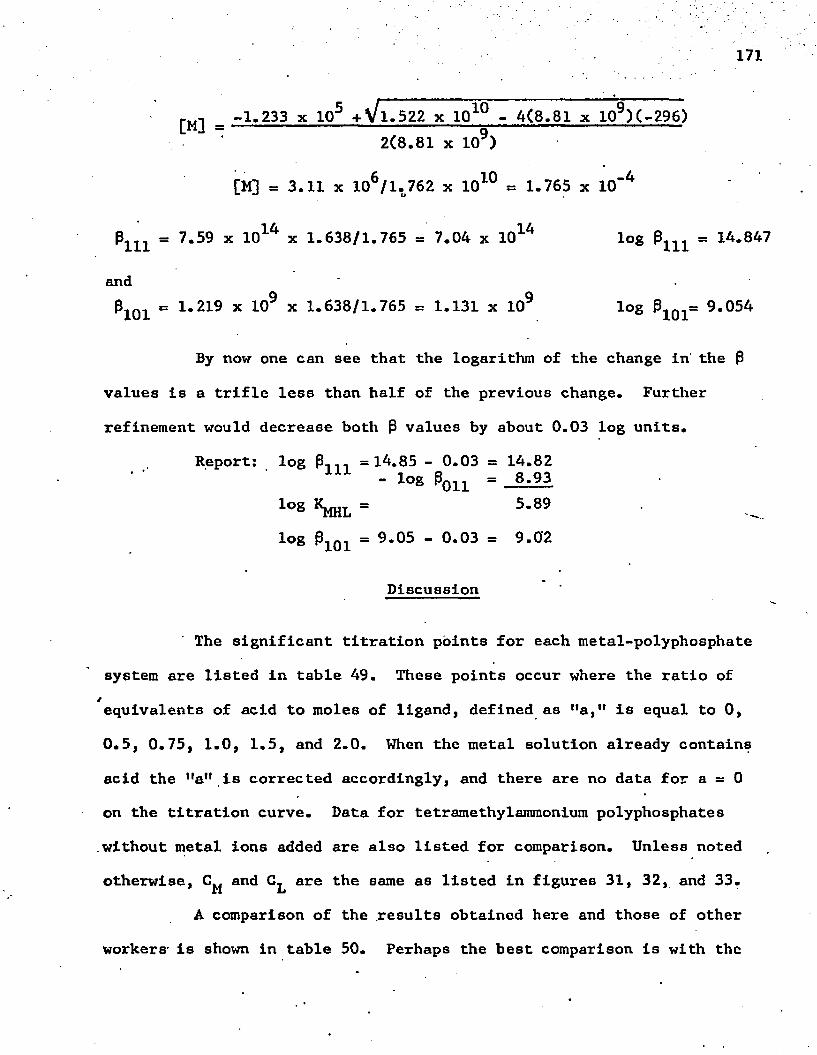
171
-1.233 x 10⁵ + V 1.522 x 101 0 - 4(8.81 x 10⁹)(-296)2(8.81 x 1 0 9)
[H] = 3.11 x 10⁶/1.762 x 101 0 = 1.765 x 10~ 4
Pm = 7.59 x 101 4 x 1.638/1.765 = 7.04 x 101 4 !°g Pm = 14.847
andP1 Q 1 = 1.219 x 109 x 1.638/1.765 = 1.131 x 10⁹ log ^101= 9’05^
By now one can see that the logarithm of the change in the P
values is a trifle less than half of the previous change. Further
refinement would decrease both P values by about 0.03 log units.
The significant titration points for each metal-polyphosphate
system are listed in table 49. These points occur where the ratio of
equivalents of acid to moles of ligand, defined as "a," is equal to 0 ,
0.5, 0.75, 1.0, 1.5, and 2.0. When the metal solution already contains
acid the "a11 is corrected accordingly, and there are no data for a = 0
on the titration curve. Data for tetramethylamraonium polyphosphates
without metal ions added are also listed for comparison. Unless noted
otherwise, and are the same as listed in figures 31, 32, and 33.
A comparison of the .results obtained here and those of other
workers- is shown in table 50. Perhaps the best comparison is with the
lo® Km m . - 5.89
iog Pl 0 1 = 9.05 - 0.03 = 9.0'2
Discussion
/
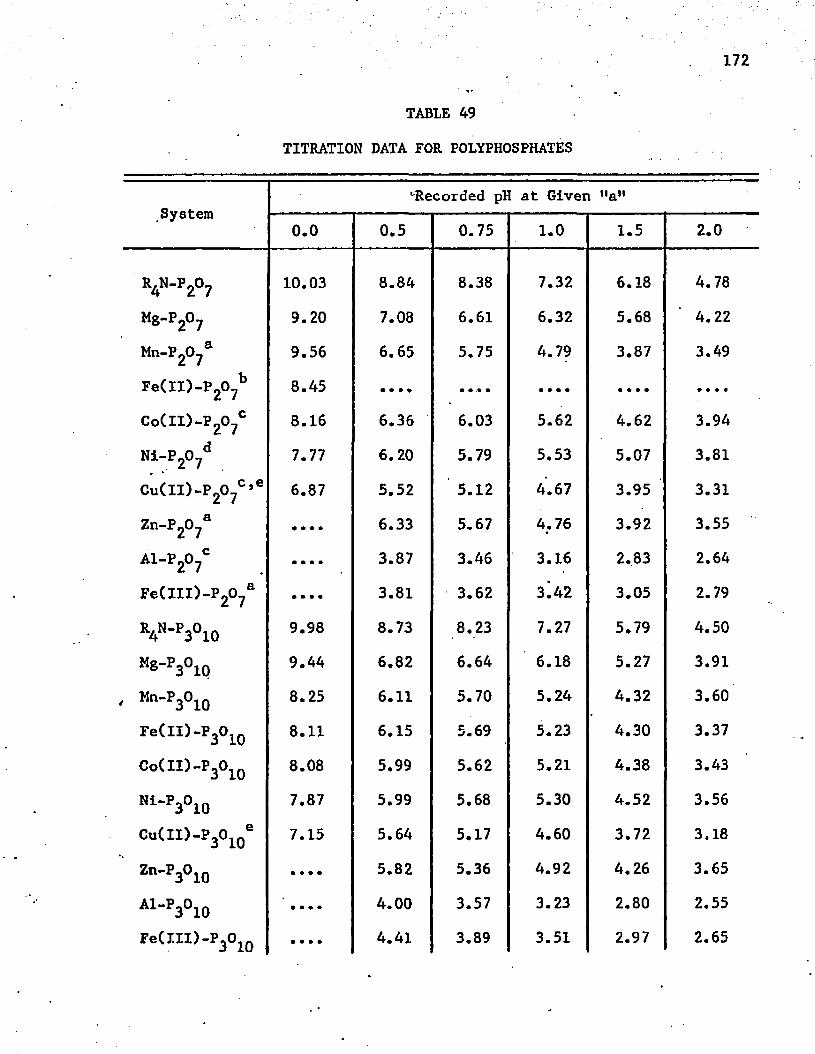
172
TABLE 49
TITRATION DATA FOR POLYPHOSPHATES
System•'Recorded pH at Given "a”
0 . 0 0.5 0.75 1 . 0 1.5 2 . 0
r 4n - p 2o 7 10.03 8.84 8.38 7.32 6.18 4.78
Mg-P20 7 9.20 7.08 6.61 6.32 5.68 4.22
Mn-P20?a 9.56 6.65 5.75 4.79 3.87 3.49
Fe(ll)-P207b 8.45 • • • % • • .• • • * * • • • • • • • • •
C o C i i ) - p 2o 7c 8.16 6.36 6.03 5.62 4.62 3.94
Ni-P20?d 7.77 6 . 2 0 5.79 5.53 5.07 3.81
Cu(ll)-P207c,e 6.87 5.52 5.12 4.67 3.95 3.31
Zn-P20?a • • • • 6.33 5.67 4.76 3.92 3.55
A 1-P2°7C • • • • 3.87 3.46 3.16 2.83 2.64
Fe(lll)-P207a » • * • 3.81 3.62 3^42 3.05 2.79
V - P3°10 9.98 8.73 8.23 7.27 5.79 4.50
Mg-P3°ip 9.44 6.82 6.64 6.18 5.27 3.91
Mn"P3°10 8.25 6 . 1 1 5.70 5.24 4.32 3.60
Fe(ll)-P3O1 0 8 . 1 1 6.15 5.69 5.23 4.30 3.37
Co(ll)-P3 0 1 0 8.08 5.99 5.62 5.21 4.38 3.43
Ni"P3°10 7.87 5.99 5.68 5.30 4.52 3.56
Cu(ll)-P3 0 10e 7.15 5.64 5.17 4.60 3.72 3.18
Zii-P3°io • • • • 5.82 5.36 4.92 4.26 3.65
Al-p3°io • • # • 4.00 3.57 3.23 2.80 2.55
Fe(lll)-P301 0 • • • # 4.41 3.89 3.51 2.97 2.65
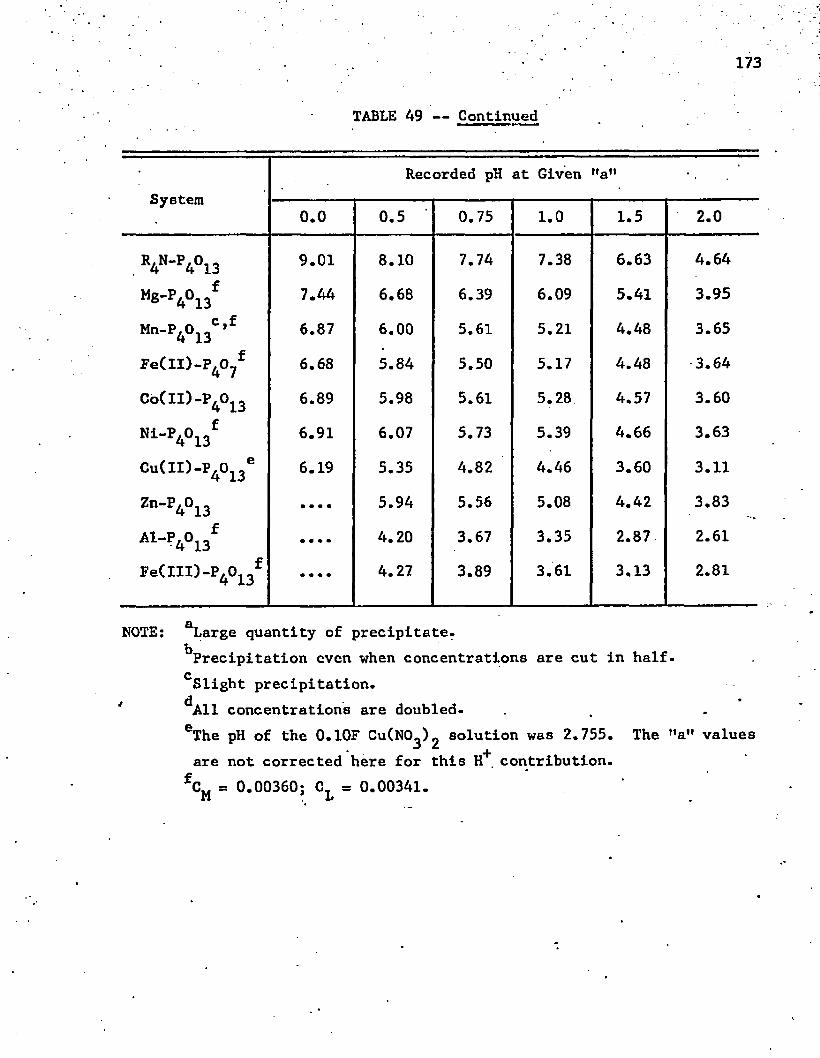
173
TABLE 49 — Continued
SystemRecorded pH at Given "a"
0 . 0 0.5 ' 0.75 1 . 0 1.5 2 . 0
V ' V l 3 9.01 8 . 1 0 7.74 7.38 6.63 4.64
7.44 6 . 6 8 6.39 6.09 5.41 3.95
Mn- V l 3 C ’f 6.87 6 . 0 0 5.61 5.21 4.48 3.65
Fe(II)-P407f 6 . 6 8 5.84 5.50 5.17 4.48 3.64
Co(lI)-P4On 6.89 5.98 5.61 5.28 4.57 3.60
Hi-P4°i3f 6.91 6.07 5.73 5.39 4.66 3.63
Cu(XI)-P.0,3e 6.19 5.35 4.82 4.46 3.60 3.11
Zn-P4°13 • • • • 5.94 5.56 5.08 4.42 3.83
Al-?4°13f • • • • 4.20 3.67 3.35 2.87 2.61
Pe(III)-P4 013£ • • * • 4.27 3.89 3.61 3.13 2.81
NOTE: Large quantity of precipitate.^Precipitation even when concentrations are cut in half.Slight precipitation.
' All concentrations are doubled.eThe pH of the 0.10F CuCNO^g solution was 2.755. The "a" values are not corrected here for this H . contribution.
fC„ = 0.00360; C. = 0.00341.M : L
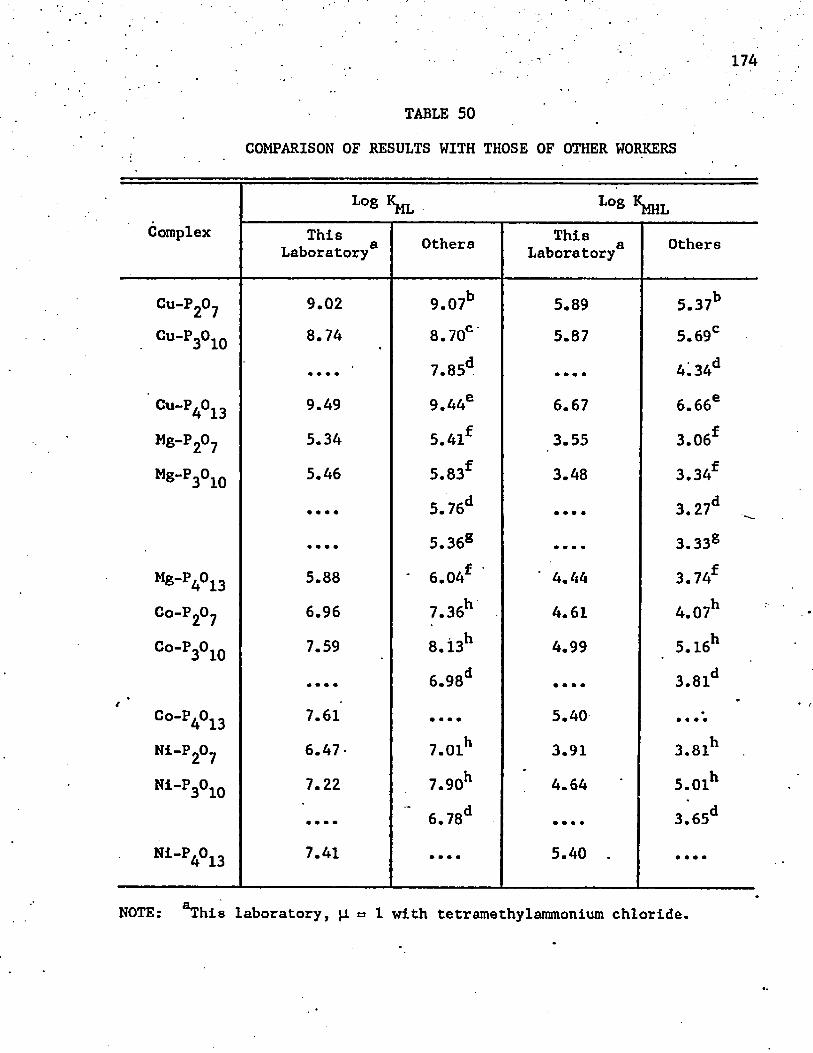
174
TABLE 50
COMPARISON OF RESULTS WITH THOSE OF OTHER WORKERS
Complexlog “m l Iofi Sjhl
ThisLaboratory Others This
Laboratory Others
Cu-P2 0 7 9.02 9.07b 5.89 5.37b
Cu-P3°10 8.74 8.70° 5.87 5.69c• * • * 7.85d * * • • 4.34d
Cu-PA°i3 9.49 9.44e 6.67 6.66e«s-r2o 7 5.34 5.41f 3.55 3.06f
M«-P3°10 5.46 5.83f 3.48 3.34f• • • * 5.76d • • • • 3.27d• • • • 5.36s * 9 m m 3.33s
Mg-P4°13 5.88 ' 6.04f ‘ 4.44 3.74fC o - P ^ 6.96 7.36h 4.61 4.07h
Oo-p3°10 7.59 8.13h 4.99 5.16h* • • ♦ 6.98d • • m • 3.81d
Co-pA°i3 7.61 * m • • 5.40 * « * •
Ni-P.,0, 6.47- 7.01h 3.91 3.81hHl-PjOjjj 7.22 7.90h 4.64 5.01h
• • • • 6.78d • • • • 3.65d
N1-P*°13 7.41 • • * • 5.40 . * • • •
NOTE: ^his laboratory, [1 = 1 with tetramethylammonium chloride.
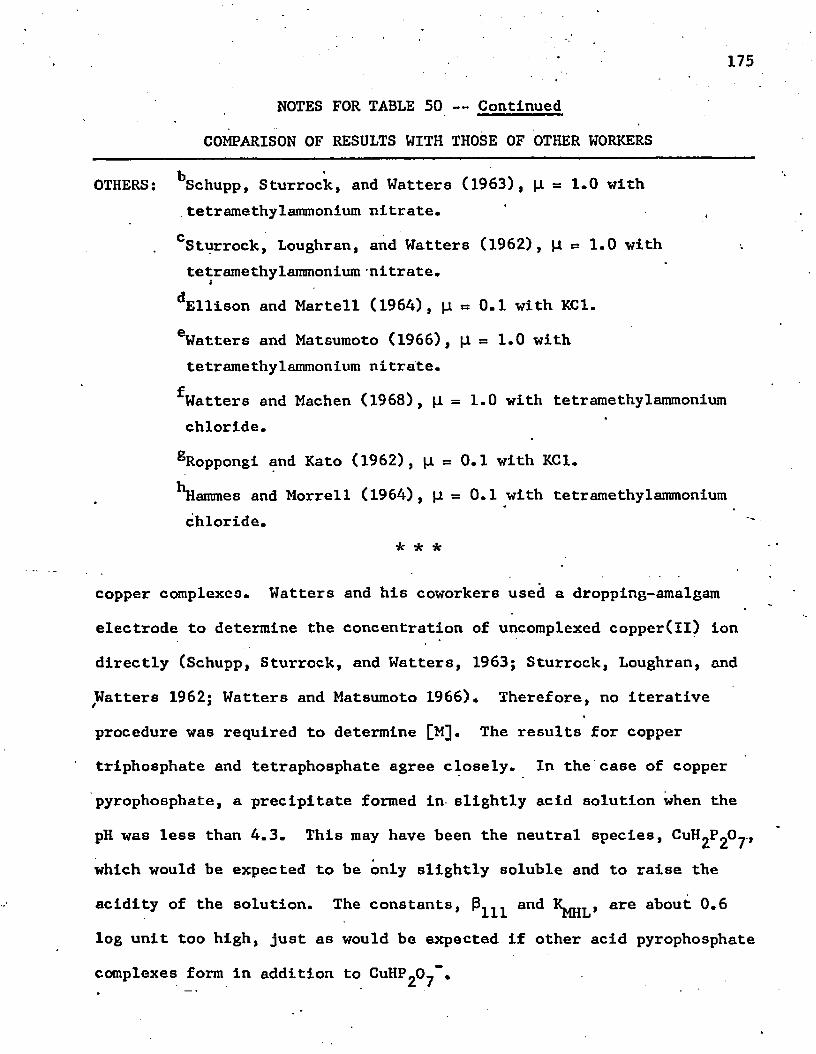
* 175
NOTES FOR TABLE 50 — Continued
COMPARISON OF RESULTS WITH THOSE OF OTHER WORKERS
OTHERS: ^Schupp, Sturrock, and Watters (1963), (1 = 1.0 with.tetramethylammonium nitrate. ' ,
CSturrock, Loughran, and Watters (1962), H = 1.0 with tetramethylammonium nitrate.
^Ellison and Martell (1964), p. « 0.1 with RC1.
Matters and Matsumoto (1966), p = 1.0 with tetramethylammonium nitrate.
£Watters and Machen (1968), p = 1.0 with tetramethylammonium chloride.
®Roppongi and Kato (1962), p c 0.1 with KCi.
^Hammes and Morrell (1964), p s 0.1 with tetramethylammonium chloride.
* * *
copper complexes. Watters and his coworkers used a dropping-amalgam
electrode to determine the concentration of uncomplexed copper(II) ion
directly (Schupp, Sturrock, and Watters, 1963; Sturrock, Loughran, and
Watters 1962; Watters and Matsumoto 1966). Therefore, no iterative
procedure was required to determine CM], The results for copper
triphosphate and tetraphosphate agree closely. In the case of copper
pyrophosphate, a precipitate formed in slightly acid solution when the
pH was less than 4.3. This may have been the neutral species, CuH^P^O^.,
which would be expected to be only slightly soluble and to raise the
acidity of the solution. The constants, and are a^out
log unit too high, just as would be expected if other acid pyrophosphate
complexes form in addition to CuHP^O^”.
The results for nickel and cobalt triphosphates may be compared
with those of two other groups of workers. It is interesting to observe
that the results in this laboratory are about halfway between those of
Hammes and Morrell (1964) and of Ellison and Martell (1964). .The former
authors used an ionic strength of only 0.1M, so that their constants
would be expected to be somewhat higher. Ellison and Martell used 0.1M
KC1 instead, of (CH^)^NCl. Since potassium ions also form weak complexes
with polyphosphates (Watters and Matsumoto 1967), the additional lowering
of the pH by transition metal ions would be less, and thus the calculated
constants would be lower. The constant, f°r cobalt pyrophosphate i
too.high because a precipitate formed in slightly acid solution.
Even when no pyrophosphate precipitate formed, as with ^
magnesium, the constant, appears to be high, possibly because the
method does not take other complexes such as MH^L into account. The
titration curves show that the pH is still slightly depressed a little
beyond the point where a = 2 , and that such complexes may form in small
concentrations.
In the case of magnesium triphosphate.the results of three
other groups of workers (Watters and Machen 1968; Ellison and Martell
1964; and Roppongi and Kato 1962) may be compared. All agree closely
for the acid stability constant, I*1 closest agreement with the
■results obtained in this laboratory for are those of Roppongi and
Kato (1962). Even though magnesium is not a transition metal, experi
mental work was done for comparison. The ionic radius of the magnesium
ion is just a little less than that of the first row divalent transition
metal ions.
177
Another fact not previously taken into account is that the
third acid constant becomes important below a pH of 4.0. The third acid3
constant enters the y expression as (3C^ - » an<* ^ is aboutu
1% of .the total y expression at pH 4. This additional factor becomes
very important in calculating the constants for the trivalent metals
where the pH is about 3 at a = 1.5.An attempt was made to determine the constant for or 1
?1 2 i directly. The algebraic equations can be developed in the same way
by assuming ^ 1 2 1 important metal-complex constants.
There is a similar quadratic equation for CM], and the slope-intercept
equation is' [0H - ct][M]CH)Pl u + (CH - 2cl)[m](h)2 P121- = (CL - V pon(H) +<2CL " °H)P021(H)Z + <3CL " CM)P031<H) " °H‘
The intercept, b, is (C^ - Cl > [ M ] ( H ) T^e sloPe *-s ^121* T^ese can2be found by plotting (C - 2CT)[M](H) as x, and the entire right side ofH L
the equation as y. Unfortunately, the acidity is so high that the ApH
between the ligand and metal-complex titrations does not give a positive
slope. All the acid phosphates exist in equilibrium. Furthermore,
hydrolysis of the polyphosphates to lower phosphates also does occur. It
follows that the method used here is limited to the titration of complexes
where the pH is in the neutral range.
Other complexes, M 2L and are indicated by the titration
curves when the metal-polyphosphate ratio is other than 1:1. These both
were found in calculations based on data obtained with a dropping amalgam
electrode (Schupp, Sturrock, and Watters 1963; Sturrock, Loughran, and
Watters 1962; and Watters and Matsumoto 1966). In slightly acid
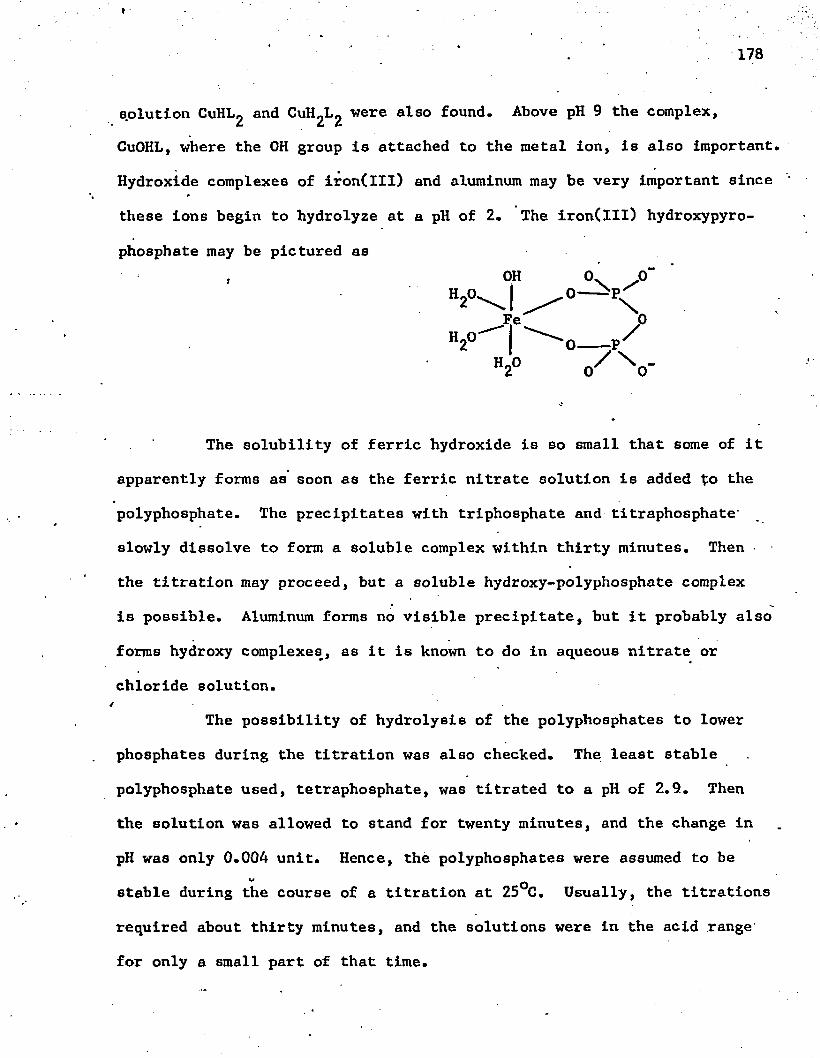
178
s.olution CuHL>2 and CuH^Lg were also found. Above pH 9 the complex,
CuOHL, where the OH group is attached to the metal ion, is also important.
apparently forms as soon as the ferric nitrate solution is added to the
polyphosphate. The precipitates with triphosphate and titraphosphate-
slowly dissolve to form a soluble complex within thirty minutes. Then ■
the titration may proceed, but a soluble hydroxy-polyphosphate complex
is possible. Aluminum forms no visible precipitate, but it probably also
forms hydroxy complexes^, as it is known to do in aqueous nitrate or
chloride solution.
The possibility of hydrolysis of the polyphosphates to lower
phosphates during the titration was also checked. The least stable
polyphosphate used, tetraphosphate, was titrated to a pH of 2.9. Then
the solution was allowed to stand for twenty minutes, and the change in
pH was only 0.004 unit. Hence, the polyphosphates were assumed to bew —
stable during the course of a titration at 25 C. Usually, the titrations
required about thirty minutes, and the solutions were in the acid range
for only a small part of that time.
Hydroxide complexes of iron(lll) and aluminum may be very important since '
these ions begin to hydrolyze at a pH of 2. The iron(lll) hydroxypyro-
phosphate may be pictured asOH 0X O"
H o0 ^ I — — P.
The solubility of ferric hydroxide is so small that some of it
4
. • 179
The remaining stability constants obtained are listed in table
51. As one would expect, the stabilities of the trivalent metal phos
phates are much greater than those of the divalent metals. The log
iron (III) and aluminum is about two units higher than for copper, which
forms the most stable divalent metal complexes. The stabilities of the
complexes of iron(lll) are only slightly greater than those of aluminum.
This fact suggests that the use of d orbitals for bond formation with
ferric ion is of only slight importance when the ionic charge is high.
It should be emphasized that the stability constants with the trivalent
ions are only approximate, because hydroxy complexes are probably also
formed.
McNabb, Hazel, and Baxter (1968) recently published a list of
stability constants for lanthanum polyphosphates. Their log values
were 4.66, 6.56, and 6.59 for the pyrophosphate, triphosphate and tetra-
phosphate respectively. The log values were 0.85, 2.90, and 3.29.
The ionic strength was adjusted to 0.1 with tetramethylammonium chloride,
but the sodium ion was apparently not removed from the polyphosphate by
/ion exchange. Mass balance equations were listed, but working equations
were not developed.
Malik and Sharma (1968, pp. 29 and 503) characterized some
pyrophosphate precipitates of the trivalent metals, chromium, iron, and
aluminum. The concentrations of iron(lll) and chromium(lll) could be
determined by polarography. With iron as an example, typical complexes-6 +2 -
were Fe2 (p2° 7 ^ 3 » Fe4^P2°7^3* Fe2F2°7 ' ant* FeF2°7 *
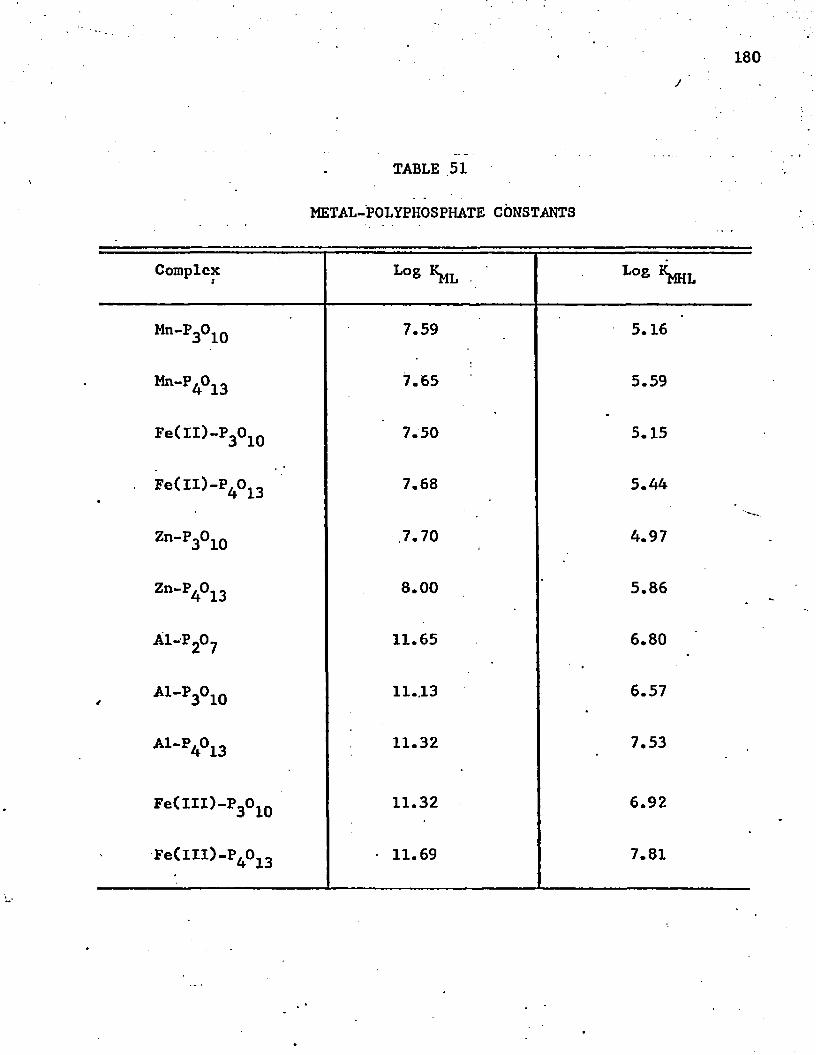
180y '
TABLE 51
METAL-POLYPHOSPHATE CONSTANTS
Complex L°s Km l Lo£ ^MHL
M 11-P3 O 1 0 7.59 5.16
Mn"P4°13 7.65 5.59
Fe(lX)-P3 O l 0 7.50 5.15
Fe(ll)-P4 0 13 7.68 5.44
Zn-P3°io 7.70 4.97
Zn“P4°13 8 . 0 0 5.86
A1-P20? 11.65 6.80
A 1 -P3°10 11.13 6.57
A1"P4°13 11.32 7.53
Fe(lIl)-P3 O 1 0 11.32 6.92
Fe<IXl)-P4 0 1 3 11.69 7.81
. ' 181
The trends in stability of the divalent metal complexes are as
follows:For with triphosphate, Mg < Ni < Fe < Co, Mn < Zn < Cu. '
‘ For with triphosphate, Mg < Ni < Co, Zn < Fe, Mn < Cu.
For with tetraphosphate, Mg < Ni < Co, Mn, Fe < Zn < Cu.
' For with tetraphosphate, Mg < Ni, Co Fe < Mn < Zn < Cu.
As is usual with transition metal complexes, those of copper are the most
stable and are followed by those of zinc in most cases. Of the elements,
manganese through nickel, the usual order of stability is reversed. The
complexes of nickel are the least stable, while those of manganese are
the most stable. One must remember that the metal-ligand bond is through
oxygen, and the bond is thought to be chiefly ionic. An explanation for
the stronger copper and zinc bonds is that one of the PO^ groups appears
to be bidentate (Brintzinger and Plane 1967), and thus the whole poly
phosphate is at least tridentate. The determination of the stability con
stants of iron(ll) appears to be a new contribution. In this laboratory
the possibility of oxidation of iron(ll) was no problem as long as the
solution was kept under a nitrogen atmosphere before and during the
titration.
The relative stabilities of a given metal ion with the various
polyphosphates are of. some interest. In every case the stability of the
metal tetraphosphate is somewhat greater than the stability of the
triphosphate. This is to be expected simply because there are more oxy
gen atoms available for bonding to the metal ion. There is also a statis
tical factor favoring complex formation with tetraphosphate. On the basis
of stability per phosphorus atom, the triphosphates are more stable. The
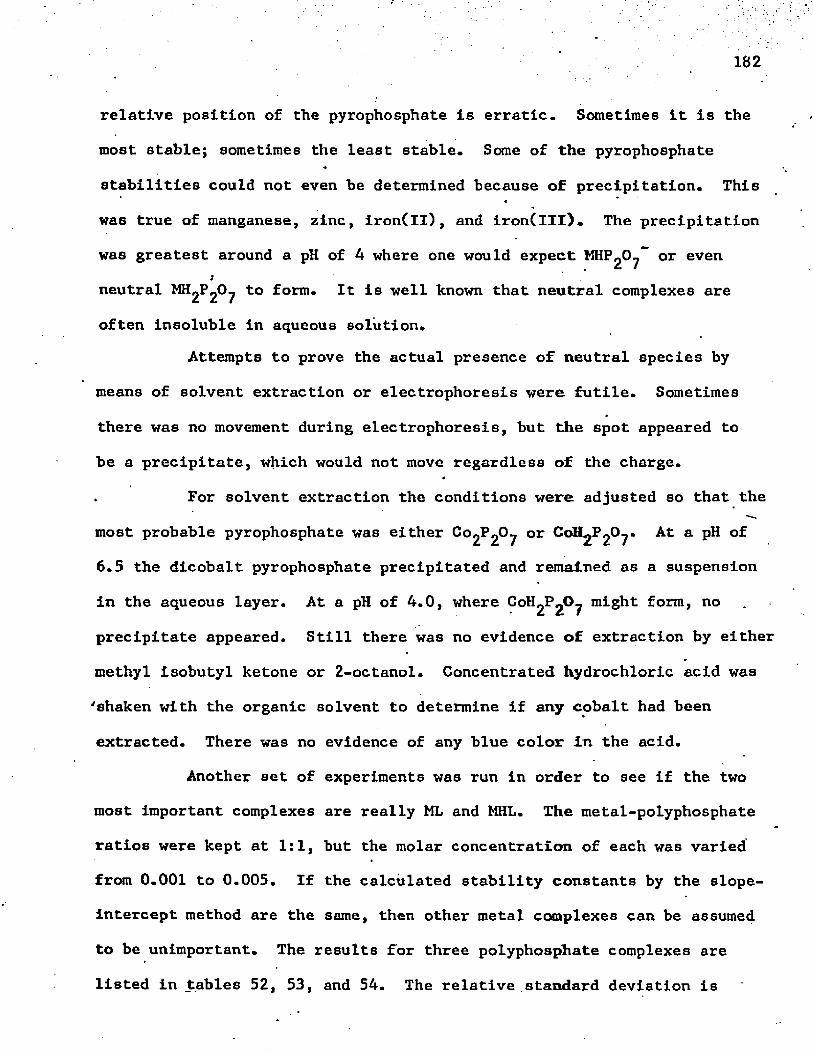
182
relative position of the pyrophosphate is erratic. Sometimes it is the
most stable; sometimes the least stable. Some of the pyrophosphate
stabilities could not even be determined because of precipitation. This4
was true of manganese, zinc, iron(ll), and iron(lll). The precipitation
was greatest around a pH of 4 where one would expect MHPgO^ or even
neutral MHgPgOy to form. It is well known that neutral complexes are
often insoluble in aqueous solution.Attempts to prove the actual presence of neutral species by
means of solvent extraction or electrophoresis were futile. Sometimes
there was no movement during electrophoresis, but the spot appeared to
be a precipitate, which would not move regardless of the charge.
For solvent extraction the conditions were adjusted so that the
most probable pyrophosphate was either 0 0 2 ^ 2 ^ 7 or a ^6.5 the dicobalt pyrophosphate precipitated and remained as a suspension
in the aqueous layer. At a pH of 4.0, where might form, no
precipitate appeared. Still there was no evidence of extraction by either
methyl isobutyl ketone or 2-octanol. Concentrated hydrochloric acid was
'shaken with the organic solvent to determine if any cobalt had been
extracted. There was no evidence of any blue color in the acid.
Another set of experiments was run in order to see if the two
most important complexes are really ML and MHL. The metal-polyphosphate
ratios were kept at 1 :1 , but the molar concentration of each was varied
from 0.001 to 0.005. If the calculated stability constants by the slope-
intercept method are the same, then other metal complexes can be assumed
to be unimportant. The results for three polyphosphate complexes are
listed in tables 52, 53, and 54. The relative standard deviation is
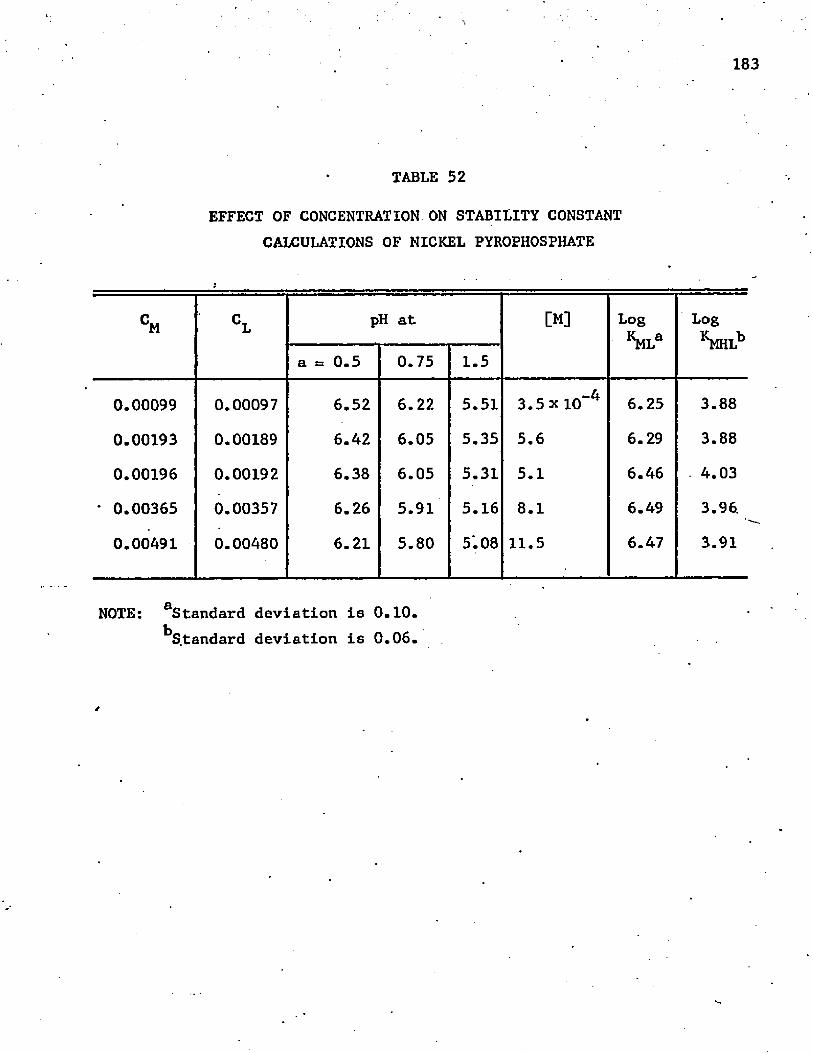
183
TABLE 52
EFFECT OF CONCENTRATION ON STABILITY CONSTANT CALCULATIONS OF NICKEL PYROPHOSPHATE
CM CL pH at [M] LogKMLa
Logw
a « 0.5 0.75 1.5
0.00099 0.00097 6.52 6 . 2 2 5.51 3.5 x i o " 4 6.25 3.88
0.00193 0.00189 6.42 6.05 5.35 5.6 6.29 3.88
0.00196 0.00192 6.38 6.05 5.31 5.1 6.46 . 4.03
* 0.00365 0.00357 6.26 5.91 5.16 8 . 1 6.49 3.96.
0.00491 0.00480 6 . 2 1 5.80 5.08 11.5 6.47 3.91
NOTE: ^Standard deviation is 0.10.^S.tandard deviation is 0.06.
S
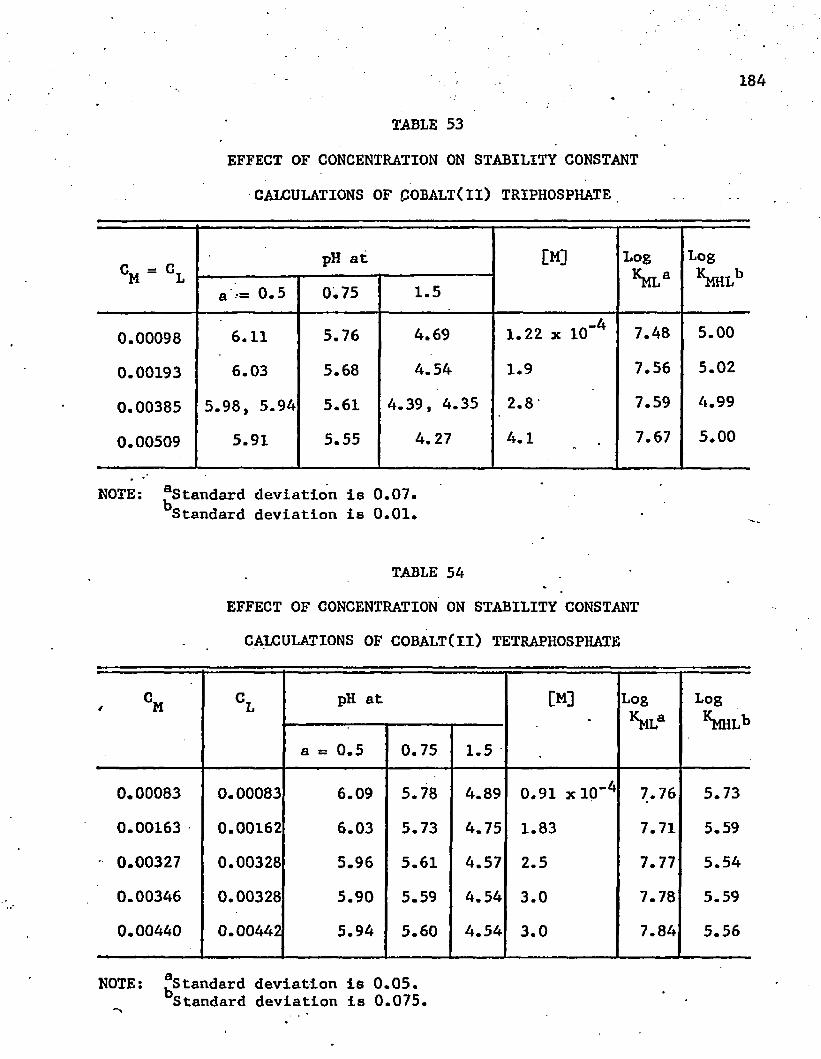
184
TABLE 53
EFFECT OF CONCENTRATION ON STABILITY CONSTANT
CALCULATIONS OF POBALT(II) TRIPHOSPHATE
CM “ CLpH at
£
i—i LogKm l *
LogKMHLba ■= 0.5 0.75 1.5
0.00098 6 . 1 1 5.76 4.69 1 . 2 2 x 1 0 " 4 7.48 5.00
0.00193 6.03 5.68 4.54 1.9 7.56 5.02
0.00385 5.98, 5.94 5.61 4.39, 4.35 2 . 8 7.59 4.99
0.00509 5.91 5.55 4.27 4.! 7.67 5.00
NOTE: ^Standard deviation is 0.07.Standard deviation is 0.01.
TABLE 54
EFFECT OF CONCENTRATION ON STABILITY CONSTANT
CALCULATIONS OF COBALT(ll) TETRAPHOSPHATE
CM CL pH at [M] LogKMLa
Log^ L *
a = 0.5 0.75 1.5
0.00083 0.00083 6.09 5.78 4.89 0.91 x l p -4 7.76 5.73
0.00163 0.00162 6.03 5.73 4.75 1.83 7.71 5.59
0.00327 0.00328 5.96 5.61 4.57 2.5 7.77 5.54
0.00346 0.00328 5.90 5.59 4.54 3.0 7.78 5.59
0.00440 0.00442 5.94 5.60 4.54 3.0 7.84 5.56
NOTE: ^Standard deviation is 0.05.Standard deviation is 0.075.
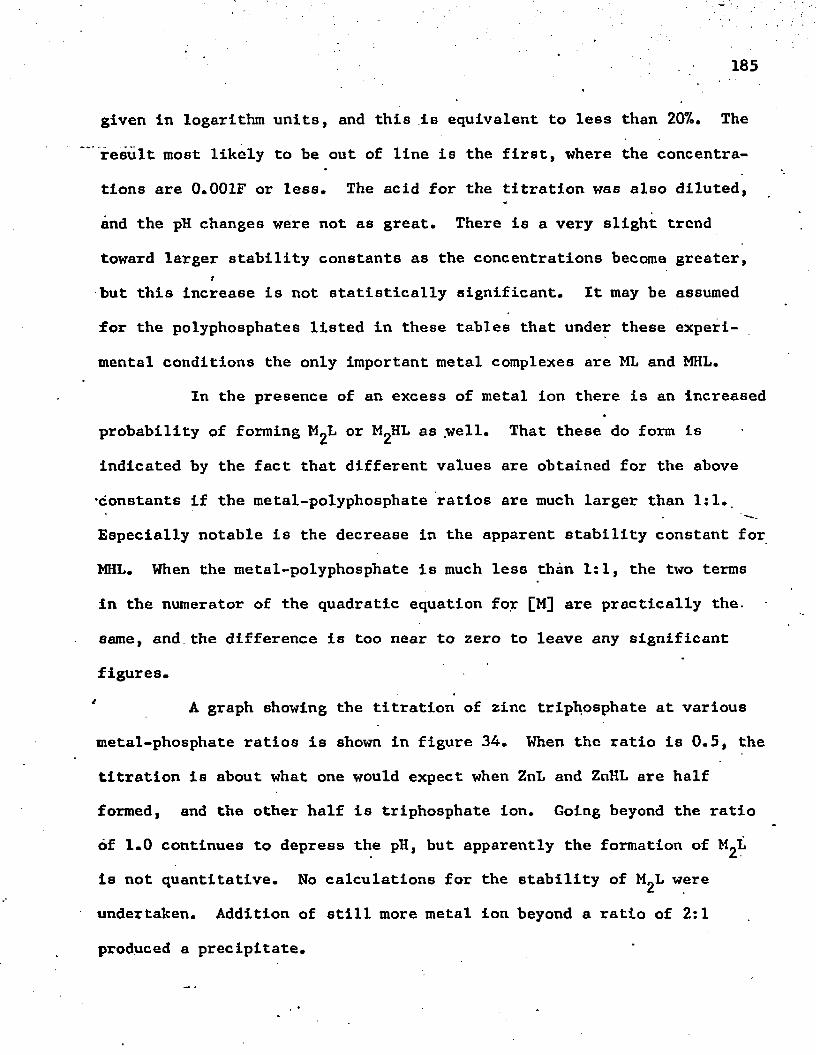
185
given in logarithm units, and this is equivalent to less than 207.. The
result most likely to be out of line is the first, where the concentra
tions are 0.001F or less. The acid for the titration was also diluted,
and the pH changes were not as great. There is a very slight trend
toward larger stability constants as the concentrations become greater,;
but this increase is not statistically significant. It may be assumed
for the polyphosphates listed in these tables that under these experi
mental conditions the only important metal complexes are ML and MHL.
In the presence of an excess of metal ion there is an increased
probability of forming or MgHL as .well. That these do form is
indicated by the fact that different values are obtained for the above
'constants if the metal-polyphosphate ratios are much larger than 1 :1 .
Especially notable is the decrease in the apparent stability constant for
MHL. When the metal-polyphosphate is much less than 1:1, the two terms
in the numerator of the quadratic equation for [M] are practically the.
same, and.the difference is too near to zero to leave any significant
figures.
1 A graph showing the titration of zinc triphosphate at various
metal-phosphate ratios is shown in figure 34. When the ratio is 0.5, the
titration is about what one would expect when ZnL and ZnHL are half
formed, and the other half is triphosphate ion. Going beyond the ratio
of 1.0 continues to depress the pH, but apparently the formation of M 2L
is not quantitative. No calculations for the stability of M^L were
undertaken. Addition of still more metal ion beyond a ratio of 2:1
produced a precipitate.
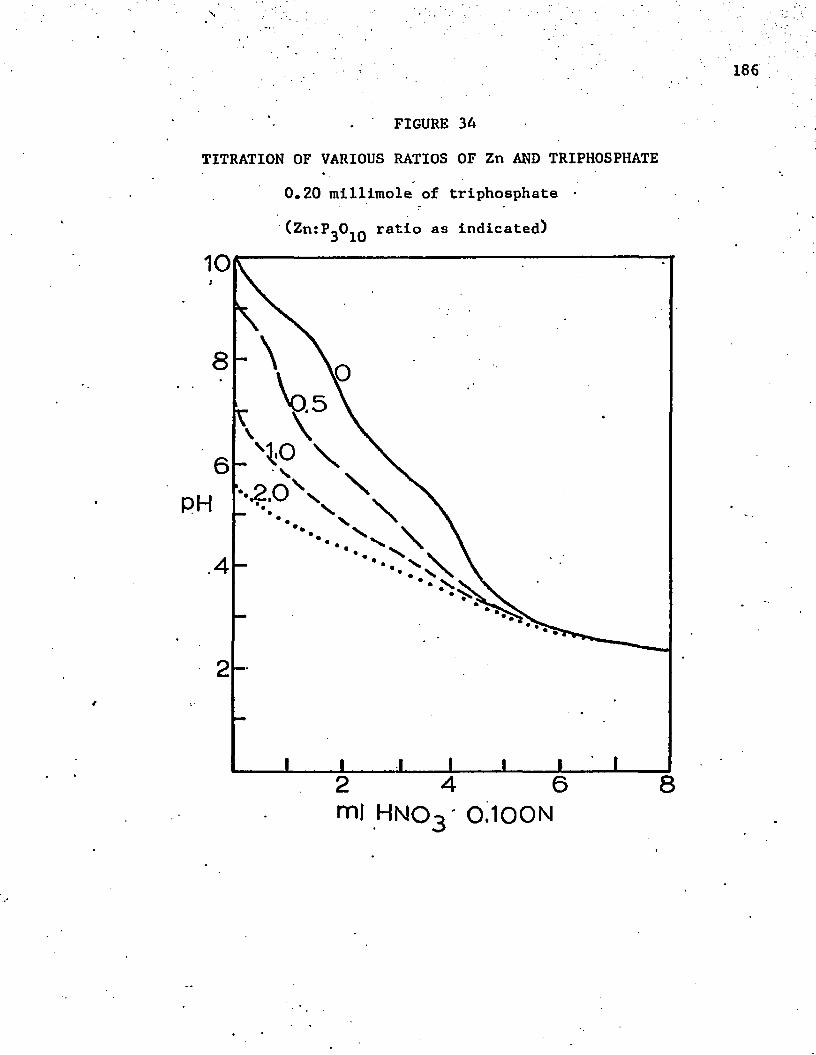
. FIGURE 34
TITRATION OF VARIOUS RATIOS OF Zn AND TRIPHOSPHATE
0 . 2 0 millimole of triphosphate
(Zn:P^O^Q ratio as indicated)
-\
‘••.2.0 X
2 4 6 ml HN03 ' 0 100N
187
Summary
A mathematical'method of determining the stability constants
of metal polyphosphates from a potentiometric titration has been utiliz
ed. The complexes of magnesium, aluminum, and several transition metals
with pyrophosphate, triphosphate, and tetraphosphate were studied. The
stability constants of the divalent transition metals with the poly-7 9phosphates ranged between 10 and 10 . In the case of aluminum and
iron(lll) the stability constants are greater than 10^. When there is
one hydrogen attached to the polyphosphate group, the stability constants5 7are about 1 0 for the divalent metals and 1 0 for the trivalent ones.
REFERENCES
Addison, C. C. , and Sutton, D.1964. J. Chem. Soc. 1964:5553.
Angell, C. A., and Gruen, D. M.1967. J. Inorg. Nucl. Chem. 29:2243.
Awad, W. I., Gawargious, Y. A., Hassan, S. S. M., and Milad, N. E1966. Anal. Chim. Acta. 36:339.
Ball, R. G., Manning, D. C., and Menis, 0.1960. Anal. Chem. 32:621.
Ballaux, C., Dams, R., and Hoste, J.1967. Anal. Chim. Acta. 37:164.
Ballhausen, C. J., and Jorgensen, C. K. 1955. Acta Chem. Scand. 9:397.
Barney, J. E., and Bertolocini, R. J.1957. Anal. Chem. 29:1187.
Beamish, F. E.1966. The Analytical Chemistry of the Noble Metals. New York
Pergamon Press, p. 57.
Belcher, R., and Fildes, J. E.1961. Anal. Chim. Acta. 25:34.
Belcher, R., and Ingram, G.1952. Anal. Chem. Acta. 7:319.
188
189
Belcher, R., MacDonald, A. M. G., and Nutten, A. J.1954. Mikrochim. Acta. 1954:104.
Bergman, J. G., and Cotton, F. A.I960. Inorg. Chem. _5:l420.1966. Inorg. Chem. 5_:1208.
Bergman,'J. G., and Martin, R. L.1962. Anal. Chem. 34:911.
Bergman, J. G., and Sanlk, J.1957. Anal. Chem. 29:241.
Bertrand, J. A., and Plymale, D. L.1964. Inorg. Chem. _3:775.1966.- Inorg. Chem. _5:879.
Biagetti, R. V., and Haendler, H. M.1966. Inorg. Chem. 5:383.
Bjerrum, J.1944. Kg. Danski Videnskob Selskab Mat. Fys. Medd., No. 4. 21.
Blake, A. B., and Cotton, F. A.1963. Inorg. Chem. Ji:906.
Boltz, D. F. •1958. Colorimeteric Determination of Nonmetals. New York:
Interscience, chap. 5.
Brintzinger, J., and Plane, R. A.1967. Inorg. Chem. £:623.
Buffagni, S., and Dunn, T. M.1960. Nature. 188:937.
Carlson, G. A., McReynolds, J. P., and Verhoek, F. H.1945. J. Am. Chem. Soc. 67:1334.
190
Chang, J. C., and Garner, C. S. 1965. ■ Inorg. Chem. _4:209.
Chapman, F. W. , and SherwoodtJ R. M.1957. Anal. Chem. 28:172.
Cheng., F. W.1959. Mlcrochemlcal Journal. 3:537.
Clark, R. J. H., and Williams, C. S.1965. Inorg. Chem. 4:350.
Coleman, J. S.1966. J. Inorg. Nucl. Chem. 28:2371.
Collman, J. F.1968. Stanford University. Lecture at The Ohio State'University,
May 1968, at Columbus, Ohio.
Cosgrove, J. F., Bastian, R. P., and Morrison, G. H.1958. Anal. Chem. 30:1872.
Cotton, F. A., and Dunne, T. G.1962. J. Am. Chem. Soc. 84:2013.
Cotton, F. A., Dunne, T. G., and Wood, J. S.1965. Inorg. Chem. 4:318.
Cotton, F. A., and Elder, R. C.1965. Inorg. Chem. ^:1145.1966. Inorg. Chem. 5:423.
Cotton, F. A., Faut, 0. D., and Mague, J. T.1964. Inorg. Chem. 3:17.
Cotton, F. A., and Gooagame, M.1961. J. Am. Chem. Soc. 83:1777.
Cotton, F. A., Goodgame, D. M. L . , and Goodgame, M.1961. J. Am. Chem. Soc. 83:4161 and 4690.
Cotton, F. A., Goodgame, D. >1. L., Goodgame, M. , and Haas, T. E.1962. Inorg. Chem. 1:565. (Cotton et al. 1962)
Cotton,- F. A., Goodgame, D. M. L., Goodgame, M., and Sacco, A.1961. J. Am. Chem. Soc. 83:4157. (Cotton et al. 1961)
Cotton, F. A., Goodgame, D. M. L., and Soderburg, R. H.1963. Inorg. Chem. _2:1162.
Cotton, F. A., and Weaver, D. L.1965. J. Am. Chem. Soc. 87:4189.
.Crocket, D. S., and Grossman, R. A.1964. Inorg. Chem. 3:644.
Douglas, B. E., and McDaniel, D. H.1965. Concepts and Models of Inorganic Chemistry. New York:
Blalsdell, p. 121.
Dubsky, J. V. , and Trtilek, J. 1933. Mlkrochemle. 12:315.
Einstein, F. W. B., and Rodley, G. A.1967. J. Inorg. Nucl. Chem. 29:347.
El-Awady, A. A., Bounsall, E. J., and Garner, C. S.1967. Inorg. Chem. 6:79.
Ellison, H . , and Martell, A. E.1964. J. Inorg. Nucl. Chem. 26:1555.
Elshelmer, H. N., Johnston, A. L. , and Kochen, R. L.1966. Anal. Chem. 38:1684.
Eswien, R. P., Howald, E. S., Howald, R. A., and Kuton, D. P. 1967A. J. Chem. Soc. 1967A:437.
192
Everett, G. W. , and Holme, R. H.1965. J. Am. Chem. Soc. 87:5226.
Filby, R. H.1964. Anal. Chim. Acta. 1,31:437.
Fildes, J. E., and MacDonald, A. M. G.1961. Anal. Chim. Acta. 24:121.
Fine, D. A.1962. J. Am. Chem. Soc.; 84:1139.1965. Inorg. Chem. It: 345.
Garaka, K. J.1968. Anal. Chem. 40:809.
Gerlach, J. L., and Frazier, R. G.1958. Anal. Chem. 30:1142.
Gill, J. B., and Riaz, S. A.1969A. J. Chem. Soc. 1969A:183.
Gill, N. S., and Nyholm, R. S.1959. J. Chem. Soc. 1959:3997.
Good, M. L., and Srivaatava, S. C.1965. J. Inorg. Nucl. Chem. 27:2429.
Goodgame, D. M. L., and Goodgame, M.1963. J. Chem. Soc. 1963:207.
Griffith, E. J.1964. Inorg. Chem. 26:1381.
Griffith, E. J., and Buxton, R. L.1965. Inorg. Chem. j4:549.1967. J. Am. Chem. Soc. 89:2884.
193
Harames, 6 . C., and Morrell, M. L.1964. •j. Am. Chem. Soc. 86:1497.
Berber, R. H., and Irvine, J. W*1956. J. Am. Chem. Soc. *^8:905.1958. J. Am. Chem. Soc.. 80:5622.
Holm, R. H., and Cotton, F. A.1959. J. Chem. Phys. 31:788.
Hull, 0. E., and Gilmore, J. T.1964. Anal. Chem. 36:2072.
Iwasaki, I., Utsumi, S., and Ozawa, T.1952. Bull. Chem. Soc., Japan. 25:226.
Job, P.1928. Ann. Chim. [10]. 9^:113.
Jorgensen, C. K.1954. Acta Chem. Scand. J3:1495.
Katzin, L. I.1952. J. Chem. Phys. 20:1165.1954. J. Am. Chem. Soc. 76:3089.1961. J. Chem. Phys. 35:467.1962. J. Chem. Phys. 36:3034.
Katzin, L. I., and Gebert, E.1950. J. Am. Chem. Soc. 72:5451 and 5455.1953. J. Am. Chem. Soc. 75:2830.
King, H. C. A., Kor'os, E., and Nelson, S. M.1963. J. Chem. Soc. 1963:5449.1964. J. Chem. Soc. 1964:4832.
Kolthoff, I. M . , and Willraan, A.1934. J. Am. Chem. Soc. 56:1007.
194
Kraus, K. A., Nelson, F., Clough, F. B., and Carlson, R. C.1955. J. Am. Chem. Soc. 77:1391.
Kristjanson, A. M . ,• and Lederer, M. .1959. Journal of Less-Common Metals. _1:245.
Laltlnen, H. A., and Lin, Zul-flng.1963. Anal. Chem. 35:1405.
Lawson, D., and Wilkinson, G.1965. J. Chem. Soc. 1965:1900.
.Lederer, M.1958. J. of Chromatography. 1:279.
Llndenbaum, S., and Boyd, G. E.1963. J. Phys. Chem. 67:1238.
Lister, M. W . , and Rosenblum, P.1960. Can. J. Chem. 38:1827.
MacNevin, W. M., and Crummett, W. B.1954. Anal. Chim. Acta. 10:323.
MacNevin, W. M., and Dunton, M. L.1957. Anal. Chem. 29:1806.
MacNevin, W. M., and McKay, E. S.,1957. Anal. Chem.■ 29:1220.
Machen, R. C. -1967. Ph.D. dissertation, The Ohio State University at Columbus.
Magor, B. S., and Smith, T. D.1968A. J. Chem. Soc. 1968A:1753.
Malik, W. U . , and Sharma, C.. L.1968. J. Indian Chem. Soc. 45:29 and 503
Malmstadt, H. V., Fett, E. R., and Winefordner, J. D.1956. Anal. Chem. 28:1878.
Matwiyoff, N. A.,1966. Inorg. Chem. 5:789.
McNabb, Hazel, J. F., and Baxter, R. A.1968. J. Inorg. Nucl. Chem. 30:1585.
Miller, D. L., and Westheimer, F. H.1966. J. Am. Chem. Soc. 88:1507.
Moore, G. E., and Kraus, K. A.1952. J. Am. Chem. Soc. 74:843.
Moore, T. E., Gootman, E. A., and Yates, P. C.1955. J. Am. Chem. Soc. 77:298.
Moore, W. J.1962. Physical Chemistry. 3rd ed. Englewood Cliffs, N. J.:
Prentice-Hall, p. 351.
Morris, D. F. C., Reed, G. L., Short, E. L., Slater, D. N., and Waters, D. N.
1965. J. Inorg. Nucl. Chem. 27:377.
Orgel, L. E.1955. J. Chem. Phys. 23:1004.
Osterheld, R. K., and Langguth, R. P.1955. J. Phys. Chem. 59:76.
0ye, H. A., and Gruen, D. M.1964. Inorg. Chem. <3:836.1965. Inorg. Chem. 7:1173.
Pasternack, R. F., and Plane, R. A.1965. Inorg. Chem. 4:1171-.
Pauling, Peter*1966. Inorg. Chem. 5,: 1498.
Paulsen, I. A., and Garner, C. S.1962. J. Am. Chem. Soc. 84:2032.
Pflaum, R. T., Frohliger, J. 0., and Berge1962. Anal. Chem. 34:1812.
Qulmby, 0. T.1954. J. Phys. Chem. 58:614.
Ramette, R. W.1963. J. Chem. Ed. 40:71.
Raspanti, G.1967. Z. Anal. Chem. 225:24.
Rodley, G. A., and Smith, P. W. 1967A. J. Chem. Soc. 1967A:1580.
Roppongi, A., and Kato, T.1962. Bull. Chem. Soc. Japan. 35:1086
Rowe, R.1965. Anal. Chem. 37:368.
Rudolph, J. S., and Nadalin, R. J.1964. Anal. Chem. 36:1815.
Rutner, E.1961. J. Phys. Chem. 65:1027.
Sato, T.1967A. J. Chem. Soc. 1967A:547.
Scaife, D. E., and Wood, K. P.1967. Inorg. Chinn,. b:358. •
Schbniger, W.1955. Mikrochim. Acta. 1955:123.1956. Mikrochim. Acta. 1956:869.
Schulz, I.1956. Z. Anorg. Allgem. Chem. 287:106.
Schupp, 0. £., Sturrock, P. E., and Watters, J. X.1963. Inorg. Chem. 2:106.
Shen, C. Y., Stahlheber, N. E., Dyroff, D. R.1969. J. Amer. Chem. Soc. 91:62.
Shukla, S. K.1958. J. of Chromatography. _1:457.1959. Journal of Less-Common Metals. 1:333.
Shukla, S. K., and Lederer, M.1959. Journal of Less-Common Metals. 1:255.
Smithson, J. M. , and Williams, R. J. P.1958. J. Chem. Soc. 1958:457.
Stern, M., Shwachman, H., Licht, T. S., and Bethune1958. Anal. Chem. 30:1506.
Sturrock, P. E., Loughran, E. D., and Watters, J. I1962. Inorg. Chem. 1:457. '
Thilo, E., and Ratz, R.1949. Z. Anorg. Chem. 260:255.
Vallarino. L. M.1965. Inorg. Chem. ^:161.
VanLoon, J. C.1968. Analyst. 93:788.
Viebock, F.1932. Ber. 65:493.
Vosburgh, W. C. , and Cooper, G. G. 1941. J. Am. Chem. Soc. 63:437.
Watters, J. X., and Machen, R.1968. J. Inorg. Chem. 30:2163.
Watters, J. I., and Matsumoto, S.1964. J. Am. Chem. Soc. 86:3961.1966. •• Inorg. Chem. 5^:361.1967. J. Inorg. Nucl. Chem. 29:2955.
Watters, J. I., and Simonaltis, R. A.1964. Talanta. 11:247.
Watters, J. I., Sturrock, P. E., and Simonaltis, R. A.1963. Inorg. Chem. 2:765.
Weed, E. D.1964. Ph.D. dissertation, The Ohio State University at Columbus.
West, P. W., and Coll, H.1956. Anal. Chem. 28:1834.
Westman, A. E. R., and Scott, A. E.1951. Nature. 168:740.
Whiteker, R. A., and Davidson, N.1953. J. Am. Chem. Soc. 75:3081.
Willett, R. D., and Liles, D. L., Jr.1967. Inorg. Chem. 6:1666.
Wolsey, W. C., Reynolds, C. A., and Kleinberg, J.1963. Inorg. Chem. 2:463.
Wormser, Y.1948. Bui. Soc. Chim. France. 1948:395.
Wu, C., Witonsky, R. J., George, P., and Rutman, R. J.1967. J. Am. Chem. Soc. 89:1987.