6. service blueprints - designpsykologi
TRANSCRIPT
Service Design / UX Campus / 2020 © D.Psy
6. Service Blueprints
!143

Service Design / UX Campus / 2020 © D.Psy
KONFIDENSIELT live|work nordic AS www.livework.no
Anders Kjeseth Valdersnes [email protected]
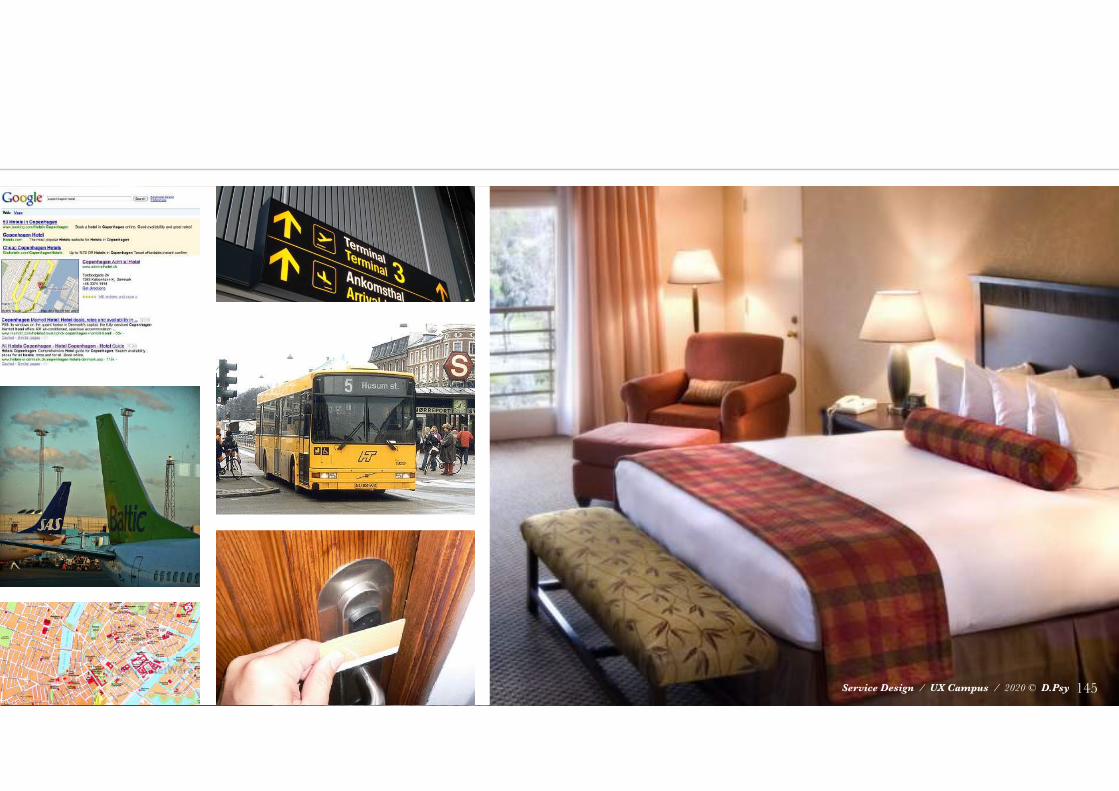
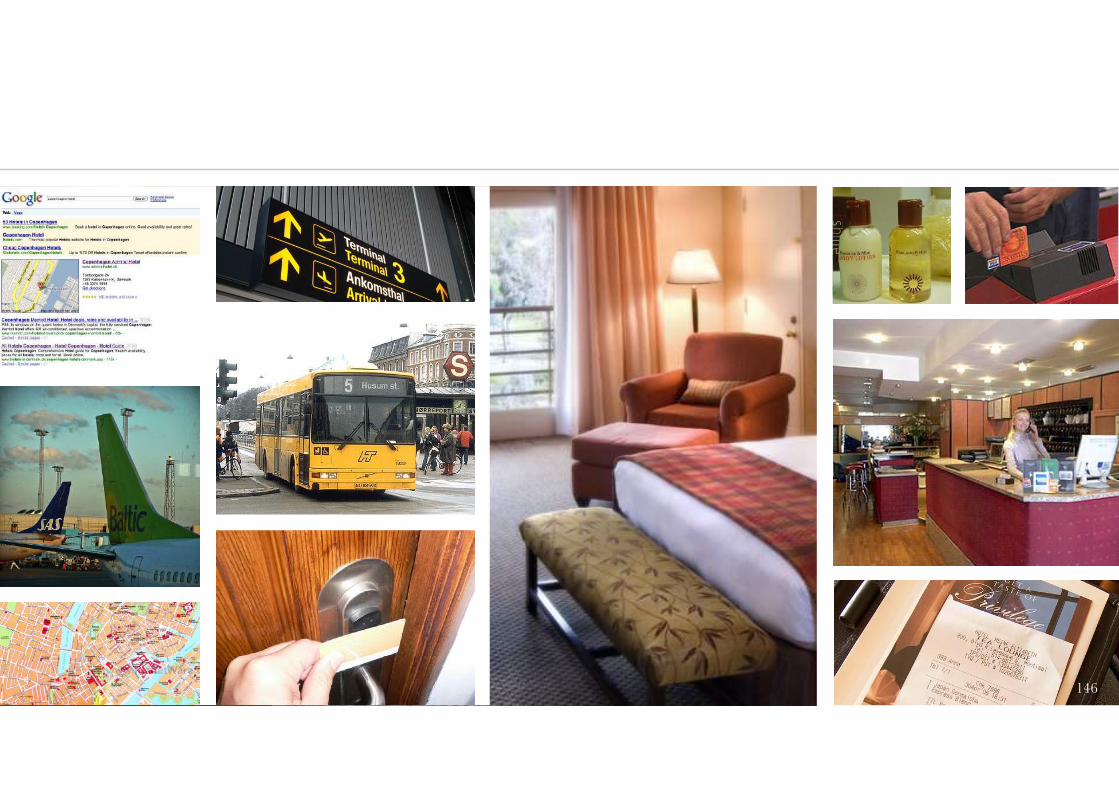
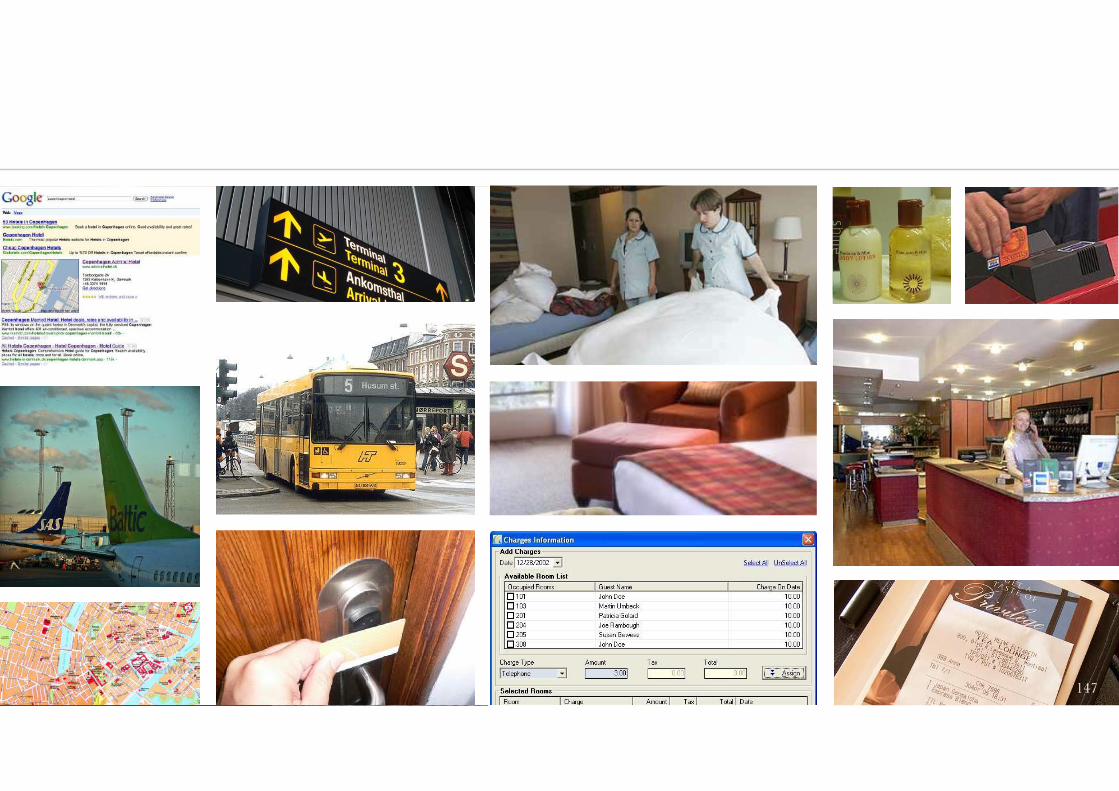
A stay in a hotel
September 26, 2012 3
!144Service Design / UX Campus / 2020 © D.Psy
Service Design / UX Campus / 2020 © D.Psy
KONFIDENSIELT live|work nordic AS www.livework.no
Anders Kjeseth Valdersnes [email protected]
A stay in a hotel
September 26, 2012 4
!145Service Design / UX Campus / 2020 © D.Psy
Service Design / UX Campus / 2020 © D.Psy
KONFIDENSIELT live|work nordic AS www.livework.no
Anders Kjeseth Valdersnes [email protected]
A stay in a hotel
September 26, 2012 5
!146
Service Design / UX Campus / 2020 © D.Psy
KONFIDENSIELT live|work nordic AS www.livework.no
Anders Kjeseth Valdersnes [email protected]
A stay in a hotel
September 26, 2012 6
!147
Service Design / UX Campus / 2020 © D.Psy !148
Service Design / UX Campus / 2020 © D.Psy !149
Service Design / UX Campus / 2020 © D.Psy !150
Service Design / UX Campus / 2020 © D.Psy
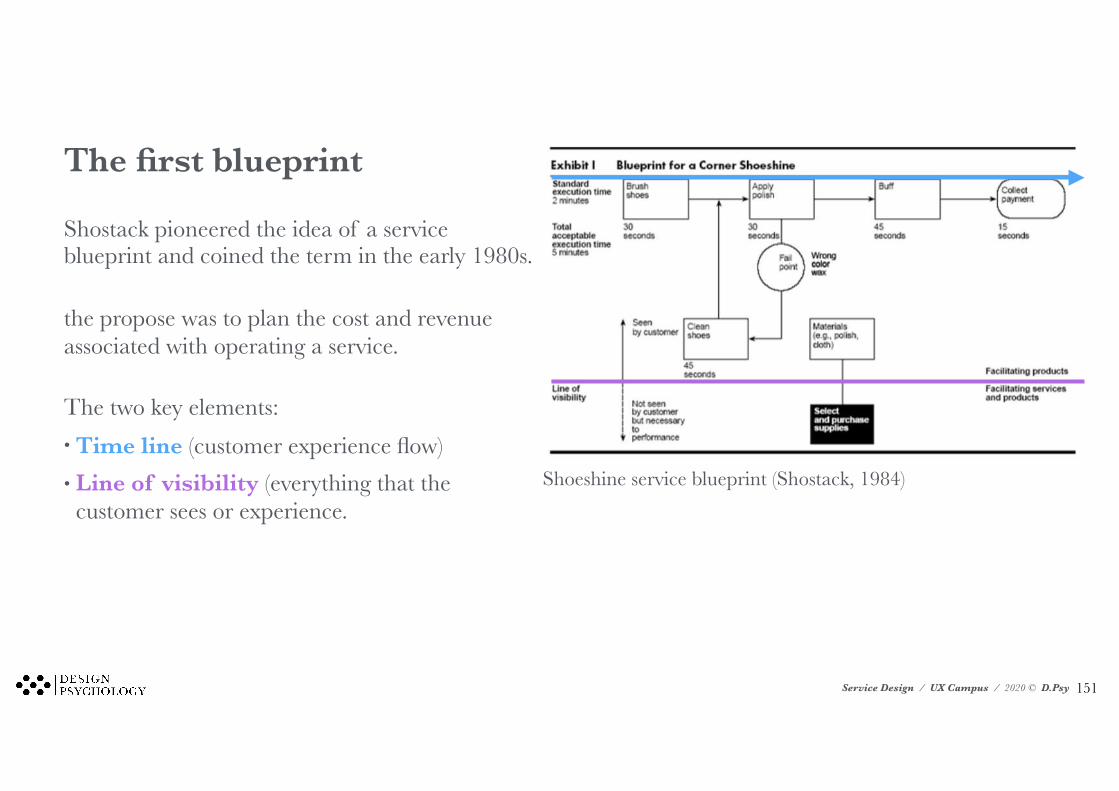
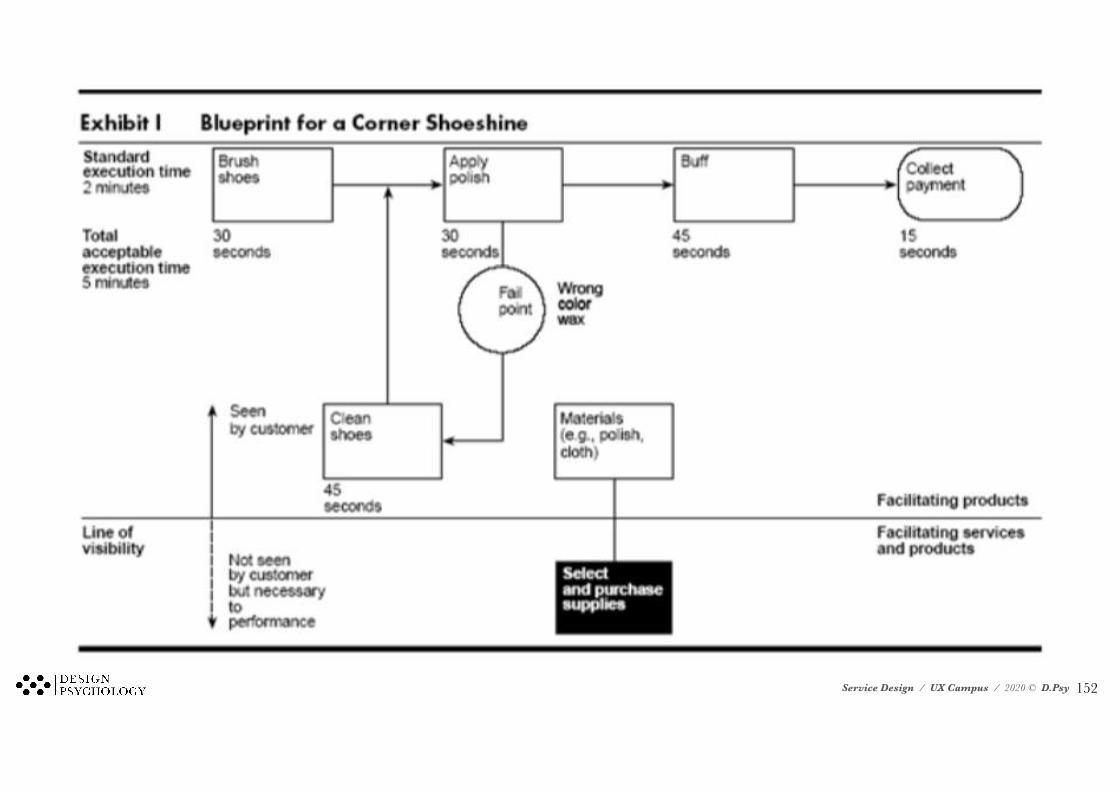
The first blueprint
Shostack pioneered the idea of a service blueprint and coined the term in the early 1980s.
the propose was to plan the cost and revenue associated with operating a service.
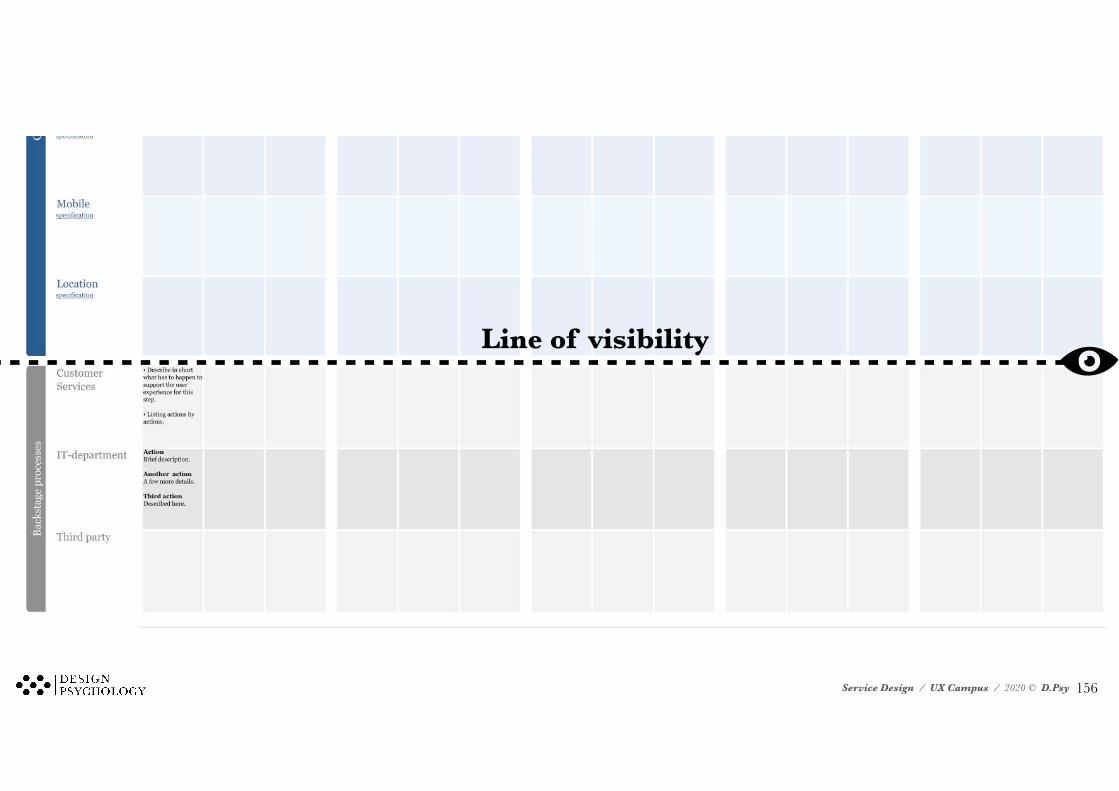
The two key elements: • Time line (customer experience flow) • Line of visibility (everything that the
customer sees or experience. Shoeshine service blueprint (Shostack, 1984)
!151
Service Design / UX Campus / 2020 © D.Psy !152
Service Design / UX Campus / 2020 © D.Psy
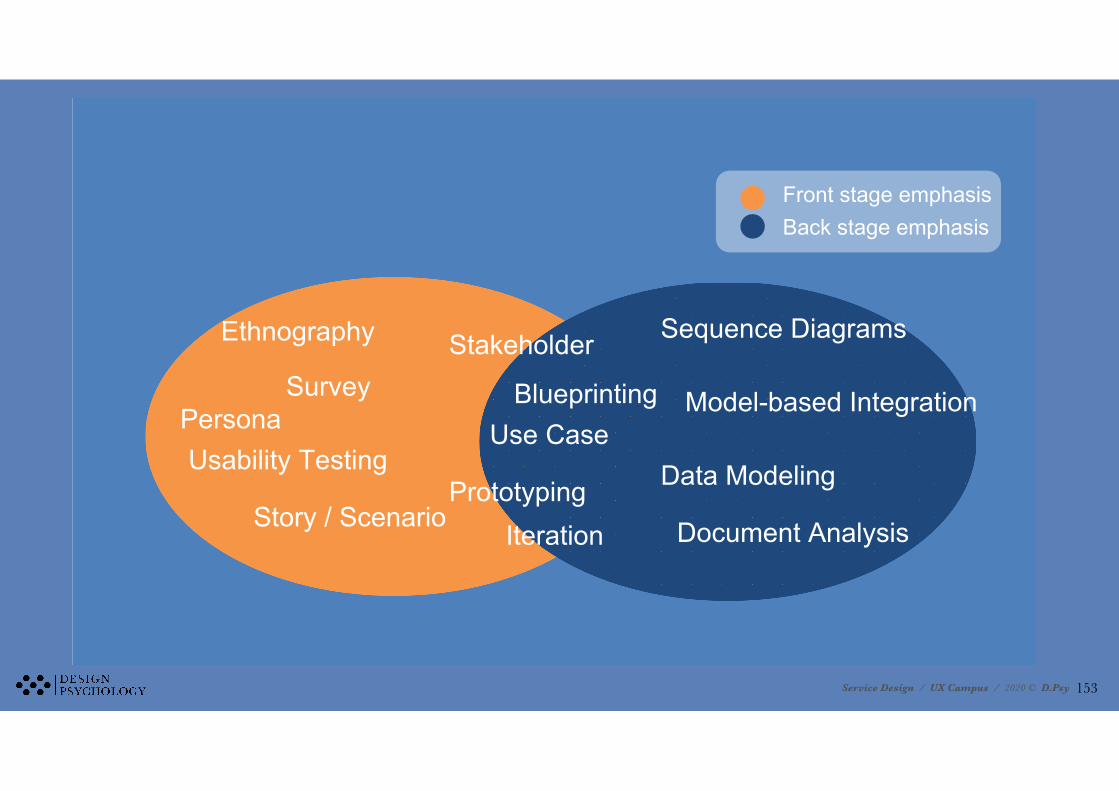
Portfolio of Methods
Front stage emphasisBack stage emphasis
Ethnography
Data Modeling
Sequence Diagrams
Document Analysis
Persona
Story / Scenario
Usability Testing
Model-based IntegrationUse Case
Stakeholder
Prototyping
Survey
Iteration
Blueprinting
!153
Service Design / UX Campus / 2020 © D.Psy !154
Service Design / UX Campus / 2020 © D.Psy !155
Service Design / UX Campus / 2020 © D.Psy
Line of visibility
!156
Service Design / UX Campus / 2020 © D.Psy
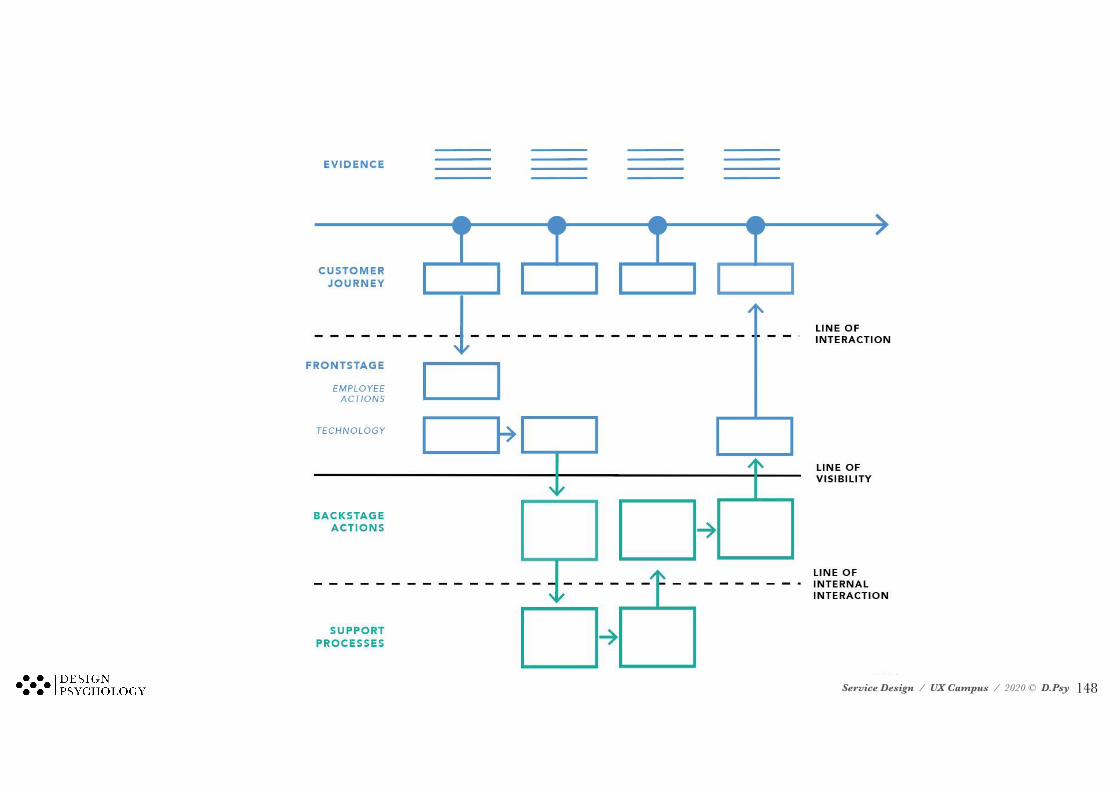
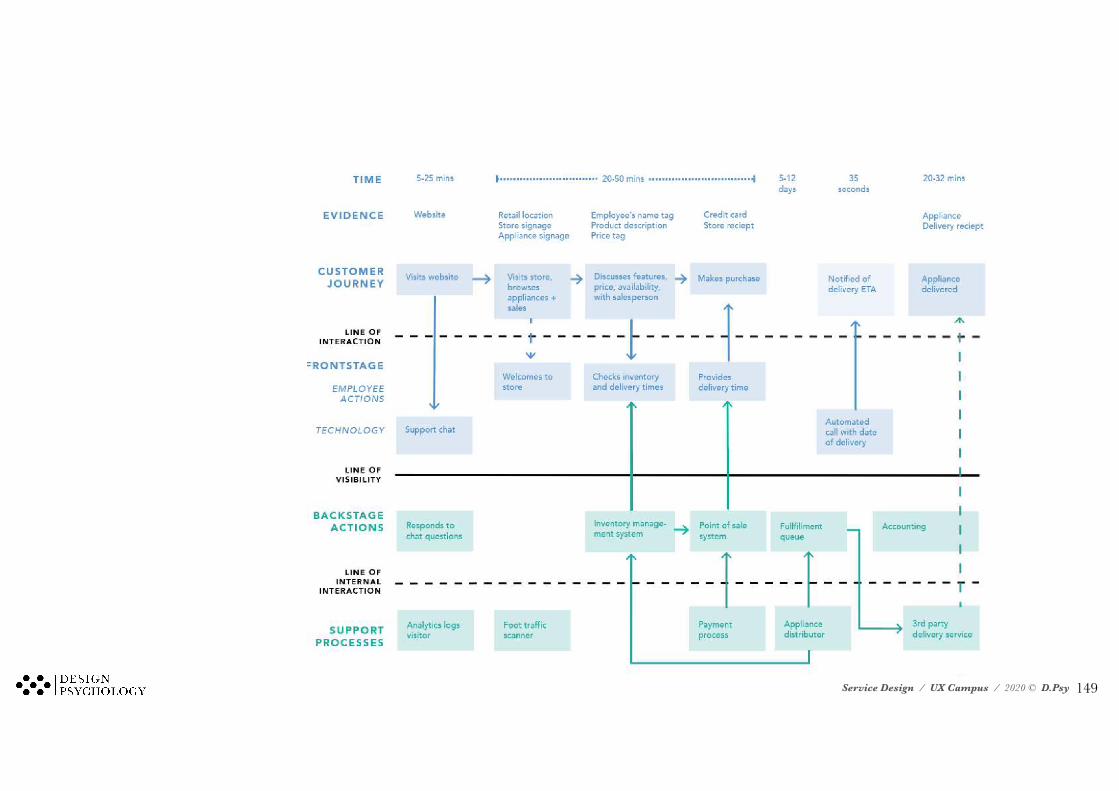
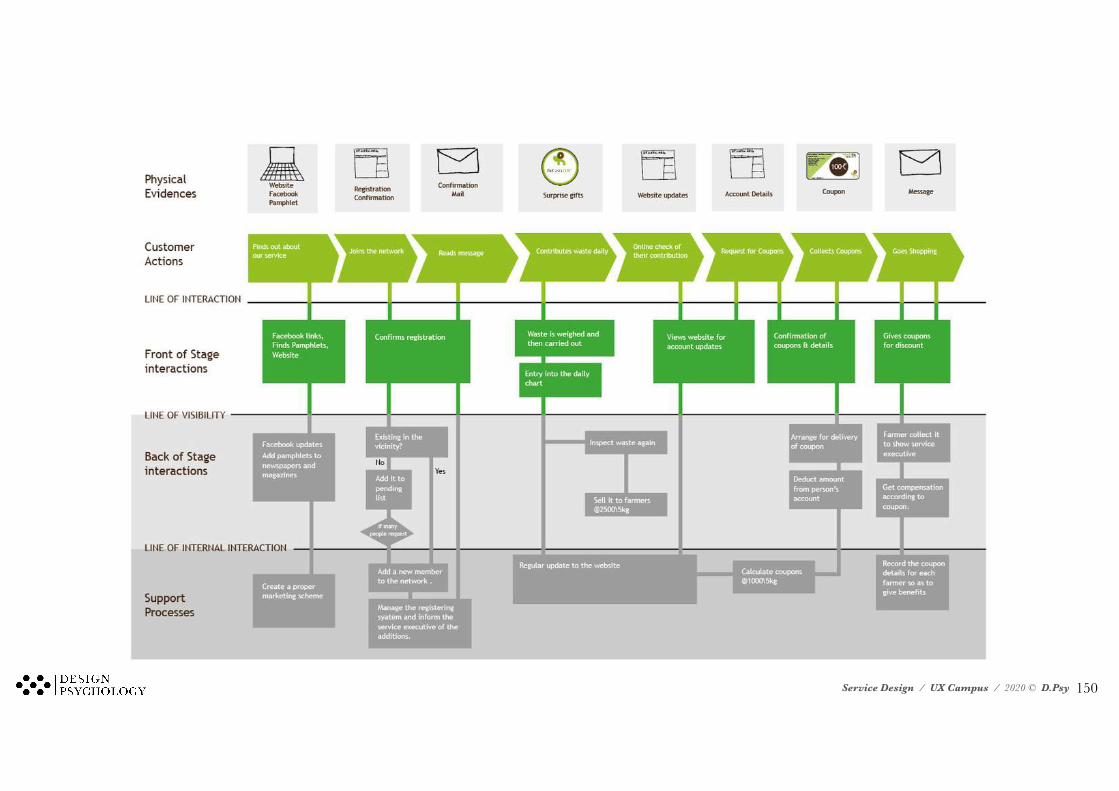
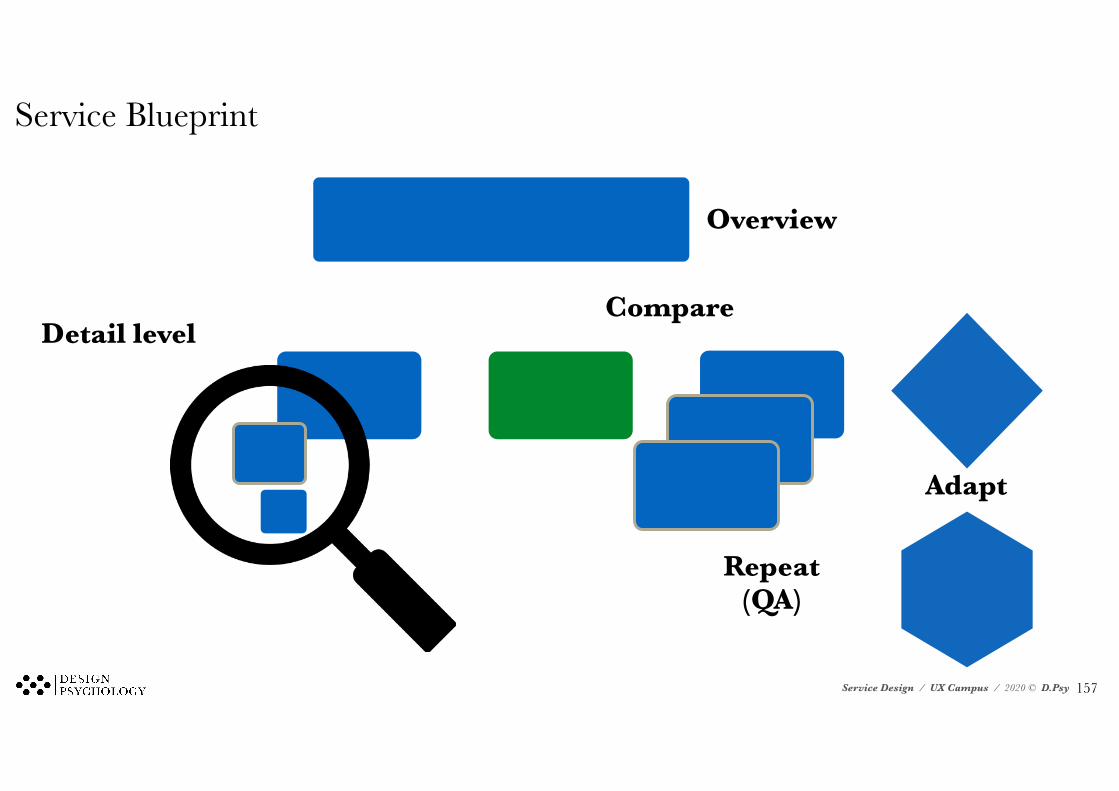
Service Blueprint
Adapt
Detail level
Overview
Repeat (QA)
Compare
!157
Service Design / UX Campus / 2020 © D.Psy
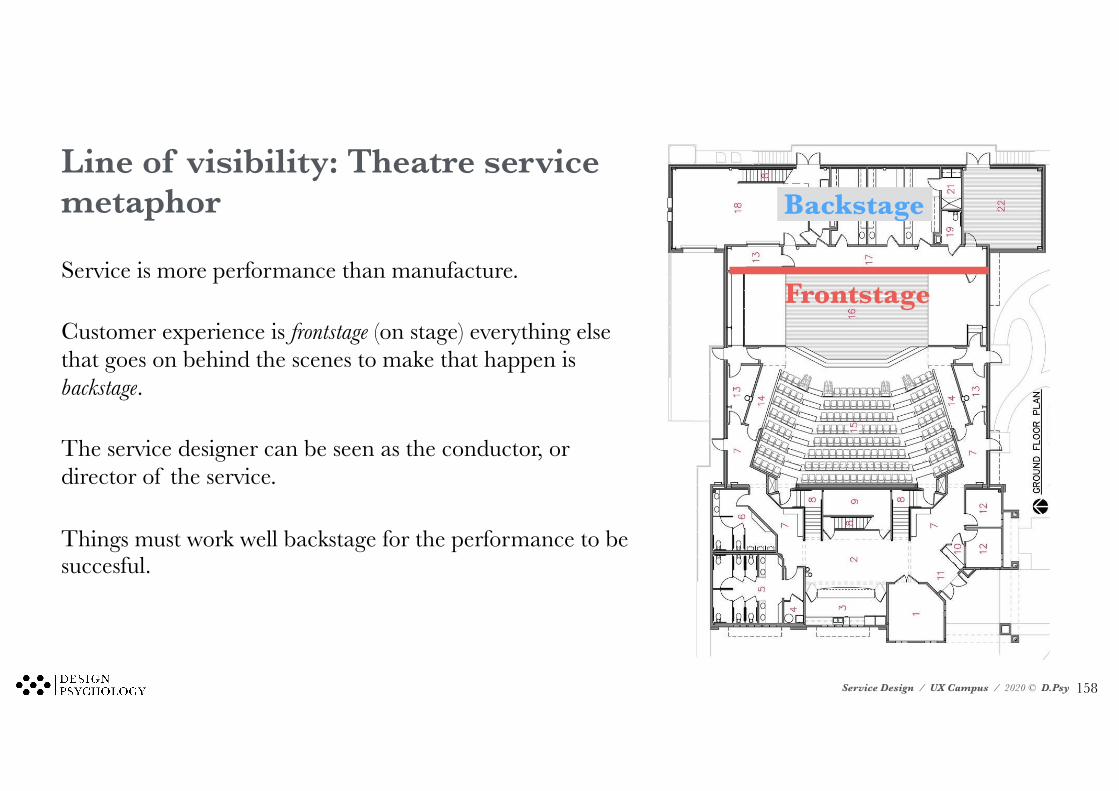
Line of visibility: Theatre service metaphor
Service is more performance than manufacture.
Customer experience is frontstage (on stage) everything else that goes on behind the scenes to make that happen is backstage.
The service designer can be seen as the conductor, or director of the service.
Things must work well backstage for the performance to be succesful.
Frontstage
Backstage
!158
Service Design / UX Campus / 2020 © D.Psy
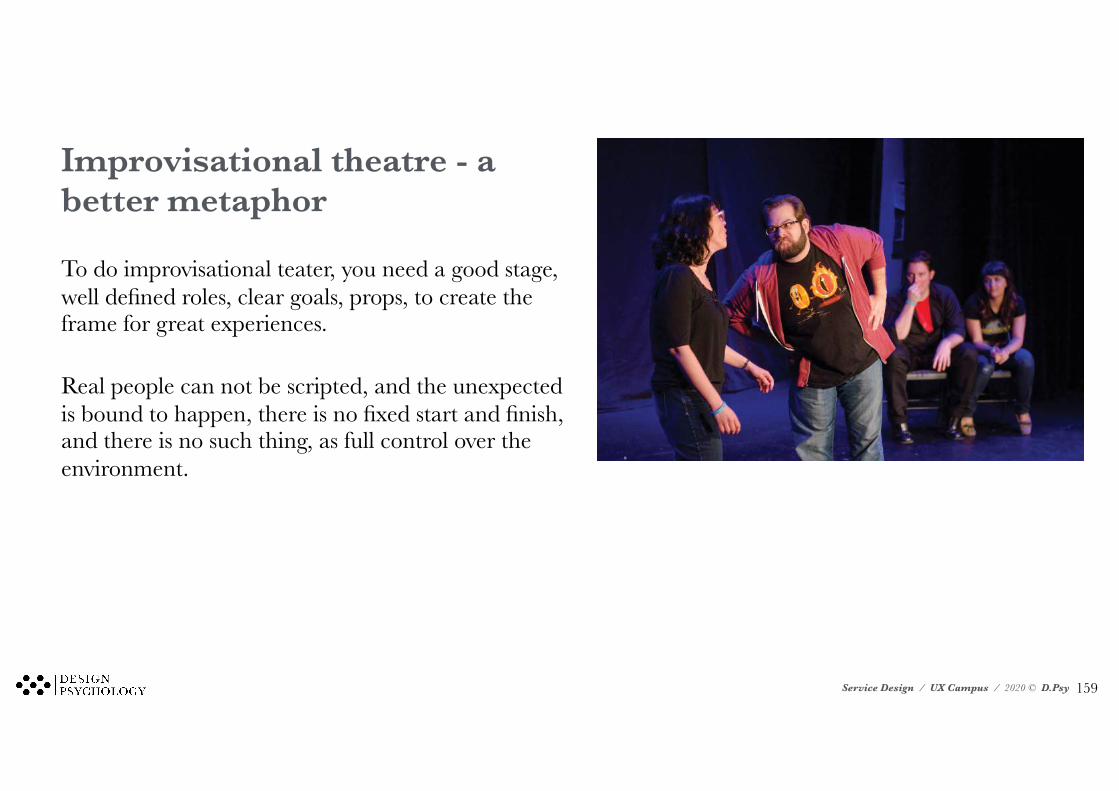
Improvisational theatre - a better metaphor
To do improvisational teater, you need a good stage, well defined roles, clear goals, props, to create the frame for great experiences.
Real people can not be scripted, and the unexpected is bound to happen, there is no fixed start and finish, and there is no such thing, as full control over the environment.
!159
Service Design / UX Campus / 2020 © D.Psy
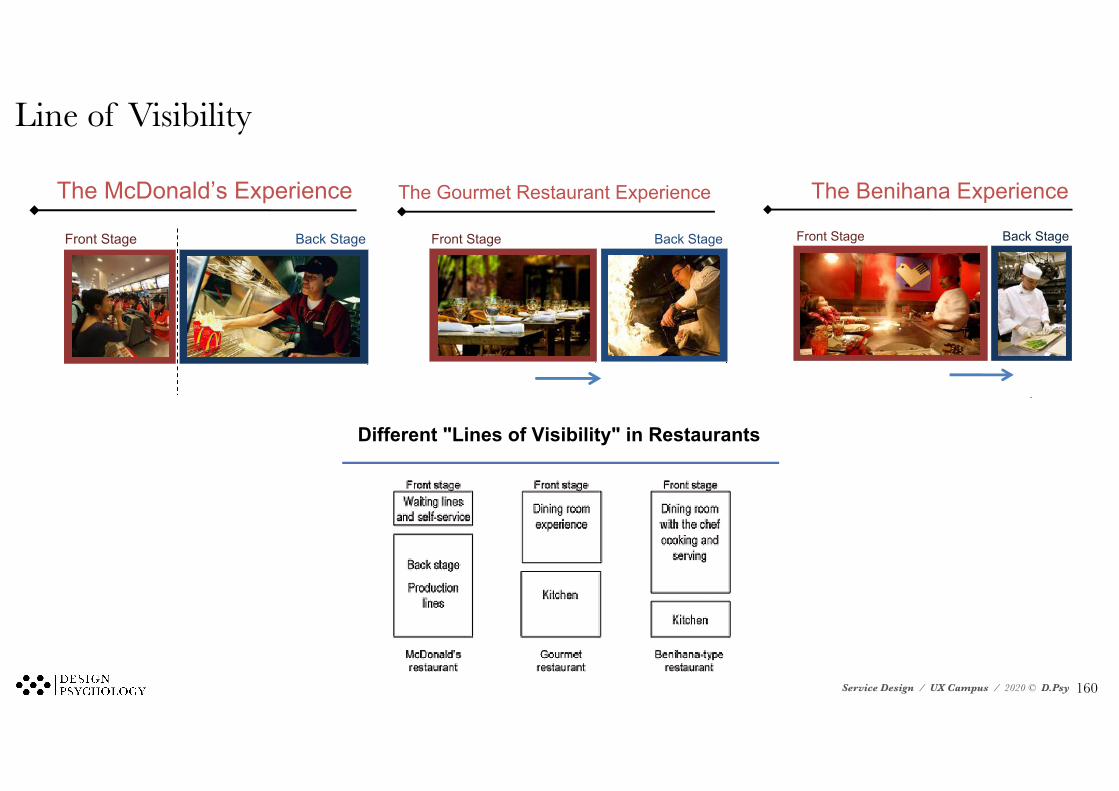
Line of Visibility
The McDonald’s Experience
Front Stage Back Stage
Line of Visibility
The Gourmet Restaurant Experience
Front Stage Back Stage
The Benihana Experience
Front Stage Back Stage
“Touch Points” andService Intensity / Quality
� Services differ intrinsically in the number of touch points they require to create value; this is often called the service intensity
� Traditional P2P service system design assumes that intensity is positively correlated with service quality
� This view lets us treat intensity as a design parameter to differentiate service offerings of the same type or industry domain
� The “generic” service offering is a design pattern that can be increased or reduced in intensity by changing the number of touch points
The McDonald’s Experience
Front Stage Back Stage
Line of Visibility
The Gourmet Restaurant Experience
Front Stage Back Stage
Different "Lines of Visibility" in Restaurants
Queuing Theory as a Generic Modelfor Service Systems
Queuing theory provides a generic framework for describing service systems where people wait to be served
The parameters of these models – arrival rates, waiting time, numberof service providers, etc. – explicitly represent the quality of the"customer service" experience
The formal rigor of queuing models has created a rich body ofknowledge about different queue structures and who-gets-served-whendisciplines that enable designers to maintain a desired quality of service in the service system.
!160
Service Design / UX Campus / 2020 © D.Psy !161
Service Design / UX Campus / 2020 © D.Psy
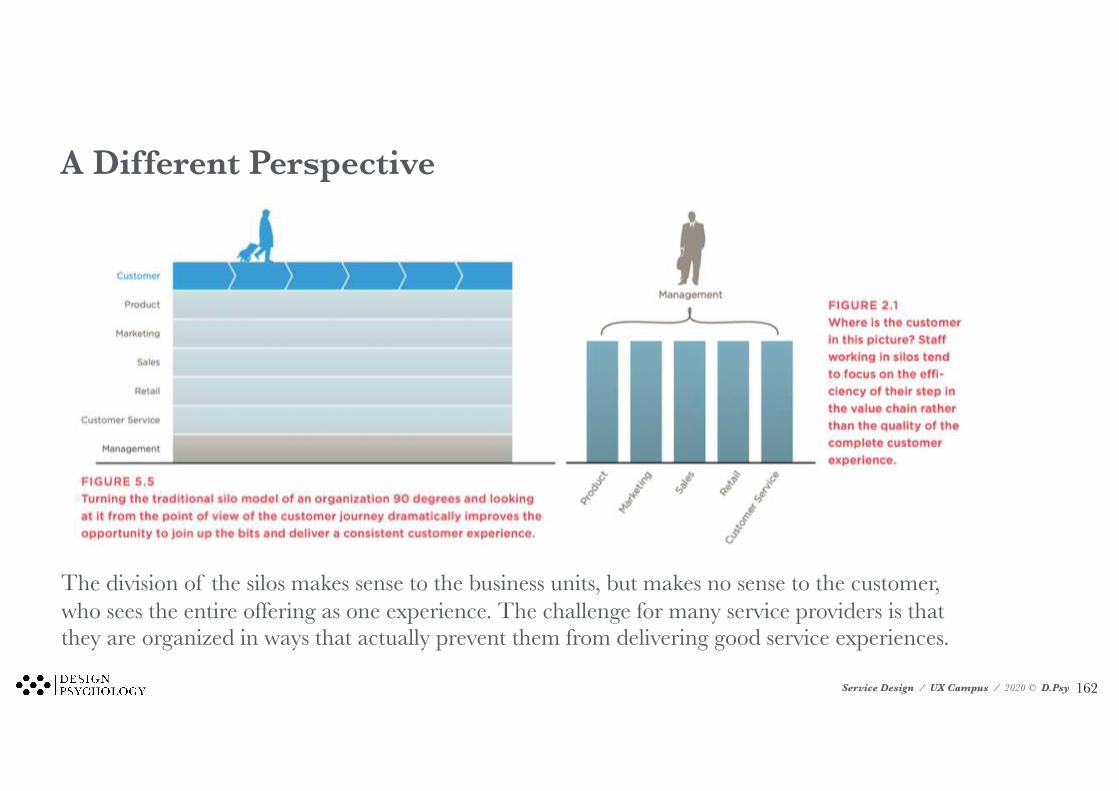
The division of the silos makes sense to the business units, but makes no sense to the customer, who sees the entire offering as one experience. The challenge for many service providers is that they are organized in ways that actually prevent them from delivering good service experiences.
A Different Perspective
!162
Service Design / UX Campus / 2020 © D.Psy
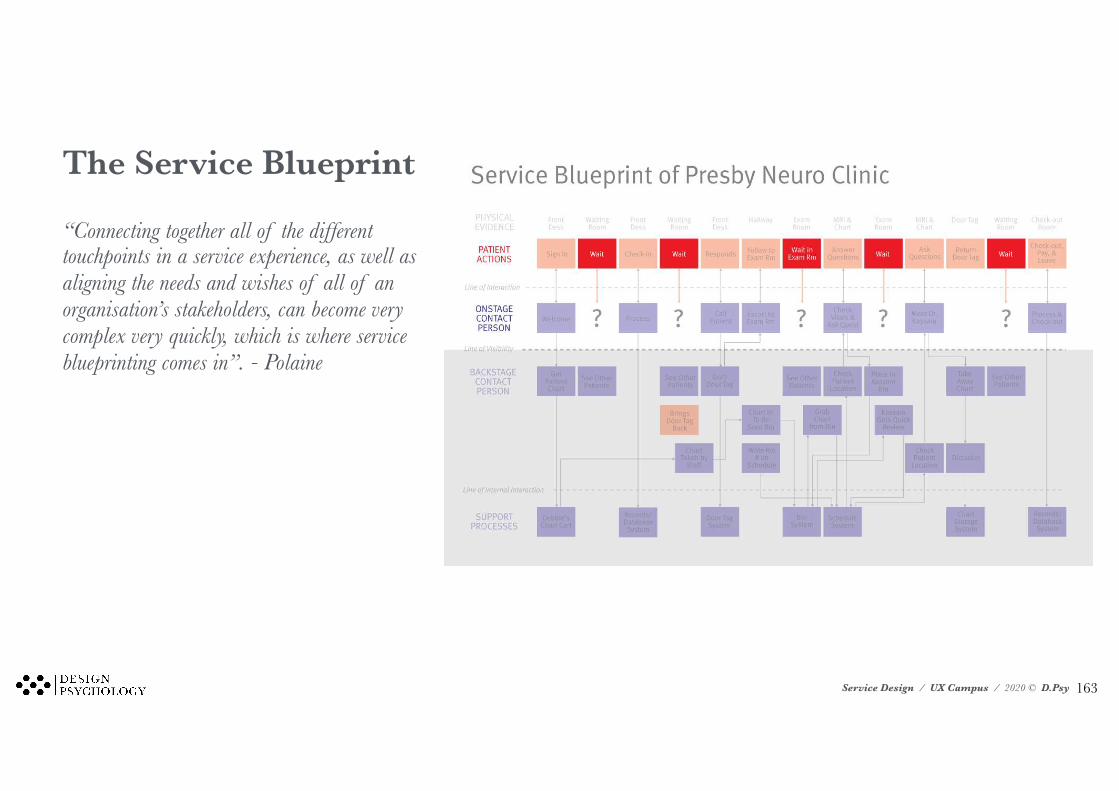
The Service Blueprint
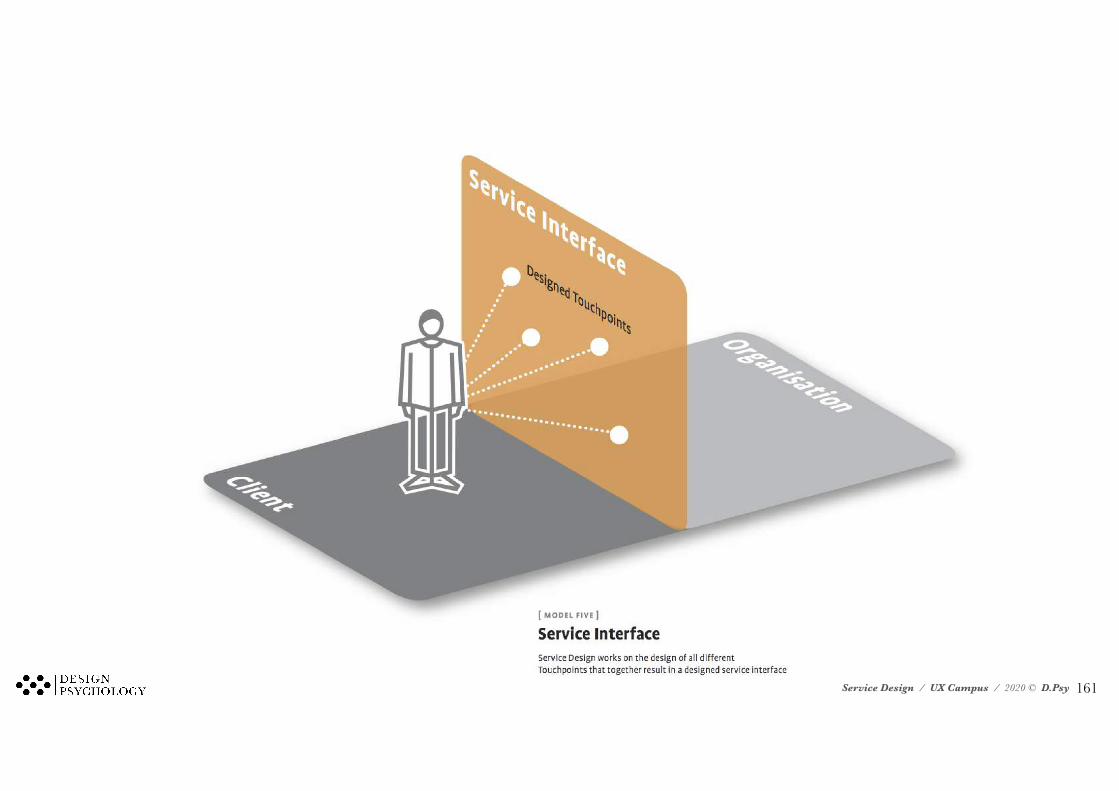
“Connecting together all of the different touchpoints in a service experience, as well as aligning the needs and wishes of all of an organisation’s stakeholders, can become very complex very quickly, which is where service blueprinting comes in”. - Polaine
!163
Service Design / UX Campus / 2020 © D.Psy
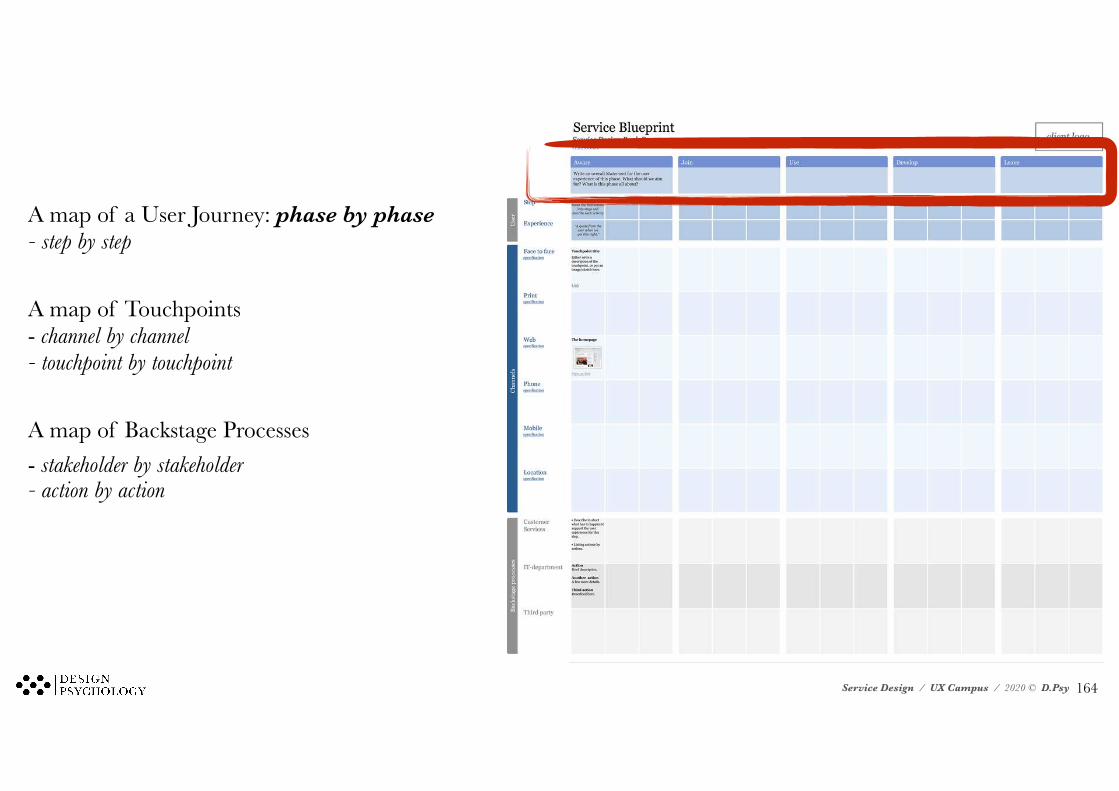
A map of a User Journey: phase by phase - step by step
A map of Touchpoints - channel by channel - touchpoint by touchpoint
A map of Backstage Processes - stakeholder by stakeholder - action by action
!164
Service Design / UX Campus / 2020 © D.Psy
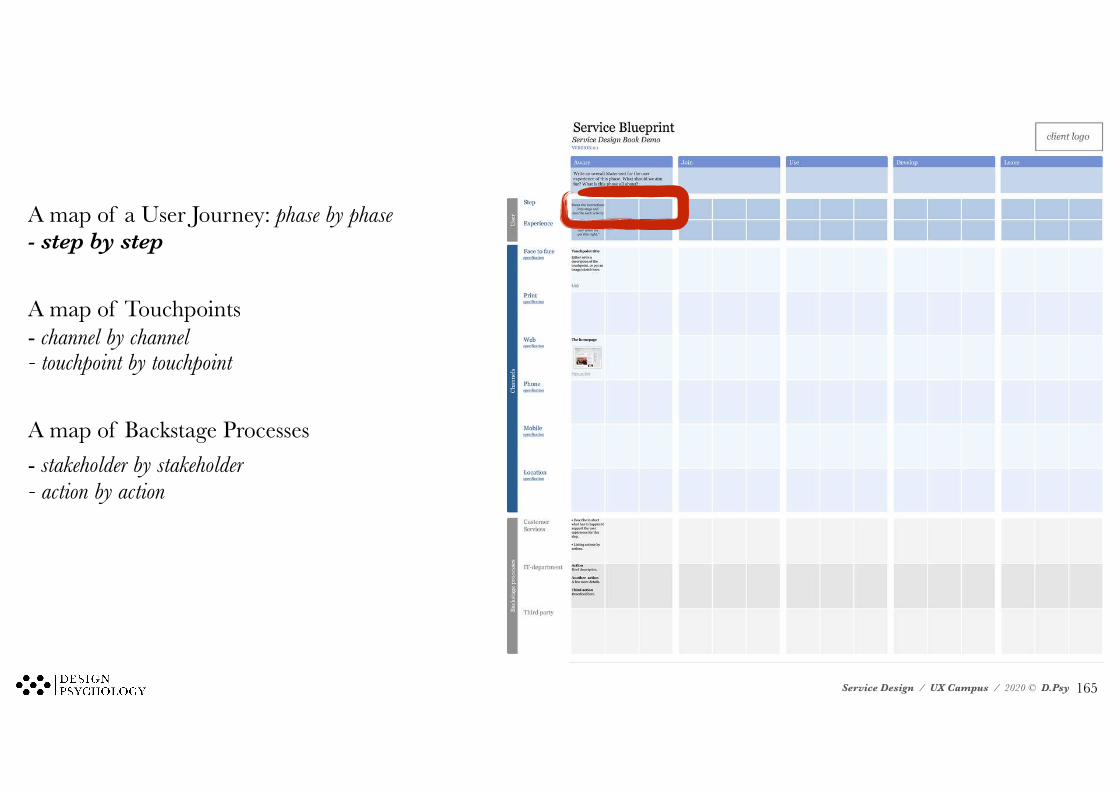
A map of a User Journey: phase by phase - step by step
A map of Touchpoints - channel by channel - touchpoint by touchpoint
A map of Backstage Processes - stakeholder by stakeholder - action by action
!165
Service Design / UX Campus / 2020 © D.Psy !166
Service Design / UX Campus / 2020 © D.Psy
A map of a User Journey: phase by phase - step by step
A map of Touchpoints - channel by channel - touchpoint by touchpoint
A map of Backstage Processes - stakeholder by stakeholder - action by action
!167
Service Design / UX Campus / 2020 © D.Psy
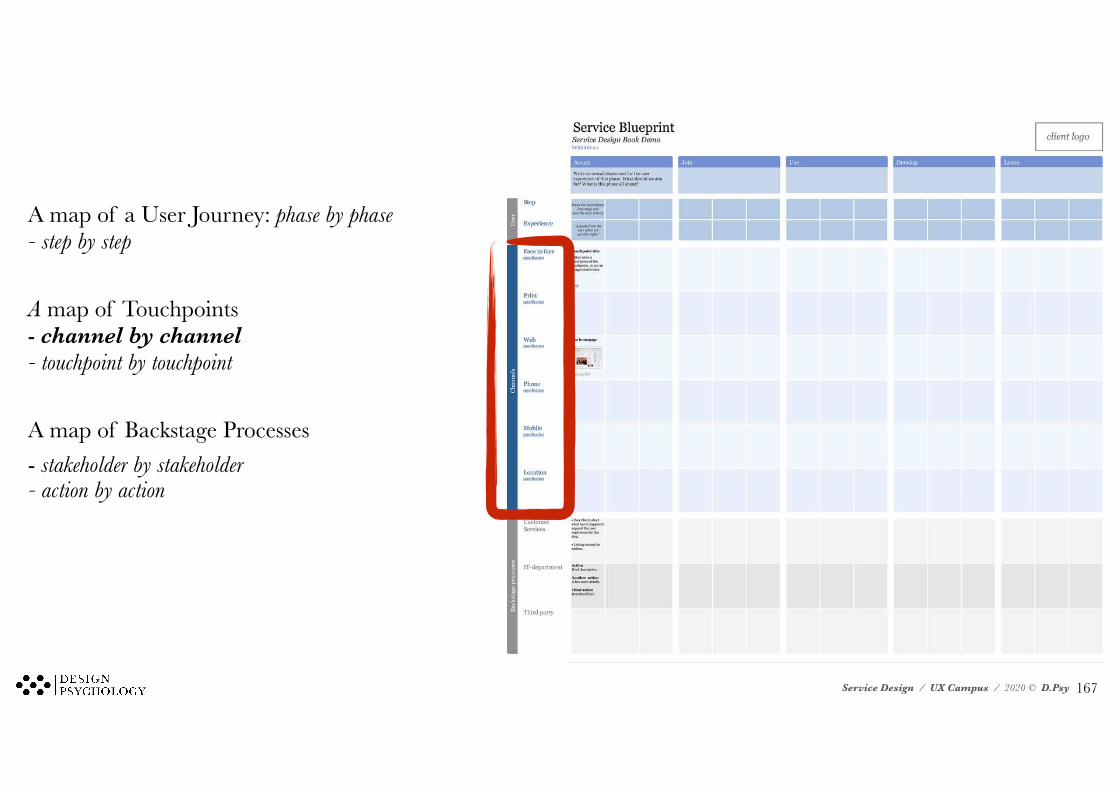
A map of a User Journey: phase by phase - step by step
A map of Touchpoints - channel by channel - touchpoint by touchpoint
A map of Backstage Processes - stakeholder by stakeholder - action by action
!168
Service Design / UX Campus / 2020 © D.Psy
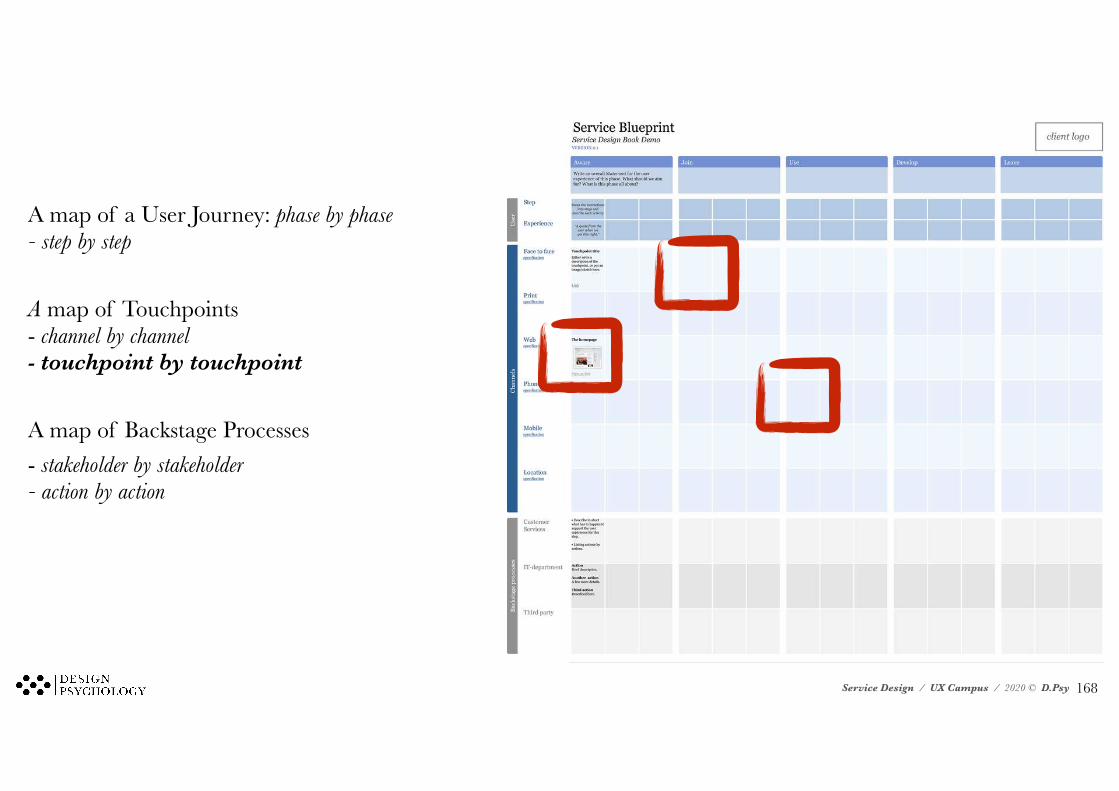
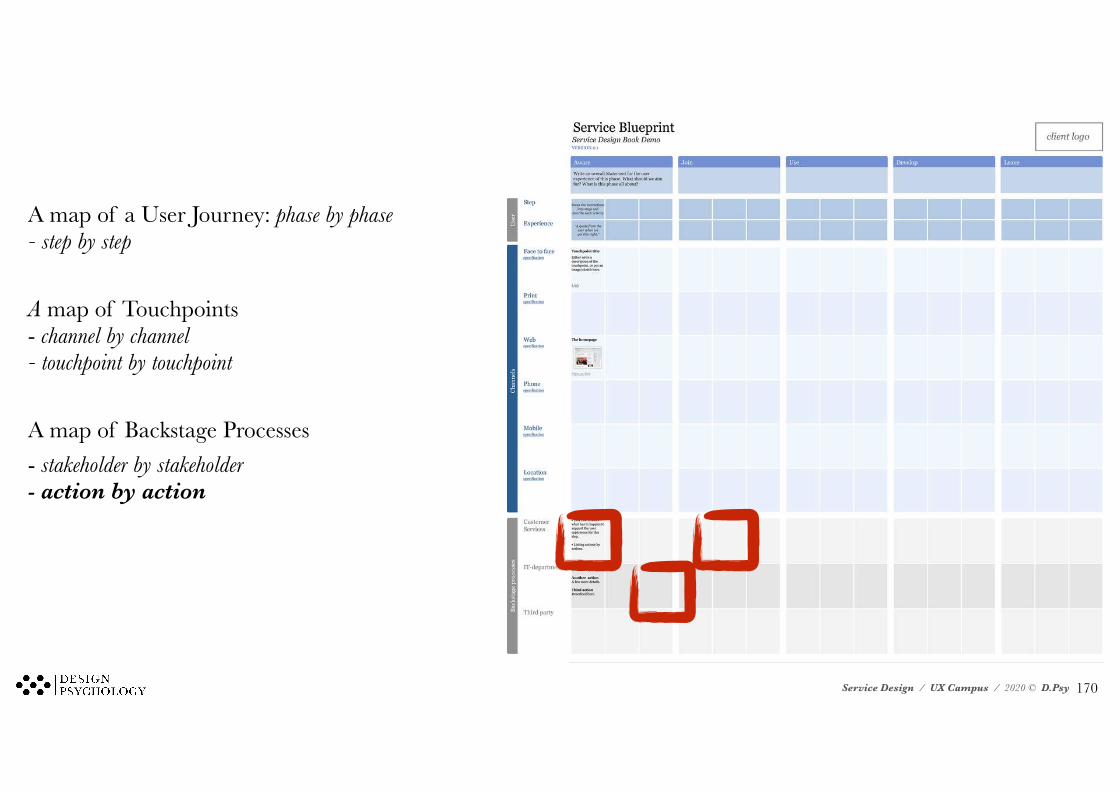
A map of a User Journey: phase by phase - step by step
A map of Touchpoints - channel by channel - touchpoint by touchpoint
A map of Backstage Processes - stakeholder by stakeholder - action by action
!169
Service Design / UX Campus / 2020 © D.Psy
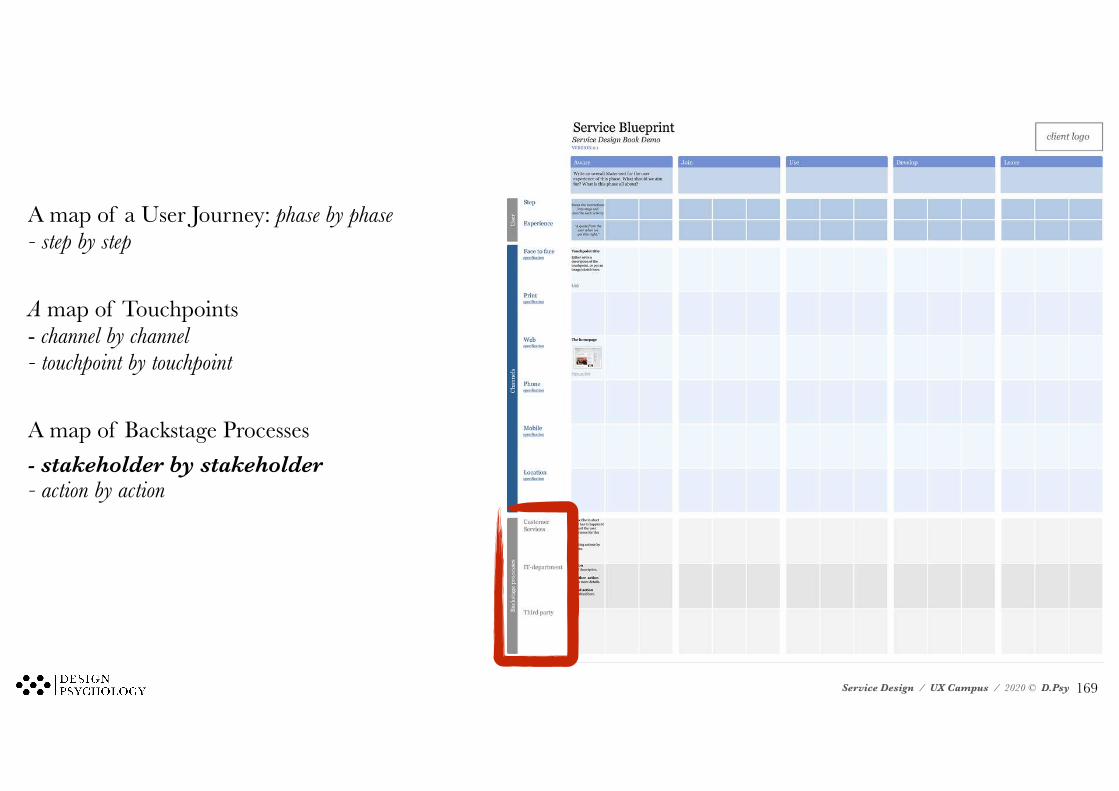
A map of a User Journey: phase by phase - step by step
A map of Touchpoints - channel by channel - touchpoint by touchpoint
A map of Backstage Processes - stakeholder by stakeholder - action by action
!170
Service Design / UX Campus / 2020 © D.Psy
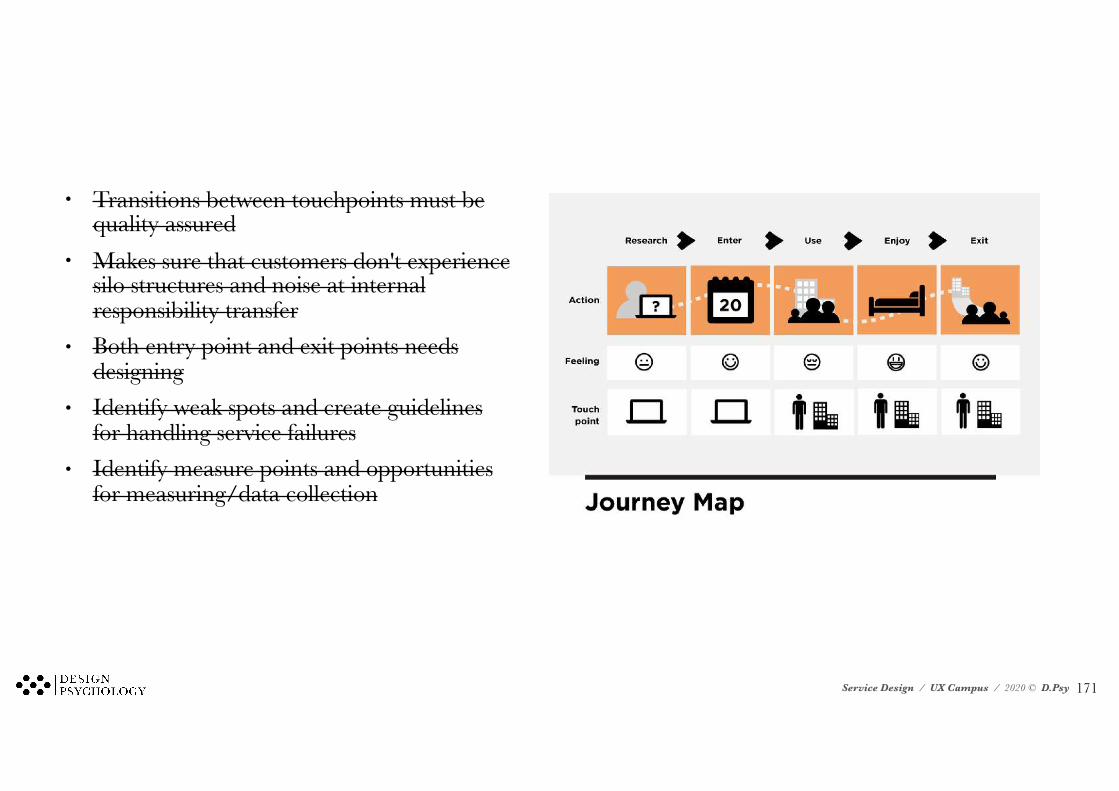
• Transitions between touchpoints must be quality assured
• Makes sure that customers don't experience silo structures and noise at internal responsibility transfer
• Both entry point and exit points needs designing
• Identify weak spots and create guidelines for handling service failures
• Identify measure points and opportunities for measuring/data collection
!171
Service Design / UX Campus / 2020 © D.Psy
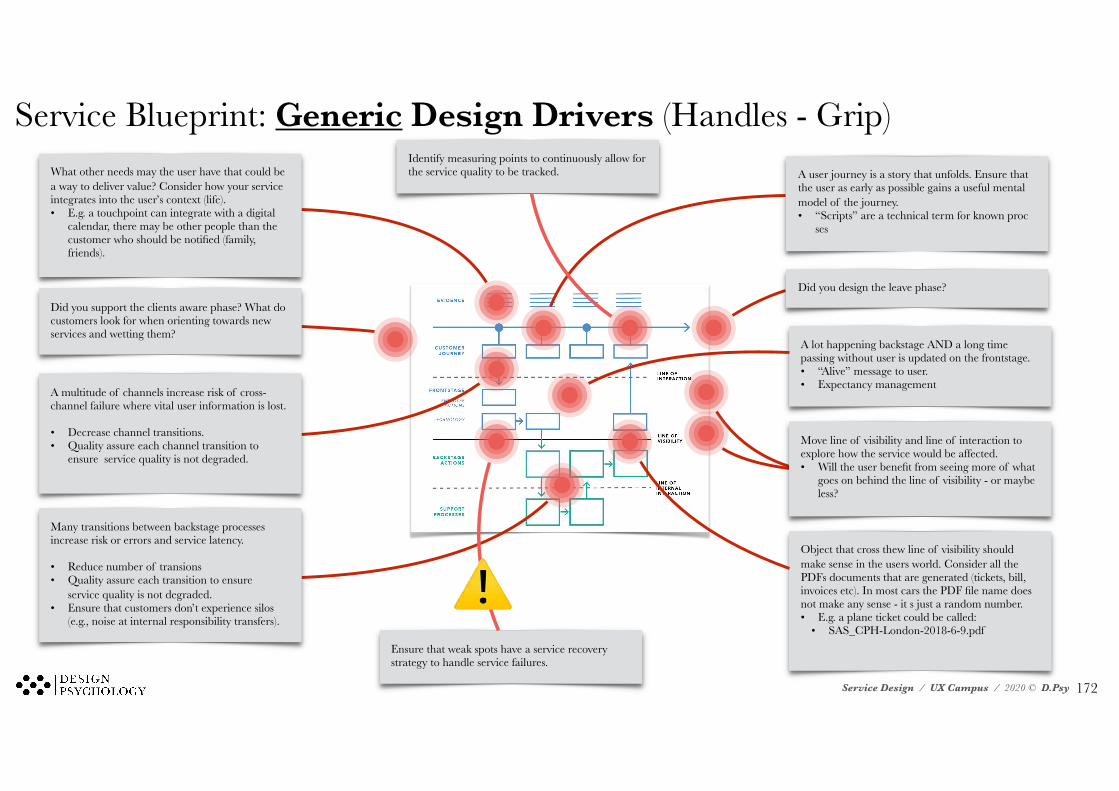
Service Blueprint: Generic Design Drivers (Handles - Grip)
A lot happening backstage AND a long time passing without user is updated on the frontstage. • “Alive” message to user. • Expectancy management
What other needs may the user have that could be a way to deliver value? Consider how your service integrates into the user’s context (life). • E.g. a touchpoint can integrate with a digital
calendar, there may be other people than the customer who should be notified (family, friends).
Many transitions between backstage processes increase risk or errors and service latency.
• Reduce number of transions • Quality assure each transition to ensure
service quality is not degraded. • Ensure that customers don’t experience silos
(e.g., noise at internal responsibility transfers).
A multitude of channels increase risk of cross-channel failure where vital user information is lost.
• Decrease channel transitions. • Quality assure each channel transition to
ensure service quality is not degraded.
A user journey is a story that unfolds. Ensure that the user as early as possible gains a useful mental model of the journey. • “Scripts” are a technical term for known proc
ses
Move line of visibility and line of interaction to explore how the service would be affected. • Will the user benefit from seeing more of what
goes on behind the line of visibility - or maybe less?
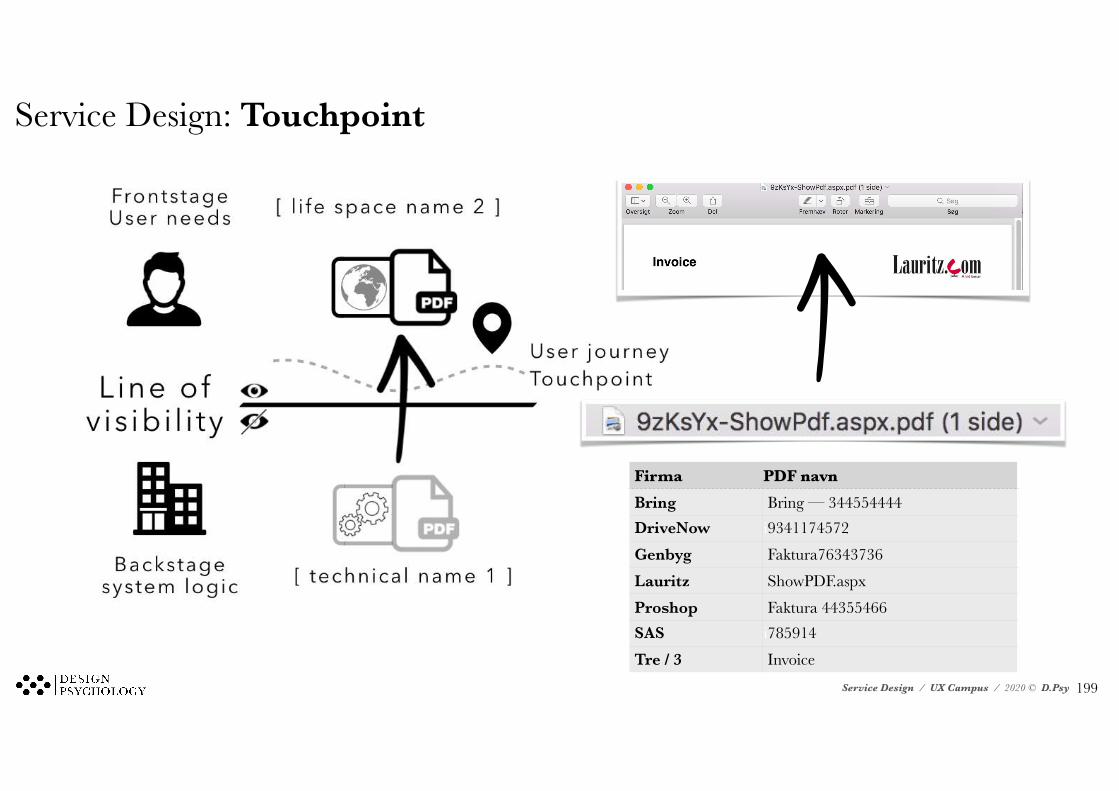
Object that cross thew line of visibility should make sense in the users world. Consider all the PDFs documents that are generated (tickets, bill, invoices etc). In most cars the PDF file name does not make any sense - it s just a random number. • E.g. a plane ticket could be called:
• SAS_CPH-London-2018-6-9.pdf
Did you design the leave phase?
Did you support the clients aware phase? What do customers look for when orienting towards new services and wetting them?
!172
Ensure that weak spots have a service recovery strategy to handle service failures.
⚠
Identify measuring points to continuously allow for the service quality to be tracked.
Service Design / UX Campus / 2020 © D.Psy
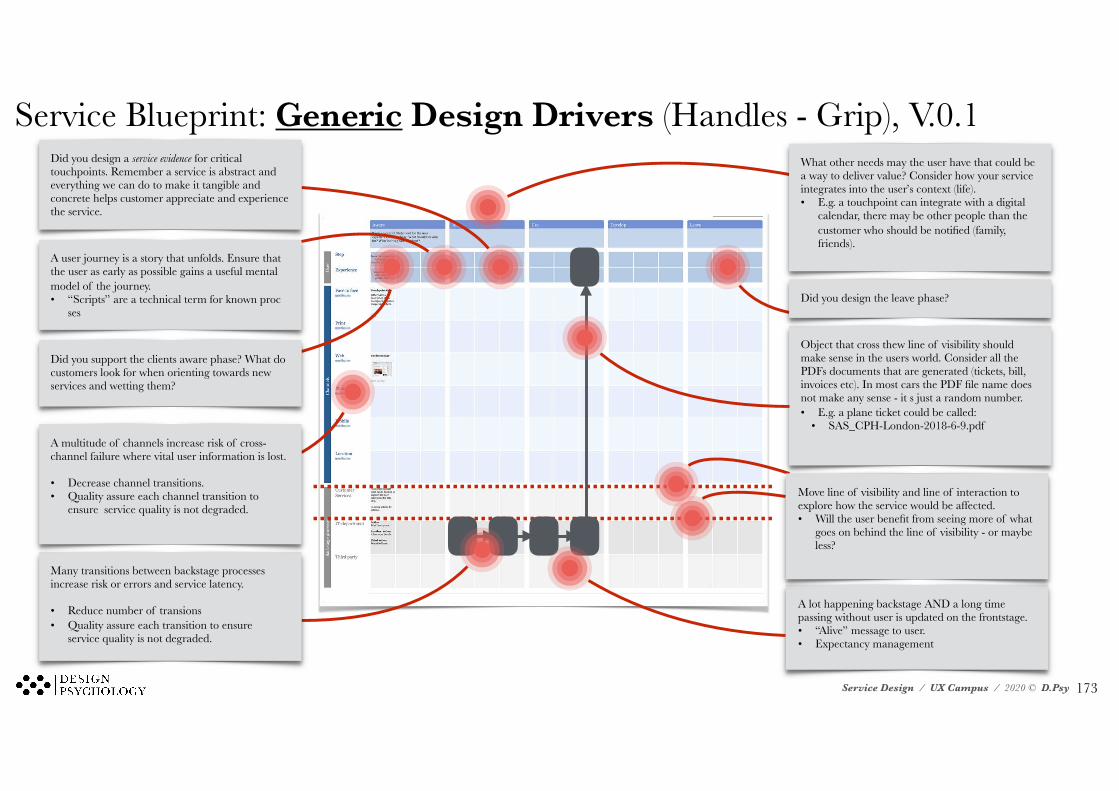
Service Blueprint: Generic Design Drivers (Handles - Grip), V.0.1
A lot happening backstage AND a long time passing without user is updated on the frontstage. • “Alive” message to user. • Expectancy management
What other needs may the user have that could be a way to deliver value? Consider how your service integrates into the user’s context (life). • E.g. a touchpoint can integrate with a digital
calendar, there may be other people than the customer who should be notified (family, friends).
Many transitions between backstage processes increase risk or errors and service latency.
• Reduce number of transions • Quality assure each transition to ensure
service quality is not degraded.
A multitude of channels increase risk of cross-channel failure where vital user information is lost.
• Decrease channel transitions. • Quality assure each channel transition to
ensure service quality is not degraded.
A user journey is a story that unfolds. Ensure that the user as early as possible gains a useful mental model of the journey. • “Scripts” are a technical term for known proc
ses
Move line of visibility and line of interaction to explore how the service would be affected. • Will the user benefit from seeing more of what
goes on behind the line of visibility - or maybe less?
Object that cross thew line of visibility should make sense in the users world. Consider all the PDFs documents that are generated (tickets, bill, invoices etc). In most cars the PDF file name does not make any sense - it s just a random number. • E.g. a plane ticket could be called:
• SAS_CPH-London-2018-6-9.pdf
Did you design the leave phase?
Did you support the clients aware phase? What do customers look for when orienting towards new services and wetting them?
Did you design a service evidence for critical touchpoints. Remember a service is abstract and everything we can do to make it tangible and concrete helps customer appreciate and experience the service.
!173
Service Design / UX Campus / 2020 © D.Psy
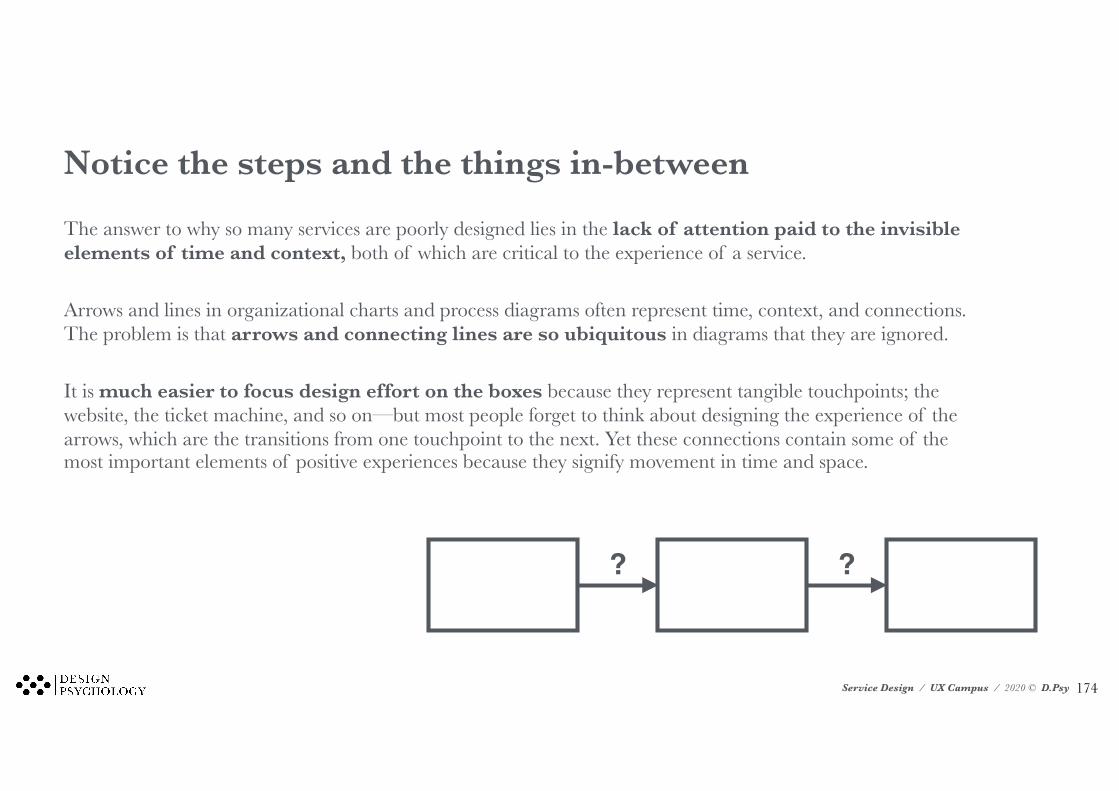
Notice the steps and the things in-between
The answer to why so many services are poorly designed lies in the lack of attention paid to the invisible elements of time and context, both of which are critical to the experience of a service.
Arrows and lines in organizational charts and process diagrams often represent time, context, and connections. The problem is that arrows and connecting lines are so ubiquitous in diagrams that they are ignored.
It is much easier to focus design effort on the boxes because they represent tangible touchpoints; the website, the ticket machine, and so on—but most people forget to think about designing the experience of the arrows, which are the transitions from one touchpoint to the next. Yet these connections contain some of the most important elements of positive experiences because they signify movement in time and space.
? ?
!174
Service Design / UX Campus / 2020 © D.Psy !175Service Design / UX Campus / 2020 © D.Psy
Service Design / UX Campus / 2020 © D.Psy
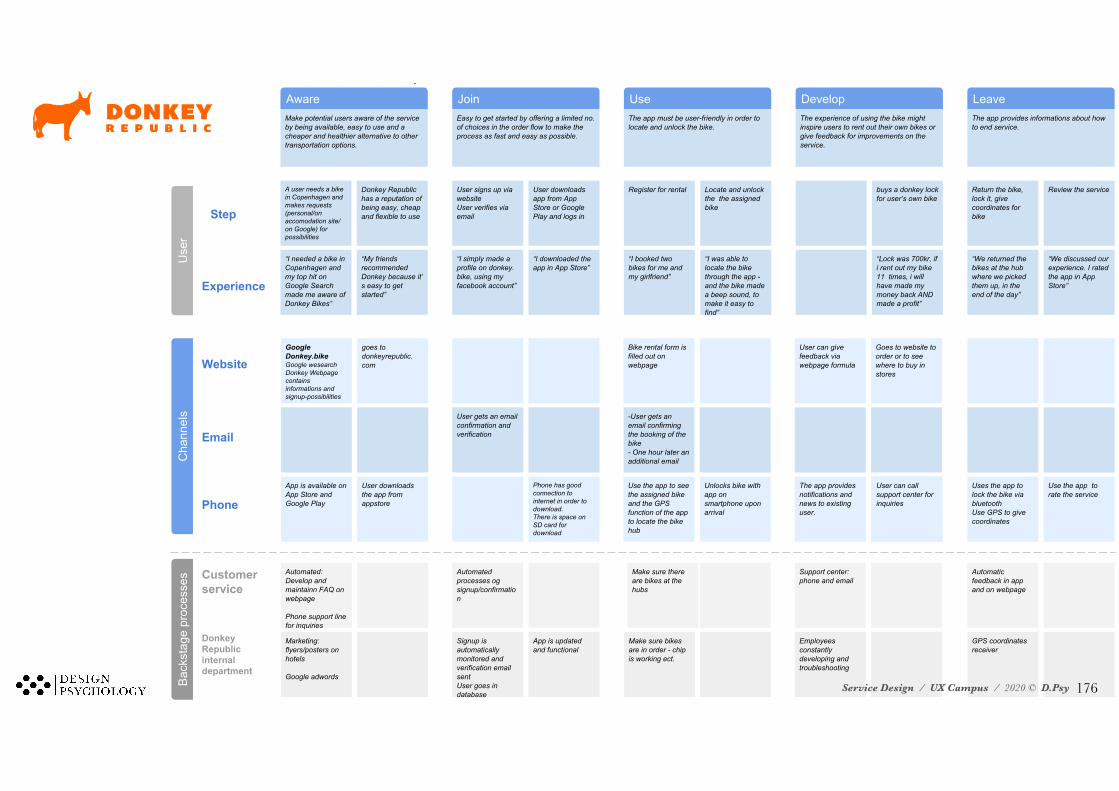
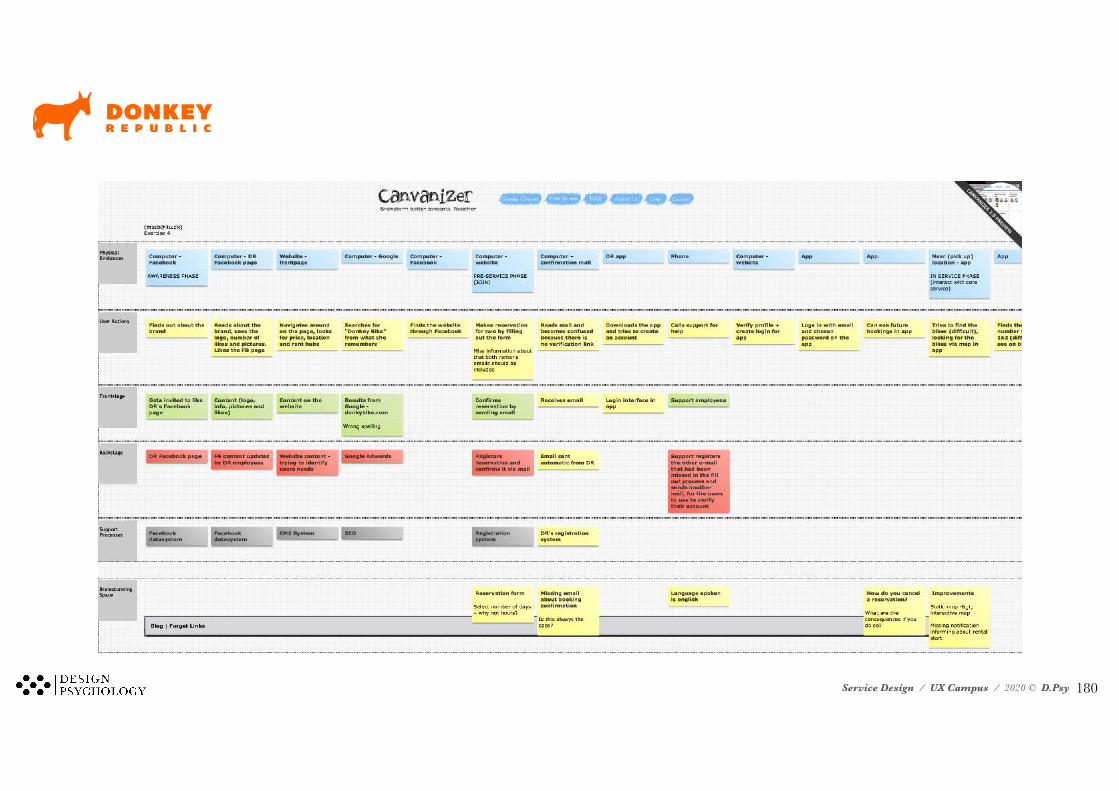
Make potential users aware of the service by being available, easy to use and a cheaper and healthier alternative to other transportation options.
Aware
Service BlueprintDonkey Republic: The Donkey ForceMarie, Damir, Rasmus, Anna, Aja
JoinEasy to get started by offering a limited no. of choices in the order flow to make the process as fast and easy as possible.
UseThe app must be user-friendly in order to locate and unlock the bike.
DevelopThe experience of using the bike might inspire users to rent out their own bikes or give feedback for improvements on the service.
LeaveThe app provides informations about how to end service.
A user needs a bike in Copenhagen and makes requests (personal/on accomodation site/ on Google) for possibilities
Use
r
Step
Experience
Donkey Republic has a reputation of being easy, cheap and flexible to use
“My friends recommended Donkey because it’s easy to get started”
“I needed a bike in Copenhagen and my top hit on Google Search made me aware of Donkey Bikes”
“I simply made a profile on donkey.bike, using my facebook account”
User signs up via websiteUser verifies via email
“I downloaded the app in App Store”
User downloads app from App Store or Google Play and logs in
“I booked two bikes for me and my girlfriend”
Register for rental
“I was able to locate the bike through the app - and the bike made a beep sound, to make it easy to find”
Locate and unlock the the assigned bike
“Lock was 700kr, if i rent out my bike 11 times, i will have made my money back AND made a profit”
buys a donkey lock for user’s own bike
“We returned the bikes at the hub where we picked them up, in the end of the day”
Return the bike, lock it, give coordinates for bike
“We discussed our experience. I rated the app in App Store”
Review the serviceC
hann
els
Website
GoogleDonkey.bike Google wesearchDonkey Webpage contains informations and signup-possibilities
goes to donkeyrepublic.com
User downloads the app from appstore
App is available on App Store and Google PlayPhone
User gets an email confirmation and verification
Phone has good connection to internet in order to download.There is space on SD card for download
-User gets an email confirming the booking of the bike- One hour later an additional email
Unlocks bike with app on smartphone upon arrival
Use the app to see the assigned bike and the GPS function of the app to locate the bike hub
Bike rental form is filled out on webpage
Goes to website to order or to see where to buy in stores
User can give feedback via webpage formula
Use the app to rate the service
Uses the app to lock the bike via bluetoothUse GPS to give coordinates
Bac
ksta
ge p
roce
sses Customer
service
Marketing: flyers/posters on hotels
Google adwords
Automated: Develop and maintainn FAQ on webpage
Phone support line for inquiries
Signup is automatically monitored and verification email sentUser goes in database
Automated processes og signup/confirmation
App is updated and functional
Make sure bikes are in order - chip is working ect.
Make sure there are bikes at the hubs
Employees constantly developing and troubleshooting
Support center: phone and email
GPS coordinates receiver
Automatic feedback in app and on webpage
Donkey Republic internal department
The app provides notifications and news to existing user.
User can call support center for inquiries
!176Service Design / UX Campus / 2020 © D.Psy
Service Design / UX Campus / 2020 © D.Psy
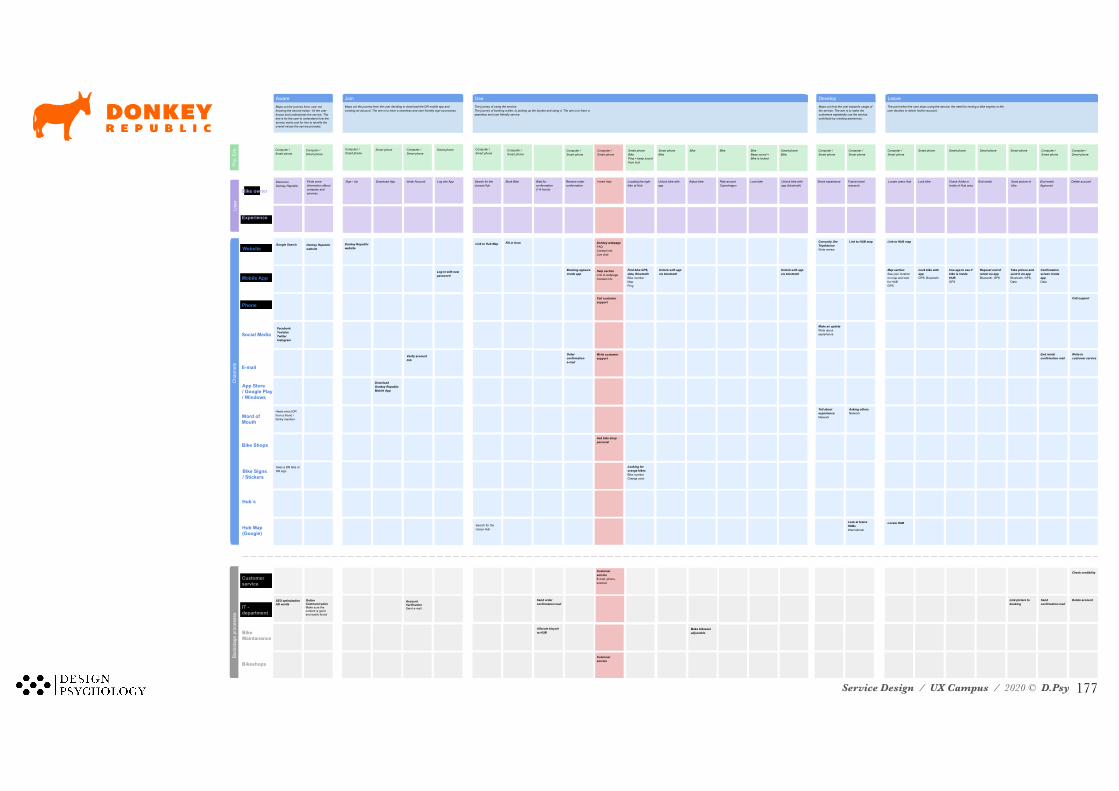
Aware
Donkey Republic Service Blueprint
Join Use Develop Leave
Use
r
Bike owner
Experience
Cha
nnel
s
Website
Mobile App
Phone
Social Media
App Store/ Google Play/ Windows
Word ofMouth
Bike Shops
Bike Signs/ Stickers
Hub´s
Hub Map(Google)
Bac
ksta
ge p
roce
sses
Customer
BikeMaintanance
Bikeshops
service
SEO optimizationAD words
IT - department
Phy
. Eve
.
Maps out the journey from; user not knowing the service exists - till the user knows and understands the service. The aim is for the user to understand how the service works and for him to identify the overall values the service provides.
Group: Nono NoGroup members: Julie, Christina, Oddny & SilasDate: 01.03.2016
Maps out the journey from the user deciding to download the DR mobile app and creating an account. The aim is to have a seamless and user friendly sign-up process.
The journey of using the service; The journey of booking a bike, to picking up the bicykle and using it. The aim is to have a seamless and user friendly service.
Maps out how the user expands usage of the service. The aim is to make the customers repeatedly use the service, contribute by creating awareness.
The point when the user stops using the service; the need for renting a bike expires or the user decides to delete his/her account.
Discovers Donkey Republic
Computer / Smart phone
Computer / Smart phone
Computer / Smart phone
Computer / Smart phone
Computer / Smart phone
Computer / Smart phone
Smart phone Smart phone
Finds more information afbout company and services
Sign - Up Download App Verify Account Search for the closest Hub
Recieve order confermation
I need help Unlock bike with app
Ride around Copenhagen
Lock bikeAdjust bikeWait for confermation (1-6 hours)
Locating the right bike at Hub
Book BikeLog into App Unlock bike with app (bluetooth)
Share experience Future travel research
Locate users Hub Lock bike Check if bike is inside of Hub area
End rental Send picture of bike
End rental Approved
Delete account
Google Search Donkey Republicwebsite
Donkey Republicwebsite
Log-in with new password
FacebookYoutube TwitterInstagram
Hears anout DR from a friend / family member
Sees a DR bike or DR sign
Search for the closes Hub
OnlineCommunicationMake sure the content is good and easily found
Account VarificationSend e-mail
Download Donkey RepublicMobile App
Order confirmation e-mail
Booking appears inside app
Donkey webpageFAQContact infoLive chat
Find bike GPS, data, BluetoothBike numberMapPing
Unlock with app via bluetooth
Unlock with app via bluetooth
Comunity like TripAdvisorWrite review
Link to HUB map Link to HUB map
Map sectionSee your location on map and look for HUBGPS
Lock bike with appGPS, Bluetooth
Use app to see if bike is inside HUBGPS
Request end of rental via appBluetooth, GPS
Take picture and send it via appBluetooth, GPS, Data
Confirmation screen inside appData
End rental confirmation mail
Write to customer service
Call support
Locate HUBLook at future HUBsInternational
Make an updateWrite about expierience
Tell about expierienceNetwork
Asking othersNetwork
Looking for orange bikesBike numberOrange color
Make bikeseat adjustable
Link picture to booking
Delete accountSend confirmation mail
Check credibility
Help sectionLink to webpageContact info
Call customer support
Write customer support
Ask bike shop personal
Customer serviceE-mail, phone, livechat
Customer service
Send order confirmation mail
Allocate bicycle to HUB
Fill in form
Computer /Smart phone
Smart phoneBikePing = beep sound from lock
Smart phoneBike
Smart phoneBike
Computer /Smart phone
Computer /Smart phone
Computer /Smart phone
Smart phone Smart phone Smart phone Smart phone Computer / Smart phone
Computer / Smart phone
Bike Bike BikeBeep sound = Bike is locked
Computer /Smart phone
Verify account link
Link to Hub Map
!177
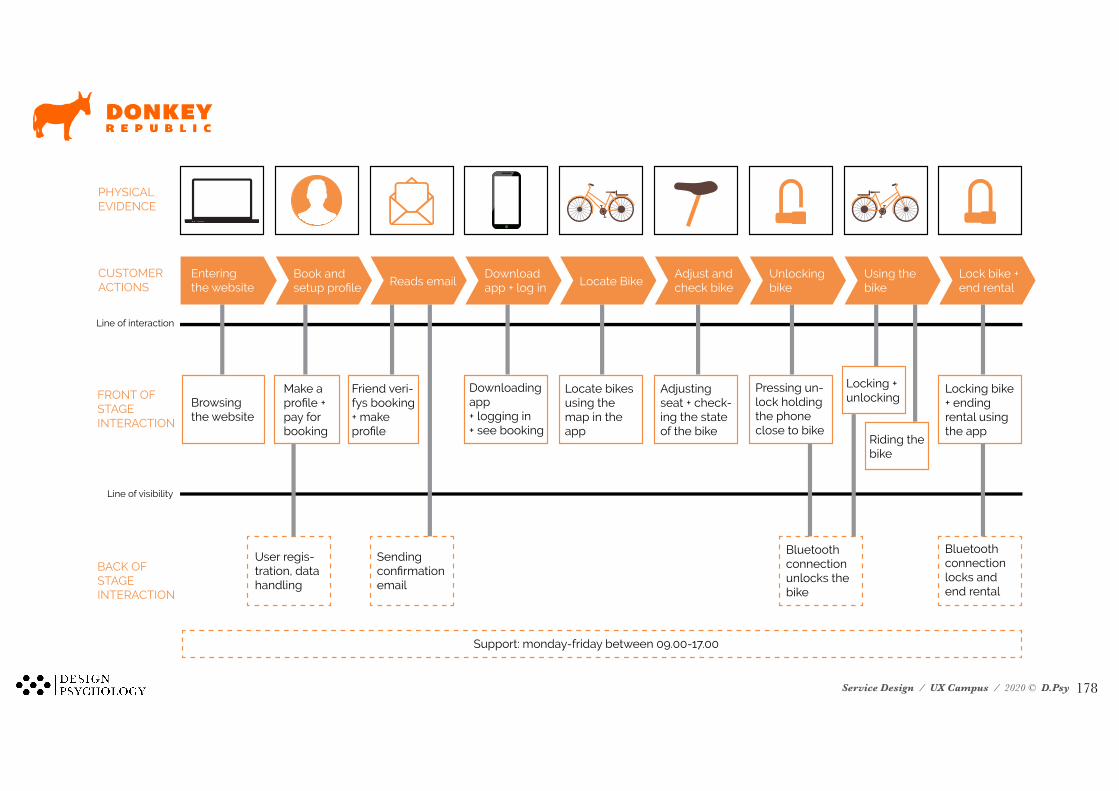
Service Design / UX Campus / 2020 © D.Psy
Entering the website
Book and setup profile Reads email
Download app + log in Locate Bike
Adjust and check bike
Unlocking bike
Using the bike
Lock bike + end rental
Service Blueprintby FunkyDonkeys03/03-16 - Pernille, Anne, Olga, Anne-Sofie & Margit
PHYSICAL EVIDENCE
CUSTOMER ACTIONS
Line of interaction
Line of visibility
FRONT OF STAGEINTERACTION
BACK OF STAGEINTERACTION
Browsing the website
Make a profile + pay for booking
Friend veri-fys booking + make profile
Downloadingapp+ logging in + see booking
Locate bikes using the map in the app
Adjusting seat + check-ing the state of the bike
Pressing un-lock holding the phone close to bike
Locking + unlocking
Riding the bike
Locking bike + ending rental using the app
Bluetooth connection unlocks the bike
Bluetooth connection locks and end rental
User regis-tration, data handling
Sending confirmation email
Support: monday-friday between 09.00-17.00
!178
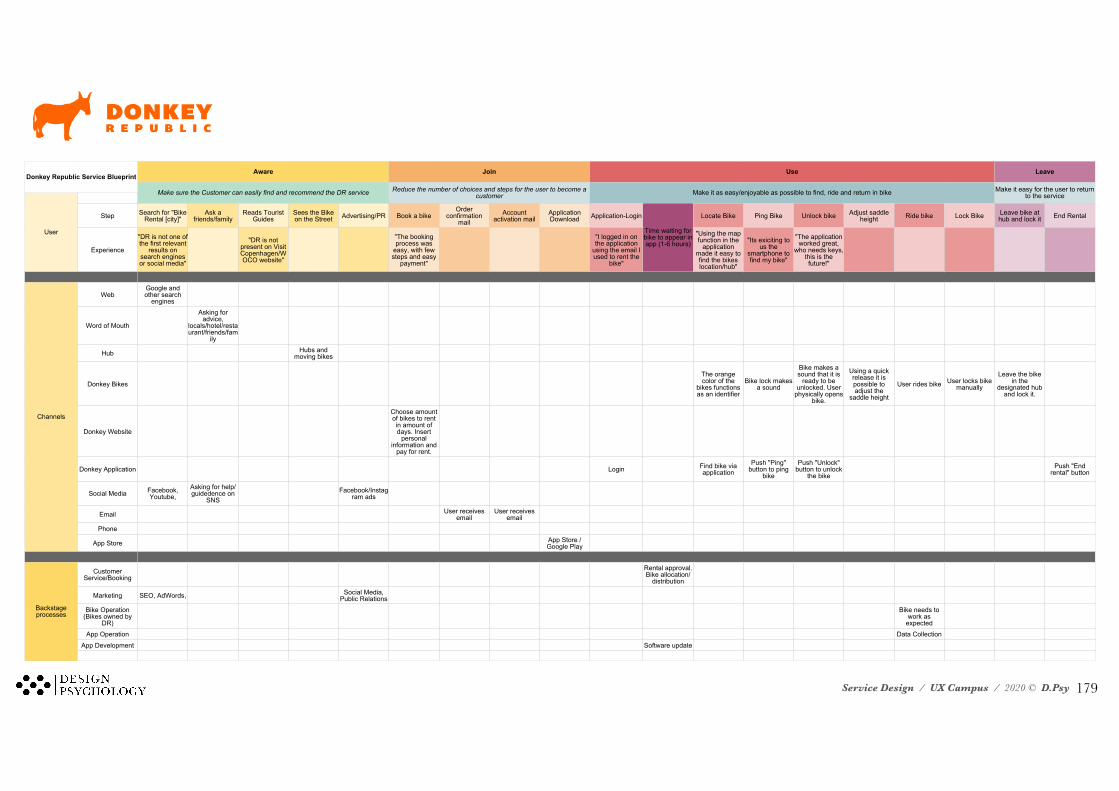
Service Design / UX Campus / 2020 © D.Psy
Step Search for "BikeRental [city]"
Ask afriends/family
Reads TouristGuides
Sees the Bikeon the Street Advertising/PR Book a bike
Orderconfirmation
mailAccount
activation mailApplicationDownload Application-Login Locate Bike Ping Bike Unlock bike Adjust saddle
height Ride bike Lock Bike Leave bike athub and lock it End Rental
Experience
"DR is not one ofthe first relevant
results onsearch enginesor social media"
"DR is notpresent on VisitCopenhagen/WOCO website"
"The bookingprocess was
easy, with fewsteps and easy
payment"
"I logged in onthe application
using the email Iused to rent the
bike"
"Using the mapfunction in the
applicationmade it easy tofind the bikeslocation/hub"
"Its exiciting tous the
smartphone tofind my bike"
"The applicationworked great,
who needs keys,this is thefuture!"
WebGoogle andother search
engines
Word of Mouth
Asking foradvice,
locals/hotel/restaurant/friends/fam
ily
Hub Hubs andmoving bikes
Donkey BikesThe orangecolor of the
bikes functionsas an identifier
Bike lock makesa sound
Bike makes asound that it is
ready to beunlocked. User
physically opensbike.
Using a quickrelease it ispossible toadjust the
saddle height
User rides bike User locks bikemanually
Leave the bikein the
designated huband lock it.
Donkey Website
Choose amountof bikes to rentin amount ofdays. Insert
personalinformation and
pay for rent.
Donkey Application Login Find bike viaapplication
Push "Ping"button to ping
bike
Push "Unlock"button to unlock
the bikePush "End
rental" button
Social Media Facebook,Youtube,
Asking for help/guidedence on
SNSFacebook/Instag
ram ads
Email User receivesemail
User receivesemail
Phone
App Store App Store /Google Play
CustomerService/Booking
Rental approval.Bike allocation/
distribution
Marketing SEO, AdWords, Social Media,Public Relations
Bike Operation(Bikes owned by
DR)
Bike needs towork as
expectedApp Operation Data Collection
App Development Software update
Donkey Republic Service BlueprintAware Join Use Leave
Make sure the Customer can easily find and recommend the DR service Reduce the number of choices and steps for the user to become acustomer Make it as easy/enjoyable as possible to find, ride and return in bike Make it easy for the user to return
to the service
User Time waiting forbike to appear inapp (1-6 hours)
Channels
Backstageprocesses
!179
Service Design / UX Campus / 2020 © D.Psy !180
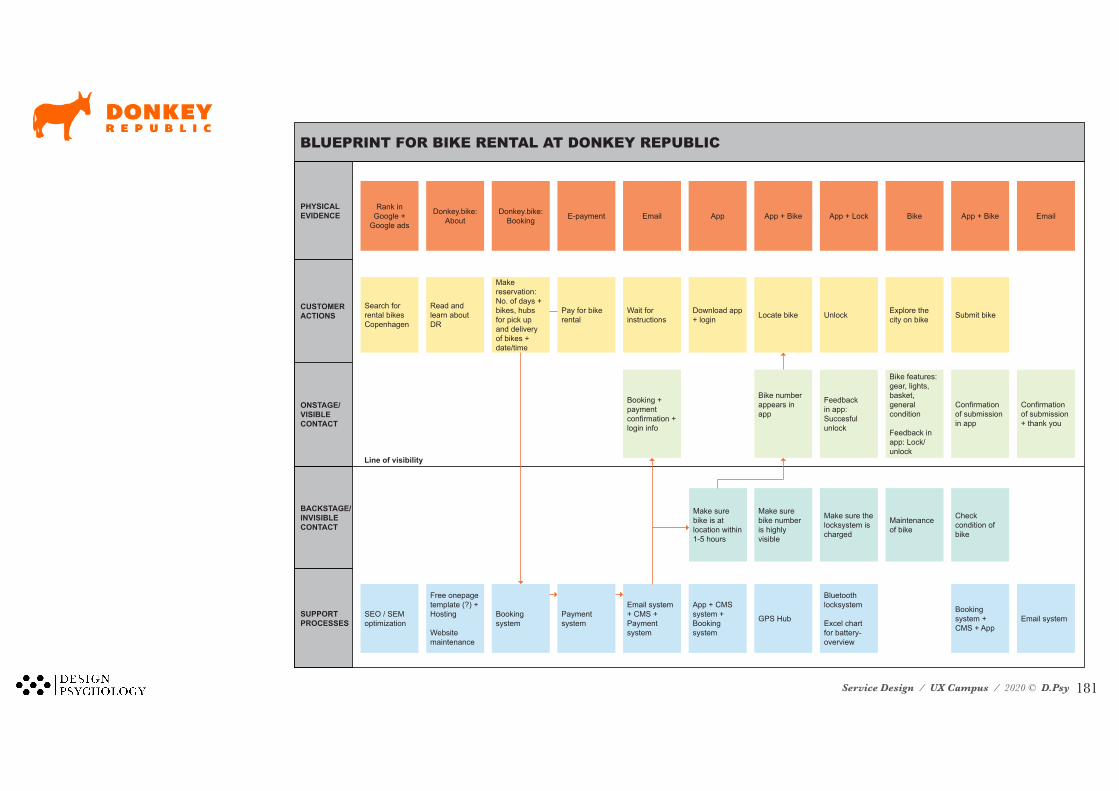
Service Design / UX Campus / 2020 © D.Psy
PHYSICAL EVIDENCE
Rank in Google +
Google ads
Donkey.bike: About
Donkey.bike: Booking E-payment Email App App + Bike App + Lock Bike App + Bike
CUSTOMER ACTIONS
Search for rental bikes Copenhagen
Read and learn about DR
Make reservation: No. of days + bikes, hubs for pick up and delivery of bikes + date/time
Pay for bike rental
Wait for instructions
Download app + login Locate bike Unlock Explore the
city on bike Submit bike
ONSTAGE/VISIBLE CONTACT
Booking + payment confirmation + login info
Bike number appears in app
Feedback in app: Succesful unlock
Bike features: gear, lights, basket, general condition
Feedback in app: Lock/unlock
Confirmation of submission in app
BACKSTAGE/INVISIBLE CONTACT
Make sure bike is at location within 1-5 hours
Make sure bike number is highly visible
Make sure the locksystem is charged
Maintenance of bike
Check condition of bike
SUPPORT PROCESSES
SEO / SEM optimization
Free onepage template (?) + Hosting
Website maintenance
Booking system
Payment system
Email system + CMS + Payment system
App + CMS system + Booking system
GPS Hub
Bluetooth locksystem
Excel chart for battery-overview
Booking system + CMS + App
Confirmation of submission + thank you
Email system
Line of visibility
BLUEPRINT FOR BIKE RENTAL AT DONKEY REPUBLIC
!181
Service Design / UX Campus / 2020 © D.Psy !182
Service Design / UX Campus / 2020 © D.Psy
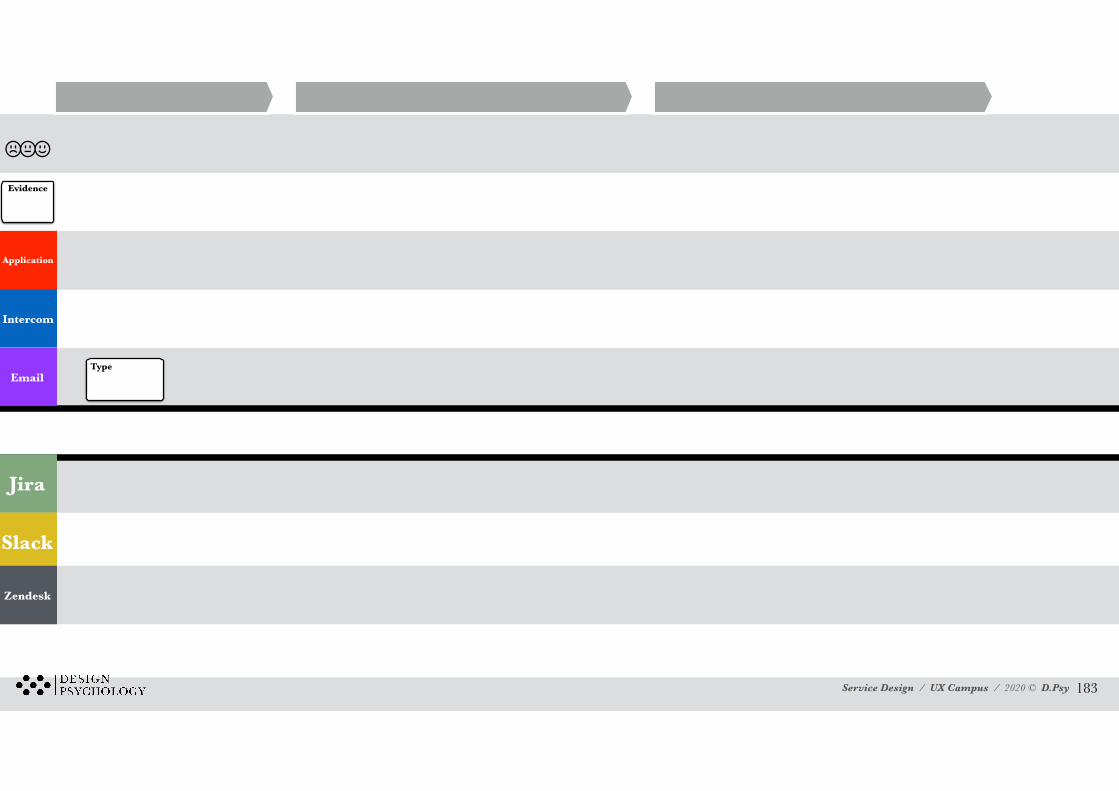
Jira
Slack
Zendesk
Intercom
Application
Type
Evidence
!183
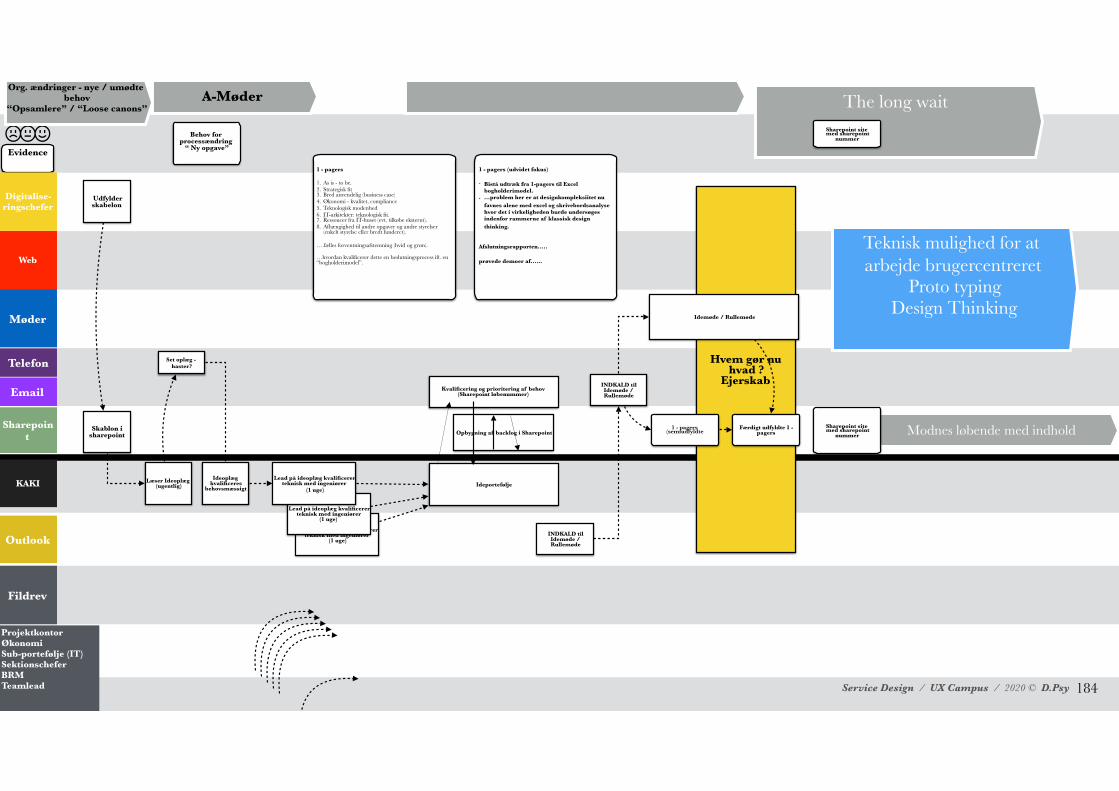
Service Design / UX Campus / 2020 © D.Psy
Hvem gør nu hvad ?
Ejerskab
Opbygning af backlog i Sharepoint
Lead på ideoplæg kvalificerer teknisk med ingeniører
(1 uge)
Lead på ideoplæg kvalificerer teknisk med ingeniører
(1 uge)
Sharepoint
Outlook
Fildrev
Møder
Web
Evidence
A-Møder The long waitOrg. ændringer - nye / umødte
behov “Opsamlere” / “Loose canons”
Behov for processændring
“ Ny opgave”
Udfylder skabelon
Digitalise-ringschefer
Skablon i sharepoint
KAKI Læser Ideoplæg (ugentlig)
Ideoplæg kvalificeres
behovsmæssigt
Telefon Set oplæg - haster?
Lead på ideoplæg kvalificerer teknisk med ingeniører
(1 uge)Ideportefølje
Kvalificering og prioritering af behov (Sharepoint løbenummer)
INDKALD til Idemøde / Rullemøde
INDKALD til Idemøde / Rullemøde
Idemøde / Rullemøde
1 - pagers (semiudfyldte
Færdigt udfyldte 1 - pagers
Projektkontor Økonomi Sub-portefølje (IT) Sektionschefer BRM Teamlead
Sharepoint site med sharepoint
nummer
Modnes løbende med indholdSharepoint site med sharepoint
nummer
Teknisk mulighed for at arbejde brugercentreret
Proto typing Design Thinking
1 - pagers
1. As is - to be. 2. Strategisk fit 3. Bred anvendelig (business case) 4. Økonomi - kvalitet, compliance 5. Teknologisk modenhed 6. IT-arkitekter: teknologisk fit. 7. Ressoucer fra IT-huset (evt. tilkøbe eksternt). 8. Afhængighed til andre opgaver og andre styrelser
(enkelt styrelse eller bredt funderet).
….fælles forventningsafstemning (hvid og grøn).
…hvordan kvalificerer dette en beslutningsprocess ift. en “bogholderimodel”.
1 - pagers (udvidet fokus)
- Bistå udtræk fra 1-pagers til Excel bogholderimodel.
- …problem her er at designkompleksiitet nu favnes alene med excel og skrivebordsanalyse hvor det i virkeligheden burde undersøges indenfor rammerne af klassisk design thinking.
Afslutningsrapporten…..
prøvede demoer af……
!184
Service Design / UX Campus / 2020 © D.Psy
Sharepoint
Outlook
Fildrev
Møder
Web
Evidence
A-MøderOrg. ændringer - nye / umødte
behov “Opsamlere” / “Loose canons”
Digitalise-ringschefer
KAKI
Telefon
Projektkontor Økonomi Sub-portefølje (IT) Sektionschefer BRM Teamlead
Sharepoint site med sharepoint
nummer
!185
Service Design / UX Campus / 2020 © D.Psy
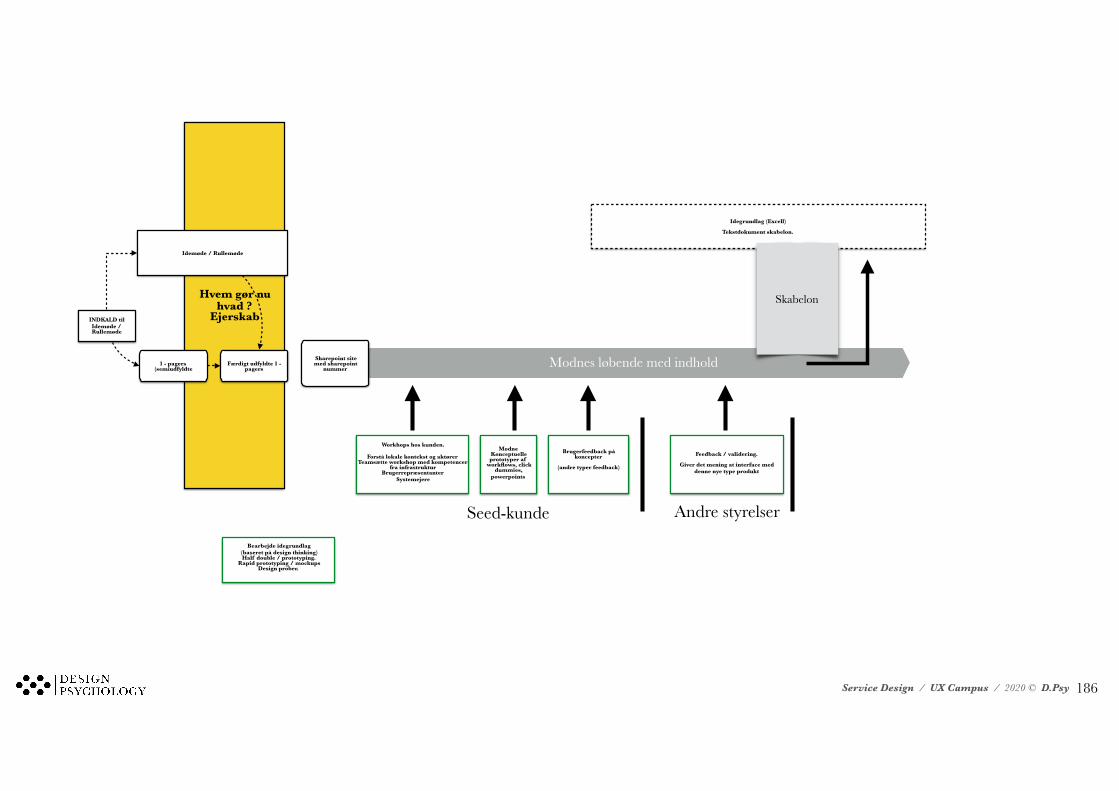
Modnes løbende med indhold
Bearbejde idegrundlag (baseret på design thinking) Half double / prototyping.
Rapid prototyping / mockups Design prober.
Hvem gør nu hvad ?
EjerskabINDKALD til Idemøde / Rullemøde
Idemøde / Rullemøde
1 - pagers (semiudfyldte
Færdigt udfyldte 1 - pagers
Sharepoint site med sharepoint
nummer
Idegrundlag (Excell)
Tekstdokument skabelon.
Workhops hos kunden.
Forstå lokale kontekst og aktører Teamsætte workshop med kompetencer
fra infrastruktur Brugerrepræsentanter
Systemejere
Modne Konceptuelle prototyper af
workflows, click dummies,
powerpoints
Brugerfeedback på koncepter
(andre typer feedback)
Feedback / validering.
Giver det mening at interface med denne nye type produkt
Seed-kunde Andre styrelser
Skabelon
!186
Service Design / UX Campus / 2020 © D.Psy !187
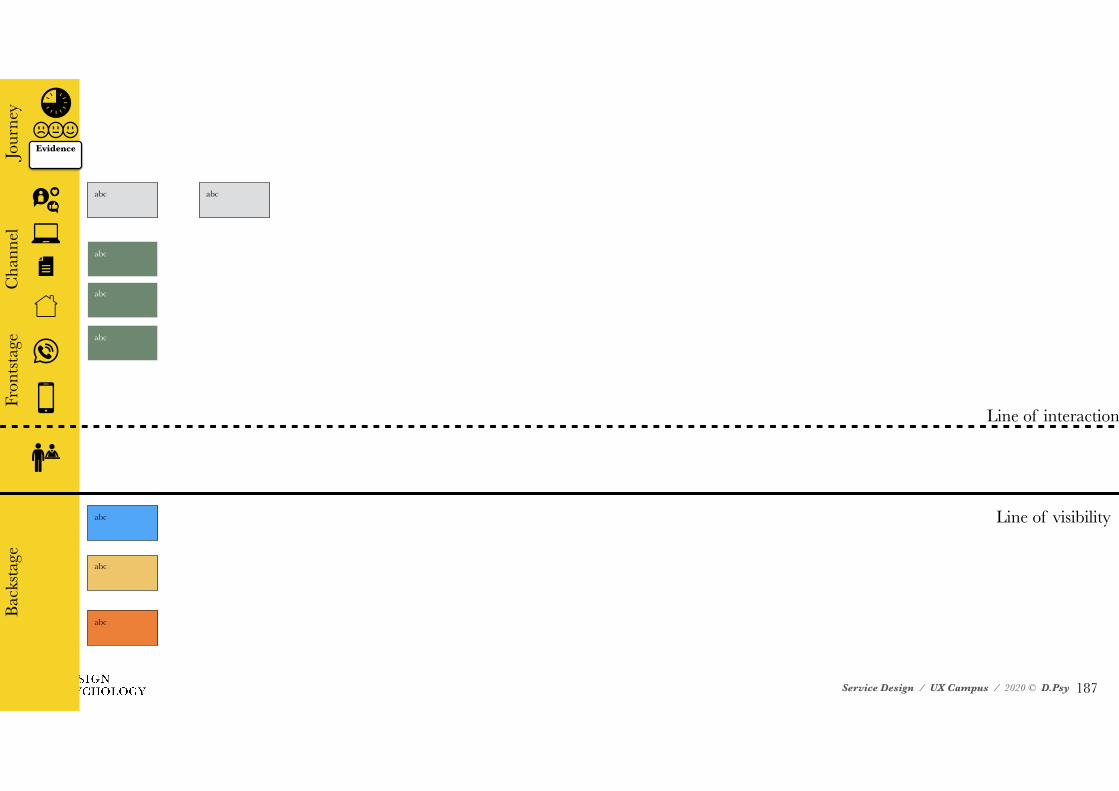
abc abc
abc
abc
abc
Jour
ney
Fron
tstag
eBa
cksta
geC
hann
el
Line of visibility
Line of interaction
abc
abc
abc
Evidence
Service Design / UX Campus / 2020 © D.Psy
Applying Blueprinting in Practice - Bitner 1. Decide on the company’s service or service process to be blueprinted and the objective
2. Determine who should be involved in the blueprinting process
3. Modify the blueprinting technique as appropriate
4. Map the service as it happens most of the time
5. Note disagreements to capture learning
6. Be sure customers remains the focus
7. Track insights that emerge for future action
8. Develop recommendations and future actions based on blueprinting goals
9. If desired, create final blueprints for use with the organisation
!188
Service Design / UX Campus / 2020 © D.Psy
Be Attentive to: 1. What crosses the line of visibility
2. Backstage waiting time
3. Correlations
!189
Service Design / UX Campus / 2020 © D.Psy
Blueprint of Your Service
!190
Service Design / UX Campus / 2020 © D.Psy
7. Touchpoints
!191
Service Design / UX Campus / 2020 © D.Psy
Service Design: Touchpoint Analysis & Optimization
Every touch point users encouter with a service can be scrutinized in detail from a behavioral point of view.
Several expert tools are used to drive this analysis & optimization.
This process is deeply rooted in existing well-establish disciplines such as usability and behavioral psychology.
!192
Service Design / UX Campus / 2020 © D.Psy
Service Design: Touchpoints
✪Working across Time and Multiple Touchpoints For designers who come from a discipline that already uses human-centered design methods, much of this material will be familiar. Understanding people and their daily lives and needs provides the central insights on which many design projects are built (in an ideal world).
The difference between service design and product or UX design, for example, is that the number of stakeholders we are designing for is usually larger, the number and range of touchpoints broader, and all of these interact over time.
Experience in individual and across touchpoints
!193
Service Design / UX Campus / 2020 © D.Psy
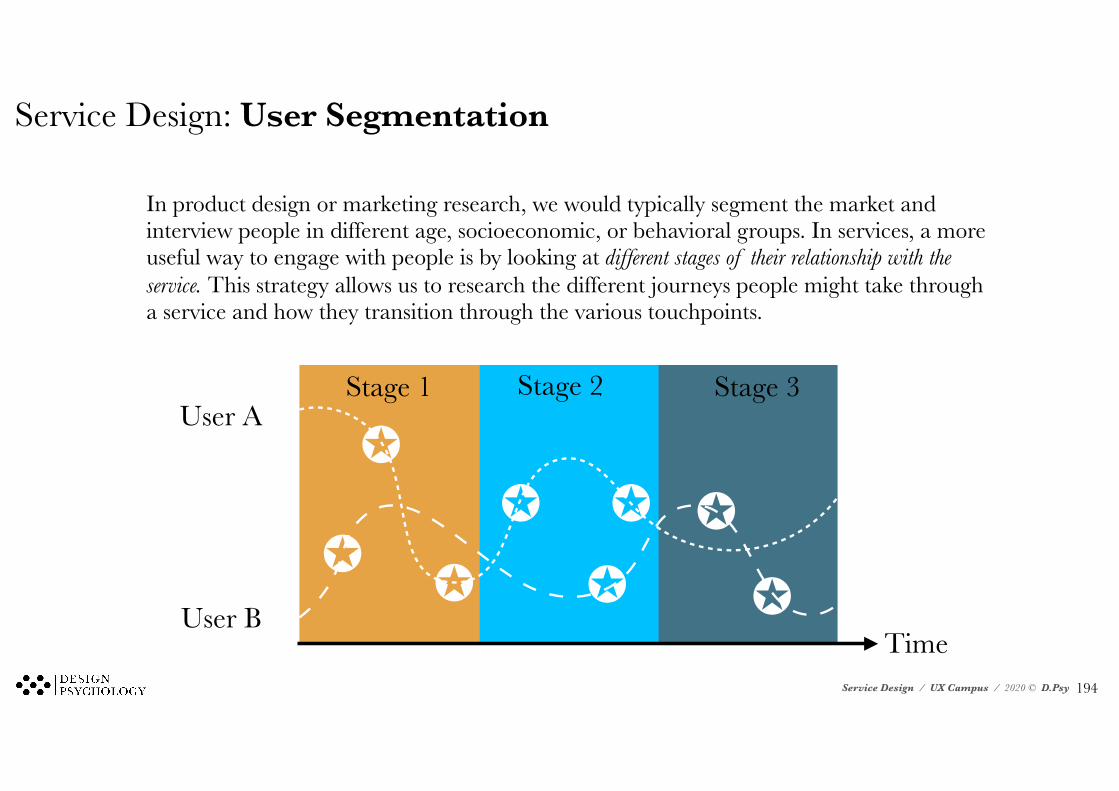
Service Design: User Segmentation
In product design or marketing research, we would typically segment the market and interview people in different age, socioeconomic, or behavioral groups. In services, a more useful way to engage with people is by looking at different stages of their relationship with the service. This strategy allows us to research the different journeys people might take through a service and how they transition through the various touchpoints.
Stage 1 Stage 2 Stage 3User A
User BTime
✪
✪✪
✪ ✪
✪
✪
✪
!194
Service Design / UX Campus / 2020 © D.Psy
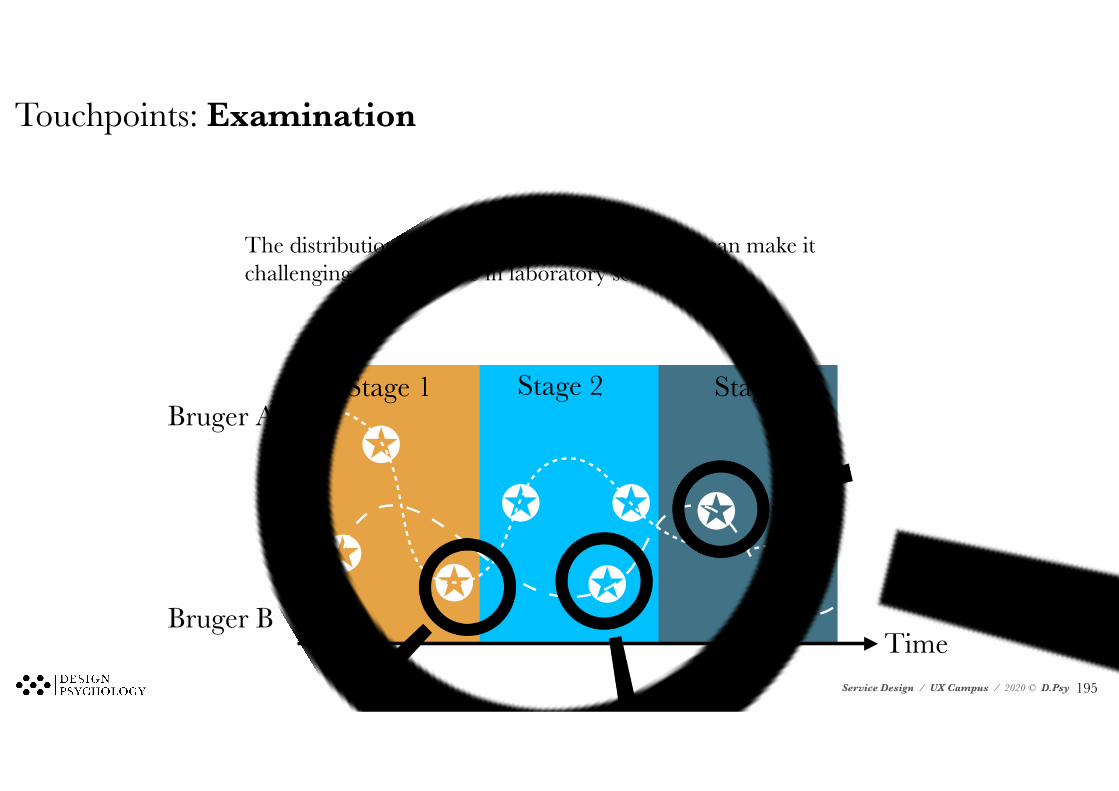
Touchpoints: Examination
Bruger A
Bruger BTime
✪
✪✪
✪ ✪
✪
✪
✪
The distribution of touchpoint in time and space can make it challenging to investigate in laboratory settings.
Stage 1 Stage 2 Stage 3
!195
Service Design / UX Campus / 2020 © D.Psy
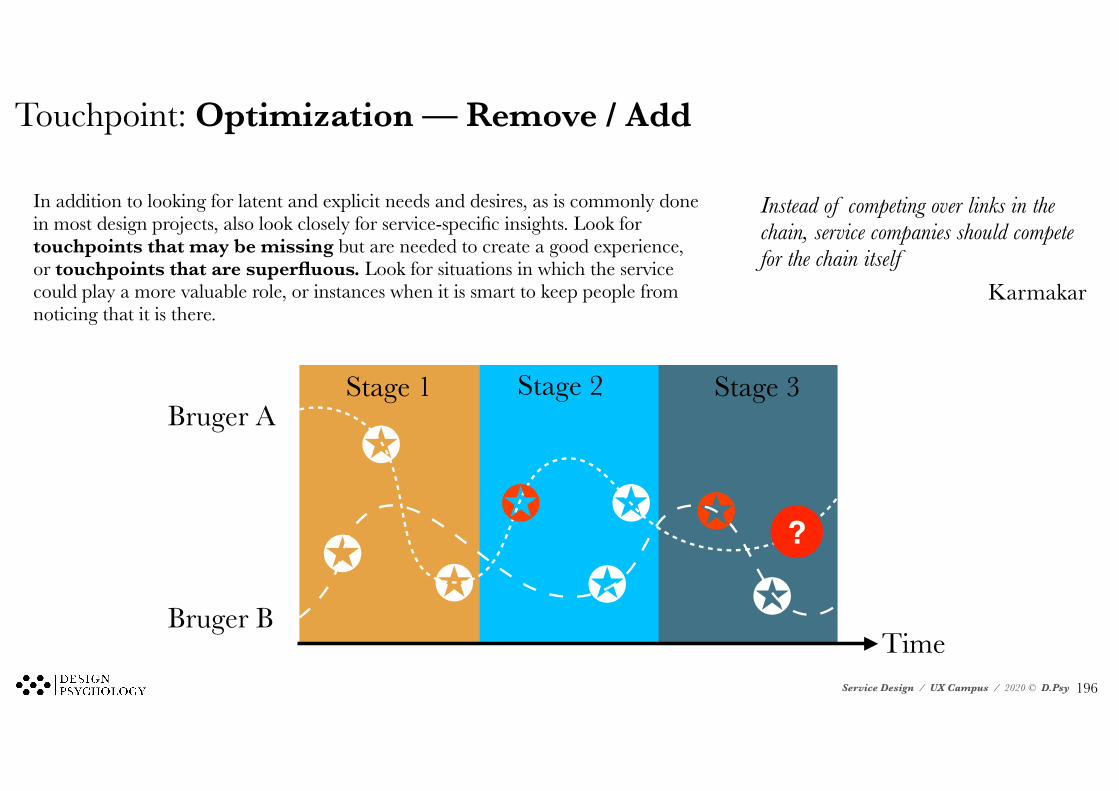
Touchpoint: Optimization — Remove / Add
In addition to looking for latent and explicit needs and desires, as is commonly done in most design projects, also look closely for service-specific insights. Look for touchpoints that may be missing but are needed to create a good experience, or touchpoints that are superfluous. Look for situations in which the service could play a more valuable role, or instances when it is smart to keep people from noticing that it is there.
Bruger A
Bruger BTime
✪
✪✪
✪ ✪
✪
✪
✪
?
Instead of competing over links in the chain, service companies should compete for the chain itself
Karmakar
Stage 1 Stage 2 Stage 3
!196
Service Design / UX Campus / 2020 © D.Psy
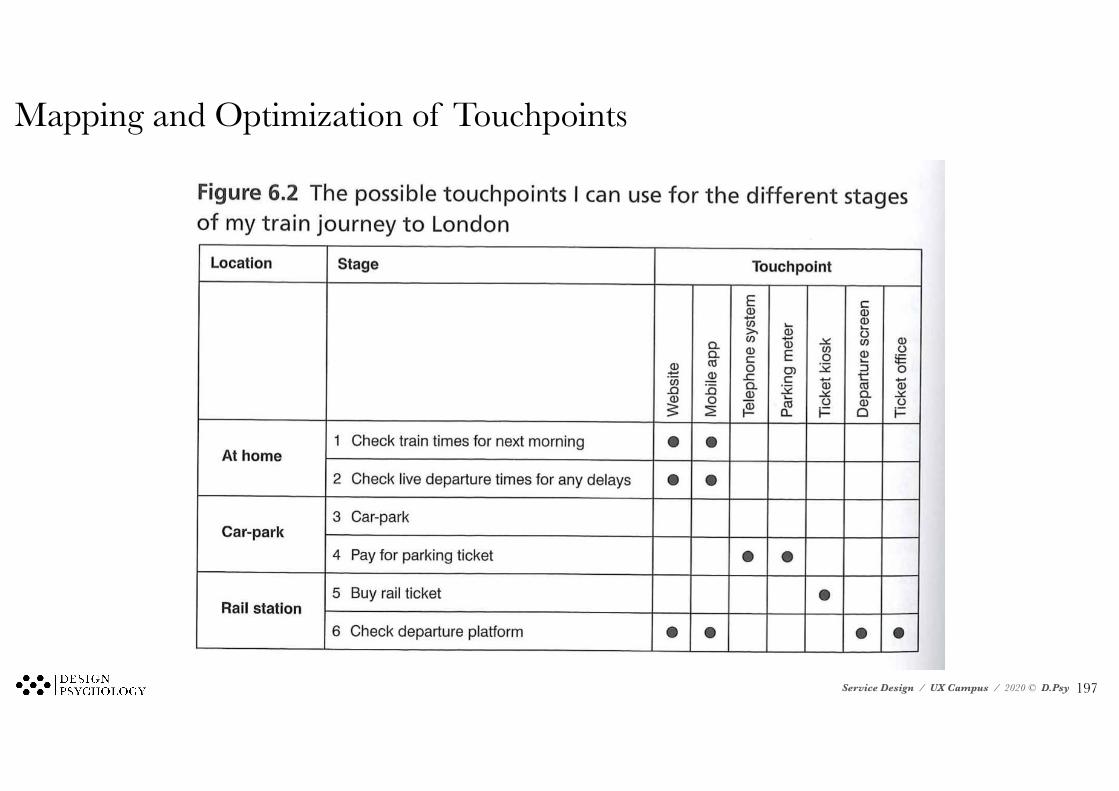
Mapping and Optimization of Touchpoints
!197
Service Design / UX Campus / 2020 © D.Psy
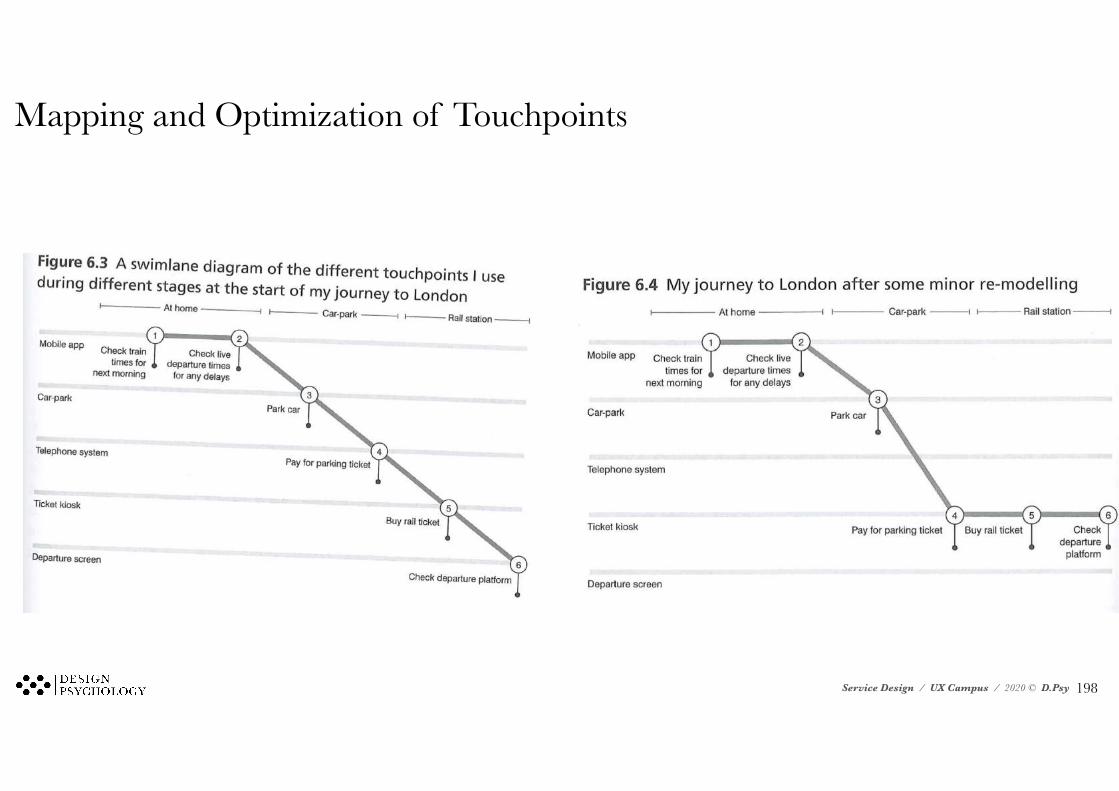
Mapping and Optimization of Touchpoints
!198
Service Design / UX Campus / 2020 © D.Psy
Firma PDF navn Bring Bring — 344554444 DriveNow i9341174572 Genbyg Faktura76343736 Lauritz ShowPDF.aspx Proshop Faktura 44355466 SAS i785914 Tre / 3 Invoice
Service Design: Touchpoint
!199
Service Design / UX Campus / 2020 © D.Psy
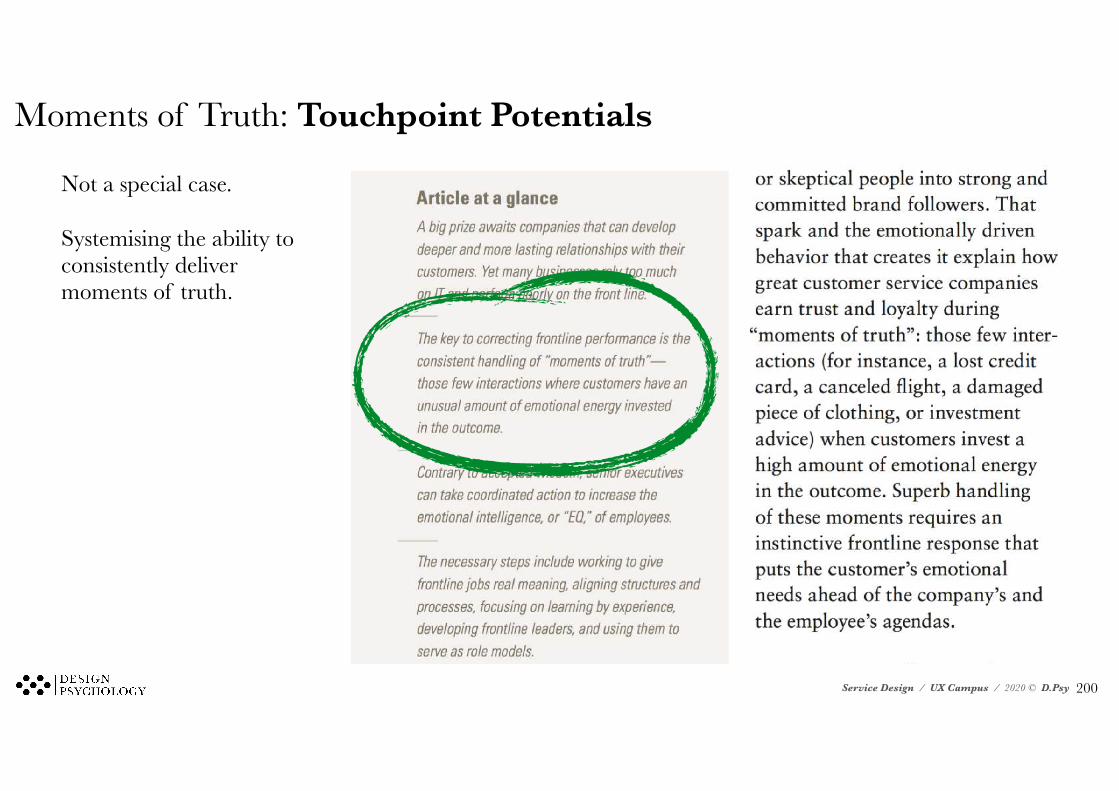
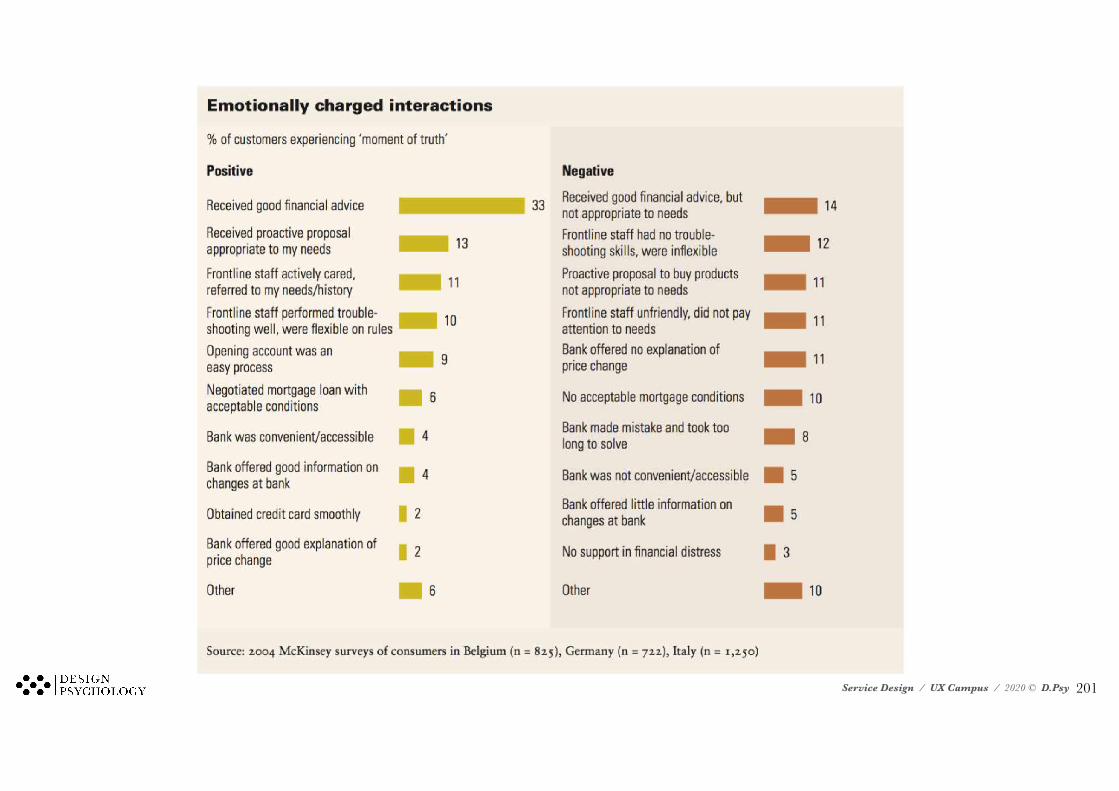
Moments of Truth: Touchpoint Potentials
Not a special case.
Systemising the ability to consistently deliver moments of truth.
!200
Service Design / UX Campus / 2020 © D.Psy !201
Service Design / UX Campus / 2020 © D.Psy
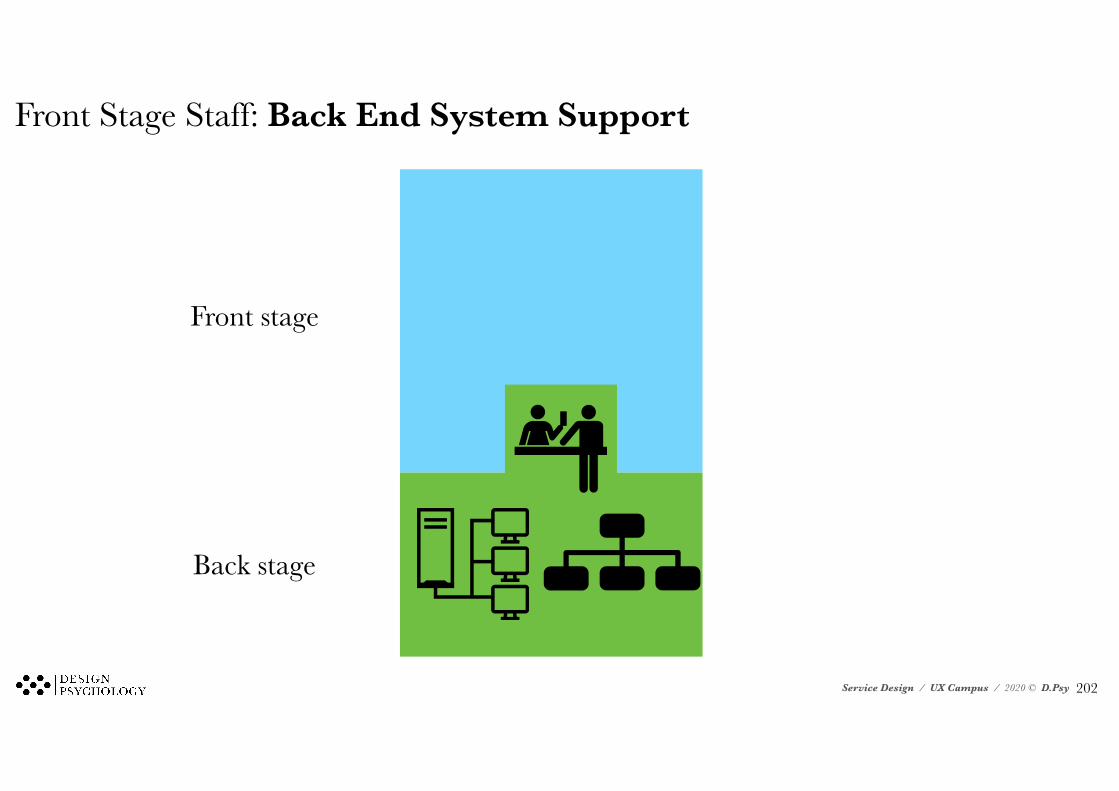
Front Stage Staff: Back End System Support
Front stage
Back stage
!202
Service Design / UX Campus / 2020 © D.Psy
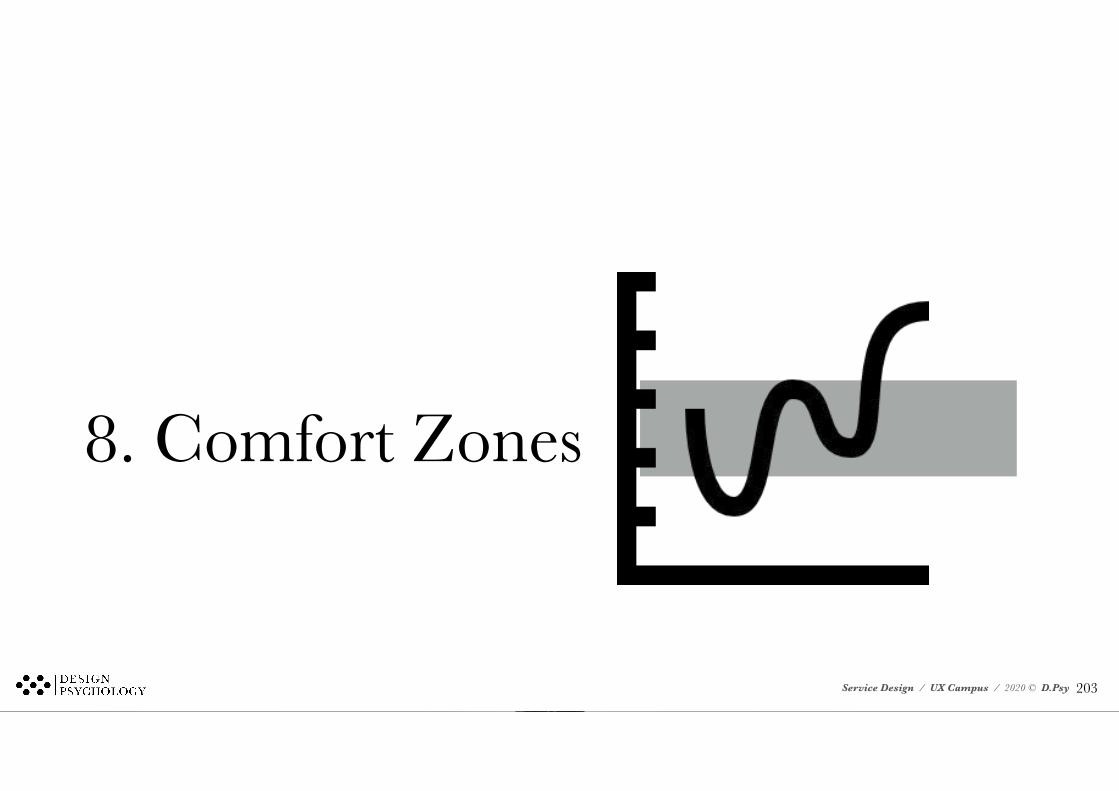
8. Comfort Zones
!203
Service Design / UX Campus / 2020 © D.Psy
Time
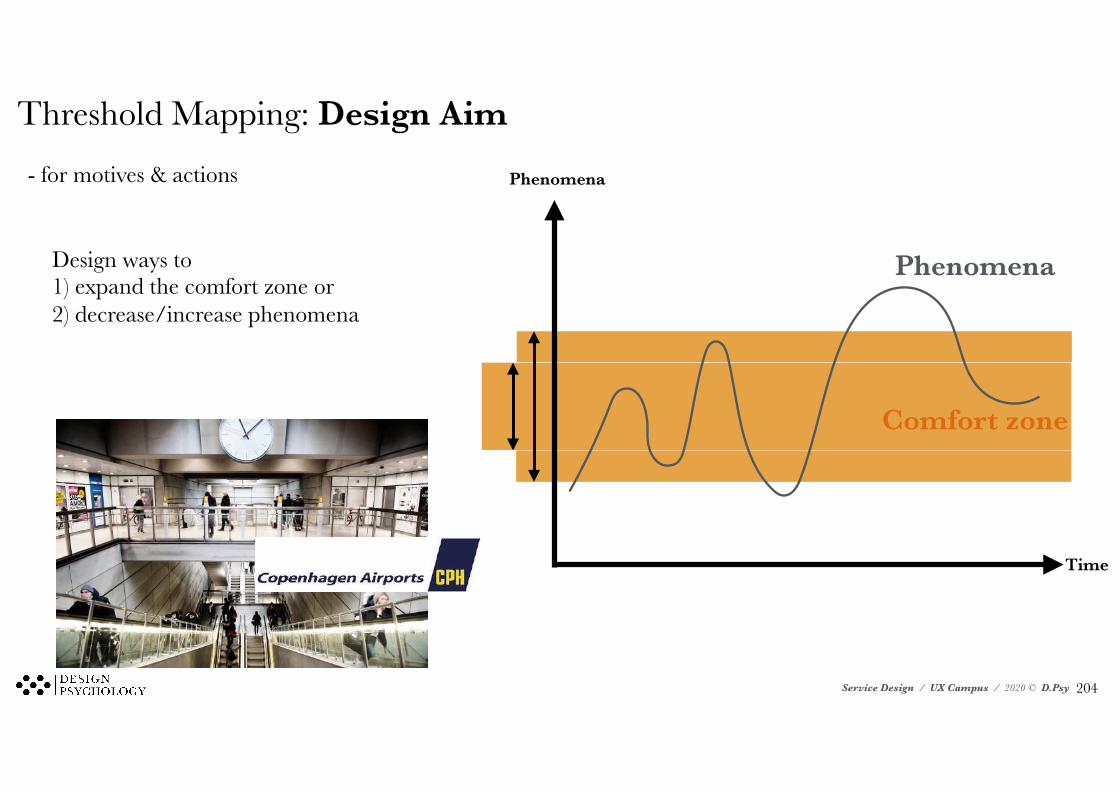
Phenomena- for motives & actions
Design ways to 1) expand the comfort zone or 2) decrease/increase phenomena
Comfort zone
Phenomena
Threshold Mapping: Design Aim
!204
Service Design / UX Campus / 2020 © D.Psy
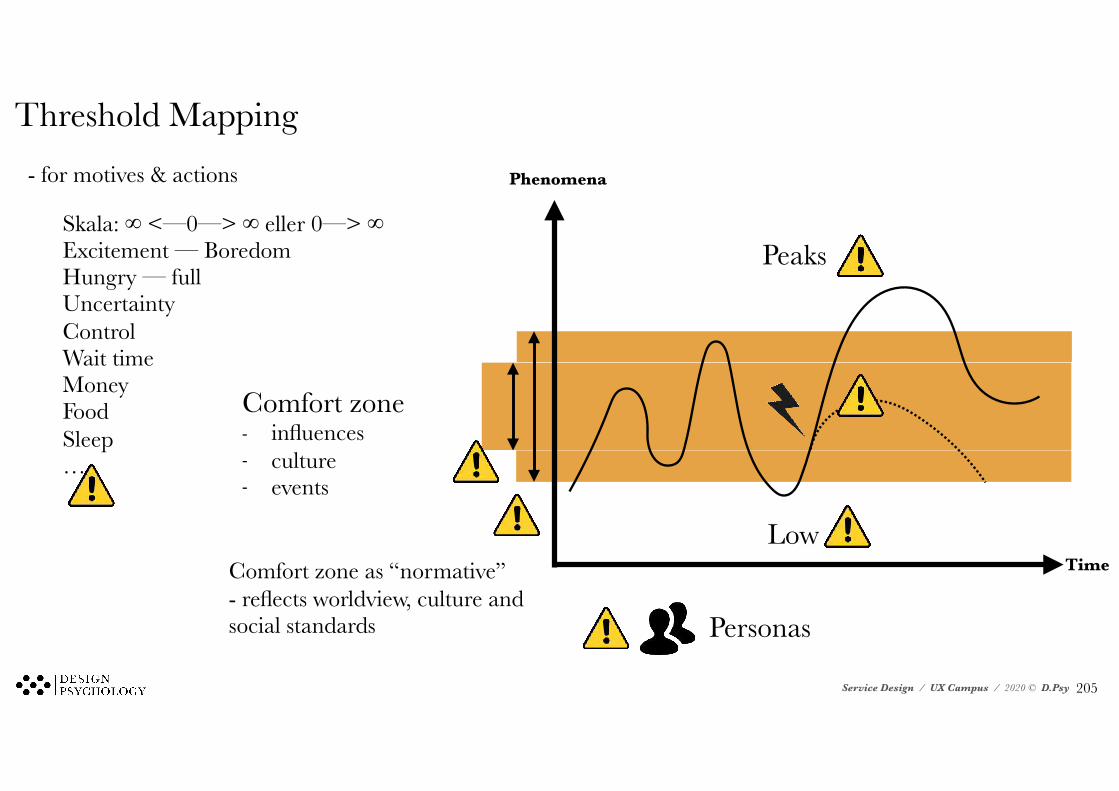
Threshold Mapping
Comfort zone - influences - culture - events
Peaks
Low
Skala: ∞ <—0—> ∞ eller 0—> ∞ Excitement — Boredom Hungry — full Uncertainty Control Wait time Money Food Sleep …
Personas
Comfort zone as “normative” - reflects worldview, culture and social standards
- for motives & actions
Time
Phenomena
!205
Service Design / UX Campus / 2020 © D.Psy !206
Service Design / UX Campus / 2020 © D.Psy
“Phenomena”
Time
!207
Service Design / UX Campus / 2020 © D.Psy
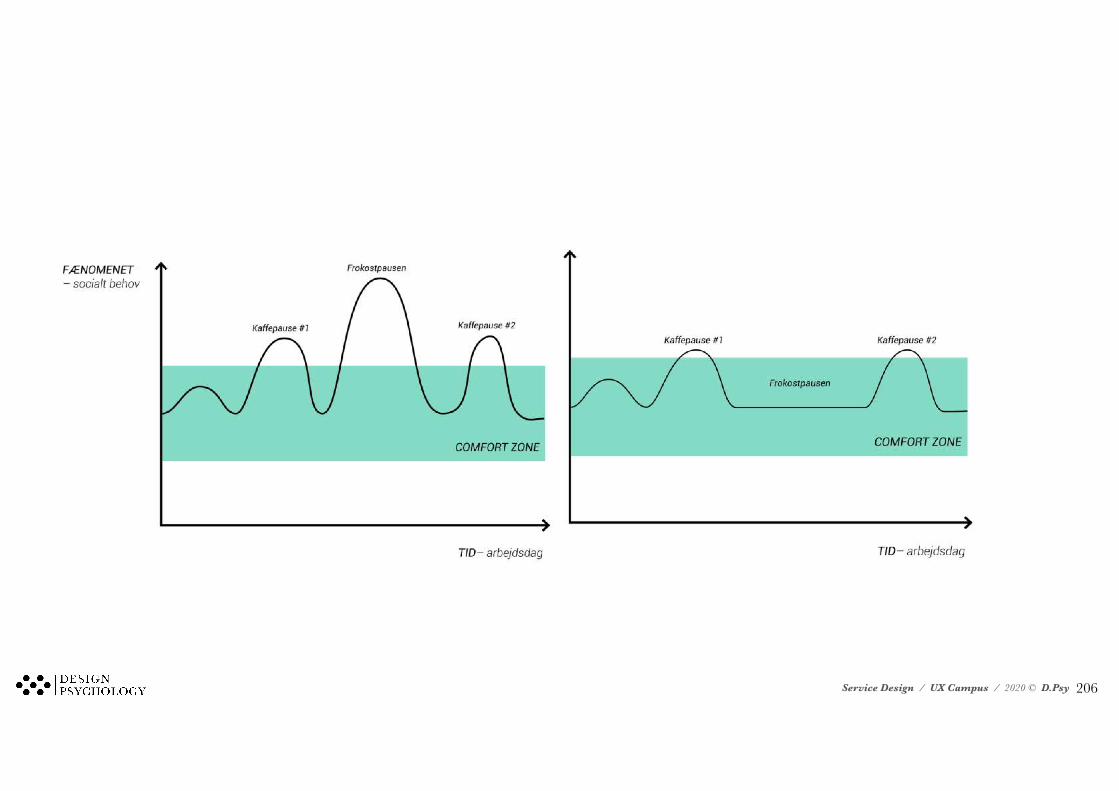
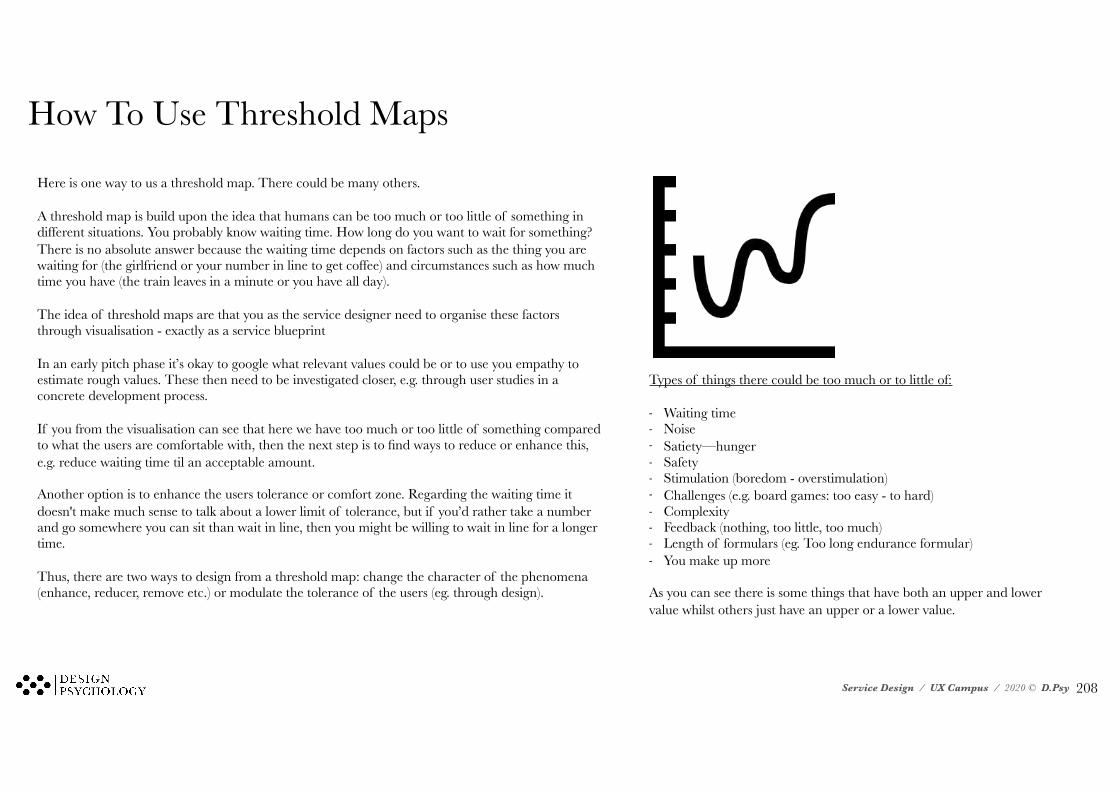
How To Use Threshold Maps
Here is one way to us a threshold map. There could be many others.
A threshold map is build upon the idea that humans can be too much or too little of something in different situations. You probably know waiting time. How long do you want to wait for something? There is no absolute answer because the waiting time depends on factors such as the thing you are waiting for (the girlfriend or your number in line to get coffee) and circumstances such as how much time you have (the train leaves in a minute or you have all day).
The idea of threshold maps are that you as the service designer need to organise these factors through visualisation - exactly as a service blueprint
In an early pitch phase it’s okay to google what relevant values could be or to use you empathy to estimate rough values. These then need to be investigated closer, e.g. through user studies in a concrete development process.
If you from the visualisation can see that here we have too much or too little of something compared to what the users are comfortable with, then the next step is to find ways to reduce or enhance this, e.g. reduce waiting time til an acceptable amount.
Another option is to enhance the users tolerance or comfort zone. Regarding the waiting time it doesn't make much sense to talk about a lower limit of tolerance, but if you’d rather take a number and go somewhere you can sit than wait in line, then you might be willing to wait in line for a longer time.
Thus, there are two ways to design from a threshold map: change the character of the phenomena (enhance, reducer, remove etc.) or modulate the tolerance of the users (eg. through design).
Types of things there could be too much or to little of:
- Waiting time - Noise - Satiety—hunger - Safety - Stimulation (boredom - overstimulation) - Challenges (e.g. board games: too easy - to hard) - Complexity - Feedback (nothing, too little, too much) - Length of formulars (eg. Too long endurance formular) - You make up more
As you can see there is some things that have both an upper and lower value whilst others just have an upper or a lower value.
!208
Service Design / UX Campus / 2020 © D.Psy
9. Service Recovery
!209
Service Design / UX Campus / 2020 © D.Psy !210Service Design / UX Campus / 2020 © D.Psy
Service Design / UX Campus / 2020 © D.Psy
Service Design: Service Failure
“A service failure, simply defined, is service performance that fails to meet a customer’s expectations.” (Maxham III, 2001)
!211
Service Design / UX Campus / 2020 © D.Psy
A service failure is any service related error or problem that arise in the user interaction with the service - Actual or perceived
Actual: objective service breakdown
Perceived: 1) unrealistic expectations, 2) user error (be very careful!)
Users tend to have some measure of forgiveness - especially if the situation is dealt with gracefully
An unaddressed service failure is likely to result in dissatisfaction
Service Failure: Business as Usual
!212
Service Design / UX Campus / 2020 © D.Psy
Service Failure: Business as Usual
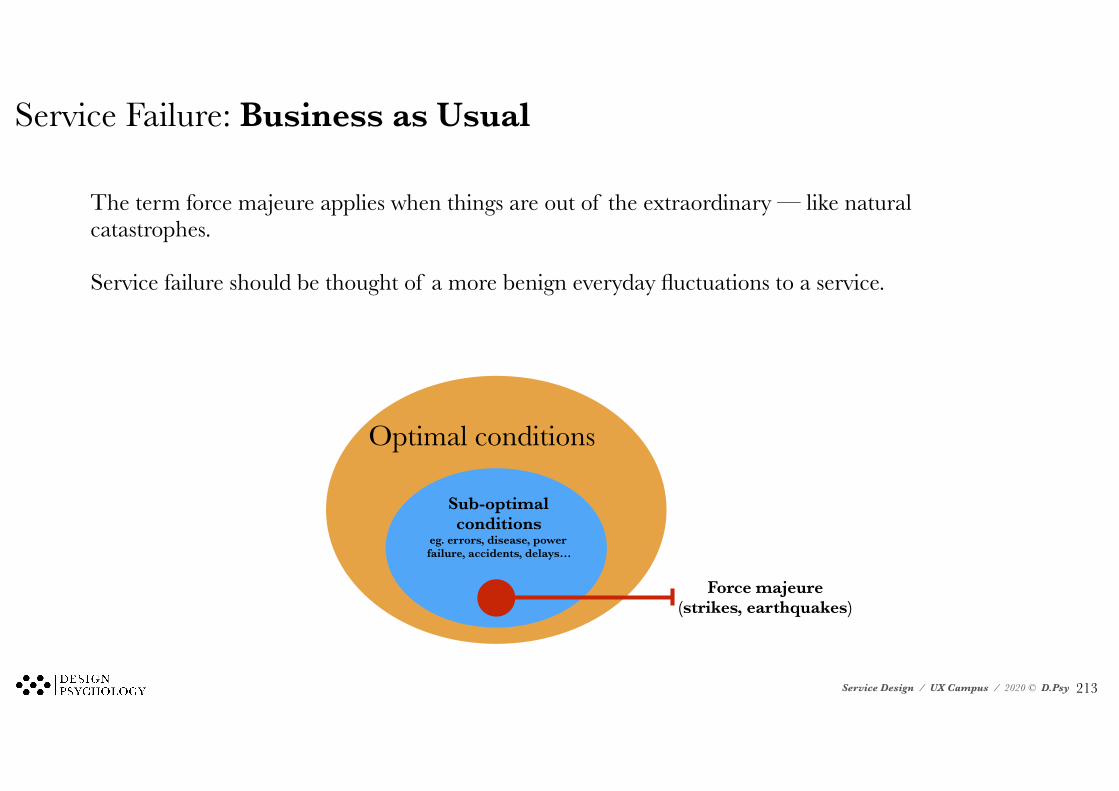
The term force majeure applies when things are out of the extraordinary — like natural catastrophes.
Service failure should be thought of a more benign everyday fluctuations to a service.
Optimal conditions
Sub-optimal conditions
eg. errors, disease, power failure, accidents, delays…
Force majeure (strikes, earthquakes)
!213
Service Design / UX Campus / 2020 © D.Psy
Service Failure: Complaint Thresholds
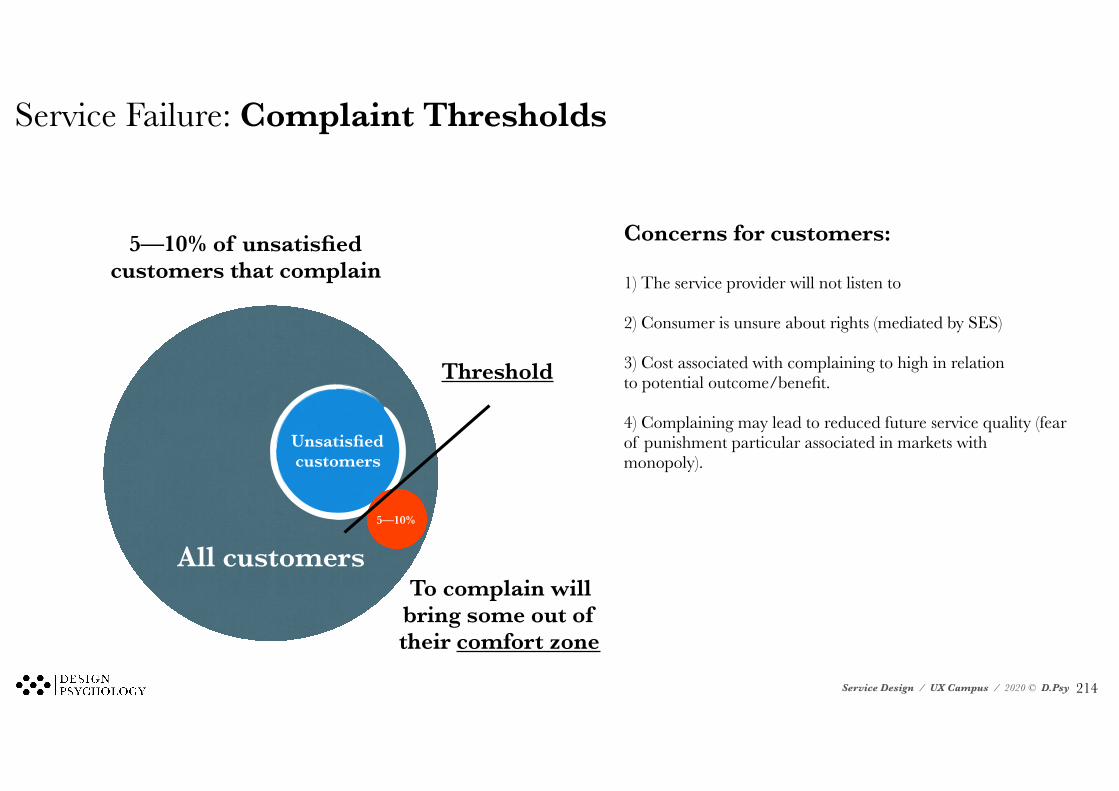
All customers
Unsatisfied customers
5—10%
5—10% of unsatisfied customers that complain
Threshold
To complain will bring some out of their comfort zone
Concerns for customers:
1) The service provider will not listen to
2) Consumer is unsure about rights (mediated by SES)
3) Cost associated with complaining to high in relation to potential outcome/benefit.
4) Complaining may lead to reduced future service quality (fear of punishment particular associated in markets with monopoly).
!214
Service Design / UX Campus / 2020 © D.Psy
Service Failure: Cost & ConsequencesUnaddressed service failures are most common reason for customers leaving a service provider
Three broad behavioral patterns associated with unaddressed service failures:
1) Customer seeks options for complaining 2) Customer complains to external sources (friends &
family — or online fora). 3) Customer makes a personal boycott of service
Particular behavior pattern is linked to factors like: pricing, degree of service failure, SES, market dynamics.
Higher service cost generates more willingness to complain. Higher SES generates more willingness to complain Markets with high degree of competitiveness and customer mobility generates lower tolerance for service failure.
Only 5—10% of customers that experience a service failure complains.
—> Consequences in a service economy?
!215
Service Design / UX Campus / 2020 © D.Psy
Service Failure: Cost & Consequences
The cost of gaining new customers in service industries is 20-30% higher on online than offline services (reduce churn).
It is very valuable to make sure customers do not leave a service and remains loyal — due to new customer overhead.
Loyal customers typically generate larger sales.
Recommendations from friends & family and the social network is more effective than company marketing.
Word of mouth has dramatically increased it’s range with online communities.
!216
Service Design / UX Campus / 2020 © D.Psy
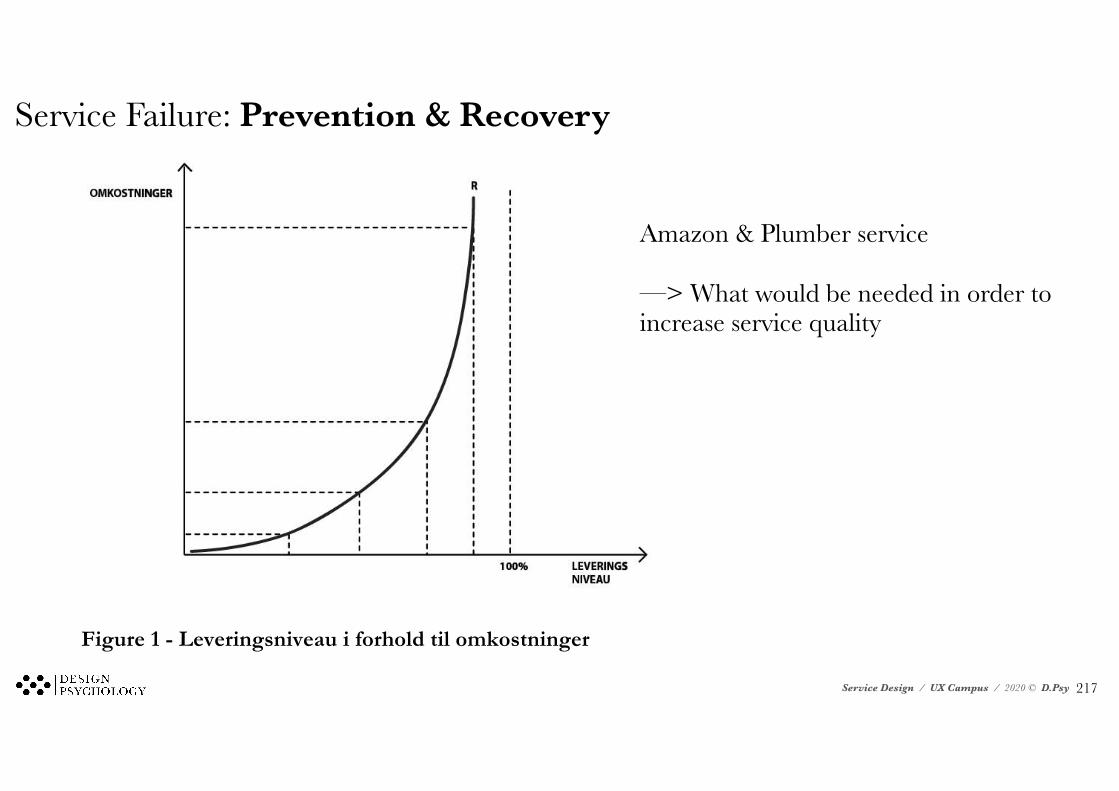
Service Failure: Prevention & Recovery
! 7!
Serviceudbyderne kan forsøge at optimere kundetilfredsheden ud fra to overordnede perspektiver; forebyggelse og
recovery. Forbyggelse og recovery er ikke de eneste to metoder, men blot dem jeg vælger at fremhæve. Med
forebyggelse refererer jeg til investeringer, der har til formål at forhindre, at service failure overhovedet opstår, for
dermed via et højt serviceleveringsniveau at skabe grundlaget for tilfredse kunder. At service failure aldrig opstår
ville være ideelt, men vil kun kunne tilstræbes. Et 100% leveringsniveau er ikke realiserbart i serviceindustrien
(Evanschitzky & Wangenheim et al., 2012). Jeg vil dermed argumentere for, at det er centralt for
servicevirksomheder at identificere det niveau, hvor omkostningerne ved at forbedre serviceleveringen (forbygge at
service failure finder sted) når et niveau, hvor investeringer ikke længere resulterer i betydelige forbedringer i
serviceleveringerne.
Figure 1 - Leveringsniveau i forhold til omkostninger
For at visualisere dette introducerer jeg Figur 1, som viser en vækstfunktion. Vækstfunktionen konceptualiserer
forholdet mellem omkostninger i forbindelse med forebyggelse af service failure og serviceleveringsniveauet. Når
Vækstraten(R) begynder at stige drastisk, vil omkostningerne ved små forbedringer i leveringsniveauet være så
relativt store, at jeg vil argumentere for, at det er hensigtsmæssigt og mere rentabelt at begynde at fokusere
ressourcer på recovery frem for forebyggelse, for på den måde at forbedre leveringsniveauet ved at skabe failure
tolerant design, i stedet for at jagte et leveringsniveau på 100%. Med failure tolerant design refererer jeg til design
der har inkorporeret systemer til at håndtere uforudsete situationer, failures ogsuboptimale omstændigheder.
Hvor tæt det er muligt at komme på den fiktive 100% leveringsgrænse og hvornår investeringer i forbyggelse ikke
længere vil resultere i betydelige forbedringer, er varierende fra virksomhed til virksomhed.
Amazon & Plumber service
—> What would be needed in order to increase service quality
!217
Service Design / UX Campus / 2020 © D.Psy
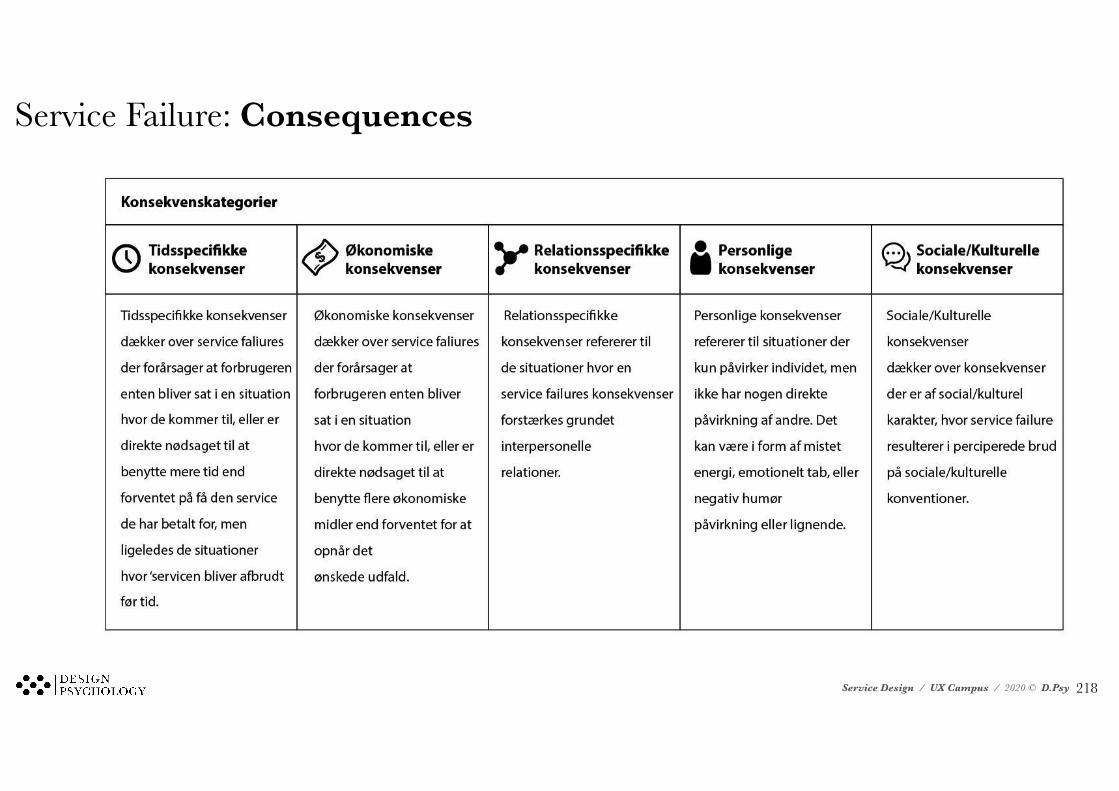
Service Failure: Consequences
! 61!
Dataeksempel: The waiter at this expensive restaurant treted us like dirt because we were only high school kids on a prom date.” (Bitner & Booms et al., (1990) Gestalt Dataeksempel: ”The flight was a nightmare. A nightmare. A one-hour layover went to 3,5 houres. The air conditioning didn’t work. The pilots and stewardesses were fighting because of an impending flight attendant strike. The landing was extremely rough. To top it all off, when the plane stopped, the pilots and stewardesses were the firs tones off.” (Bitner & Booms et al., (1990) Ugunstige betingelser Dataeksempel: - ingen data
11.2!Konsekvenskategorier!!
Tidsspecifikke konsekvenser dækker over service faliures, der forårsager, at forbrugeren enten bliver sat i en situation, hvor
de kommer til, eller er direkte nødsaget til at benytte mere tid end forventet på den service, de har betalt for, men ligeledes de
situationer hvor servicen bliver afbrudt før tid.
Eksempel Post Danmark
”Når man betaler ekstra for udbringning, bør man da få pakken, når man er hjemme, men næhh nej jeg ventede og ventede, og
fik så en mail som fortalte at pakken var forsøgt afleveret!!! Og kunne hentes næste dag på ”posthuset” fra kl. 10.00 en ommer”
(Trustpilot, 2014)
I dette tilfælde oplever Trustpilotbrugeren at have betalt for levering til døren, men grundet en x failure må forbrugeren vente til
dagen efter med at få pakken, når den kan hentes på posthuset. Udover at modtage pakken en dag senere end forventet, skal
forbrugerne nu også bruge tid på at tage på posthuset selv.!
Økonomiske konsekvenser dækker over service faliures, der forårsager at forbrugeren enten bliver sat i en situation, hvor de
kommer til eller er direkte nødsaget til at benytte flere økonomiske midler end forventet for at opnå det ønskede udfald.
Eksempel Easy Jet
“…Men nu sidder jeg så her. Strandet i Kastrup Lufthavn. Mit fly skulle være lettet for en halv time siden, men lige pt. hedder
afgangen 17.40 (2 timers forsinkelse), og denne er blevet udskudt op til flere gange i løbet af i dag. Officielt hedder
undskyldningen, som er at finde via app'en (ingen andre steder - i hverken CPH, på nettet eller i infoskrankerne), at der blev
!218
Service Design / UX Campus / 2020 © D.Psy
Service Failure: Consequences
! 61!
Dataeksempel: The waiter at this expensive restaurant treted us like dirt because we were only high school kids on a prom date.” (Bitner & Booms et al., (1990) Gestalt Dataeksempel: ”The flight was a nightmare. A nightmare. A one-hour layover went to 3,5 houres. The air conditioning didn’t work. The pilots and stewardesses were fighting because of an impending flight attendant strike. The landing was extremely rough. To top it all off, when the plane stopped, the pilots and stewardesses were the firs tones off.” (Bitner & Booms et al., (1990) Ugunstige betingelser Dataeksempel: - ingen data
11.2!Konsekvenskategorier!!
Tidsspecifikke konsekvenser dækker over service faliures, der forårsager, at forbrugeren enten bliver sat i en situation, hvor
de kommer til, eller er direkte nødsaget til at benytte mere tid end forventet på den service, de har betalt for, men ligeledes de
situationer hvor servicen bliver afbrudt før tid.
Eksempel Post Danmark
”Når man betaler ekstra for udbringning, bør man da få pakken, når man er hjemme, men næhh nej jeg ventede og ventede, og
fik så en mail som fortalte at pakken var forsøgt afleveret!!! Og kunne hentes næste dag på ”posthuset” fra kl. 10.00 en ommer”
(Trustpilot, 2014)
I dette tilfælde oplever Trustpilotbrugeren at have betalt for levering til døren, men grundet en x failure må forbrugeren vente til
dagen efter med at få pakken, når den kan hentes på posthuset. Udover at modtage pakken en dag senere end forventet, skal
forbrugerne nu også bruge tid på at tage på posthuset selv.!
Økonomiske konsekvenser dækker over service faliures, der forårsager at forbrugeren enten bliver sat i en situation, hvor de
kommer til eller er direkte nødsaget til at benytte flere økonomiske midler end forventet for at opnå det ønskede udfald.
Eksempel Easy Jet
“…Men nu sidder jeg så her. Strandet i Kastrup Lufthavn. Mit fly skulle være lettet for en halv time siden, men lige pt. hedder
afgangen 17.40 (2 timers forsinkelse), og denne er blevet udskudt op til flere gange i løbet af i dag. Officielt hedder
undskyldningen, som er at finde via app'en (ingen andre steder - i hverken CPH, på nettet eller i infoskrankerne), at der blev
! 42!
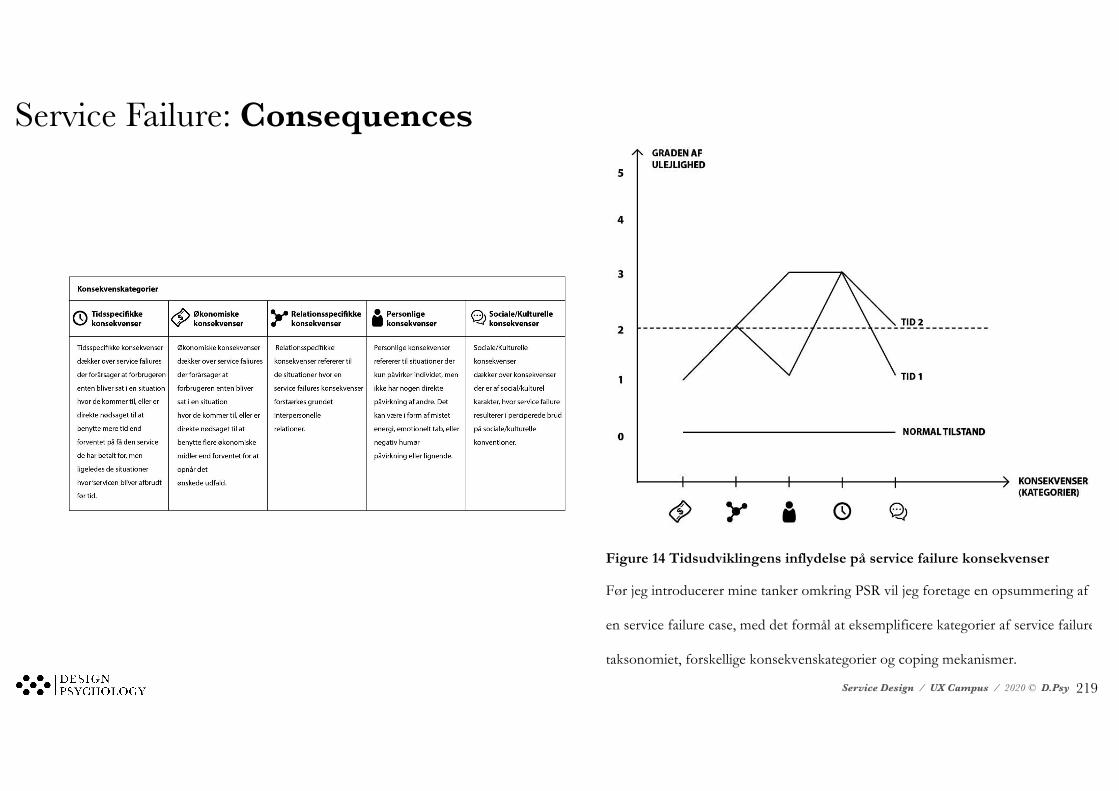
!Figure 14 Tidsudviklingens inflydelse på service failure konsekvenser
Før jeg introducerer mine tanker omkring PSR vil jeg foretage en opsummering af foregående kapitler ved hjælp af
en service failure case, med det formål at eksemplificere kategorier af service failures defineret i service failure
taksonomiet, forskellige konsekvenskategorier og coping mekanismer.
!
7.0!Service!failure!case!
Jeg benytter en service failure case, som jeg personligt oplevede, mens jeg var i min specialeproces. Jeg har valgt
denne case, da jeg har indgående kendskab til situationen, da jeg dokumenterede forløbet undervejs og dermed har
udførlige beskrivelser af egen samt medpassageres oplevelser. Jeg vælger at tage udgangspunkt i min personlige
oplevelse, da jeg dermed kan give en rigere analyse af situationen, ved kontinuerligt at kontekstualisere og fortolke
situationen på baggrund af min viden om service failure, coping strategier og konsekvenskategorier. Jeg gennemgår
service failure scenariet ud fra brugerrejsen visualiseret i figur 15. Hvert step i brugerrejsen er indikeret med et
nummer, som jeg løbende vil referere til. I løbet af gennemgangen vil jeg komme med perspektiverede
metakommentarer for dermed at referere til indsigter fra tidligere afsnit.
!219
Service Design / UX Campus / 2020 © D.Psy
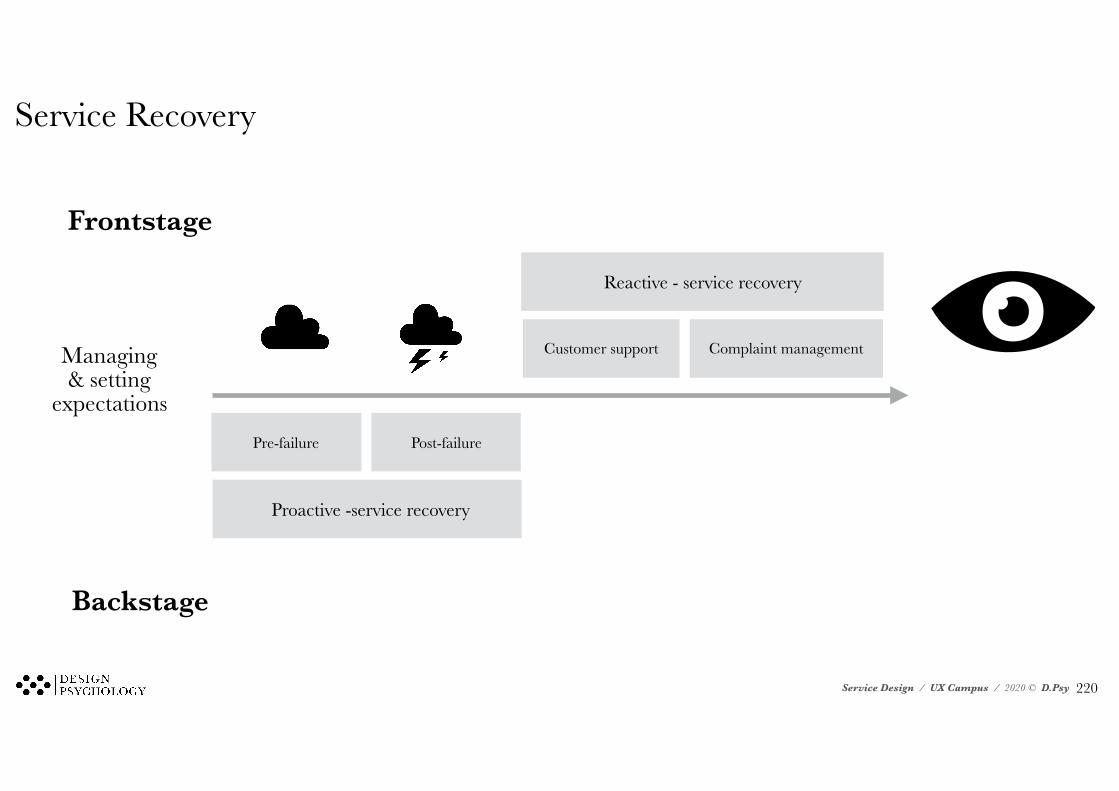
Service Recovery
Pre-failure Post-failure
Proactive -service recovery
Customer support Complaint management
Reactive - service recovery
Frontstage
Backstage
Managing & setting
expectations
!220
Service Design / UX Campus / 2020 © D.Psy
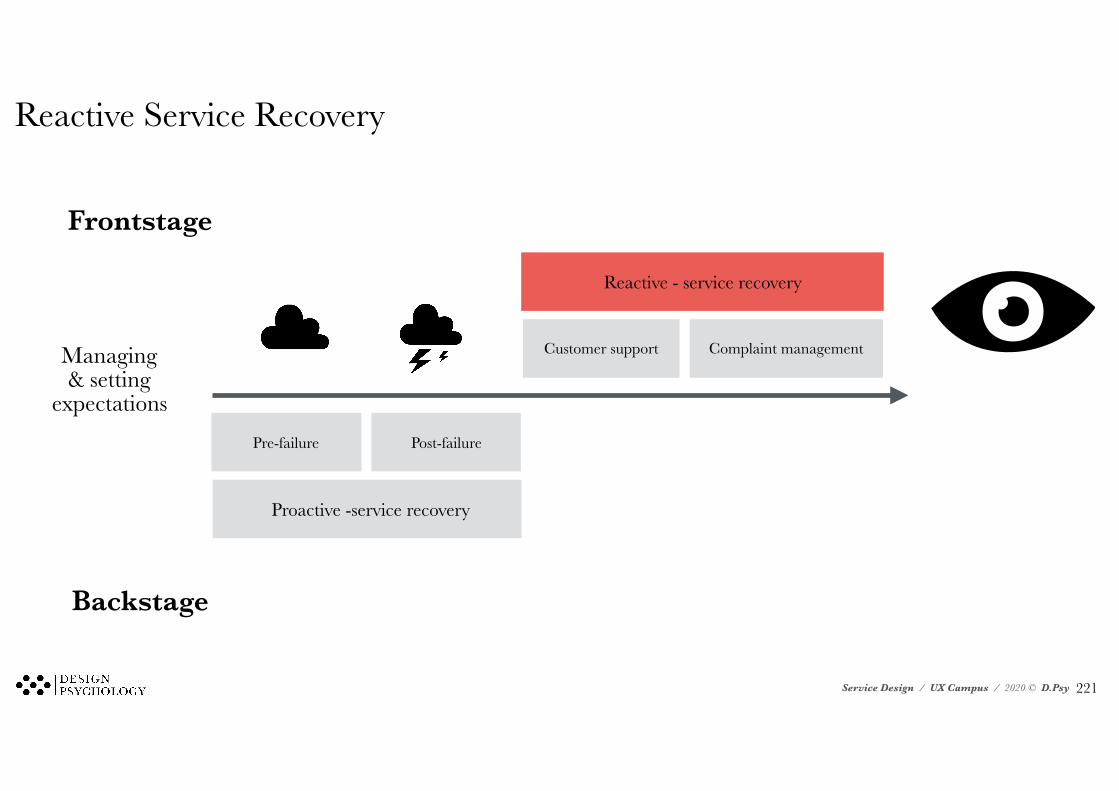
Reactive Service Recovery
Pre-failure Post-failure
Proactive -service recovery
Customer support Complaint management
Reactive - service recovery
Frontstage
Backstage
Managing & setting
expectations
!221
Service Design / UX Campus / 2020 © D.Psy
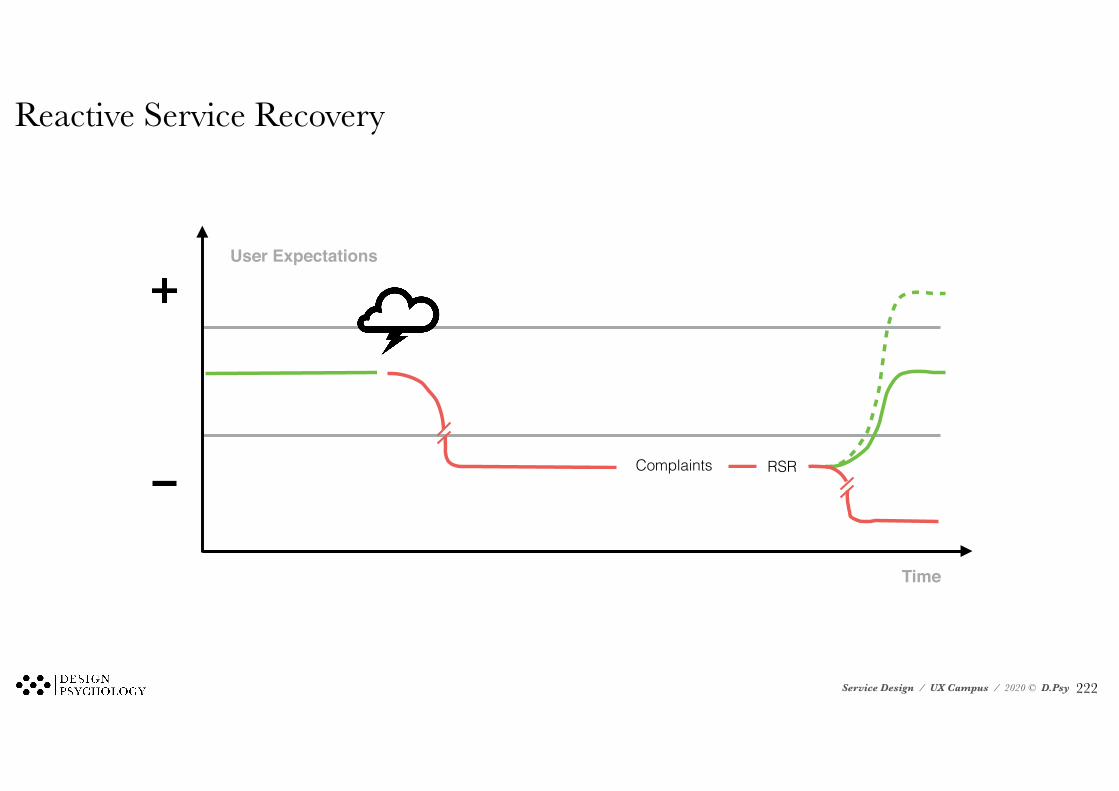
Reactive Service Recovery
Complaints RSR
User Expectations
Time
!222
Service Design / UX Campus / 2020 © D.Psy
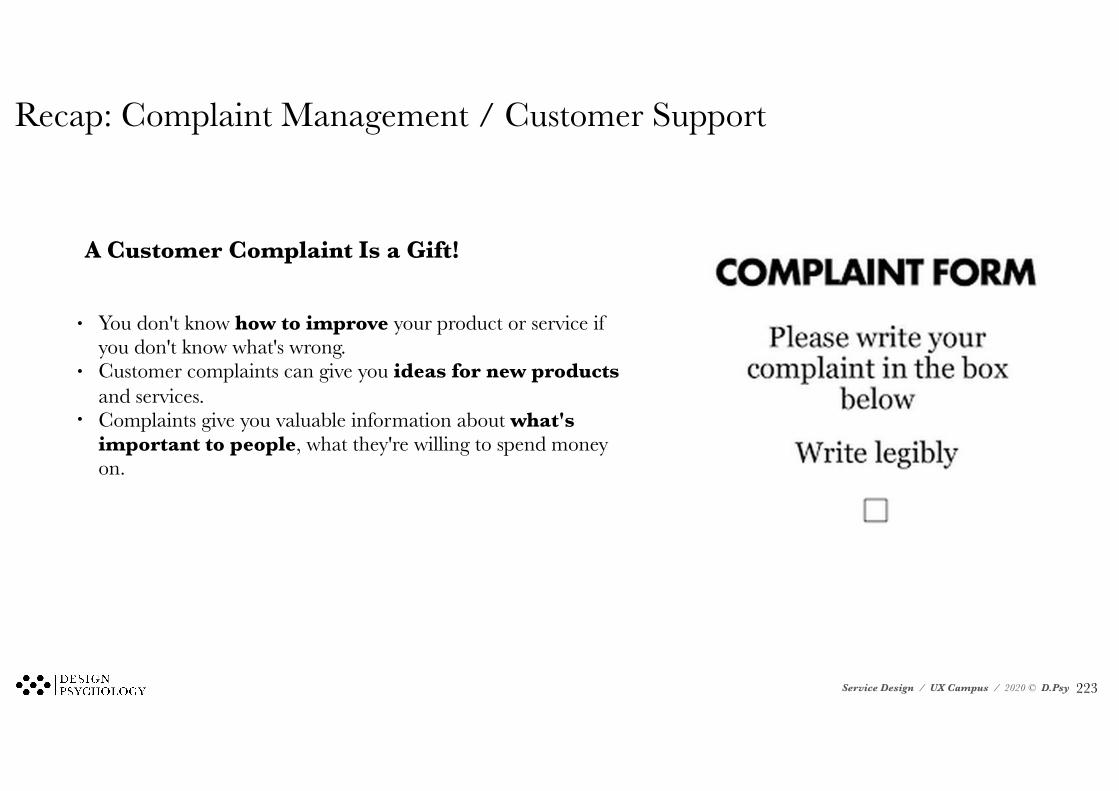
Recap: Complaint Management / Customer Support
A Customer Complaint Is a Gift!
• You don't know how to improve your product or service if you don't know what's wrong.
• Customer complaints can give you ideas for new products and services.
• Complaints give you valuable information about what's important to people, what they're willing to spend money on.
!223
Service Design / UX Campus / 2020 © D.Psy
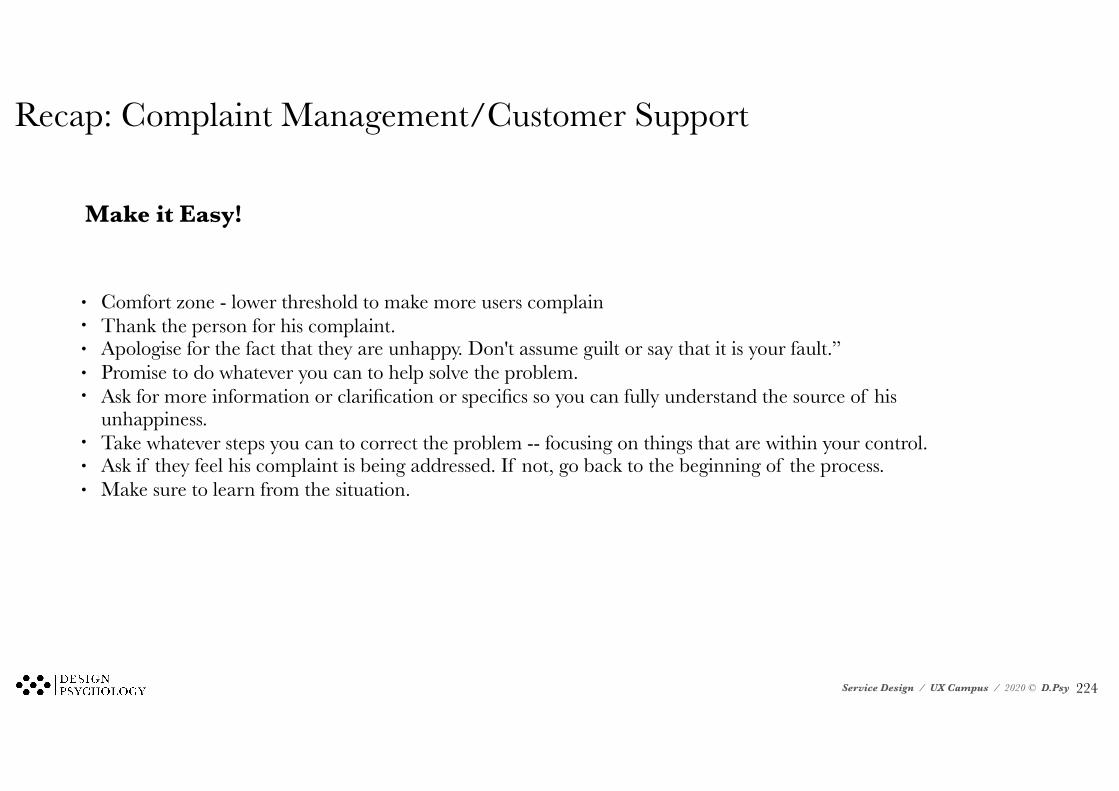
Recap: Complaint Management/Customer Support
Make it Easy!
• Comfort zone - lower threshold to make more users complain • Thank the person for his complaint. • Apologise for the fact that they are unhappy. Don't assume guilt or say that it is your fault.” • Promise to do whatever you can to help solve the problem. • Ask for more information or clarification or specifics so you can fully understand the source of his
unhappiness. • Take whatever steps you can to correct the problem -- focusing on things that are within your control. • Ask if they feel his complaint is being addressed. If not, go back to the beginning of the process. • Make sure to learn from the situation.
!224
Service Design / UX Campus / 2020 © D.Psy
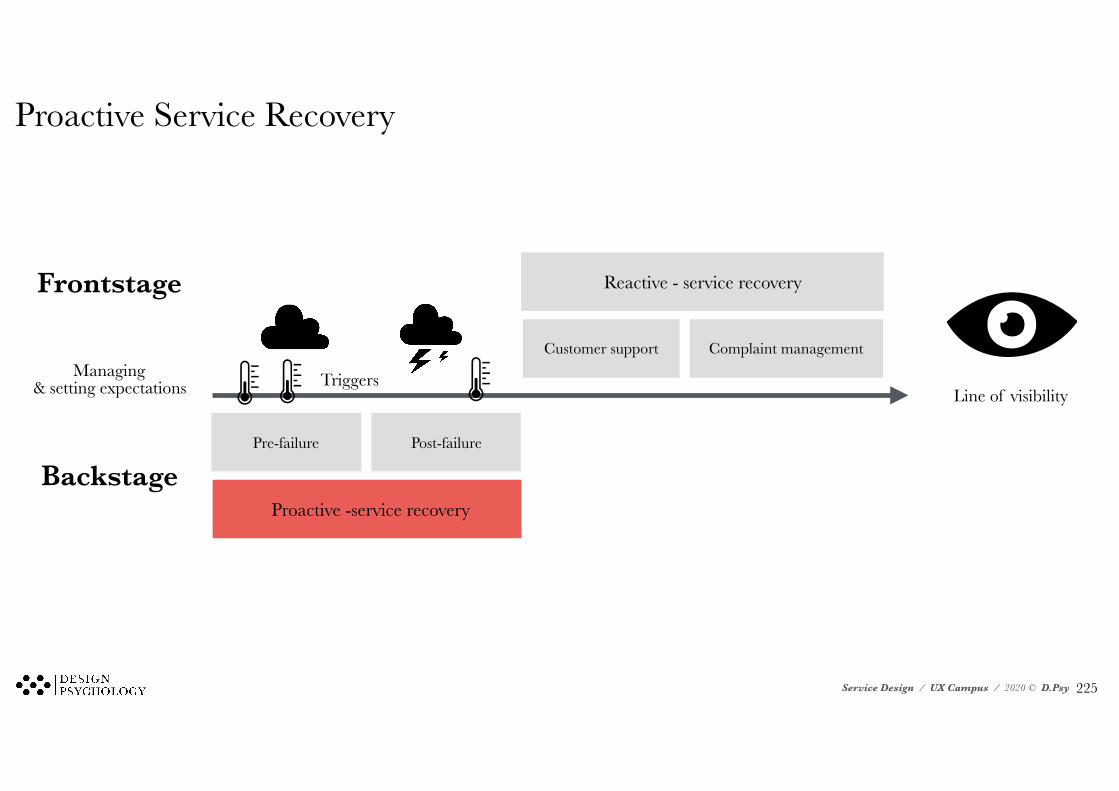
Proactive Service Recovery
Pre-failure Post-failure
Proactive -service recovery
Customer support Complaint management
Reactive - service recoveryFrontstage
Backstage
Managing & setting expectations Triggers
Line of visibility
!225
Service Design / UX Campus / 2020 © D.Psy
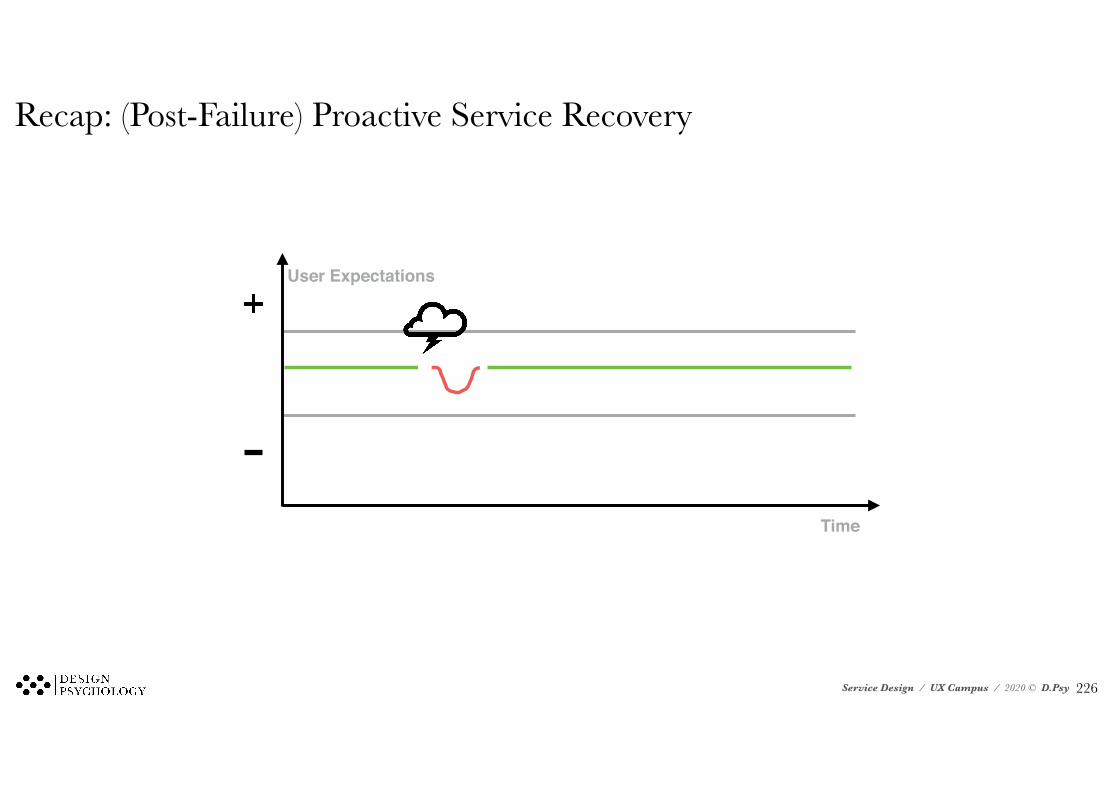
Recap: (Post-Failure) Proactive Service Recovery
User Expectations
Time
!226
Service Design / UX Campus / 2020 © D.Psy
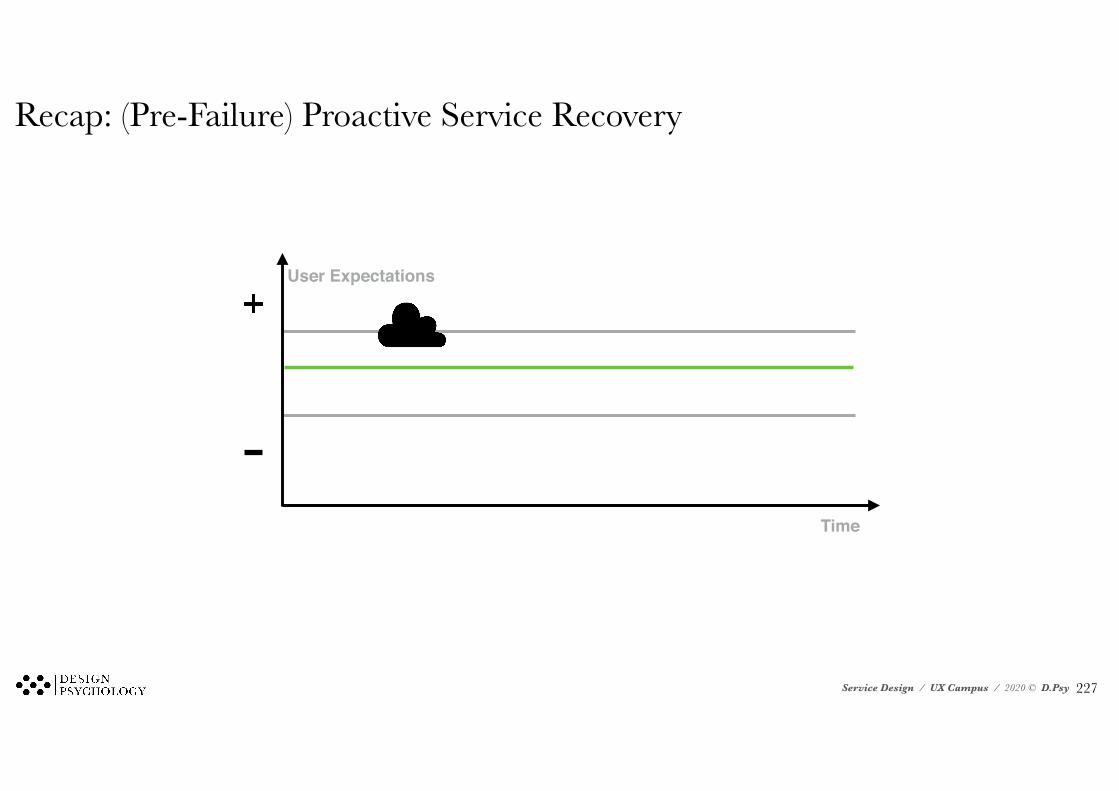
Recap: (Pre-Failure) Proactive Service Recovery
User Expectations
Time
!227
Service Design / UX Campus / 2020 © D.Psy
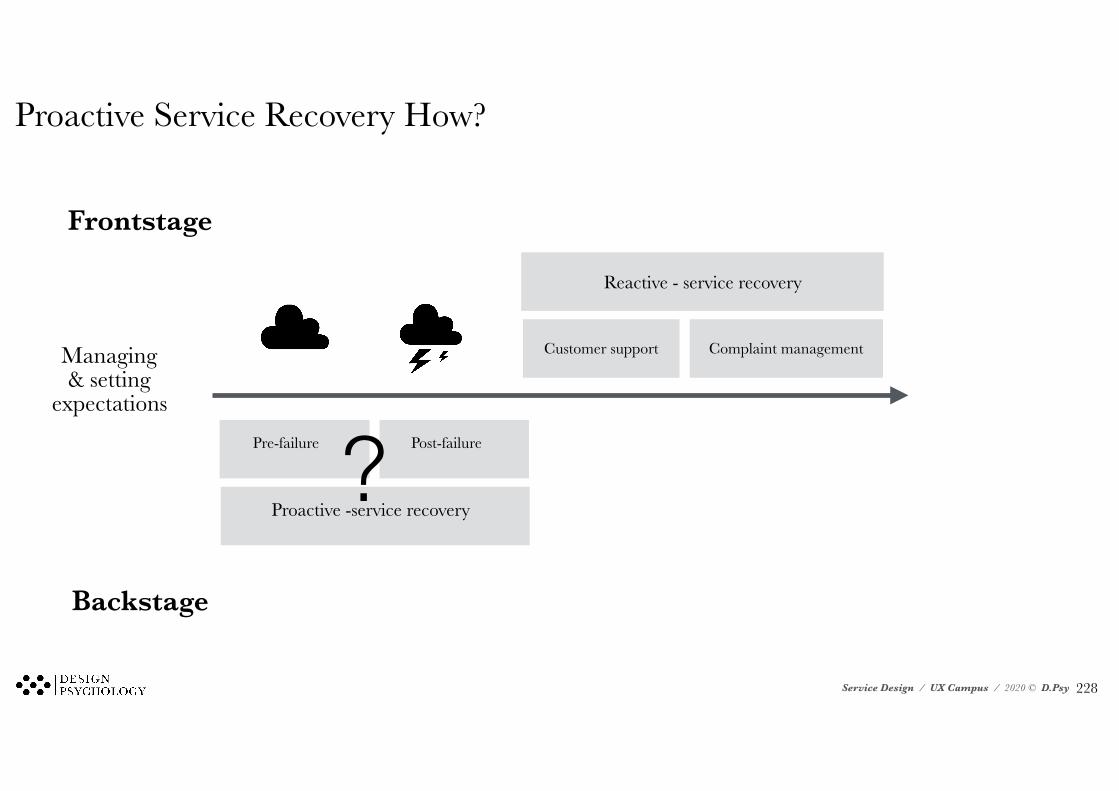
Proactive Service Recovery How?
Pre-failure Post-failure
Proactive -service recovery
Customer support Complaint management
Reactive - service recovery
?
Frontstage
Backstage
Managing & setting
expectations
!228
Service Design / UX Campus / 2020 © D.Psy
Strategy for Failure Tolerant Design
Well defined value propositions, sensors & triggers
• Value propositions: Identify what value you want to deliver
• Sensors: Create data strategy that make it possible for you to measure your service delivery
• Triggers: Create a agile organisation culture, ready to react
!229
Service Design / UX Campus / 2020 © D.Psy
Sensors & Triggers What do we need to know? What will we collect, how and why?
!230
Service Design / UX Campus / 2020 © D.Psy
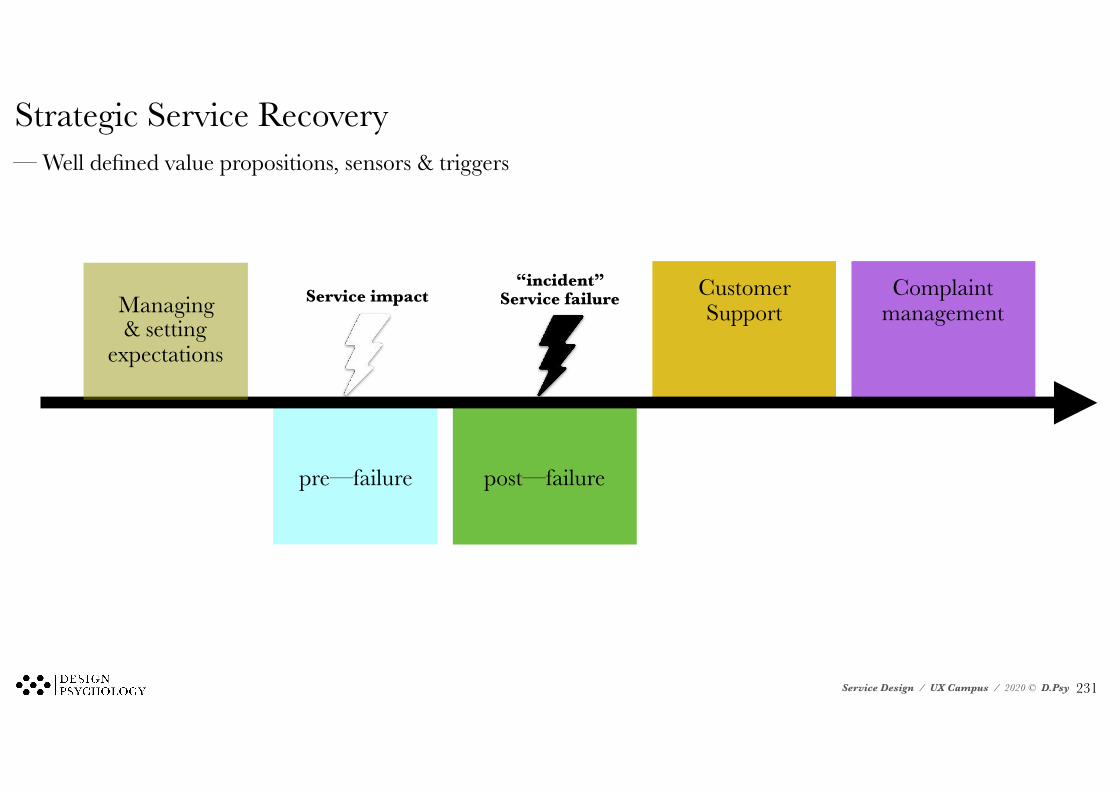
Strategic Service Recovery
pre—failure post—failure
“incident” Service failureService impact Complaint
managementCustomer SupportManaging
& setting expectations
— Well defined value propositions, sensors & triggers
!231
Service Design / UX Campus / 2020 © D.Psy
Sensors: Data Strategy
1. Establish scalable data storing system 2. Measure over time - experiences develop 3. Measure at multiple touch-points using multiple methods 4. Share data in organisation, e.g. feedback in Key
Performance Indicators
!232
Service Design / UX Campus / 2020 © D.Psy
10. Nature of Services
!233
Service Design / UX Campus / 2020 © D.Psy
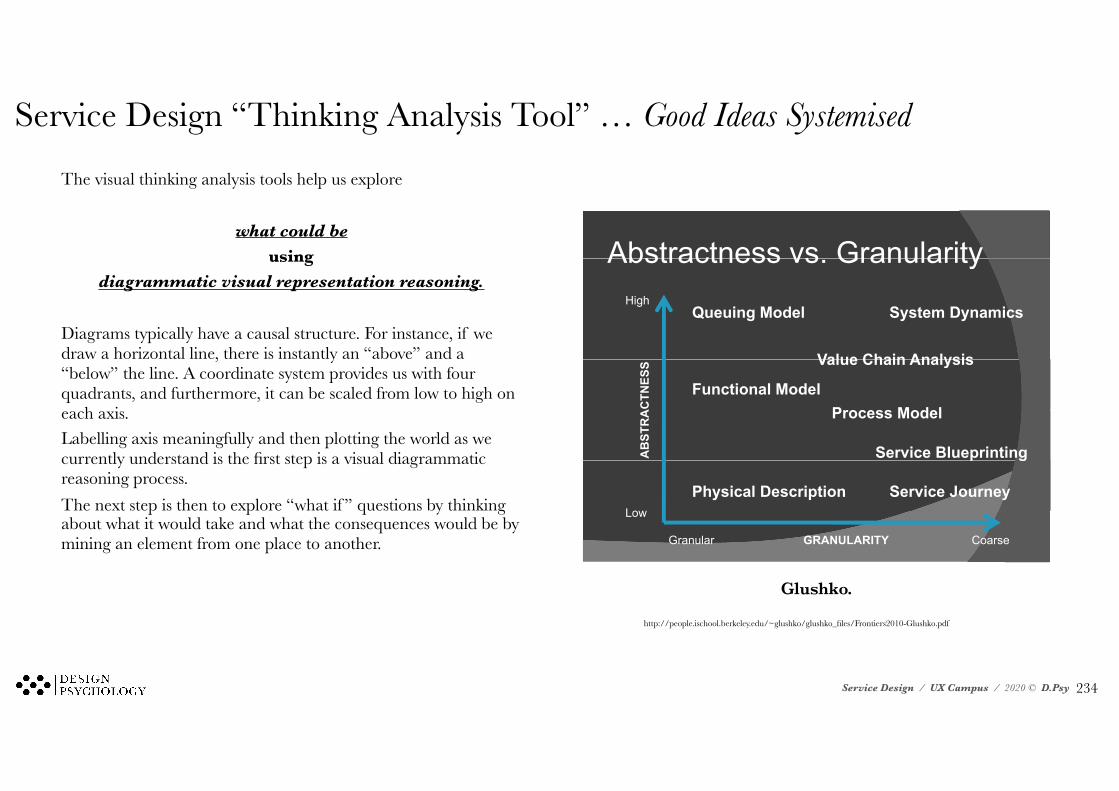
Service Design “Thinking Analysis Tool” … Good Ideas Systemised
The visual thinking analysis tools help us explore
what could be using
diagrammatic visual representation reasoning.
Diagrams typically have a causal structure. For instance, if we draw a horizontal line, there is instantly an “above” and a “below” the line. A coordinate system provides us with four quadrants, and furthermore, it can be scaled from low to high on each axis. Labelling axis meaningfully and then plotting the world as we currently understand is the first step is a visual diagrammatic reasoning process. The next step is then to explore “what if ” questions by thinking about what it would take and what the consequences would be by mining an element from one place to another.
Abstractness vs GranularityAbstractness vs. GranularityHigh
S t D iQ i M d l System DynamicsQueuing Model
Value Chain Analysis
AC
TNES
S Value Chain Analysis
Process ModelFunctional Model
AB
STR
A Process Model
Service Blueprinting
Physical Description Service JourneyLow
p g
GRANULARITY CoarseGranular
Low
Decision Tree for Model SSelection
Granular Physical ModelGranular Physical ModelFunctional Model
Concrete
Coarse Service JourneyService Blueprinting
Concrete
Granular
Service Blueprinting
Queuing ModelAbstract SOAAbstract SOA
Coarse System DynamicsValue Chain Analysis
Glushko.
http://people.ischool.berkeley.edu/~glushko/glushko_files/Frontiers2010-Glushko.pdf
!234
Service Design / UX Campus / 2020 © D.Psy
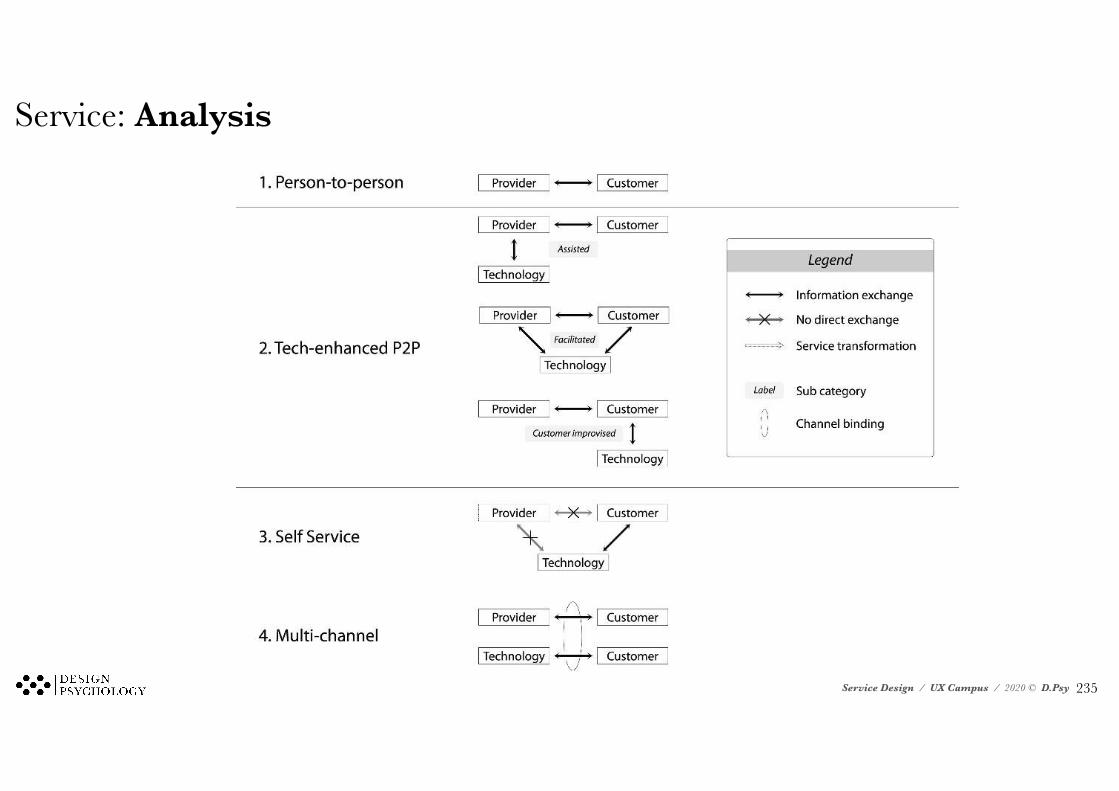
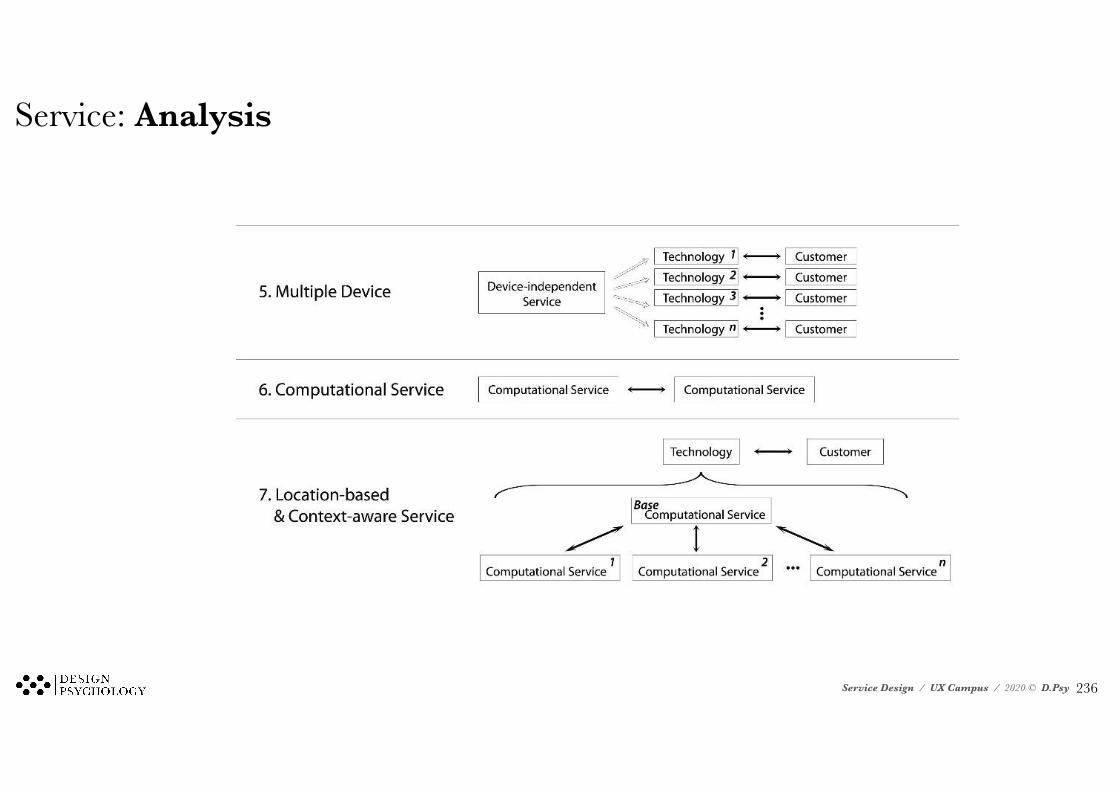
Service: Analysis
Figure 1. The Seven Design Contexts: Derivational and Compositional Rela-tionships
R.J. Glushko 236
!235
Service Design / UX Campus / 2020 © D.Psy
Service: Analysis
Figure 1. The Seven Design Contexts: Derivational and Compositional Rela-tionships
R.J. Glushko 236
!236
Service Design / UX Campus / 2020 © D.Psy
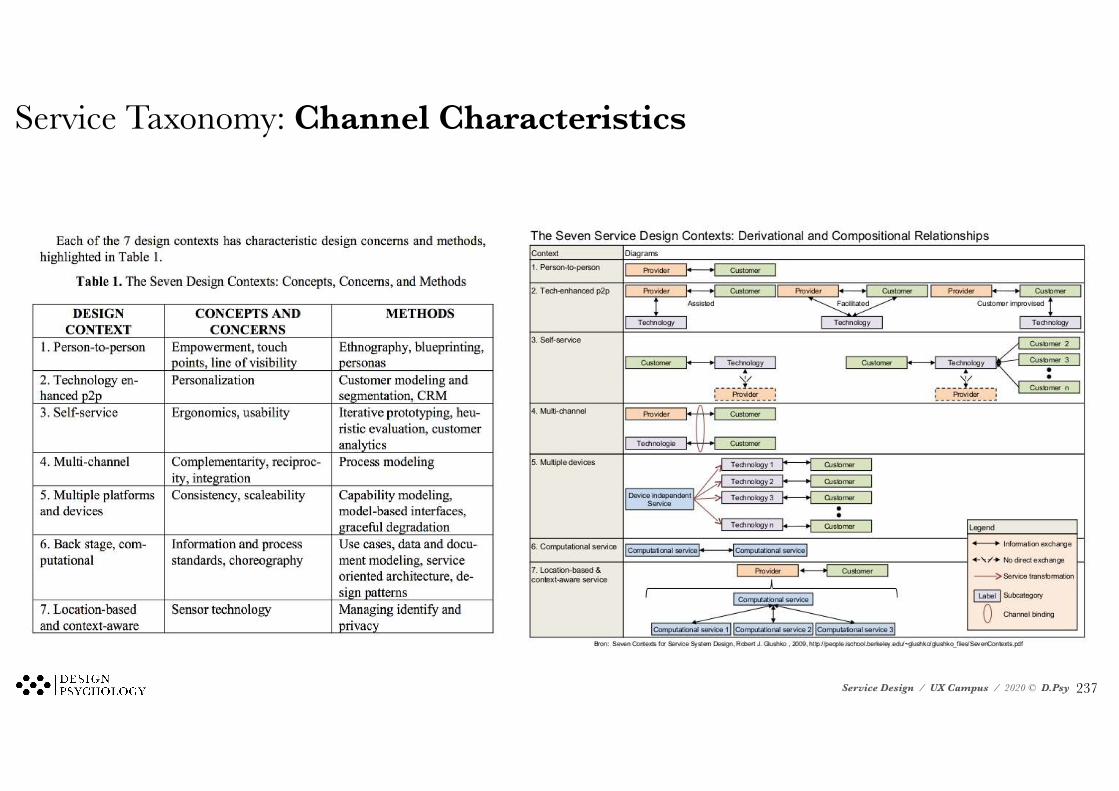
Service Taxonomy: Channel Characteristics
!237
Service Design / UX Campus / 2020 © D.Psy
6/20/2011
12
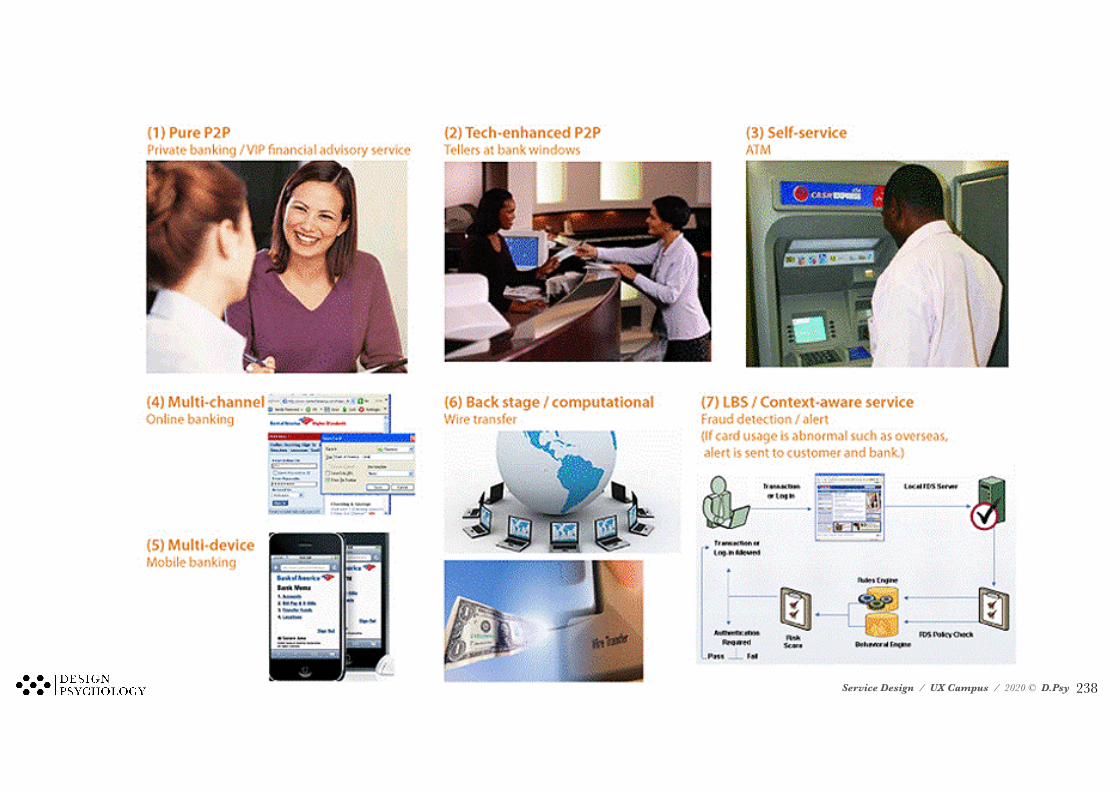
Seven Contexts Framework
Seven Contexts in Banking
!238
Service Design / UX Campus / 2020 © D.Psy
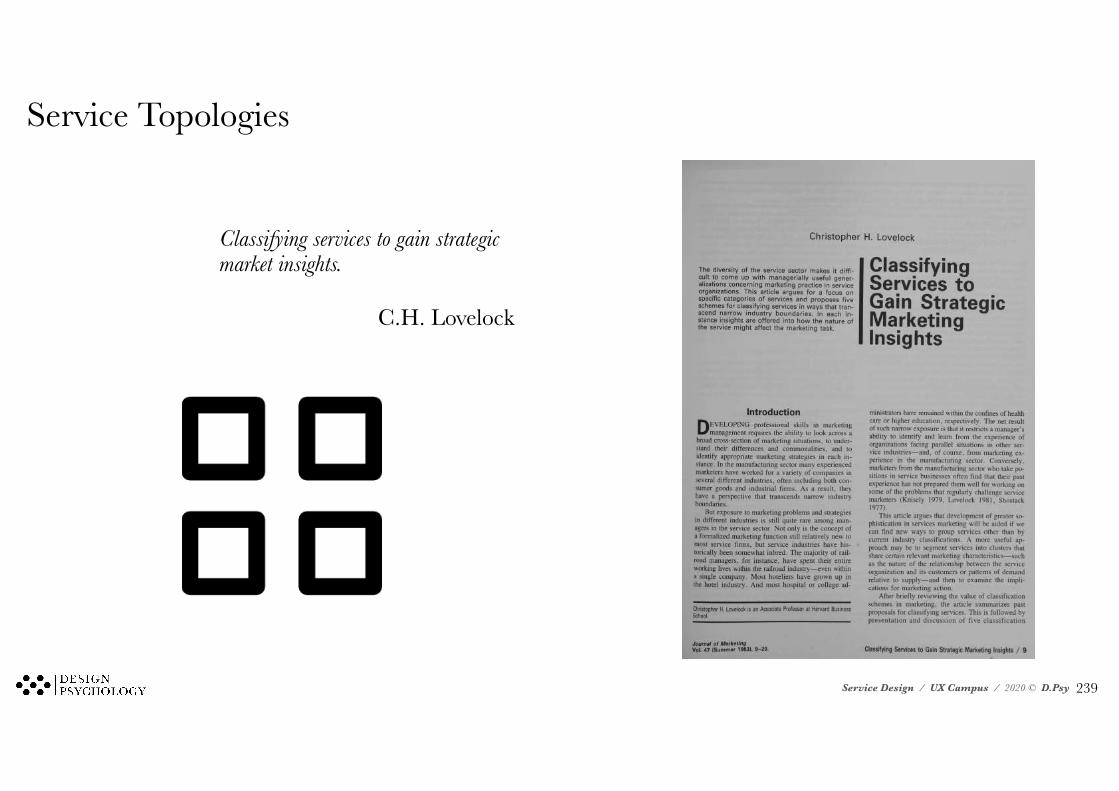
Christopher H. Lovelock
The diversity of the service sector makes it diffi-cult to come up with managerially useful gener-alizations concerning marketing practice in serviceorganizations. This article argues for a focus onspecific categories of services and proposes fiveschemes for classifying services in ways that tran-scend narrow industry boundaries. In each in-stance insights are offered into how the nature ofthe service might affect the marketing task.
ClassifyingServices toGain StrategicMarketingInsights
Introduction
DEVELOPING professional skills in marketingmanagement requires the ability to look across a
broad cross-section of marketing situations, to under-stand their differences and commonalities, and toidentify appropriate marketing strategies in each in-stance. In the manufacturing sector many experiencedmarketers have worked for a variety of companies inseveral different industries, often including both con-sumer goods and industrial firms. As a result, theyhave a perspective that transcends narrow industryboundaries.
But exposure to marketing problems and strategiesin different industries is still quite rare among man-agers in the service sector. Not only is the concept ofa formalized marketing function still relatively new tomost service firms, but service industries have his-torically been somewhat inbred. The majority of rail-road managers, for instance, have spent their entireworking lives within the railroad industry—even withina single company. Most hoteliers have grown up inthe hotel industry. And most hospital or college ad-
Christopher H. Lovelock is an Associate Professor at Harvard BusinessSchool.
ministrators have remained within the confmes of healthcare or higher education, respectively. The net resultof such narrow exposure is that it restricts a manager'sability to identify and learn from the experience oforganizations facing parallel situations in other ser-vice industries—and, of course, from marketing ex-perience in the manufacturing sector. Conversely,marketers from the manufacturing sector who take po-sitions in service businesses often find that their pastexperience has not prepared them well for working onsome of the problems that regularly challenge servicemarketers (Knisely 1979, Lovelock 1981, Shostack1977).
This article argues that development of greater so-phistication in services marketing will be aided if wecan find new ways to group services other than bycurrent industry classifications. A more useful ap-proach may be to segment services into clusters thatshare certain relevant marketing characteristics—suchas the nature of the relationship between the serviceorganization and its customers or patterns of demandrelative to supply—and then to examine the impli-cations for marketing action.
After briefly reviewing the value of classificationschemes in marketing, the article summarizes pastproposals for classifying services. This is followed bypresentation and discussion of five classification
Journal of MarketingVol. 47 (Summer 1983), 9-20. Classifying Services to Gain Strategic Marketing Insights / 9
Service Topologies
Classifying services to gain strategic market insights.
C.H. Lovelock
!239
Service Design / UX Campus / 2020 © D.Psy
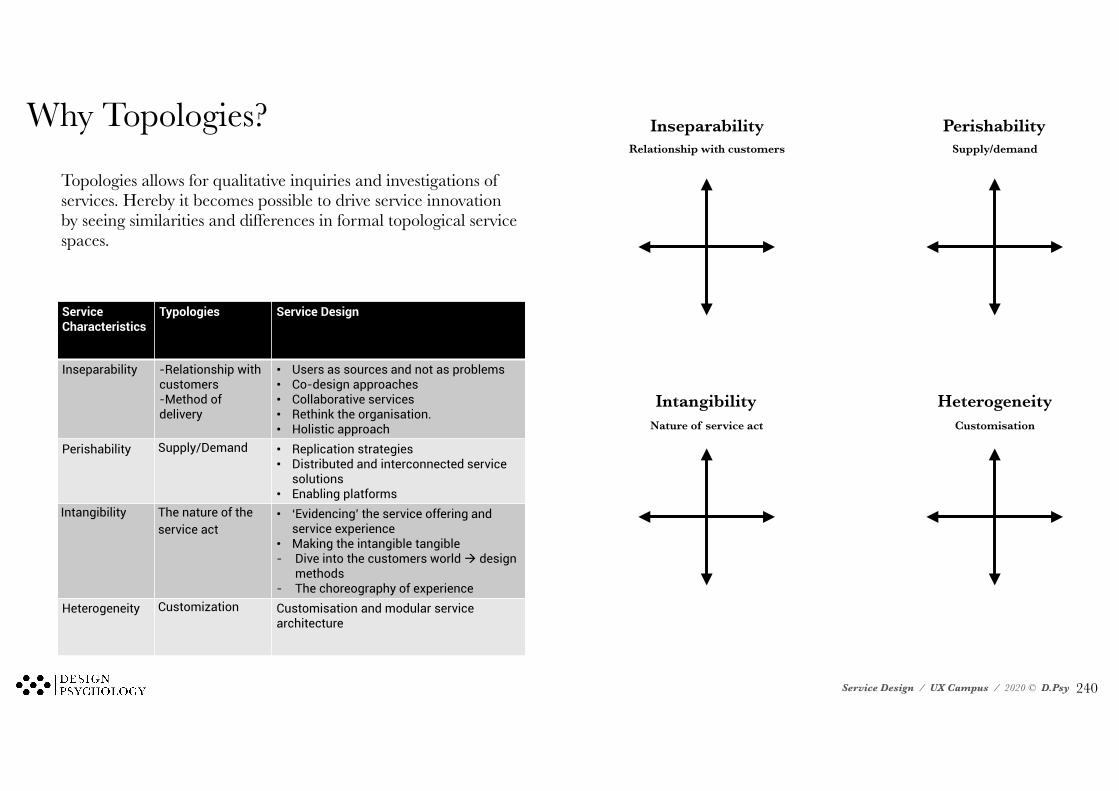
Topologies allows for qualitative inquiries and investigations of services. Hereby it becomes possible to drive service innovation by seeing similarities and differences in formal topological service spaces.
Service Characteristics
Typologies Service Design
Inseparability -Relationship with customers -Method of delivery
• Users as sources and not as problems • Co-design approaches • Collaborative services • Rethink the organisation. • Holistic approach
Perishability Supply/Demand • Replication strategies • Distributed and interconnected service
solutions • Enabling platforms
Intangibility The nature of the service act
• ‘Evidencing’ the service offering and service experience
• Making the intangible tangible - Dive into the customers world Æ design
methods - The choreography of experience
Heterogeneity Customization Customisation and modular service architecture
Why Topologies? Inseparability Relationship with customers
Perishability Supply/demand
Intangibility Nature of service act
Heterogeneity Customisation
!240
Service Design / UX Campus / 2020 © D.Psy
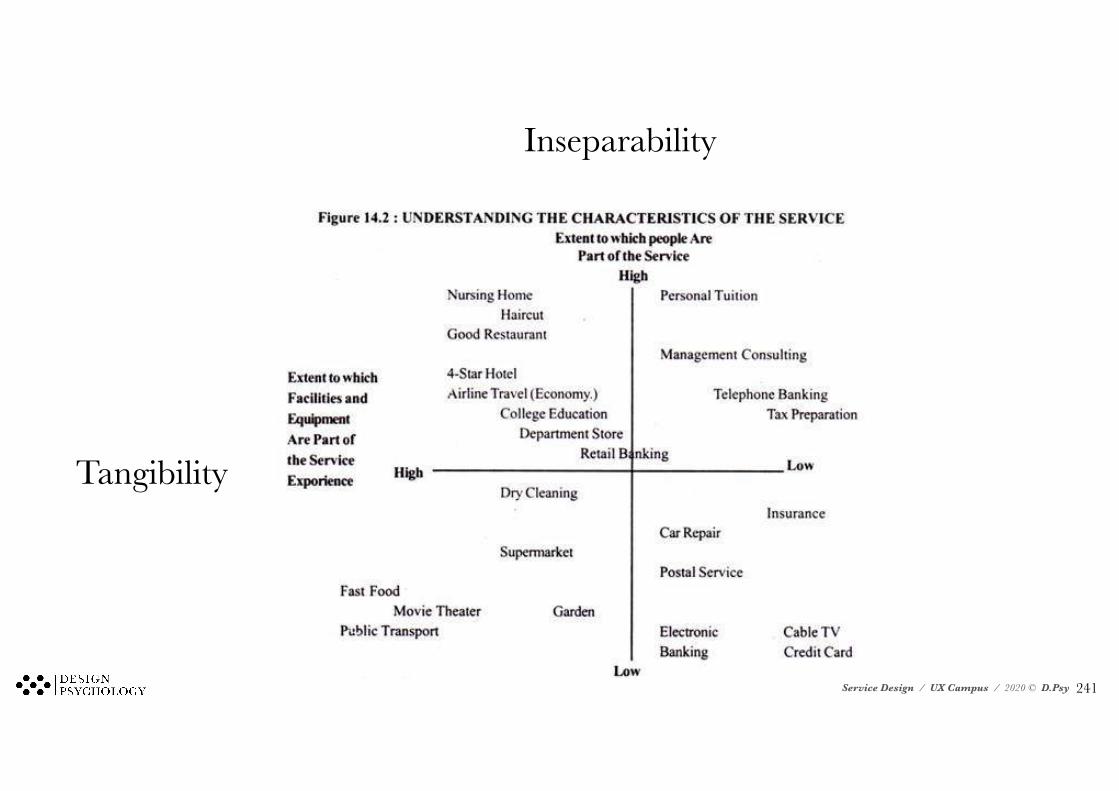
Inseparability
Tangibility
!241
Service Design / UX Campus / 2020 © D.Psy
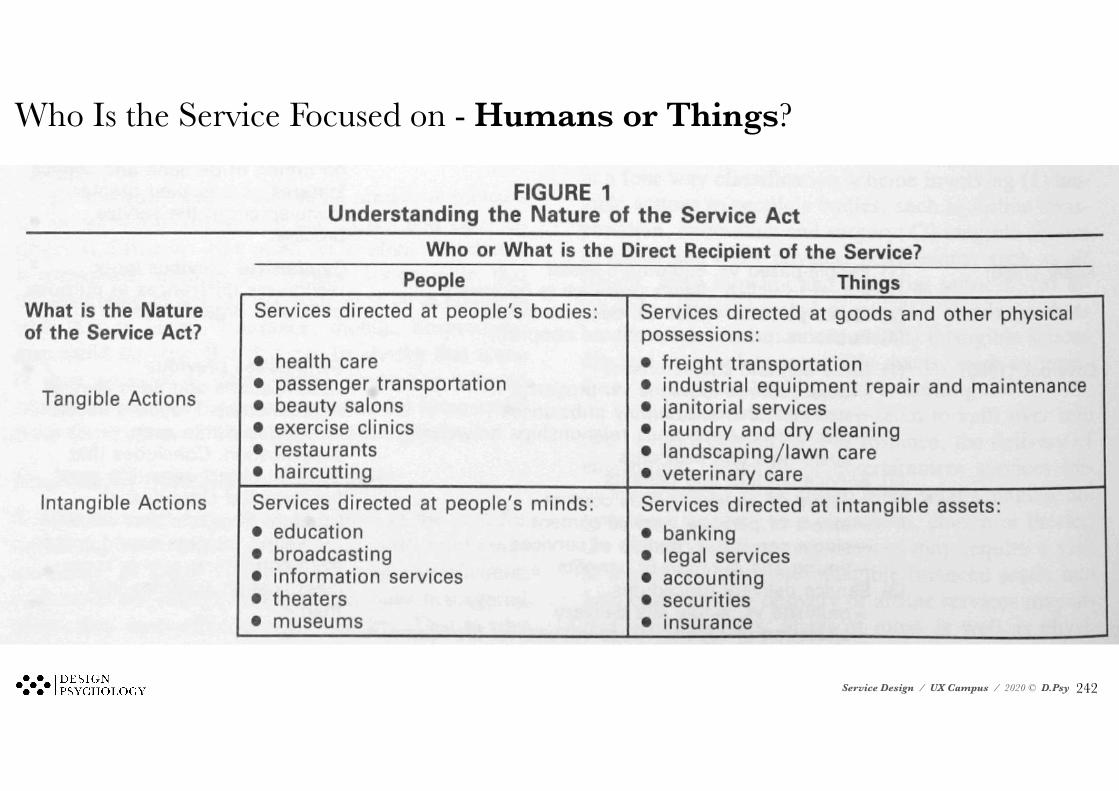
Who Is the Service Focused on - Humans or Things?
!242
Service Design / UX Campus / 2020 © D.Psy
Understanding the Nature of the Service Act
Who or What is the Direct Recipient of the Service?
People Things What is the Nature of the Service Act?
Tangible Actions
Intangible Actions
Service directed at people’s bodies
Service directed at people’s minds
Service directed at goods and other physical possessions
Service directed at intangible assets
3
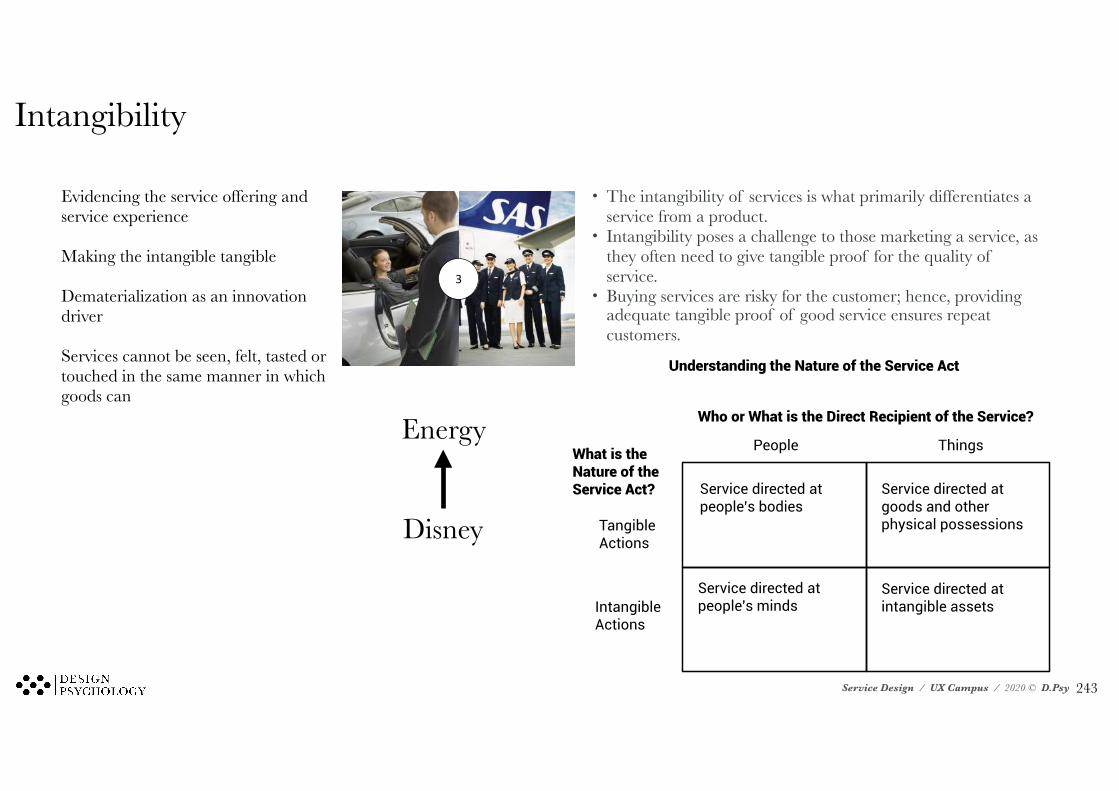
Evidencing the service offering and service experience
Making the intangible tangible
Dematerialization as an innovation driver
Services cannot be seen, felt, tasted or touched in the same manner in which goods can
Energy
Disney
Intangibility
• The intangibility of services is what primarily differentiates a service from a product.
• Intangibility poses a challenge to those marketing a service, as they often need to give tangible proof for the quality of service.
• Buying services are risky for the customer; hence, providing adequate tangible proof of good service ensures repeat customers.
!243
Service Design / UX Campus / 2020 © D.Psy
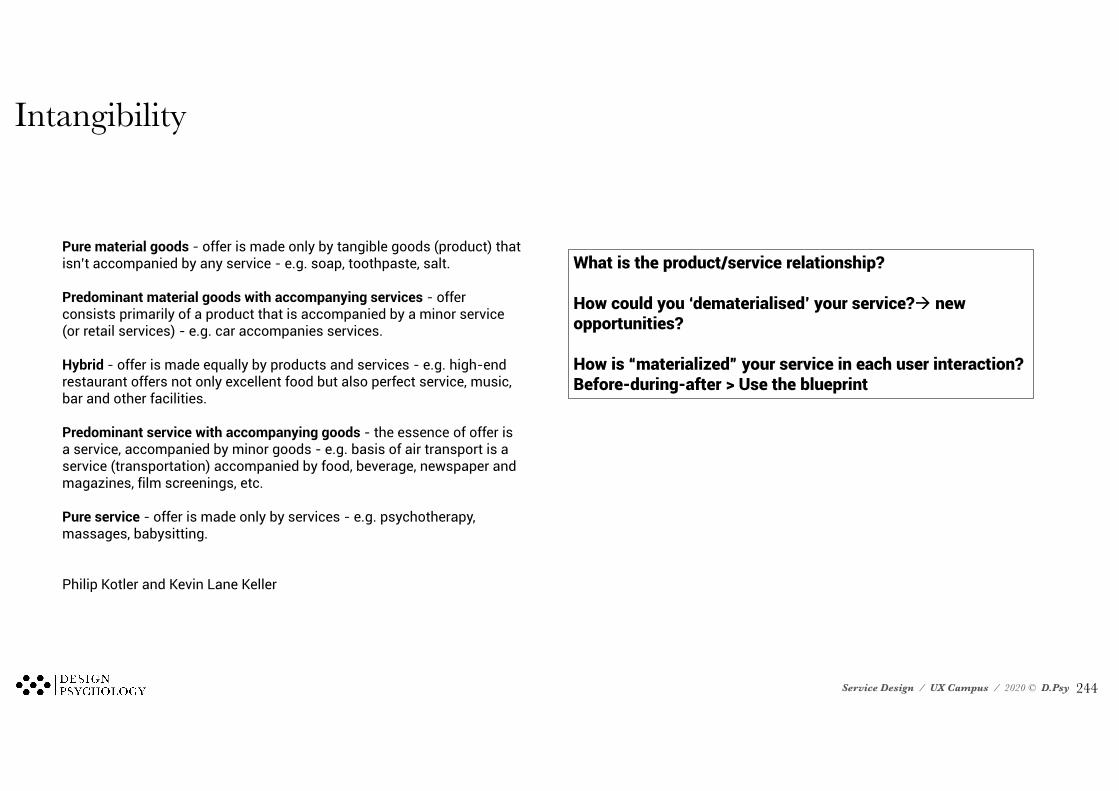
What is the product/service relationship? How could you ‘dematerialised’ your service?Æ new opportunities? How is “materialized” your service in each user interaction? Before-during-after > Use the blueprint
Pure material goods - offer is made only by tangible goods (product) that isn’t accompanied by any service - e.g. soap, toothpaste, salt. Predominant material goods with accompanying services - offer consists primarily of a product that is accompanied by a minor service (or retail services) - e.g. car accompanies services. Hybrid - offer is made equally by products and services - e.g. high-end restaurant offers not only excellent food but also perfect service, music, bar and other facilities. Predominant service with accompanying goods - the essence of offer is a service, accompanied by minor goods - e.g. basis of air transport is a service (transportation) accompanied by food, beverage, newspaper and magazines, film screenings, etc. Pure service - offer is made only by services - e.g. psychotherapy, massages, babysitting. Philip Kotler and Kevin Lane Keller
Intangibility
!244
Service Design / UX Campus / 2020 © D.Psy
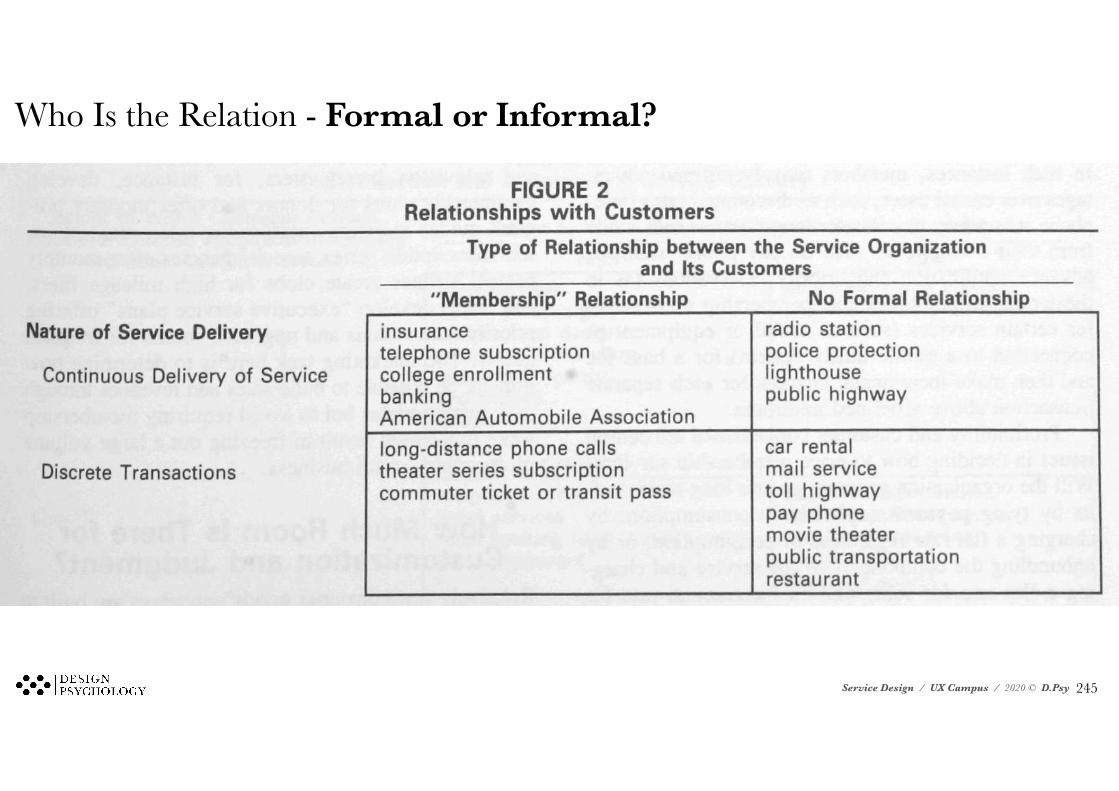
Who Is the Relation - Formal or Informal?
!245
Service Design / UX Campus / 2020 © D.Psy
1
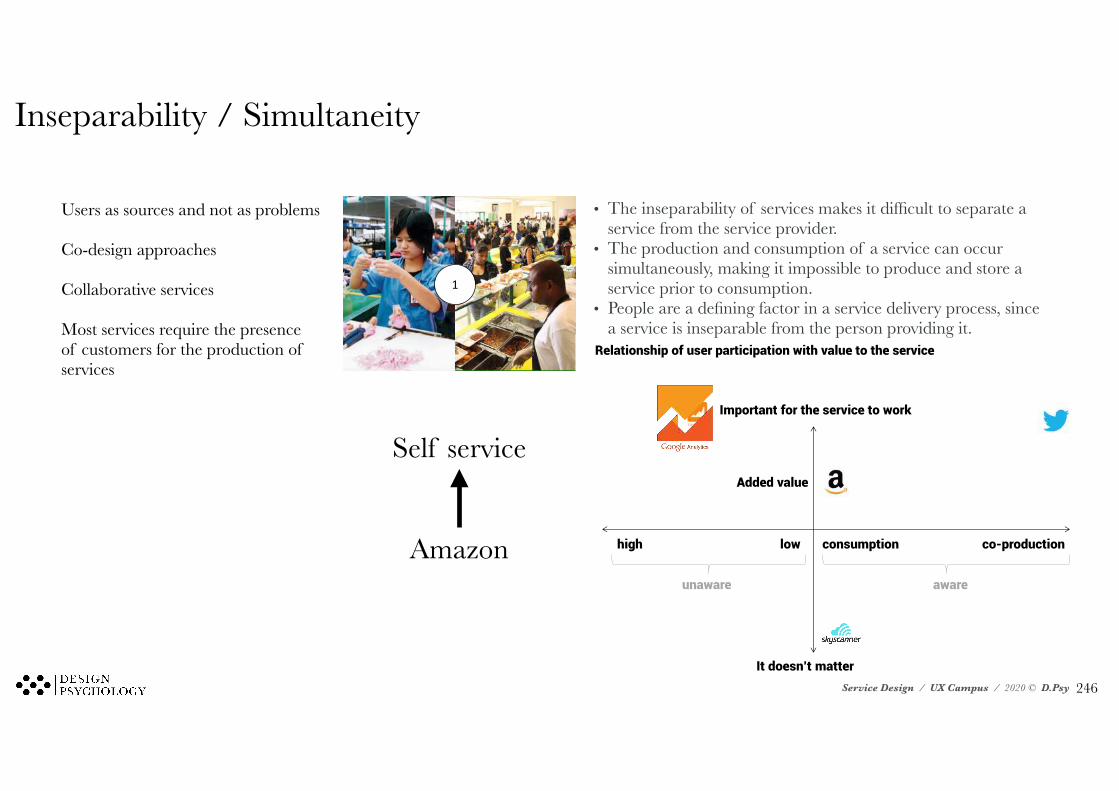
Relationship of user participation with value to the service
Important for the service to work
It doesn’t matter
low high
unaware
co-production consumption
aware
Added value
Users as sources and not as problems
Co-design approaches
Collaborative services
Most services require the presence of customers for the production of services
Self service
Amazon
Inseparability / Simultaneity
• The inseparability of services makes it difficult to separate a service from the service provider.
• The production and consumption of a service can occur simultaneously, making it impossible to produce and store a service prior to consumption.
• People are a defining factor in a service delivery process, since a service is inseparable from the person providing it.
!246
Service Design / UX Campus / 2020 © D.Psy
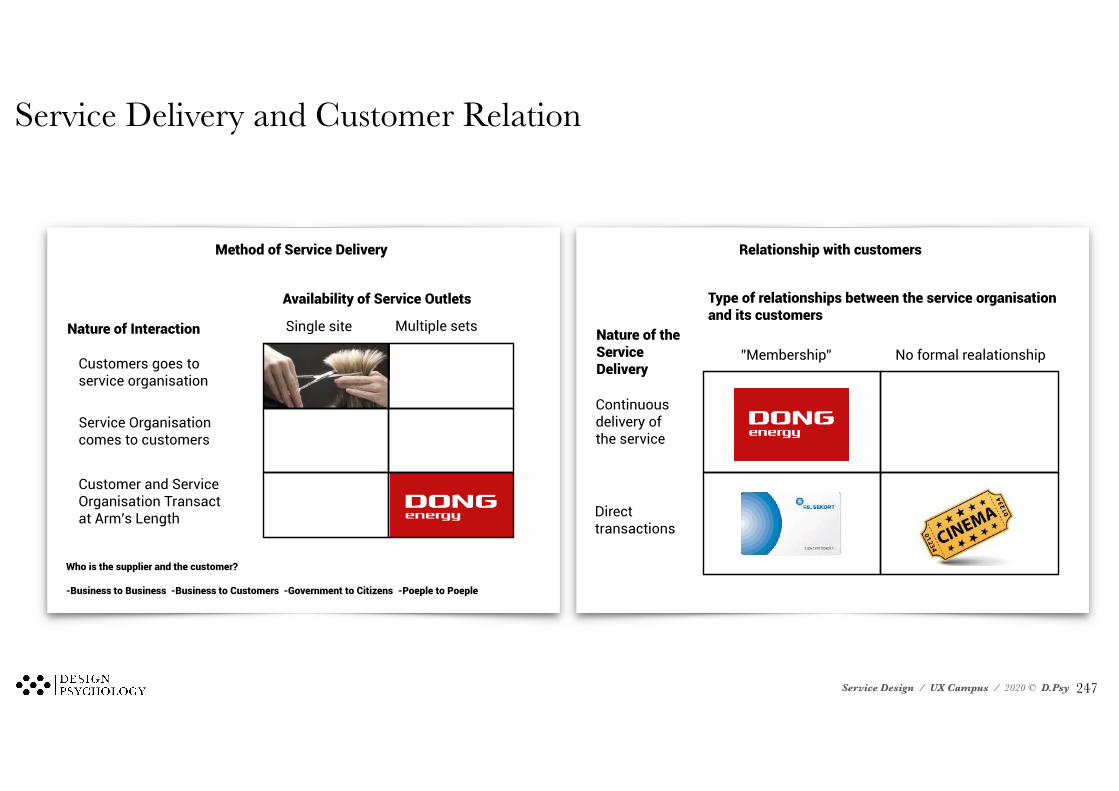
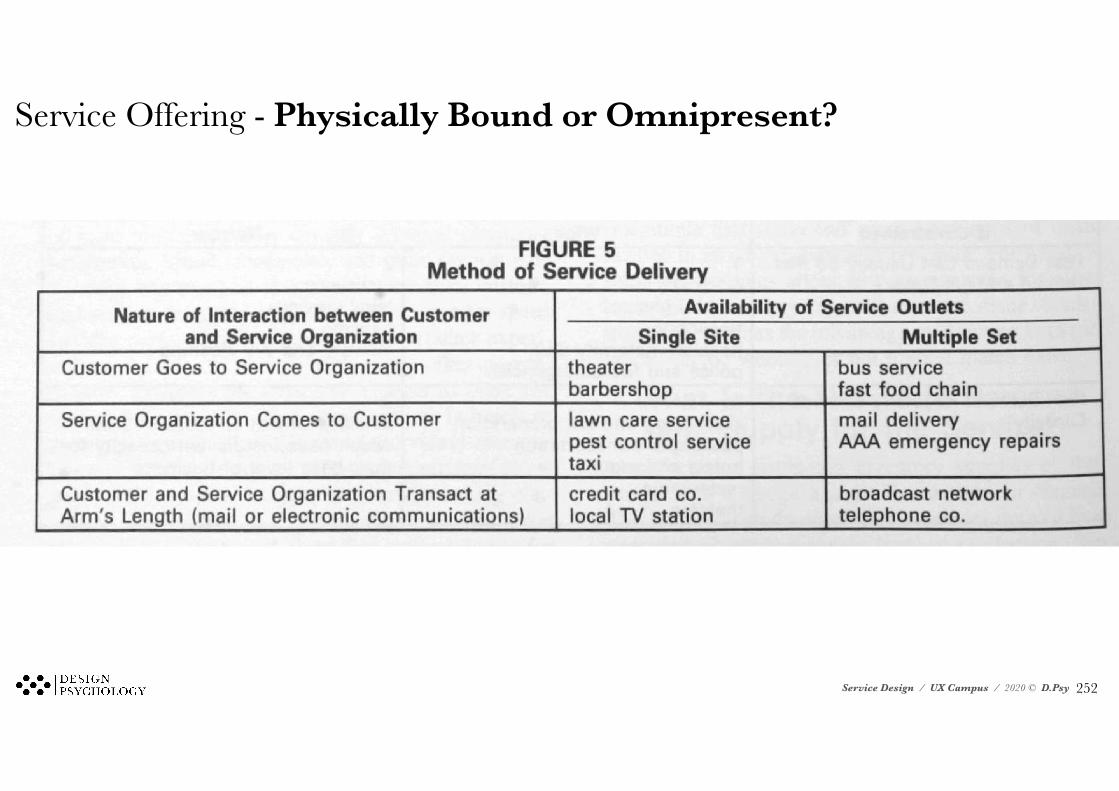
Method of Service Delivery
Availability of Service Outlets
Single site Multiple sets Nature of Interaction
Customers goes to service organisation
Service Organisation comes to customers
Customer and Service Organisation Transact at Arm’s Length
Who is the supplier and the customer? -Business to Business -Business to Customers -Government to Citizens -Poeple to Poeple
Relationship with customers
Type of relationships between the service organisation and its customers
”Membership” No formal realationship Nature of the Service Delivery
Continuous delivery of the service
Direct transactions
Service Delivery and Customer Relation
!247
Service Design / UX Campus / 2020 © D.Psy
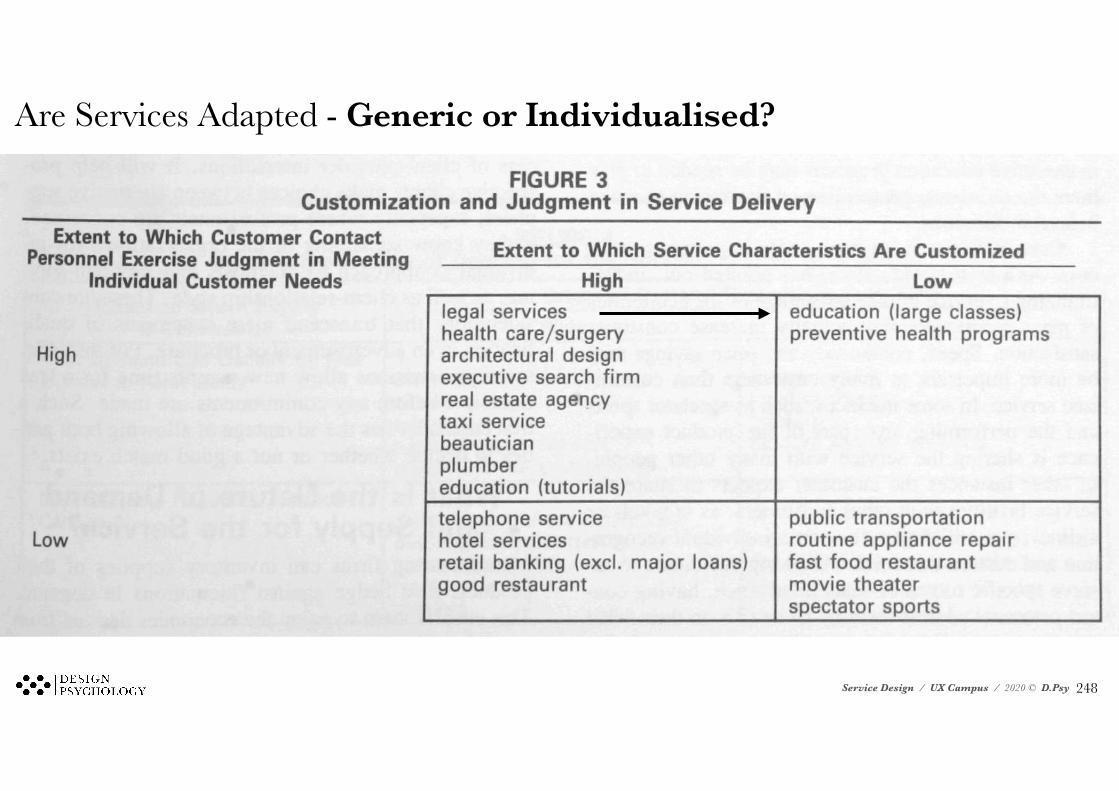
Are Services Adapted - Generic or Individualised?
!248
Service Design / UX Campus / 2020 © D.Psy
Customization in Service Delivery
Extent to which Service Characteristics are Customized
High Low Personnel ”power” to meet customers needs
High
Low
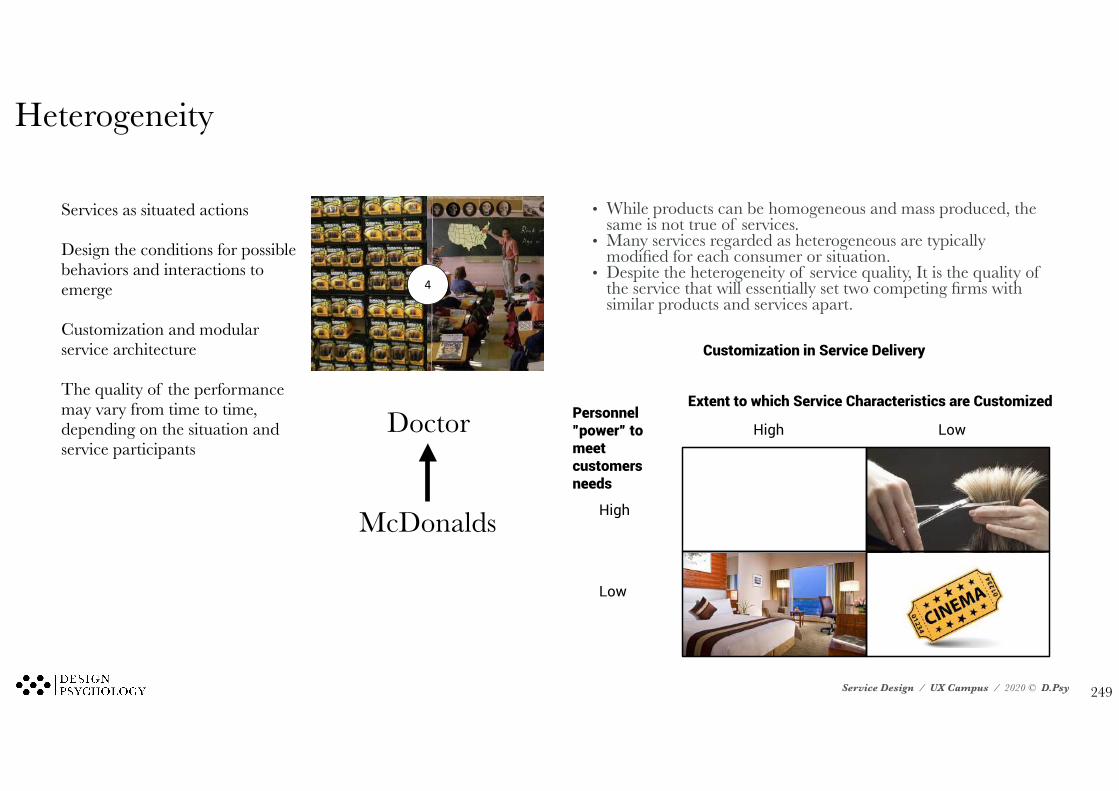
4
Services as situated actions
Design the conditions for possible behaviors and interactions to emerge
Customization and modular service architecture
The quality of the performance may vary from time to time, depending on the situation and service participants
Doctor
McDonalds
Heterogeneity
• While products can be homogeneous and mass produced, the same is not true of services.
• Many services regarded as heterogeneous are typically modified for each consumer or situation.
• Despite the heterogeneity of service quality, It is the quality of the service that will essentially set two competing firms with similar products and services apart.
!249
Service Design / UX Campus / 2020 © D.Psy
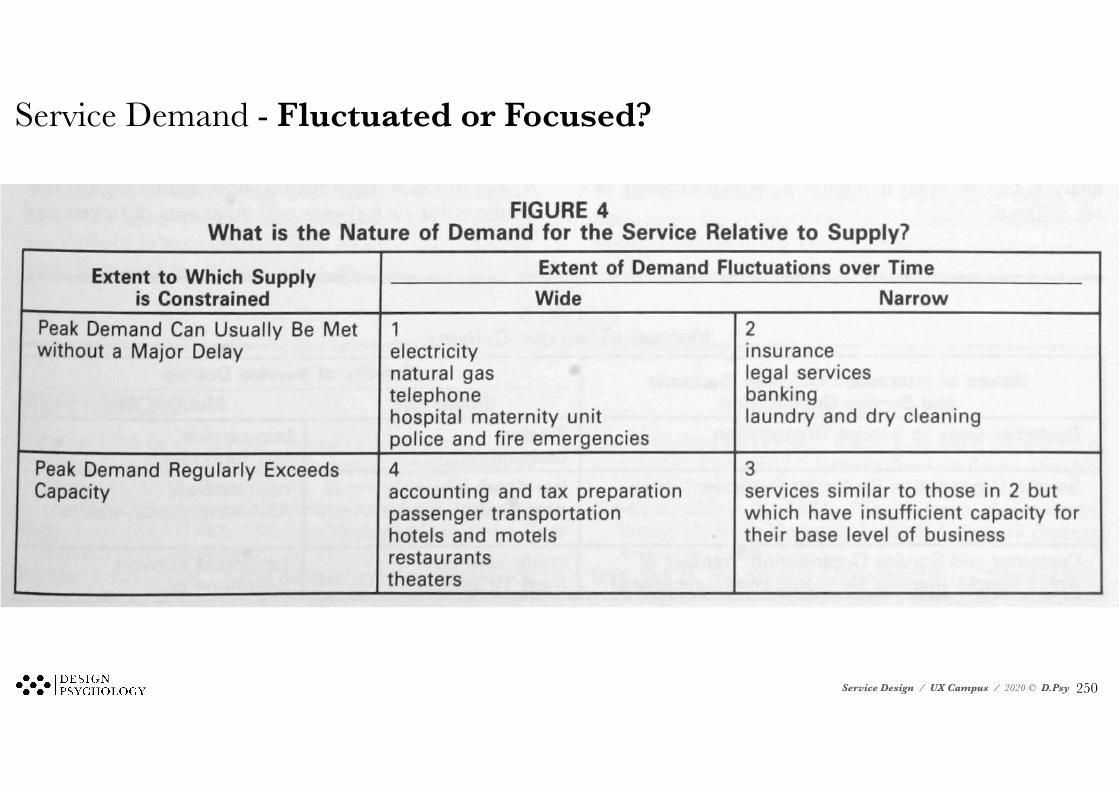
Service Demand - Fluctuated or Focused?
!250
Service Design / UX Campus / 2020 © D.Psy
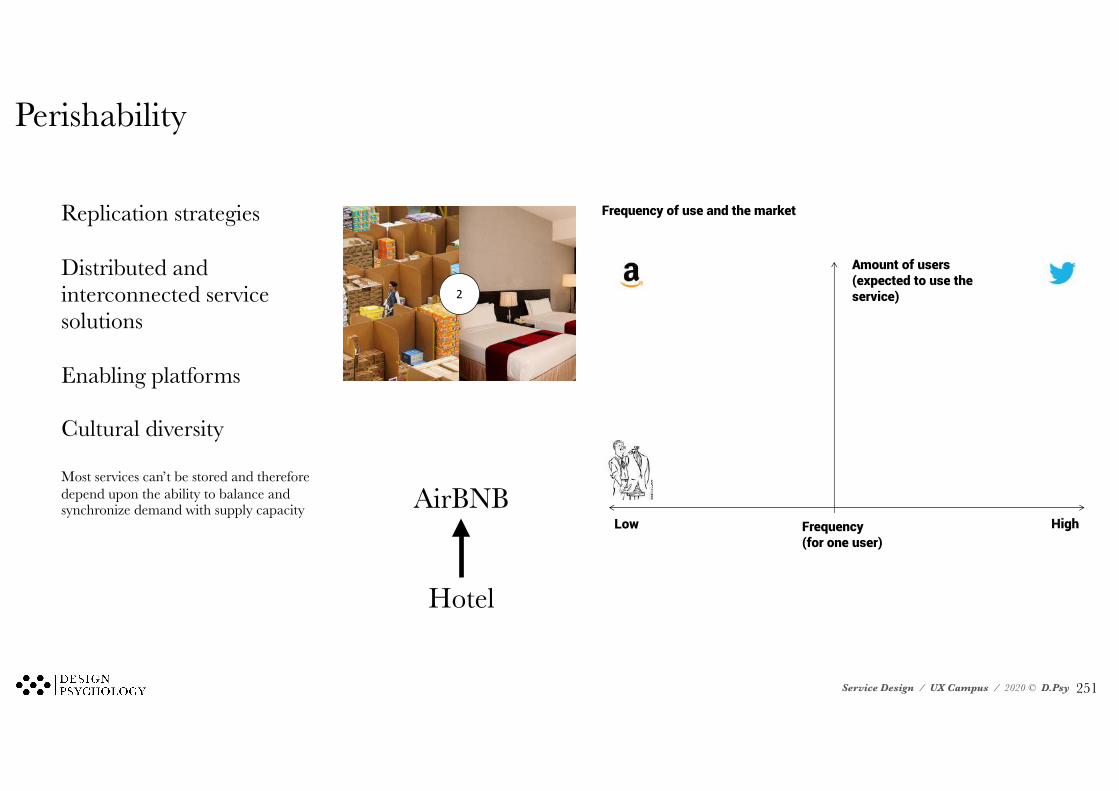
Frequency of use and the market
Low High Frequency (for one user)
Amount of users (expected to use the service) 2
Replication strategies
Distributed and interconnected service solutions
Enabling platforms
Cultural diversity
Most services can’t be stored and therefore depend upon the ability to balance and synchronize demand with supply capacity AirBNB
Hotel
Perishability
!251
Service Design / UX Campus / 2020 © D.Psy
Service Offering - Physically Bound or Omnipresent?
!252
Service Design / UX Campus / 2020 © D.Psy
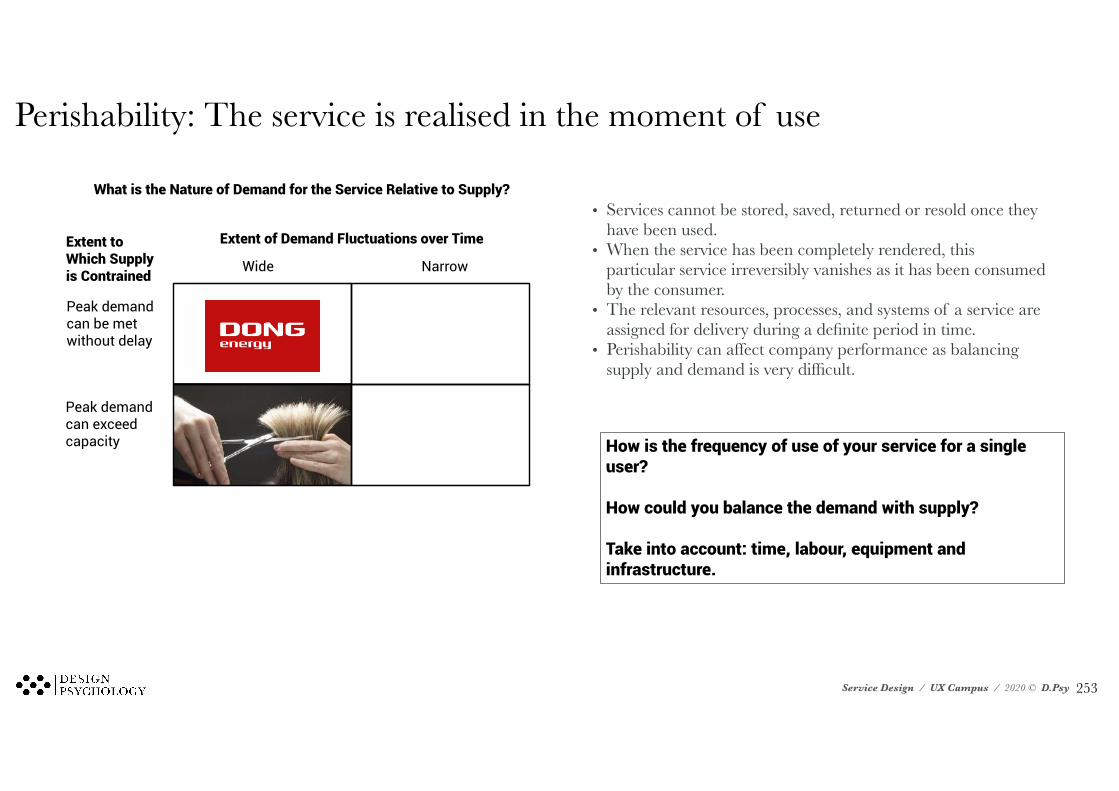
How is the frequency of use of your service for a single user? How could you balance the demand with supply? Take into account: time, labour, equipment and infrastructure.
What is the Nature of Demand for the Service Relative to Supply?
Extent of Demand Fluctuations over Time
Wide Narrow
Extent to Which Supply is Contrained
Peak demand can be met without delay
Peak demand can exceed capacity
Perishability: The service is realised in the moment of use
• Services cannot be stored, saved, returned or resold once they have been used.
• When the service has been completely rendered, this particular service irreversibly vanishes as it has been consumed by the consumer.
• The relevant resources, processes, and systems of a service are assigned for delivery during a definite period in time.
• Perishability can affect company performance as balancing supply and demand is very difficult.
!253