542.pdf - studia universitatis babes-bolyai
TRANSCRIPT
NEGOTIA3/2010
ANUL LV 2010
S T U D I A
UNIVERSITATIS BABE Ş-BOLYAI
NEGOTIA
3
Desktop Editing Office: 51ST B.P. Hasdeu, Cluj-Napoca, Romania, Phone + 40 264-40.53.52
CUPRINS – CONTENT – SOMMAIRE – INHALT ROXANA STEGEREAN, CORINA GAVREA, ANAMARIA MARIN, The
Application of a Diagnostic Model: An Empirical Study............................ 3 MARIA-ANDRADA GEORGESCU, DANA MIHAELA MURGESCU, The
Architectural Design of the Cohesion Policy within the EU Budget......... 13 OVIDIU I. MOISESCU, DŨNG ANH VŨ, A study of the Relation between
Brand Loyalty and Consumer Involvement with purchase Decision and Product Class....................................................................................... 27
MONICA MARIA COROŞ, MARIUS EMIL COROŞ, The Role of Public Administration in City Branding the Case of Cluj-Napoca ....................... 37
CRISTINA SILVIA NISTOR, An Empirical Research about the Contain of Balanced Scorecard Concept in Public Sector........................................... 51
ADRIAN GROŞANU, PAULA RAMONA RĂCHIŞAN, Challenges of the Auditing Profession in the Context of Economic Crisis ............................ 69
SIMONA - CLARA BARSAN, MIHAELA - GEORGIA SIMA, ANCUTA - MARIA PUSCAS, AUREL-GHEORGHE SETEL, Technology Audit - General and Practical Lines ............................................................................77

MARIUS DAN GAVRILETEA, Insurance Consumer Protection in Romania ..... 89 OLCAY ÇETINER, Examining the Firm Buildings of the News Printing
Sector from the Point of Architecture and Construction.......................... 101 ŠÁRKA BRYCHTOVÁ, Crisis – Time for Purification and Change .................. 113 ERIKA KULCSÁR, Tourists Attitudes, Preferences and Opinions Regarding
the Services Provided by Hotels Located in the Romanian Center Development Region ............................................................................... 121

STUDIA UNIVERSITATIS BABEŞ-BOLYAI, NEGOTIA, LV, 3, 2010
THE APPLICATION OF A DIAGNOSTIC MODEL: AN EMPIRICAL STUDY
ROXANA STEGEREAN 1, CORINA GAVREA 2, ANAMARIA MARIN 3 ABSTRACT. The vast majority of managers and consultants use in conducting organizational diagnosis specific models to identify the organizational aspects that proved to be essential in the past. The object of this paper is to apply such a model within a Romanian organization. More specifically we extended the well known Six Box Model to include, besides the six variables (purpose, structure, rewards, mechanisms, relation and leadership), other interest variables such as external environment and organizational performance in order to evaluate the organizational performance based on employees’ perceptions. The results obtained show that three of the 8 variable registered a significant and positive impact on organizational performance (purpose, mechanisms and external environment, the latter was not considered as a distinct variable in the Six Box Model). Keywords: organizational diagnosis, Six Box Model, organizational performance,
external environment. 1. Introduction
The intense global competition that characterizes the present business environment generated a high level of uncertainty among companies in all industries. This hiper-competition requires a continuous improvement in quality for products and services. Therefore, in order to survive and to ensure success, organizations must be flexible and able to adapt to the new changes in the business environment in a short period of time. Over time practitioners and academics have identified many strategies to improve organizational performance. Such a strategy is the organizational diagnosis, which represents the assessment of the current situation of an organization in order to identify the most appropriate interventions for future development. Organizational diagnosis is one essential step in the organizational development process. In order to improve organizational performance an evaluation of
1 Professor Roxana Stegerean, PhD, Babeş-Bolyai University, Faculty of Economics and Business
Administration, [email protected] 2 Teaching assistant, Corina Gavrea, Babeş-Bolyai University, Faculty of Economics and Business
Administration, [email protected] 3 Teaching assistant, Anamaria Marin, Babeş-Bolyai University, Faculty of Economics and Business
Administration, [email protected]
ROXANA STEGEREAN, CORINA GAVREA, ANAMARIA MARIN
4
the current performance is needed. These evaluations can be planned, systematic and explicit or unplanned and implicit.
In Lowman’s opinion (2005) the organizational diagnostic process is influenced by three basic questions: What does the practitioner diagnose? With what purpose? and Using what system?
Organizational diagnosis has two main purposes: one is the evaluation of organizational disfunctionalities (Lowman, 2005) and the other is the evaluation of the current state of the organization.
Some organizational diagnostic models within the academic literature are rather old, but if we are to cite Mintzberg “sometimes, like good wine, some of the best models are the older ones” (Mintzberg, et al., 1998:8).
According to a 1999 study, the most frequent used in practice proved to be Weisbord’s Six Box Model (25% of firms), followed by the 7S model (19%) and on the third place were the STAR Model and Nadler and Tushman’ Congruence model (10%). (Jones and Brazzel, 2006).
Organizational diagnostic models have the following advantages (Lok and Crawford, 2000 after Burke, 1994):
- help organizational development practitioners categorize data about organizations;
- enhance the understanding about organizational problems; - allow for a systematic data interpretation; - provide appropriate change strategies. 2. A diagnostic model: Weisbord’s Six Box Model
We decided to concentrate our empirical study on the Weisbord’s model because it is the most widely used model especially in practice but also in empirical studies mostly because its lack of complexity.
This model, was developed in 1976, by the American analyst Marvin Weistbord to assess the functioning of an organization.
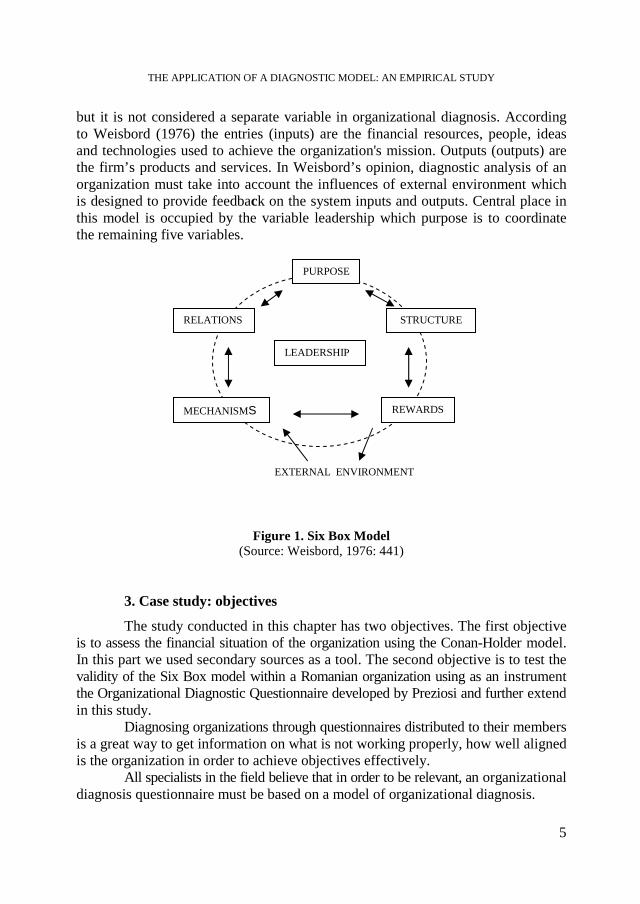
This model is based on six different variables (purpose, structure, relationships, leadership, rewards and mechanisms) which have a relationship of interdependence, the central position, as observed from the graphical representation of this model (Figure 1) is occupied by the variable leadership.
The goals of the organization are represented by its mission and objectives. Weisbord (1976) considers the structure as the way a firm is organized. The way people and units interact are called by the author "relationships". Also included in the category of relations is the way people interact with technology at work. The rewards, according to Weisbord, are those intrinsic and extrinsic rewards that people associate with their work. The variable leadership refers to the leadership tasks, including the balance between the other variables. The mechanisms refer to those procedures such as planning, control, information systems used to achieve organizational objectives. In Weisbord's model the external environment is present,
THE APPLICATION OF A DIAGNOSTIC MODEL: AN EMPIRICAL STUDY
5
but it is not considered a separate variable in organizational diagnosis. According to Weisbord (1976) the entries (inputs) are the financial resources, people, ideas and technologies used to achieve the organization's mission. Outputs (outputs) are the firm’s products and services. In Weisbord’s opinion, diagnostic analysis of an organization must take into account the influences of external environment which is designed to provide feedback on the system inputs and outputs. Central place in this model is occupied by the variable leadership which purpose is to coordinate the remaining five variables.
Figure 1. Six Box Model (Source: Weisbord, 1976: 441)
3. Case study: objectives
The study conducted in this chapter has two objectives. The first objective is to assess the financial situation of the organization using the Conan-Holder model. In this part we used secondary sources as a tool. The second objective is to test the validity of the Six Box model within a Romanian organization using as an instrument the Organizational Diagnostic Questionnaire developed by Preziosi and further extend in this study.
Diagnosing organizations through questionnaires distributed to their members is a great way to get information on what is not working properly, how well aligned is the organization in order to achieve objectives effectively.
All specialists in the field believe that in order to be relevant, an organizational diagnosis questionnaire must be based on a model of organizational diagnosis.
PURPOSE
RELATIONS STRUCTURE
REWARDS MECHANISMS
LEADERSHIP
EXTERNAL ENVIRONMENT

ROXANA STEGEREAN, CORINA GAVREA, ANAMARIA MARIN
6
Thus, as we previously said, the second objective of this study is to analyze the employees’ opinion on the functionality of an organization using the Organizational Diagnosis Questionnaire.
The questionnaire used in this study is based on the Weisbord's Six Box model. The elements of this model are similar to those of other organizational diagnostic models such as Nadler and Tushman (1982), Burke and Litwin (1992). The advantage of this model is its lack of complexity compared to other models of organizational diagnosis which makes it easier to understand and visualize being successfully implemented by many organizations (Preziosi, 1980). Thus, many organizational diagnostic models were developed based on the Weisbord’s model (Nadler and Tushman, 1982, Burke and Litwin, 1992).
Also, as we mentioned in the introductory part, this model is the most often used in practice.
The organization examined in this study is a Romanian cosmetics company, more specifically the largest cosmetics company in Romania and also the winner of the National Top of the Private Companies published by the Chamber of Commerce and Industry for four consecutive years.
4.Research design
4.1 Instruments used The first part of our study is based on secondary sources, namely, the indicators
included in the balance sheet of the firm. The second part, used as a diagnostic tool the Preziosi's Organizational
Diagnostic Questionnaire (1980) which is an extension of the original version used by Weisbord. Weisbord instrument included 30 items that were used to quantify the six variables of the model. Preziosi's questionnaire (1980) included in addition to the Weisbord's 30 original items 5 more to reflect an additional factor, namely "the attitudes toward change" of members of the organization. This new variable has a special importance in our study because of the numerous changes that occurred in the company starting with the changing of the CEO in the early 2009. This questionnaire allows for data collection on the functioning of the organization, measuring the perception of the organization’s members regarding those aspects that should be modified but also those that should be valued in the future to ensure its success.
In this study we further extended the Weisbord’s model and thus the questionnaire by including two more variables, namely: the external environment (which is exists in Weisbord's model without being reflected as a separate variable) and performance which is completely missing giving us an instrument that totaled a number of 44 items. We decided to include the latter variable to identify, based on an empirical study, which of the variables specified by Weisbord have a significant influence on organizational performance.
To obtain information on these variables we used the Likert scale 1-5 (1-totally disagree, 2-disagree, 3-undecided, 4-agree, 5-total agreement).

THE APPLICATION OF A DIAGNOSTIC MODEL: AN EMPIRICAL STUDY
7
4.2 Sample and data collection The questionnaires were distributed electronically to all employees who
have an e-mail address. Thus, we obtained a sample of 231 employees (essentially we eliminated the workers form production sections). Of the 231 sent questionnaires, we collected a total of 105 representing a response rate of 45%.
Data analysis For secondary data analysis in order to assess the general health of the
company we used the Conan-Holder model based on the calculation of the Z score indicating the likelihood of bankruptcy of this company.
The Z score of the Conan-Holder model based on the performance indicators for the two years analyzed (2007, 2008) is illustrated in Table 1:
Tabel 1.
Z score
Year r1 r2 r3 r4 r5 Z 2007 1,1219 0,8641 1,67 0,0126 0,4614 0,669 2008 0,5519 0,8259 1,42 0,0289 0,5321 0,463
Authors’ calculation
Tabel 2. Interpretation of the results
Year Z 2007 0,669 Z>0,16 – Bancrupcy risk is smaller than 10% (Verry good financial
situation) 2008 0,463 Z>0,16 – Bancrupcy risk is smaller than 10% (Verry good financial
situation)
Authors’ calculation The Conan-Holder model’s results match our expectations, the risk of
bankruptcy for the analyzed firm in both years is less than 10%. One can notice a slight decrease in Z score value in 2008 compared with 2007 which can be attributed to the financial and economic crisis that had a negative impact on the company’s cash flow.
In order to analyze data collected through questionnaires we followed several steps. First, we examined each variable in the model especially the items that registered extreme scores (less than three and four). Second, we tried to identify those variables that contribute most significantly to organizational performance. Thus, we estimated a statistical regression of the following form:

ROXANA STEGEREAN, CORINA GAVREA, ANAMARIA MARIN
8
∑ ++=7
1
εββ iio XY
Where Y - dependent variable: organizational performance Independent variables: purpose, structure, leadership, relationships, mechanisms,
external environment, rewards. The results of this regression are included in table 6. Table 3 illustrates a classification of the variables based on the mean, standard
deviation and Cronbach alpha. Alpha coefficients show to what extent a set of statements reflect a single category. In this study, alpha coefficients have values between 0.69 and 0.90, values considered acceptable in the academic literature.
Table 3.
Mean, standard deviation and Cronbach alpha
Variable Position Mean Standard Deviation
Alpha
Relations Purpose Leadership Structure Attitudes toward change Mecanisms Performance External environment Rewards
1 2 3 4 5 6 7 8 9
3.93 3.81 3.77 3.70 3.68 3.66 3.55 3.49 2.87
0.59 0.62 0.84 0.62 0.53 0.61 0.65 0.84 0.61
0.72 0.78 0.90 0.76 0.72 0.72 0.87 0.78 0.69
Authors’ calculation Each statement with a score below 3 (mean) was regarded as a sign of
weakness that should concern the management of the organization. These results are presented in table 4.
Tabel 4.
Items with the lowest scores (below 3)
Variable Item number
Mean Standard Deviation
Item
Rewards
Rewards
Rewards
Rewards
12
26
33
40
2.44
2.72
2.14
2.88
0.93
1.12
0.86
1.07
Compensation and benefits are equitable for all employees. The salary they receive is correlated with their work. Each task to be performed is accompanied by incentives. The future of the organization is viewed with optimism by employees.
Authors’ calculation

THE APPLICATION OF A DIAGNOSTIC MODEL: AN EMPIRICAL STUDY
9
Table 5 presents the Pearson correlations which allows for a detailed analysis of the relationship between the variables. We used the following notations for the variables depicted in table 5: Performanace (V1); Purpose (V2); Structure (V3); Leadership (V4); Relations (V5);
Rewards (V6);Mecanisms (V7); External environment (V8). According to the author the variables are interrelated, the central place being occupied by variable leadership. Results from Table 5 indicate a positive and significant correlation for most variables. The strongest correlation occurred between the variables: purpose and structure (0.80) followed by the correlation between purpose and leadership (0.79), leadership and structure (0.78). If the correlation coefficient is less than 0.5 we can say that there isn’t a strong relationship between the variables. In this category fall the relations with the environment variables. This does not affect the validity of the model for the analyzed organization since the external environment is not present as a separate variable in the model developed by Weisbord.
Table 5.
Pearson correlations
V1 V2 V3 V4 V5 V6 V7 V8 V1 1.000 V2 .741*
* 1.000
V3 .621**
.801** 1.000
V4 .664**
.794** .786** 1.000
V5 .606**
.722** .691** .692** 1.000
V6 .482**
.594** .535** .448** .471** 1.000
V7 .781**
.768** .684** .817** .758** .556** 1.000
V8 .796**
.522** .400** .439** .397** .228 .379* 1.000
** and * Correlation is significant at 1% şi 5% level Authors’ calculation Table 6 shows the variables that have a significant influence on performance.
Of the eight independent variables considered only three were found to have a significant impact on individual and organizational performance.

ROXANA STEGEREAN, CORINA GAVREA, ANAMARIA MARIN
10
Table 6.
Prediction model: Performance
Variabila independentă
Coeficienţi t statistic
Purpose Mechanisms External enviroment
0.19 0.31 0.48
1.73* 2.03** 4.87**
2R 0.75
Authors’ calculation Thus, when we search for action fields these factors should receive the
strongest consideration. Similar results were obtained by Lok and Crawford (2000) who applied the Weisbord model in two leading companies in Australia. According to him, the only significant variables were the purpose and attitudes toward change. In another study that was conducted in 2002 at NASA of the 11 variables analyzed, only four variables were found to have a significant impact on performance: the climate of the workplace, motivation, structure, mission (IBM Business Consulting Services, 2003).
5. Conclusions
The results of this study suggest that even when using a model with a well defined variable content, identifying the source of organizational problems requires a more detailed analysis than originally thought. Initially, according to the results included in Table 3, we can identify problems regarding the rewards variable, with no information on the incentives offered to employees, their salary or their opinion on the future of the organization. Only a more detailed analysis of these variables allows us to identify the gaps in the matters mentioned above.
In general, the survey shows that the analyzed organization has strengths in the areas of relationships, purpose, leadership and structure. This suggests that employees are satisfied with the existing management team, their work, the distribution of tasks. The weaker aspects regard performance, external environment and rewards which were ranked the last three places. This suggests dissatisfaction regarding the current reward system, employees do not feel rewarded by the organization at their true value. This result should suggest the need to rethink and change the organization’s management policies to reward and motivate employees. The results also indicate uncertainty regarding the future of the organization. This attitude could be justified by the numerous changes that have occurred within the organization: the change in the management team in 2009 and the effects of the economic and financial crisis which resulted in a reduction of staff with 22% in 2009 compared to previous years.
THE APPLICATION OF A DIAGNOSTIC MODEL: AN EMPIRICAL STUDY
11
REFERENCES
Burke, W. and Litwin, G. (1992). A casual model of organizational performance and change. Journal of Management, 18(3): 523-545.
Jones, B and Brazzel, M. (2006). The NTL Handbook of Organization Development and Change: Principles, Practices, and Perspectives. Pfeiffer, San Francisco, California.
Lowman, R. (2005). Importance of diagnosis in organizational assessment, The Psychologist Manager Journal, 8(1): 17-28.
Lok, P and Crawford, J. (1999). The application of a diagnostic model and survey in organizational development, Journal of Managerial Psychology, 15(2): 108-125.
Lok, P and Crawford, J. (2000). The application of a diagnostic model and survey in organizational development, Journal of Managerial Psychology, 15(2): 108-125.
Mintzberg, H., Ahlstrand, B., and Lampel, J. (1998). Strategic safari. New York: The Free Press.
Nadler, D şi Tushman, L. (1982). A model for diagnosing organizational behavior: Applying a congruence perspective, Managing Organizations: readings and cases, Little, Brown and Company: Boston Toronto.
Preziosi, R. (1980), "Organizational Diagnosis Questionnaire", The 1980 Annual Handbook for Group Facilitators, University Associates, New Jersey.
Weisbord, M (1976). Organizational Diagnosis: Six Places to Look for Trouble with or without a Theory, Group & Organization Studies, 1(4 ): 430-440.

STUDIA UNIVERSITATIS BABEŞ-BOLYAI, NEGOTIA, LV, 3, 2010
THE ARCHITECTURAL DESIGN OF THE COHESION POLICY WITHIN THE EU BUDGET
MARIA-ANDRADA GEORGESCU 1, DANA MIHAELA MURGESCU 2 ABSTRACT. The cohesion policy of the European Union reflects the communitarian financial priorities. As all public policies of the EU, the cohesion policy is financed from the EU budget. Therefore, it has a major role in shaping the budget. The paper analyzes the interdependence between the cohesion policy and the EU budget, indicating the direct connection between the expenses made from the communitarian budget and the architectural design of the cohesion policy.
The paper presents the parallel evolution of the European Union budget, on the one hand, and of the cohesion policy, on the other hand. At the same time, the changes brought about by the accession of new Member States are described and analyzed, as well as the multi-annual financial programming periods. The focus of the research and analysis will fall on the 2000-2006 and 2007-2013 financial frameworks.
Finally, the paper will attempt to identify the possible changes predicted for the 2014-2020 period, brought about by the new challenges faced by the European Union, both in terms of budgetary construction and regarding the architecture, objectives and programs of the cohesion policy. Hence, the dynamism and mutual influence in the relationship between the cohesion policy and the EU budget will be once more demonstrated. Keywords: EU budget, cohesion policy, financial resources. 1. The dawn of the cohesion policy
EU Cohesion (or regional) policy has not had a flowless evolution. Since its inception, the criticism of it has become a constant factor in the history of the European Union.
The roots of regional policy can be seen as early as the signing of the Treaty of Rome (1957). In the preamble to the Treaty of Rome, the founding “fathers” of the European Economic Community (EEC, later the European Union), did declare their aim of “reducing the differences existing between the various regions and the
1 Ph.D. Lecturer, Faculty of Public Administration, National School of Political Studies and Public
Administration, Bucharest 2 Ph.D. Candidate, assistant professor, Faculty of Public Administration, National School of Political
Studies and Public Administration, Bucharest
MARIA-ANDRADA GEORGESCU, DANA MIHAELA MURGESCU
14
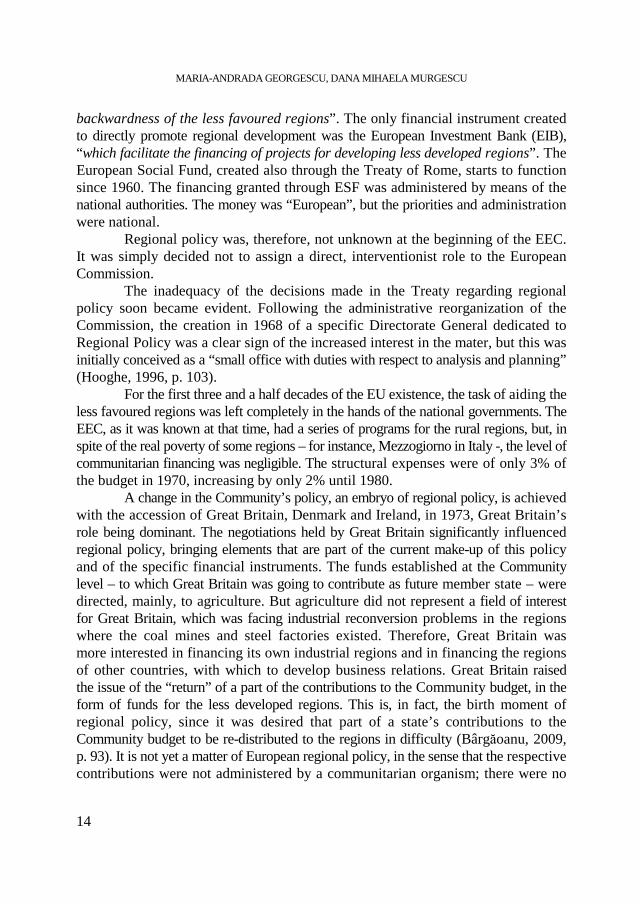
backwardness of the less favoured regions”. The only financial instrument created to directly promote regional development was the European Investment Bank (EIB), “which facilitate the financing of projects for developing less developed regions”. The European Social Fund, created also through the Treaty of Rome, starts to function since 1960. The financing granted through ESF was administered by means of the national authorities. The money was “European”, but the priorities and administration were national.
Regional policy was, therefore, not unknown at the beginning of the EEC. It was simply decided not to assign a direct, interventionist role to the European Commission.
The inadequacy of the decisions made in the Treaty regarding regional policy soon became evident. Following the administrative reorganization of the Commission, the creation in 1968 of a specific Directorate General dedicated to Regional Policy was a clear sign of the increased interest in the mater, but this was initially conceived as a “small office with duties with respect to analysis and planning” (Hooghe, 1996, p. 103).
For the first three and a half decades of the EU existence, the task of aiding the less favoured regions was left completely in the hands of the national governments. The EEC, as it was known at that time, had a series of programs for the rural regions, but, in spite of the real poverty of some regions – for instance, Mezzogiorno in Italy -, the level of communitarian financing was negligible. The structural expenses were of only 3% of the budget in 1970, increasing by only 2% until 1980.
A change in the Community’s policy, an embryo of regional policy, is achieved with the accession of Great Britain, Denmark and Ireland, in 1973, Great Britain’s role being dominant. The negotiations held by Great Britain significantly influenced regional policy, bringing elements that are part of the current make-up of this policy and of the specific financial instruments. The funds established at the Community level – to which Great Britain was going to contribute as future member state – were directed, mainly, to agriculture. But agriculture did not represent a field of interest for Great Britain, which was facing industrial reconversion problems in the regions where the coal mines and steel factories existed. Therefore, Great Britain was more interested in financing its own industrial regions and in financing the regions of other countries, with which to develop business relations. Great Britain raised the issue of the “return” of a part of the contributions to the Community budget, in the form of funds for the less developed regions. This is, in fact, the birth moment of regional policy, since it was desired that part of a state’s contributions to the Community budget to be re-distributed to the regions in difficulty (Bârgăoanu, 2009, p. 93). It is not yet a matter of European regional policy, in the sense that the respective contributions were not administered by a communitarian organism; there were no

THE ARCHITECTURAL DESIGN OF THE COHESION POLICY WITHIN THE EU BUDGET
15
common objectives to be targeted at the level of all regions and the notion of region was not defined in a unitary manner.
The creation of ERDF (European Regional Development Fund) in 1975 was decided as a consequence of the first enlargement and the oil crisis. This fund answers a double purpose: the granting of a regional dimension to the communitarian regional policies and the creation o fan aiding system which two of the new member status could benefit of - Ireland, whose GNP was (at the respective moment) only 60% of the communitarian average, and Great Britain, which was in a very unbalanced budgetary position vis-a-vis the community budget. At first, the European regional policy mainly materialized in the form of reimbursement to the member states of certain expenses.
The negotiations regarding ERDF determined strong tensions among Member States and with the Commission. After agreement of the main financial elements at the summit of December 1974, the regulations were approved by the Council in March 19753. “However, the final outcome could not be described as a comprehensive and common regional policy based on Community-wide criteria and priorities. Not only was the ERDF’s budget and distribution calculated on an inter-governmental basis, but Member States also retained direct control over every aspect of the Fund’s management and implementation” (Manzella and Mendez, 2009, p. 10).
The total agreed budget for the Fund was 1.3 billion European Units of Account (EUA) over a three year period (1975-8), representing around 5% of the Community budget. The initial resources of ERDF were channeled as follows: Italy 40%, Great Britain 28%, France 15%, Federal Republic of Germany 6.4%, Ireland 6%, Holland 1.7%, Belgium 1.5%, Denmark 1.3% and Luxembourg 0.1% (“A New Regional Policy for Europe”, 1975, p. 10). This distribution of resources to each Member State was determined on the basis of a system of national quotas, setting out the percentage share allocated to each Member State. The shares were largely worked out on the basis of inter-state bargaining, linked to net budgetary balances, and did not have a direct, explicit link to Community regional development needs. Similarly, geographical eligibility was to be determined on the basis of areas targeted under the Member States own regional policies, while applications for project financing would be channeled through and approved by central governments, with no significant role for the Commission, let alone sub-national actors.
The inadequacies of the newly created Community regional policy were clear from the outset.
The ERDF reform was launched in June 1977, with the Commission’s submission of “Guidelines on Community Regional Policy”4. The Council was asked
3 Regulation (EEC) No. 724/75 of the Council of 18th of March, 1975 (OJ L 73, 21 March 1975); 4 Commission of the European Communities (1977), Communication of the European Commission,
COM77 (195) def, Brussels
MARIA-ANDRADA GEORGESCU, DANA MIHAELA MURGESCU
16
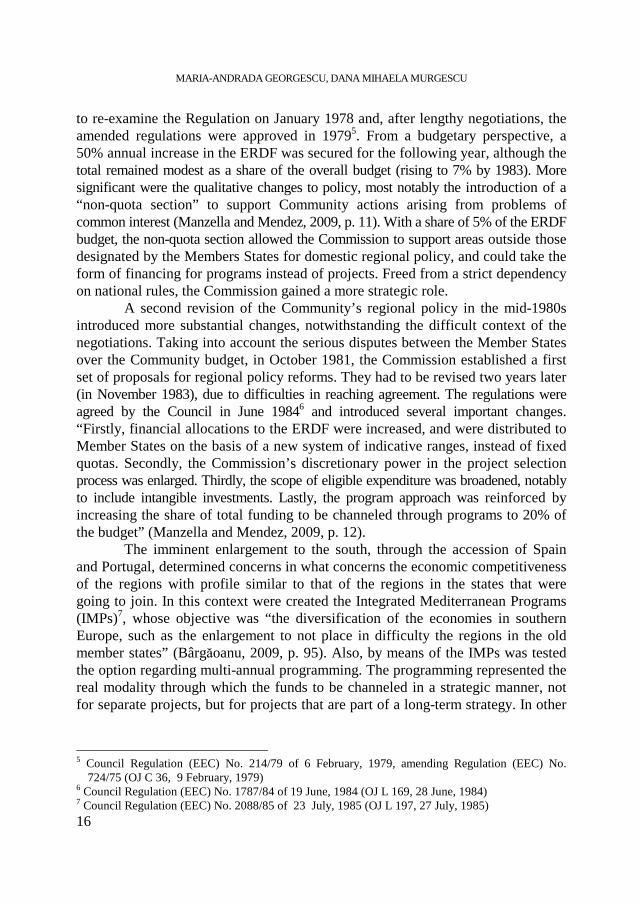
to re-examine the Regulation on January 1978 and, after lengthy negotiations, the amended regulations were approved in 19795. From a budgetary perspective, a 50% annual increase in the ERDF was secured for the following year, although the total remained modest as a share of the overall budget (rising to 7% by 1983). More significant were the qualitative changes to policy, most notably the introduction of a “non-quota section” to support Community actions arising from problems of common interest (Manzella and Mendez, 2009, p. 11). With a share of 5% of the ERDF budget, the non-quota section allowed the Commission to support areas outside those designated by the Members States for domestic regional policy, and could take the form of financing for programs instead of projects. Freed from a strict dependency on national rules, the Commission gained a more strategic role.
A second revision of the Community’s regional policy in the mid-1980s introduced more substantial changes, notwithstanding the difficult context of the negotiations. Taking into account the serious disputes between the Member States over the Community budget, in October 1981, the Commission established a first set of proposals for regional policy reforms. They had to be revised two years later (in November 1983), due to difficulties in reaching agreement. The regulations were agreed by the Council in June 19846 and introduced several important changes. “Firstly, financial allocations to the ERDF were increased, and were distributed to Member States on the basis of a new system of indicative ranges, instead of fixed quotas. Secondly, the Commission’s discretionary power in the project selection process was enlarged. Thirdly, the scope of eligible expenditure was broadened, notably to include intangible investments. Lastly, the program approach was reinforced by increasing the share of total funding to be channeled through programs to 20% of the budget” (Manzella and Mendez, 2009, p. 12).
The imminent enlargement to the south, through the accession of Spain and Portugal, determined concerns in what concerns the economic competitiveness of the regions with profile similar to that of the regions in the states that were going to join. In this context were created the Integrated Mediterranean Programs (IMPs)7, whose objective was “the diversification of the economies in southern Europe, such as the enlargement to not place in difficulty the regions in the old member states” (Bârgăoanu, 2009, p. 95). Also, by means of the IMPs was tested the option regarding multi-annual programming. The programming represented the real modality through which the funds to be channeled in a strategic manner, not for separate projects, but for projects that are part of a long-term strategy. In other
5 Council Regulation (EEC) No. 214/79 of 6 February, 1979, amending Regulation (EEC) No.
724/75 (OJ C 36, 9 February, 1979) 6 Council Regulation (EEC) No. 1787/84 of 19 June, 1984 (OJ L 169, 28 June, 1984) 7 Council Regulation (EEC) No. 2088/85 of 23 July, 1985 (OJ L 197, 27 July, 1985)

THE ARCHITECTURAL DESIGN OF THE COHESION POLICY WITHIN THE EU BUDGET
17
words, the change was made from “project management to program management and projects portfolio management” (Bârgăoanu, 2009, p. 96).
The trend over the first half of the 1980s was clear. From a model controlled by the member states, in which the Commission role was only of treasurer, policy moved to “one involving a more cooperative relationship between both levels and became more grounded on Community objectives, priorities and experimentation, at least for part of the Cohesion policy budget” (Manzella and Mendez, 2009, p. 12).
The European Single Act of February 1986 constituted a true turning point in what concerns communitarian regional policy. ERDF, eleven years after its creation, gained institutional recognition (Art. 130c). “Economic and social cohesion” becomes an authentic communitarian policy, defined through the new Title V of the Treaty. This policy, which occurs as a logical consequence of the enlargements of 1981 and 1986 (the three new member states had a development level inferior to the least prosperous of the nine member states – Ireland), accompanies the achievement of the internal market and targets “reducing disparities between the various regions and backwardness of the least-favoured regions” (Art. 130a) within a real development strategy.
Year 1988 marked the start of the EU Cohesion Policy. The Council issued the first regulation that integrates the three structural-type funds – ERDF, ESF and EAGGF - Orientation Section – under the common name “Structural Funds” and will subordinate them to the Cohesion Policy, thus eliminating the “splendid isolation” (Hooghe, 1996, p. 103) that had characterized, until then, the respective funds. The “Delors I Package” (named after the President of the Commission at the time, Jacques Delors) established the first multi-annual communitarian budget for years 1989-93, budget that favoured the three Structural Funds and lead to a significant increase of resources. While the annual payments increased from approximately 6.4 billion ECU in 1988 to 20.5 billion ECU in 1993 (in current prices), their afferent share increased from 16 to almost 31% of the EU budget. The budgetary reform of 1988 brought about changes regarding the assignment of resources. Until 1988, the resources were assigned depending on the Member States’ contribution, while the responsibility rested with the beneficiary state; from 1988 onwards, the resources were alloted depending on unitary criteria and on the development level of the region (measured by GDP per capita and by the unemployment rate). “The fact that the economic and social cohesion policy is no longer defined in financial terms, but on objectives, means a total break from the old system, in which the resources were divided between the countries according to a fixed scheme” (Prisecaru et al., 2004, p. 60).
At the same time, the reform from 1988 introduced a series of principles regarding the cohesion policy and its instruments (“EU Cohesion Policy 1988-2008: Investing in Europe’s Future”, Inforegio Panorama, No 26, June 2008, p. 10), respectively: Concentration on a limited number of objectives with the focus

MARIA-ANDRADA GEORGESCU, DANA MIHAELA MURGESCU
18
on the least developed regions; Multi-annual programming based on analysis, strategic planning and evaluation; Additionality ensuring that Member States do not substitute national with EU expenditure; Partnership in the design and implementation of programs involving national, sub-national and EU actors, including the social partners and non-government organizations, ensuring ownership and transparency of the interventions.
In 1988 there were established five priority objectives: − Objective 1: promoting the development and structural adjustment of
regions whose development is lagging behind; − Objective 2: converting regions seriously affected by industrial decline; − Objective 3: combating long-term unemployment; − Objective 4: facilitating the occupational integration of young people; − Objective 5: (a) speeding up the adjustment of agricultural structures and
(b) promoting the development of rural areas. The funding provided by the ERDF, the ESF and the EAGGF under
Objective 1 totaled ECU 43.8 billion (64 % of the total). The main beneficiaries were: Spain (ECU 10.2 billion), Italy (ECU 8.5 billion), Portugal (ECU 8.45 billion), Greece (ECU 7.5 billion) and Ireland (ECU 4.46 billion). The financing of Objective 2 was done through ERDF and ESF, the main beneficiaries being: the United Kingdom (ECU 2 billion), followed by Spain (ECU 1.5 billion) and France (ECU 1.2 billion). Programs under Objectives 3 and 4 had no geographical concentration and were agreed at national level instead. The total allocation for both objectives was about ECU 6.67 billion (10 % of the total) and provided by the ESF only. Major beneficiary countries were the United Kingdom (ECU 1.5 billion), followed by France (ECU 1.44 billion) and Germany (ECU 1.05 billion). Finally, Objective 5 amounted to ECU 6.3 billion (9.2 % of the total) with France (ECU 2.3 billion), Germany (ECU 1.4 billion) and Italy (ECU 0.96 billion) as the major beneficiary countries. For the entire period 1988-93, the total Structural Funds budget was of ECU 69 billion, representing 25 % of the EU budget and 0.3 % of the total GDP of the EU.
2. Consolidation of the Cohesion Policy and Transforming the Enlargement
into a Success After the completion of the internal market, the Maastricht Treaty (approved in
February 1992) marked a new age in European integration by providing for the establishment of the Economic and Monetary Union (EMU). It also reinforced the priority attached to economic and social cohesion by making it a core EU objective, on a par with the internal market and EMU. In this context, a new instrument was introduced to co-finance infrastructures projects in the poorer Member States (Greece,
THE ARCHITECTURAL DESIGN OF THE COHESION POLICY WITHIN THE EU BUDGET
19
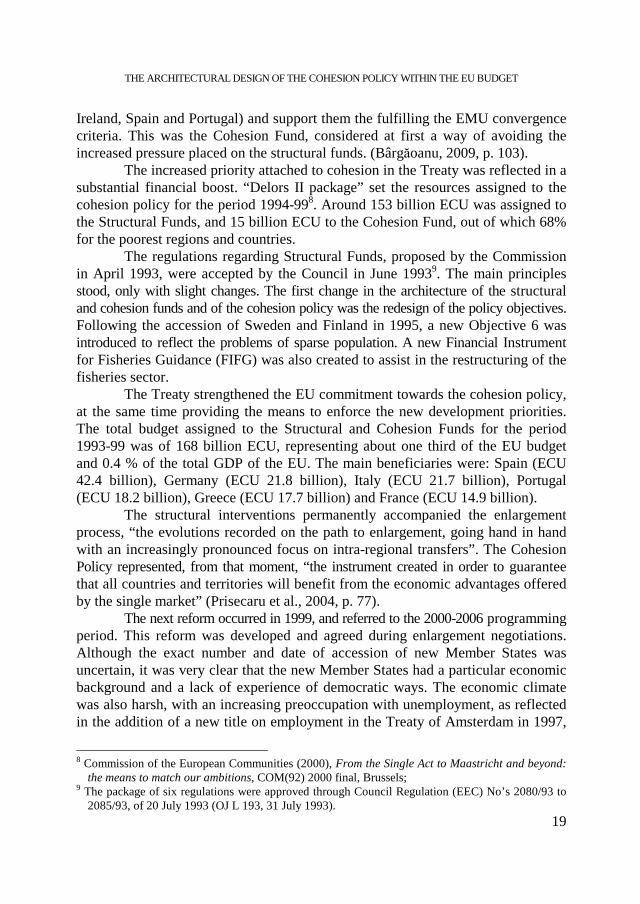
Ireland, Spain and Portugal) and support them the fulfilling the EMU convergence criteria. This was the Cohesion Fund, considered at first a way of avoiding the increased pressure placed on the structural funds. (Bârgăoanu, 2009, p. 103).
The increased priority attached to cohesion in the Treaty was reflected in a substantial financial boost. “Delors II package” set the resources assigned to the cohesion policy for the period 1994-998. Around 153 billion ECU was assigned to the Structural Funds, and 15 billion ECU to the Cohesion Fund, out of which 68% for the poorest regions and countries.
The regulations regarding Structural Funds, proposed by the Commission in April 1993, were accepted by the Council in June 19939. The main principles stood, only with slight changes. The first change in the architecture of the structural and cohesion funds and of the cohesion policy was the redesign of the policy objectives. Following the accession of Sweden and Finland in 1995, a new Objective 6 was introduced to reflect the problems of sparse population. A new Financial Instrument for Fisheries Guidance (FIFG) was also created to assist in the restructuring of the fisheries sector.
The Treaty strengthened the EU commitment towards the cohesion policy, at the same time providing the means to enforce the new development priorities. The total budget assigned to the Structural and Cohesion Funds for the period 1993-99 was of 168 billion ECU, representing about one third of the EU budget and 0.4 % of the total GDP of the EU. The main beneficiaries were: Spain (ECU 42.4 billion), Germany (ECU 21.8 billion), Italy (ECU 21.7 billion), Portugal (ECU 18.2 billion), Greece (ECU 17.7 billion) and France (ECU 14.9 billion).
The structural interventions permanently accompanied the enlargement process, “the evolutions recorded on the path to enlargement, going hand in hand with an increasingly pronounced focus on intra-regional transfers”. The Cohesion Policy represented, from that moment, “the instrument created in order to guarantee that all countries and territories will benefit from the economic advantages offered by the single market” (Prisecaru et al., 2004, p. 77).
The next reform occurred in 1999, and referred to the 2000-2006 programming period. This reform was developed and agreed during enlargement negotiations. Although the exact number and date of accession of new Member States was uncertain, it was very clear that the new Member States had a particular economic background and a lack of experience of democratic ways. The economic climate was also harsh, with an increasing preoccupation with unemployment, as reflected in the addition of a new title on employment in the Treaty of Amsterdam in 1997,
8 Commission of the European Communities (2000), From the Single Act to Maastricht and beyond:
the means to match our ambitions, COM(92) 2000 final, Brussels; 9 The package of six regulations were approved through Council Regulation (EEC) No’s 2080/93 to
2085/93, of 20 July 1993 (OJ L 193, 31 July 1993).
MARIA-ANDRADA GEORGESCU, DANA MIHAELA MURGESCU
20
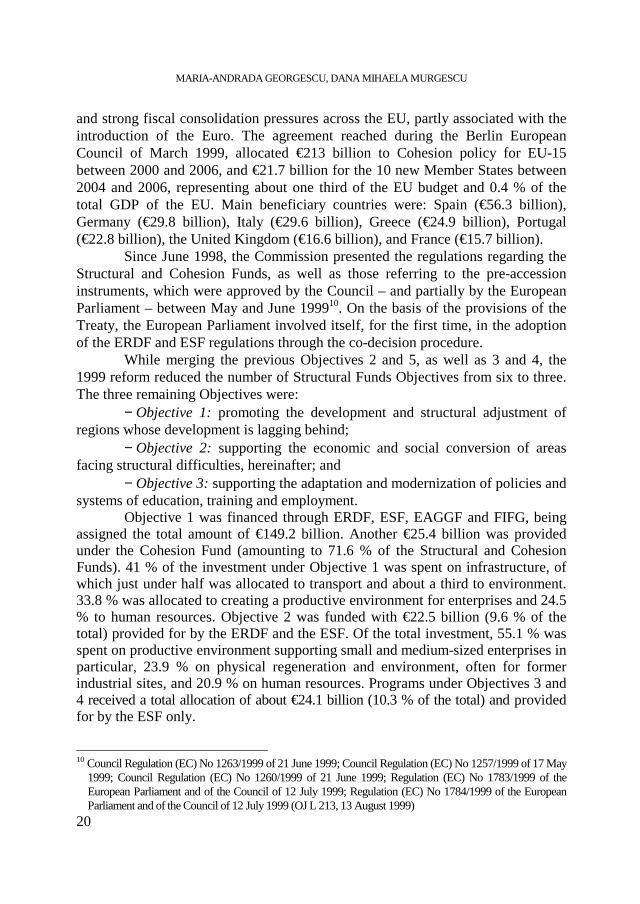
and strong fiscal consolidation pressures across the EU, partly associated with the introduction of the Euro. The agreement reached during the Berlin European Council of March 1999, allocated €213 billion to Cohesion policy for EU-15 between 2000 and 2006, and €21.7 billion for the 10 new Member States between 2004 and 2006, representing about one third of the EU budget and 0.4 % of the total GDP of the EU. Main beneficiary countries were: Spain (€56.3 billion), Germany (€29.8 billion), Italy (€29.6 billion), Greece (€24.9 billion), Portugal (€22.8 billion), the United Kingdom (€16.6 billion), and France (€15.7 billion).
Since June 1998, the Commission presented the regulations regarding the Structural and Cohesion Funds, as well as those referring to the pre-accession instruments, which were approved by the Council – and partially by the European Parliament – between May and June 199910. On the basis of the provisions of the Treaty, the European Parliament involved itself, for the first time, in the adoption of the ERDF and ESF regulations through the co-decision procedure.
While merging the previous Objectives 2 and 5, as well as 3 and 4, the 1999 reform reduced the number of Structural Funds Objectives from six to three. The three remaining Objectives were:
− Objective 1: promoting the development and structural adjustment of regions whose development is lagging behind;
− Objective 2: supporting the economic and social conversion of areas facing structural difficulties, hereinafter; and
− Objective 3: supporting the adaptation and modernization of policies and systems of education, training and employment.
Objective 1 was financed through ERDF, ESF, EAGGF and FIFG, being assigned the total amount of €149.2 billion. Another €25.4 billion was provided under the Cohesion Fund (amounting to 71.6 % of the Structural and Cohesion Funds). 41 % of the investment under Objective 1 was spent on infrastructure, of which just under half was allocated to transport and about a third to environment. 33.8 % was allocated to creating a productive environment for enterprises and 24.5 % to human resources. Objective 2 was funded with €22.5 billion (9.6 % of the total) provided for by the ERDF and the ESF. Of the total investment, 55.1 % was spent on productive environment supporting small and medium-sized enterprises in particular, 23.9 % on physical regeneration and environment, often for former industrial sites, and 20.9 % on human resources. Programs under Objectives 3 and 4 received a total allocation of about €24.1 billion (10.3 % of the total) and provided for by the ESF only.
10 Council Regulation (EC) No 1263/1999 of 21 June 1999; Council Regulation (EC) No 1257/1999 of 17 May
1999; Council Regulation (EC) No 1260/1999 of 21 June 1999; Regulation (EC) No 1783/1999 of the European Parliament and of the Council of 12 July 1999; Regulation (EC) No 1784/1999 of the European Parliament and of the Council of 12 July 1999 (OJ L 213, 13 August 1999)

THE ARCHITECTURAL DESIGN OF THE COHESION POLICY WITHIN THE EU BUDGET
21
There was also a reduction in the number of Community Initiatives from thirteen to four (Interreg III, Urban II, Equal, Leader+) and a corresponding cut in their budgetary allocation (to 5.35% of total resources, representing 11.5 billion euros).
3. 2006 – A Turning Point of the Cohesion Policy. Looking to the Future
In the period 2000-2006, the programs management was simplified and accelerated. The financial management and control became more rigorous, by introducing the so-called “n+2” rule, according to which the non-presentation within two years of documents certifying the making of the payments brings forth the loss of the funds. Apart from this, a stronger involvement of the member states and of the regions in monitoring and evaluating the programs was imposed, by means of a system of ex-ante, interim and ex-post evaluations.
The most recent reform of Cohesion policy for the 2007-2013 period was determined by the EU enlargement in 2004, enlargement that incorporated 10 new member states, with significantly lower levels of income. The accession of Romania and Bulgaria only increased the gap between the richest and poorest regions of Europe. Therefore, an inevitable budgetary shift occurred in the Cohesion policy resources, towards the new Member States. Another factor was the increase of the importance assigned to the EUs growth and jobs agenda. “The Lisbon strategy was formally launched in 2000, but the lacklustre performance of the EU economy and the difficulties in implementing the programme soon became evident” (Manzella and Mendez, 2009, p. 18).
In February 2004, the European Commission published a document11 in which it presented its reform proposals for the EU Cohesion policy and the broader EU budget. Following difficult negotiations, the European Council of 11th and 12th of December 2005 from Brussels, reached consensus with respect to a budget, which was transformed in an inter-institutional agreement in April 2006. The overall amount of resources available for Cohesion policy over the 2007-2013 period was set at €347 billion, representing 35.7% of the EU budget and 0.38% of the total GDP of the EU.
The adoption of the regulatory package in July 200612 became “the most radical reform of the policy since 1988”. 11 Commission of the European Communities (2004), Building our common Future – Policy challenges and
Budgetary means of the Enlarged Union 2007-2013, COM (2004) 101 final, Brussels 12 Council Regulation (EC) No 1083/2006 of 11 July 2006 laying down general provisions on the European
Regional Fund, the European Social Fund and the Cohesion Fund and the repealing regulation (EC) No 1260/1999; Council Regulation (EC) No 1084/2006 of 11 July 2006 establishing a Cohesion Fund and repealing Regulation (EC) No 1164/94; Regulation (EC) No 1080/2006 of the European Parliament and of the Council of 5 July 2006 on the European Regional Development Fund and the repealing Regulation (EC) No 1783/1999; Regulation (EC) No 1081/2006 of the European Parliament and of the Council of 5 July 2006 on the European Social Fund and the repealing Regulation (EC) No 1784/1999; Regulation (EC) No 1082/2006 of the European Parliament and of the Council of 5 July 2006 on a European grouping of territorial cooperation (EGTC), (OJ L 210, 31 July 2006)

MARIA-ANDRADA GEORGESCU, DANA MIHAELA MURGESCU
22
Again, the objectives of the Cohesion Policy were reformulated, as follows: − Convergence: aims at speeding up the convergence of the least-
developed Member States and regions defined by GDP per capital of less than 75 % of the EU average;
− Regional Competitiveness and Employment: covers all other EU regions with the aim of strengthening regions' competitiveness and attractiveness as well as employment; and
− European Territorial Cooperation: based on the Interreg initiative, support is available for cross-border, transnational and interregional cooperation as well as for networks.
The number of the financial instruments for cohesion reduced from six to three: two Structural Funds (ERDF, ESF) and the Cohesion Fund.
The previous instruments linked to rural development and fisheries (EARDF-Guidance and FIFG) were replaced by the European Agriculture Fund for Rural Development, while the European Fisheries Fund was integrated into the CAP. Three new financial instruments (Jaspers, Jeremie and Jessica) were introduced into the Cohesion policy framework in cooperation with the European Investment Bank Group and other multilateral banks. Community Initiatives and innovative actions were discontinued, apart from Interreg which would be subsumed within the new Territorial Cooperation Objective.
The “Convergence” Objective was assigned 282.8 billion euros, representing 81.5% of the total amount, divided as follows: 199.3 billion for the regions under the incidence of the “Convergence” objective; 13.9 billion euros for the regions in the progressive aid-suspension stage; 69.6 billion for the Cohesion Fund.
To the “Regional competitiveness and occupation of the work force” objective were assigned 54.9 billion euros, out of which 11.4 billion for the regions in the progressive aid establishment stage .
The „Territorial cooperation” objective benefits of 8.7 billion euros, which represent 2.5% of the total amount, divided as follows: 6.44 billion for cross—border cooperation; 1.83 billion for transnational cooperation and 445 million for “interregional and networks” cooperation.
The main beneficiary countries of the Structural Instruments, taking into account the value of the amounts assigned (in billion euros) are: Poland (67.3); Spain (35.2); Italy (28.8); the Czeck Republic (26.7); Germany (26.3); Hungary (25.3), Portugal (21.5) and Greece (20.4).
Another novelty brought about by the 2006 reform refers to the correlation between the objectives of the Structural Instruments and the objectives of the Lisbon Strategy, process that even received the name of „lisbonization of the Cohesion Policy”. An innovative procedure was introduced, the earmarking procedure, by means of which the funds afferent to the respective instruments are „reserved”, in
THE ARCHITECTURAL DESIGN OF THE COHESION POLICY WITHIN THE EU BUDGET
23
a considerable proportion, for the following fields: technological research and development, innovation, informational society, energetic efficiency and human resources development (many times, these fields are called „Lisbon-type”).
The last dimension added to the Cohesion Policy is territorial cohesion, introduced in the Lisbon Treaty, signed in 2007, in order to take into account the geographic diversity of the EU. After the ratification of the Treaty, influencing the territorial development of the Union will become a common component of the Commission and the Member States. In what concerns economic and social cohesion, things are relatively clear (even if not simple or far from controversy): economic cohesion is measured through the GDP per capita, and the social one through the unemployment rate. For the territorial cohesion there are no such clear marks, this being the reason why the EU invests, through the EPSON (European Spatial Planning Observatory Network) program, considerable amounts to establish indicators and to suggest actual possible directions for action.
In 2009, and given the relatively long lead times needed to achieve agreement on European policies, more and more attention is being given to reflecting on the future Cohesion policy beyond 2013. Discussion is ongoing, with input being thought from a wide range of interested parties on the shape and priorities for the future policy, with a view to maintaining effectiveness against a background of changing economic circumstances. This reflection process must also be viewed in the context of the ongoing general review of the EU budget covering all aspects of EU spending.
The budgetary review will not propose a new multi-annual financial frame for the period starting in 2014 or the global dimensioning and detailed break-down of the EU budget, but, it will rather present the structure and orientation of the future Union priorities in matter of expenses, performing an evaluation of what brings the highest value added and the most efficient results.
The enlargement waves from 2004 and 2007 are merely some of the elements that lead to the need for reform of the European budget. The current 12 new member states are structurally poorer and more in need of European funds. On the other hand, within the EU, the talks about reforming the PAC or reforming the Cohesion Policy are older. To these discussions is added the fact that the world is changing very rapidly and new challenges occur, such as globalization, climatic changes, energetic safety, population’s aging etc. The problem arising is if the answer to these challenges will be found by means of the European budget.
In the conditions when the level of the European budget remains relatively unchanged, the re-assignment of expenses inevitably involves a compromise (a trade off) between the two major components of the European budgetary policy, PAC and the Cohesion Policy. As a consequence, the increase of the structural funds (as several member states wish, especially the countries in Eastern Europe) cannot be achieved without diminishing the current level of the agricultural subsidies, and the other way around.
MARIA-ANDRADA GEORGESCU, DANA MIHAELA MURGESCU
24
Analyzing the current stage of the debates regarding the reform of the budget and of the budgetary policies, especially in what concerns the future of the cohesion policy, focusing in particular on the future of Cohesion policy after 2013, Bachtler, Mendez and Wishlade (2009) identify the differences of opinion among the member states. The most radical position is taken by the UK: that Cohesion policy should be limited to the poorer Member States and phased out in richer countries. Denmark, Ireland, the Netherlands and Sweden also favour Structural and Cohesion Funds being directed to the least prosperous regions in the least prosperous countries, supplemented by cross-border and/or transnational cooperation programs. Several of the submissions underline the importance of richer countries being responsible for their own regional development challenges (for example, Sweden). Estonia argues that the financing of poorer regions in richer states should be reconsidered, while both the Czech Republic and Romania are in favour of increasing the focus of the policy on the least-developed Member States.
Other richer Member States are less radical. Germany advocates focusing resources on “structurally weak regions” but sees a continued case for other regions being given “targeted assistance in developing their competences”. Finland and France take a similar view, supporting measures for growth competitiveness and jobs being implemented across the EU. Austria in also cautions, supporting the concept of a ‘comprehensive and integrated structural and regional policy’ but, like Finland and Germany, believes that spending should be focused on higher added value measures, especially in richer parts of the EU. Several of the more prosperous countries (Austria, Denmark, Sweden) are concerned to ensure that allocations under Cohesion policy are made on the basis of relative wealth so that countries with comparable levels of GDP should benefit equally from returns from the EU budget. The maintenance of an EU-wide Cohesion policy is supported strongly by other EU15 countries, such as Greece, Italy, Portugal and Spain. Greece is especially concerned to avoid ‘discrimination between old and new Member States’.
For the newer Member States, Cohesion policy plays a still more central role in national thinking about the budget. Most of the new Member States the EU12 highlight ‘solidarity’ as one of the main principles of the EU budget appending and the need for ‘adequate resources’, meaning (in the Czech Republic and Romania view) a greater concentration of Cohesion policy funding on the less-developed Member States.
4. Conclusions
The targets of the Cohesion policy - economic growth, employment and competitiveness, have positively contributed to the reduction of disparities across EU Member States and regions. However, the disparities across EU regions remain high and the rate of economic development of the regions is still unbalanced.
THE ARCHITECTURAL DESIGN OF THE COHESION POLICY WITHIN THE EU BUDGET
25
Therefore, the need to maintain an active Cohesion policy at the EU level is widely considered to be strong and supported by grounded arguments.
With respect to future tendencies, it seems that the new ideas regarding the aim and purpose of the Cohesion Policy is more focused on European added value, with support more firmly focused on areas where Community action is necessary or more effective that through national action alone.
REFERENCES
Bachtler, J., Mendez, C. and Wishlade, F. (2009). Ideas for Budget and Policy Reform: Reviewing the Debate on Cohesion Policy 2014+, European Policy Research Papers, No 67, University of Strathclyde, Glasgow, available at http://www.eprc.strath.ac.uk/eprc/documents/PDF_files/EPRP_67_Ideas_for_Budget_and_Policy_Reform.pdf;
Bârgăoanu, A. (2009). Fondurile europene. Strategii de promovare şi utilizare, Editura Tritonic, Bucharest;
Commission of the European Communities (1977), Guidelines on Community Regional Policy, COM77 (195) def, Brussels;
Commission of the European Communities (2000), From the Single Act to Maastricht and beyond: the means to match our ambitions, COM(92) 2000 final, Brussels;
Hooghe, L. (1996). Building a Europe with the Regions: The changing role of the European Commission, in L. Hooghe (ed.), Cohesion Policy and European Integration: Buiding Multi-level Governance, pp. 89-129, Oxford University Press, Oxford;
Manzella, G.P. and Mendez, C. (2009). The turning points of EU cohesion policy, Working Paper in the context of the Barca Report , Brussels, available at http://ec.europa.eu/regional_policy/policy/future/pdf/8_manzella_final-formatted.pdf;
Prisecaru, P. et al. (2004). Politici comune ale Uniunii Europene, Editura Economică, Bucharest;
“EU Cohesion Policy 1988-2008: Investing in Europe’s Future”, Inforegio Panorama, No 26, June 2008, available at http://ec.europa.eu/regional_policy/sources/ docgener/panorama/pdf/mag26/mag26_en.pdf
“A New Regional Policy for Europe”, 1975. available at http://aei.pitt.edu/1756/01/ regions_brochure_3_1975.pdf;
http://ec.europa.eu/regional_policy/sources/docoffic/official/reglem_en.htm.

STUDIA UNIVERSITATIS BABEŞ-BOLYAI, NEGOTIA, LV, 3, 2010
A STUDY OF THE RELATION BETWEEN BRAND LOYALTY AND CONSUMER INVOLVEMENT WITH PURCHASE DECISION
AND PRODUCT CLASS
OVIDIU I. MOISESCU1, DŨNG ANH VŨ2 ABSTRACT. This paper aims to analyze the correlations between the components of brand loyalty – brand repurchase intention and brand recommend intention – and consumer purchase involvement, which is reflected by the degree to which consumers seek information about different brands and compare them during their purchase decision-making process. Being conducted in a comparative manner, the research considered the cases of two product classes – durables and nondurables – with an investigation of statistics on the population of urban Romanian consumers. The results show that the more involved the consumers are in the purchase decision for a durable good, the more loyal they are in terms of repurchase intention to a certain preferred brand in that product class. However, there is no similar relation in the case of nondurable goods. The study also shows that the consumers are more loyal, in terms of recommend intention the consumers willing to make in the future, to a certain preferred brand in both durable and nondurable goods when they are more involved in the purchase decision. However, the relation is found stronger in the case of nondurable goods. Keywords: involvement, brand loyalty, repurchase & recommend intention, purchase
decision, durables & nondurables 1. Brief literature review
Brand equity is an important concept in defining brand loyalty. The author who comprehensively models brand equity is Aaker (1991). In his approach, brand equity is viewed as a complex system including a set of brand fundamental dimensions such as “brand awareness”, “brand perceived quality”, “brand loyalty” and “brand associations”. Aaker also proposes a brand equity measuring system which takes into consideration ten analytical dimensions, of which “brand loyalty” is fundamental and core. In the measuring system, brand loyalty consists of three main components – satisfaction level, repurchase intention, and recommend intention (Aaker, 1996). Brand loyalty also reflects the probability that a customer will switch to
1 Lecturer, PhD, Department of Marketing, Faculty of Economics and Business Administration,
Babes-Bolyai University of Cluj-Napoca, Romania. Email: [email protected] 2 Dean, International Economics Faculty, University of Economics and Business, Vietnam National
University, Hanoi, Vietnam. Email: [email protected]
OVIDIU I. MOISESCU, DŨNG ANH VŨ
28
another brand, especially when a brand makes a change in its marketing mix. Trying to define the term of brand loyalty, David A. Aaker (1991) considers that it reflects the probability that a customer will switch to another brand, especially when that brand makes a change in its marketing mix. In Aaker’s view, brand loyalty represents the core of a brand’s equity.
Another important work that views brand equity from a customer-based perspective comes from Keller (1993). According to this approach, brand knowledge is essential in generating differential effects on consumers’ responses to marketing actions that are related to the brand. The Keller’s brand equity model (Keller, 2008) covers two general dimensions – brand awareness and brand image – to which the latter being composed of brand associations. In his approach, brand loyalty is seen as a fundamental outcome of a strong brand.
Farquhar (1989) models brand equity through a set of three core elements that build a strong brand – a positive customer brand evaluation, an accessible brand attitude, and a consistent brand image in customers’ minds. His approach is more abstract but still relates directly, more or less, to brand awareness and brand loyalty.
In order to define brand loyalty and its constituencies, the American Marketing Association’s definition can be a starting point. The A.M.A. regards brand loyalty as “the situation in which a consumer generally buys the same manufacturer-originated product or service repeatedly over time rather than buying from multiple suppliers within the category” or “the degree to which a consumer consistently purchases the same brand within a product class”.
Representing the core meaning of brand equity (Travis, 2000), brand loyalty should be analyzed together with its relationship with the other dimensions of brand equity such as “awareness”, “perceived quality”, and “associations”. All of these dimensions enhance brand loyalty, provide reasons for customers to buy and affect their satisfaction. For instance, while loyalty can be generated independently, it adheres to brand’s perceived quality or associations. Having a loyal customer-base also means the brand is perceived of having higher quality. The brand can be also associated to elements that characterize its loyal customers. Meanwhile, its loyal customers tend to provide brand exposure to new customers through “words-of-mouth” communications and, therefore, enhance its awareness. It can be concluded that brand loyalty is both an input and an output of brand equity and there is always a two-way interaction between brand loyalty and the other elements of brand equity such as awareness, perceived quality or the other associations.
In a regard to consumer involvement the literature reveals several approaches of conceptualization. Consumers are considered to be involved in at least two ways – with product classes and with purchase decisions (Zaichkowsky, 1985). Their involvement with product classes can lead to greater perception of greater product importance (Howard and Sheth, 1969) while their involvement with purchase decisions drive them to search more information and consequently to spend more time to make the right selection (Clarke and Belk, 1978).

A STUDY OF THE RELATION BETWEEN BRAND LOYALTY AND CONSUMER INVOLVEMENT WITH …
29
Most of the studies in the field of consumer involvement show that there is a set of aspects that differentiate between high-involved and low-involved consumers. When the consumers are highly involved – e.g. they actively seek information about brands – they compare as many product attributes as possible. In addition they perceive differentiation among various brands and usually have preference for a particular brand (Zaichkowsky, 1985).
2. Research methodology
This paper represents a part of the findings of a larger study which has been conducted to investigate and identify significant relationships among specific brand dimensions such as brand awareness, brand associations (e.g. perceived quality, brand personality) and brand loyalty by taking into considerations cognitive, affective and action-based perspectives. The larger study intended to statistically quantify the influence of several demographics (e.g. sex, age, income, education, consumer personality) on the brand dimensions and components mentioned above. From these the larger study aimed to build a general model to explain the synergic impact of brand dimensions on consumer behavior by comparing two market product categories: durables and nondurables.
In order to have a clear starting point for the research methodology, we considered a product is as being “durable” if it did not rapidly wear out, it yielded utility over time, and it was not completely used up when used once. On the other hand, we considered products as being “nondurables” if they were used up when used once, or if they did rapidly wear out, having a short lifespan (less than a number of years).
The specific objectives of this paper are to analyze the correlations between the components of brand loyalty – which is represented by brand repurchase intention and brand recommend intention – and consumer purchase involvement. Being conducted in a comparative manner, the research considered the cases of two product classes – durables and nondurables – with an investigation of statistics on the population of urban Romanian consumers.
Based upon these objectives, certain particular indicators were built up and used to measure brand loyalty and consumer involvement.
In order to build up an operational indicator for the involvement in purchase decision-making process, we defined involvement is the degree to which consumers seek information and compare brands in the process. By using questionnaire-based survey method, respondents were asked to state their agreement with an involvement measuring specific statement (“I carefully study and seek information about existing brands before deciding what brand of … to buy”) on a scale from 1 (“totally disagree”) to 6 (“totally agree”) for a chosen durable and, respectively, a nondurable product.
For brand loyalty we defined it as the probability that consumers who have bought a certain brand in their last buying would chose the (same) brand in their following purchase in a similar context given by product class (durable or nondurable). We further extended the concept of brand loyalty towards the active involvement of
OVIDIU I. MOISESCU, DŨNG ANH VŨ
30
loyal consumers in brand promotion through brand recommendations to other potential buyers. Therefore, the necessary data that needed to be collected regarding to brand loyalty consisted of the intention to repurchase the brand (“Will you repurchase the same brand next time?”) and the intention to recommend the brand (“Would you recommend the brand you bought last time to others?”). The data regarding to these two components of brand loyalty were implicitly collected in relation to the last purchased brand within each of the two product classes, corresponding to a chosen durable and respectively a selected nondurable product. Respondents were asked to mention the most recent purchased brand and to evaluate their intention to repurchase that brand on a symmetric scale from 1 (“will definitely not repurchase”) to 6 (“will definitely repurchase”). In addition each respondent evaluated his/her intention to recommend the most recently purchased brand on a symmetric scale from 1 (“will definitely not recommend”) to 6 (“will definitely recommend”).
Data were collected through an ad-hoc questionnaire-based survey. The instrument for data collection included open-ended questions (to identify most recent purchased brands) and closed questions with symmetric scales in order to assess brand loyalty from the perspective of repurchase and recommend intentions. The establishment of six instead of the classical five scale answering options was intended in order to avoid neutral responses and to force either positive or negative attitudes.
The allocated resources and time did not permit the research to conduct a panel survey in order to investigate a medium or long-term evolution of the analyzed relations. Although the intention of the research was to analyze the urban Romanian consumers as a whole, the scope was narrowed down to the investigation of the urban consumers in Cluj-Napoca, one of the largest cities of Romania. Despite of this the result of the research could still be considered to represent for the urban Romanian population (as Cluj-Napoca is the second largest city of Romania constituting almost 3% of the Romanian urban population in 2009) and be used to induce the behaviors of Romanian consumers.
The investigated population was heterogeneous in terms of demographics (e.g. age, income, education and sex), vocabulary, intelligence level, technical knowledge, different product categories usage and the like. In order to ensure that the survey samples (consumers) could describe their behavior and attitudes towards brands of durable and nondurable products, the product categories selected for the survey had to meet some criteria: (i) being different in usage duration; (ii) being not too technical (so that most of the consumers could evaluate their own behavior and express their attitudes towards those product categories); and (3) having a large rate of penetration into households usage or consumption. Based upon these we decided to select tooth-paste representing for nondurable goods, and television sets representing for durable goods.
Face-to-face interviews using questionnaire were conducted at the households’ residence of the respondents by a group of 119 students – each completed a set of five interviews.

A STUDY OF THE RELATION BETWEEN BRAND LOYALTY AND CONSUMER INVOLVEMENT WITH …
31
The sampling consisted of a mixture of classical probabilistic and non-probabilistic methods. At the first step, the population was geographically clustered according to 474 postal areas of Cluj-Napoca. 119 clusters were extracted through systematic random sampling and then assigned to the 119 interview operators (one cluster to each operator): each operator had to complete five questionnaire-based interviews on the basis of an itinerary sampling method (5 consumers from different households which locate into five consecutive buildings in the assigned cluster i.e. postal area).
The collected data was checked and validated by randomly telephoning the respondents. As such any interviewer who misled the research by providing and asking non-valid questions would be identified. 551 over total 595 face-to-face interviews were validated. Therefore, the reliability of the data was around 95% (estimated error of ±4.2%).
The survey investigated three hypotheses: H1: Purchase decision involvement is different in the case of durables
compared to the case of nondurables. H2: There is a general positive correlation between brand loyalty and
purchase decision involvement. H3: The correlation between brand loyalty and purchase decision involvement
is different in nature in the case of durables compared to the case of nondurables. 3. Results
The data analysis regarding to the H1 hypothesis are shown in Table no. 1. According to the analysis, both independent sample t-test results for equality of means (T=-11,775; p=0,000<0,05) and the Mann-Whitney non-parametric test results (Z=-11,209; p=0,000<0,05) confirm H1.
Table 1.
Purchase decision involvement levels within durables versus nondurables
Purchase decision involvement (on a scale from 1 to 6)
Mean Std. Dev.
Nondurables 3,49 1,731 Product class
Durables 4,66 1,560
T-test for equality of means: T=-11,775; p=0,000<0,05. Mann-Whitney non-parametric test: Z=-11,209; p=0,000<0,05
OVIDIU I. MOISESCU, DŨNG ANH VŨ
32
Therefore, there is a statistical significant difference between the involvement levels in purchase decision in the case of durables compared to the case of nondurables. Moreover, it can been seen that the level of involvement is generally higher in the case of durables (Mean=4,66) than in the case of nondurables (Mean=3,49).
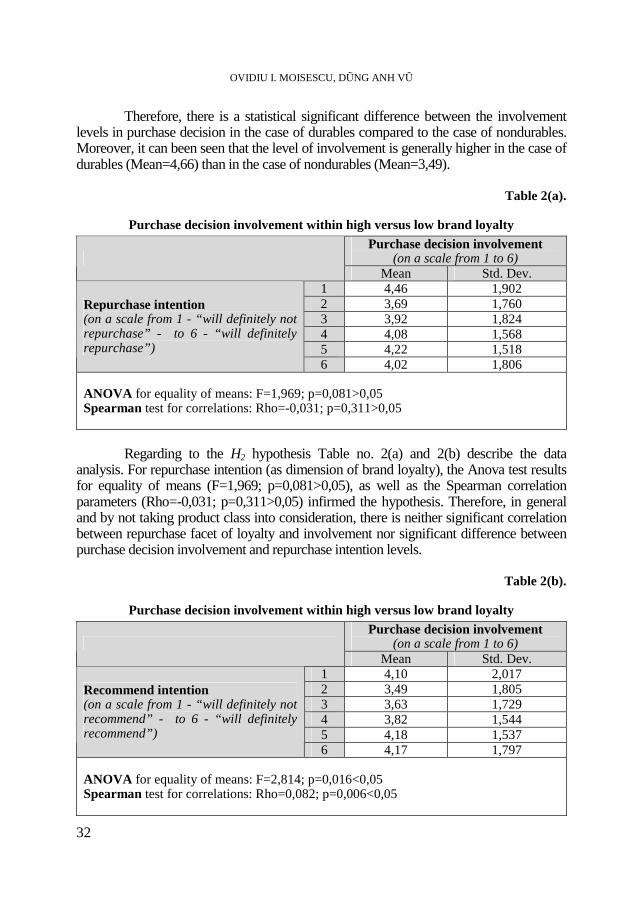
Table 2(a).
Purchase decision involvement within high versus low brand loyalty
Purchase decision involvement (on a scale from 1 to 6)
Mean Std. Dev. 1 4,46 1,902 2 3,69 1,760 3 3,92 1,824 4 4,08 1,568 5 4,22 1,518
Repurchase intention (on a scale from 1 - “will definitely not repurchase” - to 6 - “will definitely repurchase”)
6 4,02 1,806
ANOVA for equality of means: F=1,969; p=0,081>0,05 Spearman test for correlations: Rho=-0,031; p=0,311>0,05
Regarding to the H2 hypothesis Table no. 2(a) and 2(b) describe the data
analysis. For repurchase intention (as dimension of brand loyalty), the Anova test results for equality of means (F=1,969; p=0,081>0,05), as well as the Spearman correlation parameters (Rho=-0,031; p=0,311>0,05) infirmed the hypothesis. Therefore, in general and by not taking product class into consideration, there is neither significant correlation between repurchase facet of loyalty and involvement nor significant difference between purchase decision involvement and repurchase intention levels.
Table 2(b).
Purchase decision involvement within high versus low brand loyalty
Purchase decision involvement (on a scale from 1 to 6)
Mean Std. Dev. 1 4,10 2,017 2 3,49 1,805 3 3,63 1,729 4 3,82 1,544 5 4,18 1,537
Recommend intention (on a scale from 1 - “will definitely not recommend” - to 6 - “will definitely recommend”)
6 4,17 1,797
ANOVA for equality of means: F=2,814; p=0,016<0,05 Spearman test for correlations: Rho=0,082; p=0,006<0,05
A STUDY OF THE RELATION BETWEEN BRAND LOYALTY AND CONSUMER INVOLVEMENT WITH …
33
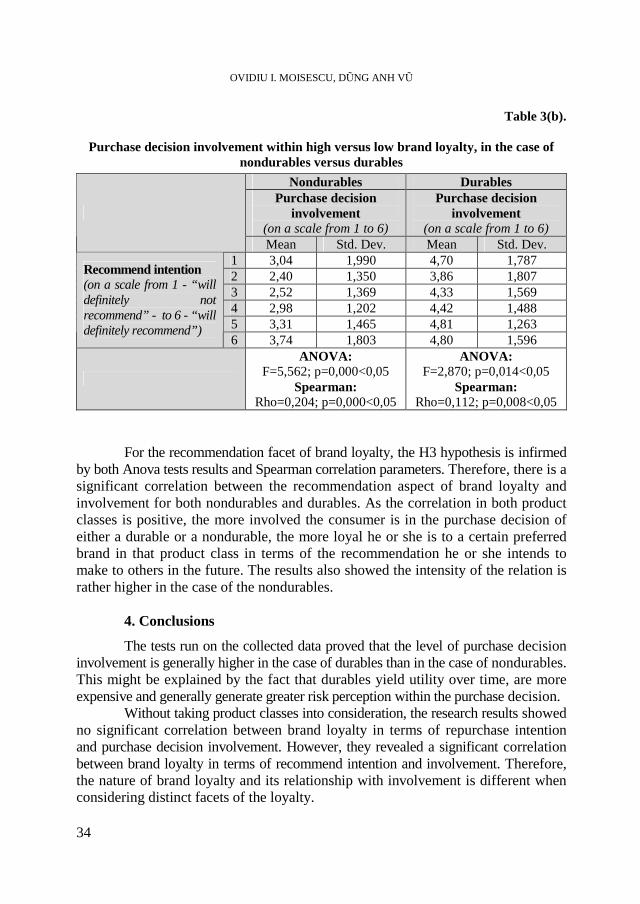
For recommendation intention (as a component and determinant of brand
loyalty) the Anova test results for equality of means (F=2,814; p=0,016<0,05) and the Spearman correlation parameters (Rho=0,082; p=0,006<0,05) confirm the H2. Therefore, by not taking product class into consideration, there is a general positive correlation between loyalty in terms of recommend intention and purchase decision involvement although the intensity of the correlation is rather low. There is also a significant difference between involvement degree and repurchase intention levels.
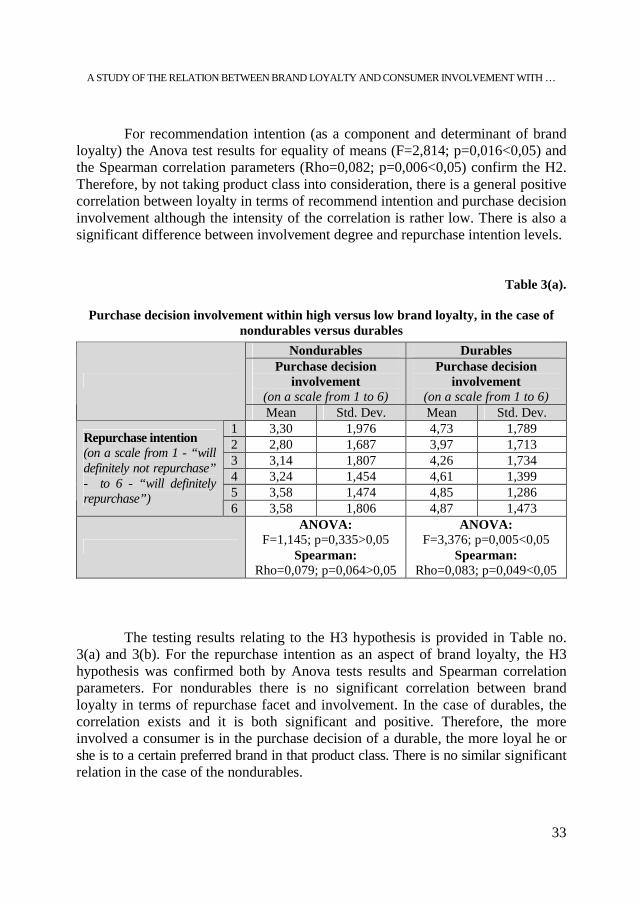
Table 3(a).
Purchase decision involvement within high versus low brand loyalty, in the case of nondurables versus durables
Nondurables Durables Purchase decision
involvement (on a scale from 1 to 6)
Purchase decision involvement
(on a scale from 1 to 6)
Mean Std. Dev. Mean Std. Dev. 1 3,30 1,976 4,73 1,789 2 2,80 1,687 3,97 1,713 3 3,14 1,807 4,26 1,734 4 3,24 1,454 4,61 1,399 5 3,58 1,474 4,85 1,286
Repurchase intention (on a scale from 1 - “will definitely not repurchase” - to 6 - “will definitely repurchase”)
6 3,58 1,806 4,87 1,473
ANOVA: F=1,145; p=0,335>0,05
Spearman: Rho=0,079; p=0,064>0,05
ANOVA: F=3,376; p=0,005<0,05
Spearman: Rho=0,083; p=0,049<0,05
The testing results relating to the H3 hypothesis is provided in Table no.
3(a) and 3(b). For the repurchase intention as an aspect of brand loyalty, the H3 hypothesis was confirmed both by Anova tests results and Spearman correlation parameters. For nondurables there is no significant correlation between brand loyalty in terms of repurchase facet and involvement. In the case of durables, the correlation exists and it is both significant and positive. Therefore, the more involved a consumer is in the purchase decision of a durable, the more loyal he or she is to a certain preferred brand in that product class. There is no similar significant relation in the case of the nondurables.
OVIDIU I. MOISESCU, DŨNG ANH VŨ
34
Table 3(b).
Purchase decision involvement within high versus low brand loyalty, in the case of nondurables versus durables
Nondurables Durables Purchase decision
involvement (on a scale from 1 to 6)
Purchase decision involvement
(on a scale from 1 to 6)
Mean Std. Dev. Mean Std. Dev. 1 3,04 1,990 4,70 1,787 2 2,40 1,350 3,86 1,807 3 2,52 1,369 4,33 1,569 4 2,98 1,202 4,42 1,488 5 3,31 1,465 4,81 1,263
Recommend intention (on a scale from 1 - “will definitely not recommend” - to 6 - “will definitely recommend”)
6 3,74 1,803 4,80 1,596
ANOVA: F=5,562; p=0,000<0,05
Spearman: Rho=0,204; p=0,000<0,05
ANOVA: F=2,870; p=0,014<0,05
Spearman: Rho=0,112; p=0,008<0,05
For the recommendation facet of brand loyalty, the H3 hypothesis is infirmed
by both Anova tests results and Spearman correlation parameters. Therefore, there is a significant correlation between the recommendation aspect of brand loyalty and involvement for both nondurables and durables. As the correlation in both product classes is positive, the more involved the consumer is in the purchase decision of either a durable or a nondurable, the more loyal he or she is to a certain preferred brand in that product class in terms of the recommendation he or she intends to make to others in the future. The results also showed the intensity of the relation is rather higher in the case of the nondurables.
4. Conclusions
The tests run on the collected data proved that the level of purchase decision involvement is generally higher in the case of durables than in the case of nondurables. This might be explained by the fact that durables yield utility over time, are more expensive and generally generate greater risk perception within the purchase decision.
Without taking product classes into consideration, the research results showed no significant correlation between brand loyalty in terms of repurchase intention and purchase decision involvement. However, they revealed a significant correlation between brand loyalty in terms of recommend intention and involvement. Therefore, the nature of brand loyalty and its relationship with involvement is different when considering distinct facets of the loyalty.
A STUDY OF THE RELATION BETWEEN BRAND LOYALTY AND CONSUMER INVOLVEMENT WITH …
35
When taking product classes into consideration (i.e. durables and nondurables), it can be concluded that the more involved a consumer is in the purchase decision of a durable, the more loyal he or she is to a certain preferred brand in that product class in terms of repurchasing. This agrees with the classical presumption in the existing literature. Still, there is no similar relation in the case of nondurables. Therefore, the nature of the relationship between brand loyalty and involvement must consider both several distinct facets of brand loyalty and product class as determinant of involvement intensity.
On the other hand, the more involved a consumer is in the purchase decision of either a durable or a nondurable, the more loyal he or she is to a certain preferred brand in that product class in terms of the recommendations he or she intends to make to others in the future. The analysis proves the fact that the relation is stronger in the case of nondurables. This implies the necessity to adapt marketing actions to product classes regardless which aspect of brand loyalty (i.e. repurchase vs. recommendation) needs to promote.
5. Limitations and future directions of the research
The indicators we used to measure brand loyalty and involvement in this research can partially cover the significance and the complexity of the two concepts. Therefore, a future research that focuses on studying the correlation between loyalty, purchase decision involvement and product classes by taking more indicators into consideration is necessary.
The overall significance of our research findings is limited to a certain region of the urban Romanian market (i.e. Cluj-Napoca). Although it is reasonable for us to claim the induction of the research results to the overall Romanian urban market for some reasons, it will be more useful and validated to conduct further research over different cities/regions of Romania on the same basis.
Future research can apply panel method to analyze urban Romanian consumers overtime, so that the consumer evolution can be recognized and emphasized when the Romanian market develop further. Furthermore, taking service into consideration can be another future research direction.
REFERENCES Aaker, D.A. (1991), ‘Managing Brand Equity: Capitalizing on the Value of a Brand
Name’, The Free Press, New York Aaker, D.A. (1996), ‘Measuring Brand Equity Across Products and Markets’, California
Management Review, Vol.38, No.3

OVIDIU I. MOISESCU, DŨNG ANH VŨ
36
Clarke, K., Belk, R.W. (1978), ’The Effects of Product Involvement and Task Definition on Anticipated Consumer Effort’, Advances in Consumer Research, Vol.5
Farquhar, P.H. (1989), ‘Managing Brand Equity’, Journal of Marketing Research, Vol.1 Howard, J.A., Sheth, J.N. (1969), ‘The Theory of Buyer Behovior’, John Wiley, New York Keller, K.L. (1993), ‘Conceptualizing, Measuring, and Managing Customer-Based
Brand Equity”, Journal of Marketing, Vol.57, No. 1 Keller, K.L. (2008), ’Strategic Brand Management: Building, Measuring and Managing
Brand Equity”, Prentice Hall, Upper Saddle River, New Jersey Moisescu, O.I. (2009), ‘The Importance of Brand Awareness in Consumers’ Buying
Decision and Perceived Risk Assessment”, Management&Marketing (Craiova), Vol.7, No. 1
Moisescu, O.I. (2009), ‘The Relation Between Unaided Brand Awareness and Brand Commercial Performance”, Studia Universitatis Babeş-Bolyai. Negotia, Vol.54, No. 1
Travis, D. (2000), ‘Emotional Branding: How Successful Brands Gain the Irrational Edge”, Crown Publishing Group
Zaichkowsky, J.L. (1985), ’Measuring the Involvement Construct”, Journal of Consumer Research, Vol.12
*** (2010), American Marketing Association Definitions, http://www.marketingpower.com

STUDIA UNIVERSITATIS BABEŞ-BOLYAI, NEGOTIA, LV, 3, 2010
THE ROLE OF PUBLIC ADMINISTRATION IN CITY BRANDING THE CASE OF CLUJ-NAPOCA
MONICA MARIA CORO Ş1, MARIUS EMIL CORO Ş
2 ABSTRACT. This paper focuses on two different topics that apparently do not seem to be linked: city branding and the perception of public administration services. The authors intend to briefly sketch the framework of the manner how public administration institutions can get involved in researching how citizens and private entrepreneurs perceive the services provided by the local authorities of the Municipality of Cluj-Napoca, how the image of these services influences the perception of the city, and how public administration servants can contribute to the development of the city’s brand. We have chosen to focus on Cluj-Napoca, as it is one of the most important cities of Romania, which has also enjoyed a spectacular economic development throughout the past decade. A question may be raised: Is there a linkage between the manner how local public administration institutions are perceived and the way how citizens regard the city from the perspective of branding? We are interested to identify how public services interfere with the branding of a city. Keywords: Cluj-Napoca, perception of public services, evaluation, local public
authorities, city branding. 1. Introduction
Situated in the center of Transylvania, Cluj-Napoca is perhaps the most important city of this region. Despite its privileged position and its development, the city does not yet have an identity, a coherent brand, or a promotion strategy. Unfortunately, this is the sad situation of most of Romania’s cities. Generally speaking, except for a few cases, Romanian cities enjoy a low international notoriety; more recently, it also seems that Romanians have little knowledge regarding the heritage of their cities and surroundings (as one may further notice). The luckier examples are: Bucharest (Romania’s capital city); Sibiu (as the city that hosted the European Cultural Capital in 2007); Constanţa (the country’s main harbor and a key summer destination); Braşov (one of Romania’s main winter tourist destinations);
1 Teaching Assistant, PhD candidate, Faculty of Business, Babeş-Bolyai University of Cluj-Napoca,
[email protected]. 2 Engineer, public officer, Primăria Municipiului Cluj-Napoca, Master Student, Faculty of Political
Sciences, Public Administration and Communication, Babeş-Bolyai University of Cluj-Napoca, [email protected].
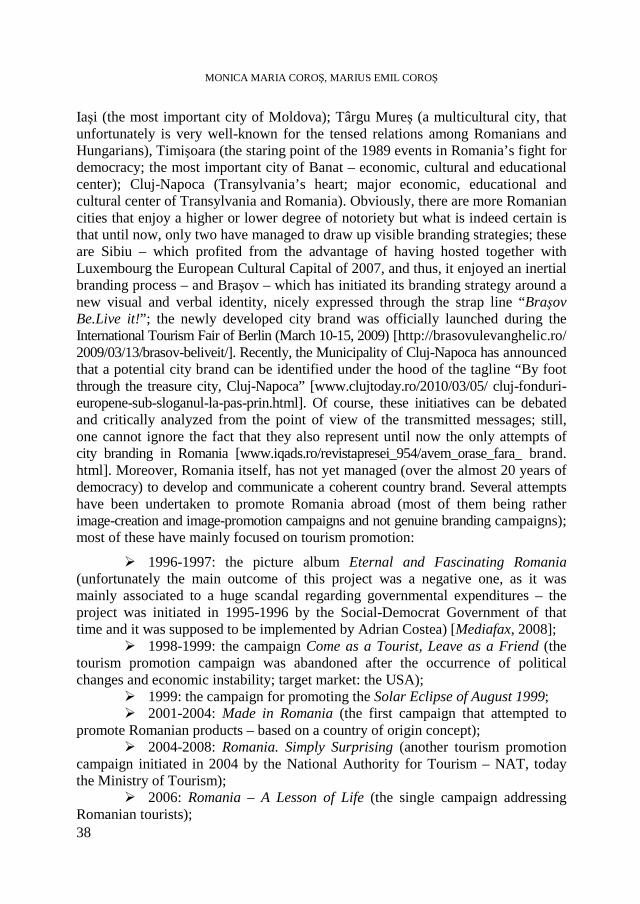
MONICA MARIA COROŞ, MARIUS EMIL COROŞ
38
Iaşi (the most important city of Moldova); Târgu Mureş (a multicultural city, that unfortunately is very well-known for the tensed relations among Romanians and Hungarians), Timişoara (the staring point of the 1989 events in Romania’s fight for democracy; the most important city of Banat – economic, cultural and educational center); Cluj-Napoca (Transylvania’s heart; major economic, educational and cultural center of Transylvania and Romania). Obviously, there are more Romanian cities that enjoy a higher or lower degree of notoriety but what is indeed certain is that until now, only two have managed to draw up visible branding strategies; these are Sibiu – which profited from the advantage of having hosted together with Luxembourg the European Cultural Capital of 2007, and thus, it enjoyed an inertial branding process – and Braşov – which has initiated its branding strategy around a new visual and verbal identity, nicely expressed through the strap line “Braşov Be.Live it!”; the newly developed city brand was officially launched during the International Tourism Fair of Berlin (March 10-15, 2009) [http://brasovulevanghelic.ro/ 2009/03/13/brasov-beliveit/]. Recently, the Municipality of Cluj-Napoca has announced that a potential city brand can be identified under the hood of the tagline “By foot through the treasure city, Cluj-Napoca” [www.clujtoday.ro/2010/03/05/ cluj-fonduri-europene-sub-sloganul-la-pas-prin.html]. Of course, these initiatives can be debated and critically analyzed from the point of view of the transmitted messages; still, one cannot ignore the fact that they also represent until now the only attempts of city branding in Romania [www.iqads.ro/revistapresei_954/avem_orase_fara_ brand. html]. Moreover, Romania itself, has not yet managed (over the almost 20 years of democracy) to develop and communicate a coherent country brand. Several attempts have been undertaken to promote Romania abroad (most of them being rather image-creation and image-promotion campaigns and not genuine branding campaigns); most of these have mainly focused on tourism promotion:
� 1996-1997: the picture album Eternal and Fascinating Romania (unfortunately the main outcome of this project was a negative one, as it was mainly associated to a huge scandal regarding governmental expenditures – the project was initiated in 1995-1996 by the Social-Democrat Government of that time and it was supposed to be implemented by Adrian Costea) [Mediafax, 2008];
� 1998-1999: the campaign Come as a Tourist, Leave as a Friend (the tourism promotion campaign was abandoned after the occurrence of political changes and economic instability; target market: the USA);
� 1999: the campaign for promoting the Solar Eclipse of August 1999; � 2001-2004: Made in Romania (the first campaign that attempted to
promote Romanian products – based on a country of origin concept); � 2004-2008: Romania. Simply Surprising (another tourism promotion
campaign initiated in 2004 by the National Authority for Tourism – NAT, today the Ministry of Tourism);
� 2006: Romania – A Lesson of Life (the single campaign addressing Romanian tourists);
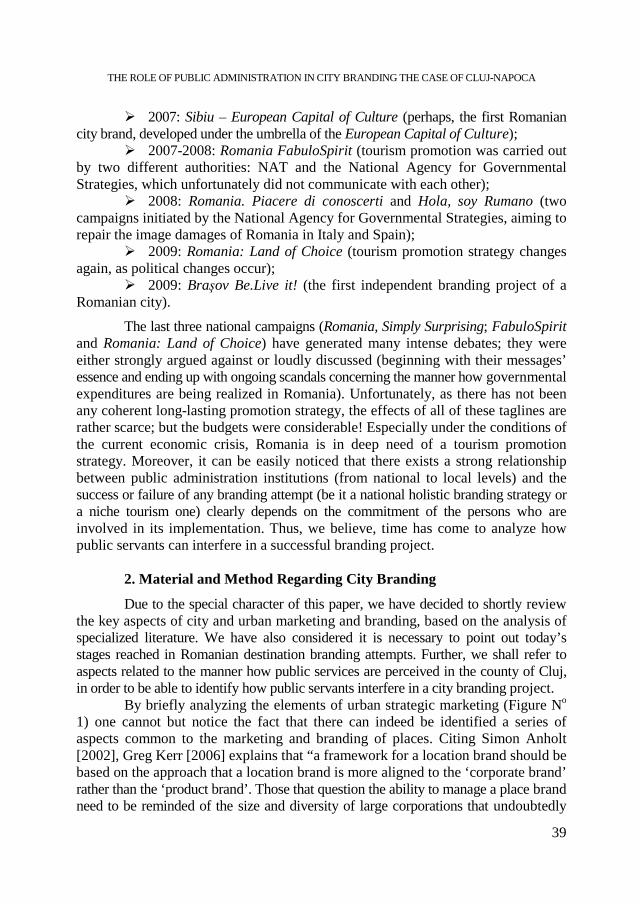
THE ROLE OF PUBLIC ADMINISTRATION IN CITY BRANDING THE CASE OF CLUJ-NAPOCA
39
� 2007: Sibiu – European Capital of Culture (perhaps, the first Romanian city brand, developed under the umbrella of the European Capital of Culture);
� 2007-2008: Romania FabuloSpirit (tourism promotion was carried out by two different authorities: NAT and the National Agency for Governmental Strategies, which unfortunately did not communicate with each other);
� 2008: Romania. Piacere di conoscerti and Hola, soy Rumano (two campaigns initiated by the National Agency for Governmental Strategies, aiming to repair the image damages of Romania in Italy and Spain);
� 2009: Romania: Land of Choice (tourism promotion strategy changes again, as political changes occur);
� 2009: Braşov Be.Live it! (the first independent branding project of a Romanian city).
The last three national campaigns (Romania, Simply Surprising; FabuloSpirit and Romania: Land of Choice) have generated many intense debates; they were either strongly argued against or loudly discussed (beginning with their messages’ essence and ending up with ongoing scandals concerning the manner how governmental expenditures are being realized in Romania). Unfortunately, as there has not been any coherent long-lasting promotion strategy, the effects of all of these taglines are rather scarce; but the budgets were considerable! Especially under the conditions of the current economic crisis, Romania is in deep need of a tourism promotion strategy. Moreover, it can be easily noticed that there exists a strong relationship between public administration institutions (from national to local levels) and the success or failure of any branding attempt (be it a national holistic branding strategy or a niche tourism one) clearly depends on the commitment of the persons who are involved in its implementation. Thus, we believe, time has come to analyze how public servants can interfere in a successful branding project.
2. Material and Method Regarding City Branding
Due to the special character of this paper, we have decided to shortly review the key aspects of city and urban marketing and branding, based on the analysis of specialized literature. We have also considered it is necessary to point out today’s stages reached in Romanian destination branding attempts. Further, we shall refer to aspects related to the manner how public services are perceived in the county of Cluj, in order to be able to identify how public servants interfere in a city branding project.
By briefly analyzing the elements of urban strategic marketing (Figure No 1) one cannot but notice the fact that there can indeed be identified a series of aspects common to the marketing and branding of places. Citing Simon Anholt [2002], Greg Kerr [2006] explains that “a framework for a location brand should be based on the approach that a location brand is more aligned to the ‘corporate brand’ rather than the ‘product brand’. Those that question the ability to manage a place brand need to be reminded of the size and diversity of large corporations that undoubtedly

MONICA MARIA COROŞ, MARIUS EMIL COROŞ
40
share the conflicts of interest and political agendas of a location, and yet need to manage the corporate brand effectively. Corporations, like locations [be it the case of a country, a region or a city], often have many unrelated industries, products and different cultures. /…/ [L]ocations are essentially social organizations: ‘behind good brands lie stakeholder companies, or at least companies which actually put some time and effort into investing in their relationships’.”
Figure No 1. Elements and Levels of Strategic Urban Marketing
Source: Ph. Kotler, D. H. Haider, I. Rein, 2001, p. 25.
Target markets
Exporters
Tourists and participants at conferences
Investors
New, permanent, and temporary residents
Companies’ headquarters
Manufacturer
Marketing factors
Infrastructure
Attraction elements
Image and quality of life
People
TThhee ppllaannnniinngg
The citizens
Business community LL ooccaall //RReeggiioonnaall
ppuubbll iicc aaddmmiinniissttrr aatt iioonn
The place marketing
plan: • Diagnosis
• Vision • Action
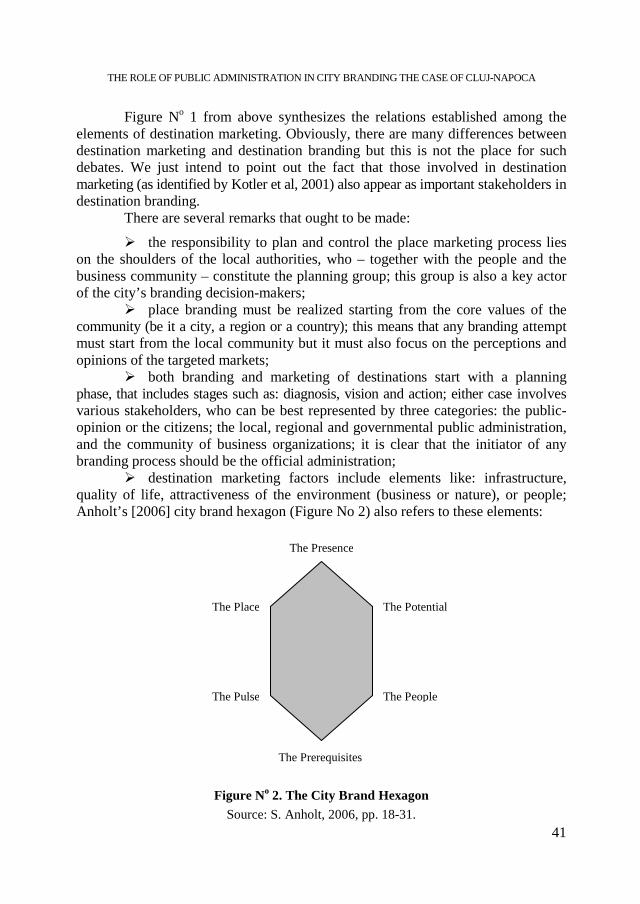
THE ROLE OF PUBLIC ADMINISTRATION IN CITY BRANDING THE CASE OF CLUJ-NAPOCA
41
Figure No 1 from above synthesizes the relations established among the elements of destination marketing. Obviously, there are many differences between destination marketing and destination branding but this is not the place for such debates. We just intend to point out the fact that those involved in destination marketing (as identified by Kotler et al, 2001) also appear as important stakeholders in destination branding.
There are several remarks that ought to be made:
� the responsibility to plan and control the place marketing process lies on the shoulders of the local authorities, who – together with the people and the business community – constitute the planning group; this group is also a key actor of the city’s branding decision-makers;
� place branding must be realized starting from the core values of the community (be it a city, a region or a country); this means that any branding attempt must start from the local community but it must also focus on the perceptions and opinions of the targeted markets;
� both branding and marketing of destinations start with a planning phase, that includes stages such as: diagnosis, vision and action; either case involves various stakeholders, who can be best represented by three categories: the public-opinion or the citizens; the local, regional and governmental public administration, and the community of business organizations; it is clear that the initiator of any branding process should be the official administration;
� destination marketing factors include elements like: infrastructure, quality of life, attractiveness of the environment (business or nature), or people; Anholt’s [2006] city brand hexagon (Figure No 2) also refers to these elements:
Figure No 2. The City Brand Hexagon
Source: S. Anholt, 2006, pp. 18-31.
The Presence
The Potential
The People
The Prerequisites
The Place
The Pulse
MONICA MARIA COROŞ, MARIUS EMIL COROŞ
42
The six elements of the brand hexagon, particularized for the case of cities, as analyzed within the Anholt-GMI Brands Index, can be described, in a few words, as follows:
� the presence is the indicator that reveals the city’s international status and standing;
� the place sums up the perceptions of the people regarding the physical aspects of the city (how pleasant or unpleasant they imagine being outdoors and traveling around the city, how beautiful it is and how the climate is like);
� the potential refers to the economic, educational, and, why not, even health service opportunities that are offered by the city to its inhabitants, visitors, businesses and immigrants; the evaluation goes as far as taking into consideration, when characterizing the city from the perspective of its capability to offer an attractive job, a well-developed educational infrastructure or good medical services;
� the pulse is associated to the city’s appeal from the point of view of urban lifestyle, excitement and leisure offerings, both for long-term residents and for short-term visitors;
� the people are those who give life to the city; they contribute to the city’s attractiveness through their openness, communication skills, abilities and willingness or even through their behavior; they are strongly related to the safety image;
� the prerequisites (or the city’s infrastructure) definitely contribute(s) to the city’s image; they include elements that define the cost of living, the possibility of finding satisfactory affordable accommodation or public amenities, in general.
� the main actors who are normally involved in destination marketing and, similarly, branding processes are presented below, in Table No 1:
One ought to notice that any attempt of approaching any destination marketing and branding process is inevitably linked to the local, regional, national, and, even, international pubic administration and public services. This is, in fact, a normal situation because both of these processes start from the local reputation (that, we dare point out, resembles quite well to the national reputation). This, according to Simon Anholt (2007: 25-27) is created deliberately or accidentally based on a six-channel natural communication (briefly discussed in the following lines and presented below in Figure No 3):
� tourism, through its promotion but, most importantly, through the visitors’ personal experience (from business travelers to those who visit their friends and relatives or to those who visit the city for any purpose, including transit) is, probably, in most cases the loudest message carrier related to destination branding; usually tourist offices seem to have the largest budgets and well-prepared marketers; still, one must also acknowledge the fact that people transmit important quantities of information regarding the places they have visited, intend to visit, or, on the contrary, do not wish to hear again of them; moreover, people seem to rely more and more on their peers’ opinions when considering destinations, hence it becomes clear that negative messages can tremendously damage the image of the city as a destination;

THE ROLE OF PUBLIC ADMINISTRATION IN CITY BRANDING THE CASE OF CLUJ-NAPOCA
43
Table No 1.
Key Actors Involved in Destination Marketing and Branding
Public sector actors: • city hall and city council; • department of business development; • department of urban planning (transportation, education, health); • tourism offices; • public information offices;
Lo
cal a
cto
rs Private sector actors:
• the citizens; • key and powerful companies; • real-estate developers and agents; • financial institutions (banks, brokers and insurance companies); • public amenity providers (electric energy, gas, telecommunications); • chamber of commerce and other local business organizations; • actors belonging to fields like: retailing, HoReCa, shops, exhibitions, etc.; • travel agencies and tour-operators; • labor force organizations; • architects; • transportation companies (taxi, rail-road, airlines, couches, etc.); • mass-media (newspapers, magazines, radio, TV);
Reg
ion
al
acto
rs
• regional economic development agencies; • local public administration; • regional tourism organizations;
Nat
ion
al
acto
rs
• the government and the politicians; • agencies that are supposed to attract foreign investments; • national tourist organizations;
Inte
rnat
ion
al
acto
rs • embassies and consulates;
• agencies that are supposed to attract foreign investments; • economic development agencies; • international organizations that are connected to a city or region.
Source: Ph. Kotler, C. Asplund, I. Rein, D. H. Haider, 1999.
� export brands play an increasingly important role when it comes to destinations, as they are country or place image “ambassadors abroad”; the country-of-origin effect is absolutely evident in several cases and it can prove to be at least as efficient as tourism promotion, when it comes to branding of destinations; let’s take just a few world-wide-known examples: Coca-Cola, Pepsi-
MONICA MARIA COROŞ, MARIUS EMIL COROŞ
44
Cola, Ford, Levi Strauss, etc. – Made in the USA; Mercedes, BMW, Braun – Made in Germany; Nokia – Made in Finland; Sony – Made in Japan; Daewoo – Made in Koreea; Swatch – Made in Switzerland; obviously, local brands are less powerful but they clearly generate positive associations; let us mention just a few notorious Romanian brands: Jolidon, Ursus, Farmec or Clujana from Cluj-Napoca; or Dacia from Piteşti, Arctic from Găieşti, La Dorna from Vatra Dornei or Borsec from Harghita; etc.);
� policy decision-makers play a key role, as, through the decisions they take, they set the frame of the destination’s / destinations’ further development; as long as these policies are communicated and discussed by the media (local, regional, national or even international media) and affect natives or even foreigners, they become important message carriers (a few examples for our case would be: the media coverage of the Nokia factory relocation from Bochum, Germany, at Bonţida, near Cluj-Napoca, Romania;
� investment and business related attitudes can be, for example, translated through national, regional or local policies concerning inward investments, recruitment of labor force, etc. (briefly, Baia-Mare being declared a disadvantaged area, attracts investors, as taxes are lower, in order to stimulate employment; at some point in the near past, the Government decided to allot subsidies for the first employment of university graduates or for the recruitment of personnel from the unemployed persons; at the end of September 2009 the Romanian Minister of Small and Medium-Sized Enterprises announced that the Government had decided to cut off all taxes for the registration of new SMEs in order to stimulate investors to initiate start-ups; on the other hand, the fact that, for example Polus Shopping Mall and Metro Cash & Carry have decided to locate outside the city – due to the hostile political environment that existed in Cluj-Napoca during those times, and also to the more convenient and attractive economic facilities they were offered by Floreşti – represent two negative associations for Cluj-Napoca);
� cultural exchange and cultural activities and exports manifest in many different ways, such as: international tours made by sports teams; concerts and recordings of famous musicians; works and literary pieces of poets, writers, philosophers, professors, play-writes, film-makers, etc; even shooting a moving picture in a certain area represents a sort of cultural export; similarly, including descriptions of certain destinations in international textbooks can also be assimilated to such types of communication;
� the people of the country, region or city have important contributions to the destination’s image; this may be the case of: media and sports stars, public personalities, artists, doctors, professors, political leaders, etc; the people, themselves (normal citizens or employees of hospitality organizations, etc), also influence the perception of the city, as they have direct contact with the visitors. This is the case where public servants intervene, too, especially in their contacts with foreign entrepreneurs, for example, who intend to develop their businesses in Cluj-Napoca,

THE ROLE OF PUBLIC ADMINISTRATION IN CITY BRANDING THE CASE OF CLUJ-NAPOCA
45
or with visitors (transit, tourists, etc), or with professors or exchange students who remain here for more than 90 days, and thus need to receive residency permits, etc.
3. Results and Discussions
As Simon Anholt is one of the highest authorities regarding destination branding, we believe it is “a must” to refer to his hexagon of competitive identity:
Figure No 3 The Hexagon of Competitive Identity Source: S. Anholt, 2007. p.26 apud S. Anholt, 2003.
Any city that seeks to brand itself, obviously struggles to identify those
core elements that are able to constitute its competitive identity. Besides tourism and culture, which have absolutely clear contributions to the unique character of the city and which are also obviously very much influenced by the administration, the development of two of the other four elements (investments and brands) is closely related to the local policy-makers. The attitude of the city’s representatives towards attracting investments and local brand development is easily visible in the policies regarding taxation, quickness of company start-ups, levels of bureaucracy, friendliness and politeness of public servants, availability of infrastructure, city development plans, etc.
Kotler’s audit tool for infrastructure, beauty spots, tourist attractions and people is quite appropriate and very useful for synthesizing the starting points in the analyses of Cluj-Napoca as a tourist destination.
Brands
Policy
Investments
People
Culture
Tourism
Competitive Identity
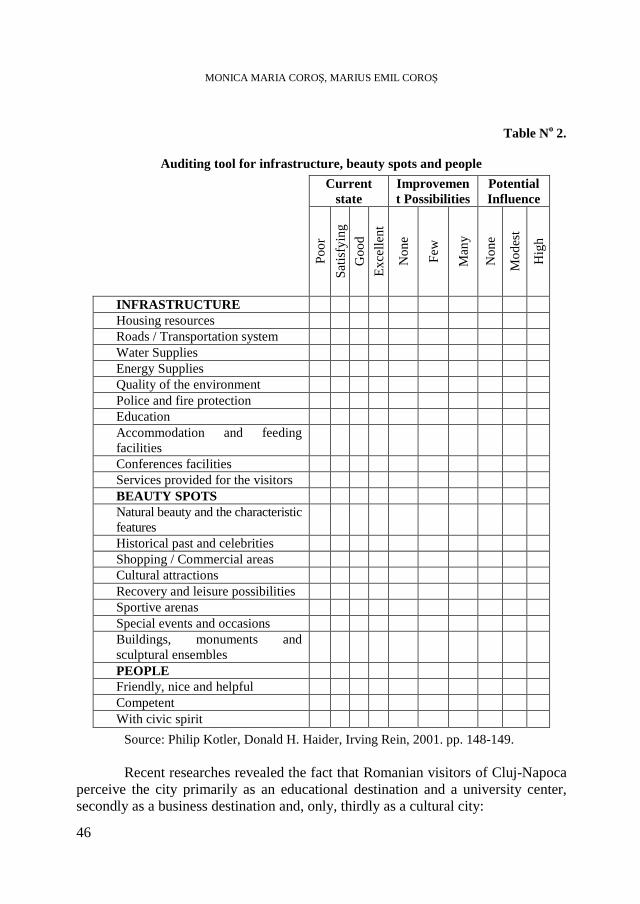
MONICA MARIA COROŞ, MARIUS EMIL COROŞ
46
Table No 2.
Auditing tool for infrastructure, beauty spots and people
Current state
Improvement Possibilities
Potential Influence
Po
or
Sat
isfy
ing
Go
od
Exc
elle
nt
No
ne
Few
Man
y
No
ne
Mo
des
t
Hig
h
INFRASTRUCTURE Housing resources Roads / Transportation system Water Supplies Energy Supplies Quality of the environment Police and fire protection Education Accommodation and feeding facilities
Conferences facilities Services provided for the visitors BEAUTY SPOTS Natural beauty and the characteristic features
Historical past and celebrities Shopping / Commercial areas Cultural attractions Recovery and leisure possibilities Sportive arenas Special events and occasions Buildings, monuments and sculptural ensembles
PEOPLE Friendly, nice and helpful Competent With civic spirit
Source: Philip Kotler, Donald H. Haider, Irving Rein, 2001. pp. 148-149. Recent researches revealed the fact that Romanian visitors of Cluj-Napoca
perceive the city primarily as an educational destination and a university center, secondly as a business destination and, only, thirdly as a cultural city:
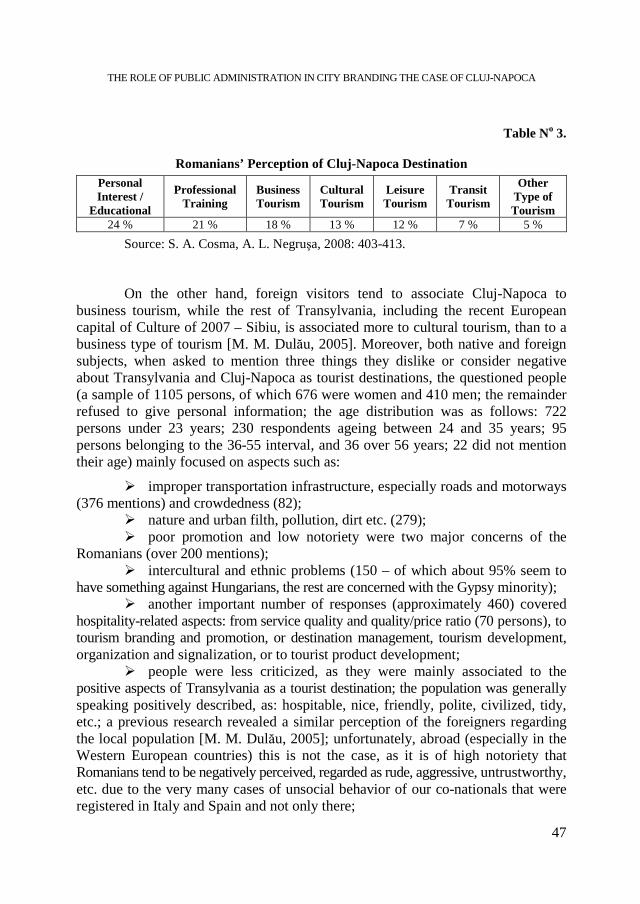
THE ROLE OF PUBLIC ADMINISTRATION IN CITY BRANDING THE CASE OF CLUJ-NAPOCA
47
Table No 3.
Romanians’ Perception of Cluj-Napoca Destination
Personal Interest /
Educational
Professional Training
Business Tourism
Cultural Tourism
Leisure Tourism
Transit Tourism
Other Type of Tourism
24 % 21 % 18 % 13 % 12 % 7 % 5 %
Source: S. A. Cosma, A. L. Negruşa, 2008: 403-413. On the other hand, foreign visitors tend to associate Cluj-Napoca to
business tourism, while the rest of Transylvania, including the recent European capital of Culture of 2007 – Sibiu, is associated more to cultural tourism, than to a business type of tourism [M. M. Dulău, 2005]. Moreover, both native and foreign subjects, when asked to mention three things they dislike or consider negative about Transylvania and Cluj-Napoca as tourist destinations, the questioned people (a sample of 1105 persons, of which 676 were women and 410 men; the remainder refused to give personal information; the age distribution was as follows: 722 persons under 23 years; 230 respondents ageing between 24 and 35 years; 95 persons belonging to the 36-55 interval, and 36 over 56 years; 22 did not mention their age) mainly focused on aspects such as:
� improper transportation infrastructure, especially roads and motorways (376 mentions) and crowdedness (82);
� nature and urban filth, pollution, dirt etc. (279); � poor promotion and low notoriety were two major concerns of the
Romanians (over 200 mentions); � intercultural and ethnic problems (150 – of which about 95% seem to
have something against Hungarians, the rest are concerned with the Gypsy minority); � another important number of responses (approximately 460) covered
hospitality-related aspects: from service quality and quality/price ratio (70 persons), to tourism branding and promotion, or destination management, tourism development, organization and signalization, or to tourist product development;
� people were less criticized, as they were mainly associated to the positive aspects of Transylvania as a tourist destination; the population was generally speaking positively described, as: hospitable, nice, friendly, polite, civilized, tidy, etc.; a previous research revealed a similar perception of the foreigners regarding the local population [M. M. Dulău, 2005]; unfortunately, abroad (especially in the Western European countries) this is not the case, as it is of high notoriety that Romanians tend to be negatively perceived, regarded as rude, aggressive, untrustworthy, etc. due to the very many cases of unsocial behavior of our co-nationals that were registered in Italy and Spain and not only there;
MONICA MARIA COROŞ, MARIUS EMIL COROŞ
48
� only very few respondents (up to 30 persons) mentioned the lack of tourists’ safety; concerning this aspect, one should also keep in mind the negative image of the Romanian population especially in Spain and Italy, but also in other Western European countries; such associations inevitably lead to the lack of interest of foreigners for the Romanian tourist destinations;
� cultural aspects mainly referred to the exaggeration of Dracula’s myth (78 persons do not agree with the notorious association Dracula-Transylvania);
� 68 answers were irrelevant, 65 persons refused to mention anything, while 17 people declared that nothing negative can be associated to Transylvania.
4. Conclusions
After having very shortly discussed general aspects related to what city branding is, how it functions and how it can be done, we have revealed a few facts regarding the manner in which visitors of Cluj-Napoca perceive the city, now we dare conclude by pointing out how authorities should involve public servants in this crucial attempt of branding the city.
Obviously, up to a point, public servants are all those who work in any kind of public institutions, be it a city hall, a city council, a local university, a hospital, etc. All of these persons are more or less responsible of how the city’s image is to be created and promoted, and, later on, supported and consolidated. We believe that it is highly important to try to involve as many public officers of the city hall in such an attempt as they can provide valuable contributions by:
� distributing questionnaires to the local citizens and to foreigners, too; � collecting completed questionnaires; � conducting personal interviews with citizens and representatives of the
economic environment; � providing information regarding the authorities’ strategies of city
branding and city development; � transmitting through their attitudes and behaviors a certain – positive –
image as message carriers; etc.
One last remark is related to the fact that success chances in the case of city branding increase if public servants are directly involved in this process and if they fully understand the importance of such attempts. It is clear that their direct involvement also increases their interest and motivation to support it. Moreover, public servants, inevitably create a part of the city’s image, as they interact with important numbers of locals and foreigners, too. Representing the first contact of the people with the institution, they constitute a sort of an interface, determining the way how the public institution itself is perceived, and further on generating an important part of the city’s image. A well-known example concerning Cluj-Napoca is the “Funar era” – when the city was badly perceived (as a hostile business environment, with a tensed atmosphere, struggling because of interethnic conflicts,
THE ROLE OF PUBLIC ADMINISTRATION IN CITY BRANDING THE CASE OF CLUJ-NAPOCA
49
etc. – all in all, the city was basically closed to any foreign investments); the bad image (a genuine negative brand) was generated exactly by the Mayor and by the institution that he ruled – the City Hall. Obviously, as long as the entire administrative body can generate endless jokes and mockery, it can, for sure, also contribute to the creation and promotion of a positive image of the city, too.
REFERENCES Anholt, Simon: April 2002. “Foreword”, Journal of Brand Management, Volume 9, No
4-5, pp. 229-239. Anholt, Simon, 2003. Brand New Justice, Oxford: Butterworth Heinemann. Anholt, Simon: January 2006. “The Anholt-GMI City Brand Index. How the World Sees
the World’s Cities”, Journal of Brand Management, Volume 2, Issue 1, pp. 18-31. Anholt, Simon, 2007. Competitive Identity. The New Brand Management for Nations,
Cities and Regions, Palgrave Macmillan. Coroş, M. M., 2009. Starting Points in Transylvania’s Branding As a Tourist Destination
(Proceedings of IABE Conference, 5-7 June 2009, Thessalonica); European Journal of Management, edited by IABE (accepted for publishing).
Cosma, Smaranda Adina; Negruşa, Adina Letiţia, 2008. “The Place of Cultural Tourism for Cluj-Napoca, Romania As a Tourist Destination”, WSEAS Transactions on Business and Economics, Issue 7, Volume 5, July 2008, pp. 403-413.
Dulău, M. M., 2005. Proposal of Tourism Promotion in Transylvania by Realizing the Brand of the Region that Follows: Transylvania, the Multicultural Heart of Europe, Graduation Paper, coordinator: Lecturer PhD Smaranda Cosma, Faculty of Business, “Babeş-Bolyai” University of Cluj-Napoca.
Kerr, Greg: April-June 2006. “From Destination Brand to Location Brand”, Journal of Brand Management, Volume 13, No 4-5, pp. 276-283.
Kotler Philip; Asplund, C.; Rein, Irving; Haider, Donald H., 1999. Marketing Places in Europe, Prentice Hall.
Kotler, Philip; Haider, Donald H.; Rein Irving, 2001. Marketingul locurilor, Bucureşti, Teora. *** http://brasovulevanghelic.ro/2009/03/13/brasov-beliveit/. *** www.clujtoday.ro/2010/03/05/cluj-fonduri-europene-sub-sloganul-la-pas-prin.html. *** www.iqads.ro/revistapresei_954/avem_orase_fara_brand.html. *** Mediafax, January 10th 2008, “Adrian Costea condamnat în cazul «Eterna şi Fascinanta
Românie»” in Ziarul Financiar, http://www.zf.ro/politica/adrian-costea-condamnat-in-cazul-quot-eterna-si-fascinanta-romanie-quot-3054910/.
STUDIA UNIVERSITATIS BABEŞ-BOLYAI, NEGOTIA, LV, 3, 2010
AN EMPIRICAL RESEARCH ABOUT THE CONTAIN OF BALANCED SCORECARD CONCEPT IN PUBLIC SECTOR
CRISTINA SILVIA NISTOR1 ABSTRACT. Balanced Scorecard is a newly recognized concept applied in the public institutions system. The purpose of this paper is to bring forward a concise perspective over the experience of other countries regarding the implementation of this concept and, as a result, stating a conclusion about the opportunity to apply the concept in Romanian universities, starting from the global identification of the specific conditions and rules of the notion Balanced Scorecard (BSC).
Is this respect we have chosen to identify, using a content analysis of 50 articles written on the subject of Balanced Scorecard in universities, the ideal model of this concept for a Romanian public university, whose actual implementation will be the subject of a future paper. The analysis was an underlying themes type and it focused on clusters of words regarding the same theme or element/group in relation to the Balanced Scorecard perspectives, respectively the objectives stated for each perspective; along with the analysis we also used the comparison procedure. Keywords: Balanced Scorecard Concept, Perspectives, Goals, Underlying Themes,
Public University 1. INTRODUCTION
At an international level, this concept was firstly used by the private sector, followed by its usage by the public sector as well. In universities of the Anglo – Saxon states, there have been debates on the subject for a long period of time in relation to the opportunity of introducing this concept; these debates have been supported by pro and against arguments. At a national level, this concept is virtually unknown in the public higher education institution system.
The reason why we have chosen this subject for our paper is closely connected to the recentness of the issue concerning the implementation of the BSC system nationally, in Romanian public universities. Taken into consideration the experience of other universities, it is interesting to find out what would be the
1 PhD Lecturer, Department of Accounting, Faculty of Economics and Business Administration,
“Babeş-Bolyai” University, Cluj-Napoca, Romania, [email protected]
CRISTINA SILVIA NISTOR
52
model obtained based on the common points of every model described by the 50 articles subject to analysis, as part of one university.
The results will have a special relevance on the one hand for those parties who are involved in assuring strategy and quality- based performance management in universities, and on the other hand, it can constitute a model for other public institutions in implementing the BSC concept.
Our personal contribution to the subject of this paper is broadening on numerous levels. In this paper we would like to underline the first part of this complex research project i.e. a brief overview of the literature which would highlight the experience of other universities regarding the implementation of the concept, with arguments for and against. In order to be able to introduce the notion into Romanian universities we find it necessary to familiarize with the results obtained by other BSC users. In order to process data based on specific underlying themes type procedures, we will develop a Balanced Scorecard model specific to the Romanian academic system, whose eventual implementation will be tested in a future research. Thus, in our future papers, starting from the theoretical knowledge, we will develop a survey that, following its interpretation, will supply data about the opportunity of using BSC in universities, the degree of knowledge about this instrument in the academic and administrative environment, the importance the academic stakeholders give to essential elements of this instrument. Finally, we will analyze the results of the empirical research and if the conditions are favorable we will start developing and implementing the BSC system in Romanian public universities.
1.1 THE BSC CONCEPT IN THE PUBLIC SECTOR
The public sector applicability of the concept has been discussed (Tonge, 1996) and numerous examples of successful public sector applications have been documented.
For the public sector, Kaplan and Norton propose that success for government and not-for-profit organizations should be measured by how effectively and efficiently they meet the needs of their constituencies. Tangible objectives must be defined for customers and constituencies. Financial considerations can play an enabling or constraining role, but will rarely be the primary objective." (Kaplan & Norton 1996) Compared to the original BSC in industries, there are some basic differences (Ferrari & Tausch, 2002). These differences evolve from the organizational and general framework.
For public sector, financial measures are not the most relevant indicators of whether the organization is delivering on the rationale for its existence. Instead, public-sector organizations need to measure how effectively and efficiently they are meeting the needs of their constituencies. The financial perspective, which is affected by its restrictive character, consequently takes a back seat compared to its leading position in the enterprises’ BSC (Jonen et al., 2004).
AN EMPIRICAL RESEARCH ABOUT THE CONTAIN OF BALANCED SCORECARD CONCEPT IN …
53
The purpose of BSC also for public sectors is to implement organization goals and vision in practice. This model assumes the goals and strategies by translating the organizational goals to key success factors in the BSC four perspectives, as a center of organizational performance control system (Kaplan & Norton, 1996).
Frieder Naschold (1998) described strategic management as the missing link in internal modernization that contributes to the redesign of the interface between administration and its political, economic and social environment (Naschold & Daley, 1999). Naschold, Oppen et al. identify four key competencies of strategic management: (1) value management, (2) management of structures, (3) management of change, and (4) strategic evaluation (Naschold et al. 1998). Value management involves addressing the behavior of employees, as well as their attitudes, values and beliefs. Therefore, Naschold argues, it is critical to link cultural change programs within an organization to organizational strategy rather than simply basing them upon organizational development processes. He argues that processes of cultural and organizational change have to proceed in parallel, with employees involved at every stage and in every aspect of these processes (Naschold, et al. 1997).
A recent empirical analysis of these processes and their effects in an international range of municipalities (Schiller, 2005) identified certain factors associated with the success of change management:
� A common understanding of strategic objectives needs to be established and institutionalized between politicians, public service managers, citizens and employees. In practice, this may be achieved through forums of politicians, public service employees and citizens.
� A "fit" between the shared strategic objectives and the structure of the organization, which means that, for example, working committees on the organizational level are aligned with municipal authority committees.
� Resource allocation needs to be related to the shared objectives. � Evaluation of goal achievement needs to include feedback channels
with users, for example via user panels. � Evaluation also requires feedback channels with citizens, in that
capacity, in addition to their capacity as customers, which means that local institutions of direct democracy need to be in place.
� Double-loop learning processes need to be institutionalized, for example through networks of city governments.
Public sector is predetermined directly or indirectly by politics, thus the degree of the closeness of politics to the organization strongly influences the design of the BSC (Horvath & Partner, 2001). As a result of the strong interconnection with politics, it may be reasonable to synchronize the timeframe of BSC with the one of a parliamentary term (Konig & Rehling, 2002).
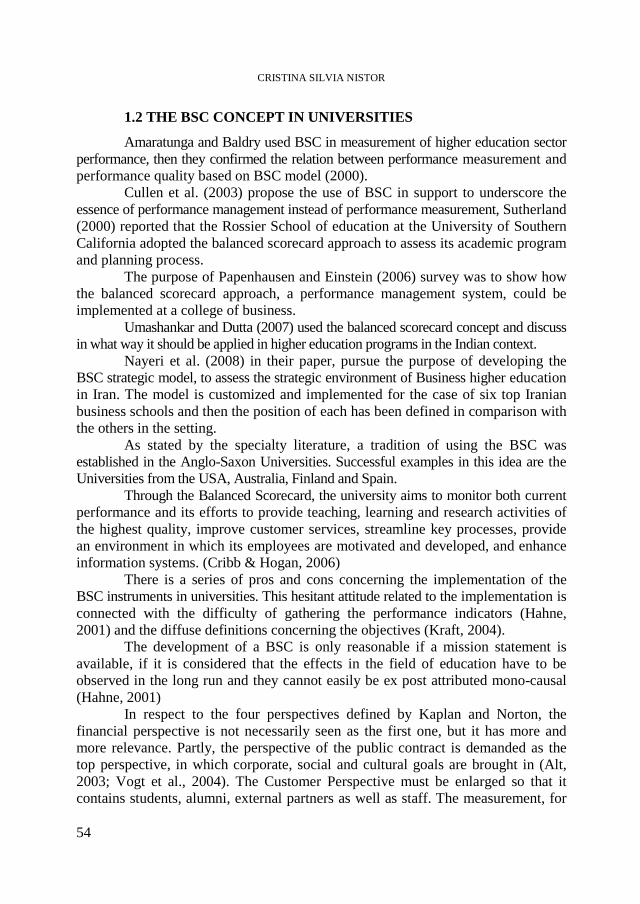
CRISTINA SILVIA NISTOR
54
1.2 THE BSC CONCEPT IN UNIVERSITIES
Amaratunga and Baldry used BSC in measurement of higher education sector performance, then they confirmed the relation between performance measurement and performance quality based on BSC model (2000).
Cullen et al. (2003) propose the use of BSC in support to underscore the essence of performance management instead of performance measurement, Sutherland (2000) reported that the Rossier School of education at the University of Southern California adopted the balanced scorecard approach to assess its academic program and planning process.
The purpose of Papenhausen and Einstein (2006) survey was to show how the balanced scorecard approach, a performance management system, could be implemented at a college of business.
Umashankar and Dutta (2007) used the balanced scorecard concept and discuss in what way it should be applied in higher education programs in the Indian context.
Nayeri et al. (2008) in their paper, pursue the purpose of developing the BSC strategic model, to assess the strategic environment of Business higher education in Iran. The model is customized and implemented for the case of six top Iranian business schools and then the position of each has been defined in comparison with the others in the setting.
As stated by the specialty literature, a tradition of using the BSC was established in the Anglo-Saxon Universities. Successful examples in this idea are the Universities from the USA, Australia, Finland and Spain.
Through the Balanced Scorecard, the university aims to monitor both current performance and its efforts to provide teaching, learning and research activities of the highest quality, improve customer services, streamline key processes, provide an environment in which its employees are motivated and developed, and enhance information systems. (Cribb & Hogan, 2006)
There is a series of pros and cons concerning the implementation of the BSC instruments in universities. This hesitant attitude related to the implementation is connected with the difficulty of gathering the performance indicators (Hahne, 2001) and the diffuse definitions concerning the objectives (Kraft, 2004).
The development of a BSC is only reasonable if a mission statement is available, if it is considered that the effects in the field of education have to be observed in the long run and they cannot easily be ex post attributed mono-causal (Hahne, 2001)
In respect to the four perspectives defined by Kaplan and Norton, the financial perspective is not necessarily seen as the first one, but it has more and more relevance. Partly, the perspective of the public contract is demanded as the top perspective, in which corporate, social and cultural goals are brought in (Alt, 2003; Vogt et al., 2004). The Customer Perspective must be enlarged so that it contains students, alumni, external partners as well as staff. The measurement, for

AN EMPIRICAL RESEARCH ABOUT THE CONTAIN OF BALANCED SCORECARD CONCEPT IN …
55
instance in the field of students, should be conducted by means of evaluations and fluctuation rates.
The Learning and Growth Perspective suggests goals like using information technology’s options more intensely and the introduction of human recourses management by objectives. (Gerling et al., 2005)
2. MATERIAL AND METHODS
We based our scientific research on two fundamental hypotheses: H1: The Balanced Scorecard concept can be implemented in Romanian public
universities, part of the public system; H2: The development of the Balanced Scorecard model for the public
system (in this case public universities) is different than the model specific to economic entities.
In order to reach the paper’s objectives and issue an opinion regarding the stated hypotheses, we resorted to:
1. A fundamental research of the theories regarding highlighting and implementing BSC in universities. Out of the socio sciences methods used within this research we could mention: document analysis, the comparison method and the observation method.
2. Using digital libraries through accessing certain databases (EBSCO – Academic Search Complete, EBSCO – Business Source Premier, Emerald Management Extra, ProQuest Central, Science Direct, SSRN) we identified a number of 50 representative articles on the subject Balanced Scorecard concept in universities, published between 1998 and 2008. We have chosen the articles with a detailed analysis of a strategic map, strategic targets, and also articles that include measurable indicators of different perspectives.
3. Using the underlying themes type of content analysis we identified the order of the perspectives according to the strategic map developed for each model specific to each university;
We determined the category variable: number of occurrences in the first, second, third or fourth place related to the total number of occurrences. The formula used to determine the category variable was:
NR
Cii T
NC =
Where Ci – category variable, based on number of rows and clauses/enumerations NCi – number of occurrences of category i TNR – total number of analyzed articles

CRISTINA SILVIA NISTOR
56
4. Using the underlying themes type of content analysis we identified the multiple objectives and key performance indicators specific to each perspective.
We determined the category variable: number of occurrences of a word/cluster of words which reflect an objective specific to a certain perspective related to the total number of occurrences. Depending on the statement, words/clusters of words with similar content were considered as part of the same category. The formula used to determine the category variable was:
NR
Cii T
NC =
Where Ci – category variable, based on number of rows and clauses/enumerations NCi – number of occurrences of category i TNR – total number of analyzed articles Afterwards, we determined the perspective variable by combining category
variables part of the same theme, using the formula:
∑=
=n
iii CT
1
Where Ti – category variable, based on number of quotations in articles 5. Depending on the score obtained in the previous content analysis and
after the compilation of information, we finally developed an ideal model for Romanian public universities.
6. The study ended with discussions about previous obtained results, conclusions, research limits and perspectives.
3. RESULTS AND DISCUSSIONS
Establishing the perspectives in the public system may be different from the system for economic entities. Taken into consideration the specific nature of the public sector i.e. supplying services for and in the benefit of the population, it is our opinion that the most important perspective in „Customers”. The main purpose of public institutions is working for the general public, by providing high quality services and professionalism. Of course, this is not possible without an important financial support.
This is the reason why we consider that, in the present context, the financial perspective gain a lot of ground and it is now at a closer level to the customers’

AN EMPIRICAL RESEARCH ABOUT THE CONTAIN OF BALANCED SCORECARD CONCEPT IN …
57
perspective. Nowadays the majority of public sector institutions tend to become entrepreneurial units, in which public funds are strongly sustained by extra-budgetary sources. Financial profitability has become an essential requirement also for the public sector.
In this respect, after analyzing the 50 articles representative for the research subject i.e. implementing balanced scorecard in universities, the following standing of perspectives has emerged, considering the number of occurrences in a certain order (table 1):
Table 1.
Standing of perspectives
Perspectives First place
Second place
Third place
Fourth place
TOTAL
Financial Perspective
23
0.46
20 0.4
5 0.1
2
0.04
50
Internal Business Perspective
2
0.04
7
0.14
26
0.52
15
0.3
50
Customer & Stakeholders Perspective
26
0.52
20
0.4
3
0.06
1
0.02
50
Employees & Organization Capacity Perspective
1
0.02
2
0.04
17
0.34
30
0.6
50
TOTAL 50 50 50 50 100% Taken into account the fact that the implementation of the BSC concept in
university is still at an early stage, we tried to name each perspective closely to the perspectives in the Kaplan and Norton model, in order to ease the subsequent documentation of the individuals willing to implement the method. However, given its initial focus i.e. economic entities, we consider that the model can not be identically undertaken for public institutions. Thus, we named the Customers’ Perspective as Customer & Stakeholders Perspective, and the Innovation and Learning Perspective became Employees & Organization Capacity Perspective.
As a result, depending on the scores obtained, we established the following hierarchy:
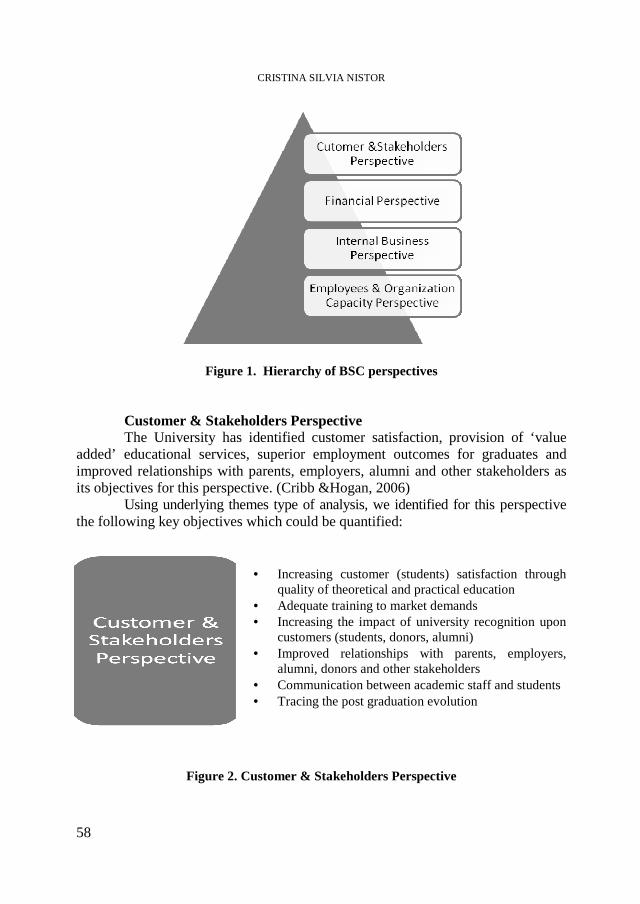
CRISTINA SILVIA NISTOR
58
Figure 1. Hierarchy of BSC perspectives Customer & Stakeholders Perspective The University has identified customer satisfaction, provision of ‘value
added’ educational services, superior employment outcomes for graduates and improved relationships with parents, employers, alumni and other stakeholders as its objectives for this perspective. (Cribb &Hogan, 2006)
Using underlying themes type of analysis, we identified for this perspective the following key objectives which could be quantified:
Figure 2. Customer & Stakeholders Perspective
• Increasing customer (students) satisfaction through quality of theoretical and practical education
• Adequate training to market demands • Increasing the impact of university recognition upon
customers (students, donors, alumni) • Improved relationships with parents, employers,
alumni, donors and other stakeholders • Communication between academic staff and students • Tracing the post graduation evolution

AN EMPIRICAL RESEARCH ABOUT THE CONTAIN OF BALANCED SCORECARD CONCEPT IN …
59
Based on a content analysis of a set of 50 specialized articles published in international data bases, the following standing of relevant terms has emerged, according to the number of occurrences, sorted by descending order, on this segment:
Table 2.
Score of Stakeholders perspective
Objectives / Stakeholders perspective Score (number of occurrences in
article)
Variable of indicator in the
total of the theme Increasing customer (students) satisfaction through quality of theoretical and practical education Adequate training to market demands Increasing the impact of university recognition upon customers (students, donors, alumni) Improved relationships with parents, employers, alumni, donors and other stakeholders Communication between academic staff and students Tracing the post graduation evolution
43
36 28
16
10 5
0.86
0.72 0.56
0.32
0.2
0.1
Financial perspective The necessity of implementing BSC in Romanian universities is underlined
by the fact that they are transforming from institutions funded exclusively from budgetary funds into entrepreneurial companies, whose range of business may focus on diverse processes. This makes financial aspects become essential, as it also happens in the case of economic entities. A modern university may no longer be sustained from public funds. Its financial policy must draw in funds in order for it to function at high standards.
Using underlying themes type of analysis, we identified for this perspective the following key objectives which could be quantified:

CRISTINA SILVIA NISTOR
60
Figure 3. Financial perspective Based on a content analysis of a set of 50 specialized articles published in
international data bases, the following standing of relevant terms has emerged, according to the number of occurrences, sorted by descending order, on this segment:
Table 3.
Score of Financial perspective
Indicators / Financial Perspective Score (number of
occurrences in article)
Variable of indicator in
the total of the theme
Clearly identified budgets Increasing incomes from other sources than the budget (including financing contracts, donors or grants) Decreasing costs Average life cycle of facilities and equipments Ensuring the cost-effectiveness ratio when allocating resources Average cost of educational/ administrative staff Modern accounting system Raising attractiveness levels through a reasonable policy for tuition taxes Developing a financial plan
42 38
32 18 15
10 6 3 2
0.84 0.76
0.64 0.36 0.3
0.2 0.12 0.06
0.04
• Clearly identified budgets • Increasing incomes from other sources than the budget
(including financing contracts, donors or grants) • Decreasing costs • Average life cycle of facilities and equipments • Ensuring the cost-effectiveness ratio when allocating
resources • Average cost of educational/ administrative staff • Modern accounting system • Raising attractiveness levels through a reasonable policy
for tuition taxes • Developing a financial plan

AN EMPIRICAL RESEARCH ABOUT THE CONTAIN OF BALANCED SCORECARD CONCEPT IN …
61
Internal Business Perspective The Internal Business Perspective describes essential internal processes
which lead to stakeholders’ satisfaction and to the financial results of the university. The internal business processes offer value proposes for stakeholders and lead to financial efficiency. Detailed analysis highlighted the fact that internal business perspective in universities could be renamed as Teaching and Learning, Scholarship and Research, but given the arguments mentioned earlier in the paper i.e. insufficient acquaintance with the model in the case of public entities, we chose to keep the name initially proposed by Kaplan and Norton, in order to ease future research. For the internal business perspective the following objectives were identified:
Figure 4. Internal Business Perspective Based on a content analysis of a set of 50 specialized articles published in
international data bases, the following standing of relevant terms has emerged, according to the number of occurrences, sorted by descending order, on this segment:
Table 4.
Score of Internal Business perspective
Indicators / Internal Business Perspective Score (number of occurrences in
article)
Variable of indicator in the
total of the theme
Continuous improvement of quality and service Adequate monitoring and evaluation Adequate infrastructures
41 33 27
0.82 0.66 0.54
• Continuous improvement of quality and service • Adequate monitoring and evaluation • Adequate infrastructures • Policy effectiveness • Ensuring an efficient educational process by
continuously assessing the students’ training level • Increasing the degree of adaptability to market
demand (updating the curricula) • Increasing the safety degree of the educational process • Developing a marketing plan that would ensure future
generations of graduates (anticipation of the future) • Increasing the national and international recognition of
academic staff (through the number of articles presented in conferences, ISI, publications/year)
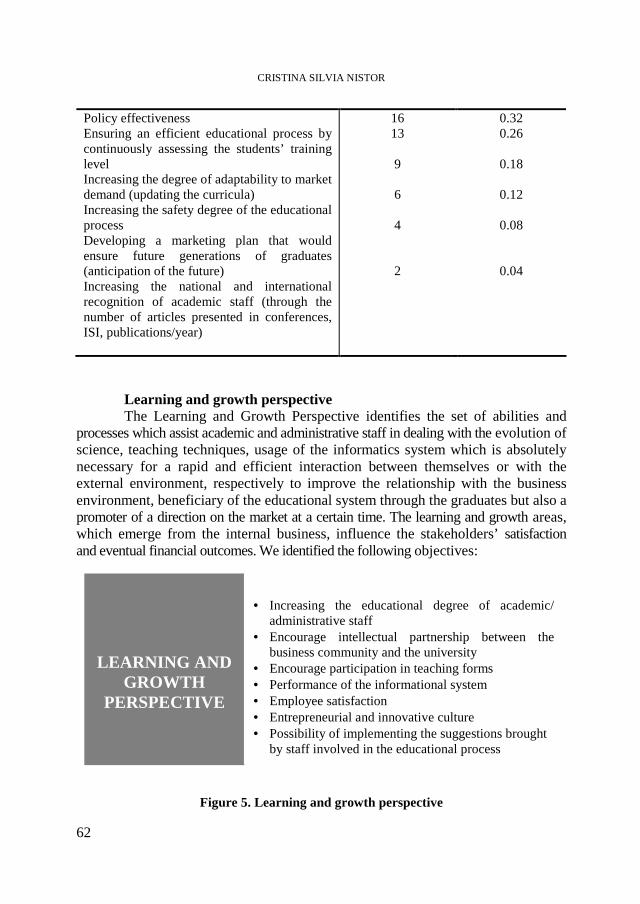
CRISTINA SILVIA NISTOR
62
Policy effectiveness Ensuring an efficient educational process by continuously assessing the students’ training level Increasing the degree of adaptability to market demand (updating the curricula) Increasing the safety degree of the educational process Developing a marketing plan that would ensure future generations of graduates (anticipation of the future) Increasing the national and international recognition of academic staff (through the number of articles presented in conferences, ISI, publications/year)
16 13 9 6 4 2
0.32 0.26
0.18
0.12
0.08
0.04
Learning and growth perspective The Learning and Growth Perspective identifies the set of abilities and
processes which assist academic and administrative staff in dealing with the evolution of science, teaching techniques, usage of the informatics system which is absolutely necessary for a rapid and efficient interaction between themselves or with the external environment, respectively to improve the relationship with the business environment, beneficiary of the educational system through the graduates but also a promoter of a direction on the market at a certain time. The learning and growth areas, which emerge from the internal business, influence the stakeholders’ satisfaction and eventual financial outcomes. We identified the following objectives:
Figure 5. Learning and growth perspective
LEARNING AND GROWTH
PERSPECTIVE
• Increasing the educational degree of academic/
administrative staff • Encourage intellectual partnership between the
business community and the university • Encourage participation in teaching forms • Performance of the informational system • Employee satisfaction • Entrepreneurial and innovative culture • Possibility of implementing the suggestions brought
by staff involved in the educational process

AN EMPIRICAL RESEARCH ABOUT THE CONTAIN OF BALANCED SCORECARD CONCEPT IN …
63
Table 5.
Score of Learning and growth perspective
Indicators / Learning and growth perspective
Score (number of occurrences in
article)
Variable of indicator in the
total of the theme Increasing the educational degree of academic/administrative staff Encourage intellectual partnership between the business community and the university Encourage participation in teaching forms Performance of the informational system Employee satisfaction Entrepreneurial and innovative culture Possibility of implementing the suggestions brought by staff involved in the educational process
43
31
22 19 18 9 4
0.86
0.62
0.44 0.38 0.36 0.18 0.08
4. CONCLUSIONS
This paper is only the beginning of an ample research project on the subject of implementing BSC in Romanian public universities. This system generates, moreover it justifies, the performance measures which will indulge a performance management in universities based on strategy and quality. The experience of other universities, especially Anglo-Saxon universities, emphasizes the possibility of success. As a result, the first hypothesis stated, H1 - The Balanced Scorecard concept can be implemented in Romanian public universities, part of the public system, has proven to be valid. It only depends on the will of the individuals responsible for the organization of the higher education system to accept a new system, to start the documentation process followed by the implementation. We hope that by continuing research we would be able to offer guidance to successful implementation of the BSC concept in Romanian public universities.
The level of novelty highlighted by the researched subject made it possible for our personal contribution to broaden on various aspects, out of which we mention two areas. The first one regards covering the theories on the BSC concept on three levels: the private sector as the promoter of the BSC concept, the public sector which successfully undertook and adapted the concept to its own characteristics and finally, as part of the public sector but with specific characteristics, the universities. The second area regards the issue of implementing the BSC concept in Romanian public universities, a subject that has not yet been researched on a national level.
In order to reach our goals we identified the objectives with the highest impact on the models in the universities analyzed and described in the 50 articles we have chosen. This has proven the fact that the second hypothesis, H2 - The

CRISTINA SILVIA NISTOR
64
development of the Balanced Scorecard model for the public system (in this case public universities) is different than the model specific to economic entities, is valid. If we make a parallel with the model proposed and developed by the promoters of the BSC concept, Kaplan and Norton, we notice multiple differences between the model for economic entities and the model for public institutions. Some of these differences are: the fact that the financial perspective has a secondary position in comparison to the case of economic entities, the customers’ perspective comes first and it is renamed Customer & Stakeholder Perspective, according to the specific nature of public institutions, the development of objectives clearly connected to particularities of public universities (e.g. the financing manner, customers, staff efficiency, level of demand for services) etc.
In conclusion, we consider that this study has shaped in some way the BSC concept which could be implemented in Romanian public higher education institutions. If we take into account the recommendation issued by the founders of the concept, Kaplan and Norton, the ideal model would contain 15-25 objectives. It is up to the persons interested in the subject to develop their own model according to their option, as this study offers an important support by presenting the impact of each perspective’s objectives sorted by decreasing order.
FUTURE RESEARCH
Based in the study’s findings we want to continue research by developing a model suited for Romanian public universities, whose possible implementation will be verified through a survey among the representatives of Romanian universities, in order to test their availability, acquaintance with the model and willingness to use the BSC concept.
In the case of positive result we will make use of the 9 steps to success method. Firstly, developing a BSC performance system will focus on: conducting an organizational assessment (usually by using SWOT analysis), defining strategic themes, choosing perspectives and establishing objectives, developing a strategic map of the university, defining performance indicators, developing initiatives. The second stage i.e. the implementation of BSC will focus on: processing and communicating information related to performance, spreading BSC within the whole organization, usage of scorecard information for assessing and improving performance.
REFERENCES
Amaratunga D. & Baldry D. (2000), “Assessment of facilities management performance in higher education properties”, Facilities, vol 18 : 293-301
Anthony, R.N. (1965), Planning and control systems: a framework for analysis, Harvard Graduate School of business, Boston

AN EMPIRICAL RESEARCH ABOUT THE CONTAIN OF BALANCED SCORECARD CONCEPT IN …
65
Bailey, A., Chow, C., Haddad, K. (1999), “Continuous improvement in business education: insights from the for-profit sector and business deans", Journal of Education for Business, Vol. 74 No. 3, pp. 165-80.
Breton, A. (1996), Competitive Governments. An Economic Theory of Politics and Public Finance, Cambridge University Press, Cambridge
Briggs, C.L., Stark, J.S., Roland-Poplawski, J. (2003), “How do we know a continuous planning academic program when we see one?”, The Journal of Higher Education, Vol. 74 pp. 361-85
Camp, R.C. (1989), Benchmarking: The Search for Industry Best Practice That Leads to Superior Performance, ASQC Quality Press, Milwaukee, WI.,
Chang, O.H. and Chow, C.W. (1999), “The balanced scorecard; a potential tool for suporting change and continuous improvement in accounting education”, Issue in accounting education, Vol. 14, No 3, 395-412
Ching, C.T., Hero L., Po-young, Ch. (2005), “Agility index in the supply chain”, Int. J. Production Economics
Clewes, D (2003), “A student-centred conceptual model of service quality in higher education”, Qual High Educ, Vol 9 No. 1, 69-85
Cribb G. & Hogan C, “Balanced scorecard: linking planning to measurement and communication”, available on line at http://jobfunctions.bnet.com/whitepaper. aspx?docid=139453
Cullen, J., Joyce, J., Hassal, T., Broadbent, M. (2003), “Quality in higher education: from monitoring to management”, Quality Assurance in Education, vol.11: 5-14
El – shishini H. (2001), Integrating Financial and Non – financial Performance Measures: State of the Art and Research Opportunities, available on line at SSRN: http://ssrn.com/abstract=283651
Epstein, M.J. and Roy, M. (2004), “How does your board rate?”, Strategic Finance, February, 25-31
European University Association, EUA statement on the Bologna process. Berlin Ministerial meeting, September 2003
European University Association, Graz declaration. May 2003 Ferrari, E & Tausch, C. (2002), “Balanced scorecard – und die Verwaltung findet
ihren”, vol. Controlling, no. 14: 245-255 Gerling, P., Hubig, L., Jonen, A., Lingnau, V. (2005), “Software fur die
Hochschulverwatung”, vol Die Verwltung, no. 37: 399-415 Hahne (2001), “Balanced scorecard”, Luchterhand, Neuwied et al., 15-21 Horvath & Partner (2001), “Balanced Scorecard umsetzen”, Schaffer – Poeschel,
Stuttgart Johnes, J.& Taylor, J. (1990), “Performance Indicators in Higher Education”,
Buckingam: The Society for Research into Higher Education & Open University Press
Jonen, A & Simgen – Weber, B. (2006), “Balanced Scorecard fur den Mittelstand – Ausgeslatlungsvorschlage und deren praktische Relevanz”, Lohmar, Koln
Jonen, A., Lingnau, V., Muller, P. (2004), “Balanced IT – Decision-Card- Ein Instrument fur das Investitionscontrollling von IT-Projecten”, Wirtschaftsinformatik, vol. 46: 196-203

CRISTINA SILVIA NISTOR
66
Jones A & Hubig L. (2006), Balanced University Decision Support, available on line at SSRN: http://ssrn.com/abstract=931633
Kahraman, C., Tolga, E. and Ulukan, Z. (2000), “Justification of manufacturing technologies using fuzzy benefit/cost ratio analysis”, International Journal of Production Economics, Vol. 66, 45-52
Kaplan, R.S. & Norton, D.P. (1992), The Balanced Scorercard – Measures that drive Performance”, Harvard Business Review, (January - February): 71-79
Kaplan, R.S. & Norton, D.P. (1996), “Using the Balanced scorecard as a Strategic Management System”, Harvard Business Review, (January - February): 75-82
Karathanos, D. and Karathanos, P (2005), “Applying the balanced scorecard to education”, Journal of Education for Business, Vol. 80 No. 4, 222-300
Karname Haghi, H. and Akbari, N. (2004), “Investigation of social demand for higher education in Iran”, Economical Research in Iran seasonal, No. 20, 115-134
Konig, S. & Rehling, M. (2002), “Zur Ubertragbarkeit der Balanced Scorecard auf ein zukunftsgerichtetes Personalmanagement der offentlichen Verwaltung” (01-02), Oldenburg
Kraft, I. (2004), “Rechnungs – und Berichtswesen fur Universitaten vor dem Hintergrund des Universitatsgesetzes”, Controller News, vol 2: 54-56
Levin, I.M. (2000), “Vision revisited”, Journal of Applied Behavioral Science, Vol. 36 pp. 91-107.
Merchant, K.A. (1998), Modern management control system: text and cases, Prentice Hall. Naschold, F. & Daley, G. (1999), Learning from the pioneers: Modernizing local
government. Part One. International Public Management Journal, vol. 2(1): 25-51
Naschold, F., Oppen, M., & Wegener, A. (1998), Kommunale Spitzeninnovationen: Konzepte, Umsetzung, Wirkungen in internationaler Perspektive. Berlin: Edition Sigma.
Nayeri M.D., Mashhadi M.M., Mohajeri, K. (2008), “Universities strategic Evaluation Using Balanced Scorecard”, Proceeding of World Academy of science, Engineering and Technology, vol. 27: 332-337
Norreklit, H. (2000), “The balance on the Balanced Scorecard: a critical analysis of some of its assumptions”, Management accounting research, 11, 65-88
Oliveira, J. (2001), “The balanced scorecard: an integrative approach to performance evaluation”, Healthcare Financial Management, Vol. 55 pp. 42-64
Papenhausen C. & Einstein W. (2006), “Insights from the Balanced Scorecard Implementing the Balanced Scorecard at a college of business”, Measuring Business Excellence, vol 10, no. 3: 15-22
Ruben, B. (1999), “Toward a balanced scorecard for higher education: rethinking the college and university excellence indicators framework”, Higher Education Forum QCI Center for Organizational Development and Leadership, Vol. 99 No. 2, pp. 1-10
Schiller, C. (2005), Strategisches Management in Kommunen - untersucht am Beispiel von OECD-Staaten. Potsdam, Diplomarbeit. Retrieved April, 2006, available on line at http://www.local-governance.de/docs/Strategisches_Mgt.pdf

AN EMPIRICAL RESEARCH ABOUT THE CONTAIN OF BALANCED SCORECARD CONCEPT IN …
67
Simon, H.A. (1997), Administrative Behavior. A Study of Decision-making Processes in Administrative Organizations, 4th ed., The Free Press, New York, NY,
Smeby, J.C. (2003), “The impact of massification of university research”, Tertiary Education and Management, Vol. 9 No. 2, 141-442
Sutherland, T (2000), “Designing and implementing an academic scorecard”, Accounting education News, Summer, 11-14
Tam, M. (2001), “Measuring quality and performance in higher education”, Quality in Higher education, Vol. 7, No. 1, 47-54
Umashankar, V. & Dutta, K (2007), “Balanced scorecard in managing higher education institutions: an Indian perspective”, International Journal of Educational Management, vol 21: 54-67
Welsh, J.F., Metcalf, J. (2003), “Faculty and administrative support for institutional effectiveness activities: a bridge across the chasm?”, The Journal of Higher Education, Vol. 74 pp. 361-85.
Wintrobe, R. (1997), “Modern bureaucratic theory”, in Mueller, D.C. (Eds),Perspectives on Public Choice, Cambridge University Press, Cambridge, pp. 429-54.
Zajac, E.J., Kraatz, M.S., Bresser, R.F. (2000), “Modeling the dynamics of strategic fit: a normative approach to strategic change”, Strategic Management Journal, Vol. 21 No. 4, pp. 429-53
STUDIA UNIVERSITATIS BABEŞ-BOLYAI, NEGOTIA, LV, 3, 2010
CHALLENGES OF THE AUDITING PROFESSION IN THE CONTEXT OF ECONOMIC CRISIS
ADRIAN GRO ŞANU1, PAULA RAMONA R ĂCHI ŞAN2 ABSTRACT. The crisis that influences the contemporary worldwide economy is the result of the manner in which the financial-economic system is built and of the manner in which the patrimonial situation and the performances of the economic entities are evaluated and presented. As a result of the public interest for the auditing profession, the financial auditor develops his/ her activity by respecting some regulations particularly elaborated for this profession (the code of ethics and the audit standards) in order for his/ her opinion to have a solid background and, most important, to be trustworthy.
While the accounting conventions (national and international) are based on two concepts that support the entire accounting structure, the going concern activity and the accrual accountancy, structure which is built with the help of cash flow, the international audit standards (in accordance with which the audit activity is being developed) are built around two main concepts: professional judgement and professional skepticism.
In the economic crisis context, the auditor’s professional judgement receives a fundamental importance in order to provide to the users of audited accounting information an acceptable level of trust. Also, the appreciation of the going concern activity is an element which receives different valences in the new context in comparison with previous periods of time.
Therefore, in this paper, we propose to analyze the role of the professional judgement and professional skepticism in the development of audit activity within the current economic context. By its nature, the professional judgement is a concept that reflects the idea of subjectivity, but the opinion that the auditor expresses by using the professional judgement must be objective. Thus, an objective anchor must be found in order to transform the subjectivity of professional judgement into an objective audit opinion. Keywords: professional judgement, professional skepticism, going concern activity,
auditor’s opinion.
1 Assistant professor, Ph.D., Faculty of Economics and Business Administration, Department of
Accounting, University Babes-Bolyai, Cluj-Napoca, Romania, [email protected] 2 Assistant professor, Ph.D., Faculty of Business, Department of Business, University Babes-Bolyai,
Cluj-Napoca, Romania, [email protected]

ADRIAN GROŞANU, PAULA RAMONA RĂCHIŞAN
70
1. Introduction
Lately, many analyses have been made concerning the economic and/or financial crisis that affected the global economy, its causes and the instruments that shall ensure the passage over this unpleasant moment, primarily for the population. Now we can establish the main causes that triggered this phenomenon, a year after the first signs of contradiction between the economies of countries worldwide have emerged.
Basically, the crisis that affects the contemporary global economy is, in our opinion, the result of the manner in which the financial-economic system is built and of the manner in which the patrimonial situation and the performances of the economic entities are evaluated and presented. Therefore, the causes of the economic crisis are generated by an amount of macroeconomic and microeconomic factors.
In times of crisis, the trust that people and economic operators have in economy and state institutions is a very sensitive element on which depends the period of time when an economic uplifting and also a reasonable living standard for the population shall be ensured. The economic crisis was generated by human nature, by the desire of enrichment without foundation, by a profound moral crisis that affects the contemporary society, and by the absence of some institutions of regulation and surveillance of the economic system. “Our reaction to crisis depends on the fundamental principles we believe in, on available resources, and on institutions and instruments that we can use”, states Mugur Isărescu, the Governor of the National Bank of Romania, Academic PhD Associate Professor, in an article published in the Financial Audit Magazine (Isărescu, 2009).
Regardless of which the causes were, solutions shall eventually be found in order to pass the crisis, due to a fundamental characteristic of human species, which is optimism. Therefore, the economic crisis brought into question the manner in which the systems of accounting reporting ensure a faithful image of the provided information.
We tried to present the current economic context in a concise manner and in a very accessible language in order to highlight, in what follows, the role of the auditing profession in this context.
2. Research methodology
In order to elaborate this paper we have studied the International Standards on Auditing, the Ethic Code for professional auditors, and other papers from the financial audit domain elaborated by national and international authors. The authors’ experience in this field, both educational and practical, has an important contribution in the elaboration of this study.
The main target that we aimed was to settle an objective anchor that transforms the subjectivity of professional judgement into an objective audit opinion. Therefore, we have elaborated our own judgements concerning the approached topic.
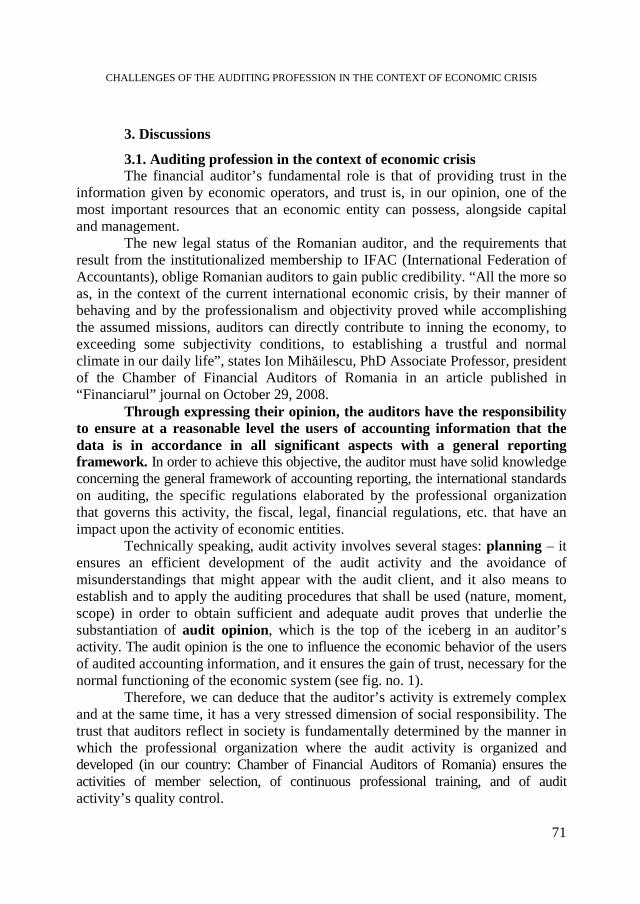
CHALLENGES OF THE AUDITING PROFESSION IN THE CONTEXT OF ECONOMIC CRISIS
71
3. Discussions
3.1. Auditing profession in the context of economic crisis The financial auditor’s fundamental role is that of providing trust in the
information given by economic operators, and trust is, in our opinion, one of the most important resources that an economic entity can possess, alongside capital and management.
The new legal status of the Romanian auditor, and the requirements that result from the institutionalized membership to IFAC (International Federation of Accountants), oblige Romanian auditors to gain public credibility. “All the more so as, in the context of the current international economic crisis, by their manner of behaving and by the professionalism and objectivity proved while accomplishing the assumed missions, auditors can directly contribute to inning the economy, to exceeding some subjectivity conditions, to establishing a trustful and normal climate in our daily life”, states Ion Mihăilescu, PhD Associate Professor, president of the Chamber of Financial Auditors of Romania in an article published in “Financiarul” journal on October 29, 2008.
Through expressing their opinion, the auditors have the responsibility to ensure at a reasonable level the users of accounting information that the data is in accordance in all significant aspects with a general reporting framework. In order to achieve this objective, the auditor must have solid knowledge concerning the general framework of accounting reporting, the international standards on auditing, the specific regulations elaborated by the professional organization that governs this activity, the fiscal, legal, financial regulations, etc. that have an impact upon the activity of economic entities.
Technically speaking, audit activity involves several stages: planning – it ensures an efficient development of the audit activity and the avoidance of misunderstandings that might appear with the audit client, and it also means to establish and to apply the auditing procedures that shall be used (nature, moment, scope) in order to obtain sufficient and adequate audit proves that underlie the substantiation of audit opinion, which is the top of the iceberg in an auditor’s activity. The audit opinion is the one to influence the economic behavior of the users of audited accounting information, and it ensures the gain of trust, necessary for the normal functioning of the economic system (see fig. no. 1).
Therefore, we can deduce that the auditor’s activity is extremely complex and at the same time, it has a very stressed dimension of social responsibility. The trust that auditors reflect in society is fundamentally determined by the manner in which the professional organization where the audit activity is organized and developed (in our country: Chamber of Financial Auditors of Romania) ensures the activities of member selection, of continuous professional training, and of audit activity’s quality control.
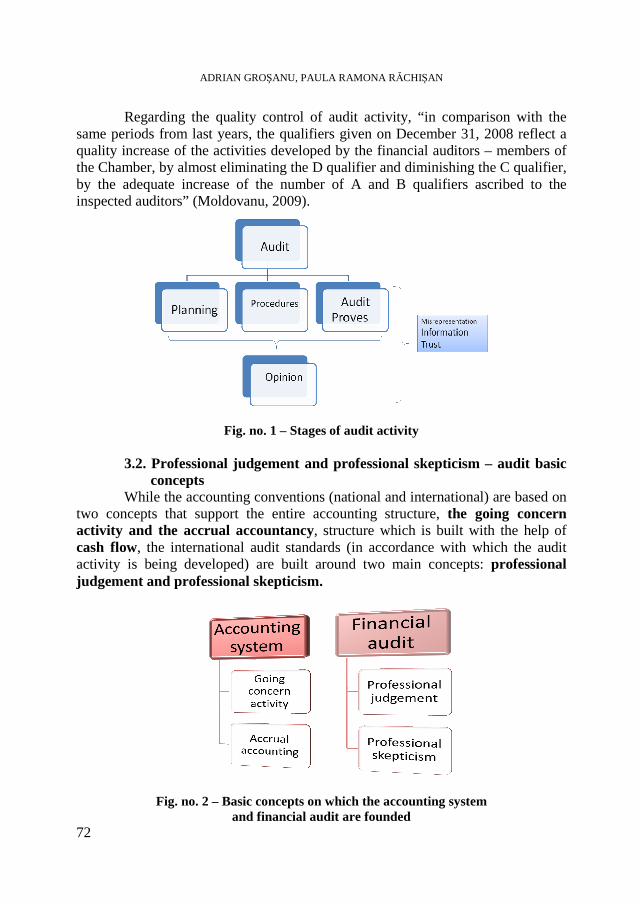
ADRIAN GROŞANU, PAULA RAMONA RĂCHIŞAN
72
Regarding the quality control of audit activity, “in comparison with the same periods from last years, the qualifiers given on December 31, 2008 reflect a quality increase of the activities developed by the financial auditors – members of the Chamber, by almost eliminating the D qualifier and diminishing the C qualifier, by the adequate increase of the number of A and B qualifiers ascribed to the inspected auditors” (Moldovanu, 2009).
Fig. no. 1 – Stages of audit activity 3.2. Professional judgement and professional skepticism – audit basic
concepts While the accounting conventions (national and international) are based on
two concepts that support the entire accounting structure, the going concern activity and the accrual accountancy, structure which is built with the help of cash flow, the international audit standards (in accordance with which the audit activity is being developed) are built around two main concepts: professional judgement and professional skepticism.
Fig. no. 2 – Basic concepts on which the accounting system and financial audit are founded
CHALLENGES OF THE AUDITING PROFESSION IN THE CONTEXT OF ECONOMIC CRISIS
73
In the economic crisis context, the auditor’s professional judgement receives a fundamental importance in order to provide to the users of audited accounting information an acceptable level of trust. Also, the appreciation of the going concern activity is an element which receives different valences in the new context in comparison with previous periods of time.
The Ethic Code for professional auditors appreciates that the concepts of professional judgement and professional skepticism are very strongly related with the concept of independence with its two sides: spirit independence (state of mind that allows the issuance of an opinion without being affected by influences that compromise professional judgement, and that allows the individual to act with integrity, to exert his objectivity and professional judgement) and surface independence (avoidance of facts and situations that are so important that a reasonable and objective third person, who is familiar with all relevant information, including the protection measures applied, would conclude in a reasonable manner that integrity, objectivity or professional skepticism of the enterprise or of a member of the insurance team had been compromised).
Therefore, an auditor is independent as long as his professional judgement, integrity, objectivity and professional skepticism are not compromised.
The notion of professional judgement is not explicitly defined in the ethic code, but professional skepticism is defined as being an attitude that involves an interrogatory spirit and a critical evaluation of proves. According to ISA 200 “General objectives and principles that govern an audit of financial situations”, professional skepticism has an important role throughout the development of audit process for the auditor to reduce the elusion risk of unusual circumstances, the risk of excessive generalization when issuing conclusions, the risk of using erroneous arguments when determining the nature, the moment and the extension of the audit procedures and the result evaluation.
The auditor must reveal an attitude of professional skepticism as against audit proves and board statements.
In accordance with ISA 240 “The auditor’s responsibility to analyze fraud within an audit of financial situations”, due to fraud’s characteristics, the auditor’s attitude of professional skepticism is extremely important when the risks of significant forgery caused by fraud are being analyzed. Professional skepticism involves having permanently in mind the question if the obtained information and audit proves indicate the fact that there could be a significant forgery caused by fraud. In order to stress even more the auditor’s responsibility to have an attitude of professional skepticism, within the international standard on audit ISA 220 “Quality control for auditing historical financial information” it is stated that the responsibilities of the mission team include maintaining objectivity and an adequate level of professional skepticism, and executing the activity that was delegated according to the ethic principle concerning proper attention.
In what concerns the professional judgement, we can appreciate that it is the result of knowing and applying the accounting and audit conventions, both

ADRIAN GROŞANU, PAULA RAMONA RĂCHIŞAN
74
practically and theoretically. Professional skepticism involves the manifestation of professional judgement. Professional judgement is the element that ensures the functioning of the audit process; it is the link between theory and practice. Professional judgement appears in several key moments throughout audit process, such as: in establishing materiality, audit risk, nature, moment and extension of audit procedures, in analyzing audit proves, etc.
The problem that occurs is that professional judgement is subjective; it is influenced by the auditor’s experience, professional training and even by his personality. In this manner it is advisable to assure ourselves that the subjectivity of professional judgement eventually determines the issuance of an objective audit opinion. By its nature, the professional judgement is a concept that reflects the idea of subjectivity, but the opinion that the auditor expresses by using the professional judgement must be objective. Thus, an objective anchor must be found in order to transform the subjectivity of professional judgement into an objective audit opinion.
3.3. Instruments of ensuring an objective audit opinion In order to ensure an objective audit opinion we consider necessary to
cover the following stages: Stage 1: “Training” the professional judgement In our opinion this stage involves the passage (not exclusive) from the
individual professional judgement to the professional judgement of professional auditors. This step is achievable through the Chamber of Financial Auditors of Romania, in the following ways:
- a more frequent usage of the working group by the Chamber members, the stated purpose of this structure within the Chamber being to analyze and to propose practical solutions for the problems that the Chamber members are confronted with, to harmonize the Romanian legislation in this field and the pro-active attitude in approaching potential problems;
- organization of some courses within the continuous training program of Chamber members with the objective of professional judgement in audit activity;
- elaboration of some papers on professional judgement and the organization of simulations of its application in practice.
Fig. no. 3 – “Training” of professional judgement (Stage 1)
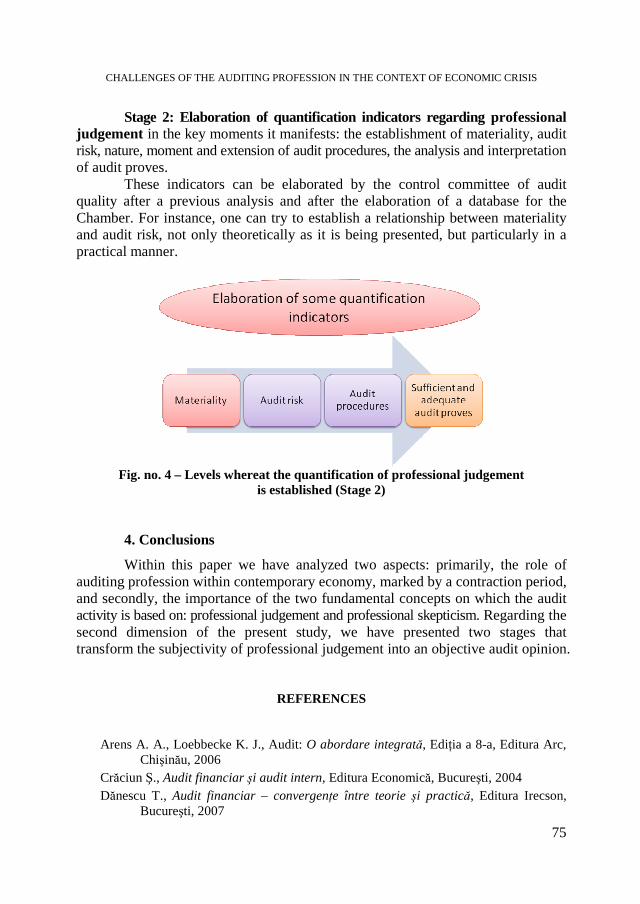
CHALLENGES OF THE AUDITING PROFESSION IN THE CONTEXT OF ECONOMIC CRISIS
75
Stage 2: Elaboration of quantification indicators regarding professional judgement in the key moments it manifests: the establishment of materiality, audit risk, nature, moment and extension of audit procedures, the analysis and interpretation of audit proves.
These indicators can be elaborated by the control committee of audit quality after a previous analysis and after the elaboration of a database for the Chamber. For instance, one can try to establish a relationship between materiality and audit risk, not only theoretically as it is being presented, but particularly in a practical manner.
Fig. no. 4 – Levels whereat the quantification of professional judgement
is established (Stage 2) 4. Conclusions
Within this paper we have analyzed two aspects: primarily, the role of auditing profession within contemporary economy, marked by a contraction period, and secondly, the importance of the two fundamental concepts on which the audit activity is based on: professional judgement and professional skepticism. Regarding the second dimension of the present study, we have presented two stages that transform the subjectivity of professional judgement into an objective audit opinion.
REFERENCES
Arens A. A., Loebbecke K. J., Audit: O abordare integrată, Ediţia a 8-a, Editura Arc, Chişinău, 2006
Crăciun Ş., Audit financiar şi audit intern, Editura Economică, Bucureşti, 2004 Dănescu T., Audit financiar – convergenţe între teorie şi practică, Editura Irecson,
Bucureşti, 2007
ADRIAN GROŞANU, PAULA RAMONA RĂCHIŞAN
76
Dănescu T., Proceduri şi tehnici de audit financiar, Editura Irecson, Bucureşti, 2007 Dobroţeanu L., Dobroţeanu C.L., Audit, concepte şi practici, Editura Economică,
Bucureşti, 2002 Isărescu M., Nouă lecţii din actuala criză financiară, Revista Audit Financiar, nr.
6/2009 Moldovanu U., Exigenţele controlului calităţii activităţii de audit financiar în contextul
actualelor reglementări europene şi naţionale (II), Revista Audit Financiar, nr. 5/2009
Oprean I., Popa I. E., Lenghel R. D., Procedurile auditului şi ale controlului financiar, Editura Risoprint, Cluj-Napoca, 2007
Camera Auditorilor Financiari din România, Revista Audit Financiar 2008-2009 Federaţia Internaţională a Contabililor, Audit financiar 2006: Standarde. Codul Etic,
Editura Irecson, Bucureşti, 2007

STUDIA UNIVERSITATIS BABEŞ-BOLYAI, NEGOTIA, LV, 3, 2010
TECHNOLOGY AUDIT - GENERAL AND PRACTICAL LINES SIMONA - CLARA BARSAN 1, MIHAELA - GEORGIA SIMA 2, ANCUTA - MARIA PUSCAS 1, AUREL - GHEORGHE SETEL 3 ABSTRACT. The present paper is a mixture between the theoretical notions regarding the procedure of technology audit (TA) and the experience the authors have gained from actually applying it on SMEs, so that the provided viewpoint shall be a realistic one. It starts with a general presentation of the technology audit process (TA), its main parts and subdivisions, emphasizing the role and importance of each single one. There are detailed descriptions of the benefits recurring from performing a TA, as well as the implication of the analyzed company in these activities. We have considered useful to resume the process into a graphic representation, showing the interconnection between all the parts of a TA, as well as their order. At the end, one has mentioned the action plan, the component of the TA that provides specific solutions for the deficiencies determined with the help of a SWOT analysis. Last but not least, extending the procedure to macro level, one has presented some of TAs general utilities and impacts, correlated with the cooperation with the local and central authorities. Keywords: SMEs, Technology Audit, SWOT, Action Plan The actual worldwide economic context forces SMEs to adopt measures to
enrich resistance to potential waves due to new arrangements of the involved actors - clients, suppliers, competitors, and the state and government institutions.
Since the SMEs are the providers for two thirds of the existing working places, in Romania there is a permanent search for solutions in order to sustain them in becoming or maintaining competitive, by intensifying the contacts between Government, social partners, National Bank and other factors (innovation and technological transfer network) that can contribute for defining a coherent politic for the field.
Competitiveness is a complex concept which, at a general level, expresses the ability of persons, companies, economies, regions to maintain competition on internal and / or especially international scale, and to get economic benefits, in
1 Research Institute for Analytical Instrumentation, Technology Transfer Center CENTI, Cluj-
Napoca, [email protected] 2 Bucharest Chamber of Commerce and Industry, Technological Transfer Center, e-mail:
[email protected] 3 University of Oradea, Technology Transfer Center, [email protected]

SIMONA-CLARA BARSAN, MIHAELA-GEORGIA SIMA, ANCUTA-MARIA PUSCAS, AUREL-GHEORGHE SETEL
78
terms of a specific business environment, resulting in constant increases in productivity and standard of living.
There are many factors that influence competitiveness, such as: material base, financial means, market information, skilled and competent staff, and creative potential of human resources and expertise level of the company. Still, when you ask a manager about his business and the influencing factors, not many seem to realize that, somehow, not mentioning or diminishing the role of innovation, they leave out the most important instrument of development for their company.
Whether we are talking about developing new products or services or identification of the most efficient already existing methods of accomplishment, innovation brings added value to an organization. In the same time, it allows to maintain or improve their market share.
Since innovation does not have the proper quotation in the life of a potential competitive company, we have decided to emphasize its importance and the way it can be evaluated and further sustained.
In the same time, we need to correlate innovation with the other factors that have strong impact on companies’ good development.
The assessment of manufacturing and service SMEs with a technology platform is accomplished through a technology audit (TA), which is in fact a method for identifying the major company requirements, needs, weaknesses and strengths on both human resources and infrastructure. At the same time, the TA is a technique, which identifies the management’s view of how the company performs as well as strong indications of what the company really needs. By accomplishing a TA, one can have a real view over the external and internal environment of the company and, simultaneously, identify the human resources relation to company’s performance. The main objective of TA is to provide a clear identification of company’s first priority needs as well as strengths and opportunities that should be taken under consideration.
The SMEs suited for performing a TA should wish to create new products, incorporate new processes, diversify their activities and be with growth potential. Moreover, the SMEs should however have the capacity and ability to survive and innovate, and also have a strong will for international cooperation.
An SME can perform a TA in order to: - generate income (or more income) for the technology driven
organizations (e.g. technology based enterprises, research centers, institutes) from their available technology;
- improve the productivity of the technological factors; - improve business competitiveness; - learn how to optimize the use of current technology; - learn about company technology options; -check the technological status against technological criteria and to issue
recommendations.

TECHNOLOGY AUDIT - GENERAL AND PRACTICAL LINES
79
The benefits for the SME are obvious. Thus, a TA will produce an action plan that, after being applied, will generally lead to improved performance of the company. At the same time, it is important to mention that performing a TA does not necessarily imply success for the company. In fact, TA is a tool simply providing a structure within which a company is more likely to improve its potential.
There are some other assessment methods, approaching in a way to the objectives of a TA, but still different in their essences. Among them, one can mention:
• The innovation management audit. In this case, the SME auditing and analysis is performed with the aim of providing action plans concerning mainly management issues (e.g. strategic planning, HR development, marketing etc.)
• The self-evaluation audit, which is a method performed in-house, providing the SME’s relevant existing mechanisms.
• The benchmarking exercise mainly consists of a thorough analysis, made on certain criteria, in order to evaluate and compare the considered SME with other leading or average companies existing in the same activity sector.
• The company visit. This is a method of getting in touch with SMEs, used mainly for identifying local RTD needs and/or offers.
Still, many of unauthorized people confuse the technology audit with the company visit. Comparing the two mentioned ones, the technology audit is far more detailed and time consuming than the company visit. In a further separate chapter, this paper will present the complex structure of a TA. Last but not least, the TA mainly aims at delivering recommendations that could benefit the client.
At the same time, a TA should not be undertaken without first completing a company visit. During the company visit, the auditor will collect the first information on the SME, pin-pointing topics for a further examination and discussion. The information related to the activities carried out in the company will show if the SME really needs a TA. As it was already mentioned, only the manufacturing and service SMEs, with a technology platform, are suitable to performing a TA. In this respect, the information collected during the company visit will give some focus to the future TA.
Structure of a Technology Audit From the beginning, one can mention that there is not a universal, fixed
structure of a TA. Still, there are some general stages, valid for each TA (Fig.1) 1. Pre-Audit phase
The starting point of the technology audit process is the desire of a SME to carry out a TA. In this respect, the SME manager contacts an authorized company/ person for performing TAs. At this stage, after signing an agreement, the auditors designed for performing the TA start their preparatory work, gathering information
SIMONA-CLARA BARSAN, MIHAELA-GEORGIA SIMA, ANCUTA-MARIA PUSCAS, AUREL-GHEORGHE SETEL
80
about the SME taken from its official website, published and unpublished reports. Then, the auditors make a company visit, in order to have primary discussions with the manager or different representatives of its boarding staff and to explain and agree on the purpose of the audit and to select the employees to be interviewed. On the basis of this company visit, the auditors will assess the opportunity of making a TA at the involved SME – the pre-audit assessment.
2. The Technology Audit Tool
The TA itself consists of two parts: the questionnaire and the TA report. In this stage, the SME (its representatives that take part in TA) is being
interviewed on the basis of a questionnaire, made by the audit company. The information gathered along the questionnaire will help the auditors to prepare the TA report.
The questionnaire generally comprises the following sections: 2.1. Organisation chart and human resources For identifying the decision makers, the auditors ask questions about the
organizational structure of the SME, viewing in this sense its organigramme. Concerning the human resources, the asked questions focus on: a) the staff number and its trend throughout the last years, for emphasizing
the growth potential and investment in human capital (e.g. material and non-material compensations for excellence);
b) its distribution to the various (technology related) departments/ compartments. The auditors will check if the SME has a separate R&D department, relevant for the innovative character of the company;
c) expertise and education. The questions should here refer to the number of superior degree employees in the activity field of the SME, the personnel structure on age levels and their expertise in the professional field. The information referring to the preoccupations of the company for improving the professional level of its employees, mainly through external or internal trainings and, at the same time, how each employee understands to enhance his/her professional knowledge.
2.2. Products and markets The TA questionnaire should contain relevant questions concerning the
developed products or product series and their share in the company’s turnover, in order to examine the new product development capacity and flexibility of the audited SME.
The distribution chain, especially major clients and suppliers represent another issue that should be considered in the TA questionnaire, for assessing the vulnerability, flexibility and extroversion on the market of the company. Information concerning SMEs with similar activities existing in the region could be useful for drawing a map representing the market position/share and competitors of the company.
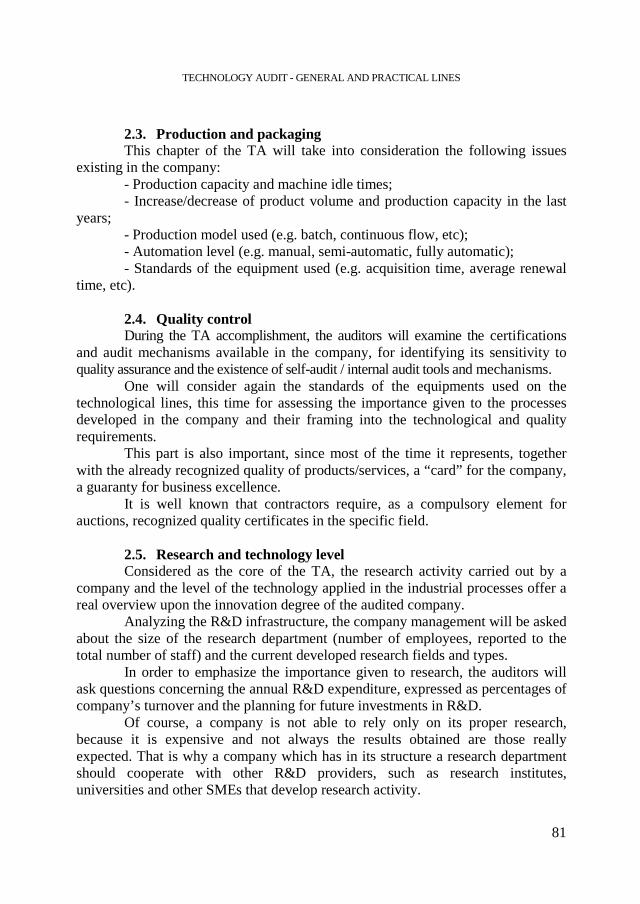
TECHNOLOGY AUDIT - GENERAL AND PRACTICAL LINES
81
2.3. Production and packaging This chapter of the TA will take into consideration the following issues
existing in the company: - Production capacity and machine idle times; - Increase/decrease of product volume and production capacity in the last
years; - Production model used (e.g. batch, continuous flow, etc); - Automation level (e.g. manual, semi-automatic, fully automatic); - Standards of the equipment used (e.g. acquisition time, average renewal
time, etc). 2.4. Quality control During the TA accomplishment, the auditors will examine the certifications
and audit mechanisms available in the company, for identifying its sensitivity to quality assurance and the existence of self-audit / internal audit tools and mechanisms.
One will consider again the standards of the equipments used on the technological lines, this time for assessing the importance given to the processes developed in the company and their framing into the technological and quality requirements.
This part is also important, since most of the time it represents, together with the already recognized quality of products/services, a “card” for the company, a guaranty for business excellence.
It is well known that contractors require, as a compulsory element for auctions, recognized quality certificates in the specific field.
2.5. Research and technology level Considered as the core of the TA, the research activity carried out by a
company and the level of the technology applied in the industrial processes offer a real overview upon the innovation degree of the audited company.
Analyzing the R&D infrastructure, the company management will be asked about the size of the research department (number of employees, reported to the total number of staff) and the current developed research fields and types.
In order to emphasize the importance given to research, the auditors will ask questions concerning the annual R&D expenditure, expressed as percentages of company’s turnover and the planning for future investments in R&D.
Of course, a company is not able to rely only on its proper research, because it is expensive and not always the results obtained are those really expected. That is why a company which has in its structure a research department should cooperate with other R&D providers, such as research institutes, universities and other SMEs that develop research activity.
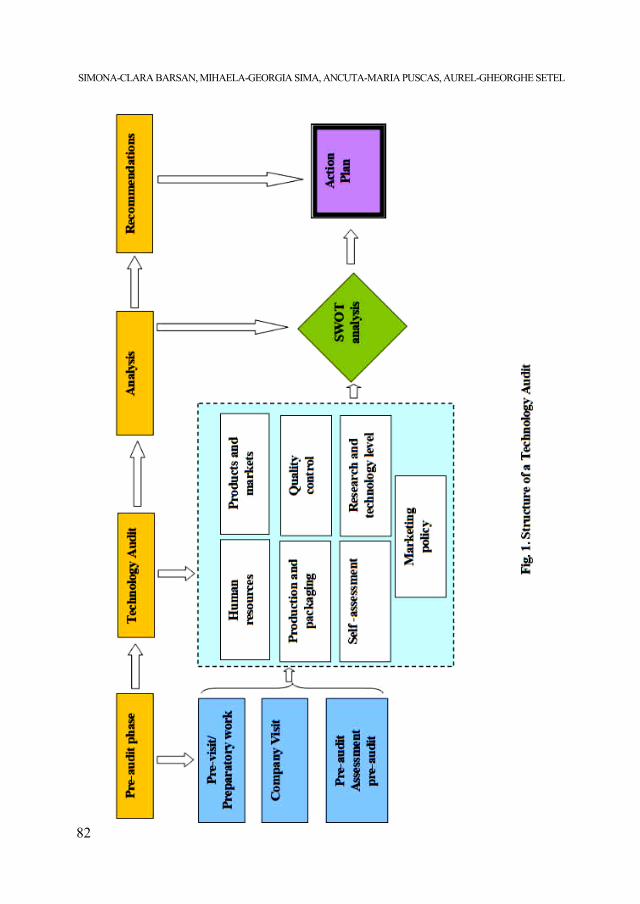
SIMONA-CLARA BARSAN, MIHAELA-GEORGIA SIMA, ANCUTA-MARIA PUSCAS, AUREL-GHEORGHE SETEL
82

TECHNOLOGY AUDIT - GENERAL AND PRACTICAL LINES
83
Through various national and international programs, the Romanian SMEs are encouraged to participate in R&D projects, for acquiring latest professional knowledge, increasing their potential for new products and services or solving their technological problems. In this sense, information concerning the participation of the audited company in R&D projects will be helpful.
The audited technology based company has a technology portfolio, which includes innovative technologies and know-how, developed by the research department of the company.
It is very important if they are protected, using Intellectual Property Rights such as patents or trademarks (for the developed products).
One will also consider if the company has the appropriate means for transferring own technologies / technological know-how to other SMEs or for importing technologies from other entities, for covering the company’s technological needs. If the answer is positive and the company has already developed technology transfers, the auditors will discuss with the company representatives about the difficulties encountered during the transfer processes.
2.6. Marketing policy The marketing policy reflects the view of the company concerning the
evolution of its activity, its guiding options, principles and norms, as well its actions for enhancing its potential, according to the market requirements. It can be expressed through a unitary and coherent ensemble of strategies, tactics and specific action programs, which ensure both its vision for a certain period of time and the transposition into practice of its defining orientations, options and elements.
The marketing policy is a must for each company willing to promptly and realistically receive the market signals and to rapidly adapt to the changes appeared on the market. Thus, the company is able to correctly assess the market parameters and to allocate its resources according to the real requirements and, at the same time, to recourse the uncovered market segments and its advantages towards its competitors.
Through his ability, the manager of the company selects a restrained number of limited strategic possibilities, which can be delimited as function of the two dimensions of the vectorial matrix of developments, elaborated by Igor Ansoff:
- mission or markets (public or request); - technology or product (companies or offers). This bi-dimensional model has in view the present (actuality) and the
novelty, which lead to 4 competitive alternatives or basic possibilities: 1. market penetration can be achieved only if encourages the clients to
consume more or it will attract its potential or other’s clients, due to the offered advantages, such as: price, availability, post-sale services etc.;
2. product development as function of the clients’ preferences;

SIMONA-CLARA BARSAN, MIHAELA-GEORGIA SIMA, ANCUTA-MARIA PUSCAS, AUREL-GHEORGHE SETEL
84
3. market development in the conditions in which it maintains the same technologies, will attract new clients by penetrating new spatial markets and discovering new utilities for the existing product;
4. diversification which resembles the bypass or innovation strategy, a high risk option.
The merit of Ansoff’s matrix is to present, in a simple way, a complex process, which offers the possibility to formulate strategies, starting from the essential elements (Fig. 2).
Product \ Mission Present (actuality) Novelty
Present (actuality) Market penetration Product development Novelty Market development Diversification
Fig 2. Vectorial matrix of development (Ansoff, 1968)
Nevertheless, in choosing a very efficient strategy variant, the manager
should consider the difficulties determined by: change rhythm, processual tackling, market maturity, clients’ technical knowledge and power, enterprise internationalization etc. and adopt a sliding strategy system in order to properly align to every single request/change of the market. This is a very useful technique that allows the company to limit the assumed or unknown risks towards the economic market process.
The auditors will take into consideration the sales and marketing procedures of the company, such as:
● Sales: - Type: direct, through commissioners or on-line sales type; - Policy: bonuses, discounts, raffles. ● Publicity: for the company or for a specific product: - Own website; - Fliers and brochures presenting the products / services / technologies
of the company; - New products launching events; - Advertising in newspapers and business magazines, radio or any other
media channel; - Participation with own stand in regional / national / international fairs; - Promotion of the technology portfolio in conferences and brokerage events; - Awareness campaigns for the activity field.
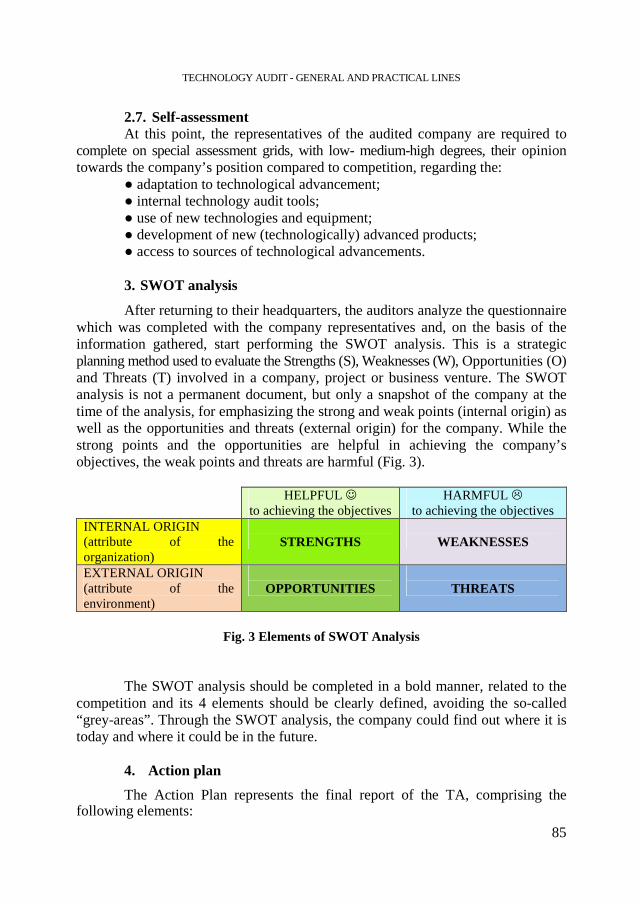
TECHNOLOGY AUDIT - GENERAL AND PRACTICAL LINES
85
2.7. Self-assessment At this point, the representatives of the audited company are required to
complete on special assessment grids, with low- medium-high degrees, their opinion towards the company’s position compared to competition, regarding the:
● adaptation to technological advancement; ● internal technology audit tools; ● use of new technologies and equipment; ● development of new (technologically) advanced products; ● access to sources of technological advancements. 3. SWOT analysis
After returning to their headquarters, the auditors analyze the questionnaire which was completed with the company representatives and, on the basis of the information gathered, start performing the SWOT analysis. This is a strategic planning method used to evaluate the Strengths (S), Weaknesses (W), Opportunities (O) and Threats (T) involved in a company, project or business venture. The SWOT analysis is not a permanent document, but only a snapshot of the company at the time of the analysis, for emphasizing the strong and weak points (internal origin) as well as the opportunities and threats (external origin) for the company. While the strong points and the opportunities are helpful in achieving the company’s objectives, the weak points and threats are harmful (Fig. 3).
HELPFUL ☺
to achieving the objectives HARMFUL �
to achieving the objectives INTERNAL ORIGIN (attribute of the organization)
STRENGTHS
WEAKNESSES
EXTERNAL ORIGIN (attribute of the environment)
OPPORTUNITIES
THREATS
Fig. 3 Elements of SWOT Analysis
The SWOT analysis should be completed in a bold manner, related to the
competition and its 4 elements should be clearly defined, avoiding the so-called “grey-areas”. Through the SWOT analysis, the company could find out where it is today and where it could be in the future.
4. Action plan
The Action Plan represents the final report of the TA, comprising the following elements:
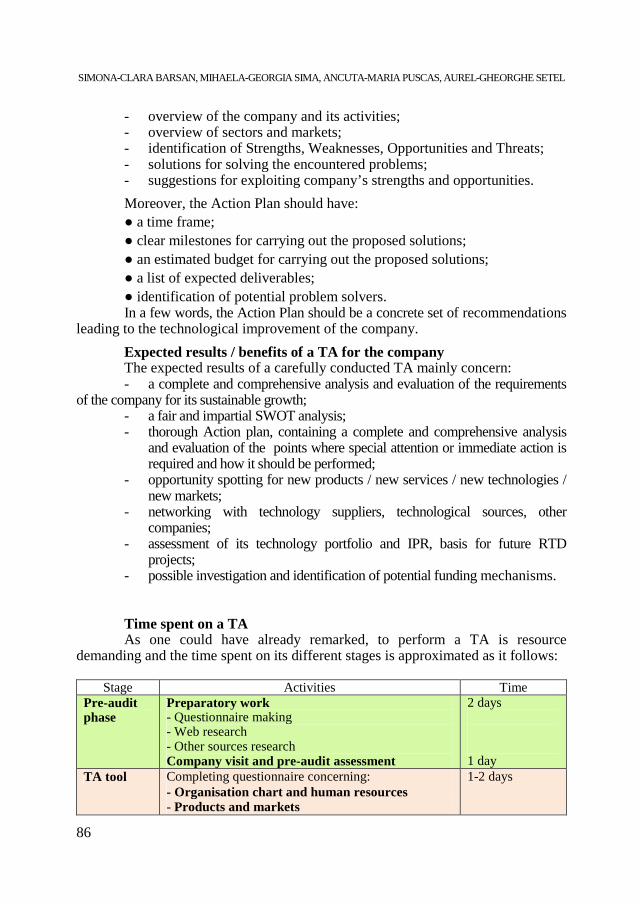
SIMONA-CLARA BARSAN, MIHAELA-GEORGIA SIMA, ANCUTA-MARIA PUSCAS, AUREL-GHEORGHE SETEL
86
- overview of the company and its activities; - overview of sectors and markets; - identification of Strengths, Weaknesses, Opportunities and Threats; - solutions for solving the encountered problems; - suggestions for exploiting company’s strengths and opportunities.
Moreover, the Action Plan should have: ● a time frame; ● clear milestones for carrying out the proposed solutions; ● an estimated budget for carrying out the proposed solutions; ● a list of expected deliverables; ● identification of potential problem solvers. In a few words, the Action Plan should be a concrete set of recommendations
leading to the technological improvement of the company.
Expected results / benefits of a TA for the company The expected results of a carefully conducted TA mainly concern: - a complete and comprehensive analysis and evaluation of the requirements
of the company for its sustainable growth; - a fair and impartial SWOT analysis; - thorough Action plan, containing a complete and comprehensive analysis
and evaluation of the points where special attention or immediate action is required and how it should be performed;
- opportunity spotting for new products / new services / new technologies / new markets;
- networking with technology suppliers, technological sources, other companies;
- assessment of its technology portfolio and IPR, basis for future RTD projects;
- possible investigation and identification of potential funding mechanisms. Time spent on a TA As one could have already remarked, to perform a TA is resource
demanding and the time spent on its different stages is approximated as it follows:
Stage Activities Time Pre-audit phase
Preparatory work - Questionnaire making - Web research - Other sources research Company visit and pre-audit assessment
2 days 1 day
TA tool Completing questionnaire concerning: - Organisation chart and human resources - Products and markets
1-2 days

TECHNOLOGY AUDIT - GENERAL AND PRACTICAL LINES
87
Stage Activities Time - Production and packaging - Quality control - Research and technology level - Marketing policy - Self-assessment
SWOT analysis
Identification the strengths, weaknesses, opportunities and threats for the company
1-2 days
Action plan - - Overview of the company and its activities; - - Overview of sectors and markets; - - Identification of Strengths, Weaknesses, Opportunities and Threats; - - Solutions for solving the encountered problems; - Suggestions for exploiting company’s Strengths and Opportunities
2-3 days
TOTAL TIME SPENT ON TA 7-10 days Conclusions
The Technology Audit is a tool for evaluating technological status and capacity, procedures and processes applied and technological needs of a company. It requires much more detail and effort than a company visit and definitely an active engagement from the company.
The TA has four different stages, each of them with its specific importance. If any is not properly approached, the process of TA itself will be compromised.
The SWOT analysis resulting from the Technology Audit aims at creating an accurate picture of the present moment for the company, emphasizing the weaker parts, that need to be corrected, and the strong ones, that give the company the possibility to boost.
The Action Plan starts from SWOT and provides the SME, within a schedule, the necessary managerial and technical advise, in order to improve its technological level and evolve in such a way that would at least maintain its present market share if not rise it.
Extended to the level of a certain domain or region, TA is useful to establish a specific general problem. If the entitled authorities would eventually take into serious consideration these reports, at least few of the necessary solutions shall be provided, leading to economic regeneration.
SIMONA-CLARA BARSAN, MIHAELA-GEORGIA SIMA, ANCUTA-MARIA PUSCAS, AUREL-GHEORGHE SETEL
88
BIBLIOGRAPHY
Ansoff, Igor , Strategia corporatistă Penguin Books 1968, p. 99 Bărsan, S.C., Sima, M.G., 2008, Inovarea şi transferul tehnologic-instrumente de
aliniere a IMM-urilor la cerinţele economiei de piaţă, Seminar “Interferenţe economico-sociale la frontiera inovării” – editia 1;
Brown, David, Getting the Best from Innovation Management Techniques, Centre for Small and Medium Enterprises, Warwick Business School, University of Warwick, United Kingdom, 1997
Brown, David, Innovation Management Tools: A review of selected methodologies, European Commission, 1997
Gardiner, Paul and Rothwell, Roy, Innovation: A study of the problems and benefits of product Innovation, The Design Council, 1985
Naum N., Bala G., Năstase G., Centre de Inovare şi Afaceri, În: Revista de Inventică şi Economie, nr.23, 1998.
Nicolescu, O. Verboncu, I. 1999, Management, Editura Economica, Bucureşti; Sima, M.G., 2009, Role of Technology Transfer Center in the promotion, protection
and capitalization of industrial property; the impact on competitiveness of Romanian SMEs, rev. Hidraulica, nr.3, pag.21-25;
STUDIA UNIVERSITATIS BABEŞ-BOLYAI, NEGOTIA, LV, 3, 2010
INSURANCE CONSUMER PROTECTION IN ROMANIA
MARIUS DAN GAVRILETEA 1
ABSTRACT. A very active sector in recent years (2002-2008) fot Romania is the insurance industry. Both individuals and companies need protection that should become more accurate. Given these aspects, sustained by a steady growth of the insurance market, in Romania the issue of protection of policyholders - as consumers of services (insurance) appeared. Inside this paper we will focus on the regulatory body which supervise the insurance business in Romania and the insurance contract – the main factor for triggering complaints. Having access to various statistics between 2002 and 2008, we provide an analysis of complaints relating to insurance; the analysis is split by classes, causes at the origin of complaints and the modality of their finalization. There will be presented case studies under the criterion of confidence and the conclusions reached are useful for both insurance companies (to improve the quality of the services) and policyholders (awareness of their rights as consumers of insurance). Keywords: consumer protection, insurance, insurance contract, complaint. Introduction
A very active sector in recent years for Romania is the insurance industry. In addition to the known American phrase that the only certitudes in life are "death and taxes", we have to add also the certitude of insurance fees.
Because of the low level of importance of insurance for an individual that start own career, once with the time passing and advance to higher levels of the Maslow's Pyramid, the need for protection inevitably becomes more urgent. Similarly there are also companies that along with their development are exposed to a wider variety of risks.
Given these issues, sustained by a steady growth of the insurance market in Romania, the protection of policyholders - as consumers of services (insurance) grew in importance.
1 Associate Professor PhD, Faculty of Business, Babes-Bolyai University, email:

MARIUS DAN GAVRILETEA
90
1. Consumer protection in insurance
In Romania, the regulatory body empowered to protect insurance consumers (policyholders - insurance customers after signing a facultative or a mandatory insurance) is the Insurance Supervisory Commission (referred to as ISC).
Under the Romanian law - the Insurance Supervisory Commission was established as an autonom administrative authority, with legal personality. ISC has its headquarter in Bucharest and operates through branches in several other Romanian cities: Cluj Napoca, Iasi, Constanta, and Timisoara. According to this law and subsequent amendments, the tasks of ISC are established and regarding the insurance consumer protection ISC has the supervising position for the insurers' financial situation. In order to achieve this task ISC controls continuously the activity of insurers and insurance brokers.
In insurance field, consumer protection is neccessary and justified at the moment of a loss occurrence to property, person or liability insured. Consumer protection is reflected in how the compensation of damage incurred is carried out (or settled):
- The modality of compensation calculation; - The odality of dealing with the clients by insurance company
employees; - The quality of repairs carried out Similar, the protection of policyholders is also reflected by the maintenance
of an acceptable level of insurers’ solvency, based on the regulation – insurers that must pay the future compensations using the currently received insurance premiums.
In order to register a complaint in insurance industry, there must be two steps that preceded it:
- The existence of the insurance contract - The occurence of an insured or uninsured risk The first condition is the one that generates the requirement of compensation
therefore it is needed a careful analysis of the insurance contract. The insurance contract is valid under the conditions specified in Civil Code - a contract become valid if all the following 4 conditions are simultaneously fulfilled:
- All parties should have the capacity to contract - The consent given by the parties should be valid - There must be a specific or determinable object of the insurance
contract - The clauses of the contract should be auctioned
The insurance contract is signed between two parties – the insurance company (insurer) and the insured person (policyholder); there can appear an
INSURANCE CONSUMER PROTECTION IN ROMANIA
91
intermediary either an insurance agent or an insurance borker. The insurance contract must be in writing form and must include:
a) the name, adresses of the contracting parties; b) the object of insurance: property, people or civil liability; c) the insured risks and exclusions; d) the starting and ending time of liability of the insurer; e) the insurance premiums; f) the insured amount.
Name and address of the individual, or company name and its location are important for insurers, since it must carry the official correspondence (instalments announcement, the date when contract expires, the appearence of new insurance products, initiation of any civil actions) and at the moment of the complaint.
The object of insurance must be clearly identified (so that no unwanted situations should appear at the time when damages occurr), as follow:
- in the case of property insurance there is specified the type of the insured object (for example, car identification number, or manufacturing serial code)
- in the case of persons insurance there is mentioned the personal identification number of policyholders
- in the case of liability insurance is mentioned exactly the type of exposed liability, according to the specific activity
The category „insured risks” is important because it clearly specifies the type of risk to be compensated. They must be carefully described in order to leave no ways for interpretation. Furthermore to strengthen their capacity to cover any damage, the insurers mentioned in the contract the uninsured risks inside the ‘chapter exclusions’. Insured risks should be carefully studied by potential policyholders to see if they cover their own needs.
The policy of insured risks vary from an insurer to another, some risks that are covered by an insurer, may be insured by another only on the basis of special clauses. Risks insured under special clauses are included in insurance contract through annexes to the insurance policy and by paying an additional premium.
Insurance policy (insurance contract) may be issued only if the relevant norms of the insurer are fulfilled following a methodology that specifies the conditions under a property or a person may be accepted to be insured.
In most cases, insurers require to potential policyholders to complete a questionnaire in order to identify their risk exposure. After completing the questionnaire, following the methodology of insurers, the insurance agents / brokers will make the bidding. If the customer accepts the insurance premium, depending on the class of insurance there will be an inspection of the risks described in the questionnaire:
MARIUS DAN GAVRILETEA
92
- in case of property insurance there is neccessary the inspection of risk for goods which are intended to be insured (depending on the requirements of insurers there must be done photos of the insured property)
- in case of person insurance (life insurance, private health insurance, workers compensations) there might be required to conduct a series of medical tests.
If the situation described by the potential insured in the questionnaire does not corespond with the reality, a new insurance premium will be calculated (based on the new level of exposure) or a refuse to underwrite the insurance contract will be issued.
If the situation described is according to the questionnaire, the insurance policy will be issued; the questionnaire and the risk inspection will become an integral part of the insurance policy. To every insurance contract, the insurers can add special clauses to extend certain risks. By signing these by the insured, the terms are part of the insurance contract. Insurance supplements have the similar treatment as special clauses. The insurance supplement is an official document issued by the insurer at the request of the insured, that bring changes to the original insurance policy (address changing, the increase of sum insured for properties or vehicles by adding additional equipments etc). Once the supplemets were issuaed and signed by the insured and insurer, any insurance supplement becomes part of the insurance contract. All these terms should be carefully verified because at the moment of a loss occurence all the above mentions represent evidence for paying or refusing the compensation.
Unfortunately, for many policyholders an insurance contract is only the colored part of the policy where amount insured and the insurance premium are specified. The most significant contractual relationship - rights and obligations - are printed on the back of the policy and usually remain unread by the insured when the insurance policies are signed and sealed.
2. Research Methodology
The research methodology used for this paper rely on the insurance literature from USA, Great Britain and România, the statistic bulletins of Insurance Supervising Commission of Romania, and facts published by National Association of Insurance Commissioners USA, and also by individual studies inside three Romanian insurance companies.
The purpose of this paper is the analysis of the insurance complaints (by types of causes) and the given solution.
The objectives followed in the present research were: - The acknowledge to the insured persons the existence of an institution
that represents theirs’ rights;
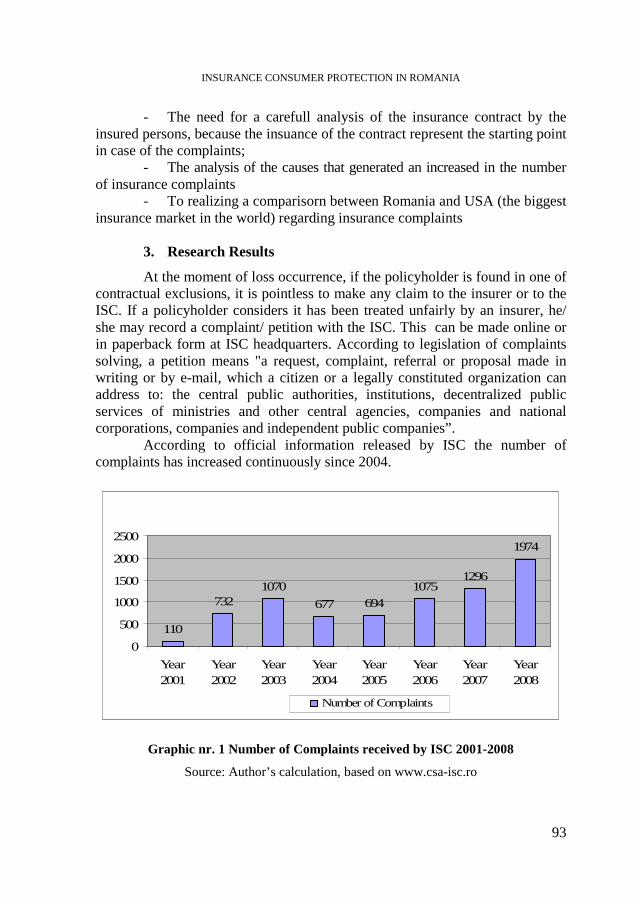
INSURANCE CONSUMER PROTECTION IN ROMANIA
93
- The need for a carefull analysis of the insurance contract by the insured persons, because the insuance of the contract represent the starting point in case of the complaints;
- The analysis of the causes that generated an increased in the number of insurance complaints
- To realizing a comparisorn between Romania and USA (the biggest insurance market in the world) regarding insurance complaints
3. Research Results
At the moment of loss occurrence, if the policyholder is found in one of contractual exclusions, it is pointless to make any claim to the insurer or to the ISC. If a policyholder considers it has been treated unfairly by an insurer, he/ she may record a complaint/ petition with the ISC. This can be made online or in paperback form at ISC headquarters. According to legislation of complaints solving, a petition means "a request, complaint, referral or proposal made in writing or by e-mail, which a citizen or a legally constituted organization can address to: the central public authorities, institutions, decentralized public services of ministries and other central agencies, companies and national corporations, companies and independent public companies”.
According to official information released by ISC the number of complaints has increased continuously since 2004.
110
7321070
677 6941075
1296
1974
0
500
1000
1500
2000
2500
Year2001
Year2002
Year2003
Year2004
Year2005
Year2006
Year2007
Year2008
Number of Complaints
Graphic nr. 1 Number of Complaints received by ISC 2001-2008
Source: Author’s calculation, based on www.csa-isc.ro

MARIUS DAN GAVRILETEA
94
It can be seen from the chart above that since 2002, when an important increase in complaints number has been recorded, the insured persons became increasingly aware of their rights.
The number of complaints addressed to ISC can be found in all classes of insurance, but most important are those connected with:
- Life insurance - claims relating to the modality of compensation calculation for death, survival, insurance with investment component
- Insurance for accident, illness - complaints related to the way of calculation of the compensation paid by the insured in case of accidents. In addition, due to the rising number of Romanian citizens traveling abroad, there is an increase in the number of claims on damages from travel insurance
- Motors and Green Card Insurance - complaints relating to payment refusal/ or delayed payment for claims, poor communication between the insured and the insurance company, the level of the compensations, quality of work in the specialised car repairshops.
All these claims are generated by incorrect practices and may occur also due to the lack of ethics among insurer staff: distortion of facts and contractual provisions, providing the compensation to a lower level than appropriate values, lack of prompt answer to policyholders’ requests.
According to ISC, the majority of the complaints relating to insurance in 2008 in Romania - 71.63% - was due to non-payment of damages/ compensation and the delay in payment.
We offer in the following part (because of privacy we will not use the name of the insured / insurer) an example of actual late payment of a modest sum by the insurer to its customer. The insured person for Motors and Green Card policies to the insurer were to make a trip to Greece via the area of Serbia. At the issuing time of the policy Green Card, Serbia figured crossed in the official document of the Green Card. According to its methodology insurer was entitled to charge 1 USD, for issuing a complementry Green Card with the not crossed box for Serbia, for the period of travelling/crossing that country. Insured received the Green Card but this form was one out of date - Serbia and Montenegro were listed together in one box. Because of political changes the two countries were separated, therefore this change has occurred in terms of security by introducing two individual boxes in the form of Green Card. At the time of entry into the Customs Office in Serbia - July 2009, the insured submitted the purchased form Green Card, and because the fact that Serbia does not appear individually in the box, the insured was refused to entry in the territory of Serbia.
To address this impediment insured sought a representative of the insurer in the Moraviţa representation of which is closed because it was Saturday. The reasons for which the policyholder will need a Green Card insurance from the same insurer were simple:
- Free extension of motor insurance outside Romania by paying a Green Card to the same insurer
- Preferential price of 1 USD

INSURANCE CONSUMER PROTECTION IN ROMANIA
95
Because the insured was unable to complete a Green Card on the same insurer, was forced to buy one new insurance Green Card for the minimum period of 6 months to another insurer that had a working point in customs and take new form Green Card for an insurance premium of 550 lei.
At the moment of returning to the country insured notified the personal insurer about inconvenience occurred, requiring compensation amount of 550 lei overpaid due to negligence insurer. The insured has not received any official response from the insurer within 60 days from the date of application, being forced in this case to make an online complaint by ISC. There was analyzed file complaint based on documentary evidential and ISC ordered the insurer reimbursement amount of 550 lei-paid by the insured due to negligence insurer. However the reason for defiance of the customer continues after ISC decission, the insurance company has delayed the settlement of that amount by an additional 30 days.
By this example we want to present how some insurers avoid responding in writing to requests its policyholders, this leading to dissatisfaction of the policyholders, which will lead to a negative image by bad advertising of this the case by the insured in his influence areas.
The number of complaints recorded in these classes are presented in the table below, in the brackets there can be noticed theirs’ share in the total complaints recorded in that year.
Tabel nr. 1
Complaints Evolution by Insurance Classes
Year 2003 2004 2005 2006 2007 2008 Complaints 1070 677 694 1075 1296 1974 Insurance
Class
- life 21
(2%) 25
(3.7%) 36
(5.2%) 88
(8.65%) 120
(9.25%) 102
(5.17%) - accidents,
illness 23
(2.1%) 32
(4.7%) 29
(4.2%) 35
(3.44%) 38
(2.93%) 51
(2.59%)
- motors 208
(19.4%) 156
(23.1%) 175
(25.2%) 282
(27.73%) 285
(21.99%) 559
(28.32%) - vehicle third
party 715
(66.8%) 386
(57.0%) 423
(60.9%) 496
(46.13%) 737
(56.86%) 1076
(54.51%)
Source: Author’s calculation, based on www.csa-isc.ro Because of all complaints recorded most concern car insurance, about 83%
in 2008, we had review complaints related policies Green Card and Motors policies.
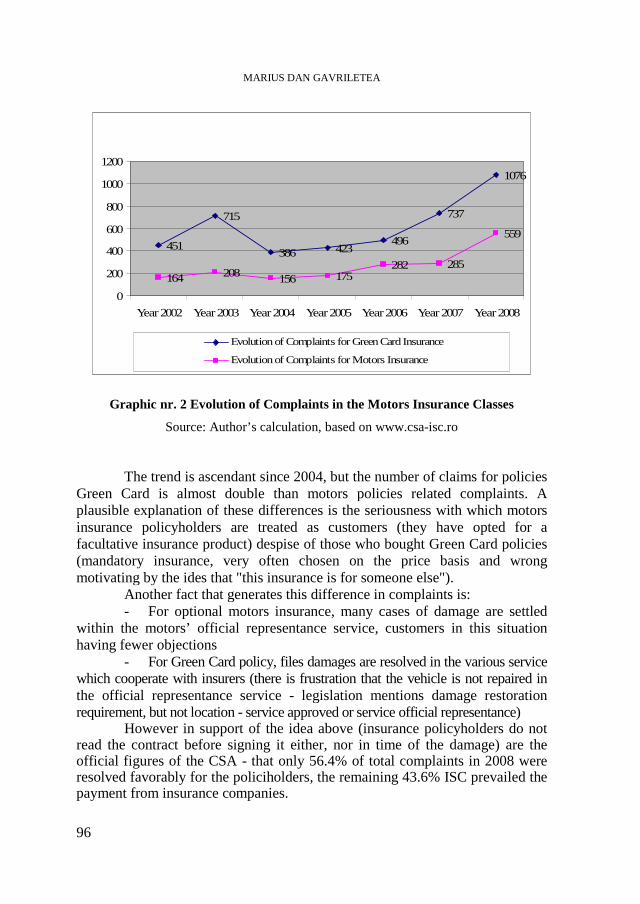
MARIUS DAN GAVRILETEA
96
451
715
386 423496
737
1076
164 208 156 175282 285
559
0
200
400
600
800
1000
1200
Year 2002 Year 2003 Year 2004 Year 2005 Year 2006 Year 2007 Year 2008
Evolution of Complaints for Green Card Insurance
Evolution of Complaints for Motors Insurance
Graphic nr. 2 Evolution of Complaints in the Motors Insurance Classes
Source: Author’s calculation, based on www.csa-isc.ro The trend is ascendant since 2004, but the number of claims for policies
Green Card is almost double than motors policies related complaints. A plausible explanation of these differences is the seriousness with which motors insurance policyholders are treated as customers (they have opted for a facultative insurance product) despise of those who bought Green Card policies (mandatory insurance, very often chosen on the price basis and wrong motivating by the ides that "this insurance is for someone else").
Another fact that generates this difference in complaints is: - For optional motors insurance, many cases of damage are settled
within the motors’ official representance service, customers in this situation having fewer objections
- For Green Card policy, files damages are resolved in the various service which cooperate with insurers (there is frustration that the vehicle is not repaired in the official representance service - legislation mentions damage restoration requirement, but not location - service approved or service official representance)
However in support of the idea above (insurance policyholders do not read the contract before signing it either, nor in time of the damage) are the official figures of the CSA - that only 56.4% of total complaints in 2008 were resolved favorably for the policiholders, the remaining 43.6% ISC prevailed the payment from insurance companies.

INSURANCE CONSUMER PROTECTION IN ROMANIA
97
56%
36%
59% 57%
0%
10%
20%
30%
40%
50%
60%
70%
Total Complanits Life Motors Green Card
Total Complanits Life Motors Green Card
Graphic nr. 3 The Percentage of Solution for Insurance Complaints in 2008
Source: Author’s calculation, based on www.csa-isc.ro
Thus in 2008, from the toal number of complaints to the CSA, only
56% - 1,974 were favorable to policyholders. If we extend the analysis to the main insurance classes, we see in the chart above that percentage is similar to the one for of motors’ insurance. We can thus appreciate that an average between 40-50% of the policyholders did not know their rights and obligations and are doing pointless these complaints.
The number of insurance contracts is increasing from 2005 to 2008, but increasing number of complaints is much higher in percentage:
Tabel nr.2
The Evolution of Complaints’ Frecquncy
Year Total Complaint Insurance Policies Complaints’ Frecquncy 2005 694 11,629,827 0.00596% 2006 1,075 14,008,597 0.00767% 2007 1,296 14,987,145 0.00864% 2008 1,974 14,816,116 0.01334%
Source: Author’s calculation, based on www.csa-isc.ro From the above table we notice an increasing of the complaints’ frequency
between 2005-2008, this fact represents a negative aspect for insurance companies. If we deepen our analysis to records of loss files for classes Green Card,
the number of complaints is not very high compared to the insurance market in Romania, fact proved by the following table.
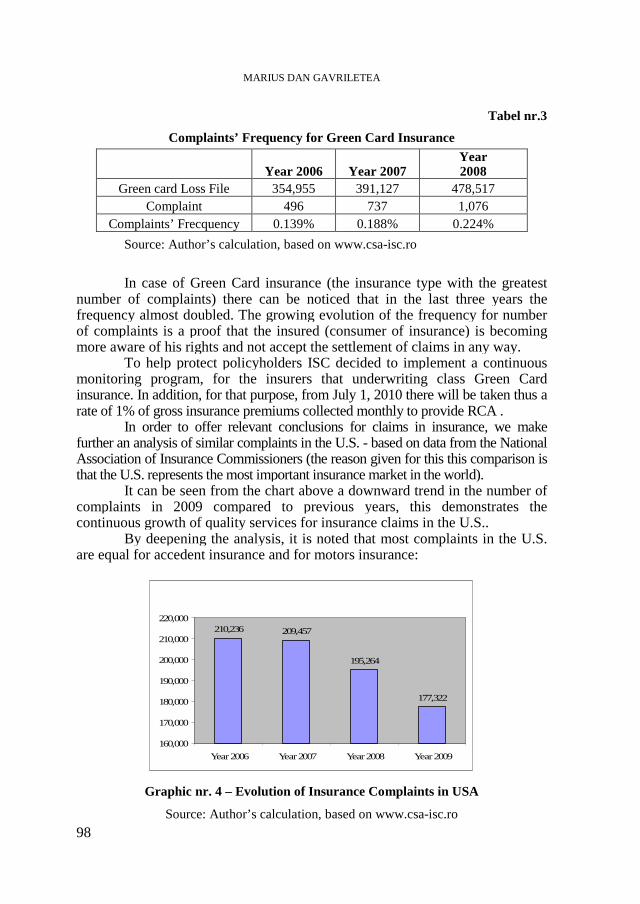
MARIUS DAN GAVRILETEA
98
Tabel nr.3
Complaints’ Frequency for Green Card Insurance
Year 2006 Year 2007 Year 2008
Green card Loss File 354,955 391,127 478,517 Complaint 496 737 1,076
Complaints’ Frecquency 0.139% 0.188% 0.224%
Source: Author’s calculation, based on www.csa-isc.ro
In case of Green Card insurance (the insurance type with the greatest number of complaints) there can be noticed that in the last three years the frequency almost doubled. The growing evolution of the frequency for number of complaints is a proof that the insured (consumer of insurance) is becoming more aware of his rights and not accept the settlement of claims in any way.
To help protect policyholders ISC decided to implement a continuous monitoring program, for the insurers that underwriting class Green Card insurance. In addition, for that purpose, from July 1, 2010 there will be taken thus a rate of 1% of gross insurance premiums collected monthly to provide RCA .
In order to offer relevant conclusions for claims in insurance, we make further an analysis of similar complaints in the U.S. - based on data from the National Association of Insurance Commissioners (the reason given for this this comparison is that the U.S. represents the most important insurance market in the world).
It can be seen from the chart above a downward trend in the number of complaints in 2009 compared to previous years, this demonstrates the continuous growth of quality services for insurance claims in the U.S..
By deepening the analysis, it is noted that most complaints in the U.S. are equal for accedent insurance and for motors insurance:
210,236 209,457
195,264
177,322
160,000
170,000
180,000
190,000
200,000
210,000
220,000
Year 2006 Year 2007 Year 2008 Year 2009
Graphic nr. 4 – Evolution of Insurance Complaints in USA
Source: Author’s calculation, based on www.csa-isc.ro
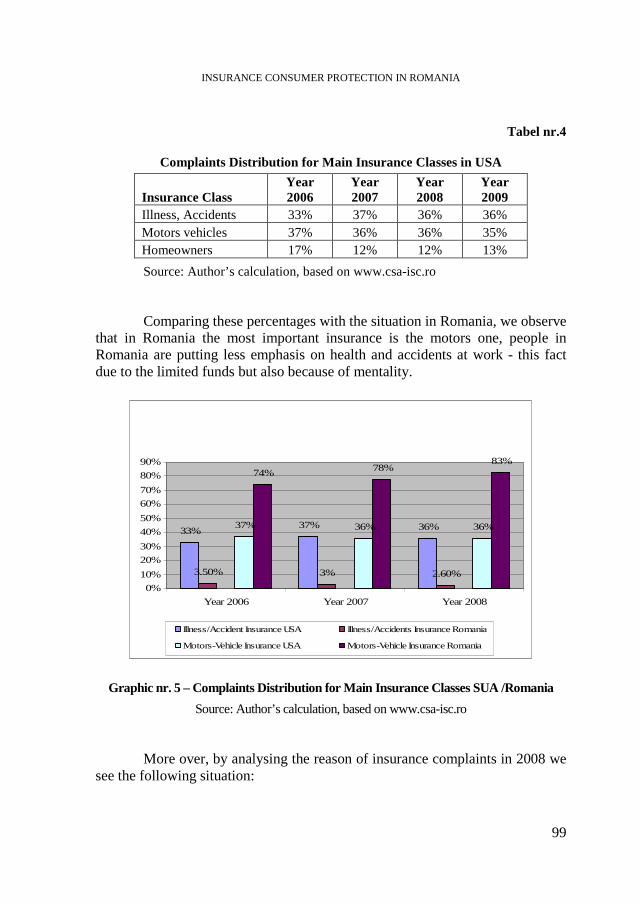
INSURANCE CONSUMER PROTECTION IN ROMANIA
99
Tabel nr.4
Complaints Distribution for Main Insurance Classes in USA
Insurance Class Year 2006
Year 2007
Year 2008
Year 2009
Illness, Accidents 33% 37% 36% 36% Motors vehicles 37% 36% 36% 35% Homeowners 17% 12% 12% 13%
Source: Author’s calculation, based on www.csa-isc.ro Comparing these percentages with the situation in Romania, we observe
that in Romania the most important insurance is the motors one, people in Romania are putting less emphasis on health and accidents at work - this fact due to the limited funds but also because of mentality.
33%37% 36%
3.50% 3% 2.60%
37% 36% 36%
74% 78%83%
0%
10%
20%
30%
40%
50%
60%
70%
80%
90%
Year 2006 Year 2007 Year 2008
Illness/Accident Insurance USA Illness/Accidents Insurance Romania
Motors-Vehicle Insurance USA Motors-Vehicle Insurance Romania
Graphic nr. 5 – Complaints Distribution for Main In surance Classes SUA /Romania
Source: Author’s calculation, based on www.csa-isc.ro More over, by analysing the reason of insurance complaints in 2008 we
see the following situation:
MARIUS DAN GAVRILETEA
100
Conclusion
For an evolving insurance market such as that of Romania, research results are of real use. It shows that policyholders are becoming increasingly aware of the importance / quality of compensation offered by insurers, but also of their rights regarding the timeliness of these services. Also, policyholders should be aware that ISC is an entity that protect and help theam in delicate situations in the insurance market and who they can call with confidence.
The most unpleasant part for policyholders is that many of them are unaware of CSA, that entity should have to do some advertise in media, in order to meet also this objective for which it was founded (as consumers policyholders protection insurance ).
Figures, graphs and tables presented throughout the paper is a warning signal to insurance companies in Romania, they must be aware that the number of complaints directed against them is a short-term threat that will inevitably lead to a decrease in the rate of market share and turnovers.
The insurance companies that will improve the handling of complaints / the quality of communication with policyholders / claims management, will be the successfull ones in financial and economic crisis - by efficient settlement of a loss file, the policyholder is maintained in the future, and will further benefit for free advertisement from it. It becomes true also in the insurance industry the assertion that a satisfied customer will return again.
REFERENCES
Badea Dumitru – Manualul Agentului de Asigurǎri, Ed. Economicǎ 2008, pag. 77-87 Banks E., Dunn R. – Practical Risk Management, Wiley Finance UK 2003, pag. 51-61 Ciurel Violeta – Asigurări şi reasigurări: Abordări teoretice şi practici internaţionale, Ed. All
Beck Bucureşti 2000, pag. 177-217 Constantinescu Dan A. – Asigurǎri şi Reasigurǎri, Editura Tehnicǎ, Bucureşti 1998, pag.
365-376 Gavriletea Marius – Asigurări Generale, Ed. EFES 2009, pag. 51-54 Hampton John - Fundamentals of Enterprise Risk Management, AMACOM US, 2009,
pag. 275-288 Pritchett T., Schmit J. – Risk Management and Insurance, West Publishing US, 1996, pag.
566-572 Civil Code - Art.948 Legea 32/2000 Legea 172/2004 Ordin CSA 17/2009 Ordonanţa nr. 27/2002 www.csa-isc.ro www.naic.org
STUDIA UNIVERSITATIS BABEŞ-BOLYAI, NEGOTIA, LV, 3, 2010
EXAMINING THE FIRM BUILDINGS OF THE NEWS PRINTING SECTOR FROM THE POINT OF ARCHITECTURE
AND CONSTRUCTION
OLCAY ÇET İNER∗∗∗∗ ABSTRACT. The functional features of the news printing and the systems they use reflect the printing centers’ architectural building characteristic. The function of news printing and the organization schema affects the news printing buildings’ urban locations, plan types, facade design, construction techniques and material choices.
In the article, the Izmir Hurriyet Business Center building that had been constructed in the years 1987-1988 and which had been attended at the construction phase and also the DPC Doğan Print Facility Center which has been brought in to use in 2006 were examined. Keywords: Izmir, News printing, Firm Organization, Business Center, Building
Features, Construction Techniques and Material in Architecture. 1. INTRODUCTION
As the communication gained great importance at every stage of the daily life; printing activities are industrialized. Offset printing workshops are formed. In addition to the traditional printing methods digital offset printing systems have been also developed.
Since 1970s difference in the plan types of news printing buildings can be observed by the integration of working environment and opportunities brought by advancing printing systems.
With the change of plan types and developing construction/ building technologies, the construction technique and material selection are also affected.
In the last 20 years, newsprinting have come to the contemporary level by computer usage, by setting in of the satellites, by printing, folding and packaging machinery improvements. There occurs a differentiation on the news printing organization schema and buildings used for it due to the decreasing human contribution to the news printing.
∗ Dr., Yıldız Technical University Faculty of Architecture Department of Architecture, Barbaros Str.
34349 Yıldız-İstanbul, Türkiye, emails: [email protected], [email protected]

OLCAY ÇETİNER
102
2. MATERİAL AND METHOD
Two different news printing buildings of a company located in Izmir province, Turkey are analyzed in the study. These buildings are the ones applied with the choice of the company at different times and different locations. One of these buildings is Hürriyet İş Merkezi Binası (the building of Hurriyet Business Center), located in the center of Izmir province in Umurbey locality, Konak District and the other is Doğan Baskı Tesisi (Dogan Printing Facilities) located on the main motorway which is closer to the Izmir airport in Gaziemir District and on the city’s south entrance (Table 1, Photo 1).
Photo 1 - The place of the buildings examined in the study on the aerial photograph (Google Maps, 2009)
There are information about news printing’s function properties and
organization chart, architectural properties of the building, materials selection and construction techniques in the study.

EXAMINING THE FIRM BUILDINGS OF THE NEWS PRINTING SECTOR FROM THE POINT OF …
103
Table 1
Building Identity of the examined Buildings (Yapı Tanıtımı, Göktepe, Gökerti & Çetiner, 2009)
The workflow containing the basic functions of the newspaper building:
The newspaper production is carried out in three main stages. 1.Prepress preparation : it contains the whole process including even the
moulding process passing from the manually or electronically created page to
Building Identity of the examined Buildings Building Name DPC Dogan Printing
Facilities İzmir Hürriyet Business Center Building
Employer
Hürriyet Gazetecilik ve Matbaacılık
Hürriyet Holding A.Ş. ve Birlik A. Ş.
Architectural Project/Architect
Tabanlıoğlu Architecture M.Gürsel & M. Tabanlıoğlu
Ergin Algım
Architectural Design Group
Hacer Akgün, Oktay Murat, Ozan Öztepe, Zeynep Yıldırımoğlu, Ali Çalışkan
Cemil Koç, Müjde Özışık, Dianna Sert Technical team: Neşe Göktepe, Mehmet Köprülü, Cem Özkaleli, Murat Gökerti
Interior Design Tabanlıoğlu Architecture - Static Project
Altıneller Engineering
General Coordinator Semih Kavalalı, Mustafa Gündüz
Mechanical Project
Elmak A.Ş
Kemal Ölçüm, Bülent Altuğlu, Mehmet Yavuz
Electrical Project:
Öneren Project Engineering
Doyran Elektric/ Sadettin Doyran, Mehmet Ali Bilgili
Project Location İzmir, Gaziemir İlçesi, Sarnıç
İzmir, Konak İlçesi, Merkez/Umurbey
Production Company
D-Yap
Demirağ Prefabric, Şahabettin Demirağ, Cemil Koç (Const. Management), Levent Algan (Civil Eng., Olcay Çetiner (Arch.)
Building Land Area 35.000 m2 3594 m2 Building Area 17.000 m2 14654 m2 Application Date 2006 1987–1988/1990 Main Structural System Concrete/Çelik Reinforced Concrete Number of floors 2 7 (21.80m)
OLCAY ÇETİNER
104
obtaining films or electronic files appropriate for blocking as a result of processing and using any kinds of articles, photographs and visual materials
2. Press: it is the process of printing the newspaper. Newspaper printing machines with blanket to blanket offset are used in the facilities. The printing blocks required by this printing type are mostly produced by using the ctp-computer to plate machines.
3. Post-press/ Packaging: it is the stage of optimizing the newspapers (if any supplements and commercial inserts) prepared as folded from the printing machine for distribution (piling/ insert/packaging).
These main processes in main stages of newspaper production can differ in the enterprises depending on the technology and automation used (İş Akışı, 2009).
These differences also give direction to architectural properties, construction technique and materials selection of the newspaper buildings
3. ANALYZING THE TWO EXAMPLES OF NEWS PRINTING
BUILDING APPLICATIONS Basic factors in a news printing building are; - Correlation of printing buildings’ entrance-production and newspaper
output with editorial and administration personnel’s entrance-working-social need areas in the best way
- Resolving of the heavy traffic problem generated by paper storage, paper distribution and staff
- Isolating the working areas from the press machines’ noise by taking the necessary preventive measures (Öz, 1999).
Having the headquarters in Istanbul, the news printing group has set up press facilities in various provinces of Turkey to ensure rapid and effective distribution.
Doğan Printing Center is the newspaper production facilities, in which group newspapers belonging to the Doğan Media Group are printed. The Doğan Printing Center Facilities, carrying on activities under the roof of DMG, are located in six cities in Turkey.
In these facilities, which are located in Istanbul, Ankara, Izmir, Adana, Antalya and Trabzon, 11 daily newspapers including Hürriyet, Milliyet, Posta, Radikal, Fanatik, Referans, Vatan, Şok, Turkish Daily News, International Herald Tribune, and Bild and the supplements of these newspapers are printed.
Apart from these, weekly, monthly periodicals and as agreed other out-group newspapers and their supplements are also printed in DPC facilities.
Dogan Printing Center Facilities are among the leading companies of the world newspaper industry in terms of technology used, production techniques, machinery and production sizes (Doğan Printing Center, 2009).
The idea of a building that will represent the news printing is the main factor that determines the architectural approach (Boysan, Kuban, Konuralp,

EXAMINING THE FIRM BUILDINGS OF THE NEWS PRINTING SECTOR FROM THE POINT OF …
105
Tabanlıoğlu, Enginöz, Jeanneney). The news printing building’s geometry consists of two big rectangle parts which in general encounter pre-press and pro-press activities within them. The simplicity in the general approach and functional solutions in the interior units take place. It can be observed that on the floor plans; service, stair, elevator and closed/open office spaces are placed according to functionality. Façade and architectural expression formed with a plain and simple understanding in parallel with its function. The details are produced by handling the aesthetic and technical solutions together.
One of these facilities, Hürriyet Business Center Building, is located in the district Alsancak in İzmir. The building is located in a region which was used to be the entrance of the old city and today became the part of the city center having university and commercial buildings in it.
The design realized taking into consideration of the functioning of the building. The function of the building is formed through the organization chart of the company and the units in the organization chart affect the design (Figure 1). The departments that require being in close relation are placed to be on the same floor.
Figure 1 - Organization Chart (Begeç, 2005). At the İzmir Hürriyet Business Center Building; on the Ground floor: Golden
Pages, security, administrative departments; on the First floor: the advertising departments, central area, transport service; on the Second floor: DPC department, data processing department, technical service department, the golden Pages department, health room; on the Third floor: news agencies, editorial department, archives; on the Fourth floor: VIP, Cafeteria, Canteen; on the Fifth floor: General Manager, deputy general manager, secretary, DBR, department directorates; on the Sixth floor: guest house, gym, cafeteria, Terrace units are placed (Figure 2).

OLCAY ÇETİNER
106
Figure 2 - The Plan, Section and the elevation of the building (Göktepe, Gökerti & Çetiner 2009)
Construction of the building began in 1987, first the construction of the
printing section was completed in 1988 and the printing department started working. Then in 1990 the construction of the entire building was completed and the building started to serve as a business center (Begeç, 2005).

EXAMINING THE FIRM BUILDINGS OF THE NEWS PRINTING SECTOR FROM THE POINT OF …
107
The building is placed on a rectangular parcel which has the long side in the direction of north-south. There are office floors on the front part and print sections on the back part of the parcel. The main entrance of the building is from Şehitler street whereas the staff entrance, distribution and service units’ entrance is from the entrance on the street number 1501 (Photo 2).
Photo 2 - General view of the İzmir Hürriyet Business Center Building (Aksoy, Gökyılmaz, 2009)
In the interior of the building, each floor is divided into two parts by the
core unit consisting of vertical circulation unit, toilets and mechanical-electrical facilities unit (Photo 3). Different departments allocated in these two separated parts. The interior spaces have a 2.60m height. (H. Begeç, 2005). Office areas are used as open and semi-open offices and cabinets are placed as separators (Photo 4). The construction system of the Izmir Hürriyet Business Center is realized by applying reinforced concrete construction system. Prefabricated structure system is used as a structure system.
The precast stair elements are used for the vertical circulation. Roof is realized as a flat roof and part of it is benefited as an open resting area. On the façade, horizontal band windows are realized utilizing prefabricated elements. It is observed; marble flooring and plasterboard suspended ceiling materials are used at the entrance area.

OLCAY ÇETİNER
108
Photo 3 - Entry to management department and an example a manager office (Çetiner, 2009)
Photo 4 - An example of semi open office (left photo) and an example of open office (right photo) (Çetiner, 2009)
Actual printing part has been renovated in 1997 and brought in to use
again. Following the increasing requirements; the new place with a 16.000m2 closed area is realized in the year 2006 (Hakkımızda, 2009, DPC İzmir, 2009).
Like the counterparts in Ankara and Istanbul, the printing facilities in Izmir was constructed as an innovative industrial building arranged around a wide linear printing hall 100 m in length and 16,5 m in width. The building is located in a strategic location on the city’s entrance, on the main motorway and near the airport. The strong horizontal emphasis in the architectural form signifies the function of the Printing Center (Projeler, 2009) (Figure 3).

EXAMINING THE FIRM BUILDINGS OF THE NEWS PRINTING SECTOR FROM THE POINT OF …
109
Figure 3 - The Plan and Section of the building (Yapı Tanıtımı, 2009) With the production flow’s having a rational structure, the pre- and post-
press activities located in both sides of the printing hall form the geometry of the building. There is an area in the form of a roof garden that can be reached through the staff dining hall and the administrative offices between the printing hall and the post-press block. With its wooden floors and green area arrangement, this area forms the recreational area.
Reinforced concrete and steel were used together in the building system of the DPC Doğan Printing Facilities. Insulated monochrome metal panel and exposed concrete were used in the siding application (Yapı Tanıtımı, 2009) (Photo 5).
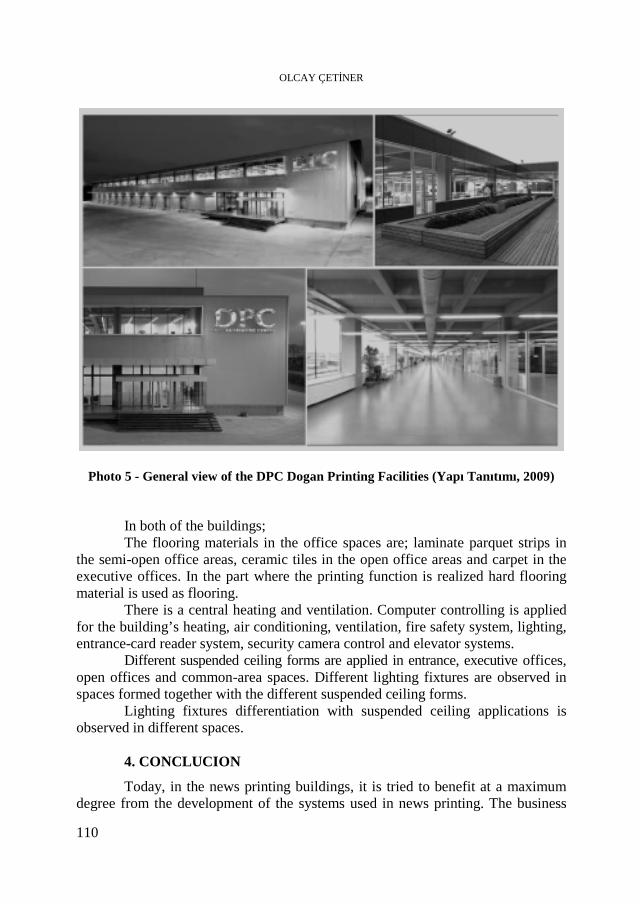
OLCAY ÇETİNER
110
Photo 5 - General view of the DPC Dogan Printing Facilities (Yapı Tanıtımı, 2009) In both of the buildings; The flooring materials in the office spaces are; laminate parquet strips in
the semi-open office areas, ceramic tiles in the open office areas and carpet in the executive offices. In the part where the printing function is realized hard flooring material is used as flooring.
There is a central heating and ventilation. Computer controlling is applied for the building’s heating, air conditioning, ventilation, fire safety system, lighting, entrance-card reader system, security camera control and elevator systems.
Different suspended ceiling forms are applied in entrance, executive offices, open offices and common-area spaces. Different lighting fixtures are observed in spaces formed together with the different suspended ceiling forms.
Lighting fixtures differentiation with suspended ceiling applications is observed in different spaces.
4. CONCLUCION
Today, in the news printing buildings, it is tried to benefit at a maximum degree from the development of the systems used in news printing. The business
EXAMINING THE FIRM BUILDINGS OF THE NEWS PRINTING SECTOR FROM THE POINT OF …
111
centers constructed for news printing and news printing buildings are equipped with the new communication systems and techniques.
This can be observed that the Izmir Hürriyet Business Center Building which has started to be constructed in 1987, also affected by the developments. Actual printing part has been renovated in 1997 and brought in to use again. Following the increasing requirements; the new place with a 16.000m2 closed area is realized in the year 2006. In the Izmir Hürriyet Business Center Building, contribution to the news printing activities with all the functions except only the printing function is continuing.
As these improvements increase the overall functioning rate of the spatial functions, on the other hand brings along some spatial scale differences. The news printing organs that provide the information flow, build up their centers by taking advantage of the technological developments and tend to have new spatial structuring.
REFERENCES
Baskı Tesisleri, DPC İzmir, 2009. http://www.dpc.com.tr/P_P_IZM.HTML Begeç, H., 2005. İletişim Teknolojilerinin Büro Mekanlarına Etkileri ve Medya
Yapılarında Yeni Mekan Kullanım Biçimlerinin Uygulanabilirli ği, Doktora Tezi, Dokuz Eylül Üni, F.B.E. İzmir.
Boysan, Aydın, 1994. “Hürriyet Güneşli Tesisleri”, Yapı Dergisi, YEM Yayınları, İstanbul, No: 148, pp. 59–62.
Doğan Printing Center, 2009. http://www.dpc.com.tr/INDEX.HTML Enginöz Y. K., 2006. Gazetenin Mimari Yüzü”, XXI Dergisi, No: 44, pp. 54. İstanbul. Google Maps, 2009. http://maps.google.com/maps/ Göktepe Neşe, Gökerti Murat & Çetiner O., 2009. Firma ve Yapım Bilgileri, İzmir. Gökyılmaz Çetiner, Ayşegül, Zuhal Aksoy Buralı and Çetiner O., 2009. Photos, İzmir. Hakkımızda, 2009, http://www.dpc.com.tr/A_U.HTML İş Akışı, 2009. http://www.dpc.com.tr/W_F.HTML J.Jeanneney, 1998. Başlangıcından Günümüze Medya Tarihi, Yapı Kredi Yayınları,
İstanbul. Konuralp, M., 1992. Gazete Tesisi Tasarımı ve Çağdaş Teknoloji, Tasarım Dergisi,
No: 29, pp. 48–59. Konuralp, M., 1993. Sabah Medya Merkezi, Yapı Dergisi, YEM Yayınları, İstanbul,
No: 222, pp. 62–68. Kuban, Doğan, 1992. Mehmet Konuralp’in Sabah Gazetesi Tesisleri, Tasarım Dergisi,
No: 29, pp. 60–61.

OLCAY ÇETİNER
112
Öz Ş., 1999. İletişim Yapıları, Mimarlık ve İletişim Teknolojisi Etkileşimi, YTÜ, FBE, YL. Tezi, İstanbul.
Projeler, 2009. DPC Doğan Baskı Tesisleri, İzmir, http://arkiv.arkitera.com/p8339#a Projeler, Arkiv, 2008. Zaman Gazetesi Yönetim Binası, http://arkiv.arkitera.com/p7830 Tabanlıoğlu M. & Tabanlıoğlu H., 1994. Doğan Medya Center, Yapı Dergisi, YEM
Yayınları, İstanbul, No: 149, pp. 50–58. Yapı Dergisi, 1994. Hürriyet Güneşli Tesisleri Konusunda Aydın Boysan’la Kısa Bir
Söyleşi YEM Yayınları, İstanbul, No: 148, pp. 63–65. Yapı Tanıtımı, Ekim 2009. Güçlü Yatay Formuyla DPC, EGE MİMARLIK Dergisi, pp. 36–
39, İzmir.

STUDIA UNIVERSITATIS BABEŞ-BOLYAI, NEGOTIA, LV, 3, 2010
CRISIS – TIME FOR PURIFICATION AND CHANGE
ŠÁRKA BRYCHTOVÁ 1 ABSTRACT. The present article aims to provide an uneconomic view of the current economic crisis. The text deals with the substance of the crisis in its wide connections and creates a parallel between a general crisis and the economic crisis. It perceives the economic crisis like a kind of illness and indicates a possible solution in the future. The article also contains a hidden philosophical meaning. Keywords: economic crisis, crisis like an illness, the causes of crisis, the way out
of the crisis, balance. Introduction
The global economic crisis is one of the most commonly encountered phrases used at present. Time impact is perceived practically in all aspects of life, and even quite fatally by a certain part of the population. The crisis affects the whole society as far as the economic, social, political as well as ethical sphere is concerned. It is clearly seen in the regional as well as global dimension. The crisis has actually had an essential impact on most economic sectors. The Economic Chamber indicates that more than one half of companies in the Czech Republic expect their economic results to end in red numbers. One third of all firms have been forced to reduce the numbers of their employees and every tenth company is planning to dismiss some of its workers in the near future. Figures signalling that a number of firms do not really have any contracts, do not produce anything and are therefore forced to get rid of their workers are alarming. The economic crisis is rather concrete, depressing and, simply speaking, affects the mere existence of the whole society and any individual.
1. Crisis – it had to be expected …
The general public therefore asks a justified question: What was the cause of the crisis and how could the crisis be overcome with losses as low as possible?
M. Potůček can see above all two essential circumstances that contributed to the origin of the current financial and economic crisis [7]: 1 RNDr., PhD, Institute of Public Administration and Law, Faculty of Economics and Administration,
University of Pardubice, email: [email protected]
ŠÁRKA BRYCHTOVÁ
114
• articulated interests of the financial capital supporting the neo-liberal ideology, which successfully won recognition in the political decision-making arenas,
• poor competence of social sciences in understanding the character of the current stage of human civilisation development.
And he adds: The huge and articulated economic interests of the global financial capital
must be viewed as the background for the success of the neo-liberal interpretation of present civilisation problems. These interests were focused, with considerable resources invested, on direct as well as indirect support for the academic and political circles that applied such concepts in preparation, justification and implementation of reforms of the economic (de)regulation as well as social state removal. [7]
Certain economists had warned against this danger of development already before – nevertheless they had been in a considerable minority and had not actually managed to affect the reality.
Some authors also warned of a dangerous change in relations between the public and private sectors. The state had gradually waived a number of decision-making powers which it had gained in market economies after World War Two. The process may be summed up in three areas:
• institutional deregulation, i.e. restriction of managing and decision-making powers of the public sector bodies,
• privatisation which concerns large state-controlled companies, communal housing, health care, school system, social and other services,
• completion of the full price liberalisation, e.g. deregulation of the rents in the residential sector.
Thus the policy of deregulation is often referred to as decentralisation from the public sector to the market. [3]
Keller writes in connection with deregulation that consequently the minimum possibility of democratic control disappears and the deregulated activities transfer to the spheres that are entirely non-transparent for the public. [4]
Although expert circles were most probably aware of the crisis, it occurred in fact all of a sudden and without any warning for the general public – namely both for people in America and also e.g. for a common Czech citizen, who had enjoyed the market system for nearly twenty years and had certainly compared it in media and the public as well as private life with the period before 1989. Naturally, with regard to our previous experience nobody dared to criticise the capitalist system, let alone to call it in question, without earning a suspicion of enthusing about communism. Intellectuals commonly do that, however, in the countries to the west of ours. E.g. Noam Chomsky, the most frequently quoted intellectual in the world, is of the opinion that:… what is called capitalism is a system of corporate mercantilism, in which the private tyrants who are not obliged to render accounts to anybody have a huge and vast control over the economy, political systems and social and cultural life.[1] Chomsky openly reminds that the system in the society and in
CRISIS – TIME FOR PURIFICATION AND CHANGE
115
democratic countries works in principle on the following basis: 20 % of population make decisions; 80 % are wanted to carry out orders somehow. Approximately 80 % of the United States population deem that the state is controlled by a few large interest groups looking after themselves – meaning after corporations, not after people. [2]
Strictly speaking, nobody can say that the society really works in this simplified way, but the system – as it is existing now – must necessarily go through a crisis; it actually generates the crisis in fact. But it should also be mentioned, however, that N. Chomsky can see a great hope for the whole society in the current development – in the awareness of humanity and the appeal to human rights and real meaningful democracy. Nevertheless there is a question concerning the tendency of the development – economic, political, social etc.
2. A slightly different point of view on the crisis – the crisis of the
system as the crisis of the organism
The economic crisis is not a single crisis, however. The crisis is found in different variants and in connection with other aspects of life – one speaks about a personal crisis of man, crisis of identity, crisis of middle age, existential crisis, artistic crisis, intellectual crisis, etc.
The economic crisis is an integral part of the market system and capitalism as the life crisis is part of life and man. “We must learn for the whole life how to live,” said Seneca more than two thousand years ago, and what may make you wonder even more, we must learn for the whole life how to die. [5] While thinking about the nature of the crisis and what it actually brings about, we cannot avoid two quite different points of view:
• The first one is a view of the crisis as something quite bad, something to get rid of as soon as possible, after which we should get back on the rails again.
• The other view of the crisis is a positive one – something new and above all a promise of change is sought even in the crisis.
While the first view is not possible for ever, the other one hides the growth potential in itself. And like any other growth or development, it brings about a time of changes in itself which no development can do without unless the system is so far-sighted that it continues to clean itself and to look for new ways already while the old rooted and temporarily prosperous ways still exist. And no system and no person (but for exceptions, naturally) does this. Professor Zelený expressed an interesting idea in this line: We must learn how to carry out the crisis functions that are purgative – without any crisis and without negligence of natural regeneration and renaissance. [8]
It is clear that while comparing the economic crisis with a life crisis of a man, I can see a certain parallel between the two. If a man wants to overcome a personal crisis, he must give up something, must let something die in his life, waive something in order to be able to move forward again, and a bit differently, in
ŠÁRKA BRYCHTOVÁ
116
a different way, and changed a little himself in most cases, and the system will have to do the same thing similarly as the man. If the system fails to do it, it will not move ahead any further.
3. What in fact is the crisis?
The Dictionary of Foreign Words for the New Century says that the crisis is a culmination, decisive moment, turn in the development, dangerous conditions in the development or a hard precarious situation, problem, confusion. No matter whether it is a phenomenon or a condition, the crisis does not occur out of the blue, but is a result of a long-term development or rather a long-term development, a bit erroneous in certain aspects. It is apparently quite common. Capitalism is a system for which crises are natural issues, as for any other system that is not perfect – and nobody or nothing is such.
But what about the essence of the crisis, the essence of the undesired development resulting in the crisis? President V. Klaus compared the current crisis to a mild illness – flu. On the other hand, a number of economists and politicians including e.g. M. Zeman, the former prime minister, oppose that flu can also result in death. If we keep to such comparisons – the world is ill. But it is already a long time ago it fell ill (has it ever been healthy at all?) – at least I cannot remember any period in history when it was not ill. The untreated, continuously not purged world prepared the optimum conditions for the crisis to break out. K. Tepperwein2 considers any illness (meaning that of a man) to be demonstration of disharmony, breach of integrity and unity. [6] If this statement is considered a paradigm and is transferred to the outlined sphere of problems, we will receive an interesting view.
4. Causes of the crisis (general view):
• loss (or breach) of balance, • eruption of long-term problems and errors onto the surface, • deviation of development to the descent, decline, fall.
The depth, length and intensity of the decline will probably be appropriate to the depth, length and intensity of errors that have collected in the course of development since the last purification. In the event of a human body, it is usually the whole organism that suffers, although e.g. the backbone scoliosis was caused by a bad life style, sedentary way of life and lack of exercise. It is not only the backbone that is ill, but the whole organism is affected by the results of the previous imbalanced development. Our world is also an organism, unbelievably interlocked and interwoven – one cell depending on the other. Living entirely out of the system is impossible. But the system is ill … The system is in the crisis … We cannot pretend
2 Kurt Tepperwein is a senior lecturer at the Academy of Spiritual Sciences, doctor and therapist, and
has written more then twenty books that have been translated into many world languages.

CRISIS – TIME FOR PURIFICATION AND CHANGE
117
that it is a coincidence, that something can be patched and we can continue. It is not as simple as that as a rule. If we want to move really ahead, we must learn a lesson.
5. What does the crisis say?
• Something is wrong – the system must look for the lost balance. • It is clear that the balance must be new – probably on a higher level of
development. • It is necessary to find and define imperfections in development that
have resulted in the crisis, to eliminate them and to find out qualitatively new ways. Is there any way out of the crisis? Certainly yes, both from the general
viewpoint and in the real situation of the current economic crisis. The only issue is which way is to be selected. Shall we take a pain-killer and continue as before? Shall we select a radical method of treatment – e.g. operation? Or shall we leave the illness to its fate and let the body recover in its self-treating manner similarly as we let the bark-beetle consume half of the forest and wait till a new more resistant forest with natural immunity against the bark-beetle grows from its ruins?
6. Way out of the crisis
In fact we could sum up the ways out of crisis by giving the three possibilities below:
1. patching of problems that have occurred, and search for solutions on the current level of the system without any qualitative transformation,
2. resignation, submission to the crisis, waiting till the crisis itself makes the system clean,
3. change – deep and comprehensive.
For somebody who is not an economist, it may certainly be difficult to engage in a discussion whether or not the pumping of state finances into companies going bankrupt (for which there are certainly good reasons too – social shocks get reduced) is meaningful, or whether or not the crisis should be left to carry out its purifying functions which liquidate those not able to survive. This market selection may also simply do away with a number of people who would take the rap for the crisis caused, in essence, due to the greediness of the financial capital, however. If these reasons are considered, state interventions will also be important then.
The third point mentions a deep and comprehensive change. What does this mean? I am of the opinion that a mere change in economic thinking, the entering of innovating projects, new modern environmental technologies, new types of ecologically driven cars will not be enough – this condition is necessary but not sufficient. The mankind, at least in the civilised world, has already appeared in the stage when people start to understand the meaning of humanity, democracy, responsibility, value of quality life, health, peace and prosperity; they should learn,
ŠÁRKA BRYCHTOVÁ
118
however, how these values are to be fulfilled and lived as well. The present man continuously balances on the edge between what should be done because it is correct and what is expected from him by the manipulating and controlling reality. Therefore I claim that a change in thinking as such, not only economic thinking but also the overall view of the world, is necessary. Otherwise the mankind will always be in a permanent crisis and economic recessions will only be their medially attractive output – a visible part of a disease, similarly as patient’s ulcers may be seen – they only indicate the scope of the illness hidden inside, however.
If the man concerned wants to recover for ever, he must usually change many of his rooted stereotypes – e.g. stop smoking, drinking alcoholic beverages, loose weight, increase physical activities, and change his life, approach to life, thinking essentially at all3 … The ulcers may disappear all by themselves; well, you may know that famous statement: clean the chalices from the inside… And that is why I feel fears that the simple market purification will not be sufficient, it is necessary but may not be enough. It cannot be sufficient for a long time because if the mankind appears to be in permanent evolution, and it certainly is, it is a matter of any individual, not only of a large car making company or the government of the most powerful country in the world whether or not they will do just a little step to the new centuries and whether or not the crisis will purge or destroy them, improve their position or do away with them, or whether or not they get out of the crisis stronger or ruined, or whether they hget out of it at all.
Conclusion
Actually, a crisis is a loss of balance. Therefore I think that purification is necessary, but establishing a new balance is no less important, may be even more crucial. If this does not occur, the subsequent impacts of the crisis may have even a dangerous sequel – dirt that is much larger than the dirt that was there before the crisis often settles in the cleaned space. From the economic, political and social viewpoint, I mean even higher concentration of capital, zero regulation or, on the contrary, improper radical interventions by the state (both being incorrect), huge social
3 Note: An interesting opinion, which in fact corresponds to what the present article aims to say, was
formulated by Tomáš Baťa Sr. in 1932: It is above all moral misery that is the cause of the crisis. Turn of the economic crisis? I do not believe in any turns caused all by themselves. What we have got used to calling the economic crisis is just another name for moral misery. Moral misery is a cause, economic decline is a consequence. In this country, there are many people who are of the opinion that economic decline may be recovered with money. I fear the results arising from this error. We do not need any genius turns and combinations in the position we appear to be in. We need moral opinions about people, work and public property. We should not support bankrupts, not create debts, not throw away values for useless things, not exploit workers, do what improved our position from the post-war misery, work and save, and make work and saving more profitable, desirable and honest than idling and wasting. You are right, it is necessary to overcome the crisis of confidence, but it cannot get overcome through technical, financial or credit interventions, confidence is a personal matter and may be restored only by means of a moral viewpoint and personal example. [9]

CRISIS – TIME FOR PURIFICATION AND CHANGE
119
differences, even harder and unfair political rivalry, rising extremism, helplessness in dealing with migration or situation of minorities, overall vulgarisation of the society and resignation from decency, ethics, thoughtfulness and sentiment. And this is the society that reminds us of an unkind technocratic future of sci-fi films. Prediction of the future always has an alternative solution. But causality of processes is usually merciless. If the system that has generated the crisis is not changed from inside, the problems will return or other ones will occur in a certain period of time. Today is the result of yesterday and tomorrow will be as we prepare it today.
REFERENCES
CHOMSKY, N. Quotations from his interview for Red and Black Revolution. 1995. (Available at: http://www.blisty.cz/art/39049.html)
CHOMSKY, N. Economic crisis will not affect the hegemony of the United States. Interview Press TV with Avram Noam Chomsky, American linguist, philosopher, political activist and MIT professor.16 October 2008. (Available at: http://www.zvedavec.org/komentare/2008/10/2813-ekonomicka-krize-neovlivni-hegemonii-spojenych-statu-rika-chomsky.htm)
EDLIČKA, P., TOMEŠ, J., DANĚK, P. State, space, politics. Prague: Charles University, Faculty of natural sciences. 2000. 265 pp. ISBN 80-238-5566-2.
KELLER, J. ABC of prosperity. Brno, Addendum: 160 pp. PECK, M. S. Unbeaten Track. Prague: Odeon, 1993. 250 pp. ISBN 80-207-0469-8. TEPPERWEIN. K. Self-treatment. Prague: Noxi. 180 pp. - ISBN: 80-89179-65-7 POTŮČEK, M. Suspected connections of the parallel crisis of ruling, economics and
social sciences. Presentation of the Centre for Social and Economic Strategies, Faculty of Social Sciences, Charles University in Prague at the International Scientific Conference of ESF MU. Šlapanice 2009, 22.1. 2009.
ZELENÝ, M. online interview on the website Patria.cz. 22.5.2009. http://www.demokracie.info/index.php
STUDIA UNIVERSITATIS BABEŞ-BOLYAI, NEGOTIA, LV, 3, 2010
TOURISTS ATTITUDES, PREFERENCES AND OPINIONS REGARDING THE SERVICES PROVIDED BY HOTELS LOCATED
IN THE ROMANIAN CENTER DEVELOPMENT REGION
ERIKA KULCSÁR 1 ABSTRACT. This paper belongs to the category of quantitative marketing researches, because its objective is the systematic description and analysis of multiple features and relationships specific to marketing in tourism. I relied on quantitative descriptive research to find out the characteristics of the target segments of the market, estimating the percentage within the population of participants with certain characteristics or behavior, defining opinions and perceptions about the features of the offered products or services, determining the degree of association between marketing variables and the dependence and interdependence among them, etc. The present research was based on the survey method that involved a comprehensive questionnaire (39 questions) and an established probability sampling, representative for the studied population. Keywords: attitudes, preferences, bivariate analysis, multivariate analysis. Introduction
'Attitudes have great importance for understanding the behavioral mechanism of the consumer. In terms of marketing, the subject of the attitude may be a product, a tourist unit, an advertising poster, the staff from the selling points, etc.' (Cătoiu and Teodorescu, 2004:74-75). 'Preference is a very important dimension of consumer’s behavior, representing one of the central elements in motivational research' (Florescu, Mâlcomete and Pop, 2003:552) and expressed opinions is what people say about a topic. 'Study of consumer preferences is made by using a broad arsenal of methods, techniques and investigative tools developed over the recent decades within marketing researches.' (Florescu, Mâlcomete and Pop, 2003:552-553)
Methodological considerations concerning the performance of research
The general hypotheses of the research “Tourists attitudes, preferences and opinions regarding the services provided by hotels in the Romanian Center Development Region" were based on the following assumptions of major importance:
1 Assistant PhD, Faculty of Economics and Business Administration, Babeş-Bolyai University Cluj-
Napoca, Romania, [email protected]
ERIKA KULCSÁR
122
• A large number of tourists had planned to stay for more than five days in the Center Development Region.
• Most tourists have a positive view about the arrangement of hotel rooms. • A relatively small part of tourists consider that the offer of culinary
preparations does not meet their expectations in the location they most often have meals. • The majority of the respondents would recommend the hotel where
they stayed to friends and acquaintances.
The main research objectives were: � To determine the expected time of stay in days in the Center Development
Region. � To determine the scale of the tourists’ positive view on the arrangement of
hotel rooms. � To determine the scale of the tourists’ positive view on the food offered. � To identify the scale of the tourists’ recommendation for the hotel where
they stayed at. Choice of the sampling method
Most marketing researches, including the present research, aim to obtain information about the studied population. (Malhotra, 2005:400). 'The population covered by a marketing research is a well-defined entity, at a moment or during a period, consisting of a given set of simple or complex units." (Lefter, 2004:166).
As the studied population being given, the sampling unit is the tourist, the observation unit where primary data is derived from are the Romanian or foreign tourists as well. Research results will be extended to the entire studied population, i.e. to all tourists who visited the Centre Development Region in 2009 and stayed in the hotels of the counties belonging to this region of Romania.
I chose the probability sample because of the advantages of these sampling methods including ensuring a high level of accuracy of the selection and a good representativeness of the research sample as well as offering the possibility to generalize such findings on the studied community. (Cătoiu et al, 2002:486)
Theoretically, the sampling base necessary to the probability foundation of the sample is the complete list of tourists who visited the Center Development Region in 2009. The total number was 666,396 people. Obviously, such a number of data is not available for this research. Therefore, identification of other opportunities to obtain a sample base in order to obtain a probability sample was necessary.
Due to the organizational and financial limitations of the author an equivalent of the sample database was created and used, designed to provide a probability sample to ensure acceptable statistical and structural representativeness levels.
The starting point for establishing the sampling base was the creation of a probability sampling group because each hotel represents a group of tourists even though their structure may be different. Thus, out of the 144 hotels in the six counties
TOURISTS ATTITUDES, PREFERENCES AND OPINIONS REGARDING THE SERVICES PROVIDED BY …
123
of the Center Development Region, I randomly selected 56 hotels (38.9% of the total), in proportion to the share of each county’s hotels in all hotels of the Center Development Region.
In this respect I ensured the representativeness of the groups of tourists, therefore that of the hotels, in the Center Development Region.
Further, the procedure for establishing the sample base and of the sample was as follows:
I chose simultaneously two methods of carrying out the survey by sampling: the direct interview method, face to face and the self-inquiry method since the questionnaires were filled out by tourists, since they were handed by the staff in the hotel receptions. Half of all questionnaires (namely 203) was obtained by auto-filling, and the other half (207) based on direct interviews. The direct interviews were conducted based on an algorithm upon walking out from the restaurant.
The requirement of representativeness was achieved to a great extent by the fact that primary data collection period was between 15.05.2009 and 17.10.2009, i.e. over 5 months.
The actual sample size of the sample obtained at the end of the mentioned period of time was of 410 questionnaires. In this case, the random sampling error calculated based on the percentage estimation is ± 4.84.
Validation of the sample
Validation of the sample was achieved through a test to compare differences in percentages. One practically possible variable was taken into consideration, namely, the counties that form the Centre Development Region. Other variables such as gender, age, country of origin etc. can not be used because there is no statistic for them considering one year for the entire population studied in the Center Development Region.
The validation of the actual sample refers to the structure of the sample effectively carried out per counties, as compared with the structure per counties of the number of tourists who visited the Center Development Region in 2009.
Data from the last column of the table, based on the calculations made, show that the observed values of z, in each county have a lower value than the theoretical value z = 1.96 (table no.1), with a probability of 95%. This shows that the sample can be validated against the variable mentioned, since it is representative for the studied population in the Center Development Region.
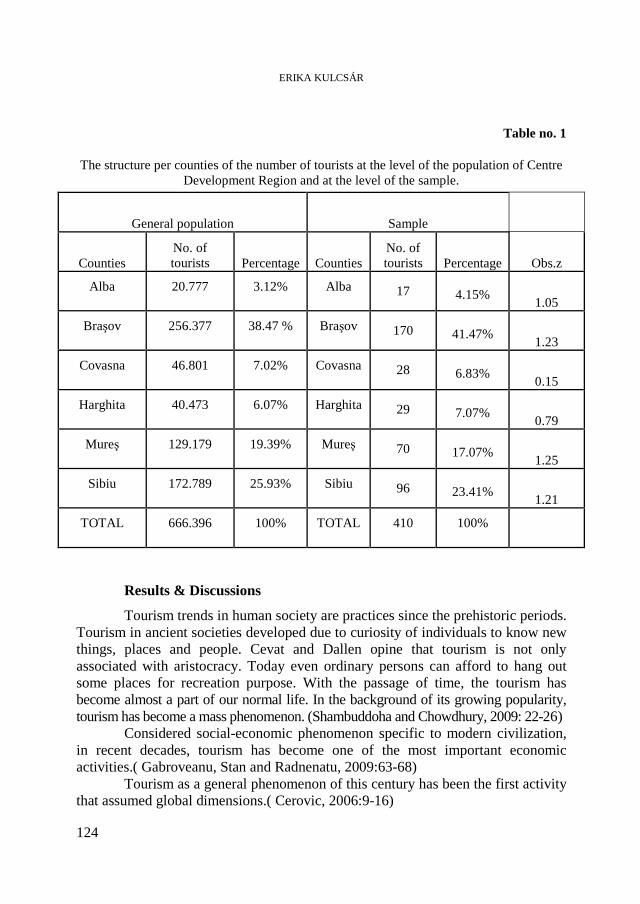
ERIKA KULCSÁR
124
Table no. 1
The structure per counties of the number of tourists at the level of the population of Centre
Development Region and at the level of the sample.
General population Sample
Counties No. of tourists Percentage Counties
No. of tourists Percentage Obs.z
Alba 20.777 3.12% Alba 17 4.15% 1.05
Braşov 256.377 38.47 % Braşov 170 41.47% 1.23
Covasna 46.801 7.02% Covasna 28 6.83% 0.15
Harghita 40.473 6.07% Harghita 29 7.07% 0.79
Mureş 129.179 19.39% Mureş 70 17.07% 1.25
Sibiu 172.789 25.93% Sibiu 96 23.41% 1.21
TOTAL 666.396 100% TOTAL 410 100%
Results & Discussions
Tourism trends in human society are practices since the prehistoric periods. Tourism in ancient societies developed due to curiosity of individuals to know new things, places and people. Cevat and Dallen opine that tourism is not only associated with aristocracy. Today even ordinary persons can afford to hang out some places for recreation purpose. With the passage of time, the tourism has become almost a part of our normal life. In the background of its growing popularity, tourism has become a mass phenomenon. (Shambuddoha and Chowdhury, 2009: 22-26)
Considered social-economic phenomenon specific to modern civilization, in recent decades, tourism has become one of the most important economic activities.( Gabroveanu, Stan and Radnenatu, 2009:63-68)
Tourism as a general phenomenon of this century has been the first activity that assumed global dimensions.( Cerovic, 2006:9-16)

TOURISTS ATTITUDES, PREFERENCES AND OPINIONS REGARDING THE SERVICES PROVIDED BY …
125
Undoubtedly, the most financially influential domain of tourist industry is
hotel industry, whose policy is to transfer its centre of attention to the tourist-customer, as the latter is responsible in forming a complete view from departure to arrival back home. Therefore, hotel services are considered as vital element of tourist products. (Karagiannis and Nedelea, 2006:5-13)
The hotel industry has become an important cultural and civilizational need of the modern man.( Grzinic, 2008:122-128)
Tourism companies that consistently deliver positive customer experiences across all touchpoints Marketers in the hospitality industry have to face interesting challenges to offer great tourist experience and develop long-term customer relationships.(Purcărea and Paul-Raţiu, 2009:71-90)
'In tourism we can not speak of persons "individual behavior" and highly heterogeneous and complex motivations, successively dosed, in an order determined rigorously. Therefore the overall satisfaction degree obtained from tourist consumption is not the mere sum of partial services consumption. Clearly, the assessment of the quality level of the entire services offer could be adversely affected by poor quality of one component of the offer. In other words, if for some subjective or objective reasons, at a given time or place, one of the links in the chain of services does not meet the demands of the domestic or foreign tourist, his/her unhappiness has no longer effects on the moment, but may distort the whole picture of the offer. Therefore all services must be impeccable.' (Tomescu, 2000:19)
Next I will also present the analysis of the raw data collected. Within this research the raw data were entered into SPSS 15 analysis software.
Analyzing the average number of days spent by tourists in the Center Development Region, I found that it was 6.65 days, the recorded minimum being of one day and the maximum, 36 days.
By testing the existence of a difference between respondents aged up to 45 years and respondents over 45 years regarding the expected number of days for the stay, it was found that there are differences between respondents aged up to 45 years and those aged over 45 years regarding the expected duration of stay in the Center Development Region. At the sample level, the average stay was 7.23 days for tourists under 45 and for those over 45 years the average was 5.62 days.
By analyzing the answers of respondents regarding the statement "The room offers a pleasant, familiar atmosphere", I have found the following:
Total of 404 persons from the interviewed respondents answered to this question. 43.1% of the respondents totally agreed with the assertion that the room they are accommodated in offers a pleasant, familiar atmosphere, by contrast to 14.6% of the respondents who chose the intermediate variant. (Table no. 2)
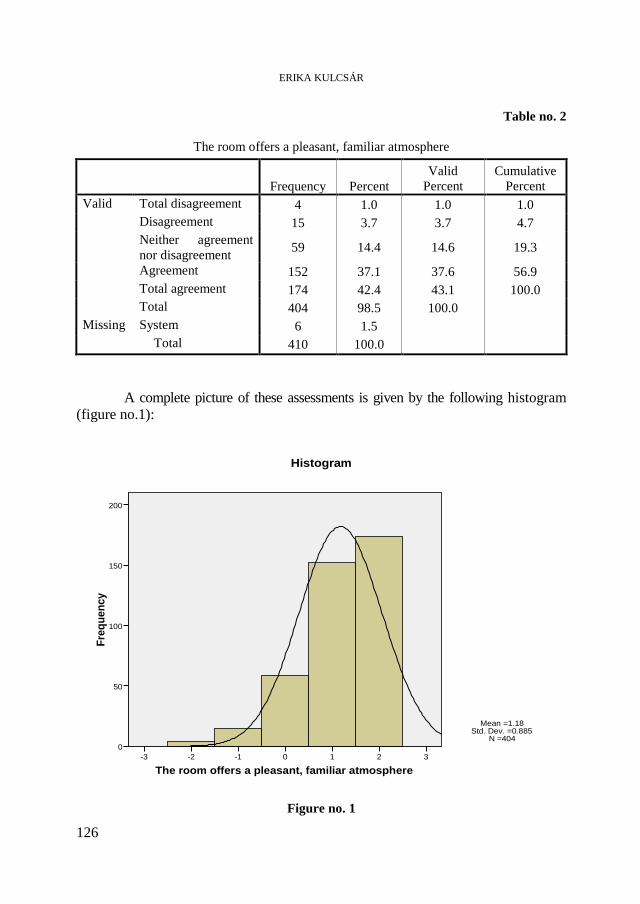
ERIKA KULCSÁR
126
Table no. 2
The room offers a pleasant, familiar atmosphere
Frequency Percent Valid
Percent Cumulative
Percent Valid Total disagreement 4 1.0 1.0 1.0 Disagreement 15 3.7 3.7 4.7 Neither agreement
nor disagreement 59 14.4 14.6 19.3
Agreement 152 37.1 37.6 56.9 Total agreement 174 42.4 43.1 100.0 Total 404 98.5 100.0 Missing System 6 1.5
Total 410 100.0
A complete picture of these assessments is given by the following histogram
(figure no.1):
The room offers a pleasant, familiar atmosphere3210-1-2-3
Freq
uenc
y
200
150
100
50
0
Histogram
Mean =1.18�Std. Dev. =0.885�
N =404
Figure no. 1

TOURISTS ATTITUDES, PREFERENCES AND OPINIONS REGARDING THE SERVICES PROVIDED BY …
127
The vaulting indicator has a positive value (0.885) indicating a leptokurtic distribution, which can be seen from the graphic representation by the help of the previously presented histogram.
The results of the bivariate analysis, by applying the Kolmogorov-Smirnov test, showed that there are no differences between male and female respondents regarding their views on their accommodation during the stay in the Centre Development Region, if its offers a pleasant, familiar atmosphere.
By interpreting the results (table no.3) regarding the respondents' opinion on culinary preparations it was found that: more than 85% of the responses assessed the quality of the culinary products as very good or good; 11.8% pointed for the intermediate level (neither nor); 3% of the respondents considered the quality of food as being bad.
Table no. 3
Quality of food
Frequency Percent Valid Percent Cumulative
Percent Valid Bad 12 2.9 3.0 3.0 Neither good
nor bad 47 11.5 11.8 14.8
good 197 48.0 49.5 64.3 Very good 142 34.6 35.7 100.0 Total 398 97.1 100.0 Missing System 12 2.9
Total 410 100.0
The following histogram (figure no.2) presents in detail the opinion of the
tourists with respect to the quality of the dishes ordered. The vaulting indicator is set to 0.752, indicating a leptokurtic distribution,
which can be also seen in the chart shown above. After applying the Nonparametric Kolmogorov-Smirnov test it was found that there are significant differences between the views of those who have been there before and of those respondents who are for the first time in the Centre Development Region as compared to the assessment on the quality of food.
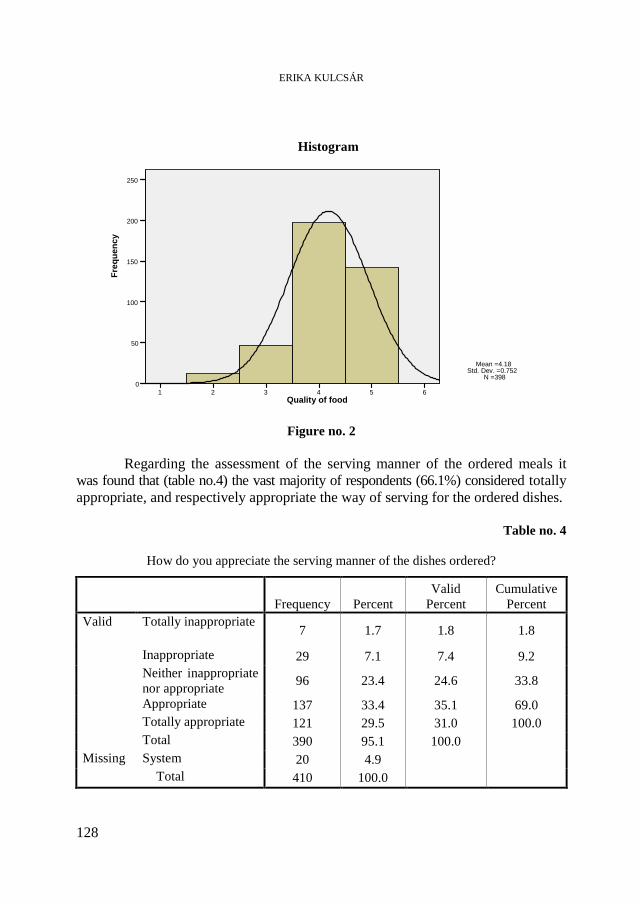
ERIKA KULCSÁR
128
Figure no. 2 Regarding the assessment of the serving manner of the ordered meals it
was found that (table no.4) the vast majority of respondents (66.1%) considered totally appropriate, and respectively appropriate the way of serving for the ordered dishes.
Table no. 4
How do you appreciate the serving manner of the dishes ordered?
Frequency Percent Valid
Percent Cumulative
Percent Valid Totally inappropriate
7 1.7 1.8 1.8
Inappropriate 29 7.1 7.4 9.2 Neither inappropriate
nor appropriate 96 23.4 24.6 33.8
Appropriate 137 33.4 35.1 69.0 Totally appropriate 121 29.5 31.0 100.0 Total 390 95.1 100.0 Missing System 20 4.9
Total 410 100.0
Quality of food 6 5 4 3 2 1
Fre
qu
ency
250
200
150
100
50
0
Histogram
Mean =4.18Std. Dev. =0.752
N =398
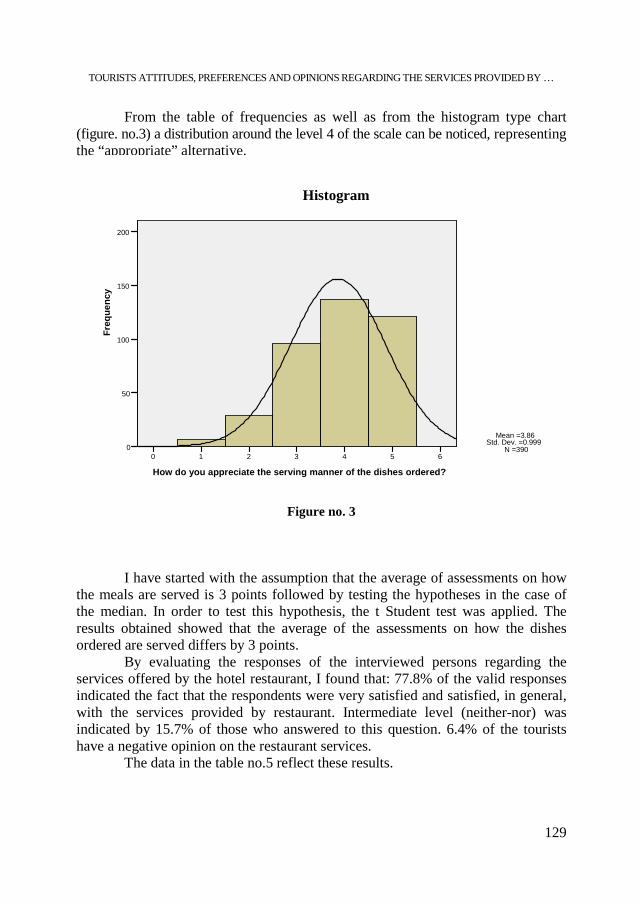
TOURISTS ATTITUDES, PREFERENCES AND OPINIONS REGARDING THE SERVICES PROVIDED BY …
129
From the table of frequencies as well as from the histogram type chart (figure. no.3) a distribution around the level 4 of the scale can be noticed, representing the “appropriate” alternative.
Figure no. 3 I have started with the assumption that the average of assessments on how
the meals are served is 3 points followed by testing the hypotheses in the case of the median. In order to test this hypothesis, the t Student test was applied. The results obtained showed that the average of the assessments on how the dishes ordered are served differs by 3 points.
By evaluating the responses of the interviewed persons regarding the services offered by the hotel restaurant, I found that: 77.8% of the valid responses indicated the fact that the respondents were very satisfied and satisfied, in general, with the services provided by restaurant. Intermediate level (neither-nor) was indicated by 15.7% of those who answered to this question. 6.4% of the tourists have a negative opinion on the restaurant services.
The data in the table no.5 reflect these results.
How do you appreciate the serving manner of the dishes ordered? 6 54 3 210
Fre
qu
ency
200
150
100
50
0
Histogram
Mean =3.86Std. Dev. =0.999
N =390
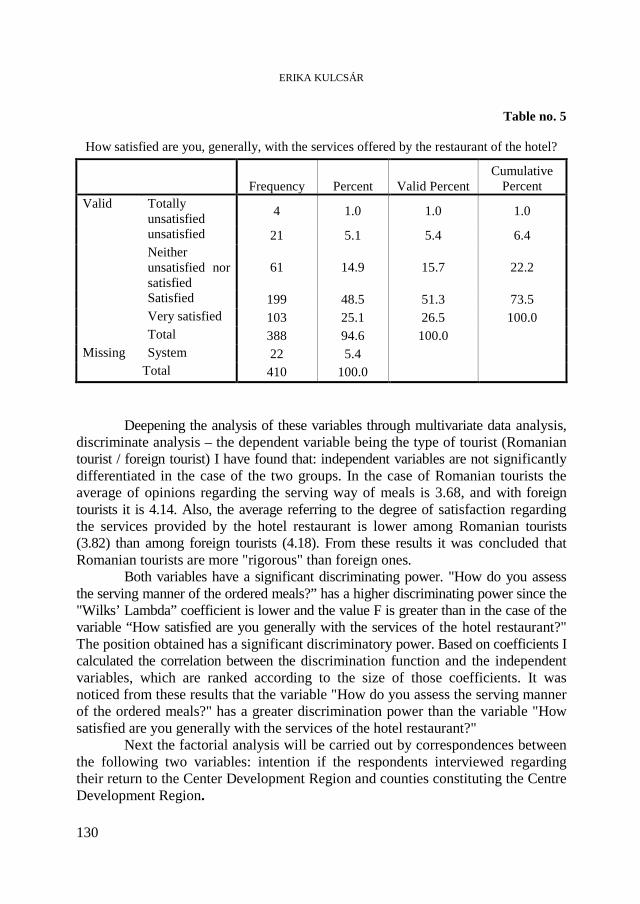
ERIKA KULCSÁR
130
Table no. 5
How satisfied are you, generally, with the services offered by the restaurant of the hotel?
Frequency Percent Valid Percent Cumulative
Percent Valid Totally
unsatisfied 4 1.0 1.0 1.0
unsatisfied 21 5.1 5.4 6.4 Neither
unsatisfied nor satisfied
61 14.9 15.7 22.2
Satisfied 199 48.5 51.3 73.5 Very satisfied 103 25.1 26.5 100.0 Total 388 94.6 100.0 Missing System 22 5.4
Total 410 100.0
Deepening the analysis of these variables through multivariate data analysis,
discriminate analysis – the dependent variable being the type of tourist (Romanian tourist / foreign tourist) I have found that: independent variables are not significantly differentiated in the case of the two groups. In the case of Romanian tourists the average of opinions regarding the serving way of meals is 3.68, and with foreign tourists it is 4.14. Also, the average referring to the degree of satisfaction regarding the services provided by the hotel restaurant is lower among Romanian tourists (3.82) than among foreign tourists (4.18). From these results it was concluded that Romanian tourists are more "rigorous" than foreign ones.
Both variables have a significant discriminating power. "How do you assess the serving manner of the ordered meals?” has a higher discriminating power since the "Wilks’ Lambda” coefficient is lower and the value F is greater than in the case of the variable “How satisfied are you generally with the services of the hotel restaurant?" The position obtained has a significant discriminatory power. Based on coefficients I calculated the correlation between the discrimination function and the independent variables, which are ranked according to the size of those coefficients. It was noticed from these results that the variable "How do you assess the serving manner of the ordered meals?" has a greater discrimination power than the variable "How satisfied are you generally with the services of the hotel restaurant?"
Next the factorial analysis will be carried out by correspondences between the following two variables: intention if the respondents interviewed regarding their return to the Center Development Region and counties constituting the Centre Development Region.

TOURISTS ATTITUDES, PREFERENCES AND OPINIONS REGARDING THE SERVICES PROVIDED BY …
131
Figure no. 4 The correspondences between the categories of response Following the analysis of the chart (figure nr.4), a strong association
between respondents from Sibiu and "yes" answer variant was noted, but also an association between the answer variant and the respondents in the counties of Harghita, Mureş, Braşov, Alba. Also, I found an association between the "I do not know" response variant and tourists in Braşov County.
The factorial analysis of correspondences between tourists’ "attitude" towards the hotel and age of respondents is presented more detailed in the following figure:
This factor analysis of correspondences shows (figure nr.5) that there is a fairly strong concentration of "yes" responses among people aged 26-35 years and between 36-45 years and of the answer "do not know" among respondents between 46 -55 years, or up to 25 years. In the case of respondents aged 56-65 years or over 65 years a concentration around "yes" alternative answer is noted.
2
1
0
-1
2.01.51.00.50.0-0.5-1.0
Alba
Harghita
Covasna
Sibiu
Mureş
BraşovDon’t know yes
no
County
Do you intend to return to this region?

ERIKA KULCSÁR
132
Figure no. 5 The correspondences between the categories of response Conclusions
In conclusion, as a result of the analysis undertaken in this research, I can say that the vast majority of tourists appreciate favorably the services offered by the hotels in the Center Development Region.
Regarding the question referring to the sources of information the respondents used to select the Center Development Region, the Internet was found to be the most important source among the respondents surveyed; this channel of advertising was mentioned by 49.5% of sample participants, followed by word of mouth of friends, colleagues, acquaintances and relatives (49.5%). There is no debate upon the importance of these channels of advertising, they are extremely important, and it is also true that the use of television as a medium of communication is costly, but it is considered that the realization of documentary films for the promotion of the Center Development Region and their broadcast on TV channels popular among "consumers" of tourism products both domestically and internationally (e.g. National Geographic) could "erase" from the potential tourists’ minds the grey color Romania is most commonly associated with and of course they would help to increase the number of tourists.
1.51.00.50.0-0.5-1.0-1.5
1.5
1.0
0.5
0.0
-0.5
-1.0
-1.5
more than 65 years old
between 56-65 years old
between 46-55 years oldbetween 36-45 years old
between 26-35 years old
Up to 25 years old
Don’t know
yes
no
Age
Would you recommend the hotel you stayed at to friends or relatives?

TOURISTS ATTITUDES, PREFERENCES AND OPINIONS REGARDING THE SERVICES PROVIDED BY …
133
Today, new consumers are influencing the pace and direction of underlying changes in the industry. The “new tourists” are more experienced travellers. Changes in consumer behaviour and values provide the fundamental driving force for the new tourism. The increased travel experience, flexibility and independent nature of the new tourists are generating demand for better quality, more value for money and greater flexibility in the travel experience. (Lupan and Mykola, 2007:38-42)
REFERENCES
Ada, M. T., (2000), Quality of tourist product, Oradea: University of Oradea Publishing House.
Cătoiu, I. and Teodorescu, N. (2004), Consumers Behaviour 2nd edition, Bucharest: Uranus.
Cătoiu, I., Bălan, C., Popescu, I. C., Orzan, Ghe., Vegheş, C., Dăneţiu, T., and Vrânceanu D. (2002), Marketing Research, Bucharest: Uranus.
Cerovic S. (2006), 'Management of tourist companies on the modern tourist market' vol. 1, no. 1, pp. 9-16, Avaible: http://www.revistadeturism.ro/content/view/ 31/78/lang,romana/ [12 Jul 2010].
Florescu, C., Mâlcomete, P. and Pop, Al. N. (2003), Marketing: Explanatory dictionary, Bucharest: Economica.
Gabroveanu E., Stan R. E.and Radneantu N. (2009), 'Analysis of Main Economic factors Influence on Romanian Tourists Number Accommodated in Romania, using Anova Method' vol. 534, no. 5, pp. 63-68, Avaible: http://www.ectap.ro/revista.php?id=49 [12 Jul 2010].
Grzinic J. (2008), 'Trends in Croatian hotel industry, Management & Marketing' vol. VI, no.1, pp.122-128, Avaible: http://www.mnmk.ro/2006.php [12 Jul 2010].
Karagiannis S. & Nedelea A. (2006), 'Tourism and the economy in touristic countries like Greece, Journal of tourism' vol. 2, no. 2, pp. 5-13, Avaible: http://www.revistadeturism.ro/content/view/32/78/lang,romana/[12 Jul 2010].
Lefter, C. (2004), Marketing Research. Theory and applications, Braşov: Infomarket. Lupan M. & Mykola L. (2007), 'Globalization in the tourism' vol. 4, no. 4, pp. 38-42,
Avaible: http://www.revistadeturism.ro/content/view/34/78/lang,romana/[12 Jul 2010].
Malhotra, K. N. (2005), Marketing Research: An Applied Orientation, 3rd edition, Budapest: Akadémia.
Purcărea I.& Paul - Raţiu M. 'Service quality management as a key for delivering the best tourist experience', Management & Marketing (2009), vol. 16, no. 4, pp. 71-90, http://www.managementmarketing.ro/arhiva.php?var[22]=en&var[1]=4&var [3]=2009[12 Jul 2010].
Shambuddoha M. & Chowdhury T. (2009) 'Opportunities of developing tourism industry in Banglades', vol. 8, no. 8, pp. 22-26, Avaible: http://www.revistadeturism.ro/content/view/30/78/lang,romana/[12 Jul 2010].