geographia - studia universitatis babes-bolyai
TRANSCRIPT
GEOGRAPHIA2/2010
ANUL LV 2010
S T U D I A
UNIVERSITATIS BABEŞ–BOLYAI
GEOGRAPHIA
2
Desktop Editing Office: 51ST B.P. Hasdeu, Cluj-Napoca, Romania, Phone + 40 264 40.53.52
CUPRINS – CONTENT – SOMMAIRE – INHALT GR. P. POP, Professor Pompei Cocean, Ph.D., at the Age of 60 and an Intensive and
Fruitful Didactic and Scientific Activity in the Field of Romanian Geography * Prof. univ. dr. Pompei Cocean, la 60 de ani de susţinută şi bogată activitate didactică şi ştiinţifică pe tărâmul Geografiei Româneşti................................................................5
VIRGIL SURDEANU, PhD. Victor Sorocovschi at the Age of 70 * Prof. univ. dr. Victor Sorocovschi la împlinirea vârstei de 70 de ani.................................................................11
G. B. HAGGARD, D. WEINDORF, H. CACOVEAN, T. RUSU J. LOFTON, Analysis of Growing Degree Days in the Transylvanian Plain, Romania * Analiza gradelor-zi de creştere în Câmpia Transilvaniei, România.............................................................13
ANDREA GÁL, Negative Effects of Mud Volcanoes on Human Society and the Built Environment * Efectele negative ale vulcanilor noroioşi asupra societăţii umane şi al mediului construit .............................................................................................................. 21
G. PANDI, S. JANOWSZKY, Neogene Climate Change in the Intra-Carpathian Basin * Schimbări climatice neogene în Bazinul Intracarpatic .................................................27
R. NEGRU, ŞT. BILAŞCO, M. CIGHER, The Methodology of Piedmontan Sediment Investigation. Case Study * Metodologia de investigare a sedimentelor piemontane. Studiu de caz .................................................................................................................33
T. TUDOSE, FL. MOLDOVAN, The Diurnal Variability of the Water Amounts Fallen During Significant Rains in North-Western Romania * Variabilitatea diurnă a cantităţilor de apă căzute în timpul ploilor semnificative, în partea de nord-vest a României .......39
AL. MUREŞAN, GABRIELA ADINA LAZĂR, Protected Elements in the Tişiţa Natural Reserve * Elemente protejate în rezervaţia naturală Tişiţa..........................................47
AGOTA-DOROTTYA DEMETER, „Travel the World!”- High School Field Trips – * “Să călătorim în lume!” - excursii geografice şcolare .................................................55
GH. ROŞIAN, R. RUSU, AL. TAHÂŞ, The Degree of Finishing of the Drainage Basins of the Transylvanian Depression * Gradul de realizare a bazinelor hidrografice din Depresiunea Transilvaniei ............................................................................................69
GH. ŞERBAN, B. MIRIŞAN, I. CÎMPEAN, H. SELAGEA, Aspects Regarding the Silting and the Basin Dynamics of Vârşolţ Reservoir (Crasna River) * Aspecte cu privire la colmatarea şi dinamica cuvetei lacului de baraj Vârşolţ (râul Crasna) .......77
MONICA MOLDOVAN, ALINA SIMION, Valorification of Geothermal Energy in the Area of Livada Village, Bihor County * Valorificarea energiei geotermale în arealul localităţii Livada, judeţul Bihor............................................................................................. 85
A. NIŢĂ, Aspects Regarding the Origin and the Evolution of the Population and Settlements in the Întorsura Buzăului Depression * Aspecte privind originea şi evoluţia populaţiei şi aşezărilor din Depresiunea Întorsura Buzăului ........................................................93
V. SURD, J. KASSAI, B. N. PĂCURAR, The Structure and Quality of the Human Factor within the Development Regions of Romania * Structura şi calitatea factorului uman în cadrul regiunilor de dezvoltare din România ................................................................. 105
ELENA PAVLUTSKAYA, N. SLUKA, TATIANA TKATCHENKO, Integration of Moscow into the Global Cities System * Integrarea Moscovei în sistemul oraşelor globale .......... 117
PÉTER BENKŐ, The International Situation of Hungary and the Position of its Mezo-regions with a View to Global Development and Competitiveness (1996-2007) * Situaţia internaţională a Ungariei şi poziţia mezo-regiunilor sale din punct de vedere al dezvoltării globale şi comptetitivităţii (1996-2007) ................................................133
I. IANOŞ, Recent Dynamics of the Foreign Direct Investments in Romania * Dinamica recentă a investiţiilor străine directe în România .......................................................139
GR. P. POP, 2009 Presidential Elections in Romania. First Round (November 22) and Second Round (December 6) * România. Alegerile prezidenţiale din anul 2009. Turul întâi (22 noiembrie) şi turul doi (6 decembrie) .................................................147
V. SURD, B. N. PĂCURAR, The Frontier – Defining the Urban Influence Area * Frontiera – definind aria de influenţă urbană................................................................................161
V. ZOTIC, V. PUIU, The Barrier Effect of the Danube in the Regional Development of the South-West – Oltenia Region. Case Study * Efectul de barieră a Dunării în dezvoltarea regională. Studiu de caz: Regiunea de Dezvoltare Sud-Vest Oltenia .........................175
V. GLIGOR, S. F. FONOGEA, Environmental Shortcomings and Geo-ecological Reballancing of Mining Sites without Activity in Maramureş County * Disfuncţiile environmentale şi reechilibrarea geoecologică a siturilor miniere cu activitate sistată din judeţul Maramureş................................................................................................189
F. FODOREAN, I. FODOREAN, The Roman Imperial Road between Sutoru and Porolissum. Cartographic and Topographic Study * Drumul roman imperial între Sutoru şi Porolissum. Studiu cartografic şi topografic ...............................................199
R. H. BĂTINAŞ, The Methodology for Assessing the Potential Attractiveness of Waterfalls as Tourist Attractions * Metodologia de evaluare a potenţialului de atractivitate generat de cascade ca obiective turistice....................................................................205
MARIA-LUMINIŢA NEAGU, I. A. IRIMUŞ, Human and Natural Resources in the Tourism Development of the Gurghiu Morpho - Hydrographic Area * Resurse antropice şi naturale în dezvoltarea turismului în aria morfo-hidrografică Gurghiu ....................213
ŞT. DEZSI, The Hydrographical Resources of Lăpuş Land – the Role in the Individualization of the System of Settlements and Specific Modalities of their Capitalization * Resursele hidrografice din Ţara Lăpuşului-rolul în individualizarea sistemului de aşezări şi modalităţi specifice de valorificare......................................................................... 221
N. CIANGĂ, ŞT. DEZSI, C. C. POP, The Influence of the Tourism Supply on the Strategy of Tourism Development in Sălaj County * Influenţa ofertei turistice asupra strategiei de dezvoltare a turismului în judeţul Sălaj..................................................................231
AL. PĂCURAR, WTO Predictions Regarding the Tendencies of Evolution of the Forms of Tourism * Predicţiile WTO cu privire la tendinţele de evoluţie a formelor de turism ...... 235
GABRIELA COCEAN, Accommodation Infrastructure in Trascău Mountains – Tourist Boarding Houses * Infrastructura de cazare în Munţii Trascău – pensiunile turistice.....247
D. M. GHERŢOIU, C. N. BOŢAN, The Educational Component in Maramureş County-Background, Failures and Strategic Elements * Componenta educaţională în judeţul Maramureş - situaţia existentă, disfuncţionalităţi şi elemente de strategie ............ 255
CSÍKI LUJZA TÜNDE, A Product of Cultural Tourism – the Most Important Thematic Routes in Romania * Un produs al turismului cultural – cele mai importante rute tematice în România....................................................................................................269
Notes and Book Reviews – Note ş i recenzi i
C. C. POP (2010), Geografie juridică. Legislaţie şi terminologie în turism – accepţii interne
şi comunitare [Juridical Geography, Legislation and Terminology in Tourism; intern and comunitar acceptance], Casa Cărţii de Ştiinţă, Cluj-Napoca, 297 p. (I. MAC).......... 279
DOINA PĂULEANU (2006), Constanţa 1878-1928. Spectacolul modernităţii târzii [Constanţa 1878-1928. Spectacle of Late Modernity], Edit. Arcade, Bucureşti, vol. I 507 p., vol. II 624 p. (AL. PĂCURAR) ......................................................................280

Professor Pompei Cocean, PhD, at six decades of life

STUDIA UNIVERSITATIS BABEŞ-BOLYAI, GEOGRAPHIA, LV, 2, 2010
PROFESSOR POMPEI COCEAN, PhD, AT THE AGE OF 60 AND AN INTENSIVE AND FRUITFUL DIDACTIC AND SCIENTIFIC
ACTIVITY IN THE FIELD OF ROMANIAN GEOGRAPHY
GR. P. POP1 Descended in the academic citadel of Cluj from the Land of Năsăud (born in Târlişua, Bistriţa-Năsăud County, on 15 August 1950), a region that has delivered valuable forerunners to the Romanian Geography, mentioning here only Tiberiu Morariu, Vasile Meruţiu or Teodor Onişor, the present-day birthday person began his university studies in 1969, at the Faculty of Biology and Geography, Specialization in Geography, graduating as national valedictorian in 1973. The initiation in the high performance scientific research took place within the Students Scientific Workshop organized by the faculty, in whose activities he assiduously took part. As result of his option for a geographer position at the “Emil Racoviţă” Institute of Speleology in Bucharest, Cluj-Napoca Branch, he carried on a prodigious activity within this institute for a decade and a half. His researches in the field of Karstology had in view the genesis and the evolution of the exokarst and endokarst forms, as well as the economic potential of the dissolution relief in general. The obtained results in the investigation work are outstanding, out of which the following worth being mentioned: the explanation of the peripheral subsidence gorges for the first time in the world, the elaboration (in collaboration with E. Silvestru) of a new theory on the genesis of the isolated massifs (klippe and olistolites) in the Trascău-Metaliferi Mountains, original contributions to the genesis of uvalas, dolinas, swallow holes, karst depressions, galleries with plane-horizontal roofs, gours, karst aquifers, etc. The arguments brought in favour of the correlation between the multilevel endokarst systems and the planation surfaces are extremely interesting and indicate a mark of indisputable originality. These results were synthesized in the work entitled Munţii Apuseni. Procese şi forme carstice [The Apuseni Mountains. Karst Processes and Forms], published by Editura Academiei Române in 2000 and awarded with the prize for scientific research by the Babeş-Bolyai University. The second important coordinate of his research in this stage, on which the doctoral thesis focused as well, namely Carstul din Munţii Apuseni, Studiu de Geografie Aplicată [The Karst of the Apuseni Mountains. Study of Applied Geography], coordinated by Prof. Tiberiu Morariu - presented in 1980 and published in 1984 by the same publishing house of the Romanian Academy, under the title of Potenţialul economic al carstului din Munţii Apuseni [The Economic Potential of Karst in the Apuseni Mountains] - was represented by the economic component of the karst relief. Initially considered an austere type of relief, without special productive valences, Pompei Cocean, Karstologist, demonstrated in his thesis that, on the contrary, the relief developed on calcareous and dolomitic soluble formations has a consistent economic potential derived from the complementarity of its agricultural, forestry, industrial, hydrological and tourist resources. The work Peşterile României. Potenţial turistic [The Caves of Romania. Tourist Potential] (Editura Dacia, 1995), awarded with the “Simion Mehedinţi” prize of the Romanian Academy (1997), must be included in the same context.
1 Babeş-Bolyai University, Faculty of Geography, 400006, Cluj-Napoca, Romania, e-mail:
GR. P. POP
8
Being attracted by the academic teaching activities, Pompei Cocean, already a passionate researcher, with a great experience in field investigations, got his transfer to the Faculty of Biology-Geography-Geology, on 15 March 1988, where he has accessed, due to his rich scientific record of achievements and to his teaching talent, all the levels of the academic hierarchy, as follows: Assistant Professor (1988-1990), Associate Professor (1990-1994), Professor (from 1994 to present). Returned to the geographical roots proper, his scientific preoccupations have broadened. A first approached direction is the one of Tourism Geography, where he has brought a series of valuable contributions such as an original structuring of the tourist resources, the emphasis and the typology of tourism risks, the structuring of the types and forms of tourism, he formulates a new method of assessing tourism potential based on value indices, accomplishes a personal tourism regionalization of the national territory, proposes new spatial models for tourist arrangements, etc. They appear in works such as Ecogeografia turismului [Tourism Ecogeography] (1992), Geografia Turismului [Tourism Geography] (1993), Geografia turismului românesc [Romanian Tourism Geography] (1997), Prospectare şi geoinformare turistică [Tourism Survey and Geoinformation] (in collaboration with Şt. Dezsi, 2001), Turismul cultural [Cultural Tourism] (2006, in French edition as well). Concomitantly, Professor Pompei Cocean has orientated himself more and more clearly towards the field of Regional Geography, where he obtains exceptional scientific results. Firstly, he elaborates, for the first time in the country, a theoretical work on the regional issue, entitled Geografie Regională [Regional Geography], published in two editions (2002 and 2005), in which a series of contributions of great originality are included, such as the ones concerning the mental space (the structure of the Romanian mental space, the typology of mental spaces, the genesis of the Carpathian archetypal mental space, the stages in the formation of the Romanian mental space), the delimitation criteria of the geographical regions (introducing for the first time the mental criterion), the typology of geographical regions, the organization of geographical time, the resilience of regional systems, etc. Karst, tourist and regional phenomena, approached with the skill of the experienced researcher, endowed with an intuition and a perception of novelty that are worth being emphasized, represent the object of the 18 books and academic courses, written as single author (to which other 12 are added, written in collaboration with different authors), elaborated and published by Professor Pompei Cocean in the period between 1979 and 2009, as follows:
1. Cocean, P. (l979), Întâlniri cu peştera, Editura Dacia, Cluj Napoca, l64 p. 2. Cocean, P. (l984), Potenţialul economic al carstului din Munţii Apuseni, Edit. Academiei,
Bucureşti, l56 p. 3. Cocean, P. (l988), Chei şi defilee din Munţii Apuseni, Edit. Academiei, Bucureşti, 166 p. 4. Cocean, P. (l991), America, Univ. “Babeş-Bolyai”, Cluj Napoca, 244 p. 5. Cocean, P. (l992), Ecogeografia turismului, Universitatea Deva, Deva, 182 p. 6. Cocean, P. (l993), Geografia turismului, Curs litografiat, Universitatea Babeş-Bolyai, Cluj
Napoca, 225 p. 7. Cocean, P. (l993), România. Ipostaze geografice, Edit. Carpatica, Cluj Napoca, 94. p. 8. Cocean, P. (l995), Peşterile României. Potenţial turistic, Edit. Dacia, Cluj Napoca, 250 p.,
144 (Premiul Academiei Române, 1997). 9. Cocean, P. (l996), Geografia turismului, Edit. Carro, Bucureşti. (Ediţia a II-a, 2004; Ediţia a
III-a, 2005), 265 p.
PROFESSOR POMPEI COCEAN, PhD, AT SIX DECADES OF LIFE
9
10. Cocean, P. (1997), Geografia turismului românesc, Edit. Focul Viu, Cluj Napoca, 152 p. 11. Cocean, P. (1998), Între Carpaţi şi Pirinei, Editura Viitorul Românesc, Bucureşti, 216 p. 12. Cocean, P. (2000), Munţii Apuseni. Procese şi forme carstice, Edit. Academiei, Bucureşti,
256 p. 13. Cocean, P. (2002), Geografie Regională, Edit. Presa Universitară Clujeană, Cluj Napoca,
157 p. 14. Cocean, P. (2003), Geographie Regionale, Curs litografiat, Univ. Babeş-Bolyai, Cluj Napoca,
146 p. 15. Cocean, P., (2005), Geografia Europei, Presa Universitară Clujeană, 157 p. 16. Cocean, P. (2005), Geografie Regională, Ediţia a II-a, revăzută şi adăugită, Presa
Universitară Clujeană, Cluj Napoca, 190 p. 17. Cocean, P. (2005), Geografia Regională a României, Proiectul pentru învăţământul rural,
Ministerul Educaţiei şi Cercetării, Bucureşti, 179 p 18. Cocean, P. (2006), Turismul cultural (Le tourisme culturel), Presa Universitară Clujeană,
Cluj Napoca, 131 p.
Secondly, Pompei Cocean has opened, through his assiduous preoccupations in the scientific research at territorial level, a wide range of preoccupations regarding the pragmatic, applicative side of Regional Geography. The 25 projects and research grants he has conducted bear witness to this affirmation. Numerous among them are of reference at national and international level, such as: PATIJ - Plan de Amenajare a Teritoriului Interjudeţean [Inter-County Spatial Arrangement Plan]; PATR - Plan de amenajare a Teritoriului Regiunii Nord-Vest [Spatial Arrangement Plan of the North-West Development Region]; Strategia de dezvoltare locală a Municipiului Craiova [Local Development Strategy of the City of Craiova]; Project SEE AF/A/638/42/X-TICAD, Tisa Catchment Area Development, a European project together with Hungary, Slovakia, Ukraine and Serbia; Plan de amenajare a teritoriului zonal inter-orăşenesc – Sinaia, Buşteni, Azuga, Predeal, Râşnov, Braşov (Poiana Braşov) [Inter-City Zonal Spatial Arrangement Plan – Sinaia, Buşteni, Azuga, Predeal, Râşnov, Braşov (Poiana Braşov)]. These projects, through their scientific benefits and the experience gained in forming the young researchers, place the Faculty of Geography of Cluj-Napoca in the outpost of national preoccupations in the field, attracting the appreciation and the respect of specialists from other fields - the work entitled Amenajarea Teritoriilor Periurbane [The Arrangement of Peri-Urban Territories] being awarded by the Romanian Register of Urban Planners. The Professor’ scientific record of achievements counts 215 books, studies and articles, published by prestigious national and international publishing houses and journals, to which the coordination and the participation in the elaboration of 69 projects and research grants are also added, the absolute majority with undoubted applicative valences. His works enjoy the attribute of being bibliographical sources frequently consulted by the specialists in Geography, more than 50 citations and reviews, appeared in international books and journals, bear witness to this and more than 350 books and monographs edited in Romania, respectively. Summed up, the scientific and the didactic activity of Professor Pompei Cocean appears as follows: books and academic courses as single author - 18/3.105 pages; books and academic courses in collaboration 12/950 pages; studies in volumes - 17/274 pages; studies as single author - 57/354 pages; studies in collaboration - 34/218 pages; studies published abroad (Germany, France, Poland) - 19/181 pages; articles, reviews, prefaces, maps - 58/ 138 pages. The balance of his creativity counts 5,220 printed pages.
GR. P. POP
10
The didactic activity has materialized in teaching courses, in an elevated manner, and in the opportune elaboration of some courses in the fields of Tourism Geography and of Regional Geography such as Tourism Geography, Tourism Survey and Arrangement, Regional Geography, Regional Geography of the Continents (Europe, Asia, America), Development Projects Management, Regional Development – Concepts and Models, etc. As doctoral thesis advisor, he has coordinated 41 theses, out of which 25 have been already defended, the series of 18 works dedicated to the “lands” of Romania being remarkable for its extent and its scientific importance. Another side of Professor Pompei Cocean’s activity is of institutional nature. Thus, he hold the office of Dean of the Faculty of Geography for two legislatures (2000-2004, 2004-2008), where he obtained unanimously appreciated managerial results. At present, he holds the office of Vice-Rector of Babeş-Bolyai University, with major attributions in the field of human resources. Within the Department of Geography of the Romanian Academy, Cluj Branch, he holds the position of first-degree scientific researcher (part time), as well as the attributions of the head of this department. Moreover, his institutional efforts were materialized in establishing the Centre for Regional Geography under the aegis of the Faculty of Geography, accredited by the National University Research Council (2005), whose director is. Professor Pompei Cocean is also the initiator of two academic journals of profile, more and more appreciated by specialists, Romanian Review of Regional Studies (edited by the above-mentioned Centre for Regional Geography, included in the B category of the National University Research Council) and Geographia Napocensis, edited by the Department of Geography of the Romanian Academy, Cluj Branch. As consequence of his remarkable accomplishments, he was elected correspondent member of the International Geographical Union, Senior Vice President of the Romanian Geographical Society, Vice President of the Romanian National Geographical Committee, member of the Romanian Register of Urban Planners, etc. Finally, we cannot omit from such a presentation with reverential valences, the literary preoccupations of the Professor in question, embodied in the seven poetry volumes published so far: 1. Arcul voltaic, Editura Albatros, Bucureşti 1986;
2. Jocul cu umbra, Editura Dacia, Cluj-Napoca, 1994; 3. Starea de labirint, Editura Focul Viu, Cluj-Napoca, 1995; 4. Floarea de rouă, Editura Dacia, Cluj-Napoca, 1998; 5. Deltele memoriei (anthology), Editura Dacia, Cluj-Napoca, 2004; 6. Vânt pieziş, Editura Limes, Cluj-Napoca, 2006; 7. Lăsarea la vatră, Editura Limes, Cluj Napoca, 2010. These original literary accomplishments of Professor Pompei Cocean, born in the
same village with Liviu Repreanu, therefore both having their origins in the Someşul Mare Hills, at the foot of the Ţibleş Mountains, with geographical and literary similarities with the one who laid the cornerstone of the Geographical School of Cluj – George Vâlsan – fully entitles his election as a select member of the Writers’Union of Romania (since 1996).
Through all he has accomplished up to this anniversary moment and having in view the time that still lies in front of him, we express our most sincere and continuous appreciations, on the one hand, and WE WISH OUR DEAR COLLEAGUE JOY AND HEALTH, ON THE OTHER HAND, AS WELL AS HAPPY BIRTHDAY!
Cluj-Napoca, 2010
STUDIA UNIVERSITATIS BABEŞ-BOLYAI, GEOGRAPHIA, LV, 2, 2010
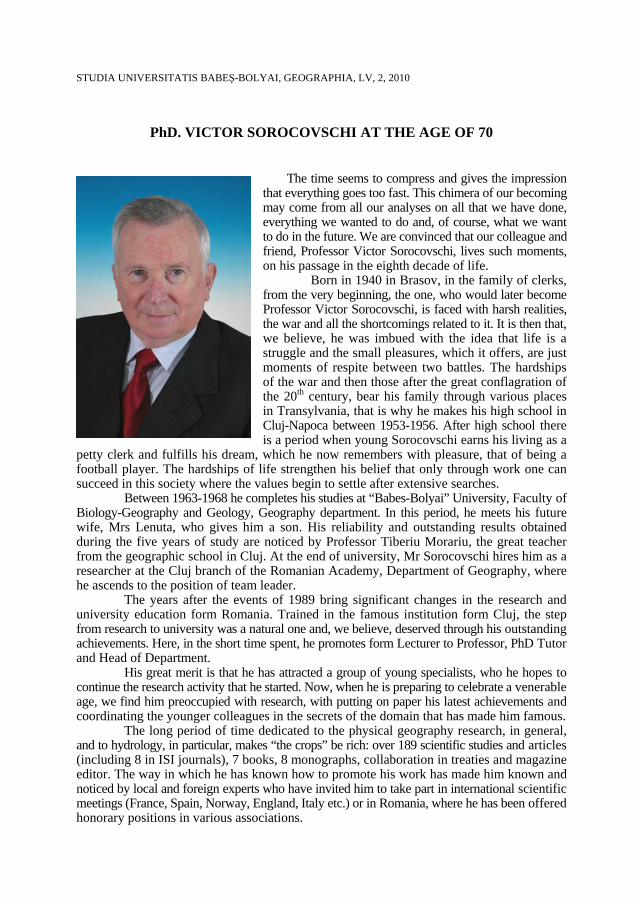
PhD. VICTOR SOROCOVSCHI AT THE AGE OF 70
The time seems to compress and gives the impression that everything goes too fast. This chimera of our becoming may come from all our analyses on all that we have done, everything we wanted to do and, of course, what we want to do in the future. We are convinced that our colleague and friend, Professor Victor Sorocovschi, lives such moments, on his passage in the eighth decade of life.
Born in 1940 in Brasov, in the family of clerks, from the very beginning, the one, who would later become Professor Victor Sorocovschi, is faced with harsh realities, the war and all the shortcomings related to it. It is then that, we believe, he was imbued with the idea that life is a struggle and the small pleasures, which it offers, are just moments of respite between two battles. The hardships of the war and then those after the great conflagration of the 20th century, bear his family through various places in Transylvania, that is why he makes his high school in Cluj-Napoca between 1953-1956. After high school there is a period when young Sorocovschi earns his living as a
petty clerk and fulfills his dream, which he now remembers with pleasure, that of being a football player. The hardships of life strengthen his belief that only through work one can succeed in this society where the values begin to settle after extensive searches.
Between 1963-1968 he completes his studies at “Babes-Bolyai” University, Faculty of Biology-Geography and Geology, Geography department. In this period, he meets his future wife, Mrs Lenuta, who gives him a son. His reliability and outstanding results obtained during the five years of study are noticed by Professor Tiberiu Morariu, the great teacher from the geographic school in Cluj. At the end of university, Mr Sorocovschi hires him as a researcher at the Cluj branch of the Romanian Academy, Department of Geography, where he ascends to the position of team leader.
The years after the events of 1989 bring significant changes in the research and university education form Romania. Trained in the famous institution form Cluj, the step from research to university was a natural one and, we believe, deserved through his outstanding achievements. Here, in the short time spent, he promotes form Lecturer to Professor, PhD Tutor and Head of Department.
His great merit is that he has attracted a group of young specialists, who he hopes to continue the research activity that he started. Now, when he is preparing to celebrate a venerable age, we find him preoccupied with research, with putting on paper his latest achievements and coordinating the younger colleagues in the secrets of the domain that has made him famous.
The long period of time dedicated to the physical geography research, in general, and to hydrology, in particular, makes “the crops” be rich: over 189 scientific studies and articles (including 8 in ISI journals), 7 books, 8 monographs, collaboration in treaties and magazine editor. The way in which he has known how to promote his work has made him known and noticed by local and foreign experts who have invited him to take part in international scientific meetings (France, Spain, Norway, England, Italy etc.) or in Romania, where he has been offered honorary positions in various associations.
VIRGIL SURDEANU
12
Among the areas that he has approached are those related to the hydro-geography of the Transylvanian Depression (the one in the Tarnavelor Plateau being the subject of his PhD thesis). But in the studies he has elaborated, Professor Sorocovschi approaches issues related to hydrogeology, climatology and the applied hydrology of the built areas. The later issue is for the first time approached by the Geographical School from Cluj. Regarded as a leading expert in this field, the Professor is invited to participate in the elaboration of economic and social development and territorial planning strategies for various regions form Transylvania. In these programmes, in addition to the problems related to water resources, Professor Sorocovschi approaches flood-related vulnerability and the risks induced by such events. In this domain, we believe, he is the leading expert in Transylvania.
In a period when the scientific research seeks to redefine its objectives, Professor Sorocovschi, together with the team of researchers from the Academy Branch, is concerned with new non-conventional energy resources, such as: solar power, wind power and hydropower.
If about the deficit character of the flow on the rivers form Transylvania Professor Sorocovschi has expressed his opinions in numerous studies, we should mention the fact that he has been, at the same time, interested in the production and silt effluence, a decisive factor in the existence of the ponds and lakes from the depression.
We seem to experience a sense of fear to interrupt the enumeration of the Professor’s merits, for fear we might omit a domain he has been interested in.
Now, at this time of celebration and balance, we believe that he has discovered a new calling, which he is experiencing together with the one he has shared his life with, that of a GRANDFATHER. Besides wishes to excel in this field, we wish him a long life, as prolific as the one he has had in the scientific field, and good health.
PhD. VIRGIL SURDEANU
STUDIA UNIVERSITATIS BABEŞ-BOLYAI, GEOGRAPHIA, LV, 2, 2010
ANALYSIS OF GROWING DEGREE DAYS IN THE
TRANSYLVANIAN PLAIN, ROMANIA
G B. HAGGARD1, D. WEINDORF1 *, H. CACOVEAN2, T. RUSU2, J. LOFTON1
ABSTRACT. – Analysis of Growing Degree Days in the Transylvanian Plain. The Transylvanian Plain (TP) is a large and diverse agronomic region located in north central Romania. Historically, planting date for crops has remained relatively constant. However, significant air and soil temperature differences exist across the TP. Growing degree days (GDDs), a measure of accumulated heat needed for plant growth and development, were analyzed at 20 stations located throughout the Transylvanian Plain, Romania. Growing degree days are preferred over maturity ratings, because they can account for temperature anomalies. The crop being considered for this study was corn. The base temperature (BT) was set at 10oC, and the upper threshold was 30oC. Two methods were used to calculate GDDs; 1) minimum and maximum daily temperatures, and 2) 24 h of averaged temperature data. Growing degree days were run from 110-199 day of year (DOY) to represent approximate planting date to tasseling. The DOY that 694 accumulated growing degree days (AGDDs) was reached at each site was then analyzed to identify differences across the TP. Three sites failed to reach 694 AGDDs by DOY 199, and were excluded from comparisons to other results. Averaged values were used to create spline interpolation maps with ArcMap 9.2 (ESRI, Redlands, CA, USA). The southeastern portion of the TP was found to tassel a month earlier assuming a planting date of 109 DOY. Four DeKalb® corn hybrids were then selected based on GDDs to tasseling, drydown, drought tolerance, and insect resistance. With a better understanding of the GDD trends across the TP, more effective planting and harvesting could be accomplished by Romanian farmers to maximize agronomic production. Keywords: soil temperature, growing degree days, agriculture, HOBO stations, Transylvania
Plain. 1. INTRODUCTION
The Transylvania Plain (TP) is a geographical region located in north-central Romania and is bordered by large rivers to the north and south, the Someşul Mare and the Mureş, respectively. The TP is ~395,000 ha and ranges from 200-600 m in elevation, with some of the highest elevations occurring in the NW region. Contrary to the name, the TP consists of rolling hills with patches of forests located mainly on the tops of hills. The region is a major agricultural zone with major crops of corn, sugar beet, wheat, sunflower, and forages. With a more proficient method of crop growth estimation, fertilization and harvesting could be achieved more effectively in farming operations of the Transylvanian
1 LSU AgCenter, 307 M.B. Sturgis Hall, Baton Rouge, LA 70803, USA. * Corresponding author: [email protected] 2 University of Agricultural Sciences and Veterinary Medicine, Cluj-Napoca, Romania, e-mail:
G B. HAGGARD, D. WEINDORF, H. CACOVEAN, T. RUSU, J. LOFTON
14
Plain (TP), Romania. Growing degree days (GDDs) have been used for many years as a method of rating the maturity of crops. Two GDD calculations are most commonly used: single-sine (BE) and averaging method [rectangular] (AM) (Arnold, 1960; Baskerville and Emin, 1969). There are other more complicated methods that have been introduced, but they have not shown a significant improvement over the aforementioned methods (Roltsch et al., 1999). The basis of growing degree days is that every crop has a base temperature (BT) at which plant growth takes place. When air temperature rises above BT, GDDs are accumulated. For example the BT for corn is usually set at 10oC. If the average temperature for a certain day was 17oC, then 7 GDDs were accumulated (Arnold, 1960). This process is conducted for the growing period of the crop, until maturity is reached. It is considered more accurate than calendar days because it can account for air temperature anomalies throughout the current growing season. All GDDs mentioned are based on oC air temperatures. Cereals and oilseeds require ~1200 GDDs with a 5 oC BT (Ash et al., 1999). Depending on the corn hybrid, the GDDs needed for silage may range from 1100 to 1200 GDDs, while grain corn could take 1100-1600 GDDs with a 10oC BT (Ash et al., 1999; Cox, 2006). Cox (2006) found that 96 to 100 calendar day corn started to tassel at around 694 GDDs in Aurora, NY. This is similar to the GDDs for some of the DeKalb® 100 day corn hybrids (Monsanto Company, 2009). Growing degree days are normally calculated using only the minimum and maximum temperatures for each day. The objectives of this study were to: (i) compare two different GDD calculation methods to serve as an initial starting point for comparing GDDs to the maturity rates of corn at twenty locations in the TP, (ii) determine if there is a need for different planting dates across the TP to maximize the use of GDD for corn, and (iii) evaluate available corn hybrids that could be planted in the TP based on GDDs.
2. MATERIALS AND METHODS
For this study, GDDs were run from approximately day of year (DOY) 110 to 199 to use available data from twenty datalogging stations to evaluate the mid-pollination GDDs of corn cultivars available from DeKalb®. The BE and AM were calculated using 24 h temperature values collected at each station (BE-Full and AM-Full) and then recalculated using only the minimum and maximum values for each day (BE-M/M and AM-M/M), giving four different values; (1) BE-Full, (2) BE-M/M, (3) AM-Full, (4) AM-M/M. Baskerville-Emin was calculated using Eq. [1a] for 24 h data and Eq. [1b] for the minimum and maximum of each day. To calculate BE, Eqs. [1c1], [1c2], and[1c3] must be evaluated and the values placed in Eqs. [1a] and [1b] (Baskerville and Emin, 1969). The AM was calculated by Eq. [2] (Arnold, 1960). BE-Full = [W * Cos(A1)] – [(BT – AVGF) * ((3.14/2) – A1)]/3.14 [1a] BE-M/M = [W * Cos(A2)] – [(BT – AVGMM) * ((3.14/2) – A2)]/3.14 [1b] A1 = Arcsine [(BT – AVGF)/W] [1c1] A2 = Arcsine [(BT – AVGMM)/W] [1c2] W = (MT – BT)/2 [1d] AMGDD = (MT – BT)/2 [2]
Where AVGF = the average temperature using the full days worth of temperature
readings, AVGMM = the average temperature using the minimum and maximum for the day, BT= base temperature, and MT= maximum temperature. The lower threshold was set at 10oC, and the upper threshold was set at 30oC, in case either the BT or MT was below or above, respectively. Outside of this temperature range, crop growth is limited.
ANALYSIS OF GROWING DEGREE DAYS IN THE TRANSYLVANIAN PLAIN, ROMANIA
15
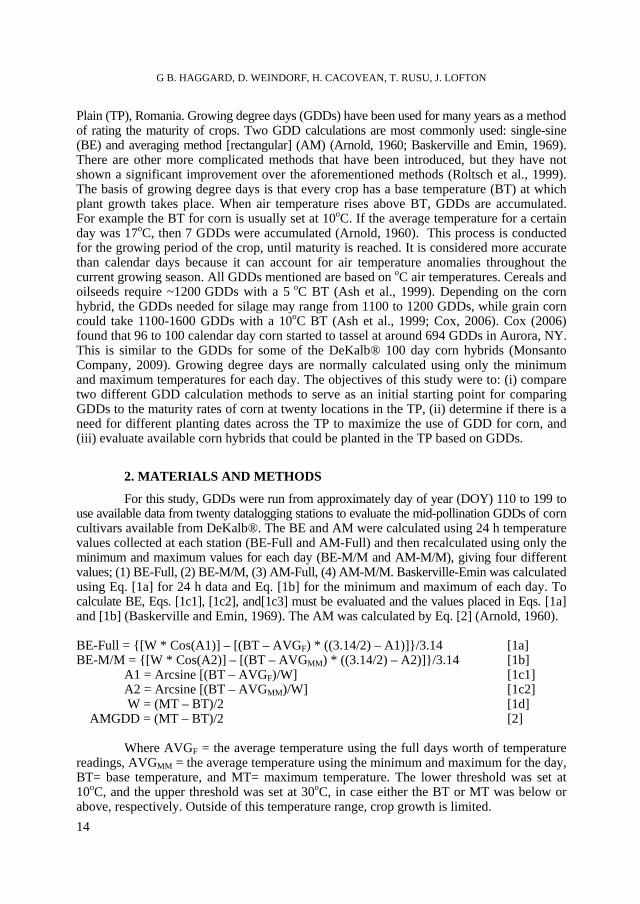
In 2009, temperature values were recorded at twenty datalogging stations by two different sensors. Ten stations without rain gauges (rain-) recorded air temperature using a 12-Bit Temperature Smart Sensor, while the other 10 (rain+) have a HOBO® Data Logging Rain Gauge (Onset Computer Corporation, Bourne, MA, USA). At the rain+ stations, temperature was recorded once every hour, while at the rain- stations, temperature was read every 2 min and a 10 min average was recorded. Table 1 shows the station configuration. Both temperature sensors are within .5 m of the surface, which removes errors that could occur due to higher elevated air temperatures not accurately describing the vegetative microclimates (Roltsch et al., 1999). The temperature data was processed in Microsoft Access 2007 to produce the minimum, maximum, and average temperature for 110-199 DOY. The temperature values were then moved to Microsoft Excel 2007 to calculate the GDDs, using the above equations.
Station configuration in the Transylvanian Plain, Romania
Table 1
Station number Station name Latitude Elevation
(m) Rain gauge
1 Balda (MS) 46.717002 360 No 2 Triteni (CJ) 46.59116 342 No 3 Luduş (MS) 46.497812 293 Yes 4 Band (MS) 46.584881 318 No 5 Jucu (CJ) 46.868676 325 Yes 6 Crăieşti (MS) 46.758798 375 No 7 Sillivaşu de Câmpie (BN) 46.781705 463 Yes 8 Dipşa (BN) 46.966299 356 Yes 9 Ţaga (CJ) 46.975769 316 No
10 Căianu (CJ) 46.790873 469 Yes 11 Cojocna (CJ) 46.748059 604 Yes 12 Unguraş (CJ) 47.120853 318 Yes 13 Braniştea (BN) 47.17046 291 Yes 14 Voiniceni (MS) 46.60518 377 Yes 15 Zau de Câmpie (MS) 46.61924 350 Yes 16 Sic (CJ) 46.92737 397 No 17 Nuşeni (BN) 47.09947 324 No 18 Matei (BN) 46.984869 352 No 19 Zorenii (BN) 46.893457 487 No 20 Filpişu Mare (MS) 46.746178 410 No
MS = Mureş county; CJ = Cluj county; BN = Bistriţa-Năsăud county. The stations in gray have incomplete data, and are not used in the interpolation maps.
The accumulated growing degree days (AGDDs) of the four methods were analyzed to find the approximate day of tasseling based on a 694 AGDDs tassel date. The data was analyzed in SAS software (SAS Institute, 2008) using the LSD test to identify any differences between sites located across the TP. Finally, the data was georeferenced to station locations in ArcMap 9.2 (ESRI, Redlands, CA, USA) to create spline interpolation maps showing the GDD trend across the TP.
G B. HAGGARD, D. WEINDORF, H. CACOVEAN, T. RUSU, J. LOFTON
16
3. RESULTS
The TP has shown some growing season variability from initial GDDs data. Table 2 shows the LSD results for the DOY that 694 AGDDs were reached at 16 sites. Three sites failed to reach 694 AGDDs by 199 DOY; the last day of data currently available. Site 3 had no air temperature data due to datalogger error.
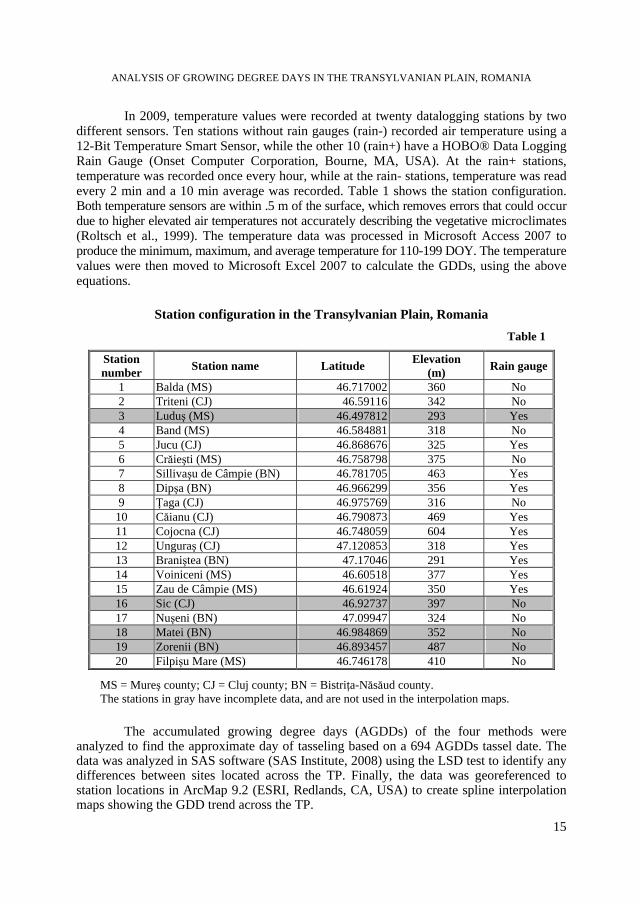
It was found that 694 AGGD were reached at 177 DOY while some sites had not reached the AGDD needed by 199 DOY. As such, sites 6 and 20 would tassel an entire month sooner than sites 8 and 14 on the plain, even with the same planting date. A slice was performed in ArcMap 9.2 (ESRI, 2006) with the same data that was evaluated in SAS using LSD, and split into 6 equal intervals (fig. 1).
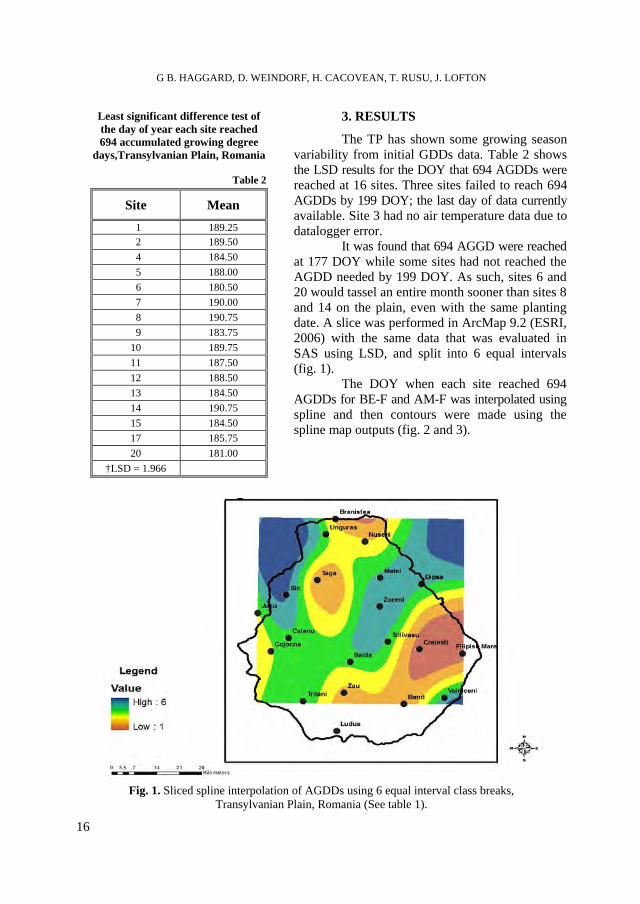
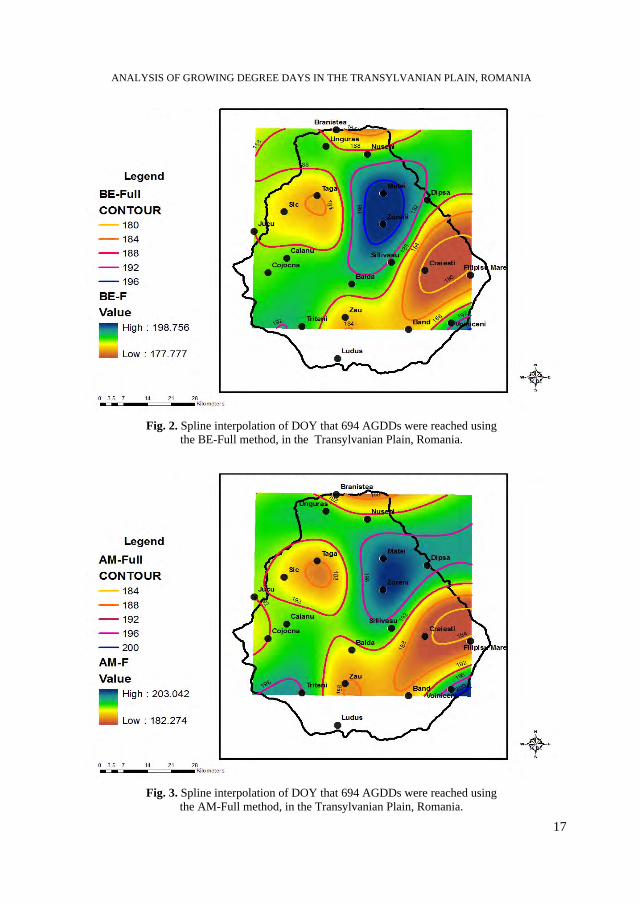
The DOY when each site reached 694 AGDDs for BE-F and AM-F was interpolated using spline and then contours were made using the spline map outputs (fig. 2 and 3).
Fig. 1. Sliced spline interpolation of AGDDs using 6 equal interval class breaks,
Transylvanian Plain, Romania (See table 1).
Least significant difference test of the day of year each site reached 694 accumulated growing degree
days,Transylvanian Plain, Romania
Table 2
Site Mean 1 189.25 2 189.50 4 184.50 5 188.00 6 180.50 7 190.00 8 190.75 9 183.75 10 189.75 11 187.50 12 188.50 13 184.50 14 190.75 15 184.50 17 185.75 20 181.00
†LSD = 1.966
ANALYSIS OF GROWING DEGREE DAYS IN THE TRANSYLVANIAN PLAIN, ROMANIA
17
Fig. 2. Spline interpolation of DOY that 694 AGDDs were reached using the BE-Full method, in the Transylvanian Plain, Romania.
Fig. 3. Spline interpolation of DOY that 694 AGDDs were reached using the AM-Full method, in the Transylvanian Plain, Romania.
G B. HAGGARD, D. WEINDORF, H. CACOVEAN, T. RUSU, J. LOFTON
18
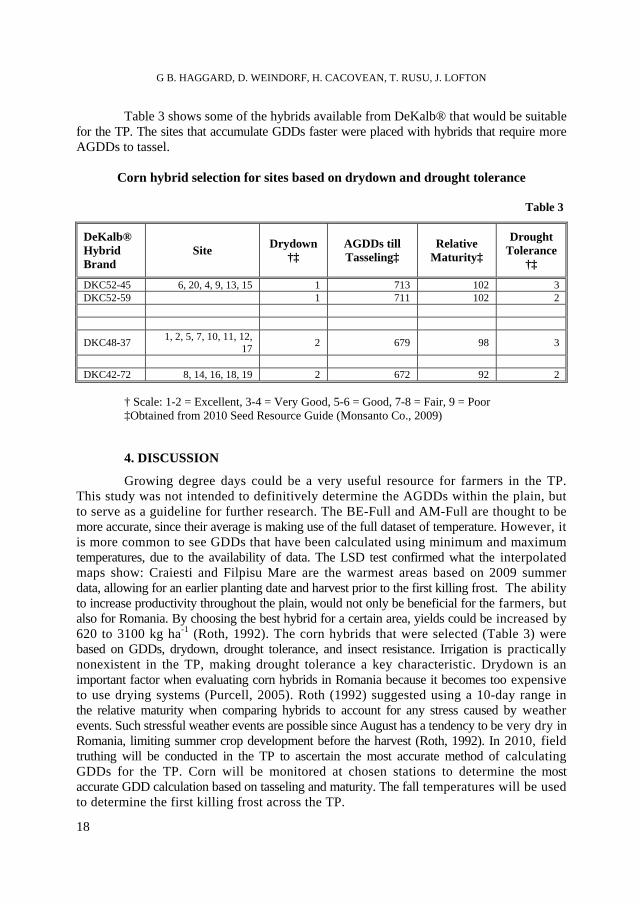
Table 3 shows some of the hybrids available from DeKalb® that would be suitable for the TP. The sites that accumulate GDDs faster were placed with hybrids that require more AGDDs to tassel.
Corn hybrid selection for sites based on drydown and drought tolerance
Table 3
DeKalb® Hybrid Brand
Site Drydown†‡
AGDDs till Tasseling‡
Relative Maturity‡
Drought Tolerance
†‡
DKC52-45 6, 20, 4, 9, 13, 15 1 713 102 3 DKC52-59 1 711 102 2
DKC48-37 1, 2, 5, 7, 10, 11, 12, 17 2 679 98 3
DKC42-72 8, 14, 16, 18, 19 2 672 92 2
† Scale: 1-2 = Excellent, 3-4 = Very Good, 5-6 = Good, 7-8 = Fair, 9 = Poor ‡Obtained from 2010 Seed Resource Guide (Monsanto Co., 2009)
4. DISCUSSION
Growing degree days could be a very useful resource for farmers in the TP. This study was not intended to definitively determine the AGDDs within the plain, but to serve as a guideline for further research. The BE-Full and AM-Full are thought to be more accurate, since their average is making use of the full dataset of temperature. However, it is more common to see GDDs that have been calculated using minimum and maximum temperatures, due to the availability of data. The LSD test confirmed what the interpolated maps show: Craiesti and Filpisu Mare are the warmest areas based on 2009 summer data, allowing for an earlier planting date and harvest prior to the first killing frost. The ability to increase productivity throughout the plain, would not only be beneficial for the farmers, but also for Romania. By choosing the best hybrid for a certain area, yields could be increased by 620 to 3100 kg ha-1 (Roth, 1992). The corn hybrids that were selected (Table 3) were based on GDDs, drydown, drought tolerance, and insect resistance. Irrigation is practically nonexistent in the TP, making drought tolerance a key characteristic. Drydown is an important factor when evaluating corn hybrids in Romania because it becomes too expensive to use drying systems (Purcell, 2005). Roth (1992) suggested using a 10-day range in the relative maturity when comparing hybrids to account for any stress caused by weather events. Such stressful weather events are possible since August has a tendency to be very dry in Romania, limiting summer crop development before the harvest (Roth, 1992). In 2010, field truthing will be conducted in the TP to ascertain the most accurate method of calculating GDDs for the TP. Corn will be monitored at chosen stations to determine the most accurate GDD calculation based on tasseling and maturity. The fall temperatures will be used to determine the first killing frost across the TP.
ANALYSIS OF GROWING DEGREE DAYS IN THE TRANSYLVANIAN PLAIN, ROMANIA
19
5. CONCLUSIONS
Growing degree days are a valuable resource in Romania with the ability to increase crop productivity. Significant differences in air temperatures exist across the TP. These differences need to be acknowledged when choosing the planting date to utilize the full growing season. DeKalb® hybrids were selected based on when 694 AGDDs were obtained at the stations and characteristics that are necessary for corn grown in the TP. Differences in air temperature across the TP are clearly evident in interpolation maps produced in ArcGIS 9.2 for 2009 data. Corn grown in the TP can be more productive with an increased knowledge of GDDs. Romania is known for many traditions, including the practice of farming the same way for generations. However, adoption of contemporary hybrids and agronomic practices holds the potential for increasing productivity on the TP.
R E F E R E N C E S
1. Ash, G.H.B., Blatta D.A., Davies B., Mitchell B.A., Raddatz R.L., Shaykewich C.F., Wilson J.L. (1999), Agricultural climate of Manitoba [Online], Available at http://www.gov.mb.ca/agriculture/climate/waa50s00.html (verified 25 Sept. 2009). Manitoba Agriculture-Food and Rural Initiatives, MB, Canada.
2. Arnold, C.Y. (1960), Maximum-minimum temperatures as a basis for computing heat units, Am. Soc. Hort. Science.
3. Baskerville, G.L., Emin P. (1969), Rapid estimation of heat accumulation from maximum and minimum temperatures, Ecology. 50.
4. Carver, S.J. (1991), Integrating multi-criteria evaluation with geographical information systems, Int. J. Geograph. Inform. Syst. 5 (3).
5. Chang K.T., Tsai B.W. (1991), The effect of DEM resolution on slope and aspect mapping., Cartography and geographic information systems 18.
6. Corbett, J.D. (1996). Dynamic crop environment classification using interpolated climate surfaces, In: Goodchild, M.F., Steyaert, L.T., Parks, B.O. (Eds.), GIS and Environmental Modeling: Progress Research Issues. GIS World Book, Fort Collins.
7. Cox, W.J. (2006), Using the number of growing degree days from the tassel/silking date to predict corn silage harvest date. What’s Cropping Up? [Online]. Available at www.css.cornell.edu/extension/WCU/Vol16No42006July-August.pdf (verified 2 Sept. 2009). Cornell University Cooperative Extension, Ithaca, NY.
8. Eastman, J.R. (1999). IDRISI 32. Guide to GIS and Image Processing, Clark Labs, Clark University, Worcester, MA, USA. IIIGEC, 1993. Atlas General del Estado de México. Secretaria de Finanzas, México.
9. ESRI (2006), ArcGIS Desktop. Release 9.2, ESRI, Redlands, CA. Monsanto Co. 2009. 2010 Seed resource guide [Online]. Available at http://www.asgrowanddekalb.com/web/pdf/products/2010_seed_resource_guide_north.pdf (verified 25 Sept. 2009). Monsanto Company, St. Louis, MO.
10. Jankowski, P., Andrienko, N., Andrienko, G. (2001), Map-centered exploratory approach to multiple criteria spatial decisionmaking, Int. J. Geograph. Inform. Sci. 15 (2).
11. Janssen, R., Rietveld, P. (1990), Multi-criteria Analysis and GIS: An Application to Agriculture Land Use in The Netherlands, In: Scholten, H., Stilwell, J. (Eds.), Geographical Information Systems for Urban and Regional Planning. Kluwer, Dordrecht, The Netherlands.
12. Kasischke E.S., Melack J.M., Dobson M.C. (1997), The use of imaging radars for ecological applications - a review, Remote Sensing of Environment 59.
G B. HAGGARD, D. WEINDORF, H. CACOVEAN, T. RUSU, J. LOFTON
20
13. Malczewski, J. (1999), GIS and Multi-criteria Decision Analysis, Wiley, New York, USA. 14. Pereira, J.M.C., Duckstein, L. (1993), A multiple criteria decision-making approach to GIS-based
land suitability evaluation, Int. J. Geograph. Inform. Syst. 7 (5). 15. Pretty JN, Shah P. (1997), Making soil and water conservation sustainable: from coercion and
control to partnerships and participation, Land Degradation & Development 8. 16. Pop, P. Gr. (2001), Depresiunea Transilvaniei, Edit. Presa Universitară Clujeană, Cluj-Napoca, 2001). 16. Purcell, B. (2005), Romania and Bulgaria: Crop travel confirms bumper winter and spring crops
[Online]. Available at http://www.fas.usda.gov/pecad/highlights/2004/11/eu_travel_pt2/index.htm (verified 15 Sept. 2009). USDA-FAS-PECAD, Washington DC.
17. Roltsch, W.J., Zalom F.G., Strawn A.J., Strand J.F., Pitcairn M.J. (1999), Evaluation of several degree-day estimation methods in California climates, Int. J. Biometeorol. 42.
18. Roth, G.W. (1992), Considerations for selecting corn hybrids in Pennsylvania [Online]. Available at http://cropsoil.psu.edu/extension/facts/agfact34.pdf (verified 24 Sept. 2009). Agronomy Facts 34, Penn State Cooperative Extension, Pennsylvania State University, University Park, PA.
19. Saaty, T.L. (1980), The Analytic Hierarchy Process. Planning, Priority Setting, Resource Allocation, McGraw Hill, New York, USA.
20. SAS Institute (2008), The SAS system for Windows, Release 9.2. SAS Inst. Inc., Cary, NC.
STUDIA UNIVERSITATIS BABEŞ-BOLYAI, GEOGRAPHIA, LV, 2, 2010
NEGATIVE EFFECTS OF MUD VOLCANOES ON
HUMAN SOCIETY AND THE BUILT ENVIRONMENT
ANDREA GÁL1
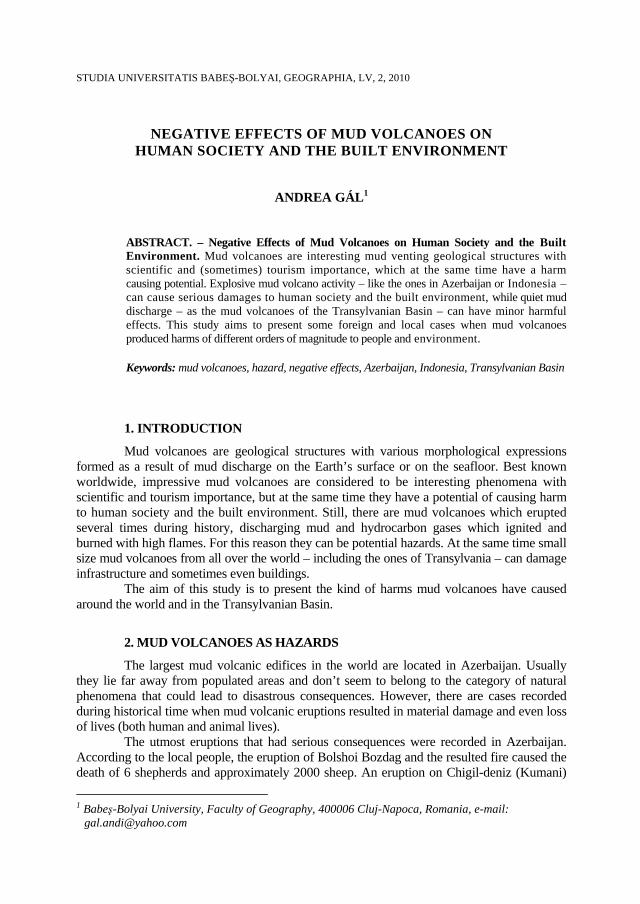
ABSTRACT. – Negative Effects of Mud Volcanoes on Human Society and the Built Environment. Mud volcanoes are interesting mud venting geological structures with scientific and (sometimes) tourism importance, which at the same time have a harm causing potential. Explosive mud volcano activity – like the ones in Azerbaijan or Indonesia – can cause serious damages to human society and the built environment, while quiet mud discharge – as the mud volcanoes of the Transylvanian Basin – can have minor harmful effects. This study aims to present some foreign and local cases when mud volcanoes produced harms of different orders of magnitude to people and environment.
Keywords: mud volcanoes, hazard, negative effects, Azerbaijan, Indonesia, Transylvanian Basin
1. INTRODUCTION
Mud volcanoes are geological structures with various morphological expressions formed as a result of mud discharge on the Earth’s surface or on the seafloor. Best known worldwide, impressive mud volcanoes are considered to be interesting phenomena with scientific and tourism importance, but at the same time they have a potential of causing harm to human society and the built environment. Still, there are mud volcanoes which erupted several times during history, discharging mud and hydrocarbon gases which ignited and burned with high flames. For this reason they can be potential hazards. At the same time small size mud volcanoes from all over the world – including the ones of Transylvania – can damage infrastructure and sometimes even buildings.
The aim of this study is to present the kind of harms mud volcanoes have caused around the world and in the Transylvanian Basin.
2. MUD VOLCANOES AS HAZARDS
The largest mud volcanic edifices in the world are located in Azerbaijan. Usually they lie far away from populated areas and don’t seem to belong to the category of natural phenomena that could lead to disastrous consequences. However, there are cases recorded during historical time when mud volcanic eruptions resulted in material damage and even loss of lives (both human and animal lives).
The utmost eruptions that had serious consequences were recorded in Azerbaijan. According to the local people, the eruption of Bolshoi Bozdag and the resulted fire caused the death of 6 shepherds and approximately 2000 sheep. An eruption on Chigil-deniz (Kumani) 1 Babeş-Bolyai University, Faculty of Geography, 400006 Cluj-Napoca, Romania, e-mail:
ANDREA GÁL
22
Island and the sudden ignition of the emitted gas set the whole island in a blaze, while the flames reaching up to 60 m destroyed the buildings and, as a result, some families perished including 5 children as well (Jevanshir, 1997).
In some cases eruptions can be associated with burning flames of couple of hundred of meters in height (but in average 77 m, Bagirov et al., 1996), in others they only erupt mud and gases without ignition. For example in 1931 the Waimata Valley mud volcano from New Zealand discharged 150000 m3 of mud, in 1954 the Tashmardan from Azerbaijan 4000000 m3 of mud, whereas the Chatham volcano in 1964 emitted 255000 m3 of mud and rocks and formed an island on the southern coast of Trinidad, reaching a height of 2 meters above sea level. In 1947 almost 500 million cubic meters of gas were thrown into the atmosphere during the eruption of Tourogay mud volcano in Azerbaijan (Feyzullayev, 2003).
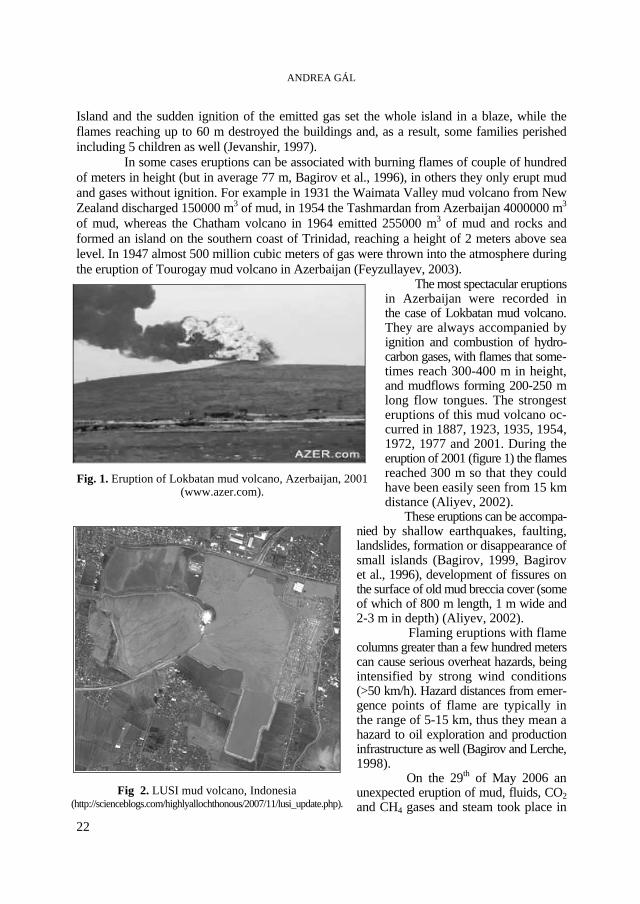
The most spectacular eruptions in Azerbaijan were recorded in the case of Lokbatan mud volcano. They are always accompanied by ignition and combustion of hydro-carbon gases, with flames that some-times reach 300-400 m in height, and mudflows forming 200-250 m long flow tongues. The strongest eruptions of this mud volcano oc-curred in 1887, 1923, 1935, 1954, 1972, 1977 and 2001. During the eruption of 2001 (figure 1) the flames reached 300 m so that they could have been easily seen from 15 km distance (Aliyev, 2002). These eruptions can be accompa-
nied by shallow earthquakes, faulting, landslides, formation or disappearance of small islands (Bagirov, 1999, Bagirov et al., 1996), development of fissures on the surface of old mud breccia cover (some of which of 800 m length, 1 m wide and 2-3 m in depth) (Aliyev, 2002).
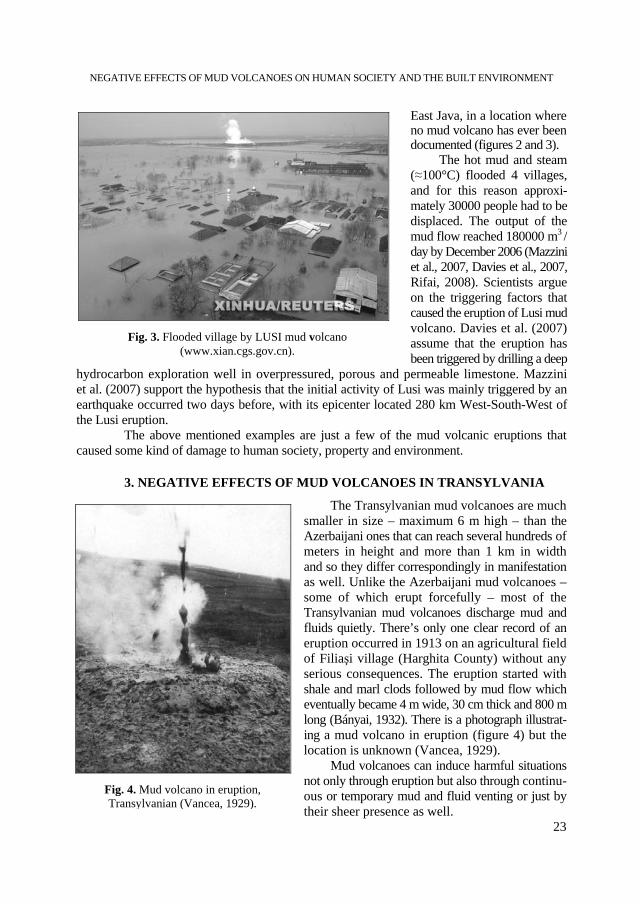
Flaming eruptions with flame columns greater than a few hundred meters can cause serious overheat hazards, being intensified by strong wind conditions (>50 km/h). Hazard distances from emer-gence points of flame are typically in the range of 5-15 km, thus they mean a hazard to oil exploration and production infrastructure as well (Bagirov and Lerche, 1998). On the 29th of May 2006 an unexpected eruption of mud, fluids, CO2 and CH4 gases and steam took place in
Fig 2. LUSI mud volcano, Indonesia
(http://scienceblogs.com/highlyallochthonous/2007/11/lusi_update.php).
Fig. 1. Eruption of Lokbatan mud volcano, Azerbaijan, 2001 (www.azer.com).
NEGATIVE EFFECTS OF MUD VOLCANOES ON HUMAN SOCIETY AND THE BUILT ENVIRONMENT
23
Fig. 3. Flooded village by LUSI mud volcano (www.xian.cgs.gov.cn).
East Java, in a location where no mud volcano has ever been documented (figures 2 and 3). The hot mud and steam (≈100°C) flooded 4 villages, and for this reason approxi-mately 30000 people had to be displaced. The output of the mud flow reached 180000 m3 / day by December 2006 (Mazzini et al., 2007, Davies et al., 2007, Rifai, 2008). Scientists argue on the triggering factors that caused the eruption of Lusi mud volcano. Davies et al. (2007) assume that the eruption has been triggered by drilling a deep
hydrocarbon exploration well in overpressured, porous and permeable limestone. Mazzini et al. (2007) support the hypothesis that the initial activity of Lusi was mainly triggered by an earthquake occurred two days before, with its epicenter located 280 km West-South-West of the Lusi eruption.
The above mentioned examples are just a few of the mud volcanic eruptions that caused some kind of damage to human society, property and environment.
3. NEGATIVE EFFECTS OF MUD VOLCANOES IN TRANSYLVANIA
The Transylvanian mud volcanoes are much smaller in size – maximum 6 m high – than the Azerbaijani ones that can reach several hundreds of meters in height and more than 1 km in width and so they differ correspondingly in manifestation as well. Unlike the Azerbaijani mud volcanoes – some of which erupt forcefully – most of the Transylvanian mud volcanoes discharge mud and fluids quietly. There’s only one clear record of an eruption occurred in 1913 on an agricultural field of Filiaşi village (Harghita County) without any serious consequences. The eruption started with shale and marl clods followed by mud flow which eventually became 4 m wide, 30 cm thick and 800 m long (Bányai, 1932). There is a photograph illustrat-ing a mud volcano in eruption (figure 4) but the location is unknown (Vancea, 1929). Mud volcanoes can induce harmful situations not only through eruption but also through continu-ous or temporary mud and fluid venting or just by their sheer presence as well.
Fig. 4. Mud volcano in eruption, Transylvanian (Vancea, 1929).
ANDREA GÁL
24
Mud pool type mud volcanoes most frequently affect animals. As they represent a source of water and (sometimes) salt, animals are attracted by this and sometimes sink in the mud pools as a consequence. As mud pools are the most frequent in the Transylvanian Basin (Gál, 2009), they can represent an everyday problem for farmers.
Mud volcanoes may affect roads if they are not taken into account when transport infrastructure is built or in cases when they appear after the road has already been built. In the eastern part of the Transylvanian Basin, there were two cases where mud volcanic manifestation provoked damages to roads.
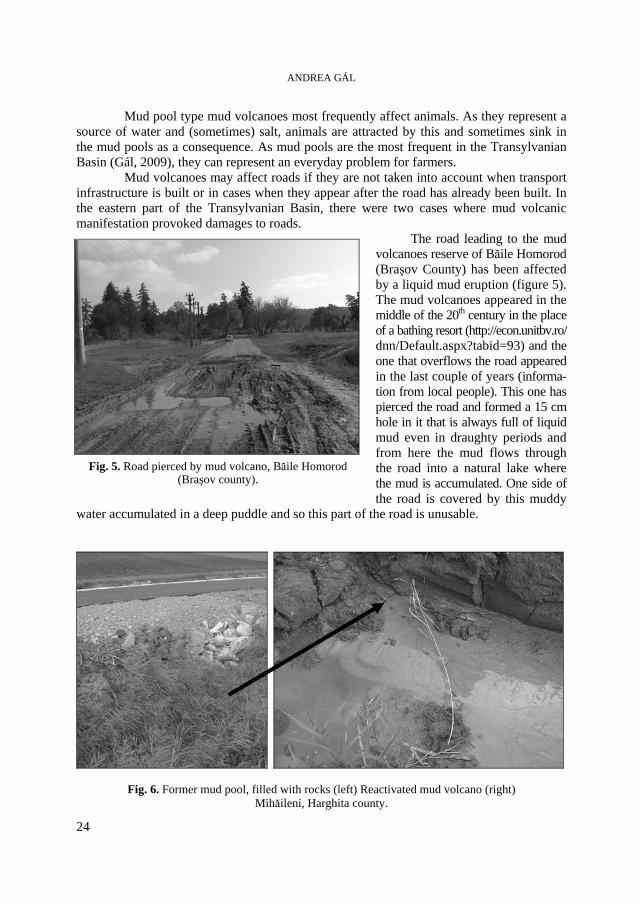
The road leading to the mud volcanoes reserve of Băile Homorod (Braşov County) has been affected by a liquid mud eruption (figure 5). The mud volcanoes appeared in the middle of the 20th century in the place of a bathing resort (http://econ.unitbv.ro/ dnn/Default.aspx?tabid=93) and the one that overflows the road appeared in the last couple of years (informa-tion from local people). This one has pierced the road and formed a 15 cm hole in it that is always full of liquid mud even in draughty periods and from here the mud flows through the road into a natural lake where the mud is accumulated. One side of the road is covered by this muddy
water accumulated in a deep puddle and so this part of the road is unusable.
Fig. 6. Former mud pool, filled with rocks (left) Reactivated mud volcano (right) Mihăileni, Harghita county.
Fig. 5. Road pierced by mud volcano, Băile Homorod (Braşov county).
NEGATIVE EFFECTS OF MUD VOLCANOES ON HUMAN SOCIETY AND THE BUILT ENVIRONMENT
25
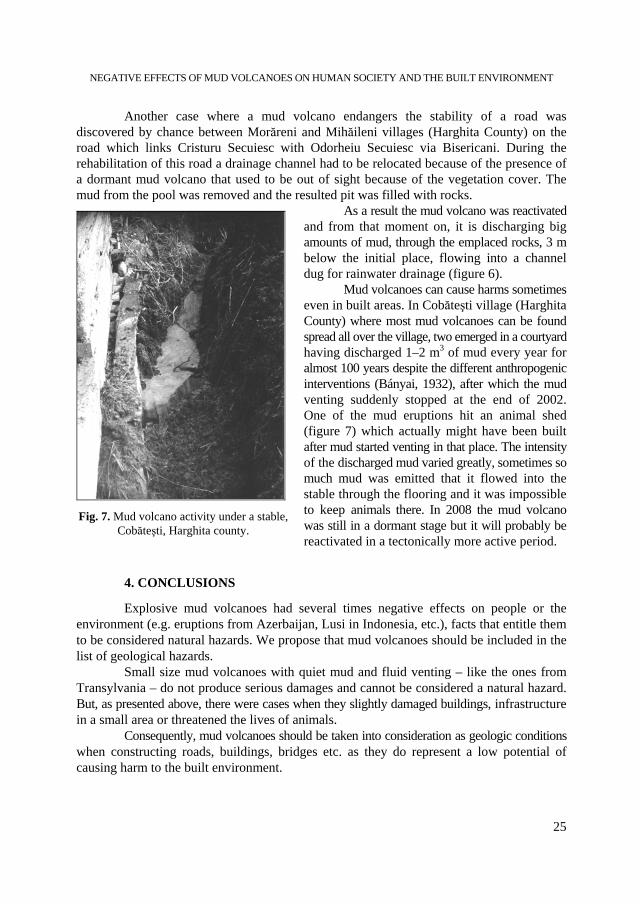
Another case where a mud volcano endangers the stability of a road was discovered by chance between Morăreni and Mihăileni villages (Harghita County) on the road which links Cristuru Secuiesc with Odorheiu Secuiesc via Bisericani. During the rehabilitation of this road a drainage channel had to be relocated because of the presence of a dormant mud volcano that used to be out of sight because of the vegetation cover. The mud from the pool was removed and the resulted pit was filled with rocks.
As a result the mud volcano was reactivated and from that moment on, it is discharging big amounts of mud, through the emplaced rocks, 3 m below the initial place, flowing into a channel dug for rainwater drainage (figure 6).
Mud volcanoes can cause harms sometimes even in built areas. In Cobăteşti village (Harghita County) where most mud volcanoes can be found spread all over the village, two emerged in a courtyard having discharged 1–2 m3 of mud every year for almost 100 years despite the different anthropogenic interventions (Bányai, 1932), after which the mud venting suddenly stopped at the end of 2002. One of the mud eruptions hit an animal shed (figure 7) which actually might have been built after mud started venting in that place. The intensity of the discharged mud varied greatly, sometimes so much mud was emitted that it flowed into the stable through the flooring and it was impossible to keep animals there. In 2008 the mud volcano was still in a dormant stage but it will probably be reactivated in a tectonically more active period.
4. CONCLUSIONS
Explosive mud volcanoes had several times negative effects on people or the environment (e.g. eruptions from Azerbaijan, Lusi in Indonesia, etc.), facts that entitle them to be considered natural hazards. We propose that mud volcanoes should be included in the list of geological hazards.
Small size mud volcanoes with quiet mud and fluid venting – like the ones from Transylvania – do not produce serious damages and cannot be considered a natural hazard. But, as presented above, there were cases when they slightly damaged buildings, infrastructure in a small area or threatened the lives of animals.
Consequently, mud volcanoes should be taken into consideration as geologic conditions when constructing roads, buildings, bridges etc. as they do represent a low potential of causing harm to the built environment.
Fig. 7. Mud volcano activity under a stable, Cobăteşti, Harghita county.
ANDREA GÁL
26
R E F E R E N C E S
1. Aliyev, A. A., I. S. Guliyev, I. S. Belov (2002), Catalogue of Recorded Eruptions of Mud Volcanoes of Azerbaijan for Period of Years 1810 –2001, Edit. Nafta, Azerbaijan.
2. Bagirov, E., R. Nadirov, and I. Lerche (1996), Flaming eruptions and ejections from mud volcanoes in Azerbaijan: Statistical risk assessment from the historical records, Energy Exploration & Exploitation, 14, Nr. 6.
3. Bagirov, E., Lerche, I. (1988), Flame hazards in the South Caspian basin, Energy Exploration & Exploitation, vol. 16, nr 4.
4. Bányai J. (1932), Udvarhely vármegye iszapforrásai, Edit. Erdélyi Múzeum, 17/1. 5. Davies, R. J., Swarbrick, R. E., Evans, R. J., Huuse, M. (2007), Birth of a mud volcano: East Java,
29 May 2006, GSA Today, v. 17, no. 2, doi: 10.1130/GSAT01702A.1. 6. Feyzullayev, A.A. (2003), Geological conditions and peculiarities of mud volcanoes formation,
Abstracts of AAPG Annual Meeting, Salt Lake City, Utah, May 11–14, 2003. 7. Gál A. (2009), Classification of Mud Volcanoes in the Eastern and Central Part of the Transylvanian
Depression, Studia UBB, Geographia, 2/2009. 8. Jevanshir, R. D. (1997), All About Mud Volcanoes, Edit. “Azerbaijan”, Baku, Azerbaijan. 9. Mazzini, A., Svensen, H., Akhmanov, G.G., Aloisi, G., Planke, S., Malthe-Sørenssen, A., Istadi, B. (2007),
Triggering and dynamic evolution of the LUSI mud volcano, Indonesia, Earth and Planetary Science Letters, Nr. 261.
10. Pop, P. Gr. (2001), Depresiunea Ttransilvaniei, Edit. Presa Universitară Clujeană, Cluj-Napoca, 2001. 11. Rifai R. (2008), Spatial Modelling and Risk Assesment of Sidoarjo Mud Volcanic Flow, MSc thesis,
Gadjah Mada University, Yogyakarta, Indonesia. 12. Vancea, A. (1929), Observaţiuni geologice în regiunea de sud-west a Câmpiei Ardelene, PhD thesis,
Mediaş, Romania. 13. *** www.azer.com, Eruption of Lokbatan mud volcano, Azerbaijan, 2001 14. ***http://scienceblogs.com/highlyallochthonous/2007/11/lusi_update.php, Satelite image, LUSI, the
man made mud volcano, Sidoarjo, Indonesia 15. *** www.xian.cgs.gov.cn, Flooded village by LUSI mud volcano, Sidoarjo, Indonesia 16. ***http://econ.unitbv.ro/dnn/Default.aspx?tabid=93, Rezervaţia Vulcanii Noroioşi de la Homorod,
judeţul Braşov
STUDIA UNIVERSITATIS BABEŞ-BOLYAI, GEOGRAPHIA, LV, 2, 2010
NEOGENE CLIMATE CHANGE IN THE INTRA-CARPATHIAN BASIN
G. PANDI1, S. JANOWSZKY2
ABSTRACT. – Neogene Climate Change in the Intra-Carpathian Basin. The Neogene climate was characterized by relatively small climate changes. However, tectonic and volcanic events, the isostatic movements and the evolution of the water covered areas, have influenced the climatic factors course, which took a cyclical character. The research methods considered the evolution of flora, fauna, din flagellates, facieses etc. Different methods often reached common conclusions, which facilitated the reconstitution of the paleoclimate. Early Neogene was characterized by cold at first, followed by a gradual warming, and relatively high humidity. In the Middle Neogene there was a long period of cooling, followed by a gradual, but very slight, warming. Rainfall has suffered a general decline. Abrupt climate oscillations occurred only in the late Neogene. The local character of climate emphasizes and the climate of mountain areas appears. At the end of Neogene the general characters of the climate approaches those of today. Key words: Temperature, precipitation, flora, fauna, research methods. 1. INTRODUCTION
The debut of the Neogene is similar to savic phase of alpine folding that was characteristic for the ending of Oligocene and the first part of the Miocene. The sediments of the Thethy’s geosyncline were folded, and the communication between both northern and southern European part of the sea basin was cut. As a result of sedimentation cycle the most part of Europe is uplifted above of the sea level.
Within Intra-Carpathian Depression the first lands having no Palaeogene sediments comes out. Tethys Sea closing triggered the small tectonic plates movement located between Gondwana and Laurasia. As a result, Parathethys and Mediteranean basins part were formed. These are the limits north and south of Alpine orogenese.
The tectonic plates drift have been simultaneous with the collapse of the area as a result of subduction processes triggering volcanic activities as island arc types.
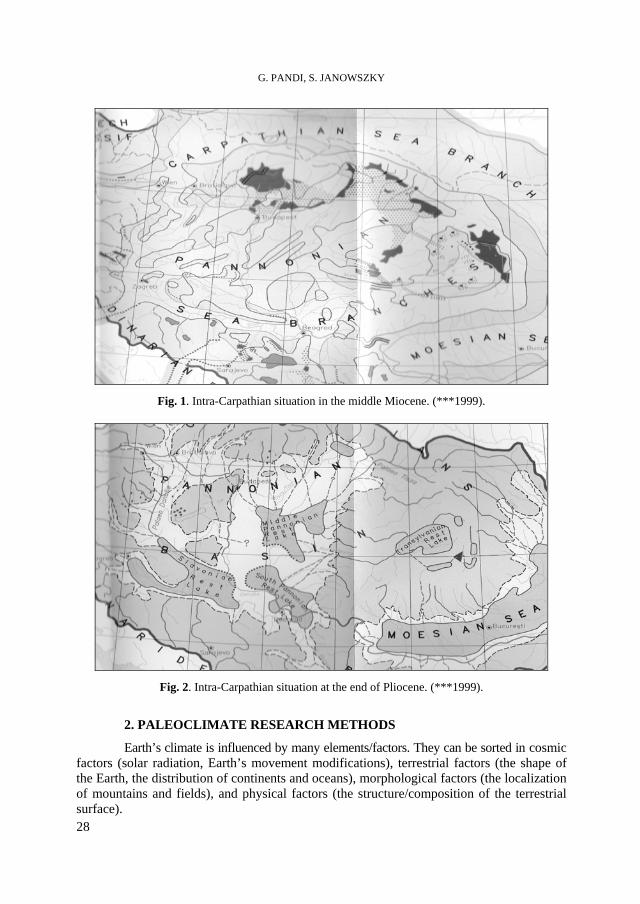
Simultaneous with orogenic movement in mountain range, in the middle of Miocene, Intra-Carpathian Depression is formed. In the same time the Carpathian orogenic belt has the Moesian Ponthic and Carpathian seas in outer neighbour areas and in inner part the Pannonian Sea that is active during the transgression periods.
At the end of Pliocene, as a consequence of successive isostatic movements, there are only a few lakes left in the Intra - Carpathian Basin, among others, the Transylvanian and Panonian ones. Their adjacent areas are highly different while Transylvanian Basin is quite stabile. ________________________ 1 Babeş-Bolyai University, Faculty of Geography, 400006, Cluj-Napoca, Romania, e-mail:
[email protected] 2. Kodolanyi Janos College, 5387, Oroshaza, Hungary, e-mail: [email protected]
G. PANDI, S. JANOWSZKY
28
Fig. 1. Intra-Carpathian situation in the middle Miocene. (***1999).
Fig. 2. Intra-Carpathian situation at the end of Pliocene. (***1999).
2. PALEOCLIMATE RESEARCH METHODS
Earth’s climate is influenced by many elements/factors. They can be sorted in cosmic factors (solar radiation, Earth’s movement modifications), terrestrial factors (the shape of the Earth, the distribution of continents and oceans), morphological factors (the localization of mountains and fields), and physical factors (the structure/composition of the terrestrial surface).
NEOGENE CLIMATE CHANGE IN THE INTRA-CARPATHIAN BASIN
29
The spatial-temporal modifications of these factors have caused climatic changes, of different intensity, which led to corresponding risks during the evolution of Earth’s abiotic and biotic compounds. The paleoclimate’s means of reconstruction are based on this tight connection between geomorphologic processes (erosion/denudation and accumulation) and biotic component’s characteristics (vegetal groupings/associations and fauna) as climatic indicators on the one hand and the main climatic elements (temperature and precipitation) on the other hand. The parallelism between air and ocean’s water temperature variation is also relevant.
The reconstruction of climatic characteristics is due to the functional connections between them:
- the characteristics of the sediments/deposits indicate the climatic conditions of their formation;
- deposits preserve the remains and proofs of flora and fauna; - there are flora and fauna elements that are specific only to a certain season; - pollen or dinoflagellate analysis indicates the age of the deposits; - different methods of facieses’ analysis indicate their relative or absolute age. The fossils indicate the place and the forming conditions of the facieses: submersion,
emersion, lagoon, draughty climate, wet climate etc. The vegetation is much more intolerant towards climatic characteristics than animals; therefore, it is seen as a much more precise indicator from this point of view. On the other hand, the aquatic fauna is much more similar on very large surfaces; therefore, the submerged facieses can indicate general climatic characteristics.
The most relevant indicators of the climatic conditions, on which analysis are based the research methods, are the following: flora, dinoflagellates, vertebrate fauna, the facieses.
Flora The sedimentary layers frequently contain remains and traces of flora. Because the
vegetation is related to a specific area and it is very sensitive to climatic characteristics, it is a very precise climatic indicator. It must be taken into consideration that sometimes the pollen and microfossils, reaching into the great circuits of airflows, can travel significant distances. They indicate regional climatic conditions, while macrofossils show the climatic characteristics of the convergence area of the sediments (Sümegi P., 2001). The quantity and quality of the vegetation is changing according to temperature and humidity.
Dinoflagellates These unicellular algae are very sensitive to climatic changes, because they adapt
to the salinity and temperature of the water they live in. Their protoplasma contains chlorophyll pigment, and their shield contains cellulose. Their characteristics and the number of individuals in the fine abyssal marine deposits indicate the forming conditions of those facieses.
Vertebrate fauna It has a special significance, because the animal’s skeleton preserves itself in great
conditions inside the deposit layers. Relatively rapid evolution of animal kingdom allowed reconstruction of climatic conditions on short periods. Characteristics and dimension of skeletons, the number of individuals, species richness, and the spatial-temporal repartition are witness of life’s environments and climatic elements. The fossils morphology is an indicator of feeding characteristics and can be differentiated ecological types: insectivorous, grass-eating, and carnivorous ones. The primary consumers are in a strong bond with vegetable association, with vegetable productivity and complexity. Secondary consumers are an indicator of humid climate, where insects have an optimum of life conditions. The feeding and body size are in a strong relation with the life habitat, characteristic vegetation and climatic conditions.
G. PANDI, S. JANOWSZKY
30
The facieses They are indicators of all abiotic and biotic formation characteristics of sedimentation
within an area. It can be differentiated facieses that were formed in subaerial and subaquatic conditions. The subaquatic facieses are more homogeneous and better preserved and the terrestrial ones are more divers. Based on their analysis it can be determined the formation place (shore, shallow waters, pelagic water, glacial and nival environments, temperate climate, desert, and tropical environments). Because of these research methods, different characteristics of paleogeographic landscapes can be reconstructed, including climatic characteristics. Their succession is a witness of the geographical landscape evolution synthesis, of the great moment of change, occurrence and profoundness induced risks.
3. THE EVOLUTION OF PALEOCLIMATE IN NEOGENE
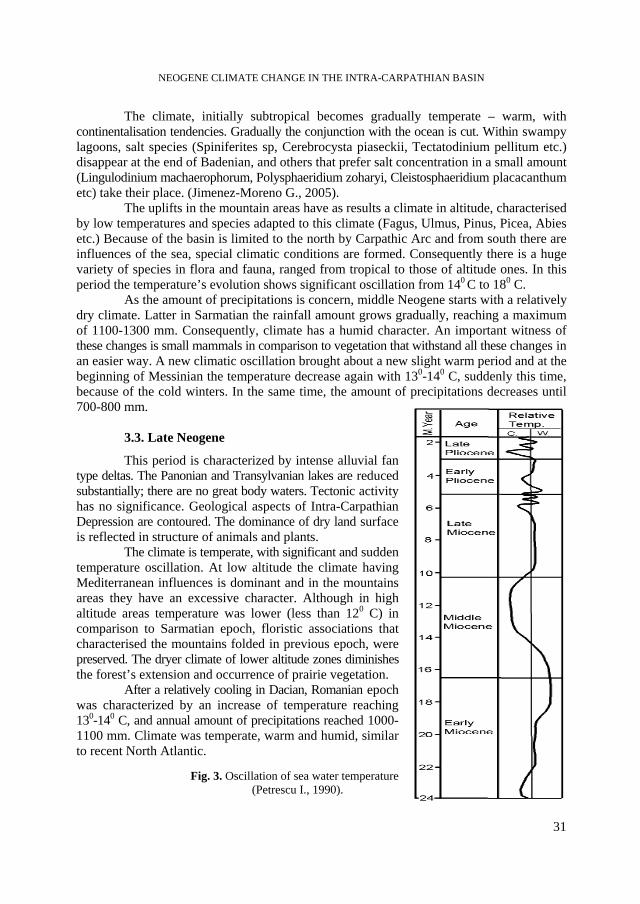
At the end of Palaeogene the climate of intra-Carpathian region was warm and humid, having temperature of 180 C and precipitation around 1000-1200 mm. From Partethys Sea and western direction, strong climatic influences were experimented. The climate of Neogene was characterized by cyclic evolutions having different length of time; well distinguish within flora and fauna. There is a strong relationship between air and ocean oscillation of temperature; diagram of Muler mentioned by Petrescu, is a relevant source of cold and warm period’s expression.
3.1. Early Neogene
Paleobiotic research indicates that flora has not suffered substantial changes, but the species that resist to warming up became more frequent. The monsoonic influences that characterize the end of Paleocene diminish, having placed the transition to a more arid climate. The temperature decrease around 10 C. Even so, the forests from swamps have formed deposits of sub-bituminous coal, emphasizing the persistence of a warm climate tropical-subtropical. The forests were composed by palm tree and bay. They were frequently flooded caused by sea level oscillations. Meantime the vegetation is the expression of a humid climate when the amounts of precipitations were around 1800 mm. A slight decrease a temperature has followed, and then, in Karpathian, in Central Europe, the temperature reached an optimum climatic with the presence of Gavialosuchus, Kameleon, Channaidae, varans, crocodiles. Amid of Miocene, all these assumed a new warming of climate and the existence of an isthmus joining Asia-Africa and Europe. The new species of animals have lived within an area covered by rich vegetation; species as Acacia, Buxus bahamensis, Caesalpiniaceae, Chloranthaceae, Sapotaceae etc. The results of some sporopollenin research show the existence of some regional differences within structure of vegetation and influence of great landscape units. All these are consequences of slight climatic differences.
3.2. Middle Miocene
Because of a great transgression, waters cover a part of an intra-Carpathian area. Consequently, volcanic eruptions become actives, and Dej volcanic ash has been sedimented. Geological event have a strong influence upon the climate. The analysis of salt deposits that has been formed in that time emphasized that climatic parameters were not of extreme arid as there was initially supposed; after that, a long period of coldness followed (Petrescu I., 1990).
NEOGENE CLIMATE CHANGE IN THE INTRA-CARPATHIAN BASIN
31
The climate, initially subtropical becomes gradually temperate – warm, with continentalisation tendencies. Gradually the conjunction with the ocean is cut. Within swampy lagoons, salt species (Spiniferites sp, Cerebrocysta piaseckii, Tectatodinium pellitum etc.) disappear at the end of Badenian, and others that prefer salt concentration in a small amount (Lingulodinium machaerophorum, Polysphaeridium zoharyi, Cleistosphaeridium placacanthum etc) take their place. (Jimenez-Moreno G., 2005).
The uplifts in the mountain areas have as results a climate in altitude, characterised by low temperatures and species adapted to this climate (Fagus, Ulmus, Pinus, Picea, Abies etc.) Because of the basin is limited to the north by Carpathic Arc and from south there are influences of the sea, special climatic conditions are formed. Consequently there is a huge variety of species in flora and fauna, ranged from tropical to those of altitude ones. In this period the temperature’s evolution shows significant oscillation from 140 C to 180 C.
As the amount of precipitations is concern, middle Neogene starts with a relatively dry climate. Latter in Sarmatian the rainfall amount grows gradually, reaching a maximum of 1100-1300 mm. Consequently, climate has a humid character. An important witness of these changes is small mammals in comparison to vegetation that withstand all these changes in an easier way. A new climatic oscillation brought about a new slight warm period and at the beginning of Messinian the temperature decrease again with 130-140 C, suddenly this time, because of the cold winters. In the same time, the amount of precipitations decreases until 700-800 mm.
3.3. Late Neogene
This period is characterized by intense alluvial fan type deltas. The Panonian and Transylvanian lakes are reduced substantially; there are no great body waters. Tectonic activity has no significance. Geological aspects of Intra-Carpathian Depression are contoured. The dominance of dry land surface is reflected in structure of animals and plants.
The climate is temperate, with significant and sudden temperature oscillation. At low altitude the climate having Mediterranean influences is dominant and in the mountains areas they have an excessive character. Although in high altitude areas temperature was lower (less than 120 C) in comparison to Sarmatian epoch, floristic associations that characterised the mountains folded in previous epoch, were preserved. The dryer climate of lower altitude zones diminishes the forest’s extension and occurrence of prairie vegetation. After a relatively cooling in Dacian, Romanian epoch was characterized by an increase of temperature reaching 130-140 C, and annual amount of precipitations reached 1000-1100 mm. Climate was temperate, warm and humid, similar to recent North Atlantic.
Fig. 3. Oscillation of sea water temperature (Petrescu I., 1990).
G. PANDI, S. JANOWSZKY
32
4. THE RISKS INDUCED BY CLIMATE VARIATION
Within Intra-Carpathian Basin, although during Neogene period the climate periodicity did not show large-scale climatic oscillation, they have induced variations in biotic associations. Climate variations were influenced by local factors as well that emphasize the variation’s amplitude of climatic elements. Another influencing factor was relatively rapidity of oscillation, especially in upper Neogene’s period.
All these have conducted to the extinction of some species and occurrence of others. The result of different investigation methods are frequent overlapping, so then reconstruction of climatic variations and the risks has been made in proper conditions. The cooling from the start of Neogene period caused the extinction of tropical species and occurrence of others, those who could survive in an environment characterized by low temperatures and humidity. Even though the climate has reached sometimes tropical-subtropical characteristics, flora and fauna never had the initial structure. Isolation of these area in respect with the ocean and gradually diminish of body waters has conducted to and adaptation of the species to s dryer climate. The uplift of Carpathian mountain range has induced an altitudinal differentiation of biotic association. It can be said that at the end of Neogene period, climatic conditions and consequently those orographic and biotic ones are similar with the actual situation (N. Mészáros, I. Mac, 1995).
R E F E R E N C E S 1. Böhme M. (2003), The Miocene Climatic Optimum: evidence from ectothermic vertebrates of Central
Europe, in Palaeogeography, Palaeoclimatology, Palaeoecology. 2. Borsi Z. (1993), Általános természet-földrajz, Nemzeti Tankönyvkiadó, Budapest Crowley T.J. (1991),
Paleoclimatology, Clarendon Press, Oxford. 3. Jimenez-Moreno G., Rodriguez-Tovara F.J., Pardo-Iguzquiza E., Fauquette S., Suc J.P., Müller P. (2005),
High-resolution palynological analysis in late early–middleMiocene core from the Pannonian Basin, Hungary: climatic changes, astronomical forcing and eustatic fluctuations in the Central Paratethys, in Palaeogeography, Palaeoclimatology, Palaeoecology
4. Mészáros N., Mac I. (1995), Paleogeografia României, UBB, Cluj 5. Nagy E. (2005), A magyarországi neogén éghajlati adatai palynológiai kutatások alapján, in A Magyar
Földtani Intézet, Budapest 6. Pándi G. (2009), Climate Change and Water Resources, in Studia Universitatis Babeş-Bolyai, Cluj 7. Petrescu I. (1990), Perioadele glaciare ale Pământului, Ed.Tehnică, Bucureşti 8. Sümegi P. (2001), The geological and pre-historic environmental basis of the quatemary, JATE Press,
Szeged 9. Van Dam J.A. (2006), Geographic and temporal patterns in the late Neogene (12–3 Ma) aridification of
Europe: The use of small mammals as paleoprecipitation proxies, in Palaeogeography, Palaeoclimatology, Palaeoecology
10. ***(1999), Palaeogeography of the Danube and its Catchment, Regional cooperation of the Danube Countries, UNESCO
STUDIA UNIVERSITATIS BABEŞ-BOLYAI, GEOGRAPHIA, LV, 2, 2010
THE METHODOLOGY OF PIEDMONTAN SEDIMENT INVESTIGATION.
CASE STUDY
R. NEGRU1, ŞT. BILAŞCO2, M. CIGHER3
ABSTRACT. – The Methodology of Piedmontan Sediment Investigation. Case Study. The investigation of the accumulative piedmont formations requires ground and laboratory steps. The first step aims to identify the outcrops, capture images, raise the lithologic column, and sample geological and geomorphological mapping. Laboratory stage envisages particle size analysis, morphometric, morphoscopic, mineralogical, petrographic analysis, numerical analysis of the terrain. The piedmont accumulative Quaternary formations are located at the contact between the Şureanu mountain front and the Orăştie depression. These formations, genetically complex, are composed of glacises, alluvial cones, terraces, flood plains and stream channels. Keywords: methodology, piedmont, glacis, sediment investigation, Şureanu, Orăştie, Luncani, Strei. 1. INTRODUCTION
The analysis of the accumulative piedmont formations requires a complex, interdisciplinary methodology. The multitude of factors and processes of the resulted sedimentary products explains the diversity and complexity of the investigation methodology. The main criteria considered in the typing methods of analysis are: the approach, the scale of analysis and the research location.
Based on the approach, two methods are differentiated: analytical methods (by dissociation of fluvial sedimentary bodies in components) and synthetic or integrative methods (combination of attributes and elements to reconstruct the sedimentary bodies, processes, depositional environment). From the analytical methods we selected: sedimentology, geochronology, pollen-analytical archeology, paleontology. Synthetic methods can be considered: geological, geomorphologic and pedological mapping, geomorphometry and sequence stratigraphy.
Depending on the scale of analysis, the study of fluvial sediments can occur both on macro and micro scale. The information from the macro scale analysis allows us to determinate the lithological and morphological structure of the sediments. The micro scalar level analysis permits the identification of compositional and structural elements useful in the interpretation of sedimentary processes and products (Aroldi, 2005). Macro scale analysis of river sediments allows the determination of the following elements: color, texture (granulometry, morphometry, morphoscopy), composition, sedimentary structures, macrofossils.
1 “Dimitrie Cantemir”University, Faculty of Tourism Geography, Târgu Mureş, Romania, e-mail:
[email protected] 2 Romanian Academy, Cluj Subsidiary, Geography Section, 400015 Cluj-Napoca, Romania, e-mail:
[email protected] 3 “Dimitrie Cantemir”University, Faculty of Tourism Geography, Târgu Mureş, Romania, e-mail:
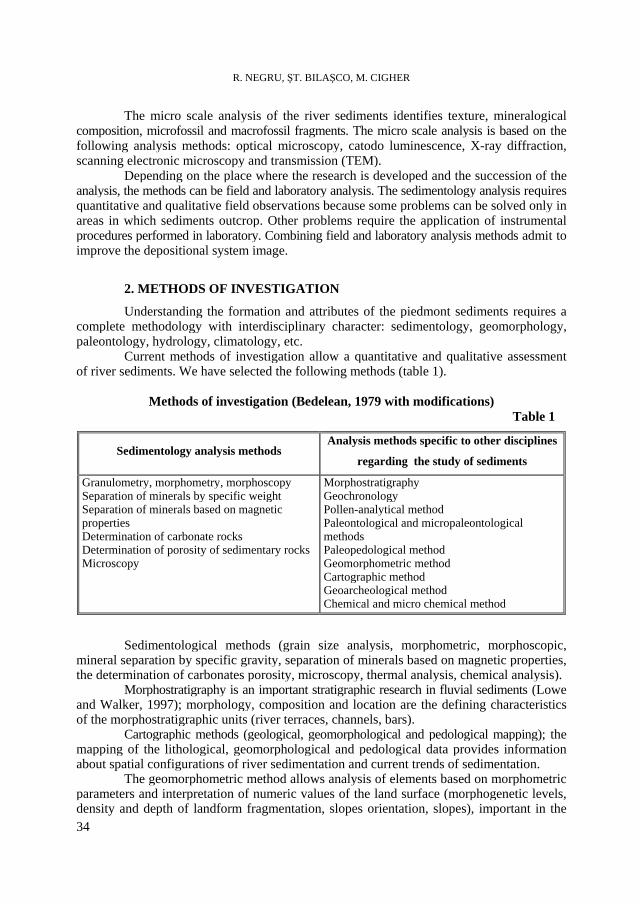
R. NEGRU, ŞT. BILAŞCO, M. CIGHER
34
The micro scale analysis of the river sediments identifies texture, mineralogical composition, microfossil and macrofossil fragments. The micro scale analysis is based on the following analysis methods: optical microscopy, catodo luminescence, X-ray diffraction, scanning electronic microscopy and transmission (TEM).
Depending on the place where the research is developed and the succession of the analysis, the methods can be field and laboratory analysis. The sedimentology analysis requires quantitative and qualitative field observations because some problems can be solved only in areas in which sediments outcrop. Other problems require the application of instrumental procedures performed in laboratory. Combining field and laboratory analysis methods admit to improve the depositional system image.
2. METHODS OF INVESTIGATION
Understanding the formation and attributes of the piedmont sediments requires a complete methodology with interdisciplinary character: sedimentology, geomorphology, paleontology, hydrology, climatology, etc.
Current methods of investigation allow a quantitative and qualitative assessment of river sediments. We have selected the following methods (table 1).
Methods of investigation (Bedelean, 1979 with modifications) Table 1
Sedimentology analysis methods Analysis methods specific to other disciplines
regarding the study of sediments
Granulometry, morphometry, morphoscopy Separation of minerals by specific weight Separation of minerals based on magnetic properties Determination of carbonate rocks Determination of porosity of sedimentary rocksMicroscopy
Morphostratigraphy Geochronology Pollen-analytical method Paleontological and micropaleontological methods Paleopedological method Geomorphometric method Cartographic method Geoarcheological method Chemical and micro chemical method
Sedimentological methods (grain size analysis, morphometric, morphoscopic, mineral separation by specific gravity, separation of minerals based on magnetic properties, the determination of carbonates porosity, microscopy, thermal analysis, chemical analysis).
Morphostratigraphy is an important stratigraphic research in fluvial sediments (Lowe and Walker, 1997); morphology, composition and location are the defining characteristics of the morphostratigraphic units (river terraces, channels, bars).
Cartographic methods (geological, geomorphological and pedological mapping); the mapping of the lithological, geomorphological and pedological data provides information about spatial configurations of river sedimentation and current trends of sedimentation.
The geomorphometric method allows analysis of elements based on morphometric parameters and interpretation of numeric values of the land surface (morphogenetic levels, density and depth of landform fragmentation, slopes orientation, slopes), important in the
THE METHODOLOGY OF PIEDMONTAN SEDIMENT INVESTIGATION. CASE STUDY
35
reconstruction of river morphogenesis; the numeric methods of meanders rivers analysis refers to the determination of the following parameters: length (L), amplitude (A), radius of curvature (Rm), thalweg length (T), the width of the riverbed (l), the depth of the riverbed (d), the slope of the riverbed (s), the coefficient of sinuosity (Ks = Ls / Ld, where Ls is the length of channel sinuousity, Ld is the straight length of the riverbed; when ks > 1.5 the riverbed is meandered); variations of meanders coefficient along the river may indicate the presence of affected areas by tectonic movements (Schumm, 1986) (Fig. 1); analysis of braided river involves the determination of the branching factor (Kds) and the coefficient of binding (Ki):
- Kds = b1 + ... bn + Bp / Bp where, Bp is the main branch with the longest and largest flow;
- Ki = sum of the length of the bars on a sector, measured in the middle of the channel.
In the paleo-pedological method, the main paleosoil environmental information is the genetic type of soil, the stage of development before the fossilization, age, traces of discoloration, clay clast aggregate, carbonate nodules, ferruginous sediments. Analysis of the genetic type of soil is important in the identification of diagnostic horizons bearing environmental information:
- the low content of organic carbon or clay, the reduced capacity of water storage of soils, indicates young river formations; enrichment in carbon and clay, increased capacity of water retention indicates older deposits;
- the calcite horizons development indicates the relative age of fluvial formations; - presence of molic horizons in combination with calcite horizons denotes a pedogenesys
in arid or semi-arid environment; - B horizons indicates wet or forest type environment and relative age of accumulation,
young sediments are characterized by lack or reduced development of B horizon; - gleysols and organic horizons; - relict features (calcite horizons with gleic features indicates an increase in hydraulic-
pressure head and a development towards a more humid climate); - traces of discoloration are represented by the halos of blue or gray-green; random
distribution of discoloration traces is the result of local organic material accumulation and its anaerobic decomposition (Retalak, 1990 in Hosu, 1999); discoloration areas caused by the presence of roots are organized on different levels which can be traced laterally for tens of meters;
- the ferruginous concretions may be caused by ferralitisation processes of well drained soils in humid climate and acidic conditions with alternation of moisture; their formation is estimated to be related with acidic wet seasons;
- carbonate nodules indicates an alkaline medium, being formed in dry periods; in well-drained soils from humid climate or alternating seasons, the calcium results from the alteration of calcium minerals (feldspar, amphibolites, etc.), accumulated as a separate Bk horizon, its depth being inversely proportional to humidity (Hosu, 1999); the forming of nodules may be the result of drying - evaporation processes from the soil surface.
Geochronological methods are relative and absolute dating: - relative dating methods take into account the processes of rock weathering that are
relatively dependent on the time factor; of these methods we mention those which estimate the age by the degree of diagenetic transformations of proteins from different fossil organic materials (amino-acids chronology), by the degree of minerals or rocks hydration (obsidian
R. NEGRU, ŞT. BILAŞCO, M. CIGHER
36
hydration), pedogenetic development index and the degree of weathering deposits. These methods have a low degree of accuracy, other relative dating methods and checking results with high precision are recommended (radiocarbon, stable isotopes of oxygen and carbon, uranium series);
- more important absolute dating methods are the C14 dating AMS, optically stimulated luminescent method (OSL), uranium series method, oxygen isotopes method.
The geoarcheological method allows the relative timing; the impact of human society over the depozitionale systems involves a complementary methodology that associates sedimentology, geomorphology and archeology.
Pollen-analytical method can be used in the study of sedimentary formations containing organic or organo-mineral levels storing the vegetation’s pollen present during the filing of the formations; host deposits of pollen may be organic peat type, gyttja and other depositional (loess-paleosoil) formations, providing valuable information to the paleoenvironmental replenishment; meadow and terrace formations (peat and gyttja) has a high potential for pollen preservation.
The paleontological and micro paleontological methods are important in the depositional environment reconstruction; the analysis of invertebrate fauna may offer important information about the depositional environment (malacofauna may be useful in recognition of climatic parameters).
3. CASE STUDY
The case study is a granulometric analysis of the piedmont glacis located between the Strei and Luncani Valley, North of the Şureanu Mountains. The piedmont glacis between Strei and Luncani Valley (fig. 1 and 3), makes contact with the Strei terraces at 300 m in the lower part and with the crystalline of the Şureanu Mountains in the upper part at 440 m. The glacis area is fragmented by parallel permanent (Gânţaga) and temporary streams, having torrential nature at the top (Covragiu, Hotarul, Vâlcelele Bune şi Rele) (fig. 2).
For the analysis of the glacis between Strei and Luncani valley, piedmont samples were analyzed in the upper (340 m) and bottom (310 m) sectors; the distance between drillings being 830 m (P1, P2). Considering the data obtained from drilling at an altitude of 340 m, on the right course of Hotarul River and laboratory data, we appreciate the following general local stratification:
- bedding included, after soil layer (with thickness of 20 cm), a layer consisting of angular sands up to 1.50 m, continued with finer sand to 2 m, followed by sand with lithic fragments; the complex granulometric curves (sigmoid and logarithmic) shows torrential depositional structures, and a very poor sorting;
- interpretation: the presence of a source area in the nearby mountains, made up of highly cracked deposits of cristalline schists from the strike slip area in the Luncani Valley, the poor sorting of deposits indicate deposits accumulated by pellicular and converged currents;
- the sequence of deposits with progradational trend indicates an allociclic control (source area lifting); the embedded of non-permanent streams (Balomir, Tilia, Bercu, Gânţaga, Hotarul, Valea Rea streams) in glacis area between the villages of Balomir and Vâlcelele Bune and a progradational trend of proluvial cones indicates an allociclic evolution type.
For the lower sector of the glacis we took and analyzed samples near Pârâul Hotarului, from the gully made with the introduction of drinking water pipeline between Gânţaga and Vâlcele (P3, P4, and P5):
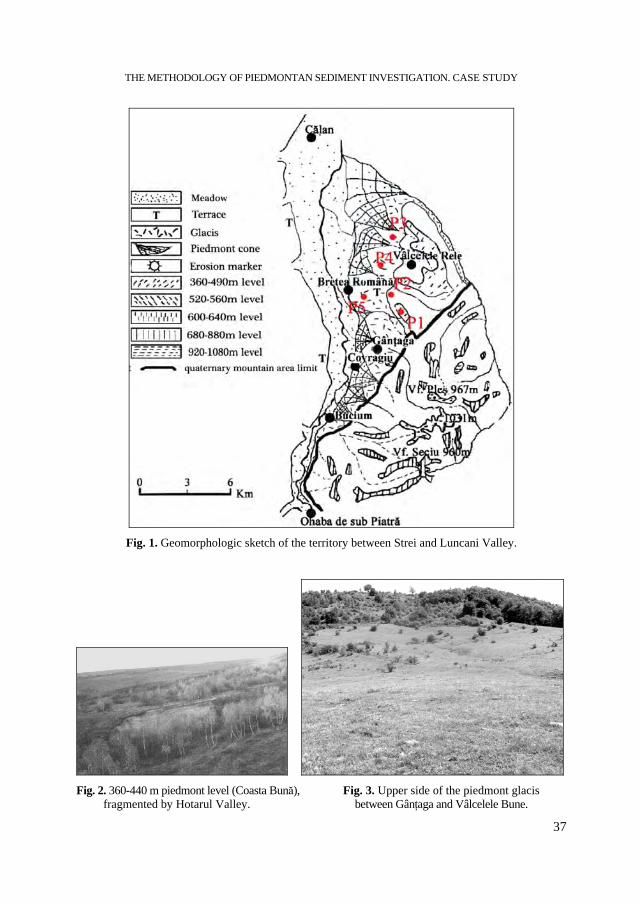
THE METHODOLOGY OF PIEDMONTAN SEDIMENT INVESTIGATION. CASE STUDY
37
Fig. 1. Geomorphologic sketch of the territory between Strei and Luncani Valley.
Fig. 2. 360-440 m piedmont level (Coasta Bună), Fig. 3. Upper side of the piedmont glacis fragmented by Hotarul Valley. between Gânţaga and Vâlcelele Bune.
R. NEGRU, ŞT. BILAŞCO, M. CIGHER
38
- bedding includes, after the soil (35 cm), a layer consisting of sand up to 1 m, flowed by a layer mud up to 2 m; the logarithmic combined with the sigmoid grain size curves indicates poorly sorted deposits and reduced permeability;
- interpretation, these deposits are specific for the distal piedmont glacis, formed during the abundant rainfall, with the predominance of water flow processes, the lower glacis deposits interfere with the meadow deposits.
4. CONCLUSIONS
This paper presents various methods of sediment analysis for piedmont areas. Literature devoted to the methods of sediment investigation is characterized by complexity in the terminology and methodological arsenal, as a result of various areas addressing issues of fluvial sediments (sedimentology, geomorphology, hydrology, ecology, biology, archeology, etc).
The nature of cumulative curves, in the glacis between the Strei and Luncani valleys is an indicator of depositional processes.
Analysis of piedmont river sediments can be focused on the following lines of research: spatial, seeks spatial organization of fluvial sedimentary bodies (channels, bars, etc.), integrative, seeks the information association for understanding the processes and environmental reconstruction, typological, focusing on highlighting the types of fluvial sedimentary environment (fluvatile menders, braided, straight), predictive based on the issue of possible scenarios of evolution and the problems of fluvial processes induced risk. Investigation methods of fluvial sediments represent a complex system of analysis, adapted to solve various problems related to the fluvial processes and elements. The nature of granulometric cumulative curves, in the glacis between the Strei and Luncani valleys is an indicator for complex depositional processes.
R E F E R E N C E S 1. Aroldi, C. (2005), Introducere în stratigrafia secvenţială, Edit. Accent, Cluj Napoca. 2. Bedelean, I. (1979), Petrologia rocilor sedimentare, Partea I-a, Universitatea “Babeş-Bolyai” Cluj
Napoca, Facultatea de Biologie, Geografie, Geologie, Catedra de Geologie-Mineralogie, Pentru uz intern, Cluj-Napoca.
3. Grecu, Florina, Comănescu, Laura (1998), Studiul reliefului. Îndrumător pentru lucrări practice, Editura Universităţii din Bucureşti.
4. Irimuş I.A. (1996), Cartografiere geomorfologică, Edit.”Focul Viu”, Cluj-Napoca. 5. Pendea, F. (2005), Paleomediile geomorfologice ale Cuaternarului Superior în Depresiunea Transilvaniei
(Eemian-Weichselian-Holocen), teza de doctorat, Universitatea Babeş Bolyai, Facultatea de Geografie. 6. Schumm, S. A. (1986), Alluvial river response to active tectonic, Studies in Geophysics, Active tectonics,
National Academy Press, Washington, D. C..
STUDIA UNIVERSITATIS BABEŞ-BOLYAI, GEOGRAPHIA, LV, 2, 2010
THE DIURNAL VARIABILITY OF THE WATER AMOUNTS FALLEN
DURING SIGNIFICANT RAINS IN NORTH-WESTERN ROMANIA
T. TUDOSE1, FL. MOLDOVAN2
ABSTRACT. – The Diurnal Variability of the Water Amounts Fallen During Significant Rains in North-Western Romania. Based on the climatic data from 11 meteorological stations in North-Western Romania, the paper analyzes the diurnal variation of the water amounts recorded during the significant rains in the warm season (April-October), between 1975 and 2006. In the case of the hourly amounts determined by the average intensity of the rain, the highest diurnal values (over 2.0 mm/h) are registered in the afternoon and in the evening, as a consequence of the short-period rains, which are very frequent in summer. During the night, the highest amounts are registered for the rains of over 3 hours, more frequent in spring and autumn. A similar diurnal variation is characteristic for the water amounts determined by the maximal intensity. The difference is given by the fact that maximal values (of over 2.0 mm/h) occur in the lowlands and the valley corridors, where there is a lower frequency of such rains. In the case of hourly average amounts determined by the length of the rains, the highest values of the amounts determined by the average and maximal intensity (between 2.2 and 2.9 mm/h, and between 1.3. and 1.9 mm/h respectively) belong to the rains lasting between 1 and 2 hours. The frequency analysis of the water amounts in relation to the duration of the rains reveals the fact that, in the case of average intensity, the rains lasting more than 3 hours have more than 50% of the total of water amounts fallen, even if the frequency of such rains is only 31.6% of the total. In the case of the maximal intensity, the largest amounts are given by short rains, up to 2 hours.
Keywords: diurnal variability, significant rains, average and maximum intensity, North-Western
Romania.
1. INTRODUCTION
The atmospheric precipitations represent one of the elements which completes the climatic feature of a region. Due to their quantifiable character (genesis, form, quantity) and temporal distribution (duration), precipitations are an important element of study and a fundamental factor of the water balance.
In the scientific literature, most approaches refer to either average, extreme, daily, monthly, seasonal, annual or multinannual water amounts. Another approach consist of the analysis of the water amounts fallen during one rain. An example in this direction is the paper of Koji Dairaku and his collaborators (2004), based on the data retrieved from 12 observation points in Mae Chaem region (north-western Thailand) between June and October 1998 and 1999.
1 National Meteorological Administration, Northern Transylvania Regional Meteorological Centre,
Romania, e-mail: [email protected] 2 „Babeş-Bolyai” University, Faculty of Geography, 400006, Cluj-Napoca, Romania, e-mail:
T. TUDOSE, FL. MOLDOVAN
40
Comparing the measured amounts and the duration of the rains, it came out that the duration was below 5 hours in about 95% of the cases. The structure of the water quantities according to the duration of the rains revealed that rains which lasted less than one hour (between 54.8 and 56.6% of the total) cumulated only 14-15% of the total of the water amounts fallen. The rains lasting between 2 and 5 hours reached between 55.6% and 58.0% of the amounts, while those lasting more than 6 hours (representing only 5% of the total number of rains), about 30% of the total of the water amounts fallen.
Carmen Sofia Dragotă (2006), analyzing the first 5 values of the maximal intensity of rains at 130 Romanian meteorological stations between 1961 and 1996, indicates that the duration of the maximal intensity is between 2 and 10 minutes.
This study intends to continue the research made on the characteristics of significant rains during the warm season in north-western Romania. The paper aims to shed light on several peculiarities of the water amounts fallen in the case of this type of precipitations. It takes into account the analysis of the diurnal variation of the water amounts fallen, registered hourly during the average and maximal intensity, also depending on the duration of the rains.
2. DATA AND METHODS
Significant rains represent liquid precipitations, regardless of their character of shower, fallen during the warm season (April-October), registered by the pluviograph, which meet certain conditions concerning the average and maximal intensity or the water amount they produce (Instrucţiuni pentru staţiile meteorologice, 1995): maximal intensity > 0.04 mm/min, average intensity > 0.02 mm/min or the recorded water amount > 2.5 mm.
For the study, we used data regarding significant rains from the annual TM 13 tables, from 11 meteorological stations located in north-western Romania: Satu Mare and Supuru de Jos (in the lowlands), Baia Mare, Sighetu Marmaţiei and Ocna Şugatag (located in Baia Mare or Maramureş Depressions), Cluj-Napoca and Dej (located along the Someşu Mic Corridor), Zalău and Bistriţa (situated in the hilly region), Vlădeasa 1800 (in Vlădeasa Mountain) and Iezer (in Rodna Mountains).
The analyzed period is 1975-2006, and the significant rains of the warm season (April-October) were taken into account, except for the mountain meteorological stations, for which the period of interest is June-September, as a consequence of the dominant solid precipitations in the other months.
The method used is statistical, determining the diurnal variation of the water amount fallen during the average intensity. In this purpose, each rainfall has been unfolded in time, depending on its beginning and its end. We proceeded similarly in the case of the water amounts fallen during the maximal intensity.
3. RESULTS
The analysis of the hourly water amounts registered during significant rains, as an effect of their average and maximal intensity, highlights a diurnal structure characterized by a series of spatial and temporal peculiarities. Thus, in the case of the hourly water amounts determined by the average intensity of the rains, there are amounts higher than 1.2 mm/h in the whole analyzed area (fig. 1). Amounts over 1.8-2.0 mm/h are registered during the afternoon and the night in the lowland region (between 17-05 hours Romanian Summer Time - RST),
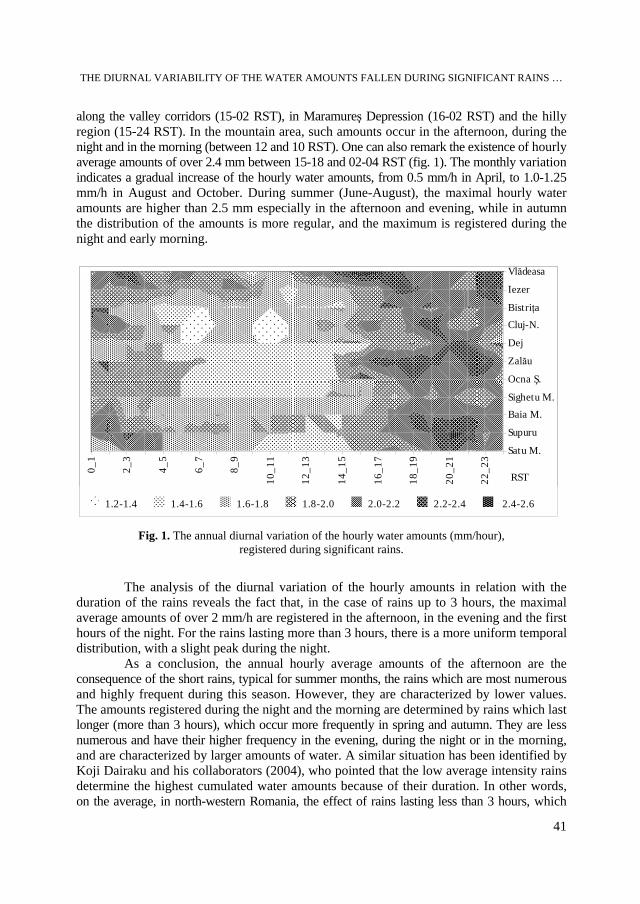
THE DIURNAL VARIABILITY OF THE WATER AMOUNTS FALLEN DURING SIGNIFICANT RAINS …
41
along the valley corridors (15-02 RST), in Maramureş Depression (16-02 RST) and the hilly region (15-24 RST). In the mountain area, such amounts occur in the afternoon, during the night and in the morning (between 12 and 10 RST). One can also remark the existence of hourly average amounts of over 2.4 mm between 15-18 and 02-04 RST (fig. 1). The monthly variation indicates a gradual increase of the hourly water amounts, from 0.5 mm/h in April, to 1.0-1.25 mm/h in August and October. During summer (June-August), the maximal hourly water amounts are higher than 2.5 mm especially in the afternoon and evening, while in autumn the distribution of the amounts is more regular, and the maximum is registered during the night and early morning.
Fig. 1. The annual diurnal variation of the hourly water amounts (mm/hour), registered during significant rains.
The analysis of the diurnal variation of the hourly amounts in relation with the duration of the rains reveals the fact that, in the case of rains up to 3 hours, the maximal average amounts of over 2 mm/h are registered in the afternoon, in the evening and the first hours of the night. For the rains lasting more than 3 hours, there is a more uniform temporal distribution, with a slight peak during the night.
As a conclusion, the annual hourly average amounts of the afternoon are the consequence of the short rains, typical for summer months, the rains which are most numerous and highly frequent during this season. However, they are characterized by lower values. The amounts registered during the night and the morning are determined by rains which last longer (more than 3 hours), which occur more frequently in spring and autumn. They are less numerous and have their higher frequency in the evening, during the night or in the morning, and are characterized by larger amounts of water. A similar situation has been identified by Koji Dairaku and his collaborators (2004), who pointed that the low average intensity rains determine the highest cumulated water amounts because of their duration. In other words, on the average, in north-western Romania, the effect of rains lasting less than 3 hours, which
0_1
2_3
4_5
6_7
8_9
10_1
1
12_1
3
14_1
5
16_1
7
18_1
9
20_2
1
22_2
3
Satu M.
Supuru
Baia M.Sighetu M.
Ocna Ş.
Zalău
Dej
Cluj-N.Bistriţa
Iezer
Vlădeasa
RST
1.2-1.4 1.4-1.6 1.6-1.8 1.8-2.0 2.0-2.2 2.2-2.4 2.4-2.62.4-2.6
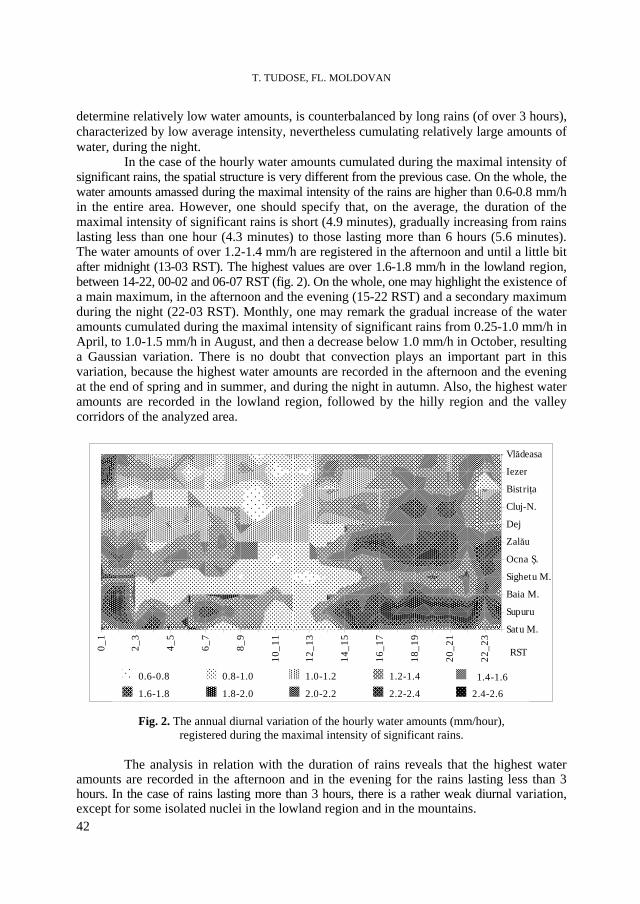
T. TUDOSE, FL. MOLDOVAN
42
determine relatively low water amounts, is counterbalanced by long rains (of over 3 hours), characterized by low average intensity, nevertheless cumulating relatively large amounts of water, during the night.
In the case of the hourly water amounts cumulated during the maximal intensity of significant rains, the spatial structure is very different from the previous case. On the whole, the water amounts amassed during the maximal intensity of the rains are higher than 0.6-0.8 mm/h in the entire area. However, one should specify that, on the average, the duration of the maximal intensity of significant rains is short (4.9 minutes), gradually increasing from rains lasting less than one hour (4.3 minutes) to those lasting more than 6 hours (5.6 minutes). The water amounts of over 1.2-1.4 mm/h are registered in the afternoon and until a little bit after midnight (13-03 RST). The highest values are over 1.6-1.8 mm/h in the lowland region, between 14-22, 00-02 and 06-07 RST (fig. 2). On the whole, one may highlight the existence of a main maximum, in the afternoon and the evening (15-22 RST) and a secondary maximum during the night (22-03 RST). Monthly, one may remark the gradual increase of the water amounts cumulated during the maximal intensity of significant rains from 0.25-1.0 mm/h in April, to 1.0-1.5 mm/h in August, and then a decrease below 1.0 mm/h in October, resulting a Gaussian variation. There is no doubt that convection plays an important part in this variation, because the highest water amounts are recorded in the afternoon and the evening at the end of spring and in summer, and during the night in autumn. Also, the highest water amounts are recorded in the lowland region, followed by the hilly region and the valley corridors of the analyzed area.
Fig. 2. The annual diurnal variation of the hourly water amounts (mm/hour), registered during the maximal intensity of significant rains.
The analysis in relation with the duration of rains reveals that the highest water
amounts are recorded in the afternoon and in the evening for the rains lasting less than 3 hours. In the case of rains lasting more than 3 hours, there is a rather weak diurnal variation, except for some isolated nuclei in the lowland region and in the mountains.
0_1
2_3
4_5
6_7
8_9
10_1
1
12_1
3
14_1
5
16_1
7
18_1
9
20_2
1
22_2
3
Satu M.
Supuru
Baia M.
Sighetu M.
Ocna Ş.
Zalău
Dej
Cluj-N.
Bistriţa
Iezer
Vlădeasa
RST
0.6-0.8 0.8-1.0 1.0-1.2 1.2-1.4 1.4-1.61.6-1.8 1.8-2.0 2.0-2.2 2.2-2.4 2.4-2.6
1.4-1.6
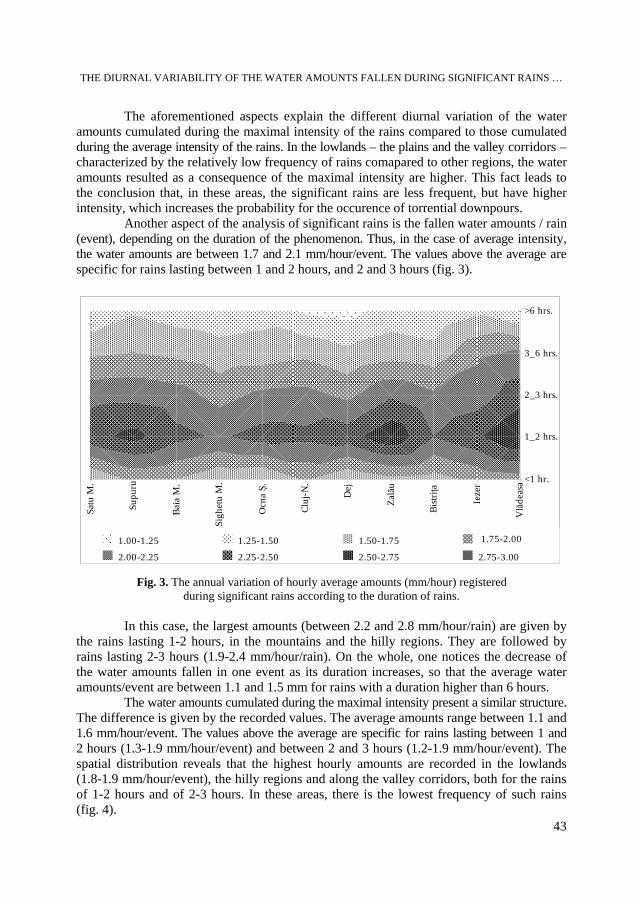
THE DIURNAL VARIABILITY OF THE WATER AMOUNTS FALLEN DURING SIGNIFICANT RAINS …
43
The aforementioned aspects explain the different diurnal variation of the water amounts cumulated during the maximal intensity of the rains compared to those cumulated during the average intensity of the rains. In the lowlands – the plains and the valley corridors – characterized by the relatively low frequency of rains comapared to other regions, the water amounts resulted as a consequence of the maximal intensity are higher. This fact leads to the conclusion that, in these areas, the significant rains are less frequent, but have higher intensity, which increases the probability for the occurence of torrential downpours.
Another aspect of the analysis of significant rains is the fallen water amounts / rain (event), depending on the duration of the phenomenon. Thus, in the case of average intensity, the water amounts are between 1.7 and 2.1 mm/hour/event. The values above the average are specific for rains lasting between 1 and 2 hours, and 2 and 3 hours (fig. 3).
Fig. 3. The annual variation of hourly average amounts (mm/hour) registered during significant rains according to the duration of rains.
In this case, the largest amounts (between 2.2 and 2.8 mm/hour/rain) are given by
the rains lasting 1-2 hours, in the mountains and the hilly regions. They are followed by rains lasting 2-3 hours (1.9-2.4 mm/hour/rain). On the whole, one notices the decrease of the water amounts fallen in one event as its duration increases, so that the average water amounts/event are between 1.1 and 1.5 mm for rains with a duration higher than 6 hours.
The water amounts cumulated during the maximal intensity present a similar structure. The difference is given by the recorded values. The average amounts range between 1.1 and 1.6 mm/hour/event. The values above the average are specific for rains lasting between 1 and 2 hours (1.3-1.9 mm/hour/event) and between 2 and 3 hours (1.2-1.9 mm/hour/event). The spatial distribution reveals that the highest hourly amounts are recorded in the lowlands (1.8-1.9 mm/hour/event), the hilly regions and along the valley corridors, both for the rains of 1-2 hours and of 2-3 hours. In these areas, there is the lowest frequency of such rains (fig. 4).
Satu
M.
Supu
ru
Baia
M.
Sigh
etu
M.
Ocn
a Ş.
Cluj
-N.
Dej
Zală
u
Bistr
iţa
Ieze
r
Vlă
deas
a <1 hr.
1_2 hrs.
2_3 hrs.
3_6 hrs.
>6 hrs.
1.00-1.25 1.25-1.50 1.50-1.75 1.75-2.002.00-2.25 2.25-2.50 2.50-2.75 2.75-3.00
1.75-2.00
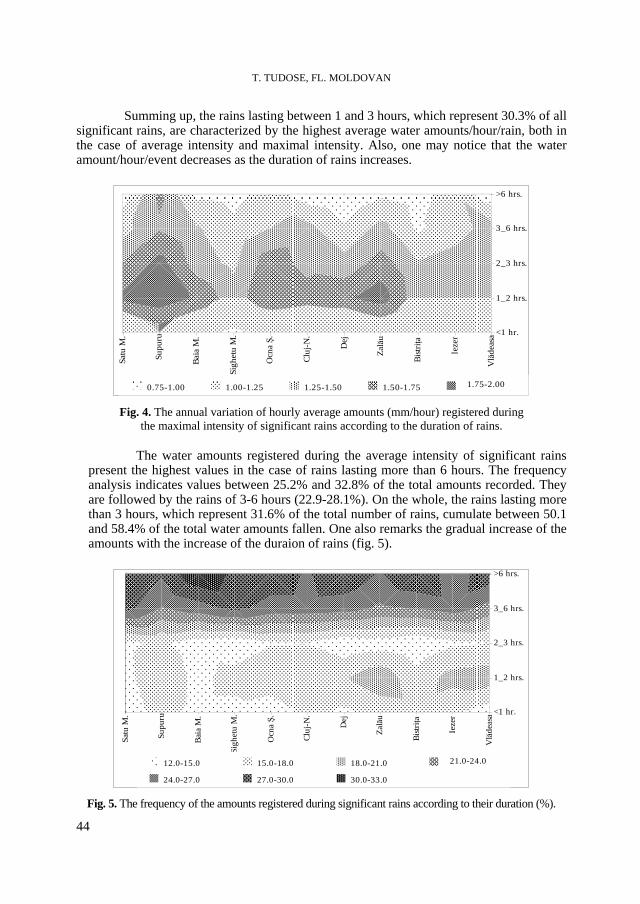
T. TUDOSE, FL. MOLDOVAN
44
Summing up, the rains lasting between 1 and 3 hours, which represent 30.3% of all significant rains, are characterized by the highest average water amounts/hour/rain, both in the case of average intensity and maximal intensity. Also, one may notice that the water amount/hour/event decreases as the duration of rains increases.
Satu
M.
Supu
ru
Baia
M.
Sigh
etu
M.
Ocn
a Ş.
Cluj
-N.
Dej
Zală
u
Bistr
iţa
Ieze
r
Vlă
deas
a <1 hr.
1_2 hrs.
2_3 hrs.
3_6 hrs.
>6 hrs.
0.75-1.00 1.00-1.25 1.25-1.50 1.50-1.75 1.75-2.001.75-2.00
Fig. 4. The annual variation of hourly average amounts (mm/hour) registered during the maximal intensity of significant rains according to the duration of rains.
The water amounts registered during the average intensity of significant rains
present the highest values in the case of rains lasting more than 6 hours. The frequency analysis indicates values between 25.2% and 32.8% of the total amounts recorded. They are followed by the rains of 3-6 hours (22.9-28.1%). On the whole, the rains lasting more than 3 hours, which represent 31.6% of the total number of rains, cumulate between 50.1 and 58.4% of the total water amounts fallen. One also remarks the gradual increase of the amounts with the increase of the duraion of rains (fig. 5).
Satu
M.
Supu
ru
Baia
M.
Sigh
etu
M.
Ocn
a Ş.
Cluj
-N.
Dej
Zală
u
Bistr
iţa
Ieze
r
Vlă
deas
a <1 hr.
1_2 hrs.
2_3 hrs.
3_6 hrs.
>6 hrs.
12.0-15.0 15.0-18.0 18.0-21.0 21.0-24.024.0-27.0 27.0-30.0 30.0-33.0
21.0-24.0
Fig. 5. The frequency of the amounts registered during significant rains according to their duration (%).
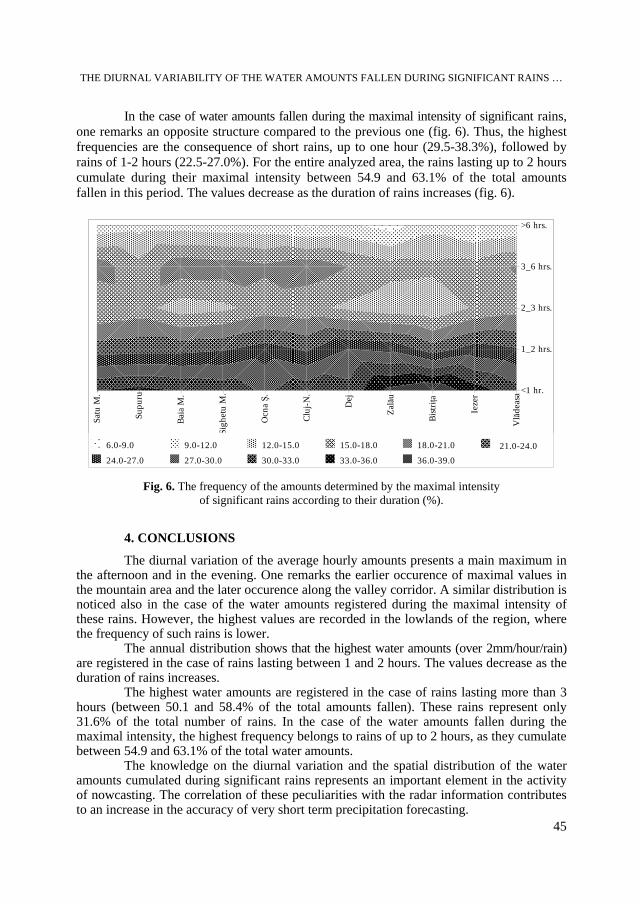
THE DIURNAL VARIABILITY OF THE WATER AMOUNTS FALLEN DURING SIGNIFICANT RAINS …
45
In the case of water amounts fallen during the maximal intensity of significant rains, one remarks an opposite structure compared to the previous one (fig. 6). Thus, the highest frequencies are the consequence of short rains, up to one hour (29.5-38.3%), followed by rains of 1-2 hours (22.5-27.0%). For the entire analyzed area, the rains lasting up to 2 hours cumulate during their maximal intensity between 54.9 and 63.1% of the total amounts fallen in this period. The values decrease as the duration of rains increases (fig. 6).
Satu
M.
Supu
ru
Baia
M.
Sigh
etu
M.
Ocn
a Ş.
Cluj
-N.
Dej
Zală
u
Bistr
iţa
Ieze
r
Vlă
deas
a <1 hr.
1_2 hrs.
2_3 hrs.
3_6 hrs.
>6 hrs.
6.0-9.0 9.0-12.0 12.0-15.0 15.0-18.0 18.0-21.0 21.0-24.024.0-27.0 27.0-30.0 30.0-33.0 33.0-36.0 36.0-39.0
21.0-24.0
Fig. 6. The frequency of the amounts determined by the maximal intensity of significant rains according to their duration (%).
4. CONCLUSIONS
The diurnal variation of the average hourly amounts presents a main maximum in the afternoon and in the evening. One remarks the earlier occurence of maximal values in the mountain area and the later occurence along the valley corridor. A similar distribution is noticed also in the case of the water amounts registered during the maximal intensity of these rains. However, the highest values are recorded in the lowlands of the region, where the frequency of such rains is lower.
The annual distribution shows that the highest water amounts (over 2mm/hour/rain) are registered in the case of rains lasting between 1 and 2 hours. The values decrease as the duration of rains increases.
The highest water amounts are registered in the case of rains lasting more than 3 hours (between 50.1 and 58.4% of the total amounts fallen). These rains represent only 31.6% of the total number of rains. In the case of the water amounts fallen during the maximal intensity, the highest frequency belongs to rains of up to 2 hours, as they cumulate between 54.9 and 63.1% of the total water amounts.
The knowledge on the diurnal variation and the spatial distribution of the water amounts cumulated during significant rains represents an important element in the activity of nowcasting. The correlation of these peculiarities with the radar information contributes to an increase in the accuracy of very short term precipitation forecasting.
T. TUDOSE, FL. MOLDOVAN
46
R E F E R E N C E S 1. Dairaku, K., Emori, S., Oki, T. (2004), Rainfall Amount, Intensity, Duration, and Frequency Relationships
in the Mae Chaem Watershed in Southeast Asia, Journal of Hydrometeorology, 5: 458–470. 2. Dragotă, Carmen-Sofia (2006), Precipitaţiile excedentare în România, Editura Academiei Române,
Bucureşti. 3. Tudose, T., Moldovan, F. (2009), Diurnal variation and duration of significant summer rains in
north-western Romania, Studia Universitatis Babeş-Bolyai, Geographia, LIV, 2, Cluj-Napoca. 4. Tudose, T., Moldovan, F. (2009), The intensity of significant rainfalls in the warm season, in the north-
western part of Romania, Studia Universitatis Babeş-Bolyai, Geographia, LIV, 3, Cluj-Napoca. 5. *** (1995), Instrucţiuni pentru staţiile meteorologice. Efectuarea observaţiilor meteorologice şi
prelucrarea lor în scopuri climatologice, I.N.M.H., Bucureşti. 6. *** Arhiva Administraţiei Naţionale de Meteorologie Bucureşti.
STUDIA UNIVERSITATIS BABEŞ-BOLYAI, GEOGRAPHIA, LV, 2, 2010
PROTECTED ELEMENTS IN THE TIŞIŢA NATURAL RESERVE
AL. MUREŞAN1, GABRIELA ADINA LAZĂR2
ABSTRACT. – Protected Elements in the Tişiţa Natural Reserve. The Putna – Vrancea National Park is the second largest area in Romania from the point of view of the density of large carnivores, thus representing an important element in the implementation of the European Ecological Network Natura 2000. The declaration of a region as a natural reserve area represents an important element of Romania’s accession processes to the European Union structures, the implementation of any preservation and conservation measures of all plant and animal species of community importance representing one of the main conditions of a new member state. Located in Vrancea Mountains, the Tişiţa Natural Reserve possesses a great variety of natural elements, ecologically important fauna and flora species being acknowledged within its perimeter. The natural landscape is dominated by the presence of the forest vegetation which represents the habitat for several large carnivores found on Romanian territory like the brown bear, the wolf or the lynx. Due to its geographical location and climate, the Tişiţa Natural Reserve shelters a large number of plant species, representing different associations with distinct features and variety from the point of view of their ecological, pedological and thermal requirements.
Key words: natural reserve, protected habitats, European network NATURA 2000, vegetal
associations, wild life monitoring.
1. INTRODUCTION
The complexity of the Tişiţa Natural Reserve is proved by the great variety of its components: the visible ones, having a role of support (the landforms, the drainage network, the climate, the vegetation, the fauna, the soils, the reminiscences of the human activities by means of deforestation), as well as invisible elements (perceived, mental ones). Another parameter that has to be considered is the time, due to the fact that the landscapes are continually transforming throughout the time, even if the human intervention is absent.
In the current paper we will present the constitution of the legal and operational frame of protecting the vulnerable elements within the region, we will make an analysis of the natural elements identified in the studied area, as well as a few of the main characteristics of the protected species.
2. THE GENERAL PRESENTATION OF THE ANALYZED AREA
The Tişiţa River is the first main right tributary of the Putna River. Their confluence is located downstream from the Lepşa village within the Tulnici commune, following the well known Putna Waterfall, at an approximate altitude of 600 m, at the cross point between the 45°56'28" northern latitude parallel and the 26°35'11" eastern longitude meridian.
1 Babeş-Bolyai University, Faculty of Geography, 400006, Cluj-Napoca, Romania, e-mail:
[email protected] 2 Babeş-Bolyai University, Faculty of Geography, 400006, Cluj-Napoca, Romania, e-mail:
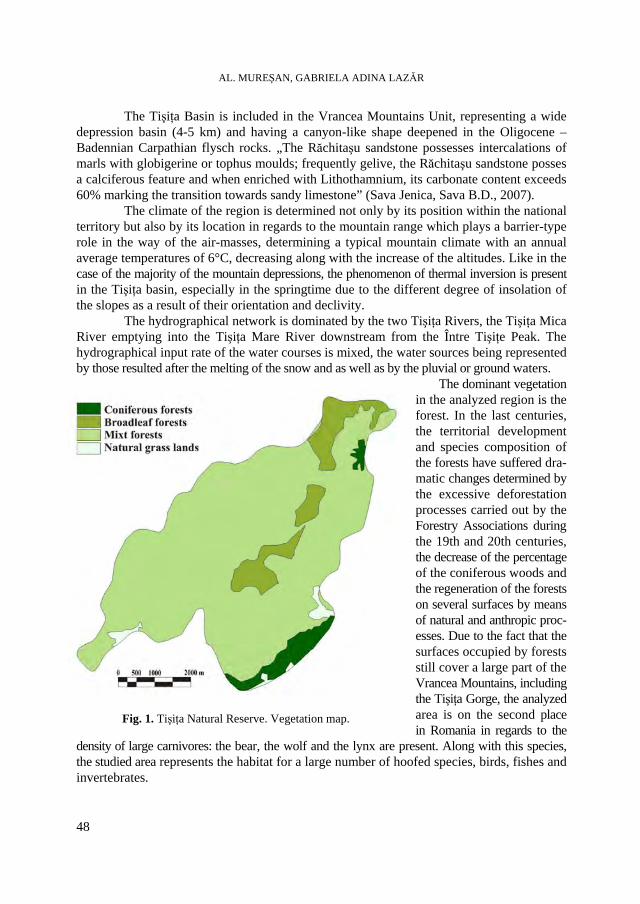
AL. MUREŞAN, GABRIELA ADINA LAZĂR
48
The Tişiţa Basin is included in the Vrancea Mountains Unit, representing a wide depression basin (4-5 km) and having a canyon-like shape deepened in the Oligocene – Badennian Carpathian flysch rocks. „The Răchitaşu sandstone possesses intercalations of marls with globigerine or tophus moulds; frequently gelive, the Răchitaşu sandstone posses a calciferous feature and when enriched with Lithothamnium, its carbonate content exceeds 60% marking the transition towards sandy limestone” (Sava Jenica, Sava B.D., 2007). The climate of the region is determined not only by its position within the national territory but also by its location in regards to the mountain range which plays a barrier-type role in the way of the air-masses, determining a typical mountain climate with an annual average temperatures of 6°C, decreasing along with the increase of the altitudes. Like in the case of the majority of the mountain depressions, the phenomenon of thermal inversion is present in the Tişiţa basin, especially in the springtime due to the different degree of insolation of the slopes as a result of their orientation and declivity. The hydrographical network is dominated by the two Tişiţa Rivers, the Tişiţa Mica River emptying into the Tişiţa Mare River downstream from the Între Tişiţe Peak. The hydrographical input rate of the water courses is mixed, the water sources being represented by those resulted after the melting of the snow and as well as by the pluvial or ground waters.
The dominant vegetation in the analyzed region is the forest. In the last centuries, the territorial development and species composition of the forests have suffered dra-matic changes determined by the excessive deforestation processes carried out by the Forestry Associations during the 19th and 20th centuries, the decrease of the percentage of the coniferous woods and the regeneration of the forests on several surfaces by means of natural and anthropic proc-esses. Due to the fact that the surfaces occupied by forests still cover a large part of the Vrancea Mountains, including the Tişiţa Gorge, the analyzed area is on the second place in Romania in regards to the
density of large carnivores: the bear, the wolf and the lynx are present. Along with this species, the studied area represents the habitat for a large number of hoofed species, birds, fishes and invertebrates.
Fig. 1. Tişiţa Natural Reserve. Vegetation map.
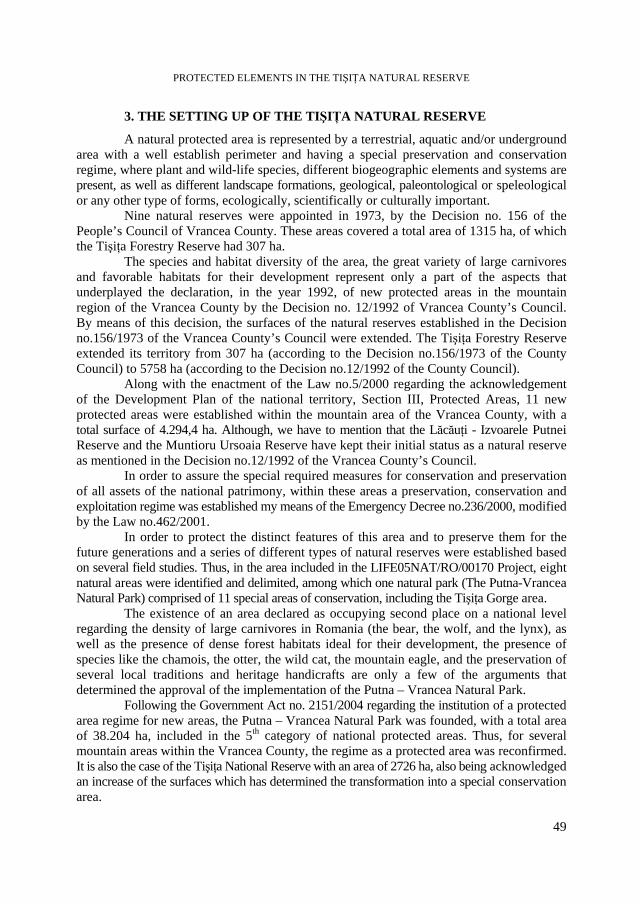
PROTECTED ELEMENTS IN THE TIŞIŢA NATURAL RESERVE
49
3. THE SETTING UP OF THE TIŞIŢA NATURAL RESERVE
A natural protected area is represented by a terrestrial, aquatic and/or underground area with a well establish perimeter and having a special preservation and conservation regime, where plant and wild-life species, different biogeographic elements and systems are present, as well as different landscape formations, geological, paleontological or speleological or any other type of forms, ecologically, scientifically or culturally important. Nine natural reserves were appointed in 1973, by the Decision no. 156 of the People’s Council of Vrancea County. These areas covered a total area of 1315 ha, of which the Tişiţa Forestry Reserve had 307 ha. The species and habitat diversity of the area, the great variety of large carnivores and favorable habitats for their development represent only a part of the aspects that underplayed the declaration, in the year 1992, of new protected areas in the mountain region of the Vrancea County by the Decision no. 12/1992 of Vrancea County’s Council. By means of this decision, the surfaces of the natural reserves established in the Decision no.156/1973 of the Vrancea County’s Council were extended. The Tişiţa Forestry Reserve extended its territory from 307 ha (according to the Decision no.156/1973 of the County Council) to 5758 ha (according to the Decision no.12/1992 of the County Council). Along with the enactment of the Law no.5/2000 regarding the acknowledgement of the Development Plan of the national territory, Section III, Protected Areas, 11 new protected areas were established within the mountain area of the Vrancea County, with a total surface of 4.294,4 ha. Although, we have to mention that the Lăcăuţi - Izvoarele Putnei Reserve and the Muntioru Ursoaia Reserve have kept their initial status as a natural reserve as mentioned in the Decision no.12/1992 of the Vrancea County’s Council. In order to assure the special required measures for conservation and preservation of all assets of the national patrimony, within these areas a preservation, conservation and exploitation regime was established my means of the Emergency Decree no.236/2000, modified by the Law no.462/2001. In order to protect the distinct features of this area and to preserve them for the future generations and a series of different types of natural reserves were established based on several field studies. Thus, in the area included in the LIFE05NAT/RO/00170 Project, eight natural areas were identified and delimited, among which one natural park (The Putna-Vrancea Natural Park) comprised of 11 special areas of conservation, including the Tişiţa Gorge area. The existence of an area declared as occupying second place on a national level regarding the density of large carnivores in Romania (the bear, the wolf, and the lynx), as well as the presence of dense forest habitats ideal for their development, the presence of species like the chamois, the otter, the wild cat, the mountain eagle, and the preservation of several local traditions and heritage handicrafts are only a few of the arguments that determined the approval of the implementation of the Putna – Vrancea Natural Park. Following the Government Act no. 2151/2004 regarding the institution of a protected area regime for new areas, the Putna – Vrancea Natural Park was founded, with a total area of 38.204 ha, included in the 5th category of national protected areas. Thus, for several mountain areas within the Vrancea County, the regime as a protected area was reconfirmed. It is also the case of the Tişiţa National Reserve with an area of 2726 ha, also being acknowledged an increase of the surfaces which has determined the transformation into a special conservation area.
AL. MUREŞAN, GABRIELA ADINA LAZĂR
50
The implementation of the Natura 2000 Network in Romania represented one of the integration conditions imposed by the European Union. The European Network Natura 2000 was conceived in order to assure the conservation of natural habitats and to protect the species affected by extinction within the European territory. Romania has fulfilled its obligations of presenting to the European Commission until the beginning of 2007, a list of potential Sites of Community Importance (SCI) according to the Habitats Directive and the list of Avifaunistic Special Protection Areas (SPA) according to the Birds Directive. Therefore, from the Vrancea County’s mountain region, the Putna – Vrancea Natural Park was designated as a Site of Community Importance (ROSCI0208), territorially overlapped by the Vrancea Mountains (ROSPA0087).
4. THE PROTECTED ELEMENTS
The implementation of the Tişiţa Forestry Reserve in 1973 was, beyond the so-called protection of the plant associations from the Tişiţa basin, a recognition of the value of the forest vegetation of this region in the given landscape. Throughout the time, the Tişiţa Reserve has gained in regards to its elements of landscape which are sheltered in the region, representing a natural reserve with important geomorphologic and biogeographic elements. If in the case of the components of the relief the absence of the economical activities and the human presence by means of tourism-related activities is enough for their conservation, the forest and wild-life requiring a proper and attentive human intervention in order to survive. 4. 1. The fauna elements
Being the second largest area in Romania regarding the density of large carnivores, the Tişiţa Natural Reserve shelters individuals from the following species: Ursus arctos, Canis lupus, Lynx lynx. In order for these species to be protected and to develop, two large projects with European funding were implemented: the LIFE02/NAT/RO/8576 Project called “The in situ conservation of large carnivores in the Vrancea County” and the Project LIFE05NAT/RO/000170 called “The improvement of the protection system of large carnivores in the Vrancea County” developed in order to assure a continuum of the conservation, administration and rehabilitation measures of the viable large carnivores populations in regards to the human presence in the area. According to the Vrancea Environmental Protection Agency, the purpose of this project is to strengthen the current protection system of large carnivores within Vrancea County and to correlate the existing protection network of large carnivores with the European Ecological Network Natura 2000. In the same time, an attempt to prevent the direct and indirect poaching activities is carried out and also to compound the existing conflicts between the local populations and the large carnivores by means of implementation of electric fences in the nearby presence of the local sheepfolds. Near the Tişiţa Natural Reserve, the Large Carnivores Monitoring and Rehabilitation Center was established, located in the Lepşa village which allows the simultaneous quartering of several wild animals. Within the Center, an Animal Rescue Mobile Unit is present with the purpose of saving the trapped animals. The Center is functioning since April 2006. The monitoring and the assessment of large carnivores and of their prey are made by using non-invasive techniques like radio-telemetry and GPS localization.
PROTECTED ELEMENTS IN THE TIŞIŢA NATURAL RESERVE
51
Also, we have to mention the presence of several families of otter (Lutra lutra), the current individuals of these populations enjoying the protected area regime of their natural habitats.
The rodent mammals represent a very important link at the base of the trophic chain within the reservation. Species like the field mouse (Microtus agrestis), the brindled mouse (Apodemus agrarius), the forest mouse (A. sylvaticus), the hazel mouse (Muscardinus avellanarius) and the squirrel (Scirus vulgaris) represent an important percentage of the small carnivore’s diet like the fox (Vulpes vulpes) or the wild cat (Felis sylvestris). Also, the diet of the night rapacious birds is entirely represented by these rodents, thus becoming an important indicator of the quality of the ecosystems within the analyzed area. The presence of the hazel mouse (Myoxus glis and Drynomis nitedula) certifies the value of the forestry biotopes within the Tişiţa basin.
Due to the reduced human presence in the reserve territory and limited access of the sheep herds, the herbivore mammals have found favorable habitat for their development especially considering the fact that during the winter months the mammals can feed in the special places laid out by the reserve Administration. Within the analyzed territory individuals of the following species are acknowledged: the wild boars (Sus scrofa), the roebucks (Capreolus capreolus), the red deer (Cervus elaphus) and the chamois (Rupicapra rupicapra).
In November 1982, 13 individuals of chamois from the Bucegi and Retezat Mountains have been introduced in the Tişiţa Valley. Still, the problem of species vulnerability within the area is a current issue, due to the reduced genetic descent (increased probability of co-sanguinity) and to the isolated, insular feature of the habitat, as well as the the lack of a mountain habitat proper for the development of the chamois; within the Tişiţa Valley, the chamois’s habitat is represented by the steep rocky slopes located in the forest levels.
The quality of the analyzed environment is demonstrated by the abundance of the bird species, some of them protected by law, like the mountain eagle (Aquila chrysaetos), or several species of batrachians, reptiles and insects.
4. 2. The vegetal associations
The great varieties of factors that activate in the analyzed area have determined the increased diversity of the flora from the point of view of its components. This fact is proved by the forestry flora which constitutes the natural forestry massifs. Analyzed as complex and long lasting terrestrial ecosystems, these natural elements represent the centers of some important and permanent genetic processes and places of appearance, development and regeneration of the forestry resources.
Within the Tişiţa Gorge several habitats for the protection of the plant species are present, all of them being included in the list published by the Vrancea Environmental Protection Agency. Within the studied area, the following vegetation associations are present:
- South – eastern Carpathian grasslands with Trisetum flavescens and Alchemilla vulgaris (code Natura 2000 - 6520, code Romania - R3801), 80-95% consisting of large sized individuals of the above mentioned species. The second level is formed by plants with 20-35 cm in height, among the most representative being the following: Trifolium pratense, Anthyllis vulneraria, Lotus corniculatus, Luzula campestris, Gymnadenia conopsea, Carum carvi, Trifolium campestre, T. montanum, Cerastium holosteoides;
AL. MUREŞAN, GABRIELA ADINA LAZĂR
52
- South – eastern Carpathian spruce (Picea abies), beech (Fagus sylvatica) and fir (Abies alba) forests, with Hieracium rotndatum (code Natura 2000 - 9110, code Romania - R4102) consisting of spruce (Picea abies), beech (Fagus sylvatica ssp. sylvatica) and fir (Abies alba) trees in different percentages, with rare individuals of birch (Betula pendula) and field ash (Sorbus aucuparia);
- South – eastern Carpathian beech (Fagus sylvatica) and fir (Abies alba) forests with Hieracium rotundatum (code Natura 2000 - 9110, code Romania - R4106). The present phytocenoses comprises European and boreal species, as well as meso-thermal, meso-phyle and oligotroph elements. The arboreal stratum is consisted exclusively of beech (Fagus sylvatica ssp. sylvatica) trees or mixed with fir (Abies alba), rarely spruce (Picea abies), birch (Betula pendula), field ash (Sorbus aucuparia) or pine trees (Pinus sylvestris);
- South – eastern Carpathian beech (Fagus sylvatica) and fir (Abies alba) forests with Vaccinium myrtillus (code Natura 2000 - 9110, code Romania - R4107). The arboreal stratum is consisted exclusively of beech (Fagus sylvatica ssp. sylvatica) (forests found between 700 and 1400 m altitude), forests with beech and fir trees (Abies alba) (forest found between 800 and 1240 m altitude) and with rare individuals of spruce (at higher altitudes) and with few specimens of field ash and birch trees;
- South – eastern Carpathian beech (Fagus sylvatica) forests with Festuca drymeia (code Natura 2000 - 9110, code Romania - R4110). The arboreal stratum comprises exclusively beech trees (Fagus sylvatica ssp. sylvatica) or a mixture of mountain maple (Acer pseudoplatanus), fir (Abies alba) at higher altitudes, and durmast (Quercus petraea), hornbeam (Carpinus betulus), trembling poplar (Plopulus tremula), elm (Ulmus glabra) and wild cherry (Cerasus avium) at lower altitudes;
- South – eastern Carpathian beech (Fagus sylvatica) forests with Phyllitis scolopendrium (code Natura 2000 - 91V0, code Romania - R4116). The present phytocenoses are composed by European nemoral species. The arboreal stratum comprises, in the upper part beech (Fagus sylvatica) with mountain maple (Acer pseudoplatanus), ash (Fraxinus ornus) and in the lower part species of field maple (Acer campestre) and hornbeam (Carpinus betulus);
- South – eastern Carpathian spruce (Picea abies), beech (Fagus sylvatica) and fir (Abies alba) forests with Pulmonaria rubra (code Natura 2000 - 91V0, code Romania - R4101). The tree stratum comprises species of spruce, beech frequently mountain maple or mountain elm;
- Dacian beech (Fagus sylvatica) and hornbeam (Carpinus betulus) forests with Dentaria bulbifera (code Natura 2000 - 9130, code Romania - R4118). The arboreal stratum comprises exclusively species of beech (Fagus sylvatica) or mixed in a small percentage with hornbeam (Carpinus betulus) and scarcely durmast (Quercus petraea), wild cherry (Cerasus avium), mountain maple (Acer pseudoplatanus), chess apple (Sorbus torminalis), elm (Ulmus glabra, U. minor), ash (Fraxinus excelsior), linden tree (Tilia cordata). In the case when the percentage of the present species exceeds 50% the so-called mixed beach- woods are formed;
- South – eastern Carpathian spruce (Picea abies) with Oxalis acetosella (code Natura 2000 - 9410, cod Romania - R4205). The arboreal stratum is exclusively comprised of spruce (Picea abies) or rarely with fir (Abies alba), mountain maple (Acer pseudoplatanus), mountain elm (Ulmus glabra) and beech (Fagus sylvatica);
PROTECTED ELEMENTS IN THE TIŞIŢA NATURAL RESERVE
53
- Dacian bush woods with underbrush (Myricaria germanica) (code Natura 2000 - 3230, cod Romania - R4415). The phytocenosis is primary installed as a pioneer grouping and is edified in a bigger extent by the presence of several mezo-thermal, mezo-hygrophile and hygrophile species and herbaceous species that can become eutrophic, especially after a flood. The shrub stratum is dominated by the Myricaria germanica species in different percentages and associated with Salix purpurea. Scarcely, juvenile individuals of Alnus glutinosa, Alnus incana, Fagus sylvatica are present. The dynamics of the herbaceous stratum is reduced, being frequently destroyed by floods, thus determining fluctuant coverage of 20-50%, with a reduced rootedness;
- South – eastern Carpathian bush woods with blueberry (Vaccinium myrtillis) and black grass (Calluna vulgaris) (code Natura 2000 - 4030, code Romania - R3112). The edifying species, Calluna vulgaris, is usually a pioneer one, covering a variable surface between 35-75% and reaching a height between 20 and 100 cm. In the Carpathian Mountains this species is frequently associated with Vaccinium myrtillis and Vaccinium vitisidaea, with Carpathian – Balkan species and, forming a different vegetal association from the central – European one.
5. CONCLUSIONS
A major problem, spread beyond the boundaries of the Tişiţa Natural Reserve is represented by the poaching activities of the animals in order to protect the existing crops, the orchards and the sheepfolds. The estimations of the Vrancea EPA indicate the fact that relatively 10% of the bear population is exposed to this phenomenon. This fact can put in danger not only the life of the local human population, but as well as the life of the wild animals which become more and more violent when captured.
Also, the tourism-related activities as an increasing economic activity can create problems related to the tailings storage places. These tailings not only pollute the ecosystems but can lead to the appearance of the “scavenger bear”. The development of the tourism also attracts the need to protect the vegetal associations.
If the re-afforestations by means of natural or anthropogenic modalities have brought back the wooded character of the Tişiţa Basin, the protection of these forests, some of them still very young, is imposed in strict correlations with the existing legislation.
The creation of SCI Putna – Vrancea National Park and its inclusion in the Natura 2000 Network represents a counterpoint on the chance that in the future all the mountain and nature lovers will be able to enjoy the beauties of the Tişiţa Natural Reserve.
R E F E R E N C E S
1. Abrudan, I.V. et al. (2004), Pădurile României. Parcuri naţionale şi parcuri naturale, Edit. Intact, Bucureşti.
2. Almăşan, H. şi colab. (1981), Pădurile României, Edit. Academiei RSR, Bucureşti. 3. Lazăr, G., Stăncioiu P.T. (2007), Habitate forestiere de interes comunitar incluse în proiectul LIFE05
NAT/RO/000176: „Habitate prioritare alpine, subalpine şi forestiere din România”. Ameninţări potenţiale, Edit. Universităţii „Transilvania”, Braşov.

AL. MUREŞAN, GABRIELA ADINA LAZĂR
54
4. Pop, Gr., P. (2000), Carpaţii şi subcarpaţii României, Edit. Presa Universitară Clujeană. 5. Roman, F. (1989) Munţii Vrancei, Edit. Sport-Turism, Bucureşti. 6. Roşu, Al. (1973), Geografia fizică a României, Edit. Didactică şi Pedagogică, Bucureşti. 7. Rozylowicz, L. et al. (2005), Protecţia carnivorelor mari în Vrancea, Edit. Ars Docendi, Bucureşti. 8. Sava J., Sava B.D. (2007), Ţara Vrancei – studiu geografic complex, Edit. Europolis, Constanţa. 9. Sârbu, A. (coord), (2007), Arii speciale pentru protecţia şi conservarea plantelor în România, Edit.
Victor B. Victor, Bucureşti. 10. *** www.icas.ro, Institutul de Cercetări şi Amenajări Silvice, accessed on November 10, 2009. 11. *** www.rosilva.ro, Regia Natională a Pădurilor Romsilva, accessed on November 10, 2009. 12. *** www.carnivoremari.ro, Agenţia pentru Protecţia Mediului Vrancea, accessed on November 10,
2009. NOTE: “Investing in people!” PhD scholarship, Project co-financed by the European Social
Fund, Sectoral Operational Programme Human Resources Development 2007 – 2013. Babeş-Bolyai University, Cluj-Napoca, Romania.
STUDIA UNIVERSITATIS BABEŞ-BOLYAI, GEOGRAPHIA, LV, 2, 2010
„TRAVEL THE WORLD!” – HIGH SCHOOL FIELD TRIPS –
AGOTA-DOROTTYA DEMETER1
ABSTRACT. – “Travel the World!” – High School Field Trips. „At one time, it was called a learning trip, whose primary goal was to enable the students to visit the country’s notable areas and towns. Today, gathering knowledge and cultural experiences has faded into the background; for students, this is no longer the experience of paramount importance; rather, it is the pleasure that comes from free, unfettered time together, and an escape from the schoolroom.” (P. Kürönya PhD). This paper is based on the theme of school field trips, changes to the traditions over the past few years of these excursions, as well as the needs and expectations of high-schoolers with regards to school trips. As well, in order to have practical value, the paper has to compile a program basis for a school trip which contains not only team building but also encompasses sight-seeing, interactive programs and games. A poll was carried out among the grade 9 and 10 students attending the Hungarian collegiates (academic high-schools), in the form of a questionnaire. A total of 403 questionnaires were completed and analyzed. Keywords: field trips, high school students, education.
1. INTRODUCTION
In the spring of 2007, as part of another of my research efforts, I came into contact with an elderly museologist gentleman, as the person I came to see was out of the office. We began to talk about my studies and I related to him my observation that, although visits to museums are on the increase, the number of visitors who arrive as part of groups has been declining for the past several years. He agreed, saying that ‘Indeed, fewer students are coming.’ He saw the reason in that there were fewer and fewer school trips which included a visit to a museum. I remembered that my grade 9 school trip consisted of traveling from Târgu-Mureş to Cluj-Napoca where we were taken to the botanical gardens, went boating on the lake, played in a park, took a look in one or two museums and went home. The 9th graders of Târgu-Mureş today are more likely to go on a team building weekend; it is rare that they would travel to another city in Transylvania. This gave rise to the idea to base my next paper on school field trips - changes to the traditions over the past few years of these excursions, as well as the needs and expectations of high-schoolers with regards to school trips. As well, in order to have practical value, the paper has to compile a program basis for a school trip which contains not only team building but also encompasses sight-seeing, interactive programs and games.
1 „Babeş-Bolyai” University, Faculty of Geography, 400006 Cluj-Napoca, Romania, e-mail:
AGOTA-DOROTTYA DEMETER
56
2. A SHORT DESCRIPTION OF THE SURVEY, ITS AIMS, ASSUMPTIONS AND HYPOTHESES
At the beginning of the following school year, I began to think how to translate the idea, the topic into practice. I decided to carry out a poll among the grade 9 and 10 students attending the Hungarian collegiates (academic high-schools), in the form of a questionnaire. Sectarian schools, or classes, were exempted, as their needs are different. The aim of the poll, apart from surveying the habits, needs and expectations of high-school students from their class trips, was for the creation of programs and ideas, based on the survey results, which address the students’ needs. According to my assumption, the students would most likely prefer the entertainment and team building activities over the sight-seeing and cultural enrichment events during their outing. Hence, they would tend to opt for outings where the emphasis is placed on team building and entertainment and not where the emphasis is placed on acquiring cultural experience. I would like to assemble programs that not only contain entertainment value and team building excercises but also reveal, in an interactive fashion, the characteristics, historical and cultural richnesses of a city or region to the students. Thus, the participants would learn while being entertained or through games, not merely being taken around in ‘boring’ sight-seeing tours. At the same time, I would like to make use of these programs to make Transylvanian destinations more attractive since I consider it likely that the majority of students in the survey, when asked to choose between a Transylvanian and a foreign trip, will opt for the foreign one. I believe that class trips are very important in creating cohesiveness in a class, especially during the early years of high-school. Trips to foreign countries may be made up of students from several classes; many will not be able to take part due to finacial considerations. The cost of in-country excursions makes it possible for students of even modest means to take part and for the trip to consist of only one class and not a group from several classes. By grades 11 and 12, the class trip is no longer as important from the perspective of getting to know each other, of building class cohesion. Hence, I think, by that time the students are more mature and better prepared for the experiences a foreign excursion offers.
It is my further hypothesis that the location and type of program will vary according to sex and academic focus of those polled, and the type of abode they inhabit. Besides the type of domicile, the choice may also be influenced whether the person’s permanent residence is in the same settlement as the school, or in some other settlement.
The field work was carried out in two phases. I performed one survey in the spring of 2008 in the Bolyai Farkas Collegiate Institute of Târgu-Mureş. I polled ten classes (out of 14, plus another two Catholic classes which were outside the scope) of grade 9 and 10 students, representing a total of 242 questionnaires. A few home room teachers also responded but, alas, too few. Since the Bolyai gives home to the majority of Hungarian academic classrooms in Târgu-Mureş, the sample thus obtained can be seen as representative for the city.
The second phase of the field work consisted of polling in Cluj-Napoca. Currently, there are three exclusively Hungarian collegiates in Cluj Napoca. They are: the Stephen Báthory, the John Apáczai Csere and the Samuel Brassai Collegiate Institutes. The noted three institutions had, at the time of the survey, 16 classes for grades 9 and 10. Of these, I was able to poll 8 classes.
Based on the results of the completed questionnaires, I can reliably compare the class trip tastes of Hungarian 9th and 10th graders from a mid-sized town (with a half-Romanian and half-Hungarian population) with those from a larger city (with a Romanian majority population).
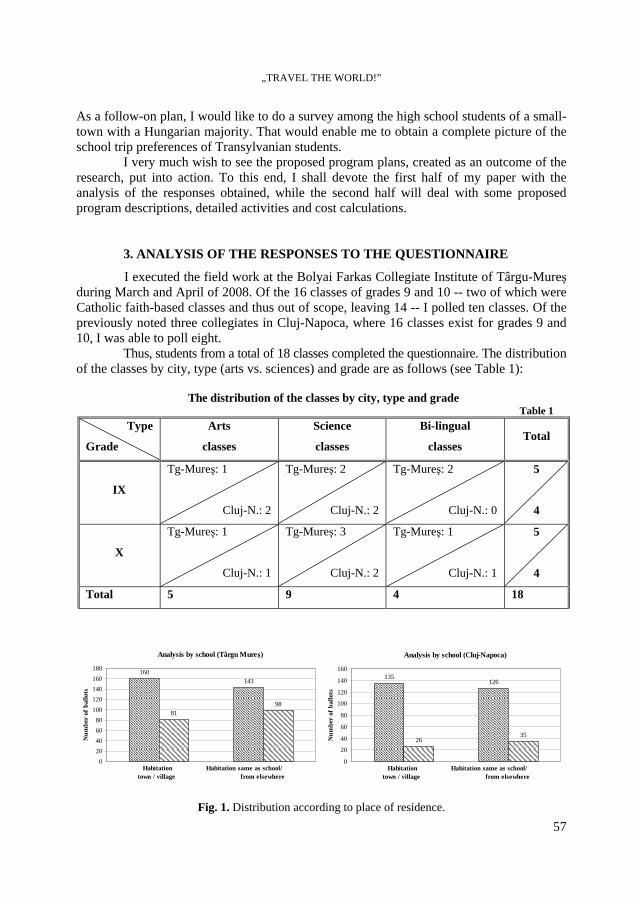
„TRAVEL THE WORLD!”
57
The distribution of the classes by city, type and grade Table 1
Type
Grade
Arts
classes
Science
classes
Bi-lingual
classes Total
IX
Tg-Mureş: 1
Cluj-N.: 2
Tg-Mureş: 2
Cluj-N.: 2
Tg-Mureş: 2
Cluj-N.: 0
5
4
X
Tg-Mureş: 1
Cluj-N.: 1
Tg-Mureş: 3
Cluj-N.: 2
Tg-Mureş: 1
Cluj-N.: 1
5
4
Total 5 9 4 18
As a follow-on plan, I would like to do a survey among the high school students of a small-town with a Hungarian majority. That would enable me to obtain a complete picture of the school trip preferences of Transylvanian students.
I very much wish to see the proposed program plans, created as an outcome of the research, put into action. To this end, I shall devote the first half of my paper with the analysis of the responses obtained, while the second half will deal with some proposed program descriptions, detailed activities and cost calculations.
3. ANALYSIS OF THE RESPONSES TO THE QUESTIONNAIRE
I executed the field work at the Bolyai Farkas Collegiate Institute of Târgu-Mureş during March and April of 2008. Of the 16 classes of grades 9 and 10 -- two of which were Catholic faith-based classes and thus out of scope, leaving 14 -- I polled ten classes. Of the previously noted three collegiates in Cluj-Napoca, where 16 classes exist for grades 9 and 10, I was able to poll eight.
Thus, students from a total of 18 classes completed the questionnaire. The distribution of the classes by city, type (arts vs. sciences) and grade are as follows (see Table 1):
Analysis by school (Târgu Mureş)
160143
8198
020406080
100120140160180
Habitation Habitation same as school/ town / village from elsewhere
Num
ber
of b
allo
ts
Analysis by school (Cluj-Napoca)
135126
2635
0
20
40
60
80
100
120
140
160
Habitation Habitation same as school/ town / village from elsewhere
Num
ber
of b
allo
ts
Fig. 1. Distribution according to place of residence.
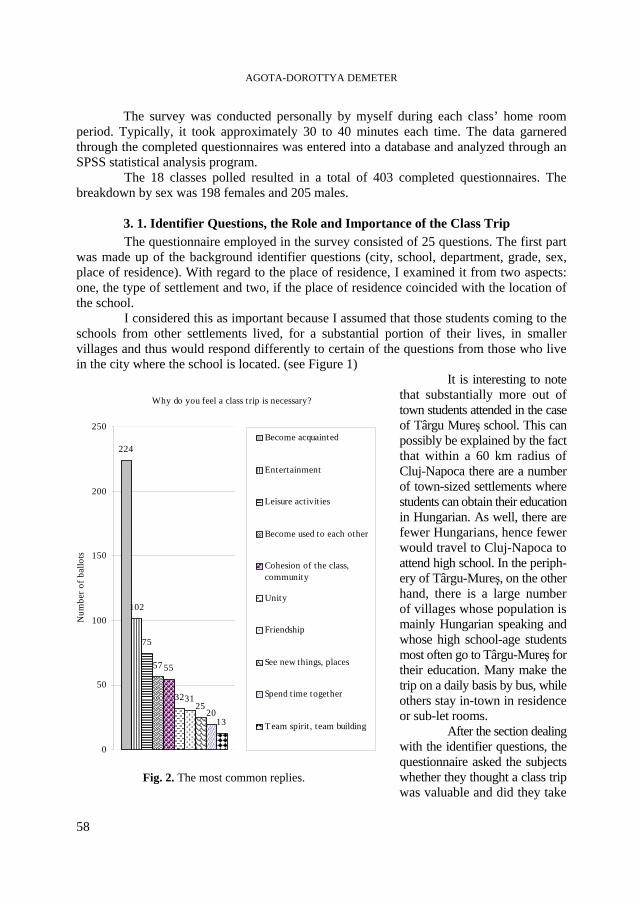
AGOTA-DOROTTYA DEMETER
58
The survey was conducted personally by myself during each class’ home room period. Typically, it took approximately 30 to 40 minutes each time. The data garnered through the completed questionnaires was entered into a database and analyzed through an SPSS statistical analysis program.
The 18 classes polled resulted in a total of 403 completed questionnaires. The breakdown by sex was 198 females and 205 males.
3. 1. Identifier Questions, the Role and Importance of the Class Trip The questionnaire employed in the survey consisted of 25 questions. The first part
was made up of the background identifier questions (city, school, department, grade, sex, place of residence). With regard to the place of residence, I examined it from two aspects: one, the type of settlement and two, if the place of residence coincided with the location of the school.
I considered this as important because I assumed that those students coming to the schools from other settlements lived, for a substantial portion of their lives, in smaller villages and thus would respond differently to certain of the questions from those who live in the city where the school is located. (see Figure 1)
It is interesting to note that substantially more out of town students attended in the case of Târgu Mureş school. This can possibly be explained by the fact that within a 60 km radius of Cluj-Napoca there are a number of town-sized settlements where students can obtain their education in Hungarian. As well, there are fewer Hungarians, hence fewer would travel to Cluj-Napoca to attend high school. In the periph-ery of Târgu-Mureş, on the other hand, there is a large number of villages whose population is mainly Hungarian speaking and whose high school-age students most often go to Târgu-Mureş for their education. Many make the trip on a daily basis by bus, while others stay in-town in residence or sub-let rooms.
After the section dealing with the identifier questions, the questionnaire asked the subjects whether they thought a class trip was valuable and did they take
Why do you feel a class trip is necessary?
224
102
75
57 55
323125
2013
0
50
100
150
200
250
Num
ber o
f bal
lots
Become acquainted
Entertainment
Leisure activities
Become used to each other
Cohesion of the class,community
Unity
Friendship
See new things, places
Spend time together
Team spirit, team building
Fig. 2. The most common replies.
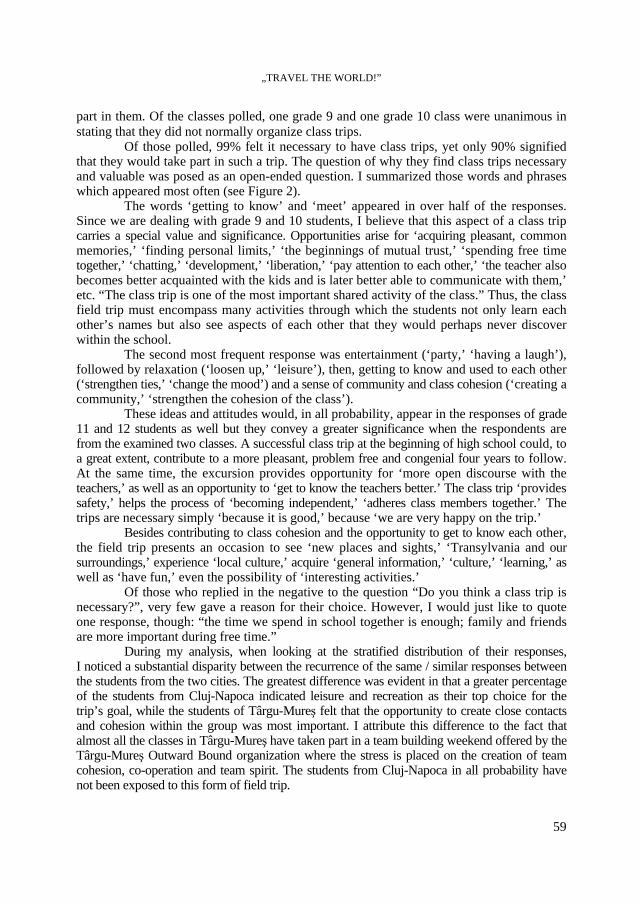
„TRAVEL THE WORLD!”
59
part in them. Of the classes polled, one grade 9 and one grade 10 class were unanimous in stating that they did not normally organize class trips.
Of those polled, 99% felt it necessary to have class trips, yet only 90% signified that they would take part in such a trip. The question of why they find class trips necessary and valuable was posed as an open-ended question. I summarized those words and phrases which appeared most often (see Figure 2).
The words ‘getting to know’ and ‘meet’ appeared in over half of the responses. Since we are dealing with grade 9 and 10 students, I believe that this aspect of a class trip carries a special value and significance. Opportunities arise for ‘acquiring pleasant, common memories,’ ‘finding personal limits,’ ‘the beginnings of mutual trust,’ ‘spending free time together,’ ‘chatting,’ ‘development,’ ‘liberation,’ ‘pay attention to each other,’ ‘the teacher also becomes better acquainted with the kids and is later better able to communicate with them,’ etc. “The class trip is one of the most important shared activity of the class.” Thus, the class field trip must encompass many activities through which the students not only learn each other’s names but also see aspects of each other that they would perhaps never discover within the school.
The second most frequent response was entertainment (‘party,’ ‘having a laugh’), followed by relaxation (‘loosen up,’ ‘leisure’), then, getting to know and used to each other (‘strengthen ties,’ ‘change the mood’) and a sense of community and class cohesion (‘creating a community,’ ‘strengthen the cohesion of the class’).
These ideas and attitudes would, in all probability, appear in the responses of grade 11 and 12 students as well but they convey a greater significance when the respondents are from the examined two classes. A successful class trip at the beginning of high school could, to a great extent, contribute to a more pleasant, problem free and congenial four years to follow. At the same time, the excursion provides opportunity for ‘more open discourse with the teachers,’ as well as an opportunity to ‘get to know the teachers better.’ The class trip ‘provides safety,’ helps the process of ‘becoming independent,’ ‘adheres class members together.’ The trips are necessary simply ‘because it is good,’ because ‘we are very happy on the trip.’
Besides contributing to class cohesion and the opportunity to get to know each other, the field trip presents an occasion to see ‘new places and sights,’ ‘Transylvania and our surroundings,’ experience ‘local culture,’ acquire ‘general information,’ ‘culture,’ ‘learning,’ as well as ‘have fun,’ even the possibility of ‘interesting activities.’
Of those who replied in the negative to the question “Do you think a class trip is necessary?”, very few gave a reason for their choice. However, I would just like to quote one response, though: “the time we spend in school together is enough; family and friends are more important during free time.”
During my analysis, when looking at the stratified distribution of their responses, I noticed a substantial disparity between the recurrence of the same / similar responses between the students from the two cities. The greatest difference was evident in that a greater percentage of the students from Cluj-Napoca indicated leisure and recreation as their top choice for the trip’s goal, while the students of Târgu-Mureş felt that the opportunity to create close contacts and cohesion within the group was most important. I attribute this difference to the fact that almost all the classes in Târgu-Mureş have taken part in a team building weekend offered by the Târgu-Mureş Outward Bound organization where the stress is placed on the creation of team cohesion, co-operation and team spirit. The students from Cluj-Napoca in all probability have not been exposed to this form of field trip.
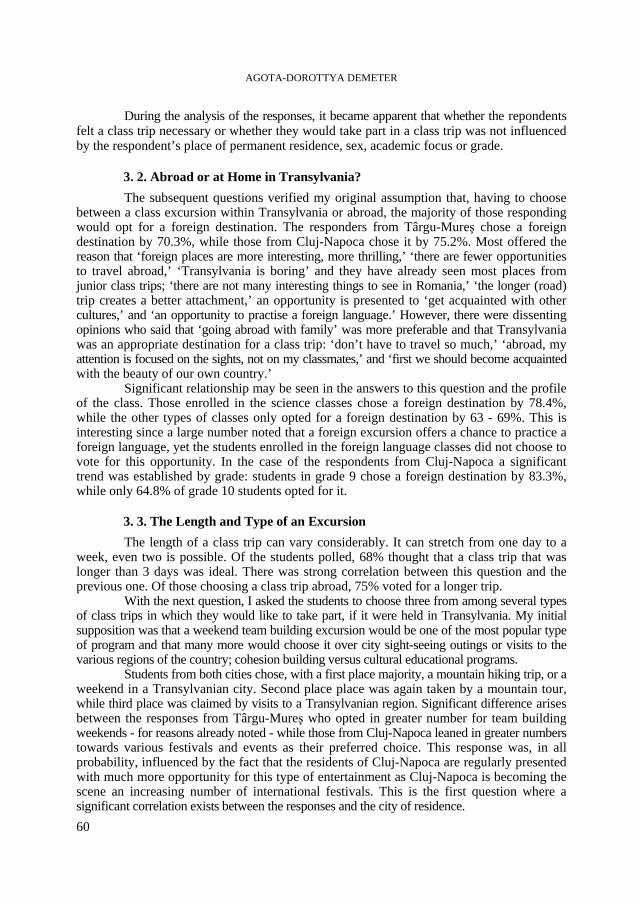
AGOTA-DOROTTYA DEMETER
60
During the analysis of the responses, it became apparent that whether the repondents felt a class trip necessary or whether they would take part in a class trip was not influenced by the respondent’s place of permanent residence, sex, academic focus or grade.
3. 2. Abroad or at Home in Transylvania? The subsequent questions verified my original assumption that, having to choose
between a class excursion within Transylvania or abroad, the majority of those responding would opt for a foreign destination. The responders from Târgu-Mureş chose a foreign destination by 70.3%, while those from Cluj-Napoca chose it by 75.2%. Most offered the reason that ‘foreign places are more interesting, more thrilling,’ ‘there are fewer opportunities to travel abroad,’ ‘Transylvania is boring’ and they have already seen most places from junior class trips; ‘there are not many interesting things to see in Romania,’ ‘the longer (road) trip creates a better attachment,’ an opportunity is presented to ‘get acquainted with other cultures,’ and ‘an opportunity to practise a foreign language.’ However, there were dissenting opinions who said that ‘going abroad with family’ was more preferable and that Transylvania was an appropriate destination for a class trip: ‘don’t have to travel so much,’ ‘abroad, my attention is focused on the sights, not on my classmates,’ and ‘first we should become acquainted with the beauty of our own country.’
Significant relationship may be seen in the answers to this question and the profile of the class. Those enrolled in the science classes chose a foreign destination by 78.4%, while the other types of classes only opted for a foreign destination by 63 - 69%. This is interesting since a large number noted that a foreign excursion offers a chance to practice a foreign language, yet the students enrolled in the foreign language classes did not choose to vote for this opportunity. In the case of the respondents from Cluj-Napoca a significant trend was established by grade: students in grade 9 chose a foreign destination by 83.3%, while only 64.8% of grade 10 students opted for it.
3. 3. The Length and Type of an Excursion The length of a class trip can vary considerably. It can stretch from one day to a
week, even two is possible. Of the students polled, 68% thought that a class trip that was longer than 3 days was ideal. There was strong correlation between this question and the previous one. Of those choosing a class trip abroad, 75% voted for a longer trip.
With the next question, I asked the students to choose three from among several types of class trips in which they would like to take part, if it were held in Transylvania. My initial supposition was that a weekend team building excursion would be one of the most popular type of program and that many more would choose it over city sight-seeing outings or visits to the various regions of the country; cohesion building versus cultural educational programs.
Students from both cities chose, with a first place majority, a mountain hiking trip, or a weekend in a Transylvanian city. Second place place was again taken by a mountain tour, while third place was claimed by visits to a Transylvanian region. Significant difference arises between the responses from Târgu-Mureş who opted in greater number for team building weekends - for reasons already noted - while those from Cluj-Napoca leaned in greater numbers towards various festivals and events as their preferred choice. This response was, in all probability, influenced by the fact that the residents of Cluj-Napoca are regularly presented with much more opportunity for this type of entertainment as Cluj-Napoca is becoming the scene an increasing number of international festivals. This is the first question where a significant correlation exists between the responses and the city of residence.
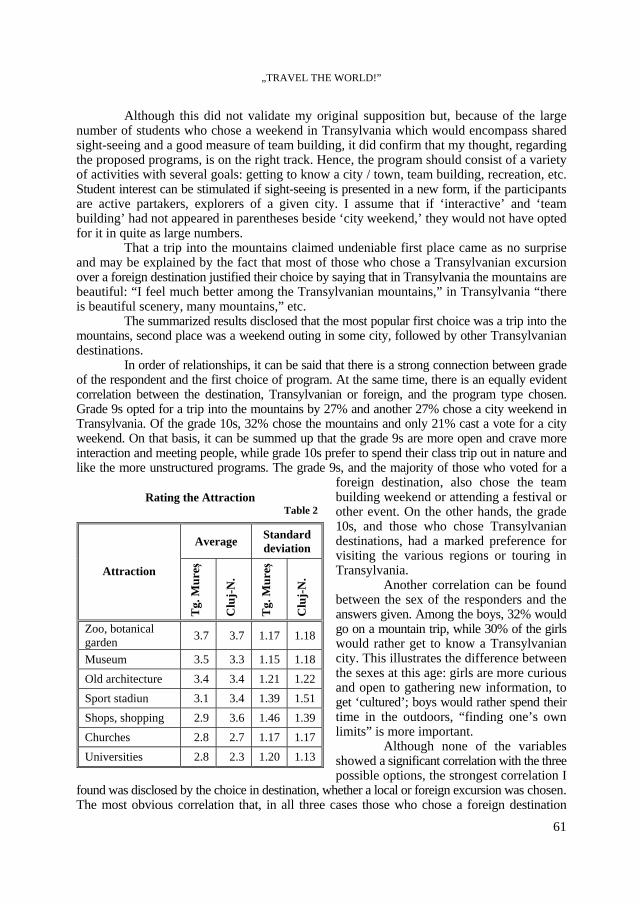
„TRAVEL THE WORLD!”
61
Rating the Attraction Table 2
Average Standard deviation
Attraction
Tg.
Mur
eş
Clu
j-N
.
Tg.
Mur
eş
Clu
j-N
.
Zoo, botanical garden 3.7 3.7 1.17 1.18
Museum 3.5 3.3 1.15 1.18 Old architecture 3.4 3.4 1.21 1.22 Sport stadiun 3.1 3.4 1.39 1.51 Shops, shopping 2.9 3.6 1.46 1.39 Churches 2.8 2.7 1.17 1.17 Universities 2.8 2.3 1.20 1.13
Although this did not validate my original supposition but, because of the large number of students who chose a weekend in Transylvania which would encompass shared sight-seeing and a good measure of team building, it did confirm that my thought, regarding the proposed programs, is on the right track. Hence, the program should consist of a variety of activities with several goals: getting to know a city / town, team building, recreation, etc. Student interest can be stimulated if sight-seeing is presented in a new form, if the participants are active partakers, explorers of a given city. I assume that if ‘interactive’ and ‘team building’ had not appeared in parentheses beside ‘city weekend,’ they would not have opted for it in quite as large numbers.
That a trip into the mountains claimed undeniable first place came as no surprise and may be explained by the fact that most of those who chose a Transylvanian excursion over a foreign destination justified their choice by saying that in Transylvania the mountains are beautiful: “I feel much better among the Transylvanian mountains,” in Transylvania “there is beautiful scenery, many mountains,” etc.
The summarized results disclosed that the most popular first choice was a trip into the mountains, second place was a weekend outing in some city, followed by other Transylvanian destinations.
In order of relationships, it can be said that there is a strong connection between grade of the respondent and the first choice of program. At the same time, there is an equally evident correlation between the destination, Transylvanian or foreign, and the program type chosen. Grade 9s opted for a trip into the mountains by 27% and another 27% chose a city weekend in Transylvania. Of the grade 10s, 32% chose the mountains and only 21% cast a vote for a city weekend. On that basis, it can be summed up that the grade 9s are more open and crave more interaction and meeting people, while grade 10s prefer to spend their class trip out in nature and like the more unstructured programs. The grade 9s, and the majority of those who voted for a
foreign destination, also chose the team building weekend or attending a festival or other event. On the other hands, the grade 10s, and those who chose Transylvanian destinations, had a marked preference for visiting the various regions or touring in Transylvania.
Another correlation can be found between the sex of the responders and the answers given. Among the boys, 32% would go on a mountain trip, while 30% of the girls would rather get to know a Transylvanian city. This illustrates the difference between the sexes at this age: girls are more curious and open to gathering new information, to get ‘cultured’; boys would rather spend their time in the outdoors, “finding one’s own limits” is more important.
Although none of the variables showed a significant correlation with the three possible options, the strongest correlation I
found was disclosed by the choice in destination, whether a local or foreign excursion was chosen. The most obvious correlation that, in all three cases those who chose a foreign destination
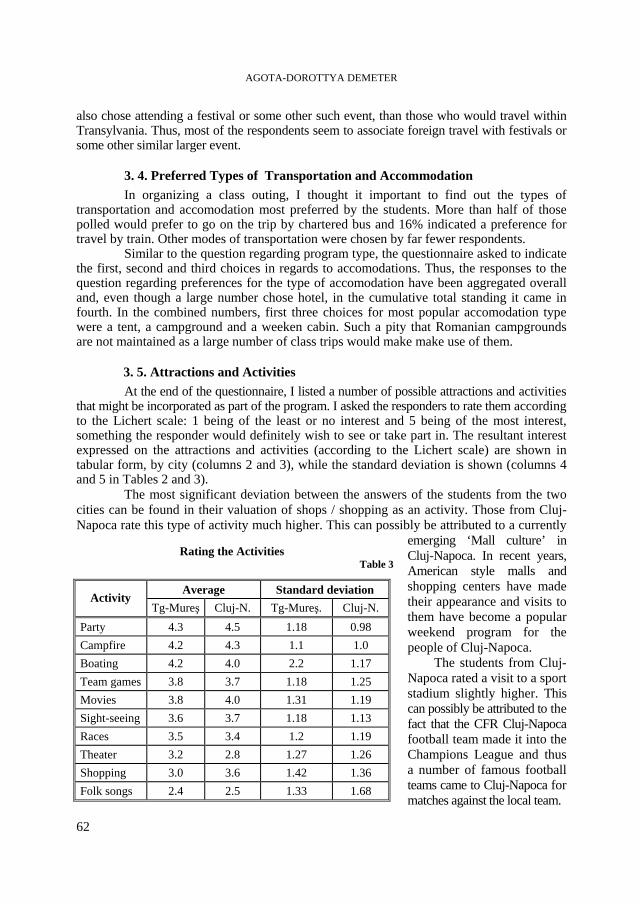
AGOTA-DOROTTYA DEMETER
62
Rating the Activities Table 3
Average Standard deviation Activity
Tg-Mureş Cluj-N. Tg-Mureş. Cluj-N. Party 4.3 4.5 1.18 0.98 Campfire 4.2 4.3 1.1 1.0 Boating 4.2 4.0 2.2 1.17 Team games 3.8 3.7 1.18 1.25 Movies 3.8 4.0 1.31 1.19 Sight-seeing 3.6 3.7 1.18 1.13 Races 3.5 3.4 1.2 1.19 Theater 3.2 2.8 1.27 1.26 Shopping 3.0 3.6 1.42 1.36 Folk songs 2.4 2.5 1.33 1.68
also chose attending a festival or some other such event, than those who would travel within Transylvania. Thus, most of the respondents seem to associate foreign travel with festivals or some other similar larger event.
3. 4. Preferred Types of Transportation and Accommodation In organizing a class outing, I thought it important to find out the types of
transportation and accomodation most preferred by the students. More than half of those polled would prefer to go on the trip by chartered bus and 16% indicated a preference for travel by train. Other modes of transportation were chosen by far fewer respondents.
Similar to the question regarding program type, the questionnaire asked to indicate the first, second and third choices in regards to accomodations. Thus, the responses to the question regarding preferences for the type of accomodation have been aggregated overall and, even though a large number chose hotel, in the cumulative total standing it came in fourth. In the combined numbers, first three choices for most popular accomodation type were a tent, a campground and a weeken cabin. Such a pity that Romanian campgrounds are not maintained as a large number of class trips would make make use of them. 3. 5. Attractions and Activities
At the end of the questionnaire, I listed a number of possible attractions and activities that might be incorporated as part of the program. I asked the responders to rate them according to the Lichert scale: 1 being of the least or no interest and 5 being of the most interest, something the responder would definitely wish to see or take part in. The resultant interest expressed on the attractions and activities (according to the Lichert scale) are shown in tabular form, by city (columns 2 and 3), while the standard deviation is shown (columns 4 and 5 in Tables 2 and 3).
The most significant deviation between the answers of the students from the two cities can be found in their valuation of shops / shopping as an activity. Those from Cluj-Napoca rate this type of activity much higher. This can possibly be attributed to a currently
emerging ‘Mall culture’ in Cluj-Napoca. In recent years, American style malls and shopping centers have made their appearance and visits to them have become a popular weekend program for the people of Cluj-Napoca. The students from Cluj-Napoca rated a visit to a sport stadium slightly higher. This can possibly be attributed to the fact that the CFR Cluj-Napoca football team made it into the Champions League and thus a number of famous football teams came to Cluj-Napoca for matches against the local team.
„TRAVEL THE WORLD!”
63
The students from Târgu-Mureş rate a visit to a university higher than those from Cluj-Napoca. Most students from Târgu-Mureş go to Cluj-Napoca for university as Cluj-Napoca is Transylvania’s biggest university center. This possibly explains why they are more curious to make a visit to a university if they visit another city. They know that in a few years they will be university students and hence wish to form an impression of the universities.
In the order of magnitude of the events, the greatest difference between the two groups can be found in their attitude to the theater and shops / shopping. The differing value attached to shopping was expected as a result of different valuation of the shops themselves.
Since there was no significant deviation with most of the attractions or activities, for the remainder of the statistics, the responses from Târgu-Mureş and Cluj-Napoca have been aggregated. On average, of the attraction, the highest response was garnered by trips to a zoo or botanical garden. It is possible that the results would have been different if the survey was held in a different city. Târgu-Mureş has a zoo, which is often visited by classes from the lower grades; Cluj-Napoca, on the other hand, has a Botanical Garden that is a ‘must-see’ destination for even day trips to the city. A visit to the Botanical Garden is also an important venue for those from Cluj-Napoca.
It came as a surprise to me that a visit to a museum took second place among the Târgu-Mureş students. I speculated that, while the program for a class trip may safely include city sight-seeing, a visit to a museum would not be too popular. The deviation in the case of the sports stadium and shops is relatively large, as the boys likely voted in larger numbers for the sports venue. In the order of popularity of the activities, the most popular would be a ‘party, hanging-out, bash,’ followed by an evening campfire and then boating.
Other mentioned attractions were the following: amusement park, swimming pool, skating rink, forts and castles, amusement arcades, parks, etc. Among activities, touring (hiking, biking) and city sight-seeing at night were mentioned. It is interesting to note that girls voted in larger numbers for old architecture, churches, zoo and botanical parks, team games, learning of songs, campfires and the theater. The only attraction where the average of votes cast by the boys is greater is in the case of the sports stadium. This is of interest because, in picking a program type, boys opted, in a larger proportion, for a team building weekend than the girls, yet here, girls seem to place higher value on team building.
There is a significant link between the results and the grade of those polled. Grade 9s are more interested in old architecture, learning songs and, as fully expected, a much higher interest was expressed in team activities and competitions. This was already evident in the choices of programs. It seems that grade 10s would rather spend time in shops and shopping during a class excursion.
Statistical stratification by SPSS disclosed that old buildings, churches and museums were mostly preferred by the students in the arts classes; the science classes were drawn to the sports stadium (which can be explained as there are significantly more boys in this stream); and the bi-lingual classes were drawn to campfires, learning songs and visits to a zoo and botanical garden.
The type of residential settlement was only influential insofar as city dwellers were more disposed toward city sight-seeing and old buildings. Unfortunately, this does not support my supposition that there would be significant difference in the answers from the differing types of residential settlements. Those choosing a foreign destination seem to have placed a higher value on the less cultural activities: shopping, hanging out, movies and visiting sports arenas. Thus, if those wishing to travel abroad had to choose between sight-seeing and other free time activities, their preference would be the free time activities. Those choosing destinations within Transylvania would rather look at old architecture and buildings.
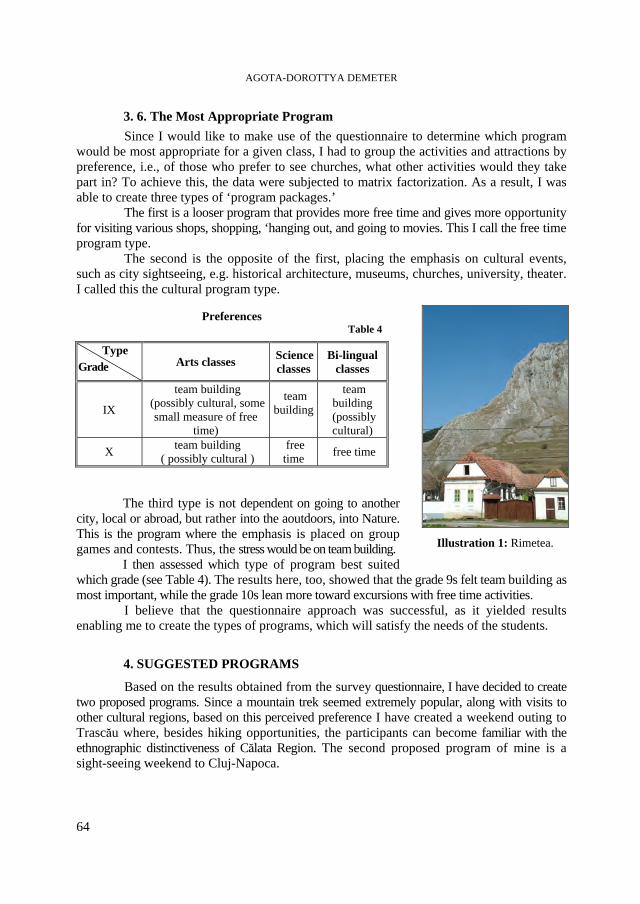
AGOTA-DOROTTYA DEMETER
64
Illustration 1: Rimetea.
3. 6. The Most Appropriate Program Since I would like to make use of the questionnaire to determine which program
would be most appropriate for a given class, I had to group the activities and attractions by preference, i.e., of those who prefer to see churches, what other activities would they take part in? To achieve this, the data were subjected to matrix factorization. As a result, I was able to create three types of ‘program packages.’
The first is a looser program that provides more free time and gives more opportunity for visiting various shops, shopping, ‘hanging out, and going to movies. This I call the free time program type.
The second is the opposite of the first, placing the emphasis on cultural events, such as city sightseeing, e.g. historical architecture, museums, churches, university, theater. I called this the cultural program type.
The third type is not dependent on going to another city, local or abroad, but rather into the aoutdoors, into Nature. This is the program where the emphasis is placed on group games and contests. Thus, the stress would be on team building. I then assessed which type of program best suited which grade (see Table 4). The results here, too, showed that the grade 9s felt team building as most important, while the grade 10s lean more toward excursions with free time activities.
I believe that the questionnaire approach was successful, as it yielded results enabling me to create the types of programs, which will satisfy the needs of the students.
4. SUGGESTED PROGRAMS
Based on the results obtained from the survey questionnaire, I have decided to create two proposed programs. Since a mountain trek seemed extremely popular, along with visits to other cultural regions, based on this perceived preference I have created a weekend outing to Trascău where, besides hiking opportunities, the participants can become familiar with the ethnographic distinctiveness of Călata Region. The second proposed program of mine is a sight-seeing weekend to Cluj-Napoca.
Preferences Table 4
Type Grade Arts classes Science
classes Bi-lingual
classes
IX
team building (possibly cultural, some small measure of free
time)
team building
team building (possibly cultural)
X team building ( possibly cultural )
free time free time
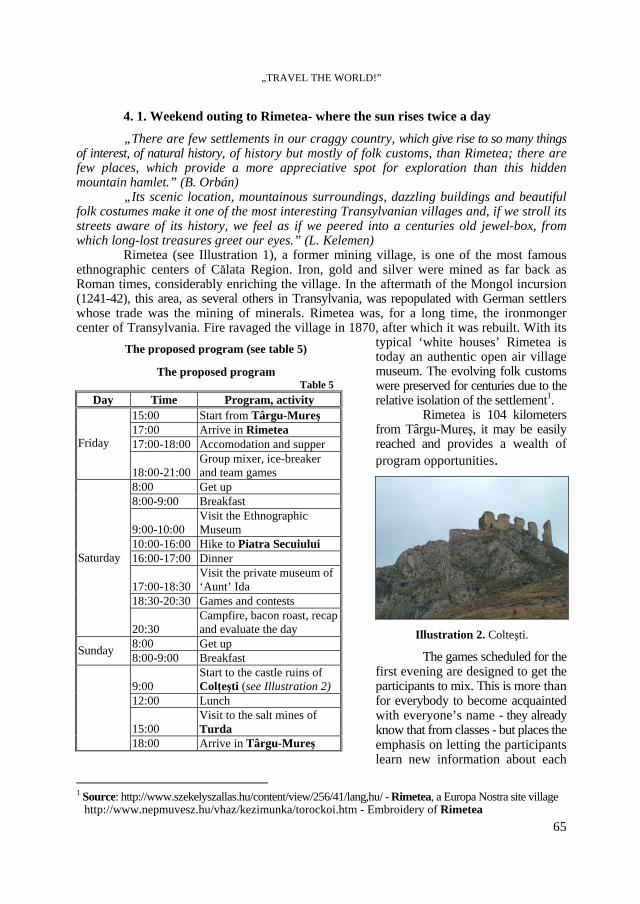
„TRAVEL THE WORLD!”
65
Illustration 2. Colteşti.
4. 1. Weekend outing to Rimetea- where the sun rises twice a day
„There are few settlements in our craggy country, which give rise to so many things of interest, of natural history, of history but mostly of folk customs, than Rimetea; there are few places, which provide a more appreciative spot for exploration than this hidden mountain hamlet.” (B. Orbán)
„Its scenic location, mountainous surroundings, dazzling buildings and beautiful folk costumes make it one of the most interesting Transylvanian villages and, if we stroll its streets aware of its history, we feel as if we peered into a centuries old jewel-box, from which long-lost treasures greet our eyes.” (L. Kelemen)
Rimetea (see Illustration 1), a former mining village, is one of the most famous ethnographic centers of Călata Region. Iron, gold and silver were mined as far back as Roman times, considerably enriching the village. In the aftermath of the Mongol incursion (1241-42), this area, as several others in Transylvania, was repopulated with German settlers whose trade was the mining of minerals. Rimetea was, for a long time, the ironmonger center of Transylvania. Fire ravaged the village in 1870, after which it was rebuilt. With its
typical ‘white houses’ Rimetea is today an authentic open air village museum. The evolving folk customs were preserved for centuries due to the relative isolation of the settlement1.
Rimetea is 104 kilometers from Târgu-Mureş, it may be easily reached and provides a wealth of program opportunities.
The games scheduled for the first evening are designed to get the participants to mix. This is more than for everybody to become acquainted with everyone’s name - they already know that from classes - but places the emphasis on letting the participants learn new information about each
1 Source: http://www.szekelyszallas.hu/content/view/256/41/lang,hu/ - Rimetea, a Europa Nostra site village
http://www.nepmuvesz.hu/vhaz/kezimunka/torockoi.htm - Embroidery of Rimetea
The proposed program Table 5
Day Time Program, activity 15:00 Start from Târgu-Mureş 17:00 Arrive in Rimetea 17:00-18:00 Accomodation and supper Friday
18:00-21:00 Group mixer, ice-breaker and team games
8:00 Get up 8:00-9:00 Breakfast
9:00-10:00 Visit the Ethnographic Museum
10:00-16:00 Hike to Piatra Secuiului 16:00-17:00 Dinner
17:00-18:30 Visit the private museum of ‘Aunt’ Ida
18:30-20:30 Games and contests
Saturday
20:30 Campfire, bacon roast, recap and evaluate the day
8:00 Get up Sunday 8:00-9:00 Breakfast
9:00 Start to the castle ruins of Colţeşti (see Illustration 2)
12:00 Lunch
15:00 Visit to the salt mines of Turda
18:00 Arrive in Târgu-Mureş
The proposed program (see table 5)
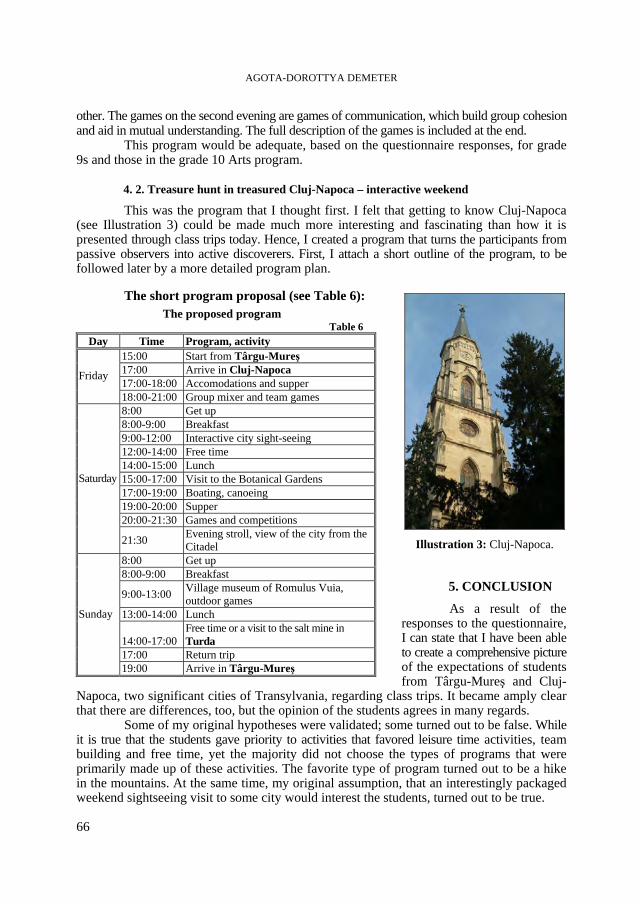
AGOTA-DOROTTYA DEMETER
66
The proposed program Table 6
Day Time Program, activity 15:00 Start from Târgu-Mureş 17:00 Arrive in Cluj-Napoca 17:00-18:00 Accomodations and supper
Friday
18:00-21:00 Group mixer and team games 8:00 Get up 8:00-9:00 Breakfast 9:00-12:00 Interactive city sight-seeing 12:00-14:00 Free time 14:00-15:00 Lunch 15:00-17:00 Visit to the Botanical Gardens 17:00-19:00 Boating, canoeing 19:00-20:00 Supper 20:00-21:30 Games and competitions
Saturday
21:30 Evening stroll, view of the city from the Citadel
8:00 Get up 8:00-9:00 Breakfast
9:00-13:00 Village museum of Romulus Vuia, outdoor games
13:00-14:00 Lunch
14:00-17:00 Free time or a visit to the salt mine in Turda
17:00 Return trip
Sunday
19:00 Arrive in Târgu-Mureş
other. The games on the second evening are games of communication, which build group cohesion and aid in mutual understanding. The full description of the games is included at the end.
This program would be adequate, based on the questionnaire responses, for grade 9s and those in the grade 10 Arts program.
4. 2. Treasure hunt in treasured Cluj-Napoca – interactive weekend
This was the program that I thought first. I felt that getting to know Cluj-Napoca (see Illustration 3) could be made much more interesting and fascinating than how it is presented through class trips today. Hence, I created a program that turns the participants from passive observers into active discoverers. First, I attach a short outline of the program, to be followed later by a more detailed program plan.
The short program proposal (see Table 6):
5. CONCLUSION
As a result of the responses to the questionnaire, I can state that I have been able to create a comprehensive picture of the expectations of students from Târgu-Mureş and Cluj-
Napoca, two significant cities of Transylvania, regarding class trips. It became amply clear that there are differences, too, but the opinion of the students agrees in many regards.
Some of my original hypotheses were validated; some turned out to be false. While it is true that the students gave priority to activities that favored leisure time activities, team building and free time, yet the majority did not choose the types of programs that were primarily made up of these activities. The favorite type of program turned out to be a hike in the mountains. At the same time, my original assumption, that an interestingly packaged weekend sightseeing visit to some city would interest the students, turned out to be true.
Illustration 3: Cluj-Napoca.
„TRAVEL THE WORLD!”
67
My supposition, that the students would rather travel abroad, was also validated. Of the respondents, 72.5% chose a foreign destination, when havin to choose between a Transylvanian or foreign excursion.
The numerous variables are in close relationship with each other; in many cases the sex, grade, class type, city of residence, etc. greatly influenced the responses received.
The questionnaires, as well as the interviews with the home room teachers, confirmed that there is great interest in organized class trips, in which the home room teacher is present as a participant and not necessarily as an organizer.
Based on all these disparate responses, I feel that the survey was successful, giving birth to findings that can be used in a practical setting.
6. FUTURE PLANS, FURTHER GOALS
This, then, is the result of my work this year. It is my hope that my proposed programs will be tried and tested by several classes. There is unequivocal demand for them.
Next year, I would like to expand my polling, as I stated at the beginning. I hope to have the opportunity to create more program packages / types and offer some help to the home room teachers, who unanimously said that they have a need for ideas and programs. It would be helpful to create a web site of program offerings, accomodation possibilities and description of the various destinations, etc. One already exists in Hungary1.
In Hungary, there are many opportunities to take part in organized programs. The Internet website (www.osztalykirandulas.lap.hu) contains a collection of links with suggestions for class trips, ideas, programs and accomodation options. There are travel agents who specialize exclusively in package tours for school classes (Pannon-Servus Turisztikai Iroda: www.osztalykirandulas.hu). As part of a spring semester in Budapest, I intend to establish some contact with this type of travel agents, thus, adding to similar offers here at home. At the same time, I would like to do more industry specific research in the libraries of Budapest. Beside the research in Hungary, there is a possible international interest in the concept, with Polish, Turkish and English partners.
I was successful in finding a few sources in Transylvania, such as the Lyceum Foundation of Cluj-Napoca2, which offers 6-day themed camps in Rimetea or the Pásztortűz / Campfire/ Guest House and Children’s Camp3, where “primarily school groups are welcome for educational field trips, forest classes, themed or summer camps.”
It is my perception that this is one tourism segment that could become financially lucrative with minimal investments. Individual initiatives and practical implementations could swiftly materialize and prosper. I intentionally chose this subject because I myself may yet be able to realize my ideas in a practical form, to the assistance of others and myself.
„Travel, in the younger sort, is a part of education; in the elder, a part of experience.” (Francis Bacon).
„You learn more from a trip that you make, than from all the maps in the world.”(Anon).
I would like to say thank you to my lecturer, Dr. József Benedek and to Péter Csermely for all their help in my work. 1 Tour Guide: http://www.kirandulastervezo.hu/Main.php?do=indexAction. 2 http://www.szallas.net/bentlakas/ 3 http://www.erdelyitabor.hu/
AGOTA-DOROTTYA DEMETER
68
R E F E R E N C E S
1. Albert-Lőrincz, E. (2004), A csoportokkal való munka módszertani kérdései [The Methodology of
Working with Groups], Scientia Kiadó, Kolozsvár. 2. Babbie, E. (2003), A társadalomtudományi kutatás gyakorlata [The Practice of Social Research],
Balassi Kiadó, Budapest. 3. Batiz, R. (szerk.) (2007), Erdély száz csodája I-II. [100 Miracols of Transylvania], Totem Kiadó,
Budapest. 4. Bodor, T. (2006), Táborszervezés, táborvezetés ifjúságsegítőknek és érdeklődőknek [Organizing
Camps in Practice], LOGO Ifjúsági Szolgálat, Szombathely. 5. Gaal, Gy. (2007), Képes Kolozsvár, Polis Kiadó, Kolozsvár. 6. Gesztes, O.-Viktor, Cs. (szerk.) (2003), Nagyító. Középiskolások iskolán kívüli nevelése. Játékgyűjtemény
[Training High-school Students outside the School. Games], Nagyító Alapítvány, Szeged. 7. Dr. Koncz, I. (2005), Gubancbogozó, a kamaszkor rejtelmei [The Difficulties of Adolescence], LOGO
Ifjúsági Szolgálat, Szombathely. 8. Dr. Küronya, P. (2003), Osztályfőnöki kézikönyv. 5-8. osztály [Guidebook for Form Masters], Apáczai
Kiadó, Celldömölk. 9. Dr. Küronya, P. (2003), Osztályfőnöki kézikönyv. 9-12. osztály [Guidebook for Form Masters], Apáczai
Kiadó, Celldömölk. 10. Lynn, D. (2005), Téma. Ötven kreatív, csoportos feladatlap középiskolás fiataloknak [50 Creative
Worksheets for High-school Students], Új Remény Alapítvány, Debrecen. 10. Székely, M.-Barna, I. (2005), Túlélőkészlet az SPSS-hez [Manual for SPSS], Typotex Kiadó, Budapest. 11. Internet:
- http://www.nepmuvesz.hu/vhaz/kezimunka/torockoi.htm - Rimetea - http://www.szekelyszallas.hu/content/view/256/41/lang,hu/ - Rimetea, the winner of Europa
Nostra Prize - http://www.demeter-panzio.go.ro/ - Dr. Demeter Béla Guesthouse - http://www.szallas.net/bentlakas/ - Lyceum Foundation - www.erdelyitabor.hu – Pásztortűz Pansion and Campsite - http://www.outwardbound.ro/?&language_id=9 – Outward Bound - www.osztalykirandulas.lap.hu – Links - http://www.kirandulastervezo.hu/Main.php?do=indexAction - Triporganizer
STUDIA UNIVERSITATIS BABEŞ-BOLYAI, GEOGRAPHIA, LV, 2, 2010
THE DEGREE OF FINISHING OF THE DRAINAGE BASINS OF
THE TRANSYLVANIAN DEPRESSION
GH. ROŞIAN1, R. RUSU2, AL. TAHÂŞ1
ABSTRACT. – The Degree of Finishing of the Drainage Basins of the Transylvanian Depression. One of the possibilities to establish the tendency of evolution of a territory from a hydrographical point of view is the knowledge of the degree or rate of finishing of the drainage basins. This indicator, closely connected to the law of the number of streams, provides information about the stage of evolution of the drainage basins. In order to calculate this indicator, we selected 35 drainage basins of different orders in the Transylvanian Depression. Most of them have a value of the indicator below 1. This fact indicates a hydrographic evolution based on the increase of the number of first order segments in Horton-Strahler system, to reach values equal or higher than 1, specific for the drainage basins in a more advanced stage of evolution. The occurrence of new first order river segments within the drainage basins has effects both at the level of the already existing riverbeds, which perform the transit of alluvia, and at the level of slopes, the common place of formation for gullies and ravines. Keywords: drainage network, confluence ratio, stream order, evolution.
1. OBJECTIVES
According to the available methods, one may establish the tendency of evolution of a territory from a hydrographical and geomorphological point of view in several ways. One of them tries to determine the existing correlation between the drainage network and the degree of finishing of the drainage basins. This indicator is closely connected to the law of the number of streams and provides information about the stage of evolution of the drainage basins and, correlated with this, the dynamics of the geomorphological processes.
This is possible because new first order river segments in Horton-Strahler system are needed within the drainage basins having a degree of finishing below 1. The changes in the present drainage network have effects both at the level of the riverbeds, which perform the transit of alluvia, and at the level of slopes, the common place of formation for gullies and ravines. Therefore, this paper has the main objective of analysing the degree of finishing of the drainage basins of the Transylvanian Depression, working from the law of the number of streams.
In order to compute the values of the above-mentioned indicator, we selected 35 drainage basins belonging to different orders. The reason for their selection from such a large area (24,648 km2) is mainly the evolutional complexity of this territory, both as a whole
1 ”Babeş-Bolyai” University, Faculty of Environmental Science, 400327, Cluj-Napoca, Romania,
e-mail: [email protected] 2 ”Babeş-Bolyai” University, Faculty of Geography, 400006, Cluj-Napoca, Romania, e-mail:
GH. ROŞIAN, R. RUSU, AL. TAHÂŞ
70
and at the level of its subdivisions. In addition, the present appearance of the Transylvanian geomorphological landscapes bears the stamp of the part played by the drainage systems, which created specific landforms because of their process of downgoing in order to adapt to new base levels.
2. METHODOLOGY
The number of river segments of different orders, the confluence ratio and the degree of finishing of the basins are established based on the law of the number of streams in Horton-Strahler system.
Having a genetic basis, this law allows the execution of comparative studies, the statistical processing of data by value classes, as well as quantitative assessments of the stages of dynamic balance (Florina Grecu and G. Palmentola, 2003).
As a result of the representation of data series values in semilogarithmic coordinates, R.E. Horton (1945, p. 291, quoted by I. Zăvoianu, 1978, p. 36) infers the law stating that “the number of different order rivers in a given basin converges towards an inverted geometric progression, in which the first term is the unit, and the ratio is the bifurcation ratio”.
1+=
u
ub N
NR
where: Rb – the bifurcation ratio; u – the order of the segment; Nu – the number of segments belonging to a certain order.
As a result of the analyses made on the drainage network of different basins, but mostly in Ialomiţa basin, and in order to use the confluence ratio instead of the bifurcation ratio3, I. Zăvoianu (1978, p. 40) proposed the removal of the idiom “the first term is the unit” from Horton’s law, which led to the reformulation of the law of the number of streams as following: “the number of river segments belonging to consecutive orders in a given basin converges towards an inverted geometric progression, in which the first term (N1) is given by the number of first order streams, while the ratio is the confluence ratio (Rc)”.
The difference between the two laws is that “the first term” is not the unit, as in Horton’s law, but the number of first order streams (I. Ichim et al. 1989).
The confluence ratio is computed as follows:
1+=
x
xc N
NR
where: Rc – the confluence ratio; Nx – the number of segments of x order; One may determine the confluence ratio for every pair of segments:
2
11 N
NRc = ; 3
22 N
NRc = ; 1+
=n
nc N
NR
n
where: 1cR – the confluence ratio between the first and second order river segments; N1 – the
number of first order segments; N2 – the number of second order segments.
3 A stream of a certain order is formed after the confluence of two streams and not after their bifurcation.
THE DEGREE OF FINISHING OF THE DRAINAGE BASINS OF THE TRANSYLVANIAN DEPRESSION
71
In this case, the confluence ratio represent the arithmetic mean of the individual ratios:
nRRR
R ncccc
++= 21 where: n – the order of the stream.
The knowledge of the number of first and second order segments and of the confluence ratio provides the opportunity to compute the number of streams belonging to any x order (I. Zăvoianu, 1978), which represents nothing else than the ratio between the number of streams belonging to an immediately lower order and the confluence ratio (Rc).
c
xx R
NN
1−=
where: Nx – the number of segments belonging to x order; Nx -1 – the number of streams belonging to an immediately lower order. The total number of river segments (N) belonging to any (x) order is computed with the ratio:
( )c
c
RRN
N−−
=Ω
Ω
11
where: N – the total number of segments; NΩ– the order of the main stream; Ω – the order of the network. According to the number of the river segments and the area of the basin, one may compute the density of the river segments (I. Zăvoianu, 1978), using the formula:
FNDr =
where: Dr – the density of river segments; N – the number of river segments; F – the area. Knowing the number of river segments and the confluence ratio, one may compute
the degree of finishing of the basin as regards the number of accumulated lower order river segments, using the following formula:
11−= s
cs R
NN
where: Ns – the degree of finishing of the main stream; N1 – the number of first order segments; Rc – the confluence ratio; s – the order of the main stream. Similar results are provided if one computes the finishing ratio (Florina Grecu and G. Palmentola, 2003), which renders the degree of finishing of the basin for its order of magnitude, according to the total number of stream segments. The finishing ratio is “the ratio between the values of the penultimate and last term of the progression formed by the sequence of the number of consecutively higher order streams, in which the first term is the number of first order segments, and the progression ratio is the confluence ratio” (Florina Grecu and G. Palmentola, 2003, p. 291). The simplified computational formula is the following:
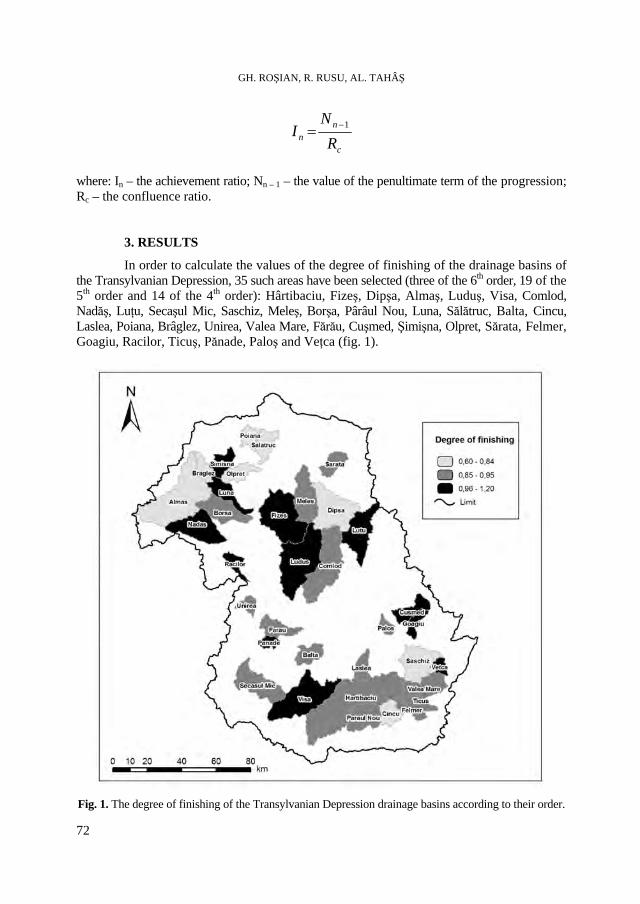
GH. ROŞIAN, R. RUSU, AL. TAHÂŞ
72
c
nn R
NI 1−=
where: In – the achievement ratio; Nn – 1 – the value of the penultimate term of the progression; Rc – the confluence ratio.
3. RESULTS
In order to calculate the values of the degree of finishing of the drainage basins of the Transylvanian Depression, 35 such areas have been selected (three of the 6th order, 19 of the 5th order and 14 of the 4th order): Hârtibaciu, Fizeş, Dipşa, Almaş, Luduş, Visa, Comlod, Nadăş, Luţu, Secaşul Mic, Saschiz, Meleş, Borşa, Pârâul Nou, Luna, Sălătruc, Balta, Cincu, Laslea, Poiana, Brâglez, Unirea, Valea Mare, Fărău, Cuşmed, Şimişna, Olpret, Sărata, Felmer, Goagiu, Racilor, Ticuş, Pănade, Paloş and Veţca (fig. 1).
Fig. 1. The degree of finishing of the Transylvanian Depression drainage basins according to their order.
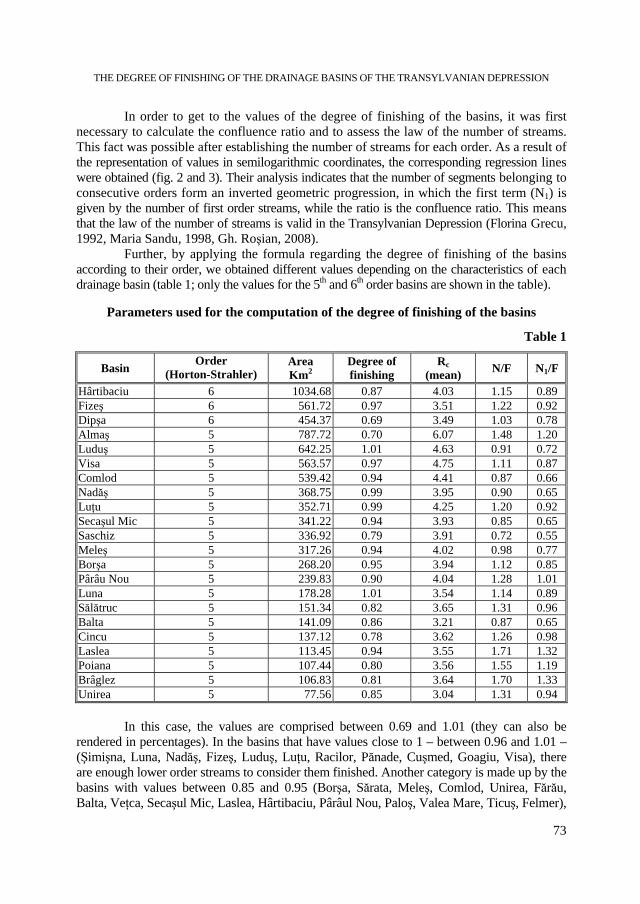
THE DEGREE OF FINISHING OF THE DRAINAGE BASINS OF THE TRANSYLVANIAN DEPRESSION
73
In order to get to the values of the degree of finishing of the basins, it was first necessary to calculate the confluence ratio and to assess the law of the number of streams. This fact was possible after establishing the number of streams for each order. As a result of the representation of values in semilogarithmic coordinates, the corresponding regression lines were obtained (fig. 2 and 3). Their analysis indicates that the number of segments belonging to consecutive orders form an inverted geometric progression, in which the first term (N1) is given by the number of first order streams, while the ratio is the confluence ratio. This means that the law of the number of streams is valid in the Transylvanian Depression (Florina Grecu, 1992, Maria Sandu, 1998, Gh. Roşian, 2008).
Further, by applying the formula regarding the degree of finishing of the basins according to their order, we obtained different values depending on the characteristics of each drainage basin (table 1; only the values for the 5th and 6th order basins are shown in the table).
Parameters used for the computation of the degree of finishing of the basins
Table 1
Basin Order (Horton-Strahler)
Area Km2
Degree of finishing
Rc (mean) N/F N1/F
Hârtibaciu 6 1034.68 0.87 4.03 1.15 0.89 Fizeş 6 561.72 0.97 3.51 1.22 0.92 Dipşa 6 454.37 0.69 3.49 1.03 0.78 Almaş 5 787.72 0.70 6.07 1.48 1.20 Luduş 5 642.25 1.01 4.63 0.91 0.72 Visa 5 563.57 0.97 4.75 1.11 0.87 Comlod 5 539.42 0.94 4.41 0.87 0.66 Nadăş 5 368.75 0.99 3.95 0.90 0.65 Luţu 5 352.71 0.99 4.25 1.20 0.92 Secaşul Mic 5 341.22 0.94 3.93 0.85 0.65 Saschiz 5 336.92 0.79 3.91 0.72 0.55 Meleş 5 317.26 0.94 4.02 0.98 0.77 Borşa 5 268.20 0.95 3.94 1.12 0.85 Pârâu Nou 5 239.83 0.90 4.04 1.28 1.01 Luna 5 178.28 1.01 3.54 1.14 0.89 Sălătruc 5 151.34 0.82 3.65 1.31 0.96 Balta 5 141.09 0.86 3.21 0.87 0.65 Cincu 5 137.12 0.78 3.62 1.26 0.98 Laslea 5 113.45 0.94 3.55 1.71 1.32 Poiana 5 107.44 0.80 3.56 1.55 1.19 Brâglez 5 106.83 0.81 3.64 1.70 1.33 Unirea 5 77.56 0.85 3.04 1.31 0.94
In this case, the values are comprised between 0.69 and 1.01 (they can also be
rendered in percentages). In the basins that have values close to 1 – between 0.96 and 1.01 – (Şimişna, Luna, Nadăş, Fizeş, Luduş, Luţu, Racilor, Pănade, Cuşmed, Goagiu, Visa), there are enough lower order streams to consider them finished. Another category is made up by the basins with values between 0.85 and 0.95 (Borşa, Sărata, Meleş, Comlod, Unirea, Fărău, Balta, Veţca, Secaşul Mic, Laslea, Hârtibaciu, Pârâul Nou, Paloş, Valea Mare, Ticuş, Felmer),
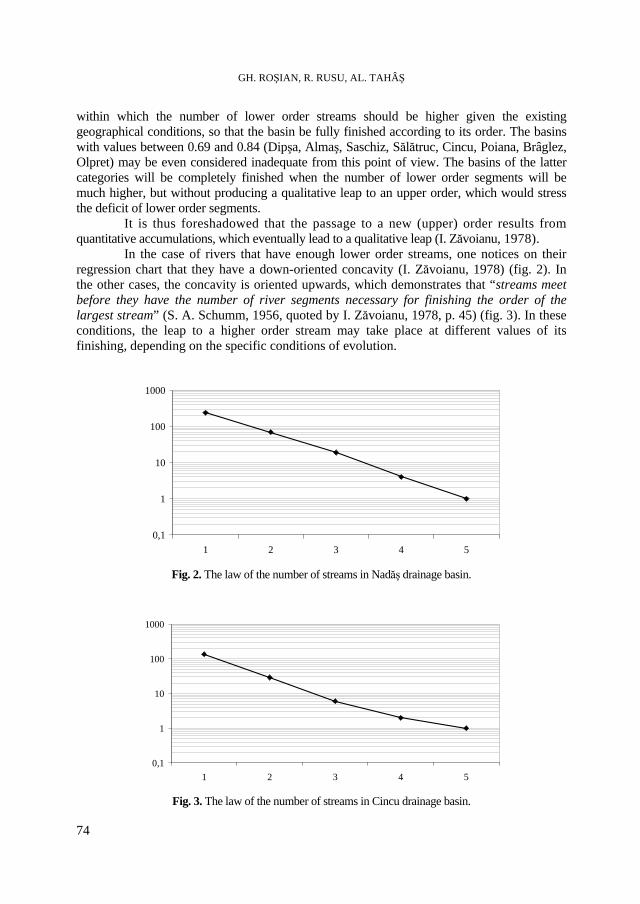
GH. ROŞIAN, R. RUSU, AL. TAHÂŞ
74
within which the number of lower order streams should be higher given the existing geographical conditions, so that the basin be fully finished according to its order. The basins with values between 0.69 and 0.84 (Dipşa, Almaş, Saschiz, Sălătruc, Cincu, Poiana, Brâglez, Olpret) may be even considered inadequate from this point of view. The basins of the latter categories will be completely finished when the number of lower order segments will be much higher, but without producing a qualitative leap to an upper order, which would stress the deficit of lower order segments.
It is thus foreshadowed that the passage to a new (upper) order results from quantitative accumulations, which eventually lead to a qualitative leap (I. Zăvoianu, 1978).
In the case of rivers that have enough lower order streams, one notices on their regression chart that they have a down-oriented concavity (I. Zăvoianu, 1978) (fig. 2). In the other cases, the concavity is oriented upwards, which demonstrates that “streams meet before they have the number of river segments necessary for finishing the order of the largest stream” (S. A. Schumm, 1956, quoted by I. Zăvoianu, 1978, p. 45) (fig. 3). In these conditions, the leap to a higher order stream may take place at different values of its finishing, depending on the specific conditions of evolution.
0,1
1
10
100
1000
1 2 3 4 5 Fig. 2. The law of the number of streams in Nadăş drainage basin.
0,1
1
10
100
1000
1 2 3 4 5 Fig. 3. The law of the number of streams in Cincu drainage basin.
THE DEGREE OF FINISHING OF THE DRAINAGE BASINS OF THE TRANSYLVANIAN DEPRESSION
75
For the elongated basins, such as Luna, Luduş, Cuşmed, Goagiu etc., which also have a favourable shape ratio, there are more lower order segments than necessary for a basin of their order, for their own confluence ratio. Also, the higher the confluence ratio of a basin, more lower order stream segments are necessary for finishing the order of the mainstem, as it is in the case of Almaş. 4. CONCLUSIONS
Several conclusions have been drawn as a result of the application of the law of the number of streams and the processing of the values regarding the degree of finishing of the basins.
The present structure of the drainage of the Transylvanian Depression is the result of a long process of evolution, developed according to objective laws, a fact also emphasized by the statistical analysis of morphometric elements.
Analyzing the regression lines obtained as a result of the data representation in semilogarithmic coordinates, it is noticeable that the law of the number of streams is validated, as the number of consecutive order segments form an inverted geometric progression, in which the first term (N1) is given by the number of first order streams, while the ratio is represented by the confluence ratio.
The predominance of basins with values of the degree of finishing below 1 shows that there are not enough lower order stream segments. This fact means that, in the future, there is a possibility for the number of lower order streams to increase in order to reach a state of dynamic balance between the factors favoring erosion and those that contribute to the stability of the landforms. Because the drainage network has the tendency to ensure enough lower order streams, it is likely that the process of landform fragmentation will continue. This means an accelerated dynamics both at the level of the existing first order segments, which tend to upgrade their order, and at the level of slopes, on the account of which this action takes place, by dint of gullies and ravines.
The already obtained results must be confronted with the existing field situation. Such an approach is necessary in order to be able to demonstrate that larger areas affected by contemporary geomorphological processes are characteristic for drainage basins with low values of the degree of finishing.
R E F E R E N C E S
1. Grecu, Florina (1992), Bazinul Hârtibaciului. Elemente de morfohidrografie, Edit. Academiei Române,
Bucureşti. 2. Grecu, Florina, Palmentola, G. (2003), Geomorfologie dinamică, Edit. Tehnică, Bucureşti. 3. Horton, R. E. (1945) Erosional development of streams and their drainage basins: hydrophysical
approach to quantitative morphology, Geol. Soc. Amer. Bull., 56. 4. Ichim, I., Bătucă, D., Rădoane, Maria, Duma, Didi (1989), Morfologia şi dinamica albiilor de râuri,
Edit. Tehnică, Bucureşti.
GH. ROŞIAN, R. RUSU, AL. TAHÂŞ
76
5. Roşian, Gh. (2008), Modele de geomorfologie funcţională ale sistemului vale-versant din Depresiunea Transilvaniei, Teză de doctorat, Facultatea de Geografie, Univ. ”Babeş-Bolyai”, Cluj-Napoca.
6. Sandu, Maria (1998), Culoarul depresionar Sibiu-Apold. Studiu geomorfologic, Edit. Academiei, Bucureşti.
7. Schumm, S. A. (1956), The evolution of drainage systems and slopes in Badlands at Perth Amboi, New Jersey, Geol. Soc. Amer. Bull., 67, New York.
8. Zăvoianu, I. (1978), Morfometria bazinelor hidrografice, Edit. Academiei, Bucureşti.
STUDIA UNIVERSITATIS BABEŞ-BOLYAI, GEOGRAPHIA, LV, 2, 2010
ASPECTS REGARDING THE SILTING AND THE BASIN DYNAMICS
OF VÂRŞOLŢ RESERVOIR (CRASNA RIVER)
GH. ŞERBAN1, B. MIRIŞAN1, I. CÎMPEAN2, H. SELAGEA2
ABSTRACT. – Aspects Regarding the Silting and the Basin Dynamics of Vârşolţ Reservoir (Crasna River). Commissioned during the communist period (January 11, 1979) as the only important source of water supply for Zalău City and Şimleul Silvaniei town, Vârşolţ reservoir proved to be a little inspired solution, both in terms of quantity and (mostly) quality. The lake is located in an area with an almost maximal sedimentary discharge in the Romanian territory, which led to an increasing reservoir basin silting and thereby to the attenuation of the basic functions for which it was built (water supply, flash-floods attenuations). During the 30 years of reservoir operating, the characteristic volumes recorded significant percentage reductions ranging between 11 - 23% and even 99% for dead volume. Alluvial share made by Crasna, Coliţca and Mortăuţa tributary rivers led to the emergence of numerous specific forms on the basin space (alluvial cones, alluvial reefs etc.). By the union of the submersible and emersible alluvial cones, developed on the two lobes of the reservoir, a lacustrine delta began to evolve.
Keywords: reservoir, silting, characteristic volumes, sedimentation shapes.
1. INTRODUCTION
Vârşolţ reservoir is located in the western part of Sălaj County (fig. 1), in the piedmont basin of Crasna River, respectively in the eastern side of Şimleul Silvaniei basin.
The dam reservoir is located on the Crasna river at 500 m upstream of Vârşolţ village and at 1 km downstream of the confluence of the same river with Mortăuţa brook. The dam was made by local materials represented by non-homogeneous clay and alluvial type, protected with raw stone on the upstream frontage. Length of the dam is 2160 m, width at base of 14 m and crown width of 5 m.
At the same time with the building of the dam embankment works were carried out around the lake to defend the Crasna village against the flood. On the right bank of the Crasna river, downstream of the village, has been built with local materials an embankment. Also, in Crasna-Coliţca watershed area, an embankment was built to protect crops. Draining works were executed downstream of the dam.
The designer of the improvement was Research and Design in Water Management Institute; the implementation of the dam was made during 1977-1979. The date of entry into service planning was November 1, 1979, after which works on increasing the safety of the reservoir were performed between the period 1994-1997.
1 Babeş-Bolyai University, Faculty of Geography, 400006, Cluj-Napoca, Romania, e-mail:
[email protected] 2 “Romanian Waters” National Administration, “Someş–Tisa” Water Branch, 400213, Cluj-Napoca, Romania,
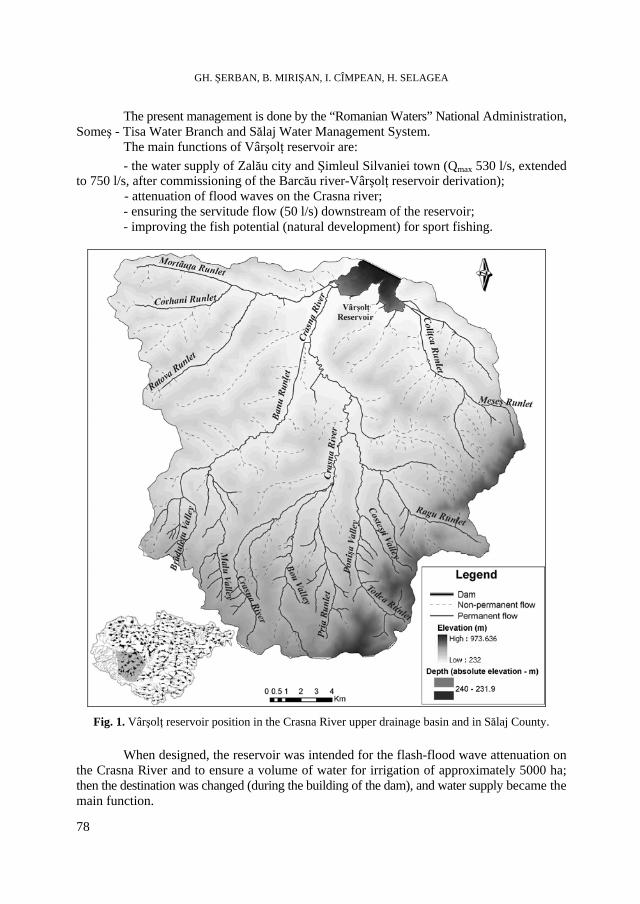
GH. ŞERBAN, B. MIRIŞAN, I. CÎMPEAN, H. SELAGEA
78
The present management is done by the “Romanian Waters” National Administration, Someş - Tisa Water Branch and Sălaj Water Management System.
The main functions of Vârşolţ reservoir are: - the water supply of Zalău city and Şimleul Silvaniei town (Qmax 530 l/s, extended
to 750 l/s, after commissioning of the Barcău river-Vârşolţ reservoir derivation); - attenuation of flood waves on the Crasna river; - ensuring the servitude flow (50 l/s) downstream of the reservoir; - improving the fish potential (natural development) for sport fishing.
Fig. 1. Vârşolţ reservoir position in the Crasna River upper drainage basin and in Sălaj County. When designed, the reservoir was intended for the flash-flood wave attenuation on
the Crasna River and to ensure a volume of water for irrigation of approximately 5000 ha; then the destination was changed (during the building of the dam), and water supply became the main function.
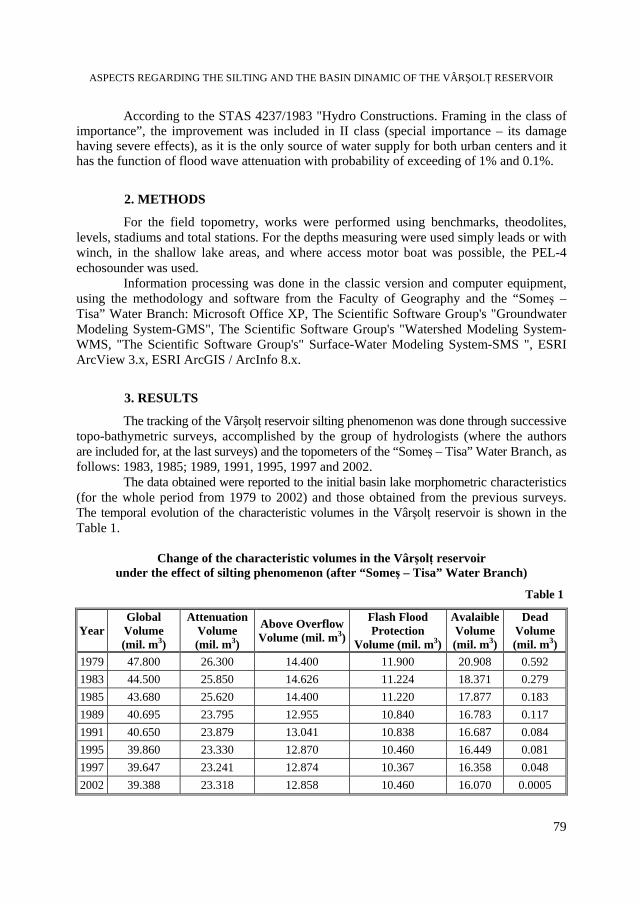
ASPECTS REGARDING THE SILTING AND THE BASIN DINAMIC OF THE VÂRŞOLŢ RESERVOIR
79
According to the STAS 4237/1983 "Hydro Constructions. Framing in the class of importance”, the improvement was included in II class (special importance – its damage having severe effects), as it is the only source of water supply for both urban centers and it has the function of flood wave attenuation with probability of exceeding of 1% and 0.1%.
2. METHODS
For the field topometry, works were performed using benchmarks, theodolites, levels, stadiums and total stations. For the depths measuring were used simply leads or with winch, in the shallow lake areas, and where access motor boat was possible, the PEL-4 echosounder was used.
Information processing was done in the classic version and computer equipment, using the methodology and software from the Faculty of Geography and the “Someş – Tisa” Water Branch: Microsoft Office XP, The Scientific Software Group's "Groundwater Modeling System-GMS", The Scientific Software Group's "Watershed Modeling System-WMS, "The Scientific Software Group's" Surface-Water Modeling System-SMS ", ESRI ArcView 3.x, ESRI ArcGIS / ArcInfo 8.x.
3. RESULTS
The tracking of the Vârşolţ reservoir silting phenomenon was done through successive topo-bathymetric surveys, accomplished by the group of hydrologists (where the authors are included for, at the last surveys) and the topometers of the “Someş – Tisa” Water Branch, as follows: 1983, 1985; 1989, 1991, 1995, 1997 and 2002.
The data obtained were reported to the initial basin lake morphometric characteristics (for the whole period from 1979 to 2002) and those obtained from the previous surveys. The temporal evolution of the characteristic volumes in the Vârşolţ reservoir is shown in the Table 1.
Change of the characteristic volumes in the Vârşolţ reservoir
under the effect of silting phenomenon (after “Someş – Tisa” Water Branch)
Table 1
Year Global Volume (mil. m3)
Attenuation Volume (mil. m3)
Above Overflow Volume (mil. m3)
Flash Flood Protection
Volume (mil. m3)
Avalaible Volume (mil. m3)
Dead Volume (mil. m3)
1979 47.800 26.300 14.400 11.900 20.908 0.592 1983 44.500 25.850 14.626 11.224 18.371 0.279 1985 43.680 25.620 14.400 11.220 17.877 0.183 1989 40.695 23.795 12.955 10.840 16.783 0.117 1991 40.650 23.879 13.041 10.838 16.687 0.084 1995 39.860 23.330 12.870 10.460 16.449 0.081 1997 39.647 23.241 12.874 10.367 16.358 0.048 2002 39.388 23.318 12.858 10.460 16.070 0.0005
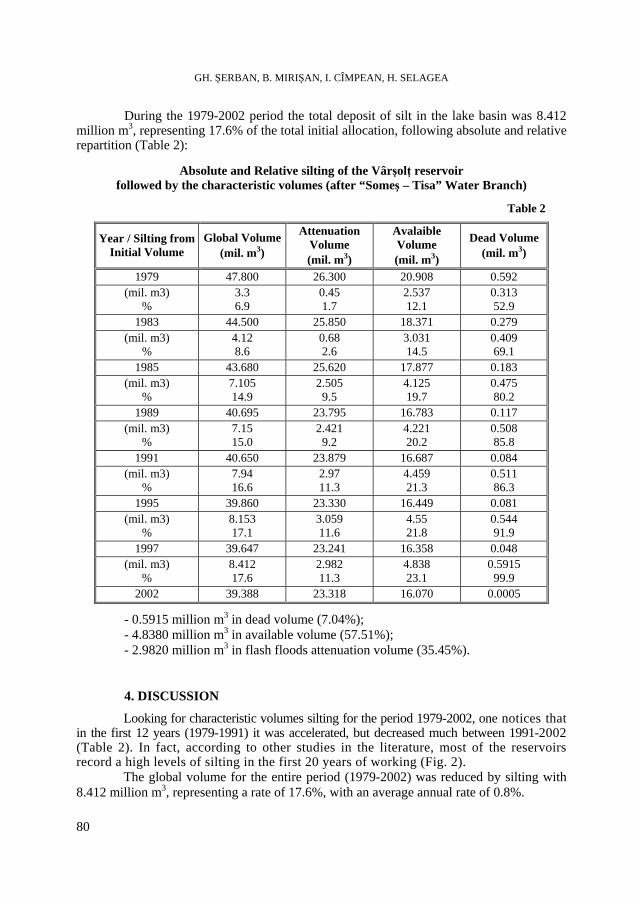
GH. ŞERBAN, B. MIRIŞAN, I. CÎMPEAN, H. SELAGEA
80
During the 1979-2002 period the total deposit of silt in the lake basin was 8.412 million m3, representing 17.6% of the total initial allocation, following absolute and relative repartition (Table 2):
Absolute and Relative silting of the Vârşolţ reservoir
followed by the characteristic volumes (after “Someş – Tisa” Water Branch)
Table 2
Year / Silting from Initial Volume
Global Volume (mil. m3)
Attenuation Volume (mil. m3)
Avalaible Volume (mil. m3)
Dead Volume (mil. m3)
1979 47.800 26.300 20.908 0.592 (mil. m3)
% 3.3 6.9
0.45 1.7
2.537 12.1
0.313 52.9
1983 44.500 25.850 18.371 0.279 (mil. m3)
% 4.12 8.6
0.68 2.6
3.031 14.5
0.409 69.1
1985 43.680 25.620 17.877 0.183 (mil. m3)
% 7.105 14.9
2.505 9.5
4.125 19.7
0.475 80.2
1989 40.695 23.795 16.783 0.117 (mil. m3)
% 7.15 15.0
2.421 9.2
4.221 20.2
0.508 85.8
1991 40.650 23.879 16.687 0.084 (mil. m3)
% 7.94 16.6
2.97 11.3
4.459 21.3
0.511 86.3
1995 39.860 23.330 16.449 0.081 (mil. m3)
% 8.153 17.1
3.059 11.6
4.55 21.8
0.544 91.9
1997 39.647 23.241 16.358 0.048 (mil. m3)
% 8.412 17.6
2.982 11.3
4.838 23.1
0.5915 99.9
2002 39.388 23.318 16.070 0.0005
- 0.5915 million m3 in dead volume (7.04%); - 4.8380 million m3 in available volume (57.51%); - 2.9820 million m3 in flash floods attenuation volume (35.45%). 4. DISCUSSION
Looking for characteristic volumes silting for the period 1979-2002, one notices that in the first 12 years (1979-1991) it was accelerated, but decreased much between 1991-2002 (Table 2). In fact, according to other studies in the literature, most of the reservoirs record a high levels of silting in the first 20 years of working (Fig. 2).
The global volume for the entire period (1979-2002) was reduced by silting with 8.412 million m3, representing a rate of 17.6%, with an average annual rate of 0.8%.
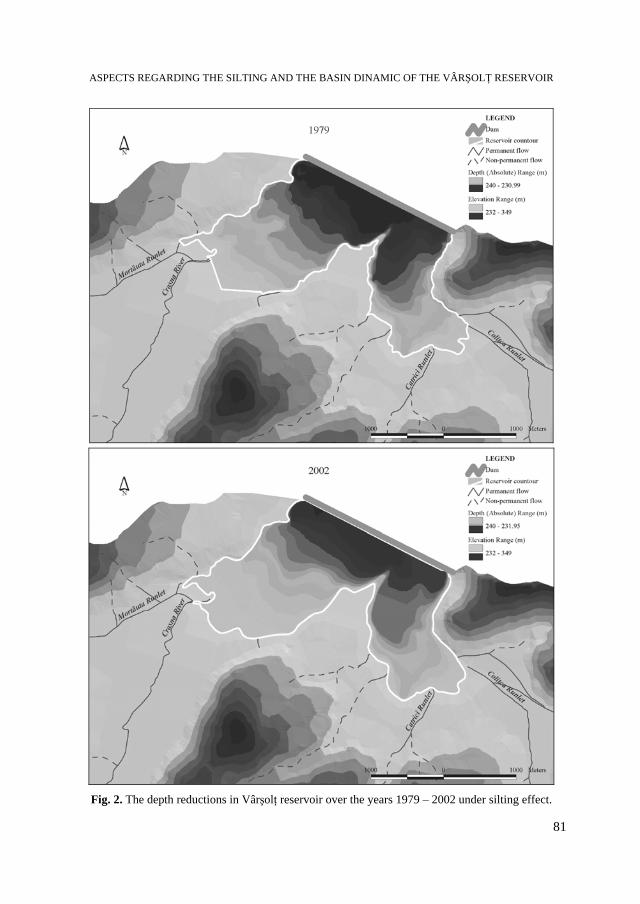
ASPECTS REGARDING THE SILTING AND THE BASIN DINAMIC OF THE VÂRŞOLŢ RESERVOIR
81
Fig. 2. The depth reductions in Vârşolţ reservoir over the years 1979 – 2002 under silting effect.
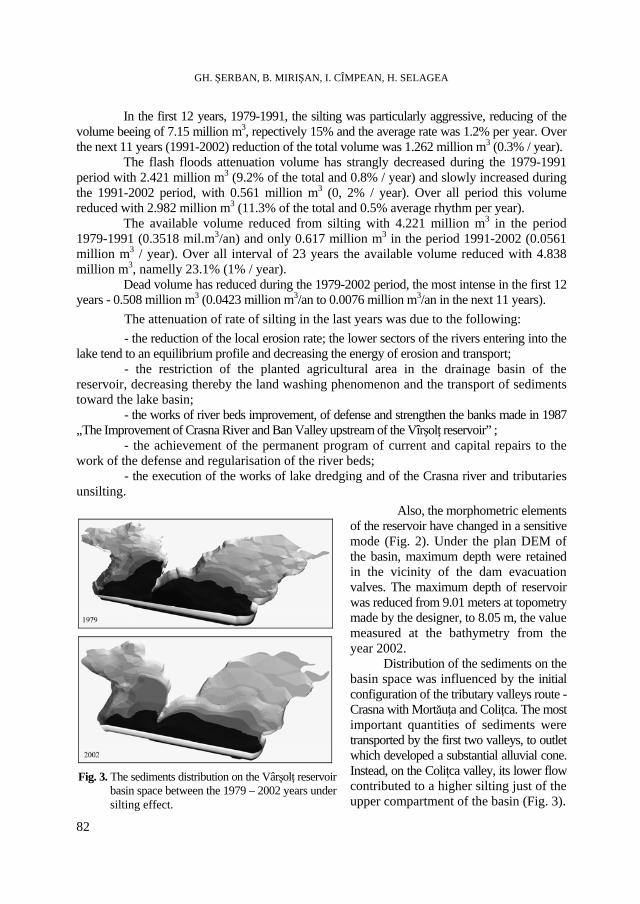
GH. ŞERBAN, B. MIRIŞAN, I. CÎMPEAN, H. SELAGEA
82
In the first 12 years, 1979-1991, the silting was particularly aggressive, reducing of the volume beeing of 7.15 million m3, repectively 15% and the average rate was 1.2% per year. Over the next 11 years (1991-2002) reduction of the total volume was 1.262 million m3 (0.3% / year).
The flash floods attenuation volume has strangly decreased during the 1979-1991 period with 2.421 million m3 (9.2% of the total and 0.8% / year) and slowly increased during the 1991-2002 period, with 0.561 million m3 (0, 2% / year). Over all period this volume reduced with 2.982 million m3 (11.3% of the total and 0.5% average rhythm per year).
The available volume reduced from silting with 4.221 million m3 in the period 1979-1991 (0.3518 mil.m3/an) and only 0.617 million m3 in the period 1991-2002 (0.0561 million m3 / year). Over all interval of 23 years the available volume reduced with 4.838 million m3, namelly 23.1% (1% / year).
Dead volume has reduced during the 1979-2002 period, the most intense in the first 12 years - 0.508 million m3 (0.0423 million m3/an to 0.0076 million m3/an in the next 11 years).
The attenuation of rate of silting in the last years was due to the following: - the reduction of the local erosion rate; the lower sectors of the rivers entering into the
lake tend to an equilibrium profile and decreasing the energy of erosion and transport; - the restriction of the planted agricultural area in the drainage basin of the
reservoir, decreasing thereby the land washing phenomenon and the transport of sediments toward the lake basin;
- the works of river beds improvement, of defense and strengthen the banks made in 1987 „The Improvement of Crasna River and Ban Valley upstream of the Vîrşolţ reservoir” ;
- the achievement of the permanent program of current and capital repairs to the work of the defense and regularisation of the river beds;
- the execution of the works of lake dredging and of the Crasna river and tributaries unsilting.
Also, the morphometric elements of the reservoir have changed in a sensitive mode (Fig. 2). Under the plan DEM of the basin, maximum depth were retained in the vicinity of the dam evacuation valves. The maximum depth of reservoir was reduced from 9.01 meters at topometry made by the designer, to 8.05 m, the value measured at the bathymetry from the year 2002. Distribution of the sediments on the basin space was influenced by the initial configuration of the tributary valleys route - Crasna with Mortăuţa and Coliţca. The most important quantities of sediments were transported by the first two valleys, to outlet which developed a substantial alluvial cone. Instead, on the Coliţca valley, its lower flow contributed to a higher silting just of the upper compartment of the basin (Fig. 3).
Fig. 3. The sediments distribution on the Vârşolţ reservoir
basin space between the 1979 – 2002 years undersilting effect.
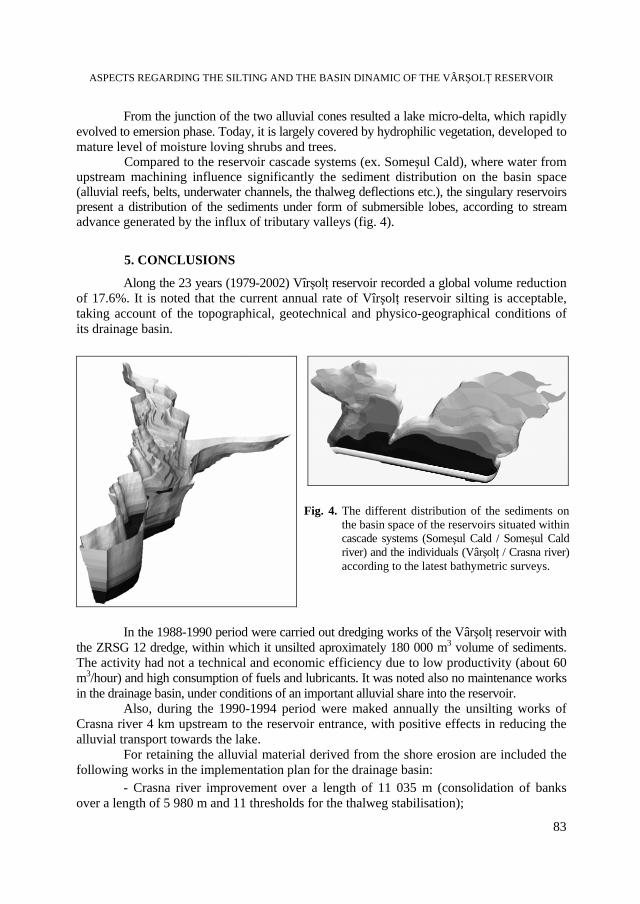
ASPECTS REGARDING THE SILTING AND THE BASIN DINAMIC OF THE VÂRŞOLŢ RESERVOIR
83
From the junction of the two alluvial cones resulted a lake micro-delta, which rapidly evolved to emersion phase. Today, it is largely covered by hydrophilic vegetation, developed to mature level of moisture loving shrubs and trees. Compared to the reservoir cascade systems (ex. Someşul Cald), where water from upstream machining influence significantly the sediment distribution on the basin space (alluvial reefs, belts, underwater channels, the thalweg deflections etc.), the singulary reservoirs present a distribution of the sediments under form of submersible lobes, according to stream advance generated by the influx of tributary valleys (fig. 4).
5. CONCLUSIONS
Along the 23 years (1979-2002) Vîrşolţ reservoir recorded a global volume reduction of 17.6%. It is noted that the current annual rate of Vîrşolţ reservoir silting is acceptable, taking account of the topographical, geotechnical and physico-geographical conditions of its drainage basin.
In the 1988-1990 period were carried out dredging works of the Vârşolţ reservoir with the ZRSG 12 dredge, within which it unsilted aproximately 180 000 m3 volume of sediments. The activity had not a technical and economic efficiency due to low productivity (about 60 m3/hour) and high consumption of fuels and lubricants. It was noted also no maintenance works in the drainage basin, under conditions of an important alluvial share into the reservoir.
Also, during the 1990-1994 period were maked annually the unsilting works of Crasna river 4 km upstream to the reservoir entrance, with positive effects in reducing the alluvial transport towards the lake.
For retaining the alluvial material derived from the shore erosion are included the following works in the implementation plan for the drainage basin:
- Crasna river improvement over a length of 11 035 m (consolidation of banks over a length of 5 980 m and 11 thresholds for the thalweg stabilisation);
Fig. 4. The different distribution of the sediments on the basin space of the reservoirs situated within cascade systems (Someşul Cald / Someşul Cald river) and the individuals (Vârşolţ / Crasna river) according to the latest bathymetric surveys.
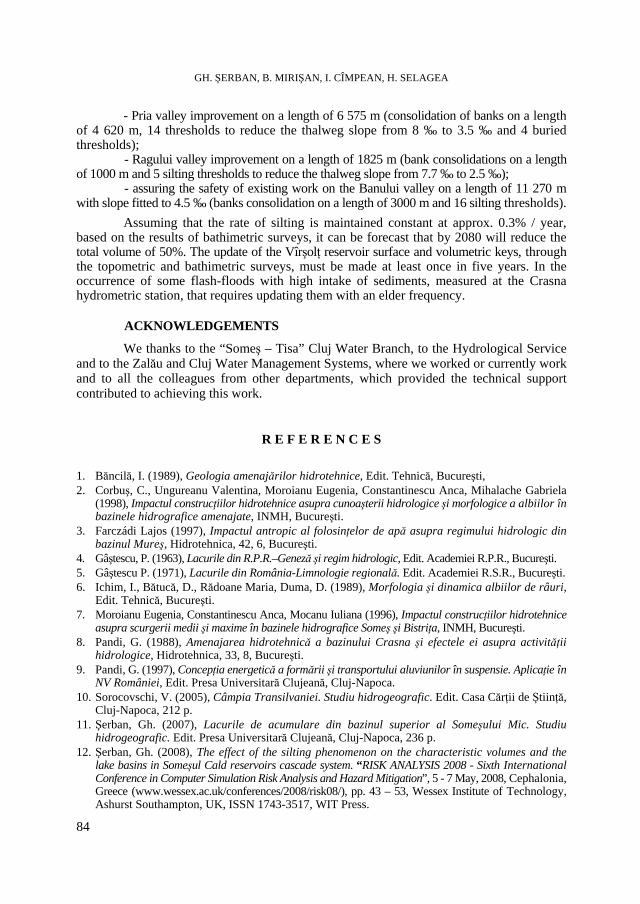
GH. ŞERBAN, B. MIRIŞAN, I. CÎMPEAN, H. SELAGEA
84
- Pria valley improvement on a length of 6 575 m (consolidation of banks on a length of 4 620 m, 14 thresholds to reduce the thalweg slope from 8 ‰ to 3.5 ‰ and 4 buried thresholds);
- Ragului valley improvement on a length of 1825 m (bank consolidations on a length of 1000 m and 5 silting thresholds to reduce the thalweg slope from 7.7 ‰ to 2.5 ‰);
- assuring the safety of existing work on the Banului valley on a length of 11 270 m with slope fitted to 4.5 ‰ (banks consolidation on a length of 3000 m and 16 silting thresholds).
Assuming that the rate of silting is maintained constant at approx. 0.3% / year, based on the results of bathimetric surveys, it can be forecast that by 2080 will reduce the total volume of 50%. The update of the Vîrşolţ reservoir surface and volumetric keys, through the topometric and bathimetric surveys, must be made at least once in five years. In the occurrence of some flash-floods with high intake of sediments, measured at the Crasna hydrometric station, that requires updating them with an elder frequency.
ACKNOWLEDGEMENTS
We thanks to the “Someş – Tisa” Cluj Water Branch, to the Hydrological Service and to the Zalău and Cluj Water Management Systems, where we worked or currently work and to all the colleagues from other departments, which provided the technical support contributed to achieving this work.
R E F E R E N C E S
1. Băncilă, I. (1989), Geologia amenajărilor hidrotehnice, Edit. Tehnică, Bucureşti, 2. Corbuş, C., Ungureanu Valentina, Moroianu Eugenia, Constantinescu Anca, Mihalache Gabriela
(1998), Impactul construcţiilor hidrotehnice asupra cunoaşterii hidrologice şi morfologice a albiilor în bazinele hidrografice amenajate, INMH, Bucureşti.
3. Farczádi Lajos (1997), Impactul antropic al folosinţelor de apă asupra regimului hidrologic din bazinul Mureş, Hidrotehnica, 42, 6, Bucureşti.
4. Gâştescu, P. (1963), Lacurile din R.P.R.–Geneză şi regim hidrologic, Edit. Academiei R.P.R., Bucureşti. 5. Gâştescu P. (1971), Lacurile din România-Limnologie regională. Edit. Academiei R.S.R., Bucureşti. 6. Ichim, I., Bătucă, D., Rădoane Maria, Duma, D. (1989), Morfologia şi dinamica albiilor de râuri,
Edit. Tehnică, Bucureşti. 7. Moroianu Eugenia, Constantinescu Anca, Mocanu Iuliana (1996), Impactul construcţiilor hidrotehnice
asupra scurgerii medii şi maxime în bazinele hidrografice Someş şi Bistriţa, INMH, Bucureşti. 8. Pandi, G. (1988), Amenajarea hidrotehnică a bazinului Crasna şi efectele ei asupra activităţii
hidrologice, Hidrotehnica, 33, 8, Bucureşti. 9. Pandi, G. (1997), Concepţia energetică a formării şi transportului aluviunilor în suspensie. Aplicaţie în
NV României, Edit. Presa Universitară Clujeană, Cluj-Napoca. 10. Sorocovschi, V. (2005), Câmpia Transilvaniei. Studiu hidrogeografic. Edit. Casa Cărţii de Ştiinţă,
Cluj-Napoca, 212 p. 11. Şerban, Gh. (2007), Lacurile de acumulare din bazinul superior al Someşului Mic. Studiu
hidrogeografic. Edit. Presa Universitară Clujeană, Cluj-Napoca, 236 p. 12. Şerban, Gh. (2008), The effect of the silting phenomenon on the characteristic volumes and the
lake basins in Someşul Cald reservoirs cascade system. “RISK ANALYSIS 2008 - Sixth International Conference in Computer Simulation Risk Analysis and Hazard Mitigation”, 5 - 7 May, 2008, Cephalonia, Greece (www.wessex.ac.uk/conferences/2008/risk08/), pp. 43 – 53, Wessex Institute of Technology, Ashurst Southampton, UK, ISSN 1743-3517, WIT Press.
STUDIA UNIVERSITATIS BABEŞ-BOLYAI, GEOGRAPHIA, LV, 2, 2010
VALORIFICATION OF GEOTERMAL ENERGY IN THE AREA OF LIVADA VILLAGE, BIHOR COUNTY
MONICA MOLDOVAN1, ALINA SIMION2
ABSTRACT. – Valorification of Geothermal Energy in the Area of Livada Village, Bihor County. Geothermal waters are used as a thermal energy source for heating and warm running water in urban areas, for watering treatments, for recreation or for other activities connected to the industrial or agricultural area, such as building up a heating system, creating different drying technologies, etc. The main geothermal reservoir in Romania is located in the Western Plain along the Romanian-Hungarian border, 2 500 km2 from Satu Mare in the North to Timisoara in the South. Out of a total potential geothermal energy production of about 5 300 TJ/year in Romania, more than 80 per cent of the potential is located in the Western Plain. The study focused on the Livada perimeter, where a well that collect the geothermal water-bearing formations from fissured carbonaceous collectors was drilled. The well can be exploited through artesian flow or pumping. The thermal water can be used for heating, preparation of hot sanitary water, greenhouses heating and recreation such as geothermal pools. Through the activity of a greenhouse of 1 ha, the well exploitation from Livada area was increased. The Dutch technology of tomato crops allows a production of 300 tonnes per year. Transgex Oradea intends to build the first greenhouse in Romania heated by a bio-ecological system, using geothermal waters in Livada village. This greenhouse will be part of the complex system necessary for the cascade system in order to capitalize the geothermal waters from that place. This kind of project can be a model for the capitalization of the geothermal waters and can be implemented in other regions, where the situation of geothermal aquifer allows it.
Keywords: alternative energy resources, geothermal waters, waterfall system.
1. INTRODUCTION
During the last years, there have been debates about the depletion of the natural resources, especially the energy resources. This new concept brings about strong concerns regarding the use of alternative energy resources.
They are destined to support and stimulate the promotion of reusable energy sources in all aspects of the socio – economical life, in the context of concerns to provide a long-lasting energetic development of human communities. Reusable sources have an important energetic potential and offer unlimited availabilities, both at regional and national level. The promotion of the reusable energy sources is based on three important premises: accessibility, availability and acceptability.
The program of developing and promoting reusable energy sources complies with the environment demands assumed by Romania, in the Kyoto Protocol, and The Frame – Convention of the United Nations on climatic changes, adopted in 1997.
1 Babeş-Bolyai University, Faculty of Geography, 400006 Cluj-Napoca, Romania, e-mail:
[email protected] 2 Babeş-Bolyai University, Faculty of Geography, Sighetu Marmaţiei extension, 435500 Sighetu Marmaţiei,
Romania, e-mail: [email protected]
MONICA MOLDOVAN, ALINA SIMION
86
Alternative energy resources with high potential in Romania are mainly geothermal energy and hydro-energy, and secondly wind energy, solar energy and biomass.
Fortunately, Romania has and exploits geothermal water deposits. There are some areas with high thermal flow and accumulations of geo-thermal waters under identification and research in the West Plain, more precisely in the counties of Bihor, Stau Mare, Arad, Timis, in Călimaneşti – Căciulata area, Băile Herculane, as well as in Otopeni – Snagov area.
Geothermal waters are subterranean waters that flow through collecting rocks located at depths between 1000 – 4500 m (or even lower), heated by the thermal flow of the earth shell at temperatures of 50-120 degrees Celsius.
Most of the geothermal deposits are located in the western part of Romania, which is the eastern part of the Pannonian Basin, a large Neogene intra- mountainous depression, formed after the Carpathian region was affected by the Miocene tectogenesis. The Basin was formed by extension and thinning – out of the lithosphere, accompanied by the sinking begun in Badenian and continued at great speed in Pannonian.
2. GEOTHERMAL RESOURCE AS AN ALTERNATIVE ENERGY
Geothermal energy represents the heat contained in the subterranean fluids and rocks. It does not pollute, it is reusable and may be used in different purposes: to heat places, for industrial purposes or to produce electricity.
Temperatures of geothermal waters are different from one area to the other between 50-250 degrees Celsius. Water is the best transfer method to extract geothermal energy from the ground. Geothermal waters penetrate the rocks, dilute the minerals and transport them in suspensions; during this process they can also accumulate different gases such as sulfur dioxide (SO2,), carbon dioxide (CO2). If these resources are artesian, their extraction is much easier as there is no need for specific technology.
The exploitation and use of alternative reusable energy sources contributes to the long lasting development of the energy field, to low import of energy resources, and especially to the protection of the environment.
In Romania, the geothermal resources with energy characteristics were included (by the Law of the Mines no. 61/1998) in the category of useful mineral resources. As a consequence, they were focused upon and assessed by geologic researches and by drillings carried out and tested by experimental exploitation.
The geothermal resources under inventory are present as warm waters with temperatures between 45 and 120 degrees Celsius; they are exploited from depths between 1500 and 3000 m, they present a specific chemistry and in particular cases, associated combustible gases.
In this field of promoting the geothermal potential, there are anterior concerns focused on two directions: promoting the therapeutic and curative potential of these waters (Balneoclimateric resorts and treatment bases) and also promoting the energy potential of these resources. If the first direction of use is represented by many treatment bases in Romania (for different types of conditions, according to the qualities of geothermal waters: Felix and 1 Mai Oradea, Călimăneşti – Căciulata, Herculane, Govora, etc.), the energetic potential does not have the same performances (except for some facilities: Oradea, Călimăneşti – Căciulata - Cozia).
The geothermal exploitations began in 1964 and up to 1994 they drilled 194 probes (D. Panu, 1994).
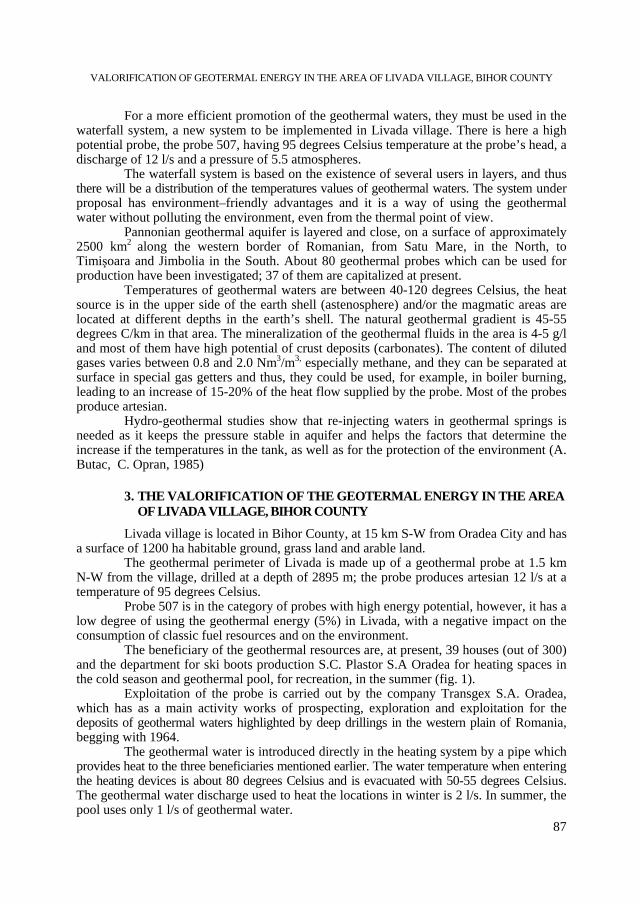
VALORIFICATION OF GEOTERMAL ENERGY IN THE AREA OF LIVADA VILLAGE, BIHOR COUNTY
87
For a more efficient promotion of the geothermal waters, they must be used in the waterfall system, a new system to be implemented in Livada village. There is here a high potential probe, the probe 507, having 95 degrees Celsius temperature at the probe’s head, a discharge of 12 l/s and a pressure of 5.5 atmospheres.
The waterfall system is based on the existence of several users in layers, and thus there will be a distribution of the temperatures values of geothermal waters. The system under proposal has environment–friendly advantages and it is a way of using the geothermal water without polluting the environment, even from the thermal point of view.
Pannonian geothermal aquifer is layered and close, on a surface of approximately 2500 km2 along the western border of Romanian, from Satu Mare, in the North, to Timişoara and Jimbolia in the South. About 80 geothermal probes which can be used for production have been investigated; 37 of them are capitalized at present.
Temperatures of geothermal waters are between 40-120 degrees Celsius, the heat source is in the upper side of the earth shell (astenosphere) and/or the magmatic areas are located at different depths in the earth’s shell. The natural geothermal gradient is 45-55 degrees C/km in that area. The mineralization of the geothermal fluids in the area is 4-5 g/l and most of them have high potential of crust deposits (carbonates). The content of diluted gases varies between 0.8 and 2.0 Nm3/m3, especially methane, and they can be separated at surface in special gas getters and thus, they could be used, for example, in boiler burning, leading to an increase of 15-20% of the heat flow supplied by the probe. Most of the probes produce artesian.
Hydro-geothermal studies show that re-injecting waters in geothermal springs is needed as it keeps the pressure stable in aquifer and helps the factors that determine the increase if the temperatures in the tank, as well as for the protection of the environment (A. Butac, C. Opran, 1985)
3. THE VALORIFICATION OF THE GEOTERMAL ENERGY IN THE AREA OF LIVADA VILLAGE, BIHOR COUNTY
Livada village is located in Bihor County, at 15 km S-W from Oradea City and has a surface of 1200 ha habitable ground, grass land and arable land.
The geothermal perimeter of Livada is made up of a geothermal probe at 1.5 km N-W from the village, drilled at a depth of 2895 m; the probe produces artesian 12 l/s at a temperature of 95 degrees Celsius.
Probe 507 is in the category of probes with high energy potential, however, it has a low degree of using the geothermal energy (5%) in Livada, with a negative impact on the consumption of classic fuel resources and on the environment.
The beneficiary of the geothermal resources are, at present, 39 houses (out of 300) and the department for ski boots production S.C. Plastor S.A Oradea for heating spaces in the cold season and geothermal pool, for recreation, in the summer (fig. 1).
Exploitation of the probe is carried out by the company Transgex S.A. Oradea, which has as a main activity works of prospecting, exploration and exploitation for the deposits of geothermal waters highlighted by deep drillings in the western plain of Romania, begging with 1964.
The geothermal water is introduced directly in the heating system by a pipe which provides heat to the three beneficiaries mentioned earlier. The water temperature when entering the heating devices is about 80 degrees Celsius and is evacuated with 50-55 degrees Celsius. The geothermal water discharge used to heat the locations in winter is 2 l/s. In summer, the pool uses only 1 l/s of geothermal water.
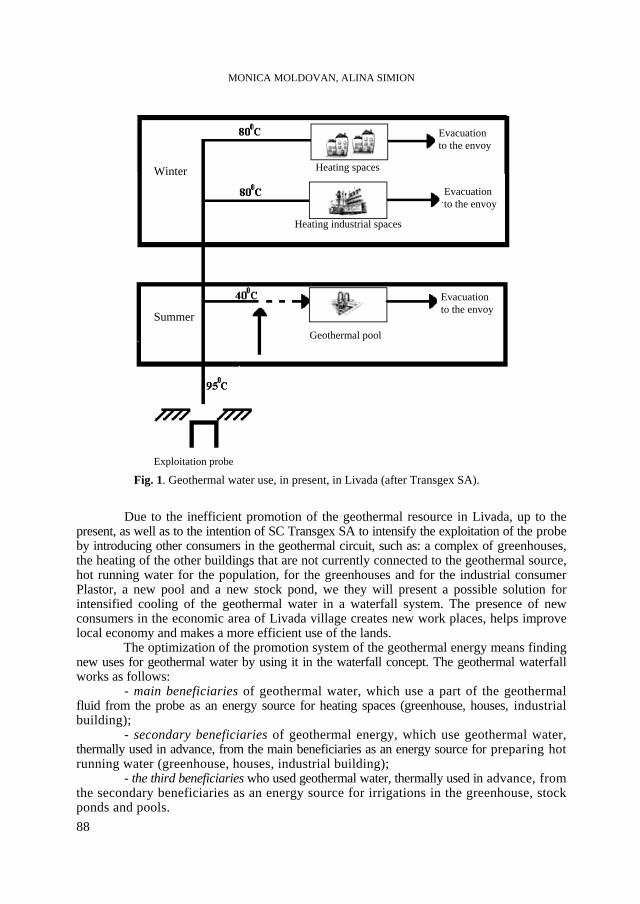
MONICA MOLDOVAN, ALINA SIMION
88
Due to the inefficient promotion of the geothermal resource in Livada, up to the
present, as well as to the intention of SC Transgex SA to intensify the exploitation of the probe by introducing other consumers in the geothermal circuit, such as: a complex of greenhouses, the heating of the other buildings that are not currently connected to the geothermal source, hot running water for the population, for the greenhouses and for the industrial consumer Plastor, a new pool and a new stock pond, we they will present a possible solution for intensified cooling of the geothermal water in a waterfall system. The presence of new consumers in the economic area of Livada village creates new work places, helps improve local economy and makes a more efficient use of the lands.
The optimization of the promotion system of the geothermal energy means finding new uses for geothermal water by using it in the waterfall concept. The geothermal waterfall works as follows: - main beneficiaries of geothermal water, which use a part of the geothermal fluid from the probe as an energy source for heating spaces (greenhouse, houses, industrial building); - secondary beneficiaries of geothermal energy, which use geothermal water, thermally used in advance, from the main beneficiaries as an energy source for preparing hot running water (greenhouse, houses, industrial building); - the third beneficiaries who used geothermal water, thermally used in advance, from the secondary beneficiaries as an energy source for irrigations in the greenhouse, stock ponds and pools.
Fig. 1. Geothermal water use, in present, in Livada (after Transgex SA). Exploitation probe
Evacuation to the envoy
Evacuation to the envoy
Evacuation to the envoy
Winter
Summer Geothermal pool
Heating spaces
Heating industrial spaces
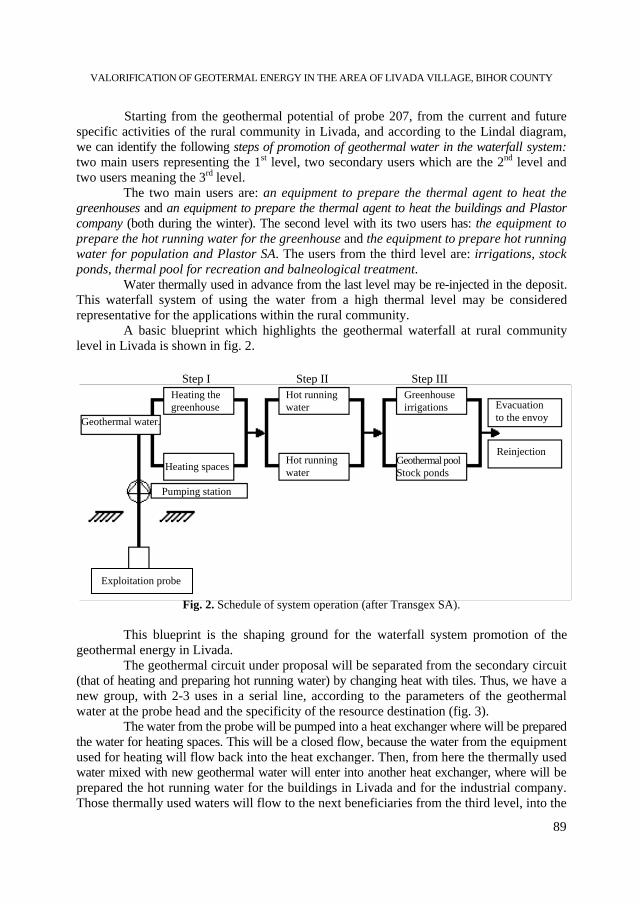
VALORIFICATION OF GEOTERMAL ENERGY IN THE AREA OF LIVADA VILLAGE, BIHOR COUNTY
89
Step III Step II
Geothermal water.
Step I Heating the greenhouse
Heating spaces
Hot running water
Hot running water
Greenhouse irrigations
Geothermal pool Stock ponds
Reinjection
Evacuation to the envoy
Exploitation probe
Pumping station
Starting from the geothermal potential of probe 207, from the current and future specific activities of the rural community in Livada, and according to the Lindal diagram, we can identify the following steps of promotion of geothermal water in the waterfall system: two main users representing the 1st level, two secondary users which are the 2nd level and two users meaning the 3rd level.
The two main users are: an equipment to prepare the thermal agent to heat the greenhouses and an equipment to prepare the thermal agent to heat the buildings and Plastor company (both during the winter). The second level with its two users has: the equipment to prepare the hot running water for the greenhouse and the equipment to prepare hot running water for population and Plastor SA. The users from the third level are: irrigations, stock ponds, thermal pool for recreation and balneological treatment.
Water thermally used in advance from the last level may be re-injected in the deposit. This waterfall system of using the water from a high thermal level may be considered representative for the applications within the rural community.
A basic blueprint which highlights the geothermal waterfall at rural community level in Livada is shown in fig. 2.
Fig. 2. Schedule of system operation (after Transgex SA). This blueprint is the shaping ground for the waterfall system promotion of the
geothermal energy in Livada. The geothermal circuit under proposal will be separated from the secondary circuit
(that of heating and preparing hot running water) by changing heat with tiles. Thus, we have a new group, with 2-3 uses in a serial line, according to the parameters of the geothermal water at the probe head and the specificity of the resource destination (fig. 3).
The water from the probe will be pumped into a heat exchanger where will be prepared the water for heating spaces. This will be a closed flow, because the water from the equipment used for heating will flow back into the heat exchanger. Then, from here the thermally used water mixed with new geothermal water will enter into another heat exchanger, where will be prepared the hot running water for the buildings in Livada and for the industrial company. Those thermally used waters will flow to the next beneficiaries from the third level, into the
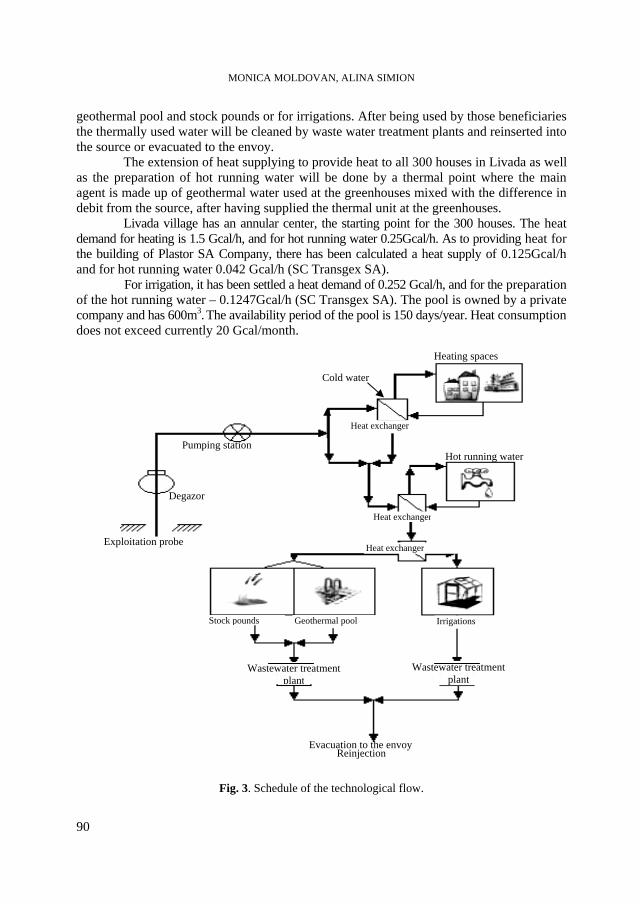
MONICA MOLDOVAN, ALINA SIMION
90
Exploitation probe
Degazor
Pumping station
Heating spaces
Hot running water
Evacuation to the envoy
Cold water
Heat exchanger
Heat exchanger
Heat exchanger
Geothermal pool Stock pounds
Wastewater treatment plant
Reinjection
Irrigations
Wastewater treatment plant
geothermal pool and stock pounds or for irrigations. After being used by those beneficiaries the thermally used water will be cleaned by waste water treatment plants and reinserted into the source or evacuated to the envoy.
The extension of heat supplying to provide heat to all 300 houses in Livada as well as the preparation of hot running water will be done by a thermal point where the main agent is made up of geothermal water used at the greenhouses mixed with the difference in debit from the source, after having supplied the thermal unit at the greenhouses.
Livada village has an annular center, the starting point for the 300 houses. The heat demand for heating is 1.5 Gcal/h, and for hot running water 0.25Gcal/h. As to providing heat for the building of Plastor SA Company, there has been calculated a heat supply of 0.125Gcal/h and for hot running water 0.042 Gcal/h (SC Transgex SA).
For irrigation, it has been settled a heat demand of 0.252 Gcal/h, and for the preparation of the hot running water – 0.1247Gcal/h (SC Transgex SA). The pool is owned by a private company and has 600m3. The availability period of the pool is 150 days/year. Heat consumption does not exceed currently 20 Gcal/month.
Fig. 3. Schedule of the technological flow.
VALORIFICATION OF GEOTERMAL ENERGY IN THE AREA OF LIVADA VILLAGE, BIHOR COUNTY
91
SC Transgex SA Company intends to include some stock ponds in the geothermal circuit, as they own 14 ha of land. The temperature needed for most of the species is between 20-30 degrees Celsius. By keeping the best temperature in the ponds they can even have an increase in the number of exotic species, the improvement of production and in certain cases even double figures in the reproduction cycle.
The chemical analysis of water showed that it can be used directly in stock ponds. For the energy analysis it has been considered a temperature of 28 degrees Celsius. The discharge of geothermal water can vary, according to the heat demand for the stock pond.
The values of temperatures do not influence the environment where they are discharged; the water temperature at discharge point is less than 16 degrees Celsius (thermal pollution is avoided), industrial waste is not even an issue. There is also an increase in the degree of consumer awareness about the energy efficiency; the content of phenols and organic substances in the geothermal waters is at a minimum level, by re-injection the impact over the aquifer layer is diminished.
4. CONCLUSIONS
The use of reusable energy is a step towards the independence from the classical resources of energy, which are limited. The implementation of the waterfall system to promote the geothermal potential leads to the paying off of costs in a shorter period of time. This system has also economic implications due to its use in agriculture, fish breeding as a thermal agent, thus leading to the development of the regions with geothermal potential. Promoting the geothermal energy in the waterfall system in Livada will determine economical development of the region. Due to the implementation of this project there will be lower bills for the thermal energy, a greenhouses system with high production/year (meaning that the capital invested will be paid off sooner). Building ponds for fish breeding may contribute with a significant input to the economy of the village. Geothermal water with a lower temperature (and which cannot be used for greenhouses or heating the buildings) will be used for recreational pools so as not to be wasted (discharged) while still having a high temperature as to the aquatic environment where is to be discharged. This way, there will be fewer emissions from the burning of natural gases from the thermal plant where the inhabitants were connected. The implementation of this system may contribute to the creation of new work places in the village. Due to the fact that the probe at Livada is equipped with only one exploitation head, where all the distribution pipes for the geothermal water are connected to the beneficiary, there is no negative impact of its use over the environment factors in the neighboring areas.
The effects of the exploitation of geothermal water in the area, over the environment factors – ground, underground, air, water, ground water – as they were described, do not justify the approach of ecological reconstruction.
R E F E R E N C E S
1. Butac, A., Opran, C. (1985), Geothermal resources in Romania and their utilization, Geothermics,
vol. 14, nr. 2/3. 2. Demetrescu, C. (1978), On the geothermal regime of some tectonic units in Romania, Pure appl.
Geophys, 117.
MONICA MOLDOVAN, ALINA SIMION
92
3. Gordan, M. (1998), Comparison between the efficiencies of some different types of geothermal plants, Electro-Energetiká Stara-Lesná, Slovakia.
4. Haiduc, Iovanca, Baboş, L. (2005), Chimia şi poluanţii mediului, Edit. Fundaţia pentru studii europene, Cluj–Napoca.
5. Karlsson, Th. (1993), Low temperature geothermal energy utilization, U.N.U. Geothermal Training Program, lecture notes, Reykjavik, Iceland.
6. Messner, R., Stegena, L. (1988), Lithosphere and evolution of the Pannonian Basin, published in AAPG Memoir 45, Budapest.
7. Panu, D. (1994), Geothermal resources in Romania – results and prospects, Edited by S.C. FORADEX S.A., Bucharest.
8. Ristoiu, D., Cosma, C. (2005), Impactul factorilor fizici şi bio-geochimici asupra dezvoltării durabile, Edit. Carpatica, Cluj-Napoca.
9. Roşca, M. (1999), Geotermalism şi centrale geotermale, Editura Universităţii din Oradea, România. 10. Stegena, l., Géczy, B., Horváth, F. (1975), Late Cenozoic evolution of the Pannonian Basin,
Tectonophysics 26. 11. Ţenu, A. (1981), Zăcămintele de ape hipertermale din nord-vestul României, Edit. Academiei,
Bucureşti. 12. www.trangex.ro 13. *** Feasibility Study for Livada perimeter, implemented by ICEMENERG Bucharest, University
from Oradea and S.C. TRANSGEX S.A. NOTE: The authors wish to thank for the financial support provided from programs co-financed
by The SECTORIAL OPERATIONAL PROGRAMME HUMAN RESOURCES DEVELOPMENT, Contract POSDRU 6/1.5/S/3 – „DOCTORAL STUDIES: THROUGH SCIENCE TOWARDS SOCIETY".
STUDIA UNIVERSITATIS BABEŞ-BOLYAI, GEOGRAPHIA, LV, 2, 2010
ASPECTS REGARDING THE ORIGIN AND EVOLUTION
OF THE POPULATION AND SETTLEMENTS IN THE ÎNTORSURA BUZĂULUI DEPRESSION
A. NIŢĂ1
ABSTRACT. – Aspects Regarding the Origin and Evolution of the Population and Settlements in the Întorsura Buzăului Depression. Area of ancient habitation in the inner Carpathians Curvature, the Întorsura Buzăului Depression was a corridor of intense military and commercial traffic, aspects that favored, or, on the contrary, limited the constant development of the settlements. More, during different historical periods, the area was a borderline region, or even considered as a buffer zone between different territorial structures. The modern administrative-territorial organization took place only in the 18th century. The real development of the settlements started at the same time with the modern exploitation of the forest, at the end of the 19th century, and especially in the next century, when, after 1918, the area is located in the center of the state, on an important transcarpathian way, in the area of influence of Braşov City. Keywords: Întorsura Buzăului, settlements, attestation, military incursions, toponymy, historical
geography, Romanians, territorial evolution, population growth. 1. INTRODUCTION
Most of the settlements in Buzaie are included in the Întorsura Buzăului Depression, suspended on Buzău River transverse valley, upstream the Buzău Defile. There are other settlements located in the neighboring mountain space, either on the valleys tributary to the main stream, or on some leveling surfaces. The morphology of the depression consists of two levels, one of the terraces and of the meadows, both agriculturally capitalized, situated at 700 – 780 m altitude, and one of the intensively shaped mountain ridges, separated from the lower leveling surface by some cols, pastoral and forestry capitalized, at 760 – 850 m altitude. The low cols are evidence of the fact that the Buzău River flowed over the actua l Braşov Depression before the Dacian and its channel had an antecedent origin. Even before the time of the Dacians, the area was the main gate to enter the large Braşov Depression from South-East, which was also an ancient inhabited territory.
2. THE ARCHAEOLOGICAL EVIDENCE
The most ancient traces of habitation in the entire inner Carpathians Curvature, belonging to the Upper Paleolithic (about 10 000 years ago) were found in Întorsura Buzăului Depression as well as in Baraolt Depression and Bran – Rucăr Corridor.
1 “Babeş-Bolyai” University, Faculty of Geography, University Extension Gheorgheni, Romania, e-mail:
A. NIŢĂ
94
A large number of findings from Paleolithic (Pleistocene), stand out in Dealu Negru (Black Hill) area and in the neighboring valleys: Buzău, Cremenea (The Flint) and Chichirău (at least a dozen locations – settlements, workshops and isolated finds – presented in The Archaeological Repertory of Covasna County). The findings are mostly situated on the terraces and on tabular watershed areas, at least 15 meters higher than the riverbeds. Economic aspects in the inhabitants’ life are illustrated by the discovery of silex cutting workshops (Gâlma Mare Hill and Black Hill) and silex processing workshops (Chichirău Valley). Another small silex object processing workshop was discovered further North, on the territory of Lădăuţi village. In that period, the economy was based on hunting, fishing and trade. Some of the settlements of this period (in Lădăuţi and Sita Buzăului areas) continued their existence in the Neolithic and even until the Bronze Age (Thracian period), mentioning that one may find the descent closer to the river valleys for a part of them.
The settlements were situated in areas protected from floods and they were unfortified, undefended, which illustrates the peaceful nature of their inhabitants, generally concerned with gathering food and other life sustaining necessities as well. But the Neolithic and Eneolithic generalized the sedentary lifestyle (development of new weapons and tools, the emergence of pottery, the taming of animals, development of agriculture), leading to the necessity of defending the space of living. The passage to the Iron Age brought the abandon of silex resources and a part of the population focused on the more advantageous agricultural fields in Braşov Depression, defended by fortifications like the Thracian-Dacian ones at Covasna (Dealul Zânelor – The Fairies Hill) and Teliu. In consequence, we may interpret the decrease of habitation evidences in the times of Thracians and Dacians by the decrease of the local population in the area. But during all this period, the neighboring areas at the eastern border of Braşov Depression were intensely populated, as proven by the Eneolithic archaeological findings at Valea Mare, Boroşneu Mic, Saciova, Aninoasa, Reci, Lisnău, Bicfalău, Teliu, Prejmer, Hărman, Săcele (Satulung), Braşov, the findings of the transition to the Bronze Age at Telechia, Valea Mare, Aninoasa, Lisnău, Zizin, Satulung, Braşov, the Bronze Age ones at Sita Buzăului, Valea Mare, Lisnău, Teliu, Prejmer, Hărman, Braşov, the transition to the Iron Age and the first part of the Iron Age (Hallstatt) ones at Covasna (the fortress on the Fairies Hill), Zagon, Boroşneu Mic, Boroşneu Mare, Aninoasa, Reci, Ozun, Teliu Fortress, Hărman, Braşov (the fortress on Păticel Hill). According to these archaeological findings, the existence of an important social and economical activity in the area of Covasna – Reci, Teliu and Braşov – Râşnov was proven during this period. It was based on agriculture and sheepherding, stimulated by the Greek colonies near the Black Sea, with whom the inhabitants maintained trade links. The Thracian ethnic and linguistic group emerged during these times.
In the time of the Dacians, the Buzaie area remained outside the fortification line built and organized in the South-East of Transylvania, according to Fl. Costea (2002), on two alignments: one outside (Racoş – Odorheiu Secuiesc – Porumbenii Mari – Mereşti) and one inside (Racu – Caşin – Cernatu – Covasna – Teliu – Braşov – Râşnov – Breaza – Arpaşu de Sus – Tilişca). They contributed to the defense of large communities, the territory being densely populated (about 160 000 inhabitants, 2002, p. 130). Judging by the size of the fortifications and by the presence of some important religious sanctuaries, it seems that their headquarters was located in Racoş – Tipia Ormenişului fortress, but the fortress at Covasna might represent a regional centre as well. The fortifications were a stronghold in front of the eastern invading tribes. The Întorsura Buzăului Depression remained an important route, supervised from Covasna, Teliu and Braşov. Concerning the Dacian families inhabiting
ASPECTS REGARDING THE ORIGIN AND EVOLUTION OF THE POPULATION AND SETTLEMENTS …
95
these territories, like V. Pârvan, Fl. Costea (2002, p. 142 – 143) places here the Caucoensi and the Cotensi. According to him, the Caucoensi lived in the northern part of the Braşov Depression (probably North from the marshy area of the confluences Tărlung – Râu Negru – Olt), and the Cotensi southwards, extending on transcarpathian areas. This division remained set and even during Medieval Times the territory was shared equally. As an undefended transit territory, probably the Întorsura Buzăului Depression was inhabited/capitalized by both Dacian families (tribes).
After the Roman Conquest (105 – 106 A.D.), the fortification line was moved from the eastern limits of the Braşov Depression (Covasna, Teliu) to the line of the Olt River and its tributary Râu Negru (The Black River). Here, the Romans built up the camps at Aninoasa, Reci and Boroşneu Mare, on the place of some former Dacian settlements. Although they were military establishments, the Roman camps represented sources of Roman civilization. That contributed to the Romanization of the region, although slower then in other parts in Dacia, considering the lack of urban areas, the main economic and social development factor. Once the Roman administration installed, the natives were constrained, by the practice of everyday life, to learn Latin, at the beginning as a way of administrative communication but finally as the only way. In parallel, the Dacians took forms of Roman culture and civilization as well (Fl. Costea, 2002).
Settlements continued to exist after the Romans withdrew; they got organized in the so-called “people’s romanias”, small lands with extension directed by the housing and defense conditions offered by the Carpathian landforms. They were organized on the system of the communes, led by a judex, opposed to the so-called unorganized barbaricum. It is very likely that two such lands existed in this area, overlapping the territories of the two Dacian families, one name surviving until nowadays, Bârsa Land (Burzenland). Some artifacts dating before the 5th century A.D. were discovered (Aninoasa, Reci, Braşov), attesting the continuity of the Dacian and Roman culture, as well as the Gothic influences, such as the treasure discovered in the Întorsura Buzăului Depression, at Crasna, representing subsidies paid by the Roman Empire to the Goths. The treasure is part of the Sântana de Mureş – Cerneahov Culture, whose traces were identified in the neighboring area at Covasna, Reci and Lisnău. Allies of the Romans, the Goths were culturally influenced by them, especially by the spreading of Christianity, element that took the Romanization further on. At this point we can state that the natives, the old Dacians, were gradually turning into the new people, the Romanians, formed at the same time with its language and religion, within its ancient territory. Following the invasion of the Huns (376 A.D.), a part of the Goths, led by Athanaric, took refuge in the Carpathian Curvature while the rest moved South of the Danube. The treasure discovered in 1887 at Crasna, comprising about twenty gold bars (ingots) with inscriptions attesting their execution in Sirmium (today Sremska Mitrovica, Vojvodina province, Serbia), their quality and stamps from 367 – 383 A.D., made some historians to locate Caucaland, the refuge territory of the Goths, in this area. The eponymous necropolis of the Sântana de Mureş Culture made others to locate it in the centre of Transylvanian Depression. The existence on Ptolemy’s map of a Dacian tribe named Caucoensi, situated in the North of Braşov Depression and East of the Transylvanian Depression confirms, with archaeological findings, the Dacian continuity and the blending of their culture with the Goths, still under the cultural, religious and commercial influence of the Romans.
The Crasna treasure once again justifies the definition of Buzaie area as the main gate of the early medieval migratory tribes from the South-East towards the center of Transylvania.
A. NIŢĂ
96
At the beginning of the second half of the 6th century, the hand-made Slavic pottery accompanied the native one, which was worked at the spinning table; this demonstrates the presence of the Slavs in the region. Its generalization in the northern part of Braşov Depression (Poian, Cernat) indicates the entrance of the early Slavs from the Siret River Corridor, probably by Oituz Pass. The scarce traces discovered at Hărman and Braşov indicates their spreading this far, but in small numbers. The second Slavic wave, the one between the 7th and 8th centuries, seems to have been denser in Transylvania too, although the archaeological findings in the Carpathian Curvature are pretty scarce. Still, their presence is attested by many toponyms and the archaeological findings in the Transylvanian Depression.
In about the 10th century, the Pechenegs penetrated Braşov Depression along with the Cumans, from whom the Romanians took refuge into the marginal areas of the depression, building earth and wooden fortifications, palisades, on higher ground in the Oituz Pass, at Cernat, Covasna (using bricks from a former Roman building), Bodoc, on Lempeş Hill (between Hărman and Sânpetru), at Ariuşd, Teliu, Braşov (three fortresses), between Hălchiu and Crizbav, at Feldioara, Codlea (on Măgura Codlei Hill), Râşnov and Bran. Some of the invaders remained, as proven by toponyms like Oituz, Beşeneu, Oloznui (today Olteni), Ozun, Barcani or Baraolt. In order to stop their periodical alliance with the Byzantine Empire, the Hungarians colonized the Order of the Teutonic Knights in Bârsa Land.
3. THE DOCUMENTARY ATTESTATION
By the second half of the 11th century, Transylvania fell under the influence of the Hungarian Kingdom. Within the Carpathians inner curvature, the authority was only formal until the colonization of Teutonic Knights, Transylvanian Saxons and Szeklers, as Simon of Kéza said about the latter ones, “among the Vlachs” (sed cum Blakis). Such changes led to the first written documents showing the settlements here (12th and 13th century).
Most of historians consider the act of 1211as the first document mentioning the area, in which King Andrew II of Hungary gave “a land called Bârsa” to the Teutonic Knights. They were the ones in charge, but conditioned that “the people living there are not oppressed in any way” (1212). Starting from 1213, the same people had to pay the tithe to the Knights. Although no settlements are named, the document contains some river names (hydronyms) and the names of some farther located fortresses, names of Dacian and Dacian-Roman origins that should have been transmitted by a local sedentary population. So the region was not uninhabited, but it was not administered or not ordered directly by any royalty. Therefore, the extension of the Hungarian royalty accomplished this like everywhere else in Transylvania by controlling the system of local fortresses.
The Szeklers and the Transylvanian Saxons were colonized during the same century. Such changes also led to the first documentary attestation of the settlements. Until the beginning of the 14th century, the main fortresses (Braşov and Teliu, 1235), the first German settlements (Feldioara, Sânpetru, Hărman, Prejmer) and the Romanian villages, feudal possessions, in Bârsa Land and in the northern part of the depression (Turia, Valea Seacă) were attested. In 1331 – 1332, the settlements with Catholic churches were attested in the Pope’s Chart. Then, the most of the remaining settlements were attested as feudal possessions or in the tax register of 1567.
During this period (15th century), the settlements in Buzaie were attested for the first time as well. The first documents named them together as Boza, Bozza or Bodza. I. Halmaghi (2001, p. 50 – 52) mentions the area as a possession of Prejmer village, even since the 14th century,
ASPECTS REGARDING THE ORIGIN AND EVOLUTION OF THE POPULATION AND SETTLEMENTS …
97
along with the villages of Budila and Teliu, including the Cruceburg Fortress in Teliu. That fortress had to be maintained in good conditions by the Transylvanian Saxons of Prejmer. The fortress was, like before, the main defending point against the numerous invaders in Bârsa Land coming through Buzaie. The invasions are proven by the fact that, after the Cruceburg fortress had been dismantled, the Prejmer Transylvanian Saxons started building another fortress around their church (1427) before their fellows were bound to (1521). This church became the biggest fortified church (Bauernburg) in Europe (I. Halmaghi, 2001, p. 114 – 115).
The privilege was reconfirmed in 1471 when the village of Prejmer received the villages Dobârlău, Teliu and Buzău from Matthias Corvinus. Being a feudal domain, we may consider that it was a Romanian one, with the same status like the other ones around. The privilege was also reconfirmed in 1507, 1508, 1561, 1563 and 1628 (I. Halmaghi, 2001, p. 52). The territory in Buzaie was fiercely disputed between the Transylvanian Saxons of Prejmer and the Magyar noblemen of Bârsa Land (Teliu, Budila – in 1508 the beheading of the noblemen Petrus Beldi from Budila by the Prejmer Transylvanian Saxons is attested) or of the Szekler area in the North (Bicfalău). Later on, the downstream area of Buzaie is attested as property of the Mikes noble family of Zăbala. During the medieval period, according to oral tradition, the Buzaie area was permanently supplied with Romanians coming from the Szekler area in the North or the German one in the West. The neighborhood with the Romanians in transcarpathian areas favored the preservation of their language and religion.
In this period, the important roads crossing the Întorsura Buzăului Depression were also documented, along with the one that runs through Bran Pass, the only “wagon roads” connecting Braşov City and Wallachia. The main roads stretched from Braşov through Dălghiu or Predeluş (Teliu) Passes and from the Întorsura Buzăului Depression mounted on Buzău valley to Tabla Buţii (Barrel’s Punch) Pass, also called Tatars’ Pass, where it branched on Teleajen Valley (the Teleajen Road, through Boncuţa Pass, attested in 1432) and on Buzău Valley (the Buzău Road, through Chiojdu Path, attested in 1502). In addition to these main commercial roads, the area was also crossed by forbidden roads and paths, bypassing the customs, like the one descending on Buzău Valley but avoiding the defile zone by mounting on Crasna Path towards Pietroasa and Chiojdu. These passes were frequently used in the Dark Ages by the Goths, Pechenegs and Cumans and in the Middle Ages by Tatars (reminded in some toponyms like Higher Tatar and Small Tatar peaks or Tatars’ Pass) and Ottoman invasions, as well as by the Wallachian and Moldavian armies.
The invasions of the Dark Ages limited the development of the settlements in Buzaie, but once the phenomena ended, with the increase in the number of residents, the region gained an ever higher economic role. In the 18th century, the following settlements were attested for the first time: 1729, Sita Buzăului (Szita, 1854, Szita Bodza) and the Ciumernic place (Csemernek), 1763, Zăbrătău place (Zabrato), 1797, Cremenea (Cremenye olahul), 1820, Floroaia (Talpatak, 1820, Floroje), 1839, Întorsura Buzăului (Bodza-Fordulás), 1843, Barcani (Zagoni-Bodza, Bărcan, 1874, Zágonbárkáni), 1890, Sărămaş (Sărămaşu), 1909, Crasna (Krászna) and Brădet (Bredét). On the Austrian maps of the 18th century (1780s) the settlements Floroaia Mare (Talpatak), Aninoasa (today part of Întorsura Buzăului, Egerpatak), Sita Buzăului (Szita Arka) and Vama Buzăului (the households and the custom buildings, Buza Pafs) were named and some scattered households in the area of the actual settlements and hamlets Sărămaş, Barcani and Bobocea were sketched (fig. 1).
A. NIŢĂ
98
4. THE EVOLUTION OF THE SETTLEMENTS In the absence of precise descriptions, we cannot know how the settlements in the
Întorsura Buzăului Depression looked like before the end of the 18th century. But we know that the households were named Buzaie (Boza, Bozza or Bodza) and they were divided between the noblemen of Bârsa Land and of the Szekler area. We also know that, when the colonists arrived, the Romanians inhabited small villages (hamlets), which were spread in the higher areas (aspect preserved in some toponyms like Săcele, actually, Sătucele – the small villages), with more or less scattered households, depending on the landforms. Considering their existence on both sides of the Carpathians, most likely such hamlets existed in Buzaie well before their documentary attestation, but the documents registered only the newer feudal property changes. Because of the many predatory and military raids endured in these passes during the Dark and Middle Ages, the number of settlements and inhabitants was reduced. We also have to take into consideration the significant fluctuations in the number of people in those times. The decrease of the number of raids by the end of the Middle Ages and the change of the status from military to commercial roads led to the increase of the population.
If during the migratory and military raids the inhabitants preferred to live in hamlets on the higher hills (Hills of Popiceşti, Crăciuneşti, Bărbat, Petrea, Bob – families existing even today), after the area entered the Austrian sphere of influence and administration, on the background of the reduction and even rejection of Turkish military raids, the families or parts of the families began moving their households in the lower areas of the depression, nearer to the commercial roads. The newer hamlets would also keep the name of their founders, process detailed by E. Micu (1947, p. 31).
By the 18th century, the area is divided into three communes, Vama Buzăului (Buzău Customs), Întorsura Buzăului (Buzău Turning) and Sita Buzăului (Buzău Sieve), to which Barcani was added later, as hamlet of Zagon village. Some authors (Berecz G., Negoescu Gh. N. – see E. Micu, 1947, p. 29 and 31) consider this period as the beginning of the settlements in Buzaie. In fact, it is only the beginning of the modern administration of the area. Because of the lack of information, once again we may appeal to the principle of historical geography in order to see how settlements in similar Carpathian areas were represented. Thus, in “Vrancea. Geografie istorică, toponimie şi terminologie geografică”, I. Conea presents a description of a similar area, Petroşani Depression, made by the Austrian engineer Friedrich Schwanz in 1720 – 1723: «Both Jiu rivers – the Hungarian one, as well as the Wallachian one – have long meadows and large valleys with very productive pastures and grasslands for farming in them; also these valleys are inhabited by a Wallachian and Hungarian population, along their total length (so without interruption, meaning at all inhabited) so that everything seems like one village only» (I. Conea, 1993, p. 99). Watching the Austrian maps at the and of the 18th century we may see that, in fact, it was about an association of small hamlets scattered over the land, that looked like a single scattered village. Compared with Întorsura Buzăului Depression, one remarks not only the environmental similarity and the inhabitants’ occupations, but also the existence of a single village overlapping the whole depression as well, with households grouped in small hamlets, resulted from a permanent migration process. In Petroşani Depression, about three centuries before, Aninoasa, Câmpu lui Neag and Vulcan villages were already attested, so the natives were differentiating the settlements. In the same study, I. Conea also presents the future evolution of the settlements (p. 110), only a decade later three new settlements being attested and three more by 1750. Probably the events took place in the same way in Buzaie too. The individual naming of the villages was made at the same time, by the beginning of the 18th century, when the new Habsburg regime began a more rigorous administration of its territory. Certainly, considering the better shelter conditions in Petroşani Depression, the number of inhabitants in the Întorsura Buzăului Depression was comparatively smaller, with a smaller number of villages and hamlets. Also, bigger settlements
ASPECTS REGARDING THE ORIGIN AND EVOLUTION OF THE POPULATION AND SETTLEMENTS …
99
developed in the south-western part (Vama Buzăului, Floroaia, Aninoasa), closer to the commercial way towards Tabla Buţii Pass. The ones downstream developed intensively only after the road in the Buzău Defile (Pass) was built (1887). So we also may consider (like E. Micu, 1947, p. 31) that the beginning of the settlements in Buzaie set at the beginning of the 18th century is in fact the beginning of their modern administrative form of organization.
During the 18th century and especially during the next one, the households moved from the old settlements and started settling on the terraces of Buzău Valley and of its tributaries, particularly Ciumernic, Zăbrătău, Floroaia, Lădăuţi, Barcani, Buzoel and Dălghiu. The phenomenon corresponds to the intensification of migration and colonization in many other Carpathian areas, such as Dorna Land, Subcetate – Topliţa Plateau, Mureş Defile, Carpathian valleys of Bistriţa and Trotuş, Gurghiu Valley, Vărşag Depression, Bran Villages and “mărgineni” (border-liners) villages in Sibiu and Haţeg depressions, Orşova – Caransebeş Corridor, Almăj Land, some areas in Apuseni (Western) Mountains etc. (Cl. Giurcăneanu, 1988, p. 134). In those times the Buzaie area was also the target of an important influx of people. In the study of 1947 (p. 16) L. Someşan argued, based on onomatology, the origin of most of the new inhabitants in the settlements in Bârsa Land. Most of them were “The Tohăneans”, who came from Tohanu Village (later Tohanu Vechi or Old Tohanu) during the frontier-guard regiments organization, as well as from the old feudal possessions between Teliu and Baciu (Săcele). Afterwards, there were people who came from other parts of Transylvania, especially from Târnave Plateau, or from Măneciu area in Wallachia. In Barcani village, the settlement of those coming from the Szeklers area continued. They had different nationalities, were specialists in glassmaking, and worked in factories which used local resources (beech wood).
Pursuing the study of onomatology and toponymy, settlement names in Buzaie like Floroaia (Florea), Bobocea (Bob, Bobeş), Crăciuneşti (Crăciun), Barcani (probably of Cuman origin, but also met in Romanian and Latin as Borca, the valley appearing on the 18th century maps as Barka), Popiceşti (Pop), Tomogea (probably owner of a tog – grassland), Zăbrătău (the Slavic Bratoslav), Stăvăreşti (horse keepers), Băileşti (Băilă), Bucureşti (Bucur) came from the names of the families around whom they developed. Other ones like Lopata (The Shovel), Gâlma (The Hillock – later renamed Merişor, meaning Cranberry) or Şiţa (The Shingle) came from the appearance of the hills that the households scattered onto (flat, rounded or narrow). From the appearance of the valleys they stringed on came names like Întorsura Buzăului (Buzău River Turning), Sita Buzăului (Buzău River Sieve – a place where the river split in several strings before channeling work began), Găureni (hole, basin or small depression), Sărămaş (salt water) or Crasna (the beautiful valley, according to the Slavic krasĭnŭ – beautiful). About Chichirău, I. Conea (1993, p. 176) considers that it has Hungarian origins and it means “meandered river”. As regards the river and village name Ciumernic, S. Puşcariu (p. 42) explains the origin of name Ciuma (peak south of Perşani Mountains) as the peak, like the French “cime” in his book Braşovul de altădată (Braşov Timelines) using aspects of linguistic geography. Ciumernic can only be a river sourcing from a ciumă, as much as it springs from a ponc or ponţ (Ponţul Semeria, a rounded peak), word with Hungarian origin, meaning steep place. This last name was taken by locals from the Hungarian administration after the initial sense of the word Ciumă perished. Brădet is a village developed on a former fir forest (Abies alba, in Romanian, brad) and Acriş on a former sorrel pasture (Rumex acetosa) or grassland. The name Scrădoasa is from another plant, which is green during winter and is used for feeding cattle and sheep. As for the smaller and isolated village Dălghiu, its name probably came from the Hungarians of the South of Bârsa Land, dél hegy meaning “the south hill” in Hungarian. We also have to consider its origin in the Slavic name Dobromir (Dobra), as the river Dălghiu springs from Dobromir Mountain and it appeared as Delbjo Valley, phonetically adapted to Hungarian language, on the 18th century maps.
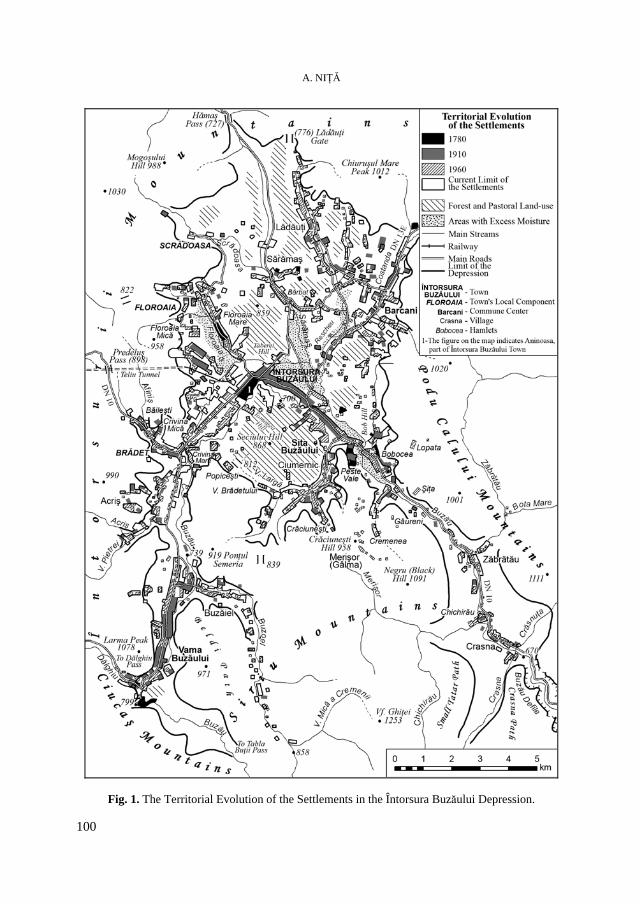
A. NIŢĂ
100
Fig. 1. The Territorial Evolution of the Settlements in the Întorsura Buzăului Depression.
ASPECTS REGARDING THE ORIGIN AND EVOLUTION OF THE POPULATION AND SETTLEMENTS …
101
The higher settlements (Gâlma, Lopata) developed at the end of the 19th century and especially during the first half of the next one, at 850 – 900 m altitude, on ridges belonging to the lower leveling surface (1000 – 1100 m), intensely fragmented by the tributaries of Buzău River but also at the level of the cols connecting the Întorsura Buzăului and Braşov depressions. Over time, these settlements suffered an intense process of depopulation, which led to their extinction.
The lower settlements, especially the ones downstream “the turning point”, had to avoid the flooding and marshy areas. Upstream the narrowing, separating the Crasna Basin (formed by differentiated erosion before the river enters the defile), the lower area of the depression includes wide valleys, with frequent marshy riverbeds. Initially, the lower settlements developed either on the alluvial terrace of Buzău and its main tributaries (Vama Buzăului, Acriş, Crivina Mare, Crivina Mică, Întorsura Buzăului, Floroaia Mare, Sărămaş, Lădăuţi, Barcani, Bobocea), or the valleys of its smaller tributaries, protected from floods (Buzăiel, Brădet, Popiceşti, Floroaia Mică, Ciumernic, Sita Buzăului, Şiţa Mică, Găureni).
Between the two World Wars, the region represented the target of a new influx of inhabitants, this time specialists in hardwood logging (especially coming from Muscel area – V. Pop, 1947, p. 118) and railway workers. During the communist regime, the area is industrialized. This process and the commuting towards Braşov City industry favored the natural increase of the number of inhabitants. In consequence, during the 20th century the settlements extended especially in the lower areas of the depression. The increasing number of the households led to the appearance of elongated villages, extending continuously on the whole length of the Buzău Valley from Vama to Sita and on some of its tributaries. The margins of the depression still preserve the type of village spread along the valleys or in the cols. The concentration of the households in the lower areas was due to the more favorable possibilities of circulation and to the implementation of some civic facilities. That led to the emigration from the isolated hamlets in higher areas. The accentuated extension of the settlements also involved some risks for the people, especially hydrological ones, the low banks of Buzău River being unable to prevent the floods, particularly between Întorsura and Sita. Therefore, the regularization of its channel was made in the last four decades.
In terms of territorial administration, before 1876 the villages of Vama Buzăului and Floroaia were an enclave of the Upper Alba County (which also included the villages Budila and Teliu from Bârsa Land); just like most of Bixad and Caşin Depressions in the North of Braşov Depression and the northern part of Măieruş – Augustin Corridor and Zek Land (H. Wachner, 1995) in the West of Bârsa Land (the villages Hăghig, Araci and Ariuşd). The villages downstream “the turning point”, including Întorsura Buzăului, were part of the Szeklers Seat (Szék, Latin, sedes) named Three Seats. After 1876, they were included, with Budila and Teliu as well, in the Three Seats County, and after 1925 in Braşov County (with the Bârsa and Bran settlements), Buzăul Ardelean District. After the changes of territorial administration in the post war period, the settlements in Buzaie were initially included in Braşov Region, Târgu Secuiesc District. Then (1968), the county organization was implemented again: Vama Buzăului commune was included in Braşov County and the rest of them in Covasna County. Întorsura Buzăului was promoted town in the same year.
5. THE EVOLUTION OF THE NUMBER OF INHABITANTS
Such proportions in territorial evolution of the settlements were based, naturally, on an important growth in the number of inhabitants. Based on the modern censuses (performed after 1850), we may find an increase in the number of inhabitants between 1850 and 2002
A. NIŢĂ
102
by 533 %. As one may see (Table 1), throughout the analyzed period, the most important growth rate of inhabitant ever registered was after the area became part of Romania, as the real value of the number of inhabitants almost doubled. Until 1992, the number of inhabitants almost doubled again. Compared with the neighboring Braşov Depression, higher average annual growth rates were registered in Întorsura Buzăului Depression until World War II. Then, until 1992, on the background of the industrialization in Bârsa Land, the situation reversed. Between the last two censuses, the people maintained a positive growth rate in the Întorsura Buzăului Depression, mainly due to the fact that, based on local population and resources, the economy could adapt faster and easier to the new social and political conditions.
The Evolution of the Number of Inhabitants in Întorsura Buzăului Depression,
between 1850 and 2002 Table 1
Average annual growth rate (‰) Year Total Femininity
index1 Romanians
(%) Orthodox
(%) Înt. Buzăului Depression
Braşov Depression
1850 3 305 92.8 93.3 96.9 - - 1910 5 366 98.8 92.12 92.5 6.4 3.9 1930 10 801 99.5 95.8 96.5 25.2 3.9 1966 16 386 91.7 98.5 - 9.5 11.0 1992 20 521 96.2 99.1 97.7 7.8 14.4 2002 20 932 97.5 99.5 97.8 2.0 -8.1
1 Women per 100 Men; 2 Based on Mother’s Tongue
Concerning some population structures, we note in all the analyzed periods a low femininity index, specific to the mountain areas with an economy based on the exploitation and capitalization of natural resources (nowadays only Întorsura Buzăului Town has values over 100, considering the concentration of the main administrative and service activities there), as well as the important majority of Romanian Christian-Orthodox population.
At the level of settlements (Table 2), until 1966 the most important growths of the number of inhabitants registered in the ones situated on the main road crossing the region (National Road 10), Întorsura Buzăului and Sita Buzăului. As percentage, Barcani registered the highest growth, 694 %, because of the low number of inhabitants in 1850.
After 1966, one notices the same trend of evolution. The increase registered in Întorsura Buzăului was due to its promotion as town and to its industrialization. Important growths can be seen at Brădet as well, situated on the same important road, and in the two villages situated at the entrance in Vama Buzăului Commune: Acriş and Buzăiel. In terms of weight, between 1966 and 2002 the most important growth was in Brădet, followed by Întorsura Buzăului, Acriş and Buzăiel. The increase of population within the settlements in this part of the depression was also favored by the neighboring of Braşov City, many of their inhabitants activating in its economy.
On the contrary, during the same years, important decreases of the number of inhabitants (as weight and real value) took place in the settlements situated at longer distances from DN 10 (Floroaia and Scrădoasa), or within those situated in the south-eastern part of the depression (Zăbrătău and Crasna), and in the commune center of Vama Buzăului, which seemed to lose its number of inhabitants in favor of the two component villages, Acriş and Buzăiel, situated nearer the city of Braşov.
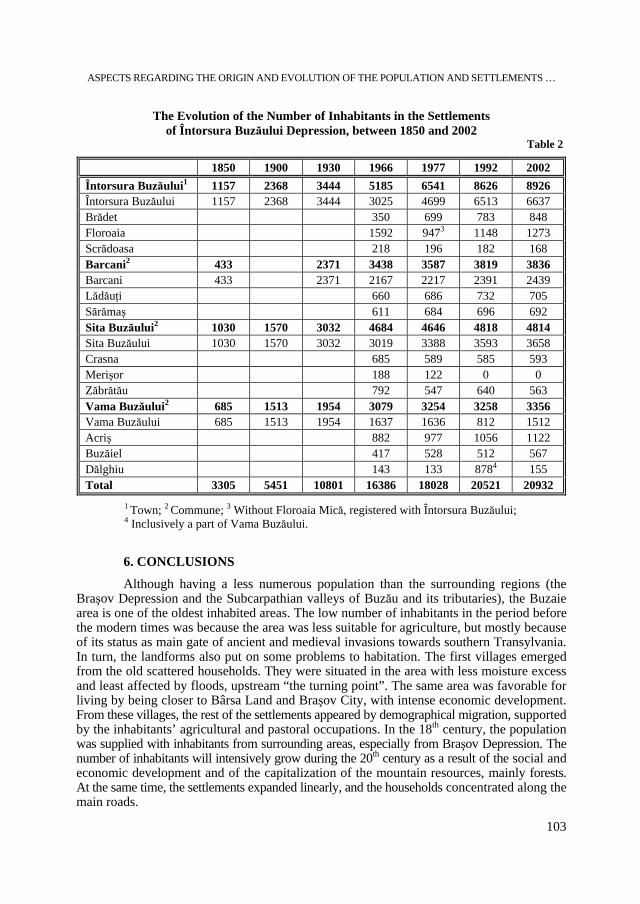
ASPECTS REGARDING THE ORIGIN AND EVOLUTION OF THE POPULATION AND SETTLEMENTS …
103
The Evolution of the Number of Inhabitants in the Settlements of Întorsura Buzăului Depression, between 1850 and 2002
Table 2
1850 1900 1930 1966 1977 1992 2002 Întorsura Buzăului1 1157 2368 3444 5185 6541 8626 8926 Întorsura Buzăului 1157 2368 3444 3025 4699 6513 6637 Brădet 350 699 783 848 Floroaia 1592 9473 1148 1273 Scrădoasa 218 196 182 168 Barcani2 433 2371 3438 3587 3819 3836 Barcani 433 2371 2167 2217 2391 2439 Lădăuţi 660 686 732 705 Sărămaş 611 684 696 692 Sita Buzăului2 1030 1570 3032 4684 4646 4818 4814 Sita Buzăului 1030 1570 3032 3019 3388 3593 3658 Crasna 685 589 585 593 Merişor 188 122 0 0
Zăbrătău 792 547 640 563 Vama Buzăului2 685 1513 1954 3079 3254 3258 3356 Vama Buzăului 685 1513 1954 1637 1636 812 1512 Acriş 882 977 1056 1122 Buzăiel 417 528 512 567 Dălghiu 143 133 8784 155 Total 3305 5451 10801 16386 18028 20521 20932
1 Town; 2 Commune; 3 Without Floroaia Mică, registered with Întorsura Buzăului; 4 Inclusively a part of Vama Buzăului.
6. CONCLUSIONS
Although having a less numerous population than the surrounding regions (the Braşov Depression and the Subcarpathian valleys of Buzău and its tributaries), the Buzaie area is one of the oldest inhabited areas. The low number of inhabitants in the period before the modern times was because the area was less suitable for agriculture, but mostly because of its status as main gate of ancient and medieval invasions towards southern Transylvania. In turn, the landforms also put on some problems to habitation. The first villages emerged from the old scattered households. They were situated in the area with less moisture excess and least affected by floods, upstream “the turning point”. The same area was favorable for living by being closer to Bârsa Land and Braşov City, with intense economic development. From these villages, the rest of the settlements appeared by demographical migration, supported by the inhabitants’ agricultural and pastoral occupations. In the 18th century, the population was supplied with inhabitants from surrounding areas, especially from Braşov Depression. The number of inhabitants will intensively grow during the 20th century as a result of the social and economic development and of the capitalization of the mountain resources, mainly forests. At the same time, the settlements expanded linearly, and the households concentrated along the main roads.
A. NIŢĂ
104
R E F E R E N C E S 1. Colectiv (1972), Ţara Bârsei, Edit. Academiei Republicii Socialiste România, Bucureşti (sub redacţia
lui M. Dunăre). 2. Colectiv (1987), Geografia României, III, Carpaţii şi Depresiunea Transilvaniei, Edit. Academiei
Republicii Socialiste România, Bucureşti. 3. Colectiv (1998), Repertoriul arheologic al Judeţului Covasna, Tipografia Cova-print, Sfântu Gheorghe. 4. Conea, I. (1993), Vrancea. Geografie istorică, toponimie şi terminologie geografică, Edit. Academiei,
Bucureşti. 5. Costea, Fl. (2002), Dacii din sud-estul Transilvaniei înaintea şi în timpul stăpânirii romane, Edit.
C2Design, Braşov. 6. Costea, Fl. (2004), Repertoriul arheologic al Judeţului Braşov, Edit. C2Design, Braşov. 7. Coşa, A. (2001), Românii din sud-estul Transilvaniei în secolele XIII - XV, Angustia, Nr. 6, Edit.
Carpaţilor Răsăriteni, Sfântu Gheorghe. 8. Edroiu, N. (2001), Estul Transilvaniei în Evul Mediu Timpuriu - secolele VIII - XIII, Angustia, Nr. 6,
Edit. Carpaţilor Răsăriteni, Sfântu Gheorghe. 9. Furtună, D. (1996), Covasna – Voineşti, leagăn de romanitate în arcul intracarpatic, Angustia, Nr. 1,
Edit. Carpatica, Sfântu Gheorghe. 10. Giurcăneanu, Cl. (1988), Populaţia şi aşezările din Carpaţii Româneşti, Edit. Ştiinţifică şi Enciclopedică,
Bucureşti. 11. Halmaghi, I. (2001), Prejmerul medieval, Edit. Lux Libris, Braşov. 12. Lăcătuşu, I., Lechinţan, V., Pătrunjel, Violeta (2003), Românii din Covasna şi Harghita. Istorie. Biserică.
Şcoală. Cultură, Edit. Grai Românesc, Miercurea-Ciuc. 13. Pop, Gr. (1984), România. Geografia circulaţiei, Edit. Ştiinţifică şi Enciclopedică, Bucureşti. 14. Pop, Gr. (2000), Carpaţii şi Subcarpaţii României, Edit. Presa Universitară Clujeană, Cluj-Napoca. 15. Puşcariu, S. (1977), Braşovul de altădată, Edit. Dacia, Cluj-Napoca. 16. Salvan, Fl. (1996), Viaţa satelor din Ţara Bârsei în Evul Mediu (secolele XIII – XVII), Edit. Academiei
Române, Bucureşti. 17. Salvan, Fl., Costea, Fl. (1999), Civilizaţie şi continuitate românească în Ţara Bârsei (din cele mai vechi
timpuri, până spre amurgul Evului Mediu timpuriu), Edit. Orientul Latin, Braşov. 18. Someşan, L., Micu, E., Pop, V. (1947), Depresiunea Întorsurii Buzăului – studiu geografic, istoric şi
economic, Tip. „Cartea Ardeleană”, Braşov. 19. Wachner, H. (1995), Istoria Ţării Bârsei, Edit. Aldus, Braşov.
STUDIA UNIVERSITATIS BABEŞ-BOLYAI, GEOGRAPHIA, LV, 2, 2010
THE STRUCTURE AND QUALITY OF THE HUMAN FACTOR WITHIN
THE DEVELOPMENT REGIONS OF ROMANIA
V. SURD1, J. KASSAI2, B. N. PĂCURAR3
ABSTRACT. – The Structure and Quality of the Human Factor within the Development Regions of Romania. In 2000, 8.4% of Romania`s population had higher education, 77.4 % medium education and 14.3% primary education. The obvious increase of the population with higher studies, as a result of the establishment of numerous state and private universities, lead to spectacular leaps within this last decade. Meanwhile, there was also a significant increase in the population with medium studies (77.4%), exceeding the European Union average (70%), a trend that will continue in the following years. The decrease of the population with primary studies is caused by the dramatic decrease in the population of school age, within the greater context of the general demographic decline of Romania. One must notice that, at the level of development regions, the former economic system, the economic and cultural legacy generated significant regional availabilities, with an excessive polarisation of the development factor by the Bucureşti-Ilfov region. Likewise, the regional development centres, which are mainly second tier cities in the national hierarchy (Cluj-Napoca, Iaşi, Braşov, Craiova, Timişoara, Galaţi and Constanţa), sustain and concentrate a population with a high degree of education and with an enhanced ability to innovate, but well below the advanced states. The „brain-drain” phenomenon, within this category of population, has reached alarming levels.
Key words: structure and quality of population, development region, Romania
1. INTRODUCTION
Alongside the technological and financial capital, the human capital, which is the stock of skills and knowledge embodied in the ability to perform labour as to produce economic value, plays an essential role in the development of a state in general and more specifically of a region. The education of a nation has always been a priority for development policies, next to ensuring health standards for all the inhabitants of a state. Investments in education later become benefits, but it is proven that, the greater the education effort is, the more expressive the population`s participation at the economic progress and at the wellbeing of the country is. Within this context, the general level of education is highly relevant and important, but the percentage of the demographic segment with a higher education out of a swatch of 10,000 people is even more crucial. In similar terms, there are sums of money alocatted by states and regions for research and development. In the following pages, we will present the population`s education degree at a national and development region level, backed by several other indicators refering to the quality of the human factor.
1 Babeş-Bolyai University, Faculty of Geography, 400006, Cluj-Napoca, Romania, e-mail: [email protected] 2 Babeş-Bolyai University, Faculty of Geography, 400006, Cluj-Napoca, Romania, e-mail: [email protected] 3 Cluj County Council, 400094, Cluj-Napoca, Romania, e-mail: [email protected]
V. SURD, J. KASSAI, B.N. PĂCURAR
106
2. THE QUALITY OF THE HUMAN FACTOR
The school population in 2004/2005 was 4,390,835 people, a decrease of 5% from 1994/1995 (MEC, Starea învăţământului 2004/2005). The average educational level of the workforce (15 and over) increased from the middle of the 1990s, but remained low in comparison with the average values of the EU. In 2000, 8.4% of Romania`s population had higher education, 77.4% high school studies and 14.3% elementary studies. Taking into account the educational levels, in Romania, the 25-64 age group that graduated at least high school increased from 67.9% in 1999 to 70% in 2003, this indicator registering a higher level than other European states. However, even though the percentage of those with higher education from the same age group, 25-64 years, registers an ascending trend (from 8.7% in 1999 to 9.6% in 2003), it still remains below advanced countries (in 1999: USA – 27.7%, France – 16.4%, Germany – 15%, UK – 15.4%; White Paper on Labour Force, DTI/UK). The competitivenes of the human capital is directly influenced by the education level. For the 20-24 age group, the data delivered by Eurostat indicate that, in the case Romania, in 2004, 75.3% of the population from this age group graduated at least high school, the value of this indicator being close to UE-15 average of 76.6% and superior to the UE-25 average of 73.8%. In the case of the 25-64 age group, the percentage of the population that graduated at least high school is close to the European average, but lower than the average level of the 10 new member states, as well as Europe`s target of 85%, established for 2010 in Lisbon. The dynamics of the percentage of the population between 25-64 years, that has at least medium studies, shows an accelerated increase in 1999 and 2000, followed by a stabilization between 2000 and 2004, at approximately 70.5%. The data obtained at the 2002 Population Census indicate an increase in the number of higher education graduates, within the 15-29 age group. The number of students increased between 1995 and 2005 by 150%. Moreover, the percentage of graduates in the post high school and technical schools and the percentage of graduates in the elementary cycle also increased in the same age group, between 1992 and 2002. In the case of the 15-29 age group, within the same period, there was a decrease in the percentage of high school graduates (from 43.2% in 1992 to 38% in 2002). On the whole, in 2002, approximately 8% of the 15-29 age group, graduated a form of higher education, 82% high school, 8% elementary education and 3% did not graduate any form of education. In order to develop a competitive human capital, high-quality education is the main objective. High-quality education is an essential condition, that ensures the necessary framework to cater the knowledge, abilities, qualifications and attitudes that support competitiveness and the steady development of the human capital. The universities represent the „key players”, being the main provider of highly qualified workforce and knowledge. Considering the fact that universities are at the „crossroads” between education, research and innovation, one can state that they represent the key answer for a knowledge economy and society. They should be helped in their quest to develop the ability to create qualified students, therefore contributing to the increase in economic competitiveness. However, Romania, when it comes to qualified university staff, has a 40% deficit. From all the major problems confronted by universities, we can mention poor teaching conditions, poor study and living conditions for students, the lack of laboratories and equipment.
Although we can notice a continuous increase in the number of students in large cities/university centres, the Romanian higher educational system has a relatively reduced ability to adapt its qualifications and professional education to the demands of the labour market. The high unemployment rate among young men sustains this conclusion. Within this
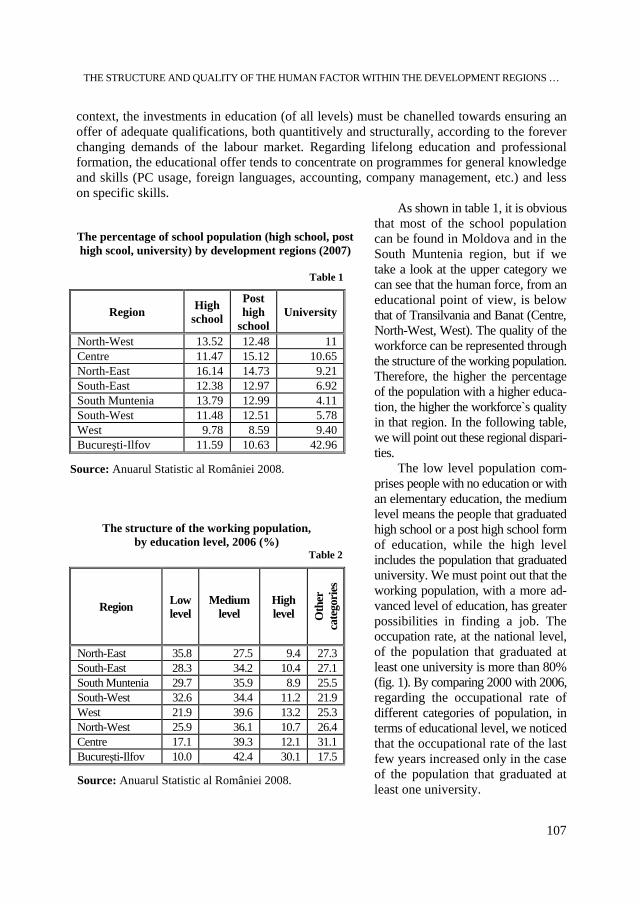
THE STRUCTURE AND QUALITY OF THE HUMAN FACTOR WITHIN THE DEVELOPMENT REGIONS …
107
context, the investments in education (of all levels) must be chanelled towards ensuring an offer of adequate qualifications, both quantitively and structurally, according to the forever changing demands of the labour market. Regarding lifelong education and professional formation, the educational offer tends to concentrate on programmes for general knowledge and skills (PC usage, foreign languages, accounting, company management, etc.) and less on specific skills.
As shown in table 1, it is obvious that most of the school population can be found in Moldova and in the South Muntenia region, but if we take a look at the upper category we can see that the human force, from an educational point of view, is below that of Transilvania and Banat (Centre, North-West, West). The quality of the workforce can be represented through the structure of the working population. Therefore, the higher the percentage of the population with a higher educa-tion, the higher the workforce`s quality in that region. In the following table, we will point out these regional dispari-ties. The low level population com-prises people with no education or with an elementary education, the medium level means the people that graduated high school or a post high school form of education, while the high level includes the population that graduated university. We must point out that the working population, with a more ad-vanced level of education, has greater possibilities in finding a job. The occupation rate, at the national level, of the population that graduated at least one university is more than 80% (fig. 1). By comparing 2000 with 2006, regarding the occupational rate of different categories of population, in terms of educational level, we noticed that the occupational rate of the last few years increased only in the case of the population that graduated at least one university.
The percentage of school population (high school, post high scool, university) by development regions (2007)
Table 1
Region High school
Post high
school University
North-West 13.52 12.48 11 Centre 11.47 15.12 10.65 North-East 16.14 14.73 9.21 South-East 12.38 12.97 6.92 South Muntenia 13.79 12.99 4.11 South-West 11.48 12.51 5.78 West 9.78 8.59 9.40 Bucureşti-Ilfov 11.59 10.63 42.96
Source: Anuarul Statistic al României 2008.
The structure of the working population, by education level, 2006 (%)
Table 2
Region Low level
Medium level
High level O
ther
ca
tego
ries
North-East 35.8 27.5 9.4 27.3 South-East 28.3 34.2 10.4 27.1 South Muntenia 29.7 35.9 8.9 25.5 South-West 32.6 34.4 11.2 21.9 West 21.9 39.6 13.2 25.3 North-West 25.9 36.1 10.7 26.4 Centre 17.1 39.3 12.1 31.1 Bucureşti-Ilfov 10.0 42.4 30.1 17.5
Source: Anuarul Statistic al României 2008.
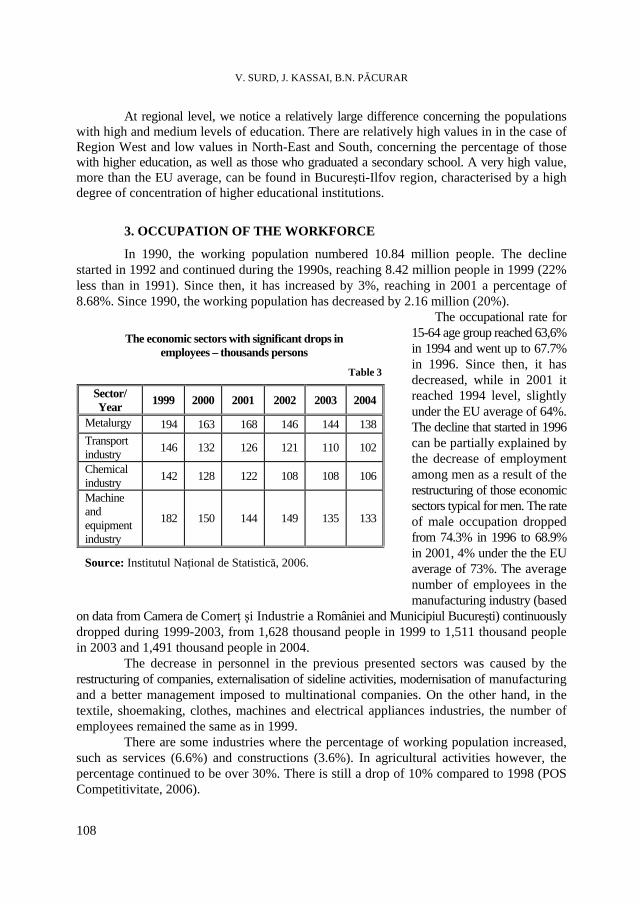
V. SURD, J. KASSAI, B.N. PĂCURAR
108
At regional level, we notice a relatively large difference concerning the populations with high and medium levels of education. There are relatively high values in in the case of Region West and low values in North-East and South, concerning the percentage of those with higher education, as well as those who graduated a secondary school. A very high value, more than the EU average, can be found in Bucureşti-Ilfov region, characterised by a high degree of concentration of higher educational institutions.
3. OCCUPATION OF THE WORKFORCE
In 1990, the working population numbered 10.84 million people. The decline started in 1992 and continued during the 1990s, reaching 8.42 million people in 1999 (22% less than in 1991). Since then, it has increased by 3%, reaching in 2001 a percentage of 8.68%. Since 1990, the working population has decreased by 2.16 million (20%).
The occupational rate for 15-64 age group reached 63,6% in 1994 and went up to 67.7% in 1996. Since then, it has decreased, while in 2001 it reached 1994 level, slightly under the EU average of 64%. The decline that started in 1996 can be partially explained by the decrease of employment among men as a result of the restructuring of those economic sectors typical for men. The rate of male occupation dropped from 74.3% in 1996 to 68.9% in 2001, 4% under the the EU average of 73%. The average number of employees in the manufacturing industry (based
on data from Camera de Comerţ şi Industrie a României and Municipiul Bucureşti) continuously dropped during 1999-2003, from 1,628 thousand people in 1999 to 1,511 thousand people in 2003 and 1,491 thousand people in 2004.
The decrease in personnel in the previous presented sectors was caused by the restructuring of companies, externalisation of sideline activities, modernisation of manufacturing and a better management imposed to multinational companies. On the other hand, in the textile, shoemaking, clothes, machines and electrical appliances industries, the number of employees remained the same as in 1999. There are some industries where the percentage of working population increased, such as services (6.6%) and constructions (3.6%). In agricultural activities however, the percentage continued to be over 30%. There is still a drop of 10% compared to 1998 (POS Competitivitate, 2006).
The economic sectors with significant drops in
employees – thousands persons Table 3
Sector/ Year 1999 2000 2001 2002 2003 2004
Metalurgy 194 163 168 146 144 138 Transport industry 146 132 126 121 110 102
Chemical industry 142 128 122 108 108 106
Machine and equipment industry
182 150 144 149 135 133
Source: Institutul Naţional de Statistică, 2006.
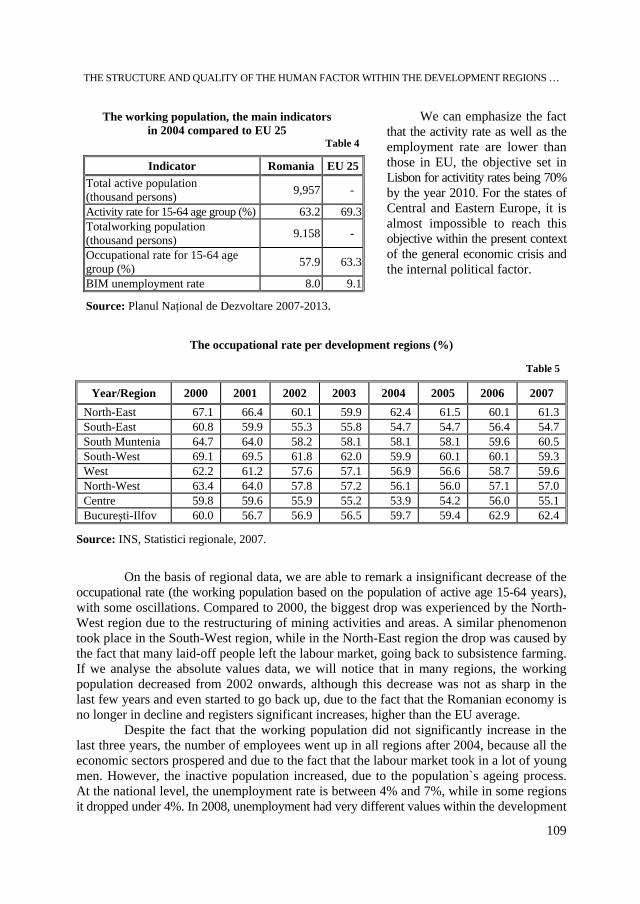
THE STRUCTURE AND QUALITY OF THE HUMAN FACTOR WITHIN THE DEVELOPMENT REGIONS …
109
We can emphasize the fact that the activity rate as well as the employment rate are lower than those in EU, the objective set in Lisbon for activitity rates being 70% by the year 2010. For the states of Central and Eastern Europe, it is almost impossible to reach this objective within the present context of the general economic crisis and the internal political factor.
The occupational rate per development regions (%)
Table 5
Year/Region 2000 2001 2002 2003 2004 2005 2006 2007 North-East 67.1 66.4 60.1 59.9 62.4 61.5 60.1 61.3 South-East 60.8 59.9 55.3 55.8 54.7 54.7 56.4 54.7 South Muntenia 64.7 64.0 58.2 58.1 58.1 58.1 59.6 60.5 South-West 69.1 69.5 61.8 62.0 59.9 60.1 60.1 59.3 West 62.2 61.2 57.6 57.1 56.9 56.6 58.7 59.6 North-West 63.4 64.0 57.8 57.2 56.1 56.0 57.1 57.0 Centre 59.8 59.6 55.9 55.2 53.9 54.2 56.0 55.1 Bucureşti-Ilfov 60.0 56.7 56.9 56.5 59.7 59.4 62.9 62.4
Source: INS, Statistici regionale, 2007.
On the basis of regional data, we are able to remark a insignificant decrease of the occupational rate (the working population based on the population of active age 15-64 years), with some oscillations. Compared to 2000, the biggest drop was experienced by the North-West region due to the restructuring of mining activities and areas. A similar phenomenon took place in the South-West region, while in the North-East region the drop was caused by the fact that many laid-off people left the labour market, going back to subsistence farming. If we analyse the absolute values data, we will notice that in many regions, the working population decreased from 2002 onwards, although this decrease was not as sharp in the last few years and even started to go back up, due to the fact that the Romanian economy is no longer in decline and registers significant increases, higher than the EU average. Despite the fact that the working population did not significantly increase in the last three years, the number of employees went up in all regions after 2004, because all the economic sectors prospered and due to the fact that the labour market took in a lot of young men. However, the inactive population increased, due to the population`s ageing process. At the national level, the unemployment rate is between 4% and 7%, while in some regions it dropped under 4%. In 2008, unemployment had very different values within the development
The working population, the main indicators in 2004 compared to EU 25
Table 4
Indicator Romania EU 25Total active population (thousand persons) 9,957 -
Activity rate for 15-64 age group (%) 63.2 69.3Totalworking population (thousand persons) 9.158 -
Occupational rate for 15-64 age group (%) 57.9 63.3
BIM unemployment rate 8.0 9.1
Source: Planul Naţional de Dezvoltare 2007-2013.
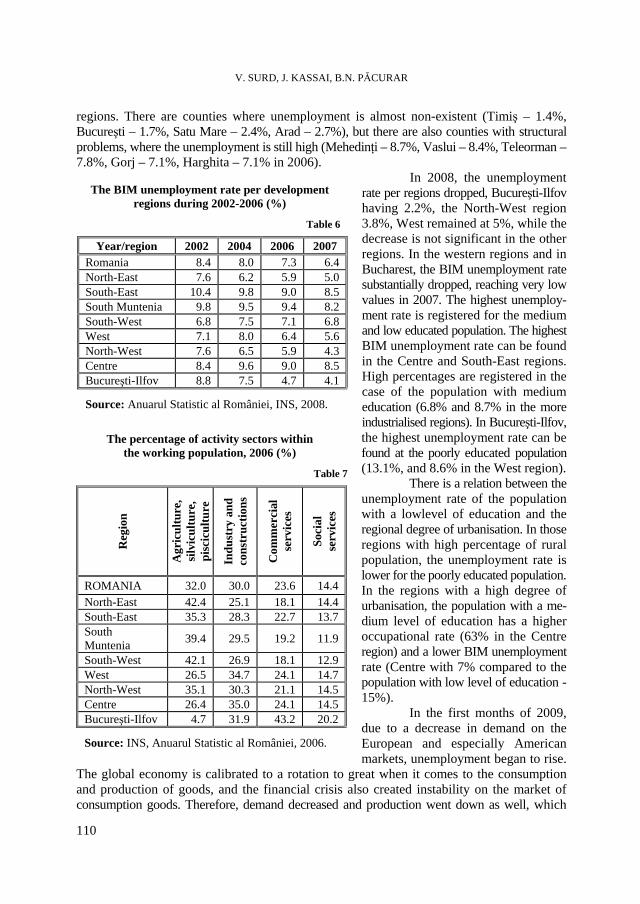
V. SURD, J. KASSAI, B.N. PĂCURAR
110
regions. There are counties where unemployment is almost non-existent (Timiş – 1.4%, Bucureşti – 1.7%, Satu Mare – 2.4%, Arad – 2.7%), but there are also counties with structural problems, where the unemployment is still high (Mehedinţi – 8.7%, Vaslui – 8.4%, Teleorman – 7.8%, Gorj – 7.1%, Harghita – 7.1% in 2006).
In 2008, the unemployment rate per regions dropped, Bucureşti-Ilfov having 2.2%, the North-West region 3.8%, West remained at 5%, while the decrease is not significant in the other regions. In the western regions and in Bucharest, the BIM unemployment rate substantially dropped, reaching very low values in 2007. The highest unemploy-ment rate is registered for the medium and low educated population. The highest BIM unemployment rate can be found in the Centre and South-East regions. High percentages are registered in the case of the population with medium education (6.8% and 8.7% in the more industrialised regions). In Bucureşti-Ilfov, the highest unemployment rate can be found at the poorly educated population (13.1%, and 8.6% in the West region).
There is a relation between the unemployment rate of the population with a lowlevel of education and the regional degree of urbanisation. In those regions with high percentage of rural population, the unemployment rate is lower for the poorly educated population. In the regions with a high degree of urbanisation, the population with a me-dium level of education has a higher occupational rate (63% in the Centre region) and a lower BIM unemployment rate (Centre with 7% compared to the population with low level of education - 15%). In the first months of 2009, due to a decrease in demand on the European and especially American markets, unemployment began to rise.
The global economy is calibrated to a rotation to great when it comes to the consumption and production of goods, and the financial crisis also created instability on the market of consumption goods. Therefore, demand decreased and production went down as well, which
The BIM unemployment rate per development regions during 2002-2006 (%)
Table 6
Year/region 2002 2004 2006 2007 Romania 8.4 8.0 7.3 6.4 North-East 7.6 6.2 5.9 5.0 South-East 10.4 9.8 9.0 8.5 South Muntenia 9.8 9.5 9.4 8.2 South-West 6.8 7.5 7.1 6.8 West 7.1 8.0 6.4 5.6 North-West 7.6 6.5 5.9 4.3 Centre 8.4 9.6 9.0 8.5 Bucureşti-Ilfov 8.8 7.5 4.7 4.1
Source: Anuarul Statistic al României, INS, 2008.
The percentage of activity sectors within the working population, 2006 (%)
Table 7
Reg
ion
Agr
icul
ture
, si
lvic
ultu
re,
pisc
icul
ture
Indu
stry
and
co
nstr
uctio
ns
Com
mer
cial
se
rvic
es
Soci
al
serv
ices
ROMANIA 32.0 30.0 23.6 14.4 North-East 42.4 25.1 18.1 14.4 South-East 35.3 28.3 22.7 13.7 South Muntenia 39.4 29.5 19.2 11.9
South-West 42.1 26.9 18.1 12.9 West 26.5 34.7 24.1 14.7 North-West 35.1 30.3 21.1 14.5 Centre 26.4 35.0 24.1 14.5 Bucureşti-Ilfov 4.7 31.9 43.2 20.2
Source: INS, Anuarul Statistic al României, 2006.
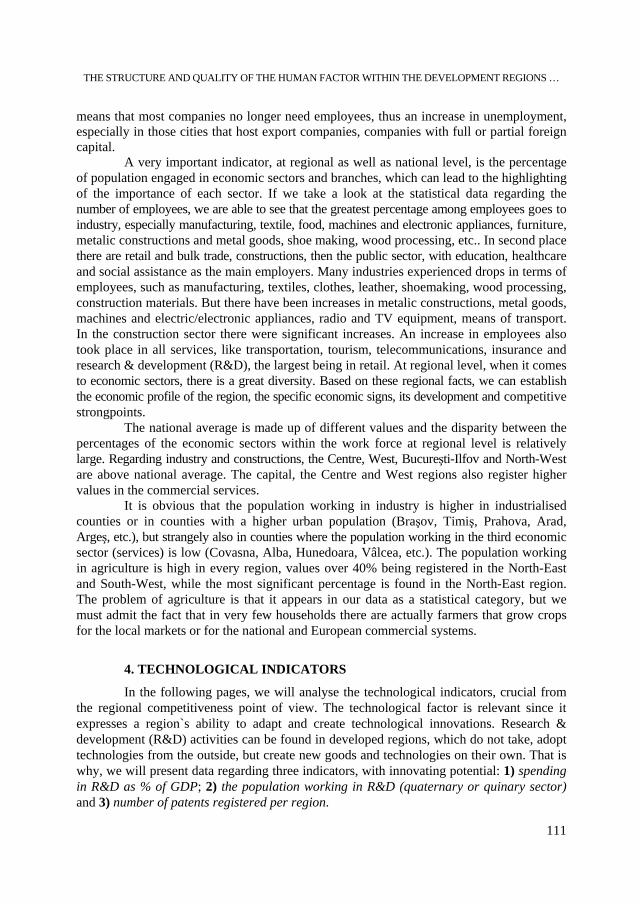
THE STRUCTURE AND QUALITY OF THE HUMAN FACTOR WITHIN THE DEVELOPMENT REGIONS …
111
means that most companies no longer need employees, thus an increase in unemployment, especially in those cities that host export companies, companies with full or partial foreign capital. A very important indicator, at regional as well as national level, is the percentage of population engaged in economic sectors and branches, which can lead to the highlighting of the importance of each sector. If we take a look at the statistical data regarding the number of employees, we are able to see that the greatest percentage among employees goes to industry, especially manufacturing, textile, food, machines and electronic appliances, furniture, metalic constructions and metal goods, shoe making, wood processing, etc.. In second place there are retail and bulk trade, constructions, then the public sector, with education, healthcare and social assistance as the main employers. Many industries experienced drops in terms of employees, such as manufacturing, textiles, clothes, leather, shoemaking, wood processing, construction materials. But there have been increases in metalic constructions, metal goods, machines and electric/electronic appliances, radio and TV equipment, means of transport. In the construction sector there were significant increases. An increase in employees also took place in all services, like transportation, tourism, telecommunications, insurance and research & development (R&D), the largest being in retail. At regional level, when it comes to economic sectors, there is a great diversity. Based on these regional facts, we can establish the economic profile of the region, the specific economic signs, its development and competitive strongpoints. The national average is made up of different values and the disparity between the percentages of the economic sectors within the work force at regional level is relatively large. Regarding industry and constructions, the Centre, West, Bucureşti-Ilfov and North-West are above national average. The capital, the Centre and West regions also register higher values in the commercial services. It is obvious that the population working in industry is higher in industrialised counties or in counties with a higher urban population (Braşov, Timiş, Prahova, Arad, Argeş, etc.), but strangely also in counties where the population working in the third economic sector (services) is low (Covasna, Alba, Hunedoara, Vâlcea, etc.). The population working in agriculture is high in every region, values over 40% being registered in the North-East and South-West, while the most significant percentage is found in the North-East region. The problem of agriculture is that it appears in our data as a statistical category, but we must admit the fact that in very few households there are actually farmers that grow crops for the local markets or for the national and European commercial systems.
4. TECHNOLOGICAL INDICATORS
In the following pages, we will analyse the technological indicators, crucial from the regional competitiveness point of view. The technological factor is relevant since it expresses a region`s ability to adapt and create technological innovations. Research & development (R&D) activities can be found in developed regions, which do not take, adopt technologies from the outside, but create new goods and technologies on their own. That is why, we will present data regarding three indicators, with innovating potential: 1) spending in R&D as % of GDP; 2) the population working in R&D (quaternary or quinary sector) and 3) number of patents registered per region.
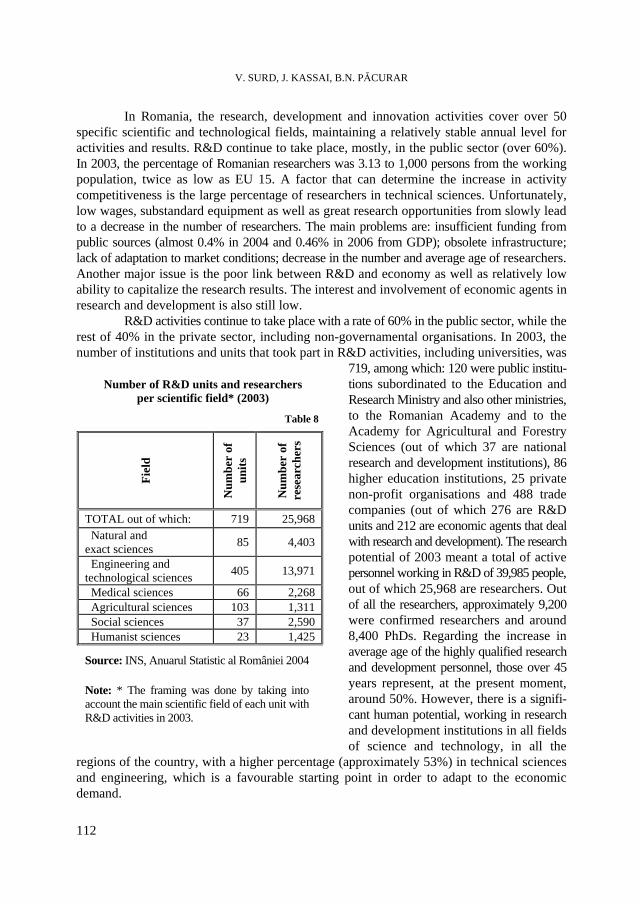
V. SURD, J. KASSAI, B.N. PĂCURAR
112
In Romania, the research, development and innovation activities cover over 50 specific scientific and technological fields, maintaining a relatively stable annual level for activities and results. R&D continue to take place, mostly, in the public sector (over 60%). In 2003, the percentage of Romanian researchers was 3.13 to 1,000 persons from the working population, twice as low as EU 15. A factor that can determine the increase in activity competitiveness is the large percentage of researchers in technical sciences. Unfortunately, low wages, substandard equipment as well as great research opportunities from slowly lead to a decrease in the number of researchers. The main problems are: insufficient funding from public sources (almost 0.4% in 2004 and 0.46% in 2006 from GDP); obsolete infrastructure; lack of adaptation to market conditions; decrease in the number and average age of researchers. Another major issue is the poor link between R&D and economy as well as relatively low ability to capitalize the research results. The interest and involvement of economic agents in research and development is also still low.
R&D activities continue to take place with a rate of 60% in the public sector, while the rest of 40% in the private sector, including non-governamental organisations. In 2003, the number of institutions and units that took part in R&D activities, including universities, was
719, among which: 120 were public institu-tions subordinated to the Education and Research Ministry and also other ministries, to the Romanian Academy and to the Academy for Agricultural and Forestry Sciences (out of which 37 are national research and development institutions), 86 higher education institutions, 25 private non-profit organisations and 488 trade companies (out of which 276 are R&D units and 212 are economic agents that deal with research and development). The research potential of 2003 meant a total of active personnel working in R&D of 39,985 people, out of which 25,968 are researchers. Out of all the researchers, approximately 9,200 were confirmed researchers and around 8,400 PhDs. Regarding the increase in average age of the highly qualified research and development personnel, those over 45 years represent, at the present moment, around 50%. However, there is a signifi-cant human potential, working in research and development institutions in all fields of science and technology, in all the
regions of the country, with a higher percentage (approximately 53%) in technical sciences and engineering, which is a favourable starting point in order to adapt to the economic demand.
Number of R&D units and researchers per scientific field* (2003)
Table 8
Fiel
d
Num
ber
of
units
Num
ber
of
rese
arch
ers
TOTAL out of which: 719 25,968 Natural and exact sciences 85 4,403
Engineering and technological sciences 405 13,971
Medical sciences 66 2,268 Agricultural sciences 103 1,311 Social sciences 37 2,590 Humanist sciences 23 1,425
Source: INS, Anuarul Statistic al României 2004
Note: * The framing was done by taking into account the main scientific field of each unit with R&D activities in 2003.
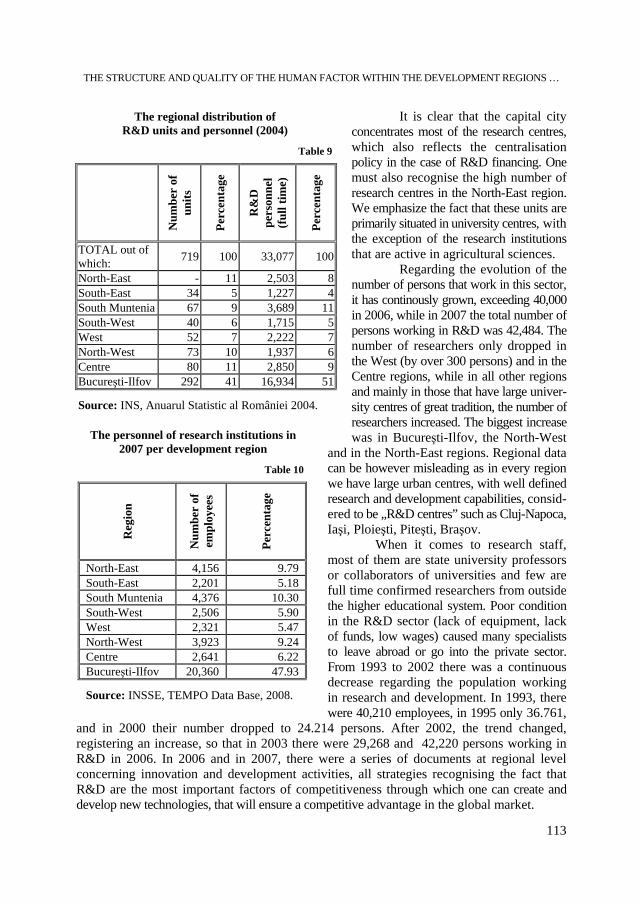
THE STRUCTURE AND QUALITY OF THE HUMAN FACTOR WITHIN THE DEVELOPMENT REGIONS …
113
It is clear that the capital city concentrates most of the research centres, which also reflects the centralisation policy in the case of R&D financing. One must also recognise the high number of research centres in the North-East region. We emphasize the fact that these units are primarily situated in university centres, with the exception of the research institutions that are active in agricultural sciences. Regarding the evolution of the number of persons that work in this sector, it has continously grown, exceeding 40,000 in 2006, while in 2007 the total number of persons working in R&D was 42,484. The number of researchers only dropped in the West (by over 300 persons) and in the Centre regions, while in all other regions and mainly in those that have large univer-sity centres of great tradition, the number of researchers increased. The biggest increase was in Bucureşti-Ilfov, the North-West
and in the North-East regions. Regional data can be however misleading as in every region we have large urban centres, with well defined research and development capabilities, consid-ered to be „R&D centres” such as Cluj-Napoca, Iaşi, Ploieşti, Piteşti, Braşov. When it comes to research staff, most of them are state university professors or collaborators of universities and few are full time confirmed researchers from outside the higher educational system. Poor condition in the R&D sector (lack of equipment, lack of funds, low wages) caused many specialists to leave abroad or go into the private sector. From 1993 to 2002 there was a continuous decrease regarding the population working in research and development. In 1993, there were 40,210 employees, in 1995 only 36.761,
and in 2000 their number dropped to 24.214 persons. After 2002, the trend changed, registering an increase, so that in 2003 there were 29,268 and 42,220 persons working in R&D in 2006. In 2006 and in 2007, there were a series of documents at regional level concerning innovation and development activities, all strategies recognising the fact that R&D are the most important factors of competitiveness through which one can create and develop new technologies, that will ensure a competitive advantage in the global market.
The regional distribution of R&D units and personnel (2004)
Table 9
Num
ber
of
units
Perc
enta
ge
R&
D
pers
onne
l (f
ull t
ime)
Perc
enta
ge
TOTAL out of which: 719 100 33,077 100
North-East - 11 2,503 8South-East 34 5 1,227 4South Muntenia 67 9 3,689 11South-West 40 6 1,715 5West 52 7 2,222 7North-West 73 10 1,937 6Centre 80 11 2,850 9Bucureşti-Ilfov 292 41 16,934 51
Source: INS, Anuarul Statistic al României 2004.
The personnel of research institutions in 2007 per development region
Table 10
Reg
ion
Num
ber
of
empl
oyee
s
Perc
enta
ge
North-East 4,156 9.79 South-East 2,201 5.18 South Muntenia 4,376 10.30 South-West 2,506 5.90 West 2,321 5.47 North-West 3,923 9.24 Centre 2,641 6.22 Bucureşti-Ilfov 20,360 47.93
Source: INSSE, TEMPO Data Base, 2008.
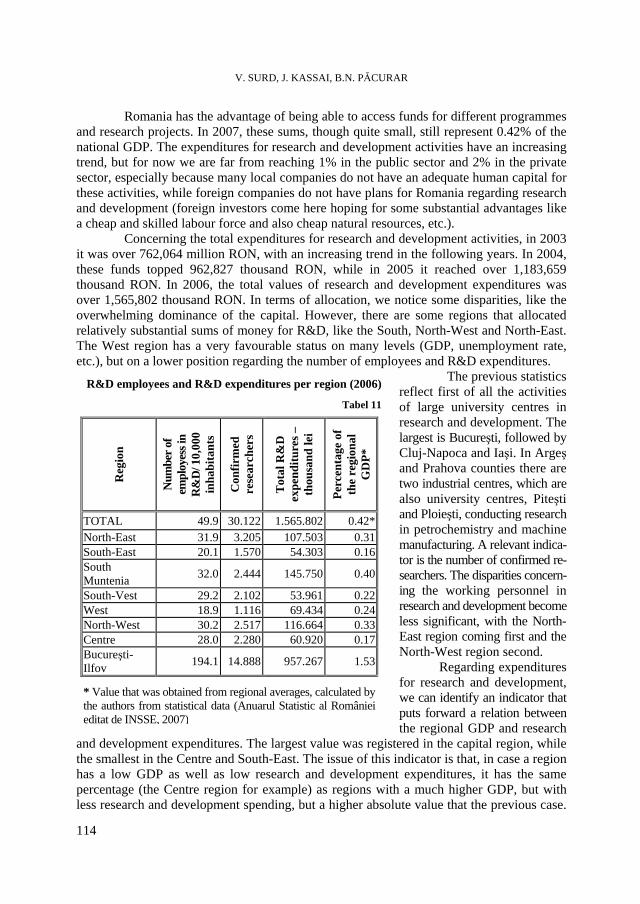
V. SURD, J. KASSAI, B.N. PĂCURAR
114
Romania has the advantage of being able to access funds for different programmes and research projects. In 2007, these sums, though quite small, still represent 0.42% of the national GDP. The expenditures for research and development activities have an increasing trend, but for now we are far from reaching 1% in the public sector and 2% in the private sector, especially because many local companies do not have an adequate human capital for these activities, while foreign companies do not have plans for Romania regarding research and development (foreign investors come here hoping for some substantial advantages like a cheap and skilled labour force and also cheap natural resources, etc.). Concerning the total expenditures for research and development activities, in 2003 it was over 762,064 million RON, with an increasing trend in the following years. In 2004, these funds topped 962,827 thousand RON, while in 2005 it reached over 1,183,659 thousand RON. In 2006, the total values of research and development expenditures was over 1,565,802 thousand RON. In terms of allocation, we notice some disparities, like the overwhelming dominance of the capital. However, there are some regions that allocated relatively substantial sums of money for R&D, like the South, North-West and North-East. The West region has a very favourable status on many levels (GDP, unemployment rate, etc.), but on a lower position regarding the number of employees and R&D expenditures.
The previous statistics reflect first of all the activities of large university centres in research and development. The largest is Bucureşti, followed by Cluj-Napoca and Iaşi. In Argeş and Prahova counties there are two industrial centres, which are also university centres, Piteşti and Ploieşti, conducting research in petrochemistry and machine manufacturing. A relevant indica-tor is the number of confirmed re-searchers. The disparities concern-ing the working personnel in research and development become less significant, with the North-East region coming first and the North-West region second. Regarding expenditures for research and development, we can identify an indicator that puts forward a relation between the regional GDP and research
and development expenditures. The largest value was registered in the capital region, while the smallest in the Centre and South-East. The issue of this indicator is that, in case a region has a low GDP as well as low research and development expenditures, it has the same percentage (the Centre region for example) as regions with a much higher GDP, but with less research and development spending, but a higher absolute value that the previous case.
R&D employees and R&D expenditures per region (2006)
Tabel 11
Reg
ion
Num
ber o
f em
ploy
ess i
n
R&
D/ 1
0,00
0 in
habi
tant
s
Con
firm
ed
rese
arch
ers
Tot
al R
&D
ex
pend
iture
s –
thou
sand
lei
Perc
enta
ge o
f th
e re
gion
al
GD
P*
TOTAL 49.9 30.122 1.565.802 0.42*North-East 31.9 3.205 107.503 0.31South-East 20.1 1.570 54.303 0.16South Muntenia 32.0 2.444 145.750 0.40
South-Vest 29.2 2.102 53.961 0.22West 18.9 1.116 69.434 0.24North-West 30.2 2.517 116.664 0.33Centre 28.0 2.280 60.920 0.17Bucureşti-Ilfov 194.1 14.888 957.267 1.53
* Value that was obtained from regional averages, calculated by the authors from statistical data (Anuarul Statistic al României editat de INSSE, 2007)
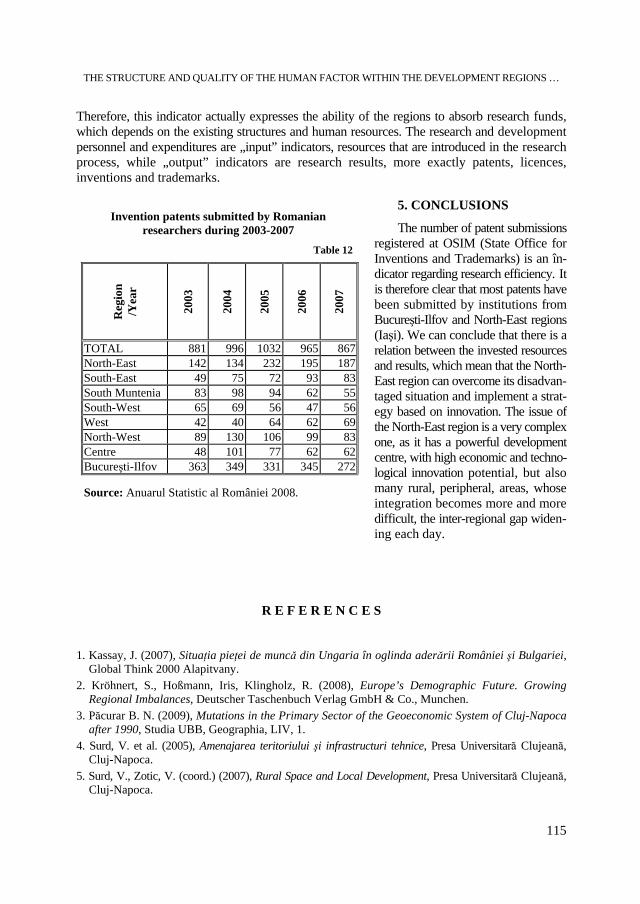
THE STRUCTURE AND QUALITY OF THE HUMAN FACTOR WITHIN THE DEVELOPMENT REGIONS …
115
Therefore, this indicator actually expresses the ability of the regions to absorb research funds, which depends on the existing structures and human resources. The research and development personnel and expenditures are „input” indicators, resources that are introduced in the research process, while „output” indicators are research results, more exactly patents, licences, inventions and trademarks.
5. CONCLUSIONS
The number of patent submissions registered at OSIM (State Office for Inventions and Trademarks) is an în-dicator regarding research efficiency. It is therefore clear that most patents have been submitted by institutions from Bucureşti-Ilfov and North-East regions (Iaşi). We can conclude that there is a relation between the invested resources and results, which mean that the North-East region can overcome its disadvan-taged situation and implement a strat-egy based on innovation. The issue of the North-East region is a very complex one, as it has a powerful development centre, with high economic and techno-logical innovation potential, but also many rural, peripheral, areas, whose integration becomes more and more difficult, the inter-regional gap widen-ing each day.
R E F E R E N C E S 1. Kassay, J. (2007), Situaţia pieţei de muncă din Ungaria în oglinda aderării României şi Bulgariei,
Global Think 2000 Alapitvany. 2. Kröhnert, S., Hoßmann, Iris, Klingholz, R. (2008), Europe’s Demographic Future. Growing
Regional Imbalances, Deutscher Taschenbuch Verlag GmbH & Co., Munchen. 3. Păcurar B. N. (2009), Mutations in the Primary Sector of the Geoeconomic System of Cluj-Napoca
after 1990, Studia UBB, Geographia, LIV, 1. 4. Surd, V. et al. (2005), Amenajarea teritoriului şi infrastructuri tehnice, Presa Universitară Clujeană,
Cluj-Napoca. 5. Surd, V., Zotic, V. (coord.) (2007), Rural Space and Local Development, Presa Universitară Clujeană,
Cluj-Napoca.
Invention patents submitted by Romanian
researchers during 2003-2007 Table 12
Reg
ion
/Yea
r
2003
2004
2005
2006
2007
TOTAL 881 996 1032 965 867North-East 142 134 232 195 187South-East 49 75 72 93 83South Muntenia 83 98 94 62 55South-West 65 69 56 47 56West 42 40 64 62 69North-West 89 130 106 99 83Centre 48 101 77 62 62Bucureşti-Ilfov 363 349 331 345 272
Source: Anuarul Statistic al României 2008.
V. SURD, J. KASSAI, B.N. PĂCURAR
116
6. Vincze, Maria (2003), Competitivitatea regională a României, în vol. “Competitivitatea economiilor naţionale şi integrarea eficientă în Uniunea Europeană”, Edit. Fundaţiei pentru Studii Europene, Cluj-Napoca.
7. *** (2000) White Paper on Labour Force, DTI/UK. 8. *** (2006), Planul Naţional de Dezvoltare 2007-2013. 9. *** (2005), Anuarul Statistic al României, Institutul Naţional de Statistică, Bucureşti. 10. *** (2006), Anuarul Statistic al României, Institutul Naţional de Statistică, Bucureşti. 11. *** (2007), Anuarul Statistic al României, Institutul Naţional de Statistică, Bucureşti. 12. *** (2008), Anuarul Statistic al României, Institutul Naţional de Statistică, Bucureşti.
STUDIA UNIVERSITATIS BABEŞ-BOLYAI, GEOGRAPHIA, LV, 2, 2010
INTEGRATION OF MOSCOW INTO THE GLOBAL CITIES SYSTEM
ELENA PAVLUTSKAYA1, N. SLUKA1, TATIANA TKATCHENKO1
ABSTRACT. – Integration of Moscow into the Global Cities System. This survey presents the major problems which the capital of Russia faces in the process of its integration into the system of world cities. The research work is based on description, systematization and analysis of vast actual data on Moscow. In the first section of the paper the concept of world global cities is being studied in its most important aspects. The classifications of world global centers are listed and the positions of four leading cities (London, New York, Paris and Tokyo) in the international community are briefly described. In the second section the attention is concentrated on the significance of the Russian capital and its role among other global centers. It is investigated in detail according to different indicators, such as demographic potential, gross domestic product, connectivity and cumulative index of global cities. The close survey of all the characteristics taken into consideration vividly shows the fact that in terms of international integration Moscow is among the “outlying districts”. The third section is devoted to the analysis of the key factors of influence on the development of the Russian capital. It was carried out in three levels. Firstly the position of Moscow in the world community was defined. Then the same was fulfilled for the capital of Russia in comparison to the rest of Russian cities. After that the most important factors of development were overviewed directly on the Moscow city level, which is the most complicated with all its contradictions and conflicts in demography, architecture and planning, social and economical live. The final part of the survey states the fact, that Moscow present development as a part of world global cities system has in its basis the principle of following the main stream rather than taking the lead over the process.
Keywords: system of global world cities, Moscow, the City of Moscow, international rates of cities,
problems of development, the 2000-es. 1. INTRODUCTION
The contemporary phase of world society development is often called “the epoch of large cities”. In accordance with the UN experts` estimation, by the beginning of 2008 there are 459 agglomerations worldwide inhabited by more than 1 million people each. There live approximately 2/5 of urban population and 1/5 of the whole planet population. (World Urbanization Prospects…, 2007).
But "the largest" does not mean now "the strongest" at all. In conditions of a postindustrial society formation the tendency to a deepening divergence between demographic weight of separate agglomerations and their role not only in national, but also in the international division of labour on a global scale is more and more evident.
Recently special attention of international scientific circles is paid to a special category of cities – global cities. Such name of the centers has arisen rather recently, it directly testifies the close relationship with globalization process. Such centers are allocated on a range
1 Moscow State University, Russia, E-mail: [email protected]
ELENA PAVLUTSKAYA, N. SLUKA, TATIANA TKATCHENKO
118
of actions and influence degree, they are some kind of command and control points of the world system and, as a consequence, they have key positions in the city hierarchy of the planet. Each emerging market tries to "get" global cities.
Their absence deprives the country of the economic dynamism potential connected with the sector of corporate services of the highest level, with economy of knowledge and with access to world financial, innovative and information streams. In that case the nation or region appears in isolation, away from economic and intellectual world movement.
The problem of the accelerated integration into system of the global centers is valid for Moscow which is burdened with some "old", historically inherited problems, and new ones, emerging already during the “post-perestroika” period. Their analysis is especially urgent now while working out the Strategy of development of Moscow till 2025 (The order of the Government of Moscow 513 from June, 26th, 2007).
2. THE CONCEPT OF GLOBAL CITIES
Formation of the world cities theory has quite a long history. There are a variety of scientific schools in different countries of the world. The term world city – "ancestor" of global city – has appeared in scientific use in the beginning of the last century. It was used by the British urbanist P. Geddes in his book “Evolution of cities” (1915) for indicating a special category of the cities playing a major centers role in a world policy and economy (Geddes, 1915).
According to one of the most successful definitions, formulated in the 1970s by also the British P. Hall, world cities represent a limited circle of „places in which rather disproportionate part of the world most important issues” (Hall, 1966) is carried out. During the period from XV to XX centuries Venice, Antwerp, Genoa, Amsterdam, London successively were such individual world centers.
The political and economic eminence of the USA after the Great Depression in the thirties of the 20th century has defined New York as a new global city-leader. For the first time in the history the world economic core “moved out” of Europe. In the third quarter of XX century in the period of world economy consolidation and transition from industrial capitalism to a postindustrial society, there appeard a so-called triad of control centers of the world – London, New York and Tokyo.
From the general view it is possible to speak about four basic approaches to define the cities position in the world economy system. The first one is closely connected with the development of process of transnationalization of economies when the strategic leadership of cities is defined by the level of concentration of headquarters of the leading multinational corporations (Hall, 1966; Heenan, 1977; Hymer, 1972; etc.).
Within the second approach which is based on the special importance of financial sector and export of spare capital, world cities are identified as international financial centers (Reed, 1981; 1989). The third approach especially takes into consideration changes in cities functions and their differentiation on senior and younger positions in the “cities command structure” in a context of formation of a new international division of labour system (Fröbel et al., 1980).
Many works are devoted to strengthening of an operating and supervising role of the largest centers of the world (Feagin, Smith, 1987; Glickman, 1987; King, 1990; Knox, 1995; Thrift, 1989) among which the works by J. Friedmann occupy a special place (Friedmann, 1986; 1995, etc.). The fourth approach tightly connects hierarchy of cities to their participation in the process of internationalization, concentration and their role in economics of services.
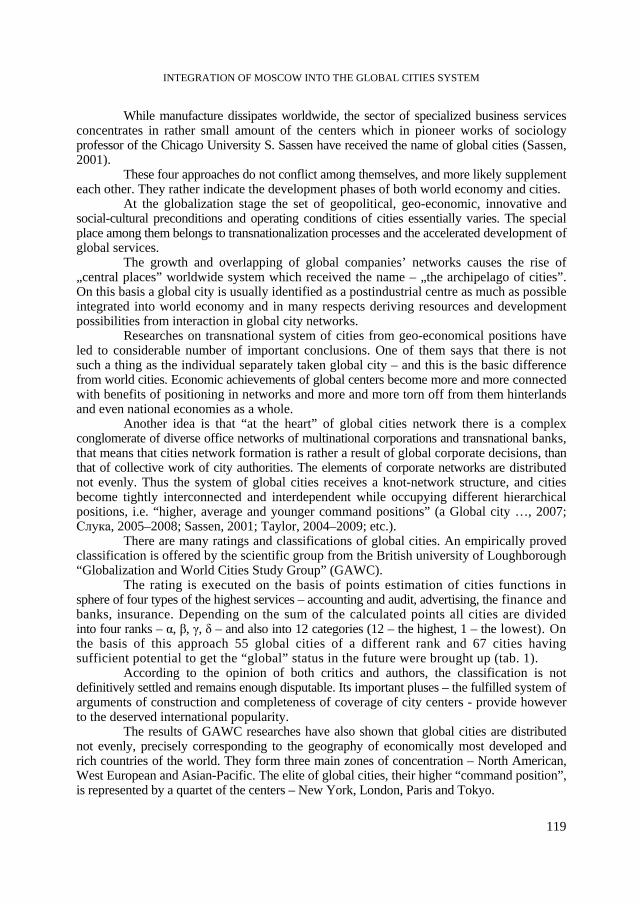
INTEGRATION OF MOSCOW INTO THE GLOBAL CITIES SYSTEM
119
While manufacture dissipates worldwide, the sector of specialized business services concentrates in rather small amount of the centers which in pioneer works of sociology professor of the Chicago University S. Sassen have received the name of global cities (Sassen, 2001).
These four approaches do not conflict among themselves, and more likely supplement each other. They rather indicate the development phases of both world economy and cities.
At the globalization stage the set of geopolitical, geo-economic, innovative and social-cultural preconditions and operating conditions of cities essentially varies. The special place among them belongs to transnationalization processes and the accelerated development of global services.
The growth and overlapping of global companies’ networks causes the rise of „central places” worldwide system which received the name – „the archipelago of cities”. On this basis a global city is usually identified as a postindustrial centre as much as possible integrated into world economy and in many respects deriving resources and development possibilities from interaction in global city networks.
Researches on transnational system of cities from geo-economical positions have led to considerable number of important conclusions. One of them says that there is not such a thing as the individual separately taken global city – and this is the basic difference from world cities. Economic achievements of global centers become more and more connected with benefits of positioning in networks and more and more torn off from them hinterlands and even national economies as a whole.
Another idea is that “at the heart” of global cities network there is a complex conglomerate of diverse office networks of multinational corporations and transnational banks, that means that cities network formation is rather a result of global corporate decisions, than that of collective work of city authorities. The elements of corporate networks are distributed not evenly. Thus the system of global cities receives a knot-network structure, and cities become tightly interconnected and interdependent while occupying different hierarchical positions, i.e. “higher, average and younger command positions” (a Global city …, 2007; Слука, 2005–2008; Sassen, 2001; Taylor, 2004–2009; etc.).
There are many ratings and classifications of global cities. An empirically proved classification is offered by the scientific group from the British university of Loughborough “Globalization and World Cities Study Group” (GAWC).
The rating is executed on the basis of points estimation of cities functions in sphere of four types of the highest services – accounting and audit, advertising, the finance and banks, insurance. Depending on the sum of the calculated points all cities are divided into four ranks – α, β, γ, δ – and also into 12 categories (12 – the highest, 1 – the lowest). On the basis of this approach 55 global cities of a different rank and 67 cities having sufficient potential to get the “global” status in the future were brought up (tab. 1).
According to the opinion of both critics and authors, the classification is not definitively settled and remains enough disputable. Its important pluses – the fulfilled system of arguments of construction and completeness of coverage of city centers - provide however to the deserved international popularity.
The results of GAWC researches have also shown that global cities are distributed not evenly, precisely corresponding to the geography of economically most developed and rich countries of the world. They form three main zones of concentration – North American, West European and Asian-Pacific. The elite of global cities, their higher “command position”, is represented by a quartet of the centers – New York, London, Paris and Tokyo.
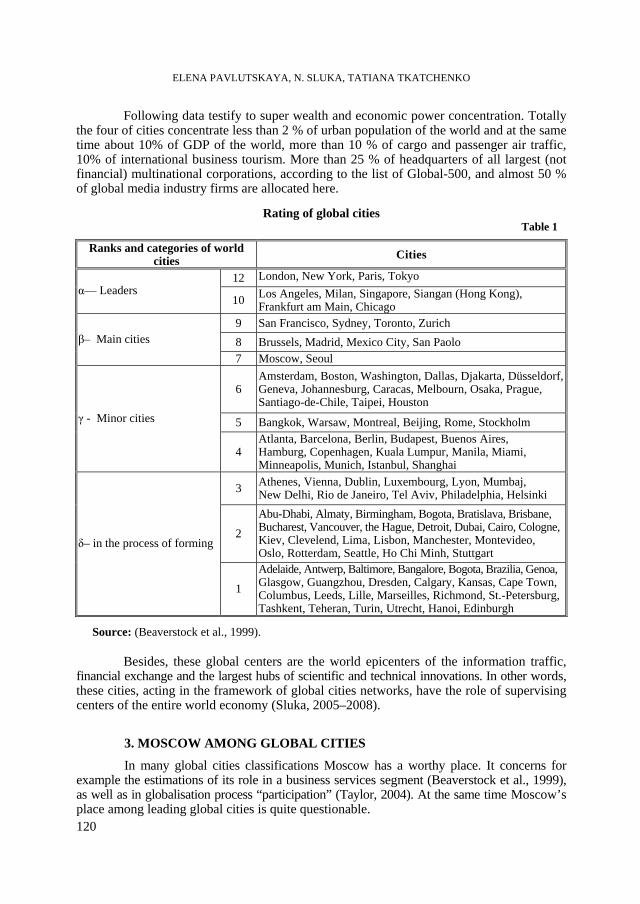
ELENA PAVLUTSKAYA, N. SLUKA, TATIANA TKATCHENKO
120
Following data testify to super wealth and economic power concentration. Totally the four of cities concentrate less than 2 % of urban population of the world and at the same time about 10% of GDP of the world, more than 10 % of cargo and passenger air traffic, 10% of international business tourism. More than 25 % of headquarters of all largest (not financial) multinational corporations, according to the list of Global-500, and almost 50 % of global media industry firms are allocated here.
Rating of global cities
Table 1
Ranks and categories of world cities Cities
12 London, New York, Paris, Tokyoα–– Leaders
10 Los Angeles, Milan, Singapore, Siangan (Hong Kong), Frankfurt am Main, Chicago
9 San Francisco, Sydney, Toronto, Zurich 8 Brussels, Madrid, Mexico City, San Paolo β– Main cities 7 Moscow, Seoul
6 Amsterdam, Boston, Washington, Dallas, Djakarta, Düsseldorf, Geneva, Johannesburg, Caracas, Melbourn, Osaka, Prague, Santiago-de-Chile, Taipei, Houston
5 Bangkok, Warsaw, Montreal, Beijing, Rome, Stockholm γ - Minor cities
4 Atlanta, Barcelona, Berlin, Budapest, Buenos Aires, Hamburg, Copenhagen, Kuala Lumpur, Manila, Miami, Minneapolis, Munich, Istanbul, Shanghai
3 Athenes, Vienna, Dublin, Luxembourg, Lyon, Mumbaj, New Delhi, Rio de Janeiro, Tel Aviv, Philadelphia, Helsinki
2
Abu-Dhabi, Almaty, Birmingham, Bogota, Bratislava, Brisbane, Bucharest, Vancouver, the Hague, Detroit, Dubai, Cairo, Cologne, Kiev, Clevelend, Lima, Lisbon, Manchester, Montevideo, Oslo, Rotterdam, Seattle, Ho Chi Minh, Stuttgart
δ– in the process of forming
1
Adelaide, Antwerp, Baltimore, Bangalore, Bogota, Brazilia, Genoa, Glasgow, Guangzhou, Dresden, Calgary, Kansas, Cape Town, Columbus, Leeds, Lille, Marseilles, Richmond, St.-Petersburg, Tashkent, Teheran, Turin, Utrecht, Hanoi, Edinburgh
Source: (Beaverstock et al., 1999). Besides, these global centers are the world epicenters of the information traffic,
financial exchange and the largest hubs of scientific and technical innovations. In other words, these cities, acting in the framework of global cities networks, have the role of supervising centers of the entire world economy (Sluka, 2005–2008).
3. MOSCOW AMONG GLOBAL CITIES
In many global cities classifications Moscow has a worthy place. It concerns for example the estimations of its role in a business services segment (Beaverstock et al., 1999), as well as in globalisation process “participation” (Taylor, 2004). At the same time Moscow’s place among leading global cities is quite questionable.
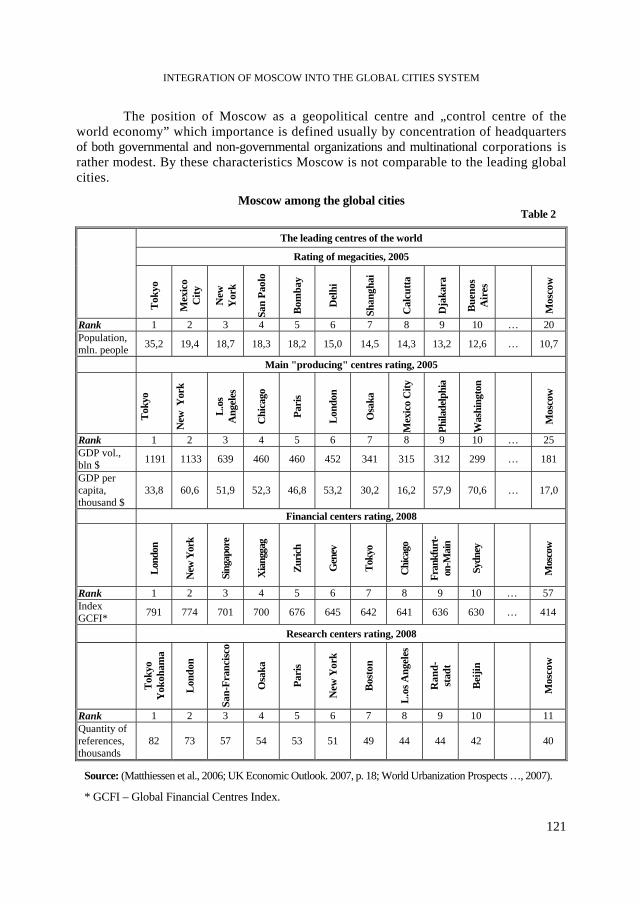
INTEGRATION OF MOSCOW INTO THE GLOBAL CITIES SYSTEM
121
The position of Moscow as a geopolitical centre and „control centre of the world economy” which importance is defined usually by concentration of headquarters of both governmental and non-governmental organizations and multinational corporations is rather modest. By these characteristics Moscow is not comparable to the leading global cities.
Moscow among the global cities Table 2
The leading centres of the world
Rating of megacities, 2005
Toky
o
Mex
ico
City
New
Y
ork
San
Paol
o
Bom
bay
Del
hi
Shan
ghai
Cal
cutta
Dja
kara
Buen
os
Air
es
Mos
cow
Rank 1 2 3 4 5 6 7 8 9 10 … 20 Population, mln. people 35,2 19,4 18,7 18,3 18,2 15,0 14,5 14,3 13,2 12,6 … 10,7
Main "producing" centres rating, 2005
Toky
o
New
Yor
k
L.os
A
ngel
es
Chi
cago
Pari
s
Lond
on
Osa
ka
Mex
ico
City
Phila
delp
hia
Was
hing
ton
Mos
cow
Rank 1 2 3 4 5 6 7 8 9 10 … 25 GDP vol., bln $ 1191 1133 639 460 460 452 341 315 312 299 … 181
GDP per capita, thousand $
33,8 60,6 51,9 52,3 46,8 53,2 30,2 16,2 57,9 70,6 … 17,0
Financial centers rating, 2008
Lond
on
New
Yor
k
Sing
apor
e
Xia
ngga
g
Zuric
h
Gen
ev
Toky
o
Chi
cago
Fran
kfur
t-on
-Mai
n
Sydn
ey
M
osco
w
Rank 1 2 3 4 5 6 7 8 9 10 … 57 Index GCFI* 791 774 701 700 676 645 642 641 636 630 … 414
Research centers rating, 2008
Toky
o Y
okoh
ama
Lond
on
San-
Fran
cisc
o
Osa
ka
Pari
s
New
Yor
k
Bost
on
L.os
Ang
eles
Ran
d-
stad
t
Beiji
n
Mos
cow
Rank 1 2 3 4 5 6 7 8 9 10 11 Quantity of references, thousands
82 73 57 54 53 51 49 44 44 42 40
Source: (Matthiessen et al., 2006; UK Economic Outlook. 2007, p. 18; World Urbanization Prospects …, 2007).
* GCFI – Global Financial Centres Index.
ELENA PAVLUTSKAYA, N. SLUKA, TATIANA TKATCHENKO
122
Thus, in National capital region of Tokyo, by different estimations, 50–60 headquarters of leading corporations of the world take place; in London and Paris – nearly 20-30 in each (Lysak, 2007, p. 14). Taking into consideration that classifications often base upon superficial analysis and some „playing with figures” there occur in Moscow’s case many questions that need to get reasonable discussions and a constructive decision. For this purpose at least three approaches are possible. First, the estimation of the city’s place could follow on basis of a certain number of absolute indicators; second, on basis of its integration level into the global communications system; third, on basis of the so-called global cities Index.
In the first case the ratings are rather effective. In table 2 the place of Moscow in hierarchy of the leading world centers according to a number of indicators is well read. The capital of Russia occupies the 22nd place among the world megacities, its demographic potential it more than three times less than that of Tokyo.
In the rating of leading "producing" cities of the world which is headed by Tokyo and New York, Moscow occupies the 25th place and cedes to many emerging global centers from developing countries (Seoul, San Paolo, Mexico City and a variety of others). In the system of the global financial centers Moscow occupies the 57th place, its index is almost twice less than that of London (Shegloff, 2009).
Fig. 1. GIS map of MNC corporate network (9243 connections between 2259 unique cities) Source: (Wall R., van der Knaap G., 2009).
The capital of Russia is rather highly positioned as a research centre (the 11th place). There are many other ratings, but nowhere is Moscow found among the world leaders.
The second group of indicators is connected with the estimation of integration level of Moscow into global structures. Its position in the communications system of multinational corporations and the global Internet traffic is shown on the maps (Figure 1–2). Very obvious is the low connectivity to leading business centers, the “outsideness” of Moscow by the indicator of its work as aviahub.
INTEGRATION OF MOSCOW INTO THE GLOBAL CITIES SYSTEM
123
Source: [The 2008 Global Cities Index, 2008// Foreign Policy. 2008.].
The Moscow aviation hub (MAH) – the largest in the country – includes three international airports – Domodedovo, Sheremetyevo and Vnukovo – and a number of others (civil and military), and serves about 80 % of the international passenger traffic in Russia.
Source: (http://www.telegeography.com/).
Fig. 2. The global Internet traffic, 2008.
But by whole transport work – about 30 millions passengers in 2007 – МАH cannot make a worthy competition to the leading world aviahubs and airports. It is three times less than Atlanta (89 million) and Chicago (76 million), four times than the London aviahub (125 million passengers in 2007) (the Global city …, 2007, p. 132; http://www.icao.int/).
The third approach on the basis of the Index of global cities which is developed by the Chicago International Relations Council is also informative and reflects the participation of a city in various spheres of international activities (tab. 3). For the Index calculation 24 variables aggregated on five positions – business activity, political activity, human capital, information exchange and eventness in cultural life - are used. According to these features Moscow is on the 19th place and positioned at level of Shanghai, Mexico City and Bangkok.
Dimension
Ran
king
City
Bus
ines
s A
ctiv
ity
Hum
an
Cap
ital
Info
rmat
ion
Exc
hage
Cul
tura
l E
xper
ienc
e
Polit
ical
E
ngag
emen
t
1 New York 1 1 4 3 2 2 London 4 2 3 1 5 3 Paris 3 11 1 2 4 4 Tokyo 2 6 7 7 6 5 Hong Kong 5 5 6 26 40 6 Los Angeles 15 4 11 5 17 7 Singapore 6 7 15 37 16 8 Chicago 12 3 24 20 20 9 Seoul 7 35 5 10 19 10 Toronto 26 10 18 4 24 11 Washington 35 17 10 14 1 12 Beijing 9 22 28 19 7 13 Brussels 19 34 2 32 3 14 Madrid 14 18 9 24 33 15 San Francisco 27 12 22 23 29 16 Sydney 17 8 27 36 43 17 Berlin 28 29 12 8 14 18 Vienna 13 31 29 11 9 19 Moscow 23 15 33 6 39 20 Shanghai 6 25 42 35 18
Index of global cities, 2008 Table 3
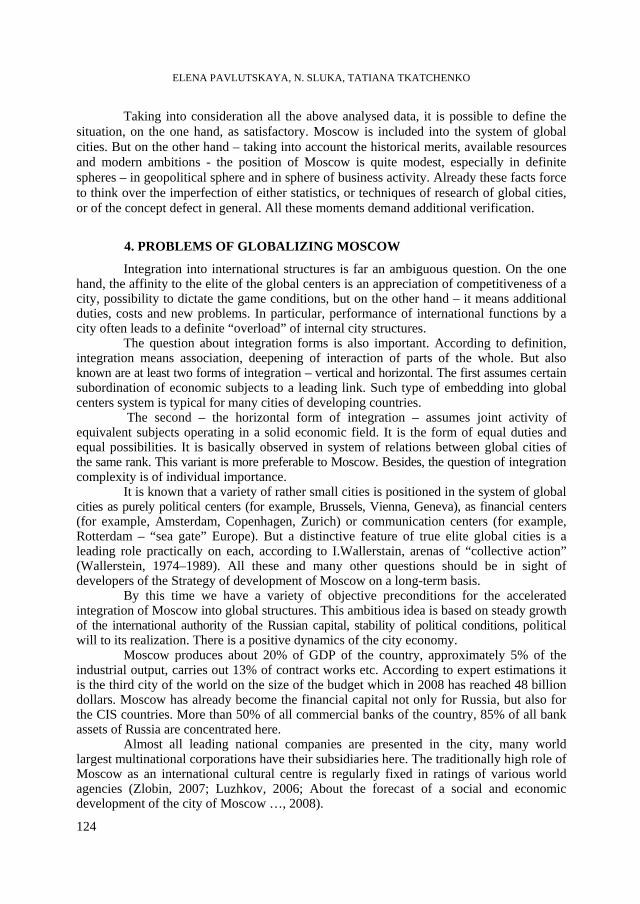
ELENA PAVLUTSKAYA, N. SLUKA, TATIANA TKATCHENKO
124
Taking into consideration all the above analysed data, it is possible to define the situation, on the one hand, as satisfactory. Moscow is included into the system of global cities. But on the other hand – taking into account the historical merits, available resources and modern ambitions - the position of Moscow is quite modest, especially in definite spheres – in geopolitical sphere and in sphere of business activity. Already these facts force to think over the imperfection of either statistics, or techniques of research of global cities, or of the concept defect in general. All these moments demand additional verification.
4. PROBLEMS OF GLOBALIZING MOSCOW
Integration into international structures is far an ambiguous question. On the one hand, the affinity to the elite of the global centers is an appreciation of competitiveness of a city, possibility to dictate the game conditions, but on the other hand – it means additional duties, costs and new problems. In particular, performance of international functions by a city often leads to a definite “overload” of internal city structures.
The question about integration forms is also important. According to definition, integration means association, deepening of interaction of parts of the whole. But also known are at least two forms of integration – vertical and horizontal. The first assumes certain subordination of economic subjects to a leading link. Such type of embedding into global centers system is typical for many cities of developing countries.
The second – the horizontal form of integration – assumes joint activity of equivalent subjects operating in a solid economic field. It is the form of equal duties and equal possibilities. It is basically observed in system of relations between global cities of the same rank. This variant is more preferable to Moscow. Besides, the question of integration complexity is of individual importance.
It is known that a variety of rather small cities is positioned in the system of global cities as purely political centers (for example, Brussels, Vienna, Geneva), as financial centers (for example, Amsterdam, Copenhagen, Zurich) or communication centers (for example, Rotterdam – “sea gate” Europe). But a distinctive feature of true elite global cities is a leading role practically on each, according to I.Wallerstain, arenas of “collective action” (Wallerstein, 1974–1989). All these and many other questions should be in sight of developers of the Strategy of development of Moscow on a long-term basis.
By this time we have a variety of objective preconditions for the accelerated integration of Moscow into global structures. This ambitious idea is based on steady growth of the international authority of the Russian capital, stability of political conditions, political will to its realization. There is a positive dynamics of the city economy.
Moscow produces about 20% of GDP of the country, approximately 5% of the industrial output, carries out 13% of contract works etc. According to expert estimations it is the third city of the world on the size of the budget which in 2008 has reached 48 billion dollars. Moscow has already become the financial capital not only for Russia, but also for the CIS countries. More than 50% of all commercial banks of the country, 85% of all bank assets of Russia are concentrated here.
Almost all leading national companies are presented in the city, many world largest multinational corporations have their subsidiaries here. The traditionally high role of Moscow as an international cultural centre is regularly fixed in ratings of various world agencies (Zlobin, 2007; Luzhkov, 2006; About the forecast of a social and economic development of the city of Moscow …, 2008).
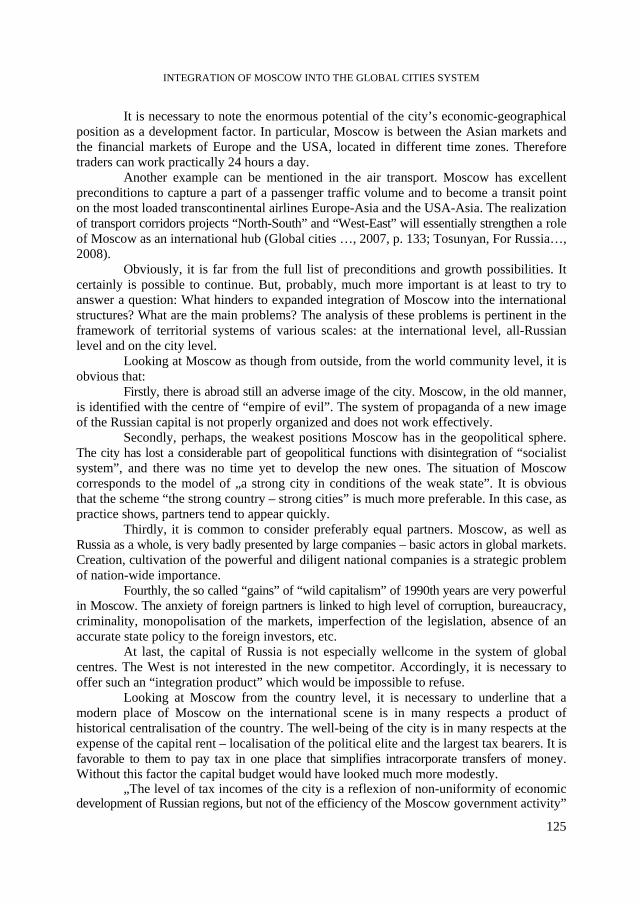
INTEGRATION OF MOSCOW INTO THE GLOBAL CITIES SYSTEM
125
It is necessary to note the enormous potential of the city’s economic-geographical position as a development factor. In particular, Moscow is between the Asian markets and the financial markets of Europe and the USA, located in different time zones. Therefore traders can work practically 24 hours a day.
Another example can be mentioned in the air transport. Moscow has excellent preconditions to capture a part of a passenger traffic volume and to become a transit point on the most loaded transcontinental airlines Europe-Asia and the USA-Asia. The realization of transport corridors projects “North-South” and “West-East” will essentially strengthen a role of Moscow as an international hub (Global cities …, 2007, p. 133; Tosunyan, For Russia…, 2008).
Obviously, it is far from the full list of preconditions and growth possibilities. It certainly is possible to continue. But, probably, much more important is at least to try to answer a question: What hinders to expanded integration of Moscow into the international structures? What are the main problems? The analysis of these problems is pertinent in the framework of territorial systems of various scales: at the international level, all-Russian level and on the city level.
Looking at Moscow as though from outside, from the world community level, it is obvious that:
Firstly, there is abroad still an adverse image of the city. Moscow, in the old manner, is identified with the centre of “empire of evil”. The system of propaganda of a new image of the Russian capital is not properly organized and does not work effectively.
Secondly, perhaps, the weakest positions Moscow has in the geopolitical sphere. The city has lost a considerable part of geopolitical functions with disintegration of “socialist system”, and there was no time yet to develop the new ones. The situation of Moscow corresponds to the model of „a strong city in conditions of the weak state”. It is obvious that the scheme “the strong country – strong cities” is much more preferable. In this case, as practice shows, partners tend to appear quickly.
Thirdly, it is common to consider preferably equal partners. Moscow, as well as Russia as a whole, is very badly presented by large companies – basic actors in global markets. Creation, cultivation of the powerful and diligent national companies is a strategic problem of nation-wide importance.
Fourthly, the so called “gains” of “wild capitalism” of 1990th years are very powerful in Moscow. The anxiety of foreign partners is linked to high level of corruption, bureaucracy, criminality, monopolisation of the markets, imperfection of the legislation, absence of an accurate state policy to the foreign investors, etc.
At last, the capital of Russia is not especially wellcome in the system of global centres. The West is not interested in the new competitor. Accordingly, it is necessary to offer such an “integration product” which would be impossible to refuse.
Looking at Moscow from the country level, it is necessary to underline that a modern place of Moscow on the international scene is in many respects a product of historical centralisation of the country. The well-being of the city is in many respects at the expense of the capital rent – localisation of the political elite and the largest tax bearers. It is favorable to them to pay tax in one place that simplifies intracorporate transfers of money. Without this factor the capital budget would have looked much more modestly.
„The level of tax incomes of the city is a reflexion of non-uniformity of economic development of Russian regions, but not of the efficiency of the Moscow government activity”
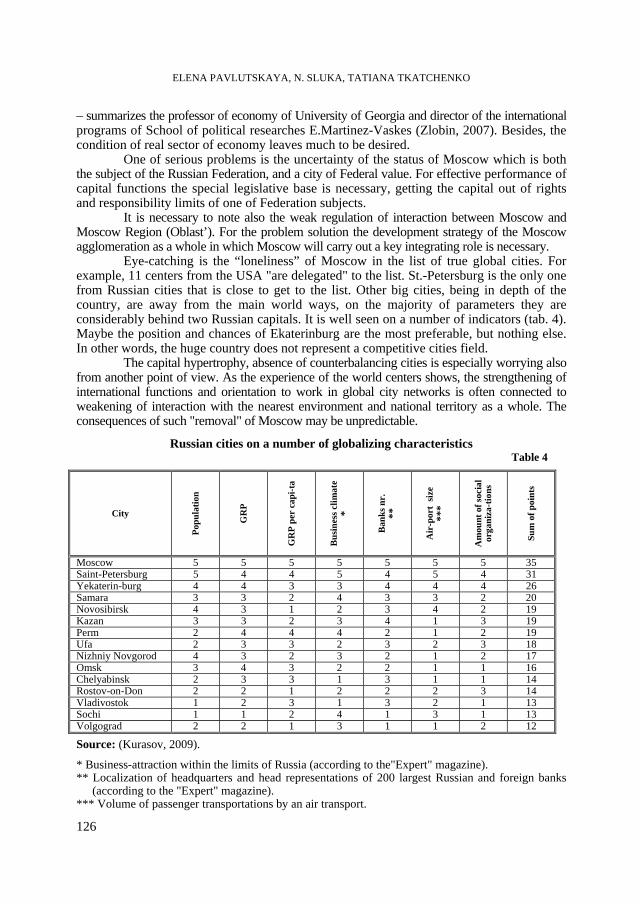
ELENA PAVLUTSKAYA, N. SLUKA, TATIANA TKATCHENKO
126
– summarizes the professor of economy of University of Georgia and director of the international programs of School of political researches E.Martinez-Vaskes (Zlobin, 2007). Besides, the condition of real sector of economy leaves much to be desired.
One of serious problems is the uncertainty of the status of Moscow which is both the subject of the Russian Federation, and a city of Federal value. For effective performance of capital functions the special legislative base is necessary, getting the capital out of rights and responsibility limits of one of Federation subjects.
It is necessary to note also the weak regulation of interaction between Moscow and Moscow Region (Oblast’). For the problem solution the development strategy of the Moscow agglomeration as a whole in which Moscow will carry out a key integrating role is necessary.
Eye-catching is the “loneliness” of Moscow in the list of true global cities. For example, 11 centers from the USA "are delegated" to the list. St.-Petersburg is the only one from Russian cities that is close to get to the list. Other big cities, being in depth of the country, are away from the main world ways, on the majority of parameters they are considerably behind two Russian capitals. It is well seen on a number of indicators (tab. 4). Maybe the position and chances of Ekaterinburg are the most preferable, but nothing else. In other words, the huge country does not represent a competitive cities field.
The capital hypertrophy, absence of counterbalancing cities is especially worrying also from another point of view. As the experience of the world centers shows, the strengthening of international functions and orientation to work in global city networks is often connected to weakening of interaction with the nearest environment and national territory as a whole. The consequences of such "removal" of Moscow may be unpredictable.
Russian cities on a number of globalizing characteristics Table 4
City
Popu
latio
n
GR
P
GR
P pe
r ca
pi-t
a
Bus
ines
s clim
ate
*
Ban
ks n
r.
**
Air
-por
t si
ze
***
Am
ount
of s
ocia
l or
gani
za-t
ions
Sum
of p
oint
s
Moscow 5 5 5 5 5 5 5 35 Saint-Petersburg 5 4 4 5 4 5 4 31 Yekaterin-burg 4 4 3 3 4 4 4 26 Samara 3 3 2 4 3 3 2 20 Novosibirsk 4 3 1 2 3 4 2 19 Kazan 3 3 2 3 4 1 3 19 Perm 2 4 4 4 2 1 2 19 Ufa 2 3 3 2 3 2 3 18 Nizhniy Novgorod 4 3 2 3 2 1 2 17 Omsk 3 4 3 2 2 1 1 16 Chelyabinsk 2 3 3 1 3 1 1 14 Rostov-on-Don 2 2 1 2 2 2 3 14 Vladivostok 1 2 3 1 3 2 1 13 Sochi 1 1 2 4 1 3 1 13 Volgograd 2 2 1 3 1 1 2 12
Source: (Kurasov, 2009).
* Business-attraction within the limits of Russia (according to the"Expert" magazine). ** Localization of headquarters and head representations of 200 largest Russian and foreign banks
(according to the "Expert" magazine). *** Volume of passenger transportations by an air transport.
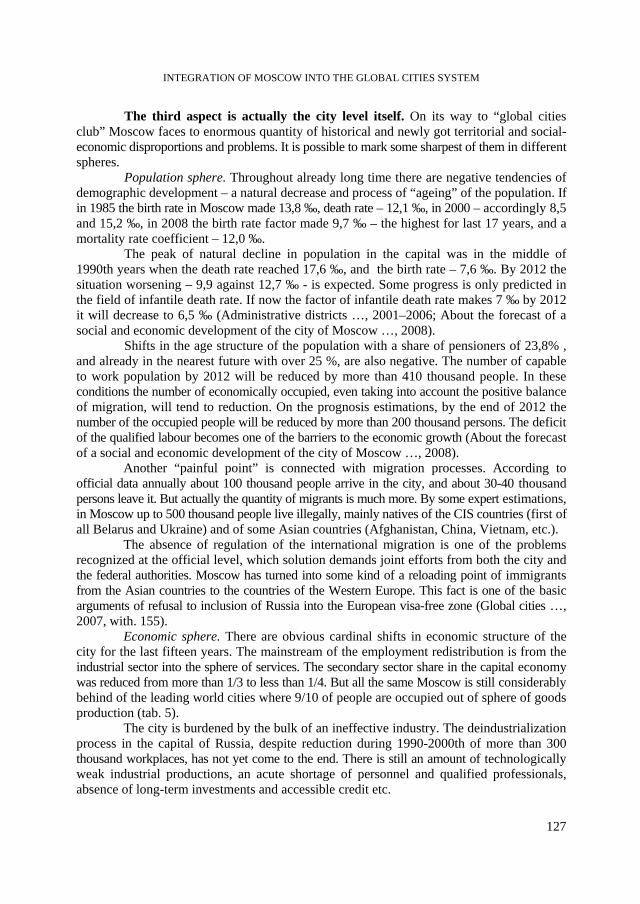
INTEGRATION OF MOSCOW INTO THE GLOBAL CITIES SYSTEM
127
The third aspect is actually the city level itself. On its way to “global cities club” Moscow faces to enormous quantity of historical and newly got territorial and social- economic disproportions and problems. It is possible to mark some sharpest of them in different spheres.
Population sphere. Throughout already long time there are negative tendencies of demographic development – a natural decrease and process of “ageing” of the population. If in 1985 the birth rate in Moscow made 13,8 ‰, death rate – 12,1 ‰, in 2000 – accordingly 8,5 and 15,2 ‰, in 2008 the birth rate factor made 9,7 ‰ – the highest for last 17 years, and a mortality rate coefficient – 12,0 ‰.
The peak of natural decline in population in the capital was in the middle of 1990th years when the death rate reached 17,6 ‰, and the birth rate – 7,6 ‰. By 2012 the situation worsening – 9,9 against 12,7 ‰ - is expected. Some progress is only predicted in the field of infantile death rate. If now the factor of infantile death rate makes 7 ‰ by 2012 it will decrease to 6,5 ‰ (Administrative districts …, 2001–2006; About the forecast of a social and economic development of the city of Moscow …, 2008).
Shifts in the age structure of the population with a share of pensioners of 23,8% , and already in the nearest future with over 25 %, are also negative. The number of capable to work population by 2012 will be reduced by more than 410 thousand people. In these conditions the number of economically occupied, even taking into account the positive balance of migration, will tend to reduction. On the prognosis estimations, by the end of 2012 the number of the occupied people will be reduced by more than 200 thousand persons. The deficit of the qualified labour becomes one of the barriers to the economic growth (About the forecast of a social and economic development of the city of Moscow …, 2008).
Another “painful point” is connected with migration processes. According to official data annually about 100 thousand people arrive in the city, and about 30-40 thousand persons leave it. But actually the quantity of migrants is much more. By some expert estimations, in Moscow up to 500 thousand people live illegally, mainly natives of the CIS countries (first of all Belarus and Ukraine) and of some Asian countries (Afghanistan, China, Vietnam, etc.).
The absence of regulation of the international migration is one of the problems recognized at the official level, which solution demands joint efforts from both the city and the federal authorities. Moscow has turned into some kind of a reloading point of immigrants from the Asian countries to the countries of the Western Europe. This fact is one of the basic arguments of refusal to inclusion of Russia into the European visa-free zone (Global cities …, 2007, with. 155).
Economic sphere. There are obvious cardinal shifts in economic structure of the city for the last fifteen years. The mainstream of the employment redistribution is from the industrial sector into the sphere of services. The secondary sector share in the capital economy was reduced from more than 1/3 to less than 1/4. But all the same Moscow is still considerably behind of the leading world cities where 9/10 of people are occupied out of sphere of goods production (tab. 5).
The city is burdened by the bulk of an ineffective industry. The deindustrialization process in the capital of Russia, despite reduction during 1990-2000th of more than 300 thousand workplaces, has not yet come to the end. There is still an amount of technologically weak industrial productions, an acute shortage of personnel and qualified professionals, absence of long-term investments and accessible credit etc.
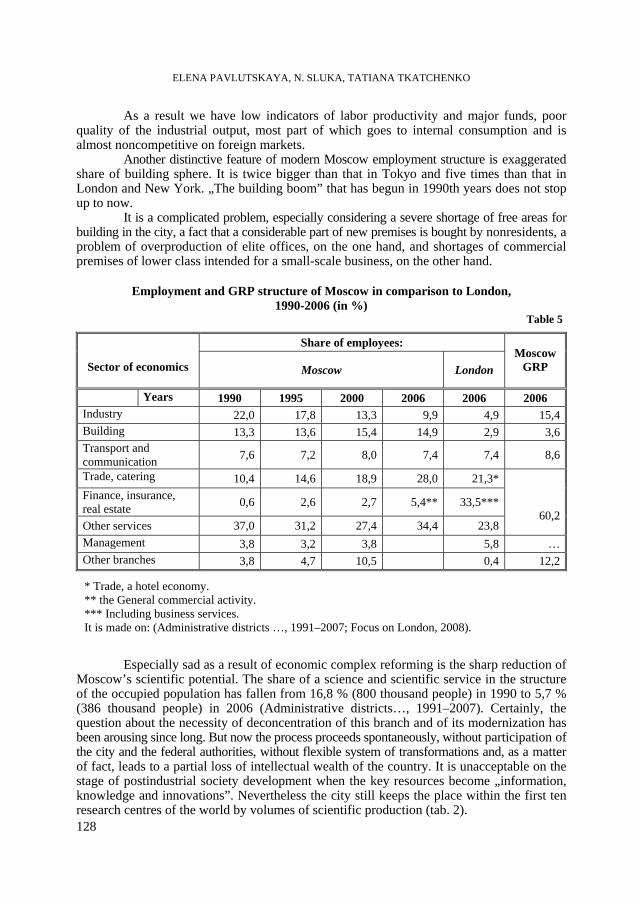
ELENA PAVLUTSKAYA, N. SLUKA, TATIANA TKATCHENKO
128
As a result we have low indicators of labor productivity and major funds, poor quality of the industrial output, most part of which goes to internal consumption and is almost noncompetitive on foreign markets.
Another distinctive feature of modern Moscow employment structure is exaggerated share of building sphere. It is twice bigger than that in Tokyo and five times than that in London and New York. „The building boom” that has begun in 1990th years does not stop up to now.
It is a complicated problem, especially considering a severe shortage of free areas for building in the city, a fact that a considerable part of new premises is bought by nonresidents, a problem of overproduction of elite offices, on the one hand, and shortages of commercial premises of lower class intended for a small-scale business, on the other hand.
Employment and GRP structure of Moscow in comparison to London,
1990-2006 (in %) Table 5
Share of employees:
Sector of economics Moscow London Moscow
GRP
Years 1990 1995 2000 2006 2006 2006 Industry 22,0 17,8 13,3 9,9 4,9 15,4 Building 13,3 13,6 15,4 14,9 2,9 3,6 Transport and communication 7,6 7,2 8,0 7,4 7,4 8,6
Trade, catering 10,4 14,6 18,9 28,0 21,3* Finance, insurance, real estate 0,6 2,6 2,7 5,4** 33,5***
Other services 37,0 31,2 27,4 34,4 23,8
60,2
Management 3,8 3,2 3,8 5,8 … Other branches 3,8 4,7 10,5 0,4 12,2
* Trade, a hotel economy. ** the General commercial activity. *** Including business services. It is made on: (Administrative districts …, 1991–2007; Focus on London, 2008).
Especially sad as a result of economic complex reforming is the sharp reduction of Moscow’s scientific potential. The share of a science and scientific service in the structure of the occupied population has fallen from 16,8 % (800 thousand people) in 1990 to 5,7 % (386 thousand people) in 2006 (Administrative districts…, 1991–2007). Certainly, the question about the necessity of deconcentration of this branch and of its modernization has been arousing since long. But now the process proceeds spontaneously, without participation of the city and the federal authorities, without flexible system of transformations and, as a matter of fact, leads to a partial loss of intellectual wealth of the country. It is unacceptable on the stage of postindustrial society development when the key resources become „information, knowledge and innovations”. Nevertheless the city still keeps the place within the first ten research centres of the world by volumes of scientific production (tab. 2).
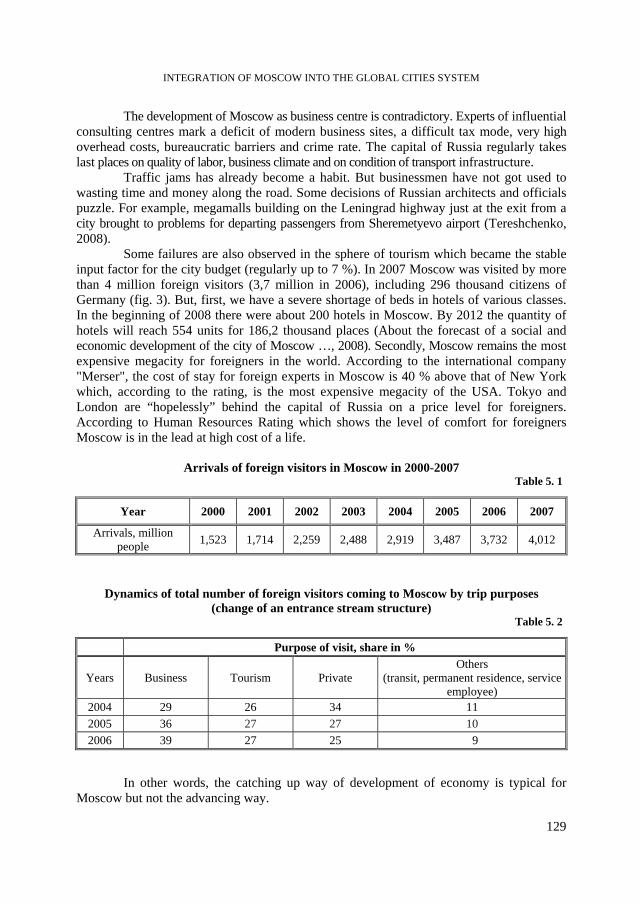
INTEGRATION OF MOSCOW INTO THE GLOBAL CITIES SYSTEM
129
The development of Moscow as business centre is contradictory. Experts of influential consulting centres mark a deficit of modern business sites, a difficult tax mode, very high overhead costs, bureaucratic barriers and crime rate. The capital of Russia regularly takes last places on quality of labor, business climate and on condition of transport infrastructure.
Traffic jams has already become a habit. But businessmen have not got used to wasting time and money along the road. Some decisions of Russian architects and officials puzzle. For example, megamalls building on the Leningrad highway just at the exit from a city brought to problems for departing passengers from Sheremetyevo airport (Tereshchenko, 2008).
Some failures are also observed in the sphere of tourism which became the stable input factor for the city budget (regularly up to 7 %). In 2007 Moscow was visited by more than 4 million foreign visitors (3,7 million in 2006), including 296 thousand citizens of Germany (fig. 3). But, first, we have a severe shortage of beds in hotels of various classes. In the beginning of 2008 there were about 200 hotels in Moscow. By 2012 the quantity of hotels will reach 554 units for 186,2 thousand places (About the forecast of a social and economic development of the city of Moscow …, 2008). Secondly, Moscow remains the most expensive megacity for foreigners in the world. According to the international company "Merser", the cost of stay for foreign experts in Moscow is 40 % above that of New York which, according to the rating, is the most expensive megacity of the USA. Tokyo and London are “hopelessly” behind the capital of Russia on a price level for foreigners. According to Human Resources Rating which shows the level of comfort for foreigners Moscow is in the lead at high cost of a life.
Arrivals of foreign visitors in Moscow in 2000-2007
Table 5. 1
Year 2000 2001 2002 2003 2004 2005 2006 2007
Arrivals, million people 1,523 1,714 2,259 2,488 2,919 3,487 3,732 4,012
Dynamics of total number of foreign visitors coming to Moscow by trip purposes (change of an entrance stream structure)
Table 5. 2
Purpose of visit, share in %
Years Business Tourism Private Others
(transit, permanent residence, service employee)
2004 29 26 34 11 2005 36 27 27 10 2006 39 27 25 9
In other words, the catching up way of development of economy is typical for Moscow but not the advancing way.
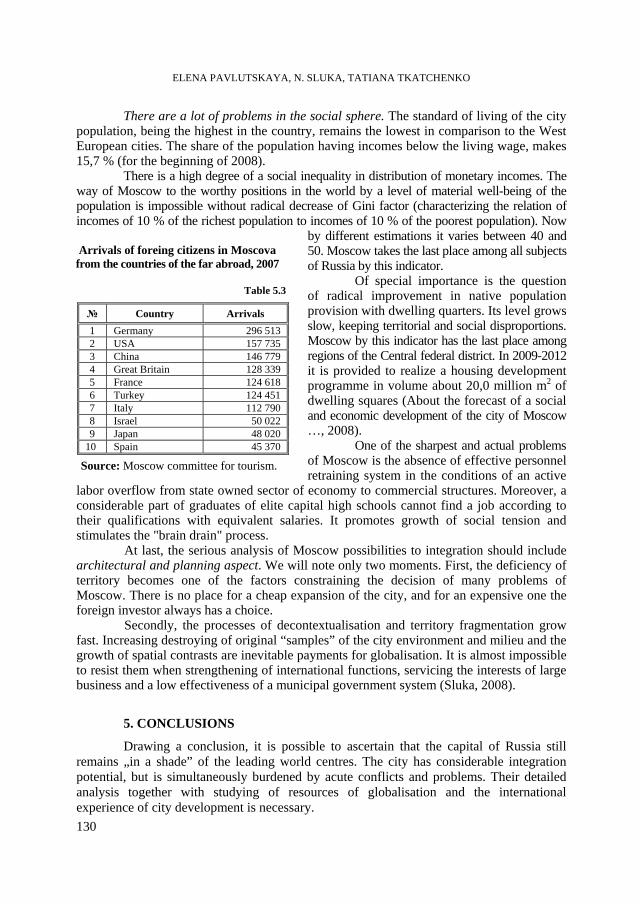
ELENA PAVLUTSKAYA, N. SLUKA, TATIANA TKATCHENKO
130
There are a lot of problems in the social sphere. The standard of living of the city population, being the highest in the country, remains the lowest in comparison to the West European cities. The share of the population having incomes below the living wage, makes 15,7 % (for the beginning of 2008).
There is a high degree of a social inequality in distribution of monetary incomes. The way of Moscow to the worthy positions in the world by a level of material well-being of the population is impossible without radical decrease of Gini factor (characterizing the relation of incomes of 10 % of the richest population to incomes of 10 % of the poorest population). Now
by different estimations it varies between 40 and 50. Moscow takes the last place among all subjects of Russia by this indicator.
Of special importance is the question of radical improvement in native population provision with dwelling quarters. Its level grows slow, keeping territorial and social disproportions. Moscow by this indicator has the last place among regions of the Central federal district. In 2009-2012 it is provided to realize a housing development programme in volume about 20,0 million m2 of dwelling squares (About the forecast of a social and economic development of the city of Moscow …, 2008).
One of the sharpest and actual problems of Moscow is the absence of effective personnel retraining system in the conditions of an active
labor overflow from state owned sector of economy to commercial structures. Moreover, a considerable part of graduates of elite capital high schools cannot find a job according to their qualifications with equivalent salaries. It promotes growth of social tension and stimulates the "brain drain" process.
At last, the serious analysis of Moscow possibilities to integration should include architectural and planning aspect. We will note only two moments. First, the deficiency of territory becomes one of the factors constraining the decision of many problems of Moscow. There is no place for a cheap expansion of the city, and for an expensive one the foreign investor always has a choice.
Secondly, the processes of decontextualisation and territory fragmentation grow fast. Increasing destroying of original “samples” of the city environment and milieu and the growth of spatial contrasts are inevitable payments for globalisation. It is almost impossible to resist them when strengthening of international functions, servicing the interests of large business and a low effectiveness of a municipal government system (Sluka, 2008).
5. CONCLUSIONS
Drawing a conclusion, it is possible to ascertain that the capital of Russia still remains „in a shade” of the leading world centres. The city has considerable integration potential, but is simultaneously burdened by acute conflicts and problems. Their detailed analysis together with studying of resources of globalisation and the international experience of city development is necessary.
Arrivals of foreing citizens in Moscova from the countries of the far abroad, 2007
Table 5.3
Country Arrivals 1 Germany 296 513 2 USA 157 735 3 China 146 779 4 Great Britain 128 339 5 France 124 618 6 Turkey 124 451 7 Italy 112 790 8 Israel 50 022 9 Japan 48 020
10 Spain 45 370
Source: Moscow committee for tourism.
INTEGRATION OF MOSCOW INTO THE GLOBAL CITIES SYSTEM
131
It will provide the way to the optimal model of Moscow’s connection to the constellation of global cities. Probably, another result is also of great importance. Studying of global cities system and of Moscow’s place among them gives vision of many pioneer directions of fundamental geographical researches, including the theory of global geography, geoconflictology, corporate geography and many others.
R E F E R E N C E S 1. Beaverstock, J., Smith, R., Taylor, P. (1999), A Roster of World Cities, GaWC Research Bulletin,
5. 2. Feagin, J., Smith, M. (1987), Cities and the new international division of location: an overview, in
The Capitalist City: Global Restructuring and Community Politics, Oxford, p. 3–34. 3. Friedmann, J. (1986), The world city hypothesis, Development and Change, 4, p. 12–50. 4. Friedmann, J. (1995), Where we stand: a decade of world city research, World Cities in a World-System.
Cambridge, p. 21–47. 5. Friedmann, J., Wolff, G. (1982), World city formation: an agenda for research and action, Intern.
J. of Urban and Regional Res., 6, p. 309–344. 6. Fröbel, F., Heinrichs, J., Kreye, D. (1980), The New International Division of Labour, Cambridge. 7. Geddes, P. (1915), Cities in Evolution, London. 8. Glickman, N. (1987), Cities and the international division of labor, in The Capitalist City: Global
Restructuring and Community Politics, Oxford, p. 66–86. 9. Hall, P. (1996), The Global City, International Social Science Journal, 147. p. 15–23. 10. Hall, P. (1966), The World Cities, London. 11. Heenan, D. (1977), Global Cities of Tomorrow, Harvard Business Review, 55. p. 79–85. 12. Hymer, S. (1972), The multinational corporation and the law of uneven development, in Economics
and World Order from the 1970-s to the 1990-s. N.Y., p. 113–140. 13. King, A. (1990), Global Cities: Post-Imperialism and the Internationalization of London, London. 14. Knox, P. (1995), World cities and the organisation of global space, Geographies of Global Change,
Oxford, p. 232–248. 15. Kurasov, A.V. (2009), Global cities formation under different geographical conditions. The candidate
of geographical sciences dissertation. М, (in russian). 16. Luzhkov, U.М. (2006), Moscow in the today's world, Mezhdunarodnaya Zhisn, 9–10 (in russian). 17. Lysak, O. A. (2007), Geoeconomic space transformation during the period of 1995 – 2005, Vestnik
MGU, Ser. 5, Geogr., 5, pp. 10–19 (in russian). 18. Мarshan, P, Samson, I. (2004), Metropolisy and economic development of Russia, Voprosy Ekonomiki,
1, pp. 4–18 (in russian). 19. Matthiessen, C., Schwarz, A., Find, S. (2006), World Cities of Knowledge: Research Strength, Networks
and Nodality, Journal of Knowledge Management, 10 (5). p. 14–25. 20. Reed, H. (1981), The Preeminence of International Financial Centers, N. Y. 21. Reed, H. (1989), Financial centre hegemony, interest rates and the global political economy,
International Banking and Financial Centres, L., p. 247–268. 22. Sassen, S. (2001), The Global City, New York, London, Tokyo.
ELENA PAVLUTSKAYA, N. SLUKA, TATIANA TKATCHENKO
132
23. Sluka, N.A. (2006), The citycentric vector in the world system development, Vestnik MGU, Ser. 5, Geogr., 5 (in russian).
24. Sluka, N.A. (2007), Global city: The Theory and the Reality, М, (in russian). 25. Sluka, N. A. (2008), A global city, Ekspert, 15 (604), pp. 121–135 (in russian). 26. Shegloff, A. (2009), Moscow cannot get out of back of beyond. The capital loses positions in a
world rating of the financial centres, Nezavisimaya Gazeta (in russian). 27. Taylor, P. (2004), World City Network. A Global Urban Analysis, L. 28. Taylor, P., et all. (2009), Measuring the World City Network: New Developments and Results,
GaWC Research Bulletin, 300. 29. Tereshchenko, O. (2008), Moscow aimes at the centre of the world finance, Moskovskiy Komsomolets
(in russian). 30. Tereshchenko, O. (2008), Pursuit of Shanghai, Moskovskiy Komsomolets (in russian). 31. Thrift, N. (1989), The geography of international economic disorder, in A World in Crisis? Geographical
Perspectives. Oxford, p. 16–78. 32. Tosunjan, G. (2008), For Russia – the financial centre of the international level, Bankovskoye Delo,
5 (in russian). 33. Wall, R., Van Der Knaap, G. (2009), Centrality and Structure within Contemporary Worldwide Corporate
Networks, GaWC Research Bulletin, 295. 34. Wallerstein, I. (1974-1989), The Modern World-System. Vol. I–III. Academic Press. 35. Zlobin, A. (2007), About Moscow against other world cities, Demoskop Weekly, 273–274 (in russian). 36. *** (2007), UK Economic Outlook, Pricewaterhouse Coopers, March. 37.*** (2008), Focus on London, L. 38. *** (2008), The 2008 Global Cities Index, Foreign Policy, November/December. 39.*** (2008), The Report to the 1st Stage of the working out of the ”Moscow’s Development
Strategy till 2025” (in russian) 40.*** Statistical Yearbook 1991–2007 Administrative districts of Moscow, Мoscow, (in russian). 41.*** The order of the Government of Moscow from 26.12.2006 “About the working out of the
Moscow’s Development Strategy for the period till 2030” (in russian). 42.*** The order of the Government of Moscow 640 from July, 22nd, 2008 “About the forecast of
a social and economic development of the city of Moscow till 2012” (in russian). 43.*** The order of the Government of Moscow 513 from June, 26th, 2007 “About the working
out of the Moscow’s Development Strategy for the period till 2025” (in russian). 44.*** Global Financial Centers Index. City of London. September 2008. Retrieved on 2008-10-20. 45.*** World Urbanization Prospects: The 2000–2007 Revision. N.Y., 2000–2007. 46. http://www.ato.ru 47. http://www.icao.int/ 48. http://www.lboro.ac.uk/gawc/ 49. http://www.moscow-city.ru/ 50. http://www.mos.ru/ 51. http://www.telegeography.com/
STUDIA UNIVERSITATIS BABEŞ-BOLYAI, GEOGRAPHIA, LV, 2, 2010
THE INTERNATIONAL SITUATION OF HUNGARY
AND THE POSITION OF ITS MEZO-REGIONS WITH A VIEW TO GLOBAL DEVELOPMENT AND COMPETITIVENESS (1996-2007)
PÉTER BENKŐ1
ABSTRACT. – The International Situation of Hungary and the Position of its Mezo-Regions with a View to Global Development and its Competitiveness (1996-2007). The analysis of the degree of development, evolution and competitiveness of Hungary and its mezo-regions (counties and capital) have been part of my regional research (Benkő, 2008). The premise of my study is that there is a close correlation between development and competitiveness. This is why the economic life and infrastructure influencing these main factors, as well as the general culture and the indicators of common civilisation and quality of life have been precisely analysed. Keywords: global development, evolution, competitiveness, complex situation, GDP, economic
activity, employment.
1. INTRODUCTION
My premise is that there are strong correlations between the state of development of the society and economy and competitiveness. I thoroughly analysed the indicators of economy, infrastructure, general culture and quality of life which have an effect on the competitiveness of regions. I demonstrate the considerable correlation existing between the global state of development and the competitiveness of the regions of Hungary. Between 1996 and 2003, the regional distribution of competitiveness was similar to the spatial level of development, but in 2003-2007 period, the situation of 1990s turned over, as some counties which were previously less competitive became stronger, for example in East Hungary.
2. DEGREE OF DEVELOPMENT AND EVOLUTION
The level of development in Hungary – if we measure it with the two most important economic and social indexes – ranks in the middle of the European scale. Its specific GDP fell back from the the 21st to the 25th place between 1991-2007 among the countries of the continent (later, on purchasing power parity, USD 19,027, half of the Austrian figure, a quarter of that of Luxembourg and more than one and a half times that of Romania). It has usually been preceded in Eastern Central Europe only by Slovenia and the Czech Republic, more recently also by Estonia and Slovakia. But between 2000 and 2007 it has produced an unprecedented development compared with its 20th century history: within seven years, compared with the USA, its specific GDP rose from 34.3 to 41.1 percent of the American figure, although it is true that the surrounding transition countries showed even better data. But in the last one and a half decades Hungary’s economic activity rate (among the 31 European informant countries) fell from the 15th to the last but one place (in 2007 61.9%),
1 Budapest College of Management, Budapest, Hungary, email: [email protected]
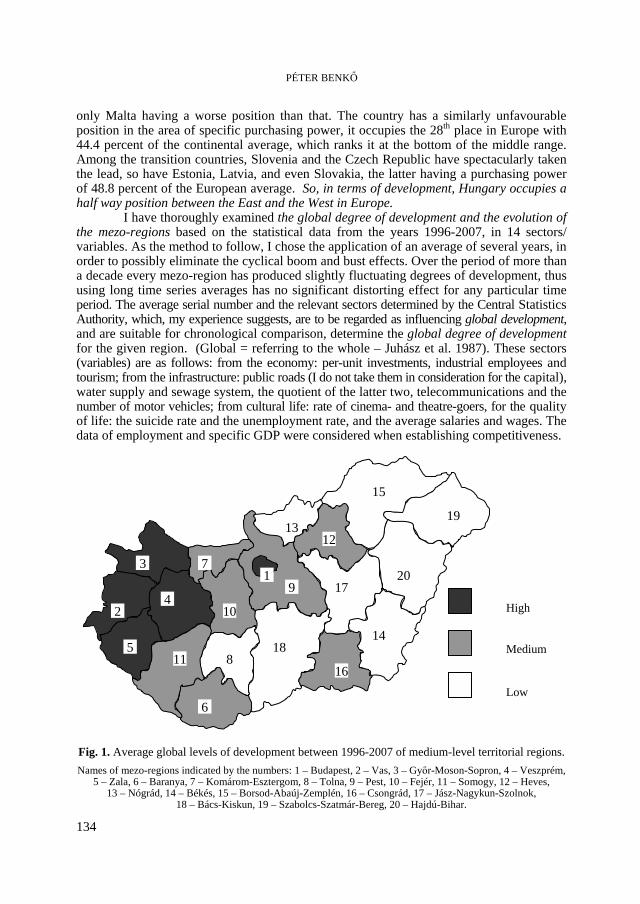
PÉTER BENKŐ
134
only Malta having a worse position than that. The country has a similarly unfavourable position in the area of specific purchasing power, it occupies the 28th place in Europe with 44.4 percent of the continental average, which ranks it at the bottom of the middle range. Among the transition countries, Slovenia and the Czech Republic have spectacularly taken the lead, so have Estonia, Latvia, and even Slovakia, the latter having a purchasing power of 48.8 percent of the European average. So, in terms of development, Hungary occupies a half way position between the East and the West in Europe.
I have thoroughly examined the global degree of development and the evolution of the mezo-regions based on the statistical data from the years 1996-2007, in 14 sectors/ variables. As the method to follow, I chose the application of an average of several years, in order to possibly eliminate the cyclical boom and bust effects. Over the period of more than a decade every mezo-region has produced slightly fluctuating degrees of development, thus using long time series averages has no significant distorting effect for any particular time period. The average serial number and the relevant sectors determined by the Central Statistics Authority, which, my experience suggests, are to be regarded as influencing global development, and are suitable for chronological comparison, determine the global degree of development for the given region. (Global = referring to the whole – Juhász et al. 1987). These sectors (variables) are as follows: from the economy: per-unit investments, industrial employees and tourism; from the infrastructure: public roads (I do not take them in consideration for the capital), water supply and sewage system, the quotient of the latter two, telecommunications and the number of motor vehicles; from cultural life: rate of cinema- and theatre-goers, for the quality of life: the suicide rate and the unemployment rate, and the average salaries and wages. The data of employment and specific GDP were considered when establishing competitiveness.
Fig. 1. Average global levels of development between 1996-2007 of medium-level territorial regions.
Names of mezo-regions indicated by the numbers: 1 – Budapest, 2 – Vas, 3 – Győr-Moson-Sopron, 4 – Veszprém, 5 – Zala, 6 – Baranya, 7 – Komárom-Esztergom, 8 – Tolna, 9 – Pest, 10 – Fejér, 11 – Somogy, 12 – Heves,
13 – Nógrád, 14 – Békés, 15 – Borsod-Abaúj-Zemplén, 16 – Csongrád, 17 – Jász-Nagykun-Szolnok, 18 – Bács-Kiskun, 19 – Szabolcs-Szatmár-Bereg, 20 – Hajdú-Bihar.
gh
1 3
2 4
5 11
6
8
10
7
18
16
17
15
9
14
20
19
1213
High Medium Low
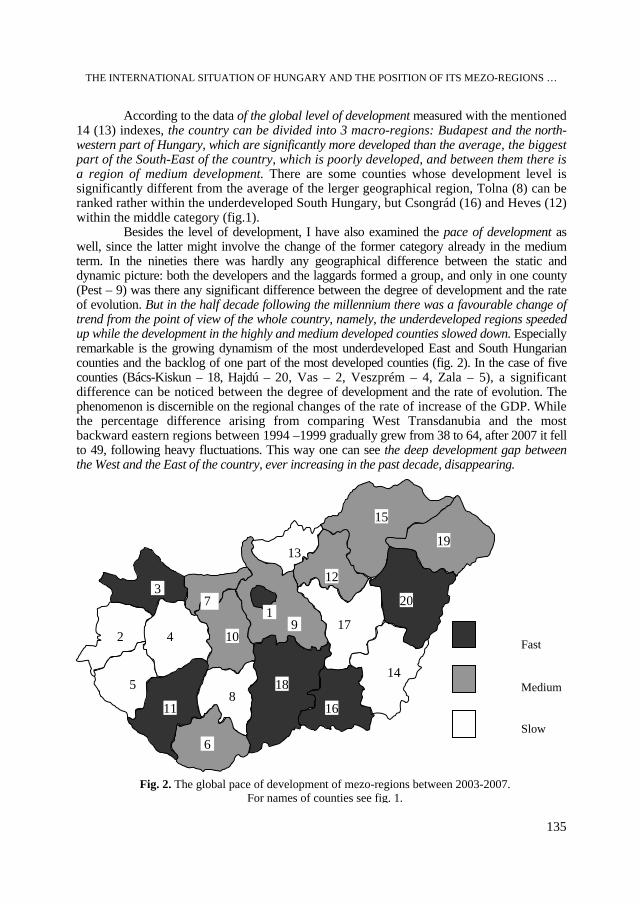
THE INTERNATIONAL SITUATION OF HUNGARY AND THE POSITION OF ITS MEZO-REGIONS …
135
According to the data of the global level of development measured with the mentioned 14 (13) indexes, the country can be divided into 3 macro-regions: Budapest and the north-western part of Hungary, which are significantly more developed than the average, the biggest part of the South-East of the country, which is poorly developed, and between them there is a region of medium development. There are some counties whose development level is significantly different from the average of the lerger geographical region, Tolna (8) can be ranked rather within the underdeveloped South Hungary, but Csongrád (16) and Heves (12) within the middle category (fig.1).
Besides the level of development, I have also examined the pace of development as well, since the latter might involve the change of the former category already in the medium term. In the nineties there was hardly any geographical difference between the static and dynamic picture: both the developers and the laggards formed a group, and only in one county (Pest – 9) was there any significant difference between the degree of development and the rate of evolution. But in the half decade following the millennium there was a favourable change of trend from the point of view of the whole country, namely, the underdeveloped regions speeded up while the development in the highly and medium developed counties slowed down. Especially remarkable is the growing dynamism of the most underdeveloped East and South Hungarian counties and the backlog of one part of the most developed counties (fig. 2). In the case of five counties (Bács-Kiskun – 18, Hajdú – 20, Vas – 2, Veszprém – 4, Zala – 5), a significant difference can be noticed between the degree of development and the rate of evolution. The phenomenon is discernible on the regional changes of the rate of increase of the GDP. While the percentage difference arising from comparing West Transdanubia and the most backward eastern regions between 1994 –1999 gradually grew from 38 to 64, after 2007 it fell to 49, following heavy fluctuations. This way one can see the deep development gap between the West and the East of the country, ever increasing in the past decade, disappearing.
1
3
2 4
5
10
7
17
15
9
14
20
19
12
13
Fast Medium Slow
Fig. 2. The global pace of development of mezo-regions between 2003-2007. For names of counties see fig. 1.
6
8 11 16
18
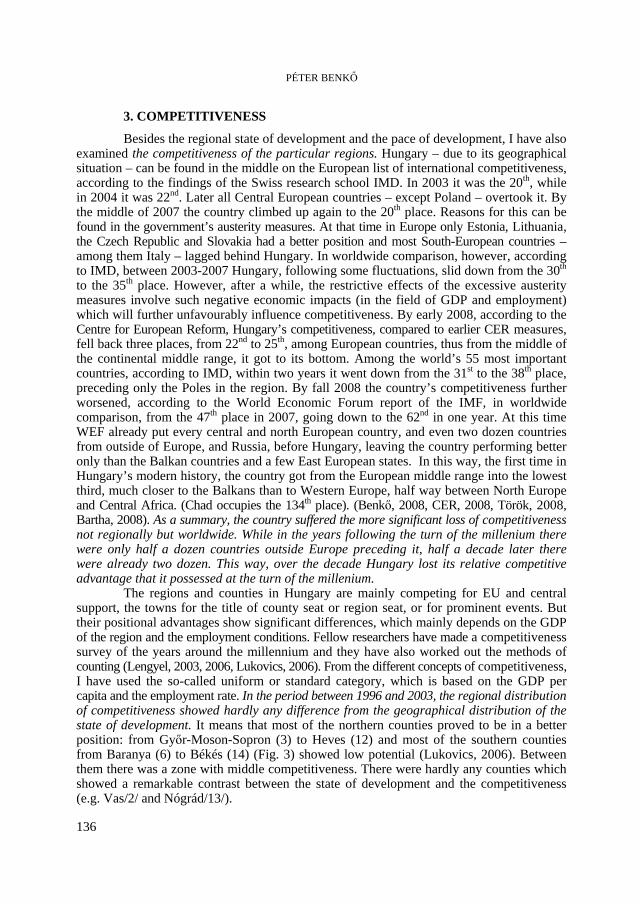
PÉTER BENKŐ
136
3. COMPETITIVENESS
Besides the regional state of development and the pace of development, I have also examined the competitiveness of the particular regions. Hungary – due to its geographical situation – can be found in the middle on the European list of international competitiveness, according to the findings of the Swiss research school IMD. In 2003 it was the 20th, while in 2004 it was 22nd. Later all Central European countries – except Poland – overtook it. By the middle of 2007 the country climbed up again to the 20th place. Reasons for this can be found in the government’s austerity measures. At that time in Europe only Estonia, Lithuania, the Czech Republic and Slovakia had a better position and most South-European countries – among them Italy – lagged behind Hungary. In worldwide comparison, however, according to IMD, between 2003-2007 Hungary, following some fluctuations, slid down from the 30th to the 35th place. However, after a while, the restrictive effects of the excessive austerity measures involve such negative economic impacts (in the field of GDP and employment) which will further unfavourably influence competitiveness. By early 2008, according to the Centre for European Reform, Hungary’s competitiveness, compared to earlier CER measures, fell back three places, from 22nd to 25th, among European countries, thus from the middle of the continental middle range, it got to its bottom. Among the world’s 55 most important countries, according to IMD, within two years it went down from the 31st to the 38th place, preceding only the Poles in the region. By fall 2008 the country’s competitiveness further worsened, according to the World Economic Forum report of the IMF, in worldwide comparison, from the 47th place in 2007, going down to the 62nd in one year. At this time WEF already put every central and north European country, and even two dozen countries from outside of Europe, and Russia, before Hungary, leaving the country performing better only than the Balkan countries and a few East European states. In this way, the first time in Hungary’s modern history, the country got from the European middle range into the lowest third, much closer to the Balkans than to Western Europe, half way between North Europe and Central Africa. (Chad occupies the 134th place). (Benkő, 2008, CER, 2008, Török, 2008, Bartha, 2008). As a summary, the country suffered the more significant loss of competitiveness not regionally but worldwide. While in the years following the turn of the millenium there were only half a dozen countries outside Europe preceding it, half a decade later there were already two dozen. This way, over the decade Hungary lost its relative competitive advantage that it possessed at the turn of the millenium.
The regions and counties in Hungary are mainly competing for EU and central support, the towns for the title of county seat or region seat, or for prominent events. But their positional advantages show significant differences, which mainly depends on the GDP of the region and the employment conditions. Fellow researchers have made a competitiveness survey of the years around the millennium and they have also worked out the methods of counting (Lengyel, 2003, 2006, Lukovics, 2006). From the different concepts of competitiveness, I have used the so-called uniform or standard category, which is based on the GDP per capita and the employment rate. In the period between 1996 and 2003, the regional distribution of competitiveness showed hardly any difference from the geographical distribution of the state of development. It means that most of the northern counties proved to be in a better position: from Győr-Moson-Sopron (3) to Heves (12) and most of the southern counties from Baranya (6) to Békés (14) (Fig. 3) showed low potential (Lukovics, 2006). Between them there was a zone with middle competitiveness. There were hardly any counties which showed a remarkable contrast between the state of development and the competitiveness (e.g. Vas/2/ and Nógrád/13/).
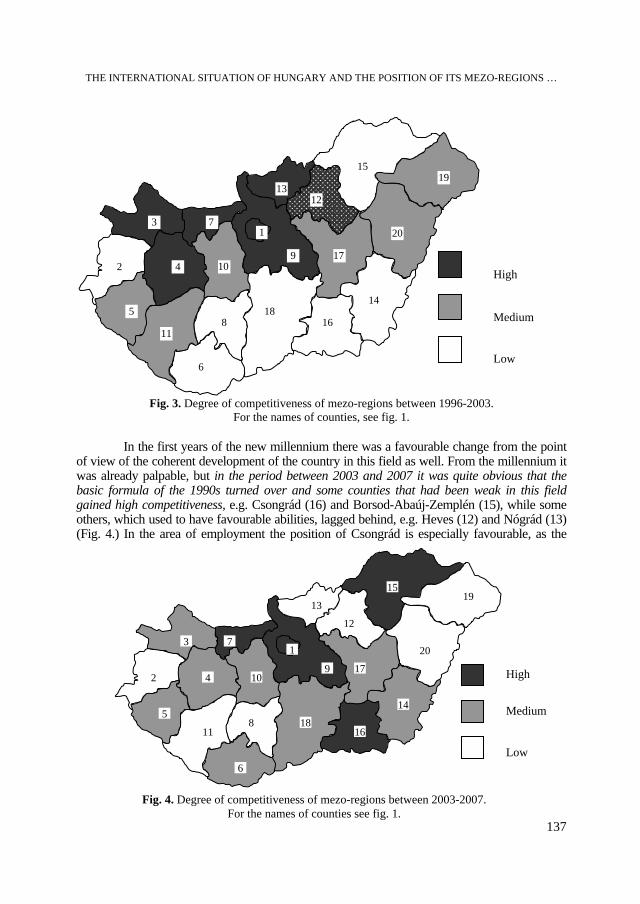
THE INTERNATIONAL SITUATION OF HUNGARY AND THE POSITION OF ITS MEZO-REGIONS …
137
Fig. 3. Degree of competitiveness of mezo-regions between 1996-2003.
For the names of counties, see fig. 1.
In the first years of the new millennium there was a favourable change from the point of view of the coherent development of the country in this field as well. From the millennium it was already palpable, but in the period between 2003 and 2007 it was quite obvious that the basic formula of the 1990s turned over and some counties that had been weak in this field gained high competitiveness, e.g. Csongrád (16) and Borsod-Abaúj-Zemplén (15), while some others, which used to have favourable abilities, lagged behind, e.g. Heves (12) and Nógrád (13) (Fig. 4.) In the area of employment the position of Csongrád is especially favourable, as the
6
2 4
5 8 16
10
7
18
17
14
High Medium
Low
13
9
11
1213
1519
20
9
1
Fig. 4. Degree of competitiveness of mezo-regions between 2003-2007. For the names of counties see fig. 1.
High
Medium Low
2
3
4
5
6
7
8
10
11
12
13
14
15
16
17
18
19
20
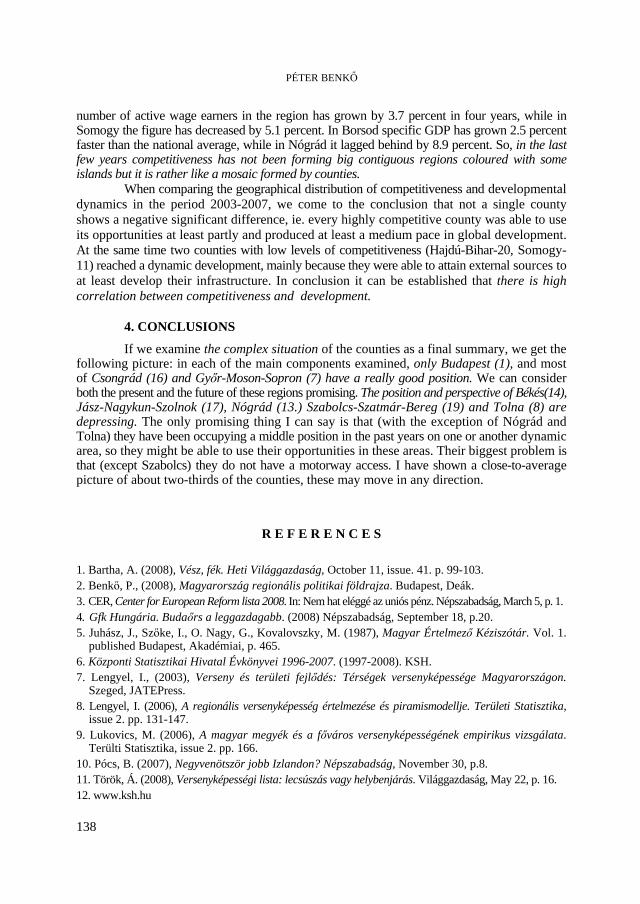
PÉTER BENKŐ
138
number of active wage earners in the region has grown by 3.7 percent in four years, while in Somogy the figure has decreased by 5.1 percent. In Borsod specific GDP has grown 2.5 percent faster than the national average, while in Nógrád it lagged behind by 8.9 percent. So, in the last few years competitiveness has not been forming big contiguous regions coloured with some islands but it is rather like a mosaic formed by counties.
When comparing the geographical distribution of competitiveness and developmental dynamics in the period 2003-2007, we come to the conclusion that not a single county shows a negative significant difference, ie. every highly competitive county was able to use its opportunities at least partly and produced at least a medium pace in global development. At the same time two counties with low levels of competitiveness (Hajdú-Bihar-20, Somogy-11) reached a dynamic development, mainly because they were able to attain external sources to at least develop their infrastructure. In conclusion it can be established that there is high correlation between competitiveness and development.
4. CONCLUSIONS
If we examine the complex situation of the counties as a final summary, we get the following picture: in each of the main components examined, only Budapest (1), and most of Csongrád (16) and Győr-Moson-Sopron (7) have a really good position. We can consider both the present and the future of these regions promising. The position and perspective of Békés(14), Jász-Nagykun-Szolnok (17), Nógrád (13.) Szabolcs-Szatmár-Bereg (19) and Tolna (8) are depressing. The only promising thing I can say is that (with the exception of Nógrád and Tolna) they have been occupying a middle position in the past years on one or another dynamic area, so they might be able to use their opportunities in these areas. Their biggest problem is that (except Szabolcs) they do not have a motorway access. I have shown a close-to-average picture of about two-thirds of the counties, these may move in any direction.
R E F E R E N C E S 1. Bartha, A. (2008), Vész, fék. Heti Világgazdaság, October 11, issue. 41. p. 99-103. 2. Benkő, P., (2008), Magyarország regionális politikai földrajza. Budapest, Deák. 3. CER, Center for European Reform lista 2008. In: Nem hat eléggé az uniós pénz. Népszabadság, March 5, p. 1. 4. Gfk Hungária. Budaőrs a leggazdagabb. (2008) Népszabadság, September 18, p.20. 5. Juhász, J., Szőke, I., O. Nagy, G., Kovalovszky, M. (1987), Magyar Értelmező Kéziszótár. Vol. 1.
published Budapest, Akadémiai, p. 465. 6. Központi Statisztikai Hivatal Évkönyvei 1996-2007. (1997-2008). KSH. 7. Lengyel, I., (2003), Verseny és területi fejlődés: Térségek versenyképessége Magyarországon.
Szeged, JATEPress. 8. Lengyel, I. (2006), A regionális versenyképesség értelmezése és piramismodellje. Területi Statisztika,
issue 2. pp. 131-147. 9. Lukovics, M. (2006), A magyar megyék és a főváros versenyképességének empirikus vizsgálata.
Terülti Statisztika, issue 2. pp. 166. 10. Pócs, B. (2007), Negyvenötször jobb Izlandon? Népszabadság, November 30, p.8. 11. Török, Á. (2008), Versenyképességi lista: lecsúszás vagy helybenjárás. Világgazdaság, May 22, p. 16. 12. www.ksh.hu
STUDIA UNIVERSITATIS BABEŞ-BOLYAI, GEOGRAPHIA, LV, 2, 2010
ABOUT RECENT DYNAMICS OF THE FOREIGN DIRECT
INVESTMENTS IN ROMANIA
I. IANOŞ1
ABSTRACT. – About Recent Dynamics of the Foreign Direct Investments in Romania. The present paper surveys the dynamics of the foreign investments in Romania. The main difficulty here is to identify the comparative and credible data, endorsed by the journals of some responsible institutions in the field, as well. According to the UNCTAB latest reports, in the recent years, Romania has become the second best destination for foreign investments – after Poland – in Central and South-Eastern Europe (Turkey was left aside). The dynamics of the foreign investments, analyzed on the basis of the data offered by the monthly Syntheses of the National Office for Trade Register, is shown by the variograms performed on a monthly-, quarterly-, and yearly-basis, respectively, between January 2004 and October 2009. The spectacular increase of the foreign investments is obvious following Romania’s accession to NATO (2004) and its integration into EU (2007). Between 2007 and 2009, the most important investors came from Germany, followed by those from the Netherlands, Austria, Czech Republic, France, and Switzerland. With the penetration of the great foreign companies and the increase of the autochthonous entrepreneurial spirit, the foreign investments from the Near and Middle East have diminished – the greatest majority of the existing ones focus on whole sales and retail trade. However, because of the indecisive dynamics of the world economy, we cannot extrapolate future developments of the dynamics of the foreign investments.
Keywords: transition, foreign direct investments, investments dynamics, Romania.
1. INTRODUCTION
The main target of the countries that made the transition from centrally planned economies to market economies was to attract foreign investments, based on one sure thing: they are the focus points of the complex and intricate process of the economy fundamental structuring (Pavlinek, 2004). The most important aspect in attracting foreign investments was a legal framework able to ensure facilities to the would-be investors, and an economically and socially attractive milieu, as well. At first, the main obstacle was the domination of a state economy and of an extremely controversial economic-social environment (Guran, 2000). The controversies were generated by the lack of an entrepreneurial culture among the autochthonous population, but also by the population’s dual mentality when faced with transition to a market economy.
Therefore, the political regimens in the post-socialist countries initiated vast privatization processes. Both the privatization rate and the openness to foreign investors were highly different. Thus, there were no less than three rates: the most rapid one was Hungary, the first to open its economy to foreign investors (Samary, 2001), that privatized its best industrial enterprises and banks (at the mid 1990s it had attracted half of the direct foreign investments in 1 University of Bucharest, Interdisciplinary Centre for Advanced Researches on Territorial Dynamics
(CICADIT), e-mail: [email protected]
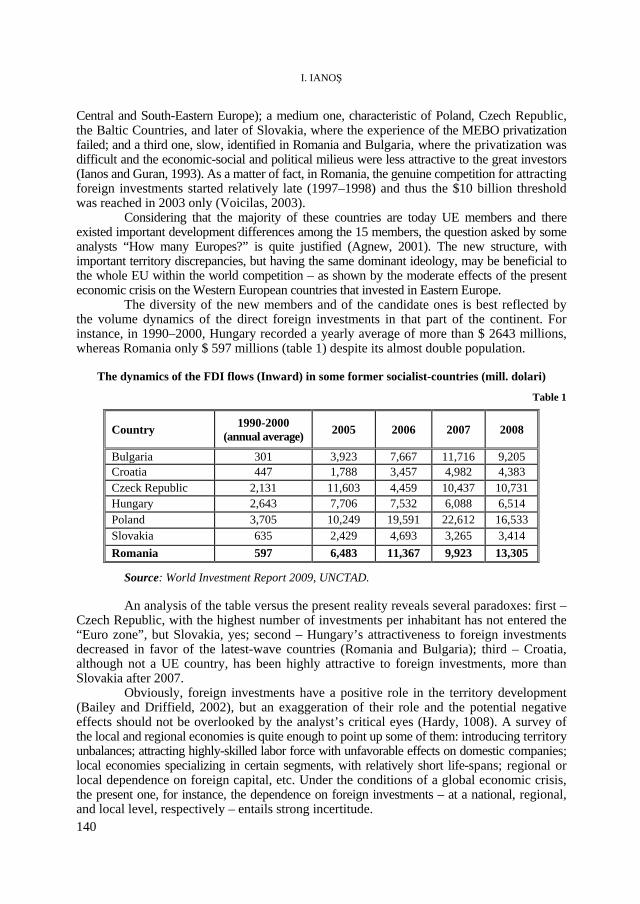
I. IANOŞ
140
Central and South-Eastern Europe); a medium one, characteristic of Poland, Czech Republic, the Baltic Countries, and later of Slovakia, where the experience of the MEBO privatization failed; and a third one, slow, identified in Romania and Bulgaria, where the privatization was difficult and the economic-social and political milieus were less attractive to the great investors (Ianos and Guran, 1993). As a matter of fact, in Romania, the genuine competition for attracting foreign investments started relatively late (1997–1998) and thus the $10 billion threshold was reached in 2003 only (Voicilas, 2003).
Considering that the majority of these countries are today UE members and there existed important development differences among the 15 members, the question asked by some analysts “How many Europes?” is quite justified (Agnew, 2001). The new structure, with important territory discrepancies, but having the same dominant ideology, may be beneficial to the whole EU within the world competition – as shown by the moderate effects of the present economic crisis on the Western European countries that invested in Eastern Europe.
The diversity of the new members and of the candidate ones is best reflected by the volume dynamics of the direct foreign investments in that part of the continent. For instance, in 1990–2000, Hungary recorded a yearly average of more than $ 2643 millions, whereas Romania only $ 597 millions (table 1) despite its almost double population.
The dynamics of the FDI flows (Inward) in some former socialist-countries (mill. dolari)
Table 1
Country 1990-2000 (annual average) 2005 2006 2007 2008
Bulgaria 301 3,923 7,667 11,716 9,205 Croatia 447 1,788 3,457 4,982 4,383 Czeck Republic 2,131 11,603 4,459 10,437 10,731 Hungary 2,643 7,706 7,532 6,088 6,514 Poland 3,705 10,249 19,591 22,612 16,533 Slovakia 635 2,429 4,693 3,265 3,414 Romania 597 6,483 11,367 9,923 13,305
Source: World Investment Report 2009, UNCTAD.
An analysis of the table versus the present reality reveals several paradoxes: first – Czech Republic, with the highest number of investments per inhabitant has not entered the “Euro zone”, but Slovakia, yes; second – Hungary’s attractiveness to foreign investments decreased in favor of the latest-wave countries (Romania and Bulgaria); third – Croatia, although not a UE country, has been highly attractive to foreign investments, more than Slovakia after 2007.
Obviously, foreign investments have a positive role in the territory development (Bailey and Driffield, 2002), but an exaggeration of their role and the potential negative effects should not be overlooked by the analyst’s critical eyes (Hardy, 1008). A survey of the local and regional economies is quite enough to point up some of them: introducing territory unbalances; attracting highly-skilled labor force with unfavorable effects on domestic companies; local economies specializing in certain segments, with relatively short life-spans; regional or local dependence on foreign capital, etc. Under the conditions of a global economic crisis, the present one, for instance, the dependence on foreign investments – at a national, regional, and local level, respectively – entails strong incertitude.
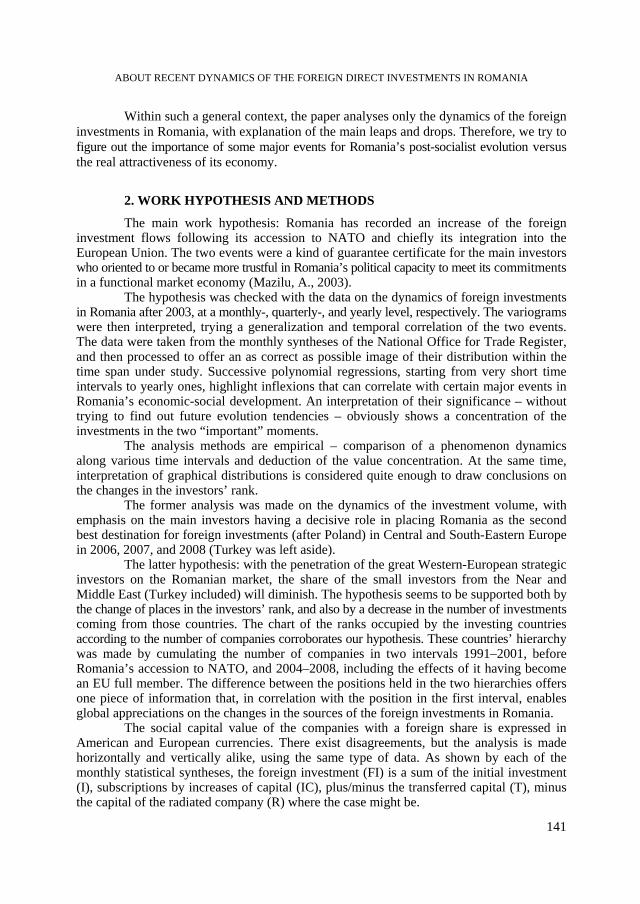
ABOUT RECENT DYNAMICS OF THE FOREIGN DIRECT INVESTMENTS IN ROMANIA
141
Within such a general context, the paper analyses only the dynamics of the foreign investments in Romania, with explanation of the main leaps and drops. Therefore, we try to figure out the importance of some major events for Romania’s post-socialist evolution versus the real attractiveness of its economy.
2. WORK HYPOTHESIS AND METHODS
The main work hypothesis: Romania has recorded an increase of the foreign investment flows following its accession to NATO and chiefly its integration into the European Union. The two events were a kind of guarantee certificate for the main investors who oriented to or became more trustful in Romania’s political capacity to meet its commitments in a functional market economy (Mazilu, A., 2003).
The hypothesis was checked with the data on the dynamics of foreign investments in Romania after 2003, at a monthly-, quarterly-, and yearly level, respectively. The variograms were then interpreted, trying a generalization and temporal correlation of the two events. The data were taken from the monthly syntheses of the National Office for Trade Register, and then processed to offer an as correct as possible image of their distribution within the time span under study. Successive polynomial regressions, starting from very short time intervals to yearly ones, highlight inflexions that can correlate with certain major events in Romania’s economic-social development. An interpretation of their significance – without trying to find out future evolution tendencies – obviously shows a concentration of the investments in the two “important” moments.
The analysis methods are empirical – comparison of a phenomenon dynamics along various time intervals and deduction of the value concentration. At the same time, interpretation of graphical distributions is considered quite enough to draw conclusions on the changes in the investors’ rank.
The former analysis was made on the dynamics of the investment volume, with emphasis on the main investors having a decisive role in placing Romania as the second best destination for foreign investments (after Poland) in Central and South-Eastern Europe in 2006, 2007, and 2008 (Turkey was left aside).
The latter hypothesis: with the penetration of the great Western-European strategic investors on the Romanian market, the share of the small investors from the Near and Middle East (Turkey included) will diminish. The hypothesis seems to be supported both by the change of places in the investors’ rank, and also by a decrease in the number of investments coming from those countries. The chart of the ranks occupied by the investing countries according to the number of companies corroborates our hypothesis. These countries’ hierarchy was made by cumulating the number of companies in two intervals 1991–2001, before Romania’s accession to NATO, and 2004–2008, including the effects of it having become an EU full member. The difference between the positions held in the two hierarchies offers one piece of information that, in correlation with the position in the first interval, enables global appreciations on the changes in the sources of the foreign investments in Romania.
The social capital value of the companies with a foreign share is expressed in American and European currencies. There exist disagreements, but the analysis is made horizontally and vertically alike, using the same type of data. As shown by each of the monthly statistical syntheses, the foreign investment (FI) is a sum of the initial investment (I), subscriptions by increases of capital (IC), plus/minus the transferred capital (T), minus the capital of the radiated company (R) where the case might be.
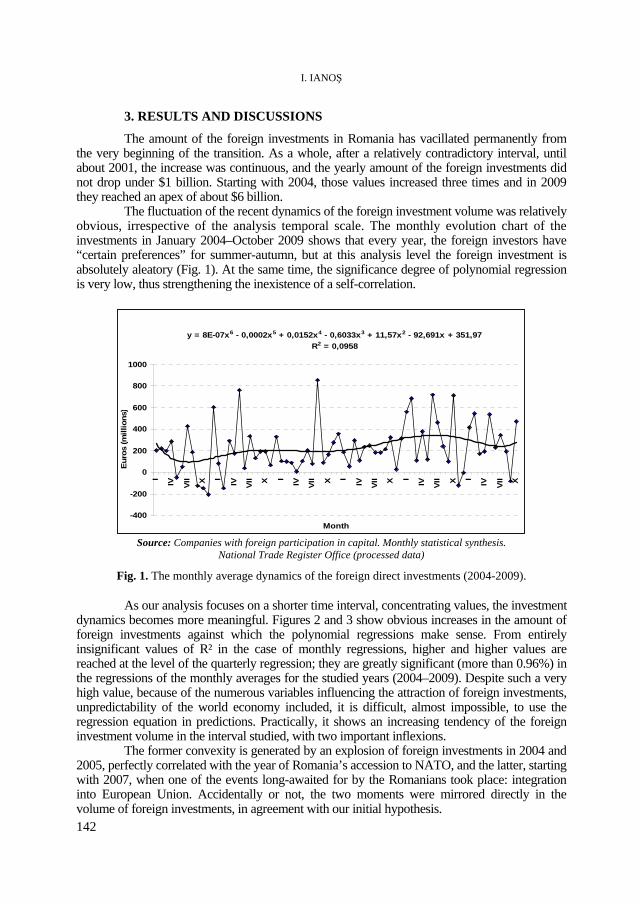
I. IANOŞ
142
3. RESULTS AND DISCUSSIONS
The amount of the foreign investments in Romania has vacillated permanently from the very beginning of the transition. As a whole, after a relatively contradictory interval, until about 2001, the increase was continuous, and the yearly amount of the foreign investments did not drop under $1 billion. Starting with 2004, those values increased three times and in 2009 they reached an apex of about $6 billion.
The fluctuation of the recent dynamics of the foreign investment volume was relatively obvious, irrespective of the analysis temporal scale. The monthly evolution chart of the investments in January 2004–October 2009 shows that every year, the foreign investors have “certain preferences” for summer-autumn, but at this analysis level the foreign investment is absolutely aleatory (Fig. 1). At the same time, the significance degree of polynomial regression is very low, thus strengthening the inexistence of a self-correlation.
y = 8E-07x6 - 0,0002x5 + 0,0152x4 - 0,6033x3 + 11,57x2 - 92,691x + 351,97R2 = 0,0958
-400
-200
0
200
400
600
800
1000
I IV VII X I IV VII X I IV VII X I IV VII X I IV VII X I IV VII X
Month
Eur
os (m
illio
ns)
Source: Companies with foreign participation in capital. Monthly statistical synthesis.
National Trade Register Office (processed data)
Fig. 1. The monthly average dynamics of the foreign direct investments (2004-2009).
As our analysis focuses on a shorter time interval, concentrating values, the investment dynamics becomes more meaningful. Figures 2 and 3 show obvious increases in the amount of foreign investments against which the polynomial regressions make sense. From entirely insignificant values of R² in the case of monthly regressions, higher and higher values are reached at the level of the quarterly regression; they are greatly significant (more than 0.96%) in the regressions of the monthly averages for the studied years (2004–2009). Despite such a very high value, because of the numerous variables influencing the attraction of foreign investments, unpredictability of the world economy included, it is difficult, almost impossible, to use the regression equation in predictions. Practically, it shows an increasing tendency of the foreign investment volume in the interval studied, with two important inflexions.
The former convexity is generated by an explosion of foreign investments in 2004 and 2005, perfectly correlated with the year of Romania’s accession to NATO, and the latter, starting with 2007, when one of the events long-awaited for by the Romanians took place: integration into European Union. Accidentally or not, the two moments were mirrored directly in the volume of foreign investments, in agreement with our initial hypothesis.
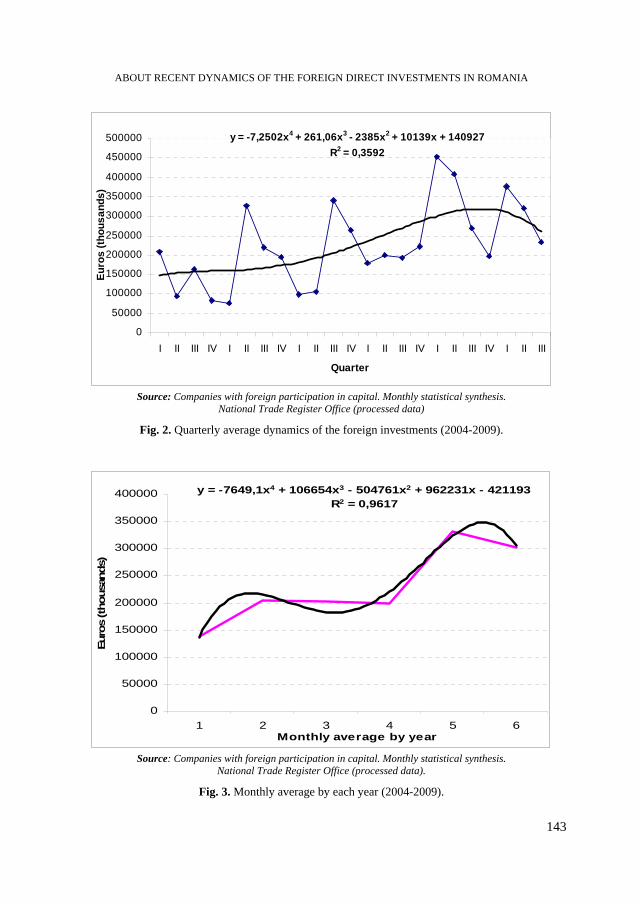
ABOUT RECENT DYNAMICS OF THE FOREIGN DIRECT INVESTMENTS IN ROMANIA
143
y = -7,2502x4 + 261,06x3 - 2385x2 + 10139x + 140927R2 = 0,3592
0
50000
100000
150000
200000
250000
300000
350000
400000
450000
500000
I II III IV I II III IV I II III IV I II III IV I II III IV I II III
Quarter
Euro
s (th
ousa
nds)
Source: Companies with foreign participation in capital. Monthly statistical synthesis.
National Trade Register Office (processed data)
Fig. 2. Quarterly average dynamics of the foreign investments (2004-2009).
y = -7649,1x4 + 106654x3 - 504761x2 + 962231x - 421193R2 = 0,9617
0
50000
100000
150000
200000
250000
300000
350000
400000
1 2 3 4 5 6Monthly average by year
Euro
s (t
hous
ands
)
Source: Companies with foreign participation in capital. Monthly statistical synthesis.
National Trade Register Office (processed data).
Fig. 3. Monthly average by each year (2004-2009).
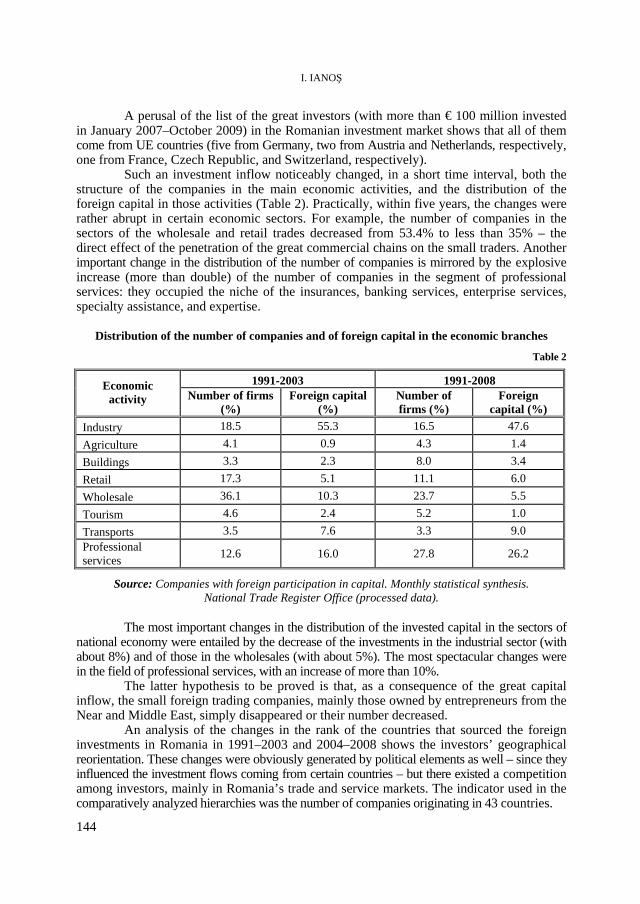
I. IANOŞ
144
A perusal of the list of the great investors (with more than € 100 million invested in January 2007–October 2009) in the Romanian investment market shows that all of them come from UE countries (five from Germany, two from Austria and Netherlands, respectively, one from France, Czech Republic, and Switzerland, respectively).
Such an investment inflow noticeably changed, in a short time interval, both the structure of the companies in the main economic activities, and the distribution of the foreign capital in those activities (Table 2). Practically, within five years, the changes were rather abrupt in certain economic sectors. For example, the number of companies in the sectors of the wholesale and retail trades decreased from 53.4% to less than 35% – the direct effect of the penetration of the great commercial chains on the small traders. Another important change in the distribution of the number of companies is mirrored by the explosive increase (more than double) of the number of companies in the segment of professional services: they occupied the niche of the insurances, banking services, enterprise services, specialty assistance, and expertise.
Distribution of the number of companies and of foreign capital in the economic branches
Table 2
1991-2003 1991-2008 Economic activity Number of firms
(%) Foreign capital
(%) Number of firms (%)
Foreign capital (%)
Industry 18.5 55.3 16.5 47.6 Agriculture 4.1 0.9 4.3 1.4 Buildings 3.3 2.3 8.0 3.4 Retail 17.3 5.1 11.1 6.0 Wholesale 36.1 10.3 23.7 5.5 Tourism 4.6 2.4 5.2 1.0 Transports 3.5 7.6 3.3 9.0 Professional services 12.6 16.0 27.8 26.2
Source: Companies with foreign participation in capital. Monthly statistical synthesis. National Trade Register Office (processed data).
The most important changes in the distribution of the invested capital in the sectors of
national economy were entailed by the decrease of the investments in the industrial sector (with about 8%) and of those in the wholesales (with about 5%). The most spectacular changes were in the field of professional services, with an increase of more than 10%.
The latter hypothesis to be proved is that, as a consequence of the great capital inflow, the small foreign trading companies, mainly those owned by entrepreneurs from the Near and Middle East, simply disappeared or their number decreased.
An analysis of the changes in the rank of the countries that sourced the foreign investments in Romania in 1991–2003 and 2004–2008 shows the investors’ geographical reorientation. These changes were obviously generated by political elements as well – since they influenced the investment flows coming from certain countries – but there existed a competition among investors, mainly in Romania’s trade and service markets. The indicator used in the comparatively analyzed hierarchies was the number of companies originating in 43 countries.
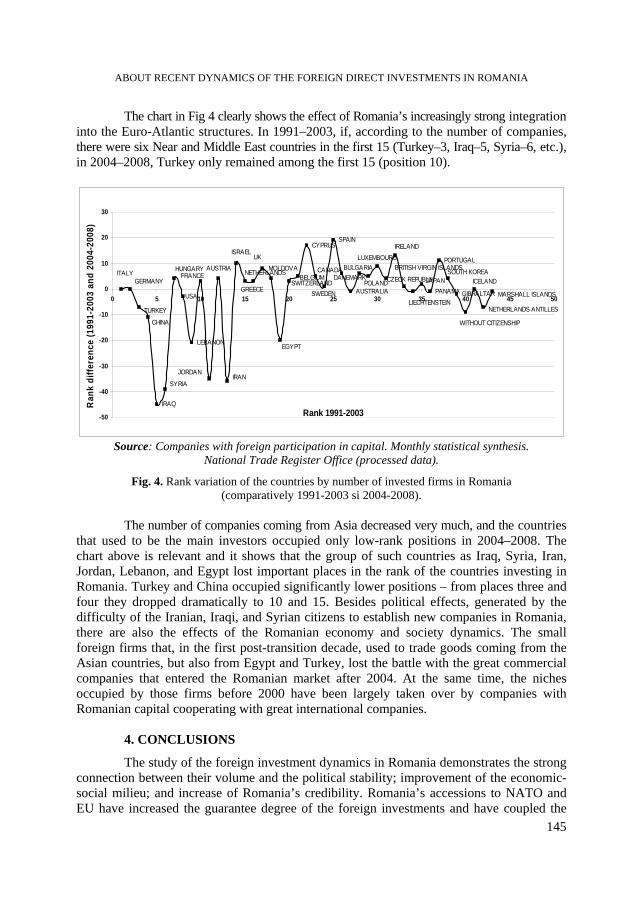
ABOUT RECENT DYNAMICS OF THE FOREIGN DIRECT INVESTMENTS IN ROMANIA
145
The chart in Fig 4 clearly shows the effect of Romania’s increasingly strong integration into the Euro-Atlantic structures. In 1991–2003, if, according to the number of companies, there were six Near and Middle East countries in the first 15 (Turkey–3, Iraq–5, Syria–6, etc.), in 2004–2008, Turkey only remained among the first 15 (position 10).
IRAQ
LEBANON
CYPRUSSPAIN
AUSTRALIA PANAMA
PORTUGAL
GIBRALTAR
IRANJORDAN
SYRIA
USA
HUNGARYFRANCE
AUSTRIA
ISRAEL
GERMANYITALY
TURKEY
CHINA
UK
GREECE
NETHERLANDSMOLDOVA
SWITZERLANDBELGIUM
CANADA
SWEDEN
BULGARIA
CZECK REPUBLIK
LUXEMBOURGIRELAND
POLANDDANEMARK
BRITISH VIRGIN ISLANDS
LIECHTENSTEIN
JAPANSOUTH KOREA
ICELAND
MARSHALL ISLANDS
WITHOUT CITIZENSHIP
NETHERLANDS ANTILLES
EGYPT
-50
-40
-30
-20
-10
0
10
20
30
0 5 10 15 20 25 30 35 40 45 50
Rank 1991-2003
Ran
k di
ffere
nce
(199
1-20
03 a
nd 2
004-
2008
)
Source: Companies with foreign participation in capital. Monthly statistical synthesis.
National Trade Register Office (processed data).
Fig. 4. Rank variation of the countries by number of invested firms in Romania (comparatively 1991-2003 si 2004-2008).
The number of companies coming from Asia decreased very much, and the countries
that used to be the main investors occupied only low-rank positions in 2004–2008. The chart above is relevant and it shows that the group of such countries as Iraq, Syria, Iran, Jordan, Lebanon, and Egypt lost important places in the rank of the countries investing in Romania. Turkey and China occupied significantly lower positions – from places three and four they dropped dramatically to 10 and 15. Besides political effects, generated by the difficulty of the Iranian, Iraqi, and Syrian citizens to establish new companies in Romania, there are also the effects of the Romanian economy and society dynamics. The small foreign firms that, in the first post-transition decade, used to trade goods coming from the Asian countries, but also from Egypt and Turkey, lost the battle with the great commercial companies that entered the Romanian market after 2004. At the same time, the niches occupied by those firms before 2000 have been largely taken over by companies with Romanian capital cooperating with great international companies.
4. CONCLUSIONS
The study of the foreign investment dynamics in Romania demonstrates the strong connection between their volume and the political stability; improvement of the economic-social milieu; and increase of Romania’s credibility. Romania’s accessions to NATO and EU have increased the guarantee degree of the foreign investments and have coupled the
I. IANOŞ
146
country with the global economy. Despite the economic crisis that dominated the world in 2009, the foreign investments in Romania were rather important (in the first ten months they were of about € 940 million).
At the same time, the dynamics of the foreign investment structure by the main economic activities shows an increase in the number of professional service enterprises and a drop to almost one half of the wholesale and retail ones. The same trend is to be found in the invested capital structure that diminished its weight in industrial activities, while increasing in professional services.
The dynamics of the number of enterprises in the intervals under study, 1991–2003 and 2004–2008, demonstrates a less attractiveness to foreign small and middle companies coming from Near and Middle East in comparison with the great Western European investors.
Although the Romanian market is important in this part of Europe, the prospective evolution of the foreign investments is difficult to tell. The contradictory signs of the world economic crisis becoming weaker lead to a reticent attitude towards the volume of the future investments. It is however sure that for a long-lasting social-economic development, the endogenous resources and investments should be reevaluated for supporting the autochthonous investors, at least at a local and regional level. Thus, the total dependence of the local and regional economies on the foreign investments – that “easy come, easy go” – can be avoided!
R E F E R E N C E S
1. Agnew, J. (2001), How Many Europes? European Urban and Regional Studies, 8, 1. 2. Bailey, D., Driffield, N. (2002), Hymer and Uneven Development Revisited: Foreign Direct Investment
and Regional Inequalities, Political Economy, 21. 3. Guran Liliana (2000), Investiţiile străine directe în România, Edit. tehnică, Bucureşti. 4. Hardy, J. (1998), Cathedrals in the Desert? Transnationals, Corporate Strategy and Locality in Wroclaw,
Regional Studies, 32. 5. Ianoş, I., Guran, Liliana (1993), Regionale Aspekte ausländischer Investitionen in Rumänien seit 1990,
Österreichische Osthefte, 35, 4. 6. Ianoş, I., Heller, W. (2007), Minorities and image of local/regional in the context of globalization.
Romania as case study, in Ethnizität in der Globalisierung, Sudosteuropa Studien 74. 7. Mazilu, A. (2003), Investiţiile străine directe şi creşterea performanţei economiei româneşti, in: Romania în
contextul integrării europene şi globalizării, Institutul de Economie Mondială, Bucureşti, 69-70. 8. Pavlinek, P (2004), Regional development implications of foreign direct investment in Central Europe,
European and Regional Studies, 11, 1. 9. Samary, Catherine (2001), Foreign investment and capitalist enterprise,
http://www.internationalviewpoint.org/spip.php?article501, accessed February 4, 2009. 10. Voicilaş, D.M. (2004), Foreign direct investments flows in transition countries and the impact on the
rural development, Proceedings of the 3rd Conference for Young Researchers, Godollo, 385-391. 11. x x x Societati comerciale cu participare straina la capital. Sinteza statistica (69-137). Oficiul National al
Registrului Comertului. (Companies with foreign participation in capital. Monthly statistical synthesis. National Trade Register Office), Bucureşti.
STUDIA UNIVERSITATIS BABEŞ-BOLYAI, GEOGRAPHIA, LV, 2, 2010
2009 PRESIDENTIAL ELECTIONS IN ROMANIA. FIRST ROUND (NOVEMBER 22) AND SECOND ROUND (DECEMBER 6)
GR. P. POP1
ABSTRACT. – 2009 Presidential Elections in Romania. First Round (November 22) and Second Round (December 6). Until 2004, the presidential elections were held together with the Parliamentary ones. Afterwards, the legislation changed and a five-year period from one presidential election to another was established. As a result, the analysed event took place at the end of 2009, on November 22 (the first round) and December 6 (the second round). 12 candidates (table 1) were enrolled for the first round. 18,293,277 voters were comprised on the electoral lists in the entire country, of which 9,946,748 (54.37%) actually voted. There were 9,718,840 (97.71%) valid votes, while 227,446 (2.29%) votes were declared void. As a result of the first round of elections, only four candidates out of 12 gained more than 5% of the total of valid expressed (9,718,840). Only two candidates managed to obtain more than 30% of the votes: T. Băsescu (32.45%) and M. Geoană (31.15%), the third candidate, C. Antonescu, received 20.02%, while the fourth, C.V. Tudor, was preferred by only 5.56% of the voters. Other five candidates obtained a percentage below 1% (see table 1). Compared to this situation at national level, at county level T. Băsescu obtained most votes in Arad County (46.79%) and less votes in Botoşani County (23.85%), without taking into consideration the votes achieved abroad (56.05%) and in Covasna (19.77%) and Harghita (12.70%) counties. M. Geoană, as the first runner-up, was most voted in Olt County (45.81%) and less voted in Cluj County (19.41%), except for the two counties of Covasna (9.87%) and Harghita (5.69%), where the Hungarian voters had their own candidate, and the voters abroad (12.41%). The second runner-up, C. Antonescu, had his best result in Bucharest - Sector 1 (30.28%) and in Braşov County (27.18%), and the worst result in Dâmboviţa County (12.62%), of course with the exception of the two counties with a Hungarian majority, Harghita (5.44%) and Covasna (9.90%) (table 2). This aforementioned manner of territorial representation is illustrated similarly in the analysis by geographical-historical regions. T. Băsescu obtained 41.50% in Banat, and 29.67% of the votes in Oltenia. M. Geoană was most voted in Oltenia (41.47%) and less voted in Transylvania (21.75%). C. Antonescu obtained 28.50% in Bucharest and only 17.67% in Dobrudja. The second round, held on December 6, 2009, was much simpler than the first one, because the competition was only between the first two candidates, T. Băsescu and M. Geoană. The second round took place under the condition in which the number of voters included on the electoral lists was 18,303,224. The turnout was 58.02%, meaning that 10,620,116 people voted, of which 10,481,568 votes were valid (98.69%), while 138,548 (1.31%) were null. At the end of the election process, the final result was very close between the two candidates. T. Băsescu obtained 5,275,808 votes (50.33% of the valid votes) while M. Geoană achieved 5,205,760 votes (49.67%) accounted from the above-mentioned total. The difference between the two candidates was small, 70,048 votes in absolute numbers, and 0.66% in relative values. Regarding the highest and lowest relative (percentage) values of votes at county level, T. Băsescu received a maximum of 63.96% out of 224,185 valid votes in Arad County and a minimum of 38.01% out of 201,381 votes in Botoşani County, while M. Geoană obtained 61.99% of the votes in Botoşani County and 36.07% in Arad County. Analyzing the number of votes achieved by the two candidates in the geographical-historical regions, it came out that T. Băsescu got most votes in Banat (59.30% out of 720,881 valid votes) and less votes in Oltenia (43.94% out of 1,177,775 valid votes). M. Geoană obtained most votes in Oltenia (50.06%) and fewer votes in Banat (40.70%). Keywords: presidential elections, Romania, 2009, first round (12 candidates), second round
(two candidates), territorial distribution, counties, geographical-historical provinces.
1 Babeş-Bolyai University, Faculty of Geography, 400006, Cluj-Napoca, Romania, e-mail:
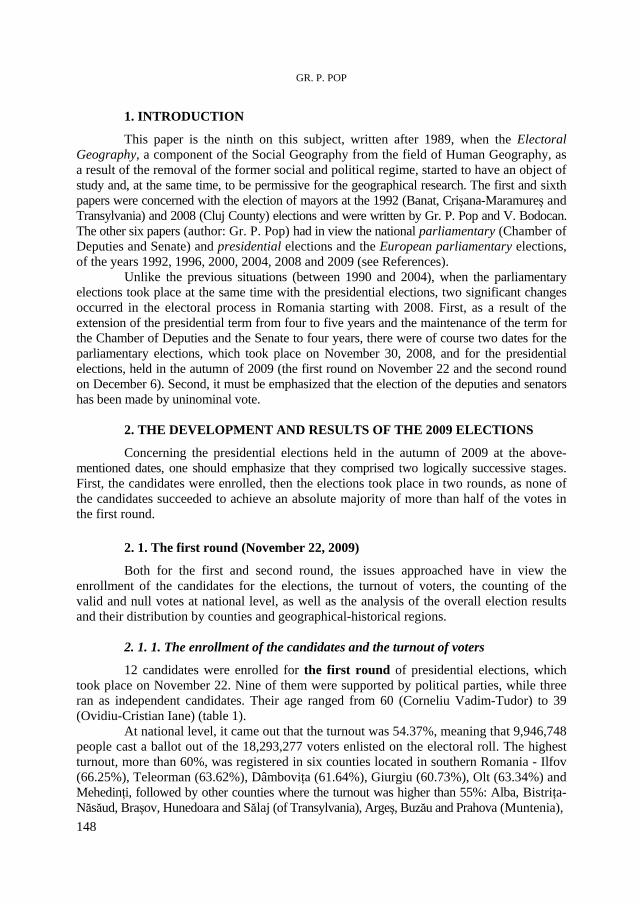
GR. P. POP
148
1. INTRODUCTION
This paper is the ninth on this subject, written after 1989, when the Electoral Geography, a component of the Social Geography from the field of Human Geography, as a result of the removal of the former social and political regime, started to have an object of study and, at the same time, to be permissive for the geographical research. The first and sixth papers were concerned with the election of mayors at the 1992 (Banat, Crişana-Maramureş and Transylvania) and 2008 (Cluj County) elections and were written by Gr. P. Pop and V. Bodocan. The other six papers (author: Gr. P. Pop) had in view the national parliamentary (Chamber of Deputies and Senate) and presidential elections and the European parliamentary elections, of the years 1992, 1996, 2000, 2004, 2008 and 2009 (see References). Unlike the previous situations (between 1990 and 2004), when the parliamentary elections took place at the same time with the presidential elections, two significant changes occurred in the electoral process in Romania starting with 2008. First, as a result of the extension of the presidential term from four to five years and the maintenance of the term for the Chamber of Deputies and the Senate to four years, there were of course two dates for the parliamentary elections, which took place on November 30, 2008, and for the presidential elections, held in the autumn of 2009 (the first round on November 22 and the second round on December 6). Second, it must be emphasized that the election of the deputies and senators has been made by uninominal vote.
2. THE DEVELOPMENT AND RESULTS OF THE 2009 ELECTIONS
Concerning the presidential elections held in the autumn of 2009 at the above-mentioned dates, one should emphasize that they comprised two logically successive stages. First, the candidates were enrolled, then the elections took place in two rounds, as none of the candidates succeeded to achieve an absolute majority of more than half of the votes in the first round. 2. 1. The first round (November 22, 2009)
Both for the first and second round, the issues approached have in view the enrollment of the candidates for the elections, the turnout of voters, the counting of the valid and null votes at national level, as well as the analysis of the overall election results and their distribution by counties and geographical-historical regions.
2. 1. 1. The enrollment of the candidates and the turnout of voters
12 candidates were enrolled for the first round of presidential elections, which took place on November 22. Nine of them were supported by political parties, while three ran as independent candidates. Their age ranged from 60 (Corneliu Vadim-Tudor) to 39 (Ovidiu-Cristian Iane) (table 1). At national level, it came out that the turnout was 54.37%, meaning that 9,946,748 people cast a ballot out of the 18,293,277 voters enlisted on the electoral roll. The highest turnout, more than 60%, was registered in six counties located in southern Romania - Ilfov (66.25%), Teleorman (63.62%), Dâmboviţa (61.64%), Giurgiu (60.73%), Olt (63.34%) and Mehedinţi, followed by other counties where the turnout was higher than 55%: Alba, Bistriţa-Năsăud, Braşov, Hunedoara and Sălaj (of Transylvania), Argeş, Buzău and Prahova (Muntenia),
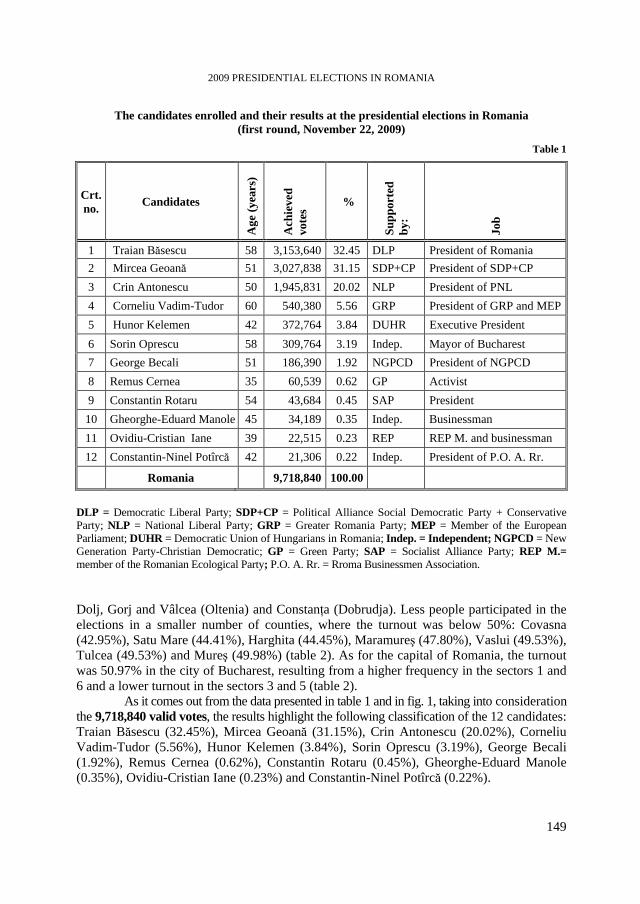
2009 PRESIDENTIAL ELECTIONS IN ROMANIA
149
The candidates enrolled and their results at the presidential elections in Romania (first round, November 22, 2009)
Table 1
Crt. no. Candidates
Age
(yea
rs)
Ach
ieve
d vo
tes
%
Supp
orte
d by
:
Job
1 Traian Băsescu 58 3,153,640 32.45 DLP President of Romania 2 Mircea Geoană 51 3,027,838 31.15 SDP+CP President of SDP+CP 3 Crin Antonescu 50 1,945,831 20.02 NLP President of PNL 4 Corneliu Vadim-Tudor 60 540,380 5.56 GRP President of GRP and MEP 5 Hunor Kelemen 42 372,764 3.84 DUHR Executive President 6 Sorin Oprescu 58 309,764 3.19 Indep. Mayor of Bucharest 7 George Becali 51 186,390 1.92 NGPCD President of NGPCD 8 Remus Cernea 35 60,539 0.62 GP Activist 9 Constantin Rotaru 54 43,684 0.45 SAP President 10 Gheorghe-Eduard Manole 45 34,189 0.35 Indep. Businessman 11 Ovidiu-Cristian Iane 39 22,515 0.23 REP REP M. and businessman 12 Constantin-Ninel Potîrcă 42 21,306 0.22 Indep. President of P.O. A. Rr.
Romania 9,718,840 100.00
DLP = Democratic Liberal Party; SDP+CP = Political Alliance Social Democratic Party + Conservative Party; NLP = National Liberal Party; GRP = Greater Romania Party; MEP = Member of the European Parliament; DUHR = Democratic Union of Hungarians in Romania; Indep. = Independent; NGPCD = New Generation Party-Christian Democratic; GP = Green Party; SAP = Socialist Alliance Party; REP M.= member of the Romanian Ecological Party; P.O. A. Rr. = Rroma Businessmen Association. Dolj, Gorj and Vâlcea (Oltenia) and Constanţa (Dobrudja). Less people participated in the elections in a smaller number of counties, where the turnout was below 50%: Covasna (42.95%), Satu Mare (44.41%), Harghita (44.45%), Maramureş (47.80%), Vaslui (49.53%), Tulcea (49.53%) and Mureş (49.98%) (table 2). As for the capital of Romania, the turnout was 50.97% in the city of Bucharest, resulting from a higher frequency in the sectors 1 and 6 and a lower turnout in the sectors 3 and 5 (table 2).
As it comes out from the data presented in table 1 and in fig. 1, taking into consideration the 9,718,840 valid votes, the results highlight the following classification of the 12 candidates: Traian Băsescu (32.45%), Mircea Geoană (31.15%), Crin Antonescu (20.02%), Corneliu Vadim-Tudor (5.56%), Hunor Kelemen (3.84%), Sorin Oprescu (3.19%), George Becali (1.92%), Remus Cernea (0.62%), Constantin Rotaru (0.45%), Gheorghe-Eduard Manole (0.35%), Ovidiu-Cristian Iane (0.23%) and Constantin-Ninel Potîrcă (0.22%).
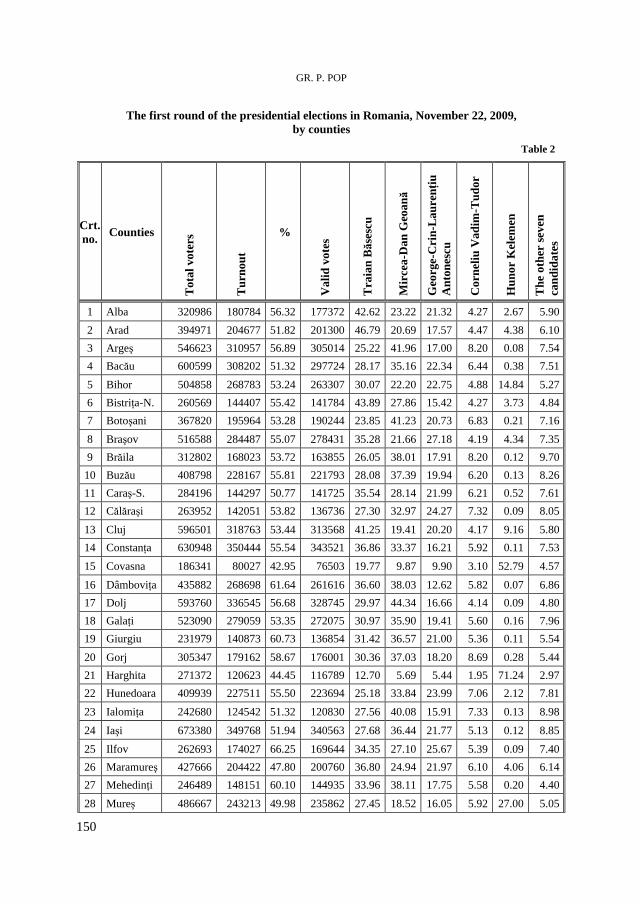
GR. P. POP
150
The first round of the presidential elections in Romania, November 22, 2009, by counties
Table 2
Crt. no. Counties
Tot
al v
oter
s
Tur
nout
%
Val
id v
otes
Tra
ian
Băs
escu
Mir
cea-
Dan
Geo
ană
Geo
rge-
Cri
n-L
aure
nţiu
A
nton
escu
Cor
neliu
Vad
im-T
udor
Hun
or K
elem
en
The
oth
er se
ven
cand
idat
es
1 Alba 320986 180784 56.32 177372 42.62 23.22 21.32 4.27 2.67 5.90 2 Arad 394971 204677 51.82 201300 46.79 20.69 17.57 4.47 4.38 6.10 3 Argeş 546623 310957 56.89 305014 25.22 41.96 17.00 8.20 0.08 7.54 4 Bacău 600599 308202 51.32 297724 28.17 35.16 22.34 6.44 0.38 7.51
5 Bihor 504858 268783 53.24 263307 30.07 22.20 22.75 4.88 14.84 5.27 6 Bistriţa-N. 260569 144407 55.42 141784 43.89 27.86 15.42 4.27 3.73 4.84 7 Botoşani 367820 195964 53.28 190244 23.85 41.23 20.73 6.83 0.21 7.16
8 Braşov 516588 284487 55.07 278431 35.28 21.66 27.18 4.19 4.34 7.35 9 Brăila 312802 168023 53.72 163855 26.05 38.01 17.91 8.20 0.12 9.70
10 Buzău 408798 228167 55.81 221793 28.08 37.39 19.94 6.20 0.13 8.26 11 Caraş-S. 284196 144297 50.77 141725 35.54 28.14 21.99 6.21 0.52 7.61 12 Călăraşi 263952 142051 53.82 136736 27.30 32.97 24.27 7.32 0.09 8.05
13 Cluj 596501 318763 53.44 313568 41.25 19.41 20.20 4.17 9.16 5.80 14 Constanţa 630948 350444 55.54 343521 36.86 33.37 16.21 5.92 0.11 7.53
15 Covasna 186341 80027 42.95 76503 19.77 9.87 9.90 3.10 52.79 4.57
16 Dâmboviţa 435882 268698 61.64 261616 36.60 38.03 12.62 5.82 0.07 6.86 17 Dolj 593760 336545 56.68 328745 29.97 44.34 16.66 4.14 0.09 4.80 18 Galaţi 523090 279059 53.35 272075 30.97 35.90 19.41 5.60 0.16 7.96 19 Giurgiu 231979 140873 60.73 136854 31.42 36.57 21.00 5.36 0.11 5.54
20 Gorj 305347 179162 58.67 176001 30.36 37.03 18.20 8.69 0.28 5.44 21 Harghita 271372 120623 44.45 116789 12.70 5.69 5.44 1.95 71.24 2.97 22 Hunedoara 409939 227511 55.50 223694 25.18 33.84 23.99 7.06 2.12 7.81
23 Ialomiţa 242680 124542 51.32 120830 27.56 40.08 15.91 7.33 0.13 8.98
24 Iaşi 673380 349768 51.94 340563 27.68 36.44 21.77 5.13 0.12 8.85
25 Ilfov 262693 174027 66.25 169644 34.35 27.10 25.67 5.39 0.09 7.40 26 Maramureş 427666 204422 47.80 200760 36.80 24.94 21.97 6.10 4.06 6.14 27 Mehedinţi 246489 148151 60.10 144935 33.96 38.11 17.75 5.58 0.20 4.40
28 Mureş 486667 243213 49.98 235862 27.45 18.52 16.05 5.92 27.00 5.05
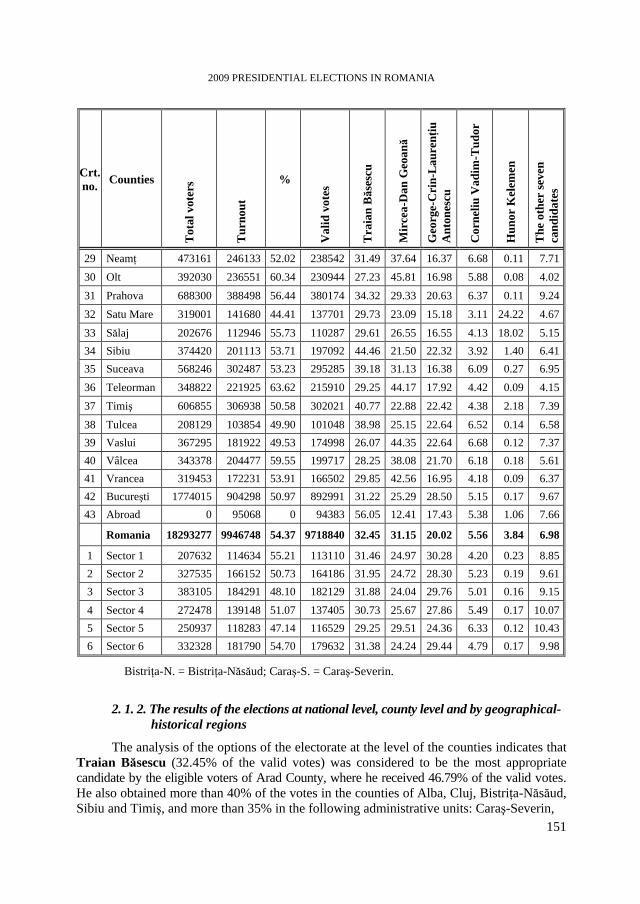
2009 PRESIDENTIAL ELECTIONS IN ROMANIA
151
Crt. no. Counties
Tot
al v
oter
s
Tur
nout
%
Val
id v
otes
Tra
ian
Băs
escu
Mir
cea-
Dan
Geo
ană
Geo
rge-
Cri
n-L
aure
nţiu
A
nton
escu
Cor
neliu
Vad
im-T
udor
Hun
or K
elem
en
The
oth
er se
ven
cand
idat
es
29 Neamţ 473161 246133 52.02 238542 31.49 37.64 16.37 6.68 0.11 7.71
30 Olt 392030 236551 60.34 230944 27.23 45.81 16.98 5.88 0.08 4.02
31 Prahova 688300 388498 56.44 380174 34.32 29.33 20.63 6.37 0.11 9.24
32 Satu Mare 319001 141680 44.41 137701 29.73 23.09 15.18 3.11 24.22 4.67
33 Sălaj 202676 112946 55.73 110287 29.61 26.55 16.55 4.13 18.02 5.15 34 Sibiu 374420 201113 53.71 197092 44.46 21.50 22.32 3.92 1.40 6.41 35 Suceava 568246 302487 53.23 295285 39.18 31.13 16.38 6.09 0.27 6.95
36 Teleorman 348822 221925 63.62 215910 29.25 44.17 17.92 4.42 0.09 4.15
37 Timiş 606855 306938 50.58 302021 40.77 22.88 22.42 4.38 2.18 7.39
38 Tulcea 208129 103854 49.90 101048 38.98 25.15 22.64 6.52 0.14 6.58 39 Vaslui 367295 181922 49.53 174998 26.07 44.35 22.64 6.68 0.12 7.37 40 Vâlcea 343378 204477 59.55 199717 28.25 38.08 21.70 6.18 0.18 5.61 41 Vrancea 319453 172231 53.91 166502 29.85 42.56 16.95 4.18 0.09 6.37 42 Bucureşti 1774015 904298 50.97 892991 31.22 25.29 28.50 5.15 0.17 9.67 43 Abroad 0 95068 0 94383 56.05 12.41 17.43 5.38 1.06 7.66
Romania 18293277 9946748 54.37 9718840 32.45 31.15 20.02 5.56 3.84 6.98
1 Sector 1 207632 114634 55.21 113110 31.46 24.97 30.28 4.20 0.23 8.85 2 Sector 2 327535 166152 50.73 164186 31.95 24.72 28.30 5.23 0.19 9.61 3 Sector 3 383105 184291 48.10 182129 31.88 24.04 29.76 5.01 0.16 9.15
4 Sector 4 272478 139148 51.07 137405 30.73 25.67 27.86 5.49 0.17 10.07 5 Sector 5 250937 118283 47.14 116529 29.25 29.51 24.36 6.33 0.12 10.43 6 Sector 6 332328 181790 54.70 179632 31.38 24.24 29.44 4.79 0.17 9.98
Bistriţa-N. = Bistriţa-Năsăud; Caraş-S. = Caraş-Severin.
2. 1. 2. The results of the elections at national level, county level and by geographical- historical regions
The analysis of the options of the electorate at the level of the counties indicates that Traian Băsescu (32.45% of the valid votes) was considered to be the most appropriate candidate by the eligible voters of Arad County, where he received 46.79% of the valid votes. He also obtained more than 40% of the votes in the counties of Alba, Cluj, Bistriţa-Năsăud, Sibiu and Timiş, and more than 35% in the following administrative units: Caraş-Severin,
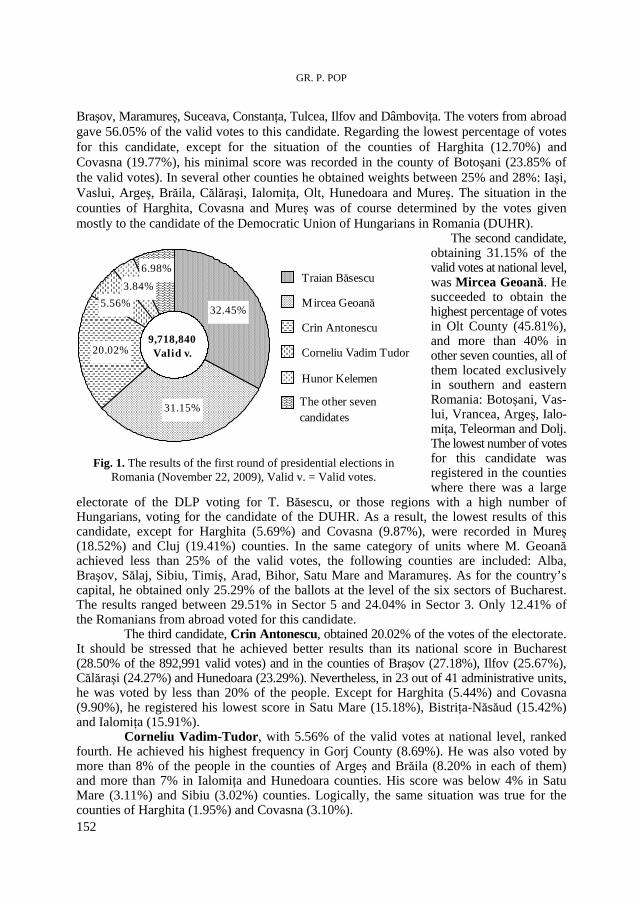
GR. P. POP
152
Braşov, Maramureş, Suceava, Constanţa, Tulcea, Ilfov and Dâmboviţa. The voters from abroad gave 56.05% of the valid votes to this candidate. Regarding the lowest percentage of votes for this candidate, except for the situation of the counties of Harghita (12.70%) and Covasna (19.77%), his minimal score was recorded in the county of Botoşani (23.85% of the valid votes). In several other counties he obtained weights between 25% and 28%: Iaşi, Vaslui, Argeş, Brăila, Călăraşi, Ialomiţa, Olt, Hunedoara and Mureş. The situation in the counties of Harghita, Covasna and Mureş was of course determined by the votes given mostly to the candidate of the Democratic Union of Hungarians in Romania (DUHR).
The second candidate, obtaining 31.15% of the valid votes at national level, was Mircea Geoană. He succeeded to obtain the highest percentage of votes in Olt County (45.81%), and more than 40% in other seven counties, all of them located exclusively in southern and eastern Romania: Botoşani, Vas-lui, Vrancea, Argeş, Ialo-miţa, Teleorman and Dolj. The lowest number of votes for this candidate was registered in the counties where there was a large
electorate of the DLP voting for T. Băsescu, or those regions with a high number of Hungarians, voting for the candidate of the DUHR. As a result, the lowest results of this candidate, except for Harghita (5.69%) and Covasna (9.87%), were recorded in Mureş (18.52%) and Cluj (19.41%) counties. In the same category of units where M. Geoană achieved less than 25% of the valid votes, the following counties are included: Alba, Braşov, Sălaj, Sibiu, Timiş, Arad, Bihor, Satu Mare and Maramureş. As for the country’s capital, he obtained only 25.29% of the ballots at the level of the six sectors of Bucharest. The results ranged between 29.51% in Sector 5 and 24.04% in Sector 3. Only 12.41% of the Romanians from abroad voted for this candidate. The third candidate, Crin Antonescu, obtained 20.02% of the votes of the electorate. It should be stressed that he achieved better results than its national score in Bucharest (28.50% of the 892,991 valid votes) and in the counties of Braşov (27.18%), Ilfov (25.67%), Călăraşi (24.27%) and Hunedoara (23.29%). Nevertheless, in 23 out of 41 administrative units, he was voted by less than 20% of the people. Except for Harghita (5.44%) and Covasna (9.90%), he registered his lowest score in Satu Mare (15.18%), Bistriţa-Năsăud (15.42%) and Ialomiţa (15.91%). Corneliu Vadim-Tudor, with 5.56% of the valid votes at national level, ranked fourth. He achieved his highest frequency in Gorj County (8.69%). He was also voted by more than 8% of the people in the counties of Argeş and Brăila (8.20% in each of them) and more than 7% in Ialomiţa and Hunedoara counties. His score was below 4% in Satu Mare (3.11%) and Sibiu (3.02%) counties. Logically, the same situation was true for the counties of Harghita (1.95%) and Covasna (3.10%).
31.15%
20.02%
32.45%
3.84%5.56%
6.98% Traian Băsescu
Mircea Geoană
Crin Antonescu
Corneliu Vadim Tudor
Hunor Kelemen
The other seven candidates
9,718,840 Valid v.
Fig. 1. The results of the first round of presidential elections in Romania (November 22, 2009), Valid v. = Valid votes.
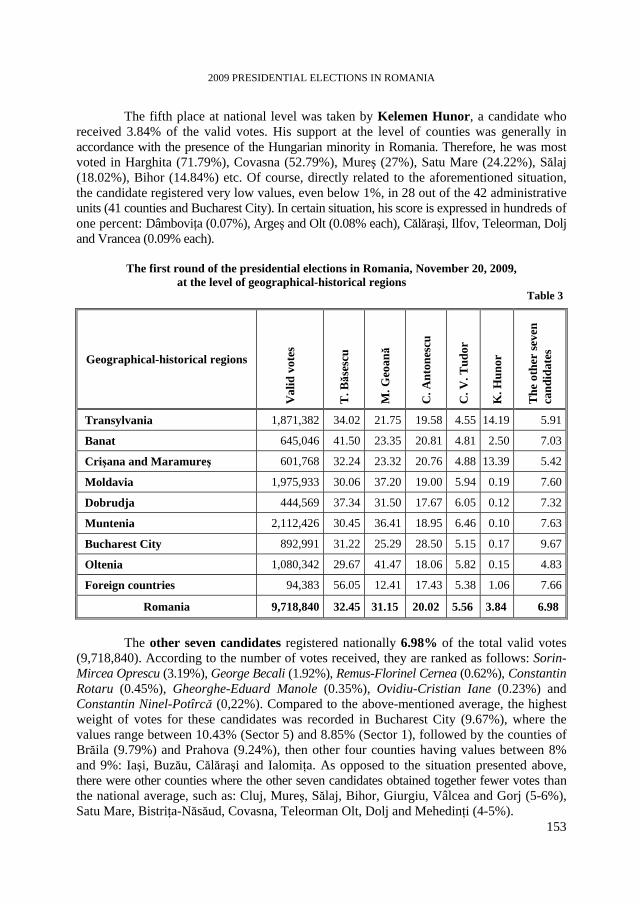
2009 PRESIDENTIAL ELECTIONS IN ROMANIA
153
The fifth place at national level was taken by Kelemen Hunor, a candidate who received 3.84% of the valid votes. His support at the level of counties was generally in accordance with the presence of the Hungarian minority in Romania. Therefore, he was most voted in Harghita (71.79%), Covasna (52.79%), Mureş (27%), Satu Mare (24.22%), Sălaj (18.02%), Bihor (14.84%) etc. Of course, directly related to the aforementioned situation, the candidate registered very low values, even below 1%, in 28 out of the 42 administrative units (41 counties and Bucharest City). In certain situation, his score is expressed in hundreds of one percent: Dâmboviţa (0.07%), Argeş and Olt (0.08% each), Călăraşi, Ilfov, Teleorman, Dolj and Vrancea (0.09% each).
The first round of the presidential elections in Romania, November 20, 2009,
at the level of geographical-historical regions Table 3
Geographical-historical regions
Val
id v
otes
T. B
ăses
cu
M. G
eoană
C. A
nton
escu
C. V
. Tud
or
K. H
unor
The
oth
er se
ven
cand
idat
es
Transylvania 1,871,382 34.02 21.75 19.58 4.55 14.19 5.91
Banat 645,046 41.50 23.35 20.81 4.81 2.50 7.03
Crişana and Maramureş 601,768 32.24 23.32 20.76 4.88 13.39 5.42
Moldavia 1,975,933 30.06 37.20 19.00 5.94 0.19 7.60
Dobrudja 444,569 37.34 31.50 17.67 6.05 0.12 7.32
Muntenia 2,112,426 30.45 36.41 18.95 6.46 0.10 7.63
Bucharest City 892,991 31.22 25.29 28.50 5.15 0.17 9.67
Oltenia 1,080,342 29.67 41.47 18.06 5.82 0.15 4.83
Foreign countries 94,383 56.05 12.41 17.43 5.38 1.06 7.66
Romania 9,718,840 32.45 31.15 20.02 5.56 3.84 6.98
The other seven candidates registered nationally 6.98% of the total valid votes
(9,718,840). According to the number of votes received, they are ranked as follows: Sorin-Mircea Oprescu (3.19%), George Becali (1.92%), Remus-Florinel Cernea (0.62%), Constantin Rotaru (0.45%), Gheorghe-Eduard Manole (0.35%), Ovidiu-Cristian Iane (0.23%) and Constantin Ninel-Potîrcă (0,22%). Compared to the above-mentioned average, the highest weight of votes for these candidates was recorded in Bucharest City (9.67%), where the values range between 10.43% (Sector 5) and 8.85% (Sector 1), followed by the counties of Brăila (9.79%) and Prahova (9.24%), then other four counties having values between 8% and 9%: Iaşi, Buzău, Călăraşi and Ialomiţa. As opposed to the situation presented above, there were other counties where the other seven candidates obtained together fewer votes than the national average, such as: Cluj, Mureş, Sălaj, Bihor, Giurgiu, Vâlcea and Gorj (5-6%), Satu Mare, Bistriţa-Năsăud, Covasna, Teleorman Olt, Dolj and Mehedinţi (4-5%).
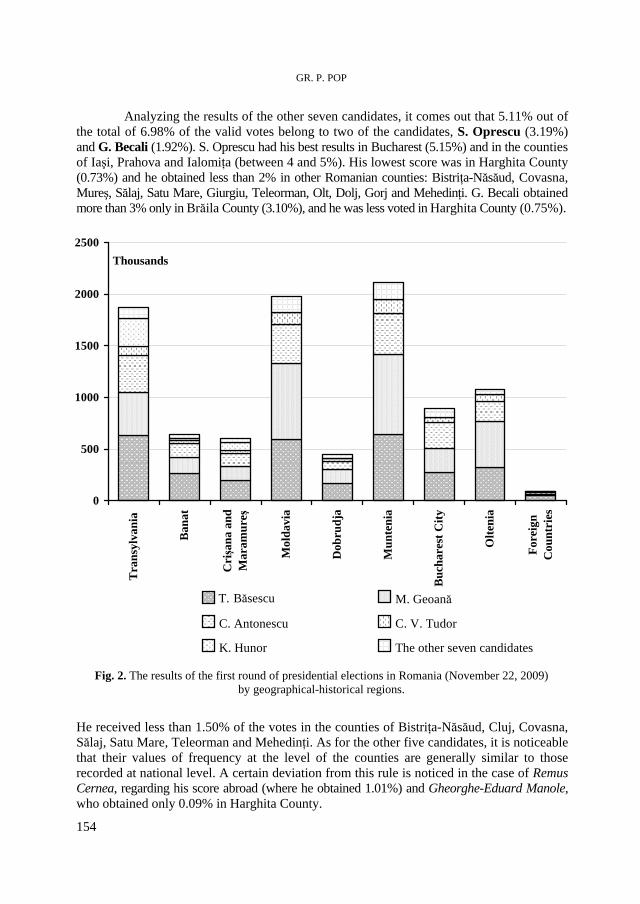
GR. P. POP
154
Analyzing the results of the other seven candidates, it comes out that 5.11% out of the total of 6.98% of the valid votes belong to two of the candidates, S. Oprescu (3.19%) and G. Becali (1.92%). S. Oprescu had his best results in Bucharest (5.15%) and in the counties of Iaşi, Prahova and Ialomiţa (between 4 and 5%). His lowest score was in Harghita County (0.73%) and he obtained less than 2% in other Romanian counties: Bistriţa-Năsăud, Covasna, Mureş, Sălaj, Satu Mare, Giurgiu, Teleorman, Olt, Dolj, Gorj and Mehedinţi. G. Becali obtained more than 3% only in Brăila County (3.10%), and he was less voted in Harghita County (0.75%).
Fig. 2. The results of the first round of presidential elections in Romania (November 22, 2009) by geographical-historical regions.
He received less than 1.50% of the votes in the counties of Bistriţa-Năsăud, Cluj, Covasna, Sălaj, Satu Mare, Teleorman and Mehedinţi. As for the other five candidates, it is noticeable that their values of frequency at the level of the counties are generally similar to those recorded at national level. A certain deviation from this rule is noticed in the case of Remus Cernea, regarding his score abroad (where he obtained 1.01%) and Gheorghe-Eduard Manole, who obtained only 0.09% in Harghita County.
0
500
1000
1500
2000
2500
Tra
nsyl
vani
a
Ban
at
Crişa
na a
ndM
aram
ureş
Mol
davi
a
Dob
rudj
a
Mun
teni
a
Buc
hare
st C
ity
Olte
nia
Fore
ign
Cou
ntri
es
Thousands
M. Geoană
C. Antonescu C. V. Tudor
K. Hunor The other seven candidates
T. Băsescu
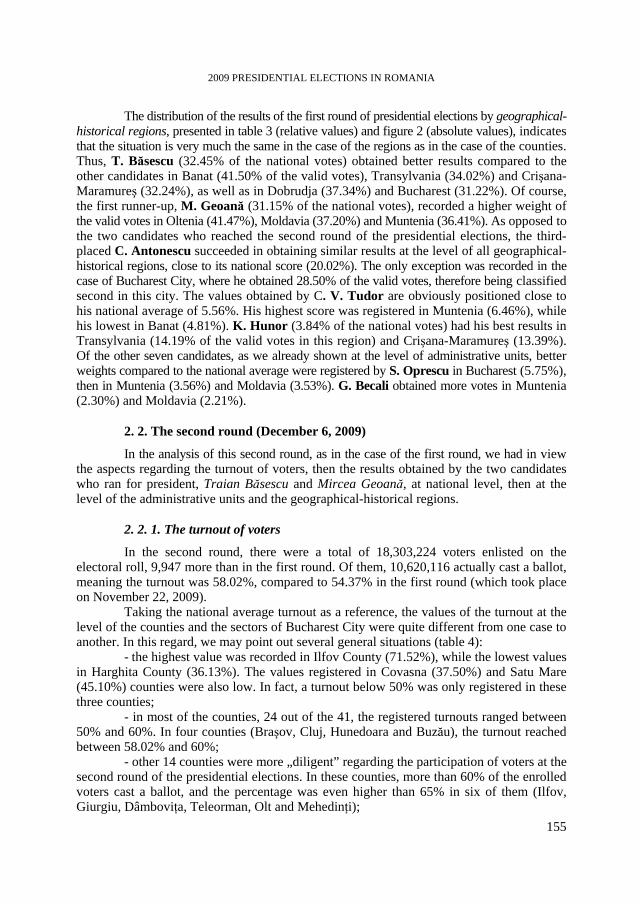
2009 PRESIDENTIAL ELECTIONS IN ROMANIA
155
The distribution of the results of the first round of presidential elections by geographical-historical regions, presented in table 3 (relative values) and figure 2 (absolute values), indicates that the situation is very much the same in the case of the regions as in the case of the counties. Thus, T. Băsescu (32.45% of the national votes) obtained better results compared to the other candidates in Banat (41.50% of the valid votes), Transylvania (34.02%) and Crişana-Maramureş (32.24%), as well as in Dobrudja (37.34%) and Bucharest (31.22%). Of course, the first runner-up, M. Geoană (31.15% of the national votes), recorded a higher weight of the valid votes in Oltenia (41.47%), Moldavia (37.20%) and Muntenia (36.41%). As opposed to the two candidates who reached the second round of the presidential elections, the third-placed C. Antonescu succeeded in obtaining similar results at the level of all geographical-historical regions, close to its national score (20.02%). The only exception was recorded in the case of Bucharest City, where he obtained 28.50% of the valid votes, therefore being classified second in this city. The values obtained by C. V. Tudor are obviously positioned close to his national average of 5.56%. His highest score was registered in Muntenia (6.46%), while his lowest in Banat (4.81%). K. Hunor (3.84% of the national votes) had his best results in Transylvania (14.19% of the valid votes in this region) and Crişana-Maramureş (13.39%). Of the other seven candidates, as we already shown at the level of administrative units, better weights compared to the national average were registered by S. Oprescu in Bucharest (5.75%), then in Muntenia (3.56%) and Moldavia (3.53%). G. Becali obtained more votes in Muntenia (2.30%) and Moldavia (2.21%). 2. 2. The second round (December 6, 2009)
In the analysis of this second round, as in the case of the first round, we had in view the aspects regarding the turnout of voters, then the results obtained by the two candidates who ran for president, Traian Băsescu and Mircea Geoană, at national level, then at the level of the administrative units and the geographical-historical regions. 2. 2. 1. The turnout of voters
In the second round, there were a total of 18,303,224 voters enlisted on the electoral roll, 9,947 more than in the first round. Of them, 10,620,116 actually cast a ballot, meaning the turnout was 58.02%, compared to 54.37% in the first round (which took place on November 22, 2009).
Taking the national average turnout as a reference, the values of the turnout at the level of the counties and the sectors of Bucharest City were quite different from one case to another. In this regard, we may point out several general situations (table 4):
- the highest value was recorded in Ilfov County (71.52%), while the lowest values in Harghita County (36.13%). The values registered in Covasna (37.50%) and Satu Mare (45.10%) counties were also low. In fact, a turnout below 50% was only registered in these three counties;
- in most of the counties, 24 out of the 41, the registered turnouts ranged between 50% and 60%. In four counties (Braşov, Cluj, Hunedoara and Buzău), the turnout reached between 58.02% and 60%;
- other 14 counties were more „diligent” regarding the participation of voters at the second round of the presidential elections. In these counties, more than 60% of the enrolled voters cast a ballot, and the percentage was even higher than 65% in six of them (Ilfov, Giurgiu, Dâmboviţa, Teleorman, Olt and Mehedinţi);
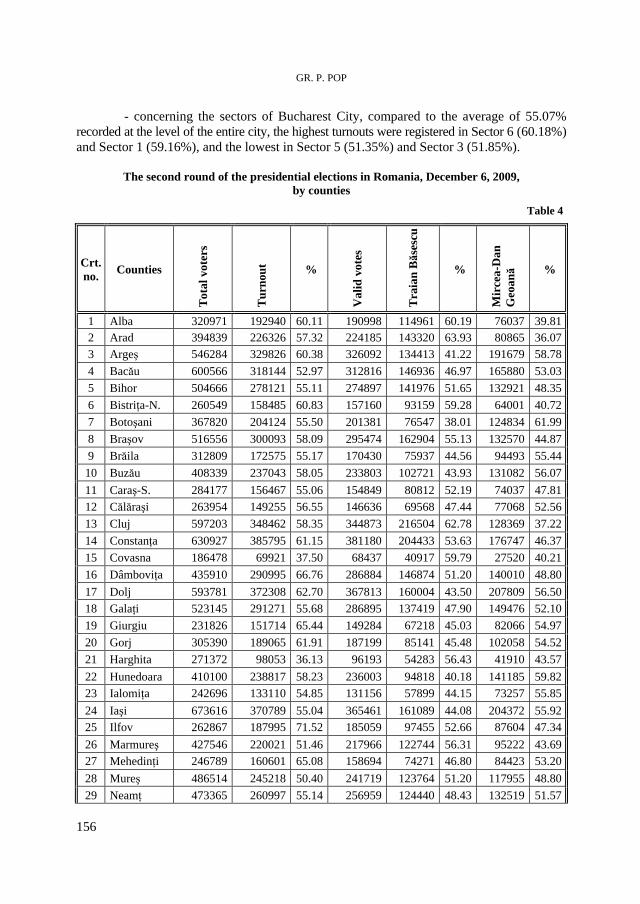
GR. P. POP
156
- concerning the sectors of Bucharest City, compared to the average of 55.07% recorded at the level of the entire city, the highest turnouts were registered in Sector 6 (60.18%) and Sector 1 (59.16%), and the lowest in Sector 5 (51.35%) and Sector 3 (51.85%).
The second round of the presidential elections in Romania, December 6, 2009, by counties
Table 4
Crt. no. Counties
Tot
al v
oter
s
Tur
nout
%
Val
id v
otes
Tra
ian
Băs
escu
%
Mir
cea-
Dan
G
eoană %
1 Alba 320971 192940 60.11 190998 114961 60.19 76037 39.81 2 Arad 394839 226326 57.32 224185 143320 63.93 80865 36.07 3 Argeş 546284 329826 60.38 326092 134413 41.22 191679 58.78 4 Bacău 600566 318144 52.97 312816 146936 46.97 165880 53.03 5 Bihor 504666 278121 55.11 274897 141976 51.65 132921 48.35 6 Bistriţa-N. 260549 158485 60.83 157160 93159 59.28 64001 40.72 7 Botoşani 367820 204124 55.50 201381 76547 38.01 124834 61.99 8 Braşov 516556 300093 58.09 295474 162904 55.13 132570 44.87 9 Brăila 312809 172575 55.17 170430 75937 44.56 94493 55.44 10 Buzău 408339 237043 58.05 233803 102721 43.93 131082 56.07 11 Caraş-S. 284177 156467 55.06 154849 80812 52.19 74037 47.81 12 Călăraşi 263954 149255 56.55 146636 69568 47.44 77068 52.56 13 Cluj 597203 348462 58.35 344873 216504 62.78 128369 37.22 14 Constanţa 630927 385795 61.15 381180 204433 53.63 176747 46.37 15 Covasna 186478 69921 37.50 68437 40917 59.79 27520 40.21 16 Dâmboviţa 435910 290995 66.76 286884 146874 51.20 140010 48.80 17 Dolj 593781 372308 62.70 367813 160004 43.50 207809 56.50 18 Galaţi 523145 291271 55.68 286895 137419 47.90 149476 52.10 19 Giurgiu 231826 151714 65.44 149284 67218 45.03 82066 54.97 20 Gorj 305390 189065 61.91 187199 85141 45.48 102058 54.52 21 Harghita 271372 98053 36.13 96193 54283 56.43 41910 43.57 22 Hunedoara 410100 238817 58.23 236003 94818 40.18 141185 59.82 23 Ialomiţa 242696 133110 54.85 131156 57899 44.15 73257 55.85 24 Iaşi 673616 370789 55.04 365461 161089 44.08 204372 55.92 25 Ilfov 262867 187995 71.52 185059 97455 52.66 87604 47.34 26 Marmureş 427546 220021 51.46 217966 122744 56.31 95222 43.69 27 Mehedinţi 246789 160601 65.08 158694 74271 46.80 84423 53.20 28 Mureş 486514 245218 50.40 241719 123764 51.20 117955 48.80 29 Neamţ 473365 260997 55.14 256959 124440 48.43 132519 51.57
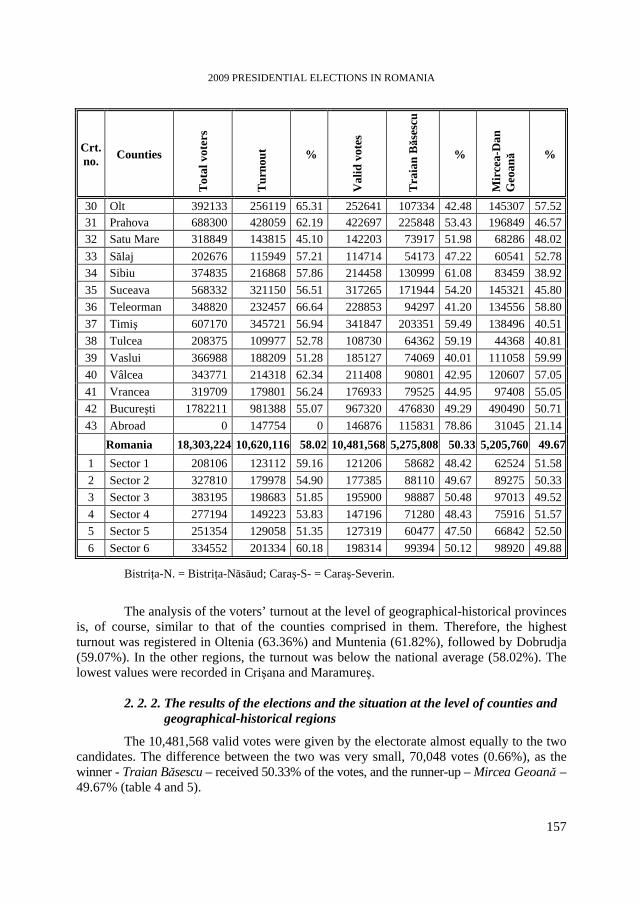
2009 PRESIDENTIAL ELECTIONS IN ROMANIA
157
Crt. no. Counties
Tot
al v
oter
s
Tur
nout
%
Val
id v
otes
Tra
ian
Băs
escu
%
Mir
cea-
Dan
G
eoană %
30 Olt 392133 256119 65.31 252641 107334 42.48 145307 57.52 31 Prahova 688300 428059 62.19 422697 225848 53.43 196849 46.57 32 Satu Mare 318849 143815 45.10 142203 73917 51.98 68286 48.02 33 Sălaj 202676 115949 57.21 114714 54173 47.22 60541 52.78 34 Sibiu 374835 216868 57.86 214458 130999 61.08 83459 38.92 35 Suceava 568332 321150 56.51 317265 171944 54.20 145321 45.80 36 Teleorman 348820 232457 66.64 228853 94297 41.20 134556 58.80 37 Timiş 607170 345721 56.94 341847 203351 59.49 138496 40.51 38 Tulcea 208375 109977 52.78 108730 64362 59.19 44368 40.81 39 Vaslui 366988 188209 51.28 185127 74069 40.01 111058 59.99 40 Vâlcea 343771 214318 62.34 211408 90801 42.95 120607 57.05 41 Vrancea 319709 179801 56.24 176933 79525 44.95 97408 55.05 42 Bucureşti 1782211 981388 55.07 967320 476830 49.29 490490 50.71 43 Abroad 0 147754 0 146876 115831 78.86 31045 21.14 Romania 18,303,224 10,620,116 58.02 10,481,568 5,275,808 50.33 5,205,760 49.67
1 Sector 1 208106 123112 59.16 121206 58682 48.42 62524 51.58 2 Sector 2 327810 179978 54.90 177385 88110 49.67 89275 50.33 3 Sector 3 383195 198683 51.85 195900 98887 50.48 97013 49.52 4 Sector 4 277194 149223 53.83 147196 71280 48.43 75916 51.57 5 Sector 5 251354 129058 51.35 127319 60477 47.50 66842 52.50 6 Sector 6 334552 201334 60.18 198314 99394 50.12 98920 49.88
Bistriţa-N. = Bistriţa-Năsăud; Caraş-S- = Caraş-Severin.
The analysis of the voters’ turnout at the level of geographical-historical provinces is, of course, similar to that of the counties comprised in them. Therefore, the highest turnout was registered in Oltenia (63.36%) and Muntenia (61.82%), followed by Dobrudja (59.07%). In the other regions, the turnout was below the national average (58.02%). The lowest values were recorded in Crişana and Maramureş.
2. 2. 2. The results of the elections and the situation at the level of counties and geographical-historical regions
The 10,481,568 valid votes were given by the electorate almost equally to the two candidates. The difference between the two was very small, 70,048 votes (0.66%), as the winner - Traian Băsescu – received 50.33% of the votes, and the runner-up – Mircea Geoană – 49.67% (table 4 and 5).
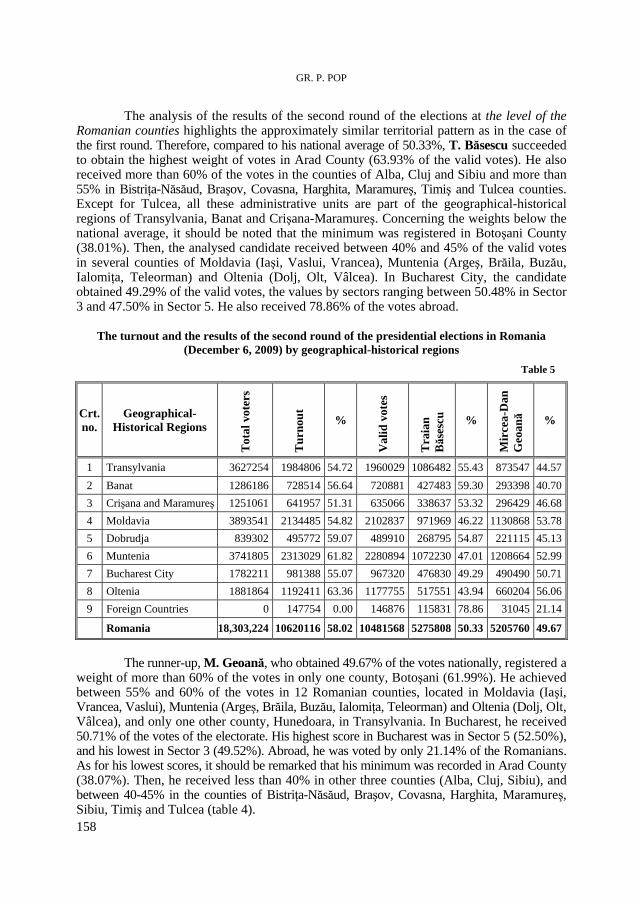
GR. P. POP
158
The analysis of the results of the second round of the elections at the level of the Romanian counties highlights the approximately similar territorial pattern as in the case of the first round. Therefore, compared to his national average of 50.33%, T. Băsescu succeeded to obtain the highest weight of votes in Arad County (63.93% of the valid votes). He also received more than 60% of the votes in the counties of Alba, Cluj and Sibiu and more than 55% in Bistriţa-Năsăud, Braşov, Covasna, Harghita, Maramureş, Timiş and Tulcea counties. Except for Tulcea, all these administrative units are part of the geographical-historical regions of Transylvania, Banat and Crişana-Maramureş. Concerning the weights below the national average, it should be noted that the minimum was registered in Botoşani County (38.01%). Then, the analysed candidate received between 40% and 45% of the valid votes in several counties of Moldavia (Iaşi, Vaslui, Vrancea), Muntenia (Argeş, Brăila, Buzău, Ialomiţa, Teleorman) and Oltenia (Dolj, Olt, Vâlcea). In Bucharest City, the candidate obtained 49.29% of the valid votes, the values by sectors ranging between 50.48% in Sector 3 and 47.50% in Sector 5. He also received 78.86% of the votes abroad.
The turnout and the results of the second round of the presidential elections in Romania (December 6, 2009) by geographical-historical regions
Table 5
Crt. no.
Geographical-Historical Regions
Tot
al v
oter
s
Tur
nout
%
Val
id v
otes
Tra
ian
Băs
escu
%
Mir
cea-
Dan
G
eoană %
1 Transylvania 3627254 1984806 54.72 1960029 1086482 55.43 873547 44.57 2 Banat 1286186 728514 56.64 720881 427483 59.30 293398 40.70 3 Crişana and Maramureş 1251061 641957 51.31 635066 338637 53.32 296429 46.68 4 Moldavia 3893541 2134485 54.82 2102837 971969 46.22 1130868 53.78 5 Dobrudja 839302 495772 59.07 489910 268795 54.87 221115 45.13 6 Muntenia 3741805 2313029 61.82 2280894 1072230 47.01 1208664 52.99 7 Bucharest City 1782211 981388 55.07 967320 476830 49.29 490490 50.71 8 Oltenia 1881864 1192411 63.36 1177755 517551 43.94 660204 56.06 9 Foreign Countries 0 147754 0.00 146876 115831 78.86 31045 21.14
Romania 18,303,224 10620116 58.02 10481568 5275808 50.33 5205760 49.67
The runner-up, M. Geoană, who obtained 49.67% of the votes nationally, registered a weight of more than 60% of the votes in only one county, Botoşani (61.99%). He achieved between 55% and 60% of the votes in 12 Romanian counties, located in Moldavia (Iaşi, Vrancea, Vaslui), Muntenia (Argeş, Brăila, Buzău, Ialomiţa, Teleorman) and Oltenia (Dolj, Olt, Vâlcea), and only one other county, Hunedoara, in Transylvania. In Bucharest, he received 50.71% of the votes of the electorate. His highest score in Bucharest was in Sector 5 (52.50%), and his lowest in Sector 3 (49.52%). Abroad, he was voted by only 21.14% of the Romanians. As for his lowest scores, it should be remarked that his minimum was recorded in Arad County (38.07%). Then, he received less than 40% in other three counties (Alba, Cluj, Sibiu), and between 40-45% in the counties of Bistriţa-Năsăud, Braşov, Covasna, Harghita, Maramureş, Sibiu, Timiş and Tulcea (table 4).
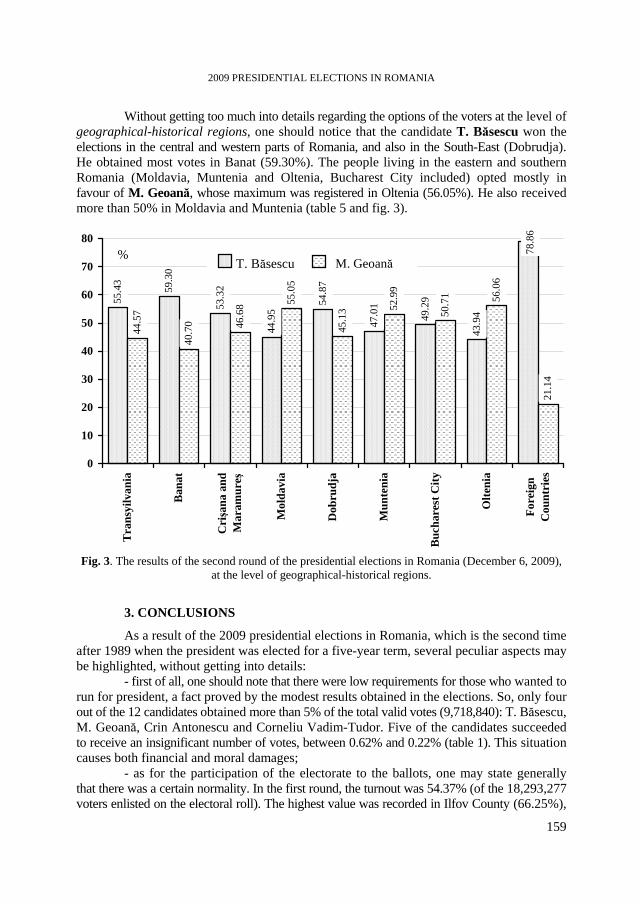
2009 PRESIDENTIAL ELECTIONS IN ROMANIA
159
Without getting too much into details regarding the options of the voters at the level of geographical-historical regions, one should notice that the candidate T. Băsescu won the elections in the central and western parts of Romania, and also in the South-East (Dobrudja). He obtained most votes in Banat (59.30%). The people living in the eastern and southern Romania (Moldavia, Muntenia and Oltenia, Bucharest City included) opted mostly in favour of M. Geoană, whose maximum was registered in Oltenia (56.05%). He also received more than 50% in Moldavia and Muntenia (table 5 and fig. 3).
Fig. 3. The results of the second round of the presidential elections in Romania (December 6, 2009), at the level of geographical-historical regions.
3. CONCLUSIONS
As a result of the 2009 presidential elections in Romania, which is the second time after 1989 when the president was elected for a five-year term, several peculiar aspects may be highlighted, without getting into details: - first of all, one should note that there were low requirements for those who wanted to run for president, a fact proved by the modest results obtained in the elections. So, only four out of the 12 candidates obtained more than 5% of the total valid votes (9,718,840): T. Băsescu, M. Geoană, Crin Antonescu and Corneliu Vadim-Tudor. Five of the candidates succeeded to receive an insignificant number of votes, between 0.62% and 0.22% (table 1). This situation causes both financial and moral damages; - as for the participation of the electorate to the ballots, one may state generally that there was a certain normality. In the first round, the turnout was 54.37% (of the 18,293,277 voters enlisted on the electoral roll). The highest value was recorded in Ilfov County (66.25%),
43.9
449.2
9
47.0
154.8
7
44.9
553.3
259.3
0
55.4
3
78.8
6
44.5
7
40.7
0 46.6
8 55.0
5
45.1
3 52.9
9
50.7
1 56.0
6
21.1
4
0
10
20
30
40
50
60
70
80
Tra
nsyi
lvan
ia
Ban
at
Crişa
na a
ndM
aram
ureş
Mol
davi
a
Dob
rudj
a
Mun
teni
a
Buc
hare
st C
ity
Olte
nia
Fore
ign
Cou
ntri
es
T. Băsescu M. Geoană%
GR. P. POP
160
and the lowest one in Covasna County (42.95%). In the second round, the national turnout reached 58.02% (of the 18,303,224 people marked on the electoral roll). The highest value was recorded also in Ilfov County (71.52%) and the lowest one in Harghita County (36.13%) (table 4); - regarding the development of the presidential elections, in order to avoid the suspicions related to the voting process of the Romanian citizens abroad, as it happened at the second round (December 6, 2009), it would be necessary for the right of vote of these citizens to be expressed before the end of the elections across the national territory of Romania (usually 9 p.m. in the day when the elections are scheduled);
- the analysis of the results of the elections, presented in detail in the paper, indicates a clearly expressed balance. The competition took place only between two candidates, Traian Băsescu and Mircea Geoană. In this order, they obtained 32.45% and 31.15% of the total valid votes (9,718,840) in the first round, then 50.33% and 49.67% (out of 10,481,568 valid votes) in the second round.
R E F E R E N C E S 1. Pop, Gr., Bodocan, V. (1991), Opţiuni electorale pentru alegerea primarilor în Banat, Crişana-
Maramureş şi Transilvania, Studia UBB, Geographia, Anul XXXVI, 2, Cluj-Napoca. 2. Pop, P. Gr. (1992), Romania. An Electoral Geography (September-October, 1992), Studia UBB,
Geographia, Anul XXXVII, 1-2, Cluj-Napoca. 3. Pop, P. Gr. (1997), România. Geografie Electorală (Noiembrie, 1996), Studia UBB, Geographia,
Anul XLII, 1-2, Cluj-Napoca. 4. Pop, P. Gr. (2001), România. Geografie electorală (noiembrie-decembrie 2000), Revista Română
de Geografie Politică, Anul III, nr. 1, Edit. Universităţii din Oradea, Oradea. 5. Pop, P. Gr. (2006), România. Geografie electorală (noiembrie-decembrie, 2004), Studia UBB,
Geographia, Anul LI, 1, Cluj-Napoca. 6. Pop, P. Gr., Bodocan, V. (2009), Mayor’s Elections in Cluj County, in June 2008, Studia UBB,
Geographia, Anul LIV, 2, Cluj-Napoca. 7. Pop, P. Gr. (2010), The Parliamentary Elections in Romania (November 30, 2008), Studia UBB,
Geographia, Anul LV, 1, Cluj-Napoca. 8. Pop, P. Gr. (2010), Alegerile Europarlamentare din România, 7 iunie 2009, Revista Română de
Geografie Politică, Anul III, nr. 1, Edit. Universităţii din Oradea, Oradea. 10. Data sources: Biroul Electoral Central pentru alegerea Preşedintelui României din anul 2009.
Rezultatele finale la alegerile pentru Preşedintele României din anul 2009 http://www.bec2009p.ro/rezultateP.html
STUDIA UNIVERSITATIS BABEŞ-BOLYAI, GEOGRAPHIA, LV, 2, 2010
THE FRONTIER – DEFINING THE URBAN INFLUENCE AREA
V. SURD1, B. N. PĂCURAR2
ABSTRACT. – The Frontier – Defining the Urban Influence Area. In the following paper, we will take on the difficult issue of systemic relations between the concept of „frontier”, viewed as an expansionary phenomenon, and the city. More exactly, what we intend to accomplish is to take the theoretical background of the frontier and its phenomena, as put forward by Frederick J. Turner, the American sociologist and historian who coined the concept, R.A. Billington, W.J. Eccles, R.V. Hine, I. Bădescu, D. Dungaciu, C. Degeratu, R. Săgeată and A. Cuşco, and project it into/onto the definition of the urban area of influence due to the fact that we consider the frontier and especially the “European (Euro-Atlantic) frontier” to be the fundamental element, the main pillar in defining the city and its area of influence. The European frontier started as an intricate network of urban centres that had the ability to dominate vast rural areas (peasants) and became „the sum of all expansion processes of the urban-capitalist world in large rural areas” (I. Bădescu, 1995). Therefore, throughout the paper, we will stress the ways in which this concept manifests itself upon the city, how its areas of influence are created by the frontier through different manners and the permanent deterministic relations that still are and always will be between the frontier and the city.
Key words: frontier, ethno-frontier, urban influence area, influence generator, influence vector,
urban function, confrontational space, systems of thought, logistical groups, elites, geopolitics, localization, nomenclature, integrated protection system, spirit of place
1. INTRODUCTION
The history of human settlements registers the emergence of the city, within the geographical landscape, 10 000 years ago, when people began to live in states and towns/cities. This is the moment when „the frontiers were created” between tribal communities and civilizations (I. Bodley, 1990, taken from I. Bădescu, 1995). From this moment on, the city remained a crucial element in the geography of mankind, cultivating and strengthening its position within all the later geographical sociosystems. This dominance in all the historical sociosystems determined a lot of focus on the city (from a historical, religious, geographical, antropological point of view, etc.). The complete and definitive individualization of the geographical science concerning „...the study of the position of cities within the geographical space” (C. Vert, 2000) can be seen only in the 18th century, a moment that experienced a massive surge of opinions on this system, in isolated analyses or within other geographical systems.
1 Babeş-Bolyai University, Faculty of Geography, 400006, Cluj-Napoca, Romania, e-mail:
[email protected] 2 Cluj County Council, 400094, Cluj-Napoca, Romania, e-mail: [email protected]
V. SURD, B. N. PĂCURAR
162
Going through geography`s views on the city, we see that they have complex methods, concepts and models, and within geography, the city was and still is studied intra and interdisciplinary, starting from an established series of concepts and views, with the help of which the city is defined (extremely difficult due to conceptual differences), through which it is „moulded”, theoretically and conceptually structured and planned, with sustainable development in mind, etc. From the moment when geography created its systemic view on the upper Earth cover and especially with the „structuralist-systemic” and „ecogeographical” points of view, the city`s definition, function, structure and position as a sociosystem requires new analysis perspectives, and also complex explanations. Therefore, in the following paper we will tackle the systemic relation between the concept of „frontier” and the city. More precisely, we will tackle the issue of the city`s influence area, projecting the theoretical background of the „frontier” into the definition of the urban influence area. The term „frontier” or „frontier phenomen” was coined by the American historian Frederick J. Turner in 1893. Later, in the works of historians, sociologists, geographers, but mainly geopoliticians, this concept was forever established despite several differences of „tone” which sometimes appeared, due to the synonymy between „frontier” and „border”. However „...the decisive nuance which separates them lies in the dynamic tension implied by the term frontier” (D. Dungaciu, 1995), its usage being very extensive. So, we can speak of „cultural frontiers” but not of „cultural borders”, of „religious frontiers” but not of „religious borders”. What is this term basically and what is its semantic consequence? We will use, from the many definitions, the one put forward by I. Bădescu in 1995, which is: “The frontier phenomenon expresses all the processes through which a historical expansion manifests itself, be it one of people, of a civilization, of a religion or ideology or, finally, of an empire”. Consequently, we have the following question: if frontiers are expansive phenomena, which are the ways through which the frontier achieves its objectives? On the other hand, urban geography demonstrates that all frontiers used settlements in their expansion, more exactly they used cities. The frontiers created, developed and used cities in their expansion, without exception. And from the long series of frontiers (continental or universal), the best example in this matter is „the European frontier”, which „...started as a network of urban centers capable of dominating vast rural areas (peasants)”, and became the „the sum of all expansion processes of the urban-capitalist world in large rural areas” (I. Bădescu, 1995). This is the reason why we see the frontier as a fundamental element in defining the city and the urban influence area, and throughout the article we will emphasize the way in which this concept manifests itself upon the „city” and how its influence zones are frontier created through different ways and how between the frontier and the city there are permanent deterministic relations.
2. DEFINING RELATIONS BETWEEN THE FRONTIER PHENOMENON AND URBAN INFLUENCE
In this chapter we will present the issues concerning the definition of urban influence starting from the concept of „frontier phenomenon”. In this case, we must emphasize the fact that the frontier phenomenon has a geopolitical determination. Therefore, the whole conceptual and defining „construction” must start from the premise that the city was and still is part of systems created by frontiers, where it has several systemic positions, positions from which it builds and manifests its influences in its encompassing areas. The frontier geopolitics
THE FRONTIER – DEFINING THE URBAN INFLUENCE AREA
163
will be the one to generate and determine the city`s position within the defining relations between the frontier and the city`s influence area. The city`s role, position and systemic function within the „frontier – urban influence area” can be: a) influence vector; b) influence generator; c) influence vector and generator and d) confrontational space. From the „city`s systemic localisation within the frontier`s influence space” perspective, the city can have the following spatial and defining positions, both for the frontier`s influence as well as for the city`s role and influence area: a) the city is situated inside the influence space of the „mother frontier” (I. Bădescu, C. Degeratu, 1995), inside the influence space of the frontier`s „central place” (of the generator city from a superior system); in this position, the city can have two functions: influence vector for the frontier and influence vector plus generator; b) the city is situated outside the influence space of the generator (the central place of the upper system); it will have two systemic positions: „on programmed paths” (I. Bădescu, 1995), the strategic direction of the frontier`s expansion or beach-head (launched) inside the influence space, targeted by the frontier; c) the city is in „the center” of the systemic influence space; in this case, the city in question is exclusively an influence generator for its space, where it helds „the central place”; d) the city is situated in the center of its own influence space, covered by the influence space of the hierarchical upper system. These four positions will become defining in building the „pattern” (S.A. Levin, 1992.; O. Autsuguki, 2006; I. Mac, 2008), through which city X becomes a systemic element in the suprastructure configured by the „frontier phenomenon”.
3. THE INFLUENCE RELATIONS BETWEEN CITY STRUCTURE AND THE STRUCTURE OF THE TERRITORY, WITHIN THE FRONTIER
The geographical analysis of this prospective construction introduces two fundamental systemic categories: the city structure and territorial structure. As „the frontier phenomenon” is mainly a social one, the two structures will be considered sociostructures, and within the frontier the study directions overlap and interfere, for the synthesis of the prospective analysis, the geographical space on one hand and human activities on another. Thus it becomes „a socialised system” (I. Mac, 2008), which from the frontier geopolitics point of view will be considered by the local population to be a „primary territory”, which the frontier phenomenon will try to transform through specific processes and instruments, into „secondary territory” or „public territory”. Thus rises the following question: Why do frontiers try to transform the territory in which it expands into „secondary territory” and especially into a „public one”? The answer comes to light even from the most sophisticated coverups or theories on the territories` roles in the development of society. Altman stated in 1975 that people are extremely attached to their territories (primary), which are important for their identity, for their defining national identity brand. This means that a phenomenon of a frontier, depending on its central, generator place, on its geopolitics, on its specific processes and instruments that can be used by it in the struggle to expand, will try to obtain, for the targeted geographical space and in which city X holds one of the geostrategic positions mentioned above (generator, vector or both), one of the territorial categories also mentioned above. Here comes into play the deterministic relation between the city structure and the structure of the adjacent territory. In this equation, the city`s structure will determine strategies and processes, dictating „proper intruments” so that the city`s territorial and spatial influence will be efficient and durable a possible. For example: if between the ethnic structure
V. SURD, B. N. PĂCURAR
164
of city X and the surrounding territory, there are balanced and directly proportional relations, the frontier will definitely „attack” the territory with ethnological (ethnic) instruments and processes, arrogating for a pressumed „territorial system” (I. Ianoş, 2005), the status of primary territory. If the ethno-demographical relations are stacked against it, it will aim for the status of secondary territory in order to modify the natural territorial system and make it for all (no matter the status some categories of population have in this system). In the last phase and especially if an „universal” or continental-imperial frontier is involved, then the final strategic target, for the „territoriality” of that targeted geographical space, is the „public territory” status. This thing is due to the fact that a „public territory” belongs to everybody and to no one at the same time, and no person, group or nation can claim rights over it. We believe that this is the main hidden reason behind numerous theories, which try to introduce into the geographical literature (mostly geopolitical) several concepts through which the meanings of „territory” and „territoriality” are lowered in the hierarchy used in geographical studies among others to bottom levels, similar to „plot of land” for example, thus trying „to empty” them of their semantic meaning and transfering the „territory” from national, sovereign, spatial categories, with ehtnological territorialities, to technical categories, similar to „land”, „plot of land”, „arrangement plan”, „built up space”, etc. This phenomen takes place especially in regional geography, human geography, territorial planning, etc. Hence, the assumption through which we state that between the city structure and that of the surrounding territory there are defining and configurative relations. These relations will determine specific influences between the two systems, depending on the frontiers that are „battling” each other in the city`s space, on the frontiers geopolitics, on their action strategy, on the place`s spirit and on the importance of „territory” in the frontier`s geopolitics. Within the context of frontier phenomena`s actions, the city will play an offensive role, no matter if the frontier processes will have centripetal or centrifugal directions. The influences will be specific and numerous and can be classified in the following manner: strong influences; weak influences; slow influences; fast influences; progressive influences; retrograde influences; beneficial influences; damaging influences; geopolitical influences; controllable reaction influences; uncontrollable reaction influences; global influences; national influences; ideological influences; ecological influences, etc. Indifferently of the expressions of the frontier`s phenomena, of the planned, projected, guided, controlled or objectivally resulted influences, these will be efficient and more durable if the specific relation (necessary for the influence) between the two systems is close to optimum.
4. THE CITY – DEFINING CONFRONTATIONAL SPACE FOR THE INFLUENCE AREA
As a confrontational space, the city generates defining elements and relations that are determined, mostly, by the frontier`s main feature: expansion phenomenon, which acts on the city through „instruments” and manifests itself through „specific processes”. As a result, within the city-confrontational space there will be the following relations: 1) the external frontier will always face the ethno-frontier3 in the new space; there is no space (urban, local, regional, national) without an ethno-frontier; 2) the external frontier as well as the geolocal (demolocal) one are expansionary (in nature) and 3) the expansion directions of the two frontiers can be:
3 We will use the term „ethno-frontier” with the following semantic meanings and values in mind: ethnic;
national-ethnic; geolocal, generated by the place`s spirit („the feeling of space” – I. Bădescu, 1995)
THE FRONTIER – DEFINING THE URBAN INFLUENCE AREA
165
a) in opposite directions (quasigeneral in the first stage of confrontation); b) in the same direction (when the frontiers` geopolitical interests overlap); c) in different directions in the contact stage and „reaction” and overturn of the frontier`s direction („axle”) (when the external frontier, through specific processes, becomes a generator and expansive on the original space, of „the mother frontier”).
5. CONFIGURING THE URBAN INFLUENCE AREA IN RELATION TO THE FRONTIER PHENOMENA
In contrast to the classical form of theoretical modelling, this configuration has a much more complex structure. „The city spreads its influence on areas of variable size compared to its own size, its rank and activities, its connection possibilities with the outside” (V. Surd, 2003). This basis proved to be well established in the classical form of theoretical modelling of urban influence. Within the context of frontiers, the configuration and size of an urban influence zone depends nowadays on more complex factors such as: a) geospatial position of the city; b) the city`s position within the holarchic uppersystem and its own influence system (position of generator and central place, position of vector, etc.); c) the city`s fame; d) the city resources` number, value, and most of all opportunity, resources that can be mobilised to sustain its functions and objectives; e) the size (quantity) of every deployable resource; f) the resources` strength (the ability to penetrate and expand in the geographical space); g) the specificity and quality of the vectors (instruments) that can be deployed by the city. That is why the analysis and definition of the urban influence zone related to „the frontier phenomenon” compels us to reanalyse and reconsider many elements that go into this equation. We will tackle only two which are: „the rank-size rule” şi „the relation between city size-distance-influence”. The rank-size rule, from the frontier phenomena point of view, remains valid, but without enclosing cities in proportional mathematic relations. The proportional relation between (P)-population and (n)-rank is modified by ponderal variables, which frequently intervene in the equation of this relation. The size is a very volatile variable when it comes to „frontier processes” (for example Hunedoara, Petroşani etc., whose size depended or depends on single resources). The rank can be imposed or consecrated. For example: a) cities, that become administrative and territorial centres, get larger in size and advance in rank; b) the same cities, when new administrative-territorial regiopns are set up, will decrease in size and rank; c) „the central place`s” rank will be lost or limited to county centres that are part of „regions”, while the rank and size of the regional centre will increase. Rank is mainly determined by the city`s functions, functions attract resources or generate them, while resources make the city grow (including from a numerical point of view). The estimative projection or prospecting the size of lower tier cities, starting from the present situation (Romanian cities for example – V. Surd, 2003) leads to the conclusion that these cities, mathematically prospected with the aid of the rank-size relation, suffer no changes in terms of position, rank or relation value. Only their size changes. Analysing the relation in the context of frontier phenomenon, we notice however that this relation receives new valences within the political geography, valences that introduce the issue of „centrality” in the influence`s equation and that of „alterity” in the relations between cities. Finally, this thing can create rivalry tendencies that can be speculated by some „local frontiers” and even „universal frontiers”, that will intervene in this relation, intensifying it.
V. SURD, B. N. PĂCURAR
166
The relation between size-distance-influence, established within the context of the action of frontier phenomena, refutes the consecrated rule in the theoretical model of classic urban geography. In all geographical models it is said that the strongest bond between city and its surrounding area is the economic bond. The frontier geography emphasizes the contrary. The example of „lost historical cities”, of those with strict economic (historical or contemporary) and industrial functions, but especially of „symbol cities”, of „sacred places” (I. Bădescu; D. Dungaciu, 1995), like Jerusalim, Mecca, etc., whose influence area is larger and encompasses multiple areas, demonstrates that the power of influence in the area and its endurance is determined most of all by the „feeling of space”, by the place`s spirit. This spirit is the most conservative and most reactive to frontier aggressions. However, we would like to emphasize a model, which in every theoretical construction on the way the city acts within a territory, for the configuration of the urban influence area, proved to be valid for all historical or contemporary frontiers. The model monopolizes the surrounding space through diffusion, similar to Konosuke Matsushita`s ALD theory (Aggregation through Limited Diffusion). In all the history of civilization, the city acted as a fractal when it came to its relation with the surrounding space.
6. THE CONFIGURATING ROLE FOR THE AREA OF INFLUENCE OF URBAN FUNCTIONS, WITHIIN THE CONTEXT OF FRONTIER PHENOMENA
It can be emphasized by using the conceptual and scientific accumulations from urban geography, urban planning, sociology and other related sciences. In this article, we present their role, projecting them into the frontier phenomena`s field of action and conducting research with the frontier`s study instruments. We know that basic city functions appeared and began evolving with the emergence and development of ancient cities. However, their systematic study and classification begins rather late, in 1943, by Chauncy D. Harris, as a consequence of „Euroatlantic frontier” processes, whose pressure made the cities grow extremely fast. The basic functional classification, which we used in previous papers, encompasses the following functions: commercial, cultural, industrial and administrative-political. Their systemic analysis, within the context of the frontier, puts forward some defining relations that create the city`s influence area. So: 1) in „building” the influence area, the dominant function(s) will attract and favour specific frontier instruments (scientific and academic events – the cultural function; financial and commercial institutions – the commercial functions; political and administrative institutions – the administrative and political function, etc.); 2) the dominant frontier processes in the influence area will correspond to the city`s functions and to the frontier geopolitics (the development of cultural and educational institutions; the development of the commercial network and of banks; investments in the industrial sector; the development of the transport and communications system, etc.), but also to the „threshod moments” („functional rips”– I. Ianoş, 2005), to which we can add „the antropogeographical conflicts”, as well as the waste of natural spaces, consumer mentalities, etc.3) between the frontier, city functions and influence area there will be an evolutionary „critical path”, in the following manner: a) the city functions create influence areas; b) the influence areas determine the frontier`s targets; c) the frontier`s targets impose specific instruments; d) the instruments and targets give rise to frontier processes; e) the processes are the particular expression of frontiers in the influence area, putting pressure
THE FRONTIER – DEFINING THE URBAN INFLUENCE AREA
167
on city functions. 4) the city`s dominant functions will determine, will attract and favour the frontier`s geopolitical objectives and viceversa, the frontier`s objectives and geopolitical targets exploiting and boosting the city`s functions; 5) between a dominant city function, the structure of the active population involved in this function, the ethnic structure of the influence area and the frontier`s geopolitics there are powerful determinations, resulting specific processes with massive impact on the influence area, leading to that tipology of influences that was presented before, at the analysis of the relation between the city`s structure and the structure of the influence area.
6.1. DEFINING RELATIONS BETWEEN THE FRONTIER, THE COMMERCIAL FUNCTION AND THE URBAN INFLUENCE AREA
At the beginning of the article, we presented I. Bodley`s statement, which mentioned the first great frontier, that between tribal people and „civilization”, represented by the city. Starting from this threshold and studying the history of the great civilization frontiers, in which the city was ubiquitous, we observe that the commercial function has always sustained the city, with few historical exceptions (religious cities). We also emphasize the fact that, in establishing the relation between city and its influence area, a specific element to all frontiers always intervened, that is the „means of transport”. In establishing the defining relation between city and its influence area, it is enough to use this frontier instrument and we will notice the evolution of the urban influence areas in relation to the commercial function, based on the means of transport. At the beginning, when travel was done on foot, the city`s influence area was under 10 km. In the second stage, which lasts until the 18th century, the consecrated influence area had a 30 km radius, due to travel by carts, coaches, horses, camels, etc. In the third period, that is the 19th century, the influence area spread to a 200 km radius, due to the railway „America was conquered by the railway” (P.V. de la Blache, 1950). The only exceptions are those that involve transport on water and caravans. The fourth period (20th-21st centuries), reprezentative for the European frontier, is characterised by the fact that the means of communications transformed the cities into „stations” on the communications network, creating and establishing the overlapping and interfering influence areas, in which „the universal European frontier” (I. Bădescu, 1995) found its consecration. The fundamental role of the urban commercial function and the frontier expansion also emerges from the comparison of the scale relations in city development and their influence areas, depending on the frontiers character. For example, the frontiers that relied, in their expansion, on commercial instruments, like the Greek, Roman or European frontiers, created cities and were based on a network of cities with large influence areas. On the other hand, the imperial frontiers relied in their expansion on the „imperial form”, creating small cities (fortresses), with small influence areas, with a slow evolution, with reactions of rejection, devastating confrontations, etc.
6.2. DEFINING RELATIONS BETWEEN THE FRONTIER, THE INDUSTRIAL FUNCTION AND THE URBAN INFLUENCE AREA
Among the urban functions, the industrial function is one of the youngest and represents the exclusive expression of the European frontier. „Europe`s frontier took, starting from the 16th century, the form of the modern capitalist system or, using I. Wallerstein`s
V. SURD, B. N. PĂCURAR
168
expression, the form of modern world economy” (idem, 1995). In contrast to other historical types of world economies, the modern European one did not end up as an empire. Modern Europe gradually replaced the tributary systems used by empires with a system of accumulation, based on the global market. The new system started with a network of urban centers, capable of subduing large rural areas. Consequently, modern Europe`s new frontier received a brand new meaning, ending up as „...the sum of all expansionary processes of the urban-capitalist world on vast rural areas” (idem, 1995). The character, manifestation and instruments of this frontier imposed the industrial function among the city`s dominant functions. Here we can bring into discussion the situation in the former USSR, which was a laboratory for the „modern urbanism”4, where the network of urban systems built on ideological principles was industrial. Even though, in the rest of Europe and in the world (with the exception of the communist block) there were only industrialization phenomena, the end of the 20th century and the beginning of the 21st brings into light an urban industrial function extremely dominant in the „basic” city sustainment and in the establishment of urban influence areas. Within the European frontier context, between the urban industrial function the influence area one can built a layout of the critical-evolutionary path, which emphasizes the defining relations between the frontier and the urban influence areas. E.g.: the machine created industry/industry created trade/trade concentrated money/ money concentrated people/people concentrated large cities/cities concentrated the ways of communication/ the ways of communication concentrated spaces and enlarged the influence areas. Such a „concentrationary economic system” invests the industrial function with the feature of „basic external function”, which cannot be denied. In conclusion, this function will weigh heavily in the configuration of the city`s influence area.
6.3. DEFINING RELATIONS BETWEEN THE FRONTIER, THE CULTURAL FUNCTION AND THE URBAN INFLUNCE AREA
In previous onsets on the city`s influence in the territory, we structured its analysis by adopting the analysis model of urban geography that has been consecrated for the last 100 years. The structure of the same analysis, starting this time from the „concept of frontier”, emphasizes a scale difference similar to a comparison between a primary geodesic triangulation network and another that is local. The conceptual space, the geographic space in territorial projection, put forward by the frontier concept, is larger than that put forward by classic methods. We emphasize this because the cultural function represents, for every theoretical construction necessary to define urban influence in the geographical space, the catalyst without which this construction will not last and will not remain properly structured. The defining relations between the city`s cultural function and its influence area, within the the context of frontier phenomena, have such a powerful and complex manifestation that „the inversion of the mother frontier`s axel” comes into view most clearly (I. Bădescu, 1984; 1995) and the perenity of a city`s influence in its influence area is created. The inversion of the frontier`s axel takes place when the city, from vector, becomes influence generator.
4 We express our reticence on the concept of „modern urbanism” and we choose not to judge the reasons
behind such a term. Therefore, we will just mention it.
THE FRONTIER – DEFINING THE URBAN INFLUENCE AREA
169
„The cultural frontier” generated by a city creates and consecrates a cultural influence area, that can be immensely enlarged. And because we made previous references to „Sincronism european şi cultură critică românească”, we will further use the statements of the same author, taken from the Romanian cultural frontier. The city of Blaj is the symbol of the westward expansion of the ethno-Romanian frontier, by recovering the real „the Roman age” of Romanian culture and language. Nothing of the Romanian ethno-national frontier is more evocative for disclosing the defining relation between the frontier, city and influence area. „The discovery of the long Roman time of our history made a fool out of the imperialist and civilizing demands of the Hungarian state...One cannot pretend to civilize a people...when you are 1000 year younger” (idem, 1995). This blow given by the Romanian cultural frontier through the „Şcoala Ardeleană din Blaj” was so powerful that it caused „the Hungarian inferiority complex of age” and that of „nativeness”. So, this is the role and nomenclature of the city`s cultural function in establishing its influence area, „reduced” to a proper scale, offred by the frontier. We would like to mention that, through the above mentioned theoretical construction, we do not try to exclude or change the classic model in which today`s geography tackles the issue of urban influence area and in which the city is part of an urban and cultural model comprising of: university cities, museum cities, events cities (festivals, meetings, conventions, etc.). At the level of a lower tier „triangulation”, the construction remains true. The same issue, but on another scale, gives us the possibility to observe and analyze a larger geographical space. Furthermore, the cultural frontier is not a physical „izobar”. Its forms of manifestation, its opportunities, its area of diffusion, are so complex that the expansive character of a phenomenon belonging to a cultural frontier can manifest itself in a very active and durable manner, with a city as its central place, the same character being able to manifest itself in pulsating way or reappearing after a long period of inactivity, like a precious „seed” waiting for the right moment to sprout. However, this fact depends very much on a reprezentative process of every cultural frontier, process also tackled in previous works (B. Păcurar, 20095) that is the process of creation, formation and circulation of the cultural elite in the city, the most capable of generating that geolocal (demolocal) frontier, that will configure and define the city`s influence area in the most durable way. If we stay with the assumption made in another study, through which we stated that „...there is no city without an influence space, and this is determined by the city`s ability to create it” (idem, 2009), projecting the issue in the history of urban geography as a domain, we will come to the conclusion that all frontiers relied on cities, which in turn established instruments, according to the age, through which they created frontier processes, decisive in the configuration of influence areas. The cities represented those „bacteria” (I. Ianoş, 2005), generators of civilization, which, through their frontier abilities, bought up by means of aggregation (K. Matsushita, taken from I. Ianoş, 2005) larger and larger space (influence areas), depending on the frontier`s character, instruments and spirit of place. Another field, in which the city`s cultural function really shines, by relating its influence to the frontier, is that of „institutional logistics” (I. Bădescu, 1995).
5 „Funcţia universitară a municipiului Cluj-Napoca în contextul frontierei euroatlantice” (The university function of the city of Cluj-Napoca in the context of the Euro-Atlantic frontier) – The International Geography Convention, Zalău, June 2009
V. SURD, B. N. PĂCURAR
170
We saw that, in a city, through the expansion of a frontier, especially the Euroatlantic frontier, the social space that grows the most is the one that manifests itself through: a) the numerical growth of the city`s population; b) the growth of the anthropic landscape; c) agglomeration of the city`s aspect; d) the complication of structural relations; e) the numerical growth and rise in value of infrastructural capacities (becoming more persuasive for the other geographical spaces); f) the evolution of city functions (they spread, shrink, gain new specializations, strengthen, change, etc.). Within „the pattern” of this social space, through its position in the system of the cultural function, „the groups” (idem, 1995) stand out. These are being configurated in the systemic field: frontier-city-geographical space, as vehicles and generators, cultivators and conservators of relations between the parts of the new space, built by the expanding frontier. These so called „logistical groups” (idem, 1995) have this name due to the essential relation they have with the frontier and its processes. These logistical groups can integrate or desintegrate a geographical influence space through attraction, attack on local logistical groups, replacing the local groups, etc. Through the „logistical groups” instrument, any institution created within the frontier processes has the meaning of „system of thought and system of action” (idem, 1984; 1995) meant to control bigger and bigger spaces, generated by the frontier advance. The frontier advance associates phenomena such as the growth of „groups” in the city, the expansion of the urban social space, growth of city institutions and the logistical growth of frontier institutions. We will also mention the emergence of systemic relations between the rank of a city, the size of a city and the influence area. For example: the frontier of global systems creates world institutions like banks, corporations, transnational organizations, pan-ideas, religions, empires (economic, ideological, cultural, etc.), without borders, extremely mobile, „virtual” and uncontrolable. Consequently, in the evolution of „systems of thought”, the cultural functions will configure defining relations between frontier-city-influence area, in the following manner: a) in the systems of world frontiers, the cities receive more active roles; b) the cities become thee logistical base of cultural institutions (spiritual culture, scientific and technical cultures, material culture, etc.; c) the institutions appear objectively, but also in a programmed manner; d) the city`s institutions grow normally or pathologically; e) the cities must adapt and take roles and functions from the sometimes overwhelmed state, but also to think, through its logistical groups, the new institutional relation with the state like the control and administration of its own influence area on one hand, and on the other how to refit in an integrated protection system when confronted with the agression of the „global institutionalism”. This is where the cultural function of a city comes into play, being created and established through „institutional logistics” and „logistical groups”. The cities elites will be those who will win or lose „the systems of thought war”. Hence, the city`s influence area will be the space in which the „logistical groups” will manifest and establish their value, in the context of this „systems of thought war”.
6.4. DEFINING RELATIONS BETWEEN THE FRONTIER, THE ADMINISTRATIVE AND POLITICAL FUNCTION AND THE URBAN INFLUENCE AREA
Recalling a previous statement, we return and reinforce that all of humanities great frontiers relied in their advance on cities. However, these cities became consecrated vectors of the frontier from the moment they were invested with administrative and political
THE FRONTIER – DEFINING THE URBAN INFLUENCE AREA
171
functions. Between the two functions (administrative and political) there were and still are formal or objective boundaries, but never complete or dichotomic boundaries. It is very difficult to separate the administrative and political functions of a city, especially at specific levels of the analysis. That is why we consider that, besides some explicitly specialised and technical studies, it is more appropriate for the administrative and political roles of a city, when the city is invested with them, to be integrated in the administrative-political function. In contrast to the other categories of urban functions, the administrative-political one is also reprezentative through a well thought determination, after some complex analyses that do not lack disputes and rivalries, but more or less objectively eliminate the spontaneous emergence (V. Surd, 2009). This consideration exceeds the level of assumption, being consecrated as result theoretical and practical accumulations that prove the idea. Corroborating this idea with the one previously put forward through which we can state that the frontier`s geopolitics determines the city`s position in configuring the influence area, we can make another assumption that the administrative-political function of the city configurates the influence area firstly through „the organisation of the geographical space”, through ”institutional constructions” (R. Săgeată, 2003) which serve a geographical space, many times larger than at other functions. All depends on the city`s nomenclature in geospatial (sociogeospatial), national, continental-regional and international structures and suprastructures. In relation to a frontier geopolitics, a city can gain administrative-political functions with larger or smaller influences in the geographical space, influences that, through overlapping, will configure the urban influence area. We also have to take into consideration another important element in the equation of this analisys, that is a city with administrative-political functions will always be a part of a system of cities. This system will become a basis network, in which the cities, depending on their de rank and role in the frontiers` field of action, will be „triangulation points” in the mathematic base of „surveying” every frontier. In this way, related to the holarchic level of the frontier phenomenon, a city with the help of its „institutional constructions” will exercise its influence on a geographical space, which it will configure by overlapping geosocial spaces („social spaces” - F. Ipatiov, 1996) and which it will define in its own influence area. For example, in the field of the Romanian ethno-national frontier, starting in 1968, the national territory was divided into 41 counties and the city of Bucureşti. In each of these territorial divisions, a county and geographical space is being built, consecrated as an „influence area” for each chief city. This is primarily due to the administrative-political function won by every city through official investment. At a lower level, we have the „communal centres” whose influence area results from the administrative division of the county. Above county centres, there is „the capital city”, whose influence area, from an administrative point of view, is the entire national territory. But with Romania`s efforts to be integrated in the European Union, a new administrative and geographical category appeared in Romania`s geographical space: „the development region”. All eight development regions of Romania each have a „development centre”, a function carried out by eight cities. By looking back on Romania`s history of administrative and territorial geography of the last 100 years, we will notice that the county centres were and still are administrative and political expressions of the frontier phenomena, that took place in the Romanian geographical space (ethno-national: 1918-1950; kominternist: 1950-1968; ethno-national: 1968-1989; European: 1990-the present day).
V. SURD, B. N. PĂCURAR
172
Surpassing this taxonomical level and switching to overstructures, we register, in international geographical spaces, cities with administrative-political functions, reprezentative for the European frontier and for other global frontiers. Europe contains, within its geographical space, „capitals” of several socio-geosystems such as The Brussels-Strasbourg-Luxembourg Urban System, the „capitals” of the European Union; Brussels, „the capital” of NATO; Vienna, the city that hosts the headquarters of OPEC, etc. On the American continent we find Washington D.C., not only the capital of the United States of America, but also „the capital” of the World Bank and the International Monetary Fund, etc. Retrospectively, it is revealed that the great historical frontiers had their own over-statal capitals (Rome, Istanbul, Vienna, Moscow, etc.). In conclusion, even without a complete and thorough approach of the issue, we can still say that all the frontiers expand through cities, each frontier having its specificity, while the geographical space registers urban evolutions where some of the cities are awarded administrative-political functions. The city`s area of influence is defined by overlapping the „socio-geospaces” that were generated by the frontier phenomenon in the territory „allocated” (officially or semi-officially) to a city, by national and international deeds, decrees, ratified treaties and so on.
7. CONCLUSIONS
Configuring and defining the urban area of influence, starting from the concept of frontier, is not a „simple expansion”, by difusing the city`s features into a „geographical area”, but instead it is a „complex expansion” (F. Ipatiov, 1996). The frontier phenomenon, as a „complete social phenomenon” (I. Bădescu, 1995), gradually monopolizes the geographical space doing so on specialise spaces, among which the social space occupies an important place. The city, within this „socio-geosystem”, holds the central place through its structure, qualities and functions. This phenomenon has been visible ever since the city began to „live off” the hinterland. Therefore, defining the urban area of influence, in the context of the frontier phenomena`s actions, must always be made starting from the analysis of relations that intervene and establish themselves between the frontier phenomena, city and the specific geographical space which is configured by confronting and relating the first two elements of this complex systemic relation. This area will have a personality defined by the synthesis of the structural elements of the geolocal system, with the frontiers` features, resulting a new systemic organization of the geographical space.
R E F E R E N C E S
1. Bădescu I. (1980), De la comunitatea rurală la comunitatea urbană, Editura Ştiinţifică şi
Enciclopedică, Bucureşti. 2. Bădescu I.; Dungaciu D. (1995), Sociologia şi geopolitica frontierei, Editura Floarea Albastră,
Bucureşti.
THE FRONTIER – DEFINING THE URBAN INFLUENCE AREA
173
3. Bădescu I. (2003), Sincronism european şi cultura critică românească, Editura Dacia, Cluj-Napoca.
4. Billington R.A. (1971), The American Frontier Thesis. Attack and Defense, American Historical Association, Washington D.C.
5. Blache P. V. (1950), Principles of Human Geography, Constable & Co., London. 6. Cocean P., Rotar Gabriela, Ipatiov F. (1996), Geografia socială – ramură de bază a geografiei
umane, Studii şi cercetări de geografie, tom XLI, Editura Academiei Române, Bucureşti, pp. 113-120. 7. Conea I. (1967), Cu privire la teritoriul nucleu de formare a poporului român, publicaţia Studii
şi Cercetări de Geologie, Geofizică, Geografie, tom XIV, nr. 1. 8. Cuşco A. (2007), De la graniţă imperială la „frontieră europeană”, Eseu, Revista Contrafort,
nr. 4-5, aprilie-mai 2007, Chişinău. 9. De Rynck F. et al. (2005), The Century of the City. City Republics and Grid Cities, Urban Policy
Project, Foreign Affairs Administration, Ministry of the Flemish Community, Brussels. 10. Eccles W.J. (1983), The Canadian Frontier. 1534-1760, Revised Edition, University of New Mexico
Press, Alburquerque. 11. Hine R.V. (1984), The American West. An Interpretive History, 2nd Edition, Yale University Press,
New Haven & London. 12. Ianoş I. (1987), Oraşele şi organizarea spaţiului geografic, Editura Academiei Române, Bucureşti. 13. Ianoş I. (2005), Dinamica urbană (Aplicaţii la oraşul şi sistemul urban românesc), Edit. Tehnică,
Bucureşti. 14. Kröhnert S.; Hoßmann Iris; Klingholz R. (2008), Europe’s Demographic Future. Growing
Regional Imbalances, Deutscher Taschenbuch Verlag GmbH & Co., Munchen. 15. Levin S. A. (1992), The Problem of Pattern and Scale in Ecology, Ecology no. 73. 16. Mac I. (2008), Geografie normativă, Presa Universitară Clujeană, Cluj-Napoca. 17. Marga A. (2009), Profilul şi reforma Universităţii clujene. Discursuri rectorale, Ediţia a II-a,
Presa Universitară Clujeană, Cluj-Napoca. 18. Marga A. (2009), Criză şi după criză, Editura Eikon, Cluj-Napoca. 19. Nicoară L. (1999), Geografia populaţiei, Edit. Focul Viu, Cluj-Napoca. 20. Pacione M. (2001), Urban Geography: A Global Perspective, Strathclyde University Press,
Strathclyde. 21. Păcurar B. (2009), Mutations in the Primary Sector of the Geoeconomic System of Cluj-Napoca,
Studia UBB, Geographia, Anul LIV, 1, Cluj-Napoca. 22. Păcurar B. (2009), Funcţia universitară a municipiului Cluj-Napoca în contextul frontierei europene.
Consideraţii geografice prospective, Simpozionul Internaţional de Geografie, Zalău, iunie 2009. 23. Petrea D. (2005), Obiect, metodă şi cunoaştere geografică, Edit. Universităţii din Oradea. 24. Săgeată R. (2003), România – ţară central-europeană, în Revista Română de Geografie Politică,
IV, 1-2/2002, Edit. Universităţii din Oradea, p. 15-20. 25. Surd V. (2003), Geografia aşezărilor, Presa Universitară Clujeană, Cluj-Napoca. 26. Surd V.; Bold I.; Zotic V.; Chira Carmen (2005), Amenajarea teritoriului şi infrastructuri tehnice,
Presa Universitară Clujeană, Cluj-Napoca. 27. Surd V. (2009), Geography of Settlements, Presa Universitară Clujeană, Cluj-Napoca. 28. Turner F.J. (1921), The Frontier in American History, Henry Holt & Co., New York. 29. Vert C. (2000), Geografia populaţiei şi aşezărilor umane, Universitatea de Vest, Timişoara, Facultatea
de Chimie-Biologie-Geografie, Secţia Geografie. 30. Vlas Natalia (2008), Globalizarea şi religia la începutul secolului XXI, Presa Universitară
Clujeană, Cluj-Napoca.
V. SURD, B. N. PĂCURAR
174
31. *** (1997), Istoria României. Transilvania. Vol. I, Editura „George Bariţiu”, Cluj-Napoca. 32. *** (1999), Istoria României. Transilvania. Vol. II (1867-1947), Editura „George Bariţiu”, Cluj-
Napoca. 33. *** (2006), Urban Sprawl in Europe. The Ignored Challenge, European Environmental Agency
Report, no.10/2006, Copenhagen. NOTE: “Investing in people”! PhD scholarship, Project co-financed by the European Social Fund,
SECTORAL OPERATIONAL PROGRAMME HUMAN RESOURCES DEVELOPMENT 2007 – 2013, Babeş-Bolyai University, Cluj-Napoca, Romania.
STUDIA UNIVERSITATIS BABEŞ-BOLYAI, GEOGRAPHIA, LV, 2, 2010
THE BARRIER EFFECT OF THE DANUBE IN THE REGIONAL
DEVELOPMENT OF THE SOUTH-WEST, OLTENIA REGION. CASE STUDY
V. ZOTIC1, V. PUIU1
ABSTRACT. – The Barrier Effect of the Danube in the Regional Development of the South-West, Oltenia Region. Case Study. The Danube River has always been a natural barrier as well as a navigable channel – these two major aspects being crucial for the economic development of its common border states for a long period of time. In the context of economic globalization, the barrier effect of the Danube tends to lose importance, becoming a major issue in regional development. The problems raised by the Danube in the territorial policies of development have a direct influence on the regional development of the South-West Oltenia Region. This represents one of the strongest issues for the future strategies of development. The Danube River must be contextualized again and transformed from a non-permissive barrier into a permissive one.
Keywords: barrier effect, regional development, corridor of development, economic integration,
globalization.
1. INTRODUCTION
By its geographical location, flow and economic resources of its basin, the “Danube river is considered to be the most important European river”. “Although it is surpassed by Volga in length and flow”, the Danube holds the advantage of crossing the European continent from West to East, down to its mouths into the Black Sea (after Sobaru, Al., Năstase, G., Avădanei, C., 1998).
From a geographical point of view, the Danube flows on a territory which is located at a relatively equal distance from the North Sea, the Baltic Sea, the Adriatic Sea and the Mediterranean Sea, and its final exit into the Black Sea, location which allows the development of some ways of communication with Central Asia. All these were the foundations of the well-known science man, Grigore Antipa’s statement that “Danube holds a global importance and role”.
On the other hand, the Danube constitutes a true natural limit, holding a barrier effect in the organization of regional and local geosystems. For a long time, the barrier effect of the Danube held either a complete or a transient role, in this latter case being manifested in a partial or differentiated manner. Therefore, unlike the continental or regional geosystems, for which development the barrier effect did not have a crucial importance, the national, zonal and especially local geosystems organize themselves in accordance with it.
1 Babeş-Bolyai University, Faculty of Geography, 400006, Cluj-Napoca, Romania, e-mail: [email protected]; [email protected]
V. ZOTIC, V. PUIU
176
By the barrier effect we understand the capacity of some geosystems, which, by their dimension, become natural non-transient or partially transient limits and which, according to their dimension of limiting the territorial development of other geosystems and of arresting or diverting in a parallel dynamics, the flows of matter, energy and information. The barrier effect appears more frequently in the case of anthropogenic structures development, due to the fact that they generally adopt a linear territorial development, along the barrier, for most of the cases or in some other cases keeping a distance from it, thus generating underdeveloped areas. At a national level, the Danube barrier effect has appeared to be more frequent within the South-West Oltenia Region, between Drobeta Turnu Severin and Corabia settlements, as there are no connection bridges in this area (between Romania and Serbia, as well as between Romania and Bulgaria). The anthropogenic territorial structures, located North and South from the Danube, developed independently and incoherently, nowadays turning into a major territorial dysfunction within the present framework of the European integration.
2. THE CONCEPT OF BARRIER
Limit stands for “extreme point, margin (of an object, of an area), end” (DEX, 1996). Mihai Ielenicz (1999) states that “the limit represents the border of a system through
which it creates the connection with other systems, or it may be seen as the highest value a process tends to reach or a feature can manifest. Gheorghe Erdeli (1999) understands the concept of “limit” as holding “a geographical meaning as it characterizes the discontinuities between various natural or socio-economic regions and which is used especially in the processes of geographical or economic regionalization”.
It is proper to assume that each geosystem has to be spatially delimited. The estimation of the limits of the geosystems influence areas over the environment and of the environment over the geosystems represents a rather difficult process. Sometimes, these difficulties lay in the lack of information; while in other cases in the fact that the intensity of influence diminishes as the distance from certain core areas grows.
The issue of projecting the limits has represented one of the basic difficulties in the field of natural sciences. It has become a major issue in geography as well, especially from a practical perspective. In this case, the limits dictate the manner in which the cartographic models (i.e. general or thematic maps), as well as the organizing models of the geographical space and territorial planning are established, through the capacity these limits have to spatially and temporally define a geosystem or a part of geographical space. Gheorghe Erdeli (1999) states that “even though most of the times it has been reduced to a simple line, the limit establishes an order that is not only of a spatial nature, but also of a temporal one”.
From a gnosiological perspective, the issue of delineating limits can be approached from two antagonistic viewpoints:
- some geographers perceive limits as being projected and delineated in order to reach different goals such as regionalization, or classifications, therefore contesting the definite existence of the limits (after Armand D., Preobraženskij, V., Armand, A. 1969). This apparent lack of limits within the geographical space is determined by the overlapping of multiple contexts of evolution of the elements of various systems within the same space unit, thus the structure and the complete shape of the geosystem being hidden, therefore the geographical reality emerges in an apparent continuum;
THE BARRIER EFFECT OF THE DANUBE IN THE REGIONAL DEVELOPMENT OF THE S.-W. OLTENIA REGION
177
- other geographers acknowledge the existence of limits, though insisting on the difficulties in mapping them out (after Sočava V., 1978). Thus, regardless of which form, method, type of relationships or indexes a geosystem is to be represented by, there is no certainty that there will be enough marks that will certify that the elements that are analyzed from a certain geosystem are in connection with the multitude of elements belonging to the environment or to other geosystems. Therefore, one can conclude that each component of a geosystem and a geosystem as a whole, respectively, have a limited extension, this being separated by other geosystems or by the environment through limits with various degrees of permeability for the exchange relationships (of substance, energy, information) that are really the ones that keep the geosystem in a dynamic equilibrium. As a matter of fact, the limit of a geosystem corresponds to the limit of its flows, with the limit of its areas of accumulation and dissipation, respectively of substance, energy, information that is dictated mainly by the law of gravity and is determined by the gravitational models and the law of a system, respectively. The limit of the accumulation areas crosses both the divergence areas of flows (interfluves, anticline, anticyclone, and administrative limit) and the convergence areas (valley bottom, riverbed, syncline, cyclone, settlements). Still, the limits that form in the convergence areas have a relative character, as they delineate geosystems that, in fact, integrate themselves into a new geosystem of a higher rank, because of the junction created between flows upstream the convergence area. Thus, the delineation of geosystems represents a gnoseologic reality, possible to be accomplished strictly based on a quantitative basis. Therefore, so as to prove the success of this delineation approach/ attempt we hereby mention the systemic paradigm, which sets its philosophical and conceptual premises. It states that an objective reality (including the terrestrial reality) is organized into independent functional parts that, through exchange relationships, form new systemic entities of a higher rank;
- however, sometimes it has been proved that both situations/locations presented above have legal statuses, the first having a paradigmatic status while the second an ontological one. M. Grigore (1993) states that “theoretically or in practice, in supposition or in reality, the multiple categories, types of spaces, elements, geographical processes or phenomena are marked by the limit factor without which the environmental elements and components themselves cannot be understood, identified and separated, analyzed, researched, correlated, theoretically or fundamentally interpreted, regarding the management of their borders”. Concluding, the closest approach to the truth seems to be the theory, which states that both positions are legal, while natural limits existing in reality within the geographical space, therefore becoming patterns for the delineation of anthropogenic limits, these following the route of the natural ones. Concerning the issue of approaching the issue of limits, there are two manners of interpretations:
- the geographical limits as a consequence/result of the inner interaction among geosystems (implicit shape of the limits);
- geographical limits as a consequence of the effects the environment has on geosystems (explicit shape of the limits).
M. Grigore (1993) states that “through their qualities, limits represent integrative parts of numerous functional categories of processes, phenomena, geographical units and subunits”. Therefore, limits objectively represent structural elements holding features that result from the specificity of the geographical processes and phenomena, of the natural and anthropogenic components, of the existing differentiations between theories, and between separate categories of landscape.
V. ZOTIC, V. PUIU
178
The dimension, as a quantitative expression of space, as well as a result of a man’s need to express himself, to define space, including the geographical one, directly and indirectly individualizes both the type of limit and their delineation.
The holarchy of the geographical space, which designates new lower rank spaces within the geographical space, determines the differentiation of the holarchy of limits that explains the presence of general, global limits that generate lower rank, or local limits.
Limits, as transient areas, develop differently in space, in accordance with the holarchy level they are approached from. Therefore, a global or regional limit, approached from a local level, which is of the lowest rank, corresponds to a transition corridor or even an area within which other types of limits can be individualised.
Nevertheless, a local limit, approached from a global level, it becomes invisible, as its specific spatial characteristics become homogeneous.
Hence, the limits issue needs to be approached from a holarchy perspective (considering geographical scale) in accordance with the aim of research and the necessary required spatial peculiarities. Given the functional consequences that the natural, anthropogenic and post-anthropogenic limits have within the geographic systems, it becomes compulsory to identify them and then to research the territorial reality along with the functional context determined by its limits. The spatial dimension of the natural limits as well as the rank of the anthropogenic ones imposes dissimilar behaviour of both the geographical elements and the systems within the same space. Thus, in the case of a geosystem or its component dynamics, the limits of either low or average size or rank hold a guiding role (heading the flows), while the limits of a higher dimension or rank hold a barrier role.
The guiding or the barrier role of a limit is also determined by the dimension of the geosystem or its synergic cumulative force. Therefore, in the case of small scale geosystems, which dispose of synergic cumulative forces of low intensity, their small sizes and inferior rank limits cannot be included into the category of barrier limits. This would not be the case of large systems of regional or global scale, like hydrographical systems, air masses, national communities, industrial clusters, because these could go through or include lower rank limits, such as: secondary watersheds, small scale mountainous or hilly areas, zonal or local administrative limits.
The complexity of the organization and structure of the geographical space reveals a multitude of geosystems of various hierarchical ranks, holding different functions, shapes and structures, spatially located on different levels and angles along with the flows of mass and energy, as a consequence of the continuous action of endogenous (Earth) and exogenous (cosmic) forces over the geographical space; therefore, complexity involves the materialization and development of various limits.
In order to better assess and interpret limits, their typology must be approached in accordance with the suitable categories, types and subtypes.
Considering the type of interaction between the natural processes, natural limits can be. Barrier limits (that inhibit any connection). They can be determined as they represent
natural limits of various elements of the landscape, such as: mountains, high discharge streams, rocky coasts.
There are several categories of such barrier limits in accordance with the intensity of action and the type of effect they have on systems and their elements:
- barrier limits that have a maximum absorption. This type of limits attracts and absorbs the flows, the system elements or the system as a whole, even the information, thus determining their disbanding (i.e. mountain ranges, high debit watercourses, state borders, the influence areas of bank and industrial companies). These limits mainly affect the flows and the small and medium-size systems;
THE BARRIER EFFECT OF THE DANUBE IN THE REGIONAL DEVELOPMENT OF THE S.-W. OLTENIA REGION
179
- barrier limits that have absorption properties. This type partially captivates and absorbs the flows, the system and its elements, thus determining only structural changes;
- barrier limits that have rejecting properties. They reject the flows, the system and its elements, therefore inhibiting the dynamics, adjusting and guiding their direction or diminishing their intensity. Contact/Connection limits (of linkage). These reflect a contact transition and they are characteristic to contact areas or corridors (wood outskirts, small hydrographical units, low coasts). The contact limits can be shaped linearly, sinuously, in stripes/corridors or spots.
The threshold limits. These reflect the leap/ skip transition which is characteristic to spaces that suffer a radical change in structure, typology and shape.
The foundation of existence, development and evolution of natural limits has been coordinated by “the laws of nature”, whether they are physical, geographical, systemic or ecological.
The foremost function of limits within the geographical space is that of barrier or filter against the external factors, which act like disturbances. Hence, we can induce that the geosystems themselves tend to build and develop such limits, fact that represents the first form of protection of their interests and inner structure.
In the case of limits that are delineated artificially in order to reach some goals in studies like regionalization or typology, the location function becomes more significant than the segregation function, thus the connection/linkage - segregation functions becomes the key subject of research studies.
3. THE BARRIER EFFECT OF THE DANUBE IN HISTORICAL TIMES1 Beginning with the Antiquity, the Danube River has represented an important navigable
way, as well as a strategic one, as the border that has separated the Greek - Roman Mediterranean world of the Germanic and the Getae - Dacian ones.
The strategic and military role of the Danube was first highlighted by the Empire (kingdom) of Macedon that, under Phillip II followed by Alexander the Great, successively tried to ensure the control over the Danube mouths.
Later, the Roman Empire continued the attempts that lasted until 395 AD and, for the first time, succeeded to create a political and economic synthesis/union of the two worlds: the Eastern and the Western located aside the Mediterranean Sea. During the first years of the Christian Age, the Roman State would focus on territorial expansion, towards North, over the Danube.
The first attempts regarded Dobrogea, area that, for centuries, was in the attention of the Greek world, and subsequently, during Julius Cesar reign, there was the first attempt to occupy the territories located North of the Danube, actions abandoned after Cesar’s and Burebista’s deaths in 44 BC.
During Octavian Augustus’s reign, the efforts to break through the German territories were unsuccessful; therefore the long-standing border between the Roman Empire and the German world was finally established on the Danube. Yet, on the middle section of the Danube a certain success was registered, hence Pannonia region was created.
1 This chapter was drawn up by using the research made and published by Bran Florina, Creţu, Raluca
Florentina (2005), Probleme economice şi ecologice ale Dunării şi Mării Negre, Edit. ASE, Bucureşti.
V. ZOTIC, V. PUIU
180
The Roman failure on occupying the middle section of the Danube was balanced a century later, when, by conquering Dacia (101-106 BC), Trajan integrated a great section of the Danube, to its outlet into the Black Sea, into the Roman world. The conquest over Dacia province transformed the lower Danube, the section from Dobrogea to Pontus Euxinus, into a fundamental axis of the Romanization process in Eastern Europe.
Therefore, it emerged into what Vasile Pârvan calls “the Danube Romanism”. By all means, the Romans succeeded to strengthen both the strategic and military role of the river and the economic one. By building the bridge at Drobeta, they transformed this Dacian settlement into an important urban, economic and political centre of the Roman Dacia. The middle and lower Danube did no longer represent a state border; nevertheless it became an important Romanization factor due to its integration into the Roman Empire. The two areas that were part of the Roman Empire, located North and South of the river, linked through the Danube. However, the attacks of the migratory tribes against the Romans determined the abandonment of the Danube provinces, except for Dobrogea, that strategically became extremely important, as Constantinople was established as the imperial capital. In 602, due to the Slavic invasion in the Balkans, the Eastern Roman Empire also lost the last section of the Danube.
We can thus understand that the Roman Empire was the first one that tried to transform the Danube into an integration axis of both the European Eastern and central areas, as well as to succeed a temporary expansion towards North.
During the first part of the Middle Ages, due to the territorial migration processes, the Danube River lost its role of strategic axis, yet it partially preserved an economic role by the existence of several commercial city-ports along the middle and lower Danube.
The Christian Schism (mid 11th century), movement determined by the existence of two empires that fought over the same Roman heritage, divided the Danube and hindered its role of a factor for the European unification.
Nevertheless, the Middle Ages dominated by intolerance and religious fanaticism as well as by local economic interests, yet by using the Danube and Rhine rivers, could not find the necessary ways to ensure a medieval unity but looked for military solutions. Still, it is remarkable to notice that, during the first half of the Middle Ages, the Christian civilization extended up to Northern Europe, thus the Danube ceased to represent a border, as it was during the Antiquity.
The fall of the Byzantine Empire and the ascension of the Ottoman Empire brought up a new entity in the European competition that, through a century and a half policy based on force, between 1389 and 1526, ended in controlling a long section of the Danube, from central Hungary to its outlet into the Black Sea. The powerful Romanian resistance for a century hindered the Ottoman invasion in the Central Europe, with important consequences.
The efforts made by the Christian world to take back the Ottoman section of the Danube were long and continuous and succeeded only in the 19th century, in other economic and historical conditions.
The lack of interest manifested by Central and Western Europe regarding the section of the Danube that was dominated by the Ottomans has to be clarified through the economic mutations caused by the fall of Constantinople, moment in which the European economic circles, particularly the Italians, cut out from the traditional trade with spices, looked for a new trade way towards India, thus opening the age of the great geographical discoveries. This had repercussions over the Mediterranean and the Black Sea, which were withdrawn from the economic circuit for a long period, thus directly influencing the functionality
THE BARRIER EFFECT OF THE DANUBE IN THE REGIONAL DEVELOPMENT OF THE S.-W. OLTENIA REGION
181
of the Danube. Since 1683, the Ottoman defeat in Vienna, a new issue aroused, under the mark of “the Oriental Issue”, which aimed to divide the territories under the Ottoman Empire and to re-establish Christian power on the shores of Bosphorus.
During the following years, due to the victories at Buda and Mohacs, Austria occupied Hungary and achieved the control of the upper sector of middle Danube. During the 18th century, Austria and Russia, through several military conflicts, tried to expand their influence up to the Romanian Danube, as a first attempt to reach Constantinople.
If the events in Western Europe in the years after 1789 temporarily eliminated Austria from “the Oriental Issue”, Russia still sustained the pressure over the Ottoman Empire, eventually succeeding to occupy Bessarabia (the Moldavian territory between Prut and Dniester rivers) and to reach the mouths of the Danube in 1812.
At the end of the 18th century, when the republican France showed interest in the Eastern Mediterranean as well as in the straits, the Great Powers (especially Great Britain) became active again in the Black Sea and the Danube mouths areas.
The interests of the great European powers increased once Russia took control over the Danube, as a consequence of the Adrianople Treaty in 1829. By this treaty, the Ottoman provinces called rayas, Turnu, Giurgiu and Brăila, were definitively eliminated/ dismantled, along with the Ottoman presence on the Romanian Danube. Few years later (1836-1837), Brăila and Galaţi city-ports were declared free areas, fact that increased the commercial dynamics at the mouths of the Danube. During the same period, Austria became interested in controlling the navigation on the Danube, the section between Vienna and Galaţi. The economic and commercial interests in the Danube continuously increased as the Danube was integrated in the international circuit.
After the Crimean War and the Paris Congress in 1856, Russia surrendered the Southern part of Bessarabia, therefore losing its control over the mouths of the Danube, as well. The following were stipulated by the peace treaty: the free navigation on the Danube, the establishment of a European Commission to monitor the activity, with its headquarters at Galaţi and its representatives to be part of the great European powers.
Another commission was established to be in control of technical problems. This included riverside states such as: German states (Bavaria, Württemberg), Austria, the Ottoman Empire, Serbia, and the Romanian countries. The Congress held in Paris brought a major change regarding the status of navigation on the Danube, therefore conferring it a European significance. Hence, the Danube for the first time represented a cooperation factor for Western and Eastern Europe. This new approach of the Danube issue was also related to the first attempts to build the Danube-Black Sea channel, which dated in 1834.
Even though at the Paris congress the Danube issue carried a strong economic significance, still the rivalry among the Great Powers prevailed, thus preventing the transformation of the river into an instrument of European integration. If, during the Middle Ages, the attempt of integration could not be accomplished due to the political and religious disagreements, during modern times, the political and military rivalries had the same effect.
The Danube issue became interesting to the Great Powers once the Oriental Crisis was active again, in 1875, eventually concluded through the Russian-Romanian-Ottoman conflict between 1877 and 1878.
After signing the Peace Treaty and the Congress in Berlin, Russia regained the power over the Danube region; hence, the Danube Commission’s status was re-evaluated, therefore including Romanian members, which held the right to control the Romanian section of the river.
V. ZOTIC, V. PUIU
182
The Great Powers, mainly the Austro-Hungarian Empire, had divergent opinions, thus Vienna fought for an advantageous position regarding the commercial traffic on the lower Danube and for monopoly of the modernization works of the navigation process at the Iron Gates. Austria also supported the neutralisation of the Danube River, downstream the Iron Gates. Russia replied unsatisfied to the Austrian claims, especially to the issue of river neutralisation. The most important provision was stipulated in article 55: “the regulations concerning navigation, fluvial police and supervision from the Iron Gates to Galaţi will be established by the European Commission assisted by the delegates of the riverside states and will have to be in accordance with those established from the section downstream Galaţi”.
This way, the Austro-Hungarian Empire managed to divide the Danube into two sections: one that included the middle Danube, as well as the Iron Gates, which was under its exclusive control, and another section, which included the Romanian Danube, administered by the Great Powers represented in the European Commission.
The decisions of the Congress in Berlin disadvantaged the small riverside states, especially Romania and Serbia, which proved to be unpleased. Now, the contradictions on the Danube status got a new dimension; if, at first, the Great Powers were competing between them, it became necessary to compete with these small Danube countries, as well.
Under these conditions, a new conference of the European powers took place in London in February 1883. Its main subject was the status of the European Commission on the Danube. Romania refused to participate as a guest with a right to consultative vote and it also announced that it did not consider necessary to obey the provisions of the Conference that seriously infringed Romanian sovereignty, as the jurisdiction of the Commission had been extended to Brăila.
Romanian acceptance as part of the Triple Alliance, in October 1883, diminished the rivalry with the Austro-Hungarian Empire on the Danube issue.
In the following years, Germany strengthened its relationships with Romania, the latter becoming the main trade partner, in preference to the Austro-Hungarian Empire. The interest manifested for Constanţa city-port, as it represented a gate to the straits and beyond, towards the Middle East, determined Germany to use Romania as an important transit area for goods towards the Ottoman Empire. The modernisation of Sulina channel as well as the construction of the navigation channel bearing the same name created rather a competition regarding the navigation on the Danube and on the Black Sea.
Until the First World War, a certain rivalry regarding the Danube could be noticed between Germany and the Austro-Hungarian Empire, as the former preferred to use the Romanian Danube navigation way to the Black Sea in order to maintain its trade relationships with the Middle East, and Vienna chose the commercial road via the Adriatic Sea and the Aegean Sea, thus disadvantaging the Black Sea.
In the last quarter of the 19th century, after the Suez Channel was inaugurated in 1869, the commercial routes to India were redefined, consequently bringing Romania, along with the Black Sea, in the global economic circuit. The Danube, as a natural commercial way, held its importance even after the railways began to be used, because of the low cost of transportation on tonne. Yet, transportation on the Danube was still marked by technical difficulties. Even though important technical efforts were made, these technical problems represented an obstacle in making the river one of the most important European navigation ways until the First World War. They were only partially solved, and only in some crucial areas like the Iron Gates and the maritime section.
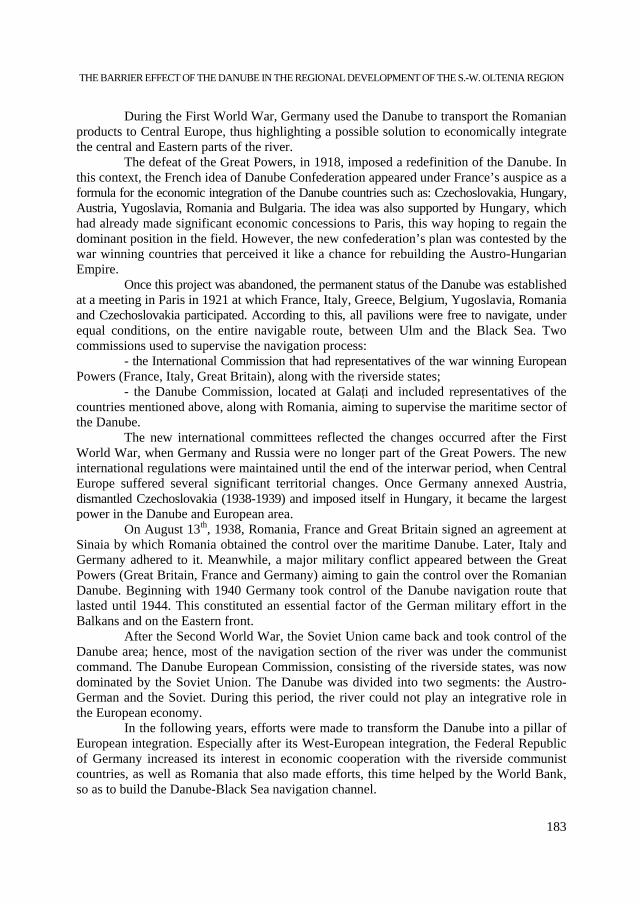
THE BARRIER EFFECT OF THE DANUBE IN THE REGIONAL DEVELOPMENT OF THE S.-W. OLTENIA REGION
183
During the First World War, Germany used the Danube to transport the Romanian products to Central Europe, thus highlighting a possible solution to economically integrate the central and Eastern parts of the river.
The defeat of the Great Powers, in 1918, imposed a redefinition of the Danube. In this context, the French idea of Danube Confederation appeared under France’s auspice as a formula for the economic integration of the Danube countries such as: Czechoslovakia, Hungary, Austria, Yugoslavia, Romania and Bulgaria. The idea was also supported by Hungary, which had already made significant economic concessions to Paris, this way hoping to regain the dominant position in the field. However, the new confederation’s plan was contested by the war winning countries that perceived it like a chance for rebuilding the Austro-Hungarian Empire.
Once this project was abandoned, the permanent status of the Danube was established at a meeting in Paris in 1921 at which France, Italy, Greece, Belgium, Yugoslavia, Romania and Czechoslovakia participated. According to this, all pavilions were free to navigate, under equal conditions, on the entire navigable route, between Ulm and the Black Sea. Two commissions used to supervise the navigation process:
- the International Commission that had representatives of the war winning European Powers (France, Italy, Great Britain), along with the riverside states;
- the Danube Commission, located at Galaţi and included representatives of the countries mentioned above, along with Romania, aiming to supervise the maritime sector of the Danube.
The new international committees reflected the changes occurred after the First World War, when Germany and Russia were no longer part of the Great Powers. The new international regulations were maintained until the end of the interwar period, when Central Europe suffered several significant territorial changes. Once Germany annexed Austria, dismantled Czechoslovakia (1938-1939) and imposed itself in Hungary, it became the largest power in the Danube and European area.
On August 13th, 1938, Romania, France and Great Britain signed an agreement at Sinaia by which Romania obtained the control over the maritime Danube. Later, Italy and Germany adhered to it. Meanwhile, a major military conflict appeared between the Great Powers (Great Britain, France and Germany) aiming to gain the control over the Romanian Danube. Beginning with 1940 Germany took control of the Danube navigation route that lasted until 1944. This constituted an essential factor of the German military effort in the Balkans and on the Eastern front.
After the Second World War, the Soviet Union came back and took control of the Danube area; hence, most of the navigation section of the river was under the communist command. The Danube European Commission, consisting of the riverside states, was now dominated by the Soviet Union. The Danube was divided into two segments: the Austro-German and the Soviet. During this period, the river could not play an integrative role in the European economy.
In the following years, efforts were made to transform the Danube into a pillar of European integration. Especially after its West-European integration, the Federal Republic of Germany increased its interest in economic cooperation with the riverside communist countries, as well as Romania that also made efforts, this time helped by the World Bank, so as to build the Danube-Black Sea navigation channel.
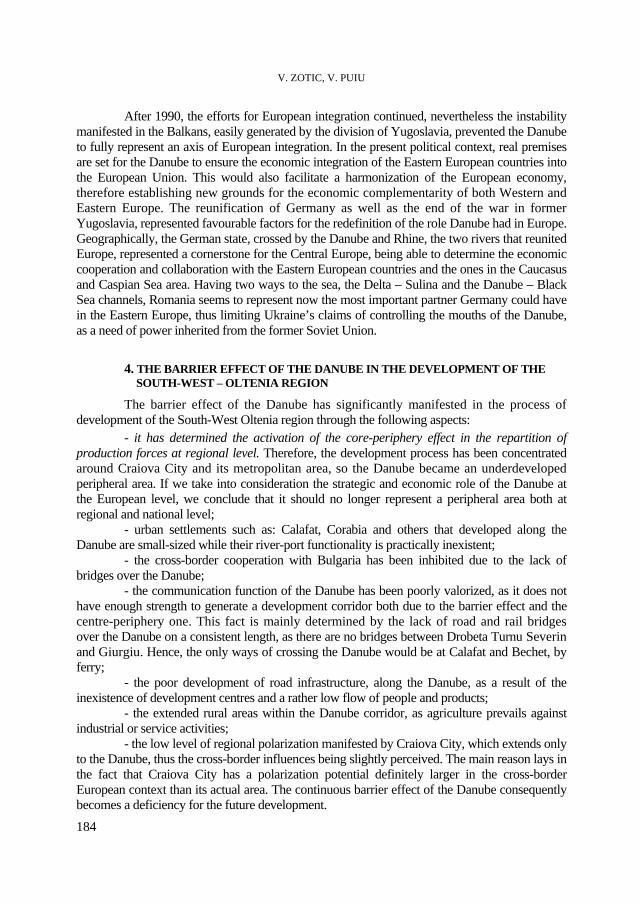
V. ZOTIC, V. PUIU
184
After 1990, the efforts for European integration continued, nevertheless the instability manifested in the Balkans, easily generated by the division of Yugoslavia, prevented the Danube to fully represent an axis of European integration. In the present political context, real premises are set for the Danube to ensure the economic integration of the Eastern European countries into the European Union. This would also facilitate a harmonization of the European economy, therefore establishing new grounds for the economic complementarity of both Western and Eastern Europe. The reunification of Germany as well as the end of the war in former Yugoslavia, represented favourable factors for the redefinition of the role Danube had in Europe. Geographically, the German state, crossed by the Danube and Rhine, the two rivers that reunited Europe, represented a cornerstone for the Central Europe, being able to determine the economic cooperation and collaboration with the Eastern European countries and the ones in the Caucasus and Caspian Sea area. Having two ways to the sea, the Delta – Sulina and the Danube – Black Sea channels, Romania seems to represent now the most important partner Germany could have in the Eastern Europe, thus limiting Ukraine’s claims of controlling the mouths of the Danube, as a need of power inherited from the former Soviet Union.
4. THE BARRIER EFFECT OF THE DANUBE IN THE DEVELOPMENT OF THE SOUTH-WEST – OLTENIA REGION
The barrier effect of the Danube has significantly manifested in the process of development of the South-West Oltenia region through the following aspects:
- it has determined the activation of the core-periphery effect in the repartition of production forces at regional level. Therefore, the development process has been concentrated around Craiova City and its metropolitan area, so the Danube became an underdeveloped peripheral area. If we take into consideration the strategic and economic role of the Danube at the European level, we conclude that it should no longer represent a peripheral area both at regional and national level;
- urban settlements such as: Calafat, Corabia and others that developed along the Danube are small-sized while their river-port functionality is practically inexistent;
- the cross-border cooperation with Bulgaria has been inhibited due to the lack of bridges over the Danube;
- the communication function of the Danube has been poorly valorized, as it does not have enough strength to generate a development corridor both due to the barrier effect and the centre-periphery one. This fact is mainly determined by the lack of road and rail bridges over the Danube on a consistent length, as there are no bridges between Drobeta Turnu Severin and Giurgiu. Hence, the only ways of crossing the Danube would be at Calafat and Bechet, by ferry;
- the poor development of road infrastructure, along the Danube, as a result of the inexistence of development centres and a rather low flow of people and products;
- the extended rural areas within the Danube corridor, as agriculture prevails against industrial or service activities;
- the low level of regional polarization manifested by Craiova City, which extends only to the Danube, thus the cross-border influences being slightly perceived. The main reason lays in the fact that Craiova City has a polarization potential definitely larger in the cross-border European context than its actual area. The continuous barrier effect of the Danube consequently becomes a deficiency for the future development.
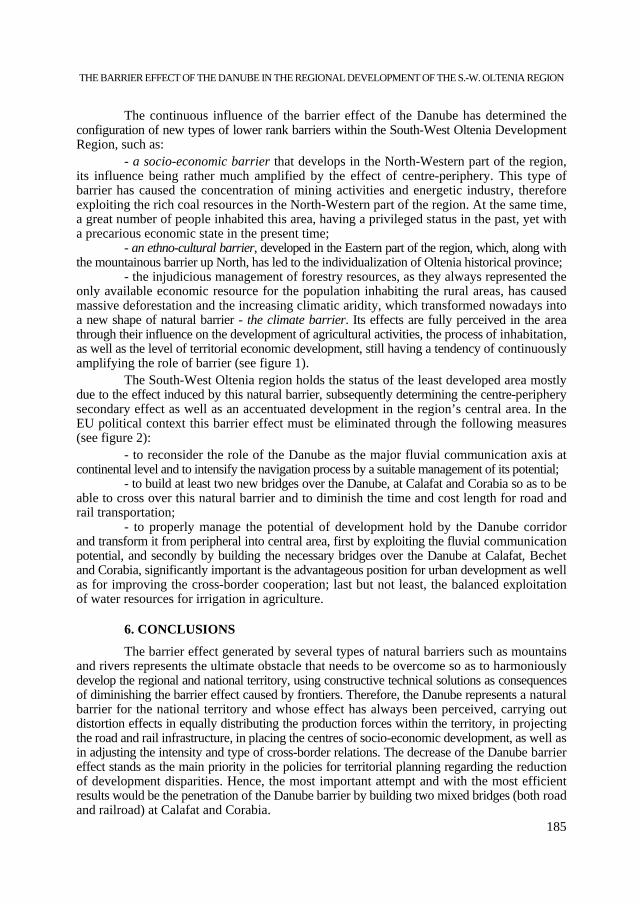
THE BARRIER EFFECT OF THE DANUBE IN THE REGIONAL DEVELOPMENT OF THE S.-W. OLTENIA REGION
185
The continuous influence of the barrier effect of the Danube has determined the configuration of new types of lower rank barriers within the South-West Oltenia Development Region, such as:
- a socio-economic barrier that develops in the North-Western part of the region, its influence being rather much amplified by the effect of centre-periphery. This type of barrier has caused the concentration of mining activities and energetic industry, therefore exploiting the rich coal resources in the North-Western part of the region. At the same time, a great number of people inhabited this area, having a privileged status in the past, yet with a precarious economic state in the present time;
- an ethno-cultural barrier, developed in the Eastern part of the region, which, along with the mountainous barrier up North, has led to the individualization of Oltenia historical province;
- the injudicious management of forestry resources, as they always represented the only available economic resource for the population inhabiting the rural areas, has caused massive deforestation and the increasing climatic aridity, which transformed nowadays into a new shape of natural barrier - the climate barrier. Its effects are fully perceived in the area through their influence on the development of agricultural activities, the process of inhabitation, as well as the level of territorial economic development, still having a tendency of continuously amplifying the role of barrier (see figure 1).
The South-West Oltenia region holds the status of the least developed area mostly due to the effect induced by this natural barrier, subsequently determining the centre-periphery secondary effect as well as an accentuated development in the region’s central area. In the EU political context this barrier effect must be eliminated through the following measures (see figure 2):
- to reconsider the role of the Danube as the major fluvial communication axis at continental level and to intensify the navigation process by a suitable management of its potential;
- to build at least two new bridges over the Danube, at Calafat and Corabia so as to be able to cross over this natural barrier and to diminish the time and cost length for road and rail transportation;
- to properly manage the potential of development hold by the Danube corridor and transform it from peripheral into central area, first by exploiting the fluvial communication potential, and secondly by building the necessary bridges over the Danube at Calafat, Bechet and Corabia, significantly important is the advantageous position for urban development as well as for improving the cross-border cooperation; last but not least, the balanced exploitation of water resources for irrigation in agriculture.
6. CONCLUSIONS
The barrier effect generated by several types of natural barriers such as mountains and rivers represents the ultimate obstacle that needs to be overcome so as to harmoniously develop the regional and national territory, using constructive technical solutions as consequences of diminishing the barrier effect caused by frontiers. Therefore, the Danube represents a natural barrier for the national territory and whose effect has always been perceived, carrying out distortion effects in equally distributing the production forces within the territory, in projecting the road and rail infrastructure, in placing the centres of socio-economic development, as well as in adjusting the intensity and type of cross-border relations. The decrease of the Danube barrier effect stands as the main priority in the policies for territorial planning regarding the reduction of development disparities. Hence, the most important attempt and with the most efficient results would be the penetration of the Danube barrier by building two mixed bridges (both road and railroad) at Calafat and Corabia.
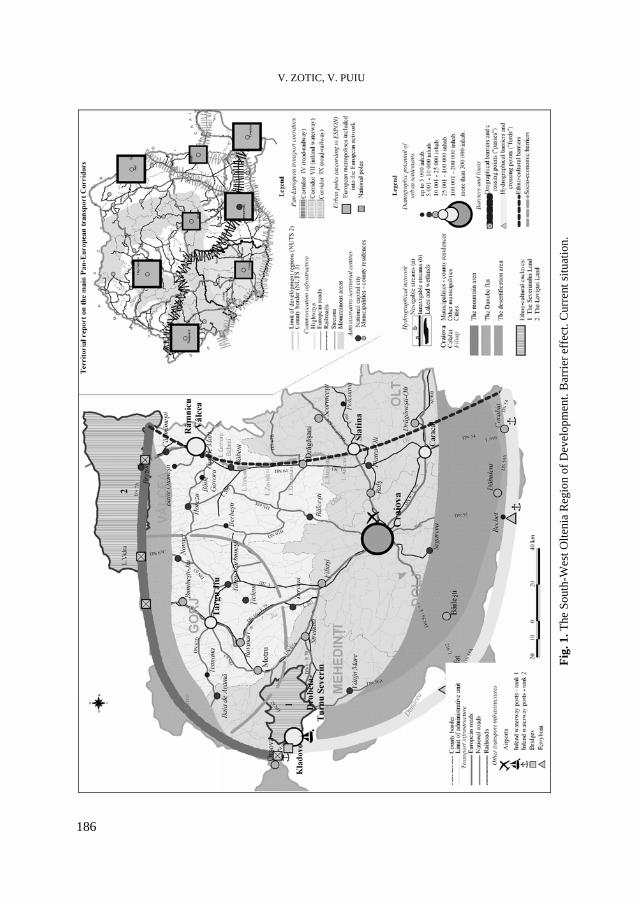
V. ZOTIC, V. PUIU
186
Fi
g. 1
. The
Sou
th-W
est O
lteni
a R
egio
n of
Dev
elop
men
t. B
arrie
r eff
ect.
Cur
rent
situ
atio
n.
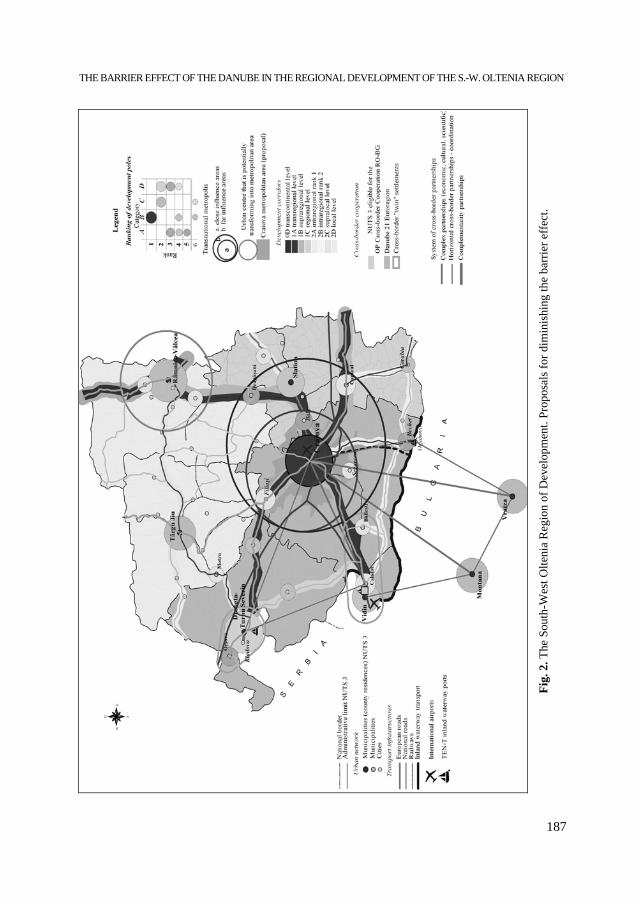
THE BARRIER EFFECT OF THE DANUBE IN THE REGIONAL DEVELOPMENT OF THE S.-W. OLTENIA REGION
187
Fi
g. 2
. The
Sou
th-W
est O
lteni
a R
egio
n of
Dev
elop
men
t. Pr
opos
als f
or d
imin
ishi
ng th
e ba
rrie
r eff
ect.
V. ZOTIC, V. PUIU
188
R E F E R E N C E S 1. Armand, D., Preobraženskij, V., Armand, A. (1969), Prirodnye kompleksy i sovremennye metody
ih izučenija. Izvestija AN SSSR, Ser. Geografičeskaja, nr. 5. 2. Bran, Florina, Creţu, Raluca Florentina (2005), Probleme economice şi ecologice ale Dunării şi
Mării Negre. Ediţia II-a, Editura ASE, Bucureşti. 3. Erdeli, Gh., Cândea, Melinda, Braghină C., Zamfir, Daniela (1999), Dicţionar de geografie umană.
Edit. Corint, Bucureşti. 4. Grigore, M. (1993), Conceptul noţiunii de limită utilizat în sistemul ştiinţific al disciplinelor geografice,
Analele Universităţii Bucureşti, geografie, Anul XLII. 5. Ielenicz, M., Comănescu, Laura, Mihai, B., Nedelea, Al., Oprea, R., Pătru Ileana (1999), Dicţionar
de geografie fizică, Edit. Corint, Bucureşti. 6. Sobaru, Al., Năstase, G., Avădanei, C. (1998), Artera navigabilă Dunăre-Main-Rhin. Strategii europene
orizont 2000, Edit. Economică, Bucureşti. 7. Sočava, V. B. (1978), Vvedenie v učenie o geosistemah, Izd-vo Nauka, Sibirskoe otdelenie, Novosibirsk.
STUDIA UNIVERSITATIS BABEŞ-BOLYAI, GEOGRAPHIA, LV, 2, 2010
ENVIRONMENTAL SHORTCOMINGS AND GEO-ECOLOGICAL REBALLANCING OF THE MINING SITES WITHOUT ACTIVITY
IN MARAMUREŞ COUNTY
V. GLIGOR1, S. F. FONOGEA2
ABSTRACT. – Environmental Shortcomings and Geo-ecological Reballancing of Mining Sites without Activity in Maramureş County. Mining inevitably induces conflicting relationships at the level of local and regional environmental systems. In the context of respecting the EU standards, mining has been shut down in Maramureş County, a very careful re-evaluation of the environmental components being required for the functional reintegration of the territorial systems. The environmental significance of the anthropogenic activities, in general, and of the mining activities, in particular, comes from the functional modifications induced on the natural components, as well as from the relationship between these modifications and the anthropogenic component. The spreading of the aggressive-destructive effects induced by mining to the environmental systems started with the exploitation of the useful mineral substances, when numerous excavations took place and many shafts and ditches appeared at the surface, alongside with a branched network of galleries placed on different levels (coast galleries, directional galleries and inclined plane galleries) and deep drillings. The materials excavated underground accumulated at the mouth of the galleries, as gross dump heaps. Analyzing the international documents and legislation referring to the mining sector, in what concerns the environmental problem and especially the strategy of mining industry development for the years to follow, the action plan for environmental protection is based on two conclusions: the mining sector in Maramureş bears the inheritance of an environmental large scale degradation and of serious environmental matters and the degradation continues even today. There is a constant raise in interest over these problems, but action is poor towards solving and preventing them. The fact that these problems continue to exist and to aggravate is not caused by the lack of rules or legal instruments or by the absence of specialized institutions, but by ignoring to put into practice the already existing regulations. The resources are poor, the awareness and the environmental management competence are also poor in the mining sector.
Keywords: environmental dysfunctions, mining site waste-dumps, settling tanks, geoecological
reballancing, space and functional reintegration.
1. INTRODUCTION
The analysis focused on the highlighting the forms of impact upon the dynamics of the environmental systems, in order to identify and promote the correct and specific interventions to solve the lack of equilibrium in the destructure spaces by the mining activities (elimination of the risks connected to waste-dumps, aesthetic and functional reintegration into the landscape, cleaning up of the soil, reconstruction of the degraded sites), according to the local specific features of all the inhabited areas. 1 Babeş-Bolyai University, Faculty of Geography, 400006 Cluj-Napoca, Romania, e-mail:
[email protected] 2 Babeş-Bolyai University, Faculty of Geography, 400006 Cluj-Napoca, Romania, e-mail:
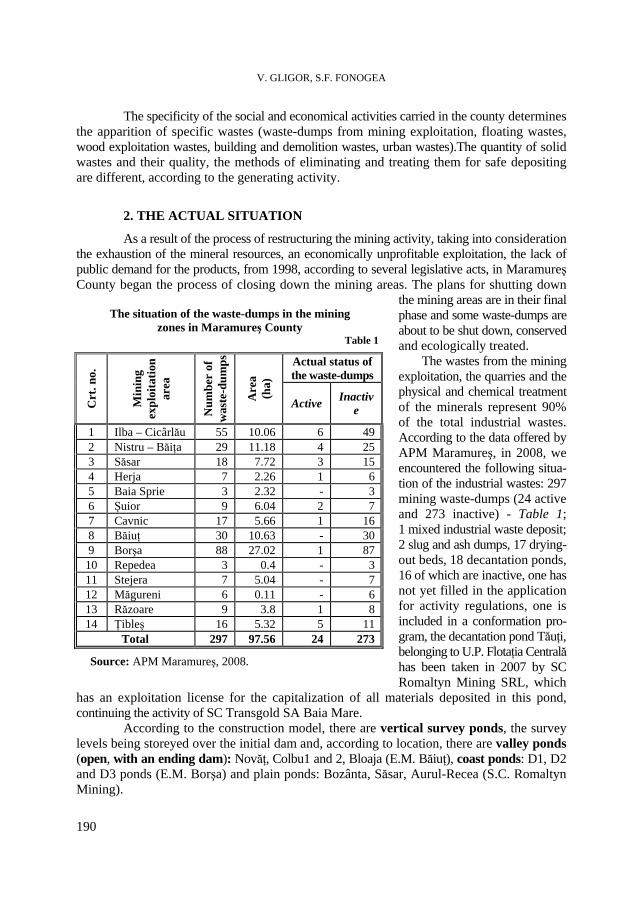
V. GLIGOR, S.F. FONOGEA
190
The specificity of the social and economical activities carried in the county determines the apparition of specific wastes (waste-dumps from mining exploitation, floating wastes, wood exploitation wastes, building and demolition wastes, urban wastes).The quantity of solid wastes and their quality, the methods of eliminating and treating them for safe depositing are different, according to the generating activity.
2. THE ACTUAL SITUATION
As a result of the process of restructuring the mining activity, taking into consideration the exhaustion of the mineral resources, an economically unprofitable exploitation, the lack of public demand for the products, from 1998, according to several legislative acts, in Maramureş County began the process of closing down the mining areas. The plans for shutting down
the mining areas are in their final phase and some waste-dumps are about to be shut down, conserved and ecologically treated. The wastes from the mining exploitation, the quarries and the physical and chemical treatment of the minerals represent 90% of the total industrial wastes. According to the data offered by APM Maramureş, in 2008, we encountered the following situa-tion of the industrial wastes: 297 mining waste-dumps (24 active and 273 inactive) - Table 1; 1 mixed industrial waste deposit; 2 slug and ash dumps, 17 drying-out beds, 18 decantation ponds, 16 of which are inactive, one has not yet filled in the application for activity regulations, one is included in a conformation pro-gram, the decantation pond Tăuţi, belonging to U.P. Flotaţia Centrală has been taken in 2007 by SC Romaltyn Mining SRL, which
has an exploitation license for the capitalization of all materials deposited in this pond, continuing the activity of SC Transgold SA Baia Mare.
According to the construction model, there are vertical survey ponds, the survey levels being storeyed over the initial dam and, according to location, there are valley ponds (open, with an ending dam): Novăţ, Colbu1 and 2, Bloaja (E.M. Băiuţ), coast ponds: D1, D2 and D3 ponds (E.M. Borşa) and plain ponds: Bozânta, Săsar, Aurul-Recea (S.C. Romaltyn Mining).
The situation of the waste-dumps in the mining zones in Maramureş County
Table 1 Actual status of the waste-dumps
Crt
. no.
Min
ing
expl
oita
tion
area
Num
ber
of
was
te-d
umps
Are
a (h
a)
Active Inactive
1 Ilba – Cicârlău 55 10.06 6 492 Nistru – Băiţa 29 11.18 4 253 Săsar 18 7.72 3 154 Herja 7 2.26 1 65 Baia Sprie 3 2.32 - 36 Şuior 9 6.04 2 77 Cavnic 17 5.66 1 168 Băiuţ 30 10.63 - 309 Borşa 88 27.02 1 8710 Repedea 3 0.4 - 311 Stejera 7 5.04 - 712 Măgureni 6 0.11 - 613 Răzoare 9 3.8 1 814 Ţibleş 16 5.32 5 11
Total 297 97.56 24 273
Source: APM Maramureş, 2008.
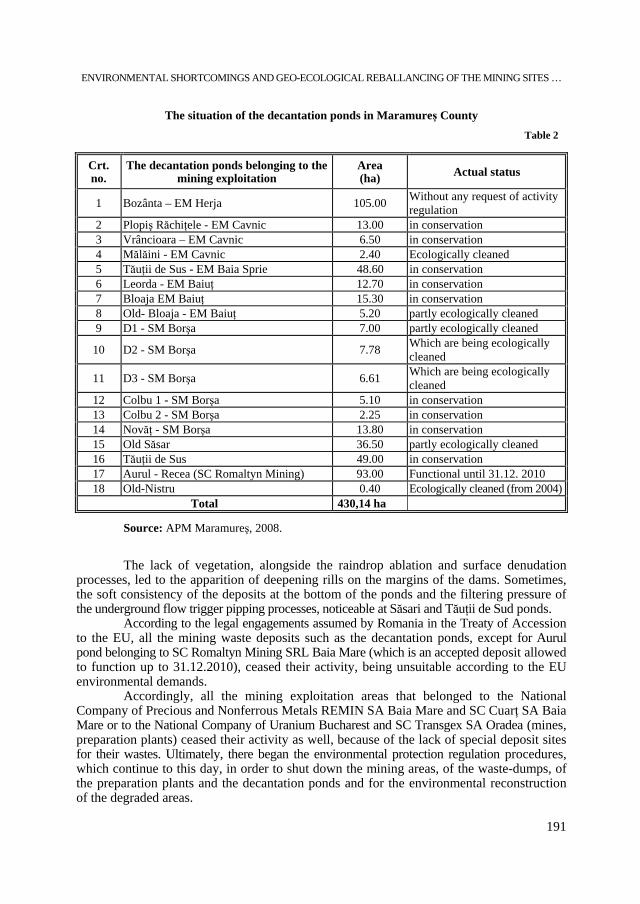
ENVIRONMENTAL SHORTCOMINGS AND GEO-ECOLOGICAL REBALLANCING OF THE MINING SITES …
191
The situation of the decantation ponds in Maramureş County Table 2
Source: APM Maramureş, 2008.
The lack of vegetation, alongside the raindrop ablation and surface denudation processes, led to the apparition of deepening rills on the margins of the dams. Sometimes, the soft consistency of the deposits at the bottom of the ponds and the filtering pressure of the underground flow trigger pipping processes, noticeable at Săsari and Tăuţii de Sud ponds.
According to the legal engagements assumed by Romania in the Treaty of Accession to the EU, all the mining waste deposits such as the decantation ponds, except for Aurul pond belonging to SC Romaltyn Mining SRL Baia Mare (which is an accepted deposit allowed to function up to 31.12.2010), ceased their activity, being unsuitable according to the EU environmental demands.
Accordingly, all the mining exploitation areas that belonged to the National Company of Precious and Nonferrous Metals REMIN SA Baia Mare and SC Cuarţ SA Baia Mare or to the National Company of Uranium Bucharest and SC Transgex SA Oradea (mines, preparation plants) ceased their activity as well, because of the lack of special deposit sites for their wastes. Ultimately, there began the environmental protection regulation procedures, which continue to this day, in order to shut down the mining areas, of the waste-dumps, of the preparation plants and the decantation ponds and for the environmental reconstruction of the degraded areas.
Crt. no.
The decantation ponds belonging to the mining exploitation
Area (ha) Actual status
1 Bozânta – EM Herja 105.00 Without any request of activity regulation
2 Plopiş Răchiţele - EM Cavnic 13.00 in conservation 3 Vrâncioara – EM Cavnic 6.50 in conservation 4 Mălăini - EM Cavnic 2.40 Ecologically cleaned 5 Tăuţii de Sus - EM Baia Sprie 48.60 in conservation 6 Leorda - EM Baiuţ 12.70 in conservation 7 Bloaja EM Baiuţ 15.30 in conservation 8 Old- Bloaja - EM Baiuţ 5.20 partly ecologically cleaned 9 D1 - SM Borşa 7.00 partly ecologically cleaned
10 D2 - SM Borşa 7.78 Which are being ecologically cleaned
11 D3 - SM Borşa 6.61 Which are being ecologically cleaned
12 Colbu 1 - SM Borşa 5.10 in conservation 13 Colbu 2 - SM Borşa 2.25 in conservation 14 Novăţ - SM Borşa 13.80 in conservation 15 Old Săsar 36.50 partly ecologically cleaned 16 Tăuţii de Sus 49.00 in conservation 17 Aurul - Recea (SC Romaltyn Mining) 93.00 Functional until 31.12. 2010 18 Old-Nistru 0.40 Ecologically cleaned (from 2004)
Total 430,14 ha
V. GLIGOR, S.F. FONOGEA
192
3. ENVIRONMENTAL SHORTCOMINGS ASSOCIATED TO MINING SITES
Inside the shut-down mining sites in Maramureş County, there are obvious modifications of the environmental components, induced by the apparition and space extension of the new anthropogenous deposit structures (layered soils, mine waste-dumps, fine waste-dumps, isolated heaps of gross material etc) underlined by the intense degradation of the hypergene layer. The environmental dysfunctions associated to these anthropogenical relocated materials are expressed by a series of evaluation markers, such as:
- physical instability of the deposits of waste material – as a potential factor of geomorphic risk for the nearby pieces of land (gravitational relocation of dry material from the edge of the waste-dumps, the inadequate placement of some dumps);
- chemical instability – due to the infiltration waters, which solubilizes some components resulted from the exogenous alteration of minerals (especially from the oxidation of metallic sulphides) or the movement of fine particles, leading to the pollution of the streams and of the underground water (Vişeu valley, the middle and lower courses of Ţâşla, Novăţ, Repedea, Ruscova, Lăpuş, Cavnic, and Săsar valleys – present waters polluted with heavy metals and different radioactive components that come from the drainage of the uranium exploitations, the waste-dumps and the decantation ponds);
- heavy metal dust – moved by atmosphere currents at the level of the dumps, the flotation and the quarries in the county, represent a pollution factor and a risk source for health, because of the high level of toxic substances (Pb, Cd, Zn, Cu, Hg, Ni, Cr, Se, As). By spreading, they contribute to soil pollution, underground and surface water pollution , with distructive effects on the local and regional ecosystems;
- visual impact – represented by the degradation of the natural components and the high degree of landscape remanence of all forms of anthropogenic intervention, expressed by zone natural markers, with negative consequences on the aesthetic evaluation, concerning the appreciation of the degree of accessibility of the mountain space and tourist exploitation.
3.1. Environmental shortcomings associated to waste-dumps and the decantation
ponds
The environmental significance of the anthropogenic activities, in general, and especially of the mining activities comes from the structural and functional modifications induced by these on the natural components and from the relationship between these modifications and the anthropogenic component.
The gross heaps are placed in front of the entrance in the mines or very close to these entrances and take the form of pyramid trunks, larger in surface than in height, isolated or organised in groups of waste-dumps (Borşa mining area – 88 waste-dumps/27,0 ha; Ilba-Cicârlău area – 55 waste-dumps/10,06 ha; Băiuţ mining area – 30 waste-dumps/10,63 ha; Nistru-Băiţa area – 29 waste-dumps/11,18 ha; Săsar area – 18 waste-dumps/7,72 ha etc). Because of the inconsistency of the materials and of the disrespect for geo-technical measures (inadequate placement, steep inclination of the edges, the lack of guard channels etc), the waste-dumps are very susceptible to erosion, by ravening or mass gliding (mud gliding, rolling, edge collapses, dry material movements), inducing states of potential risk under the form of blocking some sections of the local hydrographical network and also favourable conditions for flooding, by the high level of materials accumulated in the minor river beds.
The impact of mining on the components of the environmental system by the relocation and depositing of the materials in decantation ponds, waste-dumps, slag and ash heaps in Maramureş County generated a series of dysfunctions, such as:
ENVIRONMENTAL SHORTCOMINGS AND GEO-ECOLOGICAL REBALLANCING OF THE MINING SITES …
193
- the release of large pieces of land from the agricultural and forest activities (areas occupied by waste-dumps - 97,56 ha; decantation ponds – 430,14 ha; quarries, technological roads, plant platforms etc);
- the dissolution of the natural equilibrium among the components by the destruction of the vegetation and of the fauna, in the surfaces affected by mining dynamics and the surrounding areas (the degradation caused by pollution goes 20 km further than the original limits: Cavnic-Baia Sprie, Baia Borşa, Baia Mare);
- the raise of the landslide risk and of losing stability of the dumps or the breaking loose of the dens of the decantation ponds, with long-term ecological repercussions;
- the thickness of the dumps and of the deposits in the ponds prevents natural regeneration, the degradation of the soil becoming irreversible;
- the destruction of the submerged surfaces, including the buildings and works of art; - the dust covers the vegetation, with bad consequences because of their chemical
composition or the chemical reactions they produce in contact with the hydro-atmospheric environment;
- all these lead to the degradation of the natural aspect of the region and negatively influences the possibilities for relaxation and tourism;
- the apparition of the polluted hydrological mediums (suspensions and toxic elements-metallic ions);
- the dispersion of the polluting factors at large distances due to the hydrographical network, contaminating surface waters, underground water, the sediments in river flats and river beds;
- the great resistance of the heavy metals fixed in the sediments, that can be reoriented by high waters, according to the hydrological regime of the rivers;
- the placement of accumulated deposits of mining wastes near the borders represents an ever increasing risk factor for transboundary pollution;
- the mineral wastes and toxic substances deposited on the soil are hardly or not at all decomposed by micro-organisms or by dissolution, so the soil, as compared to the waters and the atmosphere, has no power or dispersion, therefore its degradation is immediate and irreversible;
- the infiltrations from the decantation ponds destroy or modify the bacterial flora and fauna of the soil;
- the irreversible destruction of the natural habitats and permanent landscape degradation;
- the change in the sense of natural evolution of the environmental systems and the destruction of its internal self-stability capacity.
Generally, next to the ponds in the narrow valleys, marshes appeared, as a consequence of the raise in level of underground waters and, on the mountain slopes, there are landslides caused by the excess in humidity created by blocking the underwater horizon.
3.2. Environmental dysfunctions associated to deserted mines and inactive quarries
The perpetuation of the aggressive-destructive effects induced to environmental systems by mining was triggered by the exploitation of the useful mineral substances, when numerous excavations took place, alongside ditches and shafts and a vast network of storied galleries (coast galleries, directional or inclined galleries) and deep drillings. The materials excavated from underground accumulated at the mouth of the galleries, forming gross dumps.
V. GLIGOR, S.F. FONOGEA
194
The deserted mines are associated to the frequent presence of fractures in the gravitational equilibrium, under the form of landslides, circular or longitudinal ditches, such as those at Dealul Murgăul Mare, Dealul Crucii, Dealul Mic (near Baia Mare) or those at Dosul Minei (in Baia Sprie). The research on the spot proved that the intersection of the underground waters by the slow advance of the galleries determined the emergence of hydrographical organisms of large discharge which develop profound straight erosion on the surrounding surfaces, contributing to the formation of a fluviatile relief. In the case of the underground exploitations, the placement of the mouths of the mines determined cuts into the mountain slopes, leading to the raise in their mobility and the apparition of escarps with a regressive evolution. The inactive quarries are visible, generally, in the soil excavations with variable dimension and a geometrical form. The deforesting and exploitation of clay from Tăuţii de Sus led to slow landslides, as an effect of vertical fissures and inclined dislocation surfaces. The exploitation of andhesic, riolitic and shale rocks led to the apparition of several quarries which determined the activation of landslides by meteorisation, breakdowns and rolling (Dealul Soarelui – Seini, Tău Roşu – Ferneziu, Blidari – Limpedea etc, in Igniş – Gutin area; Valea Fătului and Novăţ in Toroiaga).
3.3. Structural and functional dysfunctions with regional impact on the environmental
system associated to the processes of shutting down mining sites
In Maramureş County, when mining restrained and was shut down near Cavnic, Borşa, Baia Sprie, and near Baia Mare, hundreds of waste-dumps with thousands of tones of waste were left behind. In the summer time, a fine, suffocating dust comes out of these waste-dumps and, in spring, after the melt-down of the snow and after rain, the waste-dumps fill in with water, which overflows in the rivers. The mining waters flow towards water treatment stations which have also been deserted, so that the rivers Ţâşla, Lăpuş, Vaser, Cavnic, Băiţa, Ilba and Nistru continue to be polluted.
The following structural and functional shortcomings have been identified, with a major impact on the local environmental system associated to the processes of shutting down mining sites in Maramureş County:
a) the demolition of the structures at the surface is a potential source of risk phenomena which could lead to the following damages: waste formation, even dangerous waste, noise emissions generated by the equipment used to level and stabilise the structures inside the mining sites, dust and smoke from the traffic, vibration and micro seismic waves produced through detonation, traffic and controlled landslides of hard rocks, mud leakage on the slopes (during rainy periods), that originates in the wet fine clay fractions, in the traffic and the weak consistency of the anthropogenical relocated material, the sliding of the edges during the exploitation activity.
b) the upbuilding of the shafts can have a temporary impact on underground waters because of the solid suspensions caused by the upbuilding. The chemical analysis of the water stands for any exceeding in the concentration of hard metals or alkaline reactions.
c) the overflowing of underground waters in surface waters can be caused by the accidental discharge of pollutants with a high concentration in salts, chlorines and sulphides from underground waters.
d) the leakage of contaminated water (Cu, Pb, Zn etc) at the level of the dumps, the decantation ponds and the mouth of the mines (the uranium galleries at Poienile de sub Munte and Repedea) need urgent ecological cleaning.
e) the rehabilitation of the land and the reforesting can have a negative impact, because of the possible use of unaccepted fertilisers and/or use of the contaminated soil.
ENVIRONMENTAL SHORTCOMINGS AND GEO-ECOLOGICAL REBALLANCING OF THE MINING SITES …
195
3.4. Local environmental shortcomings due to the bad execution of the ecological cleaning workings
Apart from the fact that the shutting-down of the mining sectors did not take into consideration that these areas and the existing equipment (infrastructure, utilities, buildings etc) can be used for the development of economical, social and tourist activities, there are some dysfunctions due to the bad execution of some of the workings in the ecological cleaning projects: - the inadequate use of the coast galleries (their shutting-down at the mouth of the gallery by concreting), when some galleries could have been used as underground spaces for depositing, as snail farms or for tourist attraction (Nistru area – Mintoasa Valley); - the inadequate treatment of the mining waters (inadequate administration of the water treatment stations) – Ilba-Cicârlău, Baia Sprie areas; - the precarious fixation of the waste-dumps (the sustaining poles are not well fixed in the waste-dump): slope angles wider than 40%, when it should have normally be 30 %, slides of the stabilisation workings, destruction provoked by avalanches and forest exploitation (Borşa area, Nistru-Băiţa area, Săsar area, Ilba area - Valea Roşie waste-dump, Toroioaga area etc.); - the continuous washing of these deposits by the meteorical waters (the superior part of the waste-dumps is not water-proof) and the erosion due to slope waters (sometimes, the waste-dumps are placed in the valleys and they continuously erode the waste-dumps – Borşa mining area, Toroioaga, Băiţa, Ţibleş – Tomnatic, Burloaia, etc); - the disrespecting application of the technology for young tree plantation – pits too small and the absence of the soil (Borşa area, at Măgura 2 – the waste-dump is supported by the hearth of an old quarry, with a very abrupt edge, aprox. 300 m, where they did not use soil in the plantation of the trees).
4. GEOECOLOGICAL RECONSTRUCTION OF THE MINING SITES AND SPACE AND FUNCTIONAL REINTEGRATION OF THE AFFECTED AREAS
The social, economical and political transformations that took place globally as for the quality of the environment force us to urgent theoretically based solutions with local applicability for the re-ecologisation and rehabilitation of those regions that present deficiencies and environmental imbalances in Maramureş County, solutions that should aim at long-term equilibration measures in the areas affected by mining activities.
The shutting-down of the mines will be carried out according to Romanian legislation, which is now compatible to a good industrial applicability (“Manual of proceedings for the conservation and the shut-down of mines” (MPCIM), elaborated according to the Mining Law 85/2003, the Environmental protection Law 137/1995, with the subsequent modification and addenda and the Law for Water 107/1996, with its subsequent modifications and addenda), and the handling of mining waste according to the engagements assumed by signing Romania’s Position Document on Adhesion to the European Union, Chapter 22 – Environmental Protection.
The major problem categories which are of concern in the shutting-down and in the management of a mine are as follows:
- the waste management: all the unneeded materials (toxic underground, contaminated soil, technological waste etc) have to be isolated, eliminated or treated differently, in order to obtain a long-term stability and according to the existing national regulations or to the specific limitations imposed to the specific location;
V. GLIGOR, S.F. FONOGEA
196
- the stability of the location: the rehabilitated area has to be stabilised by the elimination of the potential disequilibrium sources of the slopes under the influence of the gravitational material dislocation or the active erosion incisions;
- the hydro-management: the quality of the underground waters and surface waters, that could have been affected by mining, has to be protected by activities of recuperation and has to be treated and cleaned in case of pollution;
- the landscape resources and the alternative of the location: if possible, the land that goes through an environmental rehabilitation will have comparable or compatible characteristics with the landscape qualities of the adjacent areas, from the point of view of location, extension and placement of the morphological alignment.
Aiming at reducing and eliminating the risk factors associated to waste deposits, to decantation ponds and underground galleries, generated by mining (instability of the edges, discharge of acid waters and toxic substances in the hydro-atmospheric medium, degradation of the soils etc) the measures for geo-ecological rehabilitation and reconstruction aim at:
- improving the degree of morphological stability inside mining sites with shut-down activity and the diminishing of vulnerability to erosion and denudation processes;
- stabilising the waste-dumps and physically fixating the decantation ponds, for which it is recommended to carry out forest plantation of well-branched round canopy trees (acacias, birch-trees, sea buckthorn);
- cylinder flattening the platform of the dumps that din not respect the technical building standards, in order to attain an inclination of minimum 3 ‰ towards the exterior edge of the dump, that should ensure the leakage of rain water;
- leading out geo-technical workings for the stabilisation of the waste-dumps and ponds which are unstable and present potential risk of collapsing and digging out guard-channels for the evacuation of the rain water that can lead to overflowing of the waste over the dens and gravitational dislocation;
- using water treatment technologies based on natural processes, projected to function as “self-regulating systems” (microbial sulphate reduction or bio-absorption);
- building concrete rills placed in mini-cascades, for the water flows that gather the waters from the mines and quarries, aiming at oxygenating the water and precipitating the metallic ions as oxides;
- using the deposits from the waste-dumps by reprocessing them and using the materials as raw material in constructions and embankment (roads and railways, sports and industrial parks, etc);
- carrying out the separation of uncontaminated waters from the contaminated ones (deviation ditches, collecting of streaming waters);
- minimising the volume and surface of the edges of the waste-dumps (removing the dumps that are small in height and occupy large areas and relocating them in one single place);
- embanking some voids at the surface and surrounding these areas. Space and functional reintegration of the areas affected by anthropogenic activities,
such as mining, in Maramureş County, involves a differentiated approach, according to the typology of the deposits, the morphology of the sites, the degree of local stability, the actual and future necessities, economical and financial profitableness, the elimination of environmental and landscape shortcomings.
The reconstruction of the degraded surfaces in the mining areas can be achieved in several ways that illustrate a long-lasting integration correlated to the actual and future development of the analysed regional system:
ENVIRONMENTAL SHORTCOMINGS AND GEO-ECOLOGICAL REBALLANCING OF THE MINING SITES …
197
- agricultural lands: Herja, Săsar, Stejara mining areas; - forest lands: Ilba-Cicârlău, Cavnic, Ţibleş, Borşa mining areas; - fishing areas: Borşa, Cavnic, Ţibleş, Răzoare areas; - reprocessing mining deposits: Novăţ, D1, D2, D3, Vrâncioara, Plopiş-Răchiţele,
Tăuţii de Sus, Leorda, - waste deposits: Repedea area Bloaja ponds;; - amusement areas (areas where people can practice different sports, extreme sports,
gardens, lakes): Ilba-Cicârlău, Borşa, Băiuţ, Tibleş areas; - architectural and mining reserves (mine museums): Baia Mare, Cavnic, Ilba, Baia
Sprie, Borşa, Nistru areas.
5. CONCLUSIONS
The impact of mining, through its extractive activities of processing and depositing materials, on the components of the environmental system in Maramureş County determined the progressive change of dynamics of some mountain areas that found themselves in a state of stable equilibrium, areas in Igniş, Gutin, Ţibleş and Maramureş, which happened by an anthropogenically induced regressive acceleration, generating new landscapes that function in an advanced degree of enthropy.
The geo-ecological reconstruction of the areas affected by mining consists of the arrangement and safe-keeping of the waste deposits after they were shut down, by specific workings concerning the increase of the stability factor of the techno-structures (quarries, mouths of the mine, waste-dumps, decantation ponds, etc.), the elimination of the environmental and landscape dysfunctions with local and regional impact.
Through teritorial rearrangement measures we have to recreate the previous economical potential of those regions according to the actual conditions and the strategic aims of space and functional reintegration.
R E F E R E N C E S 1. Barrow, C. J. (1997), Environmental and Social Impact Assessment, Arnold, London. 2. Beer, Anne R. (1998), Environmental Planning for Site Development, Routledge, London. 3. Bularda, Gh., Bularda, T., Catrinescu, Th. (1992), Reziduuri menajere, stradale şi industriale, Edit.
Tehnică, Bucureşti. 4. Gligor, V., (2005), Disfuncţionalităţi şi dezechilibre environmentale în perimetrul minier Roşia
Poieni, Lucrările Simpozionului Ştiinţific: „Ştiinţă şi dezvoltare în profil teritorial”, Baia Mare 27-28 mai 2005, Edit. Risoprint, Cluj-Napoca.
5. Goudie, A. (1993), The Human Impact on the Natural Environment, Blackwell, Oxford. 6. Hook, J.M. (1988), Geomorphology in Environmental Planning, Wiley and Sons, Chichester. 7. Ianoş, I., Dobraca, L. (1997), Dinamica sistemelor antropizate şi dezvoltarea durabilă, Analele
Universităţii de Vest, Vol. 7, Timişoara. 8. Mac, I. (2003), Ştiinţa mediului, Edit. Europontic, Cluj Napoca.
V. GLIGOR, S.F. FONOGEA
198
9. Oros,V., 2006, Evaluarea impactului asupra mediului, Editura Risoprint, Cluj-Napoca. 10. Ozunu, A. (2000), Elemente de hazard şi risc în industrii poluante, Edit. Accent, Cluj-Napoca. 11. Puia, I., Soran, V., Carlier, L., Rotar, I., Vlahova, M. (2001), Agroecologie şi ecodezvoltare, Edit.
Academicpres, Cluj-Napoca. 12. Rojanschi, VL., Bran Florina, Diaconu, Gheorghiţa (2002), Protecţia şi ingineria mediului (ediţia a II-a),
Edit. Economică, Bucureşti. 13. Rojanschi, VL., Bran, Florina (2002), Politici şi strategii de mediu, Edit. Economică, Bucureşti. 14. Selman, P. (2000), Environmental Planning, Sage Publications, London. 15. xxx (1998), Gospodărirea deşeurilor – ghid elaborat de Comisia Europeană, Directoratul General
XVII - Energie, Edit. Infoterra, Bucureşti. 16. http://www.gestiuneadeseurilor.ro/ 17. http://www.apmbm.ro/index.php
STUDIA UNIVERSITATIS BABEŞ-BOLYAI, GEOGRAPHIA, LV, 2, 2010
THE ROMAN IMPERIAL ROAD BETWEEN SUTORU AND POROLISSUM.
CARTOGRAPHIC AND TOPOGRAPHIC STUDY
F. FODOREAN1, I. FODOREAN2
ABSTRACT. – The Roman Imperial Road between Sutoru and Porolissum. Cartographic and Topographic Study. The Roman roads served for the military strategy of the empire during its full development, respectively for provisioning the Roman legions camped in Dacia Porolissensis, but also for affording fast connections with other legions. Roman roads represent an argument for the articulation of Transylvanian landscapes, but their functionality should not be substituted nowadays, so it is on us to build a scientific movement to motivate the necessity of their preserving today. This paper analyzes the route of the main imperial Roman road from Dacia between Sutoru and Porolissum. This represents a sector which is not very well known, because the information is poor. Although, based on Austrian military maps, modern plans and maps and aerial photos, we can today establish, in certain sectors, the route of this road.
Keywords: Roman roads, cartography, archaeological topography, landscape, territorial
characteristics, construction.
1. INTRODUCTION
The Roman road crosses the region called Almaş-Agrij Depression. This geographic unity is characterized by one main aspect: two relatively parallel rivers (Almaş and Agrij) contributed to its genesis (Pop 2001, p. 106).
Generally analyzed, the major part of this depression is developed at altitudes of around 200-450 m. Smaller surfaces, around 450 m, can be observed on the watershed between those two valleys mentioned above. The terrace relief is relatively fragmentary. These terraces appeared and developed on the left side of the main valleys (Agrij and Almaş). We can notice today seven terraces. The upper one finishes at 90-110 m (comparing with eight terraces belonging to the Someş River). As always during history, these terraces represented important places for human activities. Remains of the Roman military fortresses are well preserved at Buciumi and Românaşi on the third left side terrace of the river Agrij. At Romita (the Roman Certiae), the Roman military fortress was positioned on the second terrace of the river Agrij.
From the climatic point of view, the Almaş-Agrij Depression presents a certain protection, due to the presence of the Meseş Mountains. The annual temperature (the average value) is situated around 8.5 ºC, and the pluvial quantity does not exceed 600 mm/year.
1 Babeş-Bolyai University, Faculty of History and Philosophy, 400084, Cluj-Napoca, Romania, e-mail:
[email protected] 2 Babeş-Bolyai University, Faculty of Geography, 400006, Cluj-Napoca, Romania, e-mail:
F. FODOREAN, I. FODOREAN
200
2. ANTIQUE AND MEDIEVAL SOURCES
The Peutinger’s map mentions the following settlements between Napoca and Porolissum: Optatiana, Largiana and Cersie (instead of Certiae). These are Latin toponyms and they have been, in Tudor’s opinion, military mansiones or stationes (Tudor 1968, p. 234, Fodorean 2006, passim). To these, the Ravenna's Geographer adds the settlement Macedonica between Napoca and Optatiana. Regarding the distances between these settlements, TP records from Napoca to Optatiana XVI MP (23.656 km). This aspect determined some historians to place Optatiana at Gârbău. From Optatiana to Largiana the same TP mentions XV MP (22, 177 km). Today Optatiana can be located at Sutoru. Further on, from Largiana to Certiae, TP mentions XVII MP (25.134 km), so Certiae matches with the Roman settlement from Romita. After Certiae, the last settlement is Porolissum.
3. THE ROMAN ROAD SUTORU-POROLISSUM IN THE MODERN SOURCES
In the subsector Baciu-Şardu, the Roman road was investigated in the field (Ferenczi, Ursuţ 1985-1986, 213-222). The location of the Roman road was not an easy task, because the road was severely affected by agricultural activities. K. Torma was the first scholar who presented, quite exactly, the route of the Roman imperial road between Cluj-Napoca and Porolissum. He observed that the road started from the vicinity of the city railway, passed on the left bank of the river Nadăş, on the territory of the former village of Cordoş, then Baciu and continued through Rădaia, Mera and Nădăşelu. From this point, the Roman road continued through Şardul Clujului, Cubleşu, Stoboru, Bozolnic and Sutoru.
We have several information about this road in the books of several modern historians. Christescu mentions only few information about this road, in the subchapter dedicated to the Roman roads mentioned in itineraries. He outlines that from Apulum the road passed through Vinţul de Sus and Uioara (Salinae), Războieni, Bogata, Turda (Potaissa), Aiton, Feleac (sic!), Cluj (Napoca), and from here to the North-West, from Baciu to Nădăşel, Şardu-Unguresc, Zutor (Optatiana), Zimborul, Vaşcapău, Unguraş, Romita and Moigrad (Porolissum) (Christescu 1937, 107-108). E. Panaitescu presents several data concerning the Roman milestone from Mera and the route of the road through Apulum, Potaissa, Napoca and Porolissum. M. Macrea gives a genral description of the road, informing that the road reaches Potaissa and from here goes to Napoca, in the valley of the Someş river.
4. AUSTRIAN MILITARY MAPS
Based on one Austrian military map from the XIXth century, at 1:200.000 scale, we managed to identify the route of the imperial road in the sector Sutoru-Porolissum.
5. THE ROMAN IMPERIAL ROAD IN THE SECTOR SUTORU-POROLISSUM. ROMAN SETTLEMENTS
This road had the role of connecting the Roman military camps of the North-Western border of Dacia Porolissensis. We have several data in order to establish the route of the Roman road from Sutoru to Porolissum. Unfortunately, in this area, few investigations were made in the field. Although, based on information from the archaeological repertory of Sălaj County, the route of the Roman road can be establish quite well.
THE ROMAN IMPERIAL ROAD BETWEEN SUTORU AND POROLISSUM. CARTOGRAPHIC AND TOPOGRAPHIC STUDY
201
From Cuzăplac, the Roman road reaches the Roman military fortress from Sutoru, with an orientation from South-West to North-East. The route of the Roman road can be located on the left side of the current road from Almaşu to Zimbor, so on the left side of the river Almaş. From Cuzăplac, after circa 3500 m, the Roman road reaches the military fortress from Sutoru. From this point the Roman road continues on the same direction and after circa 1 km reaches Zimbor. Here the Roman road was identified on the territory of the village, in some well preserved sectors.
We have outlined an important aspect here. The location of the Roman military fortress from Sutoru was not precise until recent investigation made these last years contributed to this problem. On some aerial photographs the Roman road can be observed clearly. At the same time, the position of the military fortress can be observed very well.
From Zimbor the road continues keeping the northern orientation and after 1 km the direction is changed. It enters in the territory of the settlement called Sânmihaiu Almaşului. The width of the road is around 3 m. The road is paved with gravel, according to information given by K. Torma.
From Sânmihaiu Almaşului the Roman road goes further on, keeping the same direction North-West and after another 8 km reaches the village called Poarta Sălajului (Vaşcapău, Românaşi). From this point the road presents an important ramification. One route is heading to the Roman military fortress from Buciumi and the other one continues to North-West and after 2 km reaches the military camp from Românaşi, the antique Largiana. This settlement is positioned at the end of a promontory, in the South-Western part of the current village, in a place called “Cetate” (Tamba 1997, 8-9). The ruins of the Roman military fortress are quite well preserved. At the surface of the ground, they can be noticed in the shape of a rectangle with its edges elevated with circa 1,5 m comparing with the surrounding terrain. Numerous stones and ceramic fragments can be observed at the surface of the terrain. The Roman military fortress had, because of its position, a good visibility to North-West and South-East. It could easily control the valley of the river Agrij. From the area of the porta praetoria and the South-Eastern tower a visual contact was established with the military fortress from Certiae-Romita. In these conditions, it is obvious that the military fortress from Românaşi had as main role the control of the valley called Agrij, as an important natural route of access from Barbaricum to the province.
As we outlined before, a road intersection can be established at Largiana. The Roman imperial road to Napoca passed in the basin of the valley called Almaş, over the hill called today Gorgana. Another road connected the military fortresses from Buciumi and Bologa. The military corps which constructed the fortress from Largiana was cohors I Hispanorum quingenaria pia fidelis. The fortress was rebuilt in stone during Trajan-Hadrian or at the beginning of the reign of Antoninus Pius.
The traces of the civilian settlement were noticed in the Northern part of the current village, close to the valley called Ciumărna, where stone substructures were found. In the Western part of the military camp ceramic fragments and bricks were found. This indicates the presence of a Roman settlement here. So, the civil settlement developed in the North, East and West. From K. Torma we find that the Roman cemetery can be located somewhere in the western part from the Roman military fortress, on the slopes of the hill called Cetate. In this area, according to Torma, numerous funerary inscriptions were found.
From this point, the imperial road continues in the same direction and passes, probably, on the right bank of the river Agrij. After other 7 km, the Roman road reaches the military fortress at Romita. Close to this camp K. Torma noticed the traces of the road. The camp is positioned on the right side of the river Agrij, on the first terraces of the river. Two
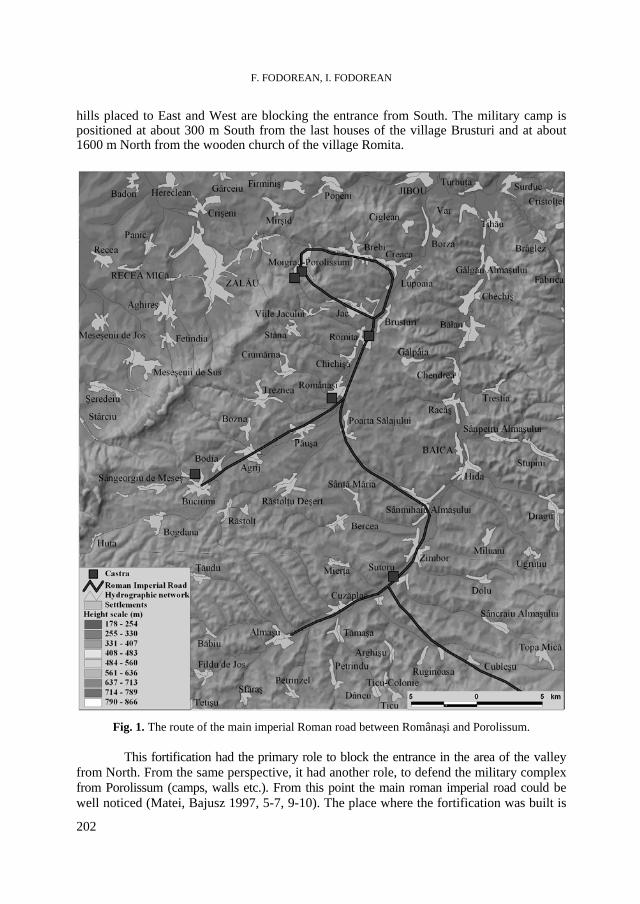
F. FODOREAN, I. FODOREAN
202
hills placed to East and West are blocking the entrance from South. The military camp is positioned at about 300 m South from the last houses of the village Brusturi and at about 1600 m North from the wooden church of the village Romita.
Fig. 1. The route of the main imperial Roman road between Românaşi and Porolissum.
This fortification had the primary role to block the entrance in the area of the valley from North. From the same perspective, it had another role, to defend the military complex from Porolissum (camps, walls etc.). From this point the main roman imperial road could be well noticed (Matei, Bajusz 1997, 5-7, 9-10). The place where the fortification was built is
THE ROMAN IMPERIAL ROAD BETWEEN SUTORU AND POROLISSUM. CARTOGRAPHIC AND TOPOGRAPHIC STUDY
203
called today “Cetate”. From Romita to Porolissum, the distance is around 3,5 km. The military units that built the camp and stayed here are cohors VI Thracum, cohors II Britannica, cohors I Ituraeorum sagittariorum and cohors I Batavorum milliaria (fig. 1).
The Romans built the thermal complex North of the Roman camp, at about 100 m from the Northern corner and close to the river Agrij. The civil settlement is positioned close to the thermal baths and the camp. The cemetery is positioned close to the Roman road. In these conditions, the Roman road reached Romita on the right bank of the river Agrij, close by the Roman cemetery and further on to the porta decumana of the camp. From the porta pretoria of the Roman military camp the road continues to North.
After this point, the road makes a large bend and enters the territory of the village Jac. After this, the road goes farther for other 4 km and ends at the military complex of Porolissum. In 1870 Andrei Cosma described the area and outlined that the ruins of the military camp at Romita can be noticed on the surface of the ground. The road is known with the denomination of „Trajan´s road”.
Traces of the former road were also remarked at Ortelec, close to the current village, on a pick called „Măgurica”. At Brebi, traces of the road were also noticed, in a point called „At the young forest”.
The Roman road enters the military complex of Porolissum close to the military fortess of Pomet. A. Cosma remarked, in 1859, that this road was still in use during his time. The same observation was made by K. Torma. He said that the road is called „Trajan´s road”. I. Martian observed the same road (Martian 1921, 8-10). A. Buday wrote about the same road: „on the North-Western slopes the Roman road can be seen to the West. This road is mentioned even on a military map because it is easy to use”.
The military fortress from Porolissum can be located at about 500 m South of the current village of Moigrad (Gudea 1997, 9-10).
6. CONCLUSIONS
The Roman imperial road between Sutoru and Porolissum is well preserved in some sectors, but there are still many aspects unsolved until now regarding its route. Along the route of this road, numerous settlements appeared and developed constantly. The main role was played in this process by the presence of the military fortresses at Sutoru, Românaşi, Romita and Porolissum. In the case of the Roman military camp at Sutoru, recent archaeological investigations had the result of establishing its exact position in the field. The route of the Roman road is well adapted to the geomorphological and geographic conditions. The general direction of the road is from South -East to North-West.
R E F E R E N C E S
1. Christescu, V. (1937), Istoria militară a Daciei romane, Ed. „Fundaţia pentru Literatură şi Artă”, Bucureşti.
2. Ferenczi, I., Ursuţ, D. (1985-1986), Cercetări de topografie arheologică privind drumul roman imperial Napoca-Porolissum (tronsonul Baciu-Şardu, jud. Cluj), in ActaMN, 22-23, 1985-1986, p. 213-222, Cluj-Napoca.
F. FODOREAN, I. FODOREAN
204
3. Fodorean F., Ursuţ D. (2001), Consideraţii arheologice, topografice şi tehnice privind sectorul de drum roman Iclozel-Silivaş, in Ephemeris Napocensis 11, p. 41-46, Edit. Academiei Române, Bucureşti.
4. Fodorean, F., Fodorean I. (2005), Drumul roman Gherla – Sic. Studiu geomorfologic, arheologic şi topografic, Studia Universitatis Babeş-Bolyai, Geographia, L, 1, pag. 111-122, Cluj-Napoca.
5. Fodorean, F. (2006), Drumurile din Dacia romană, Edit. Presa Universitară Clujeană, Cluj-Napoca. 6. Gudea, N. (1989), Porolissum. Un complex arheologic daco-roman la marginea de nord a Imperiului
daco-roman, Acta Museum Porolissensis, tom XIII, Zalău. 7. Gudea, N. (1997), Castrul roman de pe vârful dealului Pomet-Moigrad. Porolissum 1, Zalău. 8. Macrea, M. (1969), Viaţa în Dacia romană, Edit. Ştiinţifică, Bucureşti. 9. Marţian, I. (1921), Urme din războaiele romanilor cu dacii, Cluj-Napoca. 10. Matei, Al., Bajusz, I. (1997), Castrul roman de la Romita-Certiae. Zalău. 11. Panaitescu E. (1938), Le grandi strade romane in Romania, în seria Quaderni dell’Impero. Le
grandi strade del mondo romano. X, Istituto di Studi Romani – Editore, Roma. 12. Pop, Gr. P. (2001), Depresiunea Transilvaniei, Edit. Presa Universitară Clujeană, Cluj-Napoca. 13. Tamba, D. (1997), Das Römergrenzkastell von Românaşi-Largiana. Castrul roman de la Românaşi-
Largiana, Zalău. 14. Tudor, D. (1968), Oraşe, târguri şi sate în Dacia romană, Edit. Ştiinţifică, Bucureşti.
STUDIA UNIVERSITATIS BABEŞ-BOLYAI, GEOGRAPHIA, LV, 2, 2010
THE METHODOLOGY FOR ASSESSING THE POTENTIAL
ATTRACTIVENESS OF WATERFALLS AS TOURIST ATTRACTIONS
R.H. BĂTINAŞ1
ABSTRACT. – The Methodology for Assessing the Potential Attractiveness of Waterfalls as Tourist Attractions. This paper analyzes how waterfalls, as natural tourism attractions, could be evaluated with different indicators with the use of several features in order to create a certain scale of attractiveness potential. The most common features used in waterfalls comparison is the height of the falls, the river discharge or the wide of the crest. For tourism rating, we can submit other features like: the location of the fall, the position regarding the route of access, waterfall type, the number of steps, etc. The most comprehensive system used today for waterfall rating was created by Richard H. Beisel Jr., which uses a natural logarithm of the water volume in order to obtain a value between 1 and 10. The values are then rounded to the nearest whole upper number to achieve ten classes. Our perspective for this rating has improved this system by adding some new features that can be useful for tourism rating: the angle of the slope, the transport infrastructure, the presence of marked trails, local establishments for accommodation, boat transportation, fishing activities, seasonality of the flow, the size and depth of plunge-pool, the cloud mist, etc. Also as a conclusion the paper contains a model individual form for waterfall evaluation. Keywords: Waterfalls, tourism, potential attractiveness, BWR – Beisel waterfall rating, scenic
and visual magnitude. 1. INTRODUCTION
Waterfalls are one of the most spectacular shows deployed in nature, being a constant attraction for tourists. Searched for their special beauty, waterfalls are enchanting because of the size of the water volume, height of the fall, number of steps, and the thundering noise and, last but not least, due to the unique landscape in which this natural show is played.
In order to appreciate the tourism potential of waterfalls, a specific methodology must be followed. Thus, the main features that describe the fall are divided on several interval groups, according to their values.
The most common features are: total height, tallest single drop, total number of drops, waterfall type, average width, average volume, maximum recorded volume, seasonality. Besides this, in order to establish the tourism potential has been created a certain evaluation method that uses four different parameters: visual magnitude, absolute magnitude, Beisel Waterfall Rating Index (BWR) and scenic rating. Every one of them is using different parameters, computed on a logarithmic scale, that provides a final number to achieve the rating (Beisel, R., 2006). This rating is then use in order to make comparative analysis between different area with waterfalls and to define their tourism potential.
1 Babeş-Bolyai University, Faculty of Geography, 400006, Cluj-Napoca, Romania, e-mail:
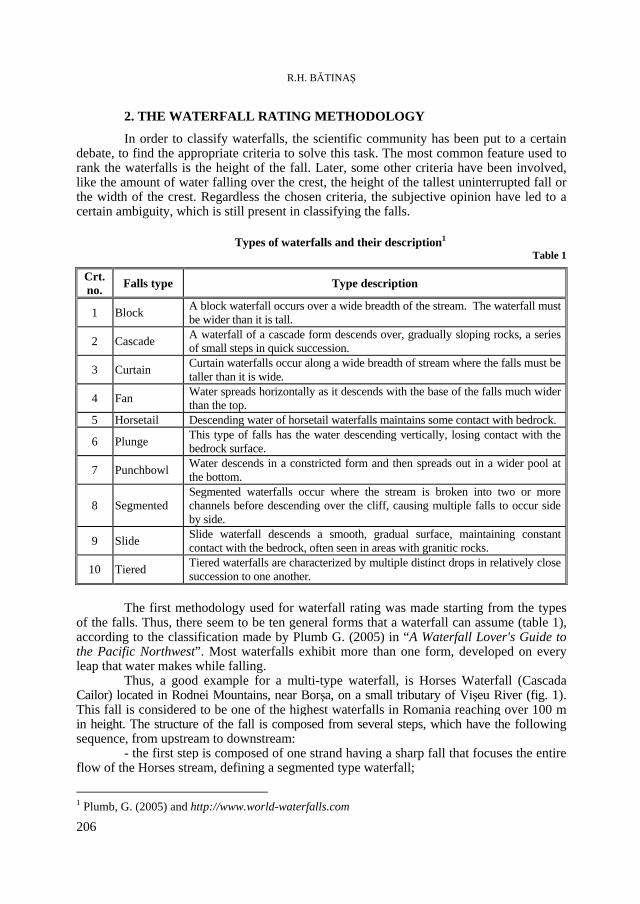
R.H. BĂTINAŞ
206
2. THE WATERFALL RATING METHODOLOGY
In order to classify waterfalls, the scientific community has been put to a certain debate, to find the appropriate criteria to solve this task. The most common feature used to rank the waterfalls is the height of the fall. Later, some other criteria have been involved, like the amount of water falling over the crest, the height of the tallest uninterrupted fall or the width of the crest. Regardless the chosen criteria, the subjective opinion have led to a certain ambiguity, which is still present in classifying the falls.
Types of waterfalls and their description1
Table 1
Crt. no. Falls type Type description
1 Block A block waterfall occurs over a wide breadth of the stream. The waterfall must be wider than it is tall.
2 Cascade A waterfall of a cascade form descends over, gradually sloping rocks, a series of small steps in quick succession.
3 Curtain Curtain waterfalls occur along a wide breadth of stream where the falls must be taller than it is wide.
4 Fan Water spreads horizontally as it descends with the base of the falls much wider than the top.
5 Horsetail Descending water of horsetail waterfalls maintains some contact with bedrock.
6 Plunge This type of falls has the water descending vertically, losing contact with the bedrock surface.
7 Punchbowl Water descends in a constricted form and then spreads out in a wider pool at the bottom.
8 Segmented Segmented waterfalls occur where the stream is broken into two or more channels before descending over the cliff, causing multiple falls to occur side by side.
9 Slide Slide waterfall descends a smooth, gradual surface, maintaining constant contact with the bedrock, often seen in areas with granitic rocks.
10 Tiered Tiered waterfalls are characterized by multiple distinct drops in relatively close succession to one another.
The first methodology used for waterfall rating was made starting from the types of the falls. Thus, there seem to be ten general forms that a waterfall can assume (table 1), according to the classification made by Plumb G. (2005) in “A Waterfall Lover's Guide to the Pacific Northwest”. Most waterfalls exhibit more than one form, developed on every leap that water makes while falling.
Thus, a good example for a multi-type waterfall, is Horses Waterfall (Cascada Cailor) located in Rodnei Mountains, near Borşa, on a small tributary of Vişeu River (fig. 1). This fall is considered to be one of the highest waterfalls in Romania reaching over 100 m in height. The structure of the fall is composed from several steps, which have the following sequence, from upstream to downstream:
- the first step is composed of one strand having a sharp fall that focuses the entire flow of the Horses stream, defining a segmented type waterfall;
1 Plumb, G. (2005) and http://www.world-waterfalls.com
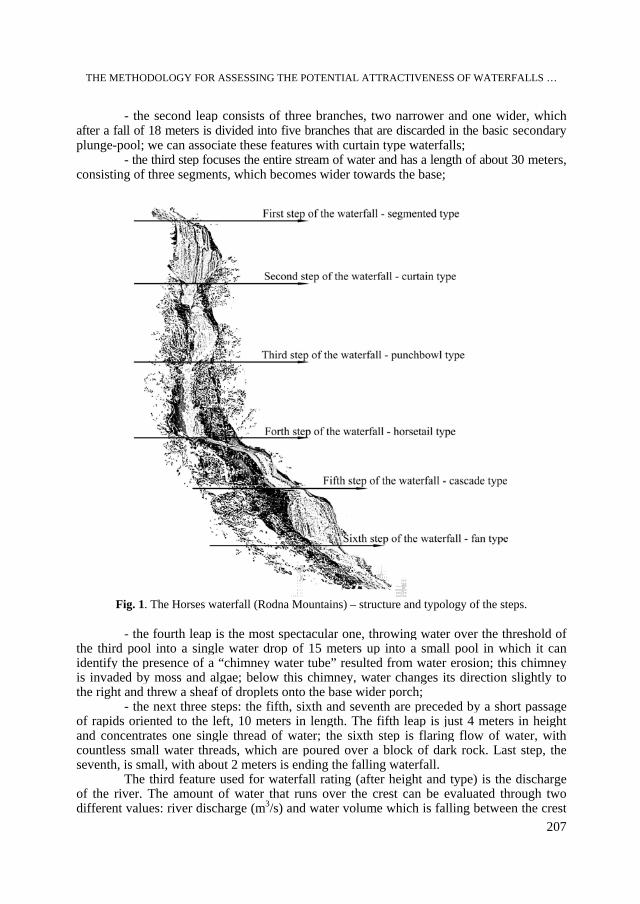
THE METHODOLOGY FOR ASSESSING THE POTENTIAL ATTRACTIVENESS OF WATERFALLS …
207
- the second leap consists of three branches, two narrower and one wider, which after a fall of 18 meters is divided into five branches that are discarded in the basic secondary plunge-pool; we can associate these features with curtain type waterfalls;
- the third step focuses the entire stream of water and has a length of about 30 meters, consisting of three segments, which becomes wider towards the base;
Fig. 1. The Horses waterfall (Rodna Mountains) – structure and typology of the steps.
- the fourth leap is the most spectacular one, throwing water over the threshold of
the third pool into a single water drop of 15 meters up into a small pool in which it can identify the presence of a “chimney water tube” resulted from water erosion; this chimney is invaded by moss and algae; below this chimney, water changes its direction slightly to the right and threw a sheaf of droplets onto the base wider porch;
- the next three steps: the fifth, sixth and seventh are preceded by a short passage of rapids oriented to the left, 10 meters in length. The fifth leap is just 4 meters in height and concentrates one single thread of water; the sixth step is flaring flow of water, with countless small water threads, which are poured over a block of dark rock. Last step, the seventh, is small, with about 2 meters is ending the falling waterfall.
The third feature used for waterfall rating (after height and type) is the discharge of the river. The amount of water that runs over the crest can be evaluated through two different values: river discharge (m3/s) and water volume which is falling between the crest
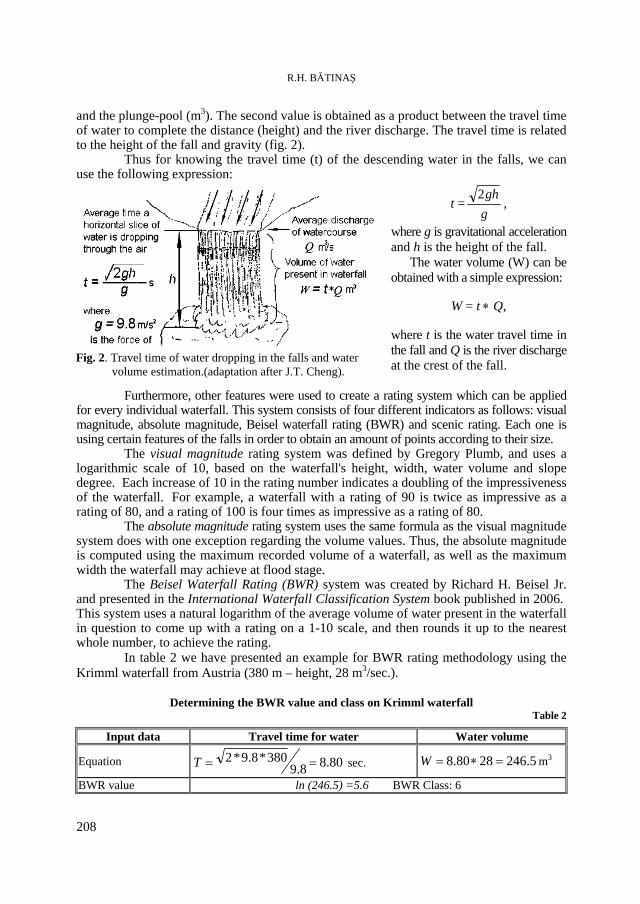
R.H. BĂTINAŞ
208
and the plunge-pool (m3). The second value is obtained as a product between the travel time of water to complete the distance (height) and the river discharge. The travel time is related to the height of the fall and gravity (fig. 2).
Thus for knowing the travel time (t) of the descending water in the falls, we can use the following expression:
t =ggh2
,
where g is gravitational acceleration and h is the height of the fall.
The water volume (W) can be obtained with a simple expression:
W = t ∗ Q,
where t is the water travel time in the fall and Q is the river discharge at the crest of the fall.
Furthermore, other features were used to create a rating system which can be applied for every individual waterfall. This system consists of four different indicators as follows: visual magnitude, absolute magnitude, Beisel waterfall rating (BWR) and scenic rating. Each one is using certain features of the falls in order to obtain an amount of points according to their size.
The visual magnitude rating system was defined by Gregory Plumb, and uses a logarithmic scale of 10, based on the waterfall's height, width, water volume and slope degree. Each increase of 10 in the rating number indicates a doubling of the impressiveness of the waterfall. For example, a waterfall with a rating of 90 is twice as impressive as a rating of 80, and a rating of 100 is four times as impressive as a rating of 80.
The absolute magnitude rating system uses the same formula as the visual magnitude system does with one exception regarding the volume values. Thus, the absolute magnitude is computed using the maximum recorded volume of a waterfall, as well as the maximum width the waterfall may achieve at flood stage.
The Beisel Waterfall Rating (BWR) system was created by Richard H. Beisel Jr. and presented in the International Waterfall Classification System book published in 2006. This system uses a natural logarithm of the average volume of water present in the waterfall in question to come up with a rating on a 1-10 scale, and then rounds it up to the nearest whole number, to achieve the rating.
In table 2 we have presented an example for BWR rating methodology using the Krimml waterfall from Austria (380 m – height, 28 m3/sec.).
Determining the BWR value and class on Krimml waterfall
Table 2
Input data Travel time for water Water volume
Equation 80.88.9380*8.9*2 ==T sec. 5.2462880.8 =∗=W m3
BWR value ln (246.5) =5.6 BWR Class: 6
Fig. 2. Travel time of water dropping in the falls and water volume estimation.(adaptation after J.T. Cheng).
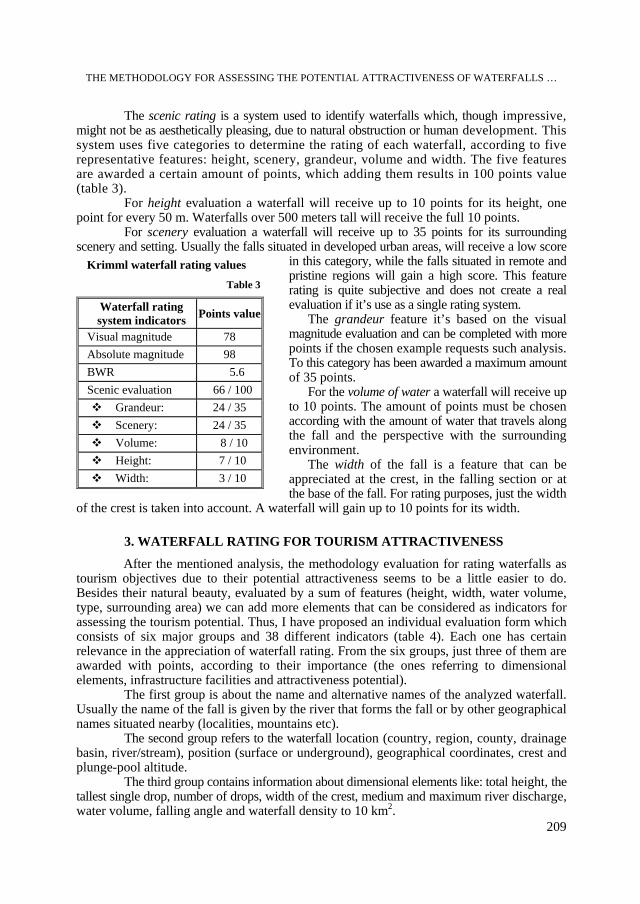
THE METHODOLOGY FOR ASSESSING THE POTENTIAL ATTRACTIVENESS OF WATERFALLS …
209
The scenic rating is a system used to identify waterfalls which, though impressive, might not be as aesthetically pleasing, due to natural obstruction or human development. This system uses five categories to determine the rating of each waterfall, according to five representative features: height, scenery, grandeur, volume and width. The five features are awarded a certain amount of points, which adding them results in 100 points value (table 3).
For height evaluation a waterfall will receive up to 10 points for its height, one point for every 50 m. Waterfalls over 500 meters tall will receive the full 10 points.
For scenery evaluation a waterfall will receive up to 35 points for its surrounding scenery and setting. Usually the falls situated in developed urban areas, will receive a low score
in this category, while the falls situated in remote and pristine regions will gain a high score. This feature rating is quite subjective and does not create a real evaluation if it’s use as a single rating system.
The grandeur feature it’s based on the visual magnitude evaluation and can be completed with more points if the chosen example requests such analysis. To this category has been awarded a maximum amount of 35 points.
For the volume of water a waterfall will receive up to 10 points. The amount of points must be chosen according with the amount of water that travels along the fall and the perspective with the surrounding environment.
The width of the fall is a feature that can be appreciated at the crest, in the falling section or at the base of the fall. For rating purposes, just the width
of the crest is taken into account. A waterfall will gain up to 10 points for its width. 3. WATERFALL RATING FOR TOURISM ATTRACTIVENESS
After the mentioned analysis, the methodology evaluation for rating waterfalls as tourism objectives due to their potential attractiveness seems to be a little easier to do. Besides their natural beauty, evaluated by a sum of features (height, width, water volume, type, surrounding area) we can add more elements that can be considered as indicators for assessing the tourism potential. Thus, I have proposed an individual evaluation form which consists of six major groups and 38 different indicators (table 4). Each one has certain relevance in the appreciation of waterfall rating. From the six groups, just three of them are awarded with points, according to their importance (the ones referring to dimensional elements, infrastructure facilities and attractiveness potential). The first group is about the name and alternative names of the analyzed waterfall. Usually the name of the fall is given by the river that forms the fall or by other geographical names situated nearby (localities, mountains etc). The second group refers to the waterfall location (country, region, county, drainage basin, river/stream), position (surface or underground), geographical coordinates, crest and plunge-pool altitude.
The third group contains information about dimensional elements like: total height, the tallest single drop, number of drops, width of the crest, medium and maximum river discharge, water volume, falling angle and waterfall density to 10 km2.
Krimml waterfall rating values Table 3
Waterfall rating system indicators Points value
Visual magnitude 78 Absolute magnitude 98 BWR 5.6 Scenic evaluation 66 / 100
Grandeur: 24 / 35 Scenery: 24 / 35 Volume: 8 / 10 Height: 7 / 10 Width: 3 / 10
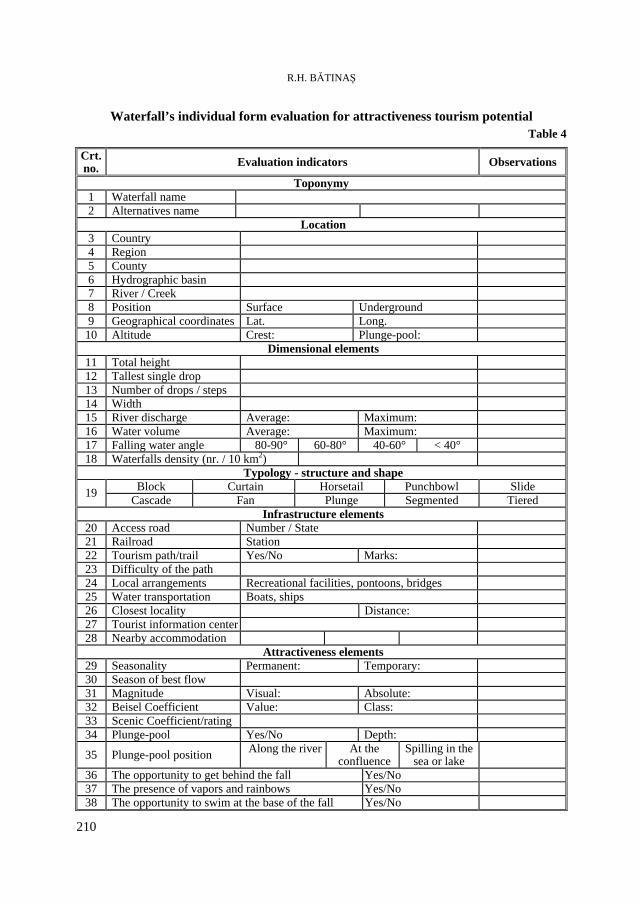
R.H. BĂTINAŞ
210
Waterfall’s individual form evaluation for attractiveness tourism potential Table 4
Crt. no. Evaluation indicators Observations
Toponymy 1 Waterfall name 2 Alternatives name
Location 3 Country 4 Region 5 County 6 Hydrographic basin 7 River / Creek 8 Position Surface Underground 9 Geographical coordinates Lat. Long.
10 Altitude Crest: Plunge-pool: Dimensional elements
11 Total height 12 Tallest single drop 13 Number of drops / steps 14 Width 15 River discharge Average: Maximum: 16 Water volume Average: Maximum: 17 Falling water angle 80-90° 60-80° 40-60° < 40° 18 Waterfalls density (nr. / 10 km2)
Typology - structure and shape Block Curtain Horsetail Punchbowl Slide 19 Cascade Fan Plunge Segmented Tiered
Infrastructure elements 20 Access road Number / State 21 Railroad Station 22 Tourism path/trail Yes/No Marks: 23 Difficulty of the path 24 Local arrangements Recreational facilities, pontoons, bridges 25 Water transportation Boats, ships 26 Closest locality Distance: 27 Tourist information center 28 Nearby accommodation
Attractiveness elements 29 Seasonality Permanent: Temporary: 30 Season of best flow 31 Magnitude Visual: Absolute: 32 Beisel Coefficient Value: Class: 33 Scenic Coefficient/rating 34 Plunge-pool Yes/No Depth:
35 Plunge-pool position Along the river At the confluence
Spilling in the sea or lake
36 The opportunity to get behind the fall Yes/No 37 The presence of vapors and rainbows Yes/No 38 The opportunity to swim at the base of the fall Yes/No
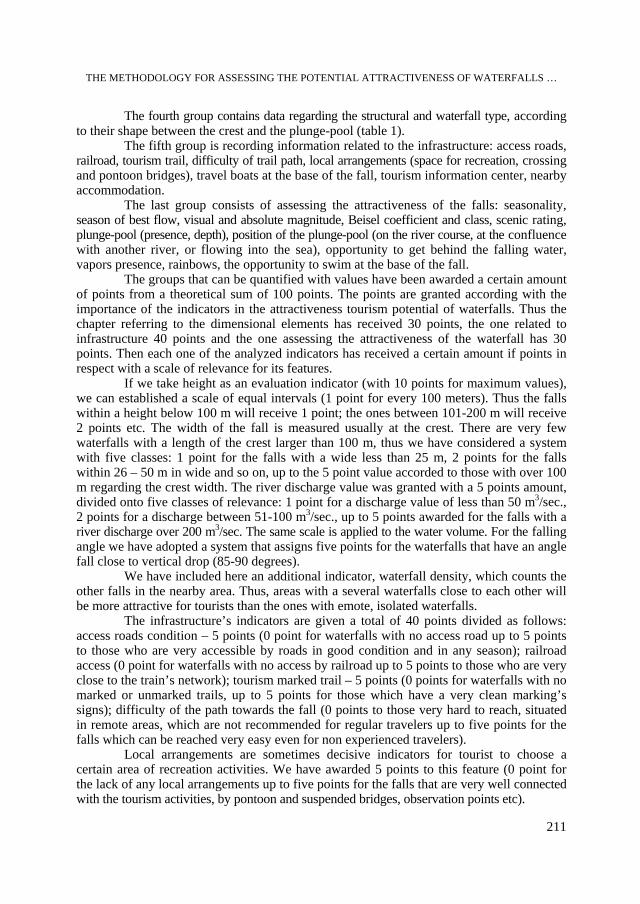
THE METHODOLOGY FOR ASSESSING THE POTENTIAL ATTRACTIVENESS OF WATERFALLS …
211
The fourth group contains data regarding the structural and waterfall type, according to their shape between the crest and the plunge-pool (table 1). The fifth group is recording information related to the infrastructure: access roads, railroad, tourism trail, difficulty of trail path, local arrangements (space for recreation, crossing and pontoon bridges), travel boats at the base of the fall, tourism information center, nearby accommodation. The last group consists of assessing the attractiveness of the falls: seasonality, season of best flow, visual and absolute magnitude, Beisel coefficient and class, scenic rating, plunge-pool (presence, depth), position of the plunge-pool (on the river course, at the confluence with another river, or flowing into the sea), opportunity to get behind the falling water, vapors presence, rainbows, the opportunity to swim at the base of the fall. The groups that can be quantified with values have been awarded a certain amount of points from a theoretical sum of 100 points. The points are granted according with the importance of the indicators in the attractiveness tourism potential of waterfalls. Thus the chapter referring to the dimensional elements has received 30 points, the one related to infrastructure 40 points and the one assessing the attractiveness of the waterfall has 30 points. Then each one of the analyzed indicators has received a certain amount if points in respect with a scale of relevance for its features. If we take height as an evaluation indicator (with 10 points for maximum values), we can established a scale of equal intervals (1 point for every 100 meters). Thus the falls within a height below 100 m will receive 1 point; the ones between 101-200 m will receive 2 points etc. The width of the fall is measured usually at the crest. There are very few waterfalls with a length of the crest larger than 100 m, thus we have considered a system with five classes: 1 point for the falls with a wide less than 25 m, 2 points for the falls within 26 – 50 m in wide and so on, up to the 5 point value accorded to those with over 100 m regarding the crest width. The river discharge value was granted with a 5 points amount, divided onto five classes of relevance: 1 point for a discharge value of less than 50 m3/sec., 2 points for a discharge between 51-100 m3/sec., up to 5 points awarded for the falls with a river discharge over 200 m3/sec. The same scale is applied to the water volume. For the falling angle we have adopted a system that assigns five points for the waterfalls that have an angle fall close to vertical drop (85-90 degrees). We have included here an additional indicator, waterfall density, which counts the other falls in the nearby area. Thus, areas with a several waterfalls close to each other will be more attractive for tourists than the ones with emote, isolated waterfalls. The infrastructure’s indicators are given a total of 40 points divided as follows: access roads condition – 5 points (0 point for waterfalls with no access road up to 5 points to those who are very accessible by roads in good condition and in any season); railroad access (0 point for waterfalls with no access by railroad up to 5 points to those who are very close to the train’s network); tourism marked trail – 5 points (0 points for waterfalls with no marked or unmarked trails, up to 5 points for those which have a very clean marking’s signs); difficulty of the path towards the fall (0 points to those very hard to reach, situated in remote areas, which are not recommended for regular travelers up to five points for the falls which can be reached very easy even for non experienced travelers).
Local arrangements are sometimes decisive indicators for tourist to choose a certain area of recreation activities. We have awarded 5 points to this feature (0 point for the lack of any local arrangements up to five points for the falls that are very well connected with the tourism activities, by pontoon and suspended bridges, observation points etc).
R.H. BĂTINAŞ
212
Another indicators is referring to the distance towards nearest locality for which we have awarded another 5 points (0 points for remote waterfalls situated far from any village or town up to 5 points for the falls within the limits of a large city). The presence of tourism information center could be useful for many inexperienced people who are trying to see new landscapes and need some support from local agents.
The nearby accommodation facilities is maybe after the dimensional features of the falls the indicator that is mostly considered for choosing a trip to a certain waterfall. The accommodation capacity, the quality of services and local amenities are just a few of the aspects that a potential traveler will consider before making that trip. The maximum number of points (five) will be accorded for a waterfall that has nearby accommodation buildings with over 100 seats. No points will receive the falls without any lodging capacity. The indicators of attractiveness can be also considered for tourism potential evaluation. Thus, the seasonality of the flow and the best season for fall viewing are some of the few indicators that can be taken into account. The presence of the lake at the base of waterfall and its size can be used for recreational purposes like swimming, boat transportation, fishing etc. Spectacular scenic rating is given by the falls that are situated at the confluence with another stream (in Romania, Peştireu waterfall from Bihor County that plunges into Crişul Repede River, Şipote waterfall from Alba County which is flowing directly into Arieş River etc.), or by the falls that are flowing directly into the sea/ocean (Duden waterfall in Antalya, Turkey flowing into the Mediterranean Sea, Ketubjörg waterfall from Iceland). The opportunity to get behind the falls can be sometimes an attractive feature for tourists, which in some cases represents an overwhelming experience (Niagara Falls – Journey behind the Falls on the Canadian side of the falls, Buttermilk Falls from Hamilton, Canada, Storseter waterfall from Norway, the thermal waterfall from Geoagiu, Romania). Regardless of any criteria that you may consider when you will visit waterfalls, it is advised that you take all the measures related to the safety and success of that trip (maps of the region were you travel, proper shoes and clothing, check the weather bulletin, any other signs that can help you to get there etc).
R E F E R E N C E S 1. Beisel, R., Jr. (2006), International Waterfall Classification System, Outskirts Press, Inc., Denver,
Colorado. 2. Brian J. Hudson (1998), Waterfalls: Resources for Tourism, in Annals of Tourism Research, Volume 25,
Issue 4, October 1998, Pages 958-973. 3. Gayle, Jennings (2007), Water-Based Tourism, Sport, Leisure, and Recreation Experiences, Elsevier
Publishing House, Burlington, USA. 4. Plumb, G. (1993), A scale for comparing the visual magnitude of waterfalls, in Earth-Science Reviews,
Volume 34, Issue 4, August 1993, Pages 261-270. 5. Plumb, G. (1997), Waterfalls of Tennessee. A guide to over 200 falls in the Volunteer State, Overmount
Printings, USA. 6. Plumb, G. (2005), A Waterfall Lover's Guide to the Pacific Northwest, Mountaineers Books Printings,
4-th Edition, Washington, USA. 7. *** http://en.wikipedia.org/wiki/Waterfall 8. *** http://www.world-waterfalls.com
STUDIA UNIVERSITATIS BABEŞ-BOLYAI, GEOGRAPHIA, LV, 2, 2010
HUMAN AND NATURAL RESOURCES IN THE TOURISM DEVELOPMENT OF THE GURGHIU MORPHO - HYDROGRAPHIC BASIN
MARIA-LUMINIŢA NEAGU1, I. A. IRIMUŞ1
ABSTRACT. – Human and Natural Resources in the Tourism Development of the Gurghiu Morpho - Hydrographic Basin. The purpose of this study is that of revealing the part of the human and natural resources of the Gurghiu area concerning its economic and rural tourism development. The specific nature of this area is given by the variety of its natural resources (forests, meadows, salt), but also by its impressive ethnographic inheritance. The Gurghiu Valley (a left side tributary of the Mureş River) represents the main hydrographical axis of this territory and in the same time a vital element for its socio - economic development.The variety of natural resources is primarily conditioned by the natural background, in which one can find the Gurghiu volcanic mountains (in the North – East and South – East part) and wide round depressions (the Ibăneşti-Hodac depression, the Gurghiu depression, the Solovăstru-Jabeniţa depression) which shelter salt deposits (especially at Jabeniţa and Orşova) in their undergorund. The climatic conditions (a generally mild climate, with moderate summers and winters), favorable for human activities (agriculture, zoological activities, wood manufacturing industry, and recently rural tourism) are also important. Among human occupations with a long tradition we may mention: wood manufacturing, clay industry, salt exploitation, sheep breeding and horned cattle breeding, and so on and so forth. Situated at the crossroads of cultures and foreign communities (Hungarians and Germans), the Gurghiu Valley area keeps its unicity through its ancestors’ traditions and customs, traditions of a special meaning for the entire community of the Gurghiu Valley. The ethnographical resource (to which we may add the richness and variety of its landscape) represents today the milestone of the development of rural tourism in this area.
Keywords: natural resources, ethnographic resources, wood manufacturing industry, rural
tourism, economical development.
1. INTRODUCTION
Gurghiu River is a left side tributary of the Mureş river, 55 km long. It springs from Gurghiu Mountains (from which it also borrowed its name), at an altitude of 1100 – 1200 meters.
Its developed drainage network, has an axial palm – shaped extension appearance (Forestry Planning Act, 1980) and it includes the tributaries Lăpuşna, Creanga Albă, Gâtii, Secuşu, Sebeşul Mic, Sebeşul Mare, Sirod, Pârâul Negru, Dulcea, Tireu, Tisieu, Orşova, Caşva, which provide the river with authority and transport capacity, features reflected by its morphology.
The average minimal flow occurs in two periods of the year: August – September (at the end of summer – the beginning of autumn) and during winter. The maximum flows are mainly determined by the overlapping of the snow-melting period with the spring falls 1 Babeş-Bolyai University, Faculty of Geography, 400006, Cluj-Napoca, Romania, e-mail:
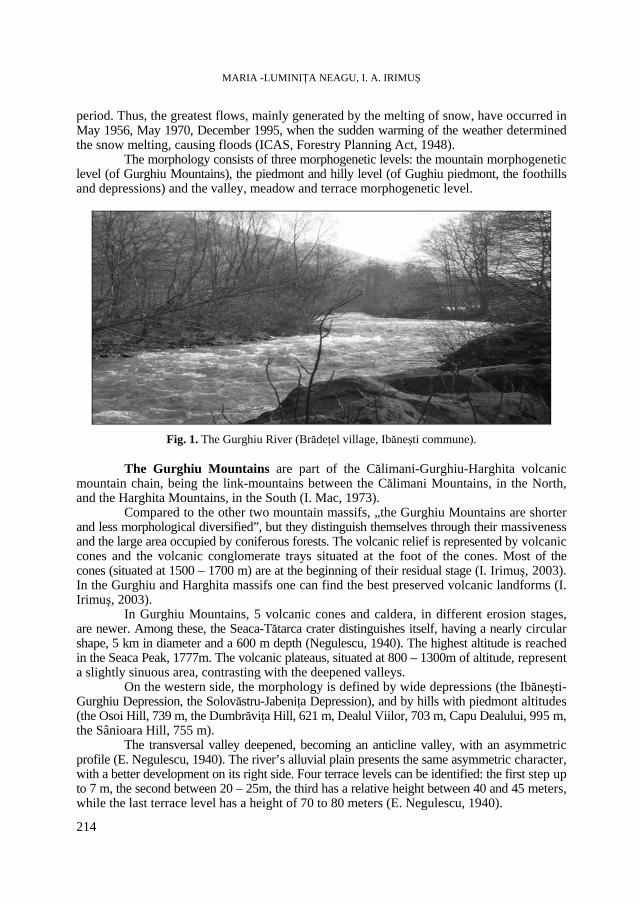
MARIA -LUMINIŢA NEAGU, I. A. IRIMUŞ
214
period. Thus, the greatest flows, mainly generated by the melting of snow, have occurred in May 1956, May 1970, December 1995, when the sudden warming of the weather determined the snow melting, causing floods (ICAS, Forestry Planning Act, 1948).
The morphology consists of three morphogenetic levels: the mountain morphogenetic level (of Gurghiu Mountains), the piedmont and hilly level (of Gughiu piedmont, the foothills and depressions) and the valley, meadow and terrace morphogenetic level.
Fig. 1. The Gurghiu River (Brădeţel village, Ibăneşti commune).
The Gurghiu Mountains are part of the Călimani-Gurghiu-Harghita volcanic mountain chain, being the link-mountains between the Călimani Mountains, in the North, and the Harghita Mountains, in the South (I. Mac, 1973).
Compared to the other two mountain massifs, „the Gurghiu Mountains are shorter and less morphological diversified”, but they distinguish themselves through their massiveness and the large area occupied by coniferous forests. The volcanic relief is represented by volcanic cones and the volcanic conglomerate trays situated at the foot of the cones. Most of the cones (situated at 1500 – 1700 m) are at the beginning of their residual stage (I. Irimuş, 2003). In the Gurghiu and Harghita massifs one can find the best preserved volcanic landforms (I. Irimuş, 2003). In Gurghiu Mountains, 5 volcanic cones and caldera, in different erosion stages, are newer. Among these, the Seaca-Tătarca crater distinguishes itself, having a nearly circular shape, 5 km in diameter and a 600 m depth (Negulescu, 1940). The highest altitude is reached in the Seaca Peak, 1777m. The volcanic plateaus, situated at 800 – 1300m of altitude, represent a slightly sinuous area, contrasting with the deepened valleys.
On the western side, the morphology is defined by wide depressions (the Ibăneşti-Gurghiu Depression, the Solovăstru-Jabeniţa Depression), and by hills with piedmont altitudes (the Osoi Hill, 739 m, the Dumbrăviţa Hill, 621 m, Dealul Viilor, 703 m, Capu Dealului, 995 m, the Sânioara Hill, 755 m).
The transversal valley deepened, becoming an anticline valley, with an asymmetric profile (E. Negulescu, 1940). The river’s alluvial plain presents the same asymmetric character, with a better development on its right side. Four terrace levels can be identified: the first step up to 7 m, the second between 20 – 25m, the third has a relative height between 40 and 45 meters, while the last terrace level has a height of 70 to 80 meters (E. Negulescu, 1940).
HUMAN AND NATURAL RESOURCES IN THE TOURISM DEVELOPMENT OF THE GURGHIU …
215
The underlay is formed by volcanic – sedimentary rock material (breccias and aggregates, micro breccias and lapilic tophus with fragments of amphibole andesits, andesits with piroxens, andesitic slates and sands), while the river meadow is dominated by Quaternary deposits (sands and gravels). The presence of salt tangles the region’s morphology. It appears in anticlines with salt seeds at Jabeniţa and Orşova.
The climate presents different variations between the hilly and mountanious areas, the average temperature varying between 6º and 9ºC. In the mountains, the annual average temperature is 2ºC. The annual average rainfalls are around the value of 958 mm/year. The sheltering effect is present in the Gurghiu Valley, which is sheltered by strong winds. The extreme climatic phenomena which occur in the Gurghiu morpho – hydrographic area are the summer pouring rains, sometimes with hail, the sudden snow melt, superimposed with a heavy spring rainfall period, determining floods, early or late frost, early hoarfrost wind blow – downs and snow breaks, which affect the forestry (ICAS, Forestry Planning Act, 1948, 2001).
The forests have a wide development in the basin, situated between 375 m and 1777 m of altitude. According to Köppen’s climatic classification, the climatic background is favorable for the development of forest vegetation (ICAS, Forestry Planning Act, 1980). Regarding the large area occupied by forests within the basin, wood represented, from ancient times, the main resource of the local economy.
2. METHOD AND PURPOSE
The methodology used in elaborating this study was based on the analysis of the climatic, geomorphologic, biogeographic and human elements of the researched area, the analysis of geologic and geomorphologic maps, field research. The purpose of the study is to point out the importance of the existing resources in the area for the economic development of the rural environment. The classes of the studied resources are: the forestry, salt and the ethnographic inheritance.
3. WOOD AND FOREST EXPLOITATION IN THE GURGHIU BASIN
The forests in this region are ordered by altitude. Up to 600 meters broadleaf forests govern: beech (Fagus silvatica), evergreen oak (Quercus petraea), oak tree (Quercus robur), hornbeam (Carpinus betulus), alder (white and black) (Alnus incana and Alnus gletinosa), ash wood (Fraxinus excelsior), sycamore maple (Acer pseudoplatanus). Between 600 and 1000 meters coniferous trees mixed with broadleaf forests are found. Pure coniferous woods - pine spruce (Picea excelsa), pine – tree (Abies alba) and larch (Larix decidua) - can be found at altitudes of over 1000 meters.
Wood exploitation has a very long tradition in the Gurghiu Valley area. The organized wood exploitation began around the year 1865 with the foundation of the Reghin Log Floating Society (“Societatea de Plutărit din Reghin”) also known as The Saxon Society (“Compania Săsească”). „This had an essential role in the forest exploitation in the Mureş and Gurghiu Valleys”. Log floating was a cheaper means of transportation and a very used one at the time, enabling the transportation of entire logs as far as Reghin, on the Gurghiu River. Another aspect in favor of wood exploitation in the Gurghiu Valley had been the construction of the Lăpuşna - Reghin railway. The 1970s floods had affected transport on the railway, which was replaced by forest roads. Presently, the existing transport installations sum up to 183.9 km and provide 85% accessibility.
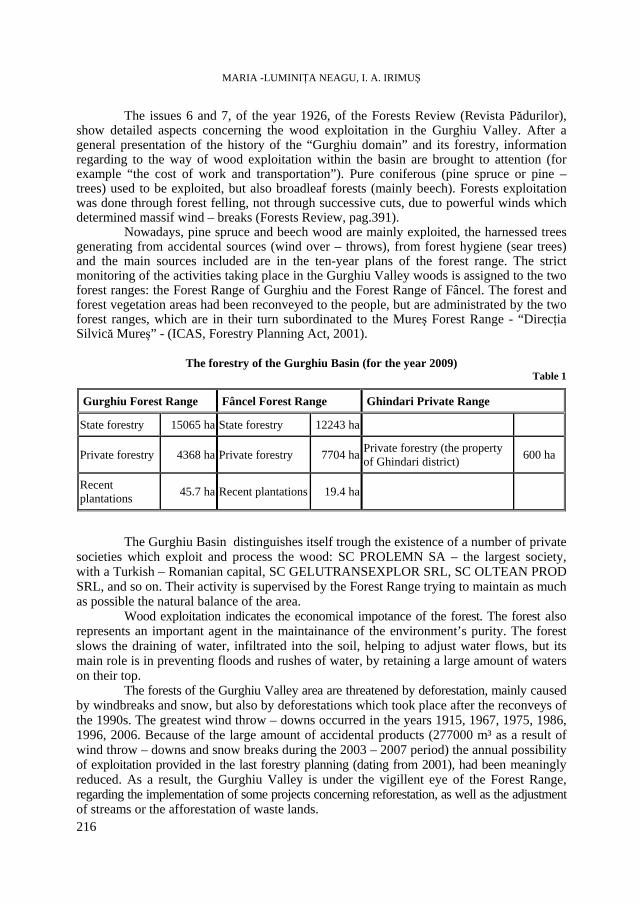
MARIA -LUMINIŢA NEAGU, I. A. IRIMUŞ
216
The issues 6 and 7, of the year 1926, of the Forests Review (Revista Pădurilor), show detailed aspects concerning the wood exploitation in the Gurghiu Valley. After a general presentation of the history of the “Gurghiu domain” and its forestry, information regarding to the way of wood exploitation within the basin are brought to attention (for example “the cost of work and transportation”). Pure coniferous (pine spruce or pine – trees) used to be exploited, but also broadleaf forests (mainly beech). Forests exploitation was done through forest felling, not through successive cuts, due to powerful winds which determined massif wind – breaks (Forests Review, pag.391).
Nowadays, pine spruce and beech wood are mainly exploited, the harnessed trees generating from accidental sources (wind over – throws), from forest hygiene (sear trees) and the main sources included are in the ten-year plans of the forest range. The strict monitoring of the activities taking place in the Gurghiu Valley woods is assigned to the two forest ranges: the Forest Range of Gurghiu and the Forest Range of Fâncel. The forest and forest vegetation areas had been reconveyed to the people, but are administrated by the two forest ranges, which are in their turn subordinated to the Mureş Forest Range - “Direcţia Silvică Mureş” - (ICAS, Forestry Planning Act, 2001).
The forestry of the Gurghiu Basin (for the year 2009)
Table 1
Gurghiu Forest Range Fâncel Forest Range Ghindari Private Range
State forestry 15065 ha State forestry 12243 ha
Private forestry 4368 ha Private forestry 7704 ha Private forestry (the property of Ghindari district) 600 ha
Recent plantations 45.7 ha Recent plantations 19.4 ha
The Gurghiu Basin distinguishes itself trough the existence of a number of private societies which exploit and process the wood: SC PROLEMN SA – the largest society, with a Turkish – Romanian capital, SC GELUTRANSEXPLOR SRL, SC OLTEAN PROD SRL, and so on. Their activity is supervised by the Forest Range trying to maintain as much as possible the natural balance of the area.
Wood exploitation indicates the economical impotance of the forest. The forest also represents an important agent in the maintainance of the environment’s purity. The forest slows the draining of water, infiltrated into the soil, helping to adjust water flows, but its main role is in preventing floods and rushes of water, by retaining a large amount of waters on their top.
The forests of the Gurghiu Valley area are threatened by deforestation, mainly caused by windbreaks and snow, but also by deforestations which took place after the reconveys of the 1990s. The greatest wind throw – downs occurred in the years 1915, 1967, 1975, 1986, 1996, 2006. Because of the large amount of accidental products (277000 m³ as a result of wind throw – downs and snow breaks during the 2003 – 2007 period) the annual possibility of exploitation provided in the last forestry planning (dating from 2001), had been meaningly reduced. As a result, the Gurghiu Valley is under the vigillent eye of the Forest Range, regarding the implementation of some projects concerning reforestation, as well as the adjustment of streams or the afforestation of waste lands.
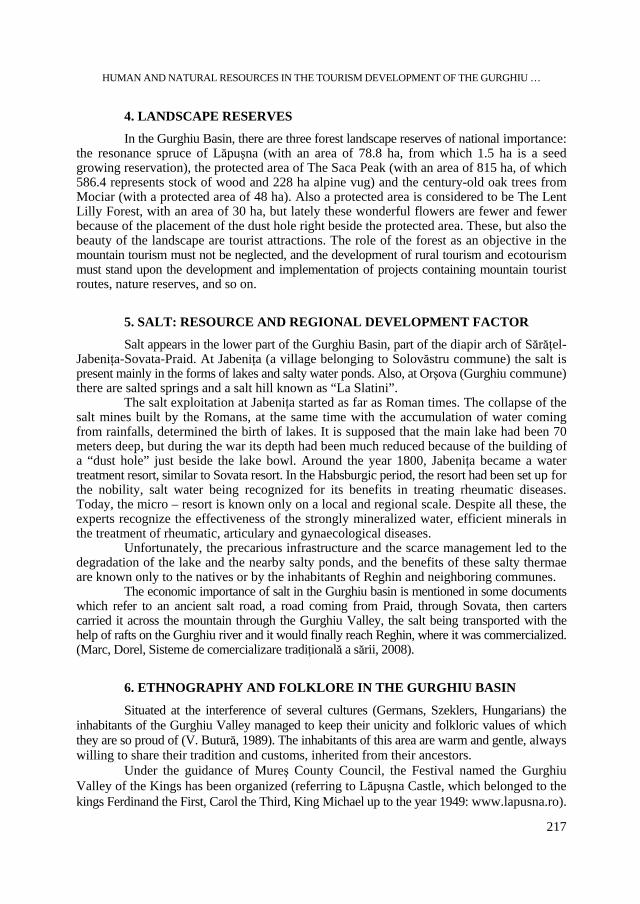
HUMAN AND NATURAL RESOURCES IN THE TOURISM DEVELOPMENT OF THE GURGHIU …
217
4. LANDSCAPE RESERVES
In the Gurghiu Basin, there are three forest landscape reserves of national importance: the resonance spruce of Lăpuşna (with an area of 78.8 ha, from which 1.5 ha is a seed growing reservation), the protected area of The Saca Peak (with an area of 815 ha, of which 586.4 represents stock of wood and 228 ha alpine vug) and the century-old oak trees from Mociar (with a protected area of 48 ha). Also a protected area is considered to be The Lent Lilly Forest, with an area of 30 ha, but lately these wonderful flowers are fewer and fewer because of the placement of the dust hole right beside the protected area. These, but also the beauty of the landscape are tourist attractions. The role of the forest as an objective in the mountain tourism must not be neglected, and the development of rural tourism and ecotourism must stand upon the development and implementation of projects containing mountain tourist routes, nature reserves, and so on.
5. SALT: RESOURCE AND REGIONAL DEVELOPMENT FACTOR
Salt appears in the lower part of the Gurghiu Basin, part of the diapir arch of Sărăţel-Jabeniţa-Sovata-Praid. At Jabeniţa (a village belonging to Solovăstru commune) the salt is present mainly in the forms of lakes and salty water ponds. Also, at Orşova (Gurghiu commune) there are salted springs and a salt hill known as “La Slatini”.
The salt exploitation at Jabeniţa started as far as Roman times. The collapse of the salt mines built by the Romans, at the same time with the accumulation of water coming from rainfalls, determined the birth of lakes. It is supposed that the main lake had been 70 meters deep, but during the war its depth had been much reduced because of the building of a “dust hole” just beside the lake bowl. Around the year 1800, Jabeniţa became a water treatment resort, similar to Sovata resort. In the Habsburgic period, the resort had been set up for the nobility, salt water being recognized for its benefits in treating rheumatic diseases. Today, the micro – resort is known only on a local and regional scale. Despite all these, the experts recognize the effectiveness of the strongly mineralized water, efficient minerals in the treatment of rheumatic, articulary and gynaecological diseases.
Unfortunately, the precarious infrastructure and the scarce management led to the degradation of the lake and the nearby salty ponds, and the benefits of these salty thermae are known only to the natives or by the inhabitants of Reghin and neighboring communes.
The economic importance of salt in the Gurghiu basin is mentioned in some documents which refer to an ancient salt road, a road coming from Praid, through Sovata, then carters carried it across the mountain through the Gurghiu Valley, the salt being transported with the help of rafts on the Gurghiu river and it would finally reach Reghin, where it was commercialized. (Marc, Dorel, Sisteme de comercializare tradiţională a sării, 2008).
6. ETHNOGRAPHY AND FOLKLORE IN THE GURGHIU BASIN
Situated at the interference of several cultures (Germans, Szeklers, Hungarians) the inhabitants of the Gurghiu Valley managed to keep their unicity and folkloric values of which they are so proud of (V. Butură, 1989). The inhabitants of this area are warm and gentle, always willing to share their tradition and customs, inherited from their ancestors.
Under the guidance of Mureş County Council, the Festival named the Gurghiu Valley of the Kings has been organized (referring to Lăpuşna Castle, which belonged to the kings Ferdinand the First, Carol the Third, King Michael up to the year 1949: www.lapusna.ro).
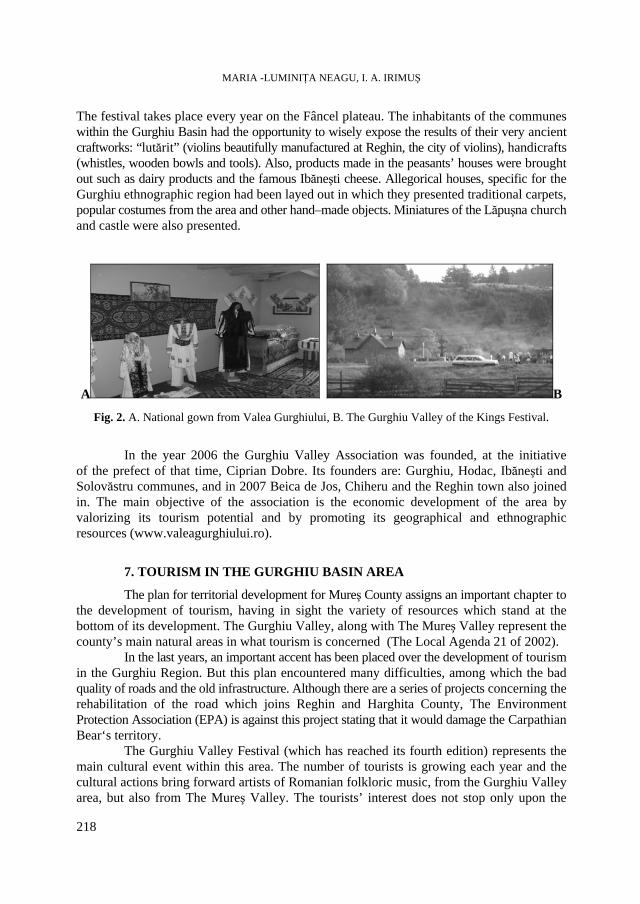
MARIA -LUMINIŢA NEAGU, I. A. IRIMUŞ
218
The festival takes place every year on the Fâncel plateau. The inhabitants of the communes within the Gurghiu Basin had the opportunity to wisely expose the results of their very ancient craftworks: “lutărit” (violins beautifully manufactured at Reghin, the city of violins), handicrafts (whistles, wooden bowls and tools). Also, products made in the peasants’ houses were brought out such as dairy products and the famous Ibăneşti cheese. Allegorical houses, specific for the Gurghiu ethnographic region had been layed out in which they presented traditional carpets, popular costumes from the area and other hand–made objects. Miniatures of the Lăpuşna church and castle were also presented.
A B
Fig. 2. A. National gown from Valea Gurghiului, B. The Gurghiu Valley of the Kings Festival.
In the year 2006 the Gurghiu Valley Association was founded, at the initiative of the prefect of that time, Ciprian Dobre. Its founders are: Gurghiu, Hodac, Ibăneşti and Solovăstru communes, and in 2007 Beica de Jos, Chiheru and the Reghin town also joined in. The main objective of the association is the economic development of the area by valorizing its tourism potential and by promoting its geographical and ethnographic resources (www.valeagurghiului.ro).
7. TOURISM IN THE GURGHIU BASIN AREA
The plan for territorial development for Mureş County assigns an important chapter to the development of tourism, having in sight the variety of resources which stand at the bottom of its development. The Gurghiu Valley, along with The Mureş Valley represent the county’s main natural areas in what tourism is concerned (The Local Agenda 21 of 2002).
In the last years, an important accent has been placed over the development of tourism in the Gurghiu Region. But this plan encountered many difficulties, among which the bad quality of roads and the old infrastructure. Although there are a series of projects concerning the rehabilitation of the road which joins Reghin and Harghita County, The Environment Protection Association (EPA) is against this project stating that it would damage the Carpathian Bear‘s territory.
The Gurghiu Valley Festival (which has reached its fourth edition) represents the main cultural event within this area. The number of tourists is growing each year and the cultural actions bring forward artists of Romanian folkloric music, from the Gurghiu Valley area, but also from The Mureş Valley. The tourists’ interest does not stop only upon the
HUMAN AND NATURAL RESOURCES IN THE TOURISM DEVELOPMENT OF THE GURGHIU …
219
festival, but also on the other various recreation possibilities of the region, such as: hiking, visiting the Lăpuşna Castle, visiting the wooden church of Lăpuşna, the dendrological park Bomemisza in Gurghiu or the Caşva Monastery.
The accommodations enclose a number of cabins on the Fâncel plateau as well as a specially set up place for camping, and a boarding house situated at the exit from Ibăneşti. Also, the Lăpuşna Castle and the Hunting House supply rooms for tourists. Some of the local people also quarter tourists, this way the latter being able to closely get in touch with the country lifestyle. But, for the practicing of organized tourism, there is need to accomplish a modern accommodation infrastructure.
Tourism, along with the forest exploitation, represents two extremely important economical income resources. The development of the rural environment should regard the necessity of protecting the natural environment, according to the principle of long term development. The production and distribution of ecological food means a major step in this direction. An accommodation and transport infrastructure represents a necessity, a major aspect to be regarded in order to practice an organized tourism. Besides the main interested people (local and county authorities, local community) there is the need of a solid financing.
8. CONCLUSIONS
Within the framework of this study, a series of aspects concerning natural and human resources from the Gurghiu Area have been analysed: wood, salt, the ethnographic inheritance, very important factors in the development of tourism (ecological, rural or cultural, even recreational tourism).
The analysis of these resources brought about the antiquity of some of the skills such as wood carving, its exploitation and also salt exploitation in mines. To all of these, one may add the carefully guarded cultural dowry, a series of customs that still linger in the everyday life of the Romanian villages of the Gurghiu Valley.
R E F E R E N C E S 1. Altman, I. (2004), Management şi marketing în unităţile de turism, Edit. Mega, Cluj-Napoca. 2. Benedek, J. (2004), Amenajarea teritoriului şi dezvoltarea regională, Edit. Presa Universitară Clujeană. 3. Butură, V. (1989), Străvechi mărturii de civilizaţie românească, Edit. Ştiinţifică şi Enciclopedică,
Bucureşti. 4. Ciangă, N. (2001), România. Geografia Turismului, Edit. Presa Universitară Clujeană, Cluj-Napoca. 5. Cocean, P. (1999), Geografia turismului, Edit. Focul Viu, Cluj-Napoca. 6. Gociman, A. (1929), Industria şi comerţul lemnului din Bazinul Mureşului Superior, Tip. Şcoala de
Arte şi Meserii “Principele Carol”, Cluj. 7. Irimuş, I.A. (1998), Relieful pe domuri şi cute diapire, Edit. Presa Universitară Clujeană.. 8. Irimuş, I.A. (2003), Geografia fizică a României, Casa Cărţii de Ştiinţă, Cluj-Napoca.
MARIA -LUMINIŢA NEAGU, I. A. IRIMUŞ
220
9. Irimuş, I.A. (2006), Hazarde şi riscuri asociate proceselor geomorfologice în aria cutelor diapire din Depresiunea Transilvaniei, Edit. Casa Cărţii de Ştiinţă, Cluj-Napoca.
10. Lateş, N., Chindea, T. (1971), Contribuţii la Monografia judeţului Mureş “Gurghiul”, Târgu-Mureş. 11. Mac, I., Şoneriu, I. (1973), Judeţele Patriei, Judeţul Mureş, Edit. Academiei, Bucureşti. 12. Mac, I. (1972), Subcarpaţii transilvăneni dintre Mureş şi Olt. Studiu geomorfologic, Edit. Academiei
Române, Bucureşti. 13. Marc, D. (2008), Sisteme de comercializare tradiţională a sării1. 14. Negulescu, E. (1940), Monografia Văii Gurghiului, Arhiva Ocolului Silvic Gurghiu. 15. Pop, P. Gr. (2001), Depresiunea Transilvaniei, Edit. Presa Universitară Clujeană, Cluj-Napoca. 16. Pop, P. Gr. (2006), Carpaţii şi Subcarpaţii României, Presa Universitară Clujeană. 17. Surd, V., Bold, I., Zotic, V., Chira Carmen (2005), Amenajarea teritorială şi infrastructuri tehnice,
Presa Universitară Clujeană. 18. xxx (1987), Geografia României, III, Carpaţii şi Depresiunea Transilvaniei, Edit. Academiei, Bucureşti. 19. xxx (1971), Râurile României. Monografie hidrologică, Institutul de Meteorologie şi hidrologie, Bucureşti. 20. xxx Amenajamentele Silvice ale Ocolului Silvic Gurghiu, Institutul de Cercetări şi Amenajări Silvice,
1948, 1980, 1990, 2001. 21. xxx (1926), Monografia Domeniului Gurghiu, Revista Pădurilor, Anul XXXVIII, Iunie-Iulie 1926, No.
6-7, Bucureşti.
1 www.cimec.ro/arheologie/sarea/24-DorelMarc.pdf
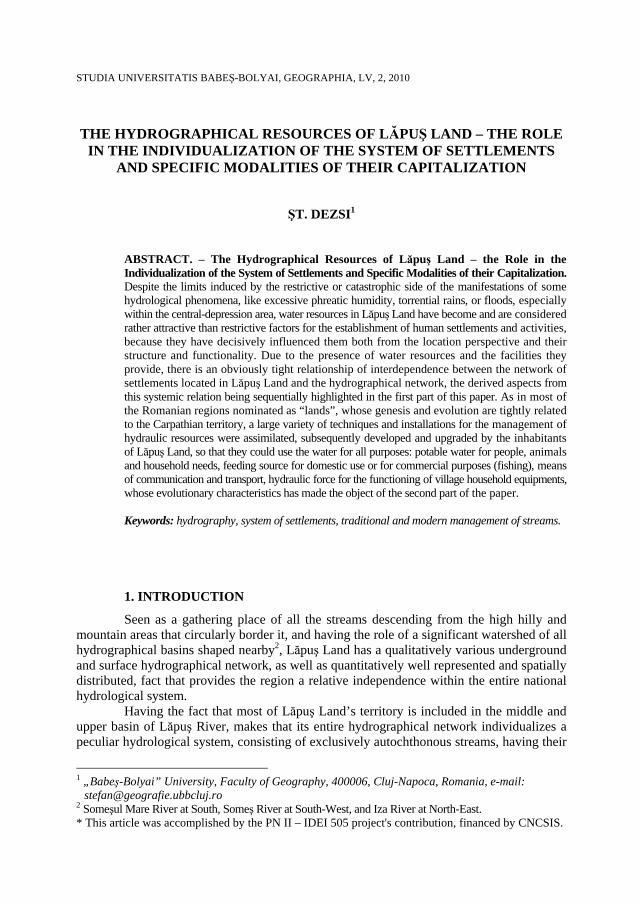
STUDIA UNIVERSITATIS BABEŞ-BOLYAI, GEOGRAPHIA, LV, 2, 2010 THE HYDROGRAPHICAL RESOURCES OF LĂPUŞ LAND – THE ROLE
IN THE INDIVIDUALIZATION OF THE SYSTEM OF SETTLEMENTS AND SPECIFIC MODALITIES OF THEIR CAPITALIZATION
ŞT. DEZSI1
ABSTRACT. – The Hydrographical Resources of Lăpuş Land – the Role in the Individualization of the System of Settlements and Specific Modalities of their Capitalization. Despite the limits induced by the restrictive or catastrophic side of the manifestations of some hydrological phenomena, like excessive phreatic humidity, torrential rains, or floods, especially within the central-depression area, water resources in Lăpuş Land have become and are considered rather attractive than restrictive factors for the establishment of human settlements and activities, because they have decisively influenced them both from the location perspective and their structure and functionality. Due to the presence of water resources and the facilities they provide, there is an obviously tight relationship of interdependence between the network of settlements located in Lăpuş Land and the hydrographical network, the derived aspects from this systemic relation being sequentially highlighted in the first part of this paper. As in most of the Romanian regions nominated as “lands”, whose genesis and evolution are tightly related to the Carpathian territory, a large variety of techniques and installations for the management of hydraulic resources were assimilated, subsequently developed and upgraded by the inhabitants of Lăpuş Land, so that they could use the water for all purposes: potable water for people, animals and household needs, feeding source for domestic use or for commercial purposes (fishing), means of communication and transport, hydraulic force for the functioning of village household equipments, whose evolutionary characteristics has made the object of the second part of the paper. Keywords: hydrography, system of settlements, traditional and modern management of streams.
1. INTRODUCTION
Seen as a gathering place of all the streams descending from the high hilly and mountain areas that circularly border it, and having the role of a significant watershed of all hydrographical basins shaped nearby2, Lăpuş Land has a qualitatively various underground and surface hydrographical network, as well as quantitatively well represented and spatially distributed, fact that provides the region a relative independence within the entire national hydrological system.
Having the fact that most of Lăpuş Land’s territory is included in the middle and upper basin of Lăpuş River, makes that its entire hydrographical network individualizes a peculiar hydrological system, consisting of exclusively autochthonous streams, having their
1 „Babeş-Bolyai” University, Faculty of Geography, 400006, Cluj-Napoca, Romania, e-mail:
[email protected] 2 Someşul Mare River at South, Someş River at South-West, and Iza River at North-East. * This article was accomplished by the PN II – IDEI 505 project's contribution, financed by CNCSIS.
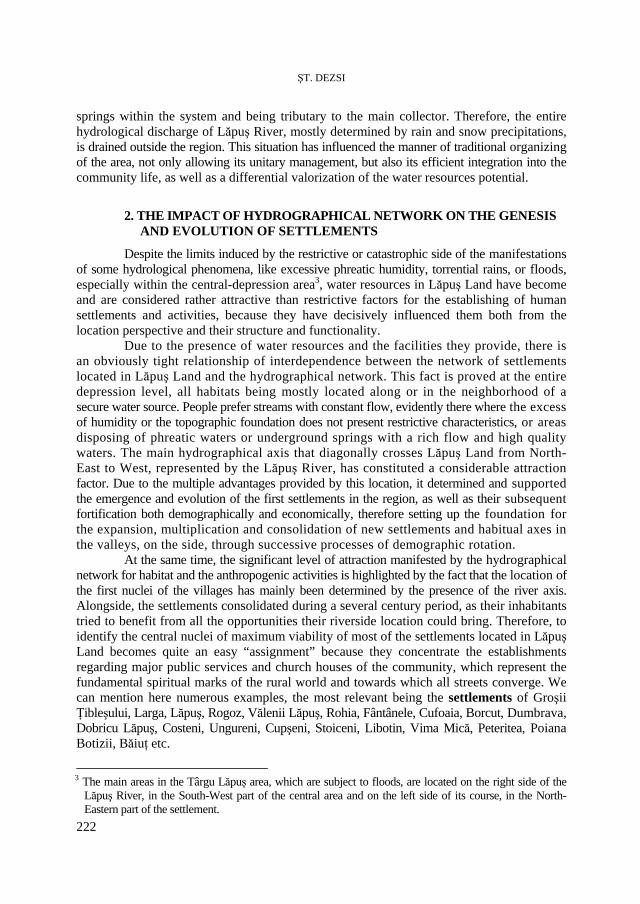
ŞT. DEZSI
222
springs within the system and being tributary to the main collector. Therefore, the entire hydrological discharge of Lăpuş River, mostly determined by rain and snow precipitations, is drained outside the region. This situation has influenced the manner of traditional organizing of the area, not only allowing its unitary management, but also its efficient integration into the community life, as well as a differential valorization of the water resources potential.
2. THE IMPACT OF HYDROGRAPHICAL NETWORK ON THE GENESIS AND EVOLUTION OF SETTLEMENTS
Despite the limits induced by the restrictive or catastrophic side of the manifestations of some hydrological phenomena, like excessive phreatic humidity, torrential rains, or floods, especially within the central-depression area3, water resources in Lăpuş Land have become and are considered rather attractive than restrictive factors for the establishing of human settlements and activities, because they have decisively influenced them both from the location perspective and their structure and functionality.
Due to the presence of water resources and the facilities they provide, there is an obviously tight relationship of interdependence between the network of settlements located in Lăpuş Land and the hydrographical network. This fact is proved at the entire depression level, all habitats being mostly located along or in the neighborhood of a secure water source. People prefer streams with constant flow, evidently there where the excess of humidity or the topographic foundation does not present restrictive characteristics, or areas disposing of phreatic waters or underground springs with a rich flow and high quality waters. The main hydrographical axis that diagonally crosses Lăpuş Land from North-East to West, represented by the Lăpuş River, has constituted a considerable attraction factor. Due to the multiple advantages provided by this location, it determined and supported the emergence and evolution of the first settlements in the region, as well as their subsequent fortification both demographically and economically, therefore setting up the foundation for the expansion, multiplication and consolidation of new settlements and habitual axes in the valleys, on the side, through successive processes of demographic rotation.
At the same time, the significant level of attraction manifested by the hydrographical network for habitat and the anthropogenic activities is highlighted by the fact that the location of the first nuclei of the villages has mainly been determined by the presence of the river axis. Alongside, the settlements consolidated during a several century period, as their inhabitants tried to benefit from all the opportunities their riverside location could bring. Therefore, to identify the central nuclei of maximum viability of most of the settlements located in Lăpuş Land becomes quite an easy “assignment” because they concentrate the establishments regarding major public services and church houses of the community, which represent the fundamental spiritual marks of the rural world and towards which all streets converge. We can mention here numerous examples, the most relevant being the settlements of Groşii Ţibleşului, Larga, Lăpuş, Rogoz, Vălenii Lăpuş, Rohia, Fântânele, Cufoaia, Borcut, Dumbrava, Dobricu Lăpuş, Costeni, Ungureni, Cupşeni, Stoiceni, Libotin, Vima Mică, Peteritea, Poiana Botizii, Băiuţ etc.
3 The main areas in the Târgu Lăpuş area, which are subject to floods, are located on the right side of the
Lăpuş River, in the South-West part of the central area and on the left side of its course, in the North-Eastern part of the settlement.
THE HYDROGRAPHICAL RESOURCES OF LĂPUŞ LAND – THE ROLE IN THE INDIVIDUALIZATION …
223
Still, there are cases in which the location of the central nucleus of a settlement was established at a certain distance from the river axis, so as to avoid the possible risks determined by the restrictive influence of some natural factors, mostly geomorphologic, like the risk of landslides, high torrents, fragmentation and severe declivity, but also hydrological, especially regarding the risk of floods or the high level of phreatic waters against the topographic surface. Nevertheless, the spatial location of the villages in this category does not entirely “neglect” the presence of the watercourse, “not turning their back to the river and maintaining enough connections with it, for accomplishing the multiple needs of the specific rural community” (N. Popa, 1999). This is the case of other several settlements, which, due to the dynamics of some significant streams like Dămăcuşeni, Rogoz, Suciu de Jos, Suciu de Sus could not integrate but partially the hydrographical axis within their centre. The same situation we notice in the case of the settlements of Drăghia, Peteritea, Sălniţa, their case being determined by a lower socio-economic dynamics. On the other hand, we can mention some rural settlements such as Băiuţ, Lăpuş or even Târgu Lăpuş town, whose spatial and functional evolution rather favored such an attempt.
The peculiarities of the local topography, especially regarding the discharge and regime of the Lăpuş River flow, have represented the causes that imposed that all the households of the Răzoare village should avoid as much as possible to settle in the meadow area. The excess of water in the meadow area, determined by the frequent Lăpuş River floods, may damage their agricultural corn crops. Răzoare village is located in the lower territory of the confluence area between the rivers of Dobric and Lăpuş, territory located behind the defile sculptured in the crystalline of Preluca Massif by the rivers conjunction upstream Răzoare village.
The anthropogenic factors and the village functionality, connected with either one of the riversides, have obviously had an important role in structuring the nuclei of the settlements. We can mention the case of Răzoare village, whose nucleus was inserted in the area situated on the left river side as a result of the attraction manifested by the road connecting Lăpuş Land and Someş Valley. A similar case is represented by Groşii Ţibleşului village, whose location of nucleus had to avoid the extended level of the fourth terrace of the river, due to the frequent floods caused by the morphological narrowing downstream, as well as due to excessive humidity. Its habitat had to be also inserted upstream that specific area, which anyhow was affected by hydrographical works during previous decades. Yet their results were not able to help the agriculture activities to become highly productive and more profitable, as they are still being used as pasture for cattle.
On the other hand, the absence of a river with constant flow, which could not provide suitable conditions for the location of households through its morphological and topographic particularities, formulates the premises that determined the scattering of settlements in Preluca Massif (i.e. Groape, Aspra, and Dealul Corbului) or the relative isolation of some peripheral habitats like Inău village.
Furthermore, the most important traditional relations with the economic and social regions located nearby Lăpuş Land were established along some hydrographical axes or valley corridors, following their origins, such as towards Năsăud Land, Maramureş Land, or Someş Valley. These have stressed the tendencies of villages to follow the river course (i.e. the settlements of Suciu de Sus, Larga, and Poiana Botizii) thus contributing to the formation of new villages at the foothills, which currently make the connection between the opposite valleys or the neighbouring drainage basins. From this perspective, the most representative
ŞT. DEZSI
224
examples are given by Vălenii Lăpuş, Coroieni, Groşii Ţibleşului or Strâmbu-Băiuţ settlements, in which cases, some of the isolated households or groups of houses administratively integrated in them, are located along the connection roads that follow the valleys mentioned before (i.e. Suciu de Sus village on the road to Ilişua valley, Groşii Ţibleşului village on the connection road to Maramureş Land, Vălenii Lăpuş and Coroieni settlements, located on both sides of Coroieni Hills).
3. TRADITIONAL AND MODERN MANAGEMENT OF STREAMS
Similar to most of the Romanian regions nominated as “lands”, whose genesis and evolution are tightly related to the Carpathian territory, a large variety of techniques and installations for the management of hydraulic resources were assimilated, subsequently developed and upgraded by the inhabitants of Lăpuş Land, so that they could use the water for all purposes: potable water for people and animals and household needs, feeding source for domestic use or for commercial purposes (fishing), means of communication and transport, hydraulic force for the functioning of village household equipment.
Traditional use of rivers. Unlike other mountain or sub-mountain areas that register high and constant river flows, the modest average flow typical to the rivers in Lăpuş Land, including Lăpuş River, could not provide the proper conditions for running logs, therefore, assuring the necessary floatability level for such a practice, being basically impossible in natural conditions or helped by specific arrangements, called “haituri”. Alongside, the low rate of coniferous species within the structure of the forestry fund, which is dominated by nemoral species of oceanic temperate influences, mainly beech and hornbeam forests, also represented a restrictive factor for such type of activity, suitable exclusively to coniferous. For this reason, the population was deprived of a cheap means of transportation of the huge quantity of wood provided by the area towards the economic centers with an accentuated economic dynamics located nearby, whose increasing requests could have been fulfilled this way.
Not even the reduced demand for wood of the villages located in the Lăpuş area could have justified the improvement of such techniques of transportation, by developing specific arrangements that would allow, at least seasonally, an optimal practice during the high waters in spring. Such an activity would have brought certain benefits to the regional economy, by creating numerous specialized jobs, therefore contributing to the improvement of the standards of living of the population.
On the other hand, Lăpuş Land proved to have a rather poor level of connection with the national railway system, fact that has also contributed to a better preservation of the forestry fund. Unlike the rest of Maramureş County, it benefited from a temporary delay of wood exploitation at industrial scale until the end of the 20th century. At a county level, the industrial forest exploitation registered high values especially in the second half of the 19th century, with a greater intensification at the beginning of the 20th century. Once the first railways were built, they facilitated the access to the forestry basins in the Maramureş mountain area, as well as the input of foreign capital, thus determining the setting up of several wood factories that processed raw material from the entire region, such as the one located in Vişeu de Sus. Despite this, the high number of specialized active workforce, directly involved in the exploitation and traditional wood processing activities, which represented the basic jobs and sources of income of the autochthonous population, has stimulated the development of other handicrafts related to the management of forestry resources.
THE HYDROGRAPHICAL RESOURCES OF LĂPUŞ LAND – THE ROLE IN THE INDIVIDUALIZATION …
225
Thus, one of the most important wood crafts has been represented by jogărit (wood processing by sawmills), activity that has developed since the 16th and 17th centuries and has increased during the following centuries. The establishments for sawmills were located mainly in the valleys, surrounded by extended forest areas that allowed the building of access roads for both an easier exploitation and transportation of wood. Along these valleys, downstream to upstream, the active workforce involved in the exploitation of these resources have built seasonal houses, which, once the time passed, gradually formed small nuclei of seasonal concentration of habitat. These incipient habitation cells have contributed to a relatively early “humanization” of the mountain areas of Lăpuş Land, gradually stimulating the trade with specific products (raw or processed) and implicitly, movements of population towards and from the peripheral regions.
Up to the second half of the last century, in the villages located in Lăpuş Land, the finishing of the wool fabrics was made through traditional activities, called dubit (piuărit) and vâltorit, which were specific to the mountain villages situated in most of the „lands”. People used traditional technical installations activated by water force, some of these being maintained up to the present, and still functioning. Their development in Lăpuş Land as well as in the entire Carpathian area, during the 18th century and the first half of the 19th century, was motivated by the increasing interest towards sheep breeding. Hence, the localization of these installations was set mainly on the mountain streams in the areas that registered intensive pastoral activities, and where wool processing has become one of the major occupations of the population, as a result of the increased requests for wool products, including for export. These areas benefited from the presence of rich discharge, high flow and good quality streams, as well as from large quantities of wood material, and specific places for collecting, storing and trading the finished wood products in fairs organized in the settlements of the region or its neighbouring areas (Cl. Giurcăneanu, 1988). The localization of whirlpools in Lăpuş Land reflect a similar distribution to that of sawmills, due to the same reason related to water flow, most locations being grouped on the Lăpuş River (settlements of Lăpuş, Rogoz and Rohia – that still have functional installations) and Ţibleş River (the villages of Suciu de Sus, Suciu de Jos and Groşii Ţibleşului, some of them still being functional, which usually were used by people from other villages that did not have such equipment).
A much larger distribution, both numerically and territorially, have had the watermills, which were practically present in all villages of Lăpuş Land, which were crossed by a sufficiently large watercourse and that would be able to support the optimal functioning of such installations. Still, very few of them fulfilled the best possible conditions in terms of discharge, which was generally low and registered significant variations from one season to another, reason for which the most usual type of watermill present in the area was that with vertical spinning (vertical wheel with cups) which functioned only by deviating the main course, falling and filling. The first watermill in Lăpuş Land was officially attested in 1553, even though their emergence had been declared much earlier. They were usually used by the entire community; yet, the social differentiation characteristic to the following period has led to the ocurrence of private watermills. This was the case of Târgu Lăpuş, Suciu de Sus, Cupşeni, Lăpuş, Stoiceni settlements that were financially administered by Lăpuş local tax bodies, or by the serf administration in Cupşeni village, as mentioned in the 18th century documents.
ŞT. DEZSI
226
Subsequently, the number of hydraulic mills increased proportionally with the growing demands, due to the “demographic boom” manifested in the region. Thus, in the second half of the 19th century and the beginning of the 20th century, most of the settlements situated in Lăpuş Land registered at least one similar functional installation. The settlements of Lăpuş, Târgu Lăpuş, Răzoare, Ungureni, Groşii Ţibleşului, Rohia, Suciu de Sus Rogoz, Dămăcuşeni, Băiuţ, Poiana Botizii, Vima Mică, Sălniţa, Cupşeni, Costeni, Libotin, Dealu Mare, Coroieni, Vălenii Lăpuş, Drăghia, Baba are worth mentioning. The location of this equipment in every village was established by taking into consideration the low discharge tributaries and usually the narrowing area of the most important streams, so that they would achieve a fast flow. Therefore, people tried to properly manage the possible slope breaks that needed minimal rehabilitation works for obtaining the optimal fall. Their locations were usually registered within the village nuclei, as well as outside that area, downstream or upstream any village, in accordance with the local conditions.
By changing the type of property of most hydraulic mills, therefore placing them under the administration of common agricultural houses in the period of forced collectivization during the 6th decade of the last century, and their gradual replacement starting with the 1950s by introducing “the fire mills”, have determined the disappearance of many. Nevertheless, part of them still remained functional until the 1970s and even the 1980s. However, only few of them are able to function nowadays after being adjusted through efficient techniques. We have to notice the fact that, regularly, these installations do not appear isolated but grouped in significant complexes, such as: watermill with whirlpool, or watermill, whirlpool and vice, sawmill, whirlpool and vice (in Rogoz village - watermill, whirlpool and vice, in Rohia village - whirlpool and vice, both settlements registering active equipments in the present).
Modern use of hydrological resources. Throughout the time, the use of water resources has evolved from simple procedures to the modern, complex ones, which allowed people to use hydrological resources for domestic or industrial purposes. Thus, even if some of the traditional methods of using the water resources in Lăpuş Land still remain functional, and simple equipments like springs and wells still hold the most significant share among all types of ground and underground methods of water management, the last decades have registered major improvements regarding techniques and means of exploiting the water (i.e. wells, drillings, and underground tanks). They are meant to cover and provide the necessary water, both for domestic and industrial purposes. Water demands are continuously increasing, as a result of modernizing the rural areas, and due to the presence of numerous formerly public and now private industrial and animal breeding establishments.
In Lăpuş Land, the underground water is the one which permanently provides the necessary potable water for the domestic use of all inhabitants. It is taken at the intersection of phreatic stratum by drillings and wells. Few are the cases when, affected by long droughts, groups of households located at higher altitudes and implicitly, vertically, at a longer distance from the phreatic stratum, are lacking water (i.e. settlements of Strâmbu-Băiuţ, Lăpuş, Cupşeni, Ungureni, Coroieni, Dealu Mare, Jugăstreni, Groape, Aspra, Dealu Corbului situated on slopes, watersheds, plateaus). During the last decades, people in the rural areas have consolidated the arrangements in the gravitational system, by building spring collection tanks and commonly using them as groups of households. More recently, people started to use mechanical and electric devices (pumps, hydrophores) so that the water in wells or tanks would be pumped out and distributed to every individual household.
Accordingly, people use natural springs for the water provision of their temporary or permanent settlements like forest and hunting lodges, pens, or other dwellings, located especially in mountain or high hilly areas that border the Lăpuş Depression, as well as in
THE HYDROGRAPHICAL RESOURCES OF LĂPUŞ LAND – THE ROLE IN THE INDIVIDUALIZATION …
227
Preluca Massif (Groape, Aspra, Dealu Corbului) or in the area of contact with Şatra Mountain. They choose to exploit the natural springs, as their only source of water, by using very simple equipment, due to their constant discharge all year long determined by the relatively high precipitations. In addition, beginning with the 6th and 7th decades of the last century, most of the settlements in Lăpuş Land have commonly used water for domestic use by exploiting some springs nearby (the settlements of Băiuţ, Strâmbu-Băiuţ, Vima Mică, Suciu de Sus, Suciu de Jos, Larga). Nevertheless, whenever the case, numerous families try to financially associate so that they could endow their households with retention basins, and build the necessary collection and distribution networks.
For these reasons, in most of the cases, people have used improvised systems for groups of households, usually including from 6 to 12 houses, and in the case of larger villages even comprising up to 60 or 80 houses (i.e. the settlements of Rohia, Rogoz, Dămăcuşeni Coroieni, Baba, Drăghia, Vălenii Lăpuş, Dealu Mare, Cupşeni, Ungureni, Libotin, Groşii Ţibleşului, Boiereni, Cufoaia, Dumbrava, Dobric, Fântânele, Răzoare, Stoiceni, Poiana Botizii). Due to the excessive usage of these installations, in terms of deterioration, precarious management and improper maintenance of the networks, along with the lack of stations and reactants necessary for filtrations, made their quality become many times uncertain. Therefore people started to use it just for waste and domestic purposes.
Under these circumstances, the necessary water is practically provided by the underground deposits. Each rural household has its own system of capturing the drinking water, usually through individual wells. Nevertheless, settlements like Târgu Lăpuş and Lăpuş benefit from a centralized system of water supply. In this case, they benefit from a more advantageous location, both of them having centralized water networks. However, their state is rather precarious, far from complying with the standards in the field, even though there are functional filtration stations that provide the necessary water quality for drinking.
However, Târgu Lăpuş town and the mining settlements of Băiuţ and Răzoare registered an increasing demand for industrial and domestic water supply necessary for the provision of residential areas, public institutions and other social and industrial establishments, as well as other food industry establishments in the rural areas. Hence, the administrations started works for the abstraction and storage of drinking water, so that the increasing demand for water should be solved by the accumulation and intersection of several underground springs, as well as by derivations and supplies from the waters of Lăpuş River and its tributaries.
Overall, Maramureş County has a total amount of 9 m3/s of underground water. At present, only 713 dm3/s are capitalized, coming from 12 springs, out of which one is situated in the area of Târgu Lăpuş town, having a discharge of 20 dm3/s. Târgu Lăpuş town benefits from centralized water supply from the underground springs located in the riverside area of Suciu and Râoaia rivers (first exploited in 1974 and 1994), whose total capacity of drinking water is 1722 m3/day, gravitationally transported to the water tanks located on the streets of Obreja and Ţibleş. Drinking water is distributed from here, through a pumping station and a distribution network, which is circular in the centre and radial towards the periphery, on the valleys, to the domestic, public and industrial consumers. The simple length of the pipes of the distribution network for drinking water is 19.8 km, while the distribution networks of the streets is 17.6 km, which represents a level of 83.8 % of endowing the streets with water pipes. The other consumers, about 300 inhabitants, whose households are located in the peripheral areas of the town, have individual sources of drinking water supply (wells). In 2000, Târgu Lăpuş Town registered a total capacity of producing drinking water in centralized system of 1500 m3/day. Out of this capacity, in the same year, a quantity of about 1134 m3/day was
ŞT. DEZSI
228
introduced in the distribution system, therefore registering losses of about 9.2 %; hence, approximately 80.3% of the total quantity was distributed among the consumers, such as: households - 827 m3/day, with specific consumption of 184 l/person /day, public institutions - 203 m3/day, and trade companies only 104 m3/day.
In the case of Băiuţ village, water supply is provided by two valleys, those of Izvorul Alb and Izvorul Negru rivers, which are led to an accumulation basin at a 4.5 km distance. From there, the water is gravitationally transported to the water station; after processes of filtration and treatment (with reactants), the purified water is subsequently distributed to the public water network. It is considered that in the near future, water from the same source will be provided to the village of Strâmbu-Băiuţ, as well (P.U.G. – General Urban Plan of Târgu Lăpuş, 2003).
Due to its peculiar soils and climate, Lăpuş Land could not be included in the category of regions that needed special arrangements for irrigations in order to the increase the agricultural productivity. Yet, on small areas, they used improvised systems to provide the necessary water for supplying a few solariums or improvised fields within the former Agricultural Cooperatives of Production in the depression area for obtaining seedlings or early vegetables. These practices were registered in the period before 1989, and the data reflected a specific situation, such as: 8 ha in Coroieni commune in 1988, between 35 and 95 ha in Târgu Lăpuş town between 1986 and 1989, 10 ha in Cupşeni commune in 1988, between 13 and 25 ha between 1986 and 1988 in Lăpuş village, 5 ha in 1987 and 1988 in Suciu de Sus commune, as well as 10 ha between 1987 and 1988 in Vima Mică commune (in case the data provided by the official sources were correct). Nevertheless, the present authorities state that those practices, before 1989, were rather sporadic and they were located on much limited areas than those declared by the official statistics of the period.
The industrial units use diverse water supply sources like underground aquifer strata exploited by their own equipment of sampling, pumping and distribution such as: E.M. Răzoare, S.C. Laroroex S.R.L. Rogoz – partially, S.C. Lăpuşul – the latter one declared out of service; springs and gravitational supplies (the flotation of E.M. Băiuţ), as well as some water reservoirs (the former U.F.E.T., in Târgu Lăpuş town, presently S.C. Construct Group S.R.L. – using water from the lake of Valea Gardului; S.C. Unimar S.R.L., Dumbrava work centre – pumping water from Dobricel lake; S.C. Unicom S.R.L Dămăcuşeni – partially – taking water from their three small lakes, recently equipped). However, most of the small and medium economic agents in Târgu Lăpuş town use the public centralized water network for all purposes (i.e. S.C. Filbac S.A., S.C. Vestindustri S.A.; S.C. AVI-SEB S.R.L., S.C. Unicom S.R.L. Dămăcuşeni village – partially; S.C. Laroroex S.R.L. Rogoz village).
The common and public agricultural farms specialized in animal breeding, which used to function in the area of Lăpuş Land before 1989, used water provided by the public network (the case of Vima Mică village), spring supplies (the case of Suciu de Sus, Suciu de Jos, Larga settlements) or anthropogenic lakes (i.e. Lăpuş Agricultural Cooperative of Production – from the lakes located in Zâmbriţa village). Additionally, they practiced individual works of pumping and conditioning of underground water sources.
In terms of pollution, the waters in Lăpuş Land comply almost exactly with the norms regulated by the Ministry of Environment. Still, they are at risk, because of two factors that are represented by the two small tributaries received by Lăpuş River in the Băiuţ Depression, Strâmbu-Băiuţ, on the right side, and Botiz on the left, both of them providing the necessary water of the sulphure, gold and silver mine exploitations, therefore discharging polluted water in Lăpuş River.
THE HYDROGRAPHICAL RESOURCES OF LĂPUŞ LAND – THE ROLE IN THE INDIVIDUALIZATION …
229
Other sources of polluting the water resources are represented by the improper management or storage of organic fertilizers, waste (with an increased share of plastic or other materials hardly or at all renewable), wood wool (as a result of the increasing number of sawmills), and whose evacuation has been made directly into the watercourses due to the lack of proper systems of waste collecting and of waste water purification stations, which is a fact for most of the settlements in Lăpuş Land. The only exception is made by Târgu Lăpuş Town, which has one water treatment station, yet undersized and insufficiently equipped for meeting the current demands and norms in the field. To these, we can add the frequent water usage in the process of producing fruit alcohol by installations for distillation (both for the cooling system of the caldrons and for the drainage of the resulted secondary products), which is a largely spread activity in many of the villages in Lăpuş Land.
We cannot place the waters in Lăpuş Land within the legally stated limits of pollution, since the quality of surface waters of Lăpuş Land is not constantly kept under observation. Therefore, the sector of Lăpuş River, upstream Băiuţ, can be included in the 1st quality category, while the sector located in the depression area belongs to the 2nd quality category.
4. CONCLUSIONS
Lăpuş Land has a qualitatively various underground and surface hydrographical network, as well as quantitatively well represented and spatially distributed, fact that provides the region a relative independence within the entire national hydrological system. Having the fact that, most of Lăpuş Land’s territory is included in the middle and upper basin of Lăpuş River, makes that its entire hydrographical network individualizes a particular hydrological system, consisting of exclusively autochthonous streams, having their springs within the system and being tributary to the main collector. Therefore, the entire hydrological discharge of Lăpuş River, mostly determined by rain and snow precipitations, is drained outside the region. This situation has influenced the pattern of traditional organizing of the area, not only allowing its unitary management, but also its efficient integration into the community life, as well as a differential valorization of the water resources potential.
Despite the limits induced by the restrictive or catastrophic side of the manifestations of some hydrological phenomena, like excessive phreatic humidity, torrential rains, or floods, especially within the central-depression area, water resources in Lăpuş Land have become and are considered rather attractive than restrictive factors for the setting of human settlements and activities, because they have decisively influenced them both from the location perspective and their structure and functionality.
Due to the presence of water resources and the facilities they provide, there is an obviously tight relationship of interdependence between the network of settlements located in Lăpuş Land and the hydrographical network. This fact is proved at the entire depression level, all habitats being mostly located along or in the neighbourhood of a secure water source.
Similar to most of the Romanian regions nominated as “lands”, whose genesis and evolution are tightly related to the Carpathian territory, a large variety of techniques and installations for the management of hydraulic resources were assimilated, subsequently developed and upgraded by the inhabitants of Lăpuş Land, so that they could use the water for all purposes: potable water for people, animals and household needs, feeding source for domestic use or for commercial purposes (fishing), means of communication and transport, hydraulic force for the functioning of village household equipments.
ŞT. DEZSI
230
R E F E R E N C E S
1. Dezsi, Şt. (2004), Evoluţia reţelei de aşezări din Ţara Lăpuşului în secolele XIII-XVI, Studia Univ. Babeş-Bolyai, Geographia, XLIX, 1, Cluj-Napoca.
2. Dezsi, Şt. (2005), Evoluţia sistemului habitual şi a ierarhiei funcţionale a aşezărilor din Ţara Lăpuşului în perioada cuprinsă între secolul XVII şi prima jumătate a secolului XIX, Studia Univ. Babeş-Bolyai, Geographia, L, 1, Cluj-Napoca.
3. Dezsi, Şt. (2005), Evoluţia sistemului de aşezări din Ţara Lăpuşului în a doua jumătate a secolului XIX şi secolul XX, Studia Univ. Babeş-Bolyai, Geographia, L, 2, Cluj-Napoca.
4. Dezsi, Şt. (2006), Ţara Lăpuşului. Studiu de Geografie regională, Edit. Presa Universitară Clujeană, Cluj-Napoca.
5. Popa, N. (1999), Ţara Haţegului – potenţialul de dezvoltare al aşezărilor omeneşti, Edit. Brumar, Timişoara.
6. Pop, P. Gr. (2001), Depresiunea Transilvaniei, Edit. Presa Universitară Clujeană, Cluj-Napoca. 7. Popa, N. (2000), Tipuri de aşezări din Ţara Haţegului, Edit. Brumar, Timişoara. 8. Posea, Gr. 1962), Ţara Lăpuşului. Studiu de geomorfologie, Edit. Ştiinţifică, Bucureşti. 9. Ujvari, J. (1972), Geografia apelor României, Edit. Ştiinţifică, Bucureşti. 10. *** (1964), Atlasul cadastrului apelor din R.P.R., C.S.A. (D.G.G.A.), vol. 1, Bucureşti. 11. *** (1965), Apele minerale şi nămolurile terapeutice din Republica Populară Română, vol. II,
Edit. Medicală, Bucureşti. 12. *** (1971), Râurile României. Monografie hidrologică, I.M.H., Bucureşti. 13. *** (1971), Râurile României. Monografie hidrologică, I.M.H., Bucureşti. 14. *** (1972-1979), Atlasul Republicii Socialiste România, Institutul de Geografie, Edit. Acad.
Române, Bucureşti. 15. *** (1983), Geografia României, I, Geografia fizică, Edit. Acad. Române, Bucureşti. 16. *** (1984), Geografia României, II, Geografia umană şi economică, Edit. Acad. Române, Bucureşti. 17. *** (1987), Geografia României, III, Carpaţii româneşti şi Depresiunea Transilvaniei, Edit. Acad.
Române, Bucureşti. 18. *** (1987), Geografia României, IV, Regiunile pericarpatice: Dealurile şi Câmpia Banatului şi
Crişanei, Podişul Mehedinţi, Subcarpaţii, Podişul Moldovei, Edit. Acad. Române, Bucureşti.
STUDIA UNIVERSITATIS BABEŞ-BOLYAI, GEOGRAPHIA, LV, 2, 2010
THE INFLUENCE OF THE TOURISM SUPPLY ON THE STRATEGY OF
TOURISM DEVELOPMENT IN SĂLAJ COUNTY
N. CIANGĂ1, ŞT. DEZSI1, C. C. POP1
ABSTRACT. – The Influence of the Tourism Supply on the Strategy of Tourism Development in Sălaj County. Seemingly disadvantaged touristically, having a reduced affiliation to the Carpathian space, Sălaj County still has enough reasons to compensate this situation. In this respect, the tourism potential of the thermo-mineral waters is to be noticed, and especially the one related to the rural-traditional culture and civilization including very important historical-cultural objectives belonging to the Roman antiquity and to the Middle Ages. The strategy of tourism development aims at the efficient capitalization through arrangements and activities, which are typical of these categories of tourism attractions through cultural tourism, watering-curative and leisure tourism and, not least, through rural tourism stimulated by all the other motivations. Keywords: strategies of development, tourism, anthropogenic heritage, hydromineral resources. 1. INTRODUCTION
Sălaj County is placed in the central part of the North-West Region of Development. It borders with four other counties of this region of development.
It is the least “mountainous” county along with Satu Mare. Only the North-East and the North-West parts of the lowest mountainous units of the Apuseni Mountains, Meseş Mountains and Plopiş Mountains, are extended here.
This feature affects the space of the county due to the relative monotony of the landscape, depriving it from the possibility of developing some forms of tourism, which are well-known in the other neighbouring counties.
2. ARGUMENTS FOR TOURISM DEVELOPMENT AND WEAK POINTS
2.1. The frequent presence of very valuable anthropogenic tourism heritage is to be noticed. It belongs to different categories and to successive historical ages:
a) ancient Roman camps: Porolisum (Moigrad), Românaşi, Romita, Buciumi; b) folk architecture, especially churches made of wood: Fildu de Sus, Creaca, Hida,
Purcăreţ, Ileanda, Zimbor, Sânmihaiu Almaşului, Tusa, Horoatu Crasnei, Zalnoc, Derşida, Chieşd;
c) fortresses and castles: Maria, Şimleu Silvaniei, Valcău de Sus, Chieşd, Nuşfalău, Bocşa, Guruslău, Jibou, Cehu Silvaniei, Năpradea (Cheud fortress), Dragu, Gârbou.
1 “Babeş-Bolyai” University, Faculty of Geography, 400006 Cluj-Napoca, Romania, e-mail:
N. CIANGĂ, ŞT. DEZSI, C. C. POP
232
d) museums and memorial houses: Zalău, Jibou, Bădăcin (Iuliu Maniu, Corneliu Coposu); geographical spaces representative for the rural and spiritual culture: Meseşenii de Sus, Moigrad, Iaz, Plopiş, Pria, Fildu de Jos, Fildu de Sus, Zimbor, the ones from North-West belonging to the Codru area.
2.2. The hydro-mineral resources from the eastern half also stand out (Bizuşa, Jibou, Motiş, Meseşenii de Sus), the thermal ones in West (Boghiş, Iaz, Şimleu Silvaniei, Zolnoc, Valea Pomilor) are insufficiently capitalized and the therapeutic muds – Stobor.
2.3. The effort of rehabilitation of the road communication infrastructure is to be highlighted, especially the road section from E 81 between Zalău-Cluj-Napoca.
2.4. As negative aspects, the following are to be mentioned: - the feeble representation of the mountainous morphology, which is present only through the existence of some sectors of gorges: Huta, Tusa, Preoteasa, Subcetate and especially Maria or the Crasna pass from Cehei; - the scanty arrangement and capitalization of the hydromineral and thermal resources.
3. PRIORITIES AND DIRECTIONS OF DEVELOPMENT IN TOURISM
On the background of this synthetic presentation, several priorities in the tourism arrangements stand out: the balneary, the rural, the urban tourism and other domains.
3.1. The hydro-mineral and thermal potential of Sălaj County is not capitalized in its most part. The re-launching of tourism using this natural source is to be done in two directions, the watering one, using the mineral and thermal waters as a curative factor and that with a leisure character by the execution of the thermal leisure swimming pools and of the reception bases, either independent or in the shape of rural family boarding-houses.
In order to do this, the reconstruction of Boghiş resort has to be achieved (hyper-thermal mineral waters, 40-410C, with a flow capacity exceeding 1000 cubic metres/24 hours, obtained through drilling,). This action implies the modernization and the extension of the treatment basis and of the two swimming pools (covered and outdoors), the modernization of the old accommodation unit, the arrangement and the introduction in circuit of the units abandoned after 1990, as watering-hotel units; the complete renewal of the school camp with little houses from Lunca Barcăului. The achievement of these objectives will lead to the increase of the resort to several hundreds of places and to the diversification of the activities, therefore of its functional profile. In this way, the impact of Boghiş resort will increase to a regional-national level, also with a stimulation in the view of the international tourism demand.
The actual situation of Bizuşa resort requires extensive work of rehabilitation and modernization, within the limits of its present capacity of reception, adjusted to the flow of the mineral waters, which is necessary to the best functioning of the therapeutic base, modernized in its turn.
A similar intervention of a much smaller amplitude will be necessary in the case of the local watering objective – Jibou Spa (with hypothermal mineral waters).
The other hypothermal and mesothermal hydro-mineral deposits of the central part (Meseşenii de Sus), and especially the ones of the western part (Şimleu Silvaniei, Zăuan, Zalnoc, Iaz, Chieşd, Valea Pomilor) are in their most part non-capitalized. Small locally created
THE INFLUENCE OF THE TOURISM SUPPLY ON THE STRATEGY OF TOURISM DEVELOPMENT …
233
resorts, including thermal swimming pools, units of accommodation having several tens of beds are to be established, adding family board and lodgings to them. The future balneary arrangement of the therapeutic muds at Stabor has to be also highlighted.
3.2. The rural tourism will be stimulated by the existence of a material and spiritual rural culture, with a particular personality, materialized in a number of villages with habitats, households and occupations, which are typical of the Silvania zone, of the Almaş-Agrij Depression, of the Someş and Codru regions. The system of the reception bases in the shape of board and lodgings and agro-tourism pensions begins to be outlined, including settlements like Gâlgău, Fildu de Jos, or Moigrad, Ileanda, Cuzăplac, Bizuşa, Zimbor respectively.
3.3. The presence of some cultural-historical objectives in the rural environment has an impact on the practice of cultural tourism and stimulates the achievement of some tourism thematic routes: - the Roman camps tour: Buciumi, Românaşi, Romita, Porolisum (Moigrad); - the wood churches round trip: Fildu de Sus, Zimbor, Sânmihaiu Almaşului, Hida, Creaca, Purcăreţ, Ileanda; - the tour of castles and fortresses: in the West - Marca, Nuşfalău, Şimleu Silvaniei, Chieşd, Bocşa, Guruslău, or in the North at Jibou, Cehu Silvaniei (the fortress built in 1597 by Sigismund Bathory), Năpradea (Ieud fortress). - the middle-sized towns (Zalău) and the small ones (Şimleu Silvaniei, Cehu Silvaniei and Jibou) have old-fashioned tourism-hotel bases which require extensive work of rehabilitation and modernization. The problem of their permanent supply with water must also be solved. The towns are the promoters of cultural tourism having museums, historical destinations or memorial houses as objectives, which are situated either in the towns or in the adjoining zones (Bădăcin). They also benefit by the premises of the long-term practice of the watering tourism in site (Jibou) or nearby (Şimleul Silvaniei). The position of the town of Zalău at the foot of the Meseş Mountains, with a difference of altitude exceeding 300 m, allows the achievement of arrangements for winter sports on the North-West slopes, through the creation of a ski slope with an average and low degree of difficulty, accessible through a tele-ski or an easier structure of baby-skilift. Situated at almost equal distance between Zalău and Şimleu Silvaniei towns, Vârşolţ Lake is a destination for fishing, but also a site for building secondary residences.
3.4. The mountainous component, located in the North-West and central part, without special morphological, climatic and bioclimatic contrasts, due to the altitudes below 1000 m, provides however conditions for the development of a climatic and mountainous resort at Tusa, having the school camp as a centre – which is in need of being modernized and extended. It can benefit by endowments with a leisure-entertaining character, also taking into consideration the existence in the neighborhood or at a certain distance of some gorges and narrow paths with a morphological landscape tourism value, generating other forms of tourism (mountaineering) at Tusa, Marca, Huta. Also, the presence of the trout nursery pond at Tusa, which has a role in the production and repopulation of the rivers, leads to the possibility of practicing the fishing tourism.
N. CIANGĂ, ŞT. DEZSI, C. C. POP
234
4. CONCLUSIONS
Although apparently disadvantaged, if compared with other counties belonging to the North-West Region of Development (Cluj, Bistriţa-Năsăud, Maramureş, Satu Mare, Bihor), of a less varied tourism supply and without major factors of attraction, Sălaj County stands out because of its particularized anthropogenic tourism heritage (belonging to all historical ages and having an original rural culture and civilization) to which the hydrothermal resources are to be added.
The central position, as part of the North-West Region, and the fact that Sălaj County will be crossed by the Transylvania highway, will be the reasons for the diversification of the tourism arrangements, of the packages of services and the attraction of sources and investment programs in tourism.
R E F E R E N C E S 1. Ciangă, N. (1997), Turismul din Carpaţii Orientali. Studiu de Geografie Umană, Edit. Presa Universitară
Clujeană, Cluj-Napoca. 2. Ciangă, N. (1998), Turismul rural, factor de conservare, valorificare şi dezvoltare a habitatului montan,
Studia Universitatis Babeş-Bolyai, Geographia, nr. 2, Cluj-Napoca. 3. Ciangă, N. (2007), România. Geografia Turismului, Presa Universitară Clujeană, Cluj-Napoca. 4. Cocean, P., Dezsi, Şt. (2001), Prospectare şi geoinformare turistică, Edit. Presa Universitară Clujeană.
Cluj-Napoca. 5. Morariu, T., Sorocovschi, V. (1972), Judeţul Sălaj, Colecţia Judeţele patriei, Edit. Academiei R. S.
România, Bucureşti. 6. Pop, C. C. (2008), Turism şi dezvoltare durabilă. Judeţul Sălaj, Casa Cărţii de Ştiinţă, Cluj-Napoca. 7. Pop, P. Gr. (1983), Sălaj. Hărţi turistice judeţene, Edit. Sport-Turism, Bucureşti (cu text caracterizare
geografică şi obiective turistice, pe verso). 8. Pop, P. Gr. (2001), Depresiunea Transilvaniei, Edit. Presa Universitară Clujeană, Cluj-Napoca. 9. Pop P. Gr. (2005), Dealurile de Vest şi Câmia de Vest, Edit. Universităţii din Oradea, Oradea, 2005.
10. xxx (1987), Geografia Carpaţilor şi Depresiunea Transilvaniei, III, Edit. Academiei R.S. România, Bucureşti.
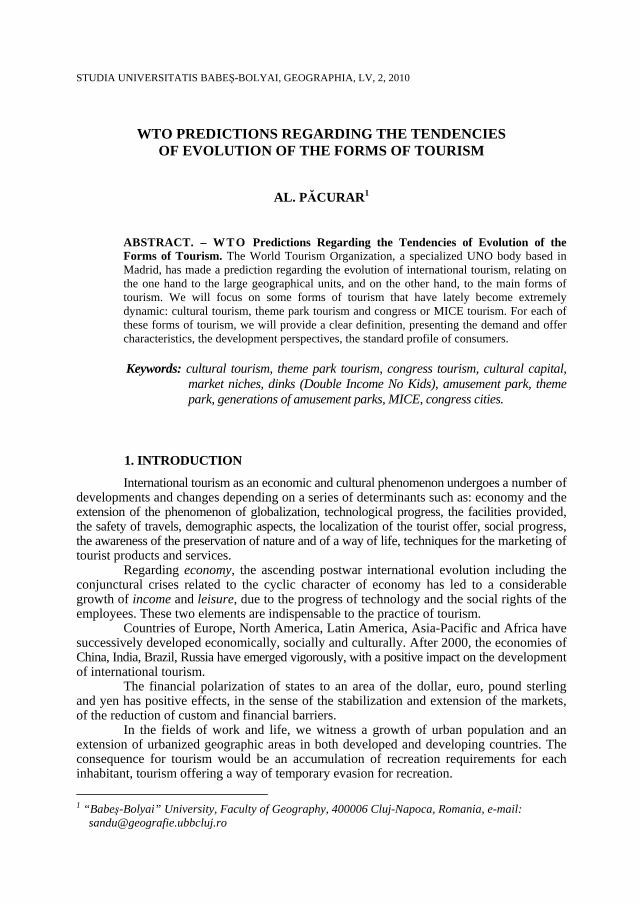
STUDIA UNIVERSITATIS BABEŞ-BOLYAI, GEOGRAPHIA, LV, 2, 2010
WTO PREDICTIONS REGARDING THE TENDENCIES
OF EVOLUTION OF THE FORMS OF TOURISM
AL. PĂCURAR1
ABSTRACT. – WTO Predictions Regarding the Tendencies of Evolution of the Forms of Tourism. The World Tourism Organization, a specialized UNO body based in Madrid, has made a prediction regarding the evolution of international tourism, relating on the one hand to the large geographical units, and on the other hand, to the main forms of tourism. We will focus on some forms of tourism that have lately become extremely dynamic: cultural tourism, theme park tourism and congress or MICE tourism. For each of these forms of tourism, we will provide a clear definition, presenting the demand and offer characteristics, the development perspectives, the standard profile of consumers.
Keywords: cultural tourism, theme park tourism, congress tourism, cultural capital,
market niches, dinks (Double Income No Kids), amusement park, theme park, generations of amusement parks, MICE, congress cities.
1. INTRODUCTION
International tourism as an economic and cultural phenomenon undergoes a number of developments and changes depending on a series of determinants such as: economy and the extension of the phenomenon of globalization, technological progress, the facilities provided, the safety of travels, demographic aspects, the localization of the tourist offer, social progress, the awareness of the preservation of nature and of a way of life, techniques for the marketing of tourist products and services. Regarding economy, the ascending postwar international evolution including the conjunctural crises related to the cyclic character of economy has led to a considerable growth of income and leisure, due to the progress of technology and the social rights of the employees. These two elements are indispensable to the practice of tourism. Countries of Europe, North America, Latin America, Asia-Pacific and Africa have successively developed economically, socially and culturally. After 2000, the economies of China, India, Brazil, Russia have emerged vigorously, with a positive impact on the development of international tourism. The financial polarization of states to an area of the dollar, euro, pound sterling and yen has positive effects, in the sense of the stabilization and extension of the markets, of the reduction of custom and financial barriers. In the fields of work and life, we witness a growth of urban population and an extension of urbanized geographic areas in both developed and developing countries. The consequence for tourism would be an accumulation of recreation requirements for each inhabitant, tourism offering a way of temporary evasion for recreation. 1 “Babeş-Bolyai” University, Faculty of Geography, 400006 Cluj-Napoca, Romania, e-mail:
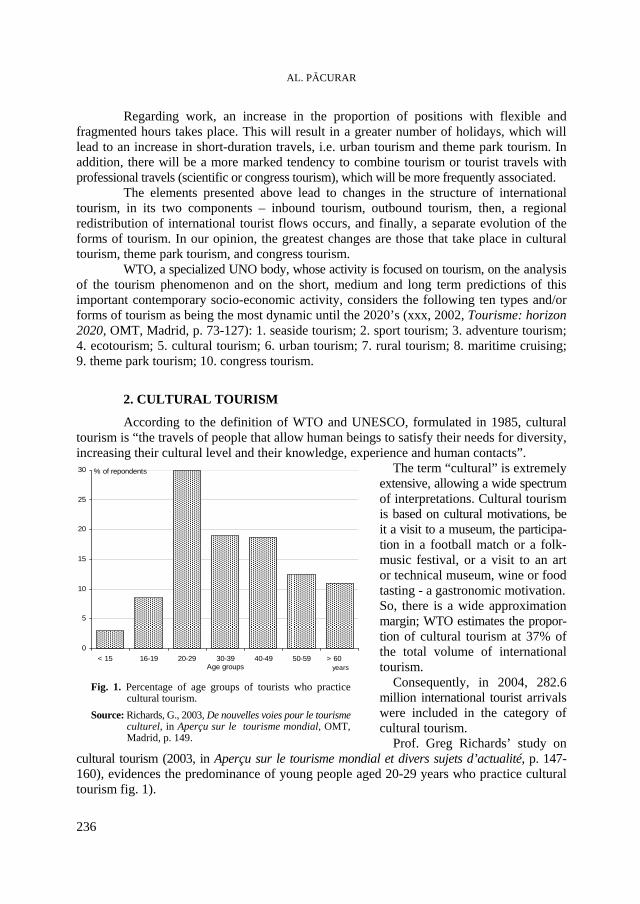
AL. PĂCURAR
236
Fig. 1. Percentage of age groups of tourists who practice cultural tourism.
Source: Richards, G., 2003, De nouvelles voies pour le tourismeculturel, in Aperçu sur le tourisme mondial, OMT, Madrid, p. 149.
0
5
10
15
20
25
30
< 15 ani 16-19 20-29 30-39 40-49 50-59 > 60 aniAge groups years
% of repondents
Regarding work, an increase in the proportion of positions with flexible and fragmented hours takes place. This will result in a greater number of holidays, which will lead to an increase in short-duration travels, i.e. urban tourism and theme park tourism. In addition, there will be a more marked tendency to combine tourism or tourist travels with professional travels (scientific or congress tourism), which will be more frequently associated. The elements presented above lead to changes in the structure of international tourism, in its two components – inbound tourism, outbound tourism, then, a regional redistribution of international tourist flows occurs, and finally, a separate evolution of the forms of tourism. In our opinion, the greatest changes are those that take place in cultural tourism, theme park tourism, and congress tourism.
WTO, a specialized UNO body, whose activity is focused on tourism, on the analysis of the tourism phenomenon and on the short, medium and long term predictions of this important contemporary socio-economic activity, considers the following ten types and/or forms of tourism as being the most dynamic until the 2020’s (xxx, 2002, Tourisme: horizon 2020, OMT, Madrid, p. 73-127): 1. seaside tourism; 2. sport tourism; 3. adventure tourism; 4. ecotourism; 5. cultural tourism; 6. urban tourism; 7. rural tourism; 8. maritime cruising; 9. theme park tourism; 10. congress tourism.
2. CULTURAL TOURISM
According to the definition of WTO and UNESCO, formulated in 1985, cultural tourism is “the travels of people that allow human beings to satisfy their needs for diversity, increasing their cultural level and their knowledge, experience and human contacts”.
The term “cultural” is extremely extensive, allowing a wide spectrum of interpretations. Cultural tourism is based on cultural motivations, be it a visit to a museum, the participa-tion in a football match or a folk-music festival, or a visit to an art or technical museum, wine or food tasting - a gastronomic motivation. So, there is a wide approximation margin; WTO estimates the propor-tion of cultural tourism at 37% of the total volume of international tourism. Consequently, in 2004, 282.6 million international tourist arrivals were included in the category of cultural tourism. Prof. Greg Richards’ study on
cultural tourism (2003, in Aperçu sur le tourisme mondial et divers sujets d’actualité, p. 147-160), evidences the predominance of young people aged 20-29 years who practice cultural tourism fig. 1).
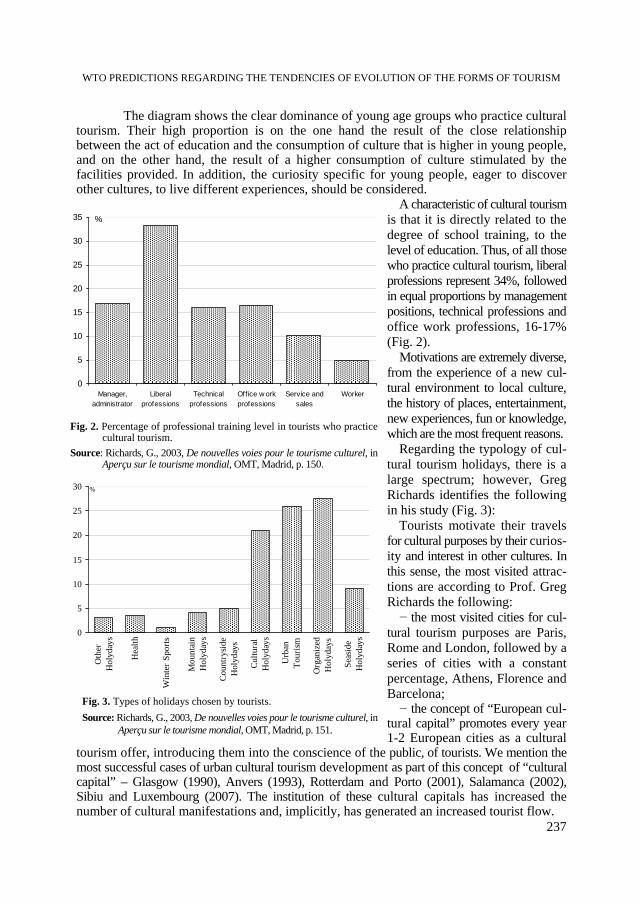
WTO PREDICTIONS REGARDING THE TENDENCIES OF EVOLUTION OF THE FORMS OF TOURISM
237
The diagram shows the clear dominance of young age groups who practice cultural tourism. Their high proportion is on the one hand the result of the close relationship between the act of education and the consumption of culture that is higher in young people, and on the other hand, the result of a higher consumption of culture stimulated by the facilities provided. In addition, the curiosity specific for young people, eager to discover other cultures, to live different experiences, should be considered.
A characteristic of cultural tourism is that it is directly related to the degree of school training, to the level of education. Thus, of all those who practice cultural tourism, liberal professions represent 34%, followed in equal proportions by management positions, technical professions and office work professions, 16-17% (Fig. 2). Motivations are extremely diverse, from the experience of a new cul-tural environment to local culture, the history of places, entertainment, new experiences, fun or knowledge, which are the most frequent reasons. Regarding the typology of cul-tural tourism holidays, there is a large spectrum; however, Greg Richards identifies the following in his study (Fig. 3): Tourists motivate their travels for cultural purposes by their curios-ity and interest in other cultures. In this sense, the most visited attrac-tions are according to Prof. Greg Richards the following: − the most visited cities for cul-
tural tourism purposes are Paris, Rome and London, followed by a series of cities with a constant percentage, Athens, Florence and Barcelona; − the concept of “European cul-
tural capital” promotes every year 1-2 European cities as a cultural
tourism offer, introducing them into the conscience of the public, of tourists. We mention the most successful cases of urban cultural tourism development as part of this concept of “cultural capital” – Glasgow (1990), Anvers (1993), Rotterdam and Porto (2001), Salamanca (2002), Sibiu and Luxembourg (2007). The institution of these cultural capitals has increased the number of cultural manifestations and, implicitly, has generated an increased tourist flow.
Fig. 2. Percentage of professional training level in tourists who practice cultural tourism.
Source: Richards, G., 2003, De nouvelles voies pour le tourisme culturel, in Aperçu sur le tourisme mondial, OMT, Madrid, p. 150.
0
5
10
15
20
25
30
35
Manager,administrator
Liberalprofessions
Technicalprofessions
Office w orkprofessions
Service andsales
Worker
%
Fig. 3. Types of holidays chosen by tourists. Source: Richards, G., 2003, De nouvelles voies pour le tourisme culturel, in
Aperçu sur le tourisme mondial, OMT, Madrid, p. 151.
0
5
10
15
20
25
30
Oth
erH
olyd
ays
Hea
lth
Win
ter S
ports
Mou
ntai
nH
olyd
ays
Coun
trysid
eH
olyd
ays
Cultu
ral
Hol
yday
s
Urb
anTo
urism
Org
aniz
edH
olyd
ays
Seas
ide
Hol
yday
s
%
AL. PĂCURAR
238
According to WTO data, the cultural tourist expenses at destination have exceeded the mean of 400 Euros for foreign tourists, and 300 Euros for national tourists. In fact, as Greg Richards shows (op. cit., 2003, p. 155), the mean daily expenses/ tourist/ type of holiday is the highest – 73 Euros, in the case of cultural tourism, being followed by organized tourism – 52 Euros, seaside tourism – 48 Euros, urban tourism – 42 Euros, similarly to ecotourism, and finally, balneation and sport tourism – 28 Euros/ day/ tourist. Over the past years, the development of cultural tourism has led to the appearance and the development of offers for new market niches, such as architectural tourism, gastronomic tourism, literary tourism, creative tourism, religious and spiritual tourism or festival tourism (Richards, G., 2003, op. cit., p. 156-158). For example, the Grecotel chain has launched creative tourism offers, aimed at the initiation of tourists into craftsmanship and domestic textile industry. In Thailand, creative tourism is aimed at the initiation into Thai massage, which is highly demanded by Western tourists, into Thai boxing or Thai gastronomy. Religious tourism, even if one of the oldest forms of tourism, currently has an increasing number of aspects in common with cultural tourism, because pilgrims and people travelling for religious reasons, who are numerous, are interested in the culture and patrimony of the visited region, so they have a much larger sphere of motivation. In fact, the number of pilgrims has enormously increased. For Europe, the pilgrimage from Northern Spain, from Santiago de Compostella is mentioned, which is attended on the route of Saint-Jean-Pied-de-Port and Santiago de Compostella over 769 km and which gathered in 1999 more than 155 000 pilgrims, compared to 2500 in 1985. So, cultural tourism includes cultural activities and experiences that attract visitors, who pleasantly enrich their stay with the life style of the local population, with its specific features. With a large variety of forms, cultural tourism has a higher growth rate than tourism in general. Its most frequent forms are related to archeology and famous archeological sites, architecture, art, the visiting of churches, historic circuits, maritime museums, military history, music festivals, opera, pilgrimages, etc. This form of tourism has developed with the evolution of customers, due to the increasingly high level of education, to the increasingly wide access of people to culture. The standard profile of the cultural tourism consumer, outlined by WTO, is that of couples without children (the dinks category – “Double Income No Kids”) and elderly people, who have an education level and income above the mean, are aged between 45-60 years, tend to travel a lot, go shopping and prefer hotels, most frequently good quality ones. Used to traveling, these tourists are always in search of new destinations. In addition to mature age tourists, young people are frequently initiated into cultural tourism, as they are increasingly attracted by famous cultural sites; this is a sort of education they are given outside school. Sometimes, cultural tourism is associated with ecotourism, because tourists share the same interest in both anthropic and natural elements. WTO estimates the development of this form of tourism, for which UNESCO proposes more than 690 famous cultural sites, some of which are even monitored, such as Kotor in Montenegro, Anghkor Watt in Cambodia, Tombouctou in Mali, Borobodur in Indonesia or Bahla in Oman. Some countries have created their own specialized bodies for the presentation, valorization and preservation of their patrimony, such as English Heritage in Great Britain.
WTO PREDICTIONS REGARDING THE TENDENCIES OF EVOLUTION OF THE FORMS OF TOURISM
239
Cultural destinations, no matter if they belong to urban or popular (rural) culture, are outstanding destinations of local identity, of traditions, which can and should be known by others. We mention in this sense the international efforts for the restoration of the “Forbidden City” in Beijing, which will last until 2020.
3. THEMATIC PARK TOURISM
3.1. Appearance and development of amusement and thematic parks
The concept of “amusement park” is old. It was materialized in 1766 by the setting up of the “Prater” in Vienna as a place of promenade, open air games (Mesplier, A., Duraffour P.B., op. cit., p. 111), but the first modern amusement park is that opened in 1955 in Anaheim, near Los Angeles. Robert Lanquar (1991, Les parcs de loisirs, PUF, Paris) identifies several generations of amusement parks:
- the first generation is represented by the parks in which various attractions related to the succession of seasons were present. Except for some alleys, kiosks, belvederes and horticultural landscape architecture, they did not benefit from other facilities;
- the second generation of parks are related to spectacular anthropic forms of attraction: ski tracks or roller-coasters created for the entertainment of the visitors, whose numbers continuously increased;
- the third generation appeared in the mid-50’s, when the brilliant Walt Disney launched the first “Disneyland parks”, amusement parks in which the playing function was dominant;
- in the 60’s, the fourth generation of parks appeared, those with a show function, such as Universal Studios of Los Angeles;
- the last generation of amusement parks is represented by theme parks, with a strong scientific and pedagogical character, which popularize science for the public by demonstrations and theme games: the Futuroscope of Poitiers or the City of Sciences from La Villette, in the proximity of Paris.
The merit of Walt Disney, who created and materialized this concept, is unanimously recognized. His American success (Orlando in Florida or Epcot) was exported to Tokyo (1983) or Paris (1992).
Paris Disneyland covers almost 2000 ha, being connected by RER to the capital and by TGV to the important neighboring cities. It is visited by over 12 million tourists every year, about 70,000 every day, being surpassed by Tokyo Disneyland, with 17 million tourists every year.
The architectural pattern of a Disneyland park includes a “main street”, from which access is gained to five theme areas: the Adventure, the Far West, the Pirates, the Imaginary Lands and the Future.
There are currently several thousand theme parks of different sizes in the world, of which 80% in the developed countries. Their geographical distribution is as follows:
- North America is the continent with more than 1200 amusement and theme parks. In the USA, those that do not belong to the Walt Disney chain, are the property of hotel chains, real estate companies or show companies. They are located on the outskirts of cities to which they are connected by various transport systems, they benefit from huge parking lots and accommodation facilities. The Orlando Park alone is visited by 25 million tourists every year. Canada, in spite of its long and cold winters, develops this tourist concept, the biggest park being West Edmonton, in the middle of the prairie.
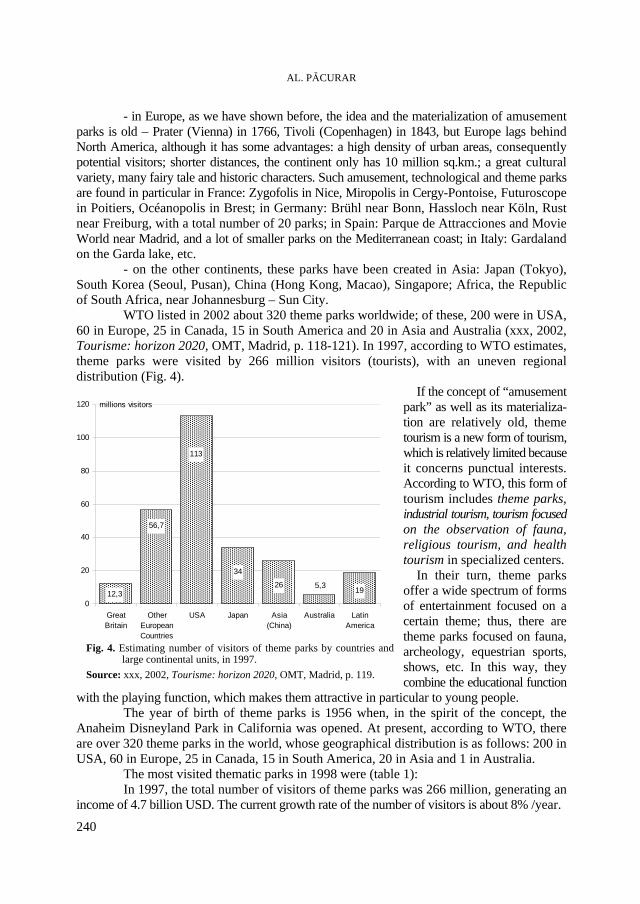
AL. PĂCURAR
240
- in Europe, as we have shown before, the idea and the materialization of amusement parks is old – Prater (Vienna) in 1766, Tivoli (Copenhagen) in 1843, but Europe lags behind North America, although it has some advantages: a high density of urban areas, consequently potential visitors; shorter distances, the continent only has 10 million sq.km.; a great cultural variety, many fairy tale and historic characters. Such amusement, technological and theme parks are found in particular in France: Zygofolis in Nice, Miropolis in Cergy-Pontoise, Futuroscope in Poitiers, Océanopolis in Brest; in Germany: Brühl near Bonn, Hassloch near Köln, Rust near Freiburg, with a total number of 20 parks; in Spain: Parque de Attracciones and Movie World near Madrid, and a lot of smaller parks on the Mediterranean coast; in Italy: Gardaland on the Garda lake, etc.
- on the other continents, these parks have been created in Asia: Japan (Tokyo), South Korea (Seoul, Pusan), China (Hong Kong, Macao), Singapore; Africa, the Republic of South Africa, near Johannesburg – Sun City.
WTO listed in 2002 about 320 theme parks worldwide; of these, 200 were in USA, 60 in Europe, 25 in Canada, 15 in South America and 20 in Asia and Australia (xxx, 2002, Tourisme: horizon 2020, OMT, Madrid, p. 118-121). In 1997, according to WTO estimates, theme parks were visited by 266 million visitors (tourists), with an uneven regional distribution (Fig. 4).
If the concept of “amusement park” as well as its materializa-tion are relatively old, theme tourism is a new form of tourism, which is relatively limited because it concerns punctual interests. According to WTO, this form of tourism includes theme parks, industrial tourism, tourism focused on the observation of fauna, religious tourism, and health tourism in specialized centers. In their turn, theme parks offer a wide spectrum of forms of entertainment focused on a certain theme; thus, there are theme parks focused on fauna, archeology, equestrian sports, shows, etc. In this way, they combine the educational function
with the playing function, which makes them attractive in particular to young people. The year of birth of theme parks is 1956 when, in the spirit of the concept, the Anaheim Disneyland Park in California was opened. At present, according to WTO, there are over 320 theme parks in the world, whose geographical distribution is as follows: 200 in USA, 60 in Europe, 25 in Canada, 15 in South America, 20 in Asia and 1 in Australia.
The most visited thematic parks in 1998 were (table 1): In 1997, the total number of visitors of theme parks was 266 million, generating an income of 4.7 billion USD. The current growth rate of the number of visitors is about 8% /year.
Fig. 4. Estimating number of visitors of theme parks by countries and large continental units, in 1997.
Source: xxx, 2002, Tourisme: horizon 2020, OMT, Madrid, p. 119.
5,3 1926
56,7
34
12,3
113
0
20
40
60
80
100
120
GreatBritain
OtherEuropeanCountries
USA Japan Asia(China)
Australia LatinAmerica
millions visitors
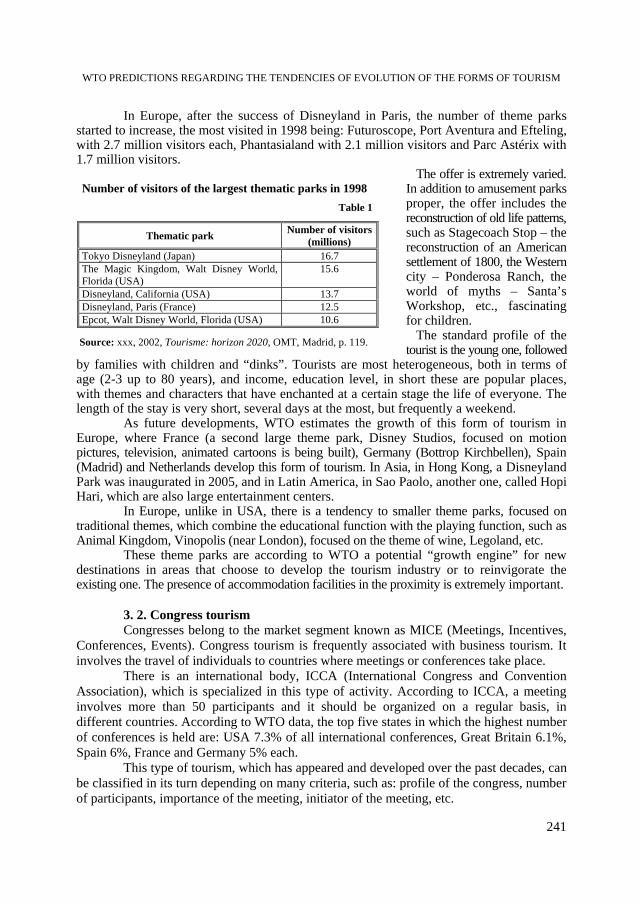
WTO PREDICTIONS REGARDING THE TENDENCIES OF EVOLUTION OF THE FORMS OF TOURISM
241
In Europe, after the success of Disneyland in Paris, the number of theme parks started to increase, the most visited in 1998 being: Futuroscope, Port Aventura and Efteling, with 2.7 million visitors each, Phantasialand with 2.1 million visitors and Parc Astérix with 1.7 million visitors.
The offer is extremely varied. In addition to amusement parks proper, the offer includes the reconstruction of old life patterns, such as Stagecoach Stop – the reconstruction of an American settlement of 1800, the Western city – Ponderosa Ranch, the world of myths – Santa’s Workshop, etc., fascinating for children. The standard profile of the tourist is the young one, followed
by families with children and “dinks”. Tourists are most heterogeneous, both in terms of age (2-3 up to 80 years), and income, education level, in short these are popular places, with themes and characters that have enchanted at a certain stage the life of everyone. The length of the stay is very short, several days at the most, but frequently a weekend. As future developments, WTO estimates the growth of this form of tourism in Europe, where France (a second large theme park, Disney Studios, focused on motion pictures, television, animated cartoons is being built), Germany (Bottrop Kirchbellen), Spain (Madrid) and Netherlands develop this form of tourism. In Asia, in Hong Kong, a Disneyland Park was inaugurated in 2005, and in Latin America, in Sao Paolo, another one, called Hopi Hari, which are also large entertainment centers. In Europe, unlike in USA, there is a tendency to smaller theme parks, focused on traditional themes, which combine the educational function with the playing function, such as Animal Kingdom, Vinopolis (near London), focused on the theme of wine, Legoland, etc. These theme parks are according to WTO a potential “growth engine” for new destinations in areas that choose to develop the tourism industry or to reinvigorate the existing one. The presence of accommodation facilities in the proximity is extremely important.
3. 2. Congress tourism Congresses belong to the market segment known as MICE (Meetings, Incentives,
Conferences, Events). Congress tourism is frequently associated with business tourism. It involves the travel of individuals to countries where meetings or conferences take place.
There is an international body, ICCA (International Congress and Convention Association), which is specialized in this type of activity. According to ICCA, a meeting involves more than 50 participants and it should be organized on a regular basis, in different countries. According to WTO data, the top five states in which the highest number of conferences is held are: USA 7.3% of all international conferences, Great Britain 6.1%, Spain 6%, France and Germany 5% each.
This type of tourism, which has appeared and developed over the past decades, can be classified in its turn depending on many criteria, such as: profile of the congress, number of participants, importance of the meeting, initiator of the meeting, etc.
Number of visitors of the largest thematic parks in 1998
Table 1
Thematic park Number of visitors (millions)
Tokyo Disneyland (Japan) 16.7 The Magic Kingdom, Walt Disney World, Florida (USA)
15.6
Disneyland, California (USA) 13.7 Disneyland, Paris (France) 12.5 Epcot, Walt Disney World, Florida (USA) 10.6
Source: xxx, 2002, Tourisme: horizon 2020, OMT, Madrid, p. 119.
AL. PĂCURAR
242
Among the great initiators, WTO identifies on the one hand companies that organize frequent congresses with a view to exchanging scientific information and, on the other hand, international and national bodies and institutions, which can be in their turn public or non-governmental. In this way, congress tourism can be structured as follows:
- tourism generated by scientific meetings, such as the Congress of Cardiology, the Congress of Byzantinology, the International Horticultural Association, etc.
- tourism generated by professional meetings, such as the Aeronautical Salons in Paris (Roissy-Ch. de Gaulle);
- tourism generated by association meetings, such as Catholic Youth Meetings, the Elvis Presley Fan Association, etc., depending on the characteristics of these meetings. All these types of meetings that generate a tourist movement have in common a series of characteristics, of which we mention:
- behind any type of meeting there is an association, a scientific, professional or volunteer association that holds such meetings on a regular basis;
- the periodicity of the meetings may vary in time, from annual, biannual to biennial, even triennial meetings;
- these meetings are usually held in different places, in the member countries, in an order decided by the members of the association.
WTO specialists have identified several characteristics of this type of tourism (xxx, 2003, Aperçu sur le tourisme mondial, OMT, Madrid, p. 124). Among these, we mention:
- these meetings generally last 4-5 days, sometimes 2-3 days and very rarely 6 or more days;
- when the number of participants is less than 400, the organizers concentrate the activities of the meeting in one geographic place, and when this number is exceeded, there is a tendency to organize the meetings in several locations close to one another;
- the meetings use specialized services – exhibitions, interpreters, guides; - the preparations for an international meeting may span several years and for
professional meetings, less than one year. WTO estimates the number of congresses and meetings organized on a regular
basis worldwide at 10,000. The international market of conferences and meetings is dealt with by a specialized body created in 1963, the International Congress and Convention Association (ICCA), to which 80 member countries have currently adhered, which has an extensive data base that can be accessed at the website: www.ccaworld.com.
It is estimated that 20% of all international tourist arrivals are due to the factor of participation in congresses or scientific meetings.
The offer is somewhat limited, as the most frequent destinations correspond to prestigious cities, given that this type of tourism needs adequate accommodation facilities, modern equipment in spaces suitable for the organization of conferences, congresses and exhibitions. In addition, various modern means of transportation are required, which favors the cities that are international transport nodal points. A number of special services are also needed – translation services, laboratories for experimentation and demonstration, easy access to communication, etc.
The hierarchy of the main congress cities in 1998 is the following (table 2): The number of visitors who participate in such congresses, according to the same
WTO data, varies from 80,000 in Amsterdam to 17,000 in Edinburgh, depending on the proportions of the meeting. This type of tourist spends more, 186 USD/day, compared to a mean of holiday expenses of 73 USD.
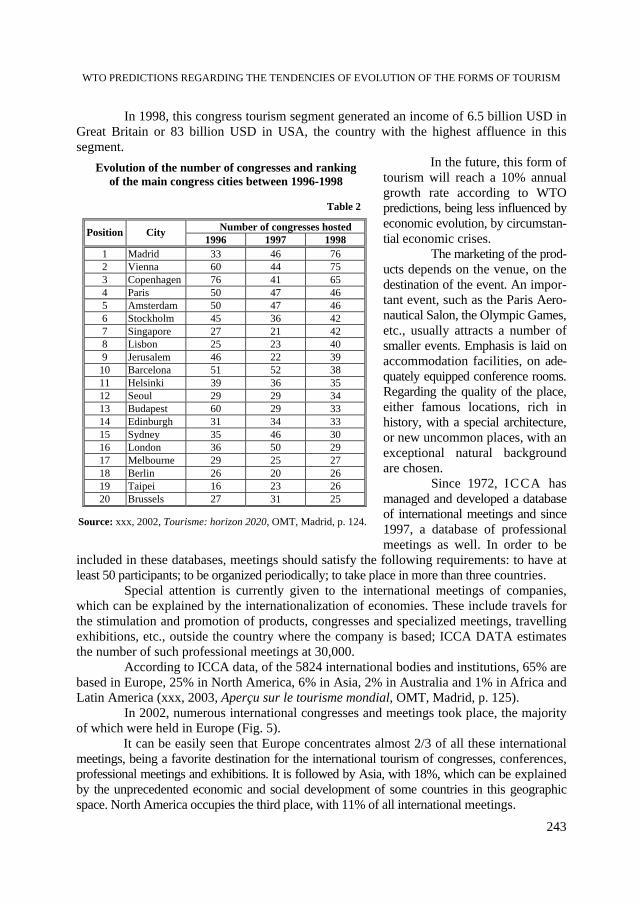
WTO PREDICTIONS REGARDING THE TENDENCIES OF EVOLUTION OF THE FORMS OF TOURISM
243
In 1998, this congress tourism segment generated an income of 6.5 billion USD in Great Britain or 83 billion USD in USA, the country with the highest affluence in this segment.
In the future, this form of tourism will reach a 10% annual growth rate according to WTO predictions, being less influenced by economic evolution, by circumstan-tial economic crises. The marketing of the prod-ucts depends on the venue, on the destination of the event. An impor-tant event, such as the Paris Aero-nautical Salon, the Olympic Games, etc., usually attracts a number of smaller events. Emphasis is laid on accommodation facilities, on ade-quately equipped conference rooms. Regarding the quality of the place, either famous locations, rich in history, with a special architecture, or new uncommon places, with an exceptional natural background are chosen. Since 1972, ICCA has managed and developed a database of international meetings and since 1997, a database of professional meetings as well. In order to be
included in these databases, meetings should satisfy the following requirements: to have at least 50 participants; to be organized periodically; to take place in more than three countries. Special attention is currently given to the international meetings of companies, which can be explained by the internationalization of economies. These include travels for the stimulation and promotion of products, congresses and specialized meetings, travelling exhibitions, etc., outside the country where the company is based; ICCA DATA estimates the number of such professional meetings at 30,000. According to ICCA data, of the 5824 international bodies and institutions, 65% are based in Europe, 25% in North America, 6% in Asia, 2% in Australia and 1% in Africa and Latin America (xxx, 2003, Aperçu sur le tourisme mondial, OMT, Madrid, p. 125). In 2002, numerous international congresses and meetings took place, the majority of which were held in Europe (Fig. 5).
It can be easily seen that Europe concentrates almost 2/3 of all these international meetings, being a favorite destination for the international tourism of congresses, conferences, professional meetings and exhibitions. It is followed by Asia, with 18%, which can be explained by the unprecedented economic and social development of some countries in this geographic space. North America occupies the third place, with 11% of all international meetings.
Evolution of the number of congresses and ranking of the main congress cities between 1996-1998
Table 2
Number of congresses hosted Position City 1996 1997 1998
1 Madrid 33 46 76 2 Vienna 60 44 75 3 Copenhagen 76 41 65 4 Paris 50 47 46 5 Amsterdam 50 47 46 6 Stockholm 45 36 42 7 Singapore 27 21 42 8 Lisbon 25 23 40 9 Jerusalem 46 22 39
10 Barcelona 51 52 38 11 Helsinki 39 36 35 12 Seoul 29 29 34 13 Budapest 60 29 33 14 Edinburgh 31 34 33 15 Sydney 35 46 30 16 London 36 50 29 17 Melbourne 29 25 27 18 Berlin 26 20 26 19 Taipei 16 23 26 20 Brussels 27 31 25
Source: xxx, 2002, Tourisme: horizon 2020, OMT, Madrid, p. 124.
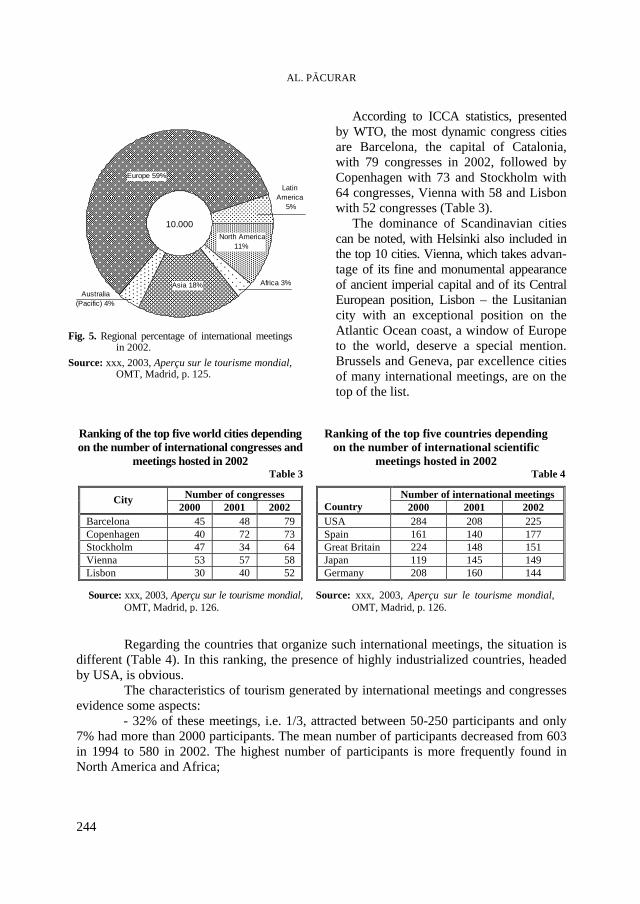
AL. PĂCURAR
244
According to ICCA statistics, presented by WTO, the most dynamic congress cities are Barcelona, the capital of Catalonia, with 79 congresses in 2002, followed by Copenhagen with 73 and Stockholm with 64 congresses, Vienna with 58 and Lisbon with 52 congresses (Table 3). The dominance of Scandinavian cities can be noted, with Helsinki also included in the top 10 cities. Vienna, which takes advan-tage of its fine and monumental appearance of ancient imperial capital and of its Central European position, Lisbon – the Lusitanian city with an exceptional position on the Atlantic Ocean coast, a window of Europe to the world, deserve a special mention. Brussels and Geneva, par excellence cities of many international meetings, are on the top of the list.
Ranking of the top five world cities depending on the number of international congresses and
meetings hosted in 2002 Table 3
Number of congresses City 2000 2001 2002
Barcelona 45 48 79 Copenhagen 40 72 73 Stockholm 47 34 64 Vienna 53 57 58 Lisbon 30 40 52
Source: xxx, 2003, Aperçu sur le tourisme mondial, OMT, Madrid, p. 126.
Ranking of the top five countries depending
on the number of international scientific meetings hosted in 2002
Table 4 Number of international meetings
Country 2000 2001 2002 USA 284 208 225 Spain 161 140 177 Great Britain 224 148 151 Japan 119 145 149 Germany 208 160 144
Source: xxx, 2003, Aperçu sur le tourisme mondial, OMT, Madrid, p. 126.
Regarding the countries that organize such international meetings, the situation is different (Table 4). In this ranking, the presence of highly industrialized countries, headed by USA, is obvious. The characteristics of tourism generated by international meetings and congresses evidence some aspects:
- 32% of these meetings, i.e. 1/3, attracted between 50-250 participants and only 7% had more than 2000 participants. The mean number of participants decreased from 603 in 1994 to 580 in 2002. The highest number of participants is more frequently found in North America and Africa;
North America 11%
Africa 3%Asia 18%Australia
(Pacific) 4%
Europe 59%
LatinAmerica
5%
10.000
Fig. 5. Regional percentage of international meetingsin 2002.
Source: xxx, 2003, Aperçu sur le tourisme mondial, OMT, Madrid, p. 125.
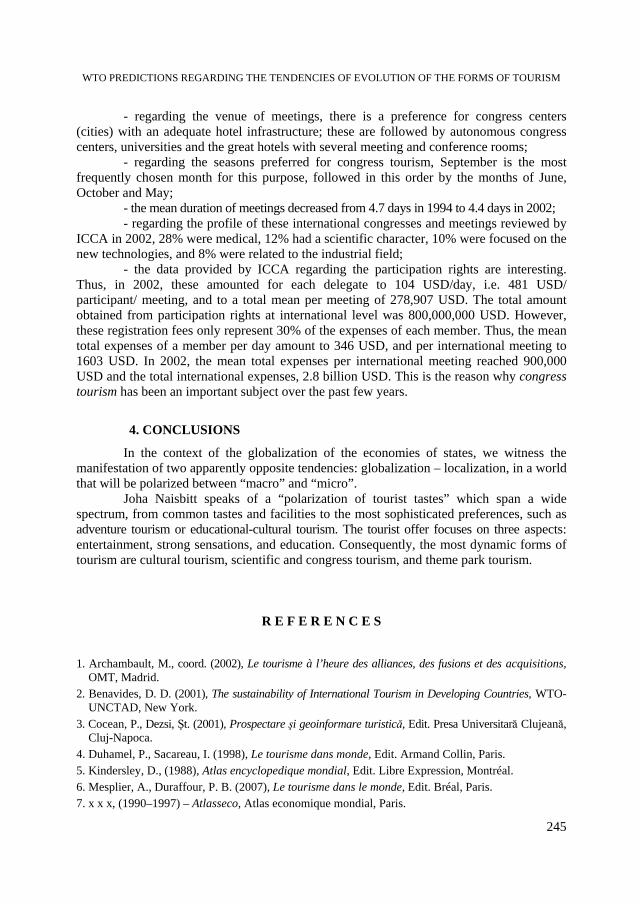
WTO PREDICTIONS REGARDING THE TENDENCIES OF EVOLUTION OF THE FORMS OF TOURISM
245
- regarding the venue of meetings, there is a preference for congress centers (cities) with an adequate hotel infrastructure; these are followed by autonomous congress centers, universities and the great hotels with several meeting and conference rooms;
- regarding the seasons preferred for congress tourism, September is the most frequently chosen month for this purpose, followed in this order by the months of June, October and May;
- the mean duration of meetings decreased from 4.7 days in 1994 to 4.4 days in 2002; - regarding the profile of these international congresses and meetings reviewed by
ICCA in 2002, 28% were medical, 12% had a scientific character, 10% were focused on the new technologies, and 8% were related to the industrial field;
- the data provided by ICCA regarding the participation rights are interesting. Thus, in 2002, these amounted for each delegate to 104 USD/day, i.e. 481 USD/ participant/ meeting, and to a total mean per meeting of 278,907 USD. The total amount obtained from participation rights at international level was 800,000,000 USD. However, these registration fees only represent 30% of the expenses of each member. Thus, the mean total expenses of a member per day amount to 346 USD, and per international meeting to 1603 USD. In 2002, the mean total expenses per international meeting reached 900,000 USD and the total international expenses, 2.8 billion USD. This is the reason why congress tourism has been an important subject over the past few years.
4. CONCLUSIONS
In the context of the globalization of the economies of states, we witness the manifestation of two apparently opposite tendencies: globalization – localization, in a world that will be polarized between “macro” and “micro”. Joha Naisbitt speaks of a “polarization of tourist tastes” which span a wide spectrum, from common tastes and facilities to the most sophisticated preferences, such as adventure tourism or educational-cultural tourism. The tourist offer focuses on three aspects: entertainment, strong sensations, and education. Consequently, the most dynamic forms of tourism are cultural tourism, scientific and congress tourism, and theme park tourism.
R E F E R E N C E S
1. Archambault, M., coord. (2002), Le tourisme à l’heure des alliances, des fusions et des acquisitions, OMT, Madrid.
2. Benavides, D. D. (2001), The sustainability of International Tourism in Developing Countries, WTO-UNCTAD, New York.
3. Cocean, P., Dezsi, Şt. (2001), Prospectare şi geoinformare turistică, Edit. Presa Universitară Clujeană, Cluj-Napoca.
4. Duhamel, P., Sacareau, I. (1998), Le tourisme dans monde, Edit. Armand Collin, Paris. 5. Kindersley, D., (1988), Atlas encyclopedique mondial, Edit. Libre Expression, Montréal. 6. Mesplier, A., Duraffour, P. B. (2007), Le tourisme dans le monde, Edit. Bréal, Paris. 7. x x x, (1990–1997) – Atlasseco, Atlas economique mondial, Paris.
AL. PĂCURAR
246
8. x x x, (1982), Dicţionar poliglot de comerţ exterior şi turism, Edit. Sport–Turism. 9. x x x, (1984, 1988, 1992) – Diercke Weltatlas, Georg Westermann, Braunschweig. 10. Organisation Mondiale du Tourisme, (1984), Étude économique du tourisme mondial. 11. x x x, OMT, Organisation Mondiale du Tourisme, (1987), Etude économique du tourisme mondial,
Madrid. 12. x x x, (1989), Tourism policy and International Tourism în OECD, Paris. 13. x x x, (2002), Le tourisme à l’heure des alliances, des fusions et des acquisitions, OMT, Madrid. 14. x x x, (2002), Tourisme-horizon 2020, OMT, Madrid. 15. x x x, (2003), Aperçu sur le tourisme mondial et divers sujets d’actualité, OMT, Madrid. 16. x x x, (2003), L’activité des croisières dand le monde, OMT, Madrid. 17. x x x, (2003), Le secteur des croisières, în Aperçu sur le tourisme mondial, OMT, Madrid. 18. x x x, (2003), The International Meeting Market 1994-2003, Rapport ICCA, Amsterdam. 19. x x x, (2005), Tourism Market Trends. Europe, OMT, Madrid. 20. x x x, (2006), Compendium of Tourism Statistics. Data 2000-2004, OMT, Madrid. 21. x x x, (2006), Tourism Market Trends: Europe, OMT, Madrid. 22. x x x, (2003), MICE Outbound Tourism 2000, OMT, Madrid.
STUDIA UNIVERSITATIS BABEŞ-BOLYAI, GEOGRAPHIA, LV, 2, 2010
ACCOMMODATION INFRASTRUCTURE
IN TRASCĂU MOUNTAINS – TOURIST BOARDING HOUSES
GABRIELA COCEAN1
ABSTRACT. – Accommodation Infrastructure in Trascău Mountains – Tourist Boarding Houses. Tourist reception units in Trascău Mountains are mainly represented by the tourist boarding houses, the only category that is increasing in the number of units and is developing as comfort and services. There are now three boarding house development micro-regions that can be delineated: Trascău Depression – Aiud Valley, Ighiu-Ampoiţa and The Middle Arieş. Unfortunately, in the rest of the massif tourist boarding houses are just modest initiatives. Today, there are 35 functional authorized units, with a number of 642 seats, and a total accommodation capacity per year of 234,330. As regards the degree of comfort, we can notice the fact that the majority of them are two-daisy units, but the number of highly classified units is increasing, since the new tourist boarding houses are mostly four or five-daisy units. There are a series of problems regarding the development of these units in Trascău Mountains: many of them function without being authorised and many of them do not have the proper number of daisies or a diversified offer of services.
Keywords: Trascău Mountains, boarding houses, accommodation infrastructure, comfort.
1. INTRODUCTION
Trascău Mountains have a diversified natural and human potential, yet not capitalized for tourism purposes according to its possibilities. It is out of the question that the karst landforms, the villages with archaic legacy in the area or the religious objectives are unknown or are less comparable with similar objectives in other areas, but their effective capitalization at tourist infrastructure level is deficient. When using the term tourist infrastructure, we refer to both the communication ways network, found in deplorable condition in some sectors, but which is at present the subject of several rehabilitation projects, and especially to the tourist reception units, which include public food units and, above all, tourist accommodation units. As regards the latter, the situation is deficient from certain points of view: hotels are situated only in the peripheral, neighbouring area, there are no motels in the region, in fact there is no demand for such units, chalets are still the old ones, only half of them being rehabilitated, the others having an indefinite fate or being already closed. However, a relatively newly appeared category of accommodation forms, tourist boarding houses, has flourished, increasing in both number of units and quality of services, becoming nowadays the most representative accommodation unit for Trascău Mountains. The tourist boarding house is the accommodation unit that implies hosting the tourist within a private residence and supplying complex services: meals, the organization of some recreational activities characterized by intimacy and authenticity. Accommodation spaces are arranged from case to case, either within the precinct of the owners’ dwelling, or
1 Babeş-Bolyai University, Faculty of Geography, 400006, Cluj-Napoca, Romania, e-mail:
GABRIELA COCEAN
248
in independent buildings, using, as much as possible, traditional pieces of furniture and ornaments for their arrangement. The supplied services are characterized by the fact that they do not address the tourist as a simple occupant of a room, but a guest, and they aim at his integration into the rural community or into the surrounding nature. It can be mentioned that, overall, the services peculiar to tourist boarding houses form “the reception of a traveller” and not only the lodging and the offer of some alternatives for spending the leisure time.
2. TERRITORIAL DISPERSION OF THE BOARDING HOUSES IN TRASCĂU MOUNTAINS
Tourist boarding houses appeared initially as modest initiatives in the village of Râmetea, situated in the centre of Trascău Depression, where there was a certain tradition in hosting the guests coming especially from Hungary. Subsequently, they flourished in other parts of the massif, as well. Today, three micro-regions of boarding house development can be delineated: - Trascău Depression – Aiud Valley. This tourist micro-region overlays the villages situated along the county road no. 27: Râmetea, Colţeşti, Izvoarele, Vălişoara and Poiana Aiudului. It is the most developed such micro-region from the tourism point of view, the first one that could be delineated, the one that has the greatest number of boarding houses in Trascău Mountains, and the most devoted customers. The expansion of the tourist phenomenon in this area is tributary to the enormous natural potential represented by Colţii Trascăului (1129m), Ardoscheia (1250m), the Aiud, Urdaş, and Bedeleu Gorges, completed by the human potential represented by the folk culture preserved and disclosed especially in the villages of Râmetea and Colţeşti, as well as by objectives such as the Museum of Ethnography, the water mill of Râmetea and, of course, by the Colţeşti Fortress. The rural cultural tourism developed in this area is completed by the possibility for practicing other forms of tourism: hiking, mountaineering, or paragliding. - Ighiu – Ampoiţa. The micro-region includes the villages of Ighiu, Ighiel and Ampoiţa. The tourist potential of this area is structured around the karst lake, the klippes of Pietrele Ampoiţei or of Piatra Grohotişului, the Ampoiţa Gorges or Peştera Liliecilor (the Bats’ Cave). In this area, the first tourist boarding houses opened their gates in 1997, as well, but others were not built until 2005-2006. One can now observe an increasing tourism interest in this area, therefore we can assume that in a short while the number of boarding houses will also increase. This development of the tourist activity is also due to the emergence of some new possible tourist locations, like Bucerdea Vinoasă or Ţelna, villages that are now focusing on the exploitation of the local wine. - The Middle Arieş. It is a newly appeared tourist micro-region, having its centre in the village of Sălciua, exceeding, however, the limits of Trascău Mountains. In this micro-region, the tourist potential is mainly natural, represented by the Arieş Defile, the Bedeleu Massif, Ponorul Vânătara, Huda lui Papară Cave and Poarta Zmeilor. It can be predicted that other areas, with development potential, will join the above-mentioned ones in the subsequent years, areas where the first boarding houses are only emerging at the moment: - The Petreşti Ridge, where, in 2008, the first boarding house supplying tourist services for the area of Turda Gorges – Tureni Gorges was opened. - The Râmeţ Valley, which includes the villages of Stremţ, where, in the same year of 2008, the first authorized boarding house in the area opened its gates, and Râmeţ, where, downstream the monastery, one remarks private initiatives, which will probably follow the same way.
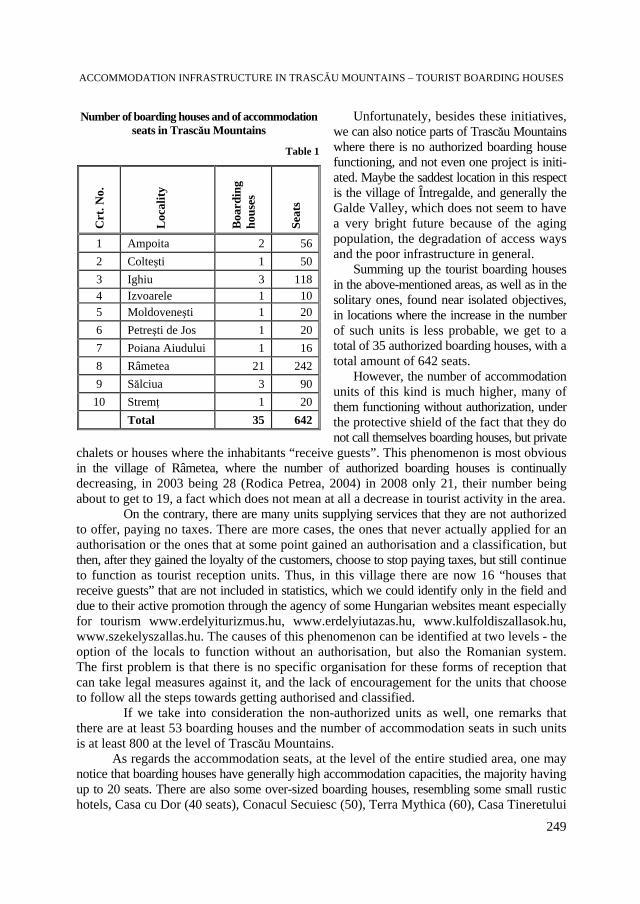
ACCOMMODATION INFRASTRUCTURE IN TRASCĂU MOUNTAINS – TOURIST BOARDING HOUSES
249
Unfortunately, besides these initiatives, we can also notice parts of Trascău Mountains where there is no authorized boarding house functioning, and not even one project is initi-ated. Maybe the saddest location in this respect is the village of Întregalde, and generally the Galde Valley, which does not seem to have a very bright future because of the aging population, the degradation of access ways and the poor infrastructure in general. Summing up the tourist boarding houses in the above-mentioned areas, as well as in the solitary ones, found near isolated objectives, in locations where the increase in the number of such units is less probable, we get to a total of 35 authorized boarding houses, with a total amount of 642 seats. However, the number of accommodation units of this kind is much higher, many of them functioning without authorization, under the protective shield of the fact that they do not call themselves boarding houses, but private
chalets or houses where the inhabitants “receive guests”. This phenomenon is most obvious in the village of Râmetea, where the number of authorized boarding houses is continually decreasing, in 2003 being 28 (Rodica Petrea, 2004) in 2008 only 21, their number being about to get to 19, a fact which does not mean at all a decrease in tourist activity in the area. On the contrary, there are many units supplying services that they are not authorized to offer, paying no taxes. There are more cases, the ones that never actually applied for an authorisation or the ones that at some point gained an authorisation and a classification, but then, after they gained the loyalty of the customers, choose to stop paying taxes, but still continue to function as tourist reception units. Thus, in this village there are now 16 “houses that receive guests” that are not included in statistics, which we could identify only in the field and due to their active promotion through the agency of some Hungarian websites meant especially for tourism www.erdelyiturizmus.hu, www.erdelyiutazas.hu, www.kulfoldiszallasok.hu, www.szekelyszallas.hu. The causes of this phenomenon can be identified at two levels - the option of the locals to function without an authorisation, but also the Romanian system. The first problem is that there is no specific organisation for these forms of reception that can take legal measures against it, and the lack of encouragement for the units that choose to follow all the steps towards getting authorised and classified. If we take into consideration the non-authorized units as well, one remarks that there are at least 53 boarding houses and the number of accommodation seats in such units is at least 800 at the level of Trascău Mountains. As regards the accommodation seats, at the level of the entire studied area, one may notice that boarding houses have generally high accommodation capacities, the majority having up to 20 seats. There are also some over-sized boarding houses, resembling some small rustic hotels, Casa cu Dor (40 seats), Conacul Secuiesc (50), Terra Mythica (60), Casa Tineretului
Number of boarding houses and of accommodation seats in Trascău Mountains
Table 1
Crt
. No.
Loc
ality
B
oard
ing
hous
es
Seat
s
1 Ampoita 2 56 2 Colteşti 1 50 3 Ighiu 3 118 4 Izvoarele 1 10 5 Moldoveneşti 1 20 6 Petreşti de Jos 1 20 7 Poiana Aiudului 1 16 8 Râmetea 21 242 9 Sălciua 3 90
10 Stremţ 1 20 Total 35 642
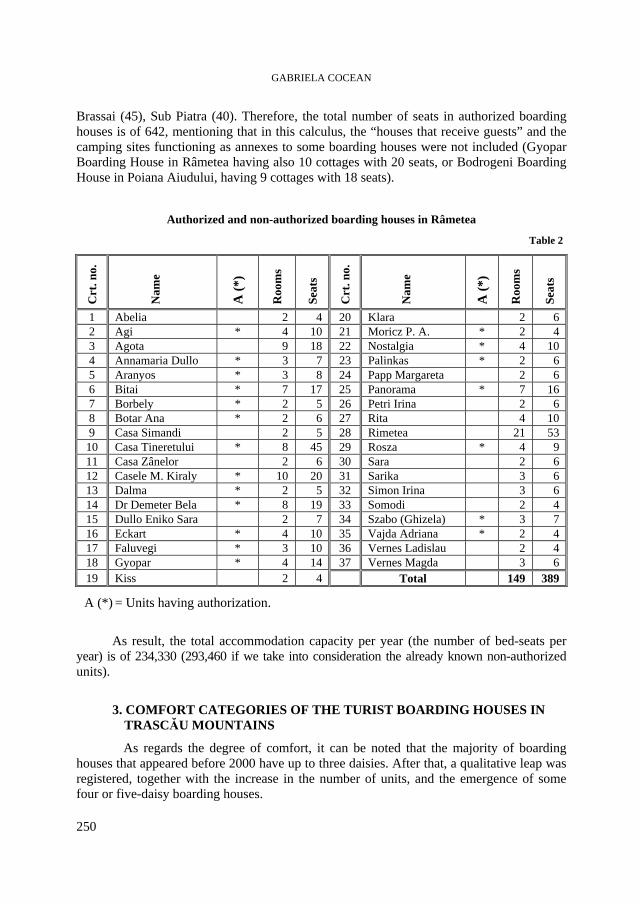
GABRIELA COCEAN
250
Brassai (45), Sub Piatra (40). Therefore, the total number of seats in authorized boarding houses is of 642, mentioning that in this calculus, the “houses that receive guests” and the camping sites functioning as annexes to some boarding houses were not included (Gyopar Boarding House in Râmetea having also 10 cottages with 20 seats, or Bodrogeni Boarding House in Poiana Aiudului, having 9 cottages with 18 seats).
Authorized and non-authorized boarding houses in Râmetea
Table 2
Crt
. no.
Nam
e A
(*)
Roo
ms
Seat
s
Crt
. no.
Nam
e A
(*)
Roo
ms
Seat
s
1 Abelia 2 4 20 Klara 2 6 2 Agi * 4 10 21 Moricz P. A. * 2 4 3 Agota 9 18 22 Nostalgia * 4 10 4 Annamaria Dullo * 3 7 23 Palinkas * 2 6 5 Aranyos * 3 8 24 Papp Margareta 2 6 6 Bitai * 7 17 25 Panorama * 7 16 7 Borbely * 2 5 26 Petri Irina 2 6 8 Botar Ana * 2 6 27 Rita 4 10 9 Casa Simandi 2 5 28 Rimetea 21 53 10 Casa Tineretului * 8 45 29 Rosza * 4 9 11 Casa Zânelor 2 6 30 Sara 2 6 12 Casele M. Kiraly * 10 20 31 Sarika 3 6 13 Dalma * 2 5 32 Simon Irina 3 6 14 Dr Demeter Bela * 8 19 33 Somodi 2 4 15 Dullo Eniko Sara 2 7 34 Szabo (Ghizela) * 3 7 16 Eckart * 4 10 35 Vajda Adriana * 2 4 17 Faluvegi * 3 10 36 Vernes Ladislau 2 4 18 Gyopar * 4 14 37 Vernes Magda 3 6 19 Kiss 2 4 Total 149 389
A (*) = Units having authorization.
As result, the total accommodation capacity per year (the number of bed-seats per year) is of 234,330 (293,460 if we take into consideration the already known non-authorized units).
3. COMFORT CATEGORIES OF THE TURIST BOARDING HOUSES IN TRASCĂU MOUNTAINS
As regards the degree of comfort, it can be noted that the majority of boarding houses that appeared before 2000 have up to three daisies. After that, a qualitative leap was registered, together with the increase in the number of units, and the emergence of some four or five-daisy boarding houses.
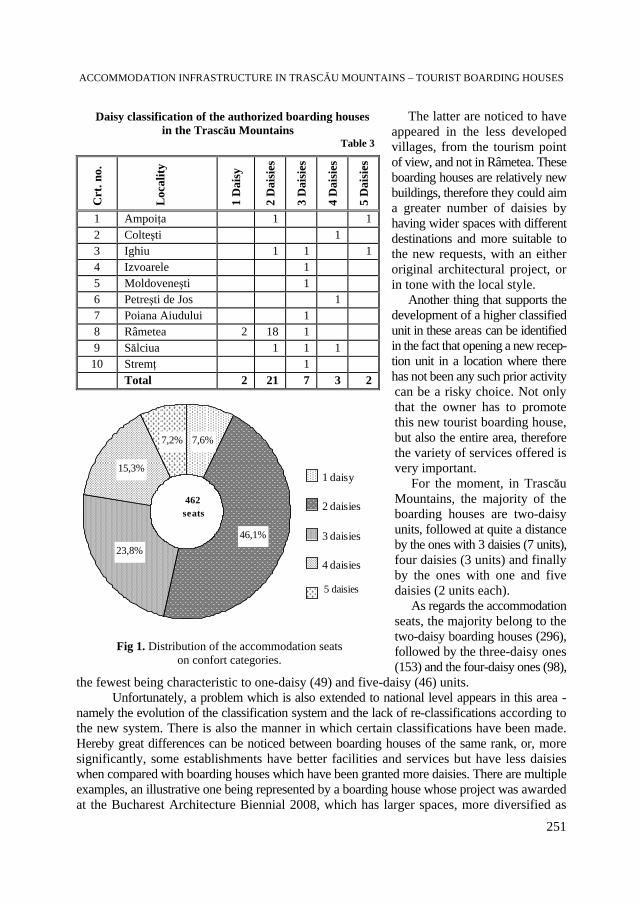
ACCOMMODATION INFRASTRUCTURE IN TRASCĂU MOUNTAINS – TOURIST BOARDING HOUSES
251
The latter are noticed to have appeared in the less developed villages, from the tourism point of view, and not in Râmetea. These boarding houses are relatively new buildings, therefore they could aim a greater number of daisies by having wider spaces with different destinations and more suitable to the new requests, with an either original architectural project, or in tone with the local style. Another thing that supports the development of a higher classified unit in these areas can be identified in the fact that opening a new recep-tion unit in a location where there has not been any such prior activity can be a risky choice. Not only that the owner has to promote this new tourist boarding house, but also the entire area, therefore the variety of services offered is very important. For the moment, in Trascău Mountains, the majority of the boarding houses are two-daisy units, followed at quite a distance by the ones with 3 daisies (7 units), four daisies (3 units) and finally by the ones with one and five daisies (2 units each). As regards the accommodation seats, the majority belong to the two-daisy boarding houses (296), followed by the three-daisy ones (153) and the four-daisy ones (98),
the fewest being characteristic to one-daisy (49) and five-daisy (46) units. Unfortunately, a problem which is also extended to national level appears in this area - namely the evolution of the classification system and the lack of re-classifications according to the new system. There is also the manner in which certain classifications have been made. Hereby great differences can be noticed between boarding houses of the same rank, or, more significantly, some establishments have better facilities and services but have less daisies when compared with boarding houses which have been granted more daisies. There are multiple examples, an illustrative one being represented by a boarding house whose project was awarded at the Bucharest Architecture Biennial 2008, which has larger spaces, more diversified as
Daisy classification of the authorized boarding houses in the Trascău Mountains
Table 3
Crt
. no.
Loc
ality
1
Dai
sy
2 D
aisi
es
3 D
aisi
es
4 D
aisi
es
5 D
aisi
es
1 Ampoiţa 1 1 2 Colteşti 1 3 Ighiu 1 1 1 4 Izvoarele 1 5 Moldoveneşti 1 6 Petreşti de Jos 1 7 Poiana Aiudului 1 8 Râmetea 2 18 1 9 Sălciua 1 1 1 10 Stremţ 1 Total 2 21 7 3 2
7,6%
46,1%23,8%
15,3%
7,2%
1 daisy
2 daisies
3 daisies
4 daisies
5 daisies
462 seats
Fig 1. Distribution of the accommodation seats on confort categories.
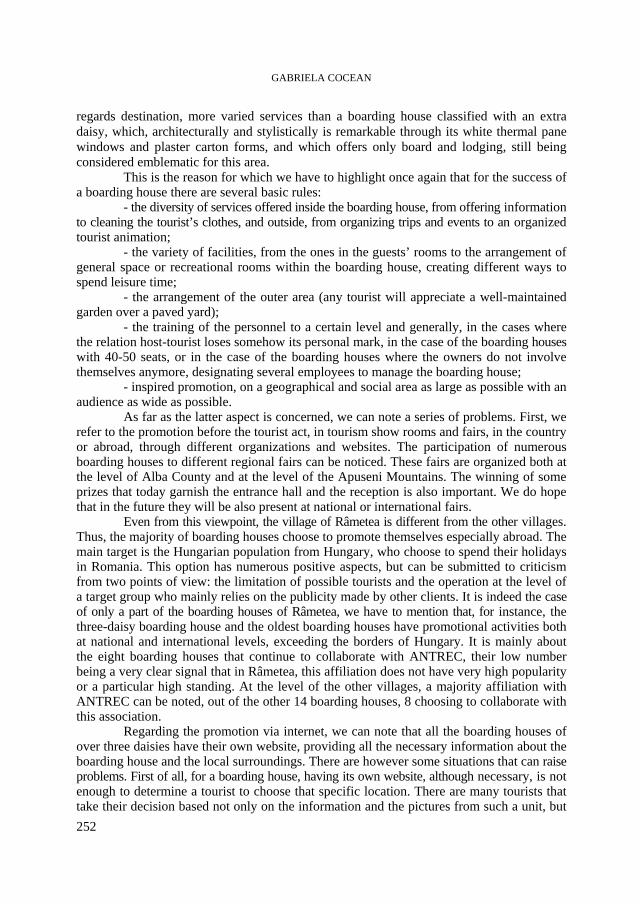
GABRIELA COCEAN
252
regards destination, more varied services than a boarding house classified with an extra daisy, which, architecturally and stylistically is remarkable through its white thermal pane windows and plaster carton forms, and which offers only board and lodging, still being considered emblematic for this area.
This is the reason for which we have to highlight once again that for the success of a boarding house there are several basic rules:
- the diversity of services offered inside the boarding house, from offering information to cleaning the tourist’s clothes, and outside, from organizing trips and events to an organized tourist animation;
- the variety of facilities, from the ones in the guests’ rooms to the arrangement of general space or recreational rooms within the boarding house, creating different ways to spend leisure time;
- the arrangement of the outer area (any tourist will appreciate a well-maintained garden over a paved yard);
- the training of the personnel to a certain level and generally, in the cases where the relation host-tourist loses somehow its personal mark, in the case of the boarding houses with 40-50 seats, or in the case of the boarding houses where the owners do not involve themselves anymore, designating several employees to manage the boarding house;
- inspired promotion, on a geographical and social area as large as possible with an audience as wide as possible.
As far as the latter aspect is concerned, we can note a series of problems. First, we refer to the promotion before the tourist act, in tourism show rooms and fairs, in the country or abroad, through different organizations and websites. The participation of numerous boarding houses to different regional fairs can be noticed. These fairs are organized both at the level of Alba County and at the level of the Apuseni Mountains. The winning of some prizes that today garnish the entrance hall and the reception is also important. We do hope that in the future they will be also present at national or international fairs.
Even from this viewpoint, the village of Râmetea is different from the other villages. Thus, the majority of boarding houses choose to promote themselves especially abroad. The main target is the Hungarian population from Hungary, who choose to spend their holidays in Romania. This option has numerous positive aspects, but can be submitted to criticism from two points of view: the limitation of possible tourists and the operation at the level of a target group who mainly relies on the publicity made by other clients. It is indeed the case of only a part of the boarding houses of Râmetea, we have to mention that, for instance, the three-daisy boarding house and the oldest boarding houses have promotional activities both at national and international levels, exceeding the borders of Hungary. It is mainly about the eight boarding houses that continue to collaborate with ANTREC, their low number being a very clear signal that in Râmetea, this affiliation does not have very high popularity or a particular high standing. At the level of the other villages, a majority affiliation with ANTREC can be noted, out of the other 14 boarding houses, 8 choosing to collaborate with this association.
Regarding the promotion via internet, we can note that all the boarding houses of over three daisies have their own website, providing all the necessary information about the boarding house and the local surroundings. There are however some situations that can raise problems. First of all, for a boarding house, having its own website, although necessary, is not enough to determine a tourist to choose that specific location. There are many tourists that take their decision based not only on the information and the pictures from such a unit, but
ACCOMMODATION INFRASTRUCTURE IN TRASCĂU MOUNTAINS – TOURIST BOARDING HOUSES
253
also on good reviews on more than one website. Plus we must take into consideration that for many of those tourists the search for a place to spend the vacation, or the weekend begins and also ends on the website of some tourism promoter that can provide more choices. Therefore we encourage boarding houses to collaborate with associations that support rural tourism and bed and breakfasts, associations that can promote such units with providing information, pictures, links and reviews.
Brochures, guidebooks and leaflets can only be found at the receptions of the boarding houses with more than three daisies, but not all of them offer such promotion materials, or at the more inspired owners of some two-daisy boarding houses. We recommend this type of promotion as it supports the loyalty of the clientele and the publicity that one can benefit from the customers after their return to their hometown, of course if the clients were satisfied and choose to recommend that particular place to anyone from the circle of friends or family.
Regarding the level of the publicity panels situated along the roads, there are four situations. Firstly, it is noted that few boarding houses have a good promotion from this perspective. We value the initiative of a boarding house in Sălciua, whose advertisements begin in the village of Copăceni, at the exit towards Turda, and continue along the entire Arieş valley. Secondly, we remark the boarding houses situated several metres from the road, which have only placed a panel at the entrance on the access way.
The latter situations are the ones that raise problems. The first situation is the one of the boarding houses that lack both the entrance panel and the name written on the gate. We do not refer here at the closed-circuit boarding house in Ighiu, whose clientele is selected, and knows exactly where to come, but to the two-daisy boarding houses that can be found only after the household number.
The second situation is equally significant and appears in Ighiu-Ampoiţa-Galda area, where the overwhelming majority of the signs lead us towards the San Benedictus Mansion in Cricău. However, once there, the image is desolate; a torn panel posted on the gate. Although a well preserved building, it is closed, being situated in the same yard with the Orthodox House, a derelict monument building, with nobody in the village knowing of its fate, not even the new “renters” of the old museum. The fate of this place is as mysterious as the one of the “Teleki Mansion”, which appears in the scientific literature as an accommodation unit with a capacity of 24 seats but, in reality, it has not functioned as a boarding house for a long time.
In the context of a lack of active and efficient promotion, the degree of occupation is much below the potential of the boarding houses. The problem appears not in the case of the number of arrivals but as regards the average length of the stay, which is on average two days, slightly higher in the village of Râmetea, where the tourists coming from Hungary spend more time. This relatively low duration has two causes: firstly, the fact that it addresses week-end tourism, and secondly, because many of the boarding houses do not have the necessary resources and services to support a longer stay from the entertainment point of view. The length of stay would increase by a diversification of the services offered by the boarding houses, as well as by the attractions and by combining several types of tourism.
The types of tourism supplied by the boarding houses in Trascău Mountains are: - cultural tourism, with its main form, rural tourism, based on valorising the life of
villages, from the small ones, typical for the Apuseni Mountains, to the large ones, with well-preserved traditions and customs, and religious tourism supported by the presence of Râmeţ monastery in the area;
GABRIELA COCEAN
254
- leisure and entertainment tourism, within which there are the most diverse forms: speleological tourism (Sălciua), hiking, mountaineering, paragliding, hunting tourism and sport fishing (Ighiu-Ighiel area or Poşaga), viticultural tourism (Ţelna, Bucerdea Vinoasă).
Tourist boarding houses should consider promoting at service level, as many forms of tourism as possible, seeking to associate themselves with the visitors’ options.
R E F E R E N C E S
1. Cândea, M., Simon, T. (2006) Potenţialul tourism al României, Edit. Universitară, Bucureşti. 2. Ciangă, N. (1985), Turismul în Munţii Apuseni, Studia UBB, Geol-Geogr., Cluj Napoca. 3. Ciangă, N. (2001), România. Geografia Turismului (Partea întâi), Presa Universitară Clujeană, Cluj-
Napoca. 4. Cocean, P. (1997), Geografia turismului românesc, Edit. Focul Viu, Cluj-Napoca. 5. Dinu, Mihaela, Peţan, Ioana (2005), Geografia turismului în România, Edit. Universitară, Bucureşti. 6. Muntele, I., Iaţu, C. (2006), Geografia Turismului. Concepte, metode şi forme de manifestare spaţio-
temporală, Edit. Sedcom Libris, Iaşi. 7. Petrea, Rodica (2004), Turism rural în Munţii Apuseni, Editura Universităţii din Oradea, Oradea. 8. Pop, P. Gr. (2006), Carpaţii şi Subcarpaţii României, Presa Universitară Clujeană.
NOTE: “Investing in people!” PhD scholarship, Project co-financed by the European Social Fund, Sectoral Operational Programme Human Resources Development 2007 – 2013. Babeş-Bolyai University, Cluj-Napoca, Romania.
STUDIA UNIVERSITATIS BABEŞ-BOLYAI, GEOGRAPHIA, LV, 2, 2010
THE EDUCATIONAL COMPONENT IN MARAMUREŞ COUNTY -
BACKGROUND, FAILURES AND STRATEGIC ELEMENTS
D. M. GHERŢOIU1, C. N. BOŢAN2
ABSTRACT. – The Educational Component in Maramureş County-Background, Failures and Strategic Elements. Education represents a very significant element in the functional system of a nation, which eventually reflects the vitality and the real possibilities of development, as well as it creates some potential interrelations at a national and continental level. At Romanian level, numbers regarding the educational indicators registered in the last years reflects a state of facts, generalized for the entire national area. They reveal a significant decrease in the number of pupils of all educational levels and a precarious qualitative state of school infrastructure and teaching staff. The already mentioned phenomenon is becoming more severe especially in rural Romanian areas, where the threats from this perspective are extremely serious. Maramureş County reflects an analogical situation, therefore this study reveals the current complex analysis of the major educational indicators.
Keywords: education, development, level, school, teaching, study.
1. INTRODUCTION
The educational component makes Maramureş an important area for the North of Romania, in that it has a full and complex department of infrastructure. Some institutions are characterized by the long tradition and national recognition through the quality of the education, emphasized by the positive results in various national and international competitions. Education is both vertically (there are all the structures of education, from preschool to university cycle and post-graduate - in Baia Mare and Sighetu Marmatiei) and horizontally integrated (which can be seen in the rest of the territory throughout the undergraduate component).
In the countries where the living standard is high, the birth rate and natural growth have reduced values. Romania unfortunately followed a similar evolutionary trend that will cause problems difficult to overcome, if the abovementioned situation continues. Compared to overall national situation, Maramureş county has some favorability in that preschool and school contingents still have significant weight, but the reduction trend is being felt here, too.
Analysis of the main educational parameters of Maramureş is done for each separate cycle (from preschool to university and postgraduate), where the main specific features are depicted and a series of strategic proposals are given.
2. THE PRE-SCHOOL EDUCATIONAL LEVEL
The preschool cycle has some interesting aspects in Maramureş (consisting of 2 municipalities, 11 cities and 64 communes), where 116 garden centers operate, amounting to over 17,000 people. The quota of 17203 preschool children enrolled is sufficient to cover both public and private kindergartens. 1„Babeş-Bolyai” University, Faculty of Physical Education and Sport, 400006, Cluj-Napoca, Romania,
e-mail: [email protected] 2„Babeş-Bolyai” University, Faculty of Geography, 400006, Cluj-Napoca, Romania,
e-mail: [email protected]
D. M. GHERŢOIU, C. N. BOŢAN
256
The quality of infrastructure and teaching material corresponds, in most kindergartens (especially in urban centers and those located in the communes), to present educational expectations, making it a positive aspect, but it is to be extended to every department. When making an overall average, you reach a regional average number of 148,30 children/kindergartens, the optimal value for teachers. It is difficult to accept, however, that in some villages, a preschool teacher has to teach over 30 children.
Out of the 116 kindergartens, 52 of them are in urban areas, they are properly equipped and they have specialized teaching personnel. Out of the 52 urban gardens, 8 of them are private (for forms of early education or step by step education). The number of private kindergartens is reduced (8) in relation to European Union practices that promote these institutions, due to reduced working groups, unlike state kindergartens.
The preschool component from the total population has a positive weight (the regional average is 3,36%). The following territorial-administrative units have higher values than the regional average: Şomcuta Mare (4,19%), Ulmeni (4,84%), Băiţa de sub Codru (4,99%), Bicaz (4,99%), Bistra (4,64%), Cicârlău (4,61%), Coltău (7,11%), Coroieni (5,69%), Mireşu Mare (4,20%), Poienile de sub Munte (4,44%), Recea (4,20%), Repedea (4,42%), Sălsig (4,49%), Vima Mică (4,27%), where there is a greater vitality in terms of the anthropogenic component. The following territorial-administrative units have a low weight (less than 2.50% of the total population) of preschool population: Borşa (2,22%), Bârsana (2,39%), Bogdan Vodă (2,45%), Câmpulung la Tisa (2,02%), Gârdani (2,44%), Giuleşti (2,36%), Moisei (2,19%), Poienile Izei (2,02%), Şieu (2,39%). Low weights are specific to places where the percentage of young and people going to work abroad is high and the remaining population is mostly grown old. In such circumstances, if the phenomenon continues, the number of preschool children will diminish, the viability of the pre-cycle related institutions will disappear and, therefore, those establishments will be closed, which is undesirable because it causes negative consequences. The rest of the administrative-territorial units is in the limits of the regional average (about 3%).
3. THE PRIMARY EDUCATIONAL LEVEL
In Maramureş county, the data analysis regarding the primary school cycle (I-IV grades) reveal some specific features, both positive and negative.
The number of students has gradually decreased after 1990, but it has been noticed a slight increase in the last 2-3 years. However, unlike other regions in Romania, the situation is not as critical, because in most cities of the county there is a sufficient number of pupils for the primary cycle which makes the basic educational cell (primary school) to function. The negative trend of diminishing the number of students has to be inhibited or it has to remain at least as it is now, in all settlements. In some rural areas the situation is difficult, in that, not reached at some point, the minimum number of students needed for primary school functioning, it was closed and students of primary schools were oriented towards the nearest city. The following settlements are in this mentioned situation: Firiza and Valea Borcutului (Baia Mare), Groape (Târgu Lăpuş), Tămăşeşti (Ariniş), Frâncenii Boiului (Boiu Mare), Bârgău (Cicârlău), Copalnic-Deal, Lăschia, Ruşor, Vad (Copalnic-Mănăştur), Mănăstirea (Giuleşti), Dăneştii Chioarului, Stejera (Mireşu Mare), Orţiţa (Oarţa de Jos), Cetate (Remetea Chioarului), Gârdani, Mânău, Tohat (Sălsig), Finteuşu Mic (Satulung), Duruşa (Valea Chioarului). Such a situation is dramatic, because primary school is the basic educational pillar and it has to be present in each city.
THE EDUCATIONAL COMPONENT IN MARAMUREŞ COUNTY …
257
There is a number of 324 primary educational entities in which there are 21598 pupils learning. All these primary schools, are divisions of secondary schools or colleges. The largest number of primary schools is in Baia Mare (22), followed by the city of Sighetu Marmaţiei (11) and the rest of the administrative-territorial units of urban type, which are also best equipped.
The regional average number of students/primary school is 66,66, which is slightly higher than the national average. In rural areas the number of pupils in primary school, compared to the number of primary schools shows a slightly reduced average compared to the urban area urban, 61,32 students/school. In urban areas, the value is higher (about 69 students of primary cycle/entity of primary school), which shows the process of depopulation of rural areas.
The appointment of teachers is relatively accurate, there are 1241 teachers (primary school teachers), most having specialized studies, that is 95% and the remaining 5% are teachers (primary school teachers) without specialized studies and they work mostly in more remote rural areas within the county. The regional average number of students a teacher has to take care of is 15.20%. It is a positive average, following the demands of the European Union in what concerns education. This is a default average reflecting a state of normality, resulting in two reasons: the correct specialization of teaching staff and the number of primary cycle pupils.
4. SECONDARY EDUCATIONAL LEVEL
Secondary cycle is characterized through a particular dynamics which can be applied to the whole country. Dynamics is a trend that proposes merging schools (some schools in the villages are closed and so students have to go to school in the common center, in the nearest town or in Baia Mare, to make them more viable), specialized teachers, auxiliary teaching materials and up to date applications, a better organization of financial resources etc.
As compared to the primary cycle, the number of secondary schools (departments) is lower. There are 196 schools/departments of secondary cycle (128 less than the primary schools).
There are 23473 students in secondary school, which means that each school has a regional number of 119,76 students. The examined area has higher values than the national average. In urban areas, the average number of students in secondary schools is over 150, while in rural areas, the value is around 100 students/schools gymnasium. Speaking about the two cities (Baia Mare and Sighetu Marmatiei), the qualitative assessment highlights a number of disparities because the schools located in the central area have a greater number of students than those in marginal districts (actually existing in the rest of Romania's urban areas). This fact has a justification: the parents work in the „center” and their perception that central schools have a better quality than the neighborhood schools.
In the cities that have secondary schools cycle there are enough students for their effective functioning. An analysis of the Ministry of Education, Research and Youth, based on a matrix covering the school's financial infrastructure, the number of teachers, number of students, personnel costs, maintenance, etc., showed that a school can not be viable if it does not have at least 50 active students. All schools with fewer students have to be closed (the process is in progress) and they are forced to go to the nearest secondary school functioning (for this fact there is a program to provide schools with sufficient rural buses, used only for the educational activity). The following secondary schools are to be closed: those from the administrative-territorial units Ariniş, Asuaju de Sus, Bicaz, Coaş, Groşi, Oarţa de Jos, Poienile Izei. This step is normally induced by the financial inefficiency due to the low number of students.
D. M. GHERŢOIU, C. N. BOŢAN
258
Some students from rural areas within the Maramureş County prefer to study in secondary schools inside the town for the simple fact that they offer a more diversified educational curriculum (first, the intensive language courses), the schools is highly equipped and the staff is fully specialized.
The appointing of secondary school teachers in Maramureş County, proposes a positive situation, worthy to be considered, in that it follows educational requirements of the European Union in this regard. The average number of students in secondary cycle, compared to the number of teachers is of 9,64 secondary school students/teacher (in the European Union the average is between 8-10 students/teacher). At the county level, there are no major regional differences in this regard and that is a very positive aspect, which must be assessed accordingly.
It is striking that in Maramureş (from data analysis, provided by the County School Inspectorate Maramureş) there is no private secondary school and no establishing request of such institution. But this is a negative aspect, as compared to other parts of the country or the European Union that promotes the private educational offer.
If we try an analysis of the efficiency of the secondary school education in terms of all components, we should establish two separate entities: the urban component which has a higher quality and the rural component, with particular weaknesses which are evident and difficult to overcome. Speaking about the first, strengths are given by the sufficient number of students, qualified teachers, which are fully specialized and have an appropriate ongoing training, fully equipped schools with the latest teaching materials, existence of specialized laboratories in each school, accessibility due to urban transport, rich educational offer, etc. The rural component of secondary school faces some real failures related to the decrease (in some cases) of the number of students and hence inefficient functioning of schools, giving jobs to non-specialized personnel, more difficult access (especially in cold season), migration of some students to city schools, poor hygiene, few equipment, etc. If we want a qualitative development in the rural education, then there is a simple solution to the theoretical level: reach the quality level visible in the city ( in all aspects). It is a difficult, but not an impossible goal.
5. COMPLEMENTARY CYCLE (VOCATIONAL SCHOOLS)
The additional educational component and that of the disciples, generically called "Vocational Schools" is well represented in the analyzed area and that is argued by the economic tradition of the region. The economy of Maramureş County is an important element in the northern part of Romania, that is why there are such institutions which form the necessary workers. The specializations that exist are based on the specific industrial branches: food, textiles, electrical industry, electronics, chemistry, exploitation and wood processing, mechanics etc.
There are 37 such institutions, out of which 23 are present in urban areas. The remaining 14 are located in centers of large municipalities (Băiuţ, Botiza, Fărcaşa, Petrova, Poienile de sub Munte, etc.). They have 6259 students, possible employees in the economic branches (agriculture, industry and service) of the county. In Baia Mare there is also a private school of arts and crafts. Reality allows a positive assessment of the importance given to this form of professional specialization. The crafts specialization gives the students a practical approach to the labor market in Maramureş. However, it requires a more specific folding and distribution of the specializations throughout the territory, in accordance with local specificities. The existence of the 14 schools of arts and crafts in rural areas is to be considered, together with specialization in industry and services, both of them being the base of the local workforce.
THE EDUCATIONAL COMPONENT IN MARAMUREŞ COUNTY …
259
The Vocational Schools in Maramureş County have 159 specialist teachers, with an average of 39.36 students/teacher, which can be categorized as a positive phenomenon.
Vocational Schools in urban areas form educational structures embedded in scholar groups and technical colleges and those in rural areas are structures of its own.
6. THE HIGH-SCHOOL EDUCATIONAL LEVEL
Secondary education is well represented in Maramureş county, with schools of great tradition and reference to national level. All range of specializations is covered through the educational offer, teacher competence is mostly flawless, aspect that it proved by the results of students during various school competitions.
There are 40 secondary schools, both public and private (national colleges, technical colleges, high schools, scholar groups, normal schools), with a totalizing number of 20916 students. Secondary schools are present in places like: Baia Mare (19), Sighetu Marmaţiei (7), Târgu Lăpuş, Ulmeni, Vişeu de Sus (each having 2), Baia Sprie, Borşa, Cavnic, Seini, Şomcuta Mare, Fărcaşa, Petrova şi Rozavlea (each having 1).
In the 40 institutions of secondary school, there are 1707 high school teachers covering all the subjects existing in the school curricula. The average number of high school students/ teacher is 12,25, a figure that falls within the expectations of the European Union.
The number of secondary schools and their types represent the territorial reality, reflecting the county’s educational needs: school preparation for acquiring a strong general culture and clear language skills, there are 10 national colleges and high schools, which satisfy the needs of their students; three schools are designed to prepare students that have art skills, and those who are physically able for sports performance; the county's industrial tradition and diversity of economic branches have required the availability of 25 high-school institutions (technical colleges, scholar groups, industrial groups, economic groups and administrative groups); the employment of the educational staff in all secondary institutions from Maramureş is based on the principle of quality (there are no teachers who do not have specialized training).
The threats that secondary education in Maramureş can face are: absence from the lessons (mainly in peripheral urban high schools); lack of contracts with companies from the economic field, the potential employer; poor equipment of educational workshops serving for specialization; poor security of students in marginal high schools etc.
The guideline of secondary institutions should aim at strengthening Maramures, more precisely the specific areas of specialization that are demanded in the labor market: economic specialization, IT, electronics, communications, agricultural and related specialties (agricultural mechanics, mountaineering, veterinary, horticulture ecc), construction, tourism etc.
7. SPECIAL AND VOCATIONAL EDUCATION
Under the School Inspectorate Maramureş there are some institutions that focus on special educational issues (table 1). We can note the existence of 6 schools for children with disabilities (2 in Baia Mare, 1 in Sighetu Marmaţiei, 1 in Târgu Lapuş, 1 in Vişeu de Sus and 1 in Gârdani), in which the appropriate and targeted educational modules are oriented towards the types of deficiencies that the students have.
Students that have a special physical potential and are talented in sports, have 4 schools with sports programs and those talented in arts are to be integrated in two special schools (Baia Mare and Sighetu Marmaţiei).
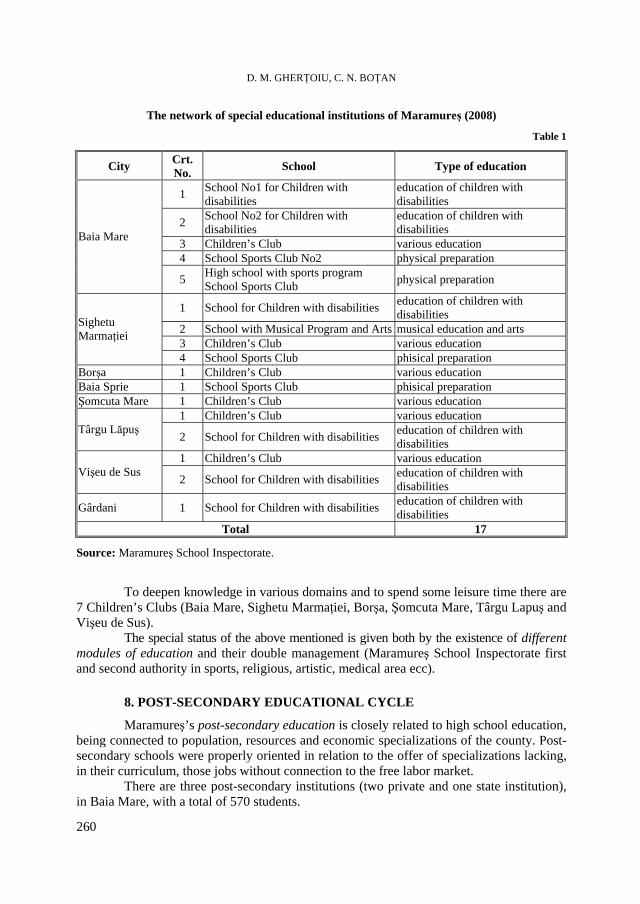
D. M. GHERŢOIU, C. N. BOŢAN
260
The network of special educational institutions of Maramureş (2008)
Table 1
City Crt. No. School Type of education
1 School No1 for Children with disabilities
education of children with disabilities
2 School No2 for Children with disabilities
education of children with disabilities
3 Children’s Club various education 4 School Sports Club No2 physical preparation
Baia Mare
5 High school with sports program School Sports Club physical preparation
1 School for Children with disabilities education of children with disabilities
2 School with Musical Program and Arts musical education and arts 3 Children’s Club various education
Sighetu Marmaţiei
4 School Sports Club phisical preparation Borşa 1 Children’s Club various education Baia Sprie 1 School Sports Club phisical preparation Şomcuta Mare 1 Children’s Club various education
1 Children’s Club various education Târgu Lăpuş 2 School for Children with disabilities education of children with
disabilities 1 Children’s Club various education
Vişeu de Sus 2 School for Children with disabilities education of children with disabilities
Gârdani 1 School for Children with disabilities education of children with disabilities
Total 17
Source: Maramureş School Inspectorate.
To deepen knowledge in various domains and to spend some leisure time there are 7 Children’s Clubs (Baia Mare, Sighetu Marmaţiei, Borşa, Şomcuta Mare, Târgu Lapuş and Vişeu de Sus).
The special status of the above mentioned is given both by the existence of different modules of education and their double management (Maramureş School Inspectorate first and second authority in sports, religious, artistic, medical area ecc).
8. POST-SECONDARY EDUCATIONAL CYCLE
Maramureş’s post-secondary education is closely related to high school education, being connected to population, resources and economic specializations of the county. Post-secondary schools were properly oriented in relation to the offer of specializations lacking, in their curriculum, those jobs without connection to the free labor market.
There are three post-secondary institutions (two private and one state institution), in Baia Mare, with a total of 570 students.
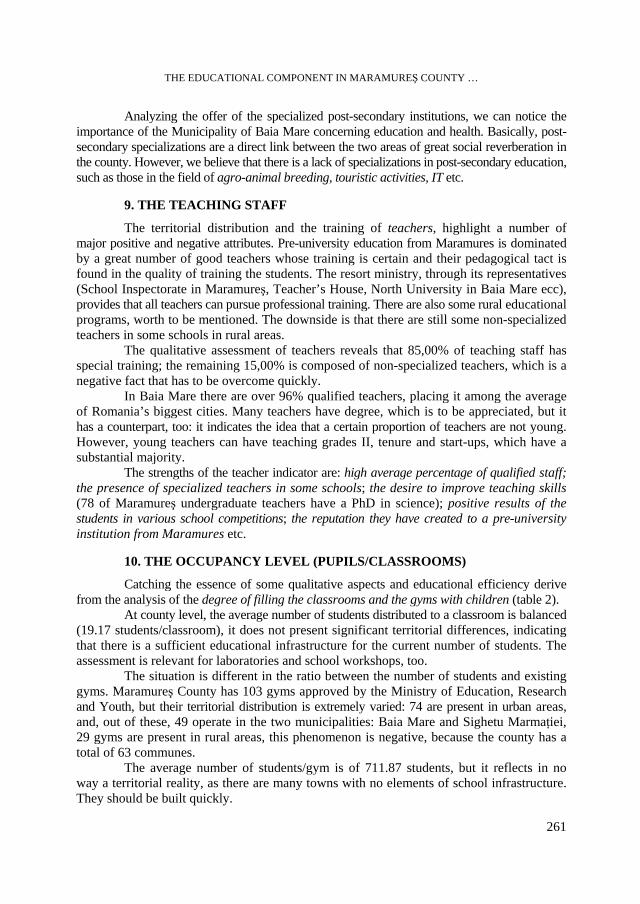
THE EDUCATIONAL COMPONENT IN MARAMUREŞ COUNTY …
261
Analyzing the offer of the specialized post-secondary institutions, we can notice the importance of the Municipality of Baia Mare concerning education and health. Basically, post-secondary specializations are a direct link between the two areas of great social reverberation in the county. However, we believe that there is a lack of specializations in post-secondary education, such as those in the field of agro-animal breeding, touristic activities, IT etc.
9. THE TEACHING STAFF
The territorial distribution and the training of teachers, highlight a number of major positive and negative attributes. Pre-university education from Maramures is dominated by a great number of good teachers whose training is certain and their pedagogical tact is found in the quality of training the students. The resort ministry, through its representatives (School Inspectorate in Maramureş, Teacher’s House, North University in Baia Mare ecc), provides that all teachers can pursue professional training. There are also some rural educational programs, worth to be mentioned. The downside is that there are still some non-specialized teachers in some schools in rural areas.
The qualitative assessment of teachers reveals that 85,00% of teaching staff has special training; the remaining 15,00% is composed of non-specialized teachers, which is a negative fact that has to be overcome quickly.
In Baia Mare there are over 96% qualified teachers, placing it among the average of Romania’s biggest cities. Many teachers have degree, which is to be appreciated, but it has a counterpart, too: it indicates the idea that a certain proportion of teachers are not young. However, young teachers can have teaching grades II, tenure and start-ups, which have a substantial majority.
The strengths of the teacher indicator are: high average percentage of qualified staff; the presence of specialized teachers in some schools; the desire to improve teaching skills (78 of Maramureş undergraduate teachers have a PhD in science); positive results of the students in various school competitions; the reputation they have created to a pre-university institution from Maramures etc.
10. THE OCCUPANCY LEVEL (PUPILS/CLASSROOMS)
Catching the essence of some qualitative aspects and educational efficiency derive from the analysis of the degree of filling the classrooms and the gyms with children (table 2).
At county level, the average number of students distributed to a classroom is balanced (19.17 students/classroom), it does not present significant territorial differences, indicating that there is a sufficient educational infrastructure for the current number of students. The assessment is relevant for laboratories and school workshops, too.
The situation is different in the ratio between the number of students and existing gyms. Maramureş County has 103 gyms approved by the Ministry of Education, Research and Youth, but their territorial distribution is extremely varied: 74 are present in urban areas, and, out of these, 49 operate in the two municipalities: Baia Mare and Sighetu Marmaţiei, 29 gyms are present in rural areas, this phenomenon is negative, because the county has a total of 63 communes.
The average number of students/gym is of 711.87 students, but it reflects in no way a territorial reality, as there are many towns with no elements of school infrastructure. They should be built quickly.
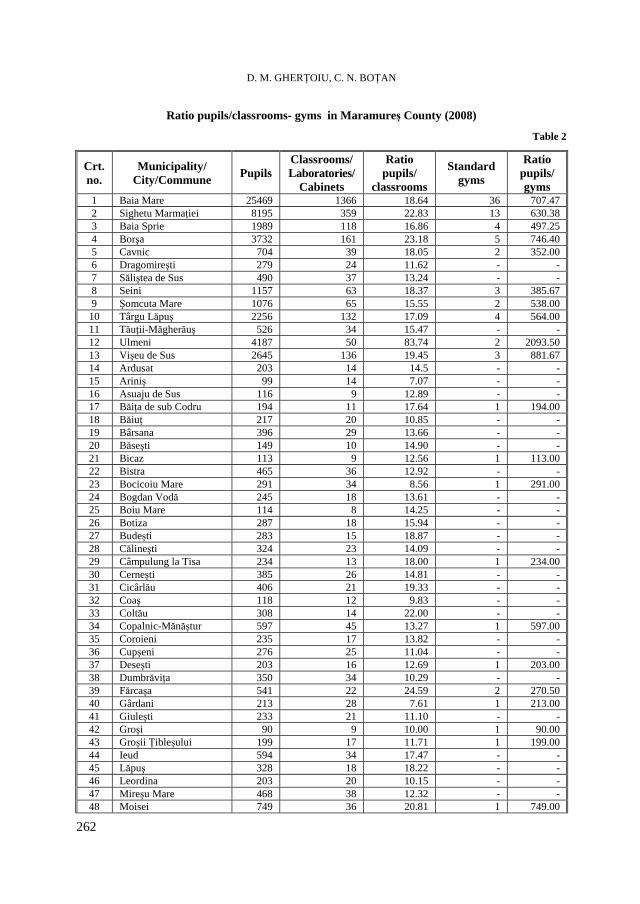
D. M. GHERŢOIU, C. N. BOŢAN
262
Ratio pupils/classrooms- gyms in Maramureş County (2008)
Table 2
Crt. no.
Municipality/ City/Commune
Pupils
Classrooms/ Laboratories/
Cabinets
Ratio pupils/
classrooms
Standard gyms
Ratio pupils/ gyms
1 Baia Mare 25469 1366 18.64 36 707.47 2 Sighetu Marmaţiei 8195 359 22.83 13 630.38 3 Baia Sprie 1989 118 16.86 4 497.25 4 Borşa 3732 161 23.18 5 746.40 5 Cavnic 704 39 18.05 2 352.00 6 Dragomireşti 279 24 11.62 - - 7 Săliştea de Sus 490 37 13.24 - - 8 Seini 1157 63 18.37 3 385.67 9 Şomcuta Mare 1076 65 15.55 2 538.00 10 Târgu Lăpuş 2256 132 17.09 4 564.00 11 Tăuţii-Măgherăuş 526 34 15.47 - - 12 Ulmeni 4187 50 83.74 2 2093.50 13 Vişeu de Sus 2645 136 19.45 3 881.67 14 Ardusat 203 14 14.5 - - 15 Ariniş 99 14 7.07 - - 16 Asuaju de Sus 116 9 12.89 - - 17 Băiţa de sub Codru 194 11 17.64 1 194.00 18 Băiuţ 217 20 10.85 - - 19 Bârsana 396 29 13.66 - - 20 Băseşti 149 10 14.90 - - 21 Bicaz 113 9 12.56 1 113.00 22 Bistra 465 36 12.92 - - 23 Bocicoiu Mare 291 34 8.56 1 291.00 24 Bogdan Vodă 245 18 13.61 - - 25 Boiu Mare 114 8 14.25 - - 26 Botiza 287 18 15.94 - - 27 Budeşti 283 15 18.87 - - 28 Călineşti 324 23 14.09 - - 29 Câmpulung la Tisa 234 13 18.00 1 234.00 30 Cerneşti 385 26 14.81 - - 31 Cicârlău 406 21 19.33 - - 32 Coaş 118 12 9.83 - - 33 Coltău 308 14 22.00 - - 34 Copalnic-Mănăştur 597 45 13.27 1 597.00 35 Coroieni 235 17 13.82 - - 36 Cupşeni 276 25 11.04 - - 37 Deseşti 203 16 12.69 1 203.00 38 Dumbrăviţa 350 34 10.29 - - 39 Fărcaşa 541 22 24.59 2 270.50 40 Gârdani 213 28 7.61 1 213.00 41 Giuleşti 233 21 11.10 - - 42 Groşi 90 9 10.00 1 90.00 43 Groşii Ţibleşului 199 17 11.71 1 199.00 44 Ieud 594 34 17.47 - - 45 Lăpuş 328 18 18.22 - - 46 Leordina 203 20 10.15 - - 47 Mireşu Mare 468 38 12.32 - - 48 Moisei 749 36 20.81 1 749.00
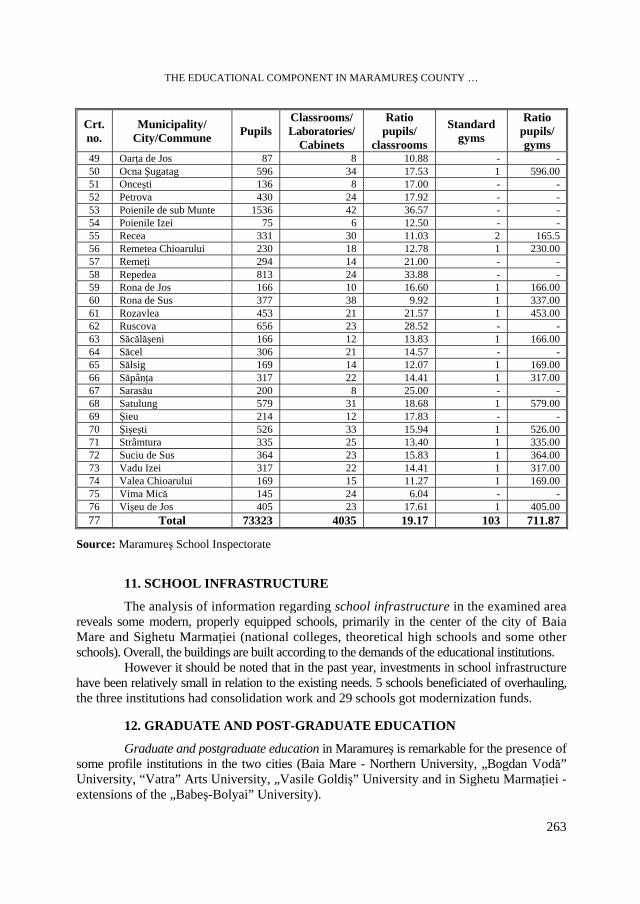
THE EDUCATIONAL COMPONENT IN MARAMUREŞ COUNTY …
263
Crt. no.
Municipality/ City/Commune
Pupils
Classrooms/ Laboratories/
Cabinets
Ratio pupils/
classrooms
Standard gyms
Ratio pupils/ gyms
49 Oarţa de Jos 87 8 10.88 - - 50 Ocna Şugatag 596 34 17.53 1 596.00 51 Onceşti 136 8 17.00 - - 52 Petrova 430 24 17.92 - - 53 Poienile de sub Munte 1536 42 36.57 - - 54 Poienile Izei 75 6 12.50 - - 55 Recea 331 30 11.03 2 165.5 56 Remetea Chioarului 230 18 12.78 1 230.00 57 Remeţi 294 14 21.00 - - 58 Repedea 813 24 33.88 - - 59 Rona de Jos 166 10 16.60 1 166.00 60 Rona de Sus 377 38 9.92 1 337.00 61 Rozavlea 453 21 21.57 1 453.00 62 Ruscova 656 23 28.52 - - 63 Săcălăşeni 166 12 13.83 1 166.00 64 Săcel 306 21 14.57 - - 65 Sălsig 169 14 12.07 1 169.00 66 Săpânţa 317 22 14.41 1 317.00 67 Sarasău 200 8 25.00 - - 68 Satulung 579 31 18.68 1 579.00 69 Şieu 214 12 17.83 - - 70 Şişeşti 526 33 15.94 1 526.00 71 Strâmtura 335 25 13.40 1 335.00 72 Suciu de Sus 364 23 15.83 1 364.00 73 Vadu Izei 317 22 14.41 1 317.00 74 Valea Chioarului 169 15 11.27 1 169.00 75 Vima Mică 145 24 6.04 - - 76 Vişeu de Jos 405 23 17.61 1 405.00 77 Total 73323 4035 19.17 103 711.87
Source: Maramureş School Inspectorate
11. SCHOOL INFRASTRUCTURE
The analysis of information regarding school infrastructure in the examined area reveals some modern, properly equipped schools, primarily in the center of the city of Baia Mare and Sighetu Marmaţiei (national colleges, theoretical high schools and some other schools). Overall, the buildings are built according to the demands of the educational institutions.
However it should be noted that in the past year, investments in school infrastructure have been relatively small in relation to the existing needs. 5 schools beneficiated of overhauling, the three institutions had consolidation work and 29 schools got modernization funds.
12. GRADUATE AND POST-GRADUATE EDUCATION
Graduate and postgraduate education in Maramureş is remarkable for the presence of some profile institutions in the two cities (Baia Mare - Northern University, „Bogdan Vodă” University, “Vatra” Arts University, „Vasile Goldiş” University and in Sighetu Marmaţiei - extensions of the „Babeş-Bolyai” University).
D. M. GHERŢOIU, C. N. BOŢAN
264
Maramureş has over a number of 7000 persons who have applied for the upper levels of education: university degree, postgraduate studies, master’s degree, post-graduate and master’s degree studies.
The Northern University in Baia Mare is the most important unit, being a state university institution with an impressive tradition. It is organized in four faculties (Engineering Faculty, Faculty of Mineral Resources and Environment, Faculty of Sciences and Faculty of Letters) which cover a wide range of specializations in all cycles (bachelor, master, postgraduate and master’s degree studies).
„Bogdan Vodă” University belongs to the private sector and is present in Baia Mare throughout three faculties (Faculty of Economics, Faculty of Law and Faculty of Physical Education and Sport Management), which cover three areas of specializations related to education.
”Vatra” University of Arts is a private higher education institution, structured in two faculties (Faculty of Choreography and Faculty of Music).
„Vasile Goldiş” Western University is also a private higher education institution and covers a wide range of educational areas, through its 9 faculties present in Baia Mare (Faculty of Legal Sciences, Faculty of Economics, Faculty of Political Science, Humanities and Administration, Faculty of Natural Sciences, Faculty of Psychology and Educational Sciences, Faculty of Medicine, Faculty of Dentistry, Faculty of Pharmacy and Faculty of Engineering).
Sighetu Marmaţiei has 3 extensions from the „Babeş-Bolyai” University in Cluj-Napoca, departments related to the Faculty of Geography, Faculty of Psychology and Educational Sciences, Faculty of Economics and Business Administration.
13. THE SWOT ANALYSIS
A SWOT analysis of the educational component of Maramureş should include the following major drivers:
Strengths: - Baia Mare should be seen as the main educational center in the northern part of
the country; - the existence of a well paid, skilled, trained labor; - the raw rate of inclusion in primary, secondary and higher education is increasing; - school and university drop out rate is decreasing; - positive assessment of students and pupils concerning the teaching quality; - diversified network of specialization in educational institutions; - education meets most standards of the basic standards within the European Union; - the existence of relations of cooperation with educational centers in the Euro-
Atlantic area, high mobility of students and academics. Weaknesses: - low coverage rate of high school; - reducing the population with school age; - the lack of complete link between all types of public and private higher
education, both among themselves and with labor market requirements; - the existence of identical or similar specialization in several universities; - the existence of the phenomenon of leaving the educational system for economic
reasons (teachers in undergraduate system, particularly in the rural areas);
THE EDUCATIONAL COMPONENT IN MARAMUREŞ COUNTY …
265
- the existence of a number of non-specialized teachers in rural areas; - poor remuneration for the teachers, the auxiliary and non-teaching personnel; - campuses often have unfavorable locations and they lack the necessary facilities; - student cafeterias are not used to their maximum capacity, the services offered to
students are expensive and often of poor quality; - lack an adequate supply of jobs for students, as the one that there is in the
European Union or in the United States of America, in the best case it is only in the form of partnerships between NGOs and private companies without a unified and integrated form.
Opportunities: - diversification of skills / specializations at all levels of education; - only qualified personnel for each discipline; - modernization and appropriate endowment for all educational institutions; they
now lack this aspect; - involvement of organizations/institutions in promoting career information and advice; - implementation of a modern concept suitable for pre-university and university
management; - reconsidering the relationship with civil society; - development of an authentic and original strategy for the educational development. Threats: - under-utilized human potential (using their own qualification); - unprofessionalization of the students; - limited access to education due to the need for financial support.
14. CONCLUSIONS
In the developed societies, the educational component occupies a significant position in the hierarchy of the life quality and in assessing the degree of local, regional and national development. The Strategy of Maramureş’s Territorial Development, from an educational perspective, should be incorporated homogeneously into the overall strategy of the region, based on a series of strategic objectives and directions of development for each area.
The efficient and coordinated development of the educational field in Maramureş is based on the following strategic goal - raising the qualitative standard of educational activities. The applicability, relevance and effectiveness of the strategic objective, may result from implementing an efficient major direction of the main elements of education in the county: increasing the quality of education by upgrading and diversifying school infrastructure, hiring well-prepared teachers.
The actions related to the development must be the result of ongoing relation of three factors with specific responsibilities: local decision-makers (County Council, Prefecture of Maramureş, mayors and members of Local Council from each political subdivision of the county), the factors responsible for educational content (School Inspectorate Maramureş and managers of each educational institution in the county) and beneficiary of the educational quality (students and their parents). In the absence of agreements between the three parts involved, the existing problems in the educational area can not be solved and the raise of quality in education can not be imagined. The actions that are responsible for enhancing the quality and efficiency of education in Maramures, aim at each cycle and each component.
D. M. GHERŢOIU, C. N. BOŢAN
266
Pre-primary cycle requires the following actions: - implementation of a state kindergarten in every village of the region that does not
have such institution: Baia Sprie (3 places- 2 kindergartens), Seini (3 places- 2 kindergartens), Şomcuta Mare (8 places- 1 kindergarten), Ulmeni (8 places- 1 kindergarten), Târgu Lăpuş (14 places- 1 kindergarten), Tăuţii-Măgheruş (6/1) and in most parts of the county’s villages;
- School Inspectorate Maramureş should provide, a number of budgeted positions in the region’s kindergartens, sufficient to cover the entire population of children who wish to be integrated into pre-school cycle; - the number of positions in state kindergartens is lower than the total of kindergarten children in almost all territorial-administrative units;
- stimulating the emergence of private kindergartens in Maramureş County, especially in urban areas (only 8 private gardens), which is not much for a county such as Maramureş, given that the European Union promotes education in private institutions;
- employment in teaching positions with qualified personnel only (focus on nursery schools in rural areas, where non-specialized teachers are hired, too);
- equipping the nursery to the requirements of each Ministry of Education, Research and Innovation, with modern teaching aids and toilets.
Primary school cycle requires a series of concrete measures: - the setting up, in each village in the region, of a section/secondary school cycle,
although the number of students is poor. The current program that works in Romania was used in other EU countries, too, and it includes the transport of schoolchildren to the school that was in the commune center. But it turned out a less effective alternative and not viable for long term, so it is up to local decision makers to reopen (with any financial effort) schools closed;
- extending the existing school buildings for each class of students, so as to reach the optimal figure claimed in the European Union (15-20 children/class). Such is the case of the following administrative and territorial units of Poienile de Sub Munte, Şişeşti, Sarasău, Ruscova, Oncesti, Lapus, Ieud, where „pressure” on students' area of school buildings is high;
- provide each cycle primary schools with modern teaching aids for an effective educational act. There is a large number of suppliers, whose quality in educational products require their presence in each classroom;
- every primary school cycle should have only qualified personnel; this is the primary issue for quality of learning;
- placing in the school’s Curriculum a package containing several disciplines aimed at anchoring the students’ preparation in the specific region, who later may become good craftsmen.
Speaking about the level of secondary education, the development strategy should be aimed at correcting (or qualitative development) the following aspects:
- each discipline should be taught qualified teaching staff only; - implementation of school programs aimed at the specific regional realities
(ethnographic subjects, tourism, agro-mountaineering, forest economy, agro-pastoral economy); - each secondary school of Maramureş should have a gym of its own; - maintaining a secondary school in each village center, even though in some cases,
the number of students is lower than the minimum number required (Ariniş, Asuaju de Sus, Băiţa de sub Codru, Băiuţ, Băseşti, Bicaz, Boiu Mare, Coaş, Deseşti, Gârdani, Groşi, Groşii Ţibleşului, Leordina, Oarţa de Jos, Onceşti, Poienile Izei, Rona de Jos, Săcălăşeni, Valea Chioarului, Vima Mică);
- raising the quality of the educational act (by hiring qualified teachers) of secondary schools in rural area to avoid reducing the number of students (many students prefer to access to secondary schools in Baia Mare and in other urban entities in the county), considered to be of higher quality;
THE EDUCATIONAL COMPONENT IN MARAMUREŞ COUNTY …
267
- stimulating the setting up of private secondary schools (there are no school of this kind). The presence of such schools is required, for two solid reasons: (1) they are approved in the EU and receive substantial financial funds and (2) the studied disciplines can easily suit the area, students have the chance to gain knowledge and serious practical skills. It is worth establishing private secondary schools in the areas which certain traditional fields (shepherds, ethnography, cultural tourism, mountain tourism);
- setting up in schools specialized laboratories, for each course that requires additional equipment.
The additional cycle and that of apprentices’ require concrete measures: - the orientation of these specializations towards the economic branches that are
well represented in the county: crafts, grazing, food industry, wood processing, agro-tourism, rural and ethnographic tourism, etc. The implementation of profile schools in some settlements in the region, is a must; mostly those with local specialties: textile, agro-tourism (school sections can be created in each village center), cultural tourism, mountain tourism, wood processing, etc;
- a larger distribution of specializations in territory, in accordance with local specificities. There are 37 schools of arts and crafts in 26 area of the county; they have specializations in the ethnographic field, crafts and agro-pastoral, forestry, etc., but the number of additional and apprentices’ must increase because the region has special preparations in this regard;
- involvement of local decision makers and those with role on an educational line (School Inspectorate Maramureş) in the establishment of partnerships between schools with practical and economic profile, in order to integrate graduates into the effective practice for each specialization.
Secondary and post-secondary cycles also require a series of concrete measures to revitalize:
- school managers should identify the causes that induce a series of threats that the regional secondary school faces (absenteeism from classes; reduced number of contracts with entities in the economic field, which may be the potential employer; poor equipment of educational workshops) in order to eliminate them;
- secondary institutions must aim at strengthening specific areas of specialization in high demand on the labor market: economic specialization, IT, agro-pastoral and related specialties (agricultural mechanics, mountaineering, veterinary field, horticulture, etc.), construction, tourism etc.
- in addition to the above mentioned secondary institutions, the authority of Maramures School Inspectorate should include also a number of educational institutions, focused on special education issues, such as schools for pupils with hearing impairment, sporting clubs, special schools etc.. Their special status (if they are implemented) will be the existence of different modules of education and their management in cooperation (first, the School Inspectorate Maramureş followed by sport, religious authorities, local governments etc);
- post-secondary specializations must be the endpoint of a direct link between areas with major social impact in the county.
- in addition, in the highest part of the region, the mountainous one that belongs to the Maramureş, Rodnei, Gutâi, Ţibleş Mountains we suggest the setting up of a sports school specialized on mountain skiing because the environmental conditions are optimal in this area.
In the upper cycle, we should try to eliminate overlaps between the various specializations in the county of Maramureş. Diversification of university education is a goal promoted in the Educational Directorate of the European Union.
D. M. GHERŢOIU, C. N. BOŢAN
268
The component concerning teachers is essential to the quality development of Maramures County. The contents and the relationships in this component, must undergo a number of urgent measures such as lessening the situations (in rural area) in which teachers work without specialized training (19,3% of the teachers in the region are non-specialized) and stimulating teachers in a continuous professional development in specialized institutions (tenure, second degree, first degree, master, master’s degree).
We think that the measures we proposed above are to be implemented as soon as possible if we want to revitalize the educational component within the Maramures County. Without these implementations, the quality of education is only partly acquired because the component in question is under the impact of weaknesses and threats with certain negative connotations.
R E F E R E N C E S
1. Beaujeu-Garnier, Jaqueline, Chabot, G. (1971), Geografie urbană, Edit. Ştiinţifică, Bucureşti. 2. Benedek, J. (2004), Amenajarea teritoriului şi dezvoltarea regională, Edit. Presa Universitară Clujeană,
Cluj-Napoca. 3. Bodocan, V. (1996), Geografie politică, Edit. Presa Universitară Clujeană, Cluj-Napoca. 4. Bold, I., Buciuman, E., Drăghici, M. (2003), Spaţiul rural. Definire, organizare, dezvoltare, Edit.
Mirton, Timişoara. 5. Ianoş, I. (2000), Sisteme teritoriale. O abordare geografică, Edit. Tehnică, Bucureşti. 6. Nistor, S. (2000), Comuna şi judeţul. Evoluţia istorică, Edit. Dacia, Cluj-Napoca. 7. Rotariu, T. (2003), Demografie şi sociologia populaţiei. Fenomene demografice, Edit. Polirom, Iaşi. 8. Rotariu, T., Ilut, P. (1997), Ancheta sociologică şi sondajul de opinie. Teorie şi practică. Edit.
Polirom, Iaşi. 9. Surd, V. (1997), Geografia dezvoltării şi a decalajelor economice contemporane, Edit. Presa Universitară
Clujeană, Cluj-Napoca. 10. ***http://www.cjmaramures.ro/portal/smaramures/cjmaramures/portal.nsf/Index/100?OpenDocument.
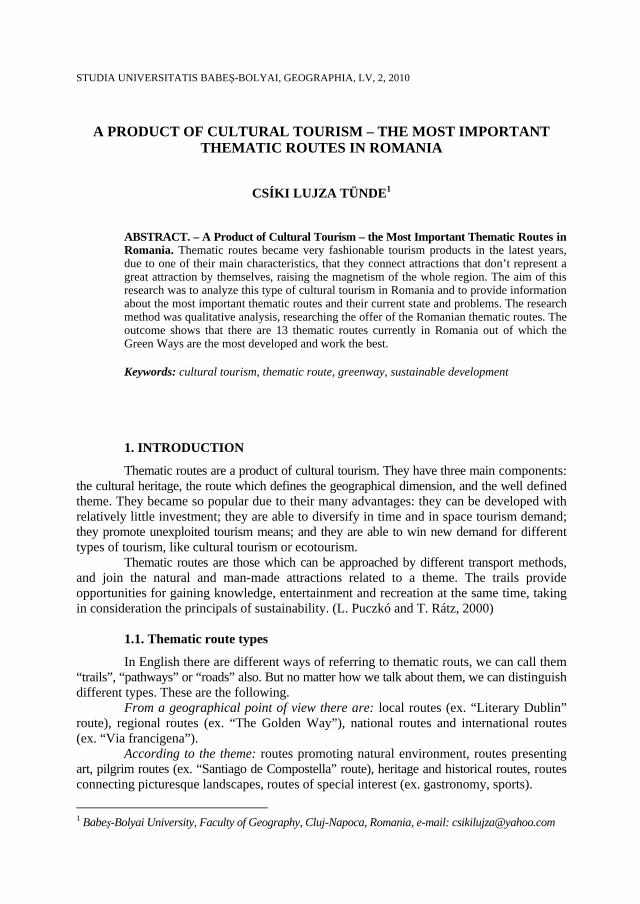
STUDIA UNIVERSITATIS BABEŞ-BOLYAI, GEOGRAPHIA, LV, 2, 2010
A PRODUCT OF CULTURAL TOURISM – THE MOST IMPORTANT
THEMATIC ROUTES IN ROMANIA
CSÍKI LUJZA TÜNDE1
ABSTRACT. – A Product of Cultural Tourism – the Most Important Thematic Routes in Romania. Thematic routes became very fashionable tourism products in the latest years, due to one of their main characteristics, that they connect attractions that don’t represent a great attraction by themselves, raising the magnetism of the whole region. The aim of this research was to analyze this type of cultural tourism in Romania and to provide information about the most important thematic routes and their current state and problems. The research method was qualitative analysis, researching the offer of the Romanian thematic routes. The outcome shows that there are 13 thematic routes currently in Romania out of which the Green Ways are the most developed and work the best. Keywords: cultural tourism, thematic route, greenway, sustainable development
1. INTRODUCTION
Thematic routes are a product of cultural tourism. They have three main components: the cultural heritage, the route which defines the geographical dimension, and the well defined theme. They became so popular due to their many advantages: they can be developed with relatively little investment; they are able to diversify in time and in space tourism demand; they promote unexploited tourism means; and they are able to win new demand for different types of tourism, like cultural tourism or ecotourism.
Thematic routes are those which can be approached by different transport methods, and join the natural and man-made attractions related to a theme. The trails provide opportunities for gaining knowledge, entertainment and recreation at the same time, taking in consideration the principals of sustainability. (L. Puczkó and T. Rátz, 2000)
1.1. Thematic route types
In English there are different ways of referring to thematic routs, we can call them “trails”, “pathways” or “roads” also. But no matter how we talk about them, we can distinguish different types. These are the following.
From a geographical point of view there are: local routes (ex. “Literary Dublin” route), regional routes (ex. “The Golden Way”), national routes and international routes (ex. “Via francigena”).
According to the theme: routes promoting natural environment, routes presenting art, pilgrim routes (ex. “Santiago de Compostella” route), heritage and historical routes, routes connecting picturesque landscapes, routes of special interest (ex. gastronomy, sports).
1 Babeş-Bolyai University, Faculty of Geography, Cluj-Napoca, Romania, e-mail: [email protected]
CSÍKI LUJZA TÜNDE
270
According to the used transportation: by foot (ex. “The Limestone Trail”), by public transportation, by motorized transportation (especially in North America), by bicycle (ex. “The Salt Way”), by horse (ex. “Maramures Heritage Trail”) or scuba diving routes.
According to geographically existing roads: thematic routes which have been developed by geographically already existing roads (ex. “The Silk Road”), and routes which are developed by connecting attractions of the same theme (ex. “Jewish Heritage Route”). (R. Orbán, 2006) 1.2. Important aspects
Developing thematic routes can be rewarding and have many advantages if some main principles are followed. The most important when choosing the theme is to decide upon the one that is easily identifiable, is known by a large group of people, and doesn’t limit the circle of the possible attractions connected to the route. After the first step it is important to make sure that the visitors and the local people know about the existing route, and realize that through the route they get a higher standard of experience. One of the most important part of this, is a proper logo used very often. Further the information activity has to be stressed. The main objectives are: right use of sign posts and information boards by the roads, printed information materials and online access to information about the routes. The planning of seasonal or annual cultural events is also very important, because they contribute to the raise of the demand.
In the majority of the cases the problems occur mostly because of four important aspects. These are: financial support, to ensure the management, sustainability and taking care that the main theme doesn’t get too dominant. In the first case developers have to ensure the continuous financing, especially with the help of the public sphere. One person is enough to develop the idea of a thematic route but there has to be a team that will make it work. There has to be a smaller management team with the proper knowledge and experience to coordinate the route. In order to protect the cultural heritage, the sustainability of the attractions and the local community, the principals of sustainability have to be considered.
1.3. The role of European institutes in the development of thematic routes
Developing thematic routes very often needs international collaboration. For example in Europe, for the members of the European Union, strengthening the European identity is a main priority. The cultural routes, which represent the main points of the common European heritage and history, are effectual tools of realizing this goal.
In the opinion of the international organizations and tourism specialists the interest of visitors in cultural experiences is growing. The interest in seaside tourism is dropping. So culture represents the alternative to spend our free time, for which thematic routes are very advantageous. (G. Michalkó, 2004)
It is not surprising that there were many national and international initiatives to develop thematic routes. Some of the most important contributing institutes and organizations in Europe are: The European Travel Commission (ETC), UNESCO, ICOMOS, Ciste Association, and the Council of Europe. 1.3.1. The role of the Council of Europe
The Council of Europe puts a great stress on strengthening the European identity, it is part of its main goals. In addition to this there are several programs initiated by the Council which are engaged in supporting culture: for example “Cultures and Regions” project, “Euroimages” or the most important considering the thematic routes is “European Cultural Routes” program.
A PRODUCT OF CULTURAL TOURISM – THE MOST IMPORTANT THEMATIC ROUTES IN ROMANIA
271
The firs idea of the “European Cultural Routes” program started in 1960. Several events and negotiations have been held until 1987, when the firs European cultural route was established. This was the pilgrim route of Santiago de Compostella, which today is the most known and associated with thematic routes. (S. Capp, 2002)
The aim of this project is to grow the knowledge of European culture throughout tourism, develop tourism networks that relate to Europe’s cultural geography, and to promote the routes and places of the European civilizations. Further to strengthen the relationship between countries and help different cultures to get to know each other by international thematic routes, to mediate the Council of Europe’s main principals, to popularize the use of free time to practice cultural tourism and to make the connection between tourism, scientific research, heritage preservation and education. (L. Puczkó and T. Rátz, 2000)
Throughout the years the number of European cultural routes grew fast, therefore today there are 39 routes, out of which 17 were declared main cultural roads. There are even more that haven’t been able to step over the proposal phase yet. Considering the growing number of proposals the Council decided in 1997 to pass over its responsibilities to the European Institute of Cultural Routes. The Institute is located in Luxembourg and has the responsibility to review the proposals, to help the developers with the information they need, negotiate with new partners, enlighten the organizers and monitor the existing routes, to publish information materials and organize expositions and conferences.
Fig. 1. The logo of the European Institute of Cultural Routes (source: www.culture-routes.lu).
In 2005 the idea of regional institutions arouse, so two new institutions were
founded in Bulgaria and Romania. These two are responsible for developing cultural routes in South East Europe, to monitor them and give the necessary information and help to potential developers. After this event Romania was directly linked to the “European Cultural Routes” project, therefore giving an opportunity for researching its two years of performance.
2. OBSERVATIONS
South-East Europe is rich in natural and built attractions which make possible the development of thematic routes in the region. Therefore Romania also has the possibility to develop this tourism product. We can find many themes which would make possible the existence of independent thematic routes or give the opportunity to join the existing and famous European routes.
It can be observed that in South-East Europe the interest in thematic routes began after the year of 2000. There were many local initiatives lately that grew the interest of Romanians in this product. At the same time the EU has a great influence by supporting the development of cultural roads through its institutions and programs.
Further more it can be observed that although Romania has a strong relationship since 2005 with the Institution of European Cultural Roads in Luxembourg, there are only a few cultural roads that are worth talking about.
The main question of this research was: What kind of thematic routs exist at the moment in Romania and how do they work?
CSÍKI LUJZA TÜNDE
272
3. RESEARCH METHOD
The research method was qualitative analyses, analyzing the Romanian thematic routes by the offer side, not from the consumer side. Therefore the qualitative analyses and observation led to the results. Besides this the quantitative information and other important information were tabulated by different aspects in order to make the comparison between the routes easier.
For the qualitative analysis and especially for the marketing analysis of the routes the use of the internet was necessary.
In order to have a comprehensive view over the routes it was necessary to talk with the operators and people in charge of the different routes. This was possible by using the method of half structured interview. The interview partners were people whose experience and opinion is relevant to the theme, who are directly or indirectly related to the theme, from the national level to the practical level. Thus the interviewed were: the general manager of the National Institute for Research and Development in Tourism, the managers and operators of the different thematic routes and a tourism manager.
4. THE MOST IMPORTANT THEMATIC ROUTES IN ROMANIA
During the research 8 interviews were made and we found information about 13 thematic routes in Romania.
As we know Romania joined the Council of Europe’s program “European Cultural Routes” and with the help of the “European Institute of Cultural Routes” and the collaboration with the Bulgarian regional centre four cultural routes were developed. These belong to the so cold “Cultural Corridors of South East Europe” project, and were developed in collaboration with Bulgaria and Greece. The four routes crossing Romania are:
- Eastern Trans-Balkan cultural corridor; - Western Trans-Balkan cultural corridor; - The Danube Road; - Via Pontica.
Fig.2. The logo of the “Cultural Corridors of South East Europe” project (source: www.seecorridors.eu).
The first discussions about these thematic routes were in 2005 and the last meeting
was held in November 2007 in Plovdiv, Bulgaria, when all the final documents have been elaborated and sent to the “European Institute of Cultural Routes” for judgment. However the routes haven’t received yet the certificate from the Council of Europe that they are “European Cultural Routes”.
Another category of thematic routes found in Romania are the “Greenways”. They are successful and recognized initiatives in Western Europe and in the US. Greenways are routes, trails and natural corridors that are used in harmony with the environment, offering opportunities for sports, tourism and recreation. These initiatives try to improve the quality of life and give the opportunity for sustainable economic activities for the local communities and towns. Greenways help local communities to add value to their natural and human “treasures” and to collaborate with the authorities.
A PRODUCT OF CULTURAL TOURISM – THE MOST IMPORTANT THEMATIC ROUTES IN ROMANIA
273
The initiator of the Romanian Greenways program is the Environmental Partnership Foundation, which was established ten years ago, and since 2000 supports environmen-tally sound projects.
At the moment there are 7 Greenways in Romania, these are:
- Mineral Water Trail; - The Golden Way; - The Limestone Trail; - Maramures Heritage Trail; - The Spruce Pine Way; - Tur River Trail; - The Salt Way.
Two more thematic routes were found which don’t belong to the above mentioned categories. These are:
- The Wine’s Route in Transylvania; - Central Pan-European Route which connects the National Parks, protected natural
areas and natural reservations of 6 countries (Poland, Slovakia, Hungary, Ukraine, Romania and Bulgaria. 4. 1. The Limestone Trail as a Romanian example
The Limestone Trail consists of a 150 km network of routes located in the central part of the Trascău Mountains. The routes follow three parallel valleys and facilitate the access to 15 natural reserves. The Limestone Trail consists of 7 routes that are accessible by walking, cycling, riding and on skies in the winter. The routes are of different length and are marked according to their level of difficulty. So there are three easy routes (marked with blue), three medium routes (marked with red) and one difficult route (marked with black).
The seven routes of the Limestone Trail are: a) Geoagiu Trail – 18 km, easy; b) Galda Trail – 48 km, easy; c) Piatra Ceţii Trail – 17 km, difficult; d) Cetea trail – 16 km, easy; e) Narcissus Trail – 11 km, medium; f) Rîmeţ Trail – 20 km, medium; g) Gorges Trail – 14 km, medium. The central part of the Trascău Mountains are known mainly due to the Rîmeţului
Gorges. The visitors have to possibility to visit the high number of natural reservations of the area, the old traditional houses, the more than 250 years old churches and familiarize with local traditions.
At the starting and ending points of each route tourists can find informative panels and along the route there are indicating signs installed for each visiting objective included in the Limestone Trail. The thematic route has three main information points: Info Center Intergalde, Rîmeţ rest-house and Credit Teiuş. The trail is advertised through different web pages, printed information materials and different programs and events (ex. camps and interactive programs for children and students).
Fig. 3. The logo of “Greenways”.
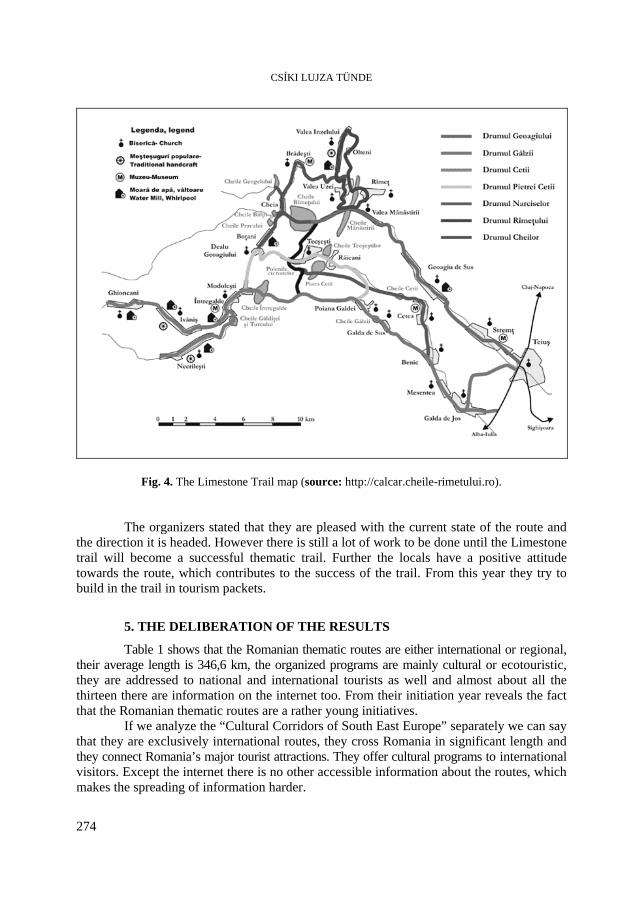
CSÍKI LUJZA TÜNDE
274
Fig. 4. The Limestone Trail map (source: http://calcar.cheile-rimetului.ro). The organizers stated that they are pleased with the current state of the route and
the direction it is headed. However there is still a lot of work to be done until the Limestone trail will become a successful thematic trail. Further the locals have a positive attitude towards the route, which contributes to the success of the trail. From this year they try to build in the trail in tourism packets.
5. THE DELIBERATION OF THE RESULTS
Table 1 shows that the Romanian thematic routes are either international or regional, their average length is 346,6 km, the organized programs are mainly cultural or ecotouristic, they are addressed to national and international tourists as well and almost about all the thirteen there are information on the internet too. From their initiation year reveals the fact that the Romanian thematic routes are a rather young initiatives.
If we analyze the “Cultural Corridors of South East Europe” separately we can say that they are exclusively international routes, they cross Romania in significant length and they connect Romania’s major tourist attractions. They offer cultural programs to international visitors. Except the internet there is no other accessible information about the routes, which makes the spreading of information harder.
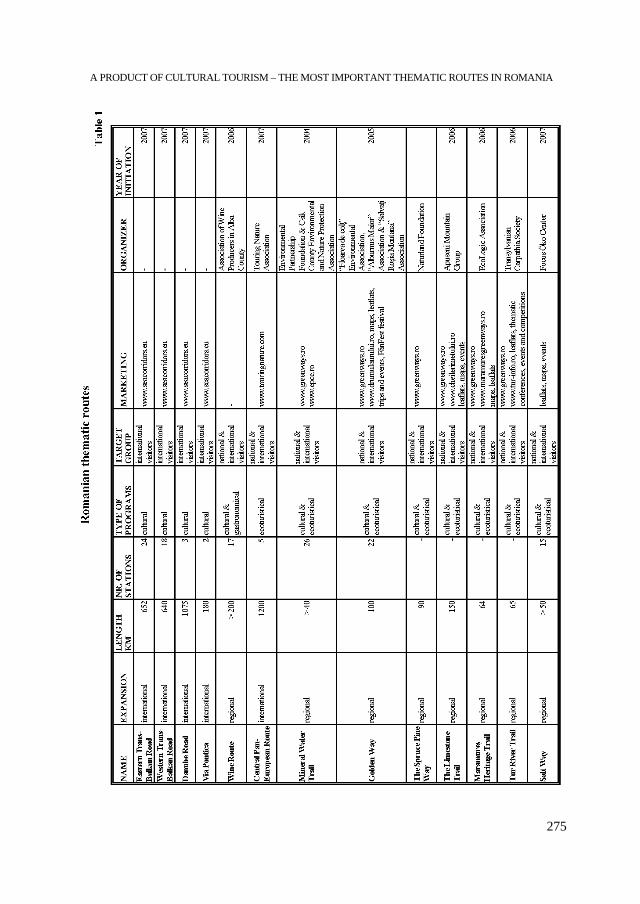
A PRODUCT OF CULTURAL TOURISM – THE MOST IMPORTANT THEMATIC ROUTES IN ROMANIA
275
CSÍKI LUJZA TÜNDE
276
In case of the Romanian “European Cultural Routes” we can not talk about working thematic routes, because even if these routes were elaborated in theory, in reality they are not working yet. They are still in the planning phase. The European Commission did not issue the “European Cultural Route” certificate yet.
There is very little information available of these routes and the available information is not detailed enough. The maps presented on the web page are very simple and there is no printed information material. The informative panels and indicating signs beside the routes are also missing. The European Cultural Routes Regional Center is not working properly, it is very hard to contact them due to the fact that they changed their initial location and they don’t have a home page or accessible phone numbers. The general manager of the National Institute for Research and Development in Tourism declared that they heard about this project at the institute and they held intercourse with the European Cultural Routes Regional Center, but they didn’t have any common projects. The questioned tourism manager also didn’t have much information about these routes, even if she organized tourism packages to most of the attractions included in the routes.
Unfortunately very few of the past and actual political leaders are interested in supporting the development of thematic routes. Without political support is very hard to take part in international projects like this one.
In the case of the Central Pan-European Route the situation is the same as with the European Cultural Routes.
Regarding the Greenways the situation is different. Namely all the seven routes are regional, they are composed of smaller routes, they address to both national and international tourists with cultural and ecotouristic programs and different associations are responsible for their existence. The local communities have in each case a positive attitude towards the routes and are convinced that they can benefit from their existence.
At the time of being the Greenways work well due to all the right characteristics they have. However in each case the tourism infrastructure is weak and the demand is not too high. The organizers are pleased with the current state of the routes even if they admit that there is still a lot of work to be done until the routes will become successful thematic routes.
Surprisingly there is a lot of information about the Romanian Greenways. These can be found in printed and digital information as well. The printed maps, leaflets and information boards along the routes are well design, using the logos and they are properly worked out containing all the necessary information the visitors need. These can be found along the routes, at the accommodation and at the information points.
However the Romanian Greenways are still in the primitive phase. Truly they just started to work because the advertisements. The organizers are trying to implement these routes in tourism packages. The questioned tourism manager decided only this year to introduce some of the trails in her offer, but only for one or two days and especially for international tourists, because otherwise there would be no demand.
Greenways are an opportunity for the development of ecotourism in Romania. Although it is not a current tourism product in Romania the organizers hope that more and more Romanian tourists will cross these routes.
About the Wine’s Route we can say that like the cultural routes they work only in theory. The route was initiated in 2006, but is not working properly yet. The information boards and indication signs were installed and the route is well elaborated, there isn’t enough
A PRODUCT OF CULTURAL TOURISM – THE MOST IMPORTANT THEMATIC ROUTES IN ROMANIA
277
information about the routes and the organizers are not willing to give away too many details. The route doesn’t have a home page either which would make program planning for tourists easier.
6. CONCLUSIONS
The main question of this research was: What kind of thematic routs exist at the moment in Romania and how do they work? The research shows that at the time of being there are thirteen thematic routes we can talk about in Romania. These can be grouped in the following categories: European Cultural Routes – Eastern Trans-Balkan cultural corridor, Western Trans-Balkan cultural corridor, Danube Road and Via Pontica; Greenways - Mineral Water Trail, The Golden Way, The Limestone Trail, Maramures Heritage Trail, The Spruce Pine Way, Tur River Trail and The Salt Way; The Wine’s Route and finally The Central Pan-European Route.
Besides the existing routes the first steps have been made to connect Romania to the following cultural routes: The Silk Route, The Jewish Heritage Route, Rural Habitat and European Monastic Orders. Further Romania has the opportunity to join to international cultural routes like European Figures, Route of the Gypsies or to Park and Gardens.
At the moment the best working thematic routes in Romania are the Greenways. Although they are only regional routes, are not connected to similar international routes, but they are well worked out and available to everyone all year long. There is space for further development, but they are the only ones that work, not just in theory.
The aim of this research was to review the existing thematic routes in Romania, to sum of the offer of the tourism market on this field, to review the routes current development and to reveal the existing problems. The research is to be continued for a deeper understanding of these routes.
R E F E R E N C E S
1. Capp, S. (2002), The European Institute of Cultural Routes, Council of Europe Publishing, Strasbourg. 2. Formádi, K., Mayer, P. (2004), Bevezetés a turizmusba társadalomtudományi megközelítésben,
Pannon Egyetem, Veszprém. 3. Horváth, A. (1999), Turizmus a kulúrában – Kultúra a turizmusban, Magyar Művelődési Intézet,
Budapest. 4. Mangion, G., Tamen, I. (1998), European Cultural Routes, Council of Europe Publishing, Strasbourg. 5. Michalkó, G. (2004), A turizmuselmélet alapjai, Kodolányi Főiskola, Székesfehérvár. 6. Orbán, R. (2006), Via Sankti Martini – Az első száz kilométer egy hosszú úton, In: Magyar Turista,
November: 14-16. 7. Rátz, T., Puczkó, L. (2000), Goethe, Humbert és Odüsszeusz nyomában avagy kulturális utak a
turizmusban. In: Turizmus Bulletin, VI (3): 21-43.
CSÍKI LUJZA TÜNDE
278
8. Silbergh, D., Fladmark, M., Henry, G., Young, M. (1994), A strategy for theme trails. In: Fledmark, M. (ed.): Cultural Tourism. Donhead, London: 123-146.
9. Urry, J. (1990), The Tourist Gaze: Leisure and Travel in Contemporary Socieites (Theory, Culture & Society), Sage Publications, London.
Internet sources:
1. www.coe.int 2. www.culture-routes.lu 3. www.greenways.ro 4. www.seecorridors.eu 5. www.touringnature.com
STUDIA UNIVERSITATIS BABEŞ-BOLYAI, GEOGRAPHIA, LV, 2, 2010
Notes and Book Reviews – Note şi recenzii
Călin Cornel Pop (2010), Juridical Geogra-phy, Legislation and Terminology in Tourism; intern and comunitar acceptance, Casa Cărţii de Ştiinţă Publishing House, Cluj-Napoca, ISBN 978-973-133-670-1, 297 pages, type B5, maps, tables, images (annexes), alphabetical index.
The training of the specialists in tourism, especially of the graduates from the faculties of geography, necessarily implies a large knowl-edge of the intern and European juridical legislation and terminology.
The book with the title Juridical Geogra-phy, with special reference to tourism not only intern but also comunitar, has an important place among the publications which establish the inbuilt preparation for the tourism activity.
The elements of the Juridical Geography are extremely rare in the literature of Romania. The author of the book quotes a few cases, limited to the legal sphere of tourism.
Because of the author’s desire to serve all the people who are interested in legal problems in tourism it was approached a variety of problems in the contents of the 6 (six) chapters.
The intern norms which refer to the signification of the terms and expressions, the tourism heritage, institutional management and the organization of the tourism activity are the elements from the first chapter.
The second chapter approaches the comu-nitar norms through the statistics and some terminological acceptances for tourism.
The intern juridical norms about the mountain area, the beach, and the balneary and recreation tourism are completed by the intern and comunitar norms regarding the rural zone and they are included in chapter three with the title legislation and terminology.
The elements from the chapter four with the title activities, professions, services presents aspects about the profession of master in gastronomic arts and tourism guide. In the same chapter are presented the necessarily conditions to obtain the tourism degree and brevet and the criteria of giving the ecological label for the camping services.
Chapter five with the title marketing, promotion, and resources refers to the problems linked to marketing in tourism, products in tourism, promotion in tourism, durable devel-opment and touristic resources and it contains also the graphic expression of some of the problems presented through the four colored images.
Though, the last chapter has a subject which refers to business management which is included in the economic sector and it is named as elements of commercial law.
NOTES AND BOOK REVIEWS
280
Adjacently to these six chapters this work paper has a foreword where the author speci-fies the fact that the ones who are interested in tourism have closely through this book a legislative guidance and a terminological clarification of the touristic load. In this work paper it is also presented a wide bibliography of studies in juridical, geographical and tourism domain (100 titles), aspects which harmoniously recruit the book.
Essentially, the whole content of the book regards 5 (five) substructures of the entire touristic system: the tourist who does the action, the entrepreneur in the touristic process, the tourism heritage (natural and human), the services, the tourism infrastructure with everything involved in it.
In consequence, this work paper is assisted with wide information, from the presentation of the touristic phenomenon in its content,
spatial signification and manifestation (moun-tain, beach, rural, urban etc.), to the organiza-tional setting and forms of satisfaction of the touristic request.
Looking attentively upon the ordered parts in its content we can get to the conclu-sion that there are some chances that some chapters form different books which serve the entire instruction, education, action, attitude and coordination system in tourism.
Through the diversity of the approached subject, through the logical enumeration of the presented facts and through the wide and diversified information we can see that this is a valuable and extremely useful work paper not only for the students but for everyone interested in a good knowledge of the tourism activity in modern society.
IOAN MAC Păuleanu, Doina – „Constanţa 1878-1928. Spectacolul modernităţii târzii” [Constanţa 1878-1928. Spectacle of Late Modernity], vol. I 507 p., vol. II 624 p., Arcade Publishing House, Bucharest, 2006. Some time ago, the Arcade Publishing House published an extremely well documented work, in two massive volumes, richly illustrated with photographs and drawings, with a vast bibliography, devoted to the modern beginnings of Constanţa from 1878, after Dobrudja was returned to Romania following the Russian- Romanian-Turkish war, to 1928, period includ-ing the first fifty years of Romanian life. The author is the distinguished and untiring researcher Doina Păuleanu, a great personality of humanistic culture, who has offered us, among others, the best monograph on the Romanian School of Painting in Balcic. The Director of the Art Museum of Constanţa, one of the most beautiful county art museums in Romania, demonstrating once more, if
needed, her exceptional professionalism, Doina Păuleanu delights us with both her artistic sensibility and scientific accuracy through this wonderful study on the modern beginnings of Constanţa. I have to confess that the review of such a work was not an easy undertaking, not because of the difficult reading, on the contrary, but because of the extraordinarily rich information, whose density makes reading an effervescent intellectual exercise. Volume I is structured in four chapters and closes with extensive notes the proof of the author’s documentation efforts. The first chapter “Tomis-Constantza-Kiustendje-Constanţa” is an exhaustive excursion into the beginnings of the city, “a Tomite condita”, which evolved from a Milesian emporion founded in the 6th century BC to the city that was so promising in the early 20th century. The author outlines the evolution of the settlement by frequent historical, philological and cultural excursions into the memory of places and of Constanţa, which manifested
NOTES AND BOOK REVIEWS
281
through “genius loci” a “real survival voca-tion”. It evolved from the trading post, then the colony of Tomis […], with its pagan name changed through Christian centuries into the surviving name of Constantia – Constanţa, to a Roman metropolis (barbarously leveled down to its water-surrounded ground), a sleeping, forgotten village – Kiustendje, a fast growing city that was subsequently vandalized, de-prived of its past and oversized in the name of dogmatic triumphalism; a palimpsest of cultures and civilizations, with a port and urban structure successively Greek, Roman, Byzantine, Ottoman and finally but rightly Romanian”, as the author writes on page 5. The layers of civilization that have left material traces of extremely varied populations in Dobrudja make this province unique, and the charm of Constanţa is partly due to this strange mixture of Greeks, Turks, Tartars, Armenians, Russians, Bulgarians, Jews and Romanians, who have found a common language for communication – the Romanian language. In the presentation of the evolution of the city, the author has recourse to a rich memoir literature that describes the metamorphoses of Constanţa, especially after the two great eastern powers – the Ottoman and Czarist empires, started to dispute their conflicts on the land of Dobrudja. After Dobrudja was reintegrated within the natural boundaries of Romania, in 1878, the first thought of the Romanian political elite headed by King Carol I - which proved to be visionary – was to reintegrate the province in the state structure of the country, by concrete actions among which the reinforcement of the Romanian element, the development of Constanţa as a maritime gateway, and the rail-way connection, by extensive works in 1895. The festive entry of Romanian civil authorities and military forces took place in November 1878, when “Constanţa began its decisive entry to the modern period, supported by a burning and relentless sense of recovery - of a bimillennial tradition, capable to confer it in compensation an unequaled ancientness and glory, and of an economic, civic, but especially
cultural lag, perceived as a vicissitude of times and not as an unjustified absence…” (p. 76). The second chapter, that of the modern beginnings of the city, is entitled “It feels so good in Constanţa!”, which is the conclusion drawn. The author presents – using inspired descriptions of the time - the picturesque position, then the “growth” of the city from 1263 inhabitants in 1878 to 63,000 in 1928, the ethnic, religious and professional structure of the population, the urbanistic beginnings and effervescence that increased the price of land from 10 bani/sq. m. to 60 lei, etc. The author introduces us to the color and the “savoir vivre” of the time by funny stories, such as that of “the grandeur and decadence of Gelal Bey” or by recalling the possibilities of entertainment – horse races, dancing balls, banquets, “national and popular feasts”, or by simply describing “what a beautiful view Constanţa offers to a broken heart”. A special place in this chapter is reserved to the balneal function of the city, because – what a visionary anticipation of the officials! – “in addition to an important commercial city, Constanţa will be one of the most visited balneal resorts!”, already having “a pleasure train to the vineyards” (“La Vii”), where the baths are located. The third chapter - “The new ideal of civilization – ‘The thriving of commerce and the decoration of Romania’” and the fourth chapter “Major urbanistic decisions” describe the “cutting” of the great boulevards and squares, the buildings named after personali-ties of the time: the Kogălniceau house, the Pariano house, still so majestic today, the house of the cereal trader Armenag Manissalian, then the Cănănău, Zahariade, Erbiceanu, Zottu, Cuculis, Şomănescu, Abramoglu houses, in beautiful styles – neo-Romanian, eclectic or art nouveau. The boyars and the small bourgeoisie, i.e. the merchants, built very beautiful houses: the boyars – boyar houses, such as the Sturdza palace, and the merchants – merchant houses, remarkable civil construc-tions. In the late 19th and early 20th centuries, major urbanistic decisions were made – the
NOTES AND BOOK REVIEWS
282
extension of the port, which was executed by Eng. Anghel Saligny, the widening and prolongation of the great boulevards, the construction of administrative buildings, of the great houses of commerce and hotels, of a casino that can still be admired on the sea-wall. All these were undertaken after long debates, negotiations, actions and reactions that drove the Romanian society forward, towards obvious progress, which should be recognized, assumed and whose material evidence should be carefully preserved. Volume II is structured in three large chapters, followed by an impressive number of “Notes” and an “Index of names”. In the first chapter, “News and facts from Constanţa”, the author develops the aspects of “cultural history and urban anthropology”, as she herself confesses, insisting on some events and personalities that marked the development of the city at a time when emphasis was placed on form and content, gestures, courtesy. In this context, the frequent visits of the members of the royal family are presented, who constantly watched over the development of the city and its port, as well as the visits of other personalities such as prince Sturdza, baron Edgar de Marçay, whose name is related to the construction of the Palace hotel, or Jean Gérard Amédé Alléon, a banker of Constantinople “interested in the development of the city”, and other public personalities who contributed to the growth of the city, such as architect Adolf Linz (1855-1927), “the most prolific designer in Constanţa during the first two decades of the century”, or the first prefect of the county, Remus Opreanu (1844-1908). The second chapter, “The aspiration to a local style” is devoted to the stage of “maturation” of the urbanistic policy of Constanţa, through the crystallization of a somewhat international local architectural style, since the population was extremely heterogeneous. The author details the prob-lems surrounding the construction of emblem-atic buildings of the city, such as the Ortho-dox Cathedral, the buildings in the proximity
of the Mahmudje Djami mosque, the Naviga-tion Palace, the Italian Church or the Communal Palace (in the third chapter). The author describes the charm of the residential area by telling the “story of houses”; these include the “House with Lions” on Diana’s street which, I must confess, has drawn my attention since I was a child. Every year when I went to the seaside with my parents, a day was devoted to Constanţa and two houses drew my attention – the Pariano House and the “House with Lions”, which aroused in me a sort of admiration for and amazement at a time period that back then I only felt, now I know for sure, was one of fulfillment for Romania. The third chapter, “The city center is Independence Square”, is in fact the “story” of the accomplishment of this square – which is a symbol of Constanţa, because this is the “emporion of commerce”, the heart of the city. The sides of the square were flanked by emblematic buildings – Mercur Hotel, the Hrisicos, Torosian houses or the Communal Palace, whose grandeur is shown in the photo-graph on page 488. The square, situated on the promontory that advances into the sea, which it dominates from 15-30 m high, under-went unsuccessful urbanistic interventions during the communist period, according to the doctrine of the preference of the new over the old, which in fact “is barbaric”, as “there is no future for a society that has no respect and taste for the past. The present, which is only the most recent moment of the past, is nothing else but the dynamic, perpetu-ally generating substance of the future. Anti-passeism is the denial of future” (Paleologu, Alexandru, 2000, Preface to the Story of Houses, Simetria Publishing House, Bucharest, p. 7). From this square, a number of streets (see map, p. 369) start radially towards the sea, an assembly whose evolution towards a “modern urban civilization” with local and national specificity marks the end of the mono-graph and represents the quintessence of the “spectacle of late modernity” of Constanţa, which must be preserved by its declaration as a national architectural patrimony reserve.
NOTES AND BOOK REVIEWS
283
Unfortunately, the legislative chaos and the crisis of authority of state institutions have led to the obvious degradation of this historical area of Constanţa. Mrs. Doina Păuleanu’s book is a plea for her city, for the preservation of its historical buildings and areas. It offers us racy or tragic details on the evolution of Constanţa in a favor-able period of our history, when Romania was a flourishing kingdom, and the author does not hesitate to describe the public life of the elites who most often represented public inter-ests in a constructive way, by assuming a representation function. The elites were models to be followed by society, it was them who drove society forward. The book suggests the idea that Romanian society was governed by laws that were respected, articulated laws that led to progress, and each member of society had their own place and role, society was functionally stratified, there was no “reversal of values”, as we call it today. Reading this admirable “story of houses” of Constanţa makes me remember two other books representative of this type of writing. One is the “Story of Houses” published in 2000 by the Simetria Publishing House in Bucharest, Rodica Ianăş ed., the other, the excellent monograph on the Ploieşti city by Mihail Sevastos, published by the Cartea Ro-mânească Publishing House in 1937. If the “Story of Houses” is about the metamorphoses of families and their houses in the context of a political regime change, an excursion into the privacy of each of the presented houses, in Mrs. Doina Păuleanu’s wonderful monograph, “the story of houses” of Constanţa describes the architectonic changes of a village turning into a city over the course of half a century. The houses of Constanţa certainly have their lives and stories and in the peace of their time, witty discussions must have taken place. I cannot help presenting a small fragment of life of the “Small House” in Popa Soare street 16 bis in Bucharest, recalled by Măriuca Vulcănescu: “…Behind the Voltaire armchair, covering all the book shelves, there was a map as large as the entire wall, which my father always had before his
eyes. It was the map of United Romania, with all its counties, waters, villages and roads! I also had a passion for it! I took for granted its round outline, as we knew it in the 30’s (compared by others to a loaf of bread, a wreath or a heart). I followed with admiration the line of the beautiful profile with the forehead and the nose drawn by the course of the Dniester, with perfect lips outlined by the Danube Delta, and with the chin delimited by the contour of Cadrilater; it seemed the image of perfect beauty to me! But there was another face: the western side face, which I called “Fifiţa”: it had a sharp nose pointing upwards (at Beba-Veche), the mouth open with disappointment, an effaced chin and a goiter, traced by the meanders of the Danube from Baziaş to Corabia. This would set me thinking, reminding me of two-faced Ianus, of a person with two different personalities, one proud and haughty, the other foolish. Today, we only have this “Fifiţa”, but now she has a modern hairstyle: a pony-tail! Now she looks like a fish that can no longer breathe…” (p. 203). There is no need to insist on the depth of thinking, on the childish interests of two exceptional young girls, Măriuca and Sandra Vulcănescu, or on the atmosphere of the Vulcănescu family. Mrs. Păuleanu’s book also describes the atmosphere of some “houses” of Constanţa. The monograph might have been more complete if it had included several images of local notabilities of the time with a constructive-visionary vocation. The comparison to the “Monograph of the Ploieşti city”, a massive volume of 906 pages, in large format (4°), including 48 advertising pages (who can claim that Ro-mania lagged behind in the interwar period?), published in 1937, is based on the rich in-formation, on the meticulous work present in the case of two authors who love their work and the cities to which they have devoted their books. It might be useful for a future edition of the monograph on Constanţa to include several maps of the city in various evolution stages, which might complete the text harmoniously.
NOTES AND BOOK REVIEWS
284
To conclude, Mrs. Doina Păuleanu, following laborious archive researches, offers us a beautiful book on the modern beginnings of the city of Constanţa. Using her encyclopedic spirit for the research, discovery and synthesis of the creation of this “mixture of peoples” who founded Tomis-Kiustendje-Constanţa, the author is through her most recent book almost singular in the Romanian cultural
landscape. We thank her for her efforts and achievements; this book is useful for any humanistic geographer and should not miss from any public or private library, being an exemplary study in the field of cultural history and urban anthropology.
AL. PĂCURAR