5(3257 - cemex nicaragua
TRANSCRIPT


UNITED STATESSECURITIES AND EXCHANGE COMMISSION
WASHINGTON, D.C. 20549
FORM 20-F(Mark One)‘ REGISTRATION STATEMENT PURSUANT TO SECTION 12(b) OR (g) OF THE SECURITIES EXCHANGE ACT OF 1934
ORÈ ANNUAL REPORT PURSUANT TO SECTION 13 OR 15(d) OF THE SECURITIES EXCHANGE ACT OF 1934
For the fiscal year ended December 31, 2016OR
‘ TRANSITION REPORT PURSUANT TO SECTION 13 OR 15(d) OF THE SECURITIES EXCHANGE ACT OF 1934OR
‘ SHELL COMPANY REPORT PURSUANT TO SECTION 13 OR 15(d) OF THE SECURITIES EXCHANGE ACT OF 1934Date of event requiring this shell company report
For the transition period from toCommission file number 1-14946
CEMEX, S.A.B. de C.V.(Exact name of Registrant as specified in its charter)
CEMEX PUBLICLY TRADED STOCK CORPORATION WITH VARIABLE CAPITAL(Translation of Registrant’s name into English)
United Mexican States(Jurisdiction of incorporation or organization)
Avenida Ricardo Margáin Zozaya #325, Colonia Valle del Campestre, San Pedro Garza García,Nuevo León, México 66265
(Address of principal executive offices)Roger Saldaña Madero,
+52 81 8888-8888, +52 81 8888-4399,Avenida Ricardo Margáin Zozaya #325, Colonia Valle del Campestre, San Pedro Garza García,
Nuevo León, México 66265(Name, Telephone, E-mail and/or Facsimile number and Address of Company Contact Person)
Securities registered or to be registered pursuant to Section 12(b) of the Act.Title of each class Name of each exchange on which registered
Ordinary Participation Certificates (Certificados de ParticipaciónOrdinarios), or CPOs, each CPO representing two Series A shares and one
Series B share, traded in the form of American Depositary Shares, or ADSs,each ADS representing ten CPOs.
New York Stock Exchange
Securities registered or to be registered pursuant to Section 12(g) of the Act.None
(Title of Class)Securities for which there is a reporting obligation pursuant to Section 15(d) of the Act.
None(Title of Class)
Indicate the number of outstanding shares of each of the issuer’s classes of capital or common stock as of the close of the period covered by the annual report.14,039,298,127 CPOs28,121,583,148 Series A shares (including Series A shares underlying CPOs)14,060,791,574 Series B shares (including Series B shares underlying CPOs)
Indicate by check mark if the registrant is a well-known seasoned issuer, as defined in Rule 405 of the Securities Act. Yes È No ‘
If this report is an annual or transition report, indicate by check mark if the registrant is not required to file reports pursuant to Section 13 or 15(d) of the SecuritiesExchange Act of 1934. Yes ‘ No È
Note—Checking the box above will not relieve any registrant required to file reports pursuant to Section 13 or 15(d) of the Securities Exchange Act of 1934 fromtheir obligations under those Sections.Indicate by check mark whether the registrant (1) has filed all reports required to be filed by Section 13 or 15(d) of the Securities Exchange Act of 1934 during thepreceding 12 months (or for such shorter period that the registrant was required to file such reports), and (2) has been subject to such filing requirements for the past90 days. Yes È No ‘
Indicate by check mark whether the registrant has submitted electronically and posted on its corporate Web site, if any, every Interactive Data File required to besubmitted and posted pursuant to Rule 405 of Regulation S-T (§232.405 of this chapter) during the preceding 12 months (or for such shorter period that theregistrant was required to submit and post such files). N/AIndicate by check mark whether the registrant is a large accelerated filer, an accelerated filer, a non-accelerated filer or an emerging growth company. See thedefinitions of “large accelerated filer,” “accelerated filer,” and “emerging growth company” in Rule 12b-2 of the Exchange Act (check one).
Large accelerated filer È Accelerated filer ‘ Non-accelerated filer ‘ Emerging growth company ‘
If an emerging growth company that prepares its financial statements in accordance with U.S. GAAP, indicate by check mark if the registrant has elected not to usethe extended transition period for complying with any new or revised financial accounting standards† provided pursuant to Section 13(a) of the Exchange Act. ‘
† The term “new or revised financial accounting standard” refers to any update issued by the Financial Accounting Standards Board to its Accounting StandardsCodification after April 5, 2012.
Indicate by check mark which basis of accounting the registrant has used to prepare the financial statements included in this filing:U.S. GAAP ‘ International Financial Reporting Standards as issued
by the International Accounting Standards Board ÈOther ‘
If “Other” has been checked in response to the previous question, indicate by check mark which financial statement item the registrant has elected tofollow. Item 17 ‘ Item 18 ‘
If this is an annual report, indicate by check mark whether the registrant is a shell company (as defined in Rule 12b-2 of the Exchange Act). Yes ‘ No È

TABLE OF CONTENTS
PART I
Item 1—Identity of Directors, Senior Management and Advisors . . . . . . . . . . . . . . . . . . . . . . . . . . . . . . . . . . 3Item 2—Offer Statistics and Expected Timetable . . . . . . . . . . . . . . . . . . . . . . . . . . . . . . . . . . . . . . . . . . . . . . 3Item 3—Key Information . . . . . . . . . . . . . . . . . . . . . . . . . . . . . . . . . . . . . . . . . . . . . . . . . . . . . . . . . . . . . . . . . 3
Summary of Most Important Transactions since the 2009 Refinancing . . . . . . . . . . . . . . . . . . . . . . . . . . 3Risk Factors . . . . . . . . . . . . . . . . . . . . . . . . . . . . . . . . . . . . . . . . . . . . . . . . . . . . . . . . . . . . . . . . . . . . . . . . 9Mexican Peso Exchange Rates . . . . . . . . . . . . . . . . . . . . . . . . . . . . . . . . . . . . . . . . . . . . . . . . . . . . . . . . . 30Selected Consolidated Financial Information . . . . . . . . . . . . . . . . . . . . . . . . . . . . . . . . . . . . . . . . . . . . . . 31
Item 4—Information on the Company . . . . . . . . . . . . . . . . . . . . . . . . . . . . . . . . . . . . . . . . . . . . . . . . . . . . . . . 36Business Overview . . . . . . . . . . . . . . . . . . . . . . . . . . . . . . . . . . . . . . . . . . . . . . . . . . . . . . . . . . . . . . . . . . 36Geographic Breakdown of Net Sales for the Year Ended December 31, 2016 . . . . . . . . . . . . . . . . . . . . 41Breakdown of Net Sales by Product for the Year Ended December 31, 2016 . . . . . . . . . . . . . . . . . . . . . 42Our Products . . . . . . . . . . . . . . . . . . . . . . . . . . . . . . . . . . . . . . . . . . . . . . . . . . . . . . . . . . . . . . . . . . . . . . . 42Our Vision . . . . . . . . . . . . . . . . . . . . . . . . . . . . . . . . . . . . . . . . . . . . . . . . . . . . . . . . . . . . . . . . . . . . . . . . . 53Financial Strategy . . . . . . . . . . . . . . . . . . . . . . . . . . . . . . . . . . . . . . . . . . . . . . . . . . . . . . . . . . . . . . . . . . . 60User Base . . . . . . . . . . . . . . . . . . . . . . . . . . . . . . . . . . . . . . . . . . . . . . . . . . . . . . . . . . . . . . . . . . . . . . . . . . 62Our Corporate Structure . . . . . . . . . . . . . . . . . . . . . . . . . . . . . . . . . . . . . . . . . . . . . . . . . . . . . . . . . . . . . . 64Our Trading Operations . . . . . . . . . . . . . . . . . . . . . . . . . . . . . . . . . . . . . . . . . . . . . . . . . . . . . . . . . . . . . . 94Our Cement Plants . . . . . . . . . . . . . . . . . . . . . . . . . . . . . . . . . . . . . . . . . . . . . . . . . . . . . . . . . . . . . . . . . . 95Regulatory Matters and Legal Proceedings . . . . . . . . . . . . . . . . . . . . . . . . . . . . . . . . . . . . . . . . . . . . . . . 96
Item 4A—Unresolved Staff Comments . . . . . . . . . . . . . . . . . . . . . . . . . . . . . . . . . . . . . . . . . . . . . . . . . . . . . . 123Item 5—Operating and Financial Review and Prospects . . . . . . . . . . . . . . . . . . . . . . . . . . . . . . . . . . . . . . . . . 124
Cautionary Statement Regarding Forward-Looking Statements . . . . . . . . . . . . . . . . . . . . . . . . . . . . . . . 124Overview . . . . . . . . . . . . . . . . . . . . . . . . . . . . . . . . . . . . . . . . . . . . . . . . . . . . . . . . . . . . . . . . . . . . . . . . . . 125Critical Accounting Policies . . . . . . . . . . . . . . . . . . . . . . . . . . . . . . . . . . . . . . . . . . . . . . . . . . . . . . . . . . . 126Results of Operations . . . . . . . . . . . . . . . . . . . . . . . . . . . . . . . . . . . . . . . . . . . . . . . . . . . . . . . . . . . . . . . . 135Consolidation of Our Results of Operations . . . . . . . . . . . . . . . . . . . . . . . . . . . . . . . . . . . . . . . . . . . . . . . 135Selected Consolidated Statement of Operations Data . . . . . . . . . . . . . . . . . . . . . . . . . . . . . . . . . . . . . . . . 137Year Ended December 31, 2016 Compared to Year Ended December 31, 2015 . . . . . . . . . . . . . . . . . . . 137Year Ended December 31, 2015 Compared to Year Ended December 31, 2014 . . . . . . . . . . . . . . . . . . . 153Liquidity and Capital Resources . . . . . . . . . . . . . . . . . . . . . . . . . . . . . . . . . . . . . . . . . . . . . . . . . . . . . . . . 168Research and Development, Patents and Licenses, etc. . . . . . . . . . . . . . . . . . . . . . . . . . . . . . . . . . . . . . . 181Trend Information . . . . . . . . . . . . . . . . . . . . . . . . . . . . . . . . . . . . . . . . . . . . . . . . . . . . . . . . . . . . . . . . . . . 182Summary of Material Contractual Obligations and Commercial Commitments . . . . . . . . . . . . . . . . . . . 182Off-Balance Sheet Arrangements . . . . . . . . . . . . . . . . . . . . . . . . . . . . . . . . . . . . . . . . . . . . . . . . . . . . . . . 189Quantitative and Qualitative Market Disclosure . . . . . . . . . . . . . . . . . . . . . . . . . . . . . . . . . . . . . . . . . . . . 189Investments, Acquisitions and Divestitures . . . . . . . . . . . . . . . . . . . . . . . . . . . . . . . . . . . . . . . . . . . . . . . 194Recent Developments . . . . . . . . . . . . . . . . . . . . . . . . . . . . . . . . . . . . . . . . . . . . . . . . . . . . . . . . . . . . . . . . 196
Item 6—Directors, Senior Management and Employees . . . . . . . . . . . . . . . . . . . . . . . . . . . . . . . . . . . . . . . . . 199Senior Management and Directors . . . . . . . . . . . . . . . . . . . . . . . . . . . . . . . . . . . . . . . . . . . . . . . . . . . . . . 199Board Practices . . . . . . . . . . . . . . . . . . . . . . . . . . . . . . . . . . . . . . . . . . . . . . . . . . . . . . . . . . . . . . . . . . . . . 209Compensation of CEMEX, S.A.B. de C.V.’s Directors and Members of Our Senior Management . . . . 211Employees . . . . . . . . . . . . . . . . . . . . . . . . . . . . . . . . . . . . . . . . . . . . . . . . . . . . . . . . . . . . . . . . . . . . . . . . . 213Share Ownership . . . . . . . . . . . . . . . . . . . . . . . . . . . . . . . . . . . . . . . . . . . . . . . . . . . . . . . . . . . . . . . . . . . . 214
Item 7—Major Shareholders and Related Party Transactions . . . . . . . . . . . . . . . . . . . . . . . . . . . . . . . . . . . . . 214Major Shareholders . . . . . . . . . . . . . . . . . . . . . . . . . . . . . . . . . . . . . . . . . . . . . . . . . . . . . . . . . . . . . . . . . . 214Related Party Transactions . . . . . . . . . . . . . . . . . . . . . . . . . . . . . . . . . . . . . . . . . . . . . . . . . . . . . . . . . . . . 216
i
Item 8—Financial Information . . . . . . . . . . . . . . . . . . . . . . . . . . . . . . . . . . . . . . . . . . . . . . . . . . . . . . . . . . . . . 216Consolidated Financial Statements and Other Financial Information . . . . . . . . . . . . . . . . . . . . . . . . . . . 216Legal Proceedings . . . . . . . . . . . . . . . . . . . . . . . . . . . . . . . . . . . . . . . . . . . . . . . . . . . . . . . . . . . . . . . . . . . 216Dividends . . . . . . . . . . . . . . . . . . . . . . . . . . . . . . . . . . . . . . . . . . . . . . . . . . . . . . . . . . . . . . . . . . . . . . . . . 216Significant Changes . . . . . . . . . . . . . . . . . . . . . . . . . . . . . . . . . . . . . . . . . . . . . . . . . . . . . . . . . . . . . . . . . . 217
Item 9—Offer and Listing . . . . . . . . . . . . . . . . . . . . . . . . . . . . . . . . . . . . . . . . . . . . . . . . . . . . . . . . . . . . . . . . . 217Market Price Information . . . . . . . . . . . . . . . . . . . . . . . . . . . . . . . . . . . . . . . . . . . . . . . . . . . . . . . . . . . . . 217
Item 10—Additional Information . . . . . . . . . . . . . . . . . . . . . . . . . . . . . . . . . . . . . . . . . . . . . . . . . . . . . . . . . . . 218Articles of Association and By-laws . . . . . . . . . . . . . . . . . . . . . . . . . . . . . . . . . . . . . . . . . . . . . . . . . . . . . 218Share Capital . . . . . . . . . . . . . . . . . . . . . . . . . . . . . . . . . . . . . . . . . . . . . . . . . . . . . . . . . . . . . . . . . . . . . . . 227Material Contracts . . . . . . . . . . . . . . . . . . . . . . . . . . . . . . . . . . . . . . . . . . . . . . . . . . . . . . . . . . . . . . . . . . . 227Exchange Controls . . . . . . . . . . . . . . . . . . . . . . . . . . . . . . . . . . . . . . . . . . . . . . . . . . . . . . . . . . . . . . . . . . 228Taxation . . . . . . . . . . . . . . . . . . . . . . . . . . . . . . . . . . . . . . . . . . . . . . . . . . . . . . . . . . . . . . . . . . . . . . . . . . . 229Documents on Display . . . . . . . . . . . . . . . . . . . . . . . . . . . . . . . . . . . . . . . . . . . . . . . . . . . . . . . . . . . . . . . 232
Item 11—Quantitative and Qualitative Disclosures About Market Risk . . . . . . . . . . . . . . . . . . . . . . . . . . . . . 233Item 12—Description of Securities Other than Equity Securities . . . . . . . . . . . . . . . . . . . . . . . . . . . . . . . . . . 233Item 12A—Debt Securities . . . . . . . . . . . . . . . . . . . . . . . . . . . . . . . . . . . . . . . . . . . . . . . . . . . . . . . . . . . . . . . . 233Item 12B—Warrants and Rights . . . . . . . . . . . . . . . . . . . . . . . . . . . . . . . . . . . . . . . . . . . . . . . . . . . . . . . . . . . . 233Item 12C—Other Securities . . . . . . . . . . . . . . . . . . . . . . . . . . . . . . . . . . . . . . . . . . . . . . . . . . . . . . . . . . . . . . . 233Item 12D—American Depositary Shares . . . . . . . . . . . . . . . . . . . . . . . . . . . . . . . . . . . . . . . . . . . . . . . . . . . . . 233
Depositary Fees and Charges . . . . . . . . . . . . . . . . . . . . . . . . . . . . . . . . . . . . . . . . . . . . . . . . . . . . . . . . . . 233Depositary Payments for the year ended December 31, 2016 . . . . . . . . . . . . . . . . . . . . . . . . . . . . . . . . . 234
PART II
Item 13—Defaults, Dividend Arrearages and Delinquencies . . . . . . . . . . . . . . . . . . . . . . . . . . . . . . . . . . . . . . 234Item 14—Material Modifications to the Rights of Security Holders and Use of Proceeds . . . . . . . . . . . . . . . 234Item 15—Controls and Procedures . . . . . . . . . . . . . . . . . . . . . . . . . . . . . . . . . . . . . . . . . . . . . . . . . . . . . . . . . . 234
Background and Internal Investigation . . . . . . . . . . . . . . . . . . . . . . . . . . . . . . . . . . . . . . . . . . . . . . . . . . . 234Disclosure Controls and Procedures . . . . . . . . . . . . . . . . . . . . . . . . . . . . . . . . . . . . . . . . . . . . . . . . . . . . . 235Management’s Annual Report on Internal Control Over Financial Reporting . . . . . . . . . . . . . . . . . . . . . 235Remediation Plan and Activities . . . . . . . . . . . . . . . . . . . . . . . . . . . . . . . . . . . . . . . . . . . . . . . . . . . . . . . . 236Attestation Report of the Independent Registered Public Accounting Firm . . . . . . . . . . . . . . . . . . . . . . . 236Changes in Internal Control Over Financial Reporting . . . . . . . . . . . . . . . . . . . . . . . . . . . . . . . . . . . . . . 236
Item 16—[RESERVED] . . . . . . . . . . . . . . . . . . . . . . . . . . . . . . . . . . . . . . . . . . . . . . . . . . . . . . . . . . . . . . . . . . 236Item 16A—Audit Committee Financial Expert . . . . . . . . . . . . . . . . . . . . . . . . . . . . . . . . . . . . . . . . . . . . . . . . 236Item 16B—Code of Ethics . . . . . . . . . . . . . . . . . . . . . . . . . . . . . . . . . . . . . . . . . . . . . . . . . . . . . . . . . . . . . . . . 236Item 16C—Principal Accountant Fees and Services . . . . . . . . . . . . . . . . . . . . . . . . . . . . . . . . . . . . . . . . . . . . 238
Audit Committee Pre-Approval Policies and Procedures . . . . . . . . . . . . . . . . . . . . . . . . . . . . . . . . . . . . . 239Item 16D—Exemptions from the Listing Standards for Audit Committees . . . . . . . . . . . . . . . . . . . . . . . . . . 239Item 16E—Purchases of Equity Securities by the Issuer and Affiliated Purchasers . . . . . . . . . . . . . . . . . . . . 239Item 16F—Change in Registrant’s Certifying Accountant . . . . . . . . . . . . . . . . . . . . . . . . . . . . . . . . . . . . . . . . 239Item 16G—Corporate Governance . . . . . . . . . . . . . . . . . . . . . . . . . . . . . . . . . . . . . . . . . . . . . . . . . . . . . . . . . . 239Item 16H—Mine Safety Disclosure . . . . . . . . . . . . . . . . . . . . . . . . . . . . . . . . . . . . . . . . . . . . . . . . . . . . . . . . . 242
PART III
Item 17—Financial Statements . . . . . . . . . . . . . . . . . . . . . . . . . . . . . . . . . . . . . . . . . . . . . . . . . . . . . . . . . . . . . 243Item 18—Financial Statements . . . . . . . . . . . . . . . . . . . . . . . . . . . . . . . . . . . . . . . . . . . . . . . . . . . . . . . . . . . . . 243Item 19—Exhibits . . . . . . . . . . . . . . . . . . . . . . . . . . . . . . . . . . . . . . . . . . . . . . . . . . . . . . . . . . . . . . . . . . . . . . . 243
ii

INTRODUCTION
CEMEX, S.A.B. de C.V. is incorporated as a publicly traded stock corporation with variable capital(sociedad anónima bursátil de capital variable) organized under the laws of the United Mexican States(“Mexico”). Except as the context otherwise may require, references in this annual report to “CEMEX,” “we,”“us” or “our” refer to CEMEX, S.A.B. de C.V. and its consolidated entities. See note 1 to our 2016 auditedconsolidated financial statements included elsewhere in this annual report.
PRESENTATION OF FINANCIAL INFORMATION
Our consolidated financial statements included elsewhere in this annual report have been prepared inaccordance with International Financial Reporting Standards (“IFRS”), as issued by the International AccountingStandards Board (“IASB”).
The regulations of the United States Securities and Exchange Commission (the “SEC”), do not requireforeign private issuers that prepare their financial statements on the basis of IFRS (as published by the IASB) toreconcile such financial statements to U.S. Generally Accepted Accounting Principles (“U.S. GAAP”).
References in this annual report to “U.S.$” and “Dollars” are to U.S. Dollars, references to “€” are to Euros,references to “£” and “Pounds” are to British Pounds, and, unless otherwise indicated, references to “Ps,”“Mexican Pesos” and “Pesos” are to Mexican Pesos. References to “billion” mean one thousand million.References in this annual report to “CPOs” are to CEMEX, S.A.B. de C.V.’s Certificados de ParticipaciónOrdinarios. The Dollar amounts provided below, unless otherwise indicated elsewhere in this annual report, aretranslations of Peso amounts at an exchange rate of Ps20.72 to U.S.$1.00, the CEMEX accounting rate (asdefined herein) as of December 31, 2016. However, in the case of transactions conducted in Dollars, we havepresented the U.S. Dollar amount of the transaction and in most cases, when such amounts are presented in ourconsolidated financial statements, the corresponding Peso amount is presented in our consolidated financialstatements. These translations have been prepared solely for the convenience of the reader and should not beconstrued as representations that the Mexican Peso amounts actually represent those Dollar amounts or could beconverted into Dollars at the rate indicated. Between January 1, 2017 and April 21, 2017, the Mexican Pesoappreciated by approximately 9% against the U.S. Dollar, based on the noon buying rate for Pesos. See “Item3—Key Information—Selected Consolidated Financial Information.”
The noon buying rate for Mexican Pesos on December 31, 2016 was Ps20.62 to U.S.$1.00 and on April 21,2017, was Ps18.84 to U.S.$1.00.
References in this annual report to total debt plus other financial obligations (which include debt under theCredit Agreement (as defined herein)) do not include debt and other financial obligations of ours held by us. Seenotes 2F and 16B to our 2016 audited consolidated financial statements included elsewhere in this annual reportfor a detailed description of our other financial obligations. Total debt plus other financial obligations differsfrom the calculation of debt under the Credit Agreement.
We also refer in various places within this annual report to non-IFRS measures, including “OperatingEBITDA.” “Operating EBITDA” equals operating earnings before other expenses, net, plus amortization anddepreciation expenses, as more fully explained in “Item 5—Operating and Financial Review and Prospects.” Thepresentation of these non-IFRS measures is not meant to be considered in isolation or as a substitute for ourconsolidated financial results prepared in accordance with IFRS as issued by the IASB.
1

CERTAIN TECHNICAL TERMS
When used herein, the terms set forth below mean the following:
• Aggregates are sand and gravel, which are mined from quarries. They give ready-mix concrete itsnecessary volume and add to its overall strength. Under normal circumstances, one cubic meter of freshconcrete contains two metric tons of gravel and sand.
• Clinker is an intermediate cement product made by sintering limestone, clay, and iron oxide in a kilnat around 1,450 degrees Celsius. One metric ton of clinker is used to make approximately 1.1 metrictons of gray portland cement.
• Gray portland cement, used for construction purposes, is a hydraulic binding agent with acomposition by weight of at least 95% clinker and up to 5% of a minor component (usually calciumsulfate) which, when mixed with sand, stone or other aggregates and water, produces either concrete ormortar.
• Petroleum coke (pet coke) is a by-product of the oil refining coking process.
• Ready-mix concrete is a mixture of cement, aggregates, and water.
• Tons means metric tons. One metric ton equals 1.102 short tons.
• White cement is a specialty cement used primarily for decorative purposes.
2

PART I
Item 1—Identity of Directors, Senior Management and Advisors
Not applicable.
Item 2—Offer Statistics and Expected Timetable
Not applicable.
Item 3—Key Information
Summary of Most Important Transactions since the 2009 Refinancing
On August 14, 2009, CEMEX, S.A.B. de C.V. and certain of its subsidiaries entered into a financingagreement (the “2009 Financing Agreement”), which extended the final maturities of approximatelyU.S.$15 billion in syndicated and bilateral loans and private placement notes to February 14, 2014. On July 5,2012, CEMEX, S.A.B. de C.V. and certain of its subsidiaries launched an exchange offer and consent request(the “2012 Exchange Offer and Consent Request”), to eligible creditors under the 2009 Financing Agreementpursuant to which eligible creditors were requested to consent to certain amendments to the 2009 FinancingAgreement (together, the “2012 Amendment Consents”). In addition, CEMEX, S.A.B. de C.V. and certain of itssubsidiaries offered to exchange the indebtedness owed to such creditors under the 2009 Financing Agreementthat were eligible to participate in the 2012 Exchange Offer and Consent Request (the “Participating Creditors”)for (i) new loans (or, in the case of the private placement notes, new private placement notes) or (ii) up toU.S.$500 million of CEMEX, S.A.B. de C.V.’s 9.50% Senior Secured Notes due 2018 issued on September 17,2012 (the “June 2018 U.S. Dollar Notes”), in each case, in transactions exempt from registration under theSecurities Act of 1933, as amended (the “Securities Act”).
On September 17, 2012, CEMEX, S.A.B. de C.V. and certain of its subsidiaries successfully completed therefinancing transactions contemplated by the 2012 Exchange Offer and Consent Request (collectively, the “2012Refinancing Transaction”), and CEMEX, S.A.B. de C.V. and certain of its subsidiaries entered into (a) anamendment and restatement agreement, dated September 17, 2012 (the “2012 Amendment and RestatementAgreement”), pursuant to which the 2012 Amendment Consents with respect to the 2009 Financing Agreementwere given effect, and (b) a facilities agreement, dated September 17, 2012 (as amended from time to time, the“2012 Facilities Agreement”), pursuant to which CEMEX, S.A.B. de C.V. and certain of its subsidiaries weredeemed to borrow loans from those Participating Creditors participating in the 2012 Exchange Offer and ConsentRequest in principal amounts equal to the principal amounts of indebtedness subject to the 2009 FinancingAgreement that was extinguished by such Participating Creditors. As a result of the 2012 RefinancingTransaction, Participating Creditors received (i) approximately U.S.$6,155 million in aggregate principal amountof new loans and new private placement notes and (ii) U.S.$500 million aggregate principal amount of the June2018 U.S. Dollar Notes. In addition, approximately U.S.$525 million aggregate principal amount of loans andprivate placement notes, which had remained outstanding under the 2009 Financing Agreement as ofSeptember 17, 2012, were subsequently repaid in full, as a result of prepayments made in accordance with the2012 Facilities Agreement.
On September 29, 2014, CEMEX, S.A.B. de C.V. and certain of its subsidiaries entered into a facilitiesagreement, as amended and restated (the “Credit Agreement”) for U.S.$1.35 billion with nine of the main lendingbanks from its 2012 Facilities Agreement. On November 3, 2014, five additional banks joined the CreditAgreement as lenders with aggregate commitments of U.S.$515 million, increasing the total amount of the CreditAgreement from U.S.$1.35 billion to U.S.$1.87 billion (increasing the revolving tranche of the Credit Agreementproportionally to U.S.$746 million).
3

On July 30, 2015, CEMEX, S.A.B. de C.V. repaid in full the total amount outstanding of approximatelyU.S.$1.94 billion under the 2012 Facilities Agreement with new funds from 17 financial institutions, whichjoined new tranches under the Credit Agreement.
In February 2016, CEMEX, S.A.B. de C.V. and certain of its subsidiaries launched a consent request tolenders under the Credit Agreement, pursuant to which lenders were requested to consent to certain amendmentsto the Credit Agreement, including certain amendments in relation to the implementation of CEMEX’s plan todivest certain assets in the Philippines, certain amendments to financial covenants, and other related technicalamendments (together, the “2016 Credit Agreement Amendments”). On March 7, 2016, CEMEX, S.A.B. de C.V.and certain of its subsidiaries obtained the requisite consents from lenders under the Credit Agreement to makethe 2016 Credit Agreement Amendments. The 2016 Credit Agreement Amendments became effective whencertain customary conditions precedent were fulfilled on March 17, 2016.
On July 12, 2016, International Finance Corporation (“IFC”) joined the Credit Agreement as a lendergranting CEMEX a loan of €106 million to support CEMEX’s sustainable investment programs in emergingmarkets. The funds will support CEMEX projects designed to enhance environmental performance with 60% ofthe funds allocated for projects relating to the reduction of CEMEX’s greenhouse gas emissions.
On November 30, 2016, CEMEX, S.A.B. de C.V. prepaid U.S.$373 million outstanding under the CreditAgreement and corresponding to the September 2017 amortization thereunder. With this prepayment, and as partof an agreement reached with a group of existing lenders under the Credit Agreement, U.S.$664 million(Ps13,758 million) of funded commitments maturing in 2018 were exchanged into a revolving facility,maintaining their original amortization schedule and the same terms and conditions. As of December 31, 2016,total commitments under the Credit Agreement included (i) approximately €746 million (approximatelyU.S.$785 million or approximately Ps16,259 million) and (ii) approximately U.S.$2,826 million (Ps58,555million), out of which about U.S.$1,413 million (Ps29,277 million) were in the revolving credit facility. TheCredit Agreement currently has an amortization profile, considering all commitments, of approximatelyU.S.$783 million in 2018, U.S.$883 million in 2019 and U.S.$1,096 million in 2020. See note 16A to our 2016audited consolidated financial statements included elsewhere in this annual report.
CEMEX, S.A.B. de C.V. and certain of its subsidiaries have pledged under pledge agreements or transferredto a trustee under a security trust substantially all the shares of CEMEX México, S.A. de C.V. (“CEMEXMéxico”), Cemex Operaciones México, S.A. de C.V. (“Cemex Operaciones México”), CEMEXTRADEMARKS HOLDING Ltd. (“CTH”), New Sunward Holding B.V. (“New Sunward”), and CEMEXEspaña, S.A. (“CEMEX España”), as collateral (together, the “Collateral”), and all proceeds of such Collateral,to secure our payment obligations under the Credit Agreement, the Senior Secured Notes (as defined herein) andunder several other financing arrangements. These subsidiaries whose shares were pledged or transferred as partof the Collateral collectively own, directly or indirectly, substantially all our operations worldwide. See “Item3—Key Information—Risk Factors—Risks Relating to Our Business—We pledged the capital stock ofsubsidiaries that represent substantially all of our business as collateral to secure our payment obligations underthe Credit Agreement, the Senior Secured Notes and other financing arrangements.”
Since 2009, CEMEX, S.A.B. de C.V. and certain of its subsidiaries have completed a number of capitalmarkets transactions, the majority of the proceeds of which have been used to repay indebtedness, to improve ourliquidity position and for general corporate purposes. The most relevant capital markets transactions wecompleted consisted of:
• in September 2009, the sale of a total of 1,495 million CPOs, directly or in the form of AmericanDepositary Shares of CEMEX, S.A.B. de C.V. (“ADSs”), in a global offering for approximatelyU.S.$1.8 billion in net proceeds;
• in December 2009 and January 2010, the issuance by CEMEX Finance LLC of U.S.$1.75 billion aggregateprincipal amount of its 9.50% U.S. Dollar-Denominated Senior Secured Notes due 2016 and €350 millionaggregate principal amount of its 9.625% Euro-Denominated Senior Secured Notes due 2017;
4
• in December 2009, the issuance by CEMEX, S.A.B. de C.V. of approximately Ps4.1 billion(approximately U.S.$315 million) of 10% mandatory convertible notes due 2019 (the “November 2019Mandatory Convertible Mexican Peso Notes”), in exchange for promissory notes previously issued byCEMEX, S.A.B. de C.V. in the Mexican capital markets (Certificados Bursátiles) (“CBs”) withmaturities between 2010 and 2012;
• in March 2010, the issuance by CEMEX, S.A.B. de C.V. of U.S.$715 million aggregate principalamount of its 4.875% Convertible Subordinated Notes due 2015, including the full exercise of theU.S.$65 million over-allotment option granted to the initial purchasers of the notes (the “March 2015Optional Convertible Subordinated U.S. Dollar Notes”);
• in May 2010, the issuance by CEMEX España, acting through its Luxembourg branch, ofU.S.$1,067,665,000 aggregate principal amount of its 9.25% U.S. Dollar-Denominated Senior SecuredNotes due 2020 and €115,346,000 aggregate principal amount of its 8.875% Euro-Denominated SeniorSecured Notes due 2017, in exchange for the U.S. Dollar-Denominated 6.196% Fixed-to-Floating RateCallable Perpetual Debentures issued by C5 Capital (SPV) Limited, U.S. Dollar-Denominated 6.640%Fixed-to-Floating Rate Callable Perpetual Debentures issued by C8 Capital (SPV) Limited,U.S. Dollar-Denominated 6.722% Fixed-to-Floating Rate Callable Perpetual Debentures issued by C10Capital (SPV) Limited and Euro-Denominated 6.277% Fixed-to-Floating Rate Callable PerpetualDebentures issued by C10-EUR Capital (SPV) Limited (collectively, the “Perpetual Debentures”),pursuant to a private placement exchange offer directed to the holders of Perpetual Debentures;
• in January 2011, the issuance by CEMEX, S.A.B. de C.V. of U.S.$1.0 billion aggregate principalamount of its 9.000% Senior Secured Notes due 2018 (the “January 2018 U.S. Dollar Notes”);
• in March 2011, the issuance by CEMEX España, acting through its Luxembourg branch, of anadditional U.S.$125,331,000 aggregate principal amount of its 9.25% U.S. Dollar-Denominated SeniorSecured Notes due 2020;
• in March 2011, the issuance by CEMEX, S.A.B. de C.V. of U.S.$1,667.5 million aggregate principalamount of its 3.250% Convertible Subordinated Notes due 2016 (the “March 2016 OptionalConvertible Subordinated U.S. Dollar Notes”) and 3.750% Convertible Subordinated Notes due 2018(the “March 2018 Optional Convertible Subordinated U.S. Dollar Notes”);
• in April 2011, the issuance by CEMEX, S.A.B. de C.V. of U.S.$800 million aggregate principalamount of its Floating Rate Senior Secured Notes due 2015;
• in July 2011, the issuance by CEMEX, S.A.B. de C.V. of an additional U.S.$650 million aggregateprincipal amount of its January 2018 U.S. Dollar Notes;
• in March 2012, the issuance by CEMEX España, acting through its Luxembourg branch, ofU.S.$703,861,000 aggregate principal amount of its 9.875% U.S. Dollar-Denominated Senior SecuredNotes Due 2019 (the “April 2019 U.S. Dollar Notes”) and €179,219,000 aggregate principal amount ofits 9.875% Euro-Denominated Senior Secured Notes Due 2019 (the “April 2019 Euro Notes” and,together with the April 2019 U.S. Dollar Notes, the “April 2019 U.S. Dollar and Euro Notes”), inexchange for Perpetual Debentures and 4.75% Notes due 2014 (the “Eurobonds”) issued by CEMEXFinance Europe B.V. pursuant to separate private placement exchange offers directed to the holders ofPerpetual Debentures and Eurobonds;
• in September 2012, the issuance by CEMEX, S.A.B. de C.V. of U.S.$500 million aggregate principalamount of the June 2018 U.S. Dollar Notes;
• in October 2012, the issuance by CEMEX Finance LLC of U.S.$1.5 billion aggregate principal amountof its 9.375% Senior Secured Notes due 2022 (the “October 2022 U.S. Dollar Notes”);
• in November 2012, CEMEX Latam Holdings, S.A. (“CEMEX Latam”), a then wholly-ownedsubsidiary of CEMEX España, completed the sale of newly issued common shares in a concurrent
5

public offering to investors in Colombia and a private placement to eligible investors outside ofColombia (together, the “CEMEX Latam Offering”), representing approximately 26.65% of CEMEXLatam’s outstanding common shares. CEMEX Latam’s common shares are listed on the ColombianStock Exchange (Bolsa de Valores de Colombia S.A.). The net proceeds to CEMEX Latam from itspublic offering were approximately U.S.$960 million after deducting estimated underwriting discountsand commissions, and other estimated offering expenses payable by CEMEX Latam. CEMEX Latamused the net proceeds from the offering to repay a portion of the indebtedness owed to us, which weused for general corporate purposes, including the repayment of indebtedness. CEMEX Latam is theholding company for CEMEX’s operations in Brazil, Colombia, Costa Rica, Guatemala, Nicaragua,Panama and El Salvador. As of December 31, 2016, CEMEX España owned approximately 73.31% ofCEMEX Latam’s outstanding common shares, excluding shares held in treasury;
• in March 2013, the issuance by CEMEX, S.A.B. de C.V. of U.S.$600 million aggregate principalamount of its 5.875% Senior Secured Notes due 2019;
• in August 2013, the issuance by CEMEX, S.A.B. de C.V. of U.S.$1.0 billion aggregate principalamount of its 6.5% Senior Secured Notes due 2019 (the “December 2019 U.S. Dollar Notes”);
• in October 2013, the issuance by CEMEX, S.A.B. de C.V. of U.S.$1.0 billion aggregate principalamount of its 7.25% Senior Secured Notes due 2021 (the “January 2021 U.S. Dollar Notes”) andU.S.$500 million aggregate amount of its Floating Rate Senior Secured Notes due 2018 (the “October2018 U.S. Dollar Notes” and, together with the January 2021 U.S. Dollar Notes, the “January 2021 andOctober 2018 U.S. Dollar Notes”);
• in April 2014, CEMEX Finance LLC issued U.S.$1.0 billion aggregate principal amount of its 6.000%U.S. Dollar-Denominated Senior Secured Notes due 2024 (the “April 2024 U.S. Dollar Notes”) and€400 million aggregate principal amount of its 5.250% Euro-Denominated Senior Secured Notes due2021 (the “April 2021 Euro Notes” and, together with the April 2024 U.S. Dollar Notes, the “April2024 U.S. Dollar and April 2021 Euro Notes”);
• in September 2014, the issuance by CEMEX, S.A.B. de C.V. of U.S.$1.1 billion aggregate principalamount of its 5.7% Senior Secured Notes due 2025 (the “January 2025 U.S. Dollar Notes”) and€400 million aggregate principal amount of its 4.750% Senior Secured Notes due 2022 (the “January2022 Euro Notes” and, together with the January 2025 U.S. Dollar Notes, the “January 2025U.S. Dollar and January 2022 Euro Notes”);
• in October 2014, the private offering by CEMEX, S.A.B. de C.V. of 200,000 Contingent ConvertibleUnits (“CCUs”), each with a stated amount of U.S.$1,000. The proceeds of the CCUs were applied tosubscribe for the First March 2020 Optional Convertible Subordinated U.S. Dollar Notes (as definedbelow), the proceeds of which, in turn, were used to finance payment of U.S.$200 million of theprincipal amount of the March 2015 Optional Convertible Subordinated U.S. Dollar Notes that maturedwithout conversion;
• in March 2015, the issuance by CEMEX, S.A.B. de C.V. of U.S.$750 million aggregate principalamount of its 6.125% Senior Secured Notes due 2025 (the “May 2025 U.S. Dollar Notes”) and€550 million aggregate amount of its 4.375% Senior Secured Notes due 2023 (the “March 2023 EuroNotes” and, together with the May 2025 U.S. Dollar Notes, the “May 2025 U.S. Dollar and March2023 Euro Notes”);
• in March 2015, the issuance by CEMEX, S.A.B. de C.V. of U.S.$200 million aggregate principalamount of its 3.72% Convertible Subordinated Notes due March 2020 (the “First March 2020 OptionalConvertible Subordinated U.S. Dollar Notes”) subscribed with the proceeds of the CCUs;
• in May 2015, a series of private exchange transactions by CEMEX, S.A.B. de C.V. in respect ofU.S.$626 million aggregate principal amount of its March 2016 Optional Convertible SubordinatedU.S. Dollar Notes held by certain institutional investors for (i) U.S.$321 million aggregate principal
6

amount of its 3.72% Convertible Subordinated Notes due March 2020 (the “Second March 2020Optional Convertible Subordinated U.S. Dollar Notes” and, together with the First March 2020Optional Convertible Subordinated U.S. Dollar Notes, the “March 2020 Optional ConvertibleSubordinated U.S. Dollar Notes”) and (ii) an estimated 42 million ADSs;
• in March 2016, the repayment of the full outstanding amount (U.S.$352 million) of the March 2016Optional Convertible Subordinated U.S. Dollar Notes;
• in March 2016, the issuance by CEMEX, S.A.B. de C.V. of U.S.$1.0 billion aggregate principalamount of its 7.75% Senior Secured Notes due 2026 (the “April 2026 U.S. Dollar Notes”). A portion ofthe net proceeds from the offering of the April 2026 U.S. Dollar Notes of approximatelyU.S.$830 million were used to fund the redemption of the remaining April 2019 U.S. Dollar and EuroNotes (such redemption, the “April 2019 U.S. Dollar and Euro Notes Redemption”), and the remainingnet proceeds from the issuance of the April 2026 U.S. Dollar Notes were used to fund the redemptionof the remaining June 2018 U.S. Dollar Notes (the “June 2018 U.S. Dollar Notes Redemption”);
• in April 2016, CEMEX España, acting through its Luxembourg branch, issued an irrevocable notice ofredemption with respect to the April 2019 U.S. Dollar and Euro Notes, pursuant to which it redeemedthe remaining U.S.$603.7 million aggregate principal amount of the April 2019 U.S. Dollar Notes;
• in April 2016, the cancelation of U.S.$217.3 million aggregate principal amount of PerpetualDebentures;
• in May 2016, the cancelation of U.S.$7.8 million and €6.1 million aggregate principal amount ofPerpetual Debentures;
• in May 2016, the purchase of approximately U.S.$178.5 million aggregate principal amount of theOctober 2018 U.S. Dollar Notes and U.S.$218.9 million aggregate principal amount of the December2019 U.S. Dollar Notes through a cash tender offer (the “May 2016 Tender Offer”);
• in June 2016, the issuance by CEMEX Finance LLC of €400 million of 4.625% Senior Secured Notesdue 2024 denominated in Euros (the “June 2024 Euro Notes”);
• in June 2016, the June 2018 U.S. Dollar Notes Redemption;
• in July 2016, the purchase of approximately U.S.$355.3 million aggregate principal amount of theOctober 2022 U.S. Dollar Notes through a cash tender offer (the “July 2016 Tender Offer”);
• in July 2016, CEMEX Holdings Philippines, Inc. (“CHP”) closed its initial public offering of 45% ofits common shares in the Philippines, and 100% of CHP’s common shares started trading on thePhilippine Stock Exchange under the ticker “CHP.” CEMEX Asian South East Corporation (“CASE”),an indirect subsidiary of CEMEX España, directly owns approximately 55% of CHP’s outstandingcommon shares. The net proceeds to CHP from its initial public offering were approximatelyU.S.$506.8 million after deducting estimated underwriting discounts and commissions, and otherestimated offering expenses payable by CHP. CHP used the net proceeds from the initial publicoffering to repay existing indebtedness owed to BDO Unibank, Inc. (“BDO Unibank”) and to anindirect subsidiary of CEMEX;
• in August 2016, the redemption of the remaining 5.875% Senior Secured Notes due 2019;
• in October 2016, the purchase of approximately U.S.$241.9 million aggregate principal amount of theJanuary 2021 U.S. Dollar Notes through a cash tender offer (the “October 2016 Tender Offer”); and
• in 2016, the repurchase of U.S.$198.5 million aggregate principal amount of the following SeniorSecured Notes (all of which have been canceled):
• U.S.$2.1 million aggregate principal amount of June 2018 U.S. Dollar Notes;
• U.S.$46.1 million aggregate principal amount of CEMEX, S.A.B. de C.V.’s 5.875% SeniorSecured Notes due 2019;
7

• U.S.$61.0 million aggregate principal amount of December 2019 U.S. Dollar Notes;
• U.S.$22.9 million aggregate principal amount of April 2019 U.S. Dollar Notes;
• U.S.$28.9 million aggregate principal amount of October 2022 U.S. Dollar Notes;
• U.S.$6.1 million aggregate principal amount of October 2018 U.S. Dollar Notes; and
• U.S.$31.4 million aggregate principal amount of January 2021 U.S. Dollar Notes.
As of December 31, 2016, our reported total debt plus other financial obligations in our balance sheet werePs273,862 million (U.S.$13,217 million) (principal amount Ps276,716 million (U.S.$13,355 million), excludingdeferred issuance costs), which does not include approximately Ps9,075 million (U.S.$438 million), whichrepresents the nominal amount of outstanding Perpetual Debentures.
Since the beginning of 2017, we have engaged in the following significant capital markets transactions anddebt related activities, which are not reflected in our 2016 audited consolidated financial statements includedelsewhere in this annual report:
• in January 2017, in connection with the offer and takeover bid (the “Offer”) by Sierra Trading(“Sierra”), one of CEMEX, S.A.B. de C.V.’s indirect subsidiaries, to all shareholders of TrinidadCement Limited (“TCL”), a company publicly listed in Trinidad and Tobago, Jamaica and Barbados, toacquire up to 132,616,942 ordinary shares in TCL, Sierra presented a change and variation noticeamending the Offer (the “Amended Offer”). Pursuant to the Amended Offer, Sierra offered 5.07Trinidad and Tobago Dollars (“TT$”) in cash per TCL share (the “Revised Offer Price”) and, exceptfor shareholders of TCL in Barbados, shareholders of TCL were granted the option of being paid ineither TT$ or U.S.$ in Trinidad, and Jamaican Dollars or U.S.$ in Jamaica. The Revised Offer Pricerepresented a premium of 50% over the December 1, 2016 closing price of TCL’s shares on theTrinidad and Tobago Stock Exchange. The total number of TCL shares tendered and accepted inresponse to the Offer was 113,629,723 which, together with Sierra’s pre-existing shareholding in TCL(147,994,188 shares), represent approximately 69.83% of the outstanding TCL shares. The total cashpayment by Sierra for the tendered shares was approximately U.S.$86.36 million. CEMEX startedconsolidating TCL for financial reporting purposes on February 1, 2017. TCL has de-listed from theJamaica and Barbados stock exchanges.
• in February 2017, CHP announced that it had entered into a senior unsecured peso term loan facilityagreement with BDO Unibank for a Philippine Peso denominated amount equal to approximatelyU.S.$280 million, to refinance a majority of CHP’s outstanding long-term loan with New Sunward.The term loan provided by BDO Unibank has a tenor of seven years and consists of a fixed rate trancheand a floating rate tranche. CHP drew the full amount of the term loan during the first quarter of 2017to repay a portion of its existing indebtedness as described below.
• in February 2017, we sold 45,000,000 shares of common stock of Grupo Cementos de Chihuahua,S.A.B. de C.V. (“GCC”) at a price of Ps95 per share in a public offering to investors in Mexicoauthorized by the Comisión Nacional Bancaria y de Valores (Mexican National Banking and SecuritiesCommission) (the “CNBV”) and in a concurrent private placement to eligible investors outside ofMexico. Prior to the offerings, CEMEX, S.A.B. de C.V. owned a 23% direct interest in GCC and aminority interest in CAMCEM, an entity which owns a majority interest in GCC. After the offerings,CEMEX, S.A.B. de C.V. owned a 9.47% direct interest in GCC and a minority interest in CAMCEM.
• in March 2017, the purchase of U.S.$89.9 million aggregate principal amount of the December 2019U.S. Dollar Notes and U.S.$385.1 million aggregate principal amount of the January 2021 U.S. DollarNotes through a cash tender offer and, during the first quarter of 2017, the open market repurchase ofU.S.$9 million aggregate principal amount of the Senior Secured Notes (all of which have beencanceled).
8

• in the first quarter of 2017, drawdowns and repayments under the revolving tranche of the CreditAgreement resulting in a reduction of Ps11,686 million (U.S.$564 million) of outstanding indebtednessunder the revolving tranche of the Credit Agreement, which was financed primarily from the proceedsof our asset divestitures. As of March 31, 2017, we had an aggregate amount of Ps43,407 million(U.S.$1,413 million) available under the revolving tranche of our Credit Agreement.
We refer to the October 2018 U.S. Dollar Notes, December 2019 U.S. Dollar Notes, January 2021U.S. Dollar Notes, April 2021 Euro Notes, January 2022 Euro Notes, October 2022 U.S. Dollar Notes, March2023 Euro Notes, April 2024 U.S. Dollar Notes, June 2024 Euro Notes, January 2025 U.S. Dollar Notes, May2025 U.S. Dollar Notes and April 2026 U.S. Dollar Notes collectively, as the “Senior Secured Notes.” For a moredetailed description of these transactions, see “Item 5—Operating and Financial Review and Prospects—Summary of Material Contractual Obligations and Commercial Commitments.”
As of March 31, 2017, our total debt plus other financial obligations were Ps237,459 million (U.S.$12,678million) (principal amount Ps239,781 million (U.S.$12,802 million)), which does not include approximatelyPs8,222 million (U.S.$439 million), which represents the nominal amount of Perpetual Debentures.
Risk Factors
We are subject to various risks mainly resulting from changing economic, environmental, political, industry,business, financial and climate conditions. The following risk factors are not the only risks we face, and any ofthe risk factors described below could significantly and adversely affect our business, results of operations orfinancial condition.
Risks Relating To Our Business
Economic conditions in some of the countries where we operate may adversely affect our business,financial condition and results of operations.
The economic conditions in some of the countries where we operate have had and may continue to have amaterial adverse effect on our business, financial condition and results of operations throughout our operationsworldwide. Our results of operations are highly dependent on the results of our operating subsidiaries mainly inthe United States, Mexico, South, Central America and the Caribbean (“SAC”), Europe, Asia, Middle East andAfrica. Accordingly, the economic conditions in some of the countries where we operate have had and maycontinue to have a material adverse effect on our business, financial condition and results of operationsthroughout our operations worldwide.
The main sources of risks in the current global economy are: (i) an inward shift in political activities,including toward protectionism, which may lead to lower global growth caused by reduced trade and cross-border investment flows, (ii) a faster-than-expected pace of interest rate increases in the United States, whichcould trigger a more rapid tightening in global financial conditions and a sharp Dollar appreciation, and itsimpact on the global economy, emerging markets, risk aversion, foreign exchange markets, volatility andfinancial markets, (iii) economic vulnerability of emerging market economies, (iv) uncertainty about theperformance of oil prices, (v) China’s economic performance and the ability of the Chinese authorities to managean economic transition and vulnerabilities in China’s financial system associated with fast credit growth,(vi) economic and political uncertainties in Europe, including the United Kingdom’s decision to withdraw fromthe European Union (“EU”), electoral processes in France, Germany and Italy, the ongoing refugee crisis,financial uncertainty in Greece and a lack of confidence in the EU’s banking system, that may threaten theregion’s integration and economic growth and (vii) geopolitical risks in the Middle East and other regionsexperiencing political turmoil.
The U.S. economy continues to grow at near trend pace. The U.S. Federal Reserve System increased short-term interest rates in December 2015, December 2016 and March 2017. There is a risk that further interest ratehikes could cause Dollar appreciation, a manufacturing slowdown and economic deceleration. On the other hand,
9
a slower than warranted pace of increase in interest rates could result in inflation acceleration and the disanchoringof inflation expectations leading to swift monetary policy tightening and a potential recession. The housing sectorsupply constraints associated in part with labor shortages could result in a slower pace of growth in housing starts.Federal budget disputes could lead to lesser than FAST Act-authorization spending levels for highways and roads.The global risks mentioned herein could lead to market volatility and consumer spending retrenchment in the U.S.The U.S. presidential election of Donald Trump has increased uncertainty about key policies, such as trade(potential protectionism and re-negotiation of the North American Free Trade Agreement (“NAFTA”)),immigration (anti-immigration rhetoric and a stated intention to build a wall on the border with Mexico) or fiscal(stated intentions to reduce tax rates and increase infrastructure expenditures) policy. In particular, there isuncertainty around the implications of a tax reform for the fiscal deficit and national debt. All of these uncertaintiescan have a significant impact on CEMEX’s business, both in the United States and worldwide.
Many emerging market economies have undergone periods of financial volatility over the past few years.Some large commodity exporters and other stressed economies have also experienced substantial exchange ratemovements. The tightening of financial conditions across emerging market economies in the immediateaftermath of the U.S. elections in 2016 is a reminder that many countries from this group remain vulnerable tosudden shifts in global market sentiment. There is a risk of new episodes of market volatility, increased riskaversion and capital outflows from emerging markets, which could cause emerging markets currencies to furtherdepreciate. The high level of U.S. Dollar denominated corporate indebtedness in emerging markets constitutes anadditional source of instability. Emerging markets would face higher global risk premiums and substantial capitaloutflows, putting particular pressure on economies with domestic debt imbalances. The risk of contagion effectacross emerging markets could be significant.
Chinese authorities are expected to maintain emphasis on protecting macroeconomic stability in the run-upto the leadership transition in 2017. Progress with demand-side rebalancing and reduction of excess industrialcapacity has continued, but so has the reliance on stimulus measures to maintain high rates of growth and theChinese economy’s dependence on rapidly expanding credit, intermediated through an increasingly opaque andcomplex financial system. Recent months have seen a return of capital outflows, reflecting market expectationsof renminbi depreciation against the Dollar and narrowing yield. External triggers, such as a shift towardprotectionism in advanced economies or domestic shocks, could lead to a broader tightening of financialconditions in China. Such tightening could be exacerbated by capital outflow pressures, causing an adverseimpact on demand and output. The consequences for emerging market economies of weaker economicperformance and increased policy uncertainty in China could be significant (as demonstrated by marketfluctuations in the second half of 2015 and early 2016, spillovers from turbulence in China into other economiescan be significant, operating mainly through commodity prices and global financial risk aversion).
Since the start of 2016, the Mexican economy has been immersed in an atmosphere of uncertainty. Concernsgrew about Mexico’s fiscal accounts amid high public expenditure, falling oil revenues and increased cost ofdebt as monetary policy began a path towards normalization. Also, manufacturing lost steam as external demandwaned and doubts emerged about whether private consumption could remain solid in a prolonged period ofindustrial fragility. Additionally, worries arose that steep depreciation of the Mexican Peso could eventually leadto higher inflation and, accordingly, to higher interest rates. This uncertainty reached new heights after theconclusion of the U.S. elections in late 2016. Protectionist stances, previously subdued, emerged as a significantrisk for future economic growth. In the case of Mexico, a potential overhaul or repeal of NAFTA poses a threatto exports, foreign and domestic investment and job creation (especially of relatively high-paying jobs).Furthermore, remittance inflows became vulnerable to potential taxes and tighter immigration controls in theU.S. Confidence indicators declined, the Mexican Peso plummeted,1 and analysts revised downwardly their
1 The Mexican Peso depreciated against the U.S. Dollar by approximately 20% in 2016. However, betweenJanuary 1, 2017 and April 21, 2017, the Peso appreciated by approximately 9%. See “Item 3—KeyInformation—Selected Consolidated Financial Information.” So far, the adjustment has happened orderly, withliquidity prevailing in market operations. Currently, Peso-denominated government bonds held bynon-residents have remained stable.
10

forecasts of Mexico’s GDP growth. Mexican authorities reassure its commitment to improving Mexico’s fiscalposition and to accelerated monetary tightening to prevent abnormal volatility of the Mexican Peso and capitaloutflows; however, additional depreciation of the Mexican Peso cannot be ruled out. Political tensions betweenMexican and U.S. administrations appear to have diminished, and we expect changes to NAFTA to be lessdisruptive. This notwithstanding, it is too early to rule out an economic downturn, given that many of theaforementioned risks are still prevalent and definitive actions on crucial topics like NAFTA and immigration arepending.
In summary, the short-term risks for the Mexican economy are as follows: (i) Potential hardening of theU.S. stance on renegotiation of NAFTA could deter manufacturing activity and investment in Mexico andsignificantly decrease the value of the Mexican Peso. (ii) A possible tax or other restrictions on remittances andimmigration in the United States could hinder private consumption in Mexico. (iii) Lower dynamism of carmanufacturing and car sales in the United States could hold back the ongoing recovery of manufacturing inMexico. (iv) Private consumption in Mexico could retreat amid each or several of the following: increasedinflation (due to further gasoline price increases and sharper depreciation of the Mexican Peso), higher interestrates and/or extended weakness of the industrial sector. (v) The downward adjustment of international oil pricesand the exacerbation of the decline in domestic oil production could negatively affect the Mexican economy.(vi) Further adjustment of the total fixed investment due to the adoption of tighter fiscal and monetary policies inMexico could negatively affect the Mexican economy. (vii) A deterioration of Mexico’s debt position could leadto a downgrade of Mexico’s sovereign credit rating. (vii) New episodes of global risk aversion due to geopoliticalinstability could spur capital outflows and affect the value of the Mexican Peso.
In Colombia, the anticipated correction in domestic demand is occurring and its weakness is expected topersist in 2017. Macroeconomic imbalances are beginning to be corrected: inflation is decreasing (4.7% in March2017), helped by the reversion of climatic shocks and the stabilization of the exchange rate; and the currentaccount deficit is narrowing (4.5% of GDP) helped by the weakness of domestic demand. Nonetheless, inflationand current account remain above comfort levels. Colombia’s approved fiscal reform was less “structural” thanrequired, so there is a risk that another “fiscal reform” will be needed in 2018/19. The increase in value-added taxrate could have a negative impact on inflation and on private consumption, with domestic demand cooling off.The risk of protectionism in the U.S. could negatively impact on the Colombian economy. The risk of furtherdepreciation of the Colombian Peso against the U.S. Dollar is non-negligible. A sudden stop of flows cannot beruled out.
The European Central Bank (the “ECB”) continued with the policy of monetary easing. The environment ofnegative deposit rates is distorting financial markets and creates uncertain consequences for the banking sector.There is a risk that negative rates will erode bank profitability and curb lending across the countries that currentlyuse the Euro as their currency (the “Eurozone”), creating other systemic risks to European economies. Theeconomic activity in the Eurozone started to recover last year and inflation expectations had recovered some ofthe ground lost since the summer of last year. However, it is too early to confirm that a turning point has beenreached in underlying inflation. According to some analysts, it is expected that the ECB could announce atapering process at the end of 2017. There is a risk, however, that the ECB concludes the policy of easing tooearly. Uncertainty about the Euro’s performance remains.
The Eurozone’s economic growth and European integration are challenged by a number of uncertainties,including (i) delays in implementing the needed structural reforms in some European countries, (ii) the politicaluncertainty regarding elections in France, Germany and Italy and their effects on the European integration,(iii) unresolved political and financial risks associated with Greece, (iv) uncertainty regarding the profitability ofthe European banking system in general and the Italian banking sector in particular, (v) the process of the UnitedKingdom’s exit from the EU, and (vi) the ongoing refugee crisis. All these factors could impact marketconfidence and could limit the benefit of the economic tailwinds and monetary policy stimulus. Regarding ouroperations in Europe, the United Kingdom’s expected exit from the EU is already affecting financial markets andincreasing foreign exchange volatility. The United Kingdom’s exit from the EU may have a significant adverse
11

impact on its economic activity. Such decision could result in substantial uncertainty weighing on investment andimport cost. This situation could impact our business. In Poland, there is a risk that the populist measures of thenew government could eventually restrain foreign investment and growth, which could negatively impact ouroperations in the region. In Spain, although political gridlock was overcome in the fourth quarter of 2016, thegovernment is in minority and early elections cannot be ruled out.
Significant trade links with Western Europe render some of the Eastern European countries susceptible toeconomic and political pressures from Western Europe. Additionally, in the coming years, Central Europeancountries might experience a reduction in the proceeds they receive from the EU’s Structural Funds, which couldhinder infrastructure investment in such countries.
In the Middle East, political risk could moderate economic growth and adversely affect constructioninvestments. In Egypt, the current government has brought a certain degree of political stability to the country.During the last year, the government has undertaken several economic reforms to combat Egypt’s economicimbalances including: (i) exchange rate liberalization (to face the shortage of foreign exchange and precariouslylow reserves), (ii) implementation of a VAT law (to increase fiscal revenues) and (iii) cuts in fuel subsidies(leading to a reduction of the budget deficit). In return, the Egyptian government obtained a loan from theInterntional Monetary Fund. Although these reforms improved Egypt’s economic performance (reserves havesignificantly increased and the budget deficit is expected to improve), they are now negatively affecting Egypt’spopulation. During 2016, the Egyptian pound (“EGP”) reached 19.6 EGP per US$1 (it depreciated by 120%) andinflation is growing at 30%. All this has also affected our business: there is a foreign exchange shortage forcapital repatriation, and cement demand in the country has plummeted in the first quarter of 2017. In 2018,presidential elections are scheduled to occur, but there is a risk that the current president may try to avoid them,in which case a rebound of social unrest cannot be ruled out. In Israel, potential conflicts with Hamas in Gaza,that may affect our operations, cannot be ruled out.
In the Philippines, the latest presidential elections resulted in a new government markedly different from theprevious one. Although the new government is more focused on security issues, it is also expected to becommitted to the infrastructure projects needed in the country. However, there is a risk of underspending thatcould affect our projections of business growth.
Demand for our products is strongly related to construction levels and depends, in large part, on residentialand commercial construction activity, as well as private and public infrastructure spending, in the countrieswhere we operate. Public and private infrastructure spending in countries dependent on revenue generated by theenergy sector is exposed to decreases in energy prices. Therefore, decreases in energy prices could affect publicand private infrastructure spending which, in turn, could affect the construction industry. Declines in theconstruction industry are correlated with declines in general economic conditions. As a result, deterioration ineconomic conditions in the countries where we operate could have a material adverse effect on our business,financial condition and results of operations. In addition, we cannot assure you that growth in the gross domesticproduct of the countries where we operate will translate into a correlated increase in demand for our products.
Concerns regarding the European debt crisis and market perception concerning the instability of the Eurocould affect our operating profits.
We conduct business in many countries of the Eurozone. Although this risk appears to have declined,concerns persist regarding the debt burden of certain Eurozone countries, such as Greece, and their ability tomeet future financial obligations, the overall stability of the Euro and the suitability of the Euro as a singlecurrency given the diverse economic and political circumstances in individual Eurozone countries and the UnitedKingdom’s decision to exit the EU.
These concerns could lead to the reintroduction of individual currencies in one or more Eurozone countries,or in more extreme circumstances, the possible dissolution of the Euro currency entirely. Should the Euro
12

dissolve entirely, the legal and contractual consequences for holders of Euro-denominated obligations would bedetermined by laws in effect at such time. These potential developments, or market perceptions concerning theseand related issues, could adversely affect the value of our Euro-denominated assets and obligations. In addition,concerns over the effect of this financial crisis on financial institutions in Europe and globally could have anadverse effect on the global capital markets, and more specifically on our ability, and the ability of ourcustomers, suppliers and lenders to finance their respective businesses, to access liquidity at acceptable financingcosts, if at all, and on the demand for our products.
We are subject to the effects of general global economic and market conditions that are beyond our control.If these conditions remain challenging or deteriorate, our business, financial condition and results of operationscould be adversely affected. Possible consequences from macroeconomic global challenges such as the debtcrisis in certain countries in the EU could have an adverse impact on our business, financial condition and resultsof operations.
The Credit Agreement contains several restrictions and covenants. Our failure to comply with suchrestrictions and covenants could have a material adverse effect on our business and financial conditions.
The Credit Agreement requires us to comply with several financial ratios and tests, including a minimumconsolidated coverage ratio of Operating EBITDA to interest expense (including interest accrued on PerpetualDebentures) and a maximum consolidated leverage ratio of total debt (including Perpetual Debentures andguarantees, excluding subordinated optional convertible securities and financial leases plus or minus the fairvalue of derivative financial instruments, among other adjustments) to Operating EBITDA, as described below.Our ability to comply with these ratios may be affected by economic conditions and volatility in foreignexchange rates, as well as by overall conditions in the financial and capital markets and the construction sector.
On March 17, 2016, CEMEX, S.A.B. de C.V., in line with CEMEX’s initiatives of enhancing financialflexibility and reducing risk, obtained the required consents to amend its Credit Agreement, in order to delay thescheduled tightening in its consolidated financial leverage and coverage ratio limits by one year. Pursuant to theamendment, the leverage ratio covenant in the Credit Agreement remained at 6.0 times until and includingMarch 31, 2017, and will gradually decline to 4.0 times by June 30, 2020, and the margin grid in the CreditAgreement was modified such that if the consolidated leverage ratio is greater than 5.50 times in the referenceperiods ending on December 31, 2016, March 31, 2017, June 30, 2017, and September 30, 2017, the applicablemargin will be 425 bps instead of 400 bps. All other levels in the margin grid remained unchanged. In addition,the Credit Agreement was amended to allow CEMEX the right, subject to meeting local requirements in thePhilippines, to sell a minority stake in CHP.
The Credit Agreement requires us to comply with a consolidated coverage ratio of Operating EBITDA tointerest expense (including interest accrued on Perpetual Debentures), for the following periods, measuredquarterly, of not less than (i) 1.85:1 for the period ending December 31, 2016, up to and including the periodending March 31, 2017, (ii) 2:00:1 for the period ending on June 30, 2017 up to and including the period endingon September 30, 2017 and (iii) 2.25:1 for the period ending December 31, 2017, and each subsequent referenceperiod. In addition, the Credit Agreement allows us a maximum consolidated leverage ratio of total debt(including Perpetual Debentures and guarantees, excluding subordinated optional convertible securities andfinancial leases plus or minus the fair value of derivative financial instruments, among other adjustments) toOperating EBITDA for each period of four consecutive fiscal quarters (measured quarterly) not to exceed(i) 6.00:1 for the period ending December 31, 2016, up to and including the period ending on March 31, 2017,(ii) 5.75:1 for the period ending June 30, 2017, up to and including the period ending September 30, 2017,(iii) 5.50:1 for the period ending December 31, 2017, up to and including the period ending March 31, 2018,(iv) 5.25:1 for the period ending June 30, 2018, up to and including the period ending September 30, 2018;(v) 5.00:1 for the period ending December 31, 2018, up to and including the period ending March 31, 2019;(vi) 4.50:1 for the period ending June 30, 2019, up to and including the period ending September 30, 2019;(vii) 4.25:1 for the period ending December 31, 2019, up to and including the period ending March 31, 2020; and
13
(viii) 4.00:1 for the period ending June 30, 2020 and each subsequent reference period. For the period endedDecember 31, 2016, we reported to the lenders under the Credit Agreement a consolidated coverage ratio of 3.18and a consolidated leverage ratio of 4.22, each as calculated pursuant to the Credit Agreement. See “Item 5—Operating and Financial Review and Prospects—Liquidity and Capital Resources—Our Indebtedness.”
Pursuant to the Credit Agreement, we are limited in relation to making aggregate annual capitalexpenditures in excess of U.S.$1 billion (excluding certain capital expenditures, joint venture investments andacquisitions to be made by each of CEMEX Latam and/or CHP and their respective subsidiaries), which capitalexpenditures, joint venture investments and acquisitions at any time then incurred are subject to a separateaggregate limit of U.S.$500 million (or its equivalent) for each of CEMEX Latam and its subsidiaries and CHPand its subsidiaries, in each case, the amounts of which allowed for permitted acquisitions and investments injoint ventures cannot exceed U.S.$400 million per year.
We are also subject to a number of negative covenants under the Credit Agreement that, among other things,restrict or limit our ability to: (i) create liens; (ii) incur additional debt; (iii) change our business or the businessof any obligor or material subsidiary (in each case, as defined in the Credit Agreement); (iv) enter into mergers;(v) enter into agreements that restrict our subsidiaries’ ability to pay dividends or repay intercompany debt;(vi) acquire assets; (vii) enter into or invest in joint venture agreements; (viii) dispose of certain assets; (ix) grantadditional guarantees or indemnities; (x) declare or pay cash dividends or make share redemptions; (xi) enter intocertain derivatives transactions; and (xii) exercise any call option in relation to any perpetual bonds we issueunless the exercise of the call options does not have a materially negative impact on our cash flow.
The Credit Agreement also contains a number of affirmative covenants that, among other things, require usto provide periodic financial information to our creditors. Pursuant to the Credit Agreement, however, a numberof those covenants and restrictions will, if CEMEX so elects, automatically cease to apply or become lessrestrictive if (i) our consolidated leverage ratio for the two most recently completed quarterly testing periods isless than 4.00:1; and (ii) no default under the Credit Agreement is continuing, as applicable. At that point, theconsolidated leverage ratio must not exceed 4.25:1. Restrictions that will cease to apply when we satisfy suchconditions include the capital expenditure limitations mentioned above and several negative covenants, includinglimitations on our ability to repay existing financial indebtedness, declare or pay cash dividends and distributionsto shareholders; certain asset sale restrictions, and restrictions on exercising call options in relation to anyperpetual bonds we issue and on the issuance of certain convertible and exchangeable obligations. At such time,several baskets and caps relating to negative covenants will also increase, including baskets or caps related topermitted financial indebtedness, permitted guarantees and limitations on liens. However, we cannot assure youthat we will be able to meet the conditions for these restrictions to cease to apply prior to the final maturity dateunder the Credit Agreement.
The Credit Agreement contains events of default, some of which may be outside of our control. Such eventsof default include defaults, subject to certain exceptions, based on (i) non-payment of principal, interest, or feeswhen due; (ii) material inaccuracy of representations and warranties; (iii) breach of covenants; (iv) bankruptcy(quiebra) or insolvency (concurso mercantil) of CEMEX, S.A.B. de C.V., any other obligor under the CreditAgreement or any other of our material subsidiaries (as defined in the Credit Agreement); (v) inability to paydebts as they fall due or by reason of actual financial difficulties, suspension or threatened suspension ofpayments on debts exceeding U.S.$50 million or commencement of negotiations to reschedule debt exceedingU.S.$50 million; (vi) a cross-default in relation to financial indebtedness in excess of U.S.$50 million; (vii) achange of control with respect to CEMEX, S.A.B. de C.V.; (viii) certain changes to the ownership of any of theobligors under the Credit Agreement, unless the proceeds of such disposal are used to prepay the CreditAgreement debt; (ix) enforcement of the share security; (x) final judgments or orders in excess ofU.S.$50 million that are neither discharged nor bonded in full within 60 days thereafter; (xi) restrictions not ineffect on September 29, 2014 are imposed that limit the ability of obligors to transfer foreign exchange forpurposes of performing material obligations under the Credit Agreement; (xii) any material adverse changearising in the financial condition of CEMEX, which two thirds or more of the Credit Agreement’s creditors
14

determine would result in our failure, taken as a whole, to perform payment obligations under the CreditAgreement; and (xiii) failure to comply with laws or our obligations under the Credit Agreement cease to belegal. If an event of default occurs and is continuing, upon the authorization of two thirds or more of the CreditAgreement creditors, the creditors have the ability to accelerate all outstanding amounts due under the CreditAgreement. Acceleration is automatic in the case of insolvency.
We cannot assure you that we will be able to comply with the restrictive covenants and limitationscontained in the Credit Agreement. Our failure to comply with such covenants and limitations could result in anevent of default, which could materially and adversely affect our business, financial condition and results ofoperation.
We pledged the capital stock of subsidiaries that represent substantially all of our business as collateral tosecure our payment obligations under the Credit Agreement, the Senior Secured Notes and other financingarrangements.
CEMEX, S.A.B. de C.V. and certain of its subsidiaries have pledged under pledge agreements or transferredto a trustee under a security trust substantially all the shares of CEMEX México, Cemex Operaciones México,CTH, New Sunward, and CEMEX España as Collateral and all proceeds of the Collateral to secure our paymentobligations under the Credit Agreement, the Senior Secured Notes and under a number of other financingarrangements for the benefit of the creditors and holders of debt, and other obligations that benefit fromprovisions in their instruments requiring that their obligations be equally and ratably secured.
As of March 31, 2017, the Collateral and all proceeds of such Collateral secured (i) Ps190,147 million(U.S.$10,152 million) (principal amount Ps191,720 million (U.S.$10,236 million)) of debt under the CreditAgreement, the Senior Secured Notes and other financing arrangements and (ii) Ps8,222 million (U.S.$439million) aggregate principal amount of Perpetual Debentures. These subsidiaries collectively own, directly orindirectly, substantially all of our operations worldwide. Provided that no default has occurred which iscontinuing under the Credit Agreement, the Collateral will be released automatically if we meet specified debtreduction and financial covenant targets.
We have a substantial amount of debt and other financial obligations maturing in the next several years. Ifwe are unable to secure refinancing on favorable terms or at all, we may not be able to comply with ourupcoming payment obligations. Our ability to comply with our principal maturities and financial covenantsmay depend on us making asset sales, and there is no assurance that we will be able to execute such saleson terms favorable to us or at all.
As of March 31, 2017, our total debt plus other financial obligations were Ps237,459 million (U.S.$12,678million) (principal amount Ps239,781 million (U.S.$12,802 million)), which does not include approximatelyPs8,222 million (U.S.$439 million), which represents the nominal amount of Perpetual Debentures. Of such totaldebt plus other financial obligations amount, Ps1,929 million (U.S.$103 million) (principal amountPs1,910 million (U.S.$102 million)) matures during 2017; Ps32,871 million (U.S.$1,755 million) (principalamount Ps33,414 million (U.S.$1,784 million)) matures during 2018; Ps29,387 million (U.S.$1,569 million)(principal amount Ps29,668 million (U.S.$1,584 million)) matures during 2019; Ps32,047 million (U.S.$1,711million) (principal amount Ps32,553 million (U.S.$1,738 million)) matures during 2020; and Ps141,225 million(U.S.$7,540 million) (principal amount Ps142,236 million (U.S.$7,594 million)) matures after 2020.
If we are unable to comply with our upcoming principal maturities under our indebtedness, or refinance orextend maturities of our indebtedness, our debt could be accelerated. Acceleration of our debt would have amaterial adverse effect on our business, financial condition and results of operations. As a result of therestrictions under the Credit Agreement, the indentures that govern our Senior Secured Notes and other debtinstruments, the current global economic environment and uncertain market conditions, we may not be able tocomplete asset sales on terms that we find economically attractive or at all. Volatility in the credit and capital
15

markets could significantly affect us due to its effect on the availability of funds to potential acquiring parties,including industry peers. In addition, high levels of consolidation in our industry in some jurisdictions mayfurther limit potential assets sales to interested parties due to antitrust considerations. If we are unable tocomplete asset sales and our cash flow or capital resources prove inadequate, we could face liquidity problemsand may not be able to comply with financial covenants and payment obligations under our indebtedness.
In addition, our levels of debt, contractual restrictions, and our need to deleverage may limit our planningflexibility and our ability to react to changes in our business and the industry, and may place us at a competitivedisadvantage compared to competitors who may have lower leverage ratios and fewer contractual restrictions.There can also be no assurance that, because of our high leverage ratio and contractual restrictions, we will beable to maintain our operating margins and deliver financial results comparable to the results obtained in the pastunder similar economic conditions.
We may not be able to generate sufficient cash to service all of our indebtedness or satisfy our short-termliquidity needs, and we may be forced to take other actions to satisfy our obligations under our indebtednessand our short-term liquidity needs, which may not be successful.
Historically, we have addressed our liquidity needs, including funds required to make scheduled principaland interest payments, refinance debt, and fund working capital and planned capital expenditures, with operatingcash flow, borrowings under credit facilities and receivables and inventory financing facilities, proceeds of debtand equity offerings and proceeds from asset sales.
As of December 31, 2016, we had U.S.$535 million funded under our securitization programs in Mexico,the United States, France and the United Kingdom. We cannot assure you that, going forward, we will be able to,if needed, roll over or renew these programs, which could adversely affect our liquidity.
The weakness of the global economic environment and its adverse effects on our operating results maynegatively affect our credit rating and the market value of CEMEX, S.A.B. de C.V.’s common stock, CPOs andADSs. If current economic pressures continue or worsen, we may be dependent on the issuance of equity as asource to repay our existing indebtedness. Although we have been able to raise debt, equity and equity-linkedcapital in the recent past, previous conditions in the capital markets in 2008 and 2009 were such that traditionalsources of capital were not available to us on reasonable terms or at all. As a result, we cannot assure you that wewill be able to successfully raise additional debt or equity capital on terms that are favorable to us or at all.
The Credit Agreement restricts us from incurring additional debt, subject to several exceptions. The CreditAgreement requires proceeds from asset disposals, issuances of equity and incurrences of debt to be applied tothe prepayment of indebtedness under the Credit Agreement, unless the proceeds are used to reinvest in ourbusiness and/or refinance existing indebtedness for proceeds from asset disposals and issuances of equity, and forcash replenishment or to refinance existing indebtedness for the prepayment of the indebtedness on the terms setforth in the Credit Agreement.
We have sought and obtained waivers and amendments to several of our debt instruments relating to anumber of financial ratios in the past. Our ability to comply with these ratios may be affected by current globaleconomic conditions and volatility in foreign exchange rates and the financial and capital markets. We may needto seek waivers or amendments in the future. However, we cannot assure you that any future waivers oramendments, if requested, will be obtained. If we are unable to comply with the provisions of our debtinstruments, and are unable to obtain a waiver or amendment, the indebtedness outstanding under such debtinstruments could be accelerated. Acceleration of these debt instruments would have a material adverse effect onour business and financial condition.
If the global economic environment deteriorates and our operating results worsen significantly, if we wereunable to complete debt or equity offerings or if our planned divestitures and/or our cash flow or capital
16
resources prove inadequate, we could face liquidity problems and may not be able to comply with our upcomingprincipal payments under our indebtedness or refinance our indebtedness.
The indentures governing the Senior Secured Notes and the terms of our other indebtedness imposesignificant operating and financial restrictions, which may prevent us from capitalizing on businessopportunities and may impede our ability to refinance our debt and the debt of our subsidiaries.
As of March 31, 2017, there were U.S.$6,126 million and €1,750 million aggregate principal amount ofSenior Secured Notes outstanding under the indentures governing such notes. The indentures governing theSenior Secured Notes and the other instruments governing our consolidated indebtedness impose significantoperating and financial restrictions on us. These restrictions will limit our ability, among other things, to:(i) incur debt; (ii) pay dividends on stock; (iii) redeem stock or redeem subordinated debt; (iv) make investments;(v) sell assets, including capital stock of subsidiaries; (vi) guarantee indebtedness; (vii) enter into agreements thatrestrict dividends or other distributions from restricted subsidiaries; (viii) enter into transactions with affiliates;(ix) create or assume liens; (x) engage in mergers or consolidations; and (xi) enter into a sale of all orsubstantially all of our assets.
These restrictions could limit our ability to seize attractive growth opportunities for our businesses that arecurrently unforeseeable, particularly if we are unable to incur financing or make investments to take advantage ofthese opportunities.
These restrictions may significantly impede our ability to develop and implement refinancing plans inrespect of our debt.
Most of the covenants are subject to a number of important exceptions and qualifications. The breach of anyof these covenants could result in a default under the indentures governing the Senior Secured Notes, as well ascertain other existing debt obligations, as a result of the cross-default provisions contained in the instrumentsgoverning such debt obligations. In the event of a default under any of the indentures governing the SeniorSecured Notes, holders of the Senior Secured Notes could seek to declare all amounts outstanding under suchSenior Secured Notes, together with accrued and unpaid interest, if any, to be immediately due and payable. Ifthe indebtedness under the Senior Secured Notes, or certain other existing debt obligations were to beaccelerated, we cannot assure you that our assets would be sufficient to repay in full such acceleratedindebtedness or our other indebtedness.
Furthermore, upon the occurrence of any event of default under the Credit Agreement, the indenturesgoverning our Senior Secured Notes or other credit facilities or any of our other debt, the lenders could elect todeclare all amounts outstanding thereunder, together with accrued interest, to be immediately due and payable. Ifthe lenders accelerate payment of those amounts, we cannot assure you that our assets would be sufficient torepay in full those amounts or to satisfy our other liabilities.
In addition, in connection with the entry into new financings or amendments to existing financingarrangements, our financial and operational flexibility may be further reduced as a result of more restrictivecovenants, requirements for security and other terms that are often imposed on sub-investment grade entities.
CEMEX, S.A.B. de C.V.’s ability to repay debt and pay dividends depends on our subsidiaries’ ability totransfer income and dividends to us.
Aside from operating certain assets in Mexico, CEMEX, S.A.B. de C.V. is a holding company that owns thestock of its direct and indirect subsidiaries and has holdings of cash and marketable securities. In general,CEMEX, S.A.B. de C.V.’s ability to repay debt and pay dividends depends on the continued transfer to it ofdividends and other income and funds from its wholly-owned and non-wholly-owned subsidiaries. Even thoughour debt agreements and instruments restrict us from entering into any agreement or arrangement that limits the
17

ability of any subsidiary of CEMEX, S.A.B. de C.V. to declare or pay dividends or repay or capitalizeintercompany indebtedness, the ability of CEMEX, S.A.B. de C.V.’s subsidiaries to pay dividends and makeother transfers to it is limited by various regulatory, contractual and legal constraints. The Credit Agreementrestricts CEMEX, S.A.B. de C.V.’s ability to declare or pay cash dividends. In addition, the indentures governingthe Senior Secured Notes also limit CEMEX, S.A.B. de C.V.’s ability to pay dividends.
The ability of CEMEX, S.A.B. de C.V.’s subsidiaries to pay dividends, and make loans and other transfersto it is generally subject to various regulatory, legal and economic limitations. Depending on the jurisdiction oforganization of the relevant subsidiary, such limitations may include solvency and legal reserve requirements,dividend payment restrictions based on interim financial results or minimum net worth and withholding taxes onloan interest payments. For example, our subsidiaries in Mexico are subject to Mexican legal requirements,which provide that a corporation may declare and pay dividends only out of the profits reflected in the year-endfinancial statements that are or have been approved by its stockholders. In addition, such payment can beapproved by a subsidiary’s stockholders only after the creation of a required legal reserve (equal to one fifth ofthe relevant company’s capital) and compensation or absorption of losses, if any, incurred by such subsidiary inprevious fiscal years.
CEMEX, S.A.B. de C.V. may also be subject to exchange controls on remittances by its subsidiaries fromtime to time in a number of jurisdictions. In addition, CEMEX, S.A.B. de C.V.’s ability to receive funds fromthese subsidiaries may be restricted by covenants in the debt instruments and other contractual obligations ofthose entities.
CEMEX, S.A.B. de C.V. currently does not expect that existing regulatory, legal and economic restrictionson its subsidiaries’ ability to pay dividends and make loans and other transfers to it will negatively affect itsability to meet its cash obligations. However, the jurisdictions of organization of CEMEX, S.A.B. de C.V.’ssubsidiaries may impose additional and more restrictive regulatory, legal and/or economic limitations. Inaddition, CEMEX, S.A.B. de C.V.’s subsidiaries may not be able to generate sufficient income to pay dividendsor make loans or other transfers to it in the future. Any material additional future limitations on our subsidiariescould adversely affect CEMEX, S.A.B. de C.V.’s ability to service our debt and meet its other cash obligations.
We are subject to restrictions due to non-controlling interests in our consolidated subsidiaries.
We conduct our business through subsidiaries. In some cases, third-party shareholders hold non-controllinginterests in these subsidiaries, such as in the case of CEMEX Latam, CHP and TCL. Various disadvantages mayresult from the participation of non-controlling shareholders whose interests may not always be aligned withours. Some of these disadvantages may, among other things, result in our inability to implement organizationalefficiencies and transfer cash and assets from one subsidiary to another in order to allocate assets mosteffectively.
We have to service our debt and other financial obligations denominated in Dollars with revenues generatedin Mexican Pesos or other currencies, as we do not generate sufficient revenue in Dollars from ouroperations to service all our debt and other financial obligations denominated in Dollars. This couldadversely affect our ability to service our obligations in the event of a devaluation or depreciation in thevalue of the Mexican Peso, or any of the other currencies of the countries in which we operate, compared tothe U.S. Dollar. In addition, our consolidated reported results and outstanding indebtedness aresignificantly affected by fluctuations in exchange rates between the Mexican Peso and other currencies.
A substantial portion of our total debt plus other financial obligations is denominated in Dollars. As ofMarch 31, 2017, our debt plus other financial obligations denominated in Dollars represented approximately 74%of our total debt plus other financial obligations, which does not include U.S.$371 million of Dollar-denominatedPerpetual Debentures. Our Dollar-denominated debt must be serviced with funds generated by CEMEX, S.A.B.de C.V.’s subsidiaries. Although we have substantial operations in the U.S., we continue to rely on our non-U.S.
18

assets to generate revenues to service our Dollar-denominated debt. Consequently, we have to use revenuesgenerated in Mexican Pesos, Euros or other currencies to service our Dollar-denominated obligations. See “Item5—Operating and Financial Review and Prospects—Quantitative and Qualitative Market Disclosure—InterestRate Risk, Foreign Currency Risk and Equity Risk—Foreign Currency Risk.” A devaluation or depreciation inthe value of the Mexican Peso, Euro, British Pound, Colombian Peso or any of the other currencies of thecountries in which we operate, compared to the U.S. Dollar, could adversely affect our ability to service ourDollar-denominated debt. In 2016, our operations in Mexico, the United Kingdom, Germany, France, Spain, theRest of Europe, Colombia, Egypt, the Philippines, the Rest of Asia, Middle East and Africa (as described in“Item 4—Information on the Company—Business Overview”), which are our main non-Dollar-denominatedoperations, together generated approximately 60% of our total net sales in Mexican Peso terms (approximately20%, 8%, 4%, 5%, 2%, 4%, 5%, 3%, 4%, and 5%, respectively) before eliminations resulting fromconsolidation. In 2016, approximately 26% of our net sales in Mexican Peso terms were generated in the UnitedStates. During 2016, the Mexican Peso depreciated approximately 20% against the U.S. Dollar, the Eurodepreciated approximately 3% against the U.S. Dollar and the British Pound depreciated approximately 20%against the U.S. Dollar. If we enter into currency hedges in the future, these may not be effective in covering allour currency-related risks. Our consolidated reported results for any period and our outstanding indebtedness asof any date are significantly affected by fluctuations in exchange rates between the Mexican Peso and othercurrencies, as those fluctuations influence the amount of our indebtedness when translated into Mexican Pesosand also result in foreign exchange gains and losses as well as gains and losses on derivative contracts, includingthose entered into to hedge our exchange rate exposure. The Credit Agreement and other debt instrumentssignificantly restrict our ability to enter into derivative transactions. For a description of these restrictions, see“Item 3—Key Information—Risk Factors—Risks Relating To Our Business—Our use of derivative financialinstruments has negatively affected, and any new derivative financial instruments could negatively affect, ouroperations, especially in volatile and uncertain markets.”
In addition, as of March 31, 2017, our Euro-denominated total debt plus other financial obligationsrepresented approximately 22% of our total debt plus other financial obligations, which does not include the€64 million aggregate principal amount of Euro-denominated Perpetual Debentures.
Our use of derivative financial instruments has negatively affected, and any new derivative financialinstruments could negatively affect, our operations, especially in volatile and uncertain markets.
We have used, and may continue to use, derivative financial instruments to manage the risk profileassociated with interest rates and currency exposure of our debt, to reduce our financing costs, to accessalternative sources of financing and to hedge some of our financial risks. However, we cannot assure you that ouruse of such instruments will allow us to achieve these objectives due to the inherent risks in any derivativestransaction. The Credit Agreement and other debt instruments significantly restrict our ability to enter intoderivative transactions.
As of December 31, 2016, our derivative financial instruments consisted of equity derivatives on shares ofCEMEX, S.A.B. de C.V. (including the capped call transactions in connection with the March 2018 OptionalConvertible Subordinated U.S. Dollar Notes), forward contracts, interest rate derivatives related to energyprojects and fuel price hedging, which had an impact on our other financial income, net. The fair value changesof our derivative financial instruments are reflected in our statement of operations, which could introducevolatility in our controlling interest net income and our related ratios. For the years ended December 31, 2015and 2016, the recognition of changes in the fair value of derivative financial instruments during the applicableperiod represented net losses of approximately Ps2,981 million (U.S.$173 million) and approximatelyPs317 million (U.S.$17 million), respectively.
CEMEX has significantly decreased its use of derivatives instruments related to debt, both currency andinterest rate derivatives, thereby reducing the risk of cash margin calls. See notes 2F, 16D and 16E to our 2016audited consolidated financial statements included elsewhere in this annual report. However, with respect to our
19

existing financial derivatives, we may incur net losses and be subject to margin calls that do not require asubstantial amount of cash to cover such margin calls. If we enter into new derivative financial instruments, wemay incur net losses and be subject to margin calls in which the cash required to cover margin calls may besubstantial and may reduce the funds available to us for our operations or other capital needs. In addition, as withany derivative position, CEMEX assumes the creditworthiness risk of the counterparty, including the risk that thecounterparty may not honor its obligations to us.
We are subject to the laws and regulations of the countries where we operate and any material changes insuch laws and regulations and/or any significant delays in our assessing the impact and/or adapting to suchchanges may have an adverse effect on our business, financial condition and results of operations.
Our operations are subject to the laws and regulations of the countries where we operate and such laws andregulations, and/or governmental interpretations of such laws and regulations, may change. Any such changemay have a material adverse effect on our business, financial condition and results of operations. Furthermore,changes in laws and regulations and/or governmental interpretations of such laws and regulations in the countrieswhere we operate may require us to devote a significant amount of time and resources to assess and, if required,to adjust our operations to any such changes, which could have a material adverse effect on our business,financial condition and results of operations. In addition, any significant delays in assessing the impact and/or, ifrequired, in adapting to changes in laws and regulations and/or governmental interpretations of such laws andregulations may also have a material adverse effect on our business, financial condition and results of operations.
We may fail to obtain or renew or may experience material delays in obtaining requisite governmentalapprovals, licenses and permits for the conduct of our business.
We require various approvals, licenses, permits and certificates in the conduct of our business. We cannotassure you that we will not encounter significant problems in obtaining new or renewing existing approvals,licenses, permits and certificates required in the conduct of our business, or that we will continue to satisfy theconditions to which such approvals, licenses, permits and certificates are granted. There may also be delays onthe part of regulatory and administrative bodies in reviewing our applications and granting approvals. Ifpreviously obtained approvals, licenses, permits and certificates are revoked and/or if we fail to obtain and/ormaintain the necessary approvals, licenses, permits and certificates required for the conduct of our business, wemay be required to incur substantial costs or temporarily suspend the operation of one or more of our productionfacilities or mineral extraction locations, which could have a material adverse effect on our business, financialcondition, results of operations and prospects.
We may fail to secure certain materials required to run our business.
We increasingly use in our business certain by-products of industrial processes produced by third parties,such as pet coke, fly-ash, slag and synthetic gypsum. While we are not dependent on our suppliers and while wetry to secure the supply of the required materials through long-term renewable contracts and frameworkagreements, which ensure better management of supplies, short-term contracts are however entered into incertain countries where we operate. Should existing suppliers cease operations or reduce or eliminate productionof these by-products, sourcing costs for these materials could increase significantly or require us to findalternative sources for these materials, which could have a material adverse effect on our business, financialcondition, results of operations and prospects. Additionally, scarcity of natural resources (such as water andaggregates reserves) in some of the countries where we operate could have a material adverse effect on our costsand results of operations.
We may not be able to realize the expected benefits from acquisitions, some of which may have a materialimpact on our business, financial condition and results of operations.
Even though we have not made any major acquisitions in recent years, our ability to realize the expectedbenefits from acquisitions depends, in large part, on our ability to integrate acquired operations with our existing
20

operations in a timely and effective manner. These efforts may not be successful. Although we are currentlyseeking to dispose assets to reduce our overall leverage, the Credit Agreement and other debt instruments restrictour ability to acquire assets, and we may in the future acquire new operations and integrate such operations intoour existing operations, and some of such acquisitions may have a material impact on our business, financialcondition and results of operations. We cannot assure you that we will be successful in identifying or acquiringsuitable assets in the future. If we fail to achieve the anticipated cost savings from any acquisitions, our business,financial condition and results of operations could be materially and adversely affected.
High energy and fuel costs may have a material adverse effect on our operating results.
Our operations consume significant amounts of power and fuel. Power and fuel prices generally reflectcertain volatility, particularly in times of political turbulence in Iran, Iraq, Egypt and other countries in SouthAmerica, the Middle East and Africa. Even though energy and fuel prices have recently decreased, we cannotassure you that our operations would not be materially adversely affected in the future if energy and fuel costsincrease to levels that existed prior to the recent significant decreases in the price of oil and other fuels.
In addition, if our efforts to increase our use of alternative fuels are unsuccessful, we would be required touse traditional fuels, which may increase our energy and fuel costs and could have a material adverse effect onour business, financial condition and results of operations.
The introduction of substitutes for cement, concrete or aggregates into the market and the development ofnew construction techniques could have a material adverse effect on our business, financial condition andresults of operations.
Materials such as plastic, aluminum, ceramics, glass, wood and steel can be used in construction as asubstitute for cement, concrete or aggregates. In addition, other construction techniques, such as the use of drywall, could decrease the demand for cement, concrete and/or aggregates. Further, research aimed at developingnew construction techniques and modern materials may introduce new products in the future that reduce thedemand for cement, concrete and/or aggregates. The use of substitutes for cement, concrete or aggregates couldcause a significant reduction in the demand and prices for our products.
We operate in highly competitive markets and if we do not compete effectively, our results of operations willbe harmed.
The markets in which we operate are highly competitive and are served by a variety of establishedcompanies with recognized brand names, as well as new market entrants and increasing imports. Companies inthese markets compete based on a variety of factors, often employing aggressive pricing strategies to gain marketshare. Our ability to increase our net sales depends, in part, on our ability to compete effectively. We competewith different types of companies and based on different factors in each market. For example, in the relativelyconsolidated cement and ready-mix concrete industries, we generally compete based on quality and valueproposition. In the more fragmented market for aggregates, we generally compete based on capacity and price. Incertain areas of the markets in which we compete, some of our competitors may be more established, benefitfrom greater brand recognition or have greater manufacturing and distribution channels and other resources thanwe do. In addition, if our competitors were to combine, they may be able to compete more effectively with us andthey may dispose of assets, which could lead to new market entrants that increase competition in our markets.For example, Lafarge, S.A. (“Lafarge”) and Holcim Ltd. (“Holcim”) finalized their merger in 2015, and Ireland’sCRH plc (“CRH”) acquired the vast majority of the assets disposed by Lafarge and Holcim pursuant to therequirements of regulators. Another example is HeidelbergCement AG’s (“Heidelberg”) acquisition ofItalcementi S.p.A. (“Italcementi”), which was completed in July 2016.
If we are not able to compete effectively, we may lose substantial market share, our net sales could declineor grow at a slower rate and our business and results of operations would be harmed.
21
A substantial amount of our total assets consists of intangible assets, including goodwill. We haverecognized charges for goodwill impairment in the past, and if market or industry conditions deterioratefurther, additional impairment charges may be recognized.
Our 2016 audited consolidated financial statements included elsewhere in this annual report, have beenprepared in accordance with IFRS as issued by the IASB, under which goodwill is not amortized and is tested forimpairment when impairment indicators exist or at least once a year during the fourth quarter of each year, bydetermining the recoverable amount of the groups of cash-generating units to which goodwill balances have beenallocated, which consists of the higher of such groups of cash-generating units fair value, less cost to sell, andtheir corresponding value in use, represented by the discounted amount of estimated future cash flows expectedto be generated by such groups of cash-generating units to which goodwill has been allocated. An impairmentloss is recognized under IFRS if the recoverable amount is lower than the net book value of the groups of cash-generating units to which goodwill has been allocated within other expenses, net. We determine the discountedamount of estimated future cash flows over periods of five years. In specific circumstances, when, according toour experience, actual results for a given cash-generating unit do not fairly reflect historical performance andmost external economic variables provide us with confidence that a reasonably determinable improvement in themid-term is expected in their operating results, management uses cash flow projections over a period of up to tenyears, to the point in which future expected average performance resembles the historical average performanceand to the extent we have detailed, explicit and reliable financial forecasts and is confident and can demonstrateits ability, based on past experience, to forecast cash flows accurately over that longer period. If the value in useof a group of cash-generating units to which goodwill has been allocated is lower than its corresponding carryingamount, we determine its corresponding fair value using methodologies generally accepted in the markets todetermine the value of entities, such as multiples of Operating EBITDA and/or by reference to other markettransactions, among others. Impairment tests are significantly sensitive to, among other factors, the estimation offuture prices of our products, trends in operating expenses, local and international economic trends in theconstruction industry, the long-term growth expectations in the different markets, as well as the discount ratesand the growth rates in perpetuity applied, among others. We use specific pre-tax discount rates for each group ofcash-generating units to which goodwill is allocated, which are applied to pre-tax cash flows. The amounts ofestimated undiscounted cash flows are significantly sensitive to the growth rates in perpetuity applied. Likewise,the amounts of discounted future cash flows are significantly sensitive to the weight average cost of capital(discount rate) applied. The higher the growth rate in perpetuity applied, the higher the amount of undiscountedfuture cash flows by group of cash-generating units obtained. Conversely, the higher the discount rate applied,the lower the amount of discounted estimated future cash flows by group of cash-generating units obtained.During the last quarters of each of 2014, 2015 and 2016, we performed our annual goodwill impairment test.Based on these analyses, we did not determine impairment losses of goodwill in any of the reported periods. Seenote 15C to our 2016 audited consolidated financial statements included elsewhere in this annual report.
Considering the important role that economic factors play in testing goodwill for impairment, we cannotassure that an eventual downturn in the economies where we operate will not necessitate further impairment testsand a possible downward readjustment of our goodwill for impairment under IFRS. Such an impairment testcould result in impairment charges which could be material to our financial statements.
We are subject to litigation proceedings, including antitrust proceedings, that could harm our business if anunfavorable ruling were to occur.
From time to time, we are and may become involved in litigation and other legal proceedings relating toclaims arising from our operations in the normal course of business. As described in, but not limited to, “Item4—Information on the Company—Regulatory Matters and Legal Proceedings,” we are currently subject to anumber of significant legal proceedings, including, but not limited to, those relating to an SEC investigationconcerning a new cement plant being built by CEMEX Colombia, S.A. (“CEMEX Colombia”) in the Antioquiadepartment of the Municipality of Maceo, Colombia, as well as antitrust investigations in countries in which weoperate. In addition, our main operating subsidiary in Egypt, Assiut Cement Company (“ACC”), is involved in
22

certain Egyptian legal proceedings relating to the acquisition of ACC. Litigation is subject to inherentuncertainties, and unfavorable rulings may occur. We cannot assure you that these or other legal proceedings willnot materially affect our ability to conduct our business in the manner that we expect or otherwise adverselyaffect us should an unfavorable ruling occur.
We have concluded that our internal control over financial reporting was not effective as of December 31,2016, and our remediation efforts are ongoing. As a result, our ability to report our results of operationsaccurately, including our ability to make required filings with government authorities, may be adverselyaffected if our remediation efforts are not adequate. In addition, the trading price of our securities may beadversely affected by a related negative market reaction.
We have identified a material weakness in our internal control over financial reporting. Our management,including CEMEX, S.A.B. de C.V.’s Chief Executive Officer and Executive Vice President of Finance and ChiefFinancial Officer, has concluded that our disclosure controls and procedures were not effective as ofDecember 31, 2016 to achieve their intended objectives. We have identified the following material weakness inour internal control over financial reporting: our risk assessment process did not operate effectively to implementcontrols that would prevent, or detect and correct, misstatements resulting from apparent collusion ormanagement override of controls in relation to significant unusual transactions. In addition, we did not designand operate effective monitoring controls to detect non-compliance with our policies related to the financialreporting of significant unusual transactions. This material weakness relates, in part, to the previously disclosedirregular payments to a non-governmental individual made in connection with the construction by CEMEXColombia of a new integrated cement plant in the Antioquia department near the municipality of Maceo,Colombia (the “Maceo Project”). As of December 31, 2016, the investigations of this failure, and theimplementation of our remediation plan to address it, were not far enough advanced to provide a sufficient levelof assurance that such circumvention or override of controls and misuse of funds by management would beprevented. For more information, see “Item 15—Controls and Procedures.” As of the date of this annual report,the process of designing, implementing and validating remedial measures related to the material weakness isongoing. If our efforts to remediate this material weakness are not successful, we may be unable to report ourresults of operations accurately and make our required filings with government authorities, including the SEC.Furthermore, our business and operating results and the price of our securities may be adversely affected byrelated negative market reactions. We cannot be certain that in the future additional material weaknesses will notexist or otherwise be discovered.
Our operations are subject to environmental laws and regulations.
Our operations are subject to a broad range of environmental laws and regulations in each of thejurisdictions in which we operate. These laws and regulations impose stringent environmental protectionstandards regarding, among other things, air emissions, wastewater discharges, the use and handling of hazardouswaste or materials, waste disposal practices and the remediation of environmental damage or contamination.These laws and regulations expose us to the risk of substantial environmental costs and liabilities, including finesand other sanctions, the payment of compensation to third parties, remediation costs and damage to reputation.Moreover, the enactment of stricter laws and regulations, stricter interpretation of existing laws or regulations, ornew enforcement initiatives, may impose new risks or costs on us or result in the need for additional investmentsin pollution control equipment, which could result in a material decline in our profitability.
In late 2010, the U.S. Environmental Protection Agency (“EPA”) issued the final Portland Cement NationalEmission Standard (“Portland Cement NESHAP”) for Hazardous Air Pollutants under the federal Clean Air Act(“CAA”). This rule required Portland cement plants to limit mercury emissions, total hydrocarbons, hydrochloricacid and particulate matter by September 2013. The rule was challenged in federal court, and in December 2011,the D.C. Circuit Court of Appeals remanded the Portland Cement NESHAP to EPA and directed the agency torecompute the standards. In February 2013, EPA issued a revised final Portland Cement NESHAP rule thatrelaxed emissions limits for particulate matter and moved the compliance deadline to September 2015. In April
23

2013, environmental groups again challenged the revised Portland Cement NESHAP rule in federal court. InApril 2014, the D.C. Circuit issued a ruling upholding both the revised particulate matter emission limits and theSeptember 2015 compliance deadline. Prior to the September 2015 compliance deadline, we requested andreceived an additional 12 months to demonstrate compliance. Portland Cement NESHAP compliance-relatedwork continues in 2017 in several of our plants, for which we have received extensions to the compliancedeadline. Compliance could require us to utilize significant resources, which could have a material adverseimpact on our results of operations, liquidity and financial condition; however, we expect that such impact wouldbe consistent with the impact on the cement industry as a whole.
In February 2013, EPA issued revised final emissions standards under the CAA for commercial andindustrial solid waste incinerators (“CISWI”). Under the CISWI rule, if a material being used in a cement kiln asan alternative fuel is classified as a solid waste, the plant must comply with CISWI standards. The CISWI rulecovers nine pollutants, and imposes more stringent emissions limits on certain pollutants that also are regulatedunder the Portland Cement NESHAP. The CISWI rule was challenged by both industrial and environmentalgroups in federal court. In July 2016, the D.C. Circuit issued a ruling upholding portions of the rule andremanding other portions to EPA for further consideration. In December 2016, the D.C. Circuit rejected themotions for reconsideration. If the CISWI rule takes effect in its current form, and if kilns at CEMEX plants aredetermined to be CISWI kilns due to the use of certain alternative fuels, the emissions standards imposed by theCISWI rule could have a material impact on our business operations.
Under certain environmental laws and regulations, liability associated with investigation or remediation ofhazardous substances can arise at a broad range of properties, including properties currently or formerly ownedor operated by CEMEX, as well as facilities to which we sent hazardous substances or wastes for treatment,storage or disposal. Such laws and regulations may apply without regard to causation or knowledge ofcontamination. We occasionally evaluate various alternatives with respect to our facilities, including possibledispositions or closures. Investigations undertaken in connection with these activities (or ongoing operational orconstruction activities) may lead to hazardous substance releases or discoveries of historical contamination thatmust be remediated, and closures of facilities may trigger compliance requirements that are not applicable tooperating facilities. While compliance with these laws and regulations has not materially adversely affected ouroperations in the past, we cannot assure you that these requirements will not change and that compliance will notadversely affect our operations in the future. Furthermore, we cannot assure you that existing or futurecircumstances or developments with respect to contamination will not require us to make significant remediationor restoration expenditures.
The cement manufacturing process requires the combustion of large amounts of fuel and creates carbondioxide (“CO2”) as a by-product of the calcination process. Therefore, efforts to address climate change throughfederal, state, regional, EU and international laws and regulations requiring reductions in emissions ofgreenhouse gases (“GHGs”) can create economic risks and uncertainties for our business. Such risks couldinclude the cost of purchasing allowances or credits to meet GHG emission caps, the cost of installing equipmentto reduce emissions to comply with GHG limits or required technological standards, decreased profits or lossesarising from decreased demand for our goods and higher production costs resulting directly or indirectly from theimposition of legislative or regulatory controls. To the extent that financial markets view climate change andGHG emissions as a financial risk, this could have a material adverse effect on our cost of and access to capital.Given the uncertain nature of the actual or potential statutory and regulatory requirements for GHG emissions atthe federal, state, regional, EU and international levels, we cannot predict the impact on our operations orfinancial condition or make a reasonable estimate of the potential costs to us that may result from suchrequirements. However, the impact of any such requirements, whether individually or cumulatively, could have amaterial economic impact on our operations in the United States and in other countries. For more information onthe laws and regulations addressing climate change that we are, or could become, subject to, and the impacts toour operations arising therefrom, see “Item 4—Information on the Company—Regulatory Matters and LegalProceedings—Environmental Matters.”
24

Cement production raises a number of health and safety issues. As is the case with other companies in ourindustry, some of our aggregate products contain varying amounts of crystalline silica, a common mineral. Also,some of our construction and material processing operations release, as dust, crystalline silica that is in thematerials being handled. Excessive, prolonged inhalation of very small-sized particles of crystalline silica hasallegedly been associated with respiratory disease (including silicosis). As part of our annual due diligence, wework with our stakeholders to verify that certain health and safety protocols are in place as regards themanagement of silica and its health effects. Nonetheless, under various laws we may be subject to future claimsrelated to exposure to these or other substances.
Other health and safety issues related to our business include: burns arising from contact with hot cementkiln dust or dust on preheater systems; air borne hazards related to our aggregates mining activities; noise,including from chutes and hoppers, milling plants, exhaust fans and blowers; the potential for dioxin formation ifchlorine-containing alternative fuels are introduced into kilns; plant cleaning and maintenance activitiesinvolving working at height or in confined or other awkward locations, and the storage and handling of coal, petcoke and certain alternative fuels, which, in their finely ground state, can pose a risk of fire or explosion; andhealth hazards associated with operating ready-mix concrete trucks. While we actively seek to minimize the riskposed by these issues, personal injury claims may be made, and substantial damages awarded, against us. Wemay also be required to change our operational practices, involving material capital expenditure.
As part of our insurance-risk governance approach, from time to time we evaluate the need to address thefinancial consequences of environmental laws and regulations through the purchase of insurance. As a result wedo arrange certain types of environmental impairment insurance policies for both site-specific, as well as multi-site locations. We also organize non-specific environmental impairment insurance as part of the provision of abroader corporate insurance strategy. These latter insurance policies are designed to offer some assistance to ourfinancial flexibility to the extent that the specifics of an environmental incident could give rise to a financialliability. However, we cannot assure you that a given environmental incident will be covered by theenvironmental insurance we have in place, or that the amount of such insurance will be sufficient to offset theliability arising from the incident.
We are an international company and are exposed to risks in the countries in which we have significantoperations or interests.
We are dependent, in large part, on the economies of the countries in which we market our products. Theeconomies of these countries are in different stages of socioeconomic development. Consequently, like manyother companies with significant international operations, we are exposed to risks from changes in foreigncurrency exchange rates, interest rates, inflation, governmental spending, social instability and other political,economic or social developments that may materially affect our business, financial condition and results ofoperations.
As of December 31, 2016, we had operations in Mexico, the United States, the United Kingdom, France,Germany, Spain, the Rest of Europe, Colombia, the Rest of SAC, the Philippines, Egypt, and the Rest of Asia,Middle East and Africa (as described in “Item 4—Information on the Company—Business Overview”).
For a geographic breakdown of our net sales for the year ended December 31, 2016, see “Item 4—Information on the Company—Geographic Breakdown of Net Sales for the Year Ended December 31, 2016.”
Our operations in Egypt, the United Arab Emirates (“UAE”) and Israel have experienced instability as aresult of, among other things, civil unrest, extremism and the deterioration of general diplomatic relations in the
25
region. We cannot assure you that political turbulence in Egypt, Syria, Libya and other countries in Africa andthe Middle East will abate in the near future or that neighboring countries will not be drawn into conflicts orexperience instability. In addition, our operations in Egypt are subject to political risks, such as confiscation,expropriation and/or nationalization. See “Item 4—Information on the Company—Regulatory Matters and LegalProceedings—Other Legal Proceedings—Egypt Share Purchase Agreement.”
In January 2011, protests and demonstrations demanding a regime change began taking place across Egypt,which resulted in former President Hosni Mubarak resigning from his post on February 11, 2011. Subsequently,Mr. Mubarak transferred government powers to the Egyptian Army. The Supreme Council of the Armed Forces ofEgypt dissolved the Egyptian parliament, suspended the nation’s constitution, and formed a committee torecommend constitutional changes to facilitate a political transition through democratic elections. Following somedelays, elections for a new parliament took place between November 2011 and January 2012. Elections held in Mayand June of 2012 witnessed the victory of Mohamed Morsi as the fifth president of Egypt. Despite a return tocivilian rule, demonstrations and protests continued to take place across Egypt following Mr. Morsi’s election,culminating in large-scale anti-Morsi protests in June 2013. On July 3, 2013, the Egyptian military, led by GeneralAbdel Fattah el-Sisi removed Mr. Morsi from office and suspended the Egyptian constitution. The Egyptian militarythen appointed Chief Justice Adly Mansour as the interim president of Egypt, and charged him with forming atransitional technocratic government. In May 2014, presidential elections took place, having elected General AbdelFattah el-Sisi. In November and December 2015, parliamentary elections to the House of Representatives tookplace. Although CEMEX’s operations in Egypt have not been immune from disruptions resulting from theturbulence in Egypt, CEMEX continues with its cement production, dispatch and sales activities as of the date ofthis annual report. Risks to CEMEX’s operations in Egypt include a potential reduction in overall economic activityin Egypt and exchange rate volatility, which could have a material adverse effect on our operations in Egypt.
In recent years, concerns over global economic conditions, energy costs, geopolitical issues, politicaluncertainty, the availability and cost of credit and the international financial markets have contributed toeconomic uncertainty and reduced expectations for the global economy. In addition, military activities in Ukraineand on its borders, including Russia effectively taking control of Crimea (followed by Crimea’s independencevote and absorption by Russia) have combined with Ukraine’s very weak economic conditions to create greatuncertainty in Ukraine and the global markets. In response to the annexation of the Crimean region of Ukraine byRussia, other nations, including the U.S., have imposed, and may continue imposing further, economic sanctionson Russia and Ukraine. Presently, concerns related to ongoing unrest in Ukraine have prompted calls forincreasing levels of economic sanctions against Russia and Ukraine. Resolution of Ukraine’s political andeconomic conditions may not occur for some time, and the situation could deteriorate into increased violenceand/or economic collapse. While not directly impacting territories where we had operations as of December 31,2016, this dispute could negatively affect the economies of the countries in which we operate, including throughits impact on the surrounding region, the global economy and the impact it might have on the access to Russianenergy supplies by the countries in which we operate. Further, potential responses by Russia to those sanctionscould adversely affect European economic conditions, which could have a material adverse effect on ouroperations in Europe. Meanwhile, the continued political unrest in Venezuela, the continued hostilities in theMiddle East and the occurrence or threat of terrorist attacks also could adversely affect the global economy.
There is considerable political instability in Taiwan related to its disputes with China and in South Korearelated to its disputes with North Korea. In addition, several Asian countries, particularly Japan, haveexperienced significant economic instability. A major outbreak of hostilities or other political upheaval in China,Taiwan, North Korea or South Korea could adversely affect the global economy, which could have a materialadverse effect on our business, financial condition or result of operation.
There have been terrorist attacks and ongoing threats of future terrorist attacks in countries in which wemaintain operations. We cannot assure you that there will not be other attacks or threats that will lead to aneconomic contraction or erection of material barriers to trade in any of our markets. An economic contraction inany of our major markets could affect domestic demand for cement and could have a material adverse effect onour operations.
26

Our operations can be affected by adverse weather conditions.
Construction activity, and thus demand for our products, decreases substantially during periods of coldweather, when it snows or when heavy or sustained rainfalls occur. Consequently, demand for our products issignificantly lower during the winter in temperate countries and during the rainy season in tropical countries.Winter weather in our European and North American operations significantly reduces our first quarter salesvolumes, and to a lesser extent our fourth quarter sales volumes. Sales volumes in these and similar marketsgenerally increase during the second and third quarters because of normally better weather conditions. However,high levels of rainfall can adversely affect our operations during these periods as well, such as has been the casein early 2017 for our operations in the Philippines. Such adverse weather conditions can adversely affect ourbusiness, financial condition and results of operations if they occur with unusual intensity, during abnormalperiods, or last longer than usual in our major markets, especially during peak construction periods.
We will be adversely affected by any significant or prolonged disruption to our production facilities.
Any prolonged and/or significant disruption to our production facilities, whether due to repair, maintenanceor servicing, industrial accidents, unavailability of raw materials such as energy, mechanical equipment failure,human error or otherwise, will disrupt and adversely affect our operations. Additionally, any major or sustaineddisruptions in the supply of utilities such as water or electricity or any fire, flood or other natural calamities orcommunal unrest or acts of terrorism may disrupt our operations or damage our production facilities orinventories and could adversely affect our business, financial condition and results of operations.
We typically shut down our facilities to undertake maintenance and repair work at scheduled intervals.Although we schedule shut downs such that not all of our facilities are shut down at the same time, theunexpected shut down of any facility may nevertheless affect our business, financial condition and results ofoperations from one period to another.
We are dependent on information technology and our systems and infrastructure, as well as those providedby third-party service providers; face certain risks, including cyber security risks.
We rely on a variety of information technology and automated operating systems to manage or support ouroperations. The proper functioning of these systems is critical to the efficient operation and management of ourbusiness. In addition, these systems may require modifications or upgrades as of a result of technological changesor growth in our business. These changes may be costly and disruptive to our operations, and could imposesubstantial demands on outage time. Our systems, as well as those provided by our third-party service providers,may be vulnerable to damage, disruption or intrusion caused by circumstances beyond our control, such asphysical or electronic break-ins, catastrophic events, power outages, natural disasters, computer system ornetwork failures, viruses or malware, unauthorized access and cyber-attacks. Although we take actions to secureour systems and electronic information and also have disaster recovery plans in case of incidents that could causemajor disruptions to our business, these measures may not be sufficient. As of December 31, 2016, our third-party service providers have not informed us of any relevant event that has materially damaged, disrupted orresulted in an intrusion of our systems. Any significant information leakages or theft of information could affectour compliance with data privacy laws and damage our relationship with our employees, customers andsuppliers, and also adversely impact our business, financial condition and results of operations. As ofDecember 31, 2016, our insurance does not cover any risk associated with any cyber security risks. In addition,any significant disruption to our systems could adversely affect our business, financial condition and results ofoperations.
Activities in our business can be hazardous and can cause injury to people or damage to property in certaincircumstances.
Our production facilities require individuals to work with chemicals, equipment and other materials thathave the potential to cause harm and injury, or fatalities, when used without due care. An accident or injury that
27

occurs at our facilities could result in disruptions to our business and have legal and regulatory consequences andwe may be required to compensate such individuals or incur other costs and liabilities, any and all of which couldadversely affect our reputation, business, financial condition, results of operations and prospects.
Labor activism and unrest, or failure to maintain satisfactory labor relations, could adversely affect ourresults of operations.
Labor activism and unrest may adversely affect our operations and thereby adversely affect our business,financial condition, results of operations and prospects. Although most of our operations have not been affectedby any significant labor dispute in the past, we cannot assure you that we will not experience labor unrest,activism, disputes or actions in the future, some of which may be significant and could adversely affect ourbusiness, financial condition, results of operations and prospects. For a description of our most relevant collectivebargaining agreements, see “Item 6—Directors, Senior Management and Employees—Employees.”
Increases in liabilities related to our pension plans could adversely affect our results of operations.
We have obligations under defined benefit pension and other benefit plans in certain countries in which weoperate, mainly in North America and Europe. Our actual funding obligations will depend on benefit planchanges, government regulations and other factors, including changes in longevity and mortality statistics, whichare not updated every year and could result in our paying benefits over more years due to increased lifespan. Dueto the large number of variables and assumptions that determine pension liabilities and funding requirements,which are difficult to predict because they change continuously as demographics evolve despite the fact that wesupport our projections with studies by external actuaries, our net projected liability recognized in the balancesheet of Ps23,365 million (U.S.$1,128 million) as of December 31, 2016 and the future cash fundingrequirements for our defined benefit pension plans and other postemployment benefit plans could be significantlyhigher than the amounts estimated as of December 31, 2016. If so, these funding requirements, as well as ourpossible inability to properly fund such pension plans if we are unable to deliver the cash or equivalent fundingrequirements, could have a material adverse effect on our business, financial condition, results of operations andprospects.
Our insurance coverage may not cover all the risks to which we may be exposed.
We face the risks of loss and damage to our products, property and machinery due to fire, theft and naturaldisasters such as floods, and also face risks related to cyber security risks. Such events may cause a disruption toor cessation of our operations. While we believe that we have adequate and sufficient coverage, in line withindustry practices, in some instances our insurance coverage may not be sufficient to cover all of our potentialunforeseen losses and liabilities. In addition, our insurance coverage may not cover all the risks to which we maybe exposed, such as cyber security risks. If our losses exceed our insurance coverage, or if we are not covered bythe insurance policies we have taken up, we may be liable to cover any shortfall or losses. Our insurancepremiums may also increase substantially because of such claims. In such circumstances, our financial resultsmay be adversely affected.
Our success depends on key members of our management.
Our success depends largely on the efforts and strategic vision of our executive management team. The lossof the services of some or all of our executive management could have a material adverse effect on our business,financial condition and results of operations.
The execution of our business plan also depends on our ongoing ability to attract and retain additionalqualified employees. For a variety of reasons, particularly with respect to the competitive environment and theavailability of skilled labor, we may not be successful in attracting and retaining the personnel we require. If weare unable to hire, train and retain qualified employees at a reasonable cost, we may be unable to successfullyoperate our business or capitalize on growth opportunities and, as a result, our business, financial condition andresults of operations could be adversely affected.
28

Certain tax matters may have an adverse effect on our cash flow, financial condition and net income.
We are subject to certain tax matters, mainly in Mexico, Colombia and Spain, that, if adversely resolved,may have an adverse effect on our cash flow, financial condition and net income. See notes 2M, 19C and 19D toour 2016 audited consolidated financial statements, “Item 4—Information on the Company—Regulatory Mattersand Legal Proceedings—Tax Matters—Mexico,” “—Regulatory Matters and Legal Proceedings—Tax Matters—Colombia,” and “—Regulatory Matters and Legal Proceedings—Tax Matters—Spain” for a description of thelegal proceedings regarding these Mexican, Colombian and Spanish tax matters, all included elsewhere in thisannual report.
It may be difficult to enforce civil liabilities against us or the members of CEMEX, S.A.B. de C.V.’s Boardof Directors, our executive officers and controlling persons.
CEMEX, S.A.B. de C.V. is a publicly traded stock corporation with variable capital (sociedad anónimabursátil de capital variable) organized under the laws of Mexico. Substantially all members of CEMEX, S.A.B.de C.V.’s Board of Directors and the majority of the members of our senior management reside in Mexico, andall or a significant portion of the assets of those persons may be, and the majority of our assets are, locatedoutside the United States. As a result, it may not be possible for you to effect service of process within the UnitedStates upon such persons or to enforce against them or against us in U.S. courts judgments predicated upon thecivil liability provisions of the federal securities laws of the United States. We have been advised by our GeneralCounsel, Ramiro Gerardo Villarreal Morales, that there is doubt as to the enforceability in Mexico, either inoriginal actions or in actions for enforcement of judgments of U.S. courts, of civil liabilities predicated on theU.S. federal securities laws.
The protections afforded to non-controlling shareholders in Mexico are different from those in the UnitedStates and may be more difficult to enforce.
Under Mexican law, the protections afforded to non-controlling shareholders are different from those in theUnited States. In particular, the legal framework and case law pertaining to disputes between shareholders and us,our directors, our officers or our controlling shareholders, if any, are less developed under Mexican law thanunder U.S. law. Mexican law generally only permits shareholder derivative suits (i.e., suits for our benefit asopposed to the direct benefit of our shareholders) and there are different procedural requirements for bringingshareholder lawsuits, such as shareholder derivative suits, which differ from those you may be familiar withunder U.S. and other laws. There is also a substantially less active plaintiffs’ bar dedicated to the enforcement ofshareholders’ rights in Mexico than in the United States. As a result, in practice it may be more difficult for ournon-controlling shareholders to enforce their rights against us or our directors or controlling shareholders than itwould be for shareholders of a U.S. company.
ADS holders may only vote the Series B shares represented by the CPOs deposited with the ADS depositarythrough the ADS depositary and are not entitled to vote the Series A shares represented by the CPOsdeposited with the ADS depositary or to attend shareholders’ meetings.
Under the terms of the ADSs and CEMEX, S.A.B. de C.V.’s by-laws, a holder of an ADS has the right toinstruct the ADS depositary to exercise voting rights only with respect to Series B shares represented by theCPOs deposited with the depositary, but not with respect to the Series A shares represented by the CPOsdeposited with the depositary. ADS holders will not be able to directly exercise their right to vote unless theywithdraw the CPOs underlying their ADSs (and, in the case of non-Mexican holders, even if they do so, theymay not vote the Series A shares represented by the CPOs) and may not receive voting materials on time toensure that they are able to instruct the depositary to vote the CPOs underlying their ADSs or receive sufficientnotice of a shareholders’ meeting to permit them to withdraw their CPOs to allow them to cast their vote withrespect to any specific matter. In addition, the depositary and its agents may not be able to send out votinginstructions on time or carry them out in the manner an ADS holder has instructed. As a result, ADS holders may
29

not be able to exercise their right to vote and they may lack recourse if the CPOs underlying their ADSs are notvoted as they requested. In addition, ADS holders are not entitled to attend shareholders’ meetings. ADS holderswill also not be permitted to vote the CPOs underlying the ADSs directly at a shareholders’ meeting or to appointa proxy to do so without withdrawing the CPOs. If the ADS depositary does not receive voting instructions froma holder of ADSs in a timely manner such holder will nevertheless be treated as having instructed the ADSdepositary to give a proxy to a person we designate, or at our request, the corresponding CPO trust’s technicalcommittee designates, to vote the Series B shares underlying the CPOs represented by the ADSs in his/herdiscretion. The ADS depositary or the custodian for the CPOs on deposit may represent the CPOs at any meetingof holders of CPOs even if no voting instructions have been received. The CPO trustee may represent the SeriesA shares and the Series B shares represented by the CPOs at any meeting of holders of Series A shares or SeriesB shares even if no voting instructions have been received. By so attending, the ADS depositary, the custodian orthe CPO trustee, as applicable, may contribute to the establishment of a quorum at a meeting of holders of CPOs,Series A shares or Series B shares, as appropriate.
Non-Mexicans may not hold CEMEX, S.A.B. de C.V.’s Series A shares directly and must have them held ina trust at all times.
Non-Mexican investors in CEMEX, S.A.B. de C.V.’s CPOs or ADSs may not directly hold the underlyingSeries A shares, but may hold them indirectly through CEMEX, S.A.B. de C.V.’s CPO trust. Upon the earlytermination or expiration of the term of CEMEX, S.A.B. de C.V.’s CPO trust on September 6, 2029, the Series Ashares underlying CEMEX, S.A.B. de C.V.’s CPOs held by non-Mexican investors must be placed into a newtrust similar to the current CPO trust for non-Mexican investors to continue to hold an economic interest in suchshares. We cannot assure you that a new trust similar to the CPO trust will be created or that the relevantauthorization for the creation of the new trust or the transfer of our Series A shares to such new trust will beobtained. In that event, since non-Mexican holders currently cannot hold Series A shares directly, they may berequired to sell all of their Series A shares to a Mexican individual or corporation.
Preemptive rights may be unavailable to ADS holders.
ADS holders may be unable to exercise preemptive rights granted to CEMEX, S.A.B. de C.V.’sshareholders, in which case ADS holders could be substantially diluted following future equity or equity-linkedofferings. Under Mexican law, whenever CEMEX, S.A.B. de C.V. issues new shares for payment in cash or inkind, CEMEX, S.A.B. de C.V. is generally required to grant preemptive rights to CEMEX, S.A.B. de C.V.’sshareholders, except if the shares are issued in respect of a public offering or if the relevant shares underlieconvertible securities. However, ADS holders may not be able to exercise these preemptive rights to acquire newshares unless both the rights and the new shares are registered in the United States or an exemption fromregistration is available. We cannot assure you that we would file a registration statement in the United States atthe time of any rights offering.
Mexican Peso Exchange Rates
Mexico has had no exchange control system in place since the dual exchange control system was abolishedin November 1991. The Mexican Peso has floated freely in foreign exchange markets since December 1994,when the Mexican Central Bank (Banco de México) abandoned its prior policy of having an official devaluationband. Since then, the Mexican Peso has been subject to substantial fluctuations in value. The Mexican Pesoappreciated against the U.S. Dollar by approximately 9% in 2012, depreciated against the U.S. Dollar byapproximately 2% in 2013, 11% in 2014, 14% in 2015 and 20% in 2016. These percentages are based on theexchange rate that we use for accounting purposes (the “CEMEX accounting rate”). The CEMEX accounting rateon any given date is determined based on the closing exchange rate reported by certain sources, such as Reuters.For any given date, the CEMEX accounting rate may differ from the noon buying rate for Mexican Pesos in NewYork City published by the U.S. Federal Reserve Bank of New York.
30
The following table sets forth, for the periods and dates indicated, the end-of-period, average and high andlow points of the CEMEX accounting rate as well as the noon buying rate for Mexican Pesos, expressed inMexican Pesos per U.S.$1.00.
CEMEX Accounting Rate Noon Buying Rate
Year Ended December 31,End of the
period Average(1) High LowEnd of the
period Average(1) High Low
2012 . . . . . . . . . . . . . . . . . . . . . . . 12.85 13.16 14.37 12.56 12.96 13.15 14.37 12.632013 . . . . . . . . . . . . . . . . . . . . . . . 13.05 12.85 13.39 11.98 13.10 12.76 13.43 11.982014 . . . . . . . . . . . . . . . . . . . . . . . 14.74 13.37 14.78 12.84 14.75 13.31 14.79 12.852015 . . . . . . . . . . . . . . . . . . . . . . . 17.23 15.98 17.23 14.95 17.20 15.87 17.36 14.562016 . . . . . . . . . . . . . . . . . . . . . . . 20.72 18.72 20.72 17.18 20.62 18.66 20.84 17.19
Monthly (2016)September . . . . . . . . . . . . . . . . . . . 19.39 19.34 19.86 18.84October . . . . . . . . . . . . . . . . . . . . . 18.86 18.79 19.34 18.49November . . . . . . . . . . . . . . . . . . . 20.57 20.46 20.84 18.44December . . . . . . . . . . . . . . . . . . . 20.72 20.62 20.74 20.22
Monthly (2017)January . . . . . . . . . . . . . . . . . . . . . 20.83 20.84 21.89 20.62February . . . . . . . . . . . . . . . . . . . . 20.10 20.00 20.82 19.74March . . . . . . . . . . . . . . . . . . . . . . 18.73 18.72 19.93 18.67April(2) . . . . . . . . . . . . . . . . . . . . . 18.73 18.84 18.87 18.48
(1) The average of the CEMEX accounting rate or the noon buying rate for Mexican Pesos, as applicable, onthe last day of each full month during the relevant period.
(2) April noon buying rates and CEMEX accounting rates are through April 21, 2017.
Between January 1, 2017 and April 21, 2017, the Mexican Peso appreciated by approximately 9% againstthe U.S. Dollar, based on the noon buying rate for Mexican Pesos.
For a discussion of the financial treatment of our operations conducted in other currencies, see “Item 3—Key Information—Selected Consolidated Financial Information” included elsewhere in this annual report.
Selected Consolidated Financial Information
The financial data set forth below as of and for each of the five years ended December 31, 2016, have beenderived from our 2016 audited consolidated financial statements. The financial data set forth below as ofDecember 31, 2015 and 2016 and for each of the three years ended December 31, 2014, 2015 and 2016 havebeen derived from, and should be read in conjunction with, and are qualified in their entirety by reference to, our2016 audited consolidated financial statements included elsewhere in this annual report. Our 2016 auditedconsolidated financial statements prepared under IFRS for the year ended December 31, 2016, were approved byour shareholders at the annual general ordinary shareholders’ meeting held on March 31, 2017. See “Item 5—Operating and Financial Review and Prospects—Recent Developments—Recent Developments Relating to OurShareholders.”
The operating results of newly acquired businesses are consolidated in our financial statements beginning onthe acquisition date. Therefore, all periods presented do not include operating results corresponding to newlyacquired businesses before we assumed control. As a result, the financial data for the years ended December 31,2014, 2015, and 2016 may not be comparable to that of prior periods.
Our 2016 audited consolidated financial statements included elsewhere in this annual report, have beenprepared in accordance with IFRS, which differ in significant respects from U.S. GAAP. The regulations of the
31

SEC do not require foreign private issuers that prepare their financial statements on the basis of IFRS (aspublished by the IASB) to reconcile such financial statements to U.S. GAAP.
Non-Mexican Peso amounts included in the consolidated financial statements are first translated into Dollaramounts, in each case at a commercially available or an official government exchange rate for the relevant periodor date, as applicable, and those Dollar amounts are then translated into Mexican Peso amounts at the CEMEXaccounting rate, described under “— Mexican Peso Exchange Rates,” as of the relevant period or date, asapplicable.
The Dollar amounts provided below, unless otherwise indicated elsewhere in this annual report, aretranslations of Mexican Peso amounts at an exchange rate of Ps20.72 to U.S.$1.00, the CEMEX accounting rateas of December 31, 2016. However, in the case of transactions conducted in Dollars, we have presented theU.S. Dollar amount of the transaction and the corresponding Mexican Peso amount that is presented in ourconsolidated financial statements. These translations have been prepared solely for the convenience of the readerand should not be construed as representations that the Mexican Peso amounts actually represent those Dollaramounts or could be converted into Dollars at the rate indicated. The noon buying rate for Mexican Pesos onDecember 31, 2016 was Ps20.62 to U.S.$1.00. Between January 1, 2017 and April 21, 2017, the Mexican Pesoappreciated by approximately 9% against the U.S. Dollar, based on the noon buying rate for Mexican Pesos.
32

CEMEX, S.A.B. DE C.V. AND SUBSIDIARIESSelected Consolidated Financial Information
As of and For the Year Ended December 31,
2012 2013 2014 2015 2016
(in millions of Mexican Pesos, except ratios and share andper share amounts)
Statement of Operations Information:Net sales . . . . . . . . . . . . . . . . . . . . . . . . . . . . . . . . . . . . . . . . Ps 197,036 Ps 190,370 Ps 199,942 Ps 220,326 Ps 250,909Cost of sales(1) . . . . . . . . . . . . . . . . . . . . . . . . . . . . . . . . . . (138,706) (130,686) (134,742) (146,068) (161,883)Gross profit . . . . . . . . . . . . . . . . . . . . . . . . . . . . . . . . . . . . . 58,330 59,684 65,200 74,258 89,026Operating expenses . . . . . . . . . . . . . . . . . . . . . . . . . . . . . . . (41,329) (40,404) (43,347) (47,769) (53,762)Operating earnings before other expenses, net(2) . . . . . . . . 17,001 19,280 21,853 26,489 35,264Other expense, net . . . . . . . . . . . . . . . . . . . . . . . . . . . . . . . . (5,490) (4,863) (5,045) (3,043) (1,646)Operating earnings(2) . . . . . . . . . . . . . . . . . . . . . . . . . . . . . 11,511 14,417 16,808 23,446 33,618Financial items(3) . . . . . . . . . . . . . . . . . . . . . . . . . . . . . . . . (17,534) (18,195) (18,952) (21,002) (17,027)Share of profit of equity accounted investees . . . . . . . . . . . 728 232 294 738 688Earnings (loss) before income tax . . . . . . . . . . . . . . . . . . . . (5,295) (3,546) (1,850) 3,182 17,279Discontinued operations(4)(5) . . . . . . . . . . . . . . . . . . . . . . . — 97 90 1,279 1,024Non-controlling interest net income . . . . . . . . . . . . . . . . . . 662 1,223 1,103 932 1,174Controlling interest net income (loss) . . . . . . . . . . . . . . . . . (12,000) (10,834) (6,783) 1,201 14,033Basic earnings (loss) per share(6)(7) . . . . . . . . . . . . . . . . . . (0.33) (0.28) (0.16) 0.03 0.33Diluted earnings (loss) per share(6)(7) . . . . . . . . . . . . . . . . (0.33) (0.28) (0.16) 0.03 0.33Basic earnings (loss) per share of continuing
operations(6)(7) . . . . . . . . . . . . . . . . . . . . . . . . . . . . . . . . (0.33) (0.29) (0.16) — 0.31Diluted earnings (loss) per share of continuing
operations(6)(7) . . . . . . . . . . . . . . . . . . . . . . . . . . . . . . . . (0.33) (0.29) (0.16) — 0.31Number of shares outstanding(6)(8)(9) . . . . . . . . . . . . . . . . 32,808 34,270 37,370 40,403 42,182
Balance Sheet Information:Cash and cash equivalents . . . . . . . . . . . . . . . . . . . . . . . . . . 12,478 15,176 12,589 15,280 11,555Assets from discontinued operations held for sale(4)(5) . . . — — — 3,446 13,590Property, machinery and equipment, net . . . . . . . . . . . . . . . 213,075 205,717 202,928 214,133 227,111Total assets . . . . . . . . . . . . . . . . . . . . . . . . . . . . . . . . . . . . . 478,797 496,130 514,961 542,264 599,728Short-term debt including current maturities of long-term
debt . . . . . . . . . . . . . . . . . . . . . . . . . . . . . . . . . . . . . . . . . 596 3,959 14,507 218 1,216Long-term debt . . . . . . . . . . . . . . . . . . . . . . . . . . . . . . . . . . 177,539 187,021 191,327 229,125 235,016Liabilities from operations held for sale . . . . . . . . . . . . . . . — — — 673 1,466Non-controlling interest and Perpetual Debentures(10) . . . 14,488 14,939 17,068 20,289 28,951Total controlling interest . . . . . . . . . . . . . . . . . . . . . . . . . . . 141,139 133,379 131,103 143,479 167,774
Other Financial Information:Net working capital(11) . . . . . . . . . . . . . . . . . . . . . . . . . . . . 19,667 20,754 20,757 16,781 7,908Book value per share(6)(9)(12) . . . . . . . . . . . . . . . . . . . . . . 4.30 3.89 3.51 3.55 3.98Operating margin before other expense, net . . . . . . . . . . . . 8.6% 10.1% 10.9% 12.0% 14.1%Operating EBITDA(13) . . . . . . . . . . . . . . . . . . . . . . . . . . . . 34,506 33,447 35,556 41,354 51,411Ratio of Operating EBITDA to interest expense(13) . . . . . 1.9 1.7 1.7 2.1 2.4Capital expenditures . . . . . . . . . . . . . . . . . . . . . . . . . . . . . . 10,465 8,409 9,486 12,313 13,279Depreciation and amortization . . . . . . . . . . . . . . . . . . . . . . . 17,505 14,167 13,703 14,865 16,147Net cash flow provided by continued operating activities
before interest, coupons on Perpetual Debentures andincome taxes . . . . . . . . . . . . . . . . . . . . . . . . . . . . . . . . . . 30,222 26,400 35,445 43,184 61,188
Basic earnings (loss) per CPO of continuingoperations(6)(7) . . . . . . . . . . . . . . . . . . . . . . . . . . . . . . . . (0.99) (0.87) (0.48) — 0.93
Basic earnings (loss) per CPO(6)(7) . . . . . . . . . . . . . . . . . . (0.99) (0.84) (0.48) 0.09 0.99Total debt plus other financial obligations . . . . . . . . . . . . . 218,026 230,298 244,429 268,198 273,862
(1) Cost of sales includes depreciation, amortization and depletion of assets involved in production, freight expenses of rawmaterials used in our producing plants, delivery expenses of our ready-mix concrete business and expenses related tostorage in producing plants. Our cost of sales excludes (i) expenses related to personnel and equipment comprising ourselling network and those expenses related to warehousing at the points of sale, which are included as part of the lineitem titled “Administrative and selling expenses,” and (ii) freight expenses of finished products from our producingplants to our points of sale and from our points of sale to our customers’ locations, which are all included as part of theline item titled “Distribution expenses.”
33

(2) In the statements of operations, CEMEX includes the line item titled “Operating earnings before other expenses, net”considering that is a relevant measure for CEMEX’s management as explained in note 4B to our 2016 auditedconsolidated financial statements included elsewhere in this annual report. Under IFRS, while there are line items thatare customarily included in the statement of operations, such as net sales, operating costs and expenses and financialrevenues and expenses, among others, the inclusion of certain subtotals such as “Operating earnings before otherexpenses, net” and the display of such statements of operations varies significantly by industry and company accordingto specific needs.
(3) Financial items include financial expenses and our other financial (expense) income, net, which includes our financialincome, results from financial instruments, net (derivatives, fixed-income investments and other securities), foreignexchange results and effects of net present value on assets and liabilities and others, net. See notes 7 and 16 to our 2016audited consolidated financial statements included elsewhere in this annual report.
(4) On October 31, 2015, after the conditions precedent were satisfied, we completed the sale of our operations in Austriaand Hungary to the Rohrdorfer Group for €165 million (U.S.$179 million or Ps3,090 million) after final adjustments forchanges in cash and working capital balances as of the transfer date. Our combined operations in Austria and Hungaryconsisted of 29 aggregates quarries and 68 ready-mix plants. As per IFRS, our balance sheet as of December 31, 2014was not restated as a result of the sale of our operations in Austria and Hungary. The information related to ourstatements of operations for the year ended December 31, 2012 has not been reclassified to present the financial resultsof those years of our operations in Austria, Hungary and Croatia in a single line item as “Discontinued operations.” Webelieve that the effects are not significant. On May 26, 2016, we closed the sale of our operations in Bangladesh andThailand to Siam City Cement Public Company Ltd. (“SIAM Cement”) for approximately U.S.$70 million. As per IFRS,our balance sheet as of December 31, 2015 was not restated as a result of the sale of our operations in Thailand andBangladesh. On January 31, 2017, one of CEMEX, S.A.B. de C.V.’s subsidiaries in the U.S. closed the sale of our U.S.Reinforced Concrete Pipe Manufacturing Business (the “Concrete Pipe Business”) to Quikrete Holdings, Inc.(“Quikrete”) for U.S.$500 million plus an additional U.S.$40 million contingent consideration based on futureperformance. See “Item 4—Information on the Company—Business Overview.” Considering that we disposed of ourentire concrete pipe division, the operations of the Concrete Pipe Business, as included in our statements of operationsfor the years ended December 31, 2014, 2015 and 2016, were reclassified to the single line item “DiscontinuedOperations.” In addition, as of December 31, 2016, the Concrete Pipe Business was reclassified to assets held for saleand directly related liabilities on our consolidated balance sheet, including U.S.$260 million (Ps5,369 million) ofgoodwill associated with the reporting segment in the United States that was proportionally allocated to these net assetsbased on their relative fair values. The information related to our statements of operations for the years endedDecember 31, 2012 and 2013 has not been reclassified to present the financial results of those years of our operations inThailand, Bangladesh and the Concrete Pipe Business in a single line item as discontinued operations. We believe thatthe effects are not significant. See note 4A to our 2016 audited consolidated financial statements included elsewhere inthis annual report.
(5) On August 12, 2015, we entered into an agreement for the sale of our operations in Croatia, including assets in Bosnia &Herzegovina, Montenegro and Serbia, to Duna-Dráva Cement Kft. for €231 million (approximately U.S.$243 million orPs5,032 million). Those operations mainly consist of three cement plants with aggregate annual production capacity ofapproximately 2.4 million tons of cement, two aggregates quarries and seven ready-mix plants. On April 5, 2017, weannounced that the European Commission issued a decision that restricts completion of the sale. Therefore, the sale ofour operations in Croatia will not close and we will maintain our operations in Croatia, including assets in Bosnia andHerzegovina, Montenegro and Serbia. For the years ended December 31, 2016, 2015 and 2014, the operations in Croatia,including assets in Bosnia and Herzegovina, Montenegro and Serbia, included in our statements of operations arepresented in the single line item “Discontinued operations.” However, due to the inability to complete the sale, beginningin the second quarter of 2017, we will reclassify the income statements of our operations in Croatia, including assets inBosnia & Herzegovina, Montenegro and Serbia, from the single line item “Discontinued Operations” to each applicableline item in our consolidated financial statements. See notes 4A and 26 to our 2016 audited consolidated financialstatements included elsewhere in this annual report.
(6) CEMEX, S.A.B. de C.V.’s capital stock consists of Series A shares and Series B shares. Each CPO represents two SeriesA shares and one Series B share. As of December 31, 2016, approximately 99.84% of CEMEX, S.A.B. de C.V.’soutstanding share capital was represented by CPOs. Each ADS represents ten CPOs.
(7) Earnings (loss) per share is calculated based upon the weighted average number of shares outstanding during the year, asdescribed in note 22 to our 2016 audited consolidated financial statements included elsewhere in this annual report. Basicloss per CPO is determined by multiplying the basic loss per share for each period by three (the number of sharesunderlying each CPO). Basic loss per CPO is presented solely for the convenience of the reader and does not represent ameasure under IFRS. As shown in notes 4A and 22 to our consolidated financial statements included elsewhere in thisannual report, and in connection with the sale of our operations in Croatia, Austria, Hungary, Thailand, Bangladesh, andthe sale of the Concrete Pipe Business, for the year ended December 31, 2014, “Basic loss per share” includes Ps0.16from “Continuing operations,” and for the year ended December 31, 2016, “Basic earnings per share” includes Ps0.31from “Continuing operations.” In addition, for the years ended December 31, 2015 and 2016, “Basic earnings per share”includes Ps0.03 and Ps0.02, respectively, from “Discontinued operations.” Likewise, for the year ended December 31,2014, “Diluted loss per share” includes Ps0.16, and for the year ended December 31, 2016, “Diluted earnings per share”
34

includes Ps0.31 from “Continuing operations.” In addition, for the years ended December 31, 2015 and 2016, “Dilutedearnings per share” includes Ps0.03 and Ps0.02, respectively, from “Discontinued operations.” See note 22 to our 2016audited consolidated financial statements included elsewhere in this annual report.
(8) CEMEX, S.A.B. de C.V. did not declare a dividend for fiscal years 2012, 2013, 2014, 2015 and 2016. At each ofCEMEX, S.A.B. de C.V.’s 2012, 2013, 2014, 2015 and 2016 annual general ordinary shareholders’ meetings, held onMarch 21, 2013, March 20, 2014, March 26, 2015, March 31, 2016, and March 30, 2017, respectively, CEMEX, S.A.B.de C.V.’s shareholders approved a recapitalization of retained earnings. New CPOs issued pursuant to each suchrecapitalization were allocated to shareholders on a pro-rata basis. As a result, shares equivalent to approximately437.4 million CPOs, approximately 468 million CPOs, approximately 500 million CPOs, approximately 538 millionCPOs and approximately 562.4 million CPOs were allocated to shareholders on a pro-rata basis in connection with the2012, 2013, 2014, 2015 and 2016 recapitalizations, respectively. In each case, CPO holders received one new CPO foreach 25 CPOs held and ADS holders received one new ADS for each 25 ADSs held. There was no cash distribution andno entitlement to fractional shares.
(9) Based upon the total number of shares outstanding at the end of each period, expressed in millions of shares, andincludes shares subject to financial derivative transactions, but does not include shares held by our subsidiaries.
(10) As of December 31, 2012, 2013, 2014, 2015 and 2016 non-controlling interest includes U.S.$473 million (Ps6,078million), U.S.$477 million (Ps6,223 million), U.S.$466 million (Ps6,869 million), U.S.$440 million (Ps7,581 million)and U.S.$438 million (Ps9,075 million), respectively, that represents the nominal amount of Perpetual Debentures,denominated in Dollars and Euros, issued by consolidated entities. In accordance with IFRS, these securities qualify asequity due to their perpetual nature and the option to defer the coupons.
(11) Net working capital equals trade receivables, less allowance for doubtful accounts plus inventories, net, less tradepayables.
(12) Book value per share is calculated by dividing the total controlling interest by the number of shares outstanding.(13) Operating EBITDA equals operating earnings before other expenses, net, plus amortization and depreciation expenses.
Operating EBITDA is calculated and presented because we believe that it is widely accepted as a financial indicator ofour ability to internally fund capital expenditures and service or incur debt, and the consolidated ratio of OperatingEBITDA to interest expense is calculated and presented because it is used to measure our performance under certain ofour financing agreements. Operating EBITDA and such ratio are non-IFRS measures, and should not be considered asindicators of our financial performance as alternatives to cash flow, as measures of liquidity or as being comparable toother similarly titled measures of other companies. Under IFRS, while there are line items that are customarily includedin statements of operations prepared pursuant to IFRS, such as net sales, operating costs and expenses and financialrevenues and expenses, among others, the inclusion of certain subtotals, such as operating earnings before otherexpenses, net, and the display of such statement of operations varies significantly by industry and company according tospecific needs. Our Operating EBITDA may not be comparable to similarly titled measures reported by other companiesdue to potential differences in the method of calculation. Operating EBITDA is reconciled below to operating earningsbefore other expenses, net, as reported in the statements of operations, and to net cash flows provided by operatingactivities before interest and income taxes paid in cash, as reported in the statement of cash flows. Interest expense underIFRS does not include coupon payments of the Perpetual Debentures issued by consolidated entities of approximatelyPs453 million in 2012, approximately Ps405 million in 2013, approximately Ps420 million in 2014, approximatelyPs432 million in 2015 and approximately Ps507 million in 2016, as described in note 20D to our 2016 auditedconsolidated financial statements included elsewhere in this annual report.
35

For the Year Ended December 31,
2012 2013 2014 2015 2016
(in millions of Mexican Pesos)
Reconciliation of Operating EBITDA to netcash flows provided by continuing operationsactivities before interest, coupons onPerpetual Debentures and income taxes
Operating EBITDA . . . . . . . . . . . . . . . . . . . . . . . . . Ps 34,506 Ps 33,447 Ps 35,556 Ps 41,354 Ps 51,411Less:Operating depreciation and amortization
expense . . . . . . . . . . . . . . . . . . . . . . . . . . . . . . . . . 17,505 14,167 13,703 14,865 16,147
Operating earnings before other expenses, net . . . . . 17,001 19,280 21,853 26,489 35,264
Plus/minus:Changes in working capital excluding income
taxes . . . . . . . . . . . . . . . . . . . . . . . . . . . . . . . . . . . (2,048) (4,237) 1,475 3,541 11,023Operating depreciation and amortization
expense . . . . . . . . . . . . . . . . . . . . . . . . . . . . . . . . . 17,505 14,167 13,703 14,865 16,147Other items, net . . . . . . . . . . . . . . . . . . . . . . . . . . . . (2,236) (2,810) (1,586) (1,711) (1,246)
Net cash flow provided by continuing operationsactivities before interest, coupons on PerpetualDebentures and income taxes . . . . . . . . . . . . . . . . Ps 30,222 Ps 26,400 Ps 35,445 Ps 43,184 Ps 61,188
Item 4—Information on the Company
Unless otherwise indicated, references in this annual report to our sales and assets, including percentages,for a country or region are calculated before eliminations resulting from consolidation, and thus includeintercompany balances between countries and regions. These intercompany balances are eliminated whencalculated on a consolidated basis.
Business Overview
CEMEX, S.A.B. de C.V. is a publicly traded stock corporation with variable capital, or sociedad anónimabursátil de capital variable, organized under the laws of Mexico, with its principal executive offices located atAvenida Ricardo Margáin Zozaya #325, Colonia Valle del Campestre, San Pedro Garza García, Nuevo León,66265, Mexico. Our main phone number is +52 81 8888-8888.
CEMEX, S.A.B. de C.V. was founded in 1906 and was registered with the Mercantile Section of the PublicRegistry of Property and Commerce in Monterrey, Nuevo León, Mexico, on June 11, 1920 for a period of 99years. At our 2002 ordinary general shareholders’ meeting, this period was extended to the year 2100 and in 2015this period changed to be indefinite. Beginning April 2006, CEMEX’s full legal and commercial name isCEMEX, Sociedad Anónima Bursátil de Capital Variable.
CEMEX is one of the largest cement companies in the world, based on annual installed cement productioncapacity as of December 31, 2016, of approximately 92.9 million tons. After the merger of Holcim with Lafargeduring 2015, which resulted in the company LafargeHolcim Ltd. (“LafargeHolcim”), we are the next largestready-mix concrete company in the world with annual sales volumes of approximately 52.1 million cubic metersand one of the largest aggregates companies in the world with annual sales volumes of approximately150.8 million tons, in each case, based on our annual sales volumes in 2016. We are also one of the world’slargest cement companies, with annual sales volumes of approximately 66.7 million tons of cement in 2016. Thisinformation does not include discontinued operations. See note 4A to our 2016 audited consolidated financial
36

statements included elsewhere in this annual report. CEMEX, S.A.B. de C.V. is an operating and holdingcompany engaged, directly or indirectly, through its operating subsidiaries, primarily in the production,distribution, marketing and sale of cement, ready-mix concrete, aggregates, clinker and other constructionmaterials throughout the world, and that provides reliable construction-related services to customers andcommunities in more than 50 countries throughout the world, and maintains business relationships in over 100countries worldwide.
We operate globally, with operations in Mexico, the United States, Europe, South America, CentralAmerica, the Caribbean, Asia, the Middle East and Africa. We had total assets of Ps599,728 million(approximately U.S.$28,944 million) as of December 31, 2016, and an equity market capitalization ofapproximately Ps233,924 million (U.S.$12,436 million) as of April 21, 2017.
As of December 31, 2016, our cement production facilities were located in Mexico, the United States,Spain, Egypt, the Philippines, Colombia, Poland, the Dominican Republic, Germany, the United Kingdom,Croatia, Panama, Latvia, Puerto Rico, the Czech Republic, Costa Rica, and Nicaragua. As of December 31, 2016,our assets (after eliminations), cement plants and installed capacity, on an unconsolidated basis by region, wereas set forth below. Installed capacity, which refers to theoretical annual production capacity, represents grayportland cement equivalent capacity, which counts each ton of white cement capacity as approximately two tonsof gray portland cement capacity, and includes installed capacity of cement plants that have been temporarilyclosed.
As of December 31, 2016
Assets AfterEliminations(in Billionsof Mexican
Pesos)Number of Cement
Plants
Installed CementProduction Capacity(Millions of Tons Per
Annum)
Mexico(1) . . . . . . . . . . . . . . . . . . . . . . . . . . . . . . . . . . . . . . . . Ps 70.5 15 30.0United States(2) . . . . . . . . . . . . . . . . . . . . . . . . . . . . . . . . . . . 289.1 12 16.6Europe
United Kingdom . . . . . . . . . . . . . . . . . . . . . . . . . . . . . . . 32.6 2 2.4France . . . . . . . . . . . . . . . . . . . . . . . . . . . . . . . . . . . . . . . 17.8 — —Germany . . . . . . . . . . . . . . . . . . . . . . . . . . . . . . . . . . . . . 8.5 1 2.4Spain . . . . . . . . . . . . . . . . . . . . . . . . . . . . . . . . . . . . . . . . 27.3 7 10.4Rest of Europe(3) . . . . . . . . . . . . . . . . . . . . . . . . . . . . . . 16.5 4 6.3
South, Central America and the CaribbeanColombia . . . . . . . . . . . . . . . . . . . . . . . . . . . . . . . . . . . . . 26.5 2 4.0Rest of SAC(4) . . . . . . . . . . . . . . . . . . . . . . . . . . . . . . . . 22.3 5 8.5
Asia, Middle East and AfricaPhilippines . . . . . . . . . . . . . . . . . . . . . . . . . . . . . . . . . . . 12.3 2 4.5Egypt . . . . . . . . . . . . . . . . . . . . . . . . . . . . . . . . . . . . . . . . 5.5 1 5.4Rest of Asia, Middle East and Africa(5) . . . . . . . . . . . . 12.3 — —
Corporate and Other Operations . . . . . . . . . . . . . . . . . . . . 33.3 — —Continuing operations . . . . . . . . . . . . . . . . . . . . . . . . . . . . . 574.5 51 90.5Discontinued operations(6) . . . . . . . . . . . . . . . . . . . . . . . . . 25.2 3 2.4
Total . . . . . . . . . . . . . . . . . . . . . . . . . . . . . . . . . . . . . . . . . . . . Ps 599.7 54 92.9
“— ” Not applicable
The above table includes our proportional interest in the installed capacity of companies in which we hold anon-controlling interest and reflects our organizational structure as of December 31, 2016, which effectiveas of January 1, 2016 was changed by (i) integrating the Northern Europe region and certain countries thatcomprised the Mediterranean region into a new Europe region which consists of our operations in Spain, the
37

United Kingdom, France, Germany, the Czech Republic, Poland, Latvia, Croatia, Sweden, Norway, andFinland (ii) creating the new Asia, Middle East and Africa region which consists of our operations in thePhilippines, Malaysia, Egypt, Israel, and the UAE.
(1) “Number of cement plants” and “installed cement production capacity” includes two cement plants thathave been temporarily closed with an aggregate annual installed capacity of 2.8 million tons of cement.“Installed cement production capacity” includes 1.0 million tons of cement representing our proportionalinterests through associates in three other cement plants.
(2) “Number of cement plants” and “installed cement production capacity” includes two cement plants thathave been temporarily closed with an aggregate annual installed capacity of 2.1 million tons of cement.“Installed cement production capacity” includes 1.3 million tons of cement representing our proportionalinterests through associates in six other cement plants. On February 10, 2017, one of our subsidiaries in theU.S. sold its Fairborn, Ohio cement plant and cement terminal in Columbus, Ohio with installed capacity of0.8 million tons of cement.
(3) “Rest of Europe” refers primarily to our operations in the Czech Republic, Poland, and Latvia, as well astrading activities in Scandinavia and Finland. “Installed cement production capacity” includes 0.7 milliontons of cement representing our proportional interest in a Lithuanian cement producer that operated oneother cement plant.
(4) “Rest of SAC” refers primarily to our operations in Costa Rica, Panama, Puerto Rico, the DominicanRepublic, Nicaragua, Jamaica and other countries in the Caribbean, Guatemala, and small ready-mixconcrete operations in Argentina. “Installed cement production capacity” includes 1.1 million tons ofcement representing our proportional interests through associates in Barbados, Jamaica, and Trinidad andTobago in three other cement plants.
(5) “Rest of Asia, Middle East and Africa” includes our operations in Malaysia, the UAE, and Israel.(6) “Discontinued operations” include the previously contemplated sale of our operations in Croatia, including
assets in Bosnia & Herzegovina, Montenegro and Serbia, to Duna-Dráva Cement Kft. for the years endedDecember 31, 2016, 2015 and 2014. On April 5, 2017, we announced that the European Commission issueda decision that restricts completion of the sale. Therefore, the sale of our operations in Croatia will not closeand we will maintain our operations in Croatia, including assets in Bosnia and Herzegovina, Montenegroand Serbia. Due to the inability to complete the sale, beginning in the second quarter of 2017, we willreclassify the income statements of our operations in Croatia, including assets in Bosnia & Herzegovina,Montenegro and Serbia, from the single line item “Discontinued Operations” to each applicable line item inour consolidated financial statements. See notes 4A and 26 to our 2016 audited consolidated financialstatements included elsewhere in this annual report.
During the majority of the last 26 years, we embarked on a major geographic expansion program todiversify our cash flows and enter markets whose economic cycles within the cement industry largely operateindependently from those of Mexico and which offer long-term growth potential. We have built an extensivenetwork of marine and land-based distribution centers and terminals that give us marketing access around theworld. As part of our strategy, we also periodically review and reconfigure our operations in implementing ourpost-merger integration process, and we also divest assets that we believe are less important to our strategicobjectives. The following are our significant acquisitions and our most significant divestitures andreconfigurations that we have announced or closed since 2013:
• On October 31, 2014, CEMEX, S.A.B. de C.V. announced that it had entered into agreements withHolcim (currently LafargeHolcim after the 2015 merger of Holcim with Lafarge) to complete a seriesof related transactions in Europe, which closed on January 5, 2015, with retrospective effect as ofJanuary 1, 2015. See note 15B to our 2016 audited consolidated financial statements includedelsewhere in this annual report. As a result, (i) CEMEX acquired all of Holcim’s assets in the CzechRepublic, including a cement plant, four aggregates quarries and 17 ready-mix plants for approximately€115 million (U.S.$139 million or Ps2,049 million); (ii) CEMEX sold to Holcim assets in the westernregion of Germany, consisting of one cement plant, two cement grinding mills, one slag granulator, 22aggregates quarries and 79 ready-mix plants for approximately €171 million (U.S.$207 million or
38

Ps3,047 million), while CEMEX maintained its operations in the north, east and south of Germany; and(iii) CEMEX acquired from Holcim one cement plant in the southern part of Spain and one cement millin the central part of Spain, among other related assets, for approximately €88 million(U.S.$106 million or Ps1,562 million) and we kept our other operations in Spain. In connection withthese transactions, in January 2015 CEMEX made a final payment in cash, after combined debt andworking capital adjustments, of approximately €33 million (U.S.$40 million or Ps594 million).
• On October 31, 2015, after all conditions precedent were satisfied, we completed the sale of ouroperations in Austria and Hungary to the Rohrdorfer Group for €165 million (U.S.$179 million orPs3,090 million) after final adjustments for changes in cash and working capital balances as of thetransfer date. Our combined operations in Austria and Hungary consisted of 29 aggregates quarries and68 ready-mix plants. The operations in Austria and Hungary for the ten-month period endedOctober 31, 2015 and the year ended December 31, 2014 included in our statements of operations werereclassified to the single line item “Discontinued operations,” which includes, in 2015, a gain on sale ofapproximately U.S.$45 million (Ps741 million). Such gain on sale includes the reclassification to thestatement of operations of foreign currency translation effects accrued in equity until October 31, 2015for an amount of approximately U.S.$10 million (Ps215 million). See note 4A to our 2016 auditedconsolidated financial statements included elsewhere in this annual report.
• On May 26, 2016, CEMEX, S.A.B. de C.V. closed the sale of its operations in Bangladesh andThailand to Siam City Cement Public Company Ltd for approximately U.S.$70 million (Ps1,450million). Our operations in Bangladesh and Thailand for the five-month period ended May 30, 2016and the years ended December 31, 2015 and 2014 included in CEMEX’s Statements of Operationswere reclassified to the single line item “Discontinued operations,” which includes, in 2016, a gain onsale of approximately U.S.$24 million (Ps424 million). See note 4A to our consolidated financialstatements included elsewhere in this annual report.
• On July 18, 2016, CHP closed its initial public offering of 45% of its common shares in thePhilippines, and 100% of CHP’s common shares started trading on the Philippine Stock Exchangeunder the ticker “CHP.” As of March 31, 2017, CASE, an indirect subsidiary of CEMEX España,directly owned approximately 55% of CHP’s outstanding common shares. The net proceeds to CHPfrom its initial public offering were approximately U.S.$506.8 million after deducting estimatedunderwriting discounts and commissions, and other estimated offering expenses payable by CHP. CHPused the net proceeds from the initial public offering to repay existing indebtedness owed to BDOUnibank and to an indirect subsidiary of CEMEX.
• On September 12, 2016, one of our subsidiaries in the U.S. signed a definitive agreement for the sale ofits Fairborn, Ohio cement plant and cement terminal in Columbus, Ohio to Eagle Materials Inc. forU.S.$400 million. The proceeds obtained from this transaction were used mainly for debt reduction andfor general corporate purposes. This transaction closed on February 10, 2017.
• On November 18, 2016, after all conditions precedent were satisfied, CEMEX, S.A.B. de C.V.announced that it had closed the sale of certain assets in the U.S. to GCC for approximatelyU.S.$306 million. The assets were sold by an affiliate of CEMEX to an affiliate of GCC in the U.S.,and mainly consisted of CEMEX’s cement plant in Odessa, Texas, two cement terminals and thebuilding materials business in El Paso, Texas and Las Cruces, New Mexico.
• On December 5, 2016, Sierra presented an Offer to all shareholders of TCL, a company publicly listed inTrinidad and Tobago, Jamaica and Barbados, to acquire up to 132,616,942 ordinary shares in TCL,which, together with Sierra’s existing share ownership in TCL of approximately 39.5%, would, ifsuccessful, result in Sierra holding up to 74.9% of the equity share capital in TCL. The total number ofTCL shares tendered and accepted in response to the Offer was 113,629,723, which, together withSierra’s pre-existing shareholding in TCL (147,994,188 shares), represented approximately 69.83% of theoutstanding TCL shares as of March 31, 2017. The total cash payment by Sierra for the tendered shareswas approximately U.S.$86.36 million. CEMEX started consolidating TCL for financial reportingpurposes on February 1, 2017. TCL has de-listed from the Jamaica and Barbados stock exchanges.
39

• On January 31, 2017, one of CEMEX, S.A.B. de C.V.’s subsidiaries in the U.S. closed the sale of theConcrete Pipe Business to Quikrete for U.S.$500 million plus an additional U.S.$40 million purchaseprice contingent on future performance.
• On February 15, 2017, CEMEX, S.A.B. de C.V. sold 45,000,000 shares of common stock of GCC at aprice of Ps95 per share in a public offering to investors in Mexico authorized by the CNBV and in aconcurrent private placement to eligible investors outside of Mexico. Prior to the offerings, CEMEX,S.A.B. de C.V. owned a 23% direct interest in GCC and a minority interest in CAMCEM, an entitywhich owns a majority interest in GCC. After the offerings, CEMEX, S.A.B. de C.V. owned a 9.47%direct interest in GCC and the minority interest in CAMCEM.
• On August 12, 2015, we entered into an agreement for the sale of our operations in Croatia, includingassets in Bosnia & Herzegovina, Montenegro and Serbia, to Duna-Dráva Cement Kft. for €231 million(approximately U.S.$243 million or Ps5,032 million). Those operations mainly consist of three cementplants with aggregate annual production capacity of approximately 2.4 million tons of cement, twoaggregates quarries and seven ready-mix plants. On April 5, 2017, we announced that the EuropeanCommission issued a decision that restricts completion of the sale. Therefore, the sale of our operationsin Croatia will not close and we will maintain our operations in Croatia, including assets in Bosnia andHerzegovina, Montenegro and Serbia. For the years ended December 31, 2016, 2015 and 2014, theoperations in Croatia, including assets in Bosnia and Herzegovina, Montenegro and Serbia, included inour statements of operations are presented in the single line item “Discontinued operations.” However,due to the inability to complete the sale, beginning in the second quarter of 2017, we will reclassify theincome statements of our operations in Croatia, including assets in Bosnia & Herzegovina, Montenegroand Serbia, from the single line item “Discontinued Operations” to each applicable line item in ourconsolidated financial statements. See notes 4A and 26 to our 2016 audited consolidated financialstatements included elsewhere in this annual report.
• On April 17, 2017, CEMEX, S.A.B. de C.V. announced that one of its subsidiaries in the U.S. hadentered into a definitive agreement for the sale of its Pacific Northwest Materials Business (“PacificNorthwest”) to Cadman Materials, Inc. (“Cadman Materials”), a LehighHanson company and U.S.subsidiary of HeidelbergCement Group, for U.S.$150 million. Pacific Northwest consists ofaggregates, asphalt and ready-mix concrete operations in Oregon and Washington. Pending satisfactionof certain conditions, including regulatory approvals, the proceeds obtained from this sale will be usedmainly for debt reduction and general corporate purposes.
From January 1, 2016 to March 31, 2017, we sold assets for approximately U.S.$2,063 million. As ofMarch 31, 2017, we expect to sell additional assets for U.S.$500 million to achieve our goal of approximatelyU.S.$2.5 billion in asset sales by the end of 2017. As of the date of this annual report, in addition to certainimmaterial fixed asset sales, we have sold CEMEX Concretos’ ready-mix concrete pumping assets in Mexico forU.S.$80 million and announced the sale of Pacific Northwest for U.S.$150 million.
40

Geographic Breakdown of Net Sales for the Year Ended December 31, 2016
The following chart indicates the geographic breakdown of our net sales, before eliminations resulting fromconsolidation, for the year ended December 31, 2016:
Mexico 20%
United States 26%
United Kingdom8%
Germany 4%
France 5%
Spain 2%
Rest of Europe 4%
South, CentralAmerica and theCaribbean 12%
Egypt 3%
Phillipines 4%
Others 7%Rest of Asia, MiddleEast and Africa 5%
41

Breakdown of Net Sales by Product for the Year Ended December 31, 2016
The following chart indicates the breakdown of our net sales by product, after eliminations resulting fromconsolidation, for the year ended December 31, 2016:
Aggregates 16%
Concrete 39%
Cement 45%
Our Products
We always strive to provide superior building solutions in the markets we serve. To this end, we tailor ourproducts and services to suit customers’ specific needs, from home construction, improvement and renovation toagricultural, industrial and marine/hydraulic applications.
Cement
Cement is a binding agent, which, when mixed with sand, stone or other aggregates and water, produceseither ready-mix concrete or mortar. Whether in bags or in bulk, we provide our customers with high-qualitybranded cement products and services. We tap our professional knowledge and experience to develop customizedproducts that fulfill our clients’ specific requirements and foster sustainable construction. In many of thecountries where we have cement operations, a large proportion of cement sold is a bagged, branded product. Weoften deliver the product to a large number of distribution outlets such that our bagged, branded cement isavailable to the end users in a point of sale in close proximity to where the product will be used. We strive todevelop brand identity and recognition in our bagged product.
We manufacture cement through a closely controlled chemical process, which begins with the mining andcrushing of limestone and clay, and, in some instances, other raw materials. The clay and limestone are thenpre-homogenized, a process which consists of combining different types of clay and limestone. The mix istypically dried, then fed into a grinder which grinds the various materials in preparation for the kiln. The rawmaterials are calcined, or processed, at a very high temperature in a kiln, to produce clinker. Clinker is theintermediate product used in the manufacture of cement. For limestone, clay and gypsum, requirements are basedon chemical composition that, depending on the other materials available, matches with the quality demanded by
42

the production process. For cement limestone, clay and gypsum, we run chemical tests to prepare the mining planof the quarry, to confirm material quality and reduce variations in the mineral content. We consider thatlimestone and clay quality of our cement raw material quarries are adequate for the cement production process.
There are two primary processes used to manufacture cement: the dry process and the wet process. The dryprocess is more fuel efficient. As of December 31, 2016, 52 of our 54 operative production plants used the dryprocess and one used the wet process. Our operative production plant that uses the wet process is located in theUnited Kingdom. In the wet process, the raw materials are mixed with water to form slurry, which is fed into akiln. Fuel costs are greater in the wet process than in the dry process because the water that is added to the rawmaterials to form slurry must be evaporated during the clinker manufacturing process. In the dry process, theaddition of water and the formation of slurry are eliminated, and clinker is formed by calcining the dry rawmaterials. In the most modern application of this dry process technology, the raw materials are first blended in ahomogenizing silo and processed through a pre-heater tower that utilizes exhaust heat generated by the kiln topre-calcine the raw materials before they are calcined to produce clinker.
Clinker and gypsum are fed in pre-established proportions into a cement grinding mill where they areground into an extremely fine powder to produce finished cement. We primarily cover our gypsum needs fromthird parties; however, we also operate gypsum quarries in the United States, Spain, Dominican Republic andEgypt. Our main types of cement include the following:
Gray Ordinary Portland Cement: Our gray ordinary portland cement is a high-quality, cost-effectivebuilding material, mainly composed of clinker, that meets applicable chemical and physical requirements and iswidely used in all construction segments: residential, commercial, industrial, and public infrastructure.
White Portland Cement: CEMEX is one of the world’s largest producers of white portland cement. Wemanufacture this type of cement with limestone, low iron content kaolin clay, and gypsum. Customers use ourwhite portland cement in architectural works requiring great brightness and artistic finishes, to create mosaicsand artificial granite, and for sculptural casts and other applications where white prevails.
Masonry or Mortar: Masonry or mortar is a portland cement that we mix with finely ground inert matter(limestone). Our customers use this type of cement for multiple purposes, including concrete blocks, templates,road surfaces, finishes, and brick work.
Oil-well Cement: Our oil-well cement is a specially designed variety of hydraulic cement produced withgray portland clinker. It usually forges slowly and is manageable at high temperatures and pressures. Produced inclasses from A to H and J, our oil-well cement is applicable for different depth, chemical aggression, or pressurelevels.
Blended Cement: Blended hydraulic cements are produced by inter-grinding or blending portland cementand supplementary cementitious materials such as ground granulated blast furnace slag, fly ash, silica fume,calcined clay, hydrated lime, and other pozzolans. The use of blended cements in ready-mix concrete reducesmixing water and bleeding, improves workability and finishing, inhibits sulfate attack and the alkali-aggregatereaction, and reduces the heat of hydration. CEMEX offers an array of blended cements which have a lower CO2footprint resulting from their lower clinker content due to the addition of supplementary cementitious materials.The use of blended cements reinforces our strong dedication to sustainable practices and furthers our objective ofoffering an increasing range of more sustainable products.
Ready-Mix Concrete
Ready-mix concrete is a combination of cement, fine and coarse aggregates, admixtures (which controlproperties of the concrete including plasticity, pumpability, freeze-thaw resistance, strength and setting time),and water. We tailor our ready-mix concrete to fit our clients’ specific needs. By changing the proportion of
43

water, aggregates, and cement in the mix, we modify our concrete’s resistance, manageability, and finish. Wealso use additives to customize our concrete consistent with the transportation time from our plant to the project,weather conditions at the construction site, and the project’s specifications. From our water-resistant to our self-compacting concrete, we produce a great variety of specially designed concrete to meet the many challenges ofmodern construction.
We develop solutions based on the thorough knowledge and application of ready-mix concrete technology.Leveraging years of experience, a global pool of knowledge, and state-of-the-art expertise about the differentready-mix concrete constituents and their interaction, we offer our customers tailor-designed concrete. CEMEXready-mix concrete technologists are able to modify the properties of concrete through the use of innovativechemical admixtures, combined with the proper proportions of the various concrete constituents. For example,depending on the type of application and jobsite requirements, we can design ready-mix concrete that is morefluid, stronger, develops strength faster, and also retains workability longer. Through the development ofchemical admixtures solutions, our researchers design special concretes that fulfill the construction industry’sincreasingly demanding performance requirements. CEMEX offers a special ready-mix concrete portfolio,comprised of such products as ultra-rapid hardening concrete, crack-resistant/low shrinkage concrete, self-consolidating concrete, architectural concrete, pervious concrete, and a number of others.
We continuously work to improve the properties of ready-mix concrete that make it a key component ofsustainable construction: durability, resistance to aggressive environments, light reflection, and capacity to storeenergy, among others. We also constantly work to develop innovative solutions that advance the sustainability ofstructures made with ready-mix concrete. This way, our customers can design sustainable buildings that can takeadvantage of the benefits of concrete in a wide range of applications. We offer engineered concrete for harborsand bridges with a special design of high performance concrete that combines durability and low maintenancewith resistance to aggressive environments, and for industrial applications which consists of concrete with highacid resistance which is robust and durable for such uses as cooling towers; we also offer concrete for buildingand housing used for structures such as self-compacting concrete that improves the strength and durability ofbuilding structures, while reducing energy use and noise due to concrete vibration, and envelope concrete such asstructural lightweight concrete or insulating concrete forms which offer insulation solutions to improve energyefficiency in buildings, and concrete for building design that takes advantage of concrete’s capacity to storeenergy—its thermal mass—minimizing temperature fluctuations in a building over the course of the day,reducing the need for additional heating and cooling; we also offer ready-mix concrete for water and wastewatermanagement and for roads and pavements.
The types of ready-mix concrete we offer our clients include, but are not limited to:
Standard Ready-Mix Concrete: Standard ready-mix concrete is the most common form of concrete. It isprepared for delivery at a concrete plant instead of mixed on the construction site.
Architectural and Decorative Concrete: This type of ready-mix concrete can provide a structural function,as well as an aesthetic or decorative finish. It can offer smooth or rough surfaces or textures, as well as a varietyor range of colors.
Rapid-Setting Concrete: Designed to enhance early strength development, this type of ready-mix concreteallows fast formwork removal, accelerated construction sequencing, and rapid repair for such jobs as roads andairport runways. Typically used in low temperature (5-10°C) concreting during winter, this type of ready-mixconcrete can also be used in buildings, railways, and precast applications. In addition to saving time, this type ofready-mix concrete technology offers improved durability and acid resistance.
Fiber-Reinforced Concrete: Ready-mix concrete designed with micro or macro fibers that can be used eitherfor structural applications, where the fibers can potentially substitute for steel rebar reinforcement, or forreducing shrinkage, primarily early age shrinkage. Macro fibers can significantly increase the ductility ofconcrete, making it highly resistant to crack formation and propagation.
44

Fluid-Fill Concrete: Fluid mortar or ready-mix concrete simplifies the process of laying pipe and cable bysurrounding the pipe or cable with a tightly packed shell that provides protection from the elements, preventssettling, and enables crews to work quickly.
Roller-Compacted Concrete: Compacted in place and cured, roller-compacted concrete is a zero slumpready-mix concrete with the abrasion resistance to withstand high velocity water, making it the material of choicefor spillways and other infrastructure subject to high flow conditions. It represents a competitive solution interms of cost and durability when compared to asphalt.
Self-Consolidating Concrete: Self consolidating concrete has very high flow; therefore, it is self-leveling,eliminating the need for vibration. Due to the superplasiticizers used, chemical admixtures that impart very highflow, self-consolidating concrete exhibits very high compaction as a result of its low air content. Consequently,self-consolidating concrete can have very high strengths, exceeding 50 MPa.
Pervious Concrete: Because of its unique design mix, pervious concrete is a highly porous material thatallows water, particularly rainwater, to filter through, reduces flooding and heat concentration by up to 4°C, andhelps to prevent skidding on wet roads. This ready-mix concrete is ideally used in parking lots, footpaths, andswimming pool border applications.
Antibacterial Concrete: This type of ready-mix concrete helps control bacteria growth and is used to helpmaintain clean environments in structures such as hospitals, laboratories, and farms.
Aggregates
We are one of the world’s largest suppliers of aggregates: primarily the crushed stone, sand and gravel, usedin virtually all forms of construction. Our customers use our aggregates for a wide array of applications: as a keycomponent in the construction and maintenance of highways, walkways, parking lots, airport runways, andrailways; for drainage, water filtration, purification, and erosion control; as fill material; for sand traps on golfcourses, beaches, playing field surfaces, horse racing tracks, and related applications; and to build bridges,homes, and schools.
Aggregates are obtained from land-based sources such as sand and gravel pits and rock quarries or bydredging marine deposits.
Hard Rock Production. Rock quarries usually operate for at least 30 years and are developed in distinctbenches or steps. A controlled explosion is normally used to release the rock from the working face. It is thentransported by truck or conveyor to a crusher to go through a series of crushing and screening stages to produce arange of final sizes to suit customers’ needs. Dry stone is delivered by road, rail or water from the quarry.
Sand and Gravel Production. Sand and gravel quarries are much shallower than rock quarries and areusually worked and restored in progressive phases. Water can either be pumped out of the quarries allowing themto be worked dry or they can be operated as lakes with extraction below water. A conveyor draws the rawmaterial into the processing plant where it is washed to remove unwanted clay and to separate sand. Sandseparated during processing is dewatered and stockpiled. Gravel then passes over a series of screens that sievethe material into different sizes. Processing separates the gravel into stockpiles in a range of sizes for delivery.
Marine Aggregate Production. A significant proportion of the demand for aggregates is satisfied fromrivers, lakes, and seabeds. Marine resources are increasingly important to the sustainable growth of the buildingmaterials industry. Marine aggregates also play an important role in replenishing beaches and protectingcoastlines from erosion. At sea, satellite navigation is used to position a vessel precisely within its licenseddredging area. Vessels trail a pipe along the seabed and use powerful suction pumps to draw sand and gravel intothe cargo hold. Dredged material is discharged at wharves, where it is processed, screened and washed fordelivery.
45

Aggregates are an indispensable ingredient in ready-mix concrete, asphalt, and mortar. Accounting forapproximately 60% to 75% of ready-mix concrete’s volume, aggregates strongly influence concrete’s freshlymixed and hardened properties. Aggregates not only increase concrete’s strength, but also can make the mixmore compact, enabling applications such as weatherproofing and heat retention. They can further contribute toconcrete’s aesthetic qualities. For example, sand gives surface treatments their brightness.
The types of aggregates we offer our clients include, but are not limited to:
Crushed Stone and Manufactured Sand: These products are obtained by mining rock and breaking it downto a preferred size. In the case of manufactured sand, the product is obtained by crushing rock to the selectedshape or texture, ensuring product and project specifications are met. Sources of crushed stone can be igneous,sedimentary, or metamorphic.
Gravel: Gravel deposits are produced through a natural process of weathering and erosion. It can be used forroads, for concrete manufacturing, or for decorative purposes.
Sand: Sand occurs naturally and is composed of fine rock material and mineral particles. Its composition isvariable depending on the source. It can be used for roads, for concrete manufacturing, or sanitation.
Recycled Concrete: Recycled concrete is created by breaking, removing, and crushing existing concrete to apreferred size. It is commonly used as a base layer for other construction materials because it compacts to form afirm surface.
Related Products
We rely on our close relationship with our customers to offer them complementary products for theirconstruction needs, which mainly include the following:
Asphalt: We offer a wide range of cost effective, high performance asphalt products, from our standard hotmix asphalt, which is made by combining crushed stone with liquid asphalt cement, to highly technical productsthat can be used on major highway systems, driveways, commercial parking lots, or rural country roads.Designed for consistency and reliability, our asphalt products are designed to withstand different weight loads,traffic volumes, and weather conditions.
Concrete Block: Standard concrete block, sometimes referred to as gray block, concrete masonry unit, orcinder block, is one of the most practical and long-lasting materials used in building. Its strength, durability, andversatility, including its energy efficiency, excellent fire and high wind resistance, and noise insulation, makeconcrete block a compelling alternative to many other building materials.
Roof Tiles: We offer a comprehensive range of concrete roof tiles and fittings, designed to meet therequirements of most roofing applications. Available in a wide selection of sizes, shapes, and colors, our rooftiles serve residential and commercial needs.
Architectural Products: Our high-end architectural concrete products offer a range of styles for differentbuilding or landscaping projects. Specialty rock products, as well as architectural block, in an array of colors,sizes, and textures, take our customers’ design to a new level. Block paving solutions and decorative pavingprovide an ideal range of applications for any hard landscaping project.
Pipe: We design and manufacture standard and special concrete pipe for various applications such as stormand sanitary sewers. Offered in diverse types, sizes, and lengths, our pipe products meet or exceed applicablestandards and customer requirements throughout our different operations.
46

Other Precast Products: Among our other precast products, we offer rail products, concrete floors, boxculverts, bridges, drainage basins, barriers, and parking curbs. In selected markets, we further complement ourcommercial offer with admixtures, gypsum, and cementitious materials such as fly ash and blast furnace slag.
Building Solutions
We help build the homes people live in, the roads that connect them, and the infrastructure that makes theircities vibrant. With over a century of experience delivering tailor-made building solutions, we work with ourcustomers around the world to build sustainable structures that will thrive today and well into the future.
Housing: We integrate our cutting-edge design, building materials, and construction systems into flexibleand replicable housing solutions for our clients and communities across the globe.
Paving: As the world’s leader in concrete-based pavement solutions, we help connect cities and theirsurrounding communities through safer, more durable, and energy-efficient highways, mass transit systems,airport runways, rural roadways, and city streets.
Green Building Consultancy: We are focused on delivering sustainable building solutions to the increasinglycomplex needs of a society with limited natural resources.
Services
We continuously communicate and interact with our customers to identify and implement effective ways tomeet their toughest challenges. We recognize that customer loyalty happens by design, not by chance. To betterserve our customers, we not only need to have a clear understanding of what they need, but also the means andpassion to fulfill those needs. The following are examples of the different services offered to our customersthroughout our operations, all of which services are provided in all our operations and may vary from location tolocation:
24/7 LOAD®: Our delivery service offers customers the ease of receiving products whenever they needthem, allowing our customers to optimize their project schedules according to their specific needs.
ATM-like Bulk Cement Dispatch System: This service offers our customers greater flexibility and efficiency.It enables them to get cement at their convenience, shortening their logistics schedules by minimizing loadingand unloading times and also cutting back on more traditional transactional practices.
Construrama®: We partner with our cement distribution network to offer customers an extensive range ofbrand-name products at competitive prices. Our retailers also receive integral training to better manage allaspects of their business, including inventory management, product promotion, salesforce programs, product-delivery and sourcing logistics.
Customer-oriented Educational and Training Services: In several of the countries where we operate,customers can receive training on specific topics related to the use of building materials. By sharing knowledgeand best practices, our educational and training services guide and teach our customers. Topics range fromteaching customers about the characteristics and uses of white cement, to showing retailers how to improve theirinventory management and increase their sales.
Construction Financing Services: Our customers can receive financing on certain projects and productpurchases through various innovative financing programs that vary from country to country. For example, since1998, our United Nations award-winning low-income housing program, Patrimonio Hoy, has assisted more than570,000 families with affordable services and building materials through financing mechanisms and technicalassistance. Additionally, in certain countries where we operate, such as Mexico, we offer turn-key solutions fordevelopers and partner with governments and local authorities to identify, coordinate, and develop publicinfrastructure projects.
47
Mobile Solutions: Through automated messages sent via short message services (SMS), our customers canbe notified each time an order of cement or ready-mix concrete is ready for delivery. This free-of-charge servicekeeps our customers well informed of their specific project logistics. Our customers can also receive informationabout their pending invoice payments.
Multiproducts: We offer our customers a one-stop shopping experience by providing them with a full arrayof complementary construction-related supplies through our retail stores from plumbing and electrical supplies topaint, lumber, and lighting fixtures.
Online Services: Our customers have all day online access to information, from account balances to newproducts and services releases through online services such as CEMEX Connect, CEMEX One, eSelling,CEMEXNet, Commercial Portal. Our customers can place online cement orders, and in some countries, they areable to review their order status at any time during the day or night. The online service is also an opencommunication channel to receive feedback from our customers.
Service Centers: We offer a one-stop contact call center where customers can manage their business andfind fast, reliable service, place orders, make inquiries, review order status, or request technical assistance, all inone single call.
Smart Silo®: We work together with our customers, so they always have the appropriate quantity of cementin their silos. Through 24-hour monitoring of our customers’ silos’ cement stock levels, our SmartSilo®
technology allows us to anticipate and respond to their product replenishment needs ahead of time.
Technical Support: We strive to provide our customers with top-level technical assistance through ourstate-of-the-art equipment and our highly professional, well-trained technical services staff. We go the extra mileand provide value above and beyond fulfilling our customers’ need for cement, aggregates, ready-mix concrete,and related products such as mortar.
Description of our Raw Materials Reserves
We are a leading global provider of building materials, including cement, ready-mix concrete andaggregates. Our cement production process begins with the mining and crushing of limestone and clay, and, insome instances, other raw materials. We have access to limestone and clay quarries near most of our cementplant sites worldwide since these minerals are the main raw materials in the cement production process.
In addition, we are one of the world’s largest suppliers of aggregates, primarily hard rock, sand and gravel,obtained from quarries, to be used in ready-mix concrete and other concrete-based products such as blocks andpipes.
Customers use our aggregates for a wide array of purposes, from a key component in the construction andmaintenance of highways, walkways, and railways to an indispensable ingredient in concrete, asphalt and mortar.Aggregates can be used in their natural state or crushed into smaller size pieces.
The types of mine mostly used to extract raw materials for aggregates and cement production, are open pitor open cut, which relate to deposits of economically useful minerals or rocks that are found near the landsurface. Open-pit mines that produce raw material for our industry are commonly referred to as quarries.Open-pit mines are typically enlarged until either the mineral resource is exhausted, or an increasing ratio ofoverburden to exploitable material makes further mining uneconomic. In some cases, we also extract rawmaterials by dredging underwater deposits.
Aggregates and other raw materials for our own production processes are obtained mainly from our ownsources. However, we may cover our aggregates and other raw material needs through the supply from third-parties. For the year ended December 31, 2016, approximately 15% of our total raw material needs were suppliedby third-parties.
48

Reserves are considered as proven when all legal and environmental conditions have been met and permitshave been granted. Proven reserves are those for which (i) the quantity is computed from dimensions revealed bydrill data, together with other direct and measurable observations such as outcrops, trenches and quarry faces and(ii) the grade and/or quality are computed from the results of detailed sampling; and the sampling andmeasurement data are spaced so closely and the geologic character is so well defined that size, shape, depth andmineral content of reserves are well-established. Probable reserves are those for which quantity and grade and/orquality are computed from information similar to that used from proven reserves, but the sites for inspection,sampling, and measurement are farther apart or are otherwise less adequately spaced. The degree of assurance,although lower than that for proven reserves, is high enough to assume continuity between points of observation.
Our reserve estimates are prepared by CEMEX’s engineers and geologists and are subject to annual reviewby our corporate staff jointly with the regional technical managers associated to our business units. On specificcircumstances we have used the services of third-party geologists and/or engineers to validate our own estimates.Over the three-year period ended December 31, 2016, we have employed third-parties to review (i) our cementraw materials reserves estimates in Mexico, Colombia, Nicaragua, Costa Rica, the United Kingdom, Germany,Latvia and Spain, and (ii) our aggregates reserves estimates in France, Poland, the Czech Republic, the UnitedKingdom, Germany and Mexico.
Reserves determination incorporates only materials meeting specific quality requirements. For aggregatesused in ready-mix concrete such requirements are based on hardness, shape and size; for cement raw materials(mainly limestone and clay), such requirements are based on a chemical composition that matches the qualitydemanded by the production process. In the case of cement raw materials, since chemical composition variesfrom production sites and even in the same site, we conduct geostatistical chemical tests and determine the bestblending proportions to meet production quality criteria and to try to maintain an extraction ratio close to 100%of the reported reserves for such materials.
The main equipment utilized in our production sites is as follows:
• In our cement facilities: drills, crushers, kilns, coolers, mills, packing/loading machines, pay loaders,excavators, off-road trucks and other material handling equipment.
• In our ready-mix concrete facilities: batch plants, silos and mobile equipment and mixer trucks.
• In our aggregates facilities: drills, crushers, screens, belt conveyors, pay loaders, excavators, trucks andother material handling equipment.
We believe that our facilities are in general good condition, adequate for efficient operations.
During 2016, our total quarry material production was approximately 195 million tons, of whichapproximately 63% was used for our own consumption to produce cement, ready-mix concrete, and/or otherproducts which are later sold to the public and the remaining 37% was directly sold to customers.
Our estimates distinguish between owned and leased reserves, the later determined over the term of thelease contract, and include only those permitted reserves which are proven and probable. As of December 31,2016, the total surface of property in our quarries operations (including cement raw materials quarries andaggregates quarries), was approximately 101,868 hectares, of which approximately 77% was owned by us andapproximately 23% was managed through lease contracts.
As of December 31, 2016, we operated 171 cement raw materials quarries across our global operations,serving our facilities dedicated to cement production, which are located at or near the cement plant facilities. Weestimate that our proven and probable cement raw material reserves, on a consolidated basis, have an averageremaining life of approximately 82 years, assuming 2012-2016 average annual cement production (last five yearsaverage production).
49

The table set forth below presents our total permitted proven and probable cement raw materials reserves bygeographic segment and material type extracted or produced in our cement raw materials quarries operations.
Location Mineral
Numberof
quarries
PropertySurface
(hectares) Reserves (Million tons) Years todepletion
2016AnnualizedProduction
5 yearsaver.
AnnualizedProduction
OwnUseOwned Leased Proven Probable Total
Mexico(1) . . . . . . . . . Limestone 18 8,966 48 1172 1666 2838 138 20.9 20.5 92%Clay 15 8,371 — 164 148 312 88 3.7 3.5 100%Others 15 1,729 150 8 22 30 95 0.3 0.3 100%
United States(2) . . . . Limestone 13 21,834 — 558 149 707 51 15.0 13.9 100%Clay 2 — — 22 — 22 — 0.3 — 0%
EuropeUnited Kingdom . . . . Limestone 3 681 107 128 43 171 79 2.5 2.2 100%
Clay 2 98 — 14 18 32 53 0.7 0.6 100%Others — — — — — — — — — — %
Germany Limestone 1 298 — 8 101 109 38 2.7 2.9 87%France . . . . . . . . . . . . Limestone 2 192 23 24 — 24 13 1.6 1.8 100%Spain . . . . . . . . . . . . . Limestone 12 726 117 303 131 434 82 5.3 5.3 81%
Clay 6 64 72 19 — 19 23 — 0.8 97%Others 2 102 9 1 14 15 — — — — %
Rest of Europe . . . . . . Limestone 4 843 27 255 45 300 60 5 5 96%Clay 1 70 — 10 2 12 48 0.2 0.3 100%Others 1 4 5 — — — 60 — — 100%
SACColombia . . . . . . . . . . Limestone 13 3026 1751 17 209 226 54 4.2 4.2 91%
Clay 3 183 250 — 12 12 43 0.1 0.3 100%Others 1 86 52 — 1 1 4 0.3 0.3 100%
Rest of SAC . . . . . . . Limestone 19 906 221 381 469 850 136 5.1 6.3 99%Clay 8 540 60 46 36 83 124 0.5 0.7 100%Others 6 27 1566 16 50 66 62 0.3 1.1 69%
Asia, Middle Eastand Africa
Philippines(3) . . . . . . Limestone 5 224 — 180 35 215 41 6.2 5.3 100%Clay 3 37 — — 3 3 14 0.1 0.2 100%Others 5 76 9 5 4 9 12 0.5 0.7 100%
Egypt . . . . . . . . . . . . . Limestone 2 — 146 291 — 291 52 5.3 5.6 100%Clay 4 — 402 77 — 77 53 1.3 1.4 100%Others 5 — 21.999 2 — 2 17 — 0.1 100%
CEMEXConsolidated . . . . Limestone 92 37,695 2,441 3,316 2,849 6,165 85 73.8 72.84 93%
Clay 44 9,362 784 351 220 571 73 6.9 7.80 96%Others 35 2,023 1,813 33 92 125 49 1.5 2.56 93%
Totals 171 49,081 5,037 3,701 3,160 6,860 82 82.2 83.2
(1) Our cement raw materials operations in Mexico include three limestone quarries that also produce hard rockaggregates.
(2) Our cement raw materials operations in the U.S. include one limestone quarry that also produces hard rockaggregates.
(3) Although we consolidate CHP into our consolidated financial statements under IFRS, we do not control theraw materials used in our operations in the Philippines. Such raw materials are primarily supplied by APOLand & Quarry Corporation (“ALQC”) and Island Quarry and Aggregates Corporation (“IQAC”). ALQC iswholly owned by Impact Assets Corporation, which is a corporation in which we own a 40% equity interest.
50

IQAC is wholly owned by Albatross Holdings, which is a corporation in which we own a 40% equityinterest.
As of December 31, 2016, we operated 305 aggregates quarries across our global operations dedicated toserving our ready-mix and aggregates businesses. We estimate that our proven and probable aggregates reserves,on a consolidated basis, have an average remaining life of 37 years, assuming 2012-2016 average production(last five years average aggregates production).
51

The table set forth below presents our total permitted proven and probable aggregates reserves by geographicsegment and material type extracted or produced in our aggregates quarries operations. We note that the locations ofour aggregates reserves differ from those of our cement reserves.
Location Mineral
Numberof
quarries
PropertySurface
(hectares) Reserves (Million tons) Years todepletion
2016AnnualizedProduction
5 yearsaver.
AnnualizedProduction
OwnUseOwned Leased Proven Probable Total
Mexico . . . . . . . . . . . . . . . . . Hardrock 12 755 135 212 251 463 45 10.7 10.4 56%Others 3 — 48 2 12 14 8 1.9 1.8 66%
United States . . . . . . . . . . . Hardrock 18 13,143 3,520 668 55 723 33 24.6 22.2 35%Sand &Gravel 10 2,350 2,807 86 3 88 17 5.8 5.1 46%Others 45 4,895 4,847 388 57 445 36 12.5 12.3 36%
EuropeUnited Kingdom . . . . . . . . . Hardrock 12 470 795 411 — 411 45 9.6 9.1 50%
Sand &Gravel 2 157 — 2 — 2 8 0.3 0.2 46%Others 66 2,696 1,669 137 127 263 27 8.6 9.7 46%
Germany . . . . . . . . . . . . . . . Hardrock 2 26 235 12 35 47 32 1.2 1.5 19%Sand &Gravel 23 1,613 547 55 77 132 19 5.8 7.1 13%Others 1 32 — — — 1 5 0.1 0.1 79%
France . . . . . . . . . . . . . . . . . Hardrock 12 97 458 107 29 136 31 3.6 4.4 20%Sand &Gravel 28 760 923 112 33 145 25 4.9 5.8 31%Others 5 386 594 20 7 27 15 0.9 1.8 61%
Spain . . . . . . . . . . . . . . . . . . Hardrock 8 289 144 161 151 312 385 0.7 0.8 56%Sand &Gravel 2 449 — 47 1 47 142 — 0.3 49%
Rest of Europe . . . . . . . . . . . Hardrock 6 — 84 28 54 82 42 2 2 56%Sand &Gravel 4 324 170 7 4 11 3 3.5 4.1 43%Others 14 464 143 51 49 100 21 4.3 4.8 9%
SAC
Colombia . . . . . . . . . . . . . . .Sand &Gravel 7 592 — 25 5 30 40 0.7 0.7 100%Others — — — — — — — 0%
Rest of SAC . . . . . . . . . . . . .Hardrock 5 181 164 41 620 660 431 0.4 1.5 0%Sand &Gravel 3 — 200 8 2 10 40 — 0.3 0%Others 7 — 57 — 2 2 15 0.1 0.1 47%
Asia, Middle East andAfrica
Philippines(1) . . . . . . . . . . . Hardrock 3 94 24 177 — 177 88 0.4 2 11%Rest of Asia, Middle East
and Africa Hardrock 5 — 389 83 19 102 25 10.4 11.9 43%Sand &Gravel 2 — 26 2 — 2 25 0.1 0.2 43%
CEMEX Consolidated Hardrock 83 15,055 5,948 1,900 1,215 3,114 47 63.6 65.8 43%Sand &Gravel 81 6,244 4,673 342 124 467 19 21.1 24 35%Others 141 8,473 7,356 599 253 853 28 28.5 30.6 38%
Totals 305 29,773 17,976 2,841 1,592 4,434 37 113.1 120.4
52

(1) Although we consolidate CHP into our consolidated financial statements under IFRS, we do not control theraw materials used in our operations in the Philippines. Such raw materials are primarily supplied by ALQCand IQAC. ALQC is wholly owned by Impact Assets Corporation, which is a corporation in which we owna 40% equity interest. IQAC is wholly owned by Albatross Holdings, which is a corporation in which weown a 40% equity interest.
Our Vision
CEMEX has a general vision and value creation model comprised of the following five elements:(i) purpose, (ii) mission, (iii) values (iv) strategy, and (v) operating model.
PURPOSE. We expect to build a better future for our employees, our customers, our shareholders, and thecommunities where we live and work.
MISSION. We intend to create sustainable value by providing industry-leading products and solutions tosatisfy the construction needs of our customers around the world.
VALUES. We intend to: (i) ensure the safety of all our employees by being accountable to each other forour actions and behaviors and trying to be an industry leader by example; (ii) focus on our customers by aligningourselves closely with their business and their needs and, following through with our commitments, resolvingproblems quickly and making it easy to do business with us; (iii) pursue excellence in all aspects of our businessand interactions with customers by challenging ourselves to constantly improve and build upon our strongreputation around the world for quality and reliability; (iv) work as one CEMEX by leveraging on our collectivestrength and global knowledge to share best practices, replicate good ideas and collaborate across boundaries;and (v) act with integrity by remaining honest and transparent in all our interactions, complying with our code ofethics, and caring for our people, communities and natural resources.
STRATEGY. To achieve our mission, our strategy is to create value by building and managing a globalportfolio of integrated cement, ready-mix concrete, aggregates and related businesses. The four pillars thatunderpin our strategy are (i) valuing our employees as our main competitive advantage, (ii) helping ourcustomers succeed, (iii) pursuing markets that offer long-term profitability, and (iv) ensuring sustainability isfully embedded in our business.
Value people as our main competitive advantage
We aspire to hire excellent employees, and our team’s health, safety and professional growth are toppriorities. We develop leaders and encourage them to create new ways of thinking and acting, while assessingrisks and opportunities. We foster an open dialogue in our interactions to align and achieve greater results.
Placing Health and Safety First. To ensure we are meeting our goals, four core principles guide ourdecisions and actions: (i) ensuring nothing comes before the health and safety of our employees, contractors, andcommunities; (ii) making health and safety a personal responsibility by looking after ourselves and each other;(iii) striving to create safe workplaces; and (iv) maintaining accountability for health and safety practices.
We are working towards our ultimate target of zero injuries in our operations worldwide. In 2016, ourEmployee Lost-Time Injury (LTI) Frequency Rate was 0.6 (based on number of employees per million hoursworked), bringing us closer to our goal of reducing such rate to 0.3 or less by 2020. We are encouraged to seethat 95% of CEMEX operations experienced no fatalities or lost-time-injuries in 2016. We recognize theremaining 5% is still considerable. However, we consider that the overall direction is positive. Also in 2016,CEMEX Total Recordable Injury (TRI) Frequency Rate continued to decline, reaching 4.1 compared to 4.5 in2015 and 5.6 in 2014. Two regions and 13 countries reduced their TRI Rates, with six countries maintaining arate of zero. In addition, the global Employee Sickness Absence Rate for CEMEX improved from 2.1 to 1.8 in2016.
53

We had 20 fatalities in 2016 – three employees, 10 contractors and seven third parties. From these, 75%occurred away from our installations (off-site) and 60% were road traffic related. Our goal is to have zeroinjuries and fatalities. To reach this objective, we are actively working to identify and mitigate risks. Each injuryand fatality is analyzed to determine the root cause and prevent future incidents. Most of these fatalities werecaused by moving vehicle incidents (i.e., collisions involving contractors’ trucks). To prevent further fatalities,we have invested in technology and training programs to encourage our employees and contractors to use properdriving techniques for their safety and the safety of others. For example, we are reinforcing our defensive drivertrainings while introducing a stronger driver certification scheme.
The following table sets forth our performance indicators with respect to safety by geographic location forthe year ended December 31, 2016 and accounts for information that became available in March 2017:
MexicoUnitedStates Europe SAC
Asia,Middle Eastand Africa
TotalCEMEX
Total fatalities, employees, contractors and other thirdparties (#) . . . . . . . . . . . . . . . . . . . . . . . . . . . . . . . . . . . . 13 1 1 3 2 20
Fatalities employees (#) . . . . . . . . . . . . . . . . . . . . . . . . . . . 2 0 0 1 0 3Fatality rate employees(1) . . . . . . . . . . . . . . . . . . . . . . . . . . 2.2 0.0 0.0 1.7 0.0 0.7Lost-Time injuries (LTI), employees (#) . . . . . . . . . . . . . . 11 20 17 8 4 60Lost-Time injuries (LTI), contractors (#) . . . . . . . . . . . . . . 18 6 18 7 2 53Lost-Time injury (LTI) frequency rate, employees per
million hours worked . . . . . . . . . . . . . . . . . . . . . . . . . . . 0.4 0.9 0.8 0.5 0.5 0.6
(1) Incidents per 10,000 people in a year.
We attempt to ensure that all of our employees have the correct knowledge, skills and experience to performtheir jobs safely through our investment in programs that provide employees at all levels with health and safetytraining. As part of our manager-training program, executives and supervisors must complete our Health andSafety (“H&S”) Academy. Launched in 2016, our global H&S Academy is designed to enhance the leadershipskills of our line managers and supervisors and to ensure that H&S is our top priority across our organization,from our production plants to our corporate offices. Already commenced in 21 countries, the H&S Academy’stwo-day “Foundation” module prepares executives from different roles and backgrounds to share H&S practiceswith their teams throughout CEMEX. We intend to conduct further H&S trainings for our managers.
In addition, our employees must complete E-LEGACY training, which is a non-technical, interactiveprogram that helps front-line employees assess risks and integrate safe and healthy practices into their day-to-dayactivities, promoting a strong H&S culture within our organization. Our H&S committees, which are comprisedof representatives from front-line workers, line supervisors, managers, and unions, meet regularly to discussH&S-related concerns and to help reinforce H&S practices and programs.
Furthermore, we have established interconnected global H&S networks, taskforces, and forums to ensurethat we work together through a coordinated, consistent, and collaborative approach to reach our company-widegoal of zero injuries: (i) the H&S Functional Network; (ii) the Global H&S Council; (iii) Six Global Taskforces;and (iv) a Global Health Forum.
We continue to enhance our health practices and reduce our safety risks to strengthen our H&S culture.H&S is considered in each and every phase of product development, from design to disposal. We abide by allapplicable legislation and H&S requirements when designing our products and have developed Material SafetyData Sheets that describe potential hazards and precautions to take when handling each of our products. Forinstance, with our ¡Avísame! (“Warn me!”) campaign in Spain, we encourage our employees to takeresponsibility for the safety of others. Beyond focusing on their own safety, this campaign encourages ouremployees to warn their colleagues of potential safety risks, while encouraging such employees to report unsafe
54

conditions to their managers, as well. By placing the ¡Avísame! sticker on their helmets, our employees signifythat they are receptive to correction or warning from their peers whenever they encounter hazardous situations.
Attracting and Retaining Talent. We aim to offer the programs, benefits, and work environment that attractand retain talented employees. Our approach to talent management is founded on three pillars: (i) employ theright people, in the right place, at the right time to perform the right job to achieve our strategy; (ii) enable ahigh-performing and rewarding culture to deliver sustainable business value in a safe, ethical workplace; and(iii) build and develop our workforce capabilities to confront challenges and pursue excellence.
As we transform and expand, one of our main objectives is to develop people with the potential to fill keyleadership positions—increasing their experience and capabilities to equip them to succeed in increasinglychallenging roles. Through this process, we work to improve our employees’ commitment to our company byhelping them meet their own career development expectations and preparing them for key roles as they facecritical challenges in their professional development. Our succession management process enables us to build atalented pool of leaders with the skills and understanding of our business fundamentals to continue our pursuit ofexcellence. Through ongoing training and development opportunities, our employees are taught new skills andtheir expertise is deepened in several critical areas, including H&S, customer-centric capabilities, environmentalconservation and awareness, leadership development, and stakeholder engagement.
We strive to foster a dynamic, high-performance environment, where open dialogue is encouraged andrewarded. Apart from competitive compensation, more than 80% of our global workforce receives health and lifeinsurance benefits beyond those required by local law. Approximately half of our global workforce receivesretirement provision benefits above local requirements, and more than 60% of our operations receive additionalfunds for disability and invalidity coverage beyond what is required by local law.
Helping our customers succeed
Our core strategic goal is to become the most customer-oriented company in our industry—serving as ourclients’ best option in every market while delivering a superior customer experience. To achieve this goal, wehave focused on increasing customer service by creating a customer centricity network and beginning a digitaltransformation of our customer service.
Fostering a Customer-Centric Organization. Our goal is to put our clients at the center of our business. Aswe work toward this goal, we focus on five key areas: (i) creating a superior customer experience; (ii) updatingand simplifying key internal processes and policies; (iii) developing and implementing digital solutions;(iv) measuring customer satisfaction systematically; and (v) continuously innovating and adding value for ourcustomers.
To create a superior customer experience, we are strengthening our capabilities and leadership style,involving our clients in our decision-making and implementing new ways to work and collaborate that focus onproblem solving and innovation. We also are reinforcing our training and aligning our performancemeasurements to deliver on our customers’ expectations.
To continually satisfy and better understand our customers, we conduct a thorough analysis of our clients inour key markets and classify them in segments and sub-segments. We identify their most relevant product andservice attributes. We also identify segments and opportunities where we could better serve our customers, whileimproving our profitability. We then customize our value propositions based on segment characteristics andneeds, so they are tailored to the unique requirements of each individual customer. To further enhance ourcustomer-centric organizational culture, we launched the Customer Centricity Foundations track with three mainobjectives: (i) fostering a customer-centric organization by engraining customers’ needs into the core workphilosophy throughout CEMEX; (ii) making doing business with us an effective, easy, and enjoyable experiencefor our customers, while striving to exceed their needs; and (iii) setting the management system to enable aCEMEX customer-centric evolution that incorporates ongoing monitoring, measurement, and improvement toachieve a superior customer experience.
55

We are undertaking a digital transformation designed to substantially improve our customer experience,while enhancing our operations and increasing our business efficiencies. Our digital solutions, including mobileapplications, will improve our interaction and enable real-time engagement with our customers across a range ofonline transactions—including registering and requesting credit, placing orders, receiving products and services,invoicing, and complaint resolution.
Beyond leveraging our own development experience, we are working with process and technologyspecialists from Apple, Inc., International Business Machines Corporation (“IBM”), and Neoris. For example,beginning in early 2017, we are partnering with IBM iX (Interactive Experience) to launch a suite of customizedmobile applications to enhance our client experience. Following a “speed-to-market” approach, we will pilot,launch, user test, and adjust solutions to meet our clients’ needs before scaling the applications for worldwidedeployment. Our digital transformation will fundamentally change not only how our entire company doesbusiness, but also how foremen, field operations managers, cement masons, concrete finishers and otherconstruction professionals work and interact with us.
Providing Superior and Sustainable Products, Solutions and Services. Our collaborative sustainabilityprojects address areas such as carbon capture, alternative raw materials, high temperature solar industrialprocesses, and energy efficiency, among others.
We continue to develop new concrete technologies and value-added aggregates, improve constructionsystems, and provide novel building and paving solutions. However, in addition to launching new products, weare interested in following the adoption of solutions that we presented in previous years. For us, sustainabilityinvolves not only improving our impact on the environment, but also our impact on day-to-day life in thecommunities in which we operate. Indeed, this principle led to the IFC’s decision to grant funding for ourresearch and development (“R&D”) projects that are focused on sustainability—providing “climate-smart”solutions across emerging markets.
We leverage our innovative approach and agility to develop superior building products and solutions thatperform at high standards across our operations. Led by CEMEX Global R&D in Switzerland in collaborationwith our Cement and Ready-Mix Technology Center in Mexico, our team works to anticipate and understandsociety’s trends in order to create innovative, sustainable construction solutions that satisfy our customers’current and future needs, while challenging the current technological landscape.
We established a new Green Building Management and Certification Policy to mitigate potentialenvironmental impacts associated with the design, construction, and operation of our buildings. This policyensures that the planning, design, construction, management, renovation and demolition activities of company-owned and leased facilities are carried out in a sustainable manner. This policy also mandates that new facilitiesachieve a green building certification, such as LEED or BREEAM. Moreover, we support the development ofdurable infrastructure with quality products, construction practices, and maintenance that have minimalenvironmental impact. Through revolutionary advances in concrete technology, we are aiming to positionourselves at the forefront of the industry, designing and developing unique, integrated, value-added constructionsolutions that defy the status quo and meet our clients’ evolving needs now and into the future.
Our expertise in building efficient homes with tailor-made, adaptable systems has contributed to, as ofDecember 31, 2016, the construction of more than 4,100 affordable homes and/or energy-efficient buildings,representing approximately 75,000 square meters of livable space. Our wall systems and integrated housingsolutions offer multiple advantages that improve the sustainability, speed, efficiency, and profitability of housingconstruction.
Pursue markets that offer long-term profitability
We operate in markets where we can add value for our employees, our customers and our shareholders. Weintend to focus on those markets that offer long-term profitability. We believe that a geographically diverse
56

portfolio of assets provides us with the opportunity for significant value creation through profitable organicgrowth over the medium- to long-term. Consequently, we are selective and strategic about where we operate. Ourbusiness portfolio is particularly focused on geographies that combine strong fundamentals, ranging fromeconomic growth potential to per-capita cement consumption, population growth, degree of urban developmentand political stability.
Leveraging our global presence and extensive operations worldwide, we intend to continue focusing on ourcore cement, aggregates, ready-mix concrete and related businesses. By managing our core operations as onevertically integrated business, we not only capture a significant portion of the cement value chain, but also createvalue for our customers by offering comprehensive building solutions. Historically, this strategic focus hasenabled us to grow our existing businesses, particularly in high-growth markets and with specialized, high-margin products.
Complementary Businesses. We participate selectively in complementary businesses, including, but notlimited to, the development of alternative and renewable sources of energy, concrete pavement solutions,housing, prefabricated concrete products, admixtures. We believe such projects allows us to provide valuableservices to our customers, grow our core markets, develop our competitive advantage, and improve our overallperformance.
On March 14, 2017, we also announced the launch of CEMEX Ventures, our open innovation and venturecapital unit designed to lead the evolution of the construction industry. CEMEX Ventures will leverageCEMEX’s knowledge of the business with new, leading-edge technologies and platforms and developopportunities in key focus areas outside of CEMEX’s core business, such as urban development, connectivityimprovements within the construction value chain, new construction trends and technologies, and the creationand development of new project finance resources.
Ensure sustainability is fully embedded in our business
Our sustainability efforts begin with CEMEX, S.A.B. de C.V.’s Board of Directors and are then facilitatedacross our entire organization. CEMEX, S.A.B. de C.V.’s Sustainability Committee is comprised of three ofCEMEX, S.A.B. de C.V.’s Board of Directors members reporting directly to CEMEX, S.A.B. de C.V.’s Board ofDirectors, along with the Audit and the Corporate Practices & Finance Committees. The SustainabilityCommittee is supported by our Corporate Sustainability function, which reports to a member of our ExecutiveCommittee. To ensure sustainability is embedded into our entire business strategy, we have coordinatorsrepresenting each geographical region where we operate. In parallel, our Global Sustainability FunctionalNetwork works to implement our core sustainability initiatives across all of our operating regions and businesslines.
Implementing a High-Impact Social Strategy. As a global company, we have included Corporate SocialResponsibility (CSR) as a fundamental component of our business model—aligned with our mission to build abetter future by creating lasting value for all of our stakeholders. As we provide high-quality, innovative buildingmaterials and wide-ranging construction solutions for our customers, we must also support society’s developmentneeds and contribute to the well-being of the communities in which we operate.
We are committed to advancing constructive change as envisaged in the ambitious agenda put forth in theUnited Nations’ Sustainable Development Goals (“SDGs”). We believe that achieving the SDGs is not only theresponsible thing to do; it is also strategically relevant from a growth standpoint, as such actions foster newbusiness opportunities, build markets and relationships and improve our environment and our stakeholders’quality of life. Aligned precisely with SDGs 1, 4, 5, 8, and 11, our sustainability strategy’s social priorities areparticularly focused on our contribution to end poverty, achieve gender equality, provide decent employment,foster economic growth and develop sustainable communities. To these ends, we have established a high-impactsocial strategy that fosters societal intelligence, guides our participation in international and business
57

organizations’ initiatives, develops programs designed to create greater benefits for our communities,incorporates knowledge for our commercial endeavors and, ultimately, adds to our reputation as a sociallyresponsible company.
Our efforts are channeled through the co-creation of social models that enable solutions to alleviatesignificant challenges around the world. To achieve our goals, we create strategic alliances that fostercollaboration with key partners—multiplying the benefits for our communities.
Furthermore, we are committed to bolstering our communities’ fundamental capacities for long-term self-support and upward mobility. Our mission is to serve as a key contributor to community development and anengine for economic growth through innovative and sustainable solutions. Through our community-involvementefforts across, we have learned that self-sufficiency and practical skills development are integral to the long-termprosperity of individuals and communities. However, in many of our markets, poor access to jobs, skills training,and education opportunities limit individuals’ ability to meet their basic needs. To address these challenges, wehave developed a number of programs that increase communities’ access to building materials for their homes,while providing mechanisms to improve training and employment options.
Aligned with SDG 4, “Ensure inclusive and equitable quality education and promote lifelong learningopportunities for all,” we leverage our business capabilities, our network of employees, and strategic alliances tocreate public value and provide diverse groups with numerous opportunities to achieve their potential for growthand prosperity. Equally, we recognize the challenge posed by SDG 11, “Make cities and human settlementsinclusive, safe, resilient and sustainable.” To help address this social need, we have developed social andinclusive businesses through models co-created with our communities to provide specific solutions for publicspaces and affordable housing that simultaneously combat urban poverty and contribute to the achievement ofSDG 1, “End poverty in all its forms everywhere.”
Patrimonio Hoy, our flagship inclusive business, was founded to provide low-income families with accessto financing, building materials, technical advice, and logistical support—allowing such families to build orexpand their homes more quickly and efficiently. Started in Mexico, Patrimonio Hoy has expanded to more than100 of our offices across Latin America, including Costa Rica, Colombia, the Dominican Republic, andNicaragua. During 2016, we reached more than 46,000 families, bringing the accumulated total to approximately570,000 families since 1998. In 2016, Patrimonio Hoy built approximately 231,000 square meters of livingspace, resulting in a total of approximately 4.3 million square meters of living space since 1998. According toour calculations, the Patrimonio Hoy initiative generated an external social value of approximatelyU.S.$65 million.
In 2016, we added 17 new productive centers for self-employment in Mexico, six in Colombia, five in CostaRica and one in Panama. In total, we operated 154 of these centers at the end of 2016. In 2012, CEMEX alsobecame a founding partner of New Employment Opportunities, an initiative to prepare young people, particularlydisadvantaged young people, for entry-level jobs in Latin America and the Caribbean.
Finally, we are active members of the UN Global Compact’s Advisory Group on Supply ChainSustainability and the Cement Sustainability Initiative’s supply chain group. This keeps us involved in changingpolicies, metrics, and practices within our industry. We have also developed strong sustainability relationshipswith our suppliers. Since its inception in 2010, our Supplier Sustainability Program has extended ourcommitment to sustainability to our supply chain, communicating and promoting responsible practices. Thisprogram integrates the basic sustainability requirements with which our suppliers must comply. Theserequirements express our corporate sustainability value statements, included in our Human Rights Policy, Codeof Conduct when Doing Business with Us, and Code of Ethics.
Pursuing Excellence in Environmental Management. We believe the pursuit of excellent environmentalpractices benefits sustainable growth. In addition to our Board-level Sustainability Committee, our Global
58

Environmental Council, which is composed of our primary environmental executives responsible for each of ouroperating regions, shares new trends, proposals and best practices to identify, inform and tackle keyenvironmental management concerns.
We are committed to contribute to climate change mitigation and its consequences. For decades, as part ofour carbon emissions reduction strategy, we have focused on using low-emission alternatives to traditional fossilfuels, decreasing our clinker factor, promoting clean energy, and increasing energy efficiency across ouroperations. To this end, we have continuously sought to increase our use of low-carbon alternative fuels, whichrepresented 23.3% of our total fuel mix in 2016.
We are reducing the CO2 footprint of our cementitious products by replacing traditional energy-intensiveclinker with alternative raw materials, such as slag, fly ash, and pozzolans. In 2016, our overall clinker factor was78.4%, around seven percentage points less than in 1990. Also, our emissions of CO2 per ton of cementitiousproducts in 2016 dropped by 20% compared to such emissions in 1990. Overall, in 2016, we avoided almost7.3 million tons of CO2 emissions as a result of our mitigation efforts, which is comparable to the annual averagecarbon emissions from 1.3 million passenger vehicles.
In 2016, we received an A- score from the CDP (formerly Carbon Disclosure Project). According to theCDP’s new evaluation system, companies now receive a single letter score from A to D-. This score assessesprogress across four categories: Disclosure, Awareness, Management and Leadership. The CDP has recognizedthat we belong to the leading group of companies in the sustainability field. Also, in 2016, 25% of our cementoperations’ power supply came from renewable sources. This percentage includes all electricity from renewablesources that we contracted directly, plus the renewable energy share of the grid power that our plants consume.
For more than a decade, we have worked to identify, document and register projects that mitigate carbonemissions and generate equivalent offsets. We have achieved approval for 19 CO2 offset projects registered underthe Clean Development Mechanism and four CO2 offset projects under the Verified Carbon Standard,representing a total reduction potential of nearly three million tons of CO2 per year. These initiatives are locatedin Colombia, Costa Rica, Mexico, Panama, the Dominican Republic, Egypt, and the United States.
We are determined to meet the demands of a growing population through effective and secure methods toalleviate the social, economic and environmental issues associated with municipal waste management. We arebuilding global support for the enactment and enforcement of legislation that promotes co-processing of waste,which cannot otherwise be reduced, reused or recycled.
We are a prominent industry advocate and user of alternative fuels, displacing traditional fuels like petcokeand coal with low- or zero-carbon alternatives such as municipal solid waste, tires, and biomass residues. As ofDecember 31, 2016, 92% of our cement plants co-processed alternative fuels for a total fossil fuel substitutionrate of 23.3%, which avoided the use of 1.6 million tons of coal. Moreover, eight of our cement plants that usealternative fuels surpassed a substitution rate of 50% in their fuel mix.
We have the expertise to responsibly source, process, store, and recover energy from alternative fuels. Byincreasing the co-processing of these fuels in our cement plants, we intend to help overcome challenges such asclimate change, waste management and fossil fuel depletion. We maintain our efforts to reach a 35% AlternativeFuels Target by 2020.
We dispose of waste generated in our production processes in accordance with local regulations. To reducemost of the waste generated from our processes, we maximize our reuse of clinker kiln dust in our productionloop, largely avoiding landfill disposal. To realize the financial and environmental benefits of waste, we monitor,minimize, reuse, and recycle our waste whenever possible. In 2016, 94% of the waste generated by ourproduction processes was recovered, reused or recycled. The remaining material was sent to disposal sites.Moreover, the disposal of our non-hazardous waste, which comprises the majority of the waste created in ouroperations, decreased approximately 40% from 2015 to 2016, while our hazardous waste disposal declined by9% in 2016 compared to 2015.
59

CEMEX Environmental Management System (“EMS”). We use EMS to evaluate and facilitate consistentand complete implementation of risk-based environmental management tools across our operations. EMSconsists of key mechanisms for environmental impact assessment, stakeholder engagement, and accidentresponse based on input from a range of environmental and biodiversity specialists.
As of December 31, 2016, 98% of our cement plants, 88% of our ready-mix concrete operations and 86% ofour aggregates quarries have implemented either EMS or equivalent programs. Our goal is for all of CEMEXfacilities to be 100% compliant with our internal environmental criteria.
We are committed to reducing our environmental footprint by working to monitor emissions, improve ourmeasurement methods, adapt to new and more stringent air emissions regulations, invest accordingly and executerequired training. We strive to go beyond local regulations and set ambitious targets for emissions mitigation.
In 2016, we invested US$80 million in sustainability-related projects at our global operations, includingmore than 70 projects to monitor and reduce our air emissions.
In 2016, the International Finance Corporation (“IFC”), a member of the World Bank Group, grantedCEMEX a loan of €106 million to support the company’s sustainable investment programs in emerging markets.We have allocated approximately 60% of the funds for projects related to the reduction of our greenhouse gasemissions, while we allocated the remainder to improve our overall air emission controls.
Our environmental incidents management. We minimize our emissions and reduce the likelihood of spillsand water contamination. We are prepared to respond to any emergency that may pose a threat to our operationsand communities. We consistently record and report incidents at every level of our business to identify recurringroot causes and share corrective actions based on best practices.
In particular, we recognize that reporting environmental incidents is the first step to reducing their occurrenceand severity. Our rigorous efforts to standardize the implementation of our environmental management processesenabled us to avoid the occurrence of Category 1 incidents during 2016. Moreover, our Category 2 incidentsdecreased significantly, from 436 in 2015 to 64 in 2016. This significant drop was mainly due to updating CEMEXEnvironmental Incident Reporting Procedure, wherein the circumstances of specific incidents were recorded in thecontext of their corrective action to ensure better follow-up and corresponding remediation.
Preserving land, water and biodiversity. The preservation of land, biodiversity and water plays a key role inour long-term resource management strategy.
To protect water and enable our business to succeed, we are increasing our water efficiency and minimizingour water waste through the implementation of our Corporate Water Policy. This policy includes standardizationof our water measurement based on the Water Protocol developed in coordination with the International Unionfor Conservation of Nature (IUCN). Additionally, we comply with the Cement Sustainability Initiative’s (CSI)Guidelines for Environmental & Social Impact Assessment for all of our quarry developments. According tothese guidelines, we assess all of our social and environmental impacts using different methods and techniques,including the requirement to evaluate cumulative effects on biodiversity.
OPERATING MODEL. We aim to operate effectively and achieve the greatest possible value byleveraging our knowledge and scale to establish best practices and common practices worldwide.
Financial Strategy
Regain our Investment Grade.
In light of the global economic environment and our substantial amount of indebtedness, we have beenfocusing, and expect to continue to focus, on optimizing our operations by growing our market positions and ourcore business and implementing our pricing policies, on strengthening our capital structure and regaining financialflexibility through reducing our debt and cost of debt, improving cash flow generation and extending maturities.
60

We plan to maintain and grow our market positions in cement, ready-mix concrete and aggregates by beingone of the most customer-centric companies in the industry. We also expect to implement pricing initiatives forour products and receive compensation through fees for the services we provide that should allow us to improveour overall profits. We anticipate advocating and promoting the increased usage of cementitious based products,to grow our aggregate footprint and replace our aggregate reserves in a manner, which ensures the sustainabilityof our business, and to operate in the most capital and cost-efficient manner possible.
We have a long history of successfully operating world-class cement production facilities in developed andemerging markets and have demonstrated our ability to produce cement at a lower cost compared to industrystandards in most of these markets. We continue to strive to reduce our overall production related costs for all ofour products and corporate overhead through disciplined cost management policies and through improvingefficiencies by removing redundancies. We have implemented several worldwide standard platforms as part ofthis process and have also started different initiatives, such as a system designed to improve our operatingprocesses worldwide. In addition, we implemented centralized management information systems throughout ouroperations, including administrative, accounting, purchasing, customer management, budget preparation andcontrol systems, which have helped us achieve cost efficiencies, and we also have a strategic agreement withIBM expected to improve some of our business processes. We have also transferred key processes, such asprocurement and trading, from a centralized model to a regional model and are simplifying and delayering ourbusiness to accelerate decision-making and maximize efficiency. In a number of our core markets, such asMexico, we launched aggressive initiatives aimed at reducing the use of fossil fuels, consequently reducing ouroverall energy costs.
Furthermore, significant economies of scale in key markets often allow us to obtain competitive freightcontracts for key components of our cost structure, such as fuel and coal, among others.
Through a worldwide import and export strategy, we will continue to seek to optimize capacity utilizationand maximize profitability by redirecting our products from countries experiencing economic downturns to targetexport markets where demand may be greater. Our global trading system enables us to coordinate our exportactivities globally and take advantage of demand opportunities and price movements worldwide allowing ourregions to have access to information required to execute our trading activities. Should demand for our productsin the United States improve, we believe we are well-positioned to service this market through our establishedpresence in the southern and southwestern regions of the country and our ability to import to the United States.
Our industry relies heavily on natural resources and energy, and we use cutting-edge technology to increaseenergy efficiency, reduce carbon dioxide emissions and optimize our use of raw materials and water. We arecommitted to measuring, monitoring and improving our environmental performance. In the last few years, wehave implemented various procedures to improve the environmental impact of our activities as well as ouroverall product quality, such as a reduction of carbon dioxide emissions, an increased use of alternative fuels toreduce our reliance on primary fuels, an increased number of sites with local environmental impact plans in placeand the use of alternative raw materials in our cement.
Global Cost-Reduction and Pricing Initiatives
In response to decreased demand in most of our markets as a result of the global economic recession, in2008 we identified and began implementing global cost-reduction initiatives intended to reduce our annual coststructure to a level consistent with the decline in demand for our products. Such global cost-reduction initiativesencompass different undertakings, including headcount reductions, capacity closures across the cement valuechain and a general reduction in global operating expenses. During the past years, CEMEX has launched acompany-wide program aimed at enhancing competitiveness, providing a more agile and flexible organizationalstructure and supporting an increased focus on the company’s markets and customers. For the year endedDecember 31, 2016, we reached our target that had been set out for the 2016 year of approximatelyU.S.$150 million in annualized cost savings through the implementation of our cost reduction program, which
61

contemplated an improvement in underperforming operations, a reduction in selling, general and administrativecosts and the optimization of the company’s organizational structure.
In connection with the implementation of our cost-reduction initiatives, and as part of our ongoing efforts toeliminate redundancies at all levels and streamline corporate structures to increase our efficiency and reduceoperating expenses, as well as our divestitures, we have reduced our global headcount by approximately 26%,from 56,791 employees as of December 31, 2008 (excluding personnel from our operations in Australia sold in2009 and our operations in Venezuela, which were expropriated in 2008) to 41,853 employees as ofDecember 31, 2016.
Also as part of these initiatives, since 2009, we have temporarily shut down (some for a period of at leasttwo months) several cement production lines in order to rationalize the use of our assets and reduce theaccumulation of our inventories. We have also announced the permanent closure of some of our cement plants,such as our Davenport cement plant located in northern California in 2010. Similar actions were taken in ourready-mix concrete and aggregates businesses. Such rationalizations included, among others, our operations inMexico, the United States, Spain and the United Kingdom.
Furthermore, during 2016, we achieved energy cost-savings by actively managing our energy contractingand sourcing, and by increasing our use of alternative fuels. We believe that these cost-saving measures betterposition us to quickly adapt to potential increases in demand and thereby benefit from the operating leverage wehave built into our cost structure.
We have also introduced a comprehensive pricing strategy for our products that is expected to more fullyreflect and capture the high value-creating capability of our products and services. Our strategy focuses on valueenhancement, optimizing gains in customer relationships and in generating sufficient returns that would allow usto reinvest in our business. Under this strategy we are establishing internal procedures and guidelines that areexpected to support our approach to pricing our different products and services.
Optimizing Capital Expenditures
During past years, we had reduced capital expenditures related to maintenance and expansion of ouroperations in response to weak demand for our products. Such reductions were implemented to maximize ourfree cash flow generation available for debt service and debt reduction, consistent with our ongoing efforts tostrengthen our capital structure, improve our conversion of Operating EBITDA to free cash flow and regain ourfinancial flexibility. During 2015 and 2016, as a result of a higher demand for our products in certain markets inwhich we operate, we increased capital expenditures related to maintenance and expansion of our operations toapproximately U.S.$764 million and U.S.$685 million, respectively, from approximately U.S.$689 million in2014. Pursuant to the Credit Agreement, we are prohibited from making aggregate annual capital expenditures inexcess of U.S.$1 billion (excluding certain capital expenditures, joint venture investments and acquisitions byeach of CEMEX Latam and CHP and their respective subsidiaries), which capital expenditures, joint ventureinvestments and acquisitions at any time then incurred are subject to a separate aggregate limit ofU.S.$500 million (or its equivalent) for each of CEMEX Latam and its subsidiaries and CHP and its subsidiaries,in each case, the amounts of which allowed for permitted acquisitions and investments in joint ventures cannotexceed U.S.$400 million per year. We believe that these restrictions on capital expenditures do not diminish ourworld-class operating and quality standards and we may opportunistically increase capital expenditures in someof the markets in which we operate, if necessary, to take advantage of improved market conditions.
User Base
Cement is the primary building material in the industrial and residential construction sectors of most of themarkets in which we operate. The lack of available cement substitutes further enhances the marketability of ourproduct. The primary end-users of cement in each region in which we operate vary but usually include, among
62
others, wholesalers, ready-mix concrete producers, industrial customers and contractors in bulk. Additionally,sales of bagged cement to individuals for self-construction and other basic needs are a significant component ofthe retail sector. The end-users of ready-mix concrete generally include homebuilders, commercial and industrialbuilding contractors and road builders. Major end-users of aggregates include ready-mix concrete producers,mortar producers, general building contractors and those engaged in road building activity, asphalt producers andconcrete product producers. In summary, because of their many favorable qualities, builders worldwide use ourcement, ready-mix concrete and aggregates for almost every kind of construction project, from hospitals andhighways to factories and family homes.
As of December 31, 2016, we did not depend on any of our existing customers to conduct our business andthe loss of any of our existing customers individually would not have a material adverse effect on our financialcondition or results of operations. For the period ended December 31, 2016, none of our customers representedmore than 10% of our consolidated net sales.
63
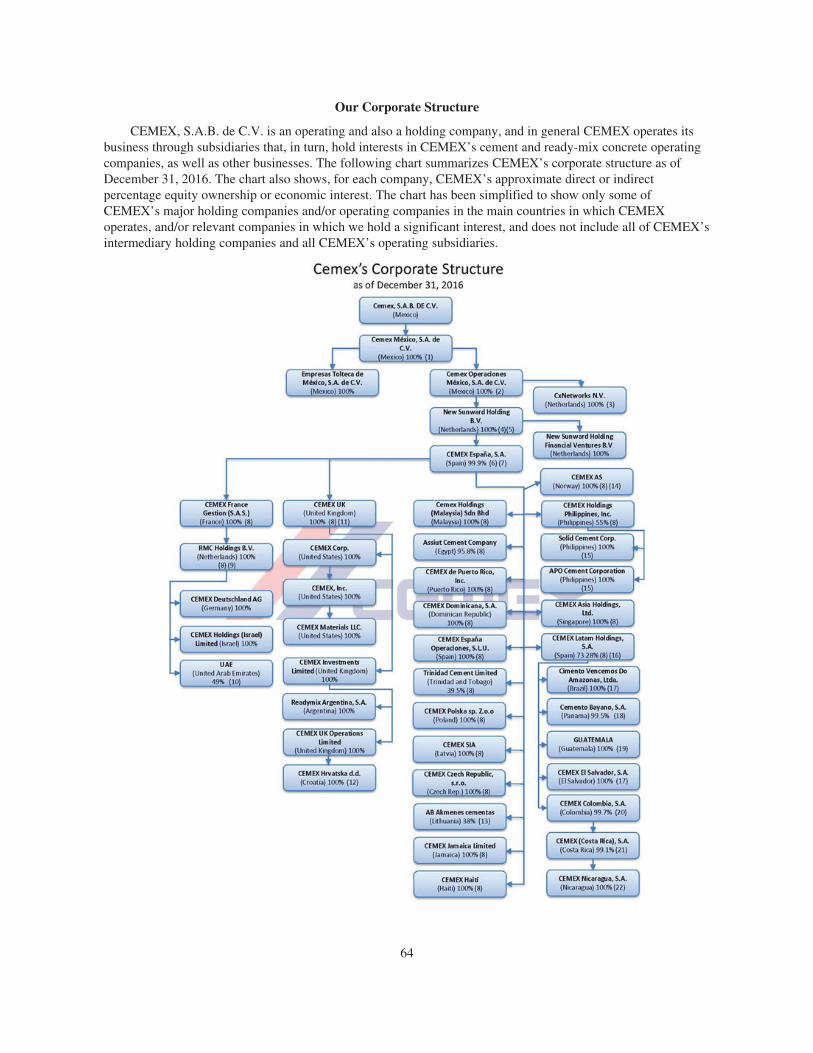
Our Corporate Structure
CEMEX, S.A.B. de C.V. is an operating and also a holding company, and in general CEMEX operates itsbusiness through subsidiaries that, in turn, hold interests in CEMEX’s cement and ready-mix concrete operatingcompanies, as well as other businesses. The following chart summarizes CEMEX’s corporate structure as ofDecember 31, 2016. The chart also shows, for each company, CEMEX’s approximate direct or indirectpercentage equity ownership or economic interest. The chart has been simplified to show only some ofCEMEX’s major holding companies and/or operating companies in the main countries in which CEMEXoperates, and/or relevant companies in which we hold a significant interest, and does not include all of CEMEX’sintermediary holding companies and all CEMEX’s operating subsidiaries.
64

(1) Includes an approximately 99.88% interest pledged or transferred to a security trust as collateral for thebenefit of certain secured creditors of CEMEX and certain of its subsidiaries.
(2) Includes an approximately 99.99% interest pledged or transferred to a security trust as collateral for thebenefit of certain secured creditors of CEMEX and certain of its subsidiaries.
(3) CxNetworks N.V. is the holding company of the global business and IT consulting entities, including NeorisN.V.
(4) Includes a 100% interest pledged or transferred to a security trust as collateral for the benefit of certainsecured creditors of CEMEX and certain of its subsidiaries.
(5) Includes Cemex Operaciones México 59.64% interest and CTH 40.36% interest. CEMEX indirectly holds100% of Cemex Operaciones México and CTH.
(6) Includes New Sunward, CEMEX’s and CTH’s interest, and shares held in CEMEX España’s treasury.(7) Includes an approximately 99.63% interest pledged or transferred to a security trust as collateral for the
benefit of certain secured creditors of CEMEX and certain of its subsidiaries.(8) Includes CEMEX España’s direct or indirect interest.(9) Includes CEMEX France Gestion (S.A.S.)’s (“CEMEX France”) 94.75% interest and CEMEX UK’s 5.25%
interest.(10) Represents CEMEX España’s indirect economic interest in three companies incorporated in the United Arab
Emirates, CEMEX Topmix LLC, CEMEX Supermix LLC and CEMEX Falcon LLC. CEMEX Españaindirectly owns a 49% equity interest in each of these companies, and CEMEX España indirectly holds theremaining 51% of the economic benefits through agreements with other shareholders.
(11) Includes CEMEX España’s 69.39% interest and CEMEX France’s 30.61% interest.(12) Divestment of CEMEX Hrvatska d.d. was expected to be completed during the first half of 2017, but the
divestment will not be made and CEMEX Hrvatska d.d. remains one of our subsidiaries.(13) Represents CEMEX España’s indirect 37.84% and 11.76% interest in ordinary and preferred shares,
respectively.(14) CEMEX AS is an operating company and also the holding company for CEMEX’s operations in Finland,
Norway and Sweden.(15) Represents CHP’s direct and indirect equity interest.(16) Represents outstanding shares of CEMEX Latam’s capital stock and excludes treasury stock.(17) Represents CEMEX Latam’s indirect interest.(18) Represents CEMEX Latam’s 99.483% indirect interest in ordinary shares, and excludes: (i) a 0.515%
interest held in Cemento Bayano, S.A.’s treasury, and (ii) a 0.002% interest held by third parties.(19) Represents CEMEX Latam’s direct and indirect interest in five companies incorporated in Guatemala,
CEMEX Guatemala, S.A. (“CEMEX Guatemala”), Global Concrete, S.A., Gestión Integral de Proyectos,S.A., Equipos para uso de Guatemala, S.A., and Cementos de Centroamérica, S.A.
(20) Represents CEMEX Latam’s 99.75% and 98.94% indirect interest in ordinary and preferred shares,respectively.
(21) Represents CEMEX Colombia’s indirect interest.(22) Includes CEMEX (Costa Rica), S.A.’s 98% interest and CEMEX Colombia’s 2% indirect interest.
Mexico
Overview. For the year ended December 31, 2016, our operations in Mexico represented approximately 20%of our net sales in Mexican Peso terms before eliminations resulting from consolidation. As of December 31,2016, our business in Mexico represented approximately 32% of our total installed cement capacity andapproximately 12% of our total assets.
As of December 31, 2016, CEMEX México, a direct subsidiary of CEMEX, S.A.B. de C.V., was both aholding company for some of our operating companies in Mexico and an operating company involved in themanufacturing and distribution of cement, aggregates, steel, ground stone and other construction materials andcement by-products in Mexico. CEMEX México, indirectly, is also the holding company for substantially all ourinternational operations. CEMEX México, together with its subsidiaries, accounts for a substantial part of therevenues and operating income of our operations in Mexico.
65

Our Tepeaca cement plant in Puebla, Mexico currently has a production capacity of approximately3.4 million tons of cement per year. In December 2014, we announced the restart of the Tepeaca cement plantexpansion, consisting in the construction of a new kiln, so that its total production capacity reachesapproximately 7.5 million tons of cement per year by 2018. As of December 31, 2016, we were monitoring themarket for the best timing to expand the Tepeaca cement plant without disrupting the market. Other options thatrequire less investment and could provide additional capacity in the same region are also available. For example,debottlenecking approximately U.S.$8 million in Huichapan could represent approximately 0.5 million tons ofcement supplying essentially the same market.
In 2001, we launched the Construrama program, a registered brand name for construction material stores.Through the Construrama program, we offer to an exclusive group of our Mexican distributors the opportunity tosell a variety of products under the Construrama brand name, a concept that includes the standardization ofstores, image, marketing, products and services. As of December 31, 2016, approximately 677 independentconcessionaries with more than 1,612 stores were integrated into the Construrama program, with nationwidecoverage.
Industry. For 2016, the National Institute of Statistics and Geography (Instituto Nacional de Estadística yGeografía) indicated that total construction activity in Mexico expanded by 1.8% up to December (seasonallyadjusted figures). This performance has been attributed mainly to an increase in industrial and commercialactivity, which has offset a steep decline in infrastructure activity.
Cement in Mexico is sold principally through distributors, with the remaining balance sold throughready-mix concrete producers, manufacturers of pre-cast concrete products and construction contractors. Cementsold through distributors is mixed with aggregates and water by the end user at the construction site to formconcrete. Ready-mix concrete producers mix the ingredients in plants and deliver it to local construction sites inmixer trucks, which pour the concrete. Unlike more developed economies, where purchases of cement areconcentrated in the commercial and industrial sectors, retail sales of cement through distributors in 2016accounted for approximately 61% of Mexico’s demand (bagged presentation). Individuals who purchase bags ofcement for self-construction and other basic construction needs are a significant component of the retail sector.We believe that this large retail sales base is a factor that significantly contributes to the overall performance ofthe Mexican cement market.
The retail nature of the Mexican cement market also enables us to foster brand loyalty, which distinguishesus from other worldwide producers selling primarily in bulk. We own the registered trademarks for our brands inMexico, such as “Tolteca,” “Monterrey,” “Maya,” “Anáhuac,” “Campana,” “Gallo,” “Centenario,” “Impercem”and “Tolteca Extra,” “Monterrey Extra,” “Maya Extra,” “Anáhuac Extra,” “Campana Extra,” “Gallo Extra,”“Centenario Extra,” and “Multiplast.” We believe that these brand names are important in Mexico since cementis principally sold in bags to retail customers who may develop brand loyalty based on differences in quality andservice. In addition, we own the registered trademark for the “Construrama” brand name for constructionmaterial stores.
Competition. In the early 1970s, the cement industry in Mexico was regionally fragmented. However, forover more than the past 45 years, cement producers in Mexico have increased their production capacity and theMexican cement industry has consolidated into a national market, thus becoming increasingly competitive. Themajor cement producers in Mexico are CEMEX; LafargeHolcim; Sociedad Cooperativa Cruz Azul, a Mexicanoperator; Cementos Moctezuma, an associate of Ciments Molins; and GCC, a Mexican operator in which wehold a 9.47% direct interest and in whose majority holder, CAMCEM, we hold a minority interest. During 2013,a new cement producer, Elementia (Cementos Fortaleza), entered the market and in 2014 merged with Lafarge(prior to the Lafarge-Holcim merger) within the Mexican market. The major ready-mix concrete producers inMexico are CEMEX, LafargeHolcim, Sociedad Cooperativa Cruz Azul and Cementos Moctezuma. In addition,the use of non-integrated ready-mixers has been increasing.
66

Potential entrants into the Mexican cement market face various impediments to entry, including, amongother things, the time-consuming and expensive process of establishing a retail distribution network anddeveloping the brand identification necessary to succeed in the retail market; the lack of port infrastructure andthe high inland transportation costs resulting from the low value-to-weight ratio of cement; the distance fromports to major consumption centers and the presence of significant natural barriers, such as mountain ranges,which border Mexico’s east and west coasts; the strong brand recognition and the wide variety of specialproducts with enhanced properties; the extensive capital expenditure requirements; and the length of timerequired for construction of new plants, which is approximately two years.
Our Operating Network in Mexico
During 2016, we operated 13 out of our total of 15 cement plants (two were temporarily shut down givenmarket conditions) and 85 cement distribution centers (including seven marine terminals) located throughoutMexico.
We operate modern cement plants on the Gulf of Mexico and Pacific coasts, allowing us to take advantageof low transportation costs to export to the United States, the Caribbean, and Central and South America.
67

Products and Distribution Channels
Cement. For the year ended December 31, 2016, our cement operations represented approximately 57% ofnet sales for our operations in Mexico before eliminations resulting from consolidation in Mexican Peso termsand our domestic cement sales volume represented approximately 97% of our total cement sales volume inMexico. As a result of the retail nature of the Mexican market, our operations in Mexico are not dependent on alimited number of large customers. The total volume (bagged) of the five most important distributors accountedfor approximately 11% of our total cement sales by volume in Mexico in 2016 (excluding our in-housechannels).
Ready-Mix Concrete. For the year ended December 31, 2016, our ready-mix concrete operations representedapproximately 21% of net sales for our operations in Mexico before eliminations resulting from consolidation inMexican Peso terms. Our ready-mix concrete operations in Mexico purchase all their cement requirements fromour cement operations in Mexico. Ready-mix concrete is sold through our own internal sales force and facilitiesnetwork.
Aggregates. For the year ended December 31, 2016, our aggregates operations represented approximately5% of net sales for our operations in Mexico before eliminations resulting from consolidation in Mexican Pesoterms.
Exports. Our operations in Mexico export a portion of their cement production, mainly in the form ofcement and to a lesser extent in the form of clinker. Exports of cement by our operations in Mexico representedapproximately 3% of our total cement sales volume in Mexico for 2016. In 2016, approximately 46% of ourcement exports from Mexico were to the United States, 42% to Central America and the Caribbean and 12% toSouth America.
The cement and clinker exports by our operations in Mexico to the United States are mostly marketedthrough subsidiaries of CEMEX Corp., the holding company of CEMEX, Inc. All transactions between CEMEXand the subsidiaries of CEMEX Corp., which act as our U.S. importers, are conducted on an arm’s-length basis.
Production Costs. Our cement plants in Mexico primarily utilize pet coke and alternative fuels. We haveentered into four 20-year agreements with Petróleos Mexicanos (“PEMEX”) pursuant to which PEMEX has
68
agreed to supply us with pet coke, including Termoeléctrica del Golfo’s (“TEG”) coke consumption, through2024. In 2016, PEMEX supplied us with approximately a total of 1.1 million tons of pet coke. Pet coke ispetroleum coke, a solid or fixed carbon substance that remains after the distillation of hydrocarbons in petroleumand that may be used as fuel in the production of cement. The PEMEX pet coke contracts have reduced thevolatility of our fuel costs. In addition, in 1992, our operations in Mexico began using alternative fuels to furtherreduce the consumption of residual fuel oil and natural gas. These alternative fuels represented approximately14% of the total fuel consumption for our operations in Mexico in 2016. For additional information, see “Item5—Operating and Financial Review and Prospects—Summary of Material Contractual Obligations andCommercial Commitments—Commercial Commitments.”
In 1999, we entered into an agreement with an international partnership, which financed, built and operatedTEG, a 230 megawatt (“MW”) energy plant in Tamuín, San Luis Potosí, Mexico. We entered into this agreementin order to reduce the volatility of our energy costs. The total cost of the project was approximatelyU.S.$360 million. The power plant commenced commercial operations in April 2004. In 2007, the originaloperator was replaced and the contract was extended to 2027. For additional information, see “Item 5—Operatingand Financial Review and Prospects—Summary of Material Contractual Obligations and CommercialCommitments—Commercial Commitments.”
In 2006, in order to take advantage of the high wind potential in the “Tehuantepec Isthmus,” CEMEX andthe Spanish company ACCIONA, S.A. (“ACCIONA”), formed an alliance to develop a wind farm project for thegeneration of 250 MW in the Mexican state of Oaxaca. The installation of 167 wind turbines in the farm wasfinished on November 15, 2009. For additional information, see “Item 5—Operating and Financial Review andProspects—Summary of Material Contractual Obligations and Commercial Commitments—CommercialCommitments.”
In connection with the beginning of full commercial operations of the Ventika S.A.P.I. de C.V. and theVentika II S.A.P.I. de C.V. wind farms (jointly “Ventikas”) located in the Mexican state of Nuevo Leon with acombined generation capacity of 252 MW, we agreed to acquire a portion of the energy generated by Ventikasfor our Mexican plants for a period of 20 years, which began in April 2016. During 2016, Ventikas suppliedapproximately 6.4% (unaudited) of CEMEX’s overall electricity needs in Mexico. This agreement is forCEMEX’s own use and CEMEX does not intend to engage in energy trading.
We have, from time to time, purchased hedges from third parties to reduce the effect of volatility in energyprices in Mexico. See “Item 5—Operating and Financial Review and Prospects—Summary of MaterialContractual Obligations and Commercial Commitments—Commercial Commitments.” Additionally, in 2015, wecreated CEMEX Energía, an energy division seeking to develop a portfolio of power projects in Mexico.
Description of Properties, Plants and Equipment. As of December 31, 2016, we had 15 wholly-ownedcement plants and proportional interests through associates in three other cement plants located throughoutMexico, with a total potential capacity of 30 million tons per year, of which two were temporarily shut downgiven market conditions. We have exclusive access to limestone quarries and clay reserves near each of our plantsites in Mexico. We estimate that, as of December 31, 2016, the limestone and clay permitted proven andprobable reserves of our operations in Mexico had an average remaining life of approximately 138 and 88 years,respectively, assuming 2012-2016 average annual cement production levels. As of December 31, 2016, all ourproduction plants in Mexico utilized the dry process.
As of December 31, 2016, we had a network of 78 land distribution centers in Mexico, which are suppliedthrough a fleet of our own trucks and rail cars, as well as leased trucks and rail facilities, and operated sevenmarine terminals. In addition, we had 265 (58 are idle due to market conditions) ready-mix concrete plantsthroughout 77 cities in Mexico, more than 2,301 ready-mix concrete delivery trucks and 15 aggregates quarries.
69

Capital Expenditures. We made capital expenditures of approximately U.S.$79 million in 2014,U.S.$68 million in 2015 and U.S. $84 million in 2016 in our operations in Mexico. We currently expect to makecapital expenditures of over U.S.$123 million in our operations in Mexico during 2017.
United States
Overview. For the year ended December 31, 2016, our operations in the United States representedapproximately 26% of our net sales in Mexican Peso terms before eliminations resulting from consolidation. Asof December 31, 2016, our business in the United States represented approximately 18% of our total installedcement capacity and approximately 48% of our total assets. As of December 31, 2016, CEMEX, Inc. was themain holding company of our operating subsidiaries in the United States.
As of December 31, 2016, we had a cement manufacturing capacity of approximately 16.6 million tons peryear in our operations in the United States, including 1.3 million tons in proportional interests throughnon-controlling holdings. As of December 31, 2016, we operated a geographically diverse base of 12 cementplants located in Alabama, California, Colorado, Florida, Georgia, Kentucky, Louisiana, Ohio, Pennsylvania,Tennessee and Texas. As of that date, we also operated 45 rail, truck or water served active cement distributionterminals in the United States. As of December 31, 2016, we had 345 ready-mix concrete plants located inAlabama, Arizona, California, Florida, Georgia, Louisiana, Nevada, Oregon, Tennessee, Texas and Washingtonand aggregates facilities in Arizona, California, Florida, Georgia, Nevada, Oregon, Texas and Washington.
On September 23, 2013, we and Concrete Supply Company, a leading producer of ready-mix concretethroughout the Carolinas, entered into a joint venture agreement and formed a joint venture company namedConcrete Supply Co., LLC, which is majority owned by Concrete Supply Holdings Co, who acts as the managingmember. This joint venture is a leading concrete supplier in North and South Carolina with strong localmanagement.
In February 2015 we completed an asset swap with Vulcan Materials Company, under which CEMEXexchanged its asphalt plants in Arizona and Sacramento for 12 ready-mix concrete plants in California. Under theagreement, CEMEX will continue supplying aggregates to the exchanged asphalt plants. Also, CEMEX will beable to capture incremental cement sales to the acquired ready-mix concrete plants. Given the operations andstrategic focus in these markets, we expect each party should earn a higher return on the exchanged assets andcontinue serving its customers efficiently. This swap was a cash-free transaction.
On September 12, 2016, one of our subsidiaries in the U.S. signed a definitive agreement for the sale of itsFairborn, Ohio cement plant and cement terminal in Columbus, Ohio to Eagle Materials Inc. forU.S.$400 million. The proceeds obtained from this transaction were used mainly for debt reduction and forgeneral corporate purposes. This transaction closed on February 10, 2017.
On November 18, 2016, after all conditions precedent were satisfied, CEMEX, S.A.B. de C.V. announcedthat it had closed the sale of certain assets in the U.S. to GCC for approximately U.S.$306 million. The assetswere sold by an affiliate of CEMEX to an affiliate of GCC in the U.S., and mainly consisted of CEMEX’scement plant in Odessa, Texas, two cement terminals and the building materials business in El Paso, Texas andLas Cruces, New Mexico.
On January 31, 2017, one of CEMEX, S.A.B. de C.V.’s subsidiaries in the U.S. closed the sale of theConcrete Pipe Business to Quikrete for U.S.$500 million plus an additional U.S.$40 million purchase pricecontingent on future performance.
On April 17, 2017, CEMEX, S.A.B. de C.V. announced that one of its subsidiaries in the U.S. had enteredinto a definitive agreement for the sale of Pacific Northwest to Cadman Materials, a LehighHanson company andU.S. subsidiary of HeidelbergCement Group, for U.S.$150 million. Pacific Northwest consists of aggregates,
70

asphalt and ready-mix concrete operations in Oregon and Washington. Pending satisfaction of certain conditions,including regulatory approvals, the proceeds obtained from this sale will be used mainly for debt reduction andgeneral corporate purposes.
Industry. Demand for cement is derived from the demand for ready-mix concrete and concrete productswhich, in turn, is dependent on the demand for construction. The construction industry is composed of threemajor sectors: the residential, the industrial and commercial, and the public sectors. The public sector is the mostcement intensive sector, particularly for infrastructure projects such as streets, highways and bridges. Whileoverall cement demand is sensitive to the business cycle, the public sector demand is more stable and also hashelped to soften the decline in global demand during periodic economic recessions.
The construction industry is continuing to recover from the recession experienced during 2008 and 2009,which was the worst downturn in over 70 years. The construction industry was hit particularly hard during thisrecession due to the collapse of the housing sector. Housing starts fell 73% from a peak of 2.1 million units in2005 to only 554,000 units in 2009. The decline in housing and other construction activity resulted in a 45%decline in cement demand from 2005 to 2010. The economic recovery has proceeded at a relatively moderatepace, with real gross domestic product average annual growth of 2.1% since 2010. With the economy growingagain, the construction sector stabilized in 2010 and joined the economy-wide recovery in 2011. The excessvacant inventory in the housing sector has largely been absorbed and inventories have declined to below normallevels in most markets, which together have supported an increase in housing prices over the last three years ofabout 19%. Housing starts have increased by approximately 110% from 0.554 million units in 2009 to1.16 million units in 2016. Housing starts in 2016 increased by 5% to 1.16 million units which remains wellbelow the historical steady state level. The industrial and commercial sector has also been growing with nominalspending up 78% from 2012 to 2016. Industrial & commercial nominal spending increased by 10.3% in 2016.The public sector, which has lagged the other construction sectors in this recovery, remained positive in 2016with spending up approximately 1%. Cement demand has been increasing annually since 2012 with cementdemand up an estimated 2.5% in 2016 after an increase of 17% from 2012 to 2015. The Portland CementAssociation is forecasting a 3% increase in cement demand for 2017.
Competition. The cement industry in the United States is highly competitive, including national and regionalcement producers in the United States. Our principal competitors in the United States are LafargeHolcim,Buzzi-Unicem, Heidelberg and Ash Grove Cement.
The independent U.S. ready-mix concrete industry is highly fragmented. According to the National ReadyMixed Concrete Association (“NRMCA”), it is estimated that there are about 5,500 ready-mix concrete plantsthat produce ready-mix concrete in the United States and about 55,000 ready-mix concrete mixer trucks thatdeliver the concrete to the point of placement. The NRMCA estimates that the value of ready-mix concreteproduced by the industry is approximately U.S.$35 billion per year. Given that the concrete industry hashistorically consumed approximately 75% of all cement produced annually in the United States, many cementcompanies choose to develop concrete plant capabilities.
Aggregates are widely used throughout the United States for all types of construction because they are themost basic materials for building activity. The U.S. Geological Survey (“USGS”) estimates over 2.3 billion tonsof aggregates were produced in 2016, an increase of about 4% over 2015. Crushed stone accounted for 58% ofaggregates consumed, sand & gravel 41%, and slag 1%. These products are produced in all 50 states and have avalue of U.S.$21.6 billion. The U.S. aggregates industry is highly fragmented and geographically dispersed. Thetop ten producing states represent approximately 50% of all production. According to the USGS, during 2016, anestimated 4,100 companies operated approximately 6,300 sand and gravel sites and 1,430 companies operated3,700 crushed stone quarries and 82 underground mines in the 50 U.S. states.
71

Our Operating Network in the United States
The maps below reflect the location of our operating assets, including our cement plants and cementterminals in the United States as of December 31, 2016.
Products and Distribution Channels
Cement. For the year ended December 31, 2016, our cement operations represented approximately 32% ofour operations in the United States’ net sales before eliminations resulting from consolidation in Mexican Pesoterms. We deliver a substantial portion of cement by rail, which occasionally those go directly to customers.Otherwise, shipments go to distribution terminals where customers pick up the product by truck or we deliver theproduct by truck. The majority of our cement sales are made directly to users of gray portland and masonrycements, generally within a radius of approximately 200 miles of each plant.
72

Ready-Mix Concrete. For the year ended December 31, 2016, our ready-mix concrete operations representedapproximately 41% of our operations in the United States’ net sales before eliminations resulting fromconsolidation in Mexican Peso terms. Our ready-mix concrete operations in the United States purchase most oftheir cement aggregates requirements from our cement operations in the United States. Our ready-mix concreteproducts are mainly sold to residential, commercial and public contractors and to building companies.
Aggregates. For the year ended December 31, 2016, our aggregates operations represented approximately17% of our operations in the United States’ net sales before eliminations resulting from consolidation in MexicanPeso terms. We estimate that, as of December 31, 2016, the crushed stone quarries and sand/gravel pits permittedproven and probable reserves of our operations in the United States had an average remaining life ofapproximately 29 years, assuming 2012-2016 average annual aggregates production levels. Our aggregates areconsumed mainly by our internal operations and by our trade customers in the ready-mix, concrete products andasphalt industries.
Production Costs. The largest cost components of our plants are electricity and fuel, which accounted forapproximately 25% of our total production costs of our cement operations in the United States in 2016. We arecurrently implementing a program to gradually replace coal with more economic fuels, such as pet coke, tires andother alternative fuels, which has resulted in reduced energy costs. By retrofitting our cement plants to handlealternative energy fuels, we have gained more flexibility in supplying our energy needs and have become lessvulnerable to potential price spikes. In 2016, the increased use of alternative fuels helped to offset the effect onour fuel costs of increasing coal prices. Power costs in 2016 represented approximately 11% of our cashmanufacturing cost of our cement operations in the United States, which represents production cost beforedepreciation. We have improved the efficiency of our electricity usage of our cement operations in the UnitedStates, concentrating our manufacturing activities in off-peak hours and negotiating lower rates with electricitysuppliers.
Description of Properties, Plants and Equipment. As of December 31, 2016, we operated 12 cementmanufacturing plants in the United States, and had a total installed capacity of 16.6 million tons per yearincluding 1.3 million tons representing our proportional interests through associates in six other cement plants.We estimate that, as of December 31, 2016, the limestone permitted proven and probable reserves of ouroperations in the United States had an average remaining life of approximately 51 years, assuming 2012-2016average annual cement production levels. As of that date, we operated a distribution network of 45 cementterminals. All of our 12 cement production facilities in 2016 were wholly-owned except for the Louisville,Kentucky plant, which is owned by Kosmos Cement Company, a joint venture in which we own a 75% interestand a subsidiary of Dyckerhoff AG (a subsidiary of Buzzi-Unicem) owns a 25% interest. As of December 31,2016, we had 345 wholly-owned ready-mix concrete plants and operated 57 aggregates quarries. As ofDecember 31, 2016, we distributed fly ash through eight terminals and three third-party-owned utility plants,which operate both as sources of fly ash and distribution terminals. As of that date, we also owned 43 concreteblock, paver, precast, and asphalt facilities.
We have continued to take a number of actions to streamline our operations and improve productivity,including temporary capacity adjustments and rationalizations in some of our cement plants, and shutdowns ofready-mix and block plants and aggregates quarries. We are currently utilizing approximately 79% of ourready-mix plants, 63% of our block manufacturing plants and 78% of our aggregates quarries in the UnitedStates.
Capital Expenditures. We made capital expenditures of approximately U.S.$202 million in 2014,U.S.$216 million in 2015 and U.S.$197 million in 2016 in our operations in the United States. We currentlyexpect to make capital expenditures of approximately U.S.$192 million in our operations in the United Statesduring 2017.
73

Europe
For the year ended December 31, 2016, our business in Europe, which includes our operations in the UnitedKingdom, France, Germany, Spain and the Rest of Europe, as described below, represented approximately 23%of our net sales before eliminations resulting from consolidation. As of December 31, 2016, our business inEurope represented approximately 26% of our total installed capacity and approximately 17% of our total assets.
Our Operations in the United Kingdom
Overview. For the year ended December 31, 2016, our operations in the United Kingdom representedapproximately 8% of our net sales in Mexican Peso terms, before eliminations resulting from consolidation. Asof December 31, 2016, our operations in the United Kingdom represented approximately 5% of our total assets.
As of December 31, 2016, CEMEX Investments Limited was the main holding company of our operatingsubsidiaries in the United Kingdom. We are a leading provider of building materials in the United Kingdom withvertically integrated cement, ready-mix concrete, aggregates and asphalt operations. We are also an importantprovider of concrete and precast materials solutions such as concrete blocks, concrete block paving, flooringsystems and sleepers for rail infrastructure.
Industry. According to the United Kingdom’s Construction Products Association, in 2016, the grossdomestic product of the United Kingdom was estimated to have grown by 2.0% compared to 2.2% growth in2015. Total construction output is estimated to have increased by 1.6% in 2016, as compared to a 4.9% increasein 2015 over the preceding year. Whilst public housing fell by 8.0%, the private housing sector is estimated tohave grown by 10.0% in 2016, with the private housing market continuing to be stimulated by the government’sHelp to Buy scheme. Public non-housing sector is estimated to have increased by 2.9% in 2016. The industrialsector fell by 7.3%, affected by lower investment in new factories and warehouses. In 2016, the commercialsector increased by 5.4%, boosted by investment in offices and entertainment. The infrastructure sector fell by4% driven by lower investment in roads, rail, gas, air and communications. As of April 26, 2017, the official datacorresponding to 2016 has not been released by the Mineral Products Association, but we estimate that domesticcement demand expanded by approximately 2% in 2016 compared to 2015.
Competition. Our primary competitors in the United Kingdom are: Tarmac (now owned by CRH afterdivestments by Lafarge and Holcim during their merger), Hanson (a subsidiary of HeidelbergCement), AggregateIndustries (a subsidiary of LafargeHolcim) and Breedon Group, formerly Breedon Aggregates, which acquiredHope Construction Materials (owned by Mittal Investments and formed three years ago from enforceddivestments by Lafarge and Tarmac when they created Lafarge Tarmac). The Lafarge Tarmac business wasdivested to CRH (except for two cement plants to be retained by LafargeHolcim). In addition, an estimated2.6 million tons of cement were imported to the United Kingdom by various players including CRH,LafargeHolcim, HeidelbergCement and other independents, with material increasingly arriving from over-capacity markets including Ireland, Spain and Greece.
74

Our Operating Network in the United Kingdom
75

Products and Distribution Channels
Cement. For the year ended December 31, 2016, our cement operations represented approximately 18% ofnet sales for our operations in the United Kingdom before eliminations resulting from consolidation in MexicanPeso terms. About 81% of our United Kingdom cement sales were of bulk cement, with the remaining 19% inbags. Our bulk cement is mainly sold to ready-mix concrete, concrete block and pre-cast product customers andcontractors. Our bagged cement is primarily sold to national builders’ merchants.
Ready-Mix Concrete. For the year ended December 31, 2016, our ready-mix concrete operations representedapproximately 27% of net sales for our operations in the United Kingdom before eliminations resulting fromconsolidation in Mexican Peso terms. Special products, including self-compacting concrete, fiber-reinforcedconcrete, high strength concrete, flooring concrete and filling concrete, represented 26% of our 2016 UnitedKingdom sales volume. In 2016, our ready-mix concrete operations in the United Kingdom purchasedapproximately 90% of its cement requirements from our cement operations in the United Kingdom andapproximately 84% of its aggregates requirements from our aggregates operations in the United Kingdom. Ourready-mix concrete products are mainly sold to public, commercial and residential contractors.
Aggregates. For the year ended December 2016, our aggregates operations represented approximately 28%of net sales for our operations in the United Kingdom before eliminations resulting from consolidation inMexican Peso terms. In 2016, our United Kingdom aggregates sales were divided as follows: 46% were sand andgravel, 47% limestone and 7% hard stone. In 2016, 16% of our aggregates volumes were obtained from marinesources along the United Kingdom coast. In 2016, approximately 39% of our United Kingdom aggregatesproduction was consumed by our own ready-mix concrete operations as well as our asphalt, concrete block andprecast operations. We also sell aggregates to major contractors to build roads and other infrastructure projects.
Production Costs
Cement. In 2016, fixed production costs decreased by 9% driven by extending our major kiln overhaulschedule from 12 to 18 months. Variable costs decreased by 16%, primarily as a result of benefits from theelectricity cost (income from the UK government to compensate the cement sector for the indirect costs imposedto subsidize the generation of renewable energy, which have been added to electricity prices in the UK) andimproved fuel and additives costs. We continued to implement our cost reduction programs through our use ofalternative fuels. In March 2015, our partner Suez opened its Malpass factory, adjacent to our Rugby plant, tosupply us with Refuse Derived Fuels.
Ready-Mix Concrete. In 2016, fixed production costs increased by 4%, as compared to fixed productioncosts in 2015, due to annual increases in wages, salaries and services.
Aggregates. In 2016, fixed production costs remained flat as compared to 2015 fixed production costs.
Description of Properties, Plants and Equipment. As of December 31, 2016, we operated two cement plants,and one clinker grinding facility in the United Kingdom. Assets in operation at year-end 2016 represent aninstalled cement capacity of 2.4 million tons per year. We estimate that, as of December 31, 2016, the limestoneand clay permitted proven and probable reserves of our operations in the United Kingdom had an averageremaining life of approximately 79 and 53 years, respectively, assuming 2012-2016 average annual cementproduction levels. As of December 31, 2016, we also owned two cement import terminals and operated 190ready-mix fixed concrete plants and 57 aggregates quarries in the United Kingdom, in addition, we had operatingunits dedicated to the asphalt, concrete blocks, concrete block paving, sleepers and flooring businesses in theUnited Kingdom.
In order to ensure increased availability of blended cements, which are more sustainable based on theirreduced clinker factor and use of by-products from other industries, our grinding and blending facility at the Port
76

of Tilbury, located on the Thames River east of London has an annual grinding capacity of approximately1.2 million tons, which ensures availability of blended cements. Blended cements are more sustainable based ontheir reduced clinker factor and use of by-products from other industries.
Capital Expenditures. We made capital expenditures of approximately U.S.$45 million in 2014,U.S.$57 million in 2015 and U.S.$30 million in 2016 in our operations in the United Kingdom. We currentlyexpect to make capital expenditures of approximately U.S.$39 million in our operations in the United Kingdomduring 2017.
Our Operations in France
Overview. As of December 31, 2016, CEMEX France was our main subsidiary in France. We are a leadingready-mix concrete producer and a leading aggregates producer in France. We distribute the majority of ourmaterials by road and a significant quantity by waterways, seeking to maximize the use of this efficient andsustainable alternative. For the year ended December 31, 2016, our operations in France representedapproximately 5% of our net sales in Mexican Peso terms, before eliminations resulting from consolidation. Asof December 31, 2016, our operations in France represented approximately 3% of our total assets.
Industry. According to the French Building Association, housing starts in the residential sector increased by10% in 2016 compared to 2015. Non-residential buildings starts increased by 6% in 2016 compared to 2015 anddemand from the public works sector increased by approximately 3.5% over the same period.
According to the Building Materials Association, total ready-mix concrete consumption in France in 2016reached approximately 36.8 million of cubic meters, a 3% increase compared to 2015, and total aggregatesproduction amounted to approximately 319 million tons, a 1% increase compared to 2015.
Competition. Our main competitors in the ready-mix concrete market in France include LafargeHolcim,Italcementi and Vicat. Our main competitors in the aggregates market in France include LafargeHolcim,Italcementi, Colas (Bouygues) and Eurovia (Vinci). Many of our major competitors in ready-mix concrete aresubsidiaries of French cement producers, whereas we rely on sourcing cement from third parties.
77

Our Operating Network in France
Description of Properties, Plants and Equipment. As of December 31, 2016, we operated 242 ready-mixconcrete plants in France, one maritime cement terminal located in Le Havre, on the northern coast of France, 21land distribution centers, 43 quarries and ten river ports.
Capital Expenditures. We made capital expenditures of approximately U.S.$27 million in 2014,U.S.$32 million in 2015 and U.S. $19 million in 2016 in our operations in France. We currently expect to makecapital expenditures of approximately U.S.$20 million in our operations in France during 2017.
78

Our Operations in Germany
Overview. For the year ended December 31, 2016, our operations in Germany represented approximately4% of our net sales in Mexican Peso terms, before eliminations resulting from consolidation. As of December 31,2016, our operations in Germany represented approximately 1% of our total assets. As of December 31, 2016,CEMEX Deutschland AG was our main subsidiary in Germany. We are a leading provider of building materialsin Germany, with vertically integrated cement, ready-mix concrete and aggregates businesses.
On January 5, 2015, we closed a series of transactions with Holcim, pursuant to which, we sold to Holcimassets in the western region of Germany consisting of one cement plant, two cement grinding mills, one slaggranulator, 22 aggregates quarries and 79 ready-mix plants, while we maintained our operations in the north, eastand south of Germany.
Industry. According to EUROCONSTRUCT Institute, the total construction output in Germany increased by2.5% in 2016, compared to 2015. The main driver of such increase was the non-residential sector. According tothe German Cement Association, in 2016, the national cement consumption in Germany increased by 3.5% to27.5 million tons, while the ready-mix concrete market and the aggregates market each increased byapproximately 2%.
Competition. Our primary competitors in the cement market in Germany are Heidelberg, Dyckerhoff (asubsidiary of Buzzi-Unicem), LafargeHolcim, CRH and Schwenk, a local German competitor. Thesecompetitors, along with CEMEX, represent a market share of about 85%, as estimated by us for 2016. Theready-mix concrete and aggregates markets in Germany are fragmented and regionally heterogeneous, with manylocal competitors. The consolidation process in the ready-mix concrete and aggregates markets is moderate.
Our Operating Network in Germany
79

Description of Properties, Plants and Equipment. As of December 31, 2016, we operated one cement plantin Germany and our installed cement capacity was 2.4 million tons per year. We estimate that, as ofDecember 31, 2016, the limestone permitted proven and probable reserves of our operations in Germany had anaverage remaining life up to 38 years, assuming 2012-2016 average annual cement production levels. As of thatdate, our operations in Germany included one cement grinding mill, 82 ready-mix concrete plants, 21 aggregatesquarries, two land distribution centers for cement and two maritime terminals.
Capital Expenditures. We made capital expenditures of approximately U.S.$29 million in 2014,U.S.$22 million in 2015 and U.S.$26 million in 2016 in our operations in Germany. We currently expect to makecapital expenditures of approximately U.S.$13 million in our operations in Germany during 2017.
Our Operations in Spain
Overview. As of December 31, 2016, we held approximately 99.9% of CEMEX España (including sharesheld in treasury), a holding company for most of our international operations. For the year ended December 31,2016, our operations in Spain represented approximately 2% of our net sales in Mexican Peso terms, beforeeliminations resulting from consolidation. As of December 31, 2016, our business in Spain representedapproximately 5% of our total assets.
On January 5, 2015, we closed a series of transactions with Holcim, pursuant to which we acquired fromHolcim the Gador cement plant (with an annual installed cement production capacity of approximately0.97 million tons, which production capacity was recently reassessed after managing and operating the plant inthe first quarter of 2015) and the Yeles cement grinding station (with an annual installed cement productioncapacity of 0.90 million tons).
80

On October 1, 2012, CEMEX España agreed to spin-off its Spanish industrial operations in favor ofCEMEX España Operaciones, S.L.U. (“CEMEX España Operaciones”), a subsidiary in which CEMEX Españaholds 100% of the share capital.
In December 2012, the merger of CEMEX España Operaciones and Aricemex, S.A. and Hormicemex, S.A.was completed and, as a result, our manufacturing and sales of cement, aggregates, concrete and mortar wereconsolidated in CEMEX España Operaciones, which became our Spanish operating subsidiary.
Industry. In 2016, the investment in the construction sector in Spain is estimated to have increased by 2.1%compared to 2015, primarily driven by the investment in the residential construction sector, which is estimated tohave increased by 3.8% in 2016. According to the latest estimates from the Spanish Cement ProducersAssociation (Agrupación de Fabricantes de Cemento de España) (“OFICEMEN”), cement consumption in Spaindecreased by 3.2% in 2016 compared to 2015.
According to OFICEMEN, cement imports decreased 21.3% in 2013, increased 14.8% in 2014, increased15.1% in 2015 and decreased 11.6% in 2016. Clinker imports have declined 75% in 2012, 26% in 2013, 2.4% in2014, 50.4% in 2015 and 86.1% in 2016.
In the early 1980s, Spain was one of the leading exporters of cement in the world, exporting up to 13 milliontons per year. However, as of December 31, 2016, cement exports amounted to approximately 4.1 million tonsper year. In recent years, Spanish cement and clinker export volumes have fluctuated, reflecting the rapidchanges in demand in the Mediterranean basin as well as the strength of the Euro and changes in the domesticmarket. According to OFICEMEN, these total export volumes increased 56% in 2012, 17.8% in 2013, 32.5% in2014, decreased 4.1% in 2015, and increased 5.6% in 2016.
Competition. According to our estimates, as of December 31, 2016, we were one of the largest multinationalproducers of clinker and cement in Spain. Competition in the ready-mix concrete industry is intense in largeurban areas. The overall high degree of competition in the Spanish ready-mix concrete industry is reflected in themultitude of offerings from a large number of concrete suppliers. We have focused on developing value addedproducts and attempting to differentiate ourselves in the marketplace. The distribution of ready-mix concreteremains a key component of our business strategy in Spain.
81

Our Operating Network in Spain
Products and Distribution Channels
Cement. For the year ended December 31, 2016, our cement operations (including clinker) representedapproximately 79% of net sales for our operations in Spain before eliminations resulting from consolidation inMexican Peso terms. We offer various types of cement in Spain, targeting specific products to specific markets
82

and users. In 2016, approximately 21% of the domestic sales volume of CEMEX España Operaciones consistedof bagged cement, and the remainder of CEMEX España Operaciones’s domestic sales volume consisted of bulkcement, primarily to ready-mix concrete operators, including sales to our other operations in Spain, as well asindustrial customers that use cement in their production processes and construction companies.
Ready-Mix Concrete. For the year ended December 31, 2016, our ready-mix concrete operations representedapproximately 12% of net sales for our operations in Spain before eliminations resulting from consolidation inMexican Peso terms. Our ready-mix concrete operations in Spain in 2016 purchased almost 91% of their cementrequirements from our cement operations in Spain, and approximately 45% of their aggregates requirementsfrom our aggregates operations in Spain.
Aggregates. For the year ended December 31, 2016, our aggregates operations represented approximately3% of net sales for our operations in Spain before eliminations resulting from consolidation in Mexican Pesoterms.
Exports. Exports of cement and clinker by our operations in Spain, which represented approximately 32% ofnet sales for our operations in Spain before eliminations resulting from consolidation, decreased approximately16% in 2016 compared to 2015, primarily as a result of a decrease in volume sold to the UK, Benin/Ivory Coastand Cameroon, offset slightly by higher sales to Algeria and the United States. Export prices are lower thandomestic market prices, and costs are usually higher for export sales. Of our total exports from Spain in 2016,28% consisted of white cement, 23% of gray portland cement and 48% of clinker. In 2016, 28% of our exportsfrom Spain were to the United States and Central and South America, 19% to Europe and the Middle East and53% to Africa.
Production Costs. We have improved the efficiency of our operations in Spain by introducing technologicalimprovements that have significantly reduced our energy costs, including the use of alternative fuels, inaccordance with our cost reduction efforts. In 2016, we used organic waste, tires and plastics as fuel, achieving a37% substitution rate for pet coke in our gray and white clinker kilns for the year.
Description of Properties, Plants and Equipment. As of December 31, 2016, our operations in Spainincluded seven cement plants located in Spain, with an annual installed cement capacity of 10.4 million tons. Asof that date, we also have 24 operative distribution centers, including 15 land and nine marine terminals, 63ready-mix concrete plants, 21 aggregates quarries and 13 mortar plants. As of December 31, 2016, we ownednine limestone quarries located in close proximity to our cement plants and four clay quarries in our cementoperations in Spain. We estimate that, as of December 31, 2016, the limestone and clay permitted proven andprobable reserves of our operations in Spain had an average remaining life of approximately 82 and 23 years,respectively, assuming 2012-2016 average annual cement production levels.
Capital Expenditures. We made capital expenditures of approximately U.S.$12 million in 2014,U.S.$17 million in 2015 and U.S.$25 million in 2016 in our operations in Spain. We currently expect to makecapital expenditures of approximately U.S.$13 million in our operations in Spain during 2017.
Rest of Europe
As of December 31, 2016, our operations in the Rest of Europe segment consisted primarily of ouroperations in the Czech Republic, Poland and Latvia, as well as trading activities in Scandinavia and Finland, ourother European assets and our approximately 38% non-controlling interest in a Lithuanian company. Theseoperations represented approximately 4% of our net sales in Mexican Peso terms, before eliminations resultingfrom consolidation, for the year ended December 31, 2016, and approximately 3% of our total assets as ofDecember 31, 2016.
83

Our Operations in Poland
Overview. As of December 31, 2016, CEMEX Polska Sp. Z.O.O. (“CEMEX Polska”) was our mainsubsidiary in Poland. We are a leading provider of building materials in Poland, serving the cement, ready-mixconcrete and aggregates markets. As of December 31, 2016, we operated two cement plants with an installedcement capacity of 3.0 million tons per year and one grinding mill in Poland. As of December 31, 2016, we alsooperated 41 ready-mix concrete plants, eight aggregates quarries and two maritime terminals in Poland.
Industry. According to our estimates, total cement consumption in Poland reached approximately 16.3million tons in 2016, remaining flat compared to 2015.
Competition. Our primary competitors in the cement, ready-mix concrete and aggregates markets in Polandare Heidelberg, LafargeHolcim, CRH, Dyckerhoff and Miebach.
Capital Expenditures. We made capital expenditures of approximately U.S.$13 million in 2014,U.S.$12 million in 2015 and U.S.$10 million in 2016 in our operations in Poland. We currently expect to makecapital expenditures of approximately U.S.$33 million in our operations in Poland during 2017.
Our Operations in the Czech Republic
Overview. As of December 31, 2016, CEMEX Czech Republic, s.r.o. was our main subsidiary in the CzechRepublic. We are a leading producer of ready-mix concrete and aggregates in the Czech Republic. We alsodistribute cement in the Czech Republic. As of December 31, 2016, we operated 74 ready-mix concrete plants,ten gravel pits and 19 aggregates quarries in the Czech Republic. As of that date, we also operated one cementplant with annual cement installed capacity of 1.0 million tons, one cement grinding mill and one cementterminal in the Czech Republic.
Industry. According to the Czech Statistical Office, total construction output in the Czech Republicdecreased by approximately 8.5% in 2016. The decrease was primarily driven by a significant slowdown ininfrastructure development. The main drivers behind the decrease in infrastructure development were anaccelerated drawdown of EU funding in 2015 and a high number of large projects postponed due tonon-compliance with Environmental Impact Assessment legislation in 2016. The civil engineering constructiondecrease is estimated at 17% and the building construction decrease at 4%. However, new construction inhousing grew by almost 5% in 2016, and the building construction started to improve in the second half of theyear. According to the Czech Cement Association, total cement consumption in the Czech Republic reachedyear-over-year growth of 3% in the first half 2016. Full year growth is estimated at a similar level. Specific fullyear data for 2016 will be provided by the Czech Cement Association in July 2017 due to limitations imposed byEU competition laws. In 2016, growth of total ready-mix concrete production in the Czech Republic is estimatedto be 1.5%.
Competition. Our main competitors in the cement, ready-mix concrete and aggregates markets in the CzechRepublic are Heidelberg, Buzzi, Skanska and LafargeHolcim.
Capital Expenditures. We made capital expenditures of approximately U.S.$5 million in 2014,U.S.$9 million in 2015 and U.S.$7 million in 2016 in our operations in the Czech Republic. We currently expectto make capital expenditures of approximately U.S.$7 million in our operations in the Czech Republic during2017.
Our Operations in Latvia
Overview. As of December 31, 2016, CEMEX SIA was our operating subsidiary in Latvia. We are the onlycement producer and a leading ready-mix concrete producer and supplier in Latvia. From our cement plant in
84

Latvia we also supply markets in Estonia, Lithuania, Finland, Sweden, northwest Russia, and Belarus. As ofDecember 31, 2016, we operated one cement plant in Latvia with an installed cement capacity of 1.6 million tonsper year. We also operated five ready-mix concrete plants and four aggregates quarries in Latvia. In 2016, wecontinued to develop in the road construction business by supplying Roller Compacted Concrete.
Capital Expenditures. In total, we made capital expenditures of approximately U.S.$1 million in 2014,U.S.$14 million in 2015 and U.S.$7 million in 2016 in our operations in Latvia. We currently expect to makecapital expenditures of approximately U.S.$4 million in our operations in Latvia during 2017.
Our Equity Investment in Lithuania
Overview. As of December 31, 2016, we owned an interest of approximately 38% of Akmenés CementasAB, a cement producer in Lithuania, which operates one cement plant in Lithuania with an annual installedcement capacity of 1.8 million tons.
Sale of our Operations in Austria and Hungary
On October 31, 2015, after all conditions precedent were satisfied, we completed the sale of our operationsin Austria and Hungary to the Rohrdorfer Group for €165 million (U.S.$179 million or Ps3,090 million) afterfinal adjustments for changes in cash and working capital balances as of the transfer date. The operations inAustria and Hungary for the ten-month period ended October 31, 2015 and the year ended December 31, 2014included in CEMEX’s statements of operations were reclassified to the single line item “Discontinuedoperations,” which includes, in 2015, a gain on sale of approximately U.S.$45 million (Ps741 million). Such gainon sale includes the reclassification to the statement of operations of foreign currency translation effects accruedin equity until October 31, 2015 for an amount of approximately U.S.$10 million (Ps215 million). See note 4A toour 2016 audited consolidated financial statements included elsewhere in this annual report.
Attempted Sale of our Operations in Southeast Europe
On August 12, 2015, we entered into an agreement for the sale of our operations in Croatia, including assetsin Bosnia & Herzegovina, Montenegro and Serbia, to Duna-Dráva Cement Kft. for €231 million (approximatelyU.S.$243 million or Ps5,032 million). Those operations mainly consist of three cement plants with aggregateannual production capacity of approximately 2.4 million tons of cement, two aggregates quarries and sevenready-mix plants. On April 5, 2017, we announced that the European Commission issued a decision that restrictscompletion of the sale. Therefore, the sale of our operations in Croatia will not close and we will maintain ouroperations in Croatia, including assets in Bosnia and Herzegovina, Montenegro and Serbia.
The operations in Croatia, including assets in Bosnia & Herzegovina, Montenegro and Serbia, for the yearsended December 31, 2014, 2015 and 2016 included in our statements of operations were reclassified to the singleline item “Discontinued operations.” However, due to the inability to complete the sale, beginning in the secondquarter of 2017, we will reclassify the income statements of our operations in Croatia, including assets inBosnia & Herzegovina, Montenegro and Serbia, from the single line item “Discontinued Operations” to eachapplicable line item in our consolidated financial statements. See notes 4A and 26 to our 2016 auditedconsolidated financial statements included elsewhere in this annual report.
Our Operations in Other European Countries
Overview. As of December 31, 2016, we operated ten marine cement terminals in Norway and Swedenthrough CEMEX AS, a leading bulk-cement importer in the Nordic region. As of December 31, 2016, we alsooperated three marine cement terminals in Finland.
Capital Expenditures. We made no significant capital expenditures in our operations in other Europeancountries in 2014, 2015 and 2016. We currently do not expect to make any significant capital expenditures in ouroperations in other European countries during 2017.
85

South, Central America and the Caribbean
For the year ended December 31, 2016, our business in SAC, which includes our operations in the Colombiaand Rest of SAC segments, as described below, represented approximately 12% of our net sales beforeeliminations resulting from consolidation. As of December 31, 2016, our business in SAC representedapproximately 13% of our total installed capacity and approximately 8% of our total assets.
In November 2012, CEMEX Latam, a then wholly-owned subsidiary of CEMEX España, completed thesale of newly issued common shares in the CEMEX Latam Offering, representing approximately 26.65% ofCEMEX Latam’s outstanding common shares. CEMEX Latam is the main holding company for CEMEX’soperations in Brazil, Colombia, Costa Rica, Guatemala, Nicaragua, Panama and El Salvador.
Our Operations in Colombia
Overview. As of December 31, 2016, we indirectly owned through CEMEX Latam approximately 99.7% ofCEMEX Colombia, our main subsidiary in Colombia. As of December 31, 2016, CEMEX Colombia was thesecond-largest cement producer in Colombia, based on installed capacity of (4.0 million tons per year) as ofDecember 31, 2016. For the year ended December 31, 2016, our operations in Colombia representedapproximately 5% of our net sales before eliminations resulting from consolidation. As of December 31, 2016,our operations in Colombia represented 4% of our total assets.
CEMEX Colombia has a significant market share in the cement and ready-mix concrete market in the“Urban Triangle” of Colombia comprising the cities of Bogotá, Medellín and Cali. During 2016, these threemetropolitan areas accounted for approximately 36.5% of Colombia’s cement consumption. CEMEX Colombia’sIbague plant, which uses the dry process and is strategically located in the Urban Triangle, is CEMEXColombia’s largest plant and had an annual installed capacity of 2.8 million tons as of December 31, 2016.CEMEX Colombia, through its Bucaramanga and Cúcuta plants, is also an active participant in Colombia’snortheastern market.
Industry. According our estimates, the installed capacity for cement in Colombia was 19.3 million tons in2016. According to DANE, total cement consumption in Colombia reached 12.4 million tons during 2016, andecrease of 4.4% from 2015, while cement exports from Colombia reached 0.4 million tons. We estimate thatclose to 40% of cement in Colombia is consumed by the self-construction sector, while the infrastructure sectoraccounts for approximately 33% of total cement consumption and has been growing in recent years. The otherconstruction segments in Colombia, including the formal housing and commercial sectors, account for thebalance of cement consumption in Colombia.
Competition. We have two primary competitors, Cementos Argos, which has established a leading positionin the Colombian Caribbean coast, Antioquia and Southwest region markets, and LafargeHolcim Colombia.
The ready-mix concrete industry in Colombia is fairly consolidated with the top three producers accountingfor approximately 70% of the market as of December 31, 2016. CEMEX Colombia was the second-largestready-mix concrete producer as of December 31, 2016. The first- and third-largest producers were CementosArgos and LafargeHolcim Colombia, respectively.
The aggregates market in Colombia is highly fragmented and is dominated by the informal market. CEMEXColombia was the largest aggregates producer in Colombia as of December 31, 2016. Approximately 80% of theaggregates market in Colombia was comprised of small independent producers as of December 31, 2016.
86

Our Operating Network in Colombia
Products and Distribution Channels
Cement. For the year ended December 31, 2016, our cement operations represented approximately 54% ofnet sales for our operations in Colombia before eliminations resulting from consolidation in Mexican Peso terms.
Ready-Mix Concrete. For the year ended December 31, 2016, our ready-mix concrete operations representedapproximately 27% of net sales for our operations in Colombia before eliminations resulting from consolidationin Mexican Peso terms.
Aggregates. For the year ended December 31, 2016, our aggregates operations represented approximately8% of net sales for our operations in Colombia before eliminations resulting from consolidation in Mexican Pesoterms.
Description of Properties, Plants and Equipment. As of December 31, 2016, CEMEX Colombia owned twooperating cement plants and three mills, having a total annual installed capacity of 4.0 million tons. In addition,through its grinding mills, CEMEX Colombia has the ability to produce 0.5 million tons of cement sourced bythird parties. In 2016, we replaced 23.7% of our total fuel consumed in CEMEX Colombia with alternative fuels,and we have an internal electricity generating capacity of approximately 174 MW. We estimate that, as ofDecember 31, 2016, the limestone and clay permitted proven and probable reserves of our operations inColombia had an average remaining life of approximately 54 and 43 years, respectively, assuming 2012-2016average annual cement production levels. The operating licenses for quarries in Colombia are renewed every 30years; assuming renewal of such licenses, we estimate having sufficient limestone reserves for our operations inColombia for over 200 years assuming 2012-2016 average annual cement production levels. As of December 31,2016, CEMEX Colombia operated ten land distribution centers, two mortar plants, 44 ready-mix concrete plants(which includes 30 fixed plants and 14 mobile plants) and five aggregates operations. As of that date, CEMEXColombia also owned 13 limestone quarries.
CEMEX Colombia is also building a new cement plant in the Antioquia department of the Municipality ofMaceo, Colombia. See “Item 4—Information on the Company—Regulatory Matters and Legal Proceedings,” forthe status of that project.
Capital Expenditures. We made capital expenditures of approximately U.S.$101 million in 2014,U.S.$156 million in 2015 and U.S.$180 million in 2016 in our operations in Colombia. We currently expect tomake capital expenditures of approximately U.S.$96 million in our operations in Colombia during 2017.
87

Rest of South, Central America and the Caribbean
As of December 31, 2016, our operations in the Rest of SAC segment consisted primarily of our operationsin Costa Rica, the Dominican Republic, Jamaica, Nicaragua, Panama, Puerto Rico and other countries in theCaribbean, Guatemala and small ready-mix concrete operations in Argentina. These operations representedapproximately 7% of our net sales, in Mexican Peso terms, before eliminations resulting from consolidation. Asof December 31, 2016, our business in the Rest of SAC segment represented approximately 4% of our totalassets.
Our Operations in Costa Rica
Overview. As of December 31, 2016, we indirectly owned through CEMEX Latam an approximate 99.9%interest in CEMEX Costa Rica, our main operating subsidiary in Costa Rica and a leading cement producer in thecountry.
During 2015, a total of U.S.$5 million were invested as part of a program to increase the overall capacity inthe Colorado plant, allowing a 10% throughput increase that catered to our Nicaragua plant’s needs during 2016.
Industry. We estimate that approximately 1.3 million tons of cement were sold in Costa Rica during 2016.In 2016, the market had an estimated ratio of 50/50 in the bulk/bagged mix due to the execution of two majorinfrastructure projects.
Competition. The Costa Rican cement industry currently includes two producers. CEMEX Costa Rica andLafargeHolcim Costa Rica have integrated lines. Further, in 2016 an estimated 93,000 tons were imported by alocal construction company.
Description of Properties, Plants and Equipment. As of December 31, 2016, CEMEX Costa Rica operatedone cement plant and one grinding mill in Costa Rica, with a total annual installed capacity of 0.9 million tons.As of that date, CEMEX Costa Rica had six operational ready-mix concrete plants, one aggregates quarry andone land distribution center.
Exports. During 2016, clinker exports by our operations in Costa Rica represented approximately 30% ofour total production and were made to our Nicaragua plant.
Capital Expenditures. We made capital expenditures of approximately U.S.$6 million in 2014,U.S.$10 million in 2015 and U.S.$4 million in 2016 in our operations in Costa Rica. We currently expect tomake capital expenditures of approximately U.S.$6 million in our operations in Costa Rica during 2017.
Our Operations in the Dominican Republic
Overview. As of December 31, 2016, CEMEX Dominicana, S.A. (“CEMEX Dominicana”) was our mainsubsidiary in the Dominican Republic and a leading cement producer in the country. CEMEX Dominicana’ssales network covers the country’s main consumption areas, which are Santo Domingo, Santiago de losCaballeros, La Vega, San Pedro de Macorís, Samaná and La Altagracia. On May 8, 2000, CEMEX Dominicanaentered into a lease agreement with the government of the Dominican Republic related to the exploitation of agypsum mine located at Las Salinas, Barahona, which has enabled CEMEX Dominicana to supply all local andregional gypsum requirements. The lease agreement expires on May 8, 2025 and may be extended by the parties.
Industry. In 2016, cement consumption in the Dominican Republic reached 4.2 million tons according to ourestimates.
Competition. Our principal competitors in the Dominican Republic are Domicem, a mixed Italian/localcement producer; Cementos Cibao, a local competitor; Cemento Colón, an affiliated grinding operation of
88

Cementos Argos; Cementos Santo Domingo, a cement grinding partnership between a local investor andCementos La Union from Spain; Cementos Panam, a local cement producer which has an installed grindingoperation and recently constructed a cement kiln; and Cementos Andinos, a Colombian cement producer whichhas an installed grinding operation and a partially constructed cement kiln.
Description of Properties, Plants and Equipment. As of December 31, 2016, CEMEX Dominicana operatedone cement plant in the Dominican Republic, with an installed capacity of 2.6 million tons per year. As of thatdate, CEMEX Dominicana also owned eight ready-mix concrete plants, one aggregates quarry, two landdistribution centers and two marine terminals.
Capital Expenditures. We made capital expenditures of approximately U.S.$7.5 million in 2014,U.S.$17 million in 2015 and U.S.$9 million in 2016 in our operations in the Dominican Republic. We currentlyexpect to make capital expenditures of approximately U.S.$12 million in our operations in the DominicanRepublic during 2017.
Our Operations in Panama
Overview. As of December 31, 2016, we indirectly held through CEMEX Latam an approximate 99.5%interest in Cemento Bayano, S.A. (“Cemento Bayano”), our main subsidiary in Panama and a leading cementproducer in the country.
Industry. We estimate that approximately 1.7 million cubic meters of ready-mix concrete were sold inPanama during 2016. Cement consumption in Panama decreased 7% in 2016, due to termination of the PanamaCanal Expansion project.
Competition. The cement industry in Panama includes three cement producers: Cemento Bayano, ArgosPanamá, an affiliate of Cementos Argos, and Cemento Interoceánico.
Description of Properties, Plants and Equipment. As of December 31, 2016, Cemento Bayano operated onecement plant in Panama, with an annual installed capacity of 2.1 million tons. As of that date, Cemento Bayanoalso owned and operated 15 ready-mix concrete plants, two aggregates quarries and four land distributioncenters.
Capital Expenditures. We made capital expenditures of approximately U.S.$10 million in 2014,U.S.$19 million in 2015 and U.S.$7 million in 2016 in our operations in Panama. We currently expect to makecapital expenditures of approximately U.S.$13 million in our operations in Panama during 2017.
Our Operations in Nicaragua
Overview. As of December 31, 2016, CEMEX Latam owned 100% of CEMEX Nicaragua, S.A. (“CEMEXNicaragua”), our operating subsidiary in Nicaragua.
Industry. We estimate that approximately 0.9 million tons of cement, approximately 0.3 million cubicmeters of ready-mix concrete and approximately 6.6 million tons of aggregates were sold in Nicaragua during2016.
Competition. Two market participants compete in the Nicaraguan cement industry, CEMEX andLafargeHolcim.
Description of Properties, Plants and Equipment. As of December 31, 2016, we leased and operated onefixed cement plant and one grinding mill with a total installed capacity of 0.6 million tons, six ready-mix plants,one aggregates quarry and two distribution centers in Nicaragua. Since March 2003, CEMEX Nicaragua has alsoleased a 100,000 ton milling plant in Managua, which has been used exclusively for pet coke milling.
89

Capital Expenditures. We made capital expenditures of approximately U.S.$21.5 million in 2014,U.S.$9 million in 2015 and U.S.$3 million in 2016 in our operations in Nicaragua. We currently expect to makecapital expenditures of approximately U.S.$6 million in our operations in Nicaragua during 2017.
Our Operations in Puerto Rico
Overview. As of December 31, 2016, CEMEX de Puerto Rico, Inc. (“CEMEX Puerto Rico”) was our mainsubsidiary in Puerto Rico.
Industry. In 2016, cement consumption in Puerto Rico reached 0.48 million tons according to our estimates.
Competition. The cement industry in Puerto Rico in 2016 was comprised of three cement producers:CEMEX Puerto Rico, San Juan Cement Co. and Cementos Argos (formerly Antilles Cement Co).
Description of Properties, Plants and Equipment. As of December 31, 2016, CEMEX Puerto Rico operatedone cement plant with an installed cement capacity of approximately 1.2 million tons per year. As of that date,CEMEX Puerto Rico also owned and operated seven ready-mix concrete plants and two land distribution centers.As of that date, CEMEX Puerto Rico also owned an aggregates quarry, which is currently closed, and one marineterminal used for fly ash.
Capital Expenditures. We made capital expenditures of approximately U.S.$9 million in 2014,U.S.$5 million in 2015 and U.S.$2 million in 2016 in our operations in Puerto Rico. We currently expect to makecapital expenditures of approximately U.S.$2 million in our operations in Puerto Rico during 2017.
Our Operations in Guatemala
Overview. As of December 31, 2016, CEMEX Latam owned 100% of CEMEX Guatemala, our mainoperating subsidiary in Guatemala. As of December 31, 2016, we owned and operated one cement grinding millin Guatemala with an installed capacity of 500,000 tons per year. As of that date, we also owned and operatedthree land distribution centers, one clinker dome close to the maritime terminal in the southern part of the countryand four ready-mix plants.
Capital Expenditures. We made capital expenditures of approximately U.S.$1.2 million in 2014,U.S.$2 million in 2015 and U.S.$6 million in 2016 in Guatemala. We currently expect to make capitalexpenditures of approximately U.S.$3 million in our operations in Guatemala during 2017.
Our Operations in Other South, Central American and Caribbean Countries
Overview. As of December 31, 2016, CEMEX España indirectly held 100% of Readymix Argentina, S.A.,which owns two ready-mix concrete plants in Argentina.
We believe that the Caribbean region holds considerable strategic importance because of its geographiclocation. As of December 31, 2016, we operated a network of nine marine terminals in the Caribbean region,which facilitated exports from our operations in several countries, including Mexico, the Dominican Republic,Puerto Rico and the United States. Three of our marine terminals are located in the main cities of Haiti, two arein the Bahamas, and one is in Manaus, Brazil. As of December 31, 2016, we also had a non-controlling interest intwo other terminals, one in Bermuda and the other in the Cayman Islands.
As of December 31, 2016, we had non-controlling positions in TCL, with cement operations in Trinidad andTobago, Barbados and Jamaica, as well as a non-controlling position in Caribbean Cement Company Limited inJamaica, National Cement Ltd. in the Cayman Islands and Maxcem Bermuda Ltd. in Bermuda. As ofDecember 31, 2016, CEMEX España indirectly held a 100% interest in CEMEX Jamaica Limited, which
90
operates one calcined lime plant in Jamaica with a capacity of approximately 120,000 tons per year and onehydrate line with a capacity of approximately 4.800 tons per year. As of December 31, 2016, we also held anon-controlling position in Societe des Ciments Antillais, a company with cement operations in Guadalupe andMartinique.
On December 5, 2016, Sierra presented an Offer to all shareholders of TCL, a company publicly listed inTrinidad and Tobago, Jamaica and Barbados, to acquire up to 132,616,942 ordinary shares in TCL, which,together with Sierra’s existing share ownership in TCL of approximately 39.5%, would, if successful, result inSierra holding up to 74.9% of the equity share capital in TCL. The total number of TCL shares tendered andaccepted in response to the Offer was 113,629,723, which, together with Sierra’s pre-existing shareholding inTCL (147,994,188 shares), represented approximately 69.83% of the outstanding TCL shares as of March 31,2017. The total cash payment by Sierra for the tendered shares was approximately U.S.$86.36 million. CEMEXstarted consolidating TCL for financial reporting purposes on February 1, 2017. TCL has de-listed from theJamaica and Barbados stock exchanges.
Capital Expenditures. We made capital expenditures in our other operations in SAC of approximatelyU.S.$1 million in 2014, U.S.$2 million in 2015 and U.S.$3 million in 2016. We currently expect to make capitalexpenditures of approximately U.S.$31 million in our operations in other SAC countries during 2017.
Asia, Middle East and Africa
For the year ended December 31, 2016, our business in Asia, Middle East and Africa, which includes ouroperations in the Philippines, Egypt and the Rest of Asia, Middle East and Africa segment, as described below,represented approximately 12% of our net sales before eliminations resulting from consolidation. As ofDecember 31, 2016, our business in Asia represented approximately 11% of our total installed capacity andapproximately 5% of our total assets.
Our Operations in Egypt
Overview. As of December 31, 2016, ACC was our main subsidiary in Egypt. As of December 31, 2016, weoperated one cement plant in Egypt, with an annual installed capacity of approximately 5.4 million tons. Thisplant is located approximately 280 miles south of Cairo and serves the upper Nile region of Egypt, as well asCairo and the delta region, Egypt’s main cement market. We estimate that, as of December 31, 2016, thelimestone and clay permitted proven and probable reserves of our operations in Egypt had an average remaininglife of approximately 52 and 53 years, respectively, assuming 2012-2016 average annual cement productionlevels. In addition, as of December 31, 2016, we operated 11 ready-mix concrete plants, of which four are ownedand seven are under management contracts and ten land distribution centers in Egypt. For the year endedDecember 31, 2016, our operations in Egypt represented approximately 3% of our net sales before eliminationsresulting from consolidation and approximately 1% of our total assets.
See “Item 4—Information on the Company—Regulatory Matters and Legal Proceedings—Other LegalProceedings—Egypt Share Purchase Agreement” for a description of certain legal proceedings relating to theshare purchase agreement, signed in November 1999 between CEMEX, S.A.B. de C.V. and state-ownedMetallurgical Industries Company, pursuant to which CEMEX, S.A.B. de C.V. acquired a controlling interest inACC.
Industry. According to the Ministry of Investment official figures, based on government data (local andimported cement), the Egyptian market consumed approximately 56.3 million tons of cement during 2016.Cement consumption increased by approximately 5.3% in 2016 compared to 2015, which was mainly attributedto government projects related to the Suez Canal tunnels and port platforms in the city of Port Said, as wellhousing complexes. As of December 31, 2016, the cement industry in Egypt had a total of 19 cement producers,with an aggregate annual installed cement production capacity of approximately 75.3 million tons.
91

Competition. According to the Ministry of Investment official figures, during 2016, LafargeHolcim(Egyptian Cement Company), CEMEX (Assiut) and Italcementi (Suez Cement, Torah Cement and HelwanPortland Cement) were three of the largest cement producers in the world and represented approximately 37% ofthe total cement production in Egypt. Other significant competitors in Egypt are Arabian (La Union), Titan(Alexandria Portland Cement and Beni Suef Cement), Ameriyah (Cimpor/Camargo Corrêa), National, Sinai(Vicat), Sinai White cement (Cementir), South Valley, Nile Valley, El Sewedy, Army Cement, Aswan Medcom,Misr Beni Suef, Al Nahda and Misr Quena Cement Companies, Building Materials Industries Co. ASECCement, and Egyptian Kuwait Holding Company.
Cement and Ready-Mix Concrete. For the year ended December 31, 2016, cement representedapproximately 83.4% and ready-mix concrete represented approximately 12.8% of net sales for our operations inEgypt before eliminations resulting from consolidation.
Capital Expenditures. We made capital expenditures of approximately U.S.$31 million in 2014,U.S.$47 million in 2015 and U.S.$20 million in 2016 in our operations in Egypt. We currently expect to makecapital expenditures of approximately U.S.$23 million in our operations in Egypt during 2017.
Our Operations in the Philippines
Overview. As of December 31, 2016, on a consolidated basis through various subsidiaries, CEMEX Españaheld 100% of CASE, which in turn owned 55% of the outstanding share capital of CHP. CHP directly andindirectly owns 100% of our two operating subsidiaries in the Philippines, Solid Cement Corporation (“SolidCement”) and APO Cement Corporation (“APO”). For the year ended December 31, 2016, our operations in thePhilippines represented approximately 4% of our net sales before eliminations resulting from consolidation. Asof December 31, 2016, our operations in the Philippines represented approximately 2% of our total assets.
On July 18, 2016, CHP closed its initial public offering of 45% of its common shares in the Philippines, and100% of CHP’s common shares started trading on the Philippine Stock Exchange under the ticker “CHP.” As ofMarch 31, 2017, CASE, an indirect subsidiary of CEMEX España, directly owned approximately 55% of CHP’soutstanding common shares. The net proceeds to CHP from its initial public offering were approximatelyU.S.$506.8 million after deducting estimated underwriting discounts and commissions, and other estimatedoffering expenses payable by CHP. CHP used the net proceeds from the initial public offering to repay existingindebtedness owed to BDO Unibank and to an indirect subsidiary of CEMEX.
We initiated a new 1.5 million ton integrated cement production line at CEMEX’s Solid plant in Luzon withan estimated investment of approximately U.S.$225 million. We expect that this new line will double thecapacity of the Solid plant and will represent a 26% increase in our cement capacity in the Philippines. As ofDecember 31, 2016, the production line was not finalized.
Industry. According to the Cement Manufacturers’ Association of the Philippines (CEMAP), cementconsumption in the Philippine market totaled 26 million tons during 2016.
Competition. As of December 31, 2016, our major competitors in the Philippine cement market wereLafargeHolcim, Republic, Eagle, Northern, Goodfound, Taiheiyo and Mabuhay.
Description of Properties, Plants and Equipment. As of December 31, 2016, our operations in thePhilippines included two cement plants with an annual installed capacity of 4.5 million tons, exclusive access totwo quarries to supply raw materials to our cement plants, 18 land distribution centers and four marinedistribution terminals. We estimate that, as of December 31, 2016, the limestone and clay permitted proven andprobable reserves accessed by our operations in the Philippines had an average remaining life of approximately41 and 14 years, respectively, assuming 2012-2016 average annual cement production levels.
92
Cement. For the year ended December 31, 2016, our cement operations represented 96% of net sales for ouroperations in the Philippines after eliminations resulting from consolidation.
Capital Expenditures. We made capital expenditures of approximately U.S.$52 million in 2014,U.S.$21 million in 2015 and U.S.$30 million in 2016 in our operations in the Philippines. We currently expect tomake capital expenditures of approximately U.S.$41 million in our operations in the Philippines during 2017.
Rest of Asia, Middle East and Africa
Our operations in the Rest of Asia, Middle East and Africa, which as of December 31, 2016, consistedprimarily of our operations in Malaysia, Israel and the UAE. These operations represented approximately 5% ofour net sales in Mexican Peso terms, before eliminations resulting from consolidation, for the year endedDecember 31, 2016, and less than 2% of our total assets as of December 31, 2016.
Sale of our Operations in Rest of Asia, Middle East and Africa
On March 10, 2016, CEMEX, S.A.B. de C.V. announced the sale of its operations in Bangladesh andThailand to SIAM Cement for approximately U.S.$53 million, which closed on May 26, 2016. The proceedsfrom this transaction were used mainly for debt reduction and for general corporate purposes.
Our Operations in Malaysia
Overview. As of December 31, 2016, CEMEX Concrete Malaysia L.L.C. was our main subsidiary inMalaysia. We are a leading ready-mix concrete producer in Malaysia, with a significant share in the country’smajor urban centers. As of December 31, 2016, we operated 11 ready-mix concrete plants, one asphalt plant andone aggregates quarry in Malaysia.
Competition. Our main competitors in the ready-mix concrete and aggregates markets in Malaysia are YTL,LafargeHolcim, Heidelberg, Chin Hin Concrete, Tasek Concrete and Hanson.
Capital Expenditures. We made capital expenditures of approximately U.S.$1 million in 2014,U.S.$2 million in 2015 and U.S.$1 million in 2016 in our operations in Malaysia. We currently expect to makecapital expenditures of approximately U.S.$1 million in our operations in Malaysia during 2017.
Our Operations in Israel
Overview. As of December 31, 2016, CEMEX Holdings (Israel) Ltd. was our main subsidiary in Israel. Weare a leading producer and supplier of raw materials for the construction industry in Israel. In addition toready-mix concrete and aggregates, we produce a diverse range of building materials and infrastructure productsin Israel. As of December 31, 2016, we operated 63 ready-mix concrete plants, six aggregates quarries, one sandpit, one concrete products plant, one admixtures plant, and one lime factory in Israel.
Capital Expenditures. We made capital expenditures of approximately U.S.$15 million in 2014,U.S.$13 million in 2015 and U.S.$16 million in 2016 in our operations in Israel. We currently expect to makecapital expenditures of approximately U.S.$17 million in our operations in Israel during 2017.
Our Operations in the UAE
Overview. As of December 31, 2016, we held a 49% equity interest (and 100% economic benefit) in three ofour main UAE companies: CEMEX Topmix LLC and CEMEX Supermix LLC, two ready-mix manufacturingcompanies, and CEMEX Falcon LLC, which specializes in the production of cement and slag. We are notallowed to have a controlling interest in these companies (UAE law requires 51% ownership by UAE nationals).
93

However, through agreements with other shareholders in these companies, we have control over the remaining51% of the economic benefits in each of the companies. As a result, we own a 100% economic interest in allthree companies. We also held 100% in a new company, CEMEX Arabia FZC, dedicated to trading activities(100% ownership is possible as it is located in a Free Zone). As of December 31, 2016, we operated sevenready-mix concrete plants and one cement and slag grinding facility in the UAE, serving the markets of Dubaiand Abu Dhabi as well as neighboring countries such as Oman and Qatar.
Capital Expenditures. We made capital expenditures of approximately U.S.$0.5 million in 2014,U.S.$2 million in 2015 and U.S.$4 million in 2016 in our operations in the UAE. We currently expect to makecapital expenditures of approximately U.S.$3 million in our operations in the UAE during 2017.
Our Trading Operations
In 2016, we traded approximately 10.5 million tons of cementitious and non-cementitious materials inapproximately 100 countries, including 8.0 million tons of cement and clinker. Approximately 5.5 million tons ofthe traded cement and clinker consisted of exports from our operations in Costa Rica, Croatia, the CzechRepublic, the Dominican Republic, Germany, Guatemala, Latvia, Mexico, Nicaragua, the Philippines, Poland,Puerto Rico, Spain and the UAE. The remaining approximately 2.5 million tons were purchased from thirdparties in countries such as China, Honduras, Japan, South Korea, Spain, Taiwan, Thailand, Turkey, the UnitedStates and Vietnam. In 2016, we traded approximately 1.6 million tons of granulated blast furnace slag, anon-clinker cementitious material, and 0.9 million tons of other products.
Our trading network enables us to maximize the capacity utilization of our facilities worldwide whilereducing our exposure to the inherent cyclicality of the cement industry. We are able to distribute excess capacityto regions around the world where there is demand. In addition, our worldwide network of strategically locatedmarine terminals allows us to coordinate maritime logistics on a global basis and minimize transportationexpenses. Our trading operations also enable us to explore new markets without significant initial capitalexpenditure.
Freight rates, which account for a large share of the total import supply cost, have been subject to significantvolatility in recent years. Our trading operations, however, have obtained significant savings by contractingmaritime transportation in due time and by using our own and chartered fleet, which transported approximately64% of our cement and clinker traded volume during 2016.
In addition, based on our spare fleet capacity, we provide freight service to third parties, thus providing uswith valuable shipping market information and generating additional revenues.
94

Our Cement Plants
The following table provides a summary of our cement plants, including location, used capacity, includinggrinding mill production, and years of operation as of and for the year ended December 31, 2016:
Location Used Capacity Years of Operation(1)
Atotonilco, Hidalgo, México . . . . . . . . . . . . . . . . . . . . . . . . . . 1,518 58Barrientos, Estado de México, México . . . . . . . . . . . . . . . . . . 909 72Ensenada, Baja California, México . . . . . . . . . . . . . . . . . . . . . 508 41Guadalajara, Jalisco, México . . . . . . . . . . . . . . . . . . . . . . . . . 934 43CPN, Sonora, México . . . . . . . . . . . . . . . . . . . . . . . . . . . . . . . — 36Hidalgo, Nuevo León, México . . . . . . . . . . . . . . . . . . . . . . . . 79 111Huichapan, Hidalgo, México . . . . . . . . . . . . . . . . . . . . . . . . . 3,443 32Mérida, Yucatán, México . . . . . . . . . . . . . . . . . . . . . . . . . . . . 966 63Monterrey, Nuevo León, México . . . . . . . . . . . . . . . . . . . . . . 1,619 97Tamuín, San Luis Potosí, México . . . . . . . . . . . . . . . . . . . . . . 1,678 52Tepeaca, Puebla, México . . . . . . . . . . . . . . . . . . . . . . . . . . . . 2,826 22Torreón, Coahuila, México . . . . . . . . . . . . . . . . . . . . . . . . . . . 1,135 50Valles, San Luis Potosí, México . . . . . . . . . . . . . . . . . . . . . . . 354 51Yaqui, Sonora, México . . . . . . . . . . . . . . . . . . . . . . . . . . . . . . 1,977 27Zapotiltic, Jalisco, México . . . . . . . . . . . . . . . . . . . . . . . . . . . 1,560 49Balcones, TX, United States . . . . . . . . . . . . . . . . . . . . . . . . . . 1,909 36Brooksville, FL (North), United States . . . . . . . . . . . . . . . . . . — 41Brooksville, FL (South), United States . . . . . . . . . . . . . . . . . . 1,198 29Clinchfield, GA, United States . . . . . . . . . . . . . . . . . . . . . . . . 710 42Demopolis, AL, United States . . . . . . . . . . . . . . . . . . . . . . . . . 802 39Fairborn, OH, United States . . . . . . . . . . . . . . . . . . . . . . . . . . 605 42Knoxville, TN, United States . . . . . . . . . . . . . . . . . . . . . . . . . 616 37Kosmosdale/Louisville, KY, United States . . . . . . . . . . . . . . . 1,310 16Miami, FL, United States . . . . . . . . . . . . . . . . . . . . . . . . . . . . 1,001 58Lyons, CO, United States . . . . . . . . . . . . . . . . . . . . . . . . . . . . 284 36Victorville, CA, United States . . . . . . . . . . . . . . . . . . . . . . . . . 2,667 51Wampum, PA, United States . . . . . . . . . . . . . . . . . . . . . . . . . . — 51Rugby, United Kingdom . . . . . . . . . . . . . . . . . . . . . . . . . . . . . 1,194 17Ferriby, United Kingdom . . . . . . . . . . . . . . . . . . . . . . . . . . . . 498 50Rudersdof, Germany . . . . . . . . . . . . . . . . . . . . . . . . . . . . . . . . 2,133 51Chelm, Poland . . . . . . . . . . . . . . . . . . . . . . . . . . . . . . . . . . . . . 1,132 56Rudniki, Poland . . . . . . . . . . . . . . . . . . . . . . . . . . . . . . . . . . . . 733 51Broceni, Latvia . . . . . . . . . . . . . . . . . . . . . . . . . . . . . . . . . . . . 741 7Alcanar, Spain . . . . . . . . . . . . . . . . . . . . . . . . . . . . . . . . . . . . . 536 48Buñol, Spain . . . . . . . . . . . . . . . . . . . . . . . . . . . . . . . . . . . . . . 571 49Castillejo, Spain . . . . . . . . . . . . . . . . . . . . . . . . . . . . . . . . . . . 326 105Lloseta, Spain . . . . . . . . . . . . . . . . . . . . . . . . . . . . . . . . . . . . . 307 49Morata, Spain . . . . . . . . . . . . . . . . . . . . . . . . . . . . . . . . . . . . . 375 84San Vicente, Spain . . . . . . . . . . . . . . . . . . . . . . . . . . . . . . . . . 270 41Gador, Spain . . . . . . . . . . . . . . . . . . . . . . . . . . . . . . . . . . . . . . 238 40Prachovice, Czech Republic . . . . . . . . . . . . . . . . . . . . . . . . . . 732 62Assiut, Egypt . . . . . . . . . . . . . . . . . . . . . . . . . . . . . . . . . . . . . . 4,807 30Kolovoz, Croatia . . . . . . . . . . . . . . . . . . . . . . . . . . . . . . . . . . . 16 108Juraj, Croatia . . . . . . . . . . . . . . . . . . . . . . . . . . . . . . . . . . . . . . 632 104Kajo, Croatia . . . . . . . . . . . . . . . . . . . . . . . . . . . . . . . . . . . . . . 361 112Cúcuta, Colombia . . . . . . . . . . . . . . . . . . . . . . . . . . . . . . . . . . 271 33Ibagué, Colombia . . . . . . . . . . . . . . . . . . . . . . . . . . . . . . . . . . 2,360 24Colorado, Costa Rica . . . . . . . . . . . . . . . . . . . . . . . . . . . . . . . . 518 37San Pedro de Macorís, Dominican Republic . . . . . . . . . . . . . 2,314 26Calzada Larga, Panama . . . . . . . . . . . . . . . . . . . . . . . . . . . . . . 876 39San Rafael del Sur, Nicaragua(2) . . . . . . . . . . . . . . . . . . . . . . 390 74Ponce, Puerto Rico . . . . . . . . . . . . . . . . . . . . . . . . . . . . . . . . . 276 26APO, Philippines . . . . . . . . . . . . . . . . . . . . . . . . . . . . . . . . . . . 3,254 18Solid Cement, Philippines . . . . . . . . . . . . . . . . . . . . . . . . . . . . 1,580 23
(1) Approximate.(2) Leased.
95

For the aggregate installed cement production capacity of our cement plants by region, see “Item 4—Information on the Company—Business Overview.”
We have insurance coverage for our cement plants, which we believe is adequate and sufficient, in line withindustry practices. However, in some instances our insurance coverage may not be sufficient to cover all of ourpotential unforeseen losses and liabilities. In addition, our insurance coverage may not cover all the risks towhich our cement plants may be exposed. See “Item 3—Key Information—Risk Factors—Risks Relating to OurBusiness—Our insurance coverage may not cover all the risks to which we may be exposed.”
Regulatory Matters and Legal Proceedings
A description of material regulatory matters and legal proceedings affecting us is provided below.
Antitrust Proceedings
Polish Antitrust Investigation. On January 2, 2007, CEMEX Polska received a notification from the PolishCompetition and Consumer Protection Office (the “Protection Office”) informing it of the formal initiation of anantitrust proceeding against all cement producers in Poland, including CEMEX Polska and another of ourindirect subsidiaries in Poland. The notification alleged that there was an agreement between all cementproducers in Poland regarding prices and other sales conditions for cement, an agreed division of the market withrespect to the sale and production of cement, and the exchange of confidential information, all of which limitedcompetition in the Polish market with respect to the production and sale of cement. On December 9, 2009, theProtection Office delivered to CEMEX Polska its decision against Polish cement producers related to aninvestigation which covered a period from 1998 to 2006. The decision imposed fines on a number of Polishcement producers, including CEMEX Polska. The fine imposed on CEMEX Polska was approximately PolishZloty 115.56 million (approximately U.S.$29.19 million as of March 31, 2017, based on an exchange rate ofPolish Zloty 3.9582 to U.S.$1.00), which is approximately 10% of CEMEX Polska’s total revenue in 2008.CEMEX Polska disagreed with the decision, denied that it committed the practices alleged by the ProtectionOffice and, therefore, on December 23, 2009, CEMEX Polska filed an appeal before the Polish Court ofCompetition and Consumer Protection in Warsaw (the “First Instance Court”). After a series of hearings, onDecember 13, 2013, the First Instance Court issued its judgment in regards with the appeals filed by CEMEXPolska and other cement producers, which were previously combined into a joint appeal. The First Instance Courtreduced the penalty imposed on CEMEX Polska to approximately Polish Zloty 93.89 million (approximatelyU.S.$23.72 million as of March 31, 2017 based on an exchange rate of Polish Zloty 3.9582 to U.S.$1.00), whichis equal to 8.125% of CEMEX Polska’s revenue in 2008. On May 8, 2014, CEMEX Polska filed an appealagainst the First Instance Court judgment before the Appeals Court in Warsaw. After several hearings in theAppeals Court, on a hearing held on March 11, 2016, the Appeals Court did not announce a final judgment;instead, it reopened the hearing phase which had been closed on February 26, 2016. The parties involved wereinformed that the Appeals Court will ask certain questions to the Polish Constitutional Tribunal regarding theconformity with the Polish Constitution of the calculation of the reduced penalty imposed on CEMEX Polska.With this action, the issuance of the final judgment has been further delayed. As of March 31, 2017, CEMEXPolska estimates that the final judgment will be issued during the second half of 2018. The above-mentionedpenalty is not enforceable until the Appeals Court issues its final judgment and if the penalty is maintained in theAppeals Court final resolution, then the penalty will be payable within 14 calendar days of the announcement ofthe Appeals Court order regarding its final resolution. CEMEX Polska has created the accounting provision inrelation with this proceeding in an amount equal to 100% of the reduced penalty of the First Instance Courtjudgment. As of March 31, 2017, we do not expect that an adverse resolution to this matter would have a materialadverse impact on our results of operations, liquidity and financial condition.
Antitrust Investigation in Spain by the CNMC. On September 16 and 17, 2014, the Competition Directorate(Dirección de Competencia) of the Spanish National Commission of Markets and Competition (ComisiónNacional de los Mercados y la Competencia) (“CNMC”), in the context of an investigation of the Spanish
96

cement, ready-mix concrete and related products industry regarding alleged anticompetitive practices, inspectedone of our facilities in Spain. On January 12, 2015, CEMEX España Operaciones was notified of the initiation bythe CNMC of a disciplinary proceeding for alleged prohibited conducts pursuant to Article 1 of the SpanishCompetition Law (Ley 15/2007, de 3 de Julio, de Defensa de la Competencia). On November 19, 2015, CEMEXEspaña Operaciones was notified that the alleged anticompetitive practices covered the year 2013 for the cementmarket and the years 2008, 2009, 2012, 2013 and 2014 for the ready-mix market. On March 8, 2016, theCompetition Directorate (Dirección de Competencia) notified CEMEX España Operaciones of a resolutionproposal (propuesta de resolución) which considers that the alleged anti-competitive practices were carried out inthe markets and years previously indicated. Thereafter, CEMEX España Operaciones submitted allegationsrejecting the resolution proposal. On September 8, 2016, CEMEX España Operaciones was notified of a decisionissued by the CNMC pursuant to which CEMEX España Operaciones has been required to pay a fine of€5,865,480 (approximately U.S.$6.25 million as of March 31, 2017, based on an exchange rate of €0.9380 toU.S.$1.00). On November 7, 2016, CEMEX España Operaciones filed an appeal before the National Court(Audiencia Nacional) against the CNMC’s decision. The National Court has been requested to suspend thesanction, and, by a resolution issued on December 22, 2016, the National Court granted the requested suspension,subject to issuance of a bank guarantee for the principal amount of the sanction. The CNMC has been notified ofboth the interposition of the appeal and the request for suspension. As of March 31, 2017, we do not expect thatan adverse resolution to this matter would have a material adverse impact on our results of operations, liquidityand financial condition.
Antitrust Case in Ohio. On October 2013, a nonstructural steel manufacturing joint venture in whichCEMEX, Inc. has an indirect majority interest, other nonstructural steel manufacturers, and related associationswere named as defendants in a lawsuit filed in Ohio State Court alleging a conspiracy among the defendants toadopt sham industry standards with a goal to exclude the plaintiffs’ products from the market. The court grantedthe defendants motion for summary judgment dismissing the claims. On September 27, 2016, the plaintiffs filedan appeal against the decision. The summary judgement was affirmed by the Court of Appeals on March 27,2017. As of March 31, 2017, we do not expect our operations, liquidity and financial condition to suffer amaterial adverse impact because of this matter.
Antitrust Investigation in Colombia. On September 5, 2013, CEMEX Colombia was notified of ResolutionNo. 49141 dated August 21, 2013, issued by the Colombian Superintendency of Industry and Commerce(Superintendencia de Industria y Comercio) (“SIC”) pursuant to which the SIC opened an investigation andissued a statement of objections (pliego de cargos) against five cement companies and fourteen directors of thosecompanies, including CEMEX Colombia, for alleged anti-competitive practices. On October 7, 2013, CEMEXColombia answered the statement of objections and submitted evidence. The investigated parties are accused ofallegedly breaching: (i) Article 1 of Law 155 of 1959, which prohibits any kind of practice, procedure or systemdesigned to limit free competition and determining or maintaining unfair prices; (ii) numeral 1 of Article 47 ofDecree 2153 of 1992, which prohibits any agreements designed to directly or indirectly fix prices; and(iii) numeral 3 of Article 47 of Decree 2153 of 1992, which prohibits any market sharing agreements betweenproducers or between distributors. Additionally, the fourteen executives, including a former legal representativeand the current President of CEMEX Colombia, are being investigated for allegedly breaching paragraph 16 ofArticle 4 of Decree 2153 of 1992, as amended by Article 26 of Law 1340 of 2009, which provides that the SICmay investigate and sanction any individual who collaborates, facilitates, authorizes, executes or toleratesbehavior that violates free competition rules. Although the SIC announced three charges, only two of them wereunder investigation, namely, price fixing agreements and market sharing agreements.
If the alleged infringements investigated by the SIC are substantiated, aside from any measures that could beordered to stop the alleged anti-competitive practices, the following penalties may be imposed against CEMEXColombia pursuant to Law 1340 of 2009: (i) up to 100,000 times the legal monthly minimum wage, which equalsapproximately 58,950 million Colombian Pesos (approximately U.S.$20.46 million as of March 31, 2017, basedon an exchange rate of 2,880.24 Colombian Pesos to U.S.$1.00) for each violation and to each company beingdeclared in breach of the competition rules, and (ii) up to 2,000 times the legal monthly minimum wage, which
97

equals approximately 1,179 million Colombian Pesos (approximately U.S.$409,340.89 as of March 31, 2017,based on an exchange rate of 2,880.24 Colombian Pesos to U.S.$1.00) against those individuals foundresponsible of collaborating, facilitating, authorizing, executing or tolerating behavior that violates freecompetition rules. On December 18, 2014, a hearing regarding this matter took place and the parties involvedpresented their closing arguments. A non-binding report which contains an analysis of all evidence gatheredduring the investigation and which could provide a recommendation to impose sanctions or to close theinvestigation is expected to be issued by the Superintendent Delegate for Competition Protection for the benefitof the SIC. As of March 31, 2017, this non-binding report has not been issued and we cannot estimate when itwill be issued. Once the non-binding report is issued, the investigated parties will have twenty business days tofile their final arguments against it. If the SIC decides to impose a sanction against CEMEX Colombia, we havethe possibility of filing several recourses that are available to us, including a reconsideration request before theSIC and, if the reconsideration request does not succeed, challenging the validity of the SIC’s decision before theColombian Administrative Courts, which could take more than six years in order to have a final decision. At thisstage of the investigations, as of March 31, 2017, we are not able to assess the likelihood of the SIC imposingany measures and/or penalties against CEMEX Colombia, but if any penalties are imposed, as we do not expectsuch penalties would be for the maximum amounts permitted by applicable laws and because there are recoursesavailable to us that would take a considerable amount of time to get resolved, we do not expect this matter tohave a material adverse impact on our results of operations, liquidity and financial condition.
Information Request in Costa Rica. In March 2016, the Competition Directorate of Costa Rica notifiedCEMEX Costa Rica of a formal information request that has the objective of calculating the cement market sharein Costa Rica and the geographical areas in which CEMEX Costa Rica has a presence. The CompetitionDirectorate of Costa Rica is requesting this information as a result of a claim made by a third party. CEMEXCosta Rica delivered the requested information also during March 2016. In July 2016, the CompetitionDirectorate of Costa Rica resolved that there is no evidence of anti-competitive practice and took no furtheraction with respect to the claim.
Environmental Matters
In the ordinary course of business, we are subject to a broad range of environmental laws and regulations in eachof the jurisdictions in which we operate. These laws and regulations impose increasingly stringent environmentalprotection standards regarding, among other things, air emissions, wastewater discharges, the use and handling ofhazardous waste or materials, waste disposal practices and the remediation of environmental damage or contamination.These laws and regulations expose us to the risk of substantial environmental costs and liabilities, including liabilitiesassociated with divested assets and past activities and, in some cases, the acts and omissions of the previous owners oroperators of a property or facility that we own or operate. Furthermore, in some jurisdictions, certain environmentallaws and regulations impose liability without regard to fault or the legality of the original activity at the time of theactions giving rise to liability. To prevent, control and remediate environmental problems and maintain compliancewith regulatory requirements, in line with our global initiatives on environmental management, we maintain anenvironmental policy designed to monitor and control environmental matters. Our environmental policies require thateach of our subsidiaries respect and comply with local laws and meet our own internal standards to minimize the use ofnon-renewable resources and the generation of hazardous and other wastes. We use processes that are designed toreduce the impact of our operations on the environment throughout all the production stages in all our operationsworldwide. In addition, during 2012 we started the implementation of a global EMS at our operating sites that providesa framework to facilitate the consistent and systematic implementation of practical, risk-based environmentalmanagement at all sites. As of March 31, 2017, we expect to finish the implementation of the EMS at all of ouroperating sites by December 31, 2020. It will be used to support sites and businesses across CEMEX globally todocument, maintain and continuously improve our environmental performance. We believe that, as of March 31, 2017,a substantial part of our operations already comply with all material environmental laws applicable to us, as all ourcement plants already have some kind of EMS (most of which are ISO 14000 certified by the InternationalOrganization for Standardization (“ISO”)), with the remaining implementation efforts directed mainly on ouraggregates and ready-mix plants.
98

We regularly incur capital expenditures that have an environmental component or that are impacted byenvironmental regulations. However, we do not keep separate accounts for such mixed capital and environmentalexpenditures. Environmental expenditures that extend the life, increase the capacity, improve the safety orefficiency of assets or are incurred to mitigate or prevent future environmental contamination may be capitalized.Other environmental costs are expensed when incurred. For the years ended December 31, 2014, 2015 and 2016,our sustainability capital expenditures (including our environmental expenditures and investments in alternativefuels and cementitious materials) were approximately U.S.$85.1 million, approximately U.S.$86.03 million andapproximately U.S.$79.9 million, respectively. As of March 31, 2017, we do not expect a material increase in ourenvironmental expenditures in 2017.
The following is a discussion of environmental regulations and related matters in our major markets.
Mexico. We were one of the first industrial groups in Mexico to sign an agreement with the MexicanMinistry of Environment and Natural Resources (Secretaría del Medio Ambiente y Recursos Naturales)(“SEMARNAT”) to carry out voluntary environmental audits in our 15 Mexican cement plants under agovernment-run program. In 2001, the Mexican Environmental Protection Agency (Procuraduría Federal deProtección al Ambiente), which is part of SEMARNAT, completed the audit of our cement plants and awardedeach of them a Clean Industry Certificate (Certificado de Industria Limpia) (“CIC”) certifying that our cementplants are in full compliance with applicable environmental laws. The CICs are subject to renewal every twoyears. As of March 31, 2017, our operating cement plants had CICs or were in the process of renewing them. Weexpect the renewal of all currently expired CICs.
For over a decade, the technology for recycling used tires into an energy source has been employed in ourplants located in Ensenada and Huichapan. By the end of 2006, all our cement plants in Mexico were using tiresas an alternative fuel. Municipal collection centers in the cities of Tijuana, Mexicali, Ensenada, Mexico City,Reynosa, Nuevo Laredo and Guadalajara currently enable us to recycle an estimated 10,000 tons of tires per year.Overall, approximately 14.02% of the total fuel used in our operating cement plants in Mexico during 2016 wascomprised of alternative fuels.
Between 1999 and March 31, 2017, our operations in Mexico have invested approximatelyU.S.$113.19 million in the acquisition of environmental protection equipment and the implementation of the ISO14001:2004 environmental management standards of ISO. The audit to obtain the renewal of the ISO14001:2004 certification took place during the first quarter of 2015 and our operating cement plants in Mexicoobtained the renewal of the ISO 14001:2004 certification for environmental management systems which is validfor a three year period.
On June 6, 2012 the General Law on Climate Change (Ley General de Cambio Climático) (the “ClimateChange Law”) was published in the Mexican Official Gazette. The Climate Change Law establishes a legalframework to regulate policies for climate change mitigation and adaptation. Many important provisions requirethe development of secondary legislation, and depend on the publication of subsequent implementingregulations. For instance, the Climate Change Law provides, among others, for (i) the elaboration of a registry ofthe emissions that are generated by fixed sources, (ii) companies to report their emissions, if required, and(iii) the application of fines to those companies that fail to report or that report false information. In this regard,on October 29, 2014, the Regulations to the General Law on Climate Change Regarding the National Registry ofEmissions (Reglamento de la Ley General de Cambio Climático en Materia del Registro Nacional de Emisiones)(the “Regulations”) became effective. The purpose of the Regulations is to govern the Climate Change Lawregarding the National Registry of Emissions, identifying the sectors and subsectors, which include amongothers, the cement industry, that must file the corresponding reports before the National Registry of Emissions.We had previously reported our direct and indirect carbon dioxide emissions to SEMARNAT under a voluntaryscheme. The Climate Change Law also allows for the establishment of specific greenhouse gas reduction targetsin accordance with the respective contribution of each economic sector to the national greenhouse gas emissions.We cannot estimate at this time the impact, if any, that any measures related to this may have upon our
99

operations in Mexico. Although the Climate Change Law does not establish a program for emissions trading, itdoes vest on the Mexican federal government the power to create, authorize and regulate such a scheme, whichmay be voluntary or binding. We are closely observing the development of implementing regulations and, as ofMarch 31, 2017, we cannot estimate the impact, if any, that any measures related to this may have upon ouroperations in Mexico. A Special Tax on Production and Services (Impuesto Especial Sobre Producción yServicios) on the sale of fossil fuels was included in the tax reform that became effective on January 1, 2014.Starting January 1, 2014, petroleum coke, a primary fuel widely used in our kilns in Mexico has been taxed at arate of Ps15.60 (approximately U.S.$0.84 as of March 31, 2017, based on an exchange rate of Ps18.73 toU.S.$1.00) per ton.
On August 12, 2014, a package of energy reform legislation became law in Mexico. The then newly enactedenergy reform legislation, which included nine new laws, as well as amendments to existing laws, implementedthe December 2013 constitutional energy reform and established a new legal framework for Mexico’s energyindustry. One of the new laws that was enacted is the Electric Industry Law (Ley de la Industria Eléctrica) (the“Electric Industry Law”), which establishes a legal framework for electricity-related activities in Mexico, whichhas the effect of structurally changing the national electric industry. On October 31, 2014, certain rules andregulations related to the energy reform legislation, including the regulations of the Electric Industry Law, werepublished. As part of the Electric Industry Law, a system for tradable clean energy certificates was created andcertain clean energy procurement obligations were imposed on consumers. The clean energy procurementobligations for 2018 to 2021 have been announced at 5%, 5.8%, 7.4%, 10.9% and 13.9%, respectively, and thisrequirement is expected to increase in subsequent years. CEMEX’s operations in Mexico have ongoingcommitments to procure power from renewable projects operating under the “self-supply” framework of theformer Electric Energy Public Service Law, and the energy supplied under these contracts is exempted from theclean energy obligation. Nonetheless, starting in 2018, we will be required to acquire clean energy certificates tocomply with the clean energy obligations for the fraction of energy supply that does not come from cleangenerators. Over time, according to the penalty levels set by the Mexican Energy Regulatory Commission(Comisión Reguladora de Energía), non-compliance with the clean energy procurement obligations could have amaterial adverse impact on our business or operations.
On September 8, 2015, the Electricity Market Rules (Bases del Mercado Eléctrico) (the “Rules”) werepublished in the Federal Official Gazette and became effective on September 9, 2015. The Rules, which are animportant step forward in the implementation of the reforms enacted regarding Mexico’s energy industry, containthe design and operation principles of the different components of the wholesale electricity market (the“Electricity Market”). As of March 31, 2017, we have participated in the Electricity Market by submitting bids atauctions for certain projects and we have also participated in auctions for certain other projects.
United States. Our operating subsidiaries in the United States are subject to a wide range of U.S. federal,state and local laws, regulations and ordinances dealing with the protection of human health and the environmentthat are strictly enforced and can lead to significant monetary penalties for noncompliance. These laws andregulations expose us to the risk of substantial environmental costs and liabilities, including liabilities associatedwith divested assets and past activities and, in some cases, the acts and omissions of the previous owners oroperators of a property or facility. These laws regulate, among other things, water discharges, noise, and airemissions, including dust, as well as the handling, use and disposal of hazardous and non-hazardous wastematerials. Certain laws also create a shared liability scheme under which parties are held responsible for the costof cleaning up releases to the environment of designated hazardous substances. We therefore may have toconduct environmental remediation associated with the disposal or release of hazardous substances at our variousoperating facilities, or at sites in the United States to which we sent hazardous waste for disposal. We believe thatour current procedures and practices for handling and managing materials are generally consistent with industrystandards and legal and regulatory requirements, and that we take appropriate precautions to protect employeesand others from harmful exposure to hazardous materials.
As of March 31, 2017, CEMEX, Inc. and its subsidiaries had accrued liabilities specifically relating toenvironmental matters in the aggregate amount of approximately U.S.$31.99 million. The environmental matters
100

relate to (i) the disposal of various materials, in accordance with past industry practice, that might be categorizedas hazardous substances or wastes, and (ii) the cleanup of hazardous substances or wastes at sites used oroperated by CEMEX, Inc. and its subsidiaries including discontinued operations, either individually or jointlywith other parties. Most of the proceedings are in the preliminary stages, and a final resolution might take severalyears. For purposes of recording the provision, CEMEX, Inc. and its subsidiaries consider that it is probable thata liability has been incurred and the amount of the liability is reasonably estimable, whether or not claims havebeen asserted, and without giving effect to any possible future recoveries. Based on information developed todate, CEMEX, Inc. does not believe it will be required to spend significant sums on these matters, in excess ofthe amounts previously recorded. The ultimate cost that might be incurred to resolve these environmental issuescannot be assured until all environmental studies, investigations, remediation work, and negotiations with, orlitigation against, potential sources of recovery have been completed.
In 2007, the EPA launched a CAA enforcement initiative against the U.S. cement industry. The primarygoal of the initiative is to assess the industry’s historic compliance with the CAA’s New Source Review programand to reduce emissions from the industry through the installation of add-on controls. CEMEX has activelyengaged with the EPA on its investigations, which involve multiple CEMEX facilities, and has entered into foursettlements involving a total of U.S.$6.1 million in civil penalties and a commitment to incur certain capitalexpenditures for pollution control equipment at its Victorville, California, Fairborn (divested on February 10,2017), Ohio, Lyons, Colorado, Knoxville, Tennessee, Louisville, Kentucky, Demopolis, Alabama, Odessa, Texas(divested on November 18, 2016) and New Braunfels, Texas plants. Although some of these proceedings are stillnot finalized, based on our past experience with such matters and currently available information, as ofMarch 31, 2017, we believe that such cases will not have a material adverse impact on our results of operations,liquidity and financial condition.
In 2002, CEMEX Construction Materials Florida, LLC (formerly Rinker Materials of Florida, Inc.)(“CEMEX Florida”), a subsidiary of CEMEX, Inc., was granted a federal quarry permit and was the beneficiaryof another federal quarry permit for the Lake Belt area in South Florida. The permit held by CEMEX Floridacovered CEMEX Florida’s SCL and FEC quarries. CEMEX Florida’s Kendall Krome quarry is operated underthe permit of which it was a beneficiary. The FEC quarry is the largest of CEMEX Florida’s quarries measuredby volume of aggregates mined and sold. CEMEX Florida’s Miami cement mill is located at the SCL quarry andis supplied by that quarry, while the FEC and Kendall Krome quarries have supplied aggregates to CEMEX andthird-party users. In response to litigation brought by environmental groups concerning the manner in which thefederal quarry permits were granted, in January 2009, the U.S. District Court for the Southern District of Floridaordered the withdrawal of the federal quarry permits for CEMEX Florida’s SCL, FEC and Kendall Kromequarries. The judge ruled that there were deficiencies in the procedures and analysis undertaken by the ArmyCorps of Engineers (“Corps”) in connection with the issuance of the permits. Upon appeal, on January 21, 2010,the Eleventh Circuit Court of Appeals affirmed the district court’s ruling withdrawing the federal quarry permitsfor the three CEMEX Florida quarries as well as other third-party federal quarry permits subject to the litigation.On January 29, 2010, the Corps completed a multi-year review commenced as a result of this litigation andissued a Record of Decision (“ROD”) supporting the issuance of new federal quarry permits for the FEC andSCL quarries. Excavation of new aggregates was stopped at the FEC and SCL quarries from January 20, 2009until new permits were issued. The FEC permit was issued on February 3, 2010, and the SCL permit onFebruary 18, 2010. The ROD also indicated that a number of potential environmental impacts must be addressedat the wetlands located at the Kendall Krome site before a new federal quarry permit may be issued for mining atthat quarry. It is unclear how long it will take to fully address the Corps’ concerns regarding mining in theKendall Krome wetlands. While no new aggregates will be quarried from wetland areas at Kendall Kromepending the resolution of the potential environmental issues, the FEC and SCL quarries will continue to operate.If CEMEX Florida is unable to maintain the new Lake Belt permits, CEMEX Florida would need to sourceaggregates, to the extent available, from other locations in Florida or import aggregates. This would likely affectoperating income from our Florida operations. Any adverse impacts on the Florida economy arising from thecessation or significant restriction of quarrying operations in the Lake Belt area could also have a materialadverse impact on our results of operations, liquidity and financial condition.
101

In June 2010, the EPA proposed regulating Coal Combustion Residuals (“CCRs”) generated by electricutilities and independent power producers as a hazardous or special waste under the Resource Conservation andRecovery Act. CEMEX uses CCRs as a raw material in the cement manufacturing process, as well as asupplemental cementitious material in some of our ready-mix concrete products. On December 19, 2014, theEPA issued a final rule on the regulation of CCRs (the “Final Rule”). As of March 31, 2017, we expect that theeffects of the Final Rule will not have a material adverse impact on our results of operations, liquidity andfinancial condition.
We are subject to a number of federal and state laws and regulations addressing climate change. On thefederal side, EPA has promulgated a series of regulations pertaining to emissions of GHGs from industrialsources. EPA issued the Mandatory Reporting of GHGs Rule, effective December 29, 2009, which requirescertain covered sectors, including cement manufacturing, with GHG emissions above an established threshold toinventory and report their GHG emissions annually on a facility-by-facility basis. In 2010, EPA issued a finalrule that establishes GHG thresholds for the New Source Review Prevention of Significant Deterioration(“PSD”) and Title V Operating Permit programs. The rule “tailors” the requirements of these CAA permittingprograms to limit which facilities will be required to obtain PSD and Title V permits for GHG emissions. Cementproduction facilities are included within the categories of facilities required to obtain permits, provided that theirGHG emissions exceed the thresholds in the tailoring rule. The PSD program requires new major sources ofregulated pollutants and major modifications at existing major sources to secure pre-construction permits thatestablish, among other things, limits on pollutants based on Best Available Control Technology (“BACT”).According to EPA’s rules, stationary sources, such as cement manufacturing, which are already regulated underthe PSD program for non-GHG pollutants, need to apply for a PSD permit for any GHG emissions increasesabove 75,000 tons/year of carbon dioxide equivalent (“CO2E”). Therefore, new cement plants and existing plantsundergoing modification which are major sources for non-GHG pollutants regulated under the CAA need toacquire a PSD permit for construction or modification activities that increase CO2E by 75,000 or more tons/year,and would have to determine and install BACT controls for those emissions. Furthermore, any new source thatemits 100,000 tons/year of CO2E or any existing source that emits 100,000 tons/year of CO2E and undergoesmodifications that would increase CO2E emissions by at least 75,000 tons/year, must comply with PSDobligations. Complying with these PSD permitting requirements can involve significant costs and delay. Thecosts of future GHG-related regulation of our facilities through these efforts or others could have a materialeconomic impact on our U.S. operations and the U.S. cement manufacturing industry.
With respect to state efforts to address climate change, in 2006, the State of California adopted the GlobalWarming Solutions Act (Assembly Bill 32 or “AB32”) setting into law a goal to reduce the State’s carbondioxide emissions to 1990 levels by 2020. As part of the measures derived from AB32, the California AirResources Board (“CARB”) developed a cap-and-trade program, enforced from 2013, that covers most industrialsources of greenhouse gas emissions in the State, including cement production facilities. The program involvesallocating a number of allowances free of charge to covered installations, which must subsequently surrenderback to the regulator a number of allowances or qualified offset credits matching their verified emissions duringthe compliance period. Based on the free allowances received for the second compliance period (2015-2017), weexpect that our Victorville cement plant will meet all of its compliance obligations for that period without amaterial impact on its operating costs. Furthermore, we are actively pursuing initiatives to substitute lowercarbon fuels for fossil fuels, improve our energy efficiency and utilize renewable power in an effort toeconomically reduce our direct and indirect GHG emission intensities. However, even with these ongoing effortsand the expected distribution of free allowances, we cannot assure you that the overall costs of complying with acap-and-trade program will not have a material impact on our operations in California.
In 2007, CARB approved a regulation that requires California equipment owners/operators to reduce dieselparticulate and nitrogen oxide emissions from in-use off-road diesel equipment and to meet progressively morerestrictive emission targets. In 2008, CARB approved a similar regulation for in-use on-road diesel equipment.
102

The emission targets requires us to retrofit our California-based equipment with diesel emission control devicesor replace equipment with new engine technology in accordance with certain deadlines. As of March 31, 2017,compliance with the CARB regulations has resulted in equipment related expenses or capital investments,including overhauling engines and purchases of new equipment directly related to the CARB regulations, inexcess of U.S.$32.45 million. We may continue to incur substantial expenditures to comply with theserequirements.
Europe.
General overview of EU industrial regulation
In the EU, the cement sector is subject to a range of environmental laws at EU and national EU memberstate (“Member State”) levels. These laws can be very broadly categorized as (1) primary and direct controlsplaced upon their main operational activities and (2) more general legal regimes which protect different aspectsof the environment across many sectors.
The primary examples of the first kind of control are the various laws governing the specific operationalactivities of the sector, through stringent permitting and emissions controls, which are dealt with in the mainsub-section below. Examples of the second, more general, legal controls are the EU Water Framework Directive(2000/60/EC) and the EU Waste Framework Directive (2008/98/EC) which impose various obligations inrelation to protection of the surface and underground water environments and the recovery, disposal and overallmanagement of waste. In practice, the applicable substance of even these more general laws tends to filterthrough to the industry via the direct route of the permitting emissions control systems. However, it is importantto recognize that in the EU the sector is subject to a complex web of different environmental protection laws andstandards.
The EU legal system also operates in a way different to federal systems. The EU legal regime is what isreferred to as “supra-national” law. It sits “above” the legal systems of the different Member States, which retaintheir independence subject to tight oversight from EU institutions, especially the Court of Justice, the EuropeanCommission, and the European Parliament. As such, EU law operates (in its many fields of application, includingindustrial regulation) in order to “control” and authoritatively interpret the legislation and implementation of law(EU and domestic) in those Member States. One of the key manifestations of this “supra-national control” are theinter-related doctrines of the supremacy of EU law and of conforming interpretation. Essentially, where an areaof legal control in a Member State has its origin in an EU Directive, then the Member States must transpose theDirective fully and effectively into their domestic law and every organ of the Member State, including itsregulators and its Courts, must interpret (and if necessary change) domestic law in order to conform with theobjectives and the letter of the relevant EU Directive. This is of relevance to the cement sector since almost everyaspect of its environmental regulation has its origins in EU legislation.
EU Industrial Permits and Emissions Controls
In the EU, the primary legal environmental controls applied to cement plants have been those EU Directiveswhich control operational activities and emissions from those activities. Until recently, these controls wereprimarily derived from two EU Directives: (1) the so-called “IPPC Directives” (as described below) and (2) theIncineration Directive (as defined below). On January 6, 2011, the Industrial Emissions Directive (2010/75/EU)(“IED”) came into force. The IED recasts seven pieces of existing legislation into a single coherent legislativeinstrument, including the IPPC Directives and the Incineration Directive, both of which it repeals. With someexceptions, the IED retains the essential substance of the earlier Directives.
The primary EU legislative control over the sector (until the transition between 2010-2014 of the IED) wasthe Directive on Integrated Pollution Prevention and Control (2008/1/EC) (“IPPC Directive”). The 2008 versionof this Directive was in fact an update and consolidation of an earlier Directive first promulgated in 1996. Since
103
1996, these IPPC Directives have adopted an integrated approach to regulation of various sectors of industrialplant, including cement, by taking into account and controlling/regulating the whole environmental performanceof the plant. They required cement works to have a permit which, until recently in England and still in some otherstates, continues to be referred to as an “IPPC Permit.” These permits contain emission limit values and otherconditions based on the application of (what was in 1996) a new legal and technical concept called “bestavailable techniques” (“BAT”).
The concept of BAT is central to the system, and effectively imposes a legal obligation on plant operators touse and apply the best available techniques (as they develop from time to time) in order to prevent or, where thiswas not practicable, minimize emissions of pollutants likely to be emitted in significant quantities from the plantto air, water or land. Emission limit values, parameters or equivalent technical measures must be based on thebest available techniques, without prescribing the use of one specific technique or technology and taking intoconsideration the technical characteristics of the installation concerned, its geographical location and localenvironmental conditions. In all cases the permit conditions must ensure a high level of protection for theenvironment as a whole.
Permit conditions also had to address energy efficiency, waste minimization, prevention of accidentalemissions and site restoration. To assist the permitting authorities and companies in determining the BAT, theEuropean Commission organized an exchange of information between experts from the Member States, industryand environmental organizations. This resulted in the adoption and publication by the European Commission ofBAT Reference Documents (“BREFs”) for the industry sectors covered by the IPPC Directive. A key element ofthe BREFs were the conclusions on BAT (“BAT conclusions”) which were used as a reference for setting permitconditions. All of these IPPC Directive requirements have been followed through (and in some respectstightened) by the IED.
The second earlier Directive, which was applied in direct control of cement operations, was the EU WasteIncineration Directive (2000/76/EC) (“Incineration Directive”) which regulated those parts of the cementoperation that used recovered waste materials as substitute fuels in cement kilns. Its aim was to prevent or limit,as far as practicable, negative effects on the environment, in particular pollution by emissions in air, soil, surfacewater and groundwater and the resulting risks to human health, from incineration and co-incineration plants.Cement and lime kilns as a primary or secondary source of fuel fall within the definition of “co-incinerationplants.” The Incineration Directive sought to achieve its aim by setting and maintaining stringent operationalconditions and technical requirements, as well as emission limit values for a range of pollutants including dust,nitrogen oxides, sulfur dioxide, hydrogen chloride, heavy metals and dioxins. Again, the essential substance ofthe Incineration Directive has been followed through into the IED.
The IED has applied to new industrial installations since January 7, 2013 and to existing industrialinstallations (other than large combustion plants) since January 7, 2014. Under the IED, operators of industrialinstallations, including cement plants, are required to obtain an integrated permit from the relevant permittingauthority in the Member States. As with the IPPC Directive, permit conditions, including emission limit values,must be based on BAT and a total of 35 BREFs are being rewritten or revised for the IED. However, there is animportant difference between the IPPC Directive and the IED. Under the IPPC Directive, the BREFs wereconsidered as guidance only. This is not the case under the IED. Where BAT conclusions specify emissionlevels, permitting authorities are required to set emission limit values that do not exceed these levels. They mayderogate from this requirement only where the costs associated with the achievement of the emission levelsassociated with the BAT disproportionately outweigh the environmental benefits due to the geographicallocation, the local environmental conditions or the technical characteristics of the installation concerned. Thepermitting authorities must document the reasons for the derogation from the emission limit values in the permit,including the result of the cost-benefit assessment. In April 2013, pursuant to European Commission DecisionNo. 2013/163/EU, the European Commission published new BAT conclusions under the IED for Production ofCement, Lime and Magnesium Oxide, together with specific emission levels. This document sets out anextensive list of technical requirements for most aspects of the cement manufacture process in the EU, with a
104

view to prevention and minimization of all polluting emissions. It is a new requirement under the IED thatpermitting authorities must review and, if necessary, update permit conditions within four years of the EuropeanCommission publishing decisions on BAT conclusions for a particular activity. While we are not currently ableto assess what impact the IED will have on our operations, it is reasonable to assume that there will be an impactgiven the change in regulatory approach heralded by the legislation and the fact that it will be key to thepermitting of the cement industry in the EU. In particular, the European Commission describes review of theBREFs as a continuing process due to ongoing technological advances and so updates may be expected. This hasthe potential to require our operations to be adapted to conform to the latest BAT.
As a result of a lawsuit filed by the city of Kastela against the Ministry of Environment of the Republic ofCroatia, the IPPC Permit issued on behalf of CEMEX Croatia by the Ministry of Environment was revoked onJuly 6, 2015 by a final and non-appealable judgment of a first instance court in Split, Croatia. The judgmentrequired the Ministry of Environment to repeat the procedure for the issuance of a new IPPC Permit. OnNovember 23, 2015, the Ministry of Environment issued a new IPPC Permit, which has been challenged by thecity of Kastela. On January 7, 2016, CEMEX Croatia received the claim and replied to it in due time. TheMinistry of Environment also replied to the claim. At a court hearing held on September 14, 2016, the litigationproceedings concluded. On November 18, 2016, the administrative court in Split, Croatia notified CEMEXCroatia that the decision regarding the IPPC Permit was annulled and the matter was remanded to the Ministry ofEnvironment in order to repeat the procedure. On December 2, 2016, CEMEX Croatia and the Ministry ofEnvironment filed an appeal against such judgment. As of March 31, 2017, CEMEX Croatia is awaiting thedecision on the appeal. If the IPPC Permit is conclusively annulled, we do not believe that such judgment wouldhave a material adverse impact on our results of operations, liquidity and financial condition.
In addition, in accordance with Article 21(3) of the IED, within four years of BAT conclusion publications,the competent authority is to reconsider and, if necessary, update all permit conditions and ensure that theinstallation complies with such permit conditions. Accordingly, on January 3, 2017, the Ministry of Environmentinvited CEMEX Croatia to submit relevant expert opinions in order to update the existing permit conditions andensure compliance with permit conditions. On March 20, 2017, CEMEX Croatia submitted expert opinions to theMinistry of Environment, and, as of March 31, 2017, CEMEX Croatia had not yet been notified of the decisionon the Ministry of Environment’s appeal. Should the IPPC Permit be finally annulled, we do not believe that thejudgment would have a material adverse impact on our results of operations, liquidity and financial condition. Inthe meantime, a new permit will be issued in accordance with the IED.
EU Emissions Trading
In 1997, as part of the United Nations Framework Convention on Climate Change (the “UNFCCC”), theKyoto Protocol was adopted to limit and reduce GHG emissions. The Kyoto Protocol set legally bindingemission reduction targets for 37 industrialized countries and the EU. Under the Kyoto Protocol, industrializedcountries agreed to reduce their collective GHG emissions by 5% against 1990 levels over the five year period2008-2012 (“first commitment period”); future mandatory targets were expected to be established forcommitment periods after 2012. To compensate for the sting of binding targets, the Kyoto Protocol allows three“flexibility” mechanisms to be used by parties in meeting their emission limitation commitments: the CleanDevelopment Mechanism (“CDM”), Joint Implementation (“JI”) and International Emissions Trading.
In 2012, at the United Nations Climate Change Conference in Doha, Qatar, the Doha Amendment to theKyoto Protocol was adopted. Certain parties, including the UK and the EU, committed to reduce GHG emissionsby at least 18% below 1990 levels in the eight year period from 2013 to 2020 (“second commitment period”).
Our operations in the United Kingdom, Spain, Germany, Latvia, Poland, Croatia (since 2013) and CzechRepublic, are subject to binding caps on CO2 emissions imposed pursuant to the EU’s emissions trading system(“ETS”) that was established by Directive 2003/87/EC to implement the Kyoto Protocol. Under the ETS, a cap orlimit is set on the total amount of CO2 emissions that can be emitted by the power plants, energy-intensive
105

installations (including cement plants) and commercial airlines that are covered by the system. The cap isreduced over time, so that the total amount of emissions will decrease. Within the cap, companies receive or buyemission allowances. These allowances are tradable so as to enable companies that manage to reduce theiremissions to sell their excess allowances to companies that are not reaching their emissions objectives. Aftereach year, a company must surrender enough carbon allowances to cover all its emissions. Failure to meet theemissions caps is subject to significant monetary penalties.
In addition to carbon allowances, the ETS also allows the use of Kyoto Protocol units: the EmissionReduction Unit, representing a metric ton of carbon saved by a project under the JI mechanism, and the CertifiedEmission Reduction unit (“CERs”) under the CDM. The ETS recognizes these units as equivalent to its carbonallowances and allows them to be used by companies for compliance up to a certain limit to offset their carbonemissions in the EU. We have registered 19 CDM projects with a total potential to reduce approximately2.44 million tons of CO2E emissions per year. The corresponding CERs from these projects could be used forinternal purposes or sold to third parties. Croatia, as a new entrant, has a right to use only 4.5% of its verifiedcarbon emissions in relation to other EU ETS members which have a right to use up to 11% of their freeallocation of EU allowances.
The ETS consists of three trading phases: Phase I which lasted from January 1, 2005 to December 31, 2007,Phase II, which lasted from January 1, 2007 to December 31, 2012, and was intended to meet commitmentsunder the Kyoto first commitment period, and Phase III which commenced on January 1, 2013 and will end onDecember 31, 2020. For Phase III of the ETS there is also a cap on nitrous oxide and perfluorocarbons (PFC)emissions. Prior to the commencement of each of ETS Phases I and II, each Member State was responsible forpublishing its National Allocation Plan (“NAP”), a document which sets out a national cap on the total amount ofcarbon emissions by all installations during each relevant trading phase and the methodology by which the capwould be allocated to the different sectors in the ETS and their respective installations. Each Member State’s capcontributed to an overall EU cap on emissions, where one carbon allowance must be surrendered to account forone metric ton of carbon emitted. The carbon allowances were mostly distributed for free by each Member Stateto its ETS installations, although some Member States also used a fraction of their material cap for auctioning,mainly to power generators. Under ETS Phase III, however, the system of NAPs has been replaced by a singleEU-wide, top-down, cap on CO2 emissions, with allocation for all installations made according to harmonizedEU rules and set out in each Member State’s National Implementation Measures (“NIM”). Additional restrictionshave been introduced on the extent to which Kyoto Protocol units can be used to offset EU carbon emissions, andauctioning, not free allocation, has become the default method for distributing allowances. For those allowancesthat are still given away free, as discussed below, harmonized rules apply based on EU-wide benchmarks ofemissions performance.
EU policymakers see the free allocation of allowances as a principle way to reduce the risk of carbonleakage—that is, the risk that energy-intensive industries, facing higher costs because of the ETS, will move theirfacilities beyond the EU’s borders to countries that do not have climate change controls, thus resulting in aleakage of CO2 emissions without any environmental benefits. In 2009, a list of ETS sectors deemed to be atsignificant risk of carbon leakage was formally adopted by the European Commission, following agreement byMember States and the European Parliament. The list which was valid from 2010 to 2014 included the cementproduction sector, on the basis that the additional costs imposed by the ETS would lead to a 30% or moreincrease in production costs as a proportion of the “gross value added.” A decision on the list of sectors deemedto be at significant risk of carbon leakage for the period 2015-2019 was adopted by the European Commission onOctober 29, 2014 and the cement production sector resulted selected again. Sectors classified as deemed to be atsignificant risk of carbon leakage will continue to receive 100% of their benchmark allocation of allowances freeof charge during Phase III, adjusted by a cross-sectoral correction factor that is being applied uniformly upon allparticipating facilities in Europe in order to reduce the amount of free allocation that each installation so that thetotal sum does not exceed the authorized EU-wide cap for free allocation. By contrast, sectors that are notconsidered at risk of carbon leakage received 80% of their benchmark allowances for free in 2013, declining to30% by 2020.
106

On April 27, 2011, the European Commission adopted Decision 2011/278/EU that states the rules, includingthe benchmarks of greenhouse gas emissions performance, to be used by the Member States in calculating thenumber of allowances to be annually allocated for free to industrial sectors (such as cement) that are deemed tobe exposed to the risk of “carbon leakage.” The number of allowances to be allocated to installations for free willbe based on a combination of historic activity levels at that installation and an EU benchmark of carbonefficiency for the production of a particular product—for example, clinker. An installation’s historic activitylevel is calculated by taking the median of its annual production levels during the baseline period, either 2005 to2008 or, where historic activity levels are higher, 2009/10. The product benchmark is based on the averagecarbon emissions of the top 10% most “carbon efficient” EU installations for a particular product during 2007/8,where carbon efficiency is measured by carbon intensity or carbon emission per metric ton of product.Preliminary allocation calculations based on the rules were carried out by each Member State and included in aNIM table which was sent for scrutiny to the European Commission. On September 5, 2013, the EuropeanCommission adopted Decision 2013/448/EU which approved the NIMs submitted by most Member States andwhich sets the annual cross-sectoral correction factors for the period 2013-2020. The cross-sectoral correctionfigure will be used to adjust the levels of product benchmarks used to calculate the free allocation of allowancesto each installation. This is to ensure that the total amount handed out for free does not exceed the maximum setin the ETS Directive. Each Member State is required to adjust its national allocation table of free allowanceseach year and submit this for approval to the European Commission prior to issuing allowances. The applicationof this cross-sectoral correction factor results in an important decrease in the quantity of allowances that ourETS-participant operations expect to receive for free in the 2013-2020 period.
On February 26, 2014, the European Commission adopted a Decision on national allocation allowances forthe last group of Member States including Croatia, which was granted 5.56 million of free allowances. Since thistime, a regularly updated allocation table showing the number of allowances that have been allocated perMember State is published on the European Commission’s website. Based on the European Commissionapproved NIMs that were published in the first quarter of 2014 for Phase III, we expect that the aggregateamount of allowances that will be annually allocated for free to CEMEX in Phase III of the ETS will besufficient to operate. An important factor in providing such assurance is the European Commission Decision2014/746/EU (which took effect on January 1, 2015) which, as mentioned, included the manufacture of cementas an industry at significant risk of carbon leakage meaning that the industry will continue to receive 100% of itsbenchmark allocation of allowances free of charge during Phase III. Although the European Council hasindicated that the free allocation of allowances to carbon leakage sectors will continue beyond Phase III, a futuredecision that the cement industry should no longer be regarded as at significant risk of carbon leakage could havea material impact on our operations and our results of operations, liquidity and financial condition.
An installation can only receive its full allocation of free allowances if it is deemed to have not partiallyceased under the “partial cessation rule” of the ETS. Partial cessation applies where a sub-installation whichcontributes at least 30% of the installation’s final annual amount of emissions allocated, or contributes to morethan 50,000 allowances, reduces its activity level by at least 50% of its historic activity levels. If activity levelsare reduced to between 50% and 75% of the historic activity level, the amount of free carbon allowances thesub-installation will receive will reduce by half in the following year; if activity levels are reduced by 75% to90% compared to historic activity levels, the amount of free carbon allowances the sub-installation will receivewill reduce by 75% in the following year; and if activity levels are reduced by 90% or more compared to historicactivity levels, no allowances shall be allocated free of charge the following year with respect to thesub-installation concerned. This represents a change from ETS Phase II, in which the rules for partial cessationwere defined by each Member State’s NAP and often did not result in any reduction in the level of freeallocation, but an installation was no longer entitled to a free allocation from the following year if it hadpermanently ceased operating. The new rules are therefore more stringent, and to the extent that they result in ourplants foregoing free carbon allowances, they could represent a significant loss of revenue to us, since carbonallowances are also tradable.
107

Despite having sold a substantial amount of allowances during Phase II of the ETS, as mentioned, webelieve that the aggregate amount of allowances that will be annually allocated for free to CEMEX in Phase III ofthe ETS (2013-2020) will be sufficient to operate. This assessment stems from various factors, notably ourefforts to reduce emissions per unit of clinker produced, the stream of offset credits coming from our internalportfolio of CDM projects and our expected long position in the initial years of Phase III of the ETS. We aretaking measures intended to minimize our exposure to this market, while continuing to supply our products to ourcustomers. It is not possible to predict with any certainty at this stage how CEMEX will be affected by potentialreform to the EU ETS in Phase IV. However, the European Council has indicated that the EU-wide overall capon emission allowances will be reduced by 2.2% every year from 2021, that benchmarks will be updated basedon recent data and that a more dynamic allocation based on recent production shall replace the “historical activitylevel.” These modifications, which are still subject to final approval by EU institutions (presumably during2017), suggest that there may be fewer allowances available with respect to our operations in the future.
Landfills
In Great Britain, future expenditure on closed and current landfill sites has been assessed and quantifiedover the period in which the sites are considered to have the potential to cause environmental harm, generallyconsistent with the regulatory view of up to 60 years from the date of closure. The assessed expenditure relates tothe costs of monitoring the sites and the installation, repair and renewal of environmental infrastructure. Thecosts have been quantified on a net present value basis in the amount of approximately £131.0 million(approximately U.S.$164.14 million as of March 31, 2017, based on an exchange rate of £0.7981 to U.S.$1.00)as of March 31, 2017, and we made an accounting provision for this amount at March 31, 2017.
Colombian Water Use Litigation
On June 5, 2010, the District of Bogotá’s Environmental Secretary (Secretaría Distrital de Ambiente deBogotá) (the “Environmental Secretary”) issued a temporary injunction suspending all mining activities atCEMEX Colombia’s El Tunjuelo quarry, located in Bogotá, Colombia. As part of the temporary injunction,Holcim Colombia and Fundación San Antonio (local aggregates producers that also have mining activitieslocated in the same area as the El Tunjuelo quarry) were ordered to suspend mining activities in that area. TheEnvironmental Secretary alleged that during the past 60 years, CEMEX Colombia and the other companiesillegally changed the course of the Tunjuelo River, used the percolating waters without permission andimproperly used the edge of the river for mining activities. In connection with the temporary injunction, inJune 2010, the Environmental Secretary initiated proceedings to impose fines against CEMEX Colombia.CEMEX Colombia has requested that the temporary injunction be revoked, arguing that its mining activities aresupported by all authorizations required pursuant to the applicable environmental laws and that all theenvironmental impact statements submitted by CEMEX Colombia have been reviewed and authorized by theMinistry of Environment and Sustainable Development (Ministerio de Ambiente y Desarrollo Sostenible). OnJune 11, 2010, the local authorities in Bogotá, in compliance with the Environmental Secretary’s decision, sealedoff the mine to machinery and prohibited the extraction of CEMEX Colombia’s aggregates inventory. Althoughthere is not an official quantification of the possible fine, the Environmental Secretary has publicly declared thatthe fine could be as much as 300 billion Colombian Pesos (approximately U.S.$104.16 million as of March 31,2017, based on an exchange rate of 2,880.24 Colombian Pesos to U.S.$1.00). The temporary injunction does notcurrently compromise the production and supply of ready-mix concrete to any of our clients in Colombia. At thisstage, as of March 31, 2017, we are not able to assess the likelihood of an adverse result, but if adverselyresolved, it could have a material adverse impact on our results of operations, liquidity and financial condition.
Tariffs
The following is a discussion of tariffs on imported cement in our major markets.
Mexico. Mexican tariffs on imported goods vary by product and have historically been as high as 100%.Over the years, import tariffs have been substantially reduced and currently range from none at all for raw
108

materials to over 20% for finished products. As a result of NAFTA, as of January 1, 1998, the tariff on cementimported into Mexico from the United States or Canada was eliminated. While the lack of existence or reductionin tariffs could lead to increased competition from imports in our Mexican markets, it is possible that otherfactors, such as that the cost of transportation incurred from most producers outside Mexico to central Mexico,traditionally the region of highest demand in Mexico, could be seen as a barrier to enter certain of the regions inMexico in which we operate.
United States. Cement imported into the United States from Cuba and North Korea is subject to customduties depending on the specific type of cement. Imports into the United States from Cuba and North Korea aregenerally prohibited due to the U.S. import/export controls and economic sanctions. In order to import cementand other products into the United States from Cuba or North Korea, an importer would be required to obtain alicense from the U.S. government or otherwise establish the existence of a license exception.
Cement imports from countries other than Cuba and North Korea into the United States are currently dutyfree, however, certain individuals and entities on U.S. government lists of specially designated nationals andprohibited parties, may be subject to U.S. import/export controls and other sanctions that prohibit transactions(including import transactions) with such persons without a license.
Europe. Member countries of the EU are subject to the uniform EU commercial policy. There is no tariff oncement imported into a country that is a member of the EU from another member country or on cement exportedfrom an EU country to another member country. As of March 31, 2017, for cement imported into a membercountry from a non-member country, the tariff was 1.7% of the customs value. Any country with preferentialtreatment with the EU is subject to the same tariffs as members of the EU. Most Eastern European producersexporting cement into EU countries currently pay no tariff.
Tax Matters
Mexico. In November 2009, the Mexican Congress approved a general tax reform, effective as of January 1,2010 (the “2010 Tax Reform”). Specifically, the 2010 Tax Reform included changes to the tax consolidationregime that required CEMEX, among others, to determine and retroactively pay taxes at a current rate on items inpast years that were eliminated in consolidation or that reduced consolidated taxable income (“AdditionalConsolidated Taxes”). The 2010 Tax Reform required CEMEX to pay taxes on certain previously exemptedintercompany dividends, certain other special tax items and operating losses generated by members of theconsolidated tax group not recovered by the individual company generating such losses within the succeedingten-year period. The 2010 Tax Reform also increased the statutory income tax rate from 28% to 30% for theyears 2010 to 2012, then lowered it to 29% for 2013 and 28% for 2014 and future years. However, in Decemberof 2012, the Federal Revenue Law (Ley de Ingresos de la Federación), applicable in 2013, established that thestatutory income tax rate would remain at 30% in 2013, and thereafter lowered to 29% for 2014 and 28% for2015 and future years. As per the tax reforms enacted for 2014, the statutory income tax will remain at 30%.
For the 2010 fiscal year, CEMEX was required to pay (at the new, 30% tax rate) 25% of the AdditionalConsolidated Taxes for the period between 1999 and 2004, with the remaining 75% payable as follows: 25% in2011, 20% in 2012, 15% in 2013 and 15% in 2014. Additional Consolidated Taxes arising after the 2004 tax yearare taken into account in the sixth fiscal year after such year and are payable over the succeeding five years in thesame proportions (25%, 25%, 20%, 15% and 15%). Applicable taxes payable as a result of this tax reform areincreased by inflation adjustments as required by the Mexican Income Tax Law (Ley del Impuesto Sobre laRenta). In connection with these changes in the tax consolidation regime in Mexico, as of December 31, 2009,we recognized a liability of approximately Ps10.5 billion (approximately U.S.$560.60 million as of March 31,2017, based on an exchange rate of Ps18.73 to U.S.$1.00), of which approximately Ps8.2 billion (approximatelyU.S.$437.80 million as of March 31, 2017, based on an exchange rate of Ps18.73 to U.S.$1.00) was recognizedunder “Other non-current assets” in connection with the net liability recognized under the new tax law and thatwe expect to realize in connection with the payment of this tax liability, and approximately Ps2.2 billion
109

(approximately U.S.$117.46 million as of March 31, 2017, based on an exchange rate of Ps18.73 to U.S.$1.00)was recognized against “Retained earnings” upon adoption of IFRS according to the new law, related to: (a) thedifference between the sum of the equity of the controlled entities for tax purposes and the equity for taxpurposes of the consolidated entity, (b) dividends from the controlled entities for tax purposes to CEMEX, S.A.B.de C.V., and (c) other transactions among the companies included in the tax consolidation group that representedthe transfer of resources within such group.
On June 30, 2010, CEMEX paid approximately Ps325 million (approximately U.S.$17.35 million as ofMarch 31, 2017, based on an exchange rate of Ps18.73 to U.S.$1.00) of Additional Consolidated Taxes. This firstpayment represented 25% of the Additional Consolidated Taxes for the period that includes from 1999 to 2004.On March 31, 2011, CEMEX made a second payment of approximately Ps506 million (approximatelyU.S.$27.02 million as of March 31, 2017, based on an exchange rate of Ps18.73 to U.S.$1.00). This secondpayment, together with the prior payment, represented 50% of the Additional Consolidated Taxes for the periodthat includes from 1999 to 2004, and also included the first payment of 25% of the Additional ConsolidatedTaxes for the period that corresponds to 2005. On March 30, 2012, CEMEX paid Ps698 million (approximatelyU.S.$37.27 million as of March 31, 2017, based on an exchange rate of Ps18.73 to U.S.$1.00). This thirdpayment, together with the two prior payments, represented 70% of the Additional Consolidated Taxes for theperiod that includes from 1999 to 2004, 50% of the Additional Consolidated Taxes for the period thatcorresponds to 2005 and it also included the first payment of 25% of the Additional Consolidated Taxes for theperiod that corresponds to 2006. On March 27, 2013, CEMEX paid Ps2 billion (approximatelyU.S.$106.78 million as of March 31, 2017, based on an exchange rate of Ps18.73 to U.S.$1.00). This fourthpayment, together with the three prior payments, represented 85% of the Additional Consolidated Taxes for theperiod that includes from 1999 to 2004, 70% of the Additional Consolidated Taxes for the period thatcorresponds to 2005, 50% of the Additional Consolidated Taxes for the period that corresponds to 2006 and 25%of the Additional Consolidated Taxes for the period that corresponds to 2007. On March 31, 2014, CEMEX paidPs2 billion (approximately U.S.$96.53 million as of March 31, 2017, based on an exchange rate of Ps18.73 toU.S.$1.00). This fifth payment, together with the four prior payments, represented 100% of the AdditionalConsolidated Taxes for the period that includes from 1999 to 2004, 85% of the Additional Consolidated Taxesfor the period that corresponds to 2005, 70% of the Additional Consolidated Taxes for the period thatcorresponds to 2006 and 50% of the Additional Consolidated Taxes for the period that corresponds to 2007. OnMarch 31, 2015, CEMEX paid Ps1.5 billion (approximately U.S.$80.09 million as of March 31, 2017, based onan exchange rate of Ps18.73 to U.S.$1.00). This sixth payment, together with the five prior payments, represented100% of the Additional Consolidated Taxes for the period that includes from 1999 to 2004, 100% of theAdditional Consolidated Taxes for the period that corresponds to 2005, 85% of the Additional ConsolidatedTaxes for the period that corresponds to 2006 and 70% of the Additional Consolidated Taxes for the period thatcorresponds to 2007. On March 31, 2016, CEMEX paid Ps119 million (approximately U.S.$6.35 million as ofMarch 31, 2017, based on an exchange rate of Ps18.73 to U.S.$1.00). This seventh payment, together with the sixprior payments, represented 100% of the Additional Consolidated Taxes for the period that includes from 1999 to2004, 100% of the Additional Consolidated Taxes for the period that corresponds to 2005, 100% of theAdditional Consolidated Taxes for the period that corresponds to 2006 and 85% of the Additional ConsolidatedTaxes for the period that corresponds to 2007. On March 31, 2017, CEMEX paid Ps38 million (approximatelyU.S.$2.06 million as of March 31, 2017, based on an exchange rate of Ps18.73 to U.S.$1.00). This eighthpayment, together with the seven prior payments, represented 100% of the Additional Consolidated Taxes for theperiod from 1999 to 2004, 100% of the Additional Consolidates Taxes for the period that corresponds to 2005,100% of the Additional Consolidated Taxes for the period that corresponds to 2006 and 100% of the AdditionalConsolidated Taxes for the period that corresponds to 2007. As of March 31, 2017, we have paid an aggregateamount of approximately Ps7.3 billion (approximately U.S.$389.74 million as of March 31, 2017, based on anexchange rate of Ps18.73 to U.S.$1.00) of Additional Consolidated Taxes.
In December 2010, pursuant to certain additional rules, the tax authorities granted the option to defer thecalculation and payment of certain items included in the law in connection with the taxable amount for thedifference between the sum of the equity of controlled entities for tax purposes and the equity of the consolidated
110

entity for tax purposes. As a result, CEMEX reduced its estimated tax payable by approximately Ps2.9 billion(approximately U.S.$154.83 million as of March 31, 2017, based on an exchange rate of Ps18.73 to U.S.$1.00)against a credit to the income statement when the new tax enactment took place. In addition, after accounting forthe following that took place in 2010: (a) cash payments, (b) income tax from subsidiaries paid to the parentcompany, and (c) other adjustments, the estimated tax payable for tax consolidation in Mexico amounted toapproximately Ps10.1 billion (approximately U.S.$539.24 million as of March 31, 2017, based on an exchangerate of Ps18.73 to U.S.$1.00) as of December 31, 2010. Furthermore, after accounting for the following that tookplace in 2011: (a) cash payments, (b) income tax from subsidiaries paid to the parent company, and (c) otheradjustments, the estimated tax payable for tax consolidation in Mexico increased to approximately Ps12.4 billion(approximately U.S.$662.04 million as of March 31, 2017, based on an exchange rate of Ps18.73 to U.S.$1.00) asof December 31, 2011. Additionally, after accounting for the following that took place in 2012: (a) cashpayments, (b) income tax from the subsidiaries paid to the parent company, and (c) other adjustments, as ofDecember 31, 2012, the estimated tax payable for tax consolidation in Mexico increased to approximatelyPs14.5 billion (approximately U.S.$774.16 million as of March 31, 2017, based on an exchange rate of Ps18.73to U.S.$1.00). Furthermore, after accounting for the following that took place in 2013: (a) cash payments,(b) income tax from subsidiaries paid to the parent company, (c) other adjustments, and (d) effects of taxdeconsolidation, as of December 31, 2013, the estimated tax payable for tax consolidation in Mexico increased toapproximately Ps24.8 billion (approximately U.S.$1.32 billion as of March 31, 2017, based on an exchange rateof Ps18.73 to U.S.$1.00). Additionally, after accounting for the following that took place in 2014: (a) payments,the majority of which were in cash, and (b) other adjustments, as of December 31, 2014, the estimated taxpayable for tax consolidation in Mexico decreased to approximately Ps21.4 billion (approximatelyU.S.$1.14 billion as of March 31, 2017, based on an exchange rate of Ps18.73 to U.S.$1.00). Additionally, afteraccounting for the following that took place in 2015 and after giving effect to the 2016 Tax Reform (as definedbelow), as a result of: (a) payments made during the period, the tax payable for tax consolidation in Mexico wasdecreased to approximately Ps16.2 billion (approximately U.S.$864.92 million as of March 31, 2017, based onan exchange rate of Ps18.73 to U.S.$1.00), which after the application of (b) different tax credits, and (c) assetsfor tax loss carryforwards worth, before discount, approximately Ps11.9 billion (approximatelyU.S.$635.34 million as of March 31, 2017, based on an exchange rate of Ps18.73 to U.S.$1.00), as ofDecember 31, 2015, the estimated tax payable for tax consolidation in Mexico further decreased toapproximately Ps3.9 billion (approximately U.S.$208.22 million as of March 31, 2017, based on an exchangerate of Ps18.73 to U.S.$1.00). Additionally, after accounting for the following that took place in 2016: (a) cashpayments, and (b) other adjustments, as of December 31, 2016, the estimated tax payable for tax consolidation inMexico decreased to approximately Ps3.2 billion (approximately U.S.$170.84 million as of March 31, 2017,based on an exchange rate of Ps18.73 to U.S.$1.00).
In addition, as a result of the enactment of the new Income Tax Law (Ley del Impuesto Sobre la Renta) inMexico approved in December 2013 and effective beginning January 1, 2014 (the “2014 Tax Reform”), thestatutory income tax rate for 2014 will remain at 30%, and the tax consolidation regime that was in effect up untilDecember 31, 2013, was replaced prospectively by a new integration regime, to which CEMEX will not apply. Inconsequence, as of 2014, each company in Mexico will determine its income taxes based solely in its individualresults, and a period of up to ten years has been established for the settlement of the liability for income taxesrelated to the tax consolidation regime accrued until December 31, 2013 (“Deconsolidation Taxes”).
On February 12, 2014, we filed a constitutional challenge (juicio de amparo) against the 2014 Tax Reformthat abrogated the tax consolidation regime. The purpose of the challenge was to obtain certainty in theapplicable statutory rules in order to assess and pay the tax liability derived from such reform according toconstitutional principles. On February 26, 2016, we withdrew the constitutional challenge (juicio de amparo).
On April 30, 2014, CEMEX paid Ps2.3 billion (approximately U.S.$122.80 million as of March 31, 2017,based on an exchange rate of Ps18.73 to U.S.$1.00). From this amount, Ps987 million (approximatelyU.S.$52.70 million as of March 31, 2017, based on an exchange rate of Ps18.73 to U.S.$1.00) were paid in cashand Ps1.3 billion (approximately U.S.$70.76 million as of March 31, 2017, based on an exchange rate of Ps18.73
111

to U.S.$1.00) were paid through the application of a tax credit, which represented approximately 25% of theDeconsolidation Taxes for the period that corresponded to the 2008 tax year. On April 30, 2015, CEMEX paidPs3.7 billion (approximately U.S.$197.54 million as of March 31, 2017, based on an exchange rate of Ps18.73 toU.S.$1.00). From this amount, Ps2.3 billion (approximately U.S.$122.80 million as of March 31, 2017, based onan exchange rate of Ps18.73 to U.S.$1.00) were paid in cash and Ps1.4 billion (approximately U.S.$74.75 millionas of March 31, 2017, based on an exchange rate of Ps18.73 to U.S.$1.00) were paid through the application of atax credit. This second payment, together with the first payment, represented 50% of the Deconsolidation Taxesfor the period that corresponds to the 2008 tax year and 25% of the Deconsolidation Taxes for the period thatcorresponds to the 2009 tax year. On April 29, 2016, CEMEX paid Ps728 million (approximatelyU.S.$38.87 million as of March 31, 2017, based on an exchange rate of Ps18.73 to U.S.$1.00). This thirdpayment, together with the two prior payments, represented 70% of the Deconsolidation Taxes for the period thatcorresponds to the 2008 tax year, 50% of the Deconsolidation Taxes for the period that corresponds to the 2009tax year and 25% of the Deconsolidation Taxes for the period that corresponds to the 2010 tax year.
In October 2015, the Mexican Congress approved a tax reform, effective as of January 1, 2016 (the “2016Tax Reform”). Specifically, the 2016 Tax Reform granted Mexican companies two tax credits to offset part ofthe Deconsolidation Taxes payable as a result of the elimination of the group taxation regime: (a) 50% of thetaxes due as a result of unamortized losses used to compute the consolidated tax could be settled with individualaccumulated losses adjusted for inflation using a factor of .15 multiplied by such losses, and (b) tax credit againstDeconsolidation Taxes related to intercompany dividends that were paid without having sufficient tax profits.CEMEX applied both tax credits against its remaining Deconsolidation Taxes through the filing of amended taxreturns regarding the year ending on December 31, 2015 and upon the withdrawal of the constitutional challenge(juicio de amparo) against the 2014 Tax Reform filed by us on February 12, 2015. Additionally, the 2016 TaxReform granted Mexican companies the option not to pay the remaining asset tax payments included in theDeconsolidation Tax liability. CEMEX also applied this option.
As of March 31, 2017, taking into account the effects of the 2016 Tax Reform, our estimated paymentschedule of Deconsolidation Taxes (which includes the Additional Consolidated Taxes) is as follows:approximately Ps898 million (approximately U.S.$47.94 million as of March 31, 2017, based on an exchangerate of Ps18.73 to U.S.$1.00) in 2017; approximately Ps897 million (approximately U.S.$47.89 million as ofMarch 31, 2017, based on an exchange rate of Ps18.73 to U.S.$1.00) in 2018; and approximately Ps1.4 billion(approximately U.S.$74.76 million as of March 31, 2017, based on an exchange rate of Ps18.73 to U.S.$1.00) in2019 and thereafter.
United States. As of March 31, 2017, the Internal Revenue Service (“IRS”) concluded its audit for the year2014. The final findings did not alter the originally filed CEMEX return, which had no reserves set aside for anypotential tax issues. On April 24, 2015 and May 18, 2016, the IRS commenced its audit of the 2015 and 2016 taxyear, respectively, under the Compliance Assurance Process. We have not identified any material audit issuesand, as such, no reserves are recorded for either the 2015 or the 2016 audit in our financial statements.
Colombia. On April 1, 2011, the Colombian Tax Authority notified CEMEX Colombia of a proceedingnotice in which the Colombian Tax Authority rejected certain deductions taken by CEMEX Colombia in its 2009year-end tax return. The Colombian Tax Authority assessed an increase in taxes to be paid by CEMEX Colombiain the amount of approximately 90 billion Colombian Pesos (approximately U.S.$31.24 million as of March 31,2017, based on an exchange rate of 2,880.24 Colombian Pesos to U.S.$1.00) and imposed a penalty in theamount of approximately 144 billion Colombian Pesos (approximately U.S.$39.58 million as of March 31, 2017,based on an exchange rate of 2,880.24 Colombian Pesos to U.S.$1.00). The Colombian Tax Authority argues thatcertain expenses are not deductible for fiscal purposes because they are not linked to direct revenues recorded inthe same fiscal year, without taking into consideration that future revenue will be taxed with income tax inColombia. CEMEX Colombia responded to the proceeding notice on June 25, 2011. On December 15, 2011, theColombian Tax Authority issued its final determination, which confirmed the information in the specialproceeding. CEMEX Colombia appealed the final determination on February 15, 2012. On January 17, 2013, the
112
Colombian Tax Authority notified CEMEX Colombia of the resolution confirming the official liquidation.CEMEX Colombia appealed the final determination on May 10, 2013 which was admitted on June 21, 2013. OnJuly 3, 2013, the appeal was notified to the Colombian Tax Authority, and hearings took place on February 18,2014 and March 11, 2014. An adverse resolution to the appeal was notified to CEMEX Colombia on July 14,2014 and on July 22, 2014, CEMEX Colombia filed an appeal before the Colombian Consejo de Estado againstsuch adverse resolution. At this stage of the proceeding, as of March 31, 2017, we are not able to assess thelikelihood of an adverse result in this special proceeding, but if adversely resolved, they could have a materialadverse impact on our results of operations, liquidity and financial condition.
Spain. On July 7, 2011, the tax authorities in Spain notified CEMEX España of a tax audit process in Spaincovering the tax years from and including 2006 to 2009. The tax authorities in Spain have challenged part of thetax losses reported by CEMEX España for such years. CEMEX España has been formally notified of fines in theaggregate amount of approximately €456 million (approximately U.S.$486.14 million as of March 31, 2017,based on an exchange rate of €0.9380 to U.S.$1.00) resulting from the July 7, 2011 tax audit process in Spain.The laws of Spain provide a number of appeals that can be filed against such fines without CEMEX Españahaving to make any payment until such appeals are finally resolved. On April 22, 2014, CEMEX España filedappeals against such fines. At this stage, as of March 31, 2017, we are not able to assess the likelihood of anadverse result regarding this matter, and the appeals that CEMEX España has filed could take an extendedamount of time to be resolved, but if all appeals filed by CEMEX España are adversely resolved, it could have amaterial adverse impact on our results of operations, liquidity and financial condition.
Egypt. On February 9, 2014, ACC was notified of the decision of the Egyptian Ministry of Finance’sAppeals Committee (the “Appeals Committee”) pursuant to which ACC has been required to pay a developmentlevy on clay (the “Levy on Clay”) applied to the Egyptian cement industry in the amount of: (i) approximately322 million Egyptian Pounds (approximately U.S.$17.75 million as of March 31, 2017, based on an exchangerate of Egyptian Pounds 18.1358 to U.S.$1.00) for the period from May 5, 2008 to August 31, 2011; and(ii) approximately 50,235 Egyptian Pounds (approximately U.S.$2,769.94 as of March 31, 2017, based on anexchange rate of Egyptian Pounds 18.1358 to U.S.$1.00) for the period from September 1, 2011 to November 30,2011. On March 10, 2014, ACC filed a claim before the North Cairo Court requesting the nullification of theAppeals Committee’s decision and requesting that the North Cairo Court rule that the Egyptian tax authority isnot entitled to require payment of the aforementioned amounts. In parallel, ACC has filed a request before theMinisterial Committee for Resolution of Investment Disputes (the “Ministerial Committee”) claimingnon-entitlement of the Egyptian tax authority to the Levy on Clay used in the production of cement from the dateof enforceability of Law No. 114/2008 up until issuance of Law No. 73/2010, and from cement produced usingimported clinker. On September 28, 2015, ACC was notified by the Egyptian Cabinet that on September 2, 2015,it ratified an August 10, 2015 decision by the Ministerial Committee (the “Ministerial Committee’s Decision”)pursuant to which the Egyptian tax authority is instructed to cease claiming payment of the Levy on Clay fromACC. The Ministerial Committee’s Decision applies to the years from 2008 up to the issuance date of LawNo. 73/2010. It was further decided that the Levy on Clay should not be imposed on imported clinker. At thisstage, as of March 31, 2017, the Ministerial Committee’s Decision strongly supports ACC’s position in thisdispute, given the fact that the Ministerial Committee’s Decision is legally binding on the Egyptian tax authority.The Ministerial Committee’s Decision was submitted to the Egyptian tax authority and, accordingly, theEgyptian tax authority issued a settlement memorandum (the “Settlement Memorandum”), whereby it confirmedand recognized the Ministerial Committee’s Decision. Furthermore, in application of the SettlementMemorandum and the Ministerial Committee’s Decision, the Egyptian tax authority issued a new claim to ACCfor an adjusted amount of 55,586 Egyptian Pounds (approximately U.S.$3,064.99 as of March 31, 2017, based onan exchange rate of Egyptian Pounds 18.1358 to U.S.$1.00). On a March 7, 2016 session of the North CairoCourt, ACC submitted the Settlement Memorandum and the Ministerial Committee’s Decision. At a May 28,2016 session before the North Cairo Court, the expert’s office appointed to review the case file submitted itsreport that confirmed and recognized the Ministerial Committee’s Decision and at this session this case wasreviewed jointly with the Egyptian tax authority case which was filed to challenge ACC’s right to cancel theLevy on Clay. The North Cairo Court adjourned the jointly reviewed cases to June 25, 2016. These cases were
113

thereafter re-adjourned to July 30, 2016 for submission of documents by the attorney for the State pertaining tothe settlement of the dispute with ACC. At the session of July 30, 2016, the two cases were adjourned first toSeptember 19, 2016, and afterwards to October 10, 2016 and December 27, 2016 for the foregoing reason. OnDecember 27, 2016, the North Cairo Court ruled for referring the two jointly reviewed cases to the CairoAdministrative Judiciary Court for the former’s lack of jurisdiction to review the same. As of March 31, 2017, nosession has yet been scheduled before the Cairo Administrative Judiciary Court in order to review the tworeferred cases. We do not expect that such referral will prejudice ACC’s favorable legal position in this dispute.As of March 31, 2017, we do not expect our operations, liquidity and financial condition to suffer a materialadverse impact because of this matter.
Other Legal Proceedings
Colombian Construction Claims. On August 5, 2005, the Urban Development Institute (Instituto deDesarrollo Urbano) (“UDI”), and an individual filed a lawsuit in the Fourth Anti-Corruption Court of Bogotá(Fiscalía Cuarta Anticorrupción de Bogotá) against a subsidiary of CEMEX Colombia claiming that it wasliable, along with the other members of the Asociación Colombiana de Productores de Concreto(“ASOCRETO”), an association formed by the ready-mix concrete producers in Colombia, for the prematuredistress of the concrete slabs of the Autopista Norte trunk line of the TransMilenio bus rapid transit system ofBogotá in which ready-mix concrete and flowable fill supplied by CEMEX Colombia and other ASOCRETOmembers was used. The plaintiffs alleged that the base material supplied for the road construction failed to meetthe quality standards offered by CEMEX Colombia and the other ASOCRETO members and/or that theyprovided insufficient or inaccurate information in connection with the product. The plaintiffs were seeking therepair of the concrete slabs in a manner which guarantees their service during the 20-year period for which theywere originally designed, and estimate that the cost of such repair could have been approximately 100 billionColombian Pesos (approximately U.S.$34.72 million as of March 31, 2017, based on an exchange rate of2,880.24 Colombian Pesos to U.S.$1.00). The lawsuit was filed within the context of a criminal investigationagainst a former director and two officers of the UDI, the contractor, the inspector and two ASOCRETO officers.On January 21, 2008, a court issued an order, sequestering the El Tunjuelo quarry, as security for payment of apossible future money judgment against CEMEX Colombia. The court determined that in order to lift thisattachment and prevent further attachments, CEMEX Colombia was required to deposit 337.8 billion ColombianPesos (approximately U.S.$117.28 million as of March 31, 2017, based on an exchange rate of 2,880.24Colombian Pesos to U.S.$1.00) in cash instead of posting an insurance policy to secure such recovery. CEMEXColombia appealed this decision and the Superior Court of Bogotá (Tribunal Superior de Bogotá) allowedCEMEX to present an insurance policy in the amount of 20 billion Colombian Pesos (approximatelyU.S.$6.94 million as of March 31, 2017, based on an exchange rate of 2,880.24 Colombian Pesos to U.S.$1.00).CEMEX gave the aforementioned security and, on July 27, 2009, the court lifted the attachment on the quarry.
On October 10, 2012 the court issued a first instance judgment pursuant to which the accusation madeagainst the ASOCRETO officers was nullified. The judgment also convicted a former UDI director, thecontractor’s legal representatives and the inspector to a prison term of 85 months and a fine of 32 millionColombian Pesos (approximately U.S.$11,110.19 as of March 31, 2017, based on an exchange rate of 2,880.24Colombian Pesos to U.S.$1.00). As a consequence of the nullification, the judge ordered a restart of theproceeding against the ASOCRETO officers. The UDI and other parties to the legal proceeding appealed the firstinstance judgment and on August 30, 2013 the Superior Court of Bogotá resolved to reduce the prison termimposed to the former UDI director and the UDI officers to 60 months and imposed a fine equivalent to8.8 million Colombian Pesos (approximately U.S.$3,055.30 as of March 31, 2017, based on an exchange rate of2,880.24 Colombian Pesos to U.S.$1.00). Additionally, the UDI officers were sentenced to severally pay theamount of 108,000 million Colombian Pesos (approximately U.S.$37.50 million as of March 31, 2017, based onan exchange rate of 2,880.24 Colombian Pesos to U.S.$1.00) for the purported damages in the concrete slabs ofthe TransMilenio bus rapid transit system. Additionally, the Superior Court of Bogotá overturned the penaltyimposed to the contractor’s legal representatives and inspector because the criminal action against them was timebarred. Furthermore, the Superior Court of Bogotá revoked the annulment in favor of the ASOCRETO officers
114

and ordered the first instance judge to render a judgment regarding the ASOCRETO officers’ liability or lackthereof. On June 25, 2014, the Supreme Court of Colombia’s Penal Cassation Chamber (Sala de Casación Penalde la Corte Suprema de Justicia de Colombia) dismissed the cassation claim filed by the former UDI director andthe UDI officers against the Superior Court of Bogotá’s judgment. Dismissal of the cassation claim has no effecton CEMEX Colombia’s or the ASOCRETO officers’ interests in these proceedings. On January 21, 2015, thePenal Circuit Court of Bogotá issued a resolution agreeing with the arguments presented by CEMEX Colombiaregarding the application of the statute of limitations to the criminal investigation against the ASOCRETOofficers and acknowledging that the ASOCRETO officers were not public officers, and as a consequence,finalizing the process against the ASOCRETO officers and the civil responsibility claim against CEMEXColombia. On July 28, 2015, the Superior Court of Bogotá (Tribunal Superior de Bogotá) upheld this resolutionand as such the action brought against CEMEX Colombia for the premature distress of the concrete slabs of theAutopista Norte trunk line has ended. In addition, six legal actions related to the premature distress of theconcrete slabs of the Autopista Norte trunk line of the TransMilenio bus rapid transit system were broughtagainst CEMEX Colombia. The Cundinamarca Administrative Court (Tribunal Administrativo deCundinamarca) nullified five of these actions and, as of March 31 ,2017, only one remains outstanding. Inaddition, the UDI filed another action alleging that CEMEX Colombia made misleading advertisements on thecharacteristics of the flowable fill used in the construction of the concrete slabs. CEMEX Colombia participatedin this project solely and exclusively as supplier of the ready-mix concrete and flowable fill, which weredelivered and received to the satisfaction of the contractor, complying with all the required technicalspecifications. CEMEX Colombia neither participated in nor had any responsibility on the design, sourcing ofmaterials or their corresponding technical specifications or construction. On May 24, 2016, the Civil Court ofBogota settled the action filed by the UDI against CEMEX Colombia. The court accepts the arguments indefense of CEMEX Colombia, ruling that the flowable fill is not what caused the damage to the slabs and that thedamages were caused by design changes when executing the road without consulting the original designer andthe lack of drains. The UDI filed an appeal against the court’s ruling. On December 7, 2016, the Superior Courtof Bogota (Tribunal Superior de Bogotá) upheld the Civil Court of Bogota’s decision. At this stage of theproceedings, as of March 31, 2017, we are not able to assess the likelihood of an adverse result regarding theremaining pending action filed before the Cundinamarca Administrative Court, but if adversely resolved, we donot expect that it will have a material adverse impact on our results of operations, liquidity and financialcondition.
Croatian Concession Litigation. After an extended consultation period, in April 2006, the cities of Kastelaand Solin in Croatia published their respective Master (physical) Plans defining the development zones withintheir respective municipalities, adversely impacting the mining concession granted to CEMEX Croatia by theGovernment of Croatia in September 2005. During the consultation period, CEMEX Croatia submittedcomments and suggestions to the Master Plans intended to protect and preserve the rights of CEMEX Croatia’smining concession, but these were not taken into account or incorporated into the Master Plans by Kastela andSolin. Immediately after publication of the Master Plans, CEMEX Croatia filed a series of lawsuits and legalactions before the local and federal courts to protect its acquired rights under the mining concessions, including:(i) on May 17, 2006, a constitutional appeal before the constitutional court in Zagreb, seeking a declaration bythe court concerning CEMEX Croatia’s constitutional claim for decrease and obstruction of rights earned byinvestment and seeking prohibition of implementation of the Master Plans; and (ii) on May 17, 2006, anadministrative proceeding before an administrative court seeking a declaration from the Government of Croatiaconfirming that CEMEX Croatia acquired rights under the mining concessions. The administrative courtsubsequently ruled in favor of CEMEX Croatia, validating the legality of the mining concession granted toCEMEX Croatia by the Government of Croatia, in September 2005. On June 15, 2012, we were notified that thecase had been transferred from the constitutional court to the administrative court as a result of a new law thatplaces the administrative courts in charge of disputes relating to environmental planning. In February 2014, theadministrative court requested CEMEX Croatia to declare if it was still interested in proceeding with theconcession litigation and if so, to provide additional clarification and documentation to support such claims. OnMarch 3, 2014, CEMEX Croatia submitted the clarification and required documentation and on April 4, 2014,CEMEX Croatia was notified that the administrative court rejected its claims and found that its acquired rights or
115
interests under the mining concessions had not been violated as a result of any act or decision made by the citiesof Solin or Kastela or any other governmental body. On April 29, 2014, CEMEX Croatia filed two claims beforethe Constitutional Court of the Republic of Croatia alleging that CEMEX Croatia’s constitutional rights to a fairtrial and judicial protection had been violated. On August 1, 2014, CEMEX Croatia also filed an applicationbefore the European Court of Human Rights alleging that CEMEX Croatia’s constitutional rights to a fair trial,property rights, concession rights and investment had been violated due to irregularities in a general act, whichhas been denied. The European Court of Human Rights found the application to be inadmissible pursuant toarticles 34 and 35 of the Convention for the Protection of Human Rights and Fundamental Freedoms, meaningthat CEMEX Croatia did not exhaust all its domestic legal remedies, thus stipulating the Constitutional Court ofthe Republic of Croatia’s jurisdiction in this matter. On February 6, 2015, the decision of the European Court ofHuman Rights was sent to the Constitutional Court of the Republic of Croatia. The Constitutional Court of theRepublic of Croatia granted the claim, annulled the decision of the administrative court and remanded the case tothe administrative court for a new trial. As of March 31, 2017, CEMEX Croatia had yet to be notified of theadministrative court’s decision. At this stage of the proceedings, as of March 31, 2017, we are not able to assessthe likelihood of an adverse result to the claims filed before the Constitutional Court of the Republic of Croatia,but if adversely resolved, we do not believe it will have a material adverse impact on our results of operations,liquidity and financial condition. During May 2015, CEMEX Croatia obtained a new location permit from theCroatian Ministry of Construction and Physical Planning for CEMEX Croatia’s Sveti Juraj-Sveti Kajo quarry. OnAugust 2, 2016, CEMEX Croatia obtained a decision pursuant to which a right of way was granted on landowned by the Republic of Croatia and located in Sveti Juraj-Sveti Kajo quarry. The period of such right of waywill be compatible with the location permit previously granted. Such decision is one of the prerequisites forobtaining a new mining concession. As of March 31, 2017, in order to alleviate the adverse impact of the MasterPlans, CEMEX Croatia is in the process of negotiating and preparing all documentation necessary to comply withapplicable rules and regulations in order to obtain a new mining concession.
Israeli Class Action Litigation. On June 21, 2012, one of our subsidiaries in Israel was notified about anapplication for the approval of a class action suit against it. The application was filed by a homeowner who builthis house with concrete supplied by our Israeli subsidiary in October 2010 (a same application was filed againstthree other companies by the same legal representative). According to the application, the plaintiff claims that theconcrete supplied to him did not meet with the “Israel Standard for Concrete Strength No. 118” and that, as aresult, our Israeli subsidiary acted unlawfully toward all of its customers who requested a specific type ofconcrete but that received concrete that did not comply with Israeli standard requirements. As per the application,the plaintiff claims that the supply of the alleged non-conforming concrete has caused financial and non-financialdamages to those customers, including the plaintiff. We presume that the class action would represent the claimof all the clients who purchased the alleged non-conforming concrete from our Israeli subsidiary during the pastseven years, the limitation period according to applicable laws in Israel. The damages that could be soughtamount to approximately 276 million Israeli Shekels (approximately U.S.$75.99 million as of March 31, 2017,based on an exchange rate of 3.632 Israeli Shekels to U.S.$1.00). Our Israeli subsidiary submitted a formalresponse to the corresponding court. Both parties presented their preliminary arguments. In a hearing held onDecember 20, 2015, the preliminary proceeding was completed and the court set dates for hearing evidence onMay 8, 10 and 16, 2016. In addition, the court decided to join together all claims against all four companies,including our subsidiary in Israel, in order to simplify and shorten court proceedings, however, it should bementioned that the court had not formally decided to join together all claims. On the hearing dates, the applicantsin all four claims presented evidence, including expert testimony. The evidentiary hearing has not beencompleted as of March 31, 2017, and the court has set July 12, 2017 as the date to hear evidence on behalf of twoother companies. As of March 31, 2017, our subsidiary in Israel is not able to assess the likelihood of the classaction application being approved or, if approved, of an adverse result, such as an award for damages in the fullamount that could be sought, but if adversely resolved, we do not believe the final resolutions would have amaterial adverse impact on our results of operations, liquidity and financial condition.
Egypt Share Purchase Agreement. On April 7, 2011 and March 6, 2012, lawsuits seeking, among otherthings, the annulment of the share purchase agreement entered into by and between CEMEX and state-owned
116

Metallurgical Industries Company (the “Holding Company”) in November 1999 pursuant to which CEMEXacquired a controlling interest in ACC (the “Share Purchase Agreement”), were filed by different plaintiffs,including 25 former employees of ACC, before the 7th and 8th Circuits of Cairo’s State Council AdministrativeJudiciary Court, respectively. Hearings in both cases were adjourned in order for the State CommissionerAuthority (“SCA”) to prepare the corresponding reports to be submitted for the consideration of the 7th and 8thCircuits of Cairo’s State Council Administrative Judiciary Court. During March 2015, the SCA submitted therelevant reports recommending, in both cases, that the 7th and 8th Circuits of Cairo’s State CouncilAdministrative Judiciary Court stays the proceedings until the High Constitutional Court pronounces itself withregards to the challenges against the constitutionality of the Presidential Decree on Law No. 32 of 2014 (“Law32/2014”). A hearing was held on October 13, 2015 before the 8th Circuit of Cairo’s State CouncilAdministrative Judiciary Court in which the SCA’s report was reviewed and the case was adjourned toJanuary 26, 2016 for passing judgment. At the session held on January 26, 2016, the 8th Circuit of Cairo’s StateCouncil Administrative Judiciary Court issued a judgment ruling for the dismissal of this case considering theplaintiff’s lack of standing. The legal prescription period for the plaintiff to challenge the judgment before theHigh Administrative Court of 60 calendar days from the date of issuance of the judgment has expired without theplaintiff filing a judgment. Accordingly, the January 26, 2016 judgment issued by the 8th Circuit of Cairo’s StateCouncil Administrative Judiciary Court is final and definitive. At a session held on September 3, 2015, the 7thCircuit of Cairo’s State Council Administrative Judiciary Court accepted the SCA’s report recommendation andruled for staying the proceedings until the High Constitutional Court pronounces itself with regards to thechallenges against the constitutionality of Law 32/2014. As of March 31, 2017, we are not able to assess thelikelihood of an adverse resolution regarding this lawsuit filed before the 7th Circuit of Cairo’s State CouncilAdministrative Judiciary Court, but if adversely resolved, we do not believe the resolution in the first instancewould have an immediate material adverse impact on our results of operations, liquidity and financial conditionas there are different legal recourses that we could take. However, if we exhaust all legal recourses available tous, a final adverse resolution of this matter could have a material adverse impact on our operations, liquidity andfinancial condition.
Regarding a different lawsuit submitted to a First Instance Court in Assiut, Egypt and notified to ACC onMay 23, 2011, on September 13, 2012, the first instance court of Assiut, Egypt issued a judgment (the “FirstInstance Judgment”) to (i) annul the Share Purchase Agreement; and (ii) reinstate former employees to theirformer jobs at ACC. The First Instance Judgment was notified to ACC on September 19, 2012. On October 18,2012, ACC filed an appeal against the First Instance Judgment, which was followed by the Holding Company’sappeal filed on October 20, 2012 before the Appeal Court in Assiut, Egypt (the “Appeal Court”). At aNovember 17, 2013 hearing, the Appeal Court decided to join the appeals filed by ACC and the HoldingCompany and adjourned the session to January 20, 2014 to render judgment. On January 20, 2014, the AppealCourt issued a judgment (the “Appeal Judgment”) accepting both appeals, revoking the First Instance Judgment,ruling for non-qualitative jurisdiction of the first instance court to review the case and referred the matter to theadministrative court in Assiut, Egypt (the “Assiut Administrative Court”) for a hearing to be held on March 16,2014. This hearing was subsequently rescheduled to May 17, 2014 and ultimately was not held because the casefile had not been completed on time in order for it to be referred to the Assiut Administrative Court. The SCAsubmitted a report recommending that the Assiut Administrative Court to declare itself incompetent to reviewthis case and to refer it to the Assiut Administrative Judiciary Court (the “Assiut Administrative JudiciaryCourt”). The Assiut Administrative Court scheduled a new hearing for October 11, 2014 to review the case. OnOctober 15, 2014, the Assiut Administrative Court ruled for its non-jurisdiction to review the case and referredthe case to the Assiut Administrative Judiciary Court. On December 11, 2014, ACC filed an appeal against theAssiut Administrative Court ruling requesting that its enforcement be suspended until a judgment is issued on theappeal filed before the Cassation Court on March 12, 2014 (the “Appeal”). On February 10, 2015 and March 17,2015, hearings were held before the Assiut Administrative Judiciary Court’s SCA in which the SCA decided toadjourn in order to prepare the corresponding report to be submitted for the consideration of the AssiutAdministrative Judiciary Court. On October 2015, the SCA issued a report recommending mainly that due to theabsence of geographical jurisdiction to review the case, it should be referred to the 7th Circuit of “Economic andInvestment Disputes” of Cairo’s State Council Administrative Judiciary Court. The Assiut Administrative
117

Judiciary Court held a hearing for the case on February 24, 2016, in which it decided to refer the case to the FirstCircuit (formerly 7th Circuit) of “Economic and Investment Disputes” of Cairo’s State Council AdministrativeJudiciary Court. Cairo’s State Council Administrative Judiciary Court held a hearing on March 28, 2017 to notifythe parties of the procedures, whereupon the court adjourned the hearing until June 13, 2017 in order for theparties to submit their memoranda. In a session held on February 11, 2016 in order to review the Appeal, theAssiut Administrative Judiciary Court decided to refer the case to the First Circuit of Cairo’s State CouncilAdministrative Judiciary Court, which in turn decided to refer the Appeal to the Assiut Administrative JudiciaryCourt. On November 9, 2016, the Assiut Administrative Judiciary Court held a session in order to review thereferred Appeal, and adjourned the Appeal to February 8, 2017. On February 8, 2017, the court adjourned thehearing until June 14, 2017 in order for the parties to submit their final memoranda. As of March 31, 2017, ACChas not been notified of a session before the First Circuit of Cairo’s State Council Administrative Judiciary Courtin order to review the referred case.
On March 12, 2014, ACC filed a challenge before the Cassation Court against the part of the AppealJudgment that refers to the referral of the case to the Assiut Administrative Court and payment of the appealexpenses and attorney fees, and requested a suspension of the Appeal Judgment execution with respect to thesematters until the Cassation Court renders its judgment (the “Challenge”). A hearing was held on April 12, 2016in order to review the Challenge’s summary request only, which requested the Cassation Court to stay theexecution of part of the Appeal Judgment regarding the referral of the case to the Assiut Administrative Courtand payment of the appeal expenses and attorney fees. At this hearing the Cassation Court rejected the summaryrequest. As of March 31, 2017, ACC has not been notified of a session before the Cassation Court in order toreview the subject matter of the Challenge. As of March 31, 2017, we are not able to assess the likelihood of anadverse resolution regarding the Challenge, but if adversely resolved, we do not believe the resolution wouldhave an immediate material adverse impact on our results of operations, liquidity and financial condition as thereare different recourses that we could take. However, if we exhaust all legal recourses available to us, a finaladverse resolution of this matter could have a material adverse impact on our operations, liquidity and financialcondition.
Also, on February 23, 2014, three plaintiffs filed a lawsuit before the Assiut Administrative Judiciary Courtrequesting the cancellation of the resolutions taken by the Holding Company’s shareholders during theextraordinary general shareholders meeting pursuant to which it was agreed to sell ACC’s shares and enter intothe Share Purchase Agreement in 1999. A hearing held on May 17, 2014 was adjourned in order for the SCA toprepare a report to be submitted for the consideration of the Assiut Administrative Judiciary Court. OnSeptember 4, 2014, ACC received the report issued by the SCA which is non-binding to the AssiutAdministrative Judiciary Court. On December 11, 2014, the Assiut Administrative Judiciary Court resolved torefer the case to the 7th Circuit of Cairo’s State Council Administrative Judiciary Court. The 7th Circuit ofCairo’s State Council Administrative Judiciary Court decided to adjourn to July 25, 2015 in order to review theparties’ pleadings. On this hearing held on July 25, 2015, the 7th Circuit of Cairo’s State Council AdministrativeJudiciary Court adjourned the case to September 3, 2015 for passing judgment. At the session held onSeptember 3, 2015, the 7th Circuit of Cairo’s State Council Administrative Judiciary Court ruled for staying theproceedings until the High Constitutional Court pronounces itself with regards to the challenges against theconstitutionality of Law No.32/2014. As of March 31, 2017, we do not have sufficient information to assess thelikelihood of the 7th Circuit of Cairo’s State Council Administrative Judiciary Court cancelling the resolutionsadopted by the Holding Company’s shareholders, or, if such shareholders’ resolutions are cancelled, how wouldsuch cancellation affect us, but if adversely resolved, we do not believe the resolution in this first instance wouldhave an immediate material adverse impact on our results of operations, liquidity and financial condition as thereare different legal recourses that we could take. However, if we exhaust all legal recourses available to us, a finaladverse resolution of this matter could have a material adverse impact on our operations, liquidity and financialcondition.
On April 22, 2014, Law 32/2014, which regulates legal actions to challenge agreements entered into by theEgyptian State (including its ministries, departments, special budget entities, local administrative units,
118

authorities and state-participated companies) and third parties, was published in the Official Gazette, becomingeffective as of April 23, 2014, but subject to its presentation, discussion and approval by the House ofRepresentatives 15 days after it holds its first session. As per the provisions of Law 32/2014, and consideringcertain exceptions, only the parties to these agreements have standing to challenge the validity of an agreement.During October and November 2015, parliamentary elections to the House of Representatives took place and theelected House of Representatives started to hold its sessions on January 10, 2016, as expected, and Law 32/2014was discussed and ratified on January 20, 2016, as legally required. As of March 31, 2017, a constitutionalchallenge has been filed against Law 32/2014 before the High Constitutional Court. The High ConstitutionalCourt has scheduled a hearing for May 6, 2017 to proceed with the constitutional challenge that was filed againstLaw 32/2014 after the SCA had submitted its report with respect to the case. As of March 31, 2017, we are notable to assess if the High Constitutional Court will dismiss Law 32/2014, but if the High Constitutional Courtdismisses Law 32/2014, this could adversely impact the ongoing matters regarding the Share PurchaseAgreement, which could have a material adverse impact on our operations, liquidity and financial condition.
South Louisiana Flood Protection Authority-East Claim. On July 24, 2013 a Petition for Damages andInjunctive Relief was filed by the South Louisiana Flood Protection Authority-East (“SLFPAE”) in the CivilDistrict Court for the Parish of Orleans, State of Louisiana, against approximately 100 defendants, includingCEMEX, Inc. SLFPAE is seeking compensation for and the restoration of certain coastal lands near New Orleansalleged to have been damaged by activities related to oil and gas exploration and production since the early1900s. CEMEX, Inc., which was previously named Southdown, Inc., may have acquired liabilities, to the extentthere may be any, in connection with oil and gas operations that were divested in the late 1980s. The matter wasremoved to the United States District Court for the Eastern District of Louisiana (the “Louisiana District Court”)and a motion by the Plaintiffs to remand to State Court was denied. In addition, on June 6, 2014, LouisianaSenate Bill No. 469 was enacted into Act No. 544 (“Act 544”) which prohibits certain state or localgovernmental entities such as the SLFPAE from initiating certain causes of action including the claims assertedin this matter. The effect of Act 544 on the pending matter has yet to be determined by the Louisiana DistrictCourt. Further, CEMEX, Inc. was dismissed without prejudice by the plaintiffs. On February 13, 2015, theLouisiana District Court dismissed the plaintiffs’ claims with prejudice. On February 27, 2015, the plaintiffsappealed this ruling. As of March 31, 2017, we cannot assess the likelihood of an adverse result or, because ofthe number of defendants, the potential damages which could be borne by CEMEX, Inc., if any, or if suchdamages, if any, would have a material adverse impact on our results of operations, liquidity and financialcondition.
Maceo, Colombia—Legal Proceedings in Colombia. On August 28, 2012, CEMEX Colombia entered into amemorandum of understanding (the “MOU”) with CI Calizas y Minerales S.A. (“CI Calizas”) to acquire land, amining concession, an environmental license, free trade zone benefits and related assets necessary to carry outthe Maceo Project. In connection with the MOU, CI Calizas was represented by a non-governmental individual(the “Representative”).
After the execution of the MOU, one of CI Calizas’ former shareholders was linked to an expiration ofproperty proceeding by the Colombian Attorney General’s Office (the “Attorney General’s Office”) that, amongother measures, suspended CI Calizas’ ability to transfer certain assets to CEMEX Colombia as required by theMOU (the “Affected Assets”). In order to protect its interests in the Affected Assets, CEMEX Colombia joinedthe expiration of property proceeding, attended each procedural stage and cooperated with the Attorney General’sOffice. CEMEX Colombia also requested the dismissal of the expiration of property proceeding against theAffected Assets. On May 2, 2016, in order to collect further evidence, the Attorney General’s Office deniedCEMEX Colombia’s request for the dismissal of the expiration of property proceeding. The expiration ofproperty proceeding is in its investigative phase, pending the appointment of the ad litem curators by theAttorney General’s Office. Upon appointment of the ad litem curators, the evidentiary phase will commence andthe relevant evidence will be presented and studied. We expect that the Attorney General’s Office’s finaldecision as to whether it will proceed with the expiration of property proceeding with respect to the AffectedAssets could take five to ten years.
119

In July 2013, CEMEX Colombia entered into a five-year lease agreement (the “Lease Agreement”) with adepository that had been designated by the Colombian National Narcotics Directorate (Dirección Nacional deEstupefacientes) (the “CNND”) with respect to the Affected Assets. The Lease Agreement, along with anaccompanying governmental mandate, authorized CEMEX Colombia to continue the work necessary for theconstruction and operation of the Maceo Project during the expiration of property proceeding. The LeaseAgreement is currently set to expire on July 15, 2018, unless earlier terminated by the Colombian Administratorof Special Assets (Sociedad de Activos Especiales S.A.S) (the “SAE”), which assumed the functions of theCNND after the CNND’s liquidation. CEMEX Colombia plans to negotiate an extension to the term of the LeaseAgreement and intends to continue using the Affected Assets pursuant to the terms of the Lease Agreement andaccompanying mandate.
Assuming that CEMEX Colombia conducted itself in good faith, and taking into account that itsinvestments in the Maceo Project were incurred with the consent of the SAE and CI Calizas under the LeaseAgreement and the accompanying mandate, we believe the value of such investments is protected by Colombianlaw. Colombian law provides that, if a person builds on another person’s property with the knowledge of suchother person, the person that built on the property shall be compensated with the value of what was built orotherwise be transferred the property in the event the owner of the property decides to recover possession. Wealso believe that, during the term of the Lease Agreement and the accompanying mandate, CEMEX Colombiamay use the Affected Assets in order to operate the Maceo Project. In the event that CEMEX Colombia’s right tothe Affected Assets is extinguished in favor of the government of Colombia, which we believe is unlikely, theSAE may decide not to sell the Affected Assets to CEMEX Colombia or not to extend the Lease Agreement. Ineither case, under Colombian law, CEMEX Colombia would be entitled to compensation for the value of theinvestments made in the Maceo Project. As of March 31, 2017, we were not able to assess the likelihood ofCEMEX Colombia receiving an adverse decision relating to the expiration of property proceedings or if theownership of the assets subject to the MOU will be extinguished in favor of the Republic of Colombia. However,as of March 31, 2017, we believe that an adverse resolution in which CEMEX Colombia is not compensated forthe value of its investments in the Maceo Project could have a material adverse effect on our results ofoperations, liquidity or financial condition.
On December 30, 2013, CEMEX Colombia and the Representative entered into a different memorandum ofunderstanding (the “Land MOU”), pursuant to which the Representative would represent CEMEX Colombia inthe acquisition of lands adjacent to the Maceo Project. In connection with the Maceo Project, CEMEX Colombiaconveyed to the Representative over U.S.$15 million, including cash payments and interest (based on anexchange rate of 2,880.24 Colombian Pesos to U.S.$1.00 as of March 31, 2017). Due to the expiration ofproperty proceeding against the Affected Assets described above, the acquisition of the Affected Assets was notfinalized.
During 2016, CEMEX, S.A.B. de C.V. received reports through its anonymous reporting hotline regardingpotential misconduct by certain employees, including with regard to the Maceo Project. CEMEX, S.A.B. de C.V.initiated an investigation and internal audit pursuant to its corporate governance policies and its code of ethics.On September 23, 2016, CEMEX Latam disclosed that it had identified irregularities in the process for thepurchase of the land related to the Maceo Project in an accusation with the Attorney General’s Office so that theAttorney General’s Office may take the actions it deems appropriate. Further, on December 20, 2016, CEMEXLatam enhanced such filing with additional information and findings obtained as of such date.
On September 23, 2016, CEMEX Latam and CEMEX Colombia terminated the employment of the VicePresident of Planning of CEMEX Latam, who was also CEMEX Colombia’s Director of Planning, and the LegalCounsel of CEMEX Latam, who was also the General Counsel of CEMEX Colombia. In addition, effective as ofSeptember 23, 2016, the Chief Executive Officer of CEMEX Latam, who was also the President of CEMEXColombia, resigned from both positions. On October 4, 2016, in order to strengthen levels of leadership,management and corporate governance practices, the Board of Directors of CEMEX Latam resolved to split theroles of Chairman of the Board of Directors of CEMEX Latam, Chief Executive Officer of CEMEX Latam and
120

Director of CEMEX Colombia, and appointed a new Chairman of the Board of Directors of CEMEX Latam, anew Chief Executive Officer of CEMEX Latam, a new Director of CEMEX Colombia and a new Vice Presidentof Planning of CEMEX Latam and CEMEX Colombia. A new legal counsel for CEMEX Latam and CEMEXColombia was also appointed during the fourth quarter of 2016.
Additionally, pursuant to the requirements of CEMEX, S.A.B. de C.V.’s and CEMEX Latam’s auditcommittees, CEMEX Colombia retained external counsel to assist CEMEX Latam and CEMEX Colombia tocollaborate as necessary with the Attorney General’s Office, as well as to assist on other related matters. Aforensic investigator in Colombia was engaged, as well.
The Attorney General’s Office is investigating the irregularities in connection with the transactionsconducted pursuant to the MOU and the Land MOU. Such investigation is in its initial phase and, as such, wecannot predict what actions, if any, the Attorney General’s Office may implement. Any actions by the AttorneyGeneral’s Office and any actions taken by us in response to the aforementioned irregularities regarding theMaceo Project, including, but not limited to, the departure of the abovementioned executives, could have amaterial adverse effect on our results of operations, liquidity or financial condition.
SEC Investigation Relating to the Legal Proceedings in Colombia. In December 2016, CEMEX, S.A.B. deC.V. received subpoenas from the SEC seeking information to determine whether there have been any violationsof the U.S. Foreign Corrupt Practices Act stemming from the Maceo Project. These subpoenas do not mean thatthe SEC has concluded that CEMEX, S.A.B. de C.V. or any of its affiliates violated the law. As discussed in “—Maceo, Colombia—Legal Proceedings in Colombia,” internal audits and investigations by CEMEX, S.A.B. deC.V. and CEMEX Latam had raised questions about payments relating to the Maceo Project. The payments madeto the Representative in connection with the Maceo Project did not adhere to CEMEX, S.A.B. de C.V.’s andCEMEX Latam’s internal controls. As announced on September 23, 2016, the CEMEX Latam and CEMEXColombia officers responsible for the implementation and execution of the above referenced payments wereterminated and the then Chief Executive Officer of CEMEX Latam resigned. CEMEX, S.A.B. de C.V. has beencooperating with the SEC and the Attorney General’s Office and intends to continue cooperating fully with theSEC and the Attorney General’s Office. It is possible that the United States Department of Justice orinvestigatory entities in other jurisdictions may also open investigations into this matter. To the extent they do so,CEMEX, S.A.B. de C.V. intends to cooperate fully with any such inquiries. As of March 31, 2017, CEMEX,S.A.B. de C.V. is unable to predict the duration, scope, or outcome of the SEC investigation or any otherinvestigation that may arise; however, CEMEX, S.A.B. de C.V. does not expect the SEC investigation to have amaterial adverse impact on its consolidated results of operations, liquidity or financial position.
Maceo, Colombia—Operational Matters. On October 27, 2016, CEMEX Latam decided to postpone thecommencement of operations of the cement plant in Maceo, Colombia. This decision was mainly due to thefollowing circumstances:
(1) CEMEX Colombia has not received permits required to finalize road access to such cement plant. Ifsuch permits are obtained, CEMEX Latam estimates that the road access could be available in July2017. The only existing access to such cement plant cannot guarantee safety or operations and couldlimit the capacity to transport products from the cement plant;
(2) CEMEX Colombia has not received a final response to the request to expand the free trade zone thatcovers the Maceo Project in order to commission a new clinker line at such cement plant. Failure toobtain such expansion would jeopardize CEMEX Colombia’s capability to consolidate the benefits thatwould otherwise be available for CEMEX Colombia in the area. As of March 31, 2017, the ColombianMinistry of Trade, Industry and Tourism (Ministerio de Comercio, Industria y Turismo) has notreached a final decision with respect to CEMEX Colombia’s request to expand the free trade zone.CEMEX Colombia believes the delay in such decision could be related to the expiration of propertyproceeding against the Affected Assets, as discussed in “—Maceo, Colombia—Legal Proceedings inColombia”;
121
(3) The environmental license and the mining concession related to the Maceo Project are currently heldby different legal entities, which is contrary to typical procedure in Colombia. The environmentallicense related to the Maceo Project is held by Central de Mezclas S.A. (“Central de Mezclas”), asubsidiary of CEMEX Colombia. However, the mining permit related to the Maceo Project wasremanded back to CI Calizas as a result of the revocation of such mining concession by the MiningSecretariat (Secretaría de Minas) of Antioquia in December 2013; and
(4) CEMEX Colombia determined that the area covered by the environmental license related to the MaceoProject partially overlapped with a District of Integrated Management (Distrito de Manejo Integrado),which could limit the granting of the environmental license modification. Such modification seeks toachieve an increase in the proposed production under the project of up to 950,000 tons.
In connection with the environmental license that had been issued for the Maceo Project, during the secondhalf of 2016, Corantioquia, the regional environmental agency with jurisdiction over the Maceo Projectenvironmental license, requested authorization and consent from Central de Mezclas to reverse the assignment ofthe environmental license for the Maceo Project back to CI Calizas, which also holds the corresponding miningtitle. Central de Mezclas has petitioned Corantioquia to evaluate the basis for such request.
CEMEX Colombia had requested a modification to the environmental license, and on December 13, 2016,Corantioquia notified Central de Mezclas that it had adopted the decision to deny the request for modification ofthe environmental license related to the Maceo Project to 950,000 tons per annum on the basis of the overlap ofthe project area with the District of Integrated Management. On December 14, 2016, Central de Mezclasappealed the decision. On March 28, 2017, Central de Mezclas was notified of Corantioquia’s decision, whichaffirmed the decision that had previously denied the modification of the environmental license for a 950,000 perannum project. As a result, as of March 31, 2017, CEMEX Colombia was actively working on the zoning andcompatibility of the District of Integrated Management, as well as analyzing alternatives for a partial adjustmentto the District of Integrated Management, to avoid future discussions regarding feasibility of expanding theproposed production in the Maceo Project beyond 950,000 tons per annum.
Once these alternatives are implemented, CEMEX Colombia will reconsider submitting a new requestpursuing the modification of the environmental license to expand its production of 950,000 tons per annum asinitially planned. In the meantime, CEMEX Colombia will limit its activities to those that do not have a negativeimpact on the District of Integrated Management.
CEMEX Colombia and Central de Mezclas plan to continue to work on solving the issues causing thepostponement of the commissioning of the Maceo Project cement plant in order to capture, as soon as reasonablypossible, the full operating benefits of this facility in Colombia. CEMEX Colombia believes some of these issuescould be related to the expiration of property proceeding against the Affected Assets. As of March 31, 2017, wedo not expect to suffer a material adverse impact to our results of operations, liquidity or financial condition as aresult of the Maceo Project cement plant not being commissioned to operate pending resolution of these issues.
Quarry matter in France. One of our subsidiaries in France, CEMEX Granulats Rhône Méditerranée(“CEMEX Granulats”), is a party to a contract executed in 1990 (the “Quarry Contract”) with SCI La Quinoniere(“SCI”), pursuant to which CEMEX Granulats has drilling rights to extract reserves and conduct quarryremediation at a quarry in the Rhone region of France. In 2012, SCI filed a claim against CEMEX Granulats forbreach of the Quarry Contract, requesting the rescission of the Quarry Contract and damages plus interest,totaling an aggregate amount of approximately €55 million (approximately U.S.$58.63 million as of March 31,2017, based on an exchange rate of €0.9380 to U.S.$1.00), resulting from CEMEX Granulats having partiallyfilled the quarry allegedly in breach of the terms of the Quarry Contract. On May 18, 2016, CEMEX Granulatswas notified about an adverse judgment in this matter by the corresponding court in Lyon, France, primarilyordering the rescission of the Quarry Contract and damages plus interest, totaling an aggregate amount ofapproximately €55 million (approximately U.S.$58.63 million as of March 31, 2017, based on an exchange rate
122

of €0.9380 to U.S.$1.00). We believe this judgment is not enforceable. On June 6, 2016, CEMEX Granulats filedthe notice of appeal with the appeals court in Lyon, France and on September 5, 2016, CEMEX Granulats filedthe first submission of the full appeal together with its arguments and evidence. Proceedings on any additionalhearings regarding this appeal or any other actions CEMEX Granulats may initiate in this matter could takeapproximately 18 months to be finalized. There can be no assurance as to whether or not CEMEX Granulats willreceive an adverse result to any appeals or any other recourses it may pursue. An adverse resolution on thismatter could have a material adverse impact on our results of operations, liquidity and financial condition.
Panamanian Height Restriction Litigation. On July 30, 2008, the Panamanian Authority of CivilAeronautics (Autoridad de Aeronáutica Civil) (the “AAC”) denied a request from Cemento Bayano, oursubsidiary, to erect structures above the permitted height restriction applicable to certain areas surrounding theCalzada Larga Airport. This height restriction applies to the construction area of our cement plant’s second line.Cemento Bayano formally submitted a request to the AAC to reconsider its denial. On October 14, 2008, theAAC granted permission to construct the tallest building of the second line, under the following conditions: that(i) Cemento Bayano assumes any liability arising from any incident or accident caused by the construction ofsuch building, and (ii) there would be no further permissions for additional structures. Cemento Bayano filed anappeal with respect to both conditions, considering that the construction involved building 12 additionalstructures. On March 13, 2009, the AAC issued an explanatory note, stating that (i) should an accident occur inthe Calzada Larga Airport’s perimeter, an investigation shall be conducted in order to determine the cause andfurther responsibility, and (ii) there may be no further permissions for additional structures of the same height asthe tallest structure already authorized. Therefore, additional permits may be obtained as long as the structuresare lower than the tallest building, based on a case-by-case analysis to be conducted by the AAC. CementoBayano filed an authorization request for the construction of the project’s 12 remaining structures. On June 11,2009, the AAC issued a decision authorizing three of the 12 remaining structures and denying permits for nineadditional structures above the permitted height restriction applicable to certain areas surrounding Calzada LargaAirport. On June 16, 2009, Cemento Bayano requested the AAC to reconsider its denial. On May 20, 2010, theACC issued a report stating that all vertical structures erected by Cemento Bayano complied with the applicablesignaling and lighting requirements in order to receive their respective authorizations. On August 9, 2016, theAAC issued a letter approving the existence of all of the above mentioned structures and requiring CementoBayano to illuminate all structures. This is the AAC’s final decision regarding this matter. As of March 31, 2017,this matter was closed.
As of March 31, 2017, we are involved in various legal proceedings involving, but not limited to, productwarranty claims, environmental claims, claims regarding the procurement and supply of products,indemnification claims relating to divestments and acquisitions and similar types of claims brought against usthat have arisen in the ordinary course of business. We believe we have made adequate provisions to cover bothcurrent and contemplated general and specific litigation risks, and we believe these matters will be resolvedwithout any significant effect on our operations, financial position and results of operations. We are sometimesable to make and disclose reasonable estimates of the expected loss or range of possible loss, as well as discloseany provision accrued for such loss. However, for a limited number of ongoing legal proceedings, we may not beable to make a reasonable estimate of the expected loss or range of possible loss or may be able to do so butbelieve that disclosure of such information on a case-by-case basis would seriously prejudice our position in theongoing legal proceedings or in any related settlement discussions. Accordingly, in these cases, we havedisclosed qualitative information with respect to the nature and characteristics of the contingency, but have notdisclosed the estimate of the range of potential loss.
Item 4A—Unresolved Staff Comments
Not applicable.
123

Item 5—Operating and Financial Review and Prospects
Cautionary Statement Regarding Forward-Looking Statements
This annual report contains forward-looking statements within the meaning of the U.S. federal securitieslaws. We intend these forward-looking statements to be covered by the safe harbor provisions for forward-looking statements in the U.S. federal securities laws. In some cases, these statements can be identified by the useof forward-looking words such as “may,” “should,” “could,” “anticipate,” “estimate,” “expect,” “plan,”“believe,” “predict,” “potential” and “intend” or other similar words. These forward-looking statements reflectour current expectations and projections about future events based on our knowledge of present facts andcircumstances and assumptions about future events. These statements necessarily involve risks and uncertaintiesthat could cause actual results to differ materially from our expectations. Some of the risks, uncertainties andother important factors that could cause results to differ, or that otherwise could have an impact on us or oursubsidiaries, include:
• the cyclical activity of the construction sector;
• our exposure to other sectors that impact our business, such as, but not limited to, the energy sector;
• competition;
• general political, economic and business conditions in the markets in which we operate or that affectour operations;
• the regulatory environment, including environmental, tax, antitrust and acquisition-related rules andregulations;
• our ability to satisfy our obligations under our material debt agreements, the indentures that govern ourSenior Secured Notes and our other debt instruments;
• the impact of our below investment grade debt rating on our cost of capital;
• our ability to consummate asset sales, fully integrate newly acquired businesses, achieve cost-savingsfrom our cost-reduction initiatives and implement our global pricing initiatives for our products;
• the increasing reliance on information technology infrastructure for our invoicing, procurement,financial statements and other processes that can adversely affect operations in the event that theinfrastructure does not work as intended, experiences technical difficulties or is subjected to cyber-attacks;
• weather conditions;
• natural disasters and other unforeseen events; and
• the other risks and uncertainties described under “Item 3—Key Information—Risk Factors” andelsewhere in this annual report.
Readers are urged to read this annual report and carefully consider the risks, uncertainties and other factorsthat affect our business. The information contained in this annual report is subject to change without notice, andwe are not obligated to publicly update or revise forward-looking statements. Readers should review futurereports filed by us with the SEC.
This annual report also includes statistical data regarding the production, distribution, marketing and sale ofcement, ready-mix concrete, clinker and aggregates. We generated some of this data internally, and some wasobtained from independent industry publications and reports that we believe to be reliable sources. We have notindependently verified this data nor sought the consent of any organizations to refer to their reports in this annualreport.
124
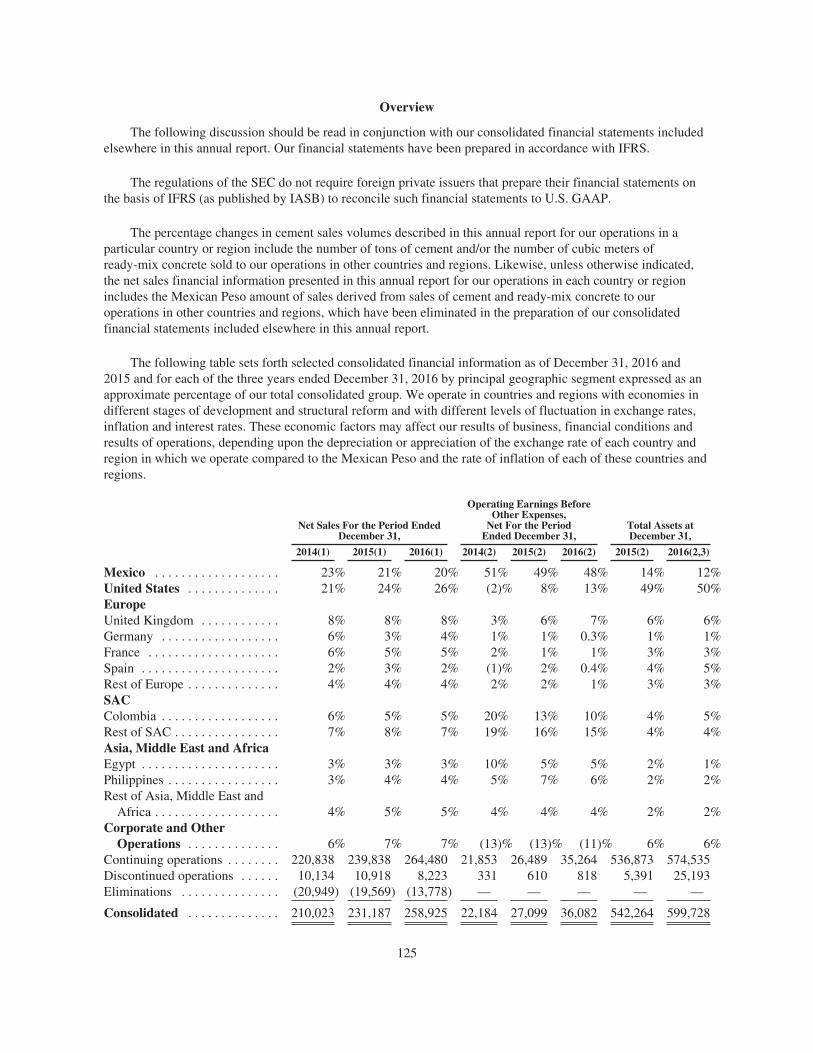
Overview
The following discussion should be read in conjunction with our consolidated financial statements includedelsewhere in this annual report. Our financial statements have been prepared in accordance with IFRS.
The regulations of the SEC do not require foreign private issuers that prepare their financial statements onthe basis of IFRS (as published by IASB) to reconcile such financial statements to U.S. GAAP.
The percentage changes in cement sales volumes described in this annual report for our operations in aparticular country or region include the number of tons of cement and/or the number of cubic meters ofready-mix concrete sold to our operations in other countries and regions. Likewise, unless otherwise indicated,the net sales financial information presented in this annual report for our operations in each country or regionincludes the Mexican Peso amount of sales derived from sales of cement and ready-mix concrete to ouroperations in other countries and regions, which have been eliminated in the preparation of our consolidatedfinancial statements included elsewhere in this annual report.
The following table sets forth selected consolidated financial information as of December 31, 2016 and2015 and for each of the three years ended December 31, 2016 by principal geographic segment expressed as anapproximate percentage of our total consolidated group. We operate in countries and regions with economies indifferent stages of development and structural reform and with different levels of fluctuation in exchange rates,inflation and interest rates. These economic factors may affect our results of business, financial conditions andresults of operations, depending upon the depreciation or appreciation of the exchange rate of each country andregion in which we operate compared to the Mexican Peso and the rate of inflation of each of these countries andregions.
Net Sales For the Period EndedDecember 31,
Operating Earnings BeforeOther Expenses,
Net For the PeriodEnded December 31,
Total Assets atDecember 31,
2014(1) 2015(1) 2016(1) 2014(2) 2015(2) 2016(2) 2015(2) 2016(2,3)
Mexico . . . . . . . . . . . . . . . . . . . 23% 21% 20% 51% 49% 48% 14% 12%United States . . . . . . . . . . . . . . 21% 24% 26% (2)% 8% 13% 49% 50%EuropeUnited Kingdom . . . . . . . . . . . . 8% 8% 8% 3% 6% 7% 6% 6%Germany . . . . . . . . . . . . . . . . . . 6% 3% 4% 1% 1% 0.3% 1% 1%France . . . . . . . . . . . . . . . . . . . . 6% 5% 5% 2% 1% 1% 3% 3%Spain . . . . . . . . . . . . . . . . . . . . . 2% 3% 2% (1)% 2% 0.4% 4% 5%Rest of Europe . . . . . . . . . . . . . . 4% 4% 4% 2% 2% 1% 3% 3%SACColombia . . . . . . . . . . . . . . . . . . 6% 5% 5% 20% 13% 10% 4% 5%Rest of SAC . . . . . . . . . . . . . . . . 7% 8% 7% 19% 16% 15% 4% 4%Asia, Middle East and AfricaEgypt . . . . . . . . . . . . . . . . . . . . . 3% 3% 3% 10% 5% 5% 2% 1%Philippines . . . . . . . . . . . . . . . . . 3% 4% 4% 5% 7% 6% 2% 2%Rest of Asia, Middle East and
Africa . . . . . . . . . . . . . . . . . . . 4% 5% 5% 4% 4% 4% 2% 2%Corporate and Other
Operations . . . . . . . . . . . . . . 6% 7% 7% (13)% (13)% (11)% 6% 6%Continuing operations . . . . . . . . 220,838 239,838 264,480 21,853 26,489 35,264 536,873 574,535Discontinued operations . . . . . . 10,134 10,918 8,223 331 610 818 5,391 25,193Eliminations . . . . . . . . . . . . . . . (20,949) (19,569) (13,778) — — — — —
Consolidated . . . . . . . . . . . . . . 210,023 231,187 258,925 22,184 27,099 36,082 542,264 599,728
125

(1) Percentages by reporting segment are determined before eliminations resulting from consolidation.(2) Percentages by reporting segment are determined after eliminations resulting from consolidation.(3) Total assets at December 31, 2015 exclude assets of our Austria and Hungary discontinued operations. See
note 4A to our consolidated financial statements included elsewhere in this annual report.(4) Total assets at December 31, 2016 exclude assets of our Thailand and Bangladesh discontinued operations.
See note 4A to our consolidated financial statements included elsewhere in this annual report.
Critical Accounting Policies
The preparation of financial statements in accordance with IFRS principles requires management to makeestimates and assumptions that affect reported amounts of assets and liabilities and the disclosure of contingentassets and liabilities at the date of the financial statements, as well as the reported amounts of revenues andexpenses during the period. These assumptions are reviewed on an ongoing basis using available information.Actual results could differ from these estimates.
The main items subject to estimates and assumptions by management include, among others, impairmenttests of long-lived assets, allowances for doubtful accounts and inventories, recognition of deferred income taxassets, uncertain tax positions, as well as the measurement of financial instruments at fair value, asset retirementobligations, emission rights and the assets and liabilities related to employee benefits. Significant judgment bymanagement is required to appropriately assess the amounts of these assets and liabilities.
Identified below are the accounting policies we have applied under IFRS that are critical to understandingour overall financial reporting.
Income Taxes
Our operations are subject to taxation in many different jurisdictions throughout the world. The effectsreflected in profit or loss for income taxes include the amounts incurred during the period and the amounts ofdeferred income taxes, determined according to the income tax law applicable to each subsidiary. Under IFRS,we recognize deferred tax assets and liabilities using a balance sheet methodology which requires adetermination of the temporary differences resulting from comparing the book and taxable values of assets andliabilities, considering tax loss carryforwards as well as other recoverable tax and credits, to the extent that it isprobable that future taxable profits will be available against which they can be utilized. Our worldwide taxposition is highly complex and subject to numerous laws that require interpretation and application and that arenot consistent among the countries in which we operate. Significant judgment is required to appropriately assessthe amounts of tax assets and liabilities. We expect to recover or settle the carrying amount of our assets andliabilities at the end of the reporting period. If this determination cannot be made, a valuation allowance isestablished to reduce the carrying value of the asset.
For the recognition of deferred tax assets derived from net operating losses and their correspondingvaluation reserve, we make an assessment of:
(a) the aggregate amount of self-determined tax loss carryforwards included in our income tax returns ineach country where we consider, based on available evidence, that the tax authorities would not reject such self-determined tax loss carryforwards; and
(b) the likelihood of the recoverability of such tax loss carryforwards prior to their expiration through ananalysis of estimated future taxable income.
If we consider that it is more likely than not that the tax authorities would reject a self-determined deferredtax asset, we would decrease such deferred tax assets. Likewise, if we consider that we would not be able to use adeferred tax carryforward asset before its expiration, we would increase our valuation reserve. Both situationswould result in additional income tax for the period in which such determination is made.
126

We consider all available positive and negative evidence including factors such as market conditions,industry analysis, our expansion plans, projected taxable income, carryforward periods, current tax structure,potential changes or adjustments in tax structure, tax planning strategies, future reversals of existing temporarydifferences, etc., in the determination of whether it is probable that such deferred tax assets will ultimately berealized.
Every reporting period, we analyze our actual results versus our estimates and adjust our tax asset valuationsas necessary. If actual results vary from our estimates, the deferred tax asset and/or valuations may be affectedand necessary adjustments will be made based on relevant information. Any adjustments recorded will affect ourstatement of operations in such period.
The income tax effects from an uncertain tax position are recognized when it is probable that the positionwill be sustained based on its technical merits and assuming that the tax authorities will examine each positionand have full knowledge of all relevant information, and they are measured using a cumulative probabilitymodel. Each position has been considered on its own, regardless of its relation to any other broader taxsettlement. The probability threshold represents a positive assertion by management that we are entitled to theeconomic benefits of a tax position. If it is improbable for a tax position to be sustained, no benefits of theposition are recognized. Our policy is to recognize interest and penalties related to unrecognized tax benefits aspart of the income tax in the consolidated statements of operations.
Our overall strategy is to structure our worldwide operations to minimize or defer the payment of incometaxes on a consolidated basis. Many of the activities we undertake in pursuing this tax reduction strategy arehighly complex and involve interpretations of tax laws and regulations in multiple jurisdictions and are subject toreview by the relevant taxing authorities. It is possible that the taxing authorities could challenge our applicationof these regulations to our operations and transactions. The taxing authorities have in the past challengedinterpretations that we have made and have assessed additional taxes. Although we have, from time to time, paidsome of these additional assessments, in general, we believe that these assessments have not been material andthat we have been successful in sustaining our positions. No assurance can be given, however, that we willcontinue to be as successful as we have been in the past or that pending appeals of current tax assessments will bejudged in our favor. Our effective income tax rate is determined by dividing the line item Income tax in ourconsolidated statements of operations, which is comprised by current and deferred income tax benefit or expensefor the period, into the line item Gain (loss) before income tax. This effective tax rate is further reconciled to ourstatutory tax rate applicable in Mexico and is presented in note 19C to our 2016 audited consolidated financialstatements included elsewhere in this annual report. During 2014, we experienced consolidated losses beforeincome tax. In any given period where a loss before income tax is reported, the reference statutory tax rate towhich CEMEX reconciles its effective income tax rate is shown as a negative percentage. A significant effect inCEMEX’s effective tax rate, and consequently in the aforementioned reconciliation of CEMEX’s effective taxrate, relates to the difference between the statutory income tax rate in Mexico of 30% against the applicableincome tax rates of each country where we operate. For the years ended December 31, 2016, 2015 and 2014, thestatutory tax rates in CEMEX’s main operations were as follows:
Country 2014 2015 2016
Mexico . . . . . . . . . . . . . . . . . . . . . . . . . . . . . . . . 30.0% 30.0% 30.0%United States . . . . . . . . . . . . . . . . . . . . . . . . . . . 35.0% 35.0% 35.0%United Kingdom . . . . . . . . . . . . . . . . . . . . . . . . . 21.5% 20.3% 20.0%France . . . . . . . . . . . . . . . . . . . . . . . . . . . . . . . . . 38.0% 38.0% 34.4%Germany . . . . . . . . . . . . . . . . . . . . . . . . . . . . . . . 29.8% 29.8% 28.2%Spain . . . . . . . . . . . . . . . . . . . . . . . . . . . . . . . . . . 30.0% 28.0% 25.0%Philippines . . . . . . . . . . . . . . . . . . . . . . . . . . . . . 30.0% 30.0% 30.0%Colombia . . . . . . . . . . . . . . . . . . . . . . . . . . . . . . 34.0% 39.0% 40.0%Egypt . . . . . . . . . . . . . . . . . . . . . . . . . . . . . . . . . 30.0% 22.5% 22.5%Switzerland . . . . . . . . . . . . . . . . . . . . . . . . . . . . . 9.6% 9.6% 9.6%Others . . . . . . . . . . . . . . . . . . . . . . . . . . . . . . . . . 10.0% - 39.0% 7.8% - 39.0% 7.8% - 39%
127

Our current and deferred income tax amounts included in our consolidated statements of operations arehighly variable, and are subject, among other factors, to the amounts of taxable income determined in eachjurisdiction in which we operate. Such amounts of taxable income depend on factors such as sale volumes andprices, costs and expenses, exchange rates fluctuations and interest on debt, among others, as well as on theestimated tax assets at the end of the period due to the expected future generation of taxable gains in eachjurisdiction. See our discussion of operations included elsewhere in this “Item 5—Operating and FinancialReview and Prospects.”
Derivative financial instruments
In compliance with the guidelines established by our risk management committee and the restrictions in ourdebt agreements and debt instruments, we use derivative financial instruments such as interest rate and currencyswaps, currency and equity forward arrangements, and other instruments, in order to change the risk profileassociated with changes in interest rates, the foreign exchange rates of debt agreements, or both, as an alternativesource of financing, and as hedges of: (i) highly probable forecasted transactions, (ii) purchases of certaincommodities, and (iii) our net assets in foreign subsidiaries. These instruments have been negotiated withinstitutions with significant financial capacity; therefore, we consider the risk of non-compliance with theobligations agreed upon by such counterparties to be minimal.
Derivative financial instruments are recognized as assets or liabilities in the balance sheet at their estimatedfair values, and the changes in such fair values are recognized in the statements of operations within “Otherfinancial (expense) income, net” for the period in which they occur, except for changes in the fair value ofderivative instruments associated with cash flow hedges, in which case, such changes in fair value are recognizedin stockholders’ equity, and are reclassified to earnings as the interest expense of the related debt is accrued, inthe case of interest rate swaps, or when the underlying products are consumed in the case of contracts on theprice of raw materials, fuel and commodities. Likewise, in hedges of the net investment in foreign subsidiaries,changes in fair value are recognized in stockholders’ equity as part of the foreign currency translation result,which reversal to earnings would take place upon disposal of the foreign investment. During the reported periods,we have not designated any derivative instruments in fair value hedges. Derivative instruments are negotiatedwith institutions with significant financial capacity; therefore, CEMEX believes the risk of non-performance ofthe obligations agreed to by such counterparties to be minimal. See note 16D to our 2016 audited consolidatedfinancial statements included elsewhere in this annual report.
Accrued interest generated by derivative financial instruments, when applicable, is recognized as financialexpense, adjusting the effective interest rate of the related debt. Pursuant to their recognition at fair value underIFRS, our balance sheets and statements of operations are subject to volatility arising from variations in interestrates, exchange rates, share prices and the counterparty’s credit risk, among other conditions established in ourderivative financial instruments. The estimated fair value under IFRS represents the price that would be receivedto sell an asset or paid to transfer a liability in an orderly transaction between market participants at themeasurement date, considering the counterparty’s credit risk in the valuation, that is, an exit price or a market-based measurement.
The concept of exit value is premised on the existence of a market and market participants for the specificasset or liability. When there is no market and/or market participants willing to make a market, IFRS establishesa fair value hierarchy that prioritizes the inputs to valuation techniques used to measure fair value. The hierarchygives the highest priority to unadjusted quoted prices in active markets for identical assets or liabilities (Level 1measurements) and the lowest priority to measurements involving significant unobservable inputs (Level 3measurements). The three levels of the fair value hierarchy are as follows:
• Level 1—It represents quoted prices (unadjusted) in active markets for identical assets or liabilities thatwe have the ability to access at the measurement date. A quote price in an active market provides themost reliable evidence of fair value and is used without adjustment to measure fair value wheneveravailable.
128

• Level 2—This are inputs other than quoted prices in active markets that are observable for the asset orliability, either directly or indirectly, and are used mainly to determine the fair value of securities,investments or loans that are not actively traded. Level 2 inputs included equity prices, certain interestrates and yield curves, implied volatility, credit spreads and other market corroborated inputs, includinginputs extrapolated from other observable inputs. In the absence of Level 1 inputs we determined fairvalues by iteration of the applicable Level 2 inputs, the number of securities and/or the other relevantterms of the contract, as applicable.
• Level 3—This are unobservable inputs for the asset or liability. We use unobservable inputs todetermine fair values, to the extent there are no Level 1 or Level 2 inputs, in valuation models such asBlack-Scholes, binomial, discounted cash flows or multiples of Operating EBITDA, including riskassumptions consistent with what market participants would use to arrive at fair value.
Significant judgment and estimates by management are required to appropriately identify the correspondinglevel of fair value applicable to each derivative financing transaction, as well as to assess the amounts of theresulting assets and liabilities, mainly in respect of level 2 and level 3 fair values, in order to account for theeffects of derivative financial instruments in the financial statements. See note 16D to our 2016 auditedconsolidated financial statements included elsewhere in this annual report.
Impairment of long-lived assets
Our balance sheet reflects significant amounts of long-lived assets (including property, machinery andequipment, goodwill, intangible assets of definite life and other investments) associated with our operationsthroughout the world. Many of these amounts have resulted from past acquisitions, which have required us toreflect these assets at their fair market values at the dates of acquisition. According to their characteristics and thespecific accounting rules related to them, we assess the recoverability of our long-lived assets at least once ayear, normally during the fourth quarter, as is the case for goodwill, or whenever events or circumstances arisethat we believe trigger a requirement to review such carrying values, as is the case with property, machinery andequipment and intangible assets of definite life.
Property, machinery and equipment, intangible assets of definite life and other investments are tested forimpairment upon the occurrence of factors such as the occurrence of a significant adverse event, changes in ouroperating environment, changes in projected use or in technology, as well as expectations of lower operatingresults for each cash generating unit, in order to determine whether their carrying amounts may not be recovered.In such cases, an impairment loss is recorded in the statements of operations for the period when suchdetermination is made within “Other expenses, net.” The impairment loss of an asset results from the excess ofthe asset’s carrying amount over its recoverable amount, corresponding to the higher of the fair value of the asset,less costs to sell such asset, and the asset’s value in use, the latter represented by the net present value ofestimated cash flows related to the use and eventual disposal of the asset.
We do not have intangible assets of indefinite life other than goodwill. As mentioned above, goodwill istested for impairment when required due to significant adverse changes or at least once a year, during the lastquarter of such year, by determining the recoverable amount of the group of cash-generating units (“CGUs”) towhich goodwill balances have been allocated, which consists of the higher of such group of CGUs fair value, lesscost to sell and its value in use, represented by the discounted amount of estimated future cash flows to begenerated by such CGUs to which goodwill has been allocated. Other intangible assets of indefinite life may betested at the CGU or group of CGUs level, depending on their allocation. We determine discounted cash flowsgenerally over periods of five years. In specific circumstances, when, according to our experience, actual resultsfor a given cash-generating unit do not fairly reflect historical performance and most external economic variablesprovide us with confidence that a reasonably determinable improvement in the mid-term is expected in theiroperating results, management uses cash flow projections over a period of up to ten years, to the point in whichfuture expected average performance resembles the historical average performance and to the extent we have
129

detailed, explicit and reliable financial forecasts and is confident and can demonstrate its ability, based on pastexperience, to forecast cash flows accurately over that longer period. If the value in use of a group of CGUs towhich goodwill has been allocated is lower than its corresponding carrying amount, we determine the fair valueof our reporting units using methodologies generally accepted in the market to determine the value of entities,such as multiples of Operating EBITDA and by reference to other market transactions, among others. Animpairment loss under IFRS is recognized within other expenses, net, if the recoverable amount is lower than thenet book value of the group of CGUs to which goodwill has been allocated. Impairment charges recognized ongoodwill are not reversed in subsequent periods.
For the years ended December 31, 2014, 2015 and 2016, the geographic segments we reported in note 4C toour 2016 audited consolidated financial statements included elsewhere in this annual report represent our groupsof CGUs to which goodwill has been allocated for purposes of testing goodwill for impairment. In arriving at thisconclusion, we considered: (a) that after the acquisition, goodwill was allocated at the level of the geographicoperating segment; (b) that the operating components that comprise the reported segment have similar economiccharacteristics; (c) that the reported segments are used by us to organize and evaluate its activities in its internalinformation system; (d) the homogenous nature of the items produced and traded in each operative component,which are all used by the construction industry; (e) the vertical integration in the value chain of the productscomprising each component; (f) the type of clients, which are substantially similar in all components, (g) theoperative integration among components; and (h) the compensation system of specific country is based on theconsolidated results of the geographic segment and not on the particular results of the components. In addition,the country level represents the lowest level within us at which goodwill is monitored for internal managementpurposes.
Significant judgment by management is required to appropriately assess the fair values and values in use ofthese assets. Impairment tests are significantly sensitive to, among other factors, the estimation of future prices ofour products, the development of operating expenses, local and international economic trends in the constructionindustry, the long-term growth expectations in the different markets as well as the discount rates and the growthrates in perpetuity applied. For purposes of estimating future prices, we use, to the extent available, historicaldata plus the expected increase or decrease according to information issued by trusted external sources, such asnational construction or cement producer chambers and/or in governmental economic expectations. Operatingexpenses are normally measured as a constant proportion of revenues, following past experience. However, suchoperating expenses are also reviewed considering external information sources in respect to inputs that behaveaccording to international prices, such as gas and oil. We use specific pre-tax discount rates for each group ofCGUs to which goodwill is allocated, which are applied to pre-tax cash flows. The amounts of estimatedundiscounted cash flows are significantly sensitive to the growth rate in perpetuity applied. Likewise, theamounts of discounted estimated future cash flows are significantly sensitive to the weighted average cost ofcapital (discount rate) applied. The higher the growth rate in perpetuity applied, the higher the amount obtainedof undiscounted future cash flows by group of CGUs obtained. Conversely, the higher the discount rate applied,the lower the amount obtained of discounted estimated future cash flows by group of CGUs obtained.Additionally, we monitor the useful lives assigned to these long-lived assets for purposes of depreciation andamortization, when applicable. This determination is subjective and is integral to the determination of whetherimpairment has occurred.
130

During the last quarter of 2014, 2015 and 2016, we performed our annual goodwill impairment test. Basedon these analyses, we did not determine impairment losses of goodwill in any of the reported periods. See note15C to our 2016 audited consolidated financial statements included elsewhere in this annual report. Pretaxdiscount rates and long-term growth rates used to determine the discounted cash flows in the group of CGUs withthe main goodwill balances in 2014, 2015 and 2016 are as follows:
Discount rates Growth rates
Reporting units 2014 2015 2016 2014 2015 2016
United States . . . . . . . . . . . . . 8.7% 8.6% 8.6% 2.5% 2.5% 2.5%Spain . . . . . . . . . . . . . . . . . . . 10.1% 9.9% 9.5% 2.0% 1.9% 1.6%Mexico . . . . . . . . . . . . . . . . . . 9.7% 9.6% 9.8% 3.8% 3.5% 2.9%Colombia . . . . . . . . . . . . . . . . 9.7% 9.8% 10.0% 3.0% 4.0% 4.0%France . . . . . . . . . . . . . . . . . . 9.2% 9.0% 9.1% 1.7% 1.6% 1.8%UAE . . . . . . . . . . . . . . . . . . . . 10.4% 10.2% 10.2% 3.4% 3.6% 3.4%United Kingdom . . . . . . . . . . 9.0% 8.8% 8.8% 2.4% 2.3% 1.9%Egypt . . . . . . . . . . . . . . . . . . . 11.6% 12.5% 11.4% 4.0% 4.6% 6.0%Range of discount rates in
other countries . . . . . . . . . . 9.2% - 14.0% 9.0% - 13.8% 9.1% - 12.8% 2.1% - 4.9% 2.4% - 4.3% 2.2% - 7.0%
As of December 31, 2016, the discount rates we used in our cash flow projections remained relatively flat incountries with the most significant goodwill balances as compared to the values determined in 2015. During theyear, the funding cost observed in the industry decreased from 6.9% in 2015 to 6.2% in 2016, and the risk-freerate also decreased from approximately 3.2% in 2015 to 2.7% in 2016. These reductions were partially offset byoverall increases in the sovereign risk rate of the majority of the countries where CEMEX operates as well as inthe risk multiple associated with CEMEX that increased from 1.08 in 2015 to 1.29 in 2016. As of December 31,2015, the discount rates remained almost flat in most cases as compared to the values determined in 2014.Among other factors, the funding cost observed in the industry increased from 6.1% in 2014 to 6.9% in 2015, andthe risk free rate increased from approximately 3.1% in 2014 to 3.2 % in 2015. Nonetheless, these increases wereoffset by reductions in 2015 in the country specific sovereign yields in the majority of the countries whereCEMEX operates. As of December 31, 2014, the discount rates decreased mainly as a result of the reduction inthe funding cost as compared to the prior year and the reduction in the risk free rate, both being significantassumptions in the determination of the discount rates. In respect to long-term growth rates, following generalpractice under IFRS, CEMEX uses country specific rates, which are mainly obtained from the ConsensusEconomics, a compilation of analysts’ forecast worldwide, or from the International Monetary Fund when thefirst are not available for a specific country.
In connection with our assumptions included in the table above, we performed sensitivity analyses tochanges in assumptions, affecting the value in use of all groups of cash-generating units with an independentreasonably possible increase of 1% in the pre-tax discount rate, and an independent possible decrease of 1% inthe long-term growth rate. In addition, we performed cross-check analyses for reasonableness of our results usingmultiples of Operating EBITDA. In order to arrive at these multiples, which represent a reasonableness check ofour discounted cash flow models; we determined a weighted average of multiples of Operating EBITDA toenterprise value observed in the industry. The average multiple was then applied to a stabilized amount ofOperating EBITDA and the result was compared to the corresponding carrying amount for each group of cash-generating units to which goodwill has been allocated. As of December 31, 2015 and 2016, we considered anindustry weighted average Operating EBITDA multiple of 9.0. Our own EBITDA multiples to enterprise value asof the same dates were 8.7 times in 2015 and 8.9 times in 2016. The lowest multiple observed in our benchmarkas of December 31, 2015 and 2016 was 5.8 times and 5.9 times, and the highest was 18.0 times and 18.3 times,respectively.
As of December 31, 2016 and 2015, none of our sensitivity analyses resulted in a relative impairment risk inour operating segments.
131

Nonetheless, we continually monitor the evolution of the specific cash-generating units to which goodwillhas been allocated and, in the event that the relevant economic variables and the related cash flows projectionswould be negatively affected, it may result in a goodwill impairment loss in the future.
We maintain a market capitalization significantly lower than our levels prior to the 2008 global crisis, whichwe believe is due to several factors such as: a) the slower recovery of the construction industry in the UnitedStates, one of our main markets, which suffered one of the deepest recessions since the Great Depression, whichalso significantly affected our operations in key countries and regions such as Mexico and Europe, andconsequently our overall generation of cash flows; b) our significant amount of consolidated debt, whichgenerates uncertainty in the markets regarding our ability to meet our financial obligations; and c) the generalizedcapital outflows from emerging markets, such as Mexico and Colombia, mainly due to high volatility generatedby risk aversion in the global financial markets, to safer assets in developed countries such as the United States.In Dollar terms, our market capitalization as of December 31, 2016 was approximately U.S.$11.2 billion(Ps232.2 billion), reflecting an increase of approximately 52% in 2016 as compared to 2015. This increase wasmainly generated by initiatives to increase free cash flow from our operations and asset divestments aimed toreduce indebtedness and financial leverage, along with a reduction of risk aversion across global financialmarkets as U.S. stock indices reached new all-time highs and international oil prices partially recovered during2016 amid reduced global growth concerns. These trends occurred despite the continued depreciation ofemerging markets currencies against the U.S. Dollar in 2016 and continued uncertainty of the pace and timing ofactions to increase interest rates in the United States. Our market capitalization decreased by approximately 41%in 2015 compared to 2014, to approximately U.S.$7.4 billion (Ps126.8 billion). This decrease was mainly due tothe significant depreciation of the emerging markets currencies against the U.S. Dollar in 2015, which intensifiedin the second half of the year, as well as a significant reduction in the international oil prices, uncertaintygenerated by the pace and timing of actions to increase interest rates in the United States, China growth concerns,lower global growth expectations and the uncertainty of our income in U.S. Dollar terms from our operations inemerging markets such as Mexico and Colombia (countries with important dependence on oil revenues for theirgovernment budget), which may result in the cancellation or delay of government infrastructure projects.
As of December 31, 2016 and 2015, goodwill allocated to the United States accounted for approximately79% and 80%, respectively, of our total amount of consolidated goodwill. In connection with our determinationof value in use relative to our groups of CGUs in the United States in the reported periods, we have consideredseveral factors, such as the historical performance of such operating segment, including operating losses in recentyears, the long-term nature of our investment, the recent signs of recovery in the construction industry, thesignificant economic barriers for new potential competitors considering the high investment required, and thelack of susceptibility of the industry to technology improvements or alternate construction products, among otherfactors. We have also considered recent developments in our operations in the United States, such as the 1%,13% and 2% increases in ready-mix concrete volumes in 2016, 2015 and 2014, respectively, and the 1%, 5% and8% increases in 2016, 2015 and 2014, respectively, of ready-mix concrete prices, which are key drivers forcement consumption and our profitability, and which trends are expected to continue over the next few years, asanticipated in our cash flow projections.
As a result of impairment tests conducted on several cash-generating units considering certain triggeringevents, mainly: a) the closing and/or reduction of operations of cement and ready-mix concrete plants resultingfrom adjusting our supply to current demand conditions, b) the transferring of installed capacity to more efficientplants, such as the projected closing in the short term of a cement mill in Colombia, and c) the recoverability ofcertain investments in Colombia, we recognized impairment losses on property, plant and equipment, for anaggregate amount of approximately Ps575 million (U.S.$39 million), Ps1,145 million (U.S.$66 million) andPs1,898 million (U.S.$101 million) in 2014, 2015 and 2016, respectively, and adjusted the related fixed assets totheir estimated value in use in those circumstances in which the assets would continue in operation based onestimated cash flows during their remaining useful life, or to their realizable value, in case of permanent shutdown.
132

During 2015 and 2016, the breakdown of impairment losses by country was as follows:
For the Year Ended December 31,
2015 2016
(in millions of Mexican Pesos)
Puerto Rico . . . . . . . . . . . . . . . . . . . . . . . . . . . . . . . Ps 172 Ps 1,087Colombia . . . . . . . . . . . . . . . . . . . . . . . . . . . . . . . . — 454Spain . . . . . . . . . . . . . . . . . . . . . . . . . . . . . . . . . . . . 392 —United States . . . . . . . . . . . . . . . . . . . . . . . . . . . . . . 269 277Latvia . . . . . . . . . . . . . . . . . . . . . . . . . . . . . . . . . . . 126 —Panama . . . . . . . . . . . . . . . . . . . . . . . . . . . . . . . . . . 118 —Mexico . . . . . . . . . . . . . . . . . . . . . . . . . . . . . . . . . . 46 46United Kingdom . . . . . . . . . . . . . . . . . . . . . . . . . . . 19 —Germany . . . . . . . . . . . . . . . . . . . . . . . . . . . . . . . . . — —Other countries . . . . . . . . . . . . . . . . . . . . . . . . . . . . 3 34
Ps 1,145 Ps 1,898
See note 15C to our 2016 audited consolidated financial statements included elsewhere in this annual report.
Valuation reserves on accounts receivable and inventories
On a periodic basis, we analyze the recoverability of our accounts receivable and our inventories, in order todetermine if, as a result of internal events, such as physical damage, or external events, such as technologicalchanges or market conditions, certain portions of such balances have become obsolete or impaired. When animpairment situation arises, the inventory balance is adjusted to its net realizable value, whereas, if anobsolescence situation occurs, the inventory obsolescence reserve is increased. In both cases, these adjustmentsare recognized against the results of the period. Advances to suppliers of inventory are presented as part of othercurrent assets.
Asset retirement obligations
We recognize unavoidable obligations, legal or constructive, to restore operating sites upon retirement oflong-lived assets at the end of their useful lives, which are measured at the net present value of estimated futurecash flows to be incurred in the restoration process, and are initially recognized against the related assets’ bookvalue. The increase to the assets’ book value is depreciated during its remaining useful life. The increase of theliability, related to the passage of time is charged to the line item titled “Other financial expenses, net.”Adjustments to the liability for changes in estimations are recognized against fixed assets, and depreciation ismodified prospectively.
Asset retirement obligations are related mainly to future costs of demolition, cleaning and reforestation, sothat quarries, maritime terminals and other production sites are left in acceptable condition at the end of theiroperation. See notes 17 and 24 to our 2016 audited consolidated financial statements included elsewhere in thisannual report.
Emission rights
In some of the countries where we operate, such as in countries of the EU, governments have establishedmechanisms aimed at reducing CO2 by means of which, industries releasing CO2 must submit to theenvironmental authorities at the end of a compliance period, emission rights for a volume equivalent to the tonsof CO2 released. Since the mechanism for emissions reduction in the EU has been in operation, a certain numberof emission rights based on historical levels have been granted by the environmental authorities to industries freeof cost. Therefore, companies are required to buy additional emission rights to meet any deficit between actual
133

CO2 emissions during the compliance period and emission rights held. Companies with surplus emission rightscan also dispose of such surpluses in the market. In addition, the UNFCCC grants CERs to qualified CO2emission reduction projects. CERs may be used in specified proportions to settle emission rights obligations inthe EU. We actively participate in the development of projects aimed to reduce CO2 emissions. Some of theseprojects have been awarded with CERs.
In the absence of an IFRS that defines the accounting treatment for these schemes, we account for theeffects associated with CO2 emission reduction mechanisms as follows:
• Certificates received free of cost are not recognized in the balance sheet. Revenues from the sale of anysurplus of certificates are recognized by decreasing cost of sales. In forward sale transactions, revenuesare recognized upon physical delivery of the emission certificates.
• Emission rights and/or CERs acquired to hedge current CO2 emissions are recognized as intangibleassets at cost, and are further amortized to cost of sales during the compliance period. In the case offorward purchases, assets are recognized upon physical reception of the emission certificates.
• We accrue a provision against cost of sales when the estimated annual emissions of CO2 are expectedto exceed the number of emission rights, net of any benefit obtained through swap transactions ofemission rights for CERs.
• CERs received from the UNFCCC are recognized as intangible assets at their development cost, whichare attributable mainly to legal expenses incurred with authorities in the process of obtaining suchCERs.
During 2014, 2015 and 2016, there were no sales of emission rights. In addition, in certain countries, theenvironmental authorities impose levies per ton of CO2 or other greenhouse gases released. Such expenses arerecognized as part of cost of sales as incurred.
Revenue recognition
Our consolidated net sales represent the value, before tax on sales, of products and services sold byconsolidated subsidiaries as a result of ordinary activities, after the elimination of related parties transactions andare quantified at the fair value of the consideration received or receivable, decreased by any trade discounts orvolume rebates granted to customers.
Revenue from the sale of goods and services is recognized when goods are delivered or services arerendered to customers, there is no condition or uncertainty implying a reversal thereof, and they have assumedthe risk of loss. Revenues from trading activities, in which we acquire finished goods from a third party andsubsequently we sell the goods to another third party, are recognized on a gross basis, considering that weassume the total risk of property on the goods purchased and we are not acting as agent or broker.
Revenue and costs associated with construction contracts are recognized in the period in which the work isperformed by reference to the stage of completion of the contract activity at the end of the period, consideringthat the following have been defined: (a) each party’s enforceable rights regarding the asset to be constructed;(b) the consideration to be exchanged; (c) the manner and terms of settlement; (d) actual cost incurred andcontract costs required to complete the asset are effectively controlled; and (e) it is probable that the economicbenefits associated with the contract will flow to us.
The percentage of completion of construction contracts represents the proportion that contract costs incurredfor work performed to date bear to the estimated total contract costs or the surveys of work performed or thephysical proportion of the contract work completed, whichever better reflects the percentage of completion underthe specific circumstances. Progress payments and advances received from customers do not reflect the workperformed and are recognized as a short or long term advanced payments, as appropriate.
134

Results of Operations
Consolidation of Our Results of Operations
Our 2016 audited consolidated financial statements included elsewhere in this annual report include thosesubsidiaries in which we hold a controlling interest or which we otherwise control. Control exists when we havethe power, directly or indirectly, to govern the administrative, financial and operating policies of an entity inorder to obtain benefits from its activities.
Investments in associates are accounted for by the equity method, when we have significant influence,which is generally presumed with a minimum equity interest of 20% unless it is proven that we have significantinfluence with a lower percentage. Under the equity method, after acquisition, the investment’s original cost isadjusted for the proportional interest of the holding company in the associate’s equity and earnings, consideringthe effects of inflation.
All balances and transactions between the group subsidiaries have been eliminated in consolidation.
For the years ended December 31, 2014, 2015 and 2016, our consolidated results reflect the followingtransactions:
• On November 18, 2016, after all conditions precedent were satisfied, CEMEX, S.A.B. de C.V.announced that it had closed the sale of certain assets in the U.S. to GCC for approximatelyU.S.$306 million. The assets were sold by an affiliate of CEMEX to an affiliate of GCC in the U.S.,and mainly consisted of CEMEX’s cement plant in Odessa, Texas, two cement terminals and thebuilding materials business in El Paso, Texas and Las Cruces, New Mexico.
• On September 12, 2016, one of our subsidiaries in the U.S. signed a definitive agreement for the sale ofits Fairborn, Ohio cement plant and cement terminal in Columbus, Ohio to Eagle Materials Inc. forU.S.$400 million. The proceeds obtained from this transaction were used mainly for debt reduction andfor general corporate purposes. This transaction closed on February 10, 2017.
• On July 18, 2016, CHP closed its initial public offering of 45% of its common shares in thePhilippines, and 100% of CHP’s common shares started trading on the Philippine Stock Exchangeunder the ticker “CHP.” As of March 31, 2017, CASE, an indirect subsidiary of CEMEX España,directly owned approximately 55% of CHP’s outstanding common shares. The net proceeds to CHPfrom its initial public offering were approximately U.S.$506.8 million after deducting estimatedunderwriting discounts and commissions, and other estimated offering expenses payable by CHP. CHPused the net proceeds from the initial public offering to repay existing indebtedness owed to BDOUnibank and to an indirect subsidiary of CEMEX.
• On March 10, 2016, CEMEX, S.A.B. de C.V. announced the sale of its operations in Bangladesh andThailand to SIAM Cement for approximately U.S.$53 million, which closed on May 26, 2016. Theproceeds from this transaction were used mainly for debt reduction and for general corporate purposes.Our operations in Bangladesh and Thailand for the five-month period ended May 30, 2016 and theyears ended December 31, 2015 and 2014 included in CEMEX’s statements of operations werereclassified to the single line item “Discontinued operations,” which includes, in 2016, a gain on sale ofapproximately U.S.$24 million (Ps424 million). See note 4A to our consolidated financial statementsincluded elsewhere in this annual report.
• On August 12, 2015, we entered into an agreement for the sale of our operations in Croatia, includingassets in Bosnia & Herzegovina, Montenegro and Serbia, to Duna-Dráva Cement Kft. for €231 million(approximately U.S.$243 million or Ps5,032 million). Those operations mainly consist of three cementplants with aggregate annual production capacity of approximately 2.4 million tons of cement, twoaggregates quarries and seven ready-mix plants. On April 5, 2017, we announced that the EuropeanCommission issued a decision that restricts completion of the sale. Therefore, the sale of our operations
135

in Croatia will not close and we will maintain our operations in Croatia, including assets in Bosnia andHerzegovina, Montenegro and Serbia. For the years ended December 31, 2016, 2015 and 2014, theoperations in Croatia, including assets in Bosnia and Herzegovina, Montenegro and Serbia, included inour statements of operations are presented in the single line item “Discontinued operations.” However,due to the inability to complete the sale, beginning in the second quarter of 2017, we will reclassify theincome statements of our operations in Croatia, including assets in Bosnia & Herzegovina, Montenegroand Serbia, from the single line item “Discontinued Operations” to each applicable line item in ourconsolidated financial statements. See notes 4A and 26 to our 2016 audited consolidated financialstatements included elsewhere in this annual report.
• On October 31, 2015, after all conditions precedent were satisfied, we completed the sale of ouroperations in Austria and Hungary to the Rohrdorfer Group for €165 million (U.S.$179 million orPs3,090 million), after final adjustments for changes in cash and working capital balances as of thetransfer date. Our combined operations in Austria and Hungary consisted of 29 aggregate quarries and68 ready-mix plants. The operations in Austria and Hungary for the ten-month period endedOctober 31, 2015 and the year ended December 31, 2014, included in our statements of operations,were reclassified to the single line item “Discontinued operations,” which includes, in 2015, a gain onsale of approximately U.S.$45 million (Ps741 million). Such gain on sale includes the reclassificationto the statement of operations of foreign currency translation effects accrued in equity until October 31,2015 for an amount of approximately Ps215 million. See note 4A to our consolidated financialstatements included elsewhere in this annual report.
• On October 31, 2014, we announced that we had entered into agreements with Holcim, a globalproducer of building materials based in Switzerland, to complete a series of related transactions inEurope, which closed on January 5, 2015, with retrospective effect as of January 1, 2015. See note 15Bto our 2016 audited consolidated financial statements included elsewhere in this annual report. As aresult, (i) CEMEX acquired all of Holcim’s assets in the Czech Republic, including a cement plant,four aggregates quarries and 17 ready-mix plants for approximately €115 million (U.S.$139 million orPs2,049 million); (ii) CEMEX sold to Holcim assets in the western region of Germany, consisting ofone cement plant, two cement grinding mills, one slag granulator, 22 aggregates quarries and 79ready-mix plants for approximately €171 million (U.S.$207 million or Ps3,047 million), whileCEMEX maintained its operations in the north, east and south of Germany; and (iii) CEMEX acquiredfrom Holcim one cement plant in the southern part of Spain, and one cement mill in the central part ofSpain, among other related assets for approximately €88 million (U.S.$106 million or Ps1,562 million);we kept our other operations in Spain. In connection with these transactions, in January 2015 CEMEXmade a final payment in cash, after combined debt and working capital adjustments, of approximately€33 million (U.S.$40 million or Ps594 million).
136

Selected Consolidated Statement of Operations Data
The following table sets forth our selected consolidated statement of operations data for each of the threeyears ended December 31, 2014, 2015 and 2016 expressed as a percentage of net sales.
Year Ended December 31,
2014 2015 2016
Net sales . . . . . . . . . . . . . . . . . . . . . . . . . . . . . . . . . . . . . . . . . . . . . . . . . . . . . . . . . . . . . . . 100% 100% 100%Cost of sales . . . . . . . . . . . . . . . . . . . . . . . . . . . . . . . . . . . . . . . . . . . . . . . . . . . . . . . . . . . . (67.4) (66.3) (64.5)
Gross profit . . . . . . . . . . . . . . . . . . . . . . . . . . . . . . . . . . . . . . . . . . . . . . . . . . . . . . . . . . . . . 32.6 33.7 35.5
Total operating expenses . . . . . . . . . . . . . . . . . . . . . . . . . . . . . . . . . . . . . . . . . . . . . . (21.7) (21.7) (21.4)
Operating earnings before other expenses, net . . . . . . . . . . . . . . . . . . . . . . . . . . . . . . . . . . 10.9 12.0 14.1
Other expenses, net . . . . . . . . . . . . . . . . . . . . . . . . . . . . . . . . . . . . . . . . . . . . . . . . . . . . . . . (2.5) (1.4) (0.7)
Operating earnings . . . . . . . . . . . . . . . . . . . . . . . . . . . . . . . . . . . . . . . . . . . . . . . . . . . . . . . 8.4 10.6 13.4
Financial expense . . . . . . . . . . . . . . . . . . . . . . . . . . . . . . . . . . . . . . . . . . . . . . . . . . . . . . . . (10.7) (9.0) (8.6)Other financial (expense) income, net . . . . . . . . . . . . . . . . . . . . . . . . . . . . . . . . . . . . . . . . 1.3 (0.6) 1.8Equity in gain of associates . . . . . . . . . . . . . . . . . . . . . . . . . . . . . . . . . . . . . . . . . . . . . . . . 0.1 0.3 0.3
Earnings (loss) before income tax . . . . . . . . . . . . . . . . . . . . . . . . . . . . . . . . . . . . . . . . . . . (0.9) (1.4) 6.9
Income taxes . . . . . . . . . . . . . . . . . . . . . . . . . . . . . . . . . . . . . . . . . . . . . . . . . . . . . . . . . . . . (2.0) (1.1) (1.2)
Net income (loss) from continuing operations . . . . . . . . . . . . . . . . . . . . . . . . . . . . . . . . . . (2.9) 0.4 5.7
Discontinued operations, net of tax . . . . . . . . . . . . . . . . . . . . . . . . . . . . . . . . . . . . . . . . . . 0.1 0.6 0.4
Consolidated net income (loss) . . . . . . . . . . . . . . . . . . . . . . . . . . . . . . . . . . . . . . . . . . . . . (2.8) 1.0 6.1
Non-controlling interest net income . . . . . . . . . . . . . . . . . . . . . . . . . . . . . . . . . . . . . . . . . . 0.6 0.5 0.5
Controlling interest net income (loss) . . . . . . . . . . . . . . . . . . . . . . . . . . . . . . . . . . . . . . . . (3.4) 0.5 5.6
Year Ended December 31, 2016 Compared to Year Ended December 31, 2015
Summarized in the table below are the percentage (%) increases (+) and decreases (-) for the year endedDecember 31, 2016, compared to the year ended December 31, 2015, in our domestic cement and ready-mixconcrete sales volumes, as well as export sales volumes of cement and domestic cement and ready-mix concreteaverage sales prices for each of our geographic segments.
Effective January 1, 2016, according to an announcement made by CEMEX’s Chief Executive Officer onDecember 1, 2015, CEMEX’s operations were reorganized into five geographical regions, each under thesupervision of a regional president, as follows: (1) Mexico, (2) United States, (3) Europe, (4) SAC and (5) Asia,Middle East and Africa. Under the new organization, the geographical operating segments under the formerMediterranean region were incorporated to the Europe region or the Asia, Middle East and Africa region, asapplicable.
137

The table below and the other volume data presented by geographic segment in this “—Year EndedDecember 31, 2016 Compared to Year Ended December 31, 2015” section are presented before eliminationsresulting from consolidation (including those shown on note 4B to our 2016 audited consolidated financialstatements included elsewhere in this annual report).
Domestic Sales VolumesExport Sales
VolumesAverage Domestic Sales
Prices in Local Currency(1)
Geographic Segment CementReady-MixConcrete Cement Cement
Ready-MixConcrete
Mexico . . . . . . . . . . . . . . . . . . . . . . . . . . . . . . . . . . +4% -3% +22% +18% +8%United States . . . . . . . . . . . . . . . . . . . . . . . . . . . . . +2% +1% — +4% +1%EuropeUnited Kingdom . . . . . . . . . . . . . . . . . . . . . . . . . . . +7% -3% — +2% +2%Germany . . . . . . . . . . . . . . . . . . . . . . . . . . . . . . . . . Flat +2% — -2% +1%France . . . . . . . . . . . . . . . . . . . . . . . . . . . . . . . . . . . — +4% — — -3%Spain . . . . . . . . . . . . . . . . . . . . . . . . . . . . . . . . . . . . -3% +2% -12% -2% -5%Rest of Europe(2) . . . . . . . . . . . . . . . . . . . . . . . . . . -2% +4% — -4% -4%South, Central America and the CaribbeanColombia . . . . . . . . . . . . . . . . . . . . . . . . . . . . . . . . . Flat -8% — +1% +4%Rest of South, Central America and the
Caribbean(3) . . . . . . . . . . . . . . . . . . . . . . . . . . . . +2% -20% — -5% -4%Asia, Middle East and AfricaPhilippines . . . . . . . . . . . . . . . . . . . . . . . . . . . . . . . . +1% — -7% +1% —Egypt . . . . . . . . . . . . . . . . . . . . . . . . . . . . . . . . . . . . +2% -3% — +3% +6%Rest of Asia, Middle East and Africa(4) . . . . . . . . . -44% -4% — Flat +3%
“—” = Not Applicable(1) Represents the average change in domestic cement and ready-mix concrete prices in local currency terms.
For purposes of a geographic segment consisting of a region, the average prices in local currency terms foreach individual country within the region are first translated into Dollar terms (except for the Rest ofEurope, in which they are translated first into Euros) at the exchange rates in effect as of the end of thereporting period. Variations for a region represent the weighted average change of prices in Dollar terms(except for the Rest of Europe, in which they represent the weighted average change of prices in Euros)based on total sales volumes in the region.
(2) The “Rest of Europe” segment refers primarily to operations in the Czech Republic, Poland and Latvia, aswell as trading activities in Scandinavia and Finland. On October 31, 2015, we completed the sale of ouroperations in Austria and Hungary. See “Item 4—Information on the Company—Our Corporate Structure—Rest of Europe—Sale of our Operations in Austria and Hungary.” The operations in Austria and Hungaryfor the ten-month period ended October 31, 2015 and the year ended December 31, 2014, included in ourstatements of operations, were reclassified to the single line item “Discontinued operations.” On August 12,2015, we entered into an agreement for the sale of our operations in Croatia, including assets in Bosnia &Herzegovina, Montenegro and Serbia, to Duna-Dráva Cement Kft. See “Item 4—Information on theCompany—Our Corporate Structure—Rest of Europe—Attempted Sale of our Operations in SoutheastEurope.” For the years ended December 31, 2016, 2015 and 2014, the operations in Croatia, including assetsin Bosnia and Herzegovina, Montenegro and Serbia, included in our statements of operations are presentedin the single line item “Discontinued Operations.” On April 5, 2017, we announced that the EuropeanCommission issued a decision that restricts completion of the sale. Therefore, the sale of our operations inCroatia will not close and we will maintain our operations in Croatia, including assets in Bosnia andHerzegovina, Montenegro and Serbia. Due to the inability to complete the sale, beginning in the secondquarter of 2017, we will reclassify the income statements of our operations in Croatia, including assets inBosnia & Herzegovina, Montenegro and Serbia, from the single line item “Discontinued Operations” to
138

each applicable line item in our consolidated financial statements. See notes 4A and 26 to our 2016 auditedconsolidated financial statements included elsewhere in this annual report.
(3) The “Rest of South, Central America and the Caribbean” segment includes CEMEX’s operations in CostaRica, Panama, Puerto Rico, the Dominican Republic, Nicaragua, Jamaica and other countries in theCaribbean, Guatemala and small ready-mix concrete operations in Argentina.
(4) The “Rest of Asia, Middle East and Africa” segment includes the operations in the UAE, Israel andMalaysia. On May 26, 2016, we completed the sale of our operations in Bangladesh and Thailand. See“Item 4—Information on the Company—Our Corporate Structure—Rest of Asia, Middle East and Africa—Sale of our Operations in Rest of Asia, Middle East and Africa.” Our operations in Bangladesh and Thailandfor the five-month period ended May 30, 2016 and the years ended December 31, 2015 and 2014 included inCEMEX’s statements of operations were reclassified to the single line item “Discontinued operations,”which includes, in 2016, a gain on sale of approximately U.S.$24 million (Ps424 million). See note 4A toour consolidated financial statements included elsewhere in this annual report.
On a consolidated basis, our cement sales volumes remained flat at 66.7 million tons in 2015 and 2016, andour ready-mix concrete sales volumes decreased approximately 2%, from 52.9 million cubic meters in 2015 to52.1 cubic meters in 2016. Our net sales increased approximately 14%, from Ps220,326 million in 2015 toPs250,909 in 2016, and our operating earnings before other expenses, net increased approximately 33%, fromPs26,489 million in 2015 to Ps35,264 in 2016.
139

The following tables present selected financial information of net sales and operating earnings before otherexpenses, net for each of our geographic segments for the years ended December 31, 2016 and 2015. The netsales information in the table below is presented before eliminations resulting from consolidation (includingthose shown in note 4B to our 2016 audited consolidated financial statements included elsewhere in this annualreport). Variations in net sales determined on the basis of Mexican Pesos include the appreciation or depreciationwhich occurred during the period between the local currencies of the countries in the regions vis-à-vis theMexican Peso; therefore, such variations differ substantially from those based solely on the countries’ localcurrencies:
Geographic Segment
Variation inLocal
Currency(1)
ApproximateCurrency
FluctuationsVariation in
Mexican Pesos
Net SalesFor the Year Ended
2015 2016
(in millions of Mexican Pesos)
Mexico . . . . . . . . . . . . . . . . . . . . . . . . . . . . . +7% — +7% Ps 50,260 Ps 53,579United States . . . . . . . . . . . . . . . . . . . . . . . . — +17% +17% 58,668 68,553EuropeUnited Kingdom . . . . . . . . . . . . . . . . . . . . . . +2% +3% +5% 20,227 21,153Germany . . . . . . . . . . . . . . . . . . . . . . . . . . . . -2% +18% +16% 8,285 9,572France . . . . . . . . . . . . . . . . . . . . . . . . . . . . . . +3% +17% +20% 12,064 14,535Spain . . . . . . . . . . . . . . . . . . . . . . . . . . . . . . . -9% +16% +7% 6,151 6,563Rest of Europe(2) . . . . . . . . . . . . . . . . . . . . . -3% +12% +9% 10,010 10,881Rest of South, Central America and the
CaribbeanColombia . . . . . . . . . . . . . . . . . . . . . . . . . . . . +1% +6% +7% 11,562 12,415Rest of South, Central America and the
Caribbean(3) . . . . . . . . . . . . . . . . . . . . . . . -9% +7% -2% 19,169 18,820Asia, Middle East and AfricaEgypt . . . . . . . . . . . . . . . . . . . . . . . . . . . . . . . +5% -5% — 6,923 6,950Philippines . . . . . . . . . . . . . . . . . . . . . . . . . . +2% +12% +14% 8,436 9,655Rest of Asia, Middle East and Africa(4) . . . -2% +17% +15% 11,025 12,676Others(5) . . . . . . . . . . . . . . . . . . . . . . . . . . . +15% -3% +12% 17,058 19,128
Continuing operations . . . . . . . . . . . . . . . . . . +10% Ps 239,838 Ps 264,480Discontinued operations . . . . . . . . . . . . . . . . -25% 10,918 8,223
Net sales before eliminations . . . . . . . . . . . +9% Ps 250,756 Ps 272,703
Eliminations resulting fromconsolidation . . . . . . . . . . . . . . . . . . . . . . . 19,569 13,778
Net sales . . . . . . . . . . . . . . . . . . . . . . . . . . . . Ps 231,187 Ps 258,925
140

Geographic Segment
Variation inLocal
Currency(1)
ApproximateCurrency
Fluctuations
Variationin
MexicanPesos
Operating Earnings (Loss)Before Other Expenses, Net
For the Year EndedDecember 31,
2015 2016
(in millions of Mexican Pesos)
Mexico . . . . . . . . . . . . . . . . . . . . . . . . . . . . . . . . . . . +30% — +30% Ps 12,963 Ps 16,866United States . . . . . . . . . . . . . . . . . . . . . . . . . . . . . . +79% +27% +106% 2,215 4,554EuropeUnited Kingdom . . . . . . . . . . . . . . . . . . . . . . . . . . . +48 -2% +50% 1,701 2,559Germany . . . . . . . . . . . . . . . . . . . . . . . . . . . . . . . . . -15% -27% -42% 153 89France . . . . . . . . . . . . . . . . . . . . . . . . . . . . . . . . . . . -33% +13% -20% 232 185Spain . . . . . . . . . . . . . . . . . . . . . . . . . . . . . . . . . . . . -68% +3% -65% 427 151Rest of Europe(2) . . . . . . . . . . . . . . . . . . . . . . . . . . . +18% -5% +13% 447 506South, Central America and the CaribbeanColombia . . . . . . . . . . . . . . . . . . . . . . . . . . . . . . . . . -7% +5% -2% 3,541 3,486Rest of South, Central America and the
Caribbean(3) . . . . . . . . . . . . . . . . . . . . . . . . . . . . +4% +16% +20% 4,367 5,234Asia, Middle East and AfricaEgypt . . . . . . . . . . . . . . . . . . . . . . . . . . . . . . . . . . . . +59% -5% +54% 1,241 1,915Philippines . . . . . . . . . . . . . . . . . . . . . . . . . . . . . . . . +10% +13% +23% 1,759 2,157Rest of Asia, Middle East and Africa(4) . . . . . . . . . +13% +17% +30% 987 1,282Others(5) . . . . . . . . . . . . . . . . . . . . . . . . . . . . . . . . . +5% — +5% (3,544) (3,720)
Operating earnings before other expenses, net fromcontinuing operations . . . . . . . . . . . . . . . . . . . . . +33% Ps 26,489 Ps 35,264
Operating earnings before other expenses, net fromdiscontinued operations . . . . . . . . . . . . . . . . . . . . +34% 610 818
Total . . . . . . . . . . . . . . . . . . . . . . . . . . . . . . . . . . . . . +33% Ps 27,099 Ps 36,082
“— ” = Not Applicable
(1) Represents the variation in local currency terms. For purposes of a geographic segment consisting of aregion, the variation in local currency terms for each individual country within the region are first translatedinto Dollar terms (except for the Rest of Europe, in which they are translated first into Euros) at theexchange rates in effect as of the end of the reporting period. Variations for a region represent the change inDollar terms (except for the Rest Europe region, in which they represent the change in Euros), net, in theregion.
(2) The “Rest of Europe” segment refers primarily to operations in the Czech Republic, Poland and Latvia, aswell as trading activities in Scandinavia and Finland. On October 31, 2015, we completed the sale of ouroperations in Austria and Hungary. See “Item 4—Information on the Company—Our Corporate Structure—Rest of Europe—Sale of our Operations in Austria and Hungary.” The operations in Austria and Hungaryfor the ten-month period ended October 31, 2015 and the year ended December 31, 2014, included in ourstatements of operations, were reclassified to the single line item “Discontinued operations.” On August 12,2015, we entered into an agreement for the sale of our operations in Croatia, including assets in Bosnia &Herzegovina, Montenegro and Serbia, to Duna-Dráva Cement Kft. See “Item 4—Information on theCompany—Our Corporate Structure—Rest of Europe—Attempted Sale of our Operations in SoutheastEurope.” For the years ended December 31, 2016, 2015 and 2014, the operations in Croatia, including assetsin Bosnia and Herzegovina, Montenegro and Serbia, included in our statements of operations are presentedin the single line item “Discontinued Operations.” On April 5, 2017, we announced that the EuropeanCommission issued a decision that restricts completion of the sale. Therefore, the sale of our operations inCroatia will not close and we will maintain our operations in Croatia, including assets in Bosnia andHerzegovina, Montenegro and Serbia. Due to the inability to complete the sale, beginning in the second
141
quarter of 2017, we will reclassify the income statements of our operations in Croatia, including assets inBosnia & Herzegovina, Montenegro and Serbia, from the single line item “Discontinued Operations” toeach applicable line item in our consolidated financial statements. See notes 4A and 26 to our 2016 auditedconsolidated financial statements included elsewhere in this annual report.
(3) The “Rest of South, Central America and the Caribbean” segment includes CEMEX’s operations in CostaRica, Panama, Puerto Rico, the Dominican Republic, Nicaragua, Jamaica and other countries in theCaribbean, Guatemala and small ready-mix concrete operations in Argentina.
(4) The “Rest of Asia, Middle East and Africa” segment includes the operations in the UAE, Israel andMalaysia. On May 26, 2016, we completed the sale of our operations in Bangladesh and Thailand. See“Item 4—Information on the Company—Our Corporate Structure—Rest of Asia, Middle East and Africa—Sale of our Operations in Rest of Asia, Middle East and Africa.” Our operations in Bangladesh and Thailandfor the five-month period ended May 30, 2016 and the years ended December 31, 2015 and 2014 included inCEMEX’s statements of operations were reclassified to the single line item “Discontinued operations,”which includes, in 2016, a gain on sale of approximately U.S.$24 million (Ps424 million). See note 4A toour consolidated financial statements included elsewhere in this annual report.
(5) The “Others” segment refers to: (i) cement trade maritime operations, (ii) our information technologysolutions business (Neoris N.V.), (iii) CEMEX, S.A.B. de C.V. and other corporate entities and (iv)otherminor subsidiaries with different lines of business.
Net sales. Our consolidated net sales increased approximately 14%, from Ps220,326 million in 2015 toPs250,909 million in 2016. The increase was primarily attributable to higher prices of our products, in localcurrency terms, in most of our operations, as well as higher volumes in our Mexican operations. Set forth belowis a quantitative and qualitative analysis of the various factors affecting our net sales on a geographic segmentbasis. The discussion of volume data and net sales information below is presented before eliminations resultingfrom consolidation as described in note 4B to our 2016 audited consolidated financial statements includedelsewhere in this annual report.
Mexico
Our domestic cement sales volumes from our operations in Mexico increased approximately 4% in 2016compared to 2015, and ready-mix concrete sales volumes decreased approximately 3% over the same period. Ournet sales from our operations in Mexico represented approximately 20% of our total net sales for the year endedDecember 31, 2016, in Mexican Peso terms, before eliminations resulting from consolidation. The increase indomestic cement sales volumes was primarily attributable to conditions in the industrial/commercial, formalhousing and self-construction sectors, as well as our value-before-volume strategy. The industrial/commercialsector was supported by continued commercial activity, as well as warehouse and industrial-park construction.Despite a decline in government subsidies during 2016, the formal residential sector benefited from the Institutodel Fondo Nacional de la Vivienda para los Trabajadores’ (Infonavit) stable investment and banks’ double-digitgrowth in mortgage lending. The main indicators for the self-construction sector, including remittances and jobcreation, remained solid during the year. Our cement export volumes from our operations in Mexico, whichrepresented approximately 4% of our Mexican cement sales volumes for the year ended December 31, 2016,increased approximately 22% in 2016 compared to 2015. Of our total cement export volumes from ouroperations in Mexico during 2016, 46% was shipped to the United States, 41% to Central America and theCaribbean and 13% to South America. Our average sales price of domestic cement from our operations inMexico increased approximately 18%, in Mexican Peso terms, in 2016 compared to 2015, and our average salesprice of ready-mix concrete also increased approximately 8%, in Mexican Peso terms, over the same period. Forthe year ended December 31, 2016, cement represented approximately 57%, ready-mix concrete approximately21% and our aggregates and other businesses approximately 22% of our net sales in Mexican Peso terms fromour operations in Mexico before intra-sector eliminations within the segment and before eliminations resultingfrom consolidation, as applicable.
142

As a result of increases in domestic cement sales volumes and domestic cement and ready-mix concretesales prices, partially offset by a decrease in ready-mix concrete sales volumes, our net sales in Mexico, inMexican Peso terms, increased approximately 7% in 2016 compared to 2015.
United States
Our domestic cement sales volumes from our operations in the United States increased approximately 2% in2016 compared to 2015, and ready-mix concrete sales volumes increased approximately 1% over the sameperiod. The increases in the domestic cement and ready mix concrete sales volume of our operation in the UnitedStates were mainly driven by the residential, construction and infrastructure sectors. The residential sector wassupported by low interest rates and inventories, strong job creation and household formation. Constructionspending for the cement-intensive segments in the industrial/commercial sector increased in 2016, whichreflected growth in the lodging and office segments, offsetting a decline in energy, agriculture andmanufacturing. In the infrastructure sector, streets-and-highways spending picked up toward the end of the yearafter a weak pre-election performance. Our operations in the United States represented approximately 26% of ourtotal net sales for the year ended December 31, 2016, in Mexican Peso terms, before eliminations resulting fromconsolidation. Our average domestic cement sales prices of our operations in the United States increasedapproximately 4%, in Dollar terms, in 2016 compared to 2015, and our average ready-mix concrete sales priceincreased approximately 1%, in Dollar terms, over the same period. For the year ended December 31, 2016,cement represented approximately 32%, ready-mix concrete approximately 41% and our aggregates and otherbusinesses approximately 27% of net sales in Mexican Peso terms from our operations in the United Statesbefore intra-sector eliminations within the segment and before eliminations resulting from consolidation, asapplicable.
As a result of the increases in domestic cement and ready-mix concrete sales volumes and sales prices,completely offset by a decrease in our other segments, net sales from our operations in the United States, inDollar terms, remained flat in 2016 compared to 2015.
Europe
In 2016, our operations in the Europe region consisted of our operations in the United Kingdom, Germany,France and Spain, which represent the most significant operations in this region, in addition to the Rest ofEurope, which refers primarily to operations in the Czech Republic, Poland and Latvia, as well as tradingactivities in Scandinavia and Finland. Our net sales from our operations in the Europe region representedapproximately 23% of our total net sales for the year ended December 31, 2016, in Mexican Peso terms, beforeeliminations resulting from consolidation. As of December 31, 2016, our operations in the Europe regionrepresented approximately 18% of our total assets. Set forth below is a quantitative and qualitative analysis of theeffects of the various factors affecting our net sales for our main operations in the Europe region.
United Kingdom
Our domestic cement sales volumes from our operations in the United Kingdom increased approximately 7%in 2016 compared to 2015, and ready-mix concrete sales volumes decreased approximately 3% over the sameperiod. The increase in domestic cement sales volumes resulted primarily from improvements in all of our maindemand sectors. In addition, cement volume growth during the year benefited from higher sales of blended cementthat resulted from fly ash scarcity. Our operations in the United Kingdom represented approximately 8% of our totalnet sales for the year ended December 31, 2016, in Mexican Peso terms, before eliminations resulting fromconsolidation. Our average sales price of domestic cement from our operations in the United Kingdom increasedapproximately 2%, in Pound terms, in 2016 compared to 2015, and our average sales price of ready-mix concreteincreased approximately 2%, in Pound terms, over the same period. For the year ended December 31, 2016, cementrepresented approximately 18%, ready-mix concrete approximately 27% and our aggregates and other businessesapproximately 55% of net sales in Mexican Peso terms from our operations in the United Kingdom before intra-sector eliminations within the segment and before eliminations resulting from consolidation, as applicable.
143

As a result of the increases in domestic cement sales volumes and sales prices and ready-mix concrete salesprices, partially offset by a decrease in ready-mix concrete sales volumes, net sales from our operations in theUnited Kingdom, in Pound terms, increased approximately 2% in 2016 compared to 2015.
Germany
Our domestic cement sales volumes from our operations in Germany remained flat in 2016 compared to2015, and ready-mix concrete sales volumes increased approximately 2% over the same period. Competitivedynamics improved during 2016. The residential sector was the main driver of cement consumption despitecapacity constraints in the local construction industry and public authorities’ restrictions. This sector continued tobenefit from low unemployment and mortgage rates, rising purchasing power and growing immigration. Ourcement export volumes from our operations in Germany, which represented approximately 37% of our cementsales volumes in Germany for the year ended December 31, 2016, decreased approximately 6% in 2016compared to 2015. Our operations in Germany represented approximately 4% of our total net sales for the yearended December 31, 2016, in Mexican Peso terms, before eliminations resulting from consolidation. Our averagesales price of domestic cement from our operations in Germany decreased approximately 2%, in Euro terms, in2016 compared to 2015, and our average sales price of ready-mix concrete increased approximately 1%, in Euroterms, over the same period. For the year ended December 31, 2016, cement represented approximately 28%,ready-mix concrete approximately 37% and our aggregates and other businesses approximately 35% of net salesin Mexican Peso terms from our operations in Germany before intra-sector eliminations within the segment andbefore eliminations resulting from consolidation, as applicable.
As a result of the decrease in domestic cement sales prices, partially offset by the increases in ready-mixconcrete sales prices and sales volumes, net sales from our operations in Germany, in Euro terms, decreasedapproximately 2% in 2016 compared to 2015.
France
Our ready-mix concrete sales volumes from our operations in France increased approximately 4% in 2016compared to 2015. The increase in ready-mix concrete sales volumes resulted primarily from improvements inthe residential and industrial/commercial sectors, which were the main drivers of demand during the year. Theresidential sector was supported by low interest rates and government initiatives, including a buy-to-let programand zero-rates loans for first time buyers. Our operations in France represented approximately 5% of our total netsales for the year ended December 31, 2016, in Mexican Peso terms, before eliminations resulting fromconsolidation. Our average sales price of ready-mix concrete of our operations in France decreasedapproximately 3%, in Euro terms, in 2016 compared to 2015. For the year ended December 31, 2016, ready-mixconcrete represented approximately 67% and our aggregates and other businesses approximately 33% of net salesin Mexican Peso terms from our operations in France before intra-sector eliminations within the segment andbefore eliminations resulting from consolidation, as applicable.
As a result of the increases in ready-mix concrete sales volumes, partially offset by the decrease inready-mix concrete sales prices, net sales from our operations in France, in Euro terms, increased approximately3% in 2016 compared to 2015.
Spain
Our domestic cement sales volumes from our operations in Spain decreased approximately 3% in 2016compared to 2015, while ready-mix concrete sales volumes increased approximately 2% over the same period.Political uncertainty for most of 2016 weighed on consumer sentiment, and the construction activity wasparticularly negatively affected during 2016. The residential sector, which was the main driver of cement demandduring the year, benefited from favorable credit conditions and income prospects, job creation, and pent-uphousing demand. Our operations in Spain represented approximately 2% of our total net sales for the year ended
144

December 31, 2016, in Mexican Peso terms, before eliminations resulting from consolidation. Our cement exportvolumes from our operations in Spain, which represented approximately 58% of our Spain cement sales volumesfor the year ended December 31, 2016, decreased approximately 12% in 2016 compared to 2015. Of our totalcement export volumes from our operations in Spain during 2016, approximately 5% were to Central Americaand the Caribbean, approximately 6% were to South America, approximately 16% were to the United States,approximately 19% were to Europe and the Middle East and approximately 53% were to Africa. Our averagesales price of domestic cement of our operations in Spain decreased approximately 2%, in Euro terms, in 2016compared to 2015, and our average sales price of ready-mix concrete decreased approximately 5%, in Euroterms, over the same period. For the year ended December 31, 2016, cement represented approximately 79%,ready-mix concrete approximately 12% and our aggregates and other businesses approximately 9% of net salesfrom our operations in Spain before intra-sector eliminations within the segment and before eliminationsresulting from consolidation, as applicable.
As a result of the decreases in domestic cement sales volumes and domestic cement and ready-mix concretesales prices, partially offset by an increase in ready-mix concrete sales volumes, net sales from our operations inSpain, in Euro terms, decreased approximately 9% in 2016 compared to 2015.
Rest of Europe
Our domestic cement sales volumes from our operations in the Rest of Europe decreased approximately 2%in 2016 compared to 2015, and ready-mix concrete sales volumes increased approximately 4% over the sameperiod. The decreases in domestic cement sales volumes were primarily due delays in infrastructure sectorprojects in our operations in the Rest of Europe. The residential sector was the main driver of demand during theyear. Our cement export volumes from our operations in the Rest of Europe segment, which representedapproximately 13% of our Rest of Europe cement sales volumes for the year ended December 31, 2016,decreased approximately 36% in 2016 compared to 2015. Our net sales from our operations in the Rest of Europerepresented approximately 4% of our total net sales for the year ended December 31, 2016, in Mexican Pesoterms, before eliminations resulting from consolidation. Our average sales price of domestic cement from ouroperations in the Rest of Europe decreased approximately 4%, in Euro terms, in 2016 compared to 2015, and ouraverage sales price of ready-mix concrete decreased approximately 4%, in Euro terms, over the same period. Forthe year ended December 31, 2016, cement represented approximately 51%, ready-mix concrete approximately33% and our aggregates and other businesses approximately 16% of net sales in Mexican Peso terms from ouroperations in the Rest of Europe before intra-sector eliminations within the segment and before eliminationsresulting from consolidation, as applicable.
As a result of the decreases in domestic cement and ready-mix concrete sales prices and domestic cementsales volumes, partially offset by the increases in ready-mix concrete sales prices, net sales in the Rest of Europe,in Euro terms, decreased approximately 3% in 2016 compared to 2015.
South, Central America and the Caribbean
In 2016, our operations in the SAC region consisted of our operations in Colombia, which represents themost significant operations in this region, in addition to the Rest of SAC, which refers primarily to operations inCosta Rica, Panama, Puerto Rico, the Dominican Republic, Nicaragua, Jamaica and other countries in theCaribbean, Guatemala and small ready-mix concrete operations in Argentina. Some of these trading operations inthe Caribbean region consist of the resale of cement produced by our operations in Mexico. Our net sales fromour operations in the SAC region represented approximately 12% of our total net sales for the year endedDecember 31, 2016, in Mexican Peso terms, before eliminations resulting from consolidation. As ofDecember 31, 2016, our operations in the SAC region represented approximately 8% of our total assets. Set forthbelow is a quantitative and qualitative analysis of the effects of the various factors affecting our net sales for ourmain operations in the SAC region.
145

Colombia
Our domestic cement sales volumes from our operations in Colombia remained flat in 2016 compared to2015, and ready-mix concrete sales volumes decreased approximately 8% over the same period. The decrease inready-mix concrete sales volumes was primarily due to delays and macroeconomic challenges that adverselyaffected national consumption during 2016. Our net sales from our operations in Colombia representedapproximately 5% of our total net sales for the year ended December 31, 2016, in Mexican Peso terms, beforeeliminations resulting from consolidation. Our average sales price of domestic cement from our operations inColombia increased approximately 1%, in Colombian Peso terms, in 2016 compared to 2015, and our averagesales price of ready-mix concrete increased approximately 4%, in Colombian Peso terms, over the same period.For the year ended December 31, 2016, cement represented approximately 54%, ready-mix concreteapproximately 27% and our aggregates and other businesses approximately 19% of our net sales from ouroperations in Colombia before intra-sector eliminations within the segment and before eliminations resultingfrom consolidation, as applicable.
As a result of the increases in domestic cement and ready-mix concrete sales prices, partially offset by thedecrease in ready-mix concretes sales volumes, net sales of our operations in Colombia, in Colombian Pesoterms, increased approximately 1% in 2016 compared to 2015.
Rest of South, Central America and the Caribbean
Our domestic cement volumes from our operations in the Rest of SAC increased 2% in 2016 compared to2015, and ready-mix concrete sales volumes decreased approximately 20% over the same period. Our net salesfrom our operations in the Rest of SAC represented approximately 7% of our total net sales for the year endedDecember 31, 2016, in Mexican Peso terms, before eliminations resulting from consolidation. Our cement exportvolumes from our operations in the Rest of SAC segment, which represented approximately 12% of our Rest ofSAC cement sales volumes for the year ended December 31, 2016, decreased approximately 19% in 2016compared to 2015. Our average sales price of domestic cement from our operations in the Rest of SAC decreasedapproximately 5% in Dollar terms, in 2016 compared to 2015, and our average sales price of ready-mix concretedecreased approximately 4%, in Dollar terms, over the same period. For the year ended December 31, 2016,cement represented approximately 77%, ready-mix concrete approximately 16% and our other businessesapproximately 7% of net sales from our operations in the Rest of SAC before intra-sector eliminations within thesegment and before eliminations resulting from consolidation, as applicable.
As a result of the decreases in ready-mix concrete sales volumes and sales prices and domestic cement salesprices, partially offset by the increase in domestic cement sales volumes, net sales of our operations in the Rest ofSAC, in Dollar terms, decreased approximately 9% in 2016 compared to 2015.
Asia, Middle East and Africa
For the year ended December 31, 2016, our operations in the Asia, Middle East and Africa region consistedof our operations in Egypt and the Philippines, which represent the most significant operations in this region, inaddition to the Rest of Asia, Middle East and Africa, which refers primarily to operations in the UAE, Israel andMalaysia. Our net sales from our operations in the Asia, Middle East and Africa region representedapproximately 12% of our total net sales for the year ended December 31, 2016, in Mexican Peso terms, beforeeliminations resulting from consolidation. As of December 31, 2016, our operations in the Asia, Middle East andAfrica region represented approximately 5% of our total assets. Set forth below is a quantitative and qualitativeanalysis of the effects of the various factors affecting our net sales for our main operations in the Asia, MiddleEast and Africa region.
Egypt
Our domestic cement sales volumes from our operations in Egypt increased approximately 2% in 2016compared to 2015, while ready-mix concrete sales volumes decreased approximately 3% over the same period.
146

The decrease in ready-mix concrete sales volumes resulted primarily from the currency depreciation, whichtriggered inflation and reduced purchasing power. Our net sales from our operations in Egypt representedapproximately 3% of our total net sales for the year ended December 31, 2016, in Mexican Peso terms. Ouraverage sales price of domestic cement increased approximately 3%, in Egyptian Pound terms, in 2016 comparedto 2015, and our average sales price of ready-mix concrete increased approximately 6%, in Egyptian Poundterms, over the same period. For the year ended December 31, 2016, cement represented approximately 84%,ready-mix concrete approximately 13% and our aggregates and other businesses approximately 3% of net salesin Mexican Peso terms from our operations in Egypt before intra-sector eliminations within the segment andbefore eliminations resulting from consolidation, as applicable.
As a result of the increases in domestic cement sales volumes and sales prices and ready-mix concrete salesprices, partially offset by the decreases in ready-mix concrete sales volumes, our net sales in Egypt, in EgyptianPound terms, increased approximately 5% in 2016 compared to 2015.
The Philippines
Our domestic cement sales volumes from our operations in the Philippines increased approximately 1% in2016 compared to 2015. The increase in our domestic cement sales volumes resulted primarily from moderationin cement consumption, especially in infrastructure, due to the post-election government transition. Our cementexport volumes from our operations in Philippines, which represented less than 1% of our Philippines cementsales volumes for the year ended December 31, 2016, decreased approximately 7% in 2016 compared to 2015.Our net sales from our operations in the Philippines represented approximately 4% of our total net sales for theyear ended December 31, 2016, in Mexican Peso terms, before eliminations resulting from consolidation. Ouraverage sales price of domestic cement from our operations in the Philippines increased approximately 1% inPhilippine Peso terms, in 2016 compared to 2015. For the year ended December 31, 2016, cement representedapproximately 96% and our other businesses approximately 4% of our net sales in Mexican Peso terms from ouroperations in the Philippines before intra-sector eliminations within the segment and before eliminationsresulting from consolidation, as applicable.
As a result of the increases in domestic cement sales volumes and sales prices, net sales of our operations inthe Philippines, in Philippine Peso terms, increased approximately 2% in 2016 compared to 2015.
Rest of Asia, Middle East and Africa
Our domestic cement sales volumes from our operations in the Rest of Asia, Middle East and Africadecreased approximately 44% in 2016 compared to 2015, and ready-mix concrete sales volumes decreasedapproximately 4% over the same period. The decrease in our domestic cement sales volumes resulted primarilyfrom a decrease in our sales volumes in our UAE operations. The decrease in our ready-mix concrete salesvolumes resulted primarily from a decrease in our sales volumes ready-mix concrete sales volumes in ourMalaysian operations. Our net sales from our operations in our Rest of Asia segment represented approximately5% of our total net sales for the year ended December 31, 2016, in Mexican Peso terms, before eliminationsresulting from consolidation. Our average sales price of domestic cement remained flat in Dollar terms, in 2016compared to 2015, and the average sales price of ready-mix concrete increased approximately 3%, in Dollarterms, over the same period. For the year ended December 31, 2016, cement represented approximately 6%,ready-mix concrete approximately 68% and our other businesses approximately 26% of net sales from ouroperations in the Rest of Asia, Middle East and Africa before intra-sector eliminations within the segment andbefore eliminations resulting from consolidation, as applicable.
As a result of the increase in ready-mix concrete sales volumes, partially offset by decreases in domesticcement and ready-mix concrete sales prices, net sales from our operations in the Rest of Asia, Middle East andAfrica, in Dollar terms, increased approximately 15% in 2016 compared to 2015.
147

Others
Our Others segment refers to: (i) cement trade maritime operations, (ii) our information technologysolutions business (Neoris N.V.), (iii) CEMEX, S.A.B. de C.V. and other corporate entities and (iv) other minorsubsidiaries with different lines of business. Net sales from our Others segment increased approximately 15%before intra-sector eliminations within the segment and before eliminations resulting from consolidation, asapplicable, in 2016 compared to 2015, in Dollar terms. The increase resulted primarily from an increase in ourworldwide cement volume of our trading operations. For the year ended December 31, 2016, our informationtechnology solutions company represented approximately 30% and our trading operations representedapproximately 32% of our net sales in our Others segment, in Dollar terms.
Cost of Sales. Our cost of sales, including depreciation, increased approximately 11% fromPs146,068 million in 2015 to Ps161,883 million in 2016. As a percentage of net sales, cost of sales decreasedfrom 66.3% in 2015 to 64.5% in 2016. The decrease in cost of sales as a percentage of net sales was mainlydriven by our cost reduction initiatives. Our cost of sales includes freight expenses of raw materials used in ourproducing plants.
Gross Profit. For the reasons explained above, our gross profit increased approximately 20% fromapproximately Ps74,258 million in 2015 to approximately Ps89,026 million in 2016. As a percentage of net sales,gross profit increased from approximately 33.7% in 2015 to 35.5% in 2016. In addition, our gross profit may notbe directly comparable to those of other entities that include all their freight expenses in cost of sales. Asdescribed above, we include freight expenses of finished products from our producing plants to our points of saleand from our points of sale to our customers’ locations within distribution expenses, which in aggregaterepresented costs of approximately Ps23,109 million in 2015 and approximately Ps25,925 million in 2016. As apercentage of net sales, distribution and logistics expenses decreased from approximately 10.5% in 2015 to10.3% in 2016.
Operating expenses. Our operating expenses, which are represented by administrative, selling anddistribution and logistics expenses, increased approximately 12.5%, from approximately Ps47,769 million in2015 to approximately Ps53,762 million in 2016. As a percentage of net sales, operating expenses decreasedfrom approximately 21.7% in 2015 to 21.4% in 2016. Our operating expenses include expenses related topersonnel, equipment and services involved in sales activities and storage of product at points of sale, which areincluded as part of the administrative and selling expenses, as well as freight expenses of finished productsbetween plants and points of sale and freight expenses between points of sale and the customers’ facilities, whichare included as part of the distribution expenses line item. For the years ended December 31, 2015 and 2016,selling expenses included as part of the selling and administrative expenses line item amounted to approximatelyPs5,943 million and Ps6,954 million, respectively. As mentioned before, we include freight expenses of finishedproducts from our producing plants to our points of sale and from our points of sale to our customers’ locationswithin distribution expenses, which in aggregate represented costs of approximately Ps23,109 million in 2015and approximately Ps25,925 million in 2016. As a percentage of net sales, distribution and logistics expensesdecreased from approximately 10.5% in 2015 to 10.3% in 2016.
Operating Earnings Before Other Expenses, Net
For the reasons mentioned above, our operating earnings before other expenses, net increased approximately33.1% from approximately Ps26,489 million in 2015 to approximately Ps35,264 million in 2016. As a percentageof net sales, operating earnings before other expenses, net increased from approximately 12.0% in 2015 to 14.1%in 2016. Additionally, set forth below is a quantitative and qualitative analysis of the effects of the various factorsaffecting our operating earnings before other expenses, net on a geographic segment basis.
Mexico
Our operating earnings before other expenses, net, from our operations in Mexico increased approximately30%, in Mexican Peso terms, from operating earnings before other expenses, net, of approximately
148

Ps12,963 million in 2015 to operating earnings before other expenses, net, of approximately Ps16,866 million in2016. The increase resulted primarily from higher contributions in our products, as well as an increase indomestic cement sales volumes.
United States
Our operating earnings before other expenses, net, from our operations in the United States increasedsignificantly in Dollar terms. The increase in operating earnings before other expenses, net resulted primarilyfrom an increase in net sales due to higher sales prices and sales volumes during 2016 compared to 2015.
Europe
United Kingdom. Our operating earnings before other expenses, net, from our operations in the UnitedKingdom increased approximately 48% in Pound terms. The increase resulted primarily from our cost reductioninitiatives and an increase in net sales.
Germany. Our operating earnings before other expenses, net, from our operations in Germany decreasedapproximately 15% in Euro terms. The decrease resulted primarily from a decrease in net sales.
France. Our operating earnings before other expenses, net, from our operations in France decreasedapproximately 33% in Euro terms. The decrease in our operating earnings before other expenses, net in Franceresulted primarily from higher maintenance costs.
Spain. Our operating earnings before other expenses, net, from our operations in Spain decreasedapproximately 68% in Euro terms. The decrease in the operating earnings before other expenses, net, resultedprimarily from a decrease in net sales.
Rest of Europe. Our operating earnings before other expenses, net, from our operations in the Rest ofEurope increased approximately 18% in Euro terms. The increase resulted primarily from our improvedoperating efficiencies in our Rest of Europe region.
South, Central America and the Caribbean
Colombia. Our operating earnings before other expenses, net, from our operations in Colombia decreasedapproximately 7% in Colombian Peso terms. The decrease resulted primarily from increases in electricity ratesand higher maintenance costs.
Rest of South, Central America and the Caribbean. Our operating earnings before other expenses, net, fromour operations in the Rest of SAC increased approximately 4% in Dollar terms. The increase resulted primarilyfrom an increase in net sales.
Asia, Middle East and Africa
Egypt. Our operating earnings before other expenses, net, from our operations in Egypt increased 59% inEgyptian Pound terms. The increase resulted primarily from an increase in net sales.
The Philippines. Our operating earnings before other expenses, net, from our operations in the Philippinesincreased approximately 10% in Philippine Peso terms. The increase resulted primarily from an increase in netsales.
Rest of Asia, Middle East and Africa. Our operating earnings before other expenses, net, from our operationsin the Rest of Asia, Middle East and Africa increased approximately 13% in Dollar terms. The increase resultedprimarily from our cost reduction initiatives and operating efficiencies.
149
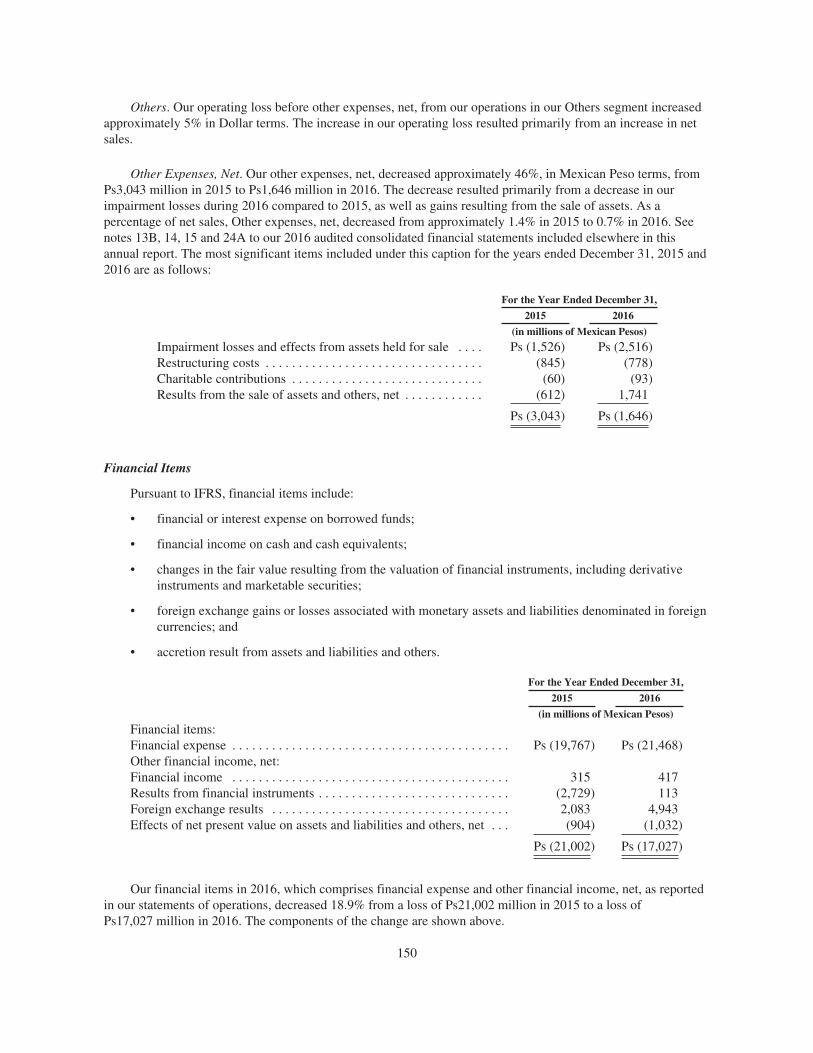
Others. Our operating loss before other expenses, net, from our operations in our Others segment increasedapproximately 5% in Dollar terms. The increase in our operating loss resulted primarily from an increase in netsales.
Other Expenses, Net. Our other expenses, net, decreased approximately 46%, in Mexican Peso terms, fromPs3,043 million in 2015 to Ps1,646 million in 2016. The decrease resulted primarily from a decrease in ourimpairment losses during 2016 compared to 2015, as well as gains resulting from the sale of assets. As apercentage of net sales, Other expenses, net, decreased from approximately 1.4% in 2015 to 0.7% in 2016. Seenotes 13B, 14, 15 and 24A to our 2016 audited consolidated financial statements included elsewhere in thisannual report. The most significant items included under this caption for the years ended December 31, 2015 and2016 are as follows:
For the Year Ended December 31,
2015 2016
(in millions of Mexican Pesos)
Impairment losses and effects from assets held for sale . . . . Ps (1,526) Ps (2,516)Restructuring costs . . . . . . . . . . . . . . . . . . . . . . . . . . . . . . . . . (845) (778)Charitable contributions . . . . . . . . . . . . . . . . . . . . . . . . . . . . . (60) (93)Results from the sale of assets and others, net . . . . . . . . . . . . (612) 1,741
Ps (3,043) Ps (1,646)
Financial Items
Pursuant to IFRS, financial items include:
• financial or interest expense on borrowed funds;
• financial income on cash and cash equivalents;
• changes in the fair value resulting from the valuation of financial instruments, including derivativeinstruments and marketable securities;
• foreign exchange gains or losses associated with monetary assets and liabilities denominated in foreigncurrencies; and
• accretion result from assets and liabilities and others.
For the Year Ended December 31,
2015 2016
(in millions of Mexican Pesos)
Financial items:Financial expense . . . . . . . . . . . . . . . . . . . . . . . . . . . . . . . . . . . . . . . . . . Ps (19,767) Ps (21,468)Other financial income, net:Financial income . . . . . . . . . . . . . . . . . . . . . . . . . . . . . . . . . . . . . . . . . . 315 417Results from financial instruments . . . . . . . . . . . . . . . . . . . . . . . . . . . . . (2,729) 113Foreign exchange results . . . . . . . . . . . . . . . . . . . . . . . . . . . . . . . . . . . . 2,083 4,943Effects of net present value on assets and liabilities and others, net . . . (904) (1,032)
Ps (21,002) Ps (17,027)
Our financial items in 2016, which comprises financial expense and other financial income, net, as reportedin our statements of operations, decreased 18.9% from a loss of Ps21,002 million in 2015 to a loss ofPs17,027 million in 2016. The components of the change are shown above.
150

Our financial expense increased approximately 8.6%, from Ps19,767 million in 2015 to Ps21,468 million in2016, primarily attributable to depreciation of the Mexican Peso against the U.S. Dollar. See notes 16A and 16Bto our 2016 audited consolidated financial statements included elsewhere in this annual report.
Our other financial income, net increased approximately 32.4%, from Ps315 million in 2015 toPs417 million in 2016. Our results from financial instruments decreased significantly from a loss ofPs2,729 million in 2015 to a gain of Ps113 million in 2016, primarily attributable to derivatives related toCEMEX, S.A.B. de C.V.’s shares. Our foreign exchange results increased 137%, from a gain of approximatelyPs2,083 million in 2015 to a gain of approximately Ps4,943 million in 2016. The increase was primarilyattributable to the fluctuation of the Mexican Peso against the U.S. Dollar. The accretion expense, whichrepresents the effects on our net assets and liabilities recognized at amortized cost due to the passage of time,increased by approximately 14% from an expense of Ps904 million in 2015 to Ps1,032 million in 2016.
Derivative Financial Instruments. For the years ended December 31, 2015 and 2016, our derivativefinancial instruments that had a potential impact on our other financial income, net consisted of interest rateswaps, equity forward in third-party shares contracts, options on CEMEX, S.A.B. de C.V.’s own shares, foreignexchange contracts and derivatives related to energy projects, as discussed in note 16D to our 2016 auditedconsolidated financial statements included elsewhere in this annual report.
For the year ended December 31, 2016, our loss from our financial instruments decreased significantly forthe reasons described above. See “Item 5—Operating and Financial Review and Prospects—Liquidity andCapital Resources—Our Equity Forward Arrangements.”
Income Taxes. Our income tax effect in the statement of operations, which is primarily comprised of currentincome taxes plus deferred income taxes, increased approximately 33% from an expense of Ps2,328 million in2015 to an expense of Ps3,096 million in 2016.
The increase in the income tax expense is mainly attributable to several factors discussed below. See notes19A and 19D to our 2016 audited consolidated financial statements included elsewhere in this annual report.
Our current income tax increased from an income of Ps6,149 million in 2015 to an expense ofPs3,448 million in 2016. The increase in our current income tax expense in 2016 resulted primarily from aone-time benefit of approximately Ps12.3 billion recognized in 2015 resulting from the reduction of income taxaccounts payable accrued in prior years related to the disconnection of the tax consolidation regime in Mexicopursuant to the income tax reform approved by the Mexican Congress in 2015. Such increase was partially offsetby the significant devaluation of the Mexican Peso during 2016. See notes 19B and 19D to our 2016 auditedconsolidated financial statements included elsewhere in this annual report.
Our deferred income tax decreased from an expense of Ps8,477 million in 2015 to an income ofPs352 million in 2016. The decrease in our deferred income tax income in 2016 resulted primarily from anexpense of approximately Ps5.9 billion recognized in 2015 attributable to the reduction of our deferred tax assetsfrom tax loss carryforwards and also as a consequence of the changes resulting from the income tax reform inMexico mentioned above, which allowed us to settle a portion of the income tax accounts payable related to thedisconnection of the tax consolidation regime using the aforementioned deferred tax assets. Such decrease waspartially offset by an increase in our deferred tax assets in 2016 of approximately Ps856 million related primarilyfrom the effects of foreign currency results. See notes 19B and 19D to our 2016 audited consolidated financialstatements included elsewhere in this annual report.
For each of the years ended December 31, 2015 and 2016, our statutory income tax rate in Mexico was30%. Our effective tax rate in 2015, which is determined as described below, resulted in an income tax rate of73.2%, considering a gain before income tax of approximately Ps3,182 million, and our effective tax rate in 2016resulted in an income tax rate of 17.9%, considering a gain before income tax of approximately Ps17,279 million.
151
See “Item 3—Key Information—Risk Factors—Risks Relating to Our Business—Certain tax matters may havean adverse effect on our cash flow, financial condition and net income.”
Net Income from continuing operations. For the reasons described above, our net income from continuingoperations for 2016 increased significantly from a net income from continuing operations of Ps854 million in2015 to a net income from continuing operations of Ps14,183 million in 2016.
Discontinued operations, net of tax. For the years ended December 31, 2015 and 2016, our discontinuedoperations included in our consolidated statements of operations amounted to Ps1,279 million andPs1,024 million, respectively. As a percentage of net sales, discontinued operations, net of tax, represented 0.6%for the year ended as of December 31, 2015 and 0.4% for the year ended as of December 31, 2016. See note 4Ato our 2016 audited consolidated financial statements included elsewhere in this annual report.
Consolidated Net Income (Loss). For the reasons described above, our consolidated net income (beforededucting the portion allocable to non-controlling interest) for 2016 increased significantly from a consolidatednet income of approximately Ps2,133 million in 2015 to a consolidated net income of approximatelyPs15,207 million in 2016.
Non-controlling Interest Net Income. Changes in non-controlling interest net income in any period reflectchanges in the percentage of the stock of our subsidiaries held by non-associated third parties as of the end ofeach month during the relevant period and the consolidated net loss attributable to those subsidiaries.Non-controlling interest net income increased, from a gain of Ps932 million in 2015 to a gain of Ps1,174 millionin 2016, primarily attributable to an increase in the net income of the consolidated entities in which others have anon-controlling interest and for the increase in our non-controlling interest in our Philippines operations throughCHP. See note 20D to our 2016 audited consolidated financial statements included elsewhere in this annualreport.
Controlling Interest Net Income (Loss). Controlling interest net income represents the difference betweenour consolidated net income and non-controlling interest net income, which is the portion of our consolidated netloss attributable to those of our subsidiaries in which non-associated third parties hold interests. For the reasonsdescribed above, our controlling interest net income increased significantly from a net income of approximatelyPs1,201 million in 2015 to a controlling interest net income of approximately Ps14,033 million in 2016.
152

Year Ended December 31, 2015 Compared to Year Ended December 31, 2014
Summarized in the table below are the percentage (%) increases (+) and decreases (-) for the year endedDecember 31, 2015, compared to the year ended December 31, 2014, in our domestic cement and ready-mixconcrete sales volumes, as well as export sales volumes of cement and domestic cement and ready-mix concreteaverage sales prices for each of our geographic segments. The table below and the other volume data presentedby geographic segment in this “— Year Ended December 31, 2015 Compared to Year Ended December 31,2014” section are presented before eliminations resulting from consolidation (including those shown on note 4Bto our 2016 audited consolidated financial statements included elsewhere in this annual report).
Domestic Sales VolumesExport Sales
VolumesAverage Domestic Sales
Prices in Local Currency(1)
Geographic Segment CementReady-MixConcrete Cement Cement
Ready-MixConcrete
Mexico . . . . . . . . . . . . . . . . . . . . . . . . . . . . . . . . . . +1% -5% -45% +10% +7%United States . . . . . . . . . . . . . . . . . . . . . . . . . . . . . +2% +13% — +6% +5%EuropeUnited Kingdom . . . . . . . . . . . . . . . . . . . . . . . . . . . +7% -2% — +4% +5%Germany . . . . . . . . . . . . . . . . . . . . . . . . . . . . . . . . . -47% -45% -24% +7% +2%France . . . . . . . . . . . . . . . . . . . . . . . . . . . . . . . . . . . — -5% — — -2%Spain . . . . . . . . . . . . . . . . . . . . . . . . . . . . . . . . . . . . +35% -18% +19% +1% +12%Rest of Europe(2) . . . . . . . . . . . . . . . . . . . . . . . . . . +28% +14% -17% -22% -17%South, Central America and the CaribbeanColombia . . . . . . . . . . . . . . . . . . . . . . . . . . . . . . . . . -9% -3% — +8% +6%Rest of South, Central America and the
Caribbean(3) . . . . . . . . . . . . . . . . . . . . . . . . . . . . Flat -2% +3% -5% -1%Asia, Middle East and AfricaEgypt . . . . . . . . . . . . . . . . . . . . . . . . . . . . . . . . . . . . -9% +48% — -5% +12%Philippines . . . . . . . . . . . . . . . . . . . . . . . . . . . . . . . . +21% — -11% +3% —Rest of Asia, Middle East and Africa(4) . . . . . . . . . -5% -11% — -7% -15%
“— ” = Not Applicable(1) Represents the average change in domestic cement and ready-mix concrete prices in local currency terms.
For purposes of a geographic segment consisting of a region, the average prices in local currency terms foreach individual country within the region are first translated into Dollar terms (except for the Rest ofEurope, in which they are translated first into Euros) at the exchange rates in effect as of the end of thereporting period. Variations for a region represent the weighted average change of prices in Dollar terms(except for the Rest of Europe, in which they represent the weighted average change of prices in Euros)based on total sales volumes in the region.
(2) The “Rest of Europe” segment refers primarily to operations in the Czech Republic, Poland and Latvia, aswell as trading activities in Scandinavia and Finland. On October 31, 2015, we completed the sale of ouroperations in Austria and Hungary. See “Item 4—Information on the Company—Our Corporate Structure—Rest of Europe—Sale of our Operations in Austria and Hungary.” The operations in Austria and Hungaryfor the ten-month period ended October 31, 2015 and the year ended December 31, 2014, included in ourstatements of operations, were reclassified to the single line item “Discontinued operations.” On August 12,2015, we entered into an agreement for the sale of our operations in Croatia, including assets in Bosnia &Herzegovina, Montenegro and Serbia, to Duna-Dráva Cement Kft. See “Item 4—Information on theCompany—Our Corporate Structure—Rest of Europe—Attempted Sale of our Operations in SoutheastEurope.” For the years ended December 31, 2016, 2015 and 2014, the operations in Croatia, including assetsin Bosnia and Herzegovina, Montenegro and Serbia, included in our statements of operations are presentedin the single line item “Discontinued Operations.” On April 5, 2017, we announced that the EuropeanCommission issued a decision that restricts completion of the sale. Therefore, the sale of our operations in
153

Croatia will not close and we will maintain our operations in Croatia, including assets in Bosnia andHerzegovina, Montenegro and Serbia. Due to the inability to complete the sale, beginning in the secondquarter of 2017, we will reclassify the income statements of our operations in Croatia, including assets inBosnia & Herzegovina, Montenegro and Serbia, from the single line item “Discontinued Operations” toeach applicable line item in our consolidated financial statements. See notes 4A and 26 to our 2016 auditedconsolidated financial statements included elsewhere in this annual report.
(3) The “Rest of South, Central America and the Caribbean” segment includes CEMEX’s operations in CostaRica, Panama, Puerto Rico, the Dominican Republic, Nicaragua, Jamaica and other countries in theCaribbean, Guatemala and small ready-mix concrete operations in Argentina.
(4) The “Rest of Asia, Middle East and Africa” segment includes the operations in the UAE, Israel andMalaysia. On May 26, 2016, we completed the sale of our operations in Bangladesh and Thailand. See“Item 4—Information on the Company—Our Corporate Structure—Rest of Asia, Middle East and Africa—Sale of our Operations in Rest of Asia, Middle East and Africa.” Our operations in Bangladesh and Thailandfor the five-month period ended May 30, 2016 and the years ended December 31, 2015 and 2014 included inCEMEX’s statements of operations were reclassified to the single line item “Discontinued operations,”which includes, in 2016, a gain on sale of approximately U.S.$24 million (Ps424 million). See note 4A toour consolidated financial statements included elsewhere in this annual report.
154

On a consolidated basis, our cement sales volumes increased approximately 1%, from 65.6 million tons in2014 to 66.7 million tons in 2015, and our ready-mix concrete sales volumes decreased approximately 1%, from53.6 million cubic meters in 2014 to 52.9 million cubic meters in 2015. Our net sales increased approximately10.2%, from Ps199,942 million in 2014 to Ps220,326 million in 2015, and our operating earnings before otherexpenses, net increased approximately 21.2%, from Ps21,853 million in 2014 to Ps26,489 million in 2015. Thefollowing tables present selected financial information of net sales and operating earnings before other expenses,net for each of our geographic segments for the years ended December 31, 2015 and 2014. The net salesinformation in the table below is presented before eliminations resulting from consolidation (including thoseshown in note 4C to our 2016 audited consolidated financial statements included elsewhere in this annual report).Variations in net sales determined on the basis of Mexican Pesos include the appreciation or depreciation whichoccurred during the period between the local currencies of the countries in the regions vis-à-vis the MexicanPeso; therefore, such variations differ substantially from those based solely on the countries’ local currencies:
Geographic Segment
Variation inLocal
Currency(1)
ApproximateCurrency
Fluctuations
Variation inMexican
Pesos
Net Sales For the Year Ended
2014 2015
(in millions of Mexican Pesos)
Mexico . . . . . . . . . . . . . . . . . . . . . . . . . . . . . . . -2% — -2% Ps 51,412 Ps 50,260United States . . . . . . . . . . . . . . . . . . . . . . . . . . +7% +21% +28% 45,691 58,668EuropeUnited Kingdom . . . . . . . . . . . . . . . . . . . . . . . . +7% +11% +18% 17,071 20,227Germany . . . . . . . . . . . . . . . . . . . . . . . . . . . . . . -41% — -41% 14,138 8,285France . . . . . . . . . . . . . . . . . . . . . . . . . . . . . . . . -6% -1% -7% 12,914 12,064Spain . . . . . . . . . . . . . . . . . . . . . . . . . . . . . . . . . +31% -1% +30% 4,717 6,151Rest of Europe(2) . . . . . . . . . . . . . . . . . . . . . . . +7% +3% +10% 9,101 10,010Rest of South, Central America and the
CaribbeanColombia . . . . . . . . . . . . . . . . . . . . . . . . . . . . . Flat -13% -13% 13,242 11,562Rest of South, Central America and the
Caribbean(3) . . . . . . . . . . . . . . . . . . . . . . . . . -3% +21% +18% 16,292 19,169Asia, Middle East and AfricaEgypt . . . . . . . . . . . . . . . . . . . . . . . . . . . . . . . . -11% +8% -3% 7,123 6,923Philippines . . . . . . . . . . . . . . . . . . . . . . . . . . . . +23% +20% +43% 5,912 8,436Rest of Asia, Middle East and Africa(4) . . . . . -5% +19% +14% 9,694 11,025Others(5) . . . . . . . . . . . . . . . . . . . . . . . . . . . . . +30% -4% +26% 13,531 17,058
Continuing operations . . . . . . . . . . . . . . . . . . . +9% Ps 220,838 Ps 239,838Discontinued operations . . . . . . . . . . . . . . . . . . +8% 10,134 10,918
Net sales before consolidation . . . . . . . . . . . . +9% Ps 230,972 Ps 250,756
Eliminations resulting from consolidation . . . . 20,949 19,569
Net sales . . . . . . . . . . . . . . . . . . . . . . . . . . . . . . Ps 210,023 Ps 231,187
155

Geographic Segment
Variation inLocal
Currency(1)
ApproximateCurrency
Fluctuations
Variationin
MexicanPesos
Operating Earnings(Loss) Before Other
Expenses, Net For theYear Ended
December 31,
2014 2015
(in millions of Mexican Pesos)
Mexico . . . . . . . . . . . . . . . . . . . . . . . . . . . . . . . . . . . . . . . +17% — +17% Ps 11,060 Ps 12,963United States . . . . . . . . . . . . . . . . . . . . . . . . . . . . . . . . . . +718% +21% +763% (334) 2,215EuropeUnited Kingdom . . . . . . . . . . . . . . . . . . . . . . . . . . . . . . . +127% +28% +155% 668 1,701Germany . . . . . . . . . . . . . . . . . . . . . . . . . . . . . . . . . . . . . -50% +13% -37% 244 153France . . . . . . . . . . . . . . . . . . . . . . . . . . . . . . . . . . . . . . . -31% — -31% 336 232Spain . . . . . . . . . . . . . . . . . . . . . . . . . . . . . . . . . . . . . . . . +302% +3% +305% (208) 427Rest of Europe(2) . . . . . . . . . . . . . . . . . . . . . . . . . . . . . . . -13% +21% +8% 413 447South, Central America and the CaribbeanColombia . . . . . . . . . . . . . . . . . . . . . . . . . . . . . . . . . . . . . -6% -13% -19% 4,362 3,541Rest of South, Central America and the Caribbean(3) . . -14% +21% +7% 4,079 4,367Asia, Middle East and AfricaEgypt . . . . . . . . . . . . . . . . . . . . . . . . . . . . . . . . . . . . . . . . -48% +5% -43% 2,190 1,241Philippines . . . . . . . . . . . . . . . . . . . . . . . . . . . . . . . . . . . . +46% +24% +70% 1,036 1,759Rest of Asia, Middle East and Africa(4) . . . . . . . . . . . . . -3% +20% +17% 844 987Others(5) . . . . . . . . . . . . . . . . . . . . . . . . . . . . . . . . . . . . . +7% +18% +25% (2,837) (3,544)
Operating earnings before other expenses, net fromcontinuing operations . . . . . . . . . . . . . . . . . . . . . . . . . +21% Ps 21,853 Ps 26,489
Operating earnings before other expenses, net fromdiscontinued operations . . . . . . . . . . . . . . . . . . . . . . . . +84% 331 610
Total . . . . . . . . . . . . . . . . . . . . . . . . . . . . . . . . . . . . . . . . . +22% Ps 22,184 Ps 27,099
“— ” = Not Applicable(1) Represents the variation in local currency terms. For purposes of a geographic segment consisting of a
region, the variation in local currency terms for each individual country within the region are first translatedinto Dollar terms (except for the Rest of Europe, in which they are translated first into Euros) at theexchange rates in effect as of the end of the reporting period. Variations for a region represent the change inDollar terms (except for the Rest Europe region, in which they represent the change in Euros), net, in theregion.
(2) The “Rest of Europe” segment refers primarily to operations in the Czech Republic, Poland and Latvia, aswell as trading activities in Scandinavia and Finland. On October 31, 2015, we completed the sale of ouroperations in Austria and Hungary. See “Item 4—Information on the Company—Our Corporate Structure—Rest of Europe—Sale of our Operations in Austria and Hungary.” The operations in Austria and Hungaryfor the ten-month period ended October 31, 2015 and the year ended December 31, 2014, included in ourstatements of operations, were reclassified to the single line item “Discontinued operations.” On August 12,2015, we entered into an agreement for the sale of our operations in Croatia, including assets in Bosnia &Herzegovina, Montenegro and Serbia, to Duna-Dráva Cement Kft. See “Item 4—Information on theCompany—Our Corporate Structure—Rest of Europe—Attempted Sale of our Operations in SoutheastEurope.” For the years ended December 31, 2016, 2015 and 2014, the operations in Croatia, including assetsin Bosnia and Herzegovina, Montenegro and Serbia, included in our statements of operations are presentedin the single line item “Discontinued Operations.” On April 5, 2017, we announced that the EuropeanCommission issued a decision that restricts completion of the sale. Therefore, the sale of our operations inCroatia will not close and we will maintain our operations in Croatia, including assets in Bosnia and
156

Herzegovina, Montenegro and Serbia. Due to the inability to complete the sale, beginning in the secondquarter of 2017, we will reclassify the income statements of our operations in Croatia, including assets inBosnia & Herzegovina, Montenegro and Serbia, from the single line item “Discontinued Operations” toeach applicable line item in our consolidated financial statements. See notes 4A and 26 to our 2016 auditedconsolidated financial statements included elsewhere in this annual report.
(3) The “Rest of South, Central America and the Caribbean” segment includes CEMEX’s operations in CostaRica, Panama, Puerto Rico, the Dominican Republic, Nicaragua, Jamaica and other countries in theCaribbean, Guatemala and small ready-mix concrete operations in Argentina.
(4) The “Rest of Asia, Middle East and Africa” segment includes the operations in the UAE, Israel andMalaysia. On May 26, 2016, we completed the sale of our operations in Bangladesh and Thailand. See“Item 4—Information on the Company—Our Corporate Structure—Rest of Asia, Middle East and Africa—Sale of our Operations in Rest of Asia, Middle East and Africa.” Our operations in Bangladesh and Thailandfor the five-month period ended May 30, 2016 and the years ended December 31, 2015 and 2014 included inCEMEX’s statements of operations were reclassified to the single line item “Discontinued operations,”which includes, in 2016, a gain on sale of approximately U.S.$24 million (Ps424 million). See note 4A toour consolidated financial statements included elsewhere in this annual report.
(5) The “Others” segment refers to: (i) cement trade maritime operations, (ii) our information technologysolutions business (Neoris N.V.), (iii) CEMEX, S.A.B. de C.V. and other corporate entities and (iv)otherminor subsidiaries with different lines of business.
Net sales. Our consolidated net sales increased approximately 10%, from Ps199,942 million in 2014 toPs220,326 million in 2015. The increase was primarily attributable to higher prices of our products, in localcurrency terms, in most of our operations, as well as higher volumes in the U.S., and our Mediterranean and Asiaregions. Set forth below is a quantitative and qualitative analysis of the various factors affecting our net sales ona geographic segment basis. The discussion of volume data and net sales information below is presented beforeeliminations resulting from consolidation as described in note 4B to our 2016 audited consolidated financialstatements included elsewhere in this annual report.
Mexico
Our domestic cement sales volumes from our operations in Mexico increased approximately 1% in 2015compared to 2014, and ready-mix concrete sales volumes decreased approximately 5% over the same period. Ournet sales from our operations in Mexico represented approximately 21% of our total net sales for the year endedDecember 31, 2015, in Mexican Peso terms, before eliminations resulting from consolidation. Our volumes wereimpacted by our focus on our value-before-volume strategy and on profitability. The industrial/commercial sectorwas the main driver of the increase in our domestic cement volumes during 2015. The formal residential sectoralso had a positive performance during 2015, supported by credit growth from private banks and public entities.Our cement export volumes from our operations in Mexico, which represented approximately 3% of our Mexicancement sales volumes for the year ended December 31, 2015, decreased approximately 45% in 2015 compared to2014. Of our total cement export volumes from our operations in Mexico during 2015, approximately 38% wasshipped to the United States, approximately 34% to Central America and the Caribbean and approximately 28%to South America. Our average sales price of domestic cement from our operations in Mexico increasedapproximately 10%, in Mexican Peso terms, in 2015 compared to 2014, and our average sales price of ready-mixconcrete also increased approximately 7%, in Mexican Peso terms, over the same period. For the year endedDecember 31, 2015, cement represented approximately 54%, ready-mix concrete approximately 23% and ouraggregates and other businesses approximately 23% of our net sales in Mexican Peso terms from our operationsin Mexico before intra-sector eliminations within the segment and before eliminations resulting fromconsolidation, as applicable.
As a result of a decrease in ready-mix sales volumes, partially offset by the increases in domestic cementand ready-mix concrete sales prices and domestic cement sales volumes, our net sales in Mexico, in MexicanPeso terms, decreased approximately 2% in 2015 compared to 2014.
157

United States
Our domestic cement sales volumes from our operations in the United States increased approximately 2% in2015 compared to 2014, and ready-mix concrete sales volumes increased approximately 13% over the sameperiod. The increases in domestic cement and ready-mix concrete sales volumes from our operations in theUnited States were driven by increased demand from improvements in the residential and infrastructure sectors.Housing starts increased in 2015, driven by low levels of inventories, job creation and increased householdformation. In the infrastructure sector, the levels of activity increased during 2015. The industrial/commercialsector, excluding oil well activity, continued its growth, supported by lodging and office construction spending.Our operations in the United States represented approximately 24% of our total net sales for the year endedDecember 31, 2015, in Mexican Peso terms, before eliminations resulting from consolidation. Our averagedomestic cement sales prices of our operations in the United States increased approximately 6%, in Dollar terms,in 2015 compared to 2014, and our average ready-mix concrete sales price increased approximately 5%, inDollar terms, over the same period. For the year ended December 31, 2015, cement represented approximately31%, ready-mix concrete approximately 41% and our aggregates and other businesses approximately 28% of netsales in Mexican Peso terms from our operations in the United States before intra-sector eliminations within thesegment and before eliminations resulting from consolidation, as applicable.
As a result of the increases in domestic cement and ready-mix concrete sales volumes and sales prices, netsales from our operations in the United States, in Dollar terms, increased approximately 7% in 2015 compared to2014.
Europe
In 2015, our operations in Europe region consisted of our operations in the United Kingdom, Germany,France, and Spain, which represent the most significant operations in this region, in addition to the Rest ofEurope. Our net sales from our operations in the Europe region represented approximately 23% of our total netsales for the year ended December 31, 2015, in Mexican Peso terms, before eliminations resulting fromconsolidation. As of December 31, 2015, our operations in the Europe region represented approximately 17% ofour total assets. Set forth below is a quantitative and qualitative analysis of the effects of the various factorsaffecting our net sales for our main operations in the Europe region.
United Kingdom
Our domestic cement sales volumes from our operations in the United Kingdom increased approximately7% in 2015 compared to 2014, and ready-mix concrete sales volumes decreased approximately 2% over the sameperiod. The increase in domestic cement sales volumes resulted primarily from improvements in all of our maindemand sectors. The decrease in ready-mix concrete sales volumes reflects our focus on profitability. Ouroperations in the United Kingdom represented approximately 8% of our total net sales for the year endedDecember 31, 2015, in Mexican Peso terms, before eliminations resulting from consolidation. Our average salesprice of domestic cement from our operations in the United Kingdom increased approximately 4%, in Poundterms, in 2015 compared to 2014, and our average sales price of ready-mix concrete increased approximately 5%,in Pound terms, over the same period. For the year ended December 31, 2015, cement represented approximately17%, ready-mix concrete approximately 28% and our aggregates and other businesses approximately 55% of netsales in Mexican Peso terms from our operations in the United Kingdom before intra-sector eliminations withinthe segment and before eliminations resulting from consolidation, as applicable.
As a result of the increases in domestic cement sales volumes and sales prices and ready-mix concrete salesprices, partially offset by a decrease in ready-mix concrete sales volumes, net sales from our operations in theUnited Kingdom, in Pound terms, increased approximately 7% in 2015 compared to 2014.
158

Germany
Our domestic cement sales volumes from our operations in Germany decreased approximately 47% in 2015compared to 2014, and ready-mix concrete sales volumes decreased approximately 45% over the same period.The decreases in our cement and ready-mix concrete sales volumes were primarily due to the sale of assets toHolcim in January 2015. See note 15B to our 2016 audited consolidated financial statements included elsewherein this annual report. The residential sector remained as the main driver of cement consumption, benefiting fromlow unemployment, low mortgage rates, rising purchase power and growing immigration. Our cement exportvolumes from our operations in Germany, which represented approximately 39% of our cement sales volumes inGermany for the year ended December 31, 2015, decreased approximately 24% in 2015 compared to 2014. Ouroperations in Germany represented approximately 3% of our total net sales for the year ended December 31,2015, in Mexican Peso terms, before eliminations resulting from consolidation. Our average sales price ofdomestic cement from our operations in Germany increased approximately 7%, in Euro terms, in 2015 comparedto 2014, and our average sales price of ready-mix concrete increased approximately 2%, in Euro terms, over thesame period. For the year ended December 31, 2015, cement represented approximately 29%, ready-mixconcrete approximately 35% and our aggregates and other businesses approximately 36% of net sales in MexicanPeso terms from our operations in Germany before intra-sector eliminations within the segment and beforeeliminations resulting from consolidation, as applicable.
As a result of the decreases in domestic cement and ready-mix concrete sales volumes, partially offset bythe increases in domestic cement and ready-mix concrete sales prices, net sales from our operations in Germany,in Euro terms, decreased approximately 41% in 2015 compared to 2014.
France
Our ready-mix concrete sales volumes from our operations in France decreased approximately 5% in 2015compared to 2014. The decrease in ready-mix concrete sales volumes resulted primarily from lower demand dueto continued macroeconomic weakness. Our operations in France represented approximately 5% of our total netsales for the year ended December 31, 2015, in Mexican Peso terms, before eliminations resulting fromconsolidation. Our average sales price of ready-mix concrete of our operations in France decreasedapproximately 2%, in Euro terms, in 2015 compared to 2014. For the year ended December 31, 2015, ready-mixconcrete represented approximately 68% and our aggregates and other businesses approximately 32% of net salesin Mexican Peso terms from our operations in France before intra-sector eliminations within the segment andbefore eliminations resulting from consolidation, as applicable.
As a result of the decreases in ready-mix concrete sales volumes and sales prices, net sales from ouroperations in France, in Euro terms, decreased approximately 6% in 2015 compared to 2014.
Spain
Our domestic cement sales volumes from our operations in Spain increased approximately 35% in 2015compared to 2014, while ready-mix concrete sales volumes decreased approximately 18% over the same period.The increase in domestic cement sales volumes resulted primarily from our acquisition of assets from Holcim inJanuary 2015. See note 15B to our 2016 audited consolidated financial statements included elsewhere in thisannual report. Our operations in Spain represented approximately 3% of our total net sales for the year endedDecember 31, 2015, in Mexican Peso terms, before eliminations resulting from consolidation. Our cement exportvolumes from our operations in Spain, which represented approximately 61% of our Spain cement sales volumesfor the year ended December 31, 2015, increased approximately 19% in 2015 compared to 2014. Of our totalcement export volumes from our operations in Spain during 2015, approximately 2% were to Central Americaand the Caribbean, approximately 7% were to South America, approximately 10% were to the United States,approximately 23% were to Europe and the Middle East and approximately 58% were to Africa. Our averagesales price of domestic cement of our operations in Spain increased approximately 1%, in Euro terms, in 2015
159

compared to 2014, and our average sales price of ready-mix concrete increased approximately 12%, in Euroterms, over the same period. For the year ended December 31, 2015, cement represented approximately 81%,ready-mix concrete approximately 11% and our aggregates and other businesses approximately 8% of net salesfrom our operations in Spain before intra-sector eliminations within the segment and before eliminationsresulting from consolidation, as applicable.
As a result of the increases in domestic cement sales volumes and domestic cement and ready-mix concretesales prices, partially offset by a decrease in ready-mix concrete sales volumes, net sales from our operations inSpain, in Euro terms, increased approximately 31% in 2015 compared to 2014.
Rest of Europe
In 2015, our operations in Rest of Europe region consisted of our operations in the Czech Republic, Austria,Poland, Hungary and Latvia, as well as trading activities in Scandinavia and Finland. Our domestic cement salesvolumes from our operations in the Rest of Europe increased approximately 28% in 2015 compared to 2014, andready-mix concrete sales volumes increased approximately 19% over the same period. The increases in domesticcement and ready-mix concrete sales volumes were primarily due to the acquisition of assets from Holcim inJanuary 2015. See note 15B to our 2016 audited consolidated financial statements included elsewhere in thisannual report. The infrastructure and residential sectors were the main drivers of demand during the year. Ourcement export volumes from our operations in the Rest of Europe segment, which represented approximately24% of our Rest of Europe cement sales volumes for the year ended December 31, 2015, decreasedapproximately 17% in 2015 compared to 2014. Our net sales from our operations in the Rest of Europerepresented approximately 4% of our total net sales for the year ended December 31, 2015, in Mexican Pesoterms, before eliminations resulting from consolidation. Our average sales price of domestic cement from ouroperations in the Rest of Europe decreased approximately 22%, in Euro terms, in 2015 compared to 2014, andour average sales price of ready-mix concrete decreased approximately 16%, in Euro terms, over the sameperiod. For the year ended December 31, 2015, cement represented approximately 53%, ready-mix concreteapproximately 32% and our aggregates and other businesses approximately 15% of net sales in Mexican Pesoterms from our operations in the Rest of Europe before intra-sector eliminations within the segment and beforeeliminations resulting from consolidation, as applicable.
As a result of the increases in domestic cement and ready-mix concrete sales volumes, partially offset by thedecreases in domestic cement and ready-mix concrete sales prices, net sales in the Rest of Europe, in Euro terms,increased approximately 7% in 2015 compared to 2014.
On October 31, 2015, we completed the sale of our operations in Austria and Hungary to the RohrdorferGroup for €165 million (U.S.$179 million or Ps3,090 million) after final adjustments for changes in cash andworking capital balances as of the transfer date. See note 4A to our 2016 audited consolidated financialstatements included elsewhere in this annual report.
South, Central America and the Caribbean
In 2015, our operations in the SAC region consisted of our operations in Colombia, which represents themost significant operations in this region, in addition to the Rest of SAC. Some of these trading operations in theCaribbean region consist of the resale of cement produced by our operations in Mexico. Our net sales from ouroperations in the SAC region represented approximately 12% of our total net sales for the year endedDecember 31, 2015, in Mexican Peso terms, before eliminations resulting from consolidation. As ofDecember 31, 2015, our operations in the SAC region represented approximately 8% of our total assets. Set forthbelow is a quantitative and qualitative analysis of the effects of the various factors affecting our net sales for ourmain operations in the SAC region.
160

Colombia
Our domestic cement sales volumes from our operations in Colombia decreased approximately 9% in 2015compared to 2014, and ready-mix concrete sales volumes decreased approximately 3% over the same period. Thedecreases in domestic cement and ready-mix concrete sales volumes was primarily due to our value-before-volume strategy. Our net sales from our operations in Colombia represented approximately 5% of our total netsales for the year ended December 31, 2015, in Mexican Peso terms, before eliminations resulting fromconsolidation. Our average sales price of domestic cement from our operations in Colombia increasedapproximately 8%, in Colombian Peso terms, in 2015 compared to 2014, and our average sales price ofready-mix concrete increased approximately 6%, in Colombian Peso terms, over the same period. For the yearended December 31, 2015, cement represented approximately 53%, ready-mix concrete approximately 29% andour aggregates and other businesses approximately 18% of our net sales from our operations in Colombia beforeintra-sector eliminations within the segment and before eliminations resulting from consolidation, as applicable.
As a result of the increases in domestic cement and ready-mix concrete sales prices, completely offset by thedecreases in domestic cement and ready-mix concretes sales volumes, net sales of our operations in Colombia, inColombian Peso terms, remained flat in 2015 compared to 2014.
Rest of South, Central America and the Caribbean
Our domestic cement volumes from our operations in the Rest of SAC remained flat in 2015 compared to2014, and ready-mix concrete sales volumes decreased approximately 2% over the same period. Our net salesfrom our operations in the Rest of SAC represented approximately 8% of our total net sales for the year endedDecember 31, 2015, in Mexican Peso terms, before eliminations resulting from consolidation. Our cement exportvolumes from our operations in the Rest of SAC segment, which represented approximately 15% of our Rest ofSAC cement sales volumes for the year ended December 31, 2015, increased approximately 3% in 2015compared to 2014. Our average sales price of domestic cement from our operations in the Rest of SAC decreasedapproximately 5% in Dollar terms, in 2015 compared to 2014, and our average sales price of ready-mix concretedecreased approximately 1%, in Dollar terms, over the same period. For the year ended December 31, 2015,cement represented approximately 73%, ready-mix concrete approximately 19% and our other businessesapproximately 8% of net sales from our operations in the Rest of SAC before intra-sector eliminations within thesegment and before eliminations resulting from consolidation, as applicable.
As a result of the decreases in ready-mix concrete sales volumes and sales prices and domestic cement salesprices, net sales of our operations in the Rest of SAC, in Dollar terms, decreased approximately 3% in 2015compared to 2014.
Asia, Middle East and Africa
In 2015, our operations in the Asia, Middle East and Africa region consisted of our operations in Egypt andPhilippines, which represent the most significant operations in this region, in addition to our Rest of Asia, MiddleEast and Africa segment, which includes the UAE, Israel and Malaysia. Our net sales from our operations in theAsia, Middle East and Africa region represented approximately 7% of our total net sales for the year endedDecember 31, 2015, in Mexican Peso terms, before eliminations resulting from consolidation. As ofDecember 31, 2015, our operations in the Asia, Middle East and Africa region represented approximately 4% ofour total assets. Set forth below is a quantitative and qualitative analysis of the effects of the various factorsaffecting our net sales for our main operations in the Asia, Middle East and Africa region.
Egypt
Our domestic cement sales volumes from our operations in Egypt decreased approximately 9% in 2015compared to 2014, while ready-mix concrete sales volumes increased approximately 48% over the same period.
161

The increase in ready-mix concrete sales volumes resulted primarily from the continuation of governmentprojects and an increase in formal activity. Our net sales from our operations in Egypt represented approximately3% of our total net sales for the year ended December 31, 2015, in Mexican Peso terms. Our average sales priceof domestic cement decreased approximately 5%, in Egyptian Pound terms, in 2015 compared to 2014, and ouraverage sales price of ready-mix concrete increased approximately 12%, in Egyptian Pound terms, over the sameperiod. For the year ended December 31, 2015, cement represented approximately 83%, ready-mix concreteapproximately 13% and our aggregates and other businesses approximately 4% of net sales in Mexican Pesoterms from our operations in Egypt before intra-sector eliminations within the segment and before eliminationsresulting from consolidation, as applicable.
As a result of the decreases in domestic cement sales volumes and sales prices, partially offset by theincreases in ready-mix concrete sales volumes and sales prices, our net sales in Egypt, in Egyptian Pound terms,decreased approximately 11% in 2015 compared to 2014.
The Philippines
Our domestic cement sales volumes from our operations in the Philippines increased approximately 21% in2015 compared to 2014. The increase in our domestic cement sales volumes resulted primarily from growth inthe demand of infrastructure sector. In addition, the residential sector remained strong as developers continued toexpand housing projects supported by stable inflation, low mortgage rates and higher housing demand fromFilipinos. The industrial/commercial sector continued its growth momentum driven by office space demand. Ourcement export volumes from our operations in Philippines, which represented approximately 1% of ourPhilippines cement sales volumes for the year ended December 31, 2015, decreased approximately 11% in 2015compared to 2014. Our net sales from our operations in the Philippines represented approximately 4% of ourtotal net sales for the year ended December 31, 2015, in Mexican Peso terms, before eliminations resulting fromconsolidation. Our average sales price of domestic cement from our operations in the Philippines increasedapproximately 3% in Philippine Peso terms, in 2015 compared to 2014. For the year ended December 31, 2015,cement represented approximately 97%, ready-mix concrete approximately 1%, and our other businessesapproximately 2% of our net sales in Mexican Peso terms from our operations in the Philippines before intra-sector eliminations within the segment and before eliminations resulting from consolidation, as applicable.
As a result of the increases in domestic cement sales volumes and sales prices, net sales of our operations inthe Philippines, in Philippine Peso terms, increased approximately 23% in 2015 compared to 2014.
Rest of Asia, Middle East and Africa
Our domestic cement sales volumes from our operations in our Rest of Asia, Middle East and Africasegment decreased approximately 14% in 2015 compared to 2014, and ready-mix concrete sales volumesincreased approximately 1% over the same period. Our net sales from our operations in our Rest of Asia, MiddleEast and Africa segment represented approximately 5% of our total net sales for the year ended December 31,2015, in Mexican Peso terms, before eliminations resulting from consolidation. The cement export volumes fromour operations in our Rest of Asia, Middle East and Africa segment, which represented approximately 37% ofour Rest of Asia, Middle East and Africa cement sales volumes for the year ended December 31, 2015, increasedapproximately 78% in 2015 compared to 2014. Our average sales price of domestic cement from our operationsin our Rest of Asia, Middle East and Africa segment decreased approximately 1%, in Dollar terms, in 2015compared to 2014, and our average sales price of ready-mix concrete decreased approximately 1%, in Dollarterms, over the same period. For the year ended December 31, 2015, cement represented approximately 1%,ready-mix concrete approximately 69% and our aggregates and other businesses approximately 24% of our netsales from our operations in our Rest of Asia, Middle East and Africa segment before intra-sector eliminationswithin the segment and before eliminations resulting from consolidation, as applicable.
162

As a result of the increase in ready-mix concrete sales volumes, partially offset by the decreases inready-mix concrete sales prices and domestic cement sales volumes and prices, net sales in our Rest of Asia,Middle East and Africa segment, in Dollar terms, decreased approximately 5% in 2015 compared to 2014.
Others
Our Others segment refers to: (i) cement trade maritime operations, (ii) our information technologysolutions business (Neoris N.V.), (iii) CEMEX, S.A.B. de C.V. and other corporate entities and (iv) other minorsubsidiaries with different lines of business. Net sales from our Others segment increased approximately 20%before intra-sector eliminations within the segment and before eliminations resulting from consolidation, asapplicable, in 2015 compared to 2014, in Dollar terms. The increase resulted primarily from an increase in ourworldwide cement volume of our trading operations. For the year ended December 31, 2015, our informationtechnology solutions company represented approximately 35% and our trading operations representedapproximately 30% of our net sales in our Others segment, in Dollar terms.
Cost of Sales. Our cost of sales, including depreciation, increased approximately 8% fromPs134,742 million in 2014 to Ps146,068 million in 2015. As a percentage of net sales, cost of sales decreasedfrom 67.4% in 2014 to 66.3% in 2015. The decrease in cost of sales as a percentage of net sales was mainlydriven by improved operating efficiencies. Our cost of sales includes freight expenses of raw materials used inour producing plants.
Gross Profit. For the reasons explained above, our gross profit increased approximately 14% fromapproximately Ps65,200 million in 2014 to approximately Ps74,258 million in 2015. As a percentage of net sales,gross profit increased from approximately 32.6% in 2014 to 33.7% in 2015. In addition, our gross profit may notbe directly comparable to those of other entities that include all their freight expenses in cost of sales. Asdescribed above, we include freight expenses of finished products from our producing plants to our points of saleand from our points of sale to our customers’ locations within distribution expenses, which in aggregaterepresented costs of approximately Ps20,689 million in 2014 and approximately Ps23,109 million in 2015. As apercentage of net sales, distribution expenses represented 10.3% and 10.5% for the years ended December 31,2014 and 2015, respectively.
Operating expenses. Our operating expenses increased approximately 10.2%, from approximatelyPs43,347 million in 2014 to approximately Ps47,769 million in 2015. As a percentage of net sales, operatingexpenses represented 21.7% for the years ended December 31, 2014 and 2015. Our operating expenses includeexpenses related to personnel, equipment and services involved in sales activities and storage of product at pointsof sale, which are included as part of the administrative and selling expenses, as well as freight expenses offinished products between plants and points of sale and freight expenses between points of sale and thecustomers’ facilities, which are included as part of the distribution expenses line item. For the years endedDecember 31, 2014 and 2015, selling expenses included as part of the selling and administrative expenses lineitem amounted to approximately Ps5,674 million and Ps5,943 million, respectively. As a percentage of net sales,administrative and selling expenses represented 11.3% and 11.2% for the years ended December 31, 2014 and2015, respectively. As mentioned before, we include freight expenses of finished products from our producingplants to our points of sale and from our points of sale to our customers’ locations within distribution expenses,which in aggregate represented costs of approximately Ps20,689 million in 2014 and approximatelyPs23,109 million in 2015. As a percentage of net sales, distribution expenses represented 10.3% and 10.5% forthe years ended December 31, 2014 and 2015, respectively.
Operating Earnings Before Other Expenses, Net
For the reasons mentioned above, our operating earnings before other expenses, net increased approximately21.2% from approximately Ps21,853 million in 2014 to approximately Ps26,489 million in 2015. As a percentageof net sales, operating earnings before other expenses, net increased from approximately 10.9% in 2014 to 12%
163

in 2015. Additionally, set forth below is a quantitative and qualitative analysis of the effects of the various factorsaffecting our operating earnings before other expenses, net on a geographic segment basis.
Mexico
Our operating earnings before other expenses, net, from our operations in Mexico increased approximately17%, in Mexican Peso terms, from operating earnings before other expenses, net, of approximatelyPs11,060 million in 2014 to operating earnings before other expenses, net, of approximately Ps12,963 million in2015. The increase resulted primarily from improved operating efficiencies, partially offset by a decrease in ournet sales.
United States
Our operating earnings before other expenses, net, from our operations in the United States increasedsignificantly in Dollar terms. The increase in operating earnings before other expenses, net resulted primarilyfrom an increase in net sales and improved operating efficiencies.
Europe
United Kingdom. Our operating earnings before other expenses, net, from our operations in the UnitedKingdom increased approximately 127% in Pound terms. The increase resulted primarily from an increase in netsales and improved operating efficiencies.
Germany. Our operating earnings before other expenses, net, from our operations in Germany decreasedapproximately 50% in Euro terms. The decrease resulted primarily from a decrease in net sales, which wasprimarily due to the sale of assets to Holcim in January 2015. See note 15B to our 2016 audited consolidatedfinancial statements included elsewhere in this annual report.
France. Our operating earnings before other expenses, net, from our operations in France decreasedapproximately 31% in Euro terms. The decrease resulted primarily from a decrease in our net sales.
Spain. Our operating earnings before other expenses, net, from our operations in Spain increasedapproximately 302% in Euro terms. The increase in the operating earnings before other expenses, net, resultedprimarily from an increase in net sales.
Rest of Europe. Our operating earnings before other expenses, net, from our operations in the Rest ofEurope decreased approximately 13% in Euro terms. The decrease resulted primarily from higher depreciationexpense related to the assets acquired from Holcim (a non-cash expense) partially offset by an increase indomestic cement and ready-mix concrete sales volumes, supported by the infrastructure and residential sectors.
On October 31, 2015, we completed the sale of our operations in Austria and Hungary to the RohrdorferGroup for €165 million (U.S.$179 million or Ps3,090 million) after final adjustments for changes in cash andworking capital balances as of the transfer date. See note 4A to our 2016 audited consolidated financialstatements included elsewhere in this annual report.
South, Central America and the Caribbean
Colombia. Our operating earnings before other expenses, net, from our operations in Colombia decreasedapproximately 6% in Colombian Peso terms. The decrease resulted primarily from lower sales volumes.
Rest of South, Central America and the Caribbean. Our operating earnings before other expenses, net, fromour operations in the Rest of SAC increased approximately 13% in Dollar terms. The increase resulted primarilyfrom improved operating efficiencies.
164

Asia, Middle East and Africa
Egypt. Our operating earnings before other expenses, net, from our operations in Egypt decreased 48% inEgyptian Pound terms. The decrease resulted primarily from a decrease in net sales.
The Philippines. Our operating earnings before other expenses, net, from our operations in the Philippinesincreased approximately 46% in Philippine Peso terms. The increase resulted primarily from an increase in netsales as well as improved operating efficiencies.
Rest of Asia, Middle East and Africa. Our operating earnings before other expenses, net, from our operationsin our Rest of Asia, Middle East and Africa segment decreased approximately 3% in Dollar terms. The decreaseresulted primarily from decreases in net sales prices and sales volumes.
Others. Our operating loss before other expenses, net, from our operations in our Others segment increasedapproximately 19% in Dollar terms. The increase in our operating loss resulted primarily from an increase in netsales.
Other Expenses, Net. Our other expenses, net, decreased approximately 40%, in Mexican Peso terms, fromPs5,451 million in 2014 to Ps3,043 million in 2015. The decrease resulted primarily from lower impairmentlosses in 2015 compared to 2014. As a percentage of net sales, Other expenses, net, decreased fromapproximately 2.5% in 2014 to 1.4% in 2015. In 2014, the Other expenses, net, includes impairment losses oninventory of Ps292 million, as well as aggregate impairment losses from assets reclassified to other assets heldfor sale of Ps2,392 million. See notes 6, 12, 13B, 14 and 15A to our 2016 audited consolidated financialstatements included elsewhere in this annual report.
The most significant items included under this caption for the years ended December 31, 2014 and 2015 areas follows:
For the Year Ended December 31,
2014 2015
(in millions of Mexican Pesos)
Impairment losses and effects from assets held for sale . . . Ps(3,848) Ps(1,526)Restructuring costs . . . . . . . . . . . . . . . . . . . . . . . . . . . . . . . (544) (845)Charitable contributions . . . . . . . . . . . . . . . . . . . . . . . . . . . (18) (60)Results from the sale of assets and others, net . . . . . . . . . . (635) (612)
Ps(5,045) Ps(3,043)
Financial Items
Pursuant to IFRS, financial items include:
• financial or interest expense on borrowed funds;
• financial income on cash and cash equivalents;
• changes in the fair value resulting from the valuation of financial instruments, including derivativeinstruments and marketable securities;
• foreign exchange gains or losses associated with monetary assets and liabilities denominated in foreigncurrencies; and
165

• accretion result from assets and liabilities and others.
For the Year Ended December 31,
2014 2015
(in millions of Mexican Pesos)
Financial items:Financial expense . . . . . . . . . . . . . . . . . . . . . . . . . . . . . . . . . . . . . . . . . . Ps(21,483) Ps(19,767)Other financial income, net:Financial income . . . . . . . . . . . . . . . . . . . . . . . . . . . . . . . . . . . . . . . . . . 312 315Results from financial instruments . . . . . . . . . . . . . . . . . . . . . . . . . . . . . (880) (2,729)Foreign exchange results . . . . . . . . . . . . . . . . . . . . . . . . . . . . . . . . . . . . 3,936 2,083Effects of net present value on assets and liabilities and others, net . . . (837) (904)
Ps(18,952) Ps(21,002)
Our financial items in 2015, which comprises financial expense and other financial income, net, as reportedin our statements of operations, increased 10.8% from a loss of Ps18,952 million in 2014 to a loss of Ps21,002million in 2015. The components of the change are shown above.
Our financial expense decreased approximately 8%, from Ps21,483 million in 2014 to Ps19,767 million in2015, primarily attributable to lower premium payments, as well as lower interest rates on our financial debtduring 2015 compared to 2014. See notes 16A and 16B to our 2016 audited consolidated financial statementsincluded elsewhere in this annual report.
Our other financial income, net increased approximately 1%, from Ps312 million in 2014 to Ps315 millionin 2015. Our loss in our results from financial instruments increased 210% from a loss of Ps880 million in 2014to a loss of Ps2,729 million in 2015, primarily attributable to derivatives related to CEMEX, S.A.B. de C.V.’sshares. Our foreign exchange results decreased 47%, from a gain of approximately Ps3,936 million in 2014 to again of approximately Ps2,083 million in 2015. The decrease was primarily attributable to the fluctuation of theMexican Peso against the U.S. Dollar. The accretion expense, which represents the effects on our net assets andliabilities recognized at amortized cost due to the passage of time, increased by approximately 8% from anexpense of Ps837 million in 2014 to an expense of Ps904 million in 2015.
Derivative Financial Instruments. For the years ended December 31, 2014 and 2015, our derivativefinancial instruments that had a potential impact on our other financial income, net consisted of equity forward inthird-party shares contracts, interest rate swaps contracts, derivatives related to energy projects, conversionoptions embedded in the March 2015 Optional Convertible Subordinated U.S. Dollar Notes, the March 2016Optional Convertible Subordinated U.S. Dollar Notes and the March 2018 Optional Convertible SubordinatedU.S. Dollar Notes until December 31, 2012 and since then, the conversion option embedded in the November2019 Mandatory Convertible Mexican Peso Notes, as discussed in note 16D to our 2016 audited consolidatedfinancial statements included elsewhere in this annual report. Additionally, on March 13, 2015, CEMEX, S.A.B.de C.V. issued U.S.$200 million aggregate principal amount of its First March 2020 Optional ConvertibleSubordinated U.S. Dollar Notes to the holders of the CCUs in exchange for a cash payment of U.S.$200 million.The proceeds of the issuance of the First March 2020 Optional Convertible Subordinated U.S. Dollar Notes wereused to substantially finance the full payment at maturity of the March 2015 Optional Convertible SubordinatedU.S. Dollar Notes that matured without conversion. Additionally, on May 28, 2015, CEMEX, S.A.B. de C.V.issued U.S.$321 million aggregate principal amount of its Second March 2020 Optional ConvertibleSubordinated U.S. Dollar Notes (along with an estimated 42 million ADSs) to certain holders of the March 2016Optional Convertible Subordinated U.S. Dollar Notes in exchange for U.S.$626 million aggregate principalamount of its March 2016 Optional Convertible Subordinated U.S. Dollar Notes.
For the year ended December 31, 2015, our loss from our financial instruments decreased significantly forthe reasons described above. See “Item 5—Operating and Financial Review and Prospects—Liquidity andCapital Resources—Our Equity Forward Arrangements.”
166
Income Taxes. Our income tax effect in the statement of operations, which is primarily comprised of currentincome taxes plus deferred income taxes, decreased approximately 41% from an expense of Ps3,920 million in2014 to an expense of Ps2,328 million in 2015.
The decrease in the income tax expense is mainly attributable to current income taxes, which decreasedfrom an expense of Ps4,184 million in 2014 to an income of Ps6,149 million in 2015, considering a one-timebenefit of approximately Ps12.3 billion resulting from the reduction of income tax accounts payable accrued inprior years related to the disconnection of the tax consolidation regime in Mexico pursuant to a new income taxreform approved by the Mexican Congress in 2015. See notes 19A and 19D to our 2016 audited consolidatedfinancial statements included elsewhere in this annual report.
Our deferred income tax decreased from an income of Ps264 million in 2014 to an expense ofPs8,477 million in 2015. Our deferred income tax expense in 2015 resulted primarily from a one-time expense ofapproximately Ps5.9 billion attributable to the reduction of our deferred income tax assets from tax losscarryforwards, also as a consequence of the changes resulting from the new income tax law reform mentionedabove, which allowed us to settle a portion of the income tax accounts payable related to the disconnection of thetax consolidation regime in Mexico, using the aforementioned deferred tax assets. See notes 19B and 19D to our2016 audited consolidated financial statements included elsewhere in this annual report.
For each of the years ended December 31, 2014 and 2015, our statutory income tax rate in Mexico was30%. Our effective tax rate in 2014, which is determined as described below, resulted in a negative income taxrate of 211.9%, considering a loss before income tax of approximately Ps1,850 million, and our effective tax ratein 2015 resulted in an income tax rate of 73.2%, considering a gain before income tax of approximatelyPs3,182 million. See “Item 3—Key Information—Risk Factors—Risks Relating to Our Business—Certain taxmatters may have an adverse effect on our cash flow, financial condition and net income.”
Net Income from continuing operations. For the reasons described above, our net income from continuingoperations for 2015 increased 115%, from a net loss from continuing operations of Ps5,770 million in 2014 to anet income from continuing operations of Ps854 million in 2015.
Discontinued operations, net of tax. For the years ended December 31, 2014 and 2015, our discontinuedoperations included in our consolidated statements of operations amounted to Ps90 million and Ps1,279 million,respectively. As a percentage of net sales, discontinued operations, net of tax, represented 0.05% and 0.6% forthe years ended as of December 31, 2014 and 2015, respectively. See note 4A to our 2016 audited consolidatedfinancial statements included elsewhere in this annual report.
Consolidated Net Income (Loss). For the reasons described above, our consolidated net income (loss)(before deducting the portion allocable to non-controlling interest) for 2015 increased significantly from aconsolidated net loss of Ps5,680 million in 2014 to a consolidated net income of Ps2,133 million in 2015.
Non-controlling Interest Net Income. Changes in non-controlling interest net income in any period reflectchanges in the percentage of the stock of our subsidiaries held by non-associated third parties as of the end ofeach month during the relevant period and the consolidated net loss attributable to those subsidiaries.Non-controlling interest net income decreased, from a gain of Ps1,103 million in 2014 to a gain of Ps932 millionin 2015, primarily attributable to a decrease in the net income of the consolidated entities in which others have anon-controlling interest.
Controlling Interest Net Income (Loss). Controlling interest net income represents the difference betweenour consolidated net income and non-controlling interest net income, which is the portion of our consolidated netloss attributable to those of our subsidiaries in which non-associated third parties hold interests. For the reasonsdescribed above, our controlling interest net income increased 118%, from a net loss of approximatelyPs6,783 million in 2014 to a controlling interest net income of approximately Ps1,201 million in 2015.
167
Liquidity and Capital Resources
Operating Activities
We have satisfied our operating liquidity needs primarily through operations of our subsidiaries and expectto continue to do so for both the short and long-term. Although cash flow from our operations has historicallymet our overall liquidity needs for operations, servicing debt and funding capital expenditures and acquisitions,our subsidiaries are exposed to risks from changes in foreign currency exchange rates, price and currencycontrols, interest rates, inflation, governmental spending, social instability and other political, economic and/orsocial developments in the countries in which we operate, any one of which may materially decrease our netincome and decrease cash from operations. Consequently, in order to meet our liquidity needs, we also rely oncost-cutting and operating improvements to optimize capacity utilization and maximize profitability, as well asborrowing under credit facilities, proceeds of debt and equity offerings, and proceeds from asset sales. Ourconsolidated net cash flows provided by operating activities from continuing operations before interest, couponson Perpetual Debentures and income taxes paid in cash were approximately Ps35,941 million in 2014,Ps43,956 million in 2015 and Ps61,188 million in 2016. See our statement of cash flows included elsewhere inthis annual report. CEMEX management is of the opinion that working capital is sufficient for our presentrequirements.
Sources and Uses of Cash
Our review of sources and uses of resources below refers to nominal amounts included in our statement ofcash flows for 2014, 2015 and 2016.
168

Our primary sources and uses of cash during the years ended December 31, 2014, 2015 and 2016 were asfollows:
Year Ended December 31,
2014 2015 2016
(in millions of Mexican Pesos)Operating ActivitiesConsolidated net income (loss) . . . . . . . . . . . . . . . . . . . . . . . . . . . . . . . . . . . . . . . . . (5,680) 2,133 15,207Discontinued operations, net of tax . . . . . . . . . . . . . . . . . . . . . . . . . . . . . . . . . . . . . . 90 1,279 1,024
Net income (loss) from continuing operations . . . . . . . . . . . . . . . . . . . . . . . . . . . . . . (5,770) 854 14,183Non-cash items . . . . . . . . . . . . . . . . . . . . . . . . . . . . . . . . . . . . . . . . . . . . . . . . . . . . . . 39,740 38,789 35,982Changes in working capital, excluding income taxes . . . . . . . . . . . . . . . . . . . . . . . . 1,475 3,541 11,023
Net cash flows provided by operating activities from continuing operationsbefore interest, coupons on Perpetual Debentures and income taxes . . . . . . 35,445 43,184 61,188
Financial expense and coupons on Perpetual Debentures and income taxes paid incash . . . . . . . . . . . . . . . . . . . . . . . . . . . . . . . . . . . . . . . . . . . . . . . . . . . . . . . . . . . . . (24,522) (25,302) (23,312)
Net cash flows provided by operating activities of continuing operations . . . . 10,923 17,882 37,876Net cash flows provided by operating activities of discontinued operations . . . 1,069 1,213 1,194
Net cash flows provided by operating activities . . . . . . . . . . . . . . . . . . . . . . . . 11,992 19,095 39,070Investing ActivitiesProperty, machinery and equipment, net . . . . . . . . . . . . . . . . . . . . . . . . . . . . . . . . . . (5,965) (8,872) (4,500)Disposal of subsidiaries and associates, net . . . . . . . . . . . . . . . . . . . . . . . . . . . . . . . . 167 2,722 1,424Other long-term assets and others, net . . . . . . . . . . . . . . . . . . . . . . . . . . . . . . . . . . . . (703) (1,674) (2,326)
Net cash flows used in investing activities of continuing operations . . . . . . . . (6,501) (7,824) (5,402)Net cash flows used in investing activities of discontinued operations . . . . . . . (161) (153) 2
Net cash flows used in investing activities . . . . . . . . . . . . . . . . . . . . . . . . . . . . (6,662) (7,977) (5,400)Financing ActivitiesSale of non-controlling interest in subsidiaries . . . . . . . . . . . . . . . . . . . . . . . . . . . . . — — 9,777Derivative financial instruments . . . . . . . . . . . . . . . . . . . . . . . . . . . . . . . . . . . . . . . . 1,561 1,098 399Issuance (repayment) of debt, net . . . . . . . . . . . . . . . . . . . . . . . . . . . . . . . . . . . . . . . (6,714) (11,473) (37,050)Other financial obligations, net . . . . . . . . . . . . . . . . . . . . . . . . . . . . . . . . . . . . . . . . . (4,396) 177 (9,773)Securitization of trade receivables . . . . . . . . . . . . . . . . . . . . . . . . . . . . . . . . . . . . . . . 2,052 (506) (999)Non-current liabilities, net . . . . . . . . . . . . . . . . . . . . . . . . . . . . . . . . . . . . . . . . . . . . . (1,128) (1,763) (1,972)
Net cash flows used in financing activities . . . . . . . . . . . . . . . . . . . . . . . . (8,625) (12,467) (39,618)
Decrease in cash and cash equivalents of continuing operations . . . . . . . . . . . . . . . . (4,203) (2,409) (7,144)Increase in cash and cash equivalents of discontinued operations . . . . . . . . . . . . . . . 908 1,060 1,196Cash conversion effects, net . . . . . . . . . . . . . . . . . . . . . . . . . . . . . . . . . . . . . . . . . . . . 708 4,040 2,223Cash and cash equivalents at the beginning of the year . . . . . . . . . . . . . . . . . . . . . . . 15,176 12,589 15,280
Cash and cash equivalents at the end of the year . . . . . . . . . . . . . . . . . . . . . . . . . . . . 12,589 15,280 11,555
2016. During 2016, excluding the positive foreign currency effect of our initial balances of cash and cashequivalents generated during the period of approximately Ps2,223 million, there was a decrease in cash and cashequivalents of continuing operations of approximately Ps7,144 million. This decrease was the result of our netcash flows used in financing activities of approximately Ps39,618 million and our net cash flows used ininvesting activities of continuing operations of approximately Ps5,402 million, partially offset by our net cashflows provided by operating activities of continuing operations, which, after financial expense and coupons onPerpetual Debentures and income taxes paid in cash of approximately Ps23,312 million, amounted toapproximately Ps37,876 million.
169

For the year ended December 31, 2016, our net cash flows provided by operating activities included cashflows generated in working capital of approximately Ps11,023 million, which was primarily comprised of tradepayables and other accounts payable and accrued expenses, for an aggregate amount of approximatelyPs16,826 million, partially offset by trade receivable, net, other accounts receivable and other assets andinventories for an aggregate amount of approximately Ps5,803 million.
During 2016, our net cash flows provided by operating activities of continuing operations after financialexpense and coupons on Perpetual Debentures and income taxes paid in cash of approximately Ps37,876 millionwere mainly disbursed in connection with (i) our net cash flows used in financing activities of approximatelyPs39,618 million, which include repayment of our debt, net, other financial obligations, net, securitization oftrade receivables and non-current liabilities for an aggregate amount of approximately Ps49,794 million, partiallyoffset by derivative financial instruments and sale of non-controlling interest in subsidiaries for an aggregateamount of approximately Ps10,176 million and (ii) our net cash flows used in the investing activities ofcontinuing operations of approximately Ps5,402 million, which include investing in property, machinery andequipment, net and other long term assets and others, net for an aggregate amount of approximatelyPs6,826 million, partially offset by disposal of subsidiaries and associates, net for an amount of approximatelyPs1,424 million.
2015. During 2015, excluding the positive foreign currency effect of our initial balances of cash and cashequivalents generated during the period of approximately Ps4,040 million, there was a decrease in cash and cashequivalents of continuing operations of approximately Ps2,409 million. This decrease was the result of our netcash flows used in financing activities of approximately Ps12,467 million and our net cash flows used ininvesting activities of continuing operations of approximately Ps7,824 million, partially offset by our net cashflows provided by operating activities of continuing operations, which, after financial expense and coupons onPerpetual Debentures and income taxes paid in cash of approximately Ps25,302 million, amounted toapproximately Ps17,882 million.
For the year ended December 31, 2015, our net cash flows provided by operating activities included cashflows generated in working capital of approximately Ps3,541 million, which was primarily comprised of cashflows originated by trade payables and other accounts payable and accrued expenses, for an aggregate amount ofapproximately Ps10,185 million, partially offset by cash flows disbursed by trade receivable, net, other accountsreceivable and other assets and inventories for an aggregate amount of approximately Ps6,644 million.
During 2015, our net cash flows provided by operating activities of continuing operations after financialexpense and coupons on Perpetual Debentures and income taxes paid in cash of approximately Ps17,882 millionwere mainly disbursed in connection with (i) our net cash flows used in financing activities of approximatelyPs12,467 million, which include repayment of our debt, net, securitization of trade receivables and non-currentliabilities for an aggregate amount of approximately Ps13,742 million, partially offset by derivative financialinstruments and other financial obligations, net, for an aggregate amount of approximately Ps1,275 million and(ii) our net cash flows used in the investing activities of continuing operations of approximately Ps7,824 million,which include investing in property, machinery and equipment, net, intangible assets and other deferred charges,and other long term assets and others, net for an aggregate amount of approximately Ps10,546 million, partiallyoffset by disposal of subsidiaries and associates, net for an amount of approximately Ps2,722 million.
2014. During 2014, excluding the positive foreign currency effect of our initial balances of cash and cashequivalents generated during the period of approximately Ps708 million, there was a decrease in cash and cashequivalents of continuing operations of approximately Ps3,706 million. This decrease was the result of our netcash flows used in financing activities of approximately Ps8,625 million and our net cash flows used in investingactivities of continuing operations of approximately Ps6,500 million, partially offset by our net cash flowsprovided by operating activities of continuing operations, which, after financial expense, coupons on PerpetualDebentures and income taxes paid in cash of approximately Ps24,522 million, amounted to approximatelyPs11,419 million.
170

For the year ended December 31, 2014, our net cash flows provided by operating activities included cashflows generated in working capital of approximately Ps1,475 million, which was primarily comprised of cashflows originated by other accounts receivable and other assets, trade payables and other accounts payable andaccrued expenses, for an aggregate amount of approximately Ps7,539 million, partially offset by cash flowsdisbursed by trade receivable, net, and inventories for an aggregate amount of approximately Ps6,064 million.
During 2014, our net cash flows provided by operating activities of continuing operations after financialexpense, coupons on Perpetual Debentures and income taxes paid in cash of approximately Ps11,419 millionwere disbursed mainly in connection with (i) our net cash flows used in financing activities of approximatelyPs8,625 million, which include repayment of our debt, net, other financial obligations, net, and non-currentliabilities for an aggregate amount of approximately Ps12,238 million, partially offset by our cash flowsgenerated by the securitization of trade receivables and our derivative financial instruments for an aggregateamount of approximately Ps3,613 million and (ii) our net cash flows used in investing activities of continuingoperations of Ps6,500 million, which include investing in property, machinery and equipment, net, intangibleassets and other deferred charges, and other long term assets and others, net, for an aggregate amount ofapproximately Ps6,667 million, partially offset by our disposal of subsidiaries and associates, net, for an amountof Ps167 million.
As of December 31, 2016, we had the following uncommitted lines of credit, at annual interest rates rangingbetween approximately 1.25% and 6.50%, depending on the negotiated currency:
Lines of Credit Available
(in millions of Mexican Pesos)
Other lines of credit in foreign subsidiaries . . . . . . . . . . . . . . . . . 9,601 7,230Other lines of credit from banks . . . . . . . . . . . . . . . . . . . . . . . . . . 5,834 5,834
15,435 13,064
171

Capital Expenditures
Our capital expenditures incurred for the years ended December 31, 2015 and 2016, and our expectedcapital expenditures during 2017, which include an allocation to 2017 of a portion of our total future committedamount, are as follows:
Actual For the YearEnded December 31,
Actual Estimatedin 20172015 2016
(in millions of U.S. Dollars)
Mexico . . . . . . . . . . . . . . . . . . . . . . . . . . . . . . . . . . . . . . . . . 68 84 123United States . . . . . . . . . . . . . . . . . . . . . . . . . . . . . . . . . . . . 216 197 192Europe
United Kingdom . . . . . . . . . . . . . . . . . . . . . . . . . . . . . . 57 30 39Germany . . . . . . . . . . . . . . . . . . . . . . . . . . . . . . . . . . . . 22 26 13France . . . . . . . . . . . . . . . . . . . . . . . . . . . . . . . . . . . . . . 32 19 20Spain . . . . . . . . . . . . . . . . . . . . . . . . . . . . . . . . . . . . . . . 17 25 13Rest of Europe . . . . . . . . . . . . . . . . . . . . . . . . . . . . . . . 35 23 45
South, Central America and the CaribbeanColombia . . . . . . . . . . . . . . . . . . . . . . . . . . . . . . . . . . . 156 180 96Rest of South, Central America and the Caribbean . . . 64 34 73
Asia, Middle East and AfricaPhilippines . . . . . . . . . . . . . . . . . . . . . . . . . . . . . . . . . . 21 30 41Egypt . . . . . . . . . . . . . . . . . . . . . . . . . . . . . . . . . . . . . . 47 20 23Rest of Asia, Middle East and Africa . . . . . . . . . . . . . . 18 21 21
Others . . . . . . . . . . . . . . . . . . . . . . . . . . . . . . . . . . . . . . . . . . 1 5 27
Continuing operations . . . . . . . . . . . . . . . . . . . . . . . . . . . . . 754 685 727Discontinued operations . . . . . . . . . . . . . . . . . . . . . . . . . . . . 10 — 3Total consolidated . . . . . . . . . . . . . . . . . . . . . . . . . . . . . . . . 764 685 730
Of whichExpansion capital expenditures . . . . . . . . . . . . . . . . . . 252 251 212Base capital expenditures . . . . . . . . . . . . . . . . . . . . . . . 512 434 518
For the years ended December 31, 2015 and 2016, we recognized U.S.$754 million and U.S.$685 million incapital expenditures from our continuing operations, respectively. As of December 31, 2016, in connection withour significant projects, we had contractually committed capital expenditures of approximately U.S.$111 million,including our capital expenditures estimated to be incurred during 2017. This amount is expected to be incurredduring 2017, based on the evolution of the related projects. Pursuant to the Credit Agreement, we are prohibitedfrom making aggregate annual capital expenditures in excess of U.S.$1 billion (excluding certain capitalexpenditures, joint venture investments and acquisitions by each of CEMEX Latam and CHP and their respectivesubsidiaries), which capital expenditures, joint venture investments and acquisitions at any time then incurred aresubject to a separate aggregate limit of U.S.$500 million (or its equivalent) for each of CEMEX Latam and itssubsidiaries and CHP and its subsidiaries, in each case, the amounts of which allowed for permitted acquisitionsand investments in joint ventures cannot exceed U.S.$400 million per year.
Our Indebtedness
As of December 31, 2016, we had approximately Ps273,862 million (U.S.$13,217 million) (principalamount Ps276,716 million (U.S.$13,355 million), excluding deferred issuance costs) of total debt plus otherfinancial obligations in our balance sheet, which does not include approximately Ps9,075 million (U.S.$438million) of Perpetual Debentures. See notes 16A, 16B and 20D to our 2016 audited consolidated financial
172

statements included elsewhere in this annual report. Of our total debt plus other financial obligations,approximately 5% were short-term (including current maturities of long-term debt) and 95% were long-term. Asof December 31, 2016, approximately 77% of our total debt plus other financial obligations was Dollar-denominated, approximately 21% was Euro-denominated, approximately 1% was Mexican Peso-denominatedand immaterial amounts were denominated in other currencies.
On August 14, 2009, CEMEX, S.A.B. de C.V. and certain of its subsidiaries entered into the 2009 FinancingAgreement, which extended the final maturities of approximately U.S.$15 billion in syndicated and bilateralloans and private placement notes to February 14, 2014. On July 5, 2012, CEMEX, S.A.B. de C.V. and certain ofits subsidiaries launched the 2012 Exchange Offer and Consent Request to eligible creditors under the 2009Financing Agreement pursuant to which eligible creditors were requested to provide the 2012 AmendmentConsents. In addition, CEMEX, S.A.B. de C.V. and certain of its subsidiaries offered to exchange theindebtedness owed to the Participating Creditors for (i) new loans (or, in the case of the private placement notes,new private placement notes) or (ii) up to U.S.$500 million of our June 2018 U.S. Dollar Notes, in each case, intransactions exempt from registration under the Securities Act.
On September 17, 2012, CEMEX, S.A.B. de C.V. and certain of its subsidiaries successfully completed the2012 Refinancing Transaction, and CEMEX, S.A.B. de C.V. and certain of its subsidiaries entered into (a) the2012 Amendment and Restatement Agreement, pursuant to which the 2012 Amendment Consents with respect tothe 2009 Financing Agreement were given effect, and (b) the 2012 Facilities Agreement, pursuant to whichCEMEX, S.A.B. de C.V. and certain of its subsidiaries were deemed to borrow loans from those ParticipatingCreditors participating in the 2012 Exchange Offer and Consent Request in principal amounts equal to theprincipal amounts of indebtedness subject to the 2009 Financing Agreement that was extinguished by suchParticipating Creditors. As a result of the 2012 Refinancing Transaction, Participating Creditors received(i) approximately U.S.$6,155 million in aggregate principal amount of new loans and new private placementnotes and (ii) U.S.$500 million aggregate principal amount of the June 2018 U.S. Dollar Notes. In addition,approximately U.S.$525 million aggregate principal amount of loans and private placement notes, which hadremained outstanding under the 2009 Financing Agreement as of September 17, 2012, were subsequently repaidin full, as a result of prepayments made in accordance with the 2012 Facilities Agreement.
On September 29, 2014, CEMEX, S.A.B. de C.V. and certain of its subsidiaries entered into the CreditAgreement for U.S.$1.35 billion with nine of the main lending banks from its 2012 Facilities Agreement. OnNovember 3, 2014, five additional banks joined the Credit Agreement as lenders with aggregate commitments ofU.S.$515 million, increasing the total amount of the Credit Agreement from U.S.$1.35 billion toU.S.$1.87 billion (increasing the revolving tranche of the Credit Agreement proportionally to U.S.$746 million).
On July 30, 2015, CEMEX, S.A.B. de C.V. repaid in full the total amount outstanding of approximatelyU.S.$1.94 billion under the 2012 Facilities Agreement with new funds from 17 financial institutions, whichjoined new tranches under the Credit Agreement.
In February 2016, CEMEX, S.A.B. de C.V. and certain of its subsidiaries launched a consent request tolenders under the Credit Agreement, pursuant to which lenders were requested to consent to the 2016 CreditAgreement Amendments. On March 7, 2016, CEMEX, S.A.B. de C.V. and certain of its subsidiaries obtained therequisite consents from lenders under the Credit Agreement to make the 2016 Credit Agreement Amendments.The 2016 Credit Agreement Amendments became effective when certain customary conditions precedent werefulfilled on March 17, 2016.
In addition, the 2016 Credit Agreement Amendments effected changes to the margin grid in the CreditAgreement such that if the consolidated leverage ratio (as defined in the Credit Agreement) is greater than 5.50times in the reference periods ending on December 31, 2016, March 31, 2017, June 30, 2017, and September 30,2017, the applicable margin will be 425 bps instead of 400 bps. All other levels in the margin grid remainedunchanged.
173
Finally, pursuant to the 2016 Credit Agreement Amendments (i) the consolidated leverage ratio covenant (asdefined in the Credit Agreement) remained at 6.0 times until and including March 31, 2017, and will graduallydecline to 4.0 times by June 30, 2020; and (ii) the consolidated coverage ratio covenant (as defined in the CreditAgreement) remained at 1.85 times until and including March 31, 2017, increasing then to 2.0 times on June 30,2017, and to 2.25 times on December 31, 2017, and remaining at this level for each subsequent reference period.
On July 12, 2016, IFC joined the Credit Agreement as a lender granting CEMEX a loan of €106 million tosupport CEMEX’s sustainable investment programs in emerging markets. The funds will support CEMEXprojects designed to enhance environmental performance with 60% of the funds allocated for projects relating tothe reduction of CEMEX’s greenhouse gas emissions.
On November 30, 2016, CEMEX, S.A.B. de C.V. prepaid U.S.$373 million outstanding under the CreditAgreement and corresponding to the September 2017 amortization thereunder. With this prepayment, and as partof an agreement reached with a group of existing lenders under the Credit Agreement, U.S.$664 million(Ps13,758 million) of funded commitments maturing in 2018 were exchanged into a revolving facility,maintaining their original amortization schedule and the same terms and conditions. As of December 31, 2016,total commitments under the Credit Agreement included (i) approximately €746 million (approximatelyU.S.$785 million or approximately Ps16,259 million) and (ii) approximately U.S.$2,826 million (Ps58,555million), out of which about U.S.$1,413 million (Ps29,277 million) were in the revolving credit facility. TheCredit Agreement currently has an amortization profile, considering all commitments, of approximatelyU.S.$783 million in 2018, U.S.$883 million in 2019 and U.S.$1,096 million in 2020. See note 16A to our 2016audited consolidated financial statements included elsewhere in this annual report.
CEMEX, S.A.B. de C.V. and certain of its subsidiaries have pledged under pledge agreements or transferredto a trustee under a security trust substantially all the Collateral, and all proceeds of the Collateral, to secure ourpayment obligations under the Credit Agreement, the Senior Secured Notes and under several other financingarrangements. These subsidiaries whose shares were pledged or transferred as part of the Collateral collectivelyown, directly or indirectly, substantially all our operations worldwide. See “Item 3—Key Information—RiskFactors—Risks Relating to Our Business—We pledged the capital stock of subsidiaries that representsubstantially all of our business as collateral to secure our payment obligations under the Credit Agreement, theSenior Secured Notes and other financing arrangements.”
As of December 31, 2016, we reported an aggregate principal amount of outstanding debt of approximatelyPs56,879 million (U.S.$2,745 million) (principal amount Ps57,220 million (U.S.$2,762 million), excludingdeferred issuance costs) under the Credit Agreement. As of December 31, 2016, we had U.S.$849 millionavailable under the U.S.$1,413 million revolving credit facility. If we are unable to comply with our upcomingprincipal maturities under our indebtedness, or refinance or extend maturities of our indebtedness, our debt couldbe accelerated. Acceleration of our debt would have a material adverse effect on our financial condition. See“Item 3—Key Information—Risk Factors—Risks Relating to Our Business—We have a substantial amount ofdebt and other financial obligations maturing in the next several years. If we are unable to secure refinancing onfavorable terms or at all, we may not be able to comply with our upcoming payment obligations. Our ability tocomply with our principal maturities and financial covenants may depend on us making asset sales, and there isno assurance that we will be able to execute such sales on terms favorable to us or at all.”
For a discussion of restrictions and covenants under the Credit Agreement, see “Item 3—Key Information—Risk Factors—Risks Relating to Our Business—The Credit Agreement contains several restrictions andcovenants. Our failure to comply with such restrictions and covenants could have a material adverse effect on ourbusiness and financial conditions.”
For a description of the Senior Secured Notes, see “Item 5—Operating and Financial Review andProspects—Summary of Material Contractual Obligations and Commercial Commitments—Senior SecuredNotes.”
174

Some of our subsidiaries and special purpose vehicles have issued or provided guarantees of certain of ourindebtedness, as indicated in the table below.
Senior SecuredNotes
CreditAgreement
PerpetualDebentures CBs(1)
U.S.$7,924 million(Ps148,417
million) (principalamount
U.S.$7,992million (Ps149,690
million))
U.S.$2,192million
(Ps41,056million) (principalamount U.S.$2,208million (Ps41,356
million))
U.S.$439million
(Ps8,222million)
U.S.$36million(Ps674million)
Amount outstanding as of March 31, 2017
CEMEX, S.A.B. de C.V. . . . . . . . . . . . . . . . . . . . . . . . . ✓ ✓ ✓ ✓CEMEX México, S.A. de C.V. . . . . . . . . . . . . . . . . . . . ✓ ✓ ✓ ✓CEMEX Concretos, S.A. de C.V. . . . . . . . . . . . . . . . . . ✓ ✓ ✓ ✓Empresas Tolteca de México, S.A. de C.V. . . . . . . . . . ✓ ✓New Sunward Holding B.V. . . . . . . . . . . . . . . . . . . . . . ✓ ✓CEMEX España, S.A. . . . . . . . . . . . . . . . . . . . . . . . . . . ✓ ✓ ✓Cemex Asia B.V. . . . . . . . . . . . . . . . . . . . . . . . . . . . . . . ✓ ✓CEMEX Corp. . . . . . . . . . . . . . . . . . . . . . . . . . . . . . . . . ✓ ✓CEMEX Finance LLC . . . . . . . . . . . . . . . . . . . . . . . . . . ✓ ✓Cemex Egyptian Investments B.V. . . . . . . . . . . . . . . . . ✓ ✓CEMEX France Gestion (S.A.S) . . . . . . . . . . . . . . . . . . ✓ ✓Cemex Research Group AG . . . . . . . . . . . . . . . . . . . . . ✓ ✓CEMEX UK . . . . . . . . . . . . . . . . . . . . . . . . . . . . . . . . . ✓ ✓
(1) Includes long-term secured CBs.
In addition, as of March 31, 2017, (i) CEMEX Materials LLC is a borrower of Ps2,941 million (U.S.$157million) (principal amount Ps2,810 million (U.S.$150 million)) under an indenture, which is guaranteed byCEMEX Corp.; and (ii) several of our other operating subsidiaries were borrowers under debt facilities and otherfinancial obligations aggregating Ps12,905 million (U.S.$689 million).
Most of our outstanding indebtedness has been incurred to finance our acquisitions and to finance ourcapital expenditure programs. Historically, we have addressed our liquidity needs (including funds required tomake scheduled principal and interest payments, refinance debt, and fund working capital and planned capitalexpenditures) with operating cash flow, securitizations, borrowings under credit facilities, proceeds of debt andequity offerings and proceeds from asset sales.
The moderate growth of the global economic environment and its adverse effects on our operating resultsmay negatively affect our credit rating and the market value of CEMEX, S.A.B. de C.V. common stock, CPOsand ADSs. If current economic pressures continue or worsen, we may be dependent on the issuance of equity as asource to repay our existing indebtedness, including indebtedness under the Credit Agreement. Although we havebeen able to raise debt, equity and equity-linked capital in the recent past, previous conditions in the capitalmarkets in 2008 and 2009 were such that traditional sources of capital were not available to us on reasonableterms or at all. As a result, we cannot assure you that we will be able to successfully raise additional debt orequity capital on terms that are favorable to us or at all.
175

If the global economic environment deteriorates and our operating results worsen significantly, if we wereunable to complete debt or equity offerings or if the proceeds of any divestitures and/or our cash flow or capitalresources prove inadequate, we could face liquidity problems and may not be able to comply with our upcomingprincipal payments under our indebtedness or refinance our indebtedness. If we are unable to comply with ourupcoming principal maturities under our indebtedness, or refinance or extend maturities of our indebtedness, ourdebt could be accelerated. Acceleration of our debt would have a material adverse effect on our business andfinancial condition.
We and our subsidiaries have sought and obtained waivers and amendments to several of our debtinstruments relating to a number of financial ratios in the past. Our ability to comply with these ratios may beaffected by current global economic conditions and volatility in foreign exchange rates and the financial andcapital markets. We may need to seek waivers or amendments in the future. However, we cannot assure you thatany future waivers or amendments, if requested, will be obtained. If we or our subsidiaries are unable to complywith the provisions of our debt instruments, and are unable to obtain a waiver or amendment, the indebtednessoutstanding under such debt instruments could be accelerated. Acceleration of these debt instruments would havea material adverse effect on our financial condition.
Relevant Transactions Related to Our Indebtedness During 2016
As of December 31, 2016, we had approximately Ps273,862 million (U.S.$13,217 million) (principalamount Ps276,716 million (U.S.$13,355 million), excluding deferred issuance costs) of total debt plus otherfinancial obligations in our balance sheet, which does not include approximately Ps9,075 million (U.S.$438million) of Perpetual Debentures. As of December 31, 2016, approximately 77% of our total debt plus otherfinancial obligations was Dollar-denominated, approximately 21% was Euro-denominated, approximately 1%was Mexican Peso-denominated and immaterial amounts were denominated in other currencies. Our financingactivities through December 31, 2015 are described in the 2015 Annual Report. The following is a description ofour most important transactions related to our indebtedness in 2016:
• On March 7, 2016, CEMEX, S.A.B. de C.V. and certain of its subsidiaries obtained the requisiteconsents from lenders under the Credit Agreement to make the 2016 Credit Agreement Amendments.The 2016 Credit Agreement Amendments became effective when certain customary conditionsprecedent were fulfilled on March 17, 2016.
• On March 15, 2016, CEMEX, S.A.B. de C.V. repaid the remaining outstanding amount (U.S.$352million) of the March 2016 Optional Convertible Subordinated U.S. Dollar Notes at their maturity.
• On March 16, 2016, CEMEX, S.A.B. de C.V. issued U.S.$1.0 billion aggregate principal amount of itsApril 2026 U.S. Dollar Notes. A portion of the net proceeds from the offering of the April 2026U.S. Dollar Notes of approximately U.S.$830 million were used to fund the April 2019 U.S. Dollar andEuro Notes Redemption, and the remaining net proceeds from the issuance of the April 2026U.S. Dollar Notes were used to fund the June 2018 U.S. Dollar Notes Redemption.
• On April 1, 2016, CEMEX España, acting through its Luxembourg branch, issued an irrevocable noticeof redemption with respect to the April 2019 U.S. Dollar and Euro Notes, pursuant to which itredeemed the remaining U.S.$603.7 million aggregate principal amount of the April 2019 U.S. DollarNotes, including some notes held by CEMEX, S.A.B. de C.V., and the remaining €179.2 millionaggregate principal amount of the April 2019 Euro Notes on May 3, 2016 using a portion of theproceeds from the issuance by CEMEX, S.A.B. de C.V. of the April 2026 U.S. Dollar Notes onMarch 16, 2016.
• On April 28, 2016, CEMEX, S.A.B. de C.V. canceled U.S.$217.3 million aggregate principal amountof Perpetual Debentures. On May 13, 2016, CEMEX, S.A.B. de C.V. canceled U.S.$7.8 million and€6.1 million aggregate principal amount of Perpetual Debentures. These cancelations refer to PerpetualDebentures that were already held by us.
176
• On May 2, 2016, CEMEX, S.A.B. de C.V. completed the April 2019 U.S. Dollar and Euro NotesRedemption.
• On May 12, 2016, CEMEX, S.A.B. de C.V. completed the May 2016 Tender Offer. The May 2016Tender Offer was financed with the proceeds from a draw-down on the revolving tranche of our CreditAgreement of U.S.$400 million. All October 2018 U.S. Dollar Notes and December 2019 U.S. DollarNotes purchased in the May 2016 Tender Offer were immediately canceled. Following the settlementof the May 2016 Tender Offer, U.S.$319.5 million aggregate principal amount of the October 2018U.S. Dollar Notes and U.S.$746.2 million aggregate principal amount of the December 2019U.S. Dollar Notes remained outstanding.
• On June 14, 2016, CEMEX Finance LLC issued €400 million aggregate principal amount of its June2024 Euro Notes. The net proceeds from the offering of the June 2024 Euro Notes were used forgeneral corporate purposes, including to repay indebtedness, all in accordance with the CreditAgreement.
• On June 15, 2016, CEMEX, S.A.B. de C.V. completed the June 2018 U.S. Dollar Notes Redemption.
• On July 12, 2016, IFC joined the Credit Agreement as a lender granting CEMEX a loan of€106 million to support CEMEX’s sustainable investment programs in emerging markets. The fundswill support CEMEX projects designed to enhance environmental performance with 60% of the fundsallocated for projects relating to the reduction of CEMEX’s greenhouse gas emissions.
• On July 28, 2016, CEMEX, S.A.B. de C.V. completed the July 2016 Tender Offer. The July 2016Tender Offer was financed with the proceeds from a draw-down on the revolving tranche of our CreditAgreement of approximately U.S.$450 million. All October 2022 U.S. Dollar Notes purchased in theJuly 2016 Tender Offer were immediately canceled. Following the settlement of the July 2016 TenderOffer, U.S.$1,055.6 million aggregate principal amount of the October 2022 U.S. Dollar Notesremained outstanding.
• On August 15, 2016, CEMEX, S.A.B. de C.V. completed the redemption of the remaining 5.875%Senior Secured Notes due 2019.
• On October 28, 2016, CEMEX, S.A.B. de C.V. completed the October 2016 Tender Offer. TheOctober 2016 Tender Offer was financed with the proceeds from a draw-down on the revolving trancheof our Credit Agreement of U.S.$500 million, together with available cash. All January 2021U.S. Dollar Notes purchased in the October 2016 Tender Offer were immediately canceled. Followingthe settlement of the October 2016 Tender Offer, U.S.$758.1 million aggregate principal amount of theJanuary 2021 U.S. Dollar Notes remained outstanding.
• On November 30, 2016, CEMEX, S.A.B. de C.V. prepaid U.S.$373 million outstanding under theCredit Agreement and corresponding to the September 2017 amortization thereunder. With thisprepayment, and as part of an agreement reached with a group of existing lenders under the CreditAgreement, U.S.$664 million (Ps13,758 million) of funded commitments maturing in 2018 wereexchanged into a revolving facility, maintaining their original amortization schedule and the sameterms and conditions. As of December 31, 2016, total commitments under the Credit Agreementincluded (i) approximately €746 million (approximately U.S.$785 million or approximately Ps16,259million) and (ii) approximately U.S.$2,826 million (Ps58,555 million), out of which aboutU.S.$1,413 million (Ps29,277 million) were in the revolving credit facility.
• In 2016, the repurchase of U.S.$198.5 million aggregate principal amount of the following SeniorSecured Notes (all of which Senior Secured Notes have been canceled):
• U.S.$2.1 million aggregate principal amount of June 2018 U.S. Dollar Notes;
• U.S.$46.1 million aggregate principal amount of CEMEX, S.A.B. de C.V.’s 5.875% SeniorSecured Notes due 2019;
177

• U.S.$61.0 million aggregate principal amount of December 2019 U.S. Dollar Notes;
• U.S.$22.9 million aggregate principal amount of April 2019 U.S. Dollar Notes;
• U.S.$28.9 million aggregate principal amount of October 2022 U.S. Dollar Notes;
• U.S.$6.1 million aggregate principal amount of October 2018 U.S. Dollar Notes; and
• U.S.$31.4 million aggregate principal amount of January 2021 U.S. Dollar Notes.
We used a substantial portion of the proceeds from these transactions to repay and refinance indebtedness,to improve our liquidity position and for general corporate purposes. Through these and prior refinancingtransactions, we addressed all maturities under the 2009 Financing Agreement and the 2012 FacilitiesAgreement. For a description of the 2016 Credit Agreement Amendments, see “Item 5—Operating and FinancialReview and Prospects—Liquidity and Capital Resources—Our Indebtedness.”
Our Other Financial Obligations
Other financial obligations in the consolidated balance sheet as of December 31, 2015 and 2016 are detailedas follows:
December 31, 2015 December 31, 2016
Short-term
Long-term Total
Short-term
Long-term Total
March 2020 Optional Convertible SubordinatedU.S. Dollar Notes . . . . . . . . . . . . . . . . . . . . . . . . . . . Ps — 8,569 8,569 — 10,417 10,417
March 2018 Optional Convertible SubordinatedU.S. Dollar Notes . . . . . . . . . . . . . . . . . . . . . . . . . . . — 10,826 10,826 — 13,575 13,575
March 2016 Optional Convertible SubordinatedU.S. Dollar Notes . . . . . . . . . . . . . . . . . . . . . . . . . . . 6,007 — 6,007 — — —
November 2019 Mandatory Convertible Mexican PesoNotes . . . . . . . . . . . . . . . . . . . . . . . . . . . . . . . . . . . . . 239 961 1,200 278 689 967
Liabilities secured with accounts receivable . . . . . . . . . 9,071 1,430 10,501 11,095 — 11,095Capital leases . . . . . . . . . . . . . . . . . . . . . . . . . . . . . . . . . 270 1,482 1,752 285 1,291 1,576
Ps15,587 23,286 38,855 11,658 25,972 37,630
As mentioned in note 2F to our 2016 audited consolidated financial statements included elsewhere in thisannual report, financial instruments convertible into CEMEX, S.A.B. de C.V.’s CPOs and/or ADSs containcomponents of both liability and equity, which are recognized differently depending on whether the instrument ismandatorily convertible, or is optionally convertible by election of the note holders, as well as the currency inwhich the instrument is denominated.
March 2020 Optional Convertible Subordinated U.S. Dollar Notes
During 2015, CEMEX, S.A.B. de C.V. issued U.S.$521 million (Ps 8,977 million) aggregate principalamount of its March 2020 Optional Convertible Subordinated U.S. Dollar Notes. The March 2020 OptionalConvertible Subordinated U.S. Dollar Notes were issued: (a) U.S.$200 million as a result of the exercise onMarch 13, 2015 of U.S.$200 million notional amount of CCUs (described below), and (b) U.S.$321 million as aresult of private exchanges with certain institutional investors on May 28, 2015, which together with earlyconversions, resulted in a total of approximately U.S.$626 million aggregate principal amount of the March 2016Optional Convertible Subordinated U.S. Dollar Notes held by such investors being paid and the issuance anddelivery by CEMEX of an estimated 42 million ADSs, which included a number of additional ADSs issued to theholders as non-cash inducement premiums. The March 2020 Optional Convertible Subordinated U.S. Dollar
178

Notes, which are subordinated to all of CEMEX’s liabilities and commitments, are convertible into a fixednumber of CEMEX, S.A.B. de C.V.’s ADSs at any time at the holder’s election and are subject to antidilutionadjustments. The difference at the exchange date between the fair value of the March 2016 Optional ConvertibleSubordinated U.S. Dollar Notes and the 42 million ADSs against the fair value of March 2020 OptionalConvertible Subordinated U.S. Dollar Notes, represented a loss of approximately Ps365 million recognized in2015 as part of other financial (expense) income, net. As of December 31, 2015 and 2016, the conversion priceper ADS was approximately U.S.$11.90 and U.S.$11.45, respectively. The aggregate fair value of the conversionoption as of the issuance dates which amounted to approximately Ps199 million was recognized in other equityreserves. After antidilution adjustments, the conversion rate as of December 31, 2015 and 2016 was 84.00 ADSand 87.3646 ADS, respectively, per each U.S.$1 thousand principal amount of such notes. See note 16B to our2016 audited consolidated financial statements included elsewhere in this annual report.
March 2018 Optional Convertible Subordinated U.S. Dollar Notes
On March 15, 2011, CEMEX, S.A.B. de C.V. closed the offering of U.S.$690 million (Ps8,211 million)aggregate principal amount of the March 2018 Optional Convertible Subordinated U.S. Dollar Notes. The notesare subordinated to all of CEMEX’s liabilities and commitments. The notes are convertible into a fixed numberof CEMEX, S.A.B. de C.V.’s ADSs, at the holder’s election, and are subject to antidilution adjustments. As ofDecember 31, 2015 and 2016, the conversion price per ADS was approximately U.S.$9.27 dollars and U.S.$8.92dollars, respectively. After antidilution adjustments, the conversion rate as of December 31, 2015 and 2016 was107.8211 ADS and 112.1339 ADS, respectively, per each U.S.$1 thousand principal amount of the March 2018Optional Convertible Subordinated U.S. Dollar Notes. A portion of the net proceeds from this transaction wereused to fund the purchase of capped call options, which are generally expected to reduce the potential dilutioncost to us upon the potential conversion of the March 2018 Optional Convertible Subordinated U.S. Dollar Notes.See notes 16B and 16D to our 2016 audited consolidated financial statements included elsewhere in this annualreport.
November 2019 Mandatory Convertible Mexican Peso Notes
In December 2009, CEMEX, S.A.B. de C.V. completed an exchange offer of debt into mandatorilyconvertible securities in pesos for approximately U.S.$315 million (Ps4,126 million) of the November 2019Mandatory Convertible Mexican Peso Notes. Reflecting antidilution adjustments, the notes will be converted atmaturity or earlier if the price of the CPO reaches approximately Ps29.50 into approximately 210 million CPOsat a conversion price of approximately Ps18.1808 per CPO. During their tenure, holders have an option tovoluntarily convert their securities on any interest payment date into CPOs. Considering the currency in whichthe notes are denominated and the functional currency of CEMEX, S.A.B. de C.V.’s financing division, theconversion option embedded in these securities is treated as a stand-alone derivative liability at fair value in thestatement of operations, recognizing an initial effect of Ps365 million. Changes in fair value of the conversionoption generated gains of approximately U.S.$11 million (Ps159 million) in 2014, gains of approximatelyU.S.$18 million (Ps310 million) in 2015 and losses of approximately U.S.$29 million (Ps601 million) in 2016.See notes 2D and 16B to our 2016 audited consolidated financial statements included elsewhere in this annualreport.
Our Receivables Financing Arrangements
Our subsidiaries in Mexico, the United States, France and the United Kingdom are parties to sales of tradeaccounts receivable programs with financial institutions, referred to as securitization programs. As ofDecember 31, 2015 and 2016, trade accounts receivable included receivables of U.S.$746 million (Ps12,858million) and U.S.$658 million (Ps13,644 million), respectively. Under these programs, our subsidiarieseffectively surrender control associated with the trade accounts receivable sold and there is no guarantee orobligation to reacquire the assets. However, we retain certain residual interest in the programs and/or maintain
179

continuing involvement with the accounts receivable; therefore, the amounts received are recognized within“Other financial obligations.” Trade accounts receivable qualifying for sale exclude amounts over certain dayspast due or concentrations over certain limits to any customer, according to the terms of the programs. Theportion of the accounts receivable sold maintained as reserves amounted to Ps2,357 million and Ps2,549 millionas of December 31, 2015 and 2016, respectively. Therefore, the funded amount to CEMEX was U.S.$609 million(Ps10,501 million) in 2015 and U.S.$535 million (Ps11,095 million) in 2016. The discount granted to theacquirers of the trade accounts receivable is recorded as financial expense and amounted to approximatelyU.S.$16 million (Ps249 million) and U.S.$14 million (Ps258 million) in 2015 and 2016, respectively. Oursecuritization programs are negotiated for specific periods and may be renewed at their maturity. As ofDecember 31, 2016, the securitization programs outstanding in Mexico, the United States, France and the UnitedKingdom each mature in March 2017. See notes 9 and 16B to our 2016 audited consolidated financial statementsincluded elsewhere in this annual report. For a description of our renewals of the securitization programs, see“Item 5—Operating and Financial Review and Prospects—Recent Developments—Recent DevelopmentsRelating to Our Indebtedness.”
Capital Leases
As of December 31, 2015 and 2016, we held several operating buildings and mainly mobile equipment,under capital lease contracts for a total of approximately U.S.$102 million (Ps1,752 million) and U.S.$84 million(Ps1,576 million), respectively. See note 16B to our 2016 audited consolidated financial statements includedelsewhere in this annual report. Future payments associated with these contracts are presented in note 23E to our2016 audited consolidated financial statements included elsewhere in this annual report.
Our Equity Forward Arrangements
As of December 31, 2015 and 2016, we had a forward contract to be settled in cash maturing in October2016 over the price of 59.5 million CPOs of Axtel, S.A.B. de C.V. (“Axtel”), a Mexican telecommunicationscompany traded on the Mexican Stock Exchange. Changes in the fair value of this instrument generated losses ofapproximately U.S.$9 million (Ps133 million) in 2014, gains of approximately U.S.$15 million (Ps258 million)in 2015 and losses of approximately U.S.$2 million (Ps30 million) in 2016, recognized in our statements ofoperations for each period. In October 2015, Axtel announced its merger with Alestra, S. de R.L. de C.V.(“Alestra”), a Mexican provider of information technology solutions and a subsidiary of Alfa, S.A.B. de C.V.(“Alfa”) whose merger became effective on February 15, 2016. In connection with this merger, on January 6,2016, we settled in cash the forward contract and received approximately U.S.$4 million, net of transaction costs.As of December 31, 2015, we held an investment in Axtel that, upon completion of the Alestra and Axtel merger,would be exchanged proportionately according to the new ownership interests for shares in the new mergedentity that will remain public and that we believe has an attractive business outlook. Therefore, in a separatetransaction after the settlement of the Axtel forward contract, we purchased 59.5 million CPOs of Axtel in theopen market and incorporated them into our existing investment in Axtel as part of our investments available forsale. See note 16D to our 2016 audited consolidated financial statements included elsewhere in this annual report.
Perpetual Debentures
As of December 31, 2015 and 2016, non-controlling interest stockholders’ equity included approximatelyU.S.$440 million (Ps7,581 million) and U.S.$438 million (Ps9,075 million), respectively, representing thenotional amount of Perpetual Debentures, which exclude any perpetual debentures held by subsidiaries. ThePerpetual Debentures have no fixed maturity date and do not represent contractual obligations to exchange anyseries of its outstanding Perpetual Debentures for financial assets or financial liabilities. Based on theircharacteristics, the Perpetual Debentures, issued through SPVs, qualify as equity instruments and are classifiedwithin non-controlling interest as they were issued by consolidated entities, and, if the conditions to interestdeferred are satisfied, we have the unilateral right to defer indefinitely the payment of interest due on thePerpetual Debentures. Issuance costs, as well as the interest expense, which is accrued based on the principal
180

amount of the Perpetual Debentures, are included within “Other equity reserves” and represented expenses ofapproximately Ps432 million and Ps507 million in 2015 and 2016, respectively. The different SPVs wereestablished solely for purposes of issuing the Perpetual Debentures and are included in our 2016 auditedconsolidated financial statements included elsewhere in this annual report. As of December 31, 2016, thePerpetual Debentures were as follows
Issuer Issuance Date
NominalAmount
at IssuanceDate (inmillions)
Nominal AmountOutstanding as of
December 31,2016
(in millions) Repurchase OptionInterest
Rate
C10-EUR Capital (SPV)Ltd. . . . . . . . . . . . . . . . . . . May 2007 € 730 € 64 Tenth anniversary 6.277%
C8 Capital (SPV) Ltd.(1) . . . . February 2007 U.S.$750 U.S.$135 Eighth anniversary LIBOR + 4.40%C5 Capital (SPV) Ltd.(1) . . . . December 2006 U.S.$350 U.S.$ 61 Fifth anniversary LIBOR + 4.277%C10 Capital (SPV) Ltd. . . . . . December 2006 U.S.$900 U.S.$175 Tenth anniversary LIBOR + 4.71%
(1) We are restricted to call these Perpetual Debentures under the Credit Agreement.
Stock Repurchase Program
Under Mexican law, CEMEX, S.A.B. de C.V.’s shareholders may authorize a stock repurchase program atany annual general ordinary shareholders’ meeting. Unless otherwise instructed by CEMEX, S.A.B. de C.V.’sshareholders, we are not required to purchase any minimum number of shares pursuant to such program.
In connection with CEMEX, S.A.B. de C.V.’s 2014, 2015 and 2016 annual general ordinary shareholders’meetings held on March 26, 2015, March 31, 2016, and March 30, 2017, respectively, no stock repurchaseprogram has been proposed between March 2014 and the date of this annual report. Subject to certain exceptions,we are not permitted to repurchase shares of our capital stock under the Credit Agreement and the indenturesgoverning the Senior Secured Notes.
Research and Development, Patents and Licenses, etc.
Headed by CEMEX Research Group AG (“CEMEX Research Group”), based in Switzerland, R&D isincreasingly assuming a key role as it is recognized as an important contributor to CEMEX’s comprehensivepricing strategy for CEMEX’s products. Through the development of innovative technologies, services, andcommercial models, CEMEX is leveraging its know-how based assets to create an important differentiation in itsofferings to customers in a broad range of markets with unique challenges. Focus is placed on creating tangiblevalue for our customers by making their business more profitable, but more importantly, as leaders in theindustry, there is an underlying mission for CEMEX to elevate and accelerate the industry’s evolution in order toachieve greater sustainability, increase engagement in social responsibility and provoke an important leap in itstechnological advancement.
CEMEX’s R&D initiatives are globally led, coordinated and managed by CEMEX Research Group, whichencompasses the areas of Product Development & Construction Trends, Cement Production Technology,Sustainability, Business Process & IT, Innovation, and Commercial & Logistics. The areas of ProductDevelopment & Construction Trends and Cement Production Technology are responsible for, among others,developing new products for our cement, ready-mix concrete, aggregate and admixture businesses as well asintroduce novel and/or improved processing and manufacturing technology for all of CEMEX’s core businesses.Additionally, the Product Development & Construction Trends and Sustainability areas collaborate to developand propose construction solutions through consulting and the integration of the aforementioned technologies.The Cement Production Technology and Sustainability areas are dedicated to, among others, operationalefficiencies leading to cost reductions and enhancing our CO2 footprint and overall environmental impactthrough the usage of alternative or biomass fuels and the use of supplementary materials in substitution of
181
clinker. For example, we have developed processes and products that allow us to reduce heat consumption in ourkilns, which in turn reduces energy costs. Global products/brands have been conceptualized and engineered topositively impact the jobsite safety, promote efficient construction practices, sensibly preserve natural resourcesvital to life, lower carbon foot-print and improve the quality of life in rapidly transforming cities. UnderlyingCEMEX’s R&D philosophy is a growing culture of global collaboration and coordination, where the InnovationTeam identifies and promotes novel collaboration practices, and mobilizes its adoption within CEMEX. Gettingcloser and understanding our customers is a fundamental transformation within CEMEX, and consequently theCommercial & Logistics area is carrying out research initiatives to better attend the needs of customers as well asidentify key changes in our supply chain management that will enable us to bring products, solutions, andservices to our customers in the most cost-effective and efficient manner.
There are nine laboratories supporting CEMEX’s R&D efforts under a collaboration network. Thelaboratories are strategically located in close proximity to our plants, and assist the operating subsidiaries withtroubleshooting, optimization techniques and quality assurance methods. The laboratory located in Switzerland iscontinually improving and consolidating our research and development efforts in the areas of cement, concrete,aggregates, admixtures, mortar and asphalt technology, sustainability as well as in energy management. Inaddition, CEMEX Research Group actively generates as well as registers patents and pending applications inmany of the countries in which CEMEX operates. Patents and trade secrets are managed strategically in order toensure an important technology lock-ins associated with CEMEX technology.
Our Information Technology divisions develop information management systems and software relating tocement and ready-mix concrete operational practices, automation and maintenance. These systems have helpedus to better serve our clients with respect to purchasing, delivery and payment. More importantly, thanks to theactivities of the Business Process and IT departments, CEMEX is continuously improving and innovating itsbusiness processes to adapt them to the dynamically evolving markets, and better serve CEMEX’s needs.
R&D activities comprise part of the daily routine of the departments and divisions mentioned above;therefore, the costs associated with such activities are expensed as incurred. However, the costs incurred in thedevelopment of software for internal use are capitalized and amortized in operating results over the estimateduseful life of the software, which is approximately five years.
In 2014, 2015 and 2016, the total combined expense of the technology and energy departments in CEMEX,which includes all significant R&D activities, amounted to approximately Ps538 million (U.S.$36 million),Ps660 million (U.S.$41 million) and Ps712 million (U.S.$38 million), respectively.
Trend Information
Other than as disclosed elsewhere in this annual report, we are not aware of any trends, uncertainties,demands, commitments or events for the year ended December 31, 2016 that are reasonably likely to have amaterial and adverse effect on our net sales, income, profitability, liquidity or capital resources, or that wouldcause the disclosed financial information to be not necessarily indicative of future results of operations orfinancial conditions.
Summary of Material Contractual Obligations and Commercial Commitments
The Credit Agreement
On September 29, 2014, CEMEX, S.A.B. de C.V. entered into the Credit Agreement for U.S.$1.35 billionwith nine of the main lending banks from our 2012 Facilities Agreement. On November 3, 2014, five additionalbanks joined the Credit Agreement as lenders with aggregate commitments of U.S.$515 million, increasing thetotal amount of the Credit Agreement from U.S.$1.35 billion to U.S.$1.87 billion (increasing the revolvingtranche of the Credit Agreement proportionally to U.S.$746 million). On July 30, 2015, CEMEX, S.A.B. de C.V.
182

repaid in full the total amount outstanding of approximately U.S.$1.94 billion under the 2012 FacilitiesAgreement with new funds from 17 financial institutions. These lenders have joined new tranches under theCredit Agreement, allowing us to increase the average life of our syndicated bank debt to approximately fouryears as of such date. The new tranches share the same guarantors and collateral package as the original tranchesunder the Credit Agreement.
As of December 31, 2016, we reported an aggregate principal amount of outstanding debt under the CreditAgreement of approximately Ps56,879 million (U.S.$2,745 million) (principal amount Ps57,220 million(U.S.$2,762 million), excluding deferred issuance costs). The Credit Agreement is secured by a first-prioritysecurity interest over the Collateral and all proceeds of such Collateral.
On July 12, 2016, IFC joined the Credit Agreement as a lender granting CEMEX a loan of €106 million tosupport CEMEX’s sustainable investment programs in emerging markets. The funds will support CEMEXprojects designed to enhance environmental performance with 60% of the funds allocated for projects relating tothe reduction of CEMEX’s greenhouse gas emissions.
On November 30, 2016, CEMEX, S.A.B. de C.V. prepaid U.S.$373 million outstanding under the CreditAgreement and corresponding to the September 2017 amortization thereunder. With this prepayment, and as partof an agreement reached with a group of existing lenders under the Credit Agreement, U.S.$664 million(Ps13,758 million) of funded commitments maturing in 2018 were exchanged into a revolving facility,maintaining their original amortization schedule and the same terms and conditions. As of December 31, 2016,total commitments under the Credit Agreement included (i) approximately €746 million (approximatelyU.S.$785 million or approximately Ps16,259 million) and (ii) approximately U.S.$2,826 million (Ps58,555million), out of which about U.S.$1,413 million (Ps29,277 million) were in the revolving credit facility. TheCredit Agreement currently has an amortization profile, considering all commitments, of approximatelyU.S.$783 million in 2018, U.S.$883 million in 2019 and U.S.$1,096 million in 2020. See note 16A to our 2016audited consolidated financial statements included elsewhere in this annual report.
The Credit Agreement is secured by a first-priority security interest over the Collateral and all proceeds ofsuch Collateral.
For a discussion of restrictions and covenants under the Credit Agreement, see “Item 3—Key Information—Risk Factors—Risks Relating to Our Business—The Credit Agreement contains several restrictions andcovenants. Our failure to comply with such restrictions and covenants could have a material adverse effect on ourbusiness and financial conditions.”
Senior Secured Notes
The indentures governing the Senior Secured Notes impose significant operating and financial restrictionson us. These restrictions will limit our ability, among other things, to: (i) create liens; (ii) incur in additional debt;(iii) change CEMEX’s business or the business of any obligor or material subsidiary (in each case, as defined inthe Credit Agreement); (iv) enter into mergers; (v) enter into agreements that restrict our subsidiaries’ ability topay dividends or repay intercompany debt; (vi) acquire assets; (vii) enter into or invest in joint ventureagreements; (viii) dispose certain assets; (ix) grant additional guarantees or indemnities; (x) declare or pay cashdividends or make share redemptions; (xi) enter into certain derivatives transactions and (xii) exercise any calloption in relation to any perpetual bonds issues unless the exercise of the call options does not have a materiallynegative impact on our cash flow.
October 2022 U.S. Dollar Notes. On October 12, 2012, our subsidiary, CEMEX Finance LLC, issued theOctober 2022 U.S. Dollar Notes in transactions exempt from registration pursuant to Rule 144A andRegulation S under the Securities Act. CEMEX, S.A.B. de C.V., CEMEX México, CEMEX España, NewSunward, Cemex Asia B.V. (“CEMEX Asia”), CEMEX Concretos, S.A. de C.V. (“CEMEX Concretos”),
183

CEMEX Corp., Cemex Egyptian Investments B.V. (“CEMEX Egyptian Investments”), CEMEX France,CEMEX Research Group, CEMEX UK and Empresas Tolteca de México, S.A. de C.V. (“Empresas Tolteca”)have fully and unconditionally guaranteed the performance of all obligations of CEMEX Finance LLC under theOctober 2022 U.S. Dollar Notes on a senior basis. The payment of principal, interest and premium, if any, onsuch notes is secured by a first-priority security interest over the Collateral and all proceeds of such Collateral.On June 29, 2016, CEMEX, S.A.B. de C.V. commenced a tender offer to purchase up to U.S.$450 million of theoutstanding October 2022 U.S. Dollar Notes. On July 28, 2016, CEMEX, S.A.B. de C.V. announced thatapproximately U.S.$355.3 million of the October 2022 U.S. Dollar Notes were validly tendered by holders ofsuch notes. All such October 2022 U.S. Dollar Notes purchased in the tender offer were immediately canceled.Following the settlement of the tender offer, U.S.$1,055.6 million aggregate principal amount of the October2022 U.S. Dollar Notes remained outstanding.
December 2019 U.S. Dollar Notes. On August 12, 2013, CEMEX, S.A.B. de C.V. issued the December2019 U.S. Dollar Notes, in transactions exempt from registration pursuant to Rule 144A and Regulation S underthe Securities Act. CEMEX México, CEMEX España, New Sunward, CEMEX Asia, CEMEX Concretos,CEMEX Corp., CEMEX Finance LLC, CEMEX Egyptian Investments, CEMEX France, CEMEX ResearchGroup, CEMEX UK and Empresas Tolteca have fully and unconditionally guaranteed the performance of allobligations of CEMEX, S.A.B. de C.V. under the December 2019 U.S. Dollar Notes. The payment of principal,interest and premium, if any, on such notes is secured by a first-priority security interest over the Collateral andall proceeds of such Collateral. On May 12, 2016, CEMEX, S.A.B. de C.V. completed the purchase ofU.S.$218.9 million aggregate principal amount of the December 2019 U.S. Dollar Notes through a cash tenderoffer. On March 2, 2017, CEMEX, S.A.B. de C.V. completed the purchase of an additional U.S.$89.9 millionaggregate principal amount of the December 2019 U.S. Dollar Notes through a cash tender offer. All suchDecember 2019 U.S. Dollar Notes purchased in the tender offers were immediately canceled. Following thesettlement of the tender offers, U.S.$618.2 million aggregate principal amount of the December 2019 U.S. DollarNotes remained outstanding.
January 2021 and October 2018 U.S. Dollar Notes. On October 2, 2013, CEMEX, S.A.B. de C.V. issuedthe January 2021 and October 2018 U.S. Dollar Notes, in transactions exempt from registration pursuant to Rule144A and Regulation S under the Securities Act. CEMEX México, CEMEX España, New Sunward, CEMEXAsia, CEMEX Concretos, CEMEX Corp., CEMEX Finance LLC, CEMEX Egyptian Investments, CEMEXFrance, CEMEX Research Group, CEMEX UK and Empresas Tolteca have fully and unconditionally guaranteedthe performance of all obligations of CEMEX, S.A.B. de C.V. under the January 2021 and October 2018U.S. Dollar Notes. The payment of principal, interest and premium, if any, on such notes is secured by a first-priority security interest over the Collateral and all proceeds of such Collateral. On May 12, 2016, CEMEX,S.A.B. de C.V. completed the purchase of U.S.$178.5 million aggregate principal amount of the October 2018U.S. Dollar Notes through a cash tender offer. All such October 2018 U.S. Dollar Notes purchased in the tenderoffer were immediately canceled. Following the settlement of the tender offer, U.S.$319.5 million aggregateprincipal amount of the October 2018 U.S. Dollar Notes remained outstanding. On September 29, 2016,CEMEX, S.A.B. de C.V. commenced a tender offer to purchase up to U.S.$500 million of the outstandingJanuary 2021 U.S. Dollar Notes. On October 28, 2016, CEMEX, S.A.B. de C.V. announced that approximatelyU.S.$241.9 million of the January 2021 U.S. Dollar Notes were validly tendered by holders of such notes. OnMarch 2, 2017, CEMEX, S.A.B. de C.V. completed the purchase of an additional U.S.$385.1 million aggregateprincipal amount of the January 2021 U.S. Dollar Notes through a cash tender offer. All such January 2021U.S. Dollar Notes purchased in the tender offers were immediately canceled. Following the settlement of thetender offers, U.S.$341.7 million aggregate principal amount of the January 2021 U.S. Dollar Notes remainedoutstanding.
April 2024 U.S. Dollar and April 2021 Euro Notes. On April 1, 2014, CEMEX Finance LLC issued theApril 2024 U.S. Dollar and April 2021 Euro Notes in transactions exempt from registration pursuant to Rule144A and Regulation S under the Securities Act. CEMEX, S.A.B. de C.V., CEMEX México, CEMEX España,
184

New Sunward, CEMEX Asia, CEMEX Concretos, CEMEX Corp., CEMEX Egyptian Investments, CEMEXFrance, CEMEX Research Group, CEMEX UK and Empresas Tolteca have fully and unconditionally guaranteedthe performance of all obligations of CEMEX Finance LLC under the April 2024 U.S. Dollar and April 2021Euro Notes. The payment of principal, interest and premium, if any, on such notes is secured by a first-prioritysecurity interest over the Collateral and all proceeds of such Collateral.
January 2025 U.S. Dollar and January 2022 Euro Notes. On September 11, 2014, CEMEX, S.A.B. de C.V.issued the January 2025 U.S. Dollar and January 2022 Euro Notes, in transactions exempt from registrationpursuant to Rule 144A and Regulation S under the Securities Act. CEMEX México, CEMEX Concretos,Empresas Tolteca, New Sunward, CEMEX España, CEMEX Asia, CEMEX Corp., CEMEX Finance LLC,Cemex Egyptian Investments, CEMEX France, CEMEX Research Group and CEMEX UK have fully andunconditionally guaranteed the performance of all obligations of CEMEX, S.A.B. de C.V. under the January2025 U.S. Dollar and January 2022 Euro Notes. The payment of principal, interest and premium, if any, on suchnotes is secured by a first-priority security interest over the Collateral and all proceeds of such Collateral.
May 2025 U.S. Dollar and March 2023 Euro Notes. In March 2015, CEMEX, S.A.B. de C.V. issued theMay 2025 U.S. Dollar and March 2023 Euro Notes in transactions exempt from registration pursuant to Rule144A and Regulation S under the Securities Act. CEMEX México, CEMEX Concretos, Empresas Tolteca, NewSunward, CEMEX España, CEMEX Asia, CEMEX Corp., CEMEX Finance LLC, Cemex Egyptian Investments,CEMEX France, CEMEX Research Group and CEMEX UK, have fully and unconditionally guaranteed theperformance of all obligations of CEMEX, S.A.B. de C.V. under the May 2025 U.S. Dollar and March 2023Euro Notes. The payment of principal, interest and premium, if any, on such notes is secured by a first-prioritysecurity interest over the Collateral and all proceeds of such Collateral.
April 2026 U.S. Dollar Notes. On March 16, 2016, CEMEX, S.A.B. de C.V. issued the April 2026U.S. Dollar Notes, in transactions exempt from registration pursuant to Rule 144A and Regulation S under theSecurities Act. CEMEX México, CEMEX España, New Sunward, CEMEX Asia, CEMEX Concretos, CEMEXCorp., CEMEX Finance LLC, CEMEX Egyptian Investments, CEMEX France, CEMEX Research Group andCEMEX UK and Empresas Tolteca have fully and unconditionally guaranteed the performance of all obligationsof CEMEX, S.A.B. de C.V. under the April 2026 U.S. Dollar Notes. The payment of principal, interest andpremium, if any, on such notes is secured by a first-priority security interest over the Collateral and all proceedsof such Collateral.
June 2024 Euro Notes. On June 14, 2016, CEMEX Finance LLC issued the June 2024 Euro Notes, intransactions exempt from registration pursuant to Rule 144A and Regulation S under the Securities Act.CEMEX, S.A.B. de C.V., CEMEX México, CEMEX Concretos, Empresas Tolteca, New Sunward, CEMEXEspaña, Cemex Asia, CEMEX Corp., Cemex Egyptian Investments, CEMEX France, Cemex Research Groupand CEMEX UK have fully and unconditionally guaranteed the performance of all obligations of CEMEXFinance LLC under the June 2024 Euro Notes. The payment of principal, interest and premium, if any, on suchnotes is secured by a first-priority security interest over the Collateral and all proceeds of such Collateral.
Convertible Notes
March 2020 Optional Convertible Subordinated U.S. Dollar Notes. During 2015, CEMEX, S.A.B. de C.V.issued U.S.$521 million (Ps8,977 million) aggregate principal amount of its March 2020 Optional ConvertibleSubordinated U.S. Dollar Notes. The March 2020 Optional Convertible Subordinated U.S. Dollar Notes wereissued: (a) U.S.$200 million as a result of the exercise on March 13, 2015 of U.S.$200 million notional amountof CCUs (described below), and (b) U.S.$321 million as a result of private exchanges with certain institutional
185

investors on May 28, 2015, which together with early conversions, resulted in a total of approximatelyU.S.$626 million aggregate principal amount of the March 2016 Optional Convertible Subordinated U.S. DollarNotes held by such investors being paid and the issuance and delivery by CEMEX of an estimated 42 millionADSs, which included a number of additional ADSs issued to the holders as non-cash inducement premiums.The March 2020 Optional Convertible Subordinated U.S. Dollar Notes, which are subordinated to all ofCEMEX’s liabilities and commitments, are convertible into a fixed number of CEMEX, S.A.B. de C.V.’s ADSsat any time at the holder’s election and are subject to antidilution adjustments. The difference at the exchangedate between the fair value of the March 2016 Optional Convertible Subordinated U.S. Dollar Notes and the42 million ADSs against the fair value of the March 2020 Optional Convertible Subordinated U.S. Dollar Notes,represented a loss of approximately Ps365 million recognized in 2015 as part of other financial (expense)income, net. The aggregate fair value of the conversion option as of the issuance dates which amounted toapproximately Ps199 million was recognized in other equity reserves. As of December 31, 2015 and 2016, theconversion price per ADS was approximately U.S.$11.90 and U.S.$11.45, respectively. After antidilutionadjustments, the conversion rate as of December 31, 2015 and 2016 was 84.0044 ADS and 87.36 ADS,respectively; per each U.S.$1 thousand principal amount of such notes. See note 16B to our 2016 auditedconsolidated financial statements included elsewhere in this annual report.
November 2019 Mandatory Convertible Mexican Peso Notes. In December 2009, CEMEX, S.A.B. de C.V.completed an exchange offer of debt into mandatorily convertible securities in pesos for approximatelyU.S.$315 million (Ps4,126 million) of the November 2019 Mandatory Convertible Mexican Peso Notes.Reflecting antidilution adjustments, the notes will be converted at maturity or earlier if the price of the CPOreaches approximately Ps29.50 into approximately 210 million CPOs at a conversion price of approximatelyPs19.66 per CPO. During their tenure, holders have an option to voluntarily convert their securities on anyinterest payment date into CPOs. Considering the currency in which the notes are denominated and the functionalcurrency of CEMEX, S.A.B. de C.V.’s financing division, the conversion option embedded in these securities istreated as a stand-alone derivative liability at fair value in the statement of operations, recognizing an initialeffect of Ps365 million. See note 16B to our 2016 audited consolidated financial statements included elsewherein this annual report.
March 2016 Optional Convertible Subordinated U.S. Dollar Notes and March 2018 Optional ConvertibleSubordinated U.S. Dollar Notes. On March 15, 2011, CEMEX, S.A.B. de C.V. closed the offering of U.S.$978aggregate principal amount of the March 2016 Optional Convertible Subordinated U.S. Dollar Notes andU.S.$690 million (Ps8,211 million) aggregate principal amount of the March 2018 Optional ConvertibleSubordinated U.S. Dollar Notes. The notes are subordinated to all of CEMEX’s liabilities and commitments. Thenotes are convertible into a fixed number of CEMEX, S.A.B. de C.V.’s ADSs, at the holder’s election, and aresubject to antidilution adjustments. As of December 31, 2015 and 2016, the conversion price per ADS wasapproximately U.S.$9.27 and U.S.$8.92, respectively. After antidilution adjustments, the conversion rate as ofDecember 31, 2015 and 2016 was 107.8211 ADS and 112.1339 ADS, respectively; per each U.S.$1 thousandprincipal amount of the March 2018 Optional Convertible Subordinated U.S. Dollar Notes. During 2015, weamended a portion of the capped calls relating to the March 2016 Optional Convertible Subordinated U.S. DollarNotes and, as a result, CEMEX received approximately U.S.$44 million (Ps758 million) in cash, equivalent tothe unwind of 44.2% of the total notional amount of such capped call. On March 15, 2016, the remaining optionsfor the 55.8% of the March 2016 Optional Convertible Subordinated U.S. Dollar Notes expired out of the money.During August 2016, we amended the capped calls relating to the March 2018 Optional ConvertibleSubordinated U.S. Dollar Notes and, as a result, the exercise price was adjusted to U.S.$8.92 per ADS and theunderlying to six million ADSs. See notes 16B and 16D to our 2016 audited consolidated financial statementsincluded elsewhere in this annual report.
Commercial Commitments
On July 30, 2012, we entered into a Master Professional Services Agreement with IBM. This agreementprovides the framework for our contracting for IBM to provide us with the following services: information
186

technology, application development and maintenance, finance and accounting outsourcing, human resourcesadministration and contact center services. The agreement provides for these services to be provided to us fromJuly 30, 2012 until August 31, 2022, unless earlier terminated. Our minimum required payments to IBM underthe agreement are approximately U.S.$50 million per year. We will have the right to adjust the cost and qualityof the services every two years if it is determined that they do not meet certain benchmarks. We may terminatethe agreement (or a portion of it) at our discretion and without cause at any time by providing at least six-months’notice to IBM and paying termination charges consisting of IBM’s unrecovered investment and breakage andwind-down costs. In addition, we may terminate the agreement (or a portion of it) for cause without payingtermination charges. Other termination rights may be available to us for a termination charge that will vary withthe reason for termination. IBM may terminate the agreement if we (i) fail to make payments when due or(ii) become bankrupt and do not pay in advance for the services.
In some countries, we have self-insured health care benefits plans for its active employees, which aremanaged on cost plus fee arrangements with major insurance companies or provided through health maintenanceorganizations. As of December 31, 2016, in certain plans, we have established stop-loss limits for continuedmedical assistance derived from a series of specific causes (e.g., an automobile accident, illness, etc.) rangingfrom U.S.$23 thousand to U.S.$400 thousand. In other plans, we have established stop-loss limits per employeeregardless of the number of events ranging from U.S.$100 thousand to U.S.$2.5 million. The contingency forCEMEX if all employees qualifying for health care benefits required medical services simultaneously issignificantly. However, this scenario is remote. The amount expensed through self-insured health care benefitswas approximately U.S.$64 million (Ps943 million) in 2014, U.S.$69 million (Ps1,189 million) in 2015 andU.S.$69 million (Ps1,430 million) in 2016. See note 23D to our 2016 audited consolidated financial statementsincluded elsewhere in this annual report.
As of December 31, 2016, we did not depend on any of our suppliers of goods or services to conduct ourbusiness.
Contractual Obligations
As of December 31, 2015 and 2016, we had material contractual obligations as set forth in the table below.
As ofDecember 31, 2015 As of December 31, 2016
Obligations TotalLess than
1 year 1-3 years 3-5 years
Morethan 5years Total
(in millions of U.S. Dollars)
Long-term debt . . . . . . . . . . . . . . . . . . . . . . . . U.S.$ 13,303 37 2,675 2,221 6,446 11,379Capital lease obligations(1) . . . . . . . . . . . . . . . 135 18 36 33 20 107Convertible notes(2) . . . . . . . . . . . . . . . . . . . . 1,543 13 689 503 — 1,205
Total debt and other financialobligations(3) . . . . . . . . . . . . . . . . . . . . . . . . 14,981 68 3,400 2,757 6,466 12,691
Operating leases(4) . . . . . . . . . . . . . . . . . . . . . 434 117 193 127 78 515Interest payments on debt(5) . . . . . . . . . . . . . . 4,659 678 1,240 969 1,109 3,996Pension plans and other benefits(6) . . . . . . . . . 1,568 142 277 269 726 1,414Purchases of raw material, fuel and
energy(7) . . . . . . . . . . . . . . . . . . . . . . . . . . . 3,963 584 816 739 2,301 4,440
Total contractual obligations . . . . . . . . . . . . . . U.S.$ 25,605 1,589 5,926 4,861 10,680 23,056
Total contractual obligations (MexicanPesos) . . . . . . . . . . . . . . . . . . . . . . . . . . Ps 441,174 32,934 122,787 100,720 221,290 477,720
(1) Represents nominal cash flows. As of December 31, 2016, the net present value of future payments undersuch leases was approximately U.S.$76 million (Ps1,576 million), of which, approximately U.S.$24 million
187

(Ps497 million) refers to payments from one to three years, approximately U.S.$23 million (Ps389 million)refers to payments from three to five years and approximately U.S.$16 million (Ps332 million) refers topayments of more than five years
(2) Refers to the components of liability of the convertible notes described in note 16B to our 2016 auditedconsolidated financial statements included elsewhere in this annual report and assumes repayment atmaturity and no conversion of the such convertible notes.
(3) The schedule of debt payments, which includes current maturities, does not consider the effect of anyrefinancing of debt that may occur during the following years. In the past, we have replaced our long-termobligations for others of a similar nature.
(4) The amounts represent nominal cash flows. We have operating leases, primarily for operating facilities,cement storage and distribution facilities and certain transportation and other equipment, under whichannual rental payments are required plus the payment of certain operating expenses. Rental expense wasU.S.$114 million (Ps1,967 million) in 2015 and U.S.$121 million (Ps2,507 million) in 2016.
(5) Estimated cash flows on floating rate denominated debt were determined using the floating interest rates ineffect as of December 31, 2015 and 2016.
(6) Represents estimated annual payments under these benefits for the next ten years (see note 18 to our 2016audited consolidated financial statements included elsewhere in this annual report). Future payments includethe estimate of new retirees during such future years.
(7) Future nominal payments for the purchase of raw materials are presented on the basis of contractual nominalcash flows. Future nominal payments of energy were estimated for all contractual commitments on the basisof an aggregate average expected consumption of approximately 3,124.1 GWh per year using the futureprices of energy established in the contracts for each period. Future payments also include our commitmentsfor the purchase of fuel.
As of December 31, 2014, 2015 and 2016, in connection with the commitments for the purchase of fuel andenergy included in the table above, a description of the most significant contracts is as follows:
In connection with the beginning of full commercial operations of the Ventikas located in the Mexican stateof Nuevo Leon with a combined generation capacity of 252 MW, we agreed to acquire a portion of the energygenerated by Ventikas for our Mexican plants for a period of 20 years, which began in April 2016. During 2016,Ventikas supplied approximately 6.4% (unaudited) of our overall electricity needs in Mexico. This agreement isfor our own use and we do not intend to engage in energy trading. Until our divestment in the fourth quarter of2016, we participated in the Ventikas project as sponsor, main developer and equity investor. We, FisterraEnergy and private investors contributed 25% of the investment and the remaining 75% was financed.ACCIONA constructed the facilities and currently operates the wind farms. The installation of 84 wind turbinesin the farms was finished in December 2015. On December 15, 2016, we sold our interest in Ventikas toInfraestructura Energética Nova S.A.B. de C.V., current sole owner of Ventikas, for approximatelyU.S.$21 million (Ps435 million). In addition, during 2016 and in accordance with the established contracts wealso received a total of U.S.$35 million (Ps725 million) in development fees and other payments. We will remainthe manager of the Ventikas facilities in exchange for a management fee.
In September 2006, in order to take advantage of the high wind potential in the “Tehuantepec Isthmus,” weand ACCIONA formed an alliance to develop a wind farm project for the generation of 250 MW in the Mexicanstate of Oaxaca. We acted as promoter of the project, which was named EURUS. ACCIONA provided therequired financing, constructed the facility and currently owns and operates the wind farm. The operation of the167 wind turbines on the farm commenced on November 15, 2009. The agreements between us and ACCIONAestablished that our plants in Mexico will acquire a portion of the energy generated by the wind farm for a periodof at least 20 years, which began in February 2010, when EURUS reached the committed limit capacity. For theyears ended December 31, 2014, 2015 and 2016, EURUS supplied approximately 28.2%, 28.0% and 22.9%,respectively, of our overall electricity needs in Mexico during such years. In 1999, we entered into agreementswith an international partnership, which financed, built and operated TEG, an electrical energy generating plantin Mexico. In 2007, the original operator was replaced. Pursuant to the agreement, we would purchase the energy
188
generated from TEG for a term of not less than 20 years, which started in April 2004 and that was furtherextended until 2027 with the change of operator. In addition, we committed to supply TEG and another third-party electrical energy generating plant adjacent to TEG all fuel necessary for their operations, a commitmentthat has been hedged through four 20-year agreements entered with PEMEX, which terminate in 2024.Consequently, for the last three years, CEMEX intends to purchase the required fuel in the market. For the yearsended December 31, 2014, 2015 and 2016, TEG supplied approximately 69.6%, 69.3% and 66.3%, respectively,of our overall electricity needs during such year for our cement plants in Mexico.
In regards with the above, in March 1998 and July 1999, we signed contracts with PEMEX providing thatbeginning in April 2004 PEMEX’s refineries in Cadereyta and Madero City would supply us with a combinedvolume of approximately 1.75 million tons of pet coke per year. As per the pet coke contracts with PEMEX,1.2 million tons of the contracted volume will be allocated to TEG and the other energy producer and theremaining volume will be allocated to our operations in Mexico. By entering into the pet coke contracts withPEMEX, we expect to have a consistent source of pet coke throughout the 20-year term.
In 2007, CEMEX OstZement GmbH (“COZ”), our subsidiary in Germany, entered into a long-term energysupply contract with Vattenfall Europe New Energy Ecopower (“VENEE”), pursuant to which VENEEcommitted to supply energy to our Rüdersdorf plant for a period of 15 years starting on January 1, 2008. Basedon the contract, each year COZ has the option to fix in advance the volume of energy that it will acquire fromVENEE, with the option to adjust the purchase amount one time on a monthly and quarterly basis. According tothe contract, COZ acquired approximately 27 MW per year from 2016 up to and including 2018, 15 MW for2019, and COZ expects to acquire between 26 and 28 MW per year starting in 2020 and thereafter. The contract,which establishes a price mechanism for the energy acquired, based on the price of energy future contractsquoted on the European Energy Exchange, did not require initial investments and was expected to be performedat a future date. Based on its terms, this contract qualified as a financial instrument under IFRS. However, as thecontract is for CEMEX’s own use and CEMEX sells any energy surplus as soon as actual energy requirementsare known, regardless of changes in prices and thereby avoiding any intention of trading in energy, such contractis not recognized at its fair value.
Off-Balance Sheet Arrangements
We do not have any off-balance sheet arrangements that are reasonably likely to have a material effect onour financial condition, operating results and liquidity or capital resources.
Quantitative and Qualitative Market Disclosure
Our Derivative Financial Instruments
For the year ended December 31, 2015, we had net losses related to the recognition of changes in fair valuesof derivative financial instruments of Ps2,981 million (U.S.$173 million). For the year ended December 31,2016, we had a net gain related to the recognition of changes in fair values of derivative financial instruments ofPs317 million (U.S.$17 million). See note 16D to our 2016 audited consolidated financial statements includedelsewhere in this annual report.
Since the beginning of 2009, with the exception of our capped call transaction entered into in March 2011,we have been reducing the aggregate notional amount of our derivatives, thereby reducing the risk of cashmargin calls. This initiative has included closing substantially all notional amounts of derivative instrumentsrelated to our debt (currency and interest rate derivatives) and the settlement of our inactive derivative financialinstruments (see note 16D to our 2016 audited consolidated financial statements included elsewhere in thisannual report), which we finalized during April 2009. The Credit Agreement significantly restricts our ability toenter into derivative transactions.
We use derivative financial instruments in order to change the risk profile associated with changes ininterest rates and foreign exchange rates of debt agreements, as a vehicle to reduce financing costs, as an
189

alternative source of financing, and as hedges of: (i) highly probable forecasted transactions, (ii) our net assets inforeign subsidiaries and (iii) future exercises of options under our executive stock option programs. Beforeentering into any transaction, we evaluate, by reviewing credit ratings and our business relationship according toour policies, the creditworthiness of the financial institutions and corporations that are prospective counterpartiesto our derivative financial instruments. We select our counterparties to the extent we believe that they have thefinancial capacity to meet their obligations in relation to these instruments. Under current financial conditionsand volatility, we cannot assure that risk of non-compliance with the obligations agreed to with suchcounterparties is minimal.
The fair value of derivative financial instruments is based on estimated settlement costs or quoted marketprices and supported by confirmations of these values received from the counterparties to these financialinstruments. The notional amounts of derivative financial instrument agreements are used to measure interest tobe paid or received and do not represent the amount of exposure to credit loss.
At December 31, 2015 At December 31, 2016
(in millions of U.S. Dollars)NotionalAmount
EstimatedFair value
NotionalAmount
EstimatedFair value Maturity Date
Interest Rate Swaps . . . . . . . . . . . . . . . . . 157 28 147 23 September 2022Equity forwards on third-party shares . . . 24 6 — — October 2016Options on CEMEX, S.A.B. de C.V.’s
shares . . . . . . . . . . . . . . . . . . . . . . . . . . 1,145 12 576 26 March 2018Foreign exchange forward contracts . . . . 173 (1) 80 — February 2017Fuels price hedging . . . . . . . . . . . . . . . . . 16 (3) 77 15 May 2017 - October 2018
1,515 42 880 64
Our Interest Rate Swaps. As of December 31, 2015 and 2016, we had an interest rate swap maturing inSeptember 2022 with notional amounts of U.S.$157 million and U.S.$147 million, respectively, negotiated toexchange floating for fixed rates in connection with agreements we entered into for the acquisition of electricenergy in Mexico. As of December 31, 2015 and 2016, the fair value of the swap represented assets ofapproximately U.S.$28 million and U.S.$23 million, respectively. Pursuant to this instrument, during the tenureof the swap and based on its notional amount, we will receive a fixed rate of 5.4% and will pay at LIBOR.Changes in the fair value of interest rate swaps, generated losses of approximately U.S.$1 million (Ps3 million)in 2014, approximately U.S.$4 million (Ps69 million) in 2015 and approximately U.S.$6 million (Ps112 million)in 2016, which were recognized in the statement of operations for each year. See note 16D to our 2016 auditedconsolidated financial statements included elsewhere in this annual report.
Our Equity Forwards on Third-Party Shares. On January 6, 2016, in connection with the merger of Alestraand Axtel effective beginning February 15, 2016, the forward contract between a financial counterparty andCEMEX, S.A.B. de C.V. over 59.5 million CPOs of Axtel was cash settled and as a result we receivedapproximately U.S.$4 million (Ps69 million), net of transaction costs. In a separate transaction, considering thatas of December 31, 2015, CEMEX held an investment in Axtel that upon completion of the Alestra and Axtelmerger would be exchanged proportionately according to the new ownership interests for shares in the newmerged entity that will remain public and the attractive business outlook of such new entity, after the settlementof the Axtel forward contract, we decided to purchase in the market the 59.5 million CPOs of Axtel andincorporate them to CEMEX, S.A.B. de C.V.’s investments available for sale.
Our Options on Our Own Shares. On March 15, 2011, in connection with the offering of the March 2016Optional Convertible Subordinated U.S. Dollar Notes and the March 2018 Optional Convertible SubordinatedU.S. Dollar Notes and to effectively increase the conversion price for CEMEX, S.A.B. de C.V.’s ADSs undersuch notes, CEMEX, S.A.B. de C.V. entered into capped call transactions after antidilution adjustments of overapproximately 173 million ADSs (101 million ADSs maturing in March 2016 and 72 million ADSs maturing in
190

March 2018), by means of which, for the March 2016 Optional Convertible Subordinated U.S. Dollar Notes, atmaturity of the notes in March 2016, if the price per ADS was above U.S.$9.2746 dollars, we would have receivedin cash the difference between the market price of the ADS and U.S.$9.2746 dollars, with a maximumappreciation per ADS of U.S.$13.5552 dollars. Likewise, for the March 2018 Optional Convertible SubordinatedU.S. Dollar Notes, at maturity of the notes in March 2018, if the price per ADS is above U.S.$9.2746 dollars, wewill receive in cash the difference between the market price of the ADS and U.S.$9.2746 dollars, with a maximumappreciation per ADS of U.S.$14.9821 dollars. We paid a total premium of approximately U.S.$222 million. As ofDecember 31, 2015 and 2016, the fair value of such options represented assets of approximately U.S.$22 million(Ps379 million) and U.S.$66 million (Ps1,368 million), respectively. During 2014, 2015 and 2016, changes in thefair value of this contract generated losses of approximately U.S.$65 million (Ps962 million), losses ofapproximately U.S.$228 million (Ps3,928 million) and gains of approximately U.S.$44 million (Ps818 million),respectively, which were recognized in the statements of operations for each year. During 2015, CEMEX amendeda portion of the capped calls relating to the March 2016 Optional Convertible Subordinated U.S. Dollar Notes withthe purpose of unwinding the position, and as a result we received an aggregate amount of approximatelyU.S.$44 million (Ps758 million) in cash, equivalent to the unwind of 44.2% of the total notional amount of suchcapped call. See note 16D to our 2016 audited consolidated financial statements included elsewhere in this annualreport. In March 2016, CEMEX, S.A.B. de C.V. repaid the full outstanding amount (U.S.$352 million) of theMarch 2016 Optional Convertible Subordinated U.S. Dollar Notes.
In addition, in connection with the November 2019 Mandatory Convertible Mexican Peso Notes (see note16B to our 2016 audited consolidated financial statements included elsewhere in this annual report), andconsidering (i) the aforementioned change in CEMEX, S.A.B. de C.V.’s functional currency effective January 1,2013 and (ii) that the currency in which such November 2019 Mandatory Convertible Mexican Peso Notes aredenominated and the functional currency of the issuer differ, beginning January 1, 2013, we separate now theconversion option embedded in such instruments and recognizes it at fair value through profit or loss, which as ofDecember 31, 2015 and 2016, resulted in a liability of approximately U.S.$10 million (Ps178 million) andU.S.$40 million (Ps829 million), respectively. Changes in fair value of the conversion option generated gains ofU.S.$11 million (Ps159 million) in 2014, gains of U.S.$18 million (Ps310 million) in 2015 and losses ofU.S.$29 million (Ps545 million) in 2016.
Foreign exchange forward contracts. As of December 31, 2016, we held foreign exchange forwardcontracts maturing in February 2017 to hedge the U.S. Dollar value of future proceeds in other currencies fromexpected sale of assets. As of December 31, 2015, we held foreign exchange forward contracts maturing in April2016 to hedge the U.S. Dollar value of future proceeds in euros from the sale of our operations in Austria andHungary. See note 4A to our 2016 audited consolidated financial statements included elsewhere in this annualreport. For the years 2015 and 2016, changes in the estimated fair value of these instruments, including theeffects resulting from positions entered and settled during each year, generated gains of U.S.$26 million (Ps448million) in 2015 and U.S.$10 million (Ps186 million) in 2016, each recognized within “Other financial income(expense), net.”
Fuel price hedging. As of December 31, 2015 and 2016, we maintained forward contracts negotiated tohedge the price of diesel fuel in the United Kingdom in 2015 and several countries in 2016 for aggregate notionalamounts as of December 31, 2015 and 2016 of U.S.$16 million (Ps276 million) and U.S.$44 million (Ps912million), respectively, with an estimated fair value representing a liability of U.S.$3 million (Ps52 million) in2015 and an estimated fair value representing an asset of U.S.$7 million (Ps145 million) in 2016. By means ofthese contracts, for own consumption only, we fixed the fuel component of the market price of diesel over certainvolumes representing a portion of the estimated diesel consumption in such operations. These contracts havebeen designated as cash flow hedges of diesel fuel consumption, and as such, changes in fair value arerecognized temporarily through other comprehensive income (loss), and are recycled to operating expenses as therelated diesel volumes are consumed. For the years 2015 and 2016, changes in fair value of these contractsrecognized in other comprehensive income (loss) represented losses of U.S.$3 million (Ps52 million) and gainsof U.S.$7 million (Ps145 million), respectively.
191

In addition, as of December 31, 2016, we held forward contracts negotiated in 2016 to hedge the price ofcoal, as solid fuel, for an aggregate notional amount of U.S.$33 million (Ps684 million) and an estimated fairvalue representing an asset of U.S.$8 million (Ps166 million). By means of these contracts, for own consumptiononly, we fixed the price of coal over certain volumes representing a portion of the estimated coal consumption inour applicable operations. These contracts have been designated as cash flow hedges of coal consumption, and assuch, changes in fair value are recognized temporarily through other comprehensive income (loss), and arerecycled to operating expenses as the related coal volumes are consumed. For the year ended December 31, 2016,changes in fair value of these contracts recognized in other comprehensive income (loss) represented gains ofU.S.$8 million (Ps166 million).
Interest Rate Risk, Foreign Currency Risk and Equity Risk
Interest Rate Risk. The table below presents tabular information of our fixed and floating rate long-termforeign currency-denominated debt as of December 31, 2016. Average floating interest rates are calculated basedon forward rates in the yield curve as of December 31, 2016. Future cash flows represent contractual principalpayments. The fair value of our floating rate long-term debt is determined by discounting future cash flows usingborrowing rates available to us as of December 31, 2016 and is summarized as follows:
Expected maturity dates as of December 31, 2016
Long-Term Debt(1) 2017 2018 2019 2020 After 2021 Total Fair Value
(In millions of U.S. Dollars, except percentages)
Variable rate . . . . . . . . . . . . . U.S.$ 4 1,100 877 1,085 53 U.S.$3,119 U.S.$3,133Average interest rate . . . . . . . 4.92% 4.32% 3.80% 3.80% 3.70%Fixed rate . . . . . . . . . . . . . . . . U.S.$ 32 — 699 — 7,529 U.S.$8,260 U.S.$8,600Average interest rate . . . . . . . 4.52% — 6.50% — 6.51%
(1) The information above includes the current maturities of the long-term debt. Total long-term debt as ofDecember 31, 2016 does not include our other financial obligations and the Perpetual Debentures for anaggregate amount of approximately U.S.$438 million (Ps9,075 million) issued by consolidated entities. Seenotes 16B and 20D to our 2016 audited consolidated financial statements included elsewhere in this annualreport.
As of December 31, 2016, we were subject to the volatility of floating interest rates, which, if such rateswere to increase, may adversely affect our financing cost and our net income. As of December 31, 2015, 27% ofour foreign currency-denominated long-term debt bears floating rates at a weighted average interest rate ofLIBOR plus 367 basis points. As of December 31, 2016, 28% of our foreign currency-denominated long-termdebt bears floating rates at a weighted average interest rate of LIBOR plus 306 basis points. As of December 31,2015 and 2016, if interest rates at that date had been 0.5% higher, with all other variables held constant,CEMEX’s net income for 2015 and 2016 would have been reduced by approximately U.S.$18 million (Ps312million) and U.S.$18 million (Ps373 million), respectively, as a result of higher interest expense on variable-ratedebt. However, this analysis does not include the interest rate swaps held by CEMEX during 2015 and 2016. Seenote 16E to our 2016 audited consolidated financial statements included elsewhere in this annual report.
Foreign Currency Risk. Due to our geographic diversification, our revenues are generated in variouscountries and settled in different currencies. However, some of our production costs, including fuel and energy,and some of our cement prices, are periodically adjusted to take into account fluctuations in the U.S. Dollar/Mexican Peso exchange rate. For the year ended December 31, 2016, approximately 20% of our net sales, beforeeliminations resulting from consolidation, were generated in Mexico, 26% in the United States, 8% in the UnitedKingdom, 5% in France, 4% in Germany, 2% in Spain, 4% in the Rest of Europe, 5% in Colombia, 7% in theRest of SAC, 3% in Egypt, 9% in the Rest of Asia, Middle East and Africa and 7% from our Other operations.
Foreign exchange gains and losses occur by monetary assets or liabilities in a currency different from itsfunctional currency, and are recorded in the consolidated statements of operations, except for exchange
192

fluctuations associated with foreign currency indebtedness directly related to the acquisition of foreign entitiesand related parties’ long-term balances denominated in foreign currency, for which the resulting gains or lossesare reported in other comprehensive income (loss). As of December 31, 2015 and 2016, excluding from thesensitivity analysis the impact of translating the net assets of foreign operations into our reporting currency andconsidering a hypothetical 10% strengthening of the U.S. Dollar against the Mexican peso, with all othervariables held constant, our net income for 2015 and 2016 would have increased by approximatelyU.S.$232 million (Ps3,998 million) and U.S.$136 million (Ps2,829 million), respectively, as a result of higherforeign exchange losses on our dollar-denominated net monetary liabilities held in consolidated entities withother functional currencies. Conversely, a hypothetical 10% weakening of the U.S. Dollar against the Mexicanpeso would have the opposite effect.
As of December 31, 2016, approximately 77% of our total debt plus other financial obligations wasU.S. Dollar-denominated, approximately 21% was Euro-denominated, approximately 1% was Mexican Peso-denominated and immaterial amounts were denominated in other currencies, which does not includeapproximately Ps438 million (U.S.$9,075 million) of Perpetual Debentures; therefore, we had a foreign currencyexposure arising from the debt plus other financial obligations denominated in U.S. Dollars, and the debt andother financial obligations denominated in Euros, versus the currencies in which our revenues are settled in mostcountries in which we operate. We cannot guarantee that we will generate sufficient revenues in U.S. Dollars andEuros from our operations to service these obligations. As of December 31, 2015 and 2016, CEMEX had notimplemented any derivative financing hedging strategy to address this foreign currency risk.
Equity Risk. As described above, we have entered into equity forward contracts on Axtel shares, as well ascapped call options based on the price of CEMEX’s own shares. See “Item 5—Operating and Financial Reviewand Prospects—Quantitative and Qualitative Market Disclosure—Our Derivative Financial Instruments—OurOptions on Our Own Shares.” Under these equity derivative instruments, there is a direct relationship in thechange in the fair value of the derivative with the change in price of the underlying share. Upon liquidation, theequity forward contracts provided for cash settlement and the effects were recognized in the statement ofoperations as part of “Other financial income, net” in our 2016 audited consolidated financial statements includedelsewhere in this annual report. A significant decrease in the market price of CEMEX’s own shares wouldnegatively affect CEMEX’s liquidity and financial position.
As of December 31, 2015, the potential change in the fair value of CEMEX’s forward contracts in Axtel’sshares that would result from a hypothetical, instantaneous decrease of 10% in the market price of Axtel’s CPOs,with all other variables held constant, our net income for 2015 would have reduced by approximatelyU.S.$3 million (Ps51 million) as a result of additional negative changes in fair value associated with suchforward contracts. A 10% hypothetical increase in the Axtel CPO price would have generated approximately theopposite effects.
As of December 31, 2015 and 2016, the potential change in the fair value of our options (capped call) andbased on the price of CEMEX, S.A.B. de C.V.’s ADSs that would result from a hypothetical, instantaneousdecrease of 10% in the market price of CEMEX, S.A.B. de C.V.’s ADSs, with all other variables held constant,our net income for 2015 would have reduced by approximately U.S.$8 million (Ps137 million) and our netincome for 2016 would have reduced by approximately U.S.$23 million (Ps476 million) and, as a result ofadditional negative changes in fair value associated with these contracts. A 10% hypothetical increase in ourADS price would generate approximately the opposite effect.
In addition, even though the change in fair value of our embedded conversion options in the November 2019Mandatory Convertible Mexican Peso Notes denominated in a currency other than the functional issuer’scurrency affect profit or loss, they do not imply any risk or variability in cash flows, considering that throughtheir exercise, we will settle a fixed amount of debt with a fixed amount of shares. As of December 31, 2015 and2016, the potential change in the fair value of these embedded conversion options in the November 2019Mandatory Convertible Mexican Peso Notes that would result from a hypothetical, instantaneous decrease of
193

10% in the market price of CEMEX, S.A.B. de C.V.’s CPOs, with all other variables held constant, would haveincreased our net income for 2015 by approximately U.S.$3 million (Ps47 million) and our net income for 2016would have increased by approximately U.S.$7 million (Ps154 million), respectively, as a result of additionalpositive changes in fair value associated with this option. A 10% hypothetical increase in the CPO price wouldgenerate approximately the opposite effect.
Liquidity risk. We are exposed to risks from changes in foreign currency exchange rates, prices and currencycontrols, interest rates, inflation, governmental spending, social instability and other political, economic and/orsocial developments in the countries in which we operate, any one of which may materially affect our results andreduce cash from operations. As of December 31, 2016, we had approximately U.S.$849 million (Ps17,591million) available in our committed revolving credit tranche under the Credit Agreement. See notes 16A and 23Eto our 2016 audited consolidated financial statements included elsewhere in this annual report.
Investments, Acquisitions and Divestitures
The transactions described below represent our principal investments, acquisitions and divestiturescompleted during 2014, 2015 and 2016.
Investments and Acquisitions
On April 10, 2014, we successfully completed the financing of Ventika, a project comprising theconstruction of two 126 MW wind farms each, for a total nominal capacity of 252 MW located in Nuevo León,Mexico. The investment for the project is approximately U.S.$650 million (approximately Ps9,581 million), ofwhich 75% correspond to debt and 25% to equity. The project includes debt financiers, equity partners, privateinvestors and CEMEX. In addition, we agreed to supervise the construction process and, once operational, tomanage the wind farms without exercising control and owning a minority stake of 5% of the equity. We divestedin the fourth quarter of 2016 and, therefore, the project will not be consolidated into our balance sheet and theproject’s debt will have no recourse to ours. These wind farms will supply renewable energy to facilitiesbelonging to several local companies including us, under the self-supply scheme approved by the MexicanEnergy Regulatory Commission.
On August 14, 2014, we announced that our subsidiary, CEMEX Latam began the construction of a cementplant in Colombia. See “Item 4—Information on the Company—Regulatory Matters and Legal Proceedings,” forthe status of the project.
On October 31, 2014, we announced that we had entered into agreements with Holcim to complete a seriesof transactions in Europe, which closed on January 5, 2015, with retrospective effect as of January 1, 2015. Seenote 15B to our 2016 audited consolidated financial statements included elsewhere in this annual report.
On December 1, 2014, we announced the restart of the Tepeaca cement plant expansion in México. By 2018the total production capacity will reach 7.5 million tons per year and the total investment is estimated to beapproximately U.S.$650 million. The additional investment, in order to add 4.4 million tons per year to thecurrent capacity, will be approximately U.S.$200 million.
On May 14, 2015, we announced a new 1.5 million ton integrated cement production line at CEMEX’sSolid plant in Luzon with an estimated investment of approximately U.S.$225 million. We expect that this newline will double the capacity of the Solid plant and will represent a 26% increase in our cement capacity in thePhilippines. As of December 31, 2016, the production line was not finalized.
On August 27, 2015, we completed the construction of the first phase of a new cement grinding plant inNicaragua. CEMEX Latam invested approximately U.S.$30 million for infrastructure procurement and theinstallation of the first cement grinding mill. The second phase, which is expected to be completed by the end of
194

2017, will include the installation of a second cement grinding mill and an additional investment ofapproximately U.S.$25 million. Upon completion of the second phase, CEMEX Nicaragua is expected to reachan estimated total annual cement production capacity of approximately 860,000 tons.
On December 5, 2016, Sierra presented an Offer to all shareholders of TCL, a company publicly listed inTrinidad and Tobago, Jamaica and Barbados, to acquire up to 132,616,942 ordinary shares in TCL, which,together with Sierra’s existing share ownership in TCL of approximately 39.5%, would, if successful, result inSierra holding up to 74.9% of the equity share capital in TCL. The total number of TCL shares tendered andaccepted in response to the Offer was 113,629,723, which, together with Sierra’s pre-existing shareholding inTCL (147,994,188 shares), represented approximately 69.83% of the outstanding TCL shares as of March 31,2017. The total cash payment by Sierra for the tendered shares was approximately U.S.$86.36 million. CEMEXstarted consolidating TCL for financial reporting purposes on February 1, 2017. TCL has de-listed from theJamaica and Barbados stock exchanges.
Divestitures
During 2015 and 2016, we made divestitures of approximately U.S.$670 million and U.S.$1,045 million,respectively (which included fixed assets of approximately U.S.$194 million and U.S.$121 million, respectively).
On October 31, 2015, after all conditions precedent were satisfied, we completed the sale of our operationsin Austria and Hungary to the Rohrdorfer Group for €165 million (U.S.$179 million or Ps3,090 million) afterfinal adjustments for changes in cash and working capital balances as of the transfer date. Our combinedoperations in Austria and Hungary consisted of 29 aggregate quarries and 68 ready-mix plants. Our consolidatedstatements of operations present the results of our operations in Austria and Hungary, net of income tax, for theyear ended December 31, 2014 and the ten-month period ended October 31, 2015 as “Discontinued operations”and include, in 2015, a gain on sale of approximately U.S.$45 million (Ps741 million). Such gain on sale includesthe reclassification to the statement of operations of approximately U.S.$10 million (Ps215 million) of foreigncurrency translation effects accrued in equity until October 31, 2015.
On March 10, 2016, CEMEX, S.A.B. de C.V. announced the sale of its operations in Bangladesh andThailand to SIAM Cement for approximately U.S.$53 million, which closed on May 26, 2016. The proceedsfrom this transaction were used mainly for debt reduction and for general corporate purposes.
On July 18, 2016, CHP closed its initial public offering of 45% of its common shares in the Philippines, and100% of CHP’s common shares started trading on the Philippine Stock Exchange under the ticker “CHP.” As ofMarch 31, 2017, CASE, an indirect subsidiary of CEMEX España, directly owned approximately 55% of CHP’soutstanding common shares. The net proceeds to CHP from its initial public offering were approximatelyU.S.$506.8 million after deducting estimated underwriting discounts and commissions, and other estimatedoffering expenses payable by CHP. CHP used the net proceeds from the initial public offering to repay existingindebtedness owed to BDO Unibank and to an indirect subsidiary of CEMEX. CHP’s assets consist primarily ofCEMEX’s cement manufacturing assets in the Philippines.
On August 29, 2016, we announced that we would be participating in the proposed corporate restructuringof GCC. In connection with the corporate restructuring, if approved by GCC’s shareholders as proposed,CEMEX would directly own 23% of the outstanding share capital of GCC and, additionally, own a minorityinterest in CAMCEM, an entity which in turn would own a majority interest in GCC as a result of the proposedrestructuring. On the same day, we also announced that we reached an agreement with GCC on the terms andconditions regarding the sale to GCC of certain assets in the U.S. On February 15, 2017, we sold 45,000,000shares of common stock of GCC at a price of Ps95 per share in a public offering to investors in Mexicoauthorized by the CNBV and in a concurrent private placement to eligible investors outside of Mexico. Prior tothe offerings, CEMEX, S.A.B. de C.V. owned a 23% direct interest in GCC and a minority interest inCAMCEM, an entity which owns a majority interest in GCC. After the offerings, CEMEX, S.A.B. de C.V.owned a 9.47% direct interest in GCC and the minority interest in CAMCEM.
195

On September 12, 2016, one of our subsidiaries in the U.S. signed a definitive agreement for the sale of itsFairborn, Ohio cement plant and cement terminal in Columbus, Ohio to Eagle Materials Inc. forU.S.$400 million. The proceeds obtained from this transaction were used mainly for debt reduction and forgeneral corporate purposes. This transaction closed on February 10, 2017.
On November 18, 2016, after all conditions precedent were satisfied, CEMEX announced that it had closedthe sale of certain assets in the U.S. to GCC for approximately U.S.$306 million. The assets were sold by anaffiliate of CEMEX to an affiliate of GCC in the U.S., and mainly consisted of CEMEX’s cement plant inOdessa, Texas, two cement terminals and the building materials business in El Paso, Texas and Las Cruces, NewMexico
On August 12, 2015, we entered into an agreement for the sale of our operations in Croatia, including assetsin Bosnia & Herzegovina, Montenegro and Serbia, to Duna-Dráva Cement Kft. for €231 million (approximatelyU.S.$243 million or Ps5,032 million). Those operations mainly consist of three cement plants with aggregateannual production capacity of approximately 2.4 million tons of cement, two aggregates quarries and sevenready-mix plants. On April 5, 2017, we announced that the European Commission issued a decision that restrictscompletion of the sale. Therefore, the sale of our operations in Croatia will not close and we will maintain ouroperations in Croatia, including assets in Bosnia and Herzegovina, Montenegro and Serbia. For the years endedDecember 31, 2016, 2015 and 2014, the operations in Croatia, including assets in Bosnia and Herzegovina,Montenegro and Serbia, included in our statements of operations are presented in the single line item“Discontinued operations.” However, due to the inability to complete the sale, beginning in the second quarter of2017, we will reclassify the income statements of our operations in Croatia, including assets in Bosnia &Herzegovina, Montenegro and Serbia, from the single line item “Discontinued Operations” to each applicableline item in our consolidated financial statements. See notes 4A and 26 to our 2016 audited consolidated financialstatements included elsewhere in this annual report.
Recent Developments
Recent Developments Relating to Our Indebtedness
On February 1, 2017, CHP announced that it had entered into a senior unsecured peso term loan facilityagreement with BDO Unibank for a Philippine Peso denominated amount equal to approximatelyU.S.$280 million, to refinance a majority of CHP’s outstanding long-term loan with New Sunward. The termloan provided by BDO Unibank has a tenor of seven years and it consists of a fixed rate and a floating ratetranche. CHP has drawn the full amount of the term loan.
During March 2017, we renewed the securitization programs outstanding in the United States, France andthe United Kingdom. As a result of such renewals, each program is now scheduled to mature in March 2018. Thesecuritization program in Mexico was settled and paid down in March 2017.
On February 13, 2017, CEMEX, S.A.B. de C.V. commenced a tender offer to purchase up toU.S.$475 million aggregate principal amount of the outstanding January 2021 U.S. Dollar Notes, December 2019U.S. Dollar Notes and October 2022 U.S. Dollar Notes. On February 28, 2017, CEMEX, S.A.B. de C.V.announced that U.S.$385.1 million aggregate principal amount of the January 2021 U.S. Dollar Notes,U.S.$240.7 million aggregate principal amount of the December 2019 U.S. Dollar Notes and U.S.$626.7 millionaggregate principal amount of the October 2022 U.S. Dollar Notes had been validly tendered by holders of suchnotes. U.S.$385.1 million aggregate principal amount of the January 2021 U.S. Dollar Notes, U.S.$89.9 millionaggregate principal amount of the December 2019 U.S. Dollar Notes and none of the October 2022 U.S. DollarNotes were purchased in the tender offer and immediately canceled. Following the settlement of the tender offer,approximately U.S.$341.7 million aggregate principal amount of the January 2021 U.S. Dollar Notes,U.S.$618.2 million aggregate principal amount of the December 2019 U.S. Dollar Notes andU.S.$1,055.6 million aggregate principal amount of the October 2022 U.S. Dollar Notes remained outstanding.
196

During the first quarter of 2017, we repurchased U.S.$9 million aggregate principal amount of SeniorSecured Notes on the open market (all of which have been canceled).
Recent Developments Relating to Equity Purchases
On December 5, 2016, Sierra presented an Offer to all shareholders of TCL, a company publicly listed inTrinidad and Tobago, Jamaica and Barbados, to acquire up to 132,616,942 ordinary shares in TCL, which,together with Sierra’s existing share ownership in TCL of approximately 39.5%, would, if successful, result inSierra holding up to 74.9% of the equity share capital in TCL. The total number of TCL shares tendered andaccepted in response to the Offer was 113,629,723, which, together with Sierra’s pre-existing shareholding inTCL (147,994,188 shares), represented approximately 69.83% of the outstanding TCL shares as of March 31,2017. The total cash payment by Sierra for the tendered shares was approximately U.S.$86.36 million. CEMEXstarted consolidating TCL for financial reporting purposes on February 1, 2017. TCL has de-listed from theJamaica and Barbados stock exchanges.
Recent Developments Relating to Our Assets Divestiture Plans
On January 31, 2017, one of CEMEX, S.A.B. de C.V.’s subsidiaries in the U.S. closed the sale of theConcrete Pipe Business to Quikrete for U.S.$500 million plus an additional U.S.$40 million purchase pricecontingent on future performance.
On February 10, 2017, one of our subsidiaries in the U.S. closed the sale of its Fairborn, Ohio cement plantand cement terminal in Columbus, Ohio to Eagle Materials Inc. for U.S.$400 million. The proceeds obtainedfrom this transaction were used mainly for debt reduction and for general corporate purposes.
On February 15, 2017, we sold 45,000,000 shares of common stock of GCC at a price of Ps95 per share in apublic offering to investors in Mexico authorized by the CNBV and in a concurrent private placement to eligibleinvestors outside of Mexico. Prior to the offerings, CEMEX, S.A.B. de C.V. owned a 23% direct interest in GCCand a minority interest in CAMCEM, an entity which owns a majority interest in GCC. After the offerings,CEMEX, S.A.B. de C.V. owned a 9.47% direct interest in GCC and the minority interest in CAMCEM.
On August 12, 2015, we entered into an agreement for the sale of our operations in Croatia, including assetsin Bosnia & Herzegovina, Montenegro and Serbia, to Duna-Dráva Cement Kft. for €231 million (approximatelyU.S.$243 million or Ps5,032 million). Those operations mainly consist of three cement plants with aggregateannual production capacity of approximately 2.4 million tons of cement, two aggregates quarries and sevenready-mix plants. On April 5, 2017, we announced that the European Commission issued a decision that restrictscompletion of the sale. Therefore, the sale of our operations in Croatia will not close and we will maintain ouroperations in Croatia, including assets in Bosnia and Herzegovina, Montenegro and Serbia. For the years endedDecember 31, 2016, 2015 and 2014, the operations in Croatia, including assets in Bosnia and Herzegovina,Montenegro and Serbia, included in our statements of operations are presented in the single line item“Discontinued operations.” However, due to the inability to complete the sale, beginning in the second quarter of2017, we will reclassify the income statements of our operations in Croatia, including assets in Bosnia &Herzegovina, Montenegro and Serbia, from the single line item “Discontinued Operations” to each applicableline item in our consolidated financial statements. See notes 4A and 26 to our 2016 audited consolidated financialstatements included elsewhere in this annual report.
On April 17, 2017, CEMEX, S.A.B. de C.V. announced that one of its subsidiaries in the U.S. had enteredinto a definitive agreement for the sale of Pacific Northwest to Cadman Materials, a LehighHanson company andU.S. subsidiary of HeidelbergCement Group, for U.S.$150 million. Pacific Northwest consists of aggregates,asphalt and ready-mix concrete operations in Oregon and Washington. Pending satisfaction of certain conditions,including regulatory approvals, the proceeds obtained from this sale will be used mainly for debt reduction andgeneral corporate purposes.
197

Recent Developments Relating to Our Shareholders
On March 30, 2017, CEMEX, S.A.B. de C.V. held an Ordinary General Shareholders Meeting. The mostsignificant items that were approved by shareholders at the meeting were:
• An increase of CEMEX, S.A.B. de C.V’s capital stock in its variable part by the amount ofPs716,365.38 through the issuance of up to 258,000,000 ordinary common registered shares withoutnominal value, of which up to 172,000,000 will be Series A and up to 86,000,000 will be Series B, withthe same characteristics and the same rights of the currently outstanding shares. These shares will bekept in treasury and will be destined to preserve the right of conversion of the holders of ourconvertible notes.
• The appointment of the members of CEMEX, S.A.B. de C.V.’s Board of Directors, including newdirectors Ramiro Gerardo Villarreal Morales and Marcelo Zambrano Lozano.
Recent Developments Relating to Our Board of Directors and Senior Management
On February 14, 2017, we announced that Ramiro Gerardo Villarreal Morales, Executive Vice President ofLegal and Secretary of the Board of Directors of CEMEX, S.A.B. de C.V., will retire effective as of June 1,2017. Starting as of June 1, 2017, the corporate legal function at CEMEX, S.A.B. de C.V. will be headed byRoger Saldaña Madero as Senior Vice President of Legal. He will report to José Antonio González Flores,Executive Vice President of Finance and CFO of CEMEX, S.A.B. de C.V. Ramiro Gerardo Villarreal Moraleswill thereafter act as an advisor to the Chairman of the Board of Directors and CEO of CEMEX, S.A.B. de C.V.
As described under “— Recent Developments Relating to Our Shareholders,” on March 30, 2017, RamiroGerardo Villarreal Morales and Marcelo Zambrano Lozano were appointed as members of CEMEX, S.A.B. deC.V.’s Board of Directors. Additionally, Rogelio Zambrano Lozano, Roger Saldaña Madero and René DelgadilloGalván were elected as Chairman, Secretary and Assistant Secretary of the Board of Directors of CEMEX,S.A.B. de C.V., respectively.
Name, Position (Age) Experience
Marcelo Zambrano Lozano (61) Has been a member of CEMEX, S.A.B. de C.V.’sBoard of Directors since March 31, 2017.Mr. Zambrano is a founding member and ExecutiveChairman of the board of directors of Carza, S.A. deC.V. In addition, Mr. Zambrano is a member of theboards of directors of several companies andinstitutions such as the National Council of Telmex,Green Paper (Propasa), Banregio, S.A., Fibra Inn,NAFIN (Nacional Financiera Nuevo LeonDelegation), Universidad de Monterrey (UDEM),Grupo Vigia, Instituto Tecnológico y de EstudiosSuperiores de Monterrey and the Treviño ElizondoFoundation. He was a member of CEMEX México’sboard of directors until February 2017.Mr. Zambrano is a graduate of the InstitutoTecnológico y de Estudios Superiores de Monterreywith a degree in marketing. He is a brother ofRogelio Zambrano Lozano, Chairman of CEMEX,S.A.B. de C.V.’s Board of Directors.
198

Item 6—Directors, Senior Management and Employees
Senior Management and Directors
Senior Management
Set forth below is the name and position of each member of our senior management team as ofDecember 31, 2016. The terms of office of the senior managers are indefinite.
Name, Position (Age) Experience
Fernando Ángel González Olivieri,Chief Executive Officer (62)
Has been a member of CEMEX, S.A.B. de C.V.’sBoard of Directors since March 26, 2015, and he isalso a member of the boards of directors of GCC,Axtel and the Instituto Tecnológico y de EstudiosSuperiores de Monterrey. He was a member of theboard of directors of CEMEX México until February2017. Mr. González earned his B.A. and M.B.A.degrees from the Instituto Tecnológico y de EstudiosSuperiores de Monterrey. He joined CEMEX in1989, and served as Corporate Vice President ofStrategic Planning from 1994 to 1998, President ofCEMEX Venezuela, S.A.C.A. from 1998 to 2000,President of CEMEX Asia from 2000 to May 2003,and President of CEMEX’s former South Americanand Caribbean Region from May 2003 to February2005. In March 2005, he was appointed President ofthe expanded CEMEX European Region, in February2007, President of CEMEX’s former Europe, MiddleEast, Africa, Asia and Australia Region, and, in May2009, Executive Vice President of Planning andDevelopment. In February 2010, Mr. González wasappointed Executive Vice President of Planning andFinance, and, in 2011, he was additionally appointedChief Financial Officer. On May 15, 2014,Mr. González was appointed as CEMEX’s ChiefExecutive Officer.
Juan Romero Torres,President CEMEX México (60)
Joined CEMEX in 1989 and has occupied severalsenior management positions, including President ofCEMEX Colombia, President of our operations inMexico, President of the South America and theCaribbean Regions and President of our formerEurope, Middle East, Africa and Asia Region. He iscurrently President of our operations in Mexico andis also in charge of our global procurement area.Mr. Romero graduated from Universidad de Comillasin Spain, where he studied law and economic andenterprise sciences. Mr. Romero was appointed VicePresident and representative of the board of directorsof the National Chamber of Cement (CámaraNacional del Cemento) in June 2011, and is also amember of the board of directors of GCC.
199

Name, Position (Age) Experience
Jaime Gerardo Elizondo Chapa,President CEMEX Europe (53)
Joined CEMEX in 1985 and since then he has headedseveral operations, including Panama, Colombia,Venezuela and Mexico, and more recently wasPresident of CEMEX South America (includingCentral America) and the Caribbean. He is thecurrent President of CEMEX Europe, and is also incharge of CEMEX’s global technology area.Mr. Elizondo served as President and Vice Presidentof the National Chamber of Cement (CámaraNacional del Cemento) and as Vice President of theTransformation Industry Chamber of Nuevo León(Cámara de la Industria de la Transformación deNuevo León). Mr. Elizondo is currently the ViceChairman of CEMEX Latam’s board of directors. Hegraduated with a B.S. in chemical and systemengineering and an M.B.A. from ITESM.
Ignacio Madridejos Fernández,President CEMEX USA (51)
Joined CEMEX in 1996 and, after holding managementpositions in the Strategic Planning area, he headedCEMEX’s operations in Egypt, Spain, Western Europeand Northern Europe. He is currently President ofCEMEX USA, and is also responsible for our GlobalEnergy, Health and Safety and Sustainability areas.Mr. Madridejos Fernández is also a member of theboard of directors of CEMEX Latam. He has served asa member of the board of directors of COMAC(Comercial de Materiales de Construcción S.L.),member of the board and President of OFICEMEN,member of the board and President of IECA (InstitutoEspañol del Cemento y sus Aplicaciones), President ofCEMA (Fundación Laboral del Cemento y elMedioambiente), Patron of the Junior AchievementFoundation and Vice President and Chairman ofCEMBUREAU (European Cement Association),member of the board of Inversiones Danaime SICAVS.A. and member of the board of CEMEX Latam. Hegraduated with a degree in civil engineering from theUniversidad Politécnica de Madrid and holds an M.B.A.from Stanford University.
Jaime Muguiro Domínguez,President CEMEX South, Central America and theCaribbean (48)
Joined CEMEX in 1996 and has held several executivepositions in the areas of Strategic Planning, BusinessDevelopment, Ready-mix Concrete, Aggregates, andHuman Resources. He headed CEMEX’s operations inEgypt and our former Mediterranean Region. He iscurrently President of CEMEX’s SAC Region, andChief Executive Officer of CEMEX Latam. Hegraduated with a management degree from San PabloCEU University, and holds a law degree from theUniversidad Complutense de Madrid and an M.B.A.from the Massachusetts Institute of Technology.
200

Name, Position (Age) Experience
Joaquín Miguel Estrada Suarez,President CEMEX Asia, Middle East and Africa (53)
Joined CEMEX in 1992 and has held severalexecutive positions, including head of operations inEgypt and Spain, as well as head of Trading forEurope, the Middle East and Asia. He is currentlyPresident of CEMEX Asia, Middle East and Africaand is also responsible for our global tradingactivities. He is also the Chairman of the board ofdirectors of CHP. From 2008 to 2011, he served as amember of the board of directors of COMAC(Comercial de Materiales de Construcción S.L.),President and member of the board of OFICEMEN,and member of the board of IECA (Instituto Españoldel Cemento y sus Aplicaciones). He was also thePresident of CEMA (Fundación Laboral delCemento y el Medioambiente) from 2010 to 2011. Hegraduated with a degree in economics from theUniversidad de Zaragoza and holds an M.B.A. fromthe Instituto de Empresa.
José Antonio González Flores,Executive Vice President of Finance and Chief FinancialOfficer (46)
Joined CEMEX in 1998 and since then has heldmanagement positions in corporate and operating areasin Finance, Strategic Planning, and CorporateCommunications and Public Affairs. He is currentlyresponsible for CEMEX’s Finance, Controllership, Taxand Process Assessment areas, and will be responsiblefor the Legal area as of June 2017. Mr. González is alsoa member of the board of directors of GCC and is analternate director of the board of directors of Axtel.Mr. González has a B.S. in Industrial and ManagementSystems Engineering from ITESM and an M.B.A. fromStanford University.
Juan Pablo San Agustín Rubio,Executive Vice President of Strategic Planning and NewBusiness Development (48)
Joined CEMEX in 1994 and has held executivepositions in the Strategic Planning, ContinuousImprovement, E-business, and Marketing areas. He iscurrently Executive Vice President of StrategicPlanning and New Business Development. Mr. SanAgustín is Chairman of the board of directors ofCEMEX Latam. He graduated with a B.S. from theUniversidad Metropolitana and holds an InternationalM.B.A. from the Instituto de Empresa.
Luis Hernández Echávez,Executive Vice President of Administration andOrganization (53)
Joined CEMEX in 1996 and has held seniormanagement positions in the Strategic Planning andHuman Resources areas. He is currently ExecutiveVice President of Administration and Organization.He graduated with a degree in civil engineering fromITESM, and holds a master’s degree in civilengineering and an M.B.A. from the University ofTexas at Austin. Mr. Hernández is also a member ofthe board of directors of GCC.
201

Name, Position (Age) Experience
Maher Al-Haffar,Executive Vice President of Investor Relations,Corporate Communications and Public Affairs (59)
Joined CEMEX in 2000. Prior to his current positionhe was Vice President of Investor Relations,Corporate Communications and Public Affairs. Healso served as a Managing Director in Finance andHead of Investor Relations for CEMEX. Beforejoining CEMEX, he spent nineteen years withCiticorp Securities Inc. and Santander InvestmentSecurities as an investment banker and capitalmarkets professional. Mr. Al-Haffar holds a B.S. inEconomics from the University of Texas and aMaster’s Degree in International Relations andFinance from Georgetown University.
Mauricio Doehner Cobián,Executive Vice President of Corporate Affairs andEnterprise Risk Management (42)
Joined CEMEX in 1996 and has held severalexecutive positions in areas such as StrategicPlanning and Enterprise Risk Management forEurope, Asia, the Middle East, South America andMexico. He is currently in charge of CorporateAffairs and Enterprise Risk Management. He has alsoworked in the public sector within the MexicanPresidency. Mr. Doehner earned his B.A. inEconomics from ITESM and holds an M.B.A. fromIESE/IPADE. He also holds a ProfessionalCertification in Competitive Intelligence from theFULD Academy of Competitive Intelligence inBoston, Massachusetts.
Rafael Garza Lozano,Chief Accounting Officer (53)
Joined CEMEX in 1985 and has served as ChiefAccounting Officer since 1999. Mr. Garza is acertified public accountant and he received a master’sdegree in administration and finance from ITESM.He also attended executive programs at ITAM,IPADE and Harvard University. He is currently amember of the board of directors of ConsejoMexicano para la Investigación y Desarrollo deNormas de Información Financiera and an alternatemember of the board of directors of GCC.
Ramiro Gerardo Villarreal Morales,Executive Vice President of Legal (69)
Joined CEMEX in 1987 and has served as GeneralCounsel since then. He served as Secretary ofCEMEX, S.A.B. de C.V.’s Board of Directors from1995 to March 30, 2017. He was the Secretary ofCEMEX México’s board of directors until February2017. Mr. Villarreal will retire as General Counsel ofCEMEX effective as of June 1, 2017 and fromCEMEX, S.A.B. de C.V. effective as ofDecember 31, 2017. After retiring as GeneralCounsel of CEMEX, he will serve as advisor to theChairman of the Board of Directors and to the ChiefExecutive Officer of CEMEX, S.A.B. de C.V. He is a
202

Name, Position (Age) Experience
graduate of the Universidad Autónoma de NuevoLeón with a degree in law with honorary citation. Healso received a master of science degree in financefrom the University of Wisconsin and was appointedto the Roll of Honor. Prior to joining CEMEX, heserved as deputy general director of GrupoFinanciero Banpaís from 1985 to 1987.
Mr. Villarreal has been a member of CEMEX, S.A.B.de C.V.’s Board of Directors since March 30, 2017.He is also a member of the boards of directors ofGCC, Vinte Viviendas Integrales, S.A.B. de C.V., areal estate development company, and a member ofthe board of directors of Grupo Acosta Verde and analternate member of the board of directors of Axtel.Until February 2012, Mr. Villarreal was the Secretaryof the board of directors of Enseñanza e InvestigaciónSuperior, A.C., which manages Instituto Tecnológicoy de Estudios Superiores de Monterrey.
Board of Directors
Rafael Rangel Sostmann was a member of CEMEX, S.A.B. de C.V.’s Board of Directors. Mr. RangelSostmann was not elected as a director at CEMEX, S.A.B. de C.V.’s 2015 annual general ordinary shareholders’meeting held on March 31, 2016, and no longer serves on the Board of Directors. Set forth below are the namesof the members of CEMEX, S.A.B. de C.V.’s Board of Directors as of December 31, 2016. For a description ofchanges to CEMEX, S.A.B. de C.V.’s Board of Directors in 2017, see the description of CEMEX, S.A.B. deC.V.’s 2016 annual general ordinary shareholders’ meeting held on March 30, 2017 in “Item 5—Operating andFinancial Review and Prospects—Recent Developments—Recent Developments Relating to Our Board ofDirectors and Senior Management.” No alternate directors were elected at CEMEX, S.A.B. de C.V.’s 2016annual general ordinary shareholders’ meeting. Members of CEMEX, S.A.B. de C.V.’s Board of Directors servefor one-year terms.
Name (Age) Experience
Rogelio Zambrano Lozano,Chairman (60)
Has been a member of CEMEX, S.A.B. de C.V.’sBoard of Directors since 1987 and Chairman ofCEMEX, S.A.B. de C.V.’s Board of Directors sinceMay 15, 2014. He was President of CEMEX, S.A.B.de C.V.’s Finance Committee from 2009 until March2015 and he was also Chairman of CEMEXMéxico’s board of directors until February 2017. Heis also a member of the advisory board of GrupoFinanciero Banamex, Zona Norte, and member of theboards of directors of Carza, S.A. de C.V. and theInstituto Tecnológico y de Estudios Superiores deMonterrey, among others. He holds an industrial andsystems engineering degree from the InstitutoTecnológico y de Estudios Superiores de Monterreyand an M.B.A. from the Wharton Business School ofPennsylvania University. He is a grandson of the lateMr. Lorenzo Zambrano Gutiérrez, one of CEMEX,S.A.B. de C.V.’s founders, and a son of Mr. Marcelo
203

Name (Age) Experience
Zambrano Hellión, who was a member of CEMEX,S.A.B. de C.V.’s Board of Directors from 1957 untilhis passing away and its Chairman from 1979 to1995. He is also a second cousin of Roberto LuisZambrano Villarreal, a second uncle of TomásMilmo Santos, and a second uncle of Ian ChristianArmstrong Zambrano, all members of CEMEX,S.A.B. de C.V.’s Board of Directors.
Fernando Ángel González Olivieri (62) . . . . . . . . . . . . . . See “— Senior Management.”
Tomás Milmo Santos (52) . . . . . . . . . . . . . . . . . . . . . . . . Has been a member of CEMEX, S.A.B. de C.V.’sBoard of Directors since 2006 and member ofCEMEX, S.A.B. de C.V.’s Finance Committee from2009 until March 2015. Mr. Milmo Santos served asan alternate member of CEMEX, S.A.B. de C.V.’sBoard of Directors from 2001 to 2006. He isCo-Chairman of the board of directors of Axtel. He isalso a member of the boards of directors ofPromotora Ambiental, S.A., the Instituto Tecnológicoy de Estudios Superiores de Monterrey and Chairmanof the board of directors of Tec Salud and AlianzaEducativa por Nuevo León. He was a member ofCEMEX México’s board of directors until February2017. He graduated with a degree in economics fromStanford University. Mr. Milmo Santos is a secondnephew of Rogelio Zambrano Lozano, Chairman ofCEMEX, S.A.B. de C.V.’s Board of Directors.
Ian Christian Armstrong Zambrano (36) . . . . . . . . . . . . . Has been a member of CEMEX, S.A.B. de C.V.’sBoard of Directors since March 26, 2015. He hadpreviously been a provisional member of CEMEX,S.A.B. de C.V.’s Board of Directors since May 15,2014. He is a former Vice President of Promotionand Analysis at Evercore Casa de Bolsa, andcurrently is a founding member and President ofBiopower, a founding member of RIC EnergyMexico and a member of the boards of directors ofTec Salud and Fondo Zambrano Hellión.Mr. Armstrong Zambrano is a graduate in businessadministration from the Instituto Tecnológico y deEstudios Superiores de Monterrey and holds anM.B.A. from the IE Business School. He is a secondnephew of Rogelio Zambrano Lozano, Chairman ofCEMEX, S.A.B. de C.V.’s Board of Directors.
Armando J. García Segovia (65) . . . . . . . . . . . . . . . . . . . Has been a member of CEMEX, S.A.B. de C.V.’sBoard of Directors since 1983. He initially joinedCEMEX in 1975 and rejoined CEMEX in 1985. Heserved as Director of Operational and StrategicPlanning from 1985 to 1988, Director of Operationsfrom 1988 to 1991, Director of Corporate Services
204

Name (Age) Experience
and Affiliate Companies from 1991 to 1994, Directorof Development from 1994 to 1996, General Directorof Development from 1996 to 2000, Executive VicePresident of Development from 2000 to May 2009,and Executive Vice President for Technology,Energy and Sustainability from May 2009 to March2010. He is a graduate of the Instituto Tecnológico yde Estudios Superiores de Monterrey with a degree inmechanical engineering and administration and hereceived an M.B.A. from the University of Texas. Hewas employed at Cydsa, S.A. from 1979 to 1981 andat Conek, S.A. de C.V. from 1981 to 1985.
He is also an alternate member of the board ofdirectors of GCC. He was also Vice President of theMexican Employers’ Association (ConfederaciónPatronal de la República Mexicana or“COPARMEX”), member of the board and formerChairman of the Private Sector Center forSustainable Development Studies (Centro deEstudios del Sector Privado para el DesarrolloSustentable), former Chairman of COPARMEXNuevo León, he was Chairman and member of theboard of directors of Gas Industrial de Monterrey,S.A. de C.V. He also served as Chairman of anadvisory board of the School of Engineering andInformation Technology of the Instituto Tecnológicoy de Estudios Superiores de Monterrey and memberof the board of directors of the World EnvironmentalCenter. Currently, he is a member of the boards ofdirectors of Hoteles City Express, S.A.P.I. de C.V.and of Innovación y Conveniencia, S.A. de C.V.,formerly known as Grupo Chapa, S.A. de C.V. He isalso a member of the boards of directors ofUniversidad de Monterrey, A.C., Unidos para laConservación, Pronatura Noreste, A.C., and ConsejoConsultivo de Flora y Fauna del Estado de NuevoLeón. He is also founder and Chairman of the boardof directors of Comenzar de Nuevo, A.C. He is a firstcousin of Rodolfo García Muriel, a member ofCEMEX, S.A.B. de C.V.’s Board of Directors.
Rodolfo García Muriel (71) . . . . . . . . . . . . . . . . . . . . . . . Has been a member of CEMEX, S.A.B. de C.V.’sBoard of Directors since 1985 and was a member ofCEMEX, S.A.B. de C.V.’s Finance Committee from2009 until March 2015. On March 26, 2015, he wasappointed as a member of CEMEX, S.A.B. de C.V.’sCorporate Practices and Finance Committee and hasbeen a member since then. On March 31, 2016, hewas appointed as a member of CEMEX, S.A.B. deC.V.’s Audit Committee. He is the Chief Executive
205

Name (Age) Experience
Officer of Compañía Industrial de Parras, S.A. deC.V. He is a member of the boards of directors ofInmobiliaria Romacarel, S.A.P.I. de C.V., ComfortJet, S.A. de C.V., and member of the regional boardof Grupo Financiero Banamex. He was a member ofCEMEX México’s board of directors until February2017. Mr. García Muriel is also Vice President of theNational Chamber of the Textile Industry (CámaraNacional de la Industria Textil). Mr. García Murielholds a degree in electric mechanical engineeringfrom Universidad Iberoamericana. He is a first cousinof Armando J. García Segovia, a member ofCEMEX, S.A.B. de C.V.’s Board of Directors.
Roberto Luis Zambrano Villarreal (71) . . . . . . . . . . . . . . Has been a member of CEMEX, S.A.B. de C.V.’sBoard of Directors since 1987. He was President ofCEMEX, S.A.B. de C.V.’s Audit Committee from2002 to 2006, President of CEMEX, S.A.B. de C.V.’sCorporate Practices and Audit Committee from 2006to 2009, and President of CEMEX, S.A.B. de C.V.’snew Audit Committee from 2009 until March 2015.On March 26, 2015, he was appointed as a memberof CEMEX, S.A.B. de C.V.’s Audit Committee andhas been a member since then. He is Chairman of theboards of directors of Desarrollo Integrado, S.A. deC.V., Administración Ficap, S.A. de C.V., AeroZano, S.A. de C.V., Ciudad Villamonte, S.A. deC.V., Focos, S.A. de C.V., Industrias Diza, S.A. deC.V., Mantenimiento Integrado, S.A. de C.V., andPilatus PC-12 Center de México, S.A. de C.V. He is amember of the board of directors of S.L.I. de México,S.A. de C.V. He was a member of CEMEX México’sboard of directors until February 2017.Mr. Zambrano Villarreal is a graduate in mechanicalengineering and administration from the InstitutoTecnológico y de Estudios Superiores de Monterrey.He is a second cousin of Rogelio Zambrano Lozano,Chairman of CEMEX, S.A.B. de C.V.’s Board ofDirectors.
Dionisio Garza Medina (63) . . . . . . . . . . . . . . . . . . . . . . Has been a member of CEMEX, S.A.B. de C.V.’sBoard of Directors since 1995 and President ofCEMEX, S.A.B. de C.V.’s Corporate PracticesCommittee from 2009 until March 2015. OnMarch 26, 2015, he was appointed as a member andPresident of CEMEX, S.A.B. de C.V.’s CorporatePractices and Finance Committee and has served asits President since then. He is Chairman of the boardof directors and Chief Executive Officer of TenedoraTOPAZ, S.A.P.I. de C.V. He was a member of theboard of directors of Alfa, S.A.B. de C.V. untilMarch 2013 and Chairman and Chief Executive
206

Name (Age) Experience
Officer for 16 years until March 2010. Mr. GarzaMedina is currently a member of the boards ofdirectors of ABC Holding, S.A.P.I. de C.V. andAutlán, S.A.B. de C.V. Mr. Garza Medina was amember of the Board of Dean’s Advisors of theHarvard Business School and member of theadvisory council of Stanford University’s School ofEngineering. Additionally, Mr. Garza Medina wasthe Chairman of the board of the Universidad deMonterrey, A.C. for 13 years until April 2012.Mr. Garza Medina holds a bachelor of science and amaster’s degree in industrial engineering fromStanford University, where he earned the F. TermanAward. He also holds an M.B.A. from HarvardUniversity.
José Manuel Rincón Gallardo Purón (74) . . . . . . . . . . . . Has been a member of CEMEX, S.A.B. de C.V.’sBoard of Directors since 2003. On March 26, 2015,he was appointed as President of CEMEX, S.A.B. deC.V.’s Audit Committee, where he qualifies as a“financial expert” for purposes of the Sarbanes-OxleyAct of 2002, and has remained its President sincethen. He is President of the board of directors ofSonoco de México S.A. de C.V., member of theboards of directors and audit committees of GrupoFinanciero Banamex, Grupo Herdez, S.A. de C.V.,General de Seguros, S.A.B., Reaseguradora PatriamS,A,B,, Peña Verde, S.A.B., Cinépolis, S.A. de C.V.,Citelis, S.A. de C.V., Grupo Proa, S.A. de C.V.,Grupo CP, S.A. de C.V., and member of the board ofdirectors of Invekra, S.A.P.I. and Fondo Wamex,S.A. de C.V. Mr. Rincón Gallardo is a member ofInstituto Mexicano de Contadores Públicos, A.C., hewas a managing partner of KPMG México, and wasmember of the boards of directors of KPMG UnitedStates and KPMG International. He was a member ofCEMEX México’s board of directors until February2017. He is also a member of the Corporate PracticesCommittee of Consejo Coordinador Empresarial. Heis a certified public accountant from the UniversidadNacional Autónoma de México.
Francisco Javier Fernández Carbajal (61) . . . . . . . . . . . . Has been a member of CEMEX, S.A.B. de C.V.’sBoard of Directors and member of CEMEX, S.A.B.de C.V.’s Finance Committee from February 2012until March 2015 and a member of CEMEX, S.A.B.de C.V.’s Corporate Practices Committee fromMarch 2013 until March 2015. On March 26, 2015,he was appointed as a member of CEMEX, S.A.B. deC.V.’s Audit Committee and the Corporate Practicesand Finance Committee, and has remained in both
207

Name (Age) Experience
committees since then. Mr. Fernández is currently theChief Executive Officer of Servicios AdministrativosContry, S.A. de C.V., a privately held company thatprovides central administrative and investmentmanagement services. He has served as ChiefExecutive Officer of the Corporate DevelopmentDivision at Grupo Financiero BBVA Bancomer, S.A.de C.V., after holding several positions in BBVABancomer since 1991. Furthermore, Mr. Fernández isa member of the boards of directors of Alfa, S.A.B.de C.V., Fomento Económico Mexicano, S.A.B. deC.V., and VISA, Inc. He graduated with a degree inelectric mechanical engineering from the InstitutoTecnológico y de Estudios Superiores de Monterreyand also holds an M.B.A. from Harvard BusinessSchool.
Armando Garza Sada (59) . . . . . . . . . . . . . . . . . . . . . . . . Has been a member of CEMEX, S.A.B. de C.V.’sBoard of Directors and Corporate Practices andFinance Committee since March 26, 2015. Mr. GarzaSada is currently the Chairman of the boards ofdirectors of Alfa, S.A.B. de C.V., Alpek, S.A.B. deC.V. and Nemak, S.A.B. de C.V. and a member ofthe boards of directors of El Puerto de Liverpool,S.A.B. de C.V., Grupo Lamosa, S.A.B. de C.V.,Instituto Tecnológico y de Estudios Superiores deMonterrey, Fomento Económico Mexicano, S.A.B.de C.V., Grupo Financiero Banorte, S.A.B. de C.V.,Frisa Industrias, S.A. de C.V., Grupo Proeza, S.A.P.I.de C.V., and the Stanford Graduate School ofBusiness advisory board and Stanford University’sboard of trustees. Mr. Garza Sada holds a bachelor’sdegree from the Massachusetts Institute ofTechnology and an M.B.A. from Stanford University.
David Martínez Guzmán (59) . . . . . . . . . . . . . . . . . . . . . Has been a member of CEMEX, S.A.B. de C.V.’sBoard of Directors since March 26, 2015.Mr. Martínez Guzmán is a Managing Director ofFintech Advisory Inc. In addition, as ofDecember 31, 2016, he was a member of the boardsof directors of Alfa, S.A.B. de C.V., Vitro, S.A.B. deC.V., Telecom Argentina and Banco de Sabadell.Mr. Martínez Guzmán earned degrees in electricaland mechanical engineering from UniversidadNacional Autónoma de México and also holds anM.B.A. from Harvard Business School.
Everardo Elizondo Almaguer (73) . . . . . . . . . . . . . . . . . . Mr. Elizondo Almaguer has been an independentmember of Grupo Financiero Banorte, S.A.B. deC.V.’s board of directors since April 2010, and amember of the boards of directors of Autlán, S.A.B.
208
Name (Age) Experience
de C.V., Rassini, S.A.B. de C.V., Grupo SendaAutotransporte, S.A. de C.V. and Gruma, S.A.B. deC.V. He is also professor of economics andinternational finance at EGADE Business School, thegraduate business school of Instituto Tecnológico yde Estudios Superiores de Monterrey. He wasdirector for economic studies at Alfa, S.A.B. de C.V.and Grupo Financiero BBVA Bancomer, S.A. deC.V. He founded and was director of the GraduateSchool of Economics of the Universidad Autónomade Nuevo León. He was deputy governor of theBanco de México from 1998 to 2008. Mr. ElizondoAlmaguer is a graduate in economics from theUniversidad de Nuevo León and holds a master’sdegree in economics from the University ofWisconsin-Madison.
Board Practices
In compliance with the Mexican Securities Market Law (Ley del Mercado de Valores), which was enactedon December 28, 2005 and became effective on June 28, 2006 (the “Mexican Securities Market Law”), CEMEX,S.A.B. de C.V.’s shareholders approved, at an extraordinary shareholders’ meeting held on April 27, 2006, aproposal to amend various articles of CEMEX, S.A.B. de C.V.’s by-laws (estatutos sociales), in order to improveour standards of corporate governance and transparency, among other matters. The amendments includedoutlining the fiduciary duties of the members of CEMEX, S.A.B. de C.V.’s board of directors, who are nowrequired:
• to perform their duties in a value-creating manner for the benefit of CEMEX without favoring aspecific shareholder or group of shareholders;
• to act diligently and in good faith by adopting informed decisions; and
• to comply with their duty of care and loyalty, abstaining from engaging in illicit acts or activities.
The Mexican Securities Market Law also eliminated the position of statutory examiner, whose duties ofsurveillance are now the responsibility of the board of directors, fulfilled through the corporate practices andfinance committee the audit committees, as well as through the external auditor who audits the entity’s financialstatements, each within its professional role. With its surveillance duties, CEMEX, S.A.B. de C.V.’s board ofdirectors is no longer in charge of managing CEMEX; instead, this is the responsibility of CEMEX, S.A.B. deC.V.’s chief executive officer.
Pursuant to the Mexican Securities Market Law and CEMEX, S.A.B. de C.V.’s by-laws, at least 25% of itsdirectors must qualify as independent directors.
CEMEX, S.A.B. de C.V. has not entered into any service contracts with its directors that provide forbenefits upon termination of employment.
The Audit Committee, the Corporate Practices and Finance Committee and Other Committees
The Mexican Securities Market Law required CEMEX, S.A.B. de C.V. to create a corporate practicescommittee comprised entirely of independent directors, in addition to its then existing audit committee. Incompliance with such requirement, in 2006 CEMEX, S.A.B. de C.V. increased the responsibilities of its auditcommittee and changed its name to “corporate practices and audit committee.” To further enhance the
209

effectiveness of its corporate governance, at CEMEX, S.A.B. de C.V.’s annual general ordinary shareholders’meeting held on April 23, 2009, CEMEX, S.A.B. de C.V.’s shareholders approved the division of this committeeinto two committees with different members and responsibilities, the audit committee and the corporate practicescommittee. In addition, at the annual general ordinary shareholders’ meeting held on April 29, 2010, CEMEX,S.A.B. de C.V.’s shareholders approved the creation of the finance committee. In addition, at the annual generalordinary shareholders’ meeting held on March 26, 2015, CEMEX, S.A.B. de C.V.’s shareholders approved thatthe then existing corporate practices committee took over certain responsibilities of the then existing financecommittee and changed its name to “corporate practices and finance committee.”
CEMEX, S.A.B. de C.V.’s audit committee is responsible for:
• evaluating our internal controls and procedures, and identifying deficiencies;
• following up with corrective and preventive measures in response to any non-compliance with ouroperation and accounting guidelines and policies;
• evaluating the performance of our external auditors;
• describing and valuing non-audit services performed by our external auditor;
• reviewing CEMEX, S.A.B. de C.V.’s financial statements;
• assessing the effects of any modifications to the accounting policies approved during any fiscal year;
• overseeing measures adopted as a result of any observations made by CEMEX, S.A.B. de C.V.’sshareholders, directors, executive officers, employees or any third parties with respect to accounting,internal controls and internal and external audit, as well as any complaints regarding managementirregularities, including anonymous and confidential methods for addressing concerns raised byemployees; and
• analyzing the risks identified by CEMEX, S.A.B. de C.V.’s independent auditors, accounting, internalcontrol and process assessment areas.
CEMEX, S.A.B. de C.V.’s corporate practices committee and finance committee is responsible for:
• evaluating the hiring, firing and compensation of CEMEX, S.A.B. de C.V.’s chief executive officer;
• reviewing the hiring and compensation policies for CEMEX, S.A.B. de C.V.’s executive officers;
• reviewing related party transactions;
• reviewing policies regarding use of corporate assets;
• reviewing unusual or material transactions;
• evaluating waivers granted to our directors or executive officers regarding seizure of corporateopportunities; and
• identifying, evaluating and following up on the operating risks affecting the company and itssubsidiaries.
• evaluating the company’s financial plans
• reviewing the company’s financial strategy and its implementation; and
• evaluating mergers, acquisitions, review of market information and financial plans, including financingand related transactions.
Under CEMEX, S.A.B. de C.V.’s by-laws and the Mexican Securities Market Law, all members of thecorporate practices and finance committee and the audit committee, including their presidents, are required to beindependent directors. The president of the audit committee and the corporate practices and finance committeeshall be appointed and removed from his or her position only by the general shareholders meeting, and the rest ofthe members may only be removed by a resolution of the general shareholders or of the board of directors.
210

Set forth below are the names of the members of CEMEX, S.A.B. de C.V.’s current audit committee andcorporate practices and finance committee. Each member of the committees is an independent director. Theterms of the members of the committees are indefinite. José Manuel Rincón Gallardo qualifies as an “auditcommittee financial expert” for purposes of the Sarbanes Oxley Act of 2002. See “Item 16A—Audit CommitteeFinancial Expert.”
AUDIT COMMITTEE:José Manuel Rincón Gallardo Purón PresidentRoberto Luis Zambrano VillarrealRodolfo García MurielFrancisco Javier Fernández CarbajalCORPORATE PRACTICES AND FINANCE COMMITTEE:Dionisio Garza Medina PresidentFrancisco Javier Fernández CarbajalRodolfo García MurielArmando Garza Sada
In addition, at a meeting of CEMEX, S.A.B. de C.V.’s Board of Directors held on September 25, 2014,CEMEX, S.A.B. de C.V.’s directors approved the creation of a sustainability committee.
CEMEX, S.A.B. de C.V.’s sustainability committee is responsible for:
• ensuring sustainable development in CEMEX’s strategy;
• supporting CEMEX, S.A.B. de C.V.’s Board of Directors in fulfilling its responsibility to shareholdersregarding sustainable growth;
• evaluating the effectiveness of sustainability programs and initiatives;
• proving assistance to CEMEX’s Chief Executive Officer and senior management team regarding thestrategic direction on sustainability; and
• endorsing a model of sustainability, priorities and key indicators.
The current members of CEMEX, S.A.B. de C.V.’s sustainability committee are:
Armando J. García Segovia PresidentIan Christian Armstrong ZambranoRoberto Luis Zambrano Villarreal
Compensation of CEMEX, S.A.B. de C.V.’s Directors and Members of Our Senior Management
For the year ended December 31, 2016, the aggregate amount of compensation we paid, or our subsidiariespaid, to all members of our Board of Directors, alternate members of our Board of Directors and seniormanagers, as a group, was approximately U.S.$43 million. Approximately U.S.$32 million of this amount waspaid as base compensation, including approximately U.S.$8 million of a bonus pool to key executives based onour operating performance and U.S.$12 million to provide pension, retirement or similar benefits. In addition,approximately U.S.$11 million of the aggregate amount corresponds to stock-based compensation, includingapproximately U.S.$7 million related to the bonus pool to key executives based on our operating performance.During 2016, we issued approximately 54 million CPOs to this group pursuant to the Restricted Stock IncentivePlan (“RSIP”) described below under “—Restricted Stock Incentive Plan (RSIP).”
CEMEX, Inc. ESOP
As a result of the acquisition of CEMEX, Inc. (formerly Southdown, Inc.) in November 2000, weestablished a stock option program (the “ESOP”) for CEMEX, Inc.’s executives to purchase CEMEX, S.A.B. de
211

C.V.’s ADSs. The options granted under the program had a fixed exercise price in U.S. Dollars equivalent to theaverage market price of one ADS during a six-month period before the grant date and had a ten-year term. 25%of the options vested annually during the first four years after their grant date. The options were covered usingshares owned by our subsidiaries, thus potentially increasing stockholders’ equity and the number of sharesoutstanding. As of December 31, 2016, these options expired without being exercised.
Consolidated Employee Stock Option Information
Stock options activity during 2015 and 2016, the balance of options outstanding as of December 31, 2015and 2016 and other general information regarding our stock option programs, is presented in notes 2Q and 21 toour 2016 audited consolidated financial statements included elsewhere in this annual report.
As of December 31, 2016, no employee stock options to purchase our securities were outstanding. Theoptions granted under the ESOP that were outstanding as of December 31, 2014 expired without being exercised.
Restricted Stock Incentive Plan (RSIP)
Since January 2005, we have been changing our long-term variable compensation programs from stockoption grants to restricted stock awards under a RSIP. Under the terms of the RSIP, eligible employees areallocated a specific number of restricted CPOs as variable compensation to be vested over a four-year period.Before 2006, we distributed annually to a trust an amount in cash sufficient to purchase in the market, on behalfof each eligible employee, 25% of such employee’s allocated number of CPOs. During 2006, in order to reducethe volatility of our RSIP, we began to distribute annually an amount in cash sufficient to purchase 100% of theallocated CPOs for each eligible employee. Although the vesting period of the restricted CPOs and other featuresof the RSIP did not change as a result of this new policy, the nominal amount of annual compensation receivedby eligible employees increased in proportion to the additional number of CPOs received as a result of the newpolicy. The CPOs purchased by the trust was held in a restricted account by the trust on behalf of each employeefor four years. At the end of each year during such four-year period, the restrictions lapsed with respect to 25% ofthe allocated CPOs and such CPOs became freely transferable and subject to withdrawal from the trust.
Starting in 2009, we made additional changes to the mechanism for granting the RSIP, but the benefitsremained the same as in previous years. First, CPOs are no longer purchased in the open market, but insteadCEMEX, S.A.B. de C.V. issues new CPOs to cover the RSIP. Second, CEMEX, S.A.B. de C.V. now issues theRSIP in four blocks of 25% per year. The total number of CEMEX, S.A.B. de C.V. CPOs granted during 2016were approximately 70 million, of which approximately 15.7 million were related to senior management and theboard of directors. In 2016, approximately 54.8 million CPOs were issued, representing the first 25% of the 2016program, the second 25% of the 2015 program, the third 25% of the 2014 program and the final 25% of the 2013program. Of these 54 million CPOs, approximately 12.9 million corresponded to senior management and theboard of directors.
See note 25 to our consolidated financial statements included elsewhere in this annual report.
CEMEX Latam Employee stock-ownership plan
To better align CEMEX Latam’s executives’ interests with those of its stockholders, on January 16, 2013,CEMEX Latam’s board of directors approved, effective as of January 1, 2013, a long-term incentives planavailable to eligible executives of CEMEX Latam, which consists of an annual compensation plan based onCEMEX Latam shares. The underlying shares in this long-term incentives plan, which are held in the CEMEXLatam’s treasury, and subject to certain restrictions, are delivered fully vested under each annual program over aservice period of four years. During 2015, CEMEX Latam delivered 242,618 shares to eligible executives underthis long-term incentives plan. During 2016, CEMEX Latam delivered 271,461 shares to eligible executivesunder this long-term incentives plan. The delivery of these shares is dilutive to CEMEX’s equity indirect interestin CEMEX Latam.
212
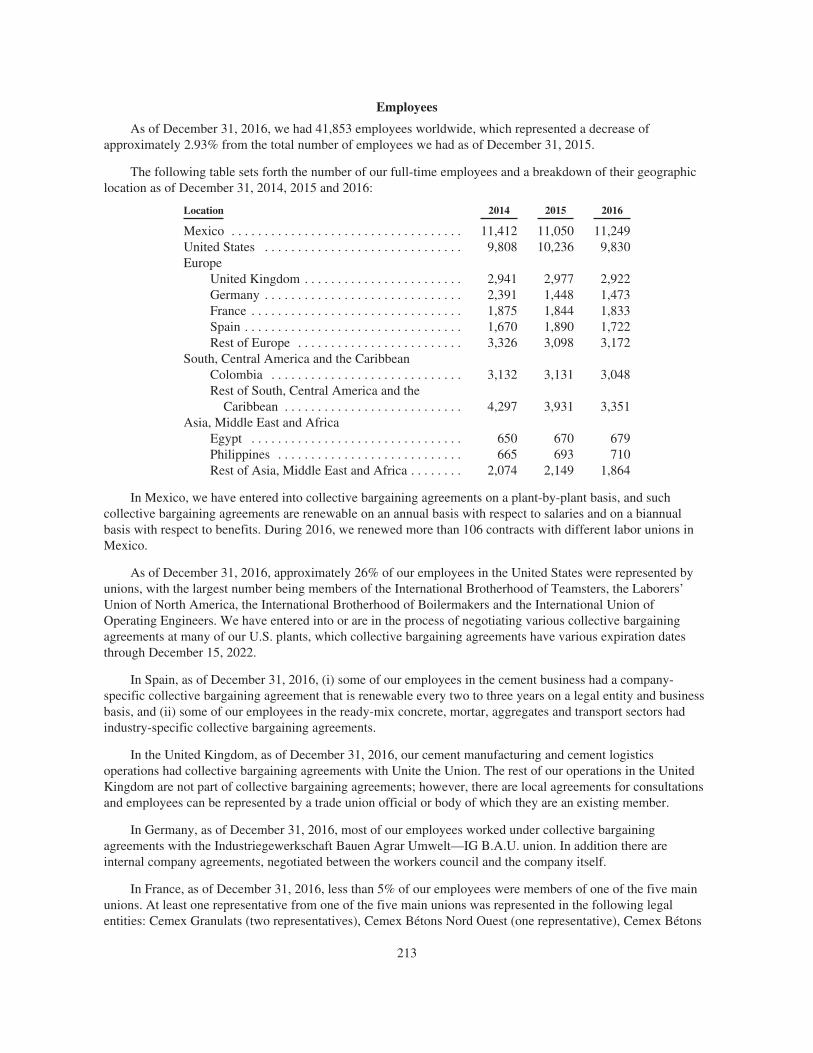
Employees
As of December 31, 2016, we had 41,853 employees worldwide, which represented a decrease ofapproximately 2.93% from the total number of employees we had as of December 31, 2015.
The following table sets forth the number of our full-time employees and a breakdown of their geographiclocation as of December 31, 2014, 2015 and 2016:
Location 2014 2015 2016
Mexico . . . . . . . . . . . . . . . . . . . . . . . . . . . . . . . . . . . 11,412 11,050 11,249United States . . . . . . . . . . . . . . . . . . . . . . . . . . . . . . 9,808 10,236 9,830Europe
United Kingdom . . . . . . . . . . . . . . . . . . . . . . . . 2,941 2,977 2,922Germany . . . . . . . . . . . . . . . . . . . . . . . . . . . . . . 2,391 1,448 1,473France . . . . . . . . . . . . . . . . . . . . . . . . . . . . . . . . 1,875 1,844 1,833Spain . . . . . . . . . . . . . . . . . . . . . . . . . . . . . . . . . 1,670 1,890 1,722Rest of Europe . . . . . . . . . . . . . . . . . . . . . . . . . 3,326 3,098 3,172
South, Central America and the CaribbeanColombia . . . . . . . . . . . . . . . . . . . . . . . . . . . . . 3,132 3,131 3,048Rest of South, Central America and the
Caribbean . . . . . . . . . . . . . . . . . . . . . . . . . . . 4,297 3,931 3,351Asia, Middle East and Africa
Egypt . . . . . . . . . . . . . . . . . . . . . . . . . . . . . . . . 650 670 679Philippines . . . . . . . . . . . . . . . . . . . . . . . . . . . . 665 693 710Rest of Asia, Middle East and Africa . . . . . . . . 2,074 2,149 1,864
In Mexico, we have entered into collective bargaining agreements on a plant-by-plant basis, and suchcollective bargaining agreements are renewable on an annual basis with respect to salaries and on a biannualbasis with respect to benefits. During 2016, we renewed more than 106 contracts with different labor unions inMexico.
As of December 31, 2016, approximately 26% of our employees in the United States were represented byunions, with the largest number being members of the International Brotherhood of Teamsters, the Laborers’Union of North America, the International Brotherhood of Boilermakers and the International Union ofOperating Engineers. We have entered into or are in the process of negotiating various collective bargainingagreements at many of our U.S. plants, which collective bargaining agreements have various expiration datesthrough December 15, 2022.
In Spain, as of December 31, 2016, (i) some of our employees in the cement business had a company-specific collective bargaining agreement that is renewable every two to three years on a legal entity and businessbasis, and (ii) some of our employees in the ready-mix concrete, mortar, aggregates and transport sectors hadindustry-specific collective bargaining agreements.
In the United Kingdom, as of December 31, 2016, our cement manufacturing and cement logisticsoperations had collective bargaining agreements with Unite the Union. The rest of our operations in the UnitedKingdom are not part of collective bargaining agreements; however, there are local agreements for consultationsand employees can be represented by a trade union official or body of which they are an existing member.
In Germany, as of December 31, 2016, most of our employees worked under collective bargainingagreements with the Industriegewerkschaft Bauen Agrar Umwelt—IG B.A.U. union. In addition there areinternal company agreements, negotiated between the workers council and the company itself.
In France, as of December 31, 2016, less than 5% of our employees were members of one of the five mainunions. At least one representative from one of the five main unions was represented in the following legalentities: Cemex Granulats (two representatives), Cemex Bétons Nord Ouest (one representative), Cemex Bétons
213

Ile de France (three representatives), Cemex Bétons Sud Est (one representative) and Cemex Granulats RhôneMéditérranée (two representatives). All agreements are negotiated with unions and non-union representativeselected in the local workers council (Comité d’Entreprise) for periods of four years. The last elections took placein April 2014 and the next election will take place in April 2018, except for Cemex Bétons Ile de France, whoselast election took place in early 2015 and the next one will be in 2019.
In Egypt, as of December 31, 2016, approximately 100% of our employees in ACC were affiliated to ACC’sunion (“ACC’s Union”), which is a member of Egypt’s General Union of Building Materials. ACC’s Unionrepresents these employees in any collective negotiation, agreement or dispute.
In Israel, as of December 31, 2016, approximately 89% of our employees in Lime & Stone ProductionCompany Ltd., one of our operating subsidiaries in Israel, or 24% of all of our employees in Israel, wererepresented by Histadrut, Israel’s largest labor union. These employees work under special collective bargainingagreements which are renewable on an annual basis with respect to salaries and benefits and every one or twoyears with respect to retirement and dismissal terms.
In the Philippines, as of December 31, 2016, approximately 33% of the cement operation employees of APOand Solid Cement were members of either one of four labor unions that are affiliated with a national federation.Each labor union has a collective bargaining agreement with either APO or Solid Cement. Each of the collectivebargaining agreements has a term of five years, with the economic terms negotiated in the third and fifth years.We consider our relationships with the labor unions representing our employees in the Philippines to besatisfactory.
In Colombia, as of December 31, 2016, there were five regional sectionals of a single union that representsour employees at the Caracolito, Clemencia, Bucaramanga, Cúcuta and Maceo cement plants and mills, and partof the logistic operations at the national level. There were also collective agreements with non-union workers atthe Santa Rosa cement plant, all aggregates operations and the majority of the logistics and ready mix operationsin Colombia. Two other unions represent minority groups of employees of our logistics and ready-mixoperations. We consider our relationships with labor unions representing our employees in Colombia to besatisfactory.
In Panama, as of December 31, 2016, approximately 62% of our workforce were members of a union namedSindicato de Trabajadores de Cemento Bayano, which is a legal entity registered before the Panamanian Ministryof Labor. The union’s board of directors is elected every two to four years through a general voting process. Thecollective bargaining agreement that is currently in full force and effect was entered into in January 2016 andexpires in December 2019.
Share Ownership
As of December 31, 2016, our senior management and directors and their immediate families owned,collectively, approximately 1.73% of CEMEX, S.A.B. de C.V.’s outstanding shares, including shares underlyingstock options and restricted CPOs under our ESOPs. This percentage does not include shares held by theextended families of members of our senior management and directors, since, to the best of our knowledge, novoting arrangements or other agreements exist with respect to those shares. As of December 31, 2016, noindividual director or member of our senior management beneficially owned one percent or more of any class ofCEMEX, S.A.B. de C.V.’s outstanding capital stock and each such individual’s share ownership has not beenpreviously disclosed to shareholders or otherwise made public.
Item 7—Major Shareholders and Related Party Transactions
Major Shareholders
The information contained in Amendment No. 5 to a statement on Schedule 13G filed with the SEC onJanuary 23, 2017, stated that as of December 31, 2016, BlackRock beneficially owned 1,033,221,731 CPOs,
214

representing 7.4% of CEMEX, S.A.B. de C.V.’s outstanding capital stock. BlackRock does not have votingrights different from our other non-Mexican holders of CPOs. As required by CEMEX, S.A.B. de C.V.’sby-laws, CEMEX, S.A.B. de C.V.’s board of directors is required to approve BlackRock beneficial ownership ofCEMEX, S.A.B. de C.V.’s outstanding capital stock. Pursuant to the authorizations by Board of Directors,BlackRock is authorized to acquire up to 13% of capital stock.
As of the date of this annual report, Dodge & Cox, an investment adviser registered under the U.S.Investment Advisers Act of 1940, as amended, has been authorized by CEMEX, S.A.B. de C.V.’s board ofdirectors to own up to 6% of CEMEX, S.A.B. de C.V.’s outstanding capital stock. Dodge & Cox does not havevoting rights different from our other non-Mexican holders of CPOs.
As of March 30, 2017, CEMEX, S.A.B. de C.V.’s outstanding capital stock consisted of 28,121,583,148Series A shares and 14,060,791,574 Series B shares, in each case including shares held by our subsidiaries.Additionally, at CEMEX, S.A.B. de C.V.’s 2016 annual general ordinary shareholders’ meeting held onMarch 30, 2017, CEMEX, S.A.B. de C.V.’s shareholders approved the issuance of 1,124,863,326 Series A sharesand 562,431,663 Series B shares, equivalent to approximately 562.4 million CPOs, to be allocated toshareholders on a pro rata basis pursuant to such approval. These shares are expected to become part of CEMEX,S.A.B. de C.V.’s outstanding capital stock on May 8, 2017.
As of March 31, 2017, a total of 28,078,596,254 Series A shares and 14,039,298,127 Series B sharesoutstanding were held by the CPO trust. Each CPO represents two Series A shares and one Series B share. Aportion of the CPOs is represented by ADSs. Under the terms of the CPO trust agreement, non-Mexican holdersof CPOs and ADSs have no voting rights with respect to the Series A shares underlying those CPOs and ADSs.All ADSs are deemed to be held by non-Mexican nationals. At every shareholders’ meeting, the Series A sharesheld in the CPO trust are voted as expressed by the shareholders representing the majority of the capital stockentitled to vote.
Other than BlackRock and the CPO trust, we are not aware of any person that is the beneficial owner of fivepercent or more of any class of CEMEX, S.A.B. de C.V.’s voting securities.
As of March 31, 2017, through CEMEX, S.A.B. de C.V.’s subsidiaries, we owned approximately19.7 million CPOs, representing approximately 0.1% of CEMEX, S.A.B. de C.V.’s outstanding CPOs andapproximately 0.1% of CEMEX, S.A.B. de C.V.’s outstanding voting stock. These CPOs are voted at thedirection of our management. CEMEX, S.A.B. de C.V.’s voting rights over those CPOs are the same as those ofany other CPO holder. As of the same date, we did not hold any CPOs in derivative instruments hedgingexpected cash flows of stock options exercises.
CEMEX, S.A.B. de C.V.’s by-laws provide that its board of directors must authorize in advance any transferof voting shares of its capital stock that would result in any person’s, or group’s acting in concert, becoming aholder of 2% or more of CEMEX, S.A.B. de C.V.’s voting shares.
Mexican securities regulations provide that our majority-owned subsidiaries may neither directly or indirectlyinvest in CEMEX, S.A.B. de C.V.’s CPOs nor other securities representing CEMEX, S.A.B. de C.V.’s capital stock.The Mexican securities authority could require any disposition of the CPOs or of other securities representing ourcapital stock so owned and/or impose fines on us if it were to determine that the ownership of CEMEX, S.A.B. deC.V.’s CPOs or of other securities representing CEMEX, S.A.B. de C.V.’s capital stock by CEMEX, S.A.B. deC.V.’s subsidiaries, in most cases, negatively affects the interests of CEMEX, S.A.B. de C.V.’s shareholders.Notwithstanding the foregoing, the exercise of all rights pertaining to CEMEX, S.A.B. de C.V.’s CPOs or to othersecurities representing our capital stock in accordance with the instructions of CEMEX, S.A.B. de C.V.’ssubsidiaries does not violate any provisions of CEMEX, S.A.B. de C.V.’s by-laws or the by-laws of its subsidiaries.The holders of these CPOs or of other securities representing CEMEX, S.A.B. de C.V.’s capital stock are entitled toexercise the same rights relating to their CPOs or their other securities representing CEMEX, S.A.B. de C.V.’scapital stock, including all voting rights, as any other holder of the same series.
215

As of March 31, 2017, we had 641 ADS holders of record, holding 648,417,085 ADRs, representing6,484,170,850 CPOs, or approximately 46.12% of CEMEX, S.A.B. de C.V.’s outstanding capital stock as of suchdate.
Related Party Transactions
We had no significant related party transactions for the year ended December 31, 2016. From January 1,2016 through the date of this annual report, we did not have any outstanding loans to any of CEMEX, S.A.B. deC.V.’s directors or members of senior management.
Item 8—Financial Information
Consolidated Financial Statements and Other Financial Information
See “Item 18—Financial Statements” and “Index to Consolidated Financial Statements.”
Legal Proceedings
See “Item 4—Information on the Company—Regulatory Matters and Legal Proceedings.”
Dividends
A declaration of any dividend can be made by CEMEX, S.A.B. de C.V.’s shareholders at any generalordinary shareholders’ meeting. Any dividend declaration is usually based upon the recommendation of CEMEX,S.A.B. de C.V.’s board of directors. However, CEMEX, S.A.B. de C.V.’s shareholders are not obligated toapprove the board’s recommendation. CEMEX, S.A.B. de C.V. may only pay dividends from retained earningsincluded in financial statements that have been approved by CEMEX, S.A.B. de C.V.’s shareholders and after alllosses have been paid for, a legal reserve equal to 5% of its paid-in capital has been created and CEMEX, S.A.B.de C.V.’s shareholders have approved the relevant dividend payment. See “Item 10—Additional Information—Taxation—Mexican Tax Considerations.” Since CEMEX, S.A.B. de C.V. conducts its operations through itssubsidiaries; it has no significant assets of its own except for its investments in those subsidiaries. Consequently,CEMEX, S.A.B. de C.V.’s ability to pay dividends to its shareholders is dependent upon its ability to receivefunds from its subsidiaries in the form of dividends, management fees, or otherwise. The Credit Agreement andthe indentures governing the Senior Secured Notes effectively prohibit CEMEX, S.A.B. de C.V. from declaringand paying cash dividends or making other cash distributions to its shareholders. See “Item 3—KeyInformation—Risk Factors—Risks Relating to Our Business—CEMEX, S.A.B. de C.V.’s ability to repay debtand pay dividends depends on our subsidiaries’ ability to transfer income and dividends to us.”
The recommendation of CEMEX, S.A.B. de C.V.’s board of directors as to whether to pay and the amountof any annual dividends has been and will continue to be, in absence of contractual restrictions to pay or declaredividends, based upon, among other things, earnings, cash flow, capital requirements, contractual restrictions,and our financial condition and other relevant factors.
Owners of ADSs on the applicable record date will be entitled to receive any dividends payable in respect ofthe Series A shares and the Series B shares underlying the CPOs represented by those ADSs; however, aspermitted by the deposit agreement pursuant to which CEMEX, S.A.B. de C.V.’s ADSs are issued, CEMEX,S.A.B. de C.V. may instruct the ADS depositary not to extend the option to elect to receive cash in lieu of thestock dividend to the holders of ADSs. The ADS depositary will fix a record date for the holders of ADSs inrespect of each dividend distribution. Unless otherwise stated, the ADS depositary has agreed to convert cashdividends received by it in respect of the Series A shares and the Series B shares underlying the CPOsrepresented by ADSs from Mexican Pesos into U.S. Dollars and, after deduction or after payment of expenses ofthe ADS depositary, to pay those dividends to holders of ADSs in U.S. Dollars. CEMEX, S.A.B. de C.V. cannotassure holders of its ADSs that the ADS depositary will be able to convert dividends received in Mexican Pesosinto U.S. Dollars.
216

CEMEX, S.A.B. de C.V. did not declare a dividend for fiscal years 2014, 2015 and 2016.
Significant Changes
Except as described herein, no significant change has occurred since the date of our 2016 consolidatedfinancial statements included elsewhere in this annual report.
Item 9—Offer and Listing
Market Price Information
CEMEX, S.A.B. de C.V.’s CPOs are listed on the Mexican Stock Exchange and trade under the symbol“CEMEX.CPO.” CEMEX, S.A.B. de C.V.’s ADSs, each of which currently represents ten CPOs, are listed onthe New York Stock Exchange (“NYSE”) and trade under the symbol “CX.” The following table sets forth, forthe periods indicated, the reported highest and lowest market quotations in nominal Mexican Pesos for CPOs onthe Mexican Stock Exchange and the high and low sales prices in U.S. Dollars for ADSs on the NYSE.
CPOs(1) ADSs
Calendar Period High Low High Low
Yearly2012 . . . . . . . . . . . . . . . . . . . . . . . . . . . . . . . . . . . . . . . . . . . . . . 12.93 7.00 10.14 4.942013 . . . . . . . . . . . . . . . . . . . . . . . . . . . . . . . . . . . . . . . . . . . . . . 16.16 12.58 12.71 9.142014 . . . . . . . . . . . . . . . . . . . . . . . . . . . . . . . . . . . . . . . . . . . . . . 18.50 14.32 14.36 9.662015 . . . . . . . . . . . . . . . . . . . . . . . . . . . . . . . . . . . . . . . . . . . . . . 16.37 8.64 10.72 4.952016 . . . . . . . . . . . . . . . . . . . . . . . . . . . . . . . . . . . . . . . . . . . . . . 18.07 7.09 9.15 3.82
Quarterly2015
First quarter . . . . . . . . . . . . . . . . . . . . . . . . . . . . . . . . . . . . . . . . 15.60 12.97 10.45 8.72Second quarter . . . . . . . . . . . . . . . . . . . . . . . . . . . . . . . . . . . . . . 16.37 14.11 10.72 9.02Third quarter . . . . . . . . . . . . . . . . . . . . . . . . . . . . . . . . . . . . . . . 14.75 10.60 9.24 6.12Fourth quarter . . . . . . . . . . . . . . . . . . . . . . . . . . . . . . . . . . . . . . 13.31 8.64 8.14 4.95
2016First quarter . . . . . . . . . . . . . . . . . . . . . . . . . . . . . . . . . . . . . . . . 12.70 6.78 7.43 3.63Second quarter . . . . . . . . . . . . . . . . . . . . . . . . . . . . . . . . . . . . . . 12.80 10.61 7.45 5.49Third quarter . . . . . . . . . . . . . . . . . . . . . . . . . . . . . . . . . . . . . . . 16.05 10.93 8.89 5.81Fourth quarter . . . . . . . . . . . . . . . . . . . . . . . . . . . . . . . . . . . . . . 18.07 15.30 9.15 7.43
2017First quarter . . . . . . . . . . . . . . . . . . . . . . . . . . . . . . . . . . . . . . . . 19.66 16.46 9.49 7.80
Monthly2016-2017
October . . . . . . . . . . . . . . . . . . . . . . . . . . . . . . . . . . . . . . . . . . . 16.94 15.30 9.15 7.90November . . . . . . . . . . . . . . . . . . . . . . . . . . . . . . . . . . . . . . . . . 16.74 15.41 8.99 7.43December . . . . . . . . . . . . . . . . . . . . . . . . . . . . . . . . . . . . . . . . . 18.07 15.90 8.93 7.74January . . . . . . . . . . . . . . . . . . . . . . . . . . . . . . . . . . . . . . . . . . . 19.88 16.46 9.49 7.80February . . . . . . . . . . . . . . . . . . . . . . . . . . . . . . . . . . . . . . . . . . 18.92 16.93 9.26 8.46March . . . . . . . . . . . . . . . . . . . . . . . . . . . . . . . . . . . . . . . . . . . . 18.06 16.56 9.14 8.54April(2) . . . . . . . . . . . . . . . . . . . . . . . . . . . . . . . . . . . . . . . . . . . 17.95 16.34 9.62 8.65
Source: Based on data of the Mexican Stock Exchange and the NYSE.
(1) As of December 31, 2016, approximately 99.84% of CEMEX, S.A.B. de C.V.’s outstanding share capitalwas represented by CPOs.
(2) CPO and ADS prices are through April 21, 2017.
217

On April 21, 2017, the last reported closing price for CPOs on the Mexican Stock Exchange was Ps16.66per CPO, and the last reported closing price for ADSs on the NYSE was U.S.$8.78 per ADS.
During 2016, (i) we did not have a market maker and (ii) there was no suspension of trading of (a) CEMEX,S.A.B. de C.V.’s CPOs on the Mexican Stock Exchange or (b) CEMEX, S.A.B. de C.V.’s ADSs on the NewYork Stock Exchange.
Item 10—Additional Information
Articles of Association and By-laws
General
Pursuant to the requirements of Mexican corporations law, CEMEX, S.A.B. de C.V.’s articles of associationand by-laws (estatutos sociales), have been registered with the Mercantile Section of the Public Registry ofProperty and Commerce in Monterrey, Nuevo León, Mexico, under entry number 21, since June 11, 1920.
CEMEX, S.A.B. de C.V. is an operating and holding company engaged directly or indirectly, through itsoperating subsidiaries, primarily in the production, distribution, marketing and sale of cement, ready-mixconcrete, aggregates, clinker and other construction materials throughout the world. CEMEX, S.A.B. de C.V.’scorporate purpose can be found in article 2 of CEMEX, S.A.B. de C.V.’s by-laws.
CEMEX, S.A.B. de C.V. has two series of common stock, the Series A common stock, with no par value(“Series A shares”), which can only be owned by Mexican nationals, and the Series B common stock, with no parvalue (“Series B shares”), which can be owned by both Mexican and non-Mexican nationals. CEMEX, S.A.B. deC.V.’s by-laws state that the Series A shares may not be held by non-Mexican individuals, corporations, groups,units, trusts, associations or governments that are foreign or have participation by foreign governments or theiragencies. CEMEX, S.A.B. de C.V.’s by-laws also state that the Series A shares shall at all times account for aminimum of 64% of CEMEX, S.A.B. de C.V.’s total outstanding voting stock and that the Series B shares shallat all times account for a minimum of 36% of CEMEX, S.A.B. de C.V.’s total outstanding voting stock. Otherthan as described herein, holders of the Series A shares and the Series B shares have the same rights andobligations.
In 1994, CEMEX, S.A.B. de C.V. changed from a fixed capital corporation to a variable capital corporationin accordance with Mexican corporation law. As a result, CEMEX, S.A.B. de C.V. established a fixed capitalaccount and a variable capital account and issued one share of variable capital stock of the same series for eacheight shares of fixed capital stock held by any shareholder. Each of our fixed and variable capital accounts iscomprised of Series A shares and Series B shares. Under the Mexican Securities Market Law and CEMEX,S.A.B. de C.V.’s by-laws, holders of shares representing variable capital are not entitled to withdraw thoseshares.
Shareholder authorization is required to increase or decrease either the fixed capital account or the variablecapital account. Shareholder authorization to increase or decrease the fixed capital account must be obtained atan extraordinary meeting of shareholders. Shareholder authorization to increase or decrease the variable capitalaccount must be obtained at an ordinary general meeting of shareholders.
On April 29, 1999, CEMEX, S.A.B. de C.V.’s shareholders approved a stock split, and for every one ofCEMEX, S.A.B. de C.V.’s shares of any series CEMEX, S.A.B. de C.V. issued two Series A shares and oneSeries B share. Concurrently with this stock split, CEMEX, S.A.B. de C.V. also consummated an exchange offerto exchange new CPOs and new ADSs representing the new CPOs for CEMEX, S.A.B. de C.V.’s then existingSeries A shares, Series B shares and ADSs, and converted CEMEX, S.A.B. de C.V.’s then existing CPOs into thenew CPOs.
218

On June 1, 2001, the then-effective Mexican securities market law was amended, among other, to increasethe protection granted to minority shareholders of Mexican listed companies and to commence bringingcorporate governance procedures of Mexican listed companies in line with international standards.
On February 6, 2002, the Mexican securities authority (Comisión Nacional Bancaria y de Valores) issued anofficial communication authorizing the amendment of CEMEX, S.A.B. de C.V.’s by-laws to incorporateadditional provisions to comply with the then new provisions of the then-effective Mexican securities marketlaw. Following approval from CEMEX, S.A.B. de C.V.’s shareholders at the 2002 annual shareholders’ meeting,CEMEX, S.A.B. de C.V. amended and restated its by-laws to incorporate these additional provisions, whichconsisted of, among other things, protective measures to prevent share acquisitions, hostile takeovers, and director indirect changes of control.
On March 19, 2003, the Mexican securities authority issued new regulations designed to (i) furtherimplement minority rights granted to shareholders by the then-effective Mexican securities market law and(ii) simplify and consolidate in a single document provisions relating to securities offerings and periodic reportsby Mexican-listed companies.
On April 24, 2003, CEMEX, S.A.B. de C.V.’s shareholders approved changes to its by-laws, incorporatingadditional provisions and removing some restrictions. The changes that are still in force are as follows:
• The limitation on CEMEX, S.A.B. de C.V.’s variable capital was removed. Formerly, CEMEX, S.A.B.de C.V.’s variable capital was limited to ten times CEMEX, S.A.B. de C.V.’s minimum fixed capital.
• Increases and decreases in CEMEX, S.A.B. de C.V.’s variable capital now require the notarization ofthe minutes of the ordinary general shareholders’ meeting that authorize such increase or decrease, aswell as the filing of these minutes with the Mexican National Securities Registry (Registro Nacional deValores), except when such increase or decrease results from (i) shareholders exercising theirredemption rights or (ii) stock repurchases.
• The cancellation of registration of our shares in the Securities Section of the Mexican NationalSecurities Registry now involves an amended procedure, which is described below under “—Repurchase Obligation.” In addition, any amendments to the article containing these provisions nolonger require the consent of the Mexican securities authority and 95% approval by shareholdersentitled to vote.
On December 30, 2005, the Mexican Securities Market Law was published to continue bringing corporategovernance requirements of Mexican listed companies in line with international standards. This new lawincluded provisions increasing disclosure information requirements, improving minority shareholder rights, andstrengthening corporate governance standards including the introduction of new requirements and fiduciaryduties (duties of care and loyalty), applicable to each director, officer, external auditor and major shareholder ofpublicly traded companies. The law also provided that each member of the audit committee must be anindependent director, and required the creation of corporate governance committees integrated by independentdirectors as well. In addition, the law clarified directors’ duties, specified safe harbors for directors’ actions,clarified what is deemed as a conflict of interest and clarified what are the confidentiality obligations fordirectors.
Under the then new Mexican Securities Market Law, CEMEX, S.A.B. de C.V. was required to adoptspecific amendments to its by-laws within 180 days of the effective date of the new law. Following approvalfrom CEMEX, S.A.B. de C.V.’s shareholders at its extraordinary shareholders’ meeting held on April 27, 2006,CEMEX, S.A.B. de C.V. amended and restated its by-laws to incorporate these amendments. The amendments toCEMEX, S.A.B. de C.V.’s by-laws became effective on July 3, 2006. The most significant of these amendmentswere as follows:
• The change of its corporate name from CEMEX, S.A. de C.V. to CEMEX, S.A.B. de C.V., whichmeans that it is now called a publicly traded company (sociedad anónima bursátil or S.A.B.).
219

• The creation of a corporate practices committee, which was a new committee of CEMEX, S.A.B. deC.V.’s board of directors and which is comprised exclusively of independent directors.
• The elimination of the position of statutory examiner (comisario) and the assumption of itsresponsibilities by the board of directors through the audit committee and the then new corporatepractices committee, as well as through the external auditor who audits CEMEX, S.A.B. de C.V.’sfinancial statements, each within its professional role.
• The express attribution of certain duties (such as the duty of loyalty and the duty of care) and liabilitieson members of the board of directors as well as on certain senior executive officers.
• The implementation of a mechanism for claims of a breach of a director’s or officer’s duties, to bebrought by us or by holders of 5% or more of CEMEX, S.A.B. de C.V.’s shares.
• The chief executive officer is now the person in charge of managing the company; previously, this wasthe duty of the board of directors. The board of directors now supervises the chief executive officer.
• Shareholders are given the right to enter into certain agreements with other shareholders.
On March 20, 2014, CEMEX, S.A.B. de C.V. held an extraordinary shareholders’ meeting, at which itsshareholders approved, among other items, the board of directors’ proposal to expand the corporate purpose ofCEMEX, S.A.B. de C.V. so that, aside from being a holding company, CEMEX, S.A.B. de C.V. can undertakeoperating activities related to the production and commercialization of cement, ready-mix concrete andaggregates.
On March 26, 2015, CEMEX, S.A.B. de C.V. held an extraordinary shareholders’ meeting, at which itsshareholders approved, among other items, (i) changes to CEMEX, S.A.B. de C.V.’s by-laws, incorporatingadditional provisions and removing some restrictions. The changes, among other items, are the following: extendCEMEX, S.A.B. de C.V.’s corporate existence for an indefinite period of time, adopt the electronic systemestablished by the Ministry of Economy (Secretaría de Economía) for the publication of notices and other legalmatters; remove a redundancy in minority rights; adopt additional considerations that CEMEX, S.A.B. de C.V.’sboard of directors shall consider in order to authorize purchases of 2% or more of shares; adopt provisions toimprove corporate governance with respect to the presidency at shareholders’ meetings and corporate bodies;separation of roles of chairman of the board and chief executive officer; include the possibility of electing analternate secretary of the board of directors; authorization to formalize CEMEX, S.A.B. de C.V.’s restatedby-laws and authorization to exchange the share certificates that represent CEMEX, S.A.B. de C.V.’s thenoutstanding capital stock.
Changes in Capital Stock and Preemptive Rights
Subject to certain exceptions referred below, CEMEX, S.A.B. de C.V.’s by-laws allow for a decrease orincrease in its capital stock if it is approved by its shareholders at a shareholders’ meeting. Additional shares ofCEMEX, S.A.B. de C.V.’s capital stock, having no voting rights or limited voting rights, are authorized by itsby-laws and may be issued upon the approval of its shareholders at a shareholders’ meeting, with the priorapproval of the Mexican securities authority.
CEMEX, S.A.B. de C.V.’s by-laws provide that, subject to certain exceptions, shareholders have preemptiverights with respect to the class and in proportion to the number of shares of our capital stock they hold, inconnection with any capital increase in the number of outstanding Series A shares, Series B shares, or any otherexisting series of shares, as the case may be. Subject to certain requirements: (i) under article 53 of the MexicanSecurities Market Law, this preemptive right to subscribe is not applicable to increases of CEMEX, S.A.B. deC.V.’s capital through public offers; and (ii) under article 210 bis of the General Law of Negotiable Instrumentsand Credit Operations (Ley General de Títulos y Operaciones de Crédito), this preemptive right to subscribe isnot applicable when issuing shares under convertible notes. Preemptive rights give shareholders the right, upon
220
any issuance of shares by us, to purchase a sufficient number of shares to maintain their existing ownershippercentages. Preemptive rights must be exercised within the period and under the conditions established for thatpurpose by the shareholders, and CEMEX, S.A.B. de C.V.’s by-laws and applicable law provide that this periodmust be 15 days following the publication of the notice of the capital increase through the electronic systemestablished by the Ministry of Economy (Secretaría de Economía) or, in its absence, in the Official Gazette of theState of Nuevo León (Periódico Oficial del Estado de Nuevo León) or in any major newspaper published anddistributed in the city of Monterrey, Nuevo León, México.
Holders of ADSs that are U.S. persons or are located in the United States may be restricted in their ability toparticipate in the exercise of such pre-emptive rights. See “Item 3—Key Information—Risk Factors—RisksRelating to Our Business—Preemptive rights may be unavailable to ADS holders.”
Pursuant to CEMEX, S.A.B. de C.V.’s by-laws, significant acquisitions of shares of CEMEX, S.A.B. deC.V.’s capital stock and changes of control of CEMEX, S.A.B. de C.V. require prior approval from CEMEX,S.A.B. de C.V.’s board of directors. CEMEX, S.A.B. de C.V.’s board of directors must authorize in advance anytransfer of, or creation of any encumbrance or lien on, voting shares of CEMEX, S.A.B. de C.V.’s capital stockthat would result in any person or group becoming a holder of 2% or more of CEMEX, S.A.B. de C.V.’s shares.CEMEX, S.A.B. de C.V.’s board of directors shall consider the following when determining whether to authorizesuch transfer of voting shares: a) the type of investors involved; b) if stock prices may be affected or if thenumber of CEMEX, S.A.B. de C.V.’s shares outstanding would be reduced in such way that marketability maybe affected; c) whether the acquisition would result in the potential acquirer exercising a significant influence orbeing able to obtain control; d) whether all applicable rules and CEMEX, S.A.B. de C.V.’s by-laws have beenobserved by the potential acquirer; e) whether the potential acquirers are our competitors or are persons or legalentities participating in companies, entities or persons that are or competitors and whether there is a risk ofaffecting market competition, or the potential acquirers could have access to confidential and privilegedinformation; f) the morality and economic solvency of the potential acquirers; g) the protection of minority rightsand the rights of our employees; and h) whether an adequate base of investors would be maintained. If CEMEX,S.A.B. de C.V.’s board of directors denies the authorization, the transfer had been authorized on the basis of falseor incorrect information or information had been withheld or the requirements established in CEMEX, S.A.B. deC.V.’s by-laws are not complied with, the persons involved in the transfer shall not be entitled to exercise thevoting rights corresponding to the transferred shares, and such shares shall not be taken into account for thedetermination of the quorums of attendance and voting at shareholders’ meetings, nor shall the transfers berecorded in our share registry and the registry undertaken by S.D. Indeval, Institución para el Depósito deValores, S.A. de C.V. (“Indeval”), the Mexican securities depositary, shall not have any effect.
Any acquisition of shares of CEMEX, S.A.B. de C.V.’s capital stock representing 30% or more of its capitalstock by a person or group of persons requires prior approval from CEMEX, S.A.B. de C.V.’s board of directorsand, in the event approval is granted, the acquirer has an obligation to make a public offer to purchase all of theoutstanding shares of CEMEX, S.A.B. de C.V.’s capital stock. In the event the requirements for significantacquisitions of shares of CEMEX, S.A.B. de C.V.’s capital stock are not met, the persons acquiring such shareswill not be entitled to any corporate rights with respect to such shares, such shares will not be taken into accountfor purposes of determining a quorum for shareholders’ meetings, CEMEX, S.A.B. de C.V. will not record suchpersons as holders of such shares in its share registry, and the registry undertaken by the Indeval shall not haveany effect.
CEMEX, S.A.B. de C.V.’s by-laws require the stock certificates representing shares of its capital stock to makereference to the provisions in its by-laws relating to the prior approval of the CEMEX, S.A.B. de C.V. board ofdirectors for significant share transfers and the requirements for recording share transfers in its share registry. Inaddition, shareholders are responsible for informing CEMEX, S.A.B. de C.V. within five business days whenever theirshareholdings exceed 5%, 10%, 15%, 20%, 25% and 30% of CEMEX, S.A.B. de C.V.’s capital stock. If a personacquires beneficial ownership (within the meaning of Rule 13d-3 promulgated by the SEC under the SecuritiesExchange Act of 1934) of 20% or more in voting power of the outstanding voting stock of CEMEX, S.A.B. de C.V., achange of control will be deemed to have occurred under the Credit Agreement and other debt agreements of CEMEX.
221

CEMEX, S.A.B. de C.V. is required to maintain a share registry to record the names, nationalities anddomiciles of all significant shareholders, and any shareholder that meets or exceeds these thresholds must berecorded in this registry if such shareholder is to be recognized or represented at any shareholders’ meeting. If ashareholder fails to inform CEMEX, S.A.B. de C.V. of its shareholdings reaching a threshold as described above,we will not record the transactions that cause such threshold to be met or exceeded in CEMEX, S.A.B. de C.V.’sshare registry, and such transaction will have no legal effect and will not be binding on us.
CEMEX, S.A.B. de C.V.’s by-laws also require that its shareholders comply with legal provisions regardingacquisitions of securities and certain shareholders’ agreements that require disclosure to the public.
Repurchase Obligation
In accordance with Mexican securities regulations, CEMEX, S.A.B. de C.V. is obligated to make a publicoffer for the purchase of stock to its shareholders if CEMEX, S.A.B. de C.V.’s registration with the Mexicansecurities registry is canceled, either by resolution of its shareholders or by an order of the Mexican securitiesauthority. The minimum price at which we must purchase the stock is the higher of:
• the weighted average price per share based on the weighted average trading price of CEMEX, S.A.B.de C.V.’s CPOs on the Mexican Stock Exchange during the latest period of 30 trading days precedingthe date of the offer, for a period not to exceed six months; or
• the book value per share, as reflected in the last quarterly report filed with the Mexican securitiesauthority and the Mexican Stock Exchange before the date of the offer.
CEMEX, S.A.B. de C.V.’s board of directors shall prepare and disclose to the public through the MexicanStock Exchange, within ten business days after the day the public offer begins, and after consulting the corporatepractices and finance committee, its opinion regarding the price of the offer and any conflicts of interests thateach of its members may have regarding such offer. This opinion may be accompanied by an additional opinionissued by an independent expert that we may hire.
Following the cancellation of CEMEX, S.A.B. de C.V.’s registration with the Mexican securities registry, itmust place in a trust set up for that purpose for a six-month period an amount equal to that required to purchasethe remaining shares held by investors who did not participate in the offer.
Shareholders’ Meetings and Voting Rights
Shareholders’ meetings may be called by:
• CEMEX, S.A.B. de C.V.’s board of directors or the corporate practices and finance committee or theaudit committee;
• shareholders representing at least 10% of outstanding and fully paid shares, by requesting that it to thechairman of CEMEX, S.A.B. de C.V.’s board of directors or CEMEX, S.A.B. de C.V.’s corporatepractices and finance committee and audit committee;
• any shareholder (i) if no meeting has been held for two consecutive years or when the matters referredto in Article 181 of the Mexican corporations law have not been dealt with, or (ii) when, for anyreason, the required quorum for valid sessions of the corporate practices and finance committee andaudit committee was not reached and the board of directors failed to make the appropriate provisionalappointments; or
• a Mexican court of competent jurisdiction, in the event CEMEX, S.A.B. de C.V.’s board of directors orthe corporate practices and finance committee and audit committee do not comply with the validshareholders’ request described above.
222
Notice of shareholders’ meetings must be published through the electronic system established by theMinistry of Economy (Secretaría de Economía) or, in its absence, in the Official Gazette of the State of NuevoLeón (Periódico Oficial del Estado de Nuevo León), Mexico or in any major newspaper published and distributedin the city of Monterrey, Nuevo León, Mexico. The notice must be published at least 15 days prior to the date ofany shareholders’ meeting. Consistent with Mexican law, CEMEX, S.A.B. de C.V.’s by-laws further require thatall information and documents relating to the shareholders’ meeting be available to shareholders from the datethe notice of the meeting is published.
General shareholders’ meetings can be ordinary or extraordinary. At every general shareholders’ meeting,each qualified holder of Series A shares and Series B shares is entitled to one vote per share. Shareholders mayvote by proxy duly appointed in writing. Under the CPO trust agreement, holders of CPOs who are not Mexicannationals cannot exercise voting rights corresponding to the Series A shares represented by their CPOs, in whichcase, the CPO trustee will vote the underlying Series A shares in the same manner as the holders of the majorityof the voting shares.
An annual general ordinary shareholders’ meeting must be held during the first four months after the end ofeach of CEMEX, S.A.B. de C.V.’s fiscal year to consider the approval of a report of its board of directorsregarding CEMEX, S.A.B. de C.V.’s performance and its financial statements for the preceding fiscal year and todetermine the allocation of profits from the preceding year. In addition, CEMEX, S.A.B. de C.V.’s annualgeneral ordinary shareholders’ meeting must:
• review the annual reports of CEMEX, S.A.B. de C.V.’ corporate practices and finance committee andaudit committee, its chief executive officer, and its board of directors;
• elect, remove, or substitute the members of CEMEX, S.A.B. de C.V.’s board of directors;
• determine the level of independence of the members of CEMEX, S.A.B. de C.V.’s board of directors;
• elect or remove the chairman of CEMEX, S.A.B. de C.V.’s audit and corporate practices and financecommittees;
• approve any transaction that represents 20% or more of CEMEX, S.A.B. de C.V. consolidated assets;and
• resolve any issues not reserved for extraordinary shareholders’ meetings.
A general extraordinary shareholders’ meeting may be called at any time to deal with any of the mattersspecified by Article 182 of the Mexican corporations law, which include, among other things:
• extending CEMEX, S.A.B. de C.V.’s corporate existence;
• CEMEX, S.A.B. de C.V.’s voluntary dissolution;
• increasing or reducing CEMEX, S.A.B. de C.V.’s fixed capital stock;
• changing CEMEX, S.A.B. de C.V.’s corporate purpose;
• changing CEMEX, S.A.B. de C.V.’s country of incorporation;
• changing CEMEX, S.A.B. de C.V.’s form of organization;
• a proposed merger;
• issuing preferred shares;
• redeeming CEMEX, S.A.B. de C.V.’s own shares;
• any amendment to CEMEX, S.A.B. de C.V.’s by-laws; and
• any other matter for which a special quorum is required by law or by CEMEX, S.A.B. de C.V.’sby-laws.
223

In order to vote at a meeting of shareholders, shareholders must (i) appear on the list that Indeval and theIndeval participants holding shares on behalf of the shareholders prepare prior to the meeting, or (ii) prior to themeeting, deposit the certificates representing their shares at CEMEX, S.A.B. de C.V.’s offices or in a Mexicancredit institution or brokerage house that operates in accordance with applicable laws in Mexico. The certificateof deposit with respect to the share certificates must be presented to CEMEX, S.A.B. de C.V.’s companysecretary at least 48 hours before a meeting of shareholders. CEMEX, S.A.B. de C.V.’s company secretaryverifies that the person in whose favor any certificate of deposit was issued is named in CEMEX, S.A.B. deC.V.’s share registry and issues an admission pass authorizing that person’s attendance at the meeting ofshareholders.
CEMEX, S.A.B. de C.V.’s by-laws provide that a shareholder may only be represented by proxy in ashareholders’ meeting with a duly completed form provided by CEMEX, S.A.B. de C.V. authorizing the proxy’spresence. In addition, CEMEX, S.A.B. de C.V.’s by-laws require that the secretary acting at the shareholders’meeting publicly affirm the compliance by all proxies with this requirement. A shareholders’ resolution isrequired to take action on any matter presented at a shareholders’ meeting.
At an ordinary meeting of shareholders, the affirmative vote of the holders of a majority of the sharespresent at the meeting is required to adopt a shareholders’ resolution. At an extraordinary meeting ofshareholders, the affirmative vote of at least 50% of the capital stock is required to adopt a shareholders’resolution, except that when amending Article 7 (with respect to measures limiting shareholding ownership),Article 10 (relating to the register of shares and significant participations) or Article 22 (specifying theimpediments to being appointed a member of CEMEX, S.A.B. de C.V.’s board of directors) of CEMEX, S.A.B.de C.V.’s by-laws, the affirmative vote of at least 75% of the voting stock is needed.
The attendance quorum for a general ordinary meeting of shareholders upon the first call, is 50% ofCEMEX, S.A.B. de C.V.’s outstanding and fully paid shares, and for the second call is any number of CEMEX,S.A.B. de C.V.’s outstanding and fully paid shares. If the quorum is not met upon the first call, a subsequentmeeting may be called and the quorum for the second ordinary meeting is any number of CEMEX, S.A.B. deC.V.’s outstanding and fully paid shares represented at the meeting. The attendance quorum for the extraordinaryshareholders’ meeting upon the first call, is 75% of CEMEX, S.A.B. de C.V.’s outstanding and fully paid shares,upon the second and subsequent calls is 50% of CEMEX, S.A.B. de C.V.’s outstanding and fully paid shares.
Rights of Minority Shareholders
At CEMEX, S.A.B. de C.V.’s annual general ordinary shareholders’ meeting, any shareholder or group ofshareholders representing 10% or more of its voting stock has the right to appoint or remove one member ofCEMEX, S.A.B. de C.V.’s board of directors, in addition to the directors appointed by the majority. Suchappointment may only be revoked by other shareholders when the appointment of all other directors is alsorevoked.
CEMEX, S.A.B. de C.V.’s by-laws provide that holders of at least 10% of its capital stock are entitled todemand the postponement of the voting on any resolution of which they deem they have not been sufficientlyinformed.
Under Mexican law, holders of at least 20% of CEMEX, S.A.B. de C.V.’s outstanding capital stock entitledto vote on a particular matter may oppose any resolution at a shareholders’ meeting, by filing a petition for acourt order to suspend the resolution temporarily with a court of law within 15 days after the adjournment of themeeting at which that action was taken and showing that the challenged action violates Mexican law or CEMEX,S.A.B. de C.V.’s by-laws and provided the opposing shareholders deliver a bond to the court to secure paymentof any damages that we suffer as a result of suspending the resolution in the event that the court ultimately rulesagainst the opposing shareholders. Relief under these provisions is only available to holders who were entitled tovote on, or whose rights as shareholders were adversely affected by, the challenged shareholder action and whoseshares were not represented when the action was taken or, if represented, voted against it.
224

Under Mexican law, an action for civil liabilities against directors may be initiated by a shareholders’resolution for violation of their duty of loyalty to shareholders. In the event shareholders decide to bring anaction of this type, the persons against whom that action is brought will immediately cease to be directors.Additionally, shareholders representing not less than 33% of the outstanding shares may directly exercise thataction against the directors; provided that:
• those shareholders shall not have voted against exercising such action at the relevant shareholders’meeting; and
• the claim covers all of the damage alleged to have been caused to us and not merely the damagesuffered by the plaintiffs.
Under CEMEX, S.A.B. de C.V.’s by-laws, shareholders representing 5% or more of its outstanding capitalstock may initiate actions exclusively on behalf of CEMEX, S.A.B. de C.V. against members of its board ofdirectors, its corporate practices and finance committee and audit committee, its chief executive officer, or anyrelevant executives, for breach of their duty of care or duty of loyalty to shareholders or for committing illicitacts or activities. The only requirement is that the claim covers all of the damage alleged to have been caused tous or any entities on which we have a significant influence and not merely the damage suffered by the plaintiffs.Actions initiated on these grounds have a five-year statute of limitations from the day of the act or action thatcaused the damage.
Any recovery of damages with respect to these actions will be for CEMEX, S.A.B. de C.V.’s benefit and notthat of the shareholders bringing the action.
Registration and Transfer
CEMEX, S.A.B. de C.V.’s common stock is evidenced by share certificates in registered form withregistered dividend coupons attached. Shareholders who have not deposited their shares into the CPO trust mayhold their shares in the form of physical certificates or through institutions that have accounts with Indeval.Accounts may be maintained at Indeval by brokers, banks and other entities approved by the Mexican securitiesauthority. CEMEX, S.A.B. de C.V. maintains a stock registry, and, in accordance with Mexican law, only thoseholders listed in CEMEX, S.A.B. de C.V.’s stock registry and those holding certificates issued by Indeval and byIndeval participants indicating ownership are recognized as CEMEX, S.A.B. de C.V. shareholders.
Pursuant to Mexican law, any transfer of shares must be registered in CEMEX, S.A.B. de C.V.’s stockregistry, if effected physically, or through book entries that may be tracked back from CEMEX, S.A.B. de C.V.’sstock registry to the records of Indeval.
Redemption
CEMEX, S.A.B. de C.V.’s capital stock is subject to redemption upon approval of our shareholders at anextraordinary shareholders’ meeting.
Share Repurchases
If approved by CEMEX, S.A.B. de C.V.’s shareholders at a general shareholders’ meeting, we maypurchase CEMEX, S.A.B. de C.V.’s outstanding shares. The economic and voting rights corresponding torepurchased shares cannot be exercised during the period the shares are owned by us and the shares will bedeemed outstanding for purposes of calculating any quorum or vote at any shareholders’ meeting. We may alsorepurchase our equity securities on the Mexican Stock Exchange at the then prevailing market prices inaccordance with Mexican securities law. If we intend to repurchase shares representing more than 1% ofCEMEX, S.A.B. de C.V.’s outstanding shares at a single trading session, we must inform the public of suchintention at least ten minutes before submitting our bid. If we intend to repurchase shares representing 3% or
225

more of CEMEX, S.A.B. de C.V.’s outstanding shares during a period of 20 trading days, we are required toconduct a public tender offer for such shares. We must conduct share repurchases through the person or personsapproved by CEMEX, S.A.B. de C.V.’s board of directors, through a single broker dealer during the relevanttrading session, and without submitting bids during the first and the last 30 minutes of each trading session. Wemust inform the Mexican Stock Exchange of the results of any share repurchase no later than the business dayfollowing any such share repurchase.
Directors’ and Shareholders’ Conflict of Interest
Under Mexican law, any shareholder who has a conflict of interest with CEMEX, S.A.B. de C.V. withrespect to any transaction is obligated to disclose such conflict and is prohibited from voting on that transaction.A shareholder who violates this prohibition may be liable for damages if the relevant transaction would not havebeen approved without that shareholder’s vote.
Under Mexican law, any director who has a conflict of interest with CEMEX, S.A.B. de C.V. in anytransaction must disclose that fact to the other directors and is prohibited from participating and being presentduring the deliberations and voting on that transaction. A director who violates this prohibition will be liable fordamages and lost profits. Additionally, CEMEX, S.A.B. de C.V.’s directors may not represent shareholders inour shareholders’ meetings.
Withdrawal Rights
Whenever CEMEX, S.A.B. de C.V.’s shareholders approve a change of corporate purpose, change ofnationality or transformation from one form of corporate organization to another, Mexican law provides that anyshareholder entitled to vote on that change who has voted against it may withdraw from CEMEX, S.A.B. de C.V.and receive an amount equal to the book value (in accordance with the latest balance sheet approved by theannual general ordinary shareholders’ meeting) attributable to such shareholder’s shares, provided that suchshareholder exercises that right within 15 days following the meeting at which the change was approved.
Dividends
At each annual general ordinary shareholders’ meeting, CEMEX, S.A.B. de C.V.’s board of directorssubmits, for approval by its shareholders, its financial statements together with a report on them prepared by itsboard of directors and the statutory auditors. CEMEX, S.A.B. de C.V.’s shareholders, once they have approvedthe financial statements, determine the allocation of our net income, after provision for income taxes, legalreserve and statutory employee profit sharing payments, for the preceding year. All shares of CEMEX, S.A.B. deC.V.’s capital stock outstanding at the time a dividend or other distribution is declared are entitled to shareequally in that dividend or other distribution.
Liquidation Rights
In the event CEMEX, S.A.B. de C.V. is liquidated, the surplus assets remaining after payment of all itscreditors will be divided among CEMEX, S.A.B. de C.V.’s shareholders in proportion to the respective sharesheld by them. The liquidator may, with the approval of CEMEX, S.A.B. de C.V.’s shareholders, distribute thesurplus assets in kind among CEMEX, S.A.B. de C.V.’s shareholders, sell the surplus assets and divide theproceeds among CEMEX, S.A.B. de C.V.’s shareholders or put the surplus assets to any other uses agreed to by amajority of CEMEX, S.A.B. de C.V.’s shareholders voting at an extraordinary shareholders’ meeting.
Differences Between Our Corporate Governance Practices and NYSE Standards for Domestic Companies
For a description of significant ways in which CEMEX, S.A.B. de C.V.’s corporate governance practicesdiffer from those required of domestic companies under NYSE standards, see “Item 16G—CorporateGovernance.”
226

You may find additional information in the corporate governance section of our website (www.cemex.com),or you may contact our investment relations team, by writing to or telephoning us as follows:
CEMEX, S.A.B. de C.V.Avenida Ricardo Margáin Zozaya #325
Colonia Valle del CampestreSan Pedro Garza García, Nuevo León, México 66265.
Attn: Eduardo RendónTelephone: +52 81 8888-4292
Email: [email protected]
Share Capital
CEMEX, S.A.B. de C.V. did not declare a dividend for fiscal years 2014, 2015 and 2016. See “Item 8—Financial Information—Dividends” for a description of CEMEX, S.A.B. de C.V.’s policy on dividenddistributions and dividend restrictions.
At each of CEMEX, S.A.B. de C.V.’s 2014, 2015 and 2016 annual general ordinary shareholders’ meetings,held on March 26, 2015, March 31, 2016 and March 30, 2017, respectively, CEMEX, S.A.B. de C.V.’sshareholders approved a recapitalization of retained earnings. New CPOs issued pursuant to each suchrecapitalization were allocated to shareholders on a pro-rata basis. As a result, shares equivalent to approximately500 million CPOs, approximately 538 million CPOs and approximately 562.4 CPOs were allocated toshareholders on a pro-rata basis in connection with the 2014, 2015 and 2016 recapitalizations, respectively. Ineach case, CPO holders received one new CPO for each 25 CPOs held and ADS holders received one new ADSfor each 25 ADSs held. There was no cash distribution and no entitlement to fractional shares.
As of December 31, 2016, CEMEX, S.A.B. de C.V.’s common stock was represented as follows:
2016
Shares1 Series A2 Series B3
Subscribed and paid shares . . . . . . . . . . . . . . . . . . . . . . . . . . . . . . 28,121,583,148 14,060,791,574Unissued shares authorized for stock compensation programs . . . 638,468,154 319,234,077Shares that guarantee the issuance of convertible securities4 . . . . 5,218,899,920 2,609,449,960
33,978,951,222 16,989,475,611
(1) As of December 31, 2016, 13,068,000,000 shares correspond to the fixed portion, and 37,900,426,833shares correspond to the variable portion.
(2) Series “A” or Mexican shares must represent at least 64% of CEMEX, S.A.B. de C.V.’s capital stock.(3) Series “B” or free subscription shares must represent at most 36% of CEMEX, S.A.B. de C.V.’s capital
stock.(4) Shares that guarantee the conversion of the November 2019 Mandatory Convertible Mexican Peso Notes,
the March 2018 Optional Convertible Subordinated U.S. Dollar Notes and the March 2020 OptionalConvertible Subordinated U.S. Dollar Notes.
Material Contracts
On March 14, 2006, CEMEX, S.A.B. de C.V. registered a Ps5 billion revolving promissory note program(programa dual revolvente de certificados bursátiles) with the Mexican securities authority. CEMEX, S.A.B. deC.V. has subsequently increased the authorized amount under this program. On March 31, 2010, we receivedauthorization from the Mexican securities authority for a Ps10 billion revolving promissory note program, whichauthorization was valid until its expiration on March 31, 2015.
227

On December 18, 2006, CEMEX, through two special purpose vehicles, issued two tranches offixed-to-floating rate callable Perpetual Debentures. C5 Capital (SPV) Limited issued U.S.$350 million originalprincipal amount of Perpetual Debentures under the first tranche, with the issuer having the option to redeemsuch Perpetual Debentures on December 31, 2011 and on each interest payment date thereafter, of whichU.S.$61 million principal amount were outstanding as of December 31, 2016 (excluding Perpetual Debenturesheld by us). C10 Capital (SPV) Limited issued U.S.$900 million original principal amount of PerpetualDebentures under the second tranche, with the issuer having the option to redeem such Perpetual Debentures onDecember 31, 2016 and on each interest payment date thereafter, of which U.S.$175 million principal amountwere outstanding as of December 31, 2016 (excluding Perpetual Debentures held by us). Both tranches paycoupons denominated in U.S. Dollars at a fixed rate until the call date and at a floating rate thereafter. OnFebruary 12, 2007, CEMEX, through a special purpose vehicle, issued a third tranche of fixed-to-floating ratecallable Debentures. C8 Capital (SPV) Limited issued U.S.$750 million original principal amount of PerpetualDebentures under this third tranche, with the issuer having the option to redeem such Perpetual Debentures onDecember 31, 2014 and on each interest payment date thereafter, of which U.S.$135 million principal amountwere outstanding as of December 31, 2016 (excluding Perpetual Debentures held by us). This third tranche alsopays coupons denominated in U.S. Dollars at a fixed rate until the call date and at a floating rate thereafter. OnMay 9, 2007, CEMEX, through a special purpose vehicle, issued a fourth tranche of fixed-to-floating ratecallable Perpetual Debentures. C10-EUR Capital (SPV) Limited issued €730 million original principal amount ofPerpetual Debentures under this fourth tranche, with the issuer having the option to redeem such PerpetualDebentures on June 30, 2017, and on each interest payment date thereafter, of which €64 million principalamount were outstanding as of December 31, 2016 (excluding Perpetual Debentures held by us). This fourthtranche pays coupons denominated in Euros at a fixed rate until the call date and at a floating rate thereafter. Dueto their perpetual nature and optional deferral of coupons, these transactions, in accordance with IFRS, qualify asequity.
For a description of the material terms relating to the November 2019 Mandatory Convertible Mexican PesoNotes, the March 2018 Optional Convertible Subordinated U.S. Dollar Notes and the March 2020 OptionalConvertible Subordinated U.S. Dollar Notes, see “Item 5—Operating and Financial Review and Prospects—Summary of Material Contractual Obligations and Commercial Commitments.”
In connection with the Credit Agreement, we are also parties to the amendment and restatement agreement,dated July 23, 2015 related to the intercreditor agreement, dated as of September 17, 2012 and amended onOctober 31, 2014; the Dutch law share pledge, dated as of September 17, 2012; the Dutch law share pledge,dated as of December 15, 2015; the Swiss law share pledge, dated as of September 17, 2012; the securityconfirmation agreement, dated as of July 23, 2015; the security confirmation agreement, dated as of March 17,2016; the Spanish law share pledge, dated as of November 8, 2012; the ratification and extension deed to theSpanish law share pledge, dated as of July 29, 2015; and the amendment and restatement agreement, datedJuly 29, 2015 to the Mexican law security trust agreement, dated as of September 17, 2012. For a description ofthe material terms of the Credit Agreement and related agreements, see “Item 5—Operating and FinancialReview and Prospects—Liquidity and Capital Resources—Our Indebtedness.”
For a description of the material terms relating to the Senior Secured Notes, see “Item 5—Operating andFinancial Review and Prospects—Summary of Material Contractual Obligations and CommercialCommitments—Senior Secured Notes.”
Exchange Controls
See “Item 3—Key Information—Mexican Peso Exchange Rates.”
228

Taxation
Mexican Tax Considerations
General
The following is a summary of certain Mexican federal income tax considerations relating to the ownershipand disposition of CEMEX, S.A.B. de C.V.’s CPOs or ADSs.
This summary is based on Mexican income tax law that is in effect on the date of this annual report, whichis subject to change. This summary is limited to non-residents of Mexico, as defined below, who own CEMEX,S.A.B. de C.V.’s CPOs or ADSs. This summary does not address all aspects of Mexican income tax law. Holdersare urged to consult their tax counsel as to the tax consequences that the purchase, ownership and disposition ofCEMEX, S.A.B. de C.V.’s CPOs or ADSs, may have.
For purposes of Mexican taxation, an individual is a resident of Mexico if he or she has established his orher home in Mexico. If the individual also has a home in another country, he or she will be considered a residentof Mexico if his or her center of vital interests is in Mexico. Under Mexican law, an individual’s center of vitalinterests is in Mexico if, among other things:
• more than 50% of the individual’s total income in the relevant year comes from Mexican sources; or
• the individual’s main center of professional activities is in Mexico.
Mexican nationals that are employed by the Mexican government are deemed residents of Mexico, even ifhis or her center of vital interests is located outside of Mexico. Unless otherwise proven, Mexican nationals aredeemed residents of Mexico for tax purposes.
A legal entity is a resident of Mexico if it is organized under the laws of Mexico or if it maintains theprincipal administration of its business or the effective location of its management in Mexico.
A Mexican citizen is presumed to be a resident of Mexico for tax purposes unless such person or entity candemonstrate otherwise. If a legal entity or an individual is deemed to have a permanent establishment in Mexicofor tax purposes, all income attributable to such permanent establishment will be subject to Mexican taxes, inaccordance with relevant tax provisions.
Individuals or legal entities that cease to be residents of Mexico must notify the tax authorities within 15business days before their change of residency.
A non-resident of Mexico is a legal entity or individual that does not satisfy the requirements to beconsidered a resident of Mexico for Mexican federal income tax purposes.
Taxation of Dividends
Dividends from earnings generated before January 1, 2014, either in cash or in any other form, paid tonon-residents of Mexico with respect to Series A shares or Series B shares represented by the CPOs (or in thecase of holders who hold CPOs represented by ADSs), will not be subject to withholding tax in Mexico.
As a result of the enactment of certain tax provisions in Mexico, as of January 1, 2014, dividends in cashfrom identified pre-tax retained earnings generated after January 1, 2014 will be subject to a 10% withholdingtax. This tax is considered as a definitive payment.
Disposition of CPOs or ADSs
As a result of the enactment of certain tax provisions in Mexico, as of January 1, 2014, in the case ofindividuals, capital gains of shares issued by Mexican companies in the Mexican Stock Exchange will be subject
229

to a 10% withholding tax which will be withheld by the intermediary acting as a withholding agent. If theindividual is a tax resident in a country with a tax treaty in force with Mexico such individual will not be subjectto any withholding tax.
Gains on the sale or disposition of CPOs by a holder who is a non-resident of Mexico will not be subject toany Mexican tax if the sale is carried out through the Mexican Stock Exchange or other recognized securitiesmarket, as determined by Mexican tax authorities. Gains realized on sales or other dispositions of CPOs bynon-residents of Mexico made in other circumstances would be subject to Mexican income tax. However, gainson the sale or disposition of ADSs by a holder who is a non-resident of Mexico will not be subject to Mexicantax.
Under the terms of the Convention Between the United States and Mexico for Avoidance of DoubleTaxation and Prevention of Fiscal Evasion with Respect to Income Taxes, and a protocol thereto, the Tax Treaty,gains obtained by a U.S. Shareholder (as defined herein) eligible for benefits under the Tax Treaty on thedisposition of CPOs will not generally be subject to Mexican tax, provided that such gains are not attributable toa permanent establishment of such U.S. Shareholder in Mexico and that the eligible U.S. Shareholder did notown, directly or indirectly, 25% or more of our outstanding stock during the 12-month period preceding thedisposition. In the case of non-residents of Mexico eligible for the benefits of a tax treaty, gains derived from thedisposition of ADSs or CPOs may also be exempt, in whole or in part, from Mexican taxation under a treaty towhich Mexico is a party.
Deposits and withdrawals of ADSs will not give rise to any Mexican tax or transfer duties.
The term U.S. Shareholder shall have the same meaning ascribed below under the section “U.S. FederalIncome Tax Considerations.”
Estate and Gift Taxes
There are no Mexican inheritance or succession taxes applicable to the ownership, transfer or disposition ofADSs or CPOs by holders that are non-residents of Mexico, although gratuitous transfers of CPOs may, in somecircumstances, cause a Mexican federal tax to be imposed upon a recipient. There are no Mexican stamp, issue,registration or similar taxes or duties payable by holders of ADSs or CPOs.
U.S. Federal Income Tax Considerations
General
The following is a summary of certain U.S. federal income tax consequences relating to the ownership anddisposition of CEMEX, S.A.B. de C.V.’s CPOs and ADSs.
This summary is based on provisions of the U.S. Internal Revenue Code of 1986, as amended (the “Code”),U.S. Treasury regulations promulgated under the Code, administrative rulings, and judicial interpretations of theCode, all as in effect on the date of this annual report and all of which are subject to change, possiblyretroactively. This summary is limited to U.S. Shareholders (as defined below) who hold our ADSs or CPOs, asthe case may be, as capital assets. This summary does not discuss all aspects of U.S. federal income taxation thatmay be important to an investor in light of its individual circumstances, for example, an investor subject tospecial tax rules (e.g., banks, thrifts, real estate investment trusts, regulated investment companies, insurancecompanies, dealers in securities or currencies, expatriates, tax-exempt investors, persons who own 10% or moreof our voting stock, or holders whose functional currency is not the U.S. Dollar or U.S. Shareholders who hold aCPO or an ADS as a position in a “straddle,” as part of a “synthetic security” or “hedge,” as part of a “conversiontransaction” or other integrated investment, or as other than a capital asset). In addition, this summary does notaddress the Medicare tax imposed on certain net investment income or any aspect of state, local foreign, gift,estate or alternative minimum tax considerations.
230

For purposes of this summary, a “U.S. Shareholder” means a beneficial owner of CPOs or ADSs, who is forU.S. federal income tax purposes:
• an individual citizen or resident of the United States;
• a corporation or other entity taxable as a corporation that is created or organized in the United States orunder the laws of the United States or any political subdivision thereof;
• an estate the income of which is subject to U.S. federal income tax regardless of its source; or
• a trust that (i) is subject to the primary supervision of a court within the United States and the control ofone or more U.S. persons are authorized to control all substantial decisions or (ii) has a valid election ineffect under applicable U.S. Treasury regulations to be treated as a United States person.
If a partnership (including any entity arrangement treated as a partnership for U.S. federal income taxpurposes) is the beneficial owner of CPOs or ADSs, the U.S. federal income tax treatment of a partner in suchpartnership will generally depend upon the status of the partner and the activities of the partnership. A partner ina partnership that is the beneficial owner of CPOs or ADSs should consult its tax advisor regarding the associatedtax consequences.
U.S. Shareholders should consult their tax advisors as to the particular tax consequences to them underUnited States federal, state and local, and foreign laws relating to the ownership and disposition of CEMEX,S.A.B. de C.V.’s CPOs and ADSs.
Ownership of CPOs or ADSs in general
In general, for U.S. federal income tax purposes, U.S. Shareholders who own ADSs will be treated as thebeneficial owners of the CPOs represented by those ADSs, and each CPO will represent a beneficial interest intwo Series A shares and one Series B share.
Taxation of distributions with respect to CPOs and ADSs
A distribution of cash or property with respect to the Series A shares or Series B shares represented byCPOs, including CPOs represented by ADSs, generally will be treated as a dividend to the extent paid out of ourcurrent or accumulated earnings and profits, as determined under U.S. federal income tax principles, and will beincludible in the gross income of a U.S. Shareholder as foreign source “passive” income on the date thedistribution is received by the CPO trustee or successor thereof. Any such dividend will not be eligible for thedividends-received deduction allowed to corporate U.S. Shareholders. To the extent, if any, that the amount ofany distribution by us exceeds our current and accumulated earnings and profits as determined under U.S. federalincome tax principles, it will be treated first as a tax-free return of the U.S. Shareholder’s adjusted tax basis in theCPOs or ADSs, as applicable, and thereafter as capital gain.
The gross amount of any dividends paid in Mexican Pesos will be includible in the income of a U.S.Shareholder in a Dollar amount calculated by reference to the exchange rate in effect the day the Mexican Pesosare received by the CPO trustee or successor thereof whether or not the Mexican Pesos are converted into Dollarson that day. Generally, any gain or loss resulting from currency exchange fluctuations during the period from thedate the dividend payment is includible in income to the date such payment is converted into Dollars will betreated as ordinary income or loss. Such gain or loss will generally be income from sources within the UnitedStates for foreign tax credit limitation purposes.
Dividend income is generally taxed as ordinary income. However “qualified dividend income” received byU.S. Shareholders that are individuals (as well as certain trusts and estates) is generally eligible for preferentialU.S. federal income tax rates (provided that certain holding period requirements are met). “Qualified dividendincome” includes dividends paid on shares of “qualified foreign corporations” if, among other things: (i) the
231

shares of the foreign corporation are readily tradable on an established securities market in the United States, or(ii) the foreign corporation is eligible with respect to substantially all of its income for the benefits of acomprehensive income tax treaty with the United States which contains an exchange of information program.
We believe that we are a “qualified foreign corporation” because (i) the ADSs trade on the New York StockExchange and (ii) we are eligible for the benefits of the comprehensive income tax treaty between Mexico andthe United States which includes an exchange of information program. Accordingly, we believe that anydividends we pay should constitute “qualified dividend income” for U.S. federal income tax purposes. We cannotassure you, however, that we will continue to be considered a “qualified foreign corporation” and that ourdividends will continue to be “qualified dividend income.”
Taxation of capital gains on disposition of CPOs or ADSs
The sale, exchange, redemption, or other disposition of CPOs or ADSs will result in the recognition of gainor loss by a U.S. Shareholder for U.S. federal income tax purposes in an amount equal to the difference betweenthe amount realized on the disposition and the U.S. Shareholder’s tax basis in the CPOs or ADSs, as applicable.Such gain or loss will be long-term capital gain or loss if the U.S. Shareholder’s holding period for the CPOs orADSs exceeds one year at the time of disposition. Long-term capital gain recognized by a U.S. Shareholder thatis an individual (as well as certain trusts and estates) upon the sale or exchange of CPOs or ADSs is generallyeligible for preferential U.S. federal income tax rates. The deduction of capital losses is subject to limitations.Gain from the disposition of CPOs or ADSs generally will be treated as U.S. source for foreign tax creditpurposes; losses will generally be allocated against U.S. source income. Deposits and withdrawals of CPOs byU.S. Shareholders in exchange for ADSs will not result in the realization of gain or loss for U.S. federal incometax purposes.
United States backup withholding and information reporting
A U.S. Shareholder may, under certain circumstances, be subject to information reporting with respect tosome payments to that U.S. Shareholder such as dividends or the proceeds of a sale or other disposition of theCPOs or ADSs. Backup withholding also may apply to amounts paid to such holder unless such holder (i) is acorporation or comes within certain exempt categories and demonstrates this fact when so required, or(ii) provides a correct taxpayer identification number and otherwise complies with applicable requirements of thebackup withholding rules. Backup withholding is not an additional tax. Amounts withheld as backup withholdingmay be creditable against the U.S. Shareholder’s federal income tax liability, and the U.S. Shareholder mayobtain a refund of any excess amounts withheld under the backup withholding rules by filing the appropriateclaim for refund with the IRS and timely furnishing any required information.
Pursuant to the Hiring Incentives to Restore Employment Act enacted on March 18, 2010, an individualU.S. Shareholder may be required to submit to the IRS certain information with respect to his or her beneficialownership of CPOs or ADSs, unless such CPOs or ADSs are held on his or her behalf by a U.S. financialinstitution. The law also imposes penalties if an individual U.S. Shareholder is required to submit suchinformation to the IRS and fails to do so. U.S. Shareholders should consult their tax advisors regarding theapplication of the new law in their particular circumstances.
Documents on Display
We are subject to the informational requirements of the Securities Exchange Act of 1934 and, in accordancewith these requirements, file reports and information statements and other information with the SEC. Thesereports and information statements and other information filed by us with the SEC can be inspected and copied atthe public reference room of the SEC at 100 F Street, N.E., Washington, D.C. 20549.
In reviewing the agreements included as exhibits to this annual report, please remember they are included toprovide you with information regarding their terms and are not intended to provide any other factual ordisclosure information about us or the other parties to the agreements.
232

The agreements may contain representations and warranties by each of the parties to the applicableagreement. These representations and warranties have been made solely for the benefit of the other parties to theapplicable agreement and:
• should not in all instances be treated as categorical statements of fact, but rather as a way of allocatingthe risk to one of the parties if those statements prove to be inaccurate;
• have been qualified by disclosures that were made to the other party in connection with the negotiationof the applicable agreement, which disclosures are not necessarily reflected in the agreement;
• may apply standards of materiality in a way that is different from what may be viewed as material toyou or other investors; and
• were made only as of the date of the applicable agreement or such other date or dates as may bespecified in the agreement and are subject to more recent developments.
Accordingly, these representations and warranties may not describe the actual state of affairs as of the datethey were made or at any other time.
Item 11—Quantitative and Qualitative Disclosures About Market Risk
See “Item 5—Operating and Financial Review and Prospects—Quantitative and Qualitative MarketDisclosure—Our Derivative Financial Instruments.”
Item 12—Description of Securities Other than Equity Securities
Item 12A—Debt Securities
Not applicable.
Item 12B—Warrants and Rights
Not applicable.
Item 12C—Other Securities
Not applicable.
Item 12D—American Depositary Shares
Depositary Fees and Charges
Under the terms of the Deposit Agreement for CEMEX, S.A.B. de C.V.’s ADSs, an ADS holder may haveto pay the following service fees to the depositary:
Services Fees
Issuance of ADSs upon deposit of eligible securities . . . . . . . . . . . . . . . . . . . . . Up to 5¢ per ADS issued.Surrender of ADSs for cancellation and withdrawal of deposited securities . . . Up to 5¢ per ADS surrendered.Exercise of rights to purchase additional ADSs . . . . . . . . . . . . . . . . . . . . . . . . . Up to 5¢ per ADS issued.Distribution of cash (i.e., upon sale of rights and other entitlements) . . . . . . . . Up to 2¢ per ADS held.
An ADS holder also is responsible to pay fees and expenses incurred by the ADS depositary and taxes andgovernmental charges including, but not limited to:
• transfer and registration fees charged by the registrar and transfer agent for eligible and depositedsecurities, such as upon deposit of eligible securities and withdrawal of deposited securities;
233

• expenses incurred for converting foreign currency into Dollars;
• expenses for cable, telex and fax transmissions and for delivery of securities;
• expenses incurred in connection with compliance with exchange control regulations and otherapplicable regulatory requirements;
• fees and expenses incurred in connection with the delivery of deposited securities; and
• taxes and duties upon the transfer of securities, such as when eligible securities are deposited orwithdrawn from deposit.
We have agreed to pay some of the other charges and expenses of the ADS depositary. Note that the feesand charges that a holder of ADSs is required to pay may vary over time and may be changed by us and by theADS depositary. ADS holders will receive notice of the changes. The fees described above may be amendedfrom time to time.
Depositary Payments for the year ended December 31, 2016
In 2016, we received approximately U.S.$1.9 million (after applicable U.S. taxes and including payments tothird parties) from our Depositary Bank, Citibank, N.A., to reimburse us for contributions towards our investorrelations activities (including but not limited to investor meetings, conferences and fees to investor relationsservice vendors) and other miscellaneous expenses related to the listing of our ADSs on the NYSE.
PART II
Item 13—Defaults, Dividend Arrearages and Delinquencies
None.
Item 14—Material Modifications to the Rights of Security Holders and Use of Proceeds
None.
Item 15—Controls and Procedures
Background and Internal Investigation
As previously disclosed in our consolidated financial statements, during 2016 CEMEX received reportsthrough its anonymous reporting line related to possible irregularities in the purchase process of land inconnection with the Maceo Project. CEMEX initiated an investigation and internal audit in accordance with itscorporate governance policies and its code of ethics, which confirmed the irregularities in the purchase process ofland in connection with the Maceo Project. As a result of this investigation and internal audit, on September 23,2016, CEMEX Latam and CEMEX Colombia terminated the employment of the Vice President of Planning ofCEMEX Latam, who was also CEMEX Colombia’s Director of Planning, and the Legal Counsel of CEMEXLatam, who was also the General Counsel of CEMEX Colombia. In addition, effective September 23, 2016, theChief Executive Officer of CEMEX Latam, who was also the President of CEMEX Colombia, resigned tofacilitate the investigation and internal audit.
Since September 2016, we engaged legal counsel, forensic and other advisors to investigate and advise withregard to different matters regarding the Maceo Project, including with respect to our internal controls. Wesubsequently filed a criminal complaint against four former employees of CEMEX Colombia. The implicatedemployees, allegedly acting in collusion, were able to intentionally circumvent the then existing internal controls.
234

While the irregularities occurred in a number of periods prior to 2016, CEMEX performed a qualitative andquantitative evaluation of the resulting financial statement effects and concluded that none of them individually,or in aggregate, were material to any such periods. Accordingly, we have not restated any previously issuedfinancial statements.
Disclosure Controls and Procedures
Our management has evaluated, with the participation of CEMEX, S.A.B. de C.V.’s Chief ExecutiveOfficer and Executive Vice President of Finance/Chief Financial Officer, the effectiveness of our disclosurecontrols and procedures (as defined in Rule 13a-15(e) under the Securities Exchange Act of 1934) as of the endof the period covered by this annual report. Based on the foregoing, our management, with the participation ofCEMEX, S.A.B. de C.V.’s Chief Executive Officer and Executive Vice President of Finance/Chief FinancialOfficer, concluded that our disclosure controls and procedures were not effective as of December 31, 2016 toachieve their intended objectives. As further described below, we have identified a material weakness in ourinternal control over financial reporting, which substantially overlaps with our disclosure controls andprocedures.
Management’s Annual Report on Internal Control Over Financial Reporting
Our management is responsible for establishing and maintaining adequate internal control over financialreporting, (as defined in Rule 13a-15(f) under the Securities Exchange Act of 1934). Internal control overfinancial reporting refers to a process designed by, or under the supervision of, our Chief Executive Officer andour Chief Financial Officer and effected by CEMEX, S.A.B. de C.V.’s board of directors, our management andother personnel, to provide reasonable assurance regarding the reliability of financial reporting and thepreparation of financial statements for external purposes in accordance with generally accepted accountingprinciples and includes those policies and procedures that:
• pertain to the maintenance of records that in reasonable detail accurately and fairly reflect thetransactions and dispositions of our assets;
• provide reasonable assurance that transactions are recorded as necessary to permit preparation offinancial statements in accordance with generally accepted accounting principles, and that our receiptsand expenditures are being made only in accordance with authorizations of our management andmembers of CEMEX, S.A.B. de C.V.’s board of directors; and
• provide reasonable assurance regarding prevention or timely detection of unauthorized acquisition, use,or disposition of our assets that could have a material effect on our financial statements.
A material weakness (as defined in Rule 12b-2 under the Exchange Act) is a deficiency, or combination ofdeficiencies, in internal control over financial reporting such that there is a reasonable possibility that a materialmisstatement of a company’s annual or interim financial statements will not be prevented or detected on a timelybasis.
Under the supervision and with the participation of our management, including CEMEX, S.A.B. de C.V.’sChief Executive Officer, Executive Vice President of Finance/Chief Financial Officer and principal financial andaccounting officers, we conducted an evaluation of the effectiveness of our internal control over financialreporting as of December 31, 2016 using criteria established in “Internal Control—Integrated Framework(2013)” issued by the Committee of Sponsoring Organizations of the Treadway Commission. Based on thisevaluation, our management has identified the following material weakness in internal control over financialreporting as of December 31, 2016: our risk assessment process did not operate effectively to implement controlsthat would prevent, or detect and correct, misstatements resulting from apparent collusion or managementoverride of controls in relation to significant unusual transactions. In addition, we did not design and operateeffective monitoring controls to detect non-compliance with our policies related to the financial reporting ofsignificant unusual transactions.
235

The control deficiencies described above resulted in immaterial misstatements that were corrected in theconsolidated financial statements as of and for the fiscal year ended December 31, 2016, as disclosed in note 24Aof our consolidated financial statements. We have concluded that the consolidated financial statements includedin this annual report fairly present, in all material respects, our financial position, results of operations and cashflows as of and for the period ended December 31, 2016.
The control deficiencies described above created a reasonable possibility that a material misstatement to theconsolidated financial statements would not be prevented or detected on a timely basis; accordingly ourmanagement has concluded that internal control over financial reporting was not effective as of December 31,2016.
Remediation Plan and Activities
Our management is engaged in remedial activities to address the material weakness described above. Wehave initiated the implementation of practices and procedures over significant unusual transactions to ensureeffective monitoring. These practices include a new approval policy over significant unusual transactions thattakes place at the operating subsidiary level, a corporate committee to oversee large investment projects,enhancements to our internal audit procedures and improvements over our current monitoring controls in order tomake them operate at a sufficient level of precision.
The material weakness will not be considered remediated until the applicable remedial controls operate for asufficient period of time and management has concluded, through testing, that these controls are operatingeffectively. We expect that the remediation of this material weakness will be completed prior to the end of fiscalyear 2017.
Attestation Report of the Independent Registered Public Accounting Firm
KPMG Cárdenas Dosal, S.C., the registered public accounting firm that audited our financial statementsincluded elsewhere in this annual report, has issued an adverse report on our internal control over financialreporting, which is included on page F-110 of this annual report.
Changes in Internal Control Over Financial Reporting
Except for the material weakness disclosed above that was identified and evaluated in the fourth quarter butthat occurred in an earlier period, we have not identified changes in our internal controls over financial reportingduring 2016 that have materially affected, or are reasonably likely to materially affect, our internal control overfinancial reporting.
Item 16—[RESERVED]
Item 16A—Audit Committee Financial Expert
Our Board of Directors has determined that it has at least one “audit committee financial expert” (as definedin Item 16A of Form 20-F) serving on its audit committee. Mr. José Manuel Rincón Gallardo meets the requisitequalifications.
Item 16B—Code of Ethics
We have adopted a written code of ethics that applies to all employees, including our principal executiveofficer, principal financial officer and principal accounting officer, to ensure that all of our employees abide bythe same high standards of conduct in their daily interactions.
236

Our code of ethics provides the following main guidelines:
(i) Our purpose, mission and values: we look to build a better future through the creation of sustainablevalue by providing industry-leading products and solutions to satisfy the construction needs of our customers;
(ii) Our people and human rights: we believe our employees give us a competitive advantage; we foster anencouraging environment for individual growth acting pursuant to our principles and values;
(iii) Customer relations and fair dealing: we work to be our customers’ best option and, to that end, conductour business dealings fairly and professionally, and supply top-quality services and products as agreed with ourcustomers; we and our employees make every possible effort to act in an innovative and proactive manner,exceeding our customers’ expectations and anticipating their needs in order to ensure long and mutuallybeneficial relationships;
(iv) Supplier relations and fair dealing: our success depends on supplier relationships that are built on trustand mutual benefit; we try to always manage our supplier relationships with honesty, respect and integrity,offering equal opportunities to all parties;
(v) Government relations: our operations require a wide range of interactions with government agencies inmany countries; these agencies may act as regulators, customers, suppliers, stockholders and/or promoters; wetry to always conduct our interactions with these agencies consistent with our principles and values, withparticular emphasis on honesty and respect;
(vi) Community relations: we are committed to promoting and contributing to the development of ourcommunities by preserving the environment, fostering mutually beneficial relationships and maintaining openlines of communication;
(vii) Antitrust compliance: we are dedicated to conducting all of our business activities with the highestethical standards; compliance with applicable laws, including antitrust legislation, is a fundamental part of ourcorporate values; we operate in many countries and are subject to different antitrust laws and regulations;therefore, our country managers must ensure that all of our business activities conform to local laws andregulations, and to our own policies;
(viii) Anti-bribery: we reject all forms of corruption; paying or receiving bribes is illegal and highlyunethical, and can lead to severe consequences for all parties involved, including jail for individuals and harshpenalties to our company; we are committed to conducting our business with transparency and integrity, and tryto ensure that all transactions comply with anti-bribery laws, including requirements to maintain complete andaccurate books and records;
(ix) Preventing money laundering: we prohibit money laundering, understood as any transaction or seriesthereof undertaken to conceal the true origin of illicit funds or making them look as they have been obtainedfrom legitimate activities;
(x) Conflicts of interest and corporate opportunities. our employees, officers and directors have anobligation to conduct themselves in an honest and ethical manner and to act in our best interest; our employees,officers and directors must avoid situations that present or could present a potential or actual conflict betweentheir interests and our interests;
(xi) Gifts, services and other courtesies: we, our employees, officers and directors may not accept or givecourtesies of any kind that may compromise, or appear to compromise, decision-making on current or futurenegotiations; it is forbidden to seek or condition a negotiation on any kind of gift, service or courtesy;
237

(xii) Environmental responsibility: managing our environmental footprint is an integral part of our businessphilosophy and, therefore, we are fully committed to carrying out our business activities in an environmentallyresponsible and sustainable manner to minimize the environmental implications of our activities;
(xiii) Political contributions and activities: we acknowledge and respect the right of our employees toparticipate in activities external to the company, such as politics, provided that they are legal and do not interferewith the employees’ duties and responsibilities or in any way involve the company;
(xiv) Health and safety in the workplace: we give highest priority to preventing incidents and safeguardingthe health and safety of our workforce and are fully committed to carrying out our business activities in a safeand efficient manner to care for the well-being of all those on our sites and those who may be impacted by ouractivities;
(xv) Confidential information: our employees must administer and handle confidential information in aresponsible, safe, objective and legal manner;
(xvi) Financial controls and records: we seek to build credibility and trust with our stakeholders and try tocommunicate effectively with them so that they are provided with full and accurate information about ourfinancial condition and results of operations; consequently, our employees, officers and directors must ensure,within the scope of their responsibilities and duties, that our financial records are accurate and our financialcontrols effective; we must also ensure that our reports and documents filed with or submitted to securitiesregulators, as well as all other public communications, include full, fair, accurate, timely and understandabledisclosure; and
(xvii) Preservation of assets: the proper use and preservation of our tangible and intangible assets areessential to fulfill our mission.
We ensure awareness and enforcement of our code of ethics through our ethics committees, trainingprograms, and secured internal communications channels. We periodically evaluate and update the provisions ofour code of ethics.
You may view our code of ethics in the corporate governance section of our website (www.cemex.com), oryou may request a copy of our code of ethics, at no cost, by writing to or telephoning us as follows:
CEMEX, S.A.B. de C.V.Avenida Ricardo Margáin Zozaya #325
Colonia Valle del CampestreSan Pedro Garza García, Nuevo León, México 66265.
Attn: Luis HernándezTelephone: +52 81 8888-8888
Item 16C—Principal Accountant Fees and Services
Audit Fees: KPMG Cárdenas Dosal, S.C. in Mexico and KPMG firms worldwide charged us approximatelyPs248 million in fiscal year 2016 in connection with the professional services rendered for the audit of our annualfinancial statements and services normally provided by them relating to statutory and regulatory filings orengagements. In fiscal year 2015, KPMG Cárdenas Dosal, S.C. in Mexico and KPMG firms worldwide billed usapproximately Ps230 million for these services.
Audit-Related Fees: KPMG Cárdenas Dosal, S.C. in Mexico and KPMG firms worldwide billed usapproximately Ps7 million in fiscal year 2016 for assurance and related services reasonably related to theperformance of our audit. In fiscal year 2015, KPMG Cárdenas Dosal, S.C. in Mexico and KPMG firmsworldwide charged us approximately Ps22 million for audit-related services.
238

Tax Fees: KPMG Cárdenas Dosal, S.C. in Mexico and KPMG firms worldwide charged us approximatelyPs20 million in fiscal year 2016 for tax compliance, tax advice and tax planning. In fiscal year 2015, KPMGCárdenas Dosal, S.C. in Mexico and KPMG firms worldwide billed us approximately Ps14 million fortax-related services.
All Other Fees: KPMG Cárdenas Dosal, S.C. in Mexico and KPMG firms worldwide billed us Ps16 millionin fiscal year 2016 for products and services other than those comprising audit fees, audit-related fees and taxfees. In fiscal year 2015, KPMG Cárdenas Dosal, S.C. in Mexico and KPMG firms worldwide charged usapproximately Ps12 million for products and services in this category. These fees relate mainly to servicesprovided by KPMG to us with respect to our due diligence activities around the world.
Audit Committee Pre-Approval Policies and Procedures
Our audit committee is responsible, among other things, for the appointment, compensation and oversight ofour external auditors. To assure the independence of our independent auditors, our audit committee pre-approvesannually a catalog of specific audit and non-audit services in the categories Audit Services, Audit-RelatedServices, Tax-Related Services, and Other Services that may be performed by our auditors, as well as thebudgeted fee levels for each of these categories. All other permitted services must receive a specific approvalfrom our audit committee. Our external auditor periodically provides a report to our audit committee in order forour audit committee to review the services that our external auditor is providing, as well as the status and cost ofthose services.
During 2016, there were no services provided to us by our external auditors that were performed pursuant tothe de minimis exception.
Item 16D—Exemptions from the Listing Standards for Audit Committees
Not applicable.
Item 16E—Purchases of Equity Securities by the Issuer and Affiliated Purchasers
Not applicable.
Item 16F—Change in Registrant’s Certifying Accountant
Not applicable.
Item 16G—Corporate Governance
Section 303A.11 of the NYSE Listed Company Manual (“LCM”) requires that listed foreign private issuers,such as CEMEX, disclose any significant ways in which their corporate governance practices differ from thosefollowed by U.S. companies under NYSE listing standards.
CEMEX’s corporate governance practices are governed by its by-laws, by the corporate governanceprovisions set forth in the Mexican Securities Market Law, the Circular de Emisoras (the “Mexican Regulationfor Issuers”) issued by the Comisión Nacional Bancaria y de Valores (the “Mexican Banking and SecuritiesCommission”) and the Reglamento Interior de la Bolsa Mexicana de Valores (the “Mexican Stock ExchangeRules”) (the Mexican Securities Market Law, the Mexican Regulation for Issuers and the Mexican StockExchange Rules, collectively the “Mexican Laws and Regulations”), and by applicable U.S. securities laws.CEMEX is also subject to the rules of the NYSE to the extent they apply to foreign private issuers. Except forthose specific rules, foreign private issuers are permitted to follow home country practice in lieu of the provisionsof Section 303A of the LCM.
239

CEMEX, on a voluntary basis, also complies with the Código de Mejores Prácticas Corporativas (the“Mexican Code of Best Corporate Practices”) as indicated below, which was promulgated by a committeeestablished by the Consejo Coordinador Empresarial (“Mexican Corporate Coordination Board”). The MexicanCorporate Coordination Board provides recommendations for better corporate governance practices for listedcompanies in Mexico, and the Mexican Code of Best Corporate Practices has been endorsed by the MexicanBanking and Securities Commission.
The following is a summary of significant ways in which our corporate governance practices differ fromthose required to be followed by U.S. domestic companies under the NYSE’s listing standards.
NYSE LISTING STANDARDS CEMEX CORPORATE GOVERNANCE PRACTICE
303A.01
Listed companies must have a majority ofindependent directors.
Pursuant to the Mexican Securities Market Law, CEMEX, S.A.B.de C.V. is required to have a board of directors with a maximumof 21 members, 25% of whom must be independent.Determination as to the independence of CEMEX, S.A.B. deC.V.’s directors is made upon their election by CEMEX, S.A.B.de C.V.’s shareholders at the corresponding meeting. As ofDecember 31, 2016, CEMEX, S.A.B. de C.V.’s Board ofDirectors had 13 members, of which more than 50% areindependent under the Mexican Securities Market Law.
The Mexican Securities Market Law sets forth, in article 26, thedefinition of “independence,” which differs from the one set forthin Section 303A.02 of the LCM. Generally, under the MexicanSecurities Market Law, a director is not independent if suchdirector is an employee or officer of the company or itssubsidiaries; an individual that has significant influence over thecompany or its subsidiaries; a shareholder that is part of a groupthat controls the company; or, if there exist certain relationshipsbetween a company and a director, entities with which thedirector is associated or family members of the director.
303A.03
Non-management directors must meet atregularly scheduled executive sessionswithout management.
Under CEMEX, S.A.B. de C.V.’s by-laws and the Mexican Lawsand Regulations, our non-management and independent directorsare not required to meet in executive sessions. Our Board ofDirectors must meet at least once every three months.
303A.04
Listed companies must have a nominating/corporate governance committee composedof independent directors.
Under CEMEX, S.A.B. de C.V.’s by-laws and the Mexican Lawsand Regulations, we are not required to have a nominatingcommittee. We do not have such a committee.
Our Corporate Practices and Finance Committee operatespursuant to the provisions of the Mexican Securities Market Lawand CEMEX, S.A.B. de C.V.’s by-laws. Our Corporate Practicesand Finance Committee is composed of four independentdirectors.
240

NYSE LISTING STANDARDS CEMEX CORPORATE GOVERNANCE PRACTICE
Our Corporate Practices and Finance Committee is responsiblefor evaluating the performance of our executive officers;reviewing related party transactions; reviewing the compensationpaid to executive officers; evaluating any waivers granted todirectors or executive officers for their taking of corporateopportunities; and carrying out the activities described underMexican law.
Our Corporate Practices and Finance Committee meets asrequired by CEMEX, S.A.B. de C.V.’s by-laws and by theMexican Laws and Regulations.
303A.05
Listed companies must have a compensationcommittee composed of independentdirectors.
Under CEMEX, S.A.B. de C.V.’s by-laws and the Mexican Lawsand Regulations, we are not required to have a compensationcommittee. We do not have such a committee.
Compensation committee members mustsatisfy additional independencerequirements specific to compensationcommittee membership.
Listed companies must have an auditcommittee that satisfies the requirements ofRule 10A-3 under the Exchange Act.
CEMEX, S.A.B. de C.V.’s Audit Committee operates pursuant tothe provisions of the Mexican Securities Market Law andCEMEX, S.A.B. de C.V.’s by-laws.
CEMEX, S.A.B. de C.V.’s Audit Committee is composed of fourmembers. According to CEMEX, S.A.B. de C.V.’s by-laws, all ofthe members must be independent.
CEMEX, S.A.B. de C.V.’s Audit Committee is responsible forevaluating the company’s internal controls and procedures,identifying any material deficiencies it finds; following up withany corrective or preventive measures adopted with respect to thenon-compliance with the operation and accounting guidelines andpolicies; evaluating the performance of the external auditors;describing and valuating those non-audit services rendered by theexternal auditor; reviewing the company’s financial statements;assessing the effects of any modifications to the accountingpolicies approved during a fiscal year; overseeing measuresadopted as result of any observations made by shareholders,directors, executive officers, employees or any third parties withrespect to accounting, internal controls and internal and externalaudit, as well as any complaints regarding irregularities inmanagement, including anonymous and confidential methods foraddressing concerns raised by employees; assuring the executionof resolutions adopted at shareholders’ or board of directors’meetings.
CEMEX, S.A.B. de C.V.’s Board of Directors has determined thatit has an “audit committee financial expert,” for purposes of theSarbanes-Oxley Act of 2002, serving on its Audit Committee.
241

NYSE LISTING STANDARDS CEMEX CORPORATE GOVERNANCE PRACTICE
CEMEX, S.A.B. de C.V.’s Audit Committee meets as required byCEMEX, S.A.B. de C.V.’s by-laws and by the Mexican Laws andRegulations.
303A.09
Listed companies must adopt and disclosecorporate governance guidelines.
Under CEMEX, S.A.B. de C.V.’s by-laws and the Mexican Lawsand Regulations, we are not required to adopt corporategovernance guidelines, but, on an annual basis, we file a reportwith the Mexican Stock Exchange regarding our compliance withthe Mexican Code of Best Corporate Practices.
303A.10
Listed companies must adopt and disclose acode of business conduct and ethics fordirectors, officers and employees, andpromptly disclose any waivers of the codefor directors or executive officers.
CEMEX, S.A.B. de C.V. has adopted a written code of ethics thatapplies to all of our employees, including our principal executiveofficer, principal financial officer and principal accountingofficer.
Equity compensation plans
Equity compensation plans requireshareholder approval under the MexicanSecurities Market Law, subject to limitedexemptions.
Shareholder approval is not expressly required under CEMEX,S.A.B. de C.V.’s by-laws for the adoption and amendment of anequity compensation plan. However, at our 2011 annualshareholders’ meeting held on February 23, 2012, CEMEX,S.A.B. de C.V.’s shareholders resolved to extend our currentstock program for our employees, officers and administratorsuntil December 31, 2018.
Item 16H—Mine Safety Disclosure
The information concerning mine safety violations and other regulatory matters required by Section 1503(a)of the Dodd-Frank Wall Street Reform and Consumer Protection Act is included in Exhibit 15.1 to this annualreport.
242

PART III
Item 17—Financial Statements
Not applicable.
Item 18—Financial Statements
See pages F-1 through F-111, incorporated herein by reference.
Item 19—Exhibits
1.1 Amended and Restated By-laws of CEMEX, S.A.B. de C.V.(a)
2.1 Form of Certificate for shares of Series A Common Stock of CEMEX, S.A.B. de C.V.(k)
2.2 Form of Certificate for shares of Series B Common Stock of CEMEX, S.A.B. de C.V.(k)
2.3 English Translation of Amended and Restated Agreement to the Trust Agreement dated November 27,2014, between CEMEX, S.A.B. de C.V., as founder of the trust, and Banco Nacional de México, S.A.regarding the CPOs.(j)
2.4 Form of CPO Certificate.(l)
2.5 Form of Second Amended and Restated Deposit Agreement (Series A and Series B share CPOs), datedAugust 10, 1999, among CEMEX, S.A. de C.V., Citibank, N.A. and holders and beneficial owners ofAmerican Depositary Shares.(b)
2.5.1 Amendment No. 1 to the Second Amended and Restated Deposit Agreement, dated as of July 1, 2005,by and among CEMEX, S.A. de C.V., Citibank, N.A., as Depositary, and all holders and beneficialowners from time to time of American Depositary Shares evidenced by American Depositary Receiptsissued thereunder, including the form of ADR attached thereto.(d)
2.5.2 Amendment No. 2 to the Second Amended and Restated Deposit Agreement, dated as of February 11,2015, by and among CEMEX, S.A.B. de C.V., Citibank, N.A., as Depositary, and all holders andbeneficial owners from time to time of American Depositary Shares evidenced by AmericanDepositary Receipts issued thereunder, including the form of ADR attached thereto.(k)
2.5.3 Letter Agreement, dated October 12, 2007, by and between CEMEX, S.A.B. de C.V. and Citibank,N.A., as Depositary, supplementing the Second Amended and Restated Deposit Agreement, asamended, to enable the Depositary to establish a direct registration system for the ADSs.(d)
2.5.4 Letter Agreement, dated March 30, 2010 by and between CEMEX, S.A.B. de C.V. and Citibank, N.A.,as Depositary, supplementing the Second Amended and Restated Deposit Agreement, as amended, toset forth the terms upon which CEMEX, S.A.B. de C.V. is to establish a restricted ADS series.(i)
2.5.5 Letter Agreement, dated March 15, 2011 by and between CEMEX, S.A.B. de C.V. and Citibank, N.A.,as Depositary, supplementing the Second Amended and Restated Deposit Agreement, as amended, toset forth the terms upon which CEMEX, S.A.B. de C.V. is to deposit CPOs upon conversion of the3.25% Subordinated Convertible Notes due 2016 and 3.75% Subordinated Convertible Notes due 2018,and the Depositary is to issue ADSs upon deposit of such CPOs.(i)
2.5.6 Letter Agreement, dated March 15, 2011 by and between CEMEX, S.A.B. de C.V. and Citibank, N.A.,as Depositary, supplementing the Second Amended and Restated Deposit Agreement, as amended, toset forth the terms upon which CEMEX, S.A.B. de C.V. is to establish a restricted ADS series.(i)
2.5.7 Letter Agreement, dated February 11, 2015 by and between CEMEX, S.A.B. de C.V. and Citibank,N.A., as Depositary, supplementing the Second Amended and Restated Deposit Agreement, asamended, to set forth the terms upon which CEMEX, S.A.B. de C.V. is to establish a restricted ADSseries.(i)
243

2.6 Form of American Depositary Receipt evidencing American Depositary Shares.(k)
4.1 Note Indenture, dated as of December 18, 2006, by and among New Sunward Holding FinancialVentures B.V., as issuer, and CEMEX, S.A.B. de C.V., CEMEX México, S.A. de C.V., and NewSunward Holding B.V., as guarantors and the Bank of New York, as trustee, relating to New SunwardHolding Financial Ventures B.V.’s U.S.$350,000,000 aggregate principal amount of Callable PerpetualDual-Currency Notes.(d)
4.1.1 First Supplemental Note Indenture, dated as of August 10, 2009, by and among New Sunward HoldingFinancial Ventures B.V., as issuer, and CEMEX, S.A.B. de C.V., CEMEX México, S.A. de C.V., andNew Sunward Holding B.V., as guarantors and the Bank of New York, as trustee, supplementing theNote Indenture, dated as of December 18, 2006, among New Sunward Holding Financial VenturesB.V., as issuer, CEMEX, S.A.B. de C.V., CEMEX México, S.A. de C.V. and New Sunward HoldingB.V., as guarantors, and The Bank of New York Mellon, as trustee, relating to New Sunward HoldingFinancial Ventures B.V.’s U.S.$350,000,000 aggregate principal amount of Callable Perpetual Dual-Currency Notes.(d)
4.1.2 Second Supplemental Note Indenture, dated as of May 12, 2010, by and among New Sunward HoldingFinancial Ventures B.V., as issuer, CEMEX, S.A.B. de C.V., CEMEX México, S.A. de C.V. and NewSunward Holding B.V., as guarantors, The Bank of New York Mellon, as trustee, Swap 5 Capital(SPV) Limited and C5 Capital (SPV) Limited., supplementing the Note Indenture, dated as ofDecember 18, 2006, among New Sunward Holding Financial Ventures B.V., as issuer, CEMEX,S.A.B. de C.V., CEMEX México, S.A. de C.V. and New Sunward Holding B.V., as guarantors, andThe Bank of New York Mellon, as trustee, relating to New Sunward Holding Financial VenturesB.V.’s U.S.$350,000,000 aggregate principal amount of Callable Perpetual Dual-Currency Notes.(d)
4.2 Note Indenture, dated as of December 18, 2006, by and among New Sunward Holding FinancialVentures B.V., as issuer, and CEMEX, S.A.B. de C.V., CEMEX México, S.A. de C.V., and NewSunward Holding B.V., as guarantors and the Bank of New York, as trustee, relating to New SunwardHolding Financial Ventures B.V.’s U.S.$900,000,000 aggregate principal amount of Callable PerpetualDual-Currency Notes.(d)
4.2.1 First Supplemental Note Indenture, dated as of August 10, 2009, by and among New Sunward HoldingFinancial Ventures B.V., as issuer, and CEMEX, S.A.B. de C.V., CEMEX México, S.A. de C.V., andNew Sunward Holding B.V., as guarantors and the Bank of New York, as trustee, supplementing theNote Indenture, dated as of December 18, 2006, among New Sunward Holding Financial VenturesB.V., as issuer, CEMEX, S.A.B. de C.V., CEMEX México, S.A. de C.V. and New Sunward HoldingB.V., as guarantors, and The Bank of New York Mellon, as trustee, relating to New Sunward HoldingFinancial Ventures B.V.’s U.S.$900,000,000 aggregate principal amount of Callable Perpetual Dual-Currency Notes.(d)
4.2.2 Second Supplemental Note Indenture, dated as of May 12, 2010, by and among New Sunward HoldingFinancial Ventures B.V., as issuer, CEMEX, S.A.B. de C.V., CEMEX México, S.A. de C.V. and NewSunward Holding B.V., as guarantors, The Bank of New York Mellon, as trustee, Swap 10 Capital(SPV) Limited and C10 Capital (SPV) Limited., supplementing the Note Indenture, dated as ofDecember 18, 2006, among New Sunward Holding Financial Ventures B.V., as issuer, CEMEX,S.A.B. de C.V., CEMEX México, S.A. de C.V. and New Sunward Holding B.V., as guarantors, andThe Bank of New York Mellon, as trustee, relating to New Sunward Holding Financial VenturesB.V.’s U.S.$900,000,000 aggregate principal amount of Callable Perpetual Dual-Currency Notes.(d)
4.3 Note Indenture, dated as of February 12, 2007, by and among New Sunward Holding FinancialVentures B.V., as issuer, and CEMEX, S.A.B. de C.V., CEMEX México, S.A. de C.V., and NewSunward Holding B.V., as guarantors and the Bank of New York, as trustee, relating to New SunwardHolding Financial Ventures B.V.’s U.S.$750,000,000 aggregate principal amount of Callable PerpetualDual-Currency Notes.(d)
244

4.3.1 First Supplemental Note Indenture, dated as of August 10, 2009, by and among New Sunward HoldingFinancial Ventures B.V., as issuer, and CEMEX, S.A.B. de C.V., CEMEX México, S.A. de C.V., andNew Sunward Holding B.V., as guarantors and the Bank of New York, as trustee, supplementing theNote Indenture, dated as of February 12, 2007, among New Sunward Holding Financial Ventures B.V.,as issuer, CEMEX, S.A.B. de C.V., CEMEX México, S.A. de C.V. and New Sunward Holding B.V., asguarantors, and The Bank of New York Mellon, as trustee, relating to New Sunward Holding FinancialVentures B.V.’s U.S.$750,000,000 aggregate principal amount of Callable Perpetual Dual-CurrencyNotes.(d)
4.3.2 Second Supplemental Note Indenture, dated as of May 12, 2010, by and among New Sunward HoldingFinancial Ventures B.V., as issuer, CEMEX, S.A.B. de C.V., CEMEX México, S.A. de C.V. and NewSunward Holding B.V., as guarantors, The Bank of New York Mellon, as trustee, Swap 8 Capital(SPV) Limited and 8 Capital (SPV) Limited., supplementing the Note Indenture, dated as ofFebruary 12, 2007, among New Sunward Holding Financial Ventures B.V., as issuer, CEMEX, S.A.B.de C.V., CEMEX México, S.A. de C.V. and New Sunward Holding B.V., as guarantors, and The Bankof New York Mellon, as trustee, relating to New Sunward Holding Financial Ventures B.V.’sU.S.$750,000,000 aggregate principal amount of Callable Perpetual Dual-Currency Notes.(d)
4.4 Note Indenture, dated as of May 9, 2007, by and among New Sunward Holding Financial VenturesB.V., as issuer, and CEMEX, S.A.B. de C.V., CEMEX México, S.A. de C.V., and New SunwardHolding B.V., as guarantors and the Bank of New York, as trustee, relating to New Sunward HoldingFinancial Ventures B.V.’s U.S. €730,000,000 Callable Perpetual Dual-Currency Notes.(d)
4.4.1 First Supplemental Note Indenture, dated as of August 10, 2009, by and among New Sunward HoldingFinancial Ventures B.V., as issuer, and CEMEX, S.A.B. de C.V., CEMEX México, S.A. de C.V., andNew Sunward Holding B.V., as guarantors and the Bank of New York, as trustee, supplementing theNote Indenture, dated as of May 9, 2007, among New Sunward Holding Financial Ventures B.V., asissuer, CEMEX, S.A.B. de C.V., CEMEX México, S.A. de C.V. and New Sunward Holding B.V., asguarantors, and The Bank of New York Mellon, as trustee, relating to New Sunward Holding FinancialVentures B.V.’s U.S. €730,000,000 Callable Perpetual Dual-Currency Notes.(d)
4.4.2 Second Supplemental Note Indenture, dated as of May 12, 2010, by and among New Sunward HoldingFinancial Ventures B.V., as issuer, CEMEX, S.A.B. de C.V., CEMEX México, S.A. de C.V. and NewSunward Holding B.V., as guarantors, The Bank of New York Mellon, as trustee, Swap C10-EURCapital (SPV) Limited and C10-EUR Capital (SPV) Limited., supplementing the Note Indenture, datedas of February 12, 2007, among New Sunward Holding Financial Ventures B.V., as issuer, CEMEX,S.A.B. de C.V., CEMEX México, S.A. de C.V. and New Sunward Holding B.V., as guarantors, andThe Bank of New York Mellon, as trustee, relating to New Sunward Holding Financial VenturesB.V.’s U.S. €730,000,000 Callable Perpetual Dual-Currency Notes.(d)
4.5 Indenture, dated as of December 10, 2009, by and among CEMEX, S.A.B. de C.V., as issuer, BancoMercantil del Norte, Sociedad Anónima, Institución de Banca Múltiple, Grupo Financiero Banorte, ascommon representative and calculation agent, in connection with the issuance of MandatoryConvertible Bonds.(d)
4.6 Master Terms and Conditions Agreement, dated March 9, 2011, by and between BNP Paribas andCEMEX, S.A.B. de C.V., relating to the capped call transaction entered into in connection withissuance by CEMEX, S.A.B. de C.V. of 3.75% Convertible Subordinated Notes due 2018.(e)
4.7 Master Terms and Conditions Agreement, dated March 9, 2011, by and between Bank of America,N.A. and CEMEX, S.A.B. de C.V., relating to the capped call transaction entered into in connectionwith issuance by CEMEX, S.A.B. de C.V. of 3.25% Convertible Subordinated Notes due 2016 and3.75% Convertible Subordinated Notes due 2018.(e)
245

4.8 Master Terms and Conditions Agreement, dated March 9, 2011, by and between Banco Santander, S.A.and CEMEX, S.A.B. de C.V., relating to the capped call transaction entered into in connection withissuance by CEMEX, S.A.B. de C.V. of 3.25% Convertible Subordinated Notes due 2016 and 3.75%Convertible Subordinated Notes due 2018.(e)
4.9 Indenture, dated as of March 15, 2011, CEMEX, S.A.B. de C.V., as issuer, The Bank of New YorkMellon, as trustee, and The Bank of New York Mellon S.A., Institución de Banca Múltiple, as Mexicantrustee, in connection with the issuance of U.S.$690,000,000 aggregate principal amount of 3.75%Convertible Subordinated Notes due 2018.(i)
4.10 Amendment and Restatement Agreement, dated July 23, 2015, by and among CEMEX, S.A.B. de C.V.and certain of its subsidiaries, the Intra-Group Lenders (as named therein), Citibank International Ltd(formerly Citibank International plc), as Facilities Agent, and Wilmington Trust (London) Limited,acting as Security Agent, relating to the Intercreditor Agreement dated September 17, 2012 andamended October 31, 2014.(k)
4.11 Dutch law Share Pledge over the registered shares in New Sunward Holding B.V., dated September 17,2012, between (i) CEMEX International Finance Company Ltd. (formerly CEMEX InternationalFinance Company) which merged into New Sunward Holding B.V., (ii) Corporación Gouda S.A. deC.V. and Mexcement Holdings, S.A. de C.V., both which merged into CEMEX Operaciones México,S.A. de C.V. and CEMEX TRADEMARKS HOLDING Ltd., as Pledgors, and Wilmington Trust(London) Limited, as Pledgee.(g)
4.11.1 Dutch law Share Pledge over the registered shares in New Sunward Holding B.V., dated December 15,2015, between (i) CEMEX Operaciones México, S.A. de C.V., as Pledgor, and Wilmington Trust(London) Limited, as Pledgee.(k)
4.12 Swiss law Share Pledge over 1,938,958,014 shares in CEMEX TRADEMARKS HOLDING Ltd., datedSeptember 17, 2012, between CEMEX, S.A.B. de C.V., CEMEX México, S.A. de C.V., InteramericanInvestments Inc. and Empresas Tolteca de México, S.A. de C.V., as Pledgors, and Wilmington Trust(London) Limited, as Pledgee.(g)
4.12.1 Security confirmation agreement of Swiss law Share Pledge over 1,938,958,014 shares in CEMEXTRADEMARKS HOLDING Ltd., dated July 23, 2015, between CEMEX, S.A.B. de C.V., CEMEXMéxico, S.A. de C.V., Interamerican Investments Inc. and Empresas Tolteca de México, S.A. de C.V.,as Pledgors, and Wilmington Trust (London) Limited, as Pledgee.(k)
4.12.2 Security confirmation agreement of Swiss law Share Pledge over 1,938,958,014 shares in CEMEXTRADEMARKS HOLDING Ltd., dated March 17, 2016, between CEMEX, S.A.B. de C.V., CEMEXMéxico, S.A. de C.V., Interamerican Investments Inc. and Empresas Tolteca de México, S.A. de C.V.,as Pledgors, and Wilmington Trust (London) Limited, as Pledgee.(k)
4.13 Spanish law Share Pledge over the shares in CEMEX España, S.A., dated November 8, 2012, betweenNew Sunward Holding B.V., CEMEX, S.A.B. de C.V., CEMEX España, S.A. and Wilmington Trust(London) Limited (as Security Agent).(g)
4.14 Ratification and Extension deed to Spanish law Share Pledge over the shares in CEMEX España, S.A.,dated July 28, 2016, between New Sunward Holding B.V., CEMEX, S.A.B. de C.V., CEMEX España,S.A. and Wilmington Trust (London) Limited (as Security Agent).(l)
4.15 English translation of the Amendment and Restatement Agreement of the Mexican law Security TrustAgreement, dated July 29, 2015, entered into by CEMEX, S.A.B. de C.V., Empresas Tolteca deMexico, S.A. de C.V., Impra Café S.A. de C.V., Interamerican Investments Inc., Cemex México, S.A.de. C.V., and CEMEX Operaciones México, S.A. de C.V. (formerly Centro Distribuidor de Cemento,S.A. de C.V.), regarding the shares that each of them owned in: CEMEX México, S.A. de C.V. andCEMEX Operaciones México, S.A. de C.V.(k)
246

4.16 Amendment and Restatement Agreement, dated March 17, 2016, among CEMEX, S.A.B. de C.V. andcertain of its subsidiaries, with the financial institutions named therein as Original Lenders andCitibank Europe PLC, UK Branch (formerly Citibank International plc) acting as Agent andWilmington Trust (London) Limited acting as Security Agent, relating to the Facilities Agreement,dated September 29, 2014, as amended and restated on July 23, 2015.(k)
4.17 Amendment and Restatement Agreement, dated November 21, 2016, among CEMEX, S.A.B. de C.V.and certain of its subsidiaries, with the financial institutions named therein as Original Lenders andCitibank Europe PLC, UK Branch (formerly Citibank International plc) acting as Agent andWilmington Trust (London) Limited acting as Security Agent, relating to the Facilities Agreement,dated September 29, 2014, as amended and restated on July 23, 2015, March 17, 2016, June 23, 2016and July 11, 2016.(l)
4.18 Indenture, dated as of October 12, 2012, among CEMEX Finance LLC, as issuer, the Note Guarantorsparty thereto and The Bank of New York Mellon, as trustee, in connection with the issuance ofU.S.$1,500,000,000 aggregate principal amount of 9.375% Senior Secured Notes due 2022.(g)
4.18.1 Supplemental Indenture No. 1, dated as of June 6, 2013, among CEMEX Finance LLC, as issuer, theNote Guarantors party thereto and The Bank of New York Mellon, as trustee, relating to its 9.375%Senior Secured Notes due 2022.(h)
4.19 Indenture, dated as of August 12, 2013, among CEMEX, S.A.B. de C.V., as issuer, the NoteGuarantors party thereto and The Bank of New York Mellon, as trustee, in connection with theissuance of U.S.$1,000,000,000 aggregate principal amount of 6.500% Senior Secured Notes due2019.(h)
4.19.1 Supplemental Indenture No. 1, dated as of April 1, 2014, among CEMEX, S.A.B. de C.V., as issuer,the Note Guarantors party thereto and The Bank of New York Mellon, as trustee, relating to its 6.500%Senior Secured Notes due 2019.(h)
4.20 English translation of Accession Deed, dated August 12, 2013, issued by The Bank of New YorkMellon, as Trustee, and CEMEX España, S.A., concerning the shares of CEMEX España, S.A. relatingto the issuance by CEMEX, S.A.B. de C.V. of U.S.$1,000,000,000 aggregate principal amount of6.500% Senior Secured Notes due 2019.(h)
4.21 Indenture, dated as of October 2, 2013, among CEMEX, S.A.B. de C.V., as issuer, the Note Guarantorsparty thereto and The Bank of New York Mellon, as trustee, in connection with the issuance ofU.S.$1,000,000,000 aggregate principal amount of 7.250% Senior Secured Notes due 2021.(h)
4.21.1 Supplemental Indenture No. 1, dated as of April 1, 2014, among CEMEX, S.A.B. de C.V., as issuer,the Note Guarantors party thereto and The Bank of New York Mellon, as trustee, relating to its 7.250%Senior Secured Notes due 2021.(h)
4.22 English translation of Accession Deed, dated as of October 2, 2013, issued by The Bank of New YorkMellon, as Trustee, and CEMEX España, S.A., concerning the shares of CEMEX España, S.A relatingto the issuance by CEMEX, S.A.B. de C.V. of U.S.$1,000,000,000 aggregate principal amount of7.250% Senior Secured Notes due 2021.(h)
4.23 Indenture, dated as of October 2, 2013, among CEMEX, S.A.B. de C.V, as issuer, the Note Guarantorsparty thereto and The Bank of New York Mellon, as trustee, in connection with the issuance ofU.S.$500,000,000 aggregate principal amount of Floating Rate Senior Secured Notes due 2018.(h)
4.23.1 Supplemental Indenture No. 1, dated as of April 1, 2014, among CEMEX, S.A.B. de C.V., as issuer,the Note Guarantors party thereto and The Bank of New York Mellon, as trustee, relating to itsFloating Rate Senior Secured Notes due 2018.(h)
4.24 English Translation of Accession Deed, dated October 2, 2013, issued by The Bank of New YorkMellon, as Trustee, and CEMEX España, S.A., concerning the shares of CEMEX España, S.A. relatingto the issuance by CEMEX, S.A.B. de C.V. of U.S.$500,000,000 aggregate principal amount ofFloating Rate Senior Secured Notes due 2018.(h)
247

4.25 Indenture, dated as of April 1, 2014, among CEMEX Finance LLC, as issuer, the Note Guarantorsparty thereto and The Bank of New York Mellon, as trustee, in connection with the issuance ofU.S.$1,000,000,000 aggregate principal amount of 6.000% U.S. Dollar-Denominated Senior SecuredNotes due 2024.(h)
4.26 English Translation of Accession Deed, dated April 1, 2014, issued by The Bank of New York Mellon,as Trustee, and CEMEX España, S.A., concerning the shares of CEMEX España, S.A. relating to theissuance by CEMEX Finance LLC of U.S.$1,000,000,000 aggregate principal amount of 6.000%U.S. Dollar-Denominated Senior Secured Notes due 2024.(h)
4.27 Indenture, dated as of April 1, 2014, among CEMEX Finance LLC, as issuer, the Note Guarantorsparty thereto, The Bank of New York Mellon, as trustee, and The Bank of New York Mellon, LondonBranch, as paying agent and transfer agent, in connection with the issuance of €400,000,000 aggregateprincipal amount of 5.250% Euro-Denominated Senior Secured Notes due 2021.(h)
4.28 English Translation of Accession Deed, dated April 1, 2014, issued by The Bank of New York Mellon,as Trustee, and CEMEX España, S.A., concerning the shares of CEMEX España, S.A. relating to theissuance by CEMEX Finance LLC of €400,000,000 aggregate principal amount of 5.250% Euro-Denominated Senior Secured Notes due 2021.(h)
4.29 Indenture, dated as of September 11, 2014, among CEMEX, S.A.B. de C.V., as issuer, the NoteGuarantors party thereto and The Bank of New York Mellon, as trustee, in connection with theissuance of U.S.$1,100,000,000 aggregate principal amount of 5.700% U.S. Dollar-DenominatedSenior Secured Notes due 2025.(j)
4.30 English Translation of Accession Deed, dated September 11, 2014, issued by The Bank of New YorkMellon, as Trustee, and CEMEX España, S.A., concerning the shares of CEMEX España, S.A. relatingto the issuance by CEMEX, S.A.B. de C.V. of U.S.$1,100,000,000 aggregate principal amount of5.700% U.S. Dollar-Denominated Senior Secured Notes due 2025.(j)
4.31 Indenture, dated as of September 11, 2014, among CEMEX, S.A.B. de C.V., as issuer, the NoteGuarantors party thereto, The Bank of New York Mellon, as trustee, and The Bank of New YorkMellon, London Branch, as paying agent and transfer agent, in connection with the issuance of€400,000,000 aggregate principal amount of 4.750% Euro-Denominated Senior Secured Notes due2022.(j)
4.32 English Translation of Accession Deed, dated September 11, 2014, issued by The Bank of New YorkMellon, as Trustee, and CEMEX España, S.A., concerning the shares of CEMEX España, S.A. relatingto the issuance by CEMEX, S.A.B. de C.V. of €400,000,000 aggregate principal amount of 4.750%Euro-Denominated Senior Secured Notes due 2022.(j)
4.33 Indenture, dated as of March 5, 2015, among CEMEX, S.A.B. de C.V., as issuer, the Note Guarantorsparty thereto, The Bank of New York Mellon, as trustee, registrar, paying agent and transfer agent, inconnection with the issuance of U.S.$750,000,000 aggregate principal amount of 6.125% U.S. Dollar-Denominated Senior Secured Notes due 2025.(j)
4.34 English Translation of Accession Deed, dated March 5, 2015, issued by The Bank of New YorkMellon, as Trustee, and CEMEX España, S.A., concerning the shares of CEMEX España, S.A. relatingto the issuance by CEMEX, S.A.B. de C.V. of U.S.$750,000,000 aggregate principal amount of6.125% U.S. Dollar-Denominated Senior Secured Notes due 2025.(j)
4.35 Indenture, dated as of March 5, 2015, among CEMEX, S.A.B. de C.V., as issuer, the Note Guarantorsparty thereto, The Bank of New York Mellon, as trustee and registrar, and The Bank of New YorkMellon, London Branch, as paying agent and transfer agent, in connection with the issuance of€550,000,000 aggregate principal amount of 4.375% Euro-Denominated Senior Secured Notes due2023.(j)
248

4.36 English Translation of Accession Deed, dated March 5, 2015, issued by The Bank of New YorkMellon, as Trustee, and CEMEX España, S.A., concerning the shares of CEMEX España, S.A. relatingto the issuance by CEMEX, S.A.B. de C.V. of €550,000,000 aggregate principal amount of 4.375%Euro-Denominated Senior Secured Notes due 2023.(j)
4.37 Indenture, dated as of March 13, 2015, among CEMEX, S.A.B. de C.V., as issuer, The Bank of NewYork Mellon, as trustee, CIBanco S.A., Institución de Banca Múltiple, as Mexican trustee, inconnection with the issuance of $200,000,000 aggregate principal amount of 3.72% ConvertibleSubordinated Notes due 2020.(j)
4.38 Indenture, dated as of May 28, 2015, among CEMEX, S.A.B. de C.V. as issuer, The Bank of NewYork Mellon, as trustee, and CIBanco S.A., Institución de Banca Múltiple, as Mexican trustee, withrespect to the issuance of 3.72% Convertible Subordinated Notes due 2020.(k)
4.39 Note Indenture, dated as of March 16, 2016, among CEMEX, S.A.B. de C.V., the guarantors listedtherein, and The Bank of New York Mellon, as trustee, with respect to the issuance of 7.750% SeniorSecured Notes due 2026.(k)
4.40 English Translation of Accession Deed, dated March 16, 2016, issued by The Bank of New YorkMellon, as Trustee, and CEMEX España, S.A., concerning the shares of CEMEX España, S.A. relatingto the issuance by CEMEX, S.A.B. de C.V. of U.S.$1,000,000,000 aggregate principal amount of7.750% Senior Secured Notes due 2026.(k)
4.41 Indenture, dated as of June 14, 2016, among CEMEX Finance LLC, the guarantors listed therein, TheBank of New York Mellon, as trustee, and The Bank of New York Mellon, London Branch, as payingagent and transfer agent, with respect to the issuance of 4.625% Senior Secured Notes due 2024.(l)
8.1 List of subsidiaries of CEMEX, S.A.B. de C.V.(l)
12.1 Certification of the Principal Executive Officer of CEMEX, S.A.B. de C.V. pursuant to Section 302 ofthe Sarbanes-Oxley Act of 2002.(l)
12.2 Certification of the Principal Financial Officer of CEMEX, S.A.B. de C.V. pursuant to Section 302 ofthe Sarbanes-Oxley Act of 2002.(l)
13.1 Certification of the Principal Executive and Financial Officers of CEMEX, S.A.B. de C.V. pursuant to18 U.S.C. Section 1350, as adopted pursuant to Section 906 of the Sarbanes-Oxley Act of 2002.(l)
14.1 Consent of KPMG Cárdenas Dosal, S.C. to the incorporation by reference into the effective registrationstatements of CEMEX, S.A.B. de C.V. under the Securities Act of their report with respect to theconsolidated financial statements of CEMEX, S.A.B. de C.V., which appears in this annual report.(l)
15.1 Mine safety and health administration safety data.(l)
(a) Incorporated by reference to Form 6-K of CEMEX, S.A.B. de C.V., filed with the SEC on March 27, 2015.(b) Incorporated by reference to the Registration Statement on Form F-4 of CEMEX, S.A.B. de C.V.
(Registration No. 333-10682), filed with the SEC on August 10, 1999.(c) Incorporated by reference to the 2002 annual report on Form 20-F of CEMEX, S.A.B. de C.V. filed with the
SEC on April 8, 2003.(d) Incorporated by reference to the 2009 annual report on Form 20-F of CEMEX, S.A.B. de C.V. filed with the
SEC on June 30, 2010.(e) Incorporated by reference to the 2010 annual report on Form 20-F of CEMEX, S.A.B. de C.V. filed with the
SEC on June 16, 2011.(f) Incorporated by reference to the 2011 annual report on Form 20-F of CEMEX, S.A.B. de C.V. filed with the
SEC on April 30, 2012.(g) Incorporated by reference to the 2012 annual report on Form 20-F of CEMEX, S.A.B. de C.V. filed with the
SEC on April 23, 2013.
249

(h) Incorporated by reference to the 2013 annual report on Form 20-F of CEMEX, S.A.B. de C.V. filed with theSEC on April 28, 2014.
(i) Incorporated by reference to the Registration Statement on Form F-6 of CEMEX, S.A.B. de C.V.(Registration No. 333-174743), filed with the SEC on June 6, 2011.
(j) Incorporated by reference to the 2014 annual report on Form 20-F of CEMEX, S.A.B. de C.V. filed with theSEC on April 27, 2015.
(k) Incorporated by reference to the 2015 annual report on Form 20-F of CEMEX, S.A.B. de C.V. filed with theSEC on April 22, 2016.
(l) Filed herewith.
In reviewing the agreements included as exhibits to this annual report, please remember they are included toprovide you with information regarding their terms and are not intended to provide any other factual ordisclosure information about us or the other parties to the agreements.
The agreements may contain representations and warranties by each of the parties to the applicableagreement. These representations and warranties have been made solely for the benefit of the other parties to theapplicable agreement and:
• should not in all instances be treated as categorical statements of fact, but rather as a way of allocatingthe risk to one of the parties if those statements prove to be inaccurate;
• have been qualified by disclosures that were made to the other party in connection with the negotiationof the applicable agreement, which disclosures are not necessarily reflected in the agreement;
• may apply standards of materiality in a way that is different from what may be viewed as material toyou or other investors; and
• were made only as of the date of the applicable agreement or such other date or dates as may bespecified in the agreement and are subject to more recent developments.
Accordingly, these representations and warranties may not describe the actual state of affairs as of the datethey were made or at any other time.
250

SIGNATURES
CEMEX, S.A.B. de C.V. hereby certifies that it meets all of the requirements for filing on Form 20-F andthat it has duly caused and authorized the undersigned to sign this annual report on its behalf.
CEMEX, S.A.B. de C.V.
By: /s/ Fernando Ángel González Olivieri
Name: Fernando Ángel González OlivieriTitle: Chief Executive Officer
Date: April 28, 2017
251

INDEX TO AUDITED CONSOLIDATED FINANCIAL STATEMENTS
CEMEX, S.A.B. de C.V. and Subsidiaries:
Consolidated Statements of Operations for the years ended December 31, 2016, 2015 and 2014 . . . . . . . . F-2
Consolidated Statements of Comprehensive Income (Loss) for the years ended December 31, 2016, 2015and 2014 . . . . . . . . . . . . . . . . . . . . . . . . . . . . . . . . . . . . . . . . . . . . . . . . . . . . . . . . . . . . . . . . . . . . . . . . . . . F-3
Consolidated Balance Sheets as of December 31, 2016 and 2015 . . . . . . . . . . . . . . . . . . . . . . . . . . . . . . . . F-4
Consolidated Statements of Cash Flows for the years ended December 31, 2016, 2015 and 2014 . . . . . . . F-5
Consolidated Statements of Changes in Stockholders’ Equity for the years ended December 31, 2016,2015 and 2014 . . . . . . . . . . . . . . . . . . . . . . . . . . . . . . . . . . . . . . . . . . . . . . . . . . . . . . . . . . . . . . . . . . . . . . F-6
Notes to the Consolidated Financial Statements . . . . . . . . . . . . . . . . . . . . . . . . . . . . . . . . . . . . . . . . . . . . . . F-7
Report of Independent Registered Public Accounting Firm — KPMG Cárdenas Dosal, S.C. . . . . . . . . . . . F-109
Internal Control Report of Independent Registered Public Accounting Firm — KPMG Cárdenas Dosal,S.C. . . . . . . . . . . . . . . . . . . . . . . . . . . . . . . . . . . . . . . . . . . . . . . . . . . . . . . . . . . . . . . . . . . . . . . . . . . . . . . F-110
F-1

CEMEX, S.A.B. DE C.V. AND SUBSIDIARIESConsolidated Statements of Operations
(Millions of Mexican pesos, except for earnings (loss) per share)
Years ended December 31,
Note 2016 2015 2014
Net sales . . . . . . . . . . . . . . . . . . . . . . . . . . . . . . . . . . . . . . . . . . . . . . . . . 3 Ps 250,909 220,326 199,942Cost of sales . . . . . . . . . . . . . . . . . . . . . . . . . . . . . . . . . . . . . . . . . . . . . . 2P (161,883) (146,068) (134,742)
Gross profit . . . . . . . . . . . . . . . . . . . . . . . . . . . . . . . . . . . . . . . . . 89,026 74,258 65,200Operating expenses . . . . . . . . . . . . . . . . . . . . . . . . . . . . . . . . . . . . . . . . 5 (53,762) (47,769) (43,347)
Operating earnings before other expenses, net . . . . . . . . . . . . . 2A 35,264 26,489 21,853Other expenses, net . . . . . . . . . . . . . . . . . . . . . . . . . . . . . . . . . . . . . . . . 6 (1,646) (3,043) (5,045)
Operating earnings . . . . . . . . . . . . . . . . . . . . . . . . . . . . . . . . . . . 33,618 23,446 16,808Financial expense . . . . . . . . . . . . . . . . . . . . . . . . . . . . . . . . . . . . . . . . . 16 (21,468) (19,767) (21,483)Other financial income (expense), net . . . . . . . . . . . . . . . . . . . . . . . . . . 7 4,441 (1,235) 2,531Share of profit of equity accounted investees . . . . . . . . . . . . . . . . . . . . 13A 688 738 294
Earnings (loss) before income tax . . . . . . . . . . . . . . . . . . . . . . . 17,279 3,182 (1,850)Income tax . . . . . . . . . . . . . . . . . . . . . . . . . . . . . . . . . . . . . . . . . . . . . . . 19 (3,096) (2,328) (3,920)
Net income (loss) from continuing operations . . . . . . . . . . . . . 14,183 854 (5,770)Discontinued operations . . . . . . . . . . . . . . . . . . . . . . . . . . . . . . . . . . . . 4A 1,024 1,279 90
CONSOLIDATED NET INCOME (LOSS) . . . . . . . . . . . . . . . 15,207 2,133 (5,680)Non-controlling interest net income . . . . . . . . . . . . . . . . . . . . . . . 1,174 932 1,103
CONTROLLING INTEREST NET INCOME (LOSS) . . . . . . Ps 14,033 1,201 (6,783)
Basic earnings (loss) per share . . . . . . . . . . . . . . . . . . . . . . . . . . 22 Ps 0.33 0.03 (0.16)Basic earnings (loss) per share from continuing operations . . 22 Ps 0.31 — (0.16)Diluted earnings (loss) per share . . . . . . . . . . . . . . . . . . . . . . . . 22 Ps 0.33 0.03 (0.16)Diluted earnings (loss) per share from continuing
operations . . . . . . . . . . . . . . . . . . . . . . . . . . . . . . . . . . . . . . . . . 22 Ps 0.31 — (0.16)
The accompanying notes are part of these consolidated financial statements.
F-2
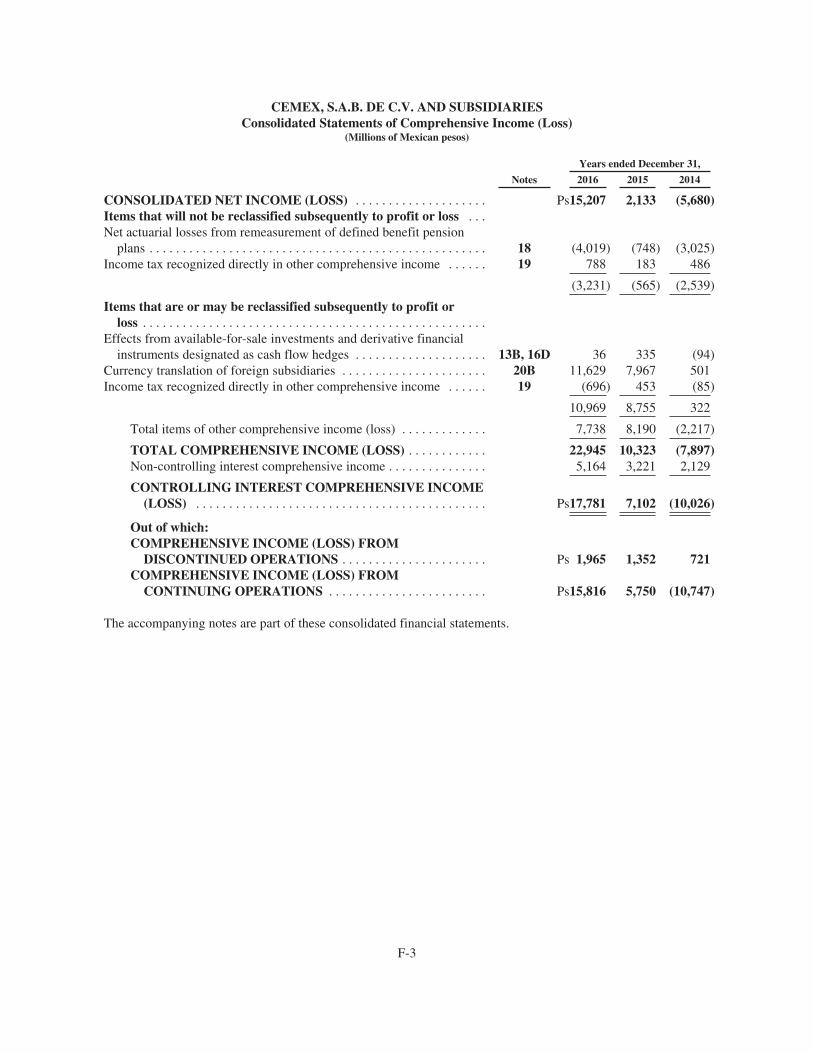
CEMEX, S.A.B. DE C.V. AND SUBSIDIARIESConsolidated Statements of Comprehensive Income (Loss)
(Millions of Mexican pesos)
Years ended December 31,
Notes 2016 2015 2014
CONSOLIDATED NET INCOME (LOSS) . . . . . . . . . . . . . . . . . . . . Ps15,207 2,133 (5,680)Items that will not be reclassified subsequently to profit or loss . . .Net actuarial losses from remeasurement of defined benefit pension
plans . . . . . . . . . . . . . . . . . . . . . . . . . . . . . . . . . . . . . . . . . . . . . . . . . . . 18 (4,019) (748) (3,025)Income tax recognized directly in other comprehensive income . . . . . . 19 788 183 486
(3,231) (565) (2,539)
Items that are or may be reclassified subsequently to profit orloss . . . . . . . . . . . . . . . . . . . . . . . . . . . . . . . . . . . . . . . . . . . . . . . . . . . .
Effects from available-for-sale investments and derivative financialinstruments designated as cash flow hedges . . . . . . . . . . . . . . . . . . . . 13B, 16D 36 335 (94)
Currency translation of foreign subsidiaries . . . . . . . . . . . . . . . . . . . . . . 20B 11,629 7,967 501Income tax recognized directly in other comprehensive income . . . . . . 19 (696) 453 (85)
10,969 8,755 322
Total items of other comprehensive income (loss) . . . . . . . . . . . . . 7,738 8,190 (2,217)
TOTAL COMPREHENSIVE INCOME (LOSS) . . . . . . . . . . . . 22,945 10,323 (7,897)Non-controlling interest comprehensive income . . . . . . . . . . . . . . . 5,164 3,221 2,129
CONTROLLING INTEREST COMPREHENSIVE INCOME(LOSS) . . . . . . . . . . . . . . . . . . . . . . . . . . . . . . . . . . . . . . . . . . . . Ps17,781 7,102 (10,026)
Out of which:COMPREHENSIVE INCOME (LOSS) FROM
DISCONTINUED OPERATIONS . . . . . . . . . . . . . . . . . . . . . . Ps 1,965 1,352 721COMPREHENSIVE INCOME (LOSS) FROM
CONTINUING OPERATIONS . . . . . . . . . . . . . . . . . . . . . . . . Ps15,816 5,750 (10,747)
The accompanying notes are part of these consolidated financial statements.
F-3

CEMEX, S.A.B. DE C.V. AND SUBSIDIARIESConsolidated Balance Sheets
(Millions of Mexican pesos)
December 31,
Note 2016 2015
ASSETSCURRENT ASSETSCash and cash equivalents . . . . . . . . . . . . . . . . . . . . . . . . . . . . . . . . . . . . . . . . . . . . . 8 Ps 11,555 15,280Trade accounts receivables, net . . . . . . . . . . . . . . . . . . . . . . . . . . . . . . . . . . . . . . . . . 9 29,949 27,774Other accounts receivable . . . . . . . . . . . . . . . . . . . . . . . . . . . . . . . . . . . . . . . . . . . . . 10 5,179 4,817Inventories . . . . . . . . . . . . . . . . . . . . . . . . . . . . . . . . . . . . . . . . . . . . . . . . . . . . . . . . . 11 17,862 17,716Assets held for sale . . . . . . . . . . . . . . . . . . . . . . . . . . . . . . . . . . . . . . . . . . . . . . . . . . 12A 25,193 5,391Other current assets . . . . . . . . . . . . . . . . . . . . . . . . . . . . . . . . . . . . . . . . . . . . . . . . . . 12B 2,292 2,687
Total current assets . . . . . . . . . . . . . . . . . . . . . . . . . . . . . . . . . . . . . . . . . . 92,030 73,665
NON-CURRENT ASSETSEquity accounted investees . . . . . . . . . . . . . . . . . . . . . . . . . . . . . . . . . . . . . . . . . . . . 13A 10,484 12,150Other investments and non-current accounts receivable . . . . . . . . . . . . . . . . . . . . . . 13B 7,049 6,549Property, machinery and equipment, net . . . . . . . . . . . . . . . . . . . . . . . . . . . . . . . . . . 14 227,111 214,133Goodwill and intangible assets, net . . . . . . . . . . . . . . . . . . . . . . . . . . . . . . . . . . . . . . 15 247,020 220,318Deferred income taxes . . . . . . . . . . . . . . . . . . . . . . . . . . . . . . . . . . . . . . . . . . . . . . . . 19B 16,034 15,449
Total non-current assets . . . . . . . . . . . . . . . . . . . . . . . . . . . . . . . . . . . . . . . 507,698 468,599
TOTAL ASSETS . . . . . . . . . . . . . . . . . . . . . . . . . . . . . . . . . . . . . . . . . . . Ps 599,728 542,264
LIABILITIES AND STOCKHOLDERS’ EQUITYCURRENT LIABILITIESShort-term debt . . . . . . . . . . . . . . . . . . . . . . . . . . . . . . . . . . . . . . . . . . . . . . . . . . . . . 16A Ps 1,216 218Other financial obligations . . . . . . . . . . . . . . . . . . . . . . . . . . . . . . . . . . . . . . . . . . . . 16B 11,658 15,587Trade payables . . . . . . . . . . . . . . . . . . . . . . . . . . . . . . . . . . . . . . . . . . . . . . . . . . . . . . 39,903 28,709Income tax payable . . . . . . . . . . . . . . . . . . . . . . . . . . . . . . . . . . . . . . . . . . . . . . . . . . 5,421 6,619Other current liabilities . . . . . . . . . . . . . . . . . . . . . . . . . . . . . . . . . . . . . . . . . . . . . . . 17 22,452 20,769Liabilities directly related to assets held for sale . . . . . . . . . . . . . . . . . . . . . . . . . . . 12A 1,466 673
Total current liabilities . . . . . . . . . . . . . . . . . . . . . . . . . . . . . . . . . . . . . . . 82,116 72,575
NON-CURRENT LIABILITIESLong-term debt . . . . . . . . . . . . . . . . . . . . . . . . . . . . . . . . . . . . . . . . . . . . . . . . . . . . . 16A 235,016 229,125Other financial obligations . . . . . . . . . . . . . . . . . . . . . . . . . . . . . . . . . . . . . . . . . . . . 16B 25,972 23,268Employee benefits . . . . . . . . . . . . . . . . . . . . . . . . . . . . . . . . . . . . . . . . . . . . . . . . . . . 18 23,365 18,269Deferred income taxes . . . . . . . . . . . . . . . . . . . . . . . . . . . . . . . . . . . . . . . . . . . . . . . . 19B 19,594 20,385Other non-current liabilities . . . . . . . . . . . . . . . . . . . . . . . . . . . . . . . . . . . . . . . . . . . 17 16,940 14,874
Total non-current liabilities . . . . . . . . . . . . . . . . . . . . . . . . . . . . . . . . . . . . 320,887 305,921
TOTAL LIABILITIES . . . . . . . . . . . . . . . . . . . . . . . . . . . . . . . . . . . . . . 403,003 378,496
STOCKHOLDERS’ EQUITYControlling interest:
Common stock and additional paid-in capital . . . . . . . . . . . . . . . . . . . . . . . . . . 20A 127,336 119,624Other equity reserves . . . . . . . . . . . . . . . . . . . . . . . . . . . . . . . . . . . . . . . . . . . . . 20B 24,793 15,273Retained earnings . . . . . . . . . . . . . . . . . . . . . . . . . . . . . . . . . . . . . . . . . . . . . . . 20C 1,612 7,381Net income . . . . . . . . . . . . . . . . . . . . . . . . . . . . . . . . . . . . . . . . . . . . . . . . . . . . 14,033 1,201
Total controlling interest . . . . . . . . . . . . . . . . . . . . . . . . . . . . . . . . . . . . . . 167,774 143,479Non-controlling interest and perpetual debentures . . . . . . . . . . . . . . . . . . . . . . 20D 28,951 20,289
TOTAL STOCKHOLDERS’ EQUITY . . . . . . . . . . . . . . . . . . . . . . . . 196,725 163,768
TOTAL LIABILITIES AND STOCKHOLDERS’ EQUITY . . . . . . . Ps 599,728 542,264
The accompanying notes are part of these consolidated financial statements.
F-4

CEMEX, S.A.B. DE C.V. AND SUBSIDIARIESConsolidated Statements of Cash Flows
(Millions of Mexican pesos)
Years ended December 31,
Notes 2016 2015 2014
OPERATING ACTIVITIESConsolidated net income (loss) . . . . . . . . . . . . . . . . . . . . . . . . . . . . . . . . . . . . . . . . . . . . . . . . . . Ps 15,207 2,133 (5,680)Discontinued operations . . . . . . . . . . . . . . . . . . . . . . . . . . . . . . . . . . . . . . . . . . . . . . . . . . . . . . . 1,024 1,279 90
Net income (loss) from continuing operations . . . . . . . . . . . . . . . . . . . . . . . . . . . . . . . . . . . . . Ps 14,183 854 (5,770)Non-cash items:
Depreciation and amortization of assets . . . . . . . . . . . . . . . . . . . . . . . . . . . . . . . . . . . . . . . . 5 16,147 14,865 13,703Impairment losses and remeasurement of assets held for sale . . . . . . . . . . . . . . . . . . . . . . . 6 2,516 1,526 3,848Share of profit of equity accounted investees . . . . . . . . . . . . . . . . . . . . . . . . . . . . . . . . . . . . 13A (688) (738) (294)Results on sale of subsidiaries, other disposal groups and others . . . . . . . . . . . . . . . . . . . . . (2,116) (194) (389)Financial items, net . . . . . . . . . . . . . . . . . . . . . . . . . . . . . . . . . . . . . . . . . . . . . . . . . . . . . . . . 17,027 21,002 18,952Income taxes . . . . . . . . . . . . . . . . . . . . . . . . . . . . . . . . . . . . . . . . . . . . . . . . . . . . . . . . . . . . . 19 3,096 2,328 3,920Changes in working capital, excluding income taxes . . . . . . . . . . . . . . . . . . . . . . . . . . . . . . 11,023 3,541 1,475
Net cash flow provided by operating activities from continuing operations beforeinterest, coupons on perpetual debentures and income taxes . . . . . . . . . . . . . . . . . . . 61,188 43,184 35,445
Financial expense and coupons on perpetual debentures paid . . . . . . . . . . . . . . . . . . . . . . . . . . . 20D (18,129) (17,865) (16,844)Income taxes paid . . . . . . . . . . . . . . . . . . . . . . . . . . . . . . . . . . . . . . . . . . . . . . . . . . . . . . . . . . . . . (5,183) (7,437) (7,678)
Net cash flow provided by operating activities from continuing operations . . . . . . . . . 37,876 17,882 10,923Net cash flow provided by operating activities from discontinued operations . . . . . . . 1,194 1,213 1,069
Net cash flows provided by operating activities . . . . . . . . . . . . . . . . . . . . . . . . . . . . . . . . 39,070 19,095 11,992
INVESTING ACTIVITIESProperty, machinery and equipment, net . . . . . . . . . . . . . . . . . . . . . . . . . . . . . . . . . . . . . . . . . . . . 14 (4,500) (8,872) (5,965)Disposal of subsidiaries and other disposal groups, net . . . . . . . . . . . . . . . . . . . . . . . . . . . . . . . . 4A, 12A 1,424 2,722 167Intangible assets and other deferred charges . . . . . . . . . . . . . . . . . . . . . . . . . . . . . . . . . . . . . . . . . 15 (1,427) (908) (902)Long term assets and others, net . . . . . . . . . . . . . . . . . . . . . . . . . . . . . . . . . . . . . . . . . . . . . . . . . . (899) (766) 199
Net cash flows used in investing activities from continuing operations . . . . . . . . . . . . . (5,402) (7,824) (6,501)Net cash flows provided by (used in) investing activities from discontinued
operations . . . . . . . . . . . . . . . . . . . . . . . . . . . . . . . . . . . . . . . . . . . . . . . . . . . . . . . . . . . . . 2 (153) (161)
Net cash flows used in investing activities . . . . . . . . . . . . . . . . . . . . . . . . . . . . . . . . . . . . . (5,400) (7,977) (6,662)
FINANCING ACTIVITIESSale of non-controlling interests in subsidiaries . . . . . . . . . . . . . . . . . . . . . . . . . . . . . . . . . . . . . . 20D 9,777 — —Derivative instruments . . . . . . . . . . . . . . . . . . . . . . . . . . . . . . . . . . . . . . . . . . . . . . . . . . . . . . . . . . 399 1,098 1,561Repayment of debt, net . . . . . . . . . . . . . . . . . . . . . . . . . . . . . . . . . . . . . . . . . . . . . . . . . . . . . . . . . 16A (37,050) (11,473) (6,714)Other financial obligations, net . . . . . . . . . . . . . . . . . . . . . . . . . . . . . . . . . . . . . . . . . . . . . . . . . . . 16B (9,773) 177 (4,396)Securitization of trade receivables . . . . . . . . . . . . . . . . . . . . . . . . . . . . . . . . . . . . . . . . . . . . . . . . . (999) (506) 2,052Non-current liabilities, net . . . . . . . . . . . . . . . . . . . . . . . . . . . . . . . . . . . . . . . . . . . . . . . . . . . . . . . (1,972) (1,763) (1,128)
Net cash flows used in financing activities . . . . . . . . . . . . . . . . . . . . . . . . . . . . . . . . . . . . (39,618) (12,467) (8,625)
Decrease in cash and cash equivalents from continuing operations . . . . . . . . . . . . . . . . . . . (7,144) (2,409) (4,203)Increase in cash and cash equivalents from discontinued operations . . . . . . . . . . . . . . . . . . 1,196 1,060 908Cash conversion effect, net . . . . . . . . . . . . . . . . . . . . . . . . . . . . . . . . . . . . . . . . . . . . . . . . . . 2,223 4,040 708Cash and cash equivalents at beginning of year . . . . . . . . . . . . . . . . . . . . . . . . . . . . . . . . . . 15,280 12,589 15,176
CASH AND CASH EQUIVALENTS AT END OF YEAR . . . . . . . . . . . . . . . . . . . . . . . 8 Ps 11,555 15,280 12,589
Changes in working capital, excluding income taxes:Trade receivables, net . . . . . . . . . . . . . . . . . . . . . . . . . . . . . . . . . . . . . . . . . . . . . . . . . . . . . . Ps (4,353) (3,384) (3,348)Other accounts receivable and other assets . . . . . . . . . . . . . . . . . . . . . . . . . . . . . . . . . . . . . . (276) (1,961) 1,255Inventories . . . . . . . . . . . . . . . . . . . . . . . . . . . . . . . . . . . . . . . . . . . . . . . . . . . . . . . . . . . . . . . (1,174) (1,299) (2,716)Trade payables . . . . . . . . . . . . . . . . . . . . . . . . . . . . . . . . . . . . . . . . . . . . . . . . . . . . . . . . . . . . 13,619 7,207 3,807Other accounts payable and accrued expenses . . . . . . . . . . . . . . . . . . . . . . . . . . . . . . . . . . . 3,207 2,978 2,477
Changes in working capital, excluding income taxes . . . . . . . . . . . . . . . . . . . . . . . . . . . . Ps 11,023 3,541 1,475
The accompanying notes are part of these consolidated financial statements.
F-5
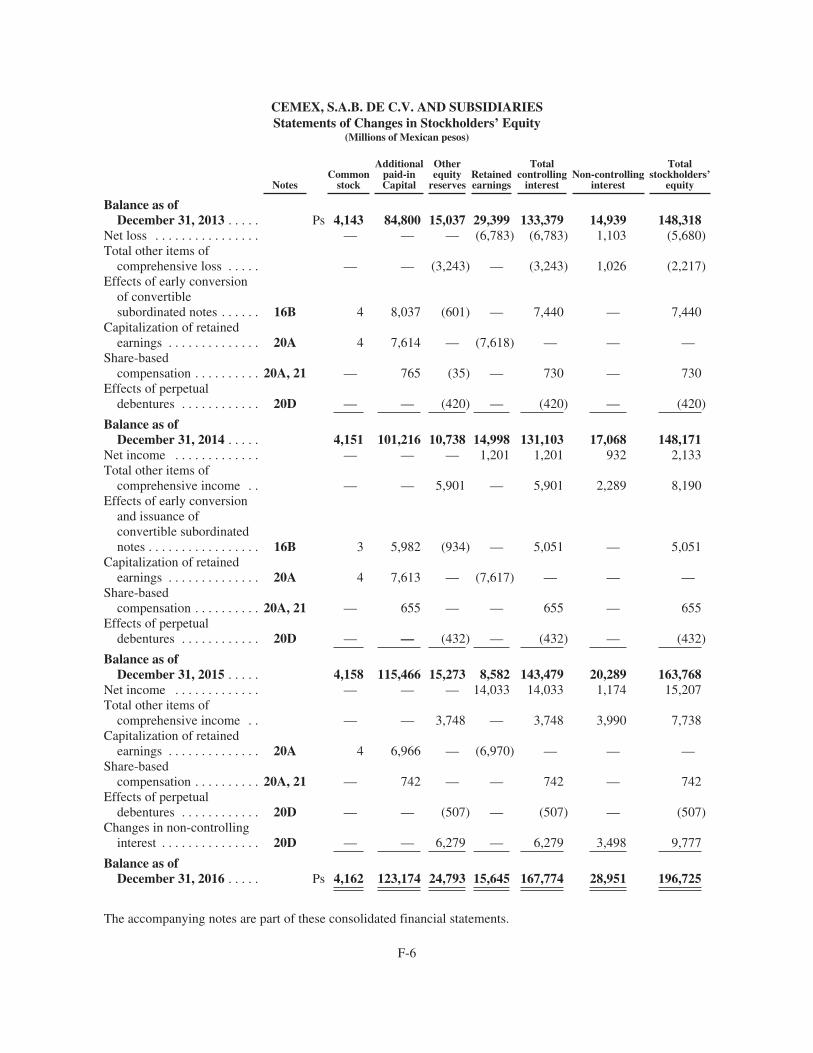
CEMEX, S.A.B. DE C.V. AND SUBSIDIARIESStatements of Changes in Stockholders’ Equity
(Millions of Mexican pesos)
NotesCommon
stock
Additionalpaid-inCapital
Otherequity
reservesRetainedearnings
Totalcontrolling
interestNon-controlling
interest
Totalstockholders’
equity
Balance as ofDecember 31, 2013 . . . . . Ps 4,143 84,800 15,037 29,399 133,379 14,939 148,318
Net loss . . . . . . . . . . . . . . . . — — — (6,783) (6,783) 1,103 (5,680)Total other items of
comprehensive loss . . . . . — — (3,243) — (3,243) 1,026 (2,217)Effects of early conversion
of convertiblesubordinated notes . . . . . . 16B 4 8,037 (601) — 7,440 — 7,440
Capitalization of retainedearnings . . . . . . . . . . . . . . 20A 4 7,614 — (7,618) — — —
Share-basedcompensation . . . . . . . . . . 20A, 21 — 765 (35) — 730 — 730
Effects of perpetualdebentures . . . . . . . . . . . . 20D — — (420) — (420) — (420)
Balance as ofDecember 31, 2014 . . . . . 4,151 101,216 10,738 14,998 131,103 17,068 148,171
Net income . . . . . . . . . . . . . — — — 1,201 1,201 932 2,133Total other items of
comprehensive income . . — — 5,901 — 5,901 2,289 8,190Effects of early conversion
and issuance ofconvertible subordinatednotes . . . . . . . . . . . . . . . . . 16B 3 5,982 (934) — 5,051 — 5,051
Capitalization of retainedearnings . . . . . . . . . . . . . . 20A 4 7,613 — (7,617) — — —
Share-basedcompensation . . . . . . . . . . 20A, 21 — 655 — — 655 — 655
Effects of perpetualdebentures . . . . . . . . . . . . 20D — — (432) — (432) — (432)
Balance as ofDecember 31, 2015 . . . . . 4,158 115,466 15,273 8,582 143,479 20,289 163,768
Net income . . . . . . . . . . . . . — — — 14,033 14,033 1,174 15,207Total other items of
comprehensive income . . — — 3,748 — 3,748 3,990 7,738Capitalization of retained
earnings . . . . . . . . . . . . . . 20A 4 6,966 — (6,970) — — —Share-based
compensation . . . . . . . . . . 20A, 21 — 742 — — 742 — 742Effects of perpetual
debentures . . . . . . . . . . . . 20D — — (507) — (507) — (507)Changes in non-controlling
interest . . . . . . . . . . . . . . . 20D — — 6,279 — 6,279 3,498 9,777
Balance as ofDecember 31, 2016 . . . . . Ps 4,162 123,174 24,793 15,645 167,774 28,951 196,725
The accompanying notes are part of these consolidated financial statements.
F-6

CEMEX, S.A.B. DE C.V. AND SUBSIDIARIESNotes to the Consolidated Financial Statements
As of December 31, 2016, 2015 and 2014(Millions of Mexican pesos)
1) DESCRIPTION OF BUSINESS
CEMEX, S.A.B. de C.V., a public stock corporation with variable capital (S.A.B. de C.V.) organized under thelaws of the United Mexican States, or Mexico, is a holding company (parent) of entities whose main activities areoriented to the construction industry, through the production, marketing, distribution and sale of cement,ready-mix concrete, aggregates and other construction materials. In addition, in order to facilitate the acquisitionof financing and to run its operations in Mexico more efficiently considering that there are efficiency andimprovement opportunities; beginning on April 1, 2014, CEMEX, S.A.B. de C.V. integrated and carries out allbusinesses and operational activities of the cement and aggregates sectors in Mexico. Moreover, beginning onJanuary 1, 2015, CEMEX, S.A.B. de C.V. completed the transition, integrated and carries all operating activitiesrelated to the sale of ready-mix concrete in Mexico.
CEMEX, S.A.B. de C.V. was founded in 1906 and was registered in the Public Register of Property andCommerce in Monterrey, N.L., Mexico in 1920 for a period of 99 years. In 2002, this period was extended to theyear 2100. The shares of CEMEX, S.A.B. de C.V. are listed on the Mexican Stock Exchange (“MSE”) asOrdinary Participation Certificates (“CPOs”) under the symbol “CEMEXCPO”. Each CPO represents two series“A” shares and one series “B” share of common stock of CEMEX, S.A.B. de C.V. In addition, CEMEX, S.A.B.de C.V.’s shares are listed on the New York Stock Exchange (“NYSE”) as American Depositary Shares(“ADSs”) under the symbol “CX”. Each ADS represents ten CPOs.
The terms “CEMEX, S.A.B. de C.V.” and/or the “Parent Company” used in these accompanying notes to thefinancial statements refer to CEMEX, S.A.B. de C.V. without its consolidated subsidiaries. The terms the“Company” or “CEMEX” refer to CEMEX, S.A.B. de C.V. together with its consolidated subsidiaries. Theissuance of these consolidated financial statements was authorized by the Board of Directors of CEMEX, S.A.B.de C.V. on February 2, 2017. These financial statements were authorized by the General Ordinary Shareholders’Meeting of CEMEX, S.A.B. de C.V. on March 30, 2017.
2) SIGNIFICANT ACCOUNTING POLICIES
2A) BASIS OF PRESENTATION AND DISCLOSURE
The consolidated financial statements as of December 31, 2016 and 2015 and for the years ended December 31,2016, 2015 and 2014, were prepared in accordance with International Financial Reporting Standards (“IFRS”) asissued by the International Accounting Standards Board (“IASB”).
Presentation currency and definition of terms
The presentation currency of the consolidated financial statements is the Mexican peso, currency in which theCompany reports periodically to the MSE. When reference is made to pesos or “Ps” it means Mexican pesos. Theamounts in the financial statements and the accompanying notes are stated in millions, except when referencesare made to earnings (loss) per share and/or prices per share. When reference is made to “US$” or “dollars”, itmeans dollars of the United States of America (“United States”). When reference is made to “€” or “euros”, itmeans the currency in circulation in a significant number of European Union (“EU”) countries. When it isdeemed relevant, certain amounts in foreign currency presented in the notes to the financial statements includebetween parentheses a convenience translation into dollars and/or into pesos, as applicable. Previously reportedconvenience translations of prior years are not restated unless the transaction is still outstanding, in which casethose are restated using the closing exchange rates as of the reporting date. These translations should not beconstrued as representations that the amounts in pesos or dollars, as applicable, actually represent those peso or
F-7

CEMEX, S.A.B. DE C.V. AND SUBSIDIARIESNotes to the Consolidated Financial Statements
As of December 31, 2016, 2015 and 2014(Millions of Mexican pesos)
Presentation currency and definition of terms — continued
dollar amounts or could be converted into pesos or dollars at the rate indicated. As of December 31, 2016 and2015, translations of pesos into dollars and dollars into pesos, were determined for balance sheet amounts usingthe closing exchange rates of Ps20.72 and Ps17.23 pesos per dollar, respectively, and for statements of operationsamounts, using the average exchange rates of Ps18.72, Ps15.98 and Ps13.37 pesos per dollar for 2016, 2015 and2014, respectively. When the amounts between parentheses are the peso and the dollar, the amounts weredetermined by translating the euro amount into dollars using the closing exchange rates at year-end and thentranslating the dollars into pesos as previously described.
Amounts disclosed in the notes in connection with tax or legal proceedings (notes 19D and 24), which areoriginated in jurisdictions which currencies are different to the peso or the dollar, are presented in dollarequivalents as of the closing of the most recent year presented. Consequently, without any change in the originalcurrency, such dollar amounts will fluctuate over time due to changes in exchange rates.
Statements of operations
CEMEX includes the line item titled “Operating earnings before other expenses, net” considering that it is arelevant measure for CEMEX’s management as explained in note 4C. Under IFRS, the inclusion of certainsubtotals such as “Operating earnings before other expenses, net” and the display of the statement of operationsvary significantly by industry and company according to specific needs.
The line item “Other expenses, net” in profit or loss consists primarily of revenues and expenses not directlyrelated to CEMEX’s main activities, or which are of an unusual and/or non-recurring nature, including impairmentlosses of long-lived assets, results on disposal of assets and restructuring costs, among others (note 6).
Considering the disposal of entire reportable operating segments, for the years 2016, 2015 and 2014, CEMEXpresents in the single line item of discontinued operations, the results of its operations in Bangladesh andThailand, sold in May 2016; for the years 2015 and 2014, the results of its operations in Austria and Hungary,sold in October 2015; for the years 2016, 2015 and 2014, the results of its operations in Croatia, including assetsin Bosnia and Herzegovina, Montenegro and Serbia, as well as the results of its Concrete Pipe Businessoperations in the United States, expected to be sold in the short-term subject to the authorization of the respectiveauthorities (note 4A). As a result, the statements of operations of 2015 and 2014 originally reported wererestated. Discontinued operations are presented net of income tax.
Statements of comprehensive income (loss)
The statements of comprehensive income (loss) for 2015 and 2014 were restated in order to give effect to thediscontinued operations mentioned above.
Statements of cash flows
The statements of cash flows for 2015 and 2014 were restated in order to give effect to the discontinuedoperations mentioned above. The statements of cash flows exclude the following transactions that did notrepresent sources or uses of cash:
• In 2016, 2015 and 2014, the increases in common stock and additional paid-in capital associated with:(i) the capitalization of retained earnings for Ps6,970, Ps7,617 and Ps7,618, respectively (note 20A); and(ii) CPOs issued as part of the executive share-based compensation programs for Ps742, Ps655 and Ps765,respectively (note 20A);
F-8

CEMEX, S.A.B. DE C.V. AND SUBSIDIARIESNotes to the Consolidated Financial Statements
As of December 31, 2016, 2015 and 2014(Millions of Mexican pesos)
Statements of cash flows — continued
• In 2016, 2015 and 2014, the increases in property, plant and equipment for approximately Ps7, Ps63 andPs108, respectively, associated with the negotiation of capital leases during the year (note 14);
• In 2016, the increase in debt and in other current accounts receivable for approximately Ps148, inconnection with a guarantee signed by CEMEX Colombia, S.A. (“CEMEX Colombia”) over the debt of atrust committed to the development of housing projects in Colombia and the related beneficial interest thatin turn holds CEMEX Colombia in the assets of such trust, which are comprised by land;
• In 2015, the decrease in debt for Ps4,517, the net decrease in other equity reserves for Ps934, the increase incommon stock for Ps3 and the increase in additional paid-in capital for Ps5,982, in connection with theissuance of optional convertible subordinated notes due in 2020, which involved, among others, theexchange and early conversion of optional convertible subordinated notes due in 2016, as well as theissuance of approximately 42 million ADSs (note 16B);
• In 2015, the decrease in other current and non-current liabilities and in deferred tax assets in connectionwith changes in the tax legislation in Mexico effective as of December 31, 2015 (notes 19C and 19D); and
• In 2014, the decrease in debt for Ps6,483, the decrease in other equity reserves for Ps601, the increase incommon stock for Ps4 and the increase in additional paid-in capital for Ps8,037, in connection with severalearly conversions of optional convertible subordinated notes due in 2015, incurred in different dates duringthe year (note 16B).
2B) PRINCIPLES OF CONSOLIDATION
The consolidated financial statements include those of CEMEX, S.A.B. de C.V. and those of the entities in whichthe Parent Company exercises control, including structured entities, by means of which the Parent Company isexposed, or has rights, to variable returns from its involvement with the investee and has the ability to affectthose returns through its power over the investee’s relevant activities. Balances and operations between relatedparties are eliminated in consolidation.
Equity accounted investees are initially recorded at cost, and are subsequently accounted for by the equitymethod when CEMEX has significant influence, which is generally presumed with a minimum equity interest of20%, unless it is proven in unusual cases that significant influence is achieved with a lower percentage. Theequity method reflects in the financial statements, the investee’s original cost and CEMEX’s share of theinvestee’s equity and earnings after acquisition. The financial statements of joint ventures, which relate to thosearrangements in which CEMEX and other third-party investors have joint control and have rights to the net assetsof the arrangements, are recognized under the equity method. During the reported periods, CEMEX did not havejoint operations, referring to those cases in which the parties that have joint control of the arrangement haverights over specific assets and obligations for specific liabilities relating to the arrangements. The equity methodis discontinued when the carrying amount of the investment, including any long-term interest in the investee orjoint venture, is reduced to zero, unless CEMEX has incurred or guaranteed additional obligations of the investeeor joint venture.
Other permanent investments where CEMEX holds equity interests of less than 20% and/or there is nosignificant influence are carried at their historical cost.
F-9

CEMEX, S.A.B. DE C.V. AND SUBSIDIARIESNotes to the Consolidated Financial Statements
As of December 31, 2016, 2015 and 2014(Millions of Mexican pesos)
2C) USE OF ESTIMATES AND CRITICAL ASSUMPTIONS
The preparation of financial statements in accordance with IFRS requires management to make estimates andassumptions that affect reported amounts of assets and liabilities, and the disclosure of contingent assets andliabilities at the date of the financial statements; as well as the reported amounts of revenues and expenses duringthe period. These assumptions are reviewed on an ongoing basis using available information. Actual results coulddiffer from these estimates. The main items subject to estimates and assumptions by management include, amongothers, impairment tests of long-lived assets, allowances for doubtful accounts and obsolescence of inventories,recognition of deferred income tax assets, as well as the measurement of financial instruments at fair value, andthe assets and liabilities related to employee benefits. Significant judgment is required by management toappropriately assess the amounts of these concepts.
2D) FOREIGN CURRENCY TRANSACTIONS AND TRANSLATION OF FOREIGN CURRENCYFINANCIAL STATEMENTS
Transactions denominated in foreign currencies are recorded in the functional currency at the exchange ratesprevailing on the dates of their execution. Monetary assets and liabilities denominated in foreign currencies aretranslated into the functional currency at the exchange rates prevailing at the balance sheet date, and the resultingforeign exchange fluctuations are recognized in earnings, except for exchange fluctuations arising from: 1)foreign currency indebtedness associated to the acquisition of foreign entities; and 2) fluctuations associated withrelated parties’ balances denominated in foreign currency, which settlement is neither planned nor likely to occurin the foreseeable future and as a result, such balances are of a permanent investment nature. These fluctuationsare recorded against “Other equity reserves”, as part of the foreign currency translation adjustment (note 20B)until the disposal of the foreign net investment, at which time, the accumulated amount is recycled through thestatement of operations as part of the gain or loss on disposal.
The financial statements of foreign subsidiaries, as determined using their respective functional currency, aretranslated to pesos at the closing exchange rate for balance sheet accounts and at the closing exchange rates ofeach month within the period for statements of operations accounts. The functional currency is that in which eachconsolidated entity primarily generates and expends cash. The corresponding translation effect is included within“Other equity reserves” and is presented in the statement of other comprehensive income (loss) for the period aspart of the foreign currency translation adjustment (note 20B) until the disposal of the net investment in theforeign subsidiary.
Considering its integrated activities, for purposes of functional currency, the Parent Company is considered tohave two divisions, one related with its financial and holding company activities, in which the functionalcurrency is the dollar for all assets, liabilities and transactions associated with these activities, and anotherdivision related with the Parent Company’s operating activities in Mexico, in which the functional currency is thepeso for all assets, liabilities and transactions associated with these activities.
During the reported periods, there were no subsidiaries whose functional currency was the currency of ahyperinflationary economy, which is generally considered to exist when the cumulative inflation rate over thelast three years is approaching, or exceeds, 100%. In a hyperinflationary economy, the accounts of thesubsidiary’s statements of operations should be restated to constant amounts as of the reporting date, in whichcase, both the balance sheet accounts and profit or loss accounts would be translated to pesos at the closingexchange rates of the year.
F-10

CEMEX, S.A.B. DE C.V. AND SUBSIDIARIESNotes to the Consolidated Financial Statements
As of December 31, 2016, 2015 and 2014(Millions of Mexican pesos)
Foreign currency transactions and translation of foreign currency financial statements — continued
The most significant closing exchange rates and the approximate average exchange rates for balance sheetaccounts and statement of operations accounts as of December 31, 2016, 2015 and 2014, were as follows:
2016 2015 2014
Currency Closing Average Closing Average Closing Average
Dollar . . . . . . . . . . . . . . . . . . . . . . . . . . . . . . . . . . . 20.7200 18.7200 17.2300 15.9800 14.7400 13.3700Euro . . . . . . . . . . . . . . . . . . . . . . . . . . . . . . . . . . . . 21.7945 20.6564 18.7181 17.6041 17.8386 17.6306British Pound Sterling . . . . . . . . . . . . . . . . . . . . . . 25.5361 25.0731 25.4130 24.3638 22.9738 21.9931Colombian Peso . . . . . . . . . . . . . . . . . . . . . . . . . . . 0.0069 0.0062 0.0055 0.0058 0.0062 0.0066Egyptian Pound . . . . . . . . . . . . . . . . . . . . . . . . . . . 1.1234 1.8261 2.2036 2.0670 2.0584 1.8824Philippine Peso . . . . . . . . . . . . . . . . . . . . . . . . . . . 0.4167 0.3927 0.3661 0.3504 0.3296 0.3009
The financial statements of foreign subsidiaries are initially translated from their functional currencies intodollars and subsequently into pesos. Therefore, the foreign exchange rates presented in the table above betweenthe functional currency and the peso represent the implied exchange rates resulting from this methodology. Thepeso to U.S. dollar exchange rate used by CEMEX is an average of free market rates available to settle its foreigncurrency transactions. No significant differences exist, in any case, between the foreign exchange rates used byCEMEX and those exchange rates published by the Mexican Central Bank.
2E) CASH AND CASH EQUIVALENTS (note 8)
The balance in this caption is comprised of available amounts of cash and cash equivalents, mainly represented byhighly-liquid short-term investments, which are easily convertible into known amounts of cash, and which are notsubject to significant risks of changes in their values, including overnight investments, which yield fixed returns andhave maturities of less than three months from the investment date. These fixed-income investments are recorded at costplus accrued interest. Accrued interest is included in profit or loss as part of “Other financial income (expense), net”.
The amount of cash and cash equivalents in the balance sheet includes restricted cash and investments,comprised of deposits in margin accounts that guarantee certain of CEMEX’s obligations, to the extent that therestriction will be lifted in less than three months from the balance sheet date. When the restriction period isgreater than three months, such restricted cash and investments are not considered cash equivalents and areincluded within short-term or long-term “Other accounts receivable”, as appropriate. When contracts containprovisions for net settlement, these restricted amounts of cash and cash equivalents are offset against theliabilities that CEMEX has with its counterparties.
2F) FINANCIAL INSTRUMENTS
Trade accounts receivable and other current accounts receivable (notes 9 and 10)
Instruments under these captions are classified as “loans and receivables” and are recorded at their amortized costrepresenting the net present value (“NPV”) of the consideration receivable or payable as of the transaction date.Due to their short-term nature, CEMEX initially recognizes these receivables at the original invoiced amount lessan estimate of doubtful accounts. Allowances for doubtful accounts as well as impairment of other currentaccounts receivable, are recognized against administrative and selling expenses.
Trade receivables sold under securitization programs, in which CEMEX maintains a residual interest in the tradeaccounts receivable sold in case of recovery failure, as well as continued involvement in such assets, do notqualify for derecognition and are maintained on the balance sheet.
F-11

CEMEX, S.A.B. DE C.V. AND SUBSIDIARIESNotes to the Consolidated Financial Statements
As of December 31, 2016, 2015 and 2014(Millions of Mexican pesos)
Other investments and non-current receivables (note 13B)
As part of the category of “loans and receivables”, non-current accounts receivable, as well as investmentsclassified as held to maturity are initially recognized at their amortized cost. Subsequent changes in NPV arerecognized in profit or loss as part of “Other financial income (expense), net”.
Investments in financial instruments held for trading, as well as those investments available for sale, are recognizedat their estimated fair value, in the first case through profit or loss as part of “Other financial income (expense), net”,and in the second case, changes in valuation are recognized as part of “Other comprehensive income (loss) of theperiod” within “Other equity reserves” until their time of disposition, when all valuation effects accrued in equityare reclassified to “Other financial income (expense), net”, in profit or loss. These investments are tested forimpairment upon the occurrence of a significant adverse change or at least once a year during the last quarter.
Debt and other financial liabilities (notes 16A and 16B)
Bank loans and notes payable are recognized at their amortized cost. Interest accrued on financial instruments isrecognized in the balance sheet within “Other accounts payable and accrued expenses” against financial expense.During the reported periods, CEMEX did not have financial liabilities voluntarily recognized at fair value orassociated to fair value hedge strategies with derivative financial instruments. Direct costs incurred in debt issuancesor borrowings, as well as debt refinancing or non-substantial modifications to debt agreements that did not representan extinguishment of debt by considering that the holders and the relevant economic terms of the new instrumentare not substantially different to the replaced instrument, adjust the carrying amount of related debt are amortized asinterest expense as part of the effective interest rate of each transaction over its maturity. These costs includecommissions and professional fees. Costs incurred in the extinguishment of debt, as well as debt refinancing ormodifications to debt agreements when the new instrument is substantially different to the old instrument accordingto a qualitative and quantitative analysis are recognized in profit or loss within “Financial expense” as incurred.
Capital leases are recognized as financing liabilities against a corresponding fixed asset for the lesser of themarket value of the leased asset and the NPV of future minimum lease payments, using the contract’s implicitinterest rate to the extent available, or the incremental borrowing cost. The main factors that determine a capitallease are: a) ownership title of the asset is transferred to CEMEX at the expiration of the contract; b) CEMEX hasa bargain purchase option to acquire the asset at the end of the lease term; c) the lease term covers the majority ofthe useful life of the asset; and/or d) the NPV of minimum payments represents substantially all the fair value ofthe related asset at the beginning of the lease.
Financial instruments with components of both liabilities and equity (note 16B)
The financial instrument that contains components of both liability and equity, such as notes convertible into afixed number of the issuer’s shares and denominated its same functional currency, each component is recognizedseparately in the balance sheet according to the specific characteristics of each transaction. In the case ofinstruments mandatorily convertible into shares of the issuer, the liability component represents the NPV ofinterest payments on the principal amount using a market interest rate, without assuming any early conversion,and is recognized within “Other financial obligations”, whereas the equity component represents the differencebetween the principal amount and the liability component, and is recognized within “Other equity reserves”, netof commissions. In the case of instruments that are optionally convertible into a fixed number of shares, theliability component represents the difference between the principal amount and the fair value of the conversionoption premium, which reflects the equity component (note 2N). When the transaction is denominated in acurrency different than the functional currency of the issuer, the conversion option is accounted for as aderivative financial instrument at fair value in the statement of operations.
F-12

CEMEX, S.A.B. DE C.V. AND SUBSIDIARIESNotes to the Consolidated Financial Statements
As of December 31, 2016, 2015 and 2014(Millions of Mexican pesos)
Derivative financial instruments (note 16D)
CEMEX recognizes all derivative instruments as assets or liabilities in the balance sheet at their estimated fairvalues, and the changes in such fair values are recognized in profit or loss within “Other financial income(expense), net” for the period in which they occur, except for the effective portion of changes in fair value ofderivative instruments associated with cash flow hedges, in which case, such changes in fair value are recognizedin stockholders’ equity, and are reclassified to earnings as the interest expense of the related debt is accrued, inthe case of interest rate swaps, or when the underlying products are consumed in the case of contracts on theprice of raw materials and commodities. Likewise, in hedges of the net investment in foreign subsidiaries,changes in fair value are recognized in stockholders’ equity as part of the foreign currency translation result (note2D), which reversal to earnings would take place upon disposal of the foreign investment. During the reportedperiods, CEMEX did not designate fair value hedges. Derivative instruments are negotiated with institutions withsignificant financial capacity; therefore, CEMEX believes the risk of non-performance of the obligations agreedto by such counterparties to be minimal.
CEMEX reviews its different contracts to identify the existence of embedded derivatives. Identified embeddedderivatives are analyzed to determine if they need to be separated from the host contract and recognized in thebalance sheet as assets or liabilities, applying the same valuation rules used for other derivative instruments.
Put options granted for the purchase of non-controlling interests and associates
Represent agreements by means of which a non-controlling interest has the right to sell, at a future date using apredefined price formula or at fair market value, its shares in a subsidiary of CEMEX. When the obligationshould be settled in cash or through the delivery of other financial asset, CEMEX recognizes a liability for theNPV of the redemption amount as of the reporting date against the controlling interest within stockholders’equity. A liability is not recognized under these agreements when the redemption amount is determined at fairmarket value at the exercise date and CEMEX has the election to settle using its own shares.
In respect of a put option granted for the purchase of an associate, CEMEX would recognize a liability against aloss in the statements of operations whenever the estimated purchase price exceeds the fair value of the net assetsto be acquired by CEMEX, had the counterparty exercised its right to sell.
Fair value measurements (note 16C)
Under IFRS, fair value represents an “Exit Value” which is the price that would be received to sell an asset orpaid to transfer a liability in an orderly transaction between market participants at the measurement date,considering the counterparty’s credit risk in the valuation. The concept of Exit Value is premised on the existenceof a market and market participants for the specific asset or liability. When there is no market and/or marketparticipants willing to make a market, IFRS establishes a fair value hierarchy that gives the highest priority tounadjusted quoted prices in active markets for identical assets or liabilities (Level 1 measurements) and thelowest priority to measurements involving significant unobservable inputs (Level 3 measurements). The threelevels of the fair value hierarchy are as follows:
• Level 1.— represent quoted prices (unadjusted) in active markets for identical assets or liabilities thatCEMEX has the ability to access at the measurement date. A quote price in an active market provides themost reliable evidence of fair value and is used without adjustment to measure fair value wheneveravailable.
F-13

CEMEX, S.A.B. DE C.V. AND SUBSIDIARIESNotes to the Consolidated Financial Statements
As of December 31, 2016, 2015 and 2014(Millions of Mexican pesos)
Fair value measurements — continued
• Level 2.— are inputs other than quoted prices in active markets that are observable for the asset or liability,either directly or indirectly, and are used mainly to determine the fair value of securities, investments orloans that are not actively traded. Level 2 inputs included equity prices, certain interest rates and yieldcurves, implied volatility and credit spreads, among others, as well as inputs extrapolated from otherobservable inputs. In the absence of Level 1 inputs, CEMEX determined fair values by iteration of theapplicable Level 2 inputs, the number of securities and/or the other relevant terms of the contract, asapplicable.
• Level 3.— inputs are unobservable inputs for the asset or liability. CEMEX used unobservable inputs todetermine fair values, to the extent there are no Level 1 or Level 2 inputs, in valuation models such asBlack-Scholes, binomial, discounted cash flows or multiples of Operative EBITDA, including riskassumptions consistent with what market participants would use to arrive at fair value.
2G) INVENTORIES (note 11)
Inventories are valued using the lower of cost or net realizable value. The cost of inventories includesexpenditures incurred in acquiring the inventories, production or conversion costs and other costs incurred inbringing them to their existing location and condition. CEMEX analyzes its inventory balances to determine if, asa result of internal events, such as physical damage, or external events, such as technological changes or marketconditions, certain portions of such balances have become obsolete or impaired. When an impairment situationarises, the inventory balance is adjusted to its net realizable value, whereas, if an obsolescence situation occurs,the inventory obsolescence reserve is increased. In both cases, these adjustments are recognized against theresults of the period. Advances to suppliers of inventory are presented as part of other current assets.
2H) PROPERTY, MACHINERY AND EQUIPMENT (note 14)
Property, machinery and equipment are recognized at their acquisition or construction cost, as applicable, lessaccumulated depreciation and accumulated impairment losses. Depreciation of fixed assets is recognized as partof cost and operating expenses (note 5), and is calculated using the straight-line method over the estimated usefullives of the assets, except for mineral reserves, which are depleted using the units-of-production method. As ofDecember 31, 2016, the maximum average useful lives by category of fixed assets were as follows:
Years
Administrative buildings . . . . . . . . . . . . . . . . . . . . . . . . . . . . . . . . . . . . . . . . . . . . . . . . . . . . . . . . . . . . . . . . . 34Industrial buildings . . . . . . . . . . . . . . . . . . . . . . . . . . . . . . . . . . . . . . . . . . . . . . . . . . . . . . . . . . . . . . . . . . . . . 32Machinery and equipment in plant . . . . . . . . . . . . . . . . . . . . . . . . . . . . . . . . . . . . . . . . . . . . . . . . . . . . . . . . . 18Ready-mix trucks and motor vehicles . . . . . . . . . . . . . . . . . . . . . . . . . . . . . . . . . . . . . . . . . . . . . . . . . . . . . . . 7Office equipment and other assets . . . . . . . . . . . . . . . . . . . . . . . . . . . . . . . . . . . . . . . . . . . . . . . . . . . . . . . . . 6
CEMEX capitalizes, as part of the related cost of fixed assets, interest expense from existing debt during theconstruction or installation period of significant fixed assets, considering CEMEX’s corporate average interestrate and the average balance of investments in process for the period.
All waste removal costs or stripping costs incurred in the operative phase of a surface mine in order to access themineral reserves are recognized as part of the carrying amount of the related quarries. The capitalized amountsare further amortized over the expected useful life of exposed ore body based on the units of production method.
F-14

CEMEX, S.A.B. DE C.V. AND SUBSIDIARIESNotes to the Consolidated Financial Statements
As of December 31, 2016, 2015 and 2014(Millions of Mexican pesos)
Property, machinery and equipment — continued
Costs incurred in respect of operating fixed assets that result in future economic benefits, such as an extension intheir useful lives, an increase in their production capacity or in safety, as well as those costs incurred to mitigateor prevent environmental damage, are capitalized as part of the carrying amount of the related assets. Thecapitalized costs are depreciated over the remaining useful lives of such fixed assets. Periodic maintenance onfixed assets is expensed as incurred. Advances to suppliers of fixed assets are presented as part of other long-term accounts receivable.
The depreciation methods, useful lives and residual values of property, machinery and equipment are reviewed ateach reporting date and adjusted if appropriate.
2I) BUSINESS COMBINATIONS, GOODWILL, OTHER INTANGIBLE ASSETS AND DEFERREDCHARGES (note 15)
Business combinations are recognized using the purchase method, by allocating the consideration transferred toassume control of the entity to all assets acquired and liabilities assumed, based on their estimated fair values asof the acquisition date. Intangible assets acquired are identified and recognized at fair value. Any unallocatedportion of the purchase price represents goodwill, which is not amortized and is subject to periodic impairmenttests (note 2J), can be adjusted for any correction to the preliminary assessment given to the assets acquired and/or liabilities assumed within the twelve-month period after purchase. Costs associated with the acquisition areexpensed in profit or loss as incurred.
CEMEX capitalizes intangible assets acquired, as well as costs incurred in the development of intangible assets,when future economic benefits associated are identified and there is evidence of control over such benefits.Intangible assets are presented at their acquisition or development cost. Indefinite life intangible assets are notamortized since the period in which the benefits associated with such intangibles will terminate cannot beaccurately established. Definite life intangible assets are amortized on straight-line basis as part of operatingcosts and expenses (note 5).
Startup costs are recognized in profit or loss as they are incurred. Costs associated with research anddevelopment activities (“R&D activities”), performed by CEMEX to create products and services, as well as todevelop processes, equipment and methods to optimize operational efficiency and reduce costs are recognized inthe operating results as incurred. Direct costs incurred in the development stage of computer software for internaluse are capitalized and amortized through the operating results over the useful life of the software, which onaverage is approximately 5 years.
Costs incurred in exploration activities such as payments for rights to explore, topographical and geologicalstudies, as well as trenching, among other items incurred to assess the technical and commercial feasibility ofextracting a mineral resource, which are not significant to CEMEX, are capitalized when future economicbenefits associated with such activities are identified. When extraction begins, these costs are amortized duringthe useful life of the quarry based on the estimated tons of material to be extracted. When future economicbenefits are not achieved, any capitalized costs are subject to impairment.
CEMEX’s extraction rights have maximum useful lives that range from 30 to 100 years, depending on the sector,and the expected life of the related reserves. As of December 31, 2016, except for extraction rights and/or asotherwise indicated, CEMEX’s intangible assets are amortized on a straight line basis over their useful lives thatrange on average from 3 to 20 years.
F-15

CEMEX, S.A.B. DE C.V. AND SUBSIDIARIESNotes to the Consolidated Financial Statements
As of December 31, 2016, 2015 and 2014(Millions of Mexican pesos)
2J) IMPAIRMENT OF LONG-LIVED ASSETS (notes 14 and 15)
Property, machinery and equipment, intangible assets of definite life and other investments
These assets are tested for impairment upon the occurrence of factors such as the occurrence of a significantadverse event, changes in CEMEX’s operating environment or in technology, as well as expectations of loweroperating results, in order to determine whether their carrying amounts may not be recovered. An impairmentloss is recorded in profit or loss for the period within “Other expenses, net”, for the excess of the asset’s carryingamount over its recoverable amount, corresponding to the higher of the fair value less costs to sell of the asset,and the asset’s value in use, the latter represented by the NPV of estimated cash flows related to the use andeventual disposal of the asset. The main assumptions utilized to develop estimates of NPV are a discount rate thatreflects the risk of the cash flows associated with the assets and the estimations of generation of future income.Those assumptions are evaluated for reasonableness by comparing such discount rates to available marketinformation and by comparing to third-party expectations of industry growth, such as governmental agencies orindustry chambers.
When impairment indicators exist, for each intangible asset, CEMEX determines its projected revenue streamsover the estimated useful life of the asset. In order to obtain discounted cash flows attributable to each intangibleasset, such revenues are adjusted for operating expenses, changes in working capital and other expenditures, asapplicable, and discounted to NPV using the risk adjusted discount rate of return. The most significant economicassumptions are: a) the useful life of the asset; b) the risk adjusted discount rate of return; c) royalty rates; and d)growth rates. Assumptions used for these cash flows are consistent with internal forecasts and industry practices.The fair values of these assets are very sensitive to changes in such significant assumptions. Certain keyassumptions are more subjective than others. In respect of trademarks, CEMEX considers that the mostsubjective key assumption is the royalty rate. In respect of extraction rights and customer relationships, the mostsubjective assumptions are revenue growth rates and estimated useful lives. CEMEX validates its assumptionsthrough benchmarking with industry practices and the corroboration of third-party valuation advisors. Significantjudgment by management is required to appropriately assess the fair values and values in use of the relatedassets, as well as to determine the appropriate valuation method and select the significant economic assumptions.
Impairment of long-lived assets — Goodwill
Goodwill is tested for impairment when required due to significant adverse changes or at least once a year,during the last quarter of such year. CEMEX determines the recoverable amount of the group of cash-generatingunits (“CGUs”) to which goodwill balances were allocated, which consists of the higher of such group of CGUsfair value less cost to sell and its value in use, the later represented by the NPV of estimated future cash flows tobe generated by such CGUs to which goodwill was allocated, which are generally determined over periods of 5years. However, in specific circumstances, when CEMEX considers that actual results for a CGU do not fairlyreflect historical performance and most external economic variables provide confidence that a reasonablydeterminable improvement in the mid-term is expected in their operating results, management uses cash flowprojections over a period of up to 10 years, to the point in which future expected average performance resemblesthe historical average performance, to the extent CEMEX has detailed, explicit and reliable financial forecastsand is confident and can demonstrate its ability, based on past experience, to forecast cash flows accurately overthat longer period. If the value in use of a group of CGUs to which goodwill has been allocated is lower than itscorresponding carrying amount, CEMEX determines the fair value of such group of CGUs using methodologiesgenerally accepted in the market to determine the value of entities, such as multiples of Operating EBITDA andby reference to other market transactions, among others. An impairment loss is recognized within “Otherexpenses, net”, if the recoverable amount is lower than the net book value of the group of CGUs to whichgoodwill has been allocated. Impairment charges recognized on goodwill are not reversed in subsequent periods.
F-16

CEMEX, S.A.B. DE C.V. AND SUBSIDIARIESNotes to the Consolidated Financial Statements
As of December 31, 2016, 2015 and 2014(Millions of Mexican pesos)
Impairment of long-lived assets — Goodwill — continued
The geographic operating segments reported by CEMEX (note 4C), represent CEMEX’s groups of CGUs towhich goodwill has been allocated for purposes of testing goodwill for impairment, considering: a) that after theacquisition, goodwill was allocated at the level of the geographic operating segment; b) that the operatingcomponents that comprise the reported segment have similar economic characteristics; c) that the reportedsegments are used by CEMEX to organize and evaluate its activities in its internal information system; d) thehomogeneous nature of the items produced and traded in each operative component, which are all used by theconstruction industry; e) the vertical integration in the value chain of the products comprising each component; f)the type of clients, which are substantially similar in all components; g) the operative integration amongcomponents; and h) that the compensation system of a specific country is based on the consolidated results of thegeographic segment and not on the particular results of the components. In addition, the country level representsthe lowest level within CEMEX at which goodwill is monitored for internal management purposes.
Impairment tests are significantly sensitive to, among other factors, the estimation of future prices of CEMEX’sproducts, the development of operating expenses, local and international economic trends in the constructionindustry, the long-term growth expectations in the different markets, as well as the discount rates and the growthrates in perpetuity applied. For purposes of estimating future prices, CEMEX uses, to the extent available,historical data plus the expected increase or decrease according to information issued by trusted external sources,such as national construction or cement producer chambers and/or in governmental economic expectations.Operating expenses are normally measured as a constant proportion of revenues, following past experience.However, such operating expenses are also reviewed considering external information sources in respect ofinputs that behave according to international prices, such as oil and gas. CEMEX uses specific pre-tax discountrates for each group of CGUs to which goodwill is allocated, which are applied to discount pre-tax cash flows.The amounts of estimated undiscounted cash flows are significantly sensitive to the growth rate in perpetuityapplied. Likewise, the amounts of discounted estimated future cash flows are significantly sensitive to theweighted average cost of capital (discount rate) applied. The higher the growth rate in perpetuity applied, thehigher the amount of undiscounted future cash flows by group of CGUs obtained. Conversely, the higher thediscount rate applied, the lower the amount of discounted estimated future cash flows by group of CGUsobtained.
2K) PROVISIONS
CEMEX recognizes provisions when it has a legal or constructive obligation resulting from past events, whoseresolution would imply cash outflows or the delivery of other resources owned by the Company. As ofDecember 31, 2016 and 2015 some significant proceedings that gave rise to a portion of the carrying amount ofCEMEX’s other current and non-current liabilities and provisions are detailed in note 24A.
Considering guidance under IFRS, CEMEX recognizes provisions for levies imposed by governments until theobligating event or the activity that triggers the payment of the levy has occurred, as defined in the legislation.
Restructuring (note 17)
CEMEX recognizes provisions for restructuring when the restructuring detailed plans have been properlyfinalized and authorized by management, and have been communicated to the third parties involved and/oraffected by the restructuring prior to the balance sheet date. These provisions may include costs not associatedwith CEMEX’s ongoing activities.
F-17

CEMEX, S.A.B. DE C.V. AND SUBSIDIARIESNotes to the Consolidated Financial Statements
As of December 31, 2016, 2015 and 2014(Millions of Mexican pesos)
Asset retirement obligations (note 17)
Unavoidable obligations, legal or constructive, to restore operating sites upon retirement of long-lived assets atthe end of their useful lives are measured at the NPV of estimated future cash flows to be incurred in therestoration process, and are initially recognized against the related assets’ book value. The increase to the assets’book value is depreciated during its remaining useful life. The increase in the liability related to adjustments toNPV by the passage of time is charged to the line item “Other financial income (expense), net.” Adjustments tothe liability for changes in estimations are recognized against fixed assets, and depreciation is modifiedprospectively. These obligations are related mainly to future costs of demolition, cleaning and reforestation, sothat quarries, maritime terminals and other production sites are left in acceptable condition at the end of theiroperation.
Costs related to remediation of the environment (notes 17 and 24)
Provisions associated with environmental damage represent the estimated future cost of remediation, which arerecognized at their nominal value when the time schedule for the disbursement is not clear, or when theeconomic effect for the passage of time is not significant; otherwise, such provisions are recognized at theirdiscounted values. Reimbursements from insurance companies are recognized as assets only when their recoveryis practically certain. In that case, such reimbursement assets are not offset against the provision for remediationcosts.
Contingencies and commitments (notes 23 and 24)
Obligations or losses related to contingencies are recognized as liabilities in the balance sheet only when presentobligations exist resulting from past events that are expected to result in an outflow of resources and the amountcan be measured reliably. Otherwise, a qualitative disclosure is included in the notes to the financial statements.The effects of long-term commitments established with third parties, such as supply contracts with suppliers orcustomers, are recognized in the financial statements on an incurred or accrued basis, after taking intoconsideration the substance of the agreements. Relevant commitments are disclosed in the notes to the financialstatements. The Company does not recognize contingent revenues, income or assets, unless their realization isvirtually certain.
2L) PENSIONS AND OTHER POST-EMPLOYMENT BENEFITS (note 18)
Defined contribution pension plans
The costs of defined contribution pension plans are recognized in the operating results as they are incurred.Liabilities arising from such plans are settled through cash transfers to the employees’ retirement accounts,without generating future obligations.
Defined benefit pension plans and other post-employment benefits
The costs associated with employees’ benefits for: a) defined benefit pension plans; and b) other post-employment benefits, basically comprised of health care benefits, life insurance and seniority premiums, grantedby CEMEX and/or pursuant to applicable law, are recognized as services are rendered, based on actuarialestimations of the benefits’ present value with the advice of external actuaries. For certain pension plans,CEMEX has created irrevocable trust funds to cover future benefit payments (“plan assets”). These plan assetsare valued at their estimated fair value at the balance sheet date. The actuarial assumptions and accounting policyconsider: a) the use of nominal rates; b) a single rate is used for the determination of the expected return on plan
F-18
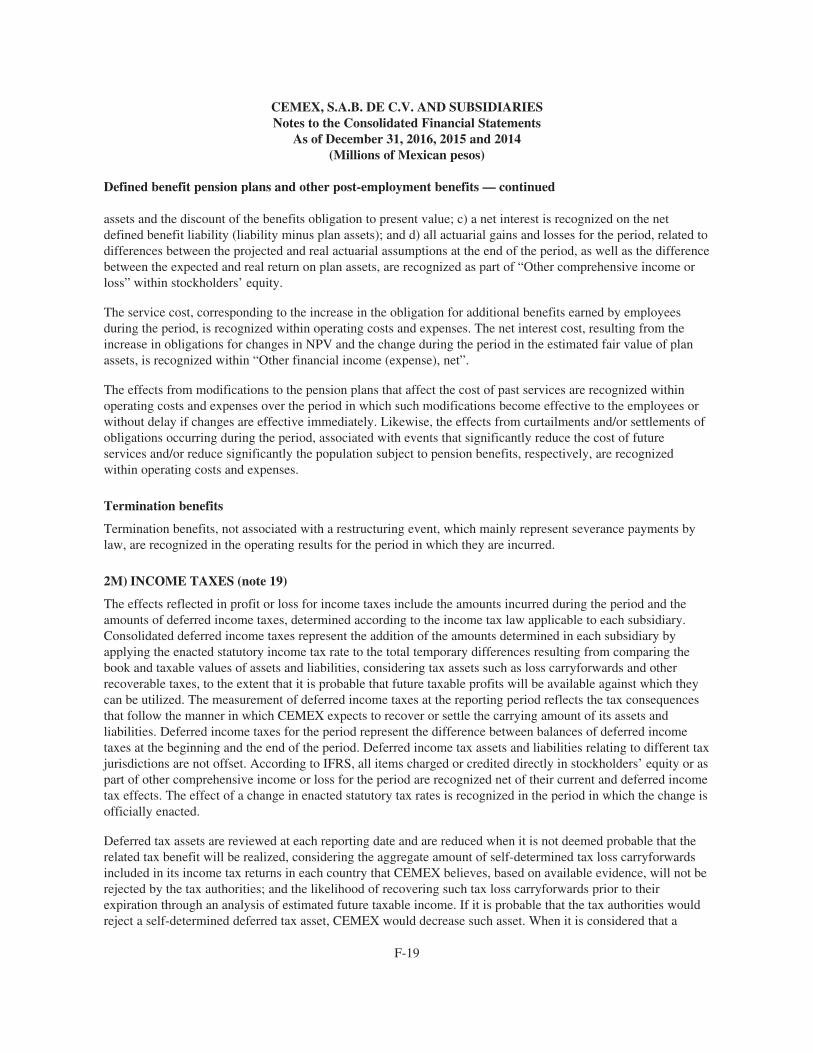
CEMEX, S.A.B. DE C.V. AND SUBSIDIARIESNotes to the Consolidated Financial Statements
As of December 31, 2016, 2015 and 2014(Millions of Mexican pesos)
Defined benefit pension plans and other post-employment benefits — continued
assets and the discount of the benefits obligation to present value; c) a net interest is recognized on the netdefined benefit liability (liability minus plan assets); and d) all actuarial gains and losses for the period, related todifferences between the projected and real actuarial assumptions at the end of the period, as well as the differencebetween the expected and real return on plan assets, are recognized as part of “Other comprehensive income orloss” within stockholders’ equity.
The service cost, corresponding to the increase in the obligation for additional benefits earned by employeesduring the period, is recognized within operating costs and expenses. The net interest cost, resulting from theincrease in obligations for changes in NPV and the change during the period in the estimated fair value of planassets, is recognized within “Other financial income (expense), net”.
The effects from modifications to the pension plans that affect the cost of past services are recognized withinoperating costs and expenses over the period in which such modifications become effective to the employees orwithout delay if changes are effective immediately. Likewise, the effects from curtailments and/or settlements ofobligations occurring during the period, associated with events that significantly reduce the cost of futureservices and/or reduce significantly the population subject to pension benefits, respectively, are recognizedwithin operating costs and expenses.
Termination benefits
Termination benefits, not associated with a restructuring event, which mainly represent severance payments bylaw, are recognized in the operating results for the period in which they are incurred.
2M) INCOME TAXES (note 19)
The effects reflected in profit or loss for income taxes include the amounts incurred during the period and theamounts of deferred income taxes, determined according to the income tax law applicable to each subsidiary.Consolidated deferred income taxes represent the addition of the amounts determined in each subsidiary byapplying the enacted statutory income tax rate to the total temporary differences resulting from comparing thebook and taxable values of assets and liabilities, considering tax assets such as loss carryforwards and otherrecoverable taxes, to the extent that it is probable that future taxable profits will be available against which theycan be utilized. The measurement of deferred income taxes at the reporting period reflects the tax consequencesthat follow the manner in which CEMEX expects to recover or settle the carrying amount of its assets andliabilities. Deferred income taxes for the period represent the difference between balances of deferred incometaxes at the beginning and the end of the period. Deferred income tax assets and liabilities relating to different taxjurisdictions are not offset. According to IFRS, all items charged or credited directly in stockholders’ equity or aspart of other comprehensive income or loss for the period are recognized net of their current and deferred incometax effects. The effect of a change in enacted statutory tax rates is recognized in the period in which the change isofficially enacted.
Deferred tax assets are reviewed at each reporting date and are reduced when it is not deemed probable that therelated tax benefit will be realized, considering the aggregate amount of self-determined tax loss carryforwardsincluded in its income tax returns in each country that CEMEX believes, based on available evidence, will not berejected by the tax authorities; and the likelihood of recovering such tax loss carryforwards prior to theirexpiration through an analysis of estimated future taxable income. If it is probable that the tax authorities wouldreject a self-determined deferred tax asset, CEMEX would decrease such asset. When it is considered that a
F-19

CEMEX, S.A.B. DE C.V. AND SUBSIDIARIESNotes to the Consolidated Financial Statements
As of December 31, 2016, 2015 and 2014(Millions of Mexican pesos)
Income taxes — continued
deferred tax asset will not be recovered before its expiration, CEMEX would not recognize such deferred taxasset. Both situations would result in additional income tax expense for the period in which such determination ismade. In order to determine whether it is probable that deferred tax assets will ultimately be recovered, CEMEXtakes into consideration all available positive and negative evidence, including factors such as market conditions,industry analysis, expansion plans, projected taxable income, carryforward periods, current tax structure,potential changes or adjustments in tax structure, tax planning strategies, future reversals of existing temporarydifferences, etc. Likewise, every reporting period, CEMEX analyzes its actual results versus the Company’sestimates, and adjusts, as necessary, its tax asset valuations. If actual results vary from CEMEX’s estimates, thedeferred tax asset and/or valuations may be affected and necessary adjustments will be made based on relevantinformation. Any adjustments recorded will affect CEMEX’s statements of operations in such period.
The income tax effects from an uncertain tax position are recognized when is probable that the position will besustained based on its technical merits and assuming that the tax authorities will examine each position and havefull knowledge of all relevant information, and they are measured using a cumulative probability model. Eachposition has been considered on its own, regardless of its relation to any other broader tax settlement. The highprobability threshold represents a positive assertion by management that CEMEX is entitled to the economicbenefits of a tax position. If a tax position is considered not probable of being sustained, no benefits of theposition are recognized. Interest and penalties related to unrecognized tax benefits are recorded as part of theincome tax in the consolidated statements of operations.
The effective income tax rate is determined by dividing the line item “Income Tax”, in profit or loss within theline item “Earnings (loss) before income tax”. This effective tax rate is further reconciled to CEMEX’s statutorytax rate applicable in Mexico (note 19C). During 2014, CEMEX has experienced consolidated losses beforeincome tax. In any given period whereas a loss before income tax is reported, the reference statutory tax rate towhich CEMEX reconciles its effective income tax rate is shown as a negative percentage. A significant effect inCEMEX’s effective tax rate and consequently in the aforementioned reconciliation of CEMEX’s effective taxrate, relates to the difference between the statutory income tax rate in Mexico of 30% against the applicableincome tax rates of each country where CEMEX operates.
For the years ended December 31, 2016, 2015 and 2014, the statutory tax rates in CEMEX’s main operationswere as follows:
Country 2016 2015 2014
Mexico . . . . . . . . . . . . . . . . . . . . . . . . . . . . . . . . . . . . . . . . . . . . 30.0% 30.0% 30.0%United States . . . . . . . . . . . . . . . . . . . . . . . . . . . . . . . . . . . . . . . 35.0% 35.0% 35.0%United Kingdom . . . . . . . . . . . . . . . . . . . . . . . . . . . . . . . . . . . . 20.0% 20.3% 21.5%France . . . . . . . . . . . . . . . . . . . . . . . . . . . . . . . . . . . . . . . . . . . . 34.4% 38.0% 38.0%Germany . . . . . . . . . . . . . . . . . . . . . . . . . . . . . . . . . . . . . . . . . . 28.2% 29.8% 29.8%Spain . . . . . . . . . . . . . . . . . . . . . . . . . . . . . . . . . . . . . . . . . . . . . 25.0% 28.0% 30.0%Philippines . . . . . . . . . . . . . . . . . . . . . . . . . . . . . . . . . . . . . . . . . 30.0% 30.0% 30.0%Colombia . . . . . . . . . . . . . . . . . . . . . . . . . . . . . . . . . . . . . . . . . . 40.0% 39.0% 34.0%Egypt . . . . . . . . . . . . . . . . . . . . . . . . . . . . . . . . . . . . . . . . . . . . . 22.5% 22.5% 30.0%Switzerland . . . . . . . . . . . . . . . . . . . . . . . . . . . . . . . . . . . . . . . . 9.6% 9.6% 9.6%Others . . . . . . . . . . . . . . . . . . . . . . . . . . . . . . . . . . . . . . . . . . . . 7.8% – 39.0% 7.8% – 39.0% 10.0% – 39.0%
F-20

CEMEX, S.A.B. DE C.V. AND SUBSIDIARIESNotes to the Consolidated Financial Statements
As of December 31, 2016, 2015 and 2014(Millions of Mexican pesos)
Income taxes — continued
CEMEX’s current and deferred income tax amounts included in profit or loss for the period are highly variable,and are subject, among other factors, to taxable income determined in each jurisdiction in which CEMEXoperates. Such amounts of taxable income depend on factors such as sale volumes and prices, costs and expenses,exchange rates fluctuations and interest on debt, among others, as well as to the estimated tax assets at the end ofthe period due to the expected future generation of taxable gains in each jurisdiction.
2N) STOCKHOLDERS’ EQUITY
Common stock and additional paid-in capital (note 20A)
These items represent the value of stockholders’ contributions, and include increases related to the capitalizationof retained earnings and the recognition of executive compensation programs in CEMEX’s CPOs as well asdecreases associated with the restitution of retained earnings.
Other equity reserves (note 20B)
Groups the cumulative effects of items and transactions that are, temporarily or permanently, recognized directlyto stockholders’ equity, and includes the comprehensive income (loss), which reflects certain changes instockholders’ equity that do not result from investments by owners and distributions to owners. The mostsignificant items within “Other equity reserves” during the reported periods are as follows:
Items of “Other equity reserves” included within other comprehensive income (loss):
• Currency translation effects from the translation of foreign subsidiaries, net of: a) exchange results fromforeign currency debt directly related to the acquisition of foreign subsidiaries; and b) exchange results fromforeign currency related parties balances that are of a long-term investment nature (note 2D);
• The effective portion of the valuation and liquidation effects from derivative instruments under cash flowhedging relationships, which are recorded temporarily in stockholders’ equity (note 2F);
• Changes in fair value during the tenure of available-for-sale investments until their disposal (note 2F); and
• Current and deferred income taxes during the period arising from items whose effects are directlyrecognized in stockholders’ equity.
Items of “Other equity reserves” not included in comprehensive income (loss):
• Effects related to controlling stockholders’ equity for changes or transactions affecting non-controllinginterest stockholders in CEMEX’s consolidated subsidiaries;
• Effects attributable to controlling stockholders’ equity for financial instruments issued by consolidatedsubsidiaries that qualify for accounting purposes as equity instruments, such as the interest expense paid onperpetual debentures;
• The equity component of securities which are mandatorily or optionally convertible into shares of the ParentCompany (notes 2F and 16B). Upon conversion, this amount will be reclassified to common stock andadditional paid-in capital; and
• The cancellation of the Parent Company’s shares held by consolidated entities.
F-21

CEMEX, S.A.B. DE C.V. AND SUBSIDIARIESNotes to the Consolidated Financial Statements
As of December 31, 2016, 2015 and 2014(Millions of Mexican pesos)
Retained earnings (note 20C)
Retained earnings represent the cumulative net results of prior years including the effects generated form initialadoption of IFRS as of January 1, 2010, net of: a) dividends declared; b) capitalization of retained earnings; andc) restitution of retained earnings when applicable.
Non-controlling interest and perpetual debentures (note 20D)
This caption includes the share of non-controlling stockholders in the results and equity of consolidatedsubsidiaries. This caption also includes the nominal amount as of the balance sheet date of financial instruments(perpetual notes) issued by consolidated entities that qualify as equity instruments considering that there is: a) nocontractual obligation to deliver cash or another financial asset; b) no predefined maturity date; and c) anunilateral option to defer interest payments or preferred dividends for indeterminate periods.
2O) REVENUE RECOGNITION (note 3)
CEMEX’s consolidated net sales represent the value, before tax on sales, of revenues originated by products andservices sold by consolidated subsidiaries as a result of their ordinary activities, after the elimination oftransactions between related parties, and are quantified at the fair value of the consideration received orreceivable, decreased by any trade discounts or volume rebates granted to customers.
Revenue from the sale of goods and services is recognized when goods are delivered or services are rendered tocustomers, there is no condition or uncertainty implying a reversal thereof, and they have assumed the risk ofloss. Revenue from trading activities, in which CEMEX acquires finished goods from a third party andsubsequently sells the goods to another third-party, are recognized on a gross basis, considering that CEMEXassumes the total risk on the goods purchased, not acting as agent or broker.
Revenue and costs related to construction contracts are recognized in the period in which the work is performedby reference to the contract’s stage of completion at the end of the period, considering that the following havebeen defined: a) each party’s enforceable rights regarding the asset under construction; b) the consideration to beexchanged; c) the manner and terms of settlement; d) actual costs incurred and contract costs required tocomplete the asset are effectively controlled; and e) it is probable that the economic benefits associated with thecontract will flow to the entity.
The stage of completion of construction contracts represents the proportion that contract costs incurred for workperformed to date bear to the estimated total contract costs or the surveys of work performed or the physicalproportion of the contract work completed, whichever better reflects the percentage of completion under thespecific circumstances. Progress payments and advances received from customers do not reflect the workperformed and are recognized as a short or long term advanced payments, as appropriate.
2P) COST OF SALES AND OPERATING EXPENSES (note 5)
Cost of sales represents the production cost of inventories at the moment of sale. Such cost of sales includesdepreciation, amortization and depletion of assets involved in production, expenses related to storage inproduction plants and freight expenses of raw material in plants and delivery expenses of CEMEX’s ready-mixconcrete business.
Administrative expenses represent the expenses associated with personnel, services and equipment, includingdepreciation and amortization, related to managerial activities and back office for the Company’s management.
F-22
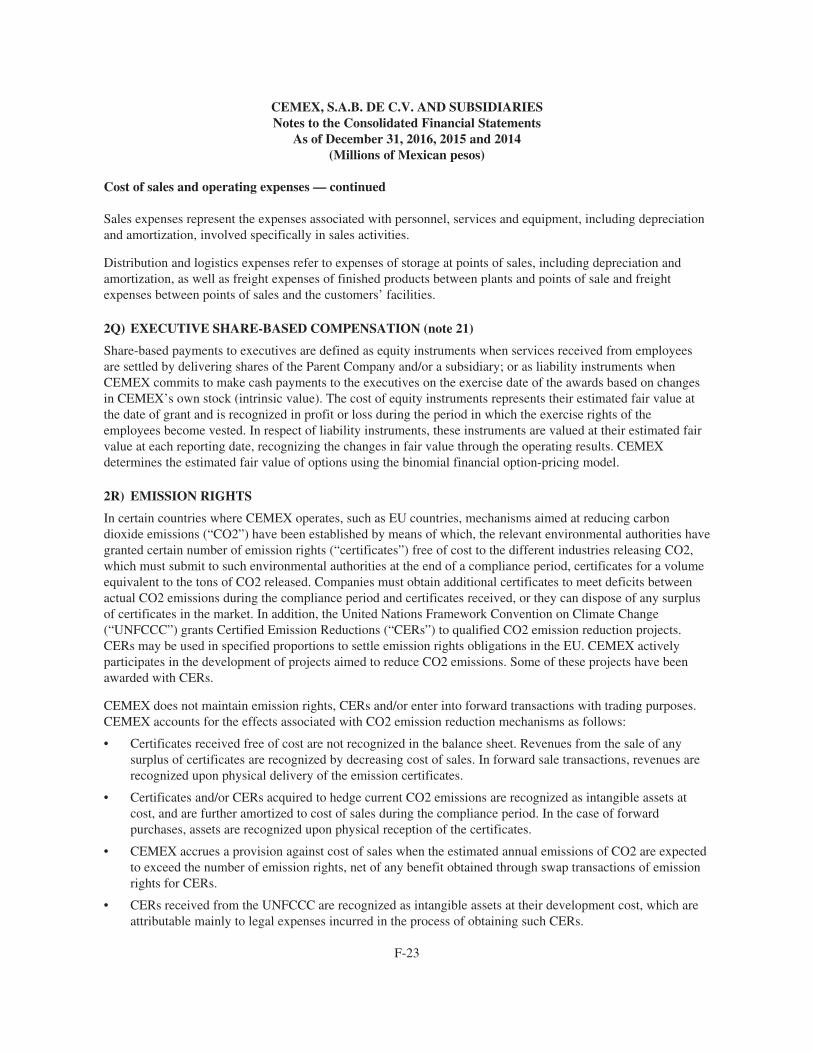
CEMEX, S.A.B. DE C.V. AND SUBSIDIARIESNotes to the Consolidated Financial Statements
As of December 31, 2016, 2015 and 2014(Millions of Mexican pesos)
Cost of sales and operating expenses — continued
Sales expenses represent the expenses associated with personnel, services and equipment, including depreciationand amortization, involved specifically in sales activities.
Distribution and logistics expenses refer to expenses of storage at points of sales, including depreciation andamortization, as well as freight expenses of finished products between plants and points of sale and freightexpenses between points of sales and the customers’ facilities.
2Q) EXECUTIVE SHARE-BASED COMPENSATION (note 21)
Share-based payments to executives are defined as equity instruments when services received from employeesare settled by delivering shares of the Parent Company and/or a subsidiary; or as liability instruments whenCEMEX commits to make cash payments to the executives on the exercise date of the awards based on changesin CEMEX’s own stock (intrinsic value). The cost of equity instruments represents their estimated fair value atthe date of grant and is recognized in profit or loss during the period in which the exercise rights of theemployees become vested. In respect of liability instruments, these instruments are valued at their estimated fairvalue at each reporting date, recognizing the changes in fair value through the operating results. CEMEXdetermines the estimated fair value of options using the binomial financial option-pricing model.
2R) EMISSION RIGHTS
In certain countries where CEMEX operates, such as EU countries, mechanisms aimed at reducing carbondioxide emissions (“CO2”) have been established by means of which, the relevant environmental authorities havegranted certain number of emission rights (“certificates”) free of cost to the different industries releasing CO2,which must submit to such environmental authorities at the end of a compliance period, certificates for a volumeequivalent to the tons of CO2 released. Companies must obtain additional certificates to meet deficits betweenactual CO2 emissions during the compliance period and certificates received, or they can dispose of any surplusof certificates in the market. In addition, the United Nations Framework Convention on Climate Change(“UNFCCC”) grants Certified Emission Reductions (“CERs”) to qualified CO2 emission reduction projects.CERs may be used in specified proportions to settle emission rights obligations in the EU. CEMEX activelyparticipates in the development of projects aimed to reduce CO2 emissions. Some of these projects have beenawarded with CERs.
CEMEX does not maintain emission rights, CERs and/or enter into forward transactions with trading purposes.CEMEX accounts for the effects associated with CO2 emission reduction mechanisms as follows:
• Certificates received free of cost are not recognized in the balance sheet. Revenues from the sale of anysurplus of certificates are recognized by decreasing cost of sales. In forward sale transactions, revenues arerecognized upon physical delivery of the emission certificates.
• Certificates and/or CERs acquired to hedge current CO2 emissions are recognized as intangible assets atcost, and are further amortized to cost of sales during the compliance period. In the case of forwardpurchases, assets are recognized upon physical reception of the certificates.
• CEMEX accrues a provision against cost of sales when the estimated annual emissions of CO2 are expectedto exceed the number of emission rights, net of any benefit obtained through swap transactions of emissionrights for CERs.
• CERs received from the UNFCCC are recognized as intangible assets at their development cost, which areattributable mainly to legal expenses incurred in the process of obtaining such CERs.
F-23

CEMEX, S.A.B. DE C.V. AND SUBSIDIARIESNotes to the Consolidated Financial Statements
As of December 31, 2016, 2015 and 2014(Millions of Mexican pesos)
Emission rights — continued
During 2016, 2015 and 2014, there were no sales of emission rights to third parties. In addition, in certaincountries, the environmental authorities impose levies per ton of CO2 or other greenhouse gases released. Suchexpenses are recognized as part of cost of sales as incurred.
2S) CONCENTRATION OF CREDIT
CEMEX sells its products primarily to distributors in the construction industry, with no specific geographicconcentration within the countries in which CEMEX operates. As of and for the years ended December 31, 2016,2015 and 2014, no single customer individually accounted for a significant amount of the reported amounts ofsales or in the balances of trade receivables. In addition, there is no significant concentration of a specificsupplier relating to the purchase of raw materials.
2T) NEWLY ISSUED IFRS NOT YET ADOPTED
There are a number of IFRS issued as of the date of issuance of these financial statements but which have not yetbeen adopted, which are listed below. Except as otherwise indicated, CEMEX expects to adopt these IFRS whenthey become effective.
• IFRS 9, Financial instruments: classification and measurement (“IFRS 9”). IFRS 9 sets forth the guidancerelating to the classification and measurement of financial assets and liabilities, to the accounting forexpected credit losses on an entity’s financial assets and commitments to extend credits, as well as therequirements related to hedge accounting; and will replace IAS 39, Financial instruments: recognition andmeasurement (“IAS 39”) in its entirety. IFRS 9 requires an entity to recognize a financial asset or a financialliability when, and only when, the entity becomes party to the contractual provisions of the instrument. Atinitial recognition, an entity shall measure a financial asset or financial liability at its fair value plus orminus, in the case of a financial asset or financial liability not at fair value through profit or loss, transactioncosts that are directly attributable to the acquisition or issue of the financial asset or financial liability, andincludes a category of financial assets at fair value through other comprehensive income (loss) for simpledebt instruments. In respect to impairment requirements, IFRS 9 eliminates the threshold set forth in IAS 39for the recognition of credit losses. Under the impairment approach in IFRS 9 it is no longer necessary for acredit event to have occurred before credit losses are recognized, instead, an entity always accounts forexpected credit losses, and changes in those expected losses through profit or loss. In respect to hedgingactivities, the requirements of IFRS 9 align hedge accounting more closely with an entity’s risk managementthrough a principles-based approach, by means of which, among other changes; the current range of 0.8 to1.25 to declare and maintain a hedge is eliminated, and in its place, under IFRS 9, a hedging instrument willbe declared only if it supports the entity’s risk management strategy. Nonetheless, the IASB providedentities with an accounting policy choice between applying the hedge accounting requirements of IFRS 9 orcontinuing to apply the existing hedge accounting requirements in IAS 39; until the IASB completes itsproject on the accounting for macro hedging.
CEMEX is currently evaluating the impact that IFRS 9 will have on the classification and measurement ofits financial assets and financial liabilities, impairment of financial assets and hedging activities.Preliminarily: a) CEMEX does not maintain fixed income investments held to maturity; and b) it isconsidered that the expected loss on trade receivables will replace the current allowance for doubtfulaccounts. The Company is considering the full adoption of IFRS 9 on January 1, 2018, including hedgeaccounting. CEMEX does not expect any significant effect in its results from the adoption of IFRS 9.Nonetheless, CEMEX is not considering an early application of IFRS 9.
F-24

CEMEX, S.A.B. DE C.V. AND SUBSIDIARIESNotes to the Consolidated Financial Statements
As of December 31, 2016, 2015 and 2014(Millions of Mexican pesos)
Newly issued ifrs not yet adopted — continued
• In May 2014, the IASB issued IFRS 15, Revenue from contracts with customers (“IFRS 15”). Under IFRS 15,an entity recognizes revenue to depict the transfer of promised goods or services to customers in an amountthat reflects the consideration to which the entity expects to be entitled in exchange for those goods or services,following a five step model: Step 1: Identify the contract(s) with a customer, which is an agreement betweentwo or more parties that creates enforceable rights and obligations; Step 2: Identify the performanceobligations in the contract, considering that if a contract includes promises to transfer distinct goods or servicesto a customer, the promises are performance obligations and are accounted for separately; Step 3: Determinethe transaction price, which is the amount of consideration in a contract to which an entity expects to beentitled in exchange for transferring promised goods or services to a customer; Step 4: Allocate the transactionprice to the performance obligations in the contract, on the basis of the relative stand-alone selling prices ofeach distinct good or service promised in the contract; and Step 5: Recognize revenue when (or as) the entitysatisfies a performance obligation, by transferring a promised good or service to a customer (which is when thecustomer obtains control of that good or service). A performance obligation may be satisfied at a point in time(typically for promises to transfer goods to a customer) or over time (typically for promises to transfer servicesto a customer). IFRS 15 also includes disclosure requirements that would provide users of financial statementswith comprehensive information about the nature, amount, timing and uncertainty of revenue and cash flowsarising from the entity’s contracts with customers. IFRS 15 will supersede all existing guidance on revenuerecognition. IFRS 15 is effective for annual periods beginning on or after January 1, 2018, with early adoptionpermitted considering certain additional disclosure requirements.
CEMEX started in 2015 the evaluation of the impact that IFRS 15 will have on its accounting and disclosuresrelated to its revenue. As of the reporting date, CEMEX has analyzed its contracts with customers in all countriesin which it operates in order to indentify the several performance obligations and other offerings (discounts,loyalty programs, etc.) included in such contracts, among other aspects, aimed to determine potential differencesin the accounting recognition of revenues in respect to current IFRS. In addition, CEMEX has provided trainingin IFRS 15 to key personnel with the support of external experts and has developed an online training.Preliminarily, considering its assessments at the reporting date, the nature of its business, its main transactionsand current accounting policies, the fact that the transaction price is allocated to goods delivered or servicesrendered to customers when customers have assumed the risk of loss, CEMEX does not expect a significant effectin the timing of its accounting of its revenue from the adoption of IFRS 15. During 2017, CEMEX plans tocomplete its assessment and quantify any adjustment that would be necessary if certain portion of revenue thatcurrently is being recognized at the transaction date or deferred during time, as applicable, should otherwise berecognized differently upon the adoption of IFRS 15. Beginning January 1, 2018, CEMEX plans to adopt IFRS15 using the full retrospective approach. CEMEX is not considering the early application of IFRS 15.
• On January 13, 2016, the IASB issued IFRS 16, Leases (“IFRS 16”), which will supersede all currentstandards and interpretations related to lease accounting. IFRS 16, defines leases as any contract or part of acontract that conveys to the lessee the right to use an asset for a period of time in exchange for considerationand the lessee directs the use of the identified asset throughout that period. In summary, IFRS 16 introduces asingle lessee accounting model, and requires a lessee to recognize, for all leases with a term of more than 12months, unless the underlying asset is of low value, assets for the right-of-use the underlying asset against acorresponding financial liability, representing the NPV of estimated lease payments under the contract, with asingle income statement model in which a lessee recognizes depreciation of the right-of-use asset and intereston the lease liability. A lessee shall present either in the balance sheet, or disclose in the notes, right-of-useassets separately from other assets, as well as, lease liabilities separately from other liabilities. IFRS 16 iseffective beginning January 1, 2019, with early adoption permitted considering certain requirements.
F-25
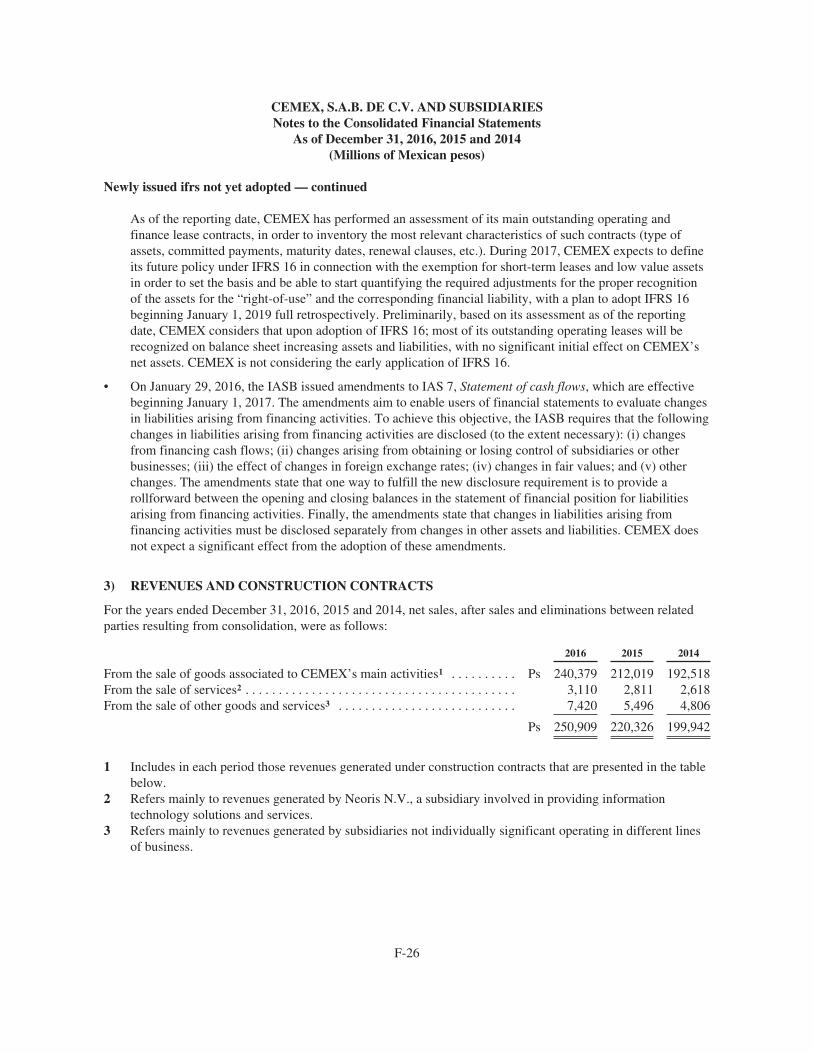
CEMEX, S.A.B. DE C.V. AND SUBSIDIARIESNotes to the Consolidated Financial Statements
As of December 31, 2016, 2015 and 2014(Millions of Mexican pesos)
Newly issued ifrs not yet adopted — continued
As of the reporting date, CEMEX has performed an assessment of its main outstanding operating andfinance lease contracts, in order to inventory the most relevant characteristics of such contracts (type ofassets, committed payments, maturity dates, renewal clauses, etc.). During 2017, CEMEX expects to defineits future policy under IFRS 16 in connection with the exemption for short-term leases and low value assetsin order to set the basis and be able to start quantifying the required adjustments for the proper recognitionof the assets for the “right-of-use” and the corresponding financial liability, with a plan to adopt IFRS 16beginning January 1, 2019 full retrospectively. Preliminarily, based on its assessment as of the reportingdate, CEMEX considers that upon adoption of IFRS 16; most of its outstanding operating leases will berecognized on balance sheet increasing assets and liabilities, with no significant initial effect on CEMEX’snet assets. CEMEX is not considering the early application of IFRS 16.
• On January 29, 2016, the IASB issued amendments to IAS 7, Statement of cash flows, which are effectivebeginning January 1, 2017. The amendments aim to enable users of financial statements to evaluate changesin liabilities arising from financing activities. To achieve this objective, the IASB requires that the followingchanges in liabilities arising from financing activities are disclosed (to the extent necessary): (i) changesfrom financing cash flows; (ii) changes arising from obtaining or losing control of subsidiaries or otherbusinesses; (iii) the effect of changes in foreign exchange rates; (iv) changes in fair values; and (v) otherchanges. The amendments state that one way to fulfill the new disclosure requirement is to provide arollforward between the opening and closing balances in the statement of financial position for liabilitiesarising from financing activities. Finally, the amendments state that changes in liabilities arising fromfinancing activities must be disclosed separately from changes in other assets and liabilities. CEMEX doesnot expect a significant effect from the adoption of these amendments.
3) REVENUES AND CONSTRUCTION CONTRACTS
For the years ended December 31, 2016, 2015 and 2014, net sales, after sales and eliminations between relatedparties resulting from consolidation, were as follows:
2016 2015 2014
From the sale of goods associated to CEMEX’s main activities1 . . . . . . . . . . Ps 240,379 212,019 192,518From the sale of services2 . . . . . . . . . . . . . . . . . . . . . . . . . . . . . . . . . . . . . . . . . 3,110 2,811 2,618From the sale of other goods and services3 . . . . . . . . . . . . . . . . . . . . . . . . . . . 7,420 5,496 4,806
Ps 250,909 220,326 199,942
1 Includes in each period those revenues generated under construction contracts that are presented in the tablebelow.
2 Refers mainly to revenues generated by Neoris N.V., a subsidiary involved in providing informationtechnology solutions and services.
3 Refers mainly to revenues generated by subsidiaries not individually significant operating in different linesof business.
F-26

CEMEX, S.A.B. DE C.V. AND SUBSIDIARIESNotes to the Consolidated Financial Statements
As of December 31, 2016, 2015 and 2014(Millions of Mexican pesos)
Revenues and construction contracts — continued
For the years ended December 31, 2016, 2015 and 2014, revenues and costs related to construction contracts inprogress were as follows:
Recognized todate1 2016 2015 2014
Revenue from construction contracts included in consolidated net sales 2 . . . Ps 4,066 1,033 994 1,507Costs incurred in construction contracts included in consolidated cost of
sales 3 . . . . . . . . . . . . . . . . . . . . . . . . . . . . . . . . . . . . . . . . . . . . . . . . . . . . . . (3,185) (1,133)(919)(1,332)
Construction contracts gross operating profit (loss) . . . . . . . . . . . . . . . . . . . . Ps 881 (100) 75 175
1 Revenues and costs recognized from inception of the contracts until December 31, 2016 in connection withthose projects still in progress.
2 Revenues from construction contracts during 2016, 2015 and 2014, determined under the percentage ofcompletion method, were mainly obtained in Mexico and Colombia.
3 Refers to actual costs incurred during the periods. The oldest contract in progress as of December 31, 2016started in 2010.
As of December 31, 2016 and 2015, amounts receivable for progress billings to customers of constructioncontracts and/or advances received by CEMEX from these customers were not significant.
4) DISCONTINUED OPERATIONS, SALE OF OTHER DISPOSAL GROUPS AND SELECTEDFINANCIAL INFORMATION BY GEOGRAPHIC OPERATING SEGMENT
4A) DISCONTINUED OPERATIONS
On November 28, 2016, CEMEX announced that one of its subsidiaries in the United States signed a definitiveagreement to divest its Concrete Reinforced Pipe Manufacturing Business (“Concrete Pipe Business”) in theUnited States to Quikrete Holdings, Inc. (“Quikrete”) for approximately US$500 plus an additional US$40contingent consideration based on future performance. The closing of this transaction is subject to the satisfactionof certain conditions, including approval from regulators. CEMEX currently expects to finalize this sale duringthe first quarter of 2017. Considering the disposal of the entire concrete pipe division, the operations of the PipeBusiness for the years ended December 31, 2016, 2015 and 2014, included in CEMEX’s statements of operationswere reclassified to the single line item “Discontinued operations”. In addition, the balance sheet of CEMEX’sPipe Business as of December 31, 2016 was reclassified to assets held for sale and directly related liabilities onthe face of the consolidated balance sheet, including approximately US$260 (Ps5,369) of goodwill associated tothe reporting segment in the United States that was proportionally allocated to these net assets based on theirrelative fair values (see note 26).
On May 26, 2016, CEMEX closed the sale of its operations in Bangladesh and Thailand to Siam City CementPublic Company Ltd. for approximately US$70 (Ps1,450), generating a net gain on sale of approximately US$24(Ps424) and included in the statement of operations in 2016 within the line item “Discontinued operations”,which includes the reclassification of foreign currency translation gains associated with these operations accruedin equity until disposal for approximately US$7 (Ps122).
With effective date October 31, 2015, after all agreed upon conditions precedent were satisfied, CEMEXcompleted the process for the sale of its operations in Austria and Hungary that started on August 12, 2015 to the
F-27

CEMEX, S.A.B. DE C.V. AND SUBSIDIARIESNotes to the Consolidated Financial Statements
As of December 31, 2016, 2015 and 2014(Millions of Mexican pesos)
Discontinued operations — continued
Rohrdorfer Group for approximately €165 (US$179 or Ps3,090), after final adjustments negotiated for changes incash and working capital balances as of the transfer date. The combined operations in Austria and Hungaryconsisted of 29 aggregate quarries and 68 ready-mix plants. The operations in Austria and Hungary for theten-month period ended October 31, 2015 and the year ended December 31, 2014, included in CEMEX’sstatements of operations, were reclassified to the single line item “Discontinued operations”, which includes, in2015, a gain on sale of approximately US$45 (Ps741). Such gain on sale includes the reclassification to thestatement of operations of foreign currency translation gains accrued in equity until October 31, 2015 for anamount of approximately US$10 (Ps215).
In addition, on August 12, 2015, CEMEX agreed with Duna-Dráva Cement, the sale of its Croatia operations,including assets in Bosnia and Herzegovina, Montenegro and Serbia, for approximately €231 (US$243 orPs5,032), amount that is subject to final adjustments negotiated for changes in cash and working capital balancesas of the change of control date. The operations in Croatia, including assets in Bosnia and Herzegovina,Montenegro and Serbia, mainly consist of three cement plants with aggregate annual production capacity ofapproximately 2.4 million tons of cement, two aggregates quarries and seven ready-mix plants. As ofDecember 31, 2016, after the compliance of customary conditions precedent agreed by the parties, the closing ofthis transaction is still subject to approval from the relevant authorities. CEMEX expects to conclude the sale ofits operations in Croatia, including assets in Bosnia and Herzegovina, Montenegro and Serbia, in the short-term.The operations in Croatia, including assets in Bosnia and Herzegovina, Montenegro and Serbia, for the yearsended December 31, 2016, 2015 and 2014, included in CEMEX’s statements of operations were reclassified, tothe single line item “Discontinued operations”.
The following table presents condensed combined information of the statement of operations of CEMEX’sdiscontinued operations in Bangladesh and Thailand for the five-months period ended May 31, 2016 and for theyears ended December 31, 2015 and 2014, in Austria and Hungary for the ten-months period ended October 31,2015 and for the year ended December 31, 2014; as well as of CEMEX’s operations in Croatia, including assetsin Bosnia and Herzegovina, Montenegro and Serbia, and the Pipe Business in the United States for the yearsended December 31, 2016, 2015 and 2014:
2016 2015 2014
Sales . . . . . . . . . . . . . . . . . . . . . . . . . . . . . . . . . . . . . . . . . . . . . . . . . . . . . . . . . . . . Ps 8,016 10,861 10,081Cost of sales and operating expenses . . . . . . . . . . . . . . . . . . . . . . . . . . . . . . . . . . . (7,198) (10,251) (9,750)Other products (expenses), net . . . . . . . . . . . . . . . . . . . . . . . . . . . . . . . . . . . . . . . (15) 33 (83)Financial expenses, net and others . . . . . . . . . . . . . . . . . . . . . . . . . . . . . . . . . . . . . (25) (65) (55)
Earnings before income tax . . . . . . . . . . . . . . . . . . . . . . . . . . . . . . . . . . . . . . . . 778 578 193Income tax . . . . . . . . . . . . . . . . . . . . . . . . . . . . . . . . . . . . . . . . . . . . . . . . . . . . . . . (130) (34) (103)
Net income . . . . . . . . . . . . . . . . . . . . . . . . . . . . . . . . . . . . . . . . . . . . . . . . . . . . . . 648 544 90Net income of non-controlling interest . . . . . . . . . . . . . . . . . . . . . . . . . . . . . . . 1 6 —
Net income of controlling interest . . . . . . . . . . . . . . . . . . . . . . . . . . . . . . . . . . . Ps 647 538 90
As of December 31, 2016 and 2015, the balance sheets of CEMEX’s Croatian discontinued operations, includingits assets in Bosnia and Herzegovina, Montenegro and Serbia, were reclassified to current assets and currentliabilities held for sale. In addition, as mentioned above, the balance sheet of CEMEX’s Pipe Business as of
F-28

CEMEX, S.A.B. DE C.V. AND SUBSIDIARIESNotes to the Consolidated Financial Statements
As of December 31, 2016, 2015 and 2014(Millions of Mexican pesos)
Discontinued operations — continued
December 31, 2016 was reclassified to current assets and current liabilities held for sale. Selected combinedcondensed financial information of balance sheet of these operations was as follows:
2016 2015
Current assets . . . . . . . . . . . . . . . . . . . . . . . . . . . . . . . . . . . . . . . . . . . . . . . . . . . . . . . . . . . . . . Ps 1,570 438Property, machinery and equipment, net . . . . . . . . . . . . . . . . . . . . . . . . . . . . . . . . . . . . . . . . . 5,798 2,562Intangible assets, net and other non-current assets . . . . . . . . . . . . . . . . . . . . . . . . . . . . . . . . . 6,222 446
Total assets held for sale . . . . . . . . . . . . . . . . . . . . . . . . . . . . . . . . . . . . . . . . . . . . . . . . 13,590 3,446
Current liabilities . . . . . . . . . . . . . . . . . . . . . . . . . . . . . . . . . . . . . . . . . . . . . . . . . . . . . . . . . . . 599 442Non-current liabilities . . . . . . . . . . . . . . . . . . . . . . . . . . . . . . . . . . . . . . . . . . . . . . . . . . . . . . . 694 231
Total liabilities directly related to assets held for sale . . . . . . . . . . . . . . . . . . . . . . . . 1,293 673
Net assets held for sale . . . . . . . . . . . . . . . . . . . . . . . . . . . . . . . . . . . . . . . . . . . . . . . . . Ps 12,297 2,773
The balance sheet of CEMEX as of December 31, 2015 was not restated as a result of the expected sale of itsConcrete Pipe Business nor for the sale of the operations in Bangladesh and Thailand described above. Selectedcondensed combined financial information of balance sheet at this date of CEMEX’s Concrete Pipe Business,Bangladesh and Thailand was as follows:
2015
Current assets . . . . . . . . . . . . . . . . . . . . . . . . . . . . . . . . . . . . . . . . . . . . . . . . . . . . . . . . . . . . . . . . . . . . . Ps 832Property, machinery and equipment, net . . . . . . . . . . . . . . . . . . . . . . . . . . . . . . . . . . . . . . . . . . . . . . . . 2,446Intangible assets, net and other non-current assets . . . . . . . . . . . . . . . . . . . . . . . . . . . . . . . . . . . . . . . . . 4,921
Total assets . . . . . . . . . . . . . . . . . . . . . . . . . . . . . . . . . . . . . . . . . . . . . . . . . . . . . . . . . . . . . . . . . . 8,199
Current liabilities . . . . . . . . . . . . . . . . . . . . . . . . . . . . . . . . . . . . . . . . . . . . . . . . . . . . . . . . . . . . . . . . . . 70Non-current liabilities . . . . . . . . . . . . . . . . . . . . . . . . . . . . . . . . . . . . . . . . . . . . . . . . . . . . . . . . . . . . . . . 387
Total liabilities . . . . . . . . . . . . . . . . . . . . . . . . . . . . . . . . . . . . . . . . . . . . . . . . . . . . . . . . . . . . . . . 457
Net assets . . . . . . . . . . . . . . . . . . . . . . . . . . . . . . . . . . . . . . . . . . . . . . . . . . . . . . . . . . . . . . . . . . . . Ps 7,742
4B) OTHER DISPOSAL GROUPS
On November 18, 2016, a subsidiary of CEMEX in the United States closed the sale to an affiliate of GrupoCementos de Chihuahua, S.A.B. de C.V. (“GCC”) of certain assets consisting in CEMEX’s cement plant inOdessa, Texas, two cement terminals and the building materials business in El Paso, Texas and Las Cruces, NewMexico, for an amount of approximately US$306 (Ps6,340). Odessa plant has an annual production capacity ofapproximately 537 thousand tons. The transfer of control was effective on November 18, 2016. As a result of thesale of these assets, CEMEX recognized a net gain of approximately US$104 (Ps2,159) as part of “Otherexpenses, net” in the statement of operations, which includes an expense related to the proportional write off ofgoodwill associated to CEMEX’s reporting segment in the United States based on their relative fair values forapproximately US$161 (Ps3,340) and the reclassification of proportional foreign currency translation gainsassociated with these net assets accrued in equity until disposal for approximately US$65 (Ps1,347).
On September 12, 2016, CEMEX announced that one of its subsidiaries in the United States signed a definitiveagreement for the sale of its Fairborn, Ohio cement plant and cement terminal in Columbus, Ohio to Eagle
F-29

CEMEX, S.A.B. DE C.V. AND SUBSIDIARIESNotes to the Consolidated Financial Statements
As of December 31, 2016, 2015 and 2014(Millions of Mexican pesos)
Other disposal groups — continued
Materials Inc. (“Eagle Materials”) for approximately US$400 (Ps8,288). Fairborn plant has an annual productioncapacity of approximately 730 thousand tons. The closing of this transaction is subject to the satisfaction ofcertain conditions, including approval from regulators. CEMEX currently expects to finalize this divestitureduring the first quarter of 2017. The balance sheet of these assets as of December 31, 2016 was reclassified toassets held for sale and liabilities directly related to assets held for sale (note 12A), including approximatelyUS$211 (Ps4,365) of goodwill associated to the reporting segment in the United States that was proportionallyallocated to these net assets based on their relative fair values.
The operations of the net assets sold to GCC on November 18, 2016 and those expected to be sold to EagleMaterials, mentioned above, did not represent discontinued operations and were consolidated by CEMEXline-by-line for all the periods presented in the statement of operations. In arriving to this conclusion, CEMEXevaluated: a) the Company’s ongoing cement operations on its CGUs in Texas and the East coast; and b) therelative size of the net assets sold and held for sale in respect to the Company’s remaining overall ongoingcement operations in the United States. Moreover, as a reasonability check, CEMEX measured the materiality ofsuch net assets using a threshold of 5% of consolidated net sales, operating earnings before other expenses, netgain (loss) and total assets. In no case was the 5% threshold reached.
For 2016, 2015 and 2014, selected combined statement of operations information of the net assets sold to GCCon November 18, 2016 and those expected to be sold to Eagle Materials was as follows:
2016 2015 2014
Net sales . . . . . . . . . . . . . . . . . . . . . . . . . . . . . . . . . . . . . . . . . . . . . . . . . . . . . . . . . . Ps 3,122 3,538 4,465Operating costs and expenses . . . . . . . . . . . . . . . . . . . . . . . . . . . . . . . . . . . . . . . . . . (2,450) (2,795) (3,240)
Operating earnings before other expenses, net . . . . . . . . . . . . . . . . . . . . . . . . . . Ps 672 743 1,225
As of December 31, 2016, the condensed balance sheet of the net assets expected to be sold to Eagle Materialswas as follows:
2016
Current assets . . . . . . . . . . . . . . . . . . . . . . . . . . . . . . . . . . . . . . . . . . . . . . . . . . . . . . . . . . . . . . . . . . . . . Ps 123Non-current assets . . . . . . . . . . . . . . . . . . . . . . . . . . . . . . . . . . . . . . . . . . . . . . . . . . . . . . . . . . . . . . . . . 5,834
Total assets of the disposal group . . . . . . . . . . . . . . . . . . . . . . . . . . . . . . . . . . . . . . . . . . . . . . . . 5,957Current liabilities . . . . . . . . . . . . . . . . . . . . . . . . . . . . . . . . . . . . . . . . . . . . . . . . . . . . . . . . . . . . . . . . . . 6Non-current liabilities . . . . . . . . . . . . . . . . . . . . . . . . . . . . . . . . . . . . . . . . . . . . . . . . . . . . . . . . . . . . . . . 158
Total liabilities directly related to disposal group . . . . . . . . . . . . . . . . . . . . . . . . . . . . . . . . . . . 164
Total net assets of disposal group . . . . . . . . . . . . . . . . . . . . . . . . . . . . . . . . . . . . . . . . . . . . . . . . Ps 5,793
In addition, on December 2, 2016, CEMEX agreed the definite transfer of its assets and activities related to theready-mix concrete pumping in Mexico to Cementos Españoles de Bombeo, S. de R.L., subsidiary in Mexico ofPumping Team S.L.L. (“Pumping Team”), specialist in the supply of ready-mix concrete pumping services basedin Spain, for US$80 (Ps1,658), which includes the sale of fixed assets upon closing of the transaction forapproximately US$15 (Ps311) plus administrative and client and market development services, as well as the
F-30

CEMEX, S.A.B. DE C.V. AND SUBSIDIARIESNotes to the Consolidated Financial Statements
As of December 31, 2016, 2015 and 2014(Millions of Mexican pesos)
Other disposal groups — continued
lease of facilities that CEMEX will supply to Pumping Team over a period of ten years with the possibility toextend for three additional years, for an aggregate initial amount of approximately US$65 (Ps1,347), plus acontingent revenue subject to results for up to US$29 (Ps601) linked to annual metrics beginning in the first yearand up to the fifth year of the agreement. As of December 31, 2016, the closing of the transaction is subject tocertain conditions, including approval by the Mexican authorities. CEMEX expects to conclude this transactionduring the first quarter of 2017.
Effective January 1, 2015, as part of a series of related transactions agreed on October 31, 2014 with Holcim Ltd.(“Holcim”), then a global producer of building materials based in Switzerland, currently LafargeHolcim after themerger of Holcim with Lafarge, S.A., during 2015, CEMEX sold to Holcim its assets in the western region ofGermany, consisting of one cement plant, two cement grinding mills, one slag granulator, 22 aggregates quarriesand 79 ready-mix plants for approximately €171 (US$207 or Ps3,047), while CEMEX maintained its operationsin the northern, eastern and southern regions of the country. The operations of the net assets sold by CEMEX toHolcim were consolidated by CEMEX line-by-line for the year ended December 31, 2014, considering that thistransaction did not represent the disposal of entire reportable operating segment. In arriving to this conclusion,CEMEX evaluated: a) the Company’s remaining operations in the North, East and South regions of Germany;and b) the relative size of the net assets sold in respect to the Company’s remaining overall ongoing operations insuch country. Moreover, as a reasonability check, CEMEX measured the materiality of such net assets using athreshold of 5% of consolidated net sales, operating earnings before other expenses, net, net income (loss) andtotal assets. In any case the 5% threshold was reached.
For the year 2014, selected combined statement of operations information of the net assets sold in Germany wasas follows:
2014
Net sales . . . . . . . . . . . . . . . . . . . . . . . . . . . . . . . . . . . . . . . . . . . . . . . . . . . . . . . . . . . . . . . . . . . . . . . . Ps 6,655Operating costs and expenses . . . . . . . . . . . . . . . . . . . . . . . . . . . . . . . . . . . . . . . . . . . . . . . . . . . . . . . . (6,428)
Operating earnings before other expenses, net . . . . . . . . . . . . . . . . . . . . . . . . . . . . . . . . . . . . . . . . Ps 227
During 2014, CEMEX sold significantly all the operating assets of Readymix plc (“Readymix”), CEMEX’s mainoperating subsidiary in the Republic of Ireland, and an indirect subsidiary of CEMEX España, for €19 (US$23 orPs339), recognizing a loss on sale of approximately €14 (US$17 or Ps250).
4C) SELECTED FINANCIAL INFORMATION BY GEOGRAPHIC OPERATING SEGMENT
Geographic operating segments represent the components of CEMEX that engage in business activities fromwhich CEMEX may earn revenues and incur expenses, whose operating results are regularly reviewed by theentity’s top management to make decisions about resources to be allocated to the segments and assess theirperformance, and for which discrete financial information is available.
CEMEX’s main activities are oriented to the construction industry segment through the production, distribution,marketing and sale of cement, ready-mix concrete, aggregates and other construction materials. CEMEX operatesgeographically on a regional basis. Effective January 1, 2016, according to an announcement made by CEMEX’sChief Executive Officer (“CEO”), the Company’s operations were reorganized into five geographical regions,
F-31

CEMEX, S.A.B. DE C.V. AND SUBSIDIARIESNotes to the Consolidated Financial Statements
As of December 31, 2016, 2015 and 2014(Millions of Mexican pesos)
Selected financial information by geographic operating segment — continued
each under the supervision of a regional president, as follows: 1) Mexico, 2) United States, 3) Europe, 4) South,Central America and the Caribbean, and 5) Asia, Middle East and Africa. Each regional president supervises andis responsible for all the business activities in the countries comprising the region. These activities refer to theproduction, distribution, marketing and sale of cement, ready-mix concrete, aggregates and other constructionmaterials, the allocation of resources and the review of their performance and operating results. All regionalpresidents report directly to CEMEX’s CEO. The country manager, who is one level below the regional presidentin the organizational structure, reports the performance and operating results of its country to the regionalpresident, including all the operating sectors. CEMEX’s top management internally evaluates the results andperformance of each country and region for decision-making purposes and allocation of resources, following avertical integration approach considering: a) that the operating components that comprise the reported segmenthave similar economic characteristics; b) that the reported segments are used by CEMEX to organize andevaluate its activities in its internal information system; c) the homogeneous nature of the items produced andtraded in each operative component, which are all used by the construction industry; d) the vertical integration inthe value chain of the products comprising each component; e) the type of clients, which are substantially similarin all components; f) the operative integration among components; and g) that the compensation system foremployees of a specific country is based on the consolidated results of the geographic segment and not on theparticular results of the components. In accordance with this approach, in CEMEX’s daily operations,management allocates economic resources and evaluates operating results on a country basis rather than on anoperating component basis. The financial information by geographic operating segment reported in the tablesbelow for the years ended December 31, 2015 and 2014 was restated in order to give effect to: a) thediscontinued operations described in note 4A, and b) the new geographical operating organization describedabove. Until December 31, 2015, CEMEX’s operations were organized into six geographical regions, also eachunder the supervision of a regional president: 1) Mexico, 2) United States, 3) Northern Europe, 4) Mediterranean,5) South, Central America and the Caribbean, and 6) Asia. Under the current operating organization, thegeographical operating segments under the former Mediterranean region were incorporated into the currentEurope region or the Asia, Middle East and Africa region, as corresponded.
Considering the financial information that is regularly reviewed by CEMEX’s top management, each of the fivegeographic regions in which CEMEX operates and the countries that comprise such regions represent reportableoperating segments. However, for disclosure purposes in the notes to the financial statements, considering similarregional and economic characteristics and/or the fact that certain countries do not exceed certain materialitythresholds to be reported separately, such countries have been aggregated and presented as single line items asfollows: a) “Rest of Europe” is mainly comprised of CEMEX’s operations in the Czech Republic, Poland andLatvia, as well as trading activities in Scandinavia and Finland; b) “Rest of South, Central America and theCaribbean” is mainly comprised of CEMEX’s operations in Costa Rica, Panama, Puerto Rico, the DominicanRepublic, Nicaragua, Jamaica and other countries in the Caribbean, Guatemala, and small ready-mix concreteoperations in Argentina; and c) “Rest of Asia, Middle East and Africa” is mainly comprised of CEMEX’soperations in the United Arab Emirates, Israel and Malaysia. The segment “Others” refers to: 1) cement trademaritime operations, 2) Neoris N.V., CEMEX’s subsidiary involved in the development of informationtechnology solutions, 3) the Parent Company and other corporate entities, and 4) other minor subsidiaries withdifferent lines of business.
The main indicator used by CEMEX’s management to evaluate the performance of each country is “OperatingEBITDA” representing operating earnings before other expenses, net, plus depreciation and amortization,considering that such amount represents a relevant measure for CEMEX’s management as an indicator of the
F-32

CEMEX, S.A.B. DE C.V. AND SUBSIDIARIESNotes to the Consolidated Financial Statements
As of December 31, 2016, 2015 and 2014(Millions of Mexican pesos)
Selected financial information by geographic operating segment — continued
ability to internally fund capital expenditures, as well as a widely accepted financial indicator to measureCEMEX’s ability to service or incur debt (note 16). Operating EBITDA should not be considered as an indicatorof CEMEX’s financial performance, as an alternative to cash flows, as a measure of liquidity, or as beingcomparable to other similarly titled measures of other companies. This indicator, which is presented in theselected financial information by geographic operating segment, is consistent with the information used byCEMEX’s management for decision-making purposes. The accounting policies applied to determine the financialinformation by geographic operating segment are consistent with those described in note 2. CEMEX recognizessales and other transactions between related parties based on market values.
Selected information of the consolidated statements of operations by geographic operating segment for the yearsended December 31, 2016, 2015 and 2014 was as follows:
2016
Net sales(including
relatedparties)
Less:Relatedparties Net sales
OperatingEBITDA
Less:Depreciation
andamortization
Operatingearnings
before otherexpenses, net
Otherexpenses,
netFinancialexpense
Otherfinancingitems, net
Mexico . . . . . . . . . . . . . . Ps 53,579 (848) 52,731 19,256 2,390 16,866 (608) (339) 2,695United States . . . . . . . . . . 68,553 — 68,553 11,159 6,605 4,554 2,911 (489) (205)EuropeUnited Kingdom . . . . . . . 21,153 — 21,153 3,606 1,047 2,559 711 (63) (393)Germany . . . . . . . . . . . . . 9,572 (1,385) 8,187 553 464 89 (64) (15) (85)France . . . . . . . . . . . . . . . 14,535 — 14,535 669 484 185 (110) (53) 2Spain . . . . . . . . . . . . . . . . 6,563 (841) 5,722 814 663 151 (112) (37) (9)Rest of Europe . . . . . . . . 10,881 (629) 10,252 1,420 914 506 (63) (23) 203South, Central America
and the Caribbean(“SAC”)
Colombia 1 . . . . . . . . . . . 12,415 (1) 12,414 3,975 489 3,486 (575) 46 38Rest of SAC 1 . . . . . . . . . 18,820 (1,252) 17,568 6,126 892 5,234 (1,255) (65) (150)Asia, Middle East and
Africa (“AMEA”)Egypt . . . . . . . . . . . . . . . . 6,950 (5) 6,945 2,454 539 1,915 (213) (78) (253)Philippines 2 . . . . . . . . . . 9,655 — 9,655 2,687 530 2,157 21 (1) (24)Rest of AMEA . . . . . . . . 12,676 (12) 12,664 1,607 325 1,282 (122) (27) (33)Others . . . . . . . . . . . . . . 19,128 (8,598) 10,530 (2,915) 805 (3,720) (2,167) (20,324) 2,655
Continuingoperations . . . . . . . . . 264,480 (13,571)250,909 51,411 16,147 35,264 (1,646) (21,468) 4,441
Discontinuedoperations . . . . . . . . . 8,223 (207) 8,016 1,355 537 818 (15) (29) 4
Total . . . . . . . . . . . . . . . . Ps 272,703 (13,778)258,925 52,766 16,684 36,082 (1,661) (21,497) 4,445
1 CEMEX Latam Holdings, S.A. (“CLH”), entity incorporated in Spain which since 2012 trades its ordinaryshares in the Colombian Stock Exchange under the symbol CLH is the indirect holding company ofCEMEX’s operations in Colombia, Panama, Costa Rica, Guatemala, El Salvador and Brazil. At year end2016, there is a non-controlling interest in CLH of approximately 26.72% of its ordinary shares, excludingshares held in CLH’s treasury.
F-33

CEMEX, S.A.B. DE C.V. AND SUBSIDIARIESNotes to the Consolidated Financial Statements
As of December 31, 2016, 2015 and 2014(Millions of Mexican pesos)
Selected financial information by geographic operating segment — continued
2 CEMEX’s operations in the Philippines are conducted through CEMEX Holdings Philippines, Inc. (“CHP”),subsidiary incorporated in the Philippines which since July 2016 trades its ordinary shares in the PhilippinesStock Exchange under the symbol CHP (note 20D). At year end 2016, there is a non-controlling interest inCHP of 45.0% of its ordinary shares.
2015
Net sales(including
relatedparties)
Less:Relatedparties Net sales
OperatingEBITDA
Less:Depreciation
andamortization
Operatingearnings
before otherexpenses, net
Otherexpenses,
netFinancialexpense
Otherfinancingitems, net
Mexico . . . . . . . . . . . . . . Ps 50,260 (5,648) 44,612 15,362 2,399 12,963 (684) (210) 915United States . . . . . . . . . 58,668 (18) 58,650 8,080 5,865 2,215 252 (439) (159)EuropeUnited Kingdom . . . . . . 20,227 — 20,227 2,705 1,004 1,701 (147) (95) (299)Germany . . . . . . . . . . . . 8,285 (1,276) 7,009 542 389 153 49 (14) (61)France . . . . . . . . . . . . . . 12,064 — 12,064 670 438 232 (8) (48) (10)Spain . . . . . . . . . . . . . . . 6,151 (755) 5,396 1,031 604 427 (735) (72) (2)Rest of Europe . . . . . . . . 10,010 (767) 9,243 1,419 972 447 (182) (57) (75)South, Central
America and theCaribbean (“SAC”)
Colombia . . . . . . . . . . . . 11,562 (2) 11,560 4,041 500 3,541 (88) (50) (570)Rest of SAC . . . . . . . . . . 19,169 (2,285) 16,884 5,211 844 4,367 (267) (43) (113)Asia, Middle East and
Africa (“AMEA”)Egypt . . . . . . . . . . . . . . . 6,923 (5) 6,918 1,777 536 1,241 (254) (115) 114Philippines . . . . . . . . . . . 8,436 (4) 8,432 2,206 447 1,759 (12) (20) 19Rest of AMEA . . . . . . . . 11,025 — 11,025 1,264 277 987 (69) (23) 97Others . . . . . . . . . . . . . . 17,058 (8,752) 8,306 (2,954) 590 (3,544) (898) (18,581) (1,091)
Continuingoperations . . . . . . . . . 239,838 (19,512)220,326 41,354 14,865 26,489 (3,043) (19,767) (1,235)
Discontinuedoperations . . . . . . . . . 10,918 (57) 10,861 1,381 771 610 33 (33) (32)
Total . . . . . . . . . . . . . . . Ps 250,756 (19,569)231,187 42,735 15,636 27,099 (3,010) (19,800) (1,267)
F-34

CEMEX, S.A.B. DE C.V. AND SUBSIDIARIESNotes to the Consolidated Financial Statements
As of December 31, 2016, 2015 and 2014(Millions of Mexican pesos)
Selected financial information by geographic operating segment — continued
2014
Net sales(including
relatedparties)
Less:Relatedparties Net sales
OperatingEBITDA
Less:Depreciation
andamortization
Operatingearningsbeforeother
expenses,net
Otherexpenses,
netFinancialexpense
Otherfinancingitems, net
Mexico . . . . . . . . . . . . . . . . Ps 51,412 (10,143) 41,269 13,480 2,420 11,060 734 (262) 481United States . . . . . . . . . . . 45,691 (33) 45,658 4,962 5,296 (334) (352) (411) (123)EuropeUnited Kingdom . . . . . . . . . 17,071 — 17,071 1,672 1,004 668 1,062 (33) (378)Germany . . . . . . . . . . . . . . . 14,138 (1,247) 12,891 869 625 244 (797) (29) (122)France . . . . . . . . . . . . . . . . . 12,914 — 12,914 852 516 336 (94) (72) (4)Spain . . . . . . . . . . . . . . . . . 4,717 (559) 4,158 363 571 (208) (2,107) (29) (4)Rest of Europe . . . . . . . . . . 9,101 (921) 8,180 1,080 667 413 (367) (26) (56)South, Central America
and the Caribbean(“SAC”)
Colombia . . . . . . . . . . . . . . 13,242 (1) 13,241 4,838 476 4,362 52 (90) (353)Rest of SAC . . . . . . . . . . . . 16,292 (1,865) 14,427 4,767 688 4,079 (101) (44) 9Asia, Middle East and
Africa (“AMEA”)Egypt . . . . . . . . . . . . . . . . . 7,123 (12) 7,111 2,664 474 2,190 (209) (28) 15Philippines . . . . . . . . . . . . . 5,912 (2) 5,910 1,374 338 1,036 40 (5) (8)Rest of AMEA . . . . . . . . . . 9,694 (6) 9,688 1,098 254 844 (147) (19) 27Others . . . . . . . . . . . . . . . . 13,531 (6,107) 7,424 (2,463) 374 (2,837) (2,759) (20,435) 3,047
Continuing operations . . . 220,838 (20,896)199,942 35,556 13,703 21,853 (5,045) (21,483) 2,531Discontinued
operations . . . . . . . . . . . 10,134 (53) 10,081 1,084 753 331 (83) (18) (37)
Total . . . . . . . . . . . . . . . . . Ps 230,972 (20,949)210,023 36,640 14,456 22,184 (5,128) (21,501) 2,494
The information of share of profits of equity accounted investees by geographic operating segment for the yearsended December 31, 2016, 2015 and 2014 is included in the note 13A.
F-35

CEMEX, S.A.B. DE C.V. AND SUBSIDIARIESNotes to the Consolidated Financial Statements
As of December 31, 2016, 2015 and 2014(Millions of Mexican pesos)
Selected financial information by geographic operating segment — continued
As of December 31, 2016 and 2015, selected balance sheet information by geographic segment was as follows:
2016
Equityaccountedinvestees
Other segmentassets
Totalassets
Totalliabilities
Net assetsby segment
Additions tofixed assets1
Mexico . . . . . . . . . . . . . . . . . . . . . . . . . . . . . Ps 490 70,012 70,502 20,752 49,750 1,651United States . . . . . . . . . . . . . . . . . . . . . . . . . 1,587 287,492 289,079 30,118 258,961 3,760EuropeUnited Kingdom . . . . . . . . . . . . . . . . . . . . . . 104 32,469 32,573 22,914 9,659 599Germany . . . . . . . . . . . . . . . . . . . . . . . . . . . . 74 8,396 8,470 6,694 1,776 507France . . . . . . . . . . . . . . . . . . . . . . . . . . . . . . 909 16,855 17,764 6,829 10,935 379Spain . . . . . . . . . . . . . . . . . . . . . . . . . . . . . . . 13 27,251 27,264 3,206 24,058 490Rest of Europe . . . . . . . . . . . . . . . . . . . . . . . . 276 16,223 16,499 4,643 11,856 440South, Central America and the
CaribbeanColombia . . . . . . . . . . . . . . . . . . . . . . . . . . . . — 26,532 26,532 11,548 14,984 3,633Rest of South, Central America and the
Caribbean . . . . . . . . . . . . . . . . . . . . . . . . . 28 22,321 22,349 5,931 16,418 637Asia, Middle East and AfricaEgypt . . . . . . . . . . . . . . . . . . . . . . . . . . . . . . . 1 5,512 5,513 2,907 2,606 381Philippines . . . . . . . . . . . . . . . . . . . . . . . . . . . 6 12,308 12,314 2,696 9,618 341Rest of Asia, Middle East and Africa . . . . . . — 12,347 12,347 6,994 5,353 394Others . . . . . . . . . . . . . . . . . . . . . . . . . . . . . . 6,996 26,333 33,329 276,305 (242,976) 67
Continuing operations . . . . . . . . . . . . . . . . 10,484 564,051 574,535 401,537 172,998 13,279Assets held for sale and directly related
liabilities (note 12A) . . . . . . . . . . . . . . . . 4 25,189 25,193 1,466 23,727 (1)
Total . . . . . . . . . . . . . . . . . . . . . . . . . . . . . . . Ps 10,488 589,240 599,728 403,003 196,725 13,278
F-36

CEMEX, S.A.B. DE C.V. AND SUBSIDIARIESNotes to the Consolidated Financial Statements
As of December 31, 2016, 2015 and 2014(Millions of Mexican pesos)
Selected financial information by geographic operating segment — continued
2015
Equityaccountedinvestees
Other segmentassets
Totalassets
Totalliabilities
Net assetsby segment
Additions tofixed assets1
Mexico . . . . . . . . . . . . . . . . . . . . . . . . . . . . . Ps 438 75,215 75,653 16,936 58,717 1,177United States . . . . . . . . . . . . . . . . . . . . . . . . . 1,228 260,847 262,075 22,832 239,243 3,453EuropeUnited Kingdom . . . . . . . . . . . . . . . . . . . . . . 103 32,339 32,442 19,054 13,388 925Germany . . . . . . . . . . . . . . . . . . . . . . . . . . . . 64 7,278 7,342 5,988 1,354 362France . . . . . . . . . . . . . . . . . . . . . . . . . . . . . . 582 14,577 15,159 6,704 8,455 515Spain . . . . . . . . . . . . . . . . . . . . . . . . . . . . . . . 94 23,544 23,638 2,810 20,828 281Rest of Europe . . . . . . . . . . . . . . . . . . . . . . . . 291 15,043 15,334 4,025 11,309 594South, Central America and the
CaribbeanColombia . . . . . . . . . . . . . . . . . . . . . . . . . . . . — 19,499 19,499 8,959 10,540 2,601Rest of South, Central America and the
Caribbean . . . . . . . . . . . . . . . . . . . . . . . . . 24 21,714 21,738 5,110 16,628 965Asia, Middle East and AfricaEgypt . . . . . . . . . . . . . . . . . . . . . . . . . . . . . . . 11 9,310 9,321 4,499 4,822 762Philippines . . . . . . . . . . . . . . . . . . . . . . . . . . . 6 10,447 10,453 2,907 7,546 329Rest of Asia, Middle East and Africa . . . . . . — 12,055 12,055 6,205 5,850 288Others . . . . . . . . . . . . . . . . . . . . . . . . . . . . . . 9,309 22,855 32,164 271,794 (239,630) 61
Continuing operations . . . . . . . . . . . . . . . . 12,150 524,723 536,873 377,823 159,050 12,313Assets held for sale and directly related
liabilities (note 12A) . . . . . . . . . . . . . . . . 4 5,387 5,391 673 4,718 154
Total . . . . . . . . . . . . . . . . . . . . . . . . . . . . . . . Ps 12,154 530,110 542,264 378,496 163,768 12,467
1 In 2016 and 2015, the total “Additions to fixed assets” includes capital expenditures of approximatelyPs12,676 and Ps11,454, respectively (note 14).
Total consolidated liabilities as of December 31, 2016 and 2015 included debt of Ps236,232 and Ps229,343,respectively. Of such balances, as of December 31, 2016 and 2015, approximately 73% and 71% was in theParent Company, less than 1% and 1% was in Spain, 25% and 27% was in finance subsidiaries in theNetherlands, Luxembourg and the United States, and 2% and 1% was in other countries, respectively. The ParentCompany and the finance subsidiaries mentioned above are included within the segment “Others”.
F-37

CEMEX, S.A.B. DE C.V. AND SUBSIDIARIESNotes to the Consolidated Financial Statements
As of December 31, 2016, 2015 and 2014(Millions of Mexican pesos)
Selected financial information by geographic operating segment — continued
Net sales by product and geographic segment for the years ended December 31, 2016, 2015 and 2014 were asfollows:
2016 Cement Concrete Aggregates Others Eliminations Net sales
Mexico . . . . . . . . . . . . . . . . . . . . . . . . . . . . . . . . . . Ps 37,647 13,664 3,156 11,773 (13,509) 52,731United States . . . . . . . . . . . . . . . . . . . . . . . . . . . . . . 28,585 36,452 15,296 7,999 (19,779) 68,553EuropeUnited Kingdom . . . . . . . . . . . . . . . . . . . . . . . . . . . 5,267 7,830 8,195 7,889 (8,028) 21,153Germany . . . . . . . . . . . . . . . . . . . . . . . . . . . . . . . . . 3,416 4,539 2,112 2,262 (4,142) 8,187France . . . . . . . . . . . . . . . . . . . . . . . . . . . . . . . . . . . — 11,883 5,640 278 (3,266) 14,535Spain . . . . . . . . . . . . . . . . . . . . . . . . . . . . . . . . . . . . 5,478 823 196 472 (1,247) 5,722Rest of Europe . . . . . . . . . . . . . . . . . . . . . . . . . . . . . 6,397 4,241 1,475 555 (2,416) 10,252South, Central America and the CaribbeanColombia . . . . . . . . . . . . . . . . . . . . . . . . . . . . . . . . . 8,814 4,522 1,364 1,761 (4,047) 12,414Rest of South, Central America and the
Caribbean . . . . . . . . . . . . . . . . . . . . . . . . . . . . . . 16,660 3,493 914 563 (4,062) 17,568Asia, Middle East and AfricaEgypt . . . . . . . . . . . . . . . . . . . . . . . . . . . . . . . . . . . . 6,076 943 26 217 (317) 6,945Philippines . . . . . . . . . . . . . . . . . . . . . . . . . . . . . . . . 9,405 143 164 70 (127) 9,655Rest of Asia, Middle East and Africa . . . . . . . . . . . 961 10,293 2,573 1,407 (2,570) 12,664Others . . . . . . . . . . . . . . . . . . . . . . . . . . . . . . . . . . . — — — 19,127 (8,597) 10,530
Continuing operations . . . . . . . . . . . . . . . . . . . . . 128,706 98,826 41,111 54,373 (72,107) 250,909Discontinued operations . . . . . . . . . . . . . . . . . . . . 2,122 250 15 5,747 (118) 8,016
Total . . . . . . . . . . . . . . . . . . . . . . . . . . . . . . . . . . . . Ps130,828 99,076 41,126 60,120 (72,225) 258,925
2015 Cement Concrete Aggregates Others Eliminations Net sales
Mexico . . . . . . . . . . . . . . . . . . . . . . . . . . . . . . . . . . Ps 30,384 13,163 2,860 9,956 (11,751) 44,612United States . . . . . . . . . . . . . . . . . . . . . . . . . . . . . . 23,358 30,575 12,524 8,758 (16,565) 58,650EuropeUnited Kingdom . . . . . . . . . . . . . . . . . . . . . . . . . . . 4,705 7,729 7,614 7,859 (7,680) 20,227Germany . . . . . . . . . . . . . . . . . . . . . . . . . . . . . . . . . 3,098 3,749 1,790 2,103 (3,731) 7,009France . . . . . . . . . . . . . . . . . . . . . . . . . . . . . . . . . . . — 10,026 4,410 224 (2,596) 12,064Spain . . . . . . . . . . . . . . . . . . . . . . . . . . . . . . . . . . . . 5,265 721 150 392 (1,132) 5,396Rest of Europe . . . . . . . . . . . . . . . . . . . . . . . . . . . . . 5,966 3,623 1,191 519 (2,056) 9,243South, Central America and the CaribbeanColombia . . . . . . . . . . . . . . . . . . . . . . . . . . . . . . . . . 8,158 4,428 1,329 1,345 (3,700) 11,560Rest of South, Central America and the
Caribbean . . . . . . . . . . . . . . . . . . . . . . . . . . . . . . 14,846 3,850 898 731 (3,441) 16,884Asia, Middle East and AfricaEgypt . . . . . . . . . . . . . . . . . . . . . . . . . . . . . . . . . . . . 6,052 975 36 236 (381) 6,918Philippines . . . . . . . . . . . . . . . . . . . . . . . . . . . . . . . . 8,270 115 95 62 (110) 8,432Rest of Asia, Middle East and Africa . . . . . . . . . . . 880 8,945 1,980 1,180 (1,960) 11,025Others . . . . . . . . . . . . . . . . . . . . . . . . . . . . . . . . . . . — — — 17,057 (8,751) 8,306
Continuing operations . . . . . . . . . . . . . . . . . . . . . 110,982 87,899 34,877 50,422 (63,854) 220,326Discontinued operations . . . . . . . . . . . . . . . . . . . . 2,787 2,678 1,296 4,885 (785) 10,861
Total . . . . . . . . . . . . . . . . . . . . . . . . . . . . . . . . . . . . Ps113,769 90,577 36,173 55,307 (64,639) 231,187
F-38

CEMEX, S.A.B. DE C.V. AND SUBSIDIARIESNotes to the Consolidated Financial Statements
As of December 31, 2016, 2015 and 2014(Millions of Mexican pesos)
Selected financial information by geographic operating segment — continued
2014 Cement Concrete Aggregates Others Eliminations Net sales
Mexico . . . . . . . . . . . . . . . . . . . . . . . . . . . . . . . . . . Ps 27,667 12,855 2,963 9,056 (11,272) 41,269United States . . . . . . . . . . . . . . . . . . . . . . . . . . . . . . 17,937 21,490 9,886 8,857 (12,512) 45,658EuropeUnited Kingdom . . . . . . . . . . . . . . . . . . . . . . . . . . . 3,824 6,666 6,128 7,929 (7,476) 17,071Germany . . . . . . . . . . . . . . . . . . . . . . . . . . . . . . . . . 4,883 6,600 4,042 2,434 (5,068) 12,891France . . . . . . . . . . . . . . . . . . . . . . . . . . . . . . . . . . . — 10,826 4,585 215 (2,712) 12,914Spain . . . . . . . . . . . . . . . . . . . . . . . . . . . . . . . . . . . . 3,856 783 168 359 (1,008) 4,158Rest of Europe . . . . . . . . . . . . . . . . . . . . . . . . . . . . . 5,305 3,154 1,089 341 (1,709) 8,180South, Central America and the CaribbeanColombia . . . . . . . . . . . . . . . . . . . . . . . . . . . . . . . . . 9,544 4,964 1,547 770 (3,584) 13,241Rest of South, Central America and the
Caribbean . . . . . . . . . . . . . . . . . . . . . . . . . . . . . . 13,123 3,417 712 690 (3,515) 14,427Asia, Middle East and AfricaEgypt . . . . . . . . . . . . . . . . . . . . . . . . . . . . . . . . . . . . 6,402 542 19 318 (170) 7,111Philippines . . . . . . . . . . . . . . . . . . . . . . . . . . . . . . . . 5,849 48 — 27 (14) 5,910Rest of Asia, Middle East and Africa . . . . . . . . . . . 593 7,993 1,831 1,093 (1,822) 9,688Others . . . . . . . . . . . . . . . . . . . . . . . . . . . . . . . . . . . — — — 11,607 (4,183) 7,424
Continuing operations . . . . . . . . . . . . . . . . . . . . . 98,983 79,338 32,970 43,696 (55,045) 199,942Discontinued operations . . . . . . . . . . . . . . . . . . . . 2,694 2,827 1,356 3,992 (788) 10,081
Total . . . . . . . . . . . . . . . . . . . . . . . . . . . . . . . . . . . . Ps101,677 82,165 34,326 47,688 (55,833) 210,023
5) OPERATING EXPENSES, DEPRECIATION AND AMORTIZATION
Consolidated operating expenses during 2016, 2015 and 2014 by function are as follows:
2016 2015 2014
Administrative expenses1 . . . . . . . . . . . . . . . . . . . . . . . . . . . . . . . . . . . . . . . . . . . . Ps 20,883 18,717 16,984Selling expenses . . . . . . . . . . . . . . . . . . . . . . . . . . . . . . . . . . . . . . . . . . . . . . . . . . . 6,954 5,943 5,674Distribution and logistics expenses . . . . . . . . . . . . . . . . . . . . . . . . . . . . . . . . . . . . 25,925 23,109 20,689
Ps 53,762 47,769 43,347
1 The Technology and Energy departments in CEMEX undertake all significant R&D activities as part oftheir daily activities. In 2016, 2015 and 2014, total combined expenses of these departments recognizedwithin administrative expenses were approximately Ps712 (US$38), Ps660 (US$41) and Ps538 (US$36),respectively.
Depreciation and amortization recognized during 2016, 2015 and 2014 are detailed as follows:
2016 2015 2014
Depreciation and amortization expense included in cost of sales . . . . . . . . . . . . . . . Ps 14,299 13,329 12,379Depreciation and amortization expense included in administrative, selling and
distribution and logistics expenses . . . . . . . . . . . . . . . . . . . . . . . . . . . . . . . . . . . . 1,848 1,536 1,324
Ps 16,147 14,865 13,703
F-39

CEMEX, S.A.B. DE C.V. AND SUBSIDIARIESNotes to the Consolidated Financial Statements
As of December 31, 2016, 2015 and 2014(Millions of Mexican pesos)
6) OTHER EXPENSES, NET
The detail of the line item “Other expenses, net” in 2016, 2015 and 2014 was as follows:
2016 2015 2014
Impairment losses and remeasurement of assets held for sale1 . . . . . . . . . . . . . . . . Ps (2,516) (1,526) (3,848)Restructuring costs 2 . . . . . . . . . . . . . . . . . . . . . . . . . . . . . . . . . . . . . . . . . . . . . . . . . (778) (845) (544)Charitable contributions . . . . . . . . . . . . . . . . . . . . . . . . . . . . . . . . . . . . . . . . . . . . . . (93) (60) (18)Results from the sale of assets and others, net . . . . . . . . . . . . . . . . . . . . . . . . . . . . . 1,741 (612) (635)
Ps (1,646) (3,043) (5,045)
1 The main effects included in this line item for the years ended December 31, 2016, 2015 and 2014 aredescribed in notes 13B, 14, 15 and 24A.
2 In 2016, 2015 and 2014, restructuring costs mainly refer to severance payments.
7) OTHER FINANCIAL INCOME (EXPENSE), NET
The detail of the line item “Other financial income (expense), net” in 2016, 2015 and 2014 was as follows:
2016 2015 2014
Financial income . . . . . . . . . . . . . . . . . . . . . . . . . . . . . . . . . . . . . . . . . . . . . . . . . . . . Ps 417 315 312Results from financial instruments, net (notes 13B and 16D) . . . . . . . . . . . . . . . . . . 113 (2,729) (880)Foreign exchange results . . . . . . . . . . . . . . . . . . . . . . . . . . . . . . . . . . . . . . . . . . . . . . 4,943 2,083 3,936Effects of NPV on assets and liabilities and others, net . . . . . . . . . . . . . . . . . . . . . . (1,032) (904) (837)
Ps 4,441 (1,235) 2,531
8) CASH AND CASH EQUIVALENTS
As of December 31, 2016 and 2015, consolidated cash and cash equivalents consisted of:
2016 2015
Cash and bank accounts . . . . . . . . . . . . . . . . . . . . . . . . . . . . . . . . . . . . . . . . . . . . . . . . . . . . . Ps 9,044 11,395Fixed-income securities and other cash equivalents . . . . . . . . . . . . . . . . . . . . . . . . . . . . . . . 2,511 3,885
Ps 11,555 15,280
Based on net settlement agreements, the balance of cash and cash equivalents excludes deposits in marginaccounts that guarantee several obligations of CEMEX of approximately Ps250 in 2016 and Ps258 in 2015,which were offset against the corresponding obligations of CEMEX with the counterparties, consideringCEMEX’s right, ability and intention to settle the amounts on a net basis.
F-40
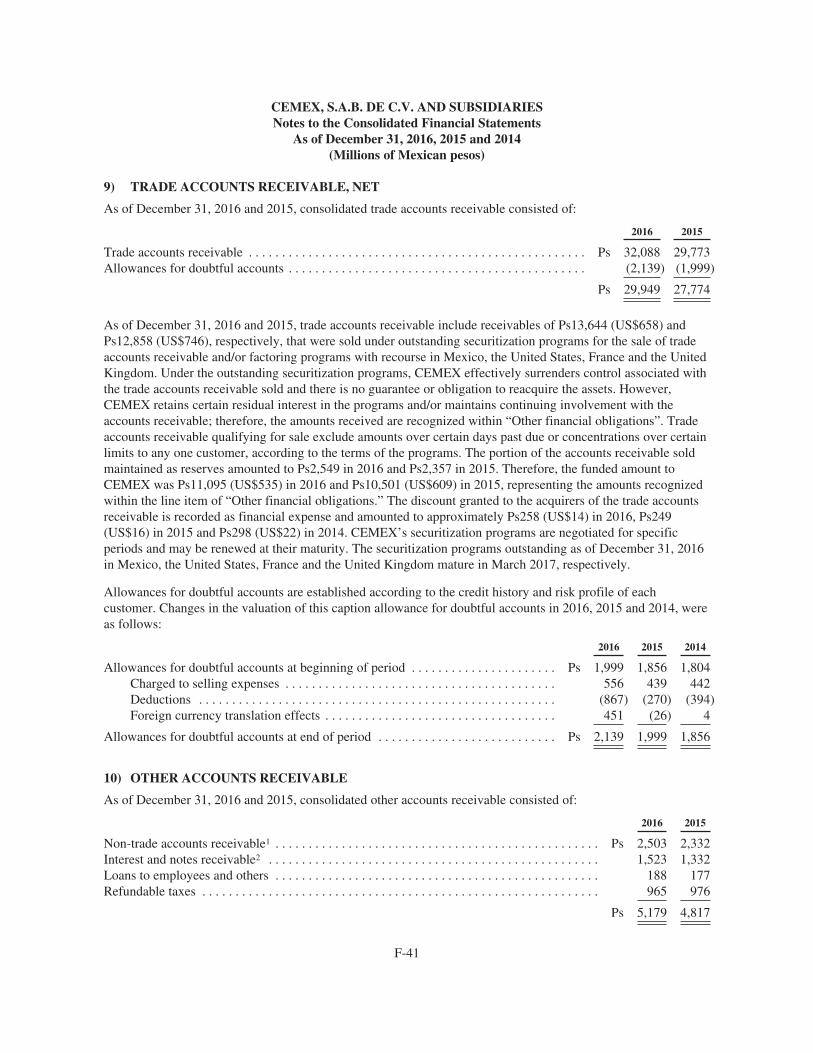
CEMEX, S.A.B. DE C.V. AND SUBSIDIARIESNotes to the Consolidated Financial Statements
As of December 31, 2016, 2015 and 2014(Millions of Mexican pesos)
9) TRADE ACCOUNTS RECEIVABLE, NET
As of December 31, 2016 and 2015, consolidated trade accounts receivable consisted of:
2016 2015
Trade accounts receivable . . . . . . . . . . . . . . . . . . . . . . . . . . . . . . . . . . . . . . . . . . . . . . . . . . . Ps 32,088 29,773Allowances for doubtful accounts . . . . . . . . . . . . . . . . . . . . . . . . . . . . . . . . . . . . . . . . . . . . . (2,139) (1,999)
Ps 29,949 27,774
As of December 31, 2016 and 2015, trade accounts receivable include receivables of Ps13,644 (US$658) andPs12,858 (US$746), respectively, that were sold under outstanding securitization programs for the sale of tradeaccounts receivable and/or factoring programs with recourse in Mexico, the United States, France and the UnitedKingdom. Under the outstanding securitization programs, CEMEX effectively surrenders control associated withthe trade accounts receivable sold and there is no guarantee or obligation to reacquire the assets. However,CEMEX retains certain residual interest in the programs and/or maintains continuing involvement with theaccounts receivable; therefore, the amounts received are recognized within “Other financial obligations”. Tradeaccounts receivable qualifying for sale exclude amounts over certain days past due or concentrations over certainlimits to any one customer, according to the terms of the programs. The portion of the accounts receivable soldmaintained as reserves amounted to Ps2,549 in 2016 and Ps2,357 in 2015. Therefore, the funded amount toCEMEX was Ps11,095 (US$535) in 2016 and Ps10,501 (US$609) in 2015, representing the amounts recognizedwithin the line item of “Other financial obligations.” The discount granted to the acquirers of the trade accountsreceivable is recorded as financial expense and amounted to approximately Ps258 (US$14) in 2016, Ps249(US$16) in 2015 and Ps298 (US$22) in 2014. CEMEX’s securitization programs are negotiated for specificperiods and may be renewed at their maturity. The securitization programs outstanding as of December 31, 2016in Mexico, the United States, France and the United Kingdom mature in March 2017, respectively.
Allowances for doubtful accounts are established according to the credit history and risk profile of eachcustomer. Changes in the valuation of this caption allowance for doubtful accounts in 2016, 2015 and 2014, wereas follows:
2016 2015 2014
Allowances for doubtful accounts at beginning of period . . . . . . . . . . . . . . . . . . . . . . Ps 1,999 1,856 1,804Charged to selling expenses . . . . . . . . . . . . . . . . . . . . . . . . . . . . . . . . . . . . . . . . . 556 439 442Deductions . . . . . . . . . . . . . . . . . . . . . . . . . . . . . . . . . . . . . . . . . . . . . . . . . . . . . . (867) (270) (394)Foreign currency translation effects . . . . . . . . . . . . . . . . . . . . . . . . . . . . . . . . . . . 451 (26) 4
Allowances for doubtful accounts at end of period . . . . . . . . . . . . . . . . . . . . . . . . . . . Ps 2,139 1,999 1,856
10) OTHER ACCOUNTS RECEIVABLE
As of December 31, 2016 and 2015, consolidated other accounts receivable consisted of:
2016 2015
Non-trade accounts receivable1 . . . . . . . . . . . . . . . . . . . . . . . . . . . . . . . . . . . . . . . . . . . . . . . . . Ps 2,503 2,332Interest and notes receivable2 . . . . . . . . . . . . . . . . . . . . . . . . . . . . . . . . . . . . . . . . . . . . . . . . . . 1,523 1,332Loans to employees and others . . . . . . . . . . . . . . . . . . . . . . . . . . . . . . . . . . . . . . . . . . . . . . . . . 188 177Refundable taxes . . . . . . . . . . . . . . . . . . . . . . . . . . . . . . . . . . . . . . . . . . . . . . . . . . . . . . . . . . . . 965 976
Ps 5,179 4,817
F-41

CEMEX, S.A.B. DE C.V. AND SUBSIDIARIESNotes to the Consolidated Financial Statements
As of December 31, 2016, 2015 and 2014(Millions of Mexican pesos)
Other accounts receivable — continued
1 Non-trade accounts receivable are mainly attributable to the sale of assets.2 Includes Ps27 in 2016 and Ps148 in 2015, representing the short-term portion of a restricted investment
related to coupon payments under CEMEX’s perpetual debentures (note 20D). In addition, in 2016, includesCEMEX Colombia’s beneficial interest in a trust oriented to promote housing projects, which its only assetis land in the municipality of Zipaquira, Colombia and its only liability is a bank credit for approximatelyPs148, guaranteed by CEMEX Colombia, obtained to purchase the land. The estimated fair value of the landas determined by external appraiser significantly exceeds the amount of the loan.
11) INVENTORIES, NET
As of December 31, 2016 and 2015, the consolidated balance of inventories was summarized as follows:
2016 2015
Finished goods . . . . . . . . . . . . . . . . . . . . . . . . . . . . . . . . . . . . . . . . . . . . . . . . . . . . . . . . . . . . Ps 5,805 6,439Work-in-process . . . . . . . . . . . . . . . . . . . . . . . . . . . . . . . . . . . . . . . . . . . . . . . . . . . . . . . . . . 3,316 3,160Raw materials . . . . . . . . . . . . . . . . . . . . . . . . . . . . . . . . . . . . . . . . . . . . . . . . . . . . . . . . . . . . 3,112 3,217Materials and spare parts . . . . . . . . . . . . . . . . . . . . . . . . . . . . . . . . . . . . . . . . . . . . . . . . . . . . 4,888 4,822Inventory in transit . . . . . . . . . . . . . . . . . . . . . . . . . . . . . . . . . . . . . . . . . . . . . . . . . . . . . . . . 1,176 525Allowance for obsolescence . . . . . . . . . . . . . . . . . . . . . . . . . . . . . . . . . . . . . . . . . . . . . . . . . (435) (447)
Ps 17,862 17,716
For the years ended December 31, 2016, 2015 and 2014, CEMEX recognized within “Cost of sales” in profit orloss, inventory impairment losses of approximately Ps52, Ps49 and Ps36, respectively.
12) ASSETS HELD FOR SALE AND OTHER CURRENT ASSETS
12A) ASSETS HELD FOR SALE
As of December 31, 2016 and 2015, assets held for sale, which are measured at the lower of their estimatedrealizable value, less costs to sell, and their carrying amounts, as well as liabilities directly related with suchassets are detailed as follows:
2016 2015
Assets Liabilities Net assets Assets Liabilities Net assets
Concrete Pipe Division (note 4A) . . . . . . . . . . . . . . . Ps 9,426 642 8,784 Ps — — —CEMEX’s operations in Croatia (note 4A) . . . . . . . . 4,164 651 3,513 3,446 673 2,773Fairborn cement plant (note 4B) . . . . . . . . . . . . . . . . 5,957 164 5,793 — — —Concrete pumping equipment (note 4B) . . . . . . . . . . 213 — 213 — — —Idle assets in Andorra, Spain . . . . . . . . . . . . . . . . . . . 560 — 560 481 — 481Investment in GCC shares (note 13A) 1 . . . . . . . . . . 3,882 — 3,882 — — —Other assets held for sale 2 . . . . . . . . . . . . . . . . . . . . . 991 9 982 1,464 — 1,464
Ps 25,193 1,466 23,727 Ps 5,391 673 4,718
1 CEMEX analyzes alternatives to sell its investment in 23% of GCC’s common stock in the short-term. Seenote 26 for subsequent events related to this investment.
F-42

CEMEX, S.A.B. DE C.V. AND SUBSIDIARIESNotes to the Consolidated Financial Statements
As of December 31, 2016, 2015 and 2014(Millions of Mexican pesos)
Assets held for sale — continued
2 During 2014, CEMEX recognized impairment losses in connection with the remeasurement of other assetsheld for sale for approximately Ps55.
12B) OTHER CURRENT ASSETS
As of December 31, 2016 and 2015, other current assets are mainly comprised of advance payments.
13) EQUITY ACCOUNTED INVESTEES, OTHER INVESTMENTS AND NON-CURRENTACCOUNTS RECEIVABLE
13A) EQUITY ACCOUNTED INVESTEES
As of December 31, 2016 and 2015, the main investments in common shares of associates were as follows:
Activity Country % 2016 2015
Camcem, S.A. de C.V. . . . . . . . . . . . . . . . . . . . . . . . Cement Mexico 40.1 Ps 3,674 600Control Administrativo Mexicano, S.A. de C.V. . . . Cement Mexico — — 5,613Trinidad Cement Limited . . . . . . . . . . . . . . . . . . . . . Cement Trinidad and
Tobago39.5 1,689 1,543
Concrete Supply Co. LLC . . . . . . . . . . . . . . . . . . . . Concrete United States 40.0 1,234 932Akmenes Cementas AB . . . . . . . . . . . . . . . . . . . . . . Cement Lithuania 37.8 586 560ABC Capital, S.A. Institución de Banca
Múltiple . . . . . . . . . . . . . . . . . . . . . . . . . . . . . . . . Financing Mexico 33.9 474 385Lehigh White Cement Company . . . . . . . . . . . . . . . Cement United States 24.5 334 276Société Méridionale de Carrières . . . . . . . . . . . . . . . Aggregates France 33.3 300 241Société d’Exploitation de Carrières . . . . . . . . . . . . . Aggregates France 50.0 257 202Industrias Básicas, S.A. . . . . . . . . . . . . . . . . . . . . . . Cement Panama 25.0 155 133Other companies . . . . . . . . . . . . . . . . . . . . . . . . . . . — — — 1,781 1,665
Ps10,484 12,150
Out of which:Book value at acquisition date . . . . . . . . . . . . . . . . . Ps 8,260 4,683Changes in stockholders’ equity . . . . . . . . . . . . . . . Ps 2,224 7,467
As of December 31, 2016 and 2015, there were no written put options for the purchase of investments inassociates.
On December 5, 2016, through one of its indirect subsidiaries, Sierra Trading (“Sierra”), CEMEX presented anoffer and take-over bid (the “Offer”) to all shareholders of Trinidad Cement Limited (“TCL”), a companypublicly listed in Trinidad and Tobago, Jamaica and Barbados, to acquire up to 132,616,942 ordinary shares inTCL for Ps4.50 trinitarian dollars (“TT”) in cash per TCL share, which together with Sierra’s existing shareownership in TCL of approximately 39.5%, would, if successful, result in Sierra holding up to 74.9% of theequity share capital in TCL. Full acceptance of the Offer would result in a cash payment by Sierra ofapproximately TTPs597 million (US$89 or Ps1,844). The Offer price represents a premium of 33.1% over theDecember 1, 2016 closing price of TCL’s shares in the Trinidad and Tobago Stock Exchange. Among other
F-43

CEMEX, S.A.B. DE C.V. AND SUBSIDIARIESNotes to the Consolidated Financial Statements
As of December 31, 2016, 2015 and 2014(Millions of Mexican pesos)
Equity accounted investees — continued
conditions, the Offer is conditional on Sierra acquiring at least an amount of TCL shares that would allowCEMEX to consolidate TCL. Unless extended, the Offer period is expected to close on January 10, 2017. If theOffer is successful, TCL will continue operating as usual and will be maintained as a publicly listed company onthe Trinidad and Tobago Stock Exchange with the benefit of a strong local shareholding together with theenhanced benefit of proven management and operational expertise from CEMEX. TCL’s main operations are inTrinidad and Tobago, Jamaica and Barbados. TCL is the majority shareholder of Caribbean Cement CompanyLimited, a main cement producer in Jamaica. In connection with the Offer, on December 23, 2016, the Board ofDirectors of TCL announced its recommendation to TCL’s shareholders of not selling their shares (see note 26for recent developments related to the Offer).
During 2016, the Parent Company participated as shareholder in a share restructuring executed by Camcem, S.A.de C.V. (“Camcem”), indirect parent company of Control Administrativo Mexicano, S.A. de C.V. (“Camsa”) andGCC, aimed to simplify its corporate structure, by means of which, Imin de México, S.A. de C.V., intermediateholding company, Camsa and GCC were merged, prevailing GCC as the surviving entity. As a result of the sharerestructuring, CEMEX’s 10.3% interest in Camcem and 49% interest in Camsa, both before the restructuring,were exchanged on equivalent basis into a 40.1% interest in Camcem and a 23% interest in GCC, which shares ofthe latest trade in the MSE (note 12A).
In addition, during 2015, through the exercise of its preemptive rights in TCL’s rights issuance and the purchase ofshares not subscribed and fully paid up by other eligible TCL shareholders in the rights issuance, Sierra increased itsparticipation in TCL from 20% to 39.5% for approximately Ps774 (US$45). Moreover, in April 2015, CEMEX andTCL entered into a Technical Services Agreement (the “TSA”) pursuant to which CEMEX will provide TCL withtechnical, managerial and other assistance from May 1, 2015 to May 1, 2018, unless earlier terminated.
Share of profit of equity accounted investees by geographic operating segment in 2016, 2015 and 2014 is detailedas follows:
2016 2015 2014
Mexico . . . . . . . . . . . . . . . . . . . . . . . . . . . . . . . . . . . . . . . . . . . . . . . . . . . . . . . . . . . . . . . . . Ps 452 330 242United States . . . . . . . . . . . . . . . . . . . . . . . . . . . . . . . . . . . . . . . . . . . . . . . . . . . . . . . . . . . . 253 92 4Europe . . . . . . . . . . . . . . . . . . . . . . . . . . . . . . . . . . . . . . . . . . . . . . . . . . . . . . . . . . . . . . . . . 54 340 74Corporate and others . . . . . . . . . . . . . . . . . . . . . . . . . . . . . . . . . . . . . . . . . . . . . . . . . . . . . . (71) (24) (26)
Ps 688 738 294
Combined condensed balance sheet information of CEMEX’s associates as of December 31, 2016 and 2015 is setforth below:
2016 2015
Current assets . . . . . . . . . . . . . . . . . . . . . . . . . . . . . . . . . . . . . . . . . . . . . . . . . . . . . . . . . . . . . Ps 21,651 16,002Non-current assets . . . . . . . . . . . . . . . . . . . . . . . . . . . . . . . . . . . . . . . . . . . . . . . . . . . . . . . . . 41,085 30,435
Total assets . . . . . . . . . . . . . . . . . . . . . . . . . . . . . . . . . . . . . . . . . . . . . . . . . . . . . . . . . . 62,736 46,437
Current liabilities . . . . . . . . . . . . . . . . . . . . . . . . . . . . . . . . . . . . . . . . . . . . . . . . . . . . . . . . . . 11,612 8,342Non-current liabilities . . . . . . . . . . . . . . . . . . . . . . . . . . . . . . . . . . . . . . . . . . . . . . . . . . . . . . 22,436 15,242
Total liabilities . . . . . . . . . . . . . . . . . . . . . . . . . . . . . . . . . . . . . . . . . . . . . . . . . . . . . . . . 34,048 23,584
Total net assets . . . . . . . . . . . . . . . . . . . . . . . . . . . . . . . . . . . . . . . . . . . . . . . . . . . . . . . Ps 28,688 22,853
F-44

CEMEX, S.A.B. DE C.V. AND SUBSIDIARIESNotes to the Consolidated Financial Statements
As of December 31, 2016, 2015 and 2014(Millions of Mexican pesos)
Equity accounted investees — continued
Combined selected information of the statements of operations of CEMEX’s associates in 2016, 2015 and 2014is set forth below:
2016 2015 2014
Sales . . . . . . . . . . . . . . . . . . . . . . . . . . . . . . . . . . . . . . . . . . . . . . . . . . . . . . . . . . . . Ps 29,791 25,484 21,173Operating earnings . . . . . . . . . . . . . . . . . . . . . . . . . . . . . . . . . . . . . . . . . . . . . . . . . 4,730 3,523 1,931Income before income tax . . . . . . . . . . . . . . . . . . . . . . . . . . . . . . . . . . . . . . . . . . . 3,111 3,350 484Net income . . . . . . . . . . . . . . . . . . . . . . . . . . . . . . . . . . . . . . . . . . . . . . . . . . . . . . . 1,860 2,403 228
13B) OTHER INVESTMENTS AND NON-CURRENT ACCOUNTS RECEIVABLE
As of December 31, 2016 and 2015, consolidated other investments and non-current accounts receivable weresummarized as follows:
2016 2015
Non-current portion of valuation of derivative financial instruments . . . . . . . . . . . . . . . . . . . . Ps 1,900 869Non-current accounts receivable and other investments 1 . . . . . . . . . . . . . . . . . . . . . . . . . . . . . 4,501 4,731Investments available-for-sale 2 . . . . . . . . . . . . . . . . . . . . . . . . . . . . . . . . . . . . . . . . . . . . . . . . 491 632Investments held for trading 3 . . . . . . . . . . . . . . . . . . . . . . . . . . . . . . . . . . . . . . . . . . . . . . . . . . 157 317
Ps 7,049 6,549
1 Includes, among other items: a) advances to suppliers of fixed assets of approximately Ps52 in 2016 andPs54 in 2015; and b) the non-current portion of a restricted investment used to pay coupons under theperpetual debentures (note 20D) of Ps83 in 2015. CEMEX recognized impairment losses of non-currentaccounts receivable in Costa Rica of approximately Ps21 in 2016, Egypt and Colombia of approximatelyPs71 and Ps22 in 2015, respectively; and the United Kingdom of approximately Ps16 in 2014.
2 This line item refers mainly to an investment in CPOs of Axtel, S.A.B. de C.V. (“Axtel”). This investment isrecognized as available for sale at fair value and changes in valuation are recorded in other comprehensiveloss until its disposal.
3 This line item refers to investments in private funds. In 2016 and 2015, no contributions were made to suchprivate funds.
F-45

CEMEX, S.A.B. DE C.V. AND SUBSIDIARIESNotes to the Consolidated Financial Statements
As of December 31, 2016, 2015 and 2014(Millions of Mexican pesos)
14) PROPERTY, MACHINERY AND EQUIPMENT, NET
As of December 31, 2016 and 2015, consolidated property, machinery and equipment, net and the changes insuch line item during 2016, 2015 and 2014, were as follows:
2016
Land andmineral
reserves 1 Building 1
Machineryand
equipment 2
Constructionin
progress 3 Total
Cost at beginning of period . . . . . . . . . . . . . . . . . Ps 85,763 47,205 210,175 13,813 356,956Accumulated depreciation and depletion . . . . . . . (12,194) (20,852) (109,777) — (142,823)
Net book value at beginning of period . . . . . . . 73,569 26,353 100,398 13,813 214,133Capital expenditures . . . . . . . . . . . . . . . . . . . 2,149 1,856 8,671 — 12,676Additions through capital leases . . . . . . . . . . — — 7 — 7Capitalization of financial expense . . . . . . . — — — 175 175Stripping costs . . . . . . . . . . . . . . . . . . . . . . . 421 — — — 421
Total capital expenditures . . . . . . . . . . . 2,570 1,856 8,678 175 13,279Disposals 4 . . . . . . . . . . . . . . . . . . . . . . . . . . . . . . . (388) (140) (1,268) (44) (1,840)Reclassifications 5 . . . . . . . . . . . . . . . . . . . . . . . . . (2,029) (703) (1,731) (86) (4,549)Depreciation and depletion for the period . . . . . . (2,430) (2,068) (9,658) — (14,156)Impairment losses . . . . . . . . . . . . . . . . . . . . . . . . . (671) (302) (547) (378) (1,898)Foreign currency translation effects . . . . . . . . . . . 9,516 1,388 7,548 3,690 22,142
Cost at end of period . . . . . . . . . . . . . . . . . . . . . . . 96,410 50,131 228,438 17,170 392,149Accumulated depreciation and depletion . . . . . . . (16,273) (23,747) (125,018) — (165,038)
Net book value at end of period . . . . . . . . . . . . . Ps 80,137 26,384 103,420 17,170 227,111
F-46

CEMEX, S.A.B. DE C.V. AND SUBSIDIARIESNotes to the Consolidated Financial Statements
As of December 31, 2016, 2015 and 2014(Millions of Mexican pesos)
Property, machinery and equipment, net — continued
2015
Landand
mineralreserves 1 Building 1
Machineryand
equipment 2Constructionin progress 3 Total 2014
Cost at beginning of period . . . . . . . . . Ps 78,511 43,473 185,629 13,480 321,093 309,668Accumulated depreciation and
depletion . . . . . . . . . . . . . . . . . . . . . (9,836) (16,970) (91,359) — (118,165) (103,951)
Net book value at beginning ofperiod . . . . . . . . . . . . . . . . . . . . . . . 68,675 26,503 94,270 13,480 202,928 205,717
Capital expenditures . . . . . . . . . . 1,429 1,198 8,827 — 11,454 8,866Additions through capital
leases . . . . . . . . . . . . . . . . . . . . — — 63 — 63 108Capitalization of financial
expense . . . . . . . . . . . . . . . . . . — — — 73 73 —Stripping costs . . . . . . . . . . . . . . 723 — — — 723 512
Total capitalexpenditures . . . . . . . . . . 2,152 1,198 8,890 73 12,313 9,486
Disposals 4 . . . . . . . . . . . . . . . . . . . . . (713) (544) (987) (3) (2,247) (2,461)Reclassifications 5 . . . . . . . . . . . . . . . . (1,147) (982) (929) (41) (3,099) (6,828)Business combinations . . . . . . . . . . . . 1,372 757 1,869 6 4,004 —Depreciation and depletion for the
period . . . . . . . . . . . . . . . . . . . . . . . (2,007) (1,969) (9,552) — (13,528) (12,949)Impairment losses . . . . . . . . . . . . . . . . (338) (114) (693) — (1,145) (589)Foreign currency translation
effects . . . . . . . . . . . . . . . . . . . . . . . 5,575 1,504 7,530 298 14,907 10,552
Cost at end of period . . . . . . . . . . . . . . 85,763 47,205 210,175 13,813 356,956 321,093Accumulated depreciation and
depletion . . . . . . . . . . . . . . . . . . . . . (12,194) (20,852) (109,777) — (142,823) (118,165)
Net book value at end of period . . . . Ps 73,569 26,353 100,398 13,813 214,133 202,928
1 Includes corporate buildings and related land sold to financial institutions in previous years, which wereleased back. The aggregate carrying amount of these assets as of December 31, 2016 and 2015 wasapproximately Ps1,777 and Ps1,865, respectively.
2 Includes assets, mainly mobile equipment, acquired through capital leases, which carrying amount as ofDecember 31, 2016 and 2015 was approximately Ps48 and Ps63, respectively.
3 In July 2014, CEMEX began the construction of a new cement plant in the municipality of Maceo,Antioquia department in Colombia with an annual production capacity of approximately 1.1 million tons.The first phase included the construction of a cement mill, which has been in testing phase with supplies ofclinker from Caracolito plant in Ibague and the cement produced has been used entirely in the constructionof the plant. The next phase that includes the construction of the kiln and the plant’s access road is expectedto be completed in phases by the first half of 2017, in order to start commercial operations during the secondhalf of 2017, considering the successful conclusion of several undergoing procedures related to certainoperational permits. In 2016, includes an investment reduction of approximately Ps483 (US$23), of which,
F-47

CEMEX, S.A.B. DE C.V. AND SUBSIDIARIESNotes to the Consolidated Financial Statements
As of December 31, 2016, 2015 and 2014(Millions of Mexican pesos)
Property, machinery and equipment, net — continued
approximately Ps295 (US$14) were recognized as impairment against the line item of “Other expenses, net”,considering that the assets, mainly advances for the purchase of land through a representative, were consideredcontingent assets considering based on low probability for their recoverability due to deficiencies in the legalprocesses, and approximately Ps188 (US$9) were decreased against “Other accounts payable” in connectionwith the cancellation of the portion payable of such assets (notes 6 and 24A). CEMEX determined an originaltotal investment in the plant of approximately US$340. As of December 31, 2016, Maceo project’s book value,net of adjustments, is for an amount in Colombian pesos equivalent to approximately US$275, excludingUS$11 of interest capitalized during the construction period.
4 In 2016, includes sales of non-strategic fixed assets in the United States, Mexico, and France for Ps317,Ps281 and Ps165, respectively. In 2015, includes the sales of non-strategic fixed assets in the UnitedKingdom, the United States and Spain for Ps584, Ps451 and Ps417, respectively. In 2014, includes the salesof non-strategic fixed assets in the United States, the United Kingdom and Ireland for Ps757, Ps539 andPs537, respectively.
5 In 2016, refers mainly to those assets of the Concrete Pipe Business in the United States for Ps2,747, as well asother disposal groups in the United States reclassified to assets available for sale for Ps1,386 (notes 4A, 4B and12A). In 2015, refers to assets in Croatia for Ps2,562 and other disposal groups in the United States reclassifiedto assets available for sale for Ps537 (notes 4A, 4B and 12A). In 2014 refers primarily to the reclassification toother current assets in connection with the sale of assets in the western region of Germany and the projectedsale of idle assets in Andorra, Spain (notes 4B and 12A) for Ps3,956 and Ps2,601, respectively.
As a result of impairment tests conducted on several CGUs considering certain triggering events, mainly: a) theclosing and/or reduction of operations of cement and ready-mix concrete plants resulting from adjusting thesupply to current demand conditions, such as the situation in Puerto Rico in the last quarter of 2016 due to theadverse outlook and the overall uncertain economic conditions in such country; b) the transferring of installedcapacity to more efficient plants, such as the projected closing in the short-term of a cement mill in Colombia; aswell as c) the recoverability of certain investments in Colombia as described above, for the years endedDecember 31, 2016, 2015 and 2014, CEMEX adjusted the related fixed assets to their estimated value in use inthose circumstances in which the assets would continue in operation based on estimated cash flows during theremaining useful life, or to their realizable value, in case of permanent shut down, and recognized impairmentlosses within the line item of “Other expenses, net” (note 2J) during the years ended December 31, 2016, 2015and 2014 in the following countries and for the following amounts:
2016 2015 2014
Puerto Rico . . . . . . . . . . . . . . . . . . . . . . . . . . . . . . . . . . . . . . . . . . . . . . . . . . . . . . . . . . . Ps 1,087 172 —Colombia . . . . . . . . . . . . . . . . . . . . . . . . . . . . . . . . . . . . . . . . . . . . . . . . . . . . . . . . . . . . . 454 — —Spain . . . . . . . . . . . . . . . . . . . . . . . . . . . . . . . . . . . . . . . . . . . . . . . . . . . . . . . . . . . . . . . . — 392 125United States . . . . . . . . . . . . . . . . . . . . . . . . . . . . . . . . . . . . . . . . . . . . . . . . . . . . . . . . . . 277 269 108Latvia . . . . . . . . . . . . . . . . . . . . . . . . . . . . . . . . . . . . . . . . . . . . . . . . . . . . . . . . . . . . . . . — 126 —Panama . . . . . . . . . . . . . . . . . . . . . . . . . . . . . . . . . . . . . . . . . . . . . . . . . . . . . . . . . . . . . . — 118 —Mexico . . . . . . . . . . . . . . . . . . . . . . . . . . . . . . . . . . . . . . . . . . . . . . . . . . . . . . . . . . . . . . 46 46 221United Kingdom . . . . . . . . . . . . . . . . . . . . . . . . . . . . . . . . . . . . . . . . . . . . . . . . . . . . . . . — 19 59Germany . . . . . . . . . . . . . . . . . . . . . . . . . . . . . . . . . . . . . . . . . . . . . . . . . . . . . . . . . . . . . — — 19Other countries . . . . . . . . . . . . . . . . . . . . . . . . . . . . . . . . . . . . . . . . . . . . . . . . . . . . . . . . 34 3 43
Ps 1,898 1,145 575
F-48

CEMEX, S.A.B. DE C.V. AND SUBSIDIARIESNotes to the Consolidated Financial Statements
As of December 31, 2016, 2015 and 2014(Millions of Mexican pesos)
15) GOODWILL AND INTANGIBLE ASSETS, NET
15A) BALANCES AND CHANGES DURING THE PERIOD
As of December 31, 2016 and 2015, consolidated goodwill, intangible assets and deferred charges weresummarized as follows:
2016 2015
CostAccumulatedamortization
Carryingamount Cost
Accumulatedamortization
Carryingamount
Intangible assets of indefiniteuseful life:
Goodwill . . . . . . . . . . . . . . . . . . . Ps 205,835 — 205,835 Ps 183,752 — 183,752Intangible assets of definite
useful life:Extraction rights . . . . . . . . . . . . . 40,994 (5,948) 35,046 34,927 (4,600) 30,327Industrial property and
trademarks . . . . . . . . . . . . . . . . 707 (350) 357 822 (200) 622Customer relationships . . . . . . . . 4,343 (4,084) 259 6,166 (5,162) 1,004Mining projects . . . . . . . . . . . . . . 961 (84) 877 992 (187) 805Others intangible assets . . . . . . . . 13,796 (9,150) 4,646 10,900 (7,092) 3,808
Ps 266,636 (19,616) 247,020 Ps 237,559 (17,241) 220,318
The amortization of intangible assets of definite useful life was approximately Ps1,991 in 2016, Ps1,848 in 2015and Ps1,508 in 2014, and was recognized within operating costs and expenses.
Goodwill
Changes in consolidated goodwill in 2016, 2015 and 2014, were as follows:
2016 2015 2014
Balance at beginning of period . . . . . . . . . . . . . . . . . . . . . . . . . . . . . . . . . . . . . Ps 183,752 160,544 144,457Business combinations . . . . . . . . . . . . . . . . . . . . . . . . . . . . . . . . . . . . . . . — 64 —Disposals, net (note 4B) . . . . . . . . . . . . . . . . . . . . . . . . . . . . . . . . . . . . . . (3,340) (552) —Reclassification to assets held for sale and other current assets (notes
4A, 4B and 12) . . . . . . . . . . . . . . . . . . . . . . . . . . . . . . . . . . . . . . . . . . . (9,734) (404) —Foreign currency translation effects . . . . . . . . . . . . . . . . . . . . . . . . . . . . . 35,157 24,100 16,087
Balance at end of period . . . . . . . . . . . . . . . . . . . . . . . . . . . . . . . . . . . . . . . . . . Ps 205,835 183,752 160,544
F-49

CEMEX, S.A.B. DE C.V. AND SUBSIDIARIESNotes to the Consolidated Financial Statements
As of December 31, 2016, 2015 and 2014(Millions of Mexican pesos)
Balances and changes during the period — continued
Intangible assets of definite life
Changes in intangible assets of definite life in 2016, 2015 and 2014, were as follows:
2016
Extractionrights
Industrialproperty andtrademarks
Customerrelations
Miningprojects Others 1 Total
Balance at beginning of period . . . . . . . . . . . Ps 30,327 622 1,004 805 3,808 36,566Additions (disposals), net 1 . . . . . . . . . . 202 (760) — (382) 343 (597)Amortization . . . . . . . . . . . . . . . . . . . . . (712) (293) (658) (12) (316) (1,991)Impairment losses . . . . . . . . . . . . . . . . . (6) — — — (19) (25)Foreign currency translation effects . . . 5,235 788 (87) 466 830 7,232
Balance at the end of period . . . . . . . . . . . . . Ps 35,046 357 259 877 4,646 41,185
2015
Extractionrights
Industrialproperty andtrademarks
Customerrelations
Miningprojects Others 1 Total 2014
Balance at beginning of period . . . Ps 27,330 122 1,393 1,501 2,594 32,940 30,483Business combinations . . . . . 458 — 156 — 2 616 —Additions (disposals), net 1 . . 157 133 (1) (577) 102 (186) 653Reclassifications (notes 4A,
4B and 12) . . . . . . . . . . . . . 1 — — — — 1 (5)Amortization . . . . . . . . . . . . . (813) (132) (601) (32) (270) (1,848) (1,508)Impairment losses . . . . . . . . . (10) — — — — (10) —Foreign currency translation
effects . . . . . . . . . . . . . . . . 3,204 499 57 (87) 1,380 5,053 3,317
Balance at the end of period . . . . . Ps 30,327 622 1,004 805 3,808 36,566 32,940
1 As of December 31, 2016 and 2015, “Others” includes the carrying amount of internal-use software ofapproximately Ps2,544 and Ps2,077, respectively. Capitalized direct costs incurred in the development stageof internal-use software, such as professional fees, direct labor and related travel expenses, amounted toapproximately Ps769 in 2016, Ps615 in 2015 and Ps702 in 2014.
15B) MAIN ACQUISITIONS DURING THE REPORTED PERIODS
In connection with the agreements entered into with Holcim on October 31, 2014 as described in note 4B,CEMEX and Holcim agreed to conduct a series of related transactions, finally executed on January 5, 2015 aftercustomary conditions precedent were concluded, with retrospective effects as of January 1, 2015, by means ofwhich: a) in the Czech Republic, CEMEX acquired all of Holcim’s assets, including a cement plant, fouraggregates quarries and 17 ready-mix plants for approximately €115 (US$139 or Ps2,049); b) in Germany,CEMEX sold to Holcim its assets in the western region of the country; c) in Spain, CEMEX acquired fromHolcim one cement plant in the southern part of the country with a production capacity of 850 thousand tons, andone cement mill in the central part of the country with grinding capacity of 900 thousand tons, among other
F-50
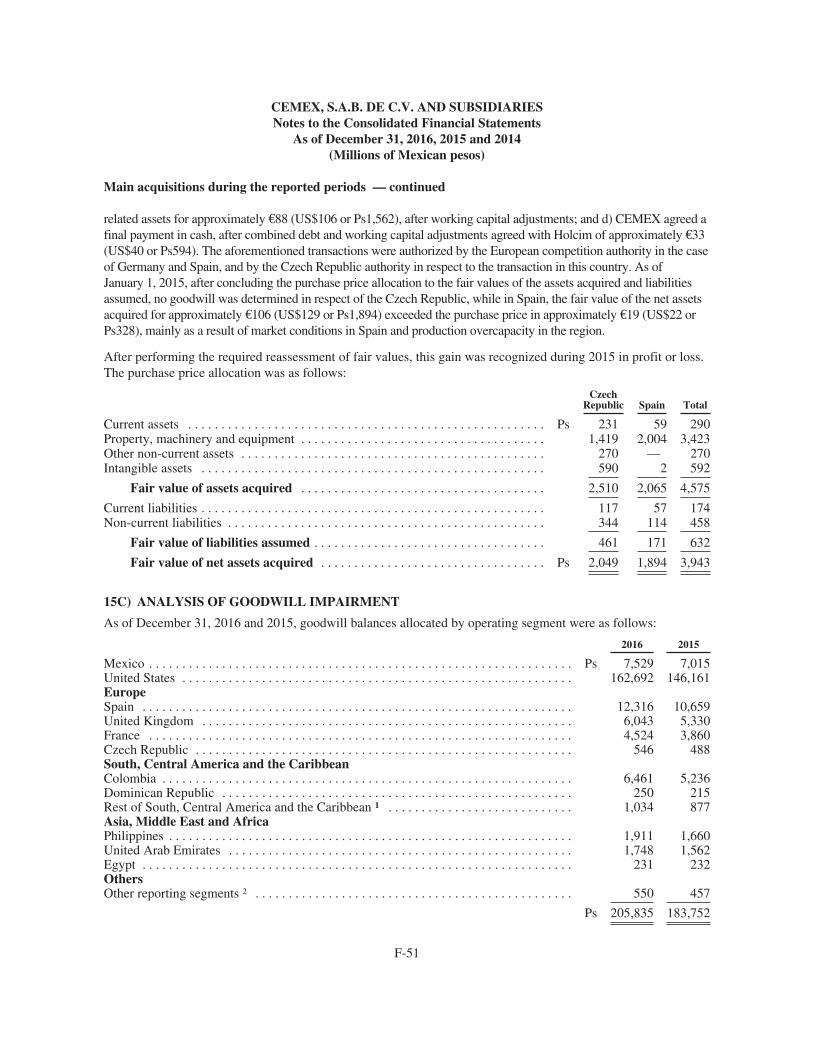
CEMEX, S.A.B. DE C.V. AND SUBSIDIARIESNotes to the Consolidated Financial Statements
As of December 31, 2016, 2015 and 2014(Millions of Mexican pesos)
Main acquisitions during the reported periods — continued
related assets for approximately €88 (US$106 or Ps1,562), after working capital adjustments; and d) CEMEX agreed afinal payment in cash, after combined debt and working capital adjustments agreed with Holcim of approximately €33(US$40 or Ps594). The aforementioned transactions were authorized by the European competition authority in the caseof Germany and Spain, and by the Czech Republic authority in respect to the transaction in this country. As ofJanuary 1, 2015, after concluding the purchase price allocation to the fair values of the assets acquired and liabilitiesassumed, no goodwill was determined in respect of the Czech Republic, while in Spain, the fair value of the net assetsacquired for approximately €106 (US$129 or Ps1,894) exceeded the purchase price in approximately €19 (US$22 orPs328), mainly as a result of market conditions in Spain and production overcapacity in the region.
After performing the required reassessment of fair values, this gain was recognized during 2015 in profit or loss.The purchase price allocation was as follows:
CzechRepublic Spain Total
Current assets . . . . . . . . . . . . . . . . . . . . . . . . . . . . . . . . . . . . . . . . . . . . . . . . . . . . . . Ps 231 59 290Property, machinery and equipment . . . . . . . . . . . . . . . . . . . . . . . . . . . . . . . . . . . . . 1,419 2,004 3,423Other non-current assets . . . . . . . . . . . . . . . . . . . . . . . . . . . . . . . . . . . . . . . . . . . . . . 270 — 270Intangible assets . . . . . . . . . . . . . . . . . . . . . . . . . . . . . . . . . . . . . . . . . . . . . . . . . . . . 590 2 592
Fair value of assets acquired . . . . . . . . . . . . . . . . . . . . . . . . . . . . . . . . . . . . . 2,510 2,065 4,575
Current liabilities . . . . . . . . . . . . . . . . . . . . . . . . . . . . . . . . . . . . . . . . . . . . . . . . . . . . 117 57 174Non-current liabilities . . . . . . . . . . . . . . . . . . . . . . . . . . . . . . . . . . . . . . . . . . . . . . . . 344 114 458
Fair value of liabilities assumed . . . . . . . . . . . . . . . . . . . . . . . . . . . . . . . . . . . 461 171 632
Fair value of net assets acquired . . . . . . . . . . . . . . . . . . . . . . . . . . . . . . . . . . Ps 2,049 1,894 3,943
15C) ANALYSIS OF GOODWILL IMPAIRMENT
As of December 31, 2016 and 2015, goodwill balances allocated by operating segment were as follows:
2016 2015
Mexico . . . . . . . . . . . . . . . . . . . . . . . . . . . . . . . . . . . . . . . . . . . . . . . . . . . . . . . . . . . . . . . . Ps 7,529 7,015United States . . . . . . . . . . . . . . . . . . . . . . . . . . . . . . . . . . . . . . . . . . . . . . . . . . . . . . . . . . . 162,692 146,161EuropeSpain . . . . . . . . . . . . . . . . . . . . . . . . . . . . . . . . . . . . . . . . . . . . . . . . . . . . . . . . . . . . . . . . . 12,316 10,659United Kingdom . . . . . . . . . . . . . . . . . . . . . . . . . . . . . . . . . . . . . . . . . . . . . . . . . . . . . . . . 6,043 5,330France . . . . . . . . . . . . . . . . . . . . . . . . . . . . . . . . . . . . . . . . . . . . . . . . . . . . . . . . . . . . . . . . 4,524 3,860Czech Republic . . . . . . . . . . . . . . . . . . . . . . . . . . . . . . . . . . . . . . . . . . . . . . . . . . . . . . . . . 546 488South, Central America and the CaribbeanColombia . . . . . . . . . . . . . . . . . . . . . . . . . . . . . . . . . . . . . . . . . . . . . . . . . . . . . . . . . . . . . . 6,461 5,236Dominican Republic . . . . . . . . . . . . . . . . . . . . . . . . . . . . . . . . . . . . . . . . . . . . . . . . . . . . . 250 215Rest of South, Central America and the Caribbean 1 . . . . . . . . . . . . . . . . . . . . . . . . . . . . 1,034 877Asia, Middle East and AfricaPhilippines . . . . . . . . . . . . . . . . . . . . . . . . . . . . . . . . . . . . . . . . . . . . . . . . . . . . . . . . . . . . . 1,911 1,660United Arab Emirates . . . . . . . . . . . . . . . . . . . . . . . . . . . . . . . . . . . . . . . . . . . . . . . . . . . . 1,748 1,562Egypt . . . . . . . . . . . . . . . . . . . . . . . . . . . . . . . . . . . . . . . . . . . . . . . . . . . . . . . . . . . . . . . . . 231 232OthersOther reporting segments 2 . . . . . . . . . . . . . . . . . . . . . . . . . . . . . . . . . . . . . . . . . . . . . . . . 550 457
Ps 205,835 183,752
F-51

CEMEX, S.A.B. DE C.V. AND SUBSIDIARIESNotes to the Consolidated Financial Statements
As of December 31, 2016, 2015 and 2014(Millions of Mexican pesos)
Analysis of goodwill impairment — continued
1 This caption refers to the operating segments in the Caribbean, Argentina, Costa Rica and Panama.2 This caption is primarily associated with Neoris N.V., CEMEX’s subsidiary involved in the sale of
information technology and services.
For purposes of goodwill impairment tests, all cash-generating units within a country are aggregated, as goodwillis allocated at that level. Considering materiality for disclosure purposes, certain balances of goodwill werepresented for Rest of South, Central America and the Caribbean, but this does not represent that goodwill wastested at a higher level than for operations in an individual country.
Impairment tests are significantly sensitive to, among other factors, the estimation of future prices of CEMEX’sproducts, the development of operating expenses, local and international economic trends in the constructionindustry, the long-term growth expectations in the different markets, as well as the discount rates and the long-term growth rates applied. CEMEX’s cash flow projections to determine the value in use of its CGUs to whichgoodwill has been allocated consider the use of long-term economic assumptions. CEMEX believes that itsdiscounted cash flow projections and the discount rates used reasonably reflect current economic conditions atthe time of the calculations, considering, among other factors that: a) the cost of capital reflects current risks andvolatility in the markets; and b) the cost of debt represents the average of industry specific interest rates observedin recent transactions. Other key assumptions used to determine CEMEX’s discounted cash flows are volume andprice increases or decreases by main product during the projected periods. Volume increases or decreasesgenerally reflect forecasts issued by trustworthy external sources, occasionally adjusted based on CEMEX’sactual backlog, experience and judgment considering its concentration in certain sectors, while price changesnormally reflect the expected inflation in the respective country. Operating costs and expenses during all periodsare maintained as a fixed percent of revenues considering historic performance. During the last quarter of 2016,2015 and 2014, CEMEX performed its annual goodwill impairment test. Based on these analyses, CEMEX didnot determine impairment losses of goodwill in any of the reported periods.
CEMEX’s pre-tax discount rates and long-term growth rates used to determine the discounted cash flows in thegroup of CGUs with the main goodwill balances were as follows:
Discount rates Growth rates
Groups of CGUs 2016 2015 2014 2016 2015 2014
United States . . . . . . . . . . . . 8.6% 8.6% 8.7% 2.5% 2.5% 2.5%Spain . . . . . . . . . . . . . . . . . . 9.5% 9.9% 10.1% 1.6% 1.9% 2.0%Mexico . . . . . . . . . . . . . . . . . 9.8% 9.6% 9.7% 2.9% 3.5% 3.8%Colombia . . . . . . . . . . . . . . . 10.0% 9.8% 9.7% 4.0% 4.0% 3.0%France . . . . . . . . . . . . . . . . . 9.1% 9.0% 9.2% 1.8% 1.6% 1.7%United Arab Emirates . . . . . 10.2% 10.2% 10.4% 3.4% 3.6% 3.4%United Kingdom . . . . . . . . . 8.8% 8.8% 9.0% 1.9% 2.3% 2.4%Egypt . . . . . . . . . . . . . . . . . . 11.4% 12.5% 11.6% 6.0% 4.6% 4.0%Range of rates in other
countries . . . . . . . . . . . . . 9.1% - 12.8% 9.0% - 13.8% 9.2% - 14.0% 2.2% - 7.0% 2.4% - 4.3% 2.1% - 4.9%
As of December 31, 2016, the discount rates used by CEMEX in its cash flows projections remained relativelyflat in the countries with the most significant goodwill balances as compared to the values determined in 2015.During the year, the funding cost observed in industry decreased from 6.9% in 2015 to 6.2% in 2016, and the risk
F-52
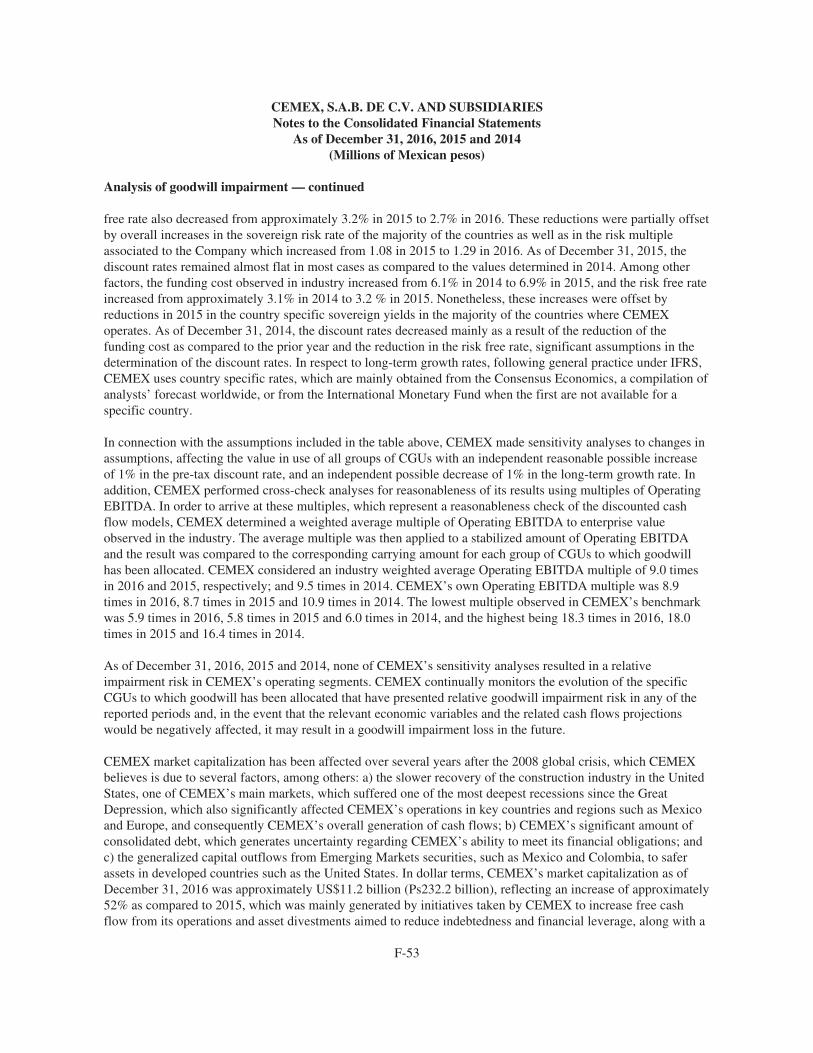
CEMEX, S.A.B. DE C.V. AND SUBSIDIARIESNotes to the Consolidated Financial Statements
As of December 31, 2016, 2015 and 2014(Millions of Mexican pesos)
Analysis of goodwill impairment — continued
free rate also decreased from approximately 3.2% in 2015 to 2.7% in 2016. These reductions were partially offsetby overall increases in the sovereign risk rate of the majority of the countries as well as in the risk multipleassociated to the Company which increased from 1.08 in 2015 to 1.29 in 2016. As of December 31, 2015, thediscount rates remained almost flat in most cases as compared to the values determined in 2014. Among otherfactors, the funding cost observed in industry increased from 6.1% in 2014 to 6.9% in 2015, and the risk free rateincreased from approximately 3.1% in 2014 to 3.2 % in 2015. Nonetheless, these increases were offset byreductions in 2015 in the country specific sovereign yields in the majority of the countries where CEMEXoperates. As of December 31, 2014, the discount rates decreased mainly as a result of the reduction of thefunding cost as compared to the prior year and the reduction in the risk free rate, significant assumptions in thedetermination of the discount rates. In respect to long-term growth rates, following general practice under IFRS,CEMEX uses country specific rates, which are mainly obtained from the Consensus Economics, a compilation ofanalysts’ forecast worldwide, or from the International Monetary Fund when the first are not available for aspecific country.
In connection with the assumptions included in the table above, CEMEX made sensitivity analyses to changes inassumptions, affecting the value in use of all groups of CGUs with an independent reasonable possible increaseof 1% in the pre-tax discount rate, and an independent possible decrease of 1% in the long-term growth rate. Inaddition, CEMEX performed cross-check analyses for reasonableness of its results using multiples of OperatingEBITDA. In order to arrive at these multiples, which represent a reasonableness check of the discounted cashflow models, CEMEX determined a weighted average multiple of Operating EBITDA to enterprise valueobserved in the industry. The average multiple was then applied to a stabilized amount of Operating EBITDAand the result was compared to the corresponding carrying amount for each group of CGUs to which goodwillhas been allocated. CEMEX considered an industry weighted average Operating EBITDA multiple of 9.0 timesin 2016 and 2015, respectively; and 9.5 times in 2014. CEMEX’s own Operating EBITDA multiple was 8.9times in 2016, 8.7 times in 2015 and 10.9 times in 2014. The lowest multiple observed in CEMEX’s benchmarkwas 5.9 times in 2016, 5.8 times in 2015 and 6.0 times in 2014, and the highest being 18.3 times in 2016, 18.0times in 2015 and 16.4 times in 2014.
As of December 31, 2016, 2015 and 2014, none of CEMEX’s sensitivity analyses resulted in a relativeimpairment risk in CEMEX’s operating segments. CEMEX continually monitors the evolution of the specificCGUs to which goodwill has been allocated that have presented relative goodwill impairment risk in any of thereported periods and, in the event that the relevant economic variables and the related cash flows projectionswould be negatively affected, it may result in a goodwill impairment loss in the future.
CEMEX market capitalization has been affected over several years after the 2008 global crisis, which CEMEXbelieves is due to several factors, among others: a) the slower recovery of the construction industry in the UnitedStates, one of CEMEX’s main markets, which suffered one of the most deepest recessions since the GreatDepression, which also significantly affected CEMEX’s operations in key countries and regions such as Mexicoand Europe, and consequently CEMEX’s overall generation of cash flows; b) CEMEX’s significant amount ofconsolidated debt, which generates uncertainty regarding CEMEX’s ability to meet its financial obligations; andc) the generalized capital outflows from Emerging Markets securities, such as Mexico and Colombia, to saferassets in developed countries such as the United States. In dollar terms, CEMEX’s market capitalization as ofDecember 31, 2016 was approximately US$11.2 billion (Ps232.2 billion), reflecting an increase of approximately52% as compared to 2015, which was mainly generated by initiatives taken by CEMEX to increase free cashflow from its operations and asset divestments aimed to reduce indebtedness and financial leverage, along with a
F-53

CEMEX, S.A.B. DE C.V. AND SUBSIDIARIESNotes to the Consolidated Financial Statements
As of December 31, 2016, 2015 and 2014(Millions of Mexican pesos)
Analysis of goodwill impairment — continued
reduction of risk aversion across global financial markets as U.S. stock indexes reached to new all-time highs andinternational oil prices partially recovered during 2016 amid reduced global growth concerns, despite thecontinued depreciation of Emerging Markets currencies against the dollar in 2016 and continued uncertainty ofthe pace and timing of actions to increase interest rates in the United States. CEMEX market capitalizationdecreased approximately 41% in 2015 compared to 2014 to approximately US$7.4 billion (Ps126.8 billion), dueto the continuing significant depreciation of the Emerging Markets currencies against the dollar in 2015, whichintensified in the second half of the year, driven by the material reduction in the international oil prices,uncertainty generated by the pace and timing of actions to increase interest rates in the United States, Chinagrowth concerns, lower global growth expectations and the uncertainty of CEMEX’s income in US dollar termsfrom its operations in Emerging Markets such as Mexico and Colombia, countries with important dependence ofoil revenues in its government budgets, which may result in the cancellation or delay of governmentinfrastructure projects.
As of December 31, 2016 and 2015, goodwill allocated to the United States accounted for approximately 79%and 80%, respectively, of CEMEX’s total amount of consolidated goodwill. In connection with CEMEX’sdetermination of value in use relative to its groups of CGUs in the United States in the reported periods, CEMEXhas considered several factors, such as the historical performance of such operating segment, including operatinglosses in recent years, the long-term nature of CEMEX’s investment, the signs of recovery in the constructionindustry over the last three years, the significant economic barriers for new potential competitors considering thehigh investment required, and the lack of susceptibility of the industry to technology improvements or alternateconstruction products, among other factors. CEMEX has also considered recent developments in its operations inthe United States, such as the increases in ready-mix concrete volumes of approximately 1% in 2016, 13% in2015 and 2% in 2014, and the increases in ready-mix concrete prices of approximately 1% in 2016, 5% in 2015and 8% in 2014, which are key drivers for cement consumption and CEMEX’s profitability, and which trends areexpected to continue over the next few years, as anticipated in CEMEX’s cash flow projections.
16) FINANCIAL INSTRUMENTS
16A) SHORT-TERM AND LONG-TERM DEBT
As of December 31, 2016 and 2015, CEMEX´s consolidated debt summarized by interest rates and currencies,was as follow:
2016 2015
Short-term Long-term Total Short-term Long-term Total
Floating rate debt . . . . . . . . . . . . . . Ps 519 64,550 65,069 Ps 176 62,319 62,495Fixed rate debt . . . . . . . . . . . . . . . . 697 170,466 171,163 42 166,806 166,848
Ps 1,216 235,016 236,232 Ps 218 229,125 229,343
Effective rate 1
Floating rate . . . . . . . . . . . . . . . . . . 9.7% 4.4% 5.5% 4.0%Fixed rate . . . . . . . . . . . . . . . . . . . . 4.4% 6.5% 1.5% 7.0%
F-54

CEMEX, S.A.B. DE C.V. AND SUBSIDIARIESNotes to the Consolidated Financial Statements
As of December 31, 2016, 2015 and 2014(Millions of Mexican pesos)
Short-term and long-term debt — continued
2016 2015
CurrencyShort-term
Long-term Total
Effectiverate 1
Short-term
Long-term Total
Effectiverate 1
Dollars . . . . . . . . . . . . . . Ps 114 179,675 179,789 6.3% Ps 87 187,427 187,514 6.5%Euros . . . . . . . . . . . . . . . 50 55,292 55,342 4.3% 38 40,954 40,992 4.8%Pesos . . . . . . . . . . . . . . . 648 — 648 4.4% — 627 627 4.4%Other currencies . . . . . . . 404 49 453 10.2% 93 117 210 6.3%
Ps 1,216 235,016 236,232 Ps 218 229,125 229,343
1 In 2016 and 2015, represents the weighted average interest rate of the related debt agreements.
As of December 31, 2016 and 2015, CEMEX´s consolidated debt summarized by type of instrument, was asfollow:
2016Short-term
Long-term 2015
Short-term
Long-term
Bank loans Bank loansLoans in foreign countries, 2017 to
2022 . . . . . . . . . . . . . . . . . . . . . . . . . . . . Ps 255 1,090Loans in foreign countries, 2016 to
2022 . . . . . . . . . . . . . . . . . . . . . . . . . . . Ps 78 996Syndicated loans, 2017 to 2020 . . . . . . . . . 36 57,032 Syndicated loans, 2016 to 2020 . . . . . . . 31 52,825
291 58,122 109 53,821
Notes payable Notes payableNotes payable in Mexico, 2017 . . . . . . . . .
— 648Notes payable in Mexico, 2016 to
2017 . . . . . . . . . . . . . . . . . . . . . . . . . . . — 627Medium-term notes, 2017 to 2026 . . . . . . . — 173,656 Medium-term notes, 2016 to 2025 . . . . . — 171,988Other notes payable, 2017 to 2025 . . . . . . . 173 3,342 Other notes payable, 2016 to 2025 . . . . . 23 2,775
173 177,646 23 175,390
Total bank loans and notes payable . . . . . . 464 235,768 Total bank loans and notes payable . . . . 132 229,211Current maturities . . . . . . . . . . . . . . . . . . . . 752 (752) Current maturities . . . . . . . . . . . . . . . . . . 86 (86)
Ps 1,216 235,016 Ps 218 229,125
As of December 31, 2016 and 2015, discounts, fees and other direct costs incurred in the issuance of CEMEX’soutstanding notes payable for approximately US$84 and US$108, respectively, adjust the balance of payableinstruments, and are amortized to financing expense over the maturity of the related debt instruments.
F-55

CEMEX, S.A.B. DE C.V. AND SUBSIDIARIESNotes to the Consolidated Financial Statements
As of December 31, 2016, 2015 and 2014(Millions of Mexican pesos)
Short-term and long-term debt — continued
Changes in consolidated debt for the years ended December 31, 2016, 2015 and 2014 were as follows:
2016 2015 2014
Debt at beginning of year . . . . . . . . . . . . . . . . . . . . . . . . . . . . . . . . . . . . . . . . . . . . . . . . . . Ps 229,343 205,834 190,980Proceeds from new debt instruments . . . . . . . . . . . . . . . . . . . . . . . . . . . . . . . . . . . . . . 48,748 52,764 72,534Debt repayments . . . . . . . . . . . . . . . . . . . . . . . . . . . . . . . . . . . . . . . . . . . . . . . . . . . . . (85,798) (64,237) (79,248)Foreign currency translation and inflation effects . . . . . . . . . . . . . . . . . . . . . . . . . . . . 43,939 34,982 21,568
Debt at end of year . . . . . . . . . . . . . . . . . . . . . . . . . . . . . . . . . . . . . . . . . . . . . . . . . . . . . . . . Ps 236,232 229,343 205,834
As of December 31, 2016 and 2015, as presented in the table above of debt by type of instrument, approximately 25% and24%, respectively, of CEMEX’s total indebtedness, was represented by bank loans, of which the most significant portioncorresponded to those balances under CEMEX’s facilities agreement entered into on September 29, 2014, as amendedseveral times in 2015 and 2016 (the “Credit Agreement”) of approximately US$2,745 (Ps56,879) in 2016 and US$3,062(Ps52,763) in 2015.
In addition, as of December 31, 2016 and 2015, as presented in the table above of debt by type of instrument, approximately75% and 76%, respectively, of CEMEX’s total indebtedness, was represented by notes payable, of which, the mostsignificant portion was long-term in both periods. As of December 31, 2016 and 2015, CEMEX’s long-term notes payableare detailed as follows:
DescriptionDate ofissuance Issuer 1, 2 Currency
Principalamount Rate 1
Maturitydate
Repurchasedamount
US$
Outstandingamount 3
US$ 2016 2015
April 2026 Notes 4 . . . . 16/Mar/16 CEMEX, S.A.B. de C.V. Dollar 1,000 7.75% 16/Apr/26 — 1,000 Ps 20,631 —July 2025 Notes . . . . . . 02/Apr/03 CEMEX Materials, LLC Dollar 150 7.70% 21/Jul/25 — 150 3,249 2,720July 2025 Notes . . . . . . 08/Jul/15 CEMEX Colombia, S.A. COP 10,000 8.30% 08/Jul/25 (3) — — 55March 2025 Notes 5 . . . 03/Mar/15 CEMEX, S.A.B. de C.V. Dollar 750 6.125% 05/May/25 — 750 15,488 12,866January 2025 Notes 6 . . 11/Sep/14 CEMEX, S.A.B. de C.V. Dollar 1,100 5.70% 11/Jan/25 (29) 1,071 22,124 18,382June 2024 Notes . . . . . . 14/Jun/16 CEMEX Finance LLC Euro 400 4.625% 15/Jun/24 — 421 8,665 —April 2024 Notes . . . . . 01/Apr/14 CEMEX Finance LLC Dollar 1,000 6.00% 01/Apr/24 (10) 990 19,886 16,483March 2023 Notes 5 . . . 03/Mar/15 CEMEX, S.A.B. de C.V. Euro 550 4.375% 05/Mar/23 — 579 11,948 10,251October 2022 Notes 4 . . 12/Oct/12 CEMEX Finance LLC Dollar 1,500 9.375% 12/Oct/22 (444) 1,056 21,738 24,634January 2022 Notes 6 . . 11/Sep/14 CEMEX, S.A.B. de C.V. Euro 400 4.75% 11/Jan/22 — 421 8,696 7,462April 2021 Notes . . . . . 01/Apr/14 CEMEX Finance LLC Euro 400 5.25% 01/Apr/21 — 421 8,679 7,448January 2021 Notes 4 . . 02/Oct/13 CEMEX, S.A.B. de C.V. Dollar 1,000 7.25% 15/Jan/21 (273) 727 14,845 17,009December 2019
Notes 4 . . . . . . . . . . . 12/Aug/13 CEMEX, S.A.B. de C.V. Dollar 1,000 6.50% 10/Dec/19 (292) 708 14,471 16,764April 2019 USD
Notes . . . . . . . . . . . . . 28/Mar/12 CEMEX España, S.A. Dollar 704 9.875% 30/Apr/19 (704) — — 10,702April 2019 Euro
Notes . . . . . . . . . . . . . 28/Mar/12 CEMEX España, S.A. Euro 179 9.875% 30/Apr/19 (188) — — 3,355March 2019 Notes . . . . 25/Mar/13 CEMEX, S.A.B. de C.V. Dollar 600 5.875% 25/Mar/19 (600) — — 10,302October 2018 Variable
Notes 4 . . . . . . . . . . . 02/Oct/13 CEMEX, S.A.B. de C.V. Dollar 500 L+475bps 15/Oct/18 (187) 313 6,485 8,564June 2018 Notes . . . . . . 17/Sep/12 CEMEX, S.A.B. de C.V. Dollar 500 9.50% 15/Jun/18 (500) — — 7,702November 2017
Notes . . . . . . . . . . . . . 30/Nov/07 CEMEX, S.A.B. de C.V. Peso 627 4.40% 17/Nov/17 (292) 30 648 627Other notes payable . . . 93 64
Ps 177,646 175,390
F-56

CEMEX, S.A.B. DE C.V. AND SUBSIDIARIESNotes to the Consolidated Financial Statements
As of December 31, 2016, 2015 and 2014(Millions of Mexican pesos)
Short-term and long-term debt — continued
1 In all applicable cases the issuer refers to CEMEX España, S.A. acting through its Luxembourg Branch. Theletter “L” included above refers to LIBOR, which represents the London Inter-Bank Offered Rate, variablerate used in international markets for debt denominated in U.S. dollars. As of December 31, 2016 and 2015,3-Month LIBOR rate was 0.9979% and 0.6127%, respectively. The contraction “bps” means basis points.One hundred basis points equal 1%.
2 Unless otherwise indicated, all issuances are fully and unconditionally guaranteed by CEMEX, S.A.B. deC.V., CEMEX México, S.A. de C.V., CEMEX Concretos, S.A. de C.V., Empresas Tolteca de México, S.A.de C.V., New Sunward Holding B.V., CEMEX España, S.A., CEMEX Asia, B.V., CEMEX Corp., CEMEXEgyptian Investments, B.V., CEMEX Finance LLC, CEMEX France Gestion, (S.A.S.), CEMEX ResearchGroup AG and CEMEX UK. CEMEX Egyptian Investments II, B.V. and CEMEX Shipping, B.V. originallyguaranteed the issuances listed above but were merged into CEMEX España, S.A. on October 3, 2016.
3 Presented net of all outstanding notes repurchased and held by CEMEX’s subsidiaries.4 On May 9, 2016, using available funds from the issuance of the April 2026 Notes, the sale of assets and cash
flows provided by operating activities, and by means of tender offers, CEMEX completed the purchase ofapproximately US$178 principal amount of the October 2018 Variable Notes, and the purchase ofapproximately US$219 principal amount of the December 2019 Notes. In addition, on July 28, 2016,CEMEX repurchased additional US$355 principal amount of the October 2022 Notes. Moreover, onOctober 28, 2016, CEMEX repurchased US$242 principal amount of the January 2021 Notes.
5 On March 30, 2015, in connection with the issuance of the March 2023 Notes and the March 2025 Notes,CEMEX repurchased US$344 of the remaining principal amount of the then outstanding January 2018Notes. In addition, on May 15, 2015, CEMEX repurchased US$213 of the remaining principal amount ofthe then outstanding May 2020 Notes, and on June 30, 2015, the purchase of the remaining principal amountfor US$746 of the then outstanding September 2015 Variable Notes.
6 On January 11, 2015, in connection with the issuance of the January 2025 Notes and the January 2022Notes, CEMEX completed the purchase of additional US$217 principal amount of the then outstandingJanuary 2018 Notes.
During 2016, 2015 and 2014, as a result of the debt transactions incurred by CEMEX mentioned above,including exchange offers and tender offers to replace and/or repurchase existing debt instruments, CEMEX paidcombined premiums, fees and issuance costs for approximately US$196 (Ps4,061), US$61 (Ps1,047) andUS$232 (Ps3,107), respectively, of which approximately US$151 (Ps3,129) in 2016, US$35 (Ps604) in 2015 andUS$167 (Ps2,236) in 2014, associated with the extinguished portion of the exchanged or repurchased notes, wererecognized in the statement of operations in each year within “Financial expense”. In addition, approximatelyUS$8 (Ps166) in 2016, US$26 (Ps443) in 2015 and US$65 (Ps871) in 2014, corresponding to issuance costs ofnew debt and/or the portion of the combined premiums, fees and issuance costs treated as a refinancing of the oldinstruments by considering that: a) the relevant economic terms of the old and new notes were not substantiallydifferent; and b) the final holders of the new notes were the same of such portion of the old notes; adjusted thecarrying amount of the new debt instruments, and are amortized over the remaining term of each instrument.Moreover, proportional fees and issuance costs related to the extinguished debt instruments for approximatelyUS$37 (Ps767) in 2016, US$31 (Ps541) in 2015 and US$87 (Ps1,161) in 2014 that were pending foramortization were recognized in the statement of operations of each year as part of “Financial expense”.
F-57
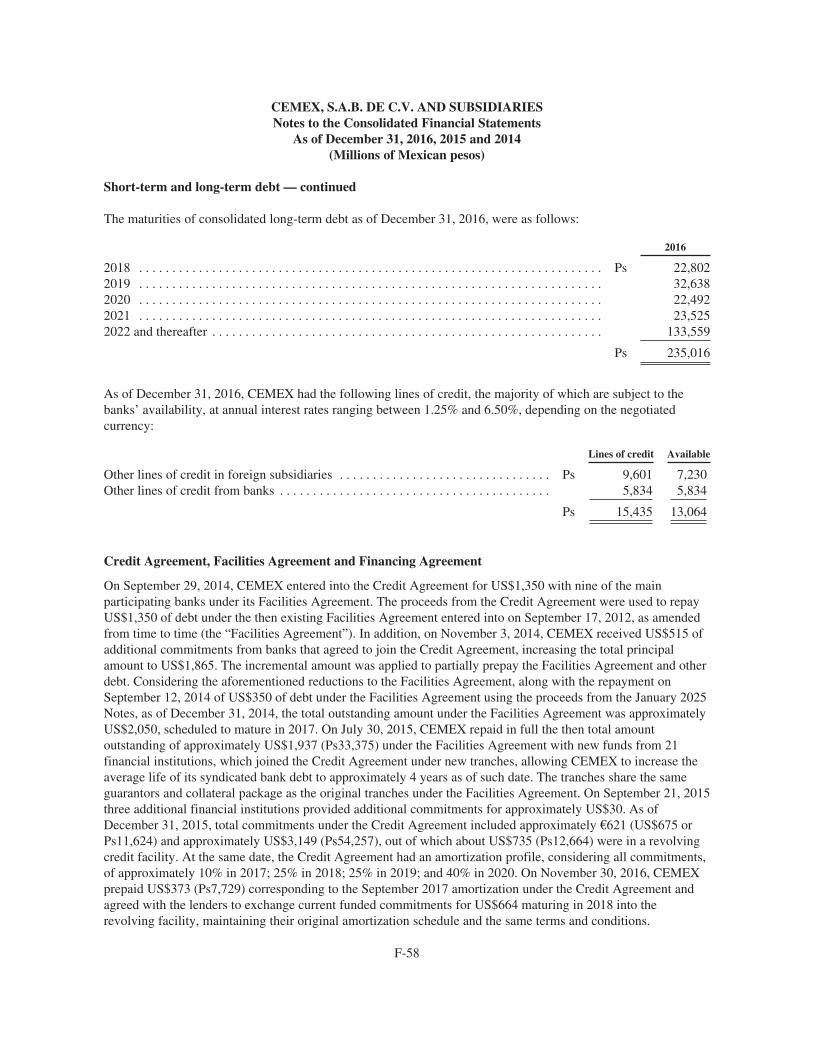
CEMEX, S.A.B. DE C.V. AND SUBSIDIARIESNotes to the Consolidated Financial Statements
As of December 31, 2016, 2015 and 2014(Millions of Mexican pesos)
Short-term and long-term debt — continued
The maturities of consolidated long-term debt as of December 31, 2016, were as follows:
2016
2018 . . . . . . . . . . . . . . . . . . . . . . . . . . . . . . . . . . . . . . . . . . . . . . . . . . . . . . . . . . . . . . . . . . . . . . Ps 22,8022019 . . . . . . . . . . . . . . . . . . . . . . . . . . . . . . . . . . . . . . . . . . . . . . . . . . . . . . . . . . . . . . . . . . . . . . 32,6382020 . . . . . . . . . . . . . . . . . . . . . . . . . . . . . . . . . . . . . . . . . . . . . . . . . . . . . . . . . . . . . . . . . . . . . . 22,4922021 . . . . . . . . . . . . . . . . . . . . . . . . . . . . . . . . . . . . . . . . . . . . . . . . . . . . . . . . . . . . . . . . . . . . . . 23,5252022 and thereafter . . . . . . . . . . . . . . . . . . . . . . . . . . . . . . . . . . . . . . . . . . . . . . . . . . . . . . . . . . . 133,559
Ps 235,016
As of December 31, 2016, CEMEX had the following lines of credit, the majority of which are subject to thebanks’ availability, at annual interest rates ranging between 1.25% and 6.50%, depending on the negotiatedcurrency:
Lines of credit Available
Other lines of credit in foreign subsidiaries . . . . . . . . . . . . . . . . . . . . . . . . . . . . . . . . Ps 9,601 7,230Other lines of credit from banks . . . . . . . . . . . . . . . . . . . . . . . . . . . . . . . . . . . . . . . . . 5,834 5,834
Ps 15,435 13,064
Credit Agreement, Facilities Agreement and Financing Agreement
On September 29, 2014, CEMEX entered into the Credit Agreement for US$1,350 with nine of the mainparticipating banks under its Facilities Agreement. The proceeds from the Credit Agreement were used to repayUS$1,350 of debt under the then existing Facilities Agreement entered into on September 17, 2012, as amendedfrom time to time (the “Facilities Agreement”). In addition, on November 3, 2014, CEMEX received US$515 ofadditional commitments from banks that agreed to join the Credit Agreement, increasing the total principalamount to US$1,865. The incremental amount was applied to partially prepay the Facilities Agreement and otherdebt. Considering the aforementioned reductions to the Facilities Agreement, along with the repayment onSeptember 12, 2014 of US$350 of debt under the Facilities Agreement using the proceeds from the January 2025Notes, as of December 31, 2014, the total outstanding amount under the Facilities Agreement was approximatelyUS$2,050, scheduled to mature in 2017. On July 30, 2015, CEMEX repaid in full the then total amountoutstanding of approximately US$1,937 (Ps33,375) under the Facilities Agreement with new funds from 21financial institutions, which joined the Credit Agreement under new tranches, allowing CEMEX to increase theaverage life of its syndicated bank debt to approximately 4 years as of such date. The tranches share the sameguarantors and collateral package as the original tranches under the Facilities Agreement. On September 21, 2015three additional financial institutions provided additional commitments for approximately US$30. As ofDecember 31, 2015, total commitments under the Credit Agreement included approximately €621 (US$675 orPs11,624) and approximately US$3,149 (Ps54,257), out of which about US$735 (Ps12,664) were in a revolvingcredit facility. At the same date, the Credit Agreement had an amortization profile, considering all commitments,of approximately 10% in 2017; 25% in 2018; 25% in 2019; and 40% in 2020. On November 30, 2016, CEMEXprepaid US$373 (Ps7,729) corresponding to the September 2017 amortization under the Credit Agreement andagreed with the lenders to exchange current funded commitments for US$664 maturing in 2018 into therevolving facility, maintaining their original amortization schedule and the same terms and conditions.
F-58
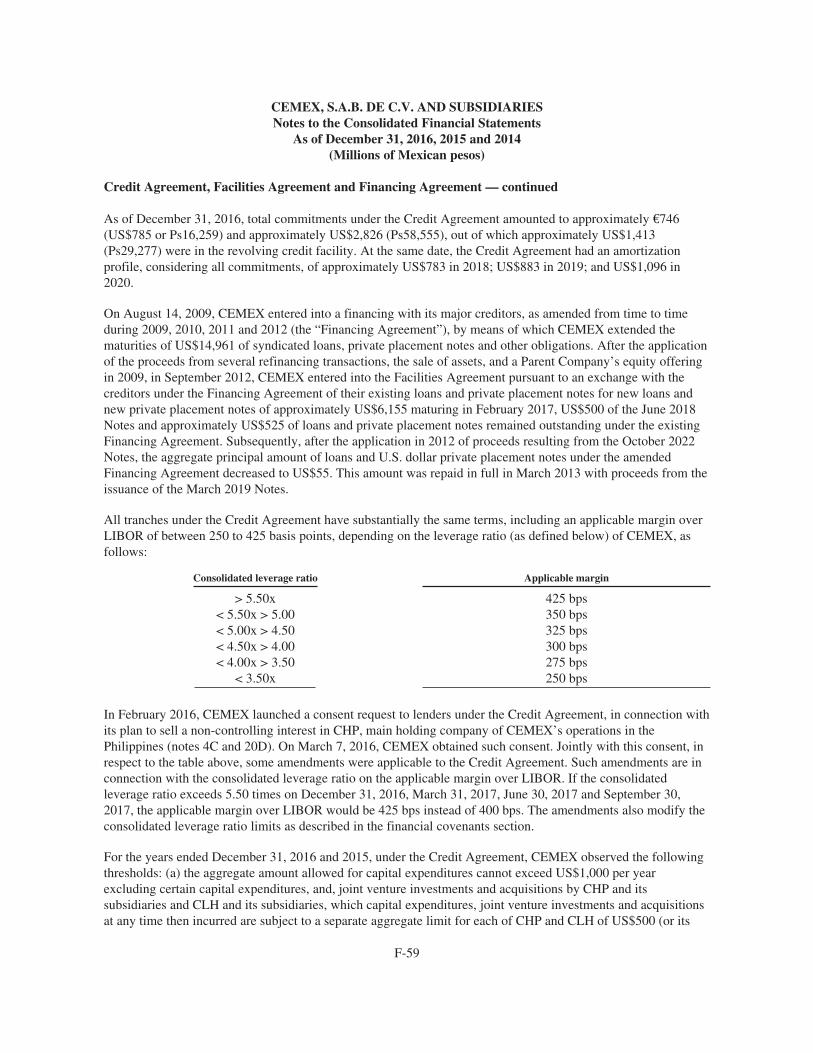
CEMEX, S.A.B. DE C.V. AND SUBSIDIARIESNotes to the Consolidated Financial Statements
As of December 31, 2016, 2015 and 2014(Millions of Mexican pesos)
Credit Agreement, Facilities Agreement and Financing Agreement — continued
As of December 31, 2016, total commitments under the Credit Agreement amounted to approximately €746(US$785 or Ps16,259) and approximately US$2,826 (Ps58,555), out of which approximately US$1,413(Ps29,277) were in the revolving credit facility. At the same date, the Credit Agreement had an amortizationprofile, considering all commitments, of approximately US$783 in 2018; US$883 in 2019; and US$1,096 in2020.
On August 14, 2009, CEMEX entered into a financing with its major creditors, as amended from time to timeduring 2009, 2010, 2011 and 2012 (the “Financing Agreement”), by means of which CEMEX extended thematurities of US$14,961 of syndicated loans, private placement notes and other obligations. After the applicationof the proceeds from several refinancing transactions, the sale of assets, and a Parent Company’s equity offeringin 2009, in September 2012, CEMEX entered into the Facilities Agreement pursuant to an exchange with thecreditors under the Financing Agreement of their existing loans and private placement notes for new loans andnew private placement notes of approximately US$6,155 maturing in February 2017, US$500 of the June 2018Notes and approximately US$525 of loans and private placement notes remained outstanding under the existingFinancing Agreement. Subsequently, after the application in 2012 of proceeds resulting from the October 2022Notes, the aggregate principal amount of loans and U.S. dollar private placement notes under the amendedFinancing Agreement decreased to US$55. This amount was repaid in full in March 2013 with proceeds from theissuance of the March 2019 Notes.
All tranches under the Credit Agreement have substantially the same terms, including an applicable margin overLIBOR of between 250 to 425 basis points, depending on the leverage ratio (as defined below) of CEMEX, asfollows:
Consolidated leverage ratio Applicable margin
> 5.50x 425 bps< 5.50x > 5.00 350 bps< 5.00x > 4.50 325 bps< 4.50x > 4.00 300 bps< 4.00x > 3.50 275 bps
< 3.50x 250 bps
In February 2016, CEMEX launched a consent request to lenders under the Credit Agreement, in connection withits plan to sell a non-controlling interest in CHP, main holding company of CEMEX’s operations in thePhilippines (notes 4C and 20D). On March 7, 2016, CEMEX obtained such consent. Jointly with this consent, inrespect to the table above, some amendments were applicable to the Credit Agreement. Such amendments are inconnection with the consolidated leverage ratio on the applicable margin over LIBOR. If the consolidatedleverage ratio exceeds 5.50 times on December 31, 2016, March 31, 2017, June 30, 2017 and September 30,2017, the applicable margin over LIBOR would be 425 bps instead of 400 bps. The amendments also modify theconsolidated leverage ratio limits as described in the financial covenants section.
For the years ended December 31, 2016 and 2015, under the Credit Agreement, CEMEX observed the followingthresholds: (a) the aggregate amount allowed for capital expenditures cannot exceed US$1,000 per yearexcluding certain capital expenditures, and, joint venture investments and acquisitions by CHP and itssubsidiaries and CLH and its subsidiaries, which capital expenditures, joint venture investments and acquisitionsat any time then incurred are subject to a separate aggregate limit for each of CHP and CLH of US$500 (or its
F-59

CEMEX, S.A.B. DE C.V. AND SUBSIDIARIESNotes to the Consolidated Financial Statements
As of December 31, 2016, 2015 and 2014(Millions of Mexican pesos)
Credit Agreement, Facilities Agreement and Financing Agreement — continued
equivalent); and (b) the amounts allowed for permitted acquisitions and investments in joint ventures cannotexceed US$400 per year. Nonetheless, such limitations do not apply if capital expenditures or acquisitions arefunded with equity, equity-like issuances or asset disposals proceeds.
The debt under the Credit Agreement and previously under the Facilities Agreement is guaranteed by CEMEXMéxico, S.A. de C.V., CEMEX Concretos, S.A. de C.V., Empresas Tolteca de México, S.A. de C.V., New SunwardHolding B.V., CEMEX España, S.A., CEMEX Asia, B.V., CEMEX Corp., CEMEX Egyptian Investments, B.V.,CEMEX Finance LLC, CEMEX France Gestion, (S.A.S.), CEMEX Research Group AG and CEMEX UK. Inaddition, the debt under such agreements (together with all other senior capital markets debt issued or guaranteed byCEMEX, and certain other precedent facilities) is also secured by a first-priority security interest in: (a) substantiallyall the shares of CEMEX México, S.A. de C.V., CEMEX Operaciones México, S.A. de C.V, New Sunward HoldingB.V., CEMEX Trademarks Holding Ltd. and CEMEX España, S.A. (the “Collateral”); and (b) all proceeds of suchCollateral. CEMEX Egyptian Investments II, B.V. and CEMEX Shipping, B.V. originally guaranteed the CreditAgreement but were merged into CEMEX España, S.A. on October 3, 2016.
In addition to the restrictions mentioned above, and subject in each case to the permitted negotiated amounts andother exceptions, CEMEX is also subject to a number of negative covenants that, among other things, restrict orlimit its ability to: (i) create liens; (ii) incur additional debt; (iii) change CEMEX’s business or the business ofany obligor or material subsidiary (in each case, as defined in the Credit Agreement and the FacilitiesAgreement); (iv) enter into mergers; (v) enter into agreements that restrict its subsidiaries’ ability to paydividends or repay intercompany debt; (vi) acquire assets; (vii) enter into or invest in joint venture agreements;(viii) dispose of certain assets; (ix) grant additional guarantees or indemnities; (x) declare or pay cash dividendsor make share redemptions; (xi) enter into certain derivatives transactions; and (xii) exercise any call option inrelation to any perpetual bonds CEMEX issues unless the exercise of the call options does not have a materiallynegative impact on its cash flow. The Credit Agreement contains a number of affirmative covenants that, amongother things, require CEMEX to provide periodic financial information to its lenders. However, a number ofthose covenants and restrictions will automatically cease to apply or become less restrictive if CEMEX so electswhen (i) CEMEX’s Leverage Ratio (as defined hereinafter) for the two most recently completed quarterly testingperiods is less than or equal to 4.0 times; and (ii) no default under the Credit Agreement is continuing. At thatpoint the Leverage Ratio must not exceed 4.25 times. Restrictions that will cease to apply when CEMEX satisfiessuch conditions include the capital expenditure limitations mentioned above and several negative covenants,including limitations on CEMEX’s ability to declare or pay cash dividends and distributions to shareholders,limitations on CEMEX’s ability to repay existing financial indebtedness, certain asset sale restrictions, certainmandatory prepayment provisions, and restrictions on exercising call options in relation to any perpetual bondsCEMEX issues. At such time, several baskets and caps relating to negative covenants will also increase,including permitted financial indebtedness, permitted guarantees and limitations on liens. However, CEMEXcannot assure that it will be able to meet the conditions for these restrictions to cease to apply prior to the finalmaturity date under the Credit Agreement.
In addition, the Credit Agreement contains events of default, some of which may occur and are outside ofCEMEX’s control such as expropriation, sequestration and availability of foreign exchange. As of December 31,2016 and 2015, CEMEX was not aware of any event of default. CEMEX cannot assure that it will be able tocomply with the restrictive covenants and limitations contained in the Credit Agreement. CEMEX’s failure tocomply with such covenants and limitations could result in an event of default, which could materially andadversely affect CEMEX’s business and financial condition.
F-60

CEMEX, S.A.B. DE C.V. AND SUBSIDIARIESNotes to the Consolidated Financial Statements
As of December 31, 2016, 2015 and 2014(Millions of Mexican pesos)
Financial Covenants
The Credit Agreement and previously the Facilities Agreement requires CEMEX the compliance with financialratios, which mainly include: a) the consolidated ratio of debt to Operating EBITDA (the “Leverage Ratio”); andb) the consolidated ratio of Operating EBITDA to interest expense (the “Coverage Ratio”). These financial ratiosare calculated according to the formulas established in the debt contracts using the consolidated amounts underIFRS. Considering the amendments of March 7, 2016 mentioned above. As of December 31, 2016, CEMEXmust comply with a Coverage ratio and a Leverage ratio for each period of four consecutive fiscal quarters asfollows:
Period Coverage ratio Period Leverage ratio
For the period ending on December 31, 2016 up toand including the period ending on March 31,2017 . . . . . . . . . . . . . . . . . . . . . . . . . . . . . . . . . . . > = 1.85
For the period ending on December 31, 2016 upto and including the period ending onMarch 31, 2017 . . . . . . . . . . . . . . . . . . . . . . . . < = 6.00
For the period ending on June 30, 2017 up to andincluding the period ending on September 30,2017 . . . . . . . . . . . . . . . . . . . . . . . . . . . . . . . . . < = 5.75
For the period ending on June 30, 2017 up to andincluding the period ending on September 30,2017 . . . . . . . . . . . . . . . . . . . . . . . . . . . . . . . . . . . > = 2.00
For the period ending on December 31, 2017 upto and including the period ending onMarch 31, 2018 . . . . . . . . . . . . . . . . . . . . . . . . < = 5.50
For the period ending on June 30, 2018 up to andincluding the period ending on September 30,2018 . . . . . . . . . . . . . . . . . . . . . . . . . . . . . . . . . < = 5.25
For the period ending on December 31, 2017 andeach subsequent reference period . . . . . . . . . . . . . > = 2.25
For the period ending on December 31, 2018 upto and including the period ending onMarch 31, 2019 . . . . . . . . . . . . . . . . . . . . . . . . < = 5.00
For the period ending on June 30, 2019 up to andincluding the period ending on September 30,2019 . . . . . . . . . . . . . . . . . . . . . . . . . . . . . . . . . < = 4.50
For the period ending on December 31, 2019 upto and including the period ending onMarch 31, 2020 . . . . . . . . . . . . . . . . . . . . . . . . < = 4.25
For the period ending on June 30, 2020 and eachsubsequent reference period . . . . . . . . . . . . . . . < = 4.00
CEMEX’s ability to comply with these ratios may be affected by economic conditions and volatility in foreignexchange rates, as well as by overall conditions in the financial and capital markets. For the compliance periodsended as of December 31, 2016, 2015 and 2014, taking into account the Credit Agreement and the FacilitiesAgreement, as applicable, CEMEX was in compliance with the financial covenants imposed by its debt contracts.The main consolidated financial ratios as of December 31, 2016, 2015 and 2014 were as follows:
Consolidated financial ratios
2016 2015 2014
Leverage ratio 1, 2 . . . . . . . . . . . . . . . . . . . . . . . . . . . . . . . . . . . . . . . . Limit =< 6.00 =< 6.00 =< 6.50Calculation 4.22 5.21 5.19
Coverage ratio 3 . . . . . . . . . . . . . . . . . . . . . . . . . . . . . . . . . . . . . . . . . Limit => 1.85 => 1.85 => 1.75Calculation 3.18 2.61 2.34
1 The leverage ratio is calculated in pesos by dividing “Funded debt” by pro forma Operating EBITDA for thelast twelve months as of the calculation date. Funded debt equals debt, as reported in the balance sheetexcluding finance leases, components of liability of convertible subordinated notes, plus perpetual
F-61

CEMEX, S.A.B. DE C.V. AND SUBSIDIARIESNotes to the Consolidated Financial Statements
As of December 31, 2016, 2015 and 2014(Millions of Mexican pesos)
Financial Covenants — continued
debentures and guarantees, plus or minus the fair value of derivative financial instruments, as applicable,among other adjustments.
2 Pro forma Operating EBITDA represents, all calculated in pesos, Operating EBITDA for the last twelvemonths as of the calculation date, plus the portion of Operating EBITDA referring to such twelve-monthperiod of any significant acquisition made in the period before its consolidation in CEMEX, minusOperating EBITDA referring to such twelve-month period of any significant disposal that had already beenliquidated.
3 The coverage ratio is calculated in pesos using the amounts from the financial statements, by dividing thepro forma operating EBITDA by the financial expense for the last twelve months as of the calculation date.Financial expense includes interest accrued on the perpetual debentures.
CEMEX will classify all of its outstanding debt as current debt in its balance sheet if: 1) as of any measurementdate CEMEX fails to comply with the aforementioned financial ratios; or 2) the cross default clause that is part ofthe Credit Agreement is triggered by the provisions contained therein; 3) as of any date prior to a subsequentmeasurement date CEMEX expects not to be in compliance with such financial ratios in the absence of: a)amendments and/or waivers covering the next succeeding 12 months; b) high probability that the violation willbe cured during any agreed upon remediation period and be sustained for the next succeeding 12 months; and/orc) a signed refinancing agreement to refinance the relevant debt on a long-term basis. Moreover, concurrent withthe aforementioned classification of debt in the short-term, the noncompliance of CEMEX with the financialratios agreed upon pursuant to the Credit Agreement or, in such event, the absence of a waiver of compliance or anegotiation thereof, after certain procedures upon CEMEX’s lenders’ request, they would call for the accelerationof payments due under the Credit Agreement. That scenario will have a material adverse effect on CEMEX’sliquidity, capital resources and financial position.
16B)OTHER FINANCIAL OBLIGATIONS
As of December 31, 2016 and 2015, other financial obligations in the consolidated balance sheet are detailed asfollows:
2016 2015
Short-term Long-term Total Short-term Long-term Total
I. Convertible subordinated notes due 2020 . . . . . Ps — 10,417 10,417 Ps — 8,569 8,569II. Convertible subordinated notes due 2018 . . . . — 13,575 13,575 — 10,826 10,826II. Convertible subordinated notes due 2016 . . . . — — — 6,007 — 6,007III. Mandatory convertible securities 2019 . . . . . 278 689 967 239 961 1,200IV. Liabilities secured with accounts
receivable . . . . . . . . . . . . . . . . . . . . . . . . . . . . . 11,095 — 11,095 9,071 1,430 10,501V. Capital leases . . . . . . . . . . . . . . . . . . . . . . . . . . 285 1,291 1,576 270 1,482 1,752
Ps 11,658 25,972 37,630 Ps 15,587 23,268 38,855
Financial instruments convertible into CEMEX’s shares contain components of liability and equity, which arerecognized differently depending upon the currency in which the instrument is denominated and the functionalcurrency of the issuer (note 2F).
F-62

CEMEX, S.A.B. DE C.V. AND SUBSIDIARIESNotes to the Consolidated Financial Statements
As of December 31, 2016, 2015 and 2014(Millions of Mexican pesos)
I. Optional convertible subordinated notes due 2020
During 2015, the Parent Company issued US$521 aggregate principal amount of 3.72% convertible subordinatednotes due in March 2020 (the “2020 Convertible Notes”). The 2020 Convertible Notes were issued: a) US$200 asa result of the exercise in March 13, 2015 of US$200 notional amount of Contingent Convertible Units (“CCUs”)(described below), and b) US$321 as a result of the exchange with certain investors in May 2015, which togetherwith early conversions, resulted in settlement of approximately US$626 aggregate principal amount of 3.25%convertible subordinated notes due in 2016 (the “2016 Convertible Notes”) held by such investors and theissuance and delivery by CEMEX of an estimated 42 million ADSs, which included a number of additionalADSs issued to the holders as non-cash inducement premiums. The 2020 Convertible Notes, which aresubordinated to all of CEMEX’s liabilities and commitments, are convertible into a fixed number of CEMEX’sADSs at any time at the holder’s election and are subject to antidilution adjustments. The difference at theexchange date between the fair value of the 2016 Convertible Notes and the 42 million ADSs against the fairvalue of the 2020 Convertible Notes represented a loss of approximately Ps365 recognized in 2015 as part of“Other financial income (expense), net”. The aggregate fair value of the conversion option as of the issuancedates which amounted to approximately Ps199 was recognized in other equity reserves. As of December 31,2016 and 2015, the conversion price per ADS was approximately 11.45 dollars and 11.90 dollars, respectively.After antidilution adjustments, the conversion rate as of December 31, 2016 and 2015 was 87.3646 ADS and84.0044 ADS per each 1 thousand dollars principal amount of such notes, respectively.
II. Optional convertible subordinated notes due in 2016 and 2018
On March 15, 2011, CEMEX, S.A.B. de C.V. closed the offering of US$978 aggregate principal amount of the2016 Convertible Notes and US$690 principal amount of 3.75% convertible subordinated notes due in 2018 (the“2018 Convertible Notes”). The notes were subordinated to all of CEMEX’s liabilities and commitments. Thenotes are convertible into a fixed number of CEMEX’s ADSs, and are subject to antidilution adjustments. Afterthe exchange of notes described in the paragraph above, as of December 31, 2015, US$352 of the 2016Convertible Notes remained outstanding, which were repaid in cash at their maturity on March 15, 2016. As ofDecember 31, 2016 and 2015, the conversion price per ADS of the notes then outstanding was approximately8.92 dollars and 9.27 dollars, respectively. After antidilution adjustments, the conversion rate as of December 31,2016 and 2015 was 112.1339 ADS and 107.8211 ADS, respectively, per each 1 thousand dollars principalamount of such notes. Concurrent with the offering, a portion of the net proceeds from this transaction were usedto fund the purchase of capped call options, which are generally expected to reduce the potential dilution cost toCEMEX upon the potential conversion of such notes (note 16D).
III. Mandatorily convertible securities due in 2019
In December 2009, the Parent Company exchanged debt into approximately US$315 principal amount of 10%mandatorily convertible securities in pesos with maturity in 2019 (the “2019 Mandatorily ConvertibleSecurities”). Reflecting antidilution adjustments, the notes will be converted at maturity or earlier if the price ofthe CPO reaches approximately Ps29.50 into approximately 210 million CPOs at a conversion price ofapproximately Ps19.66 per CPO. Holders have an option to voluntarily convert their securities on any interestpayment date into CPOs. The conversion option embedded in these securities is treated as a stand-alonederivative liability at fair value through the statement of operations (note 16D).
F-63

CEMEX, S.A.B. DE C.V. AND SUBSIDIARIESNotes to the Consolidated Financial Statements
As of December 31, 2016, 2015 and 2014(Millions of Mexican pesos)
IV. Liabilities secured with accounts receivable
As mentioned in note 9, as of December 31, 2016 and 2015, CEMEX maintained securitization programs for thesale of trade accounts receivable established in Mexico, the United States, France and the United Kingdom, bymeans of which, CEMEX effectively surrenders control associated with the trade accounts receivable sold andthere is no guarantee or obligation to reacquire the assets. However, considering that CEMEX retains certainresidual interest in the programs and/or maintains continuing involvement with the accounts receivable, thefunded amounts of the trade receivables sold are recognized in “Other financial obligations”, and the receivablessold are maintained in the balance sheet.
V. Capital leases
CEMEX has several operating and administrative assets, including buildings and mobile equipment, undercapital lease contracts. Future payments associated with these contracts are presented in note 23E.
Optional convertible subordinated notes due in 2015
On March 30, 2010, the Parent Company issued US$715 aggregate principal amount of 4.875% OptionalConvertible Subordinated Notes due 2015 (the “2015 Convertible Notes”), which were subordinated to all ofCEMEX’s liabilities and commitments, and were convertible into a fixed number of CEMEX’s ADSs, at theholder’s election considering antidilution adjustments. As of December 31, 2014, the conversion price per ADSwas approximately 11.18 dollars. After antidilution adjustments, the conversion rate as of December 31, 2014was 89.4729 ADS per each 1 thousand dollars principal amount of such notes. Concurrent with the offering, aportion of the proceeds were used to enter into a capped call transaction that was expected to generally reduce thedilution cost to CEMEX upon the potential conversion of the notes (note 16D).
On several dates during 2014, CEMEX agreed the early conversion of approximately US$511 in aggregateprincipal amount of the 2015 Convertible Notes in exchange for approximately 50.4 million ADSs, whichincluded the number of additional ADSs issued to the holders as non-cash inducement premiums. As a result ofthe early conversion agreements the liability component of the converted notes of approximately Ps6,483, wasreclassified from other financial obligations to other equity reserves. In addition, considering the issuance ofshares, CEMEX increased common stock for Ps4 and additional paid-in capital for Ps8,037 against other equityreserves, and recognized expense for the inducement premiums of approximately Ps957, representing the fairvalue of the ADSs at the issuance dates, in the statement of operations in 2014 within “Other financial income(expense), net”. As of December 31, 2014, the outstanding principal amount of the 2015 Convertible Notes wasof approximately US$204. In March 2015 CEMEX repaid at maturity the remaining balance of these notes asdescribed in the paragraph below.
In October 2014, in connection with the 2015 Convertible Notes, the Parent Company issued US$200 notionalamount of CCUs at an annual rate of 3.0% on the notional amount, by means of which, in exchange for cuponpayments, CEMEX secured the refinancing for any of the 2015 Convertible Notes that would mature withoutconversion up to US$200 of the principal amount. Pursuant to the CCUs, holders invested the US$200 in U.S.treasury bonds, and irrevocably agreed to apply such investment in March 2015, if necessary, to subscribe newconvertible notes of the Parent Company for up to US$200. As previously mentioned, in March 2015, CEMEXexercised the CCUs, issued US$200 principal amount of the 2020 Convertible Notes to the holders of the CCUsand repaid the US$204 remaining principal amount of the 2015 Convertible Notes described above.
F-64

CEMEX, S.A.B. DE C.V. AND SUBSIDIARIESNotes to the Consolidated Financial Statements
As of December 31, 2016, 2015 and 2014(Millions of Mexican pesos)
16C) FAIR VALUE OF FINANCIAL INSTRUMENTS
Financial assets and liabilities
The carrying amounts of cash, trade accounts receivable, other accounts receivable, trade accounts payable, otheraccounts payable and accrued expenses, as well as short-term debt, approximate their corresponding estimatedfair values due to the short-term maturity and revolving nature of these financial assets and liabilities. Cashequivalents and certain long-term investments are recognized at fair value, considering to the extent available,quoted market prices for the same or similar instruments. The estimated fair value of CEMEX´s long-term debt isLevel 2, and is either based on estimated market prices for such or similar instruments, considering interest ratescurrently available for CEMEX to negotiate debt with the same maturities, or determined by discounting futurecash flows using market-based interest rates currently available to CEMEX. As of December 31, 2016 and 2015,the carrying amounts of financial assets and liabilities and their respective fair values were as follows:
2016 2015
Carryingamount Fair value
Carryingamount Fair value
Financial assetsDerivative instruments (notes 13B and 16D) . . . . . . . . . . . . . . . . . . . . . Ps 1,900 1,900 Ps 869 869Other investments and non-current accounts receivable (note 13B) . . . 5,149 5,149 5,680 5,537
Ps 7,049 7,049 Ps 6,549 6,406
Financial liabilitiesLong-term debt (note 16A) . . . . . . . . . . . . . . . . . . . . . . . . . . . . . . . . . . . Ps 235,016 241,968 Ps 229,125 220,662Other financial obligations (note 16B) . . . . . . . . . . . . . . . . . . . . . . . . . . 25,972 27,419 23,268 24,863Derivative instruments (notes 16D and 17) . . . . . . . . . . . . . . . . . . . . . . 818 818 178 178
Ps 261,806 270,205 Ps 252,571 245,703
Fair Value Hierarchy
As of December 31, 2016 and 2015, assets and liabilities carried at fair value in the consolidated balance sheetsare included in the following fair value hierarchy categories:
2016 Level 1 Level 2 Level 3 Total
Assets measured at fair valueDerivative instruments (notes 13B and 16D) . . . . . . . . . . . . . . . . . . . . Ps — 1,900 — 1,900Investments available-for-sale (note 13B) . . . . . . . . . . . . . . . . . . . . . . 491 — — 491Investments held for trading (note 13B) . . . . . . . . . . . . . . . . . . . . . . . . — 157 — 157
Ps 491 2,057 — 2,548
Liabilities measured at fair valueDerivative instruments (notes 16D and 17) . . . . . . . . . . . . . . . . . . . . . Ps — 818 — 818
2015Assets measured at fair value
Derivative instruments (notes 13B and 16D) . . . . . . . . . . . . . . . . . . . . Ps — 869 — 869Investments available-for-sale (note 13B) . . . . . . . . . . . . . . . . . . . . . . 632 — — 632Investments held for trading (note 13B) . . . . . . . . . . . . . . . . . . . . . . . . — 317 — 317
Ps 632 1,186 — 1,818
Liabilities measured at fair valueDerivative instruments (notes 16D and 17) . . . . . . . . . . . . . . . . . . . . . Ps — 178 — 178
F-65

CEMEX, S.A.B. DE C.V. AND SUBSIDIARIESNotes to the Consolidated Financial Statements
As of December 31, 2016, 2015 and 2014(Millions of Mexican pesos)
16D) DERIVATIVE FINANCIAL INSTRUMENTS
During the reported periods, in compliance with the guidelines established by its Risk Management Committee,the restrictions set forth by its debt agreements and its hedging strategy (note 16E), CEMEX held derivativeinstruments, with the objectives of, as the case may be of: a) changing the risk profile or fixed the price of fuelsand electric energy; b) foreign exchange hedging; and c) other corporate purposes. As of December 31, 2016 and2015, the notional amounts and fair values of CEMEX’s derivative instruments were as follows:
2016 2015
(U.S. dollars millions)Notionalamount Fair value
Notionalamount Fair value
I. Interest rate swaps . . . . . . . . . . . . . . . . . . . . . . . . . . . . . . . . . . . . US$ 147 23 157 28II. Equity forwards on third party shares . . . . . . . . . . . . . . . . . . . . . — — 24 6III. Options on the Parent Company’s own shares . . . . . . . . . . . . . 576 26 1,145 12IV. Foreign exchange forward contracts . . . . . . . . . . . . . . . . . . . . . 80 — 173 (1)V. Fuels price hedging . . . . . . . . . . . . . . . . . . . . . . . . . . . . . . . . . . . 77 15 16 (3)
US$ 880 64 1,515 42
The fair values determined by CEMEX for its derivative financial instruments are Level 2. There is no directmeasure for the risk of CEMEX or its counterparties in connection with the derivative instruments. Therefore, therisk factors applied for CEMEX’s assets and liabilities originated by the valuation of such derivatives wereextrapolated from publicly available risk discounts for other public debt instruments of CEMEX and itscounterparties.
The caption “Other financial income (expense), net” includes gains and losses related to the recognition ofchanges in fair values of the derivative instruments during the applicable period and that represented net gains ofUS$17 (Ps317) in 2016, net losses of US$173 (Ps2,981) and of US$46 (Ps679) in 2015 and 2014, respectively.
The estimated fair value of derivative instruments fluctuates over time and is determined by measuring the effectof future relevant economic variables according to the yield curves shown in the market as of the reporting date.These values should be analyzed in relation to the fair values of the underlying transactions and as part ofCEMEX’s overall exposure attributable to fluctuations in interest rates and foreign exchange rates. The notionalamounts of derivative instruments do not represent amounts exchanged by the parties, and consequently, there isno direct measure of CEMEX’s exposure to the use of these derivatives. The amounts exchanged are determinedbased on the basis of the notional amounts and other terms included in the derivative instruments.
I. Interest rate swap contracts
As of December 31, 2016 and 2015, CEMEX had an interest rate swap maturing in September 2022 associatedwith an agreement entered into by CEMEX for the acquisition of electric energy in Mexico, which fair valuerepresented assets of US$23 (Ps477) and US$28 (Ps482), respectively. Pursuant to this instrument, during thetenure of the swap and based on its notional amount, CEMEX will receive a fixed rate of 5.4% and will payLIBOR. Changes in the fair value of this interest rate swap generated losses of US$6 (Ps112) in 2016, losses ofUS$4 (Ps69) in 2015 and losses of US$1 (Ps3) in 2014, recognized in profit or loss for each year.
F-66

CEMEX, S.A.B. DE C.V. AND SUBSIDIARIESNotes to the Consolidated Financial Statements
As of December 31, 2016, 2015 and 2014(Millions of Mexican pesos)
II. Equity forwards in third party shares
As of December 31, 2015, CEMEX held a forward contract to be settled in cash maturing in October 2016 overthe price of 59.5 million CPOs of Axtel, a Mexican telecommunications company traded in the MSE. Changes inthe fair value of this instrument generated losses of US$2 (Ps30) in 2016, gains of US$15 (Ps258) in 2015 andlosses of US$9 (Ps133) in 2014, recognized in profit or loss for each period. In October, 2015, Axtel announcedits merger with Alestra, a Mexican entity provider of information technology solutions and member of AlfaGroup which was effective beginning February 15, 2016. In connection with this merger, on January 6, 2016,CEMEX settled in cash the forward contract and received approximately US$4, net of transaction costs. In aseparate transaction, considering that as of December 31, 2015, CEMEX held an investment in Axtel that uponcompletion of the Alestra and Axtel merger would be exchanged proportionately according to the new ownershipinterests for shares in the new merged entity that will remain public and the attractive business outlook of suchnew entity, after the settlement of the Axtel forward contract, CEMEX decided to purchase in the market the59.5 million CPOs of Axtel and incorporate them to its existing investment in Axtel as part of CEMEX’sinvestments available for sale.
III. Options on the Parent Company’s own shares
On March 15, 2011, CEMEX, S.A.B. de C.V. entered into a capped call transaction, subject to antidilutionadjustments, over 173 million CEMEX’s ADSs (101 million ADSs maturing in March 2016 in connection withthe 2016 Convertible Notes and 72 million ADSs maturing in March 2018 in connection with the 2018Convertible Notes) in order to effectively increase the conversion price of the ADSs under such notes, by meansof which, at maturity of the notes, originally CEMEX would receive in cash the excess between the market priceand the strike price of approximately 9.65 dollars per ADS, with a maximum appreciation per ADS ofapproximately 4.45 dollars for the 2016 Convertible Notes and 5.94 dollars for the 2018 Convertible Notes.CEMEX paid aggregate premiums of approximately US$222. During 2015, CEMEX amended a portion of thecapped calls relating to the 2016 Convertible Notes and, as a result, CEMEX received approximately US$44 incash, equivalent to the unwind of 44.2% of the total notional amount of such capped call. On March 15, 2016, theremaining options for the 55.8% of the 2016 Convertible Notes expired out of the money. During August 2016,CEMEX amended the capped calls relating to the 2018 Convertible Notes and, as a result, the exercise price wasadjusted to 8.92 dollars per ADS and the underlying to 6 million ADSs. As of December 31, 2016 and 2015, thefair value of the existing options represented an asset of approximately US$66 (Ps1,368) and US$22 (Ps379),respectively. Changes in the fair value of these instruments generated gains of US$44 (Ps818) in 2016, losses ofUS$228 (Ps3,928) in 2015 and losses of US$65 (Ps962) in 2014, recognized within “Other financial income(expense), net” in profit or loss.
On March 30, 2010, CEMEX, S.A.B. de C.V. entered into a capped call transaction, subject to antidilutionadjustments, over approximately 64 million CEMEX’s ADSs maturing in March 2015, in connection with the2015 Convertible Notes in order to effectively increase the conversion price of the ADSs under such notes, bymeans of which, at maturity of the notes, if the market price per ADS was above the strike price of approximately11.18 dollars, CEMEX would receive in cash the difference between the market price and the strike price, with amaximum appreciation per ADS of approximately 4.30 dollars. CEMEX paid a premium of approximatelyUS$105. In January, 2014, CEMEX amended the terms of this capped call transaction, pursuant to which, usingthe then existing market valuation of the instrument, CEMEX received approximately 7.7 million zero-strike calloptions over the same number of ADSs. In July 2014, CEMEX amended the zero-strike call options to fix aminimum value of approximately US$94 and retained the economic value of approximately 1 million ADSs.During December 2014, CEMEX further amended and unwound the zero-strike call options, monetizing theremainder value of the approximately 1 million ADSs it had retained, pursuant to which CEMEX received a total
F-67

CEMEX, S.A.B. DE C.V. AND SUBSIDIARIESNotes to the Consolidated Financial Statements
As of December 31, 2016, 2015 and 2014(Millions of Mexican pesos)
Options on the Parent Company’s own shares — continued
payment of approximately US$105. During 2014, changes in the fair value of these options generated gains ofUS$17 (Ps253), which were recognized within “Other financial income (expense), net” in profit or loss.
In addition, in connection with the 2019 Mandatorily Convertible Securities (note 16B); that the securities aredenominated in pesos and the functional currency of the Parent Company’s division that issued the securities isthe dollar (note 2D), CEMEX separated the conversion option embedded in such instruments and recognized it atfair value through profit or loss, which as of December 31, 2016 and 2015, resulted in a liability of US$40(Ps829) and US$10 (Ps178), respectively. Changes in fair value generated losses of US$29 (Ps545) in 2016,gains of US$18 (Ps310) in 2015 and gains of US$11 (Ps159) in 2014.
IV. Foreign exchange forward contracts
As of December 31, 2016, CEMEX held foreign exchange forward contracts maturing in February 2017, negotiatedto hedge the U.S. dollar value of future proceeds in other currencies from expected sale of assets. As ofDecember 31, 2015, CEMEX held foreign exchange forward contracts maturing in April 2016, negotiated to hedgethe U.S. dollar value of future proceeds in euros from the sale of CEMEX’s operations in Austria and Hungary (note4A). For the years 2016 and 2015, changes in the estimated fair value of these instruments, including the effectsresulting from positions entered and settled during the year, generated gains of US$10 (Ps186) in 2016 and gains ofUS$26 (Ps448) in 2015, recognized within “Other financial income (expense), net” in profit or loss.
V. Fuel price hedging
As of December 31, 2016 and 2015, CEMEX maintained forward contracts negotiated to hedge the price ofdiesel fuel in several countries in 2016 and in the United Kingdom in 2015 for aggregate notional amounts as ofDecember 31, 2016 and 2015 of US$44 (Ps912) and US$16 (Ps276), respectively, with an estimated fair valuerepresenting an asset of US$7 (Ps145) in 2016 and a liability of US$3 (Ps52) in 2015. By means of thesecontracts, for own consumption only, CEMEX fixed the fuel component of the market price of diesel over certainvolume representing a portion of the estimated diesel consumption in such operations. These contracts have beendesignated as cash flow hedges of diesel fuel consumption, and as such, changes in fair value are recognizedtemporarily through other comprehensive income (loss) and are recycled to operating expenses as the relateddiesel volumes are consumed. For the years 2016 and 2015, changes in fair value of these contracts recognized inother comprehensive income (loss) represented gains of US$7 (Ps145) and losses of US$3 (Ps52), respectively.
In addition, as of December 31, 2016, CEMEX held forward contracts negotiated in 2016 to hedge the price ofcoal, as solid fuel, for an aggregate notional amount as of December 31, 2016 of US$33 (Ps684) and an estimatedfair value representing an asset of US$8 (Ps166). By means of these contracts, for own consumption only,CEMEX fixed the price of coal over certain volume representing a portion of the estimated coal consumption inCEMEX’s applicable operations. These contracts have been designated as cash flow hedges of coal consumption,and as such, changes in fair value are recognized temporarily through other comprehensive income (loss) and arerecycled to operating expenses as the related coal volumes are consumed. For the year 2016, changes in fairvalue of these contracts recognized in other comprehensive income (loss) represented gains of US$8 (Ps166).
16E)RISK MANAGEMENT
In recent years, CEMEX has significantly decreased its use of derivatives instruments related to debt, bothcurrency and interest rate derivatives, thereby reducing the risk of cash margin calls. In addition, the CreditAgreement may restrict CEMEX’s ability to enter into certain derivative transactions.
F-68

CEMEX, S.A.B. DE C.V. AND SUBSIDIARIESNotes to the Consolidated Financial Statements
As of December 31, 2016, 2015 and 2014(Millions of Mexican pesos)
Credit risk
Credit risk is the risk of financial loss faced by CEMEX if a customer or counterpart of a financial instrumentdoes not meet its contractual obligations and originates mainly from trade accounts receivable. As ofDecember 31, 2016 and 2015, the maximum exposure to credit risk is represented by the balance of financialassets. Management has developed policies for the authorization of credit to customers. The exposure to creditrisk is monitored constantly according to the behavior of payment of the debtors. Credit is assigned on acustomer-by-customer basis and is subject to assessments which consider the customers’ payment capacity, aswell as past behavior regarding due dates, balances past due and delinquent accounts. In cases deemed necessary,CEMEX’s management requires guarantees from its customers and financial counterparties with regard tofinancial assets.
The Company’s management has established a policy of low risk which analyzes the creditworthiness of eachnew client individually before offering the general conditions of payment terms and delivery, the review includesexternal ratings, when references are available, and in some cases bank references. Threshold of purchase limitsare established for each client, which represent the maximum purchase amounts that require different levels ofapproval. Customers that do not meet the levels of solvency requirements imposed by CEMEX can only carryout transactions by paying cash in advance. As of December 31, 2016, considering CEMEX’s best estimate ofpotential losses based on an analysis of age and considering recovery efforts, the allowance for doubtful accountswas Ps2,139.
Interest rate risk
Interest rate risk is the risk that the fair value or future cash flows of a financial instrument will fluctuate becauseof changes in market interest rates, which only affects CEMEX’s results if the fixed-rate long-term debt ismeasured at fair value. All of CEMEX’s fixed-rate long-term debt is carried at amortized cost and therefore isnot subject to interest rate risk. CEMEX’s exposure to the risk of changes in market interest rates relatesprimarily to its long-term debt obligations with floating interest rates. As of December 31, 2016 and 2015,CEMEX was subject to the volatility of floating interest rates, which, if such rates were to increase, mayadversely affect its financing cost and the results for the period. CEMEX manages its interest rate risk bybalancing its exposure to fixed and variable rates while attempting to reduce its interest costs.
As of December 31, 2016 and 2015, approximately 28% and 27%, respectively, of CEMEX’s long-term debt wasdenominated in floating rates at a weighted average interest rate of LIBOR plus 306 basis points in 2016 and 367basis points in 2015. As of December 31, 2016 and 2015, if interest rates at that date had been 0.5% higher, withall other variables held constant, CEMEX’s net income for 2016 and 2015 would have reduced by approximatelyUS$18 (Ps373) and US$18 (Ps312), respectively, as a result of higher interest expense on variable ratedenominated debt. This analysis does not include the interest rate swaps held by CEMEX during 2016 and 2015.
Foreign currency risk
Foreign currency risk is the risk that the fair value of future cash flows of a financial instrument will fluctuatebecause of changes in foreign exchange rates. CEMEX’s exposure to the risk of changes in foreign exchangerates relates primarily to its operating activities. Due to its geographic diversification, CEMEX’s revenues andcosts are generated and settled in various countries and in different currencies. For the year ended December 31,2016, approximately 20% of CEMEX’s net sales, before eliminations resulting from consolidation, weregenerated in Mexico, 26% in the United States, 8% in the United Kingdom, 4% in Germany, 5% in France, 4% inthe Europe region, 2% in Spain, 5% in Colombia, 7% in the Rest of South, Central America and the Caribbeanregion, 3% in Egypt, 9% in Asia, Middle East and Africa and 7% in CEMEX’s other operations.
F-69

CEMEX, S.A.B. DE C.V. AND SUBSIDIARIESNotes to the Consolidated Financial Statements
As of December 31, 2016, 2015 and 2014(Millions of Mexican pesos)
Foreign currency risk — continued
Foreign exchange gains and losses occur by monetary assets or liabilities in a currency different from itsfunctional currency, and are recorded in the consolidated statements of operations, except for exchangefluctuations associated with foreign currency indebtedness directly related to the acquisition of foreign entitiesand related parties’ long-term balances denominated in foreign currency, for which are reported in the statementof other comprehensive income (loss). As of December 31, 2016 and 2015, excluding from the sensitivityanalysis the impact of translating the net assets of foreign operations into CEMEX’s reporting currency,considering a hypothetic 10% strengthening of the U.S. dollar against the Mexican peso, with all other variablesheld constant, CEMEX’s net income for 2016 and 2015 would have increased by approximately US$136(Ps2,829) and US$232 (Ps3,998), respectively, as a result of higher foreign exchange losses on CEMEX’s dollar-denominated net monetary liabilities held in consolidated entities with other functional currencies. Conversely, ahypothetic 10% weakening of the U.S. dollar against the Mexican peso would have the opposite effect.
As of December 31, 2016, approximately 76% of CEMEX’s financial debt was Dollar-denominated,approximately 23% was Euro-denominated, less than 1% was Peso-denominated and immaterial amounts weredenominated in other currencies; therefore, CEMEX had a foreign currency exposure arising from the Dollar-denominated financial debt, and the Euro-denominated financial debt, versus the currencies in which CEMEX’srevenues are settled in most countries in which it operates. CEMEX cannot guarantee that it will generatesufficient revenues in Dollars and Euros from its operations to service these obligations. As of December 31,2016 and 2015, CEMEX had not implemented any derivative financing hedging strategy to address this foreigncurrency risk.
As of December 31, 2016 and 2015, CEMEX’s consolidated net monetary assets (liabilities) by currency are asfollows:
2016
MexicoUnitedStates Europe
South, CentralAmerica and
the Caribbean
Asia, MiddleEast and
Africa Others 1 Total
Monetary assets . . . . . . . . . . . Ps 10,261 26,685 12,724 6,132 13,101 11,836 80,739Monetary liabilities . . . . . . . . 10,564 33,145 42,336 9,130 11,305 277,117 383,597
Net monetary assets(liabilities) 2 . . . . . . . . Ps (303) (6,460) (29,612) (2,998) 1,796 (265,281) (302,858)
Out of which:Dollars . . . . . . . . . . . . . . . . . . Ps (483) (6,463) 38 35 364 (214,751) (221,260)Pesos . . . . . . . . . . . . . . . . . . . . 180 3 — — — (3,395) (3,212)Euros . . . . . . . . . . . . . . . . . . . — — (9,465) — — (48,470) (57,935)Other currencies . . . . . . . . . . . — — (20,185) (3,033) 1,432 1,335 (20,451)
Ps (303) (6,460) (29,612) (2,998) 1,796 (265,281) (302,858)
F-70

CEMEX, S.A.B. DE C.V. AND SUBSIDIARIESNotes to the Consolidated Financial Statements
As of December 31, 2016, 2015 and 2014(Millions of Mexican pesos)
Foreign currency risk — continued
2015
MexicoUnitedStates Europe
South, CentralAmerica and
the Caribbean
Asia, MiddleEast and
Africa Others 1 Total
Monetary assets . . . . . . . . . . Ps 13,418 10,266 15,052 5,646 9,968 7,748 62,098Monetary liabilities . . . . . . . . 12,690 22,593 36,349 6,697 11,615 268,059 358,003
Net monetary assets(liabilities) 2 . . . . . . . Ps 728 (12,327) (21,297) (1,051) (1,647) (260,311) (295,905)
Out of which:Dollars . . . . . . . . . . . . . . . . . Ps (69) (12,334) 191 604 55 (187,553) (199,106)Pesos . . . . . . . . . . . . . . . . . . . 797 9 — — — (29,407) (28,601)Euros . . . . . . . . . . . . . . . . . . . — — (8,837) — (827) (45,183) (54,847)Other currencies . . . . . . . . . . — (2) (12,651) (1,655) (875) 1,832 (13,351)
Ps 728 (12,327) (21,297) (1,051) (1,647) (260,311) (295,905)
1 Includes the Parent Company, CEMEX’s financing subsidiaries, as well as Neoris N.V., among otherentities.
2 Includes assets held for sale and liabilities directly related with these assets considering that such items willbe realized in the short-term.
Equity risk
Equity risk is the risk that the fair value of future cash flows of a financial instrument will fluctuate because ofchanges in the market price of CEMEX’s and/or third party’s shares. As described in note 16D, CEMEX hasentered into equity forward contracts on Axtel CPOs, as well as capped call options based on the price ofCEMEX’s own ADSs. Under these equity derivative instruments, there is a direct relationship in the change inthe fair value of the derivative with the change in price of the underlying share. All changes in fair value of suchderivative instruments are recognized in profit or loss as part of “Other financial income (expense), net”. Asignificant decrease in the market price of CEMEX’s ADSs would negatively affect CEMEX’s liquidity andfinancial position.
As of December 31, 2015, the potential change in the fair value of CEMEX’s forward contracts in Axtel’s sharesthat would result from a hypothetical, instantaneous decrease of 10% in the market price of Axtel’s CPO, with allother variables held constant, CEMEX’s net income for 2015 would have reduced in approximately US$3(Ps51); as a result of additional negative changes in fair value associated with such forward contracts. A 10%hypothetical increase in the Axtel CPO price would have generated approximately the opposite effects.
As of December 31, 2016 and 2015, the potential change in the fair value of CEMEX’s options (capped calls)that would result from a hypothetical, instantaneous decrease of 10% in the market price of CEMEX’s ADSs,with all other variables held constant, CEMEX’s net income for 2016 and 2015 would have reduced inapproximately US$23 (Ps476) and US$8 (Ps137), respectively, as a result of additional negative changes in fairvalue associated with these contracts. A 10% hypothetical increase in CEMEX’s ADS price would generateapproximately the opposite effect.
F-71

CEMEX, S.A.B. DE C.V. AND SUBSIDIARIESNotes to the Consolidated Financial Statements
As of December 31, 2016, 2015 and 2014(Millions of Mexican pesos)
Equity risk — continued
In addition, even though the changes in fair value of CEMEX’s embedded conversion option in the MandatorilyConvertible Notes 2019 denominated in a currency other than the functional issuer’s currency affect profit orloss, they do not imply any risk or variability in cash flows, considering that through their exercise, CEMEX willsettle a fixed amount of debt with a fixed amount of shares. As of December 31, 2016 and 2015, the potentialchange in the fair value of the embedded conversion options in the Mandatorily Convertible Notes 2019 thatwould result from a hypothetical, instantaneous decrease of 10% in the market price of CEMEX’s CPOs, with allother variables held constant, would have increased CEMEX’s net income for 2016 and 2015 by approximatelyUS$7 (Ps154) and US$3 (Ps47), respectively; as a result of additional positive changes in fair value associatedwith this option. A 10% hypothetical increase in the CEMEX CPO price would generate approximately theopposite effect.
Liquidity risk
Liquidity risk is the risk that CEMEX will not have sufficient funds available to meet its obligations. In additionto cash flows provided by its operating activities, in order to meet CEMEX’s overall liquidity needs foroperations, servicing debt and funding capital expenditures and acquisitions, CEMEX relies on cost-cutting andoperating improvements to optimize capacity utilization and maximize profitability, as well as borrowing undercredit facilities, proceeds of debt and equity offerings, and proceeds from asset sales. CEMEX is exposed to risksfrom changes in foreign currency exchange rates, prices and currency controls, interest rates, inflation,governmental spending, social instability and other political, economic and/or social developments in thecountries in which it operates, any one of which may materially affect CEMEX’s results and reduce cash fromoperations. The maturities of CEMEX’s contractual obligations are included in note 23E. As of December 31,2016, CEMEX has approximately US$1,413 (Ps29,277) available in its committed revolving credit tranche underits Credit Agreement (note 16A).
As of December 31, 2016 and 2015, the potential requirement for additional margin calls under our differentcommitments is not significant.
17) OTHER CURRENT AND NON-CURRENT LIABILITIES
As of December 31, 2016 and 2015, consolidated other current liabilities were as follows:
2016 2015
Provisions 1 . . . . . . . . . . . . . . . . . . . . . . . . . . . . . . . . . . . . . . . . . . . . . . . . . . . . . . . . . . . . . . Ps 11,670 10,438Interest payable . . . . . . . . . . . . . . . . . . . . . . . . . . . . . . . . . . . . . . . . . . . . . . . . . . . . . . . . . . . 3,425 3,421Advances from customers . . . . . . . . . . . . . . . . . . . . . . . . . . . . . . . . . . . . . . . . . . . . . . . . . . . 3,408 2,606Other accounts payable and accrued expenses . . . . . . . . . . . . . . . . . . . . . . . . . . . . . . . . . . . 3,949 4,304
Ps 22,452 20,769
1 Current provisions primarily consist of accrued employee benefits, insurance payments, and accruals forlegal assessments, among others. These amounts are revolving in nature and are expected to be settled andreplaced by similar amounts within the next 12 months.
F-72

CEMEX, S.A.B. DE C.V. AND SUBSIDIARIESNotes to the Consolidated Financial Statements
As of December 31, 2016, 2015 and 2014(Millions of Mexican pesos)
Other current and non-current liabilities — continued
As of December 31, 2016 and 2015, consolidated other non-current liabilities were as follows:
2016 2015
Asset retirement obligations 1 . . . . . . . . . . . . . . . . . . . . . . . . . . . . . . . . . . . . . . . . . . . . . . . . Ps 8,143 7,036Accruals for legal assessments and other responsibilities 2 . . . . . . . . . . . . . . . . . . . . . . . . . 1,514 1,984Non-current liabilities for valuation of derivative instruments . . . . . . . . . . . . . . . . . . . . . . . 818 231Environmental liabilities 3 . . . . . . . . . . . . . . . . . . . . . . . . . . . . . . . . . . . . . . . . . . . . . . . . . . . 1,172 827Other non-current liabilities and provisions 4 . . . . . . . . . . . . . . . . . . . . . . . . . . . . . . . . . . . . 5,293 4,796
Ps 16,940 14,874
1 Provisions for asset retirement include future estimated costs for demolition, cleaning and reforestation ofproduction sites at the end of their operation, which are initially recognized against the related assets and aredepreciated over their estimated useful life.
2 Provisions for legal claims and other responsibilities include items related to tax contingencies.3 Environmental liabilities include future estimated costs arising from legal or constructive obligations,
related to cleaning, reforestation and other remedial actions to remediate damage caused to the environment.The expected average period to settle these obligations is greater than 15 years.
4 As of December 31, 2016 and 2015, includes approximately Ps2,300 and Ps3,131, respectively, of thenon-current portion of taxes payable recognized since 2009 as a result of the changes to the taxconsolidation regime in Mexico approved in 2009 and 2013 as described in note 19D. Approximately Ps936and Ps840 as of December 31, 2016 and 2015 respectively, were included within current taxes payable.
Changes in consolidated other current and non-current liabilities for the years ended December 31, 2016 and2015, were as follows:
2016
Assetretirementobligations
Environmentalliabilities
Accruals forlegal
proceedings
Valuation ofderivative
instruments
Otherliabilities and
provisions Total 2015
Balance at beginning ofperiod . . . . . . . . . . . . . . . . . . . Ps 7,036 827 1,984 231 15,234 25,312 41,832
Business combinations . . . . — — — — — — 629Additions or increase in
estimates . . . . . . . . . . . . . 1,437 307 — 925 65,003 67,672 46,408Releases or decrease in
estimates . . . . . . . . . . . . . (610) (54) (292) (451) (59,896) (61,303)(67,604)Reclassifications . . . . . . . . . 544 (39) 11 — (1,257) (741) (3,754)Accretion expense . . . . . . . (9) — (14) — (1,010) (1,033) (904)Foreign currency
translation . . . . . . . . . . . . (255) 131 (175) 118 (1,116) (1,297) 8,705
Balance at end of period . . . . . . . Ps 8,143 1,172 1,514 823 16,958 28,610 25,312
Out of which:Current provisions . . . . . . . . . . . Ps — — — 5 11,665 11,670 10,438
F-73

CEMEX, S.A.B. DE C.V. AND SUBSIDIARIESNotes to the Consolidated Financial Statements
As of December 31, 2016, 2015 and 2014(Millions of Mexican pesos)
18) PENSIONS AND POST-EMPLOYMENT BENEFITS
Defined contribution pension plans
The costs of defined contribution plans for the years ended December 31, 2016, 2015 and 2014 wereapproximately Ps865, Ps706 and Ps497, respectively. CEMEX contributes periodically the amounts offered bythe pension plan to the employee’s individual accounts, not retaining any remaining liability as of the financialstatements’ date.
Defined benefit pension plans
Most CEMEX’s defined benefit plans have been closed to new participants for several years. Actuarial resultsrelated to pension and other post retirement benefits are recognized in the results and/or in “Other comprehensiveincome (loss) for the period” in which they are generated, as correspond. For the years ended December 31,2016, 2015 and 2014, the effects of pension plans and other post-employment benefits are summarized asfollows:
Pensions Other benefits Total
Net period cost (revenue): 2016 2015 2014 2016 2015 2014 2016 2015 2014
Recorded in operating costs andexpenses
Service cost . . . . . . . . . . . . . . . . . . . . . . Ps 151 128 108 25 30 32 176 158 140Past service cost . . . . . . . . . . . . . . . . . . 8 12 4 — (20) — 8 (8) 4Loss for settlements and
curtailments . . . . . . . . . . . . . . . . . . . — — — — (13) (110) — (13) (110)
159 140 112 25 (3) (78) 184 137 34
Recorded in other financial expensesNet interest cost . . . . . . . . . . . . . . . . . . 711 596 527 57 56 54 768 652 581
Recorded in other comprehensiveincome (loss) for the period
Actuarial (gains) losses for theperiod . . . . . . . . . . . . . . . . . . . . . . . . 3,985 872 3,014 34 (124) (13) 4,019 748 3,001
Ps 4,855 1,608 3,653 116 (71) (37) 4,971 1,537 3,616
F-74

CEMEX, S.A.B. DE C.V. AND SUBSIDIARIESNotes to the Consolidated Financial Statements
As of December 31, 2016, 2015 and 2014(Millions of Mexican pesos)
Defined benefit pension plans — continued
The reconciliations of the actuarial benefits obligations, pension plan assets, and liabilities recognized in thebalance sheet as of December 31, 2016 and 2015 are presented as follows:
Pensions Other benefits Total
2016 2015 2016 2015 2016 2015
Change in benefits obligation:Projected benefit obligation at beginning of year . . . . . . . . . . . Ps 42,740 40,285 1,100 1,321 43,840 41,606Service cost . . . . . . . . . . . . . . . . . . . . . . . . . . . . . . . . . . . . . . . . 151 128 25 30 176 158Interest cost . . . . . . . . . . . . . . . . . . . . . . . . . . . . . . . . . . . . . . . . 1,685 1,561 59 58 1,744 1,619Actuarial (gains) losses for the period . . . . . . . . . . . . . . . . . . . 6,263 (693) 35 (129) 6,298 (822)Reduction for disposal of assets (notes 4A and 4B) . . . . . . . . . — (196) — (161) — (357)Settlements and curtailments . . . . . . . . . . . . . . . . . . . . . . . . . . — — (19) (13) (19) (13)Plan amendments . . . . . . . . . . . . . . . . . . . . . . . . . . . . . . . . . . . 8 12 — (20) 8 (8)Benefits paid . . . . . . . . . . . . . . . . . . . . . . . . . . . . . . . . . . . . . . . (2,379) (2,186) (74) (60) (2,453) (2,246)Foreign currency translation . . . . . . . . . . . . . . . . . . . . . . . . . . . 2,587 3,829 38 74 2,625 3,903
Projected benefit obligation at end of year . . . . . . . . . . . . . . . . 51,055 42,740 1,164 1,100 52,219 43,840
Change in plan assets:Fair value of plan assets at beginning of year . . . . . . . . . . . . . 25,547 24,698 24 27 25,571 24,725Return on plan assets . . . . . . . . . . . . . . . . . . . . . . . . . . . . . . . . 974 965 2 2 976 967Actuarial results . . . . . . . . . . . . . . . . . . . . . . . . . . . . . . . . . . . . 2,278 (1,565) 1 (5) 2,279 (1,570)Employer contributions . . . . . . . . . . . . . . . . . . . . . . . . . . . . . . 1,289 1,031 93 60 1,382 1,091Reduction for disposal of assets (notes 4A and 4B) . . . . . . . . . — (79) — — — (79)Settlements and curtailments . . . . . . . . . . . . . . . . . . . . . . . . . . — — (19) — (19) —Benefits paid . . . . . . . . . . . . . . . . . . . . . . . . . . . . . . . . . . . . . . . (2,379) (2,186) (74) (60) (2,453) (2,246)Foreign currency translation . . . . . . . . . . . . . . . . . . . . . . . . . . . 1,119 2,683 (1) — 1,118 2,683
Fair value of plan assets at end of year . . . . . . . . . . . . . . . . . . . 28,828 25,547 26 24 28,854 25,571
Amounts recognized in the balance sheets:Net projected liability recognized in the balance sheet . . . . . . Ps 22,227 17,193 1,138 1,076 23,365 18,269
For the years 2016, 2015 and 2014, actuarial (gains) losses for the period were generated by the following mainfactors as follows:
2016 2015 2014
Actuarial (gains) losses due to experience . . . . . . . . . . . . . . . . . . . . . . . . . . . . . . . . . . Ps (511) (105) 238Actuarial (gains) losses due to demographic assumptions . . . . . . . . . . . . . . . . . . . . . . (231) (153) 330Actuarial (gains) losses due financial assumptions . . . . . . . . . . . . . . . . . . . . . . . . . . . 4,761 1,006 2,433
Ps 4,019 748 3,001
Net actuarial losses due to financial assumptions during 2016 were mainly generated by a significant reduction inthe discount rates applicable to the benefit obligations in the United Kingdom, Germany and other Europeancountries, considering macroeconomic and political uncertainty, partially offset by an increase in the discountrate in Mexico. These actuarial losses originated by the reduction in the discount rates in 2016 were also partially
F-75

CEMEX, S.A.B. DE C.V. AND SUBSIDIARIESNotes to the Consolidated Financial Statements
As of December 31, 2016, 2015 and 2014(Millions of Mexican pesos)
Defined benefit pension plans — continued
offset by actual returns higher than estimated in some of the plan assets related to CEMEX’s defined benefitplans. During 2015, discounts rates increased slightly or remained flat as compared to 2014, but the resultingactuarial gains were offset and reversed by actuarial losses generated by actual returns lower than estimated incertain of CEMEX’s plan assets. In 2014 there was also a reduction in the discount rates applicable to theobligations at the end of the period in the United Kingdom, Germany and the United States.
As of December 31, 2016 and 2015, plan assets were measured at their estimated fair value and, based on thehierarchy of fair values, are detailed as follows:
2016 2015
Level 1 Level 2 Level 3 Total Level 1 Level 2 Level 3 Total
Cash . . . . . . . . . . . . . . . . . . . . . . . . . . . . . Ps 1,075 1,024 — 2,099 Ps 649 884 — 1,533Investments in corporate bonds . . . . . . . . 1,050 2,617 — 3,667 896 2,615 — 3,511Investments in government bonds . . . . . . 209 10,081 — 10,290 153 9,122 — 9,275
Total fixed-income securities . . . . . . 2,334 13,722 — 16,056 1,698 12,621 — 14,319
Investment in marketable securities . . . . . 2,001 5,956 — 7,957 1,503 5,441 — 6,944Other investments and private funds . . . . 770 3,478 593 4,841 618 3,244 446 4,308
Total variable-income securities . . . 2,771 9,434 593 12,798 2,121 8,685 446 11,252
Total plan assets . . . . . . . . . . . . . . . . Ps 5,105 23,156 593 28,854 Ps 3,819 21,306 446 25,571
As of December 31, 2016, estimated payments for pensions and other post-employment benefits over the next 10years were as follows:
2016
2017 . . . . . . . . . . . . . . . . . . . . . . . . . . . . . . . . . . . . . . . . . . . . . . . . . . . . . . . . . . . . . . . . . . . . . . . . . . . Ps 2,9342018 . . . . . . . . . . . . . . . . . . . . . . . . . . . . . . . . . . . . . . . . . . . . . . . . . . . . . . . . . . . . . . . . . . . . . . . . . . . 2,8502019 . . . . . . . . . . . . . . . . . . . . . . . . . . . . . . . . . . . . . . . . . . . . . . . . . . . . . . . . . . . . . . . . . . . . . . . . . . . 2,8922020 . . . . . . . . . . . . . . . . . . . . . . . . . . . . . . . . . . . . . . . . . . . . . . . . . . . . . . . . . . . . . . . . . . . . . . . . . . . 2,7712021 . . . . . . . . . . . . . . . . . . . . . . . . . . . . . . . . . . . . . . . . . . . . . . . . . . . . . . . . . . . . . . . . . . . . . . . . . . . 2,8082022 – 2026 . . . . . . . . . . . . . . . . . . . . . . . . . . . . . . . . . . . . . . . . . . . . . . . . . . . . . . . . . . . . . . . . . . . . . 15,047
The most significant assumptions used in the determination of the benefit obligation were as follows:
2016 2015
MexicoUnitedStates
UnitedKingdom
Range of rates inother countries Mexico
UnitedStates
UnitedKingdom
Rates ranges inother countries
Discount rates . . . . . . . . . . . . . . . . 9.0% 4.2% 2.6% 1.1% – 7.0% 8.0% 4.4% 3.7% 1.6% – 7.3%Rate of return on plan assets . . . . 9.0% 4.2% 2.6% 1.1% – 7.0% 8.0% 4.4% 3.7% 1.6% – 7.3%Rate of salary increases . . . . . . . . 4.0% — 3.3% 1.5% – 6.0% 4.0% — 3.1% 2.0% – 6.0%
F-76

CEMEX, S.A.B. DE C.V. AND SUBSIDIARIESNotes to the Consolidated Financial Statements
As of December 31, 2016, 2015 and 2014(Millions of Mexican pesos)
Defined benefit pension plans — continued
As of December 31, 2016 and 2015, the aggregate projected benefit obligation (“PBO”) for pension plans andother post-employment benefits and the plan assets by country were as follows:
2016 2015
PBO Assets Deficit PBO Assets Deficit
Mexico . . . . . . . . . . . . . . . . . . . . . . . . . . . . . . . . Ps 3,247 824 2,423 Ps 3,699 538 3,161United States . . . . . . . . . . . . . . . . . . . . . . . . . . . 7,110 4,192 2,918 5,988 3,552 2,436United Kingdom . . . . . . . . . . . . . . . . . . . . . . . . 33,925 22,154 11,771 27,522 20,042 7,480Germany . . . . . . . . . . . . . . . . . . . . . . . . . . . . . . 4,429 227 4,202 3,700 205 3,495Other countries . . . . . . . . . . . . . . . . . . . . . . . . . . 3,508 1,457 2,051 2,931 1,234 1,697
Ps 52,219 28,854 23,365 Ps 43,840 25,571 18,269
Applicable regulation in the United Kingdom requires entities to maintain plan assets at a level similar to that ofthe obligations. In November 2012, in order to better manage CEMEX’s obligations under its defined benefitpension schemes and future cash funding requirements thereof, CEMEX implemented an asset backed pensionfunding arrangement in its operations in the United Kingdom by means of which CEMEX transferred certainoperating assets to a non-transferable limited partnership, owned, controlled and consolidated by CEMEX UKwith a total value of approximately US$553 and entered into lease agreements for the use of such assets with thelimited partnership, in which the pension schemes hold a limited interest. On an ongoing basis CEMEX UK willmake annual rental payments of approximately US$20, increasing at annual rate of 5%, which will generateprofits in the limited partnership that are then distributed to the pension schemes. As previously mentioned, thepurpose of the structure, in addition to provide the pension schemes with secured assets producing an annualreturn over a period of 25 years, improves the security for the trustees of the pension schemes, and reduces thelevel of cash funding that CEMEX UK will have to make in future periods. In 2037, on expiry of the leasearrangements, the limited partnership will be terminated and under the terms of the agreement, the remainingassets will be distributed to CEMEX UK. Any future profit distribution from the limited partnership to thepension fund will be considered as an employer contribution to plan assets in the period in which they occur.
In some countries, CEMEX has established health care benefits for retired personnel limited to a certain numberof years after retirement. As of December 31, 2016 and 2015, the projected benefits obligation related to thesebenefits was approximately Ps837 and Ps786, respectively. The medical inflation rates used to determine theprojected benefits obligation of these benefits in 2016 and 2015 for Mexico were 7.0% and 7.0%, respectively,for Puerto Rico 4.3% and 4.5%, respectively, and for the United Kingdom were 6.8% and 6.6%, respectively.Eligibility for retiree medical in the United States has been terminated for all new employees on December 31,2014, and remaining participants are under a capped group and future health care cost trend rates are notapplicable. The medical inflation rate for 2014 in the United States was 4.4%.
Significant events related to employees’ pension benefits and other post-employment benefits during thereported periods
During 2015, CEMEX in the United States terminated the retiree medical coverage for certain participants not yetretired. In addition, during 2014, CEMEX in the United States terminated the retiree medical and life insurance coveragefor most new retirees, and changed the existing retirees program effective January 1, 2015, where participants will ceasetheir current plans and instead receive a Health Reimbursement Account (HRA) contribution, if they become eligible.These curtailment events resulted in an adjustment to past service cost which generated gains of approximately Ps13(US$1) in 2015 and Ps110 (US$8) in 2014, recognized immediately through the benefit cost of the respective year.
F-77

CEMEX, S.A.B. DE C.V. AND SUBSIDIARIESNotes to the Consolidated Financial Statements
As of December 31, 2016, 2015 and 2014(Millions of Mexican pesos)
Sensitivity analysis of pension and other post-employment benefits
For the year ended December 31, 2016, CEMEX performed sensitivity analyses on the most significantassumptions that affect the PBO, considering reasonable independent changes of plus or minus 50 basis points ineach of these assumptions. The increase (decrease) that would have resulted in the PBO of pensions and otherpost-employment benefits as of December 31, 2016 are shown below:
Pensions Other benefits Total
+50 bps -50 bps +50 bps -50 bps +50 bps -50 bps
Assumptions:Discount Rate Sensitivity . . . . . . . . . . . . . . . . . . . . . . . Ps (3,699) 4,033 (53) 58 (3,752) 4,091Salary Increase Rate Sensitivity . . . . . . . . . . . . . . . . . . 91 (83) 6 (7) 97 (90)Pension Increase Rate Sensitivity . . . . . . . . . . . . . . . . . 2,254 (2,127) — — 2,254 (2,127)
19) INCOME TAXES
19A) INCOME TAXES FOR THE PERIOD
The amounts of income tax revenue (expense) in the statements of operations for 2016, 2015 and 2014 aresummarized as follows:
2016 2015 2014
Current income taxes . . . . . . . . . . . . . . . . . . . . . . . . . . . . . . . . . . . . . . . . . . . . . . . . Ps (3,448) 6,149 (4,184)Deferred income taxes . . . . . . . . . . . . . . . . . . . . . . . . . . . . . . . . . . . . . . . . . . . . . . . 352 (8,477) 264
Ps (3,096) (2,328) (3,920)
19B) DEFERRED INCOME TAXES
As of December 31, 2016 and 2015, the main temporary differences that generated the consolidated deferredincome tax assets and liabilities are presented below:
2016 2015
Deferred tax assets:Tax loss carryforwards and other tax credits . . . . . . . . . . . . . . . . . . . . . . . . . . . . . . . . . . . Ps 17,514 16,658Accounts payable and accrued expenses . . . . . . . . . . . . . . . . . . . . . . . . . . . . . . . . . . . . . . 9,262 8,220Intangible assets and deferred charges, net . . . . . . . . . . . . . . . . . . . . . . . . . . . . . . . . . . . . . 6,358 5,487Others . . . . . . . . . . . . . . . . . . . . . . . . . . . . . . . . . . . . . . . . . . . . . . . . . . . . . . . . . . . . . . . . . 359 130
Total deferred tax assets, net . . . . . . . . . . . . . . . . . . . . . . . . . . . . . . . . . . . . . . . . . . . 33,493 30,495
Deferred tax liabilities:Property, machinery and equipment . . . . . . . . . . . . . . . . . . . . . . . . . . . . . . . . . . . . . . . . . . (35,095) (32,742)Investments and other assets . . . . . . . . . . . . . . . . . . . . . . . . . . . . . . . . . . . . . . . . . . . . . . . . (1,958) (2,689)
Total deferred tax liabilities, net . . . . . . . . . . . . . . . . . . . . . . . . . . . . . . . . . . . . . . . . . (37,053) (35,431)
Net deferred tax liabilities . . . . . . . . . . . . . . . . . . . . . . . . . . . . . . . . . . . . . . . . . . . . Ps (3,560) (4,936)
Out of which:Net deferred tax (liability) asset in Mexican entities . . . . . . . . . . . . . . . . . . . . . . . Ps (2,509) 255Net deferred tax (liability) asset in Foreign entities . . . . . . . . . . . . . . . . . . . . . . . Ps (1,051) (5,191)
F-78

CEMEX, S.A.B. DE C.V. AND SUBSIDIARIESNotes to the Consolidated Financial Statements
As of December 31, 2016, 2015 and 2014(Millions of Mexican pesos)
Deferred income taxes — continued
The breakdown of changes in consolidated deferred income taxes during 2016, 2015 and 2014 were as follows:
2016 2015 2014
Deferred income tax (charged) credited to profit or loss . . . . . . . . . . . . . . . . . . . . . . Ps 352 (8,477) 264Deferred income tax (charged) credited to stockholders’ equity . . . . . . . . . . . . . . . . 514 1,089 229Reclassification to other captions in the balance sheet and in the statement of
operations 1, 2 . . . . . . . . . . . . . . . . . . . . . . . . . . . . . . . . . . . . . . . . . . . . . . . . . . . . . . 510 (5,479) 410
Change in deferred income tax during the period . . . . . . . . . . . . . . . . . . . . . . . . . . . . Ps 1,376 (12,867) 903
1 In 2016, 2015 and 2014, includes the effects of discontinued operations (note 4A) and in 2015 the effects ofthe termination of tax consolidation regime.
2 In 2014, includes the effect of the divest assets in the western region of Germany (note 15B).
Current and/or deferred income tax relative to items of other comprehensive income (loss) during 2016, 2015 and2014 were as follows:
2016 2015 2014
Tax effects relative to foreign exchange fluctuations from debt (note 20B) . . . . . . . . . . Ps (410) (272) (75)Tax effects relative to foreign exchange fluctuations from intercompany balances
(note 20B) . . . . . . . . . . . . . . . . . . . . . . . . . . . . . . . . . . . . . . . . . . . . . . . . . . . . . . . . . . . (12) (181) 247Tax effects relative to actuarial (gains) and losses (note 20B) . . . . . . . . . . . . . . . . . . . . . 788 183 486Foreign currency translation and other effects . . . . . . . . . . . . . . . . . . . . . . . . . . . . . . . . . (274) 906 (257)
Ps 92 636 401
For the recognition of deferred tax assets, CEMEX analyzes the aggregate amount of self-determined tax losscarryforwards included in its income tax returns in each country where CEMEX believes, based on availableevidence, that the tax authorities would not reject such tax loss carryforwards; and the likelihood of therecoverability of such tax loss carryforwards prior to their expiration through an analysis of estimated futuretaxable income. If CEMEX believes that it is probable that the tax authorities would reject a self-determineddeferred tax asset, it would decrease such asset. Likewise, if CEMEX believes that it would not be able to use atax loss carryforward before its expiration or any other tax asset, CEMEX would not recognize such asset. Bothsituations would result in additional income tax expense for the period in which such determination is made. Inorder to determine whether it is probable that deferred tax assets will ultimately be realized, CEMEX takes intoconsideration all available positive and negative evidence, including factors such as market conditions, industryanalysis, expansion plans, projected taxable income, carryforward periods, current tax structure, potentialchanges or adjustments in tax structure, tax planning strategies, future reversals of existing temporarydifferences, etc. In addition, every reporting period, CEMEX analyzes its actual results versus its estimates, andadjusts, as necessary, its tax asset valuations. If actual results vary from CEMEX’s estimates, the deferred taxasset may be affected and necessary adjustments will be made based on relevant information, any adjustmentsrecorded will affect CEMEX’s statements of operations in such period.
F-79

CEMEX, S.A.B. DE C.V. AND SUBSIDIARIESNotes to the Consolidated Financial Statements
As of December 31, 2016, 2015 and 2014(Millions of Mexican pesos)
Deferred income taxes — continued
As of December 31, 2016, consolidated tax loss and tax credits carryforwards expire as follows:
Amount ofcarryforwards
Amount ofreserved
carryforwards
Amount ofunreserved
carryforwards
2017 . . . . . . . . . . . . . . . . . . . . . . . . . . . . . . . . . . . . . . . . . . . . . . . Ps 935 579 3562018 . . . . . . . . . . . . . . . . . . . . . . . . . . . . . . . . . . . . . . . . . . . . . . . 1,916 1,577 3392019 . . . . . . . . . . . . . . . . . . . . . . . . . . . . . . . . . . . . . . . . . . . . . . . 7,956 7,821 1352020 . . . . . . . . . . . . . . . . . . . . . . . . . . . . . . . . . . . . . . . . . . . . . . . 8,922 2,375 6,5472021 and thereafter . . . . . . . . . . . . . . . . . . . . . . . . . . . . . . . . . . . 373,840 325,292 48,548
Ps 393,569 337,644 55,925
As of December 31, 2016, in connection with CEMEX’s deferred tax loss carryforwards presented in the tableabove, in order to realize the benefits associated with such deferred tax assets that have not been reserved, beforetheir expiration, CEMEX would need to generate approximately Ps55,925 in consolidated pre-tax income infuture periods. For the year ended December 31, 2014, CEMEX reported pre-tax losses on a worldwideconsolidated basis. Nonetheless, based on the same forecasts of future cash flows and operating results used byCEMEX’s management to allocate resources and evaluate performance in the countries in which CEMEXoperates, which include expected growth in revenues and reductions in interest expense in several countries dueto a reduction in intra-group debt balances, along with the implementation of feasible tax strategies, CEMEXbelieves that it will recover the balance of its tax loss carryforwards that have not been reserved before theirexpiration. In addition, CEMEX concluded that, the deferred tax liabilities that were considered in the analysis ofrecoverability of its deferred tax assets will reverse in the same period and tax jurisdiction of the relatedrecognized deferred tax assets. Moreover, a certain amount of CEMEX’s deferred tax assets refer to operatingsegments and tax jurisdictions in which CEMEX is currently generating taxable income or in which, according toCEMEX’s management cash flow projections, will generate taxable income in the relevant periods before theexpiration of the deferred tax assets.
CEMEX does not recognize a deferred income tax liability related to its investments in subsidiaries and interestsin joint ventures, considering that CEMEX controls the reversal of the temporary differences arising from theseinvestments and management is satisfied that such temporary differences will not reverse in the foreseeablefuture.
19C) EFFECTIVE TAX RATE
For the years ended as of December 31, 2016, 2015 and 2014, the effective consolidated income tax rates were asfollows:
2016 2015 2014
Income (loss) before income tax . . . . . . . . . . . . . . . . . . . . . . . . . . . . . . . . . . . . . . . Ps 17,279 3,182 (1,850)Income tax expense . . . . . . . . . . . . . . . . . . . . . . . . . . . . . . . . . . . . . . . . . . . . . . . . . (3,096) (2,328) (3,920)
Effective consolidated income tax rate 1 . . . . . . . . . . . . . . . . . . . . . . . . . . . . . . . . . (17.9)% (73.2)% 211.9%
1 The average effective tax rate equals the net amount of income tax revenue or expense divided by income orloss before income taxes, as these line items are reported in profit or loss.
F-80
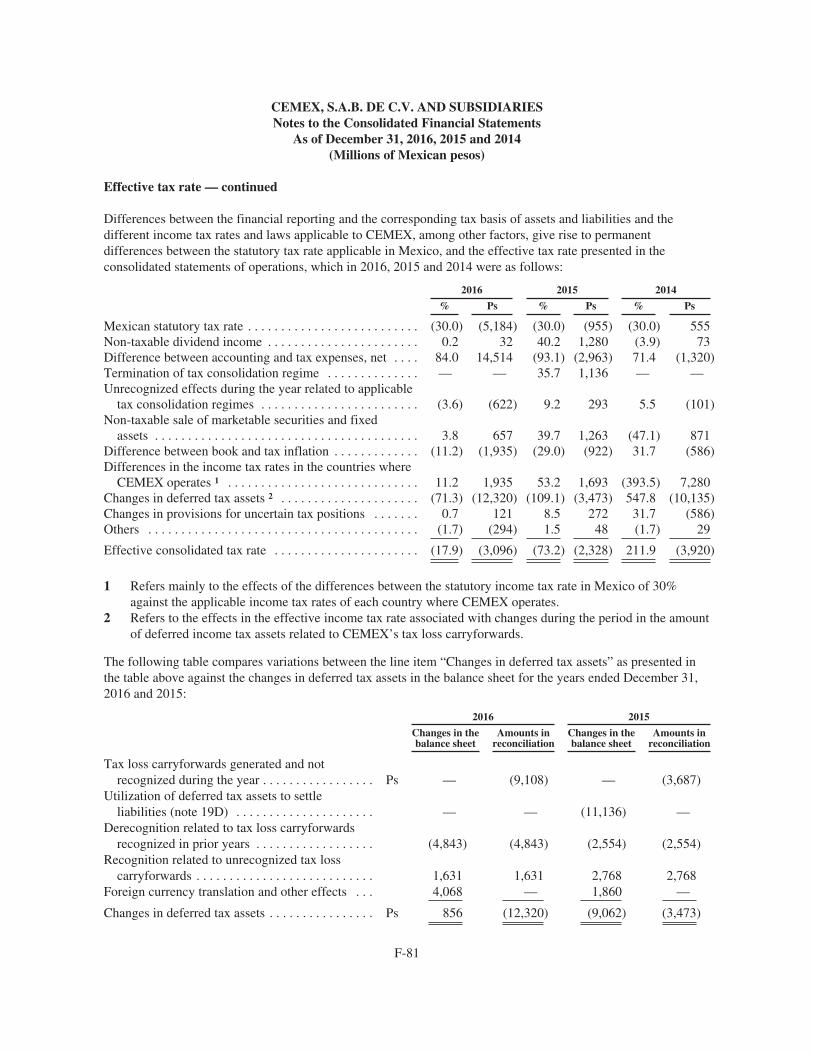
CEMEX, S.A.B. DE C.V. AND SUBSIDIARIESNotes to the Consolidated Financial Statements
As of December 31, 2016, 2015 and 2014(Millions of Mexican pesos)
Effective tax rate — continued
Differences between the financial reporting and the corresponding tax basis of assets and liabilities and thedifferent income tax rates and laws applicable to CEMEX, among other factors, give rise to permanentdifferences between the statutory tax rate applicable in Mexico, and the effective tax rate presented in theconsolidated statements of operations, which in 2016, 2015 and 2014 were as follows:
2016 2015 2014
% Ps % Ps % Ps
Mexican statutory tax rate . . . . . . . . . . . . . . . . . . . . . . . . . . (30.0) (5,184) (30.0) (955) (30.0) 555Non-taxable dividend income . . . . . . . . . . . . . . . . . . . . . . . 0.2 32 40.2 1,280 (3.9) 73Difference between accounting and tax expenses, net . . . . 84.0 14,514 (93.1) (2,963) 71.4 (1,320)Termination of tax consolidation regime . . . . . . . . . . . . . . — — 35.7 1,136 — —Unrecognized effects during the year related to applicable
tax consolidation regimes . . . . . . . . . . . . . . . . . . . . . . . . (3.6) (622) 9.2 293 5.5 (101)Non-taxable sale of marketable securities and fixed
assets . . . . . . . . . . . . . . . . . . . . . . . . . . . . . . . . . . . . . . . . 3.8 657 39.7 1,263 (47.1) 871Difference between book and tax inflation . . . . . . . . . . . . . (11.2) (1,935) (29.0) (922) 31.7 (586)Differences in the income tax rates in the countries where
CEMEX operates 1 . . . . . . . . . . . . . . . . . . . . . . . . . . . . . 11.2 1,935 53.2 1,693 (393.5) 7,280Changes in deferred tax assets 2 . . . . . . . . . . . . . . . . . . . . . (71.3) (12,320) (109.1) (3,473) 547.8 (10,135)Changes in provisions for uncertain tax positions . . . . . . . 0.7 121 8.5 272 31.7 (586)Others . . . . . . . . . . . . . . . . . . . . . . . . . . . . . . . . . . . . . . . . . (1.7) (294) 1.5 48 (1.7) 29
Effective consolidated tax rate . . . . . . . . . . . . . . . . . . . . . . (17.9) (3,096) (73.2) (2,328) 211.9 (3,920)
1 Refers mainly to the effects of the differences between the statutory income tax rate in Mexico of 30%against the applicable income tax rates of each country where CEMEX operates.
2 Refers to the effects in the effective income tax rate associated with changes during the period in the amountof deferred income tax assets related to CEMEX’s tax loss carryforwards.
The following table compares variations between the line item “Changes in deferred tax assets” as presented inthe table above against the changes in deferred tax assets in the balance sheet for the years ended December 31,2016 and 2015:
2016 2015
Changes in thebalance sheet
Amounts inreconciliation
Changes in thebalance sheet
Amounts inreconciliation
Tax loss carryforwards generated and notrecognized during the year . . . . . . . . . . . . . . . . . Ps — (9,108) — (3,687)
Utilization of deferred tax assets to settleliabilities (note 19D) . . . . . . . . . . . . . . . . . . . . . — — (11,136) —
Derecognition related to tax loss carryforwardsrecognized in prior years . . . . . . . . . . . . . . . . . . (4,843) (4,843) (2,554) (2,554)
Recognition related to unrecognized tax losscarryforwards . . . . . . . . . . . . . . . . . . . . . . . . . . . 1,631 1,631 2,768 2,768
Foreign currency translation and other effects . . . 4,068 — 1,860 —
Changes in deferred tax assets . . . . . . . . . . . . . . . . Ps 856 (12,320) (9,062) (3,473)
F-81

CEMEX, S.A.B. DE C.V. AND SUBSIDIARIESNotes to the Consolidated Financial Statements
As of December 31, 2016, 2015 and 2014(Millions of Mexican pesos)
19D) UNCERTAIN TAX POSITIONS AND SIGNIFICANT TAX PROCEEDINGS
As of December 31, 2016 and 2015, as part of short-term and long-term provisions and other liabilities (note 17),CEMEX has recognized provisions related to unrecognized tax benefits in connection with uncertain taxpositions taken, in which it is deemed probable that the tax authority would differ from the position adopted byCEMEX. As of December 31, 2016, the tax returns submitted by some subsidiaries of CEMEX located in severalcountries are under review by the respective tax authorities in the ordinary course of business. CEMEX cannotanticipate if such reviews will result in new tax assessments, which would, should any arise, be appropriatelydisclosed and/or recognized in the financial statements.
A summary of the beginning and ending amount of unrecognized tax benefits for the years ended December 31,2016, 2015 and 2014, excluding interest and penalties, is as follows:
2016 2015 2014
Balance of tax positions at beginning of year . . . . . . . . . . . . . . . . . . . . . . . . . . . . . . . Ps 1,190 1,396 1,283Additions for tax positions of prior years . . . . . . . . . . . . . . . . . . . . . . . . . . . . . . . 200 134 216Additions for tax positions of current year . . . . . . . . . . . . . . . . . . . . . . . . . . . . . . 90 71 278Reductions for tax positions related to prior years and other items . . . . . . . . . . . (131) (95) (71)Settlements and reclassifications . . . . . . . . . . . . . . . . . . . . . . . . . . . . . . . . . . . . . (163) (204) (317)Expiration of the statute of limitations . . . . . . . . . . . . . . . . . . . . . . . . . . . . . . . . . (126) (231) (73)Foreign currency translation effects . . . . . . . . . . . . . . . . . . . . . . . . . . . . . . . . . . . 72 119 80
Balance of tax positions at end of year . . . . . . . . . . . . . . . . . . . . . . . . . . . . . . . . . . . . . Ps 1,132 1,190 1,396
Tax examinations can involve complex issues, and the resolution of issues may span multiple years, particularlyif subject to negotiation or litigation. Although CEMEX believes its estimates of the total unrecognized taxbenefits are reasonable, uncertainties regarding the final determination of income tax audit settlements and anyrelated litigation could affect the amount of total unrecognized tax benefits in future periods. It is difficult toestimate the timing and range of possible changes related to the uncertain tax positions, as finalizing audits withthe income tax authorities may involve formal administrative and legal proceedings. Accordingly, it is notpossible to reasonably estimate the expected changes to the total unrecognized tax benefits over the next 12months, although any settlements or statute of limitations expirations may result in a significant increase ordecrease in the total unrecognized tax benefits, including those positions related to tax examinations beingcurrently conducted.
As of December 31, 2016, the Company’s most significant tax proceedings, some of which are associated withthe uncertain tax positions described above are as follows:
• As of December 31, 2016, the U.S. Internal Revenue Service (“IRS”) has concluded its audit for the year2014. The final findings did not alter the originally filed tax return, which had no reserves set aside for anypotential tax issue. In addition, there is any tax matter considered material to CEMEX’s financial resultsrelated to the IRS’ audits of prior periods. On May 18, 2016 and April 24, 2015, the IRS commenced itsaudits of the 2016 and 2015 tax years, respectively, under the Compliance Assurance Process. CEMEX hasnot identified any material audit issues and, as such, no reserves are recorded for either the 2016 or 2015audits in CEMEX’s financial statements.
• On July 7, 2011, the tax authorities in Spain notified CEMEX España of a tax audit process in Spaincovering the tax years from and including 2006 to 2009. The tax authorities in Spain have challenged part ofthe tax losses reported by CEMEX España for such years. The tax authorities in Spain notified CEMEX
F-82

CEMEX, S.A.B. DE C.V. AND SUBSIDIARIESNotes to the Consolidated Financial Statements
As of December 31, 2016, 2015 and 2014(Millions of Mexican pesos)
Uncertain tax positions and significant tax proceedings — continued
España of fines in the aggregate amount of approximately €456 (US$480 or Ps9,938). The laws of Spainprovide a number of appeals that could be filed against such penalty without making any payment until theyare finally resolved. On April 22, 2014, CEMEX España filed appeals against such fines. At this stage,CEMEX does not consider probable an adverse resolution in this proceeding. Nonetheless, is difficult toassess with certainty the likelihood of an adverse result, and the appeals that CEMEX España has file couldtake an extended amount of time to be resolved, but if adversely resolved, it could have a material adverseimpact on CEMEX’s results of operations, liquidity or financial position.
• In November 2009, amendments to the income tax law in Mexico effective on January 1, 2010 modified thetax consolidation regime by requiring entities to determine income taxes as if the tax consolidation rules didnot exist from 1999 onward, specifically, turning into taxable items: a) the difference between the sum ofthe equity of the controlled entities for tax purposes and the equity of the consolidated entity for taxpurposes; b) dividends from the controlled entities for tax purposes to the Parent Company; and c) othertransactions that represented the transfer of resources between the companies included in the taxconsolidation. In December 2010, the tax authority in Mexico had granted the option to defer the calculationand payment of the income tax over the difference in equity explained above, until the subsidiary wasexcluded or the elimination of the tax consolidation. Nonetheless, in December 2013 new amendments tothe income tax law in Mexico were approved effective January 1, 2014, which eliminated the taxconsolidation regime and implemented prospectively a new voluntary integration regime that CEMEX didnot join. As a result, beginning in 2014, each Mexican entity determines its income taxes based solely in itsindividual results. A period of up to 10 years was established for the settlement of the liability for incometaxes related to the tax consolidation regime accrued until December 31, 2013, amount which consideringthe rules issued for the disconnection of the tax consolidation regime as well as payments made during 2013amounted to approximately Ps24,804 as of December 31, 2013. In 2014, considering payments incurred netof inflation adjustments, as of December 31, 2014, the balance payable was reduced to approximatelyPs21,429. Furthermore, in October 2015, a new tax reform approved by Congress (the “new tax reform”)granted entities the option to settle a portion of the liability for the exit of the tax consolidation regime usingavailable tax loss carryforwards of the previously consolidated entities, considering a discount factor, and atax credit to offset certain items of the aforementioned liability. Consequently, during 2015, as a result ofpayments made, the liability was further reduced to approximately Ps16,244, which after the application oftax credits and assets for tax loss carryforwards (as provided by the new tax reform) which had a book valuefor CEMEX before discount of approximately Ps11,136, as of December 31, 2015, the Parent Company’sliability was reduced to approximately Ps3,971. In 2016, considering payments made during the year net ofinflation adjustments, as of December 31, 2016, CEMEX reduced the balance payable to approximatelyPs3,236.
• On April 1, 2011, the Colombian Tax Authority notified CEMEX Colombia of a special proceedingrejecting certain deductions taken by CEMEX Colombia in its 2009 tax return. The Colombian TaxAuthority assessed an increase in taxes to be paid by CEMEX Colombia in an amount in Colombian pesosequivalent to approximately US$30 (Ps622) and imposed a penalty in an amount in Colombian pesosequivalent to approximately US$48 (Ps995), both as of December 31, 2016. The Colombian Tax Authorityargues that certain expenses are not deductible for fiscal purposes because they are not linked to directrevenues recorded in the same fiscal year, without considering that future revenue will be taxed under theincome tax law in Colombia. CEMEX Colombia responded to the special proceeding on June 25, 2011. OnDecember 15, 2011, the Colombian Tax Authority issued its final resolution, which confirmed theinformation in the special proceeding. CEMEX Colombia appealed such resolution on February 15, 2012.
F-83

CEMEX, S.A.B. DE C.V. AND SUBSIDIARIESNotes to the Consolidated Financial Statements
As of December 31, 2016, 2015 and 2014(Millions of Mexican pesos)
Uncertain tax positions and significant tax proceedings — continued
On January 17, 2013, the Colombian Tax Authority confirmed CEMEX Colombia its final resolution. OnMay 10, 2013, CEMEX Colombia appealed the final resolution before the Administrative Tribunal ofCundinamarca, which was admitted on June 21, 2013. On July 14, 2014, CEMEX Colombia was notifiedabout an adverse resolution to its appeal, which confirms the official liquidation notified by the ColombianTax Authority. On July 22, 2014, CEMEX Colombia filed an appeal against this resolution before theColombian State Council (Consejo de Estado). On September 17, 2015, CEMEX Colombia presentedarguments in second instance on this proceeding. At this stage of the proceeding, as of December 31, 2016,CEMEX does not consider probable an adverse resolution in this proceeding. Nonetheless, is difficult toassess with certainty the likelihood of an adverse result; but if adversely resolved, this proceeding couldhave a material adverse impact on CEMEX’s results of operations, liquidity or financial position.
20) STOCKHOLDERS’ EQUITY
As of December 31, 2016 and 2015, stockholders’ equity excludes investments in CPOs of the Parent Companyheld by subsidiaries of approximately Ps327 (19,751,229 CPOs) and Ps179 (18,991,576 CPOs), respectively,which were eliminated within “Other equity reserves”.
20A) COMMON STOCK AND ADDITIONAL PAID-IN CAPITAL
As of December 31, 2016 and 2015, the breakdown of common stock and additional paid-in capital was asfollows:
2016 2015
Common stock . . . . . . . . . . . . . . . . . . . . . . . . . . . . . . . . . . . . . . . . . . . . . . . . . . . . . . . . . . Ps 4,162 4,158Additional paid-in capital . . . . . . . . . . . . . . . . . . . . . . . . . . . . . . . . . . . . . . . . . . . . . . . . . 123,174 115,466
Ps 127,336 119,624
As of December 31, 2016 and 2015 the common stock of CEMEX, S.A.B. de C.V. was presented as follows:
2016 2015
Shares 1 Series A 2 Series B 2 Series A 2 Series B 2
Subscribed and paid shares . . . . . . . . . . . 28,121,583,148 14,060,791,574 26,935,196,072 13,467,598,036Unissued shares authorized for stock
compensation programs . . . . . . . . . . . . 638,468,154 319,234,077 747,447,386 373,723,693Shares that guarantee the issuance of
convertible securities 3 . . . . . . . . . . . . 5,218,899,920 2,609,449,960 5,020,899,920 2,510,449,960
33,978,951,222 16,989,475,611 32,703,543,378 16,351,771,689
1 As of December 31, 2016 and 2015, 13,068,000,000 shares correspond to the fixed portion, and37,900,426,833 shares in 2016 and 35,987,315,067 shares in 2015, correspond to the variable portion.
2 Series “A” or Mexican shares must represent at least 64% of CEMEX’s capital stock; meanwhile, Series“B” or free subscription shares must represent at most 36% of CEMEX’s capital stock.
3 Shares that guarantee the conversion of both the outstanding voluntary and mandatorily convertiblesecurities and new securities issues (note 16B).
F-84

CEMEX, S.A.B. DE C.V. AND SUBSIDIARIESNotes to the Consolidated Financial Statements
As of December 31, 2016, 2015 and 2014(Millions of Mexican pesos)
Common stock and additional paid-in capital — continued
On March 31, 2016, stockholders at the annual ordinary shareholders’ meeting approved resolutions to:(i) increase the variable common stock through the capitalization of retained earnings by issuing up to1,616 million shares (539 million CPOs), which shares were issued, representing an increase in common stock ofapproximately Ps4, considering a nominal value of Ps0.00833 per CPO, and additional paid-in capital ofapproximately Ps6,966; (ii) increase the variable common stock by issuing up to 297 million shares (99 millionCPOs), which will be kept in the Parent Company’s treasury to be used to preserve the anti-dilutive rights of noteholders pursuant CEMEX’s convertible securities (note 16B).
On March 26, 2015, stockholders at the annual ordinary shareholders’ meeting approved resolutions to:(i) increase the variable common stock through the capitalization of retained earnings by issuing up to1,500 million shares (500 million CPOs), which shares were issued, representing an increase in common stock ofapproximately Ps4, considering a nominal value of Ps0.00833 per CPO, and additional paid-in capital ofapproximately Ps7,613; (ii) increase the variable common stock by issuing up to 297 million shares (99 millionCPOs), which will be kept in the Parent Company’s treasury to be used to preserve the anti-dilutive rights of noteholders pursuant CEMEX’s convertible securities (note 16B).
On March 20, 2014, stockholders at the annual ordinary shareholders’ meeting approved resolutions to:(i) increase the variable common stock through the capitalization of retained earnings by issuing up to1,404 million shares (468 million CPOs), which shares were issued, representing an increase in common stock ofapproximately Ps4, considering a nominal value of Ps0.00833 per CPO, and additional paid-in capital ofapproximately Ps7,614; (ii) increase the variable common stock by issuing up to 387 million shares (129 millionCPOs), which will be kept in the Parent Company’s treasury to be used to preserve the anti-dilutive rights of noteholders pursuant CEMEX’s convertible securities (note 16B).
In connection with the long-term executive share-based compensation program (note 21) in 2016, 2015 and 2014,CEMEX issued approximately 53.9 million CPOs, 49.2 million and 61.1 million, respectively, generating anadditional paid-in capital of approximately Ps742 in 2016, Ps655 in 2015 and Ps765 in 2014 associated with thefair value of the compensation received by executives.
20B) OTHER EQUITY RESERVES
As of December 31, 2016 and 2015 other equity reserves are summarized as follows:
2016 2015
Cumulative translation effect, net of effects from perpetual debentures and deferredincome taxes recognized directly in equity (notes 19B and 20D) . . . . . . . . . . . . . . . . . . Ps 31,293 17,606
Cumulative actuarial losses . . . . . . . . . . . . . . . . . . . . . . . . . . . . . . . . . . . . . . . . . . . . . . . . . (10,934) (6,915)Effects associated with CEMEX´s convertible securities 1 . . . . . . . . . . . . . . . . . . . . . . . . . 4,761 4,761Treasury shares held by subsidiaries . . . . . . . . . . . . . . . . . . . . . . . . . . . . . . . . . . . . . . . . . . (327) (179)
Ps 24,793 15,273
1 Represents the equity component upon the issuance of CEMEX’s convertible securities described in note16B, as well as the effects associated with such securities in connection with the change in the ParentCompany’s functional currency (note 2D). Upon conversion of these securities, the balances have beencorrespondingly reclassified to common stock and/or additional paid-in capital (note 16A).
F-85

CEMEX, S.A.B. DE C.V. AND SUBSIDIARIESNotes to the Consolidated Financial Statements
As of December 31, 2016, 2015 and 2014(Millions of Mexican pesos)
Other equity reserves — continued
For the years ended December 31, 2016, 2015 and 2014, the translation effects of foreign subsidiaries included inthe statements of comprehensive income (loss) were as follows:
2016 2015 2014
Foreign currency translation adjustment 1 . . . . . . . . . . . . . . . . . . . . . . . . . . . . . . Ps 20,647 12,860 15,157Foreign exchange fluctuations from debt 2 . . . . . . . . . . . . . . . . . . . . . . . . . . . . . 1,367 908 479Foreign exchange fluctuations from intercompany balances 3 . . . . . . . . . . . . . . (10,385) (5,801) (15,135)
Ps 11,629 7,967 501
1 These effects refer to the result from the translation of the financial statements of foreign subsidiaries.2 Generated by foreign exchange fluctuations over a notional amount of debt in CEMEX, S.A.B. de C.V.,
associated with the acquisition of foreign subsidiaries and designated as a hedge of the net investment inforeign subsidiaries (note 2D).
3 Refers to foreign exchange fluctuations arising from balances with related parties in foreign currencies thatare of a long-term investment nature considering that their liquidation is not anticipated in the foreseeablefuture and foreign exchange fluctuations over a notional amount of debt of a subsidiary of CEMEX Españaidentified and designated as a hedge of the net investment in foreign subsidiaries.
20C) RETAINED EARNINGS
The Parent Company’s net income for the year is subject to a 5% allocation toward a legal reserve until suchreserve equals one fifth of the common stock. As of December 31, 2016, the legal reserve amounted to Ps1,804.
20D) NON-CONTROLLING INTEREST AND PERPETUAL DEBENTURES
Non-controlling interest
Non-controlling interest represents the share of non-controlling stockholders in the results and equity ofconsolidated subsidiaries. As of December 31, 2016 and 2015, non-controlling interest in equity amounted toapproximately Ps19,876 and Ps12,708, respectively.
On July 18, 2016, CEMEX Holdings Philippines, Inc. (“CHP”), an indirect wholly-owned subsidiary of CEMEXEspaña, S.A., closed its initial offering of 2,337,927,954 new common shares, at a price of 10.75 PhilippinePesos per common share, in a public offering to investors in the Philippines and in a concurrent privateplacement to eligible investors outside of the Philippines. The number of common shares issued by CHP includes304,947,124 shares which subscription option was exercised by the underwriters any time from June 30, 2016,the date of pricing, up to and including the day prior to the first day of trading of the shares on July 18, 2016.CHP’s assets consist primarily of CEMEX’s cement manufacturing assets in the Philippines. After giving effectto the offering, and the exercise of the subscription option, CEMEX Asian South East Corporation (“CASE”), anindirect wholly-owned subsidiary of CEMEX España, S.A., owns approximately 55.0% of CHP’s outstandingcommon shares. CHP’s common shares are listed on the Philippine Stock Exchange under the ticker CHP. Thenet proceeds from the offering of approximately US$507 (considering an exchange rate of 46.932 PhilippinesPesos per U.S. dollar on June 30, 2016), after deducting commissions and other offering expenses, were used byCEMEX for general corporate purposes, including the repayment of existing debt.
F-86
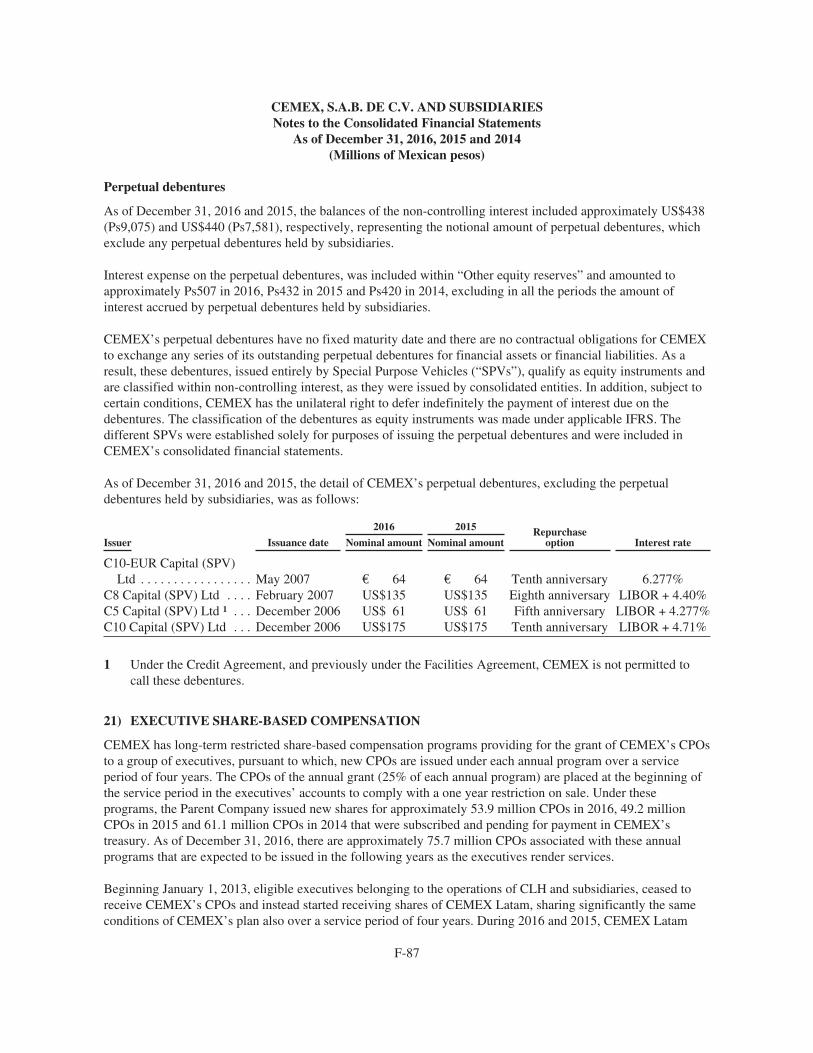
CEMEX, S.A.B. DE C.V. AND SUBSIDIARIESNotes to the Consolidated Financial Statements
As of December 31, 2016, 2015 and 2014(Millions of Mexican pesos)
Perpetual debentures
As of December 31, 2016 and 2015, the balances of the non-controlling interest included approximately US$438(Ps9,075) and US$440 (Ps7,581), respectively, representing the notional amount of perpetual debentures, whichexclude any perpetual debentures held by subsidiaries.
Interest expense on the perpetual debentures, was included within “Other equity reserves” and amounted toapproximately Ps507 in 2016, Ps432 in 2015 and Ps420 in 2014, excluding in all the periods the amount ofinterest accrued by perpetual debentures held by subsidiaries.
CEMEX’s perpetual debentures have no fixed maturity date and there are no contractual obligations for CEMEXto exchange any series of its outstanding perpetual debentures for financial assets or financial liabilities. As aresult, these debentures, issued entirely by Special Purpose Vehicles (“SPVs”), qualify as equity instruments andare classified within non-controlling interest, as they were issued by consolidated entities. In addition, subject tocertain conditions, CEMEX has the unilateral right to defer indefinitely the payment of interest due on thedebentures. The classification of the debentures as equity instruments was made under applicable IFRS. Thedifferent SPVs were established solely for purposes of issuing the perpetual debentures and were included inCEMEX’s consolidated financial statements.
As of December 31, 2016 and 2015, the detail of CEMEX’s perpetual debentures, excluding the perpetualdebentures held by subsidiaries, was as follows:
2016 2015 Repurchaseoption Interest rateIssuer Issuance date Nominal amount Nominal amount
C10-EUR Capital (SPV)Ltd . . . . . . . . . . . . . . . . . May 2007 € 64 € 64 Tenth anniversary 6.277%
C8 Capital (SPV) Ltd . . . . February 2007 US$135 US$135 Eighth anniversary LIBOR + 4.40%C5 Capital (SPV) Ltd 1 . . . December 2006 US$ 61 US$ 61 Fifth anniversary LIBOR + 4.277%C10 Capital (SPV) Ltd . . . December 2006 US$175 US$175 Tenth anniversary LIBOR + 4.71%
1 Under the Credit Agreement, and previously under the Facilities Agreement, CEMEX is not permitted tocall these debentures.
21) EXECUTIVE SHARE-BASED COMPENSATION
CEMEX has long-term restricted share-based compensation programs providing for the grant of CEMEX’s CPOsto a group of executives, pursuant to which, new CPOs are issued under each annual program over a serviceperiod of four years. The CPOs of the annual grant (25% of each annual program) are placed at the beginning ofthe service period in the executives’ accounts to comply with a one year restriction on sale. Under theseprograms, the Parent Company issued new shares for approximately 53.9 million CPOs in 2016, 49.2 millionCPOs in 2015 and 61.1 million CPOs in 2014 that were subscribed and pending for payment in CEMEX’streasury. As of December 31, 2016, there are approximately 75.7 million CPOs associated with these annualprograms that are expected to be issued in the following years as the executives render services.
Beginning January 1, 2013, eligible executives belonging to the operations of CLH and subsidiaries, ceased toreceive CEMEX’s CPOs and instead started receiving shares of CEMEX Latam, sharing significantly the sameconditions of CEMEX’s plan also over a service period of four years. During 2016 and 2015, CEMEX Latam
F-87

CEMEX, S.A.B. DE C.V. AND SUBSIDIARIESNotes to the Consolidated Financial Statements
As of December 31, 2016, 2015 and 2014(Millions of Mexican pesos)
Executive share-based compensation — continued
physically delivered 271,461 shares and 242,618 shares, respectively, corresponding to the vested portion ofprior years’ grants, which were subscribed and held in CEMEX Latam’s treasury. As of December 31, 2016,there are approximately 540,359 shares of CEMEX Latam associated with these annual programs that areexpected to be delivered in the following years as the executives render services.
In addition, in 2012, CEMEX initiated a share-based compensation program for a group of executives which waslinked to both, internal performance conditions (increase in Operating EBITDA) and market conditions (increasein the price of CEMEX’s CPO), over a period of three years ending on December 31, 2014. Under this program,CEMEX granted awards over approximately 39.9 million CPOs, which became fully vested upon achievement ofthe annual internal and/or external performance conditions in each of the three years. CPOs vested weredelivered, fully unrestricted, to active executives in March 2015.
The combined compensation expense related to the programs described above in 2016, 2015 and 2014,recognized in the operating results, amounted to approximately Ps742, Ps655 and Ps730, respectively. Theweighted average price per CPO granted during the period was approximately 13.79 pesos in 2016, 13.34 pesosin 2015 and 12.53 pesos in 2014. Moreover, the weighted average price per CEMEX Latam share granted duringthe period was approximately 13,423 colombian pesos in 2016, 14,291 colombian pesos in 2015 and 15,073colombian pesos in 2014. As of December 31, 2016 and 2015, there were no options or commitments to makepayments in cash to the executives based on changes in the market price of the Parent Company’s CPO or CLH’sshares.
22) EARNINGS (LOSS) PER SHARE
Basic earnings (loss) per share is calculated by dividing profit or loss attributable to ordinary equity holders ofthe Parent Company (the numerator) by the weighted average number of shares outstanding (the denominator)during the period. Shares that would be issued depending only by the passage of time should be included in thedetermination of the basic weighted average number of shares outstanding. Diluted earnings (loss) per shareshould reflect in both, the numerator and denominator, the assumption that convertible instruments are converted,that options or warrants are exercised, or that ordinary shares are issued upon the satisfaction of specifiedconditions, to the extent that such assumption would led to a reduction in basic earnings per share or an increasein basic loss per share, otherwise, the effects of potential shares are not considered because they generateantidilution.
F-88
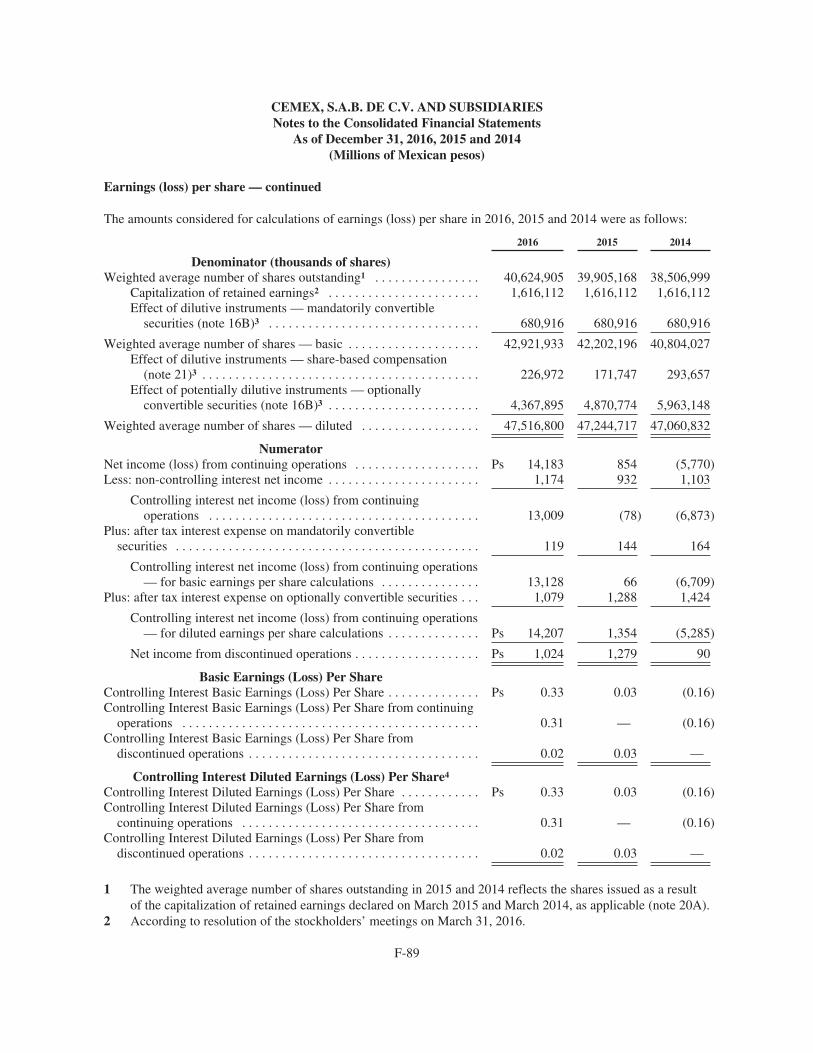
CEMEX, S.A.B. DE C.V. AND SUBSIDIARIESNotes to the Consolidated Financial Statements
As of December 31, 2016, 2015 and 2014(Millions of Mexican pesos)
Earnings (loss) per share — continued
The amounts considered for calculations of earnings (loss) per share in 2016, 2015 and 2014 were as follows:
2016 2015 2014
Denominator (thousands of shares)Weighted average number of shares outstanding1 . . . . . . . . . . . . . . . . 40,624,905 39,905,168 38,506,999
Capitalization of retained earnings2 . . . . . . . . . . . . . . . . . . . . . . . 1,616,112 1,616,112 1,616,112Effect of dilutive instruments — mandatorily convertible
securities (note 16B)3 . . . . . . . . . . . . . . . . . . . . . . . . . . . . . . . . 680,916 680,916 680,916
Weighted average number of shares — basic . . . . . . . . . . . . . . . . . . . . 42,921,933 42,202,196 40,804,027Effect of dilutive instruments — share-based compensation
(note 21)3 . . . . . . . . . . . . . . . . . . . . . . . . . . . . . . . . . . . . . . . . . . 226,972 171,747 293,657Effect of potentially dilutive instruments — optionally
convertible securities (note 16B)3 . . . . . . . . . . . . . . . . . . . . . . . 4,367,895 4,870,774 5,963,148
Weighted average number of shares — diluted . . . . . . . . . . . . . . . . . . 47,516,800 47,244,717 47,060,832
NumeratorNet income (loss) from continuing operations . . . . . . . . . . . . . . . . . . . Ps 14,183 854 (5,770)Less: non-controlling interest net income . . . . . . . . . . . . . . . . . . . . . . . 1,174 932 1,103
Controlling interest net income (loss) from continuingoperations . . . . . . . . . . . . . . . . . . . . . . . . . . . . . . . . . . . . . . . . . 13,009 (78) (6,873)
Plus: after tax interest expense on mandatorily convertiblesecurities . . . . . . . . . . . . . . . . . . . . . . . . . . . . . . . . . . . . . . . . . . . . . . 119 144 164
Controlling interest net income (loss) from continuing operations— for basic earnings per share calculations . . . . . . . . . . . . . . . 13,128 66 (6,709)
Plus: after tax interest expense on optionally convertible securities . . . 1,079 1,288 1,424
Controlling interest net income (loss) from continuing operations— for diluted earnings per share calculations . . . . . . . . . . . . . . Ps 14,207 1,354 (5,285)
Net income from discontinued operations . . . . . . . . . . . . . . . . . . . Ps 1,024 1,279 90
Basic Earnings (Loss) Per ShareControlling Interest Basic Earnings (Loss) Per Share . . . . . . . . . . . . . . Ps 0.33 0.03 (0.16)Controlling Interest Basic Earnings (Loss) Per Share from continuing
operations . . . . . . . . . . . . . . . . . . . . . . . . . . . . . . . . . . . . . . . . . . . . . 0.31 — (0.16)Controlling Interest Basic Earnings (Loss) Per Share from
discontinued operations . . . . . . . . . . . . . . . . . . . . . . . . . . . . . . . . . . . 0.02 0.03 —
Controlling Interest Diluted Earnings (Loss) Per Share4
Controlling Interest Diluted Earnings (Loss) Per Share . . . . . . . . . . . . Ps 0.33 0.03 (0.16)Controlling Interest Diluted Earnings (Loss) Per Share from
continuing operations . . . . . . . . . . . . . . . . . . . . . . . . . . . . . . . . . . . . 0.31 — (0.16)Controlling Interest Diluted Earnings (Loss) Per Share from
discontinued operations . . . . . . . . . . . . . . . . . . . . . . . . . . . . . . . . . . . 0.02 0.03 —
1 The weighted average number of shares outstanding in 2015 and 2014 reflects the shares issued as a resultof the capitalization of retained earnings declared on March 2015 and March 2014, as applicable (note 20A).
2 According to resolution of the stockholders’ meetings on March 31, 2016.
F-89

CEMEX, S.A.B. DE C.V. AND SUBSIDIARIESNotes to the Consolidated Financial Statements
As of December 31, 2016, 2015 and 2014(Millions of Mexican pesos)
Earnings (loss) per share — continued
3 The number of CPOs to be issued under the executive share-based compensation programs, as well as thetotal amount of CPOs committed for issuance in the future under the mandatorily and optionally convertiblesecurities, are computed from the beginning of the reporting period. The number of shares resulting from theexecutives’ stock option programs is determined under the inverse treasury method.
4 For 2016, 2015 and 2014, the effects on the denominator and numerator of potential dilutive shares generateantidilution; therefore, there is no change between the reported basic and diluted earning (loss) per share.
23) COMMITMENTS
23A) GUARANTEES
As of December 31, 2016 and 2015, CEMEX, S.A.B. de C.V., had guaranteed loans of certain subsidiaries forapproximately US$2,887 (Ps59,819) and US$3,726 (Ps64,195), respectively.
23B) PLEDGED ASSETS
CEMEX transferred to a guarantee trust the shares of its main subsidiaries, including CEMEX México, S.A. deC.V., New Sunward Holding B.V. and CEMEX España, S.A., and entered into pledge agreements in order tosecure payment obligations under the Credit Agreement (formerly under the Facilities Agreement) and other debtinstruments entered into prior to the date of these agreements (note 16A).
As of December 31, 2016 and 2015, there are no liabilities secured by property, machinery and equipment.
23C) OTHER COMMITMENTS
As of December 31, 2016 and 2015, CEMEX was party of other commitments for several purposes, including thepurchase of fuel and energy, which estimated future cash flows over their maturity are presented in note 23E. Adescription of the most significant contracts is as follows:
• In connection with the beginning of full commercial operations of the Ventika S.A.P.I. de C.V. and theVentika II S.A.P.I. de C.V. wind farms (jointly “Ventikas”) located in the Mexican state of Nuevo Leonwith a combined generation capacity of 252 Megawatts (“MW”), CEMEX agreed to acquire a portion of theenergy generated by Ventikas for its Mexican Plants for a period of 20 years, which began in April 2016.During 2016, Ventikas supplied approximately 6.4% (unaudited) of CEMEX’s overall electricity needs inMexico. This agreement is for CEMEX’s own use and there is no intention of energy trading. CEMEXparticipated in Ventikas project as sponsor, main developer and equity investor. On December 15, 2016,CEMEX sold its interest in Ventikas to Infraestructura Energética Nova, S.A.B. de C.V. (“IEnova”), currentowner of 100% of Ventikas, for approximately US$21 (Ps435). In addition, during 2016 and in accordancewith the established contracts CEMEX also received a total of US$35 (Ps725) for development fee andother concepts. CEMEX will remain as the manager of the Ventikas facilities in exchange of a managementfee.
• On July 30, 2012, CEMEX signed a 10-year strategic agreement with International Business MachinesCorporation (“IBM”) pursuant to which IBM provides, among others, data processing services (back office)in finance, accounting and human resources; as well as Information Technology (“IT”) infrastructureservices, support and maintenance of IT applications in the countries in which CEMEX operates.
• Beginning in February 2010, CEMEX agreed with EURUS the purchase of electric energy for a period of noless than 20 years. EURUS is a wind farm with an installed capacity of 250 MW operated by ACCIONA in
F-90

CEMEX, S.A.B. DE C.V. AND SUBSIDIARIESNotes to the Consolidated Financial Statements
As of December 31, 2016, 2015 and 2014(Millions of Mexican pesos)
Other commitments — continued
the Mexican state of Oaxaca. For the years 2016, 2015 and 2014, EURUS supplied (unaudited)approximately 22.9%, 28.0% and 28.2%, respectively, of CEMEX’s overall electricity needs in Mexicoduring such year.
• CEMEX maintains a commitment initiated in April 2004 to purchase the energy generated byTermoeléctrica del Golfo (“TEG”) until 2027. CEMEX committed to supply TEG and another third-partyelectrical energy generating plant adjacent to TEG all fuel necessary for their operations, a commitment thathas been hedged through four 20-year agreements entered with Petróleos Mexicanos (“PEMEX”), whichterminate in 2024. For the years ended December 31, 2016, 2015 and 2014, TEG supplied (unaudited)approximately 66.3%, 69.3% and 69.6% respectively, of CEMEX’s overall electricity needs during suchyear for its cement plants in Mexico.
In regards with the above, in March 1998 and July 1999, CEMEX signed contracts with PEMEX providingthat beginning in April 2004 PEMEX’s refineries in Cadereyta and Madero City would supply CEMEXwith a combined volume of approximately 1.75 million tons of petroleum coke per year. As per thepetroleum coke contracts with PEMEX, 1.2 million tons of the contracted volume will be allocated to TEGand the other energy producer and the remaining volume will be allocated to CEMEX’s operations inMexico. By entering into the petroleum coke contracts with PEMEX, CEMEX expects to have a consistentsource of petroleum coke throughout the 20-year term.
• In 2007, CEMEX Ostzement GmbH (“COZ”), CEMEX’s subsidiary in Germany, entered into a long-termenergy supply contract with Vattenfall Europe New Energy Ecopower (“VENEE”), pursuant to whichVENEE committed to supply energy to CEMEX’s Rüdersdorf plant for a period of 15 years starting onJanuary 1, 2008. Based on the contract, each year COZ has the option to fix in advance the volume ofenergy in terms of MW that it will acquire from VENEE, with the option to adjust the purchase amount onetime on a monthly and quarterly basis. According to the contract, COZ acquired (unaudited) approximately27 MW in 2016, 2015 and 2014, and COZ expects to acquire between 26 and 28 MW per year starting in2015 and thereafter. The contract, which establishes a price mechanism for the energy acquired, based onthe price of energy future contracts quoted on the European Energy Exchange, did not require initialinvestments and was expected to be performed at a future date. Considering that the contract is forCEMEX’s own use and CEMEX sells any energy surplus as soon as actual energy requirements are known,regardless of changes in prices and thereby avoiding any intention of trading in energy, such contract is notrecognized at its fair value.
23D) COMMITMENTS FROM EMPLOYEE BENEFITS
In some countries, CEMEX has self-insured health care benefits plans for its active employees, which aremanaged on cost plus fee arrangements with major insurance companies or provided through health maintenanceorganizations. As of December 31, 2016, in certain plans, CEMEX has established stop-loss limits for continuedmedical assistance derived from a specific cause (e.g., an automobile accident, illness, etc.) ranging from23 thousand dollars to 400 thousand dollars. In other plans, CEMEX has established stop-loss limits peremployee regardless of the number of events ranging from 100 thousand dollars to 2.5 million dollars. Thecontingency for CEMEX if all employees qualifying for health care benefits required medical servicessimultaneously is significantly. However, this scenario is remote. The amount expensed through self-insuredhealth care benefits was approximately US$69 (Ps1,430) in 2016, US$69 (Ps1,189) in 2015 and US$64 (Ps943)in 2014.
F-91

CEMEX, S.A.B. DE C.V. AND SUBSIDIARIESNotes to the Consolidated Financial Statements
As of December 31, 2016, 2015 and 2014(Millions of Mexican pesos)
23E) CONTRACTUAL OBLIGATIONS
As of December 31, 2016 and 2015, CEMEX had the following contractual obligations:
(U.S. dollars millions) 2016 2015
Less than1 year 1-3 years 3-5 years
Morethan
5 years Total Total
ObligationsLong-term debt . . . . . . . . . . . . . . . . . . . . . . . . . . . . US$ 37 2,675 2,221 6,446 11,379 13,303Capital lease obligations1 . . . . . . . . . . . . . . . . . . . . 18 36 33 20 107 135Convertible notes2 . . . . . . . . . . . . . . . . . . . . . . . . . . 13 689 503 — 1,205 1,543
Total debt and other financial obligations3 . . . 68 3,400 2,757 6,466 12,691 14,981Operating leases4 . . . . . . . . . . . . . . . . . . . . . . . . . . . 117 193 127 78 515 434Interest payments on debt5 . . . . . . . . . . . . . . . . . . . 678 1,240 969 1,109 3,996 4,659Pension plans and other benefits6 . . . . . . . . . . . . . . 142 277 269 726 1,414 1,568Purchases of raw materials, fuel and energy7 . . . . . 584 816 739 2,301 4,440 3,963
Total contractual obligations . . . . . . . . . . . . . . US$ 1,589 5,926 4,861 10,680 23,056 25,605
Ps 32,934 122,787 100,720 221,290 477,720 441,174
1 Represent nominal cash flows. As of December 31, 2016, the NPV of future payments under such leaseswas US$76 (Ps1,576), of which, US$24 (Ps497) refers to payments from 1 to 3 years, US$23 (Ps477) referto payments from 3 to 5 years, and US$16 (Ps332) refer payments of more than 5 years.
2 Refers to the components of liability of the convertible notes described in note 16B and assumes repaymentat maturity and no conversion of the notes.
3 The schedule of debt payments, which includes current maturities, does not consider the effect of anyrefinancing of debt that may occur during the following years. In the past, CEMEX has replaced its long-term obligations for others of a similar nature.
4 The amounts represent nominal cash flows. CEMEX has operating leases, primarily for operating facilities,cement storage and distribution facilities and certain transportation and other equipment, under whichannual rental payments are required plus the payment of certain operating expenses. Rental expense wasUS$121 (Ps2,507) in 2016, US$114 (Ps1,967) in 2015 and US$112 (Ps1,657) in 2014.
5 Estimated cash flows on floating rate denominated debt were determined using the floating interest rates ineffect as of December 31, 2016 and 2015.
6 Represents estimated annual payments under these benefits for the next 10 years (note 18), including theestimate of new retirees during such future years.
7 Future payments for the purchase of raw materials are presented on the basis of contractual nominal cashflows. Future nominal payments for energy were estimated for all contractual commitments on the basis ofan aggregate average expected consumption of 3,124.1 GWh per year using the future prices of energyestablished in the contracts for each period. Future payments also include CEMEX’s commitments for thepurchase of fuel.
24) CONTINGENCIES
24A) PROVISIONS RESULTING FROM LEGAL PROCEEDINGS
CEMEX is involved in various significant legal proceedings, the resolutions of which are deemed probable andimply cash outflows or the delivery of other resources owned by CEMEX. As a result, certain provisions orlosses have been recognized in the financial statements, representing the best estimate of the amounts payable or
F-92

CEMEX, S.A.B. DE C.V. AND SUBSIDIARIESNotes to the Consolidated Financial Statements
As of December 31, 2016, 2015 and 2014(Millions of Mexican pesos)
Provisions resulting from legal proceedings — continued
impaired assets. Therefore, CEMEX believes that it will not incur significant expenditure or losses in excess ofthe amounts recorded. As of December 31, 2016, the details of the most significant events giving effect toprovisions or losses are as follows:
• Regarding the Maceo project in Colombia (note 14), on August 28, 2012, CEMEX Colombia signed amemorandum of understanding (“MOU”) with the representative of CI Calizas y Minerales S.A. (“CICalizas”), which objective was the acquisition and transfer of assets comprising land, the mining concessionand the environmental permit, the common shares of the entity Zona Franca Especial Cementera delMagdalena Medio S.A.S. (“Zomam”) (holder of the free trade zone concession), as well as the beneficialrights of a trust entered between Acción Sociedad Fiduciaria S.A., CI Calizas and Zomam, to execute theconstruction of the new cement plant. During 2016, CEMEX received reports through its anonymousreporting line, related to possible deficiencies in the purchase process of land where the cement plant islocated. At this respect, CEMEX initiated an investigation and internal audit in accordance with itscorporate governance policies and its code of ethics, confirming the irregularities in such process. As aresult of this process, on September 23, 2016, CLH and CEMEX Colombia decided to terminateemployment relationship with the Vice President of Planning of CLH and CEMEX Colombia, and with theLegal Counsel of CLH and CEMEX Colombia. In addition, effective the same date September 23, 2016, theChief Executive Officer of CLH and President of CEMEX Colombia resigned to facilitate investigations.CEMEX and CLH have made these findings known to the appropriate authorities in Colombia. In order tostrengthen the levels of leadership, management and best practices of corporate governance, on October 4,2016, the Board of Directors of CLH decided to separate the roles of Chairman of the Board of Directors,Chief Executive Officer of CLH and President of CEMEX Colombia. Consequently, new appointments forChairman of the Board of Directors of CLH, new Chief Executive Officer of CLH, new President ofCEMEX Colombia and new Vice President of Planning of CLH, were effective immediately.
In addition, after signing the original MOU, a former shareholder of CI Calizas, who presumptivelytransferred its shares of CI Calizas two years before the signing of the MOU, was linked to a process ofexpiration of property initiated by Colombia’s Attorney General (the “Attorney General”). Amongst othermeasures, the Attorney General ordered the seizure and consequent suspension of the right to dispose theassets subject to the MOU. The shares of Zomam were fully acquired by CEMEX Colombia before thebeginning of such process; nonetheless, the Attorney General decided to also include such shares in theaction of expiration of property. To protect its interests and defend its rights as a third party acting in goodfaith and free of guilt, CEMEX Colombia joined the expiration of property process, attending promptly eachprocedural stages, under the policy of full cooperation with the Attorney General. Additionally, CEMEXColombia requested the inadmissibility of the action of expiration of property against the assets subject tothe MOU.
In July 2013, CEMEX Colombia signed with the provisional depository of the assets, designed by the DrugsNational Department (Dirección Nacional de Estupefacientes, then depository of the affected assets), whichfunctions after its liquidation were assumed by the Administrator of Special Assets (Sociedad de ActivosEspeciales S.A.S. or the “SAE”), a lease contract for a period of five years, which can be early terminated bythe SAE, by means of which CEMEX Colombia was duly authorized to continue with the necessary worksfor the construction and operation of the plant (the “Lease Contract”). Likewise, the provisional depositorygranted a mandate to CEMEX Colombia for the same purpose.
On May 2, 2016, the Attorney General resolved to deny CEMEX’s Colombia inadmissibility request to theaction for expiration of property mentioned above, considering that it should broaden the obtention of
F-93

CEMEX, S.A.B. DE C.V. AND SUBSIDIARIESNotes to the Consolidated Financial Statements
As of December 31, 2016, 2015 and 2014(Millions of Mexican pesos)
Provisions resulting from legal proceedings — continued
probatory elements and its analisys in order to take a resolution according to law. Given on the nature of theprocess, despite the Colombian law has defined terms for the several procedural stages, as of December 31,2016, it is estimated that the issuance of a final resolution in respect to the applicability or not for the actionof expiration of property over the aforementioned assets may take between five and ten years. As ofDecember 31, 2016, the expiration of property process is in its investigation stage, awaiting the appointmentof the guardians ad litem designated by the Attorney General. The appointment of the guardian ad litemwould open the probatory stage, in which evidence will be tested.
The maturity of the Lease Contract is July 15, 2018, therefore, subject to the resolution of the ongoing legalprocess, CEMEX Colombia plans to negotiate and extension to such Lease Contract.
Moreover, in connection with Maceo’s project, CEMEX Colombia also engaged the same representative ofCI Calizas to also represent CEMEX Colombia in the acquisition of land adjacent to the plant, signing a newmemorandum of understanding with this representative (the “MOU with the Representative”). CEMEXColombia made cash advances to this representative for amounts in Colombian pesos equivalent toapproximately US$13.4 and has paid interest for approximately US$1.2, in both cases considering theColombian peso to U.S. dollar exchange rate as of December 31, 2016. These payments were deposited inthe representative’s personal bank account as advance payments for CI Calizas’ assets and for the purchasein the name and on behalf of CEMEX Colombia under the MOU with the Representative of Maceo’s projectadjacent land, interest was paid by CEMEX Colombia according to the representative’s instructions.Pursuant to the expiration of property process of the assets subject to the MOU and the failures to legallyformalize the purchases under the MOU with the Representative, as of the reporting date, CEMEXColombia is not the legitimate owner of the aforementioned assets. Moreover, considering that paymentsmade by CEMEX Colombia for the purchase of property, shares and transfer of the mining contract and theenvironmental permit, as well as the land adjacent to the manufacturing plant, were made in violation ofCEMEX’s and CLH’s internal policies, both CLH and CEMEX Colombia reported these facts to theAttorney General, providing the findings obtained during the investigations and internal audits, in order forthe Attorney General to take any actions it may deemed relevant. On December 20, 2016, CEMEXColombia filed an extension of the original complaint of September 23, 2016, with information and findingsobtained to date.
Pursuant to a requirement of CEMEX, S.A.B. de C.V.’s Audit Committee and of CLH’s Audit Commission,an audit firm, experts in forensic audits, was engaged in order to perform an independent investigation ofMaceo’s project. Aditionally, CEMEX Colombia and CLH engaged an external lawyers firm with the aimof assisting CLH and CEMEX Colombia on the necessary collaboration with the Attorney General.Moreover, considering CLH’s internal controls and usual best practices, management also engaged a teamof external lawyers for its own legal advice. In relation to the irregularities detected in the purchase of CICalizas’ assets and the aforementioned additional land, which led to the execution of the internal audit, thetermination of employment of certain executives and the report of these findings, there is an ongoinginvestigation by the Attorney General. As of the financial statements date, the investigation by the AttorneyGeneral is in its initial stage (inquiry), in which CEMEX is neither able to predict the actions that theAttorney General could implement, nor the possibility and degree in which any of these possible actions,including the termination of employment of the aforementioned executives, could have a material adverseeffect on CEMEX’s results of operation, liquidity or financial position. At this respect, under thepresumption that CEMEX Colombia conducted itself in good faith, and considering that the rest of itsinvestments made in the development of Maceo’s project were made with the consent of the SAE and CI
F-94

CEMEX, S.A.B. DE C.V. AND SUBSIDIARIESNotes to the Consolidated Financial Statements
As of December 31, 2016, 2015 and 2014(Millions of Mexican pesos)
Provisions resulting from legal proceedings — continued
Calizas by virtue of the lease contract and the mandate, such investments are protected by Colombian law,under which, if a person builds on the property of a third party, with full knowledge of such third party, thisthird party may: a) take ownership of the plant, provided a corresponding indemnity to CEMEX Colombia,or otherwise, b) oblige CEMEX Colombia to purchase the land.
Considering this, CEMEX estimates that, during the term of the Lease Contract, it will be able to use andenjoy the land in order to operate the plant. Moreover, CEMEX considers that will be able to retainownership of the plant and other refurbishments made. Nonetheless, had this not be the case, CEMEXColombia would take all necessary actions to safeguard the project in Maceo. At this respect, there is thepossibility that CEMEX considers remote, in which, in the event that the expiration of property over theassets subject to the MOU is ordered in favor of the State, the SAE may decide not to sell the assets toCEMEX Colombia, or, the SAE may elect to maintain ownership of the assets and not extend the LeaseContract. In both cases, under Colombian law, CEMEX Colombia would be entitled to an indemnity for theamount of its incurred investments. However, an adverse resolution at this respect could have a materialadverse effect on the Company’s results of operations, liquidity or financial condition.
In connection with the investigation and internal audit related to Maceo’s project, and considering the findingsand the legal opinions available, during the fourth quarter of 2016, CEMEX determined that: a) there is lowprobability of recover resources delivered under different memorandums of understanding for the purchase ofthe assets related to the project for an amount in Colombian pesos equivalent to approximately US$14.3(Ps295), which were recognized as part of investments in progress, have been considered as contingent assetsand therefore were reduced to zero recognizing an impairment loss for such amount against other expenses, net(nonetheless, on December 19, 2016, CEMEX filed a claim in the civil courts aiming that all property rightsrelated to the additional land, some of which were assigned to the representative, would be effectivelytransferred to CEMEX); b) certain purchases of equipment installed in the plant were considered exempt forVAT purposes under the benefits of the free trade zone, however, as those assets were actually installed outsideof the free trade zone’s area, they lack of such benefits, therefore, CEMEX increased investments in progressagainst VAT accounts payable for approximately US$9.2 (Ps191); and c) the cancellation of the balancepayable to CI Calizas under the MOU in connection with the acquisition of the assets for approximatelyUS$9.1 (Ps188) against a reduction in investments in progress, all these amounts considering the Colombianpeso to U.S. dollar exchange rate as of December 31, 2016.
On October 27, 2016, CLH communicated its decision to postpone the start-up of Maceo plant, for the followingreasons that emerged from the audits already in progress: (i) there are pending permits required to finalize theroad access to the plant at Maceo. In the event that those permits are obtained, CLH estimates that road accesscould be concluded and be ready for use until July 2017. Using the only existing access to the plant instead of theone under construction, would risk the safety of the operation and would probably limit the capacity to transportproducts from the plant at Maceo; (ii) CEMEX Colombia has requested an expansion to the free trade zone; tocommission the new clinker line at Maceo without such expansion would risk CEMEX’s capability to consolidatethe fiscal benefits that would otherwise be available for CEMEX Colombia. It is possible that a final decisioncannot be taken, with respect to the expansion of the free trade zone, due to the process of domain extinctionalready on course. With the objective of protecting the benefits to be had with the free trade zone, CLH will notcommission the clinker line until the free trade zone is expanded to cover the totality of the cement plant atMaceo; and (iii) a subsidiary of CEMEX Colombia holds the environmental permit for project Maceo, however,the transfer of the mining concession was revoked by the Antioquia Mining Government Ministry in December2013, hence was reassigned to CI Calizas. As a result, the environmental permit and the mining concession are incustody of different entities, contrary to standar situation.
F-95

CEMEX, S.A.B. DE C.V. AND SUBSIDIARIESNotes to the Consolidated Financial Statements
As of December 31, 2016, 2015 and 2014(Millions of Mexican pesos)
Provisions resulting from legal proceedings — continued
In any case, CEMEX Colombia will continue using the assets under the Lease Contract and the mandatewith the SAE.
CLH has also determined that the mining permit of the new plant partially overlaps with and integrallymanaged district. CEMEX Colombia has also confirmed that the environmental permit needs modificationsin order to allow incrementing production up to 950 thousand tons per year. It is possible that this processcould be affected by the process of expiration of property currently on course. CEMEX Colombia willcontinue to work to address these matters as soon as possible. At this respect, on December 13, 2016,Corantioquia, the regional environmental agency, communicated its negative resolution to CEMEXColombia’s request to increase the mining concession for up to 950 thousand tons per year. This resolutionwas appealed within the following ten days.
• In December 2016, CEMEX, S.A.B. de C.V. received subpoenas from the United States Securities andExchange Commission (“SEC”) seeking information that may allow determining whether there areviolations of the U.S. Foreign Corrupt Practices Act in connection with Maceo’s project. These subpoenasdo not mean that the SEC has concluded that CEMEX has broken the law. CEMEX’s and CLH’s internalaudits and investigations question certain payments made in connection with Maceo’s project under theMOU and the MOU with the Representative described above. These payments were made tonon-governmental individuals in connection with the purchase of the factory land, adyacent land, miningrights and the benefits of the free trade zone of Maceo’s project, were made in breach of CEMEX and CLHestablished protocols. CEMEX has been cooperating with the SEC and the Attorney General and intends tocontinue cooperating fully with the SEC and the Attorney General. It is possible that the United StatesDepartment of Justice or investigatory entities in other jurisdictions may also open investigations into thismatter. To the extent they do so, CEMEX intends to cooperate fully with those inquiries, as well. As ofDecember 31, 2016, CEMEX is neither able to predict the duration, scope, or outcome of the SECinvestigation or any other investigation that may arise, nor has elements to determine the probability that theSEC’s investigation results may or may not have a material adverse impact on its consolidated results ofoperations, liquidity or financial position.
• In January 2007, the Polish Competition and Consumers Protection Office (the “Protection Office”) notifiedCEMEX Polska Sp. Z.o.o.(“CEMEX Polska”), a subsidiary of CEMEX in Poland, about the initiation of anantitrust proceeding against all cement producers in the country, including CEMEX Polska and another ofCEMEX’s indirect subsidiaries in Poland. The Protection Office alleged that there was an agreementbetween all cement producers in Poland regarding prices, market quotas and other sales conditions; and thatthe producers exchanged information, all of which limited competition in the Polish cement market.CEMEX Polska denied that it had committed the practices listed by the Protection Office, and submittedformal comments and objections gathered during the proceeding supporting its position that its activitieswere in line with Polish competition law. In December 2009, the Protection Office issued a resolutionimposing fines on a number of Polish cement producers, including CEMEX Polska for the period of 1998 to2006. The fine imposed on CEMEX Polska amounted to the equivalent of approximately US$27 (Ps559). InDecember 2009, CEMEX Polska filed an appeal before the Polish Court of Competition and ConsumerProtection in Warsaw (the “First Instance Court”). In December 2013, the First Instance Court reduced thepenalty imposed on CEMEX Polska to the equivalent of approximately US$24 (Ps497). In May 2014,CEMEX Polska filed an appeal against the First Instance Court judgment before the Appeals Court inWarsaw. After several hearings, on March 11, 2016, the Appeals Court reopened the hearing phase whichhad been closed in February 2016. The Appeals Court will ask certain questions to the Polish Constitutional
F-96

CEMEX, S.A.B. DE C.V. AND SUBSIDIARIESNotes to the Consolidated Financial Statements
As of December 31, 2016, 2015 and 2014(Millions of Mexican pesos)
Provisions resulting from legal proceedings — continued
Tribunal regarding the conformity with the Polish Constitution of the calculation of the reduced penaltyimposed on CEMEX Polska. The above-mentioned penalty is not enforceable until the Appeals Court issuesits final judgment and if the penalty is maintained in the final resolution, then it will be payable within 14calendar days of the announcement. As of December 31, 2016, CEMEX had accrued a provision equivalentto approximately US$24 (Ps497), representing the best estimate in connection with this resolution. CEMEXPolska estimates that the final judgment will be issued during the second half of 2018. As of December 31,2016, CEMEX does not expect this matter would have a material adverse impact on its results of operations,liquidity or financial condition.
• In August 2005, Cartel Damages Claims, S.A. (“CDC”), a Belgian company established in the aftermath ofthe German cement cartel investigation that took place from July 2002 to April 2003 with the purpose ofpurchasing potential damage claims from consumers and pursuing those claims against the cartelparticipants, filed a lawsuit in the District Court in Düsseldorf, Germany, against CEMEX Deutschland AG,a subsidiary of CEMEX in Germany, and other German cement companies in respect of damage claimsrelating to alleged price and quota fixing by German cement companies between 1993 and 2002. CDC hasbrought claims for an amount equivalent of approximately US$142. After several resolutions by the DistrictCourt in Düsseldorf over the years, court hearings and appeals from the defendants, in December 2013 theDistrict Court in Düsseldorf issued a resolution by means of which all claims brought to court by CDC weredismissed on the grounds that the way CDC obtained the claims was illegal given the limited risk it facedfor covering the litigation costs and that the acquisition of the claims also breached rules that make theprovision of legal advice subject to public authorization. In January 2014, CDC filed an appeal to the HigherRegional Court in Düsseldorf. On February 18, 2015, the Court of Appeals in Düsseldorf fully rejectedCDC’s appeal and maintained the first instance decision. The Court of Appeals in Düsseldorf expressly didnot admit a second appeal against this decision. The Court of Appeals decision is final and binding.Therefore, in 2015, CEMEX canceled the provision accrued until December 31, 2014 of approximatelyUS$36.
• As of December 31, 2016, CEMEX had accrued environmental remediation liabilities in the UnitedKingdom pertaining to closed and current landfill sites for the confinement of waste, representing the NPVof such obligations for an amount in British pounds sterling equivalent to approximately US$161 (Ps3,345).Expenditure was assessed and quantified over the period in which the sites have the potential to causeenvironmental harm, which was accepted by the regulator as being up to 60 years from the date of closure.The assessed expenditure included the costs of monitoring the sites and the installation, repair and renewalof environmental infrastructure.
• As of December 31, 2016, CEMEX had accrued environmental remediation liabilities in the United Statesfor an amount of approximately US$34 (Ps704), related to: a) the disposal of various materials inaccordance with past industry practice, which might currently be categorized as hazardous substances orwastes, and b) the cleanup of sites used or operated by CEMEX, including discontinued operations,regarding the disposal of hazardous substances or waste, either individually or jointly with other parties.Most of the proceedings are in the preliminary stages, and a final resolution might take several years. Basedon the information developed to date, CEMEX’s does not believe that it will be required to spend significantsums on these matters in excess of the amounts previously recorded. The ultimate cost that may be incurredto resolve these environmental issues cannot be assured until all environmental studies, investigations,remediation work and negotiations with, or litigation against, potential sources of recovery have beencompleted.
F-97

CEMEX, S.A.B. DE C.V. AND SUBSIDIARIESNotes to the Consolidated Financial Statements
As of December 31, 2016, 2015 and 2014(Millions of Mexican pesos)
24B) OTHER CONTINGENCIES FROM LEGAL PROCEEDINGS
CEMEX is involved in various legal proceedings, which have not required the recognition of accruals,considering that the probability of loss is less than probable or remote. In certain cases, a negative resolution mayrepresent the revocation of an operating license, in which case, CEMEX may experience a decrease in futurerevenues, an increase in operating costs or a loss. Nonetheless, until all stages in the procedures are exhausted ineach proceeding, CEMEX cannot assure the obtention of a final favorable resolution. As of December 31, 2016,the most significant events with a quantification of the potential loss, when it is determinable and would notimpair the outcome of the relevant proceeding, were as follows:
• In September 2014, the National Markets and Competition Commission (Comisión Nacional de losMercados y la Competencia or the “CNMC”), in the context of an investigation of the Spanish cement,ready-mix concrete and related products industry regarding alleged anticompetitive practices, inspected oneof CEMEX’s facilities in Spain. In January 2015, CEMEX España Operaciones, S.L.U., was notified of theinitiation by the CNMC of a disciplinary proceeding for alleged prohibited conducts, and in November2015, such entity was notified of alleged anticompetitive practices in 2009 for the cement market and theyears 2008, 2009, 2012, 2013 and 2014 for the ready-mix market. CEMEX España Operaciones, S.L.U.believes that it has not breached any applicable laws. On September 8, 2016, CEMEX España Operaciones,S.L.U. was notified of a decision issued by the CNMC pursuant to which CEMEX España Operaciones,S.L.U. has been required to pay a fine of approximately €6 (US$7 or Ps145). CEMEX España Operaciones,S.L.U. filed an appeal against the CNMC resolution and requested the suspension of payment of the fine. Asof December 31, 2016 the resolution is still pending.
• On February 9, 2014, the Egyptian Ministry of Finance’s Appeals Committee (the “Appeals Committee”)notified a resolution to Assiut Cement Company (“ACC”), a subsidiary of CEMEX in Egypt, by means ofwhich the Egyptian Tax Authority is requiring the payment of a development levy on clay applied to theEgyptian cement industry in amounts equivalent as of December 31, 2016 of approximately US$17 (Ps352)for the period from May 5, 2008 to November 30, 2011. On March 10, 2014, ACC filed a claim before theNorth Cairo Court requesting the nullification of the Appeals Committee decision. In parallel, ACC filed arequest before the Ministerial Committee for Resolution of Investment Disputes (the “MinisterialCommittee”) claiming non-entitlement of the Egyptian Tax Authority to the levy on clay during thereference period, and from cement produced using imported clinker. On September 28, 2015, ACC wasnotified of a resolution by the Ministerial Committee pursuant to which the Egyptian Tax Authority wouldbe instructed to cease claiming ACC the aforementioned payment of the levy on clay. It was further decidedthat the levy on clay should not be imposed on imported clinker. The Ministerial Committee’s resolutionstrongly supports ACC position in this case, given the fact that it is legally binding on the Egyptian TaxAuthority. During 2016 the Ministerial Committee’s resolution was submitted to the Egyptian TaxAuthority, which in turn issued a settlement memorandum whereby it confirmed and recognized theMinisterial Committee’s resolution. Nonetheless, on May 28, 2016, the Egyptian Tax Authority challengedbefore the North Cairo Court ACC’s right to cancel the levy on clay. ACC expects that the document to besubmitted by the attorney for the State at the upcoming North Cairo Court’s session scheduled forOctober 10, 2016 and December 27, 2016, shall request that the jointly reviewed cases to be struck off thecourt’s roll, but no session has yet been scheduled before the Cairo Administrative Judiciary Court in orderto review the two referred cases. At this stage, as of December 31, 2016, CEMEX does not expect a materialadverse impact due to this matter in its results of operations, liquidity or financial position.
• On September 5, 2013, the Colombian Superintendence of Industry and Commerce (Superintendencia deIndustria y Comercio the “SIC”) opened an investigation against five cement companies and 14 directors ofthose companies, including CEMEX Colombia, its former legal representative and the current President of
F-98

CEMEX, S.A.B. DE C.V. AND SUBSIDIARIESNotes to the Consolidated Financial Statements
As of December 31, 2016, 2015 and 2014(Millions of Mexican pesos)
Other contingencies from legal proceedings — continued
CEMEX Colombia, for allegedly breaching rules which prohibit: a) to limit free competition and/ordetermining or maintaining unfair prices; b) direct or indirect price fixing agreements; and c) any marketsharing agreements between producers or distributors. In connection with the 14 executives underinvestigation, the SIC may sanction any individual who collaborated, facilitated, authorized, executed ortolerated behavior that violates free competition rules. On October 7, 2013, CEMEX Colombia respondedthe resolution and submitted evidence in its relief. If the alleged infringements are substantiated, penaltiesmay be imposed by the SIC against each company being declared in breach of the competition rules for anequivalent of up to US$19 (Ps394) for each violation, and an equivalent of up to US$1 (Ps21) against thoseindividuals found responsible. CEMEX cannot determine when a final decision by the SIC would be issued.As of December 31, 2016, CEMEX is not able to assess the likelihood of the SIC imposing any measuresand/or penalties against CEMEX Colombia, but if any penalties are imposed, would not have a materialadverse effect on CEMEX’s results of operations, liquidity or financial condition.
• On September 13, 2012, in connection with a lawsuit submitted to a first instance court in Assiut, Egypt andnotified on May 23, 2011 to ACC, the first instance court of Assiut issued a resolution in order to nullify theShare Purchase Agreement (the “SPA”) pursuant to which CEMEX acquired a controlling interest in ACC.In addition, on April 7, 2011 and March 6, 2012, lawsuits seeking, among other things, the annulment of theSPA were filed by different plaintiffs, including 25 former employees of ACC, before Cairo’s State Council.On January 20, 2014, the Appeals Court in Assiut, Egypt, issued a judgment revoking the court’s resolutionand referring the matter to an administrative court in Assiut (the “Assiut Administrative Court”). Moreover,on February 23, 2014, in connection with the above, three plaintiffs filed a lawsuit before the AssiutAdministrative Judiciary Court requesting the cancellation of the resolutions taken by the shareholders ofMetallurgical Industries Company (“MIC”) in connection with the sale of ACC’s shares and negotiation ofthe SPA. In a related matter, on April 22, 2014, the Presidential Decree on Law No. 32 of 2014 (“Law32/2014”), which regulates legal actions to challenge agreements entered into by the Egyptian State andthird parties, become effective, but still subject to approval by the House of Representatives. On October 15,2014, the Assiut Administrative Court referred the case to the Administrative Judiciary Court of Assiut.During March 2015, the Court’s State Commissioner Authority (“SCA”) recommended the 7th and 8thCircuits of Cairo’s State Council Administrative Judiciary Court to suspend the proceedings until the HighConstitutional Court pronounces itself with regards to the challenges against the constitutionality of the Law32/2014. At a session held on September 3, 2015, the 7th Circuit of Cairo’s State Council AdministrativeJudiciary Court accepted the SCA’s report recommendation and ruled for staying the proceedings until theHigh Constitutional Court pronounces itself with regards to the challenges against the constitutionality ofLaw No. 32/2014.
• In connection with the preceding paragraph, on January 26, 2016, the 8th Circuit of Cairo’s State CouncilAdministrative Judiciary Court ruled for the dismissal of this case considering the plaintiff’s lack ofstanding. This ruling was no appealed by the plaintiff accordingly; such ruling is final and definitive. InOctober 2015, the SCA, recommended that due to the absence of geographical jurisdiction to review thecase, it should be referred to the 7th Circuit of “Economic and Investment Disputes” of Cairo’s StateCouncil Administrative Judiciary Court. On February 24, 2016, the Assiut Administrative Judiciary Courtdecided to refer the case to the First Circuit of “Economic and Investment Disputes” of Cairo’s StateCouncil Administrative Judiciary Court, which as of the reporting date, has not notified ACC of any sessionto review the case. During October and November 2015, parliamentary elections to the House ofRepresentatives took place and the elected House of Representatives started to hold its sessions onJanuary 10, 2016, as expected, and Law 32/2014 was discussed and ratified on January 20, 2016, as legally
F-99

CEMEX, S.A.B. DE C.V. AND SUBSIDIARIESNotes to the Consolidated Financial Statements
As of December 31, 2016, 2015 and 2014(Millions of Mexican pesos)
Other contingencies from legal proceedings — continued
required. As of December 31, 2016, several constitutional challenges have been filed against Law 32/2014before the High Constitutional Court. In consideration of the aforementioned, after several resolutions,hearings and appeals in these cases over the years, as of December 31, 2016, CEMEX is not able to assessthe likelihood of an adverse resolution regarding these lawsuits nor is able to assess if the ConstitutionalCourt will dismiss Law 32/2014, but, regarding the lawsuits, if adversely resolved, CEMEX does notbelieve the resolutions in the first instance would have an immediate material adverse impact on CEMEX’soperations, liquidity and financial condition. However, if CEMEX exhausts all legal recourses available, afinal adverse resolution of these lawsuits, or if the Constitutional Court dismisses Law 32/2014, this couldadversely impact the ongoing matters regarding the SPA, which could have a material adverse impact onCEMEX’s operations, liquidity and financial condition.
• In 2012, in connection with a contract (the “Quarry Contract”) entered into in 1990 by CEMEX GranulatsRhône Méditerranée (“CEMEX GRM”), one of CEMEX’s subsidiaries in France, with SCI La Quinoniere(“SCI”) pursuant to which CEMEX GRM has drilling rights in order to extract reserves and do quarryremediation at a quarry in the Rhône region of France, SCI filed a claim against CEMEX GRM for breachof the Quarry Contract, requesting the rescission of the Quarry Contract and damages plus interest for anamount in euros equivalent to approximately US$58 (Ps1,202), resulting from CEMEX GRM havingpartially filled the quarry allegedly in breach of the terms of the Quarry Contract. After many hearings, onMay 18, 2016, CEMEX GRM was notified about an adverse judgment in this matter by the correspondingcourt in Lyon, France, primarily ordering the rescission of the Quarry Contract and the aforementionedpayment for damages plus interest. On June 6, 2016, CEMEX GRM filed an appeal with the appeals court inLyon, France and on September 5, 2016, CEMEX GRM filed the first submission of the full appeal togetherwith its arguments and evidence. Proceedings on any additional hearings regarding this appeal or any otheractions CEMEX GRM may initiate in this matter could take approximately 18 months to be finalized. As ofDecember 31, 2016, CEMEX considers that an adverse resolution on this matter would have a materialadverse impact on CEMEX’s results of operations, liquidity and financial condition.
• On June 21, 2012, one of CEMEX’s subsidiaries in Israel was notified about a class action suit against it andother three companies filed by a homeowner who built his house with concrete supplied by CEMEX inOctober of 2010. The class action argues that the concrete supplied to him did not meet with the Israeliready-mix strength standard requirements and that as a result CEMEX acted unlawfully toward all of itscustomers who received concrete that did not comply with such standard requirements. As per theapplication, the plaintiff claims that the supply of the alleged non-conforming concrete has caused financialand non-financial damages to those customers, including the plaintiff. CEMEX presumes that the classaction would represent the claim of all the clients who purchased the alleged non-conforming concrete fromits subsidiary in Israel during the past 7 years, the limitation period according to applicable laws in Israel.The damages that could be sought an equivalent approximately US$71 (Ps1,471). CEMEX’s subsidiarysubmitted a formal response to the corresponding court. The applicant requested the court to join all claimsbrought by him. In a hearing held on December 20, 2015, the preliminary proceeding was completed and thecourt set dates for hearing evidence on May 8, 10 and 16, 2016. Moreover, the court decided to join togetherall claims against all four companies, including CEMEX’s subsidiary in Israel, in order to simplify andshorten court proceedings, however, the court has not formally decided to join together all claims. As ofDecember 31, 2016, CEMEX’s subsidiary in Israel is not able to assess the likelihood of the class actionapplication being approved or, if approved, of an adverse result, such as an award for damages in the fullamount that could be sought, but if adversely resolved CEMEX does not believe that the final resolutionswould have a material adverse impact on its results of operations, liquidity or financial condition.
F-100

CEMEX, S.A.B. DE C.V. AND SUBSIDIARIESNotes to the Consolidated Financial Statements
As of December 31, 2016, 2015 and 2014(Millions of Mexican pesos)
Other contingencies from legal proceedings — continued
• On June 5, 2010, the District of Bogota’s Environmental Secretary (the “Environmental Secretary”), orderedthe suspension of CEMEX Colombia’s mining activities at El Tunjuelo quarry, located in Bogota, as well asthose of other aggregates producers in the same area. The Environmental Secretary alleged that during thepast 60 years, CEMEX Colombia and the other companies have illegally changed the course of the TunjueloRiver, have used the percolating waters without permission and have improperly used the edge of the riverfor mining activities. In connection with the injunction, on June 5, 2010, CEMEX Colombia received anotification from the Environmental Secretary informing the initiation of proceedings to impose finesagainst CEMEX Colombia based on the above mentioned alleged environmental violations. CEMEXColombia responded to the injunction by requesting that it be revoked based on the fact that the miningactivities at El Tunjuelo quarry are supported by the authorizations required by the applicable environmentallaws and that all the environmental impact statements submitted by CEMEX Colombia have been reviewedand permanently authorized by the Ministry of Environment and Sustainable Development. On June 11,2010, the local authorities in Bogota, in compliance with the Environmental Secretary’s decision, sealed offthe mine to machinery and prohibited the removal of CEMEX’s aggregates inventory. Although there is notan official quantification of the possible fine, the Environmental Secretary has publicly declared that the finecould be up to the equivalent of approximately US$95 (Ps1,968). The temporary injunction does notcurrently compromise the production and supply of ready-mix concrete to CEMEX’s clients in Colombia.At this stage, CEMEX is not able to assess the likelihood of an adverse result or potential damages whichcould be borne by CEMEX Colombia. An adverse resolution on this case could have a material adverseimpact on CEMEX’s results of operations, liquidity or financial condition.
• In January 2009, in connection with federal quarry permits granted to CEMEX Construction MaterialsFlorida, LLC (“CEMEX Florida”), one of CEMEX’s subsidiaries in the United States, a judge from the U.S.District Court for the Southern District of Florida ordered the withdrawal of the federal quarry permits ofCEMEX Florida’s SCL, FEC and Kendall Krome quarries, in the Lake Belt area in South Florida. The judgeruled that there were deficiencies in the procedures and analysis undertaken by the Army Corps ofEngineers (the “Engineers”) in connection with the issuance of the permits. In January 2010, the Engineersconcluded a review and issued a decision supporting the issuance of new federal quarry permits for the SCLand FEC quarries. In February 2010, new quarry permits were granted to the SCL and FEC quarries. Anumber of potential environmental impacts must be addressed at the wetlands located at the Kendall Kromesite before a new federal quarry permit may be issued for mining at that quarry. If CEMEX Florida is unableto maintain the new Lake Belt permits, CEMEX Florida would need to source aggregates, to the extentavailable, from other locations in Florida or import aggregates. The cessation or significant restriction ofquarrying operations in the Lake Belt area could have a significant adverse impact on CEMEX’s results ofoperations, liquidity or financial condition.
• In connection with an action brought against CEMEX Colombia in 2005, on July 28, 2015, the SuperiorCourt of Bogota upheld its resolution in respect that CEMEX Colombia was not responsible for thepremature distress of the concrete slabs of the Autopista Norte line of Transmilenio system and as suchfinalized such action. In addition, six actions related to the premature distress were brought against CEMEXColombia, of which, the Cundinamarca Administrative Court nullified five of these actions and currently,only one remains outstanding. In addition, the Urban Development Institute (“UDI”) filed another actionalleging that CEMEX Colombia made deceiving advertisements on the characteristics of the flowable fillused in the construction of the line. CEMEX Colombia participated in this project solely and exclusively assupplier of the ready-mix concrete and flowable fill, which were delivered and received to the satisfaction ofthe contractor, fulfilling all the required technical specifications, and did not participate or had any
F-101

CEMEX, S.A.B. DE C.V. AND SUBSIDIARIESNotes to the Consolidated Financial Statements
As of December 31, 2016, 2015 and 2014(Millions of Mexican pesos)
Other contingencies from legal proceedings — continued
responsibility on the design or technical specifications of construction. On May 31, 2016, the Civil Court ofBogota settled the action filed by the UDI ruling that the flowable fill was not what caused the damage tothe slabs but by design changes when executing the road without consulting the original designer and to thelack of drains. The UDI filed an appeal against the court’s ruling. On December 7, 2016, the Superior Courtof Bogota upheld the Civil Court of Bogota’s decision. As of December 31, 2016, CEMEX is not able toaccurately assess the likelihood of an adverse result in these proceedings, but if adversely resolved, theycould have a material adverse impact on CEMEX’s results of operations, liquidity or financial condition.
In connection with the legal proceedings presented in notes 24A and 24B, the exchange rates as of December 31,2016 used by CEMEX to convert the amounts in local currency to their equivalents in dollars were the officialclosing exchange rates of approximately 4.21 Polish zloty per dollar, 0.95 euro per dollar, 0.81 British poundsterling per dollar, 3,000.72 Colombian pesos per dollar and 3.85 Israelite shekel per dollar.
In addition to the legal proceedings described above in notes 24A and 24B, as of December 31, 2016, CEMEX isinvolved in various legal proceedings of minor impact that have arisen in the ordinary course of business. Theseproceedings involve: 1) product warranty claims; 2) claims for environmental damages; 3) indemnificationclaims relating to acquisitions or divestitures; 4) claims to revoke permits and/or concessions; and 5) otherdiverse civil actions. CEMEX considers that in those instances in which obligations have been incurred, CEMEXhas accrued adequate provisions to cover the related risks. CEMEX believes these matters will be resolvedwithout any significant effect on its business, financial position or results of operations. In addition, in relation tocertain ongoing legal proceedings, CEMEX is sometimes able to make and disclose reasonable estimates of theexpected loss or range of possible loss, as well as disclose any provision accrued for such loss, but for a limitednumber of ongoing legal proceedings, CEMEX may not be able to make a reasonable estimate of the expectedloss or range of possible loss or may be able to do so but believes that disclosure of such information on acase-by-case basis would seriously prejudice CEMEX’s position in the ongoing legal proceedings or in anyrelated settlement discussions. Accordingly, in these cases, CEMEX has disclosed qualitative information withrespect to the nature and characteristics of the contingency, but has not disclosed the estimate of the range ofpotential loss.
25) RELATED PARTIES
All significant balances and transactions between the entities that constitute the CEMEX group have beeneliminated in the preparation of the consolidated financial statements. These balances with related partiesresulted primarily from: (i) the sale and purchase of goods between group entities; (ii) the sale and/or acquisitionof subsidiaries’ shares within the CEMEX group; (iii) the invoicing of administrative services, rentals,trademarks and commercial name rights, royalties and other services rendered between group entities; and(iv) loans between related parties. Transactions between group entities are conducted on arm’s length termsbased on market prices and conditions. When market prices and/or market conditions are not readily available,CEMEX conducts transfer pricing studies in the countries in which it operates to assure compliance withregulations applicable to transactions between related parties. The definition of related parties includes entities orindividuals outside the CEMEX group, which, pursuant to their relationship with CEMEX, may take advantageof being in a privileged situation. Likewise, this applies to cases in which CEMEX may take advantage of suchrelationships and obtain benefits in its financial position or operating results. CEMEX’s transactions with relatedparties are executed under market conditions.
F-102

CEMEX, S.A.B. DE C.V. AND SUBSIDIARIESNotes to the Consolidated Financial Statements
As of December 31, 2016, 2015 and 2014(Millions of Mexican pesos)
Related parties — continued
As of December 31, 2016, except for the top management executives, CEMEX has not identified othertransactions between related parties:
• For the years ended December 31, 2016, 2015 and 2014, the aggregate amount of compensation of CEMEXboard of directors, including alternate directors, and top management executives, was approximately US$43(Ps802), US$36 (Ps579) and US$68 (Ps909), respectively. Of these amounts, approximately US$32 (Ps595)in 2016, US$25 (Ps402) in 2015 and US$35 (Ps464) in 2014, was paid as base compensation plusperformance bonuses, including pension and post-employment benefits. In addition, approximately US$11(Ps207) in 2016, US$11 (Ps177) in 2015, and US$33 (Ps444) in 2014 of the aggregate amount in each year,corresponded to allocations of CPOs under CEMEX’s executive share-based compensation programs. In2014, the amount of CPOs allocated included approximately US$4 (Ps52), of compensation earned underthe program that is linked to the fulfillment of certain performance conditions and that was payable throughMarch 2015 to then still active members of CEMEX, S.A.B. de C.V.‘s board of directors and topmanagement executives (note 21).
26) SUBSEQUENT EVENTS
• In connection with the Offer to purchase TCL’s shares (note 13A), on January 9, 2017, Sierra presented achange and variation notice making an amended offer (the “Amended Offer”) to the Offer to acquire up to132,616,942 ordinary shares in TCL. Pursuant to the Amended Offer, Sierra offered TTPs5.07 in cash perTCL share (the “Revised Offer Price”) and, except for shareholders of TCL in Barbados, shareholders ofTCL will have the option to be paid for their TCL shares in TTPs or in dollars. Full acceptance of the Offer,as amended by the Amended Offer, in TTPs would result in a cash payment by Sierra of approximatelyTTPs672 million (US$101 or Ps2,093). The Revised Offer Price represents a premium of 50% over theDecember 1, 2016 closing price of TCL’s shares in the Trinidad and Tobago Stock Exchange. Among otherconditions, the Amended Offer was still conditional on Sierra acquiring at least an amount of TCL sharesthat would allow CEMEX to consolidate TCL for financial reporting purposes. Unless extended, theAmended Offer period is expected to close on January 24, 2017. Sierra does not currently expect to extendthe Offer period after January 24, 2017. All other terms and conditions of the Offer not modified by theAmended Offer remained unchanged.
Moreover, on January 24, 2017, Sierra communicated that having received the Foreign Investment Licensefrom the Trinidad and Tobago Ministry of Finance, all terms and conditions have been complied with orwaived and the Offer has accordingly been declared unconditional. In addition, the Offer closed in Jamaicaon February 7, 2017. Sierra acquired all TCL shares deposited pursuant to the Offer up to the maximumnumber of the Offered Shares. TCL shares deposited in response to the Offer together with Sierra’s existingshareholding in TCL represented approximately 69.83% of the outstanding TCL shares. The totalconsideration paid by Sierra for the TCL shares was approximately US$86. After conclusion of the Offer,CEMEX consolidates TCL for financial reporting purposes beginning February 1, 2017.
• On January 25, 2017, in connection with CEMEX’s investment in GCC shares (notes 12A and 13A), the ParentCompany and GCC announced that they will commence offerings that are expected to include an aggregate of upto 76,483,332 shares of the common stock (the “Shares”) of GCC currently owned by CEMEX at a price range ofbetween 95.00 to 115.00 pesos per share, which includes 9,976,087 shares available to the underwriters of theofferings pursuant to a 30-day option to purchase such shares expected to be granted to them by CEMEX. Suchofferings are expected to be comprised of Shares to be offered: (a) in a public offering to investors in Mexicoconducted through the MSE; and (b) in a concurrent private placement to eligible investors outside of Mexico.The size and timing of the offerings will depend on market and other conditions.
F-103

CEMEX, S.A.B. DE C.V. AND SUBSIDIARIESNotes to the Consolidated Financial Statements
As of December 31, 2016, 2015 and 2014(Millions of Mexican pesos)
Subsequent events — continued
• In connection with the sale of the Concrete Pipe Business in the United States to Quikrete described in note4A, on January 31, 2017, after the satisfaction of certain conditions precedent including approval fromregulators. CEMEX announced the closing of the transaction according to the agreed upon price conditions.
• On February 10, 2017, CEMEX and GCC announced that they priced their previously announced secondaryofferings of 51,750,000 shares of the Shares, owned by CEMEX, at a price of Mexican pesos 95 per share.Such offerings were comprised of Shares offered (a) in a public offering to investors in Mexico authorizedby the Mexican National Banking and Securities Commission conducted through the MSE; and (b), in aconcurrent private placement, to eligible investors outside of Mexico. CEMEX sold 13.53% of its 23%direct ownership interest in GCC. After the offerings, CEMEX owns a 9.47% direct interest in GCC andalso have a minority interest in CAMCEM, an entity which owns a majority interest in GCC.
• On February 10, 2017, CEMEX finalize the divestment of its Fairborn, Ohio cement plant and cementterminal in Columbus, Ohio to a subsidiary of Eagle Materials, Inc. for approximately US$400.
• On February 13, 2017, CEMEX announced that commenced a tender offer (the “Tender Offer”) to purchaseup to US$475 (the “Aggregate Maximum Tender Amount”) of the outstanding 7.25% Notes due 2021,6.50% Notes due 2019 and 9.375% Notes due 2022 (note 16A).
• On February 28, 2017, CEMEX accepted for purchase US$475 aggregate principal amount of the tenderedNotes, including all US$385 aggregate principal amount of the 7.25% Notes due 2021 and US$90 aggregateprincipal amount of the 6.50% Notes due 2019 (note 16A). CEMEX paid a premium of approximatelyUS$37 in connection with such Tender offer.
• On March 28, 2017, in connection with the Maceo project described in note 24A, Central de Mezclas, S.A.(“Central de Mezclas”), an indirect subsidiary of CEMEX, was notified of Corantioquia’s decisionregarding the appeal for reversal against the decision of the authority that denied the request to modify theenvironmental license of the Maceo project to 950,000 tons per year, due to the overlap of the project withan Integrally Managed District. Corantioquia’s decision was to confirm the previous decision, andconsequently to deny the appeal for reversal despite the appeal filed by Central de Mezclas. As a result ofthis decision, CEMEX is currently working on the zoning and compatibilization of the Maceo project withthe integrally managed district, as well as analyzing alternatives for partial subtraction of the IntegrallyManaged District in order to avoid future discussions regarding of the feasibility of achieving the expansionof the proposed activity in the project, above 950,000 tons of production. Once these alternatives areimplemented, CEMEX will reconsider submitting a new request for modification of the environmentallicense to expand its production to the initially planned 950,000 tons. In the meantime, CEMEX will limitits activities to those that are currently authorized by the current environmental license and mining title.During the first quarter of 2017, investigations and legal proceedings are ongoing and as of March 31, 2017,no further adjustments have been made (note 24A).
• On March 30, 2017, stockholders at the annual ordinary shareholders’ meeting approved, among otherresolutions, a capitalization of retained earnings consisting in the issuance of 1,124,863,326 Series A sharesand 562,431,663 Series B shares, equivalent to approximately 562.4 million CPOs, to be allocated toshareholders on a pro rata basis pursuant to such approval. These shares will become part of CEMEX,S.A.B. de C.V.’s outstanding capital stock on May 8, 2017.
• On April 5, 2017, in connection with the previously announced sale of our operations in Croatia, includingassets in Bosnia and Herzegovina, Montenegro and Serbia, agreed with Duna-Dráva Cement Kft. in August2015 (note 4A), CEMEX announced that the European Commission (the “EC”) issued a decision that
F-104

CEMEX, S.A.B. DE C.V. AND SUBSIDIARIESNotes to the Consolidated Financial Statements
As of December 31, 2016, 2015 and 2014(Millions of Mexican pesos)
Subsequent events — continued
ultimately does not allow Duna-Dráva Cement Kft to purchase the aforementioned operations. As one of theclosing conditions under the corresponding sale purchase agreement was to receive the necessary clearancefrom the EC and said clearance was received, the transaction will not close and CEMEX will maintain itsoperations in Croatia, including assets in Bosnia and Herzegovina, Montenegro and Serbia, and continue tooperate them, which mainly consist of three cement plants with aggregate annual production capacity ofapproximately 2.4 million tons of cement, two aggregates quarries and seven ready-mix plants. For the yearsended December 31, 2016, 2015 and 2014, the operations in Croatia, including assets in Bosnia andHerzegovina, Montenegro and Serbia, included in CEMEX’s statements of operations are presented in thesingle line item “Discontinued Operations.” Considering the recent developments related to this transactionmentioned above and for purposes of the consolidated income statements, beginning in the second quarter of2017, CEMEX will reclassify the income statements of its operations in Croatia, including assets in Bosniaand Herzegovina, Montenegro and Serbia, from the single line item “Discontinued Operations” to eachspecific line item.
• On April 17, 2017, CEMEX announced that one of its subsidiaries in the United States signed a definitiveagreement for the sale of its Pacific Northwest Materials Business consisting of aggregate, asphalt andready-mix concrete operations in Oregon and Washington to Cadman Materials, Inc., a LehighHansoncompany and U.S. subsidiary of HeidelbergCement Group, for approximately US$150. The closing of thistransaction is subject to the satisfaction of certain conditions, including approval from regulators. CEMEXcurrently expects to finalize this divestiture during the second quarter of 2017 or soon thereafter.
• In connection with the securitization programs for the sale of accounts receivable (note 9) in the UnitedStates, France and the United Kingdom, CEMEX extended such plans in March 2017 and now they maturein March 2018. The securitization program in Mexico was settled and paid in March 2017.
F-105

CEMEX, S.A.B. DE C.V. AND SUBSIDIARIESNotes to the Consolidated Financial Statements
As of December 31, 2016, 2015 and 2014(Millions of Mexican pesos)
Subsequent events — continued
• In connection with earnings (loss) per share (note 22) and the capitalization of retained earnings mentionedabove, on a pro forma basis giving effect to the issuance of new shares, CEMEX’s earnings (loss) per sharein 2016, 2015 and 2014 would have been as follows:
2016 2015 2014
Denominator (thousands of shares)Weighted average number of shares outstanding . . . . . . . . . . . . . . . . . 42,211,409 41,491,672 40,093,504
Capitalization of retained earnings . . . . . . . . . . . . . . . . . . . . . . . . 1,687,295 1,687,295 1,687,295Effect of dilutive instruments — mandatorily convertible
securities (note 16B) . . . . . . . . . . . . . . . . . . . . . . . . . . . . . . . . . 708,153 708,153 708,153
Weighted average number of shares — basic . . . . . . . . . . . . . . . . . . . . 44,606,857 43,887,120 42,488,952Effect of dilutive instruments — stock-based compensation (note
21) . . . . . . . . . . . . . . . . . . . . . . . . . . . . . . . . . . . . . . . . . . . . . . . 226,972 171,747 293,657Effect of potentially dilutive instruments — optionally
convertible securities (note 16B) . . . . . . . . . . . . . . . . . . . . . . . . 3,834,458 5,065,605 6,449,741
Weighted average number of shares — diluted . . . . . . . . . . . . . . . . . . 48,668,287 49,124,472 49,232,350
NumeratorNet income (loss) from continuing operations . . . . . . . . . . . . . . . . . . . Ps 14,183 854 (5,770)Less: non-controlling interest net income . . . . . . . . . . . . . . . . . . . . . . . 1,174 932 1,103
Controlling interest net income (loss) from continuingoperations . . . . . . . . . . . . . . . . . . . . . . . . . . . . . . . . . . . . . . . . . 13,009 (78) (6,873)
Plus: after tax interest expense on mandatorily convertiblesecurities . . . . . . . . . . . . . . . . . . . . . . . . . . . . . . . . . . . . . . . . . . . . . . 119 144 164
Controlling interest net income (loss) from continuing operations— for basic earnings per share calculations . . . . . . . . . . . . . . . 13,128 66 (6,709)
Plus: after tax interest expense on optionally convertible securities . . . 1,079 1,288 1,424
Controlling interest net income (loss) from continuing operations— for diluted earnings per share calculations . . . . . . . . . . . . . . Ps 14,207 1,354 (5,285)
Income from discontinued operations . . . . . . . . . . . . . . . . . . . . . . Ps 1,024 1,279 90
Basic Earnings (Loss) Per ShareControlling Interest Basic Earnings (Loss) Per Share . . . . . . . . . . . . . . Ps 0.32 0.03 (0.16)Controlling Interest Basic Earnings (Loss) Per Share from continuing
operations . . . . . . . . . . . . . . . . . . . . . . . . . . . . . . . . . . . . . . . . . . . . . 0.29 — (0.16)Controlling Interest Basic Earnings (Loss) Per Share from
discontinued operations . . . . . . . . . . . . . . . . . . . . . . . . . . . . . . . . . . . 0.03 0.03 —
Controlling Interest Diluted Earnings (Loss) Per ShareControlling Interest Diluted Earnings (Loss) Per Share . . . . . . . . . . . . Ps 0.32 0.03 (0.16)Controlling Interest Diluted Earnings (Loss) Per Share from
continuing operations . . . . . . . . . . . . . . . . . . . . . . . . . . . . . . . . . . . . 0.29 — (0.16)Controlling Interest Diluted Earnings (Loss) Per Share from
discontinued operations . . . . . . . . . . . . . . . . . . . . . . . . . . . . . . . . . . . 0.03 0.03 —
F-106

CEMEX, S.A.B. DE C.V. AND SUBSIDIARIESNotes to the Consolidated Financial Statements
As of December 31, 2016, 2015 and 2014(Millions of Mexican pesos)
27) MAIN SUBSIDIARIES
The main subsidiaries as of December 31, 2016 and 2015 were as follows:
% Interest
Subsidiary Country 2016 2015
CEMEX México, S. A. de C.V.1 . . . . . . . . . . . . . . . . . . . . . . . . . . . . . Mexico 100.0 100.0CEMEX España, S.A.2 . . . . . . . . . . . . . . . . . . . . . . . . . . . . . . . . . . . . . Spain 99.9 99.9CEMEX, Inc. . . . . . . . . . . . . . . . . . . . . . . . . . . . . . . . . . . . . . . . . . . . . United States of America 100.0 100.0CEMEX Latam Holdings, S.A.3 . . . . . . . . . . . . . . . . . . . . . . . . . . . . . . Spain 74.3 74.4CEMEX (Costa Rica), S.A. . . . . . . . . . . . . . . . . . . . . . . . . . . . . . . . . . Costa Rica 99.1 99.1CEMEX Nicaragua, S.A. . . . . . . . . . . . . . . . . . . . . . . . . . . . . . . . . . . . Nicaragua 100.0 100.0Assiut Cement Company . . . . . . . . . . . . . . . . . . . . . . . . . . . . . . . . . . . Egypt 95.8 95.8CEMEX Colombia, S.A.4 . . . . . . . . . . . . . . . . . . . . . . . . . . . . . . . . . . . Colombia 99.9 99.7Cemento Bayano, S.A.5 . . . . . . . . . . . . . . . . . . . . . . . . . . . . . . . . . . . . Panama 100.0 99.9CEMEX Dominicana, S.A. . . . . . . . . . . . . . . . . . . . . . . . . . . . . . . . . . . Dominican Republic 100.0 100.0CEMEX de Puerto Rico Inc. . . . . . . . . . . . . . . . . . . . . . . . . . . . . . . . . Puerto Rico 100.0 100.0CEMEX France Gestion (S.A.S.) . . . . . . . . . . . . . . . . . . . . . . . . . . . . . France 100.0 100.0CEMEX Holdings Philippines6 . . . . . . . . . . . . . . . . . . . . . . . . . . . . . . Philippines 55.0 —Solid Cement Corporation6 . . . . . . . . . . . . . . . . . . . . . . . . . . . . . . . . . . Philippines 100.0 100.0APO Cement Corporation6 . . . . . . . . . . . . . . . . . . . . . . . . . . . . . . . . . . Philippines 100.0 100.0CEMEX Holdings (Malaysia) Sdn Bhd . . . . . . . . . . . . . . . . . . . . . . . . Malaysia 100.0 100.0CEMEX U.K. . . . . . . . . . . . . . . . . . . . . . . . . . . . . . . . . . . . . . . . . . . . . United Kingdom 100.0 100.0CEMEX Deutschland, AG. . . . . . . . . . . . . . . . . . . . . . . . . . . . . . . . . . . Germany 100.0 100.0CEMEX Czech Republic, s.r.o. . . . . . . . . . . . . . . . . . . . . . . . . . . . . . . Czech Republic 100.0 100.0CEMEX Polska sp. Z.o.o. . . . . . . . . . . . . . . . . . . . . . . . . . . . . . . . . . . . Poland 100.0 100.0CEMEX Holdings (Israel) Ltd. . . . . . . . . . . . . . . . . . . . . . . . . . . . . . . Israel 100.0 100.0CEMEX SIA . . . . . . . . . . . . . . . . . . . . . . . . . . . . . . . . . . . . . . . . . . . . . Latvia 100.0 100.0CEMEX Topmix LLC, CEMEX Supermix LLC and CEMEX Falcon
LLC7 . . . . . . . . . . . . . . . . . . . . . . . . . . . . . . . . . . . . . . . . . . . . . . . . . United Arab Emirates 100.0 100.0CEMEX AS . . . . . . . . . . . . . . . . . . . . . . . . . . . . . . . . . . . . . . . . . . . . . Norway 100.0 100.0Cimentos Vencemos do Amazonas, Ltda. . . . . . . . . . . . . . . . . . . . . . . Brazil 100.0 100.0Readymix Argentina, S.A. . . . . . . . . . . . . . . . . . . . . . . . . . . . . . . . . . . Argentina 100.0 100.0CEMEX Jamaica . . . . . . . . . . . . . . . . . . . . . . . . . . . . . . . . . . . . . . . . . Jamaica 100.0 100.0Neoris N.V.8 . . . . . . . . . . . . . . . . . . . . . . . . . . . . . . . . . . . . . . . . . . . . . The Netherlands 99.8 99.8CEMEX International Trading, LLC9 . . . . . . . . . . . . . . . . . . . . . . . . . United States of America 100.0 100.0Transenergy, Inc.10 . . . . . . . . . . . . . . . . . . . . . . . . . . . . . . . . . . . . . . . . United States of America 100.0 100.0
1 CEMEX México, S.A. de C.V. is the indirect holding company of CEMEX España, S.A. and subsidiaries.2 CEMEX España, S.A is the indirect holding company of most of CEMEX’s international operations.3 The interest reported includes own shares held at CLH’s treasury.4 Represents our 99.7% and 98.9% interest in ordinary and preferred shares, respectively.5 Includes a 0.515% interest held on Cemento Bayano’s treasury.6 Represents CEMEX Holdings Philippines Inc. direct and indirect interest.7 CEMEX owns a 49% equity interest in each of these entities and holds the remaining 51% of the economic
benefits, through agreements with other shareholders.8 Neoris N.V. is the holding company of the entities involved in the sale of information technology solutions
and services.
F-107

CEMEX, S.A.B. DE C.V. AND SUBSIDIARIESNotes to the Consolidated Financial Statements
As of December 31, 2016, 2015 and 2014(Millions of Mexican pesos)
Main subsidiaries — continued
9 CEMEX International Trading, LLC is involved in the international trading of CEMEX’s products.10 Formerly named Gulf Coast Portland Cement Co., it is engaged in the procurement and trading of fuels,
such as coal and petroleum coke, used in certain operations of CEMEX’s.
F-108

REPORT OF INDEPENDENT REGISTERED PUBLIC ACCOUNTING FIRM
The Board of Directors and StockholdersCEMEX, S.A.B. de C.V.:
We have audited the accompanying consolidated balance sheets of CEMEX, S.A.B. de C.V. and subsidiaries (theCompany) as of December 31, 2016 and 2015, and the related consolidated statements of operations,comprehensive income (loss), changes in stockholders’ equity, and cash flows for each of the years in thethree-year period ended December 31, 2016. These consolidated financial statements are the responsibility of theCompany’s management. Our responsibility is to express an opinion on these consolidated financial statementsbased on our audits.
We conducted our audits in accordance with the standards of the Public Company Accounting Oversight Board(United States). Those standards require that we plan and perform the audit to obtain reasonable assurance aboutwhether the financial statements are free of material misstatement. An audit includes examining, on a test basis,evidence supporting the amounts and disclosures in the financial statements. An audit also includes assessing theaccounting principles used and significant estimates made by management, as well as evaluating the overallfinancial statement presentation. We believe that our audits provide a reasonable basis for our opinion.
In our opinion, the consolidated financial statements referred to above present fairly, in all material respects, thefinancial position of CEMEX, S.A.B. de C.V. and subsidiaries as of December 31, 2016 and 2015, and the resultsof their operations and their cash flows for each of the years in the three-year period ended December 31, 2016,in conformity with International Reporting Standards as issued by the International Accounting Standards Board.
We also have audited, in accordance with the standards of the Public Company Accounting Oversight Board(United States), CEMEX, S.A.B de C.V. and subsidiaries’ internal control over financial reporting as ofDecember 31, 2016, based on criteria established in Internal Control — Integrated Framework (2013) issued bythe Committee of Sponsoring Organizations of the Treadway Commission (COSO), and our report datedApril 28, 2017 expressed an adverse opinion on the effectiveness of the Company’s internal control overfinancial reporting.
KPMG Cardenas Dosal, S.C.
/s/ Luis Gabriel Ortiz EsquedaMonterrey, N.L. MexicoApril 28, 2017
F-109

INTERNAL CONTROL REPORT OF INDEPENDENT REGISTERED PUBLIC ACCOUNTING FIRM
The Board of Directors and StockholdersCEMEX, S.A.B. de C.V.:
We have audited CEMEX S.A.B. de C.V. and subsidiaries’ (the Company) internal control over financialreporting as of December 31, 2016, based on criteria established in Internal Control Integrated Framework(2013) issued by the Committee of Sponsoring Organizations of the Treadway Commission (COSO). CEMEXS.A.B de C.V. and subsidiaries’ management is responsible for maintaining effective internal control overfinancial reporting and for its assessment of the effectiveness of internal control over financial reporting,included in the accompanying Management’s Annual Report on Internal Control over Financial Reporting. Ourresponsibility is to express an opinion on the Group’s internal control over financial reporting based on our audit.
We conducted our audit in accordance with the standards of the Public Company Accounting Oversight Board(United States). Those standards require that we plan and perform the audit to obtain reasonable assurance aboutwhether effective internal control over financial reporting was maintained in all material respects. Our auditincluded obtaining an understanding of internal control over financial reporting, assessing the risk that a materialweakness exists, and testing and evaluating the design and operating effectiveness of internal control based onthe assessed risk. Our audit also included performing such other procedures as we considered necessary in thecircumstances. We believe that our audit provides a reasonable basis for our opinion.
A company’s internal control over financial reporting is a process designed to provide reasonable assuranceregarding the reliability of financial reporting and the preparation of financial statements for external purposes inaccordance with generally accepted accounting principles. A company’s internal control over financial reportingincludes those policies and procedures that (1) pertain to the maintenance of records that, in reasonable detail,accurately and fairly reflect the transactions and dispositions of the assets of the company; (2) provide reasonableassurance that transactions are recorded as necessary to permit preparation of financial statements in accordancewith generally accepted accounting principles, and that receipts and expenditures of the company are being madeonly in accordance with authorizations of management and directors of the company; and (3) provide reasonableassurance regarding prevention or timely detection of unauthorized acquisition, use, or disposition of thecompany’s assets that could have a material effect on the financial statements.
Because of its inherent limitations, internal control over financial reporting may not prevent or detectmisstatements. Also, projections of any evaluation of effectiveness to future periods are subject to the risk thatcontrols may become inadequate because of changes in conditions, or that the degree of compliance with thepolicies or procedures may deteriorate.
A material weakness is a deficiency, or a combination of deficiencies, in internal control over financial reporting,such that there is a reasonable possibility that a material misstatement of the company’s annual or interimfinancial statements will not be prevented or detected on a timely basis. A material weakness related to theCompany’s risk assessment and monitoring of significant unusual transactions has been identified and includedin Management’s Annual Report on Internal Control Over Financial Reporting as of December 31, 2016. Wealso have audited, in accordance with the standards of the Public Company Accounting Oversight Board (UnitedStates), the consolidated balance sheets of the Company as of December 31, 2016 and 2015, and the relatedconsolidated statements of operations, comprehensive income (loss), changes in stockholders’ equity, and cashflows for each of the years in the three year period ended December 31, 2016. This material weakness wasconsidered in determining the nature, timing, and extent of audit tests applied in our audit of the 2016consolidated financial statements, and this report does not affect our report dated April 28, 2017, whichexpressed an unqualified opinion on those consolidated financial statements.
In our opinion, because of the effect of the aforementioned material weakness on the achievement of the objectives ofthe control criteria, CEMEX S.A.B. de C.V. and subsidiaries has not maintained effective internal control overfinancial reporting as of December 31, 2016, based on criteria established in Internal Control — Integrated Framework(2013) issued by the Committee of Sponsoring Organizations of the Treadway Commission (COSO)”.
F-110

We do not express an opinion or any other form of assurance on management’s statements referring to correctiveactions taken after December 31, 2016, relative to the aforementioned material weakness in internal control overfinancial reporting.
KPMG Cardenas Dosal, S.C.
/s/ Luis Gabriel Ortiz EsquedaMonterrey, N.L. MexicoApril 28, 2017
F-111