5.2.1 current performance - major projects (nsw.gov.au)
TRANSCRIPT
HOTEL ASSESSMENT
Final Report - Project Star EIA - July 3.doc Page 25
5.2.1 Current Performance Room rates and occupancy rates are the two most commonly used measures of hotel performance. However, assuming hotels don’t significantly discount their rooms regularly, occupancy rates are arguably the more useful measure. As a rough rule of thumb, hotels achieving occupancy rates of >65% should be relatively profitable for the operator.
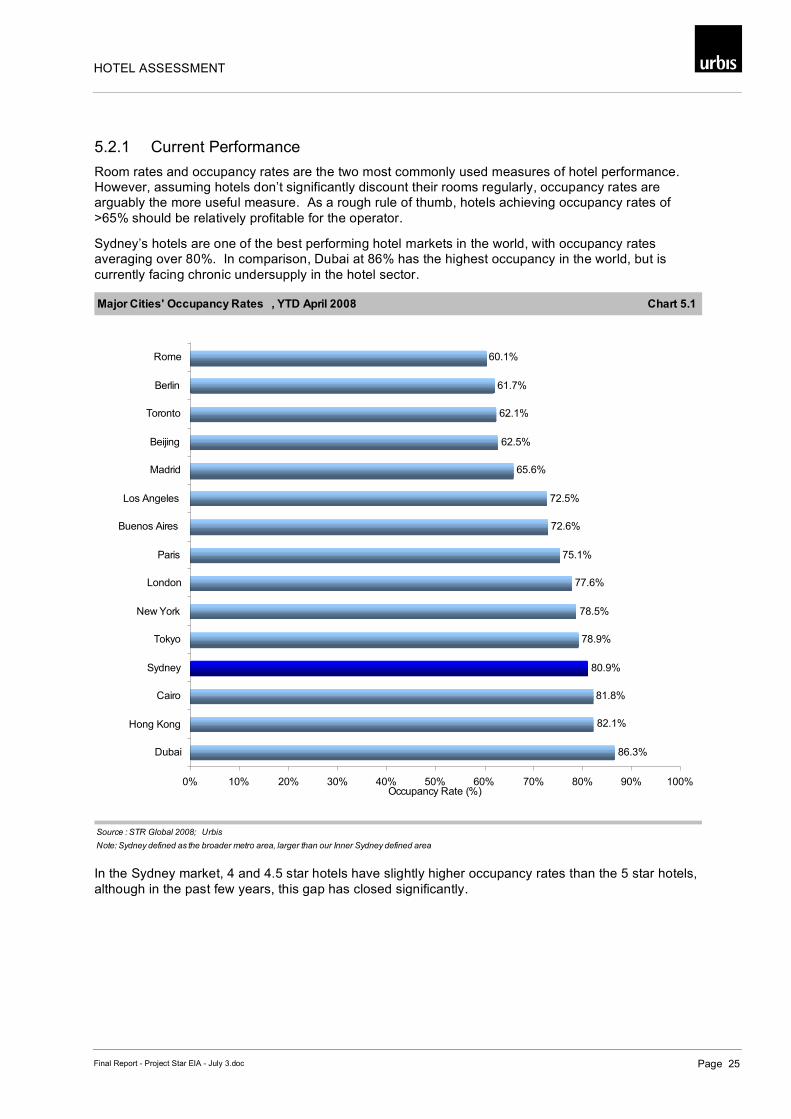
Sydney’s hotels are one of the best performing hotel markets in the world, with occupancy rates averaging over 80%. In comparison, Dubai at 86% has the highest occupancy in the world, but is currently facing chronic undersupply in the hotel sector.
Major Cities' Occupancy Rates , YTD April 2008 Chart 5.1
Source : STR Global 2008; Urbis
Note: Sydney defined as the broader metro area, larger than our Inner Sydney defined area
86.3%
82.1%
81.8%
80.9%
78.9%
78.5%
77.6%
75.1%
72.6%
72.5%
65.6%
62.5%
62.1%
61.7%
60.1%
0% 10% 20% 30% 40% 50% 60% 70% 80% 90% 100%
Dubai
Hong Kong
Cairo
Sydney
Tokyo
New York
London
Paris
Buenos Aires
Los Angeles
Madrid
Beijing
Toronto
Berlin
Rome
Occupancy Rate (%)
In the Sydney market, 4 and 4.5 star hotels have slightly higher occupancy rates than the 5 star hotels, although in the past few years, this gap has closed significantly.
HOTEL ASSESSMENT
Page 26 Final Report - Project Star EIA - July 3.doc
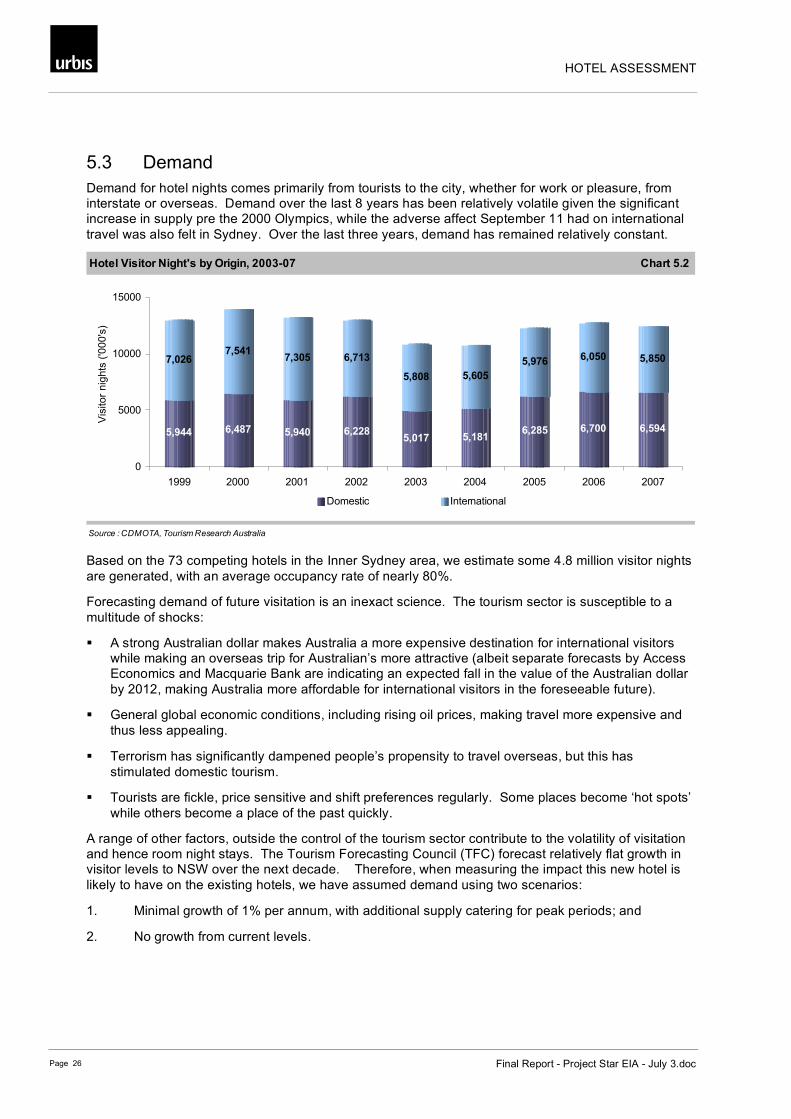
5.3 Demand Demand for hotel nights comes primarily from tourists to the city, whether for work or pleasure, from interstate or overseas. Demand over the last 8 years has been relatively volatile given the significant increase in supply pre the 2000 Olympics, while the adverse affect September 11 had on international travel was also felt in Sydney. Over the last three years, demand has remained relatively constant.
Hotel Visitor Night's by Origin, 2003-07 Chart 5.2
Source : CDMOTA, Tourism Research Australia
5,944 6,487 5,940 6,2285,017 5,181
6,285 6,700 6,594
7,0267,541
7,305 6,713
5,808 5,605
5,976 6,050 5,850
0
5000
10000
15000
1999 2000 2001 2002 2003 2004 2005 2006 2007
Vis
ito
r n
igh
ts (
'00
0's
)
Domestic International
Based on the 73 competing hotels in the Inner Sydney area, we estimate some 4.8 million visitor nights are generated, with an average occupancy rate of nearly 80%.
Forecasting demand of future visitation is an inexact science. The tourism sector is susceptible to a multitude of shocks:
A strong Australian dollar makes Australia a more expensive destination for international visitors while making an overseas trip for Australian’s more attractive (albeit separate forecasts by Access Economics and Macquarie Bank are indicating an expected fall in the value of the Australian dollar by 2012, making Australia more affordable for international visitors in the foreseeable future).
General global economic conditions, including rising oil prices, making travel more expensive and thus less appealing.
Terrorism has significantly dampened people’s propensity to travel overseas, but this has stimulated domestic tourism.
Tourists are fickle, price sensitive and shift preferences regularly. Some places become ‘hot spots’ while others become a place of the past quickly.
A range of other factors, outside the control of the tourism sector contribute to the volatility of visitation and hence room night stays. The Tourism Forecasting Council (TFC) forecast relatively flat growth in visitor levels to NSW over the next decade. Therefore, when measuring the impact this new hotel is likely to have on the existing hotels, we have assumed demand using two scenarios:
1. Minimal growth of 1% per annum, with additional supply catering for peak periods; and
2. No growth from current levels.
HOTEL ASSESSMENT
Final Report - Project Star EIA - July 3.doc Page 27
5.4 Impact Assessment
5.4.1 Methodology Growth in visitor nights is not expected to increase significantly, however, it is understood that during peak times, particularly when major events and exhibitions are staged, hotels in Sydney reach full capacity. As such, some visitors will either not visit the city (because they cannot get accommodation) or defer their trip (which for business visitors this is typically not an option). The introduction of a new hotel in Sydney will therefore accommodate those visitors who currently cannot book accommodation during those peak periods, whilst also spread the existing tourist nights amongst more hotel rooms.
The following assumptions have been made when assessing the impact of the new hotel on the existing accommodation offer:
1. The new Star City hotel will achieve an occupancy rate of 80% (about the current occupancy rate of existing hotels in Sydney). This equates to 90,228 room nights.
2. A 1% per annum increase in hotel guest nights over the next four years will result in an additional 195,000 room nights.
3. The impact is calculated by allocating the lost number of visitor nights (90,228) across the competition, and then adding in the 195,000 room nights from market growth.
4. Competition only includes those in the local area (as defined above). Further, only hotels with 4 star ratings or higher are considered to compete with the new hotel.
5. The impact will be weighted towards 5 star hotels (70%) vs. 4 and 4.5 star hotels (30%).
6. There are six hotels we expect will experience a greater impact because of their:
Proximity to the proposed hotel
Relative size
Quality
The hotels are:
Star City Hotel & Apartments
Hilton Sydney
Grand Mercure Apartments One Darling Harbour
Novotel Rockford Darling Harbour
Holiday Inn Darling Harbour
Four Points by Sheraton Darling Harbour Sydney
5.5 Results The 73 hotels in the inner Sydney area are estimated to contribute 4.8 million guest nights. With minimal visitor growth, this is expected to increase to nearly 5 million guest nights by 2012.
The Australian Hotels Association collects data on a select number of hotels in terms of their occupancy and room rates. Where specific hotel occupancy rates are unknown the average is applied. The hotels have been split into three groups:
1. Competitive Hotels, which are the 6 hotels most likely to be impacted by the Star City development. These hotels currently have an occupancy rate of 83.5%;
2. 5 Star Hotels, which have an average occupancy of 77.7%; and
HOTEL ASSESSMENT
Page 28 Final Report - Project Star EIA - July 3.doc
3. 4 & 4.5 Star Hotels, which have an average occupancy rate of 81.1%.
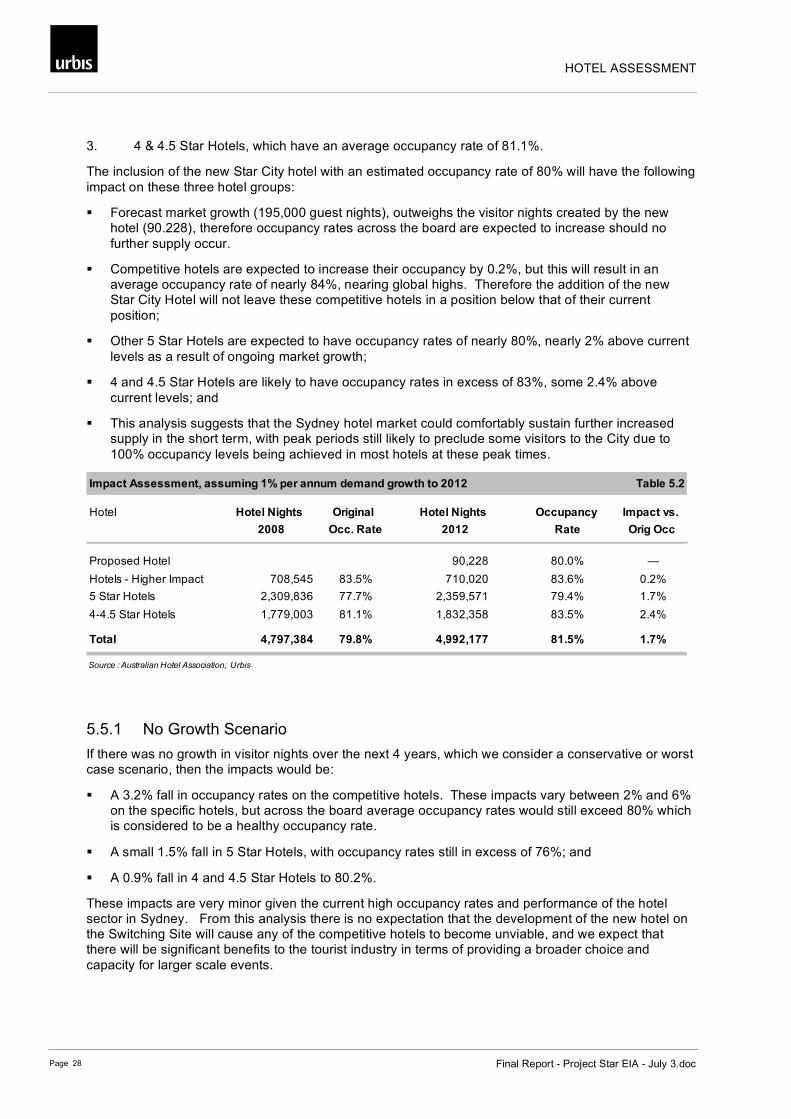
The inclusion of the new Star City hotel with an estimated occupancy rate of 80% will have the following impact on these three hotel groups:
Forecast market growth (195,000 guest nights), outweighs the visitor nights created by the new hotel (90.228), therefore occupancy rates across the board are expected to increase should no further supply occur.
Competitive hotels are expected to increase their occupancy by 0.2%, but this will result in an average occupancy rate of nearly 84%, nearing global highs. Therefore the addition of the new Star City Hotel will not leave these competitive hotels in a position below that of their current position;
Other 5 Star Hotels are expected to have occupancy rates of nearly 80%, nearly 2% above current levels as a result of ongoing market growth;
4 and 4.5 Star Hotels are likely to have occupancy rates in excess of 83%, some 2.4% above current levels; and
This analysis suggests that the Sydney hotel market could comfortably sustain further increased supply in the short term, with peak periods still likely to preclude some visitors to the City due to 100% occupancy levels being achieved in most hotels at these peak times.
Impact Assessment, assuming 1% per annum demand growth to 2012 Table 5.2
Hotel Hotel Nights Original Hotel Nights Occupancy Impact vs.
2008 Occ. Rate 2012 Rate Orig Occ
Proposed Hotel 90,228 80.0% —
Hotels - Higher Impact 708,545 83.5% 710,020 83.6% 0.2%
5 Star Hotels 2,309,836 77.7% 2,359,571 79.4% 1.7%
4-4.5 Star Hotels 1,779,003 81.1% 1,832,358 83.5% 2.4%
Total 4,797,384 79.8% 4,992,177 81.5% 1.7%
Source : Australian Hotel Association; Urbis
5.5.1 No Growth Scenario If there was no growth in visitor nights over the next 4 years, which we consider a conservative or worst case scenario, then the impacts would be:
A 3.2% fall in occupancy rates on the competitive hotels. These impacts vary between 2% and 6% on the specific hotels, but across the board average occupancy rates would still exceed 80% which is considered to be a healthy occupancy rate.
A small 1.5% fall in 5 Star Hotels, with occupancy rates still in excess of 76%; and
A 0.9% fall in 4 and 4.5 Star Hotels to 80.2%.
These impacts are very minor given the current high occupancy rates and performance of the hotel sector in Sydney. From this analysis there is no expectation that the development of the new hotel on the Switching Site will cause any of the competitive hotels to become unviable, and we expect that there will be significant benefits to the tourist industry in terms of providing a broader choice and capacity for larger scale events.
HOTEL ASSESSMENT
Final Report - Project Star EIA - July 3.doc Page 29
5.6 Economic Benefits The addition of a new hotel can have the following benefits:
Increased competition, which leads to downward pressure on prices. This in turn can generate additional demand (i.e. will attract people to the City who were previously priced out of the market).
New supply creates efficiencies in the market, with poorer operators likely to be impacted most in the long run.
New supply rejuvenates the overall hotel offer. Older and obsolete stock can be rebranded (e.g. downgraded star rating), or ultimately redeveloped (either as a new hotel or for another use).
Increased competition, efficiency and rejuvenation will ultimately have a positive impact for the city.
5.7 Conference Upgrade Impact The new development will increase the capacity of the existing conference facility from 900 to 1,200 delegates. Given the very minor increase in supply to the overall conferencing market, an in-depth analysis on the impact of this aspect of the development has not been conducted. However, a report conducted by URS for the Property Council of Australia (PCA) suggests that Sydney is significantly undersupplied in terms of conference and exhibition space. In fact, Sydney may be losing a substantial number of conferences/exhibitions due to the current shortfall of adequate space in the city.
Therefore, the increase in Star City’s conference capacity is not only unlikely to impact existing facilities, it is likely to encourage more conferences and conventions to the city. Given the expenditure profile of conference delegates (their average daily expenditure is considerably higher than the typical tourist), this can result in significant benefits to the local and state economies.
SOCIAL AND ECONOMIC BENEFIT ASSESSMENT
Page 30 Final Report - Project Star EIA - July 3.doc
6 Social and Economic Benefit Assessment
6.1 State and Local Benefits The assessment of the economic benefits of this development are based on the plans outlined in Section 2.
The economic benefits of the Star City redevelopment occur in two distinct phases. The operational phase provides benefits to the local, regional and state economies as a result of the operation of the hotel and retail facilities, which in turn attracts additional visitors to the region. The construction phase provides a number of jobs to the local and state economies in the construction industry in particular, but also to supporting industries.
The benefits of each of these phases are outlined and quantified below.
6.2 Operational Phase Once the redevelopment is completed, there will be additional expenditure and employment impacts derived from the operating activities of the new hotel and retail development.
The development will attract additional visitors to Inner Sydney, who will then spend locally, and thus boost local employment. Based on the estimated development mix, it is estimated that over 500 jobs will be required to service the substantial retail and hotel offer. This in turn will generate 400 jobs in supporting industries.
The increase in gaming floorspace will also provide additional employment opportunities in gaming, cleaning, security, administration etc. This alone could boost employment by in excess of 300 FTE jobs.
6.3 Construction Phase In order to assess the economic benefit of the construction phase of the development, the number of jobs the development might create has been assessed. For the purposes of this analysis the Australian Input-Output (I-O) employment multiplier tables from 1996-971 have been utilised. These are the most recently published tables by the ABS. Appendix 3 gives an overview of I-O analysis and modelling.
We note that the published tables are not current. In order to make them reflect the current state of the economy more accurately, adjustments have been made for productivity and inflation.
Using the adjusted employment multipliers and value of construction (as provided by Star City and estimated at $350 million), it is possible to estimate the number of jobs to be created. This is presented in Table 6.1.
1 ABS Australian National Accounts, I-O Multiplier Table 3T, 1996-97
SOCIAL AND ECONOMIC BENEFIT ASSESSMENT
Final Report - Project Star EIA - July 3.doc Page 31
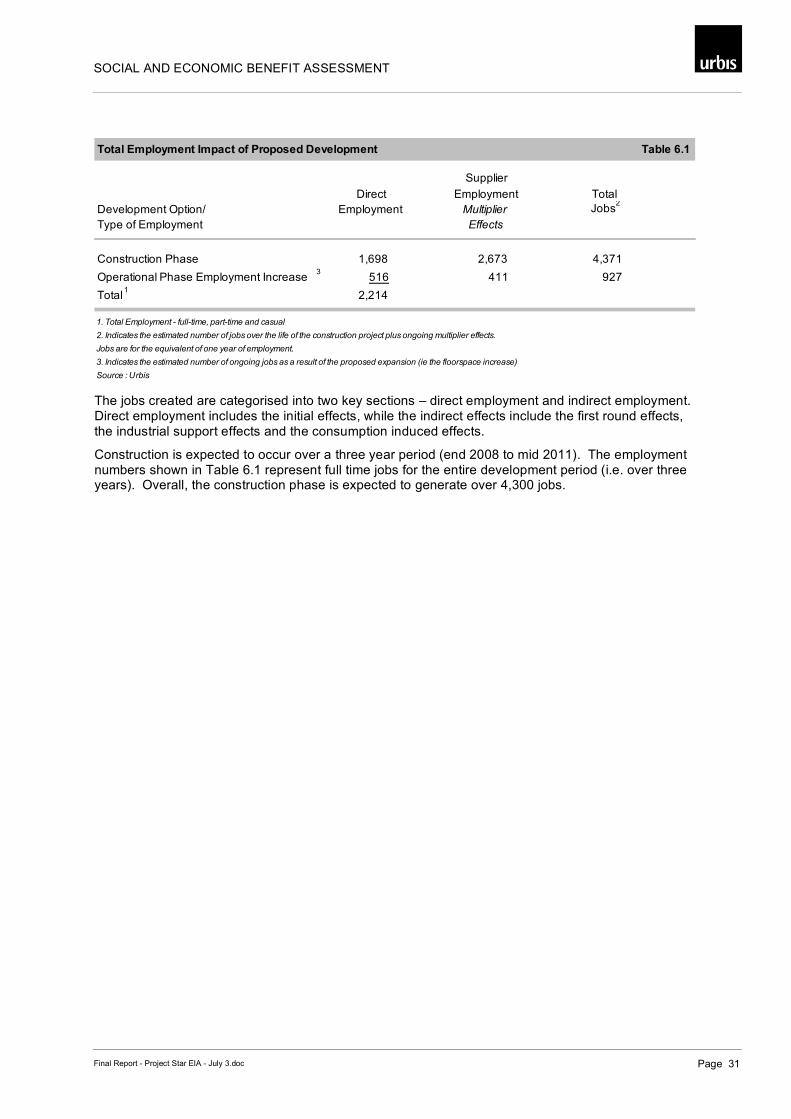
Total Employment Impact of Proposed Development Table 6.1
Supplier
Direct Employment Total
Development Option/ Employment Multiplier Jobs2
Type of Employment Effects
Construction Phase 1,698 2,673 4,371
Operational Phase Employment Increase3
516 411 927
Total1
2,214
1. Total Employment - full-time, part-time and casual
2. Indicates the estimated number of jobs over the life of the construction project plus ongoing multiplier effects.
Jobs are for the equivalent of one year of employment.
3. Indicates the estimated number of ongoing jobs as a result of the proposed expansion (ie the floorspace increase)
Source : Urbis The jobs created are categorised into two key sections – direct employment and indirect employment. Direct employment includes the initial effects, while the indirect effects include the first round effects, the industrial support effects and the consumption induced effects.
Construction is expected to occur over a three year period (end 2008 to mid 2011). The employment numbers shown in Table 6.1 represent full time jobs for the entire development period (i.e. over three years). Overall, the construction phase is expected to generate over 4,300 jobs.

APPENDICES
Final Report - Project Star EIA - July 3.doc Appendix A
Appendix A Socio-Economic Profile
APPENDICES
Appendix A Final Report - Project Star EIA - July 3.doc
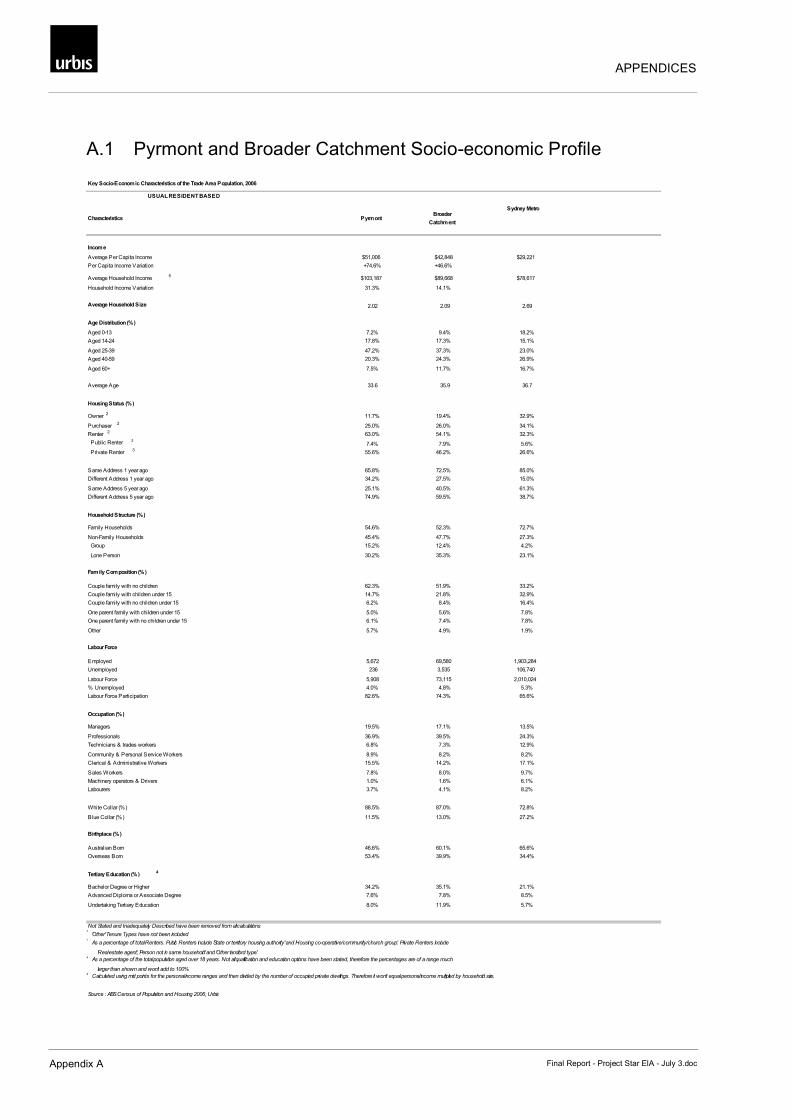
A.1 Pyrmont and Broader Catchment Socio-economic Profile x
Key Socio-Economic Characteristics of the Trade Area Population, 2006
USUAL RESIDENT BASED
Characteristics PyrmontBroader
Catchment
Sydney Metro
Income
Average Per Capita Income $51,006 $42,848 $29,221
Per Capita Income Variation +74.6% +46.6%
Average Household Income5
$103,187 $89,668 $78,617
Household Income Variation 31.3% 14.1%
Average Household Size 2.02 2.09 2.69
Age Distribution (%)
Aged 0-13 7.2% 9.4% 18.2%
Aged 14-24 17.8% 17.3% 15.1%
Aged 25-39 47.2% 37.3% 23.0%
Aged 40-59 20.3% 24.3% 26.9%
Aged 60+ 7.5% 11.7% 16.7%
Average Age 33.6 35.9 36.7
Housing Status (%)
Owner2
11.7% 19.4% 32.9%
Purchaser2
25.0% 26.0% 34.1%
Renter2
63.0% 54.1% 32.3%
Public Renter3
7.4% 7.9% 5.6%
Private Renter3
55.6% 46.2% 26.6%
Same Address 1 year ago 65.8% 72.5% 85.0%
Different Address 1 year ago 34.2% 27.5% 15.0%
Same Address 5 year ago 25.1% 40.5% 61.3%
Different Address 5 year ago 74.9% 59.5% 38.7%
Household Structure (%)
Family Households 54.6% 52.3% 72.7%
Non-Family Households 45.4% 47.7% 27.3%
Group 15.2% 12.4% 4.2%
Lone Person 30.2% 35.3% 23.1%
Family Composition (%)
Couple family with no children 62.3% 51.9% 33.2%
Couple family with children under 15 14.7% 21.8% 32.9%
Couple family with no children under 15 6.2% 8.4% 16.4%
One parent family with children under 15 5.0% 5.6% 7.8%
One parent family with no children under 15 6.1% 7.4% 7.8%
Other 5.7% 4.9% 1.9%
Labour Force
Employed 5,672 69,580 1,903,284
Unemployed 236 3,535 106,740
Labour Force 5,908 73,115 2,010,024
% Unemployed 4.0% 4.8% 5.3%
Labour Force Participation 82.6% 74.3% 65.6%
Occupation (%)
Managers 19.5% 17.1% 13.5%
Professionals 36.9% 39.5% 24.3%
Technicians & trades workers 6.8% 7.3% 12.9%
Community & Personal Service Workers 8.9% 8.2% 8.2%
Clerical & Administrative Workers 15.5% 14.2% 17.1%
Sales Workers 7.8% 8.0% 9.7%
Machinery operators & Drivers 1.0% 1.6% 6.1%
Labourers 3.7% 4.1% 8.2%
White Collar (%) 88.5% 87.0% 72.8%
Blue Collar (%) 11.5% 13.0% 27.2%
Birthplace (%)
Australian Born 46.6% 60.1% 65.6%
Overseas Born 53.4% 39.9% 34.4%
Tertiary Education (%)4
Bachelor Degree or Higher 34.2% 35.1% 21.1%
Advanced Diploma or Associate Degree 7.6% 7.8% 8.5%
Undertaking Tertiary Education 8.0% 11.9% 5.7%
Not Stated and Inadequately Described have been removed from all calculations2
'Other' Tenure Types have not been included3
As a percentage of total Renters. Public Renters include 'State or territory housing authority' and 'Housing co-operative/community/church group'. Private Renters include
'Real estate agent', 'Person not in same household' and 'Other landlord type'.4
As a percentage of the total population aged over 18 years. Not all qualification and education options have been stated, therefore the percentages are of a range much
larger than shown and won't add to 100%5
Calculated using mid points for the personal income ranges and then divided by the number of occupied private dwellings. Therefore it won't equal personal income multiplied by household size.
Source : ABS Census of Population and Housing 2006; Urbis
APPENDICES
Final Report - Project Star EIA - July 3.doc Appendix B
Appendix B Tourist Profile
APPENDICES
Appendix B Final Report - Project Star EIA - July 3.doc
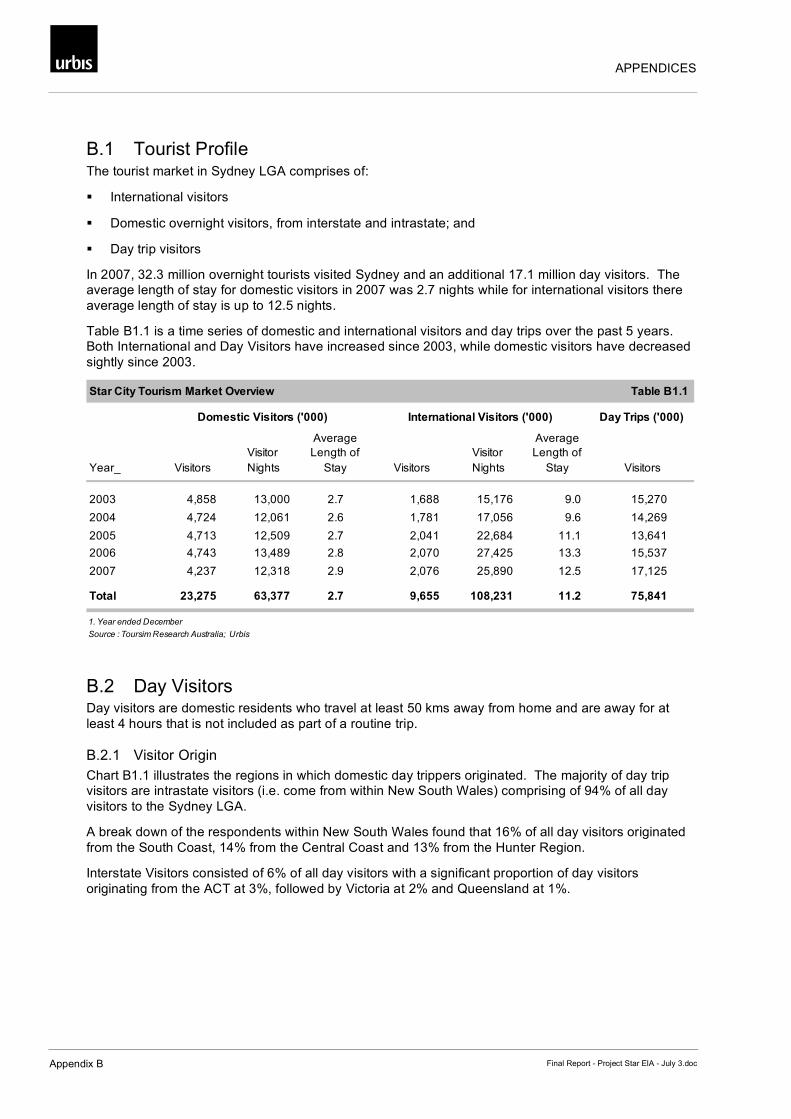
B.1 Tourist Profile The tourist market in Sydney LGA comprises of:
International visitors
Domestic overnight visitors, from interstate and intrastate; and
Day trip visitors
In 2007, 32.3 million overnight tourists visited Sydney and an additional 17.1 million day visitors. The average length of stay for domestic visitors in 2007 was 2.7 nights while for international visitors there average length of stay is up to 12.5 nights.
Table B1.1 is a time series of domestic and international visitors and day trips over the past 5 years. Both International and Day Visitors have increased since 2003, while domestic visitors have decreased sightly since 2003.
Star City Tourism Market Overview Table B1.1
Day Trips ('000)
Year_
2003 4,858 13,000 2.7 1,688 15,176 9.0 15,270
2004 4,724 12,061 2.6 1,781 17,056 9.6 14,269
2005 4,713 12,509 2.7 2,041 22,684 11.1 13,641
2006 4,743 13,489 2.8 2,070 27,425 13.3 15,537
2007 4,237 12,318 2.9 2,076 25,890 12.5 17,125
Total 23,275 63,377 2.7 9,655 108,231 11.2 75,841
1. Year ended December
Source : Toursim Research Australia; Urbis
International Visitors ('000)
Average
Length of
Stay
Visitor
NightsVisitors
Domestic Visitors ('000)
VisitorsVisitors
Visitor
Nights
Average
Length of
Stay
B.2 Day Visitors Day visitors are domestic residents who travel at least 50 kms away from home and are away for at least 4 hours that is not included as part of a routine trip.
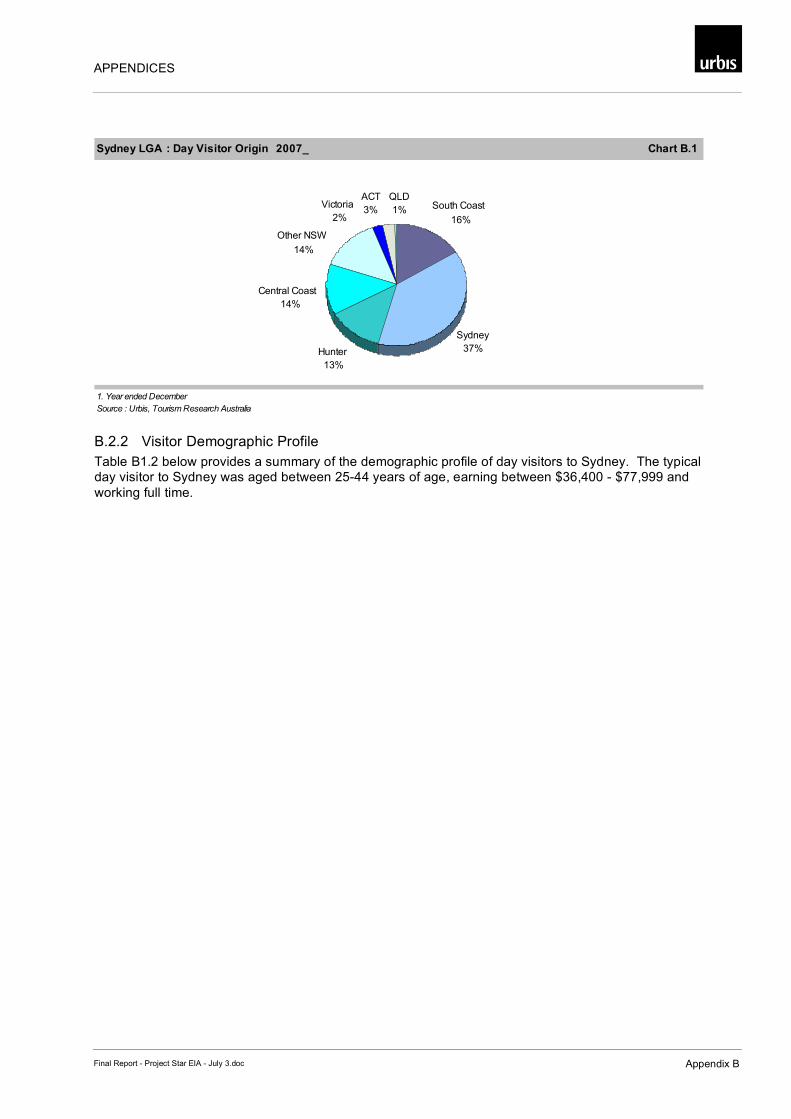
B.2.1 Visitor Origin Chart B1.1 illustrates the regions in which domestic day trippers originated. The majority of day trip visitors are intrastate visitors (i.e. come from within New South Wales) comprising of 94% of all day visitors to the Sydney LGA.
A break down of the respondents within New South Wales found that 16% of all day visitors originated from the South Coast, 14% from the Central Coast and 13% from the Hunter Region.
Interstate Visitors consisted of 6% of all day visitors with a significant proportion of day visitors originating from the ACT at 3%, followed by Victoria at 2% and Queensland at 1%.
APPENDICES
Final Report - Project Star EIA - July 3.doc Appendix B
Sydney LGA : Day Visitor Origin 2007_ Chart B.1
1. Year ended December
Source : Urbis, Tourism Research Australia
South Coast
16%
Sydney
37%Hunter
13%
ACT
3%Victoria
2%
Other NSW
14%
QLD
1%
Central Coast
14%
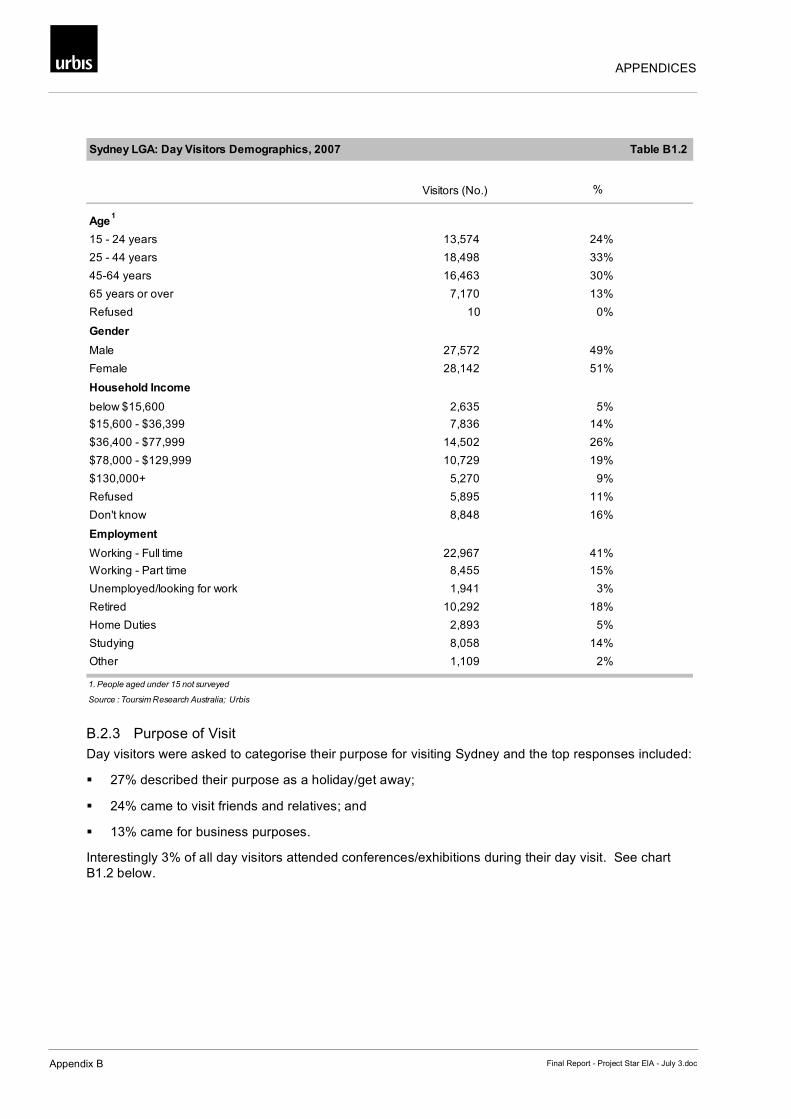
B.2.2 Visitor Demographic Profile Table B1.2 below provides a summary of the demographic profile of day visitors to Sydney. The typical day visitor to Sydney was aged between 25-44 years of age, earning between $36,400 - $77,999 and working full time.
APPENDICES
Appendix B Final Report - Project Star EIA - July 3.doc
Sydney LGA: Day Visitors Demographics, 2007 Table B1.2
Visitors (No.) %
Age1
15 - 24 years 13,574 24%
25 - 44 years 18,498 33%
45-64 years 16,463 30%
65 years or over 7,170 13%
Refused 10 0%
Gender
Male 27,572 49%
Female 28,142 51%
Household Income
below $15,600 2,635 5%
$15,600 - $36,399 7,836 14%
$36,400 - $77,999 14,502 26%
$78,000 - $129,999 10,729 19%
$130,000+ 5,270 9%
Refused 5,895 11%
Don't know 8,848 16%
Employment
Working - Full time 22,967 41%
Working - Part time 8,455 15%
Unemployed/looking for work 1,941 3%
Retired 10,292 18%
Home Duties 2,893 5%
Studying 8,058 14%
Other 1,109 2%
1. People aged under 15 not surveyed
Source : Toursim Research Australia; Urbis
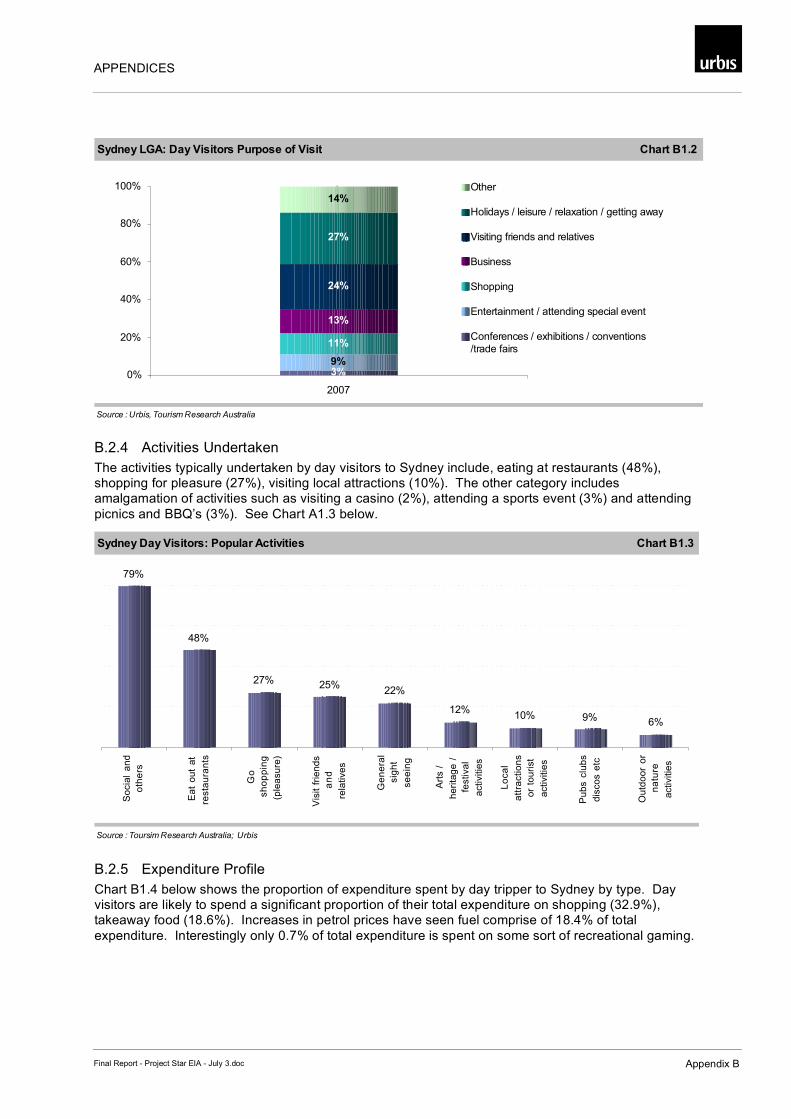
B.2.3 Purpose of Visit Day visitors were asked to categorise their purpose for visiting Sydney and the top responses included:
27% described their purpose as a holiday/get away;
24% came to visit friends and relatives; and
13% came for business purposes.
Interestingly 3% of all day visitors attended conferences/exhibitions during their day visit. See chart B1.2 below.
APPENDICES
Final Report - Project Star EIA - July 3.doc Appendix B
Sydney LGA: Day Visitors Purpose of Visit Chart B1.2
Source : Urbis, Tourism Research Australia
3%9%
11%
13%
24%
14%
27%
0%
20%
40%
60%
80%
100%
2007
Other
Holidays / leisure / relaxation / getting away
Visiting friends and relatives
Business
Shopping
Entertainment / attending special event
Conferences / exhibitions / conventions
/trade fairs
B.2.4 Activities Undertaken The activities typically undertaken by day visitors to Sydney include, eating at restaurants (48%), shopping for pleasure (27%), visiting local attractions (10%). The other category includes amalgamation of activities such as visiting a casino (2%), attending a sports event (3%) and attending picnics and BBQ’s (3%). See Chart A1.3 below.
Sydney Day Visitors: Popular Activities Chart B1.3
Source : Toursim Research Australia; Urbis
79%
48%
27% 25%22%
12%10% 9% 6%
So
cia
l a
nd
oth
ers
Ea
t o
ut
at
resta
ura
nts
Go
sh
op
pin
g
(ple
asu
re)
Vis
it f
rie
nd
s
an
d
rela
tive
s
Ge
ne
ral
sig
ht
se
ein
g
Art
s /
he
rita
ge
/
festiva
l
activitie
s
Lo
ca
l
att
ractio
ns
or
tou
rist
activitie
s
Pu
bs c
lub
s
dis
co
s e
tc
Ou
tdo
or
or
na
ture
activitie
s
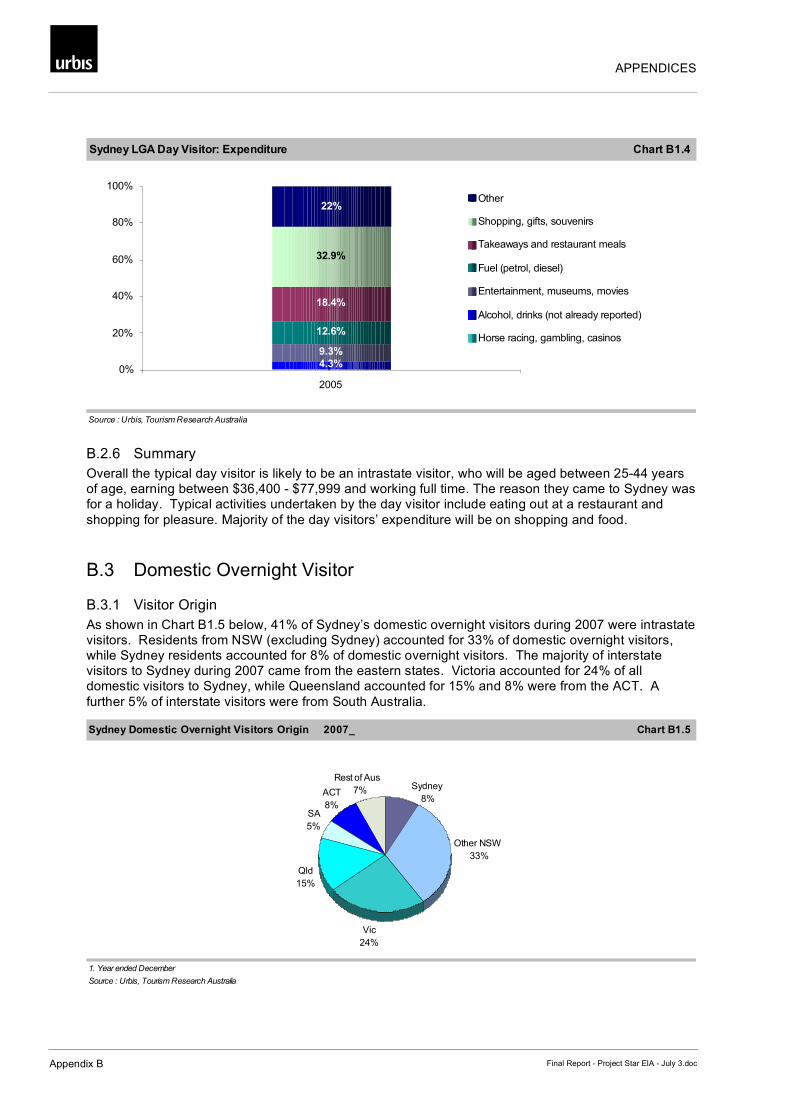
B.2.5 Expenditure Profile Chart B1.4 below shows the proportion of expenditure spent by day tripper to Sydney by type. Day visitors are likely to spend a significant proportion of their total expenditure on shopping (32.9%), takeaway food (18.6%). Increases in petrol prices have seen fuel comprise of 18.4% of total expenditure. Interestingly only 0.7% of total expenditure is spent on some sort of recreational gaming.
APPENDICES
Appendix B Final Report - Project Star EIA - July 3.doc
Sydney LGA Day Visitor: Expenditure Chart B1.4
Source : Urbis, Tourism Research Australia
4.3%
9.3%
32.9%
22%
12.6%
18.4%
0%
20%
40%
60%
80%
100%
2005
Other
Shopping, gifts, souvenirs
Takeaways and restaurant meals
Fuel (petrol, diesel)
Entertainment, museums, movies
Alcohol, drinks (not already reported)
Horse racing, gambling, casinos
B.2.6 Summary Overall the typical day visitor is likely to be an intrastate visitor, who will be aged between 25-44 years of age, earning between $36,400 - $77,999 and working full time. The reason they came to Sydney was for a holiday. Typical activities undertaken by the day visitor include eating out at a restaurant and shopping for pleasure. Majority of the day visitors’ expenditure will be on shopping and food.
B.3 Domestic Overnight Visitor
B.3.1 Visitor Origin As shown in Chart B1.5 below, 41% of Sydney’s domestic overnight visitors during 2007 were intrastate visitors. Residents from NSW (excluding Sydney) accounted for 33% of domestic overnight visitors, while Sydney residents accounted for 8% of domestic overnight visitors. The majority of interstate visitors to Sydney during 2007 came from the eastern states. Victoria accounted for 24% of all domestic visitors to Sydney, while Queensland accounted for 15% and 8% were from the ACT. A further 5% of interstate visitors were from South Australia.
Sydney Domestic Overnight Visitors Origin 2007_ Chart B1.5
1. Year ended December
Source : Urbis, Tourism Research Australia
Vic
24%
Qld
15%
SA
5%
Other NSW
33%
Rest of Aus
7% Sydney
8%ACT
8%
APPENDICES
Final Report - Project Star EIA - July 3.doc Appendix B
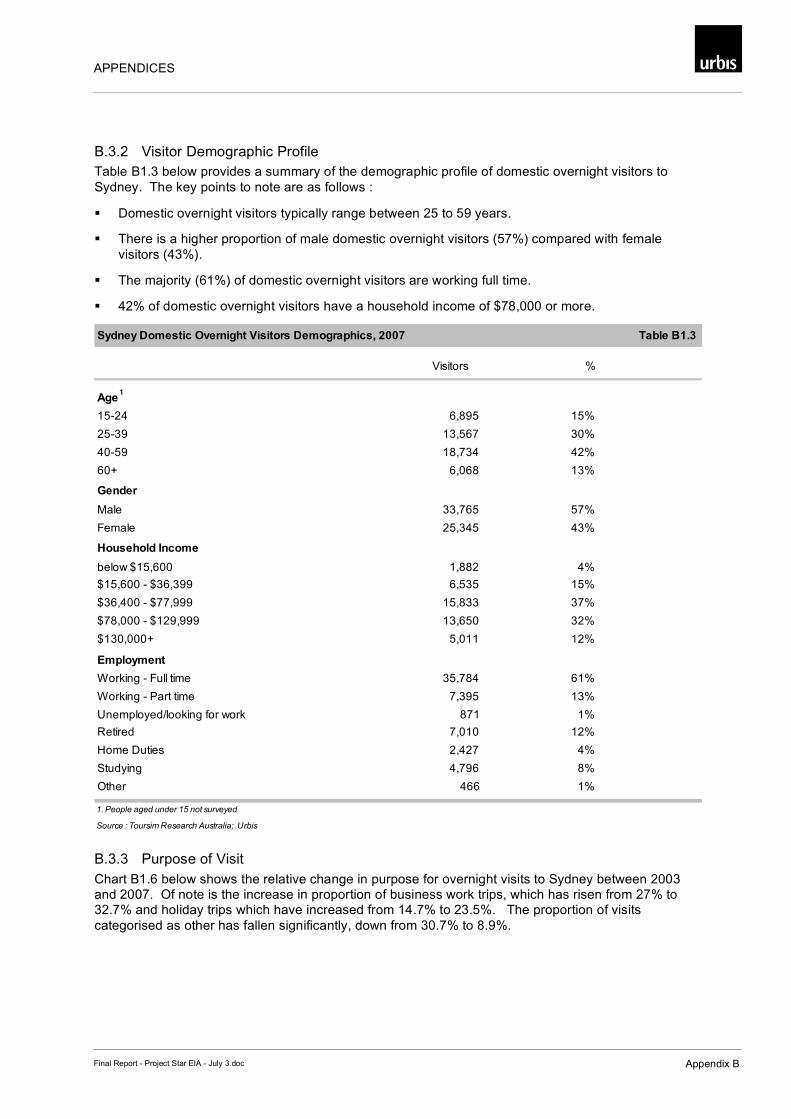
B.3.2 Visitor Demographic Profile Table B1.3 below provides a summary of the demographic profile of domestic overnight visitors to Sydney. The key points to note are as follows :
Domestic overnight visitors typically range between 25 to 59 years.
There is a higher proportion of male domestic overnight visitors (57%) compared with female visitors (43%).
The majority (61%) of domestic overnight visitors are working full time.
42% of domestic overnight visitors have a household income of $78,000 or more.
Sydney Domestic Overnight Visitors Demographics, 2007 Table B1.3
Visitors %
Age1
15-24 6,895 15%
25-39 13,567 30%
40-59 18,734 42%
60+ 6,068 13%
Gender
Male 33,765 57%
Female 25,345 43%
Household Income
below $15,600 1,882 4%
$15,600 - $36,399 6,535 15%
$36,400 - $77,999 15,833 37%
$78,000 - $129,999 13,650 32%
$130,000+ 5,011 12%
Employment
Working - Full time 35,784 61%
Working - Part time 7,395 13%
Unemployed/looking for work 871 1%
Retired 7,010 12%
Home Duties 2,427 4%
Studying 4,796 8%
Other 466 1%
1. People aged under 15 not surveyed
Source : Toursim Research Australia; Urbis
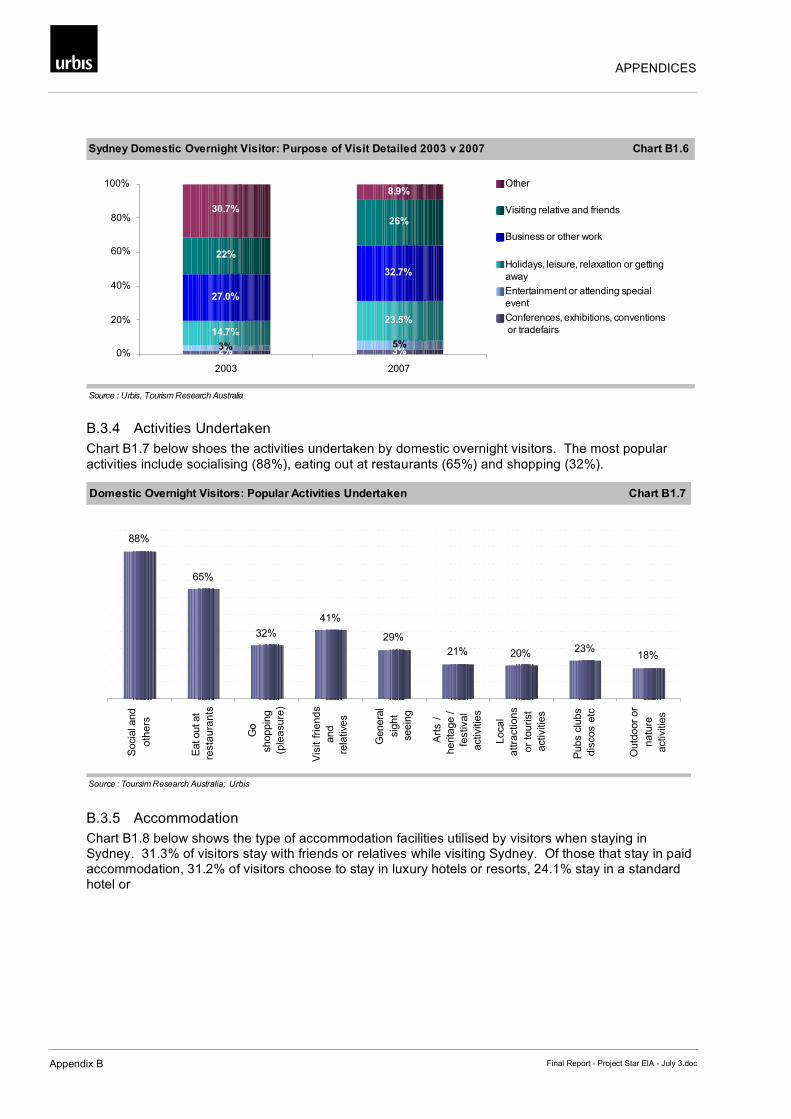
B.3.3 Purpose of Visit Chart B1.6 below shows the relative change in purpose for overnight visits to Sydney between 2003 and 2007. Of note is the increase in proportion of business work trips, which has risen from 27% to 32.7% and holiday trips which have increased from 14.7% to 23.5%. The proportion of visits categorised as other has fallen significantly, down from 30.7% to 8.9%.
APPENDICES
Appendix B Final Report - Project Star EIA - July 3.doc
Sydney Domestic Overnight Visitor: Purpose of Visit Detailed 2003 v 2007 Chart B1.6
Source : Urbis, Tourism Research Australia
2% 3%3% 5%
14.7%
23.5%
27.0%
32.7%
26%
8.9%
22%
30.7%
0%
20%
40%
60%
80%
100%
2003 2007
Other
Visiting relative and friends
Business or other work
Holidays, leisure, relaxation or getting
away
Entertainment or attending special
event
Conferences, exhibitions, conventions
or tradefairs
B.3.4 Activities Undertaken Chart B1.7 below shoes the activities undertaken by domestic overnight visitors. The most popular activities include socialising (88%), eating out at restaurants (65%) and shopping (32%).
Domestic Overnight Visitors: Popular Activities Undertaken Chart B1.7
Source : Toursim Research Australia; Urbis
88%
65%
32%
41%
29%
21% 20% 23%18%
Socia
l and
oth
ers
Eat out at
resta
ura
nts
Go
shoppin
g
(ple
asu
re)
Vis
it f
rie
nd
s
and
rela
tives
Genera
l
sig
ht
seein
g
Art
s /
herita
ge /
festiva
l
activitie
s
Local
att
ractio
ns
or
tou
rist
activitie
s
Pubs c
lubs
dis
co
s e
tc
Outd
oor
or
natu
re
activitie
s
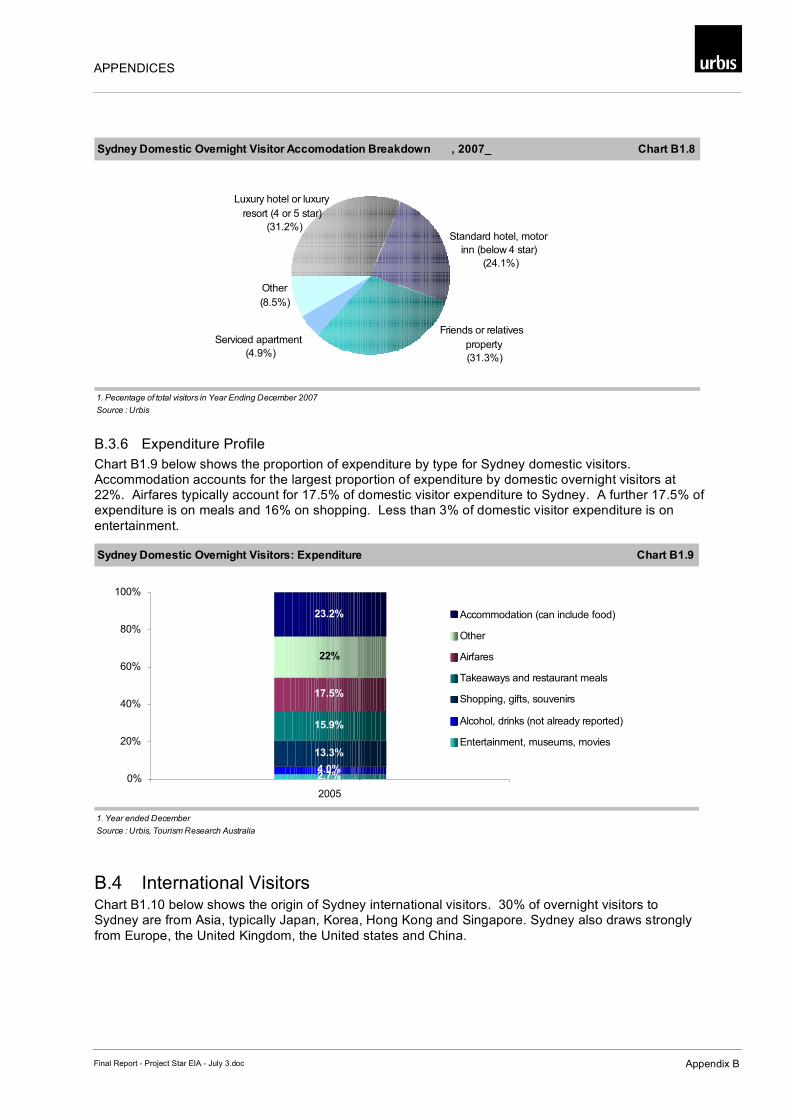
B.3.5 Accommodation Chart B1.8 below shows the type of accommodation facilities utilised by visitors when staying in Sydney. 31.3% of visitors stay with friends or relatives while visiting Sydney. Of those that stay in paid accommodation, 31.2% of visitors choose to stay in luxury hotels or resorts, 24.1% stay in a standard hotel or
APPENDICES
Final Report - Project Star EIA - July 3.doc Appendix B
Sydney Domestic Overnight Visitor Accomodation Breakdown , 2007_ Chart B1.8
1. Pecentage of total visitors in Year Ending December 2007
Source : Urbis
Serviced apartment
(4.9%)
Friends or relatives
property
(31.3%)
Standard hotel, motor
inn (below 4 star)
(24.1%)
Luxury hotel or luxury
resort (4 or 5 star)
(31.2%)
Other
(8.5%)
B.3.6 Expenditure Profile Chart B1.9 below shows the proportion of expenditure by type for Sydney domestic visitors. Accommodation accounts for the largest proportion of expenditure by domestic overnight visitors at 22%. Airfares typically account for 17.5% of domestic visitor expenditure to Sydney. A further 17.5% of expenditure is on meals and 16% on shopping. Less than 3% of domestic visitor expenditure is on entertainment.
Sydney Domestic Overnight Visitors: Expenditure Chart B1.9
1. Year ended December
Source : Urbis, Tourism Research Australia
2.7%4.0%
13.3%
22%
23.2%
15.9%
17.5%
0%
20%
40%
60%
80%
100%
2005
Accommodation (can include food)
Other
Airfares
Takeaways and restaurant meals
Shopping, gifts, souvenirs
Alcohol, drinks (not already reported)
Entertainment, museums, movies
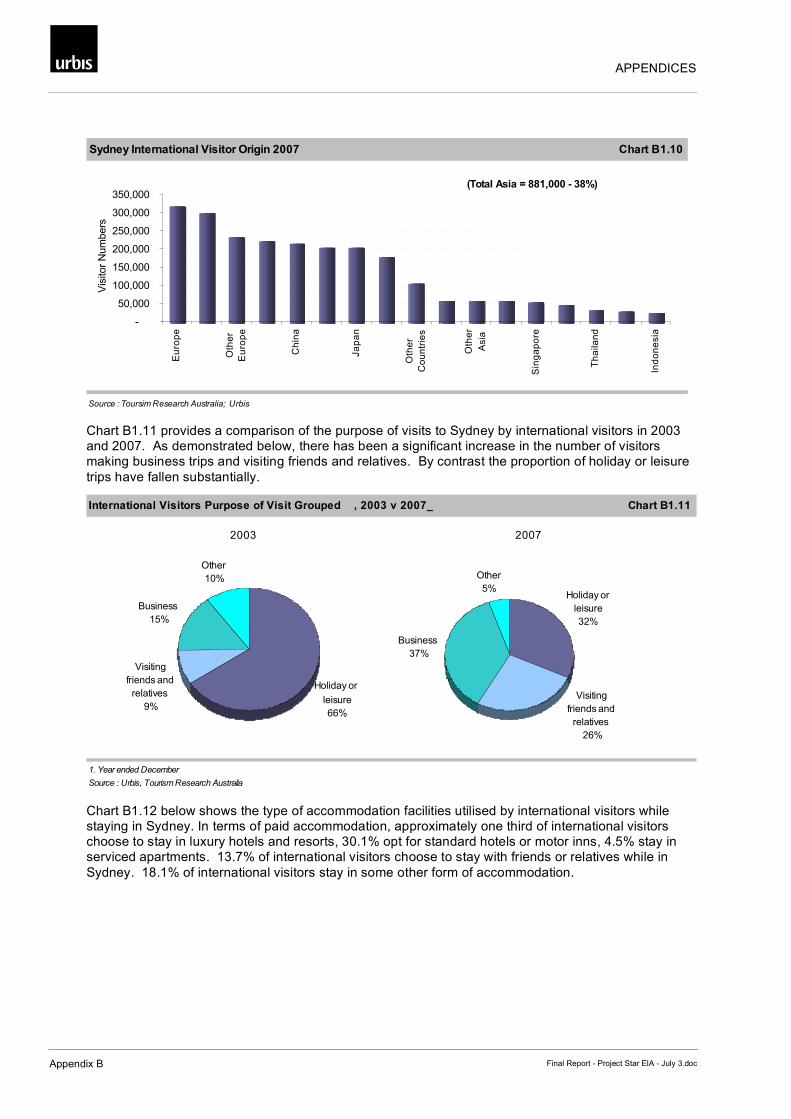
B.4 International Visitors Chart B1.10 below shows the origin of Sydney international visitors. 30% of overnight visitors to Sydney are from Asia, typically Japan, Korea, Hong Kong and Singapore. Sydney also draws strongly from Europe, the United Kingdom, the United states and China.
APPENDICES
Appendix B Final Report - Project Star EIA - July 3.doc
Sydney International Visitor Origin 2007 Chart B1.10
Source : Toursim Research Australia; Urbis
-
50,000
100,000
150,000
200,000
250,000
300,000
350,000
Eu
rop
e
Oth
er
Eu
rop
e
Ch
ina
Ja
pa
n
Oth
er
Co
un
trie
s
Oth
er
Asia
Sin
ga
po
re
Th
aila
nd
Ind
on
esia
Vis
itor
Num
bers
(Total Asia = 881,000 - 38%)
Chart B1.11 provides a comparison of the purpose of visits to Sydney by international visitors in 2003 and 2007. As demonstrated below, there has been a significant increase in the number of visitors making business trips and visiting friends and relatives. By contrast the proportion of holiday or leisure trips have fallen substantially.
International Visitors Purpose of Visit Grouped , 2003 v 2007_ Chart B1.11
2003 2007
1. Year ended December
Source : Urbis, Tourism Research Australia
Holiday or
leisure
66%
Visiting
friends and
relatives
9%
Business
15%
Other
10%
Holiday or
leisure
32%
Business
37%
Other
5%
Visiting
friends and
relatives
26%
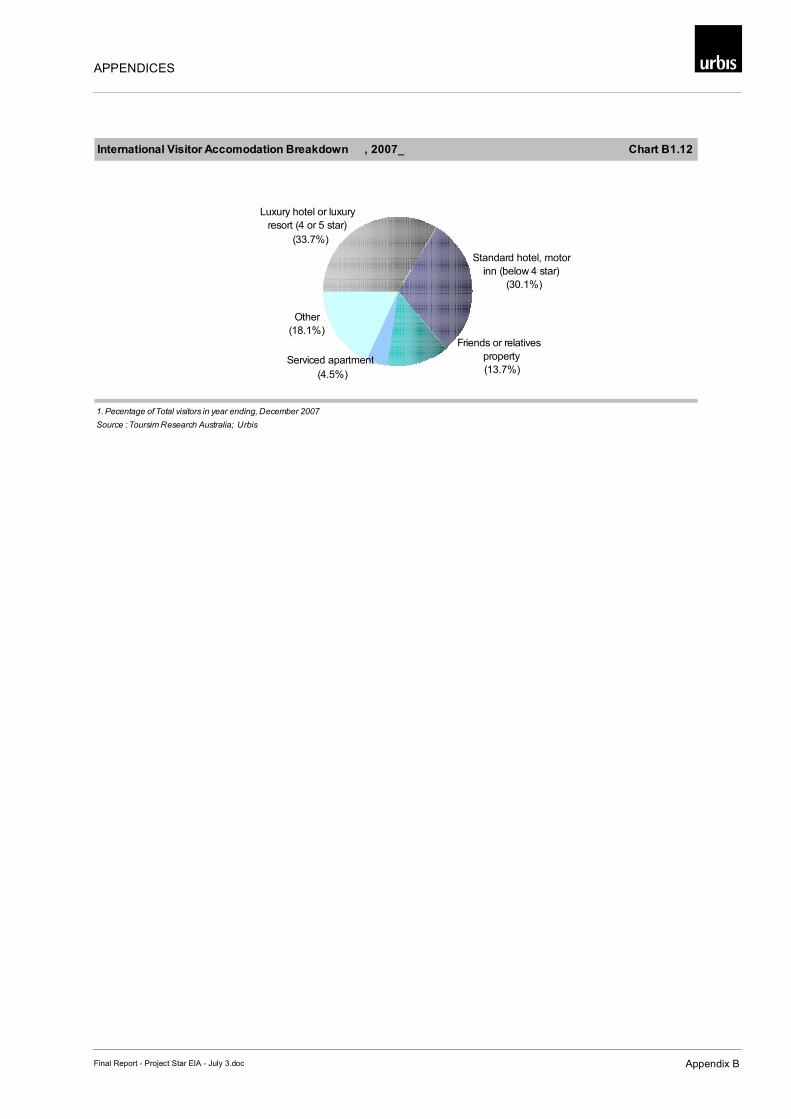
Chart B1.12 below shows the type of accommodation facilities utilised by international visitors while staying in Sydney. In terms of paid accommodation, approximately one third of international visitors choose to stay in luxury hotels and resorts, 30.1% opt for standard hotels or motor inns, 4.5% stay in serviced apartments. 13.7% of international visitors choose to stay with friends or relatives while in Sydney. 18.1% of international visitors stay in some other form of accommodation.
APPENDICES
Final Report - Project Star EIA - July 3.doc Appendix B
International Visitor Accomodation Breakdown , 2007_ Chart B1.12
1. Pecentage of Total visitors in year ending, December 2007
Source : Toursim Research Australia; Urbis
Serviced apartment
(4.5%)
Friends or relatives
property
(13.7%)
Standard hotel, motor
inn (below 4 star)
(30.1%)
Luxury hotel or luxury
resort (4 or 5 star)
(33.7%)
Other
(18.1%)
APPENDICES
Appendix C Final Report - Project Star EIA - July 3.doc
Appendix C Input – Output Analysis – General Comments
APPENDICES
Final Report - Project Star EIA - July 3.doc Appendix C
C.1 Input – Output Analysis – General Comments
Input-Output (I-O) analysis is a useful way of measuring the impact of economic shocks to a regional economy. I-O analysis requires the use of I-O tables for the defined region. Generating such tables is a complex, resource intensive process.
I-O tables are a snap-shot of an economy. They provide a detailed picture of the intermediate transactions in an economy, and describe the supply and use of the products for that economy. As such, they provide great detail on the workings of an economy, and the interrelationships between different industries, different segments of final demand (e.g. exports, households), and different sources of inputs (e.g. imports, labour).
When an individual industry changes its level of production, the impact is felt by all industries that are linked to that industry via supply or demand chains. By observing how each industry and segment of the economy is linked, it is possible to estimate how a shock that changes production in one industry impacts on the economy as a whole.
I-O Multipliers are a useful product of I-O tables. Multipliers are a simply way of showing the impact on one industry on the rest of the economy. Production multipliers show how much production is required throughout the entire economy to produce $1 worth of production in a single industry. Another useful multiplier is the employment multiplier – it shows how many jobs are required to produce $1 million in a single industry. For the purposes of this analysis we have utilised employment multipliers.
I-O employment multipliers are generally divided into four segments :
1. Initial Effects: The extra employment required to construct the facility.
2. First Round Effects: the amount of employment created in all industries of the economy to produce the goods required for the construction of the facility.
3. Industrial Support Effects: The first round output from all industries will induce output from all industries, and in turn, these will induce extra output, and so on. All of this extra output will require increased employment.
The first round effects and industrial support effects are cumulatively known as the production induced effects.
4. Consumption Induced Effects: The construction of the facility (initial effect) and the production induced output wage and salary earners will earn extra income which they will spend on commodities produced by all industries in the economy. This spending will induce further production in all industries. The required employment for this further induced production is the consumption induced output..
There are a few underlying assumptions when forecasting impacts using I-O analysis that need to be taken into account :
There is a fixed input structure in each industry, and all producers in an industry produce an identical product (or products in fixed proportions to each other). In reality, however, demand changes in one industry is likely to change the mix of goods demanded in other industries as relative prices of goods change.
Each industry exhibits constant returns to scale in production. That is, greater production can only be achieved by increasing demand for all inputs in fixed relative proportions. This is because I-O analysis only describes average effects, not marginal effects. In reality, industries are likely to be able to achieve economies of scale as they expand.
There is no restriction to the availability of labour or capital at a fixed price. Further, labour is assumed to have been idle prior to any economic shock, and not contributing to final demand. However :

APPENDICES
Appendix C Final Report - Project Star EIA - July 3.doc
− it is likely that some new labour demand resulting from an economic shock will be satisfied by labour that was previously employed (resulting in a zero net increase in employment).
− previously unemployed workers are likely to have been on some form of welfare, therefore contributing to final demand.
On average, these assumptions generally result in I-O analysis exaggerating the impact of an economic shocks, whether positive or negative. However, as long as these assumptions are kept in mind, I-O analysis is still a useful and illustrative tool for conducting economic analysis.