416.542.3024 toronto hydro-electric system limited 14
TRANSCRIPT
Daliana Coban
Director, Regulatory Applications Telephone: 416.542.2627
and Business Support Facsimile: 416.542.3024
Toronto Hydro-Electric System Limited
14 Carlton Street [email protected]
Toronto, ON M5B 1K5 www.torontohydro.com
February 12, 2020
Via RESS
Ms. Kirsten Walli
Board Secretary
Ontario Energy Board
PO Box 2319
2300 Yonge Street, 27th floor
Toronto, ON M4P 1E4
Dear Ms. Walli:
Re: EB-2018-0165, Toronto Hydro-Electric System Limited (“Toronto Hydro”), 2020-2024 Custom Incentive Rate-setting (“Custom IR”) Application – DRO Reply Submission & DRO Update
Please find enclosed Toronto Hydro’s Reply Submission to comments on the Draft Rate Order (“DRO”) and an updated DRO as noted in its January 21 and 28 letters. Physical copies will follow via courier.
The updated DRO reflects the Allowance for Funds Used During Construction (“AFUDC”) adjustment, as well as updated principal balances for three Group 2 accounts to reflect the most up-to-date year-end financial information consistent with the OEB’s Decision. Toronto Hydro notes that the changes to the updated balances are not significant and that the net result is a higher credit to customers.
As requested by the OEB’s letter dated February 5, 2020 Toronto Hydro included in the updated DRO the draft Tariffs for the unsmoothed option. In addition, in response to OEB Staff’s comments, Toronto Hydro updated the Group 2 DVA balances to include estimated carrying charges until the proposed disposition of the account.
For ease of reference, the updates to the DRO are summarized in Appendix A to this letter and are marked by /C in the attached DRO narrative.
Please contact me directly if you have any questions or concerns.
Respectfully,
Daliana Coban Director, Regulatory Applications and Business Support Toronto Hydro-Electric System Limited cc: Lawrie Gluck, OEB Case Manager Michael Millar, OEB Counsel
Parties of Record Amanda Klein, Toronto Hydro Charles Keizer, Torys LLP
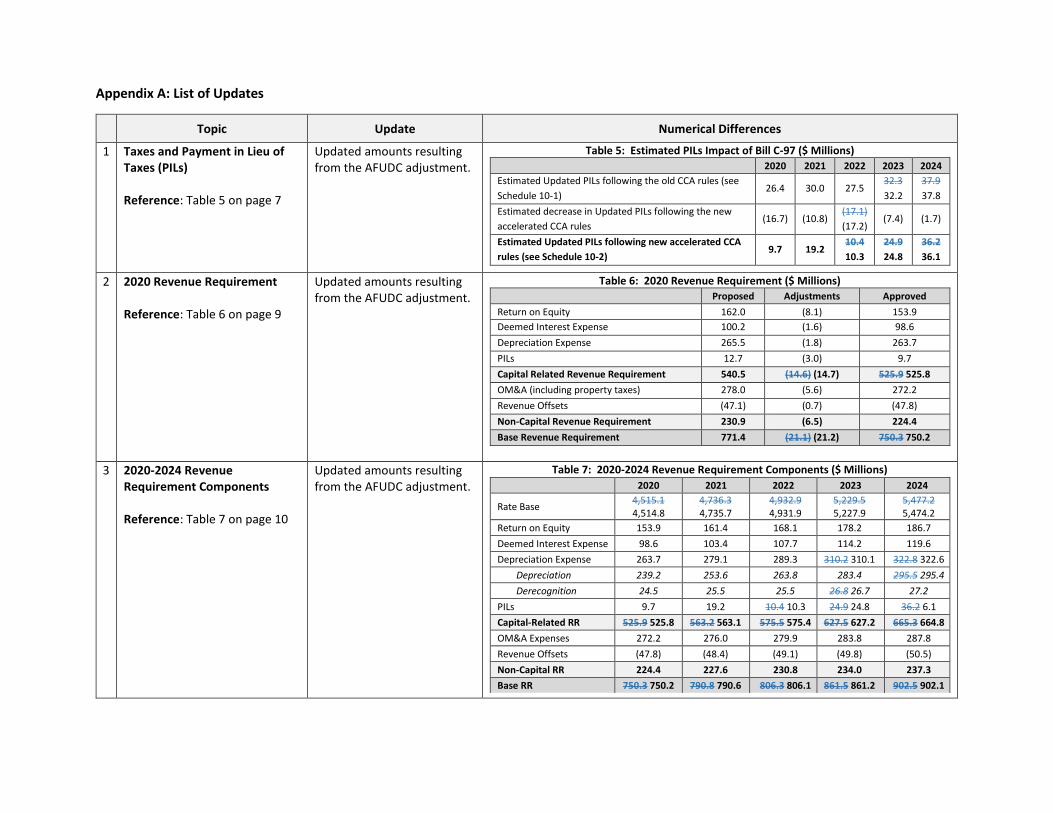
Appendix A: List of Updates
Topic Update Numerical Differences
1 Taxes and Payment in Lieu of Taxes (PILs) Reference: Table 5 on page 7
Updated amounts resulting from the AFUDC adjustment.
Table 5: Estimated PILs Impact of Bill C-97 ($ Millions) 2020 2021 2022 2023 2024
Estimated Updated PILs following the old CCA rules (see
Schedule 10-1) 26.4 30.0 27.5
32.3
32.2
37.9
37.8
Estimated decrease in Updated PILs following the new
accelerated CCA rules (16.7) (10.8)
(17.1)
(17.2) (7.4) (1.7)
Estimated Updated PILs following new accelerated CCA
rules (see Schedule 10-2) 9.7 19.2
10.4
10.3
24.9
24.8
36.2
36.1
2 2020 Revenue Requirement Reference: Table 6 on page 9
Updated amounts resulting from the AFUDC adjustment.
Table 6: 2020 Revenue Requirement ($ Millions)
Proposed Adjustments Approved
Return on Equity 162.0 (8.1) 153.9
Deemed Interest Expense 100.2 (1.6) 98.6
Depreciation Expense 265.5 (1.8) 263.7
PILs 12.7 (3.0) 9.7
Capital Related Revenue Requirement 540.5 (14.6) (14.7) 525.9 525.8
OM&A (including property taxes) 278.0 (5.6) 272.2
Revenue Offsets (47.1) (0.7) (47.8)
Non-Capital Revenue Requirement 230.9 (6.5) 224.4
Base Revenue Requirement 771.4 (21.1) (21.2) 750.3 750.2
3 2020-2024 Revenue Requirement Components Reference: Table 7 on page 10
Updated amounts resulting from the AFUDC adjustment.
Table 7: 2020-2024 Revenue Requirement Components ($ Millions)
2020 2021 2022 2023 2024
Rate Base 4,515.1 4,514.8
4,736.3 4,735.7
4,932.9 4,931.9
5,229.5 5,227.9
5,477.2 5,474.2
Return on Equity 153.9 161.4 168.1 178.2 186.7
Deemed Interest Expense 98.6 103.4 107.7 114.2 119.6
Depreciation Expense 263.7 279.1 289.3 310.2 310.1 322.8 322.6
Depreciation 239.2 253.6 263.8 283.4 295.5 295.4
Derecognition 24.5 25.5 25.5 26.8 26.7 27.2
PILs 9.7 19.2 10.4 10.3 24.9 24.8 36.2 6.1
Capital-Related RR 525.9 525.8 563.2 563.1 575.5 575.4 627.5 627.2 665.3 664.8
OM&A Expenses 272.2 276.0 279.9 283.8 287.8
Revenue Offsets (47.8) (48.4) (49.1) (49.8) (50.5)
Non-Capital RR 224.4 227.6 230.8 234.0 237.3
Base RR 750.3 750.2 790.8 790.6 806.3 806.1 861.5 861.2 902.5 902.1
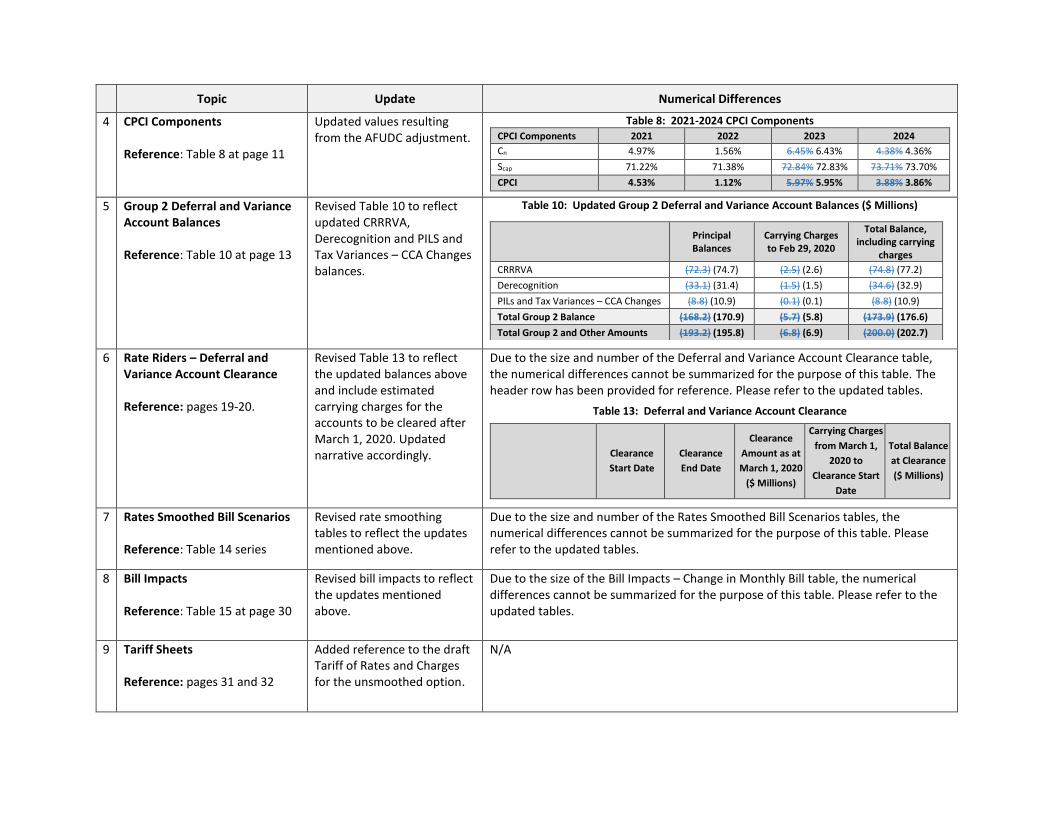
Topic Update Numerical Differences
4 CPCI Components Reference: Table 8 at page 11
Updated values resulting from the AFUDC adjustment.
Table 8: 2021-2024 CPCI Components
CPCI Components 2021 2022 2023 2024
Cn 4.97% 1.56% 6.45% 6.43% 4.38% 4.36%
Scap 71.22% 71.38% 72.84% 72.83% 73.71% 73.70%
CPCI 4.53% 1.12% 5.97% 5.95% 3.88% 3.86%
5 Group 2 Deferral and Variance Account Balances Reference: Table 10 at page 13
Revised Table 10 to reflect updated CRRRVA, Derecognition and PILS and Tax Variances – CCA Changes balances.
Table 10: Updated Group 2 Deferral and Variance Account Balances ($ Millions)
Principal Balances
Carrying Charges to Feb 29, 2020
Total Balance, including carrying
charges
CRRRVA (72.3) (74.7) (2.5) (2.6) (74.8) (77.2)
Derecognition (33.1) (31.4) (1.5) (1.5) (34.6) (32.9)
PILs and Tax Variances – CCA Changes (8.8) (10.9) (0.1) (0.1) (8.8) (10.9)
Total Group 2 Balance (168.2) (170.9) (5.7) (5.8) (173.9) (176.6)
Total Group 2 and Other Amounts (193.2) (195.8) (6.8) (6.9) (200.0) (202.7)
6 Rate Riders – Deferral and Variance Account Clearance Reference: pages 19-20.
Revised Table 13 to reflect the updated balances above and include estimated carrying charges for the accounts to be cleared after March 1, 2020. Updated narrative accordingly.
Due to the size and number of the Deferral and Variance Account Clearance table, the numerical differences cannot be summarized for the purpose of this table. The header row has been provided for reference. Please refer to the updated tables.
Table 13: Deferral and Variance Account Clearance
Clearance
Start Date
Clearance
End Date
Clearance
Amount as at
March 1, 2020
($ Millions)
Carrying Charges
from March 1,
2020 to
Clearance Start
Date
Total Balance
at Clearance
($ Millions)
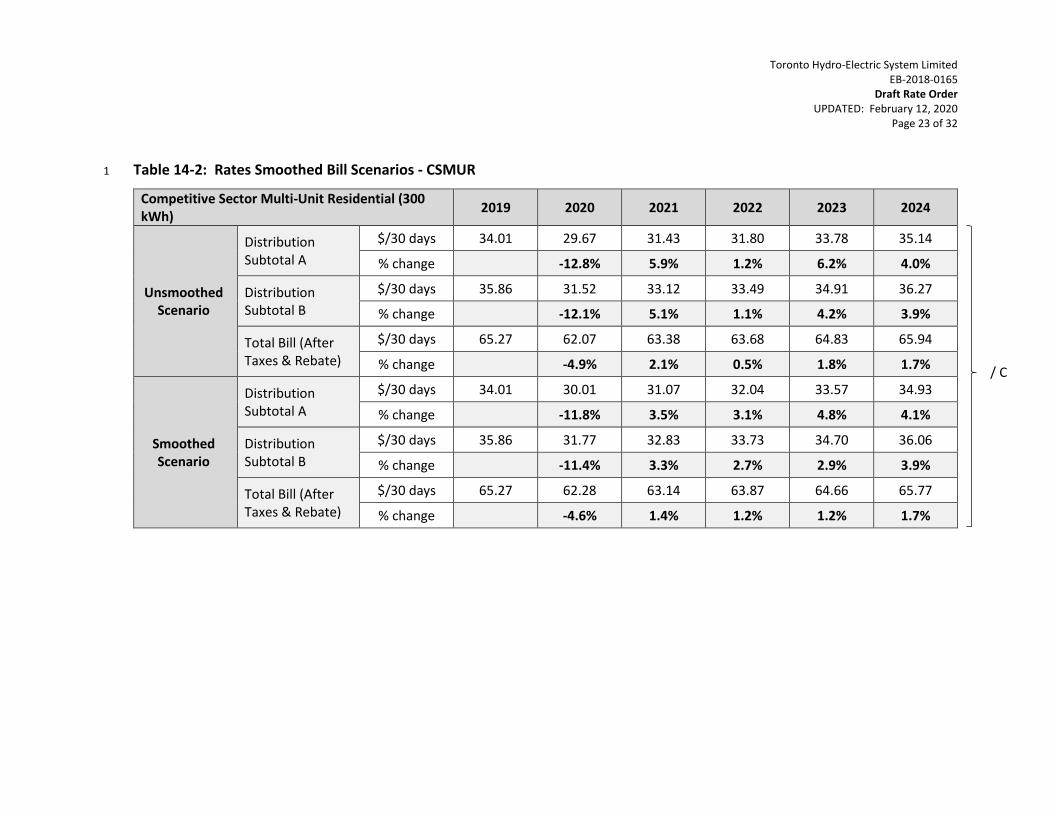
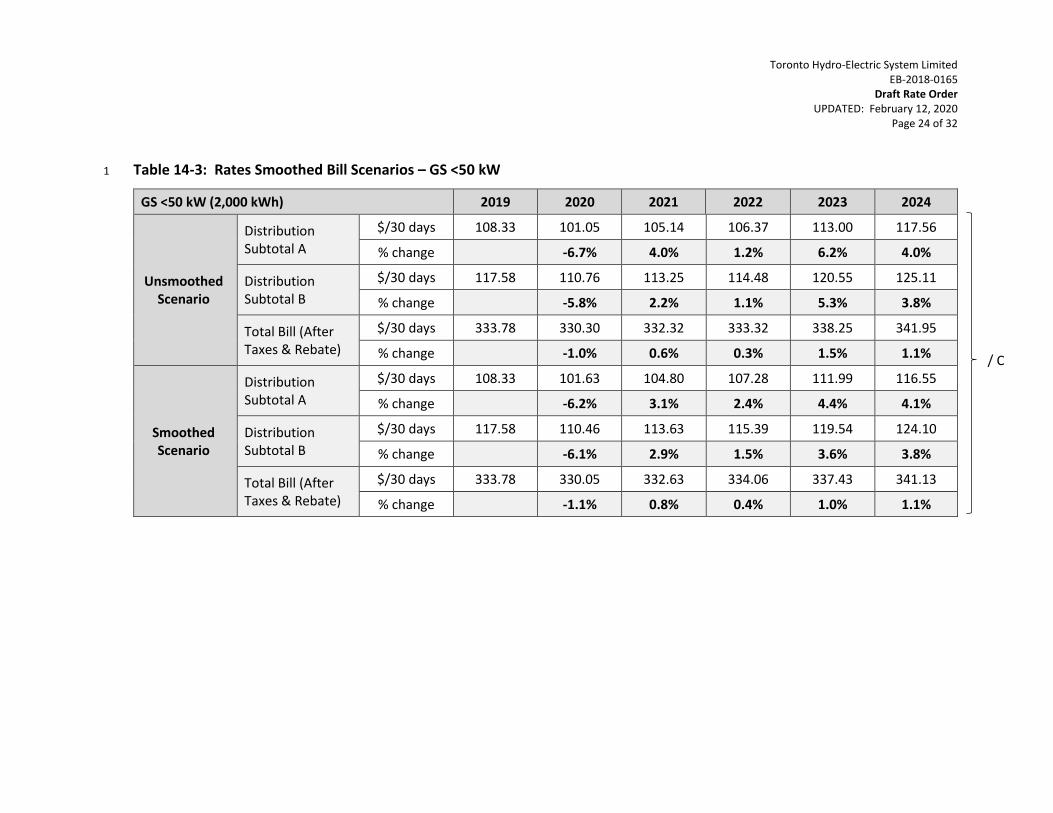
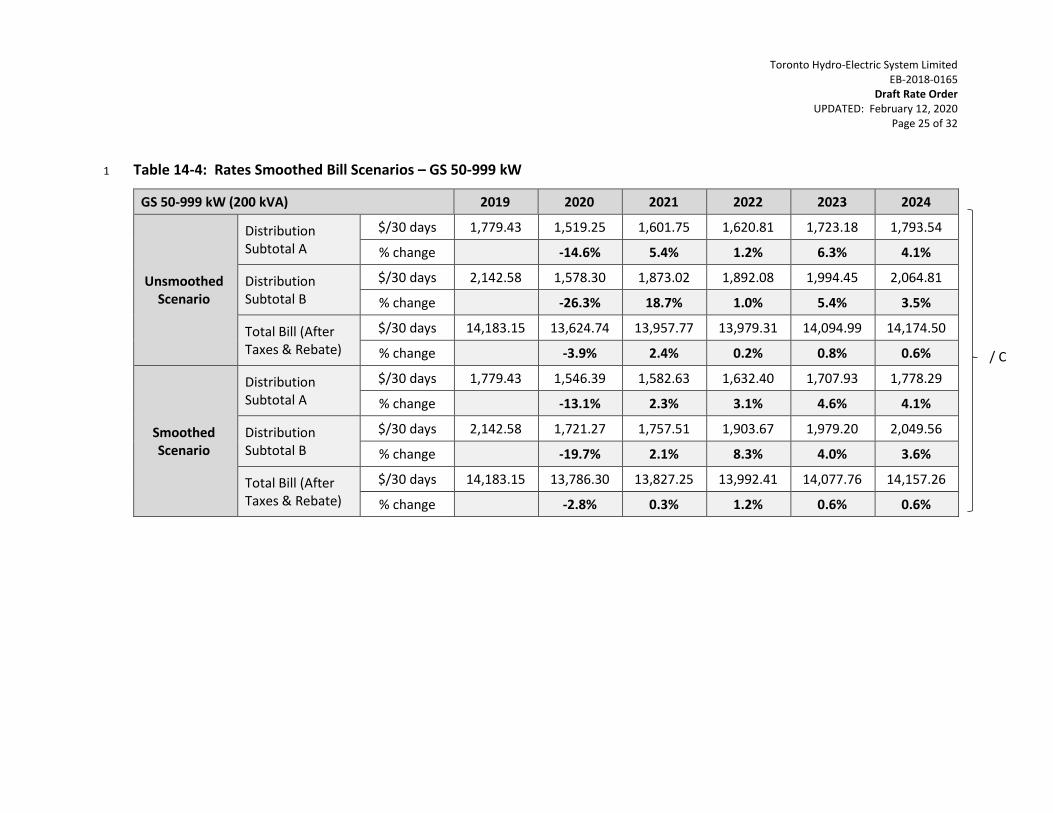
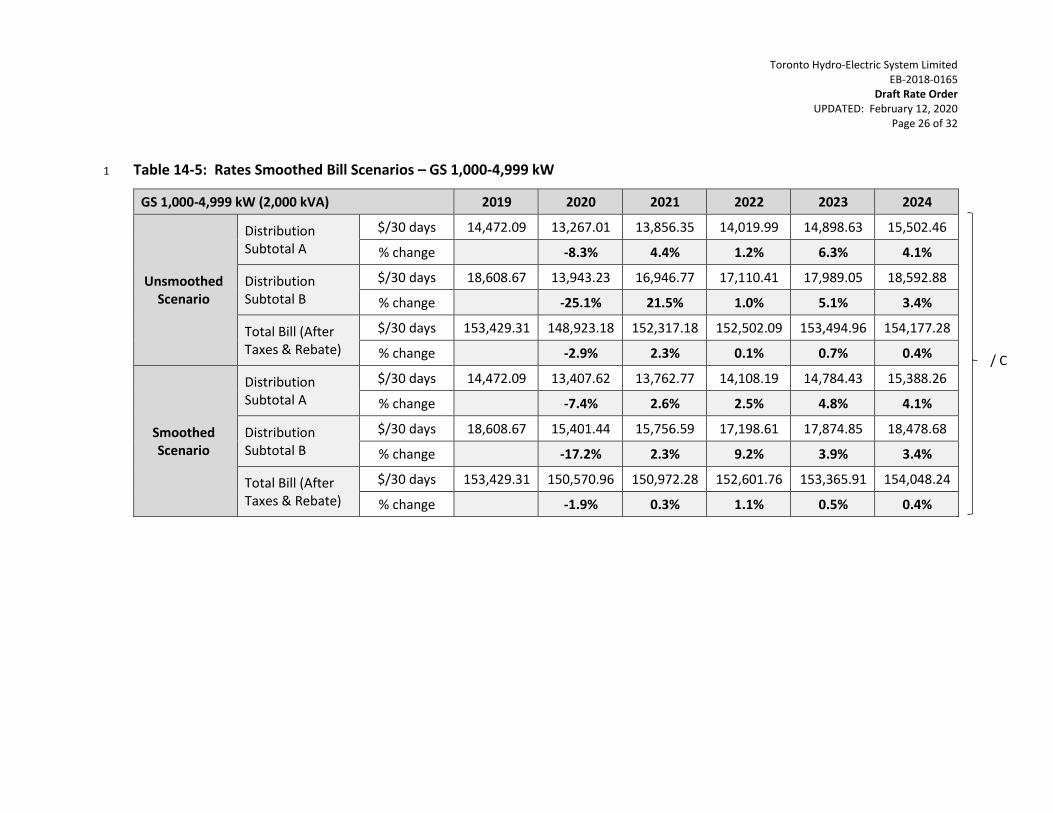
7 Rates Smoothed Bill Scenarios Reference: Table 14 series
Revised rate smoothing tables to reflect the updates mentioned above.
Due to the size and number of the Rates Smoothed Bill Scenarios tables, the numerical differences cannot be summarized for the purpose of this table. Please refer to the updated tables.
8 Bill Impacts Reference: Table 15 at page 30
Revised bill impacts to reflect the updates mentioned above.
Due to the size of the Bill Impacts – Change in Monthly Bill table, the numerical differences cannot be summarized for the purpose of this table. Please refer to the updated tables.
9 Tariff Sheets Reference: pages 31 and 32
Added reference to the draft Tariff of Rates and Charges for the unsmoothed option.
N/A
Daliana Coban
Director, Regulatory Applications Telephone: 416.542.2627
and Business Support Facsimile: 416.542.3024
Toronto Hydro-Electric System Limited
14 Carlton Street [email protected]
Toronto, ON M5B 1K5 www.torontohydro.com
January 28, 2020
Via RESS
Ms. Kirsten Walli
Board Secretary
Ontario Energy Board
PO Box 2319
2300 Yonge Street, 27th floor
Toronto, ON M4P 1E4
Dear Ms. Walli:
Re: EB-2018-0165, Toronto Hydro-Electric System Limited (“Toronto Hydro”), Custom Incentive Rate-setting (“Custom IR”) Application for 2020-2024 Electricity Distribution Rates and Charges – Draft Rate Order Narrative Update
On January 21, 2020, Toronto Hydro filed its Draft Rate Order (“DRO”) pursuant to the timelines set out in the OEB’s Decision and Order issued on December 19, 2019. At the request of OEB Staff, Toronto Hydro is filing a minor update to the DRO Narrative to clarify the items summarized in Table 1 below. For ease of reference, the updated parts of the DRO narrative are marked by /C. Physical copies of the updated DRO will follow via courier. Table 1: List of Updates
Topic Update Reference
1 In-Service Additions (“ISAs”) Statement confirming the methodology for calculating adjusted ISAs.
Page 4
2 Renewable Enabling Improvements (“REI”)
Clarification that the updated REI revenue requirement is based on in-service additions.
Page 5
3 Depreciation and Amortization Expense
Breakdown of the adjusted depreciation expense into depreciation and derecognition amounts.
Page 6 and Table 7 on Page 10
4 Updated Group 2 Deferral and Variance Account Balances
Variance explanation for the Capital Related Revenue Requirement Variance Account balance.
Page 13
page 2
Intention to File Updates to Forecast Group 2 DVA Balances In its Decision and Order, the OEB directed Toronto Hydro to update the forecasted Group 2 Deferral and Variance Account balances. Toronto Hydro filed this information in the January 21 DRO based on the best available forecasts as of mid-December 2019. Since then, Toronto Hydro obtained more up-to-date information through its year-end close-out process, and as a result the utility expects that the 2019 in-service additions are lower than forecasted as part of the DRO. Toronto Hydro intends to update the CRRRVA and Derecognition balances accordingly in its Reply Submission which will be filed on February 10, 2020. Please contact me directly if you have any questions or concerns. Respectfully,
Daliana Coban Director, Regulatory Applications and Business Support Toronto Hydro-Electric System Limited cc: Lawrie Gluck, OEB Case Manager Michael Millar, OEB Counsel
Parties of Record Amanda Klein, Toronto Hydro Andrew Sasso, Toronto Hydro Charles Keizer, Torys LLP
Daliana Coban
Director, Regulatory Applications Telephone: 416.542.2627
and Business Support Facsimile: 416.542.3024
Toronto Hydro-Electric System Limited
14 Carlton Street [email protected]
Toronto, ON M5B 1K5 www.torontohydro.com
January 21, 2020
Via RESS
Ms. Kirsten Walli
Board Secretary
Ontario Energy Board
PO Box 2319
2300 Yonge Street, 27th floor
Toronto, ON M4P 1E4
Dear Ms. Walli:
Re: EB-2018-0165, Toronto Hydro-Electric System Limited (“Toronto Hydro”), Custom Incentive Rate-setting (“Custom IR”) Application for 2020-2024 Electricity Distribution Rates and Charges – Draft Rate Order
Further to the OEB’s Decision and Order dated December 19, 2019, please find enclosed Toronto Hydro’s draft rate order. Physical copies will follow via courier. Toronto Hydro notes that due to a late correction to the recalculation of the Allowance for Funds Used During Construction (“AFUDC”) it was not able to implement all of the ADUFC adjustments in the revenue requirement calculation. The estimated impact of the outstanding AFUDC adjustment is an additional $0.9 million reduction to the five-year capital related revenue requirement. Toronto Hydro intends to update all relevant schedules in the final rate order to reflect this adjustment. Please contact me directly if you have any questions or concerns. Respectfully,
Daliana Coban Director, Regulatory Applications and Business Support Toronto Hydro-Electric System Limited cc: Lawrie Gluck, OEB Case Manager Michael Millar, OEB Counsel
Parties of Record Amanda Klein, Toronto Hydro Andrew Sasso, Toronto Hydro Charles Keizer, Torys LLP
IN THE MATTER OF the Ontario Energy Board Act, 1998, Schedule B to
the Energy Competition Act, 1998, S.O. 1998, c.15;
AND IN THE MATTER OF an Application by Toronto Hydro-Electric
System Limited for an Order or Orders approving or fixing just and
reasonable distribution rates and other charges, effective January 1,
2020 to December 31, 2024.
TORONTO HYDRO-ELECTRIC SYSTEM LIMITED
DRAFT RATE ORDER UPDATE
OEB FILE NO. EB-2018-0165
FEBRUARY 12, 2020
Toronto Hydro-Electric System Limited EB-2018-0165
Draft Rate Order UPDATED: February 12, 2020
Page 1 of 32
1. INTRODUCTION 1
Toronto Hydro-Electric System Limited (“Toronto Hydro”) filed an application with the 2
Ontario Energy Board (the “OEB”) under section 78 of the Ontario Energy Board Act, 3
1998, S.O. c.15, Schedule B, for approval of: (1) electricity distribution rates and other 4
charges effective January 1, 2020; and (2) Custom Price Cap Index framework to set 5
distribution rates effective for the period January 1, 2020 to December 31, 2024, and the 6
rates and charges resulting from it (the “Application”).1 The OEB assigned file number EB-7
2018-0165 to the Application. 8
9
On December 19, 2019, the OEB released its decision on the Application (the “Decision”).2 10
The OEB approved an effective date of January 1, 2020 for new rates with an 11
implementation date of March 1, 2020.3 Rates for 2021-2024 will be determined through 12
the annual rate update process on the basis of the approved Custom Price Cap Index.4 13
14
The OEB directed Toronto Hydro to file by January 21, 2020 a detailed draft rate order 15
that reflects the OEB’s findings in the Decision and that includes the information 16
prescribed in section 11 of the Decision.5 This Draft Rate Order (the “DRO”) implements 17
the Decision as directed by the OEB. 18
19
2. DETERMINATION OF 2020 REVENUE REQUIREMENT 20
The OEB approved Toronto Hydro’s application for recovery of its forecasted 2020 21
revenue requirement, subject to the following funding adjustments: 22
• Application of the average of monthly averages approach for the 2020-2024 rate 23
base calculation. 6 24
1 EB-2018-0165, Toronto Hydro-Electric System Limited Application (Filed: August 15, 2018). 2 EB-2018-0165, Decision and Order (December 19, 2019). 3 EB-2018-0165, Decision and Order (December 19, 2019) at pages 11-12. 4 EB-2018-0165, Decision and Order (December 19, 2019) at pages 23-24. 5 EB-2018-0165, Decision and Order (December 19, 2019) at pages 201-202. 6 EB-2018-0165, Decision and Order (December 19, 2019) at page 57.
Toronto Hydro-Electric System Limited EB-2018-0165
Draft Rate Order UPDATED: February 12, 2020
Page 2 of 32
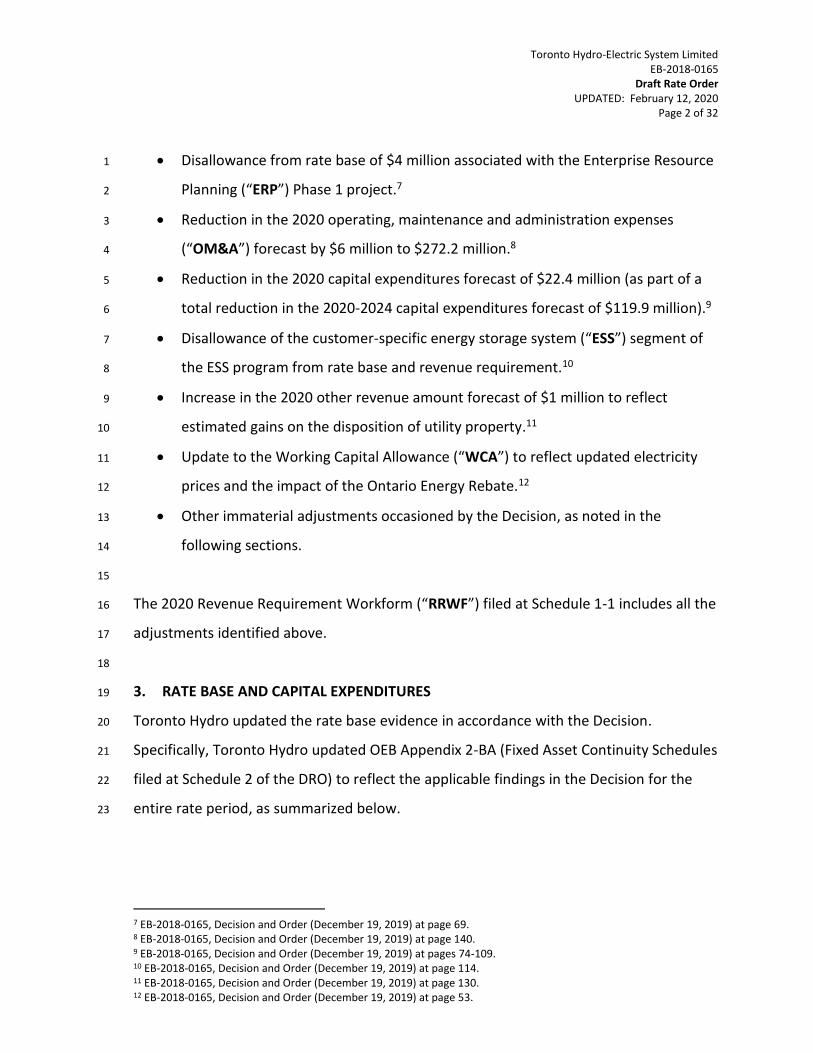
• Disallowance from rate base of $4 million associated with the Enterprise Resource 1
Planning (“ERP”) Phase 1 project.7 2
• Reduction in the 2020 operating, maintenance and administration expenses 3
(“OM&A”) forecast by $6 million to $272.2 million.8 4
• Reduction in the 2020 capital expenditures forecast of $22.4 million (as part of a 5
total reduction in the 2020-2024 capital expenditures forecast of $119.9 million).9 6
• Disallowance of the customer-specific energy storage system (“ESS”) segment of 7
the ESS program from rate base and revenue requirement.10 8
• Increase in the 2020 other revenue amount forecast of $1 million to reflect 9
estimated gains on the disposition of utility property.11 10
• Update to the Working Capital Allowance (“WCA”) to reflect updated electricity 11
prices and the impact of the Ontario Energy Rebate.12 12
• Other immaterial adjustments occasioned by the Decision, as noted in the 13
following sections. 14
15
The 2020 Revenue Requirement Workform (“RRWF”) filed at Schedule 1-1 includes all the 16
adjustments identified above. 17
18
3. RATE BASE AND CAPITAL EXPENDITURES 19
Toronto Hydro updated the rate base evidence in accordance with the Decision. 20
Specifically, Toronto Hydro updated OEB Appendix 2-BA (Fixed Asset Continuity Schedules 21
filed at Schedule 2 of the DRO) to reflect the applicable findings in the Decision for the 22
entire rate period, as summarized below. 23
7 EB-2018-0165, Decision and Order (December 19, 2019) at page 69. 8 EB-2018-0165, Decision and Order (December 19, 2019) at page 140. 9 EB-2018-0165, Decision and Order (December 19, 2019) at pages 74-109. 10 EB-2018-0165, Decision and Order (December 19, 2019) at page 114. 11 EB-2018-0165, Decision and Order (December 19, 2019) at page 130. 12 EB-2018-0165, Decision and Order (December 19, 2019) at page 53.
Toronto Hydro-Electric System Limited EB-2018-0165
Draft Rate Order UPDATED: February 12, 2020
Page 3 of 32
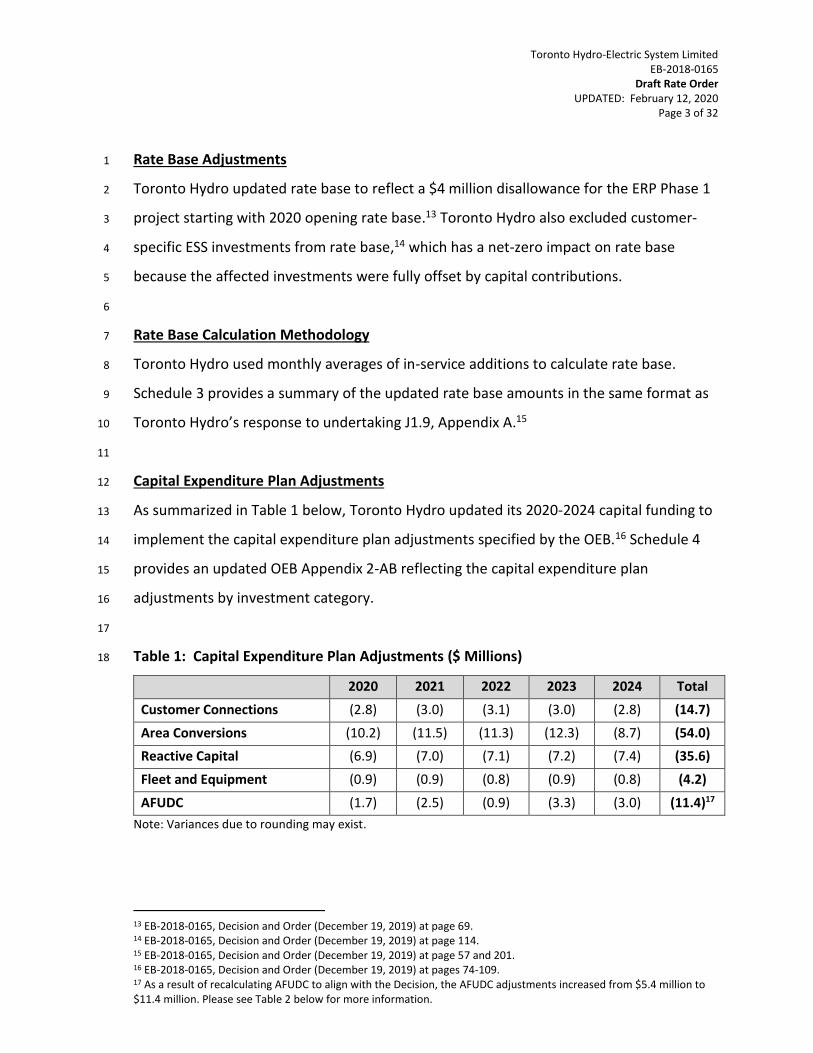
Rate Base Adjustments 1
Toronto Hydro updated rate base to reflect a $4 million disallowance for the ERP Phase 1 2
project starting with 2020 opening rate base.13 Toronto Hydro also excluded customer-3
specific ESS investments from rate base,14 which has a net-zero impact on rate base 4
because the affected investments were fully offset by capital contributions. 5
6
Rate Base Calculation Methodology 7
Toronto Hydro used monthly averages of in-service additions to calculate rate base. 8
Schedule 3 provides a summary of the updated rate base amounts in the same format as 9
Toronto Hydro’s response to undertaking J1.9, Appendix A.15 10
11
Capital Expenditure Plan Adjustments 12
As summarized in Table 1 below, Toronto Hydro updated its 2020-2024 capital funding to 13
implement the capital expenditure plan adjustments specified by the OEB.16 Schedule 4 14
provides an updated OEB Appendix 2-AB reflecting the capital expenditure plan 15
adjustments by investment category. 16
17
Table 1: Capital Expenditure Plan Adjustments ($ Millions) 18
2020 2021 2022 2023 2024 Total
Customer Connections (2.8) (3.0) (3.1) (3.0) (2.8) (14.7)
Area Conversions (10.2) (11.5) (11.3) (12.3) (8.7) (54.0)
Reactive Capital (6.9) (7.0) (7.1) (7.2) (7.4) (35.6)
Fleet and Equipment (0.9) (0.9) (0.8) (0.9) (0.8) (4.2)
AFUDC (1.7) (2.5) (0.9) (3.3) (3.0) (11.4)17
Note: Variances due to rounding may exist.
13 EB-2018-0165, Decision and Order (December 19, 2019) at page 69. 14 EB-2018-0165, Decision and Order (December 19, 2019) at page 114. 15 EB-2018-0165, Decision and Order (December 19, 2019) at page 57 and 201. 16 EB-2018-0165, Decision and Order (December 19, 2019) at pages 74-109. 17 As a result of recalculating AFUDC to align with the Decision, the AFUDC adjustments increased from $5.4 million to $11.4 million. Please see Table 2 below for more information.
Toronto Hydro-Electric System Limited EB-2018-0165
Draft Rate Order UPDATED: February 12, 2020
Page 4 of 32
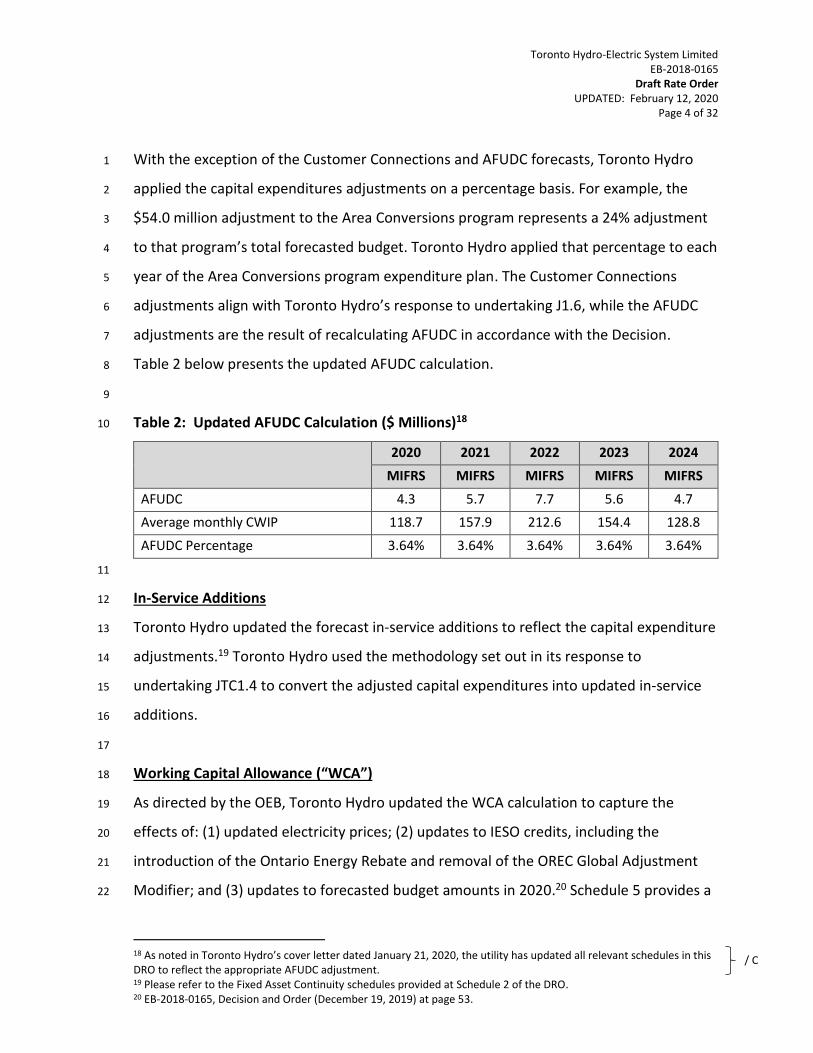
With the exception of the Customer Connections and AFUDC forecasts, Toronto Hydro 1
applied the capital expenditures adjustments on a percentage basis. For example, the 2
$54.0 million adjustment to the Area Conversions program represents a 24% adjustment 3
to that program’s total forecasted budget. Toronto Hydro applied that percentage to each 4
year of the Area Conversions program expenditure plan. The Customer Connections 5
adjustments align with Toronto Hydro’s response to undertaking J1.6, while the AFUDC 6
adjustments are the result of recalculating AFUDC in accordance with the Decision. 7
Table 2 below presents the updated AFUDC calculation. 8
9
Table 2: Updated AFUDC Calculation ($ Millions)18 10
2020 2021 2022 2023 2024
MIFRS MIFRS MIFRS MIFRS MIFRS
AFUDC 4.3 5.7 7.7 5.6 4.7
Average monthly CWIP 118.7 157.9 212.6 154.4 128.8
AFUDC Percentage 3.64% 3.64% 3.64% 3.64% 3.64%
11
In-Service Additions 12
Toronto Hydro updated the forecast in-service additions to reflect the capital expenditure 13
adjustments.19 Toronto Hydro used the methodology set out in its response to 14
undertaking JTC1.4 to convert the adjusted capital expenditures into updated in-service 15
additions. 16
17
Working Capital Allowance (“WCA”) 18
As directed by the OEB, Toronto Hydro updated the WCA calculation to capture the 19
effects of: (1) updated electricity prices; (2) updates to IESO credits, including the 20
introduction of the Ontario Energy Rebate and removal of the OREC Global Adjustment 21
Modifier; and (3) updates to forecasted budget amounts in 2020.20 Schedule 5 provides a22
18 As noted in Toronto Hydro’s cover letter dated January 21, 2020, the utility has updated all relevant schedules in this DRO to reflect the appropriate AFUDC adjustment. 19 Please refer to the Fixed Asset Continuity schedules provided at Schedule 2 of the DRO. 20 EB-2018-0165, Decision and Order (December 19, 2019) at page 53.
/ C
Toronto Hydro-Electric System Limited EB-2018-0165
Draft Rate Order UPDATED: February 12, 2020
Page 5 of 32
supporting addendum to the Navigant Working Capital Requirements Report originally 1
filed at Exhibit 2A, Tab 3, Schedule 2. 2
3
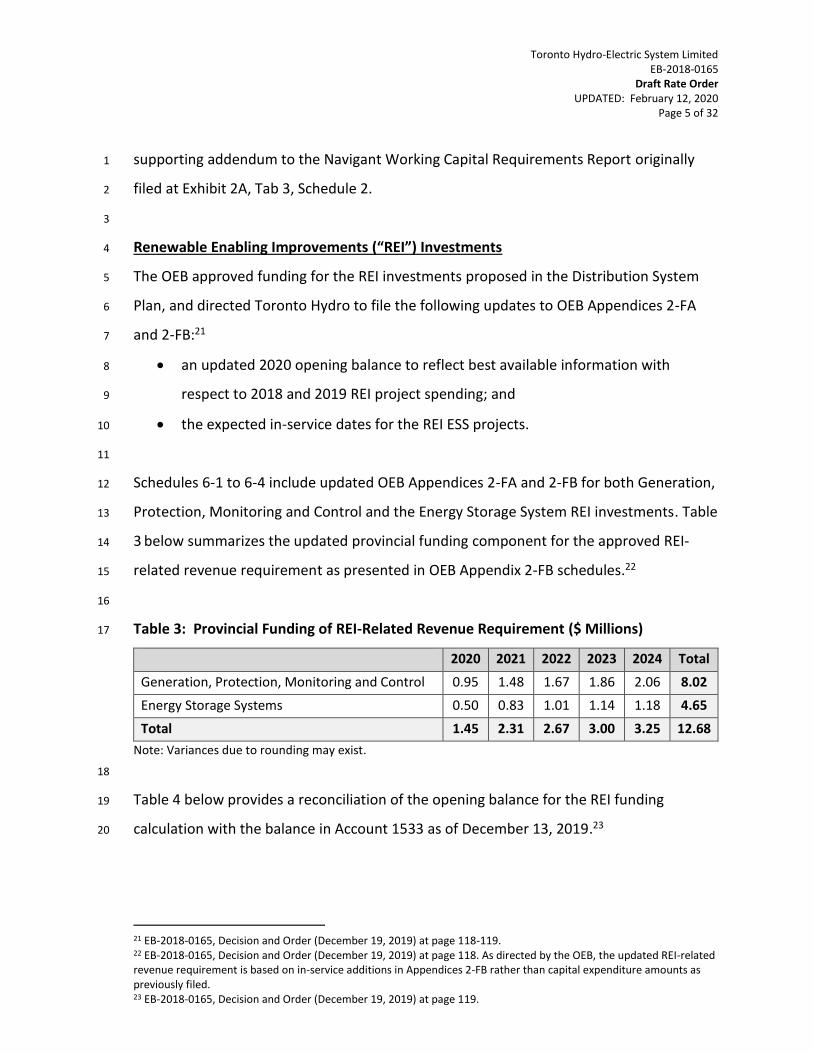
Renewable Enabling Improvements (“REI”) Investments 4
The OEB approved funding for the REI investments proposed in the Distribution System 5
Plan, and directed Toronto Hydro to file the following updates to OEB Appendices 2-FA 6
and 2-FB:21 7
• an updated 2020 opening balance to reflect best available information with 8
respect to 2018 and 2019 REI project spending; and 9
• the expected in-service dates for the REI ESS projects. 10
11
Schedules 6-1 to 6-4 include updated OEB Appendices 2-FA and 2-FB for both Generation, 12
Protection, Monitoring and Control and the Energy Storage System REI investments. Table 13
3 below summarizes the updated provincial funding component for the approved REI-14
related revenue requirement as presented in OEB Appendix 2-FB schedules.22 15
16
Table 3: Provincial Funding of REI-Related Revenue Requirement ($ Millions) 17
2020 2021 2022 2023 2024 Total
Generation, Protection, Monitoring and Control 0.95 1.48 1.67 1.86 2.06 8.02
Energy Storage Systems 0.50 0.83 1.01 1.14 1.18 4.65
Total 1.45 2.31 2.67 3.00 3.25 12.68
Note: Variances due to rounding may exist.
18
Table 4 below provides a reconciliation of the opening balance for the REI funding 19
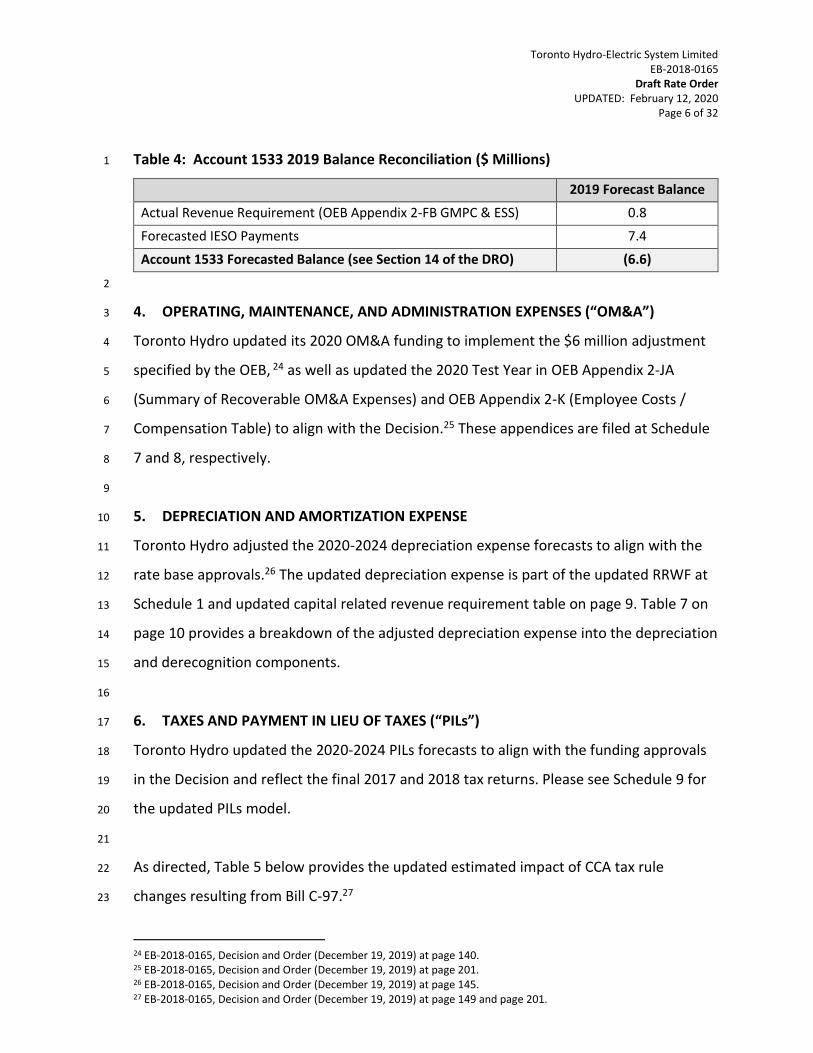
calculation with the balance in Account 1533 as of December 13, 2019.23 20
21 EB-2018-0165, Decision and Order (December 19, 2019) at page 118-119. 22 EB-2018-0165, Decision and Order (December 19, 2019) at page 118. As directed by the OEB, the updated REI-related revenue requirement is based on in-service additions in Appendices 2-FB rather than capital expenditure amounts as previously filed. 23 EB-2018-0165, Decision and Order (December 19, 2019) at page 119.
Toronto Hydro-Electric System Limited EB-2018-0165
Draft Rate Order UPDATED: February 12, 2020
Page 6 of 32
Table 4: Account 1533 2019 Balance Reconciliation ($ Millions) 1
2019 Forecast Balance
Actual Revenue Requirement (OEB Appendix 2-FB GMPC & ESS) 0.8
Forecasted IESO Payments 7.4
Account 1533 Forecasted Balance (see Section 14 of the DRO) (6.6)
2
4. OPERATING, MAINTENANCE, AND ADMINISTRATION EXPENSES (“OM&A”) 3
Toronto Hydro updated its 2020 OM&A funding to implement the $6 million adjustment 4
specified by the OEB, 24 as well as updated the 2020 Test Year in OEB Appendix 2-JA 5
(Summary of Recoverable OM&A Expenses) and OEB Appendix 2-K (Employee Costs / 6
Compensation Table) to align with the Decision.25 These appendices are filed at Schedule 7
7 and 8, respectively. 8
9
5. DEPRECIATION AND AMORTIZATION EXPENSE 10
Toronto Hydro adjusted the 2020-2024 depreciation expense forecasts to align with the 11
rate base approvals.26 The updated depreciation expense is part of the updated RRWF at 12
Schedule 1 and updated capital related revenue requirement table on page 9. Table 7 on 13
page 10 provides a breakdown of the adjusted depreciation expense into the depreciation 14
and derecognition components. 15
16
6. TAXES AND PAYMENT IN LIEU OF TAXES (“PILs”) 17
Toronto Hydro updated the 2020-2024 PILs forecasts to align with the funding approvals 18
in the Decision and reflect the final 2017 and 2018 tax returns. Please see Schedule 9 for 19
the updated PILs model. 20
21
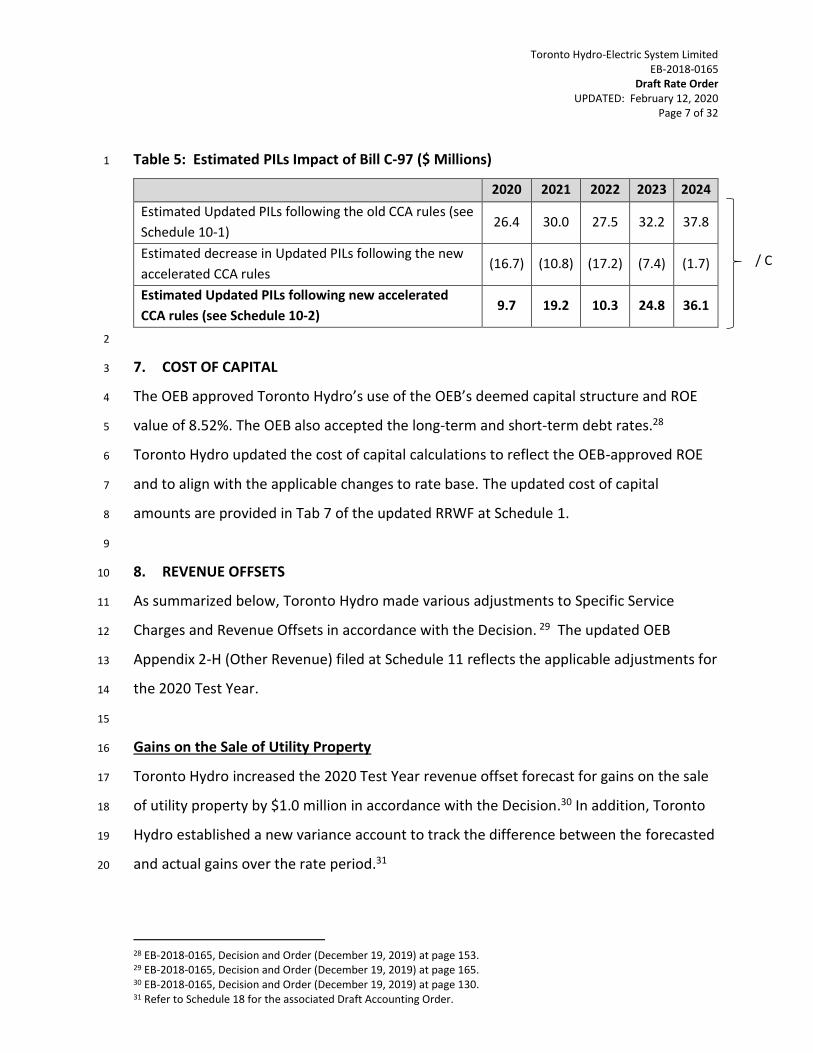
As directed, Table 5 below provides the updated estimated impact of CCA tax rule 22
changes resulting from Bill C-97.27 23
24 EB-2018-0165, Decision and Order (December 19, 2019) at page 140. 25 EB-2018-0165, Decision and Order (December 19, 2019) at page 201. 26 EB-2018-0165, Decision and Order (December 19, 2019) at page 145. 27 EB-2018-0165, Decision and Order (December 19, 2019) at page 149 and page 201.
Toronto Hydro-Electric System Limited EB-2018-0165
Draft Rate Order UPDATED: February 12, 2020
Page 7 of 32
Table 5: Estimated PILs Impact of Bill C-97 ($ Millions) 1
2020 2021 2022 2023 2024
Estimated Updated PILs following the old CCA rules (see
Schedule 10-1) 26.4 30.0 27.5 32.2 37.8
Estimated decrease in Updated PILs following the new
accelerated CCA rules (16.7) (10.8) (17.2) (7.4) (1.7)
Estimated Updated PILs following new accelerated
CCA rules (see Schedule 10-2) 9.7 19.2 10.3 24.8 36.1
2
7. COST OF CAPITAL 3
The OEB approved Toronto Hydro’s use of the OEB’s deemed capital structure and ROE 4
value of 8.52%. The OEB also accepted the long-term and short-term debt rates.28 5
Toronto Hydro updated the cost of capital calculations to reflect the OEB-approved ROE 6
and to align with the applicable changes to rate base. The updated cost of capital 7
amounts are provided in Tab 7 of the updated RRWF at Schedule 1. 8
9
8. REVENUE OFFSETS 10
As summarized below, Toronto Hydro made various adjustments to Specific Service 11
Charges and Revenue Offsets in accordance with the Decision. 29 The updated OEB 12
Appendix 2-H (Other Revenue) filed at Schedule 11 reflects the applicable adjustments for 13
the 2020 Test Year. 14
15
Gains on the Sale of Utility Property 16
Toronto Hydro increased the 2020 Test Year revenue offset forecast for gains on the sale 17
of utility property by $1.0 million in accordance with the Decision.30 In addition, Toronto 18
Hydro established a new variance account to track the difference between the forecasted 19
and actual gains over the rate period.31 20
28 EB-2018-0165, Decision and Order (December 19, 2019) at page 153. 29 EB-2018-0165, Decision and Order (December 19, 2019) at page 165. 30 EB-2018-0165, Decision and Order (December 19, 2019) at page 130. 31 Refer to Schedule 18 for the associated Draft Accounting Order.
/ C
Toronto Hydro-Electric System Limited EB-2018-0165
Draft Rate Order UPDATED: February 12, 2020
Page 8 of 32
Street Lighting 1
The street lighting revenue offset decreased by $0.3 million as a result of updating the 2
revenue requirement calculation for the street lighting assets that were deemed 3
distribution assets in previous proceedings.32 This update was necessary to: (1) align with 4
the OEB’s direction to use monthly averages of in-service additions for the purpose of 5
calculating rate base; and (2) remain consistent with the approach approved in the last 6
rebasing application to offset 100% of the revenue requirement associated with street 7
lighting assets through a direct allocation of revenues from the street lighting contract.33 8
9
Wireline Pole Attachment Rate 10
The OEB approved the generic wireline pole attachment charge of $44.50 per attachment 11
per year.34 Toronto Hydro updated the 2020 Revenue Offsets forecast accordingly. 12
13
Retailer Service Charges 14
Toronto Hydro applied a 2.0% increase to the 2020 Retailer Service Charges rates as 15
required by the Decision and Rate Order in EB-2019-0280 (November 28, 2019), and 16
updated the 2020 Revenue Offsets forecast accordingly. 17
18
9. CUSTOMER SERVICE CHARGES – VAULT ACCESS 19
The OEB directed Toronto Hydro to file the precise language in the Conditions of Service 20
confirming the status quo approach for vault access person in attendance charges.35 This 21
language can be found in section 1.7.5 of Toronto Hydro’s current Conditions of Service: 22
“For Customer-Owned vaults that contain Toronto Hydro equipment, Toronto Hydro will 23
provide a Customer with one vault access every 12 months at no charge.”3624
32 These assets were brought into rate base in 2015. See EB-2014-0116, Decision and Order (December 29, 2015) at page 34. 33 EB-2014-0116, Decision and Order (December 29, 2015) at page 41. 34 OEB Letter, Inflation Adjustment for Energy Retailer Service Charges and Wireline Pole Attachment Charge for Electricity Distributors (November 28, 2019). 35 EB-2018-0165, Decision and Order (December 19, 2019) at page 169. 36 The Conditions of Service are available online: https://www.torontohydro.com/documents/20143/85785/conditions-of-service.pdf/dd339e19-a626-794f-99e2-6daf14e3494c?t=1554732806706. Section 1.7.5 is on page 12.
Toronto Hydro-Electric System Limited EB-2018-0165
Draft Rate Order UPDATED: February 12, 2020
Page 9 of 32
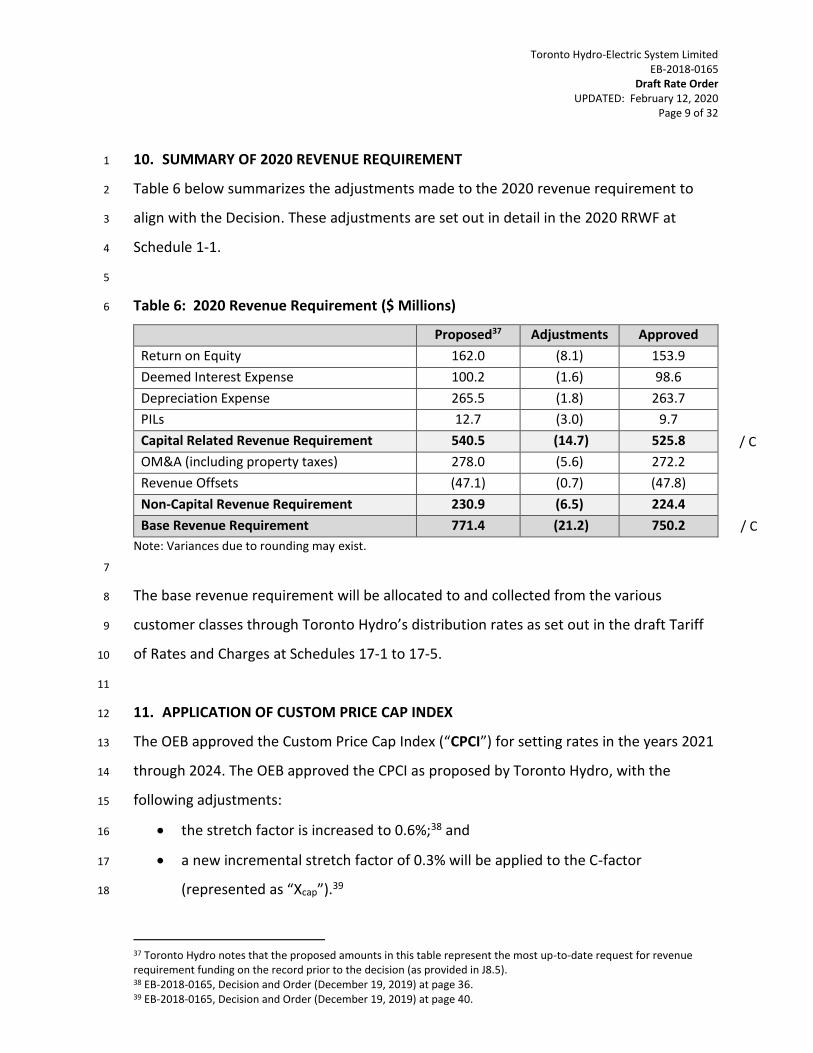
10. SUMMARY OF 2020 REVENUE REQUIREMENT 1
Table 6 below summarizes the adjustments made to the 2020 revenue requirement to 2
align with the Decision. These adjustments are set out in detail in the 2020 RRWF at 3
Schedule 1-1. 4
5
Table 6: 2020 Revenue Requirement ($ Millions) 6
Proposed37 Adjustments Approved
Return on Equity 162.0 (8.1) 153.9
Deemed Interest Expense 100.2 (1.6) 98.6
Depreciation Expense 265.5 (1.8) 263.7
PILs 12.7 (3.0) 9.7
Capital Related Revenue Requirement 540.5 (14.7) 525.8
OM&A (including property taxes) 278.0 (5.6) 272.2
Revenue Offsets (47.1) (0.7) (47.8)
Non-Capital Revenue Requirement 230.9 (6.5) 224.4
Base Revenue Requirement 771.4 (21.2) 750.2
Note: Variances due to rounding may exist.
7
The base revenue requirement will be allocated to and collected from the various 8
customer classes through Toronto Hydro’s distribution rates as set out in the draft Tariff 9
of Rates and Charges at Schedules 17-1 to 17-5. 10
11
11. APPLICATION OF CUSTOM PRICE CAP INDEX 12
The OEB approved the Custom Price Cap Index (“CPCI”) for setting rates in the years 2021 13
through 2024. The OEB approved the CPCI as proposed by Toronto Hydro, with the 14
following adjustments: 15
• the stretch factor is increased to 0.6%;38 and 16
• a new incremental stretch factor of 0.3% will be applied to the C-factor 17
(represented as “Xcap”).39 18
37 Toronto Hydro notes that the proposed amounts in this table represent the most up-to-date request for revenue requirement funding on the record prior to the decision (as provided in J8.5). 38 EB-2018-0165, Decision and Order (December 19, 2019) at page 36. 39 EB-2018-0165, Decision and Order (December 19, 2019) at page 40.
/ C
/ C
Toronto Hydro-Electric System Limited EB-2018-0165
Draft Rate Order UPDATED: February 12, 2020
Page 10 of 32
The OEB approved the CPCI formula as follows: 1
2
CPCI = I – X + C – g, or 3
CPCI = I – X + Cn – Scap * (I + Xcap) – g 4
5
Toronto Hydro’s approach for incorporating the incremental stretch factor into the 6
formula is consistent with the proposal made by Pacific Economics Group (“PEG”) in 7
response to undertaking J10.5. However, Toronto Hydro used “Xcap” in place of PEG’s 8
suggested “S” to avoid possible confusion with the scaling factor “Scap”. 9
10
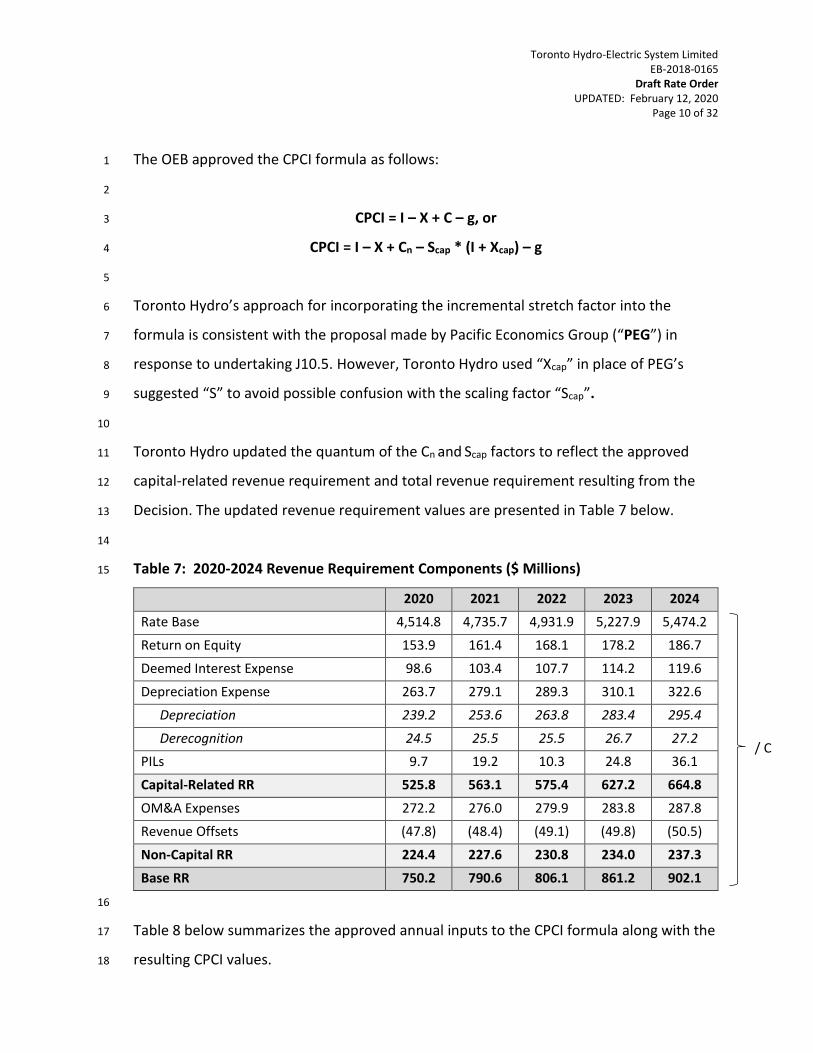
Toronto Hydro updated the quantum of the Cn and Scap factors to reflect the approved 11
capital-related revenue requirement and total revenue requirement resulting from the 12
Decision. The updated revenue requirement values are presented in Table 7 below. 13
14
Table 7: 2020-2024 Revenue Requirement Components ($ Millions) 15
2020 2021 2022 2023 2024
Rate Base 4,514.8 4,735.7 4,931.9 5,227.9 5,474.2
Return on Equity 153.9 161.4 168.1 178.2 186.7
Deemed Interest Expense 98.6 103.4 107.7 114.2 119.6
Depreciation Expense 263.7 279.1 289.3 310.1 322.6
Depreciation 239.2 253.6 263.8 283.4 295.4
Derecognition 24.5 25.5 25.5 26.7 27.2
PILs 9.7 19.2 10.3 24.8 36.1
Capital-Related RR 525.8 563.1 575.4 627.2 664.8
OM&A Expenses 272.2 276.0 279.9 283.8 287.8
Revenue Offsets (47.8) (48.4) (49.1) (49.8) (50.5)
Non-Capital RR 224.4 227.6 230.8 234.0 237.3
Base RR 750.2 790.6 806.1 861.2 902.1
16
Table 8 below summarizes the approved annual inputs to the CPCI formula along with the 17
resulting CPCI values. 18
/ C
Toronto Hydro-Electric System Limited EB-2018-0165
Draft Rate Order UPDATED: February 12, 2020
Page 11 of 32
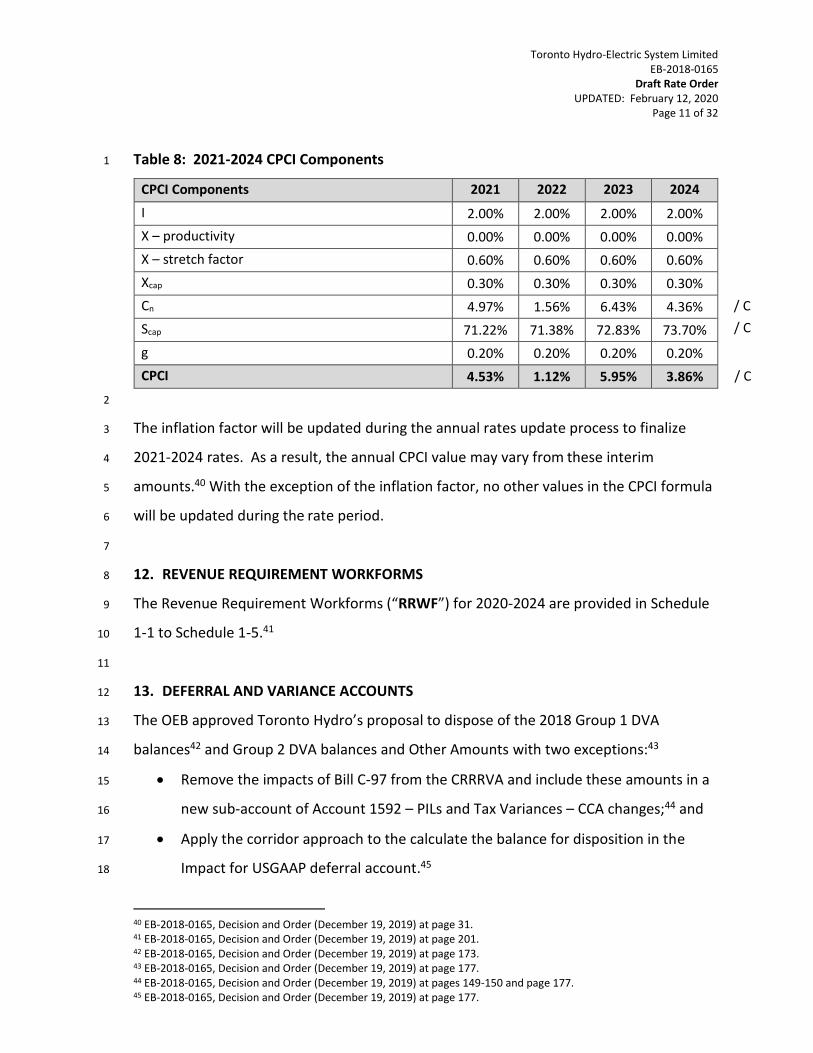
Table 8: 2021-2024 CPCI Components 1
CPCI Components 2021 2022 2023 2024
I 2.00% 2.00% 2.00% 2.00%
X – productivity 0.00% 0.00% 0.00% 0.00%
X – stretch factor 0.60% 0.60% 0.60% 0.60%
Xcap 0.30% 0.30% 0.30% 0.30%
Cn 4.97% 1.56% 6.43% 4.36%
Scap 71.22% 71.38% 72.83% 73.70%
g 0.20% 0.20% 0.20% 0.20%
CPCI 4.53% 1.12% 5.95% 3.86%
2
The inflation factor will be updated during the annual rates update process to finalize 3
2021-2024 rates. As a result, the annual CPCI value may vary from these interim 4
amounts.40 With the exception of the inflation factor, no other values in the CPCI formula 5
will be updated during the rate period. 6
7
12. REVENUE REQUIREMENT WORKFORMS 8
The Revenue Requirement Workforms (“RRWF”) for 2020-2024 are provided in Schedule 9
1-1 to Schedule 1-5.41 10
11
13. DEFERRAL AND VARIANCE ACCOUNTS 12
The OEB approved Toronto Hydro’s proposal to dispose of the 2018 Group 1 DVA 13
balances42 and Group 2 DVA balances and Other Amounts with two exceptions:43 14
• Remove the impacts of Bill C-97 from the CRRRVA and include these amounts in a 15
new sub-account of Account 1592 – PILs and Tax Variances – CCA changes;44 and 16
• Apply the corridor approach to the calculate the balance for disposition in the 17
Impact for USGAAP deferral account.45 18
40 EB-2018-0165, Decision and Order (December 19, 2019) at page 31. 41 EB-2018-0165, Decision and Order (December 19, 2019) at page 201. 42 EB-2018-0165, Decision and Order (December 19, 2019) at page 173. 43 EB-2018-0165, Decision and Order (December 19, 2019) at page 177. 44 EB-2018-0165, Decision and Order (December 19, 2019) at pages 149-150 and page 177. 45 EB-2018-0165, Decision and Order (December 19, 2019) at page 177.
/ C
/ C
/ C
Toronto Hydro-Electric System Limited EB-2018-0165
Draft Rate Order UPDATED: February 12, 2020
Page 12 of 32
In addition, the OEB directed Toronto Hydro to update the forecast 2019 Group 2 DVA 1
and Other Amount balances to reflect its most up-to-date forecast for 2019.46 2
3
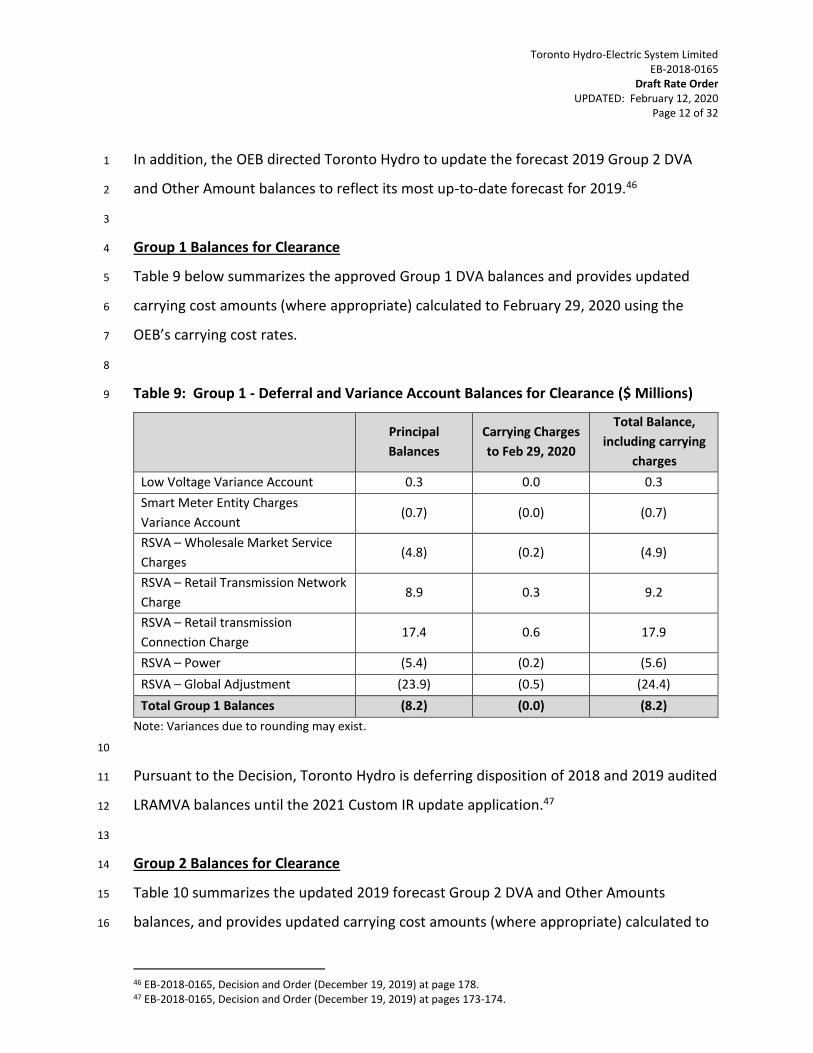
Group 1 Balances for Clearance 4
Table 9 below summarizes the approved Group 1 DVA balances and provides updated 5
carrying cost amounts (where appropriate) calculated to February 29, 2020 using the 6
OEB’s carrying cost rates. 7
8
Table 9: Group 1 - Deferral and Variance Account Balances for Clearance ($ Millions) 9
Principal
Balances
Carrying Charges
to Feb 29, 2020
Total Balance,
including carrying
charges
Low Voltage Variance Account 0.3 0.0 0.3
Smart Meter Entity Charges
Variance Account (0.7) (0.0) (0.7)
RSVA – Wholesale Market Service
Charges (4.8) (0.2) (4.9)
RSVA – Retail Transmission Network
Charge 8.9 0.3 9.2
RSVA – Retail transmission
Connection Charge 17.4 0.6 17.9
RSVA – Power (5.4) (0.2) (5.6)
RSVA – Global Adjustment (23.9) (0.5) (24.4)
Total Group 1 Balances (8.2) (0.0) (8.2)
Note: Variances due to rounding may exist.
10
Pursuant to the Decision, Toronto Hydro is deferring disposition of 2018 and 2019 audited 11
LRAMVA balances until the 2021 Custom IR update application.47 12
13
Group 2 Balances for Clearance 14
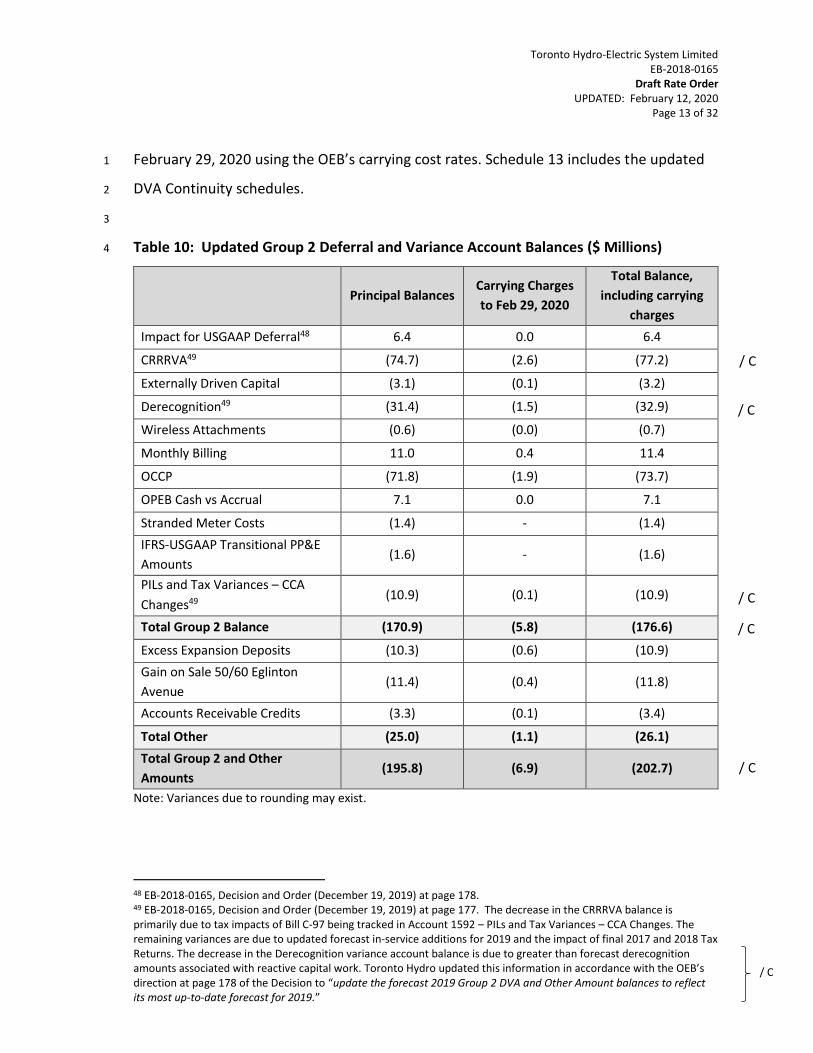
Table 10 summarizes the updated 2019 forecast Group 2 DVA and Other Amounts 15
balances, and provides updated carrying cost amounts (where appropriate) calculated to 16
46 EB-2018-0165, Decision and Order (December 19, 2019) at page 178. 47 EB-2018-0165, Decision and Order (December 19, 2019) at pages 173-174.
Toronto Hydro-Electric System Limited EB-2018-0165
Draft Rate Order UPDATED: February 12, 2020
Page 13 of 32
February 29, 2020 using the OEB’s carrying cost rates. Schedule 13 includes the updated 1
DVA Continuity schedules. 2
3
Table 10: Updated Group 2 Deferral and Variance Account Balances ($ Millions) 4
Principal Balances Carrying Charges
to Feb 29, 2020
Total Balance,
including carrying
charges
Impact for USGAAP Deferral48 6.4 0.0 6.4
CRRRVA49 (74.7) (2.6) (77.2)
Externally Driven Capital (3.1) (0.1) (3.2)
Derecognition49 (31.4) (1.5) (32.9)
Wireless Attachments (0.6) (0.0) (0.7)
Monthly Billing 11.0 0.4 11.4
OCCP (71.8) (1.9) (73.7)
OPEB Cash vs Accrual 7.1 0.0 7.1
Stranded Meter Costs (1.4) - (1.4)
IFRS-USGAAP Transitional PP&E
Amounts (1.6) - (1.6)
PILs and Tax Variances – CCA
Changes49 (10.9) (0.1) (10.9)
Total Group 2 Balance (170.9) (5.8) (176.6)
Excess Expansion Deposits (10.3) (0.6) (10.9)
Gain on Sale 50/60 Eglinton
Avenue (11.4) (0.4) (11.8)
Accounts Receivable Credits (3.3) (0.1) (3.4)
Total Other (25.0) (1.1) (26.1)
Total Group 2 and Other
Amounts (195.8) (6.9) (202.7)
Note: Variances due to rounding may exist.
48 EB-2018-0165, Decision and Order (December 19, 2019) at page 178. 49 EB-2018-0165, Decision and Order (December 19, 2019) at page 177. The decrease in the CRRRVA balance is primarily due to tax impacts of Bill C-97 being tracked in Account 1592 – PILs and Tax Variances – CCA Changes. The remaining variances are due to updated forecast in-service additions for 2019 and the impact of final 2017 and 2018 Tax Returns. The decrease in the Derecognition variance account balance is due to greater than forecast derecognition amounts associated with reactive capital work. Toronto Hydro updated this information in accordance with the OEB’s direction at page 178 of the Decision to “update the forecast 2019 Group 2 DVA and Other Amount balances to reflect its most up-to-date forecast for 2019.”
/ C
/ C
/ C
/ C
/ C
/ C
Toronto Hydro-Electric System Limited EB-2018-0165
Draft Rate Order UPDATED: February 12, 2020
Page 14 of 32
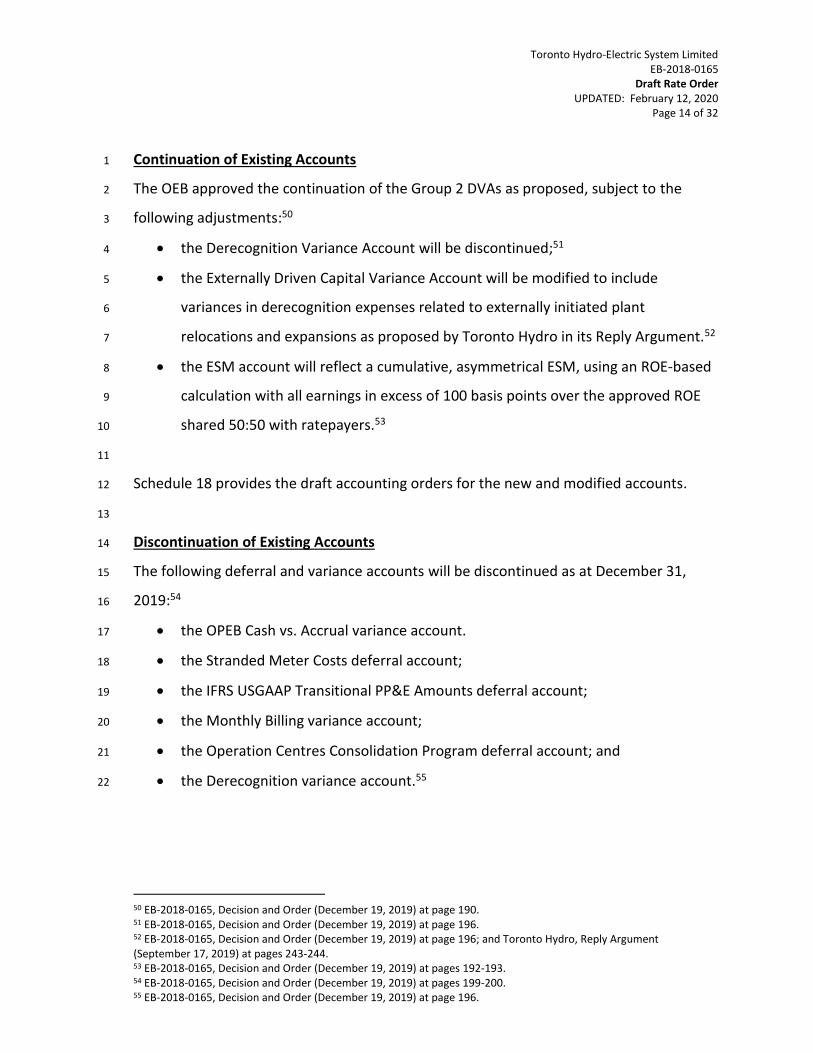
Continuation of Existing Accounts 1
The OEB approved the continuation of the Group 2 DVAs as proposed, subject to the 2
following adjustments:50 3
• the Derecognition Variance Account will be discontinued;51 4
• the Externally Driven Capital Variance Account will be modified to include 5
variances in derecognition expenses related to externally initiated plant 6
relocations and expansions as proposed by Toronto Hydro in its Reply Argument.52 7
• the ESM account will reflect a cumulative, asymmetrical ESM, using an ROE-based 8
calculation with all earnings in excess of 100 basis points over the approved ROE 9
shared 50:50 with ratepayers.53 10
11
Schedule 18 provides the draft accounting orders for the new and modified accounts. 12
13
Discontinuation of Existing Accounts 14
The following deferral and variance accounts will be discontinued as at December 31, 15
2019:54 16
• the OPEB Cash vs. Accrual variance account. 17
• the Stranded Meter Costs deferral account; 18
• the IFRS USGAAP Transitional PP&E Amounts deferral account; 19
• the Monthly Billing variance account; 20
• the Operation Centres Consolidation Program deferral account; and 21
• the Derecognition variance account.55 22
50 EB-2018-0165, Decision and Order (December 19, 2019) at page 190. 51 EB-2018-0165, Decision and Order (December 19, 2019) at page 196. 52 EB-2018-0165, Decision and Order (December 19, 2019) at page 196; and Toronto Hydro, Reply Argument (September 17, 2019) at pages 243-244. 53 EB-2018-0165, Decision and Order (December 19, 2019) at pages 192-193. 54 EB-2018-0165, Decision and Order (December 19, 2019) at pages 199-200. 55 EB-2018-0165, Decision and Order (December 19, 2019) at page 196.
Toronto Hydro-Electric System Limited EB-2018-0165
Draft Rate Order UPDATED: February 12, 2020
Page 15 of 32
New Accounts 1
The following new deferral and variance accounts will be established: 2
• Excess Expansion Deposits variance account;56 3
• Account 1522 – Pension and OPEB Forecast Accrual vs. cash Payments 4
Differential;57 5
• Carillion Insolvency Payments Receivable Account;58 and 6
• Variance Account for Gain on Sale of Property.59 7
8
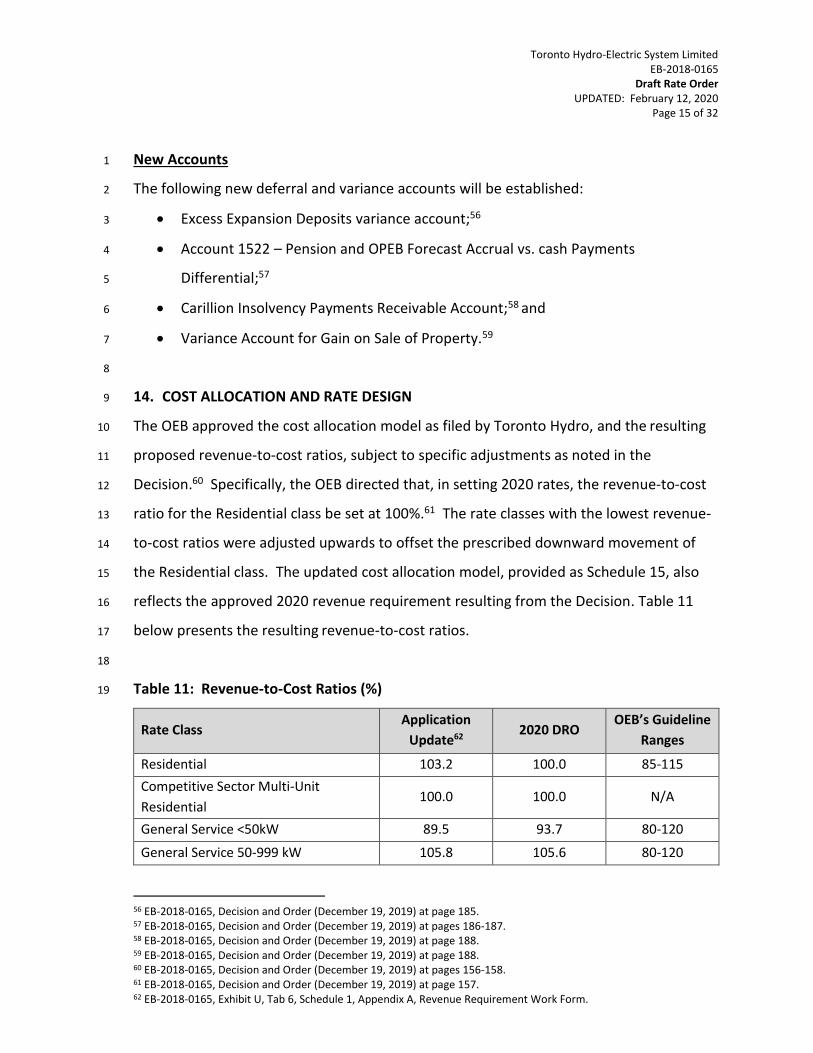
14. COST ALLOCATION AND RATE DESIGN 9
The OEB approved the cost allocation model as filed by Toronto Hydro, and the resulting 10
proposed revenue-to-cost ratios, subject to specific adjustments as noted in the 11
Decision.60 Specifically, the OEB directed that, in setting 2020 rates, the revenue-to-cost 12
ratio for the Residential class be set at 100%.61 The rate classes with the lowest revenue-13
to-cost ratios were adjusted upwards to offset the prescribed downward movement of 14
the Residential class. The updated cost allocation model, provided as Schedule 15, also 15
reflects the approved 2020 revenue requirement resulting from the Decision. Table 11 16
below presents the resulting revenue-to-cost ratios. 17
18
Table 11: Revenue-to-Cost Ratios (%) 19
Rate Class Application
Update62 2020 DRO
OEB’s Guideline
Ranges
Residential 103.2 100.0 85-115
Competitive Sector Multi-Unit
Residential 100.0 100.0 N/A
General Service <50kW 89.5 93.7 80-120
General Service 50-999 kW 105.8 105.6 80-120
56 EB-2018-0165, Decision and Order (December 19, 2019) at page 185. 57 EB-2018-0165, Decision and Order (December 19, 2019) at pages 186-187. 58 EB-2018-0165, Decision and Order (December 19, 2019) at page 188. 59 EB-2018-0165, Decision and Order (December 19, 2019) at page 188. 60 EB-2018-0165, Decision and Order (December 19, 2019) at pages 156-158. 61 EB-2018-0165, Decision and Order (December 19, 2019) at page 157. 62 EB-2018-0165, Exhibit U, Tab 6, Schedule 1, Appendix A, Revenue Requirement Work Form.
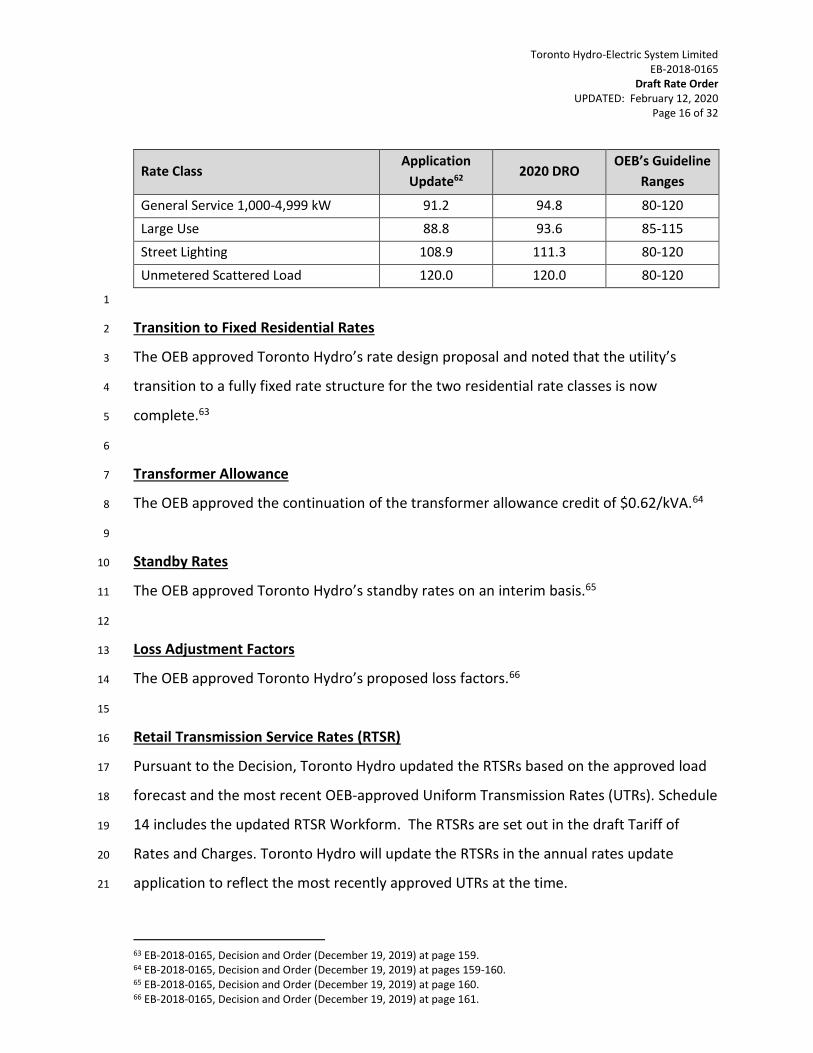
Toronto Hydro-Electric System Limited EB-2018-0165
Draft Rate Order UPDATED: February 12, 2020
Page 16 of 32
Rate Class Application
Update62 2020 DRO
OEB’s Guideline
Ranges
General Service 1,000-4,999 kW 91.2 94.8 80-120
Large Use 88.8 93.6 85-115
Street Lighting 108.9 111.3 80-120
Unmetered Scattered Load 120.0 120.0 80-120
1
Transition to Fixed Residential Rates 2
The OEB approved Toronto Hydro’s rate design proposal and noted that the utility’s 3
transition to a fully fixed rate structure for the two residential rate classes is now 4
complete.63 5
6
Transformer Allowance 7
The OEB approved the continuation of the transformer allowance credit of $0.62/kVA.64 8
9
Standby Rates 10
The OEB approved Toronto Hydro’s standby rates on an interim basis.65 11
12
Loss Adjustment Factors 13
The OEB approved Toronto Hydro’s proposed loss factors.66 14
15
Retail Transmission Service Rates (RTSR) 16
Pursuant to the Decision, Toronto Hydro updated the RTSRs based on the approved load 17
forecast and the most recent OEB-approved Uniform Transmission Rates (UTRs). Schedule 18
14 includes the updated RTSR Workform. The RTSRs are set out in the draft Tariff of 19
Rates and Charges. Toronto Hydro will update the RTSRs in the annual rates update 20
application to reflect the most recently approved UTRs at the time. 21
63 EB-2018-0165, Decision and Order (December 19, 2019) at page 159. 64 EB-2018-0165, Decision and Order (December 19, 2019) at pages 159-160. 65 EB-2018-0165, Decision and Order (December 19, 2019) at page 160. 66 EB-2018-0165, Decision and Order (December 19, 2019) at page 161.
Toronto Hydro-Electric System Limited EB-2018-0165
Draft Rate Order UPDATED: February 12, 2020
Page 17 of 32
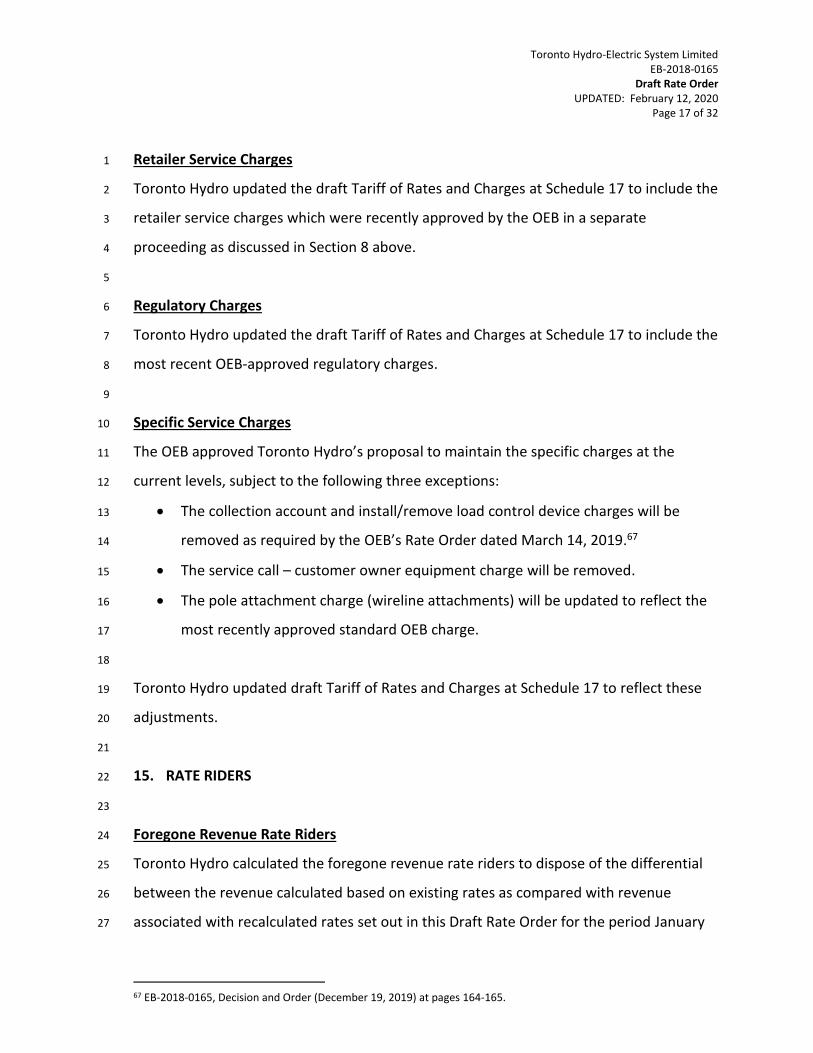
Retailer Service Charges 1
Toronto Hydro updated the draft Tariff of Rates and Charges at Schedule 17 to include the 2
retailer service charges which were recently approved by the OEB in a separate 3
proceeding as discussed in Section 8 above. 4
5
Regulatory Charges 6
Toronto Hydro updated the draft Tariff of Rates and Charges at Schedule 17 to include the 7
most recent OEB-approved regulatory charges. 8
9
Specific Service Charges 10
The OEB approved Toronto Hydro’s proposal to maintain the specific charges at the 11
current levels, subject to the following three exceptions: 12
• The collection account and install/remove load control device charges will be 13
removed as required by the OEB’s Rate Order dated March 14, 2019.67 14
• The service call – customer owner equipment charge will be removed. 15
• The pole attachment charge (wireline attachments) will be updated to reflect the 16
most recently approved standard OEB charge. 17
18
Toronto Hydro updated draft Tariff of Rates and Charges at Schedule 17 to reflect these 19
adjustments. 20
21
15. RATE RIDERS 22
23
Foregone Revenue Rate Riders 24
Toronto Hydro calculated the foregone revenue rate riders to dispose of the differential 25
between the revenue calculated based on existing rates as compared with revenue 26
associated with recalculated rates set out in this Draft Rate Order for the period January 27
67 EB-2018-0165, Decision and Order (December 19, 2019) at pages 164-165.
Toronto Hydro-Electric System Limited EB-2018-0165
Draft Rate Order UPDATED: February 12, 2020
Page 18 of 32
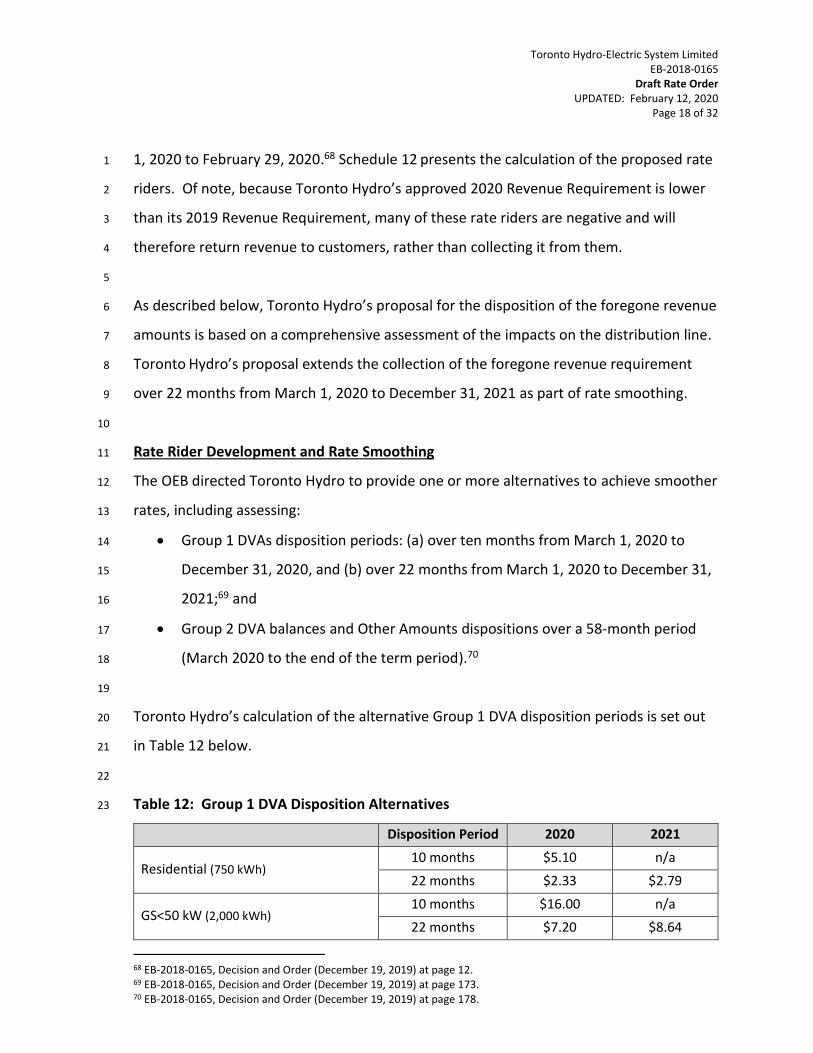
1, 2020 to February 29, 2020.68 Schedule 12 presents the calculation of the proposed rate 1
riders. Of note, because Toronto Hydro’s approved 2020 Revenue Requirement is lower 2
than its 2019 Revenue Requirement, many of these rate riders are negative and will 3
therefore return revenue to customers, rather than collecting it from them. 4
5
As described below, Toronto Hydro’s proposal for the disposition of the foregone revenue 6
amounts is based on a comprehensive assessment of the impacts on the distribution line. 7
Toronto Hydro’s proposal extends the collection of the foregone revenue requirement 8
over 22 months from March 1, 2020 to December 31, 2021 as part of rate smoothing. 9
10
Rate Rider Development and Rate Smoothing 11
The OEB directed Toronto Hydro to provide one or more alternatives to achieve smoother 12
rates, including assessing: 13
• Group 1 DVAs disposition periods: (a) over ten months from March 1, 2020 to 14
December 31, 2020, and (b) over 22 months from March 1, 2020 to December 31, 15
2021;69 and 16
• Group 2 DVA balances and Other Amounts dispositions over a 58-month period 17
(March 2020 to the end of the term period).70 18
19
Toronto Hydro’s calculation of the alternative Group 1 DVA disposition periods is set out 20
in Table 12 below. 21
22
Table 12: Group 1 DVA Disposition Alternatives 23
Disposition Period 2020 2021
Residential (750 kWh) 10 months $5.10 n/a
22 months $2.33 $2.79
GS<50 kW (2,000 kWh) 10 months $16.00 n/a
22 months $7.20 $8.64
68 EB-2018-0165, Decision and Order (December 19, 2019) at page 12. 69 EB-2018-0165, Decision and Order (December 19, 2019) at page 173. 70 EB-2018-0165, Decision and Order (December 19, 2019) at page 178.
Toronto Hydro-Electric System Limited EB-2018-0165
Draft Rate Order UPDATED: February 12, 2020
Page 19 of 32
Disposition Period 2020 2021
GS50-999 kW (200 kVA) 10 months -$2,122.20 n/a
22 months -$963.90 -$1,156.68
Note: Variances due to rounding may exist.
1
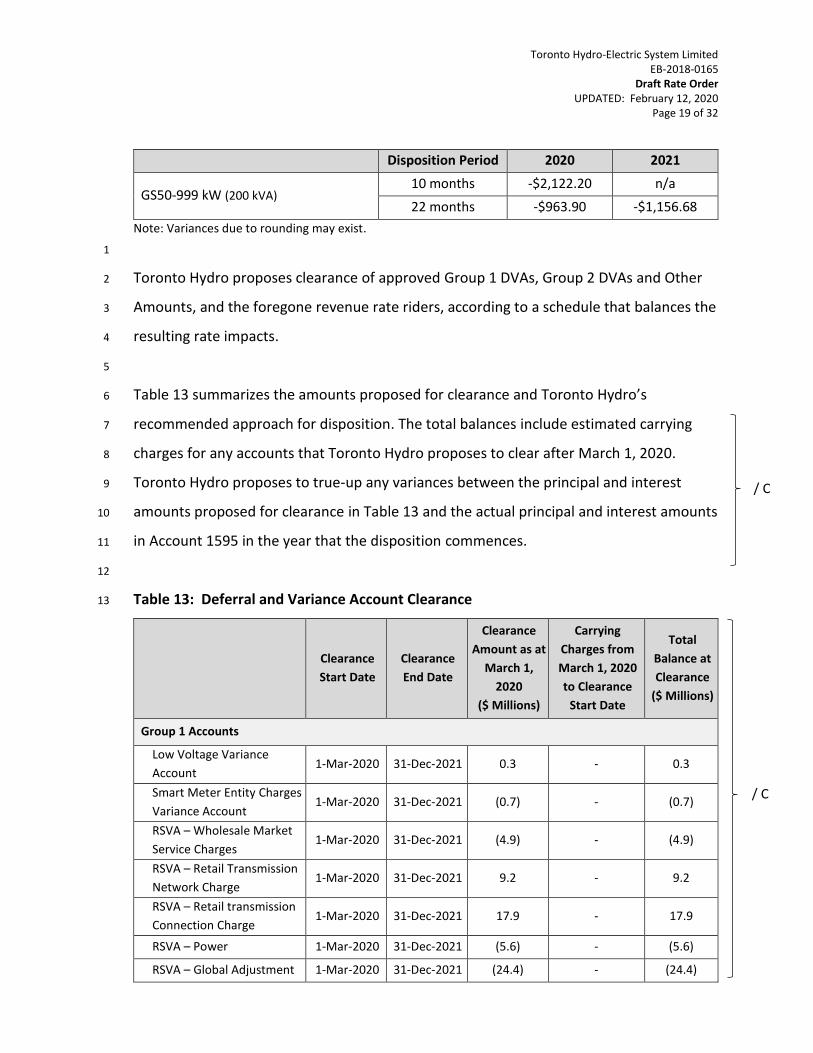
Toronto Hydro proposes clearance of approved Group 1 DVAs, Group 2 DVAs and Other 2
Amounts, and the foregone revenue rate riders, according to a schedule that balances the 3
resulting rate impacts. 4
5
Table 13 summarizes the amounts proposed for clearance and Toronto Hydro’s 6
recommended approach for disposition. The total balances include estimated carrying 7
charges for any accounts that Toronto Hydro proposes to clear after March 1, 2020. 8
Toronto Hydro proposes to true-up any variances between the principal and interest 9
amounts proposed for clearance in Table 13 and the actual principal and interest amounts 10
in Account 1595 in the year that the disposition commences. 11
12
Table 13: Deferral and Variance Account Clearance 13
Clearance
Start Date
Clearance
End Date
Clearance
Amount as at
March 1,
2020
($ Millions)
Carrying
Charges from
March 1, 2020
to Clearance
Start Date
Total
Balance at
Clearance
($ Millions)
Group 1 Accounts
Low Voltage Variance
Account 1-Mar-2020 31-Dec-2021 0.3 - 0.3
Smart Meter Entity Charges
Variance Account 1-Mar-2020 31-Dec-2021 (0.7) - (0.7)
RSVA – Wholesale Market
Service Charges 1-Mar-2020 31-Dec-2021 (4.9) - (4.9)
RSVA – Retail Transmission
Network Charge 1-Mar-2020 31-Dec-2021 9.2 - 9.2
RSVA – Retail transmission
Connection Charge 1-Mar-2020 31-Dec-2021 17.9 - 17.9
RSVA – Power 1-Mar-2020 31-Dec-2021 (5.6) - (5.6)
RSVA – Global Adjustment 1-Mar-2020 31-Dec-2021 (24.4) - (24.4)
/ C
/ C
Toronto Hydro-Electric System Limited EB-2018-0165
Draft Rate Order UPDATED: February 12, 2020
Page 20 of 32
Clearance
Start Date
Clearance
End Date
Clearance
Amount as at
March 1,
2020
($ Millions)
Carrying
Charges from
March 1, 2020
to Clearance
Start Date
Total
Balance at
Clearance
($ Millions)
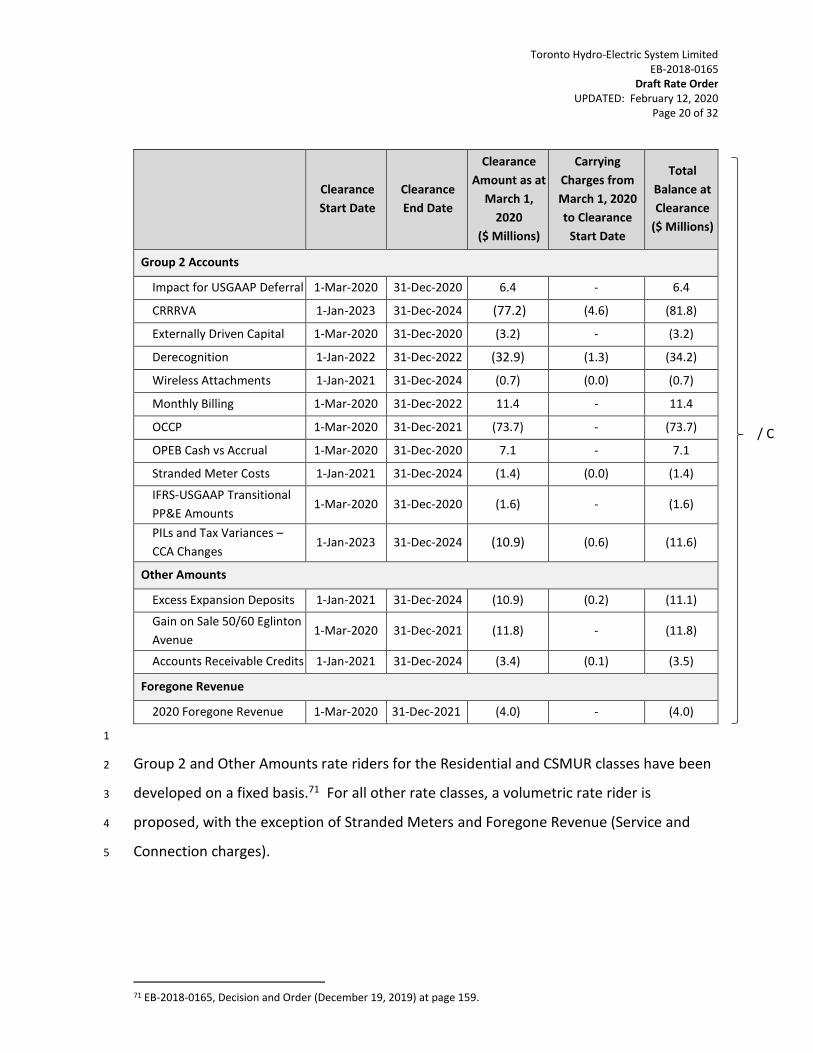
Group 2 Accounts
Impact for USGAAP Deferral 1-Mar-2020 31-Dec-2020 6.4 - 6.4
CRRRVA 1-Jan-2023 31-Dec-2024 (77.2) (4.6) (81.8)
Externally Driven Capital 1-Mar-2020 31-Dec-2020 (3.2) - (3.2)
Derecognition 1-Jan-2022 31-Dec-2022 (32.9) (1.3) (34.2)
Wireless Attachments 1-Jan-2021 31-Dec-2024 (0.7) (0.0) (0.7)
Monthly Billing 1-Mar-2020 31-Dec-2022 11.4 - 11.4
OCCP 1-Mar-2020 31-Dec-2021 (73.7) - (73.7)
OPEB Cash vs Accrual 1-Mar-2020 31-Dec-2020 7.1 - 7.1
Stranded Meter Costs 1-Jan-2021 31-Dec-2024 (1.4) (0.0) (1.4)
IFRS-USGAAP Transitional
PP&E Amounts 1-Mar-2020 31-Dec-2020 (1.6) - (1.6)
PILs and Tax Variances –
CCA Changes 1-Jan-2023 31-Dec-2024 (10.9) (0.6) (11.6)
Other Amounts
Excess Expansion Deposits 1-Jan-2021 31-Dec-2024 (10.9) (0.2) (11.1)
Gain on Sale 50/60 Eglinton
Avenue 1-Mar-2020 31-Dec-2021 (11.8) - (11.8)
Accounts Receivable Credits 1-Jan-2021 31-Dec-2024 (3.4) (0.1) (3.5)
Foregone Revenue
2020 Foregone Revenue 1-Mar-2020 31-Dec-2021 (4.0) - (4.0)
1
Group 2 and Other Amounts rate riders for the Residential and CSMUR classes have been 2
developed on a fixed basis.71 For all other rate classes, a volumetric rate rider is 3
proposed, with the exception of Stranded Meters and Foregone Revenue (Service and 4
Connection charges). 5
71 EB-2018-0165, Decision and Order (December 19, 2019) at page 159.
/ C
Toronto Hydro-Electric System Limited EB-2018-0165
Draft Rate Order UPDATED: February 12, 2020
Page 21 of 32
Group 1 rate riders are developed on volumetric basis using OEB prescribed 1
methodology.72 2
3
The rate rider calculations for each class are provided in Schedule 13 at Tabs 7 and 8. 4
5
The result of Toronto Hydro’s proposal is smooth rates, as directed by the OEB. The Table 6
14 series below sets out the "Smoothed Rates Scenario” and contrasts it with an 7
“Unsmoothed Rates Scenario”. 8
72 Filing Requirements for Electricity Distribution Rate Applications, Chapter 2 (July 12, 2018) at page 51.

Toronto Hydro-Electric System Limited EB-2018-0165
Draft Rate Order UPDATED: February 12, 2020
Page 22 of 32
Table 14-1: Rates Smoothed Bill Scenarios - Residential 1
Residential (750 kWh) 2019 2020 2021 2022 2023 2024
Unsmoothed Scenario
Distribution Subtotal A
$/30 days 44.37 35.77 38.08 38.53 40.94 42.60
% change -19.4% 6.5% 1.2% 6.3% 4.1%
Distribution Subtotal B
$/30 days 48.17 39.67 41.47 41.92 43.77 45.43
% change -17.6% 4.5% 1.1% 4.4% 3.8%
Total Bill (After Taxes & Rebate)
$/30 days 129.21 123.11 124.58 124.94 126.44 127.79
% change -4.7% 1.2% 0.3% 1.2% 1.1%
Smoothed Scenario
Distribution Subtotal A
$/30 days 44.37 36.65 37.70 39.07 40.33 41.99
% change -17.4% 2.9% 3.6% 3.2% 4.1%
Distribution Subtotal B
$/30 days 48.17 40.27 41.32 42.46 43.16 44.82
% change -16.4% 2.6% 2.8% 1.6% 3.8%
Total Bill (After Taxes & Rebate)
$/30 days 129.21 123.60 124.46 125.38 125.95 127.30
% change -4.3% 0.7% 0.7% 0.5% 1.1%
2
/ C
Toronto Hydro-Electric System Limited EB-2018-0165
Draft Rate Order UPDATED: February 12, 2020
Page 23 of 32
Table 14-2: Rates Smoothed Bill Scenarios - CSMUR 1
Competitive Sector Multi-Unit Residential (300 kWh)
2019 2020 2021 2022 2023 2024
Unsmoothed Scenario
Distribution Subtotal A
$/30 days 34.01 29.67 31.43 31.80 33.78 35.14
% change -12.8% 5.9% 1.2% 6.2% 4.0%
Distribution Subtotal B
$/30 days 35.86 31.52 33.12 33.49 34.91 36.27
% change -12.1% 5.1% 1.1% 4.2% 3.9%
Total Bill (After Taxes & Rebate)
$/30 days 65.27 62.07 63.38 63.68 64.83 65.94
% change -4.9% 2.1% 0.5% 1.8% 1.7%
Smoothed Scenario
Distribution Subtotal A
$/30 days 34.01 30.01 31.07 32.04 33.57 34.93
% change -11.8% 3.5% 3.1% 4.8% 4.1%
Distribution Subtotal B
$/30 days 35.86 31.77 32.83 33.73 34.70 36.06
% change -11.4% 3.3% 2.7% 2.9% 3.9%
Total Bill (After Taxes & Rebate)
$/30 days 65.27 62.28 63.14 63.87 64.66 65.77
% change -4.6% 1.4% 1.2% 1.2% 1.7%
/ C
Toronto Hydro-Electric System Limited EB-2018-0165
Draft Rate Order UPDATED: February 12, 2020
Page 24 of 32
Table 14-3: Rates Smoothed Bill Scenarios – GS <50 kW 1
GS <50 kW (2,000 kWh) 2019 2020 2021 2022 2023 2024
Unsmoothed Scenario
Distribution Subtotal A
$/30 days 108.33 101.05 105.14 106.37 113.00 117.56
% change -6.7% 4.0% 1.2% 6.2% 4.0%
Distribution Subtotal B
$/30 days 117.58 110.76 113.25 114.48 120.55 125.11
% change -5.8% 2.2% 1.1% 5.3% 3.8%
Total Bill (After Taxes & Rebate)
$/30 days 333.78 330.30 332.32 333.32 338.25 341.95
% change -1.0% 0.6% 0.3% 1.5% 1.1%
Smoothed Scenario
Distribution Subtotal A
$/30 days 108.33 101.63 104.80 107.28 111.99 116.55
% change -6.2% 3.1% 2.4% 4.4% 4.1%
Distribution Subtotal B
$/30 days 117.58 110.46 113.63 115.39 119.54 124.10
% change -6.1% 2.9% 1.5% 3.6% 3.8%
Total Bill (After Taxes & Rebate)
$/30 days 333.78 330.05 332.63 334.06 337.43 341.13
% change -1.1% 0.8% 0.4% 1.0% 1.1%
/ C
Toronto Hydro-Electric System Limited EB-2018-0165
Draft Rate Order UPDATED: February 12, 2020
Page 25 of 32
Table 14-4: Rates Smoothed Bill Scenarios – GS 50-999 kW 1
GS 50-999 kW (200 kVA) 2019 2020 2021 2022 2023 2024
Unsmoothed Scenario
Distribution Subtotal A
$/30 days 1,779.43 1,519.25 1,601.75 1,620.81 1,723.18 1,793.54
% change -14.6% 5.4% 1.2% 6.3% 4.1%
Distribution Subtotal B
$/30 days 2,142.58 1,578.30 1,873.02 1,892.08 1,994.45 2,064.81
% change -26.3% 18.7% 1.0% 5.4% 3.5%
Total Bill (After Taxes & Rebate)
$/30 days 14,183.15 13,624.74 13,957.77 13,979.31 14,094.99 14,174.50
% change -3.9% 2.4% 0.2% 0.8% 0.6%
Smoothed Scenario
Distribution Subtotal A
$/30 days 1,779.43 1,546.39 1,582.63 1,632.40 1,707.93 1,778.29
% change -13.1% 2.3% 3.1% 4.6% 4.1%
Distribution Subtotal B
$/30 days 2,142.58 1,721.27 1,757.51 1,903.67 1,979.20 2,049.56
% change -19.7% 2.1% 8.3% 4.0% 3.6%
Total Bill (After Taxes & Rebate)
$/30 days 14,183.15 13,786.30 13,827.25 13,992.41 14,077.76 14,157.26
% change -2.8% 0.3% 1.2% 0.6% 0.6%
/ C
Toronto Hydro-Electric System Limited EB-2018-0165
Draft Rate Order UPDATED: February 12, 2020
Page 26 of 32
Table 14-5: Rates Smoothed Bill Scenarios – GS 1,000-4,999 kW 1
GS 1,000-4,999 kW (2,000 kVA) 2019 2020 2021 2022 2023 2024
Unsmoothed Scenario
Distribution Subtotal A
$/30 days 14,472.09 13,267.01 13,856.35 14,019.99 14,898.63 15,502.46
% change -8.3% 4.4% 1.2% 6.3% 4.1%
Distribution Subtotal B
$/30 days 18,608.67 13,943.23 16,946.77 17,110.41 17,989.05 18,592.88
% change -25.1% 21.5% 1.0% 5.1% 3.4%
Total Bill (After Taxes & Rebate)
$/30 days 153,429.31 148,923.18 152,317.18 152,502.09 153,494.96 154,177.28
% change -2.9% 2.3% 0.1% 0.7% 0.4%
Smoothed Scenario
Distribution Subtotal A
$/30 days 14,472.09 13,407.62 13,762.77 14,108.19 14,784.43 15,388.26
% change -7.4% 2.6% 2.5% 4.8% 4.1%
Distribution Subtotal B
$/30 days 18,608.67 15,401.44 15,756.59 17,198.61 17,874.85 18,478.68
% change -17.2% 2.3% 9.2% 3.9% 3.4%
Total Bill (After Taxes & Rebate)
$/30 days 153,429.31 150,570.96 150,972.28 152,601.76 153,365.91 154,048.24
% change -1.9% 0.3% 1.1% 0.5% 0.4%
/ C
Toronto Hydro-Electric System Limited EB-2018-0165
Draft Rate Order UPDATED: February 12, 2020
Page 27 of 32
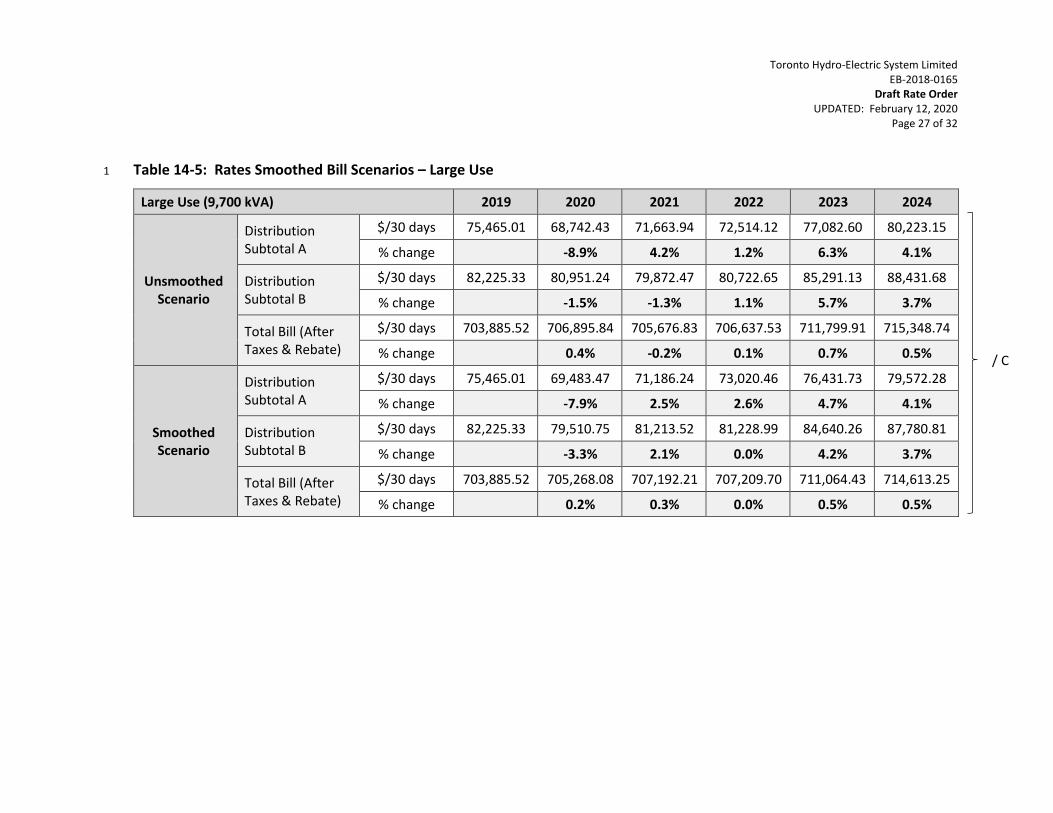
Table 14-5: Rates Smoothed Bill Scenarios – Large Use 1
Large Use (9,700 kVA) 2019 2020 2021 2022 2023 2024
Unsmoothed Scenario
Distribution Subtotal A
$/30 days 75,465.01 68,742.43 71,663.94 72,514.12 77,082.60 80,223.15
% change -8.9% 4.2% 1.2% 6.3% 4.1%
Distribution Subtotal B
$/30 days 82,225.33 80,951.24 79,872.47 80,722.65 85,291.13 88,431.68
% change -1.5% -1.3% 1.1% 5.7% 3.7%
Total Bill (After Taxes & Rebate)
$/30 days 703,885.52 706,895.84 705,676.83 706,637.53 711,799.91 715,348.74
% change 0.4% -0.2% 0.1% 0.7% 0.5%
Smoothed Scenario
Distribution Subtotal A
$/30 days 75,465.01 69,483.47 71,186.24 73,020.46 76,431.73 79,572.28
% change -7.9% 2.5% 2.6% 4.7% 4.1%
Distribution Subtotal B
$/30 days 82,225.33 79,510.75 81,213.52 81,228.99 84,640.26 87,780.81
% change -3.3% 2.1% 0.0% 4.2% 3.7%
Total Bill (After Taxes & Rebate)
$/30 days 703,885.52 705,268.08 707,192.21 707,209.70 711,064.43 714,613.25
% change 0.2% 0.3% 0.0% 0.5% 0.5%
/ C
Toronto Hydro-Electric System Limited EB-2018-0165
Draft Rate Order UPDATED: February 12, 2020
Page 28 of 32
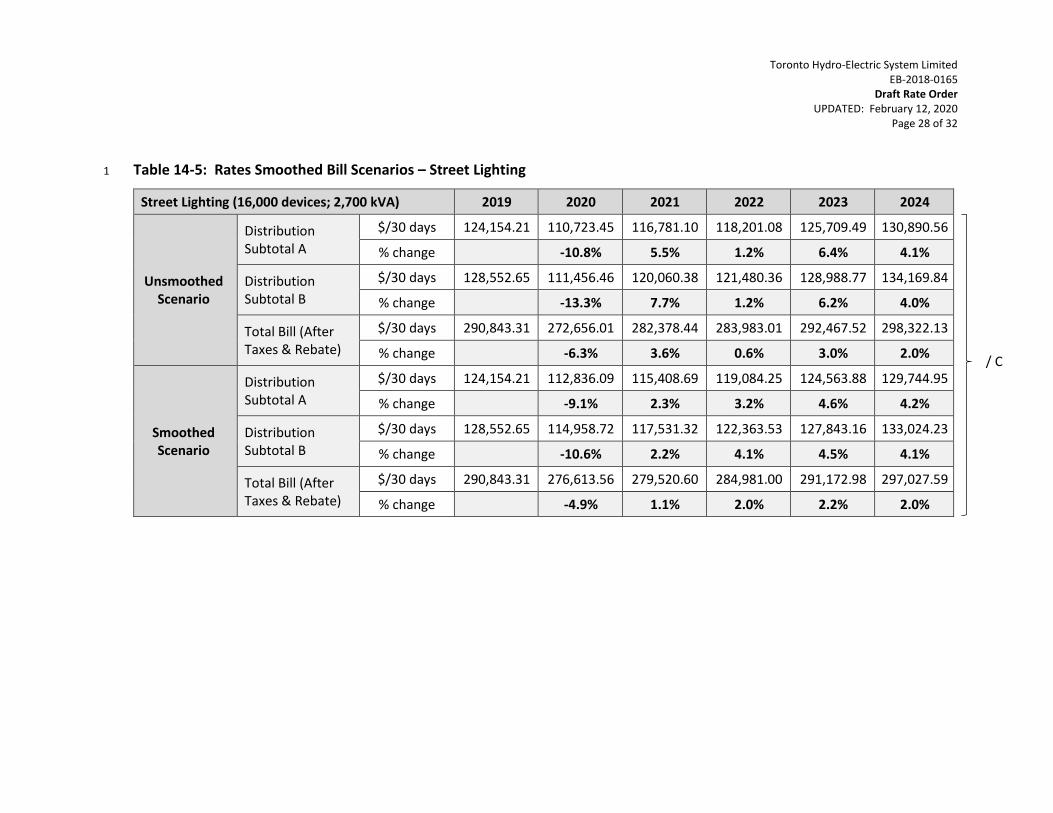
Table 14-5: Rates Smoothed Bill Scenarios – Street Lighting 1
Street Lighting (16,000 devices; 2,700 kVA) 2019 2020 2021 2022 2023 2024
Unsmoothed Scenario
Distribution Subtotal A
$/30 days 124,154.21 110,723.45 116,781.10 118,201.08 125,709.49 130,890.56
% change -10.8% 5.5% 1.2% 6.4% 4.1%
Distribution Subtotal B
$/30 days 128,552.65 111,456.46 120,060.38 121,480.36 128,988.77 134,169.84
% change -13.3% 7.7% 1.2% 6.2% 4.0%
Total Bill (After Taxes & Rebate)
$/30 days 290,843.31 272,656.01 282,378.44 283,983.01 292,467.52 298,322.13
% change -6.3% 3.6% 0.6% 3.0% 2.0%
Smoothed Scenario
Distribution Subtotal A
$/30 days 124,154.21 112,836.09 115,408.69 119,084.25 124,563.88 129,744.95
% change -9.1% 2.3% 3.2% 4.6% 4.2%
Distribution Subtotal B
$/30 days 128,552.65 114,958.72 117,531.32 122,363.53 127,843.16 133,024.23
% change -10.6% 2.2% 4.1% 4.5% 4.1%
Total Bill (After Taxes & Rebate)
$/30 days 290,843.31 276,613.56 279,520.60 284,981.00 291,172.98 297,027.59
% change -4.9% 1.1% 2.0% 2.2% 2.0%
/ C
Toronto Hydro-Electric System Limited EB-2018-0165
Draft Rate Order UPDATED: February 12, 2020
Page 29 of 32
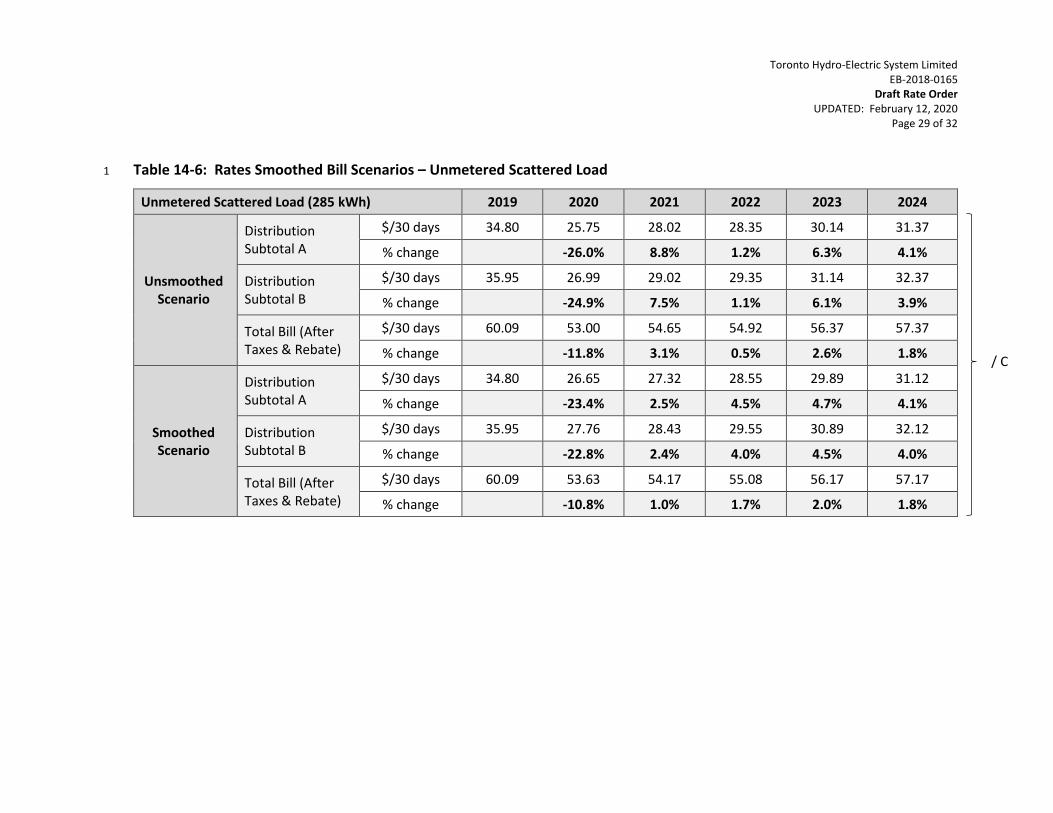
Table 14-6: Rates Smoothed Bill Scenarios – Unmetered Scattered Load 1
Unmetered Scattered Load (285 kWh) 2019 2020 2021 2022 2023 2024
Unsmoothed Scenario
Distribution Subtotal A
$/30 days 34.80 25.75 28.02 28.35 30.14 31.37
% change -26.0% 8.8% 1.2% 6.3% 4.1%
Distribution Subtotal B
$/30 days 35.95 26.99 29.02 29.35 31.14 32.37
% change -24.9% 7.5% 1.1% 6.1% 3.9%
Total Bill (After Taxes & Rebate)
$/30 days 60.09 53.00 54.65 54.92 56.37 57.37
% change -11.8% 3.1% 0.5% 2.6% 1.8%
Smoothed Scenario
Distribution Subtotal A
$/30 days 34.80 26.65 27.32 28.55 29.89 31.12
% change -23.4% 2.5% 4.5% 4.7% 4.1%
Distribution Subtotal B
$/30 days 35.95 27.76 28.43 29.55 30.89 32.12
% change -22.8% 2.4% 4.0% 4.5% 4.0%
Total Bill (After Taxes & Rebate)
$/30 days 60.09 53.63 54.17 55.08 56.17 57.17
% change -10.8% 1.0% 1.7% 2.0% 1.8%
/ C
Toronto Hydro-Electric System Limited EB-2018-0165
Draft Rate Order UPDATED: February, 2020
Page 30 of 32
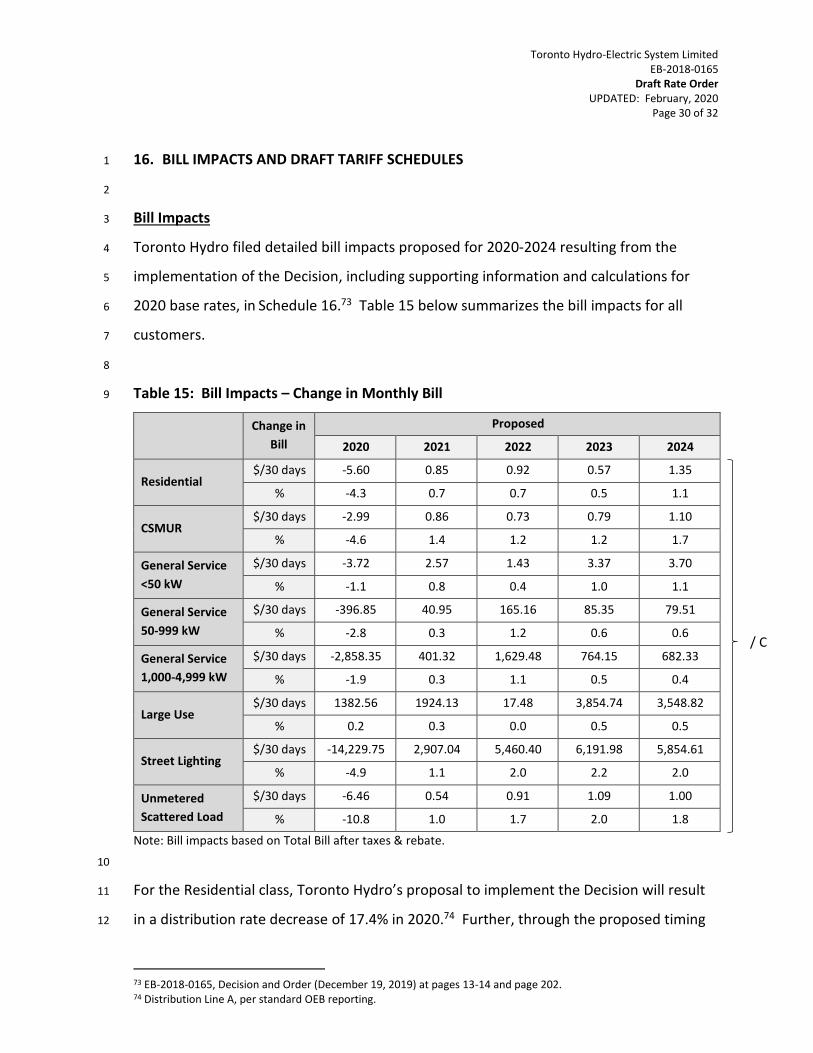
16. BILL IMPACTS AND DRAFT TARIFF SCHEDULES 1
2
Bill Impacts 3
Toronto Hydro filed detailed bill impacts proposed for 2020-2024 resulting from the 4
implementation of the Decision, including supporting information and calculations for 5
2020 base rates, in Schedule 16.73 Table 15 below summarizes the bill impacts for all 6
customers. 7
8
Table 15: Bill Impacts – Change in Monthly Bill 9
Change in
Bill
Proposed
2020 2021 2022 2023 2024
Residential $/30 days -5.60 0.85 0.92 0.57 1.35
% -4.3 0.7 0.7 0.5 1.1
CSMUR $/30 days -2.99 0.86 0.73 0.79 1.10
% -4.6 1.4 1.2 1.2 1.7
General Service
<50 kW
$/30 days -3.72 2.57 1.43 3.37 3.70
% -1.1 0.8 0.4 1.0 1.1
General Service
50-999 kW
$/30 days -396.85 40.95 165.16 85.35 79.51
% -2.8 0.3 1.2 0.6 0.6
General Service
1,000-4,999 kW
$/30 days -2,858.35 401.32 1,629.48 764.15 682.33
% -1.9 0.3 1.1 0.5 0.4
Large Use $/30 days 1382.56 1924.13 17.48 3,854.74 3,548.82
% 0.2 0.3 0.0 0.5 0.5
Street Lighting $/30 days -14,229.75 2,907.04 5,460.40 6,191.98 5,854.61
% -4.9 1.1 2.0 2.2 2.0
Unmetered
Scattered Load
$/30 days -6.46 0.54 0.91 1.09 1.00
% -10.8 1.0 1.7 2.0 1.8
Note: Bill impacts based on Total Bill after taxes & rebate.
10
For the Residential class, Toronto Hydro’s proposal to implement the Decision will result 11
in a distribution rate decrease of 17.4% in 2020.74 Further, through the proposed timing 12
73 EB-2018-0165, Decision and Order (December 19, 2019) at pages 13-14 and page 202. 74 Distribution Line A, per standard OEB reporting.
/ C
Toronto Hydro-Electric System Limited EB-2018-0165
Draft Rate Order UPDATED: February, 2020
Page 31 of 32
of starting and ending various rate riders, and taking into account the effect of the CPCI, 1
Toronto Hydro’s proposal will result in Residential distribution rates throughout the 2020-2
2024 rate period that are lower than distribution rates in 2019. 3
4
Tariffs of Rates and Charges 5
Schedules 17-1A to 17-5A set out Toronto Hydro’s draft Tariff of Rates and Charges for 6
the 2020-2024 smoothed option, respectively and schedules 17-1B to 17-5B set out those 7
for the unsmoothed option. The 2020 Tariff is for approval on a final basis. The 2021-8
2024 Tariffs are for approval on an interim basis, to be finalized in the annual rates 9
update process.75 10
11
17. SUPPORTING MATERIALS 12
Toronto Hydro provided the detailed information supporting the determination of the 13
approved revenue requirement for 2020 and CPCI inputs for 2021-2024, rate riders, rate 14
schedules, rate impacts, and the proposed accounting treatment for approved deferral 15
and variance accounts in the following schedules attached to this DRO: 16
• Schedule 1-1 – Revenue Requirement Work Forms for 2020 17
• Schedule 1-2 – Revenue Requirement Work Forms for 2021 18
• Schedule 1-3 – Revenue Requirement Work Forms for 2022 19
• Schedule 1-4 – Revenue Requirement Work Forms for 2023 20
• Schedule 1-5 – Revenue Requirement Work Forms for 2024 21
• Schedule 2 – Fixed Asset Continuity Schedule (OEB Appendix 2-BA) 22
• Schedule 3 – Rate Base Methodology (Undertaking J1.9) 23
• Schedule 4 – Capital Expenditures (OEB Appendix 2-AB) 24
• Schedule 5 – Navigant Working Capital Allowance Report Addendum 25
• Schedule 6-1 – REI Investment: GPMC (OEB Appendix 2-FA) 26
• Schedule 6-2 – REI Investment: GPMC (OEB Appendix 2-FB) 27
75 EB-2018-0165, Decision and Order (December 19, 2019) at pages 23-24.
/ C
Toronto Hydro-Electric System Limited EB-2018-0165
Draft Rate Order UPDATED: February, 2020
Page 32 of 32
• Schedule 6-3 – REI Investment: ESS (OEB Appendix 2-FA) 1
• Schedule 6-4 – REI Investment: ESS (OEB Appendix 2-FB) 2
• Schedule 7 – OM&A Expenses (OEB Appendix 2-JA) 3
• Schedule 8 – Workforce Staffing and Compensation (OEB Appendix 2-K) 4
• Schedule 9 – PILs Model 5
• Schedule 10-1 – Taxes and PILs Workform Old CCA Rules (U-Staff-188, App B) 6
• Schedule 10-2 – Taxes and PILs Workform New CCA Rules (U-Staff-188, App A) 7
• Schedule 11 – Other Revenue (OEB Appendix 2-H) 8
• Schedule 12 – Foregone Revenue Calculation 9
• Schedule 13 – DVA Continuity Schedules & Rate Riders 10
• Schedule 14 – Retail Transmission Service Rates (2020 Workform) 11
• Schedule 15 – Cost Allocation Model 12
• Schedule 16 – Bill Impacts (OEB Appendix 2-W) 13
• Schedule 17-1A – 2020 Tariff of Rates and Charges 14
• Schedule 17-2A– 2021 Tariff of Rates and Charges 15
• Schedule 17-3A– 2022 Tariff of Rates and Charges 16
• Schedule 17-4A– 2023 Tariff of Rates and Charges 17
• Schedule 17-5A – 2024 Tariff of Rates and Charges 18
• Schedule 17-1B – 2020 Tariff of Rates and Charges - Unsmoothed 19
• Schedule 17-2B– 2021 Tariff of Rates and Charges - Unsmoothed 20
• Schedule 17-3B– 2022 Tariff of Rates and Charges - Unsmoothed 21
• Schedule 17-4B– 2023 Tariff of Rates and Charges - Unsmoothed 22
• Schedule 17-5B– 2024 Tariff of Rates and Charges - Unsmoothed 23
• Schedule 18 – Draft Accounting Orders 24
/ C

Toronto Hydro-Electric System Limited
EB-2018-0165
Draft Rate Order
Schedule 1-1
UPDATED: February 12, 2020
Page 1 of 16
Version 8.00
Utility Name
Service Territory
Assigned EB Number
Name and Title
Phone Number
Email Address
Bridge Year
Last Rebasing Year 2015
Toronto Hydro-Electric System Limited
EB-2018-0165
The RRWF has been enhanced commencing with 2017 rate applications to provide estimated base distribution rates. The enhanced RRWF is not intended to replace a utility’s formal rate
generator model which should continue to be the source of the proposed rates as well as the final ones at the conclusion of the proceeding. The load forecasting addition made to this model is
intended to be demonstrative only and does not replace the information filed in the utility’s application. In an effort to minimize the incremental work required from utilities, the cost allocation and rate
design additions to this model do in fact replace former appendices that were required to be filed as part of the cost of service (Chapter 2) filing requirements.
Test Year
This Workbook Model is protected by copyright and is being made available to you solely for the purpose of filing your application. You may use and copy this model for that purpose, and provide a copy of this model to any person that is advising or assisting you in that regard. Except as indicated above, any copying, reproduction, publication, sale, adaptation, translation, modification, reverse engineering or other use or dissemination of this model without the express written consent of the Ontario Energy Board is prohibited. If you provide a copy of this model to a person that is advising or assisting you in preparing the application or reviewing your draft rate order, you must ensure that the person understands and agrees to the restrictions noted above.
While this model has been provided in Excel format and is required to be filed with the applications, the onus remains on the applicant to ensure the accuracy of the data and the results.
Ontario Energy Board
1. Info

Toronto Hydro-Electric System Limited
EB-2018-0165
Draft Rate Order
Schedule 1-1
UPDATED: February 12, 2020
Page 2 of 16
1. Info 8. Rev_Def_Suff
2. Table of Contents 9. Rev_Reqt
3. Data_Input_Sheet 10. Load Forecast
4. Rate_Base 11. Cost Allocation
5. Utility Income 12. Residential Rate Design
6. Taxes_PILs 13. Rate Design and Revenue Reconciliation
7. Cost_of_Capital 14. Tracking Sheet
Notes:
(1)
(2)
(3)
(4)
(5)
Please note that this model uses MACROS. Before starting, please ensure that macros have been enabled.
Completed versions of the Revenue Requirement Work Form are required to be filed in working Microsoft Excel format.
Pale yellow cells represent drop-down lists
Pale green cells represent inputs
Pale green boxes at the bottom of each page are for additional notes
Ontario Energy Board
2. Table of Contents
Toronto Hydro-Electric System Limited
EB-2018-0165
Draft Rate Order
Schedule 1-1
UPDATED: February 12, 2020
Page 3 of 16
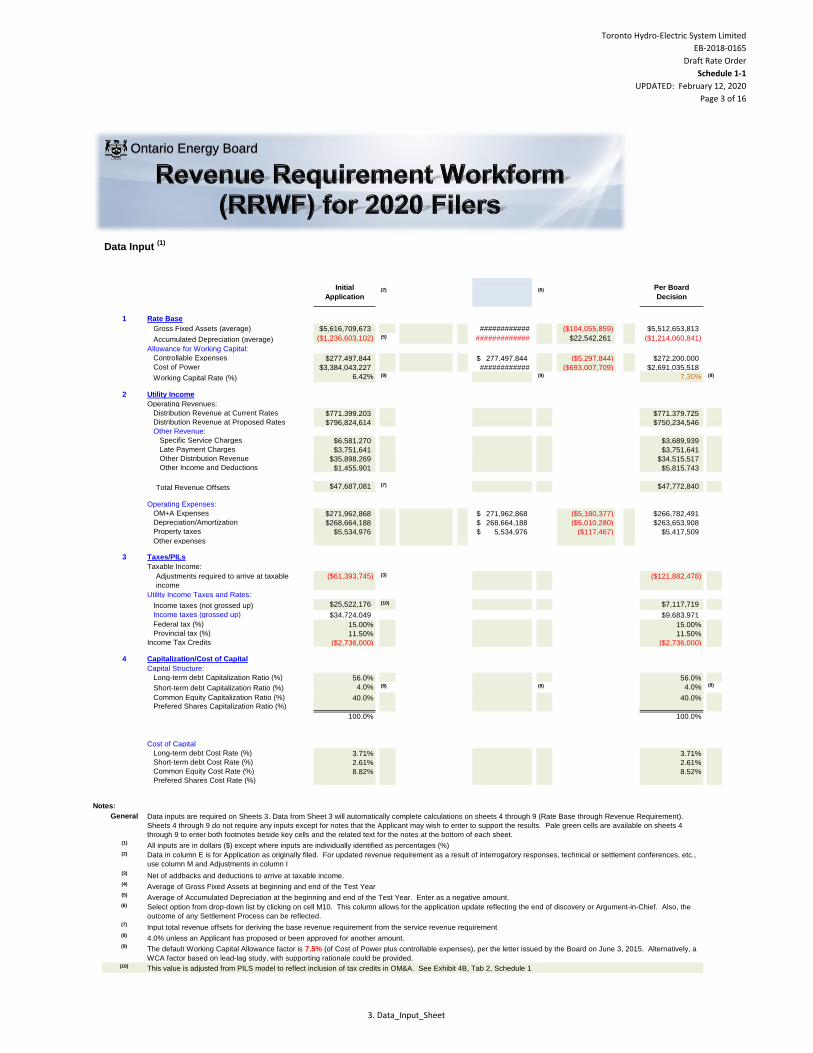
Data Input (1)
1 Rate Base
Gross Fixed Assets (average) $5,616,709,673 ############ ($104,055,859) $5,512,653,813
Accumulated Depreciation (average) ($1,236,603,102) (5) ############# $22,542,261 ($1,214,060,841)
Allowance for Working Capital:
Controllable Expenses $277,497,844 277,497,844$ ($5,297,844) $272,200,000
Cost of Power $3,384,043,227 ############ ($693,007,709) $2,691,035,518
Working Capital Rate (%) 6.42% (9) (9) 7.30% (9)
2 Utility Income
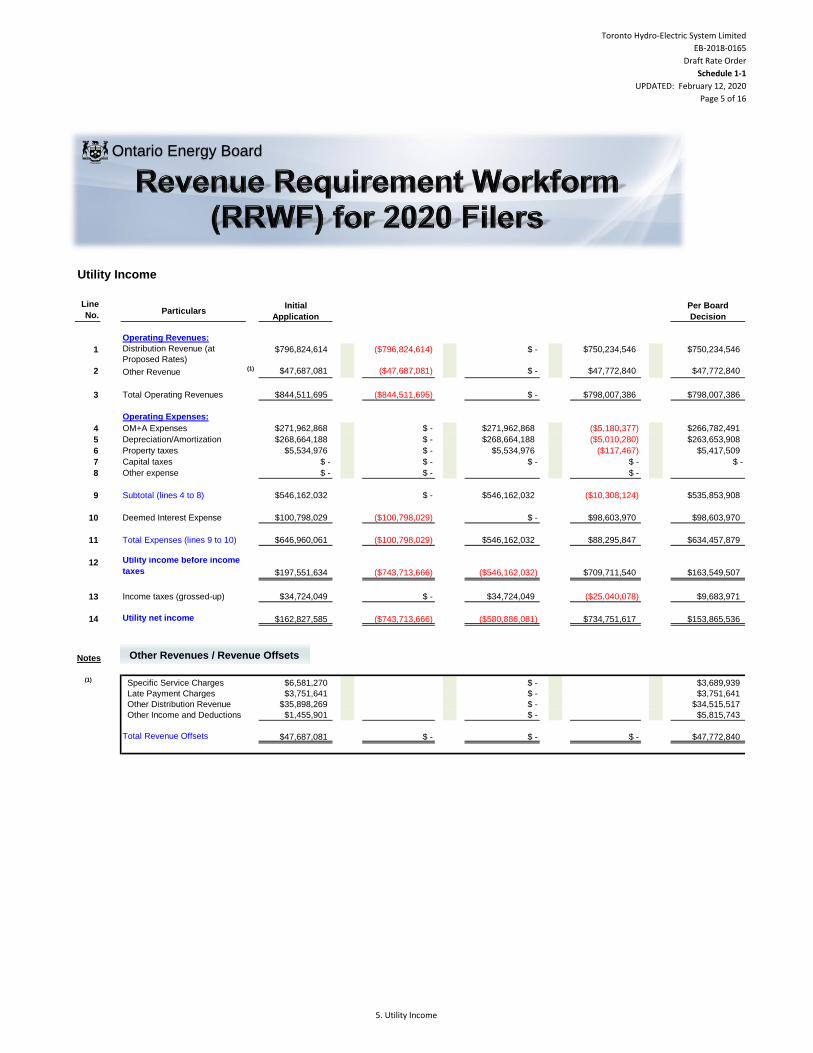
Operating Revenues:
Distribution Revenue at Current Rates $771,399,203 $771,379,725
Distribution Revenue at Proposed Rates $796,824,614 $750,234,546
Other Revenue:
Specific Service Charges $6,581,270 $3,689,939
Late Payment Charges $3,751,641 $3,751,641
Other Distribution Revenue $35,898,269 $34,515,517
Other Income and Deductions $1,455,901 $5,815,743
Total Revenue Offsets $47,687,081 (7) $47,772,840
Operating Expenses:
OM+A Expenses $271,962,868 271,962,868$ ($5,180,377) $266,782,491
Depreciation/Amortization $268,664,188 268,664,188$ ($5,010,280) $263,653,908
Property taxes $5,534,976 5,534,976$ ($117,467) $5,417,509 Capital taxes
Other expenses
3 Taxes/PILs
Taxable Income:
Adjustments required to arrive at taxable
income
($61,393,745) (3) ($121,882,478)
Utility Income Taxes and Rates:
Income taxes (not grossed up) $25,522,176 (10) $7,117,719
Income taxes (grossed up) $34,724,049 $9,683,971 Capital Taxes
Federal tax (%) 15.00% 15.00%
Provincial tax (%) 11.50% 11.50%
Income Tax Credits ($2,736,000) ($2,736,000)
4 Capitalization/Cost of Capital
Capital Structure:
Long-term debt Capitalization Ratio (%) 56.0% 56.0%
Short-term debt Capitalization Ratio (%) 4.0% (8) (8) 4.0% (8)
Common Equity Capitalization Ratio (%) 40.0% 40.0% Prefered Shares Capitalization Ratio (%)
100.0% 0.0% 100.0%
Cost of Capital
Long-term debt Cost Rate (%) 3.71% 3.71%
Short-term debt Cost Rate (%) 2.61% 2.61%
Common Equity Cost Rate (%) 8.82% 8.52%
Prefered Shares Cost Rate (%)
Notes:
General
(1)
(2)
(3)
(4)
(5)
(6)
(7)
(8)
(9)
(10) This value is adjusted from PILS model to reflect inclusion of tax credits in OM&A. See Exhibit 4B, Tab 2, Schedule 1
The default Working Capital Allowance factor is 7.5% (of Cost of Power plus controllable expenses), per the letter issued by the Board on June 3, 2015. Alternatively, a
WCA factor based on lead-lag study, with supporting rationale could be provided.
Data inputs are required on Sheets 3. Data from Sheet 3 will automatically complete calculations on sheets 4 through 9 (Rate Base through Revenue Requirement).
Sheets 4 through 9 do not require any inputs except for notes that the Applicant may wish to enter to support the results. Pale green cells are available on sheets 4
through 9 to enter both footnotes beside key cells and the related text for the notes at the bottom of each sheet.
(6)(2)Initial
Application
Per Board
Decision
Data in column E is for Application as originally filed. For updated revenue requirement as a result of interrogatory responses, technical or settlement conferences, etc.,
use column M and Adjustments in column I
Net of addbacks and deductions to arrive at taxable income.
All inputs are in dollars ($) except where inputs are individually identified as percentages (%)
Select option from drop-down list by clicking on cell M10. This column allows for the application update reflecting the end of discovery or Argument-in-Chief. Also, the
outcome of any Settlement Process can be reflected.
Average of Gross Fixed Assets at beginning and end of the Test Year
Input total revenue offsets for deriving the base revenue requirement from the service revenue requirement
4.0% unless an Applicant has proposed or been approved for another amount.
Average of Accumulated Depreciation at the beginning and end of the Test Year. Enter as a negative amount.
Ontario Energy Board
3. Data_Input_Sheet
Toronto Hydro-Electric System Limited
EB-2018-0165
Draft Rate Order
Schedule 1-1
UPDATED: February 12, 2020
Page 4 of 16
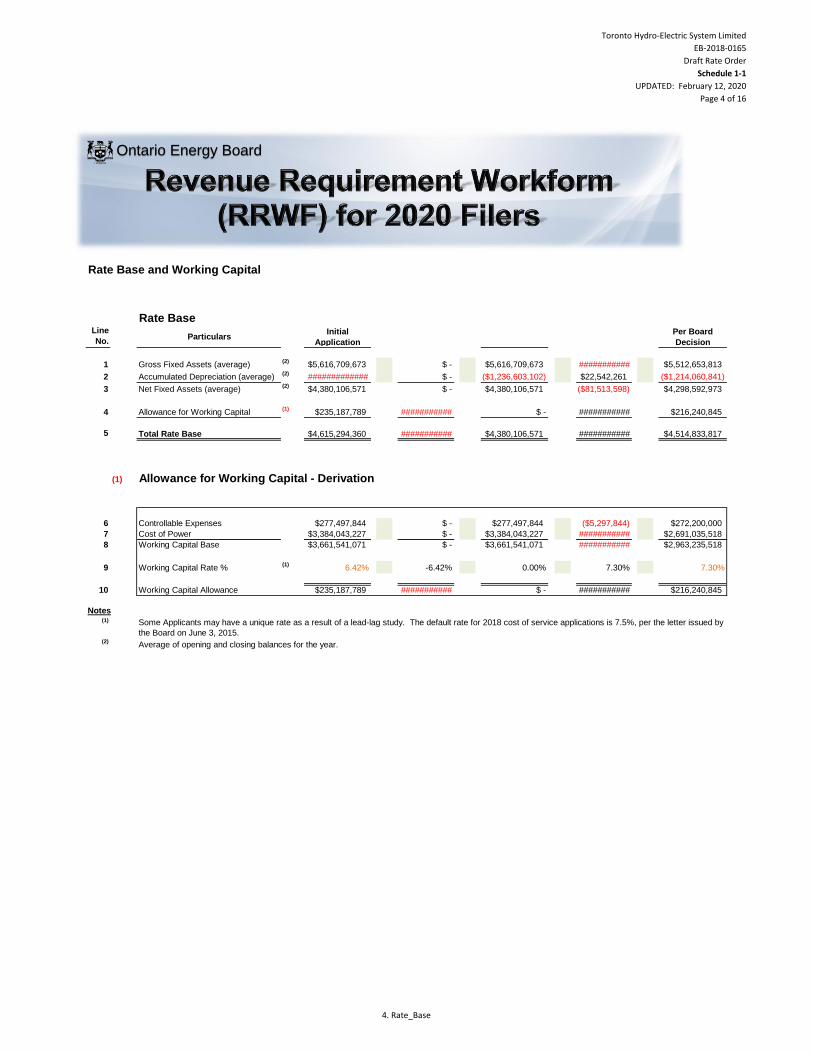
Rate Base and Working Capital
Rate BaseLine
No.Particulars
Initial
Application Per Board
Decision
1 Gross Fixed Assets (average)(2)
$5,616,709,673 $ - $5,616,709,673 ########### $5,512,653,813
2 Accumulated Depreciation (average)(2)
############# $ - ($1,236,603,102) $22,542,261 ($1,214,060,841)
3 Net Fixed Assets (average)(2)
$4,380,106,571 $ - $4,380,106,571 ($81,513,598) $4,298,592,973
4 Allowance for Working Capital(1)
$235,187,789 ########### $ - ########### $216,240,845
5
(1) Allowance for Working Capital - Derivation
6 Controllable Expenses $277,497,844 $ - $277,497,844 ($5,297,844) $272,200,000
7 Cost of Power $3,384,043,227 $ - $3,384,043,227 ########### $2,691,035,518
8 Working Capital Base $3,661,541,071 $ - $3,661,541,071 ########### $2,963,235,518
9 Working Capital Rate % (1)
6.42% -6.42% 0.00% 7.30% 7.30%
10 Working Capital Allowance $235,187,789 ########### $ - ########### $216,240,845
(1)
(2)
Some Applicants may have a unique rate as a result of a lead-lag study. The default rate for 2018 cost of service applications is 7.5%, per the letter issued by
the Board on June 3, 2015.
Average of opening and closing balances for the year.
Notes
$4,615,294,360 ########### $4,514,833,817Total Rate Base $4,380,106,571 ###########
Ontario Energy Board
4. Rate_Base
Toronto Hydro-Electric System Limited
EB-2018-0165
Draft Rate Order
Schedule 1-1
UPDATED: February 12, 2020
Page 5 of 16
Utility Income
Line
No.Particulars
Initial
Application
Per Board
Decision
Operating Revenues:
1 Distribution Revenue (at
Proposed Rates)$796,824,614 ($796,824,614) $ - $750,234,546 $750,234,546
2 Other Revenue(1) $47,687,081 ($47,687,081) $ - $47,772,840 $47,772,840
3 Total Operating Revenues
Operating Expenses:
4 OM+A Expenses $271,962,868 $ - $271,962,868 ($5,180,377) $266,782,491
5 Depreciation/Amortization $268,664,188 $ - $268,664,188 ($5,010,280) $263,653,908
6 Property taxes $5,534,976 $ - $5,534,976 ($117,467) $5,417,509
7 Capital taxes $ - $ - $ - $ - $ -
8 Other expense $ - $ - $ -
9 Subtotal (lines 4 to 8)
10 Deemed Interest Expense $100,798,029 ($100,798,029) $ - $98,603,970 $98,603,970
11 Total Expenses (lines 9 to 10) $646,960,061 ($100,798,029) $546,162,032 $88,295,847 $634,457,879
12 Utility income before income
taxes $197,551,634 ($743,713,666) ($546,162,032) $709,711,540 $163,549,507
13 Income taxes (grossed-up)
14 Utility net income
(1) Specific Service Charges $6,581,270 $ - $3,689,939
Late Payment Charges $3,751,641 $ - $3,751,641
Other Distribution Revenue $35,898,269 $ - $34,515,517
Other Income and Deductions $1,455,901 $ - $5,815,743
Total Revenue Offsets $ - $ - $ -
$ -
($743,713,666)
$ -
$9,683,971$34,724,049
$153,865,536$162,827,585 $734,751,617
$798,007,386$ - $798,007,386$844,511,695 ($844,511,695)
$546,162,032
$47,687,081 $47,772,840
Notes
($580,886,081)
$535,853,908$546,162,032
$34,724,049
($10,308,124)
($25,040,078)
Other Revenues / Revenue Offsets
Ontario Energy Board
5. Utility Income

Toronto Hydro-Electric System Limited
EB-2018-0165
Draft Rate Order
Schedule 1-1
UPDATED: February 12, 2020
Page 6 of 16
Line
No.Particulars Application
Per Board
Decision
Determination of Taxable Income
1 $162,827,585 $ - $153,865,536
2 ($61,393,745) $ - ($121,882,478)
3 $101,433,840 $ - $31,983,059
Calculation of Utility income Taxes
4 Income taxes $25,522,176 $25,522,176 $7,117,719
5Capital taxes
$ - $ - $ -
6 Total taxes
7 Gross-up of Income Taxes $9,201,873 $9,201,873 $2,566,252
8 Grossed-up Income Taxes $34,724,049 $34,724,049 $9,683,971
9$34,724,049 $34,724,049 $9,683,971
10 Other tax Credits ($2,736,000) ($2,736,000) ($2,736,000)
Tax Rates
11 Federal tax (%) 15.00% 15.00% 15.00%
12 Provincial tax (%) 11.50% 11.50% 11.50%
13 Total tax rate (%) 26.50% 26.50% 26.50%
Capital Taxes not applicable after July 1, 2010 (i.e. for 2011 and later test years)
Notes
Taxes/PILs
$25,522,176 $7,117,719
Utility net income before taxes
Adjustments required to arrive at taxable
utility income
Taxable income
PILs / tax Allowance (Grossed-up Income
taxes + Capital taxes)
$25,522,176
Ontario Energy Board
6. Taxes_PILs
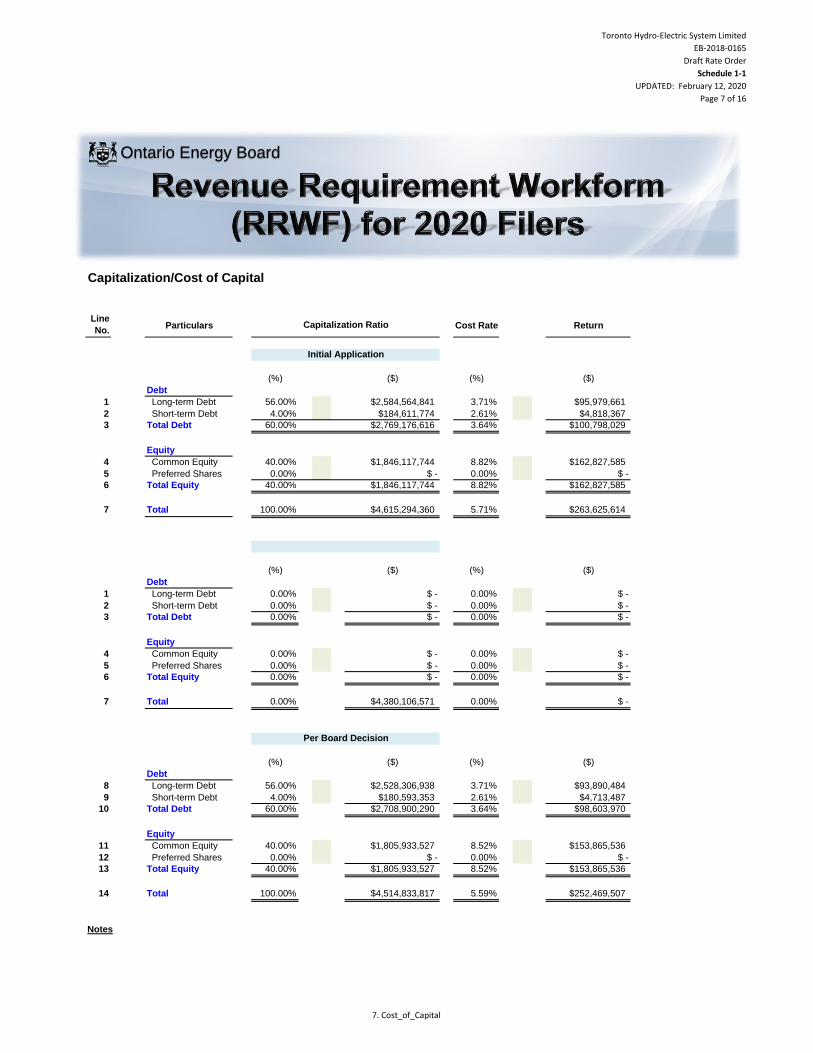
Toronto Hydro-Electric System Limited
EB-2018-0165
Draft Rate Order
Schedule 1-1
UPDATED: February 12, 2020
Page 7 of 16
Line
No.Particulars Cost Rate Return
(%) ($) (%) ($)
Debt
1 Long-term Debt 56.00% $2,584,564,841 3.71% $95,979,661
2 Short-term Debt 4.00% $184,611,774 2.61% $4,818,367
3 Total Debt 60.00% $2,769,176,616 3.64% $100,798,029
Equity
4 Common Equity 40.00% $1,846,117,744 8.82% $162,827,585
5 Preferred Shares 0.00% $ - 0.00% $ -
6 Total Equity 40.00% $1,846,117,744 8.82% $162,827,585
7 Total 100.00% $4,615,294,360 5.71% $263,625,614
(%) ($) (%) ($)
Debt
1 Long-term Debt 0.00% $ - 0.00% $ -
2 Short-term Debt 0.00% $ - 0.00% $ -
3 Total Debt 0.00% $ - 0.00% $ -
Equity
4 Common Equity 0.00% $ - 0.00% $ -
5 Preferred Shares 0.00% $ - 0.00% $ -
6 Total Equity 0.00% $ - 0.00% $ -
7 Total 0.00% $4,380,106,571 0.00% $ -
(%) ($) (%) ($)
Debt
8 Long-term Debt 56.00% $2,528,306,938 3.71% $93,890,484
9 Short-term Debt 4.00% $180,593,353 2.61% $4,713,487
10 Total Debt 60.00% $2,708,900,290 3.64% $98,603,970
Equity
11 Common Equity 40.00% $1,805,933,527 8.52% $153,865,536
12 Preferred Shares 0.00% $ - 0.00% $ -
13 Total Equity 40.00% $1,805,933,527 8.52% $153,865,536
14 Total 100.00% $4,514,833,817 5.59% $252,469,507
Per Board Decision
Notes
Initial Application
Capitalization/Cost of Capital
Capitalization Ratio
Ontario Energy Board
7. Cost_of_Capital
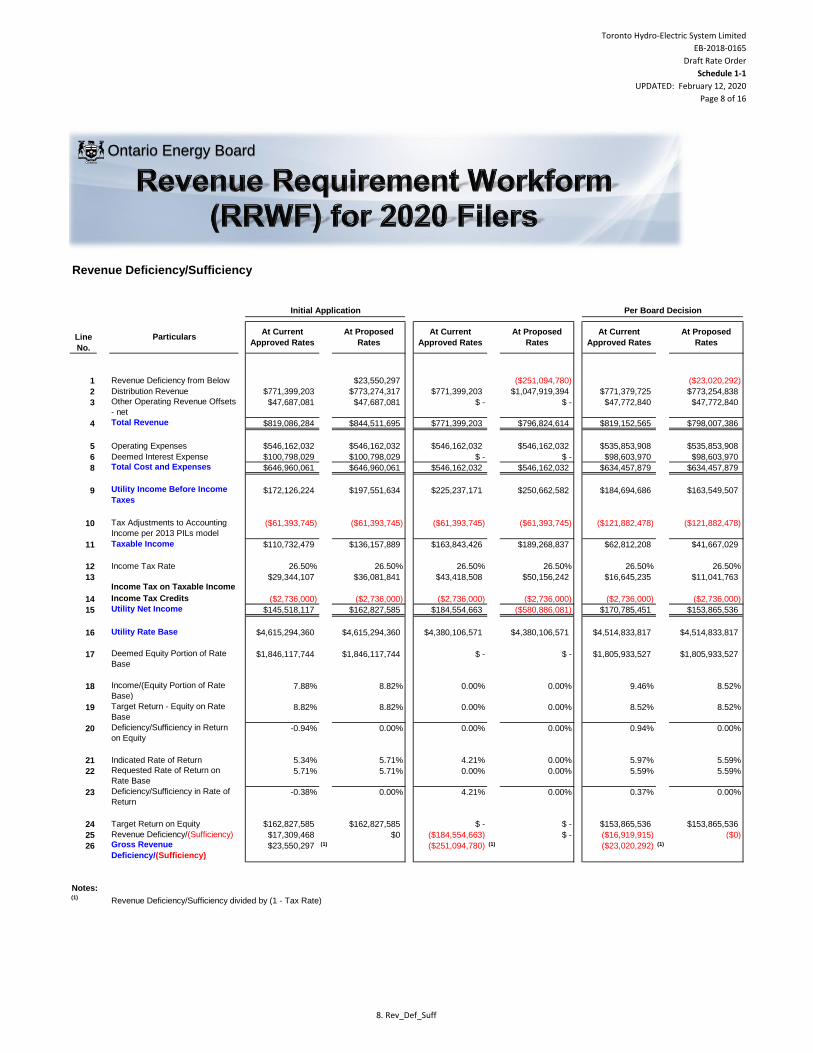
Toronto Hydro-Electric System Limited
EB-2018-0165
Draft Rate Order
Schedule 1-1
UPDATED: February 12, 2020
Page 8 of 16
Revenue Deficiency/Sufficiency
1 Revenue Deficiency from Below $23,550,297 ($251,094,780) ($23,020,292)
2 Distribution Revenue $771,399,203 $773,274,317 $771,399,203 $1,047,919,394 $771,379,725 $773,254,838
3 Other Operating Revenue Offsets
- net$47,687,081 $47,687,081 $ - $ - $47,772,840 $47,772,840
4 Total Revenue $819,086,284 $844,511,695 $771,399,203 $796,824,614 $819,152,565 $798,007,386
5 Operating Expenses $546,162,032 $546,162,032 $546,162,032 $546,162,032 $535,853,908 $535,853,908
6 Deemed Interest Expense $100,798,029 $100,798,029 $ - $ - $98,603,970 $98,603,970
8 Total Cost and Expenses $646,960,061 $646,960,061 $546,162,032 $546,162,032 $634,457,879 $634,457,879
9 Utility Income Before Income
Taxes$172,126,224 $197,551,634 $225,237,171 $250,662,582 $184,694,686 $163,549,507
10 Tax Adjustments to Accounting
Income per 2013 PILs model
($61,393,745) ($61,393,745) ($61,393,745) ($61,393,745) ($121,882,478) ($121,882,478)
11 Taxable Income $110,732,479 $136,157,889 $163,843,426 $189,268,837 $62,812,208 $41,667,029
12 Income Tax Rate 26.50% 26.50% 26.50% 26.50% 26.50% 26.50%
13Income Tax on Taxable Income
$29,344,107 $36,081,841 $43,418,508 $50,156,242 $16,645,235 $11,041,763
14 Income Tax Credits ($2,736,000) ($2,736,000) ($2,736,000) ($2,736,000) ($2,736,000) ($2,736,000)
15 Utility Net Income $145,518,117 $162,827,585 $184,554,663 ($580,886,081) $170,785,451 $153,865,536
16 Utility Rate Base $4,615,294,360 $4,615,294,360 $4,380,106,571 $4,380,106,571 $4,514,833,817 $4,514,833,817
17 Deemed Equity Portion of Rate
Base $1,846,117,744 $1,846,117,744 $ - $ - $1,805,933,527 $1,805,933,527
18 Income/(Equity Portion of Rate
Base)7.88% 8.82% 0.00% 0.00% 9.46% 8.52%
19 Target Return - Equity on Rate
Base8.82% 8.82% 0.00% 0.00% 8.52% 8.52%
20 Deficiency/Sufficiency in Return
on Equity-0.94% 0.00% 0.00% 0.00% 0.94% 0.00%
21 Indicated Rate of Return 5.34% 5.71% 4.21% 0.00% 5.97% 5.59%
22 Requested Rate of Return on
Rate Base5.71% 5.71% 0.00% 0.00% 5.59% 5.59%
23 Deficiency/Sufficiency in Rate of
Return-0.38% 0.00% 4.21% 0.00% 0.37% 0.00%
24 Target Return on Equity $162,827,585 $162,827,585 $ - $ - $153,865,536 $153,865,536
25 Revenue Deficiency/(Sufficiency) $17,309,468 $0 ($184,554,663) $ - ($16,919,915) ($0)
26 Gross Revenue
Deficiency/(Sufficiency)$23,550,297 (1) ($251,094,780) (1) ($23,020,292) (1)
(1)Revenue Deficiency/Sufficiency divided by (1 - Tax Rate)
At Proposed
Rates
At Proposed
Rates
At Current
Approved Rates
Per Board Decision
At Current
Approved Rates
At Current
Approved Rates
At Proposed
Rates
Notes:
ParticularsLine
No.
Initial Application
Ontario Energy Board
8. Rev_Def_Suff

Toronto Hydro-Electric System Limited
EB-2018-0165
Draft Rate Order
Schedule 1-1
UPDATED: February 12, 2020
Page 9 of 16
Revenue Requirement
Line
No.Particulars Application
1 OM&A Expenses $271,962,868 $271,962,868
2 Amortization/Depreciation $268,664,188 $268,664,188
3 Property Taxes $5,534,976 $5,534,976
4
Capital Taxes $ - $ -
5 Income Taxes (Grossed up) $34,724,049 $34,724,049
6 Other Expenses $ -
7 Return
Deemed Interest Expense $100,798,029 $ -
Return on Deemed Equity $162,827,585 $ -
8 Service Revenue Requirement
(before Revenues) $844,511,695 $580,886,081
9 Revenue Offsets $47,687,081 $ -
10 Base Revenue Requirement $796,824,614 $580,886,081
(excluding Tranformer Owership
Allowance credit adjustment)
11 Distribution revenue $796,824,614 $ -
12 Other revenue $47,687,081 $ -
13 Total revenue
14 Difference (Total Revenue Less
Distribution Revenue Requirement
before Revenues) (1) (1) (1)
Application Δ% (2) Δ% (2)
Service Revenue Requirement $844,511,695 $580,886,081 ($0) ($1)Grossed-Up Revenue
Deficiency/(Sufficiency) $23,550,297 ($251,094,780) ($12) ($1)
Base Revenue Requirement (to be
recovered from Distribution Rates) $796,824,614 $580,886,081 ($0) ($1)
Revenue Deficiency/(Sufficiency)
Associated with Base Revenue
Requirement $25,425,411 $ - ($1) ($1)
(1)Line 11 - Line 8
(2)Percentage Change Relative to Initial Application
$750,234,546
$9,683,971
$98,603,970
$153,865,536
$47,772,840$750,234,546
$266,782,491
Per Board Decision
$798,007,386
($0)
Per Board Decision
$798,007,386
($23,020,292)
$750,234,546
($21,145,179)
$263,653,908
$5,417,509
$798,007,386
Notes
$47,772,840
$ -
($580,886,081)$0
$844,511,695
Summary Table of Revenue Requirement and Revenue Deficiency/Sufficiency
Ontario Energy Board
9. Rev_Reqt
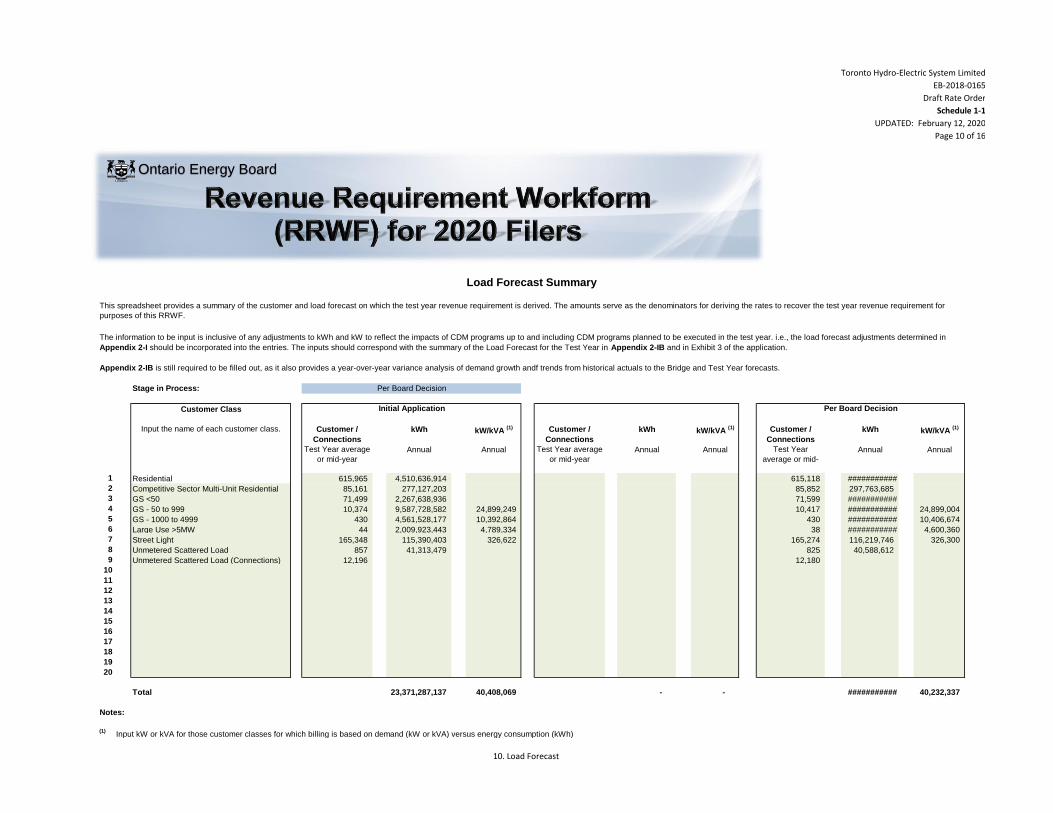
Toronto Hydro-Electric System Limited
EB-2018-0165
Draft Rate Order
Schedule 1-1
UPDATED: February 12, 2020
Page 10 of 16
Stage in Process:
Customer Class
Customer /
Connections
kWh kW/kVA (1) Customer /
Connections
kWh kW/kVA (1) Customer /
Connections
kWh kW/kVA (1)
Test Year average
or mid-year
Annual Annual Test Year average
or mid-year
Annual Annual Test Year
average or mid-
year
Annual Annual
1 Residential 615,965 4,510,636,914 615,118 ###########
2 Competitive Sector Multi-Unit Residential 85,161 277,127,203 85,852 297,763,685
3 GS <50 71,499 2,267,638,936 71,599 ###########
4 GS - 50 to 999 10,374 9,587,728,582 24,899,249 10,417 ########### 24,899,004
5 GS - 1000 to 4999 430 4,561,528,177 10,392,864 430 ########### 10,406,674
6 Large Use >5MW 44 2,009,923,443 4,789,334 38 ########### 4,600,360
7 Street Light 165,348 115,390,403 326,622 165,274 116,219,746 326,300
8 Unmetered Scattered Load 857 41,313,479 825 40,588,612
9 Unmetered Scattered Load (Connections) 12,196 12,180
10
11
12
13
14
15
16
17
18
19
20
Total 23,371,287,137 40,408,069 - - ########### 40,232,337
Notes:
(1)Input kW or kVA for those customer classes for which billing is based on demand (kW or kVA) versus energy consumption (kWh)
Load Forecast Summary
Input the name of each customer class.
Initial Application Per Board Decision
This spreadsheet provides a summary of the customer and load forecast on which the test year revenue requirement is derived. The amounts serve as the denominators for deriving the rates to recover the test year revenue requirement for
purposes of this RRWF.
The information to be input is inclusive of any adjustments to kWh and kW to reflect the impacts of CDM programs up to and including CDM programs planned to be executed in the test year. i.e., the load forecast adjustments determined in
Appendix 2-I should be incorporated into the entries. The inputs should correspond with the summary of the Load Forecast for the Test Year in Appendix 2-IB and in Exhibit 3 of the application.
Per Board Decision
Appendix 2-IB is still required to be filled out, as it also provides a year-over-year variance analysis of demand growth andf trends from historical actuals to the Bridge and Test Year forecasts.
Ontario Energy Board
10. Load Forecast
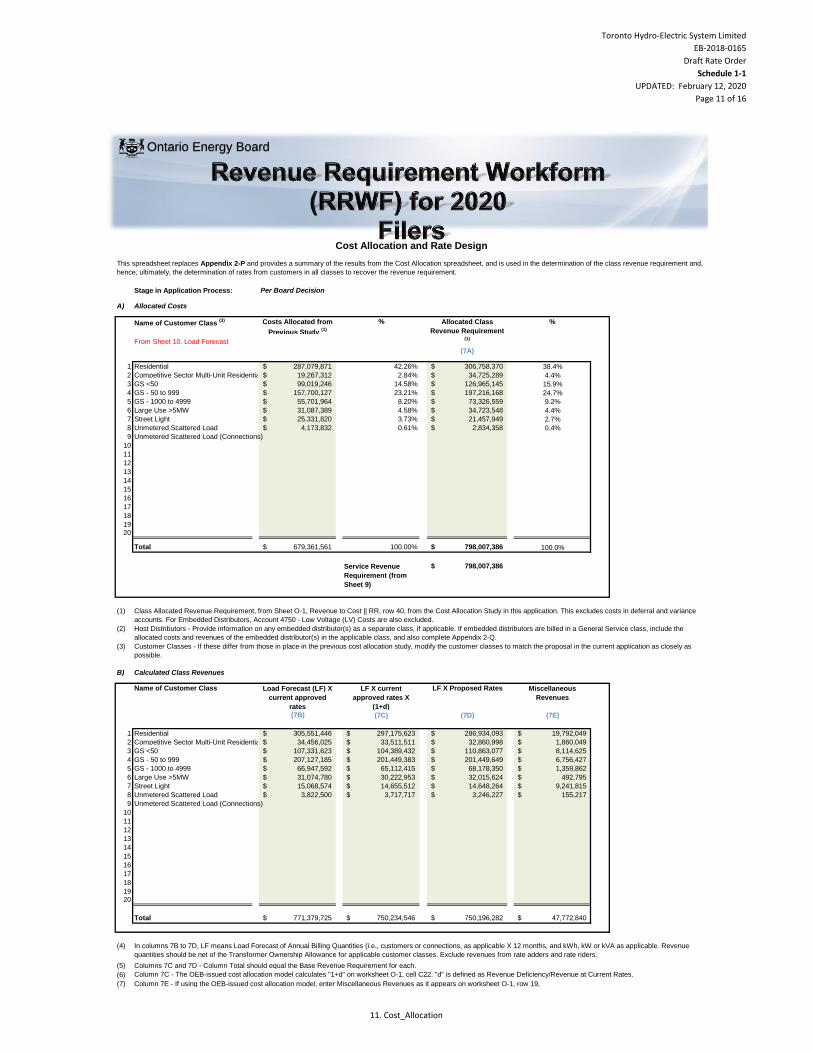
Toronto Hydro-Electric System Limited
EB-2018-0165
Draft Rate Order
Schedule 1-1
UPDATED: February 12, 2020
Page 11 of 16
Stage in Application Process:
A) Allocated Costs
Name of Customer Class (3) Costs Allocated from
Previous Study (1)
% %
From Sheet 10. Load Forecast
(7A)
1 Residential 287,079,871$ 42.26% 306,758,370$ 38.4%
2 Competitive Sector Multi-Unit Residential 19,267,312$ 2.84% 34,725,289$ 4.4%
3 GS <50 99,019,246$ 14.58% 126,965,145$ 15.9%
4 GS - 50 to 999 157,700,127$ 23.21% 197,216,168$ 24.7%
5 GS - 1000 to 4999 55,701,964$ 8.20% 73,326,559$ 9.2%
6 Large Use >5MW 31,087,389$ 4.58% 34,723,548$ 4.4%
7 Street Light 25,331,820$ 3.73% 21,457,949$ 2.7%
8 Unmetered Scattered Load 4,173,832$ 0.61% 2,834,358$ 0.4%
9 Unmetered Scattered Load (Connections) 0.00% 0.00%
10 0.00% 0.00%
11 0.00% 0.00%
12 0.00% 0.00%
13 0.00% 0.00%
14 0.00% 0.00%
15 0.00% 0.00%
16 0.00% 0.00%
17 0.00% 0.00%
18 0.00% 0.00%
19 0.00% 0.00%20 0.00% 0.00%
Total 679,361,561$ 100.00% 798,007,386$ 100.0%
Service Revenue
Requirement (from
Sheet 9)
798,007,386$
(1)
(2)
(3)
B) Calculated Class Revenues
Name of Customer Class Load Forecast (LF) X
current approved
rates
LF X current
approved rates X
(1+d)
LF X Proposed Rates Miscellaneous
Revenues
(7B) (7C) (7D) (7E)
1 Residential 305,551,446$ 297,175,623$ 286,934,093$ 19,792,049$
2 Competitive Sector Multi-Unit Residential 34,456,025$ 33,511,511$ 32,860,998$ 1,860,049$
3 GS <50 107,331,623$ 104,389,432$ 110,863,077$ 8,114,625$
4 GS - 50 to 999 207,127,185$ 201,449,383$ 201,449,649$ 6,756,427$
5 GS - 1000 to 4999 66,947,592$ 65,112,415$ 68,178,350$ 1,359,862$
6 Large Use >5MW 31,074,780$ 30,222,953$ 32,015,624$ 492,795$
7 Street Light 15,068,574$ 14,655,512$ 14,648,264$ 9,241,815$
8 Unmetered Scattered Load 3,822,500$ 3,717,717$ 3,246,227$ 155,217$
9 Unmetered Scattered Load (Connections)
10
11
12
13
14
15
16
17
18
19
20
Total 771,379,725$ 750,234,546$ 750,196,282$ 47,772,840$
(4)
(5)
(6)
(7)
Host Distributors - Provide information on any embedded distributor(s) as a separate class, if applicable. If embedded distributors are billed in a General Service class, include the
allocated costs and revenues of the embedded distributor(s) in the applicable class, and also complete Appendix 2-Q.
Customer Classes - If these differ from those in place in the previous cost allocation study, modify the customer classes to match the proposal in the current application as closely as
possible.
In columns 7B to 7D, LF means Load Forecast of Annual Billing Quantities (i.e., customers or connections, as applicable X 12 months, and kWh, kW or kVA as applicable. Revenue
quantities should be net of the Transformer Ownership Allowance for applicable customer classes. Exclude revenues from rate adders and rate riders.
This spreadsheet replaces Appendix 2-P and provides a summary of the results from the Cost Allocation spreadsheet, and is used in the determination of the class revenue requirement and,
hence, ultimately, the determination of rates from customers in all classes to recover the revenue requirement.
Cost Allocation and Rate Design
Allocated Class
Revenue Requirement (1)
Per Board Decision
Class Allocated Revenue Requirement, from Sheet O-1, Revenue to Cost || RR, row 40, from the Cost Allocation Study in this application. This excludes costs in deferral and variance
accounts. For Embedded Distributors, Account 4750 - Low Voltage (LV) Costs are also excluded.
Columns 7C and 7D - Column Total should equal the Base Revenue Requirement for each.
Column 7C - The OEB-issued cost allocation model calculates "1+d" on worksheet O-1, cell C22. "d" is defined as Revenue Deficiency/Revenue at Current Rates.
Column 7E - If using the OEB-issued cost allocation model, enter Miscellaneous Revenues as it appears on worksheet O-1, row 19,
Ontario Energy Board
11. Cost_Allocation
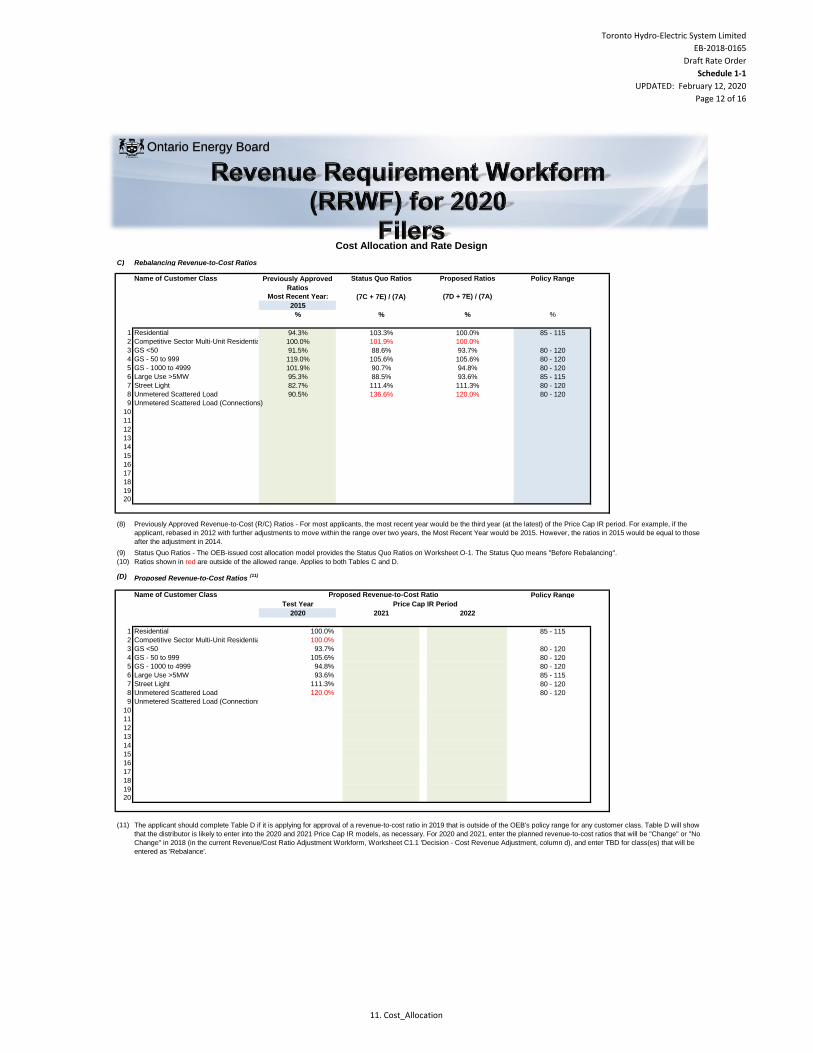
Toronto Hydro-Electric System Limited
EB-2018-0165
Draft Rate Order
Schedule 1-1
UPDATED: February 12, 2020
Page 12 of 16
Cost Allocation and Rate Design
Ontario Energy Board
C) Rebalancing Revenue-to-Cost Ratios
Name of Customer Class Previously Approved
Ratios
Status Quo Ratios Proposed Ratios Policy Range
Most Recent Year: (7D + 7E) / (7A)
2015
% % % %
1 Residential 94.3% 103.3% 100.0% 85 - 115 0.85 1.15 85 - 115
2 Competitive Sector Multi-Unit Residential 100.0% 101.9% 100.0% 80 - 120
3 GS <50 91.5% 88.6% 93.7% 80 - 120 0.8 1.2
4 GS - 50 to 999 119.0% 105.6% 105.6% 80 - 120 0.8 1.2
5 GS - 1000 to 4999 101.9% 90.7% 94.8% 80 - 120 0.8 1.2
6 Large Use >5MW 95.3% 88.5% 93.6% 85 - 115 0.85 1.15
7 Street Light 82.7% 111.4% 111.3% 80 - 120 0.8 1.2
8 Unmetered Scattered Load 90.5% 136.6% 120.0% 80 - 120 0.8 1.2
9 Unmetered Scattered Load (Connections)
10
11
12
13
14
15
16
17
18
19
20
(8)
(9)
(10)
(D)
Name of Customer Class Policy Range
Test Year
2020 2021 2022
1 Residential 100.0% 85 - 115 0.85 1.15
2 Competitive Sector Multi-Unit Residential 100.0%
3 GS <50 93.7% 80 - 120 0.8 1.2
4 GS - 50 to 999 105.6% 80 - 120 0.8 1.2
5 GS - 1000 to 4999 94.8% 80 - 120 0.8 1.2
6 Large Use >5MW 93.6% 85 - 115 0.85 1.15
7 Street Light 111.3% 80 - 120 0.8 1.2
8 Unmetered Scattered Load 120.0% 80 - 120 0.8 1.2
9 Unmetered Scattered Load (Connections)
10
11
12
13
14
15
16
17
18
19
20
(11)
(7C + 7E) / (7A)
Previously Approved Revenue-to-Cost (R/C) Ratios - For most applicants, the most recent year would be the third year (at the latest) of the Price Cap IR period. For example, if the
applicant, rebased in 2012 with further adjustments to move within the range over two years, the Most Recent Year would be 2015. However, the ratios in 2015 would be equal to those
after the adjustment in 2014.
The applicant should complete Table D if it is applying for approval of a revenue-to-cost ratio in 2019 that is outside of the OEB's policy range for any customer class. Table D will show
that the distributor is likely to enter into the 2020 and 2021 Price Cap IR models, as necessary. For 2020 and 2021, enter the planned revenue-to-cost ratios that will be "Change" or "No
Change" in 2018 (in the current Revenue/Cost Ratio Adjustment Workform, Worksheet C1.1 'Decision - Cost Revenue Adjustment, column d), and enter TBD for class(es) that will be
entered as 'Rebalance'.
Status Quo Ratios - The OEB-issued cost allocation model provides the Status Quo Ratios on Worksheet O-1. The Status Quo means "Before Rebalancing".
Ratios shown in red are outside of the allowed range. Applies to both Tables C and D.
Proposed Revenue-to-Cost Ratios (11)
Price Cap IR Period
Proposed Revenue-to-Cost Ratio
11. Cost_Allocation

Toronto Hydro-Electric System Limited
EB-2018-0165
Draft Rate Order
Schedule 1-1
UPDATED: February 12, 2020
Page 13 of 16
Please complete the following tables.
A Data Inputs (from Sheet 10. Load Forecast)
Customers 615,118 kWh 4,531,218,421
Proposed Residential Class Specific Revenue
Requirement1
286,934,093.46$
Monthly Fixed Charge ($) 38.00$ Distribution Volumetric Rate ($/kWh) 0.00553$
B Current Fixed/Variable Split
Base Rates Billing Determinants Revenue % of Total Revenue
Fixed 38.00055556 615,118 280,497,908.79$ 91.80%
Variable 0.00553 4,531,218,421 25,057,637.87$ 8.20%TOTAL - - 305,555,546.66$ -
C Calculating Test Year Base Rates
Number of Remaining Rate Design Policy
Transition Years2 1
Test Year Revenue @
Current F/V Split
Test Year Base Rates
@ Current F/V Split
Reconciliation - Test
Year Base Rates @
Current F/V Split
Fixed 263,403,541.70$ 35.68 263,368,922.88$
Variable 23,530,551.76$ 0.0052 23,562,335.79$
TOTAL 286,934,093.46$ - 286,931,258.67$
New F/V Split
Revenue @ new
F/V Split
Final Adjusted
Base Rates
Revenue
Reconciliation @
Adjusted Rates
Fixed 100.00% 286,934,093.46$ 38.87$ 286,915,639.92$
Variable 0.00% -$ -$ -$
TOTAL - 286,934,093.46$ - 286,915,639.92$
Change in Fixed Rate 3.19$
($18,453.54)
-0.01%
Notes:
1
2
3
The final residential class specific revenue requirement, excluding allocated Miscellaneous Revenues, as shown on Sheet 11. Cost Allocation, should be
used (i.e. the revenue requirement after any proposed adjustments to R/C ratios).
Change in fixed rate due to rate design policy should be less than $4. The difference between the proposed class revenue requirement and the revenue
at calculated base rates should be minimal (i.e. should be reasonably considered as a rounding error)
New Rate Design Policy For Residential Customers
Test Year Billing Determinants for Residential Class
Residential Base Rates on Current Tariff
Checks3
Difference Between Revenues @ Proposed Rates
and Class Specific Revenue Requirement
The distributor should enter the number of years remaining before the transition to fully fixed rates is completed. A distributor transitioning to fully fixed
rates over a four year period and began the transition in 2016 would input the number "3" into cell D40. A distributor transitioning over a five-year period
would input the number "4". Where the change in the residential rate design will result in the fixed charge increasing by more than $4/year, a distributor
may propose an additional transition year.
Ontario Energy Board
12. Res_Rate_Design
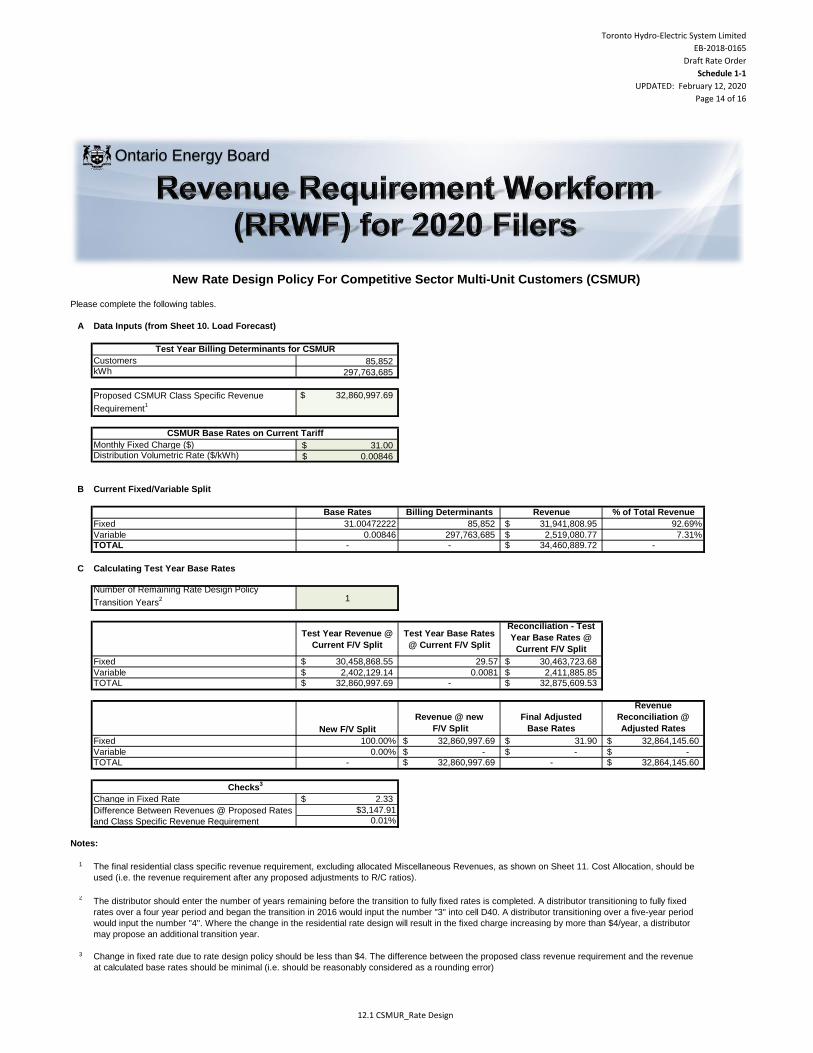
Toronto Hydro-Electric System Limited
EB-2018-0165
Draft Rate Order
Schedule 1-1
UPDATED: February 12, 2020
Page 14 of 16
Please complete the following tables.
A Data Inputs (from Sheet 10. Load Forecast)
Customers 85,852 kWh 297,763,685
Proposed CSMUR Class Specific Revenue
Requirement1
32,860,997.69$
Monthly Fixed Charge ($) 31.00$ Distribution Volumetric Rate ($/kWh) 0.00846$
B Current Fixed/Variable Split
Base Rates Billing Determinants Revenue % of Total Revenue
Fixed 31.00472222 85,852 31,941,808.95$ 92.69%
Variable 0.00846 297,763,685 2,519,080.77$ 7.31%TOTAL - - 34,460,889.72$ -
C Calculating Test Year Base Rates
Number of Remaining Rate Design Policy
Transition Years2 1
Test Year Revenue @
Current F/V Split
Test Year Base Rates
@ Current F/V Split
Reconciliation - Test
Year Base Rates @
Current F/V Split
Fixed 30,458,868.55$ 29.57 30,463,723.68$
Variable 2,402,129.14$ 0.0081 2,411,885.85$
TOTAL 32,860,997.69$ - 32,875,609.53$
New F/V Split
Revenue @ new
F/V Split
Final Adjusted
Base Rates
Revenue
Reconciliation @
Adjusted Rates
Fixed 100.00% 32,860,997.69$ 31.90$ 32,864,145.60$
Variable 0.00% -$ -$ -$
TOTAL - 32,860,997.69$ - 32,864,145.60$
Change in Fixed Rate 2.33$
$3,147.91
0.01%
Notes:
1
2
3
Difference Between Revenues @ Proposed Rates
and Class Specific Revenue Requirement
The final residential class specific revenue requirement, excluding allocated Miscellaneous Revenues, as shown on Sheet 11. Cost Allocation, should be
used (i.e. the revenue requirement after any proposed adjustments to R/C ratios).
The distributor should enter the number of years remaining before the transition to fully fixed rates is completed. A distributor transitioning to fully fixed
rates over a four year period and began the transition in 2016 would input the number "3" into cell D40. A distributor transitioning over a five-year period
would input the number "4". Where the change in the residential rate design will result in the fixed charge increasing by more than $4/year, a distributor
may propose an additional transition year.
Change in fixed rate due to rate design policy should be less than $4. The difference between the proposed class revenue requirement and the revenue
at calculated base rates should be minimal (i.e. should be reasonably considered as a rounding error)
New Rate Design Policy For Competitive Sector Multi-Unit Customers (CSMUR)
Test Year Billing Determinants for CSMUR
CSMUR Base Rates on Current Tariff
Checks3
Ontario Energy Board
12.1 CSMUR_Rate Design
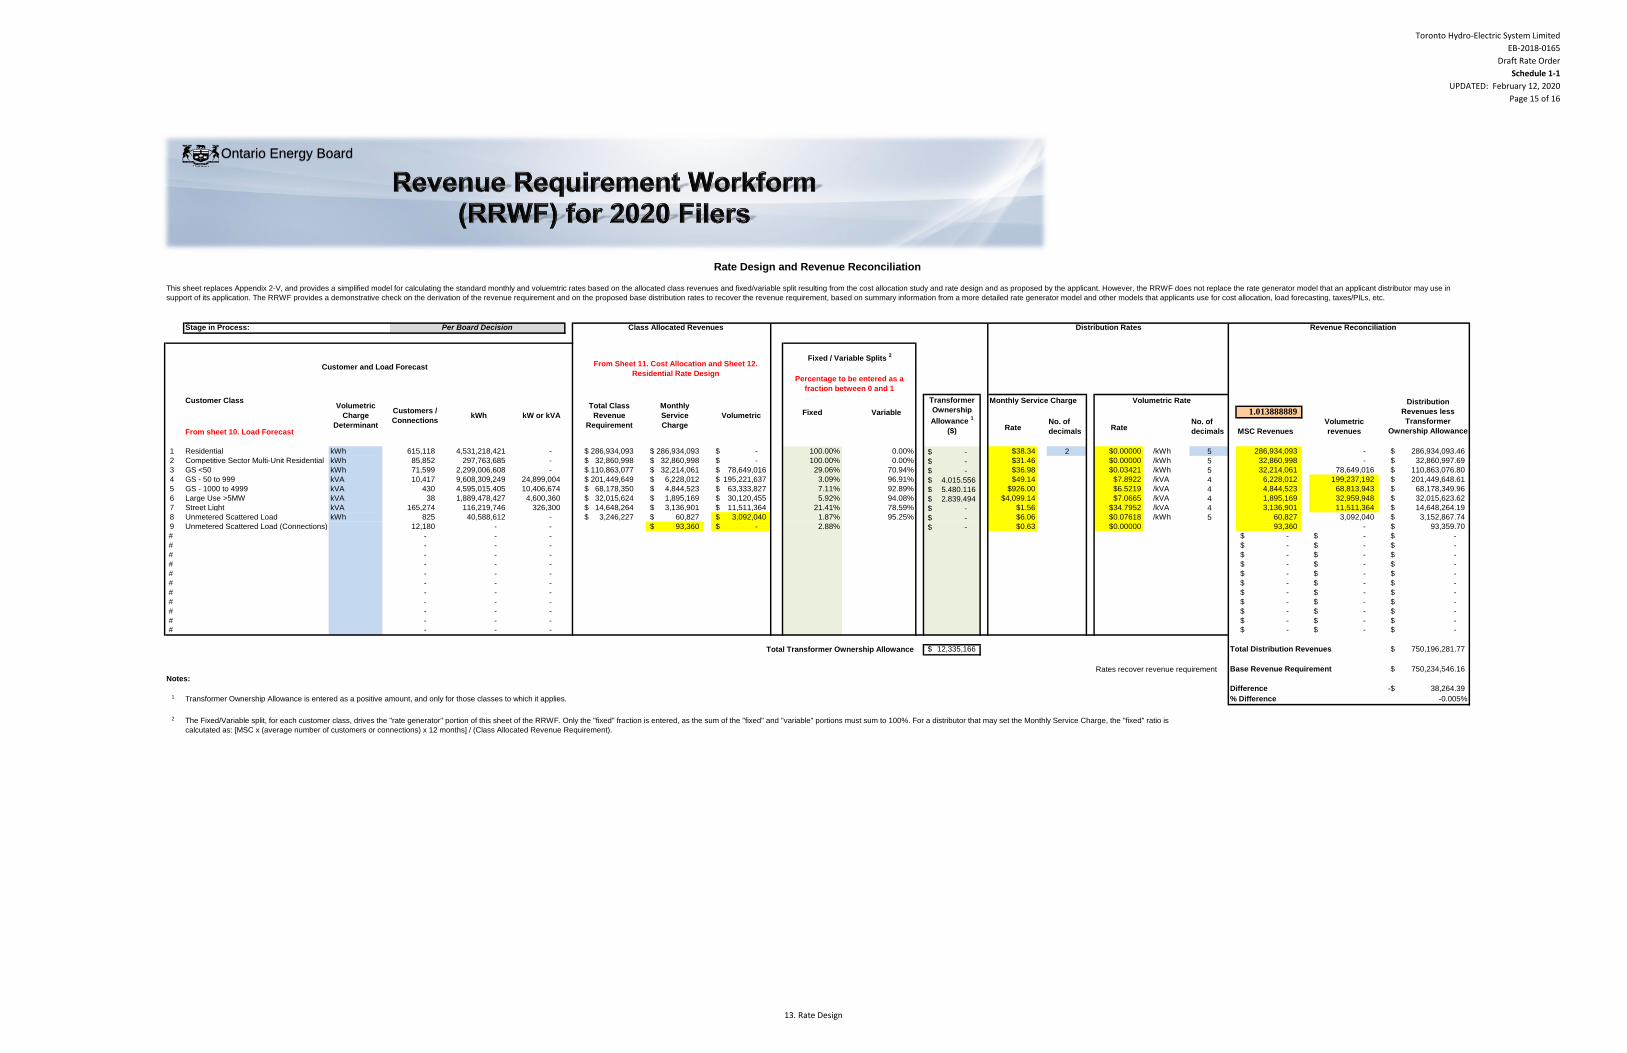
Toronto Hydro-Electric System Limited
EB-2018-0165
Draft Rate Order
Schedule 1-1
UPDATED: February 12, 2020
Page 15 of 16
Initial Application1 F H J
2 L N P
Per Board Decision3 R T V
Stage in Process:
Customer Class Monthly Service Charge
Fixed Variable 1.013888889
From sheet 10. Load ForecastRate
No. of
decimalsRate
No. of
decimals MSC Revenues
Volumetric
revenues
1 Residential kWh 615,118 4,531,218,421 - 286,934,093$ 286,934,093$ -$ 100.00% 0.00% -$ $38.34 2 $0.00000 /kWh 5 286,934,093 - 286,934,093.46$
2 Competitive Sector Multi-Unit Residential kWh 85,852 297,763,685 - 32,860,998$ 32,860,998$ -$ 100.00% 0.00% -$ $31.46 2 $0.00000 /kWh 5 32,860,998 - 32,860,997.69$
3 GS <50 kWh 71,599 2,299,006,608 - 110,863,077$ 32,214,061$ 78,649,016$ 29.06% 70.94% -$ $36.98 2 $0.03421 /kWh 5 32,214,061 78,649,016 110,863,076.80$
4 GS - 50 to 999 kVA 10,417 9,608,309,249 24,899,004 201,449,649$ 6,228,012$ 195,221,637$ 3.09% 96.91% 4,015,556$ $49.14 2 $7.8922 /kVA 4 6,228,012 199,237,192 201,449,648.61$
5 GS - 1000 to 4999 kVA 430 4,595,015,405 10,406,674 68,178,350$ 4,844,523$ 63,333,827$ 7.11% 92.89% 5,480,116$ $926.00 2 $6.5219 /kVA 4 4,844,523 68,813,943 68,178,349.96$
6 Large Use >5MW kVA 38 1,889,478,427 4,600,360 32,015,624$ 1,895,169$ 30,120,455$ 5.92% 94.08% 2,839,494$ $4,099.14 2 $7.0665 /kVA 4 1,895,169 32,959,948 32,015,623.62$
7 Street Light kVA 165,274 116,219,746 326,300 14,648,264$ 3,136,901$ 11,511,364$ 21.41% 78.59% -$ $1.56 2 $34.7952 /kVA 4 3,136,901 11,511,364 14,648,264.19$
8 Unmetered Scattered Load kWh 825 40,588,612 - 3,246,227$ 60,827$ 3,092,040$ 1.87% 95.25% -$ $6.06 2 $0.07618 /kWh 5 60,827 3,092,040 3,152,867.74$
9 Unmetered Scattered Load (Connections) 12,180 - - 93,360$ -$ 2.88% -$ $0.63 2 $0.00000 5 93,360 - 93,359.70$
# - - - 2 5 -$ -$ -$
# - - - 2 5 -$ -$ -$
# - - - 2 5 -$ -$ -$
# - - - 2 5 -$ -$ -$
# - - - 2 5 -$ -$ -$
# - - - 2 5 -$ -$ -$
# - - - 2 5 -$ -$ -$
# - - - 2 5 -$ -$ -$
# - - - 2 5 -$ -$ -$
# - - - 2 5 -$ -$ -$
# - - - 2 5 -$ -$ -$
12,335,166$ Total Distribution Revenues 750,196,281.77$
Base Revenue Requirement 750,234,546.16$
Notes:
Difference 38,264.39-$ 1 Transformer Ownership Allowance is entered as a positive amount, and only for those classes to which it applies. % Difference -0.005%
2
Volumetric
Revenue Reconciliation
Rates recover revenue requirement
Fixed / Variable Splits 2
From Sheet 11. Cost Allocation and Sheet 12.
Residential Rate DesignPercentage to be entered as a
fraction between 0 and 1
Total Transformer Ownership Allowance
The Fixed/Variable split, for each customer class, drives the "rate generator" portion of this sheet of the RRWF. Only the "fixed" fraction is entered, as the sum of the "fixed" and "variable" portions must sum to 100%. For a distributor that may set the Monthly Service Charge, the "fixed" ratio is
calcutated as: [MSC x (average number of customers or connections) x 12 months] / (Class Allocated Revenue Requirement).
Rate Design and Revenue Reconciliation
This sheet replaces Appendix 2-V, and provides a simplified model for calculating the standard monthly and voluemtric rates based on the allocated class revenues and fixed/variable split resulting from the cost allocation study and rate design and as proposed by the applicant. However, the RRWF does not replace the rate generator model that an applicant distributor may use in
support of its application. The RRWF provides a demonstrative check on the derivation of the revenue requirement and on the proposed base distribution rates to recover the revenue requirement, based on summary information from a more detailed rate generator model and other models that applicants use for cost allocation, load forecasting, taxes/PILs, etc.
Volumetric Rate
kW or kVA
Customer and Load Forecast
Transformer
Ownership
Allowance 1
($)
Distribution Rates
Distribution
Revenues less
Transformer
Ownership Allowance
Per Board Decision
Volumetric
Charge
Determinant
Customers /
ConnectionskWh
Class Allocated Revenues
Total Class
Revenue
Requirement
Monthly
Service
Charge
Ontario Energy Board
13. Rate Design
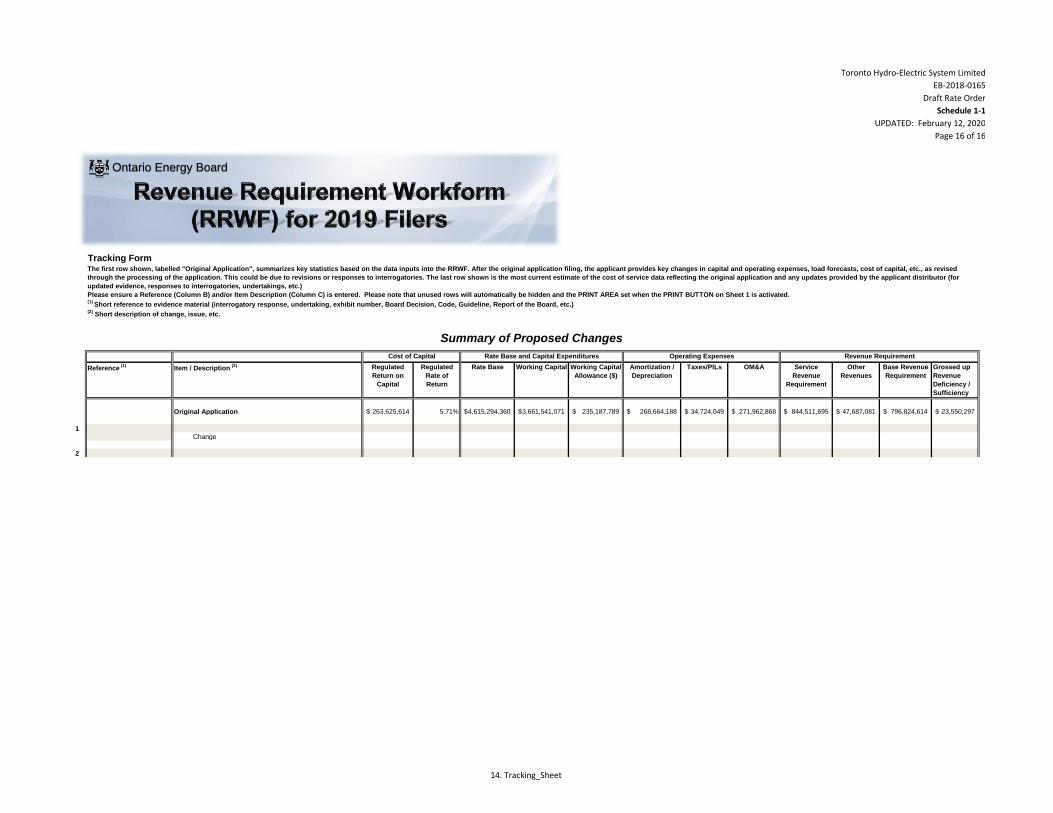
Toronto Hydro-Electric System Limited
EB-2018-0165
Draft Rate Order
Schedule 1-1
UPDATED: February 12, 2020
Page 16 of 16
Tracking Form
Reference (1)
Item / Description (2) Regulated
Return on
Capital
Regulated
Rate of
Return
Rate Base Working Capital Working Capital
Allowance ($)
Amortization /
Depreciation
Taxes/PILs OM&A Service
Revenue
Requirement
Other
Revenues
Base Revenue
Requirement
Grossed up
Revenue
Deficiency /
Sufficiency
Original Application 263,625,614$ 5.71% 4,615,294,360$ 3,661,541,071$ 235,187,789$ 268,664,188$ 34,724,049$ 271,962,868$ 844,511,695$ 47,687,081$ 796,824,614$ 23,550,297$
Change
Summary of Proposed Changes
Cost of Capital Operating ExpensesRate Base and Capital Expenditures Revenue Requirement
1
2
The first row shown, labelled "Original Application", summarizes key statistics based on the data inputs into the RRWF. After the original application filing, the applicant provides key changes in capital and operating expenses, load forecasts, cost of capital, etc., as revised
through the processing of the application. This could be due to revisions or responses to interrogatories. The last row shown is the most current estimate of the cost of service data reflecting the original application and any updates provided by the applicant distributor (for
updated evidence, responses to interrogatories, undertakings, etc.)
Please ensure a Reference (Column B) and/or Item Description (Column C) is entered. Please note that unused rows will automatically be hidden and the PRINT AREA set when the PRINT BUTTON on Sheet 1 is activated.(1)
Short reference to evidence material (interrogatory response, undertaking, exhibit number, Board Decision, Code, Guideline, Report of the Board, etc.)(2)
Short description of change, issue, etc.
Ontario Energy Board
14. Tracking_Sheet
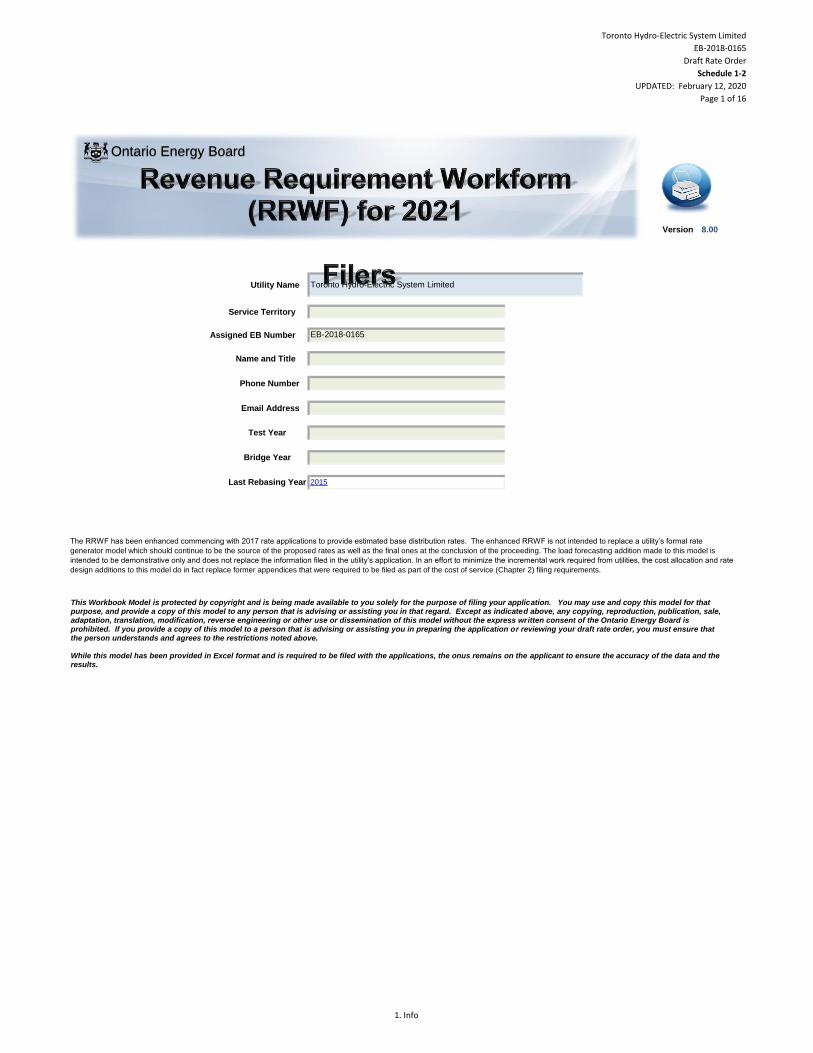
Toronto Hydro-Electric System Limited
EB-2018-0165
Draft Rate Order
Schedule 1-2
UPDATED: February 12, 2020
Page 1 of 16
Version 8.00
Utility Name
Service Territory
Assigned EB Number
Name and Title
Phone Number
Email Address
Toronto Hydro-Electric System Limited
EB-2018-0165
The RRWF has been enhanced commencing with 2017 rate applications to provide estimated base distribution rates. The enhanced RRWF is not intended to replace a utility’s formal rate
generator model which should continue to be the source of the proposed rates as well as the final ones at the conclusion of the proceeding. The load forecasting addition made to this model is
intended to be demonstrative only and does not replace the information filed in the utility’s application. In an effort to minimize the incremental work required from utilities, the cost allocation and rate
design additions to this model do in fact replace former appendices that were required to be filed as part of the cost of service (Chapter 2) filing requirements.
Test Year
Bridge Year
Last Rebasing Year 2015
This Workbook Model is protected by copyright and is being made available to you solely for the purpose of filing your application. You may use and copy this model for that purpose, and provide a copy of this model to any person that is advising or assisting you in that regard. Except as indicated above, any copying, reproduction, publication, sale, adaptation, translation, modification, reverse engineering or other use or dissemination of this model without the express written consent of the Ontario Energy Board is prohibited. If you provide a copy of this model to a person that is advising or assisting you in preparing the application or reviewing your draft rate order, you must ensure that the person understands and agrees to the restrictions noted above.
While this model has been provided in Excel format and is required to be filed with the applications, the onus remains on the applicant to ensure the accuracy of the data and the results.
Ontario Energy Board
1. Info

Toronto Hydro-Electric System Limited
EB-2018-0165
Draft Rate Order
Schedule 1-2
UPDATED: February 12, 2020
Page 2 of 16
1. Info 8. Rev_Def_Suff
2. Table of Contents 9. Rev_Reqt
3. Data_Input_Sheet 10. Load Forecast
4. Rate_Base 11. Cost Allocation
5. Utility Income 12. Residential Rate Design
6. Taxes_PILs 13. Rate Design and Revenue Reconciliation
7. Cost_of_Capital 14. Tracking Sheet
Notes:
(1)
(2)
(3)
(4)
(5)
Please note that this model uses MACROS. Before starting, please ensure that macros have been enabled.
Completed versions of the Revenue Requirement Work Form are required to be filed in working Microsoft Excel format.
Pale yellow cells represent drop-down lists
Pale green cells represent inputs
Pale green boxes at the bottom of each page are for additional notes
Ontario Energy Board
2. Table of Contents

Toronto Hydro-Electric System Limited
EB-2018-0165
Draft Rate Order
Schedule 1-2
UPDATED: February 12, 2020
Page 3 of 16
Data Input (1)
1 Rate Base
Gross Fixed Assets (average) $6,073,208,605 6,073,208,605$ ($96,547,584) $5,976,661,021
Accumulated Depreciation (average) ($1,483,326,686) (5) ($1,483,326,686) $23,793,694 ($1,459,532,992)
Allowance for Working Capital:
Controllable Expenses $279,995,324 279,995,324$ ($3,984,524) $276,010,800 Cost of Power $3,442,278,635 3,442,278,635$ ($723,118,629) $2,719,160,005
Working Capital Rate (%) 6.42% (9) (9) 7.30% (9)
2 Utility Income
Operating Revenues:
Distribution Revenue at Current Rates $797,841,742 $750,485,516 Distribution Revenue at Proposed Rates $824,227,732 $785,070,036 Other Revenue:
Specific Service Charges $6,640,353 $3,741,598 Late Payment Charges $3,785,321 $3,804,164 Other Distribution Revenue $37,689,511 $34,998,734 Other Income and Deductions $5,897,163
Total Revenue Offsets $48,115,184 (7) $48,441,660
Operating Expenses:
OM+A Expenses $274,410,533 274,410,533$ ($3,893,087) $270,517,446 Depreciation/Amortization $281,929,611 281,929,611$ ($2,859,310) $279,070,301 Property taxes $5,584,791 5,584,791$ ($91,437) $5,493,354 Capital taxes
Other expenses
3 Taxes/PILs
Taxable Income:
Adjustments required to arrive at taxable income
($63,873,242) (3) ($103,059,104)
Utility Income Taxes and Rates:
Income taxes (not grossed up) $26,862,812 $14,100,593 Income taxes (grossed up) $36,548,043 $19,184,481 Capital Taxes
Federal tax (%) 15.00% 15.00% Provincial tax (%) 11.50% 11.50%Income Tax Credits ($2,736,000) ($2,736,000)
4 Capitalization/Cost of Capital
Capital Structure:
Long-term debt Capitalization Ratio (%) 56.0% 56.0%
Short-term debt Capitalization Ratio (%) 4.0% (8) (8) 4.0% (8)
Common Equity Capitalization Ratio (%) 40.0% 40.0% Prefered Shares Capitalization Ratio (%)
100.0% 0.0% 100.0%
Cost of Capital
Long-term debt Cost Rate (%) 3.71% 3.71% Short-term debt Cost Rate (%) 2.61% 2.61% Common Equity Cost Rate (%) 8.82% 8.52% Prefered Shares Cost Rate (%)
Notes:
General
(1)
(2)
(3)
(4)
(5)
(6)
(7)
(8)
(9)
Data in column E is for Application as originally filed. For updated revenue requirement as a result of interrogatory responses, technical or settlement conferences, etc., use
column M and Adjustments in column I
Net of addbacks and deductions to arrive at taxable income.
All inputs are in dollars ($) except where inputs are individually identified as percentages (%)
Select option from drop-down list by clicking on cell M10. This column allows for the application update reflecting the end of discovery or Argument-in-Chief. Also, the
outcome of any Settlement Process can be reflected.
Average of Gross Fixed Assets at beginning and end of the Test Year
Input total revenue offsets for deriving the base revenue requirement from the service revenue requirement
4.0% unless an Applicant has proposed or been approved for another amount.
Average of Accumulated Depreciation at the beginning and end of the Test Year. Enter as a negative amount.
The default Working Capital Allowance factor is 7.5% (of Cost of Power plus controllable expenses), per the letter issued by the Board on June 3, 2015. Alternatively, a
WCA factor based on lead-lag study, with supporting rationale could be provided.
Data inputs are required on Sheets 3. Data from Sheet 3 will automatically complete calculations on sheets 4 through 9 (Rate Base through Revenue Requirement). Sheets
4 through 9 do not require any inputs except for notes that the Applicant may wish to enter to support the results. Pale green cells are available on sheets 4 through 9 to
enter both footnotes beside key cells and the related text for the notes at the bottom of each sheet.
(6)(2)Initial
Application
Per Board
Decision
Ontario Energy Board
3. Data_Input_Sheet
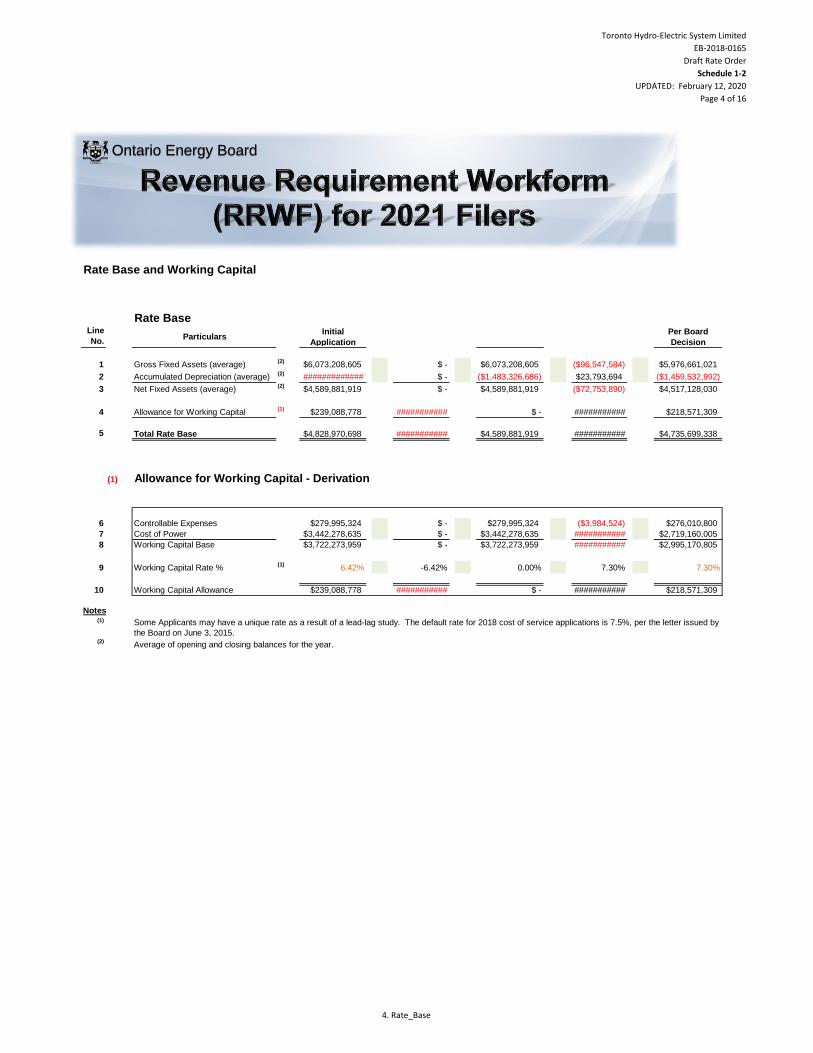
Toronto Hydro-Electric System Limited
EB-2018-0165
Draft Rate Order
Schedule 1-2
UPDATED: February 12, 2020
Page 4 of 16
Rate Base and Working Capital
Rate BaseLine
No.Particulars
Initial
Application Per Board
Decision
1 Gross Fixed Assets (average)(2)
$6,073,208,605 $ - $6,073,208,605 ($96,547,584) $5,976,661,021
2 Accumulated Depreciation (average)(2)
############# $ - ($1,483,326,686) $23,793,694 ($1,459,532,992)
3 Net Fixed Assets (average)(2)
$4,589,881,919 $ - $4,589,881,919 ($72,753,890) $4,517,128,030
4 Allowance for Working Capital(1)
$239,088,778 ########### $ - ########### $218,571,309
5
(1) Allowance for Working Capital - Derivation
6 Controllable Expenses $279,995,324 $ - $279,995,324 ($3,984,524) $276,010,800
7 Cost of Power $3,442,278,635 $ - $3,442,278,635 ########### $2,719,160,005
8 Working Capital Base $3,722,273,959 $ - $3,722,273,959 ########### $2,995,170,805
9 Working Capital Rate % (1)
6.42% -6.42% 0.00% 7.30% 7.30%
10 Working Capital Allowance $239,088,778 ########### $ - ########### $218,571,309
(1)
(2)
Notes
$4,828,970,698 ########### $4,735,699,338Total Rate Base $4,589,881,919 ###########
Some Applicants may have a unique rate as a result of a lead-lag study. The default rate for 2018 cost of service applications is 7.5%, per the letter issued by
the Board on June 3, 2015.
Average of opening and closing balances for the year.
Ontario Energy Board
4. Rate_Base

Toronto Hydro-Electric System Limited
EB-2018-0165
Draft Rate Order
Schedule 1-2
UPDATED: February 12, 2020
Page 5 of 16
Utility Income
Line
No.Particulars
Initial
Application
Per Board
Decision
Operating Revenues:
1 Distribution Revenue (at
Proposed Rates)$824,227,732 ($824,227,732) $ - $785,070,036 $785,070,036
2 Other Revenue(1) $48,115,184 ($48,115,184) $ - $48,441,660 $48,441,660
3 Total Operating Revenues
Operating Expenses:
4 OM+A Expenses $274,410,533 $ - $274,410,533 ($3,893,087) $270,517,446
5 Depreciation/Amortization $281,929,611 $ - $281,929,611 ($2,859,310) $279,070,301
6 Property taxes $5,584,791 $ - $5,584,791 ($91,437) $5,493,354
7 Capital taxes $ - $ - $ - $ - $ -
8 Other expense $ - $ - $ -
9 Subtotal (lines 4 to 8)
10 Deemed Interest Expense $105,464,720 ($105,464,720) $ - $103,427,673 $103,427,673
11 Total Expenses (lines 9 to 10) $667,389,654 ($105,464,720) $561,924,935 $96,583,840 $658,508,774
12 Utility income before income
taxes $204,953,261 ($766,878,196) ($561,924,935) $736,927,856 $175,002,922
13 Income taxes (grossed-up)
14 Utility net income
(1) Specific Service Charges $6,640,353 $ - $3,741,598
Late Payment Charges $3,785,321 $ - $3,804,164
Other Distribution Revenue $37,689,511 $ - $34,998,734
Other Income and Deductions $ - $ - $5,897,163
Total Revenue Offsets
$561,924,935
$48,115,184 $48,441,660
Notes
($598,472,978)
$555,081,101$561,924,935
$36,548,043
($6,843,834)
($17,363,562)
$833,511,696$ - $833,511,696$872,342,916 ($872,342,916)
$ -
$19,184,481$36,548,043
$155,818,441$168,405,218 $754,291,419
$ - $ - $ -
$ -
($766,878,196)
Other Revenues / Revenue Offsets
Ontario Energy Board
5. Utility Income
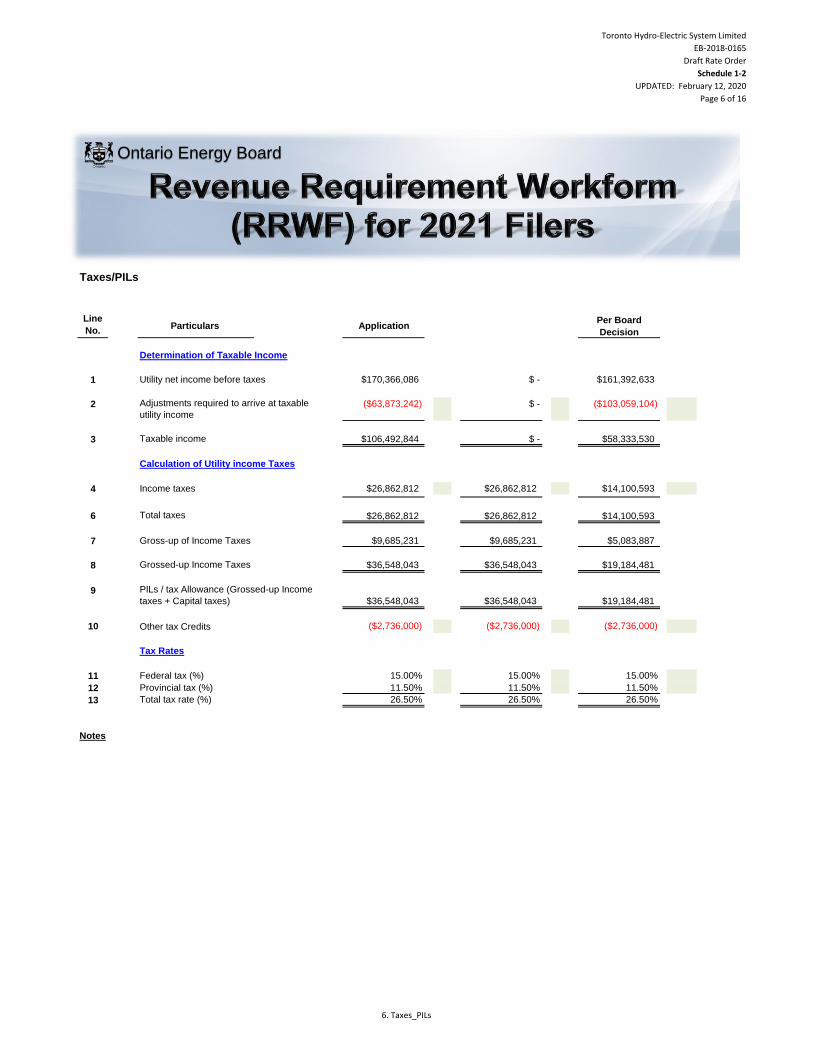
Toronto Hydro-Electric System Limited
EB-2018-0165
Draft Rate Order
Schedule 1-2
UPDATED: February 12, 2020
Page 6 of 16
Line
No.Particulars Application
Per Board
Decision
Determination of Taxable Income
1 $170,366,086 $ - $161,392,633
2 ($63,873,242) $ - ($103,059,104)
3 $106,492,844 $ - $58,333,530
Calculation of Utility income Taxes
4 Income taxes $26,862,812 $26,862,812 $14,100,593
5Capital taxes
$ - $ - $ -
6 Total taxes
7 Gross-up of Income Taxes $9,685,231 $9,685,231 $5,083,887
8 Grossed-up Income Taxes $36,548,043 $36,548,043 $19,184,481
9$36,548,043 $36,548,043 $19,184,481
10 Other tax Credits ($2,736,000) ($2,736,000) ($2,736,000)
Tax Rates
11 Federal tax (%) 15.00% 15.00% 15.00%
12 Provincial tax (%) 11.50% 11.50% 11.50%
13 Total tax rate (%) 26.50% 26.50% 26.50%
Notes
Taxes/PILs
$26,862,812 $14,100,593
Utility net income before taxes
Adjustments required to arrive at taxable
utility income
Taxable income
PILs / tax Allowance (Grossed-up Income
taxes + Capital taxes)
$26,862,812
Ontario Energy Board
6. Taxes_PILs
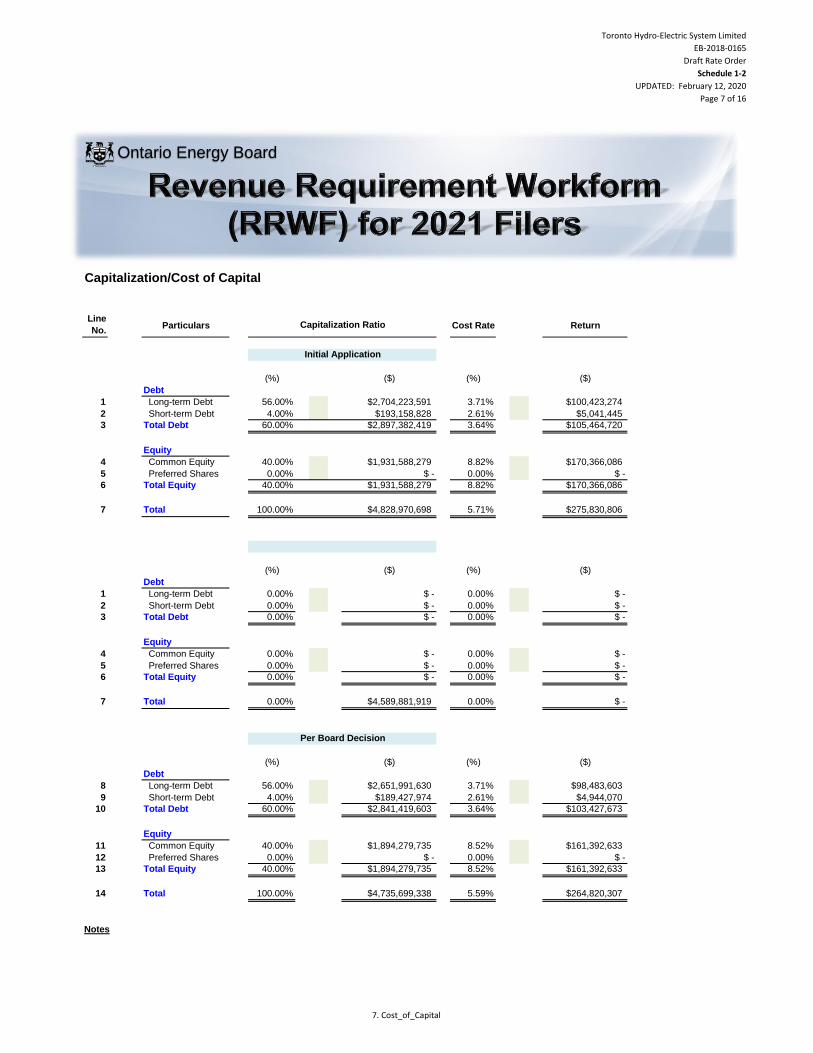
Toronto Hydro-Electric System Limited
EB-2018-0165
Draft Rate Order
Schedule 1-2
UPDATED: February 12, 2020
Page 7 of 16
Line
No.Particulars Cost Rate Return
(%) ($) (%) ($)
Debt
1 Long-term Debt 56.00% $2,704,223,591 3.71% $100,423,274
2 Short-term Debt 4.00% $193,158,828 2.61% $5,041,445
3 Total Debt 60.00% $2,897,382,419 3.64% $105,464,720
Equity
4 Common Equity 40.00% $1,931,588,279 8.82% $170,366,086
5 Preferred Shares 0.00% $ - 0.00% $ -
6 Total Equity 40.00% $1,931,588,279 8.82% $170,366,086
7 Total 100.00% $4,828,970,698 5.71% $275,830,806
(%) ($) (%) ($)
Debt
1 Long-term Debt 0.00% $ - 0.00% $ -
2 Short-term Debt 0.00% $ - 0.00% $ -
3 Total Debt 0.00% $ - 0.00% $ -
Equity
4 Common Equity 0.00% $ - 0.00% $ -
5 Preferred Shares 0.00% $ - 0.00% $ -
6 Total Equity 0.00% $ - 0.00% $ -
7 Total 0.00% $4,589,881,919 0.00% $ -
(%) ($) (%) ($)
Debt
8 Long-term Debt 56.00% $2,651,991,630 3.71% $98,483,603
9 Short-term Debt 4.00% $189,427,974 2.61% $4,944,070
10 Total Debt 60.00% $2,841,419,603 3.64% $103,427,673
Equity
11 Common Equity 40.00% $1,894,279,735 8.52% $161,392,633
12 Preferred Shares 0.00% $ - 0.00% $ -
13 Total Equity 40.00% $1,894,279,735 8.52% $161,392,633
14 Total 100.00% $4,735,699,338 5.59% $264,820,307
Initial Application
Capitalization/Cost of Capital
Capitalization Ratio
Per Board Decision
Notes
Ontario Energy Board
7. Cost_of_Capital

Toronto Hydro-Electric System Limited
EB-2018-0165
Draft Rate Order
Schedule 1-2
UPDATED: February 12, 2020
Page 8 of 16
Revenue Deficiency/Sufficiency
1 Revenue Deficiency from Below $26,471,745 ($262,668,384) $38,283,600
2 Distribution Revenue $797,841,742 $797,755,986 $797,841,742 $1,086,896,116 $750,485,516 $746,786,436
3 Other Operating Revenue Offsets
- net$48,115,184 $48,115,184 $ - $ - $48,441,660 $48,441,660
4 Total Revenue $845,956,926 $872,342,916 $797,841,742 $824,227,732 $798,927,176 $833,511,696
5 Operating Expenses $561,924,935 $561,924,935 $561,924,935 $561,924,935 $555,081,101 $555,081,101
6 Deemed Interest Expense $105,464,720 $105,464,720 $ - $ - $103,427,673 $103,427,673
8 Total Cost and Expenses $667,389,654 $667,389,654 $561,924,935 $561,924,935 $658,508,774 $658,508,774
9 Utility Income Before Income
Taxes$178,567,271 $204,953,261 $235,916,807 $262,302,797 $140,418,402 $175,002,922
10 Tax Adjustments to Accounting
Income per 2013 PILs model
($63,873,242) ($63,873,242) ($63,873,242) ($63,873,242) ($103,059,104) ($103,059,104)
11 Taxable Income $114,694,029 $141,080,019 $172,043,565 $198,429,555 $37,359,298 $71,943,818
12 Income Tax Rate 26.50% 26.50% 26.50% 26.50% 26.50% 26.50%
13Income Tax on Taxable Income
$30,393,918 $37,386,205 $45,591,545 $52,583,832 $9,900,214 $19,065,112
14 Income Tax Credits ($2,736,000) ($2,736,000) ($2,736,000) ($2,736,000) ($2,736,000) ($2,736,000)
15 Utility Net Income $150,909,353 $168,405,218 $193,061,262 ($598,472,978) $133,254,188 $155,818,441
16 Utility Rate Base $4,828,970,698 $4,828,970,698 $4,589,881,919 $4,589,881,919 $4,735,699,338 $4,735,699,338
17 Deemed Equity Portion of Rate
Base $1,931,588,279 $1,931,588,279 $ - $ - $1,894,279,735 $1,894,279,735
18 Income/(Equity Portion of Rate
Base)7.81% 8.72% 0.00% 0.00% 7.03% 8.23%
19 Target Return - Equity on Rate
Base8.82% 8.82% 0.00% 0.00% 8.52% 8.52%
20 Deficiency/Sufficiency in Return
on Equity-1.01% -0.10% 0.00% 0.00% -1.49% -0.29%
21 Indicated Rate of Return 5.31% 5.67% 4.21% 0.00% 5.00% 5.47%
22 Requested Rate of Return on
Rate Base5.71% 5.71% 0.00% 0.00% 5.59% 5.59%
23 Deficiency/Sufficiency in Rate of
Return-0.40% -0.04% 4.21% 0.00% -0.59% -0.12%
24 Target Return on Equity $170,366,086 $170,366,086 $ - $ - $161,392,633 $161,392,633
25 Revenue Deficiency/(Sufficiency) $19,456,733 ($1,960,868) ($193,061,262) $ - $28,138,446 ($5,574,193)
26 Gross Revenue
Deficiency/(Sufficiency)$26,471,745 (1) ($262,668,384) (1) $38,283,600 (1)
(1)
Notes:
ParticularsLine
No.
Initial Application
Revenue Deficiency/Sufficiency divided by (1 - Tax Rate)
At Proposed
Rates
At Proposed
Rates
At Current
Approved Rates
Per Board Decision
At Current
Approved Rates
At Current
Approved Rates
At Proposed
Rates
Ontario Energy Board
8. Rev_Def_Suff
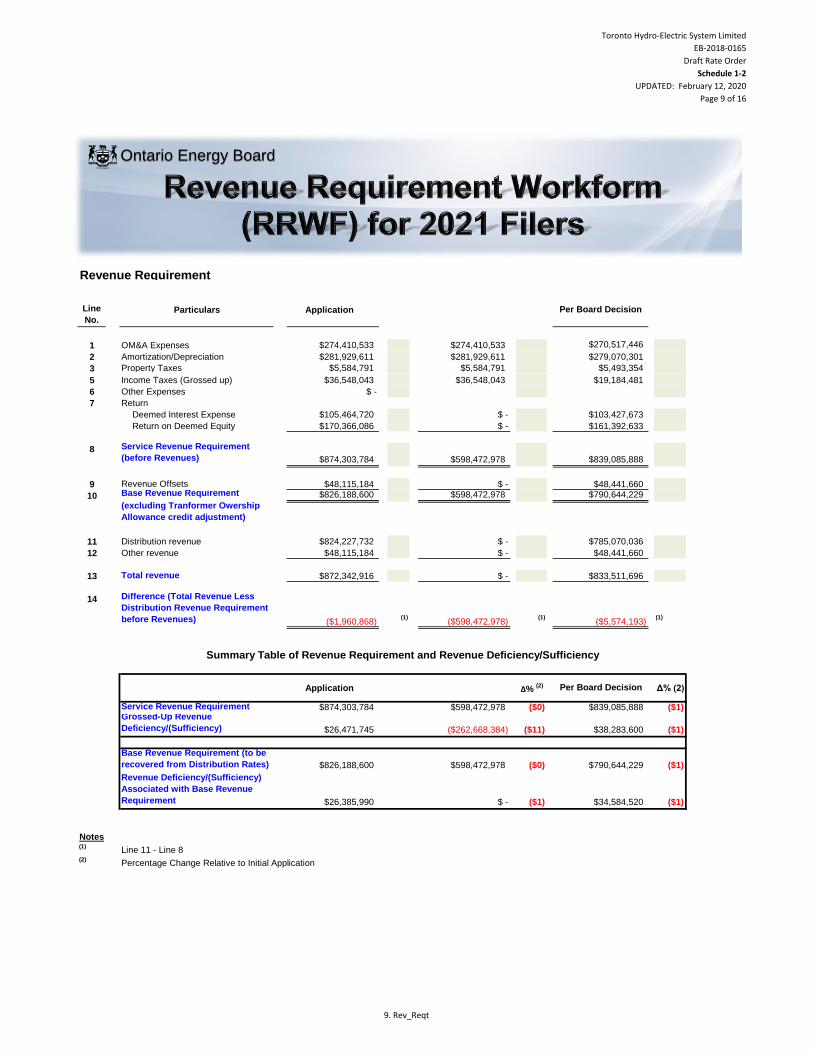
Toronto Hydro-Electric System Limited
EB-2018-0165
Draft Rate Order
Schedule 1-2
UPDATED: February 12, 2020
Page 9 of 16
Revenue Requirement
Line
No.Particulars Application
1 OM&A Expenses $274,410,533 $274,410,533
2 Amortization/Depreciation $281,929,611 $281,929,611
3 Property Taxes $5,584,791 $5,584,791
4
Capital Taxes $ - $ -
5 Income Taxes (Grossed up) $36,548,043 $36,548,043
6 Other Expenses $ -
7 Return
Deemed Interest Expense $105,464,720 $ -
Return on Deemed Equity $170,366,086 $ -
8 Service Revenue Requirement
(before Revenues) $874,303,784 $598,472,978
9 Revenue Offsets $48,115,184 $ -
10 Base Revenue Requirement $826,188,600 $598,472,978
(excluding Tranformer Owership
Allowance credit adjustment)
11 Distribution revenue $824,227,732 $ -
12 Other revenue $48,115,184 $ -
13 Total revenue
14 Difference (Total Revenue Less
Distribution Revenue Requirement
before Revenues) (1) (1) (1)
Application Δ% (2) Δ% (2)
Service Revenue Requirement $874,303,784 $598,472,978 ($0) ($1)Grossed-Up Revenue
Deficiency/(Sufficiency) $26,471,745 ($262,668,384) ($11) ($1)
Base Revenue Requirement (to be
recovered from Distribution Rates) $826,188,600 $598,472,978 ($0) ($1)
Revenue Deficiency/(Sufficiency)
Associated with Base Revenue
Requirement $26,385,990 $ - ($1) ($1)
(1)Line 11 - Line 8
(2)Percentage Change Relative to Initial Application
$279,070,301
$5,493,354
$839,085,888
Notes
$48,441,660
$ -
($598,472,978)($1,960,868)
$872,342,916
Summary Table of Revenue Requirement and Revenue Deficiency/Sufficiency
Per Board Decision
$833,511,696
($5,574,193)
Per Board Decision
$839,085,888
$38,283,600
$790,644,229
$34,584,520
$785,070,036
$19,184,481
$103,427,673
$161,392,633
$48,441,660$790,644,229
$270,517,446
Ontario Energy Board
9. Rev_Reqt
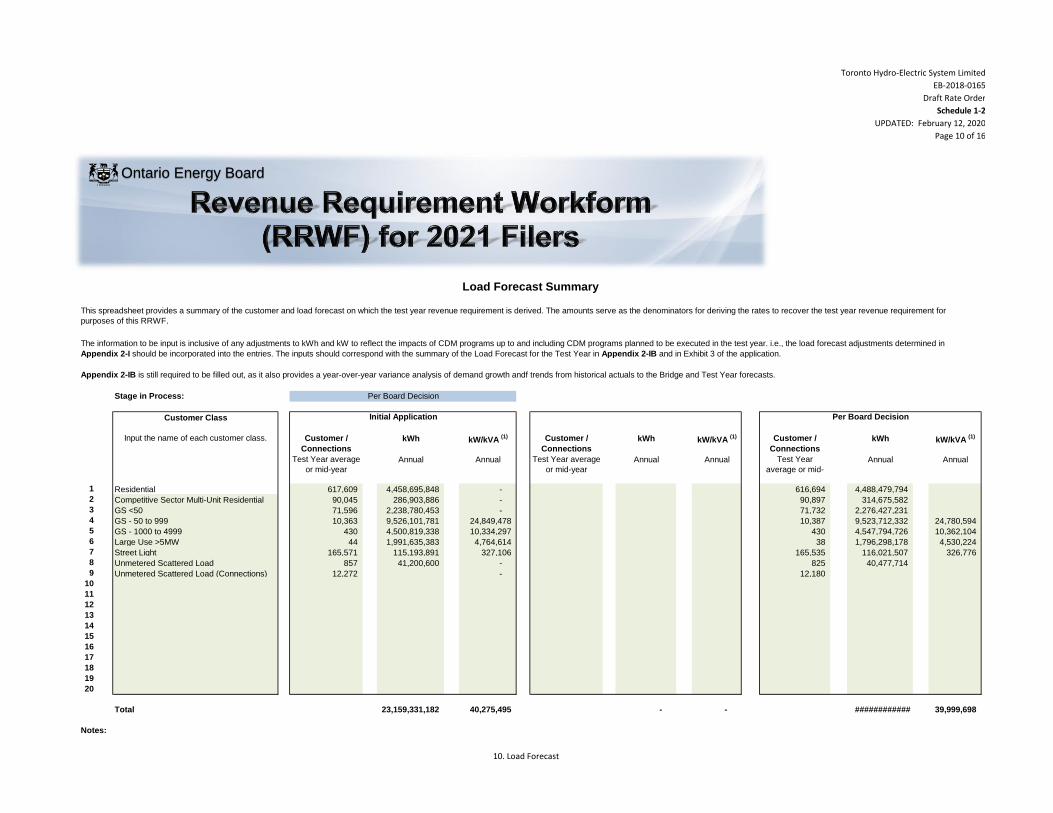
Toronto Hydro-Electric System Limited
EB-2018-0165
Draft Rate Order
Schedule 1-2
UPDATED: February 12, 2020
Page 10 of 16
Stage in Process:
Customer Class
Customer /
Connections
kWh kW/kVA (1) Customer /
Connections
kWh kW/kVA (1) Customer /
Connections
kWh kW/kVA (1)
Test Year average
or mid-year
Annual Annual Test Year average
or mid-year
Annual Annual Test Year
average or mid-
year
Annual Annual
1 Residential 617,609 4,458,695,848 - 616,694 4,488,479,794
2 Competitive Sector Multi-Unit Residential 90,045 286,903,886 - 90,897 314,675,582
3 GS <50 71,596 2,238,780,453 - 71,732 2,276,427,231
4 GS - 50 to 999 10,363 9,526,101,781 24,849,478 10,387 9,523,712,332 24,780,594
5 GS - 1000 to 4999 430 4,500,819,338 10,334,297 430 4,547,794,726 10,362,104
6 Large Use >5MW 44 1,991,635,383 4,764,614 38 1,796,298,178 4,530,224
7 Street Light 165,571 115,193,891 327,106 165,535 116,021,507 326,776
8 Unmetered Scattered Load 857 41,200,600 - 825 40,477,714
9 Unmetered Scattered Load (Connections) 12,272 - 12,180
10
11
12
13
14
15
16
17
18
19
20
Total 23,159,331,182 40,275,495 - - ############ 39,999,698
Notes:
Load Forecast Summary
Input the name of each customer class.
Initial Application Per Board Decision
This spreadsheet provides a summary of the customer and load forecast on which the test year revenue requirement is derived. The amounts serve as the denominators for deriving the rates to recover the test year revenue requirement for
purposes of this RRWF.
The information to be input is inclusive of any adjustments to kWh and kW to reflect the impacts of CDM programs up to and including CDM programs planned to be executed in the test year. i.e., the load forecast adjustments determined in
Appendix 2-I should be incorporated into the entries. The inputs should correspond with the summary of the Load Forecast for the Test Year in Appendix 2-IB and in Exhibit 3 of the application.
Per Board Decision
Appendix 2-IB is still required to be filled out, as it also provides a year-over-year variance analysis of demand growth andf trends from historical actuals to the Bridge and Test Year forecasts.
Ontario Energy Board
10. Load Forecast
Toronto Hydro-Electric System Limited
EB-2018-0165
Draft Rate Order
Schedule 1-2
UPDATED: February 12, 2020
Page 11 of 16
(1)Input kW or kVA for those customer classes for which billing is based on demand (kW or kVA) versus energy consumption (kWh)
10. Load Forecast
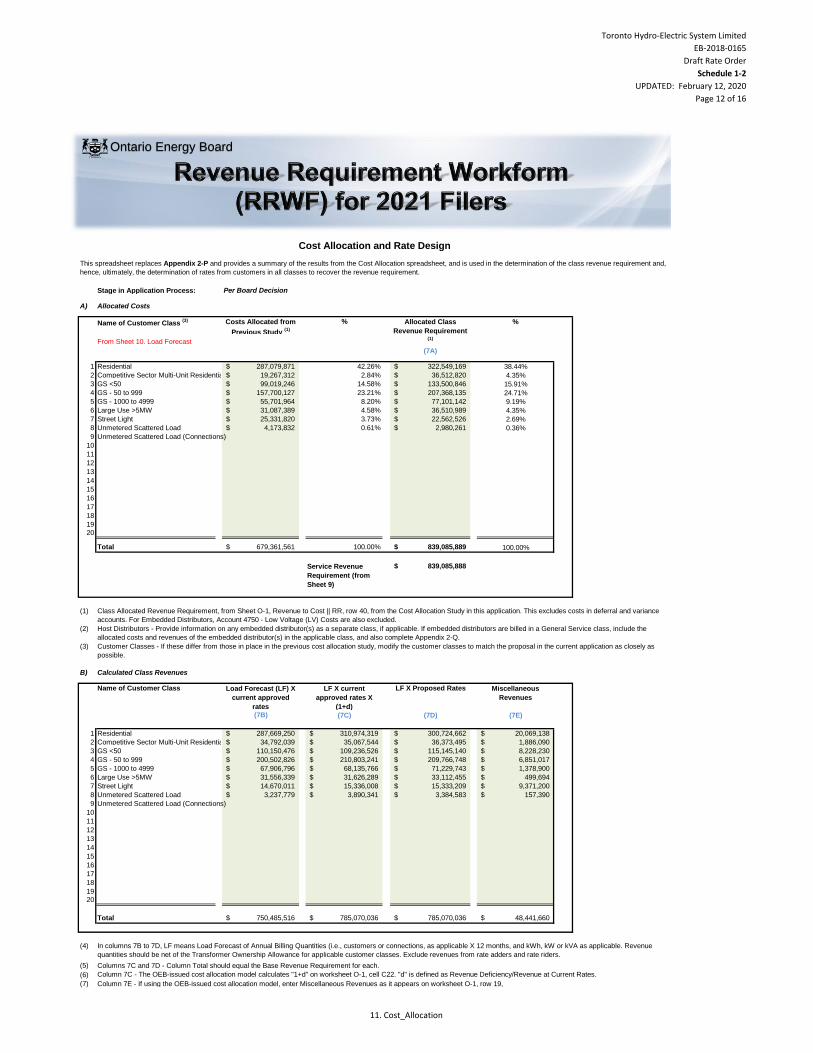
Toronto Hydro-Electric System Limited
EB-2018-0165
Draft Rate Order
Schedule 1-2
UPDATED: February 12, 2020
Page 12 of 16
Stage in Application Process:
A) Allocated Costs
Name of Customer Class (3) Costs Allocated from
Previous Study (1)
% %
From Sheet 10. Load Forecast
(7A)
1 Residential 287,079,871$ 42.26% 322,549,169$ 38.44%
2 Competitive Sector Multi-Unit Residential 19,267,312$ 2.84% 36,512,820$ 4.35%
3 GS <50 99,019,246$ 14.58% 133,500,846$ 15.91%
4 GS - 50 to 999 157,700,127$ 23.21% 207,368,135$ 24.71%
5 GS - 1000 to 4999 55,701,964$ 8.20% 77,101,142$ 9.19%
6 Large Use >5MW 31,087,389$ 4.58% 36,510,989$ 4.35%
7 Street Light 25,331,820$ 3.73% 22,562,526$ 2.69%
8 Unmetered Scattered Load 4,173,832$ 0.61% 2,980,261$ 0.36%
9 Unmetered Scattered Load (Connections) 0.00% 0.00%
10 0.00% 0.00%
11 0.00% 0.00%
12 0.00% 0.00%
13 0.00% 0.00%
14 0.00% 0.00%
15 0.00% 0.00%
16 0.00% 0.00%
17 0.00% 0.00%
18 0.00% 0.00%
19 0.00% 0.00%20 0.00% 0.00%
Total 679,361,561$ 100.00% 839,085,889$ 100.00%
Service Revenue
Requirement (from
Sheet 9)
839,085,888$
(1)
(2)
(3)
B) Calculated Class Revenues
Name of Customer Class Load Forecast (LF) X
current approved
rates
LF X current
approved rates X
(1+d)
LF X Proposed Rates Miscellaneous
Revenues
(7B) (7C) (7D) (7E)
1 Residential 287,669,250$ 310,974,319$ 300,724,662$ 20,069,138$
2 Competitive Sector Multi-Unit Residential 34,792,039$ 35,067,544$ 36,373,495$ 1,886,090$
3 GS <50 110,150,476$ 109,236,526$ 115,145,140$ 8,228,230$
4 GS - 50 to 999 200,502,826$ 210,803,241$ 209,766,748$ 6,851,017$
5 GS - 1000 to 4999 67,906,796$ 68,135,766$ 71,229,743$ 1,378,900$
6 Large Use >5MW 31,556,339$ 31,626,289$ 33,112,455$ 499,694$
7 Street Light 14,670,011$ 15,336,008$ 15,333,209$ 9,371,200$
8 Unmetered Scattered Load 3,237,779$ 3,890,341$ 3,384,583$ 157,390$
9 Unmetered Scattered Load (Connections)
10
11
12
13
14
15
16
17
18
19
20
Total 750,485,516$ 785,070,036$ 785,070,036$ 48,441,660$
(4)
(5)
(6)
(7)
Columns 7C and 7D - Column Total should equal the Base Revenue Requirement for each.
Column 7C - The OEB-issued cost allocation model calculates "1+d" on worksheet O-1, cell C22. "d" is defined as Revenue Deficiency/Revenue at Current Rates.
Column 7E - If using the OEB-issued cost allocation model, enter Miscellaneous Revenues as it appears on worksheet O-1, row 19,
Host Distributors - Provide information on any embedded distributor(s) as a separate class, if applicable. If embedded distributors are billed in a General Service class, include the
allocated costs and revenues of the embedded distributor(s) in the applicable class, and also complete Appendix 2-Q.
Customer Classes - If these differ from those in place in the previous cost allocation study, modify the customer classes to match the proposal in the current application as closely as
possible.
In columns 7B to 7D, LF means Load Forecast of Annual Billing Quantities (i.e., customers or connections, as applicable X 12 months, and kWh, kW or kVA as applicable. Revenue
quantities should be net of the Transformer Ownership Allowance for applicable customer classes. Exclude revenues from rate adders and rate riders.
This spreadsheet replaces Appendix 2-P and provides a summary of the results from the Cost Allocation spreadsheet, and is used in the determination of the class revenue requirement and,
hence, ultimately, the determination of rates from customers in all classes to recover the revenue requirement.
Cost Allocation and Rate Design
Allocated Class
Revenue Requirement (1)
Per Board Decision
Class Allocated Revenue Requirement, from Sheet O-1, Revenue to Cost || RR, row 40, from the Cost Allocation Study in this application. This excludes costs in deferral and variance
accounts. For Embedded Distributors, Account 4750 - Low Voltage (LV) Costs are also excluded.
Ontario Energy Board
11. Cost_Allocation
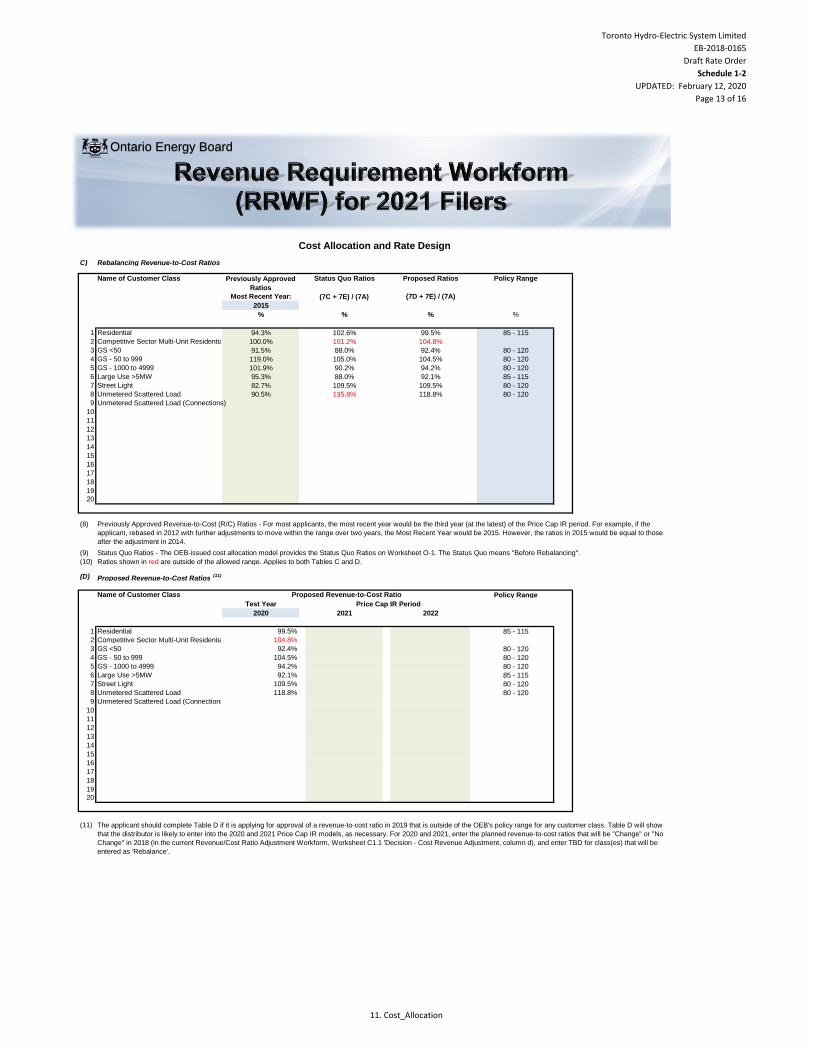
Toronto Hydro-Electric System Limited
EB-2018-0165
Draft Rate Order
Schedule 1-2
UPDATED: February 12, 2020
Page 13 of 16
Cost Allocation and Rate Design
Ontario Energy Board
C) Rebalancing Revenue-to-Cost Ratios
Name of Customer Class Previously Approved
Ratios
Status Quo Ratios Proposed Ratios Policy Range
Most Recent Year: (7D + 7E) / (7A)
2015
% % % %
1 Residential 94.3% 102.6% 99.5% 85 - 115 0.85 1.15 85 - 115
2 Competitive Sector Multi-Unit Residential 100.0% 101.2% 104.8% 80 - 120
3 GS <50 91.5% 88.0% 92.4% 80 - 120 0.8 1.2
4 GS - 50 to 999 119.0% 105.0% 104.5% 80 - 120 0.8 1.2
5 GS - 1000 to 4999 101.9% 90.2% 94.2% 80 - 120 0.8 1.2
6 Large Use >5MW 95.3% 88.0% 92.1% 85 - 115 0.85 1.15
7 Street Light 82.7% 109.5% 109.5% 80 - 120 0.8 1.2
8 Unmetered Scattered Load 90.5% 135.8% 118.8% 80 - 120 0.8 1.2
9 Unmetered Scattered Load (Connections)
10
11
12
13
14
15
16
17
18
19
20
(8)
(9)
(10)
(D)
Name of Customer Class Policy Range
Test Year
2020 2021 2022
1 Residential 99.5% 85 - 115 0.85 1.15
2 Competitive Sector Multi-Unit Residential 104.8%
3 GS <50 92.4% 80 - 120 0.8 1.2
4 GS - 50 to 999 104.5% 80 - 120 0.8 1.2
5 GS - 1000 to 4999 94.2% 80 - 120 0.8 1.2
6 Large Use >5MW 92.1% 85 - 115 0.85 1.15
7 Street Light 109.5% 80 - 120 0.8 1.2
8 Unmetered Scattered Load 118.8% 80 - 120 0.8 1.2
9 Unmetered Scattered Load (Connections)
10
11
12
13
14
15
16
17
18
19
20
(11) The applicant should complete Table D if it is applying for approval of a revenue-to-cost ratio in 2019 that is outside of the OEB's policy range for any customer class. Table D will show
that the distributor is likely to enter into the 2020 and 2021 Price Cap IR models, as necessary. For 2020 and 2021, enter the planned revenue-to-cost ratios that will be "Change" or "No
Change" in 2018 (in the current Revenue/Cost Ratio Adjustment Workform, Worksheet C1.1 'Decision - Cost Revenue Adjustment, column d), and enter TBD for class(es) that will be
entered as 'Rebalance'.
Status Quo Ratios - The OEB-issued cost allocation model provides the Status Quo Ratios on Worksheet O-1. The Status Quo means "Before Rebalancing".
Ratios shown in red are outside of the allowed range. Applies to both Tables C and D.
Proposed Revenue-to-Cost Ratios (11)
Price Cap IR Period
Proposed Revenue-to-Cost Ratio
(7C + 7E) / (7A)
Previously Approved Revenue-to-Cost (R/C) Ratios - For most applicants, the most recent year would be the third year (at the latest) of the Price Cap IR period. For example, if the
applicant, rebased in 2012 with further adjustments to move within the range over two years, the Most Recent Year would be 2015. However, the ratios in 2015 would be equal to those
after the adjustment in 2014.
11. Cost_Allocation
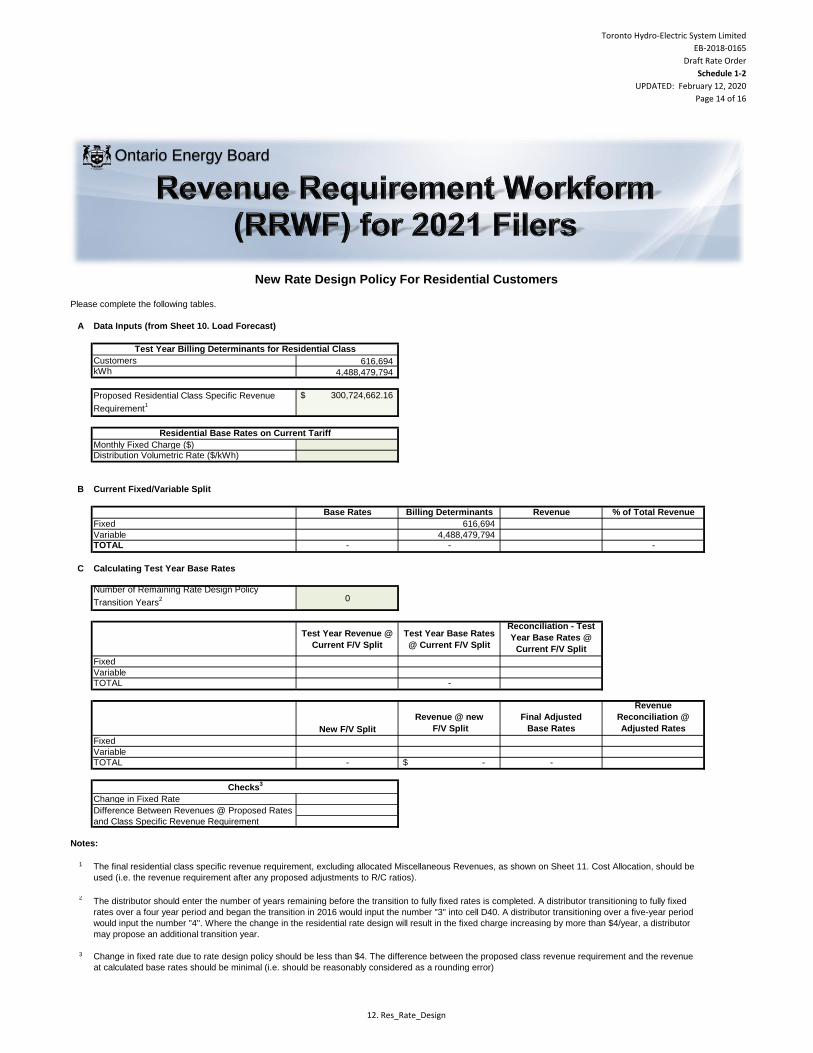
Toronto Hydro-Electric System Limited
EB-2018-0165
Draft Rate Order
Schedule 1-2
UPDATED: February 12, 2020
Page 14 of 16
Please complete the following tables.
A Data Inputs (from Sheet 10. Load Forecast)
Customers 616,694 kWh 4,488,479,794
Proposed Residential Class Specific Revenue
Requirement1
300,724,662.16$
Monthly Fixed Charge ($)
Distribution Volumetric Rate ($/kWh)
B Current Fixed/Variable Split
Base Rates Billing Determinants Revenue % of Total Revenue
Fixed 616,694
Variable 4,488,479,794 TOTAL - - -
C Calculating Test Year Base Rates
Number of Remaining Rate Design Policy
Transition Years2 0
Test Year Revenue @
Current F/V Split
Test Year Base Rates
@ Current F/V Split
Reconciliation - Test
Year Base Rates @
Current F/V Split
Fixed
Variable
TOTAL -
New F/V Split
Revenue @ new
F/V Split
Final Adjusted
Base Rates
Revenue
Reconciliation @
Adjusted Rates
Fixed
Variable
TOTAL - -$ -
Change in Fixed Rate
Notes:
1
2
3
The final residential class specific revenue requirement, excluding allocated Miscellaneous Revenues, as shown on Sheet 11. Cost Allocation, should be
used (i.e. the revenue requirement after any proposed adjustments to R/C ratios).
Change in fixed rate due to rate design policy should be less than $4. The difference between the proposed class revenue requirement and the revenue
at calculated base rates should be minimal (i.e. should be reasonably considered as a rounding error)
New Rate Design Policy For Residential Customers
Test Year Billing Determinants for Residential Class
Residential Base Rates on Current Tariff
Checks3
Difference Between Revenues @ Proposed Rates
and Class Specific Revenue Requirement
The distributor should enter the number of years remaining before the transition to fully fixed rates is completed. A distributor transitioning to fully fixed
rates over a four year period and began the transition in 2016 would input the number "3" into cell D40. A distributor transitioning over a five-year period
would input the number "4". Where the change in the residential rate design will result in the fixed charge increasing by more than $4/year, a distributor
may propose an additional transition year.
Ontario Energy Board
12. Res_Rate_Design

Toronto Hydro-Electric System Limited
EB-2018-0165
Draft Rate Order
Schedule 1-2
UPDATED: February 12, 2020
Page 15 of 16
Initial Application1 F H J
2 L N P
Per Board Decision3 R T V
Stage in Process:
Customer Class Monthly Service Charge
Fixed Variable 1.013888889
From sheet 10. Load ForecastRate
No. of
decimalsRate
No. of
decimals MSC Revenues
Volumetric
revenues
1 Residential kWh 616,694 4,488,479,794 - 300,724,662$ 300,724,662$ -$ 100.00% 0.00% -$ $40.08 2 $0.00000 /kWh 5 300,724,662 - 300,724,662.16$
2 Competitive Sector Multi-Unit Residential kWh 90,897 314,675,582 - 36,373,495$ 36,373,495$ -$ 100.00% 0.00% -$ $32.89 2 $0.00000 /kWh 5 36,373,495 - 36,373,495.02$
3 GS <50 kWh 71,732 2,276,427,231 - 115,145,140$ 33,740,103$ 81,405,038$ 29.30% 70.70% -$ $38.66 2 $0.03576 /kWh 5 33,740,103 81,405,038 115,145,140.40$
4 GS - 50 to 999 kVA 10,387 9,523,712,332 24,780,594 209,766,748$ 6,491,892$ 203,274,855$ 3.09% 96.91% 3,996,954$ $51.37 2 $8.2497 /kVA 4 6,491,892 207,271,809 209,766,747.59$
5 GS - 1000 to 4999 kVA 430 4,547,794,726 10,362,104 71,229,743$ 5,063,992$ 66,165,751$ 7.11% 92.89% 5,456,952$ $967.95 2 $6.8173 /kVA 4 5,063,992 71,622,703 71,229,743.09$
6 Large Use >5MW kVA 38 1,796,298,178 4,530,224 33,112,455$ 1,981,020$ 31,131,436$ 5.98% 94.02% 2,796,279$ $4,284.83 2 $7.3866 /kVA 4 1,981,020 33,927,715 33,112,455.35$
7 Street Light kVA 165,535 116,021,507 326,776 15,333,209$ 3,282,835$ 12,050,374$ 21.41% 78.59% -$ $1.63 2 $36.3714 /kVA 4 3,282,835 12,050,374 15,333,209.17$
8 Unmetered Scattered Load kWh 825 40,477,714 - 3,384,583$ 63,537$ 3,223,240$ 1.88% 95.23% -$ $6.33 2 $0.07963 /kWh 5 63,537 3,223,240 3,286,777.78$
9 Unmetered Scattered Load (Connections) 12,180 - - 97,805$ -$ 2.89% -$ $0.66 2 $0.00000 5 97,805 - 97,805.40$
10 - - - 2 5 -$ -$ -$
11 - - - 2 5 -$ -$ -$
12 - - - 2 5 -$ -$ -$
13 - - - 2 5 -$ -$ -$
14 - - - 2 5 -$ -$ -$
15 - - - 2 5 -$ -$ -$
16 - - - 2 5 -$ -$ -$
17 - - - 2 5 -$ -$ -$
18 - - - 2 5 -$ -$ -$
19 - - - 2 5 -$ -$ -$
20 - - - 2 5 -$ -$ -$
12,250,185$ Total Distribution Revenues 785,070,035.96$
Base Revenue Requirement 790,644,228.58$
Notes:
Difference 5,574,192.62-$ 1 Transformer Ownership Allowance is entered as a positive amount, and only for those classes to which it applies. % Difference -0.705%
2 The Fixed/Variable split, for each customer class, drives the "rate generator" portion of this sheet of the RRWF. Only the "fixed" fraction is entered, as the sum of the "fixed" and "variable" portions must sum to 100%. For a distributor that may set the Monthly Service Charge, the "fixed" ratio is calcutated
as: [MSC x (average number of customers or connections) x 12 months] / (Class Allocated Revenue Requirement).
Rate Design and Revenue Reconciliation
This sheet replaces Appendix 2-V, and provides a simplified model for calculating the standard monthly and voluemtric rates based on the allocated class revenues and fixed/variable split resulting from the cost allocation study and rate design and as proposed by the applicant. However, the RRWF does not replace the rate generator model that an applicant distributor may use in support of its
application. The RRWF provides a demonstrative check on the derivation of the revenue requirement and on the proposed base distribution rates to recover the revenue requirement, based on summary information from a more detailed rate generator model and other models that applicants use for cost allocation, load forecasting, taxes/PILs, etc.
Volumetric Rate
kW or kVA
Customer and Load Forecast
Transformer
Ownership
Allowance 1 ($)
Distribution Rates
Distribution Revenues
less Transformer
Ownership Allowance
Per Board Decision
Volumetric
Charge
Determinant
Customers /
ConnectionskWh
Class Allocated Revenues
Total Class
Revenue
Requirement
Monthly
Service ChargeVolumetric
Revenue Reconciliation
Revenues recovered from rates deviate
materially from revenue requirement -
check data inputs and calculations
Fixed / Variable Splits 2
From Sheet 11. Cost Allocation and Sheet 12.
Residential Rate DesignPercentage to be entered as a
fraction between 0 and 1
Total Transformer Ownership Allowance
Ontario Energy Board
13. Rate Design

Toronto Hydro-Electric System Limited
EB-2018-0165
Draft Rate Order
Schedule 1-2
UPDATED: February 12, 2020
Page 16 of 16
Tracking Form
Reference (1)
Item / Description (2) Regulated
Return on
Capital
Regulated
Rate of
Return
Rate Base Working Capital Working Capital
Allowance ($)
Amortization /
Depreciation
Taxes/PILs OM&A Service
Revenue
Requirement
Other
Revenues
Base Revenue
Requirement
Grossed up
Revenue
Deficiency /
Sufficiency
Original Application 275,830,806$ 5.71% 4,828,970,698$ 3,722,273,959$ 239,088,778$ 281,929,611$ 36,548,043$ 274,410,533$ 874,303,784$ 48,115,184$ 826,188,600$ 26,471,745$
The first row shown, labelled "Original Application", summarizes key statistics based on the data inputs into the RRWF. After the original application filing, the applicant provides key changes in capital and operating expenses, load forecasts, cost of capital, etc., as revised
through the processing of the application. This could be due to revisions or responses to interrogatories. The last row shown is the most current estimate of the cost of service data reflecting the original application and any updates provided by the applicant distributor (for
updated evidence, responses to interrogatories, undertakings, etc.)
Please ensure a Reference (Column B) and/or Item Description (Column C) is entered. Please note that unused rows will automatically be hidden and the PRINT AREA set when the PRINT BUTTON on Sheet 1 is activated.(1)
Short reference to evidence material (interrogatory response, undertaking, exhibit number, Board Decision, Code, Guideline, Report of the Board, etc.)(2)
Short description of change, issue, etc.
Cost of Capital Operating ExpensesRate Base and Capital Expenditures Revenue Requirement
1
Summary of Proposed Changes
Ontario Energy Board
14. Tracking_Sheet
Toronto Hydro-Electric System Limited
EB-2018-0165
Draft Rate Order
Schedule 1-3
UPDATED: February 12, 2020
Page 1 of 15
Version 8.00
Utility Name
Service Territory
Assigned EB Number
Name and Title
Phone Number
Email Address
Toronto Hydro-Electric System Limited
EB-2018-0165
The RRWF has been enhanced commencing with 2017 rate applications to provide estimated base distribution rates. The enhanced RRWF is not intended to replace a utility’s formal rate
generator model which should continue to be the source of the proposed rates as well as the final ones at the conclusion of the proceeding. The load forecasting addition made to this model is
intended to be demonstrative only and does not replace the information filed in the utility’s application. In an effort to minimize the incremental work required from utilities, the cost allocation and rate
design additions to this model do in fact replace former appendices that were required to be filed as part of the cost of service (Chapter 2) filing requirements.
Test Year
Bridge Year
Last Rebasing Year 2015
This Workbook Model is protected by copyright and is being made available to you solely for the purpose of filing your application. You may use and copy this model for that purpose, and provide a copy of this model to any person that is advising or assisting you in that regard. Except as indicated above, any copying, reproduction, publication, sale, adaptation, translation, modification, reverse engineering or other use or dissemination of this model without the express written consent of the Ontario Energy Board is prohibited. If you provide a copy of this model to a person that is advising or assisting you in preparing the application or reviewing your draft rate order, you must ensure that the person understands and agrees to the restrictions noted above.
While this model has been provided in Excel format and is required to be filed with the applications, the onus remains on the applicant to ensure the accuracy of the data and the results.
Ontario Energy Board
1. Info

Toronto Hydro-Electric System Limited
EB-2018-0165
Draft Rate Order
Schedule 1-3
UPDATED: February 12, 2020
Page 2 of 15
1. Info 8. Rev_Def_Suff
2. Table of Contents 9. Rev_Reqt
3. Data_Input_Sheet 10. Load Forecast
4. Rate_Base 11. Cost Allocation
5. Utility Income 12. Residential Rate Design
6. Taxes_PILs 13. Rate Design and Revenue Reconciliation
7. Cost_of_Capital 14. Tracking Sheet
Notes:
(1)
(2)
(3)
(4)
(5)
Please note that this model uses MACROS. Before starting, please ensure that macros have been enabled.
Completed versions of the Revenue Requirement Work Form are required to be filed in working Microsoft Excel format.
Pale yellow cells represent drop-down lists
Pale green cells represent inputs
Pale green boxes at the bottom of each page are for additional notes
Ontario Energy Board
2. Table of Contents
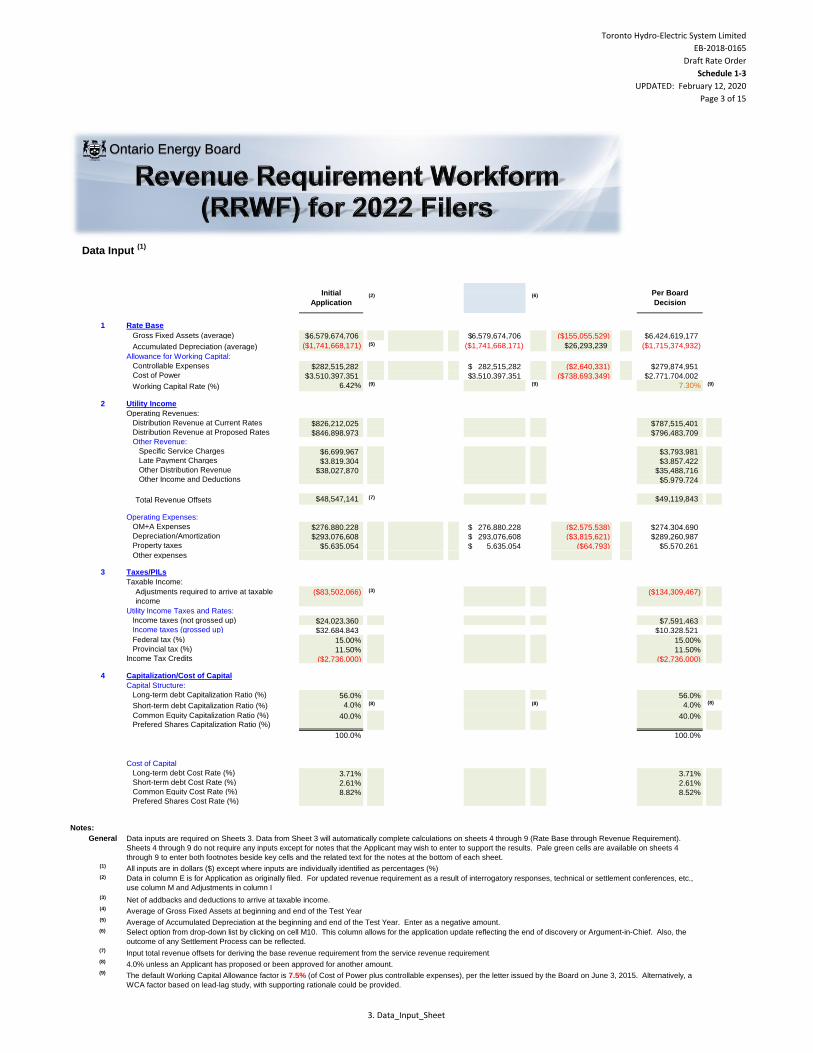
Toronto Hydro-Electric System Limited
EB-2018-0165
Draft Rate Order
Schedule 1-3
UPDATED: February 12, 2020
Page 3 of 15
Data Input (1)
1 Rate Base
Gross Fixed Assets (average) $6,579,674,706 6,579,674,706$ ($155,055,529) $6,424,619,177
Accumulated Depreciation (average) ($1,741,668,171) (5) ($1,741,668,171) $26,293,239 ($1,715,374,932)
Allowance for Working Capital:
Controllable Expenses $282,515,282 282,515,282$ ($2,640,331) $279,874,951 Cost of Power $3,510,397,351 3,510,397,351$ ($738,693,349) $2,771,704,002
Working Capital Rate (%) 6.42% (9) (9) 7.30% (9)
2 Utility Income
Operating Revenues:
Distribution Revenue at Current Rates $826,212,025 $787,515,401 Distribution Revenue at Proposed Rates $846,898,973 $796,483,709 Other Revenue:
Specific Service Charges $6,699,967 $3,793,981 Late Payment Charges $3,819,304 $3,857,422 Other Distribution Revenue $38,027,870 $35,488,716 Other Income and Deductions $5,979,724
Total Revenue Offsets $48,547,141 (7) $49,119,843
Operating Expenses:
OM+A Expenses $276,880,228 276,880,228$ ($2,575,538) $274,304,690 Depreciation/Amortization $293,076,608 293,076,608$ ($3,815,621) $289,260,987 Property taxes $5,635,054 5,635,054$ ($64,793) $5,570,261 Capital taxes
Other expenses
3 Taxes/PILs
Taxable Income:
Adjustments required to arrive at taxable
income
($83,502,066) (3) ($134,309,467)
Utility Income Taxes and Rates:
Income taxes (not grossed up) $24,023,360 $7,591,463 Income taxes (grossed up) $32,684,843 $10,328,521 Capital Taxes
Federal tax (%) 15.00% 15.00% Provincial tax (%) 11.50% 11.50%Income Tax Credits ($2,736,000) ($2,736,000)
4 Capitalization/Cost of Capital
Capital Structure:
Long-term debt Capitalization Ratio (%) 56.0% 56.0%
Short-term debt Capitalization Ratio (%) 4.0% (8) (8) 4.0% (8)
Common Equity Capitalization Ratio (%) 40.0% 40.0% Prefered Shares Capitalization Ratio (%)
100.0% 0.0% 100.0%
Cost of Capital
Long-term debt Cost Rate (%) 3.71% 3.71% Short-term debt Cost Rate (%) 2.61% 2.61% Common Equity Cost Rate (%) 8.82% 8.52% Prefered Shares Cost Rate (%)
Notes:
General
(1)
(2)
(3)
(4)
(5)
(6)
(7)
(8)
(9)
Data in column E is for Application as originally filed. For updated revenue requirement as a result of interrogatory responses, technical or settlement conferences, etc.,
use column M and Adjustments in column I
Net of addbacks and deductions to arrive at taxable income.
All inputs are in dollars ($) except where inputs are individually identified as percentages (%)
Select option from drop-down list by clicking on cell M10. This column allows for the application update reflecting the end of discovery or Argument-in-Chief. Also, the
outcome of any Settlement Process can be reflected.
Average of Gross Fixed Assets at beginning and end of the Test Year
Input total revenue offsets for deriving the base revenue requirement from the service revenue requirement
4.0% unless an Applicant has proposed or been approved for another amount.
Average of Accumulated Depreciation at the beginning and end of the Test Year. Enter as a negative amount.
The default Working Capital Allowance factor is 7.5% (of Cost of Power plus controllable expenses), per the letter issued by the Board on June 3, 2015. Alternatively, a
WCA factor based on lead-lag study, with supporting rationale could be provided.
Data inputs are required on Sheets 3. Data from Sheet 3 will automatically complete calculations on sheets 4 through 9 (Rate Base through Revenue Requirement).
Sheets 4 through 9 do not require any inputs except for notes that the Applicant may wish to enter to support the results. Pale green cells are available on sheets 4
through 9 to enter both footnotes beside key cells and the related text for the notes at the bottom of each sheet.
(6)(2)Initial
Application
Per Board
Decision
Ontario Energy Board
3. Data_Input_Sheet
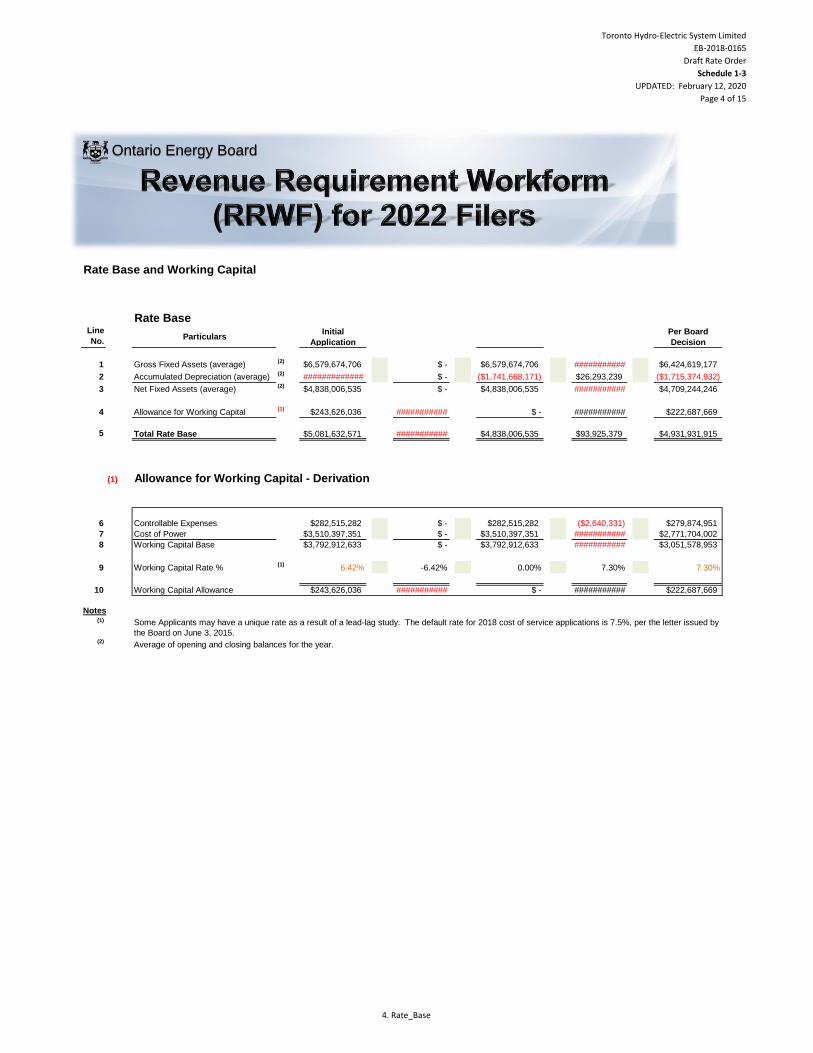
Toronto Hydro-Electric System Limited
EB-2018-0165
Draft Rate Order
Schedule 1-3
UPDATED: February 12, 2020
Page 4 of 15
Rate Base and Working Capital
Rate BaseLine
No.Particulars
Initial
Application Per Board
Decision
1 Gross Fixed Assets (average)(2)
$6,579,674,706 $ - $6,579,674,706 ########### $6,424,619,177
2 Accumulated Depreciation (average)(2)
############# $ - ($1,741,668,171) $26,293,239 ($1,715,374,932)
3 Net Fixed Assets (average)(2)
$4,838,006,535 $ - $4,838,006,535 ########### $4,709,244,246
4 Allowance for Working Capital(1)
$243,626,036 ########### $ - ########### $222,687,669
5
(1) Allowance for Working Capital - Derivation
6 Controllable Expenses $282,515,282 $ - $282,515,282 ($2,640,331) $279,874,951
7 Cost of Power $3,510,397,351 $ - $3,510,397,351 ########### $2,771,704,002
8 Working Capital Base $3,792,912,633 $ - $3,792,912,633 ########### $3,051,578,953
9 Working Capital Rate % (1)
6.42% -6.42% 0.00% 7.30% 7.30%
10 Working Capital Allowance $243,626,036 ########### $ - ########### $222,687,669
(1)
(2)
Notes
$5,081,632,571 ########### $4,931,931,915Total Rate Base $4,838,006,535 $93,925,379
Some Applicants may have a unique rate as a result of a lead-lag study. The default rate for 2018 cost of service applications is 7.5%, per the letter issued by
the Board on June 3, 2015.
Average of opening and closing balances for the year.
Ontario Energy Board
4. Rate_Base
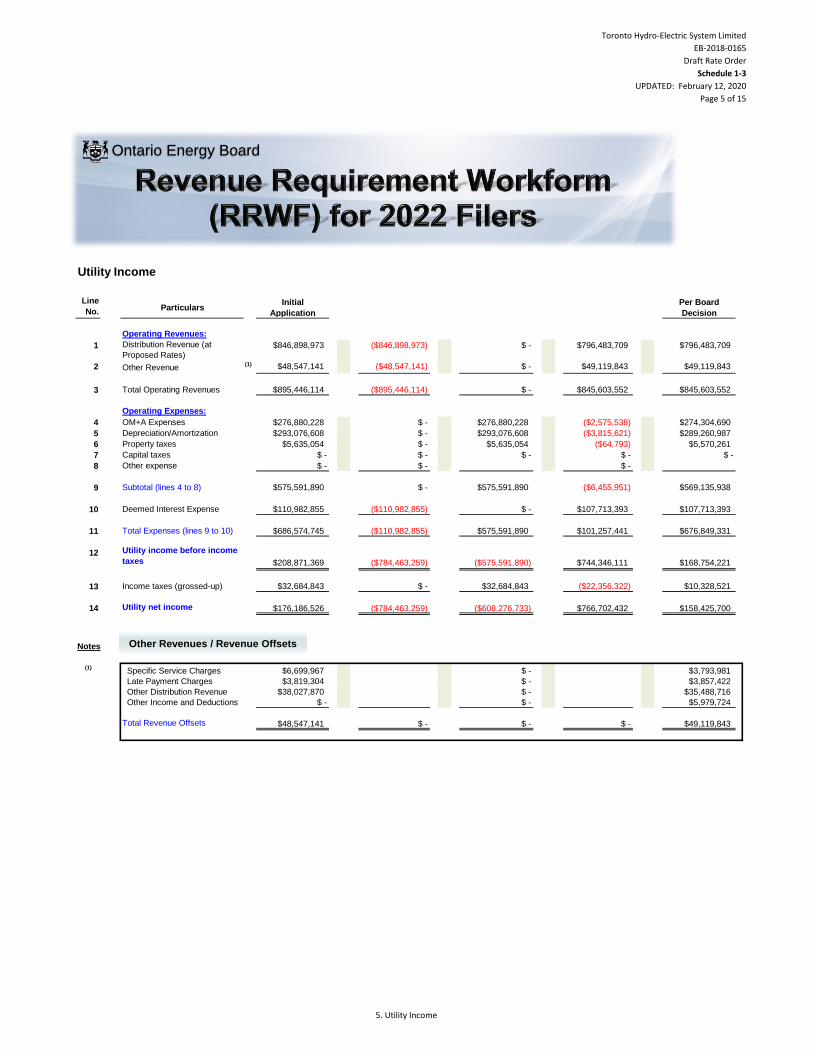
Toronto Hydro-Electric System Limited
EB-2018-0165
Draft Rate Order
Schedule 1-3
UPDATED: February 12, 2020
Page 5 of 15
Utility Income
Line
No.Particulars
Initial
Application
Per Board
Decision
Operating Revenues:
1 Distribution Revenue (at
Proposed Rates)$846,898,973 ($846,898,973) $ - $796,483,709 $796,483,709
2 Other Revenue(1) $48,547,141 ($48,547,141) $ - $49,119,843 $49,119,843
3 Total Operating Revenues
Operating Expenses:
4 OM+A Expenses $276,880,228 $ - $276,880,228 ($2,575,538) $274,304,690
5 Depreciation/Amortization $293,076,608 $ - $293,076,608 ($3,815,621) $289,260,987
6 Property taxes $5,635,054 $ - $5,635,054 ($64,793) $5,570,261
7 Capital taxes $ - $ - $ - $ - $ -
8 Other expense $ - $ - $ -
9 Subtotal (lines 4 to 8)
10 Deemed Interest Expense $110,982,855 ($110,982,855) $ - $107,713,393 $107,713,393
11 Total Expenses (lines 9 to 10) $686,574,745 ($110,982,855) $575,591,890 $101,257,441 $676,849,331
12 Utility income before income
taxes $208,871,369 ($784,463,259) ($575,591,890) $744,346,111 $168,754,221
13 Income taxes (grossed-up)
14 Utility net income
(1) Specific Service Charges $6,699,967 $ - $3,793,981
Late Payment Charges $3,819,304 $ - $3,857,422
Other Distribution Revenue $38,027,870 $ - $35,488,716
Other Income and Deductions $ - $ - $5,979,724
Total Revenue Offsets
$575,591,890
$48,547,141 $49,119,843
Notes
($608,276,733)
$569,135,938$575,591,890
$32,684,843
($6,455,951)
($22,356,322)
$845,603,552$ - $845,603,552$895,446,114 ($895,446,114)
$ -
$10,328,521$32,684,843
$158,425,700$176,186,526 $766,702,432
$ - $ - $ -
$ -
($784,463,259)
Other Revenues / Revenue Offsets
Ontario Energy Board
5. Utility Income

Toronto Hydro-Electric System Limited
EB-2018-0165
Draft Rate Order
Schedule 1-3
UPDATED: February 12, 2020
Page 6 of 15
Line
No.Particulars Application
Per Board
Decision
Determination of Taxable Income
1 $179,279,997 $ - $168,080,240
2 ($83,502,066) $ - ($134,309,467)
3 $95,777,931 $ - $33,770,773
Calculation of Utility income Taxes
4 Income taxes $24,023,360 $24,023,360 $7,591,463
5Capital taxes
$ - $ - $ -
6 Total taxes
7 Gross-up of Income Taxes $8,661,483 $8,661,483 $2,737,058
8 Grossed-up Income Taxes $32,684,843 $32,684,843 $10,328,521
9$32,684,843 $32,684,843 $10,328,521
10 Other tax Credits ($2,736,000) ($2,736,000) ($2,736,000)
Tax Rates
11 Federal tax (%) 15.00% 15.00% 15.00%
12 Provincial tax (%) 11.50% 11.50% 11.50%
13 Total tax rate (%) 26.50% 26.50% 26.50%
Notes
Taxes/PILs
$24,023,360 $7,591,463
Utility net income before taxes
Adjustments required to arrive at taxable
utility income
Taxable income
PILs / tax Allowance (Grossed-up Income
taxes + Capital taxes)
$24,023,360
Ontario Energy Board
6. Taxes_PILs
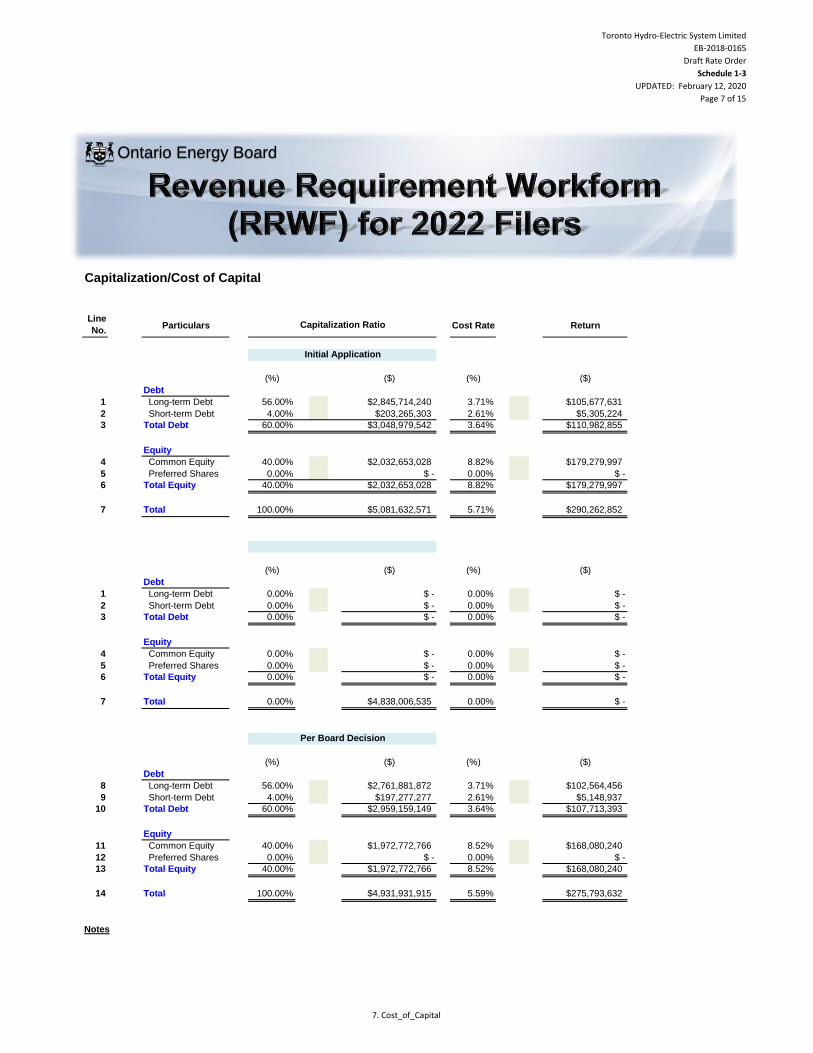
Toronto Hydro-Electric System Limited
EB-2018-0165
Draft Rate Order
Schedule 1-3
UPDATED: February 12, 2020
Page 7 of 15
Line
No.Particulars Cost Rate Return
(%) ($) (%) ($)
Debt
1 Long-term Debt 56.00% $2,845,714,240 3.71% $105,677,631
2 Short-term Debt 4.00% $203,265,303 2.61% $5,305,224
3 Total Debt 60.00% $3,048,979,542 3.64% $110,982,855
Equity
4 Common Equity 40.00% $2,032,653,028 8.82% $179,279,997
5 Preferred Shares 0.00% $ - 0.00% $ -
6 Total Equity 40.00% $2,032,653,028 8.82% $179,279,997
7 Total 100.00% $5,081,632,571 5.71% $290,262,852
(%) ($) (%) ($)
Debt
1 Long-term Debt 0.00% $ - 0.00% $ -
2 Short-term Debt 0.00% $ - 0.00% $ -
3 Total Debt 0.00% $ - 0.00% $ -
Equity
4 Common Equity 0.00% $ - 0.00% $ -
5 Preferred Shares 0.00% $ - 0.00% $ -
6 Total Equity 0.00% $ - 0.00% $ -
7 Total 0.00% $4,838,006,535 0.00% $ -
(%) ($) (%) ($)
Debt
8 Long-term Debt 56.00% $2,761,881,872 3.71% $102,564,456
9 Short-term Debt 4.00% $197,277,277 2.61% $5,148,937
10 Total Debt 60.00% $2,959,159,149 3.64% $107,713,393
Equity
11 Common Equity 40.00% $1,972,772,766 8.52% $168,080,240
12 Preferred Shares 0.00% $ - 0.00% $ -
13 Total Equity 40.00% $1,972,772,766 8.52% $168,080,240
14 Total 100.00% $4,931,931,915 5.59% $275,793,632
Initial Application
Capitalization/Cost of Capital
Capitalization Ratio
Per Board Decision
Notes
Ontario Energy Board
7. Cost_of_Capital

Toronto Hydro-Electric System Limited
EB-2018-0165
Draft Rate Order
Schedule 1-3
UPDATED: February 12, 2020
Page 8 of 15
Revenue Deficiency/Sufficiency
1 Revenue Deficiency from Below $21,905,307 ($284,448,771) $16,747,735
2 Distribution Revenue $826,212,025 $824,993,666 $826,212,025 $1,131,347,744 $787,515,401 $779,735,974
3 Other Operating Revenue Offsets
- net$48,547,141 $48,547,141 $ - $ - $49,119,843 $49,119,843
4 Total Revenue $874,759,165 $895,446,114 $826,212,025 $846,898,973 $836,635,244 $845,603,552
5 Operating Expenses $575,591,890 $575,591,890 $575,591,890 $575,591,890 $569,135,938 $569,135,938
6 Deemed Interest Expense $110,982,855 $110,982,855 $ - $ - $107,713,393 $107,713,393
8 Total Cost and Expenses $686,574,745 $686,574,745 $575,591,890 $575,591,890 $676,849,331 $676,849,331
9 Utility Income Before Income
Taxes$188,184,420 $208,871,369 $250,620,135 $271,307,083 $159,785,913 $168,754,221
10 Tax Adjustments to Accounting
Income per 2013 PILs model
($83,502,066) ($83,502,066) ($83,502,066) ($83,502,066) ($134,309,467) ($134,309,467)
11 Taxable Income $104,682,354 $125,369,303 $167,118,069 $187,805,017 $25,476,446 $34,444,754
12 Income Tax Rate 26.50% 26.50% 26.50% 26.50% 26.50% 26.50%
13Income Tax on Taxable Income
$27,740,824 $33,222,865 $44,286,288 $49,768,330 $6,751,258 $9,127,860
14 Income Tax Credits ($2,736,000) ($2,736,000) ($2,736,000) ($2,736,000) ($2,736,000) ($2,736,000)
15 Utility Net Income $163,179,597 $176,186,526 $209,069,847 ($608,276,733) $155,770,654 $158,425,700
16 Utility Rate Base $5,081,632,571 $5,081,632,571 $4,838,006,535 $4,838,006,535 $4,931,931,915 $4,931,931,915
17 Deemed Equity Portion of Rate
Base $2,032,653,028 $2,032,653,028 $ - $ - $1,972,772,766 $1,972,772,766
18 Income/(Equity Portion of Rate
Base)8.03% 8.67% 0.00% 0.00% 7.90% 8.03%
19 Target Return - Equity on Rate
Base8.82% 8.82% 0.00% 0.00% 8.52% 8.52%
20 Deficiency/Sufficiency in Return
on Equity-0.79% -0.15% 0.00% 0.00% -0.62% -0.49%
21 Indicated Rate of Return 5.40% 5.65% 4.32% 0.00% 5.34% 5.40%
22 Requested Rate of Return on
Rate Base5.71% 5.71% 0.00% 0.00% 5.59% 5.59%
23 Deficiency/Sufficiency in Rate of
Return-0.32% -0.06% 4.32% 0.00% -0.25% -0.20%
24 Target Return on Equity $179,279,997 $179,279,997 $ - $ - $168,080,240 $168,080,240
25 Revenue Deficiency/(Sufficiency) $16,100,401 ($3,093,471) ($209,069,847) $ - $12,309,585 ($9,654,540)
26 Gross Revenue
Deficiency/(Sufficiency)$21,905,307 (1) ($284,448,771) (1) $16,747,735 (1)
(1)
Notes:
ParticularsLine
No.
Initial Application
Revenue Deficiency/Sufficiency divided by (1 - Tax Rate)
At Proposed
Rates
At Proposed
Rates
At Current
Approved Rates
Per Board Decision
At Current
Approved Rates
At Current
Approved Rates
At Proposed
Rates
Ontario Energy Board
8. Rev_Def_Suff

Toronto Hydro-Electric System Limited
EB-2018-0165
Draft Rate Order
Schedule 1-3
UPDATED: February 12, 2020
Page 9 of 15
Revenue Requirement
Line
No.Particulars Application
1 OM&A Expenses $276,880,228 $276,880,228
2 Amortization/Depreciation $293,076,608 $293,076,608
3 Property Taxes $5,635,054 $5,635,054
4
Capital Taxes $ - $ -
5 Income Taxes (Grossed up) $32,684,843 $32,684,843
6 Other Expenses $ -
7 Return
Deemed Interest Expense $110,982,855 $ -
Return on Deemed Equity $179,279,997 $ -
8 Service Revenue Requirement
(before Revenues) $898,539,585 $608,276,733
9 Revenue Offsets $48,547,141 $ -
10 Base Revenue Requirement $849,992,444 $608,276,733
(excluding Tranformer Owership
Allowance credit adjustment)
11 Distribution revenue $846,898,973 $ -
12 Other revenue $48,547,141 $ -
13 Total revenue
14 Difference (Total Revenue Less
Distribution Revenue Requirement
before Revenues) (1) (1) (1)
Application Δ% (2) Δ% (2)
Service Revenue Requirement $898,539,585 $608,276,733 ($0) ($1)Grossed-Up Revenue
Deficiency/(Sufficiency) $21,905,307 ($284,448,771) ($14) ($1)
Base Revenue Requirement (to be
recovered from Distribution Rates) $849,992,444 $608,276,733 ($0) ($1)
Revenue Deficiency/(Sufficiency)
Associated with Base Revenue
Requirement $20,686,948 $ - ($1) ($1)
(1)Line 11 - Line 8
(2)Percentage Change Relative to Initial Application
$289,260,987
$5,570,261
$855,258,092
Notes
$49,119,843
$ -
($608,276,733)($3,093,471)
$895,446,114
Summary Table of Revenue Requirement and Revenue Deficiency/Sufficiency
Per Board Decision
$845,603,552
($9,654,540)
Per Board Decision
$855,258,092
$16,747,735
$806,138,249
$8,968,308
$796,483,709
$10,328,521
$107,713,393
$168,080,240
$49,119,843$806,138,249
$274,304,690
Ontario Energy Board
9. Rev_Reqt
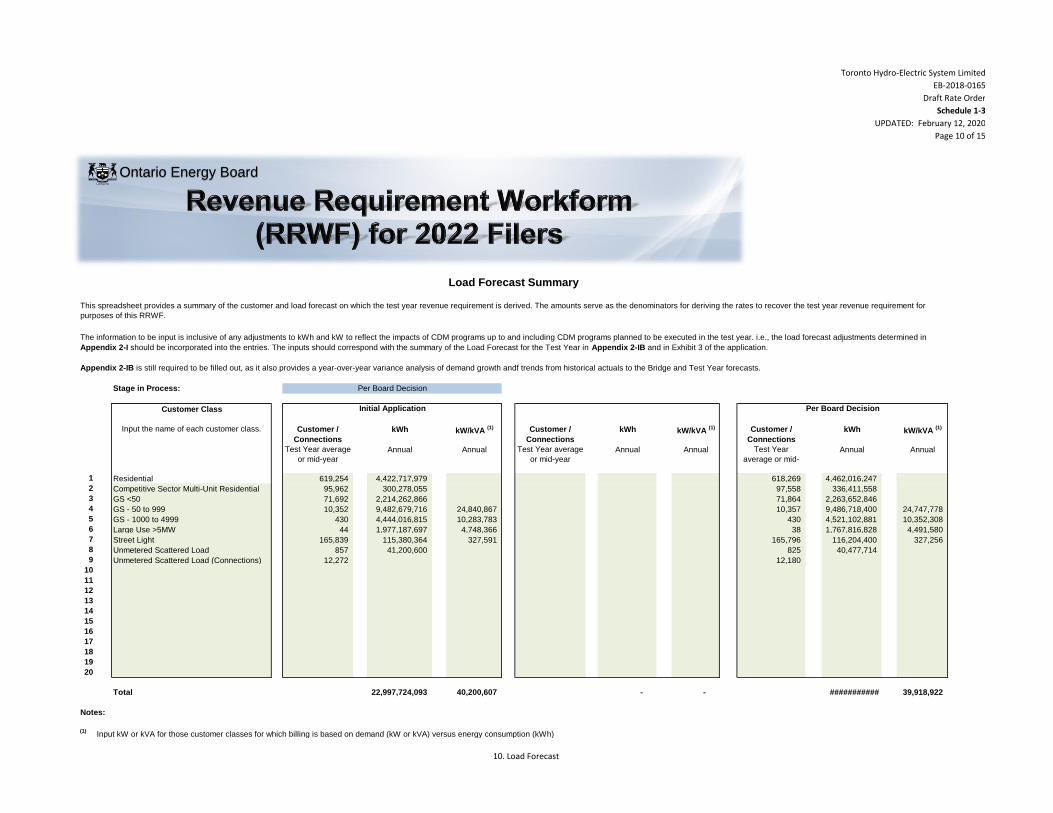
Toronto Hydro-Electric System Limited
EB-2018-0165
Draft Rate Order
Schedule 1-3
UPDATED: February 12, 2020
Page 10 of 15
Stage in Process:
Customer Class
Customer /
Connections
kWh kW/kVA (1) Customer /
Connections
kWh kW/kVA (1) Customer /
Connections
kWh kW/kVA (1)
Test Year average
or mid-year
Annual Annual Test Year average
or mid-year
Annual Annual Test Year
average or mid-
year
Annual Annual
1 Residential 619,254 4,422,717,979 618,269 4,462,016,247
2 Competitive Sector Multi-Unit Residential 95,962 300,278,055 97,558 336,411,558
3 GS <50 71,692 2,214,262,866 71,864 2,263,652,846
4 GS - 50 to 999 10,352 9,482,679,716 24,840,867 10,357 9,486,718,400 24,747,778
5 GS - 1000 to 4999 430 4,444,016,815 10,283,783 430 4,521,102,881 10,352,308
6 Large Use >5MW 44 1,977,187,697 4,748,366 38 1,767,816,828 4,491,580
7 Street Light 165,839 115,380,364 327,591 165,796 116,204,400 327,256
8 Unmetered Scattered Load 857 41,200,600 825 40,477,714
9 Unmetered Scattered Load (Connections) 12,272 12,180
10
11
12
13
14
15
16
17
18
19
20
Total 22,997,724,093 40,200,607 - - ########### 39,918,922
Notes:
(1)Input kW or kVA for those customer classes for which billing is based on demand (kW or kVA) versus energy consumption (kWh)
Load Forecast Summary
Input the name of each customer class.
Initial Application Per Board Decision
This spreadsheet provides a summary of the customer and load forecast on which the test year revenue requirement is derived. The amounts serve as the denominators for deriving the rates to recover the test year revenue requirement for
purposes of this RRWF.
The information to be input is inclusive of any adjustments to kWh and kW to reflect the impacts of CDM programs up to and including CDM programs planned to be executed in the test year. i.e., the load forecast adjustments determined in
Appendix 2-I should be incorporated into the entries. The inputs should correspond with the summary of the Load Forecast for the Test Year in Appendix 2-IB and in Exhibit 3 of the application.
Per Board Decision
Appendix 2-IB is still required to be filled out, as it also provides a year-over-year variance analysis of demand growth andf trends from historical actuals to the Bridge and Test Year forecasts.
Ontario Energy Board
10. Load Forecast

Toronto Hydro-Electric System Limited
EB-2018-0165
Draft Rate Order
Schedule 1-3
UPDATED: February 12, 2020
Page 11 of 15
Stage in Application Process:
A) Allocated Costs
Name of Customer Class (3) Costs Allocated from
Previous Study (1)
% %
From Sheet 10. Load Forecast
(7A)
1 Residential 287,079,871$ 42.26% 328,765,852$ 38.44%
2 Competitive Sector Multi-Unit Residential 19,267,312$ 2.84% 37,216,554$ 4.35%
3 GS <50 99,019,246$ 14.58% 136,073,888$ 15.91%
4 GS - 50 to 999 157,700,127$ 23.21% 211,364,865$ 24.71%
5 GS - 1000 to 4999 55,701,964$ 8.20% 78,587,158$ 9.19%
6 Large Use >5MW 31,087,389$ 4.58% 37,214,687$ 4.35%
7 Street Light 25,331,820$ 3.73% 22,997,387$ 2.69%
8 Unmetered Scattered Load 4,173,832$ 0.61% 3,037,701$ 0.36%
9 Unmetered Scattered Load (Connections) 0.00% 0.00%
10 0.00% 0.00%
11 0.00% 0.00%
12 0.00% 0.00%
13 0.00% 0.00%
14 0.00% 0.00%
15 0.00% 0.00%
16 0.00% 0.00%
17 0.00% 0.00%
18 0.00% 0.00%
19 0.00% 0.00%20 0.00% 0.00%
Total 679,361,561$ 100.00% 855,258,092$ 100.00%
Service Revenue
Requirement (from
Sheet 9)
855,258,092$
(1)
(2)
(3)
B) Calculated Class Revenues
Name of Customer Class Load Forecast (LF) X
current approved
rates
LF X current
approved rates X
(1+d)
LF X Proposed Rates Miscellaneous
Revenues
(7B) (7C) (7D) (7E)
0.025104534
1 Residential 301,492,695$ 315,495,392$ 304,877,718$ 20,350,106$
2 Competitive Sector Multi-Unit Residential 39,038,972$ 35,577,371$ 39,478,145$ 1,912,495$
3 GS <50 114,750,416$ 110,824,652$ 116,031,846$ 8,343,425$
4 GS - 50 to 999 209,478,676$ 213,867,986$ 211,870,216$ 6,946,932$
5 GS - 1000 to 4999 71,167,075$ 69,126,352$ 72,025,688$ 1,398,205$
6 Large Use >5MW 32,846,897$ 32,086,085$ 33,245,697$ 506,690$
7 Street Light 15,356,086$ 15,558,970$ 15,531,605$ 9,502,397$
8 Unmetered Scattered Load 3,384,583$ 3,946,901$ 3,422,793$ 159,594$
9 Unmetered Scattered Load (Connections)
10
11
12
13
14
15
16
17
18
19
20
Total 787,515,401$ 796,483,709$ 796,483,709$ 49,119,843$
(4)
(5)
(6)
(7)
Columns 7C and 7D - Column Total should equal the Base Revenue Requirement for each.
Column 7C - The OEB-issued cost allocation model calculates "1+d" on worksheet O-1, cell C22. "d" is defined as Revenue Deficiency/Revenue at Current Rates.
Column 7E - If using the OEB-issued cost allocation model, enter Miscellaneous Revenues as it appears on worksheet O-1, row 19,
Host Distributors - Provide information on any embedded distributor(s) as a separate class, if applicable. If embedded distributors are billed in a General Service class, include the
allocated costs and revenues of the embedded distributor(s) in the applicable class, and also complete Appendix 2-Q.
Customer Classes - If these differ from those in place in the previous cost allocation study, modify the customer classes to match the proposal in the current application as closely as
possible.
In columns 7B to 7D, LF means Load Forecast of Annual Billing Quantities (i.e., customers or connections, as applicable X 12 months, and kWh, kW or kVA as applicable. Revenue
quantities should be net of the Transformer Ownership Allowance for applicable customer classes. Exclude revenues from rate adders and rate riders.
This spreadsheet replaces Appendix 2-P and provides a summary of the results from the Cost Allocation spreadsheet, and is used in the determination of the class revenue requirement and,
hence, ultimately, the determination of rates from customers in all classes to recover the revenue requirement.
Cost Allocation and Rate Design
Allocated Class
Revenue Requirement (1)
Per Board Decision
Class Allocated Revenue Requirement, from Sheet O-1, Revenue to Cost || RR, row 40, from the Cost Allocation Study in this application. This excludes costs in deferral and variance
accounts. For Embedded Distributors, Account 4750 - Low Voltage (LV) Costs are also excluded.
Ontario Energy Board
11. Cost_Allocation

Toronto Hydro-Electric System Limited
EB-2018-0165
Draft Rate Order
Schedule 1-3
UPDATED: February 12, 2020
Page 12 of 15
Cost Allocation and Rate Design
Ontario Energy Board
C) Rebalancing Revenue-to-Cost Ratios
Name of Customer Class Previously Approved
Ratios
Status Quo Ratios Proposed Ratios Policy Range
Most Recent Year: (7D + 7E) / (7A)
2015
% % % %
1 Residential 94.3% 102.2% 98.9% 85 - 115 0.85 1.15 85 - 115
2 Competitive Sector Multi-Unit Residential 100.0% 100.7% 111.2% 80 - 120
3 GS <50 91.5% 87.6% 91.4% 80 - 120 0.8 1.2
4 GS - 50 to 999 119.0% 104.5% 103.5% 80 - 120 0.8 1.2
5 GS - 1000 to 4999 101.9% 89.7% 93.4% 80 - 120 0.8 1.2
6 Large Use >5MW 95.3% 87.6% 90.7% 85 - 115 0.85 1.15
7 Street Light 82.7% 109.0% 108.9% 80 - 120 0.8 1.2
8 Unmetered Scattered Load 90.5% 135.2% 117.9% 80 - 120 0.8 1.2
9 Unmetered Scattered Load (Connections)
10
11
12
13
14
15
16
17
18
19
20
(8)
(9)
(10)
(D)
Name of Customer Class Policy Range
Test Year
2020 2021 2022
1 Residential 98.9% 85 - 115 0.85 1.15
2 Competitive Sector Multi-Unit Residential 111.2%
3 GS <50 91.4% 80 - 120 0.8 1.2
4 GS - 50 to 999 103.5% 80 - 120 0.8 1.2
5 GS - 1000 to 4999 93.4% 80 - 120 0.8 1.2
6 Large Use >5MW 90.7% 85 - 115 0.85 1.15
7 Street Light 108.9% 80 - 120 0.8 1.2
8 Unmetered Scattered Load 117.9% 80 - 120 0.8 1.2
9 Unmetered Scattered Load (Connections)
10
11
12
13
14
15
16
17
18
19
20
(11) The applicant should complete Table D if it is applying for approval of a revenue-to-cost ratio in 2019 that is outside of the OEB's policy range for any customer class. Table D will show
that the distributor is likely to enter into the 2020 and 2021 Price Cap IR models, as necessary. For 2020 and 2021, enter the planned revenue-to-cost ratios that will be "Change" or "No
Change" in 2018 (in the current Revenue/Cost Ratio Adjustment Workform, Worksheet C1.1 'Decision - Cost Revenue Adjustment, column d), and enter TBD for class(es) that will be
entered as 'Rebalance'.
Status Quo Ratios - The OEB-issued cost allocation model provides the Status Quo Ratios on Worksheet O-1. The Status Quo means "Before Rebalancing".
Ratios shown in red are outside of the allowed range. Applies to both Tables C and D.
Proposed Revenue-to-Cost Ratios (11)
Price Cap IR Period
Proposed Revenue-to-Cost Ratio
(7C + 7E) / (7A)
Previously Approved Revenue-to-Cost (R/C) Ratios - For most applicants, the most recent year would be the third year (at the latest) of the Price Cap IR period. For example, if the
applicant, rebased in 2012 with further adjustments to move within the range over two years, the Most Recent Year would be 2015. However, the ratios in 2015 would be equal to those
after the adjustment in 2014.
11. Cost_Allocation

Toronto Hydro-Electric System Limited
EB-2018-0165
Draft Rate Order
Schedule 1-3
UPDATED: February 12, 2020
Page 13 of 15
Please complete the following tables.
A Data Inputs (from Sheet 10. Load Forecast)
Customers 618,269 kWh 4,462,016,247
Proposed Residential Class Specific Revenue
Requirement1
304,877,717.94$
Monthly Fixed Charge ($) -$ Distribution Volumetric Rate ($/kWh) -$
B Current Fixed/Variable Split
Base Rates Billing Determinants Revenue % of Total Revenue
Fixed 0 618,269 -$
Variable 0 4,462,016,247 -$ TOTAL - - -$ -
C Calculating Test Year Base Rates
Number of Remaining Rate Design Policy
Transition Years2 1
Test Year Revenue @
Current F/V Split
Test Year Base Rates
@ Current F/V Split
Reconciliation - Test
Year Base Rates @
Current F/V Split
Fixed
Variable
TOTAL -
New F/V Split
Revenue @ new
F/V Split
Final Adjusted
Base Rates
Revenue
Reconciliation @
Adjusted Rates
Fixed
Variable
TOTAL - -$ -
Change in Fixed Rate
Notes:
1
2
3
The final residential class specific revenue requirement, excluding allocated Miscellaneous Revenues, as shown on Sheet 11. Cost Allocation, should be
used (i.e. the revenue requirement after any proposed adjustments to R/C ratios).
Change in fixed rate due to rate design policy should be less than $4. The difference between the proposed class revenue requirement and the revenue
at calculated base rates should be minimal (i.e. should be reasonably considered as a rounding error)
New Rate Design Policy For Residential Customers
Test Year Billing Determinants for Residential Class
Residential Base Rates on Current Tariff
Checks3
Difference Between Revenues @ Proposed Rates
and Class Specific Revenue Requirement
The distributor should enter the number of years remaining before the transition to fully fixed rates is completed. A distributor transitioning to fully fixed
rates over a four year period and began the transition in 2016 would input the number "3" into cell D40. A distributor transitioning over a five-year period
would input the number "4". Where the change in the residential rate design will result in the fixed charge increasing by more than $4/year, a distributor
may propose an additional transition year.
Ontario Energy Board
12. Res_Rate_Design
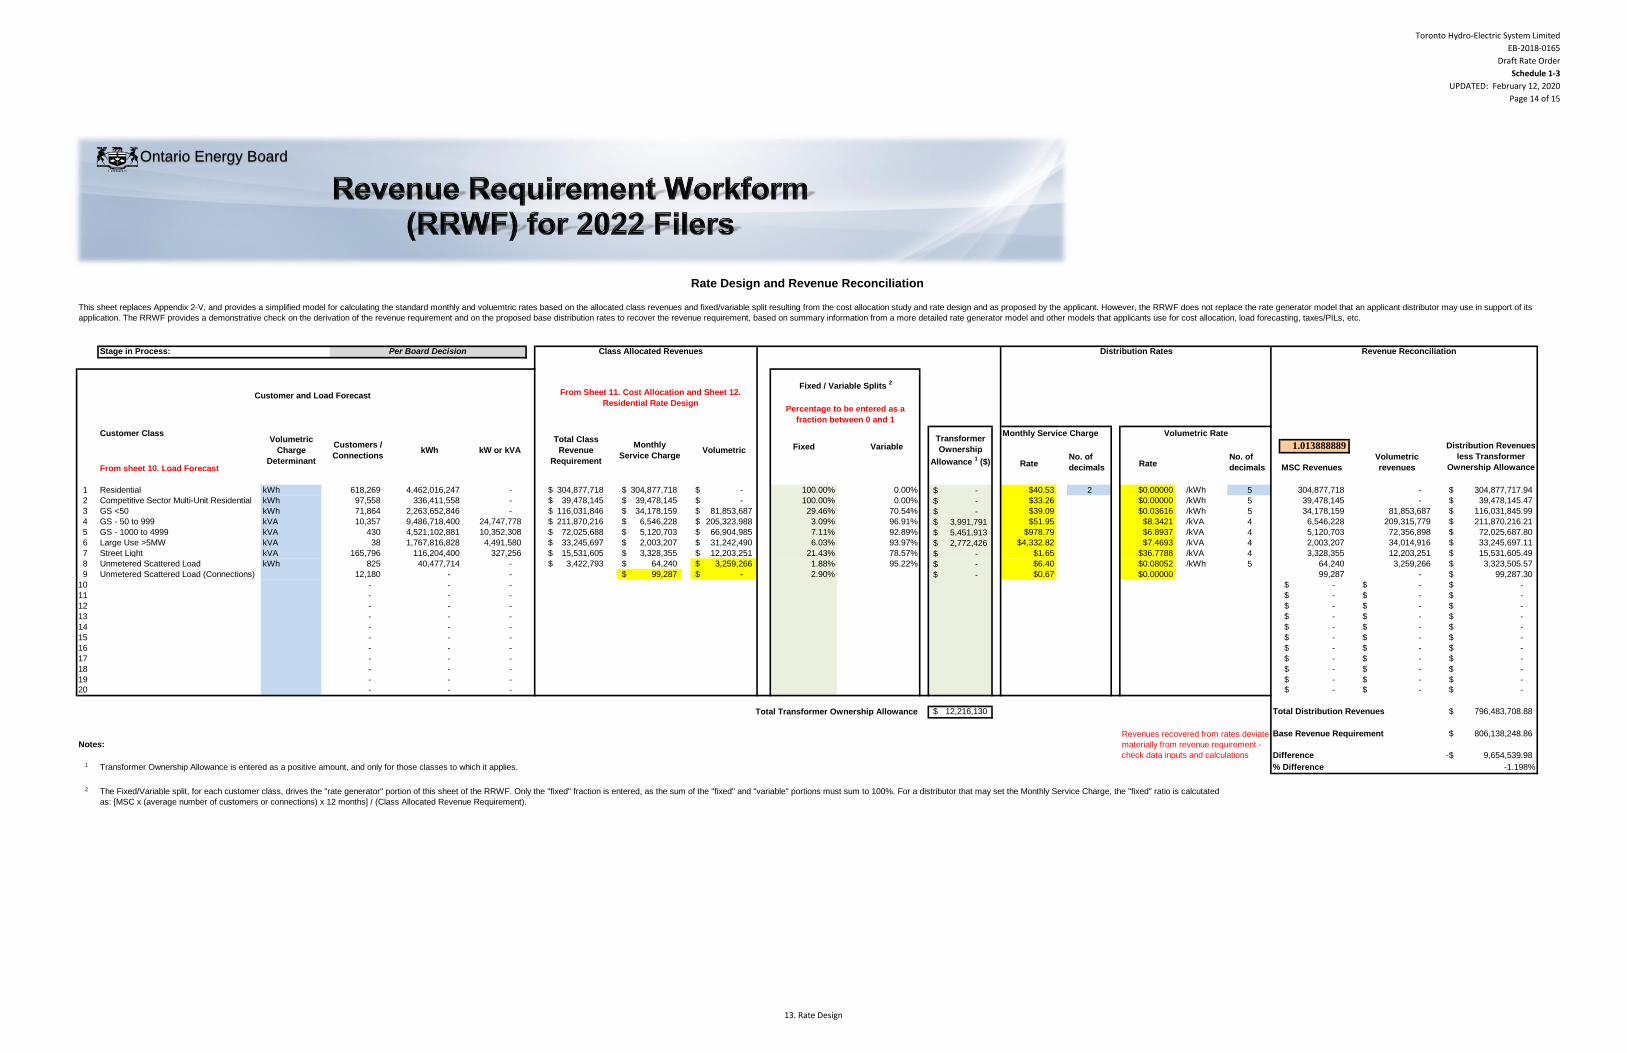
Toronto Hydro-Electric System Limited
EB-2018-0165
Draft Rate Order
Schedule 1-3
UPDATED: February 12, 2020
Page 14 of 15
Initial Application1 F H J
2 L N P
Per Board Decision3 R T V
Stage in Process:
Customer Class Monthly Service Charge
Fixed Variable 1.013888889
From sheet 10. Load ForecastRate
No. of
decimalsRate
No. of
decimals MSC Revenues
Volumetric
revenues
1 Residential kWh 618,269 4,462,016,247 - 304,877,718$ 304,877,718$ -$ 100.00% 0.00% -$ $40.53 2 $0.00000 /kWh 5 304,877,718 - 304,877,717.94$
2 Competitive Sector Multi-Unit Residential kWh 97,558 336,411,558 - 39,478,145$ 39,478,145$ -$ 100.00% 0.00% -$ $33.26 2 $0.00000 /kWh 5 39,478,145 - 39,478,145.47$
3 GS <50 kWh 71,864 2,263,652,846 - 116,031,846$ 34,178,159$ 81,853,687$ 29.46% 70.54% -$ $39.09 2 $0.03616 /kWh 5 34,178,159 81,853,687 116,031,845.99$
4 GS - 50 to 999 kVA 10,357 9,486,718,400 24,747,778 211,870,216$ 6,546,228$ 205,323,988$ 3.09% 96.91% 3,991,791$ $51.95 2 $8.3421 /kVA 4 6,546,228 209,315,779 211,870,216.21$
5 GS - 1000 to 4999 kVA 430 4,521,102,881 10,352,308 72,025,688$ 5,120,703$ 66,904,985$ 7.11% 92.89% 5,451,913$ $978.79 2 $6.8937 /kVA 4 5,120,703 72,356,898 72,025,687.80$
6 Large Use >5MW kVA 38 1,767,816,828 4,491,580 33,245,697$ 2,003,207$ 31,242,490$ 6.03% 93.97% 2,772,426$ $4,332.82 2 $7.4693 /kVA 4 2,003,207 34,014,916 33,245,697.11$
7 Street Light kVA 165,796 116,204,400 327,256 15,531,605$ 3,328,355$ 12,203,251$ 21.43% 78.57% -$ $1.65 2 $36.7788 /kVA 4 3,328,355 12,203,251 15,531,605.49$
8 Unmetered Scattered Load kWh 825 40,477,714 - 3,422,793$ 64,240$ 3,259,266$ 1.88% 95.22% -$ $6.40 2 $0.08052 /kWh 5 64,240 3,259,266 3,323,505.57$
9 Unmetered Scattered Load (Connections) 12,180 - - 99,287$ -$ 2.90% -$ $0.67 2 $0.00000 5 99,287 - 99,287.30$
10 - - - 2 5 -$ -$ -$
11 - - - 2 5 -$ -$ -$
12 - - - 2 5 -$ -$ -$
13 - - - 2 5 -$ -$ -$
14 - - - 2 5 -$ -$ -$
15 - - - 2 5 -$ -$ -$
16 - - - 2 5 -$ -$ -$
17 - - - 2 5 -$ -$ -$
18 - - - 2 5 -$ -$ -$
19 - - - 2 5 -$ -$ -$
20 - - - 2 5 -$ -$ -$
12,216,130$ Total Distribution Revenues 796,483,708.88$
Base Revenue Requirement 806,138,248.86$
Notes:
Difference 9,654,539.98-$ 1 Transformer Ownership Allowance is entered as a positive amount, and only for those classes to which it applies. % Difference -1.198%
2 The Fixed/Variable split, for each customer class, drives the "rate generator" portion of this sheet of the RRWF. Only the "fixed" fraction is entered, as the sum of the "fixed" and "variable" portions must sum to 100%. For a distributor that may set the Monthly Service Charge, the "fixed" ratio is calcutated
as: [MSC x (average number of customers or connections) x 12 months] / (Class Allocated Revenue Requirement).
Rate Design and Revenue Reconciliation
This sheet replaces Appendix 2-V, and provides a simplified model for calculating the standard monthly and voluemtric rates based on the allocated class revenues and fixed/variable split resulting from the cost allocation study and rate design and as proposed by the applicant. However, the RRWF does not replace the rate generator model that an applicant distributor may use in support of its
application. The RRWF provides a demonstrative check on the derivation of the revenue requirement and on the proposed base distribution rates to recover the revenue requirement, based on summary information from a more detailed rate generator model and other models that applicants use for cost allocation, load forecasting, taxes/PILs, etc.
Volumetric Rate
kW or kVA
Customer and Load Forecast
Transformer
Ownership
Allowance 1 ($)
Distribution Rates
Distribution Revenues
less Transformer
Ownership Allowance
Per Board Decision
Volumetric
Charge
Determinant
Customers /
ConnectionskWh
Class Allocated Revenues
Total Class
Revenue
Requirement
Monthly
Service ChargeVolumetric
Revenue Reconciliation
Revenues recovered from rates deviate
materially from revenue requirement -
check data inputs and calculations
Fixed / Variable Splits 2
From Sheet 11. Cost Allocation and Sheet 12.
Residential Rate DesignPercentage to be entered as a
fraction between 0 and 1
Total Transformer Ownership Allowance
Ontario Energy Board
13. Rate Design

Toronto Hydro-Electric System Limited
EB-2018-0165
Draft Rate Order
Schedule 1-3
UPDATED: February 12, 2020
Page 15 of 15
Tracking Form
Reference (1)
Item / Description (2) Regulated
Return on
Capital
Regulated
Rate of
Return
Rate Base Working Capital Working Capital
Allowance ($)
Amortization /
Depreciation
Taxes/PILs OM&A Service
Revenue
Requirement
Other
Revenues
Base Revenue
Requirement
Grossed up
Revenue
Deficiency /
Sufficiency
Original Application 290,262,852$ 5.71% 5,081,632,571$ 3,792,912,633$ 243,626,036$ 293,076,608$ 32,684,843$ 276,880,228$ 898,539,585$ 48,547,141$ 849,992,444$ 21,905,307$
The first row shown, labelled "Original Application", summarizes key statistics based on the data inputs into the RRWF. After the original application filing, the applicant provides key changes in capital and operating expenses, load forecasts, cost of capital, etc., as revised
through the processing of the application. This could be due to revisions or responses to interrogatories. The last row shown is the most current estimate of the cost of service data reflecting the original application and any updates provided by the applicant distributor (for
updated evidence, responses to interrogatories, undertakings, etc.)
Please ensure a Reference (Column B) and/or Item Description (Column C) is entered. Please note that unused rows will automatically be hidden and the PRINT AREA set when the PRINT BUTTON on Sheet 1 is activated.(1)
Short reference to evidence material (interrogatory response, undertaking, exhibit number, Board Decision, Code, Guideline, Report of the Board, etc.)(2)
Short description of change, issue, etc.
Cost of Capital Operating ExpensesRate Base and Capital Expenditures Revenue Requirement
1
Summary of Proposed Changes
Ontario Energy Board
14. Tracking_Sheet

Toronto Hydro-Electric System Limited
EB-2018-0165
Draft Rate Order
Schedule 1-4
UPDATED: February 12, 2020
Page 1 of 15
Version 8.00
Utility Name
Service Territory
Assigned EB Number
Name and Title
Phone Number
Email Address
Toronto Hydro-Electric System Limited
EB-2018-0165
The RRWF has been enhanced commencing with 2017 rate applications to provide estimated base distribution rates. The enhanced RRWF is not intended to replace a utility’s formal rate
generator model which should continue to be the source of the proposed rates as well as the final ones at the conclusion of the proceeding. The load forecasting addition made to this model is
intended to be demonstrative only and does not replace the information filed in the utility’s application. In an effort to minimize the incremental work required from utilities, the cost allocation and rate
design additions to this model do in fact replace former appendices that were required to be filed as part of the cost of service (Chapter 2) filing requirements.
Test Year
Bridge Year
Last Rebasing Year 2015
This Workbook Model is protected by copyright and is being made available to you solely for the purpose of filing your application. You may use and copy this model for that purpose, and provide a copy of this model to any person that is advising or assisting you in that regard. Except as indicated above, any copying, reproduction, publication, sale, adaptation, translation, modification, reverse engineering or other use or dissemination of this model without the express written consent of the Ontario Energy Board is prohibited. If you provide a copy of this model to a person that is advising or assisting you in preparing the application or reviewing your draft rate order, you must ensure that the person understands and agrees to the restrictions noted above.
While this model has been provided in Excel format and is required to be filed with the applications, the onus remains on the applicant to ensure the accuracy of the data and the results.
Ontario Energy Board
1. Info

Toronto Hydro-Electric System Limited
EB-2018-0165
Draft Rate Order
Schedule 1-4
UPDATED: February 12, 2020
Page 2 of 15
1. Info 8. Rev_Def_Suff
2. Table of Contents 9. Rev_Reqt
3. Data_Input_Sheet 10. Load Forecast
4. Rate_Base 11. Cost Allocation
5. Utility Income 12. Residential Rate Design
6. Taxes_PILs 13. Rate Design and Revenue Reconciliation
7. Cost_of_Capital 14. Tracking Sheet
Notes:
(1)
(2)
(3)
(4)
(5)
Please note that this model uses MACROS. Before starting, please ensure that macros have been enabled.
Completed versions of the Revenue Requirement Work Form are required to be filed in working Microsoft Excel format.
Pale yellow cells represent drop-down lists
Pale green cells represent inputs
Pale green boxes at the bottom of each page are for additional notes
Ontario Energy Board
2. Table of Contents

Toronto Hydro-Electric System Limited
EB-2018-0165
Draft Rate Order
Schedule 1-4
UPDATED: February 12, 2020
Page 3 of 15
Data Input (1)
1 Rate Base
Gross Fixed Assets (average) $7,140,052,883 7,140,052,883$ ($152,174,925) $6,987,877,958
Accumulated Depreciation (average) ($2,013,781,505) (5) ($2,013,781,505) $27,071,358 ($1,986,710,147)
Allowance for Working Capital:
Controllable Expenses $285,057,919 285,057,919$ ($1,264,719) $283,793,201 Cost of Power $3,579,801,165 3,579,801,165$ ($757,065,126) $2,822,736,039
Working Capital Rate (%) 6.42% (9) (9) 7.30% (9)
2 Utility Income
Operating Revenues:
Distribution Revenue at Current Rates $848,702,180 $798,363,426 Distribution Revenue at Proposed Rates $885,241,080 $846,586,035 Other Revenue:
Specific Service Charges $6,760,117 $3,847,097 Late Payment Charges $3,853,592 $3,911,426 Other Distribution Revenue $38,369,275 $35,985,558 Other Income and Deductions $6,063,440
Total Revenue Offsets $48,982,985 (7) $49,807,521
Operating Expenses:
OM+A Expenses $279,372,150 279,372,150$ ($1,227,194) $278,144,956 Depreciation/Amortization $310,853,964 310,853,964$ ($750,317) $310,103,648 Property taxes $5,685,769 5,685,769$ ($37,525) $5,648,244 Capital taxes
Other expenses
3 Taxes/PILs
Taxable Income:
Adjustments required to arrive at taxable
income
($85,418,999) (3) ($104,301,134)
Utility Income Taxes and Rates:
Income taxes (not grossed up) $26,253,623 $18,216,306 Income taxes (grossed up) $35,719,215 $24,784,090 Capital Taxes
Federal tax (%) 15.00% 15.00% Provincial tax (%) 11.50% 11.50%Income Tax Credits ($2,736,000) ($2,736,000)
4 Capitalization/Cost of Capital
Capital Structure:
Long-term debt Capitalization Ratio (%) 56.0% 56.0%
Short-term debt Capitalization Ratio (%) 4.0% (8) (8) 4.0% (8)
Common Equity Capitalization Ratio (%) 40.0% 40.0% Prefered Shares Capitalization Ratio (%)
100.0% 0.0% 100.0%
Cost of Capital
Long-term debt Cost Rate (%) 3.71% 3.71% Short-term debt Cost Rate (%) 2.61% 2.61% Common Equity Cost Rate (%) 8.82% 8.52% Prefered Shares Cost Rate (%)
Notes:
General
(1)
(2)
(3)
(4)
(5)
(6)
(7)
(8)
(9)
Data in column E is for Application as originally filed. For updated revenue requirement as a result of interrogatory responses, technical or settlement conferences, etc.,
use column M and Adjustments in column I
Net of addbacks and deductions to arrive at taxable income.
All inputs are in dollars ($) except where inputs are individually identified as percentages (%)
Select option from drop-down list by clicking on cell M10. This column allows for the application update reflecting the end of discovery or Argument-in-Chief. Also, the
outcome of any Settlement Process can be reflected.
Average of Gross Fixed Assets at beginning and end of the Test Year
Input total revenue offsets for deriving the base revenue requirement from the service revenue requirement
4.0% unless an Applicant has proposed or been approved for another amount.
Average of Accumulated Depreciation at the beginning and end of the Test Year. Enter as a negative amount.
The default Working Capital Allowance factor is 7.5% (of Cost of Power plus controllable expenses), per the letter issued by the Board on June 3, 2015. Alternatively, a
WCA factor based on lead-lag study, with supporting rationale could be provided.
Data inputs are required on Sheets 3. Data from Sheet 3 will automatically complete calculations on sheets 4 through 9 (Rate Base through Revenue Requirement).
Sheets 4 through 9 do not require any inputs except for notes that the Applicant may wish to enter to support the results. Pale green cells are available on sheets 4
through 9 to enter both footnotes beside key cells and the related text for the notes at the bottom of each sheet.
(6)(2)Initial
Application
Per Board
Decision
Ontario Energy Board
3. Data_Input_Sheet

Toronto Hydro-Electric System Limited
EB-2018-0165
Draft Rate Order
Schedule 1-4
UPDATED: February 12, 2020
Page 4 of 15
Rate Base and Working Capital
Rate BaseLine
No.Particulars
Initial
Application Per Board
Decision
1 Gross Fixed Assets (average)(2)
$7,140,052,883 $ - $7,140,052,883 ########### $6,987,877,958
2 Accumulated Depreciation (average)(2)
($2,013,781,505) $ - ($2,013,781,505) $27,071,358 ($1,986,710,147)
3 Net Fixed Assets (average)(2)
$5,126,271,378 $ - $5,126,271,378 ########### $5,001,167,811
4 Allowance for Working Capital(1)
$248,247,294 ########### $ - ########### $226,697,643
5
(1) Allowance for Working Capital - Derivation
6 Controllable Expenses $285,057,919 $ - $285,057,919 ($1,264,719) $283,793,201
7 Cost of Power $3,579,801,165 $ - $3,579,801,165 ########### $2,822,736,039
8 Working Capital Base $3,864,859,084 $ - $3,864,859,084 ########### $3,106,529,239
9 Working Capital Rate % (1)
6.42% -6.42% 0.00% 7.30% 7.30%
10 Working Capital Allowance $248,247,294 ########### $ - ########### $226,697,643
(1)
(2)
Notes
$5,374,518,672 ########### $5,227,865,453Total Rate Base $5,126,271,378 ###########
Some Applicants may have a unique rate as a result of a lead-lag study. The default rate for 2018 cost of service applications is 7.5%, per the letter issued by
the Board on June 3, 2015.
Average of opening and closing balances for the year.
Ontario Energy Board
4. Rate_Base
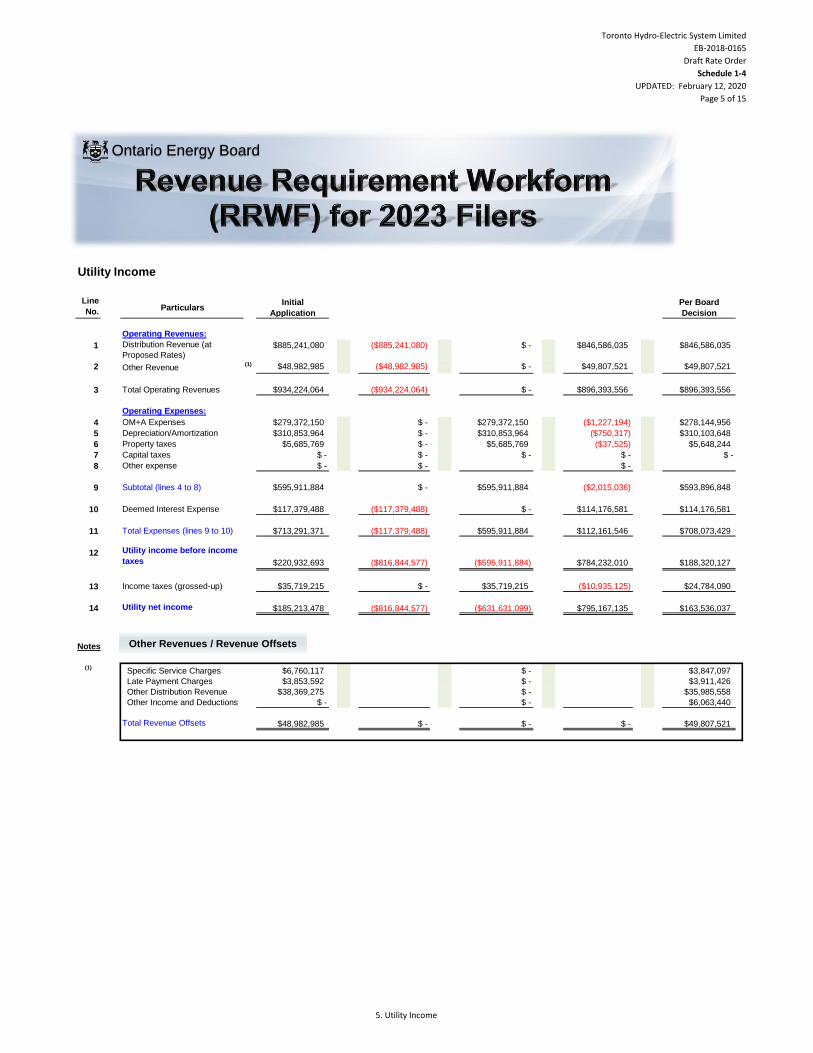
Toronto Hydro-Electric System Limited
EB-2018-0165
Draft Rate Order
Schedule 1-4
UPDATED: February 12, 2020
Page 5 of 15
Utility Income
Line
No.Particulars
Initial
Application
Per Board
Decision
Operating Revenues:
1 Distribution Revenue (at
Proposed Rates)$885,241,080 ($885,241,080) $ - $846,586,035 $846,586,035
2 Other Revenue(1) $48,982,985 ($48,982,985) $ - $49,807,521 $49,807,521
3 Total Operating Revenues
Operating Expenses:
4 OM+A Expenses $279,372,150 $ - $279,372,150 ($1,227,194) $278,144,956
5 Depreciation/Amortization $310,853,964 $ - $310,853,964 ($750,317) $310,103,648
6 Property taxes $5,685,769 $ - $5,685,769 ($37,525) $5,648,244
7 Capital taxes $ - $ - $ - $ - $ -
8 Other expense $ - $ - $ -
9 Subtotal (lines 4 to 8)
10 Deemed Interest Expense $117,379,488 ($117,379,488) $ - $114,176,581 $114,176,581
11 Total Expenses (lines 9 to 10) $713,291,371 ($117,379,488) $595,911,884 $112,161,546 $708,073,429
12 Utility income before income
taxes $220,932,693 ($816,844,577) ($595,911,884) $784,232,010 $188,320,127
13 Income taxes (grossed-up)
14 Utility net income
(1) Specific Service Charges $6,760,117 $ - $3,847,097
Late Payment Charges $3,853,592 $ - $3,911,426
Other Distribution Revenue $38,369,275 $ - $35,985,558
Other Income and Deductions $ - $ - $6,063,440
Total Revenue Offsets
$595,911,884
$48,982,985 $49,807,521
Notes
($631,631,099)
$593,896,848$595,911,884
$35,719,215
($2,015,036)
($10,935,125)
$896,393,556$ - $896,393,556$934,224,064 ($934,224,064)
$ -
$24,784,090$35,719,215
$163,536,037$185,213,478 $795,167,135
$ - $ - $ -
$ -
($816,844,577)
Other Revenues / Revenue Offsets
Ontario Energy Board
5. Utility Income
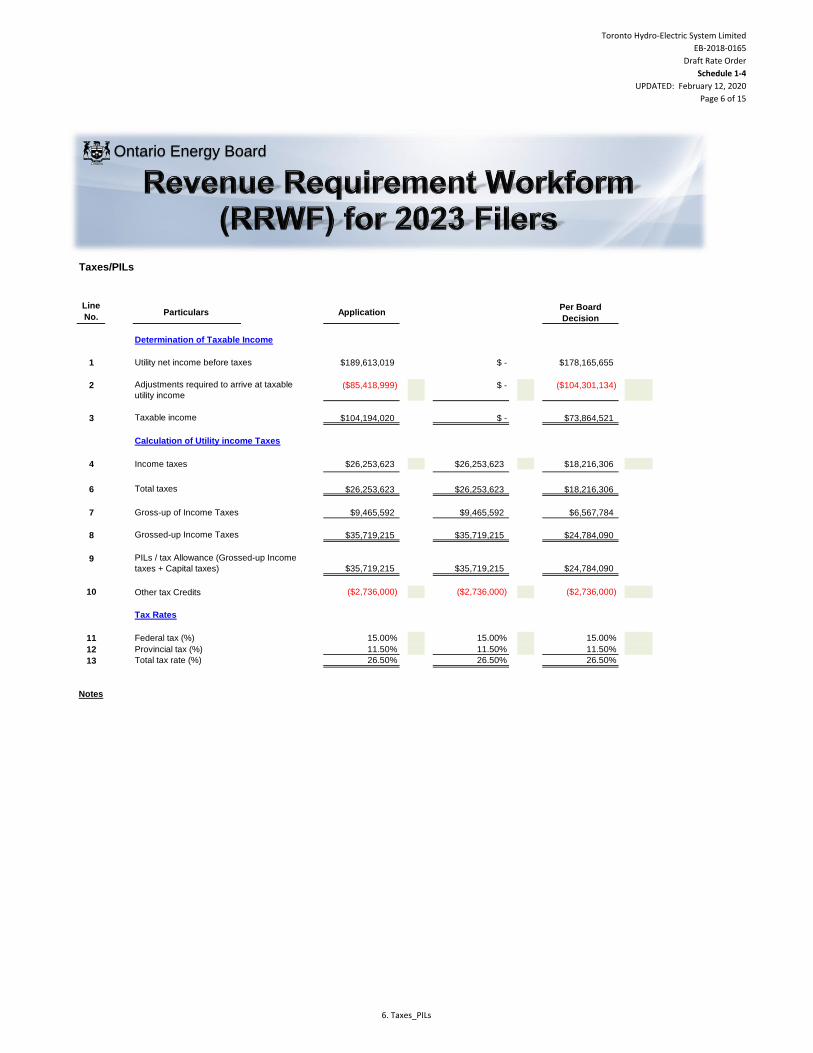
Toronto Hydro-Electric System Limited
EB-2018-0165
Draft Rate Order
Schedule 1-4
UPDATED: February 12, 2020
Page 6 of 15
Line
No.Particulars Application
Per Board
Decision
Determination of Taxable Income
1 $189,613,019 $ - $178,165,655
2 ($85,418,999) $ - ($104,301,134)
3 $104,194,020 $ - $73,864,521
Calculation of Utility income Taxes
4 Income taxes $26,253,623 $26,253,623 $18,216,306
5Capital taxes
$ - $ - $ -
6 Total taxes
7 Gross-up of Income Taxes $9,465,592 $9,465,592 $6,567,784
8 Grossed-up Income Taxes $35,719,215 $35,719,215 $24,784,090
9$35,719,215 $35,719,215 $24,784,090
10 Other tax Credits ($2,736,000) ($2,736,000) ($2,736,000)
Tax Rates
11 Federal tax (%) 15.00% 15.00% 15.00%
12 Provincial tax (%) 11.50% 11.50% 11.50%
13 Total tax rate (%) 26.50% 26.50% 26.50%
Notes
Taxes/PILs
$26,253,623 $18,216,306
Utility net income before taxes
Adjustments required to arrive at taxable
utility income
Taxable income
PILs / tax Allowance (Grossed-up Income
taxes + Capital taxes)
$26,253,623
Ontario Energy Board
6. Taxes_PILs

Toronto Hydro-Electric System Limited
EB-2018-0165
Draft Rate Order
Schedule 1-4
UPDATED: February 12, 2020
Page 7 of 15
Line
No.Particulars Cost Rate Return
(%) ($) (%) ($)
Debt
1 Long-term Debt 56.00% $3,009,730,456 3.71% $111,768,490
2 Short-term Debt 4.00% $214,980,747 2.61% $5,610,997
3 Total Debt 60.00% $3,224,711,203 3.64% $117,379,488
Equity
4 Common Equity 40.00% $2,149,807,469 8.82% $189,613,019
5 Preferred Shares 0.00% $ - 0.00% $ -
6 Total Equity 40.00% $2,149,807,469 8.82% $189,613,019
7 Total 100.00% $5,374,518,672 5.71% $306,992,506
(%) ($) (%) ($)
Debt
1 Long-term Debt 0.00% $ - 0.00% $ -
2 Short-term Debt 0.00% $ - 0.00% $ -
3 Total Debt 0.00% $ - 0.00% $ -
Equity
4 Common Equity 0.00% $ - 0.00% $ -
5 Preferred Shares 0.00% $ - 0.00% $ -
6 Total Equity 0.00% $ - 0.00% $ -
7 Total 0.00% $5,126,271,378 0.00% $ -
(%) ($) (%) ($)
Debt
8 Long-term Debt 56.00% $2,927,604,654 3.71% $108,718,690
9 Short-term Debt 4.00% $209,114,618 2.61% $5,457,892
10 Total Debt 60.00% $3,136,719,272 3.64% $114,176,581
Equity
11 Common Equity 40.00% $2,091,146,181 8.52% $178,165,655
12 Preferred Shares 0.00% $ - 0.00% $ -
13 Total Equity 40.00% $2,091,146,181 8.52% $178,165,655
14 Total 100.00% $5,227,865,453 5.59% $292,342,236
Initial Application
Capitalization/Cost of Capital
Capitalization Ratio
Per Board Decision
Notes
Ontario Energy Board
7. Cost_of_Capital

Toronto Hydro-Electric System Limited
EB-2018-0165
Draft Rate Order
Schedule 1-4
UPDATED: February 12, 2020
Page 8 of 15
Revenue Deficiency/Sufficiency
1 Revenue Deficiency from Below $39,063,327 ($287,310,071) $60,977,114
2 Distribution Revenue $848,702,180 $846,177,752 $848,702,180 $1,172,551,151 $798,363,426 $785,608,922
3 Other Operating Revenue Offsets
- net$48,982,985 $48,982,985 $ - $ - $49,807,521 $49,807,521
4 Total Revenue $897,685,165 $934,224,064 $848,702,180 $885,241,080 $848,170,947 $896,393,556
5 Operating Expenses $595,911,884 $595,911,884 $595,911,884 $595,911,884 $593,896,848 $593,896,848
6 Deemed Interest Expense $117,379,488 $117,379,488 $ - $ - $114,176,581 $114,176,581
8 Total Cost and Expenses $713,291,371 $713,291,371 $595,911,884 $595,911,884 $708,073,429 $708,073,429
9 Utility Income Before Income
Taxes$184,393,794 $220,932,693 $252,790,296 $289,329,196 $140,097,518 $188,320,127
10 Tax Adjustments to Accounting
Income per 2013 PILs model
($85,418,999) ($85,418,999) ($85,418,999) ($85,418,999) ($104,301,134) ($104,301,134)
11 Taxable Income $98,974,795 $135,513,694 $167,371,297 $203,910,197 $35,796,384 $84,018,993
12 Income Tax Rate 26.50% 26.50% 26.50% 26.50% 26.50% 26.50%
13Income Tax on Taxable Income
$26,228,321 $35,911,129 $44,353,394 $54,036,202 $9,486,042 $22,265,033
14 Income Tax Credits ($2,736,000) ($2,736,000) ($2,736,000) ($2,736,000) ($2,736,000) ($2,736,000)
15 Utility Net Income $160,901,473 $185,213,478 $211,172,903 ($631,631,099) $133,347,476 $163,536,037
16 Utility Rate Base $5,374,518,672 $5,374,518,672 $5,126,271,378 $5,126,271,378 $5,227,865,453 $5,227,865,453
17 Deemed Equity Portion of Rate
Base $2,149,807,469 $2,149,807,469 $ - $ - $2,091,146,181 $2,091,146,181
18 Income/(Equity Portion of Rate
Base)7.48% 8.62% 0.00% 0.00% 6.38% 7.82%
19 Target Return - Equity on Rate
Base8.82% 8.82% 0.00% 0.00% 8.52% 8.52%
20 Deficiency/Sufficiency in Return
on Equity-1.34% -0.20% 0.00% 0.00% -2.14% -0.70%
21 Indicated Rate of Return 5.18% 5.63% 4.12% 0.00% 4.73% 5.31%
22 Requested Rate of Return on
Rate Base5.71% 5.71% 0.00% 0.00% 5.59% 5.59%
23 Deficiency/Sufficiency in Rate of
Return-0.53% -0.08% 4.12% 0.00% -0.86% -0.28%
24 Target Return on Equity $189,613,019 $189,613,019 $ - $ - $178,165,655 $178,165,655
25 Revenue Deficiency/(Sufficiency) $28,711,546 ($4,399,540) ($211,172,903) $ - $44,818,179 ($14,629,618)
26 Gross Revenue
Deficiency/(Sufficiency)$39,063,327 (1) ($287,310,071) (1) $60,977,114 (1)
(1)
Notes:
ParticularsLine
No.
Initial Application
Revenue Deficiency/Sufficiency divided by (1 - Tax Rate)
At Proposed
Rates
At Proposed
Rates
At Current
Approved Rates
Per Board Decision
At Current
Approved Rates
At Current
Approved Rates
At Proposed
Rates
Ontario Energy Board
8. Rev_Def_Suff

Toronto Hydro-Electric System Limited
EB-2018-0165
Draft Rate Order
Schedule 1-4
UPDATED: February 12, 2020
Page 9 of 15
Revenue Requirement
Line
No.Particulars Application
1 OM&A Expenses $279,372,150 $279,372,150
2 Amortization/Depreciation $310,853,964 $310,853,964
3 Property Taxes $5,685,769 $5,685,769
4
Capital Taxes $ - $ -
5 Income Taxes (Grossed up) $35,719,215 $35,719,215
6 Other Expenses $ -
7 Return
Deemed Interest Expense $117,379,488 $ -
Return on Deemed Equity $189,613,019 $ -
8 Service Revenue Requirement
(before Revenues) $938,623,605 $631,631,099
9 Revenue Offsets $48,982,985 $ -
10 Base Revenue Requirement $889,640,620 $631,631,099
(excluding Tranformer Owership
Allowance credit adjustment)
11 Distribution revenue $885,241,080 $ -
12 Other revenue $48,982,985 $ -
13 Total revenue
14 Difference (Total Revenue Less
Distribution Revenue Requirement
before Revenues) (1) (1) (1)
Application Δ% (2) Δ% (2)
Service Revenue Requirement $938,623,605 $631,631,099 ($0) ($1)Grossed-Up Revenue
Deficiency/(Sufficiency) $39,063,327 ($287,310,071) ($8) ($1)
Base Revenue Requirement (to be
recovered from Distribution Rates) $889,640,620 $631,631,099 ($0) ($1)
Revenue Deficiency/(Sufficiency)
Associated with Base Revenue
Requirement $36,538,900 $ - ($1) ($1)
(1)Line 11 - Line 8
(2)Percentage Change Relative to Initial Application
$310,103,648
$5,648,244
$911,023,174
Notes
$49,807,521
$ -
($631,631,099)($4,399,540)
$934,224,064
Summary Table of Revenue Requirement and Revenue Deficiency/Sufficiency
Per Board Decision
$896,393,556
($14,629,618)
Per Board Decision
$911,023,174
$60,977,114
$861,215,653
$48,222,609
$846,586,035
$24,784,090
$114,176,581
$178,165,655
$49,807,521$861,215,653
$278,144,956
Ontario Energy Board
9. Rev_Reqt
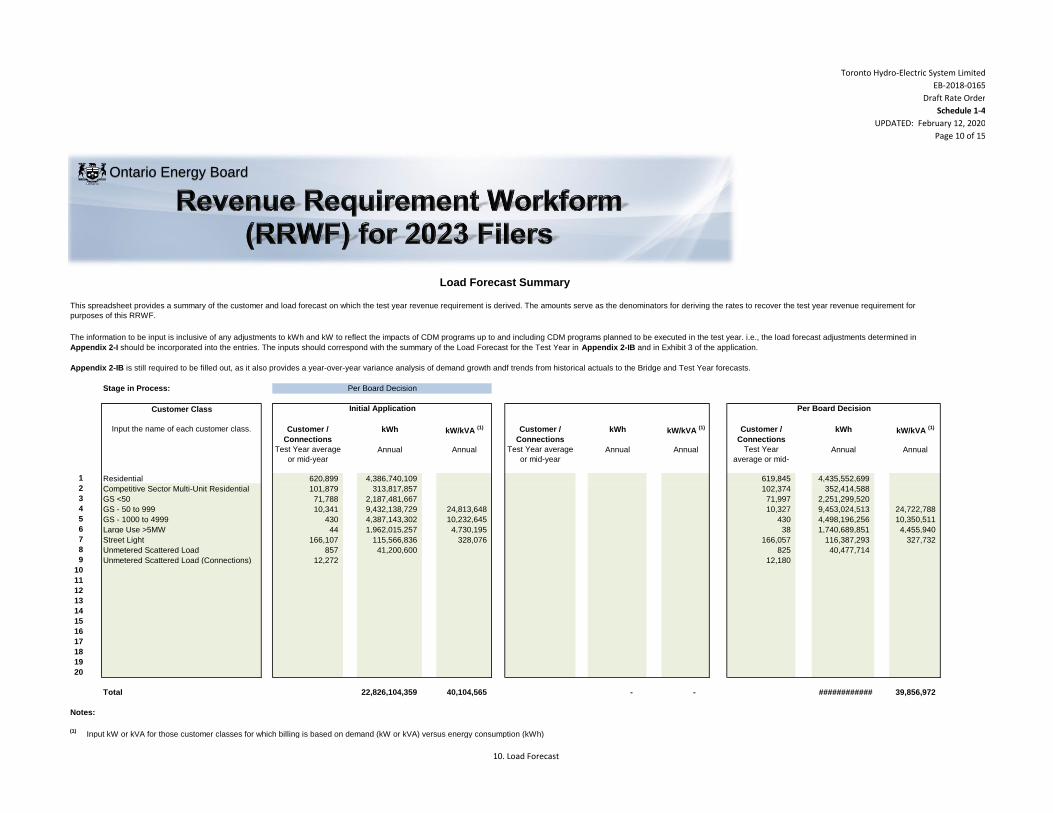
Toronto Hydro-Electric System Limited
EB-2018-0165
Draft Rate Order
Schedule 1-4
UPDATED: February 12, 2020
Page 10 of 15
Stage in Process:
Customer Class
Customer /
Connections
kWh kW/kVA (1) Customer /
Connections
kWh kW/kVA (1) Customer /
Connections
kWh kW/kVA (1)
Test Year average
or mid-year
Annual Annual Test Year average
or mid-year
Annual Annual Test Year
average or mid-
year
Annual Annual
1 Residential 620,899 4,386,740,109 619,845 4,435,552,699
2 Competitive Sector Multi-Unit Residential 101,879 313,817,857 102,374 352,414,588
3 GS <50 71,788 2,187,481,667 71,997 2,251,299,520
4 GS - 50 to 999 10,341 9,432,138,729 24,813,648 10,327 9,453,024,513 24,722,788
5 GS - 1000 to 4999 430 4,387,143,302 10,232,645 430 4,498,196,256 10,350,511
6 Large Use >5MW 44 1,962,015,257 4,730,195 38 1,740,689,851 4,455,940
7 Street Light 166,107 115,566,836 328,076 166,057 116,387,293 327,732
8 Unmetered Scattered Load 857 41,200,600 825 40,477,714
9 Unmetered Scattered Load (Connections) 12,272 12,180
10
11
12
13
14
15
16
17
18
19
20
Total 22,826,104,359 40,104,565 - - ############ 39,856,972
Notes:
(1)Input kW or kVA for those customer classes for which billing is based on demand (kW or kVA) versus energy consumption (kWh)
Load Forecast Summary
Input the name of each customer class.
Initial Application Per Board Decision
This spreadsheet provides a summary of the customer and load forecast on which the test year revenue requirement is derived. The amounts serve as the denominators for deriving the rates to recover the test year revenue requirement for
purposes of this RRWF.
The information to be input is inclusive of any adjustments to kWh and kW to reflect the impacts of CDM programs up to and including CDM programs planned to be executed in the test year. i.e., the load forecast adjustments determined in
Appendix 2-I should be incorporated into the entries. The inputs should correspond with the summary of the Load Forecast for the Test Year in Appendix 2-IB and in Exhibit 3 of the application.
Per Board Decision
Appendix 2-IB is still required to be filled out, as it also provides a year-over-year variance analysis of demand growth andf trends from historical actuals to the Bridge and Test Year forecasts.
Ontario Energy Board
10. Load Forecast

Toronto Hydro-Electric System Limited
EB-2018-0165
Draft Rate Order
Schedule 1-4
UPDATED: February 12, 2020
Page 11 of 15
Stage in Application Process:
A) Allocated Costs
Name of Customer Class (3) Costs Allocated from
Previous Study (1)
% %
From Sheet 10. Load Forecast
(7A)
1 Residential 287,079,871$ 42.26% 350,202,252$ 38.44%
2 Competitive Sector Multi-Unit Residential 19,267,312$ 2.84% 39,643,171$ 4.35%
3 GS <50 99,019,246$ 14.58% 144,946,264$ 15.91%
4 GS - 50 to 999 157,700,127$ 23.21% 225,146,411$ 24.71%
5 GS - 1000 to 4999 55,701,964$ 8.20% 83,711,248$ 9.19%
6 Large Use >5MW 31,087,389$ 4.58% 39,641,183$ 4.35%
7 Street Light 25,331,820$ 3.73% 24,496,878$ 2.69%
8 Unmetered Scattered Load 4,173,832$ 0.61% 3,235,767$ 0.36%
9 Unmetered Scattered Load (Connections) 0.00% 0.00%
10 0.00% 0.00%
11 0.00% 0.00%
12 0.00% 0.00%
13 0.00% 0.00%
14 0.00% 0.00%
15 0.00% 0.00%
16 0.00% 0.00%
17 0.00% 0.00%
18 0.00% 0.00%
19 0.00% 0.00%20 0.00% 0.00%
Total 679,361,561$ 100.00% 911,023,174$ 100.00%
Service Revenue
Requirement (from
Sheet 9)
911,023,174$
(1)
(2)
(3)
B) Calculated Class Revenues
Name of Customer Class Load Forecast (LF) X
current approved
rates
LF X current
approved rates X
(1+d)
LF X Proposed Rates Miscellaneous
Revenues
(7B) (7C) (7D) (7E)
1 Residential 305,654,867$ 335,341,439$ 323,829,756$ 20,635,008$
2 Competitive Sector Multi-Unit Residential 41,427,004$ 37,815,344$ 43,893,194$ 1,939,270$
3 GS <50 115,648,404$ 117,796,009$ 122,529,693$ 8,460,233$
4 GS - 50 to 999 211,643,883$ 227,321,222$ 224,474,969$ 7,044,189$
5 GS - 1000 to 4999 72,014,076$ 73,474,704$ 76,623,517$ 1,417,780$
6 Large Use >5MW 32,997,804$ 34,104,441$ 35,124,716$ 513,784$
7 Street Light 15,554,595$ 16,537,697$ 16,483,768$ 9,635,430$
8 Unmetered Scattered Load 3,422,793$ 4,195,178$ 3,626,423$ 161,828$
9 Unmetered Scattered Load (Connections)
10
11
12
13
14
15
16
17
18
19
20
Total 798,363,426$ 846,586,035$ 846,586,035$ 49,807,521$
(4)
(5)
(6)
(7)
Columns 7C and 7D - Column Total should equal the Base Revenue Requirement for each.
Column 7C - The OEB-issued cost allocation model calculates "1+d" on worksheet O-1, cell C22. "d" is defined as Revenue Deficiency/Revenue at Current Rates.
Column 7E - If using the OEB-issued cost allocation model, enter Miscellaneous Revenues as it appears on worksheet O-1, row 19,
Host Distributors - Provide information on any embedded distributor(s) as a separate class, if applicable. If embedded distributors are billed in a General Service class, include the
allocated costs and revenues of the embedded distributor(s) in the applicable class, and also complete Appendix 2-Q.
Customer Classes - If these differ from those in place in the previous cost allocation study, modify the customer classes to match the proposal in the current application as closely as
possible.
In columns 7B to 7D, LF means Load Forecast of Annual Billing Quantities (i.e., customers or connections, as applicable X 12 months, and kWh, kW or kVA as applicable. Revenue
quantities should be net of the Transformer Ownership Allowance for applicable customer classes. Exclude revenues from rate adders and rate riders.
This spreadsheet replaces Appendix 2-P and provides a summary of the results from the Cost Allocation spreadsheet, and is used in the determination of the class revenue requirement and,
hence, ultimately, the determination of rates from customers in all classes to recover the revenue requirement.
Cost Allocation and Rate Design
Allocated Class
Revenue Requirement (1)
Per Board Decision
Class Allocated Revenue Requirement, from Sheet O-1, Revenue to Cost || RR, row 40, from the Cost Allocation Study in this application. This excludes costs in deferral and variance
accounts. For Embedded Distributors, Account 4750 - Low Voltage (LV) Costs are also excluded.
Ontario Energy Board
11. Cost_Allocation
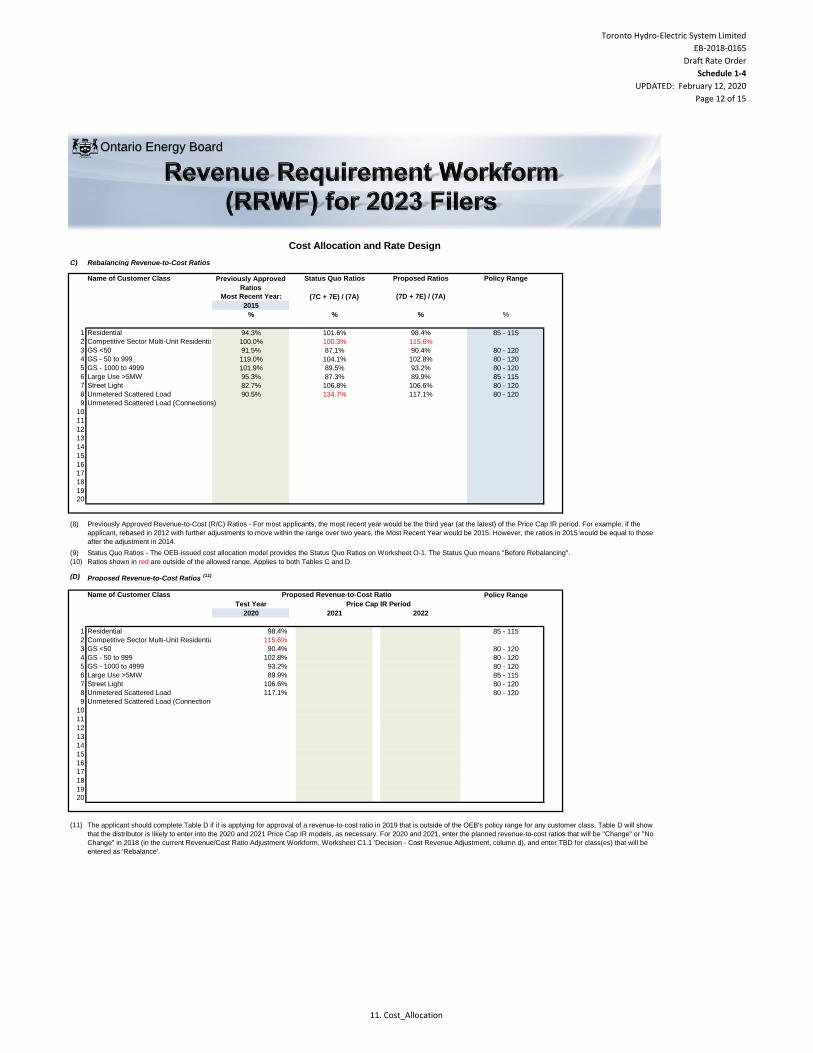
Toronto Hydro-Electric System Limited
EB-2018-0165
Draft Rate Order
Schedule 1-4
UPDATED: February 12, 2020
Page 12 of 15
Cost Allocation and Rate Design
Ontario Energy Board
C) Rebalancing Revenue-to-Cost Ratios
Name of Customer Class Previously Approved
Ratios
Status Quo Ratios Proposed Ratios Policy Range
Most Recent Year: (7D + 7E) / (7A)
2015
% % % %
1 Residential 94.3% 101.6% 98.4% 85 - 115 0.85 1.15 85 - 115
2 Competitive Sector Multi-Unit Residential 100.0% 100.3% 115.6% 80 - 120
3 GS <50 91.5% 87.1% 90.4% 80 - 120 0.8 1.2
4 GS - 50 to 999 119.0% 104.1% 102.8% 80 - 120 0.8 1.2
5 GS - 1000 to 4999 101.9% 89.5% 93.2% 80 - 120 0.8 1.2
6 Large Use >5MW 95.3% 87.3% 89.9% 85 - 115 0.85 1.15
7 Street Light 82.7% 106.8% 106.6% 80 - 120 0.8 1.2
8 Unmetered Scattered Load 90.5% 134.7% 117.1% 80 - 120 0.8 1.2
9 Unmetered Scattered Load (Connections)
10
11
12
13
14
15
16
17
18
19
20
(8)
(9)
(10)
(D)
Name of Customer Class Policy Range
Test Year
2020 2021 2022
1 Residential 98.4% 85 - 115 0.85 1.15
2 Competitive Sector Multi-Unit Residential 115.6%
3 GS <50 90.4% 80 - 120 0.8 1.2
4 GS - 50 to 999 102.8% 80 - 120 0.8 1.2
5 GS - 1000 to 4999 93.2% 80 - 120 0.8 1.2
6 Large Use >5MW 89.9% 85 - 115 0.85 1.15
7 Street Light 106.6% 80 - 120 0.8 1.2
8 Unmetered Scattered Load 117.1% 80 - 120 0.8 1.2
9 Unmetered Scattered Load (Connections)
10
11
12
13
14
15
16
17
18
19
20
(11) The applicant should complete Table D if it is applying for approval of a revenue-to-cost ratio in 2019 that is outside of the OEB's policy range for any customer class. Table D will show
that the distributor is likely to enter into the 2020 and 2021 Price Cap IR models, as necessary. For 2020 and 2021, enter the planned revenue-to-cost ratios that will be "Change" or "No
Change" in 2018 (in the current Revenue/Cost Ratio Adjustment Workform, Worksheet C1.1 'Decision - Cost Revenue Adjustment, column d), and enter TBD for class(es) that will be
entered as 'Rebalance'.
Status Quo Ratios - The OEB-issued cost allocation model provides the Status Quo Ratios on Worksheet O-1. The Status Quo means "Before Rebalancing".
Ratios shown in red are outside of the allowed range. Applies to both Tables C and D.
Proposed Revenue-to-Cost Ratios (11)
Price Cap IR Period
Proposed Revenue-to-Cost Ratio
(7C + 7E) / (7A)
Previously Approved Revenue-to-Cost (R/C) Ratios - For most applicants, the most recent year would be the third year (at the latest) of the Price Cap IR period. For example, if the
applicant, rebased in 2012 with further adjustments to move within the range over two years, the Most Recent Year would be 2015. However, the ratios in 2015 would be equal to those
after the adjustment in 2014.
11. Cost_Allocation
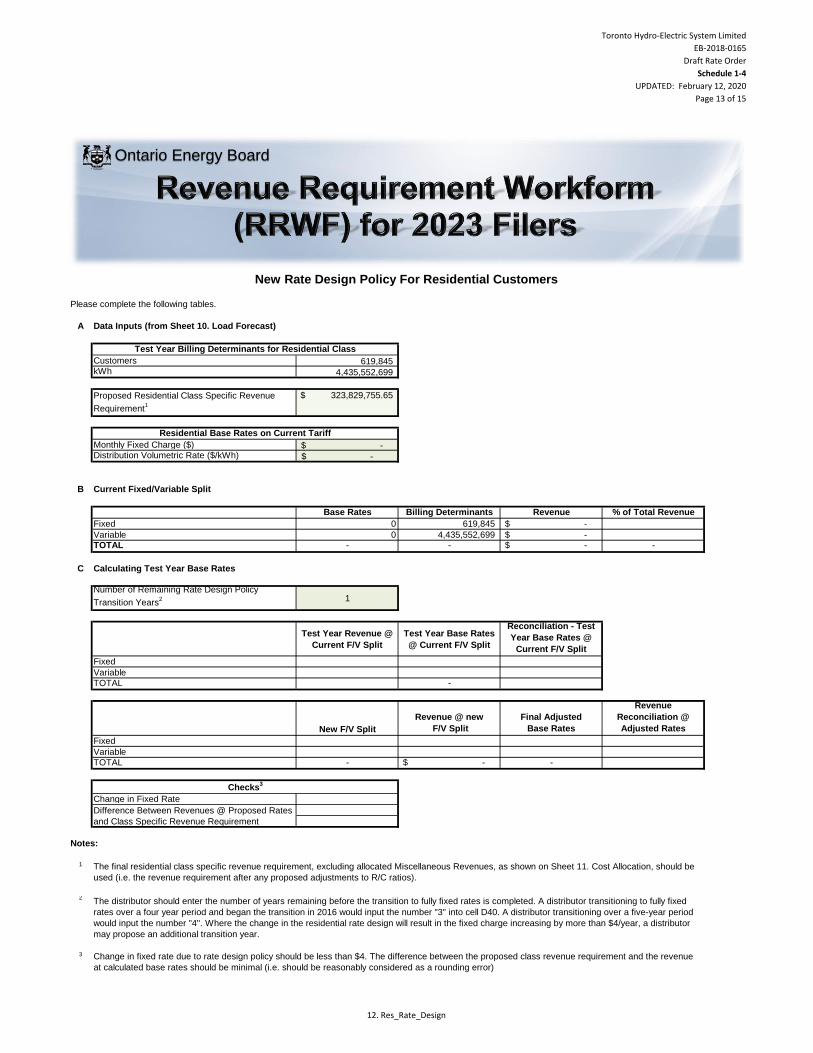
Toronto Hydro-Electric System Limited
EB-2018-0165
Draft Rate Order
Schedule 1-4
UPDATED: February 12, 2020
Page 13 of 15
Please complete the following tables.
A Data Inputs (from Sheet 10. Load Forecast)
Customers 619,845 kWh 4,435,552,699
Proposed Residential Class Specific Revenue
Requirement1
323,829,755.65$
Monthly Fixed Charge ($) -$ Distribution Volumetric Rate ($/kWh) -$
B Current Fixed/Variable Split
Base Rates Billing Determinants Revenue % of Total Revenue
Fixed 0 619,845 -$
Variable 0 4,435,552,699 -$ TOTAL - - -$ -
C Calculating Test Year Base Rates
Number of Remaining Rate Design Policy
Transition Years2 1
Test Year Revenue @
Current F/V Split
Test Year Base Rates
@ Current F/V Split
Reconciliation - Test
Year Base Rates @
Current F/V Split
Fixed
Variable
TOTAL -
New F/V Split
Revenue @ new
F/V Split
Final Adjusted
Base Rates
Revenue
Reconciliation @
Adjusted Rates
Fixed
Variable
TOTAL - -$ -
Change in Fixed Rate
Notes:
1
2
3
The final residential class specific revenue requirement, excluding allocated Miscellaneous Revenues, as shown on Sheet 11. Cost Allocation, should be
used (i.e. the revenue requirement after any proposed adjustments to R/C ratios).
Change in fixed rate due to rate design policy should be less than $4. The difference between the proposed class revenue requirement and the revenue
at calculated base rates should be minimal (i.e. should be reasonably considered as a rounding error)
New Rate Design Policy For Residential Customers
Test Year Billing Determinants for Residential Class
Residential Base Rates on Current Tariff
Checks3
Difference Between Revenues @ Proposed Rates
and Class Specific Revenue Requirement
The distributor should enter the number of years remaining before the transition to fully fixed rates is completed. A distributor transitioning to fully fixed
rates over a four year period and began the transition in 2016 would input the number "3" into cell D40. A distributor transitioning over a five-year period
would input the number "4". Where the change in the residential rate design will result in the fixed charge increasing by more than $4/year, a distributor
may propose an additional transition year.
Ontario Energy Board
12. Res_Rate_Design
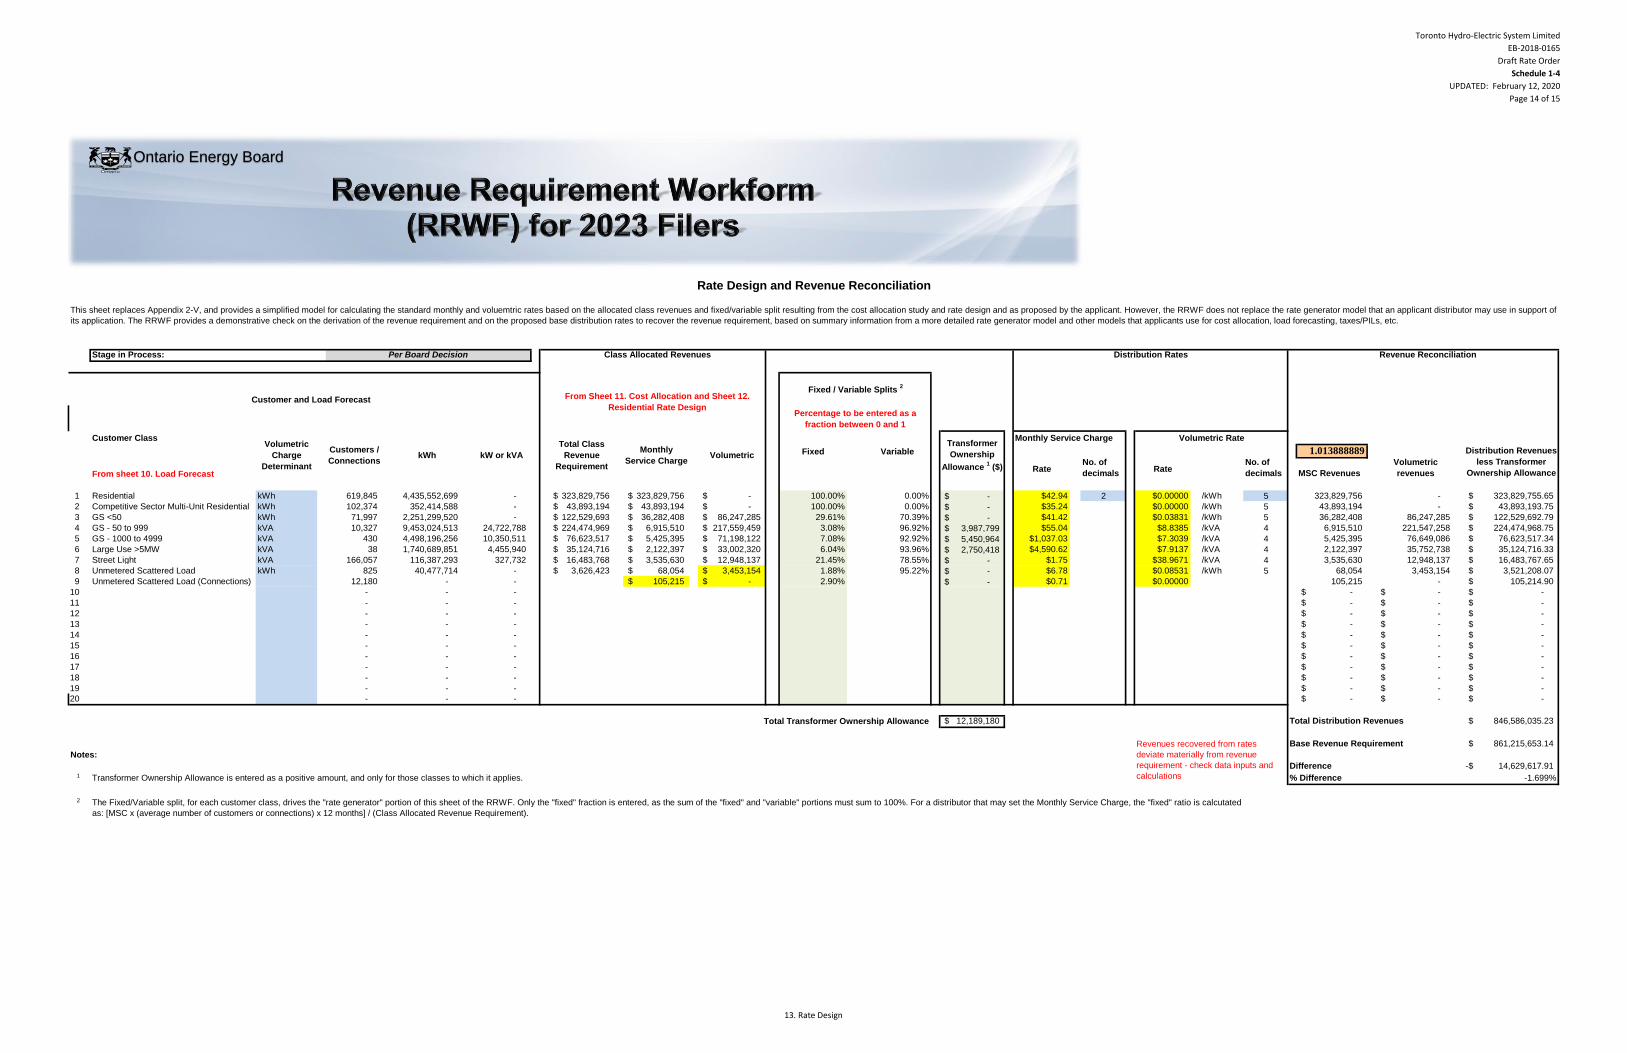
Toronto Hydro-Electric System Limited
EB-2018-0165
Draft Rate Order
Schedule 1-4
UPDATED: February 12, 2020
Page 14 of 15
Initial Application1 F H J
2 L N P
Per Board Decision3 R T V
Stage in Process:
Customer Class Monthly Service Charge
Fixed Variable 1.013888889
From sheet 10. Load ForecastRate
No. of
decimalsRate
No. of
decimals MSC Revenues
Volumetric
revenues
1 Residential kWh 619,845 4,435,552,699 - 323,829,756$ 323,829,756$ -$ 100.00% 0.00% -$ $42.94 2 $0.00000 /kWh 5 323,829,756 - 323,829,755.65$
2 Competitive Sector Multi-Unit Residential kWh 102,374 352,414,588 - 43,893,194$ 43,893,194$ -$ 100.00% 0.00% -$ $35.24 2 $0.00000 /kWh 5 43,893,194 - 43,893,193.75$
3 GS <50 kWh 71,997 2,251,299,520 - 122,529,693$ 36,282,408$ 86,247,285$ 29.61% 70.39% -$ $41.42 2 $0.03831 /kWh 5 36,282,408 86,247,285 122,529,692.79$
4 GS - 50 to 999 kVA 10,327 9,453,024,513 24,722,788 224,474,969$ 6,915,510$ 217,559,459$ 3.08% 96.92% 3,987,799$ $55.04 2 $8.8385 /kVA 4 6,915,510 221,547,258 224,474,968.75$
5 GS - 1000 to 4999 kVA 430 4,498,196,256 10,350,511 76,623,517$ 5,425,395$ 71,198,122$ 7.08% 92.92% 5,450,964$ $1,037.03 2 $7.3039 /kVA 4 5,425,395 76,649,086 76,623,517.34$
6 Large Use >5MW kVA 38 1,740,689,851 4,455,940 35,124,716$ 2,122,397$ 33,002,320$ 6.04% 93.96% 2,750,418$ $4,590.62 2 $7.9137 /kVA 4 2,122,397 35,752,738 35,124,716.33$
7 Street Light kVA 166,057 116,387,293 327,732 16,483,768$ 3,535,630$ 12,948,137$ 21.45% 78.55% -$ $1.75 2 $38.9671 /kVA 4 3,535,630 12,948,137 16,483,767.65$
8 Unmetered Scattered Load kWh 825 40,477,714 - 3,626,423$ 68,054$ 3,453,154$ 1.88% 95.22% -$ $6.78 2 $0.08531 /kWh 5 68,054 3,453,154 3,521,208.07$
9 Unmetered Scattered Load (Connections) 12,180 - - 105,215$ -$ 2.90% -$ $0.71 2 $0.00000 5 105,215 - 105,214.90$
10 - - - 2 5 -$ -$ -$
11 - - - 2 5 -$ -$ -$
12 - - - 2 5 -$ -$ -$
13 - - - 2 5 -$ -$ -$
14 - - - 2 5 -$ -$ -$
15 - - - 2 5 -$ -$ -$
16 - - - 2 5 -$ -$ -$
17 - - - 2 5 -$ -$ -$
18 - - - 2 5 -$ -$ -$
19 - - - 2 5 -$ -$ -$
20 - - - 2 5 -$ -$ -$
12,189,180$ Total Distribution Revenues 846,586,035.23$
Base Revenue Requirement 861,215,653.14$
Notes:
Difference 14,629,617.91-$ 1 Transformer Ownership Allowance is entered as a positive amount, and only for those classes to which it applies. % Difference -1.699%
2 The Fixed/Variable split, for each customer class, drives the "rate generator" portion of this sheet of the RRWF. Only the "fixed" fraction is entered, as the sum of the "fixed" and "variable" portions must sum to 100%. For a distributor that may set the Monthly Service Charge, the "fixed" ratio is calcutated
as: [MSC x (average number of customers or connections) x 12 months] / (Class Allocated Revenue Requirement).
Rate Design and Revenue Reconciliation
This sheet replaces Appendix 2-V, and provides a simplified model for calculating the standard monthly and voluemtric rates based on the allocated class revenues and fixed/variable split resulting from the cost allocation study and rate design and as proposed by the applicant. However, the RRWF does not replace the rate generator model that an applicant distributor may use in support of
its application. The RRWF provides a demonstrative check on the derivation of the revenue requirement and on the proposed base distribution rates to recover the revenue requirement, based on summary information from a more detailed rate generator model and other models that applicants use for cost allocation, load forecasting, taxes/PILs, etc.
Volumetric Rate
kW or kVA
Customer and Load Forecast
Transformer
Ownership
Allowance 1 ($)
Distribution Rates
Distribution Revenues
less Transformer
Ownership Allowance
Per Board Decision
Volumetric
Charge
Determinant
Customers /
ConnectionskWh
Class Allocated Revenues
Total Class
Revenue
Requirement
Monthly
Service ChargeVolumetric
Revenue Reconciliation
Revenues recovered from rates
deviate materially from revenue
requirement - check data inputs and
calculations
Fixed / Variable Splits 2
From Sheet 11. Cost Allocation and Sheet 12.
Residential Rate DesignPercentage to be entered as a
fraction between 0 and 1
Total Transformer Ownership Allowance
Ontario Energy Board
13. Rate Design
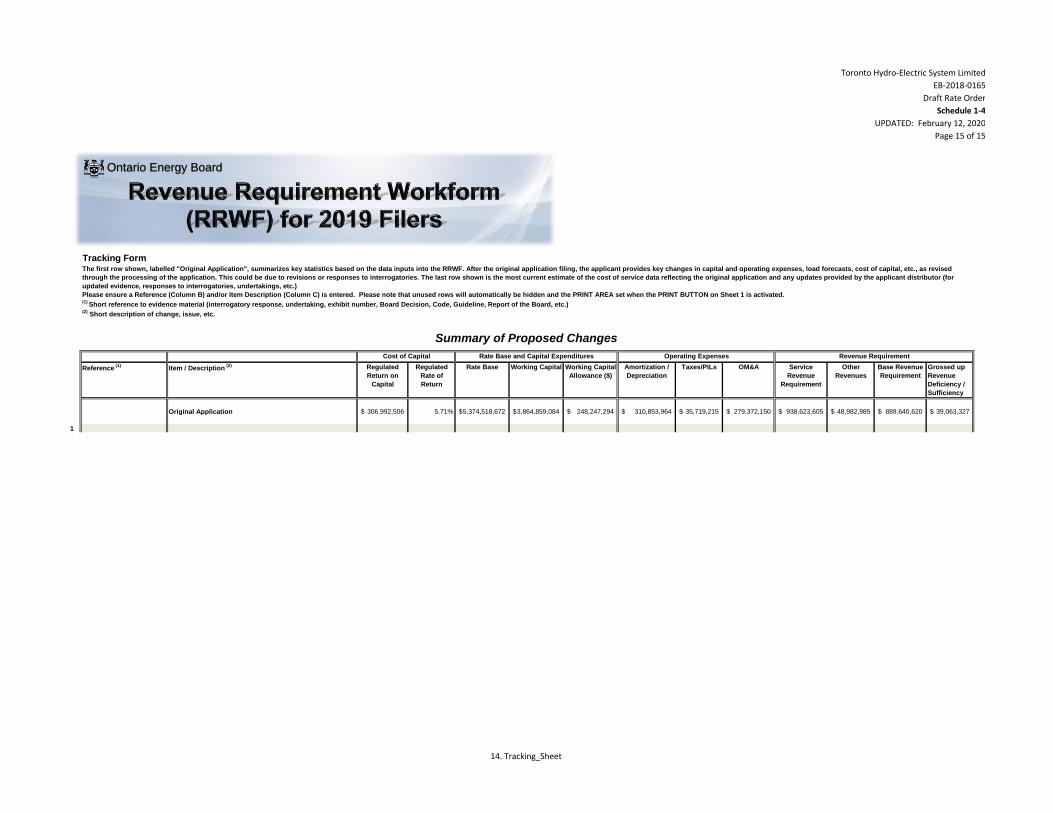
Toronto Hydro-Electric System Limited
EB-2018-0165
Draft Rate Order
Schedule 1-4
UPDATED: February 12, 2020
Page 15 of 15
Tracking Form
Reference (1)
Item / Description (2) Regulated
Return on
Capital
Regulated
Rate of
Return
Rate Base Working Capital Working Capital
Allowance ($)
Amortization /
Depreciation
Taxes/PILs OM&A Service
Revenue
Requirement
Other
Revenues
Base Revenue
Requirement
Grossed up
Revenue
Deficiency /
Sufficiency
Original Application 306,992,506$ 5.71% 5,374,518,672$ 3,864,859,084$ 248,247,294$ 310,853,964$ 35,719,215$ 279,372,150$ 938,623,605$ 48,982,985$ 889,640,620$ 39,063,327$
The first row shown, labelled "Original Application", summarizes key statistics based on the data inputs into the RRWF. After the original application filing, the applicant provides key changes in capital and operating expenses, load forecasts, cost of capital, etc., as revised
through the processing of the application. This could be due to revisions or responses to interrogatories. The last row shown is the most current estimate of the cost of service data reflecting the original application and any updates provided by the applicant distributor (for
updated evidence, responses to interrogatories, undertakings, etc.)
Please ensure a Reference (Column B) and/or Item Description (Column C) is entered. Please note that unused rows will automatically be hidden and the PRINT AREA set when the PRINT BUTTON on Sheet 1 is activated.(1)
Short reference to evidence material (interrogatory response, undertaking, exhibit number, Board Decision, Code, Guideline, Report of the Board, etc.)(2)
Short description of change, issue, etc.
Cost of Capital Operating ExpensesRate Base and Capital Expenditures Revenue Requirement
1
Summary of Proposed Changes
Ontario Energy Board
14. Tracking_Sheet

Toronto Hydro-Electric System Limited
EB-2018-0165
Draft Rate Order
Schedule 1-5
UPDATED: February 12, 2020
Page 1 of 15
Version 8.00
Utility Name
Service Territory
Assigned EB Number
Name and Title
Phone Number
Email Address
Bridge Year
Last Rebasing Year 2015
Toronto Hydro-Electric System Limited
EB-2018-0165
The RRWF has been enhanced commencing with 2017 rate applications to provide estimated base distribution rates. The enhanced RRWF is not intended to replace a utility’s formal rate
generator model which should continue to be the source of the proposed rates as well as the final ones at the conclusion of the proceeding. The load forecasting addition made to this model is
intended to be demonstrative only and does not replace the information filed in the utility’s application. In an effort to minimize the incremental work required from utilities, the cost allocation and rate
design additions to this model do in fact replace former appendices that were required to be filed as part of the cost of service (Chapter 2) filing requirements.
Test Year
This Workbook Model is protected by copyright and is being made available to you solely for the purpose of filing your application. You may use and copy this model for that purpose, and provide a copy of this model to any person that is advising or assisting you in that regard. Except as indicated above, any copying, reproduction, publication, sale, adaptation, translation, modification, reverse engineering or other use or dissemination of this model without the express written consent of the Ontario Energy Board is prohibited. If you provide a copy of this model to a person that is advising or assisting you in preparing the application or reviewing your draft rate order, you must ensure that the person understands and agrees to the restrictions noted above.
While this model has been provided in Excel format and is required to be filed with the applications, the onus remains on the applicant to ensure the accuracy of the data and the results.
Ontario Energy Board
1. Info
Toronto Hydro-Electric System Limited
EB-2018-0165
Draft Rate Order
Schedule 1-5
UPDATED: February 12, 2020
Page 2 of 15
1. Info 8. Rev_Def_Suff
2. Table of Contents 9. Rev_Reqt
3. Data_Input_Sheet 10. Load Forecast
4. Rate_Base 11. Cost Allocation
5. Utility Income 12. Residential Rate Design
6. Taxes_PILs 13. Rate Design and Revenue Reconciliation
7. Cost_of_Capital 14. Tracking Sheet
Notes:
(1)
(2)
(3)
(4)
(5)
Please note that this model uses MACROS. Before starting, please ensure that macros have been enabled.
Completed versions of the Revenue Requirement Work Form are required to be filed in working Microsoft Excel format.
Pale yellow cells represent drop-down lists
Pale green cells represent inputs
Pale green boxes at the bottom of each page are for additional notes
Ontario Energy Board
2. Table of Contents
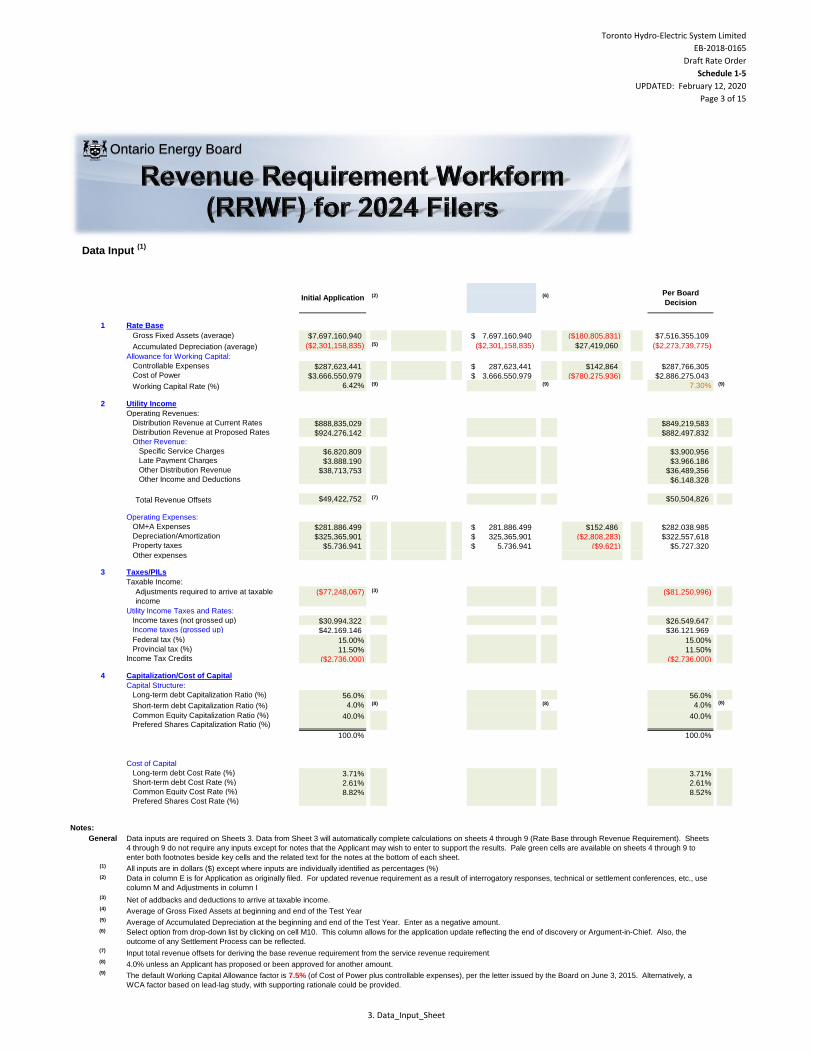
Toronto Hydro-Electric System Limited
EB-2018-0165
Draft Rate Order
Schedule 1-5
UPDATED: February 12, 2020
Page 3 of 15
Data Input (1)
1 Rate Base
Gross Fixed Assets (average) $7,697,160,940 7,697,160,940$ ($180,805,831) $7,516,355,109
Accumulated Depreciation (average) ($2,301,158,835) (5) ($2,301,158,835) $27,419,060 ($2,273,739,775)
Allowance for Working Capital:
Controllable Expenses $287,623,441 287,623,441$ $142,864 $287,766,305 Cost of Power $3,666,550,979 3,666,550,979$ ($780,275,936) $2,886,275,043
Working Capital Rate (%) 6.42% (9) (9) 7.30% (9)
2 Utility Income
Operating Revenues:
Distribution Revenue at Current Rates $888,835,029 $849,219,583 Distribution Revenue at Proposed Rates $924,276,142 $882,497,832 Other Revenue:
Specific Service Charges $6,820,809 $3,900,956 Late Payment Charges $3,888,190 $3,966,186 Other Distribution Revenue $38,713,753 $36,489,356 Other Income and Deductions $6,148,328
Total Revenue Offsets $49,422,752 (7) $50,504,826
Operating Expenses:
OM+A Expenses $281,886,499 281,886,499$ $152,486 $282,038,985 Depreciation/Amortization $325,365,901 325,365,901$ ($2,808,283) $322,557,618 Property taxes $5,736,941 5,736,941$ ($9,621) $5,727,320 Capital taxes
Other expenses
3 Taxes/PILs
Taxable Income:
Adjustments required to arrive at taxable
income
($77,248,067) (3) ($81,250,996)
Utility Income Taxes and Rates:
Income taxes (not grossed up) $30,994,322 $26,549,647 Income taxes (grossed up) $42,169,146 $36,121,969 Capital Taxes
Federal tax (%) 15.00% 15.00% Provincial tax (%) 11.50% 11.50%Income Tax Credits ($2,736,000) ($2,736,000)
4 Capitalization/Cost of Capital
Capital Structure:
Long-term debt Capitalization Ratio (%) 56.0% 56.0%
Short-term debt Capitalization Ratio (%) 4.0% (8) (8) 4.0% (8)
Common Equity Capitalization Ratio (%) 40.0% 40.0% Prefered Shares Capitalization Ratio (%)
100.0% 0.0% 100.0%
Cost of Capital
Long-term debt Cost Rate (%) 3.71% 3.71% Short-term debt Cost Rate (%) 2.61% 2.61% Common Equity Cost Rate (%) 8.82% 8.52% Prefered Shares Cost Rate (%)
Notes:
General
(1)
(2)
(3)
(4)
(5)
(6)
(7)
(8)
(9) The default Working Capital Allowance factor is 7.5% (of Cost of Power plus controllable expenses), per the letter issued by the Board on June 3, 2015. Alternatively, a
WCA factor based on lead-lag study, with supporting rationale could be provided.
Data inputs are required on Sheets 3. Data from Sheet 3 will automatically complete calculations on sheets 4 through 9 (Rate Base through Revenue Requirement). Sheets
4 through 9 do not require any inputs except for notes that the Applicant may wish to enter to support the results. Pale green cells are available on sheets 4 through 9 to
enter both footnotes beside key cells and the related text for the notes at the bottom of each sheet.
(6)(2)Initial ApplicationPer Board
Decision
Data in column E is for Application as originally filed. For updated revenue requirement as a result of interrogatory responses, technical or settlement conferences, etc., use
column M and Adjustments in column I
Net of addbacks and deductions to arrive at taxable income.
All inputs are in dollars ($) except where inputs are individually identified as percentages (%)
Select option from drop-down list by clicking on cell M10. This column allows for the application update reflecting the end of discovery or Argument-in-Chief. Also, the
outcome of any Settlement Process can be reflected.
Average of Gross Fixed Assets at beginning and end of the Test Year
Input total revenue offsets for deriving the base revenue requirement from the service revenue requirement
4.0% unless an Applicant has proposed or been approved for another amount.
Average of Accumulated Depreciation at the beginning and end of the Test Year. Enter as a negative amount.
Ontario Energy Board
3. Data_Input_Sheet
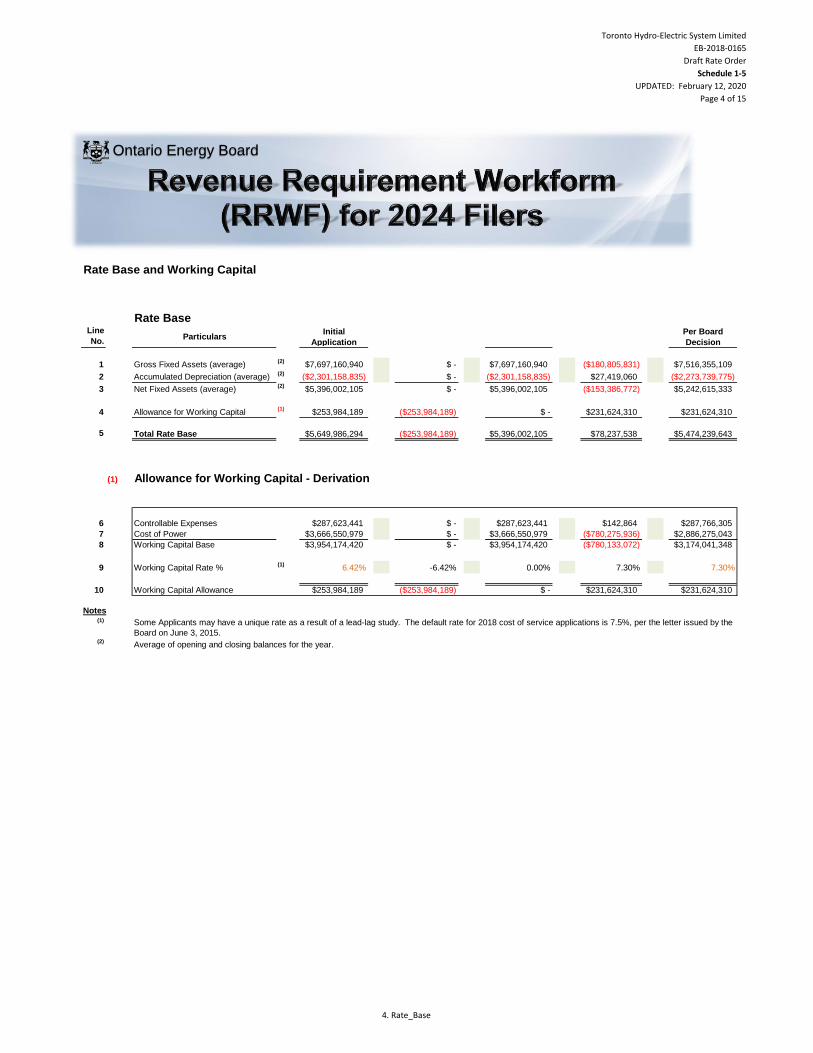
Toronto Hydro-Electric System Limited
EB-2018-0165
Draft Rate Order
Schedule 1-5
UPDATED: February 12, 2020
Page 4 of 15
Rate Base and Working Capital
Rate BaseLine
No.Particulars
Initial
Application Per Board
Decision
1 Gross Fixed Assets (average)(2)
$7,697,160,940 $ - $7,697,160,940 ($180,805,831) $7,516,355,109
2 Accumulated Depreciation (average)(2)
($2,301,158,835) $ - ($2,301,158,835) $27,419,060 ($2,273,739,775)
3 Net Fixed Assets (average)(2)
$5,396,002,105 $ - $5,396,002,105 ($153,386,772) $5,242,615,333
4 Allowance for Working Capital(1)
$253,984,189 ($253,984,189) $ - $231,624,310 $231,624,310
5
(1) Allowance for Working Capital - Derivation
6 Controllable Expenses $287,623,441 $ - $287,623,441 $142,864 $287,766,305
7 Cost of Power $3,666,550,979 $ - $3,666,550,979 ($780,275,936) $2,886,275,043
8 Working Capital Base $3,954,174,420 $ - $3,954,174,420 ($780,133,072) $3,174,041,348
9 Working Capital Rate % (1)
6.42% -6.42% 0.00% 7.30% 7.30%
10 Working Capital Allowance $253,984,189 ($253,984,189) $ - $231,624,310 $231,624,310
(1)
(2)
Some Applicants may have a unique rate as a result of a lead-lag study. The default rate for 2018 cost of service applications is 7.5%, per the letter issued by the
Board on June 3, 2015.
Average of opening and closing balances for the year.
Notes
$5,649,986,294 ($253,984,189) $5,474,239,643Total Rate Base $5,396,002,105 $78,237,538
Ontario Energy Board
4. Rate_Base
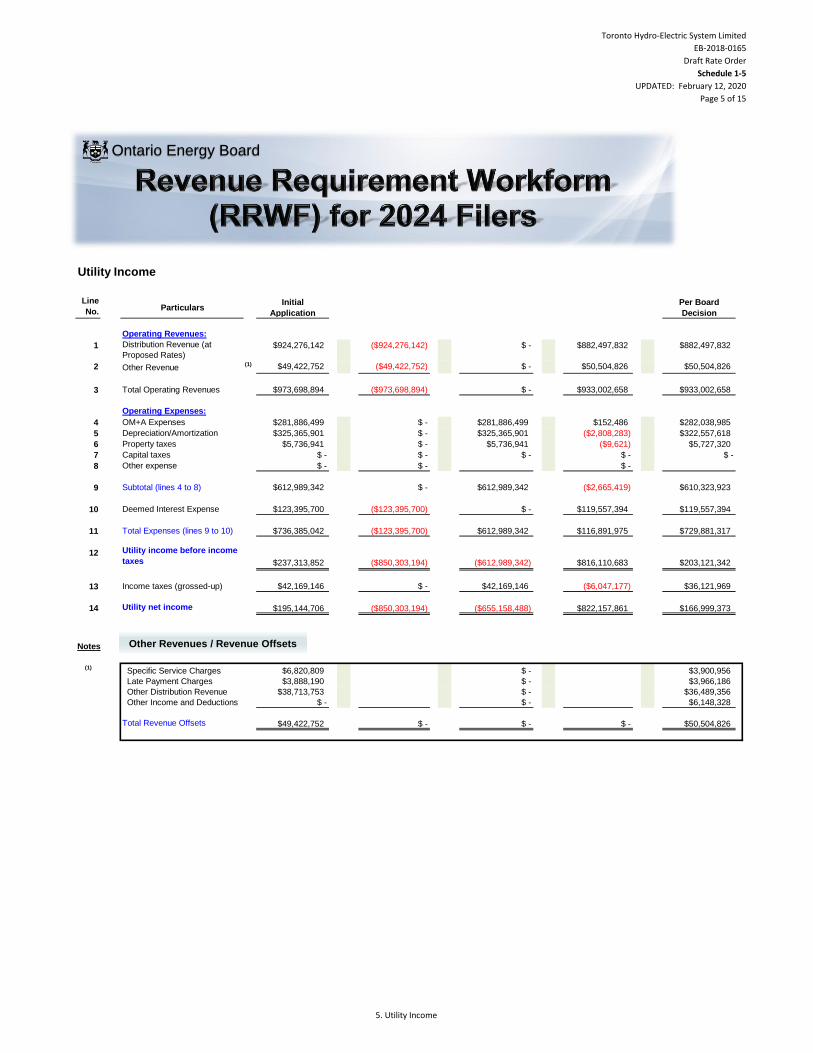
Toronto Hydro-Electric System Limited
EB-2018-0165
Draft Rate Order
Schedule 1-5
UPDATED: February 12, 2020
Page 5 of 15
Utility Income
Line
No.Particulars
Initial
Application
Per Board
Decision
Operating Revenues:
1 Distribution Revenue (at
Proposed Rates)$924,276,142 ($924,276,142) $ - $882,497,832 $882,497,832
2 Other Revenue(1) $49,422,752 ($49,422,752) $ - $50,504,826 $50,504,826
3 Total Operating Revenues
Operating Expenses:
4 OM+A Expenses $281,886,499 $ - $281,886,499 $152,486 $282,038,985
5 Depreciation/Amortization $325,365,901 $ - $325,365,901 ($2,808,283) $322,557,618
6 Property taxes $5,736,941 $ - $5,736,941 ($9,621) $5,727,320
7 Capital taxes $ - $ - $ - $ - $ -
8 Other expense $ - $ - $ -
9 Subtotal (lines 4 to 8)
10 Deemed Interest Expense $123,395,700 ($123,395,700) $ - $119,557,394 $119,557,394
11 Total Expenses (lines 9 to 10) $736,385,042 ($123,395,700) $612,989,342 $116,891,975 $729,881,317
12 Utility income before income
taxes $237,313,852 ($850,303,194) ($612,989,342) $816,110,683 $203,121,342
13 Income taxes (grossed-up)
14 Utility net income
(1) Specific Service Charges $6,820,809 $ - $3,900,956
Late Payment Charges $3,888,190 $ - $3,966,186
Other Distribution Revenue $38,713,753 $ - $36,489,356
Other Income and Deductions $ - $ - $6,148,328
Total Revenue Offsets $ - $ - $ -
$ -
($850,303,194)
$ -
$36,121,969$42,169,146
$166,999,373$195,144,706 $822,157,861
$933,002,658$ - $933,002,658$973,698,894 ($973,698,894)
$612,989,342
$49,422,752 $50,504,826
Notes
($655,158,488)
$610,323,923$612,989,342
$42,169,146
($2,665,419)
($6,047,177)
Other Revenues / Revenue Offsets
Ontario Energy Board
5. Utility Income

Toronto Hydro-Electric System Limited
EB-2018-0165
Draft Rate Order
Schedule 1-5
UPDATED: February 12, 2020
Page 6 of 15
Line
No.Particulars Application
Per Board
Decision
Determination of Taxable Income
1 $199,331,516 $ - $186,562,087
2 ($77,248,067) $ - ($81,250,996)
3 $122,083,449 $ - $105,311,091
Calculation of Utility income Taxes
4 Income taxes $30,994,322 $30,994,322 $26,549,647
5Capital taxes
$ - $ - $ -
6 Total taxes
7 Gross-up of Income Taxes $11,174,824 $11,174,824 $9,572,322
8 Grossed-up Income Taxes $42,169,146 $42,169,146 $36,121,969
9$42,169,146 $42,169,146 $36,121,969
10 Other tax Credits ($2,736,000) ($2,736,000) ($2,736,000)
Tax Rates
11 Federal tax (%) 15.00% 15.00% 15.00%
12 Provincial tax (%) 11.50% 11.50% 11.50%
13 Total tax rate (%) 26.50% 26.50% 26.50%
Notes
Taxes/PILs
$30,994,322 $26,549,647
Utility net income before taxes
Adjustments required to arrive at taxable
utility income
Taxable income
PILs / tax Allowance (Grossed-up Income
taxes + Capital taxes)
$30,994,322
Ontario Energy Board
6. Taxes_PILs

Toronto Hydro-Electric System Limited
EB-2018-0165
Draft Rate Order
Schedule 1-5
UPDATED: February 12, 2020
Page 7 of 15
Line
No.Particulars Cost Rate Return
(%) ($) (%) ($)
Debt
1 Long-term Debt 56.00% $3,163,992,324 3.71% $117,497,115
2 Short-term Debt 4.00% $225,999,452 2.61% $5,898,586
3 Total Debt 60.00% $3,389,991,776 3.64% $123,395,700
Equity
4 Common Equity 40.00% $2,259,994,517 8.82% $199,331,516
5 Preferred Shares 0.00% $ - 0.00% $ -
6 Total Equity 40.00% $2,259,994,517 8.82% $199,331,516
7 Total 100.00% $5,649,986,294 5.71% $322,727,217
(%) ($) (%) ($)
Debt
1 Long-term Debt 0.00% $ - 0.00% $ -
2 Short-term Debt 0.00% $ - 0.00% $ -
3 Total Debt 0.00% $ - 0.00% $ -
Equity
4 Common Equity 0.00% $ - 0.00% $ -
5 Preferred Shares 0.00% $ - 0.00% $ -
6 Total Equity 0.00% $ - 0.00% $ -
7 Total 0.00% $5,396,002,105 0.00% $ -
(%) ($) (%) ($)
Debt
8 Long-term Debt 56.00% $3,065,574,200 3.71% $113,842,287
9 Short-term Debt 4.00% $218,969,586 2.61% $5,715,106
10 Total Debt 60.00% $3,284,543,786 3.64% $119,557,394
Equity
11 Common Equity 40.00% $2,189,695,857 8.52% $186,562,087
12 Preferred Shares 0.00% $ - 0.00% $ -
13 Total Equity 40.00% $2,189,695,857 8.52% $186,562,087
14 Total 100.00% $5,474,239,643 5.59% $306,119,481
Per Board Decision
Notes
Initial Application
Capitalization/Cost of Capital
Capitalization Ratio
Ontario Energy Board
7. Cost_of_Capital

Toronto Hydro-Electric System Limited
EB-2018-0165
Draft Rate Order
Schedule 1-5
UPDATED: February 12, 2020
Page 8 of 15
Revenue Deficiency/Sufficiency
1 Revenue Deficiency from Below $37,752,811 ($307,419,480) $50,965,850
2 Distribution Revenue $888,835,029 $886,523,332 $888,835,029 $1,231,695,622 $849,219,583 $831,531,982
3 Other Operating Revenue Offsets
- net$49,422,752 $49,422,752 $ - $ - $50,504,826 $50,504,826
4 Total Revenue $938,257,781 $973,698,894 $888,835,029 $924,276,142 $899,724,409 $933,002,658
5 Operating Expenses $612,989,342 $612,989,342 $612,989,342 $612,989,342 $610,323,923 $610,323,923
6 Deemed Interest Expense $123,395,700 $123,395,700 $ - $ - $119,557,394 $119,557,394
8 Total Cost and Expenses $736,385,042 $736,385,042 $612,989,342 $612,989,342 $729,881,317 $729,881,317
9 Utility Income Before Income
Taxes$201,872,739 $237,313,852 $275,845,687 $311,286,800 $169,843,093 $203,121,342
10 Tax Adjustments to Accounting
Income per 2013 PILs model
($77,248,067) ($77,248,067) ($77,248,067) ($77,248,067) ($81,250,996) ($81,250,996)
11 Taxable Income $124,624,672 $160,065,785 $198,597,620 $234,038,733 $88,592,096 $121,870,345
12 Income Tax Rate 26.50% 26.50% 26.50% 26.50% 26.50% 26.50%
13Income Tax on Taxable Income
$33,025,538 $42,417,433 $52,628,369 $62,020,264 $23,476,906 $32,295,641
14 Income Tax Credits ($2,736,000) ($2,736,000) ($2,736,000) ($2,736,000) ($2,736,000) ($2,736,000)
15 Utility Net Income $171,583,201 $195,144,706 $225,953,318 ($655,158,488) $149,102,187 $166,999,373
16 Utility Rate Base $5,649,986,294 $5,649,986,294 $5,396,002,105 $5,396,002,105 $5,474,239,643 $5,474,239,643
17 Deemed Equity Portion of Rate
Base $2,259,994,517 $2,259,994,517 $ - $ - $2,189,695,857 $2,189,695,857
18 Income/(Equity Portion of Rate
Base)7.59% 8.63% 0.00% 0.00% 6.81% 7.63%
19 Target Return - Equity on Rate
Base8.82% 8.82% 0.00% 0.00% 8.52% 8.52%
20 Deficiency/Sufficiency in Return
on Equity-1.23% -0.19% 0.00% 0.00% -1.71% -0.89%
21 Indicated Rate of Return 5.22% 5.64% 4.19% 0.00% 4.91% 5.23%
22 Requested Rate of Return on
Rate Base5.71% 5.71% 0.00% 0.00% 5.59% 5.59%
23 Deficiency/Sufficiency in Rate of
Return-0.49% -0.07% 4.19% 0.00% -0.68% -0.36%
24 Target Return on Equity $199,331,516 $199,331,516 $ - $ - $186,562,087 $186,562,087
25 Revenue Deficiency/(Sufficiency) $27,748,316 ($4,186,810) ($225,953,318) $ - $37,459,900 ($19,562,714)
26 Gross Revenue
Deficiency/(Sufficiency)$37,752,811 (1) ($307,419,480) (1) $50,965,850 (1)
(1)Revenue Deficiency/Sufficiency divided by (1 - Tax Rate)
At Proposed
Rates
At Proposed
Rates
At Current
Approved Rates
Per Board Decision
At Current
Approved Rates
At Current
Approved Rates
At Proposed
Rates
Notes:
ParticularsLine
No.
Initial Application
Ontario Energy Board
8. Rev_Def_Suff
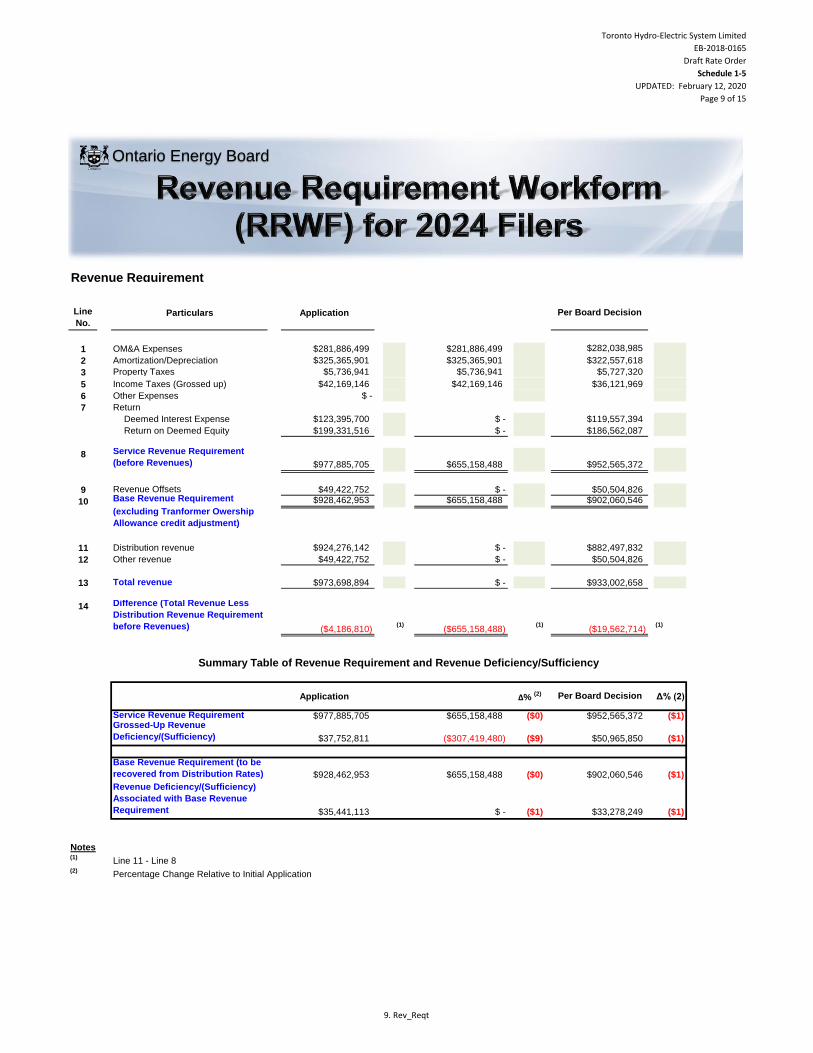
Toronto Hydro-Electric System Limited
EB-2018-0165
Draft Rate Order
Schedule 1-5
UPDATED: February 12, 2020
Page 9 of 15
Revenue Requirement
Line
No.Particulars Application
1 OM&A Expenses $281,886,499 $281,886,499
2 Amortization/Depreciation $325,365,901 $325,365,901
3 Property Taxes $5,736,941 $5,736,941
4
Capital Taxes $ - $ -
5 Income Taxes (Grossed up) $42,169,146 $42,169,146
6 Other Expenses $ -
7 Return
Deemed Interest Expense $123,395,700 $ -
Return on Deemed Equity $199,331,516 $ -
8 Service Revenue Requirement
(before Revenues) $977,885,705 $655,158,488
9 Revenue Offsets $49,422,752 $ -
10 Base Revenue Requirement $928,462,953 $655,158,488
(excluding Tranformer Owership
Allowance credit adjustment)
11 Distribution revenue $924,276,142 $ -
12 Other revenue $49,422,752 $ -
13 Total revenue
14 Difference (Total Revenue Less
Distribution Revenue Requirement
before Revenues) (1) (1) (1)
Application Δ% (2) Δ% (2)
Service Revenue Requirement $977,885,705 $655,158,488 ($0) ($1)Grossed-Up Revenue
Deficiency/(Sufficiency) $37,752,811 ($307,419,480) ($9) ($1)
Base Revenue Requirement (to be
recovered from Distribution Rates) $928,462,953 $655,158,488 ($0) ($1)
Revenue Deficiency/(Sufficiency)
Associated with Base Revenue
Requirement $35,441,113 $ - ($1) ($1)
(1)Line 11 - Line 8
(2)Percentage Change Relative to Initial Application
$882,497,832
$36,121,969
$119,557,394
$186,562,087
$50,504,826$902,060,546
$282,038,985
Per Board Decision
$933,002,658
($19,562,714)
Per Board Decision
$952,565,372
$50,965,850
$902,060,546
$33,278,249
$322,557,618
$5,727,320
$952,565,372
Notes
$50,504,826
$ -
($655,158,488)($4,186,810)
$973,698,894
Summary Table of Revenue Requirement and Revenue Deficiency/Sufficiency
Ontario Energy Board
9. Rev_Reqt
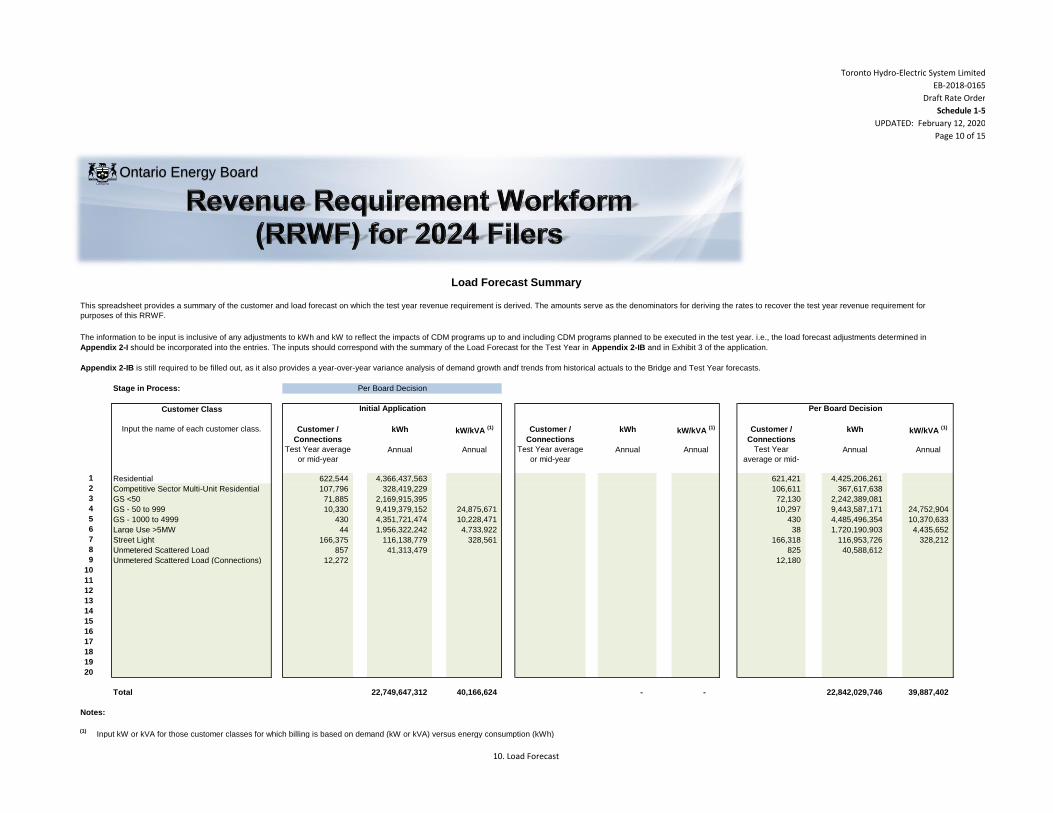
Toronto Hydro-Electric System Limited
EB-2018-0165
Draft Rate Order
Schedule 1-5
UPDATED: February 12, 2020
Page 10 of 15
Stage in Process:
Customer Class
Customer /
Connections
kWh kW/kVA (1) Customer /
Connections
kWh kW/kVA (1) Customer /
Connections
kWh kW/kVA (1)
Test Year average
or mid-year
Annual Annual Test Year average
or mid-year
Annual Annual Test Year
average or mid-
year
Annual Annual
1 Residential 622,544 4,366,437,563 621,421 4,425,206,261
2 Competitive Sector Multi-Unit Residential 107,796 328,419,229 106,611 367,617,638
3 GS <50 71,885 2,169,915,395 72,130 2,242,389,081
4 GS - 50 to 999 10,330 9,419,379,152 24,875,671 10,297 9,443,587,171 24,752,904
5 GS - 1000 to 4999 430 4,351,721,474 10,228,471 430 4,485,496,354 10,370,633
6 Large Use >5MW 44 1,956,322,242 4,733,922 38 1,720,190,903 4,435,652
7 Street Light 166,375 116,138,779 328,561 166,318 116,953,726 328,212
8 Unmetered Scattered Load 857 41,313,479 825 40,588,612
9 Unmetered Scattered Load (Connections) 12,272 12,180
10
11
12
13
14
15
16
17
18
19
20
Total 22,749,647,312 40,166,624 - - 22,842,029,746 39,887,402
Notes:
(1)Input kW or kVA for those customer classes for which billing is based on demand (kW or kVA) versus energy consumption (kWh)
Load Forecast Summary
Input the name of each customer class.
Initial Application Per Board Decision
This spreadsheet provides a summary of the customer and load forecast on which the test year revenue requirement is derived. The amounts serve as the denominators for deriving the rates to recover the test year revenue requirement for
purposes of this RRWF.
The information to be input is inclusive of any adjustments to kWh and kW to reflect the impacts of CDM programs up to and including CDM programs planned to be executed in the test year. i.e., the load forecast adjustments determined in
Appendix 2-I should be incorporated into the entries. The inputs should correspond with the summary of the Load Forecast for the Test Year in Appendix 2-IB and in Exhibit 3 of the application.
Per Board Decision
Appendix 2-IB is still required to be filled out, as it also provides a year-over-year variance analysis of demand growth andf trends from historical actuals to the Bridge and Test Year forecasts.
Ontario Energy Board
10. Load Forecast
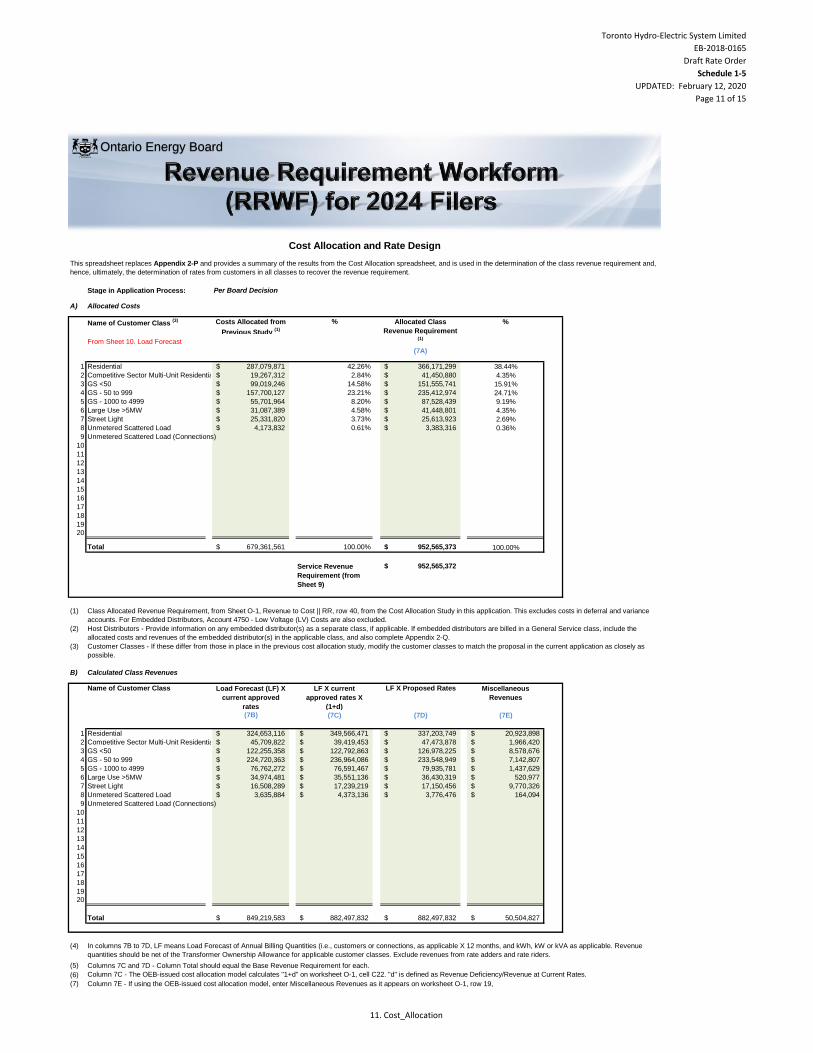
Toronto Hydro-Electric System Limited
EB-2018-0165
Draft Rate Order
Schedule 1-5
UPDATED: February 12, 2020
Page 11 of 15
Stage in Application Process:
A) Allocated Costs
Name of Customer Class (3) Costs Allocated from
Previous Study (1)
% %
From Sheet 10. Load Forecast
(7A)
1 Residential 287,079,871$ 42.26% 366,171,299$ 38.44%
2 Competitive Sector Multi-Unit Residential 19,267,312$ 2.84% 41,450,880$ 4.35%
3 GS <50 99,019,246$ 14.58% 151,555,741$ 15.91%
4 GS - 50 to 999 157,700,127$ 23.21% 235,412,974$ 24.71%
5 GS - 1000 to 4999 55,701,964$ 8.20% 87,528,439$ 9.19%
6 Large Use >5MW 31,087,389$ 4.58% 41,448,801$ 4.35%
7 Street Light 25,331,820$ 3.73% 25,613,923$ 2.69%
8 Unmetered Scattered Load 4,173,832$ 0.61% 3,383,316$ 0.36%
9 Unmetered Scattered Load (Connections) 0.00% 0.00%
10 0.00% 0.00%
11 0.00% 0.00%
12 0.00% 0.00%
13 0.00% 0.00%
14 0.00% 0.00%
15 0.00% 0.00%
16 0.00% 0.00%
17 0.00% 0.00%
18 0.00% 0.00%
19 0.00% 0.00%20 0.00% 0.00%
Total 679,361,561$ 100.00% 952,565,373$ 100.00%
Service Revenue
Requirement (from
Sheet 9)
952,565,372$
(1)
(2)
(3)
B) Calculated Class Revenues
Name of Customer Class Load Forecast (LF) X
current approved
rates
LF X current
approved rates X
(1+d)
LF X Proposed Rates Miscellaneous
Revenues
(7B) (7C) (7D) (7E)
1 Residential 324,653,116$ 349,566,471$ 337,203,749$ 20,923,898$
2 Competitive Sector Multi-Unit Residential 45,709,822$ 39,419,453$ 47,473,878$ 1,966,420$
3 GS <50 122,255,358$ 122,792,863$ 126,978,225$ 8,578,676$
4 GS - 50 to 999 224,720,363$ 236,964,086$ 233,548,949$ 7,142,807$
5 GS - 1000 to 4999 76,762,272$ 76,591,467$ 79,935,781$ 1,437,629$
6 Large Use >5MW 34,974,481$ 35,551,136$ 36,430,319$ 520,977$
7 Street Light 16,508,289$ 17,239,219$ 17,150,456$ 9,770,326$
8 Unmetered Scattered Load 3,635,884$ 4,373,136$ 3,776,476$ 164,094$
9 Unmetered Scattered Load (Connections)
10
11
12
13
14
15
16
17
18
19
20
Total 849,219,583$ 882,497,832$ 882,497,832$ 50,504,827$
(4)
(5)
(6)
(7)
Host Distributors - Provide information on any embedded distributor(s) as a separate class, if applicable. If embedded distributors are billed in a General Service class, include the
allocated costs and revenues of the embedded distributor(s) in the applicable class, and also complete Appendix 2-Q.
Customer Classes - If these differ from those in place in the previous cost allocation study, modify the customer classes to match the proposal in the current application as closely as
possible.
In columns 7B to 7D, LF means Load Forecast of Annual Billing Quantities (i.e., customers or connections, as applicable X 12 months, and kWh, kW or kVA as applicable. Revenue
quantities should be net of the Transformer Ownership Allowance for applicable customer classes. Exclude revenues from rate adders and rate riders.
This spreadsheet replaces Appendix 2-P and provides a summary of the results from the Cost Allocation spreadsheet, and is used in the determination of the class revenue requirement and,
hence, ultimately, the determination of rates from customers in all classes to recover the revenue requirement.
Cost Allocation and Rate Design
Allocated Class
Revenue Requirement (1)
Per Board Decision
Class Allocated Revenue Requirement, from Sheet O-1, Revenue to Cost || RR, row 40, from the Cost Allocation Study in this application. This excludes costs in deferral and variance
accounts. For Embedded Distributors, Account 4750 - Low Voltage (LV) Costs are also excluded.
Columns 7C and 7D - Column Total should equal the Base Revenue Requirement for each.
Column 7C - The OEB-issued cost allocation model calculates "1+d" on worksheet O-1, cell C22. "d" is defined as Revenue Deficiency/Revenue at Current Rates.
Column 7E - If using the OEB-issued cost allocation model, enter Miscellaneous Revenues as it appears on worksheet O-1, row 19,
Ontario Energy Board
11. Cost_Allocation

Toronto Hydro-Electric System Limited
EB-2018-0165
Draft Rate Order
Schedule 1-5
UPDATED: February 12, 2020
Page 12 of 15
Cost Allocation and Rate Design
Ontario Energy Board
C) Rebalancing Revenue-to-Cost Ratios
Name of Customer Class Previously Approved
Ratios
Status Quo Ratios Proposed Ratios Policy Range
Most Recent Year: (7D + 7E) / (7A)
2015
% % % %
1 Residential 94.3% 101.2% 97.8% 85 - 115 0.85 1.15 85 - 115
2 Competitive Sector Multi-Unit Residential 100.0% 99.8% 119.3% 80 - 120
3 GS <50 91.5% 86.7% 89.4% 80 - 120 0.8 1.2
4 GS - 50 to 999 119.0% 103.7% 102.2% 80 - 120 0.8 1.2
5 GS - 1000 to 4999 101.9% 89.1% 93.0% 80 - 120 0.8 1.2
6 Large Use >5MW 95.3% 87.0% 89.1% 85 - 115 0.85 1.15
7 Street Light 82.7% 105.4% 105.1% 80 - 120 0.8 1.2
8 Unmetered Scattered Load 90.5% 134.1% 116.5% 80 - 120 0.8 1.2
9 Unmetered Scattered Load (Connections)
10
11
12
13
14
15
16
17
18
19
20
(8)
(9)
(10)
(D)
Name of Customer Class Policy Range
Test Year
2020 2021 2022
1 Residential 97.8% 85 - 115 0.85 1.15
2 Competitive Sector Multi-Unit Residential 119.3%
3 GS <50 89.4% 80 - 120 0.8 1.2
4 GS - 50 to 999 102.2% 80 - 120 0.8 1.2
5 GS - 1000 to 4999 93.0% 80 - 120 0.8 1.2
6 Large Use >5MW 89.1% 85 - 115 0.85 1.15
7 Street Light 105.1% 80 - 120 0.8 1.2
8 Unmetered Scattered Load 116.5% 80 - 120 0.8 1.2
9 Unmetered Scattered Load (Connections)
10
11
12
13
14
15
16
17
18
19
20
(11)
(7C + 7E) / (7A)
Previously Approved Revenue-to-Cost (R/C) Ratios - For most applicants, the most recent year would be the third year (at the latest) of the Price Cap IR period. For example, if the
applicant, rebased in 2012 with further adjustments to move within the range over two years, the Most Recent Year would be 2015. However, the ratios in 2015 would be equal to those
after the adjustment in 2014.
The applicant should complete Table D if it is applying for approval of a revenue-to-cost ratio in 2019 that is outside of the OEB's policy range for any customer class. Table D will show
that the distributor is likely to enter into the 2020 and 2021 Price Cap IR models, as necessary. For 2020 and 2021, enter the planned revenue-to-cost ratios that will be "Change" or "No
Change" in 2018 (in the current Revenue/Cost Ratio Adjustment Workform, Worksheet C1.1 'Decision - Cost Revenue Adjustment, column d), and enter TBD for class(es) that will be
entered as 'Rebalance'.
Status Quo Ratios - The OEB-issued cost allocation model provides the Status Quo Ratios on Worksheet O-1. The Status Quo means "Before Rebalancing".
Ratios shown in red are outside of the allowed range. Applies to both Tables C and D.
Proposed Revenue-to-Cost Ratios (11)
Price Cap IR Period
Proposed Revenue-to-Cost Ratio
11. Cost_Allocation

Toronto Hydro-Electric System Limited
EB-2018-0165
Draft Rate Order
Schedule 1-5
UPDATED: February 12, 2020
Page 13 of 15
Please complete the following tables.
A Data Inputs (from Sheet 10. Load Forecast)
Customers 621,421 kWh 4,425,206,261
Proposed Residential Class Specific Revenue
Requirement1
337,203,748.63$
Monthly Fixed Charge ($) 37.98$ Distribution Volumetric Rate ($/kWh) 0.00552$
B Current Fixed/Variable Split
Base Rates Billing Determinants Revenue % of Total Revenue
Fixed 37.98 621,421 283,218,834.96$ 92.06%
Variable 0.00552 4,425,206,261 24,427,138.56$ 7.94%TOTAL - - 307,645,973.52$ -
C Calculating Test Year Base Rates
Number of Remaining Rate Design Policy
Transition Years2 1
Test Year Revenue @
Current F/V Split
Test Year Base Rates
@ Current F/V Split
Reconciliation - Test
Year Base Rates @
Current F/V Split
Fixed 310,429,718.09$ 41.63 310,437,074.76$
Variable 26,774,030.54$ 0.0061 26,993,758.19$
TOTAL 337,203,748.63$ - 337,430,832.95$
New F/V Split
Revenue @ new
F/V Split
Final Adjusted
Base Rates
Revenue
Reconciliation @
Adjusted Rates
Fixed 100.00% 337,203,748.63$ 45.22$ 337,207,891.44$
Variable 0.00% -$ -$ -$
TOTAL - 337,203,748.63$ - 337,207,891.44$
Change in Fixed Rate 3.59$
$4,142.81
0.00%
Notes:
1
2
3
The final residential class specific revenue requirement, excluding allocated Miscellaneous Revenues, as shown on Sheet 11. Cost Allocation, should be
used (i.e. the revenue requirement after any proposed adjustments to R/C ratios).
Change in fixed rate due to rate design policy should be less than $4. The difference between the proposed class revenue requirement and the revenue
at calculated base rates should be minimal (i.e. should be reasonably considered as a rounding error)
New Rate Design Policy For Residential Customers
Test Year Billing Determinants for Residential Class
Residential Base Rates on Current Tariff
Checks3
Difference Between Revenues @ Proposed Rates
and Class Specific Revenue Requirement
The distributor should enter the number of years remaining before the transition to fully fixed rates is completed. A distributor transitioning to fully fixed
rates over a four year period and began the transition in 2016 would input the number "3" into cell D40. A distributor transitioning over a five-year period
would input the number "4". Where the change in the residential rate design will result in the fixed charge increasing by more than $4/year, a distributor
may propose an additional transition year.
Ontario Energy Board
12. Res_Rate_Design
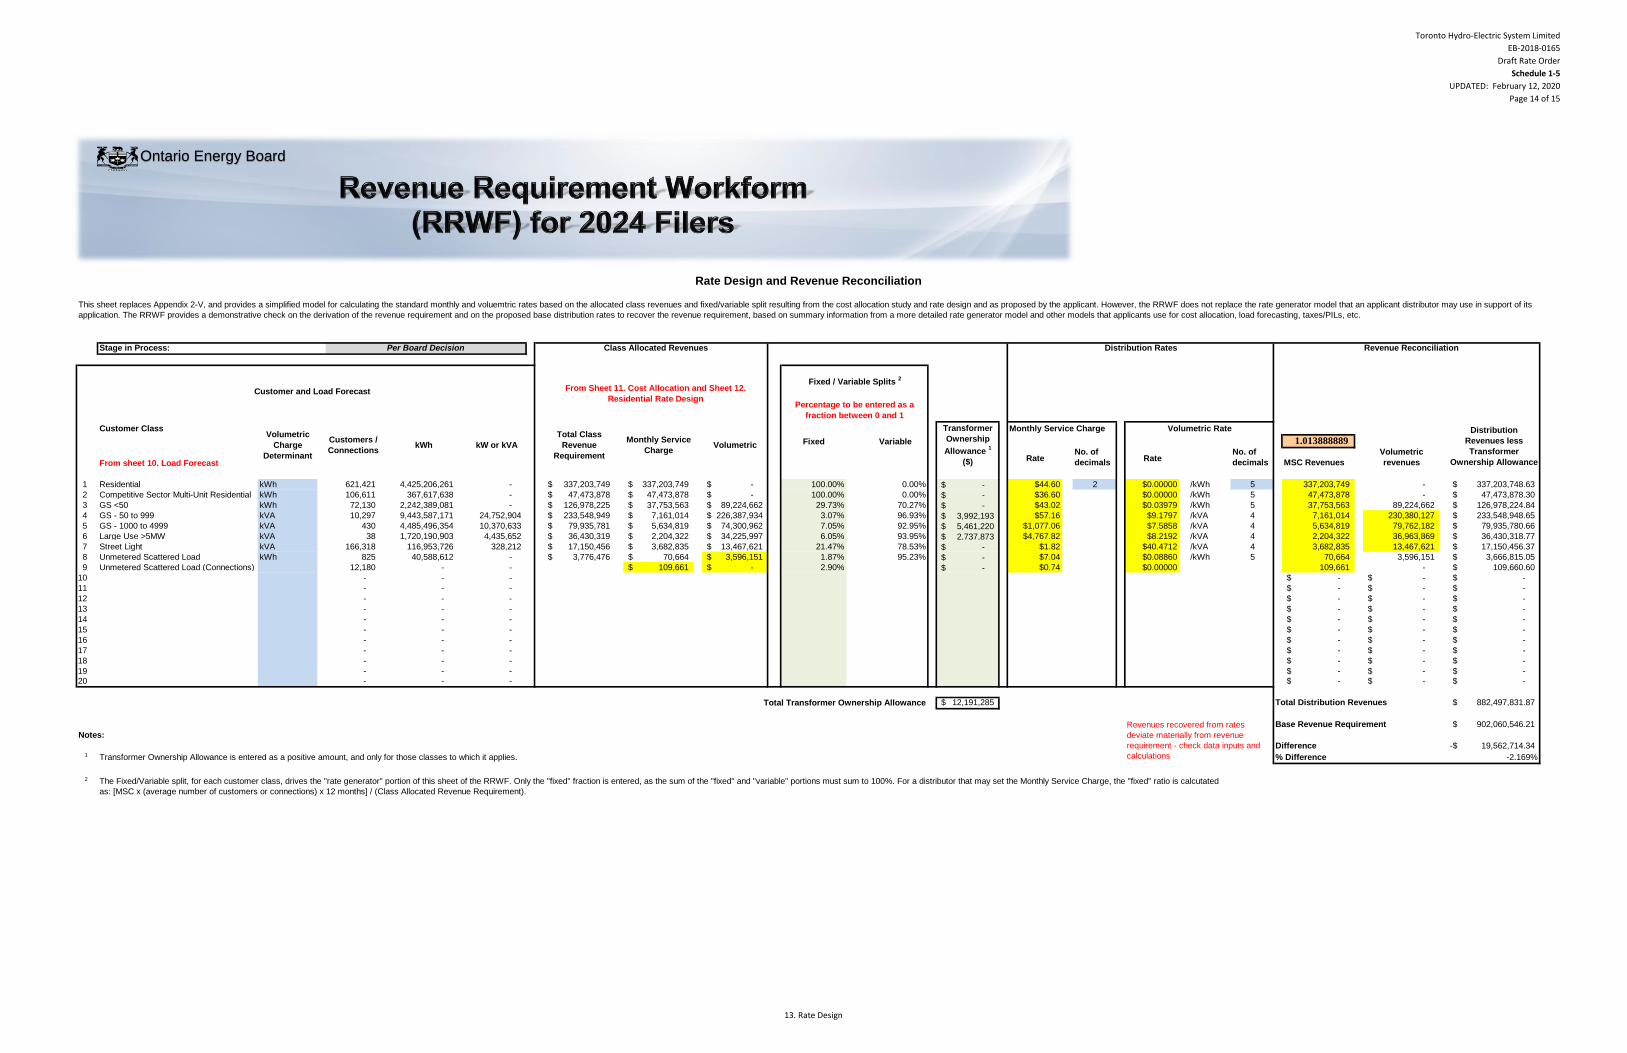
Toronto Hydro-Electric System Limited
EB-2018-0165
Draft Rate Order
Schedule 1-5
UPDATED: February 12, 2020
Page 14 of 15
Initial Application1 F H J
2 L N P
Per Board Decision3 R T V
Stage in Process:
Customer Class Monthly Service Charge
Fixed Variable 1.013888889
From sheet 10. Load ForecastRate
No. of
decimalsRate
No. of
decimals MSC Revenues
Volumetric
revenues
1 Residential kWh 621,421 4,425,206,261 - 337,203,749$ 337,203,749$ -$ 100.00% 0.00% -$ $44.60 2 $0.00000 /kWh 5 337,203,749 - 337,203,748.63$
2 Competitive Sector Multi-Unit Residential kWh 106,611 367,617,638 - 47,473,878$ 47,473,878$ -$ 100.00% 0.00% -$ $36.60 2 $0.00000 /kWh 5 47,473,878 - 47,473,878.30$
3 GS <50 kWh 72,130 2,242,389,081 - 126,978,225$ 37,753,563$ 89,224,662$ 29.73% 70.27% -$ $43.02 2 $0.03979 /kWh 5 37,753,563 89,224,662 126,978,224.84$
4 GS - 50 to 999 kVA 10,297 9,443,587,171 24,752,904 233,548,949$ 7,161,014$ 226,387,934$ 3.07% 96.93% 3,992,193$ $57.16 2 $9.1797 /kVA 4 7,161,014 230,380,127 233,548,948.65$
5 GS - 1000 to 4999 kVA 430 4,485,496,354 10,370,633 79,935,781$ 5,634,819$ 74,300,962$ 7.05% 92.95% 5,461,220$ $1,077.06 2 $7.5858 /kVA 4 5,634,819 79,762,182 79,935,780.66$
6 Large Use >5MW kVA 38 1,720,190,903 4,435,652 36,430,319$ 2,204,322$ 34,225,997$ 6.05% 93.95% 2,737,873$ $4,767.82 2 $8.2192 /kVA 4 2,204,322 36,963,869 36,430,318.77$
7 Street Light kVA 166,318 116,953,726 328,212 17,150,456$ 3,682,835$ 13,467,621$ 21.47% 78.53% -$ $1.82 2 $40.4712 /kVA 4 3,682,835 13,467,621 17,150,456.37$
8 Unmetered Scattered Load kWh 825 40,588,612 - 3,776,476$ 70,664$ 3,596,151$ 1.87% 95.23% -$ $7.04 2 $0.08860 /kWh 5 70,664 3,596,151 3,666,815.05$
9 Unmetered Scattered Load (Connections) 12,180 - - 109,661$ -$ 2.90% -$ $0.74 2 $0.00000 5 109,661 - 109,660.60$
10 - - - 2 5 -$ -$ -$
11 - - - 2 5 -$ -$ -$
12 - - - 2 5 -$ -$ -$
13 - - - 2 5 -$ -$ -$
14 - - - 2 5 -$ -$ -$
15 - - - 2 5 -$ -$ -$
16 - - - 2 5 -$ -$ -$
17 - - - 2 5 -$ -$ -$
18 - - - 2 5 -$ -$ -$
19 - - - 2 5 -$ -$ -$ 20 - - - 2 5 -$ -$ -$
12,191,285$ Total Distribution Revenues 882,497,831.87$
Base Revenue Requirement 902,060,546.21$
Notes:
Difference 19,562,714.34-$ 1 Transformer Ownership Allowance is entered as a positive amount, and only for those classes to which it applies. % Difference -2.169%
2
Volumetric
Revenue Reconciliation
Revenues recovered from rates
deviate materially from revenue
requirement - check data inputs and
calculations
Fixed / Variable Splits 2
From Sheet 11. Cost Allocation and Sheet 12.
Residential Rate DesignPercentage to be entered as a
fraction between 0 and 1
Total Transformer Ownership Allowance
The Fixed/Variable split, for each customer class, drives the "rate generator" portion of this sheet of the RRWF. Only the "fixed" fraction is entered, as the sum of the "fixed" and "variable" portions must sum to 100%. For a distributor that may set the Monthly Service Charge, the "fixed" ratio is calcutated
as: [MSC x (average number of customers or connections) x 12 months] / (Class Allocated Revenue Requirement).
Rate Design and Revenue Reconciliation
This sheet replaces Appendix 2-V, and provides a simplified model for calculating the standard monthly and voluemtric rates based on the allocated class revenues and fixed/variable split resulting from the cost allocation study and rate design and as proposed by the applicant. However, the RRWF does not replace the rate generator model that an applicant distributor may use in support of its
application. The RRWF provides a demonstrative check on the derivation of the revenue requirement and on the proposed base distribution rates to recover the revenue requirement, based on summary information from a more detailed rate generator model and other models that applicants use for cost allocation, load forecasting, taxes/PILs, etc.
Volumetric Rate
kW or kVA
Customer and Load Forecast
Transformer
Ownership
Allowance 1
($)
Distribution Rates
Distribution
Revenues less
Transformer
Ownership Allowance
Per Board Decision
Volumetric
Charge
Determinant
Customers /
ConnectionskWh
Class Allocated Revenues
Total Class
Revenue
Requirement
Monthly Service
Charge
Ontario Energy Board
13. Rate Design
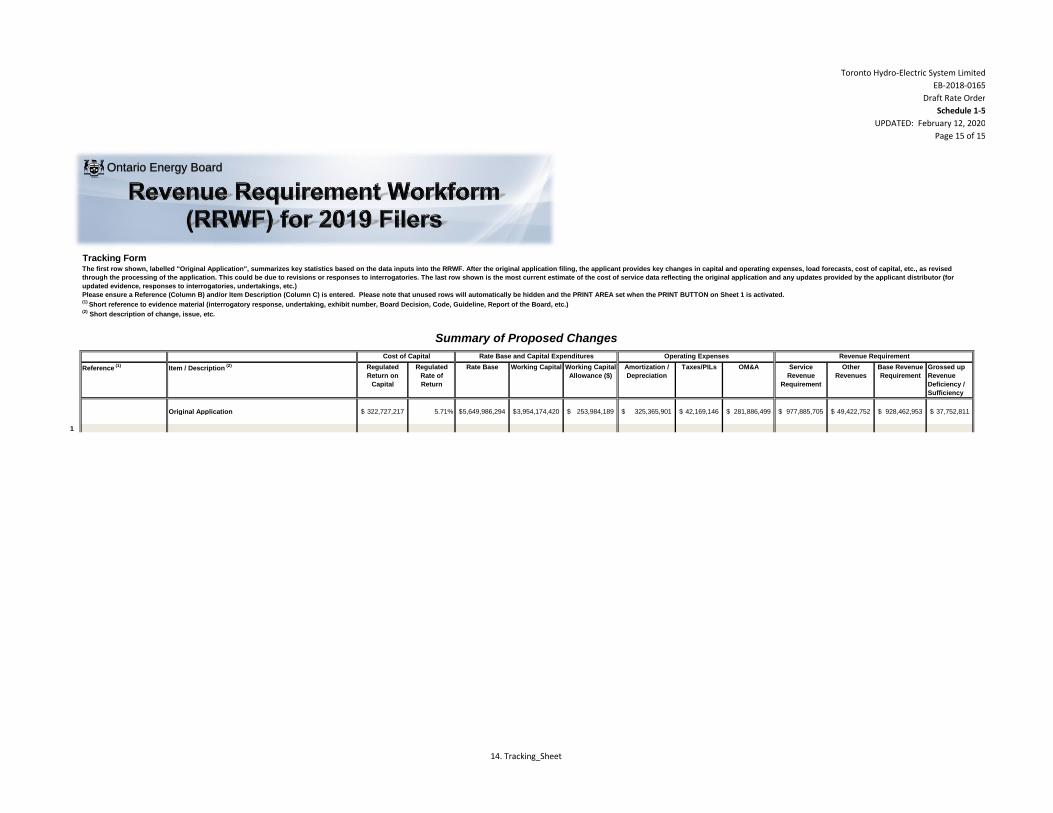
Toronto Hydro-Electric System Limited
EB-2018-0165
Draft Rate Order
Schedule 1-5
UPDATED: February 12, 2020
Page 15 of 15
Tracking Form
Reference (1)
Item / Description (2) Regulated
Return on
Capital
Regulated
Rate of
Return
Rate Base Working Capital Working Capital
Allowance ($)
Amortization /
Depreciation
Taxes/PILs OM&A Service
Revenue
Requirement
Other
Revenues
Base Revenue
Requirement
Grossed up
Revenue
Deficiency /
Sufficiency
Original Application 322,727,217$ 5.71% 5,649,986,294$ 3,954,174,420$ 253,984,189$ 325,365,901$ 42,169,146$ 281,886,499$ 977,885,705$ 49,422,752$ 928,462,953$ 37,752,811$
Summary of Proposed Changes
Cost of Capital Operating ExpensesRate Base and Capital Expenditures Revenue Requirement
1
The first row shown, labelled "Original Application", summarizes key statistics based on the data inputs into the RRWF. After the original application filing, the applicant provides key changes in capital and operating expenses, load forecasts, cost of capital, etc., as revised
through the processing of the application. This could be due to revisions or responses to interrogatories. The last row shown is the most current estimate of the cost of service data reflecting the original application and any updates provided by the applicant distributor (for
updated evidence, responses to interrogatories, undertakings, etc.)
Please ensure a Reference (Column B) and/or Item Description (Column C) is entered. Please note that unused rows will automatically be hidden and the PRINT AREA set when the PRINT BUTTON on Sheet 1 is activated.(1)
Short reference to evidence material (interrogatory response, undertaking, exhibit number, Board Decision, Code, Guideline, Report of the Board, etc.)(2)
Short description of change, issue, etc.
Ontario Energy Board
14. Tracking_Sheet
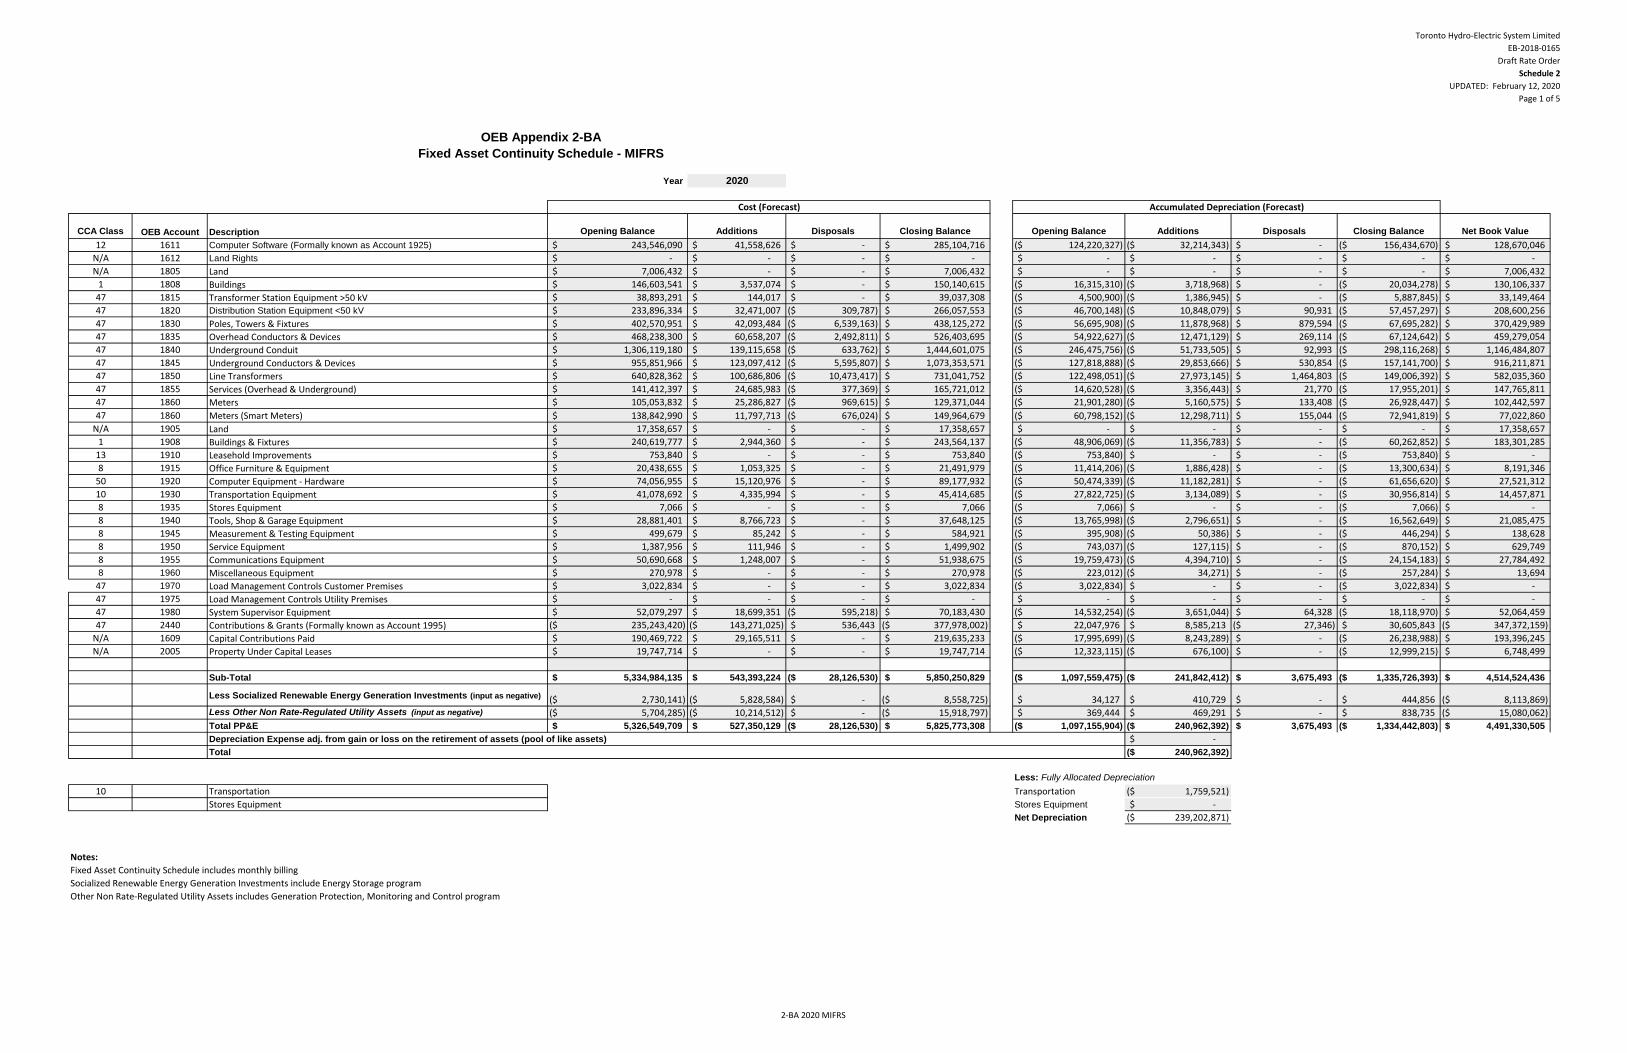
Toronto Hydro-Electric System Limited
EB-2018-0165
Draft Rate Order
Schedule 2
UPDATED: February 12, 2020
Page 1 of 5
Year 2020
Cost (Forecast) Accumulated Depreciation (Forecast)
CCA Class OEB Account Description Opening Balance Additions Disposals Closing Balance Opening Balance Additions Disposals Closing Balance Net Book Value
12 1611 Computer Software (Formally known as Account 1925) 243,546,090$ 41,558,626$ -$ 285,104,716$ 124,220,327)($ 32,214,343)($ -$ 156,434,670)($ 128,670,046$
N/A 1612 Land Rights -$ -$ -$ -$ -$ -$ -$ -$ -$
N/A 1805 Land 7,006,432$ -$ -$ 7,006,432$ -$ -$ -$ -$ 7,006,432$
1 1808 Buildings 146,603,541$ 3,537,074$ -$ 150,140,615$ 16,315,310)($ 3,718,968)($ -$ 20,034,278)($ 130,106,337$
47 1815 Transformer Station Equipment >50 kV 38,893,291$ 144,017$ -$ 39,037,308$ 4,500,900)($ 1,386,945)($ -$ 5,887,845)($ 33,149,464$
47 1820 Distribution Station Equipment <50 kV 233,896,334$ 32,471,007$ 309,787)($ 266,057,553$ 46,700,148)($ 10,848,079)($ 90,931$ 57,457,297)($ 208,600,256$
47 1830 Poles, Towers & Fixtures 402,570,951$ 42,093,484$ 6,539,163)($ 438,125,272$ 56,695,908)($ 11,878,968)($ 879,594$ 67,695,282)($ 370,429,989$
47 1835 Overhead Conductors & Devices 468,238,300$ 60,658,207$ 2,492,811)($ 526,403,695$ 54,922,627)($ 12,471,129)($ 269,114$ 67,124,642)($ 459,279,054$
47 1840 Underground Conduit 1,306,119,180$ 139,115,658$ 633,762)($ 1,444,601,075$ 246,475,756)($ 51,733,505)($ 92,993$ 298,116,268)($ 1,146,484,807$
47 1845 Underground Conductors & Devices 955,851,966$ 123,097,412$ 5,595,807)($ 1,073,353,571$ 127,818,888)($ 29,853,666)($ 530,854$ 157,141,700)($ 916,211,871$
47 1850 Line Transformers 640,828,362$ 100,686,806$ 10,473,417)($ 731,041,752$ 122,498,051)($ 27,973,145)($ 1,464,803$ 149,006,392)($ 582,035,360$
47 1855 Services (Overhead & Underground) 141,412,397$ 24,685,983$ 377,369)($ 165,721,012$ 14,620,528)($ 3,356,443)($ 21,770$ 17,955,201)($ 147,765,811$
47 1860 Meters 105,053,832$ 25,286,827$ 969,615)($ 129,371,044$ 21,901,280)($ 5,160,575)($ 133,408$ 26,928,447)($ 102,442,597$
47 1860 Meters (Smart Meters) 138,842,990$ 11,797,713$ 676,024)($ 149,964,679$ 60,798,152)($ 12,298,711)($ 155,044$ 72,941,819)($ 77,022,860$
N/A 1905 Land 17,358,657$ -$ -$ 17,358,657$ -$ -$ -$ -$ 17,358,657$
1 1908 Buildings & Fixtures 240,619,777$ 2,944,360$ -$ 243,564,137$ 48,906,069)($ 11,356,783)($ -$ 60,262,852)($ 183,301,285$
13 1910 Leasehold Improvements 753,840$ -$ -$ 753,840$ 753,840)($ -$ -$ 753,840)($ -$
8 1915 Office Furniture & Equipment 20,438,655$ 1,053,325$ -$ 21,491,979$ 11,414,206)($ 1,886,428)($ -$ 13,300,634)($ 8,191,346$
50 1920 Computer Equipment - Hardware 74,056,955$ 15,120,976$ -$ 89,177,932$ 50,474,339)($ 11,182,281)($ -$ 61,656,620)($ 27,521,312$
10 1930 Transportation Equipment 41,078,692$ 4,335,994$ -$ 45,414,685$ 27,822,725)($ 3,134,089)($ -$ 30,956,814)($ 14,457,871$
8 1935 Stores Equipment 7,066$ -$ -$ 7,066$ 7,066)($ -$ -$ 7,066)($ -$
8 1940 Tools, Shop & Garage Equipment 28,881,401$ 8,766,723$ -$ 37,648,125$ 13,765,998)($ 2,796,651)($ -$ 16,562,649)($ 21,085,475$
8 1945 Measurement & Testing Equipment 499,679$ 85,242$ -$ 584,921$ 395,908)($ 50,386)($ -$ 446,294)($ 138,628$
8 1950 Service Equipment 1,387,956$ 111,946$ -$ 1,499,902$ 743,037)($ 127,115)($ -$ 870,152)($ 629,749$
8 1955 Communications Equipment 50,690,668$ 1,248,007$ -$ 51,938,675$ 19,759,473)($ 4,394,710)($ -$ 24,154,183)($ 27,784,492$
8 1960 Miscellaneous Equipment 270,978$ -$ -$ 270,978$ 223,012)($ 34,271)($ -$ 257,284)($ 13,694$
47 1970 Load Management Controls Customer Premises 3,022,834$ -$ -$ 3,022,834$ 3,022,834)($ -$ -$ 3,022,834)($ -$
47 1975 Load Management Controls Utility Premises -$ -$ -$ -$ -$ -$ -$ -$ -$
47 1980 System Supervisor Equipment 52,079,297$ 18,699,351$ 595,218)($ 70,183,430$ 14,532,254)($ 3,651,044)($ 64,328$ 18,118,970)($ 52,064,459$
47 2440 Contributions & Grants (Formally known as Account 1995) 235,243,420)($ 143,271,025)($ 536,443$ 377,978,002)($ 22,047,976$ 8,585,213$ 27,346)($ 30,605,843$ 347,372,159)($
N/A 1609 Capital Contributions Paid 190,469,722$ 29,165,511$ -$ 219,635,233$ 17,995,699)($ 8,243,289)($ -$ 26,238,988)($ 193,396,245$
N/A 2005 Property Under Capital Leases 19,747,714$ -$ -$ 19,747,714$ 12,323,115)($ 676,100)($ -$ 12,999,215)($ 6,748,499$
Sub-Total 5,334,984,135$ 543,393,224$ 28,126,530)($ 5,850,250,829$ 1,097,559,475)($ 241,842,412)($ 3,675,493$ 1,335,726,393)($ 4,514,524,436$
Less Socialized Renewable Energy Generation Investments (input as negative) 2,730,141)($ 5,828,584)($ -$ 8,558,725)($ 34,127$ 410,729$ -$ 444,856$ 8,113,869)($ Less Other Non Rate-Regulated Utility Assets (input as negative) 5,704,285)($ 10,214,512)($ -$ 15,918,797)($ 369,444$ 469,291$ -$ 838,735$ 15,080,062)($
Total PP&E 5,326,549,709$ 527,350,129$ 28,126,530)($ 5,825,773,308$ 1,097,155,904)($ 240,962,392)($ 3,675,493$ 1,334,442,803)($ 4,491,330,505$
-$
240,962,392)($
Less: Fully Allocated Depreciation
10 Transportation Transportation 1,759,521)($
Stores Equipment Stores Equipment -$
Net Depreciation 239,202,871)($
OEB Appendix 2-BA
Fixed Asset Continuity Schedule - MIFRS
Depreciation Expense adj. from gain or loss on the retirement of assets (pool of like assets)
Total
Notes:
Fixed Asset Continuity Schedule includes monthly billing
Socialized Renewable Energy Generation Investments include Energy Storage program
Other Non Rate-Regulated Utility Assets includes Generation Protection, Monitoring and Control program
2-BA 2020 MIFRS

Toronto Hydro-Electric System Limited
EB-2018-0165
Draft Rate Order
Schedule 2
UPDATED: February 12, 2020
Page 2 of 5
Year 2021
Cost (Forecast) Accumulated Depreciation (Forecast)
CCA Class OEB Account Description Opening Balance Additions Disposals Closing Balance Opening Balance Additions Disposals Closing Balance Net Book Value
12 1611 Computer Software (Formally known as Account 1925) 285,104,716$ 36,966,899$ -$ 322,071,615$ 156,434,670)($ 35,304,504)($ -$ 191,739,174)($ 130,332,441$
N/A 1612 Land Rights -$ -$ -$ -$ -$ -$ -$ -$ -$
N/A 1805 Land 7,006,432$ -$ -$ 7,006,432$ -$ -$ -$ -$ 7,006,432$
1 1808 Buildings 150,140,615$ 5,037,762$ -$ 155,178,377$ 20,034,278)($ 3,845,140)($ -$ 23,879,418)($ 131,298,959$
47 1815 Transformer Station Equipment >50 kV 39,037,308$ 113,846$ -$ 39,151,155$ 5,887,845)($ 1,428,135)($ -$ 7,315,980)($ 31,835,175$
47 1820 Distribution Station Equipment <50 kV 266,057,553$ 24,418,112$ 322,316)($ 290,153,349$ 57,457,297)($ 11,752,104)($ 94,603$ 69,114,797)($ 221,038,552$
47 1830 Poles, Towers & Fixtures 438,125,272$ 34,768,145$ 6,910,066)($ 465,983,351$ 67,695,282)($ 12,693,643)($ 914,174$ 79,474,751)($ 386,508,600$
47 1835 Overhead Conductors & Devices 526,403,695$ 49,734,750$ 2,633,755)($ 573,504,691$ 67,124,642)($ 13,675,684)($ 281,427$ 80,518,898)($ 492,985,793$
47 1840 Underground Conduit 1,444,601,075$ 109,834,968$ 664,831)($ 1,553,771,212$ 298,116,268)($ 56,135,236)($ 96,383$ 354,155,121)($ 1,199,616,091$
47 1845 Underground Conductors & Devices 1,073,353,571$ 101,760,729$ 5,935,844)($ 1,169,178,456$ 157,141,700)($ 32,289,773)($ 561,973$ 188,869,499)($ 980,308,956$
47 1850 Line Transformers 731,041,752$ 82,061,261$ 10,962,533)($ 802,140,480$ 149,006,392)($ 29,947,542)($ 1,531,727$ 177,422,207)($ 624,718,273$
47 1855 Services (Overhead & Underground) 165,721,012$ 20,146,754$ 402,416)($ 185,465,350$ 17,955,201)($ 3,704,054)($ 23,213$ 21,636,042)($ 163,829,308$
47 1860 Meters 129,371,044$ 15,758,768$ 961,414)($ 144,168,397$ 26,928,447)($ 5,611,663)($ 132,280$ 32,407,830)($ 111,760,567$
47 1860 Meters (Smart Meters) 149,964,679$ 7,778,389$ 404,621)($ 157,338,446$ 72,941,819)($ 12,056,086)($ 92,732$ 84,905,172)($ 72,433,274$
N/A 1905 Land 17,358,657$ -$ -$ 17,358,657$ -$ -$ -$ -$ 17,358,657$
1 1908 Buildings & Fixtures 243,564,137$ 4,470,732$ -$ 248,034,869$ 60,262,852)($ 11,386,786)($ -$ 71,649,639)($ 176,385,230$
13 1910 Leasehold Improvements 753,840$ -$ -$ 753,840$ 753,840)($ -$ -$ 753,840)($ -$
8 1915 Office Furniture & Equipment 21,491,979$ 1,602,715$ -$ 23,094,695$ 13,300,634)($ 1,522,209)($ -$ 14,822,843)($ 8,271,852$
50 1920 Computer Equipment - Hardware 89,177,932$ 10,939,692$ -$ 100,117,624$ 61,656,620)($ 11,560,551)($ -$ 73,217,171)($ 26,900,453$
10 1930 Transportation Equipment 45,414,685$ 7,522,222$ -$ 52,936,908$ 30,956,814)($ 3,533,932)($ -$ 34,490,746)($ 18,446,162$
8 1935 Stores Equipment 7,066$ -$ -$ 7,066$ 7,066)($ -$ -$ 7,066)($ -$
8 1940 Tools, Shop & Garage Equipment 37,648,125$ 4,713,302$ -$ 42,361,427$ 16,562,649)($ 3,021,437)($ -$ 19,584,086)($ 22,777,340$
8 1945 Measurement & Testing Equipment 584,921$ 229,520$ -$ 814,441$ 446,294)($ 40,341)($ -$ 486,635)($ 327,806$
8 1950 Service Equipment 1,499,902$ 223,794$ -$ 1,723,696$ 870,152)($ 128,807)($ -$ 998,960)($ 724,736$
8 1955 Communications Equipment 51,938,675$ 1,147,067$ -$ 53,085,741$ 24,154,183)($ 4,101,532)($ -$ 28,255,715)($ 24,830,026$
8 1960 Miscellaneous Equipment 270,978$ -$ -$ 270,978$ 257,284)($ 12,066)($ -$ 269,350)($ 1,628$
47 1970 Load Management Controls Customer Premises 3,022,834$ -$ -$ 3,022,834$ 3,022,834)($ -$ -$ 3,022,834)($ -$
47 1975 Load Management Controls Utility Premises -$ -$ -$ -$ -$ -$ -$ -$ -$
47 1980 System Supervisor Equipment 70,183,430$ 8,871,158$ 631,728)($ 78,422,859$ 18,118,970)($ 4,066,240)($ 68,271$ 22,116,939)($ 56,305,920$
47 2440 Contributions & Grants (Formally known as Account 1995) 377,978,002)($ 70,990,753)($ 547,156$ 448,421,599)($ 30,605,843$ 10,620,506$ 27,892)($ 41,198,457$ 407,223,142)($
N/A 1609 Capital Contributions Paid 219,635,233$ 2,035,515$ -$ 221,670,747$ 26,238,988)($ 8,822,093)($ -$ 35,061,081)($ 186,609,666$
N/A 2005 Property Under Capital Leases 19,747,714$ -$ -$ 19,747,714$ 12,999,215)($ 621,430)($ -$ 13,620,645)($ 6,127,069$
Sub-Total 5,850,250,829$ 459,145,348$ 29,282,369)($ 6,280,113,808$ 1,335,726,393)($ 256,640,482)($ 3,768,892$ 1,588,597,983)($ 4,691,515,825$
Less Socialized Renewable Energy Generation Investments (input as negative) 8,558,725)($ 868,193)($ -$ 9,426,917)($ 444,856$ 642,823$ -$ 1,087,679$ 8,339,239)($ Less Other Non Rate-Regulated Utility Assets (input as negative) 15,918,797)($ 2,121,225)($ -$ 18,040,021)($ 838,735$ 681,314$ -$ 1,520,049$ 16,519,972)($
Total PP&E 5,825,773,308$ 456,155,931$ 29,282,369)($ 6,252,646,870$ 1,334,442,803)($ 255,316,345)($ 3,768,892$ 1,585,990,256)($ 4,666,656,614$
-$
255,316,345)($
Less: Fully Allocated Depreciation
10 Transportation Transportation 1,759,521)($
Stores Equipment Stores Equipment -$
Net Depreciation 253,556,824)($
OEB Appendix 2-BA
Fixed Asset Continuity Schedule - MIFRS
Depreciation Expense adj. from gain or loss on the retirement of assets (pool of like assets)
Total
Notes:
Fixed Asset Continuity Schedule includes monthly billing
Socialized Renewable Energy Generation Investments include Energy Storage program
Other Non Rate-Regulated Utility Assets includes Generation Protection, Monitoring and Control program
2-BA 2021 MIFRS

Toronto Hydro-Electric System Limited
EB-2018-0165
Draft Rate Order
Schedule 2
UPDATED: February 12, 2020
Page 3 of 5
Year 2022
Cost (Forecast) Accumulated Depreciation (Forecast)
CCA Class OEB Account Description Opening Balance Additions Disposals Closing Balance Opening Balance Additions Disposals Closing Balance Net Book Value
12 1611 Computer Software (Formally known as Account 1925) 322,071,615$ 63,720,613$ -$ 385,792,228$ 191,739,174)($ 38,081,297)($ -$ 229,820,472)($ 155,971,756$
N/A 1612 Land Rights -$ -$ -$ -$ -$ -$ -$ -$ -$
N/A 1805 Land 7,006,432$ -$ -$ 7,006,432$ -$ -$ -$ -$ 7,006,432$
1 1808 Buildings 155,178,377$ 40,071,504$ -$ 195,249,881$ 23,879,418)($ 4,345,337)($ -$ 28,224,755)($ 167,025,126$
47 1815 Transformer Station Equipment >50 kV 39,151,155$ 2,450,179$ -$ 41,601,333$ 7,315,980)($ 1,495,956)($ -$ 8,811,936)($ 32,789,397$
47 1820 Distribution Station Equipment <50 kV 290,153,349$ 25,963,842$ 325,785)($ 315,791,406$ 69,114,797)($ 12,420,057)($ 95,623$ 81,439,231)($ 234,352,175$
47 1830 Poles, Towers & Fixtures 465,983,351$ 33,534,927$ 6,937,296)($ 492,580,982$ 79,474,751)($ 13,404,641)($ 924,301$ 91,955,091)($ 400,625,890$
47 1835 Overhead Conductors & Devices 573,504,691$ 44,552,261$ 2,644,380)($ 615,412,573$ 80,518,898)($ 14,722,428)($ 283,807$ 94,957,519)($ 520,455,054$
47 1840 Underground Conduit 1,553,771,212$ 109,594,748$ 669,636)($ 1,662,696,324$ 354,155,121)($ 59,369,162)($ 97,574$ 413,426,710)($ 1,249,269,614$
47 1845 Underground Conductors & Devices 1,169,178,456$ 103,511,753$ 5,950,423)($ 1,266,739,787$ 188,869,499)($ 34,591,433)($ 563,846$ 222,897,087)($ 1,043,842,699$
47 1850 Line Transformers 802,140,480$ 81,841,972$ 11,050,483)($ 872,931,970$ 177,422,207)($ 31,594,978)($ 1,544,697$ 207,472,489)($ 665,459,481$
47 1855 Services (Overhead & Underground) 185,465,350$ 19,712,338$ 402,416)($ 204,775,272$ 21,636,042)($ 4,003,468)($ 23,215$ 25,616,295)($ 179,158,977$
47 1860 Meters 144,168,397$ 16,716,232$ 951,748)($ 159,932,881$ 32,407,830)($ 5,963,686)($ 130,950$ 38,240,566)($ 121,692,315$
47 1860 Meters (Smart Meters) 157,338,446$ 8,075,723$ 246,773)($ 165,167,397$ 84,905,172)($ 10,048,193)($ 56,465$ 94,896,900)($ 70,270,497$
N/A 1905 Land 17,358,657$ -$ -$ 17,358,657$ -$ -$ -$ -$ 17,358,657$
1 1908 Buildings & Fixtures 248,034,869$ 21,557,810$ -$ 269,592,679$ 71,649,639)($ 11,520,211)($ -$ 83,169,850)($ 186,422,829$
13 1910 Leasehold Improvements 753,840$ -$ -$ 753,840$ 753,840)($ -$ -$ 753,840)($ -$
8 1915 Office Furniture & Equipment 23,094,695$ 7,728,271$ -$ 30,822,966$ 14,822,843)($ 1,469,875)($ -$ 16,292,718)($ 14,530,248$
50 1920 Computer Equipment - Hardware 100,117,624$ 13,266,570$ -$ 113,384,194$ 73,217,171)($ 10,934,024)($ -$ 84,151,195)($ 29,232,999$
10 1930 Transportation Equipment 52,936,908$ 7,168,511$ -$ 60,105,418$ 34,490,746)($ 4,235,035)($ -$ 38,725,781)($ 21,379,638$
8 1935 Stores Equipment 7,066$ -$ -$ 7,066$ 7,066)($ -$ -$ 7,066)($ -$
8 1940 Tools, Shop & Garage Equipment 42,361,427$ 7,936,220$ -$ 50,297,647$ 19,584,086)($ 3,318,369)($ -$ 22,902,456)($ 27,395,191$
8 1945 Measurement & Testing Equipment 814,441$ 11,665$ -$ 826,107$ 486,635)($ 36,839)($ -$ 523,474)($ 302,633$
8 1950 Service Equipment 1,723,696$ 212,515$ -$ 1,936,211$ 998,960)($ 148,646)($ -$ 1,147,605)($ 788,605$
8 1955 Communications Equipment 53,085,741$ 1,143,895$ -$ 54,229,636$ 28,255,715)($ 3,318,200)($ -$ 31,573,915)($ 22,655,721$
8 1960 Miscellaneous Equipment 270,978$ 1,579,433$ -$ 1,850,410$ 269,350)($ 19,256)($ -$ 288,606)($ 1,561,804$
47 1970 Load Management Controls Customer Premises 3,022,834$ -$ -$ 3,022,834$ 3,022,834)($ -$ -$ 3,022,834)($ -$
47 1975 Load Management Controls Utility Premises -$ -$ -$ -$ -$ -$ -$ -$ -$
47 1980 System Supervisor Equipment 78,422,859$ 11,411,697$ 633,171)($ 89,201,386$ 22,116,939)($ 4,281,646)($ 68,428$ 26,330,157)($ 62,871,229$
47 2440 Contributions & Grants (Formally known as Account 1995) 448,421,599)($ 56,786,436)($ 566,329$ 504,641,706)($ 41,198,457$ 11,585,861$ 28,869)($ 52,755,449$ 451,886,257)($
N/A 1609 Capital Contributions Paid 221,670,747$ 4,024,266$ -$ 225,695,014$ 35,061,081)($ 8,946,603)($ -$ 44,007,685)($ 181,687,329$
N/A 2005 Property Under Capital Leases 19,747,714$ -$ -$ 19,747,714$ 13,620,645)($ 359,675)($ -$ 13,980,321)($ 5,767,394$
Sub-Total 6,280,113,808$ 569,000,511$ 29,245,780)($ 6,819,868,539$ 1,588,597,983)($ 267,043,155)($ 3,760,035$ 1,851,881,103)($ 4,967,987,436$
Less Socialized Renewable Energy Generation Investments (input as negative) 9,426,917)($ 1,694,024)($ -$ 11,120,941)($ 1,087,679$ 748,002$ -$ 1,835,680$ 9,285,261)($ Less Other Non Rate-Regulated Utility Assets (input as negative) 18,040,021)($ 2,219,756)($ -$ 20,259,777)($ 1,520,049$ 760,391$ -$ 2,280,440$ 17,979,338)($
Total PP&E 6,252,646,870$ 565,086,731$ 29,245,780)($ 6,788,487,821$ 1,585,990,256)($ 265,534,763)($ 3,760,035$ 1,847,764,983)($ 4,940,722,837$
-$
265,534,763)($
Less: Fully Allocated Depreciation
10 Transportation Transportation 1,759,521)($
Stores Equipment Stores Equipment -$
Net Depreciation 263,775,243)($
OEB Appendix 2-BA
Fixed Asset Continuity Schedule - MIFRS
Depreciation Expense adj. from gain or loss on the retirement of assets (pool of like assets)
Total
Notes:
Fixed Asset Continuity Schedule includes monthly billing
Socialized Renewable Energy Generation Investments include Energy Storage program
Other Non Rate-Regulated Utility Assets includes Generation Protection, Monitoring and Control program
2-BA 2022 MIFRS

Toronto Hydro-Electric System Limited
EB-2018-0165
Draft Rate Order
Schedule 2
UPDATED: February 12, 2020
Page 4 of 5
Year 2023
Cost (Forecast) Accumulated Depreciation (Forecast)
CCA Class OEB Account Description Opening Balance Additions Disposals Closing Balance Opening Balance Additions Disposals Closing Balance Net Book Value
12 1611 Computer Software (Formally known as Account 1925) 385,792,228$ 41,634,016$ -$ 427,426,244$ 229,820,472)($ 42,732,653)($ -$ 272,553,125)($ 154,873,119$
N/A 1612 Land Rights -$ -$ -$ -$ -$ -$ -$ -$ -$
N/A 1805 Land 7,006,432$ -$ -$ 7,006,432$ -$ -$ -$ -$ 7,006,432$
1 1808 Buildings 195,249,881$ 27,524,351$ -$ 222,774,232$ 28,224,755)($ 6,042,531)($ -$ 34,267,286)($ 188,506,946$
47 1815 Transformer Station Equipment >50 kV 41,601,333$ 2,936,184$ -$ 44,537,517$ 8,811,936)($ 1,625,670)($ -$ 10,437,606)($ 34,099,912$
47 1820 Distribution Station Equipment <50 kV 315,791,406$ 26,205,410$ 339,308)($ 341,657,508$ 81,439,231)($ 13,345,858)($ 99,587$ 94,685,502)($ 246,972,006$
47 1830 Poles, Towers & Fixtures 492,580,982$ 34,747,296$ 7,354,183)($ 519,974,095$ 91,955,091)($ 14,182,021)($ 965,853$ 105,171,259)($ 414,802,835$
47 1835 Overhead Conductors & Devices 615,412,573$ 45,296,794$ 2,801,622)($ 657,907,746$ 94,957,519)($ 15,630,417)($ 298,057$ 110,289,879)($ 547,617,867$
47 1840 Underground Conduit 1,662,696,324$ 114,160,256$ 704,563)($ 1,776,152,018$ 413,426,710)($ 62,969,121)($ 101,626$ 476,294,205)($ 1,299,857,812$
47 1845 Underground Conductors & Devices 1,266,739,787$ 109,957,891$ 6,332,006)($ 1,370,365,671$ 222,897,087)($ 36,611,443)($ 598,700$ 258,909,831)($ 1,111,455,840$
47 1850 Line Transformers 872,931,970$ 85,340,070$ 11,580,591)($ 946,691,448$ 207,472,489)($ 33,497,604)($ 1,617,209$ 239,352,884)($ 707,338,564$
47 1855 Services (Overhead & Underground) 204,775,272$ 20,282,126$ 430,358)($ 224,627,041$ 25,616,295)($ 4,315,524)($ 24,827$ 29,906,992)($ 194,720,049$
47 1860 Meters 159,932,881$ 20,448,846$ 929,126)($ 179,452,601$ 38,240,566)($ 6,340,147)($ 127,837$ 44,452,876)($ 134,999,726$
47 1860 Meters (Smart Meters) 165,167,397$ 9,375,918$ 110,074)($ 174,433,241$ 94,896,900)($ 8,717,326)($ 25,072$ 103,589,154)($ 70,844,087$
N/A 1905 Land 17,358,657$ -$ -$ 17,358,657$ -$ -$ -$ -$ 17,358,657$
1 1908 Buildings & Fixtures 269,592,679$ 5,387,713$ -$ 274,980,392$ 83,169,850)($ 12,337,161)($ -$ 95,507,010)($ 179,473,382$
13 1910 Leasehold Improvements 753,840$ -$ -$ 753,840$ 753,840)($ -$ -$ 753,840)($ -$
8 1915 Office Furniture & Equipment 30,822,966$ 1,931,444$ -$ 32,754,410$ 16,292,718)($ 1,896,695)($ -$ 18,189,413)($ 14,564,997$
50 1920 Computer Equipment - Hardware 113,384,194$ 14,011,746$ -$ 127,395,941$ 84,151,195)($ 12,720,769)($ -$ 96,871,964)($ 30,523,977$
10 1930 Transportation Equipment 60,105,418$ 7,690,996$ -$ 67,796,414$ 38,725,781)($ 5,007,342)($ -$ 43,733,123)($ 24,063,291$
8 1935 Stores Equipment 7,066$ -$ -$ 7,066$ 7,066)($ -$ -$ 7,066)($ -$
8 1940 Tools, Shop & Garage Equipment 50,297,647$ 2,138,434$ -$ 52,436,081$ 22,902,456)($ 3,434,866)($ -$ 26,337,322)($ 26,098,759$
8 1945 Measurement & Testing Equipment 826,107$ 227$ -$ 826,334$ 523,474)($ 21,944)($ -$ 545,417)($ 280,916$
8 1950 Service Equipment 1,936,211$ 228,613$ -$ 2,164,824$ 1,147,605)($ 176,152)($ -$ 1,323,758)($ 841,066$
8 1955 Communications Equipment 54,229,636$ 1,359,554$ -$ 55,589,191$ 31,573,915)($ 2,798,996)($ -$ 34,372,912)($ 21,216,279$
8 1960 Miscellaneous Equipment 1,850,410$ -$ -$ 1,850,410$ 288,606)($ 226,779)($ -$ 515,385)($ 1,335,026$
47 1970 Load Management Controls Customer Premises 3,022,834$ -$ -$ 3,022,834$ 3,022,834)($ -$ -$ 3,022,834)($ -$
47 1975 Load Management Controls Utility Premises -$ -$ -$ -$ -$ -$ -$ -$ -$
47 1980 System Supervisor Equipment 89,201,386$ 12,238,116$ 674,310)($ 100,765,192$ 26,330,157)($ 4,460,078)($ 72,872$ 30,717,362)($ 70,047,830$
47 2440 Contributions & Grants (Formally known as Account 1995) 504,641,706)($ 52,792,609)($ 609,544$ 556,824,771)($ 52,755,449$ 12,360,736$ 31,072)($ 65,085,114$ 491,739,657)($
N/A 1609 Capital Contributions Paid 225,695,014$ 38,016,887$ -$ 263,711,901$ 44,007,685)($ 9,844,081)($ -$ 53,851,765)($ 209,860,136$
N/A 2005 Property Under Capital Leases 19,747,714$ -$ -$ 19,747,714$ 13,980,321)($ 128,056)($ -$ 14,108,376)($ 5,639,338$
Sub-Total 6,819,868,539$ 568,120,281$ 30,646,597)($ 7,357,342,224$ 1,851,881,103)($ 286,702,496)($ 3,900,567$ 2,134,683,032)($ 5,222,659,192$
Less Socialized Renewable Energy Generation Investments (input as negative) 11,120,941)($ -$ -$ 11,120,941)($ 1,835,680$ 741,396$ -$ 2,577,076$ 8,543,865)($ Less Other Non Rate-Regulated Utility Assets (input as negative) 20,259,777)($ 2,364,569)($ -$ 22,624,347)($ 2,280,440$ 843,961$ -$ 3,124,401$ 19,499,946)($
Total PP&E 6,788,487,821$ 565,755,712$ 30,646,597)($ 7,323,596,936$ 1,847,764,983)($ 285,117,139)($ 3,900,567$ 2,128,981,555)($ 5,194,615,382$
-$
285,117,139)($
Less: Fully Allocated Depreciation
10 Transportation Transportation 1,759,521)($
Stores Equipment Stores Equipment -$
Net Depreciation 283,357,618)($
OEB Appendix 2-BA
Fixed Asset Continuity Schedule - MIFRS
Depreciation Expense adj. from gain or loss on the retirement of assets (pool of like assets)
Total
Notes:
Fixed Asset Continuity Schedule includes monthly billing
Socialized Renewable Energy Generation Investments include Energy Storage program
Other Non Rate-Regulated Utility Assets includes Generation Protection, Monitoring and Control program
2-BA 2023 MIFRS
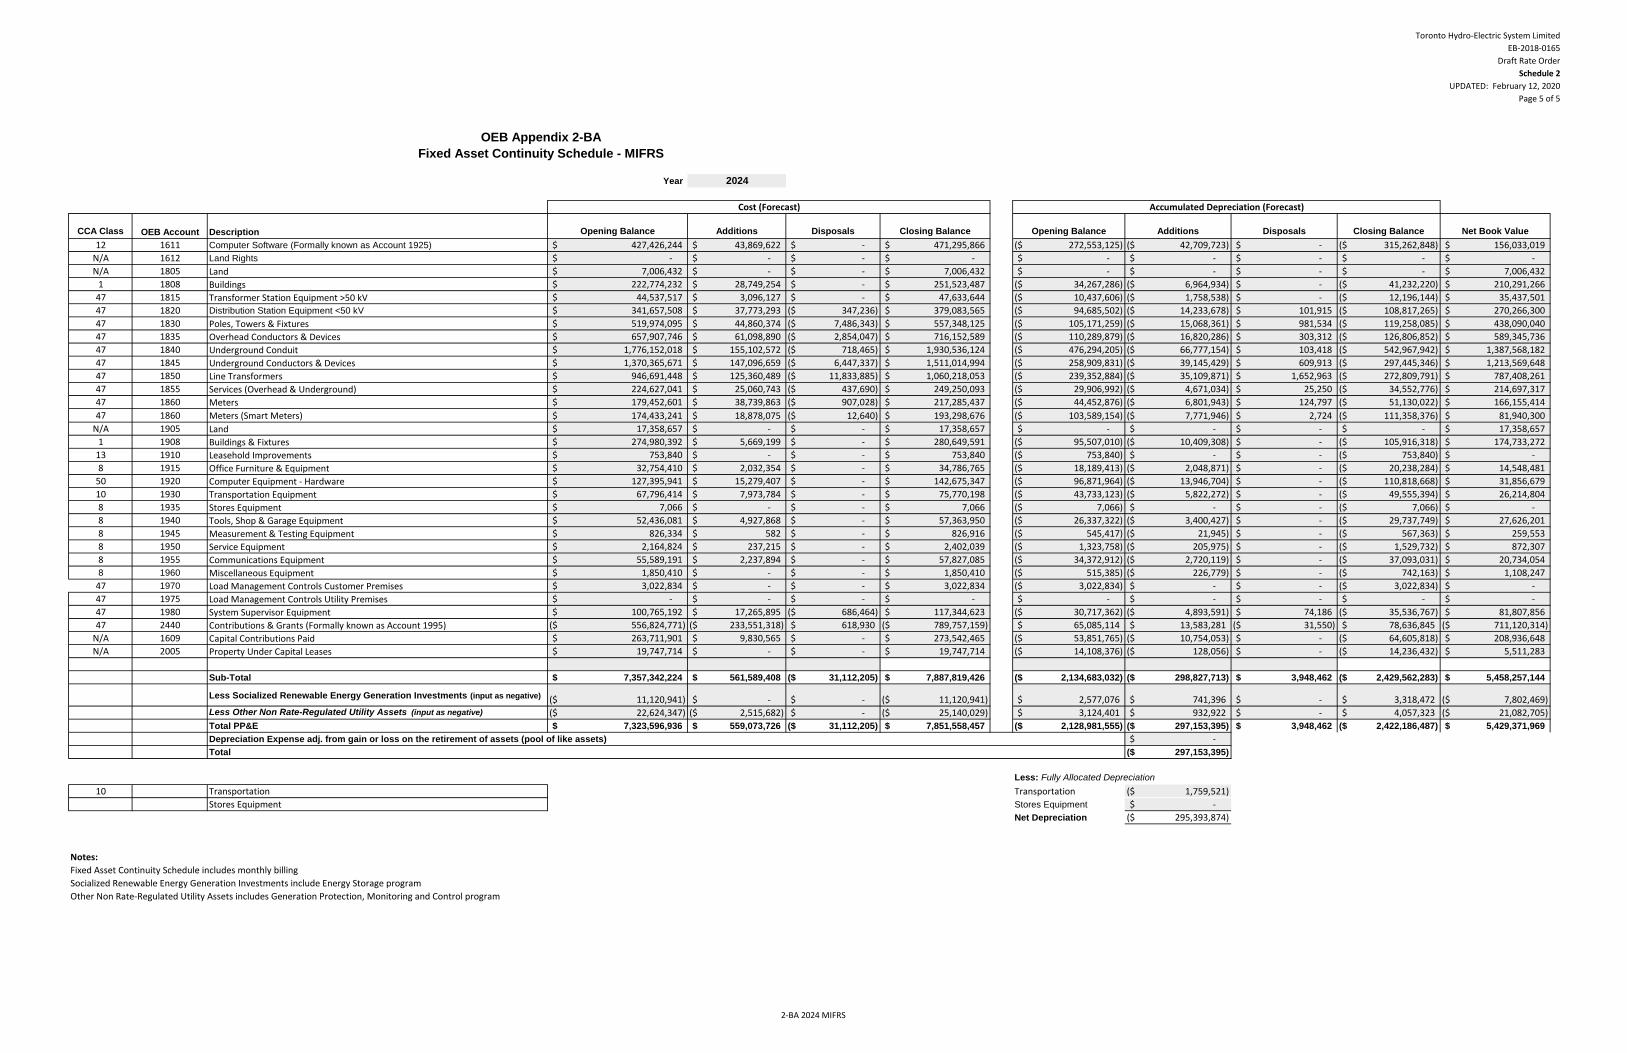
Toronto Hydro-Electric System Limited
EB-2018-0165
Draft Rate Order
Schedule 2
UPDATED: February 12, 2020
Page 5 of 5
Year 2024
Cost (Forecast) Accumulated Depreciation (Forecast)
CCA Class OEB Account Description Opening Balance Additions Disposals Closing Balance Opening Balance Additions Disposals Closing Balance Net Book Value
12 1611 Computer Software (Formally known as Account 1925) 427,426,244$ 43,869,622$ -$ 471,295,866$ 272,553,125)($ 42,709,723)($ -$ 315,262,848)($ 156,033,019$
N/A 1612 Land Rights -$ -$ -$ -$ -$ -$ -$ -$ -$
N/A 1805 Land 7,006,432$ -$ -$ 7,006,432$ -$ -$ -$ -$ 7,006,432$
1 1808 Buildings 222,774,232$ 28,749,254$ -$ 251,523,487$ 34,267,286)($ 6,964,934)($ -$ 41,232,220)($ 210,291,266$
47 1815 Transformer Station Equipment >50 kV 44,537,517$ 3,096,127$ -$ 47,633,644$ 10,437,606)($ 1,758,538)($ -$ 12,196,144)($ 35,437,501$
47 1820 Distribution Station Equipment <50 kV 341,657,508$ 37,773,293$ 347,236)($ 379,083,565$ 94,685,502)($ 14,233,678)($ 101,915$ 108,817,265)($ 270,266,300$
47 1830 Poles, Towers & Fixtures 519,974,095$ 44,860,374$ 7,486,343)($ 557,348,125$ 105,171,259)($ 15,068,361)($ 981,534$ 119,258,085)($ 438,090,040$
47 1835 Overhead Conductors & Devices 657,907,746$ 61,098,890$ 2,854,047)($ 716,152,589$ 110,289,879)($ 16,820,286)($ 303,312$ 126,806,852)($ 589,345,736$
47 1840 Underground Conduit 1,776,152,018$ 155,102,572$ 718,465)($ 1,930,536,124$ 476,294,205)($ 66,777,154)($ 103,418$ 542,967,942)($ 1,387,568,182$
47 1845 Underground Conductors & Devices 1,370,365,671$ 147,096,659$ 6,447,337)($ 1,511,014,994$ 258,909,831)($ 39,145,429)($ 609,913$ 297,445,346)($ 1,213,569,648$
47 1850 Line Transformers 946,691,448$ 125,360,489$ 11,833,885)($ 1,060,218,053$ 239,352,884)($ 35,109,871)($ 1,652,963$ 272,809,791)($ 787,408,261$
47 1855 Services (Overhead & Underground) 224,627,041$ 25,060,743$ 437,690)($ 249,250,093$ 29,906,992)($ 4,671,034)($ 25,250$ 34,552,776)($ 214,697,317$
47 1860 Meters 179,452,601$ 38,739,863$ 907,028)($ 217,285,437$ 44,452,876)($ 6,801,943)($ 124,797$ 51,130,022)($ 166,155,414$
47 1860 Meters (Smart Meters) 174,433,241$ 18,878,075$ 12,640)($ 193,298,676$ 103,589,154)($ 7,771,946)($ 2,724$ 111,358,376)($ 81,940,300$
N/A 1905 Land 17,358,657$ -$ -$ 17,358,657$ -$ -$ -$ -$ 17,358,657$
1 1908 Buildings & Fixtures 274,980,392$ 5,669,199$ -$ 280,649,591$ 95,507,010)($ 10,409,308)($ -$ 105,916,318)($ 174,733,272$
13 1910 Leasehold Improvements 753,840$ -$ -$ 753,840$ 753,840)($ -$ -$ 753,840)($ -$
8 1915 Office Furniture & Equipment 32,754,410$ 2,032,354$ -$ 34,786,765$ 18,189,413)($ 2,048,871)($ -$ 20,238,284)($ 14,548,481$
50 1920 Computer Equipment - Hardware 127,395,941$ 15,279,407$ -$ 142,675,347$ 96,871,964)($ 13,946,704)($ -$ 110,818,668)($ 31,856,679$
10 1930 Transportation Equipment 67,796,414$ 7,973,784$ -$ 75,770,198$ 43,733,123)($ 5,822,272)($ -$ 49,555,394)($ 26,214,804$
8 1935 Stores Equipment 7,066$ -$ -$ 7,066$ 7,066)($ -$ -$ 7,066)($ -$
8 1940 Tools, Shop & Garage Equipment 52,436,081$ 4,927,868$ -$ 57,363,950$ 26,337,322)($ 3,400,427)($ -$ 29,737,749)($ 27,626,201$
8 1945 Measurement & Testing Equipment 826,334$ 582$ -$ 826,916$ 545,417)($ 21,945)($ -$ 567,363)($ 259,553$
8 1950 Service Equipment 2,164,824$ 237,215$ -$ 2,402,039$ 1,323,758)($ 205,975)($ -$ 1,529,732)($ 872,307$
8 1955 Communications Equipment 55,589,191$ 2,237,894$ -$ 57,827,085$ 34,372,912)($ 2,720,119)($ -$ 37,093,031)($ 20,734,054$
8 1960 Miscellaneous Equipment 1,850,410$ -$ -$ 1,850,410$ 515,385)($ 226,779)($ -$ 742,163)($ 1,108,247$
47 1970 Load Management Controls Customer Premises 3,022,834$ -$ -$ 3,022,834$ 3,022,834)($ -$ -$ 3,022,834)($ -$
47 1975 Load Management Controls Utility Premises -$ -$ -$ -$ -$ -$ -$ -$ -$
47 1980 System Supervisor Equipment 100,765,192$ 17,265,895$ 686,464)($ 117,344,623$ 30,717,362)($ 4,893,591)($ 74,186$ 35,536,767)($ 81,807,856$
47 2440 Contributions & Grants (Formally known as Account 1995) 556,824,771)($ 233,551,318)($ 618,930$ 789,757,159)($ 65,085,114$ 13,583,281$ 31,550)($ 78,636,845$ 711,120,314)($
N/A 1609 Capital Contributions Paid 263,711,901$ 9,830,565$ -$ 273,542,465$ 53,851,765)($ 10,754,053)($ -$ 64,605,818)($ 208,936,648$
N/A 2005 Property Under Capital Leases 19,747,714$ -$ -$ 19,747,714$ 14,108,376)($ 128,056)($ -$ 14,236,432)($ 5,511,283$
Sub-Total 7,357,342,224$ 561,589,408$ 31,112,205)($ 7,887,819,426$ 2,134,683,032)($ 298,827,713)($ 3,948,462$ 2,429,562,283)($ 5,458,257,144$
Less Socialized Renewable Energy Generation Investments (input as negative) 11,120,941)($ -$ -$ 11,120,941)($ 2,577,076$ 741,396$ -$ 3,318,472$ 7,802,469)($ Less Other Non Rate-Regulated Utility Assets (input as negative) 22,624,347)($ 2,515,682)($ -$ 25,140,029)($ 3,124,401$ 932,922$ -$ 4,057,323$ 21,082,705)($
Total PP&E 7,323,596,936$ 559,073,726$ 31,112,205)($ 7,851,558,457$ 2,128,981,555)($ 297,153,395)($ 3,948,462$ 2,422,186,487)($ 5,429,371,969$
-$
297,153,395)($
Less: Fully Allocated Depreciation
10 Transportation Transportation 1,759,521)($
Stores Equipment Stores Equipment -$
Net Depreciation 295,393,874)($
OEB Appendix 2-BA
Fixed Asset Continuity Schedule - MIFRS
Depreciation Expense adj. from gain or loss on the retirement of assets (pool of like assets)
Total
Notes:
Fixed Asset Continuity Schedule includes monthly billing
Socialized Renewable Energy Generation Investments include Energy Storage program
Other Non Rate-Regulated Utility Assets includes Generation Protection, Monitoring and Control program
2-BA 2024 MIFRS
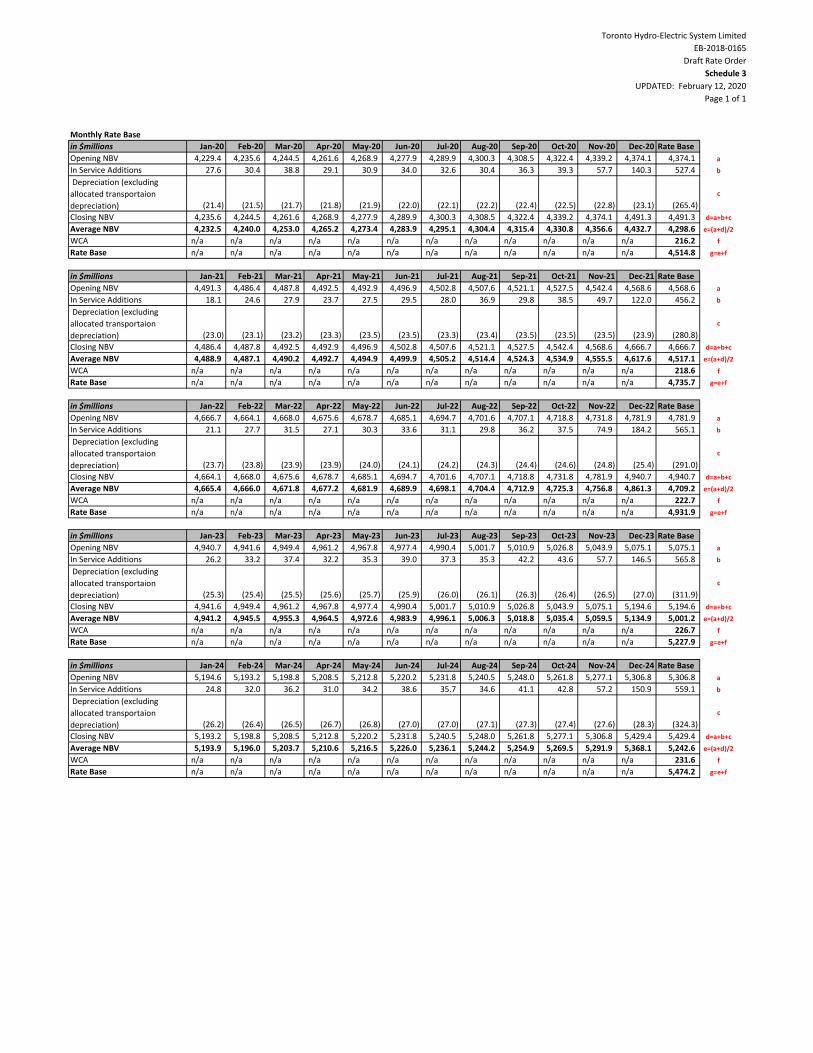
Toronto Hydro-Electric System Limited
EB-2018-0165
Draft Rate Order
Schedule 3
UPDATED: February 12, 2020
Page 1 of 1
Monthly Rate Base
in $millions Jan-20 Feb-20 Mar-20 Apr-20 May-20 Jun-20 Jul-20 Aug-20 Sep-20 Oct-20 Nov-20 Dec-20 Rate Base
Opening NBV 4,229.4 4,235.6 4,244.5 4,261.6 4,268.9 4,277.9 4,289.9 4,300.3 4,308.5 4,322.4 4,339.2 4,374.1 4,374.1 a
In Service Additions 27.6 30.4 38.8 29.1 30.9 34.0 32.6 30.4 36.3 39.3 57.7 140.3 527.4 b
Depreciation (excluding
allocated transportaion
depreciation) (21.4) (21.5) (21.7) (21.8) (21.9) (22.0) (22.1) (22.2) (22.4) (22.5) (22.8) (23.1) (265.4)
c
Closing NBV 4,235.6 4,244.5 4,261.6 4,268.9 4,277.9 4,289.9 4,300.3 4,308.5 4,322.4 4,339.2 4,374.1 4,491.3 4,491.3 d=a+b+c
Average NBV 4,232.5 4,240.0 4,253.0 4,265.2 4,273.4 4,283.9 4,295.1 4,304.4 4,315.4 4,330.8 4,356.6 4,432.7 4,298.6 e=(a+d)/2
WCA n/a n/a n/a n/a n/a n/a n/a n/a n/a n/a n/a n/a 216.2 f
Rate Base n/a n/a n/a n/a n/a n/a n/a n/a n/a n/a n/a n/a 4,514.8 g=e+f
in $millions Jan-21 Feb-21 Mar-21 Apr-21 May-21 Jun-21 Jul-21 Aug-21 Sep-21 Oct-21 Nov-21 Dec-21 Rate Base
Opening NBV 4,491.3 4,486.4 4,487.8 4,492.5 4,492.9 4,496.9 4,502.8 4,507.6 4,521.1 4,527.5 4,542.4 4,568.6 4,568.6 a
In Service Additions 18.1 24.6 27.9 23.7 27.5 29.5 28.0 36.9 29.8 38.5 49.7 122.0 456.2 b
Depreciation (excluding
allocated transportaion
depreciation) (23.0) (23.1) (23.2) (23.3) (23.5) (23.5) (23.3) (23.4) (23.5) (23.5) (23.5) (23.9) (280.8)
c
Closing NBV 4,486.4 4,487.8 4,492.5 4,492.9 4,496.9 4,502.8 4,507.6 4,521.1 4,527.5 4,542.4 4,568.6 4,666.7 4,666.7 d=a+b+c
Average NBV 4,488.9 4,487.1 4,490.2 4,492.7 4,494.9 4,499.9 4,505.2 4,514.4 4,524.3 4,534.9 4,555.5 4,617.6 4,517.1 e=(a+d)/2
WCA n/a n/a n/a n/a n/a n/a n/a n/a n/a n/a n/a n/a 218.6 f
Rate Base n/a n/a n/a n/a n/a n/a n/a n/a n/a n/a n/a n/a 4,735.7 g=e+f
in $millions Jan-22 Feb-22 Mar-22 Apr-22 May-22 Jun-22 Jul-22 Aug-22 Sep-22 Oct-22 Nov-22 Dec-22 Rate Base
Opening NBV 4,666.7 4,664.1 4,668.0 4,675.6 4,678.7 4,685.1 4,694.7 4,701.6 4,707.1 4,718.8 4,731.8 4,781.9 4,781.9 a
In Service Additions 21.1 27.7 31.5 27.1 30.3 33.6 31.1 29.8 36.2 37.5 74.9 184.2 565.1 b
Depreciation (excluding
allocated transportaion
depreciation) (23.7) (23.8) (23.9) (23.9) (24.0) (24.1) (24.2) (24.3) (24.4) (24.6) (24.8) (25.4) (291.0)
c
Closing NBV 4,664.1 4,668.0 4,675.6 4,678.7 4,685.1 4,694.7 4,701.6 4,707.1 4,718.8 4,731.8 4,781.9 4,940.7 4,940.7 d=a+b+c
Average NBV 4,665.4 4,666.0 4,671.8 4,677.2 4,681.9 4,689.9 4,698.1 4,704.4 4,712.9 4,725.3 4,756.8 4,861.3 4,709.2 e=(a+d)/2
WCA n/a n/a n/a n/a n/a n/a n/a n/a n/a n/a n/a n/a 222.7 f
Rate Base n/a n/a n/a n/a n/a n/a n/a n/a n/a n/a n/a n/a 4,931.9 g=e+f
in $millions Jan-23 Feb-23 Mar-23 Apr-23 May-23 Jun-23 Jul-23 Aug-23 Sep-23 Oct-23 Nov-23 Dec-23 Rate Base
Opening NBV 4,940.7 4,941.6 4,949.4 4,961.2 4,967.8 4,977.4 4,990.4 5,001.7 5,010.9 5,026.8 5,043.9 5,075.1 5,075.1 a
In Service Additions 26.2 33.2 37.4 32.2 35.3 39.0 37.3 35.3 42.2 43.6 57.7 146.5 565.8 b
Depreciation (excluding
allocated transportaion
depreciation) (25.3) (25.4) (25.5) (25.6) (25.7) (25.9) (26.0) (26.1) (26.3) (26.4) (26.5) (27.0) (311.9)
c
Closing NBV 4,941.6 4,949.4 4,961.2 4,967.8 4,977.4 4,990.4 5,001.7 5,010.9 5,026.8 5,043.9 5,075.1 5,194.6 5,194.6 d=a+b+c
Average NBV 4,941.2 4,945.5 4,955.3 4,964.5 4,972.6 4,983.9 4,996.1 5,006.3 5,018.8 5,035.4 5,059.5 5,134.9 5,001.2 e=(a+d)/2
WCA n/a n/a n/a n/a n/a n/a n/a n/a n/a n/a n/a n/a 226.7 f
Rate Base n/a n/a n/a n/a n/a n/a n/a n/a n/a n/a n/a n/a 5,227.9 g=e+f
in $millions Jan-24 Feb-24 Mar-24 Apr-24 May-24 Jun-24 Jul-24 Aug-24 Sep-24 Oct-24 Nov-24 Dec-24 Rate Base
Opening NBV 5,194.6 5,193.2 5,198.8 5,208.5 5,212.8 5,220.2 5,231.8 5,240.5 5,248.0 5,261.8 5,277.1 5,306.8 5,306.8 a
In Service Additions 24.8 32.0 36.2 31.0 34.2 38.6 35.7 34.6 41.1 42.8 57.2 150.9 559.1 b
Depreciation (excluding
allocated transportaion
depreciation) (26.2) (26.4) (26.5) (26.7) (26.8) (27.0) (27.0) (27.1) (27.3) (27.4) (27.6) (28.3) (324.3)
c
Closing NBV 5,193.2 5,198.8 5,208.5 5,212.8 5,220.2 5,231.8 5,240.5 5,248.0 5,261.8 5,277.1 5,306.8 5,429.4 5,429.4 d=a+b+c
Average NBV 5,193.9 5,196.0 5,203.7 5,210.6 5,216.5 5,226.0 5,236.1 5,244.2 5,254.9 5,269.5 5,291.9 5,368.1 5,242.6 e=(a+d)/2
WCA n/a n/a n/a n/a n/a n/a n/a n/a n/a n/a n/a n/a 231.6 f
Rate Base n/a n/a n/a n/a n/a n/a n/a n/a n/a n/a n/a n/a 5,474.2 g=e+f
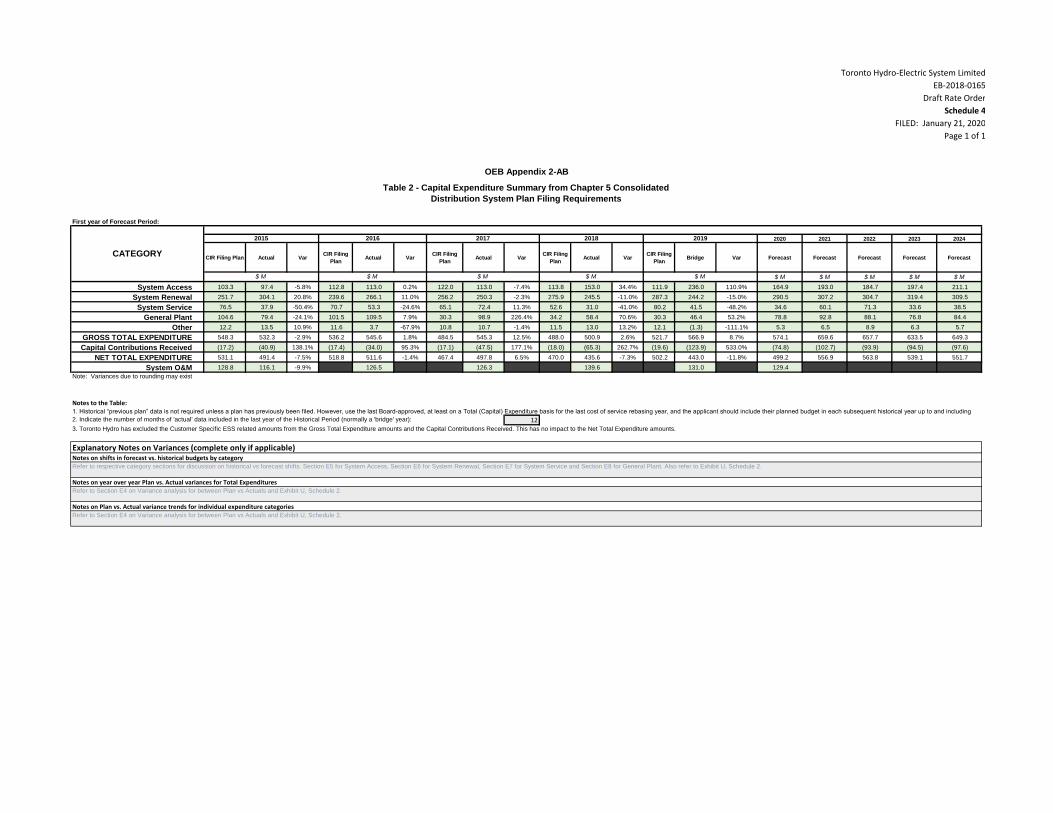
Toronto Hydro-Electric System Limited
EB-2018-0165
Draft Rate Order
Schedule 4
FILED: January 21, 2020
Page 1 of 1
First year of Forecast Period:
2020 2021 2022 2023 2024
CIR Filing Plan Actual VarCIR Filing
PlanActual Var
CIR Filing
PlanActual Var
CIR Filing
PlanActual Var
CIR Filing
PlanBridge Var Forecast Forecast Forecast Forecast Forecast
$ M $ M $ M $ M $ M
System Access 103.3 97.4 -5.8% 112.8 113.0 0.2% 122.0 113.0 -7.4% 113.8 153.0 34.4% 111.9 236.0 110.9% 164.9 193.0 184.7 197.4 211.1
System Renewal 251.7 304.1 20.8% 239.6 266.1 11.0% 256.2 250.3 -2.3% 275.9 245.5 -11.0% 287.3 244.2 -15.0% 290.5 307.2 304.7 319.4 309.5
System Service 76.5 37.9 -50.4% 70.7 53.3 -24.6% 65.1 72.4 11.3% 52.6 31.0 -41.0% 80.2 41.5 -48.2% 34.6 60.1 71.3 33.6 38.5
General Plant 104.6 79.4 -24.1% 101.5 109.5 7.9% 30.3 98.9 226.4% 34.2 58.4 70.6% 30.3 46.4 53.2% 78.8 92.8 88.1 76.8 84.4
Other 12.2 13.5 10.9% 11.6 3.7 -67.9% 10.8 10.7 -1.4% 11.5 13.0 13.2% 12.1 (1.3) -111.1% 5.3 6.5 8.9 6.3 5.7
GROSS TOTAL EXPENDITURE 548.3 532.3 -2.9% 536.2 545.6 1.8% 484.5 545.3 12.5% 488.0 500.9 2.6% 521.7 566.9 8.7% 574.1 659.6 657.7 633.5 649.3
Capital Contributions Received (17.2) (40.9) 138.1% (17.4) (34.0) 95.3% (17.1) (47.5) 177.1% (18.0) (65.3) 262.7% (19.6) (123.9) 533.0% (74.8) (102.7) (93.9) (94.5) (97.6)
NET TOTAL EXPENDITURE 531.1 491.4 -7.5% 518.8 511.6 -1.4% 467.4 497.8 6.5% 470.0 435.6 -7.3% 502.2 443.0 -11.8% 499.2 556.9 563.8 539.1 551.7
System O&M 128.8 116.1 -9.9% 126.5 126.3 139.6 131.0 129.4
Note: Variances due to rounding may exist
Notes to the Table:
12
OEB Appendix 2-AB
Table 2 - Capital Expenditure Summary from Chapter 5 Consolidated
Distribution System Plan Filing Requirements
CATEGORY
2015 2016 2017 2018 2019
$ M $ M $ M $ M $ M
1. Historical “previous plan” data is not required unless a plan has previously been filed. However, use the last Board-approved, at least on a Total (Capital) Expenditure basis for the last cost of service rebasing year, and the applicant should include their planned budget in each subsequent historical year up to and including
Refer to Section E4 on Variance analysis for between Plan vs Actuals and Exhibit U, Schedule 2.
Explanatory Notes on Variances (complete only if applicable)Notes on shifts in forecast vs. historical budgets by categoryRefer to respective category sections for discussion on historical vs forecast shifts. Section E5 for System Access, Section E6 for System Renewal, Section E7 for System Service and Section E8 for General Plant. Also refer to Exhibit U, Schedule 2.
Notes on year over year Plan vs. Actual variances for Total ExpendituresRefer to Section E4 on Variance analysis for between Plan vs Actuals and Exhibit U, Schedule 2.
Notes on Plan vs. Actual variance trends for individual expenditure categories
3. Toronto Hydro has excluded the Customer Specific ESS related amounts from the Gross Total Expenditure amounts and the Capital Contributions Received. This has no impact to the Net Total Expenditure amounts.
2. Indicate the number of months of 'actual' data included in the last year of the Historical Period (normally a 'bridge' year):
Confidential and Proprietary ©2020 Navigant Consulting Ltd. Do not distribute or copy
Working Capital Requirements of Toronto Hydro Electric System Limited’s Distribution Business
Prepared for:
Submitted by: Navigant, a Guidehouse Company First Canadian Place 100 King Street West, Suite 4950 P.O. Box 64 | Toronto, Ontario M5X 1B1 | Canada +1-416-777-2440 main +1-416-777-2441 fax navigant.com January 8, 2020
Working Capital Requirements of Toronto Hydro Electric System Limited’s Distribution Business
Confidential and Proprietary Page i ©2020 Navigant Consulting Ltd. Do not distribute or copy
This is an addendum to a report that was prepared for Toronto Hydro Electric System Limited (“THESL”) by Navigant Consulting, Ltd. (“Navigant”). The report was prepared solely for the purposes of THESL’s rate filing before the Ontario Energy Board (“OEB”) and may not be used for any other purpose. Use of this report by any third party outside of THESL’s rate filing is prohibited. Use of this report should not, and does not, absolve the third party from using due diligence in verifying the report’s contents. Any use which a third party makes of this report, or any reliance on it, is the responsibility of the third party. Navigant extends no warranty to any third party.
Working Capital Requirements of Toronto Hydro Electric System Limited’s Distribution Business
Confidential and Proprietary Page ii ©2020 Navigant Consulting Ltd. Do not distribute or copy
LIST OF TABLES Table 1: THESL Distribution Working Capital Requirements (2020) ........................................................... 1 Table 2: Summary of Revenue Lag ............................................................................................................. 2 Table 3: Summary of Cost of Power Expenses ........................................................................................... 2 Table 4: Summary of HST Working Capital Amounts .................................................................................. 2
Confidential and Proprietary Page 1 ©2020 Navigant Consulting Ltd. Do not distribute or copy
ADDENDUM This is an addendum to a report that was prepared for Toronto Hydro Electric System Limited (“THESL”) by Navigant Consulting, Ltd. (“Navigant”) for the purposes of determining THESL’s working capital requirements. This addendum, as directed by THESL, provides an update to THESL’s working capital requirements for 2020 based on the following changes that have been provided by THESL:
• Updates to the IESO Credits
o Ontario Energy Rebate (“OER”) to replace the Ontario Rebate for Electricity Consumers (“OREC”)
o Removal of the OREC Global Adjustment Modifier
• Updates to the forecasted budget amounts for the 2020 test year Based upon the updates above, the resulting working capital requirements for 2020 are shown below.
Table 1: THESL Distribution Working Capital Requirements (2020)
Description Revenue
Lag Days
Expense Lead Days
Net Lag Days
Working Capital Factor
Expenses ($M)
Working Capital Requirements
($M)
Cost of Power 54.07 32.62 21.45 5.86% $2,691.04 $157.70
OM&A Expenses 54.07 35.19 18.88 5.16% $272.20 $14.04
PILS 54.07 -10.05 64.12 17.52% $9.70 $1.70
Interest Expense 54.07 25.34 28.73 7.85% $89.15 $7.00
Total $3,062.09 $180.44
HST $35.81
Total - Including HST $216.25
Working Capital as a Percent of OM&A incl. Cost of Power 7.30%
Confidential and Proprietary Page 2 ©2020 Navigant Consulting Ltd. Do not distribute or copy
The corresponding updated revenue lag summary is shown below Table 2: Summary of Revenue Lag
Description Lag Days Revenues ($M)
Weighting (%)
Weighted Lag
Retail Customer Revenues 53.36 $4,077.72 84.90% 45.30
IESO Credits 62.71 $614.15 12.79% 8.02
Other External Revenues 32.54 $111.10 2.31% 0.75
Total $4,802.96 100.00% 54.07
The corresponding updated cost of power expense lead summary is shown below
Table 3: Summary of Cost of Power Expenses
Description Lag Days Expenses ($M)
Weighting (%)
Weighted Lag
IESO Cost of Power 32.75 $2,400.15 97.59% 31.96
Hydro One Low Voltage Expense 32.79 $0.35 0.01% 0.00
Payments to Non-Utility Generators 32.89 $0.03 0.00% 0.00
Payments to DG 27.51 $58.88 2.39% 0.66
Total $2,459.40 100.00% 32.62
The corresponding updated HST amounts are shown below
Table 4: Summary of HST Working Capital Amounts
Description HST Lead Time
HST Working Capital Amount ($M)
Revenues -7.86 -$9.74
Cost of Power 46.04 $44.01
OM&A 41.58 $1.54
Total $35.81
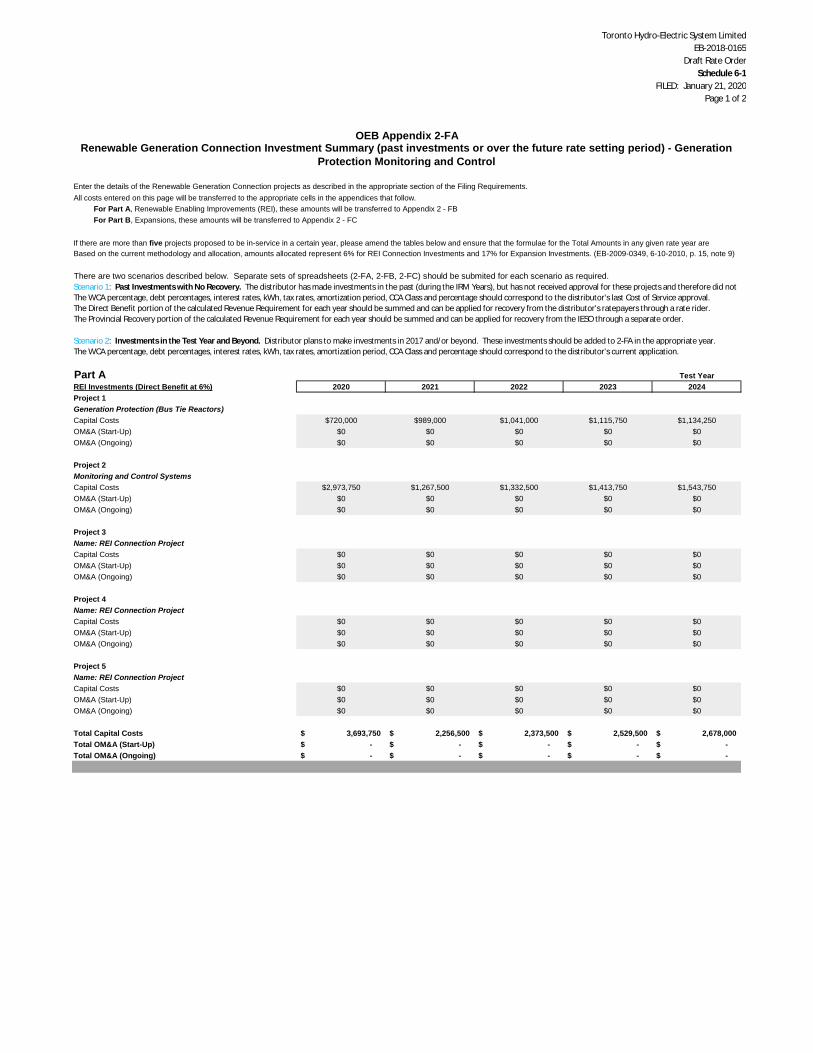
Toronto Hydro-Electric System LimitedEB-2018-0165
Draft Rate OrderSchedule 6-1
FILED: January 21, 2020Page 1 of 2
Part A Test YearREI Investments (Direct Benefit at 6%) 2020 2021 2022 2023 2024Project 1Generation Protection (Bus Tie Reactors)Capital Costs $720,000 $989,000 $1,041,000 $1,115,750 $1,134,250OM&A (Start-Up) $0 $0 $0 $0 $0OM&A (Ongoing) $0 $0 $0 $0 $0
Project 2Monitoring and Control SystemsCapital Costs $2,973,750 $1,267,500 $1,332,500 $1,413,750 $1,543,750OM&A (Start-Up) $0 $0 $0 $0 $0OM&A (Ongoing) $0 $0 $0 $0 $0
Project 3Name: REI Connection ProjectCapital Costs $0 $0 $0 $0 $0OM&A (Start-Up) $0 $0 $0 $0 $0OM&A (Ongoing) $0 $0 $0 $0 $0
Project 4Name: REI Connection ProjectCapital Costs $0 $0 $0 $0 $0OM&A (Start-Up) $0 $0 $0 $0 $0OM&A (Ongoing) $0 $0 $0 $0 $0
Project 5Name: REI Connection ProjectCapital Costs $0 $0 $0 $0 $0OM&A (Start-Up) $0 $0 $0 $0 $0OM&A (Ongoing) $0 $0 $0 $0 $0
Total Capital Costs 3,693,750$ 2,256,500$ 2,373,500$ 2,529,500$ 2,678,000$Total OM&A (Start-Up) -$ -$ -$ -$ -$Total OM&A (Ongoing) -$ -$ -$ -$ -$
The Provincial Recovery portion of the calculated Revenue Requirement for each year should be summed and can be applied for recovery from the IESO through a separate order.
Scenario 2: Investments in the Test Year and Beyond. Distributor plans to make investments in 2017 and/or beyond. These investments should be added to 2-FA in the appropriate year.The WCA percentage, debt percentages, interest rates, kWh, tax rates, amortization period, CCA Class and percentage should correspond to the distributor's current application.
If there are more than five projects proposed to be in-service in a certain year, please amend the tables below and ensure that the formulae for the Total Amounts in any given rate year areBased on the current methodology and allocation, amounts allocated represent 6% for REI Connection Investments and 17% for Expansion Investments. (EB-2009-0349, 6-10-2010, p. 15, note 9)
There are two scenarios described below. Separate sets of spreadsheets (2-FA, 2-FB, 2-FC) should be submited for each scenario as required.Scenario 1: Past Investments with No Recovery. The distributor has made investments in the past (during the IRM Years), but has not received approval for these projects and therefore did notThe WCA percentage, debt percentages, interest rates, kWh, tax rates, amortization period, CCA Class and percentage should correspond to the distributor's last Cost of Service approval.The Direct Benefit portion of the calculated Revenue Requirement for each year should be summed and can be applied for recovery from the distributor's ratepayers through a rate rider.
For Part B, Expansions, these amounts will be transferred to Appendix 2 - FC
OEB Appendix 2-FARenewable Generation Connection Investment Summary (past investments or over the future rate setting period) - Generation
Protection Monitoring and Control
Enter the details of the Renewable Generation Connection projects as described in the appropriate section of the Filing Requirements.All costs entered on this page will be transferred to the appropriate cells in the appendices that follow.
For Part A, Renewable Enabling Improvements (REI), these amounts will be transferred to Appendix 2 - FB
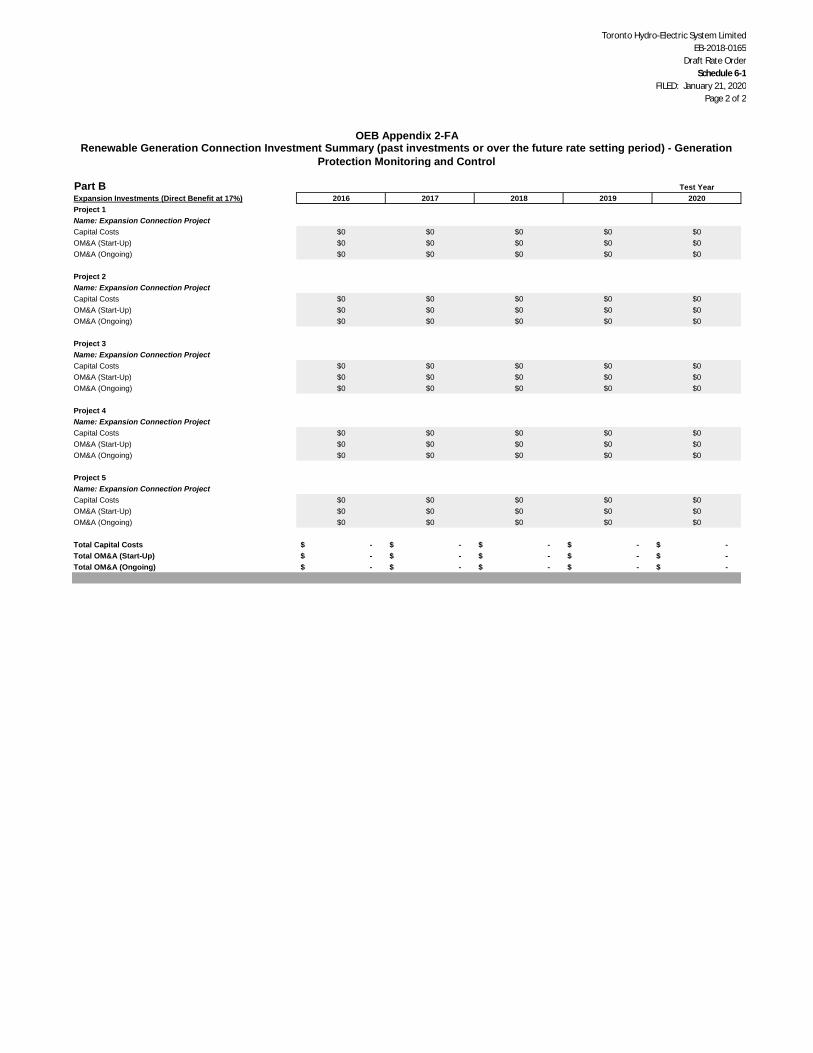
Toronto Hydro-Electric System LimitedEB-2018-0165
Draft Rate OrderSchedule 6-1
FILED: January 21, 2020Page 2 of 2
OEB Appendix 2-FARenewable Generation Connection Investment Summary (past investments or over the future rate setting period) - Generation
Protection Monitoring and Control
Part B Test YearExpansion Investments (Direct Benefit at 17%) 2016 2017 2018 2019 2020Project 1Name: Expansion Connection ProjectCapital Costs $0 $0 $0 $0 $0OM&A (Start-Up) $0 $0 $0 $0 $0OM&A (Ongoing) $0 $0 $0 $0 $0
Project 2Name: Expansion Connection ProjectCapital Costs $0 $0 $0 $0 $0OM&A (Start-Up) $0 $0 $0 $0 $0OM&A (Ongoing) $0 $0 $0 $0 $0
Project 3Name: Expansion Connection ProjectCapital Costs $0 $0 $0 $0 $0OM&A (Start-Up) $0 $0 $0 $0 $0OM&A (Ongoing) $0 $0 $0 $0 $0
Project 4Name: Expansion Connection ProjectCapital Costs $0 $0 $0 $0 $0OM&A (Start-Up) $0 $0 $0 $0 $0OM&A (Ongoing) $0 $0 $0 $0 $0
Project 5Name: Expansion Connection ProjectCapital Costs $0 $0 $0 $0 $0OM&A (Start-Up) $0 $0 $0 $0 $0OM&A (Ongoing) $0 $0 $0 $0 $0
Total Capital Costs -$ -$ -$ -$ -$Total OM&A (Start-Up) -$ -$ -$ -$ -$Total OM&A (Ongoing) -$ -$ -$ -$ -$
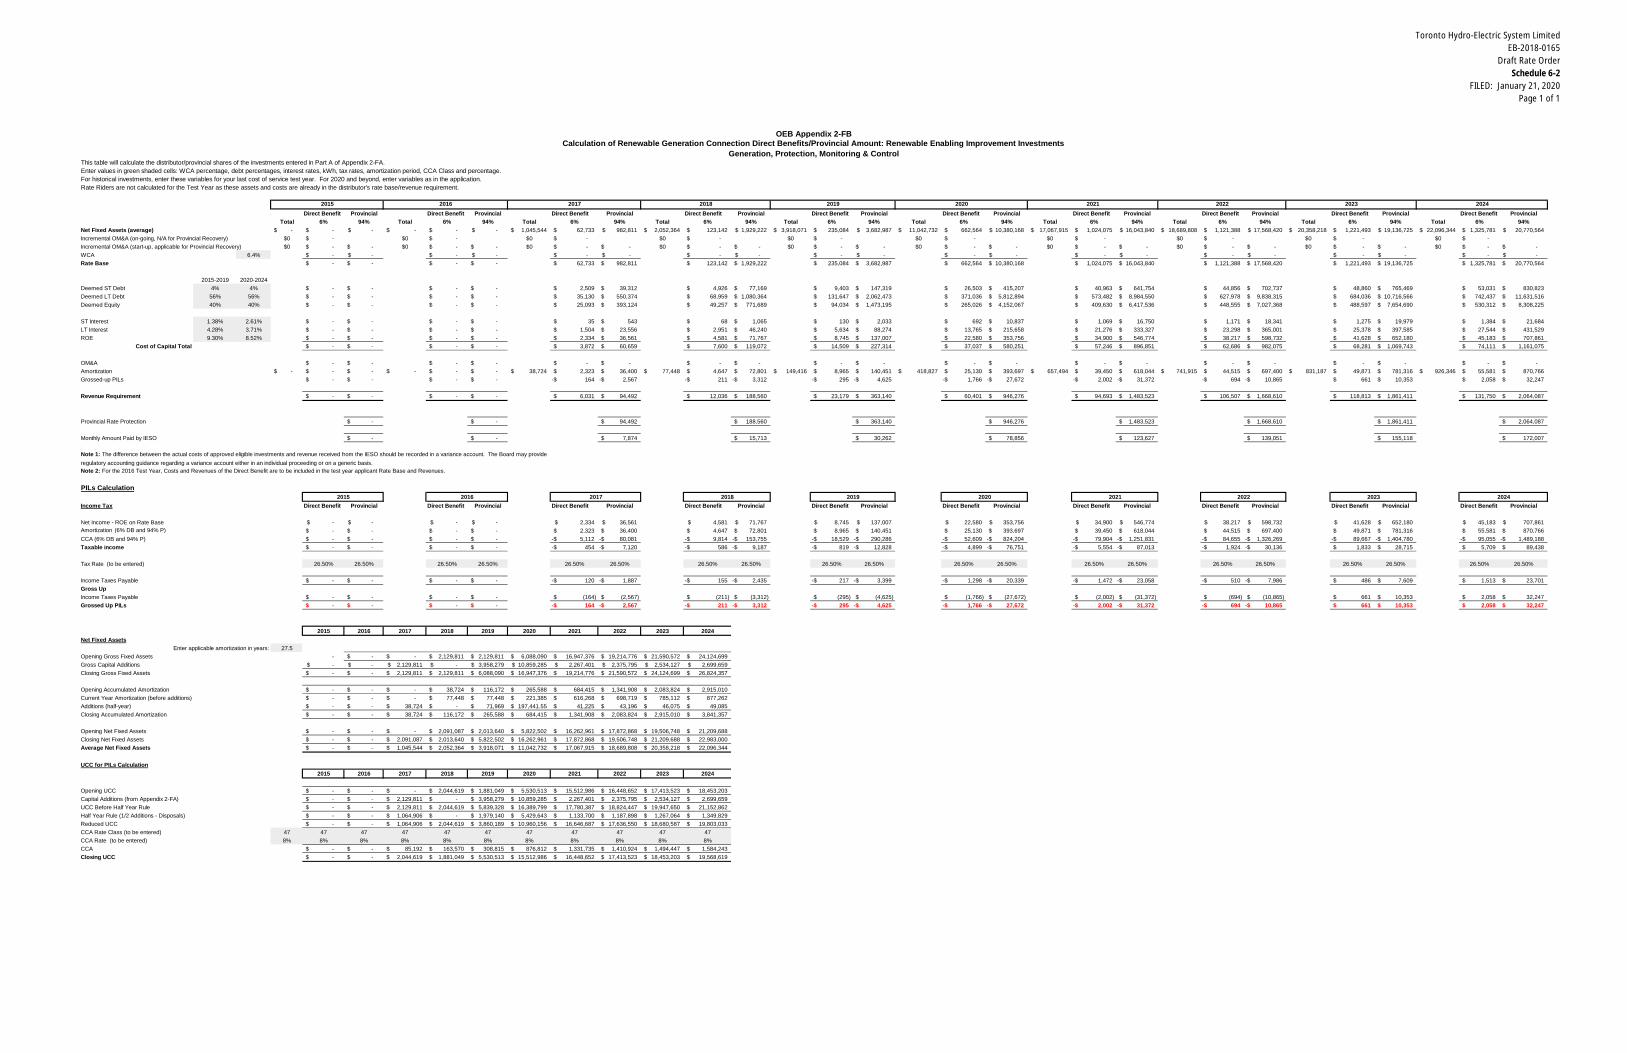
Toronto Hydro-Electric System LimitedEB-2018-0165
Draft Rate OrderSchedule 6-2
FILED: January 21, 2020Page 1 of 1
Enter values in green shaded cells: WCA percentage, debt percentages, interest rates, kWh, tax rates, amortization period, CCA Class and percentage.For historical investments, enter these variables for your last cost of service test year. For 2020 and beyond, enter variables as in the application.Rate Riders are not calculated for the Test Year as these assets and costs are already in the distributor's rate base/revenue requirement.
Direct Benefit Provincial Direct Benefit Provincial Direct Benefit Provincial Direct Benefit Provincial Direct Benefit Provincial Direct Benefit Provincial Direct Benefit Provincial Direct Benefit Provincial Direct Benefit Provincial Direct Benefit ProvincialTotal 6% 94% Total 6% 94% Total 6% 94% Total 6% 94% Total 6% 94% Total 6% 94% Total 6% 94% Total 6% 94% Total 6% 94% Total 6% 94%
Net Fixed Assets (average) -$ -$ -$ -$ -$ -$ 1,045,544$ 62,733$ 982,811$ 2,052,364$ 123,142$ 1,929,222$ 3,918,071$ 235,084$ 3,682,987$ 11,042,732$ 662,564$ 10,380,168$ 17,067,915$ 1,024,075$ 16,043,840$ 18,689,808$ 1,121,388$ 17,568,420$ 20,358,218$ 1,221,493$ 19,136,725$ 22,096,344$ 1,325,781$ 20,770,564$Incremental OM&A (on-going, N/A for Provincial Recovery) $0 -$ $0 -$ $0 -$ $0 -$ $0 -$ $0 -$ $0 -$ $0 -$ $0 -$ $0 -$Incremental OM&A (start-up, applicable for Provincial Recovery) $0 -$ -$ $0 -$ -$ $0 -$ -$ $0 -$ -$ $0 -$ -$ $0 -$ -$ $0 -$ -$ $0 -$ -$ $0 -$ -$ $0 -$ -$WCA 6.4% -$ -$ -$ -$ -$ -$ -$ -$ -$ -$ -$ -$ -$ -$ -$ -$ -$ -$ -$ -$Rate Base -$ -$ -$ -$ 62,733$ 982,811$ 123,142$ 1,929,222$ 235,084$ 3,682,987$ 662,564$ 10,380,168$ 1,024,075$ 16,043,840$ 1,121,388$ 17,568,420$ 1,221,493$ 19,136,725$ 1,325,781$ 20,770,564$
2015-2019 2020-2024Deemed ST Debt 4% 4% -$ -$ -$ -$ 2,509$ 39,312$ 4,926$ 77,169$ 9,403$ 147,319$ 26,503$ 415,207$ 40,963$ 641,754$ 44,856$ 702,737$ 48,860$ 765,469$ 53,031$ 830,823$Deemed LT Debt 56% 56% -$ -$ -$ -$ 35,130$ 550,374$ 68,959$ 1,080,364$ 131,647$ 2,062,473$ 371,036$ 5,812,894$ 573,482$ 8,984,550$ 627,978$ 9,838,315$ 684,036$ 10,716,566$ 742,437$ 11,631,516$Deemed Equity 40% 40% -$ -$ -$ -$ 25,093$ 393,124$ 49,257$ 771,689$ 94,034$ 1,473,195$ 265,026$ 4,152,067$ 409,630$ 6,417,536$ 448,555$ 7,027,368$ 488,597$ 7,654,690$ 530,312$ 8,308,225$
ST Interest 1.38% 2.61% -$ -$ -$ -$ 35$ 543$ 68$ 1,065$ 130$ 2,033$ 692$ 10,837$ 1,069$ 16,750$ 1,171$ 18,341$ 1,275$ 19,979$ 1,384$ 21,684$LT Interest 4.28% 3.71% -$ -$ -$ -$ 1,504$ 23,556$ 2,951$ 46,240$ 5,634$ 88,274$ 13,765$ 215,658$ 21,276$ 333,327$ 23,298$ 365,001$ 25,378$ 397,585$ 27,544$ 431,529$ROE 9.30% 8.52% -$ -$ -$ -$ 2,334$ 36,561$ 4,581$ 71,767$ 8,745$ 137,007$ 22,580$ 353,756$ 34,900$ 546,774$ 38,217$ 598,732$ 41,628$ 652,180$ 45,183$ 707,861$
Cost of Capital Total -$ -$ -$ -$ 3,872$ 60,659$ 7,600$ 119,072$ 14,509$ 227,314$ 37,037$ 580,251$ 57,246$ 896,851$ 62,686$ 982,075$ 68,281$ 1,069,743$ 74,111$ 1,161,075$
OM&A -$ -$ -$ -$ -$ -$ -$ -$ -$ -$ -$ -$ -$ -$ -$ -$ -$ -$ -$ -$Amortization -$ -$ -$ -$ -$ -$ 38,724$ 2,323$ 36,400$ 77,448$ 4,647$ 72,801$ 149,416$ 8,965$ 140,451$ 418,827$ 25,130$ 393,697$ 657,494$ 39,450$ 618,044$ 741,915$ 44,515$ 697,400$ 831,187$ 49,871$ 781,316$ 926,346$ 55,581$ 870,766$Grossed-up PILs -$ -$ -$ -$ 164-$ 2,567-$ 211-$ 3,312-$ 295-$ 4,625-$ 1,766-$ 27,672-$ 2,002-$ 31,372-$ 694-$ 10,865-$ 661$ 10,353$ 2,058$ 32,247$
Revenue Requirement -$ -$ -$ -$ 6,031$ 94,492$ 12,036$ 188,560$ 23,179$ 363,140$ 60,401$ 946,276$ 94,693$ 1,483,523$ 106,507$ 1,668,610$ 118,813$ 1,861,411$ 131,750$ 2,064,087$
Provincial Rate Protection -$ -$ 94,492$ 188,560$ 363,140$ 946,276$ 1,483,523$ 1,668,610$ 1,861,411$ 2,064,087$
Monthly Amount Paid by IESO -$ -$ 7,874$ 15,713$ 30,262$ 78,856$ 123,627$ 139,051$ 155,118$ 172,007$
Note 1: The difference between the actual costs of approved eligible investments and revenue received from the IESO should be recorded in a variance account. The Board may provideregulatory accounting guidance regarding a variance account either in an individual proceeding or on a generic basis.Note 2: For the 2016 Test Year, Costs and Revenues of the Direct Benefit are to be included in the test year applicant Rate Base and Revenues.
PILs Calculation
Income Tax Direct Benefit Provincial Direct Benefit Provincial Direct Benefit Provincial Direct Benefit Provincial Direct Benefit Provincial Direct Benefit Provincial Direct Benefit Provincial Direct Benefit Provincial Direct Benefit Provincial Direct Benefit Provincial
Net Income - ROE on Rate Base -$ -$ -$ -$ 2,334$ 36,561$ 4,581$ 71,767$ 8,745$ 137,007$ 22,580$ 353,756$ 34,900$ 546,774$ 38,217$ 598,732$ 41,628$ 652,180$ 45,183$ 707,861$Amortization (6% DB and 94% P) -$ -$ -$ -$ 2,323$ 36,400$ 4,647$ 72,801$ 8,965$ 140,451$ 25,130$ 393,697$ 39,450$ 618,044$ 44,515$ 697,400$ 49,871$ 781,316$ 55,581$ 870,766$CCA (6% DB and 94% P) -$ -$ -$ -$ 5,112-$ 80,081-$ 9,814-$ 153,755-$ 18,529-$ 290,286-$ 52,609-$ 824,204-$ 79,904-$ 1,251,831-$ 84,655-$ 1,326,269-$ 89,667-$ 1,404,780-$ 95,055-$ 1,489,188-$Taxable income -$ -$ -$ -$ 454-$ 7,120-$ 586-$ 9,187-$ 819-$ 12,828-$ 4,899-$ 76,751-$ 5,554-$ 87,013-$ 1,924-$ 30,136-$ 1,833$ 28,715$ 5,709$ 89,438$
Tax Rate (to be entered) 26.50% 26.50% 26.50% 26.50% 26.50% 26.50% 26.50% 26.50% 26.50% 26.50% 26.50% 26.50% 26.50% 26.50% 26.50% 26.50% 26.50% 26.50% 26.50% 26.50%
Income Taxes Payable -$ -$ -$ -$ 120-$ 1,887-$ 155-$ 2,435-$ 217-$ 3,399-$ 1,298-$ 20,339-$ 1,472-$ 23,058-$ 510-$ 7,986-$ 486$ 7,609$ 1,513$ 23,701$Gross UpIncome Taxes Payable -$ -$ -$ -$ (164)$ (2,567)$ (211)$ (3,312)$ (295)$ (4,625)$ (1,766)$ (27,672)$ (2,002)$ (31,372)$ (694)$ (10,865)$ 661$ 10,353$ 2,058$ 32,247$Grossed Up PILs -$ -$ -$ -$ 164-$ 2,567-$ 211-$ 3,312-$ 295-$ 4,625-$ 1,766-$ 27,672-$ 2,002-$ 31,372-$ 694-$ 10,865-$ 661$ 10,353$ 2,058$ 32,247$
2015 2016 2017 2018 2019 2020 2021 2022 2023 2024Net Fixed Assets
Enter applicable amortization in years: 27.5Opening Gross Fixed Assets - -$ -$ 2,129,811$ 2,129,811$ 6,088,090$ 16,947,376$ 19,214,776$ 21,590,572$ 24,124,699$Gross Capital Additions -$ -$ 2,129,811$ -$ 3,958,279$ 10,859,285$ 2,267,401$ 2,375,795$ 2,534,127$ 2,699,659$Closing Gross Fixed Assets -$ -$ 2,129,811$ 2,129,811$ 6,088,090$ 16,947,376$ 19,214,776$ 21,590,572$ 24,124,699$ 26,824,357$
Opening Accumulated Amortization -$ -$ -$ 38,724$ 116,172$ 265,588$ 684,415$ 1,341,908$ 2,083,824$ 2,915,010$Current Year Amortization (before additions) -$ -$ -$ 77,448$ 77,448$ 221,385$ 616,268$ 698,719$ 785,112$ 877,262$Additions (half-year) -$ -$ 38,724$ -$ 71,969$ 197,441.55$ 41,225$ 43,196$ 46,075$ 49,085$Closing Accumulated Amortization -$ -$ 38,724$ 116,172$ 265,588$ 684,415$ 1,341,908$ 2,083,824$ 2,915,010$ 3,841,357$
Opening Net Fixed Assets -$ -$ -$ 2,091,087$ 2,013,640$ 5,822,502$ 16,262,961$ 17,872,868$ 19,506,748$ 21,209,688$Closing Net Fixed Assets -$ -$ 2,091,087$ 2,013,640$ 5,822,502$ 16,262,961$ 17,872,868$ 19,506,748$ 21,209,688$ 22,983,000$Average Net Fixed Assets -$ -$ 1,045,544$ 2,052,364$ 3,918,071$ 11,042,732$ 17,067,915$ 18,689,808$ 20,358,218$ 22,096,344$
UCC for PILs Calculation2015 2016 2017 2018 2019 2020 2021 2022 2023 2024
Opening UCC -$ -$ -$ 2,044,619$ 1,881,049$ 5,530,513$ 15,512,986$ 16,448,652$ 17,413,523$ 18,453,203$Capital Additions (from Appendix 2-FA) -$ -$ 2,129,811$ -$ 3,958,279$ 10,859,285$ 2,267,401$ 2,375,795$ 2,534,127$ 2,699,659$UCC Before Half Year Rule -$ -$ 2,129,811$ 2,044,619$ 5,839,328$ 16,389,799$ 17,780,387$ 18,824,447$ 19,947,650$ 21,152,862$Half Year Rule (1/2 Additions - Disposals) -$ -$ 1,064,906$ -$ 1,979,140$ 5,429,643$ 1,133,700$ 1,187,898$ 1,267,064$ 1,349,829$Reduced UCC -$ -$ 1,064,906$ 2,044,619$ 3,860,189$ 10,960,156$ 16,646,687$ 17,636,550$ 18,680,587$ 19,803,033$CCA Rate Class (to be entered) 47 47 47 47 47 47 47 47 47 47 47CCA Rate (to be entered) 8% 8% 8% 8% 8% 8% 8% 8% 8% 8% 8%CCA -$ -$ 85,192$ 163,570$ 308,815$ 876,812$ 1,331,735$ 1,410,924$ 1,494,447$ 1,584,243$Closing UCC -$ -$ 2,044,619$ 1,881,049$ 5,530,513$ 15,512,986$ 16,448,652$ 17,413,523$ 18,453,203$ 19,568,619$
2024
2024
2015 2016 2017 2018 2019 2020 2021 2022 2023
OEB Appendix 2-FB
2015 2016 2017 2018 2019 2020 2021 2022 2023
Calculation of Renewable Generation Connection Direct Benefits/Provincial Amount: Renewable Enabling Improvement InvestmentsGeneration, Protection, Monitoring & Control
This table will calculate the distributor/provincial shares of the investments entered in Part A of Appendix 2-FA.
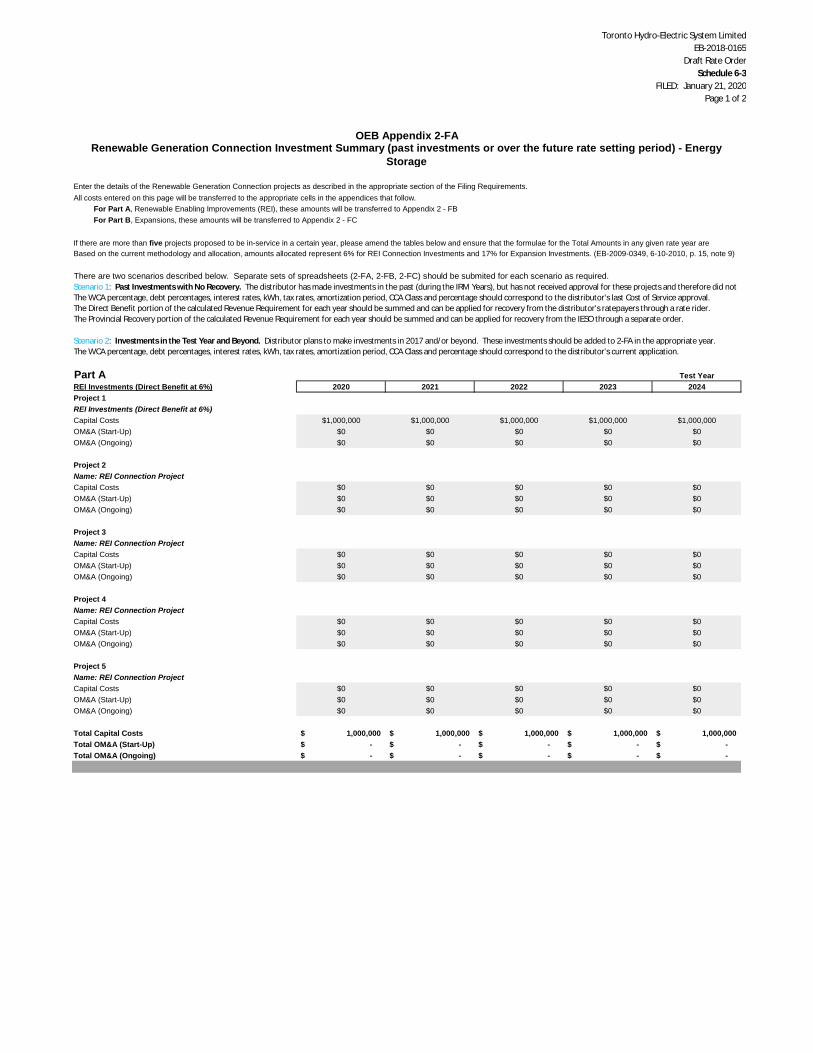
Toronto Hydro-Electric System LimitedEB-2018-0165
Draft Rate OrderSchedule 6-3
FILED: January 21, 2020Page 1 of 2
Part A Test YearREI Investments (Direct Benefit at 6%) 2020 2021 2022 2023 2024Project 1REI Investments (Direct Benefit at 6%)Capital Costs $1,000,000 $1,000,000 $1,000,000 $1,000,000 $1,000,000OM&A (Start-Up) $0 $0 $0 $0 $0OM&A (Ongoing) $0 $0 $0 $0 $0
Project 2Name: REI Connection ProjectCapital Costs $0 $0 $0 $0 $0OM&A (Start-Up) $0 $0 $0 $0 $0OM&A (Ongoing) $0 $0 $0 $0 $0
Project 3Name: REI Connection ProjectCapital Costs $0 $0 $0 $0 $0OM&A (Start-Up) $0 $0 $0 $0 $0OM&A (Ongoing) $0 $0 $0 $0 $0
Project 4Name: REI Connection ProjectCapital Costs $0 $0 $0 $0 $0OM&A (Start-Up) $0 $0 $0 $0 $0OM&A (Ongoing) $0 $0 $0 $0 $0
Project 5Name: REI Connection ProjectCapital Costs $0 $0 $0 $0 $0OM&A (Start-Up) $0 $0 $0 $0 $0OM&A (Ongoing) $0 $0 $0 $0 $0
Total Capital Costs 1,000,000$ 1,000,000$ 1,000,000$ 1,000,000$ 1,000,000$Total OM&A (Start-Up) -$ -$ -$ -$ -$Total OM&A (Ongoing) -$ -$ -$ -$ -$
The Provincial Recovery portion of the calculated Revenue Requirement for each year should be summed and can be applied for recovery from the IESO through a separate order.
Scenario 2: Investments in the Test Year and Beyond. Distributor plans to make investments in 2017 and/or beyond. These investments should be added to 2-FA in the appropriate year.The WCA percentage, debt percentages, interest rates, kWh, tax rates, amortization period, CCA Class and percentage should correspond to the distributor's current application.
If there are more than five projects proposed to be in-service in a certain year, please amend the tables below and ensure that the formulae for the Total Amounts in any given rate year areBased on the current methodology and allocation, amounts allocated represent 6% for REI Connection Investments and 17% for Expansion Investments. (EB-2009-0349, 6-10-2010, p. 15, note 9)
There are two scenarios described below. Separate sets of spreadsheets (2-FA, 2-FB, 2-FC) should be submited for each scenario as required.Scenario 1: Past Investments with No Recovery. The distributor has made investments in the past (during the IRM Years), but has not received approval for these projects and therefore did notThe WCA percentage, debt percentages, interest rates, kWh, tax rates, amortization period, CCA Class and percentage should correspond to the distributor's last Cost of Service approval.The Direct Benefit portion of the calculated Revenue Requirement for each year should be summed and can be applied for recovery from the distributor's ratepayers through a rate rider.
For Part B, Expansions, these amounts will be transferred to Appendix 2 - FC
OEB Appendix 2-FARenewable Generation Connection Investment Summary (past investments or over the future rate setting period) - Energy
Storage
Enter the details of the Renewable Generation Connection projects as described in the appropriate section of the Filing Requirements.All costs entered on this page will be transferred to the appropriate cells in the appendices that follow.
For Part A, Renewable Enabling Improvements (REI), these amounts will be transferred to Appendix 2 - FB

Toronto Hydro-Electric System LimitedEB-2018-0165
Draft Rate OrderSchedule 6-3
FILED: January 21, 2020Page 2 of 2
OEB Appendix 2-FARenewable Generation Connection Investment Summary (past investments or over the future rate setting period) - Energy
Storage
Part B Test YearExpansion Investments (Direct Benefit at 17%) 2016 2017 2018 2019 2020Project 1Name: Expansion Connection ProjectCapital Costs $0 $0 $0 $0 $0OM&A (Start-Up) $0 $0 $0 $0 $0OM&A (Ongoing) $0 $0 $0 $0 $0
Project 2Name: Expansion Connection ProjectCapital Costs $0 $0 $0 $0 $0OM&A (Start-Up) $0 $0 $0 $0 $0OM&A (Ongoing) $0 $0 $0 $0 $0
Project 3Name: Expansion Connection ProjectCapital Costs $0 $0 $0 $0 $0OM&A (Start-Up) $0 $0 $0 $0 $0OM&A (Ongoing) $0 $0 $0 $0 $0
Project 4Name: Expansion Connection ProjectCapital Costs $0 $0 $0 $0 $0OM&A (Start-Up) $0 $0 $0 $0 $0OM&A (Ongoing) $0 $0 $0 $0 $0
Project 5Name: Expansion Connection ProjectCapital Costs $0 $0 $0 $0 $0OM&A (Start-Up) $0 $0 $0 $0 $0OM&A (Ongoing) $0 $0 $0 $0 $0
Total Capital Costs -$ -$ -$ -$ -$Total OM&A (Start-Up) -$ -$ -$ -$ -$Total OM&A (Ongoing) -$ -$ -$ -$ -$
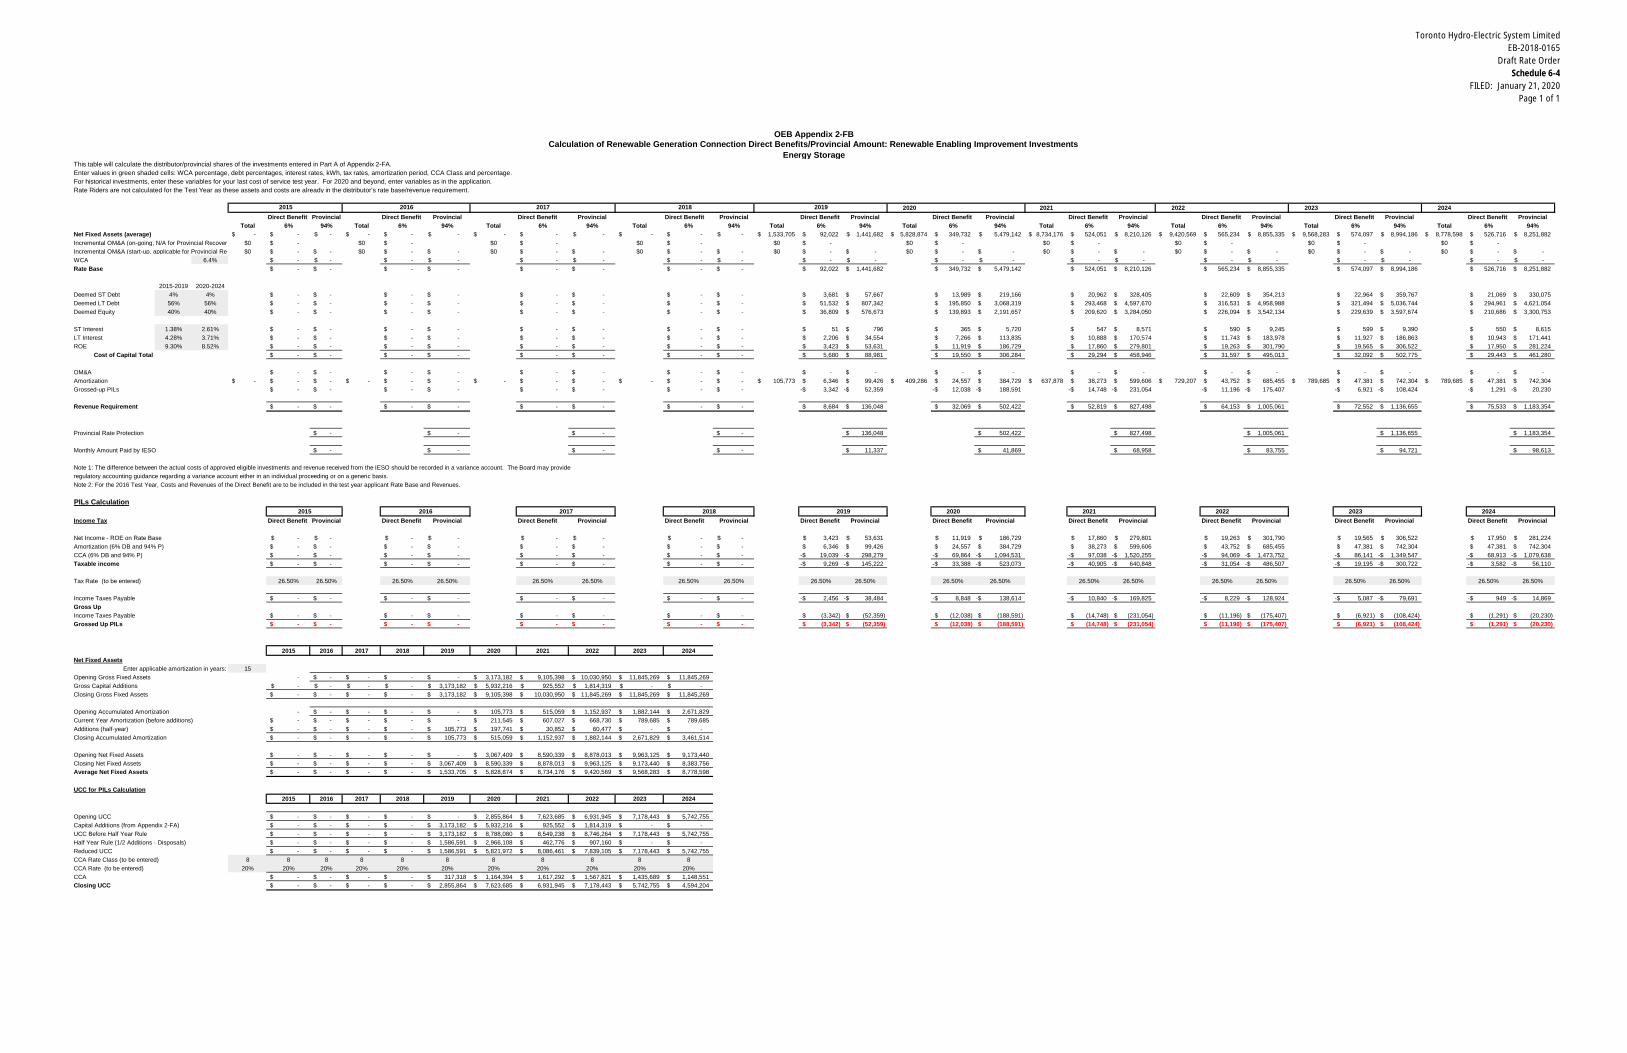
Toronto Hydro-Electric System LimitedEB-2018-0165
Draft Rate OrderSchedule 6-4
FILED: January 21, 2020Page 1 of 1
This table will calculate the distributor/provincial shares of the investments entered in Part A of Appendix 2-FA.Enter values in green shaded cells: WCA percentage, debt percentages, interest rates, kWh, tax rates, amortization period, CCA Class and percentage.For historical investments, enter these variables for your last cost of service test year. For 2020 and beyond, enter variables as in the application.Rate Riders are not calculated for the Test Year as these assets and costs are already in the distributor's rate base/revenue requirement.
2020 2021 2022 2023 2024Direct Benefit Provincial Direct Benefit Provincial Direct Benefit Provincial Direct Benefit Provincial Direct Benefit Provincial Direct Benefit Provincial Direct Benefit Provincial Direct Benefit Provincial Direct Benefit Provincial Direct Benefit Provincial
Total 6% 94% Total 6% 94% Total 6% 94% Total 6% 94% Total 6% 94% Total 6% 94% Total 6% 94% Total 6% 94% Total 6% 94% Total 6% 94%Net Fixed Assets (average) -$ -$ -$ -$ -$ -$ -$ -$ -$ -$ -$ -$ 1,533,705$ 92,022$ 1,441,682$ 5,828,874$ 349,732$ 5,479,142$ 8,734,176$ 524,051$ 8,210,126$ 9,420,569$ 565,234$ 8,855,335$ 9,568,283$ 574,097$ 8,994,186$ 8,778,598$ 526,716$ 8,251,882$Incremental OM&A (on-going, N/A for Provincial Recovery) $0 -$ $0 -$ $0 -$ $0 -$ $0 -$ $0 -$ $0 -$ $0 -$ $0 -$ $0 -$Incremental OM&A (start-up, applicable for Provincial Recovery)$0 -$ -$ $0 -$ -$ $0 -$ -$ $0 -$ -$ $0 -$ -$ $0 -$ -$ $0 -$ -$ $0 -$ -$ $0 -$ -$ $0 -$ -$WCA 6.4% -$ -$ -$ -$ -$ -$ -$ -$ -$ -$ -$ -$ -$ -$ -$ -$ -$ -$ -$ -$Rate Base -$ -$ -$ -$ -$ -$ -$ -$ 92,022$ 1,441,682$ 349,732$ 5,479,142$ 524,051$ 8,210,126$ 565,234$ 8,855,335$ 574,097$ 8,994,186$ 526,716$ 8,251,882$
2015-2019 2020-2024Deemed ST Debt 4% 4% -$ -$ -$ -$ -$ -$ -$ -$ 3,681$ 57,667$ 13,989$ 219,166$ 20,962$ 328,405$ 22,609$ 354,213$ 22,964$ 359,767$ 21,069$ 330,075$Deemed LT Debt 56% 56% -$ -$ -$ -$ -$ -$ -$ -$ 51,532$ 807,342$ 195,850$ 3,068,319$ 293,468$ 4,597,670$ 316,531$ 4,958,988$ 321,494$ 5,036,744$ 294,961$ 4,621,054$Deemed Equity 40% 40% -$ -$ -$ -$ -$ -$ -$ -$ 36,809$ 576,673$ 139,893$ 2,191,657$ 209,620$ 3,284,050$ 226,094$ 3,542,134$ 229,639$ 3,597,674$ 210,686$ 3,300,753$
ST Interest 1.38% 2.61% -$ -$ -$ -$ -$ -$ -$ -$ 51$ 796$ 365$ 5,720$ 547$ 8,571$ 590$ 9,245$ 599$ 9,390$ 550$ 8,615$LT Interest 4.28% 3.71% -$ -$ -$ -$ -$ -$ -$ -$ 2,206$ 34,554$ 7,266$ 113,835$ 10,888$ 170,574$ 11,743$ 183,978$ 11,927$ 186,863$ 10,943$ 171,441$ROE 9.30% 8.52% -$ -$ -$ -$ -$ -$ -$ -$ 3,423$ 53,631$ 11,919$ 186,729$ 17,860$ 279,801$ 19,263$ 301,790$ 19,565$ 306,522$ 17,950$ 281,224$
Cost of Capital Total -$ -$ -$ -$ -$ -$ -$ -$ 5,680$ 88,981$ 19,550$ 306,284$ 29,294$ 458,946$ 31,597$ 495,013$ 32,092$ 502,775$ 29,443$ 461,280$
OM&A -$ -$ -$ -$ -$ -$ -$ -$ -$ -$ -$ -$ -$ -$ -$ -$ -$ -$ -$ -$Amortization -$ -$ -$ -$ -$ -$ -$ -$ -$ -$ -$ -$ 105,773$ 6,346$ 99,426$ 409,286$ 24,557$ 384,729$ 637,878$ 38,273$ 599,606$ 729,207$ 43,752$ 685,455$ 789,685$ 47,381$ 742,304$ 789,685$ 47,381$ 742,304$Grossed-up PILs -$ -$ -$ -$ -$ -$ -$ -$ 3,342-$ 52,359-$ 12,038-$ 188,591-$ 14,748-$ 231,054-$ 11,196-$ 175,407-$ 6,921-$ 108,424-$ 1,291-$ 20,230-$
Revenue Requirement -$ -$ -$ -$ -$ -$ -$ -$ 8,684$ 136,048$ 32,069$ 502,422$ 52,819$ 827,498$ 64,153$ 1,005,061$ 72,552$ 1,136,655$ 75,533$ 1,183,354$
Provincial Rate Protection -$ -$ -$ -$ 136,048$ 502,422$ 827,498$ 1,005,061$ 1,136,655$ 1,183,354$
Monthly Amount Paid by IESO -$ -$ -$ -$ 11,337$ 41,869$ 68,958$ 83,755$ 94,721$ 98,613$
Note 1: The difference between the actual costs of approved eligible investments and revenue received from the IESO should be recorded in a variance account. The Board may provideregulatory accounting guidance regarding a variance account either in an individual proceeding or on a generic basis.Note 2: For the 2016 Test Year, Costs and Revenues of the Direct Benefit are to be included in the test year applicant Rate Base and Revenues.
PILs Calculation2020 2021 2022 2023 2024
Income Tax Direct Benefit Provincial Direct Benefit Provincial Direct Benefit Provincial Direct Benefit Provincial Direct Benefit Provincial Direct Benefit Provincial Direct Benefit Provincial Direct Benefit Provincial Direct Benefit Provincial Direct Benefit Provincial
Net Income - ROE on Rate Base -$ -$ -$ -$ -$ -$ -$ -$ 3,423$ 53,631$ 11,919$ 186,729$ 17,860$ 279,801$ 19,263$ 301,790$ 19,565$ 306,522$ 17,950$ 281,224$Amortization (6% DB and 94% P) -$ -$ -$ -$ -$ -$ -$ -$ 6,346$ 99,426$ 24,557$ 384,729$ 38,273$ 599,606$ 43,752$ 685,455$ 47,381$ 742,304$ 47,381$ 742,304$CCA (6% DB and 94% P) -$ -$ -$ -$ -$ -$ -$ -$ 19,039-$ 298,279-$ 69,864-$ 1,094,531-$ 97,038-$ 1,520,255-$ 94,069-$ 1,473,752-$ 86,141-$ 1,349,547-$ 68,913-$ 1,079,638-$Taxable income -$ -$ -$ -$ -$ -$ -$ -$ 9,269-$ 145,222-$ 33,388-$ 523,073-$ 40,905-$ 640,848-$ 31,054-$ 486,507-$ 19,195-$ 300,722-$ 3,582-$ 56,110-$
Tax Rate (to be entered) 26.50% 26.50% 26.50% 26.50% 26.50% 26.50% 26.50% 26.50% 26.50% 26.50% 26.50% 26.50% 26.50% 26.50% 26.50% 26.50% 26.50% 26.50% 26.50% 26.50%
Income Taxes Payable -$ -$ -$ -$ -$ -$ -$ -$ 2,456-$ 38,484-$ 8,848-$ 138,614-$ 10,840-$ 169,825-$ 8,229-$ 128,924-$ 5,087-$ 79,691-$ 949-$ 14,869-$Gross UpIncome Taxes Payable -$ -$ -$ -$ -$ -$ -$ -$ (3,342)$ (52,359)$ (12,038)$ (188,591)$ (14,748)$ (231,054)$ (11,196)$ (175,407)$ (6,921)$ (108,424)$ (1,291)$ (20,230)$Grossed Up PILs -$ -$ -$ -$ -$ -$ -$ -$ (3,342)$ (52,359)$ (12,038)$ (188,591)$ (14,748)$ (231,054)$ (11,196)$ (175,407)$ (6,921)$ (108,424)$ (1,291)$ (20,230)$
2015 2016 2017 2018 2019 2020 2021 2022 2023 2024Net Fixed Assets
Enter applicable amortization in years: 15Opening Gross Fixed Assets - -$ -$ -$ -$ 3,173,182$ 9,105,398$ 10,030,950$ 11,845,269$ 11,845,269$Gross Capital Additions -$ -$ -$ -$ 3,173,182$ 5,932,216$ 925,552$ 1,814,319$ -$ -$Closing Gross Fixed Assets -$ -$ -$ -$ 3,173,182$ 9,105,398$ 10,030,950$ 11,845,269$ 11,845,269$ 11,845,269$
Opening Accumulated Amortization - -$ -$ -$ -$ 105,773$ 515,059$ 1,152,937$ 1,882,144$ 2,671,829$Current Year Amortization (before additions) -$ -$ -$ -$ -$ 211,545$ 607,027$ 668,730$ 789,685$ 789,685$Additions (half-year) -$ -$ -$ -$ 105,773$ 197,741$ 30,852$ 60,477$ -$ -$Closing Accumulated Amortization -$ -$ -$ -$ 105,773$ 515,059$ 1,152,937$ 1,882,144$ 2,671,829$ 3,461,514$
Opening Net Fixed Assets -$ -$ -$ -$ -$ 3,067,409$ 8,590,339$ 8,878,013$ 9,963,125$ 9,173,440$Closing Net Fixed Assets -$ -$ -$ -$ 3,067,409$ 8,590,339$ 8,878,013$ 9,963,125$ 9,173,440$ 8,383,756$Average Net Fixed Assets -$ -$ -$ -$ 1,533,705$ 5,828,874$ 8,734,176$ 9,420,569$ 9,568,283$ 8,778,598$
UCC for PILs Calculation2015 2016 2017 2018 2019 2020 2021 2022 2023 2024
Opening UCC -$ -$ -$ -$ -$ 2,855,864$ 7,623,685$ 6,931,945$ 7,178,443$ 5,742,755$Capital Additions (from Appendix 2-FA) -$ -$ -$ -$ 3,173,182$ 5,932,216$ 925,552$ 1,814,319$ -$ -$UCC Before Half Year Rule -$ -$ -$ -$ 3,173,182$ 8,788,080$ 8,549,238$ 8,746,264$ 7,178,443$ 5,742,755$Half Year Rule (1/2 Additions - Disposals) -$ -$ -$ -$ 1,586,591$ 2,966,108$ 462,776$ 907,160$ -$ -$Reduced UCC -$ -$ -$ -$ 1,586,591$ 5,821,972$ 8,086,461$ 7,839,105$ 7,178,443$ 5,742,755$CCA Rate Class (to be entered) 8 8 8 8 8 8 8 8 8 8 8CCA Rate (to be entered) 20% 20% 20% 20% 20% 20% 20% 20% 20% 20% 20%CCA -$ -$ -$ -$ 317,318$ 1,164,394$ 1,617,292$ 1,567,821$ 1,435,689$ 1,148,551$Closing UCC -$ -$ -$ -$ 2,855,864$ 7,623,685$ 6,931,945$ 7,178,443$ 5,742,755$ 4,594,204$
OEB Appendix 2-FB
2015 2016 2017 2018 2019
2015 2016 2017 2018 2019
Calculation of Renewable Generation Connection Direct Benefits/Provincial Amount: Renewable Enabling Improvement InvestmentsEnergy Storage
Toronto Hydro-Electric System LimitedEB-2018-0165
Draft Rate OrderSchedule 7
FILED: January 21, 2020Page 1 of 2
(in $ Millions)
Last Rebasing Year(2015 Board-
Approved)2015 Actuals 2016 Actuals 2017 Actuals 2018 Actuals 2019 Bridge
Year Test Year
Reporting Basis MIFRS MIFRS MIFRS MIFRS MIFRS MIFRS MIFRS Operations - $ 48.6 $ 56.9 $ 55.1 $ 57.7 $ 61.2 $ 59.9 Maintenance - $ 67.1 $ 63.1 $ 64.3 $ 74.0 $ 67.1 $ 66.3 SubTotal - $ 115.7 $ 120.0 $ 119.3 $ 131.7 $ 128.3 $ 126.3%Change (year over year) 3.7% -0.5% 10.4% -2.6% -1.6%%Change (Test Year vs Last Rebasing Year - Actual) 9.1% Billing and Collecting - $ 36.7 $ 33.4 $ 34.9 $ 32.5 $ 38.4 $ 38.0 Community Relations - $ 3.5 $ 2.5 $ 2.3 $ 2.4 $ 2.7 $ 2.7 Administrative and General - $ 81.9 $ 88.3 $ 92.5 $ 95.9 $ 92.0 $ 93.1 Taxes Other Than Income Taxes - $ 5.2 $ 4.6 $ 5.3 $ 4.9 $ 5.4 $ 5.4 Donations - $ 1.0 $ 1.0 $ 1.0 $ 0.8 $ 1.1 $ 1.0 SubTotal - $ 128.3 $ 129.9 $ 135.9 $ 136.6 $ 139.6 $ 140.2%Change (year over year) 1.2% 4.7% 0.5% 2.2% 0.4%%Change (Test Year vsLast Rebasing Year - Actual) 9.3%
Total $ 243.9 $ 244.0 $ 249.8 $ 255.3 $ 268.3 $ 267.9 $ 266.5%Change (year over year) 2.4% 2.2% 5.1% -0.1% -0.5% Cash vs. Accrual OPEB and Monthly Billing - - - - - - $ 5.7Total - including Cash vs. Accrual OPEB and Monthly Billing $ 243.9 $ 244.0 $ 249.8 $ 255.3 $ 268.3 $ 267.9 $ 272.2%Change (year over year) 2.4% 2.2% 5.1% -0.1% 1.6%
Last Rebasing Year(2015 Board-
Approved)2015 Actuals 2016 Actuals 2017 Actuals 2018 Actuals 2019 Bridge Year Test Year
Operations - $ 48.6 $ 56.9 $ 55.1 $ 57.7 $ 61.2 $ 59.9 Maintenance - $ 67.1 $ 63.1 $ 64.3 $ 74.0 $ 67.1 $ 66.3 Billing and Collecting - $ 36.7 $ 33.4 $ 34.9 $ 32.5 $ 38.4 $ 38.0 Community Relations - $ 3.5 $ 2.5 $ 2.3 $ 2.4 $ 2.7 $ 2.7 Administrative and General - $ 81.9 $ 88.3 $ 92.5 $ 95.9 $ 92.0 $ 93.1 Taxes Other Than Income Taxes - $ 5.2 $ 4.6 $ 5.3 $ 4.9 $ 5.4 $ 5.4 Donations - $ 1.0 $ 1.0 $ 1.0 $ 0.8 $ 1.1 $ 1.0Cash vs. Accrual OPEB and Monthly Billing - - - - - - $ 5.7 Total $ 243.9 $ 244.0 $ 249.8 $ 255.3 $ 268.3 $ 267.9 $ 272.2%Change (year over year) 2.4% 2.2% 5.1% -0.1% 1.6%
OEB Appendix 2-JASummary of Recoverable OM&A Expenses
Toronto Hydro-Electric System LimitedEB-2018-0165
Draft Rate OrderSchedule 7
FILED: January 21, 2020Page 2 of 2
OEB Appendix 2-JASummary of Recoverable OM&A Expenses
Last Rebasing Year(2015 Board-
Approved)2015 Actuals Variance 2015 BA
- 2015 Actuals 2016 ActualsVariance 2016
Actuals vs. 2015Actuals
2017 ActualsVariance 2017
Actuals vs. 2016Actuals
2018 ActualsVariance 2018
Actuals vs.2017 Actuals
2019 BridgeYear
Variance 2019Bridge vs.
2018 ActualsTest Year
Variance 2020Test vs. 2019
Bridge Operations - $ 48.6 $ (48.6) $ 56.9 $ 8.3 $ 55.1 $ (1.9) $ 57.7 $ 2.7 $ 61.2 $ 3.5 $ 59.9 $ (1.3) Maintenance - $ 67.1 $ (67.1) $ 63.1 $ (4.1) $ 64.3 $ 1.2 $ 74.0 $ 9.7 $ 67.1 $ (6.9) $ 66.3 $ (0.8) Billing and Collecting - $ 36.7 $ (36.7) $ 33.4 $ (3.4) $ 34.9 $ 1.5 $ 32.5 $ (2.4) $ 38.4 $ 5.9 $ 38.0 $ (0.5) Community Relations - $ 3.5 $ (3.5) $ 2.5 $ (1.0) $ 2.3 $ (0.2) $ 2.4 $ 0.1 $ 2.7 $ 0.3 $ 2.7 $ 0.0 Administrative and General - $ 81.9 $ (81.9) $ 88.3 $ 6.4 $ 92.5 $ 4.1 $ 95.9 $ 3.5 $ 92.0 $ (3.9) $ 93.1 $ 1.1 Taxes Other Than Income Taxes - $ 5.2 $ (5.2) $ 4.6 $ (0.5) $ 5.3 $ 0.6 $ 4.9 $ (0.4) $ 5.4 $ 0.5 $ 5.4 $ 0.0 Donations - $ 1.0 $ (1.0) $ 1.0 $ (0.0) $ 1.0 $ (0.0) $ 0.8 $ (0.1) $ 1.1 $ 0.3 $ 1.0 $ (0.1) Cash vs. Accrual OPEB and Monthly Billing - - - - - - - - - - - $ 5.7 $ 5.7 Total OM&A Expenses $ 243.9 $ 244.0 $ (244.0) $ 249.8 $ 5.8 $ 255.3 $ 5.4 $ 268.3 $ 13.0 $ 267.9 $ (0.4) $ 272.2 $ 4.3 Adjustments for Total non-recoverable items (from Appendices2-JA and 2-JB) - - - - - - - - - - - - -
Total Recoverable OM&A Expenses $ 243.9 $ 244.0 $ (244.0) $ 249.8 $ 5.8 $ 255.3 $ 5.4 $ 268.3 $ 13.0 $ 267.9 $ (0.4) $ 272.2 $ 4.3 Variance from previous year $ 5.8 $ 5.4 $ 13.0 $ (0.4) $ 4.3Percent change (year over year) 2.4% 2.2% 5.1% -0.1% 1.6%Percent Change:Test year vs. Most Current Actual 1.6%
Simple average of % variance for all years 2.2%Compound Annual Growth Rate for all years 2.2%
Toronto Hydro-Electric System LimitedEB-2018-0165
Draft Rate OrderSchedule 8
FILED: January 21, 2020Page 1 of 1
OEB Appendix 2-KEMPLOYEE COSTS/ COMPENSATION TABLE
2015 Actuals 2016 Actuals 2017 Actuals 2018 Actuals 2019 Bridge 2020 TestNumber of Employees (FTEs including Part-Time)
Management (including executive) 61 69 69 72 68 66Non-Management (union and non-union) 1422 1415 1403 1353 1455 1393
TOTAL 1483 1484 1473 1425 1523 1459Total Salary and Wages (including overtime and incentive pay)
Management (including executive) 12,292,778$ 14,152,809$ 14,971,880$ 15,718,629$ 15,478,739$ 15,429,296$Non-Management (union and non-union) 145,975,363$ 146,148,053$ 148,139,852$ 151,009,285$ 160,518,242$ 157,815,545$
TOTAL 158,268,141$ 160,300,862$ 163,111,731$ 166,727,914$ 175,996,982$ 173,244,841$Total Benefits (Current + Accrued)
Management (including executive) 3,573,323$ 3,919,134$ 4,202,856$ 4,306,945$ 4,646,449$ 4,956,127$Non-Management (union and non-union) 49,254,110$ 48,138,488$ 49,111,532$ 46,686,723$ 52,253,105$ 54,962,965$
TOTAL 52,827,432$ 52,057,622$ 53,314,387$ 50,993,668$ 56,899,554$ 59,919,093$Total Compensation (Salary, Wages, & Benefits)
Management (including executive) 15,866,100$ 18,071,943$ 19,174,735$ 20,025,575$ 20,125,188$ 20,385,423$Non-Management (union and non-union) 195,229,473$ 194,286,540$ 197,251,383$ 197,696,008$ 212,771,347$ 212,778,511$
TOTAL 211,095,573$ 212,358,484$ 216,426,119$ 217,721,582$ 232,896,535$ 233,163,934$
Toronto Hydro-Electric System Limited
EB-2018-0165
Draft Rate Order
Schedule 9
UPDATED: February 12, 2020
Page 1 of 24
Version 1.10
Utility Name
Assigned EB Number
Name and Title
Phone Number
Email Address
Date
Last COS Re-based Year 2015
Note: Drop-down lists are shaded blue; Input cells are shaded green.
Toronto Hydro-Electric System Limited
This Workbook Model is protected by copyright and is being made available to you solely for the purpose of filing your rate application. You may use and copy this model for that purpose, and provide a copy of this model to any person that is advising or assisting you in that regard. Except as indicated above, any copying, reproduction, publication, sale, adaptation, translation, modification, reverse engineering or other use or dissemination of this model without the express written consent of the Ontario Energy Board is prohibited. If you provide a copy of this model to a person that is advising or assisting you in preparing the application or reviewing your draft rate order, you must ensure that the person understands and agrees to the restrictions noted above.
While this model has been provided in Excel format and is required to be filed with the applications, the onus remains on the applicant to ensure the accuracy of the data and the results.
Ontario Energy Board
1. Info and Instructions
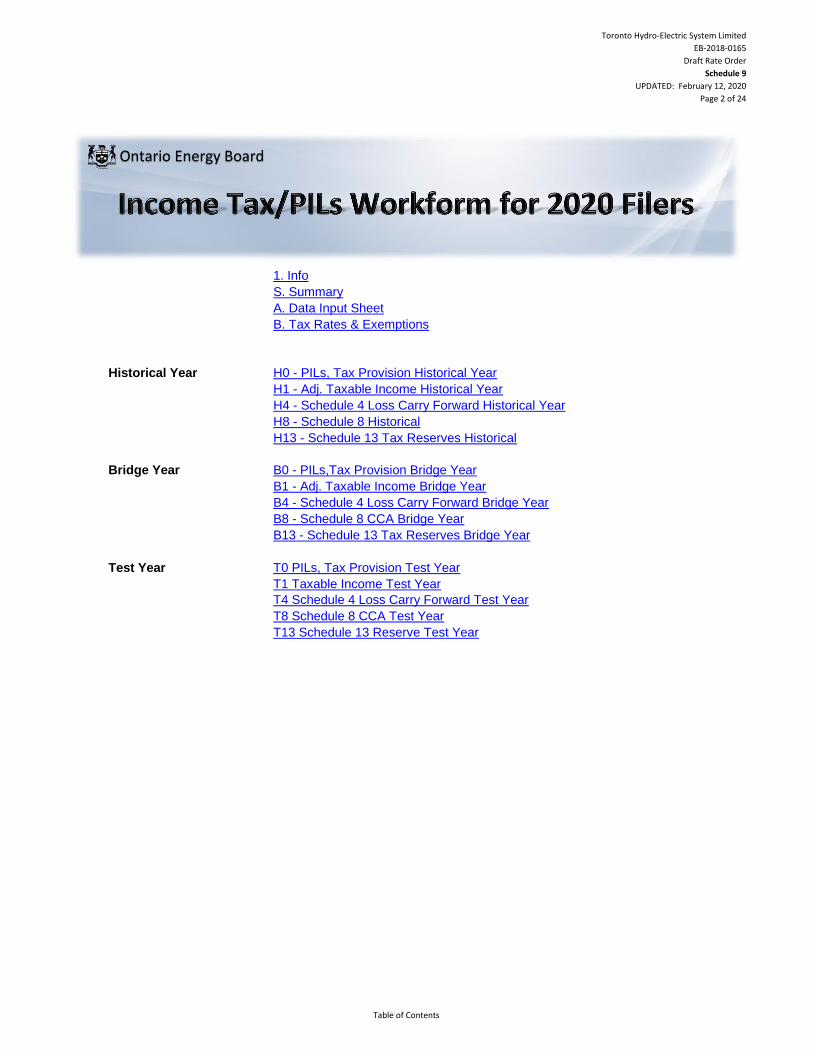
Toronto Hydro-Electric System Limited
EB-2018-0165
Draft Rate Order
Schedule 9
UPDATED: February 12, 2020
Page 2 of 24
1. Info
S. Summary
A. Data Input Sheet
B. Tax Rates & Exemptions
Historical Year H0 - PILs, Tax Provision Historical Year
H1 - Adj. Taxable Income Historical Year
H4 - Schedule 4 Loss Carry Forward Historical Year
H8 - Schedule 8 Historical
H13 - Schedule 13 Tax Reserves Historical
Bridge Year B0 - PILs,Tax Provision Bridge Year
B1 - Adj. Taxable Income Bridge Year
B4 - Schedule 4 Loss Carry Forward Bridge Year
B8 - Schedule 8 CCA Bridge Year
B13 - Schedule 13 Tax Reserves Bridge Year
Test Year T0 PILs, Tax Provision Test Year
T1 Taxable Income Test Year
T4 Schedule 4 Loss Carry Forward Test Year
T8 Schedule 8 CCA Test Year
T13 Schedule 13 Reserve Test Year
Ontario Energy Board
Table of Contents
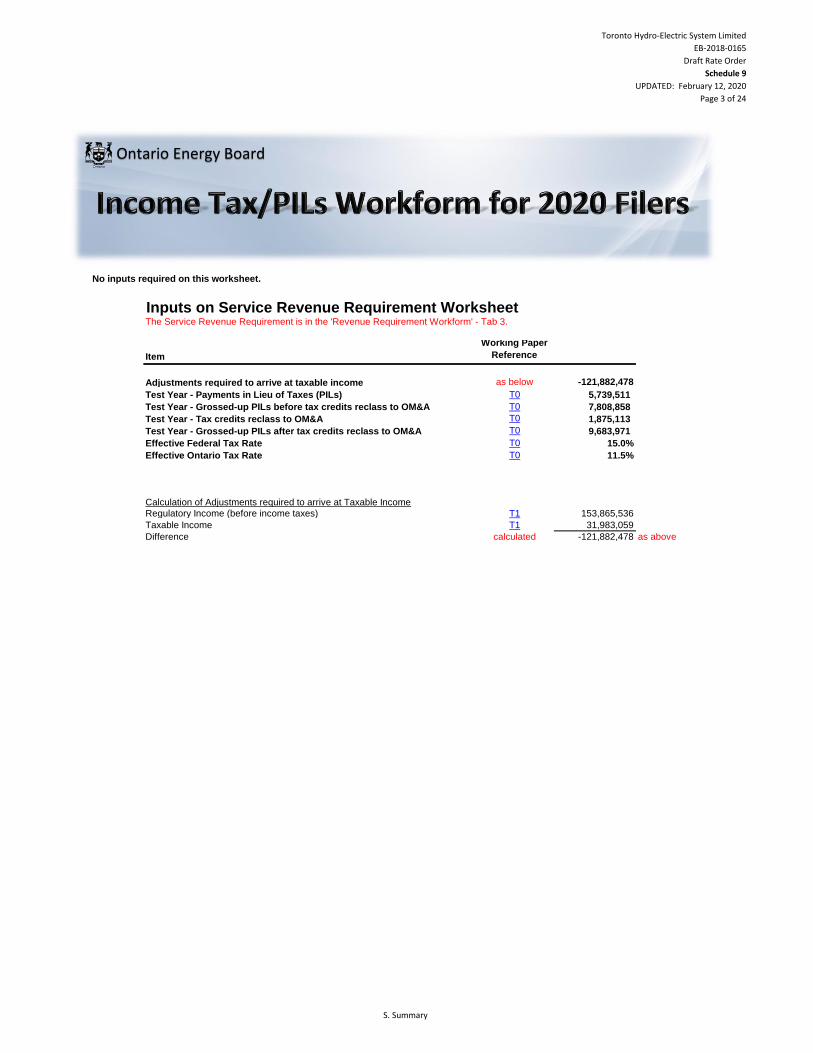
Toronto Hydro-Electric System Limited
EB-2018-0165
Draft Rate Order
Schedule 9
UPDATED: February 12, 2020
Page 3 of 24
No inputs required on this worksheet.
Inputs on Service Revenue Requirement WorksheetThe Service Revenue Requirement is in the 'Revenue Requirement Workform' - Tab 3.
Item
Working Paper
Reference
Adjustments required to arrive at taxable income as below -121,882,478
Test Year - Payments in Lieu of Taxes (PILs) T0 5,739,511
Test Year - Grossed-up PILs before tax credits reclass to OM&A T0 7,808,858
Test Year - Tax credits reclass to OM&A T0 1,875,113
Test Year - Grossed-up PILs after tax credits reclass to OM&A T0 9,683,971
Effective Federal Tax Rate T0 15.0%
Effective Ontario Tax Rate T0 11.5%
Calculation of Adjustments required to arrive at Taxable Income
Regulatory Income (before income taxes) T1 153,865,536
Taxable Income T1 31,983,059
Difference calculated -121,882,478 as above
Ontario Energy Board
S. Summary
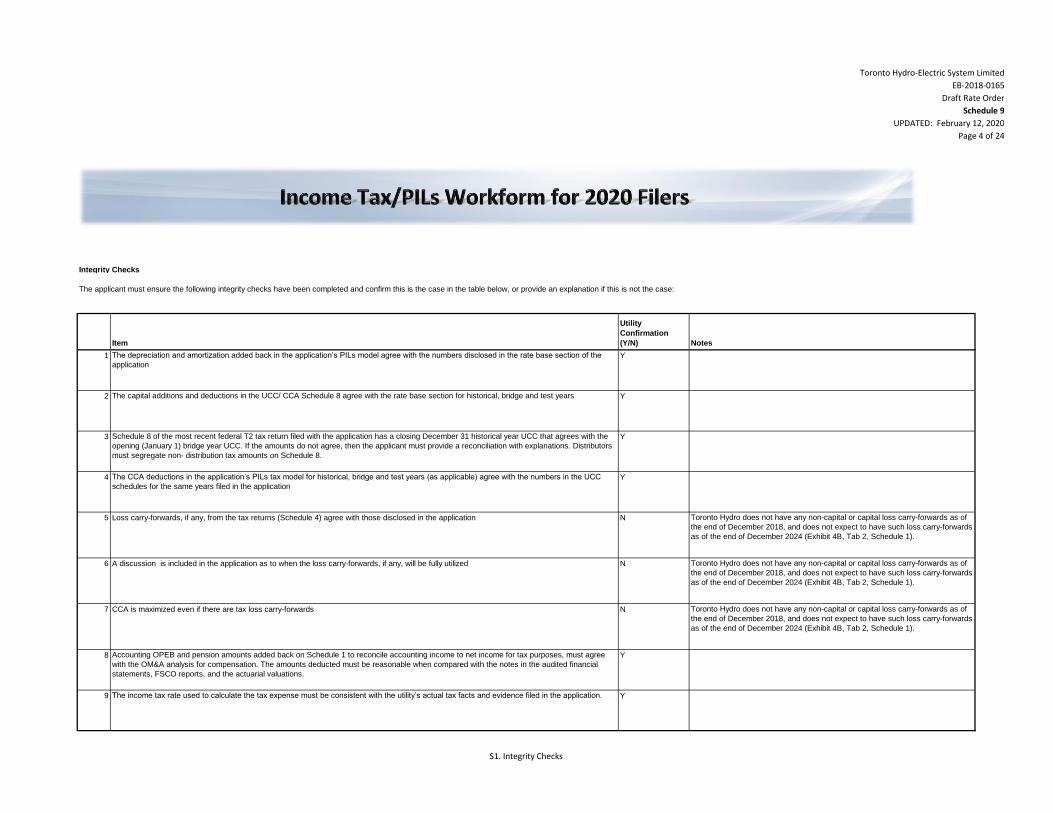
Toronto Hydro-Electric System Limited
EB-2018-0165
Draft Rate Order
Schedule 9
UPDATED: February 12, 2020
Page 4 of 24
Integrity Checks
Item
Utility
Confirmation
(Y/N) Notes
1 The depreciation and amortization added back in the application’s PILs model agree with the numbers disclosed in the rate base section of the
application
Y
2 The capital additions and deductions in the UCC/ CCA Schedule 8 agree with the rate base section for historical, bridge and test years Y
3 Schedule 8 of the most recent federal T2 tax return filed with the application has a closing December 31 historical year UCC that agrees with the
opening (January 1) bridge year UCC. If the amounts do not agree, then the applicant must provide a reconciliation with explanations. Distributors
must segregate non- distribution tax amounts on Schedule 8.
Y
4 The CCA deductions in the application’s PILs tax model for historical, bridge and test years (as applicable) agree with the numbers in the UCC
schedules for the same years filed in the application
Y
5 Loss carry-forwards, if any, from the tax returns (Schedule 4) agree with those disclosed in the application N Toronto Hydro does not have any non-capital or capital loss carry-forwards as of
the end of December 2018, and does not expect to have such loss carry-forwards
as of the end of December 2024 (Exhibit 4B, Tab 2, Schedule 1).
6 A discussion is included in the application as to when the loss carry-forwards, if any, will be fully utilized N Toronto Hydro does not have any non-capital or capital loss carry-forwards as of
the end of December 2018, and does not expect to have such loss carry-forwards
as of the end of December 2024 (Exhibit 4B, Tab 2, Schedule 1).
7 CCA is maximized even if there are tax loss carry-forwards N Toronto Hydro does not have any non-capital or capital loss carry-forwards as of
the end of December 2018, and does not expect to have such loss carry-forwards
as of the end of December 2024 (Exhibit 4B, Tab 2, Schedule 1).
8 Accounting OPEB and pension amounts added back on Schedule 1 to reconcile accounting income to net income for tax purposes, must agree
with the OM&A analysis for compensation. The amounts deducted must be reasonable when compared with the notes in the audited financial
statements, FSCO reports, and the actuarial valuations.
Y
9 The income tax rate used to calculate the tax expense must be consistent with the utility’s actual tax facts and evidence filed in the application. Y
The applicant must ensure the following integrity checks have been completed and confirm this is the case in the table below, or provide an explanation if this is not the case:
S1. Integrity Checks
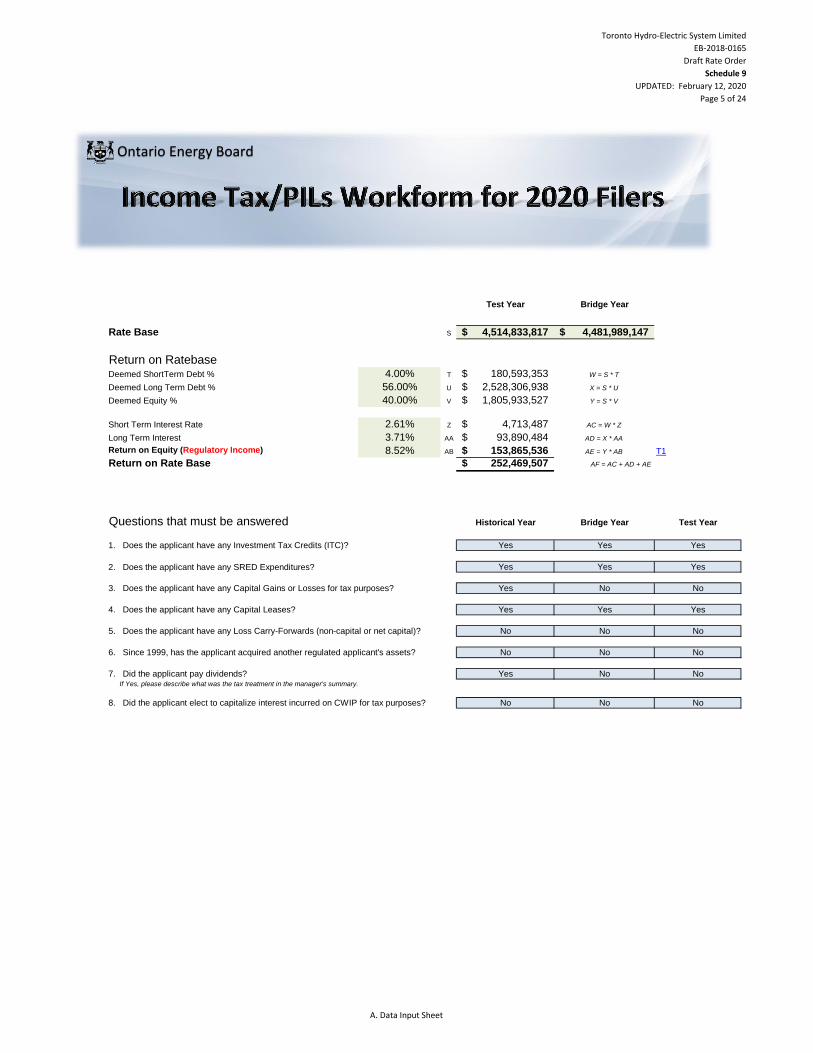
Toronto Hydro-Electric System Limited
EB-2018-0165
Draft Rate Order
Schedule 9
UPDATED: February 12, 2020
Page 5 of 24
Test Year Bridge Year
Rate Base S 4,514,833,817$ 4,481,989,147$
Return on RatebaseDeemed ShortTerm Debt % 4.00% T 180,593,353$ W = S * T
Deemed Long Term Debt % 56.00% U 2,528,306,938$ X = S * U
Deemed Equity % 40.00% V 1,805,933,527$ Y = S * V
Short Term Interest Rate 2.61% Z 4,713,487$ AC = W * Z
Long Term Interest 3.71% AA 93,890,484$ AD = X * AA
Return on Equity (Regulatory Income) 8.52% AB 153,865,536$ AE = Y * AB T1
Return on Rate Base 252,469,507$ AF = AC + AD + AE
Questions that must be answered Historical Year Bridge Year Test Year
Yes Yes Yes
Yes Yes Yes
Yes No No
Yes Yes Yes
No No No
No No No
Yes No No If Yes, please describe what was the tax treatment in the manager's summary.
No No No
7. Did the applicant pay dividends?
8. Did the applicant elect to capitalize interest incurred on CWIP for tax purposes?
3. Does the applicant have any Capital Gains or Losses for tax purposes?
4. Does the applicant have any Capital Leases?
5. Does the applicant have any Loss Carry-Forwards (non-capital or net capital)?
6. Since 1999, has the applicant acquired another regulated applicant's assets?
1. Does the applicant have any Investment Tax Credits (ITC)?
2. Does the applicant have any SRED Expenditures?
Ontario Energy Board
A. Data Input Sheet
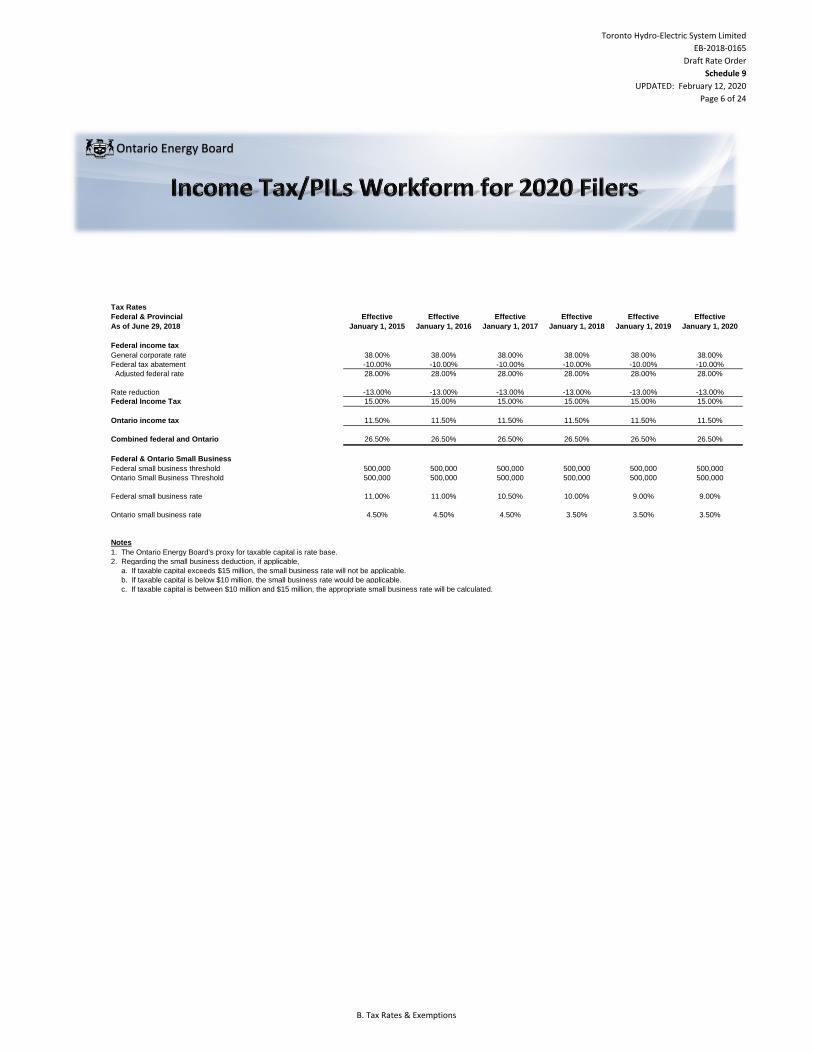
Toronto Hydro-Electric System Limited
EB-2018-0165
Draft Rate Order
Schedule 9
UPDATED: February 12, 2020
Page 6 of 24
Tax Rates
Federal & Provincial Effective Effective Effective Effective Effective Effective
As of June 29, 2018 January 1, 2015 January 1, 2016 January 1, 2017 January 1, 2018 January 1, 2019 January 1, 2020
Federal income tax
General corporate rate 38.00% 38.00% 38.00% 38.00% 38.00% 38.00%
Federal tax abatement -10.00% -10.00% -10.00% -10.00% -10.00% -10.00%
Adjusted federal rate 28.00% 28.00% 28.00% 28.00% 28.00% 28.00%
Rate reduction -13.00% -13.00% -13.00% -13.00% -13.00% -13.00%
Federal Income Tax 15.00% 15.00% 15.00% 15.00% 15.00% 15.00%
Ontario income tax 11.50% 11.50% 11.50% 11.50% 11.50% 11.50%
Combined federal and Ontario 26.50% 26.50% 26.50% 26.50% 26.50% 26.50%
Federal & Ontario Small Business
Federal small business threshold 500,000 500,000 500,000 500,000 500,000 500,000
Ontario Small Business Threshold 500,000 500,000 500,000 500,000 500,000 500,000
Federal small business rate 11.00% 11.00% 10.50% 10.00% 9.00% 9.00%
Ontario small business rate 4.50% 4.50% 4.50% 3.50% 3.50% 3.50%
Notes
1. The Ontario Energy Board's proxy for taxable capital is rate base.
2. Regarding the small business deduction, if applicable,
a. If taxable capital exceeds $15 million, the small business rate will not be applicable.
b. If taxable capital is below $10 million, the small business rate would be applicable.
c. If taxable capital is between $10 million and $15 million, the appropriate small business rate will be calculated.
Ontario Energy Board
B. Tax Rates & Exemptions
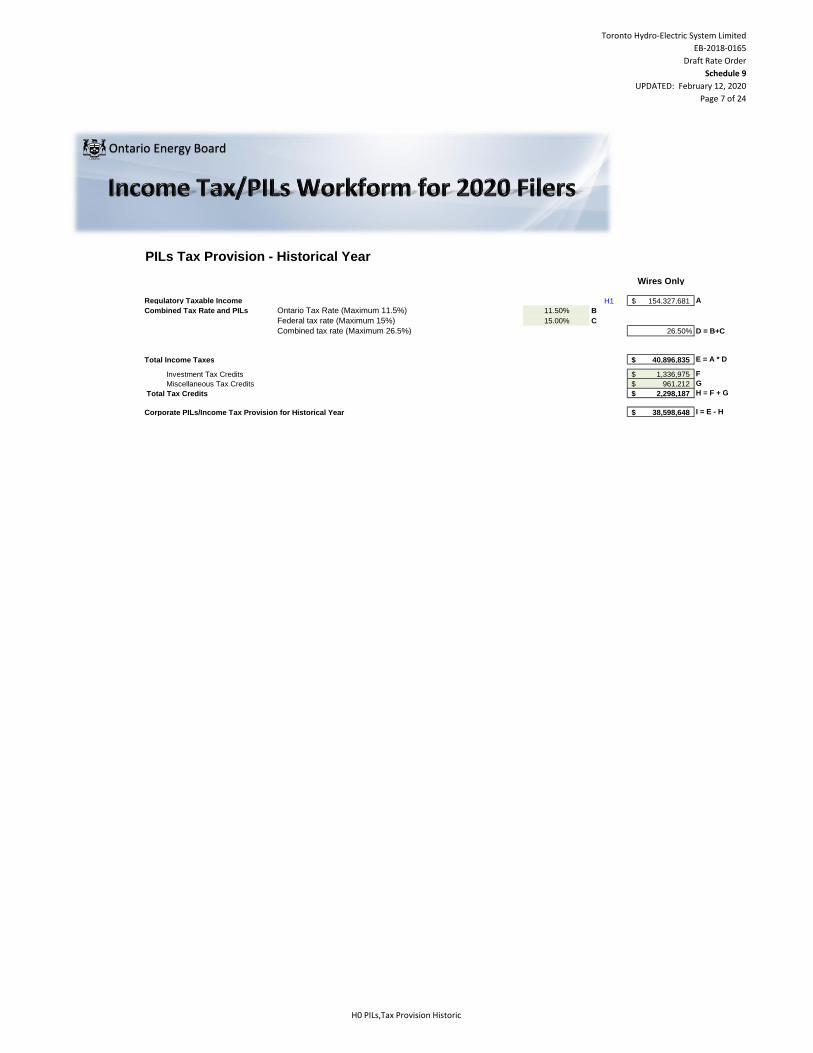
Toronto Hydro-Electric System Limited
EB-2018-0165
Draft Rate Order
Schedule 9
UPDATED: February 12, 2020
Page 7 of 24
PILs Tax Provision - Historical Year
Wires Only
Regulatory Taxable Income H1 154,327,681$ A
Combined Tax Rate and PILs Ontario Tax Rate (Maximum 11.5%) 11.50% B
Federal tax rate (Maximum 15%) 15.00% C
Combined tax rate (Maximum 26.5%) 26.50% D = B+C
Total Income Taxes 40,896,835$ E = A * D
Investment Tax Credits 1,336,975$ F
Miscellaneous Tax Credits 961,212$ G
Total Tax Credits 2,298,187$ H = F + G
Corporate PILs/Income Tax Provision for Historical Year 38,598,648$ I = E - H
Ontario Energy Board
H0 PILs,Tax Provision Historic
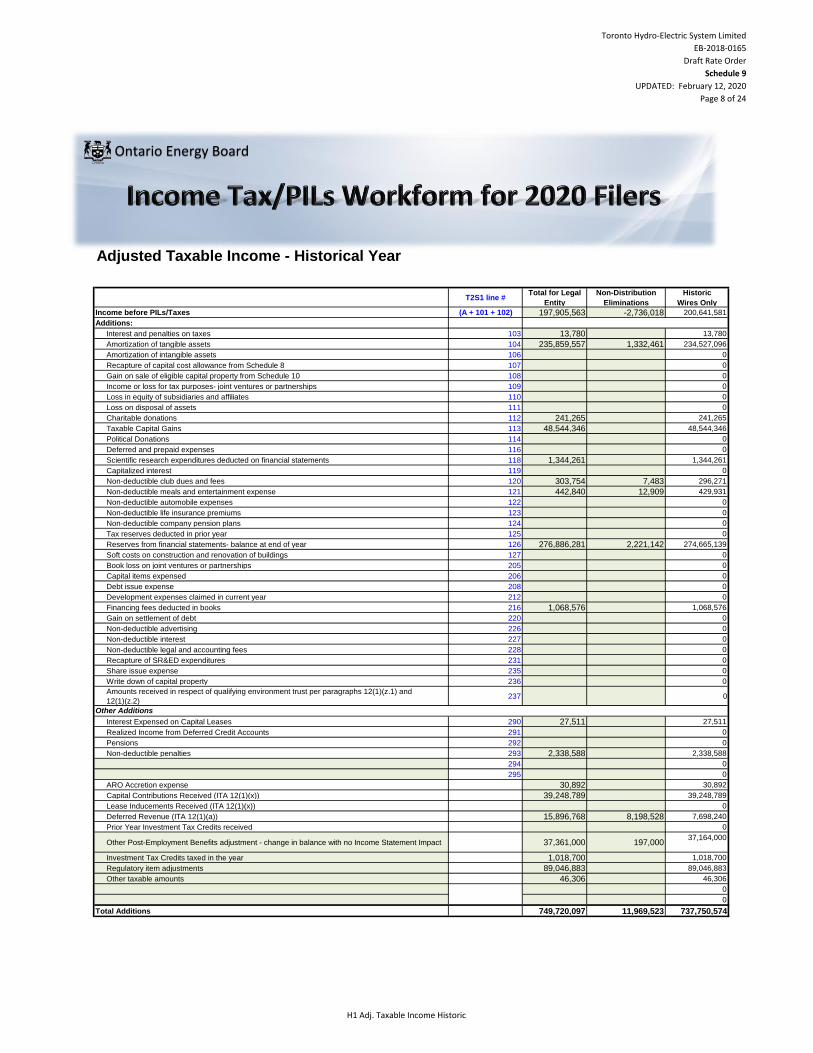
Toronto Hydro-Electric System Limited
EB-2018-0165
Draft Rate Order
Schedule 9
UPDATED: February 12, 2020
Page 8 of 24
Adjusted Taxable Income - Historical Year
T2S1 line #Total for Legal
Entity
Non-Distribution
Eliminations
Historic
Wires Only
Income before PILs/Taxes (A + 101 + 102) 197,905,563 -2,736,018 200,641,581
Additions:
Interest and penalties on taxes 103 13,780 13,780
Amortization of tangible assets 104 235,859,557 1,332,461 234,527,096
Amortization of intangible assets 106 0
Recapture of capital cost allowance from Schedule 8 107 0
Gain on sale of eligible capital property from Schedule 10 108 0
Income or loss for tax purposes- joint ventures or partnerships 109 0
Loss in equity of subsidiaries and affiliates 110 0
Loss on disposal of assets 111 0
Charitable donations 112 241,265 241,265
Taxable Capital Gains 113 48,544,346 48,544,346
Political Donations 114 0
Deferred and prepaid expenses 116 0
Scientific research expenditures deducted on financial statements 118 1,344,261 1,344,261
Capitalized interest 119 0
Non-deductible club dues and fees 120 303,754 7,483 296,271
Non-deductible meals and entertainment expense 121 442,840 12,909 429,931
Non-deductible automobile expenses 122 0
Non-deductible life insurance premiums 123 0
Non-deductible company pension plans 124 0
Tax reserves deducted in prior year 125 0
Reserves from financial statements- balance at end of year 126 276,886,281 2,221,142 274,665,139
Soft costs on construction and renovation of buildings 127 0
Book loss on joint ventures or partnerships 205 0
Capital items expensed 206 0
Debt issue expense 208 0
Development expenses claimed in current year 212 0
Financing fees deducted in books 216 1,068,576 1,068,576
Gain on settlement of debt 220 0
Non-deductible advertising 226 0
Non-deductible interest 227 0
Non-deductible legal and accounting fees 228 0
Recapture of SR&ED expenditures 231 0
Share issue expense 235 0
Write down of capital property 236 0
Amounts received in respect of qualifying environment trust per paragraphs 12(1)(z.1) and
12(1)(z.2)237 0
Interest Expensed on Capital Leases 290 27,511 27,511
Realized Income from Deferred Credit Accounts 291 0
Pensions 292 0
Non-deductible penalties 293 2,338,588 2,338,588
294 0
295 0
ARO Accretion expense 30,892 30,892
Capital Contributions Received (ITA 12(1)(x)) 39,248,789 39,248,789
Lease Inducements Received (ITA 12(1)(x)) 0
Deferred Revenue (ITA 12(1)(a)) 15,896,768 8,198,528 7,698,240
Prior Year Investment Tax Credits received 0
Other Post-Employment Benefits adjustment - change in balance with no Income Statement Impact 37,361,000 197,00037,164,000
Investment Tax Credits taxed in the year 1,018,700 1,018,700
Regulatory item adjustments 89,046,883 89,046,883
Other taxable amounts 46,306 46,306
0
0
Total Additions 749,720,097 11,969,523 737,750,574
Other Additions
Ontario Energy Board
H1 Adj. Taxable Income Historic
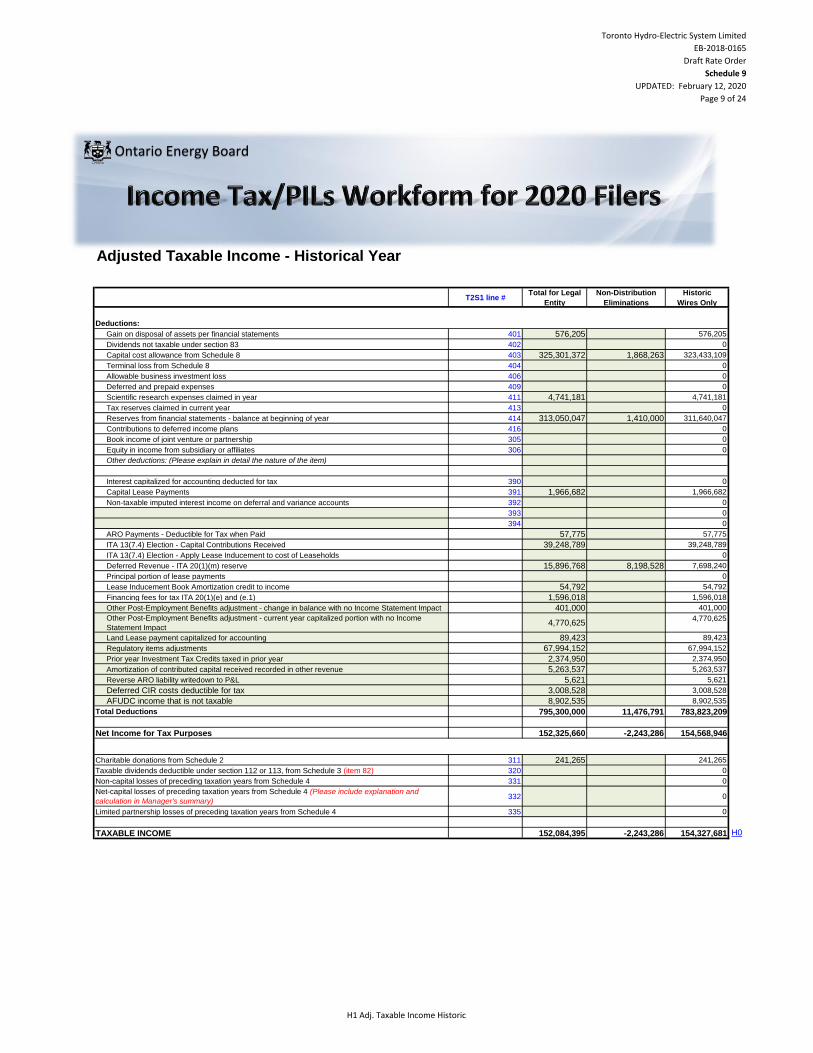
Toronto Hydro-Electric System Limited
EB-2018-0165
Draft Rate Order
Schedule 9
UPDATED: February 12, 2020
Page 9 of 24
Adjusted Taxable Income - Historical Year
T2S1 line #Total for Legal
Entity
Non-Distribution
Eliminations
Historic
Wires Only
Ontario Energy Board
Deductions:
Gain on disposal of assets per financial statements 401 576,205 576,205
Dividends not taxable under section 83 402 0
Capital cost allowance from Schedule 8 403 325,301,372 1,868,263 323,433,109
Terminal loss from Schedule 8 404 0
Allowable business investment loss 406 0
Deferred and prepaid expenses 409 0
Scientific research expenses claimed in year 411 4,741,181 4,741,181
Tax reserves claimed in current year 413 0
Reserves from financial statements - balance at beginning of year 414 313,050,047 1,410,000 311,640,047
Contributions to deferred income plans 416 0
Book income of joint venture or partnership 305 0
Equity in income from subsidiary or affiliates 306 0
Other deductions: (Please explain in detail the nature of the item)
Interest capitalized for accounting deducted for tax 390 0
Capital Lease Payments 391 1,966,682 1,966,682
Non-taxable imputed interest income on deferral and variance accounts 392 0
393 0
394 0
ARO Payments - Deductible for Tax when Paid 57,775 57,775
ITA 13(7.4) Election - Capital Contributions Received 39,248,789 39,248,789
ITA 13(7.4) Election - Apply Lease Inducement to cost of Leaseholds 0
Deferred Revenue - ITA 20(1)(m) reserve 15,896,768 8,198,528 7,698,240
Principal portion of lease payments 0
Lease Inducement Book Amortization credit to income 54,792 54,792
Financing fees for tax ITA 20(1)(e) and (e.1) 1,596,018 1,596,018
Other Post-Employment Benefits adjustment - change in balance with no Income Statement Impact 401,000 401,000
Other Post-Employment Benefits adjustment - current year capitalized portion with no Income
Statement Impact4,770,625
4,770,625
Land Lease payment capitalized for accounting 89,423 89,423
Regulatory items adjustments 67,994,152 67,994,152
Prior year Investment Tax Credits taxed in prior year 2,374,950 2,374,950
Amortization of contributed capital received recorded in other revenue 5,263,537 5,263,537
Reverse ARO liability writedown to P&L 5,621 5,621
Deferred CIR costs deductible for tax 3,008,528 3,008,528
AFUDC income that is not taxable 8,902,535 8,902,535
Total Deductions 795,300,000 11,476,791 783,823,209
Net Income for Tax Purposes 152,325,660 -2,243,286 154,568,946
Charitable donations from Schedule 2 311 241,265 241,265
Taxable dividends deductible under section 112 or 113, from Schedule 3 (item 82) 320 0
Non-capital losses of preceding taxation years from Schedule 4 331 0
Net-capital losses of preceding taxation years from Schedule 4 (Please include explanation and
calculation in Manager's summary)332 0
Limited partnership losses of preceding taxation years from Schedule 4 335 0
TAXABLE INCOME 152,084,395 -2,243,286 154,327,681 H0
H1 Adj. Taxable Income Historic
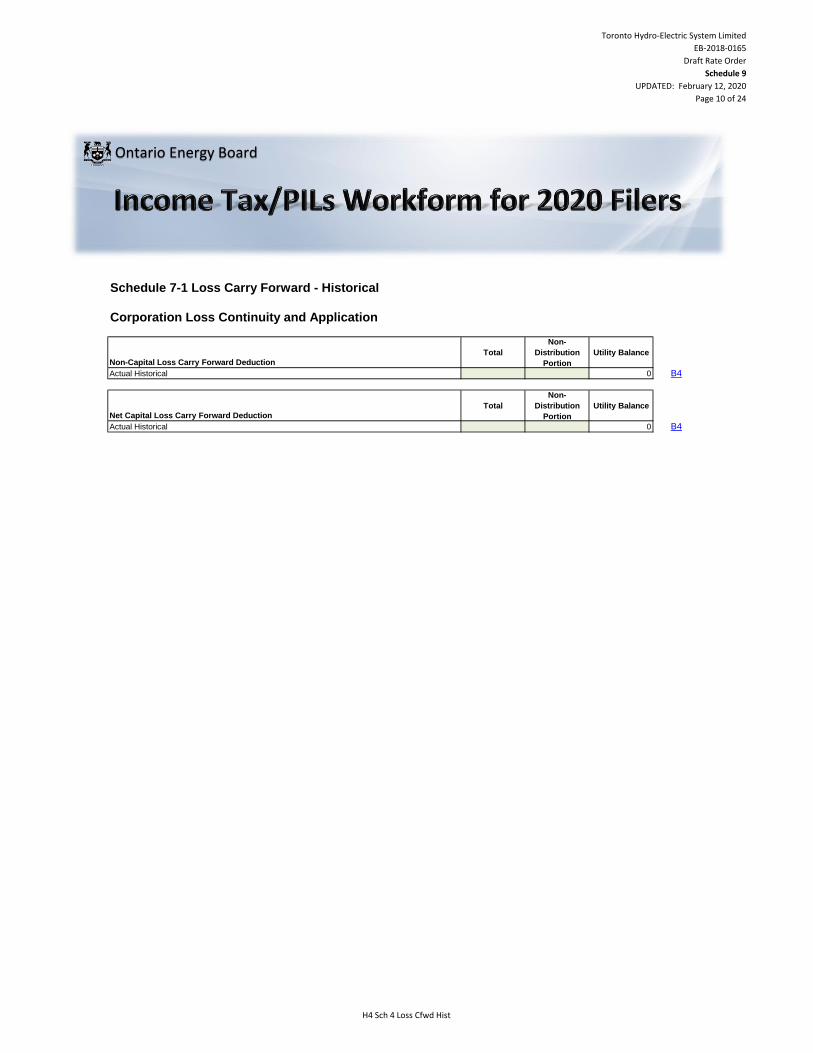
Toronto Hydro-Electric System Limited
EB-2018-0165
Draft Rate Order
Schedule 9
UPDATED: February 12, 2020
Page 10 of 24
Schedule 7-1 Loss Carry Forward - Historical
Corporation Loss Continuity and Application
Total
Non-
Distribution
Portion
Utility Balance
0 B4
Total
Non-
Distribution
Portion
Utility Balance
0 B4
Net Capital Loss Carry Forward Deduction
Actual Historical
Non-Capital Loss Carry Forward Deduction
Actual Historical
Ontario Energy Board
H4 Sch 4 Loss Cfwd Hist
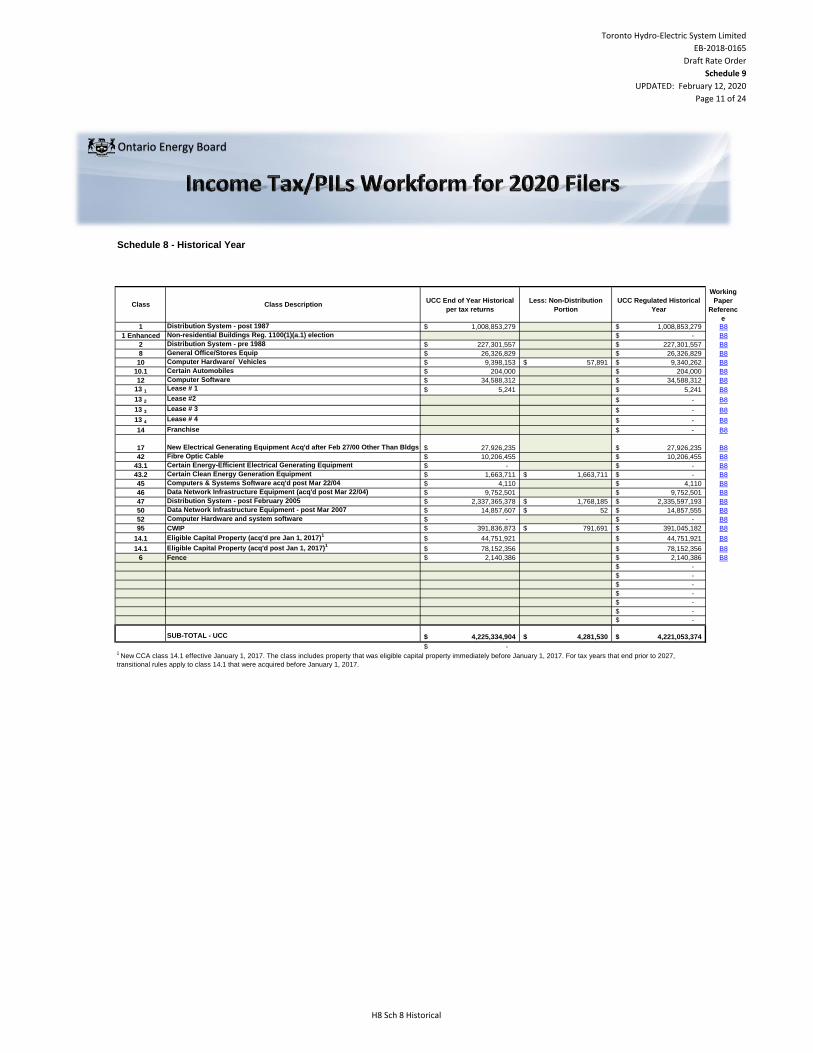
Toronto Hydro-Electric System Limited
EB-2018-0165
Draft Rate Order
Schedule 9
UPDATED: February 12, 2020
Page 11 of 24
Schedule 8 - Historical Year
Class Class DescriptionUCC End of Year Historical
per tax returns
Less: Non-Distribution
Portion
UCC Regulated Historical
Year
Working
Paper
Referenc
e
1 Distribution System - post 1987 1,008,853,279$ 1,008,853,279$ B8
1 Enhanced Non-residential Buildings Reg. 1100(1)(a.1) election -$ B8
2 Distribution System - pre 1988 227,301,557$ 227,301,557$ B8
8 General Office/Stores Equip 26,326,829$ 26,326,829$ B8
10 Computer Hardware/ Vehicles 9,398,153$ 57,891$ 9,340,262$ B8
10.1 Certain Automobiles 204,000$ 204,000$ B8
12 Computer Software 34,588,312$ 34,588,312$ B8
13 1 Lease # 1 5,241$ 5,241$ B8
13 2 Lease #2 -$ B8
13 3 Lease # 3 -$ B8
13 4 Lease # 4 -$ B8
14 Franchise -$ B8
17 New Electrical Generating Equipment Acq'd after Feb 27/00 Other Than Bldgs 27,926,235$ 27,926,235$ B8
42 Fibre Optic Cable 10,206,455$ 10,206,455$ B8
43.1 Certain Energy-Efficient Electrical Generating Equipment -$ -$ B8
43.2 Certain Clean Energy Generation Equipment 1,663,711$ 1,663,711$ -$ B8
45 Computers & Systems Software acq'd post Mar 22/04 4,110$ 4,110$ B8
46 Data Network Infrastructure Equipment (acq'd post Mar 22/04) 9,752,501$ 9,752,501$ B8
47 Distribution System - post February 2005 2,337,365,378$ 1,768,185$ 2,335,597,193$ B8
50 Data Network Infrastructure Equipment - post Mar 2007 14,857,607$ 52$ 14,857,555$ B8
52 Computer Hardware and system software -$ -$ B8
95 CWIP 391,836,873$ 791,691$ 391,045,182$ B8
14.1 Eligible Capital Property (acq'd pre Jan 1, 2017)1
44,751,921$ 44,751,921$ B8
14.1 Eligible Capital Property (acq'd post Jan 1, 2017)1
78,152,356$ 78,152,356$ B8
6 Fence 2,140,386$ 2,140,386$ B8
-$
-$
-$
-$
-$
-$
-$
SUB-TOTAL - UCC 4,225,334,904$ 4,281,530$ 4,221,053,374$
-$ 1
New CCA class 14.1 effective January 1, 2017. The class includes property that was eligible capital property immediately before January 1, 2017. For tax years that end prior to 2027,
transitional rules apply to class 14.1 that were acquired before January 1, 2017.
Ontario Energy Board
H8 Sch 8 Historical
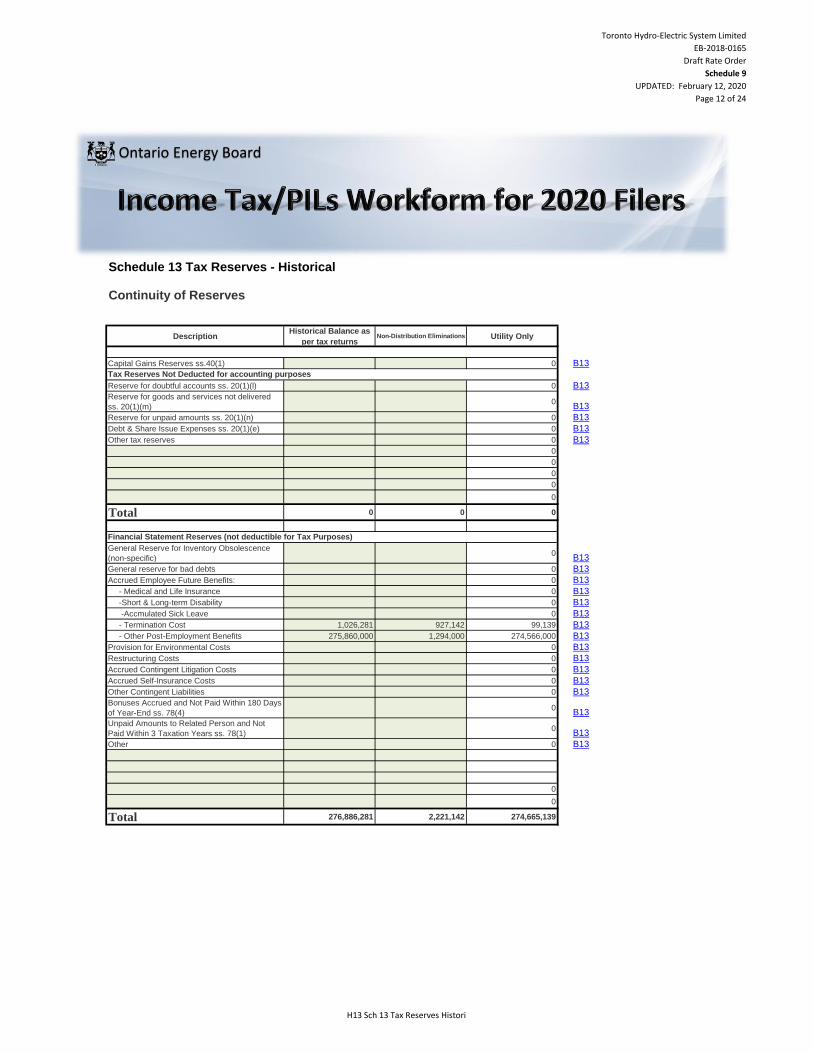
Toronto Hydro-Electric System Limited
EB-2018-0165
Draft Rate Order
Schedule 9
UPDATED: February 12, 2020
Page 12 of 24
Schedule 13 Tax Reserves - Historical
Continuity of Reserves
DescriptionHistorical Balance as
per tax returnsNon-Distribution Eliminations Utility Only
Capital Gains Reserves ss.40(1) 0 B13
Reserve for doubtful accounts ss. 20(1)(l) 0 B13
Reserve for goods and services not delivered
ss. 20(1)(m)0
B13
Reserve for unpaid amounts ss. 20(1)(n) 0 B13
Debt & Share Issue Expenses ss. 20(1)(e) 0 B13
Other tax reserves 0 B13
0
0
0
0
0
Total 0 0 0
General Reserve for Inventory Obsolescence
(non-specific)0
B13
General reserve for bad debts 0 B13
Accrued Employee Future Benefits: 0 B13
- Medical and Life Insurance 0 B13
-Short & Long-term Disability 0 B13
-Accmulated Sick Leave 0 B13
- Termination Cost 1,026,281 927,142 99,139 B13
- Other Post-Employment Benefits 275,860,000 1,294,000 274,566,000 B13
Provision for Environmental Costs 0 B13
Restructuring Costs 0 B13
Accrued Contingent Litigation Costs 0 B13
Accrued Self-Insurance Costs 0 B13
Other Contingent Liabilities 0 B13
Bonuses Accrued and Not Paid Within 180 Days
of Year-End ss. 78(4)0
B13
Unpaid Amounts to Related Person and Not
Paid Within 3 Taxation Years ss. 78(1)0
B13
Other 0 B13
0
0
Total 276,886,281 2,221,142 274,665,139
Tax Reserves Not Deducted for accounting purposes
Financial Statement Reserves (not deductible for Tax Purposes)
Ontario Energy Board
H13 Sch 13 Tax Reserves Histori
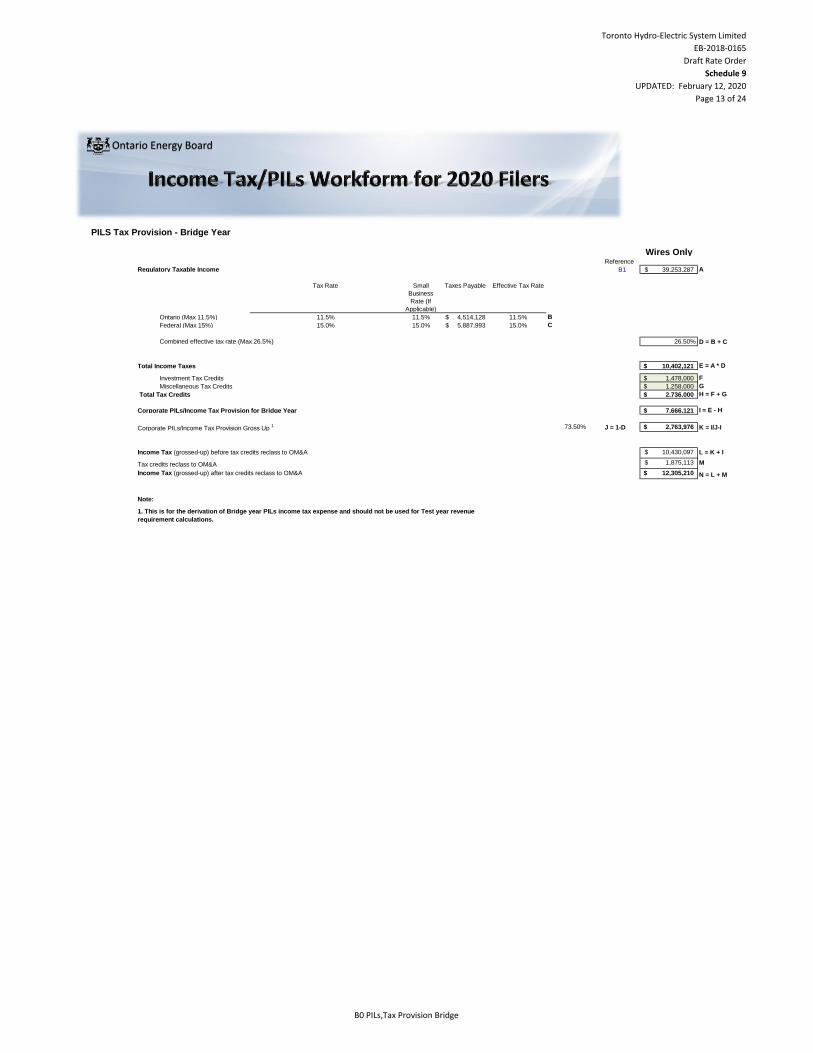
Toronto Hydro-Electric System Limited
EB-2018-0165
Draft Rate Order
Schedule 9
UPDATED: February 12, 2020
Page 13 of 24
PILS Tax Provision - Bridge Year
Wires OnlyReference
Regulatory Taxable Income B1 39,253,287$ A
Tax Rate Small
Business
Rate (If
Applicable)
Taxes Payable Effective Tax Rate
Ontario (Max 11.5%) 11.5% 11.5% 4,514,128$ 11.5% B
Federal (Max 15%) 15.0% 15.0% 5,887,993$ 15.0% C
Combined effective tax rate (Max 26.5%) 26.50% D = B + C
Total Income Taxes 10,402,121$ E = A * D
Investment Tax Credits 1,478,000$ F
Miscellaneous Tax Credits 1,258,000$ G
Total Tax Credits 2,736,000$ H = F + G
Corporate PILs/Income Tax Provision for Bridge Year 7,666,121$ I = E - H
Corporate PILs/Income Tax Provision Gross Up 1 73.50% J = 1-D 2,763,976$ K = I/J-I
Income Tax (grossed-up) before tax credits reclass to OM&A 10,430,097$ L = K + I
Tax credits reclass to OM&A 1,875,113$ M
Income Tax (grossed-up) after tax credits reclass to OM&A 12,305,210$ N = L + M
Note:
1. This is for the derivation of Bridge year PILs income tax expense and should not be used for Test year revenue
requirement calculations.
Ontario Energy Board
B0 PILs,Tax Provision Bridge
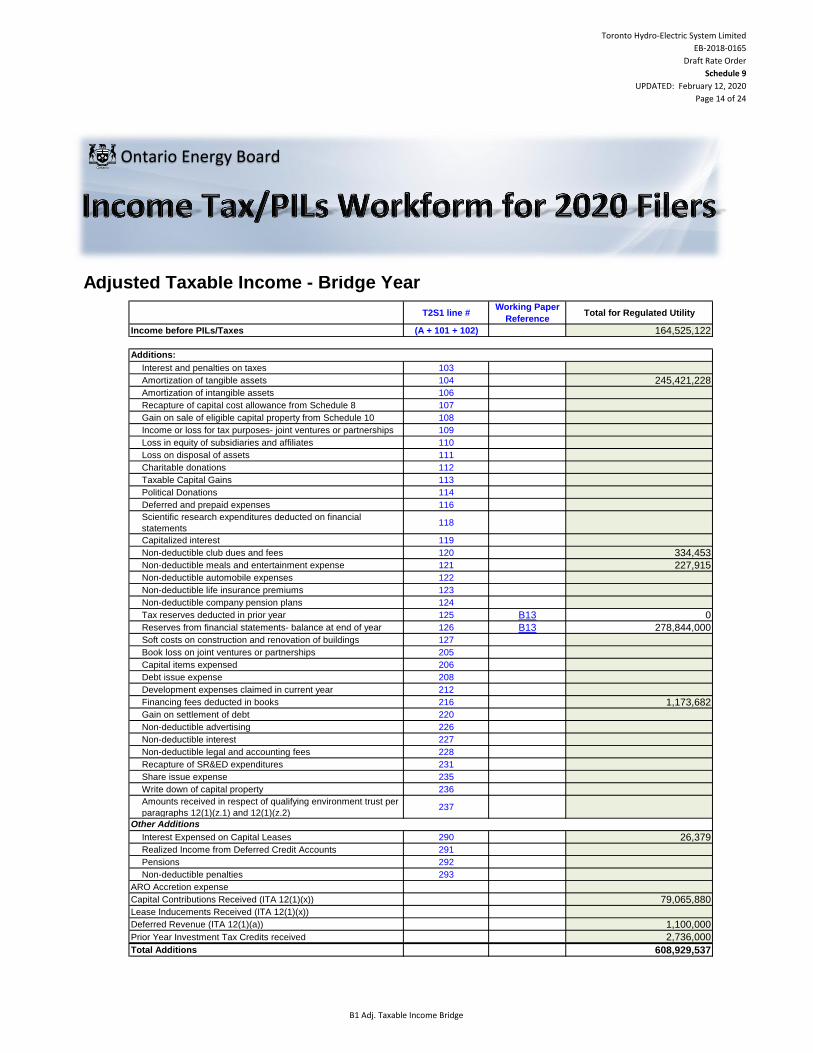
Toronto Hydro-Electric System Limited
EB-2018-0165
Draft Rate Order
Schedule 9
UPDATED: February 12, 2020
Page 14 of 24
Adjusted Taxable Income - Bridge Year
T2S1 line #Working Paper
ReferenceTotal for Regulated Utility
Income before PILs/Taxes (A + 101 + 102) 164,525,122
Interest and penalties on taxes 103
Amortization of tangible assets 104 245,421,228
Amortization of intangible assets 106
Recapture of capital cost allowance from Schedule 8 107
Gain on sale of eligible capital property from Schedule 10 108
Income or loss for tax purposes- joint ventures or partnerships 109
Loss in equity of subsidiaries and affiliates 110
Loss on disposal of assets 111
Charitable donations 112
Taxable Capital Gains 113
Political Donations 114
Deferred and prepaid expenses 116
Scientific research expenditures deducted on financial
statements118
Capitalized interest 119
Non-deductible club dues and fees 120 334,453
Non-deductible meals and entertainment expense 121 227,915
Non-deductible automobile expenses 122
Non-deductible life insurance premiums 123
Non-deductible company pension plans 124
Tax reserves deducted in prior year 125 B13 0
Reserves from financial statements- balance at end of year 126 B13 278,844,000
Soft costs on construction and renovation of buildings 127
Book loss on joint ventures or partnerships 205
Capital items expensed 206
Debt issue expense 208
Development expenses claimed in current year 212
Financing fees deducted in books 216 1,173,682
Gain on settlement of debt 220
Non-deductible advertising 226
Non-deductible interest 227
Non-deductible legal and accounting fees 228
Recapture of SR&ED expenditures 231
Share issue expense 235
Write down of capital property 236
Amounts received in respect of qualifying environment trust per
paragraphs 12(1)(z.1) and 12(1)(z.2)237
Interest Expensed on Capital Leases 290 26,379
Realized Income from Deferred Credit Accounts 291
Pensions 292
Non-deductible penalties 293
ARO Accretion expense
Capital Contributions Received (ITA 12(1)(x)) 79,065,880
Lease Inducements Received (ITA 12(1)(x))
Deferred Revenue (ITA 12(1)(a)) 1,100,000
Prior Year Investment Tax Credits received 2,736,000
Total Additions 608,929,537
Other Additions
Additions:
Ontario Energy Board
B1 Adj. Taxable Income Bridge
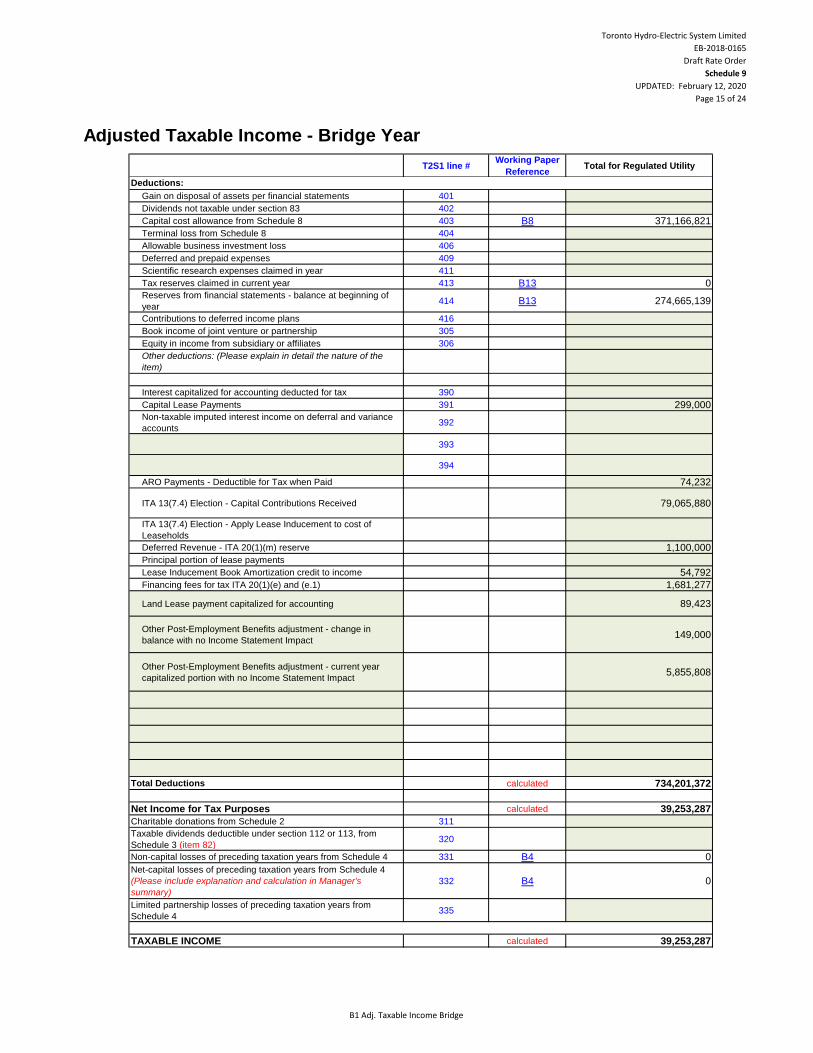
Toronto Hydro-Electric System Limited
EB-2018-0165
Draft Rate Order
Schedule 9
UPDATED: February 12, 2020
Page 15 of 24
Adjusted Taxable Income - Bridge Year
T2S1 line #Working Paper
ReferenceTotal for Regulated Utility
Gain on disposal of assets per financial statements 401
Dividends not taxable under section 83 402
Capital cost allowance from Schedule 8 403 B8 371,166,821
Terminal loss from Schedule 8 404
Allowable business investment loss 406
Deferred and prepaid expenses 409
Scientific research expenses claimed in year 411
Tax reserves claimed in current year 413 B13 0
Reserves from financial statements - balance at beginning of
year414 B13 274,665,139
Contributions to deferred income plans 416
Book income of joint venture or partnership 305
Equity in income from subsidiary or affiliates 306
Other deductions: (Please explain in detail the nature of the
item)
Interest capitalized for accounting deducted for tax 390
Capital Lease Payments 391 299,000
Non-taxable imputed interest income on deferral and variance
accounts 392
393
394
ARO Payments - Deductible for Tax when Paid 74,232
ITA 13(7.4) Election - Capital Contributions Received 79,065,880
ITA 13(7.4) Election - Apply Lease Inducement to cost of
Leaseholds
Deferred Revenue - ITA 20(1)(m) reserve 1,100,000
Principal portion of lease payments
Lease Inducement Book Amortization credit to income 54,792
Financing fees for tax ITA 20(1)(e) and (e.1) 1,681,277
Land Lease payment capitalized for accounting 89,423
Other Post-Employment Benefits adjustment - change in
balance with no Income Statement Impact149,000
Other Post-Employment Benefits adjustment - current year
capitalized portion with no Income Statement Impact5,855,808
Total Deductions calculated 734,201,372
Net Income for Tax Purposes calculated 39,253,287
Charitable donations from Schedule 2 311
Taxable dividends deductible under section 112 or 113, from
Schedule 3 (item 82)320
Non-capital losses of preceding taxation years from Schedule 4 331 B4 0
Net-capital losses of preceding taxation years from Schedule 4
(Please include explanation and calculation in Manager's
summary)
332 B4 0
Limited partnership losses of preceding taxation years from
Schedule 4335
TAXABLE INCOME calculated 39,253,287
Deductions:
B1 Adj. Taxable Income Bridge
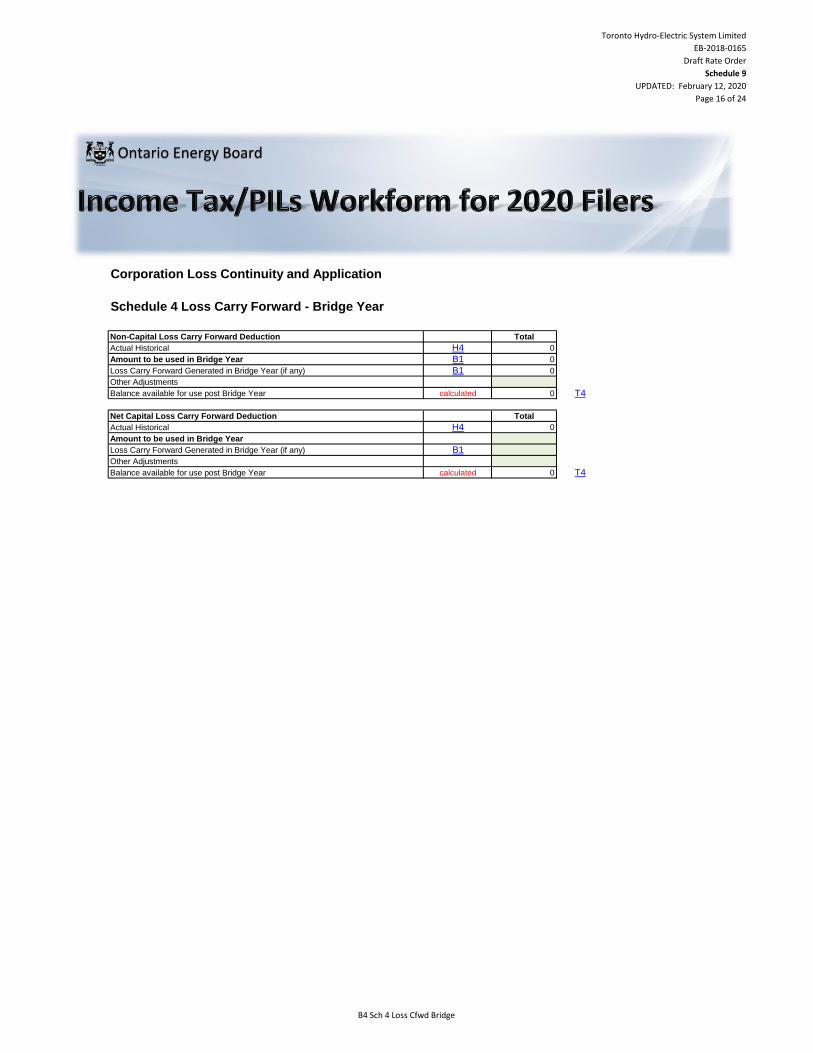
Toronto Hydro-Electric System Limited
EB-2018-0165
Draft Rate Order
Schedule 9
UPDATED: February 12, 2020
Page 16 of 24
Corporation Loss Continuity and Application
Schedule 4 Loss Carry Forward - Bridge Year
Total
H4 0
Amount to be used in Bridge Year B1 0
B1 0
Balance available for use post Bridge Year calculated 0 T4
Total
H4 0
Amount to be used in Bridge Year
B1
Balance available for use post Bridge Year calculated 0 T4
Other Adjustments
Other Adjustments
Loss Carry Forward Generated in Bridge Year (if any)
Actual Historical
Loss Carry Forward Generated in Bridge Year (if any)
Net Capital Loss Carry Forward Deduction
Non-Capital Loss Carry Forward Deduction
Actual Historical
Ontario Energy Board
B4 Sch 4 Loss Cfwd Bridge
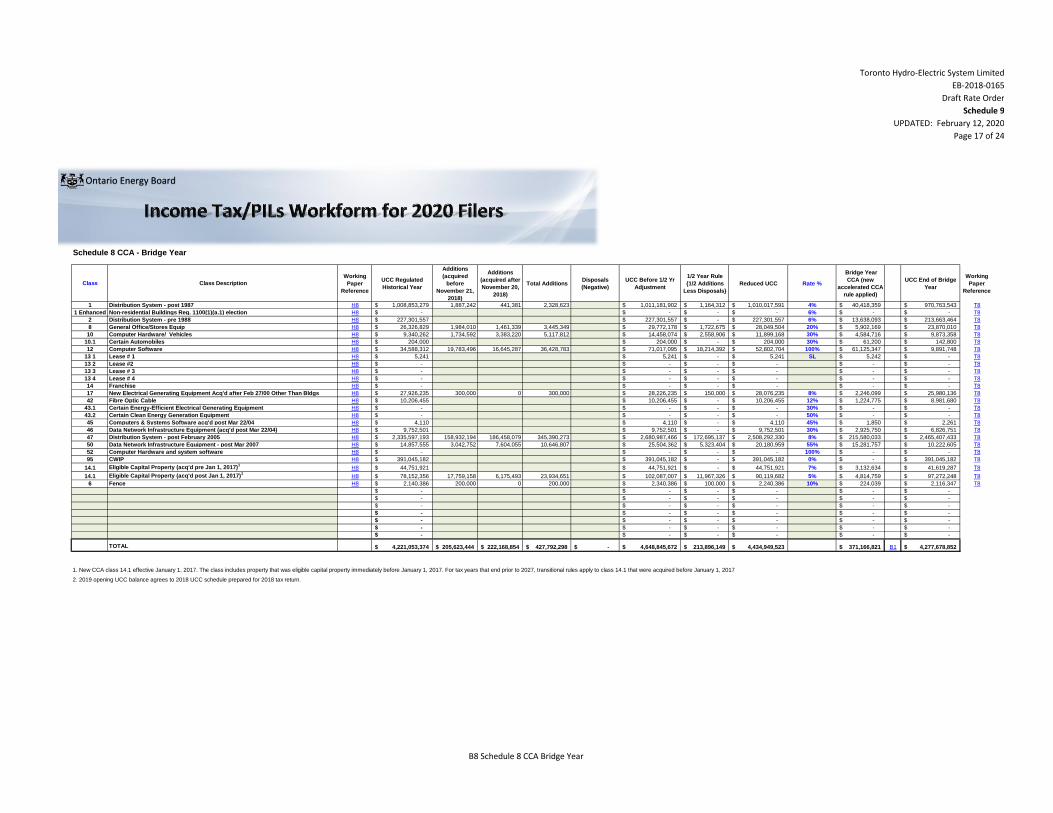
Toronto Hydro-Electric System Limited
EB-2018-0165
Draft Rate Order
Schedule 9
UPDATED: February 12, 2020
Page 17 of 24
Schedule 8 CCA - Bridge Year
Class Class Description
Working
Paper
Reference
UCC Regulated
Historical Year
Additions
(acquired
before
November 21,
2018)
Additions
(acquired after
November 20,
2018)
Total AdditionsDisposals
(Negative)
UCC Before 1/2 Yr
Adjustment
1/2 Year Rule
{1/2 Additions
Less Disposals}
Reduced UCC Rate %
Bridge Year
CCA (new
accelerated CCA
rule applied)
UCC End of Bridge
Year
Working
Paper
Reference
1 Distribution System - post 1987 H8 1,008,853,279$ 1,887,242 441,381 2,328,623 1,011,181,902$ 1,164,312$ 1,010,017,591$ 4% 40,418,359$ 970,763,543$ T8
1 Enhanced Non-residential Buildings Reg. 1100(1)(a.1) election H8 -$ -$ -$ -$ 6% -$ -$ T8
2 Distribution System - pre 1988 H8 227,301,557$ 227,301,557$ -$ 227,301,557$ 6% 13,638,093$ 213,663,464$ T8
8 General Office/Stores Equip H8 26,326,829$ 1,984,010 1,461,339 3,445,349 29,772,178$ 1,722,675$ 28,049,504$ 20% 5,902,169$ 23,870,010$ T8
10 Computer Hardware/ Vehicles H8 9,340,262$ 1,734,592 3,383,220 5,117,812 14,458,074$ 2,558,906$ 11,899,168$ 30% 4,584,716$ 9,873,358$ T8
10.1 Certain Automobiles H8 204,000$ 204,000$ -$ 204,000$ 30% 61,200$ 142,800$ T8
12 Computer Software H8 34,588,312$ 19,783,496 16,645,287 36,428,783 71,017,095$ 18,214,392$ 52,802,704$ 100% 61,125,347$ 9,891,748$ T8
13 1 Lease # 1 H8 5,241$ 5,241$ -$ 5,241$ SL 5,242$ -$ T8
13 2 Lease #2 H8 -$ -$ -$ -$ -$ -$ T8
13 3 Lease # 3 H8 -$ -$ -$ -$ -$ -$ T8
13 4 Lease # 4 H8 -$ -$ -$ -$ -$ -$ T8
14 Franchise H8 -$ -$ -$ -$ -$ -$ T8
17 New Electrical Generating Equipment Acq'd after Feb 27/00 Other Than Bldgs H8 27,926,235$ 300,000 0 300,000 28,226,235$ 150,000$ 28,076,235$ 8% 2,246,099$ 25,980,136$ T8
42 Fibre Optic Cable H8 10,206,455$ 10,206,455$ -$ 10,206,455$ 12% 1,224,775$ 8,981,680$ T8
43.1 Certain Energy-Efficient Electrical Generating Equipment H8 -$ -$ -$ -$ 30% -$ -$ T8
43.2 Certain Clean Energy Generation Equipment H8 -$ -$ -$ -$ 50% -$ -$ T8
45 Computers & Systems Software acq'd post Mar 22/04 H8 4,110$ 4,110$ -$ 4,110$ 45% 1,850$ 2,261$ T8
46 Data Network Infrastructure Equipment (acq'd post Mar 22/04) H8 9,752,501$ 9,752,501$ -$ 9,752,501$ 30% 2,925,750$ 6,826,751$ T8
47 Distribution System - post February 2005 H8 2,335,597,193$ 158,932,194 186,458,079 345,390,273 2,680,987,466$ 172,695,137$ 2,508,292,330$ 8% 215,580,033$ 2,465,407,433$ T8
50 Data Network Infrastructure Equipment - post Mar 2007 H8 14,857,555$ 3,042,752 7,604,055 10,646,807 25,504,362$ 5,323,404$ 20,180,959$ 55% 15,281,757$ 10,222,605$ T8
52 Computer Hardware and system software H8 -$ -$ -$ -$ 100% -$ -$ T8
95 CWIP H8 391,045,182$ 391,045,182$ -$ 391,045,182$ 0% -$ 391,045,182$ T8
14.1 Eligible Capital Property (acq'd pre Jan 1, 2017)1
H8 44,751,921$ 44,751,921$ -$ 44,751,921$ 7% 3,132,634$ 41,619,287$ T8
14.1 Eligible Capital Property (acq'd post Jan 1, 2017)1
H8 78,152,356$ 17,759,158 6,175,493 23,934,651 102,087,007$ 11,967,326$ 90,119,682$ 5% 4,814,759$ 97,272,248$ T8
6 Fence H8 2,140,386$ 200,000 0 200,000 2,340,386$ 100,000$ 2,240,386$ 10% 224,039$ 2,116,347$ T8
-$ -$ -$ -$ -$ -$
-$ -$ -$ -$ -$ -$
-$ -$ -$ -$ -$ -$
-$ -$ -$ -$ -$ -$
-$ -$ -$ -$ -$ -$
-$ -$ -$ -$ -$ -$
-$ -$ -$ -$ -$ -$
TOTAL 4,221,053,374$ 205,623,444$ 222,168,854$ 427,792,298$ -$ 4,648,845,672$ 213,896,149$ 4,434,949,523$ 371,166,821$ B1 4,277,678,852$
1. New CCA class 14.1 effective January 1, 2017. The class includes property that was eligible capital property immediately before January 1, 2017. For tax years that end prior to 2027, transitional rules apply to class 14.1 that were acquired before January 1, 2017
2. 2019 opening UCC balance agrees to 2018 UCC schedule prepared for 2018 tax return.
Ontario Energy Board
B8 Schedule 8 CCA Bridge Year
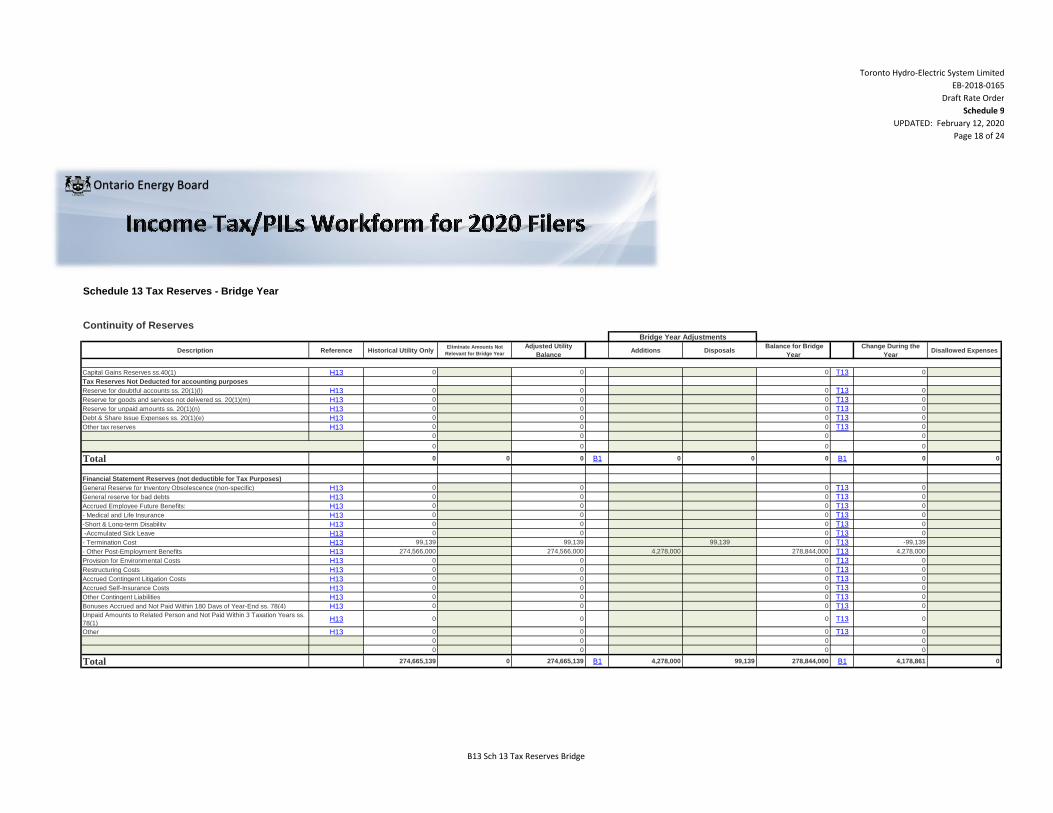
Toronto Hydro-Electric System Limited
EB-2018-0165
Draft Rate Order
Schedule 9
UPDATED: February 12, 2020
Page 18 of 24
Schedule 13 Tax Reserves - Bridge Year
Continuity of Reserves
Description Reference Historical Utility OnlyEliminate Amounts Not
Relevant for Bridge Year
Adjusted Utility
BalanceAdditions Disposals
Balance for Bridge
Year
Change During the
YearDisallowed Expenses
Capital Gains Reserves ss.40(1) H13 0 0 0 T13 0
Tax Reserves Not Deducted for accounting purposes
Reserve for doubtful accounts ss. 20(1)(l) H13 0 0 0 T13 0
Reserve for goods and services not delivered ss. 20(1)(m) H13 0 0 0 T13 0
Reserve for unpaid amounts ss. 20(1)(n) H13 0 0 0 T13 0
Debt & Share Issue Expenses ss. 20(1)(e) H13 0 0 0 T13 0
Other tax reserves H13 0 0 0 T13 0
0 0 0 0
0 0 0 0
Total 0 0 0 B1 0 0 0 B1 0 0
0
Financial Statement Reserves (not deductible for Tax Purposes)
General Reserve for Inventory Obsolescence (non-specific) H13 0 0 0 T13 0
General reserve for bad debts H13 0 0 0 T13 0
Accrued Employee Future Benefits: H13 0 0 0 T13 0
- Medical and Life Insurance H13 0 0 0 T13 0
-Short & Long-term Disability H13 0 0 0 T13 0
-Accmulated Sick Leave H13 0 0 0 T13 0
- Termination Cost H13 99,139 99,139 99,139 0 T13 -99,139
- Other Post-Employment Benefits H13 274,566,000 274,566,000 4,278,000 278,844,000 T13 4,278,000
Provision for Environmental Costs H13 0 0 0 T13 0
Restructuring Costs H13 0 0 0 T13 0
Accrued Contingent Litigation Costs H13 0 0 0 T13 0
Accrued Self-Insurance Costs H13 0 0 0 T13 0
Other Contingent Liabilities H13 0 0 0 T13 0
Bonuses Accrued and Not Paid Within 180 Days of Year-End ss. 78(4) H13 0 0 0 T13 0
Unpaid Amounts to Related Person and Not Paid Within 3 Taxation Years ss.
78(1)H13 0 0 0 T13 0
Other H13 0 0 0 T13 0
0 0 0 0
0 0 0 0
Total 274,665,139 0 274,665,139 B1 4,278,000 99,139 278,844,000 B1 4,178,861 0
0
Bridge Year Adjustments
Ontario Energy Board
B13 Sch 13 Tax Reserves Bridge
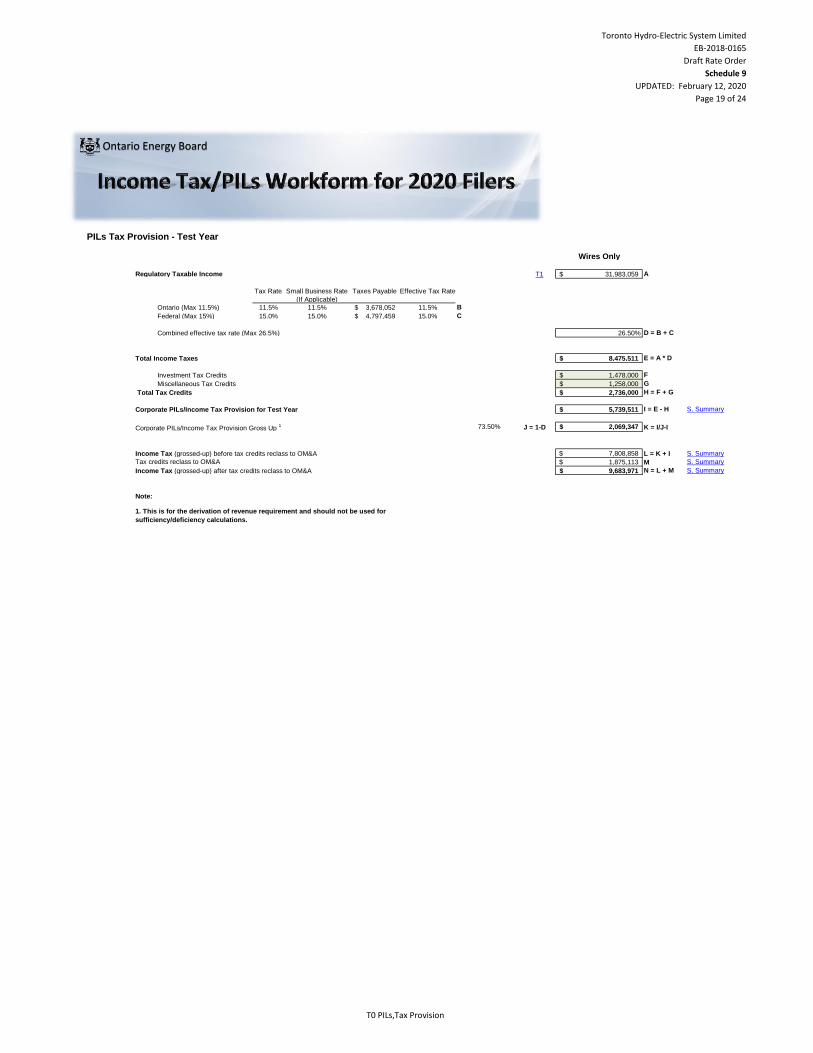
Toronto Hydro-Electric System Limited
EB-2018-0165
Draft Rate Order
Schedule 9
UPDATED: February 12, 2020
Page 19 of 24
PILs Tax Provision - Test Year
Wires Only
Regulatory Taxable Income T1 31,983,059$ A
Tax Rate Small Business Rate
(If Applicable)
Taxes Payable Effective Tax Rate
Ontario (Max 11.5%) 11.5% 11.5% 3,678,052$ 11.5% B
Federal (Max 15%) 15.0% 15.0% 4,797,459$ 15.0% C
Combined effective tax rate (Max 26.5%) 26.50% D = B + C
Total Income Taxes 8,475,511$ E = A * D
Investment Tax Credits 1,478,000$ F
Miscellaneous Tax Credits 1,258,000$ G
Total Tax Credits 2,736,000$ H = F + G
Corporate PILs/Income Tax Provision for Test Year 5,739,511$ I = E - H S. Summary
Corporate PILs/Income Tax Provision Gross Up 1 73.50% J = 1-D 2,069,347$ K = I/J-I
Income Tax (grossed-up) before tax credits reclass to OM&A 7,808,858$ L = K + I S. Summary
Tax credits reclass to OM&A 1,875,113$ M S. Summary
Income Tax (grossed-up) after tax credits reclass to OM&A 9,683,971$ N = L + M S. Summary
Note:
1. This is for the derivation of revenue requirement and should not be used for
sufficiency/deficiency calculations.
Ontario Energy Board
T0 PILs,Tax Provision
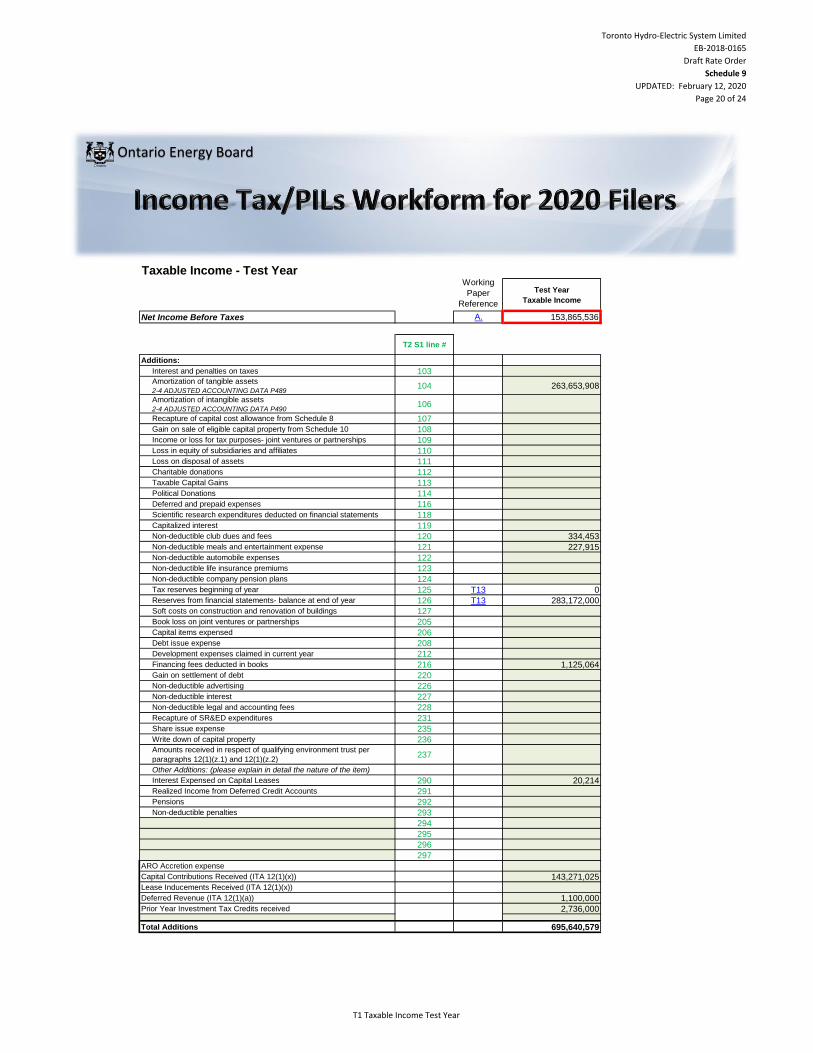
Toronto Hydro-Electric System Limited
EB-2018-0165
Draft Rate Order
Schedule 9
UPDATED: February 12, 2020
Page 20 of 24
Taxable Income - Test YearWorking
Paper
Reference
Test Year
Taxable Income
Net Income Before Taxes A. 153,865,536
T2 S1 line #
Additions:
Interest and penalties on taxes 103Amortization of tangible assets2-4 ADJUSTED ACCOUNTING DATA P489
104 263,653,908
Amortization of intangible assets2-4 ADJUSTED ACCOUNTING DATA P490
106
Recapture of capital cost allowance from Schedule 8 107
Gain on sale of eligible capital property from Schedule 10 108
Income or loss for tax purposes- joint ventures or partnerships 109
Loss in equity of subsidiaries and affiliates 110
Loss on disposal of assets 111
Charitable donations 112
Taxable Capital Gains 113
Political Donations 114
Deferred and prepaid expenses 116
Scientific research expenditures deducted on financial statements 118
Capitalized interest 119
Non-deductible club dues and fees 120 334,453
Non-deductible meals and entertainment expense 121 227,915
Non-deductible automobile expenses 122
Non-deductible life insurance premiums 123
Non-deductible company pension plans 124
Tax reserves beginning of year 125 T13 0
Reserves from financial statements- balance at end of year 126 T13 283,172,000
Soft costs on construction and renovation of buildings 127
Book loss on joint ventures or partnerships 205
Capital items expensed 206
Debt issue expense 208
Development expenses claimed in current year 212
Financing fees deducted in books 216 1,125,064
Gain on settlement of debt 220
Non-deductible advertising 226
Non-deductible interest 227
Non-deductible legal and accounting fees 228
Recapture of SR&ED expenditures 231
Share issue expense 235
Write down of capital property 236Amounts received in respect of qualifying environment trust per
paragraphs 12(1)(z.1) and 12(1)(z.2)237
Other Additions: (please explain in detail the nature of the item)
Interest Expensed on Capital Leases 290 20,214
Realized Income from Deferred Credit Accounts 291
Pensions 292
Non-deductible penalties 293
294
295
296
297
ARO Accretion expense
Capital Contributions Received (ITA 12(1)(x)) 143,271,025
Lease Inducements Received (ITA 12(1)(x))
Deferred Revenue (ITA 12(1)(a)) 1,100,000
Prior Year Investment Tax Credits received 2,736,000
Total Additions 695,640,579
Ontario Energy Board
T1 Taxable Income Test Year
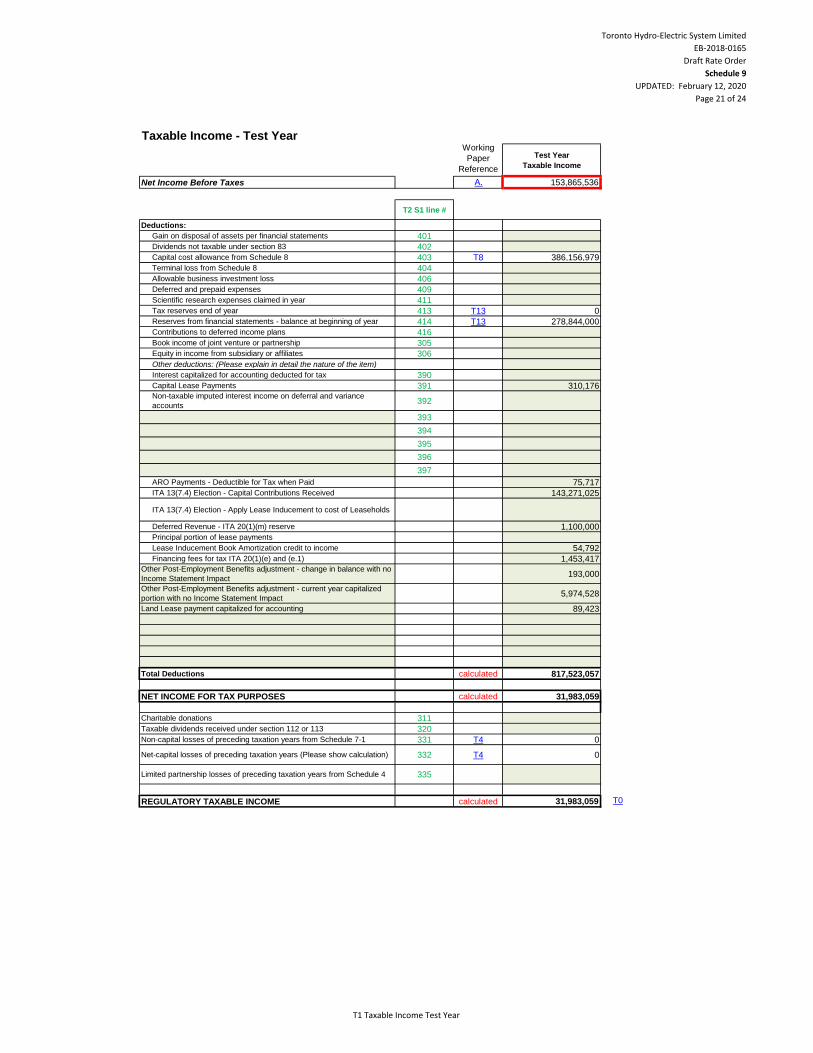
Toronto Hydro-Electric System Limited
EB-2018-0165
Draft Rate Order
Schedule 9
UPDATED: February 12, 2020
Page 21 of 24
Taxable Income - Test YearWorking
Paper
Reference
Test Year
Taxable Income
Net Income Before Taxes A. 153,865,536
T2 S1 line #
Deductions:
Gain on disposal of assets per financial statements 401
Dividends not taxable under section 83 402
Capital cost allowance from Schedule 8 403 T8 386,156,979
Terminal loss from Schedule 8 404
Allowable business investment loss 406
Deferred and prepaid expenses 409
Scientific research expenses claimed in year 411
Tax reserves end of year 413 T13 0
Reserves from financial statements - balance at beginning of year 414 T13 278,844,000
Contributions to deferred income plans 416
Book income of joint venture or partnership 305
Equity in income from subsidiary or affiliates 306
Other deductions: (Please explain in detail the nature of the item)
Interest capitalized for accounting deducted for tax 390
Capital Lease Payments 391 310,176Non-taxable imputed interest income on deferral and variance
accounts 392
393
394
395
396
397
ARO Payments - Deductible for Tax when Paid 75,717
ITA 13(7.4) Election - Capital Contributions Received 143,271,025
ITA 13(7.4) Election - Apply Lease Inducement to cost of Leaseholds
Deferred Revenue - ITA 20(1)(m) reserve 1,100,000
Principal portion of lease payments
Lease Inducement Book Amortization credit to income 54,792
Financing fees for tax ITA 20(1)(e) and (e.1) 1,453,417Other Post-Employment Benefits adjustment - change in balance with no
Income Statement Impact193,000
Other Post-Employment Benefits adjustment - current year capitalized
portion with no Income Statement Impact5,974,528
Land Lease payment capitalized for accounting 89,423
Total Deductions calculated 817,523,057
NET INCOME FOR TAX PURPOSES calculated 31,983,059
Charitable donations 311
Taxable dividends received under section 112 or 113 320
Non-capital losses of preceding taxation years from Schedule 7-1 331 T4 0
Net-capital losses of preceding taxation years (Please show calculation) 332 T4 0
Limited partnership losses of preceding taxation years from Schedule 4 335
REGULATORY TAXABLE INCOME calculated 31,983,059 T0
T1 Taxable Income Test Year

Toronto Hydro-Electric System Limited
EB-2018-0165
Draft Rate Order
Schedule 9
UPDATED: February 12, 2020
Page 22 of 24
Schedule 7-1 Loss Carry Forward - Test Year
Corporation Loss Continuity and Application
Working Paper
ReferenceTotal
Non-
Distribution
Portion
Utility Balance
B4 0 0
Amount to be used in Test Year and Price Cap Years T1 0 0
Number of years loss until next cost of service (i.e. years the loss is to be spread over)
calculated 0 0
T1 0 0
0
Balance available for use in Future Years calculated 0 0
Total
Non-
Distribution
Portion
Utility Balance
B4 0 0
Amount to be used in Test Year and Price Cap Years 0
Number of years loss until next cost of service (i.e. years the loss is to be spread over)
T1 0 0
0
0
Balance available for use in Future Years 0 0
Other Adjustments
Amount to be used in Test Year
Loss Carry Forward Generated in Test Year (if any)
Actual/Estimated Bridge Year Carried Forward
Non-Capital Loss Carry Forward Deduction
Loss Carry Forward Generated in Test Year (if any)
Net Capital Loss Carry Forward Deduction
Actual/Estimated Bridge Year Carried Forward
Amount to be used in Test Year
Other Adjustments
Ontario Energy Board
T4 Sch 4 Loss Cfwd
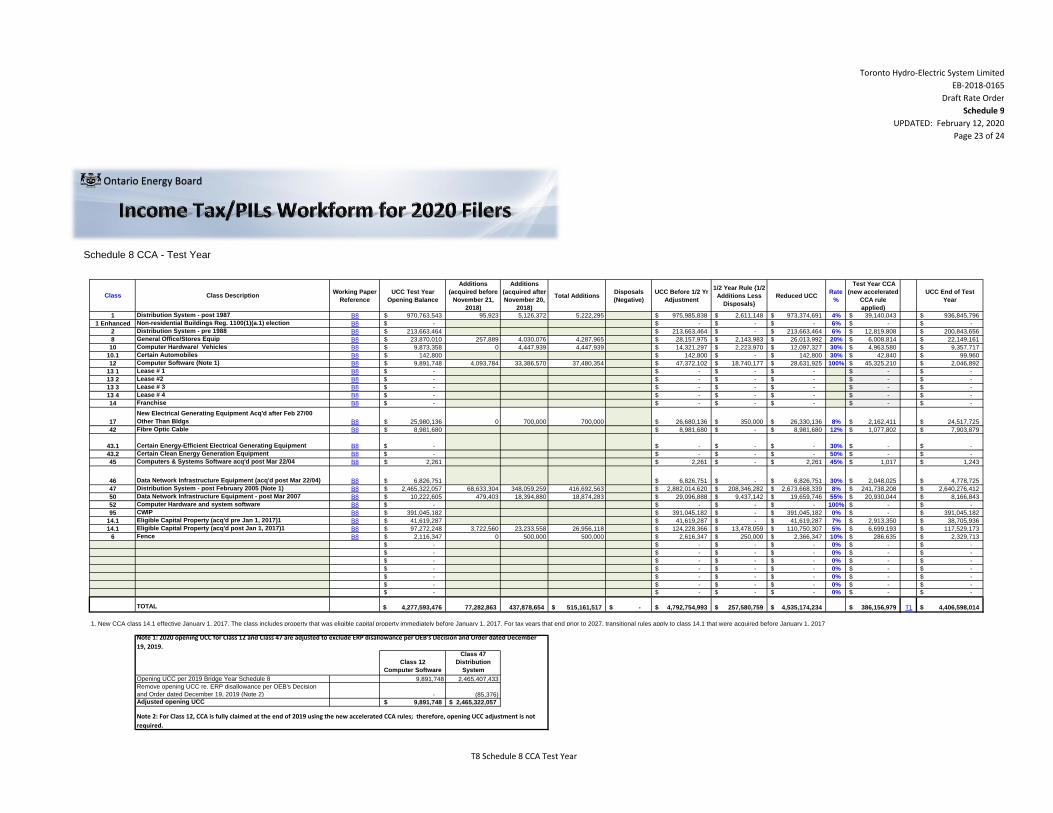
Toronto Hydro-Electric System Limited
EB-2018-0165
Draft Rate Order
Schedule 9
UPDATED: February 12, 2020
Page 23 of 24
Schedule 8 CCA - Test Year
Class Class DescriptionWorking Paper
Reference
UCC Test Year
Opening Balance
Additions
(acquired before
November 21,
2018)
Additions
(acquired after
November 20,
2018)
Total AdditionsDisposals
(Negative)
UCC Before 1/2 Yr
Adjustment
1/2 Year Rule {1/2
Additions Less
Disposals}
Reduced UCCRate
%
Test Year CCA
(new accelerated
CCA rule
applied)
UCC End of Test
Year
1 Distribution System - post 1987 B8 970,763,543$ 95,923 5,126,372 5,222,295 975,985,838$ 2,611,148$ 973,374,691$ 4% 39,140,043$ 936,845,796$
1 Enhanced Non-residential Buildings Reg. 1100(1)(a.1) election B8 -$ -$ -$ -$ 6% -$ -$
2 Distribution System - pre 1988 B8 213,663,464$ 213,663,464$ -$ 213,663,464$ 6% 12,819,808$ 200,843,656$
8 General Office/Stores Equip B8 23,870,010$ 257,889 4,030,076 4,287,965 28,157,975$ 2,143,983$ 26,013,992$ 20% 6,008,814$ 22,149,161$
10 Computer Hardware/ Vehicles B8 9,873,358$ 0 4,447,939 4,447,939 14,321,297$ 2,223,970$ 12,097,327$ 30% 4,963,580$ 9,357,717$
10.1 Certain Automobiles B8 142,800$ 142,800$ -$ 142,800$ 30% 42,840$ 99,960$
12 Computer Software (Note 1) B8 9,891,748$ 4,093,784 33,386,570 37,480,354 47,372,102$ 18,740,177$ 28,631,925$ 100% 45,325,210$ 2,046,892$
13 1 Lease # 1 B8 -$ -$ -$ -$ -$ -$
13 2 Lease #2 B8 -$ -$ -$ -$ -$ -$
13 3 Lease # 3 B8 -$ -$ -$ -$ -$ -$
13 4 Lease # 4 B8 -$ -$ -$ -$ -$ -$
14 Franchise B8 -$ -$ -$ -$ -$ -$
17
New Electrical Generating Equipment Acq'd after Feb 27/00
Other Than Bldgs B8 25,980,136$ 0 700,000 700,000 26,680,136$ 350,000$ 26,330,136$ 8% 2,162,411$ 24,517,725$
42 Fibre Optic Cable B8 8,981,680$ 8,981,680$ -$ 8,981,680$ 12% 1,077,802$ 7,903,879$
43.1 Certain Energy-Efficient Electrical Generating Equipment B8 -$ -$ -$ -$ 30% -$ -$
43.2 Certain Clean Energy Generation Equipment B8 -$ -$ -$ -$ 50% -$ -$
45 Computers & Systems Software acq'd post Mar 22/04 B8 2,261$ 2,261$ -$ 2,261$ 45% 1,017$ 1,243$
46 Data Network Infrastructure Equipment (acq'd post Mar 22/04) B8 6,826,751$ 6,826,751$ -$ 6,826,751$ 30% 2,048,025$ 4,778,725$
47 Distribution System - post February 2005 (Note 1) B8 2,465,322,057$ 68,633,304 348,059,259 416,692,563 2,882,014,620$ 208,346,282$ 2,673,668,339$ 8% 241,738,208$ 2,640,276,412$
50 Data Network Infrastructure Equipment - post Mar 2007 B8 10,222,605$ 479,403 18,394,880 18,874,283 29,096,888$ 9,437,142$ 19,659,746$ 55% 20,930,044$ 8,166,843$
52 Computer Hardware and system software B8 -$ -$ -$ -$ 100% -$ -$
95 CWIP B8 391,045,182$ 391,045,182$ -$ 391,045,182$ 0% -$ 391,045,182$
14.1 Eligible Capital Property (acq'd pre Jan 1, 2017)1 B8 41,619,287$ 41,619,287$ -$ 41,619,287$ 7% 2,913,350$ 38,705,936$
14.1 Eligible Capital Property (acq'd post Jan 1, 2017)1 B8 97,272,248$ 3,722,560 23,233,558 26,956,118 124,228,366$ 13,478,059$ 110,750,307$ 5% 6,699,193$ 117,529,173$
6 Fence B8 2,116,347$ 0 500,000 500,000 2,616,347$ 250,000$ 2,366,347$ 10% 286,635$ 2,329,713$
-$ -$ -$ -$ 0% -$ -$
-$ -$ -$ -$ 0% -$ -$
-$ -$ -$ -$ 0% -$ -$
-$ -$ -$ -$ 0% -$ -$
-$ -$ -$ -$ 0% -$ -$
-$ -$ -$ -$ 0% -$ -$
-$ -$ -$ -$ 0% -$ -$
TOTAL 4,277,593,476$ 77,282,863 437,878,654 515,161,517$ -$ 4,792,754,993$ 257,580,759$ 4,535,174,234$ 386,156,979$ T1 4,406,598,014$
1. New CCA class 14.1 effective January 1, 2017. The class includes property that was eligible capital property immediately before January 1, 2017. For tax years that end prior to 2027, transitional rules apply to class 14.1 that were acquired before January 1, 2017
Class 12
Computer Software
Class 47
Distribution
System
Opening UCC per 2019 Bridge Year Schedule 8 9,891,748 2,465,407,433
Remove opening UCC re. ERP disallowance per OEB's Decision
and Order dated December 19, 2019 (Note 2) - (85,376)Adjusted opening UCC 9,891,748$ 2,465,322,057$
Note 1: 2020 opening UCC for Class 12 and Class 47 are adjusted to exclude ERP disallowance per OEB's Decision and Order dated December
19, 2019.
Note 2: For Class 12, CCA is fully claimed at the end of 2019 using the new accelerated CCA rules; therefore, opening UCC adjustment is not
required.
Ontario Energy Board
T8 Schedule 8 CCA Test Year
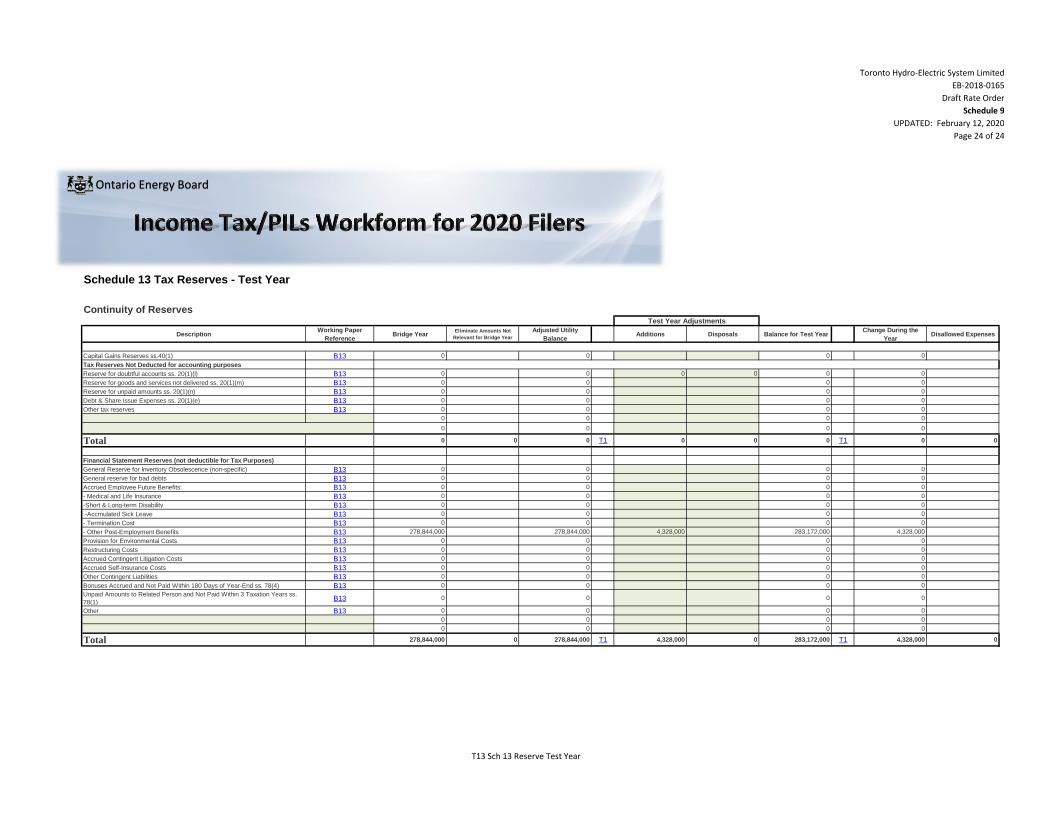
Toronto Hydro-Electric System Limited
EB-2018-0165
Draft Rate Order
Schedule 9
UPDATED: February 12, 2020
Page 24 of 24
Schedule 13 Tax Reserves - Test Year
Continuity of Reserves
DescriptionWorking Paper
ReferenceBridge Year
Eliminate Amounts Not
Relevant for Bridge Year
Adjusted Utility
BalanceAdditions Disposals Balance for Test Year
Change During the
YearDisallowed Expenses
Capital Gains Reserves ss.40(1) B13 0 0 0 0
Tax Reserves Not Deducted for accounting purposes
Reserve for doubtful accounts ss. 20(1)(l) B13 0 0 0 0 0 0
Reserve for goods and services not delivered ss. 20(1)(m) B13 0 0 0 0
Reserve for unpaid amounts ss. 20(1)(n) B13 0 0 0 0
Debt & Share Issue Expenses ss. 20(1)(e) B13 0 0 0 0
Other tax reserves B13 0 0 0 0
0 0 0 0
0 0 0 0
Total 0 0 0 T1 0 0 0 T1 0 0
0
Financial Statement Reserves (not deductible for Tax Purposes)
General Reserve for Inventory Obsolescence (non-specific) B13 0 0 0 0
General reserve for bad debts B13 0 0 0 0
Accrued Employee Future Benefits: B13 0 0 0 0
- Medical and Life Insurance B13 0 0 0 0
-Short & Long-term Disability B13 0 0 0 0
-Accmulated Sick Leave B13 0 0 0 0
- Termination Cost B13 0 0 0 0
- Other Post-Employment Benefits B13 278,844,000 278,844,000 4,328,000 283,172,000 4,328,000
Provision for Environmental Costs B13 0 0 0 0
Restructuring Costs B13 0 0 0 0
Accrued Contingent Litigation Costs B13 0 0 0 0
Accrued Self-Insurance Costs B13 0 0 0 0
Other Contingent Liabilities B13 0 0 0 0
Bonuses Accrued and Not Paid Within 180 Days of Year-End ss. 78(4) B13 0 0 0 0
Unpaid Amounts to Related Person and Not Paid Within 3 Taxation Years ss.
78(1)B13 0 0 0 0
Other B13 0 0 0 0
0 0 0 0
0 0 0 0
Total 278,844,000 0 278,844,000 T1 4,328,000 0 283,172,000 T1 4,328,000 0
0
Test Year Adjustments
Ontario Energy Board
T13 Sch 13 Reserve Test Year
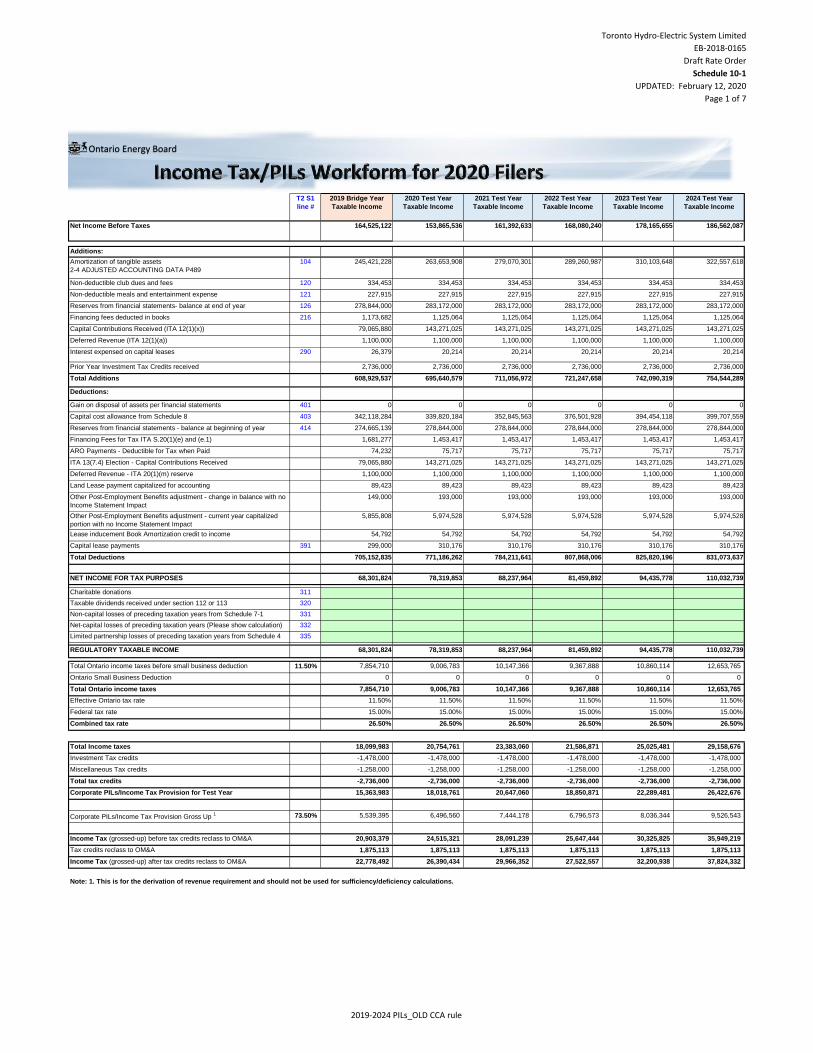
Toronto Hydro-Electric System Limited
EB-2018-0165
Draft Rate Order
Schedule 10-1
UPDATED: February 12, 2020
Page 1 of 7
T2 S1
line #
2019 Bridge Year
Taxable Income
2020 Test Year
Taxable Income
2021 Test Year
Taxable Income
2022 Test Year
Taxable Income
2023 Test Year
Taxable Income
2024 Test Year
Taxable Income
Net Income Before Taxes 164,525,122 153,865,536 161,392,633 168,080,240 178,165,655 186,562,087
Additions:
Amortization of tangible assets
2-4 ADJUSTED ACCOUNTING DATA P489
104 245,421,228 263,653,908 279,070,301 289,260,987 310,103,648 322,557,618
Non-deductible club dues and fees 120 334,453 334,453 334,453 334,453 334,453 334,453
Non-deductible meals and entertainment expense 121 227,915 227,915 227,915 227,915 227,915 227,915
Reserves from financial statements- balance at end of year 126 278,844,000 283,172,000 283,172,000 283,172,000 283,172,000 283,172,000
Financing fees deducted in books 216 1,173,682 1,125,064 1,125,064 1,125,064 1,125,064 1,125,064
Capital Contributions Received (ITA 12(1)(x)) 79,065,880 143,271,025 143,271,025 143,271,025 143,271,025 143,271,025
Deferred Revenue (ITA 12(1)(a)) 1,100,000 1,100,000 1,100,000 1,100,000 1,100,000 1,100,000
Interest expensed on capital leases 290 26,379 20,214 20,214 20,214 20,214 20,214
Prior Year Investment Tax Credits received 2,736,000 2,736,000 2,736,000 2,736,000 2,736,000 2,736,000
Total Additions 608,929,537 695,640,579 711,056,972 721,247,658 742,090,319 754,544,289
Deductions:
Gain on disposal of assets per financial statements 401 0 0 0 0 0 0
Capital cost allowance from Schedule 8 403 342,118,284 339,820,184 352,845,563 376,501,928 394,454,118 399,707,559
Reserves from financial statements - balance at beginning of year 414 274,665,139 278,844,000 278,844,000 278,844,000 278,844,000 278,844,000
Financing Fees for Tax ITA S.20(1)(e) and (e.1) 1,681,277 1,453,417 1,453,417 1,453,417 1,453,417 1,453,417
ARO Payments - Deductible for Tax when Paid 74,232 75,717 75,717 75,717 75,717 75,717
ITA 13(7.4) Election - Capital Contributions Received 79,065,880 143,271,025 143,271,025 143,271,025 143,271,025 143,271,025
Deferred Revenue - ITA 20(1)(m) reserve 1,100,000 1,100,000 1,100,000 1,100,000 1,100,000 1,100,000
Land Lease payment capitalized for accounting 89,423 89,423 89,423 89,423 89,423 89,423
Other Post-Employment Benefits adjustment - change in balance with no
Income Statement Impact
149,000 193,000 193,000 193,000 193,000 193,000
Other Post-Employment Benefits adjustment - current year capitalized
portion with no Income Statement Impact
5,855,808 5,974,528 5,974,528 5,974,528 5,974,528 5,974,528
Lease inducement Book Amortization credit to income 54,792 54,792 54,792 54,792 54,792 54,792
Capital lease payments 391 299,000 310,176 310,176 310,176 310,176 310,176
Total Deductions 705,152,835 771,186,262 784,211,641 807,868,006 825,820,196 831,073,637
NET INCOME FOR TAX PURPOSES 68,301,824 78,319,853 88,237,964 81,459,892 94,435,778 110,032,739
Charitable donations 311
Taxable dividends received under section 112 or 113 320
Non-capital losses of preceding taxation years from Schedule 7-1 331
Net-capital losses of preceding taxation years (Please show calculation) 332
Limited partnership losses of preceding taxation years from Schedule 4 335
REGULATORY TAXABLE INCOME 68,301,824 78,319,853 88,237,964 81,459,892 94,435,778 110,032,739
Total Ontario income taxes before small business deduction 11.50% 7,854,710 9,006,783 10,147,366 9,367,888 10,860,114 12,653,765
Ontario Small Business Deduction 0 0 0 0 0 0
Total Ontario income taxes 7,854,710 9,006,783 10,147,366 9,367,888 10,860,114 12,653,765
Effective Ontario tax rate 11.50% 11.50% 11.50% 11.50% 11.50% 11.50%
Federal tax rate 15.00% 15.00% 15.00% 15.00% 15.00% 15.00%
Combined tax rate 26.50% 26.50% 26.50% 26.50% 26.50% 26.50%
Total Income taxes 18,099,983 20,754,761 23,383,060 21,586,871 25,025,481 29,158,676
Investment Tax credits -1,478,000 -1,478,000 -1,478,000 -1,478,000 -1,478,000 -1,478,000
Miscellaneous Tax credits -1,258,000 -1,258,000 -1,258,000 -1,258,000 -1,258,000 -1,258,000
Total tax credits -2,736,000 -2,736,000 -2,736,000 -2,736,000 -2,736,000 -2,736,000
Corporate PILs/Income Tax Provision for Test Year 15,363,983 18,018,761 20,647,060 18,850,871 22,289,481 26,422,676
Corporate PILs/Income Tax Provision Gross Up 1 73.50% 5,539,395 6,496,560 7,444,178 6,796,573 8,036,344 9,526,543
Income Tax (grossed-up) before tax credits reclass to OM&A 20,903,379 24,515,321 28,091,239 25,647,444 30,325,825 35,949,219
Tax credits reclass to OM&A 1,875,113 1,875,113 1,875,113 1,875,113 1,875,113 1,875,113
Income Tax (grossed-up) after tax credits reclass to OM&A 22,778,492 26,390,434 29,966,352 27,522,557 32,200,938 37,824,332
Note: 1. This is for the derivation of revenue requirement and should not be used for sufficiency/deficiency calculations.
Ontario Energy Board
2019-2024 PILs_OLD CCA rule
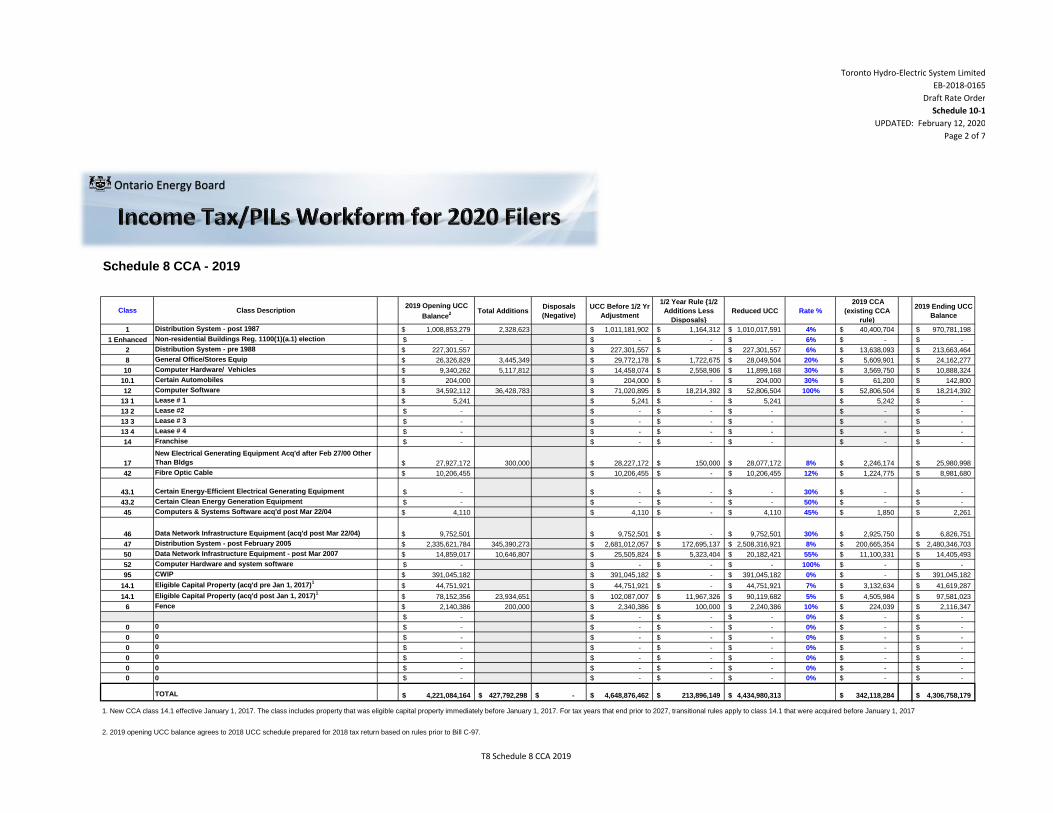
Toronto Hydro-Electric System Limited
EB-2018-0165
Draft Rate Order
Schedule 10-1
UPDATED: February 12, 2020
Page 2 of 7
Schedule 8 CCA - 2019
Class Class Description2019 Opening UCC
Balance2 Total Additions
Disposals
(Negative)
UCC Before 1/2 Yr
Adjustment
1/2 Year Rule {1/2
Additions Less
Disposals}
Reduced UCC Rate %
2019 CCA
(existing CCA
rule)
2019 Ending UCC
Balance
1 Distribution System - post 1987 1,008,853,279$ 2,328,623 1,011,181,902$ 1,164,312$ 1,010,017,591$ 4% 40,400,704$ 970,781,198$
1 Enhanced Non-residential Buildings Reg. 1100(1)(a.1) election -$ -$ -$ -$ 6% -$ -$
2 Distribution System - pre 1988 227,301,557$ 227,301,557$ -$ 227,301,557$ 6% 13,638,093$ 213,663,464$
8 General Office/Stores Equip 26,326,829$ 3,445,349 29,772,178$ 1,722,675$ 28,049,504$ 20% 5,609,901$ 24,162,277$
10 Computer Hardware/ Vehicles 9,340,262$ 5,117,812 14,458,074$ 2,558,906$ 11,899,168$ 30% 3,569,750$ 10,888,324$
10.1 Certain Automobiles 204,000$ 204,000$ -$ 204,000$ 30% 61,200$ 142,800$
12 Computer Software 34,592,112$ 36,428,783 71,020,895$ 18,214,392$ 52,806,504$ 100% 52,806,504$ 18,214,392$
13 1 Lease # 1 5,241$ 5,241$ -$ 5,241$ 5,242$ -$
13 2 Lease #2 -$ -$ -$ -$ -$ -$
13 3 Lease # 3 -$ -$ -$ -$ -$ -$
13 4 Lease # 4 -$ -$ -$ -$ -$ -$
14 Franchise -$ -$ -$ -$ -$ -$
17
New Electrical Generating Equipment Acq'd after Feb 27/00 Other
Than Bldgs 27,927,172$ 300,000 28,227,172$ 150,000$ 28,077,172$ 8% 2,246,174$ 25,980,998$
42 Fibre Optic Cable 10,206,455$ 10,206,455$ -$ 10,206,455$ 12% 1,224,775$ 8,981,680$
43.1 Certain Energy-Efficient Electrical Generating Equipment -$ -$ -$ -$ 30% -$ -$
43.2 Certain Clean Energy Generation Equipment -$ -$ -$ -$ 50% -$ -$
45 Computers & Systems Software acq'd post Mar 22/04 4,110$ 4,110$ -$ 4,110$ 45% 1,850$ 2,261$
46 Data Network Infrastructure Equipment (acq'd post Mar 22/04) 9,752,501$ 9,752,501$ -$ 9,752,501$ 30% 2,925,750$ 6,826,751$
47 Distribution System - post February 2005 2,335,621,784$ 345,390,273 2,681,012,057$ 172,695,137$ 2,508,316,921$ 8% 200,665,354$ 2,480,346,703$
50 Data Network Infrastructure Equipment - post Mar 2007 14,859,017$ 10,646,807 25,505,824$ 5,323,404$ 20,182,421$ 55% 11,100,331$ 14,405,493$
52 Computer Hardware and system software -$ -$ -$ -$ 100% -$ -$
95 CWIP 391,045,182$ 391,045,182$ -$ 391,045,182$ 0% -$ 391,045,182$
14.1 Eligible Capital Property (acq'd pre Jan 1, 2017)1
44,751,921$ 44,751,921$ -$ 44,751,921$ 7% 3,132,634$ 41,619,287$
14.1 Eligible Capital Property (acq'd post Jan 1, 2017)1
78,152,356$ 23,934,651 102,087,007$ 11,967,326$ 90,119,682$ 5% 4,505,984$ 97,581,023$
6 Fence 2,140,386$ 200,000 2,340,386$ 100,000$ 2,240,386$ 10% 224,039$ 2,116,347$
-$ -$ -$ -$ 0% -$ -$
0 0 -$ -$ -$ -$ 0% -$ -$
0 0 -$ -$ -$ -$ 0% -$ -$
0 0 -$ -$ -$ -$ 0% -$ -$
0 0 -$ -$ -$ -$ 0% -$ -$
0 0 -$ -$ -$ -$ 0% -$ -$
0 0 -$ -$ -$ -$ 0% -$ -$
TOTAL 4,221,084,164$ 427,792,298$ -$ 4,648,876,462$ 213,896,149$ 4,434,980,313$ 342,118,284$ 4,306,758,179$
1. New CCA class 14.1 effective January 1, 2017. The class includes property that was eligible capital property immediately before January 1, 2017. For tax years that end prior to 2027, transitional rules apply to class 14.1 that were acquired before January 1, 2017
2. 2019 opening UCC balance agrees to 2018 UCC schedule prepared for 2018 tax return based on rules prior to Bill C-97.
Ontario Energy Board
T8 Schedule 8 CCA 2019
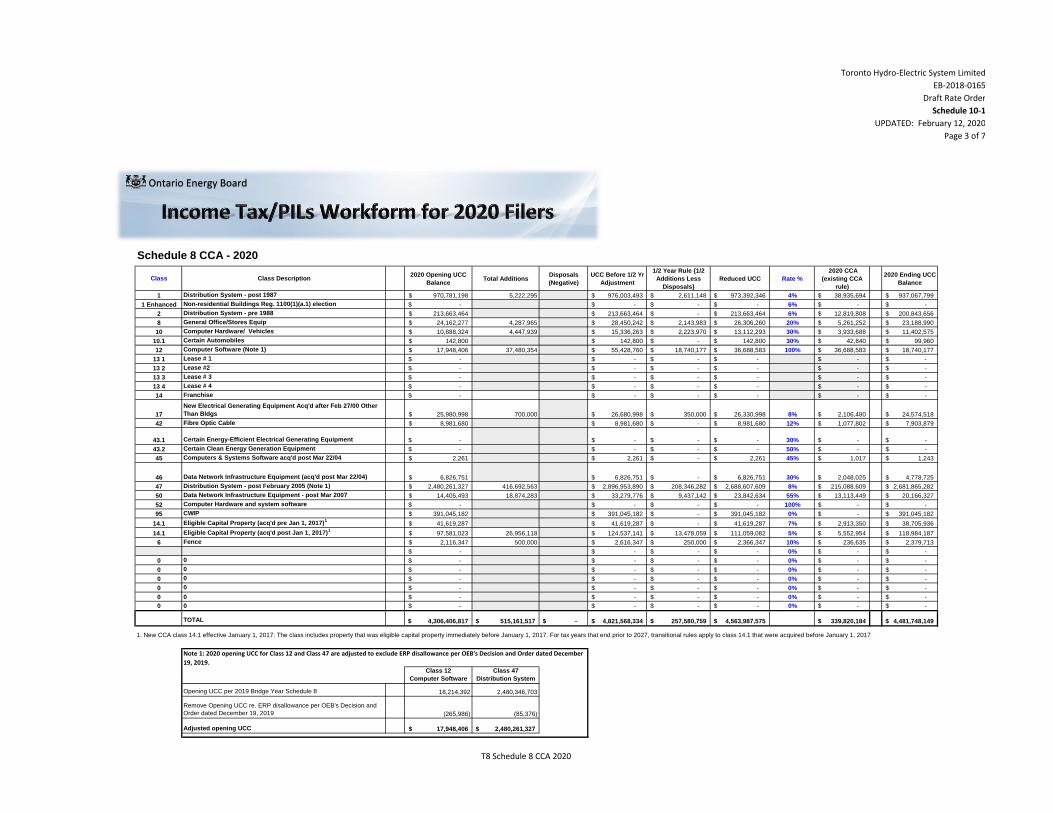
Toronto Hydro-Electric System Limited
EB-2018-0165
Draft Rate Order
Schedule 10-1
UPDATED: February 12, 2020
Page 3 of 7
Schedule 8 CCA - 2020
Class Class Description2020 Opening UCC
BalanceTotal Additions
Disposals
(Negative)
UCC Before 1/2 Yr
Adjustment
1/2 Year Rule {1/2
Additions Less
Disposals}
Reduced UCC Rate %
2020 CCA
(existing CCA
rule)
2020 Ending UCC
Balance
1 Distribution System - post 1987 970,781,198$ 5,222,295 976,003,493$ 2,611,148$ 973,392,346$ 4% 38,935,694$ 937,067,799$
1 Enhanced Non-residential Buildings Reg. 1100(1)(a.1) election -$ -$ -$ -$ 6% -$ -$
2 Distribution System - pre 1988 213,663,464$ 213,663,464$ -$ 213,663,464$ 6% 12,819,808$ 200,843,656$
8 General Office/Stores Equip 24,162,277$ 4,287,965 28,450,242$ 2,143,983$ 26,306,260$ 20% 5,261,252$ 23,188,990$
10 Computer Hardware/ Vehicles 10,888,324$ 4,447,939 15,336,263$ 2,223,970$ 13,112,293$ 30% 3,933,688$ 11,402,575$
10.1 Certain Automobiles 142,800$ 142,800$ -$ 142,800$ 30% 42,840$ 99,960$
12 Computer Software (Note 1) 17,948,406$ 37,480,354 55,428,760$ 18,740,177$ 36,688,583$ 100% 36,688,583$ 18,740,177$
13 1 Lease # 1 -$ -$ -$ -$ -$ -$
13 2 Lease #2 -$ -$ -$ -$ -$ -$
13 3 Lease # 3 -$ -$ -$ -$ -$ -$
13 4 Lease # 4 -$ -$ -$ -$ -$ -$
14 Franchise -$ -$ -$ -$ -$ -$
17
New Electrical Generating Equipment Acq'd after Feb 27/00 Other
Than Bldgs 25,980,998$ 700,000 26,680,998$ 350,000$ 26,330,998$ 8% 2,106,480$ 24,574,518$
42 Fibre Optic Cable 8,981,680$ 8,981,680$ -$ 8,981,680$ 12% 1,077,802$ 7,903,879$
43.1 Certain Energy-Efficient Electrical Generating Equipment -$ -$ -$ -$ 30% -$ -$
43.2 Certain Clean Energy Generation Equipment -$ -$ -$ -$ 50% -$ -$
45 Computers & Systems Software acq'd post Mar 22/04 2,261$ 2,261$ -$ 2,261$ 45% 1,017$ 1,243$
46 Data Network Infrastructure Equipment (acq'd post Mar 22/04) 6,826,751$ 6,826,751$ -$ 6,826,751$ 30% 2,048,025$ 4,778,725$
47 Distribution System - post February 2005 (Note 1) 2,480,261,327$ 416,692,563 2,896,953,890$ 208,346,282$ 2,688,607,609$ 8% 215,088,609$ 2,681,865,282$
50 Data Network Infrastructure Equipment - post Mar 2007 14,405,493$ 18,874,283 33,279,776$ 9,437,142$ 23,842,634$ 55% 13,113,449$ 20,166,327$
52 Computer Hardware and system software -$ -$ -$ -$ 100% -$ -$
95 CWIP 391,045,182$ 391,045,182$ -$ 391,045,182$ 0% -$ 391,045,182$
14.1 Eligible Capital Property (acq'd pre Jan 1, 2017)1
41,619,287$ 41,619,287$ -$ 41,619,287$ 7% 2,913,350$ 38,705,936$
14.1 Eligible Capital Property (acq'd post Jan 1, 2017)1
97,581,023$ 26,956,118 124,537,141$ 13,478,059$ 111,059,082$ 5% 5,552,954$ 118,984,187$
6 Fence 2,116,347$ 500,000 2,616,347$ 250,000$ 2,366,347$ 10% 236,635$ 2,379,713$
-$ -$ -$ -$ 0% -$ -$
0 0 -$ -$ -$ -$ 0% -$ -$
0 0 -$ -$ -$ -$ 0% -$ -$
0 0 -$ -$ -$ -$ 0% -$ -$
0 0 -$ -$ -$ -$ 0% -$ -$
0 0 -$ -$ -$ -$ 0% -$ -$
0 0 -$ -$ -$ -$ 0% -$ -$
TOTAL 4,306,406,817$ 515,161,517$ -$ 4,821,568,334$ 257,580,759$ 4,563,987,575$ 339,820,184$ 4,481,748,149$
1. New CCA class 14.1 effective January 1, 2017. The class includes property that was eligible capital property immediately before January 1, 2017. For tax years that end prior to 2027, transitional rules apply to class 14.1 that were acquired before January 1, 2017
Class 12
Computer Software
Class 47
Distribution System
Opening UCC per 2019 Bridge Year Schedule 8 18,214,392 2,480,346,703
Remove Opening UCC re. ERP disallowance per OEB's Decision and
Order dated December 19, 2019 (265,986) (85,376)
Adjusted opening UCC 17,948,406$ 2,480,261,327$
Note 1: 2020 opening UCC for Class 12 and Class 47 are adjusted to exclude ERP disallowance per OEB's Decision and Order dated December
19, 2019.
Ontario Energy Board
T8 Schedule 8 CCA 2020
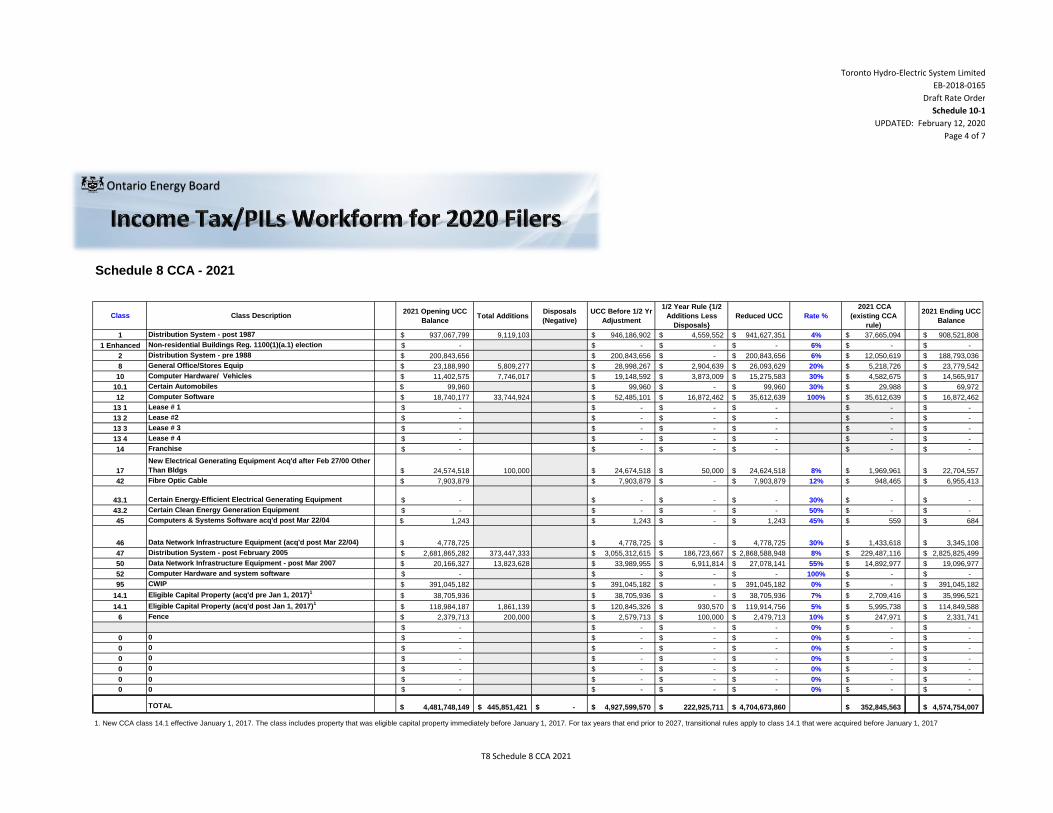
Toronto Hydro-Electric System Limited
EB-2018-0165
Draft Rate Order
Schedule 10-1
UPDATED: February 12, 2020
Page 4 of 7
Schedule 8 CCA - 2021
Class Class Description2021 Opening UCC
BalanceTotal Additions
Disposals
(Negative)
UCC Before 1/2 Yr
Adjustment
1/2 Year Rule {1/2
Additions Less
Disposals}
Reduced UCC Rate %
2021 CCA
(existing CCA
rule)
2021 Ending UCC
Balance
1 Distribution System - post 1987 937,067,799$ 9,119,103 946,186,902$ 4,559,552$ 941,627,351$ 4% 37,665,094$ 908,521,808$
1 Enhanced Non-residential Buildings Reg. 1100(1)(a.1) election -$ -$ -$ -$ 6% -$ -$
2 Distribution System - pre 1988 200,843,656$ 200,843,656$ -$ 200,843,656$ 6% 12,050,619$ 188,793,036$
8 General Office/Stores Equip 23,188,990$ 5,809,277 28,998,267$ 2,904,639$ 26,093,629$ 20% 5,218,726$ 23,779,542$
10 Computer Hardware/ Vehicles 11,402,575$ 7,746,017 19,148,592$ 3,873,009$ 15,275,583$ 30% 4,582,675$ 14,565,917$
10.1 Certain Automobiles 99,960$ 99,960$ -$ 99,960$ 30% 29,988$ 69,972$
12 Computer Software 18,740,177$ 33,744,924 52,485,101$ 16,872,462$ 35,612,639$ 100% 35,612,639$ 16,872,462$
13 1 Lease # 1 -$ -$ -$ -$ -$ -$
13 2 Lease #2 -$ -$ -$ -$ -$ -$
13 3 Lease # 3 -$ -$ -$ -$ -$ -$
13 4 Lease # 4 -$ -$ -$ -$ -$ -$
14 Franchise -$ -$ -$ -$ -$ -$
17
New Electrical Generating Equipment Acq'd after Feb 27/00 Other
Than Bldgs 24,574,518$ 100,000 24,674,518$ 50,000$ 24,624,518$ 8% 1,969,961$ 22,704,557$
42 Fibre Optic Cable 7,903,879$ 7,903,879$ -$ 7,903,879$ 12% 948,465$ 6,955,413$
43.1 Certain Energy-Efficient Electrical Generating Equipment -$ -$ -$ -$ 30% -$ -$
43.2 Certain Clean Energy Generation Equipment -$ -$ -$ -$ 50% -$ -$
45 Computers & Systems Software acq'd post Mar 22/04 1,243$ 1,243$ -$ 1,243$ 45% 559$ 684$
46 Data Network Infrastructure Equipment (acq'd post Mar 22/04) 4,778,725$ 4,778,725$ -$ 4,778,725$ 30% 1,433,618$ 3,345,108$
47 Distribution System - post February 2005 2,681,865,282$ 373,447,333 3,055,312,615$ 186,723,667$ 2,868,588,948$ 8% 229,487,116$ 2,825,825,499$
50 Data Network Infrastructure Equipment - post Mar 2007 20,166,327$ 13,823,628 33,989,955$ 6,911,814$ 27,078,141$ 55% 14,892,977$ 19,096,977$
52 Computer Hardware and system software -$ -$ -$ -$ 100% -$ -$
95 CWIP 391,045,182$ 391,045,182$ -$ 391,045,182$ 0% -$ 391,045,182$
14.1 Eligible Capital Property (acq'd pre Jan 1, 2017)1
38,705,936$ 38,705,936$ -$ 38,705,936$ 7% 2,709,416$ 35,996,521$
14.1 Eligible Capital Property (acq'd post Jan 1, 2017)1
118,984,187$ 1,861,139 120,845,326$ 930,570$ 119,914,756$ 5% 5,995,738$ 114,849,588$
6 Fence 2,379,713$ 200,000 2,579,713$ 100,000$ 2,479,713$ 10% 247,971$ 2,331,741$
-$ -$ -$ -$ 0% -$ -$
0 0 -$ -$ -$ -$ 0% -$ -$
0 0 -$ -$ -$ -$ 0% -$ -$
0 0 -$ -$ -$ -$ 0% -$ -$
0 0 -$ -$ -$ -$ 0% -$ -$
0 0 -$ -$ -$ -$ 0% -$ -$
0 0 -$ -$ -$ -$ 0% -$ -$
TOTAL 4,481,748,149$ 445,851,421$ -$ 4,927,599,570$ 222,925,711$ 4,704,673,860$ 352,845,563$ 4,574,754,007$
1. New CCA class 14.1 effective January 1, 2017. The class includes property that was eligible capital property immediately before January 1, 2017. For tax years that end prior to 2027, transitional rules apply to class 14.1 that were acquired before January 1, 2017
Ontario Energy Board
T8 Schedule 8 CCA 2021
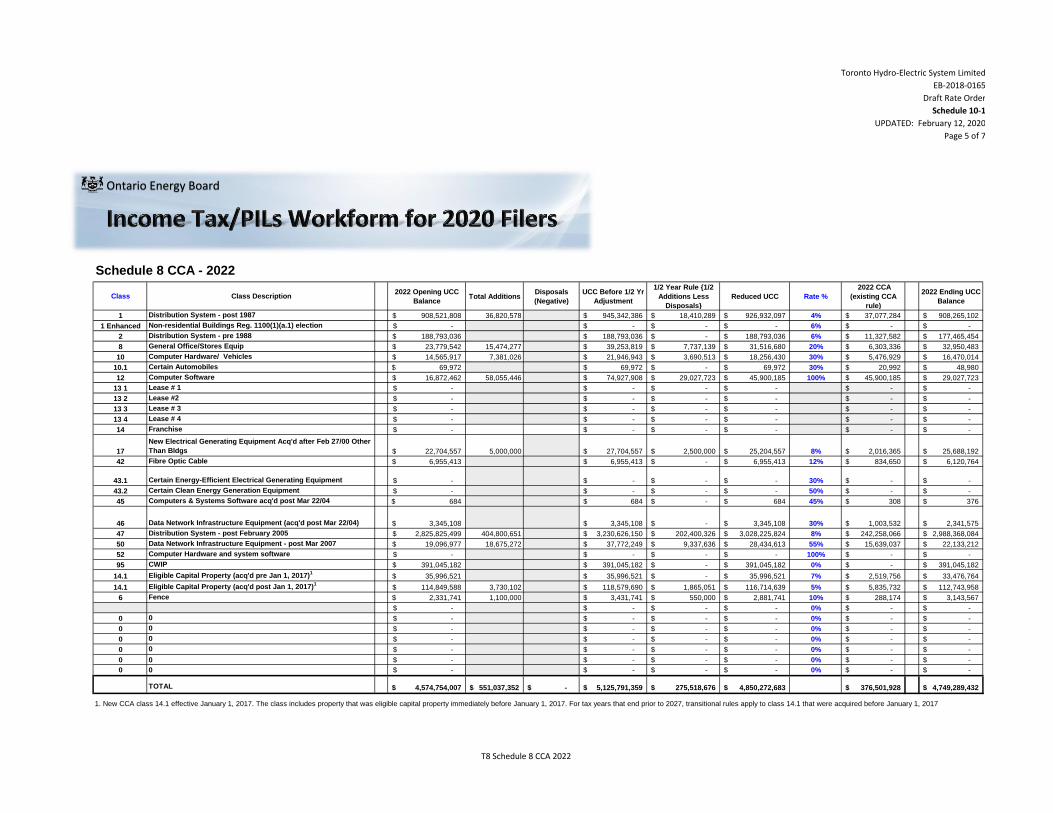
Toronto Hydro-Electric System Limited
EB-2018-0165
Draft Rate Order
Schedule 10-1
UPDATED: February 12, 2020
Page 5 of 7
Schedule 8 CCA - 2022
Class Class Description2022 Opening UCC
BalanceTotal Additions
Disposals
(Negative)
UCC Before 1/2 Yr
Adjustment
1/2 Year Rule {1/2
Additions Less
Disposals}
Reduced UCC Rate %
2022 CCA
(existing CCA
rule)
2022 Ending UCC
Balance
1 Distribution System - post 1987 908,521,808$ 36,820,578 945,342,386$ 18,410,289$ 926,932,097$ 4% 37,077,284$ 908,265,102$
1 Enhanced Non-residential Buildings Reg. 1100(1)(a.1) election -$ -$ -$ -$ 6% -$ -$
2 Distribution System - pre 1988 188,793,036$ 188,793,036$ -$ 188,793,036$ 6% 11,327,582$ 177,465,454$
8 General Office/Stores Equip 23,779,542$ 15,474,277 39,253,819$ 7,737,139$ 31,516,680$ 20% 6,303,336$ 32,950,483$
10 Computer Hardware/ Vehicles 14,565,917$ 7,381,026 21,946,943$ 3,690,513$ 18,256,430$ 30% 5,476,929$ 16,470,014$
10.1 Certain Automobiles 69,972$ 69,972$ -$ 69,972$ 30% 20,992$ 48,980$
12 Computer Software 16,872,462$ 58,055,446 74,927,908$ 29,027,723$ 45,900,185$ 100% 45,900,185$ 29,027,723$
13 1 Lease # 1 -$ -$ -$ -$ -$ -$
13 2 Lease #2 -$ -$ -$ -$ -$ -$
13 3 Lease # 3 -$ -$ -$ -$ -$ -$
13 4 Lease # 4 -$ -$ -$ -$ -$ -$
14 Franchise -$ -$ -$ -$ -$ -$
17
New Electrical Generating Equipment Acq'd after Feb 27/00 Other
Than Bldgs 22,704,557$ 5,000,000 27,704,557$ 2,500,000$ 25,204,557$ 8% 2,016,365$ 25,688,192$
42 Fibre Optic Cable 6,955,413$ 6,955,413$ -$ 6,955,413$ 12% 834,650$ 6,120,764$
43.1 Certain Energy-Efficient Electrical Generating Equipment -$ -$ -$ -$ 30% -$ -$
43.2 Certain Clean Energy Generation Equipment -$ -$ -$ -$ 50% -$ -$
45 Computers & Systems Software acq'd post Mar 22/04 684$ 684$ -$ 684$ 45% 308$ 376$
46 Data Network Infrastructure Equipment (acq'd post Mar 22/04) 3,345,108$ 3,345,108$ -$ 3,345,108$ 30% 1,003,532$ 2,341,575$
47 Distribution System - post February 2005 2,825,825,499$ 404,800,651 3,230,626,150$ 202,400,326$ 3,028,225,824$ 8% 242,258,066$ 2,988,368,084$
50 Data Network Infrastructure Equipment - post Mar 2007 19,096,977$ 18,675,272 37,772,249$ 9,337,636$ 28,434,613$ 55% 15,639,037$ 22,133,212$
52 Computer Hardware and system software -$ -$ -$ -$ 100% -$ -$
95 CWIP 391,045,182$ 391,045,182$ -$ 391,045,182$ 0% -$ 391,045,182$
14.1 Eligible Capital Property (acq'd pre Jan 1, 2017)1
35,996,521$ 35,996,521$ -$ 35,996,521$ 7% 2,519,756$ 33,476,764$
14.1 Eligible Capital Property (acq'd post Jan 1, 2017)1
114,849,588$ 3,730,102 118,579,690$ 1,865,051$ 116,714,639$ 5% 5,835,732$ 112,743,958$
6 Fence 2,331,741$ 1,100,000 3,431,741$ 550,000$ 2,881,741$ 10% 288,174$ 3,143,567$
-$ -$ -$ -$ 0% -$ -$
0 0 -$ -$ -$ -$ 0% -$ -$
0 0 -$ -$ -$ -$ 0% -$ -$
0 0 -$ -$ -$ -$ 0% -$ -$
0 0 -$ -$ -$ -$ 0% -$ -$
0 0 -$ -$ -$ -$ 0% -$ -$
0 0 -$ -$ -$ -$ 0% -$ -$
TOTAL 4,574,754,007$ 551,037,352$ -$ 5,125,791,359$ 275,518,676$ 4,850,272,683$ 376,501,928$ 4,749,289,432$
1. New CCA class 14.1 effective January 1, 2017. The class includes property that was eligible capital property immediately before January 1, 2017. For tax years that end prior to 2027, transitional rules apply to class 14.1 that were acquired before January 1, 2017
Ontario Energy Board
T8 Schedule 8 CCA 2022
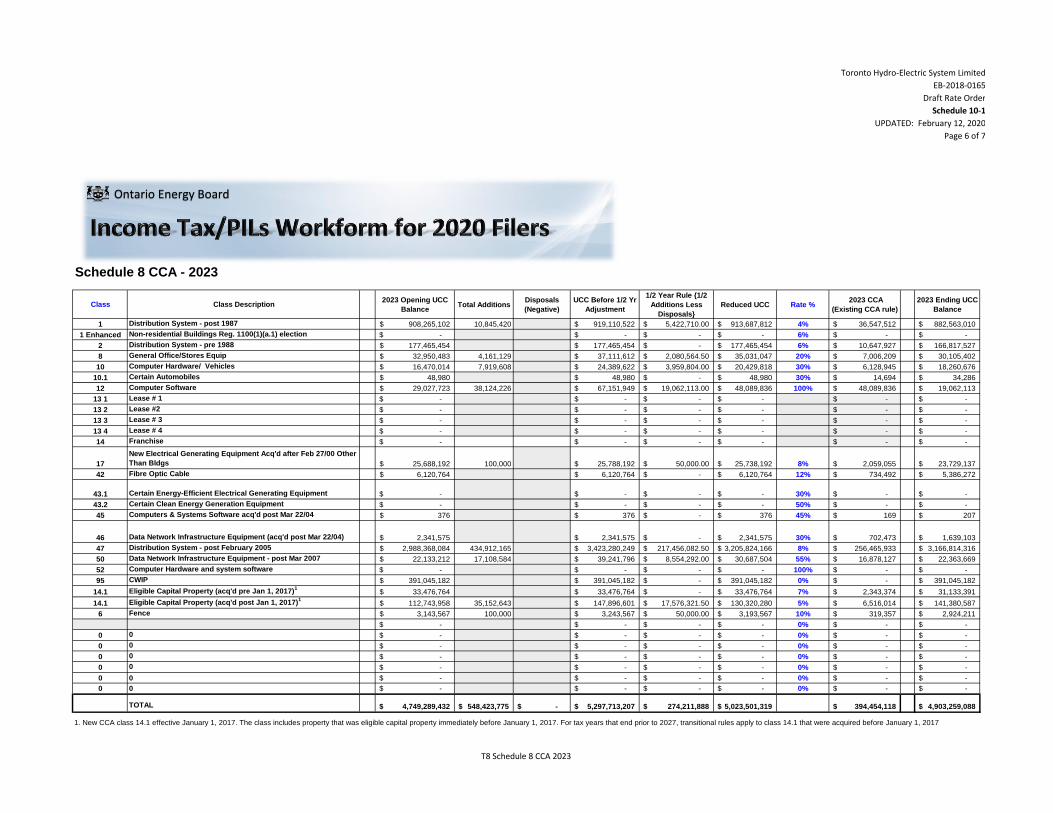
Toronto Hydro-Electric System Limited
EB-2018-0165
Draft Rate Order
Schedule 10-1
UPDATED: February 12, 2020
Page 6 of 7
Schedule 8 CCA - 2023
Class Class Description2023 Opening UCC
BalanceTotal Additions
Disposals
(Negative)
UCC Before 1/2 Yr
Adjustment
1/2 Year Rule {1/2
Additions Less
Disposals}
Reduced UCC Rate % 2023 CCA
(Existing CCA rule)
2023 Ending UCC
Balance
1 Distribution System - post 1987 908,265,102$ 10,845,420 919,110,522$ 5,422,710.00$ 913,687,812$ 4% 36,547,512$ 882,563,010$
1 Enhanced Non-residential Buildings Reg. 1100(1)(a.1) election -$ -$ -$ -$ 6% -$ -$
2 Distribution System - pre 1988 177,465,454$ 177,465,454$ -$ 177,465,454$ 6% 10,647,927$ 166,817,527$
8 General Office/Stores Equip 32,950,483$ 4,161,129 37,111,612$ 2,080,564.50$ 35,031,047$ 20% 7,006,209$ 30,105,402$
10 Computer Hardware/ Vehicles 16,470,014$ 7,919,608 24,389,622$ 3,959,804.00$ 20,429,818$ 30% 6,128,945$ 18,260,676$
10.1 Certain Automobiles 48,980$ 48,980$ -$ 48,980$ 30% 14,694$ 34,286$
12 Computer Software 29,027,723$ 38,124,226 67,151,949$ 19,062,113.00$ 48,089,836$ 100% 48,089,836$ 19,062,113$
13 1 Lease # 1 -$ -$ -$ -$ -$ -$
13 2 Lease #2 -$ -$ -$ -$ -$ -$
13 3 Lease # 3 -$ -$ -$ -$ -$ -$
13 4 Lease # 4 -$ -$ -$ -$ -$ -$
14 Franchise -$ -$ -$ -$ -$ -$
17
New Electrical Generating Equipment Acq'd after Feb 27/00 Other
Than Bldgs 25,688,192$ 100,000 25,788,192$ 50,000.00$ 25,738,192$ 8% 2,059,055$ 23,729,137$
42 Fibre Optic Cable 6,120,764$ 6,120,764$ -$ 6,120,764$ 12% 734,492$ 5,386,272$
43.1 Certain Energy-Efficient Electrical Generating Equipment -$ -$ -$ -$ 30% -$ -$
43.2 Certain Clean Energy Generation Equipment -$ -$ -$ -$ 50% -$ -$
45 Computers & Systems Software acq'd post Mar 22/04 376$ 376$ -$ 376$ 45% 169$ 207$
46 Data Network Infrastructure Equipment (acq'd post Mar 22/04) 2,341,575$ 2,341,575$ -$ 2,341,575$ 30% 702,473$ 1,639,103$
47 Distribution System - post February 2005 2,988,368,084$ 434,912,165 3,423,280,249$ 217,456,082.50$ 3,205,824,166$ 8% 256,465,933$ 3,166,814,316$
50 Data Network Infrastructure Equipment - post Mar 2007 22,133,212$ 17,108,584 39,241,796$ 8,554,292.00$ 30,687,504$ 55% 16,878,127$ 22,363,669$
52 Computer Hardware and system software -$ -$ -$ -$ 100% -$ -$
95 CWIP 391,045,182$ 391,045,182$ -$ 391,045,182$ 0% -$ 391,045,182$
14.1 Eligible Capital Property (acq'd pre Jan 1, 2017)1
33,476,764$ 33,476,764$ -$ 33,476,764$ 7% 2,343,374$ 31,133,391$
14.1 Eligible Capital Property (acq'd post Jan 1, 2017)1
112,743,958$ 35,152,643 147,896,601$ 17,576,321.50$ 130,320,280$ 5% 6,516,014$ 141,380,587$
6 Fence 3,143,567$ 100,000 3,243,567$ 50,000.00$ 3,193,567$ 10% 319,357$ 2,924,211$
-$ -$ -$ -$ 0% -$ -$
0 0 -$ -$ -$ -$ 0% -$ -$
0 0 -$ -$ -$ -$ 0% -$ -$
0 0 -$ -$ -$ -$ 0% -$ -$
0 0 -$ -$ -$ -$ 0% -$ -$
0 0 -$ -$ -$ -$ 0% -$ -$
0 0 -$ -$ -$ -$ 0% -$ -$
TOTAL 4,749,289,432$ 548,423,775$ -$ 5,297,713,207$ 274,211,888$ 5,023,501,319$ 394,454,118$ 4,903,259,088$
1. New CCA class 14.1 effective January 1, 2017. The class includes property that was eligible capital property immediately before January 1, 2017. For tax years that end prior to 2027, transitional rules apply to class 14.1 that were acquired before January 1, 2017
Ontario Energy Board
T8 Schedule 8 CCA 2023
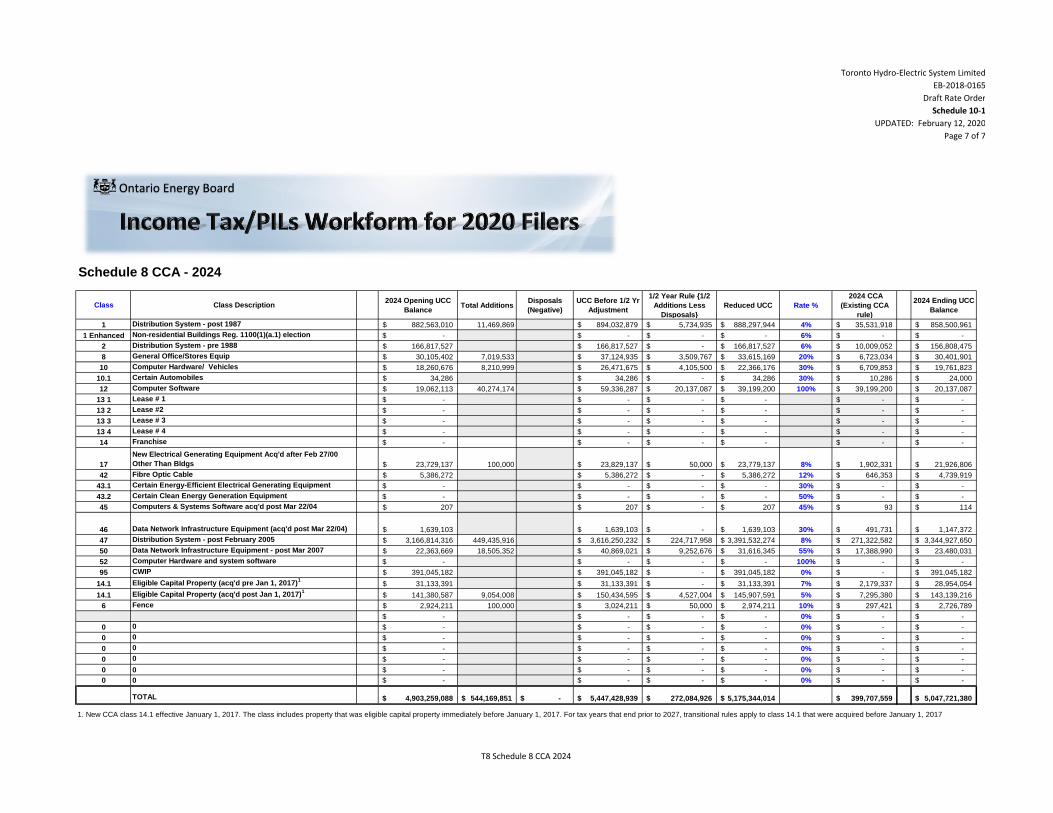
Toronto Hydro-Electric System Limited
EB-2018-0165
Draft Rate Order
Schedule 10-1
UPDATED: February 12, 2020
Page 7 of 7
Schedule 8 CCA - 2024
Class Class Description2024 Opening UCC
BalanceTotal Additions
Disposals
(Negative)
UCC Before 1/2 Yr
Adjustment
1/2 Year Rule {1/2
Additions Less
Disposals}
Reduced UCC Rate %
2024 CCA
(Existing CCA
rule)
2024 Ending UCC
Balance
1 Distribution System - post 1987 882,563,010$ 11,469,869 894,032,879$ 5,734,935$ 888,297,944$ 4% 35,531,918$ 858,500,961$
1 Enhanced Non-residential Buildings Reg. 1100(1)(a.1) election -$ -$ -$ -$ 6% -$ -$
2 Distribution System - pre 1988 166,817,527$ 166,817,527$ -$ 166,817,527$ 6% 10,009,052$ 156,808,475$
8 General Office/Stores Equip 30,105,402$ 7,019,533 37,124,935$ 3,509,767$ 33,615,169$ 20% 6,723,034$ 30,401,901$
10 Computer Hardware/ Vehicles 18,260,676$ 8,210,999 26,471,675$ 4,105,500$ 22,366,176$ 30% 6,709,853$ 19,761,823$
10.1 Certain Automobiles 34,286$ 34,286$ -$ 34,286$ 30% 10,286$ 24,000$
12 Computer Software 19,062,113$ 40,274,174 59,336,287$ 20,137,087$ 39,199,200$ 100% 39,199,200$ 20,137,087$
13 1 Lease # 1 -$ -$ -$ -$ -$ -$
13 2 Lease #2 -$ -$ -$ -$ -$ -$
13 3 Lease # 3 -$ -$ -$ -$ -$ -$
13 4 Lease # 4 -$ -$ -$ -$ -$ -$
14 Franchise -$ -$ -$ -$ -$ -$
17
New Electrical Generating Equipment Acq'd after Feb 27/00
Other Than Bldgs 23,729,137$ 100,000 23,829,137$ 50,000$ 23,779,137$ 8% 1,902,331$ 21,926,806$
42 Fibre Optic Cable 5,386,272$ 5,386,272$ -$ 5,386,272$ 12% 646,353$ 4,739,919$
43.1 Certain Energy-Efficient Electrical Generating Equipment -$ -$ -$ -$ 30% -$ -$
43.2 Certain Clean Energy Generation Equipment -$ -$ -$ -$ 50% -$ -$
45 Computers & Systems Software acq'd post Mar 22/04 207$ 207$ -$ 207$ 45% 93$ 114$
46 Data Network Infrastructure Equipment (acq'd post Mar 22/04) 1,639,103$ 1,639,103$ -$ 1,639,103$ 30% 491,731$ 1,147,372$
47 Distribution System - post February 2005 3,166,814,316$ 449,435,916 3,616,250,232$ 224,717,958$ 3,391,532,274$ 8% 271,322,582$ 3,344,927,650$
50 Data Network Infrastructure Equipment - post Mar 2007 22,363,669$ 18,505,352 40,869,021$ 9,252,676$ 31,616,345$ 55% 17,388,990$ 23,480,031$
52 Computer Hardware and system software -$ -$ -$ -$ 100% -$ -$
95 CWIP 391,045,182$ 391,045,182$ -$ 391,045,182$ 0% -$ 391,045,182$
14.1 Eligible Capital Property (acq'd pre Jan 1, 2017)1
31,133,391$ 31,133,391$ -$ 31,133,391$ 7% 2,179,337$ 28,954,054$
14.1 Eligible Capital Property (acq'd post Jan 1, 2017)1
141,380,587$ 9,054,008 150,434,595$ 4,527,004$ 145,907,591$ 5% 7,295,380$ 143,139,216$
6 Fence 2,924,211$ 100,000 3,024,211$ 50,000$ 2,974,211$ 10% 297,421$ 2,726,789$
-$ -$ -$ -$ 0% -$ -$
0 0 -$ -$ -$ -$ 0% -$ -$
0 0 -$ -$ -$ -$ 0% -$ -$
0 0 -$ -$ -$ -$ 0% -$ -$
0 0 -$ -$ -$ -$ 0% -$ -$
0 0 -$ -$ -$ -$ 0% -$ -$
0 0 -$ -$ -$ -$ 0% -$ -$
TOTAL 4,903,259,088$ 544,169,851$ -$ 5,447,428,939$ 272,084,926$ 5,175,344,014$ 399,707,559$ 5,047,721,380$
1. New CCA class 14.1 effective January 1, 2017. The class includes property that was eligible capital property immediately before January 1, 2017. For tax years that end prior to 2027, transitional rules apply to class 14.1 that were acquired before January 1, 2017
Ontario Energy Board
T8 Schedule 8 CCA 2024
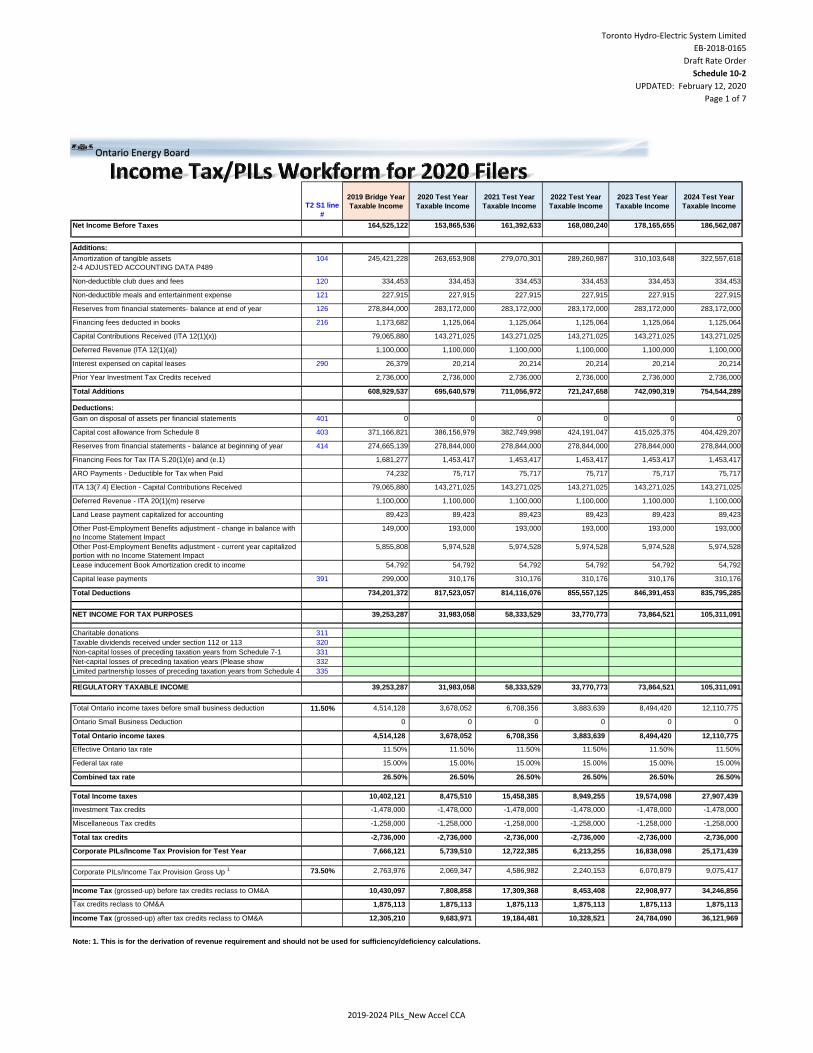
Toronto Hydro-Electric System Limited
EB-2018-0165
Draft Rate Order
Schedule 10-2
UPDATED: February 12, 2020
Page 1 of 7
T2 S1 line
#
2019 Bridge Year
Taxable Income
2020 Test Year
Taxable Income
2021 Test Year
Taxable Income
2022 Test Year
Taxable Income
2023 Test Year
Taxable Income
2024 Test Year
Taxable Income
Net Income Before Taxes 164,525,122 153,865,536 161,392,633 168,080,240 178,165,655 186,562,087
Additions:
Amortization of tangible assets
2-4 ADJUSTED ACCOUNTING DATA P489
104 245,421,228 263,653,908 279,070,301 289,260,987 310,103,648 322,557,618
Non-deductible club dues and fees 120 334,453 334,453 334,453 334,453 334,453 334,453
Non-deductible meals and entertainment expense 121 227,915 227,915 227,915 227,915 227,915 227,915
Reserves from financial statements- balance at end of year 126 278,844,000 283,172,000 283,172,000 283,172,000 283,172,000 283,172,000
Financing fees deducted in books 216 1,173,682 1,125,064 1,125,064 1,125,064 1,125,064 1,125,064
Capital Contributions Received (ITA 12(1)(x)) 79,065,880 143,271,025 143,271,025 143,271,025 143,271,025 143,271,025
Deferred Revenue (ITA 12(1)(a)) 1,100,000 1,100,000 1,100,000 1,100,000 1,100,000 1,100,000
Interest expensed on capital leases 290 26,379 20,214 20,214 20,214 20,214 20,214
Prior Year Investment Tax Credits received 2,736,000 2,736,000 2,736,000 2,736,000 2,736,000 2,736,000
Total Additions 608,929,537 695,640,579 711,056,972 721,247,658 742,090,319 754,544,289
Deductions:
Gain on disposal of assets per financial statements 401 0 0 0 0 0 0
Capital cost allowance from Schedule 8 403 371,166,821 386,156,979 382,749,998 424,191,047 415,025,375 404,429,207
Reserves from financial statements - balance at beginning of year 414 274,665,139 278,844,000 278,844,000 278,844,000 278,844,000 278,844,000
Financing Fees for Tax ITA S.20(1)(e) and (e.1) 1,681,277 1,453,417 1,453,417 1,453,417 1,453,417 1,453,417
ARO Payments - Deductible for Tax when Paid 74,232 75,717 75,717 75,717 75,717 75,717
ITA 13(7.4) Election - Capital Contributions Received 79,065,880 143,271,025 143,271,025 143,271,025 143,271,025 143,271,025
Deferred Revenue - ITA 20(1)(m) reserve 1,100,000 1,100,000 1,100,000 1,100,000 1,100,000 1,100,000
Land Lease payment capitalized for accounting 89,423 89,423 89,423 89,423 89,423 89,423
Other Post-Employment Benefits adjustment - change in balance with
no Income Statement Impact
149,000 193,000 193,000 193,000 193,000 193,000
Other Post-Employment Benefits adjustment - current year capitalized
portion with no Income Statement Impact
5,855,808 5,974,528 5,974,528 5,974,528 5,974,528 5,974,528
Lease inducement Book Amortization credit to income 54,792 54,792 54,792 54,792 54,792 54,792
Capital lease payments 391 299,000 310,176 310,176 310,176 310,176 310,176
Total Deductions 734,201,372 817,523,057 814,116,076 855,557,125 846,391,453 835,795,285
NET INCOME FOR TAX PURPOSES 39,253,287 31,983,058 58,333,529 33,770,773 73,864,521 105,311,091
Charitable donations 311
Taxable dividends received under section 112 or 113 320
Non-capital losses of preceding taxation years from Schedule 7-1 331
Net-capital losses of preceding taxation years (Please show
calculation)
332
Limited partnership losses of preceding taxation years from Schedule 4 335
REGULATORY TAXABLE INCOME 39,253,287 31,983,058 58,333,529 33,770,773 73,864,521 105,311,091
Total Ontario income taxes before small business deduction 11.50% 4,514,128 3,678,052 6,708,356 3,883,639 8,494,420 12,110,775
Ontario Small Business Deduction 0 0 0 0 0 0
Total Ontario income taxes 4,514,128 3,678,052 6,708,356 3,883,639 8,494,420 12,110,775
Effective Ontario tax rate 11.50% 11.50% 11.50% 11.50% 11.50% 11.50%
Federal tax rate 15.00% 15.00% 15.00% 15.00% 15.00% 15.00%
Combined tax rate 26.50% 26.50% 26.50% 26.50% 26.50% 26.50%
Total Income taxes 10,402,121 8,475,510 15,458,385 8,949,255 19,574,098 27,907,439
Investment Tax credits -1,478,000 -1,478,000 -1,478,000 -1,478,000 -1,478,000 -1,478,000
Miscellaneous Tax credits -1,258,000 -1,258,000 -1,258,000 -1,258,000 -1,258,000 -1,258,000
Total tax credits -2,736,000 -2,736,000 -2,736,000 -2,736,000 -2,736,000 -2,736,000
Corporate PILs/Income Tax Provision for Test Year 7,666,121 5,739,510 12,722,385 6,213,255 16,838,098 25,171,439
Corporate PILs/Income Tax Provision Gross Up 1 73.50% 2,763,976 2,069,347 4,586,982 2,240,153 6,070,879 9,075,417
Income Tax (grossed-up) before tax credits reclass to OM&A 10,430,097 7,808,858 17,309,368 8,453,408 22,908,977 34,246,856
Tax credits reclass to OM&A 1,875,113 1,875,113 1,875,113 1,875,113 1,875,113 1,875,113
Income Tax (grossed-up) after tax credits reclass to OM&A 12,305,210 9,683,971 19,184,481 10,328,521 24,784,090 36,121,969
Note: 1. This is for the derivation of revenue requirement and should not be used for sufficiency/deficiency calculations.
Ontario Energy Board
2019-2024 PILs_New Accel CCA
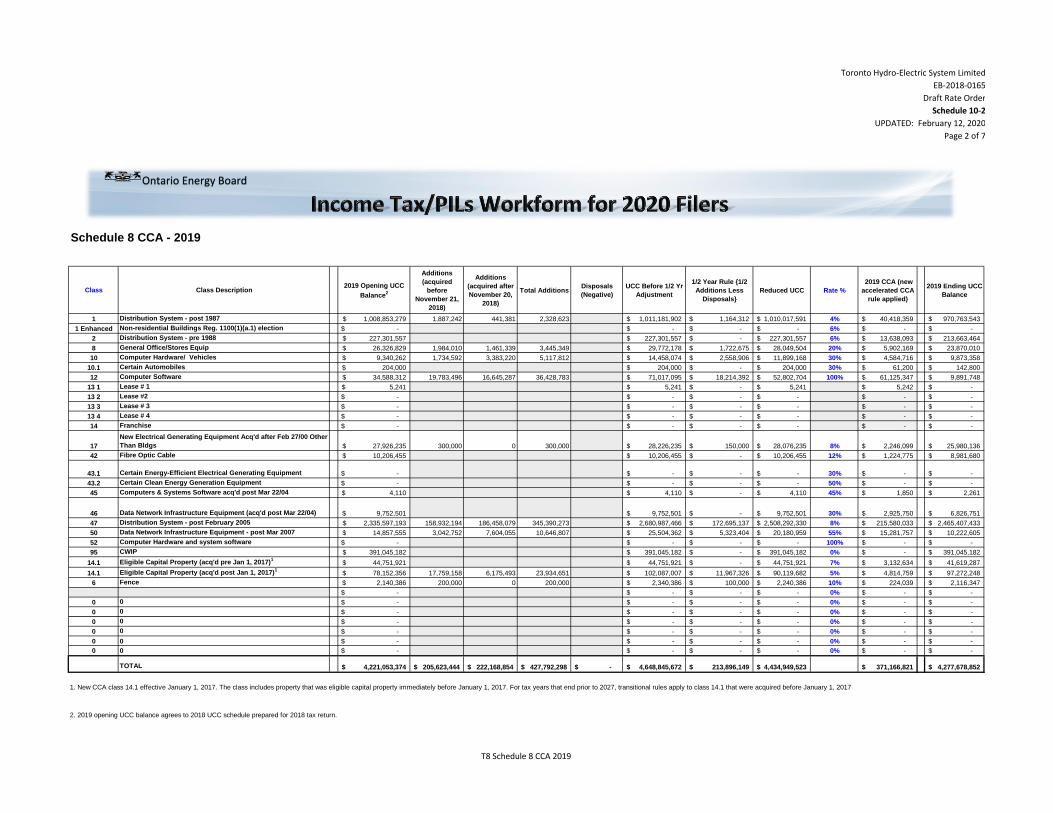
Toronto Hydro-Electric System Limited
EB-2018-0165
Draft Rate Order
Schedule 10-2
UPDATED: February 12, 2020
Page 2 of 7
Schedule 8 CCA - 2019
Class Class Description2019 Opening UCC
Balance2
Additions
(acquired
before
November 21,
2018)
Additions
(acquired after
November 20,
2018)
Total AdditionsDisposals
(Negative)
UCC Before 1/2 Yr
Adjustment
1/2 Year Rule {1/2
Additions Less
Disposals}
Reduced UCC Rate %
2019 CCA (new
accelerated CCA
rule applied)
2019 Ending UCC
Balance
1 Distribution System - post 1987 1,008,853,279$ 1,887,242 441,381 2,328,623 1,011,181,902$ 1,164,312$ 1,010,017,591$ 4% 40,418,359$ 970,763,543$
1 Enhanced Non-residential Buildings Reg. 1100(1)(a.1) election -$ -$ -$ -$ 6% -$ -$
2 Distribution System - pre 1988 227,301,557$ 227,301,557$ -$ 227,301,557$ 6% 13,638,093$ 213,663,464$
8 General Office/Stores Equip 26,326,829$ 1,984,010 1,461,339 3,445,349 29,772,178$ 1,722,675$ 28,049,504$ 20% 5,902,169$ 23,870,010$
10 Computer Hardware/ Vehicles 9,340,262$ 1,734,592 3,383,220 5,117,812 14,458,074$ 2,558,906$ 11,899,168$ 30% 4,584,716$ 9,873,358$
10.1 Certain Automobiles 204,000$ 204,000$ -$ 204,000$ 30% 61,200$ 142,800$
12 Computer Software 34,588,312$ 19,783,496 16,645,287 36,428,783 71,017,095$ 18,214,392$ 52,802,704$ 100% 61,125,347$ 9,891,748$
13 1 Lease # 1 5,241$ 5,241$ -$ 5,241$ 5,242$ -$
13 2 Lease #2 -$ -$ -$ -$ -$ -$
13 3 Lease # 3 -$ -$ -$ -$ -$ -$
13 4 Lease # 4 -$ -$ -$ -$ -$ -$
14 Franchise -$ -$ -$ -$ -$ -$
17
New Electrical Generating Equipment Acq'd after Feb 27/00 Other
Than Bldgs 27,926,235$ 300,000 0 300,000 28,226,235$ 150,000$ 28,076,235$ 8% 2,246,099$ 25,980,136$
42 Fibre Optic Cable 10,206,455$ 10,206,455$ -$ 10,206,455$ 12% 1,224,775$ 8,981,680$
43.1 Certain Energy-Efficient Electrical Generating Equipment -$ -$ -$ -$ 30% -$ -$
43.2 Certain Clean Energy Generation Equipment -$ -$ -$ -$ 50% -$ -$
45 Computers & Systems Software acq'd post Mar 22/04 4,110$ 4,110$ -$ 4,110$ 45% 1,850$ 2,261$
46 Data Network Infrastructure Equipment (acq'd post Mar 22/04) 9,752,501$ 9,752,501$ -$ 9,752,501$ 30% 2,925,750$ 6,826,751$
47 Distribution System - post February 2005 2,335,597,193$ 158,932,194 186,458,079 345,390,273 2,680,987,466$ 172,695,137$ 2,508,292,330$ 8% 215,580,033$ 2,465,407,433$
50 Data Network Infrastructure Equipment - post Mar 2007 14,857,555$ 3,042,752 7,604,055 10,646,807 25,504,362$ 5,323,404$ 20,180,959$ 55% 15,281,757$ 10,222,605$
52 Computer Hardware and system software -$ -$ -$ -$ 100% -$ -$
95 CWIP 391,045,182$ 391,045,182$ -$ 391,045,182$ 0% -$ 391,045,182$
14.1 Eligible Capital Property (acq'd pre Jan 1, 2017)1
44,751,921$ 44,751,921$ -$ 44,751,921$ 7% 3,132,634$ 41,619,287$
14.1 Eligible Capital Property (acq'd post Jan 1, 2017)1
78,152,356$ 17,759,158 6,175,493 23,934,651 102,087,007$ 11,967,326$ 90,119,682$ 5% 4,814,759$ 97,272,248$
6 Fence 2,140,386$ 200,000 0 200,000 2,340,386$ 100,000$ 2,240,386$ 10% 224,039$ 2,116,347$
-$ -$ -$ -$ 0% -$ -$
0 0 -$ -$ -$ -$ 0% -$ -$
0 0 -$ -$ -$ -$ 0% -$ -$
0 0 -$ -$ -$ -$ 0% -$ -$
0 0 -$ -$ -$ -$ 0% -$ -$
0 0 -$ -$ -$ -$ 0% -$ -$
0 0 -$ -$ -$ -$ 0% -$ -$
TOTAL 4,221,053,374$ 205,623,444$ 222,168,854$ 427,792,298$ -$ 4,648,845,672$ 213,896,149$ 4,434,949,523$ 371,166,821$ 4,277,678,852$
1. New CCA class 14.1 effective January 1, 2017. The class includes property that was eligible capital property immediately before January 1, 2017. For tax years that end prior to 2027, transitional rules apply to class 14.1 that were acquired before January 1, 2017
2. 2019 opening UCC balance agrees to 2018 UCC schedule prepared for 2018 tax return.
Ontario Energy Board
T8 Schedule 8 CCA 2019
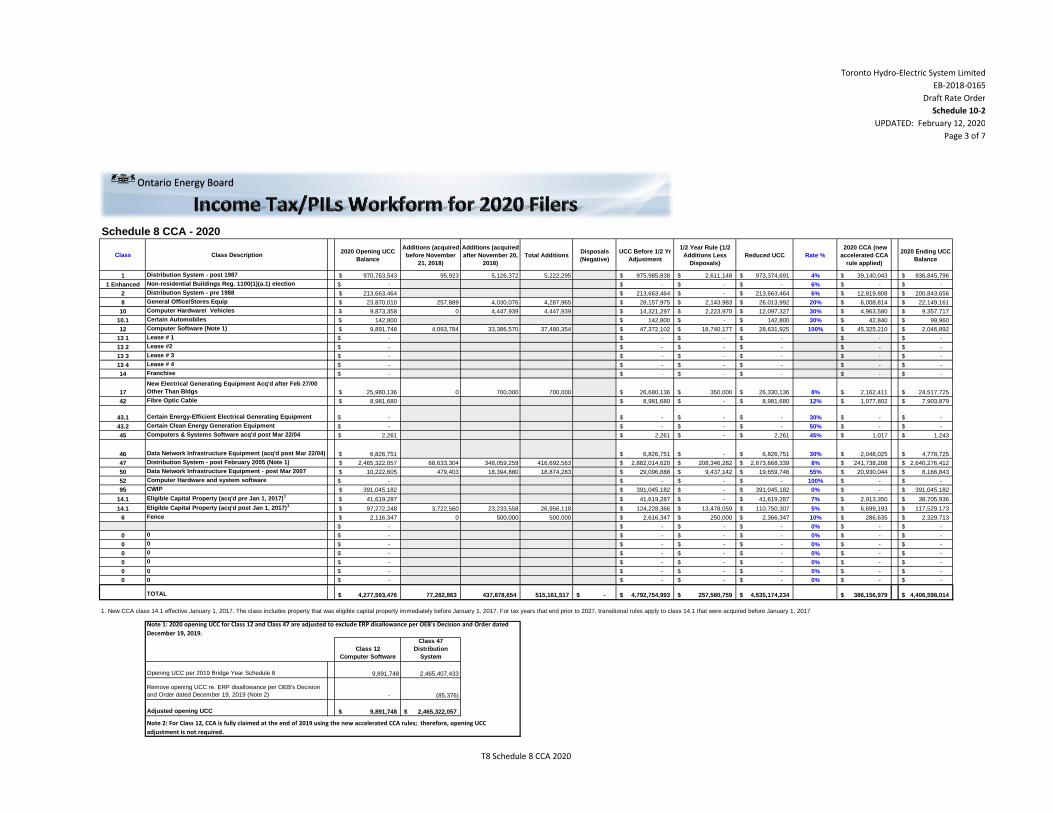
Toronto Hydro-Electric System Limited
EB-2018-0165
Draft Rate Order
Schedule 10-2
UPDATED: February 12, 2020
Page 3 of 7
Schedule 8 CCA - 2020
Class Class Description2020 Opening UCC
Balance
Additions (acquired
before November
21, 2018)
Additions (acquired
after November 20,
2018)
Total AdditionsDisposals
(Negative)
UCC Before 1/2 Yr
Adjustment
1/2 Year Rule {1/2
Additions Less
Disposals}
Reduced UCC Rate %
2020 CCA (new
accelerated CCA
rule applied)
2020 Ending UCC
Balance
1 Distribution System - post 1987 970,763,543$ 95,923 5,126,372 5,222,295 975,985,838$ 2,611,148$ 973,374,691$ 4% 39,140,043$ 936,845,796$
1 Enhanced Non-residential Buildings Reg. 1100(1)(a.1) election -$ -$ -$ -$ 6% -$ -$
2 Distribution System - pre 1988 213,663,464$ 213,663,464$ -$ 213,663,464$ 6% 12,819,808$ 200,843,656$
8 General Office/Stores Equip 23,870,010$ 257,889 4,030,076 4,287,965 28,157,975$ 2,143,983$ 26,013,992$ 20% 6,008,814$ 22,149,161$
10 Computer Hardware/ Vehicles 9,873,358$ 0 4,447,939 4,447,939 14,321,297$ 2,223,970$ 12,097,327$ 30% 4,963,580$ 9,357,717$
10.1 Certain Automobiles 142,800$ 142,800$ -$ 142,800$ 30% 42,840$ 99,960$
12 Computer Software (Note 1) 9,891,748$ 4,093,784 33,386,570 37,480,354 47,372,102$ 18,740,177$ 28,631,925$ 100% 45,325,210$ 2,046,892$
13 1 Lease # 1 -$ -$ -$ -$ -$ -$
13 2 Lease #2 -$ -$ -$ -$ -$ -$
13 3 Lease # 3 -$ -$ -$ -$ -$ -$
13 4 Lease # 4 -$ -$ -$ -$ -$ -$
14 Franchise -$ -$ -$ -$ -$ -$
17
New Electrical Generating Equipment Acq'd after Feb 27/00
Other Than Bldgs 25,980,136$ 0 700,000 700,000 26,680,136$ 350,000$ 26,330,136$ 8% 2,162,411$ 24,517,725$
42 Fibre Optic Cable 8,981,680$ 8,981,680$ -$ 8,981,680$ 12% 1,077,802$ 7,903,879$
43.1 Certain Energy-Efficient Electrical Generating Equipment -$ -$ -$ -$ 30% -$ -$
43.2 Certain Clean Energy Generation Equipment -$ -$ -$ -$ 50% -$ -$
45 Computers & Systems Software acq'd post Mar 22/04 2,261$ 2,261$ -$ 2,261$ 45% 1,017$ 1,243$
46 Data Network Infrastructure Equipment (acq'd post Mar 22/04) 6,826,751$ 6,826,751$ -$ 6,826,751$ 30% 2,048,025$ 4,778,725$
47 Distribution System - post February 2005 (Note 1) 2,465,322,057$ 68,633,304 348,059,259 416,692,563 2,882,014,620$ 208,346,282$ 2,673,668,339$ 8% 241,738,208$ 2,640,276,412$
50 Data Network Infrastructure Equipment - post Mar 2007 10,222,605$ 479,403 18,394,880 18,874,283 29,096,888$ 9,437,142$ 19,659,746$ 55% 20,930,044$ 8,166,843$
52 Computer Hardware and system software -$ -$ -$ -$ 100% -$ -$
95 CWIP 391,045,182$ 391,045,182$ -$ 391,045,182$ 0% -$ 391,045,182$
14.1 Eligible Capital Property (acq'd pre Jan 1, 2017)1
41,619,287$ 41,619,287$ -$ 41,619,287$ 7% 2,913,350$ 38,705,936$
14.1 Eligible Capital Property (acq'd post Jan 1, 2017)1
97,272,248$ 3,722,560 23,233,558 26,956,118 124,228,366$ 13,478,059$ 110,750,307$ 5% 6,699,193$ 117,529,173$
6 Fence 2,116,347$ 0 500,000 500,000 2,616,347$ 250,000$ 2,366,347$ 10% 286,635$ 2,329,713$
-$ -$ -$ -$ 0% -$ -$
0 0 -$ -$ -$ -$ 0% -$ -$
0 0 -$ -$ -$ -$ 0% -$ -$
0 0 -$ -$ -$ -$ 0% -$ -$
0 0 -$ -$ -$ -$ 0% -$ -$
0 0 -$ -$ -$ -$ 0% -$ -$
0 0 -$ -$ -$ -$ 0% -$ -$
TOTAL 4,277,593,476$ 77,282,863 437,878,654 515,161,517 -$ 4,792,754,993$ 257,580,759$ 4,535,174,234$ 386,156,979$ 4,406,598,014$
Class 12
Computer Software
Class 47
Distribution
System
Opening UCC per 2019 Bridge Year Schedule 8 9,891,748 2,465,407,433
Remove opening UCC re. ERP disallowance per OEB's Decision
and Order dated December 19, 2019 (Note 2) - (85,376)
Adjusted opening UCC 9,891,748$ 2,465,322,057$
1. New CCA class 14.1 effective January 1, 2017. The class includes property that was eligible capital property immediately before January 1, 2017. For tax years that end prior to 2027, transitional rules apply to class 14.1 that were acquired before January 1, 2017
Note 2: For Class 12, CCA is fully claimed at the end of 2019 using the new accelerated CCA rules; therefore, opening UCC
adjustment is not required.
Note 1: 2020 opening UCC for Class 12 and Class 47 are adjusted to exclude ERP disallowance per OEB's Decision and Order dated
December 19, 2019.
Ontario Energy Board
T8 Schedule 8 CCA 2020
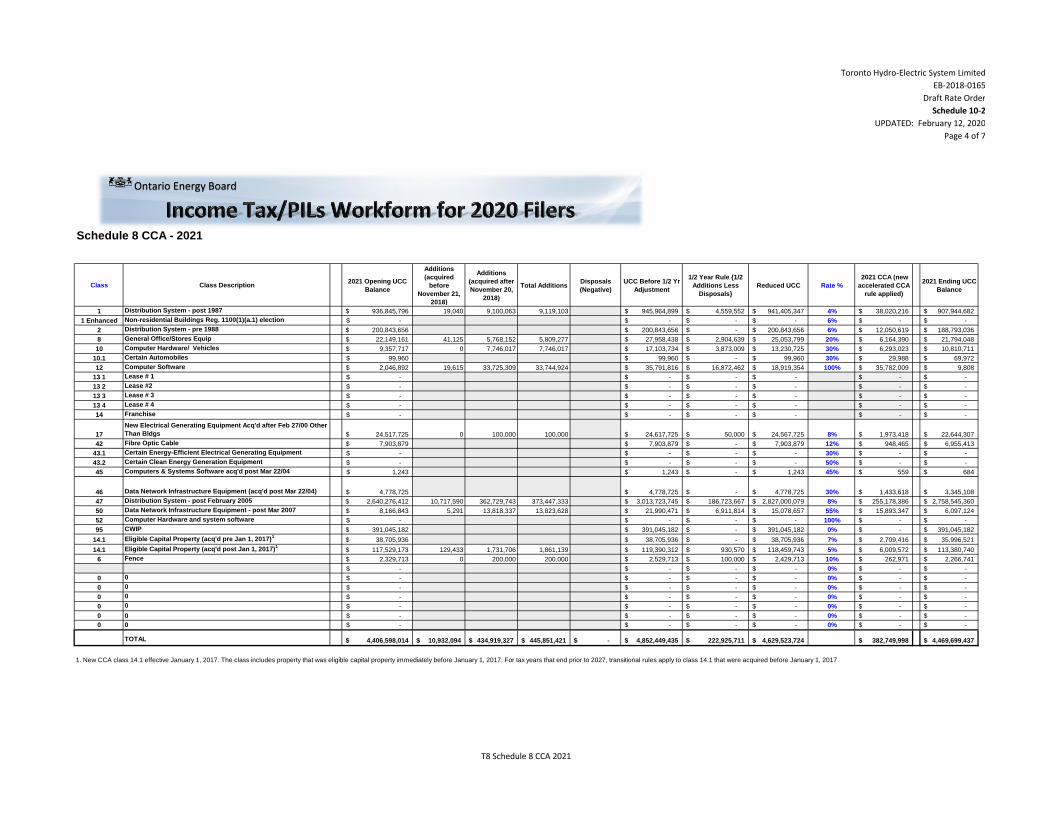
Toronto Hydro-Electric System Limited
EB-2018-0165
Draft Rate Order
Schedule 10-2
UPDATED: February 12, 2020
Page 4 of 7
Schedule 8 CCA - 2021
Class Class Description2021 Opening UCC
Balance
Additions
(acquired
before
November 21,
2018)
Additions
(acquired after
November 20,
2018)
Total AdditionsDisposals
(Negative)
UCC Before 1/2 Yr
Adjustment
1/2 Year Rule {1/2
Additions Less
Disposals}
Reduced UCC Rate %
2021 CCA (new
accelerated CCA
rule applied)
2021 Ending UCC
Balance
1 Distribution System - post 1987 936,845,796$ 19,040 9,100,063 9,119,103 945,964,899$ 4,559,552$ 941,405,347$ 4% 38,020,216$ 907,944,682$
1 Enhanced Non-residential Buildings Reg. 1100(1)(a.1) election -$ -$ -$ -$ 6% -$ -$
2 Distribution System - pre 1988 200,843,656$ 200,843,656$ -$ 200,843,656$ 6% 12,050,619$ 188,793,036$
8 General Office/Stores Equip 22,149,161$ 41,125 5,768,152 5,809,277 27,958,438$ 2,904,639$ 25,053,799$ 20% 6,164,390$ 21,794,048$
10 Computer Hardware/ Vehicles 9,357,717$ 0 7,746,017 7,746,017 17,103,734$ 3,873,009$ 13,230,725$ 30% 6,293,023$ 10,810,711$
10.1 Certain Automobiles 99,960$ 99,960$ -$ 99,960$ 30% 29,988$ 69,972$
12 Computer Software 2,046,892$ 19,615 33,725,309 33,744,924 35,791,816$ 16,872,462$ 18,919,354$ 100% 35,782,009$ 9,808$
13 1 Lease # 1 -$ -$ -$ -$ -$ -$
13 2 Lease #2 -$ -$ -$ -$ -$ -$
13 3 Lease # 3 -$ -$ -$ -$ -$ -$
13 4 Lease # 4 -$ -$ -$ -$ -$ -$
14 Franchise -$ -$ -$ -$ -$ -$
17
New Electrical Generating Equipment Acq'd after Feb 27/00 Other
Than Bldgs 24,517,725$ 0 100,000 100,000 24,617,725$ 50,000$ 24,567,725$ 8% 1,973,418$ 22,644,307$
42 Fibre Optic Cable 7,903,879$ 7,903,879$ -$ 7,903,879$ 12% 948,465$ 6,955,413$
43.1 Certain Energy-Efficient Electrical Generating Equipment -$ -$ -$ -$ 30% -$ -$
43.2 Certain Clean Energy Generation Equipment -$ -$ -$ -$ 50% -$ -$
45 Computers & Systems Software acq'd post Mar 22/04 1,243$ 1,243$ -$ 1,243$ 45% 559$ 684$
46 Data Network Infrastructure Equipment (acq'd post Mar 22/04) 4,778,725$ 4,778,725$ -$ 4,778,725$ 30% 1,433,618$ 3,345,108$
47 Distribution System - post February 2005 2,640,276,412$ 10,717,590 362,729,743 373,447,333 3,013,723,745$ 186,723,667$ 2,827,000,079$ 8% 255,178,386$ 2,758,545,360$
50 Data Network Infrastructure Equipment - post Mar 2007 8,166,843$ 5,291 13,818,337 13,823,628 21,990,471$ 6,911,814$ 15,078,657$ 55% 15,893,347$ 6,097,124$
52 Computer Hardware and system software -$ -$ -$ -$ 100% -$ -$
95 CWIP 391,045,182$ 391,045,182$ -$ 391,045,182$ 0% -$ 391,045,182$
14.1 Eligible Capital Property (acq'd pre Jan 1, 2017)1
38,705,936$ 38,705,936$ -$ 38,705,936$ 7% 2,709,416$ 35,996,521$
14.1 Eligible Capital Property (acq'd post Jan 1, 2017)1
117,529,173$ 129,433 1,731,706 1,861,139 119,390,312$ 930,570$ 118,459,743$ 5% 6,009,572$ 113,380,740$
6 Fence 2,329,713$ 0 200,000 200,000 2,529,713$ 100,000$ 2,429,713$ 10% 262,971$ 2,266,741$
-$ -$ -$ -$ 0% -$ -$
0 0 -$ -$ -$ -$ 0% -$ -$
0 0 -$ -$ -$ -$ 0% -$ -$
0 0 -$ -$ -$ -$ 0% -$ -$
0 0 -$ -$ -$ -$ 0% -$ -$
0 0 -$ -$ -$ -$ 0% -$ -$
0 0 -$ -$ -$ -$ 0% -$ -$
TOTAL 4,406,598,014$ 10,932,094$ 434,919,327$ 445,851,421$ -$ 4,852,449,435$ 222,925,711$ 4,629,523,724$ 382,749,998$ 4,469,699,437$
1. New CCA class 14.1 effective January 1, 2017. The class includes property that was eligible capital property immediately before January 1, 2017. For tax years that end prior to 2027, transitional rules apply to class 14.1 that were acquired before January 1, 2017
Ontario Energy Board
T8 Schedule 8 CCA 2021
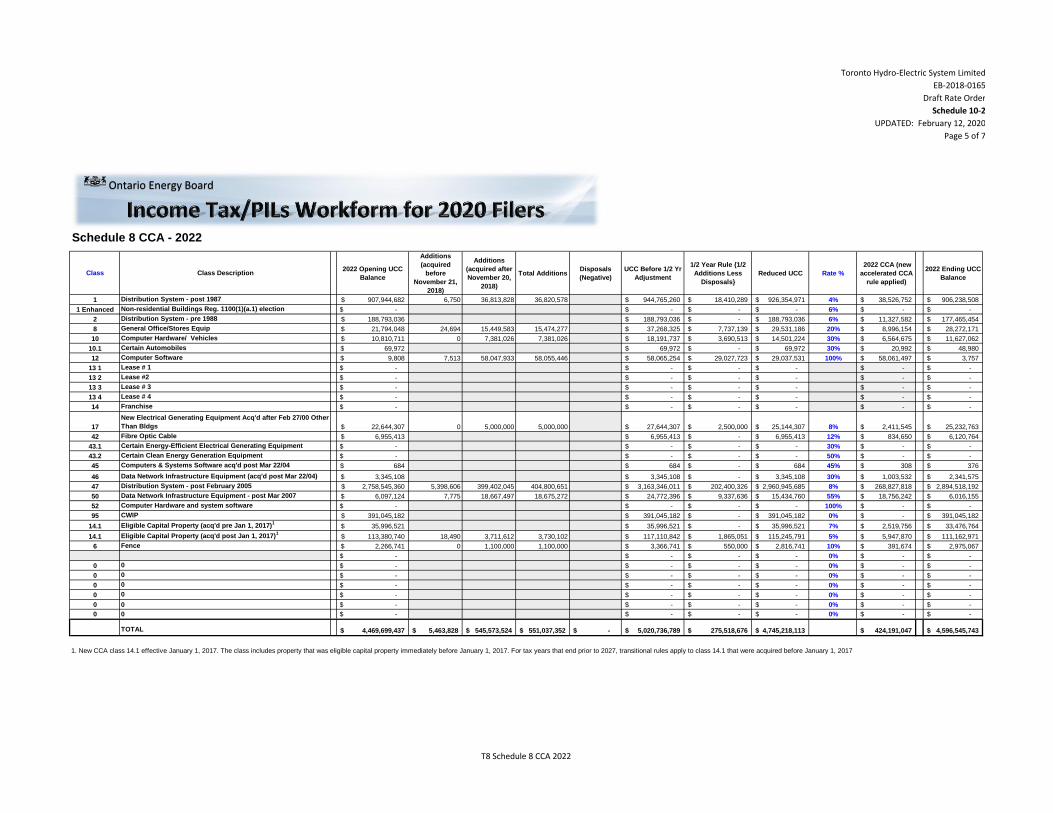
Toronto Hydro-Electric System Limited
EB-2018-0165
Draft Rate Order
Schedule 10-2
UPDATED: February 12, 2020
Page 5 of 7
Schedule 8 CCA - 2022
Class Class Description2022 Opening UCC
Balance
Additions
(acquired
before
November 21,
2018)
Additions
(acquired after
November 20,
2018)
Total AdditionsDisposals
(Negative)
UCC Before 1/2 Yr
Adjustment
1/2 Year Rule {1/2
Additions Less
Disposals}
Reduced UCC Rate %
2022 CCA (new
accelerated CCA
rule applied)
2022 Ending UCC
Balance
1 Distribution System - post 1987 907,944,682$ 6,750 36,813,828 36,820,578 944,765,260$ 18,410,289$ 926,354,971$ 4% 38,526,752$ 906,238,508$
1 Enhanced Non-residential Buildings Reg. 1100(1)(a.1) election -$ -$ -$ -$ 6% -$ -$
2 Distribution System - pre 1988 188,793,036$ 188,793,036$ -$ 188,793,036$ 6% 11,327,582$ 177,465,454$
8 General Office/Stores Equip 21,794,048$ 24,694 15,449,583 15,474,277 37,268,325$ 7,737,139$ 29,531,186$ 20% 8,996,154$ 28,272,171$
10 Computer Hardware/ Vehicles 10,810,711$ 0 7,381,026 7,381,026 18,191,737$ 3,690,513$ 14,501,224$ 30% 6,564,675$ 11,627,062$
10.1 Certain Automobiles 69,972$ 69,972$ -$ 69,972$ 30% 20,992$ 48,980$
12 Computer Software 9,808$ 7,513 58,047,933 58,055,446 58,065,254$ 29,027,723$ 29,037,531$ 100% 58,061,497$ 3,757$
13 1 Lease # 1 -$ -$ -$ -$ -$ -$
13 2 Lease #2 -$ -$ -$ -$ -$ -$
13 3 Lease # 3 -$ -$ -$ -$ -$ -$
13 4 Lease # 4 -$ -$ -$ -$ -$ -$
14 Franchise -$ -$ -$ -$ -$ -$
17
New Electrical Generating Equipment Acq'd after Feb 27/00 Other
Than Bldgs 22,644,307$ 0 5,000,000 5,000,000 27,644,307$ 2,500,000$ 25,144,307$ 8% 2,411,545$ 25,232,763$
42 Fibre Optic Cable 6,955,413$ 6,955,413$ -$ 6,955,413$ 12% 834,650$ 6,120,764$
43.1 Certain Energy-Efficient Electrical Generating Equipment -$ -$ -$ -$ 30% -$ -$
43.2 Certain Clean Energy Generation Equipment -$ -$ -$ -$ 50% -$ -$
45 Computers & Systems Software acq'd post Mar 22/04 684$ 684$ -$ 684$ 45% 308$ 376$
46 Data Network Infrastructure Equipment (acq'd post Mar 22/04) 3,345,108$ 3,345,108$ -$ 3,345,108$ 30% 1,003,532$ 2,341,575$
47 Distribution System - post February 2005 2,758,545,360$ 5,398,606 399,402,045 404,800,651 3,163,346,011$ 202,400,326$ 2,960,945,685$ 8% 268,827,818$ 2,894,518,192$
50 Data Network Infrastructure Equipment - post Mar 2007 6,097,124$ 7,775 18,667,497 18,675,272 24,772,396$ 9,337,636$ 15,434,760$ 55% 18,756,242$ 6,016,155$
52 Computer Hardware and system software -$ -$ -$ -$ 100% -$ -$
95 CWIP 391,045,182$ 391,045,182$ -$ 391,045,182$ 0% -$ 391,045,182$
14.1 Eligible Capital Property (acq'd pre Jan 1, 2017)1
35,996,521$ 35,996,521$ -$ 35,996,521$ 7% 2,519,756$ 33,476,764$
14.1 Eligible Capital Property (acq'd post Jan 1, 2017)1
113,380,740$ 18,490 3,711,612 3,730,102 117,110,842$ 1,865,051$ 115,245,791$ 5% 5,947,870$ 111,162,971$
6 Fence 2,266,741$ 0 1,100,000 1,100,000 3,366,741$ 550,000$ 2,816,741$ 10% 391,674$ 2,975,067$
-$ -$ -$ -$ 0% -$ -$
0 0 -$ -$ -$ -$ 0% -$ -$
0 0 -$ -$ -$ -$ 0% -$ -$
0 0 -$ -$ -$ -$ 0% -$ -$
0 0 -$ -$ -$ -$ 0% -$ -$
0 0 -$ -$ -$ -$ 0% -$ -$
0 0 -$ -$ -$ -$ 0% -$ -$
TOTAL 4,469,699,437$ 5,463,828$ 545,573,524$ 551,037,352$ -$ 5,020,736,789$ 275,518,676$ 4,745,218,113$ 424,191,047$ 4,596,545,743$
1. New CCA class 14.1 effective January 1, 2017. The class includes property that was eligible capital property immediately before January 1, 2017. For tax years that end prior to 2027, transitional rules apply to class 14.1 that were acquired before January 1, 2017
Ontario Energy Board
T8 Schedule 8 CCA 2022
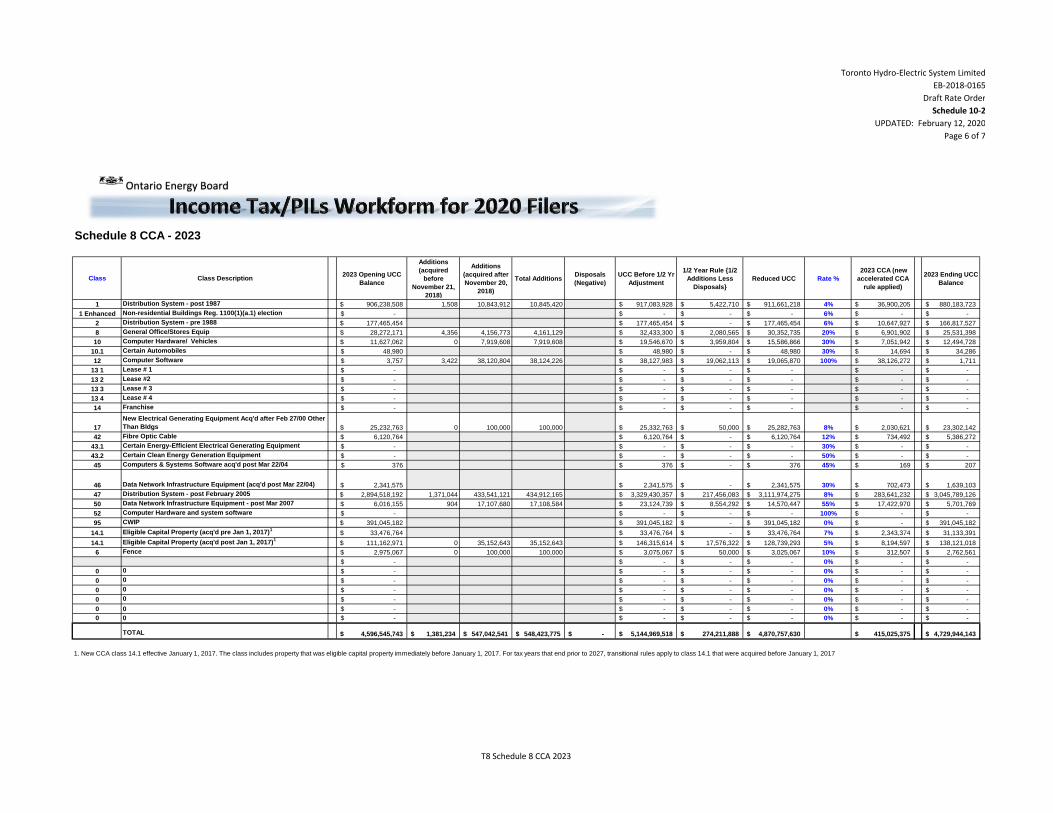
Toronto Hydro-Electric System Limited
EB-2018-0165
Draft Rate Order
Schedule 10-2
UPDATED: February 12, 2020
Page 6 of 7
Schedule 8 CCA - 2023
Class Class Description2023 Opening UCC
Balance
Additions
(acquired
before
November 21,
2018)
Additions
(acquired after
November 20,
2018)
Total AdditionsDisposals
(Negative)
UCC Before 1/2 Yr
Adjustment
1/2 Year Rule {1/2
Additions Less
Disposals}
Reduced UCC Rate %
2023 CCA (new
accelerated CCA
rule applied)
2023 Ending UCC
Balance
1 Distribution System - post 1987 906,238,508$ 1,508 10,843,912 10,845,420 917,083,928$ 5,422,710$ 911,661,218$ 4% 36,900,205$ 880,183,723$
1 Enhanced Non-residential Buildings Reg. 1100(1)(a.1) election -$ -$ -$ -$ 6% -$ -$
2 Distribution System - pre 1988 177,465,454$ 177,465,454$ -$ 177,465,454$ 6% 10,647,927$ 166,817,527$
8 General Office/Stores Equip 28,272,171$ 4,356 4,156,773 4,161,129 32,433,300$ 2,080,565$ 30,352,735$ 20% 6,901,902$ 25,531,398$
10 Computer Hardware/ Vehicles 11,627,062$ 0 7,919,608 7,919,608 19,546,670$ 3,959,804$ 15,586,866$ 30% 7,051,942$ 12,494,728$
10.1 Certain Automobiles 48,980$ 48,980$ -$ 48,980$ 30% 14,694$ 34,286$
12 Computer Software 3,757$ 3,422 38,120,804 38,124,226 38,127,983$ 19,062,113$ 19,065,870$ 100% 38,126,272$ 1,711$
13 1 Lease # 1 -$ -$ -$ -$ -$ -$
13 2 Lease #2 -$ -$ -$ -$ -$ -$
13 3 Lease # 3 -$ -$ -$ -$ -$ -$
13 4 Lease # 4 -$ -$ -$ -$ -$ -$
14 Franchise -$ -$ -$ -$ -$ -$
17
New Electrical Generating Equipment Acq'd after Feb 27/00 Other
Than Bldgs 25,232,763$ 0 100,000 100,000 25,332,763$ 50,000$ 25,282,763$ 8% 2,030,621$ 23,302,142$
42 Fibre Optic Cable 6,120,764$ 6,120,764$ -$ 6,120,764$ 12% 734,492$ 5,386,272$
43.1 Certain Energy-Efficient Electrical Generating Equipment -$ -$ -$ -$ 30% -$ -$
43.2 Certain Clean Energy Generation Equipment -$ -$ -$ -$ 50% -$ -$
45 Computers & Systems Software acq'd post Mar 22/04 376$ 376$ -$ 376$ 45% 169$ 207$
46 Data Network Infrastructure Equipment (acq'd post Mar 22/04) 2,341,575$ 2,341,575$ -$ 2,341,575$ 30% 702,473$ 1,639,103$
47 Distribution System - post February 2005 2,894,518,192$ 1,371,044 433,541,121 434,912,165 3,329,430,357$ 217,456,083$ 3,111,974,275$ 8% 283,641,232$ 3,045,789,126$
50 Data Network Infrastructure Equipment - post Mar 2007 6,016,155$ 904 17,107,680 17,108,584 23,124,739$ 8,554,292$ 14,570,447$ 55% 17,422,970$ 5,701,769$
52 Computer Hardware and system software -$ -$ -$ -$ 100% -$ -$
95 CWIP 391,045,182$ 391,045,182$ -$ 391,045,182$ 0% -$ 391,045,182$
14.1 Eligible Capital Property (acq'd pre Jan 1, 2017)1
33,476,764$ 33,476,764$ -$ 33,476,764$ 7% 2,343,374$ 31,133,391$
14.1 Eligible Capital Property (acq'd post Jan 1, 2017)1
111,162,971$ 0 35,152,643 35,152,643 146,315,614$ 17,576,322$ 128,739,293$ 5% 8,194,597$ 138,121,018$
6 Fence 2,975,067$ 0 100,000 100,000 3,075,067$ 50,000$ 3,025,067$ 10% 312,507$ 2,762,561$
-$ -$ -$ -$ 0% -$ -$
0 0 -$ -$ -$ -$ 0% -$ -$
0 0 -$ -$ -$ -$ 0% -$ -$
0 0 -$ -$ -$ -$ 0% -$ -$
0 0 -$ -$ -$ -$ 0% -$ -$
0 0 -$ -$ -$ -$ 0% -$ -$
0 0 -$ -$ -$ -$ 0% -$ -$
TOTAL 4,596,545,743$ 1,381,234$ 547,042,541$ 548,423,775$ -$ 5,144,969,518$ 274,211,888$ 4,870,757,630$ 415,025,375$ 4,729,944,143$
1. New CCA class 14.1 effective January 1, 2017. The class includes property that was eligible capital property immediately before January 1, 2017. For tax years that end prior to 2027, transitional rules apply to class 14.1 that were acquired before January 1, 2017
Ontario Energy Board
T8 Schedule 8 CCA 2023
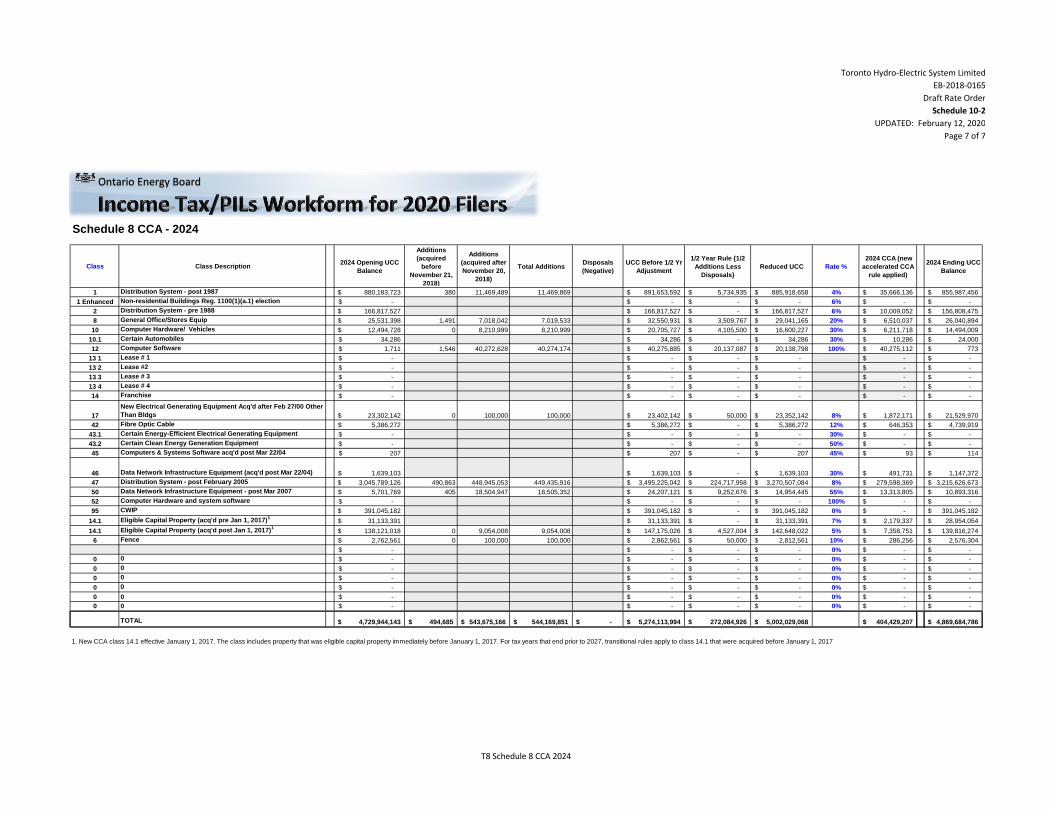
Toronto Hydro-Electric System Limited
EB-2018-0165
Draft Rate Order
Schedule 10-2
UPDATED: February 12, 2020
Page 7 of 7
Schedule 8 CCA - 2024
Class Class Description2024 Opening UCC
Balance
Additions
(acquired
before
November 21,
2018)
Additions
(acquired after
November 20,
2018)
Total AdditionsDisposals
(Negative)
UCC Before 1/2 Yr
Adjustment
1/2 Year Rule {1/2
Additions Less
Disposals}
Reduced UCC Rate %
2024 CCA (new
accelerated CCA
rule applied)
2024 Ending UCC
Balance
1 Distribution System - post 1987 880,183,723$ 380 11,469,489 11,469,869 891,653,592$ 5,734,935$ 885,918,658$ 4% 35,666,136$ 855,987,456$
1 Enhanced Non-residential Buildings Reg. 1100(1)(a.1) election -$ -$ -$ -$ 6% -$ -$
2 Distribution System - pre 1988 166,817,527$ 166,817,527$ -$ 166,817,527$ 6% 10,009,052$ 156,808,475$
8 General Office/Stores Equip 25,531,398$ 1,491 7,018,042 7,019,533 32,550,931$ 3,509,767$ 29,041,165$ 20% 6,510,037$ 26,040,894$
10 Computer Hardware/ Vehicles 12,494,728$ 0 8,210,999 8,210,999 20,705,727$ 4,105,500$ 16,600,227$ 30% 6,211,718$ 14,494,009$
10.1 Certain Automobiles 34,286$ 34,286$ -$ 34,286$ 30% 10,286$ 24,000$
12 Computer Software 1,711$ 1,546 40,272,628 40,274,174 40,275,885$ 20,137,087$ 20,138,798$ 100% 40,275,112$ 773$
13 1 Lease # 1 -$ -$ -$ -$ -$ -$
13 2 Lease #2 -$ -$ -$ -$ -$ -$
13 3 Lease # 3 -$ -$ -$ -$ -$ -$
13 4 Lease # 4 -$ -$ -$ -$ -$ -$
14 Franchise -$ -$ -$ -$ -$ -$
17
New Electrical Generating Equipment Acq'd after Feb 27/00 Other
Than Bldgs 23,302,142$ 0 100,000 100,000 23,402,142$ 50,000$ 23,352,142$ 8% 1,872,171$ 21,529,970$
42 Fibre Optic Cable 5,386,272$ 5,386,272$ -$ 5,386,272$ 12% 646,353$ 4,739,919$
43.1 Certain Energy-Efficient Electrical Generating Equipment -$ -$ -$ -$ 30% -$ -$
43.2 Certain Clean Energy Generation Equipment -$ -$ -$ -$ 50% -$ -$
45 Computers & Systems Software acq'd post Mar 22/04 207$ 207$ -$ 207$ 45% 93$ 114$
46 Data Network Infrastructure Equipment (acq'd post Mar 22/04) 1,639,103$ 1,639,103$ -$ 1,639,103$ 30% 491,731$ 1,147,372$
47 Distribution System - post February 2005 3,045,789,126$ 490,863 448,945,053 449,435,916 3,495,225,042$ 224,717,958$ 3,270,507,084$ 8% 279,598,369$ 3,215,626,673$
50 Data Network Infrastructure Equipment - post Mar 2007 5,701,769$ 405 18,504,947 18,505,352 24,207,121$ 9,252,676$ 14,954,445$ 55% 13,313,805$ 10,893,316$
52 Computer Hardware and system software -$ -$ -$ -$ 100% -$ -$
95 CWIP 391,045,182$ 391,045,182$ -$ 391,045,182$ 0% -$ 391,045,182$
14.1 Eligible Capital Property (acq'd pre Jan 1, 2017)1
31,133,391$ 31,133,391$ -$ 31,133,391$ 7% 2,179,337$ 28,954,054$
14.1 Eligible Capital Property (acq'd post Jan 1, 2017)1
138,121,018$ 0 9,054,008 9,054,008 147,175,026$ 4,527,004$ 142,648,022$ 5% 7,358,751$ 139,816,274$
6 Fence 2,762,561$ 0 100,000 100,000 2,862,561$ 50,000$ 2,812,561$ 10% 286,256$ 2,576,304$
-$ -$ -$ -$ 0% -$ -$
0 0 -$ -$ -$ -$ 0% -$ -$
0 0 -$ -$ -$ -$ 0% -$ -$
0 0 -$ -$ -$ -$ 0% -$ -$
0 0 -$ -$ -$ -$ 0% -$ -$
0 0 -$ -$ -$ -$ 0% -$ -$
0 0 -$ -$ -$ -$ 0% -$ -$
TOTAL 4,729,944,143$ 494,685$ 543,675,166$ 544,169,851$ -$ 5,274,113,994$ 272,084,926$ 5,002,029,068$ 404,429,207$ 4,869,684,786$
1. New CCA class 14.1 effective January 1, 2017. The class includes property that was eligible capital property immediately before January 1, 2017. For tax years that end prior to 2027, transitional rules apply to class 14.1 that were acquired before January 1, 2017
Ontario Energy Board
T8 Schedule 8 CCA 2024
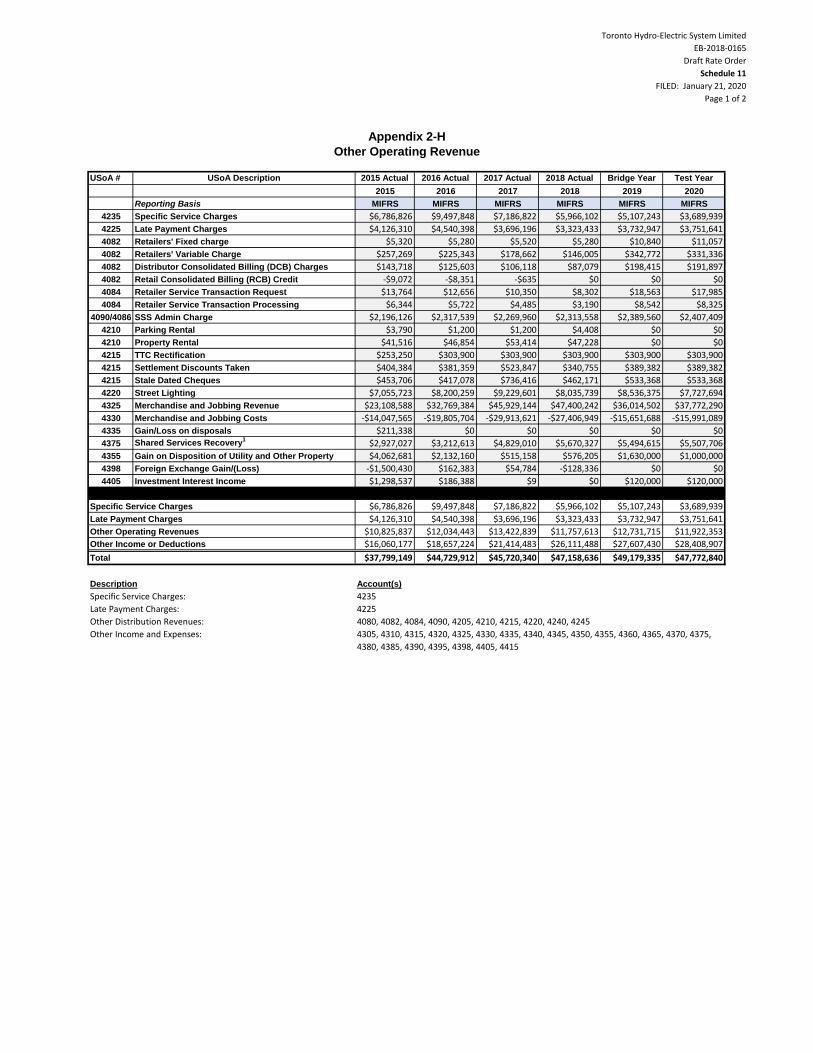
Toronto Hydro-Electric System Limited
EB-2018-0165
Draft Rate Order
Schedule 11
FILED: January 21, 2020
Page 1 of 2
USoA # USoA Description 2015 Actual 2016 Actual 2017 Actual 2018 Actual Bridge Year Test Year
2015 2016 2017 2018 2019 2020
Reporting Basis MIFRS MIFRS MIFRS MIFRS MIFRS MIFRS
4235 Specific Service Charges $6,786,826 $9,497,848 $7,186,822 $5,966,102 $5,107,243 $3,689,939
4225 Late Payment Charges $4,126,310 $4,540,398 $3,696,196 $3,323,433 $3,732,947 $3,751,641
4082 Retailers' Fixed charge $5,320 $5,280 $5,520 $5,280 $10,840 $11,057
4082 Retailers' Variable Charge $257,269 $225,343 $178,662 $146,005 $342,772 $331,336
4082 Distributor Consolidated Billing (DCB) Charges $143,718 $125,603 $106,118 $87,079 $198,415 $191,897
4082 Retail Consolidated Billing (RCB) Credit -$9,072 -$8,351 -$635 $0 $0 $0
4084 Retailer Service Transaction Request $13,764 $12,656 $10,350 $8,302 $18,563 $17,985
4084 Retailer Service Transaction Processing $6,344 $5,722 $4,485 $3,190 $8,542 $8,325
4090/4086 SSS Admin Charge $2,196,126 $2,317,539 $2,269,960 $2,313,558 $2,389,560 $2,407,409
4210 Parking Rental $3,790 $1,200 $1,200 $4,408 $0 $0
4210 Property Rental $41,516 $46,854 $53,414 $47,228 $0 $0
4215 TTC Rectification $253,250 $303,900 $303,900 $303,900 $303,900 $303,900
4215 Settlement Discounts Taken $404,384 $381,359 $523,847 $340,755 $389,382 $389,382
4215 Stale Dated Cheques $453,706 $417,078 $736,416 $462,171 $533,368 $533,368
4220 Street Lighting $7,055,723 $8,200,259 $9,229,601 $8,035,739 $8,536,375 $7,727,694
4325 Merchandise and Jobbing Revenue $23,108,588 $32,769,384 $45,929,144 $47,400,242 $36,014,502 $37,772,290
4330 Merchandise and Jobbing Costs -$14,047,565 -$19,805,704 -$29,913,621 -$27,406,949 -$15,651,688 -$15,991,089
4335 Gain/Loss on disposals $211,338 $0 $0 $0 $0 $0
4375 Shared Services Recovery1
$2,927,027 $3,212,613 $4,829,010 $5,670,327 $5,494,615 $5,507,706
4355 Gain on Disposition of Utility and Other Property $4,062,681 $2,132,160 $515,158 $576,205 $1,630,000 $1,000,000
4398 Foreign Exchange Gain/(Loss) -$1,500,430 $162,383 $54,784 -$128,336 $0 $0
4405 Investment Interest Income $1,298,537 $186,388 $9 $0 $120,000 $120,000
$6,786,826 $9,497,848 $7,186,822 $5,966,102 $5,107,243 $3,689,939
$4,126,310 $4,540,398 $3,696,196 $3,323,433 $3,732,947 $3,751,641
$10,825,837 $12,034,443 $13,422,839 $11,757,613 $12,731,715 $11,922,353
$16,060,177 $18,657,224 $21,414,483 $26,111,488 $27,607,430 $28,408,907
$37,799,149 $44,729,912 $45,720,340 $47,158,636 $49,179,335 $47,772,840
Description Account(s)
4235
4225
Other Income and Expenses: 4305, 4310, 4315, 4320, 4325, 4330, 4335, 4340, 4345, 4350, 4355, 4360, 4365, 4370, 4375,
4380, 4385, 4390, 4395, 4398, 4405, 4415
4080, 4082, 4084, 4090, 4205, 4210, 4215, 4220, 4240, 4245
Appendix 2-H
Other Operating Revenue
Specific Service Charges
Late Payment Charges
Other Operating Revenues
Other Income or Deductions
Total
Specific Service Charges:
Late Payment Charges:
Other Distribution Revenues:
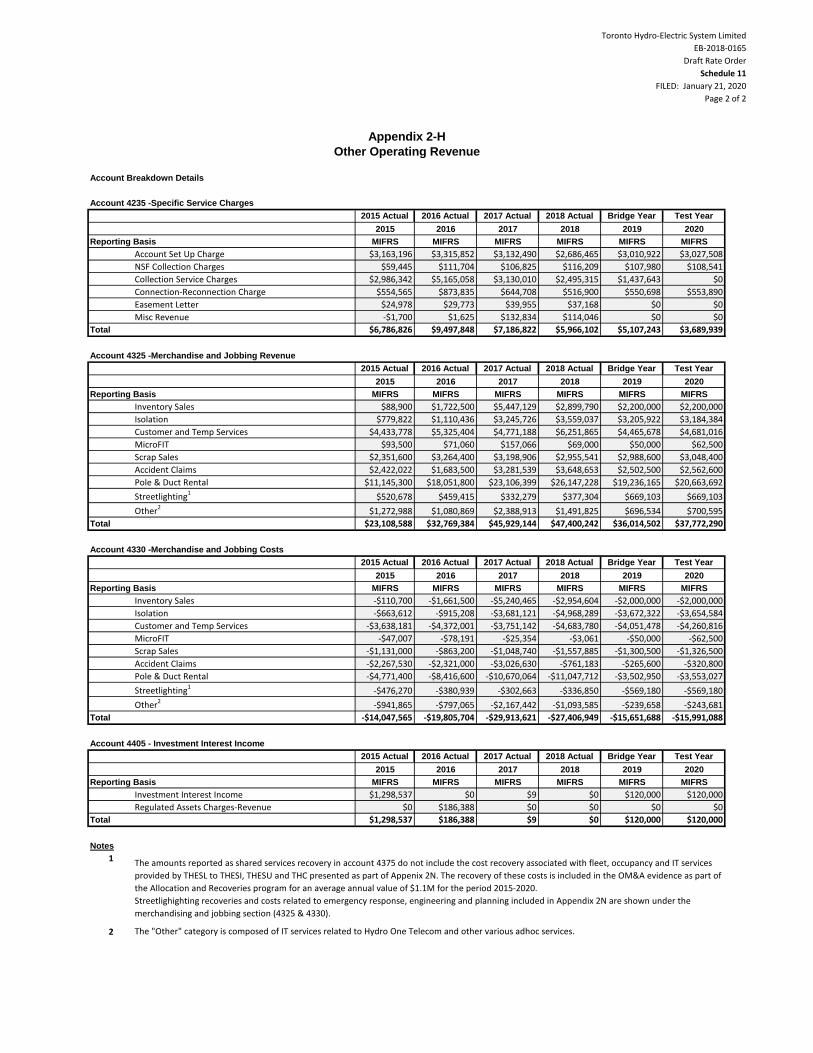
Toronto Hydro-Electric System Limited
EB-2018-0165
Draft Rate Order
Schedule 11
FILED: January 21, 2020
Page 2 of 2
Appendix 2-H
Other Operating Revenue
Account Breakdown Details
Account 4235 -Specific Service Charges
2015 Actual 2016 Actual 2017 Actual 2018 Actual Bridge Year Test Year
2015 2016 2017 2018 2019 2020
MIFRS MIFRS MIFRS MIFRS MIFRS MIFRS
Account Set Up Charge $3,163,196 $3,315,852 $3,132,490 $2,686,465 $3,010,922 $3,027,508
NSF Collection Charges $59,445 $111,704 $106,825 $116,209 $107,980 $108,541
Collection Service Charges $2,986,342 $5,165,058 $3,130,010 $2,495,315 $1,437,643 $0
Connection-Reconnection Charge $554,565 $873,835 $644,708 $516,900 $550,698 $553,890
Easement Letter $24,978 $29,773 $39,955 $37,168 $0 $0
Misc Revenue -$1,700 $1,625 $132,834 $114,046 $0 $0
$6,786,826 $9,497,848 $7,186,822 $5,966,102 $5,107,243 $3,689,939
Account 4325 -Merchandise and Jobbing Revenue
2015 Actual 2016 Actual 2017 Actual 2018 Actual Bridge Year Test Year
2015 2016 2017 2018 2019 2020
MIFRS MIFRS MIFRS MIFRS MIFRS MIFRS
Inventory Sales $88,900 $1,722,500 $5,447,129 $2,899,790 $2,200,000 $2,200,000
Isolation $779,822 $1,110,436 $3,245,726 $3,559,037 $3,205,922 $3,184,384
Customer and Temp Services $4,433,778 $5,325,404 $4,771,188 $6,251,865 $4,465,678 $4,681,016
MicroFIT $93,500 $71,060 $157,066 $69,000 $50,000 $62,500
Scrap Sales $2,351,600 $3,264,400 $3,198,906 $2,955,541 $2,988,600 $3,048,400
Accident Claims $2,422,022 $1,683,500 $3,281,539 $3,648,653 $2,502,500 $2,562,600
Pole & Duct Rental $11,145,300 $18,051,800 $23,106,399 $26,147,228 $19,236,165 $20,663,692
Streetlighting1$520,678 $459,415 $332,279 $377,304 $669,103 $669,103
Other2$1,272,988 $1,080,869 $2,388,913 $1,491,825 $696,534 $700,595
$23,108,588 $32,769,384 $45,929,144 $47,400,242 $36,014,502 $37,772,290
Account 4330 -Merchandise and Jobbing Costs
2015 Actual 2016 Actual 2017 Actual 2018 Actual Bridge Year Test Year
2015 2016 2017 2018 2019 2020
MIFRS MIFRS MIFRS MIFRS MIFRS MIFRS
Inventory Sales -$110,700 -$1,661,500 -$5,240,465 -$2,954,604 -$2,000,000 -$2,000,000
Isolation -$663,612 -$915,208 -$3,681,121 -$4,968,289 -$3,672,322 -$3,654,584
Customer and Temp Services -$3,638,181 -$4,372,001 -$3,751,142 -$4,683,780 -$4,051,478 -$4,260,816
MicroFIT -$47,007 -$78,191 -$25,354 -$3,061 -$50,000 -$62,500
Scrap Sales -$1,131,000 -$863,200 -$1,048,740 -$1,557,885 -$1,300,500 -$1,326,500
Accident Claims -$2,267,530 -$2,321,000 -$3,026,630 -$761,183 -$265,600 -$320,800
Pole & Duct Rental -$4,771,400 -$8,416,600 -$10,670,064 -$11,047,712 -$3,502,950 -$3,553,027
Streetlighting1-$476,270 -$380,939 -$302,663 -$336,850 -$569,180 -$569,180
Other2-$941,865 -$797,065 -$2,167,442 -$1,093,585 -$239,658 -$243,681
-$14,047,565 -$19,805,704 -$29,913,621 -$27,406,949 -$15,651,688 -$15,991,088
Account 4405 - Investment Interest Income
2015 Actual 2016 Actual 2017 Actual 2018 Actual Bridge Year Test Year
2015 2016 2017 2018 2019 2020
MIFRS MIFRS MIFRS MIFRS MIFRS MIFRS
Investment Interest Income $1,298,537 $0 $9 $0 $120,000 $120,000
Regulated Assets Charges-Revenue $0 $186,388 $0 $0 $0 $0
$1,298,537 $186,388 $9 $0 $120,000 $120,000
Notes
1
2 The "Other" category is composed of IT services related to Hydro One Telecom and other various adhoc services.
Reporting Basis
Total
Reporting Basis
Total
Reporting Basis
Total
Reporting Basis
The amounts reported as shared services recovery in account 4375 do not include the cost recovery associated with fleet, occupancy and IT services
provided by THESL to THESI, THESU and THC presented as part of Appenix 2N. The recovery of these costs is included in the OM&A evidence as part of
the Allocation and Recoveries program for an average annual value of $1.1M for the period 2015-2020.
Streetlighighting recoveries and costs related to emergency response, engineering and planning included in Appendix 2N are shown under the
merchandising and jobbing section (4325 & 4330).
Total
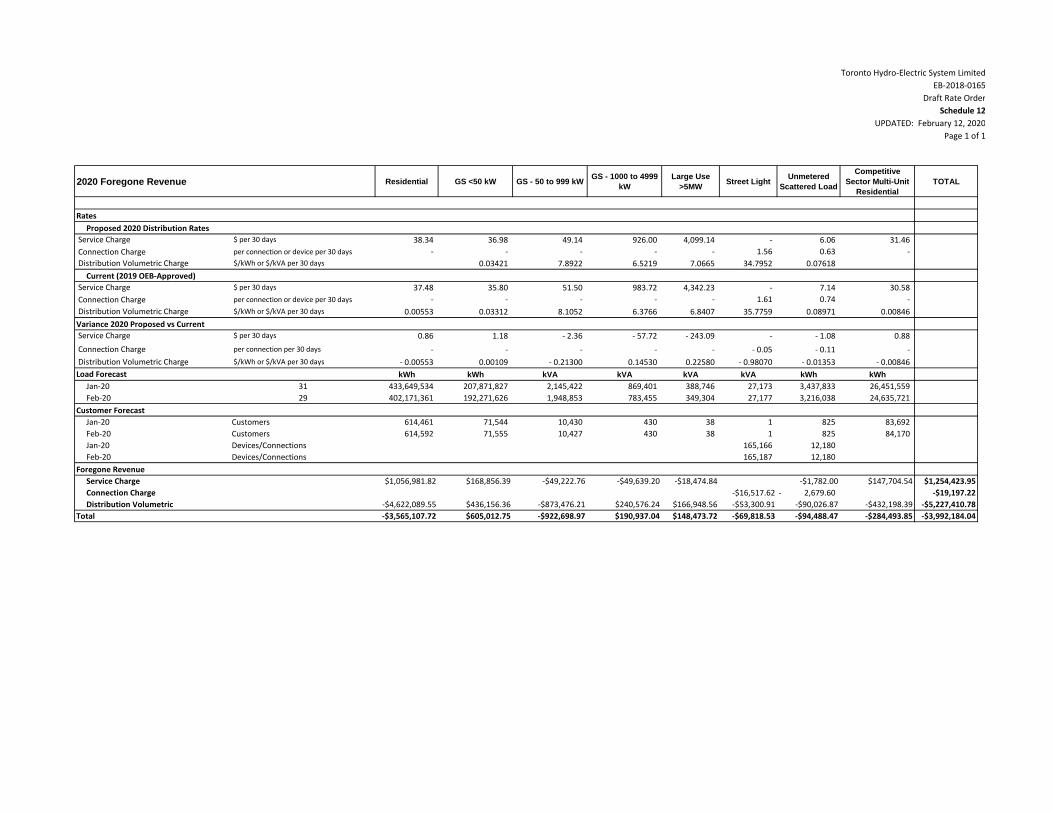
Toronto Hydro-Electric System Limited
EB-2018-0165
Draft Rate Order
Schedule 12
UPDATED: February 12, 2020
Page 1 of 1
2020 Foregone Revenue Residential GS <50 kW GS - 50 to 999 kWGS - 1000 to 4999
kW
Large Use
>5MWStreet Light
Unmetered
Scattered Load
Competitive
Sector Multi-Unit
Residential
TOTAL
Rates
Proposed 2020 Distribution Rates
Service Charge $ per 30 days 38.34 36.98 49.14 926.00 4,099.14 - 6.06 31.46
Connection Charge per connection or device per 30 days - - - - - 1.56 0.63 -
Distribution Volumetric Charge $/kWh or $/kVA per 30 days 0.03421 7.8922 6.5219 7.0665 34.7952 0.07618
Current (2019 OEB-Approved)
Service Charge $ per 30 days 37.48 35.80 51.50 983.72 4,342.23 - 7.14 30.58
Connection Charge per connection or device per 30 days - - - - - 1.61 0.74 -
Distribution Volumetric Charge $/kWh or $/kVA per 30 days 0.00553 0.03312 8.1052 6.3766 6.8407 35.7759 0.08971 0.00846
Variance 2020 Proposed vs Current
Service Charge $ per 30 days 0.86 1.18 - 2.36 - 57.72 - 243.09 - - 1.08 0.88
Connection Charge per connection per 30 days - - - - - - 0.05 - 0.11 -
Distribution Volumetric Charge $/kWh or $/kVA per 30 days - 0.00553 0.00109 - 0.21300 0.14530 0.22580 - 0.98070 - 0.01353 - 0.00846
Load Forecast kWh kWh kVA kVA kVA kVA kWh kWh
Jan-20 31 433,649,534 207,871,827 2,145,422 869,401 388,746 27,173 3,437,833 26,451,559
Feb-20 29 402,171,361 192,271,626 1,948,853 783,455 349,304 27,177 3,216,038 24,635,721
Customer Forecast
Jan-20 Customers 614,461 71,544 10,430 430 38 1 825 83,692
Feb-20 Customers 614,592 71,555 10,427 430 38 1 825 84,170
Jan-20 Devices/Connections 165,166 12,180
Feb-20 Devices/Connections 165,187 12,180
Foregone Revenue
Service Charge $1,056,981.82 $168,856.39 -$49,222.76 -$49,639.20 -$18,474.84 -$1,782.00 $147,704.54 $1,254,423.95
Connection Charge -$16,517.62 2,679.60- -$19,197.22
Distribution Volumetric -$4,622,089.55 $436,156.36 -$873,476.21 $240,576.24 $166,948.56 -$53,300.91 -$90,026.87 -$432,198.39 -$5,227,410.78
Total -$3,565,107.72 $605,012.75 -$922,698.97 $190,937.04 $148,473.72 -$69,818.53 -$94,488.47 -$284,493.85 -$3,992,184.04
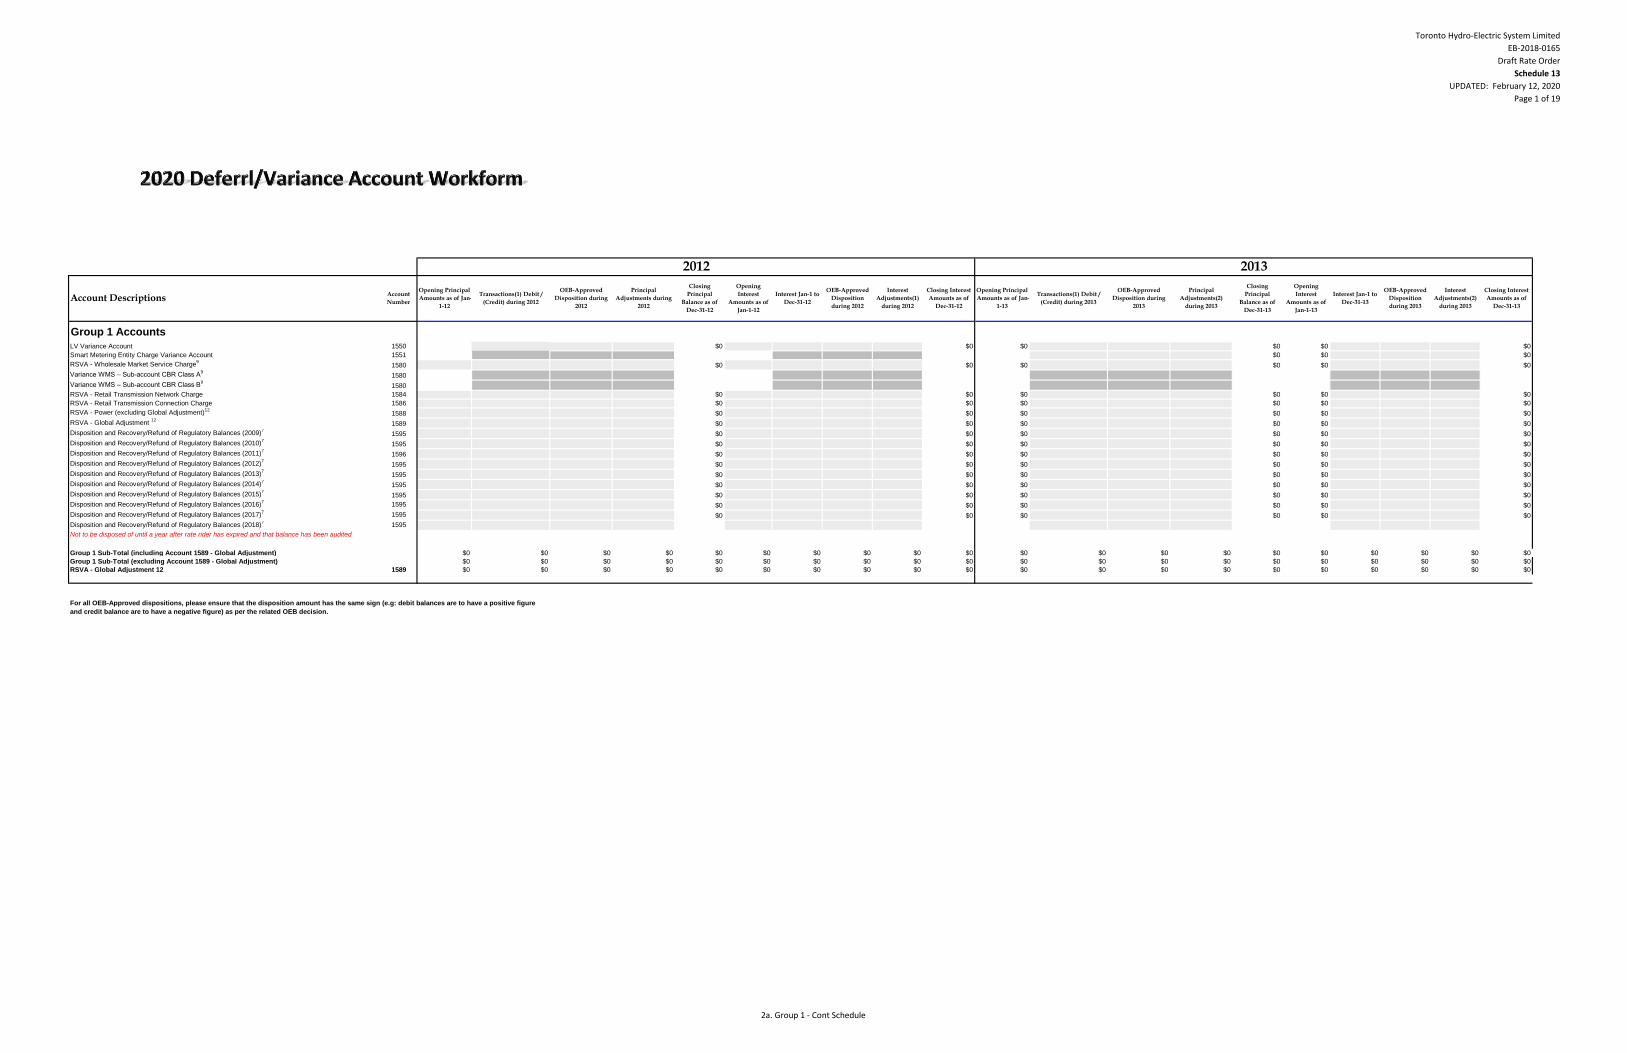
Toronto Hydro-Electric System Limited
EB-2018-0165
Draft Rate Order
Schedule 13
UPDATED: February 12, 2020
Page 1 of 19
20
Group 1 Accounts
LV Variance Account 1550 $0 $0 $0 $0 $0 $0
Smart Metering Entity Charge Variance Account 1551 $0 $0 $0
RSVA - Wholesale Market Service Charge9
1580 $0 $0 $0 $0 $0 $0
Variance WMS – Sub-account CBR Class A9
1580
Variance WMS – Sub-account CBR Class B9
1580
RSVA - Retail Transmission Network Charge 1584 $0 $0 $0 $0 $0 $0
RSVA - Retail Transmission Connection Charge 1586 $0 $0 $0 $0 $0 $0
RSVA - Power (excluding Global Adjustment)12
1588 $0 $0 $0 $0 $0 $0
RSVA - Global Adjustment 12
1589 $0 $0 $0 $0 $0 $0
Disposition and Recovery/Refund of Regulatory Balances (2009)7
1595 $0 $0 $0 $0 $0 $0
Disposition and Recovery/Refund of Regulatory Balances (2010)7
1595 $0 $0 $0 $0 $0 $0
Disposition and Recovery/Refund of Regulatory Balances (2011)7
1596 $0 $0 $0 $0 $0 $0
Disposition and Recovery/Refund of Regulatory Balances (2012)7
1595 $0 $0 $0 $0 $0 $0
Disposition and Recovery/Refund of Regulatory Balances (2013)7
1595 $0 $0 $0 $0 $0 $0
Disposition and Recovery/Refund of Regulatory Balances (2014)7
1595 $0 $0 $0 $0 $0 $0
Disposition and Recovery/Refund of Regulatory Balances (2015)7
1595 $0 $0 $0 $0 $0 $0
Disposition and Recovery/Refund of Regulatory Balances (2016)7
1595 $0 $0 $0 $0 $0 $0
Disposition and Recovery/Refund of Regulatory Balances (2017)7
1595 $0 $0 $0 $0 $0 $0
Disposition and Recovery/Refund of Regulatory Balances (2018)7
1595
Not to be disposed of until a year after rate rider has expired and that balance has been audited
Group 1 Sub-Total (including Account 1589 - Global Adjustment) $0 $0 $0 $0 $0 $0 $0 $0 $0 $0 $0 $0 $0 $0 $0 $0 $0 $0 $0 $0
Group 1 Sub-Total (excluding Account 1589 - Global Adjustment) $0 $0 $0 $0 $0 $0 $0 $0 $0 $0 $0 $0 $0 $0 $0 $0 $0 $0 $0 $0
RSVA - Global Adjustment 12 1589 $0 $0 $0 $0 $0 $0 $0 $0 $0 $0 $0 $0 $0 $0 $0 $0 $0 $0 $0 $0
For all OEB-Approved dispositions, please ensure that the disposition amount has the same sign (e.g: debit balances are to have a positive figure
and credit balance are to have a negative figure) as per the related OEB decision.
2012 2013
Closing
Principal
Balance as of
Dec-31-12
Opening
Interest
Amounts as of
Jan-1-12
Interest Jan-1 to
Dec-31-12
OEB-Approved
Disposition
during 2012
Interest
Adjustments(1)
during 2012
Closing Interest
Amounts as of
Dec-31-12
Interest Jan-1 to
Dec-31-13
OEB-Approved
Disposition
during 2013
Interest
Adjustments(2)
during 2013
Closing Interest
Amounts as of
Dec-31-13
Opening Principal
Amounts as of Jan-
1-13
Transactions(1) Debit /
(Credit) during 2013
OEB-Approved
Disposition during
2013
Principal
Adjustments(2)
during 2013
Closing
Principal
Balance as of
Dec-31-13
Opening
Interest
Amounts as of
Jan-1-13
Account DescriptionsAccount
Number
Opening Principal
Amounts as of Jan-
1-12
Transactions(1) Debit /
(Credit) during 2012
OEB-Approved
Disposition during
2012
Principal
Adjustments during
2012
2a. Group 1 - Cont Schedule
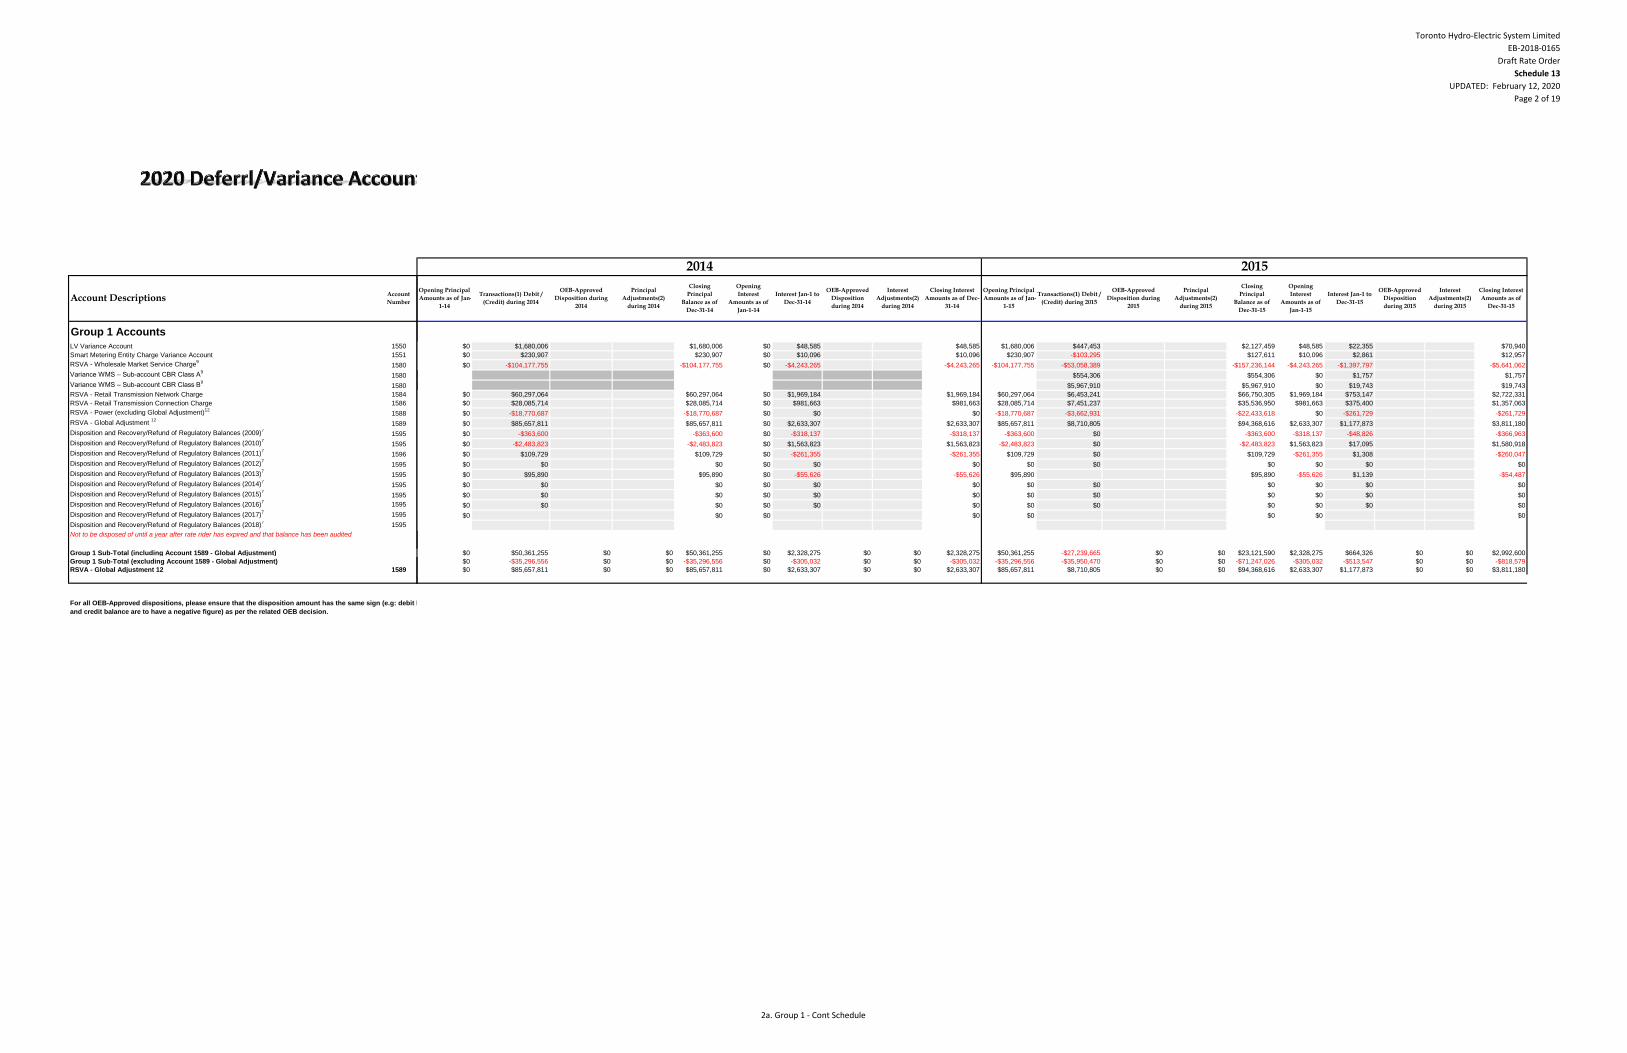
Toronto Hydro-Electric System Limited
EB-2018-0165
Draft Rate Order
Schedule 13
UPDATED: February 12, 2020
Page 2 of 19
Group 1 Accounts
LV Variance Account 1550
Smart Metering Entity Charge Variance Account 1551
RSVA - Wholesale Market Service Charge9
1580
Variance WMS – Sub-account CBR Class A9
1580
Variance WMS – Sub-account CBR Class B9
1580
RSVA - Retail Transmission Network Charge 1584
RSVA - Retail Transmission Connection Charge 1586
RSVA - Power (excluding Global Adjustment)12
1588
RSVA - Global Adjustment 12
1589
Disposition and Recovery/Refund of Regulatory Balances (2009)7
1595
Disposition and Recovery/Refund of Regulatory Balances (2010)7
1595
Disposition and Recovery/Refund of Regulatory Balances (2011)7
1596
Disposition and Recovery/Refund of Regulatory Balances (2012)7
1595
Disposition and Recovery/Refund of Regulatory Balances (2013)7
1595
Disposition and Recovery/Refund of Regulatory Balances (2014)7
1595
Disposition and Recovery/Refund of Regulatory Balances (2015)7
1595
Disposition and Recovery/Refund of Regulatory Balances (2016)7
1595
Disposition and Recovery/Refund of Regulatory Balances (2017)7
1595
Disposition and Recovery/Refund of Regulatory Balances (2018)7
1595
Not to be disposed of until a year after rate rider has expired and that balance has been audited
Group 1 Sub-Total (including Account 1589 - Global Adjustment)
Group 1 Sub-Total (excluding Account 1589 - Global Adjustment)
RSVA - Global Adjustment 12 1589
For all OEB-Approved dispositions, please ensure that the disposition amount has the same sign (e.g: debit balances are to have a positive figure
and credit balance are to have a negative figure) as per the related OEB decision.
Account DescriptionsAccount
Number
$0 $1,680,006 $1,680,006 $0 $48,585 $48,585 $1,680,006 $447,453 $2,127,459 $48,585 $22,355 $70,940
$0 $230,907 $230,907 $0 $10,096 $10,096 $230,907 -$103,295 $127,611 $10,096 $2,861 $12,957
$0 -$104,177,755 -$104,177,755 $0 -$4,243,265 -$4,243,265 -$104,177,755 -$53,058,389 -$157,236,144 -$4,243,265 -$1,397,797 -$5,641,062
$554,306 $554,306 $0 $1,757 $1,757
$5,967,910 $5,967,910 $0 $19,743 $19,743
$0 $60,297,064 $60,297,064 $0 $1,969,184 $1,969,184 $60,297,064 $6,453,241 $66,750,305 $1,969,184 $753,147 $2,722,331
$0 $28,085,714 $28,085,714 $0 $981,663 $981,663 $28,085,714 $7,451,237 $35,536,950 $981,663 $375,400 $1,357,063
$0 -$18,770,687 -$18,770,687 $0 $0 $0 -$18,770,687 -$3,662,931 -$22,433,618 $0 -$261,729 -$261,729
$0 $85,657,811 $85,657,811 $0 $2,633,307 $2,633,307 $85,657,811 $8,710,805 $94,368,616 $2,633,307 $1,177,873 $3,811,180
$0 -$363,600 -$363,600 $0 -$318,137 -$318,137 -$363,600 $0 -$363,600 -$318,137 -$48,826 -$366,963
$0 -$2,483,823 -$2,483,823 $0 $1,563,823 $1,563,823 -$2,483,823 $0 -$2,483,823 $1,563,823 $17,095 $1,580,918
$0 $109,729 $109,729 $0 -$261,355 -$261,355 $109,729 $0 $109,729 -$261,355 $1,308 -$260,047
$0 $0 $0 $0 $0 $0 $0 $0 $0 $0 $0 $0
$0 $95,890 $95,890 $0 -$55,626 -$55,626 $95,890 $95,890 -$55,626 $1,139 -$54,487
$0 $0 $0 $0 $0 $0 $0 $0 $0 $0 $0 $0
$0 $0 $0 $0 $0 $0 $0 $0 $0 $0 $0 $0
$0 $0 $0 $0 $0 $0 $0 $0 $0 $0 $0 $0
$0 $0 $0 $0 $0 $0 $0 $0
$0 $50,361,255 $0 $0 $50,361,255 $0 $2,328,275 $0 $0 $2,328,275 $50,361,255 -$27,239,665 $0 $0 $23,121,590 $2,328,275 $664,326 $0 $0 $2,992,600
$0 -$35,296,556 $0 $0 -$35,296,556 $0 -$305,032 $0 $0 -$305,032 -$35,296,556 -$35,950,470 $0 $0 -$71,247,026 -$305,032 -$513,547 $0 $0 -$818,579
$0 $85,657,811 $0 $0 $85,657,811 $0 $2,633,307 $0 $0 $2,633,307 $85,657,811 $8,710,805 $0 $0 $94,368,616 $2,633,307 $1,177,873 $0 $0 $3,811,180
Opening
Interest
Amounts as of
Jan-1-14
Interest Jan-1 to
Dec-31-14
OEB-Approved
Disposition
during 2014
Closing
Principal
Balance as of
Dec-31-15
Opening
Interest
Amounts as of
Jan-1-15
Interest Jan-1 to
Dec-31-15
OEB-Approved
Disposition
during 2015
Interest
Adjustments(2)
during 2015
Closing Interest
Amounts as of
Dec-31-15
2014 2015
Opening Principal
Amounts as of Jan-
1-14
Transactions(1) Debit /
(Credit) during 2014
Interest
Adjustments(2)
during 2014
Closing Interest
Amounts as of Dec-
31-14
Opening Principal
Amounts as of Jan-
1-15
Transactions(1) Debit /
(Credit) during 2015
OEB-Approved
Disposition during
2015
Principal
Adjustments(2)
during 2015
OEB-Approved
Disposition during
2014
Principal
Adjustments(2)
during 2014
Closing
Principal
Balance as of
Dec-31-14
2a. Group 1 - Cont Schedule

Toronto Hydro-Electric System Limited
EB-2018-0165
Draft Rate Order
Schedule 13
UPDATED: February 12, 2020
Page 3 of 19
Group 1 Accounts
LV Variance Account 1550
Smart Metering Entity Charge Variance Account 1551
RSVA - Wholesale Market Service Charge9
1580
Variance WMS – Sub-account CBR Class A9
1580
Variance WMS – Sub-account CBR Class B9
1580
RSVA - Retail Transmission Network Charge 1584
RSVA - Retail Transmission Connection Charge 1586
RSVA - Power (excluding Global Adjustment)12
1588
RSVA - Global Adjustment 12
1589
Disposition and Recovery/Refund of Regulatory Balances (2009)7
1595
Disposition and Recovery/Refund of Regulatory Balances (2010)7
1595
Disposition and Recovery/Refund of Regulatory Balances (2011)7
1596
Disposition and Recovery/Refund of Regulatory Balances (2012)7
1595
Disposition and Recovery/Refund of Regulatory Balances (2013)7
1595
Disposition and Recovery/Refund of Regulatory Balances (2014)7
1595
Disposition and Recovery/Refund of Regulatory Balances (2015)7
1595
Disposition and Recovery/Refund of Regulatory Balances (2016)7
1595
Disposition and Recovery/Refund of Regulatory Balances (2017)7
1595
Disposition and Recovery/Refund of Regulatory Balances (2018)7
1595
Not to be disposed of until a year after rate rider has expired and that balance has been audited
Group 1 Sub-Total (including Account 1589 - Global Adjustment)
Group 1 Sub-Total (excluding Account 1589 - Global Adjustment)
RSVA - Global Adjustment 12 1589
For all OEB-Approved dispositions, please ensure that the disposition amount has the same sign (e.g: debit balances are to have a positive figure
and credit balance are to have a negative figure) as per the related OEB decision.
Account DescriptionsAccount
Number
$2,127,459 $312,025 $1,192,584 $1,246,899 $70,940 $15,001 $64,774 $21,166 $1,246,899 $394,328 $934,874 $706,353 $21,166 $6,808 $19,906 $8,068
$127,611 -$379,776 $435,919 -$688,084 $12,957 $14,090 $16,147 $10,900 -$688,084 -$113,182 -$308,308 -$492,958 $10,900 -$15,080 -$7,181 $3,001
-$157,236,144 -$26,035,861 -$183,272,005 -$5,641,062 -$1,776,861 -$7,417,923 -$183,272,005 -$25,199,715 -$157,236,144 -$51,235,576 -$7,417,923 -$555,630 -$7,370,570 -$602,984
$554,306 $554,306 $0 $1,757 $1,757 $0 $0 $0 $0 $0
$5,967,910 $1,535,334 $7,503,244 $19,743 $14,282 $19,743 $14,282 $7,503,244 $524,231 $5,967,910 $2,059,564 $14,282 $20,888 $85,385 -$50,215
$66,750,305 -$16,414,401 $50,335,904 $2,722,331 $664,278 $3,386,608 $50,335,904 $8,096,178 $66,750,305 -$8,318,223 $3,386,608 -$83,173 $3,456,545 -$153,109
$35,536,950 -$29,949,890 $5,587,061 $1,357,063 $271,369 $1,628,432 $5,587,061 $8,333,125 $35,536,950 -$21,616,765 $1,628,432 -$278,307 $1,747,948 -$397,823
-$22,433,618 -$4,099,996 -$804,747 -$27,338,361 -$261,729 -$265,904 -$527,633 -$27,338,361 -$3,337,116 -$22,433,618 -$8,241,858 -$527,633 -$93,593 -$508,477 -$112,749
$94,368,616 -$14,088,418 $804,747 $81,084,945 $3,811,180 $1,131,533 $4,942,712 $81,084,945 $56,920,194 $94,368,616 $43,636,523 $4,942,712 $274,057 $4,812,604 $404,166
-$363,600 -$363,600 $0 -$366,963 -$26,599 -$393,562 -$0 $0 $0 -$0 -$0
-$2,483,823 -$2,483,823 -$0 $1,580,918 -$66,708 $1,514,210 -$0 -$0 -$0 -$0 -$0
$109,729 $109,729 -$0 -$260,047 -$12,853 -$272,900 $0 -$0 -$0 $0 $0
$0 $0 $0 $0 $0 $0 $0 $0
$95,890 $95,890 -$54,487 $966 -$53,521 $95,890 $95,890 -$0 -$53,521 -$53,433 -$88
$0 $0 $0 $0 $0 $0 $0 $0
$0 $0 $0 $0 $0 $0 $0 $0
$0 $8,704,230 -$45,304,160 $54,008,390 $0 -$28,061 -$131,074 $103,013 $54,008,390 -$13,829,257 $40,179,133 $103,013 -$18,718 -$993,537 -$909,242
$0 $0 $0 $0 $0 $2,791,740 $2,791,740 $0 $142,065 $142,065
$23,121,590 -$80,416,753 -$45,859,045 $0 -$11,436,118 $2,992,600 -$65,468 $819,096 $0 $2,108,037 -$11,436,118 $34,580,526 $23,676,474 $0 -$532,067 $2,108,037 -$600,683 $2,182,727 -$993,537 -$1,668,911
-$71,247,026 -$66,328,336 -$45,859,045 -$804,747 -$92,521,064 -$818,579 -$1,197,000 $819,096 $0 -$2,834,676 -$92,521,064 -$22,339,668 -$70,692,141 $0 -$44,168,591 -$2,834,676 -$874,740 -$2,629,877 -$993,537 -$2,073,076
$94,368,616 -$14,088,418 $0 $804,747 $81,084,945 $3,811,180 $1,131,533 $0 $0 $4,942,712 $81,084,945 $56,920,194 $94,368,616 $0 $43,636,523 $4,942,712 $274,057 $4,812,604 $0 $404,166
Interest
Adjustments(2)
during 2017
Closing Interest
Amounts as of
Dec-31-17
OEB-Approved
Disposition during
2017
Principal
Adjustments(2)
during 2017
Closing
Principal
Balance as of
Dec-31-17
Opening
Interest
Amounts as of
Jan-1-17
Interest Jan-1 to
Dec-31-17
OEB-Approved
Disposition
during 2017
Interest Jan-1 to
Dec-31-16
OEB-Approved
Disposition
during 2016
Interest
Adjustments(2)
during 2016
Closing Interest
Amounts as of
Dec-31-16
Opening Principal
Amounts as of Jan-
1-17
Transactions(1) Debit
/ (Credit) during 2017
Opening Principal
Amounts as of Jan-
1-16
Transactions(1) Debit
/ (Credit) during 2016
OEB-Approved
Disposition during
2016
Principal
Adjustments(2)
during 2016
Closing Principal
Balance as of Dec-31-
16
Opening
Interest
Amounts as of
Jan-1-16
2016 2017
2a. Group 1 - Cont Schedule
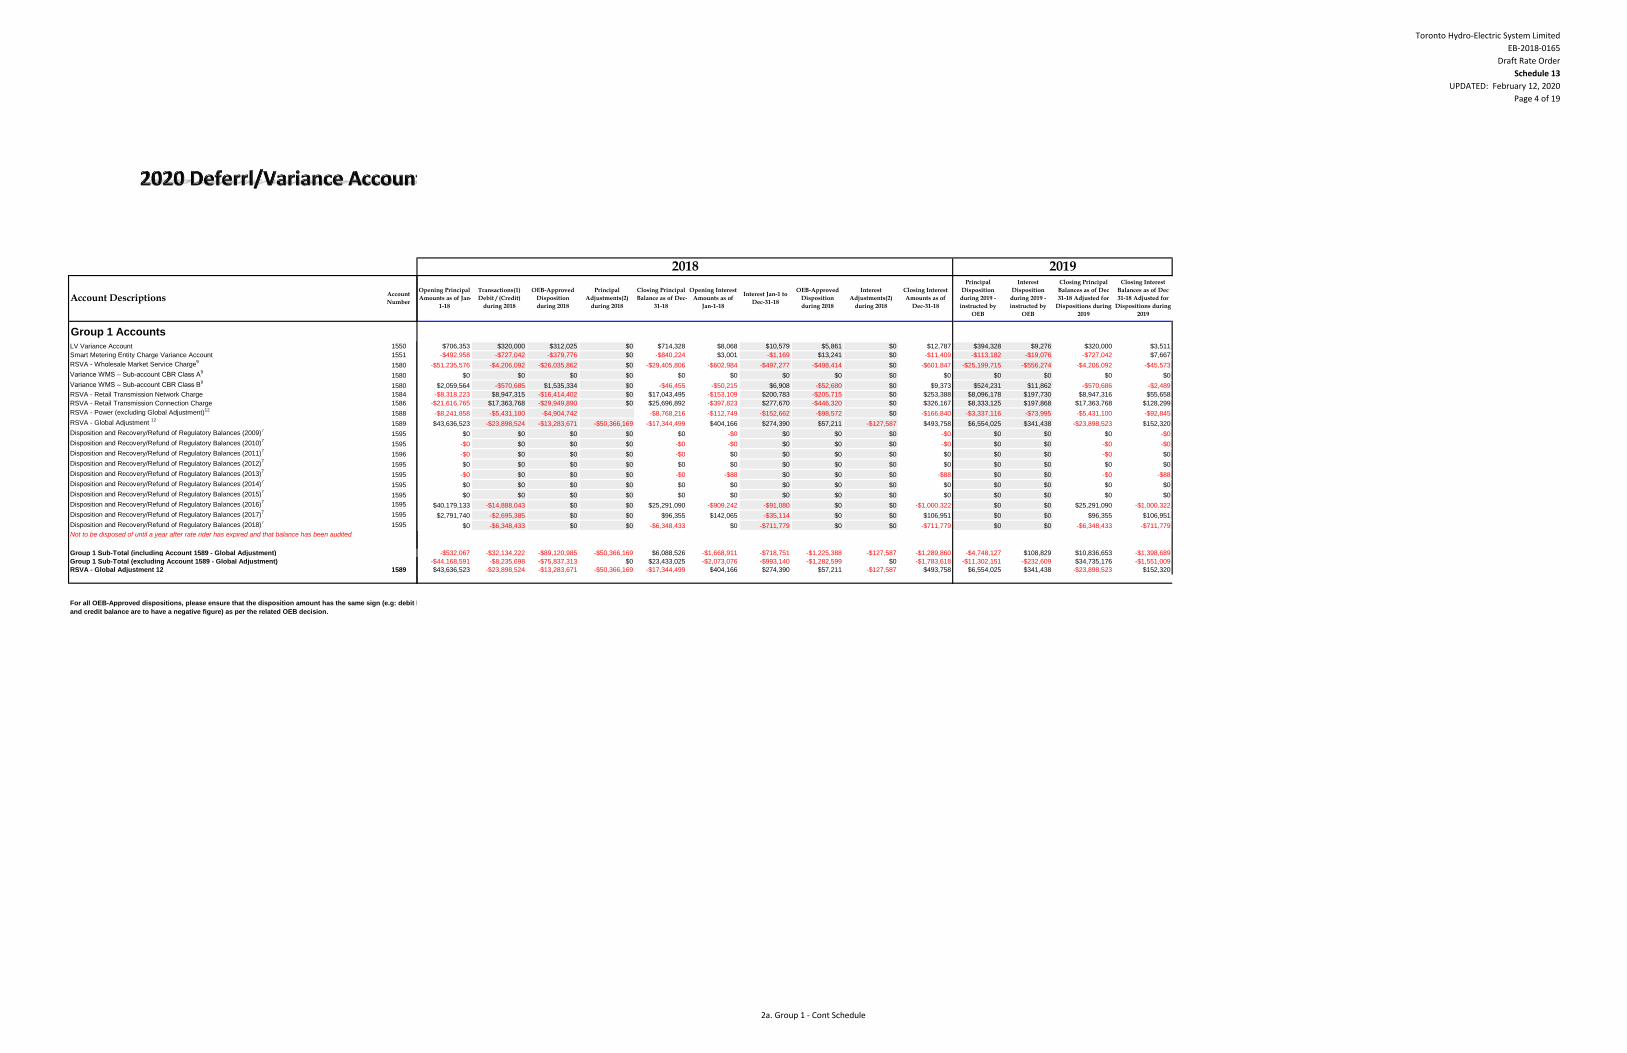
Toronto Hydro-Electric System Limited
EB-2018-0165
Draft Rate Order
Schedule 13
UPDATED: February 12, 2020
Page 4 of 19
Group 1 Accounts
LV Variance Account 1550
Smart Metering Entity Charge Variance Account 1551
RSVA - Wholesale Market Service Charge9
1580
Variance WMS – Sub-account CBR Class A9
1580
Variance WMS – Sub-account CBR Class B9
1580
RSVA - Retail Transmission Network Charge 1584
RSVA - Retail Transmission Connection Charge 1586
RSVA - Power (excluding Global Adjustment)12
1588
RSVA - Global Adjustment 12
1589
Disposition and Recovery/Refund of Regulatory Balances (2009)7
1595
Disposition and Recovery/Refund of Regulatory Balances (2010)7
1595
Disposition and Recovery/Refund of Regulatory Balances (2011)7
1596
Disposition and Recovery/Refund of Regulatory Balances (2012)7
1595
Disposition and Recovery/Refund of Regulatory Balances (2013)7
1595
Disposition and Recovery/Refund of Regulatory Balances (2014)7
1595
Disposition and Recovery/Refund of Regulatory Balances (2015)7
1595
Disposition and Recovery/Refund of Regulatory Balances (2016)7
1595
Disposition and Recovery/Refund of Regulatory Balances (2017)7
1595
Disposition and Recovery/Refund of Regulatory Balances (2018)7
1595
Not to be disposed of until a year after rate rider has expired and that balance has been audited
Group 1 Sub-Total (including Account 1589 - Global Adjustment)
Group 1 Sub-Total (excluding Account 1589 - Global Adjustment)
RSVA - Global Adjustment 12 1589
For all OEB-Approved dispositions, please ensure that the disposition amount has the same sign (e.g: debit balances are to have a positive figure
and credit balance are to have a negative figure) as per the related OEB decision.
Account DescriptionsAccount
Number
$706,353 $320,000 $312,025 $0 $714,328 $8,068 $10,579 $5,861 $0 $12,787 $394,328 $9,276 $320,000 $3,511
-$492,958 -$727,042 -$379,776 $0 -$840,224 $3,001 -$1,169 $13,241 $0 -$11,409 -$113,182 -$19,076 -$727,042 $7,667
-$51,235,576 -$4,206,092 -$26,035,862 $0 -$29,405,806 -$602,984 -$497,277 -$498,414 $0 -$601,847 -$25,199,715 -$556,274 -$4,206,092 -$45,573
$0 $0 $0 $0 $0 $0 $0 $0 $0 $0 $0 $0 $0 $0
$2,059,564 -$570,685 $1,535,334 $0 -$46,455 -$50,215 $6,908 -$52,680 $0 $9,373 $524,231 $11,862 -$570,686 -$2,489
-$8,318,223 $8,947,315 -$16,414,402 $0 $17,043,495 -$153,109 $200,783 -$205,715 $0 $253,388 $8,096,178 $197,730 $8,947,316 $55,658
-$21,616,765 $17,363,768 -$29,949,890 $0 $25,696,892 -$397,823 $277,670 -$446,320 $0 $326,167 $8,333,125 $197,868 $17,363,768 $128,299
-$8,241,858 -$5,431,100 -$4,904,742 -$8,768,216 -$112,749 -$152,662 -$98,572 $0 -$166,840 -$3,337,116 -$73,995 -$5,431,100 -$92,845
$43,636,523 -$23,898,524 -$13,283,671 -$50,366,169 -$17,344,499 $404,166 $274,390 $57,211 -$127,587 $493,758 $6,554,025 $341,438 -$23,898,523 $152,320
$0 $0 $0 $0 $0 -$0 $0 $0 $0 -$0 $0 $0 $0 -$0
-$0 $0 $0 $0 -$0 -$0 $0 $0 $0 -$0 $0 $0 -$0 -$0
-$0 $0 $0 $0 -$0 $0 $0 $0 $0 $0 $0 $0 -$0 $0
$0 $0 $0 $0 $0 $0 $0 $0 $0 $0 $0 $0 $0 $0
-$0 $0 $0 $0 -$0 -$88 $0 $0 $0 -$88 $0 $0 -$0 -$88
$0 $0 $0 $0 $0 $0 $0 $0 $0 $0 $0 $0 $0 $0
$0 $0 $0 $0 $0 $0 $0 $0 $0 $0 $0 $0 $0 $0
$40,179,133 -$14,888,043 $0 $0 $25,291,090 -$909,242 -$91,080 $0 $0 -$1,000,322 $0 $0 $25,291,090 -$1,000,322
$2,791,740 -$2,695,385 $0 $0 $96,355 $142,065 -$35,114 $0 $0 $106,951 $0 $0 $96,355 $106,951
$0 -$6,348,433 $0 $0 -$6,348,433 $0 -$711,779 $0 $0 -$711,779 $0 $0 -$6,348,433 -$711,779
-$532,067 -$32,134,222 -$89,120,985 -$50,366,169 $6,088,526 -$1,668,911 -$718,751 -$1,225,388 -$127,587 -$1,289,860 -$4,748,127 $108,829 $10,836,653 -$1,398,689
-$44,168,591 -$8,235,698 -$75,837,313 $0 $23,433,025 -$2,073,076 -$993,140 -$1,282,599 $0 -$1,783,618 -$11,302,151 -$232,609 $34,735,176 -$1,551,009
$43,636,523 -$23,898,524 -$13,283,671 -$50,366,169 -$17,344,499 $404,166 $274,390 $57,211 -$127,587 $493,758 $6,554,025 $341,438 -$23,898,523 $152,320
Principal
Disposition
during 2019 -
instructed by
OEB
Interest
Disposition
during 2019 -
instructed by
OEB
Closing Principal
Balances as of Dec
31-18 Adjusted for
Dispositions during
2019
Closing Interest
Balances as of Dec
31-18 Adjusted for
Dispositions during
2019
Closing Principal
Balance as of Dec-
31-18
Opening Interest
Amounts as of
Jan-1-18
Interest Jan-1 to
Dec-31-18
OEB-Approved
Disposition
during 2018
Interest
Adjustments(2)
during 2018
Closing Interest
Amounts as of
Dec-31-18
Opening Principal
Amounts as of Jan-
1-18
Transactions(1)
Debit / (Credit)
during 2018
OEB-Approved
Disposition
during 2018
Principal
Adjustments(2)
during 2018
2018 2019
2a. Group 1 - Cont Schedule
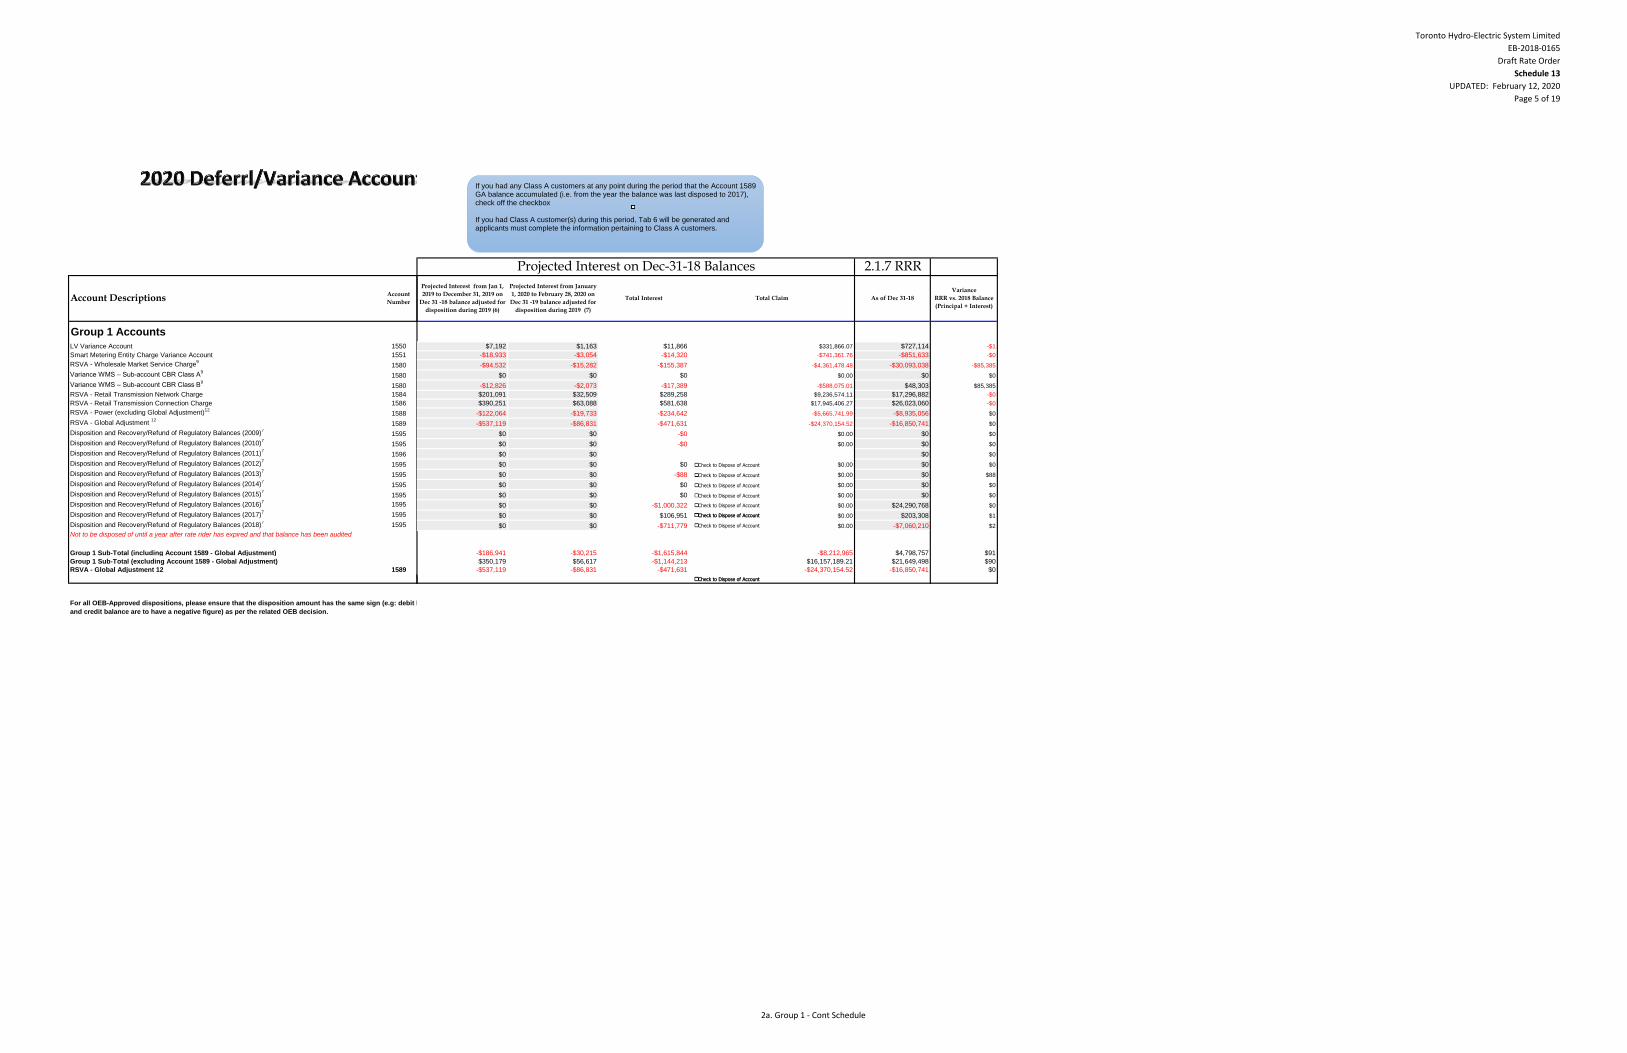
Toronto Hydro-Electric System Limited
EB-2018-0165
Draft Rate Order
Schedule 13
UPDATED: February 12, 2020
Page 5 of 19
Group 1 Accounts
LV Variance Account 1550
Smart Metering Entity Charge Variance Account 1551
RSVA - Wholesale Market Service Charge9
1580
Variance WMS – Sub-account CBR Class A9
1580
Variance WMS – Sub-account CBR Class B9
1580
RSVA - Retail Transmission Network Charge 1584
RSVA - Retail Transmission Connection Charge 1586
RSVA - Power (excluding Global Adjustment)12
1588
RSVA - Global Adjustment 12
1589
Disposition and Recovery/Refund of Regulatory Balances (2009)7
1595
Disposition and Recovery/Refund of Regulatory Balances (2010)7
1595
Disposition and Recovery/Refund of Regulatory Balances (2011)7
1596
Disposition and Recovery/Refund of Regulatory Balances (2012)7
1595
Disposition and Recovery/Refund of Regulatory Balances (2013)7
1595
Disposition and Recovery/Refund of Regulatory Balances (2014)7
1595
Disposition and Recovery/Refund of Regulatory Balances (2015)7
1595
Disposition and Recovery/Refund of Regulatory Balances (2016)7
1595
Disposition and Recovery/Refund of Regulatory Balances (2017)7
1595
Disposition and Recovery/Refund of Regulatory Balances (2018)7
1595
Not to be disposed of until a year after rate rider has expired and that balance has been audited
Group 1 Sub-Total (including Account 1589 - Global Adjustment)
Group 1 Sub-Total (excluding Account 1589 - Global Adjustment)
RSVA - Global Adjustment 12 1589
For all OEB-Approved dispositions, please ensure that the disposition amount has the same sign (e.g: debit balances are to have a positive figure
and credit balance are to have a negative figure) as per the related OEB decision.
Account DescriptionsAccount
Number
2.1.7 RRR
$7,192 $1,163 $11,866 $331,866.07 $727,114 -$1
-$18,933 -$3,054 -$14,320 -$741,361.76 -$851,633 -$0
-$94,532 -$15,282 -$155,387 -$4,361,478.48 -$30,093,038 -$85,385
$0 $0 $0 $0.00 $0 $0
-$12,826 -$2,073 -$17,389 -$588,075.01 $48,303 $85,385
$201,091 $32,509 $289,258 $9,236,574.11 $17,296,882 -$0
$390,251 $63,088 $581,638 $17,945,406.27 $26,023,060 -$0
-$122,064 -$19,733 -$234,642 -$5,665,741.99 -$8,935,056 $0
-$537,119 -$86,831 -$471,631 -$24,370,154.52 -$16,850,741 $0
$0 $0 -$0 $0.00 $0 $0
$0 $0 -$0 $0.00 $0 $0
$0 $0 $0 $0
$0 $0 $0 $0.00 $0 $0
$0 $0 -$88 $0.00 $0 $88
$0 $0 $0 $0.00 $0 $0
$0 $0 $0 $0.00 $0 $0
$0 $0 -$1,000,322 $0.00 $24,290,768 $0
$0 $0 $106,951 $0.00 $203,308 $1
$0 $0 -$711,779 $0.00 -$7,060,210 $2
-$186,941 -$30,215 -$1,615,844 -$8,212,965 $4,798,757 $91
$350,179 $56,617 -$1,144,213 $16,157,189.21 $21,649,498 $90
-$537,119 -$86,831 -$471,631 -$24,370,154.52 -$16,850,741 $0
Total Interest Total Claim As of Dec 31-18
Variance
RRR vs. 2018 Balance
(Principal + Interest)
Projected Interest from Jan 1,
2019 to December 31, 2019 on
Dec 31 -18 balance adjusted for
disposition during 2019 (6)
Projected Interest from January
1, 2020 to February 28, 2020 on
Dec 31 -19 balance adjusted for
disposition during 2019 (7)
Projected Interest on Dec-31-18 Balances
Check to Dispose of Account
Check to Dispose of Account
Check to Dispose of Account
Check to Dispose of Account
Check to Dispose of Account
Check to Dispose of Account Check to Dispose of Account
If you had any Class A customers at any point during the period that the Account 1589 GA balance accumulated (i.e. from the year the balance was last disposed to 2017), check off the checkbox
If you had Class A customer(s) during this period, Tab 6 will be generated and applicants must complete the information pertaining to Class A customers.
Check to Dispose of AccountCheck to Dispose of Account
Check to Dispose of Account
2a. Group 1 - Cont Schedule
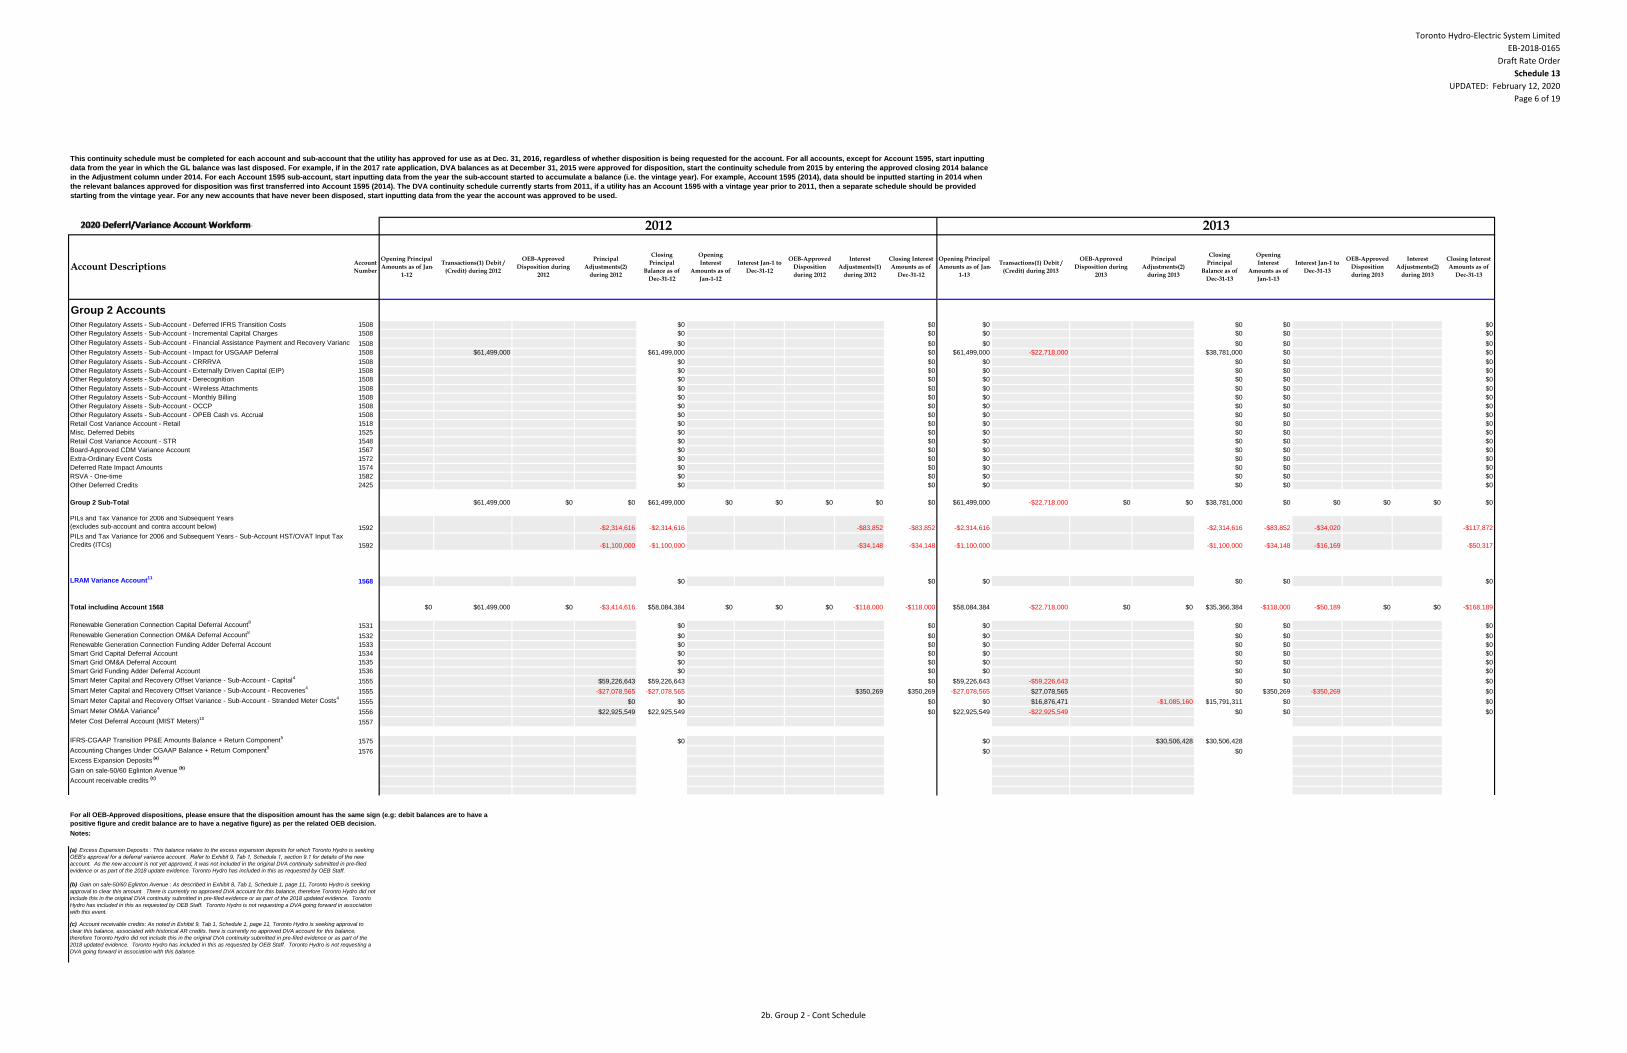
Toronto Hydro-Electric System Limited
EB-2018-0165
Draft Rate Order
Schedule 13
UPDATED: February 12, 2020
Page 6 of 19
Group 2 Accounts
Other Regulatory Assets - Sub-Account - Deferred IFRS Transition Costs 1508 $0 $0 $0 $0 $0 $0
Other Regulatory Assets - Sub-Account - Incremental Capital Charges 1508 $0 $0 $0 $0 $0 $0
Other Regulatory Assets - Sub-Account - Financial Assistance Payment and Recovery Variance - Ontario Clean Energy Benefit Act3
1508 $0 $0 $0 $0 $0 $0
Other Regulatory Assets - Sub-Account - Impact for USGAAP Deferral 1508 $61,499,000 $61,499,000 $0 $61,499,000 -$22,718,000 $38,781,000 $0 $0
Other Regulatory Assets - Sub-Account - CRRRVA 1508 $0 $0 $0 $0 $0 $0
Other Regulatory Assets - Sub-Account - Externally Driven Capital (EIP) 1508 $0 $0 $0 $0 $0 $0
Other Regulatory Assets - Sub-Account - Derecognition 1508 $0 $0 $0 $0 $0 $0
Other Regulatory Assets - Sub-Account - Wireless Attachments 1508 $0 $0 $0 $0 $0 $0
Other Regulatory Assets - Sub-Account - Monthly Billing 1508 $0 $0 $0 $0 $0 $0
Other Regulatory Assets - Sub-Account - OCCP 1508 $0 $0 $0 $0 $0 $0
Other Regulatory Assets - Sub-Account - OPEB Cash vs. Accrual 1508 $0 $0 $0 $0 $0 $0
Retail Cost Variance Account - Retail 1518 $0 $0 $0 $0 $0 $0
Misc. Deferred Debits 1525 $0 $0 $0 $0 $0 $0
Retail Cost Variance Account - STR 1548 $0 $0 $0 $0 $0 $0
Board-Approved CDM Variance Account 1567 $0 $0 $0 $0 $0 $0
Extra-Ordinary Event Costs 1572 $0 $0 $0 $0 $0 $0
Deferred Rate Impact Amounts 1574 $0 $0 $0 $0 $0 $0
RSVA - One-time 1582 $0 $0 $0 $0 $0 $0
Other Deferred Credits 2425 $0 $0 $0 $0 $0 $0
Group 2 Sub-Total $61,499,000 $0 $0 $61,499,000 $0 $0 $0 $0 $0 $61,499,000 -$22,718,000 $0 $0 $38,781,000 $0 $0 $0 $0 $0
PILs and Tax Variance for 2006 and Subsequent Years
(excludes sub-account and contra account below) 1592 -$2,314,616 -$2,314,616 -$83,852 -$83,852 -$2,314,616 -$2,314,616 -$83,852 -$34,020 -$117,872
PILs and Tax Variance for 2006 and Subsequent Years - Sub-Account HST/OVAT Input Tax
Credits (ITCs) 1592 -$1,100,000 -$1,100,000 -$34,148 -$34,148 -$1,100,000 -$1,100,000 -$34,148 -$16,169 -$50,317
LRAM Variance Account11
1568 $0 $0 $0 $0 $0 $0
Total including Account 1568 $0 $61,499,000 $0 -$3,414,616 $58,084,384 $0 $0 $0 -$118,000 -$118,000 $58,084,384 -$22,718,000 $0 $0 $35,366,384 -$118,000 -$50,189 $0 $0 -$168,189
Renewable Generation Connection Capital Deferral Account8
1531 $0 $0 $0 $0 $0 $0
Renewable Generation Connection OM&A Deferral Account8
1532 $0 $0 $0 $0 $0 $0
Renewable Generation Connection Funding Adder Deferral Account 1533 $0 $0 $0 $0 $0 $0
Smart Grid Capital Deferral Account 1534 $0 $0 $0 $0 $0 $0
Smart Grid OM&A Deferral Account 1535 $0 $0 $0 $0 $0 $0
Smart Grid Funding Adder Deferral Account 1536 $0 $0 $0 $0 $0 $0
Smart Meter Capital and Recovery Offset Variance - Sub-Account - Capital4
1555 $59,226,643 $59,226,643 $0 $59,226,643 -$59,226,643 $0 $0 $0
Smart Meter Capital and Recovery Offset Variance - Sub-Account - Recoveries4
1555 -$27,078,565 -$27,078,565 $350,269 $350,269 -$27,078,565 $27,078,565 $0 $350,269 -$350,269 $0
Smart Meter Capital and Recovery Offset Variance - Sub-Account - Stranded Meter Costs4
1555 $0 $0 $0 $0 $16,876,471 -$1,085,160 $15,791,311 $0 $0
Smart Meter OM&A Variance4
1556 $22,925,549 $22,925,549 $0 $22,925,549 -$22,925,549 $0 $0 $0
Meter Cost Deferral Account (MIST Meters)10
1557
IFRS-CGAAP Transition PP&E Amounts Balance + Return Component5
1575 $0 $0 $30,506,428 $30,506,428
Accounting Changes Under CGAAP Balance + Return Component5
1576 $0 $0
Excess Expansion Deposits (a)
Gain on sale-50/60 Eglinton Avenue (b)
Account receivable credits (c)
For all OEB-Approved dispositions, please ensure that the disposition amount has the same sign (e.g: debit balances are to have a
positive figure and credit balance are to have a negative figure) as per the related OEB decision.
Notes:
(a) Excess Expansion Deposits : This balance relates to the excess expansion deposits for which Toronto Hydro is seeking
OEB’s approval for a deferral variance account. Refer to Exhibit 9, Tab 1, Schedule 1, section 9.1 for details of the new
account. As the new account is not yet approved, it was not included in the original DVA continuity submitted in pre-filed
evidence or as part of the 2018 update evidence. Toronto Hydro has included in this as requested by OEB Staff.
(b) Gain on sale-50/60 Eglinton Avenue : As described in Exhibit 8, Tab 1, Schedule 1, page 11, Toronto Hydro is seeking
approval to clear this amount. There is currently no approved DVA account for this balance, therefore Toronto Hydro did not
include this in the original DVA continuity submitted in pre-filed evidence or as part of the 2018 updated evidence. Toronto
Hydro has included in this as requested by OEB Staff. Toronto Hydro is not requesting a DVA going forward in association
with this event.
(c) Account receivable credits: As noted in Exhibit 9, Tab 1, Schedule 1, page 11, Toronto Hydro is seeking approval to
clear this balance, associated with historical AR credits. here is currently no approved DVA account for this balance,
therefore Toronto Hydro did not include this in the original DVA continuity submitted in pre-filed evidence or as part of the
2018 updated evidence. Toronto Hydro has included in this as requested by OEB Staff. Toronto Hydro is not requesting a
DVA going forward in association with this balance.
Opening
Interest
Amounts as of
Jan-1-13
Interest Jan-1 to
Dec-31-13
OEB-Approved
Disposition
during 2013
Interest
Adjustments(2)
during 2013
Closing Interest
Amounts as of
Dec-31-13Account Descriptions
Account
Number
Opening Principal
Amounts as of Jan-
1-12
Transactions(1) Debit /
(Credit) during 2012
OEB-Approved
Disposition during
2012
Closing Interest
Amounts as of
Dec-31-12
Opening Principal
Amounts as of Jan-
1-13
Transactions(1) Debit /
(Credit) during 2013
OEB-Approved
Disposition during
2013
Principal
Adjustments(2)
during 2013
Closing
Principal
Balance as of
Dec-31-13
Principal
Adjustments(2)
during 2012
Closing
Principal
Balance as of
Dec-31-12
Opening
Interest
Amounts as of
Jan-1-12
Interest Jan-1 to
Dec-31-12
OEB-Approved
Disposition
during 2012
Interest
Adjustments(1)
during 2012
This continuity schedule must be completed for each account and sub-account that the utility has approved for use as at Dec. 31, 2016, regardless of whether disposition is being requested for the account. For all accounts, except for Account 1595, start inputting
data from the year in which the GL balance was last disposed. For example, if in the 2017 rate application, DVA balances as at December 31, 2015 were approved for disposition, start the continuity schedule from 2015 by entering the approved closing 2014 balance
in the Adjustment column under 2014. For each Account 1595 sub-account, start inputting data from the year the sub-account started to accumulate a balance (i.e. the vintage year). For example, Account 1595 (2014), data should be inputted starting in 2014 when
the relevant balances approved for disposition was first transferred into Account 1595 (2014). The DVA continuity schedule currently starts from 2011, if a utility has an Account 1595 with a vintage year prior to 2011, then a separate schedule should be provided
starting from the vintage year. For any new accounts that have never been disposed, start inputting data from the year the account was approved to be used.
2012 2013
2b. Group 2 - Cont Schedule
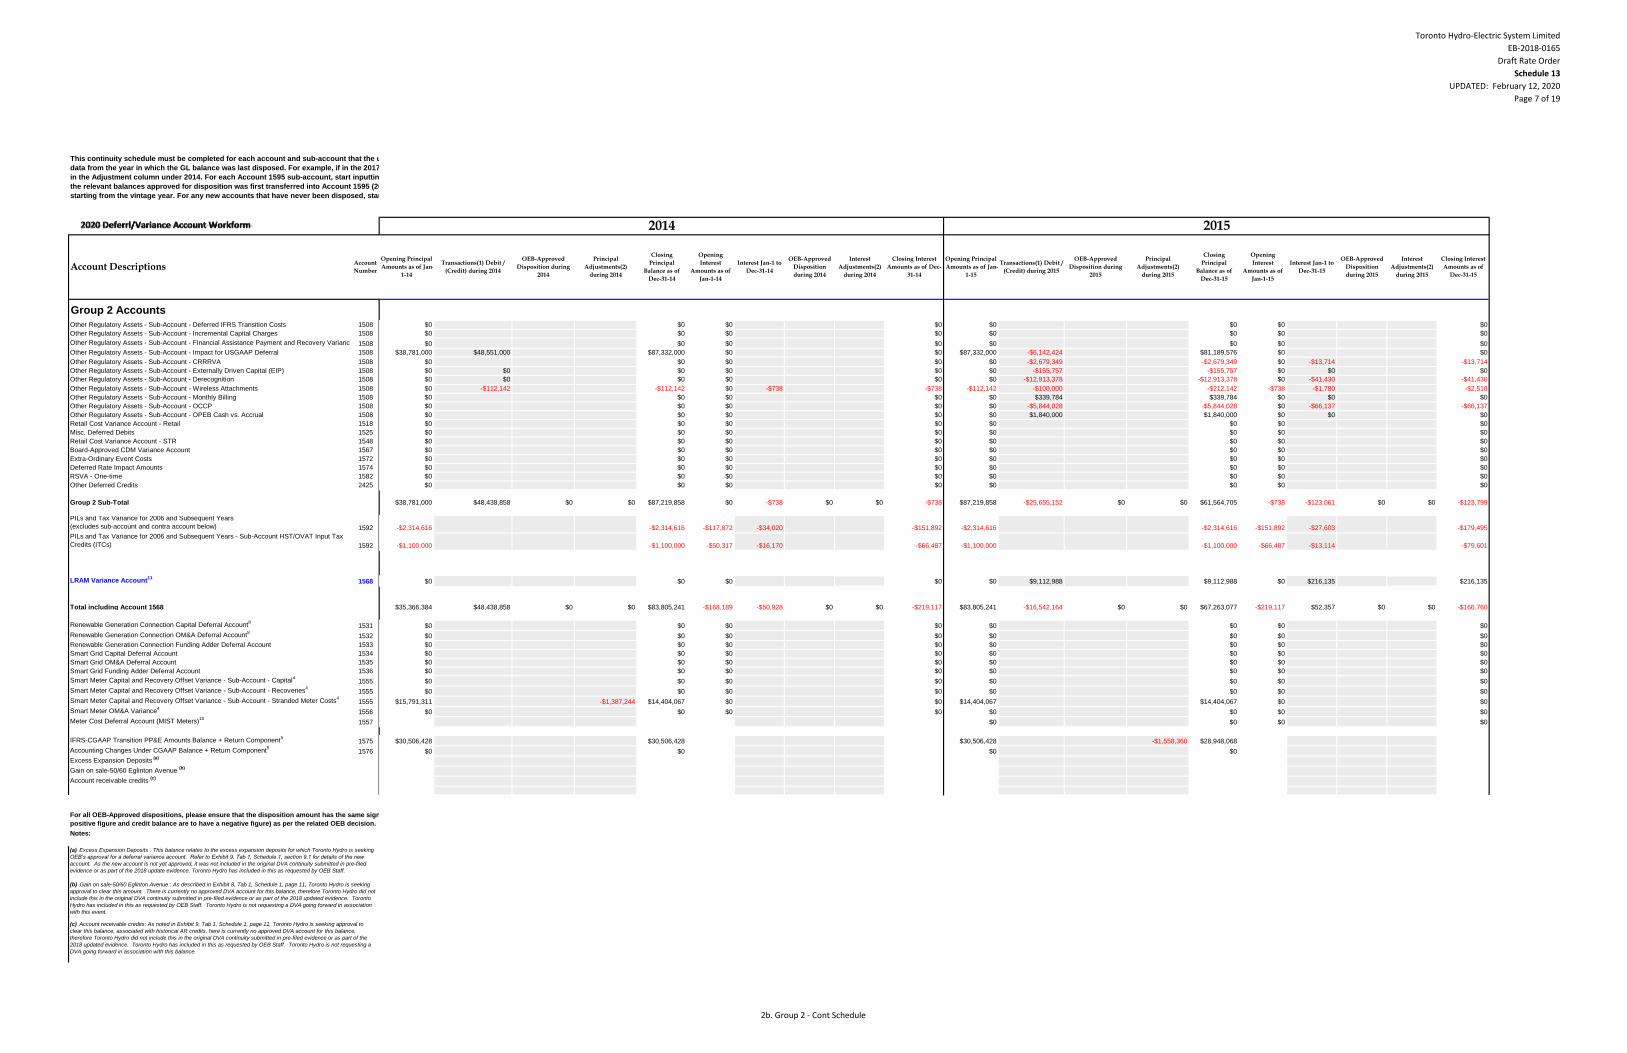
Toronto Hydro-Electric System Limited
EB-2018-0165
Draft Rate Order
Schedule 13
UPDATED: February 12, 2020
Page 7 of 19
Group 2 Accounts
Other Regulatory Assets - Sub-Account - Deferred IFRS Transition Costs 1508
Other Regulatory Assets - Sub-Account - Incremental Capital Charges 1508
Other Regulatory Assets - Sub-Account - Financial Assistance Payment and Recovery Variance - Ontario Clean Energy Benefit Act3
1508
Other Regulatory Assets - Sub-Account - Impact for USGAAP Deferral 1508
Other Regulatory Assets - Sub-Account - CRRRVA 1508
Other Regulatory Assets - Sub-Account - Externally Driven Capital (EIP) 1508
Other Regulatory Assets - Sub-Account - Derecognition 1508
Other Regulatory Assets - Sub-Account - Wireless Attachments 1508
Other Regulatory Assets - Sub-Account - Monthly Billing 1508
Other Regulatory Assets - Sub-Account - OCCP 1508
Other Regulatory Assets - Sub-Account - OPEB Cash vs. Accrual 1508
Retail Cost Variance Account - Retail 1518
Misc. Deferred Debits 1525
Retail Cost Variance Account - STR 1548
Board-Approved CDM Variance Account 1567
Extra-Ordinary Event Costs 1572
Deferred Rate Impact Amounts 1574
RSVA - One-time 1582
Other Deferred Credits 2425
Group 2 Sub-Total
PILs and Tax Variance for 2006 and Subsequent Years
(excludes sub-account and contra account below) 1592
PILs and Tax Variance for 2006 and Subsequent Years - Sub-Account HST/OVAT Input Tax
Credits (ITCs) 1592
LRAM Variance Account11
1568
Total including Account 1568
Renewable Generation Connection Capital Deferral Account8
1531
Renewable Generation Connection OM&A Deferral Account8
1532
Renewable Generation Connection Funding Adder Deferral Account 1533
Smart Grid Capital Deferral Account 1534
Smart Grid OM&A Deferral Account 1535
Smart Grid Funding Adder Deferral Account 1536
Smart Meter Capital and Recovery Offset Variance - Sub-Account - Capital4
1555
Smart Meter Capital and Recovery Offset Variance - Sub-Account - Recoveries4
1555
Smart Meter Capital and Recovery Offset Variance - Sub-Account - Stranded Meter Costs4
1555
Smart Meter OM&A Variance4
1556
Meter Cost Deferral Account (MIST Meters)10
1557
IFRS-CGAAP Transition PP&E Amounts Balance + Return Component5
1575
Accounting Changes Under CGAAP Balance + Return Component5
1576
Excess Expansion Deposits (a)
Gain on sale-50/60 Eglinton Avenue (b)
Account receivable credits (c)
For all OEB-Approved dispositions, please ensure that the disposition amount has the same sign (e.g: debit balances are to have a
positive figure and credit balance are to have a negative figure) as per the related OEB decision.
Notes:
(a) Excess Expansion Deposits : This balance relates to the excess expansion deposits for which Toronto Hydro is seeking
OEB’s approval for a deferral variance account. Refer to Exhibit 9, Tab 1, Schedule 1, section 9.1 for details of the new
account. As the new account is not yet approved, it was not included in the original DVA continuity submitted in pre-filed
evidence or as part of the 2018 update evidence. Toronto Hydro has included in this as requested by OEB Staff.
(b) Gain on sale-50/60 Eglinton Avenue : As described in Exhibit 8, Tab 1, Schedule 1, page 11, Toronto Hydro is seeking
approval to clear this amount. There is currently no approved DVA account for this balance, therefore Toronto Hydro did not
include this in the original DVA continuity submitted in pre-filed evidence or as part of the 2018 updated evidence. Toronto
Hydro has included in this as requested by OEB Staff. Toronto Hydro is not requesting a DVA going forward in association
with this event.
(c) Account receivable credits: As noted in Exhibit 9, Tab 1, Schedule 1, page 11, Toronto Hydro is seeking approval to
clear this balance, associated with historical AR credits. here is currently no approved DVA account for this balance,
therefore Toronto Hydro did not include this in the original DVA continuity submitted in pre-filed evidence or as part of the
2018 updated evidence. Toronto Hydro has included in this as requested by OEB Staff. Toronto Hydro is not requesting a
DVA going forward in association with this balance.
Account DescriptionsAccount
Number
This continuity schedule must be completed for each account and sub-account that the utility has approved for use as at Dec. 31, 2016, regardless of whether disposition is being requested for the account. For all accounts, except for Account 1595, start inputting
data from the year in which the GL balance was last disposed. For example, if in the 2017 rate application, DVA balances as at December 31, 2015 were approved for disposition, start the continuity schedule from 2015 by entering the approved closing 2014 balance
in the Adjustment column under 2014. For each Account 1595 sub-account, start inputting data from the year the sub-account started to accumulate a balance (i.e. the vintage year). For example, Account 1595 (2014), data should be inputted starting in 2014 when
the relevant balances approved for disposition was first transferred into Account 1595 (2014). The DVA continuity schedule currently starts from 2011, if a utility has an Account 1595 with a vintage year prior to 2011, then a separate schedule should be provided
starting from the vintage year. For any new accounts that have never been disposed, start inputting data from the year the account was approved to be used.
$0 $0 $0 $0 $0 $0 $0 $0
$0 $0 $0 $0 $0 $0 $0 $0
$0 $0 $0 $0 $0 $0 $0 $0
$38,781,000 $48,551,000 $87,332,000 $0 $0 $87,332,000 -$6,142,424 $81,189,576 $0 $0
$0 $0 $0 $0 $0 -$2,679,349 -$2,679,349 $0 -$13,714 -$13,714
$0 $0 $0 $0 $0 $0 -$155,757 -$155,757 $0 $0 $0
$0 $0 $0 $0 $0 $0 -$12,913,378 -$12,913,378 $0 -$41,430 -$41,430
$0 -$112,142 -$112,142 $0 -$738 -$738 -$112,142 -$100,000 -$212,142 -$738 -$1,780 -$2,518
$0 $0 $0 $0 $0 $339,784 $339,784 $0 $0 $0
$0 $0 $0 $0 $0 -$5,844,028 -$5,844,028 $0 -$66,137 -$66,137
$0 $0 $0 $0 $0 $1,840,000 $1,840,000 $0 $0 $0
$0 $0 $0 $0 $0 $0 $0 $0
$0 $0 $0 $0 $0 $0 $0 $0
$0 $0 $0 $0 $0 $0 $0 $0
$0 $0 $0 $0 $0 $0 $0 $0
$0 $0 $0 $0 $0 $0 $0 $0
$0 $0 $0 $0 $0 $0 $0 $0
$0 $0 $0 $0 $0 $0 $0 $0
$0 $0 $0 $0 $0 $0 $0 $0
$38,781,000 $48,438,858 $0 $0 $87,219,858 $0 -$738 $0 $0 -$738 $87,219,858 -$25,655,152 $0 $0 $61,564,705 -$738 -$123,061 $0 $0 -$123,799
-$2,314,616 -$2,314,616 -$117,872 -$34,020 -$151,892 -$2,314,616 -$2,314,616 -$151,892 -$27,603 -$179,495
-$1,100,000 -$1,100,000 -$50,317 -$16,170 -$66,487 -$1,100,000 -$1,100,000 -$66,487 -$13,114 -$79,601
$0 $0 $0 $0 $0 $9,112,988 $9,112,988 $0 $216,135 $216,135
$35,366,384 $48,438,858 $0 $0 $83,805,241 -$168,189 -$50,928 $0 $0 -$219,117 $83,805,241 -$16,542,164 $0 $0 $67,263,077 -$219,117 $52,357 $0 $0 -$166,760
$0 $0 $0 $0 $0 $0 $0 $0
$0 $0 $0 $0 $0 $0 $0 $0
$0 $0 $0 $0 $0 $0 $0 $0
$0 $0 $0 $0 $0 $0 $0 $0
$0 $0 $0 $0 $0 $0 $0 $0
$0 $0 $0 $0 $0 $0 $0 $0
$0 $0 $0 $0 $0 $0 $0 $0
$0 $0 $0 $0 $0 $0 $0 $0
$15,791,311 -$1,387,244 $14,404,067 $0 $0 $14,404,067 $14,404,067 $0 $0
$0 $0 $0 $0 $0 $0 $0 $0
$0 $0 $0 $0
$30,506,428 $30,506,428 $30,506,428 -$1,558,360 $28,948,068
$0 $0 $0 $0
Closing Interest
Amounts as of
Dec-31-15
Interest Jan-1 to
Dec-31-15
OEB-Approved
Disposition
during 2015
Interest
Adjustments(2)
during 2015
OEB-Approved
Disposition
during 2014
Interest
Adjustments(2)
during 2014
Closing Interest
Amounts as of Dec-
31-14
Opening Principal
Amounts as of Jan-
1-15
Transactions(1) Debit /
(Credit) during 2015
OEB-Approved
Disposition during
2015
Opening Principal
Amounts as of Jan-
1-14
Closing
Principal
Balance as of
Dec-31-14
Opening
Interest
Amounts as of
Jan-1-14
Interest Jan-1 to
Dec-31-14
Principal
Adjustments(2)
during 2015
Closing
Principal
Balance as of
Dec-31-15
Opening
Interest
Amounts as of
Jan-1-15
Transactions(1) Debit /
(Credit) during 2014
OEB-Approved
Disposition during
2014
Principal
Adjustments(2)
during 2014
2014 2015
2b. Group 2 - Cont Schedule
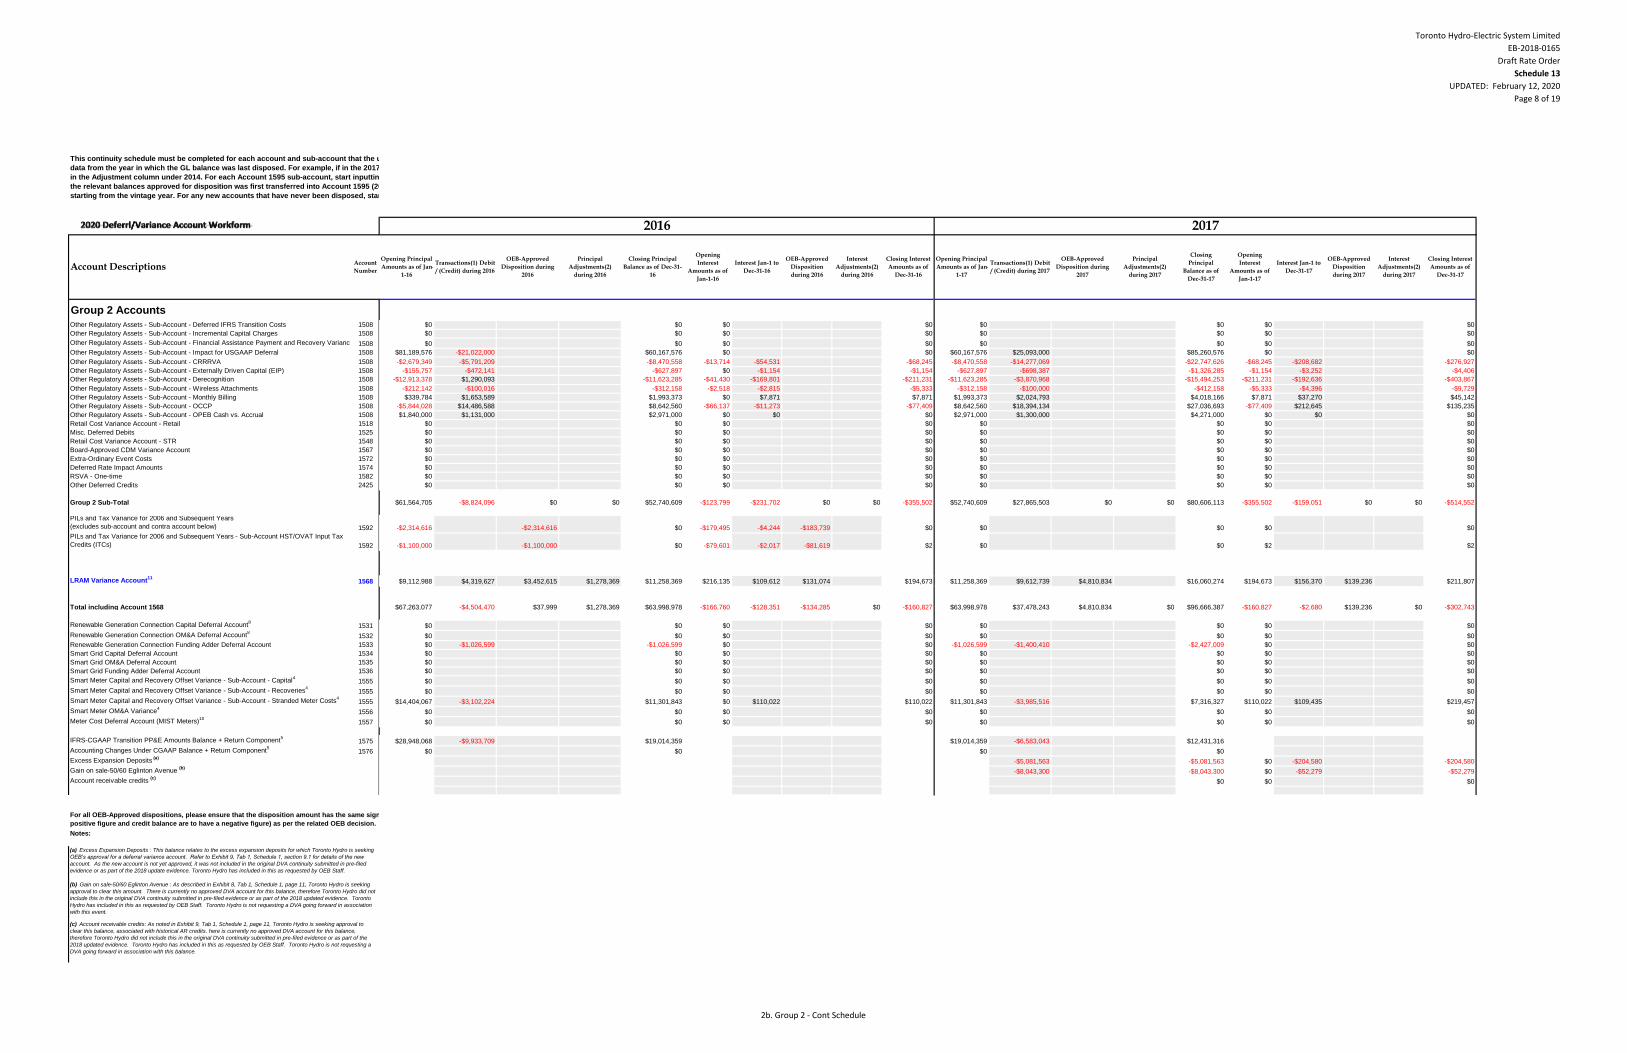
Toronto Hydro-Electric System Limited
EB-2018-0165
Draft Rate Order
Schedule 13
UPDATED: February 12, 2020
Page 8 of 19
Group 2 Accounts
Other Regulatory Assets - Sub-Account - Deferred IFRS Transition Costs 1508
Other Regulatory Assets - Sub-Account - Incremental Capital Charges 1508
Other Regulatory Assets - Sub-Account - Financial Assistance Payment and Recovery Variance - Ontario Clean Energy Benefit Act3
1508
Other Regulatory Assets - Sub-Account - Impact for USGAAP Deferral 1508
Other Regulatory Assets - Sub-Account - CRRRVA 1508
Other Regulatory Assets - Sub-Account - Externally Driven Capital (EIP) 1508
Other Regulatory Assets - Sub-Account - Derecognition 1508
Other Regulatory Assets - Sub-Account - Wireless Attachments 1508
Other Regulatory Assets - Sub-Account - Monthly Billing 1508
Other Regulatory Assets - Sub-Account - OCCP 1508
Other Regulatory Assets - Sub-Account - OPEB Cash vs. Accrual 1508
Retail Cost Variance Account - Retail 1518
Misc. Deferred Debits 1525
Retail Cost Variance Account - STR 1548
Board-Approved CDM Variance Account 1567
Extra-Ordinary Event Costs 1572
Deferred Rate Impact Amounts 1574
RSVA - One-time 1582
Other Deferred Credits 2425
Group 2 Sub-Total
PILs and Tax Variance for 2006 and Subsequent Years
(excludes sub-account and contra account below) 1592
PILs and Tax Variance for 2006 and Subsequent Years - Sub-Account HST/OVAT Input Tax
Credits (ITCs) 1592
LRAM Variance Account11
1568
Total including Account 1568
Renewable Generation Connection Capital Deferral Account8
1531
Renewable Generation Connection OM&A Deferral Account8
1532
Renewable Generation Connection Funding Adder Deferral Account 1533
Smart Grid Capital Deferral Account 1534
Smart Grid OM&A Deferral Account 1535
Smart Grid Funding Adder Deferral Account 1536
Smart Meter Capital and Recovery Offset Variance - Sub-Account - Capital4
1555
Smart Meter Capital and Recovery Offset Variance - Sub-Account - Recoveries4
1555
Smart Meter Capital and Recovery Offset Variance - Sub-Account - Stranded Meter Costs4
1555
Smart Meter OM&A Variance4
1556
Meter Cost Deferral Account (MIST Meters)10
1557
IFRS-CGAAP Transition PP&E Amounts Balance + Return Component5
1575
Accounting Changes Under CGAAP Balance + Return Component5
1576
Excess Expansion Deposits (a)
Gain on sale-50/60 Eglinton Avenue (b)
Account receivable credits (c)
For all OEB-Approved dispositions, please ensure that the disposition amount has the same sign (e.g: debit balances are to have a
positive figure and credit balance are to have a negative figure) as per the related OEB decision.
Notes:
(a) Excess Expansion Deposits : This balance relates to the excess expansion deposits for which Toronto Hydro is seeking
OEB’s approval for a deferral variance account. Refer to Exhibit 9, Tab 1, Schedule 1, section 9.1 for details of the new
account. As the new account is not yet approved, it was not included in the original DVA continuity submitted in pre-filed
evidence or as part of the 2018 update evidence. Toronto Hydro has included in this as requested by OEB Staff.
(b) Gain on sale-50/60 Eglinton Avenue : As described in Exhibit 8, Tab 1, Schedule 1, page 11, Toronto Hydro is seeking
approval to clear this amount. There is currently no approved DVA account for this balance, therefore Toronto Hydro did not
include this in the original DVA continuity submitted in pre-filed evidence or as part of the 2018 updated evidence. Toronto
Hydro has included in this as requested by OEB Staff. Toronto Hydro is not requesting a DVA going forward in association
with this event.
(c) Account receivable credits: As noted in Exhibit 9, Tab 1, Schedule 1, page 11, Toronto Hydro is seeking approval to
clear this balance, associated with historical AR credits. here is currently no approved DVA account for this balance,
therefore Toronto Hydro did not include this in the original DVA continuity submitted in pre-filed evidence or as part of the
2018 updated evidence. Toronto Hydro has included in this as requested by OEB Staff. Toronto Hydro is not requesting a
DVA going forward in association with this balance.
Account DescriptionsAccount
Number
This continuity schedule must be completed for each account and sub-account that the utility has approved for use as at Dec. 31, 2016, regardless of whether disposition is being requested for the account. For all accounts, except for Account 1595, start inputting
data from the year in which the GL balance was last disposed. For example, if in the 2017 rate application, DVA balances as at December 31, 2015 were approved for disposition, start the continuity schedule from 2015 by entering the approved closing 2014 balance
in the Adjustment column under 2014. For each Account 1595 sub-account, start inputting data from the year the sub-account started to accumulate a balance (i.e. the vintage year). For example, Account 1595 (2014), data should be inputted starting in 2014 when
the relevant balances approved for disposition was first transferred into Account 1595 (2014). The DVA continuity schedule currently starts from 2011, if a utility has an Account 1595 with a vintage year prior to 2011, then a separate schedule should be provided
starting from the vintage year. For any new accounts that have never been disposed, start inputting data from the year the account was approved to be used.
$0 $0 $0 $0 $0 $0 $0 $0
$0 $0 $0 $0 $0 $0 $0 $0
$0 $0 $0 $0 $0 $0 $0 $0
$81,189,576 -$21,022,000 $60,167,576 $0 $0 $60,167,576 $25,093,000 $85,260,576 $0 $0
-$2,679,349 -$5,791,209 -$8,470,558 -$13,714 -$54,531 -$68,245 -$8,470,558 -$14,277,069 -$22,747,626 -$68,245 -$208,682 -$276,927
-$155,757 -$472,141 -$627,897 $0 -$1,154 -$1,154 -$627,897 -$698,387 -$1,326,285 -$1,154 -$3,252 -$4,406
-$12,913,378 $1,290,093 -$11,623,285 -$41,430 -$169,801 -$211,231 -$11,623,285 -$3,870,968 -$15,494,253 -$211,231 -$192,636 -$403,867
-$212,142 -$100,016 -$312,158 -$2,518 -$2,815 -$5,333 -$312,158 -$100,000 -$412,158 -$5,333 -$4,396 -$9,729
$339,784 $1,653,589 $1,993,373 $0 $7,871 $7,871 $1,993,373 $2,024,793 $4,018,166 $7,871 $37,270 $45,142
-$5,844,028 $14,486,588 $8,642,560 -$66,137 -$11,273 -$77,409 $8,642,560 $18,394,134 $27,036,693 -$77,409 $212,645 $135,235
$1,840,000 $1,131,000 $2,971,000 $0 $0 $0 $2,971,000 $1,300,000 $4,271,000 $0 $0 $0
$0 $0 $0 $0 $0 $0 $0 $0
$0 $0 $0 $0 $0 $0 $0 $0
$0 $0 $0 $0 $0 $0 $0 $0
$0 $0 $0 $0 $0 $0 $0 $0
$0 $0 $0 $0 $0 $0 $0 $0
$0 $0 $0 $0 $0 $0 $0 $0
$0 $0 $0 $0 $0 $0 $0 $0
$0 $0 $0 $0 $0 $0 $0 $0
$61,564,705 -$8,824,096 $0 $0 $52,740,609 -$123,799 -$231,702 $0 $0 -$355,502 $52,740,609 $27,865,503 $0 $0 $80,606,113 -$355,502 -$159,051 $0 $0 -$514,552
-$2,314,616 -$2,314,616 $0 -$179,495 -$4,244 -$183,739 $0 $0 $0 $0 $0
-$1,100,000 -$1,100,000 $0 -$79,601 -$2,017 -$81,619 $2 $0 $0 $2 $2
$9,112,988 $4,319,627 $3,452,615 $1,278,369 $11,258,369 $216,135 $109,612 $131,074 $194,673 $11,258,369 $9,612,739 $4,810,834 $16,060,274 $194,673 $156,370 $139,236 $211,807
$67,263,077 -$4,504,470 $37,999 $1,278,369 $63,998,978 -$166,760 -$128,351 -$134,285 $0 -$160,827 $63,998,978 $37,478,243 $4,810,834 $0 $96,666,387 -$160,827 -$2,680 $139,236 $0 -$302,743
$0 $0 $0 $0 $0 $0 $0 $0
$0 $0 $0 $0 $0 $0 $0 $0
$0 -$1,026,599 -$1,026,599 $0 $0 -$1,026,599 -$1,400,410 -$2,427,009 $0 $0
$0 $0 $0 $0 $0 $0 $0 $0
$0 $0 $0 $0 $0 $0 $0 $0
$0 $0 $0 $0 $0 $0 $0 $0
$0 $0 $0 $0 $0 $0 $0 $0
$0 $0 $0 $0 $0 $0 $0 $0
$14,404,067 -$3,102,224 $11,301,843 $0 $110,022 $110,022 $11,301,843 -$3,985,516 $7,316,327 $110,022 $109,435 $219,457
$0 $0 $0 $0 $0 $0 $0 $0
$0 $0 $0 $0 $0 $0 $0 $0
$28,948,068 -$9,933,709 $19,014,359 $19,014,359 -$6,583,043 $12,431,316
$0 $0 $0 $0
-$5,081,563 -$5,081,563 $0 -$204,580 -$204,580
-$8,043,300 -$8,043,300 $0 -$52,279 -$52,279
$0 $0 $0
OEB-Approved
Disposition
during 2017
Interest
Adjustments(2)
during 2017
Closing Interest
Amounts as of
Dec-31-17
Transactions(1) Debit
/ (Credit) during 2017
OEB-Approved
Disposition during
2017
Principal
Adjustments(2)
during 2017
Closing
Principal
Balance as of
Dec-31-17
Opening
Interest
Amounts as of
Jan-1-17
Interest Jan-1 to
Dec-31-17
Opening
Interest
Amounts as of
Jan-1-16
Interest Jan-1 to
Dec-31-16
OEB-Approved
Disposition
during 2016
Interest
Adjustments(2)
during 2016
Closing Interest
Amounts as of
Dec-31-16
Opening Principal
Amounts as of Jan-
1-17
Opening Principal
Amounts as of Jan-
1-16
Transactions(1) Debit
/ (Credit) during 2016
OEB-Approved
Disposition during
2016
Principal
Adjustments(2)
during 2016
Closing Principal
Balance as of Dec-31-
16
2016 2017
2b. Group 2 - Cont Schedule
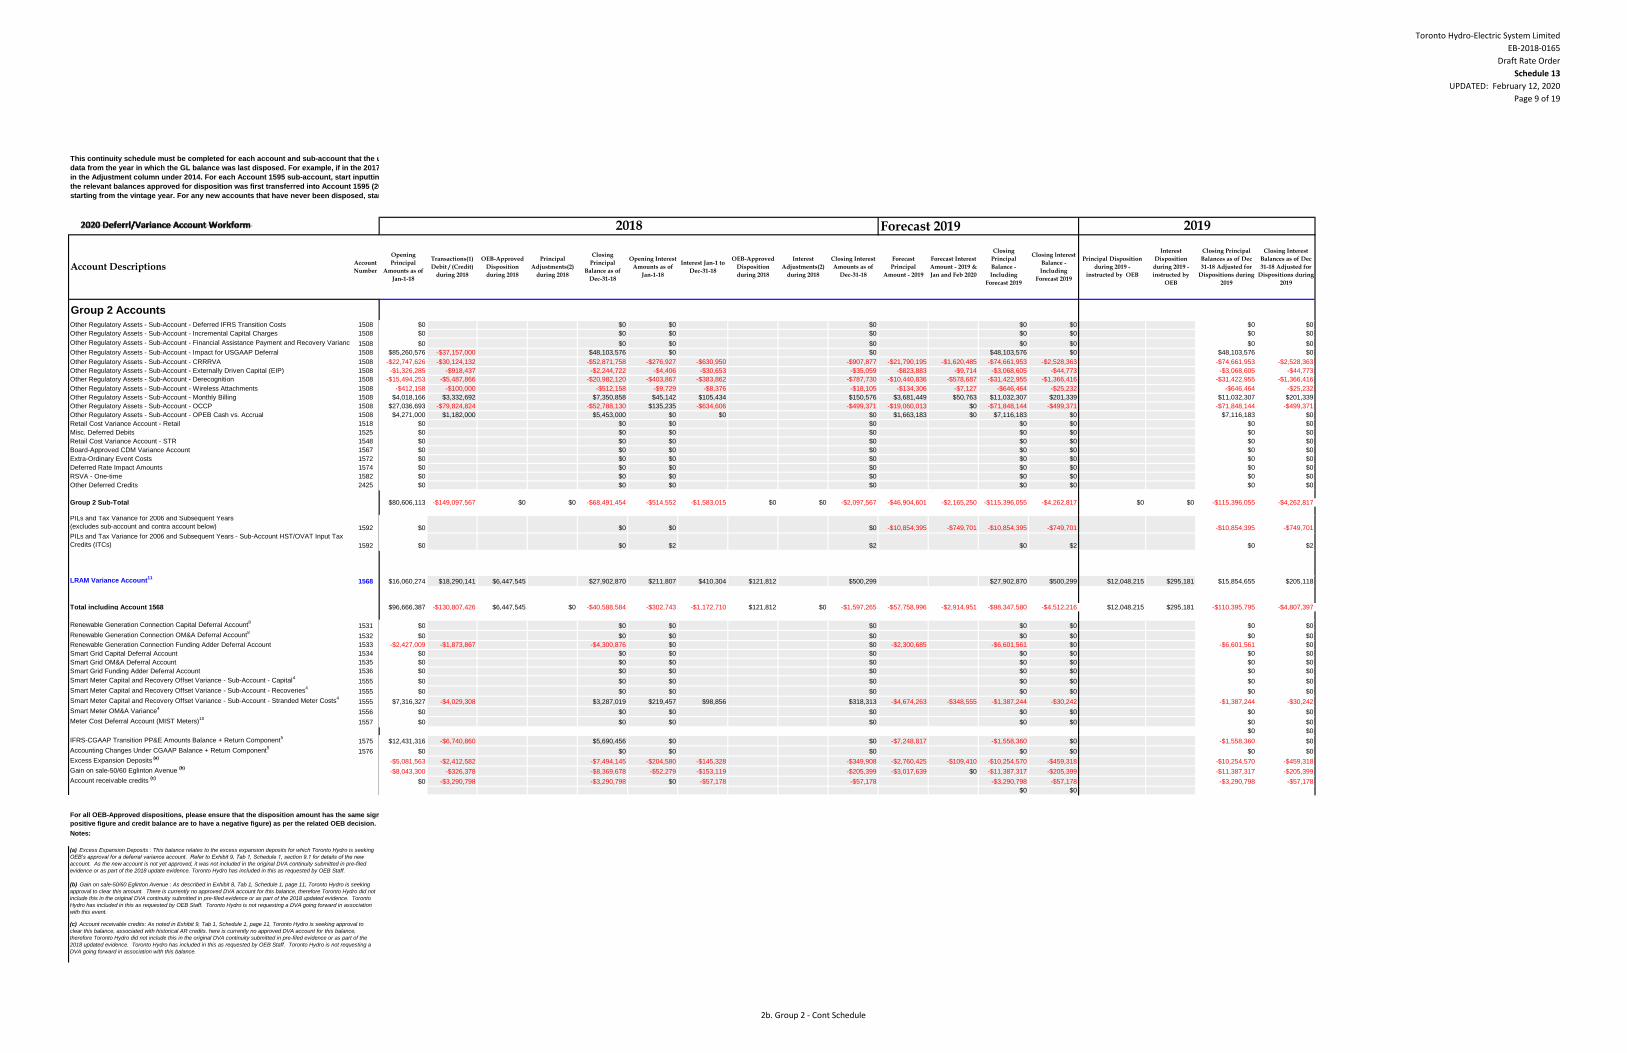
Toronto Hydro-Electric System Limited
EB-2018-0165
Draft Rate Order
Schedule 13
UPDATED: February 12, 2020
Page 9 of 19
Group 2 Accounts
Other Regulatory Assets - Sub-Account - Deferred IFRS Transition Costs 1508
Other Regulatory Assets - Sub-Account - Incremental Capital Charges 1508
Other Regulatory Assets - Sub-Account - Financial Assistance Payment and Recovery Variance - Ontario Clean Energy Benefit Act3
1508
Other Regulatory Assets - Sub-Account - Impact for USGAAP Deferral 1508
Other Regulatory Assets - Sub-Account - CRRRVA 1508
Other Regulatory Assets - Sub-Account - Externally Driven Capital (EIP) 1508
Other Regulatory Assets - Sub-Account - Derecognition 1508
Other Regulatory Assets - Sub-Account - Wireless Attachments 1508
Other Regulatory Assets - Sub-Account - Monthly Billing 1508
Other Regulatory Assets - Sub-Account - OCCP 1508
Other Regulatory Assets - Sub-Account - OPEB Cash vs. Accrual 1508
Retail Cost Variance Account - Retail 1518
Misc. Deferred Debits 1525
Retail Cost Variance Account - STR 1548
Board-Approved CDM Variance Account 1567
Extra-Ordinary Event Costs 1572
Deferred Rate Impact Amounts 1574
RSVA - One-time 1582
Other Deferred Credits 2425
Group 2 Sub-Total
PILs and Tax Variance for 2006 and Subsequent Years
(excludes sub-account and contra account below) 1592
PILs and Tax Variance for 2006 and Subsequent Years - Sub-Account HST/OVAT Input Tax
Credits (ITCs) 1592
LRAM Variance Account11
1568
Total including Account 1568
Renewable Generation Connection Capital Deferral Account8
1531
Renewable Generation Connection OM&A Deferral Account8
1532
Renewable Generation Connection Funding Adder Deferral Account 1533
Smart Grid Capital Deferral Account 1534
Smart Grid OM&A Deferral Account 1535
Smart Grid Funding Adder Deferral Account 1536
Smart Meter Capital and Recovery Offset Variance - Sub-Account - Capital4
1555
Smart Meter Capital and Recovery Offset Variance - Sub-Account - Recoveries4
1555
Smart Meter Capital and Recovery Offset Variance - Sub-Account - Stranded Meter Costs4
1555
Smart Meter OM&A Variance4
1556
Meter Cost Deferral Account (MIST Meters)10
1557
IFRS-CGAAP Transition PP&E Amounts Balance + Return Component5
1575
Accounting Changes Under CGAAP Balance + Return Component5
1576
Excess Expansion Deposits (a)
Gain on sale-50/60 Eglinton Avenue (b)
Account receivable credits (c)
For all OEB-Approved dispositions, please ensure that the disposition amount has the same sign (e.g: debit balances are to have a
positive figure and credit balance are to have a negative figure) as per the related OEB decision.
Notes:
(a) Excess Expansion Deposits : This balance relates to the excess expansion deposits for which Toronto Hydro is seeking
OEB’s approval for a deferral variance account. Refer to Exhibit 9, Tab 1, Schedule 1, section 9.1 for details of the new
account. As the new account is not yet approved, it was not included in the original DVA continuity submitted in pre-filed
evidence or as part of the 2018 update evidence. Toronto Hydro has included in this as requested by OEB Staff.
(b) Gain on sale-50/60 Eglinton Avenue : As described in Exhibit 8, Tab 1, Schedule 1, page 11, Toronto Hydro is seeking
approval to clear this amount. There is currently no approved DVA account for this balance, therefore Toronto Hydro did not
include this in the original DVA continuity submitted in pre-filed evidence or as part of the 2018 updated evidence. Toronto
Hydro has included in this as requested by OEB Staff. Toronto Hydro is not requesting a DVA going forward in association
with this event.
(c) Account receivable credits: As noted in Exhibit 9, Tab 1, Schedule 1, page 11, Toronto Hydro is seeking approval to
clear this balance, associated with historical AR credits. here is currently no approved DVA account for this balance,
therefore Toronto Hydro did not include this in the original DVA continuity submitted in pre-filed evidence or as part of the
2018 updated evidence. Toronto Hydro has included in this as requested by OEB Staff. Toronto Hydro is not requesting a
DVA going forward in association with this balance.
Account DescriptionsAccount
Number
This continuity schedule must be completed for each account and sub-account that the utility has approved for use as at Dec. 31, 2016, regardless of whether disposition is being requested for the account. For all accounts, except for Account 1595, start inputting
data from the year in which the GL balance was last disposed. For example, if in the 2017 rate application, DVA balances as at December 31, 2015 were approved for disposition, start the continuity schedule from 2015 by entering the approved closing 2014 balance
in the Adjustment column under 2014. For each Account 1595 sub-account, start inputting data from the year the sub-account started to accumulate a balance (i.e. the vintage year). For example, Account 1595 (2014), data should be inputted starting in 2014 when
the relevant balances approved for disposition was first transferred into Account 1595 (2014). The DVA continuity schedule currently starts from 2011, if a utility has an Account 1595 with a vintage year prior to 2011, then a separate schedule should be provided
starting from the vintage year. For any new accounts that have never been disposed, start inputting data from the year the account was approved to be used.
Forecast 2019
$0 $0 $0 $0 $0 $0 $0 $0
$0 $0 $0 $0 $0 $0 $0 $0
$0 $0 $0 $0 $0 $0 $0 $0
$85,260,576 -$37,157,000 $48,103,576 $0 $0 $48,103,576 $0 $48,103,576 $0
-$22,747,626 -$30,124,132 -$52,871,758 -$276,927 -$630,950 -$907,877 -$21,790,195 -$1,620,485 -$74,661,953 -$2,528,363 -$74,661,953 -$2,528,363
-$1,326,285 -$918,437 -$2,244,722 -$4,406 -$30,653 -$35,059 -$823,883 -$9,714 -$3,068,605 -$44,773 -$3,068,605 -$44,773
-$15,494,253 -$5,487,866 -$20,982,120 -$403,867 -$383,862 -$787,730 -$10,440,836 -$578,687 -$31,422,955 -$1,366,416 -$31,422,955 -$1,366,416
-$412,158 -$100,000 -$512,158 -$9,729 -$8,376 -$18,105 -$134,306 -$7,127 -$646,464 -$25,232 -$646,464 -$25,232
$4,018,166 $3,332,692 $7,350,858 $45,142 $105,434 $150,576 $3,681,449 $50,763 $11,032,307 $201,339 $11,032,307 $201,339
$27,036,693 -$79,824,824 -$52,788,130 $135,235 -$634,606 -$499,371 -$19,060,013 $0 -$71,848,144 -$499,371 -$71,848,144 -$499,371
$4,271,000 $1,182,000 $5,453,000 $0 $0 $0 $1,663,183 $0 $7,116,183 $0 $7,116,183 $0
$0 $0 $0 $0 $0 $0 $0 $0
$0 $0 $0 $0 $0 $0 $0 $0
$0 $0 $0 $0 $0 $0 $0 $0
$0 $0 $0 $0 $0 $0 $0 $0
$0 $0 $0 $0 $0 $0 $0 $0
$0 $0 $0 $0 $0 $0 $0 $0
$0 $0 $0 $0 $0 $0 $0 $0
$0 $0 $0 $0 $0 $0 $0 $0
$80,606,113 -$149,097,567 $0 $0 -$68,491,454 -$514,552 -$1,583,015 $0 $0 -$2,097,567 -$46,904,601 -$2,165,250 -$115,396,055 -$4,262,817 $0 $0 -$115,396,055 -$4,262,817
$0 $0 $0 $0 -$10,854,395 -$749,701 -$10,854,395 -$749,701 -$10,854,395 -$749,701
$0 $0 $2 $2 $0 $2 $0 $2
$16,060,274 $18,290,141 $6,447,545 $27,902,870 $211,807 $410,304 $121,812 $500,299 $27,902,870 $500,299 $12,048,215 $295,181 $15,854,655 $205,118
$96,666,387 -$130,807,426 $6,447,545 $0 -$40,588,584 -$302,743 -$1,172,710 $121,812 $0 -$1,597,265 -$57,758,996 -$2,914,951 -$98,347,580 -$4,512,216 $12,048,215 $295,181 -$110,395,795 -$4,807,397
$0 $0 $0 $0 $0 $0 $0 $0
$0 $0 $0 $0 $0 $0 $0 $0
-$2,427,009 -$1,873,867 -$4,300,876 $0 $0 -$2,300,685 -$6,601,561 $0 -$6,601,561 $0
$0 $0 $0 $0 $0 $0 $0 $0
$0 $0 $0 $0 $0 $0 $0 $0
$0 $0 $0 $0 $0 $0 $0 $0
$0 $0 $0 $0 $0 $0 $0 $0
$0 $0 $0 $0 $0 $0 $0 $0
$7,316,327 -$4,029,308 $3,287,019 $219,457 $98,856 $318,313 -$4,674,263 -$348,555 -$1,387,244 -$30,242 -$1,387,244 -$30,242
$0 $0 $0 $0 $0 $0 $0 $0
$0 $0 $0 $0 $0 $0 $0 $0
$0 $0
$12,431,316 -$6,740,860 $5,690,456 $0 $0 -$7,248,817 -$1,558,360 $0 -$1,558,360 $0
$0 $0 $0 $0 $0 $0 $0 $0
-$5,081,563 -$2,412,582 -$7,494,145 -$204,580 -$145,328 -$349,908 -$2,760,425 -$109,410 -$10,254,570 -$459,318 -$10,254,570 -$459,318
-$8,043,300 -$326,378 -$8,369,678 -$52,279 -$153,119 -$205,399 -$3,017,639 $0 -$11,387,317 -$205,399 -$11,387,317 -$205,399
$0 -$3,290,798 -$3,290,798 $0 -$57,178 -$57,178 -$3,290,798 -$57,178 -$3,290,798 -$57,178
$0 $0
Interest
Disposition
during 2019 -
instructed by
OEB
Closing Principal
Balances as of Dec
31-18 Adjusted for
Dispositions during
2019
Closing Interest
Balances as of Dec
31-18 Adjusted for
Dispositions during
2019
Closing Interest
Amounts as of
Dec-31-18
Forecast
Principal
Amount - 2019
Forecast Interest
Amount - 2019 &
Jan and Feb 2020
Closing
Principal
Balance -
Including
Forecast 2019
Closing lnterest
Balance -
Including
Forecast 2019
Principal Disposition
during 2019 -
instructed by OEB
Principal
Adjustments(2)
during 2018
Closing
Principal
Balance as of
Dec-31-18
Opening Interest
Amounts as of
Jan-1-18
Interest Jan-1 to
Dec-31-18
OEB-Approved
Disposition
during 2018
Interest
Adjustments(2)
during 2018
Opening
Principal
Amounts as of
Jan-1-18
Transactions(1)
Debit / (Credit)
during 2018
OEB-Approved
Disposition
during 2018
2018 2019
2b. Group 2 - Cont Schedule
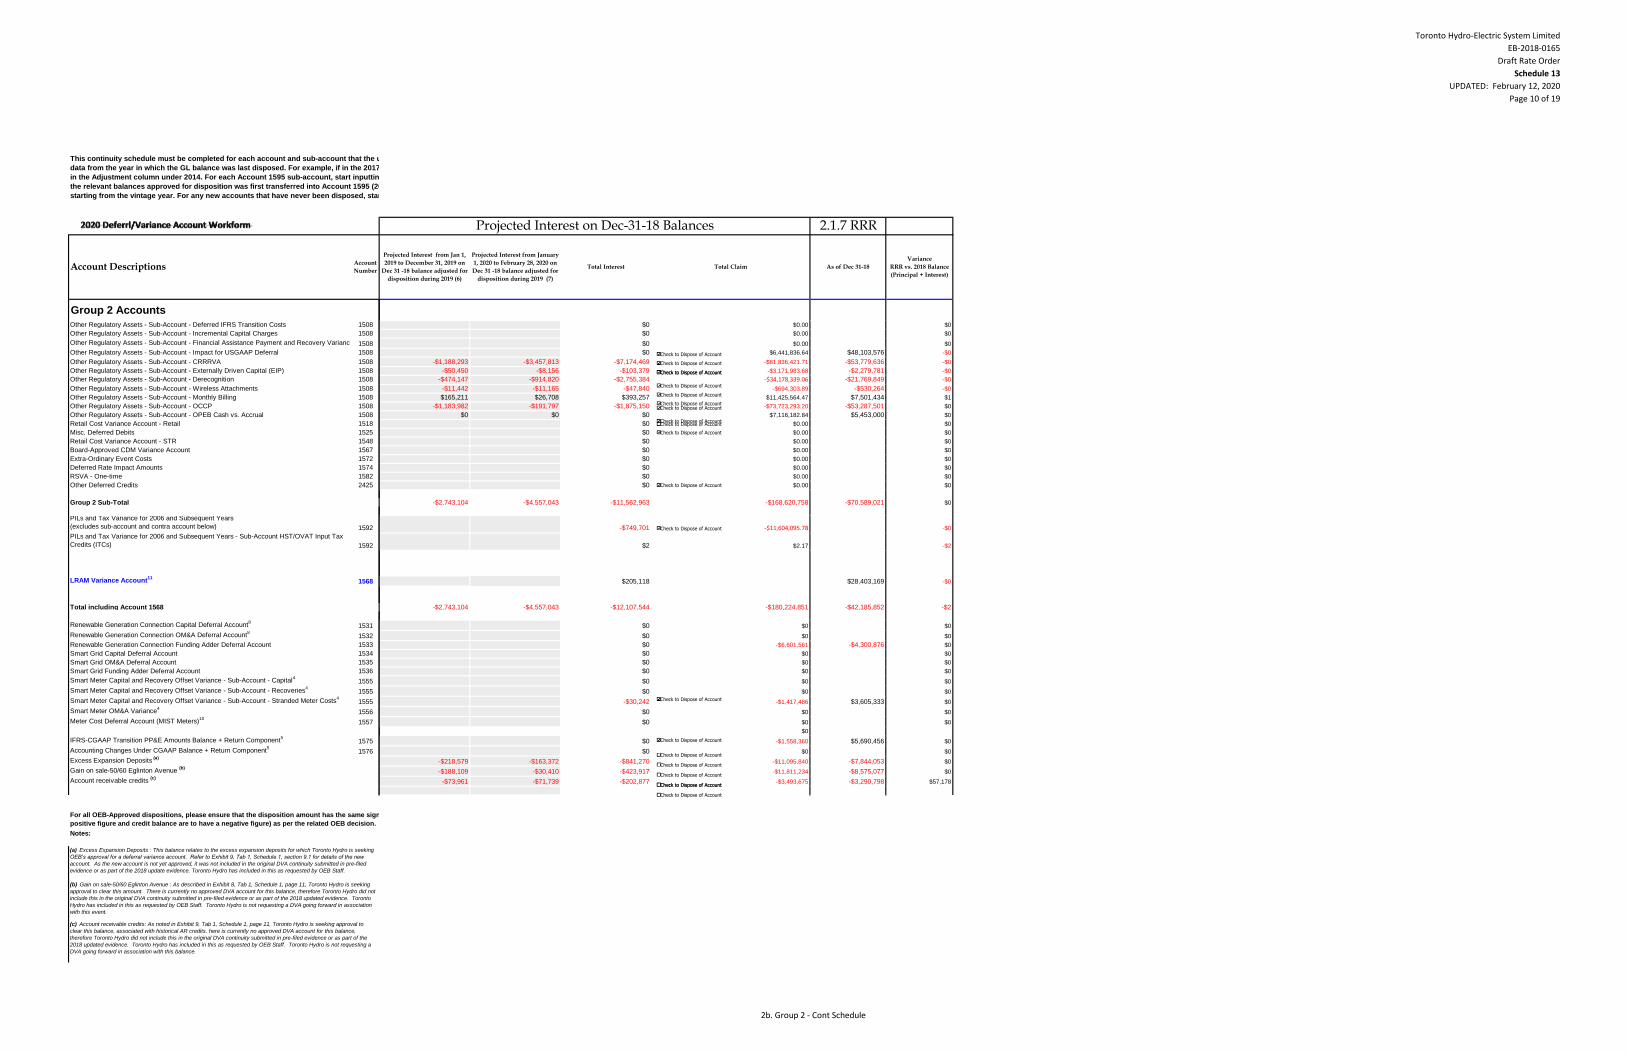
Toronto Hydro-Electric System Limited
EB-2018-0165
Draft Rate Order
Schedule 13
UPDATED: February 12, 2020
Page 10 of 19
Group 2 Accounts
Other Regulatory Assets - Sub-Account - Deferred IFRS Transition Costs 1508
Other Regulatory Assets - Sub-Account - Incremental Capital Charges 1508
Other Regulatory Assets - Sub-Account - Financial Assistance Payment and Recovery Variance - Ontario Clean Energy Benefit Act3
1508
Other Regulatory Assets - Sub-Account - Impact for USGAAP Deferral 1508
Other Regulatory Assets - Sub-Account - CRRRVA 1508
Other Regulatory Assets - Sub-Account - Externally Driven Capital (EIP) 1508
Other Regulatory Assets - Sub-Account - Derecognition 1508
Other Regulatory Assets - Sub-Account - Wireless Attachments 1508
Other Regulatory Assets - Sub-Account - Monthly Billing 1508
Other Regulatory Assets - Sub-Account - OCCP 1508
Other Regulatory Assets - Sub-Account - OPEB Cash vs. Accrual 1508
Retail Cost Variance Account - Retail 1518
Misc. Deferred Debits 1525
Retail Cost Variance Account - STR 1548
Board-Approved CDM Variance Account 1567
Extra-Ordinary Event Costs 1572
Deferred Rate Impact Amounts 1574
RSVA - One-time 1582
Other Deferred Credits 2425
Group 2 Sub-Total
PILs and Tax Variance for 2006 and Subsequent Years
(excludes sub-account and contra account below) 1592
PILs and Tax Variance for 2006 and Subsequent Years - Sub-Account HST/OVAT Input Tax
Credits (ITCs) 1592
LRAM Variance Account11
1568
Total including Account 1568
Renewable Generation Connection Capital Deferral Account8
1531
Renewable Generation Connection OM&A Deferral Account8
1532
Renewable Generation Connection Funding Adder Deferral Account 1533
Smart Grid Capital Deferral Account 1534
Smart Grid OM&A Deferral Account 1535
Smart Grid Funding Adder Deferral Account 1536
Smart Meter Capital and Recovery Offset Variance - Sub-Account - Capital4
1555
Smart Meter Capital and Recovery Offset Variance - Sub-Account - Recoveries4
1555
Smart Meter Capital and Recovery Offset Variance - Sub-Account - Stranded Meter Costs4
1555
Smart Meter OM&A Variance4
1556
Meter Cost Deferral Account (MIST Meters)10
1557
IFRS-CGAAP Transition PP&E Amounts Balance + Return Component5
1575
Accounting Changes Under CGAAP Balance + Return Component5
1576
Excess Expansion Deposits (a)
Gain on sale-50/60 Eglinton Avenue (b)
Account receivable credits (c)
For all OEB-Approved dispositions, please ensure that the disposition amount has the same sign (e.g: debit balances are to have a
positive figure and credit balance are to have a negative figure) as per the related OEB decision.
Notes:
(a) Excess Expansion Deposits : This balance relates to the excess expansion deposits for which Toronto Hydro is seeking
OEB’s approval for a deferral variance account. Refer to Exhibit 9, Tab 1, Schedule 1, section 9.1 for details of the new
account. As the new account is not yet approved, it was not included in the original DVA continuity submitted in pre-filed
evidence or as part of the 2018 update evidence. Toronto Hydro has included in this as requested by OEB Staff.
(b) Gain on sale-50/60 Eglinton Avenue : As described in Exhibit 8, Tab 1, Schedule 1, page 11, Toronto Hydro is seeking
approval to clear this amount. There is currently no approved DVA account for this balance, therefore Toronto Hydro did not
include this in the original DVA continuity submitted in pre-filed evidence or as part of the 2018 updated evidence. Toronto
Hydro has included in this as requested by OEB Staff. Toronto Hydro is not requesting a DVA going forward in association
with this event.
(c) Account receivable credits: As noted in Exhibit 9, Tab 1, Schedule 1, page 11, Toronto Hydro is seeking approval to
clear this balance, associated with historical AR credits. here is currently no approved DVA account for this balance,
therefore Toronto Hydro did not include this in the original DVA continuity submitted in pre-filed evidence or as part of the
2018 updated evidence. Toronto Hydro has included in this as requested by OEB Staff. Toronto Hydro is not requesting a
DVA going forward in association with this balance.
Account DescriptionsAccount
Number
This continuity schedule must be completed for each account and sub-account that the utility has approved for use as at Dec. 31, 2016, regardless of whether disposition is being requested for the account. For all accounts, except for Account 1595, start inputting
data from the year in which the GL balance was last disposed. For example, if in the 2017 rate application, DVA balances as at December 31, 2015 were approved for disposition, start the continuity schedule from 2015 by entering the approved closing 2014 balance
in the Adjustment column under 2014. For each Account 1595 sub-account, start inputting data from the year the sub-account started to accumulate a balance (i.e. the vintage year). For example, Account 1595 (2014), data should be inputted starting in 2014 when
the relevant balances approved for disposition was first transferred into Account 1595 (2014). The DVA continuity schedule currently starts from 2011, if a utility has an Account 1595 with a vintage year prior to 2011, then a separate schedule should be provided
starting from the vintage year. For any new accounts that have never been disposed, start inputting data from the year the account was approved to be used.
2.1.7 RRR
$0 $0.00 $0
$0 $0.00 $0
$0 $0.00 $0
$0 $6,441,836.64 $48,103,576 -$0
-$1,188,293 -$3,457,813 -$7,174,469 -$81,836,421.71 -$53,779,636 -$0
-$50,450 -$8,156 -$103,379 -$3,171,983.68 -$2,279,781 -$0
-$474,147 -$914,820 -$2,755,384 -$34,178,339.06 -$21,769,849 -$0
-$11,442 -$11,165 -$47,840 -$694,303.89 -$530,264 -$0
$165,211 $26,708 $393,257 $11,425,564.47 $7,501,434 $1
-$1,183,982 -$191,797 -$1,875,150 -$73,723,293.20 -$53,287,501 $0
$0 $0 $0 $7,116,182.84 $5,453,000 $0
$0 $0.00 $0
$0 $0.00 $0
$0 $0.00 $0
$0 $0.00 $0
$0 $0.00 $0
$0 $0.00 $0
$0 $0.00 $0
$0 $0.00 $0
-$2,743,104 -$4,557,043 -$11,562,963 -$168,620,758 -$70,589,021 $0
-$749,701 -$11,604,095.78 -$0
$2 $2.17 -$2
$205,118 $28,403,169 -$0
-$2,743,104 -$4,557,043 -$12,107,544 -$180,224,851 -$42,185,852 -$2
$0 $0 $0
$0 $0 $0
$0 -$6,601,561 -$4,300,876 $0
$0 $0 $0
$0 $0 $0
$0 $0 $0
$0 $0 $0
$0 $0 $0
-$30,242 -$1,417,486 $3,605,333 $0
$0 $0 $0
$0 $0 $0
$0
$0 -$1,558,360 $5,690,456 $0
$0 $0 $0
-$218,579 -$163,372 -$841,270 -$11,095,840 -$7,844,053 $0
-$188,109 -$30,410 -$423,917 -$11,811,234 -$8,575,077 $0
-$73,961 -$71,739 -$202,877 -$3,493,675 -$3,290,798 $57,178
Total Claim As of Dec 31-18
Variance
RRR vs. 2018 Balance
(Principal + Interest)
Projected Interest from Jan 1,
2019 to December 31, 2019 on
Dec 31 -18 balance adjusted for
disposition during 2019 (6)
Projected Interest from January
1, 2020 to February 28, 2020 on
Dec 31 -18 balance adjusted for
disposition during 2019 (7)
Total Interest
Projected Interest on Dec-31-18 Balances
Check to Dispose of Account
Check to Dispose of Account
Check to Dispose of Account
Check to Dispose of Account
Check to Dispose of Account
Check to Dispose of Account
Check to Dispose of Account
Check to Dispose of Account
Check to Dispose of Account
Check to Dispose of AccountCheck to Dispose of Account
Check to Dispose of AccountCheck to Dispose of Account
Check to Dispose of Account
Check to Dispose of Account
Check to Dispose of Account
Check to Dispose of AccountCheck to Dispose of Account
Check to Dispose of Account
Check to Dispose of Account
Check to Dispose of Account
2b. Group 2 - Cont Schedule
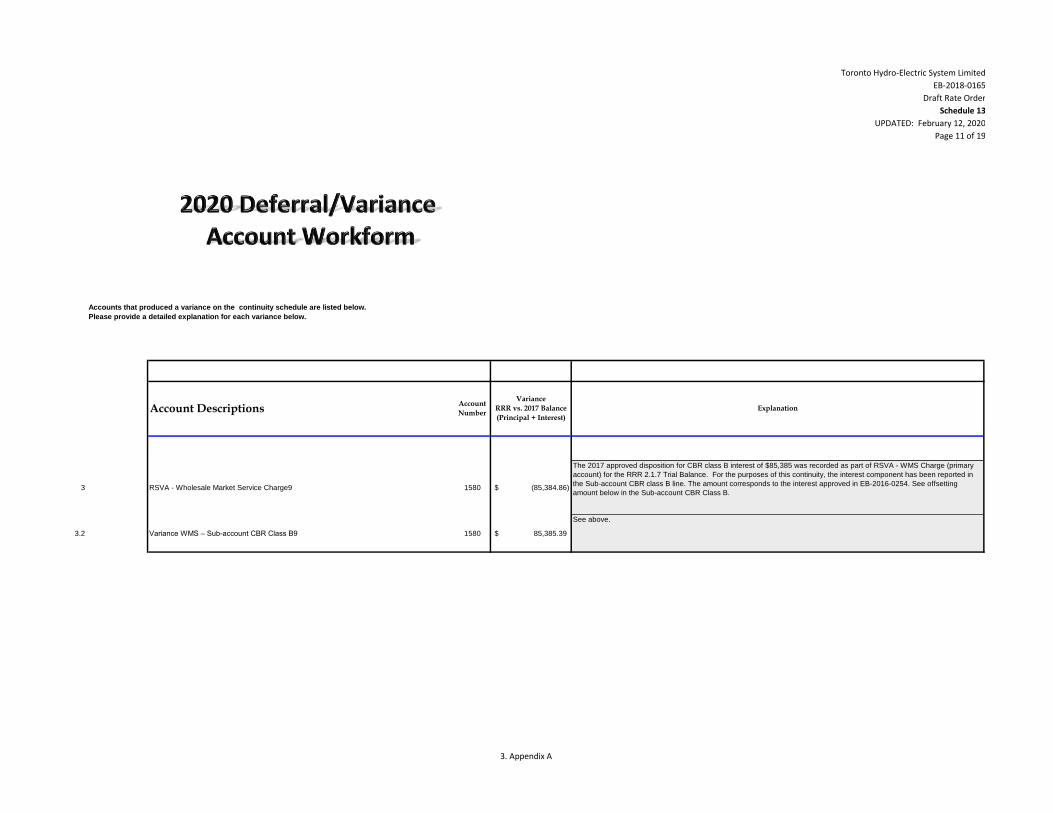
Toronto Hydro-Electric System Limited
EB-2018-0165
Draft Rate Order
Schedule 13
UPDATED: February 12, 2020
Page 11 of 19
3 RSVA - Wholesale Market Service Charge9 1580 (85,384.86)$
The 2017 approved disposition for CBR class B interest of $85,385 was recorded as part of RSVA - WMS Charge (primary
account) for the RRR 2.1.7 Trial Balance. For the purposes of this continuity, the interest component has been reported in
the Sub-account CBR class B line. The amount corresponds to the interest approved in EB-2016-0254. See offsetting
amount below in the Sub-account CBR Class B.
3.2 Variance WMS – Sub-account CBR Class B9 1580 85,385.39$
See above.
Accounts that produced a variance on the continuity schedule are listed below.
Please provide a detailed explanation for each variance below.
Account DescriptionsAccount
Number
Variance
RRR vs. 2017 Balance
(Principal + Interest)
Explanation
Canadian Niagara Power Inc. - Eastern Ontario Power
3. Appendix A
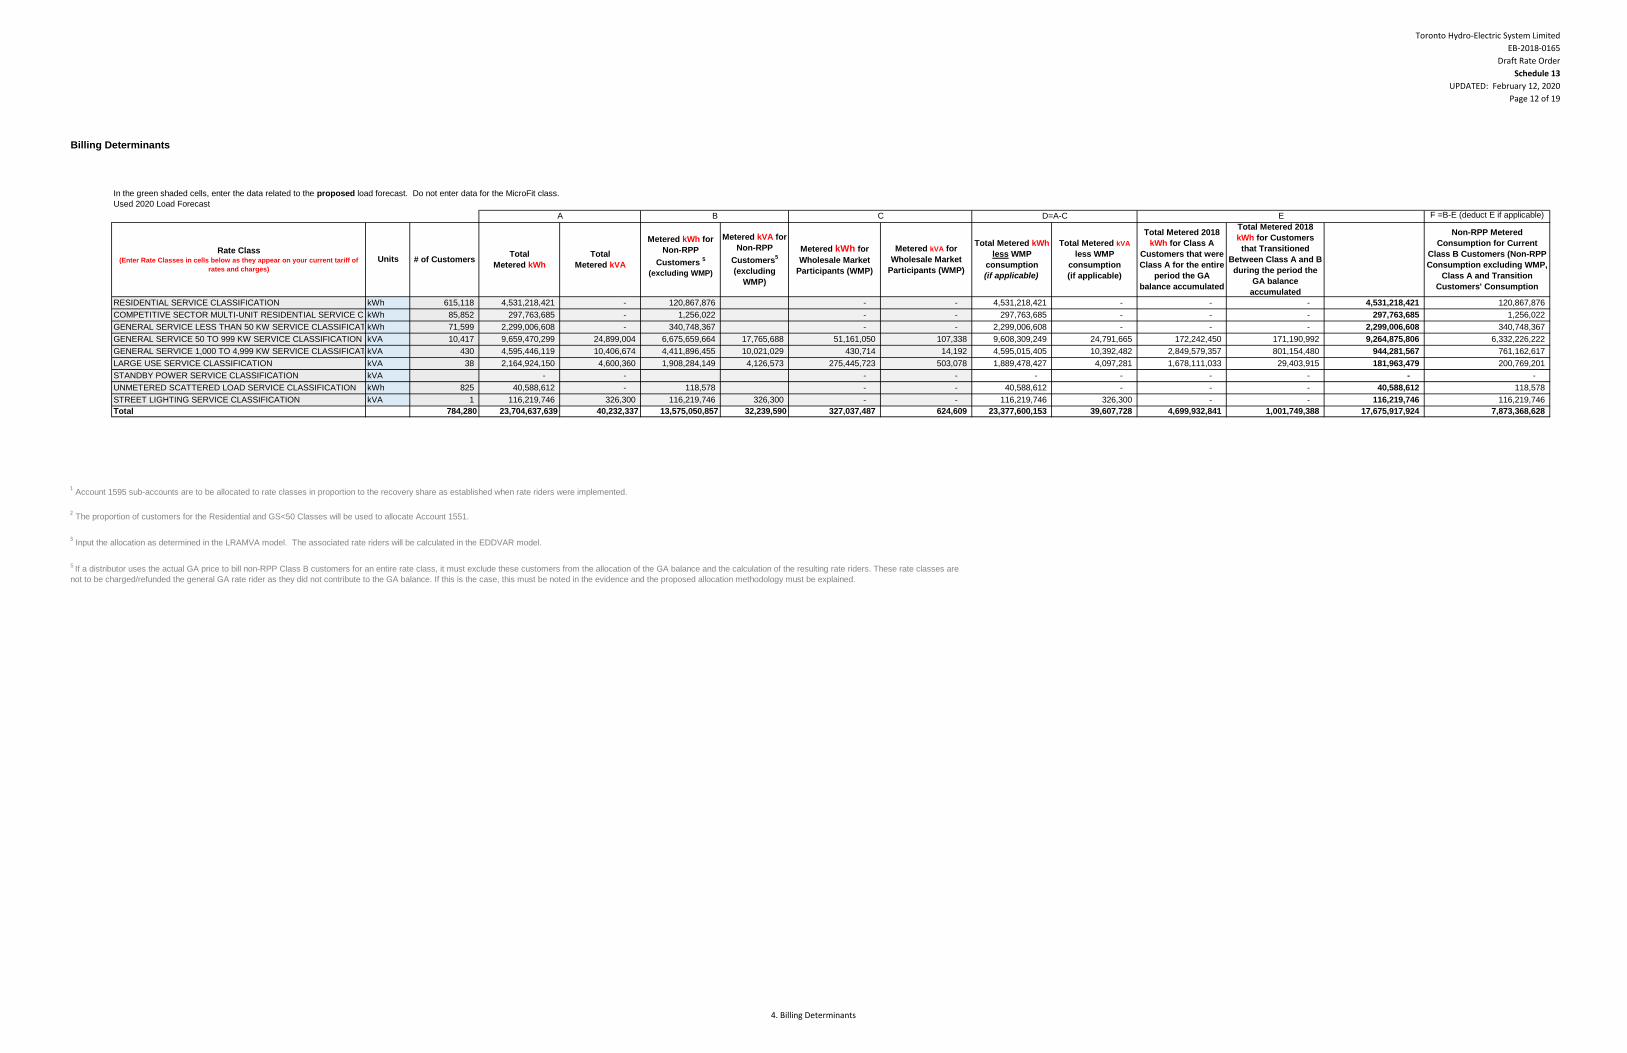
Toronto Hydro-Electric System Limited
EB-2018-0165
Draft Rate Order
Schedule 13
UPDATED: February 12, 2020
Page 12 of 19
Billing Determinants
F =B-E (deduct E if applicable)
RESIDENTIAL SERVICE CLASSIFICATION kWh 615,118 4,531,218,421 - 120,867,876 - - 4,531,218,421 - - - 4,531,218,421 120,867,876
COMPETITIVE SECTOR MULTI-UNIT RESIDENTIAL SERVICE CLASSIFICATIONkWh 85,852 297,763,685 - 1,256,022 - - 297,763,685 - - - 297,763,685 1,256,022
GENERAL SERVICE LESS THAN 50 KW SERVICE CLASSIFICATIONkWh 71,599 2,299,006,608 - 340,748,367 - - 2,299,006,608 - - - 2,299,006,608 340,748,367
GENERAL SERVICE 50 TO 999 KW SERVICE CLASSIFICATION kVA 10,417 9,659,470,299 24,899,004 6,675,659,664 17,765,688 51,161,050 107,338 9,608,309,249 24,791,665 172,242,450 171,190,992 9,264,875,806 6,332,226,222
GENERAL SERVICE 1,000 TO 4,999 KW SERVICE CLASSIFICATIONkVA 430 4,595,446,119 10,406,674 4,411,896,455 10,021,029 430,714 14,192 4,595,015,405 10,392,482 2,849,579,357 801,154,480 944,281,567 761,162,617
LARGE USE SERVICE CLASSIFICATION kVA 38 2,164,924,150 4,600,360 1,908,284,149 4,126,573 275,445,723 503,078 1,889,478,427 4,097,281 1,678,111,033 29,403,915 181,963,479 200,769,201
STANDBY POWER SERVICE CLASSIFICATION kVA - - - - - - - - - -
UNMETERED SCATTERED LOAD SERVICE CLASSIFICATION kWh 825 40,588,612 - 118,578 - - 40,588,612 - - - 40,588,612 118,578
STREET LIGHTING SERVICE CLASSIFICATION kVA 1 116,219,746 326,300 116,219,746 326,300 - - 116,219,746 326,300 - - 116,219,746 116,219,746
Total 784,280 23,704,637,639 40,232,337 13,575,050,857 32,239,590 327,037,487 624,609 23,377,600,153 39,607,728 4,699,932,841 1,001,749,388 17,675,917,924 7,873,368,628
2 The proportion of customers for the Residential and GS<50 Classes will be used to allocate Account 1551.
3 Input the allocation as determined in the LRAMVA model. The associated rate riders will be calculated in the EDDVAR model.
1 Account 1595 sub-accounts are to be allocated to rate classes in proportion to the recovery share as established when rate riders were implemented.
5 If a distributor uses the actual GA price to bill non-RPP Class B customers for an entire rate class, it must exclude these customers from the allocation of the GA balance and the calculation of the resulting rate riders. These rate classes are
not to be charged/refunded the general GA rate rider as they did not contribute to the GA balance. If this is the case, this must be noted in the evidence and the proposed allocation methodology must be explained.
Total Metered kVA
less WMP
consumption
(if applicable)
Total Metered kWh
less WMP
consumption
(if applicable)
Total Metered 2018
kWh for Class A
Customers that were
Class A for the entire
period the GA
balance accumulated
Total Metered 2018
kWh for Customers
that Transitioned
Between Class A and B
during the period the
GA balance
accumulated
Non-RPP Metered
Consumption for Current
Class B Customers (Non-RPP
Consumption excluding WMP,
Class A and Transition
Customers' Consumption
D=A-C E
Metered kWh for
Non-RPP
Customers 5
(excluding WMP)
In the green shaded cells, enter the data related to the proposed load forecast. Do not enter data for the MicroFit class.
Used 2020 Load Forecast
A B C
Rate Class (Enter Rate Classes in cells below as they appear on your current tariff of
rates and charges)
Units # of CustomersTotal
Metered kWh
Total
Metered kVA
Metered kVA for
Non-RPP
Customers5
(excluding
WMP)
Metered kWh for
Wholesale Market
Participants (WMP)
Metered kVA for
Wholesale Market
Participants (WMP)
4. Billing Determinants
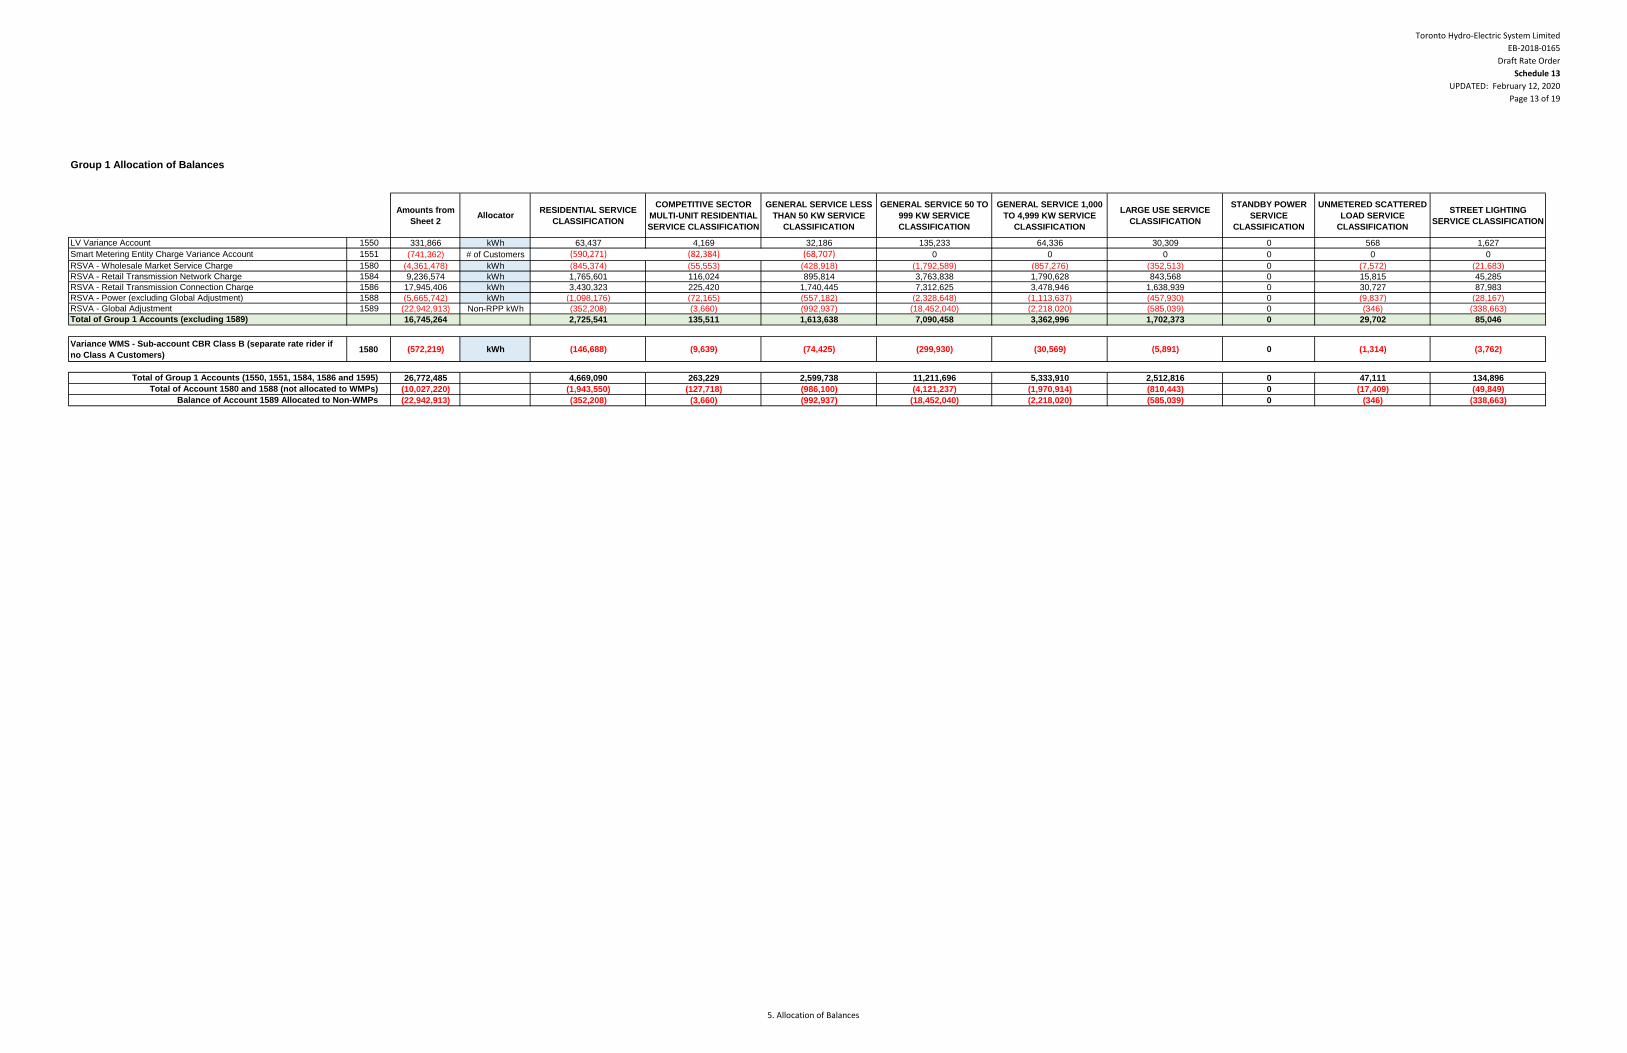
Toronto Hydro-Electric System Limited
EB-2018-0165
Draft Rate Order
Schedule 13
UPDATED: February 12, 2020
Page 13 of 19
Group 1 Allocation of Balances
Amounts from
Sheet 2Allocator
RESIDENTIAL SERVICE
CLASSIFICATION
COMPETITIVE SECTOR
MULTI-UNIT RESIDENTIAL
SERVICE CLASSIFICATION
GENERAL SERVICE LESS
THAN 50 KW SERVICE
CLASSIFICATION
GENERAL SERVICE 50 TO
999 KW SERVICE
CLASSIFICATION
GENERAL SERVICE 1,000
TO 4,999 KW SERVICE
CLASSIFICATION
LARGE USE SERVICE
CLASSIFICATION
STANDBY POWER
SERVICE
CLASSIFICATION
UNMETERED SCATTERED
LOAD SERVICE
CLASSIFICATION
STREET LIGHTING
SERVICE CLASSIFICATION
LV Variance Account 1550 331,866 kWh 63,437 4,169 32,186 135,233 64,336 30,309 0 568 1,627
Smart Metering Entity Charge Variance Account 1551 (741,362) # of Customers (590,271) (82,384) (68,707) 0 0 0 0 0 0
RSVA - Wholesale Market Service Charge 1580 (4,361,478) kWh (845,374) (55,553) (428,918) (1,792,589) (857,276) (352,513) 0 (7,572) (21,683)
RSVA - Retail Transmission Network Charge 1584 9,236,574 kWh 1,765,601 116,024 895,814 3,763,838 1,790,628 843,568 0 15,815 45,285
RSVA - Retail Transmission Connection Charge 1586 17,945,406 kWh 3,430,323 225,420 1,740,445 7,312,625 3,478,946 1,638,939 0 30,727 87,983
RSVA - Power (excluding Global Adjustment) 1588 (5,665,742) kWh (1,098,176) (72,165) (557,182) (2,328,648) (1,113,637) (457,930) 0 (9,837) (28,167)
RSVA - Global Adjustment 1589 (22,942,913) Non-RPP kWh (352,208) (3,660) (992,937) (18,452,040) (2,218,020) (585,039) 0 (346) (338,663)
Total of Group 1 Accounts (excluding 1589) 16,745,264 2,725,541 135,511 1,613,638 7,090,458 3,362,996 1,702,373 0 29,702 85,046
Variance WMS - Sub-account CBR Class B (separate rate rider if
no Class A Customers)1580 (572,219) kWh (146,688) (9,639) (74,425) (299,930) (30,569) (5,891) 0 (1,314) (3,762)
26,772,485 4,669,090 263,229 2,599,738 11,211,696 5,333,910 2,512,816 0 47,111 134,896
(10,027,220) (1,943,550) (127,718) (986,100) (4,121,237) (1,970,914) (810,443) 0 (17,409) (49,849)
(22,942,913) (352,208) (3,660) (992,937) (18,452,040) (2,218,020) (585,039) 0 (346) (338,663)
Total of Group 1 Accounts (1550, 1551, 1584, 1586 and 1595)
Total of Account 1580 and 1588 (not allocated to WMPs)
Balance of Account 1589 Allocated to Non-WMPs
5. Allocation of Balances
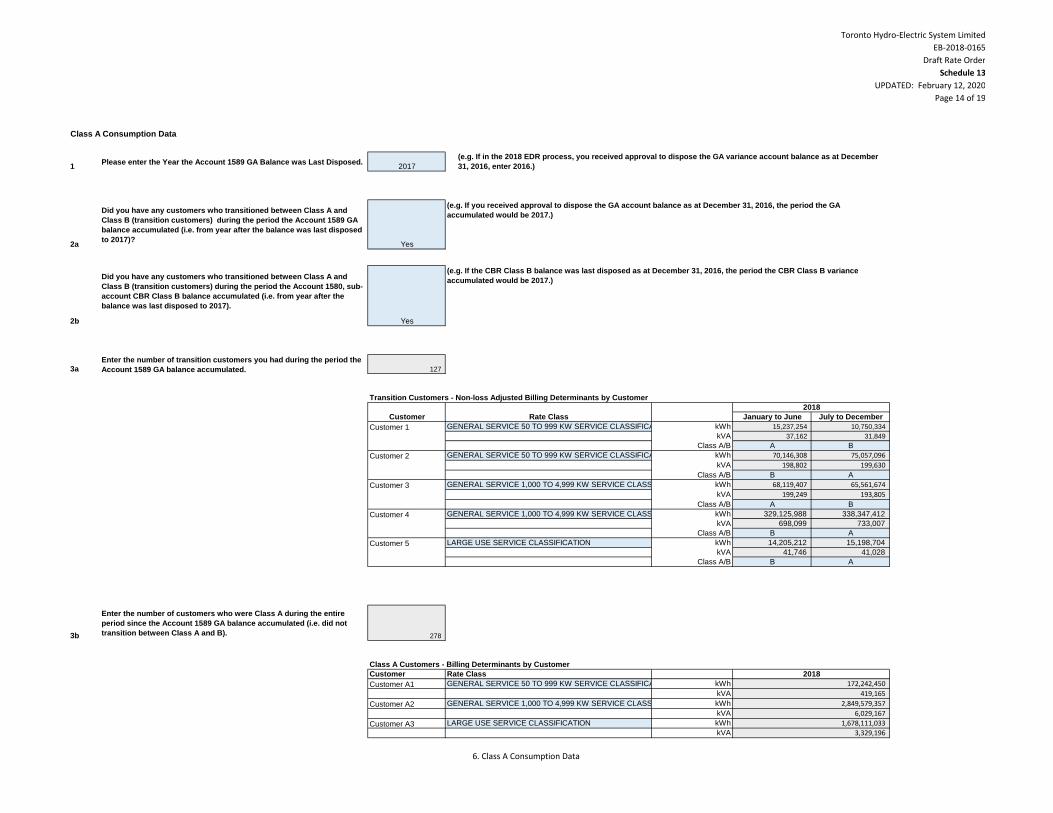
Toronto Hydro-Electric System Limited
EB-2018-0165
Draft Rate Order
Schedule 13
UPDATED: February 12, 2020
Page 14 of 19
Class A Consumption Data
1Please enter the Year the Account 1589 GA Balance was Last Disposed.
2017
2a
Did you have any customers who transitioned between Class A and
Class B (transition customers) during the period the Account 1589 GA
balance accumulated (i.e. from year after the balance was last disposed
to 2017)?Yes
2b
Did you have any customers who transitioned between Class A and
Class B (transition customers) during the period the Account 1580, sub-
account CBR Class B balance accumulated (i.e. from year after the
balance was last disposed to 2017).
Yes
3a
Enter the number of transition customers you had during the period the
Account 1589 GA balance accumulated. 127
Transition Customers - Non-loss Adjusted Billing Determinants by Customer
January to June July to December
Customer 1 GENERAL SERVICE 50 TO 999 KW SERVICE CLASSIFICATION kWh 15,237,254 10,750,334
GENERAL SERVICE 50 TO 999 KW SERVICE CLASSIFICATIONkW kVA 37,162 31,849
Class A/B A B
Customer 2 GENERAL SERVICE 50 TO 999 KW SERVICE CLASSIFICATION kWh 70,146,308 75,057,096
GENERAL SERVICE 50 TO 999 KW SERVICE CLASSIFICATIONkW kVA 198,802 199,630
Class A/B B A
Customer 3 GENERAL SERVICE 1,000 TO 4,999 KW SERVICE CLASSIFICATION kWh 68,119,407 65,561,674
GENERAL SERVICE 1,000 TO 4,999 KW SERVICE CLASSIFICATIONkW kVA 199,249 193,805
Class A/B A B
Customer 4 GENERAL SERVICE 1,000 TO 4,999 KW SERVICE CLASSIFICATION kWh 329,125,988 338,347,412
GENERAL SERVICE 1,000 TO 4,999 KW SERVICE CLASSIFICATIONkW kVA 698,099 733,007
Class A/B B A
Customer 5 LARGE USE SERVICE CLASSIFICATION kWh 14,205,212 15,198,704
LARGE USE SERVICE CLASSIFICATIONkW kVA 41,746 41,028
Class A/B B A
3b
Enter the number of customers who were Class A during the entire
period since the Account 1589 GA balance accumulated (i.e. did not
transition between Class A and B). 278
Class A Customers - Billing Determinants by Customer
Customer Rate Class
Customer A1 GENERAL SERVICE 50 TO 999 KW SERVICE CLASSIFICATION kWh
GENERAL SERVICE 50 TO 999 KW SERVICE CLASSIFICATIONKW kVA
Customer A2 GENERAL SERVICE 1,000 TO 4,999 KW SERVICE CLASSIFICATION kWh
GENERAL SERVICE 1,000 TO 4,999 KW SERVICE CLASSIFICATIONKW kVA
Customer A3 LARGE USE SERVICE CLASSIFICATION kWh
LARGE USE SERVICE CLASSIFICATIONKW kVA
2018
172,242,450
419,165
2,849,579,357
6,029,167
1,678,111,033
(e.g. If in the 2018 EDR process, you received approval to dispose the GA variance account balance as at December
31, 2016, enter 2016.)
(e.g. If you received approval to dispose the GA account balance as at December 31, 2016, the period the GA
accumulated would be 2017.)
(e.g. If the CBR Class B balance was last disposed as at December 31, 2016, the period the CBR Class B variance
accumulated would be 2017.)
Customer Rate Class
2018
3,329,196
6. Class A Consumption Data
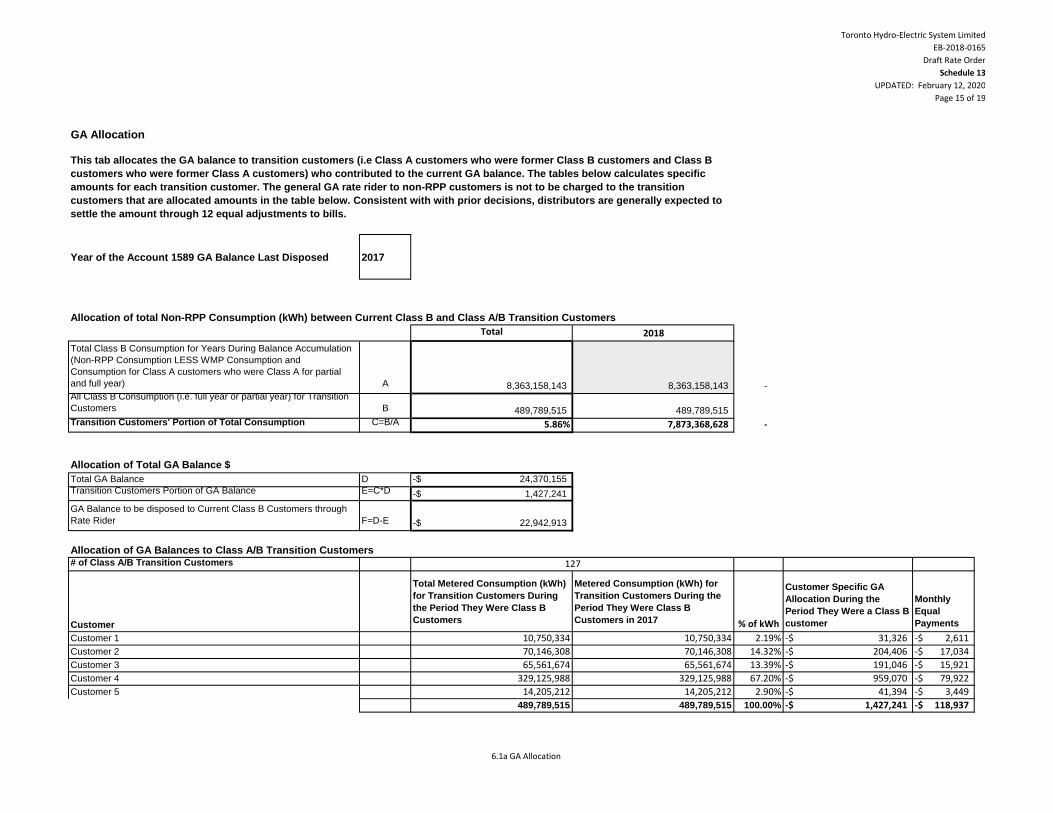
Toronto Hydro-Electric System Limited
EB-2018-0165
Draft Rate Order
Schedule 13
UPDATED: February 12, 2020
Page 15 of 19
GA Allocation
Year of the Account 1589 GA Balance Last Disposed 2017
Total 2018
Total Class B Consumption for Years During Balance Accumulation
(Non-RPP Consumption LESS WMP Consumption and
Consumption for Class A customers who were Class A for partial
and full year) A 8,363,158,143 8,363,158,143 - All Class B Consumption (i.e. full year or partial year) for Transition
Customers B 489,789,515 489,789,515
Transition Customers' Portion of Total Consumption C=B/A 5.86% 7,873,368,628 -
Total GA Balance D 24,370,155-$
Transition Customers Portion of GA Balance E=C*D 1,427,241-$
GA Balance to be disposed to Current Class B Customers through
Rate Rider F=D-E 22,942,913-$
# of Class A/B Transition Customers
Customer
Total Metered Consumption (kWh)
for Transition Customers During
the Period They Were Class B
Customers
Metered Consumption (kWh) for
Transition Customers During the
Period They Were Class B
Customers in 2017 % of kWh
Customer Specific GA
Allocation During the
Period They Were a Class B
customer
Monthly
Equal
Payments
Customer 1 10,750,334 10,750,334 2.19% 31,326-$ 2,611-$
Customer 2 70,146,308 70,146,308 14.32% 204,406-$ 17,034-$
Customer 3 65,561,674 65,561,674 13.39% 191,046-$ 15,921-$
Customer 4 329,125,988 329,125,988 67.20% 959,070-$ 79,922-$
Customer 5 14,205,212 14,205,212 2.90% 41,394-$ 3,449-$
489,789,515 489,789,515 100.00% 1,427,241-$ 118,937-$
127
This tab allocates the GA balance to transition customers (i.e Class A customers who were former Class B customers and Class B
customers who were former Class A customers) who contributed to the current GA balance. The tables below calculates specific
amounts for each transition customer. The general GA rate rider to non-RPP customers is not to be charged to the transition
customers that are allocated amounts in the table below. Consistent with with prior decisions, distributors are generally expected to
settle the amount through 12 equal adjustments to bills.
Allocation of total Non-RPP Consumption (kWh) between Current Class B and Class A/B Transition Customers
Allocation of Total GA Balance $
Allocation of GA Balances to Class A/B Transition Customers
6.1a GA Allocation
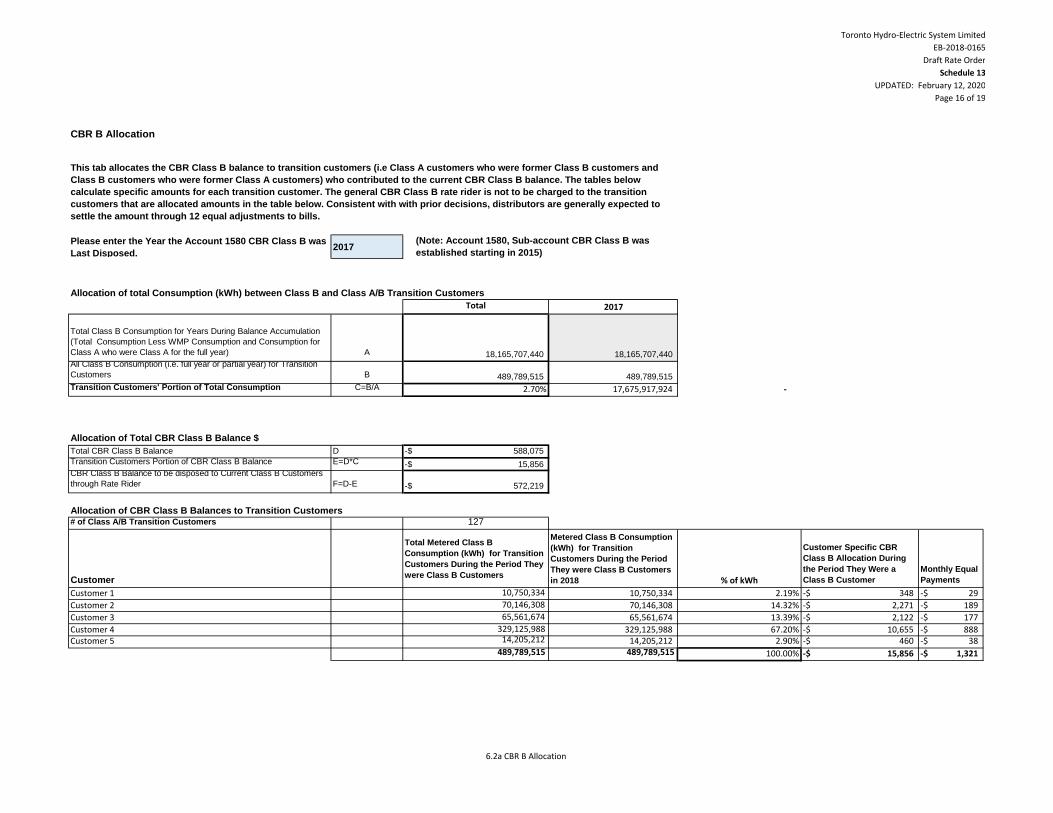
Toronto Hydro-Electric System Limited
EB-2018-0165
Draft Rate Order
Schedule 13
UPDATED: February 12, 2020
Page 16 of 19
CBR B Allocation
Please enter the Year the Account 1580 CBR Class B was
Last Disposed.2017
Total 2017
Total Class B Consumption for Years During Balance Accumulation
(Total Consumption Less WMP Consumption and Consumption for
Class A who were Class A for the full year) A 18,165,707,440 18,165,707,440 All Class B Consumption (i.e. full year or partial year) for Transition
Customers B 489,789,515 489,789,515
Transition Customers' Portion of Total Consumption C=B/A 2.70% 17,675,917,924 -
Total CBR Class B Balance D 588,075-$
Transition Customers Portion of CBR Class B Balance E=D*C 15,856-$ CBR Class B Balance to be disposed to Current Class B Customers
through Rate Rider F=D-E 572,219-$
# of Class A/B Transition Customers 127
Customer
Total Metered Class B
Consumption (kWh) for Transition
Customers During the Period They
were Class B Customers
Metered Class B Consumption
(kWh) for Transition
Customers During the Period
They were Class B Customers
in 2018 % of kWh
Customer Specific CBR
Class B Allocation During
the Period They Were a
Class B Customer
Monthly Equal
Payments
Customer 1 10,750,334 10,750,334 2.19% 348-$ 29-$
Customer 2 70,146,308 70,146,308 14.32% 2,271-$ 189-$
Customer 3 65,561,674 65,561,674 13.39% 2,122-$ 177-$
Customer 4 329,125,988 329,125,988 67.20% 10,655-$ 888-$ Customer 5 14,205,212 14,205,212 2.90% 460-$ 38-$
489,789,515 489,789,515 100.00% 15,856-$ 1,321-$
This tab allocates the CBR Class B balance to transition customers (i.e Class A customers who were former Class B customers and
Class B customers who were former Class A customers) who contributed to the current CBR Class B balance. The tables below
calculate specific amounts for each transition customer. The general CBR Class B rate rider is not to be charged to the transition
customers that are allocated amounts in the table below. Consistent with with prior decisions, distributors are generally expected to
settle the amount through 12 equal adjustments to bills.
(Note: Account 1580, Sub-account CBR Class B was
established starting in 2015)
Allocation of total Consumption (kWh) between Class B and Class A/B Transition Customers
Allocation of Total CBR Class B Balance $
Allocation of CBR Class B Balances to Transition Customers
6.2a CBR B Allocation
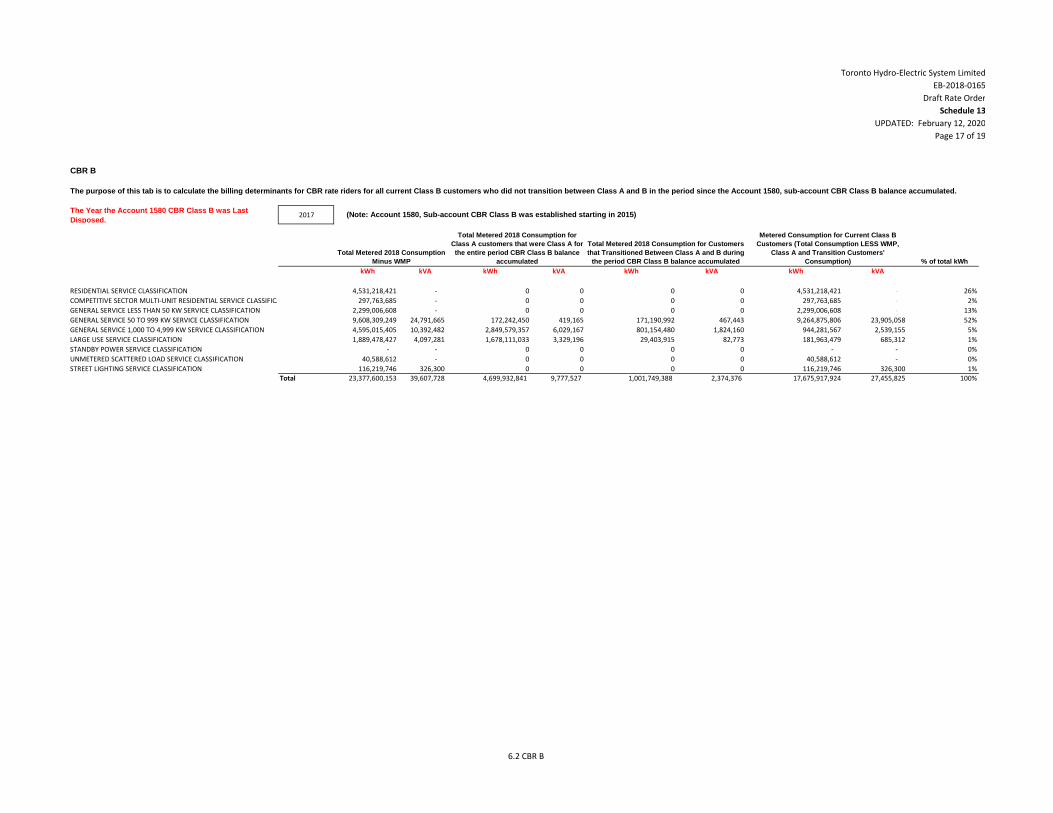
Toronto Hydro-Electric System Limited
EB-2018-0165
Draft Rate Order
Schedule 13
UPDATED: February 12, 2020
Page 17 of 19
CBR B
The Year the Account 1580 CBR Class B was Last
Disposed.2017
% of total kWh
kWh kVA kWh kVA kWh kVA kWh kVA
RESIDENTIAL SERVICE CLASSIFICATION 4,531,218,421 - 0 0 0 0 4,531,218,421 - 26%
COMPETITIVE SECTOR MULTI-UNIT RESIDENTIAL SERVICE CLASSIFICATION 297,763,685 - 0 0 0 0 297,763,685 - 2%
GENERAL SERVICE LESS THAN 50 KW SERVICE CLASSIFICATION 2,299,006,608 - 0 0 0 0 2,299,006,608 - 13%
GENERAL SERVICE 50 TO 999 KW SERVICE CLASSIFICATION 9,608,309,249 24,791,665 172,242,450 419,165 171,190,992 467,443 9,264,875,806 23,905,058 52%
GENERAL SERVICE 1,000 TO 4,999 KW SERVICE CLASSIFICATION 4,595,015,405 10,392,482 2,849,579,357 6,029,167 801,154,480 1,824,160 944,281,567 2,539,155 5%
LARGE USE SERVICE CLASSIFICATION 1,889,478,427 4,097,281 1,678,111,033 3,329,196 29,403,915 82,773 181,963,479 685,312 1%
STANDBY POWER SERVICE CLASSIFICATION - - 0 0 0 0 - - 0%
UNMETERED SCATTERED LOAD SERVICE CLASSIFICATION 40,588,612 - 0 0 0 0 40,588,612 - 0%
STREET LIGHTING SERVICE CLASSIFICATION 116,219,746 326,300 0 0 0 0 116,219,746 326,300 1%
Total 23,377,600,153 39,607,728 4,699,932,841 9,777,527 1,001,749,388 2,374,376 17,675,917,924 27,455,825 100%
The purpose of this tab is to calculate the billing determinants for CBR rate riders for all current Class B customers who did not transition between Class A and B in the period since the Account 1580, sub-account CBR Class B balance accumulated.
(Note: Account 1580, Sub-account CBR Class B was established starting in 2015)
Total Metered 2018 Consumption
Minus WMP
Total Metered 2018 Consumption for
Class A customers that were Class A for
the entire period CBR Class B balance
accumulated
Total Metered 2018 Consumption for Customers
that Transitioned Between Class A and B during
the period CBR Class B balance accumulated
Metered Consumption for Current Class B
Customers (Total Consumption LESS WMP,
Class A and Transition Customers'
Consumption)
6.2 CBR B
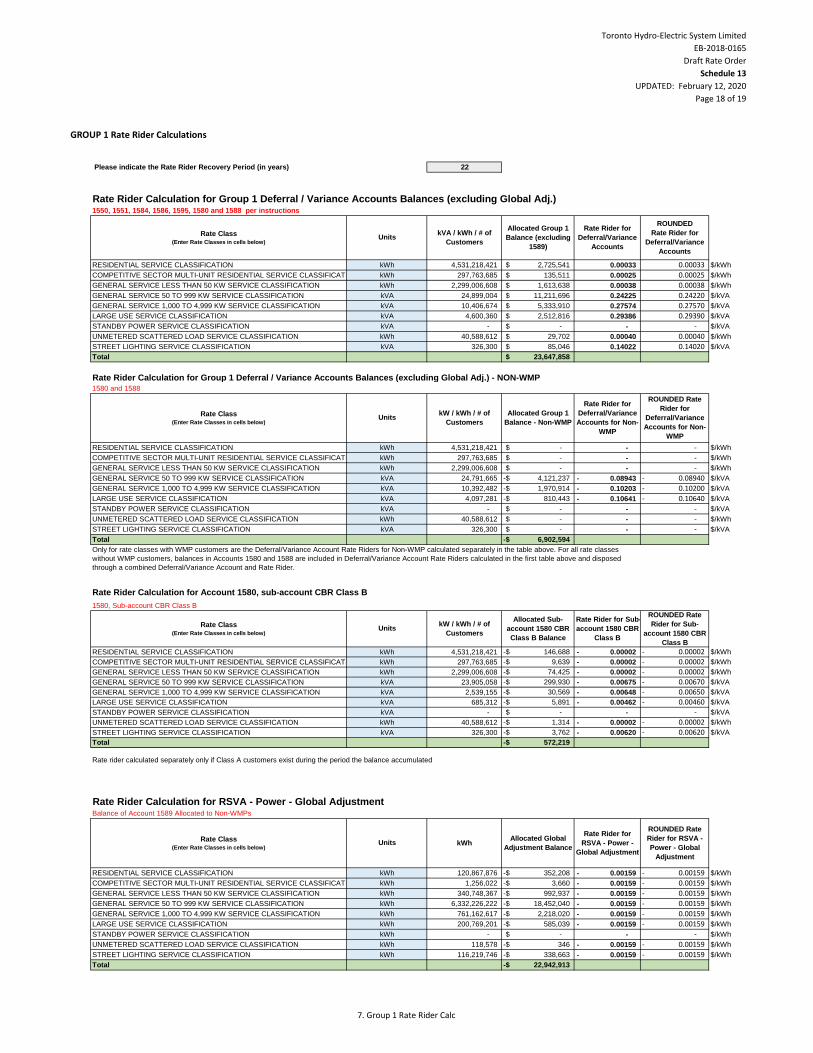
Toronto Hydro-Electric System Limited
EB-2018-0165
Draft Rate Order
Schedule 13
UPDATED: February 12, 2020
Page 18 of 19
GROUP 1 Rate Rider Calculations
Please indicate the Rate Rider Recovery Period (in years) 22
Rate Rider Calculation for Group 1 Deferral / Variance Accounts Balances (excluding Global Adj.)1550, 1551, 1584, 1586, 1595, 1580 and 1588 per instructions
RESIDENTIAL SERVICE CLASSIFICATION kWh 4,531,218,421 2,725,541$ 0.00033 0.00033 $/kWh
COMPETITIVE SECTOR MULTI-UNIT RESIDENTIAL SERVICE CLASSIFICATION kWh 297,763,685 135,511$ 0.00025 0.00025 $/kWh
GENERAL SERVICE LESS THAN 50 KW SERVICE CLASSIFICATION kWh 2,299,006,608 1,613,638$ 0.00038 0.00038 $/kWh
GENERAL SERVICE 50 TO 999 KW SERVICE CLASSIFICATION kVA 24,899,004 11,211,696$ 0.24225 0.24220 $/kVA
GENERAL SERVICE 1,000 TO 4,999 KW SERVICE CLASSIFICATION kVA 10,406,674 5,333,910$ 0.27574 0.27570 $/kVA
LARGE USE SERVICE CLASSIFICATION kVA 4,600,360 2,512,816$ 0.29386 0.29390 $/kVA
STANDBY POWER SERVICE CLASSIFICATION kVA - -$ - - $/kVA
UNMETERED SCATTERED LOAD SERVICE CLASSIFICATION kWh 40,588,612 29,702$ 0.00040 0.00040 $/kWh
STREET LIGHTING SERVICE CLASSIFICATION kVA 326,300 85,046$ 0.14022 0.14020 $/kVA
Total 23,647,858$
Rate Rider Calculation for Group 1 Deferral / Variance Accounts Balances (excluding Global Adj.) - NON-WMP
1580 and 1588
RESIDENTIAL SERVICE CLASSIFICATION kWh 4,531,218,421 -$ - - $/kWh
COMPETITIVE SECTOR MULTI-UNIT RESIDENTIAL SERVICE CLASSIFICATION kWh 297,763,685 -$ - - $/kWh
GENERAL SERVICE LESS THAN 50 KW SERVICE CLASSIFICATION kWh 2,299,006,608 -$ - - $/kWh
GENERAL SERVICE 50 TO 999 KW SERVICE CLASSIFICATION kVA 24,791,665 4,121,237-$ 0.08943- 0.08940- $/kVA
GENERAL SERVICE 1,000 TO 4,999 KW SERVICE CLASSIFICATION kVA 10,392,482 1,970,914-$ 0.10203- 0.10200- $/kVA
LARGE USE SERVICE CLASSIFICATION kVA 4,097,281 810,443-$ 0.10641- 0.10640- $/kVA
STANDBY POWER SERVICE CLASSIFICATION kVA - -$ - - $/kVA
UNMETERED SCATTERED LOAD SERVICE CLASSIFICATION kWh 40,588,612 -$ - - $/kWh
STREET LIGHTING SERVICE CLASSIFICATION kVA 326,300 -$ - - $/kVA
Total 6,902,594-$
Rate Rider Calculation for Account 1580, sub-account CBR Class B
1580, Sub-account CBR Class B
RESIDENTIAL SERVICE CLASSIFICATION kWh 4,531,218,421 146,688-$ 0.00002- 0.00002- $/kWh
COMPETITIVE SECTOR MULTI-UNIT RESIDENTIAL SERVICE CLASSIFICATION kWh 297,763,685 9,639-$ 0.00002- 0.00002- $/kWh
GENERAL SERVICE LESS THAN 50 KW SERVICE CLASSIFICATION kWh 2,299,006,608 74,425-$ 0.00002- 0.00002- $/kWh
GENERAL SERVICE 50 TO 999 KW SERVICE CLASSIFICATION kVA 23,905,058 299,930-$ 0.00675- 0.00670- $/kVA
GENERAL SERVICE 1,000 TO 4,999 KW SERVICE CLASSIFICATION kVA 2,539,155 30,569-$ 0.00648- 0.00650- $/kVA
LARGE USE SERVICE CLASSIFICATION kVA 685,312 5,891-$ 0.00462- 0.00460- $/kVA
STANDBY POWER SERVICE CLASSIFICATION kVA - -$ - - $/kVA
UNMETERED SCATTERED LOAD SERVICE CLASSIFICATION kWh 40,588,612 1,314-$ 0.00002- 0.00002- $/kWh
STREET LIGHTING SERVICE CLASSIFICATION kVA 326,300 3,762-$ 0.00620- 0.00620- $/kVA
Total 572,219-$
Rate rider calculated separately only if Class A customers exist during the period the balance accumulated
Rate Rider Calculation for RSVA - Power - Global AdjustmentBalance of Account 1589 Allocated to Non-WMPs
RESIDENTIAL SERVICE CLASSIFICATION kWh 120,867,876 352,208-$ 0.00159- 0.00159- $/kWh
COMPETITIVE SECTOR MULTI-UNIT RESIDENTIAL SERVICE CLASSIFICATION kWh 1,256,022 3,660-$ 0.00159- 0.00159- $/kWh
GENERAL SERVICE LESS THAN 50 KW SERVICE CLASSIFICATION kWh 340,748,367 992,937-$ 0.00159- 0.00159- $/kWh
GENERAL SERVICE 50 TO 999 KW SERVICE CLASSIFICATION kWh 6,332,226,222 18,452,040-$ 0.00159- 0.00159- $/kWh
GENERAL SERVICE 1,000 TO 4,999 KW SERVICE CLASSIFICATION kWh 761,162,617 2,218,020-$ 0.00159- 0.00159- $/kWh
LARGE USE SERVICE CLASSIFICATION kWh 200,769,201 585,039-$ 0.00159- 0.00159- $/kWh
STANDBY POWER SERVICE CLASSIFICATION kWh - -$ - - $/kWh
UNMETERED SCATTERED LOAD SERVICE CLASSIFICATION kWh 118,578 346-$ 0.00159- 0.00159- $/kWh
STREET LIGHTING SERVICE CLASSIFICATION kWh 116,219,746 338,663-$ 0.00159- 0.00159- $/kWh
Total 22,942,913-$
ROUNDED Rate
Rider for Sub-
account 1580 CBR
Class B
Rate Class (Enter Rate Classes in cells below)
Units kWhAllocated Global
Adjustment Balance
Rate Rider for
RSVA - Power -
Global Adjustment
ROUNDED Rate
Rider for RSVA -
Power - Global
Adjustment
Only for rate classes with WMP customers are the Deferral/Variance Account Rate Riders for Non-WMP calculated separately in the table above. For all rate classes
without WMP customers, balances in Accounts 1580 and 1588 are included in Deferral/Variance Account Rate Riders calculated in the first table above and disposed
through a combined Deferral/Variance Account and Rate Rider.
Rate Class (Enter Rate Classes in cells below)
UnitskW / kWh / # of
Customers
Allocated Sub-
account 1580 CBR
Class B Balance
Rate Rider for Sub-
account 1580 CBR
Class B
ROUNDED Rate
Rider for
Deferral/Variance
Accounts for Non-
WMP
Rate Class (Enter Rate Classes in cells below)
UnitskVA / kWh / # of
Customers
Allocated Group 1
Balance (excluding
1589)
Rate Rider for
Deferral/Variance
Accounts
ROUNDED
Rate Rider for
Deferral/Variance
Accounts
Rate Class (Enter Rate Classes in cells below)
UnitskW / kWh / # of
Customers
Allocated Group 1
Balance - Non-WMP
Rate Rider for
Deferral/Variance
Accounts for Non-
WMP
7. Group 1 Rate Rider Calc
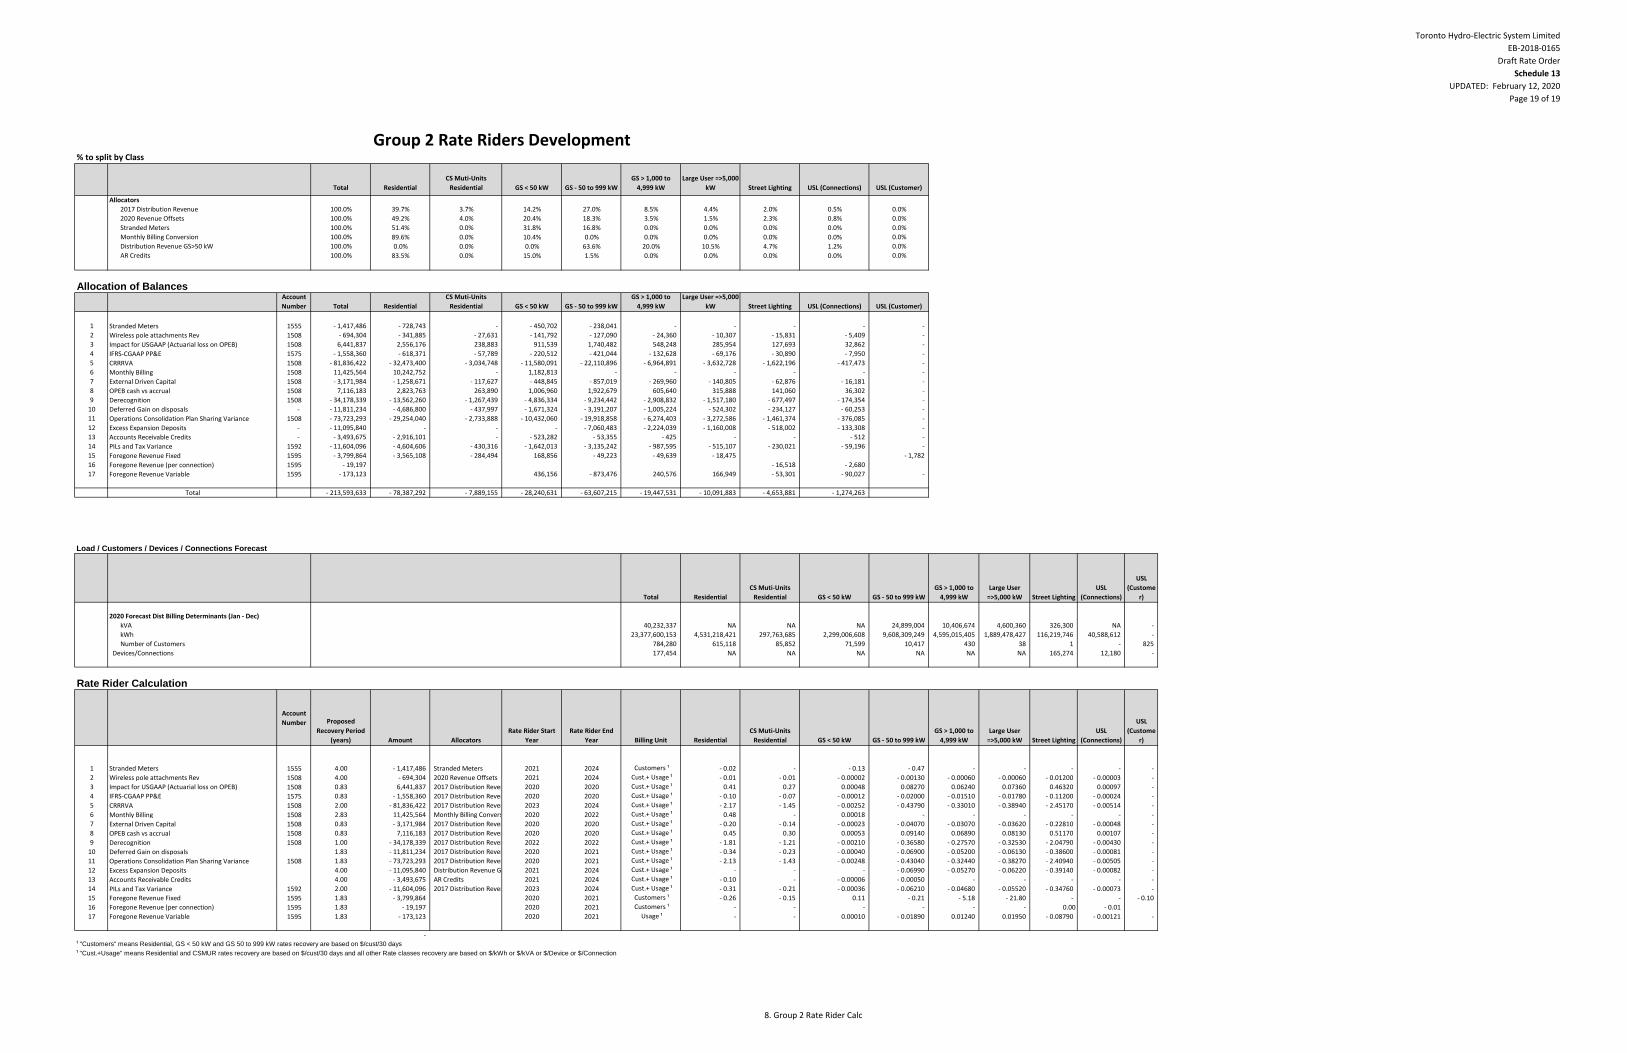
Toronto Hydro-Electric System Limited
EB-2018-0165
Draft Rate Order
Schedule 13
UPDATED: February 12, 2020
Page 19 of 19
Group 2 Rate Riders Development% to split by Class
Total Residential
CS Muti-Units
Residential GS < 50 kW GS - 50 to 999 kW
GS > 1,000 to
4,999 kW
Large User =>5,000
kW Street Lighting USL (Connections) USL (Customer)
Allocators
2017 Distribution Revenue 100.0% 39.7% 3.7% 14.2% 27.0% 8.5% 4.4% 2.0% 0.5% 0.0%
2020 Revenue Offsets 100.0% 49.2% 4.0% 20.4% 18.3% 3.5% 1.5% 2.3% 0.8% 0.0%
Stranded Meters 100.0% 51.4% 0.0% 31.8% 16.8% 0.0% 0.0% 0.0% 0.0% 0.0%
Monthly Billing Conversion 100.0% 89.6% 0.0% 10.4% 0.0% 0.0% 0.0% 0.0% 0.0% 0.0%
Distribution Revenue GS>50 kW 100.0% 0.0% 0.0% 0.0% 63.6% 20.0% 10.5% 4.7% 1.2% 0.0%
AR Credits 100.0% 83.5% 0.0% 15.0% 1.5% 0.0% 0.0% 0.0% 0.0% 0.0%
Allocation of BalancesAccount
Number Total Residential
CS Muti-Units
Residential GS < 50 kW GS - 50 to 999 kW
GS > 1,000 to
4,999 kW
Large User =>5,000
kW Street Lighting USL (Connections) USL (Customer)
1 Stranded Meters 1555 - 1,417,486 - 728,743 - - 450,702 - 238,041 - - - - -
2 Wireless pole attachments Rev 1508 - 694,304 - 341,885 - 27,631 - 141,792 - 127,090 - 24,360 - 10,307 - 15,831 - 5,409 -
3 Impact for USGAAP (Actuarial loss on OPEB) 1508 6,441,837 2,556,176 238,883 911,539 1,740,482 548,248 285,954 127,693 32,862 -
4 IFRS-CGAAP PP&E 1575 - 1,558,360 - 618,371 - 57,789 - 220,512 - 421,044 - 132,628 - 69,176 - 30,890 - 7,950 -
5 CRRRVA 1508 - 81,836,422 - 32,473,400 - 3,034,748 - 11,580,091 - 22,110,896 - 6,964,891 - 3,632,728 - 1,622,196 - 417,473 -
6 Monthly Billing 1508 11,425,564 10,242,752 - 1,182,813 - - - - - -
7 External Driven Capital 1508 - 3,171,984 - 1,258,671 - 117,627 - 448,845 - 857,019 - 269,960 - 140,805 - 62,876 - 16,181 -
8 OPEB cash vs accrual 1508 7,116,183 2,823,763 263,890 1,006,960 1,922,679 605,640 315,888 141,060 36,302 -
9 Derecognition 1508 - 34,178,339 - 13,562,260 - 1,267,439 - 4,836,334 - 9,234,442 - 2,908,832 - 1,517,180 - 677,497 - 174,354 -
10 Deferred Gain on disposals - - 11,811,234 - 4,686,800 - 437,997 - 1,671,324 - 3,191,207 - 1,005,224 - 524,302 - 234,127 - 60,253 -
11 Operations Consolidation Plan Sharing Variance 1508 - 73,723,293 - 29,254,040 - 2,733,888 - 10,432,060 - 19,918,858 - 6,274,403 - 3,272,586 - 1,461,374 - 376,085 -
12 Excess Expansion Deposits - - 11,095,840 - - - - 7,060,483 - 2,224,039 - 1,160,008 - 518,002 - 133,308 -
13 Accounts Receivable Credits - - 3,493,675 - 2,916,101 - - 523,282 - 53,355 - 425 - - - 512 -
14 PILs and Tax Variance 1592 - 11,604,096 - 4,604,606 - 430,316 - 1,642,013 - 3,135,242 - 987,595 - 515,107 - 230,021 - 59,196 -
15 Foregone Revenue Fixed 1595 - 3,799,864 - 3,565,108 - 284,494 168,856 - 49,223 - 49,639 - 18,475 - 1,782
16 Foregone Revenue (per connection) 1595 - 19,197 - 16,518 - 2,680
17 Foregone Revenue Variable 1595 - 173,123 436,156 - 873,476 240,576 166,949 - 53,301 - 90,027 -
Total - 213,593,633 - 78,387,292 - 7,889,155 - 28,240,631 - 63,607,215 - 19,447,531 - 10,091,883 - 4,653,881 - 1,274,263
Load / Customers / Devices / Connections Forecast
Total Residential
CS Muti-Units
Residential GS < 50 kW GS - 50 to 999 kW
GS > 1,000 to
4,999 kW
Large User
=>5,000 kW Street Lighting
USL
(Connections)
USL
(Custome
r)
2020 Forecast Dist Billing Determinants (Jan - Dec)
kVA 40,232,337 NA NA NA 24,899,004 10,406,674 4,600,360 326,300 NA -
kWh 23,377,600,153 4,531,218,421 297,763,685 2,299,006,608 9,608,309,249 4,595,015,405 1,889,478,427 116,219,746 40,588,612 -
Number of Customers 784,280 615,118 85,852 71,599 10,417 430 38 1 - 825
Devices/Connections 177,454 NA NA NA NA NA NA 165,274 12,180 -
Rate Rider Calculation
Account
Number Proposed
Recovery Period
(years) Amount Allocators
Rate Rider Start
Year
Rate Rider End
Year Billing Unit Residential
CS Muti-Units
Residential GS < 50 kW GS - 50 to 999 kW
GS > 1,000 to
4,999 kW
Large User
=>5,000 kW Street Lighting
USL
(Connections)
USL
(Custome
r)
1 Stranded Meters 1555 4.00 - 1,417,486 Stranded Meters 2021 2024 Customers ¹ - 0.02 - - 0.13 - 0.47 - - - - -
2 Wireless pole attachments Rev 1508 4.00 - 694,304 2020 Revenue Offsets 2021 2024 Cust.+ Usage ¹ - 0.01 - 0.01 - 0.00002 - 0.00130 - 0.00060 - 0.00060 - 0.01200 - 0.00003 -
3 Impact for USGAAP (Actuarial loss on OPEB) 1508 0.83 6,441,837 2017 Distribution Revenue 2020 2020 Cust.+ Usage ¹ 0.41 0.27 0.00048 0.08270 0.06240 0.07360 0.46320 0.00097 -
4 IFRS-CGAAP PP&E 1575 0.83 - 1,558,360 2017 Distribution Revenue 2020 2020 Cust.+ Usage ¹ - 0.10 - 0.07 - 0.00012 - 0.02000 - 0.01510 - 0.01780 - 0.11200 - 0.00024 -
5 CRRRVA 1508 2.00 - 81,836,422 2017 Distribution Revenue 2023 2024 Cust.+ Usage ¹ - 2.17 - 1.45 - 0.00252 - 0.43790 - 0.33010 - 0.38940 - 2.45170 - 0.00514 -
6 Monthly Billing 1508 2.83 11,425,564 Monthly Billing Conversion 2020 2022 Cust.+ Usage ¹ 0.48 - 0.00018 - - - - - -
7 External Driven Capital 1508 0.83 - 3,171,984 2017 Distribution Revenue 2020 2020 Cust.+ Usage ¹ - 0.20 - 0.14 - 0.00023 - 0.04070 - 0.03070 - 0.03620 - 0.22810 - 0.00048 -
8 OPEB cash vs accrual 1508 0.83 7,116,183 2017 Distribution Revenue 2020 2020 Cust.+ Usage ¹ 0.45 0.30 0.00053 0.09140 0.06890 0.08130 0.51170 0.00107 -
9 Derecognition 1508 1.00 - 34,178,339 2017 Distribution Revenue 2022 2022 Cust.+ Usage ¹ - 1.81 - 1.21 - 0.00210 - 0.36580 - 0.27570 - 0.32530 - 2.04790 - 0.00430 -
10 Deferred Gain on disposals 1.83 - 11,811,234 2017 Distribution Revenue 2020 2021 Cust.+ Usage ¹ - 0.34 - 0.23 - 0.00040 - 0.06900 - 0.05200 - 0.06130 - 0.38600 - 0.00081 -
11 Operations Consolidation Plan Sharing Variance 1508 1.83 - 73,723,293 2017 Distribution Revenue 2020 2021 Cust.+ Usage ¹ - 2.13 - 1.43 - 0.00248 - 0.43040 - 0.32440 - 0.38270 - 2.40940 - 0.00505 -
12 Excess Expansion Deposits 4.00 - 11,095,840 Distribution Revenue GS>50 kW2021 2024 Cust.+ Usage ¹ - - - - 0.06990 - 0.05270 - 0.06220 - 0.39140 - 0.00082 -
13 Accounts Receivable Credits 4.00 - 3,493,675 AR Credits 2021 2024 Cust.+ Usage ¹ - 0.10 - - 0.00006 - 0.00050 - - - - -
14 PILs and Tax Variance 1592 2.00 - 11,604,096 2017 Distribution Revenue 2023 2024 Cust.+ Usage ¹ - 0.31 - 0.21 - 0.00036 - 0.06210 - 0.04680 - 0.05520 - 0.34760 - 0.00073 -
15 Foregone Revenue Fixed 1595 1.83 - 3,799,864 2020 2021 Customers ¹ - 0.26 - 0.15 0.11 - 0.21 - 5.18 - 21.80 - - - 0.10
16 Foregone Revenue (per connection) 1595 1.83 - 19,197 2020 2021 Customers ¹ - - - - - - 0.00 - 0.01
17 Foregone Revenue Variable 1595 1.83 - 173,123 2020 2021 Usage ¹ - - 0.00010 - 0.01890 0.01240 0.01950 - 0.08790 - 0.00121 -
- ¹ "Customers" means Residential, GS < 50 kW and GS 50 to 999 kW rates recovery are based on $/cust/30 days
¹ "Cust.+Usage" means Residential and CSMUR rates recovery are based on $/cust/30 days and all other Rate classes recovery are based on $/kWh or $/kVA or $/Device or $/Connection
8. Group 2 Rate Rider Calc
Toronto Hydro-Electric System Limited
EB-2018-0165
Draft Rate Order
Schedule 14
FILED: January 21, 2020
Page 1 of 12
Drop-down lists are shaded blue; Input cells are shaded green.
Utility Name
Service Territory
Assigned EB Number EB-2018-0165
Name and Title
Phone Number
Email Address
Date
Last COS Re-based Year 2015
Toronto Hydro-Electric System Limited
This Workbook Model is protected by copyright and is being made available to you solely for the purpose of filing your COS application. You may use and copy this model for that purpose, and provide a copy of this model to any person that is advising or assisting you in that regard. Except as indicated above, any copying, reproduction, publication, sale, adaptation, translation, modification, reverse engineering or other use or dissemination of this model without the express written consent of the Ontario Energy Board is prohibited. If you provide a copy of this model to a person that is advising or assisting you in preparing the application or reviewing your draft rate order, you must ensure that the person understands and agrees to the restrictions noted above.
While this model has been provided in Excel format and is required to be filed with the applications, the onus remains on the applicant to ensure the accuracy of the data and the results.
v 1.2Ontario Energy Board
1. Info
Toronto Hydro-Electric System Limited
EB-2018-0165
Draft Rate Order
Schedule 14
FILED: January 21, 2020
Page 2 of 12
1. Info 6. Historical Wholesale
2. Table of Contents 7. Current Wholesale
3. Rate Classes 8. Forecast Wholesale
4. RRR Data 9. RTSR Rates to Forecast
5. UTRs and Sub-Transmission
v 1.2Ontario Energy Board
2. Table of Contents
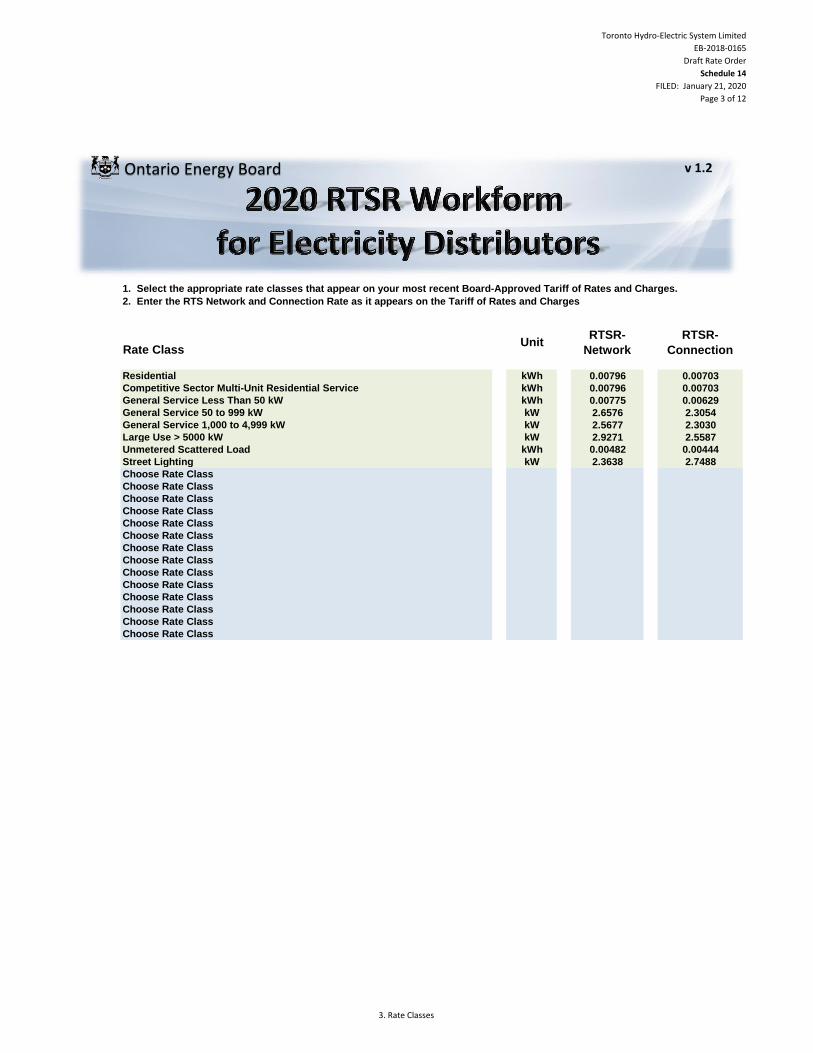
Toronto Hydro-Electric System Limited
EB-2018-0165
Draft Rate Order
Schedule 14
FILED: January 21, 2020
Page 3 of 12
Rate ClassUnit
RTSR-
Network
RTSR-
Connection
Residential kWh 0.00796 0.00703
Competitive Sector Multi-Unit Residential Service kWh 0.00796 0.00703
General Service Less Than 50 kW kWh 0.00775 0.00629
General Service 50 to 999 kW kW 2.6576 2.3054
General Service 1,000 to 4,999 kW kW 2.5677 2.3030
Large Use > 5000 kW kW 2.9271 2.5587
Unmetered Scattered Load kWh 0.00482 0.00444
Street Lighting kW 2.3638 2.7488
Choose Rate Class
Choose Rate Class
Choose Rate Class
Choose Rate Class
Choose Rate Class
Choose Rate Class
Choose Rate Class
Choose Rate Class
Choose Rate Class
Choose Rate Class
Choose Rate Class
Choose Rate Class
Choose Rate Class
Choose Rate Class
1. Select the appropriate rate classes that appear on your most recent Board-Approved Tariff of Rates and Charges.
2. Enter the RTS Network and Connection Rate as it appears on the Tariff of Rates and Charges
v 1.2Ontario Energy Board
3. Rate Classes
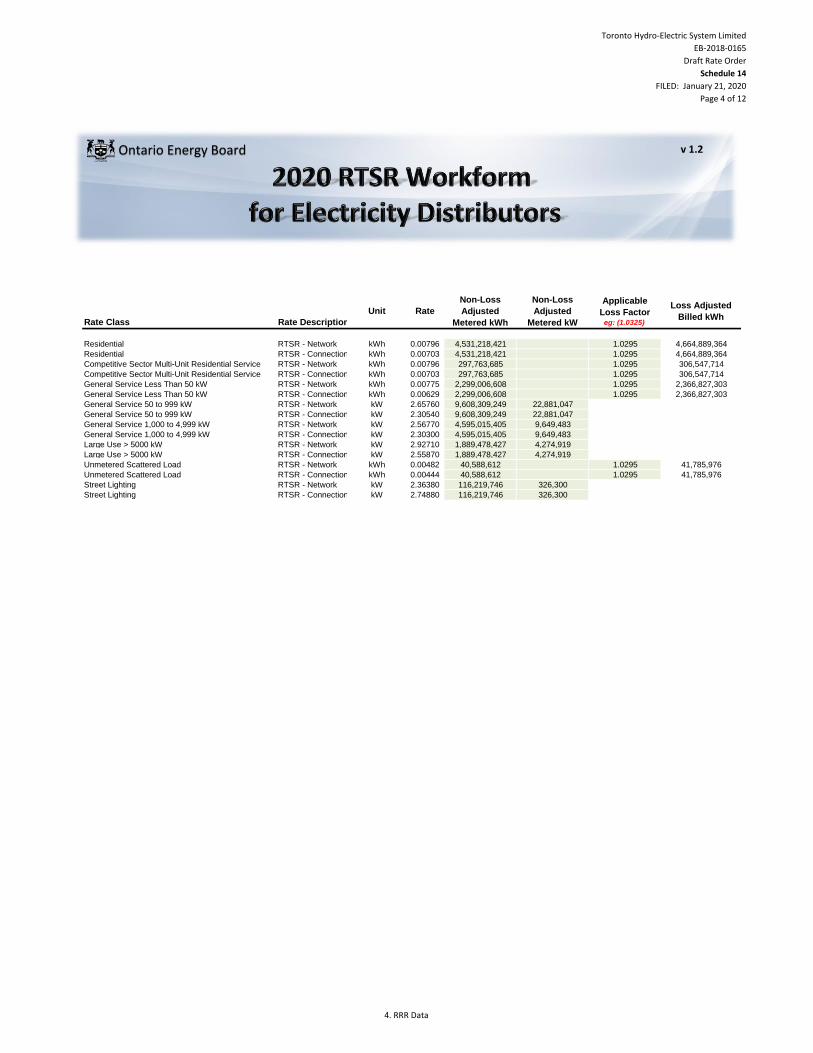
Toronto Hydro-Electric System Limited
EB-2018-0165
Draft Rate Order
Schedule 14
FILED: January 21, 2020
Page 4 of 12
Rate Class Rate Description
Unit Rate
Non-Loss
Adjusted
Metered kWh
Non-Loss
Adjusted
Metered kW
Applicable
Loss Factoreg: (1.0325)
Loss Adjusted
Billed kWh
Residential RTSR - Network kWh 0.00796 4,531,218,421 1.0295 4,664,889,364
Residential RTSR - Connection kWh 0.00703 4,531,218,421 1.0295 4,664,889,364
Competitive Sector Multi-Unit Residential Service RTSR - Network kWh 0.00796 297,763,685 1.0295 306,547,714
Competitive Sector Multi-Unit Residential Service RTSR - Connection kWh 0.00703 297,763,685 1.0295 306,547,714
General Service Less Than 50 kW RTSR - Network kWh 0.00775 2,299,006,608 1.0295 2,366,827,303
General Service Less Than 50 kW RTSR - Connection kWh 0.00629 2,299,006,608 1.0295 2,366,827,303
General Service 50 to 999 kW RTSR - Network kW 2.65760 9,608,309,249 22,881,047
General Service 50 to 999 kW RTSR - Connection kW 2.30540 9,608,309,249 22,881,047
General Service 1,000 to 4,999 kW RTSR - Network kW 2.56770 4,595,015,405 9,649,483
General Service 1,000 to 4,999 kW RTSR - Connection kW 2.30300 4,595,015,405 9,649,483
Large Use > 5000 kW RTSR - Network kW 2.92710 1,889,478,427 4,274,919
Large Use > 5000 kW RTSR - Connection kW 2.55870 1,889,478,427 4,274,919
Unmetered Scattered Load RTSR - Network kWh 0.00482 40,588,612 1.0295 41,785,976
Unmetered Scattered Load RTSR - Connection kWh 0.00444 40,588,612 1.0295 41,785,976
Street Lighting RTSR - Network kW 2.36380 116,219,746 326,300
Street Lighting RTSR - Connection kW 2.74880 116,219,746 326,300
v 1.2Ontario Energy Board
4. RRR Data
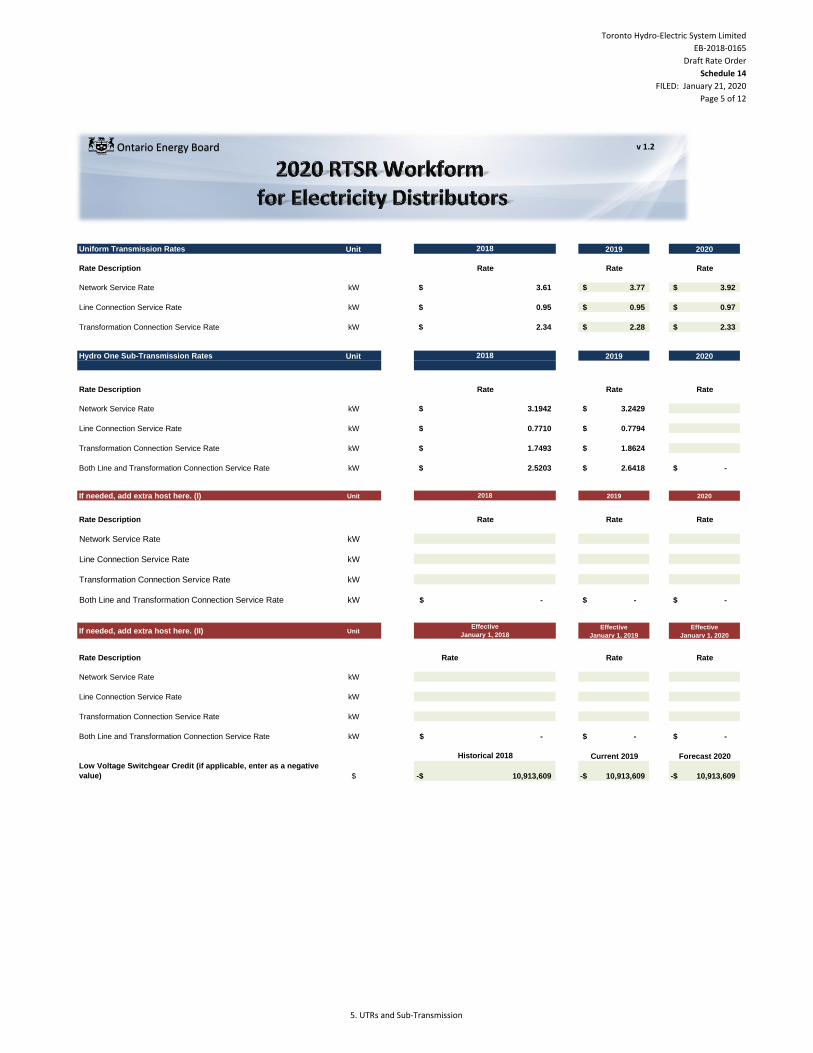
Toronto Hydro-Electric System Limited
EB-2018-0165
Draft Rate Order
Schedule 14
FILED: January 21, 2020
Page 5 of 12
Uniform Transmission Rates Unit 2019 2020
Rate Description Rate Rate
Network Service Rate kW 3.77$ 3.92$
Line Connection Service Rate kW 0.95$ 0.97$
Transformation Connection Service Rate kW 2.28$ 2.33$
Hydro One Sub-Transmission Rates Unit 2019 2020
Rate Description Rate Rate
Network Service Rate kW 3.2429$
Line Connection Service Rate kW 0.7794$
Transformation Connection Service Rate kW 1.8624$
Both Line and Transformation Connection Service Rate kW 2.6418$ -$
If needed, add extra host here. (I) Unit 2019 2020
Rate Description Rate Rate
Network Service Rate kW
Line Connection Service Rate kW
Transformation Connection Service Rate kW
Both Line and Transformation Connection Service Rate kW -$ -$
If needed, add extra host here. (II) UnitEffective
January 1, 2019
Effective
January 1, 2020
Rate Description Rate Rate Rate
Network Service Rate kW
Line Connection Service Rate kW
Transformation Connection Service Rate kW
Both Line and Transformation Connection Service Rate kW -$ -$
Current 2019 Forecast 2020
Low Voltage Switchgear Credit (if applicable, enter as a negative
value) $ 10,913,609-$ 10,913,609-$
Rate
2018
Effective
January 1, 2018
2018
2018
Rate
Rate
3.61$
0.95$
2.34$
3.1942$
0.7710$
1.7493$
2.5203$
-$
10,913,609-$
Historical 2018
-$
v 1.2Ontario Energy Board
5. UTRs and Sub-Transmission
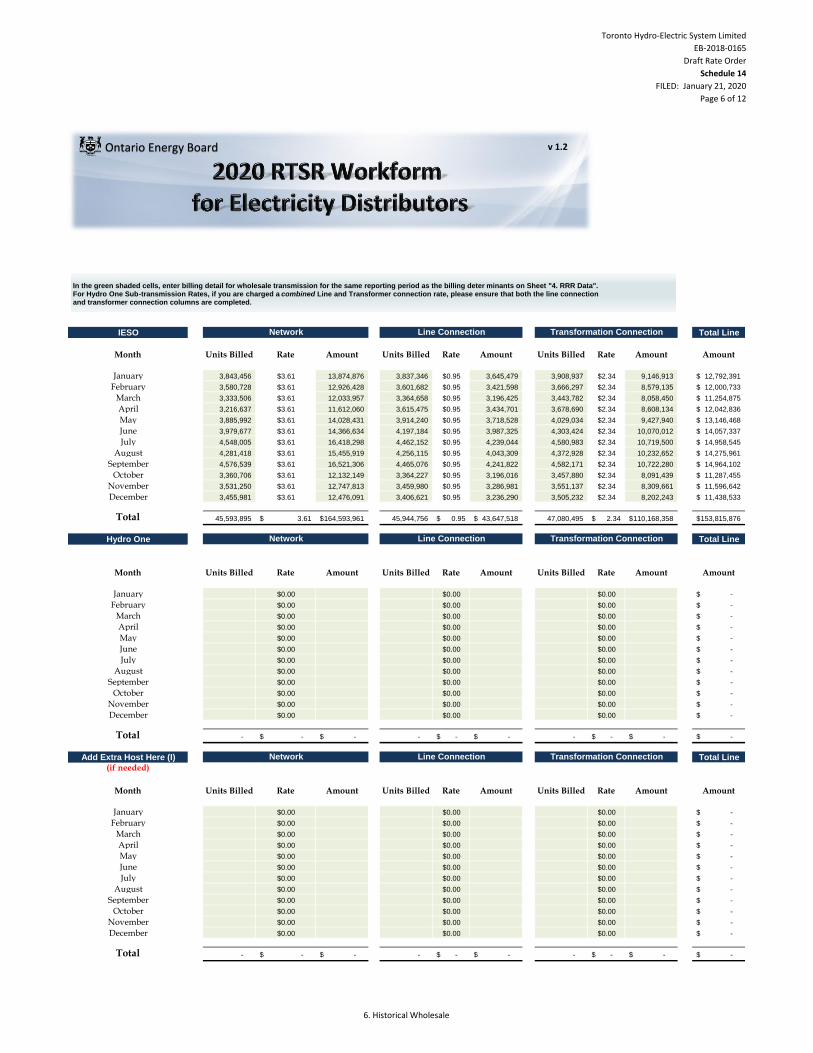
Toronto Hydro-Electric System Limited
EB-2018-0165
Draft Rate Order
Schedule 14
FILED: January 21, 2020
Page 6 of 12
IESO Total Line
Month Units Billed Rate Amount Units Billed Rate Amount Units Billed Rate Amount Amount
January 3,843,456 $3.61 13,874,876 3,837,346 $0.95 3,645,479 3,908,937 $2.34 9,146,913 12,792,391$
February 3,580,728 $3.61 12,926,428 3,601,682 $0.95 3,421,598 3,666,297 $2.34 8,579,135 12,000,733$
March 3,333,506 $3.61 12,033,957 3,364,658 $0.95 3,196,425 3,443,782 $2.34 8,058,450 11,254,875$
April 3,216,637 $3.61 11,612,060 3,615,475 $0.95 3,434,701 3,678,690 $2.34 8,608,134 12,042,836$
May 3,885,992 $3.61 14,028,431 3,914,240 $0.95 3,718,528 4,029,034 $2.34 9,427,940 13,146,468$
June 3,979,677 $3.61 14,366,634 4,197,184 $0.95 3,987,325 4,303,424 $2.34 10,070,012 14,057,337$
July 4,548,005 $3.61 16,418,298 4,462,152 $0.95 4,239,044 4,580,983 $2.34 10,719,500 14,958,545$
August 4,281,418 $3.61 15,455,919 4,256,115 $0.95 4,043,309 4,372,928 $2.34 10,232,652 14,275,961$
September 4,576,539 $3.61 16,521,306 4,465,076 $0.95 4,241,822 4,582,171 $2.34 10,722,280 14,964,102$
October 3,360,706 $3.61 12,132,149 3,364,227 $0.95 3,196,016 3,457,880 $2.34 8,091,439 11,287,455$
November 3,531,250 $3.61 12,747,813 3,459,980 $0.95 3,286,981 3,551,137 $2.34 8,309,661 11,596,642$
December 3,455,981 $3.61 12,476,091 3,406,621 $0.95 3,236,290 3,505,232 $2.34 8,202,243 11,438,533$
Total 45,593,895 3.61$ 164,593,961$ 45,944,756 0.95$ 43,647,518$ 47,080,495 2.34$ 110,168,358$ 153,815,876$
Hydro One Total Line
Month Units Billed Rate Amount Units Billed Rate Amount Units Billed Rate Amount Amount
January $0.00 $0.00 $0.00 -$
February $0.00 $0.00 $0.00 -$
March $0.00 $0.00 $0.00 -$
April $0.00 $0.00 $0.00 -$
May $0.00 $0.00 $0.00 -$
June $0.00 $0.00 $0.00 -$
July $0.00 $0.00 $0.00 -$
August $0.00 $0.00 $0.00 -$
September $0.00 $0.00 $0.00 -$
October $0.00 $0.00 $0.00 -$
November $0.00 $0.00 $0.00 -$
December $0.00 $0.00 $0.00 -$
Total - -$ -$ - -$ -$ - -$ -$ -$
Add Extra Host Here (I) Total Line
(if needed)
Month Units Billed Rate Amount Units Billed Rate Amount Units Billed Rate Amount Amount
January $0.00 $0.00 $0.00 -$
February $0.00 $0.00 $0.00 -$
March $0.00 $0.00 $0.00 -$
April $0.00 $0.00 $0.00 -$
May $0.00 $0.00 $0.00 -$
June $0.00 $0.00 $0.00 -$
July $0.00 $0.00 $0.00 -$
August $0.00 $0.00 $0.00 -$
September $0.00 $0.00 $0.00 -$
October $0.00 $0.00 $0.00 -$
November $0.00 $0.00 $0.00 -$
December $0.00 $0.00 $0.00 -$
Total - -$ -$ - -$ -$ - -$ -$ -$
Network Line Connection Transformation Connection
Network Line Connection Transformation Connection
Network Line Connection Transformation Connection
In the green shaded cells, enter billing detail for wholesale transmission for the same reporting period as the billing deter minants on Sheet "4. RRR Data". For Hydro One Sub-transmission Rates, if you are charged a combined Line and Transformer connection rate, please ensure that both the line connection and transformer connection columns are completed.
v 1.2Ontario Energy Board
6. Historical Wholesale
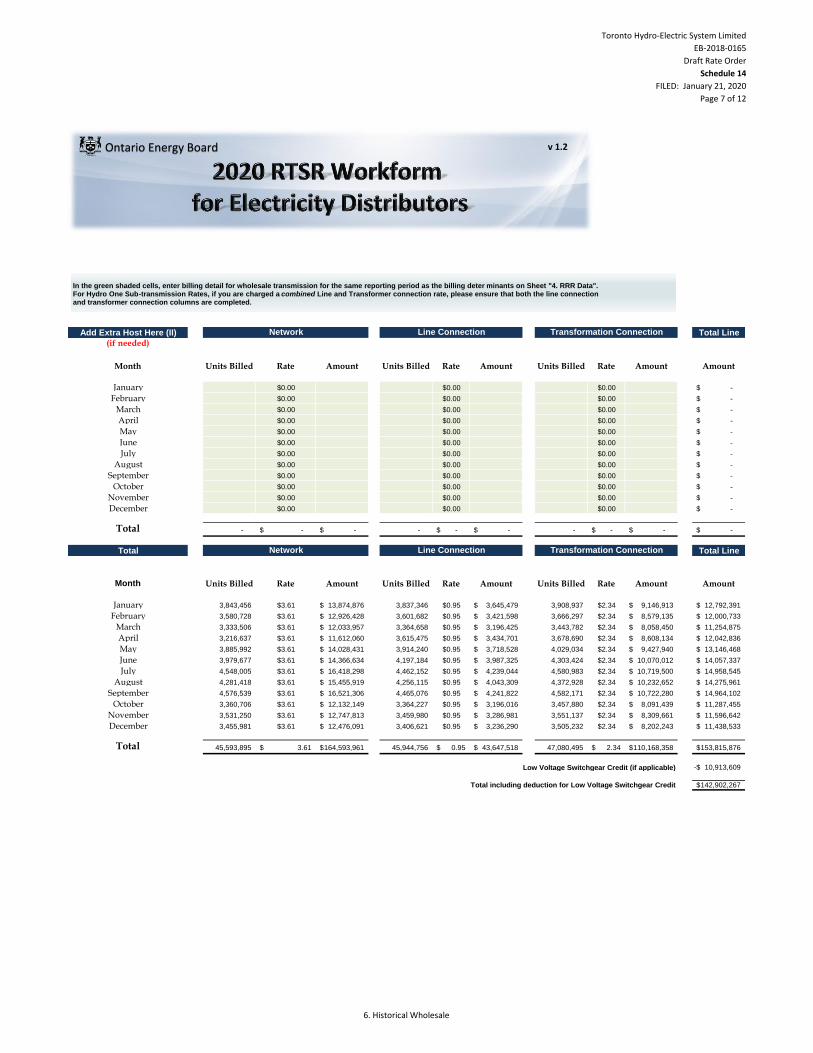
Toronto Hydro-Electric System Limited
EB-2018-0165
Draft Rate Order
Schedule 14
FILED: January 21, 2020
Page 7 of 12
In the green shaded cells, enter billing detail for wholesale transmission for the same reporting period as the billing deter minants on Sheet "4. RRR Data". For Hydro One Sub-transmission Rates, if you are charged a combined Line and Transformer connection rate, please ensure that both the line connection and transformer connection columns are completed.
v 1.2Ontario Energy Board
Add Extra Host Here (II) Total Line
(if needed)
Month Units Billed Rate Amount Units Billed Rate Amount Units Billed Rate Amount Amount
January $0.00 $0.00 $0.00 -$
February $0.00 $0.00 $0.00 -$
March $0.00 $0.00 $0.00 -$
April $0.00 $0.00 $0.00 -$
May $0.00 $0.00 $0.00 -$
June $0.00 $0.00 $0.00 -$
July $0.00 $0.00 $0.00 -$
August $0.00 $0.00 $0.00 -$
September $0.00 $0.00 $0.00 -$
October $0.00 $0.00 $0.00 -$
November $0.00 $0.00 $0.00 -$
December $0.00 $0.00 $0.00 -$
Total - -$ -$ - -$ -$ - -$ -$ -$
Total Total Line
Month Units Billed Rate Amount Units Billed Rate Amount Units Billed Rate Amount Amount
January 3,843,456 $3.61 13,874,876$ 3,837,346 $0.95 3,645,479$ 3,908,937 $2.34 9,146,913$ 12,792,391$
February 3,580,728 $3.61 12,926,428$ 3,601,682 $0.95 3,421,598$ 3,666,297 $2.34 8,579,135$ 12,000,733$
March 3,333,506 $3.61 12,033,957$ 3,364,658 $0.95 3,196,425$ 3,443,782 $2.34 8,058,450$ 11,254,875$
April 3,216,637 $3.61 11,612,060$ 3,615,475 $0.95 3,434,701$ 3,678,690 $2.34 8,608,134$ 12,042,836$
May 3,885,992 $3.61 14,028,431$ 3,914,240 $0.95 3,718,528$ 4,029,034 $2.34 9,427,940$ 13,146,468$
June 3,979,677 $3.61 14,366,634$ 4,197,184 $0.95 3,987,325$ 4,303,424 $2.34 10,070,012$ 14,057,337$
July 4,548,005 $3.61 16,418,298$ 4,462,152 $0.95 4,239,044$ 4,580,983 $2.34 10,719,500$ 14,958,545$
August 4,281,418 $3.61 15,455,919$ 4,256,115 $0.95 4,043,309$ 4,372,928 $2.34 10,232,652$ 14,275,961$
September 4,576,539 $3.61 16,521,306$ 4,465,076 $0.95 4,241,822$ 4,582,171 $2.34 10,722,280$ 14,964,102$
October 3,360,706 $3.61 12,132,149$ 3,364,227 $0.95 3,196,016$ 3,457,880 $2.34 8,091,439$ 11,287,455$
November 3,531,250 $3.61 12,747,813$ 3,459,980 $0.95 3,286,981$ 3,551,137 $2.34 8,309,661$ 11,596,642$
December 3,455,981 $3.61 12,476,091$ 3,406,621 $0.95 3,236,290$ 3,505,232 $2.34 8,202,243$ 11,438,533$
Total 45,593,895 3.61$ 164,593,961$ 45,944,756 0.95$ 43,647,518$ 47,080,495 2.34$ 110,168,358$ 153,815,876$
Low Voltage Switchgear Credit (if applicable) 10,913,609-$
Total including deduction for Low Voltage Switchgear Credit 142,902,267$
Line Connection Transformation ConnectionNetwork
Network Line Connection Transformation Connection
6. Historical Wholesale
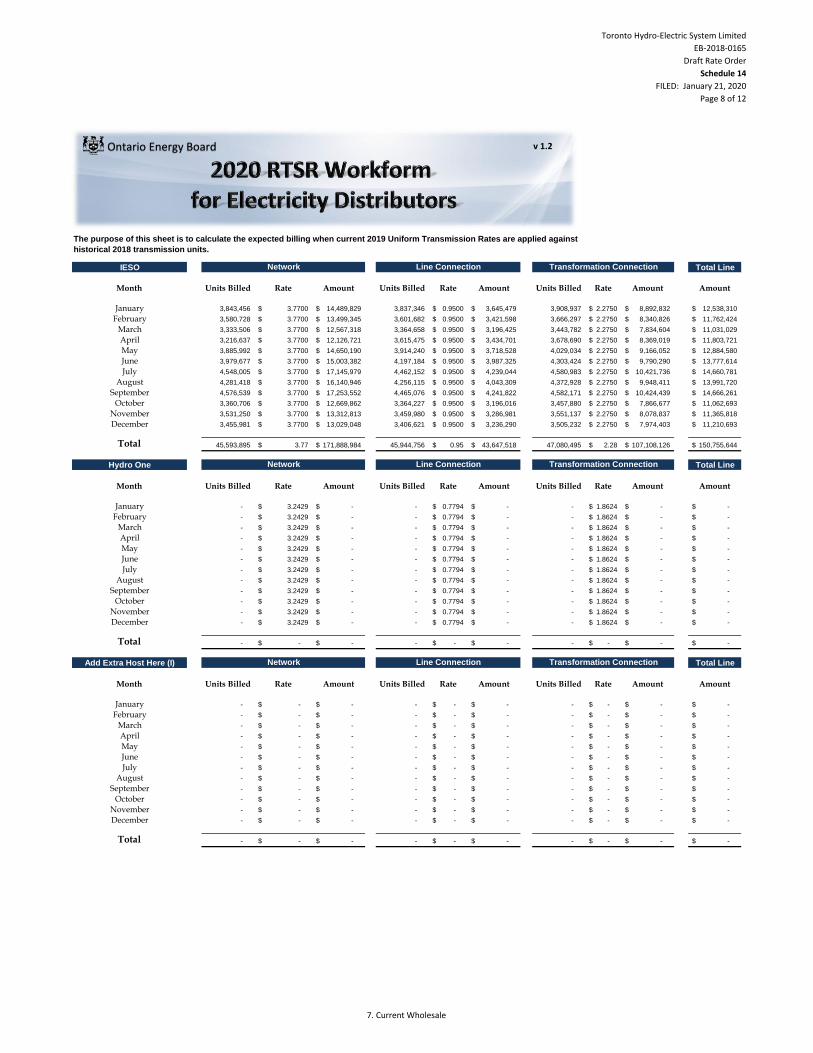
Toronto Hydro-Electric System Limited
EB-2018-0165
Draft Rate Order
Schedule 14
FILED: January 21, 2020
Page 8 of 12
IESO Total Line
Month Units Billed Rate Amount Units Billed Rate Amount Units Billed Rate Amount Amount
January 3,843,456 3.7700$ 14,489,829$ 3,837,346 0.9500$ 3,645,479$ 3,908,937 2.2750$ 8,892,832$ 12,538,310$
February 3,580,728 3.7700$ 13,499,345$ 3,601,682 0.9500$ 3,421,598$ 3,666,297 2.2750$ 8,340,826$ 11,762,424$
March 3,333,506 3.7700$ 12,567,318$ 3,364,658 0.9500$ 3,196,425$ 3,443,782 2.2750$ 7,834,604$ 11,031,029$
April 3,216,637 3.7700$ 12,126,721$ 3,615,475 0.9500$ 3,434,701$ 3,678,690 2.2750$ 8,369,019$ 11,803,721$
May 3,885,992 3.7700$ 14,650,190$ 3,914,240 0.9500$ 3,718,528$ 4,029,034 2.2750$ 9,166,052$ 12,884,580$
June 3,979,677 3.7700$ 15,003,382$ 4,197,184 0.9500$ 3,987,325$ 4,303,424 2.2750$ 9,790,290$ 13,777,614$
July 4,548,005 3.7700$ 17,145,979$ 4,462,152 0.9500$ 4,239,044$ 4,580,983 2.2750$ 10,421,736$ 14,660,781$
August 4,281,418 3.7700$ 16,140,946$ 4,256,115 0.9500$ 4,043,309$ 4,372,928 2.2750$ 9,948,411$ 13,991,720$
September 4,576,539 3.7700$ 17,253,552$ 4,465,076 0.9500$ 4,241,822$ 4,582,171 2.2750$ 10,424,439$ 14,666,261$
October 3,360,706 3.7700$ 12,669,862$ 3,364,227 0.9500$ 3,196,016$ 3,457,880 2.2750$ 7,866,677$ 11,062,693$
November 3,531,250 3.7700$ 13,312,813$ 3,459,980 0.9500$ 3,286,981$ 3,551,137 2.2750$ 8,078,837$ 11,365,818$
December 3,455,981 3.7700$ 13,029,048$ 3,406,621 0.9500$ 3,236,290$ 3,505,232 2.2750$ 7,974,403$ 11,210,693$
Total 45,593,895 3.77$ 171,888,984$ 45,944,756 0.95$ 43,647,518$ 47,080,495 2.28$ 107,108,126$ 150,755,644$
Hydro One Total Line
Month Units Billed Rate Amount Units Billed Rate Amount Units Billed Rate Amount Amount
January - 3.2429$ -$ - 0.7794$ -$ - 1.8624$ -$ -$
February - 3.2429$ -$ - 0.7794$ -$ - 1.8624$ -$ -$
March - 3.2429$ -$ - 0.7794$ -$ - 1.8624$ -$ -$
April - 3.2429$ -$ - 0.7794$ -$ - 1.8624$ -$ -$
May - 3.2429$ -$ - 0.7794$ -$ - 1.8624$ -$ -$
June - 3.2429$ -$ - 0.7794$ -$ - 1.8624$ -$ -$
July - 3.2429$ -$ - 0.7794$ -$ - 1.8624$ -$ -$
August - 3.2429$ -$ - 0.7794$ -$ - 1.8624$ -$ -$
September - 3.2429$ -$ - 0.7794$ -$ - 1.8624$ -$ -$
October - 3.2429$ -$ - 0.7794$ -$ - 1.8624$ -$ -$
November - 3.2429$ -$ - 0.7794$ -$ - 1.8624$ -$ -$
December - 3.2429$ -$ - 0.7794$ -$ - 1.8624$ -$ -$
Total - -$ -$ - -$ -$ - -$ -$ -$
Add Extra Host Here (I) Total Line
Month Units Billed Rate Amount Units Billed Rate Amount Units Billed Rate Amount Amount
January - -$ -$ - -$ -$ - -$ -$ -$
February - -$ -$ - -$ -$ - -$ -$ -$
March - -$ -$ - -$ -$ - -$ -$ -$
April - -$ -$ - -$ -$ - -$ -$ -$
May - -$ -$ - -$ -$ - -$ -$ -$
June - -$ -$ - -$ -$ - -$ -$ -$
July - -$ -$ - -$ -$ - -$ -$ -$
August - -$ -$ - -$ -$ - -$ -$ -$
September - -$ -$ - -$ -$ - -$ -$ -$
October - -$ -$ - -$ -$ - -$ -$ -$
November - -$ -$ - -$ -$ - -$ -$ -$
December - -$ -$ - -$ -$ - -$ -$ -$
Total - -$ -$ - -$ -$ - -$ -$ -$
The purpose of this sheet is to calculate the expected billing when current 2019 Uniform Transmission Rates are applied against
historical 2018 transmission units.
Network Line Connection Transformation Connection
Network Line Connection Transformation Connection
Network Line Connection Transformation Connection
v 1.2Ontario Energy Board
7. Current Wholesale
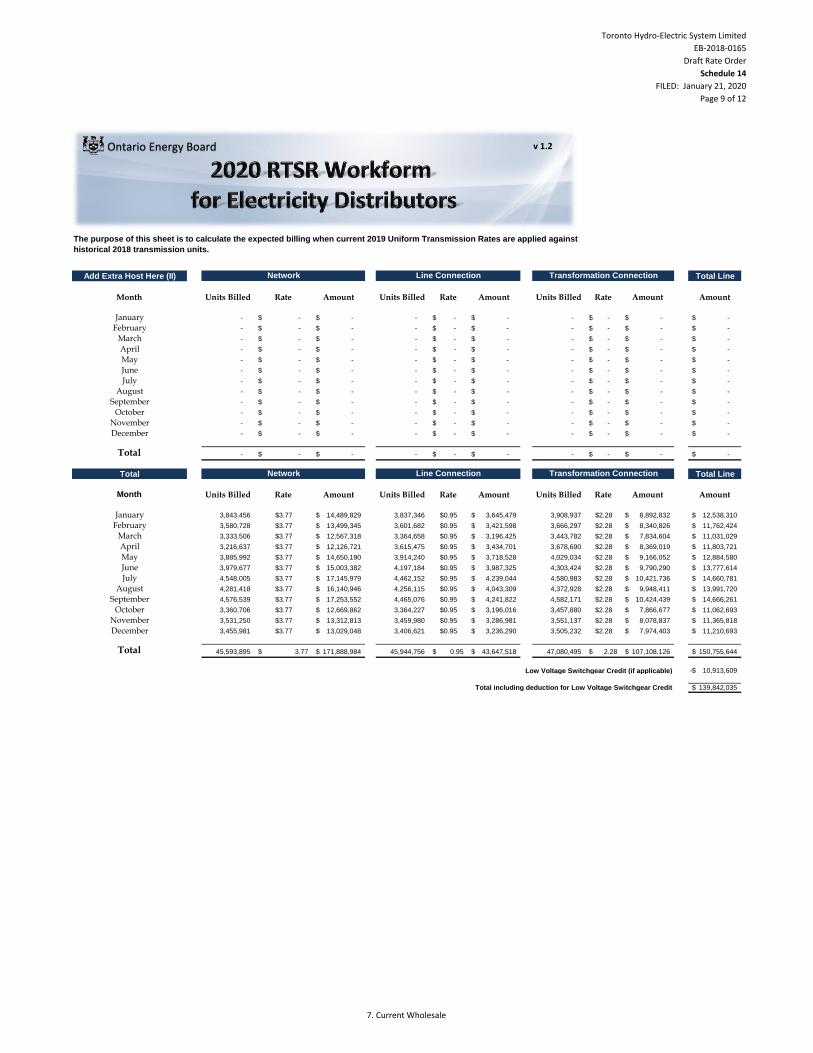
Toronto Hydro-Electric System Limited
EB-2018-0165
Draft Rate Order
Schedule 14
FILED: January 21, 2020
Page 9 of 12
The purpose of this sheet is to calculate the expected billing when current 2019 Uniform Transmission Rates are applied against
historical 2018 transmission units.
v 1.2Ontario Energy Board
Add Extra Host Here (II) Total Line
Month Units Billed Rate Amount Units Billed Rate Amount Units Billed Rate Amount Amount
January - -$ -$ - -$ -$ - -$ -$ -$
February - -$ -$ - -$ -$ - -$ -$ -$
March - -$ -$ - -$ -$ - -$ -$ -$
April - -$ -$ - -$ -$ - -$ -$ -$
May - -$ -$ - -$ -$ - -$ -$ -$
June - -$ -$ - -$ -$ - -$ -$ -$
July - -$ -$ - -$ -$ - -$ -$ -$
August - -$ -$ - -$ -$ - -$ -$ -$
September - -$ -$ - -$ -$ - -$ -$ -$
October - -$ -$ - -$ -$ - -$ -$ -$
November - -$ -$ - -$ -$ - -$ -$ -$
December - -$ -$ - -$ -$ - -$ -$ -$
Total - -$ -$ - -$ -$ - -$ -$ -$
Total Total Line
Month Units Billed Rate Amount Units Billed Rate Amount Units Billed Rate Amount Amount
January 3,843,456 $3.77 14,489,829$ 3,837,346 $0.95 3,645,479$ 3,908,937 $2.28 8,892,832$ 12,538,310$
February 3,580,728 $3.77 13,499,345$ 3,601,682 $0.95 3,421,598$ 3,666,297 $2.28 8,340,826$ 11,762,424$
March 3,333,506 $3.77 12,567,318$ 3,364,658 $0.95 3,196,425$ 3,443,782 $2.28 7,834,604$ 11,031,029$
April 3,216,637 $3.77 12,126,721$ 3,615,475 $0.95 3,434,701$ 3,678,690 $2.28 8,369,019$ 11,803,721$
May 3,885,992 $3.77 14,650,190$ 3,914,240 $0.95 3,718,528$ 4,029,034 $2.28 9,166,052$ 12,884,580$
June 3,979,677 $3.77 15,003,382$ 4,197,184 $0.95 3,987,325$ 4,303,424 $2.28 9,790,290$ 13,777,614$
July 4,548,005 $3.77 17,145,979$ 4,462,152 $0.95 4,239,044$ 4,580,983 $2.28 10,421,736$ 14,660,781$
August 4,281,418 $3.77 16,140,946$ 4,256,115 $0.95 4,043,309$ 4,372,928 $2.28 9,948,411$ 13,991,720$
September 4,576,539 $3.77 17,253,552$ 4,465,076 $0.95 4,241,822$ 4,582,171 $2.28 10,424,439$ 14,666,261$
October 3,360,706 $3.77 12,669,862$ 3,364,227 $0.95 3,196,016$ 3,457,880 $2.28 7,866,677$ 11,062,693$
November 3,531,250 $3.77 13,312,813$ 3,459,980 $0.95 3,286,981$ 3,551,137 $2.28 8,078,837$ 11,365,818$
December 3,455,981 $3.77 13,029,048$ 3,406,621 $0.95 3,236,290$ 3,505,232 $2.28 7,974,403$ 11,210,693$
Total 45,593,895 3.77$ 171,888,984$ 45,944,756 0.95$ 43,647,518$ 47,080,495 2.28$ 107,108,126$ 150,755,644$
Low Voltage Switchgear Credit (if applicable) 10,913,609-$
Total including deduction for Low Voltage Switchgear Credit 139,842,035$
Network Line Connection Transformation Connection
Network Line Connection Transformation Connection
7. Current Wholesale
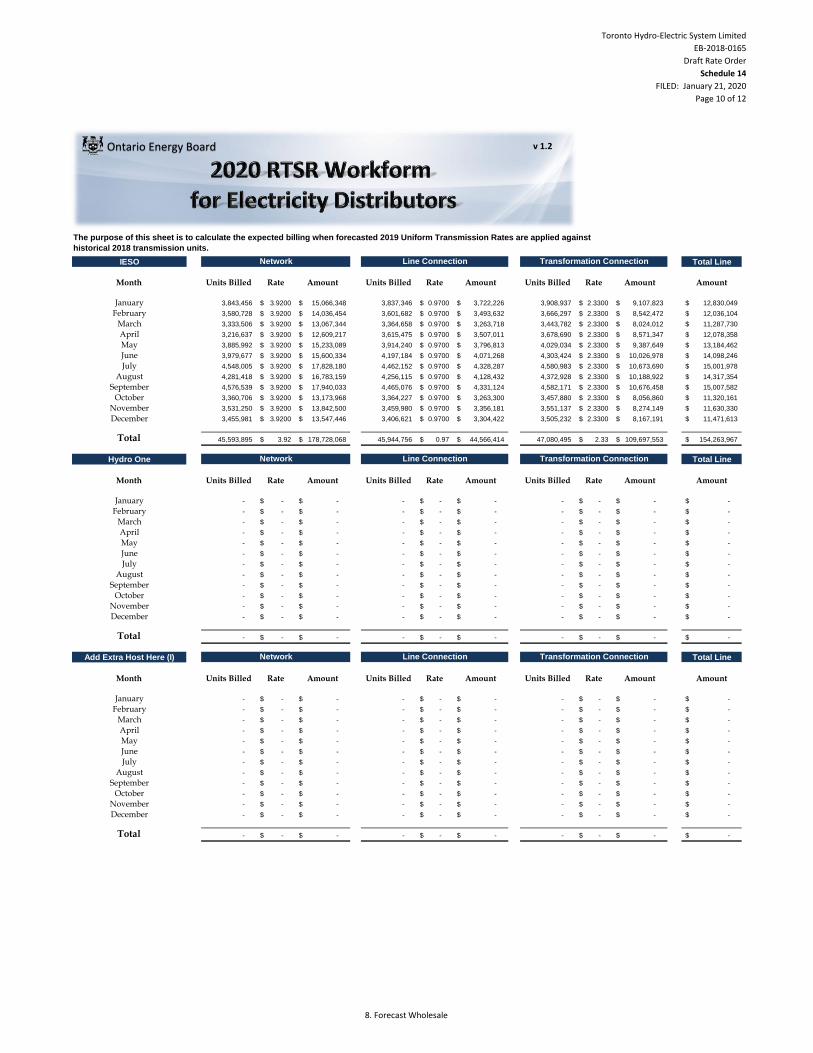
Toronto Hydro-Electric System Limited
EB-2018-0165
Draft Rate Order
Schedule 14
FILED: January 21, 2020
Page 10 of 12
IESO Total Line
Month Units Billed Rate Amount Units Billed Rate Amount Units Billed Rate Amount Amount
January 3,843,456 3.9200$ 15,066,348$ 3,837,346 0.9700$ 3,722,226$ 3,908,937 2.3300$ 9,107,823$ 12,830,049$
February 3,580,728 3.9200$ 14,036,454$ 3,601,682 0.9700$ 3,493,632$ 3,666,297 2.3300$ 8,542,472$ 12,036,104$
March 3,333,506 3.9200$ 13,067,344$ 3,364,658 0.9700$ 3,263,718$ 3,443,782 2.3300$ 8,024,012$ 11,287,730$
April 3,216,637 3.9200$ 12,609,217$ 3,615,475 0.9700$ 3,507,011$ 3,678,690 2.3300$ 8,571,347$ 12,078,358$
May 3,885,992 3.9200$ 15,233,089$ 3,914,240 0.9700$ 3,796,813$ 4,029,034 2.3300$ 9,387,649$ 13,184,462$
June 3,979,677 3.9200$ 15,600,334$ 4,197,184 0.9700$ 4,071,268$ 4,303,424 2.3300$ 10,026,978$ 14,098,246$
July 4,548,005 3.9200$ 17,828,180$ 4,462,152 0.9700$ 4,328,287$ 4,580,983 2.3300$ 10,673,690$ 15,001,978$
August 4,281,418 3.9200$ 16,783,159$ 4,256,115 0.9700$ 4,128,432$ 4,372,928 2.3300$ 10,188,922$ 14,317,354$
September 4,576,539 3.9200$ 17,940,033$ 4,465,076 0.9700$ 4,331,124$ 4,582,171 2.3300$ 10,676,458$ 15,007,582$
October 3,360,706 3.9200$ 13,173,968$ 3,364,227 0.9700$ 3,263,300$ 3,457,880 2.3300$ 8,056,860$ 11,320,161$
November 3,531,250 3.9200$ 13,842,500$ 3,459,980 0.9700$ 3,356,181$ 3,551,137 2.3300$ 8,274,149$ 11,630,330$
December 3,455,981 3.9200$ 13,547,446$ 3,406,621 0.9700$ 3,304,422$ 3,505,232 2.3300$ 8,167,191$ 11,471,613$
Total 45,593,895 3.92$ 178,728,068$ 45,944,756 0.97$ 44,566,414$ 47,080,495 2.33$ 109,697,553$ 154,263,967$
Hydro One Total Line
Month Units Billed Rate Amount Units Billed Rate Amount Units Billed Rate Amount Amount
January - -$ -$ - -$ -$ - -$ -$ -$
February - -$ -$ - -$ -$ - -$ -$ -$
March - -$ -$ - -$ -$ - -$ -$ -$
April - -$ -$ - -$ -$ - -$ -$ -$
May - -$ -$ - -$ -$ - -$ -$ -$
June - -$ -$ - -$ -$ - -$ -$ -$
July - -$ -$ - -$ -$ - -$ -$ -$
August - -$ -$ - -$ -$ - -$ -$ -$
September - -$ -$ - -$ -$ - -$ -$ -$
October - -$ -$ - -$ -$ - -$ -$ -$
November - -$ -$ - -$ -$ - -$ -$ -$
December - -$ -$ - -$ -$ - -$ -$ -$
Total - -$ -$ - -$ -$ - -$ -$ -$
Add Extra Host Here (I) Total Line
Month Units Billed Rate Amount Units Billed Rate Amount Units Billed Rate Amount Amount
January - -$ -$ - -$ -$ - -$ -$ -$
February - -$ -$ - -$ -$ - -$ -$ -$
March - -$ -$ - -$ -$ - -$ -$ -$
April - -$ -$ - -$ -$ - -$ -$ -$
May - -$ -$ - -$ -$ - -$ -$ -$
June - -$ -$ - -$ -$ - -$ -$ -$
July - -$ -$ - -$ -$ - -$ -$ -$
August - -$ -$ - -$ -$ - -$ -$ -$
September - -$ -$ - -$ -$ - -$ -$ -$
October - -$ -$ - -$ -$ - -$ -$ -$
November - -$ -$ - -$ -$ - -$ -$ -$
December - -$ -$ - -$ -$ - -$ -$ -$
Total - -$ -$ - -$ -$ - -$ -$ -$
The purpose of this sheet is to calculate the expected billing when forecasted 2019 Uniform Transmission Rates are applied against
historical 2018 transmission units.
Network Line Connection Transformation Connection
Network Line Connection Transformation Connection
Network Line Connection Transformation Connection
v 1.2Ontario Energy Board
8. Forecast Wholesale
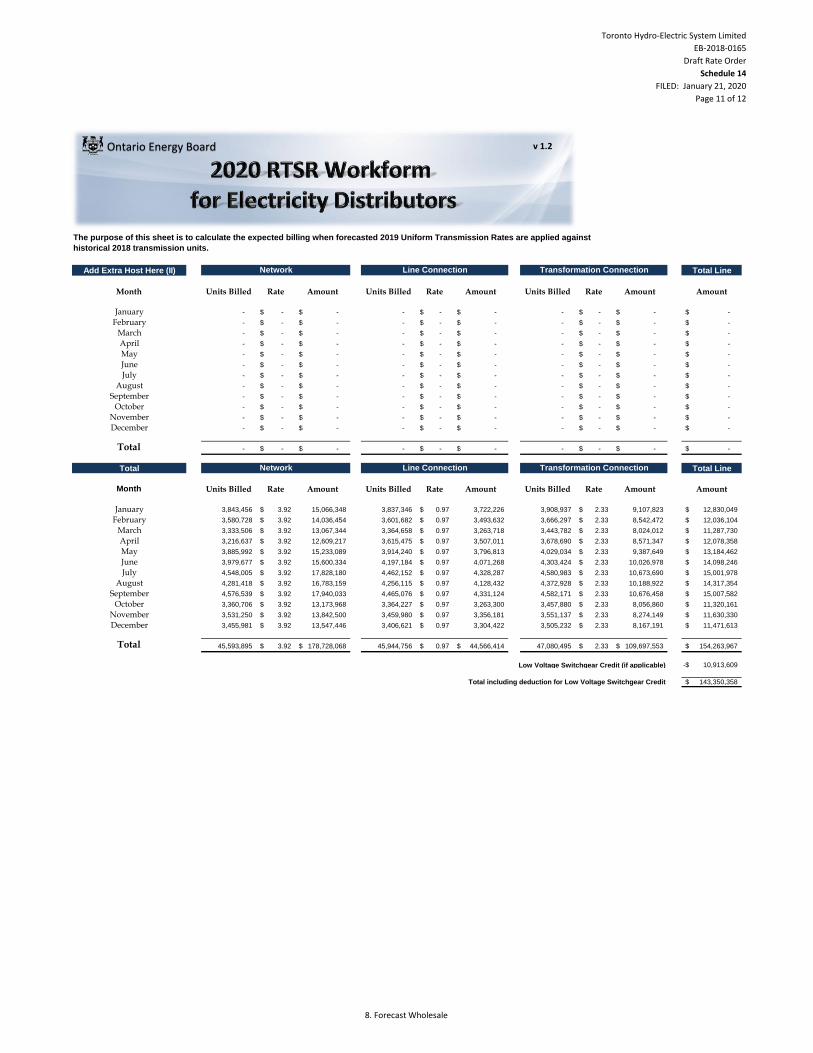
Toronto Hydro-Electric System Limited
EB-2018-0165
Draft Rate Order
Schedule 14
FILED: January 21, 2020
Page 11 of 12
The purpose of this sheet is to calculate the expected billing when forecasted 2019 Uniform Transmission Rates are applied against
historical 2018 transmission units.
v 1.2Ontario Energy Board
Add Extra Host Here (II) Total Line
Month Units Billed Rate Amount Units Billed Rate Amount Units Billed Rate Amount Amount
January - -$ -$ - -$ -$ - -$ -$ -$
February - -$ -$ - -$ -$ - -$ -$ -$
March - -$ -$ - -$ -$ - -$ -$ -$
April - -$ -$ - -$ -$ - -$ -$ -$
May - -$ -$ - -$ -$ - -$ -$ -$
June - -$ -$ - -$ -$ - -$ -$ -$
July - -$ -$ - -$ -$ - -$ -$ -$
August - -$ -$ - -$ -$ - -$ -$ -$
September - -$ -$ - -$ -$ - -$ -$ -$
October - -$ -$ - -$ -$ - -$ -$ -$
November - -$ -$ - -$ -$ - -$ -$ -$
December - -$ -$ - -$ -$ - -$ -$ -$
Total - -$ -$ - -$ -$ - -$ -$ -$
Total Total Line
Month Units Billed Rate Amount Units Billed Rate Amount Units Billed Rate Amount Amount
January 3,843,456 3.92$ 15,066,348 3,837,346 0.97$ 3,722,226 3,908,937 2.33$ 9,107,823 12,830,049$
February 3,580,728 3.92$ 14,036,454 3,601,682 0.97$ 3,493,632 3,666,297 2.33$ 8,542,472 12,036,104$
March 3,333,506 3.92$ 13,067,344 3,364,658 0.97$ 3,263,718 3,443,782 2.33$ 8,024,012 11,287,730$
April 3,216,637 3.92$ 12,609,217 3,615,475 0.97$ 3,507,011 3,678,690 2.33$ 8,571,347 12,078,358$
May 3,885,992 3.92$ 15,233,089 3,914,240 0.97$ 3,796,813 4,029,034 2.33$ 9,387,649 13,184,462$
June 3,979,677 3.92$ 15,600,334 4,197,184 0.97$ 4,071,268 4,303,424 2.33$ 10,026,978 14,098,246$
July 4,548,005 3.92$ 17,828,180 4,462,152 0.97$ 4,328,287 4,580,983 2.33$ 10,673,690 15,001,978$
August 4,281,418 3.92$ 16,783,159 4,256,115 0.97$ 4,128,432 4,372,928 2.33$ 10,188,922 14,317,354$
September 4,576,539 3.92$ 17,940,033 4,465,076 0.97$ 4,331,124 4,582,171 2.33$ 10,676,458 15,007,582$
October 3,360,706 3.92$ 13,173,968 3,364,227 0.97$ 3,263,300 3,457,880 2.33$ 8,056,860 11,320,161$
November 3,531,250 3.92$ 13,842,500 3,459,980 0.97$ 3,356,181 3,551,137 2.33$ 8,274,149 11,630,330$
December 3,455,981 3.92$ 13,547,446 3,406,621 0.97$ 3,304,422 3,505,232 2.33$ 8,167,191 11,471,613$
Total 45,593,895 3.92$ 178,728,068$ 45,944,756 0.97$ 44,566,414$ 47,080,495 2.33$ 109,697,553$ 154,263,967$
Low Voltage Switchgear Credit (if applicable) 10,913,609-$
Total including deduction for Low Voltage Switchgear Credit 143,350,358$
Network Line Connection Transformation Connection
Network Line Connection Transformation Connection
8. Forecast Wholesale
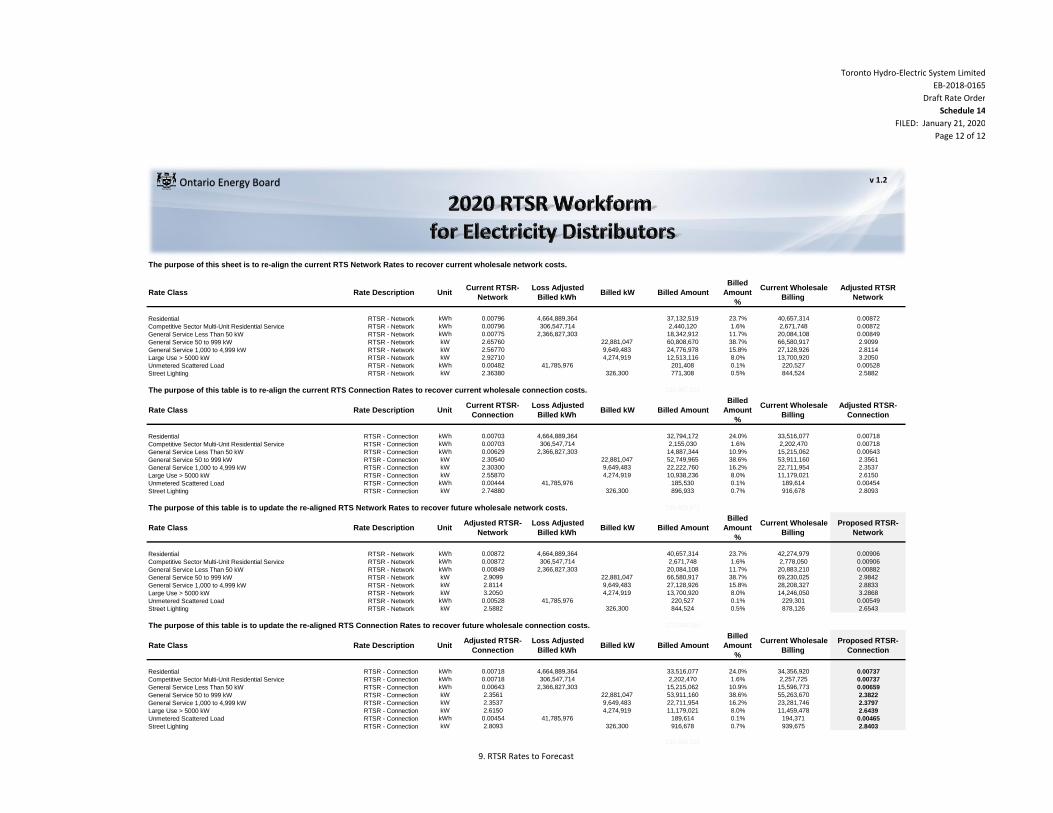
Toronto Hydro-Electric System Limited
EB-2018-0165
Draft Rate Order
Schedule 14
FILED: January 21, 2020
Page 12 of 12
The purpose of this sheet is to re-align the current RTS Network Rates to recover current wholesale network costs.
Rate Class Rate Description UnitCurrent RTSR-
Network
Loss Adjusted
Billed kWh Billed kW Billed Amount
Billed
Amount
%
Current Wholesale
Billing
Adjusted RTSR
Network
Residential RTSR - Network kWh 0.00796 4,664,889,364 37,132,519 23.7% 40,657,314 0.00872
Competitive Sector Multi-Unit Residential Service RTSR - Network kWh 0.00796 306,547,714 2,440,120 1.6% 2,671,748 0.00872
General Service Less Than 50 kW RTSR - Network kWh 0.00775 2,366,827,303 18,342,912 11.7% 20,084,108 0.00849
General Service 50 to 999 kW RTSR - Network kW 2.65760 22,881,047 60,808,670 38.7% 66,580,917 2.9099
General Service 1,000 to 4,999 kW RTSR - Network kW 2.56770 9,649,483 24,776,978 15.8% 27,128,926 2.8114
Large Use > 5000 kW RTSR - Network kW 2.92710 4,274,919 12,513,116 8.0% 13,700,920 3.2050
Unmetered Scattered Load RTSR - Network kWh 0.00482 41,785,976 201,408 0.1% 220,527 0.00528
Street Lighting RTSR - Network kW 2.36380 326,300 771,308 0.5% 844,524 2.5882
The purpose of this table is to re-align the current RTS Connection Rates to recover current wholesale connection costs. 156,987,031
Rate Class Rate Description UnitCurrent RTSR-
Connection
Loss Adjusted
Billed kWh Billed kW Billed Amount
Billed
Amount
%
Current Wholesale
Billing
Adjusted RTSR-
Connection
Residential RTSR - Connection kWh 0.00703 4,664,889,364 32,794,172 24.0% 33,516,077 0.00718
Competitive Sector Multi-Unit Residential Service RTSR - Connection kWh 0.00703 306,547,714 2,155,030 1.6% 2,202,470 0.00718
General Service Less Than 50 kW RTSR - Connection kWh 0.00629 2,366,827,303 14,887,344 10.9% 15,215,062 0.00643
General Service 50 to 999 kW RTSR - Connection kW 2.30540 22,881,047 52,749,965 38.6% 53,911,160 2.3561
General Service 1,000 to 4,999 kW RTSR - Connection kW 2.30300 9,649,483 22,222,760 16.2% 22,711,954 2.3537
Large Use > 5000 kW RTSR - Connection kW 2.55870 4,274,919 10,938,236 8.0% 11,179,021 2.6150
Unmetered Scattered Load RTSR - Connection kWh 0.00444 41,785,976 185,530 0.1% 189,614 0.00454
Street Lighting RTSR - Connection kW 2.74880 326,300 896,933 0.7% 916,678 2.8093
The purpose of this table is to update the re-aligned RTS Network Rates to recover future wholesale network costs. 136,829,971
Rate Class Rate Description UnitAdjusted RTSR-
Network
Loss Adjusted
Billed kWh Billed kW Billed Amount
Billed
Amount
%
Current Wholesale
Billing
Proposed RTSR-
Network
Residential RTSR - Network kWh 0.00872 4,664,889,364 40,657,314 23.7% 42,274,979 0.00906
Competitive Sector Multi-Unit Residential Service RTSR - Network kWh 0.00872 306,547,714 2,671,748 1.6% 2,778,050 0.00906
General Service Less Than 50 kW RTSR - Network kWh 0.00849 2,366,827,303 20,084,108 11.7% 20,883,210 0.00882
General Service 50 to 999 kW RTSR - Network kW 2.9099 22,881,047 66,580,917 38.7% 69,230,025 2.9842
General Service 1,000 to 4,999 kW RTSR - Network kW 2.8114 9,649,483 27,128,926 15.8% 28,208,327 2.8833
Large Use > 5000 kW RTSR - Network kW 3.2050 4,274,919 13,700,920 8.0% 14,246,050 3.2868
Unmetered Scattered Load RTSR - Network kWh 0.00528 41,785,976 220,527 0.1% 229,301 0.00549
Street Lighting RTSR - Network kW 2.5882 326,300 844,524 0.5% 878,126 2.6543
The purpose of this table is to update the re-aligned RTS Connection Rates to recover future wholesale connection costs. 171,888,984
Rate Class Rate Description UnitAdjusted RTSR-
Connection
Loss Adjusted
Billed kWh Billed kW Billed Amount
Billed
Amount
%
Current Wholesale
Billing
Proposed RTSR-
Connection
Residential RTSR - Connection kWh 0.00718 4,664,889,364 33,516,077 24.0% 34,356,920 0.00737
Competitive Sector Multi-Unit Residential Service RTSR - Connection kWh 0.00718 306,547,714 2,202,470 1.6% 2,257,725 0.00737
General Service Less Than 50 kW RTSR - Connection kWh 0.00643 2,366,827,303 15,215,062 10.9% 15,596,773 0.00659
General Service 50 to 999 kW RTSR - Connection kW 2.3561 22,881,047 53,911,160 38.6% 55,263,670 2.3822
General Service 1,000 to 4,999 kW RTSR - Connection kW 2.3537 9,649,483 22,711,954 16.2% 23,281,746 2.3797
Large Use > 5000 kW RTSR - Connection kW 2.6150 4,274,919 11,179,021 8.0% 11,459,478 2.6439
Unmetered Scattered Load RTSR - Connection kWh 0.00454 41,785,976 189,614 0.1% 194,371 0.00465
Street Lighting RTSR - Connection kW 2.8093 326,300 916,678 0.7% 939,675 2.8403
139,842,035
v 1.2Ontario Energy Board
9. RTSR Rates to Forecast
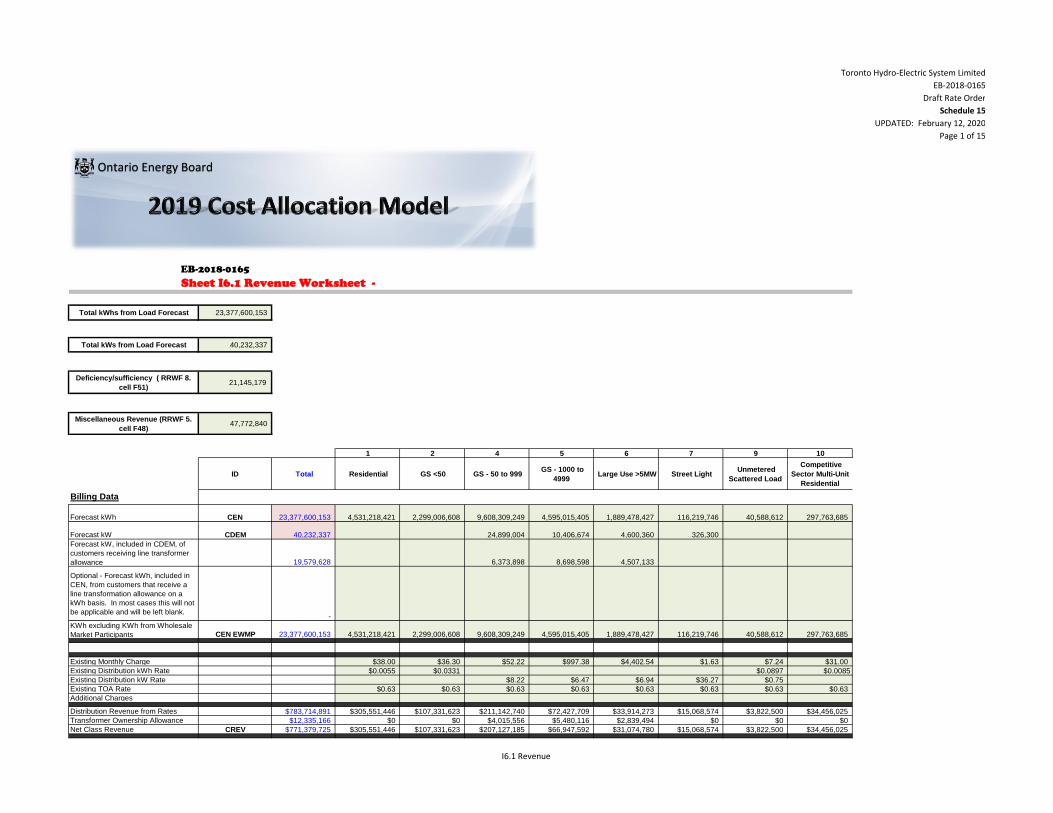
Toronto Hydro-Electric System Limited
EB-2018-0165
Draft Rate Order
Schedule 15
UPDATED: February 12, 2020
Page 1 of 15
Sheet I6.1 Revenue Worksheet -
Total kWhs from Load Forecast 23,377,600,153
Total kWs from Load Forecast 40,232,337
Deficiency/sufficiency ( RRWF 8.
cell F51) 21,145,179
Miscellaneous Revenue (RRWF 5.
cell F48)47,772,840
1 2 4 5 6 7 9 10
ID Total Residential GS <50 GS - 50 to 999 GS - 1000 to
4999 Large Use >5MW Street Light
Unmetered
Scattered Load
Competitive
Sector Multi-Unit
Residential
Forecast kWh CEN 23,377,600,153 4,531,218,421 2,299,006,608 9,608,309,249 4,595,015,405 1,889,478,427 116,219,746 40,588,612 297,763,685
Forecast kW CDEM 40,232,337 24,899,004 10,406,674 4,600,360 326,300
Forecast kW, included in CDEM, of
customers receiving line transformer
allowance 19,579,628 6,373,898 8,698,598 4,507,133
Optional - Forecast kWh, included in
CEN, from customers that receive a
line transformation allowance on a
kWh basis. In most cases this will not
be applicable and will be left blank.-
KWh excluding KWh from Wholesale
Market Participants CEN EWMP 23,377,600,153 4,531,218,421 2,299,006,608 9,608,309,249 4,595,015,405 1,889,478,427 116,219,746 40,588,612 297,763,685
Existing Monthly Charge $38.00 $36.30 $52.22 $997.38 $4,402.54 $1.63 $7.24 $31.00
Existing Distribution kWh Rate $0.0055 $0.0331 $0.0897 $0.0085
Existing Distribution kW Rate $8.22 $6.47 $6.94 $36.27 $0.75
Existing TOA Rate $0.63 $0.63 $0.63 $0.63 $0.63 $0.63 $0.63 $0.63
Additional Charges
Distribution Revenue from Rates $783,714,891 $305,551,446 $107,331,623 $211,142,740 $72,427,709 $33,914,273 $15,068,574 $3,822,500 $34,456,025
Transformer Ownership Allowance $12,335,166 $0 $0 $4,015,556 $5,480,116 $2,839,494 $0 $0 $0
Net Class Revenue CREV $771,379,725 $305,551,446 $107,331,623 $207,127,185 $66,947,592 $31,074,780 $15,068,574 $3,822,500 $34,456,025
EB-2018-0165
Billing Data
Ontario Energy Board
I6.1 Revenue
Toronto Hydro-Electric System Limited
EB-2018-0165
Draft Rate Order
Schedule 15
UPDATED: February 12, 2020
Page 2 of 15
Sheet I6.2 Customer Data Worksheet -
1 2 4 5 6 7 9 10
ID Total Residential GS <50 GS - 50 to 999 GS - 1000 to
4999
Large Use
>5MW Street Light
Unmetered
Scattered Load
Competitive
Sector Multi-Unit
Residential
Bad Debt 3 Year Historical Average BDHA $7,377,253 $3,890,292 $2,111,101 $828,264 $261,154 $0 $0 $0 $286,442
Late Payment 3 Year Historical
Average LPHA $4,287,180 $2,487,420 $919,878 $596,564 $77,959 $16,058 $5,649 $183,652
Number of Bills CNB 9,411,468 7,381,416 859,188.00 125,004.00 5,160 456.00 120.00 9,900.00 1,030,224
Number of Devices CDEV 165,274
Number of Connections (Unmetered) CCON 103,999 91,819 12,180
Total Number of Customers CCA 784,280 615,118 71,599 10,417 430 38 1 825 85,852
Bulk Customer Base CCB -
Primary Customer Base CCP 802,785 615,118 71,599 10,417 430 38 18,506 825 85,852
Line Transformer Customer Base CCLT 800,327 615,118 71,599 8,333 94 - 18,506 825 85,852
Secondary Customer Base CCS 775,441 615,118 71,599 2,041 5 - 1 825 85,852
Weighted - Services CWCS 689,087 615,118 71,599 2,041 5 - - - 325
Weighted Meter -Capital CWMC 137,068,160 87,346,756 36,658,688 11,167,024 1,675,710 219,982 - - -
Weighted Meter Reading CWMR 9,715,948 7,381,416 988,066 1,211,289 124,201 10,976 - - -
Weighted Bills CWNB 11,415,791 7,381,416 2,319,808 625,020 30,444 3,055 84 25,740 1,030,224
Bad Debt Data
Historic Year: 2015 5,920,268 3,264,885 1,679,206 910,835 - 65,342
Historic Year: 2016 9,841,560 4,872,078 2,746,113 1,039,975 783,461 399,934
Historic Year: 2017 6,369,929 3,533,912 1,907,985 533,980 - 394,051
Three-year average 7,377,253 3,890,292 2,111,101 828,264 261,154 - - - 286,442
Street Lighting Adjustment Factors
NCP Test Results 4 NCP
Class
Customers/
Devices 4 NCP
Customers/
Devices 4 NCP
Residential 615,118 4,129,569 615,118 4,129,569
Street Light 165,274 124,238 165,274 124,238
Primary 8.9309
Line Transformer 8.9309
Street Lighting Adjustment Factors
Primary Asset Data Line Transformer Asset Data
Billing Data
EB-2018-0165
Ontario Energy Board
I6.2 Customer Data
Toronto Hydro-Electric System Limited
EB-2018-0165
Draft Rate Order
Schedule 15
UPDATED: February 12, 2020
Page 3 of 15
Sheet I8 Demand Data Worksheet -
12 CP
4 NCP
Indicator
CP 1
CP 4
CP 12
Indicator
NCP 1
NCP 4
NCP 12
1 2 4 5 6 7 9 10
Total Residential GS <50 GS - 50 to 999 GS - 1000 to
4999
Large Use
>5MW Street Light
Unmetered
Scattered Load
Competitive
Sector Multi-Unit
Residential
CP
Sanity Check Pass Pass Pass Check 4CP
Check 4CP and
12CP Check 12CP
Check 4CP and
12CP Pass
1 CP
Transformation CP TCP1 4,262,830 972,614 578,946 1,662,853 764,853 239,922 - 3,548 40,093
Bulk Delivery CP BCP1 4,262,830 972,614 578,946 1,662,853 764,853 239,922 - 3,548 40,093
Total Sytem CP DCP1 4,262,830 972,614 578,946 1,662,853 764,853 239,922 - 3,548 40,093
4 CP
Transformation CP TCP4 16,449,304 3,718,466 1,992,718 6,532,784 3,069,430 966,675 - 16,832 152,399
Bulk Delivery CP BCP4 16,449,304 3,718,466 1,992,718 6,532,784 3,069,430 966,675 - 16,832 152,399
Total Sytem CP DCP4 16,449,304 3,718,466 1,992,718 6,532,784 3,069,430 966,675 - 16,832 152,399
12 CP
Transformation CP TCP12 45,262,168 8,853,188 5,623,085 18,460,316 8,322,601 3,323,660 171,288 58,103 449,926
Bulk Delivery CP BCP12 45,262,168 8,853,188 5,623,085 18,460,316 8,322,601 3,323,660 171,288 58,103 449,926
Total Sytem CP DCP12 45,262,168 8,853,188 5,623,085 18,460,316 8,322,601 3,323,660 171,288 58,103 449,926
NCP
Sanity Check Pass Pass Pass Pass Pass Pass Pass Pass
1 NCP
Classification NCP from
Load Data Provider DNCP1 4,603,543 1,085,007 601,583 1,674,421 782,816 364,037 31,399 5,833 58,447
Primary NCP PNCP1 4,489,529 1,085,007 601,583 1,560,710 782,816 364,037 31,399 5,530 58,447
Line Transformer NCP LTNCP1 3,383,973 1,085,007 601,583 1,399,700 202,306 - 31,399 5,530 58,447
Secondary NCP SNCP1 2,218,380 1,085,007 601,583 419,910 16,504 - 31,399 5,530 58,447
4 NCP
Classification NCP from
Load Data Provider DNCP4 17,678,767 4,129,569 2,275,913 6,481,669 3,096,720 1,325,478 124,238 22,521 222,660
Primary NCP PNCP4 17,237,427 4,129,569 2,275,913 6,041,495 3,096,720 1,325,478 124,238 21,354 222,660
Line Transformer NCP LTNCP4 12,980,524 4,129,569 2,275,913 5,418,227 788,565 - 124,238 21,354 222,660
Secondary NCP SNCP4 8,464,488 4,129,569 2,275,913 1,625,468 65,287 - 124,238 21,354 222,660
12 NCP
Classification NCP from
Load Data Provider DNCP12 48,381,915 10,395,631 6,389,304 18,220,979 8,564,929 3,805,731 320,510 63,331 621,500
Primary NCP PNCP12 47,141,234 10,395,631 6,389,304 16,983,582 8,564,929 3,805,731 320,510 60,047 621,500
Line Transformer NCP LTNCP12 35,213,790 10,395,631 6,389,304 15,231,478 2,195,321 - 320,510 60,047 621,500
Secondary NCP SNCP12 22,537,005 10,395,631 6,389,304 4,569,443 180,571 - 320,510 60,047 621,500
Co-incident Peak
1 CP
EB-2018-0165
CP TEST RESULTS
NCP TEST RESULTS
4 CP
12 CP
Customer Classes
NON CO_INCIDENT PEAK
CO-INCIDENT PEAK
Non-co-incident Peak
1 NCP
4 NCP
12 NCP
This is an input sheet for demand allocators.
Ontario Energy Board
I8 Demand Data
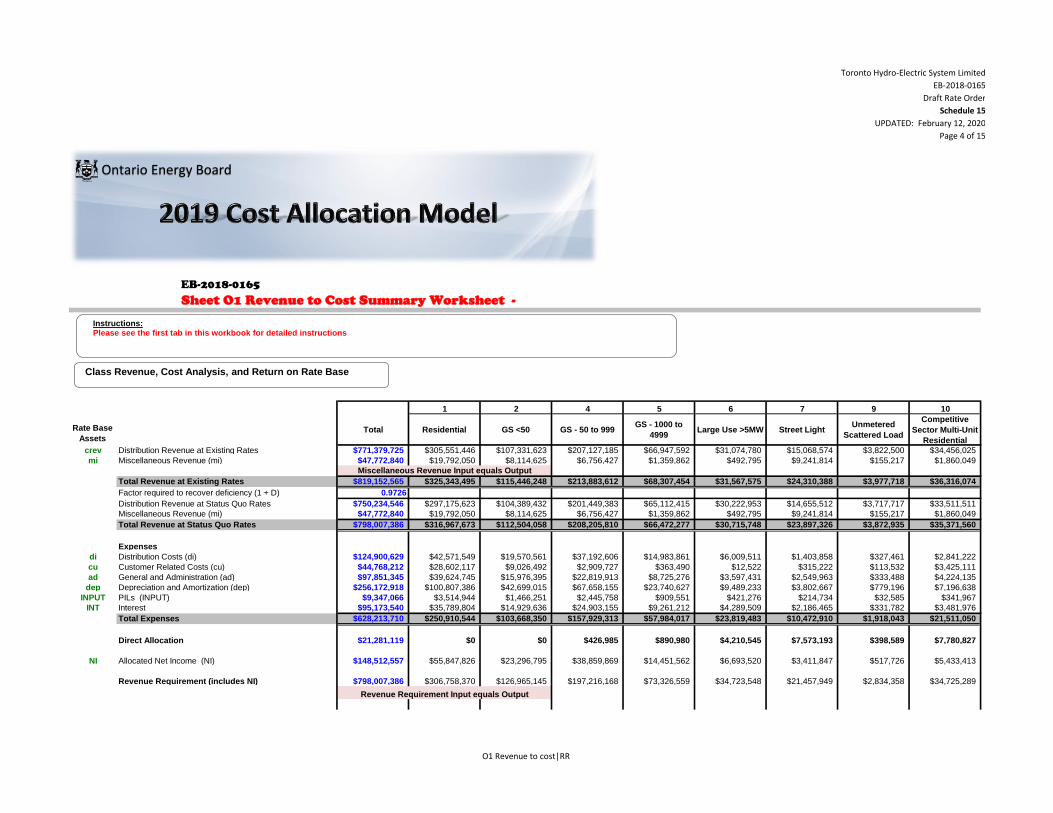
Toronto Hydro-Electric System Limited
EB-2018-0165
Draft Rate Order
Schedule 15
UPDATED: February 12, 2020
Page 4 of 15
Sheet O1 Revenue to Cost Summary Worksheet -
1 2 4 5 6 7 9 10
Rate Base
AssetsTotal Residential GS <50 GS - 50 to 999
GS - 1000 to
4999Large Use >5MW Street Light
Unmetered
Scattered Load
Competitive
Sector Multi-Unit
Residential
crev Distribution Revenue at Existing Rates $771,379,725 $305,551,446 $107,331,623 $207,127,185 $66,947,592 $31,074,780 $15,068,574 $3,822,500 $34,456,025
mi Miscellaneous Revenue (mi) $47,772,840 $19,792,050 $8,114,625 $6,756,427 $1,359,862 $492,795 $9,241,814 $155,217 $1,860,049
Total Revenue at Existing Rates $819,152,565 $325,343,495 $115,446,248 $213,883,612 $68,307,454 $31,567,575 $24,310,388 $3,977,718 $36,316,074
Factor required to recover deficiency (1 + D) 0.9726
Distribution Revenue at Status Quo Rates $750,234,546 $297,175,623 $104,389,432 $201,449,383 $65,112,415 $30,222,953 $14,655,512 $3,717,717 $33,511,511
Miscellaneous Revenue (mi) $47,772,840 $19,792,050 $8,114,625 $6,756,427 $1,359,862 $492,795 $9,241,814 $155,217 $1,860,049
Total Revenue at Status Quo Rates $798,007,386 $316,967,673 $112,504,058 $208,205,810 $66,472,277 $30,715,748 $23,897,326 $3,872,935 $35,371,560
Expenses
di Distribution Costs (di) $124,900,629 $42,571,549 $19,570,561 $37,192,606 $14,983,861 $6,009,511 $1,403,858 $327,461 $2,841,222
cu Customer Related Costs (cu) $44,768,212 $28,602,117 $9,026,492 $2,909,727 $363,490 $12,522 $315,222 $113,532 $3,425,111
ad General and Administration (ad) $97,851,345 $39,624,745 $15,976,395 $22,819,913 $8,725,276 $3,597,431 $2,549,963 $333,488 $4,224,135
dep Depreciation and Amortization (dep) $256,172,918 $100,807,386 $42,699,015 $67,658,155 $23,740,627 $9,489,233 $3,802,667 $779,196 $7,196,638
INPUT PILs (INPUT) $9,347,066 $3,514,944 $1,466,251 $2,445,758 $909,551 $421,276 $214,734 $32,585 $341,967
INT Interest $95,173,540 $35,789,804 $14,929,636 $24,903,155 $9,261,212 $4,289,509 $2,186,465 $331,782 $3,481,976
Total Expenses $628,213,710 $250,910,544 $103,668,350 $157,929,313 $57,984,017 $23,819,483 $10,472,910 $1,918,043 $21,511,050
Direct Allocation $21,281,119 $0 $0 $426,985 $890,980 $4,210,545 $7,573,193 $398,589 $7,780,827
NI Allocated Net Income (NI) $148,512,557 $55,847,826 $23,296,795 $38,859,869 $14,451,562 $6,693,520 $3,411,847 $517,726 $5,433,413
Revenue Requirement (includes NI) $798,007,386 $306,758,370 $126,965,145 $197,216,168 $73,326,559 $34,723,548 $21,457,949 $2,834,358 $34,725,289
EB-2018-0165
Revenue Requirement Input equals Output
Miscellaneous Revenue Input equals Output
Class Revenue, Cost Analysis, and Return on Rate Base
Instructions:Please see the first tab in this workbook for detailed instructions
Ontario Energy Board
O1 Revenue to cost|RR
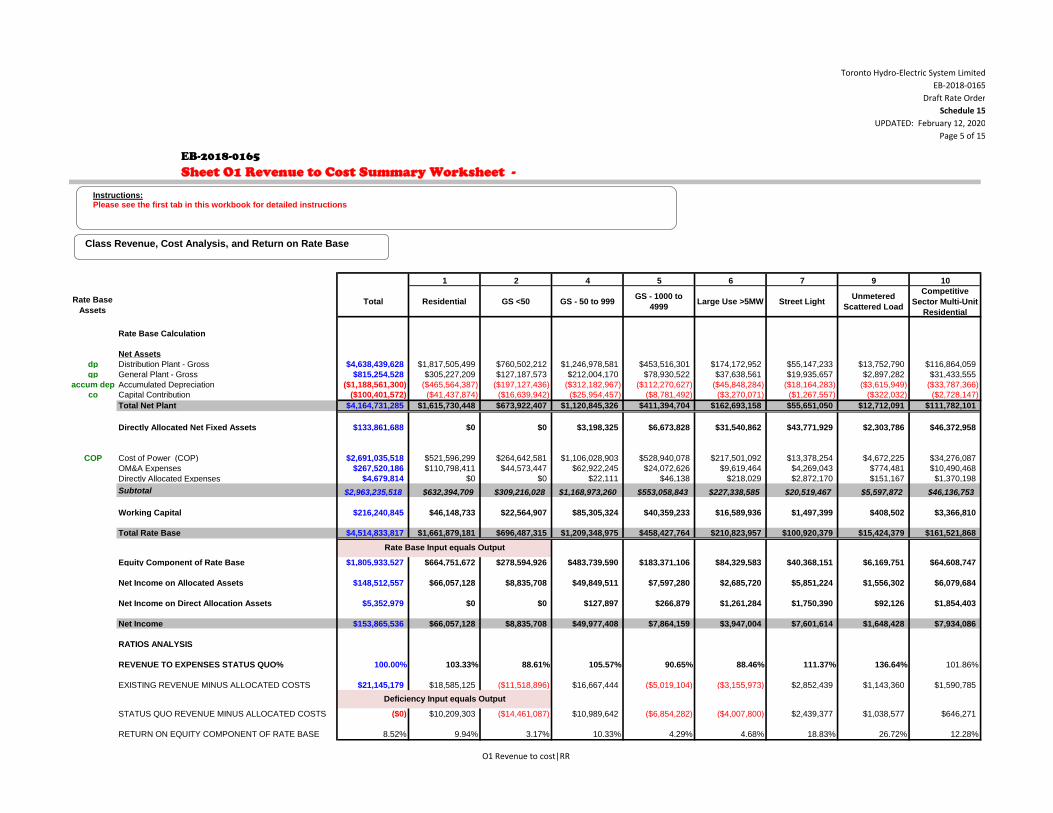
Toronto Hydro-Electric System Limited
EB-2018-0165
Draft Rate Order
Schedule 15
UPDATED: February 12, 2020
Page 5 of 15
Sheet O1 Revenue to Cost Summary Worksheet -
1 2 4 5 6 7 9 10
Rate Base
AssetsTotal Residential GS <50 GS - 50 to 999
GS - 1000 to
4999Large Use >5MW Street Light
Unmetered
Scattered Load
Competitive
Sector Multi-Unit
Residential
EB-2018-0165
Class Revenue, Cost Analysis, and Return on Rate Base
Instructions:Please see the first tab in this workbook for detailed instructions
Rate Base Calculation
Net Assets
dp Distribution Plant - Gross $4,638,439,628 $1,817,505,499 $760,502,212 $1,246,978,581 $453,516,301 $174,172,952 $55,147,233 $13,752,790 $116,864,059
gp General Plant - Gross $815,254,528 $305,227,209 $127,187,573 $212,004,170 $78,930,522 $37,638,561 $19,935,657 $2,897,282 $31,433,555
accum dep Accumulated Depreciation ($1,188,561,300) ($465,564,387) ($197,127,436) ($312,182,967) ($112,270,627) ($45,848,284) ($18,164,283) ($3,615,949) ($33,787,366)
co Capital Contribution ($100,401,572) ($41,437,874) ($16,639,942) ($25,954,457) ($8,781,492) ($3,270,071) ($1,267,557) ($322,032) ($2,728,147)
Total Net Plant $4,164,731,285 $1,615,730,448 $673,922,407 $1,120,845,326 $411,394,704 $162,693,158 $55,651,050 $12,712,091 $111,782,101
Directly Allocated Net Fixed Assets $133,861,688 $0 $0 $3,198,325 $6,673,828 $31,540,862 $43,771,929 $2,303,786 $46,372,958
COP Cost of Power (COP) $2,691,035,518 $521,596,299 $264,642,581 $1,106,028,903 $528,940,078 $217,501,092 $13,378,254 $4,672,225 $34,276,087
OM&A Expenses $267,520,186 $110,798,411 $44,573,447 $62,922,245 $24,072,626 $9,619,464 $4,269,043 $774,481 $10,490,468
Directly Allocated Expenses $4,679,814 $0 $0 $22,111 $46,138 $218,029 $2,872,170 $151,167 $1,370,198
Subtotal $2,963,235,518 $632,394,709 $309,216,028 $1,168,973,260 $553,058,843 $227,338,585 $20,519,467 $5,597,872 $46,136,753
Working Capital $216,240,845 $46,148,733 $22,564,907 $85,305,324 $40,359,233 $16,589,936 $1,497,399 $408,502 $3,366,810
Total Rate Base $4,514,833,817 $1,661,879,181 $696,487,315 $1,209,348,975 $458,427,764 $210,823,957 $100,920,379 $15,424,379 $161,521,868
Equity Component of Rate Base $1,805,933,527 $664,751,672 $278,594,926 $483,739,590 $183,371,106 $84,329,583 $40,368,151 $6,169,751 $64,608,747
Net Income on Allocated Assets $148,512,557 $66,057,128 $8,835,708 $49,849,511 $7,597,280 $2,685,720 $5,851,224 $1,556,302 $6,079,684
Net Income on Direct Allocation Assets $5,352,979 $0 $0 $127,897 $266,879 $1,261,284 $1,750,390 $92,126 $1,854,403
Net Income $153,865,536 $66,057,128 $8,835,708 $49,977,408 $7,864,159 $3,947,004 $7,601,614 $1,648,428 $7,934,086
RATIOS ANALYSIS
REVENUE TO EXPENSES STATUS QUO% 100.00% 103.33% 88.61% 105.57% 90.65% 88.46% 111.37% 136.64% 101.86%
EXISTING REVENUE MINUS ALLOCATED COSTS $21,145,179 $18,585,125 ($11,518,896) $16,667,444 ($5,019,104) ($3,155,973) $2,852,439 $1,143,360 $1,590,785
STATUS QUO REVENUE MINUS ALLOCATED COSTS ($0) $10,209,303 ($14,461,087) $10,989,642 ($6,854,282) ($4,007,800) $2,439,377 $1,038,577 $646,271
RETURN ON EQUITY COMPONENT OF RATE BASE 8.52% 9.94% 3.17% 10.33% 4.29% 4.68% 18.83% 26.72% 12.28%
Deficiency Input equals Output
Rate Base Input equals Output
O1 Revenue to cost|RR
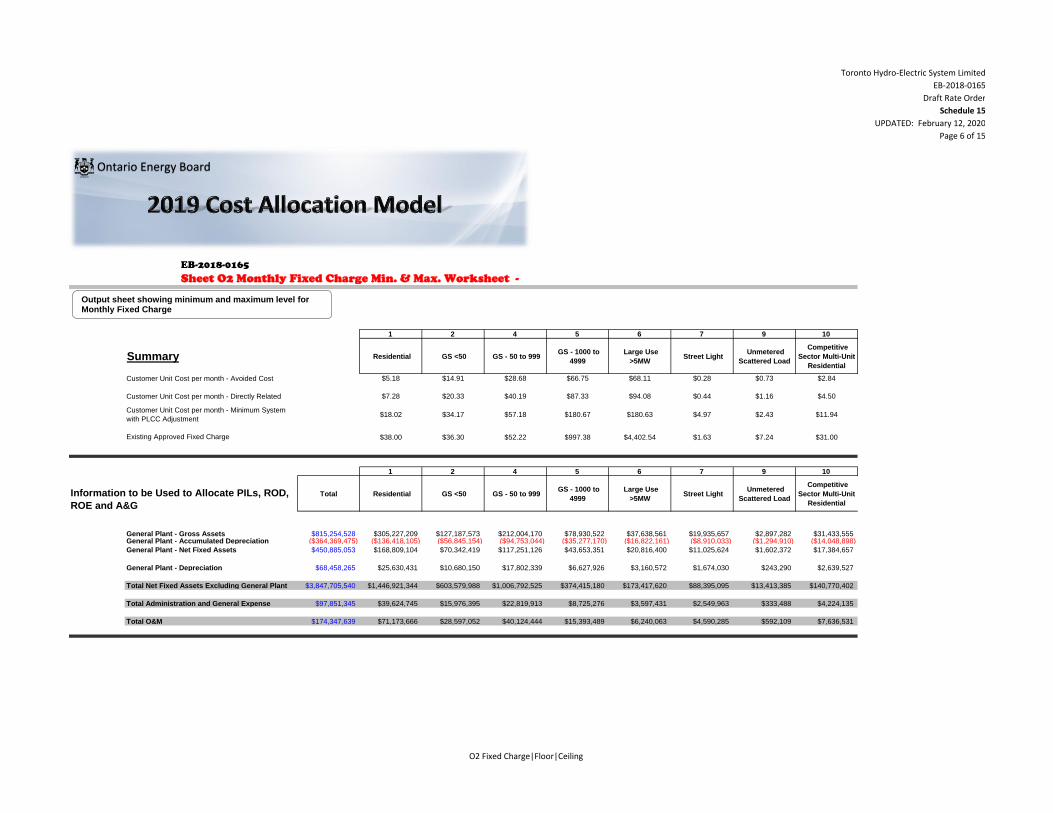
Toronto Hydro-Electric System Limited
EB-2018-0165
Draft Rate Order
Schedule 15
UPDATED: February 12, 2020
Page 6 of 15
Sheet O2 Monthly Fixed Charge Min. & Max. Worksheet -
1 2 4 5 6 7 9 10
Summary Residential GS <50 GS - 50 to 999 GS - 1000 to
4999
Large Use
>5MW Street Light
Unmetered
Scattered Load
Competitive
Sector Multi-Unit
Residential
Customer Unit Cost per month - Avoided Cost $5.18 $14.91 $28.68 $66.75 $68.11 $0.28 $0.73 $2.84
Customer Unit Cost per month - Directly Related $7.28 $20.33 $40.19 $87.33 $94.08 $0.44 $1.16 $4.50
Customer Unit Cost per month - Minimum System
with PLCC Adjustment $18.02 $34.17 $57.18 $180.67 $180.63 $4.97 $2.43 $11.94
Existing Approved Fixed Charge $38.00 $36.30 $52.22 $997.38 $4,402.54 $1.63 $7.24 $31.00
1 2 4 5 6 7 9 10
Total Residential GS <50 GS - 50 to 999 GS - 1000 to
4999
Large Use
>5MW Street Light
Unmetered
Scattered Load
Competitive
Sector Multi-Unit
Residential
General Plant - Gross Assets $815,254,528 $305,227,209 $127,187,573 $212,004,170 $78,930,522 $37,638,561 $19,935,657 $2,897,282 $31,433,555General Plant - Accumulated Depreciation ($364,369,475) ($136,418,105) ($56,845,154) ($94,753,044) ($35,277,170) ($16,822,161) ($8,910,033) ($1,294,910) ($14,048,898)
General Plant - Net Fixed Assets $450,885,053 $168,809,104 $70,342,419 $117,251,126 $43,653,351 $20,816,400 $11,025,624 $1,602,372 $17,384,657
General Plant - Depreciation $68,458,265 $25,630,431 $10,680,150 $17,802,339 $6,627,926 $3,160,572 $1,674,030 $243,290 $2,639,527
Total Net Fixed Assets Excluding General Plant $3,847,705,540 $1,446,921,344 $603,579,988 $1,006,792,525 $374,415,180 $173,417,620 $88,395,095 $13,413,385 $140,770,402
Total Administration and General Expense $97,851,345 $39,624,745 $15,976,395 $22,819,913 $8,725,276 $3,597,431 $2,549,963 $333,488 $4,224,135
Total O&M $174,347,639 $71,173,666 $28,597,052 $40,124,444 $15,393,489 $6,240,063 $4,590,285 $592,109 $7,636,531
EB-2018-0165
Information to be Used to Allocate PILs, ROD,
ROE and A&G
Output sheet showing minimum and maximum level for Monthly Fixed Charge
Ontario Energy Board
O2 Fixed Charge|Floor|Ceiling
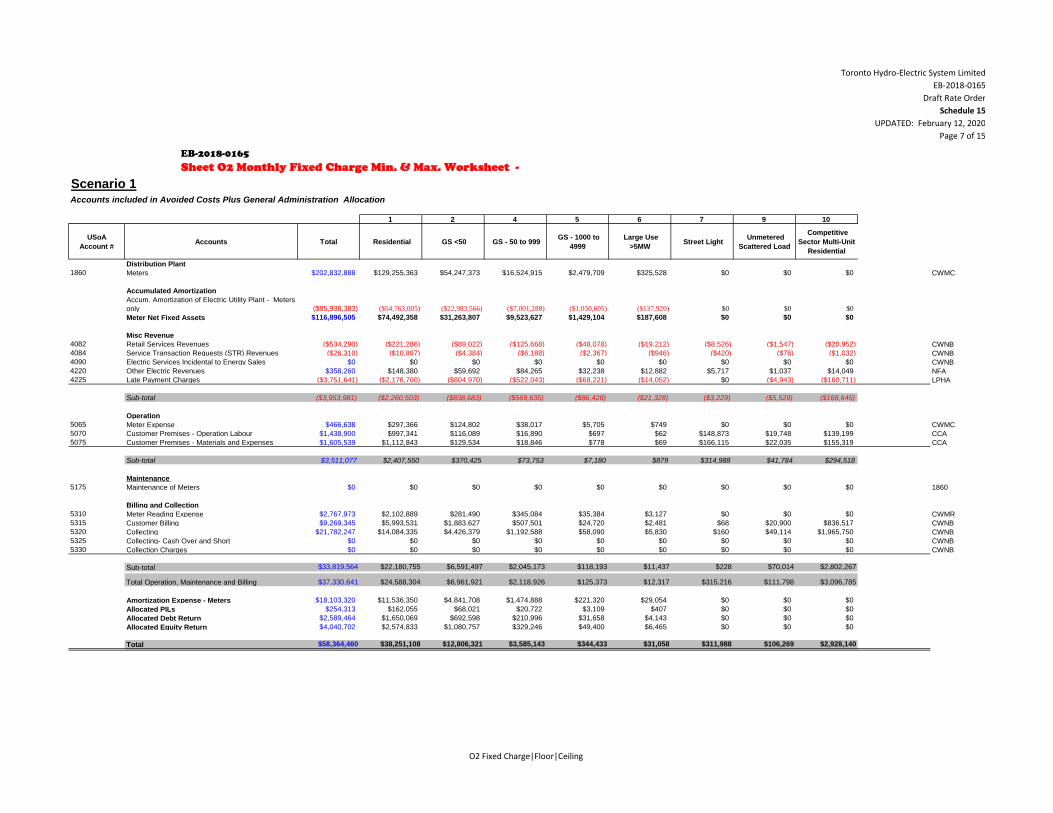
Toronto Hydro-Electric System Limited
EB-2018-0165
Draft Rate Order
Schedule 15
UPDATED: February 12, 2020
Page 7 of 15
Sheet O2 Monthly Fixed Charge Min. & Max. Worksheet -
EB-2018-0165
Accounts included in Avoided Costs Plus General Administration Allocation
1 2 4 5 6 7 9 10
USoA
Account #Accounts Total Residential GS <50 GS - 50 to 999
GS - 1000 to
4999
Large Use
>5MW Street Light
Unmetered
Scattered Load
Competitive
Sector Multi-Unit
Residential
Distribution Plant
1860 Meters $202,832,888 $129,255,363 $54,247,373 $16,524,915 $2,479,709 $325,528 $0 $0 $0 CWMC
Accumulated Amortization
Accum. Amortization of Electric Utility Plant - Meters
only ($85,936,383) ($54,763,005) ($22,983,566) ($7,001,288) ($1,050,605) ($137,920) $0 $0 $0
Meter Net Fixed Assets $116,896,505 $74,492,358 $31,263,807 $9,523,627 $1,429,104 $187,608 $0 $0 $0
Misc Revenue
4082 Retail Services Revenues ($534,290) ($221,286) ($89,022) ($125,668) ($48,078) ($19,212) ($8,526) ($1,547) ($20,952) CWNB
4084 Service Transaction Requests (STR) Revenues ($26,310) ($10,897) ($4,384) ($6,188) ($2,367) ($946) ($420) ($76) ($1,032) CWNB
4090 Electric Services Incidental to Energy Sales $0 $0 $0 $0 $0 $0 $0 $0 $0 CWNB
4220 Other Electric Revenues $358,260 $148,380 $59,692 $84,265 $32,238 $12,882 $5,717 $1,037 $14,049 NFA
4225 Late Payment Charges ($3,751,641) ($2,176,700) ($804,970) ($522,043) ($68,221) ($14,052) $0 ($4,943) ($160,711) LPHA
Sub-total ($3,953,981) ($2,260,503) ($838,683) ($569,635) ($86,428) ($21,328) ($3,229) ($5,529) ($168,645)
Operation
5065 Meter Expense $466,638 $297,366 $124,802 $38,017 $5,705 $749 $0 $0 $0 CWMC
5070 Customer Premises - Operation Labour $1,438,900 $997,341 $116,089 $16,890 $697 $62 $148,873 $19,748 $139,199 CCA
5075 Customer Premises - Materials and Expenses $1,605,539 $1,112,843 $129,534 $18,846 $778 $69 $166,115 $22,035 $155,319 CCA
Sub-total $3,511,077 $2,407,550 $370,425 $73,753 $7,180 $879 $314,988 $41,784 $294,518
Maintenance
5175 Maintenance of Meters $0 $0 $0 $0 $0 $0 $0 $0 $0 1860
Billing and Collection
5310 Meter Reading Expense $2,767,973 $2,102,889 $281,490 $345,084 $35,384 $3,127 $0 $0 $0 CWMR
5315 Customer Billing $9,269,345 $5,993,531 $1,883,627 $507,501 $24,720 $2,481 $68 $20,900 $836,517 CWNB
5320 Collecting $21,782,247 $14,084,335 $4,426,379 $1,192,588 $58,090 $5,830 $160 $49,114 $1,965,750 CWNB
5325 Collecting- Cash Over and Short $0 $0 $0 $0 $0 $0 $0 $0 $0 CWNB
5330 Collection Charges $0 $0 $0 $0 $0 $0 $0 $0 $0 CWNB
Sub-total $33,819,564 $22,180,755 $6,591,497 $2,045,173 $118,193 $11,437 $228 $70,014 $2,802,267
Total Operation, Maintenance and Billing $37,330,641 $24,588,304 $6,961,921 $2,118,926 $125,373 $12,317 $315,216 $111,798 $3,096,785
Amortization Expense - Meters $18,103,320 $11,536,350 $4,841,708 $1,474,888 $221,320 $29,054 $0 $0 $0
Allocated PILs $254,313 $162,055 $68,021 $20,722 $3,109 $407 $0 $0 $0
Allocated Debt Return $2,589,464 $1,650,069 $692,598 $210,996 $31,658 $4,143 $0 $0 $0
Allocated Equity Return $4,040,702 $2,574,833 $1,080,757 $329,246 $49,400 $6,465 $0 $0 $0
Total $58,364,460 $38,251,108 $12,806,321 $3,585,143 $344,433 $31,058 $311,988 $106,269 $2,928,140
Scenario 1
O2 Fixed Charge|Floor|Ceiling
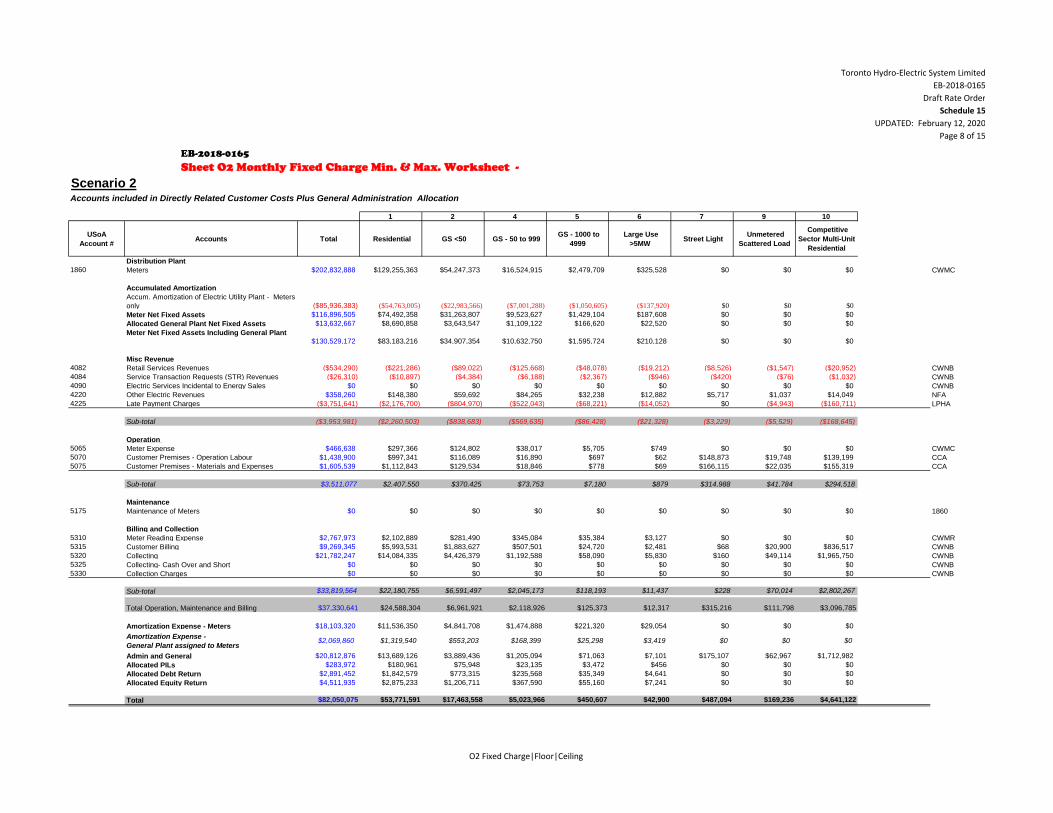
Toronto Hydro-Electric System Limited
EB-2018-0165
Draft Rate Order
Schedule 15
UPDATED: February 12, 2020
Page 8 of 15
Sheet O2 Monthly Fixed Charge Min. & Max. Worksheet -
EB-2018-0165
Accounts included in Directly Related Customer Costs Plus General Administration Allocation
1 2 4 5 6 7 9 10
USoA
Account #Accounts Total Residential GS <50 GS - 50 to 999
GS - 1000 to
4999
Large Use
>5MW Street Light
Unmetered
Scattered Load
Competitive
Sector Multi-Unit
Residential
Distribution Plant
1860 Meters $202,832,888 $129,255,363 $54,247,373 $16,524,915 $2,479,709 $325,528 $0 $0 $0 CWMC
Accumulated Amortization
Accum. Amortization of Electric Utility Plant - Meters
only ($85,936,383) ($54,763,005) ($22,983,566) ($7,001,288) ($1,050,605) ($137,920) $0 $0 $0
Meter Net Fixed Assets $116,896,505 $74,492,358 $31,263,807 $9,523,627 $1,429,104 $187,608 $0 $0 $0
Allocated General Plant Net Fixed Assets $13,632,667 $8,690,858 $3,643,547 $1,109,122 $166,620 $22,520 $0 $0 $0
Meter Net Fixed Assets Including General Plant
$130,529,172 $83,183,216 $34,907,354 $10,632,750 $1,595,724 $210,128 $0 $0 $0
Misc Revenue
4082 Retail Services Revenues ($534,290) ($221,286) ($89,022) ($125,668) ($48,078) ($19,212) ($8,526) ($1,547) ($20,952) CWNB
4084 Service Transaction Requests (STR) Revenues ($26,310) ($10,897) ($4,384) ($6,188) ($2,367) ($946) ($420) ($76) ($1,032) CWNB
4090 Electric Services Incidental to Energy Sales $0 $0 $0 $0 $0 $0 $0 $0 $0 CWNB
4220 Other Electric Revenues $358,260 $148,380 $59,692 $84,265 $32,238 $12,882 $5,717 $1,037 $14,049 NFA
4225 Late Payment Charges ($3,751,641) ($2,176,700) ($804,970) ($522,043) ($68,221) ($14,052) $0 ($4,943) ($160,711) LPHA
Sub-total ($3,953,981) ($2,260,503) ($838,683) ($569,635) ($86,428) ($21,328) ($3,229) ($5,529) ($168,645)
Operation
5065 Meter Expense $466,638 $297,366 $124,802 $38,017 $5,705 $749 $0 $0 $0 CWMC
5070 Customer Premises - Operation Labour $1,438,900 $997,341 $116,089 $16,890 $697 $62 $148,873 $19,748 $139,199 CCA
5075 Customer Premises - Materials and Expenses $1,605,539 $1,112,843 $129,534 $18,846 $778 $69 $166,115 $22,035 $155,319 CCA
Sub-total $3,511,077 $2,407,550 $370,425 $73,753 $7,180 $879 $314,988 $41,784 $294,518
Maintenance
5175 Maintenance of Meters $0 $0 $0 $0 $0 $0 $0 $0 $0 1860
Billing and Collection
5310 Meter Reading Expense $2,767,973 $2,102,889 $281,490 $345,084 $35,384 $3,127 $0 $0 $0 CWMR
5315 Customer Billing $9,269,345 $5,993,531 $1,883,627 $507,501 $24,720 $2,481 $68 $20,900 $836,517 CWNB
5320 Collecting $21,782,247 $14,084,335 $4,426,379 $1,192,588 $58,090 $5,830 $160 $49,114 $1,965,750 CWNB
5325 Collecting- Cash Over and Short $0 $0 $0 $0 $0 $0 $0 $0 $0 CWNB
5330 Collection Charges $0 $0 $0 $0 $0 $0 $0 $0 $0 CWNB
Sub-total $33,819,564 $22,180,755 $6,591,497 $2,045,173 $118,193 $11,437 $228 $70,014 $2,802,267
Total Operation, Maintenance and Billing $37,330,641 $24,588,304 $6,961,921 $2,118,926 $125,373 $12,317 $315,216 $111,798 $3,096,785
Amortization Expense - Meters $18,103,320 $11,536,350 $4,841,708 $1,474,888 $221,320 $29,054 $0 $0 $0
Amortization Expense -
General Plant assigned to Meters$2,069,860 $1,319,540 $553,203 $168,399 $25,298 $3,419 $0 $0 $0
Admin and General $20,812,876 $13,689,126 $3,889,436 $1,205,094 $71,063 $7,101 $175,107 $62,967 $1,712,982
Allocated PILs $283,972 $180,961 $75,948 $23,135 $3,472 $456 $0 $0 $0
Allocated Debt Return $2,891,452 $1,842,579 $773,315 $235,568 $35,349 $4,641 $0 $0 $0
Allocated Equity Return $4,511,935 $2,875,233 $1,206,711 $367,590 $55,160 $7,241 $0 $0 $0
Total $82,050,075 $53,771,591 $17,463,558 $5,023,966 $450,607 $42,900 $487,094 $169,236 $4,641,122
Scenario 2
O2 Fixed Charge|Floor|Ceiling
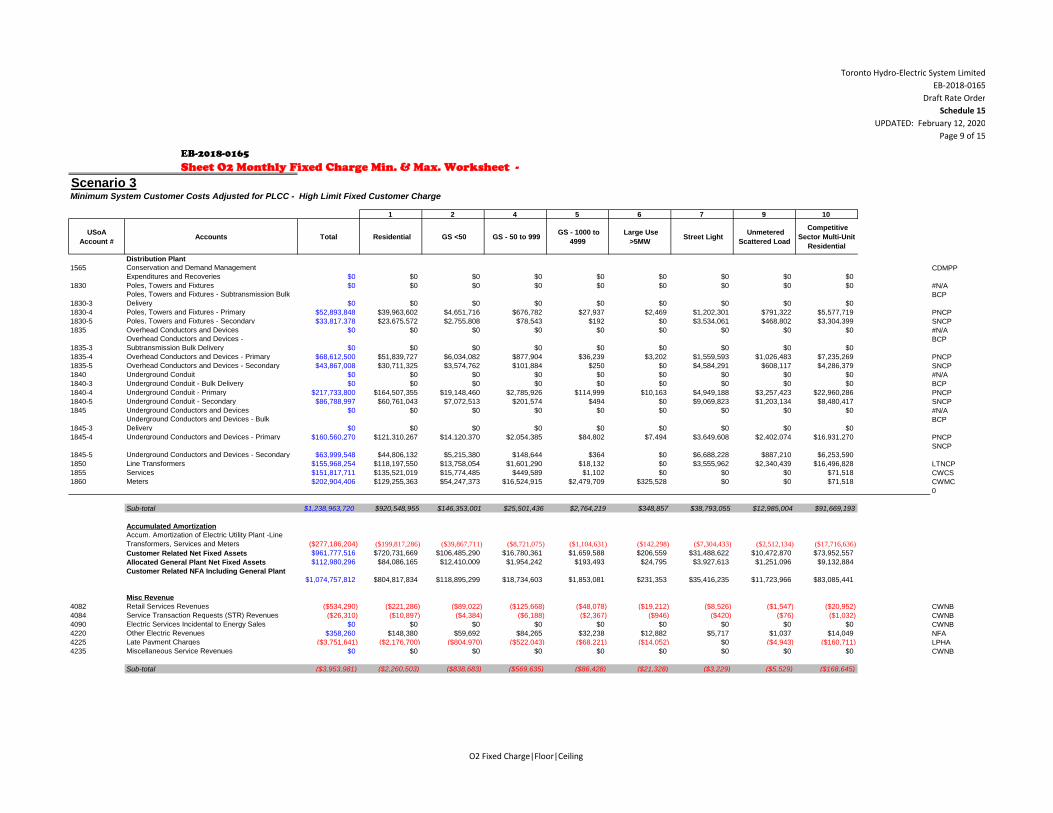
Toronto Hydro-Electric System Limited
EB-2018-0165
Draft Rate Order
Schedule 15
UPDATED: February 12, 2020
Page 9 of 15
Sheet O2 Monthly Fixed Charge Min. & Max. Worksheet -
EB-2018-0165
Minimum System Customer Costs Adjusted for PLCC - High Limit Fixed Customer Charge
1 2 4 5 6 7 9 10
USoA
Account #Accounts Total Residential GS <50 GS - 50 to 999
GS - 1000 to
4999
Large Use
>5MW Street Light
Unmetered
Scattered Load
Competitive
Sector Multi-Unit
Residential
Distribution Plant
1565 Conservation and Demand Management
Expenditures and Recoveries $0 $0 $0 $0 $0 $0 $0 $0 $0
CDMPP
1830 Poles, Towers and Fixtures $0 $0 $0 $0 $0 $0 $0 $0 $0 #N/A
1830-3
Poles, Towers and Fixtures - Subtransmission Bulk
Delivery $0 $0 $0 $0 $0 $0 $0 $0 $0
BCP
1830-4 Poles, Towers and Fixtures - Primary $52,893,848 $39,963,602 $4,651,716 $676,782 $27,937 $2,469 $1,202,301 $791,322 $5,577,719 PNCP
1830-5 Poles, Towers and Fixtures - Secondary $33,817,378 $23,675,572 $2,755,808 $78,543 $192 $0 $3,534,061 $468,802 $3,304,399 SNCP
1835 Overhead Conductors and Devices $0 $0 $0 $0 $0 $0 $0 $0 $0 #N/A
1835-3
Overhead Conductors and Devices -
Subtransmission Bulk Delivery $0 $0 $0 $0 $0 $0 $0 $0 $0
BCP
1835-4 Overhead Conductors and Devices - Primary $68,612,500 $51,839,727 $6,034,082 $877,904 $36,239 $3,202 $1,559,593 $1,026,483 $7,235,269 PNCP
1835-5 Overhead Conductors and Devices - Secondary $43,867,008 $30,711,325 $3,574,762 $101,884 $250 $0 $4,584,291 $608,117 $4,286,379 SNCP
1840 Underground Conduit $0 $0 $0 $0 $0 $0 $0 $0 $0 #N/A
1840-3 Underground Conduit - Bulk Delivery $0 $0 $0 $0 $0 $0 $0 $0 $0 BCP
1840-4 Underground Conduit - Primary $217,733,800 $164,507,355 $19,148,460 $2,785,926 $114,999 $10,163 $4,949,188 $3,257,423 $22,960,286 PNCP
1840-5 Underground Conduit - Secondary $86,788,997 $60,761,043 $7,072,513 $201,574 $494 $0 $9,069,823 $1,203,134 $8,480,417 SNCP
1845 Underground Conductors and Devices $0 $0 $0 $0 $0 $0 $0 $0 $0 #N/A
1845-3
Underground Conductors and Devices - Bulk
Delivery $0 $0 $0 $0 $0 $0 $0 $0 $0
BCP
1845-4 Underground Conductors and Devices - Primary $160,560,270 $121,310,267 $14,120,370 $2,054,385 $84,802 $7,494 $3,649,608 $2,402,074 $16,931,270 PNCP
1845-5 Underground Conductors and Devices - Secondary $63,999,548 $44,806,132 $5,215,380 $148,644 $364 $0 $6,688,228 $887,210 $6,253,590
SNCP
1850 Line Transformers $155,968,254 $118,197,550 $13,758,054 $1,601,290 $18,132 $0 $3,555,962 $2,340,439 $16,496,828 LTNCP
1855 Services $151,817,711 $135,521,019 $15,774,485 $449,589 $1,102 $0 $0 $0 $71,518 CWCS
1860 Meters $202,904,406 $129,255,363 $54,247,373 $16,524,915 $2,479,709 $325,528 $0 $0 $71,518 CWMC
0
Sub-total $1,238,963,720 $920,548,955 $146,353,001 $25,501,436 $2,764,219 $348,857 $38,793,055 $12,985,004 $91,669,193
Accumulated Amortization
Accum. Amortization of Electric Utility Plant -Line
Transformers, Services and Meters ($277,186,204) ($199,817,286) ($39,867,711) ($8,721,075) ($1,104,631) ($142,298) ($7,304,433) ($2,512,134) ($17,716,636)
Customer Related Net Fixed Assets $961,777,516 $720,731,669 $106,485,290 $16,780,361 $1,659,588 $206,559 $31,488,622 $10,472,870 $73,952,557
Allocated General Plant Net Fixed Assets $112,980,296 $84,086,165 $12,410,009 $1,954,242 $193,493 $24,795 $3,927,613 $1,251,096 $9,132,884
Customer Related NFA Including General Plant
$1,074,757,812 $804,817,834 $118,895,299 $18,734,603 $1,853,081 $231,353 $35,416,235 $11,723,966 $83,085,441
Misc Revenue
4082 Retail Services Revenues ($534,290) ($221,286) ($89,022) ($125,668) ($48,078) ($19,212) ($8,526) ($1,547) ($20,952) CWNB
4084 Service Transaction Requests (STR) Revenues ($26,310) ($10,897) ($4,384) ($6,188) ($2,367) ($946) ($420) ($76) ($1,032) CWNB
4090 Electric Services Incidental to Energy Sales $0 $0 $0 $0 $0 $0 $0 $0 $0 CWNB
4220 Other Electric Revenues $358,260 $148,380 $59,692 $84,265 $32,238 $12,882 $5,717 $1,037 $14,049 NFA
4225 Late Payment Charges ($3,751,641) ($2,176,700) ($804,970) ($522,043) ($68,221) ($14,052) $0 ($4,943) ($160,711) LPHA
4235 Miscellaneous Service Revenues $0 $0 $0 $0 $0 $0 $0 $0 $0 CWNB
Sub-total ($3,953,981) ($2,260,503) ($838,683) ($569,635) ($86,428) ($21,328) ($3,229) ($5,529) ($168,645)
Scenario 3
O2 Fixed Charge|Floor|Ceiling
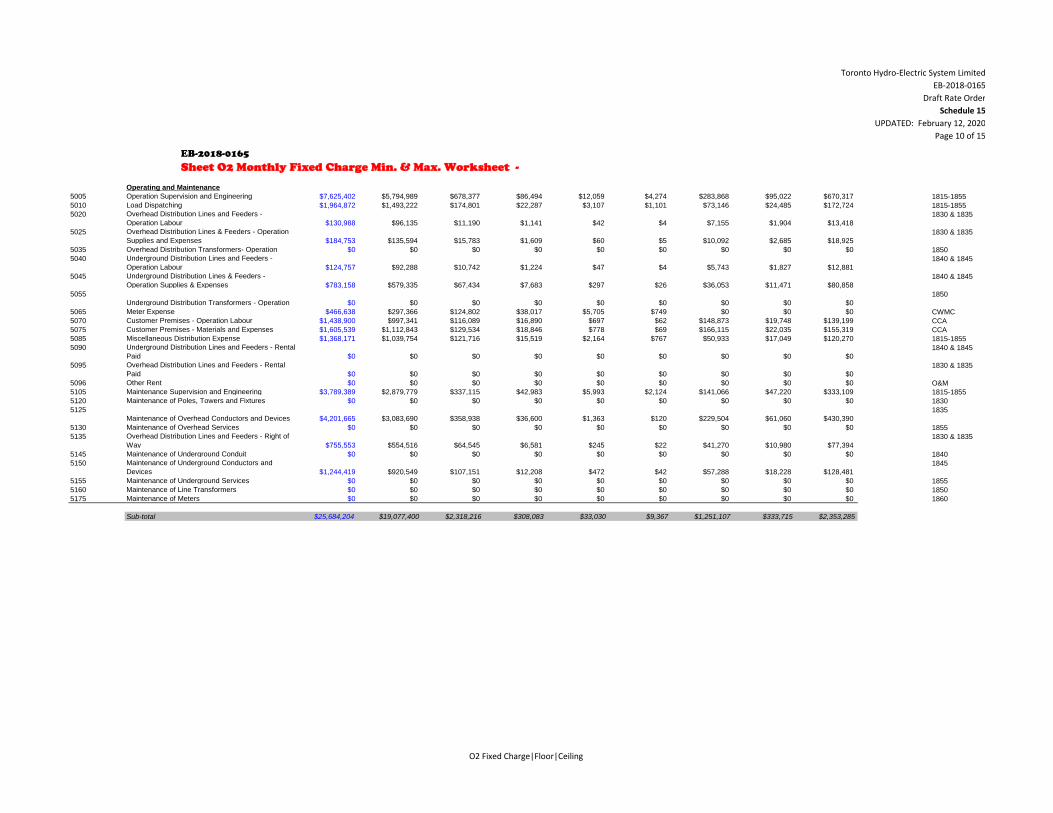
Toronto Hydro-Electric System Limited
EB-2018-0165
Draft Rate Order
Schedule 15
UPDATED: February 12, 2020
Page 10 of 15
Sheet O2 Monthly Fixed Charge Min. & Max. Worksheet -
EB-2018-0165
Operating and Maintenance
5005 Operation Supervision and Engineering $7,625,402 $5,794,989 $678,377 $86,494 $12,059 $4,274 $283,868 $95,022 $670,317 1815-1855
5010 Load Dispatching $1,964,872 $1,493,222 $174,801 $22,287 $3,107 $1,101 $73,146 $24,485 $172,724 1815-1855
5020 Overhead Distribution Lines and Feeders -
Operation Labour $130,988 $96,135 $11,190 $1,141 $42 $4 $7,155 $1,904 $13,418
1830 & 1835
5025 Overhead Distribution Lines & Feeders - Operation
Supplies and Expenses $184,753 $135,594 $15,783 $1,609 $60 $5 $10,092 $2,685 $18,925
1830 & 1835
5035 Overhead Distribution Transformers- Operation $0 $0 $0 $0 $0 $0 $0 $0 $0 1850
5040 Underground Distribution Lines and Feeders -
Operation Labour $124,757 $92,288 $10,742 $1,224 $47 $4 $5,743 $1,827 $12,881
1840 & 1845
5045 Underground Distribution Lines & Feeders -
Operation Supplies & Expenses $783,158 $579,335 $67,434 $7,683 $297 $26 $36,053 $11,471 $80,858
1840 & 1845
5055
Underground Distribution Transformers - Operation $0 $0 $0 $0 $0 $0 $0 $0 $0
1850
5065 Meter Expense $466,638 $297,366 $124,802 $38,017 $5,705 $749 $0 $0 $0 CWMC
5070 Customer Premises - Operation Labour $1,438,900 $997,341 $116,089 $16,890 $697 $62 $148,873 $19,748 $139,199 CCA
5075 Customer Premises - Materials and Expenses $1,605,539 $1,112,843 $129,534 $18,846 $778 $69 $166,115 $22,035 $155,319 CCA
5085 Miscellaneous Distribution Expense $1,368,171 $1,039,754 $121,716 $15,519 $2,164 $767 $50,933 $17,049 $120,270 1815-1855
5090 Underground Distribution Lines and Feeders - Rental
Paid $0 $0 $0 $0 $0 $0 $0 $0 $0
1840 & 1845
5095 Overhead Distribution Lines and Feeders - Rental
Paid $0 $0 $0 $0 $0 $0 $0 $0 $0
1830 & 1835
5096 Other Rent $0 $0 $0 $0 $0 $0 $0 $0 $0 O&M
5105 Maintenance Supervision and Engineering $3,789,389 $2,879,779 $337,115 $42,983 $5,993 $2,124 $141,066 $47,220 $333,109 1815-1855
5120 Maintenance of Poles, Towers and Fixtures $0 $0 $0 $0 $0 $0 $0 $0 $0 1830
5125
Maintenance of Overhead Conductors and Devices $4,201,665 $3,083,690 $358,938 $36,600 $1,363 $120 $229,504 $61,060 $430,390
1835
5130 Maintenance of Overhead Services $0 $0 $0 $0 $0 $0 $0 $0 $0 1855
5135 Overhead Distribution Lines and Feeders - Right of
Way $755,553 $554,516 $64,545 $6,581 $245 $22 $41,270 $10,980 $77,394
1830 & 1835
5145 Maintenance of Underground Conduit $0 $0 $0 $0 $0 $0 $0 $0 $0 1840
5150 Maintenance of Underground Conductors and
Devices $1,244,419 $920,549 $107,151 $12,208 $472 $42 $57,288 $18,228 $128,481
1845
5155 Maintenance of Underground Services $0 $0 $0 $0 $0 $0 $0 $0 $0 1855
5160 Maintenance of Line Transformers $0 $0 $0 $0 $0 $0 $0 $0 $0 1850
5175 Maintenance of Meters $0 $0 $0 $0 $0 $0 $0 $0 $0 1860
Sub-total $25,684,204 $19,077,400 $2,318,216 $308,083 $33,030 $9,367 $1,251,107 $333,715 $2,353,285
O2 Fixed Charge|Floor|Ceiling
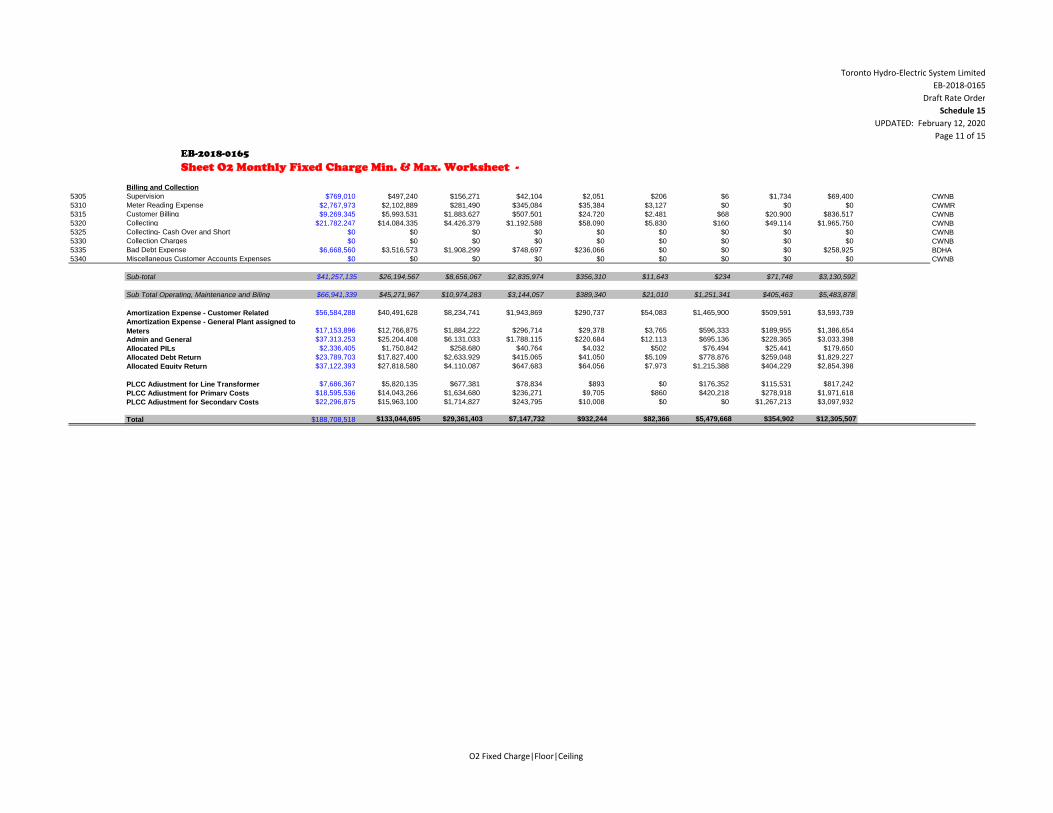
Toronto Hydro-Electric System Limited
EB-2018-0165
Draft Rate Order
Schedule 15
UPDATED: February 12, 2020
Page 11 of 15
Sheet O2 Monthly Fixed Charge Min. & Max. Worksheet -
EB-2018-0165
Billing and Collection
5305 Supervision $769,010 $497,240 $156,271 $42,104 $2,051 $206 $6 $1,734 $69,400 CWNB
5310 Meter Reading Expense $2,767,973 $2,102,889 $281,490 $345,084 $35,384 $3,127 $0 $0 $0 CWMR
5315 Customer Billing $9,269,345 $5,993,531 $1,883,627 $507,501 $24,720 $2,481 $68 $20,900 $836,517 CWNB
5320 Collecting $21,782,247 $14,084,335 $4,426,379 $1,192,588 $58,090 $5,830 $160 $49,114 $1,965,750 CWNB
5325 Collecting- Cash Over and Short $0 $0 $0 $0 $0 $0 $0 $0 $0 CWNB
5330 Collection Charges $0 $0 $0 $0 $0 $0 $0 $0 $0 CWNB
5335 Bad Debt Expense $6,668,560 $3,516,573 $1,908,299 $748,697 $236,066 $0 $0 $0 $258,925 BDHA
5340 Miscellaneous Customer Accounts Expenses $0 $0 $0 $0 $0 $0 $0 $0 $0 CWNB
Sub-total $41,257,135 $26,194,567 $8,656,067 $2,835,974 $356,310 $11,643 $234 $71,748 $3,130,592
Sub Total Operating, Maintenance and Biling $66,941,339 $45,271,967 $10,974,283 $3,144,057 $389,340 $21,010 $1,251,341 $405,463 $5,483,878
Amortization Expense - Customer Related $56,584,288 $40,491,628 $8,234,741 $1,943,869 $290,737 $54,083 $1,465,900 $509,591 $3,593,739
Amortization Expense - General Plant assigned to
Meters $17,153,896 $12,766,875 $1,884,222 $296,714 $29,378 $3,765 $596,333 $189,955 $1,386,654
Admin and General $37,313,253 $25,204,408 $6,131,033 $1,788,115 $220,684 $12,113 $695,136 $228,365 $3,033,398
Allocated PILs $2,336,405 $1,750,842 $258,680 $40,764 $4,032 $502 $76,494 $25,441 $179,650
Allocated Debt Return $23,789,703 $17,827,400 $2,633,929 $415,065 $41,050 $5,109 $778,876 $259,048 $1,829,227
Allocated Equity Return $37,122,393 $27,818,580 $4,110,087 $647,683 $64,056 $7,973 $1,215,388 $404,229 $2,854,398
PLCC Adjustment for Line Transformer $7,686,367 $5,820,135 $677,381 $78,834 $893 $0 $176,352 $115,531 $817,242
PLCC Adjustment for Primary Costs $18,595,536 $14,043,266 $1,634,680 $236,271 $9,705 $860 $420,218 $278,918 $1,971,618
PLCC Adjustment for Secondary Costs $22,296,875 $15,963,100 $1,714,827 $243,795 $10,008 $0 $0 $1,267,213 $3,097,932
Total $188,708,518 $133,044,695 $29,361,403 $7,147,732 $932,244 $82,366 $5,479,668 $354,902 $12,305,507
O2 Fixed Charge|Floor|Ceiling
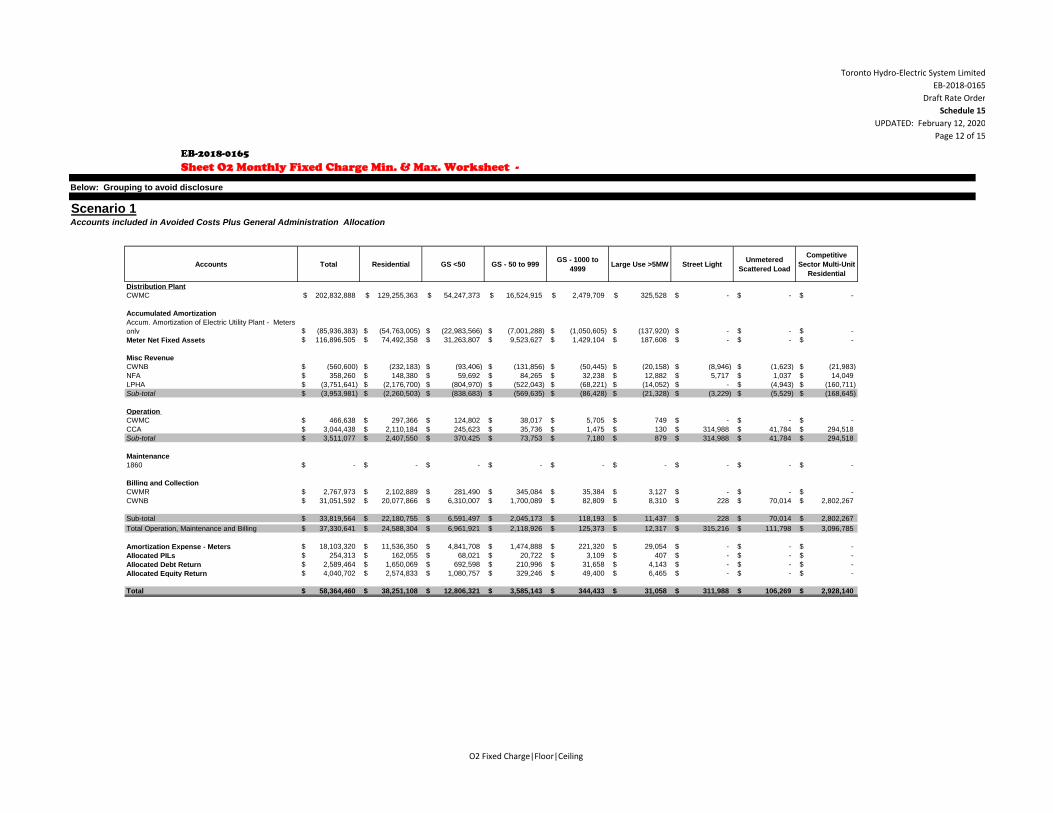
Toronto Hydro-Electric System Limited
EB-2018-0165
Draft Rate Order
Schedule 15
UPDATED: February 12, 2020
Page 12 of 15
Sheet O2 Monthly Fixed Charge Min. & Max. Worksheet -
EB-2018-0165
Accounts included in Avoided Costs Plus General Administration Allocation
Accounts Total Residential GS <50 GS - 50 to 999GS - 1000 to
4999Large Use >5MW Street Light
Unmetered
Scattered Load
Competitive
Sector Multi-Unit
Residential
Distribution Plant
CWMC 202,832,888$ 129,255,363$ 54,247,373$ 16,524,915$ 2,479,709$ 325,528$ -$ -$ -$
Accumulated Amortization
Accum. Amortization of Electric Utility Plant - Meters
only (85,936,383)$ (54,763,005)$ (22,983,566)$ (7,001,288)$ (1,050,605)$ (137,920)$ -$ -$ -$
Meter Net Fixed Assets 116,896,505$ 74,492,358$ 31,263,807$ 9,523,627$ 1,429,104$ 187,608$ -$ -$ -$
Misc Revenue
CWNB (560,600)$ (232,183)$ (93,406)$ (131,856)$ (50,445)$ (20,158)$ (8,946)$ (1,623)$ (21,983)$
NFA 358,260$ 148,380$ 59,692$ 84,265$ 32,238$ 12,882$ 5,717$ 1,037$ 14,049$
LPHA (3,751,641)$ (2,176,700)$ (804,970)$ (522,043)$ (68,221)$ (14,052)$ -$ (4,943)$ (160,711)$
Sub-total (3,953,981)$ (2,260,503)$ (838,683)$ (569,635)$ (86,428)$ (21,328)$ (3,229)$ (5,529)$ (168,645)$
Operation
CWMC 466,638$ 297,366$ 124,802$ 38,017$ 5,705$ 749$ -$ -$ -$
CCA 3,044,438$ 2,110,184$ 245,623$ 35,736$ 1,475$ 130$ 314,988$ 41,784$ 294,518$
Sub-total 3,511,077$ 2,407,550$ 370,425$ 73,753$ 7,180$ 879$ 314,988$ 41,784$ 294,518$
Maintenance
1860 -$ -$ -$ -$ -$ -$ -$ -$ -$
Billing and Collection
CWMR 2,767,973$ 2,102,889$ 281,490$ 345,084$ 35,384$ 3,127$ -$ -$ -$
CWNB 31,051,592$ 20,077,866$ 6,310,007$ 1,700,089$ 82,809$ 8,310$ 228$ 70,014$ 2,802,267$
Sub-total 33,819,564$ 22,180,755$ 6,591,497$ 2,045,173$ 118,193$ 11,437$ 228$ 70,014$ 2,802,267$
Total Operation, Maintenance and Billing 37,330,641$ 24,588,304$ 6,961,921$ 2,118,926$ 125,373$ 12,317$ 315,216$ 111,798$ 3,096,785$
Amortization Expense - Meters 18,103,320$ 11,536,350$ 4,841,708$ 1,474,888$ 221,320$ 29,054$ -$ -$ -$
Allocated PILs 254,313$ 162,055$ 68,021$ 20,722$ 3,109$ 407$ -$ -$ -$
Allocated Debt Return 2,589,464$ 1,650,069$ 692,598$ 210,996$ 31,658$ 4,143$ -$ -$ -$
Allocated Equity Return 4,040,702$ 2,574,833$ 1,080,757$ 329,246$ 49,400$ 6,465$ -$ -$ -$
Total 58,364,460$ 38,251,108$ 12,806,321$ 3,585,143$ 344,433$ 31,058$ 311,988$ 106,269$ 2,928,140$
Below: Grouping to avoid disclosure
Scenario 1
O2 Fixed Charge|Floor|Ceiling
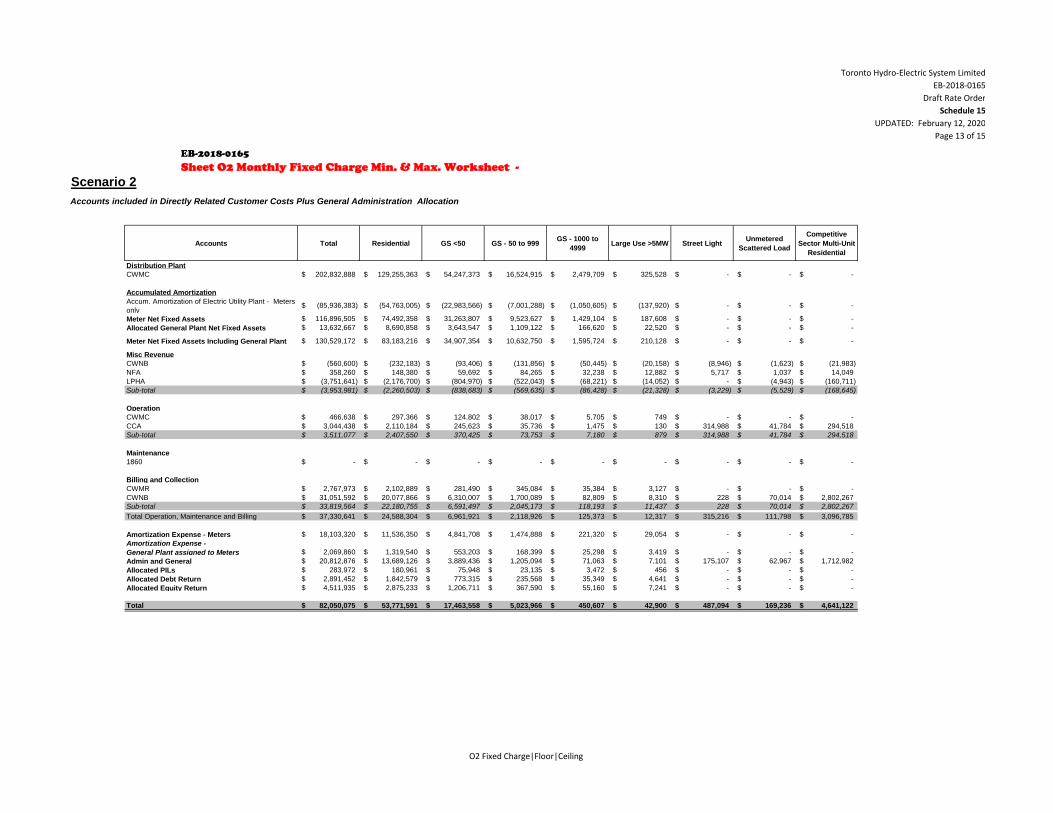
Toronto Hydro-Electric System Limited
EB-2018-0165
Draft Rate Order
Schedule 15
UPDATED: February 12, 2020
Page 13 of 15
Sheet O2 Monthly Fixed Charge Min. & Max. Worksheet -
EB-2018-0165
Accounts included in Directly Related Customer Costs Plus General Administration Allocation
Accounts Total Residential GS <50 GS - 50 to 999GS - 1000 to
4999Large Use >5MW Street Light
Unmetered
Scattered Load
Competitive
Sector Multi-Unit
Residential
Distribution Plant
CWMC 202,832,888$ 129,255,363$ 54,247,373$ 16,524,915$ 2,479,709$ 325,528$ -$ -$ -$
Accumulated Amortization
Accum. Amortization of Electric Utility Plant - Meters
only(85,936,383)$ (54,763,005)$ (22,983,566)$ (7,001,288)$ (1,050,605)$ (137,920)$ -$ -$ -$
Meter Net Fixed Assets 116,896,505$ 74,492,358$ 31,263,807$ 9,523,627$ 1,429,104$ 187,608$ -$ -$ -$
Allocated General Plant Net Fixed Assets 13,632,667$ 8,690,858$ 3,643,547$ 1,109,122$ 166,620$ 22,520$ -$ -$ -$
Meter Net Fixed Assets Including General Plant 130,529,172$ 83,183,216$ 34,907,354$ 10,632,750$ 1,595,724$ 210,128$ -$ -$ -$
Misc Revenue
CWNB (560,600)$ (232,183)$ (93,406)$ (131,856)$ (50,445)$ (20,158)$ (8,946)$ (1,623)$ (21,983)$
NFA 358,260$ 148,380$ 59,692$ 84,265$ 32,238$ 12,882$ 5,717$ 1,037$ 14,049$
LPHA (3,751,641)$ (2,176,700)$ (804,970)$ (522,043)$ (68,221)$ (14,052)$ -$ (4,943)$ (160,711)$
Sub-total (3,953,981)$ (2,260,503)$ (838,683)$ (569,635)$ (86,428)$ (21,328)$ (3,229)$ (5,529)$ (168,645)$
Operation
CWMC 466,638$ 297,366$ 124,802$ 38,017$ 5,705$ 749$ -$ -$ -$
CCA 3,044,438$ 2,110,184$ 245,623$ 35,736$ 1,475$ 130$ 314,988$ 41,784$ 294,518$
Sub-total 3,511,077$ 2,407,550$ 370,425$ 73,753$ 7,180$ 879$ 314,988$ 41,784$ 294,518$
Maintenance
1860 -$ -$ -$ -$ -$ -$ -$ -$ -$
Billing and Collection
CWMR 2,767,973$ 2,102,889$ 281,490$ 345,084$ 35,384$ 3,127$ -$ -$ -$
CWNB 31,051,592$ 20,077,866$ 6,310,007$ 1,700,089$ 82,809$ 8,310$ 228$ 70,014$ 2,802,267$
Sub-total 33,819,564$ 22,180,755$ 6,591,497$ 2,045,173$ 118,193$ 11,437$ 228$ 70,014$ 2,802,267$
Total Operation, Maintenance and Billing 37,330,641$ 24,588,304$ 6,961,921$ 2,118,926$ 125,373$ 12,317$ 315,216$ 111,798$ 3,096,785$
Amortization Expense - Meters 18,103,320$ 11,536,350$ 4,841,708$ 1,474,888$ 221,320$ 29,054$ -$ -$ -$
Amortization Expense -
General Plant assigned to Meters 2,069,860$ 1,319,540$ 553,203$ 168,399$ 25,298$ 3,419$ -$ -$ -$
Admin and General 20,812,876$ 13,689,126$ 3,889,436$ 1,205,094$ 71,063$ 7,101$ 175,107$ 62,967$ 1,712,982$
Allocated PILs 283,972$ 180,961$ 75,948$ 23,135$ 3,472$ 456$ -$ -$ -$
Allocated Debt Return 2,891,452$ 1,842,579$ 773,315$ 235,568$ 35,349$ 4,641$ -$ -$ -$
Allocated Equity Return 4,511,935$ 2,875,233$ 1,206,711$ 367,590$ 55,160$ 7,241$ -$ -$ -$
Total 82,050,075$ 53,771,591$ 17,463,558$ 5,023,966$ 450,607$ 42,900$ 487,094$ 169,236$ 4,641,122$
Scenario 2
O2 Fixed Charge|Floor|Ceiling
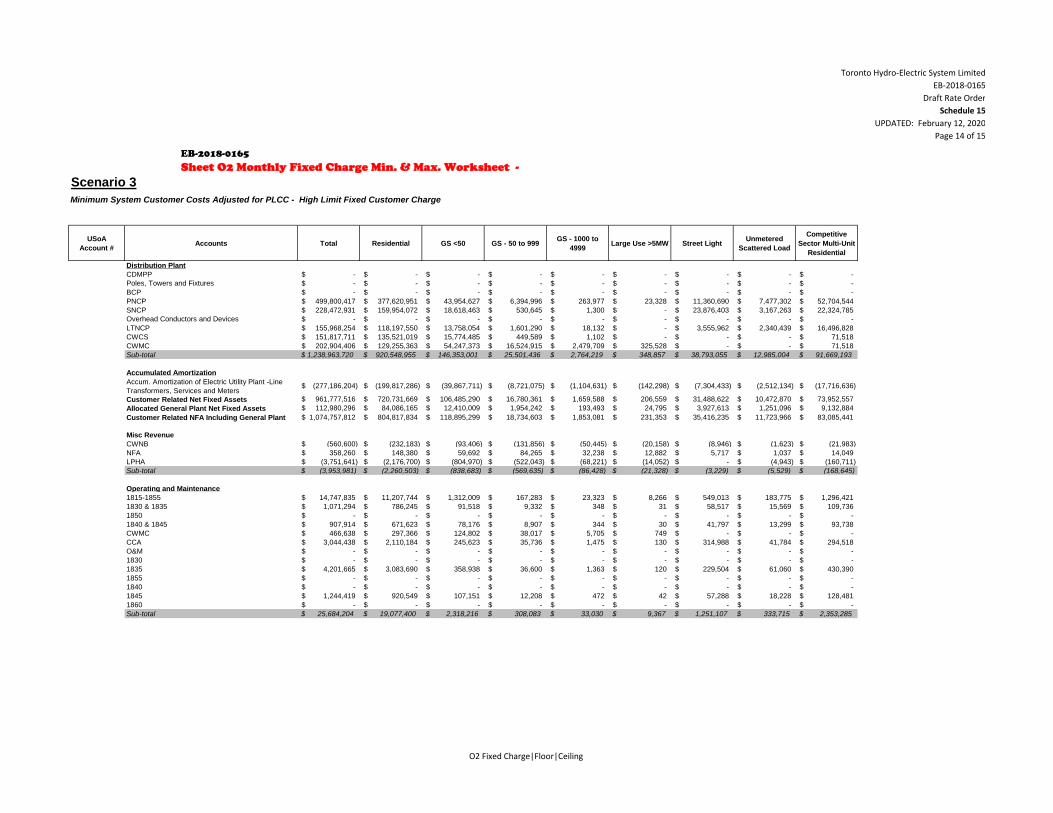
Toronto Hydro-Electric System Limited
EB-2018-0165
Draft Rate Order
Schedule 15
UPDATED: February 12, 2020
Page 14 of 15
Sheet O2 Monthly Fixed Charge Min. & Max. Worksheet -
EB-2018-0165
Minimum System Customer Costs Adjusted for PLCC - High Limit Fixed Customer Charge
USoA
Account #Accounts Total Residential GS <50 GS - 50 to 999
GS - 1000 to
4999Large Use >5MW Street Light
Unmetered
Scattered Load
Competitive
Sector Multi-Unit
Residential
Distribution Plant
CDMPP -$ -$ -$ -$ -$ -$ -$ -$ -$
Poles, Towers and Fixtures -$ -$ -$ -$ -$ -$ -$ -$ -$
BCP -$ -$ -$ -$ -$ -$ -$ -$ -$
PNCP 499,800,417$ 377,620,951$ 43,954,627$ 6,394,996$ 263,977$ 23,328$ 11,360,690$ 7,477,302$ 52,704,544$
SNCP 228,472,931$ 159,954,072$ 18,618,463$ 530,645$ 1,300$ -$ 23,876,403$ 3,167,263$ 22,324,785$
Overhead Conductors and Devices -$ -$ -$ -$ -$ -$ -$ -$ -$
LTNCP 155,968,254$ 118,197,550$ 13,758,054$ 1,601,290$ 18,132$ -$ 3,555,962$ 2,340,439$ 16,496,828$
CWCS 151,817,711$ 135,521,019$ 15,774,485$ 449,589$ 1,102$ -$ -$ -$ 71,518$
CWMC 202,904,406$ 129,255,363$ 54,247,373$ 16,524,915$ 2,479,709$ 325,528$ -$ -$ 71,518$
Sub-total $ 1,238,963,720 $ 920,548,955 $ 146,353,001 $ 25,501,436 $ 2,764,219 $ 348,857 $ 38,793,055 $ 12,985,004 $ 91,669,193
Accumulated Amortization
Accum. Amortization of Electric Utility Plant -Line
Transformers, Services and Meters (277,186,204)$ (199,817,286)$ (39,867,711)$ (8,721,075)$ (1,104,631)$ (142,298)$ (7,304,433)$ (2,512,134)$ (17,716,636)$
Customer Related Net Fixed Assets 961,777,516$ 720,731,669$ 106,485,290$ 16,780,361$ 1,659,588$ 206,559$ 31,488,622$ 10,472,870$ 73,952,557$
Allocated General Plant Net Fixed Assets 112,980,296$ 84,086,165$ 12,410,009$ 1,954,242$ 193,493$ 24,795$ 3,927,613$ 1,251,096$ 9,132,884$
Customer Related NFA Including General Plant 1,074,757,812$ 804,817,834$ 118,895,299$ 18,734,603$ 1,853,081$ 231,353$ 35,416,235$ 11,723,966$ 83,085,441$
Misc Revenue
CWNB (560,600)$ (232,183)$ (93,406)$ (131,856)$ (50,445)$ (20,158)$ (8,946)$ (1,623)$ (21,983)$
NFA 358,260$ 148,380$ 59,692$ 84,265$ 32,238$ 12,882$ 5,717$ 1,037$ 14,049$
LPHA (3,751,641)$ (2,176,700)$ (804,970)$ (522,043)$ (68,221)$ (14,052)$ -$ (4,943)$ (160,711)$
Sub-total $ (3,953,981) $ (2,260,503) $ (838,683) $ (569,635) $ (86,428) $ (21,328) $ (3,229) $ (5,529) $ (168,645)
Operating and Maintenance
1815-1855 14,747,835$ 11,207,744$ 1,312,009$ 167,283$ 23,323$ 8,266$ 549,013$ 183,775$ 1,296,421$
1830 & 1835 1,071,294$ 786,245$ 91,518$ 9,332$ 348$ 31$ 58,517$ 15,569$ 109,736$
1850 -$ -$ -$ -$ -$ -$ -$ -$ -$
1840 & 1845 907,914$ 671,623$ 78,176$ 8,907$ 344$ 30$ 41,797$ 13,299$ 93,738$
CWMC 466,638$ 297,366$ 124,802$ 38,017$ 5,705$ 749$ -$ -$ -$
CCA 3,044,438$ 2,110,184$ 245,623$ 35,736$ 1,475$ 130$ 314,988$ 41,784$ 294,518$
O&M -$ -$ -$ -$ -$ -$ -$ -$ -$
1830 -$ -$ -$ -$ -$ -$ -$ -$ -$
1835 4,201,665$ 3,083,690$ 358,938$ 36,600$ 1,363$ 120$ 229,504$ 61,060$ 430,390$
1855 -$ -$ -$ -$ -$ -$ -$ -$ -$
1840 -$ -$ -$ -$ -$ -$ -$ -$ -$
1845 1,244,419$ 920,549$ 107,151$ 12,208$ 472$ 42$ 57,288$ 18,228$ 128,481$
1860 -$ -$ -$ -$ -$ -$ -$ -$ -$
Sub-total $ 25,684,204 $ 19,077,400 $ 2,318,216 $ 308,083 $ 33,030 $ 9,367 $ 1,251,107 $ 333,715 $ 2,353,285
Scenario 3
O2 Fixed Charge|Floor|Ceiling
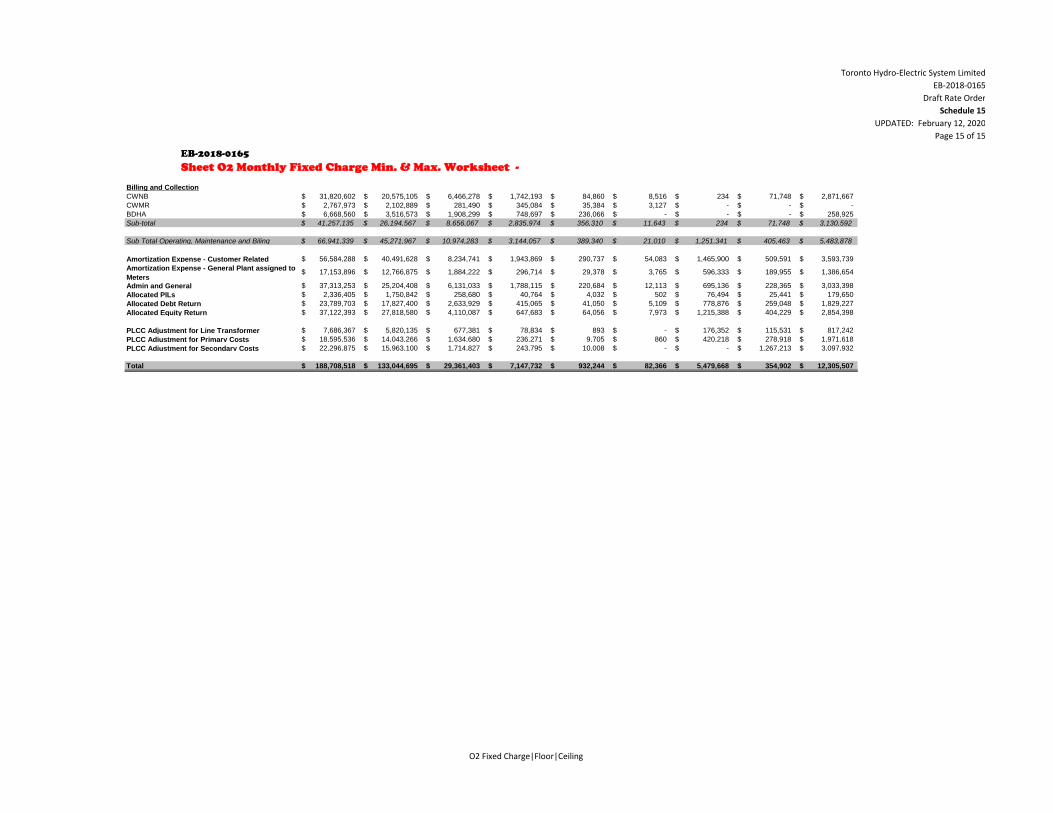
Toronto Hydro-Electric System Limited
EB-2018-0165
Draft Rate Order
Schedule 15
UPDATED: February 12, 2020
Page 15 of 15
Sheet O2 Monthly Fixed Charge Min. & Max. Worksheet -
EB-2018-0165
Billing and Collection
CWNB 31,820,602$ 20,575,105$ 6,466,278$ 1,742,193$ 84,860$ 8,516$ 234$ 71,748$ 2,871,667$
CWMR 2,767,973$ 2,102,889$ 281,490$ 345,084$ 35,384$ 3,127$ -$ -$ -$
BDHA 6,668,560$ 3,516,573$ 1,908,299$ 748,697$ 236,066$ -$ -$ -$ 258,925$
Sub-total $ 41,257,135 $ 26,194,567 $ 8,656,067 $ 2,835,974 $ 356,310 $ 11,643 $ 234 $ 71,748 $ 3,130,592
Sub Total Operating, Maintenance and Biling $ 66,941,339 $ 45,271,967 $ 10,974,283 $ 3,144,057 $ 389,340 $ 21,010 $ 1,251,341 $ 405,463 $ 5,483,878
Amortization Expense - Customer Related 56,584,288$ 40,491,628$ 8,234,741$ 1,943,869$ 290,737$ 54,083$ 1,465,900$ 509,591$ 3,593,739$
Amortization Expense - General Plant assigned to
Meters17,153,896$ 12,766,875$ 1,884,222$ 296,714$ 29,378$ 3,765$ 596,333$ 189,955$ 1,386,654$
Admin and General 37,313,253$ 25,204,408$ 6,131,033$ 1,788,115$ 220,684$ 12,113$ 695,136$ 228,365$ 3,033,398$
Allocated PILs 2,336,405$ 1,750,842$ 258,680$ 40,764$ 4,032$ 502$ 76,494$ 25,441$ 179,650$
Allocated Debt Return 23,789,703$ 17,827,400$ 2,633,929$ 415,065$ 41,050$ 5,109$ 778,876$ 259,048$ 1,829,227$
Allocated Equity Return 37,122,393$ 27,818,580$ 4,110,087$ 647,683$ 64,056$ 7,973$ 1,215,388$ 404,229$ 2,854,398$
PLCC Adjustment for Line Transformer 7,686,367$ 5,820,135$ 677,381$ 78,834$ 893$ -$ 176,352$ 115,531$ 817,242$
PLCC Adjustment for Primary Costs 18,595,536$ 14,043,266$ 1,634,680$ 236,271$ 9,705$ 860$ 420,218$ 278,918$ 1,971,618$
PLCC Adjustment for Secondary Costs 22,296,875$ 15,963,100$ 1,714,827$ 243,795$ 10,008$ -$ -$ 1,267,213$ 3,097,932$
Total 188,708,518$ 133,044,695$ 29,361,403$ 7,147,732$ 932,244$ 82,366$ 5,479,668$ 354,902$ 12,305,507$
O2 Fixed Charge|Floor|Ceiling

Toronto Hydro-Electric System Limited
EB-2018-0165
Draft Rate Order
Schedule 16
UPDATED: February 12, 2020
Page 1 of 13
0.64 TOU - Off Peak
0.18 TOU - Mid Peak
0.18 TOU - On Peak
Customer Class:
TOU / non-TOU: TOU
Consumption 750 kWh
Rate Volume Charge Rate Volume Charge Rate Volume Charge Rate Volume Charge Rate Volume Charge Rate Volume Charge
($) ($) ($) ($) ($) ($) ($) ($) ($) ($) ($) ($)
Service Charge per 30 days 37.48$ 1 37.48$ 38.34$ 1 38.34$ 0.86$ 2.3% 40.08$ 1 40.08$ 1.74$ 4.5% 40.53$ 1 40.53$ 0.45$ 1.1% 42.94$ 1 42.94$ 2.41$ 5.9% 44.60$ 1 44.60$ 1.66$ 3.9%
Rate Rider for Disposition of Other Post Employment Benefit Variance - effective until December 31, 2020 per 30 days -$ 0.45$ 1 0.45$ 0.45$ -$ 1 -$ 0.45-$ -$ 1 -$ -$ -$ 1 -$ -$ -$ 1 -$ -$
Rate Rider for Disposition of the Impact for USGAAP - effective until December 31, 2020 per 30 days -$ 0.41$ 1 0.41$ 0.41$ -$ 1 -$ 0.41-$ -$ 1 -$ -$ -$ 1 -$ -$ -$ 1 -$ -$
Rate Rider for Recovery of Monthly Billing Transition Costs - effective until December 31, 2022 per 30 days -$ 0.48$ 1 0.48$ 0.48$ 0.48$ 1 0.48$ -$ 0.0% 0.48$ 1 0.48$ -$ 0.0% -$ 1 -$ 0.48-$ -$ 1 -$ -$
Rate Rider for Disposition of Stranded Meter Assets - effective until December 31, 2024 per 30 days -$ -$ 1 -$ -$ 0.02-$ 1 0.02-$ 0.02-$ 0.02-$ 1 0.02-$ -$ 0.0% 0.02-$ 1 0.02-$ -$ 0.0% 0.02-$ 1 0.02-$ -$ 0.0%
Rate Rider for Application of Operations Center Consolidation Plan - effective until December 31, 2021 per 30 days -$ 2.13-$ 1 2.13-$ 2.13-$ 2.13-$ 1 2.13-$ -$ 0.0% -$ 1 -$ 2.13$ -$ 1 -$ -$ -$ 1 -$ -$
Rate Rider for Disposition of the Gain on Property Sale - effective until December 31, 2021 per 30 days -$ 0.34-$ 1 0.34-$ 0.34-$ 0.34-$ 1 0.34-$ -$ 0.0% -$ 1 -$ 0.34$ -$ 1 -$ -$ -$ 1 -$ -$
Rate Rider for Disposition of Wireless Pole Attachment Revenue - effective until December 31, 2024 per 30 days -$ -$ 1 -$ -$ 0.01-$ 1 0.01-$ 0.01-$ 0.01-$ 1 0.01-$ -$ 0.0% 0.01-$ 1 0.01-$ -$ 0.0% 0.01-$ 1 0.01-$ -$ 0.0%
Rate Rider for Disposition of IFRS - CGAPP Property Plant and Equipment - effective until December 31, 2020 per 30 days -$ 0.10-$ 1 0.10-$ 0.10-$ -$ 1 -$ 0.10$ -$ 1 -$ -$ -$ 1 -$ -$ -$ 1 -$ -$
Rate Rider for Disposition of Capital Related Revenue Requirement Variance Account - effective until Dec. 31, 2024 per 30 days -$ -$ 1 -$ -$ -$ 1 -$ -$ -$ 1 -$ -$ 2.17-$ 1 2.17-$ 2.17-$ 2.17-$ 1 2.17-$ -$ 0.0%
Rate Rider for Disposition of PILs and Tax Variance - effective until December 31, 2024 per 30 days -$ -$ 1 -$ -$ -$ 1 -$ -$ -$ 1 -$ -$ 0.31-$ 1 0.31-$ 0.31-$ 0.31-$ 1 0.31-$ -$ 0.0%
Rate Rider for Disposition of External Driven Capital Variance Account - effective until December 31, 2020 per 30 days -$ 0.20-$ 1 0.20-$ 0.20-$ -$ 1 -$ 0.20$ -$ 1 -$ -$ -$ 1 -$ -$ -$ 1 -$ -$
Rate Rider for Disposition of Derecognition Variance Account - effective until December 31, 2022 per 30 days -$ -$ 1 -$ -$ -$ 1 -$ -$ 1.81-$ 1 1.81-$ 1.81-$ -$ 1 -$ 1.81$ -$ 1 -$ -$
Rate Rider for Disposition of Accounts Receivable Credits - effective until December 31, 2024 per 30 days -$ -$ 1 -$ -$ 0.10-$ 1 0.10-$ 0.10-$ 0.10-$ 1 0.10-$ -$ 0.0% 0.10-$ 1 0.10-$ -$ 0.0% 0.10-$ 1 0.10-$ -$ 0.0%
Rate Rider for Recovery of 2020 Foregone Revenue - effective until December 31, 2021 per 30 days -$ 0.26-$ 1 0.26-$ 0.26-$ 0.26-$ 1 0.26-$ -$ 0.0% -$ 1 -$ 0.26$ -$ 1 -$ -$ -$ 1 -$ -$
Rate Rider for Recovery of Stranded Meters Assets - effective until Dec. 31, 2019 per 30 days 0.28$ 1 0.28$ 1 -$ 0.28-$ 1 -$ -$ 1 -$ -$ 1 -$ -$ 1 -$ -$
Rate Rider for Disposition of the Gain on Property Sale - effective until December 31, 2019 per 30 days 0.10$ 1 0.10$ 1 -$ 0.10-$ 1 -$ -$ 1 -$ -$ 1 -$ -$ 1 -$ -$
Rate Rider for Recovery of Hydro One Capital Contributions Variance - effective until Dec. 31, 2019 per 30 days 0.03$ 1 0.03$ 1 -$ 0.03-$ 1 -$ -$ 1 -$ -$ 1 -$ -$ 1 -$ -$
Rate Rider for Application of IFRS - 2014 Derecognition - effective until Dec. 31, 2019 per 30 days 0.46$ 1 0.46$ 1 -$ 0.46-$ 1 -$ -$ 1 -$ -$ 1 -$ -$ 1 -$ -$
Rate Rider for Recovery of 2015 Foregone Revenue - effective until Dec. 31, 2019 per 30 days 0.88$ 1 0.88$ 1 -$ 0.88-$ 1 -$ -$ 1 -$ -$ 1 -$ -$ 1 -$ -$
Rate Rider for Recovery of 2016 Foregone Revenue - effective until Dec. 31, 2019 per 30 days 0.28$ 1 0.28$ 1 -$ 0.28-$ 1 -$ -$ 1 -$ -$ 1 -$ -$ 1 -$ -$
Distribution Volumetric Rate per kWh 0.00553$ 750 4.15$ 750 -$ 4.15-$ 750 -$ -$ 750 -$ -$ 750 -$ -$ 750 -$ -$
Rate Rider for Disposition of Lost Revenue Adjustment Mechanism (LRAMVA) (2019) - effective until Dec. 31, 2019 per kWh 0.00095$ 750 0.71$ 750 -$ 0.71-$ 750 -$ -$ 750 -$ -$ 750 -$ -$ 750 -$ -$
Sub-Total A (excluding pass through) 44.37$ 36.65$ 7.72-$ -17.4% 37.70$ 1.05$ 2.9% 39.07$ 1.37$ 3.6% 40.33$ 1.26$ 3.2% 41.99$ 1.66$ 4.1%
Line Losses on Cost of Power per kWh 0.1280$ 28 3.61$ 0.1280$ 22 2.83$ 0.78-$ -21.5% 0.1280$ 22 2.83$ -$ 0.0% 0.1280$ 22 2.83$ -$ 0.0% 0.1280$ 22 2.83$ -$ 0.0% 0.1280$ 22 2.83$ -$ 0.0%
Rate Rider for Disposition of Deferral/Variance Accounts per kWh 0.00052-$ 750 0.39-$ 0.00033$ 750 0.25$ 0.64$ -163.5% 0.00033$ 750 0.25$ -$ 0.0% -$ 0.25-$ -$ -$ -$ -$
Rate Rider for Disposition of Capacity Based Recovery Account - Applicable only for Class B Customers per kWh 0.00003$ 750 0.02$ 0.00002-$ 750 0.02-$ 0.04-$ -166.7% 0.00002-$ 750 0.02-$ -$ 0.0% -$ 0.02$ -$ -$ -$ -$
Rate Rider for Disposition of Global Adjustment Account - (Applicable only for Non-RPP Customers) per kWh 0.00068$ -$ 0.00159-$ -$ -$ 0.00159-$ -$ -$ -$ -$ -$ -$ -$ -$
Rate Rider for Smart Metering Entity Charge - effective until Dec. 31, 2022 per 30 days 0.56$ 1 0.56$ 0.56$ 1 0.56$ -$ 0.0% 0.56$ 1 0.56$ -$ 0.0% 0.56$ 1 0.56$ -$ 0.0% -$ 0.56-$ -$ -$
Sub-Total B - Distribution (includes Sub-Total A) 48.17$ 40.27$ 7.90-$ -16.4% 41.32$ 1.05$ 2.6% 42.46$ 1.14$ 2.8% 43.16$ 0.70$ 1.6% 44.82$ 1.66$ 3.8%
Retail Transmissioin Rate - Network Service Rate per kWh 0.00796$ 778 6.19$ 0.00906$ 772 7.00$ 0.80$ 12.9% 0.00906$ 772 7.00$ -$ 0.0% 0.00906$ 772 7.00$ -$ 0.0% 0.00906$ 772 7.00$ -$ 0.0% 0.00906$ 772 7.00$ -$ 0.0%
Retail Transmissioin Rate - Line and Transformation Connection Service Rate per kWh 0.00703$ 778 5.47$ 0.00737$ 772 5.69$ 0.22$ 4.0% 0.00737$ 772 5.69$ -$ 0.0% 0.00737$ 772 5.69$ -$ 0.0% 0.00737$ 772 5.69$ -$ 0.0% 0.00737$ 772 5.69$ -$ 0.0%
Sub-Total C - Delivery (including Sub-Total B) 59.84$ 52.96$ 6.88-$ -11.5% 54.01$ 1.05$ 2.0% 55.15$ 1.14$ 2.1% 55.85$ 0.70$ 1.3% 57.51$ 1.66$ 3.0%
Wholesale Market Service Rate - not including CBR per kWh 0.0030$ 778 2.33$ 0.0030$ 772 2.32$ 0.02-$ -0.8% 0.0030$ 772 2.32$ -$ 0.0% 0.0030$ 772 2.32$ -$ 0.0% 0.0030$ 772 2.32$ -$ 0.0% 0.0030$ 772 2.32$ -$ 0.0%
Rural and Remote Rate Protection Charge (RRRP) per kWh 0.0005$ 778 0.39$ 0.0005$ 772 0.39$ 0.00-$ -0.8% 0.0005$ 772 0.39$ -$ 0.0% 0.0005$ 772 0.39$ -$ 0.0% 0.0005$ 772 0.39$ -$ 0.0% 0.0005$ 772 0.39$ -$ 0.0%
Capacity Based Recovery (CBR) - Applicable for Class B Customers per kWh 0.0004$ 778 0.31$ 0.0004$ 772 0.31$ 0.00-$ -0.8% 0.0004$ 772 0.31$ -$ 0.0% 0.0004$ 772 0.31$ -$ 0.0% 0.0004$ 772 0.31$ -$ 0.0% 0.0004$ 772 0.31$ -$ 0.0%
Standard Supply Service - Administrative Charge (if applicable) per 30 days 0.25$ 1 0.25$ 0.25$ 1 0.25$ -$ 0.0% 0.25$ 1 0.25$ -$ 0.0% 0.25$ 1 0.25$ -$ 0.0% 0.25$ 1 0.25$ -$ 0.0% 0.25$ 1 0.25$ -$ 0.0%
TOU - Off Peak per kWh 0.1010$ 480 48.48$ 0.1010$ 480 48.48$ -$ 0.0% 0.1010$ 480 48.48$ -$ 0.0% 0.1010$ 480 48.48$ -$ 0.0% 0.1010$ 480 48.48$ -$ 0.0% 0.1010$ 480 48.48$ -$ 0.0%
TOU - Mid Peak per kWh 0.1440$ 135 19.44$ 0.1440$ 135 19.44$ -$ 0.0% 0.1440$ 135 19.44$ -$ 0.0% 0.1440$ 135 19.44$ -$ 0.0% 0.1440$ 135 19.44$ -$ 0.0% 0.1440$ 135 19.44$ -$ 0.0%
TOU - On Peak per kWh 0.2080$ 135 28.08$ 0.2080$ 135 28.08$ -$ 0.0% 0.2080$ 135 28.08$ -$ 0.0% 0.2080$ 135 28.08$ -$ 0.0% 0.2080$ 135 28.08$ -$ 0.0% 0.2080$ 135 28.08$ -$ 0.0%
Energy - RPP - Tier 1 per kWh 0.1190$ 600 71.40$ 0.1190$ 600 71.40$ -$ 0.0% 0.1190$ 600 71.40$ -$ 0.0% 0.1190$ 600 71.40$ -$ 0.0% 0.1190$ 600 71.40$ -$ 0.0% 0.1190$ 600 71.40$ -$ 0.0%
Energy - RPP - Tier 2 per kWh 0.1390$ 150 20.85$ 0.1390$ 150 20.85$ -$ 0.0% 0.1390$ 150 20.85$ -$ 0.0% 0.1390$ 150 20.85$ -$ 0.0% 0.1390$ 150 20.85$ -$ 0.0% 0.1390$ 150 20.85$ -$ 0.0%
Non-RPP Retailer Avg. Price per kWh 0.1164$ - -$ 0.1164$ - -$ -$ 0.1164$ - -$ -$ 0.1164$ - -$ -$ 0.1164$ - -$ -$ 0.1164$ - -$ -$
Average IESO Wholesale Market Price per kWh 0.1164$ - -$ 0.1164$ - -$ -$ 0.1164$ - -$ -$ 0.1164$ - -$ -$ 0.1164$ - -$ -$ 0.1164$ - -$ -$
Total Bill on TOU (before Taxes) 159.12$ 152.22$ 6.90-$ -4.3% 153.27$ 1.05$ 0.7% 154.41$ 1.14$ 0.7% 155.11$ 0.70$ 0.5% 156.77$ 1.66$ 1.1%
Ontario Electricity Rebate -31.8% 50.60-$ -31.8% 48.41-$ 2.19$ -4.3% -31.8% 48.74-$ 0.33-$ 0.7% -31.8% 49.10-$ 0.36-$ 0.7% -31.8% 49.32-$ 0.22-$ 0.5% -31.8% 49.85-$ 0.53-$ 1.1%
HST 13% 20.69$ 13% 19.79$ 0.90-$ -4.3% 13% 19.93$ 0.14$ 0.7% 13% 20.07$ 0.15$ 0.7% 13% 20.16$ 0.09$ 0.5% 13% 20.38$ 0.22$ 1.1%
129.21$ 123.60$ 5.60-$ -4.3% 124.46$ 0.85$ 0.7% 125.38$ 0.92$ 0.7% 125.95$ 0.57$ 0.5% 127.30$ 1.35$ 1.1%
Loss Factor (%) 3.76% 2.95% 2.95% 2.95% 2.95% 2.95%
$ Change % Change $ Change % Change
Total Bill on TOU (after Tax & Rebate)
Impact 2024 Proposed Impact
Charge Unit $ Change % Change $ Change % Change $ Change % Change
Impact 2021 Proposed Impact 2022 Proposed Impact 2023 Proposed
OEB Appendix 2-W
Bill Impacts
RESIDENTIAL SERVICE
2019 Board-Approved 2020 Proposed
May 1 - October 31 November 1 - April 30 (Select this radio button for applications
RESIDENTIAL
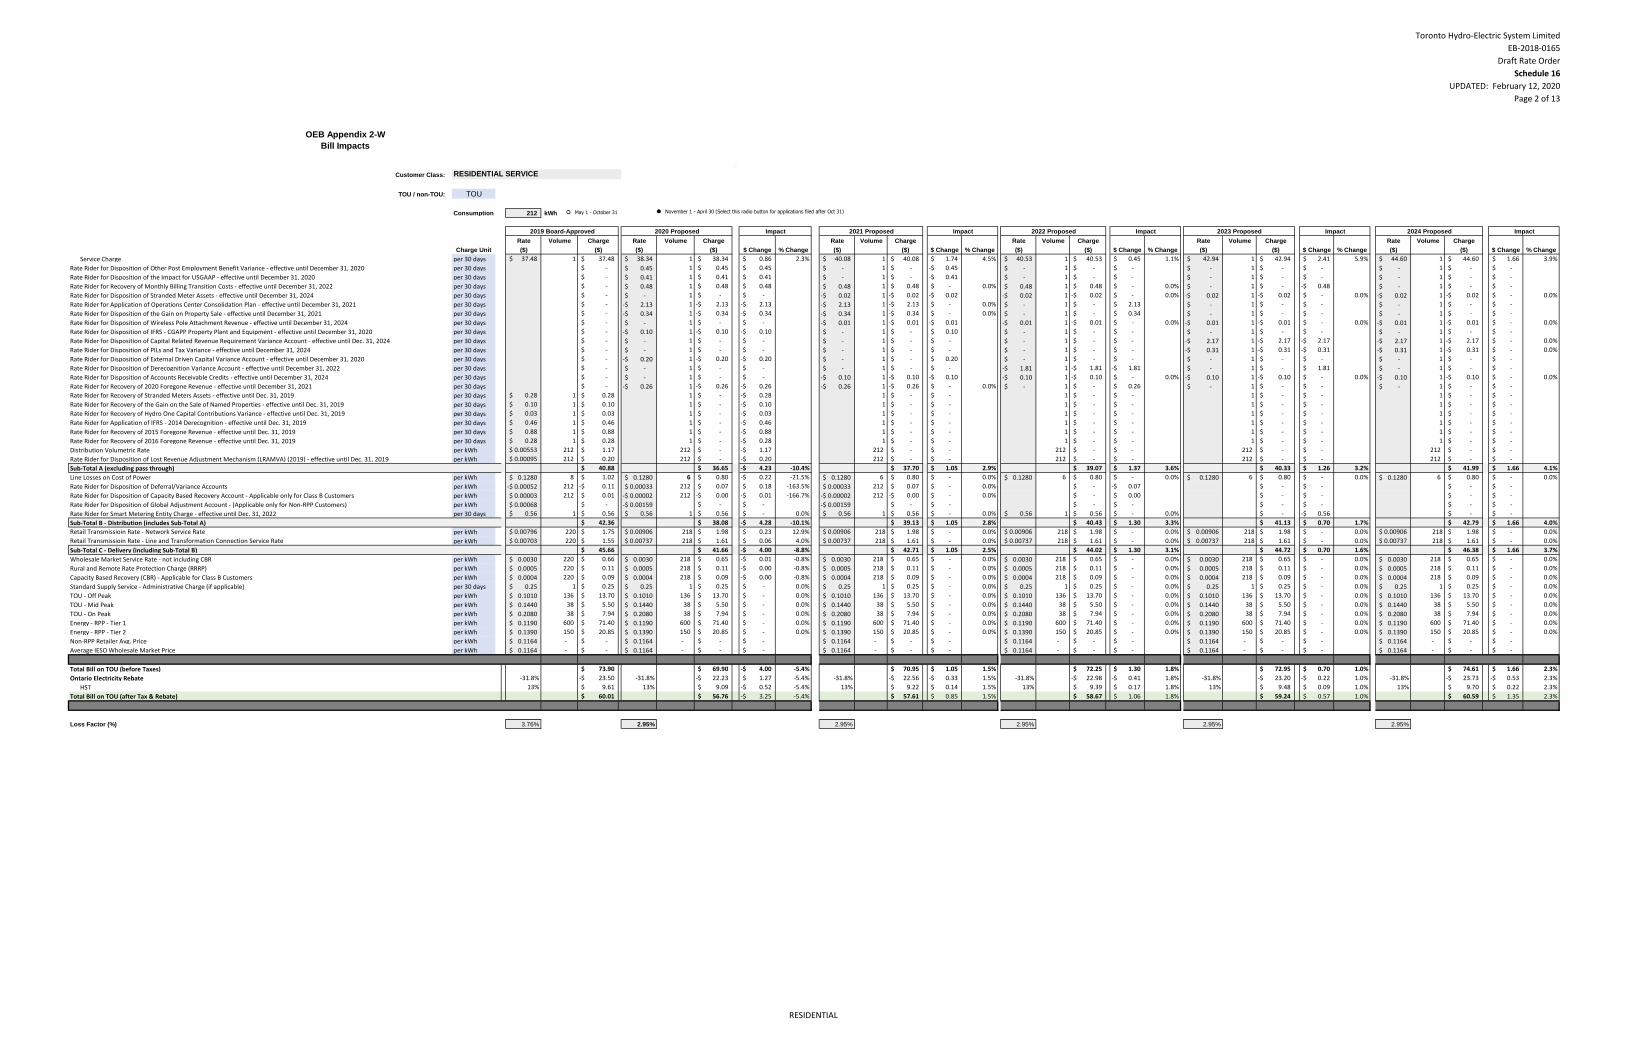
Toronto Hydro-Electric System Limited
EB-2018-0165
Draft Rate Order
Schedule 16
UPDATED: February 12, 2020
Page 2 of 13
2
Customer Class:
TOU / non-TOU: TOU
Consumption 212 kWh
Rate Volume Charge Rate Volume Charge Rate Volume Charge Rate Volume Charge Rate Volume Charge Rate Volume Charge
($) ($) ($) ($) ($) ($) ($) ($) ($) ($) ($) ($)
Service Charge per 30 days 37.48$ 1 37.48$ 38.34$ 1 38.34$ 0.86$ 2.3% 40.08$ 1 40.08$ 1.74$ 4.5% 40.53$ 1 40.53$ 0.45$ 1.1% 42.94$ 1 42.94$ 2.41$ 5.9% 44.60$ 1 44.60$ 1.66$ 3.9%
Rate Rider for Disposition of Other Post Employment Benefit Variance - effective until December 31, 2020 per 30 days -$ 0.45$ 1 0.45$ 0.45$ -$ 1 -$ 0.45-$ -$ 1 -$ -$ -$ 1 -$ -$ -$ 1 -$ -$
Rate Rider for Disposition of the Impact for USGAAP - effective until December 31, 2020 per 30 days -$ 0.41$ 1 0.41$ 0.41$ -$ 1 -$ 0.41-$ -$ 1 -$ -$ -$ 1 -$ -$ -$ 1 -$ -$
Rate Rider for Recovery of Monthly Billing Transition Costs - effective until December 31, 2022 per 30 days -$ 0.48$ 1 0.48$ 0.48$ 0.48$ 1 0.48$ -$ 0.0% 0.48$ 1 0.48$ -$ 0.0% -$ 1 -$ 0.48-$ -$ 1 -$ -$
Rate Rider for Disposition of Stranded Meter Assets - effective until December 31, 2024 per 30 days -$ -$ 1 -$ -$ 0.02-$ 1 0.02-$ 0.02-$ 0.02-$ 1 0.02-$ -$ 0.0% 0.02-$ 1 0.02-$ -$ 0.0% 0.02-$ 1 0.02-$ -$ 0.0%
Rate Rider for Application of Operations Center Consolidation Plan - effective until December 31, 2021 per 30 days -$ 2.13-$ 1 2.13-$ 2.13-$ 2.13-$ 1 2.13-$ -$ 0.0% -$ 1 -$ 2.13$ -$ 1 -$ -$ -$ 1 -$ -$
Rate Rider for Disposition of the Gain on Property Sale - effective until December 31, 2021 per 30 days -$ 0.34-$ 1 0.34-$ 0.34-$ 0.34-$ 1 0.34-$ -$ 0.0% -$ 1 -$ 0.34$ -$ 1 -$ -$ -$ 1 -$ -$
Rate Rider for Disposition of Wireless Pole Attachment Revenue - effective until December 31, 2024 per 30 days -$ -$ 1 -$ -$ 0.01-$ 1 0.01-$ 0.01-$ 0.01-$ 1 0.01-$ -$ 0.0% 0.01-$ 1 0.01-$ -$ 0.0% 0.01-$ 1 0.01-$ -$ 0.0%
Rate Rider for Disposition of IFRS - CGAPP Property Plant and Equipment - effective until December 31, 2020 per 30 days -$ 0.10-$ 1 0.10-$ 0.10-$ -$ 1 -$ 0.10$ -$ 1 -$ -$ -$ 1 -$ -$ -$ 1 -$ -$
Rate Rider for Disposition of Capital Related Revenue Requirement Variance Account - effective until Dec. 31, 2024 per 30 days -$ -$ 1 -$ -$ -$ 1 -$ -$ -$ 1 -$ -$ 2.17-$ 1 2.17-$ 2.17-$ 2.17-$ 1 2.17-$ -$ 0.0%
Rate Rider for Disposition of PILs and Tax Variance - effective until December 31, 2024 per 30 days -$ -$ 1 -$ -$ -$ 1 -$ -$ -$ 1 -$ -$ 0.31-$ 1 0.31-$ 0.31-$ 0.31-$ 1 0.31-$ -$ 0.0%
Rate Rider for Disposition of External Driven Capital Variance Account - effective until December 31, 2020 per 30 days -$ 0.20-$ 1 0.20-$ 0.20-$ -$ 1 -$ 0.20$ -$ 1 -$ -$ -$ 1 -$ -$ -$ 1 -$ -$
Rate Rider for Disposition of Derecognition Variance Account - effective until December 31, 2022 per 30 days -$ -$ 1 -$ -$ -$ 1 -$ -$ 1.81-$ 1 1.81-$ 1.81-$ -$ 1 -$ 1.81$ -$ 1 -$ -$
Rate Rider for Disposition of Accounts Receivable Credits - effective until December 31, 2024 per 30 days -$ -$ 1 -$ -$ 0.10-$ 1 0.10-$ 0.10-$ 0.10-$ 1 0.10-$ -$ 0.0% 0.10-$ 1 0.10-$ -$ 0.0% 0.10-$ 1 0.10-$ -$ 0.0%
Rate Rider for Recovery of 2020 Foregone Revenue - effective until December 31, 2021 per 30 days -$ 0.26-$ 1 0.26-$ 0.26-$ 0.26-$ 1 0.26-$ -$ 0.0% -$ 1 -$ 0.26$ -$ 1 -$ -$ -$ 1 -$ -$
Rate Rider for Recovery of Stranded Meters Assets - effective until Dec. 31, 2019 per 30 days 0.28$ 1 0.28$ 1 -$ 0.28-$ 1 -$ -$ 1 -$ -$ 1 -$ -$ 1 -$ -$
Rate Rider for Recovery of the Gain on the Sale of Named Properties - effective until Dec. 31, 2019 per 30 days 0.10$ 1 0.10$ 1 -$ 0.10-$ 1 -$ -$ 1 -$ -$ 1 -$ -$ 1 -$ -$
Rate Rider for Recovery of Hydro One Capital Contributions Variance - effective until Dec. 31, 2019 per 30 days 0.03$ 1 0.03$ 1 -$ 0.03-$ 1 -$ -$ 1 -$ -$ 1 -$ -$ 1 -$ -$
Rate Rider for Application of IFRS - 2014 Derecognition - effective until Dec. 31, 2019 per 30 days 0.46$ 1 0.46$ 1 -$ 0.46-$ 1 -$ -$ 1 -$ -$ 1 -$ -$ 1 -$ -$
Rate Rider for Recovery of 2015 Foregone Revenue - effective until Dec. 31, 2019 per 30 days 0.88$ 1 0.88$ 1 -$ 0.88-$ 1 -$ -$ 1 -$ -$ 1 -$ -$ 1 -$ -$
Rate Rider for Recovery of 2016 Foregone Revenue - effective until Dec. 31, 2019 per 30 days 0.28$ 1 0.28$ 1 -$ 0.28-$ 1 -$ -$ 1 -$ -$ 1 -$ -$ 1 -$ -$
Distribution Volumetric Rate per kWh 0.00553$ 212 1.17$ 212 -$ 1.17-$ 212 -$ -$ 212 -$ -$ 212 -$ -$ 212 -$ -$
Rate Rider for Disposition of Lost Revenue Adjustment Mechanism (LRAMVA) (2019) - effective until Dec. 31, 2019 per kWh 0.00095$ 212 0.20$ 212 -$ 0.20-$ 212 -$ -$ 212 -$ -$ 212 -$ -$ 212 -$ -$
Sub-Total A (excluding pass through) 40.88$ 36.65$ 4.23-$ -10.4% 37.70$ 1.05$ 2.9% 39.07$ 1.37$ 3.6% 40.33$ 1.26$ 3.2% 41.99$ 1.66$ 4.1%
Line Losses on Cost of Power per kWh 0.1280$ 8 1.02$ 0.1280$ 6 0.80$ 0.22-$ -21.5% 0.1280$ 6 0.80$ -$ 0.0% 0.1280$ 6 0.80$ -$ 0.0% 0.1280$ 6 0.80$ -$ 0.0% 0.1280$ 6 0.80$ -$ 0.0%
Rate Rider for Disposition of Deferral/Variance Accounts per kWh 0.00052-$ 212 0.11-$ 0.00033$ 212 0.07$ 0.18$ -163.5% 0.00033$ 212 0.07$ -$ 0.0% -$ 0.07-$ -$ -$ -$ -$
Rate Rider for Disposition of Capacity Based Recovery Account - Applicable only for Class B Customers per kWh 0.00003$ 212 0.01$ 0.00002-$ 212 0.00-$ 0.01-$ -166.7% 0.00002-$ 212 0.00-$ -$ 0.0% -$ 0.00$ -$ -$ -$ -$
Rate Rider for Disposition of Global Adjustment Account - (Applicable only for Non-RPP Customers) per kWh 0.00068$ -$ 0.00159-$ -$ -$ 0.00159-$ -$ -$ -$ -$ -$ -$ -$ -$
Rate Rider for Smart Metering Entity Charge - effective until Dec. 31, 2022 per 30 days 0.56$ 1 0.56$ 0.56$ 1 0.56$ -$ 0.0% 0.56$ 1 0.56$ -$ 0.0% 0.56$ 1 0.56$ -$ 0.0% -$ 0.56-$ -$ -$
Sub-Total B - Distribution (includes Sub-Total A) 42.36$ 38.08$ 4.28-$ -10.1% 39.13$ 1.05$ 2.8% 40.43$ 1.30$ 3.3% 41.13$ 0.70$ 1.7% 42.79$ 1.66$ 4.0%
Retail Transmissioin Rate - Network Service Rate per kWh 0.00796$ 220 1.75$ 0.00906$ 218 1.98$ 0.23$ 12.9% 0.00906$ 218 1.98$ -$ 0.0% 0.00906$ 218 1.98$ -$ 0.0% 0.00906$ 218 1.98$ -$ 0.0% 0.00906$ 218 1.98$ -$ 0.0%
Retail Transmissioin Rate - Line and Transformation Connection Service Rate per kWh 0.00703$ 220 1.55$ 0.00737$ 218 1.61$ 0.06$ 4.0% 0.00737$ 218 1.61$ -$ 0.0% 0.00737$ 218 1.61$ -$ 0.0% 0.00737$ 218 1.61$ -$ 0.0% 0.00737$ 218 1.61$ -$ 0.0%
Sub-Total C - Delivery (including Sub-Total B) 45.66$ 41.66$ 4.00-$ -8.8% 42.71$ 1.05$ 2.5% 44.02$ 1.30$ 3.1% 44.72$ 0.70$ 1.6% 46.38$ 1.66$ 3.7%
Wholesale Market Service Rate - not including CBR per kWh 0.0030$ 220 0.66$ 0.0030$ 218 0.65$ 0.01-$ -0.8% 0.0030$ 218 0.65$ -$ 0.0% 0.0030$ 218 0.65$ -$ 0.0% 0.0030$ 218 0.65$ -$ 0.0% 0.0030$ 218 0.65$ -$ 0.0%
Rural and Remote Rate Protection Charge (RRRP) per kWh 0.0005$ 220 0.11$ 0.0005$ 218 0.11$ 0.00-$ -0.8% 0.0005$ 218 0.11$ -$ 0.0% 0.0005$ 218 0.11$ -$ 0.0% 0.0005$ 218 0.11$ -$ 0.0% 0.0005$ 218 0.11$ -$ 0.0%
Capacity Based Recovery (CBR) - Applicable for Class B Customers per kWh 0.0004$ 220 0.09$ 0.0004$ 218 0.09$ 0.00-$ -0.8% 0.0004$ 218 0.09$ -$ 0.0% 0.0004$ 218 0.09$ -$ 0.0% 0.0004$ 218 0.09$ -$ 0.0% 0.0004$ 218 0.09$ -$ 0.0%
Standard Supply Service - Administrative Charge (if applicable) per 30 days 0.25$ 1 0.25$ 0.25$ 1 0.25$ -$ 0.0% 0.25$ 1 0.25$ -$ 0.0% 0.25$ 1 0.25$ -$ 0.0% 0.25$ 1 0.25$ -$ 0.0% 0.25$ 1 0.25$ -$ 0.0%
TOU - Off Peak per kWh 0.1010$ 136 13.70$ 0.1010$ 136 13.70$ -$ 0.0% 0.1010$ 136 13.70$ -$ 0.0% 0.1010$ 136 13.70$ -$ 0.0% 0.1010$ 136 13.70$ -$ 0.0% 0.1010$ 136 13.70$ -$ 0.0%
TOU - Mid Peak per kWh 0.1440$ 38 5.50$ 0.1440$ 38 5.50$ -$ 0.0% 0.1440$ 38 5.50$ -$ 0.0% 0.1440$ 38 5.50$ -$ 0.0% 0.1440$ 38 5.50$ -$ 0.0% 0.1440$ 38 5.50$ -$ 0.0%
TOU - On Peak per kWh 0.2080$ 38 7.94$ 0.2080$ 38 7.94$ -$ 0.0% 0.2080$ 38 7.94$ -$ 0.0% 0.2080$ 38 7.94$ -$ 0.0% 0.2080$ 38 7.94$ -$ 0.0% 0.2080$ 38 7.94$ -$ 0.0%
Energy - RPP - Tier 1 per kWh 0.1190$ 600 71.40$ 0.1190$ 600 71.40$ -$ 0.0% 0.1190$ 600 71.40$ -$ 0.0% 0.1190$ 600 71.40$ -$ 0.0% 0.1190$ 600 71.40$ -$ 0.0% 0.1190$ 600 71.40$ -$ 0.0%
Energy - RPP - Tier 2 per kWh 0.1390$ 150 20.85$ 0.1390$ 150 20.85$ -$ 0.0% 0.1390$ 150 20.85$ -$ 0.0% 0.1390$ 150 20.85$ -$ 0.0% 0.1390$ 150 20.85$ -$ 0.0% 0.1390$ 150 20.85$ -$ 0.0%
Non-RPP Retailer Avg. Price per kWh 0.1164$ - -$ 0.1164$ - -$ -$ 0.1164$ - -$ -$ 0.1164$ - -$ -$ 0.1164$ - -$ -$ 0.1164$ - -$ -$
Average IESO Wholesale Market Price per kWh 0.1164$ - -$ 0.1164$ - -$ -$ 0.1164$ - -$ -$ 0.1164$ - -$ -$ 0.1164$ - -$ -$ 0.1164$ - -$ -$
Total Bill on TOU (before Taxes) 73.90$ 69.90$ 4.00-$ -5.4% 70.95$ 1.05$ 1.5% 72.25$ 1.30$ 1.8% 72.95$ 0.70$ 1.0% 74.61$ 1.66$ 2.3%
Ontario Electricity Rebate -31.8% 23.50-$ -31.8% 22.23-$ 1.27$ -5.4% -31.8% 22.56-$ 0.33-$ 1.5% -31.8% 22.98-$ 0.41-$ 1.8% -31.8% 23.20-$ 0.22-$ 1.0% -31.8% 23.73-$ 0.53-$ 2.3%
HST 13% 9.61$ 13% 9.09$ 0.52-$ -5.4% 13% 9.22$ 0.14$ 1.5% 13% 9.39$ 0.17$ 1.8% 13% 9.48$ 0.09$ 1.0% 13% 9.70$ 0.22$ 2.3%
60.01$ 56.76$ 3.25-$ -5.4% 57.61$ 0.85$ 1.5% 58.67$ 1.06$ 1.8% 59.24$ 0.57$ 1.0% 60.59$ 1.35$ 2.3%
Loss Factor (%) 3.76% 2.95% 2.95% 2.95% 2.95% 2.95%
$ Change % Change
Total Bill on TOU (after Tax & Rebate)
$ Change % Change $ Change % Change
Impact 2022 Proposed Impact 2023 Proposed Impact
Charge Unit $ Change % Change $ Change % Change
Bill Impacts
RESIDENTIAL SERVICE
2019 Board-Approved 2020 Proposed Impact 2021 Proposed Impact2024 Proposed
OEB Appendix 2-W
November 1 - April 30 (Select this radio button for applications filed after Oct 31)May 1 - October 31
RESIDENTIAL

Toronto Hydro-Electric System Limited
EB-2018-0165
Draft Rate Order
Schedule 16
UPDATED: February 12, 2020
Page 3 of 13
2
Customer Class:
TOU / non-TOU: TOU
Consumption 650 kWh
Rate Volume Charge Rate Volume Charge Rate Volume Charge Rate Volume Charge Rate Volume Charge Rate Volume Charge
($) ($) ($) ($) ($) ($) ($) ($) ($) ($) ($) ($)
Service Charge per 30 days 37.48$ 1 37.48$ 38.34$ 1 38.34$ 0.86$ 2.3% 40.08$ 1 40.08$ 1.74$ 4.5% 40.53$ 1 40.53$ 0.45$ 1.1% 42.94$ 1 42.94$ 2.41$ 5.9% 44.60$ 1 44.60$ 1.66$ 3.9%
Rate Rider for Disposition of Other Post Employment Benefit Variance - effective until December 31, 2020 per 30 days 0.45$ 1 0.45$ 0.45$ -$ 1 -$ 0.45-$ -$ 1 -$ -$ -$ 1 -$ -$ -$ 1 -$ -$
Rate Rider for Disposition of the Impact for USGAAP - effective until December 31, 2020 per 30 days 0.41$ 1 0.41$ 0.41$ -$ 1 -$ 0.41-$ -$ 1 -$ -$ -$ 1 -$ -$ -$ 1 -$ -$
Rate Rider for Recovery of Monthly Billing Transition Costs - effective until December 31, 2022 per 30 days 0.48$ 1 0.48$ 0.48$ 0.48$ 1 0.48$ -$ 0.0% 0.48$ 1 0.48$ -$ 0.0% -$ 1 -$ 0.48-$ -$ 1 -$ -$
Rate Rider for Disposition of Stranded Meter Assets - effective until December 31, 2024 per 30 days -$ 1 -$ -$ 0.02-$ 1 0.02-$ 0.02-$ 0.02-$ 1 0.02-$ -$ 0.0% 0.02-$ 1 0.02-$ -$ 0.0% 0.02-$ 1 0.02-$ -$ 0.0%
Rate Rider for Application of Operations Center Consolidation Plan - effective until December 31, 2021 per 30 days 2.13-$ 1 2.13-$ 2.13-$ 2.13-$ 1 2.13-$ -$ 0.0% -$ 1 -$ 2.13$ -$ 1 -$ -$ -$ 1 -$ -$
Rate Rider for Disposition of the Gain on Property Sale - effective until December 31, 2021 per 30 days 0.34-$ 1 0.34-$ 0.34-$ 0.34-$ 1 0.34-$ -$ 0.0% -$ 1 -$ 0.34$ -$ 1 -$ -$ -$ 1 -$ -$
Rate Rider for Disposition of Wireless Pole Attachment Revenue - effective until December 31, 2024 per 30 days -$ 1 -$ -$ 0.01-$ 1 0.01-$ 0.01-$ 0.01-$ 1 0.01-$ -$ 0.0% 0.01-$ 1 0.01-$ -$ 0.0% 0.01-$ 1 0.01-$ -$ 0.0%
Rate Rider for Disposition of IFRS - CGAPP Property Plant and Equipment - effective until December 31, 2020 per 30 days 0.10-$ 1 0.10-$ 0.10-$ -$ 1 -$ 0.10$ -$ 1 -$ -$ -$ 1 -$ -$ -$ 1 -$ -$
Rate Rider for Disposition of Capital Related Revenue Requirement Variance Account - effective until Dec. 31, 2024 per 30 days -$ 1 -$ -$ -$ 1 -$ -$ -$ 1 -$ -$ 2.17-$ 1 2.17-$ 2.17-$ 2.17-$ 1 2.17-$ -$ 0.0%
Rate Rider for Disposition of PILs and Tax Variance - effective until December 31, 2024 per 30 days -$ -$ 1 -$ -$ -$ 1 -$ -$ -$ 1 -$ -$ 0.31-$ 1 0.31-$ 0.31-$ 0.31-$ 1 0.31-$ -$ 0.0%
Rate Rider for Disposition of External Driven Capital Variance Account - effective until December 31, 2020 per 30 days 0.20-$ 1 0.20-$ 0.20-$ -$ 1 -$ 0.20$ -$ 1 -$ -$ -$ 1 -$ -$ -$ 1 -$ -$
Rate Rider for Disposition of Derecognition Variance Account - effective until December 31, 2022 per 30 days -$ 1 -$ -$ -$ 1 -$ -$ 1.81-$ 1 1.81-$ 1.81-$ -$ 1 -$ 1.81$ -$ 1 -$ -$
Rate Rider for Disposition of Accounts Receivable Credits - effective until December 31, 2024 per 30 days -$ 1 -$ -$ 0.10-$ 1 0.10-$ 0.10-$ 0.10-$ 1 0.10-$ -$ 0.0% 0.10-$ 1 0.10-$ -$ 0.0% 0.10-$ 1 0.10-$ -$ 0.0%
Rate Rider for Recovery of 2020 Foregone Revenue - effective until December 31, 2021 per 30 days -$ 0.26-$ 1 0.26-$ 0.26-$ 0.26-$ 1 0.26-$ -$ 0.0% -$ 1 -$ 0.26$ -$ 1 -$ -$ -$ 1 -$ -$
Rate Rider for Recovery of Stranded Meters Assets - effective until Dec. 31, 2019 per 30 days 0.28$ 1 0.28$ 1 -$ 0.28-$ 1 -$ -$ 1 -$ -$ 1 -$ -$ 1 -$ -$
Rate Rider for Recovery of the Gain on the Sale of Named Properties - effective until Dec. 31, 2019 per 30 days 0.10$ 1 0.10$ 1 -$ 0.10-$ 1 -$ -$ 1 -$ -$ 1 -$ -$ 1 -$ -$
Rate Rider for Recovery of Hydro One Capital Contributions Variance - effective until Dec. 31, 2019 per 30 days 0.03$ 1 0.03$ 1 -$ 0.03-$ 1 -$ -$ 1 -$ -$ 1 -$ -$ 1 -$ -$
Rate Rider for Application of IFRS - 2014 Derecognition - effective until Dec. 31, 2019 per 30 days 0.46$ 1 0.46$ 1 -$ 0.46-$ 1 -$ -$ 1 -$ -$ 1 -$ -$ 1 -$ -$
Rate Rider for Recovery of 2015 Foregone Revenue - effective until Dec. 31, 2019 per 30 days 0.88$ 1 0.88$ 1 -$ 0.88-$ 1 -$ -$ 1 -$ -$ 1 -$ -$ 1 -$ -$
Rate Rider for Recovery of 2016 Foregone Revenue - effective until Dec. 31, 2019 per 30 days 0.28$ 1 0.28$ 1 -$ 0.28-$ 1 -$ -$ 1 -$ -$ 1 -$ -$ 1 -$ -$
Distribution Volumetric Rate per kWh 0.00553$ 650 3.59$ 650 -$ 3.59-$ 650 -$ -$ 650 -$ -$ 650 -$ -$ 650 -$ -$
Rate Rider for Disposition of Lost Revenue Adjustment Mechanism (LRAMVA) (2019) - effective until Dec. 31, 2019 per kWh 0.00095$ 650 0.62$ 650 -$ 0.62-$ 650 -$ -$ 650 -$ -$ 650 -$ -$ 650 -$ -$
Sub-Total A (excluding pass through) 43.72$ 36.65$ 7.07-$ -16.2% 37.70$ 1.05$ 2.9% 39.07$ 1.37$ 3.6% 40.33$ 1.26$ 3.2% 41.99$ 1.66$ 4.1%
Line Losses on Cost of Power per kWh 0.12800$ 24 3.13$ 0.12800$ 19 2.45$ 0.67-$ -21.5% 0.12800$ 19 2.45$ -$ 0.0% 0.12800$ 19 2.45$ -$ 0.0% 0.12800$ 19 2.45$ -$ 0.0% 0.12800$ 19 2.45$ -$ 0.0%
Rate Rider for Disposition of Deferral/Variance Accounts per kWh 0.00052-$ 650 0.34-$ 0.00033$ 650 0.21$ 0.55$ -163.5% 0.00033$ 650 0.21$ -$ 0.0% -$ 0.21-$ -$ -$ -$ -$
Rate Rider for Disposition of Capacity Based Recovery Account - Applicable only for Class B Customers per kWh 0.00003$ 650 0.02$ 0.00002-$ 650 0.01-$ 0.03-$ -166.7% 0.00002-$ 650 0.01-$ -$ 0.0% -$ 0.01$ -$ -$ -$ -$
Rate Rider for Disposition of Global Adjustment Account - (Applicable only for Non-RPP Customers) per kWh 0.00068$ -$ 0.00159-$ -$ -$ 0.00159-$ -$ -$ -$ -$ -$ -$ -$ -$
Rate Rider for Smart Metering Entity Charge - effective until Dec. 31, 2022 per 30 days 0.56$ 1 0.56$ 0.56$ 1 0.56$ -$ 0.0% 0.56$ 1 0.56$ -$ 0.0% 0.56$ 1 0.56$ -$ 0.0% -$ 0.56-$ -$ -$
Sub-Total B - Distribution (includes Sub-Total A) 47.09$ 39.87$ 7.23-$ -15.3% 40.92$ 1.05$ 2.6% 42.08$ 1.17$ 2.9% 42.78$ 0.70$ 1.7% 44.44$ 1.66$ 3.9%
Retail Transmissioin Rate - Network Service Rate per kWh 0.00796$ 674 5.37$ 0.00906$ 669 6.06$ 0.69$ 12.9% 0.00906$ 669 6.06$ -$ 0.0% 0.00906$ 669 6.06$ -$ 0.0% 0.00906$ 669 6.06$ -$ 0.0% 0.00906$ 669 6.06$ -$ 0.0%
Retail Transmissioin Rate - Line and Transformation Connection Service Rate per kWh 0.00703$ 674 4.74$ 0.00737$ 669 4.93$ 0.19$ 4.0% 0.00737$ 669 4.93$ -$ 0.0% 0.00737$ 669 4.93$ -$ 0.0% 0.00737$ 669 4.93$ -$ 0.0% 0.00737$ 669 4.93$ -$ 0.0%
Sub-Total C - Delivery (including Sub-Total B) 57.20$ 50.86$ 6.34-$ -11.1% 51.91$ 1.05$ 2.1% 53.08$ 1.17$ 2.3% 53.78$ 0.70$ 1.3% 55.44$ 1.66$ 3.1%
Wholesale Market Service Rate - not including CBR per kWh 0.0030$ 674 2.02$ 0.0030$ 669 2.01$ 0.02-$ -0.8% 0.0030$ 669 2.01$ -$ 0.0% 0.0030$ 669 2.01$ -$ 0.0% 0.0030$ 669 2.01$ -$ 0.0% 0.0030$ 669 2.01$ -$ 0.0%
Rural and Remote Rate Protection Charge (RRRP) per kWh 0.0005$ 674 0.34$ 0.0005$ 669 0.33$ 0.00-$ -0.8% 0.0005$ 669 0.33$ -$ 0.0% 0.0005$ 669 0.33$ -$ 0.0% 0.0005$ 669 0.33$ -$ 0.0% 0.0005$ 669 0.33$ -$ 0.0%
Capacity Based Recovery (CBR) - Applicable for Class B Customers per kWh 0.0004$ 674 0.27$ 0.0004$ 669 0.27$ 0.00-$ -0.8% 0.0004$ 669 0.27$ -$ 0.0% 0.0004$ 669 0.27$ -$ 0.0% 0.0004$ 669 0.27$ -$ 0.0% 0.0004$ 669 0.27$ -$ 0.0%
Standard Supply Service - Administrative Charge (if applicable) per 30 days 0.25$ 1 0.25$ 0.25$ 1 0.25$ -$ 0.0% 0.25$ 1 0.25$ -$ 0.0% 0.25$ 1 0.25$ -$ 0.0% 0.25$ 1 0.25$ -$ 0.0% 0.25$ 1 0.25$ -$ 0.0%
TOU - Off Peak per kWh 0.1010$ 416 42.02$ 0.1010$ 416 42.02$ -$ 0.0% 0.1010$ 416 42.02$ -$ 0.0% 0.1010$ 416 42.02$ -$ 0.0% 0.1010$ 416 42.02$ -$ 0.0% 0.1010$ 416 42.02$ -$ 0.0%
TOU - Mid Peak per kWh 0.1440$ 117 16.85$ 0.1440$ 117 16.85$ -$ 0.0% 0.1440$ 117 16.85$ -$ 0.0% 0.1440$ 117 16.85$ -$ 0.0% 0.1440$ 117 16.85$ -$ 0.0% 0.1440$ 117 16.85$ -$ 0.0%
TOU - On Peak per kWh 0.2080$ 117 24.34$ 0.2080$ 117 24.34$ -$ 0.0% 0.2080$ 117 24.34$ -$ 0.0% 0.2080$ 117 24.34$ -$ 0.0% 0.2080$ 117 24.34$ -$ 0.0% 0.2080$ 117 24.34$ -$ 0.0%
Energy - RPP - Tier 1 per kWh 0.1190$ 600 71.40$ 0.1190$ 600 71.40$ -$ 0.0% 0.1190$ 600 71.40$ -$ 0.0% 0.1190$ 600 71.40$ -$ 0.0% 0.1190$ 600 71.40$ -$ 0.0% 0.1190$ 600 71.40$ -$ 0.0%
Energy - RPP - Tier 2 per kWh 0.1390$ 150 20.85$ 0.1390$ 150 20.85$ -$ 0.0% 0.1390$ 150 20.85$ -$ 0.0% 0.1390$ 150 20.85$ -$ 0.0% 0.1390$ 150 20.85$ -$ 0.0% 0.1390$ 150 20.85$ -$ 0.0%
Non-RPP Retailer Avg. Price per kWh 0.1164$ - -$ 0.1164$ - -$ 0.12$ 0.1164$ - -$ -$ 0.1164$ - -$ -$ 0.1164$ - -$ -$ 0.1164$ - -$ -$
Average IESO Wholesale Market Price per kWh 0.1164$ - -$ 0.1164$ - -$ 0.12$ 0.1164$ - -$ -$ 0.1164$ - -$ -$ 0.1164$ - -$ -$ 0.1164$ - -$ -$
Total Bill on TOU (before Taxes) 143.28$ 136.92$ 6.36-$ -4.4% 137.97$ 1.05$ 0.8% 139.14$ 1.17$ 0.8% 139.84$ 0.70$ 0.5% 141.50$ 1.66$ 1.2%
Ontario Electricity Rebate -31.8% 45.56-$ -31.8% 43.54-$ 2.02$ -4.4% -31.8% 43.87-$ 0.33-$ 0.8% -31.8% 44.25-$ 0.37-$ 0.8% -31.8% 44.47-$ 0.22-$ 0.5% -31.8% 45.00-$ 0.53-$ 1.2%
HST 13% 18.63$ 13% 17.80$ 0.83-$ -4.4% 13% 17.94$ 0.14$ 0.8% 13% 18.09$ 0.15$ 0.8% 13% 18.18$ 0.09$ 0.5% 13% 18.39$ 0.22$ 1.2%
116.34$ 111.18$ 5.17-$ -4.4% 112.03$ 0.85$ 0.8% 112.98$ 0.95$ 0.8% 113.55$ 0.57$ 0.5% 114.90$ 1.35$ 1.2%
Loss Factor (%) 3.76% 2.95% 2.95% 2.95% 2.95% 2.95%
Total Bill on TOU (after Tax & Rebate)
$ Change % Change $ Change % ChangeCharge Unit $ Change % Change $ Change % Change $ Change % Change
Impact 2023 Proposed Impact 2024 Proposed Impact2022 Proposed
OEB Appendix 2-W
Bill Impacts
RESIDENTIAL SERVICE
2019 Board-Approved 2020 Proposed Impact 2021 Proposed Impact
May 1 - October 31 November 1 - April 30 (Select this radio button for applications filed after Oct 31)
RESIDENTIAL
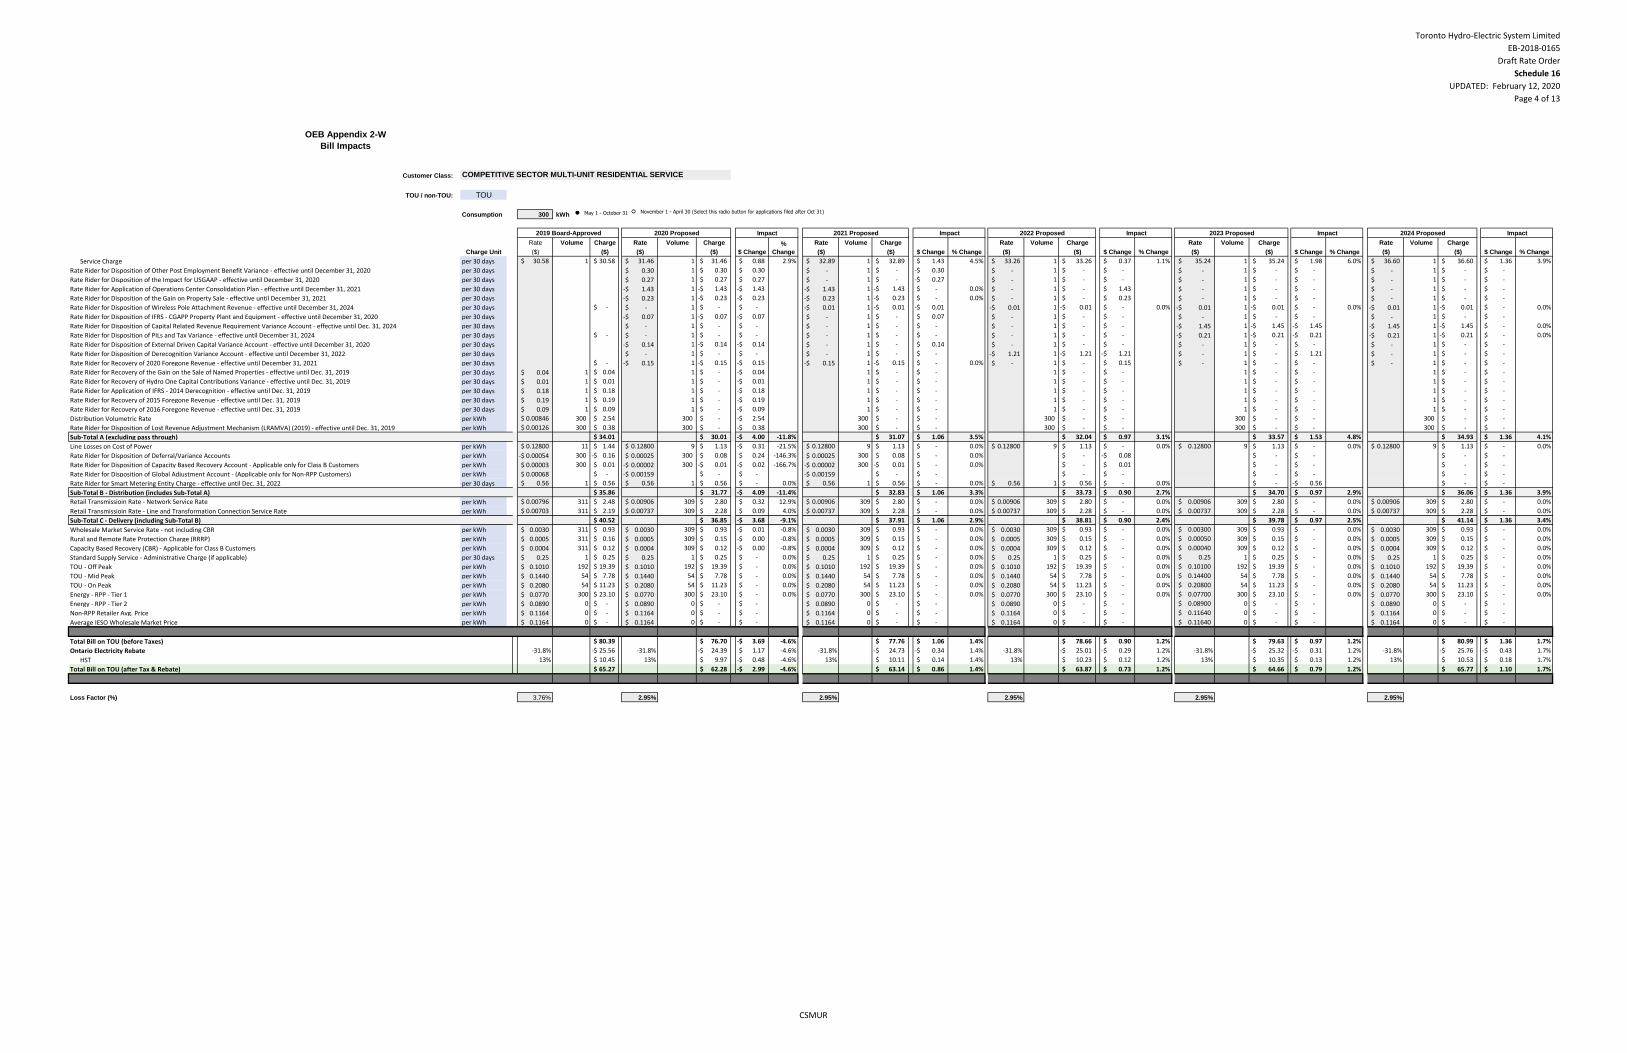
Toronto Hydro-Electric System Limited
EB-2018-0165
Draft Rate Order
Schedule 16
UPDATED: February 12, 2020
Page 4 of 13
0.64 TOU - Off Peak
0.18 TOU - Mid Peak
0.18 TOU - On Peak
Customer Class:
TOU / non-TOU: TOU
Consumption 300 kWh
Rate Volume Charge Rate Volume Charge Rate Volume Charge Rate Volume Charge Rate Volume Charge Rate Volume Charge
($) ($) ($) ($) ($) ($) ($) ($) ($) ($) ($) ($)
Service Charge per 30 days 30.58$ 1 30.58$ 31.46$ 1 31.46$ 0.88$ 2.9% 32.89$ 1 32.89$ 1.43$ 4.5% 33.26$ 1 33.26$ 0.37$ 1.1% 35.24$ 1 35.24$ 1.98$ 6.0% 36.60$ 1 36.60$ 1.36$ 3.9%
Rate Rider for Disposition of Other Post Employment Benefit Variance - effective until December 31, 2020 per 30 days 0.30$ 1 0.30$ 0.30$ -$ 1 -$ 0.30-$ -$ 1 -$ -$ -$ 1 -$ -$ -$ 1 -$ -$
Rate Rider for Disposition of the Impact for USGAAP - effective until December 31, 2020 per 30 days 0.27$ 1 0.27$ 0.27$ -$ 1 -$ 0.27-$ -$ 1 -$ -$ -$ 1 -$ -$ -$ 1 -$ -$
Rate Rider for Application of Operations Center Consolidation Plan - effective until December 31, 2021 per 30 days 1.43-$ 1 1.43-$ 1.43-$ 1.43-$ 1 1.43-$ -$ 0.0% -$ 1 -$ 1.43$ -$ 1 -$ -$ -$ 1 -$ -$
Rate Rider for Disposition of the Gain on Property Sale - effective until December 31, 2021 per 30 days 0.23-$ 1 0.23-$ 0.23-$ 0.23-$ 1 0.23-$ -$ 0.0% -$ 1 -$ 0.23$ -$ 1 -$ -$ -$ 1 -$ -$
Rate Rider for Disposition of Wireless Pole Attachment Revenue - effective until December 31, 2024 per 30 days -$ -$ 1 -$ -$ 0.01-$ 1 0.01-$ 0.01-$ 0.01-$ 1 0.01-$ -$ 0.0% 0.01-$ 1 0.01-$ -$ 0.0% 0.01-$ 1 0.01-$ -$ 0.0%
Rate Rider for Disposition of IFRS - CGAPP Property Plant and Equipment - effective until December 31, 2020 per 30 days 0.07-$ 1 0.07-$ 0.07-$ -$ 1 -$ 0.07$ -$ 1 -$ -$ -$ 1 -$ -$ -$ 1 -$ -$
Rate Rider for Disposition of Capital Related Revenue Requirement Variance Account - effective until Dec. 31, 2024 per 30 days -$ 1 -$ -$ -$ 1 -$ -$ -$ 1 -$ -$ 1.45-$ 1 1.45-$ 1.45-$ 1.45-$ 1 1.45-$ -$ 0.0%
Rate Rider for Disposition of PILs and Tax Variance - effective until December 31, 2024 per 30 days -$ -$ 1 -$ -$ -$ 1 -$ -$ -$ 1 -$ -$ 0.21-$ 1 0.21-$ 0.21-$ 0.21-$ 1 0.21-$ -$ 0.0%
Rate Rider for Disposition of External Driven Capital Variance Account - effective until December 31, 2020 per 30 days 0.14-$ 1 0.14-$ 0.14-$ -$ 1 -$ 0.14$ -$ 1 -$ -$ -$ 1 -$ -$ -$ 1 -$ -$
Rate Rider for Disposition of Derecognition Variance Account - effective until December 31, 2022 per 30 days -$ 1 -$ -$ -$ 1 -$ -$ 1.21-$ 1 1.21-$ 1.21-$ -$ 1 -$ 1.21$ -$ 1 -$ -$
Rate Rider for Recovery of 2020 Foregone Revenue - effective until December 31, 2021 per 30 days -$ 0.15-$ 1 0.15-$ 0.15-$ 0.15-$ 1 0.15-$ -$ 0.0% -$ 1 -$ 0.15$ -$ 1 -$ -$ -$ 1 -$ -$
Rate Rider for Recovery of the Gain on the Sale of Named Properties - effective until Dec. 31, 2019 per 30 days 0.04$ 1 0.04$ 1 -$ 0.04-$ 1 -$ -$ 1 -$ -$ 1 -$ -$ 1 -$ -$
Rate Rider for Recovery of Hydro One Capital Contributions Variance - effective until Dec. 31, 2019 per 30 days 0.01$ 1 0.01$ 1 -$ 0.01-$ 1 -$ -$ 1 -$ -$ 1 -$ -$ 1 -$ -$
Rate Rider for Application of IFRS - 2014 Derecognition - effective until Dec. 31, 2019 per 30 days 0.18$ 1 0.18$ 1 -$ 0.18-$ 1 -$ -$ 1 -$ -$ 1 -$ -$ 1 -$ -$
Rate Rider for Recovery of 2015 Foregone Revenue - effective until Dec. 31, 2019 per 30 days 0.19$ 1 0.19$ 1 -$ 0.19-$ 1 -$ -$ 1 -$ -$ 1 -$ -$ 1 -$ -$
Rate Rider for Recovery of 2016 Foregone Revenue - effective until Dec. 31, 2019 per 30 days 0.09$ 1 0.09$ 1 -$ 0.09-$ 1 -$ -$ 1 -$ -$ 1 -$ -$ 1 -$ -$
Distribution Volumetric Rate per kWh 0.00846$ 300 2.54$ 300 -$ 2.54-$ 300 -$ -$ 300 -$ -$ 300 -$ -$ 300 -$ -$
Rate Rider for Disposition of Lost Revenue Adjustment Mechanism (LRAMVA) (2019) - effective until Dec. 31, 2019 per kWh 0.00126$ 300 0.38$ 300 -$ 0.38-$ 300 -$ -$ 300 -$ -$ 300 -$ -$ 300 -$ -$
Sub-Total A (excluding pass through) 34.01$ 30.01$ 4.00-$ -11.8% 31.07$ 1.06$ 3.5% 32.04$ 0.97$ 3.1% 33.57$ 1.53$ 4.8% 34.93$ 1.36$ 4.1%
Line Losses on Cost of Power per kWh 0.12800$ 11 1.44$ 0.12800$ 9 1.13$ 0.31-$ -21.5% 0.12800$ 9 1.13$ -$ 0.0% 0.12800$ 9 1.13$ -$ 0.0% 0.12800$ 9 1.13$ -$ 0.0% 0.12800$ 9 1.13$ -$ 0.0%
Rate Rider for Disposition of Deferral/Variance Accounts per kWh 0.00054-$ 300 0.16-$ 0.00025$ 300 0.08$ 0.24$ -146.3% 0.00025$ 300 0.08$ -$ 0.0% -$ 0.08-$ -$ -$ -$ -$
Rate Rider for Disposition of Capacity Based Recovery Account - Applicable only for Class B Customers per kWh 0.00003$ 300 0.01$ 0.00002-$ 300 0.01-$ 0.02-$ -166.7% 0.00002-$ 300 0.01-$ -$ 0.0% -$ 0.01$ -$ -$ -$ -$
Rate Rider for Disposition of Global Adjustment Account - (Applicable only for Non-RPP Customers) per kWh 0.00068$ -$ 0.00159-$ -$ -$ 0.00159-$ -$ -$ -$ -$ -$ -$ -$ -$
Rate Rider for Smart Metering Entity Charge - effective until Dec. 31, 2022 per 30 days 0.56$ 1 0.56$ 0.56$ 1 0.56$ -$ 0.0% 0.56$ 1 0.56$ -$ 0.0% 0.56$ 1 0.56$ -$ 0.0% -$ 0.56-$ -$ -$
Sub-Total B - Distribution (includes Sub-Total A) 35.86$ 31.77$ 4.09-$ -11.4% 32.83$ 1.06$ 3.3% 33.73$ 0.90$ 2.7% 34.70$ 0.97$ 2.9% 36.06$ 1.36$ 3.9%
Retail Transmissioin Rate - Network Service Rate per kWh 0.00796$ 311 2.48$ 0.00906$ 309 2.80$ 0.32$ 12.9% 0.00906$ 309 2.80$ -$ 0.0% 0.00906$ 309 2.80$ -$ 0.0% 0.00906$ 309 2.80$ -$ 0.0% 0.00906$ 309 2.80$ -$ 0.0%
Retail Transmissioin Rate - Line and Transformation Connection Service Rate per kWh 0.00703$ 311 2.19$ 0.00737$ 309 2.28$ 0.09$ 4.0% 0.00737$ 309 2.28$ -$ 0.0% 0.00737$ 309 2.28$ -$ 0.0% 0.00737$ 309 2.28$ -$ 0.0% 0.00737$ 309 2.28$ -$ 0.0%
Sub-Total C - Delivery (including Sub-Total B) 40.52$ 36.85$ 3.68-$ -9.1% 37.91$ 1.06$ 2.9% 38.81$ 0.90$ 2.4% 39.78$ 0.97$ 2.5% 41.14$ 1.36$ 3.4%
Wholesale Market Service Rate - not including CBR per kWh 0.0030$ 311 0.93$ 0.0030$ 309 0.93$ 0.01-$ -0.8% 0.0030$ 309 0.93$ -$ 0.0% 0.0030$ 309 0.93$ -$ 0.0% 0.00300$ 309 0.93$ -$ 0.0% 0.0030$ 309 0.93$ -$ 0.0%
Rural and Remote Rate Protection Charge (RRRP) per kWh 0.0005$ 311 0.16$ 0.0005$ 309 0.15$ 0.00-$ -0.8% 0.0005$ 309 0.15$ -$ 0.0% 0.0005$ 309 0.15$ -$ 0.0% 0.00050$ 309 0.15$ -$ 0.0% 0.0005$ 309 0.15$ -$ 0.0%
Capacity Based Recovery (CBR) - Applicable for Class B Customers per kWh 0.0004$ 311 0.12$ 0.0004$ 309 0.12$ 0.00-$ -0.8% 0.0004$ 309 0.12$ -$ 0.0% 0.0004$ 309 0.12$ -$ 0.0% 0.00040$ 309 0.12$ -$ 0.0% 0.0004$ 309 0.12$ -$ 0.0%
Standard Supply Service - Administrative Charge (if applicable) per 30 days 0.25$ 1 0.25$ 0.25$ 1 0.25$ -$ 0.0% 0.25$ 1 0.25$ -$ 0.0% 0.25$ 1 0.25$ -$ 0.0% 0.25$ 1 0.25$ -$ 0.0% 0.25$ 1 0.25$ -$ 0.0%
TOU - Off Peak per kWh 0.1010$ 192 19.39$ 0.1010$ 192 19.39$ -$ 0.0% 0.1010$ 192 19.39$ -$ 0.0% 0.1010$ 192 19.39$ -$ 0.0% 0.10100$ 192 19.39$ -$ 0.0% 0.1010$ 192 19.39$ -$ 0.0%
TOU - Mid Peak per kWh 0.1440$ 54 7.78$ 0.1440$ 54 7.78$ -$ 0.0% 0.1440$ 54 7.78$ -$ 0.0% 0.1440$ 54 7.78$ -$ 0.0% 0.14400$ 54 7.78$ -$ 0.0% 0.1440$ 54 7.78$ -$ 0.0%
TOU - On Peak per kWh 0.2080$ 54 11.23$ 0.2080$ 54 11.23$ -$ 0.0% 0.2080$ 54 11.23$ -$ 0.0% 0.2080$ 54 11.23$ -$ 0.0% 0.20800$ 54 11.23$ -$ 0.0% 0.2080$ 54 11.23$ -$ 0.0%
Energy - RPP - Tier 1 per kWh 0.0770$ 300 23.10$ 0.0770$ 300 23.10$ -$ 0.0% 0.0770$ 300 23.10$ -$ 0.0% 0.0770$ 300 23.10$ -$ 0.0% 0.07700$ 300 23.10$ -$ 0.0% 0.0770$ 300 23.10$ -$ 0.0%
Energy - RPP - Tier 2 per kWh 0.0890$ 0 -$ 0.0890$ 0 -$ -$ 0.0890$ 0 -$ -$ 0.0890$ 0 -$ -$ 0.08900$ 0 -$ -$ 0.0890$ 0 -$ -$
Non-RPP Retailer Avg. Price per kWh 0.1164$ 0 -$ 0.1164$ 0 -$ -$ 0.1164$ 0 -$ -$ 0.1164$ 0 -$ -$ 0.11640$ 0 -$ -$ 0.1164$ 0 -$ -$
Average IESO Wholesale Market Price per kWh 0.1164$ 0 -$ 0.1164$ 0 -$ -$ 0.1164$ 0 -$ -$ 0.1164$ 0 -$ -$ 0.11640$ 0 -$ -$ 0.1164$ 0 -$ -$
Total Bill on TOU (before Taxes) 80.39$ 76.70$ 3.69-$ -4.6% 77.76$ 1.06$ 1.4% 78.66$ 0.90$ 1.2% 79.63$ 0.97$ 1.2% 80.99$ 1.36$ 1.7%
Ontario Electricity Rebate -31.8% 25.56-$ -31.8% 24.39-$ 1.17$ -4.6% -31.8% 24.73-$ 0.34-$ 1.4% -31.8% 25.01-$ 0.29-$ 1.2% -31.8% 25.32-$ 0.31-$ 1.2% -31.8% 25.76-$ 0.43-$ 1.7%
HST 13% 10.45$ 13% 9.97$ 0.48-$ -4.6% 13% 10.11$ 0.14$ 1.4% 13% 10.23$ 0.12$ 1.2% 13% 10.35$ 0.13$ 1.2% 13% 10.53$ 0.18$ 1.7%
65.27$ 62.28$ 2.99-$ -4.6% 63.14$ 0.86$ 1.4% 63.87$ 0.73$ 1.2% 64.66$ 0.79$ 1.2% 65.77$ 1.10$ 1.7%
Loss Factor (%) 3.76% 2.95% 2.95% 2.95% 2.95% 2.95%
$ Change % Change $ Change % Change
Total Bill on TOU (after Tax & Rebate)
Impact 2024 Proposed Impact
Charge Unit $ Change
%
Change $ Change % Change $ Change % Change
Impact 2021 Proposed Impact 2022 Proposed Impact 2023 Proposed
OEB Appendix 2-W
Bill Impacts
COMPETITIVE SECTOR MULTI-UNIT RESIDENTIAL SERVICE
2019 Board-Approved 2020 Proposed
November 1 - April 30 (Select this radio button for applications filed after Oct 31)May 1 - October 31
CSMUR
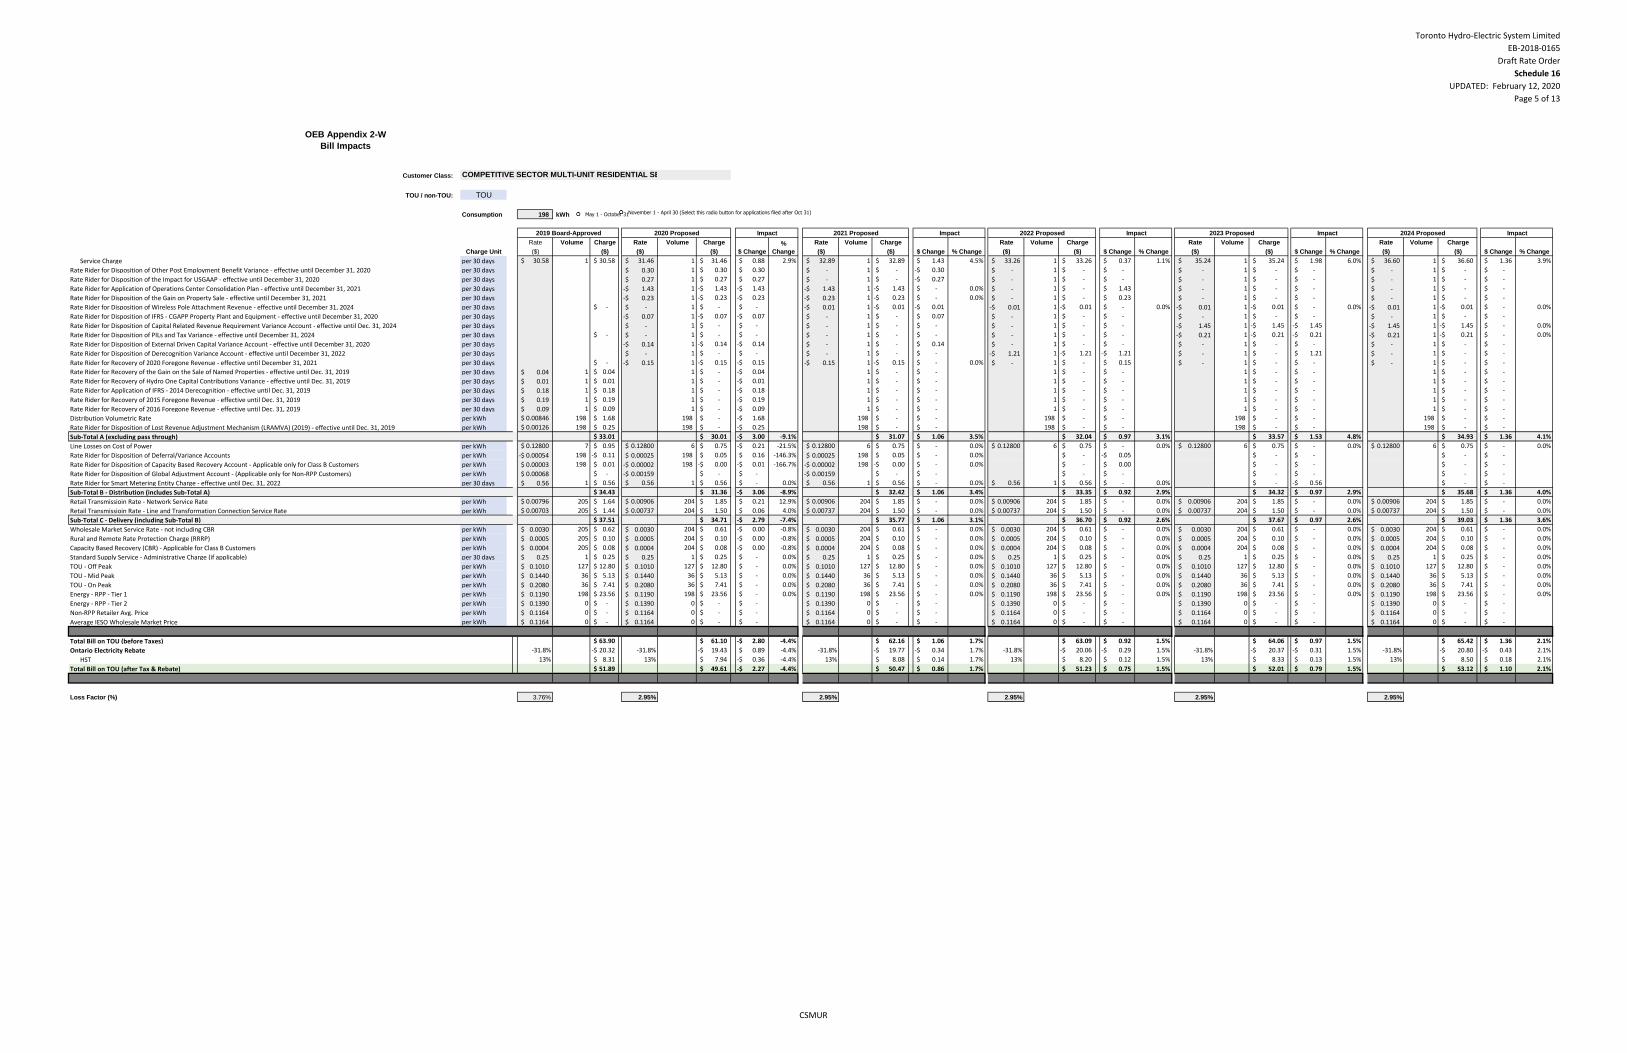
Toronto Hydro-Electric System Limited
EB-2018-0165
Draft Rate Order
Schedule 16
UPDATED: February 12, 2020
Page 5 of 13
Customer Class:
TOU / non-TOU: TOU
Consumption 198 kWh
Rate Volume Charge Rate Volume Charge Rate Volume Charge Rate Volume Charge Rate Volume Charge Rate Volume Charge
($) ($) ($) ($) ($) ($) ($) ($) ($) ($) ($) ($)
Service Charge per 30 days 30.58$ 1 30.58$ 31.46$ 1 31.46$ 0.88$ 2.9% 32.89$ 1 32.89$ 1.43$ 4.5% 33.26$ 1 33.26$ 0.37$ 1.1% 35.24$ 1 35.24$ 1.98$ 6.0% 36.60$ 1 36.60$ 1.36$ 3.9%
Rate Rider for Disposition of Other Post Employment Benefit Variance - effective until December 31, 2020 per 30 days 0.30$ 1 0.30$ 0.30$ -$ 1 -$ 0.30-$ -$ 1 -$ -$ -$ 1 -$ -$ -$ 1 -$ -$
Rate Rider for Disposition of the Impact for USGAAP - effective until December 31, 2020 per 30 days 0.27$ 1 0.27$ 0.27$ -$ 1 -$ 0.27-$ -$ 1 -$ -$ -$ 1 -$ -$ -$ 1 -$ -$
Rate Rider for Application of Operations Center Consolidation Plan - effective until December 31, 2021 per 30 days 1.43-$ 1 1.43-$ 1.43-$ 1.43-$ 1 1.43-$ -$ 0.0% -$ 1 -$ 1.43$ -$ 1 -$ -$ -$ 1 -$ -$
Rate Rider for Disposition of the Gain on Property Sale - effective until December 31, 2021 per 30 days 0.23-$ 1 0.23-$ 0.23-$ 0.23-$ 1 0.23-$ -$ 0.0% -$ 1 -$ 0.23$ -$ 1 -$ -$ -$ 1 -$ -$
Rate Rider for Disposition of Wireless Pole Attachment Revenue - effective until December 31, 2024 per 30 days -$ -$ 1 -$ -$ 0.01-$ 1 0.01-$ 0.01-$ 0.01-$ 1 0.01-$ -$ 0.0% 0.01-$ 1 0.01-$ -$ 0.0% 0.01-$ 1 0.01-$ -$ 0.0%
Rate Rider for Disposition of IFRS - CGAPP Property Plant and Equipment - effective until December 31, 2020 per 30 days 0.07-$ 1 0.07-$ 0.07-$ -$ 1 -$ 0.07$ -$ 1 -$ -$ -$ 1 -$ -$ -$ 1 -$ -$
Rate Rider for Disposition of Capital Related Revenue Requirement Variance Account - effective until Dec. 31, 2024 per 30 days -$ 1 -$ -$ -$ 1 -$ -$ -$ 1 -$ -$ 1.45-$ 1 1.45-$ 1.45-$ 1.45-$ 1 1.45-$ -$ 0.0%
Rate Rider for Disposition of PILs and Tax Variance - effective until December 31, 2024 per 30 days -$ -$ 1 -$ -$ -$ 1 -$ -$ -$ 1 -$ -$ 0.21-$ 1 0.21-$ 0.21-$ 0.21-$ 1 0.21-$ -$ 0.0%
Rate Rider for Disposition of External Driven Capital Variance Account - effective until December 31, 2020 per 30 days 0.14-$ 1 0.14-$ 0.14-$ -$ 1 -$ 0.14$ -$ 1 -$ -$ -$ 1 -$ -$ -$ 1 -$ -$
Rate Rider for Disposition of Derecognition Variance Account - effective until December 31, 2022 per 30 days -$ 1 -$ -$ -$ 1 -$ -$ 1.21-$ 1 1.21-$ 1.21-$ -$ 1 -$ 1.21$ -$ 1 -$ -$
Rate Rider for Recovery of 2020 Foregone Revenue - effective until December 31, 2021 per 30 days -$ 0.15-$ 1 0.15-$ 0.15-$ 0.15-$ 1 0.15-$ -$ 0.0% -$ 1 -$ 0.15$ -$ 1 -$ -$ -$ 1 -$ -$
Rate Rider for Recovery of the Gain on the Sale of Named Properties - effective until Dec. 31, 2019 per 30 days 0.04$ 1 0.04$ 1 -$ 0.04-$ 1 -$ -$ 1 -$ -$ 1 -$ -$ 1 -$ -$
Rate Rider for Recovery of Hydro One Capital Contributions Variance - effective until Dec. 31, 2019 per 30 days 0.01$ 1 0.01$ 1 -$ 0.01-$ 1 -$ -$ 1 -$ -$ 1 -$ -$ 1 -$ -$
Rate Rider for Application of IFRS - 2014 Derecognition - effective until Dec. 31, 2019 per 30 days 0.18$ 1 0.18$ 1 -$ 0.18-$ 1 -$ -$ 1 -$ -$ 1 -$ -$ 1 -$ -$
Rate Rider for Recovery of 2015 Foregone Revenue - effective until Dec. 31, 2019 per 30 days 0.19$ 1 0.19$ 1 -$ 0.19-$ 1 -$ -$ 1 -$ -$ 1 -$ -$ 1 -$ -$
Rate Rider for Recovery of 2016 Foregone Revenue - effective until Dec. 31, 2019 per 30 days 0.09$ 1 0.09$ 1 -$ 0.09-$ 1 -$ -$ 1 -$ -$ 1 -$ -$ 1 -$ -$
Distribution Volumetric Rate per kWh 0.00846$ 198 1.68$ 198 -$ 1.68-$ 198 -$ -$ 198 -$ -$ 198 -$ -$ 198 -$ -$
Rate Rider for Disposition of Lost Revenue Adjustment Mechanism (LRAMVA) (2019) - effective until Dec. 31, 2019 per kWh 0.00126$ 198 0.25$ 198 -$ 0.25-$ 198 -$ -$ 198 -$ -$ 198 -$ -$ 198 -$ -$
Sub-Total A (excluding pass through) 33.01$ 30.01$ 3.00-$ -9.1% 31.07$ 1.06$ 3.5% 32.04$ 0.97$ 3.1% 33.57$ 1.53$ 4.8% 34.93$ 1.36$ 4.1%
Line Losses on Cost of Power per kWh 0.12800$ 7 0.95$ 0.12800$ 6 0.75$ 0.21-$ -21.5% 0.12800$ 6 0.75$ -$ 0.0% 0.12800$ 6 0.75$ -$ 0.0% 0.12800$ 6 0.75$ -$ 0.0% 0.12800$ 6 0.75$ -$ 0.0%
Rate Rider for Disposition of Deferral/Variance Accounts per kWh 0.00054-$ 198 0.11-$ 0.00025$ 198 0.05$ 0.16$ -146.3% 0.00025$ 198 0.05$ -$ 0.0% -$ 0.05-$ -$ -$ -$ -$
Rate Rider for Disposition of Capacity Based Recovery Account - Applicable only for Class B Customers per kWh 0.00003$ 198 0.01$ 0.00002-$ 198 0.00-$ 0.01-$ -166.7% 0.00002-$ 198 0.00-$ -$ 0.0% -$ 0.00$ -$ -$ -$ -$
Rate Rider for Disposition of Global Adjustment Account - (Applicable only for Non-RPP Customers) per kWh 0.00068$ -$ 0.00159-$ -$ -$ 0.00159-$ -$ -$ -$ -$ -$ -$ -$ -$
Rate Rider for Smart Metering Entity Charge - effective until Dec. 31, 2022 per 30 days 0.56$ 1 0.56$ 0.56$ 1 0.56$ -$ 0.0% 0.56$ 1 0.56$ -$ 0.0% 0.56$ 1 0.56$ -$ 0.0% -$ 0.56-$ -$ -$
Sub-Total B - Distribution (includes Sub-Total A) 34.43$ 31.36$ 3.06-$ -8.9% 32.42$ 1.06$ 3.4% 33.35$ 0.92$ 2.9% 34.32$ 0.97$ 2.9% 35.68$ 1.36$ 4.0%
Retail Transmissioin Rate - Network Service Rate per kWh 0.00796$ 205 1.64$ 0.00906$ 204 1.85$ 0.21$ 12.9% 0.00906$ 204 1.85$ -$ 0.0% 0.00906$ 204 1.85$ -$ 0.0% 0.00906$ 204 1.85$ -$ 0.0% 0.00906$ 204 1.85$ -$ 0.0%
Retail Transmissioin Rate - Line and Transformation Connection Service Rate per kWh 0.00703$ 205 1.44$ 0.00737$ 204 1.50$ 0.06$ 4.0% 0.00737$ 204 1.50$ -$ 0.0% 0.00737$ 204 1.50$ -$ 0.0% 0.00737$ 204 1.50$ -$ 0.0% 0.00737$ 204 1.50$ -$ 0.0%
Sub-Total C - Delivery (including Sub-Total B) 37.51$ 34.71$ 2.79-$ -7.4% 35.77$ 1.06$ 3.1% 36.70$ 0.92$ 2.6% 37.67$ 0.97$ 2.6% 39.03$ 1.36$ 3.6%
Wholesale Market Service Rate - not including CBR per kWh 0.0030$ 205 0.62$ 0.0030$ 204 0.61$ 0.00-$ -0.8% 0.0030$ 204 0.61$ -$ 0.0% 0.0030$ 204 0.61$ -$ 0.0% 0.0030$ 204 0.61$ -$ 0.0% 0.0030$ 204 0.61$ -$ 0.0%
Rural and Remote Rate Protection Charge (RRRP) per kWh 0.0005$ 205 0.10$ 0.0005$ 204 0.10$ 0.00-$ -0.8% 0.0005$ 204 0.10$ -$ 0.0% 0.0005$ 204 0.10$ -$ 0.0% 0.0005$ 204 0.10$ -$ 0.0% 0.0005$ 204 0.10$ -$ 0.0%
Capacity Based Recovery (CBR) - Applicable for Class B Customers per kWh 0.0004$ 205 0.08$ 0.0004$ 204 0.08$ 0.00-$ -0.8% 0.0004$ 204 0.08$ -$ 0.0% 0.0004$ 204 0.08$ -$ 0.0% 0.0004$ 204 0.08$ -$ 0.0% 0.0004$ 204 0.08$ -$ 0.0%
Standard Supply Service - Administrative Charge (if applicable) per 30 days 0.25$ 1 0.25$ 0.25$ 1 0.25$ -$ 0.0% 0.25$ 1 0.25$ -$ 0.0% 0.25$ 1 0.25$ -$ 0.0% 0.25$ 1 0.25$ -$ 0.0% 0.25$ 1 0.25$ -$ 0.0%
TOU - Off Peak per kWh 0.1010$ 127 12.80$ 0.1010$ 127 12.80$ -$ 0.0% 0.1010$ 127 12.80$ -$ 0.0% 0.1010$ 127 12.80$ -$ 0.0% 0.1010$ 127 12.80$ -$ 0.0% 0.1010$ 127 12.80$ -$ 0.0%
TOU - Mid Peak per kWh 0.1440$ 36 5.13$ 0.1440$ 36 5.13$ -$ 0.0% 0.1440$ 36 5.13$ -$ 0.0% 0.1440$ 36 5.13$ -$ 0.0% 0.1440$ 36 5.13$ -$ 0.0% 0.1440$ 36 5.13$ -$ 0.0%
TOU - On Peak per kWh 0.2080$ 36 7.41$ 0.2080$ 36 7.41$ -$ 0.0% 0.2080$ 36 7.41$ -$ 0.0% 0.2080$ 36 7.41$ -$ 0.0% 0.2080$ 36 7.41$ -$ 0.0% 0.2080$ 36 7.41$ -$ 0.0%
Energy - RPP - Tier 1 per kWh 0.1190$ 198 23.56$ 0.1190$ 198 23.56$ -$ 0.0% 0.1190$ 198 23.56$ -$ 0.0% 0.1190$ 198 23.56$ -$ 0.0% 0.1190$ 198 23.56$ -$ 0.0% 0.1190$ 198 23.56$ -$ 0.0%
Energy - RPP - Tier 2 per kWh 0.1390$ 0 -$ 0.1390$ 0 -$ -$ 0.1390$ 0 -$ -$ 0.1390$ 0 -$ -$ 0.1390$ 0 -$ -$ 0.1390$ 0 -$ -$
Non-RPP Retailer Avg. Price per kWh 0.1164$ 0 -$ 0.1164$ 0 -$ -$ 0.1164$ 0 -$ -$ 0.1164$ 0 -$ -$ 0.1164$ 0 -$ -$ 0.1164$ 0 -$ -$
Average IESO Wholesale Market Price per kWh 0.1164$ 0 -$ 0.1164$ 0 -$ -$ 0.1164$ 0 -$ -$ 0.1164$ 0 -$ -$ 0.1164$ 0 -$ -$ 0.1164$ 0 -$ -$
Total Bill on TOU (before Taxes) 63.90$ 61.10$ 2.80-$ -4.4% 62.16$ 1.06$ 1.7% 63.09$ 0.92$ 1.5% 64.06$ 0.97$ 1.5% 65.42$ 1.36$ 2.1%
Ontario Electricity Rebate -31.8% 20.32-$ -31.8% 19.43-$ 0.89$ -4.4% -31.8% 19.77-$ 0.34-$ 1.7% -31.8% 20.06-$ 0.29-$ 1.5% -31.8% 20.37-$ 0.31-$ 1.5% -31.8% 20.80-$ 0.43-$ 2.1%
HST 13% 8.31$ 13% 7.94$ 0.36-$ -4.4% 13% 8.08$ 0.14$ 1.7% 13% 8.20$ 0.12$ 1.5% 13% 8.33$ 0.13$ 1.5% 13% 8.50$ 0.18$ 2.1%
51.89$ 49.61$ 2.27-$ -4.4% 50.47$ 0.86$ 1.7% 51.23$ 0.75$ 1.5% 52.01$ 0.79$ 1.5% 53.12$ 1.10$ 2.1%
Loss Factor (%) 3.76% 2.95% 2.95% 2.95% 2.95% 2.95%
$ Change % Change
Total Bill on TOU (after Tax & Rebate)
Impact
Charge Unit $ Change
%
Change $ Change % Change $ Change % Change $ Change % Change
Impact 2022 Proposed Impact 2023 Proposed Impact 2024 Proposed
Bill Impacts
COMPETITIVE SECTOR MULTI-UNIT RESIDENTIAL SERVICE
2019 Board-Approved 2020 Proposed Impact 2021 Proposed
OEB Appendix 2-W
November 1 - April 30 (Select this radio button for applications filed after Oct 31)May 1 - October 31
CSMUR

Toronto Hydro-Electric System Limited
EB-2018-0165
Draft Rate Order
Schedule 16
UPDATED: February 12, 2020
Page 6 of 13
0.64 TOU - Off Peak
0.18 TOU - Mid Peak
0.18 TOU - On Peak
Customer Class:
TOU / non-TOU: TOU
Consumption 2,000 kWh
Rate Volume Charge Rate Volume Charge Rate Volume Charge Rate Volume Charge Rate Volume Charge Rate Volume Charge
($) ($) ($) ($) ($) ($) ($) ($) ($) ($) ($) ($)
Service Charge per 30 days 35.80$ 1 35.80$ 36.98$ 1 36.98$ 1.18$ 3.3% 38.66$ 1 38.66$ 1.68$ 4.5% 39.09$ 1 39.09$ 0.43$ 1.1% 41.42$ 1 41.42$ 2.33$ 6.0% 43.02$ 1 43.02$ 1.60$ 3.9%
Rate Rider for Disposition of Other Post Employment Benefit Variance - effective until December 31, 2020 per kWh 0.00053$ 2,000 1.06$ 1.06$ -$ 2,000 -$ 1.06-$ -$ 2,000 -$ -$ -$ 2,000 -$ -$ -$ 2,000 -$ -$
Rate Rider for Disposition of the Impact for USGAAP - effective until December 31, 2020 per kWh 0.00048$ 2,000 0.96$ 0.96$ -$ 2,000 -$ 0.96-$ -$ 2,000 -$ -$ -$ 2,000 -$ -$ -$ 2,000 -$ -$
Rate Rider for Recovery of Monthly Billing Transition Costs - effective until December 31, 2022 per kWh 0.00018$ 2,000 0.36$ 0.36$ 0.00018$ 2,000 0.36$ -$ 0.0% 0.00018$ 2,000 0.36$ -$ 0.0% -$ 2,000 -$ 0.36-$ -$ 2,000 -$ -$
Rate Rider for Disposition of Stranded Meter Assets - effective until December 31, 2024 per 30 days -$ 1 -$ -$ 0.13-$ 1 0.13-$ 0.13-$ 0.13-$ 1 0.13-$ -$ 0.0% 0.13-$ 1 0.13-$ -$ 0.0% 0.13-$ 1 0.13-$ -$ 0.0%
Rate Rider for Application of Operations Center Consolidation Plan - effective until December 31, 2021 per kWh 0.00248-$ 2,000 4.96-$ 4.96-$ 0.00248-$ 2,000 4.96-$ -$ 0.0% -$ 2,000 -$ 4.96$ -$ 2,000 -$ -$ -$ 2,000 -$ -$
Rate Rider for Disposition of the Gain on Property Sale - effective until December 31, 2021 per kWh 0.00040-$ 2,000 0.80-$ 0.80-$ 0.00040-$ 2,000 0.80-$ -$ 0.0% -$ 2,000 -$ 0.80$ -$ 2,000 -$ -$ -$ 2,000 -$ -$
Rate Rider for Disposition of Wireless Pole Attachment Revenue - effective until December 31, 2024 per kWh -$ 2,000 -$ -$ 0.00002-$ 2,000 0.04-$ 0.04-$ 0.00002-$ 2,000 0.04-$ -$ 0.0% 0.00002-$ 2,000 0.04-$ -$ 0.0% 0.00002-$ 2,000 0.04-$ -$ 0.0%
Rate Rider for Disposition of IFRS - CGAPP Property Plant and Equipment - effective until December 31, 2020 per kWh 0.00012-$ 2,000 0.24-$ 0.24-$ -$ 2,000 -$ 0.24$ -$ 2,000 -$ -$ -$ 2,000 -$ -$ -$ 2,000 -$ -$
Rate Rider for Disposition of Capital Related Revenue Requirement Variance Account - effective until Dec. 31, 2024 per kWh -$ 2,000 -$ -$ -$ 2,000 -$ -$ -$ 2,000 -$ -$ 0.00252-$ 2,000 5.04-$ 5.04-$ 0.00252-$ 2,000 5.04-$ -$ 0.0%
Rate Rider for Disposition of PILs and Tax Variance - effective until December 31, 2024 per kWh -$ -$ 2,000 -$ -$ -$ 2,000 -$ -$ -$ 2,000 -$ -$ 0.00036-$ 2,000 0.72-$ 0.72-$ 0.00036-$ 2,000 0.72-$ -$ 0.0%
Rate Rider for Disposition of External Driven Capital Variance Account - effective until December 31, 2020 per kWh 0.00023-$ 2,000 0.46-$ 0.46-$ -$ 2,000 -$ 0.46$ -$ 2,000 -$ -$ -$ 2,000 -$ -$ -$ 2,000 -$ -$
Rate Rider for Disposition of Derecognition Variance Account - effective until December 31, 2022 per kWh -$ 2,000 -$ -$ -$ 2,000 -$ -$ 0.00210-$ 2,000 4.20-$ 4.20-$ -$ 2,000 -$ 4.20$ -$ 2,000 -$ -$
Rate Rider for Disposition of Accounts Receivable Credits - effective until December 31, 2024 per kWh -$ 2,000 -$ -$ 0.00006-$ 2,000 0.12-$ 0.12-$ 0.00006-$ 2,000 0.12-$ -$ 0.0% 0.00006-$ 2,000 0.12-$ -$ 0.0% 0.00006-$ 2,000 0.12-$ -$ 0.0%
Rate Rider for Recovery of 2020 Foregone Revenue - effective until December 31, 2021 per 30 days -$ 0.11$ 1 0.11$ 0.11$ 0.11$ 1 0.11$ -$ 0.0% -$ 1 -$ 0.11-$ -$ 1 -$ -$ -$ 1 -$ -$
Rate Rider for Recovery of 2020 Foregone Revenue - effective until December 31, 2021 per kWh -$ 0.00010$ 2,000 0.20$ 0.20$ 0.00010$ 2,000 0.20$ -$ 0.0% -$ 2,000 -$ 0.20-$ -$ 2,000 -$ -$ -$ 2,000 -$ -$
Rate Rider for Recovery of 2015 Foregone Revenue - effective until Dec. 31, 2019 per 30 days 0.79$ 1 0.79$ 1 -$ 0.79-$ 1 -$ -$ 1 -$ -$ 1 -$ -$ 1 -$ -$
Rate Rider for Recovery of 2016 Foregone Revenue - effective until Dec. 31, 2019 per 30 days 0.25$ 1 0.25$ 1 -$ 0.25-$ 1 -$ -$ 1 -$ -$ 1 -$ -$ 1 -$ -$
Rate Rider for Recovery of Stranded Meters Assets - effective until Dec. 31, 2019 per 30 days 1.55$ 1 1.55$ 1 -$ 1.55-$ 1 -$ -$ 1 -$ -$ 1 -$ -$ 1 -$ -$
Distribution Volumetric Rate per kWh 0.03312$ 2,000 66.24$ 0.03421$ 2,000 68.42$ 2.18$ 3.3% 0.03576$ 2,000 71.52$ 3.10$ 4.5% 0.03616$ 2,000 72.32$ 0.80$ 1.1% 0.03831$ 2,000 76.62$ 4.30$ 5.9% 0.03979$ 2,000 79.58$ 2.96$ 3.9%
Rate Rider for Recovery of the Gain on the Sale of Named Properties - effective until Dec. 31, 2019 per kWh 0.00013$ 2,000 0.26$ 2,000 -$ 0.26-$ 2,000 -$ -$ 2,000 -$ -$ 2,000 -$ -$ 2,000 -$ -$
Rate Rider for Recovery of Hydro One Capital Contributions Variance - effective until Dec. 31, 2019 per kWh 0.00003$ 2,000 0.06$ 2,000 -$ 0.06-$ 2,000 -$ -$ 2,000 -$ -$ 2,000 -$ -$ 2,000 -$ -$
Rate Rider for Application of IFRS - 2014 Derecognition - effective until Dec. 31, 2019 per kWh 0.00049$ 2,000 0.98$ 2,000 -$ 0.98-$ 2,000 -$ -$ 2,000 -$ -$ 2,000 -$ -$ 2,000 -$ -$
Rate Rider for Recovery of 2015 Foregone Revenue - effective until Dec. 31, 2019 per kWh 0.00076$ 2,000 1.52$ 2,000 -$ 1.52-$ 2,000 -$ -$ 2,000 -$ -$ 2,000 -$ -$ 2,000 -$ -$
Rate Rider for Recovery of 2016 Foregone Revenue - effective until Dec. 31, 2019 per kWh 0.00024$ 2,000 0.48$ 2,000 -$ 0.48-$ 2,000 -$ -$ 2,000 -$ -$ 2,000 -$ -$ 2,000 -$ -$
Rate Rider for Disposition of Lost Revenue Adjustment Mechanism (LRAMVA) (2019) - effective until Dec. 31, 2019 per kWh 0.00020$ 2,000 0.40$ 2,000 -$ 0.40-$ 2,000 -$ -$ 2,000 -$ -$ 2,000 -$ -$ 2,000 -$ -$
Sub-Total A (excluding pass through) 108.33$ 101.63$ 6.70-$ -6.2% 104.80$ 3.17$ 3.1% 107.28$ 2.48$ 2.4% 111.99$ 4.71$ 4.4% 116.55$ 4.56$ 4.1%
Line Losses on Cost of Power per kWh 0.1280$ 75 9.63$ 0.1280$ 59 7.55$ 2.07-$ -21.5% 0.1280$ 59 7.55$ -$ 0.0% 0.1280$ 59 7.55$ -$ 0.0% 0.1280$ 59 7.55$ -$ 0.0% 0.1280$ 59 7.55$ -$ 0.0%
Rate Rider for Disposition of Deferral/Variance Accounts per kWh 0.00050-$ 2,000 1.00-$ 0.00038$ 2,000 0.76$ 1.76$ -176.0% 0.00038$ 2,000 0.76$ -$ 0.0% -$ 0.76-$ -$ -$ -$ -$
Rate Rider for Disposition of Capacity Based Recovery Account - Applicable only for Class B Customers per kWh 0.00003$ 2,000 0.06$ 0.00002-$ 2,000 0.04-$ 0.10-$ -166.7% 0.00002-$ 2,000 0.04-$ -$ 0.0% -$ 0.04$ -$ -$ -$ -$
Rate Rider for Disposition of Global Adjustment Account - (Applicable only for Non-RPP Customers) per kWh 0.00068$ -$ 0.00159-$ -$ -$ 0.00159-$ -$ -$ -$ -$ -$ -$ -$ -$
Rate Rider for Smart Metering Entity Charge - effective until Dec. 31, 2022 per 30 days 0.56$ 1 0.56$ 0.56$ 1 0.56$ -$ 0.0% 0.56$ 1 0.56$ -$ 0.0% 0.56$ 1 0.56$ -$ 0.0% -$ 0.56-$ -$ -$
Sub-Total B - Distribution (includes Sub-Total A) 117.58$ 110.46$ 7.11-$ -6.1% 113.63$ 3.17$ 2.9% 115.39$ 1.76$ 1.5% 119.54$ 4.15$ 3.6% 124.10$ 4.56$ 3.8%
Retail Transmissioin Rate - Network Service Rate per kWh 0.00775$ 2,075 16.08$ 0.00882$ 2,059 18.16$ 2.08$ 12.9% 0.00882$ 2,059 18.16$ -$ 0.0% 0.00882$ 2,059 18.16$ -$ 0.0% 0.00882$ 2,059 18.16$ -$ 0.0% 0.00882$ 2,059 18.16$ -$ 0.0%
Retail Transmissioin Rate - Line and Transformation Connection Service Rate per kWh 0.00629$ 2,075 13.05$ 0.00659$ 2,059 13.57$ 0.52$ 4.0% 0.00659$ 2,059 13.57$ -$ 0.0% 0.00659$ 2,059 13.57$ -$ 0.0% 0.00659$ 2,059 13.57$ -$ 0.0% 0.00659$ 2,059 13.57$ -$ 0.0%
Sub-Total C - Delivery (including Sub-Total B) 146.71$ 142.19$ 4.52-$ -3.1% 145.36$ 3.17$ 2.2% 147.12$ 1.76$ 1.2% 151.27$ 4.15$ 2.8% 155.83$ 4.56$ 3.0%
Wholesale Market Service Charge (WMSC) per kWh 0.0030$ 2,075 6.23$ 0.0030$ 2,059 6.18$ 0.05-$ -0.8% 0.0030$ 2,059 6.18$ -$ 0.0% 0.0030$ 2,059 6.18$ -$ 0.0% 0.0030$ 2,059 6.18$ -$ 0.0% 0.0030$ 2,059 6.18$ -$ 0.0%
Rural and Remote Rate Protection (RRRP) per kWh 0.0005$ 2,075 1.04$ 0.0005$ 2,059 1.03$ 0.01-$ -0.8% 0.0005$ 2,059 1.03$ -$ 0.0% 0.0005$ 2,059 1.03$ -$ 0.0% 0.0005$ 2,059 1.03$ -$ 0.0% 0.0005$ 2,059 1.03$ -$ 0.0%
Capacity Based Recovery (CBR) - Applicable for Class B Customers per kWh 0.0004$ 2,075 0.83$ 0.0004$ 2,059 0.82$ 0.01-$ -0.8% 0.0004$ 2,059 0.82$ -$ 0.0% 0.0004$ 2,059 0.82$ -$ 0.0% 0.0004$ 2,059 0.82$ -$ 0.0% 0.0004$ 2,059 0.82$ -$ 0.0%
Standard Supply Service Charge per 30 days 0.25$ 1 0.25$ 0.25$ 1 0.25$ -$ 0.0% 0.25$ 1 0.25$ -$ 0.0% 0.25$ 1 0.25$ -$ 0.0% 0.25$ 1 0.25$ -$ 0.0% 0.25$ 1 0.25$ -$ 0.0%
TOU - Off Peak per kWh 0.1010$ 1,280 129.28$ 0.1010$ 1,280 129.28$ -$ 0.0% 0.1010$ 1,280 129.28$ -$ 0.0% 0.1010$ 1,280 129.28$ -$ 0.0% 0.1010$ 1,280 129.28$ -$ 0.0% 0.1010$ 1,280 129.28$ -$ 0.0%
TOU - Mid Peak per kWh 0.1440$ 360 51.84$ 0.1440$ 360 51.84$ -$ 0.0% 0.1440$ 360 51.84$ -$ 0.0% 0.1440$ 360 51.84$ -$ 0.0% 0.1440$ 360 51.84$ -$ 0.0% 0.1440$ 360 51.84$ -$ 0.0%
TOU - On Peak per kWh 0.2080$ 360 74.88$ 0.2080$ 360 74.88$ -$ 0.0% 0.2080$ 360 74.88$ -$ 0.0% 0.2080$ 360 74.88$ -$ 0.0% 0.2080$ 360 74.88$ -$ 0.0% 0.2080$ 360 74.88$ -$ 0.0%
Energy - RPP - Tier 1 per kWh 0.1190$ 600 71.40$ 0.1190$ 600 71.40$ -$ 0.0% 0.1190$ 600 71.40$ -$ 0.0% 0.1190$ 600 71.40$ -$ 0.0% 0.1190$ 600 71.40$ -$ 0.0% 0.1190$ 600 71.40$ -$ 0.0%
Energy - RPP - Tier 2 per kWh 0.1390$ 1,400 194.60$ 0.1390$ 1,400 194.60$ -$ 0.0% 0.1390$ 1,400 194.60$ -$ 0.0% 0.1390$ 1,400 194.60$ -$ 0.0% 0.1390$ 1,400 194.60$ -$ 0.0% 0.1390$ 1,400 194.60$ -$ 0.0%
Non-RPP Retailer Avg. Price per kWh 0.1164$ -$ 0.1164$ -$ -$ 0.1164$ -$ -$ 0.1164$ -$ -$ 0.1164$ -$ -$ 0.1164$ -$ -$
Average IESO Wholesale Market Price per kWh 0.1164$ -$ 0.1164$ -$ -$ 0.1164$ -$ -$ 0.1164$ -$ -$ 0.1164$ -$ -$ 0.1164$ -$ -$
Total Bill on TOU (before Taxes) 411.05$ 406.47$ 4.58-$ -1.1% 409.64$ 3.17$ 0.8% 411.40$ 1.76$ 0.4% 415.55$ 4.15$ 1.0% 420.11$ 4.56$ 1.1%
Ontario Electricity Rebate -31.8% 130.72-$ -31.8% 129.26-$ 1.46$ -1.1% -31.8% 130.27-$ 1.01-$ 0.8% -31.8% 130.83-$ 0.56-$ 0.4% -31.8% 132.15-$ 1.32-$ 1.0% -31.8% 133.60-$ 1.45-$ 1.1%
HST 13% 53.44$ 13% 52.84$ 0.60-$ -1.1% 13% 53.25$ 0.41$ 0.8% 13% 53.48$ 0.23$ 0.4% 13% 54.02$ 0.54$ 1.0% 13% 54.61$ 0.59$ 1.1%
333.78$ 330.05$ 3.72-$ -1.1% 332.63$ 2.57$ 0.8% 334.06$ 1.43$ 0.4% 337.43$ 3.37$ 1.0% 341.13$ 3.70$ 1.1%
Total Bill on RPP (before Taxes) 421.05$ 416.47$ 4.58-$ -1.1% 419.64$ 3.17$ 0.8% 421.40$ 1.76$ 0.4% 425.55$ 4.15$ 1.0% 430.11$ 4.56$ 1.1%
Ontario Electricity Rebate -31.8% 133.90-$ -31.8% 132.44-$ 1.46$ -1.1% -31.8% 133.45-$ 1.01-$ 0.8% -31.8% 134.01-$ 0.56-$ 0.4% -31.8% 135.33-$ 1.32-$ 1.0% -31.8% 136.78-$ 1.45-$ 1.1%
HST 13% 54.74$ 13% 54.14$ 0.60-$ -1.1% 13% 54.55$ 0.41$ 0.8% 13% 54.78$ 0.23$ 0.4% 13% 55.32$ 0.54$ 1.0% 13% 55.91$ 0.59$ 1.1%
341.90$ 338.17$ 3.72-$ -1.1% 340.75$ 2.57$ 0.8% 342.18$ 1.43$ 0.4% 345.55$ 3.37$ 1.0% 349.25$ 3.70$ 1.1%
Loss Factor (%) 3.76% 2.95% 2.95% 2.95% 2.95% 2.95%
$ Change % Change $ Change % Change
Total Bill on TOU (after Tax & Rebate)
Total Bill on RPP (after Tax & Rebate)
Impact 2024 Proposed Impact
Charge Unit $ Change
%
Change $ Change % Change $ Change % Change
Impact 2021 Proposed Impact 2022 Proposed Impact 2023 Proposed
OEB Appendix 2-W
Bill Impacts
GENERAL SERVICE LESS THAN 50 kW SERVICE
2019 Board-Approved 2020 Proposed
November 1 - April 30 (Select this radio button for applications filed after Oct 31)May 1 - October 31
GS<50 kW
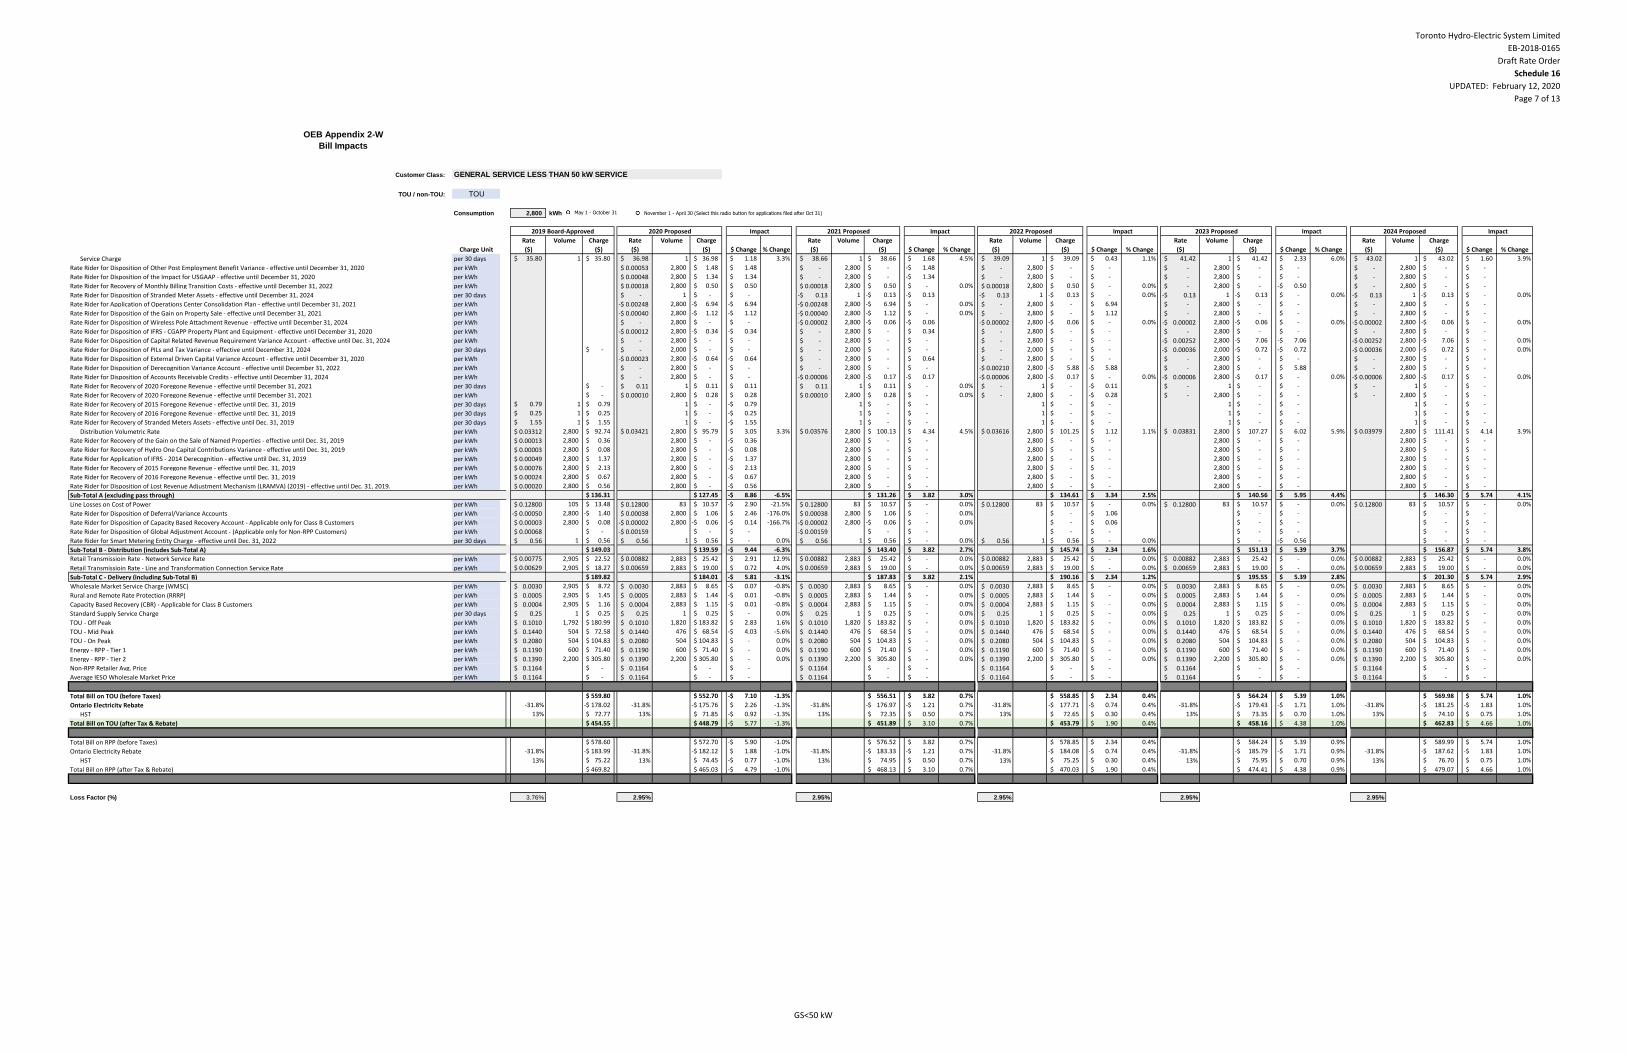
Toronto Hydro-Electric System Limited
EB-2018-0165
Draft Rate Order
Schedule 16
UPDATED: February 12, 2020
Page 7 of 13
Customer Class: GENERAL SERVICE LESS THAN 50 kW SERVICE
TOU / non-TOU: TOU
Consumption 2,800 kWh
Rate Volume Charge Rate Volume Charge Rate Volume Charge Rate Volume Charge Rate Volume Charge Rate Volume Charge
($) ($) ($) ($) ($) ($) ($) ($) ($) ($) ($) ($)
Service Charge per 30 days 35.80$ 1 35.80$ 36.98$ 1 36.98$ 1.18$ 3.3% 38.66$ 1 38.66$ 1.68$ 4.5% 39.09$ 1 39.09$ 0.43$ 1.1% 41.42$ 1 41.42$ 2.33$ 6.0% 43.02$ 1 43.02$ 1.60$ 3.9%
Rate Rider for Disposition of Other Post Employment Benefit Variance - effective until December 31, 2020 per kWh 0.00053$ 2,800 1.48$ 1.48$ -$ 2,800 -$ 1.48-$ -$ 2,800 -$ -$ -$ 2,800 -$ -$ -$ 2,800 -$ -$
Rate Rider for Disposition of the Impact for USGAAP - effective until December 31, 2020 per kWh 0.00048$ 2,800 1.34$ 1.34$ -$ 2,800 -$ 1.34-$ -$ 2,800 -$ -$ -$ 2,800 -$ -$ -$ 2,800 -$ -$
Rate Rider for Recovery of Monthly Billing Transition Costs - effective until December 31, 2022 per kWh 0.00018$ 2,800 0.50$ 0.50$ 0.00018$ 2,800 0.50$ -$ 0.0% 0.00018$ 2,800 0.50$ -$ 0.0% -$ 2,800 -$ 0.50-$ -$ 2,800 -$ -$
Rate Rider for Disposition of Stranded Meter Assets - effective until December 31, 2024 per 30 days -$ 1 -$ -$ 0.13-$ 1 0.13-$ 0.13-$ 0.13-$ 1 0.13-$ -$ 0.0% 0.13-$ 1 0.13-$ -$ 0.0% 0.13-$ 1 0.13-$ -$ 0.0%
Rate Rider for Application of Operations Center Consolidation Plan - effective until December 31, 2021 per kWh 0.00248-$ 2,800 6.94-$ 6.94-$ 0.00248-$ 2,800 6.94-$ -$ 0.0% -$ 2,800 -$ 6.94$ -$ 2,800 -$ -$ -$ 2,800 -$ -$
Rate Rider for Disposition of the Gain on Property Sale - effective until December 31, 2021 per kWh 0.00040-$ 2,800 1.12-$ 1.12-$ 0.00040-$ 2,800 1.12-$ -$ 0.0% -$ 2,800 -$ 1.12$ -$ 2,800 -$ -$ -$ 2,800 -$ -$
Rate Rider for Disposition of Wireless Pole Attachment Revenue - effective until December 31, 2024 per kWh -$ 2,800 -$ -$ 0.00002-$ 2,800 0.06-$ 0.06-$ 0.00002-$ 2,800 0.06-$ -$ 0.0% 0.00002-$ 2,800 0.06-$ -$ 0.0% 0.00002-$ 2,800 0.06-$ -$ 0.0%
Rate Rider for Disposition of IFRS - CGAPP Property Plant and Equipment - effective until December 31, 2020 per kWh 0.00012-$ 2,800 0.34-$ 0.34-$ -$ 2,800 -$ 0.34$ -$ 2,800 -$ -$ -$ 2,800 -$ -$ -$ 2,800 -$ -$
Rate Rider for Disposition of Capital Related Revenue Requirement Variance Account - effective until Dec. 31, 2024 per kWh -$ 2,800 -$ -$ -$ 2,800 -$ -$ -$ 2,800 -$ -$ 0.00252-$ 2,800 7.06-$ 7.06-$ 0.00252-$ 2,800 7.06-$ -$ 0.0%
Rate Rider for Disposition of PILs and Tax Variance - effective until December 31, 2024 per 30 days -$ -$ 2,000 -$ -$ -$ 2,000 -$ -$ -$ 2,000 -$ -$ 0.00036-$ 2,000 0.72-$ 0.72-$ 0.00036-$ 2,000 0.72-$ -$ 0.0%
Rate Rider for Disposition of External Driven Capital Variance Account - effective until December 31, 2020 per kWh 0.00023-$ 2,800 0.64-$ 0.64-$ -$ 2,800 -$ 0.64$ -$ 2,800 -$ -$ -$ 2,800 -$ -$ -$ 2,800 -$ -$
Rate Rider for Disposition of Derecognition Variance Account - effective until December 31, 2022 per kWh -$ 2,800 -$ -$ -$ 2,800 -$ -$ 0.00210-$ 2,800 5.88-$ 5.88-$ -$ 2,800 -$ 5.88$ -$ 2,800 -$ -$
Rate Rider for Disposition of Accounts Receivable Credits - effective until December 31, 2024 per kWh -$ 2,800 -$ -$ 0.00006-$ 2,800 0.17-$ 0.17-$ 0.00006-$ 2,800 0.17-$ -$ 0.0% 0.00006-$ 2,800 0.17-$ -$ 0.0% 0.00006-$ 2,800 0.17-$ -$ 0.0%
Rate Rider for Recovery of 2020 Foregone Revenue - effective until December 31, 2021 per 30 days -$ 0.11$ 1 0.11$ 0.11$ 0.11$ 1 0.11$ -$ 0.0% -$ 1 -$ 0.11-$ -$ 1 -$ -$ -$ 1 -$ -$
Rate Rider for Recovery of 2020 Foregone Revenue - effective until December 31, 2021 per kWh -$ 0.00010$ 2,800 0.28$ 0.28$ 0.00010$ 2,800 0.28$ -$ 0.0% -$ 2,800 -$ 0.28-$ -$ 2,800 -$ -$ -$ 2,800 -$ -$
Rate Rider for Recovery of 2015 Foregone Revenue - effective until Dec. 31, 2019 per 30 days 0.79$ 1 0.79$ 1 -$ 0.79-$ 1 -$ -$ 1 -$ -$ 1 -$ -$ 1 -$ -$
Rate Rider for Recovery of 2016 Foregone Revenue - effective until Dec. 31, 2019 per 30 days 0.25$ 1 0.25$ 1 -$ 0.25-$ 1 -$ -$ 1 -$ -$ 1 -$ -$ 1 -$ -$
Rate Rider for Recovery of Stranded Meters Assets - effective until Dec. 31, 2019 per 30 days 1.55$ 1 1.55$ 1 -$ 1.55-$ 1 -$ -$ 1 -$ -$ 1 -$ -$ 1 -$ -$
Distribution Volumetric Rate per kWh 0.03312$ 2,800 92.74$ 0.03421$ 2,800 95.79$ 3.05$ 3.3% 0.03576$ 2,800 100.13$ 4.34$ 4.5% 0.03616$ 2,800 101.25$ 1.12$ 1.1% 0.03831$ 2,800 107.27$ 6.02$ 5.9% 0.03979$ 2,800 111.41$ 4.14$ 3.9%
Rate Rider for Recovery of the Gain on the Sale of Named Properties - effective until Dec. 31, 2019 per kWh 0.00013$ 2,800 0.36$ 2,800 -$ 0.36-$ 2,800 -$ -$ 2,800 -$ -$ 2,800 -$ -$ 2,800 -$ -$
Rate Rider for Recovery of Hydro One Capital Contributions Variance - effective until Dec. 31, 2019 per kWh 0.00003$ 2,800 0.08$ 2,800 -$ 0.08-$ 2,800 -$ -$ 2,800 -$ -$ 2,800 -$ -$ 2,800 -$ -$
Rate Rider for Application of IFRS - 2014 Derecognition - effective until Dec. 31, 2019 per kWh 0.00049$ 2,800 1.37$ 2,800 -$ 1.37-$ 2,800 -$ -$ 2,800 -$ -$ 2,800 -$ -$ 2,800 -$ -$
Rate Rider for Recovery of 2015 Foregone Revenue - effective until Dec. 31, 2019 per kWh 0.00076$ 2,800 2.13$ 2,800 -$ 2.13-$ 2,800 -$ -$ 2,800 -$ -$ 2,800 -$ -$ 2,800 -$ -$
Rate Rider for Recovery of 2016 Foregone Revenue - effective until Dec. 31, 2019 per kWh 0.00024$ 2,800 0.67$ 2,800 -$ 0.67-$ 2,800 -$ -$ 2,800 -$ -$ 2,800 -$ -$ 2,800 -$ -$
Rate Rider for Disposition of Lost Revenue Adjustment Mechanism (LRAMVA) (2019) - effective until Dec. 31, 2019. per kWh 0.00020$ 2,800 0.56$ 2,800 -$ 0.56-$ 2,800 -$ -$ 2,800 -$ -$ 2,800 -$ -$ 2,800 -$ -$
Sub-Total A (excluding pass through) 136.31$ 127.45$ 8.86-$ -6.5% 131.26$ 3.82$ 3.0% 134.61$ 3.34$ 2.5% 140.56$ 5.95$ 4.4% 146.30$ 5.74$ 4.1%
Line Losses on Cost of Power per kWh 0.12800$ 105 13.48$ 0.12800$ 83 10.57$ 2.90-$ -21.5% 0.12800$ 83 10.57$ -$ 0.0% 0.12800$ 83 10.57$ -$ 0.0% 0.12800$ 83 10.57$ -$ 0.0% 0.12800$ 83 10.57$ -$ 0.0%
Rate Rider for Disposition of Deferral/Variance Accounts per kWh 0.00050-$ 2,800 1.40-$ 0.00038$ 2,800 1.06$ 2.46$ -176.0% 0.00038$ 2,800 1.06$ -$ 0.0% -$ 1.06-$ -$ -$ -$ -$
Rate Rider for Disposition of Capacity Based Recovery Account - Applicable only for Class B Customers per kWh 0.00003$ 2,800 0.08$ 0.00002-$ 2,800 0.06-$ 0.14-$ -166.7% 0.00002-$ 2,800 0.06-$ -$ 0.0% -$ 0.06$ -$ -$ -$ -$
Rate Rider for Disposition of Global Adjustment Account - (Applicable only for Non-RPP Customers) per kWh 0.00068$ -$ 0.00159-$ -$ -$ 0.00159-$ -$ -$ -$ -$ -$ -$ -$ -$
Rate Rider for Smart Metering Entity Charge - effective until Dec. 31, 2022 per 30 days 0.56$ 1 0.56$ 0.56$ 1 0.56$ -$ 0.0% 0.56$ 1 0.56$ -$ 0.0% 0.56$ 1 0.56$ -$ 0.0% -$ 0.56-$ -$ -$
Sub-Total B - Distribution (includes Sub-Total A) 149.03$ 139.59$ 9.44-$ -6.3% 143.40$ 3.82$ 2.7% 145.74$ 2.34$ 1.6% 151.13$ 5.39$ 3.7% 156.87$ 5.74$ 3.8%
Retail Transmissioin Rate - Network Service Rate per kWh 0.00775$ 2,905 22.52$ 0.00882$ 2,883 25.42$ 2.91$ 12.9% 0.00882$ 2,883 25.42$ -$ 0.0% 0.00882$ 2,883 25.42$ -$ 0.0% 0.00882$ 2,883 25.42$ -$ 0.0% 0.00882$ 2,883 25.42$ -$ 0.0%
Retail Transmissioin Rate - Line and Transformation Connection Service Rate per kWh 0.00629$ 2,905 18.27$ 0.00659$ 2,883 19.00$ 0.72$ 4.0% 0.00659$ 2,883 19.00$ -$ 0.0% 0.00659$ 2,883 19.00$ -$ 0.0% 0.00659$ 2,883 19.00$ -$ 0.0% 0.00659$ 2,883 19.00$ -$ 0.0%
Sub-Total C - Delivery (including Sub-Total B) 189.82$ 184.01$ 5.81-$ -3.1% 187.83$ 3.82$ 2.1% 190.16$ 2.34$ 1.2% 195.55$ 5.39$ 2.8% 201.30$ 5.74$ 2.9%
Wholesale Market Service Charge (WMSC) per kWh 0.0030$ 2,905 8.72$ 0.0030$ 2,883 8.65$ 0.07-$ -0.8% 0.0030$ 2,883 8.65$ -$ 0.0% 0.0030$ 2,883 8.65$ -$ 0.0% 0.0030$ 2,883 8.65$ -$ 0.0% 0.0030$ 2,883 8.65$ -$ 0.0%
Rural and Remote Rate Protection (RRRP) per kWh 0.0005$ 2,905 1.45$ 0.0005$ 2,883 1.44$ 0.01-$ -0.8% 0.0005$ 2,883 1.44$ -$ 0.0% 0.0005$ 2,883 1.44$ -$ 0.0% 0.0005$ 2,883 1.44$ -$ 0.0% 0.0005$ 2,883 1.44$ -$ 0.0%
Capacity Based Recovery (CBR) - Applicable for Class B Customers per kWh 0.0004$ 2,905 1.16$ 0.0004$ 2,883 1.15$ 0.01-$ -0.8% 0.0004$ 2,883 1.15$ -$ 0.0% 0.0004$ 2,883 1.15$ -$ 0.0% 0.0004$ 2,883 1.15$ -$ 0.0% 0.0004$ 2,883 1.15$ -$ 0.0%
Standard Supply Service Charge per 30 days 0.25$ 1 0.25$ 0.25$ 1 0.25$ -$ 0.0% 0.25$ 1 0.25$ -$ 0.0% 0.25$ 1 0.25$ -$ 0.0% 0.25$ 1 0.25$ -$ 0.0% 0.25$ 1 0.25$ -$ 0.0%
TOU - Off Peak per kWh 0.1010$ 1,792 180.99$ 0.1010$ 1,820 183.82$ 2.83$ 1.6% 0.1010$ 1,820 183.82$ -$ 0.0% 0.1010$ 1,820 183.82$ -$ 0.0% 0.1010$ 1,820 183.82$ -$ 0.0% 0.1010$ 1,820 183.82$ -$ 0.0%
TOU - Mid Peak per kWh 0.1440$ 504 72.58$ 0.1440$ 476 68.54$ 4.03-$ -5.6% 0.1440$ 476 68.54$ -$ 0.0% 0.1440$ 476 68.54$ -$ 0.0% 0.1440$ 476 68.54$ -$ 0.0% 0.1440$ 476 68.54$ -$ 0.0%
TOU - On Peak per kWh 0.2080$ 504 104.83$ 0.2080$ 504 104.83$ -$ 0.0% 0.2080$ 504 104.83$ -$ 0.0% 0.2080$ 504 104.83$ -$ 0.0% 0.2080$ 504 104.83$ -$ 0.0% 0.2080$ 504 104.83$ -$ 0.0%
Energy - RPP - Tier 1 per kWh 0.1190$ 600 71.40$ 0.1190$ 600 71.40$ -$ 0.0% 0.1190$ 600 71.40$ -$ 0.0% 0.1190$ 600 71.40$ -$ 0.0% 0.1190$ 600 71.40$ -$ 0.0% 0.1190$ 600 71.40$ -$ 0.0%
Energy - RPP - Tier 2 per kWh 0.1390$ 2,200 305.80$ 0.1390$ 2,200 305.80$ -$ 0.0% 0.1390$ 2,200 305.80$ -$ 0.0% 0.1390$ 2,200 305.80$ -$ 0.0% 0.1390$ 2,200 305.80$ -$ 0.0% 0.1390$ 2,200 305.80$ -$ 0.0%
Non-RPP Retailer Avg. Price per kWh 0.1164$ -$ 0.1164$ -$ -$ 0.1164$ -$ -$ 0.1164$ -$ -$ 0.1164$ -$ -$ 0.1164$ -$ -$
Average IESO Wholesale Market Price per kWh 0.1164$ -$ 0.1164$ -$ -$ 0.1164$ -$ -$ 0.1164$ -$ -$ 0.1164$ -$ -$ 0.1164$ -$ -$
Total Bill on TOU (before Taxes) 559.80$ 552.70$ 7.10-$ -1.3% 556.51$ 3.82$ 0.7% 558.85$ 2.34$ 0.4% 564.24$ 5.39$ 1.0% 569.98$ 5.74$ 1.0%
Ontario Electricity Rebate -31.8% 178.02-$ -31.8% 175.76-$ 2.26$ -1.3% -31.8% 176.97-$ 1.21-$ 0.7% -31.8% 177.71-$ 0.74-$ 0.4% -31.8% 179.43-$ 1.71-$ 1.0% -31.8% 181.25-$ 1.83-$ 1.0%
HST 13% 72.77$ 13% 71.85$ 0.92-$ -1.3% 13% 72.35$ 0.50$ 0.7% 13% 72.65$ 0.30$ 0.4% 13% 73.35$ 0.70$ 1.0% 13% 74.10$ 0.75$ 1.0%
454.55$ 448.79$ 5.77-$ -1.3% 451.89$ 3.10$ 0.7% 453.79$ 1.90$ 0.4% 458.16$ 4.38$ 1.0% 462.83$ 4.66$ 1.0%
Total Bill on RPP (before Taxes) 578.60$ 572.70$ 5.90-$ -1.0% 576.52$ 3.82$ 0.7% 578.85$ 2.34$ 0.4% 584.24$ 5.39$ 0.9% 589.99$ 5.74$ 1.0%
Ontario Electricity Rebate -31.8% 183.99-$ -31.8% 182.12-$ 1.88$ -1.0% -31.8% 183.33-$ 1.21-$ 0.7% -31.8% 184.08-$ 0.74-$ 0.4% -31.8% 185.79-$ 1.71-$ 0.9% -31.8% 187.62-$ 1.83-$ 1.0%
HST 13% 75.22$ 13% 74.45$ 0.77-$ -1.0% 13% 74.95$ 0.50$ 0.7% 13% 75.25$ 0.30$ 0.4% 13% 75.95$ 0.70$ 0.9% 13% 76.70$ 0.75$ 1.0%
469.82$ 465.03$ 4.79-$ -1.0% 468.13$ 3.10$ 0.7% 470.03$ 1.90$ 0.4% 474.41$ 4.38$ 0.9% 479.07$ 4.66$ 1.0%
Loss Factor (%) 3.76% 2.95% 2.95% 2.95% 2.95% 2.95%
$ Change % Change
Total Bill on TOU (after Tax & Rebate)
Total Bill on RPP (after Tax & Rebate)
Impact
Charge Unit $ Change % Change $ Change % Change $ Change % Change $ Change % Change
Impact 2022 Proposed Impact 2023 Proposed Impact 2024 Proposed
OEB Appendix 2-W
Bill Impacts
2019 Board-Approved 2020 Proposed Impact 2021 Proposed
November 1 - April 30 (Select this radio button for applications filed after Oct 31)May 1 - October 31
GS<50 kW
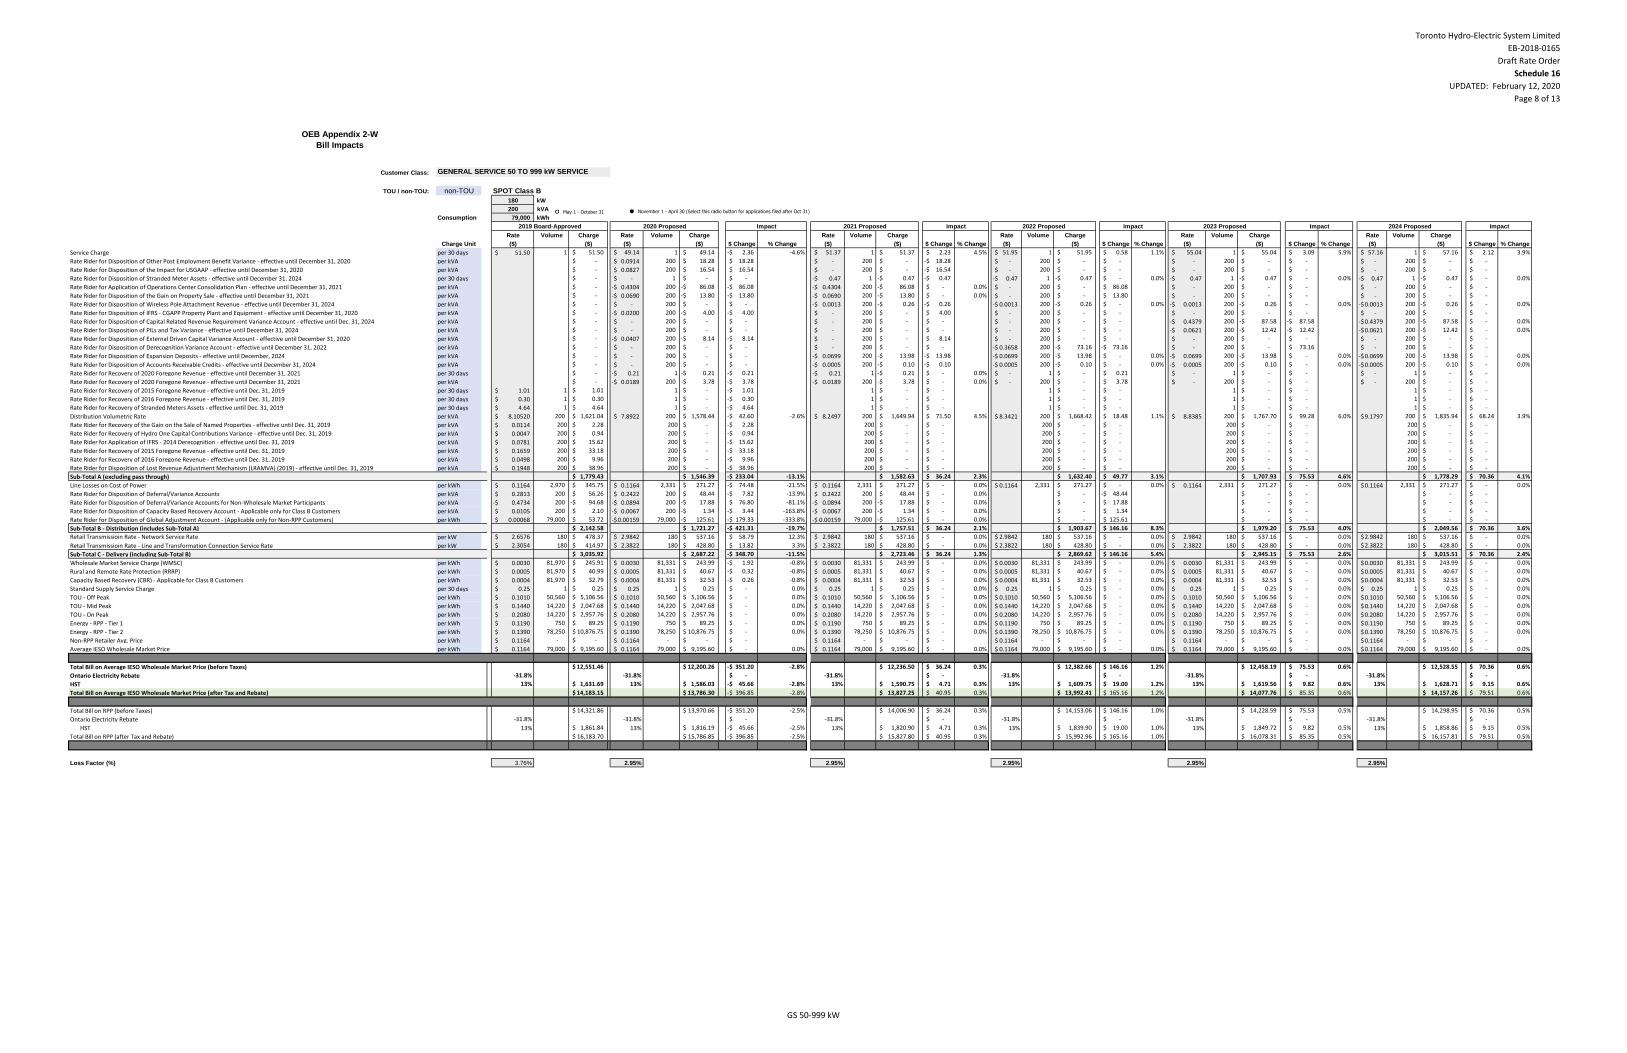
Toronto Hydro-Electric System Limited
EB-2018-0165
Draft Rate Order
Schedule 16
UPDATED: February 12, 2020
Page 8 of 13
0.64 TOU - Off Peak
0.18 TOU - Mid Peak
0.18 TOU - On Peak
Customer Class:
TOU / non-TOU: non-TOU SPOT Class B
180 kW
200 kVA
Consumption 79,000 kWh
Rate Volume Charge Rate Volume Charge Rate Volume Charge Rate Volume Charge Rate Volume Charge Rate Volume Charge
($) ($) ($) ($) ($) ($) ($) ($) ($) ($) ($) ($)
Service Charge per 30 days 51.50$ 1 51.50$ 49.14$ 1 49.14$ 2.36-$ -4.6% 51.37$ 1 51.37$ 2.23$ 4.5% 51.95$ 1 51.95$ 0.58$ 1.1% 55.04$ 1 55.04$ 3.09$ 5.9% 57.16$ 1 57.16$ 2.12$ 3.9%
Rate Rider for Disposition of Other Post Employment Benefit Variance - effective until December 31, 2020 per kVA -$ 0.0914$ 200 18.28$ 18.28$ -$ 200 -$ 18.28-$ -$ 200 -$ -$ -$ 200 -$ -$ -$ 200 -$ -$
Rate Rider for Disposition of the Impact for USGAAP - effective until December 31, 2020 per kVA -$ 0.0827$ 200 16.54$ 16.54$ -$ 200 -$ 16.54-$ -$ 200 -$ -$ -$ 200 -$ -$ -$ 200 -$ -$
Rate Rider for Disposition of Stranded Meter Assets - effective until December 31, 2024 per 30 days -$ -$ 1 -$ -$ 0.47-$ 1 0.47-$ 0.47-$ 0.47-$ 1 0.47-$ -$ 0.0% 0.47-$ 1 0.47-$ -$ 0.0% 0.47-$ 1 0.47-$ -$ 0.0%
Rate Rider for Application of Operations Center Consolidation Plan - effective until December 31, 2021 per kVA -$ 0.4304-$ 200 86.08-$ 86.08-$ 0.4304-$ 200 86.08-$ -$ 0.0% -$ 200 -$ 86.08$ -$ 200 -$ -$ -$ 200 -$ -$
Rate Rider for Disposition of the Gain on Property Sale - effective until December 31, 2021 per kVA -$ 0.0690-$ 200 13.80-$ 13.80-$ 0.0690-$ 200 13.80-$ -$ 0.0% -$ 200 -$ 13.80$ -$ 200 -$ -$ -$ 200 -$ -$
Rate Rider for Disposition of Wireless Pole Attachment Revenue - effective until December 31, 2024 per kVA -$ -$ 200 -$ -$ 0.0013-$ 200 0.26-$ 0.26-$ 0.0013-$ 200 0.26-$ -$ 0.0% 0.0013-$ 200 0.26-$ -$ 0.0% 0.0013-$ 200 0.26-$ -$ 0.0%
Rate Rider for Disposition of IFRS - CGAPP Property Plant and Equipment - effective until December 31, 2020 per kVA -$ 0.0200-$ 200 4.00-$ 4.00-$ -$ 200 -$ 4.00$ -$ 200 -$ -$ -$ 200 -$ -$ -$ 200 -$ -$
Rate Rider for Disposition of Capital Related Revenue Requirement Variance Account - effective until Dec. 31, 2024 per kVA -$ -$ 200 -$ -$ -$ 200 -$ -$ -$ 200 -$ -$ 0.4379-$ 200 87.58-$ 87.58-$ 0.4379-$ 200 87.58-$ -$ 0.0%
Rate Rider for Disposition of PILs and Tax Variance - effective until December 31, 2024 per kVA -$ -$ 200 -$ -$ -$ 200 -$ -$ -$ 200 -$ -$ 0.0621-$ 200 12.42-$ 12.42-$ 0.0621-$ 200 12.42-$ -$ 0.0%
Rate Rider for Disposition of External Driven Capital Variance Account - effective until December 31, 2020 per kVA -$ 0.0407-$ 200 8.14-$ 8.14-$ -$ 200 -$ 8.14$ -$ 200 -$ -$ -$ 200 -$ -$ -$ 200 -$ -$
Rate Rider for Disposition of Derecognition Variance Account - effective until December 31, 2022 per kVA -$ -$ 200 -$ -$ -$ 200 -$ -$ 0.3658-$ 200 73.16-$ 73.16-$ -$ 200 -$ 73.16$ -$ 200 -$ -$
Rate Rider for Disposition of Expansion Deposits - effective until December, 2024 per kVA -$ -$ 200 -$ -$ 0.0699-$ 200 13.98-$ 13.98-$ 0.0699-$ 200 13.98-$ -$ 0.0% 0.0699-$ 200 13.98-$ -$ 0.0% 0.0699-$ 200 13.98-$ -$ 0.0%
Rate Rider for Disposition of Accounts Receivable Credits - effective until December 31, 2024 per kVA -$ -$ 200 -$ -$ 0.0005-$ 200 0.10-$ 0.10-$ 0.0005-$ 200 0.10-$ -$ 0.0% 0.0005-$ 200 0.10-$ -$ 0.0% 0.0005-$ 200 0.10-$ -$ 0.0%
Rate Rider for Recovery of 2020 Foregone Revenue - effective until December 31, 2021 per 30 days -$ 0.21-$ 1 0.21-$ 0.21-$ 0.21-$ 1 0.21-$ -$ 0.0% -$ 1 -$ 0.21$ -$ 1 -$ -$ -$ 1 -$ -$
Rate Rider for Recovery of 2020 Foregone Revenue - effective until December 31, 2021 per kVA -$ 0.0189-$ 200 3.78-$ 3.78-$ 0.0189-$ 200 3.78-$ -$ 0.0% -$ 200 -$ 3.78$ -$ 200 -$ -$ -$ 200 -$ -$
Rate Rider for Recovery of 2015 Foregone Revenue - effective until Dec. 31, 2019 per 30 days 1.01$ 1 1.01$ 1 -$ 1.01-$ 1 -$ -$ 1 -$ -$ 1 -$ -$ 1 -$ -$
Rate Rider for Recovery of 2016 Foregone Revenue - effective until Dec. 31, 2019 per 30 days 0.30$ 1 0.30$ 1 -$ 0.30-$ 1 -$ -$ 1 -$ -$ 1 -$ -$ 1 -$ -$
Rate Rider for Recovery of Stranded Meters Assets - effective until Dec. 31, 2019 per 30 days 4.64$ 1 4.64$ 1 -$ 4.64-$ 1 -$ -$ 1 -$ -$ 1 -$ -$ 1 -$ -$
Distribution Volumetric Rate per kVA 8.10520$ 200 1,621.04$ 7.8922$ 200 1,578.44$ 42.60-$ -2.6% 8.2497$ 200 1,649.94$ 71.50$ 4.5% 8.3421$ 200 1,668.42$ 18.48$ 1.1% 8.8385$ 200 1,767.70$ 99.28$ 6.0% 9.1797$ 200 1,835.94$ 68.24$ 3.9%
Rate Rider for Recovery of the Gain on the Sale of Named Properties - effective until Dec. 31, 2019 per kVA 0.0114$ 200 2.28$ 200 -$ 2.28-$ 200 -$ -$ 200 -$ -$ 200 -$ -$ 200 -$ -$
Rate Rider for Recovery of Hydro One Capital Contributions Variance - effective until Dec. 31, 2019 per kVA 0.0047$ 200 0.94$ 200 -$ 0.94-$ 200 -$ -$ 200 -$ -$ 200 -$ -$ 200 -$ -$
Rate Rider for Application of IFRS - 2014 Derecognition - effective until Dec. 31, 2019 per kVA 0.0781$ 200 15.62$ 200 -$ 15.62-$ 200 -$ -$ 200 -$ -$ 200 -$ -$ 200 -$ -$
Rate Rider for Recovery of 2015 Foregone Revenue - effective until Dec. 31, 2019 per kVA 0.1659$ 200 33.18$ 200 -$ 33.18-$ 200 -$ -$ 200 -$ -$ 200 -$ -$ 200 -$ -$
Rate Rider for Recovery of 2016 Foregone Revenue - effective until Dec. 31, 2019 per kVA 0.0498$ 200 9.96$ 200 -$ 9.96-$ 200 -$ -$ 200 -$ -$ 200 -$ -$ 200 -$ -$
Rate Rider for Disposition of Lost Revenue Adjustment Mechanism (LRAMVA) (2019) - effective until Dec. 31, 2019 per kVA 0.1948$ 200 38.96$ 200 -$ 38.96-$ 200 -$ -$ 200 -$ -$ 200 -$ -$ 200 -$ -$
Sub-Total A (excluding pass through) 1,779.43$ 1,546.39$ 233.04-$ -13.1% 1,582.63$ 36.24$ 2.3% 1,632.40$ 49.77$ 3.1% 1,707.93$ 75.53$ 4.6% 1,778.29$ 70.36$ 4.1%
Line Losses on Cost of Power per kWh 0.1164$ 2,970 345.75$ 0.1164$ 2,331 271.27$ 74.48-$ -21.5% 0.1164$ 2,331 271.27$ -$ 0.0% 0.1164$ 2,331 271.27$ -$ 0.0% 0.1164$ 2,331 271.27$ -$ 0.0% 0.1164$ 2,331 271.27$ -$ 0.0%
Rate Rider for Disposition of Deferral/Variance Accounts per kVA 0.2813$ 200 56.26$ 0.2422$ 200 48.44$ 7.82-$ -13.9% 0.2422$ 200 48.44$ -$ 0.0% -$ 48.44-$ -$ -$ -$ -$
Rate Rider for Disposition of Deferral/Variance Accounts for Non-Wholesale Market Participants per kVA 0.4734-$ 200 94.68-$ 0.0894-$ 200 17.88-$ 76.80$ -81.1% 0.0894-$ 200 17.88-$ -$ 0.0% -$ 17.88$ -$ -$ -$ -$
Rate Rider for Disposition of Capacity Based Recovery Account - Applicable only for Class B Customers per kVA 0.0105$ 200 2.10$ 0.0067-$ 200 1.34-$ 3.44-$ -163.8% 0.0067-$ 200 1.34-$ -$ 0.0% -$ 1.34$ -$ -$ -$ -$
Rate Rider for Disposition of Global Adjustment Account - (Applicable only for Non-RPP Customers) per kWh 0.00068$ 79,000 53.72$ 0.00159-$ 79,000 125.61-$ 179.33-$ -333.8% 0.00159-$ 79,000 125.61-$ -$ 0.0% -$ 125.61$ -$ -$ -$ -$
Sub-Total B - Distribution (includes Sub-Total A) 2,142.58$ 1,721.27$ 421.31-$ -19.7% 1,757.51$ 36.24$ 2.1% 1,903.67$ 146.16$ 8.3% 1,979.20$ 75.53$ 4.0% 2,049.56$ 70.36$ 3.6%
Retail Transmissioin Rate - Network Service Rate per kW 2.6576$ 180 478.37$ 2.9842$ 180 537.16$ 58.79$ 12.3% 2.9842$ 180 537.16$ -$ 0.0% 2.9842$ 180 537.16$ -$ 0.0% 2.9842$ 180 537.16$ -$ 0.0% 2.9842$ 180 537.16$ -$ 0.0%
Retail Transmissioin Rate - Line and Transformation Connection Service Rate per kW 2.3054$ 180 414.97$ 2.3822$ 180 428.80$ 13.82$ 3.3% 2.3822$ 180 428.80$ -$ 0.0% 2.3822$ 180 428.80$ -$ 0.0% 2.3822$ 180 428.80$ -$ 0.0% 2.3822$ 180 428.80$ -$ 0.0%
Sub-Total C - Delivery (including Sub-Total B) 3,035.92$ 2,687.22$ 348.70-$ -11.5% 2,723.46$ 36.24$ 1.3% 2,869.62$ 146.16$ 5.4% 2,945.15$ 75.53$ 2.6% 3,015.51$ 70.36$ 2.4%
Wholesale Market Service Charge (WMSC) per kWh 0.0030$ 81,970 245.91$ 0.0030$ 81,331 243.99$ 1.92-$ -0.8% 0.0030$ 81,331 243.99$ -$ 0.0% 0.0030$ 81,331 243.99$ -$ 0.0% 0.0030$ 81,331 243.99$ -$ 0.0% 0.0030$ 81,331 243.99$ -$ 0.0%
Rural and Remote Rate Protection (RRRP) per kWh 0.0005$ 81,970 40.99$ 0.0005$ 81,331 40.67$ 0.32-$ -0.8% 0.0005$ 81,331 40.67$ -$ 0.0% 0.0005$ 81,331 40.67$ -$ 0.0% 0.0005$ 81,331 40.67$ -$ 0.0% 0.0005$ 81,331 40.67$ -$ 0.0%
Capacity Based Recovery (CBR) - Applicable for Class B Customers per kWh 0.0004$ 81,970 32.79$ 0.0004$ 81,331 32.53$ 0.26-$ -0.8% 0.0004$ 81,331 32.53$ -$ 0.0% 0.0004$ 81,331 32.53$ -$ 0.0% 0.0004$ 81,331 32.53$ -$ 0.0% 0.0004$ 81,331 32.53$ -$ 0.0%
Standard Supply Service Charge per 30 days 0.25$ 1 0.25$ 0.25$ 1 0.25$ -$ 0.0% 0.25$ 1 0.25$ -$ 0.0% 0.25$ 1 0.25$ -$ 0.0% 0.25$ 1 0.25$ -$ 0.0% 0.25$ 1 0.25$ -$ 0.0%
TOU - Off Peak per kWh 0.1010$ 50,560 5,106.56$ 0.1010$ 50,560 5,106.56$ -$ 0.0% 0.1010$ 50,560 5,106.56$ -$ 0.0% 0.1010$ 50,560 5,106.56$ -$ 0.0% 0.1010$ 50,560 5,106.56$ -$ 0.0% 0.1010$ 50,560 5,106.56$ -$ 0.0%
TOU - Mid Peak per kWh 0.1440$ 14,220 2,047.68$ 0.1440$ 14,220 2,047.68$ -$ 0.0% 0.1440$ 14,220 2,047.68$ -$ 0.0% 0.1440$ 14,220 2,047.68$ -$ 0.0% 0.1440$ 14,220 2,047.68$ -$ 0.0% 0.1440$ 14,220 2,047.68$ -$ 0.0%
TOU - On Peak per kWh 0.2080$ 14,220 2,957.76$ 0.2080$ 14,220 2,957.76$ -$ 0.0% 0.2080$ 14,220 2,957.76$ -$ 0.0% 0.2080$ 14,220 2,957.76$ -$ 0.0% 0.2080$ 14,220 2,957.76$ -$ 0.0% 0.2080$ 14,220 2,957.76$ -$ 0.0%
Energy - RPP - Tier 1 per kWh 0.1190$ 750 89.25$ 0.1190$ 750 89.25$ -$ 0.0% 0.1190$ 750 89.25$ -$ 0.0% 0.1190$ 750 89.25$ -$ 0.0% 0.1190$ 750 89.25$ -$ 0.0% 0.1190$ 750 89.25$ -$ 0.0%
Energy - RPP - Tier 2 per kWh 0.1390$ 78,250 10,876.75$ 0.1390$ 78,250 10,876.75$ -$ 0.0% 0.1390$ 78,250 10,876.75$ -$ 0.0% 0.1390$ 78,250 10,876.75$ -$ 0.0% 0.1390$ 78,250 10,876.75$ -$ 0.0% 0.1390$ 78,250 10,876.75$ -$ 0.0%
Non-RPP Retailer Avg. Price per kWh 0.1164$ - -$ 0.1164$ - -$ -$ 0.1164$ - -$ -$ 0.1164$ - -$ -$ 0.1164$ - -$ -$ 0.1164$ - -$ -$
Average IESO Wholesale Market Price per kWh 0.1164$ 79,000 9,195.60$ 0.1164$ 79,000 9,195.60$ -$ 0.0% 0.1164$ 79,000 9,195.60$ -$ 0.0% 0.1164$ 79,000 9,195.60$ -$ 0.0% 0.1164$ 79,000 9,195.60$ -$ 0.0% 0.1164$ 79,000 9,195.60$ -$ 0.0%
Total Bill on Average IESO Wholesale Market Price (before Taxes) 12,551.46$ 12,200.26$ 351.20-$ -2.8% 12,236.50$ 36.24$ 0.3% 12,382.66$ 146.16$ 1.2% 12,458.19$ 75.53$ 0.6% 12,528.55$ 70.36$ 0.6%
Ontario Electricity Rebate -31.8% -31.8% -$ -31.8% -$ -31.8% -$ -31.8% -$ -31.8% -$
HST 13% 1,631.69$ 13% 1,586.03$ 45.66-$ -2.8% 13% 1,590.75$ 4.71$ 0.3% 13% 1,609.75$ 19.00$ 1.2% 13% 1,619.56$ 9.82$ 0.6% 13% 1,628.71$ 9.15$ 0.6%
14,183.15$ 13,786.30$ 396.85-$ -2.8% 13,827.25$ 40.95$ 0.3% 13,992.41$ 165.16$ 1.2% 14,077.76$ 85.35$ 0.6% 14,157.26$ 79.51$ 0.6%
Total Bill on RPP (before Taxes) 14,321.86$ 13,970.66$ 351.20-$ -2.5% 14,006.90$ 36.24$ 0.3% 14,153.06$ 146.16$ 1.0% 14,228.59$ 75.53$ 0.5% 14,298.95$ 70.36$ 0.5%
Ontario Electricity Rebate -31.8% -31.8% -$ -31.8% -$ -31.8% -$ -31.8% -$ -31.8% -$
HST 13% 1,861.84$ 13% 1,816.19$ 45.66-$ -2.5% 13% 1,820.90$ 4.71$ 0.3% 13% 1,839.90$ 19.00$ 1.0% 13% 1,849.72$ 9.82$ 0.5% 13% 1,858.86$ 9.15$ 0.5%
16,183.70$ 15,786.85$ 396.85-$ -2.5% 15,827.80$ 40.95$ 0.3% 15,992.96$ 165.16$ 1.0% 16,078.31$ 85.35$ 0.5% 16,157.81$ 79.51$ 0.5%
Loss Factor (%) 3.76% 2.95% 2.95% 2.95% 2.95% 2.95%
$ Change % Change $ Change % Change
Total Bill on Average IESO Wholesale Market Price (after Tax and Rebate)
Total Bill on RPP (after Tax and Rebate)
Impact 2024 Proposed Impact
Charge Unit $ Change % Change $ Change % Change $ Change % Change
Impact 2021 Proposed Impact 2022 Proposed Impact 2023 Proposed
OEB Appendix 2-W
Bill Impacts
GENERAL SERVICE 50 TO 999 kW SERVICE
2019 Board-Approved 2020 Proposed
November 1 - April 30 (Select this radio button for applications filed after Oct 31)May 1 - October 31
GS 50-999 kW

Toronto Hydro-Electric System Limited
EB-2018-0165
Draft Rate Order
Schedule 16
UPDATED: February 12, 2020
Page 9 of 13
0.64 TOU - Off Peak
0.18 TOU - Mid Peak
0.18 TOU - On Peak
Customer Class:
TOU / non-TOU: non-TOU SPOT Class A Non-WMP
1,800 kW
2,000 kVA
Consumption 900,000 kWh
Rate Volume Charge Rate Volume Charge Rate Volume Charge Rate Volume Charge Rate Volume Charge Rate Volume Charge
($) ($) ($) ($) ($) ($) ($) ($) ($) ($) ($) ($)
Service Charge per 30 days 983.72$ 1 983.72$ 926.00$ 1 926.00$ 57.72-$ -5.9% 967.95$ 1 967.95$ 41.95$ 4.5% 978.79$ 1 978.79$ 10.84$ 1.1% 1,037.03$ 1 1,037.03$ 58.24$ 6.0% 1,077.06$ 1 1,077.06$ 40.03$ 3.9%
Rate Rider for Disposition of Other Post Employment Benefit Variance - effective until December 31, 2020 per kVA 0.0689$ 2,000 137.80$ 137.80$ -$ 2,000 -$ 137.80-$ -$ 2,000 -$ -$ -$ 2,000 -$ -$ -$ 2,000 -$ -$
Rate Rider for Disposition of the Impact for USGAAP - effective until December 31, 2020 per kVA 0.0624$ 2,000 124.80$ 124.80$ -$ 2,000 -$ 124.80-$ -$ 2,000 -$ -$ -$ 2,000 -$ -$ -$ 2,000 -$ -$
Rate Rider for Application of Operations Center Consolidation Plan - effective until December 31, 2021 per kVA 0.3244-$ 2,000 648.80-$ 648.80-$ 0.3244-$ 2,000 648.80-$ -$ 0.0% -$ 2,000 -$ 648.80$ -$ 2,000 -$ -$ -$ 2,000 -$ -$
Rate Rider for Disposition of the Gain on Property Sale - effective until December 31, 2021 per kVA 0.0520-$ 2,000 104.00-$ 104.00-$ 0.0520-$ 2,000 104.00-$ -$ 0.0% -$ 2,000 -$ 104.00$ -$ 2,000 -$ -$ -$ 2,000 -$ -$
Rate Rider for Disposition of Wireless Pole Attachment Revenue - effective until December 31, 2024 per kVA -$ 2,000 -$ -$ 0.0006-$ 2,000 1.20-$ 1.20-$ 0.0006-$ 2,000 1.20-$ -$ 0.0% 0.0006-$ 2,000 1.20-$ -$ 0.0% 0.0006-$ 2,000 1.20-$ -$ 0.0%
Rate Rider for Disposition of IFRS - CGAPP Property Plant and Equipment - effective until December 31, 2020 per kVA 0.0151-$ 2,000 30.20-$ 30.20-$ -$ 2,000 -$ 30.20$ -$ 2,000 -$ -$ -$ 2,000 -$ -$ -$ 2,000 -$ -$
Rate Rider for Disposition of Capital Related Revenue Requirement Variance Account - effective until Dec. 31, 2024 per kVA -$ 2,000 -$ -$ -$ 2,000 -$ -$ -$ 2,000 -$ -$ 0.3301-$ 2,000 660.20-$ 660.20-$ 0.3301-$ 2,000 660.20-$ -$ 0.0%
Rate Rider for Disposition of PILs and Tax Variance - effective until December 31, 2024 per kVA -$ -$ 2,000 -$ -$ -$ 2,000 -$ -$ -$ 2,000 -$ -$ 0.0468-$ 2,000 93.60-$ 93.60-$ 0.0468-$ 2,000 93.60-$ -$ 0.0%
Rate Rider for Disposition of External Driven Capital Variance Account - effective until December 31, 2020 per kVA 0.0307-$ 2,000 61.40-$ 61.40-$ -$ 2,000 -$ 61.40$ -$ 2,000 -$ -$ -$ 2,000 -$ -$ -$ 2,000 -$ -$
Rate Rider for Disposition of Derecognition Variance Account - effective until December 31, 2022 per kVA -$ 2,000 -$ -$ -$ 2,000 -$ -$ 0.2757-$ 2,000 551.40-$ 551.40-$ -$ 2,000 -$ 551.40$ -$ 2,000 -$ -$
Rate Rider for Disposition of Expansion Deposits - effective until December, 2024 per kVA -$ 2,000 -$ -$ 0.0527-$ 2,000 105.40-$ 105.40-$ 0.0527-$ 2,000 105.40-$ -$ 0.0% 0.0527-$ 2,000 105.40-$ -$ 0.0% 0.0527-$ 2,000 105.40-$ -$ 0.0%
Rate Rider for Recovery of 2020 Foregone Revenue - effective until December 31, 2021 per 30 days -$ 5.18-$ 1 5.18-$ 5.18-$ 5.18-$ 1 5.18-$ -$ 0.0% -$ 1 -$ 5.18$ -$ 1 -$ -$ -$ 1 -$ -$
Rate Rider for Recovery of 2020 Foregone Revenue - effective until December 31, 2021 per kVA -$ 0.0124$ 2,000 24.80$ 24.80$ 0.0124$ 2,000 24.80$ -$ 0.0% -$ 2,000 -$ 24.80-$ -$ 2,000 -$ -$ -$ 2,000 -$ -$
Rate Rider for Recovery of 2015 Foregone Revenue - effective until Dec. 31, 2019 per 30 days 18.89$ 1 18.89$ 1 -$ 18.89-$ 1 -$ -$ 1 -$ -$ 1 -$ -$ 1 -$ -$
Rate Rider for Recovery of 2016 Foregone Revenue - effective until Dec. 31, 2019 per 30 days 5.48$ 1 5.48$ 1 -$ 5.48-$ 1 -$ -$ 1 -$ -$ 1 -$ -$ 1 -$ -$
Distribution Volumetric Rate per kVA 6.3766$ 2,000 12,753.20$ 6.5219$ 2,000 13,043.80$ 290.60$ 2.3% 6.8173$ 2,000 13,634.60$ 590.80$ 4.5% 6.8937$ 2,000 13,787.40$ 152.80$ 1.1% 7.3039$ 2,000 14,607.80$ 820.40$ 6.0% 7.5858$ 2,000 15,171.60$ 563.80$ 3.9%
Rate Rider for Recovery of the Gain on the Sale of Named Properties - effective until Dec. 31, 2019 per kVA 0.0056$ 2,000 11.20$ 2,000 -$ 11.20-$ 2,000 -$ -$ 2,000 -$ -$ 2,000 -$ -$ 2,000 -$ -$
Rate Rider for Recovery of Hydro One Capital Contributions Variance - effective until Dec. 31, 2019 per kVA 0.0038$ 2,000 7.60$ 2,000 -$ 7.60-$ 2,000 -$ -$ 2,000 -$ -$ 2,000 -$ -$ 2,000 -$ -$
Rate Rider for Application of IFRS - 2014 Derecognition - effective until Dec. 31, 2019 per kVA 0.0627$ 2,000 125.40$ 2,000 -$ 125.40-$ 2,000 -$ -$ 2,000 -$ -$ 2,000 -$ -$ 2,000 -$ -$
Rate Rider for Recovery of 2015 Foregone Revenue - effective until Dec. 31, 2019 per kVA 0.1226$ 2,000 245.20$ 2,000 -$ 245.20-$ 2,000 -$ -$ 2,000 -$ -$ 2,000 -$ -$ 2,000 -$ -$
Rate Rider for Recovery of 2016 Foregone Revenue - effective until Dec. 31, 2019 per kVA 0.0356$ 2,000 71.20$ 2,000 -$ 71.20-$ 2,000 -$ -$ 2,000 -$ -$ 2,000 -$ -$ 2,000 -$ -$
Rate Rider for Disposition of Lost Revenue Adjustment Mechanism (LRAMVA) (2019) - effective until Dec. 31, 2019 per kVA 0.1251$ 2,000 250.20$ 2,000 -$ 250.20-$ 2,000 -$ -$ 2,000 -$ -$ 2,000 -$ -$ 2,000 -$ -$
Sub-Total A (excluding pass through) 14,472.09$ 13,407.62$ 1,064.47-$ -7.4% 13,762.77$ 355.15$ 2.6% 14,108.19$ 345.42$ 2.5% 14,784.43$ 676.24$ 4.8% 15,388.26$ 603.83$ 4.1%
Line Losses on Cost of Power per kWh 0.1164$ 33,840 3,938.98$ 0.1164$ 26,550 3,090.42$ 848.56-$ -21.5% 0.1164$ 26,550 3,090.42$ -$ 0.0% 0.1164$ 26,550 3,090.42$ -$ 0.0% 0.1164$ 26,550 3,090.42$ -$ 0.0% 0.1164$ 26,550 3,090.42$ -$ 0.0%
Rate Rider for Disposition of Deferral/Variance Accounts per kVA 0.2186-$ 2,000 437.20-$ 0.2757$ 2,000 551.40$ 988.60$ -226.1% 0.2757$ 2,000 551.40$ -$ 0.0% -$ 551.40-$ -$ -$ -$ -$
Rate Rider for Disposition of Deferral/Variance Accounts for Non-Wholesale Market Participants per kVA 2,000 -$ 0.1020-$ 2,000 204.00-$ 204.00-$ 0.1020-$ 2,000 204.00-$ -$ 0.0% -$ 204.00$ -$ -$ -$ -$
Rate Rider for Disposition of Capacity Based Recovery Account - Applicable only for Class B Customers per kVA 0.0114$ -$ 0.0065-$ -$ -$ 0.0065-$ - -$ -$ -$ -$
Rate Rider for Disposition of Global Adjustment Account - (Applicable only for Non-RPP Customers) per kWh 0.00068$ -$ 0.00159-$ -$ -$ 0.00159-$ - -$ -$ -$ -$
Sub-Total B - Distribution (includes Sub-Total A) 17,973.87$ 16,845.44$ 1,128.43-$ -6.3% 17,200.59$ 355.15$ 2.1% 17,198.61$ 1.98-$ 0.0% 17,874.85$ 676.24$ 3.9% 18,478.68$ 603.83$ 3.4%
Retail Transmissioin Rate - Network Service Rate per kW 2.5677$ 1,800 4,621.86$ 2.8833$ 1,800 5,189.94$ 568.08$ 12.3% 2.8833$ 1,800 5,189.94$ -$ 0.0% 2.8833$ 1,800 5,189.94$ -$ 0.0% 2.8833$ 1,800 5,189.94$ -$ 0.0% 2.8833$ 1,800 5,189.94$ -$ 0.0%
Retail Transmissioin Rate - Line and Transformation Connection Service Rate per kW 2.3030$ 1,800 4,145.40$ 2.3797$ 1,800 4,283.46$ 138.06$ 3.3% 2.3797$ 1,800 4,283.46$ -$ 0.0% 2.3797$ 1,800 4,283.46$ -$ 0.0% 2.3797$ 1,800 4,283.46$ -$ 0.0% 2.3797$ 1,800 4,283.46$ -$ 0.0%
Sub-Total C - Delivery (including Sub-Total B) 26,741.13$ 26,318.84$ 422.29-$ -1.6% 26,673.99$ 355.15$ 1.3% 26,672.01$ 1.98-$ 0.0% 27,348.25$ 676.24$ 2.5% 27,952.08$ 603.83$ 2.2%
Wholesale Market Service Charge (WMSC) per kWh 0.0030$ 933,840 2,801.52$ 0.0030$ 926,550 2,779.65$ 21.87-$ -0.8% 0.0030$ 926,550 2,779.65$ -$ 0.0% 0.0030$ 926,550 2,779.65$ -$ 0.0% 0.0030$ 926,550 2,779.65$ -$ 0.0% 0.0030$ 926,550 2,779.65$ -$ 0.0%
Rural and Remote Rate Protection (RRRP) per kWh 0.0005$ 933,840 466.92$ 0.0005$ 926,550 463.28$ 3.64-$ -0.8% 0.0005$ 926,550 463.28$ -$ 0.0% 0.0005$ 926,550 463.28$ -$ 0.0% 0.0005$ 926,550 463.28$ -$ 0.0% 0.0005$ 926,550 463.28$ -$ 0.0%
Capacity Based Recovery (CBR) - Applicable for Class B Customers per kWh 0.0004$ -$ 0.0004$ -$ -$ 0.0004$ -$ -$ 0.0004$ -$ -$ 0.0004$ -$ -$ 0.0004$ -$ -$
Standard Supply Service Charge per 30 days 0.25$ 1 0.25$ 0.25$ 1 0.25$ -$ 0.0% 0.25$ 1 0.25$ -$ 0.0% 0.25$ 1 0.25$ -$ 0.0% 0.25$ 1 0.25$ -$ 0.0% 0.25$ 1 0.25$ -$ 0.0%
TOU - Off Peak per kWh 0.1010$ 576,000 58,176.00$ 0.1010$ 576,000 58,176.00$ -$ 0.0% 0.1010$ 576,000 58,176.00$ -$ 0.0% 0.1010$ 576,000 58,176.00$ -$ 0.0% 0.1010$ 576,000 58,176.00$ -$ 0.0% 0.1010$ 576,000 58,176.00$ -$ 0.0%
TOU - Mid Peak per kWh 0.1440$ 162,000 23,328.00$ 0.1440$ 162,000 23,328.00$ -$ 0.0% 0.1440$ 162,000 23,328.00$ -$ 0.0% 0.1440$ 162,000 23,328.00$ -$ 0.0% 0.1440$ 162,000 23,328.00$ -$ 0.0% 0.1440$ 162,000 23,328.00$ -$ 0.0%
TOU - On Peak per kWh 0.2080$ 162,000 33,696.00$ 0.2080$ 162,000 33,696.00$ -$ 0.0% 0.2080$ 162,000 33,696.00$ -$ 0.0% 0.2080$ 162,000 33,696.00$ -$ 0.0% 0.2080$ 162,000 33,696.00$ -$ 0.0% 0.2080$ 162,000 33,696.00$ -$ 0.0%
Energy - RPP - Tier 1 per kWh 0.1190$ 750 89.25$ 0.1190$ 750 89.25$ -$ 0.0% 0.1190$ 750 89.25$ -$ 0.0% 0.1190$ 750 89.25$ -$ 0.0% 0.1190$ 750 89.25$ -$ 0.0% 0.1190$ 750 89.25$ -$ 0.0%
Energy - RPP - Tier 2 per kWh 0.1390$ 899,250 124,995.75$ 0.1390$ 899,250 124,995.75$ -$ 0.0% 0.1390$ 899,250 124,995.75$ -$ 0.0% 0.1390$ 899,250 124,995.75$ -$ 0.0% 0.1390$ 899,250 124,995.75$ -$ 0.0% 0.1390$ 899,250 124,995.75$ -$ 0.0%
Non-RPP Retailer Avg. Price per kWh 0.1164$ - -$ 0.1164$ - -$ -$ 0.1164$ - -$ -$ 0.1164$ - -$ -$ 0.1164$ - -$ -$ 0.1164$ - -$ -$
Average IESO Wholesale Market Price per kWh 0.1164$ 900,000 104,760.00$ 0.1164$ 900,000 104,760.00$ -$ 0.0% 0.1164$ 900,000 104,760.00$ -$ 0.0% 0.1164$ 900,000 104,760.00$ -$ 0.0% 0.1164$ 900,000 104,760.00$ -$ 0.0% 0.1164$ 900,000 104,760.00$ -$ 0.0%
Total Bill on Average IESO Wholesale Market Price (before Taxes) 134,769.82$ 134,322.02$ 447.80-$ -0.3% 134,677.17$ 355.15$ 0.3% 134,675.19$ 1.98-$ 0.0% 135,351.43$ 676.24$ 0.5% 135,955.26$ 603.83$ 0.4%
Ontario Electricity Rebate -31.8% -31.8% -$ -31.8% -$ -31.8% -$ -31.8% -$ -31.8% -$
HST 13% 17,520.08$ 13% 17,461.86$ 58.21-$ -0.3% 13% 17,508.03$ 46.17$ 0.3% 13% 17,507.77$ 0.26-$ 0.0% 13% 17,595.69$ 87.91$ 0.5% 13% 17,674.18$ 78.50$ 0.4%
152,289.89$ 151,783.88$ 506.02-$ -0.3% 152,185.20$ 401.32$ 0.3% 152,182.96$ 2.24-$ 0.0% 152,947.11$ 764.15$ 0.5% 153,629.44$ 682.33$ 0.4%
Total Bill on RPP (before Taxes) 155,094.82$ 154,647.02$ 447.80-$ -0.3% 155,002.17$ 355.15$ 0.2% 155,000.19$ 1.98-$ 0.0% 155,676.43$ 676.24$ 0.4% 156,280.26$ 603.83$ 0.4%
Ontario Electricity Rebate -31.8% -31.8% -$ -31.8% -$ -31.8% -$ -31.8% -$ -31.8% -$
HST 13% 20,162.33$ 13% 20,104.11$ 58.21-$ -0.3% 13% 20,150.28$ 46.17$ 0.2% 13% 20,150.02$ 0.26-$ 0.0% 13% 20,237.94$ 87.91$ 0.4% 13% 20,316.43$ 78.50$ 0.4%
175,257.14$ 174,751.13$ 506.02-$ -0.3% 175,152.45$ 401.32$ 0.2% 175,150.21$ 2.24-$ 0.0% 175,914.36$ 764.15$ 0.4% 176,596.69$ 682.33$ 0.4%
Loss Factor (%) 3.76% 2.95% 2.95% 2.95% 2.95% 2.95%
$ Change % Change $ Change % Change
Total Bill on Average IESO Wholesale Market Price (after Tax and Rebate)
Total Bill on RPP (after Tax and Rebate)
Impact 2024 Proposed Impact
Charge Unit $ Change % Change $ Change % Change $ Change % Change
Impact 2021 Proposed Impact 2022 Proposed Impact 2023 Proposed
OEB Appendix 2-W
Bill Impacts
GENERAL SERVICE 1,000 TO 4,999 kW SERVICE
2019 Board-Approved 2020 Proposed
November 1 - April 30 (Select this radio button for applications filed after Oct 31)May 1 - October 31
GS 1,000-4,999 kW
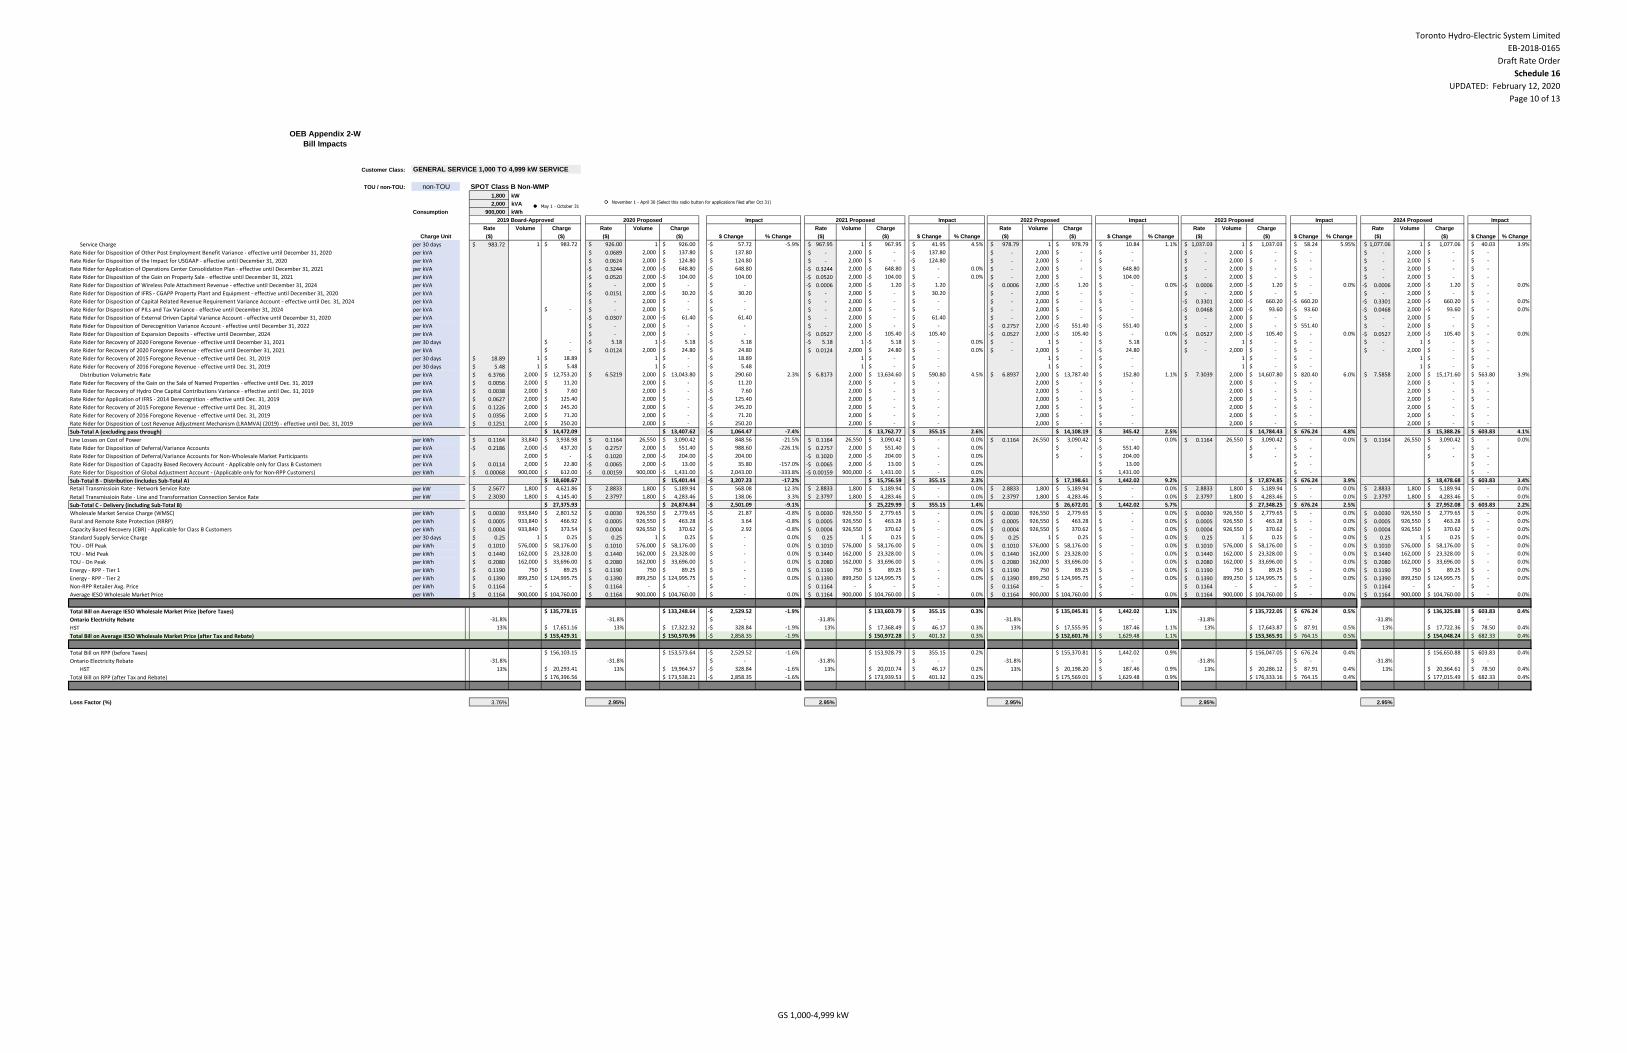
Toronto Hydro-Electric System Limited
EB-2018-0165
Draft Rate Order
Schedule 16
UPDATED: February 12, 2020
Page 10 of 13
Customer Class: GENERAL SERVICE 1,000 TO 4,999 kW SERVICE
TOU / non-TOU: non-TOU SPOT Class B Non-WMP
1,800 kW
2,000 kVA
Consumption 900,000 kWh
Rate Volume Charge Rate Volume Charge Rate Volume Charge Rate Volume Charge Rate Volume Charge Rate Volume Charge
($) ($) ($) ($) ($) ($) ($) ($) ($) ($) ($) ($)
Service Charge per 30 days 983.72$ 1 983.72$ 926.00$ 1 926.00$ 57.72-$ -5.9% 967.95$ 1 967.95$ 41.95$ 4.5% 978.79$ 1 978.79$ 10.84$ 1.1% 1,037.03$ 1 1,037.03$ 58.24$ 5.95% 1,077.06$ 1 1,077.06$ 40.03$ 3.9%
Rate Rider for Disposition of Other Post Employment Benefit Variance - effective until December 31, 2020 per kVA 0.0689$ 2,000 137.80$ 137.80$ -$ 2,000 -$ 137.80-$ -$ 2,000 -$ -$ -$ 2,000 -$ -$ -$ 2,000 -$ -$
Rate Rider for Disposition of the Impact for USGAAP - effective until December 31, 2020 per kVA 0.0624$ 2,000 124.80$ 124.80$ -$ 2,000 -$ 124.80-$ -$ 2,000 -$ -$ -$ 2,000 -$ -$ -$ 2,000 -$ -$
Rate Rider for Application of Operations Center Consolidation Plan - effective until December 31, 2021 per kVA 0.3244-$ 2,000 648.80-$ 648.80-$ 0.3244-$ 2,000 648.80-$ -$ 0.0% -$ 2,000 -$ 648.80$ -$ 2,000 -$ -$ -$ 2,000 -$ -$
Rate Rider for Disposition of the Gain on Property Sale - effective until December 31, 2021 per kVA 0.0520-$ 2,000 104.00-$ 104.00-$ 0.0520-$ 2,000 104.00-$ -$ 0.0% -$ 2,000 -$ 104.00$ -$ 2,000 -$ -$ -$ 2,000 -$ -$
Rate Rider for Disposition of Wireless Pole Attachment Revenue - effective until December 31, 2024 per kVA -$ 2,000 -$ -$ 0.0006-$ 2,000 1.20-$ 1.20-$ 0.0006-$ 2,000 1.20-$ -$ 0.0% 0.0006-$ 2,000 1.20-$ -$ 0.0% 0.0006-$ 2,000 1.20-$ -$ 0.0%
Rate Rider for Disposition of IFRS - CGAPP Property Plant and Equipment - effective until December 31, 2020 per kVA 0.0151-$ 2,000 30.20-$ 30.20-$ -$ 2,000 -$ 30.20$ -$ 2,000 -$ -$ -$ 2,000 -$ -$ -$ 2,000 -$ -$
Rate Rider for Disposition of Capital Related Revenue Requirement Variance Account - effective until Dec. 31, 2024 per kVA -$ 2,000 -$ -$ -$ 2,000 -$ -$ -$ 2,000 -$ -$ 0.3301-$ 2,000 660.20-$ 660.20-$ 0.3301-$ 2,000 660.20-$ -$ 0.0%
Rate Rider for Disposition of PILs and Tax Variance - effective until December 31, 2024 per kVA -$ -$ 2,000 -$ -$ -$ 2,000 -$ -$ -$ 2,000 -$ -$ 0.0468-$ 2,000 93.60-$ 93.60-$ 0.0468-$ 2,000 93.60-$ -$ 0.0%
Rate Rider for Disposition of External Driven Capital Variance Account - effective until December 31, 2020 per kVA 0.0307-$ 2,000 61.40-$ 61.40-$ -$ 2,000 -$ 61.40$ -$ 2,000 -$ -$ -$ 2,000 -$ -$ -$ 2,000 -$ -$
Rate Rider for Disposition of Derecognition Variance Account - effective until December 31, 2022 per kVA -$ 2,000 -$ -$ -$ 2,000 -$ -$ 0.2757-$ 2,000 551.40-$ 551.40-$ -$ 2,000 -$ 551.40$ -$ 2,000 -$ -$
Rate Rider for Disposition of Expansion Deposits - effective until December, 2024 per kVA -$ 2,000 -$ -$ 0.0527-$ 2,000 105.40-$ 105.40-$ 0.0527-$ 2,000 105.40-$ -$ 0.0% 0.0527-$ 2,000 105.40-$ -$ 0.0% 0.0527-$ 2,000 105.40-$ -$ 0.0%
Rate Rider for Recovery of 2020 Foregone Revenue - effective until December 31, 2021 per 30 days -$ 5.18-$ 1 5.18-$ 5.18-$ 5.18-$ 1 5.18-$ -$ 0.0% -$ 1 -$ 5.18$ -$ 1 -$ -$ -$ 1 -$ -$
Rate Rider for Recovery of 2020 Foregone Revenue - effective until December 31, 2021 per kVA -$ 0.0124$ 2,000 24.80$ 24.80$ 0.0124$ 2,000 24.80$ -$ 0.0% -$ 2,000 -$ 24.80-$ -$ 2,000 -$ -$ -$ 2,000 -$ -$
Rate Rider for Recovery of 2015 Foregone Revenue - effective until Dec. 31, 2019 per 30 days 18.89$ 1 18.89$ 1 -$ 18.89-$ 1 -$ -$ 1 -$ -$ 1 -$ -$ 1 -$ -$
Rate Rider for Recovery of 2016 Foregone Revenue - effective until Dec. 31, 2019 per 30 days 5.48$ 1 5.48$ 1 -$ 5.48-$ 1 -$ -$ 1 -$ -$ 1 -$ -$ 1 -$ -$
Distribution Volumetric Rate per kVA 6.3766$ 2,000 12,753.20$ 6.5219$ 2,000 13,043.80$ 290.60$ 2.3% 6.8173$ 2,000 13,634.60$ 590.80$ 4.5% 6.8937$ 2,000 13,787.40$ 152.80$ 1.1% 7.3039$ 2,000 14,607.80$ 820.40$ 6.0% 7.5858$ 2,000 15,171.60$ 563.80$ 3.9%
Rate Rider for Recovery of the Gain on the Sale of Named Properties - effective until Dec. 31, 2019 per kVA 0.0056$ 2,000 11.20$ 2,000 -$ 11.20-$ 2,000 -$ -$ 2,000 -$ -$ 2,000 -$ -$ 2,000 -$ -$
Rate Rider for Recovery of Hydro One Capital Contributions Variance - effective until Dec. 31, 2019 per kVA 0.0038$ 2,000 7.60$ 2,000 -$ 7.60-$ 2,000 -$ -$ 2,000 -$ -$ 2,000 -$ -$ 2,000 -$ -$
Rate Rider for Application of IFRS - 2014 Derecognition - effective until Dec. 31, 2019 per kVA 0.0627$ 2,000 125.40$ 2,000 -$ 125.40-$ 2,000 -$ -$ 2,000 -$ -$ 2,000 -$ -$ 2,000 -$ -$
Rate Rider for Recovery of 2015 Foregone Revenue - effective until Dec. 31, 2019 per kVA 0.1226$ 2,000 245.20$ 2,000 -$ 245.20-$ 2,000 -$ -$ 2,000 -$ -$ 2,000 -$ -$ 2,000 -$ -$
Rate Rider for Recovery of 2016 Foregone Revenue - effective until Dec. 31, 2019 per kVA 0.0356$ 2,000 71.20$ 2,000 -$ 71.20-$ 2,000 -$ -$ 2,000 -$ -$ 2,000 -$ -$ 2,000 -$ -$
Rate Rider for Disposition of Lost Revenue Adjustment Mechanism (LRAMVA) (2019) - effective until Dec. 31, 2019 per kVA 0.1251$ 2,000 250.20$ 2,000 -$ 250.20-$ 2,000 -$ -$ 2,000 -$ -$ 2,000 -$ -$ 2,000 -$ -$
Sub-Total A (excluding pass through) 14,472.09$ 13,407.62$ 1,064.47-$ -7.4% 13,762.77$ 355.15$ 2.6% 14,108.19$ 345.42$ 2.5% 14,784.43$ 676.24$ 4.8% 15,388.26$ 603.83$ 4.1%
Line Losses on Cost of Power per kWh 0.1164$ 33,840 3,938.98$ 0.1164$ 26,550 3,090.42$ 848.56-$ -21.5% 0.1164$ 26,550 3,090.42$ -$ 0.0% 0.1164$ 26,550 3,090.42$ -$ 0.0% 0.1164$ 26,550 3,090.42$ -$ 0.0% 0.1164$ 26,550 3,090.42$ -$ 0.0%
Rate Rider for Disposition of Deferral/Variance Accounts per kVA 0.2186-$ 2,000 437.20-$ 0.2757$ 2,000 551.40$ 988.60$ -226.1% 0.2757$ 2,000 551.40$ -$ 0.0% -$ 551.40-$ -$ -$ -$ -$
Rate Rider for Disposition of Deferral/Variance Accounts for Non-Wholesale Market Participants per kVA 2,000 -$ 0.1020-$ 2,000 204.00-$ 204.00-$ 0.1020-$ 2,000 204.00-$ -$ 0.0% -$ 204.00$ -$ -$ -$ -$
Rate Rider for Disposition of Capacity Based Recovery Account - Applicable only for Class B Customers per kVA 0.0114$ 2,000 22.80$ 0.0065-$ 2,000 13.00-$ 35.80-$ -157.0% 0.0065-$ 2,000 13.00-$ -$ 0.0% 13.00$ -$ -$
Rate Rider for Disposition of Global Adjustment Account - (Applicable only for Non-RPP Customers) per kWh 0.00068$ 900,000 612.00$ 0.00159-$ 900,000 1,431.00-$ 2,043.00-$ -333.8% 0.00159-$ 900,000 1,431.00-$ -$ 0.0% 1,431.00$ -$ -$
Sub-Total B - Distribution (includes Sub-Total A) 18,608.67$ 15,401.44$ 3,207.23-$ -17.2% 15,756.59$ 355.15$ 2.3% 17,198.61$ 1,442.02$ 9.2% 17,874.85$ 676.24$ 3.9% 18,478.68$ 603.83$ 3.4%
Retail Transmissioin Rate - Network Service Rate per kW 2.5677$ 1,800 4,621.86$ 2.8833$ 1,800 5,189.94$ 568.08$ 12.3% 2.8833$ 1,800 5,189.94$ -$ 0.0% 2.8833$ 1,800 5,189.94$ -$ 0.0% 2.8833$ 1,800 5,189.94$ -$ 0.0% 2.8833$ 1,800 5,189.94$ -$ 0.0%
Retail Transmissioin Rate - Line and Transformation Connection Service Rate per kW 2.3030$ 1,800 4,145.40$ 2.3797$ 1,800 4,283.46$ 138.06$ 3.3% 2.3797$ 1,800 4,283.46$ -$ 0.0% 2.3797$ 1,800 4,283.46$ -$ 0.0% 2.3797$ 1,800 4,283.46$ -$ 0.0% 2.3797$ 1,800 4,283.46$ -$ 0.0%
Sub-Total C - Delivery (including Sub-Total B) 27,375.93$ 24,874.84$ 2,501.09-$ -9.1% 25,229.99$ 355.15$ 1.4% 26,672.01$ 1,442.02$ 5.7% 27,348.25$ 676.24$ 2.5% 27,952.08$ 603.83$ 2.2%
Wholesale Market Service Charge (WMSC) per kWh 0.0030$ 933,840 2,801.52$ 0.0030$ 926,550 2,779.65$ 21.87-$ -0.8% 0.0030$ 926,550 2,779.65$ -$ 0.0% 0.0030$ 926,550 2,779.65$ -$ 0.0% 0.0030$ 926,550 2,779.65$ -$ 0.0% 0.0030$ 926,550 2,779.65$ -$ 0.0%
Rural and Remote Rate Protection (RRRP) per kWh 0.0005$ 933,840 466.92$ 0.0005$ 926,550 463.28$ 3.64-$ -0.8% 0.0005$ 926,550 463.28$ -$ 0.0% 0.0005$ 926,550 463.28$ -$ 0.0% 0.0005$ 926,550 463.28$ -$ 0.0% 0.0005$ 926,550 463.28$ -$ 0.0%
Capacity Based Recovery (CBR) - Applicable for Class B Customers per kWh 0.0004$ 933,840 373.54$ 0.0004$ 926,550 370.62$ 2.92-$ -0.8% 0.0004$ 926,550 370.62$ -$ 0.0% 0.0004$ 926,550 370.62$ -$ 0.0% 0.0004$ 926,550 370.62$ -$ 0.0% 0.0004$ 926,550 370.62$ -$ 0.0%
Standard Supply Service Charge per 30 days 0.25$ 1 0.25$ 0.25$ 1 0.25$ -$ 0.0% 0.25$ 1 0.25$ -$ 0.0% 0.25$ 1 0.25$ -$ 0.0% 0.25$ 1 0.25$ -$ 0.0% 0.25$ 1 0.25$ -$ 0.0%
TOU - Off Peak per kWh 0.1010$ 576,000 58,176.00$ 0.1010$ 576,000 58,176.00$ -$ 0.0% 0.1010$ 576,000 58,176.00$ -$ 0.0% 0.1010$ 576,000 58,176.00$ -$ 0.0% 0.1010$ 576,000 58,176.00$ -$ 0.0% 0.1010$ 576,000 58,176.00$ -$ 0.0%
TOU - Mid Peak per kWh 0.1440$ 162,000 23,328.00$ 0.1440$ 162,000 23,328.00$ -$ 0.0% 0.1440$ 162,000 23,328.00$ -$ 0.0% 0.1440$ 162,000 23,328.00$ -$ 0.0% 0.1440$ 162,000 23,328.00$ -$ 0.0% 0.1440$ 162,000 23,328.00$ -$ 0.0%
TOU - On Peak per kWh 0.2080$ 162,000 33,696.00$ 0.2080$ 162,000 33,696.00$ -$ 0.0% 0.2080$ 162,000 33,696.00$ -$ 0.0% 0.2080$ 162,000 33,696.00$ -$ 0.0% 0.2080$ 162,000 33,696.00$ -$ 0.0% 0.2080$ 162,000 33,696.00$ -$ 0.0%
Energy - RPP - Tier 1 per kWh 0.1190$ 750 89.25$ 0.1190$ 750 89.25$ -$ 0.0% 0.1190$ 750 89.25$ -$ 0.0% 0.1190$ 750 89.25$ -$ 0.0% 0.1190$ 750 89.25$ -$ 0.0% 0.1190$ 750 89.25$ -$ 0.0%
Energy - RPP - Tier 2 per kWh 0.1390$ 899,250 124,995.75$ 0.1390$ 899,250 124,995.75$ -$ 0.0% 0.1390$ 899,250 124,995.75$ -$ 0.0% 0.1390$ 899,250 124,995.75$ -$ 0.0% 0.1390$ 899,250 124,995.75$ -$ 0.0% 0.1390$ 899,250 124,995.75$ -$ 0.0%
Non-RPP Retailer Avg. Price per kWh 0.1164$ - -$ 0.1164$ - -$ -$ 0.1164$ - -$ -$ 0.1164$ - -$ -$ 0.1164$ - -$ -$ 0.1164$ - -$ -$
Average IESO Wholesale Market Price per kWh 0.1164$ 900,000 104,760.00$ 0.1164$ 900,000 104,760.00$ -$ 0.0% 0.1164$ 900,000 104,760.00$ -$ 0.0% 0.1164$ 900,000 104,760.00$ -$ 0.0% 0.1164$ 900,000 104,760.00$ -$ 0.0% 0.1164$ 900,000 104,760.00$ -$ 0.0%
Total Bill on Average IESO Wholesale Market Price (before Taxes) 135,778.15$ 133,248.64$ 2,529.52-$ -1.9% 133,603.79$ 355.15$ 0.3% 135,045.81$ 1,442.02$ 1.1% 135,722.05$ 676.24$ 0.5% 136,325.88$ 603.83$ 0.4%
Ontario Electricity Rebate -31.8% -31.8% -$ -31.8% -$ -31.8% -$ -31.8% -$ -31.8% -$
HST 13% 17,651.16$ 13% 17,322.32$ 328.84-$ -1.9% 13% 17,368.49$ 46.17$ 0.3% 13% 17,555.95$ 187.46$ 1.1% 13% 17,643.87$ 87.91$ 0.5% 13% 17,722.36$ 78.50$ 0.4%
153,429.31$ 150,570.96$ 2,858.35-$ -1.9% 150,972.28$ 401.32$ 0.3% 152,601.76$ 1,629.48$ 1.1% 153,365.91$ 764.15$ 0.5% 154,048.24$ 682.33$ 0.4%
Total Bill on RPP (before Taxes) 156,103.15$ 153,573.64$ 2,529.52-$ -1.6% 153,928.79$ 355.15$ 0.2% 155,370.81$ 1,442.02$ 0.9% 156,047.05$ 676.24$ 0.4% 156,650.88$ 603.83$ 0.4%
Ontario Electricity Rebate -31.8% -31.8% -$ -31.8% -$ -31.8% -$ -31.8% -$ -31.8% -$
HST 13% 20,293.41$ 13% 19,964.57$ 328.84-$ -1.6% 13% 20,010.74$ 46.17$ 0.2% 13% 20,198.20$ 187.46$ 0.9% 13% 20,286.12$ 87.91$ 0.4% 13% 20,364.61$ 78.50$ 0.4%
176,396.56$ 173,538.21$ 2,858.35-$ -1.6% 173,939.53$ 401.32$ 0.2% 175,569.01$ 1,629.48$ 0.9% 176,333.16$ 764.15$ 0.4% 177,015.49$ 682.33$ 0.4%
Loss Factor (%) 3.76% 2.95% 2.95% 2.95% 2.95% 2.95%
$ Change % Change
Total Bill on Average IESO Wholesale Market Price (after Tax and Rebate)
Total Bill on RPP (after Tax and Rebate)
Impact
Charge Unit $ Change % Change $ Change % Change $ Change % Change $ Change % Change
Impact 2022 Proposed Impact 2023 Proposed Impact 2024 Proposed
OEB Appendix 2-W
Bill Impacts
2019 Board-Approved 2020 Proposed Impact 2021 Proposed
November 1 - April 30 (Select this radio button for applications filed after Oct 31)May 1 - October 31
GS 1,000-4,999 kW
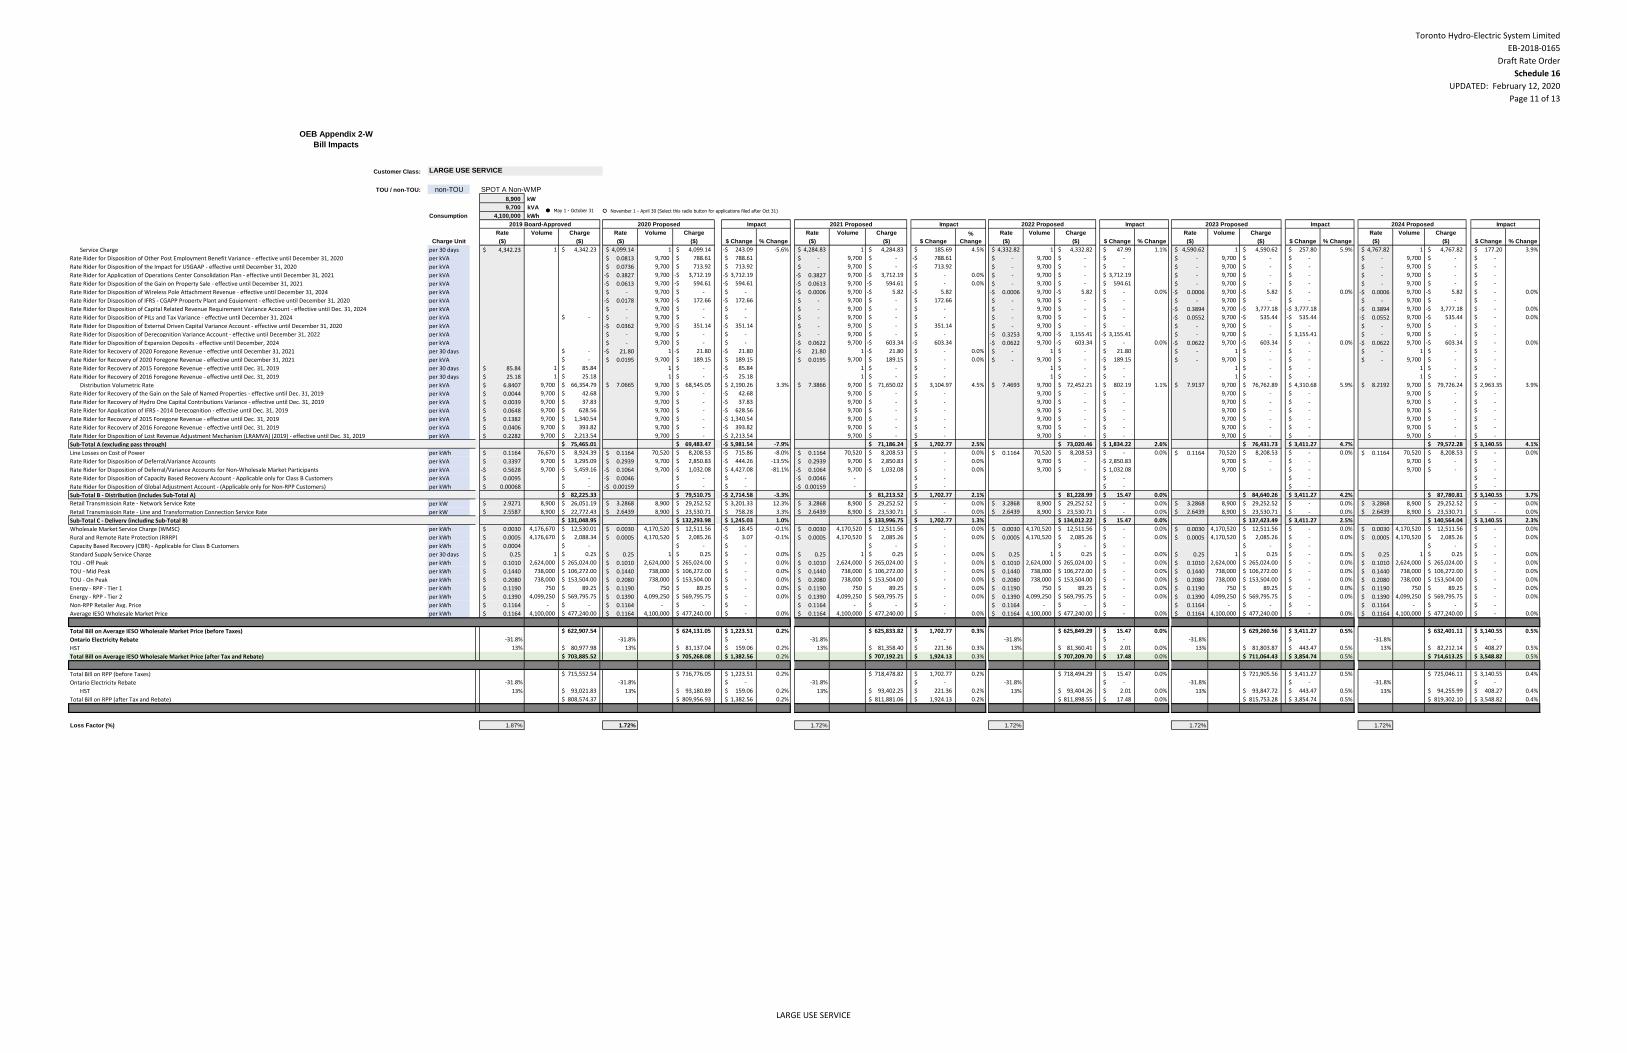
Toronto Hydro-Electric System Limited
EB-2018-0165
Draft Rate Order
Schedule 16
UPDATED: February 12, 2020
Page 11 of 13
Customer Class:
TOU / non-TOU: non-TOU SPOT A Non-WMP
8,900 kW
9,700 kVA
Consumption 4,100,000 kWh
Rate Volume Charge Rate Volume Charge Rate Volume Charge Rate Volume Charge Rate Volume Charge Rate Volume Charge
($) ($) ($) ($) ($) ($) ($) ($) ($) ($) ($) ($)
Service Charge per 30 days 4,342.23$ 1 4,342.23$ 4,099.14$ 1 4,099.14$ 243.09-$ -5.6% 4,284.83$ 1 4,284.83$ 185.69$ 4.5% 4,332.82$ 1 4,332.82$ 47.99$ 1.1% 4,590.62$ 1 4,590.62$ 257.80$ 5.9% 4,767.82$ 1 4,767.82$ 177.20$ 3.9%
Rate Rider for Disposition of Other Post Employment Benefit Variance - effective until December 31, 2020 per kVA 0.0813$ 9,700 788.61$ 788.61$ -$ 9,700 -$ 788.61-$ -$ 9,700 -$ -$ -$ 9,700 -$ -$ -$ 9,700 -$ -$
Rate Rider for Disposition of the Impact for USGAAP - effective until December 31, 2020 per kVA 0.0736$ 9,700 713.92$ 713.92$ -$ 9,700 -$ 713.92-$ -$ 9,700 -$ -$ -$ 9,700 -$ -$ -$ 9,700 -$ -$
Rate Rider for Application of Operations Center Consolidation Plan - effective until December 31, 2021 per kVA 0.3827-$ 9,700 3,712.19-$ 3,712.19-$ 0.3827-$ 9,700 3,712.19-$ -$ 0.0% -$ 9,700 -$ 3,712.19$ -$ 9,700 -$ -$ -$ 9,700 -$ -$
Rate Rider for Disposition of the Gain on Property Sale - effective until December 31, 2021 per kVA 0.0613-$ 9,700 594.61-$ 594.61-$ 0.0613-$ 9,700 594.61-$ -$ 0.0% -$ 9,700 -$ 594.61$ -$ 9,700 -$ -$ -$ 9,700 -$ -$
Rate Rider for Disposition of Wireless Pole Attachment Revenue - effective until December 31, 2024 per kVA -$ 9,700 -$ -$ 0.0006-$ 9,700 5.82-$ 5.82-$ 0.0006-$ 9,700 5.82-$ -$ 0.0% 0.0006-$ 9,700 5.82-$ -$ 0.0% 0.0006-$ 9,700 5.82-$ -$ 0.0%
Rate Rider for Disposition of IFRS - CGAPP Property Plant and Equipment - effective until December 31, 2020 per kVA 0.0178-$ 9,700 172.66-$ 172.66-$ -$ 9,700 -$ 172.66$ -$ 9,700 -$ -$ -$ 9,700 -$ -$ -$ 9,700 -$ -$
Rate Rider for Disposition of Capital Related Revenue Requirement Variance Account - effective until Dec. 31, 2024 per kVA -$ 9,700 -$ -$ -$ 9,700 -$ -$ -$ 9,700 -$ -$ 0.3894-$ 9,700 3,777.18-$ 3,777.18-$ 0.3894-$ 9,700 3,777.18-$ -$ 0.0%
Rate Rider for Disposition of PILs and Tax Variance - effective until December 31, 2024 per kVA -$ -$ 9,700 -$ -$ -$ 9,700 -$ -$ -$ 9,700 -$ -$ 0.0552-$ 9,700 535.44-$ 535.44-$ 0.0552-$ 9,700 535.44-$ -$ 0.0%
Rate Rider for Disposition of External Driven Capital Variance Account - effective until December 31, 2020 per kVA 0.0362-$ 9,700 351.14-$ 351.14-$ -$ 9,700 -$ 351.14$ -$ 9,700 -$ -$ -$ 9,700 -$ -$ -$ 9,700 -$ -$
Rate Rider for Disposition of Derecognition Variance Account - effective until December 31, 2022 per kVA -$ 9,700 -$ -$ -$ 9,700 -$ -$ 0.3253-$ 9,700 3,155.41-$ 3,155.41-$ -$ 9,700 -$ 3,155.41$ -$ 9,700 -$ -$
Rate Rider for Disposition of Expansion Deposits - effective until December, 2024 per kVA -$ 9,700 -$ -$ 0.0622-$ 9,700 603.34-$ 603.34-$ 0.0622-$ 9,700 603.34-$ -$ 0.0% 0.0622-$ 9,700 603.34-$ -$ 0.0% 0.0622-$ 9,700 603.34-$ -$ 0.0%
Rate Rider for Recovery of 2020 Foregone Revenue - effective until December 31, 2021 per 30 days -$ 21.80-$ 1 21.80-$ 21.80-$ 21.80-$ 1 21.80-$ -$ 0.0% -$ 1 -$ 21.80$ -$ 1 -$ -$ -$ 1 -$ -$
Rate Rider for Recovery of 2020 Foregone Revenue - effective until December 31, 2021 per kVA -$ 0.0195$ 9,700 189.15$ 189.15$ 0.0195$ 9,700 189.15$ -$ 0.0% -$ 9,700 -$ 189.15-$ -$ 9,700 -$ -$ -$ 9,700 -$ -$
Rate Rider for Recovery of 2015 Foregone Revenue - effective until Dec. 31, 2019 per 30 days 85.84$ 1 85.84$ 1 -$ 85.84-$ 1 -$ -$ 1 -$ -$ 1 -$ -$ 1 -$ -$
Rate Rider for Recovery of 2016 Foregone Revenue - effective until Dec. 31, 2019 per 30 days 25.18$ 1 25.18$ 1 -$ 25.18-$ 1 -$ -$ 1 -$ -$ 1 -$ -$ 1 -$ -$
Distribution Volumetric Rate per kVA 6.8407$ 9,700 66,354.79$ 7.0665$ 9,700 68,545.05$ 2,190.26$ 3.3% 7.3866$ 9,700 71,650.02$ 3,104.97$ 4.5% 7.4693$ 9,700 72,452.21$ 802.19$ 1.1% 7.9137$ 9,700 76,762.89$ 4,310.68$ 5.9% 8.2192$ 9,700 79,726.24$ 2,963.35$ 3.9%
Rate Rider for Recovery of the Gain on the Sale of Named Properties - effective until Dec. 31, 2019 per kVA 0.0044$ 9,700 42.68$ 9,700 -$ 42.68-$ 9,700 -$ -$ 9,700 -$ -$ 9,700 -$ -$ 9,700 -$ -$
Rate Rider for Recovery of Hydro One Capital Contributions Variance - effective until Dec. 31, 2019 per kVA 0.0039$ 9,700 37.83$ 9,700 -$ 37.83-$ 9,700 -$ -$ 9,700 -$ -$ 9,700 -$ -$ 9,700 -$ -$
Rate Rider for Application of IFRS - 2014 Derecognition - effective until Dec. 31, 2019 per kVA 0.0648$ 9,700 628.56$ 9,700 -$ 628.56-$ 9,700 -$ -$ 9,700 -$ -$ 9,700 -$ -$ 9,700 -$ -$
Rate Rider for Recovery of 2015 Foregone Revenue - effective until Dec. 31, 2019 per kVA 0.1382$ 9,700 1,340.54$ 9,700 -$ 1,340.54-$ 9,700 -$ -$ 9,700 -$ -$ 9,700 -$ -$ 9,700 -$ -$
Rate Rider for Recovery of 2016 Foregone Revenue - effective until Dec. 31, 2019 per kVA 0.0406$ 9,700 393.82$ 9,700 -$ 393.82-$ 9,700 -$ -$ 9,700 -$ -$ 9,700 -$ -$ 9,700 -$ -$
Rate Rider for Disposition of Lost Revenue Adjustment Mechanism (LRAMVA) (2019) - effective until Dec. 31, 2019 per kVA 0.2282$ 9,700 2,213.54$ 9,700 -$ 2,213.54-$ 9,700 -$ -$ 9,700 -$ -$ 9,700 -$ -$ 9,700 -$ -$
Sub-Total A (excluding pass through) 75,465.01$ 69,483.47$ 5,981.54-$ -7.9% 71,186.24$ 1,702.77$ 2.5% 73,020.46$ 1,834.22$ 2.6% 76,431.73$ 3,411.27$ 4.7% 79,572.28$ 3,140.55$ 4.1%
Line Losses on Cost of Power per kWh 0.1164$ 76,670 8,924.39$ 0.1164$ 70,520 8,208.53$ 715.86-$ -8.0% 0.1164$ 70,520 8,208.53$ -$ 0.0% 0.1164$ 70,520 8,208.53$ -$ 0.0% 0.1164$ 70,520 8,208.53$ -$ 0.0% 0.1164$ 70,520 8,208.53$ -$ 0.0%
Rate Rider for Disposition of Deferral/Variance Accounts per kVA 0.3397$ 9,700 3,295.09$ 0.2939$ 9,700 2,850.83$ 444.26-$ -13.5% 0.2939$ 9,700 2,850.83$ -$ 0.0% 9,700 -$ 2,850.83-$ 9,700 -$ -$ 9,700 -$ -$
Rate Rider for Disposition of Deferral/Variance Accounts for Non-Wholesale Market Participants per kVA 0.5628-$ 9,700 5,459.16-$ 0.1064-$ 9,700 1,032.08-$ 4,427.08$ -81.1% 0.1064-$ 9,700 1,032.08-$ -$ 0.0% 9,700 -$ 1,032.08$ 9,700 -$ -$ 9,700 -$ -$
Rate Rider for Disposition of Capacity Based Recovery Account - Applicable only for Class B Customers per kVA 0.0095$ -$ 0.0046-$ -$ -$ 0.0046-$ - -$ -$ -$ -$
Rate Rider for Disposition of Global Adjustment Account - (Applicable only for Non-RPP Customers) per kWh 0.00068$ -$ 0.00159-$ -$ -$ 0.00159-$ - -$ -$ -$ -$
Sub-Total B - Distribution (includes Sub-Total A) 82,225.33$ 79,510.75$ 2,714.58-$ -3.3% 81,213.52$ 1,702.77$ 2.1% 81,228.99$ 15.47$ 0.0% 84,640.26$ 3,411.27$ 4.2% 87,780.81$ 3,140.55$ 3.7%
Retail Transmissioin Rate - Network Service Rate per kW 2.9271$ 8,900 26,051.19$ 3.2868$ 8,900 29,252.52$ 3,201.33$ 12.3% 3.2868$ 8,900 29,252.52$ -$ 0.0% 3.2868$ 8,900 29,252.52$ -$ 0.0% 3.2868$ 8,900 29,252.52$ -$ 0.0% 3.2868$ 8,900 29,252.52$ -$ 0.0%
Retail Transmissioin Rate - Line and Transformation Connection Service Rate per kW 2.5587$ 8,900 22,772.43$ 2.6439$ 8,900 23,530.71$ 758.28$ 3.3% 2.6439$ 8,900 23,530.71$ -$ 0.0% 2.6439$ 8,900 23,530.71$ -$ 0.0% 2.6439$ 8,900 23,530.71$ -$ 0.0% 2.6439$ 8,900 23,530.71$ -$ 0.0%
Sub-Total C - Delivery (including Sub-Total B) 131,048.95$ 132,293.98$ 1,245.03$ 1.0% 133,996.75$ 1,702.77$ 1.3% 134,012.22$ 15.47$ 0.0% 137,423.49$ 3,411.27$ 2.5% 140,564.04$ 3,140.55$ 2.3%
Wholesale Market Service Charge (WMSC) per kWh 0.0030$ 4,176,670 12,530.01$ 0.0030$ 4,170,520 12,511.56$ 18.45-$ -0.1% 0.0030$ 4,170,520 12,511.56$ -$ 0.0% 0.0030$ 4,170,520 12,511.56$ -$ 0.0% 0.0030$ 4,170,520 12,511.56$ -$ 0.0% 0.0030$ 4,170,520 12,511.56$ -$ 0.0%
Rural and Remote Rate Protection (RRRP) per kWh 0.0005$ 4,176,670 2,088.34$ 0.0005$ 4,170,520 2,085.26$ 3.07-$ -0.1% 0.0005$ 4,170,520 2,085.26$ -$ 0.0% 0.0005$ 4,170,520 2,085.26$ -$ 0.0% 0.0005$ 4,170,520 2,085.26$ -$ 0.0% 0.0005$ 4,170,520 2,085.26$ -$ 0.0%
Capacity Based Recovery (CBR) - Applicable for Class B Customers per kWh 0.0004$ -$ -$ -$ -$ -$ -$ -$ -$ -$ -$ -$
Standard Supply Service Charge per 30 days 0.25$ 1 0.25$ 0.25$ 1 0.25$ -$ 0.0% 0.25$ 1 0.25$ -$ 0.0% 0.25$ 1 0.25$ -$ 0.0% 0.25$ 1 0.25$ -$ 0.0% 0.25$ 1 0.25$ -$ 0.0%
TOU - Off Peak per kWh 0.1010$ 2,624,000 265,024.00$ 0.1010$ 2,624,000 265,024.00$ -$ 0.0% 0.1010$ 2,624,000 265,024.00$ -$ 0.0% 0.1010$ 2,624,000 265,024.00$ -$ 0.0% 0.1010$ 2,624,000 265,024.00$ -$ 0.0% 0.1010$ 2,624,000 265,024.00$ -$ 0.0%
TOU - Mid Peak per kWh 0.1440$ 738,000 106,272.00$ 0.1440$ 738,000 106,272.00$ -$ 0.0% 0.1440$ 738,000 106,272.00$ -$ 0.0% 0.1440$ 738,000 106,272.00$ -$ 0.0% 0.1440$ 738,000 106,272.00$ -$ 0.0% 0.1440$ 738,000 106,272.00$ -$ 0.0%
TOU - On Peak per kWh 0.2080$ 738,000 153,504.00$ 0.2080$ 738,000 153,504.00$ -$ 0.0% 0.2080$ 738,000 153,504.00$ -$ 0.0% 0.2080$ 738,000 153,504.00$ -$ 0.0% 0.2080$ 738,000 153,504.00$ -$ 0.0% 0.2080$ 738,000 153,504.00$ -$ 0.0%
Energy - RPP - Tier 1 per kWh 0.1190$ 750 89.25$ 0.1190$ 750 89.25$ -$ 0.0% 0.1190$ 750 89.25$ -$ 0.0% 0.1190$ 750 89.25$ -$ 0.0% 0.1190$ 750 89.25$ -$ 0.0% 0.1190$ 750 89.25$ -$ 0.0%
Energy - RPP - Tier 2 per kWh 0.1390$ 4,099,250 569,795.75$ 0.1390$ 4,099,250 569,795.75$ -$ 0.0% 0.1390$ 4,099,250 569,795.75$ -$ 0.0% 0.1390$ 4,099,250 569,795.75$ -$ 0.0% 0.1390$ 4,099,250 569,795.75$ -$ 0.0% 0.1390$ 4,099,250 569,795.75$ -$ 0.0%
Non-RPP Retailer Avg. Price per kWh 0.1164$ - -$ 0.1164$ - -$ -$ 0.1164$ - -$ -$ 0.1164$ - -$ -$ 0.1164$ - -$ -$ 0.1164$ - -$ -$
Average IESO Wholesale Market Price per kWh 0.1164$ 4,100,000 477,240.00$ 0.1164$ 4,100,000 477,240.00$ -$ 0.0% 0.1164$ 4,100,000 477,240.00$ -$ 0.0% 0.1164$ 4,100,000 477,240.00$ -$ 0.0% 0.1164$ 4,100,000 477,240.00$ -$ 0.0% 0.1164$ 4,100,000 477,240.00$ -$ 0.0%
Total Bill on Average IESO Wholesale Market Price (before Taxes) 622,907.54$ 624,131.05$ 1,223.51$ 0.2% 625,833.82$ 1,702.77$ 0.3% 625,849.29$ 15.47$ 0.0% 629,260.56$ 3,411.27$ 0.5% 632,401.11$ 3,140.55$ 0.5%
Ontario Electricity Rebate -31.8% -31.8% -$ -31.8% -$ -31.8% -$ -31.8% -$ -31.8% -$
HST 13% 80,977.98$ 13% 81,137.04$ 159.06$ 0.2% 13% 81,358.40$ 221.36$ 0.3% 13% 81,360.41$ 2.01$ 0.0% 13% 81,803.87$ 443.47$ 0.5% 13% 82,212.14$ 408.27$ 0.5%
703,885.52$ 705,268.08$ 1,382.56$ 0.2% 707,192.21$ 1,924.13$ 0.3% 707,209.70$ 17.48$ 0.0% 711,064.43$ 3,854.74$ 0.5% 714,613.25$ 3,548.82$ 0.5%
Total Bill on RPP (before Taxes) 715,552.54$ 716,776.05$ 1,223.51$ 0.2% 718,478.82$ 1,702.77$ 0.2% 718,494.29$ 15.47$ 0.0% 721,905.56$ 3,411.27$ 0.5% 725,046.11$ 3,140.55$ 0.4%
Ontario Electricity Rebate -31.8% -31.8% -$ -31.8% -$ -31.8% -$ -31.8% -$ -31.8% -$
HST 13% 93,021.83$ 13% 93,180.89$ 159.06$ 0.2% 13% 93,402.25$ 221.36$ 0.2% 13% 93,404.26$ 2.01$ 0.0% 13% 93,847.72$ 443.47$ 0.5% 13% 94,255.99$ 408.27$ 0.4%
808,574.37$ 809,956.93$ 1,382.56$ 0.2% 811,881.06$ 1,924.13$ 0.2% 811,898.55$ 17.48$ 0.0% 815,753.28$ 3,854.74$ 0.5% 819,302.10$ 3,548.82$ 0.4%
Loss Factor (%) 1.87% 1.72% 1.72% 1.72% 1.72% 1.72%
$ Change % Change $ Change % Change
Total Bill on Average IESO Wholesale Market Price (after Tax and Rebate)
Total Bill on RPP (after Tax and Rebate)
Impact 2024 Proposed Impact
Charge Unit $ Change % Change $ Change
%
Change $ Change % Change
Impact 2021 Proposed Impact 2022 Proposed Impact 2023 Proposed
OEB Appendix 2-W
Bill Impacts
LARGE USE SERVICE
2019 Board-Approved 2020 Proposed
November 1 - April 30 (Select this radio button for applications filed after Oct 31)May 1 - October 31
LARGE USE SERVICE
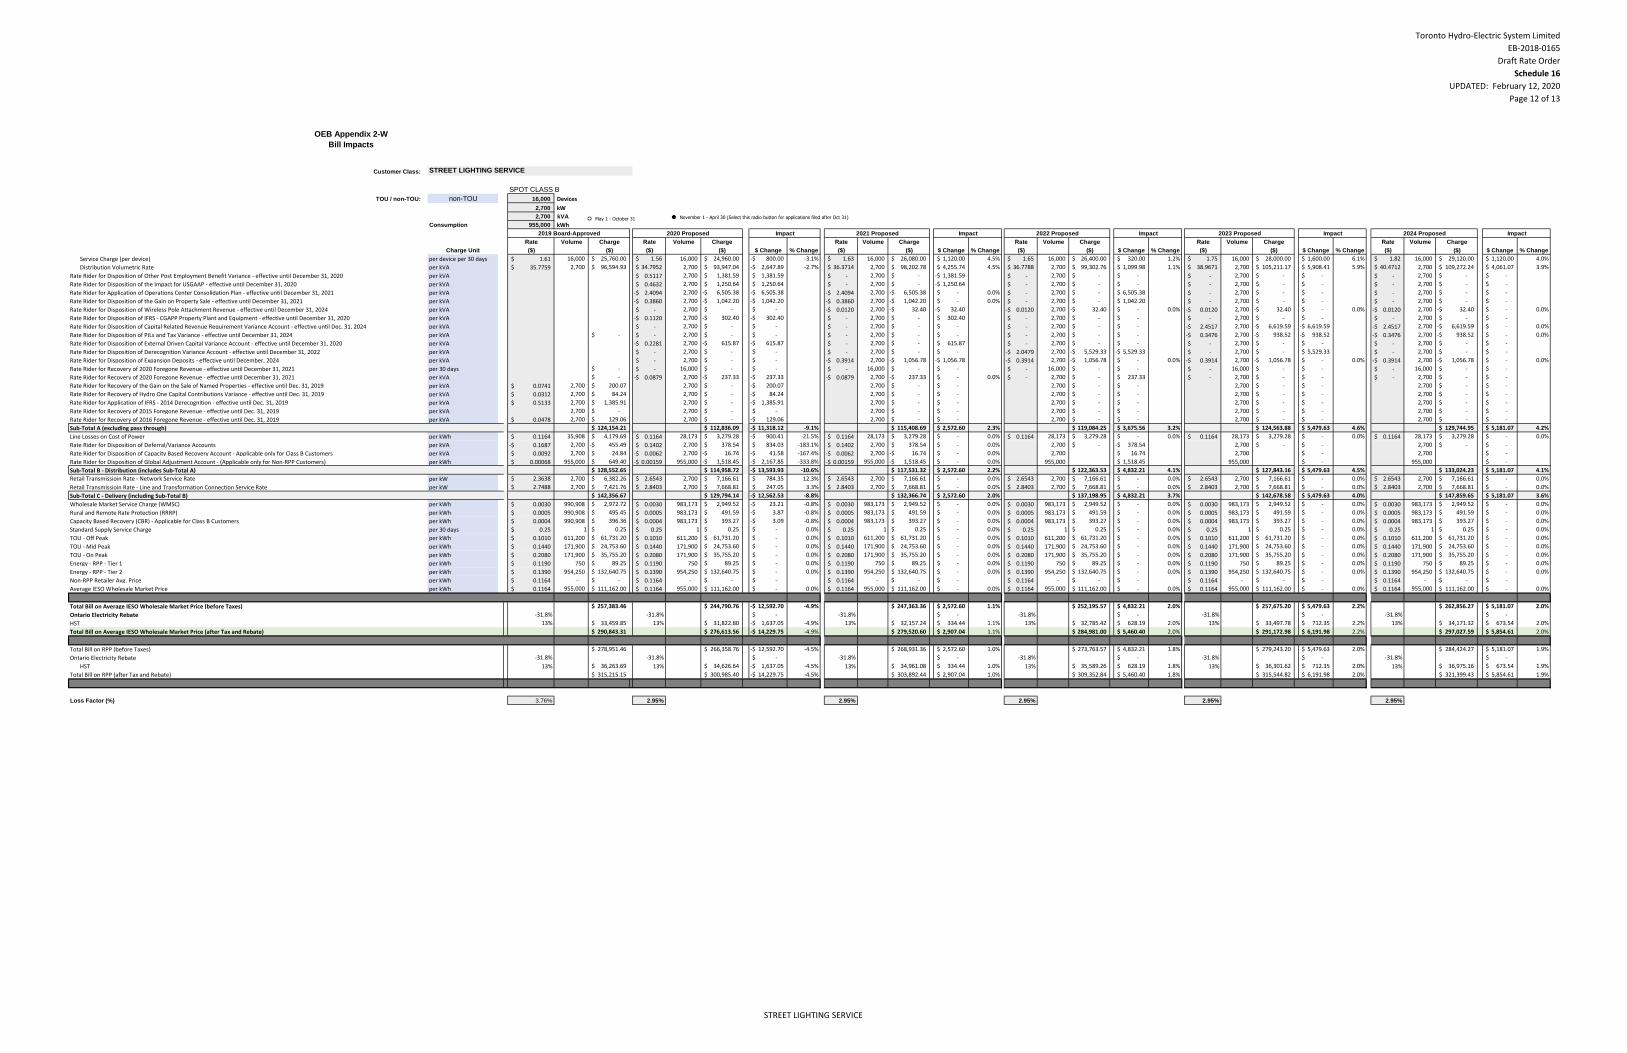
Toronto Hydro-Electric System Limited
EB-2018-0165
Draft Rate Order
Schedule 16
UPDATED: February 12, 2020
Page 12 of 13
Customer Class:
SPOT CLASS B
TOU / non-TOU: non-TOU 16,000 Devices
2,700 kW
2,700 kVA
Consumption 955,000 kWh
Rate Volume Charge Rate Volume Charge Rate Volume Charge Rate Volume Charge Rate Volume Charge Rate Volume Charge
($) ($) ($) ($) ($) ($) ($) ($) ($) ($) ($) ($)
Service Charge (per device) per device per 30 days 1.61$ 16,000 25,760.00$ 1.56$ 16,000 24,960.00$ 800.00-$ -3.1% 1.63$ 16,000 26,080.00$ 1,120.00$ 4.5% 1.65$ 16,000 26,400.00$ 320.00$ 1.2% 1.75$ 16,000 28,000.00$ 1,600.00$ 6.1% 1.82$ 16,000 29,120.00$ 1,120.00$ 4.0%
Distribution Volumetric Rate per kVA 35.7759$ 2,700 96,594.93$ 34.7952$ 2,700 93,947.04$ 2,647.89-$ -2.7% 36.3714$ 2,700 98,202.78$ 4,255.74$ 4.5% 36.7788$ 2,700 99,302.76$ 1,099.98$ 1.1% 38.9671$ 2,700 105,211.17$ 5,908.41$ 5.9% 40.4712$ 2,700 109,272.24$ 4,061.07$ 3.9%
Rate Rider for Disposition of Other Post Employment Benefit Variance - effective until December 31, 2020 per kVA 0.5117$ 2,700 1,381.59$ 1,381.59$ -$ 2,700 -$ 1,381.59-$ -$ 2,700 -$ -$ -$ 2,700 -$ -$ -$ 2,700 -$ -$
Rate Rider for Disposition of the Impact for USGAAP - effective until December 31, 2020 per kVA 0.4632$ 2,700 1,250.64$ 1,250.64$ -$ 2,700 -$ 1,250.64-$ -$ 2,700 -$ -$ -$ 2,700 -$ -$ -$ 2,700 -$ -$
Rate Rider for Application of Operations Center Consolidation Plan - effective until December 31, 2021 per kVA 2.4094-$ 2,700 6,505.38-$ 6,505.38-$ 2.4094-$ 2,700 6,505.38-$ -$ 0.0% -$ 2,700 -$ 6,505.38$ -$ 2,700 -$ -$ -$ 2,700 -$ -$
Rate Rider for Disposition of the Gain on Property Sale - effective until December 31, 2021 per kVA 0.3860-$ 2,700 1,042.20-$ 1,042.20-$ 0.3860-$ 2,700 1,042.20-$ -$ 0.0% -$ 2,700 -$ 1,042.20$ -$ 2,700 -$ -$ -$ 2,700 -$ -$
Rate Rider for Disposition of Wireless Pole Attachment Revenue - effective until December 31, 2024 per kVA -$ 2,700 -$ -$ 0.0120-$ 2,700 32.40-$ 32.40-$ 0.0120-$ 2,700 32.40-$ -$ 0.0% 0.0120-$ 2,700 32.40-$ -$ 0.0% 0.0120-$ 2,700 32.40-$ -$ 0.0%
Rate Rider for Disposition of IFRS - CGAPP Property Plant and Equipment - effective until December 31, 2020 per kVA 0.1120-$ 2,700 302.40-$ 302.40-$ -$ 2,700 -$ 302.40$ -$ 2,700 -$ -$ -$ 2,700 -$ -$ -$ 2,700 -$ -$
Rate Rider for Disposition of Capital Related Revenue Requirement Variance Account - effective until Dec. 31, 2024 per kVA -$ 2,700 -$ -$ -$ 2,700 -$ -$ -$ 2,700 -$ -$ 2.4517-$ 2,700 6,619.59-$ 6,619.59-$ 2.4517-$ 2,700 6,619.59-$ -$ 0.0%
Rate Rider for Disposition of PILs and Tax Variance - effective until December 31, 2024 per kVA -$ -$ 2,700 -$ -$ -$ 2,700 -$ -$ -$ 2,700 -$ -$ 0.3476-$ 2,700 938.52-$ 938.52-$ 0.3476-$ 2,700 938.52-$ -$ 0.0%
Rate Rider for Disposition of External Driven Capital Variance Account - effective until December 31, 2020 per kVA 0.2281-$ 2,700 615.87-$ 615.87-$ -$ 2,700 -$ 615.87$ -$ 2,700 -$ -$ -$ 2,700 -$ -$ -$ 2,700 -$ -$
Rate Rider for Disposition of Derecognition Variance Account - effective until December 31, 2022 per kVA -$ 2,700 -$ -$ -$ 2,700 -$ -$ 2.0479-$ 2,700 5,529.33-$ 5,529.33-$ -$ 2,700 -$ 5,529.33$ -$ 2,700 -$ -$
Rate Rider for Disposition of Expansion Deposits - effective until December, 2024 per kVA -$ 2,700 -$ -$ 0.3914-$ 2,700 1,056.78-$ 1,056.78-$ 0.3914-$ 2,700 1,056.78-$ -$ 0.0% 0.3914-$ 2,700 1,056.78-$ -$ 0.0% 0.3914-$ 2,700 1,056.78-$ -$ 0.0%
Rate Rider for Recovery of 2020 Foregone Revenue - effective until December 31, 2021 per 30 days -$ -$ 16,000 -$ -$ -$ 16,000 -$ -$ -$ 16,000 -$ -$ -$ 16,000 -$ -$ -$ 16,000 -$ -$
Rate Rider for Recovery of 2020 Foregone Revenue - effective until December 31, 2021 per kVA -$ 0.0879-$ 2,700 237.33-$ 237.33-$ 0.0879-$ 2,700 237.33-$ -$ 0.0% -$ 2,700 -$ 237.33$ -$ 2,700 -$ -$ -$ 2,700 -$ -$
Rate Rider for Recovery of the Gain on the Sale of Named Properties - effective until Dec. 31, 2019 per kVA 0.0741$ 2,700 200.07$ 2,700 -$ 200.07-$ 2,700 -$ -$ 2,700 -$ -$ 2,700 -$ -$ 2,700 -$ -$
Rate Rider for Recovery of Hydro One Capital Contributions Variance - effective until Dec. 31, 2019 per kVA 0.0312$ 2,700 84.24$ 2,700 -$ 84.24-$ 2,700 -$ -$ 2,700 -$ -$ 2,700 -$ -$ 2,700 -$ -$
Rate Rider for Application of IFRS - 2014 Derecognition - effective until Dec. 31, 2019 per kVA 0.5133$ 2,700 1,385.91$ 2,700 -$ 1,385.91-$ 2,700 -$ -$ 2,700 -$ -$ 2,700 -$ -$ 2,700 -$ -$
Rate Rider for Recovery of 2015 Foregone Revenue - effective until Dec. 31, 2019 per kVA 2,700 -$ 2,700 -$ -$ 2,700 -$ -$ 2,700 -$ -$ 2,700 -$ -$ 2,700 -$ -$
Rate Rider for Recovery of 2016 Foregone Revenue - effective until Dec. 31, 2019 per kVA 0.0478$ 2,700 129.06$ 2,700 -$ 129.06-$ 2,700 -$ -$ 2,700 -$ -$ 2,700 -$ -$ 2,700 -$ -$
Sub-Total A (excluding pass through) 124,154.21$ 112,836.09$ 11,318.12-$ -9.1% 115,408.69$ 2,572.60$ 2.3% 119,084.25$ 3,675.56$ 3.2% 124,563.88$ 5,479.63$ 4.6% 129,744.95$ 5,181.07$ 4.2%
Line Losses on Cost of Power per kWh 0.1164$ 35,908 4,179.69$ 0.1164$ 28,173 3,279.28$ 900.41-$ -21.5% 0.1164$ 28,173 3,279.28$ -$ 0.0% 0.1164$ 28,173 3,279.28$ -$ 0.0% 0.1164$ 28,173 3,279.28$ -$ 0.0% 0.1164$ 28,173 3,279.28$ -$ 0.0%
Rate Rider for Disposition of Deferral/Variance Accounts per kVA 0.1687-$ 2,700 455.49-$ 0.1402$ 2,700 378.54$ 834.03$ -183.1% 0.1402$ 2,700 378.54$ -$ 0.0% 2,700 -$ 378.54-$ 2,700 -$ -$ 2,700 -$ -$
Rate Rider for Disposition of Capacity Based Recovery Account - Applicable only for Class B Customers per kVA 0.0092$ 2,700 24.84$ 0.0062-$ 2,700 16.74-$ 41.58-$ -167.4% 0.0062-$ 2,700 16.74-$ -$ 0.0% 2,700 16.74$ 2,700 -$ 2,700 -$
Rate Rider for Disposition of Global Adjustment Account - (Applicable only for Non-RPP Customers) per kWh 0.00068$ 955,000 649.40$ 0.00159-$ 955,000 1,518.45-$ 2,167.85-$ -333.8% 0.00159-$ 955,000 1,518.45-$ -$ 0.0% 955,000 1,518.45$ 955,000 -$ 955,000 -$
Sub-Total B - Distribution (includes Sub-Total A) 128,552.65$ 114,958.72$ 13,593.93-$ -10.6% 117,531.32$ 2,572.60$ 2.2% 122,363.53$ 4,832.21$ 4.1% 127,843.16$ 5,479.63$ 4.5% 133,024.23$ 5,181.07$ 4.1%
Retail Transmissioin Rate - Network Service Rate per kW 2.3638$ 2,700 6,382.26$ 2.6543$ 2,700 7,166.61$ 784.35$ 12.3% 2.6543$ 2,700 7,166.61$ -$ 0.0% 2.6543$ 2,700 7,166.61$ -$ 0.0% 2.6543$ 2,700 7,166.61$ -$ 0.0% 2.6543$ 2,700 7,166.61$ -$ 0.0%
Retail Transmissioin Rate - Line and Transformation Connection Service Rate per kW 2.7488$ 2,700 7,421.76$ 2.8403$ 2,700 7,668.81$ 247.05$ 3.3% 2.8403$ 2,700 7,668.81$ -$ 0.0% 2.8403$ 2,700 7,668.81$ -$ 0.0% 2.8403$ 2,700 7,668.81$ -$ 0.0% 2.8403$ 2,700 7,668.81$ -$ 0.0%
Sub-Total C - Delivery (including Sub-Total B) 142,356.67$ 129,794.14$ 12,562.53-$ -8.8% 132,366.74$ 2,572.60$ 2.0% 137,198.95$ 4,832.21$ 3.7% 142,678.58$ 5,479.63$ 4.0% 147,859.65$ 5,181.07$ 3.6%
Wholesale Market Service Charge (WMSC) per kWh 0.0030$ 990,908 2,972.72$ 0.0030$ 983,173 2,949.52$ 23.21-$ -0.8% 0.0030$ 983,173 2,949.52$ -$ 0.0% 0.0030$ 983,173 2,949.52$ -$ 0.0% 0.0030$ 983,173 2,949.52$ -$ 0.0% 0.0030$ 983,173 2,949.52$ -$ 0.0%
Rural and Remote Rate Protection (RRRP) per kWh 0.0005$ 990,908 495.45$ 0.0005$ 983,173 491.59$ 3.87-$ -0.8% 0.0005$ 983,173 491.59$ -$ 0.0% 0.0005$ 983,173 491.59$ -$ 0.0% 0.0005$ 983,173 491.59$ -$ 0.0% 0.0005$ 983,173 491.59$ -$ 0.0%
Capacity Based Recovery (CBR) - Applicable for Class B Customers per kWh 0.0004$ 990,908 396.36$ 0.0004$ 983,173 393.27$ 3.09-$ -0.8% 0.0004$ 983,173 393.27$ -$ 0.0% 0.0004$ 983,173 393.27$ -$ 0.0% 0.0004$ 983,173 393.27$ -$ 0.0% 0.0004$ 983,173 393.27$ -$ 0.0%
Standard Supply Service Charge per 30 days 0.25$ 1 0.25$ 0.25$ 1 0.25$ -$ 0.0% 0.25$ 1 0.25$ -$ 0.0% 0.25$ 1 0.25$ -$ 0.0% 0.25$ 1 0.25$ -$ 0.0% 0.25$ 1 0.25$ -$ 0.0%
TOU - Off Peak per kWh 0.1010$ 611,200 61,731.20$ 0.1010$ 611,200 61,731.20$ -$ 0.0% 0.1010$ 611,200 61,731.20$ -$ 0.0% 0.1010$ 611,200 61,731.20$ -$ 0.0% 0.1010$ 611,200 61,731.20$ -$ 0.0% 0.1010$ 611,200 61,731.20$ -$ 0.0%
TOU - Mid Peak per kWh 0.1440$ 171,900 24,753.60$ 0.1440$ 171,900 24,753.60$ -$ 0.0% 0.1440$ 171,900 24,753.60$ -$ 0.0% 0.1440$ 171,900 24,753.60$ -$ 0.0% 0.1440$ 171,900 24,753.60$ -$ 0.0% 0.1440$ 171,900 24,753.60$ -$ 0.0%
TOU - On Peak per kWh 0.2080$ 171,900 35,755.20$ 0.2080$ 171,900 35,755.20$ -$ 0.0% 0.2080$ 171,900 35,755.20$ -$ 0.0% 0.2080$ 171,900 35,755.20$ -$ 0.0% 0.2080$ 171,900 35,755.20$ -$ 0.0% 0.2080$ 171,900 35,755.20$ -$ 0.0%
Energy - RPP - Tier 1 per kWh 0.1190$ 750 89.25$ 0.1190$ 750 89.25$ -$ 0.0% 0.1190$ 750 89.25$ -$ 0.0% 0.1190$ 750 89.25$ -$ 0.0% 0.1190$ 750 89.25$ -$ 0.0% 0.1190$ 750 89.25$ -$ 0.0%
Energy - RPP - Tier 2 per kWh 0.1390$ 954,250 132,640.75$ 0.1390$ 954,250 132,640.75$ -$ 0.0% 0.1390$ 954,250 132,640.75$ -$ 0.0% 0.1390$ 954,250 132,640.75$ -$ 0.0% 0.1390$ 954,250 132,640.75$ -$ 0.0% 0.1390$ 954,250 132,640.75$ -$ 0.0%
Non-RPP Retailer Avg. Price per kWh 0.1164$ - -$ 0.1164$ - -$ -$ 0.1164$ - -$ -$ 0.1164$ - -$ -$ 0.1164$ - -$ -$ 0.1164$ - -$ -$
Average IESO Wholesale Market Price per kWh 0.1164$ 955,000 111,162.00$ 0.1164$ 955,000 111,162.00$ -$ 0.0% 0.1164$ 955,000 111,162.00$ -$ 0.0% 0.1164$ 955,000 111,162.00$ -$ 0.0% 0.1164$ 955,000 111,162.00$ -$ 0.0% 0.1164$ 955,000 111,162.00$ -$ 0.0%
Total Bill on Average IESO Wholesale Market Price (before Taxes) 257,383.46$ 244,790.76$ 12,592.70-$ -4.9% 247,363.36$ 2,572.60$ 1.1% 252,195.57$ 4,832.21$ 2.0% 257,675.20$ 5,479.63$ 2.2% 262,856.27$ 5,181.07$ 2.0%
Ontario Electricity Rebate -31.8% -31.8% -$ -31.8% -$ -31.8% -$ -31.8% -$ -31.8% -$
HST 13% 33,459.85$ 13% 31,822.80$ 1,637.05-$ -4.9% 13% 32,157.24$ 334.44$ 1.1% 13% 32,785.42$ 628.19$ 2.0% 13% 33,497.78$ 712.35$ 2.2% 13% 34,171.32$ 673.54$ 2.0%
290,843.31$ 276,613.56$ 14,229.75-$ -4.9% 279,520.60$ 2,907.04$ 1.1% 284,981.00$ 5,460.40$ 2.0% 291,172.98$ 6,191.98$ 2.2% 297,027.59$ 5,854.61$ 2.0%
Total Bill on RPP (before Taxes) 278,951.46$ 266,358.76$ 12,592.70-$ -4.5% 268,931.36$ 2,572.60$ 1.0% 273,763.57$ 4,832.21$ 1.8% 279,243.20$ 5,479.63$ 2.0% 284,424.27$ 5,181.07$ 1.9%
Ontario Electricity Rebate -31.8% -31.8% -$ -31.8% -$ -31.8% -$ -31.8% -$ -31.8% -$
HST 13% 36,263.69$ 13% 34,626.64$ 1,637.05-$ -4.5% 13% 34,961.08$ 334.44$ 1.0% 13% 35,589.26$ 628.19$ 1.8% 13% 36,301.62$ 712.35$ 2.0% 13% 36,975.16$ 673.54$ 1.9%
315,215.15$ 300,985.40$ 14,229.75-$ -4.5% 303,892.44$ 2,907.04$ 1.0% 309,352.84$ 5,460.40$ 1.8% 315,544.82$ 6,191.98$ 2.0% 321,399.43$ 5,854.61$ 1.9%
Loss Factor (%) 3.76% 2.95% 2.95% 2.95% 2.95% 2.95%
$ Change % Change $ Change % Change
Total Bill on Average IESO Wholesale Market Price (after Tax and Rebate)
Total Bill on RPP (after Tax and Rebate)
Impact 2024 Proposed Impact
Charge Unit $ Change % Change $ Change % Change $ Change % Change
Impact 2021 Proposed Impact 2022 Proposed Impact 2023 Proposed
OEB Appendix 2-W
Bill Impacts
STREET LIGHTING SERVICE
2019 Board-Approved 2020 Proposed
November 1 - April 30 (Select this radio button for applications filed after Oct 31)May 1 - October 31
STREET LIGHTING SERVICE
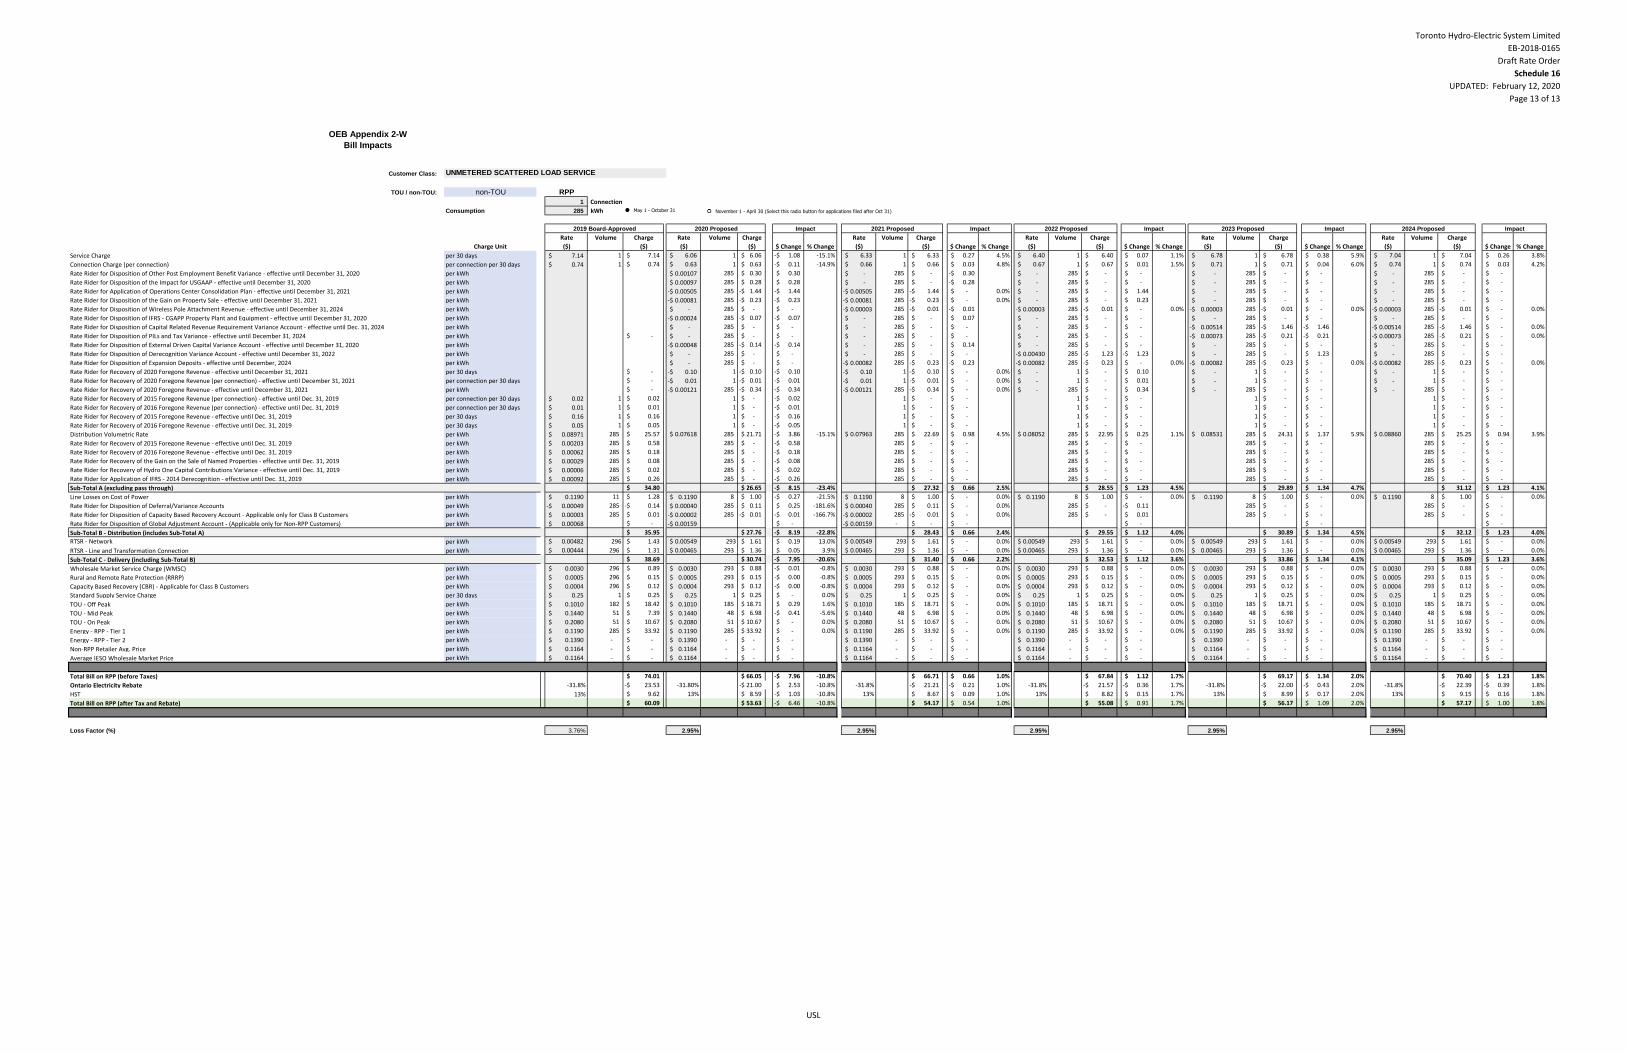
Toronto Hydro-Electric System Limited
EB-2018-0165
Draft Rate Order
Schedule 16
UPDATED: February 12, 2020
Page 13 of 13
Customer Class:
TOU / non-TOU: non-TOU RPP
1 Connection
Consumption 285 kWh
Rate Volume Charge Rate Volume Charge Rate Volume Charge Rate Volume Charge Rate Volume Charge Rate Volume Charge
($) ($) ($) ($) ($) ($) ($) ($) ($) ($) ($) ($)
Service Charge per 30 days 7.14$ 1 7.14$ 6.06$ 1 6.06$ 1.08-$ -15.1% 6.33$ 1 6.33$ 0.27$ 4.5% 6.40$ 1 6.40$ 0.07$ 1.1% 6.78$ 1 6.78$ 0.38$ 5.9% 7.04$ 1 7.04$ 0.26$ 3.8%
Connection Charge (per connection) per connection per 30 days 0.74$ 1 0.74$ 0.63$ 1 0.63$ 0.11-$ -14.9% 0.66$ 1 0.66$ 0.03$ 4.8% 0.67$ 1 0.67$ 0.01$ 1.5% 0.71$ 1 0.71$ 0.04$ 6.0% 0.74$ 1 0.74$ 0.03$ 4.2%
Rate Rider for Disposition of Other Post Employment Benefit Variance - effective until December 31, 2020 per kWh 0.00107$ 285 0.30$ 0.30$ -$ 285 -$ 0.30-$ -$ 285 -$ -$ -$ 285 -$ -$ -$ 285 -$ -$
Rate Rider for Disposition of the Impact for USGAAP - effective until December 31, 2020 per kWh 0.00097$ 285 0.28$ 0.28$ -$ 285 -$ 0.28-$ -$ 285 -$ -$ -$ 285 -$ -$ -$ 285 -$ -$
Rate Rider for Application of Operations Center Consolidation Plan - effective until December 31, 2021 per kWh 0.00505-$ 285 1.44-$ 1.44-$ 0.00505-$ 285 1.44-$ -$ 0.0% -$ 285 -$ 1.44$ -$ 285 -$ -$ -$ 285 -$ -$
Rate Rider for Disposition of the Gain on Property Sale - effective until December 31, 2021 per kWh 0.00081-$ 285 0.23-$ 0.23-$ 0.00081-$ 285 0.23-$ -$ 0.0% -$ 285 -$ 0.23$ -$ 285 -$ -$ -$ 285 -$ -$
Rate Rider for Disposition of Wireless Pole Attachment Revenue - effective until December 31, 2024 per kWh -$ 285 -$ -$ 0.00003-$ 285 0.01-$ 0.01-$ 0.00003-$ 285 0.01-$ -$ 0.0% 0.00003-$ 285 0.01-$ -$ 0.0% 0.00003-$ 285 0.01-$ -$ 0.0%
Rate Rider for Disposition of IFRS - CGAPP Property Plant and Equipment - effective until December 31, 2020 per kWh 0.00024-$ 285 0.07-$ 0.07-$ -$ 285 -$ 0.07$ -$ 285 -$ -$ -$ 285 -$ -$ -$ 285 -$ -$
Rate Rider for Disposition of Capital Related Revenue Requirement Variance Account - effective until Dec. 31, 2024 per kWh -$ 285 -$ -$ -$ 285 -$ -$ -$ 285 -$ -$ 0.00514-$ 285 1.46-$ 1.46-$ 0.00514-$ 285 1.46-$ -$ 0.0%
Rate Rider for Disposition of PILs and Tax Variance - effective until December 31, 2024 per kWh -$ -$ 285 -$ -$ -$ 285 -$ -$ -$ 285 -$ -$ 0.00073-$ 285 0.21-$ 0.21-$ 0.00073-$ 285 0.21-$ -$ 0.0%
Rate Rider for Disposition of External Driven Capital Variance Account - effective until December 31, 2020 per kWh 0.00048-$ 285 0.14-$ 0.14-$ -$ 285 -$ 0.14$ -$ 285 -$ -$ -$ 285 -$ -$ -$ 285 -$ -$
Rate Rider for Disposition of Derecognition Variance Account - effective until December 31, 2022 per kWh -$ 285 -$ -$ -$ 285 -$ -$ 0.00430-$ 285 1.23-$ 1.23-$ -$ 285 -$ 1.23$ -$ 285 -$ -$
Rate Rider for Disposition of Expansion Deposits - effective until December, 2024 per kWh -$ 285 -$ -$ 0.00082-$ 285 0.23-$ 0.23-$ 0.00082-$ 285 0.23-$ -$ 0.0% 0.00082-$ 285 0.23-$ -$ 0.0% 0.00082-$ 285 0.23-$ -$ 0.0%
Rate Rider for Recovery of 2020 Foregone Revenue - effective until December 31, 2021 per 30 days -$ 0.10-$ 1 0.10-$ 0.10-$ 0.10-$ 1 0.10-$ -$ 0.0% -$ 1 -$ 0.10$ -$ 1 -$ -$ -$ 1 -$ -$
Rate Rider for Recovery of 2020 Foregone Revenue (per connection) - effective until December 31, 2021 per connection per 30 days -$ 0.01-$ 1 0.01-$ 0.01-$ 0.01-$ 1 0.01-$ -$ 0.0% -$ 1 -$ 0.01$ -$ 1 -$ -$ -$ 1 -$ -$
Rate Rider for Recovery of 2020 Foregone Revenue - effective until December 31, 2021 per kWh -$ 0.00121-$ 285 0.34-$ 0.34-$ 0.00121-$ 285 0.34-$ -$ 0.0% -$ 285 -$ 0.34$ -$ 285 -$ -$ -$ 285 -$ -$
Rate Rider for Recovery of 2015 Foregone Revenue (per connection) - effective until Dec. 31, 2019 per connection per 30 days 0.02$ 1 0.02$ 1 -$ 0.02-$ 1 -$ -$ 1 -$ -$ 1 -$ -$ 1 -$ -$
Rate Rider for Recovery of 2016 Foregone Revenue (per connection) - effective until Dec. 31, 2019 per connection per 30 days 0.01$ 1 0.01$ 1 -$ 0.01-$ 1 -$ -$ 1 -$ -$ 1 -$ -$ 1 -$ -$
Rate Rider for Recovery of 2015 Foregone Revenue - effective until Dec. 31, 2019 per 30 days 0.16$ 1 0.16$ 1 -$ 0.16-$ 1 -$ -$ 1 -$ -$ 1 -$ -$ 1 -$ -$
Rate Rider for Recovery of 2016 Foregone Revenue - effective until Dec. 31, 2019 per 30 days 0.05$ 1 0.05$ 1 -$ 0.05-$ 1 -$ -$ 1 -$ -$ 1 -$ -$ 1 -$ -$
Distribution Volumetric Rate per kWh 0.08971$ 285 25.57$ 0.07618$ 285 21.71$ 3.86-$ -15.1% 0.07963$ 285 22.69$ 0.98$ 4.5% 0.08052$ 285 22.95$ 0.25$ 1.1% 0.08531$ 285 24.31$ 1.37$ 5.9% 0.08860$ 285 25.25$ 0.94$ 3.9%
Rate Rider for Recovery of 2015 Foregone Revenue - effective until Dec. 31, 2019 per kWh 0.00203$ 285 0.58$ 285 -$ 0.58-$ 285 -$ -$ 285 -$ -$ 285 -$ -$ 285 -$ -$
Rate Rider for Recovery of 2016 Foregone Revenue - effective until Dec. 31, 2019 per kWh 0.00062$ 285 0.18$ 285 -$ 0.18-$ 285 -$ -$ 285 -$ -$ 285 -$ -$ 285 -$ -$
Rate Rider for Recovery of the Gain on the Sale of Named Properties - effective until Dec. 31, 2019 per kWh 0.00029$ 285 0.08$ 285 -$ 0.08-$ 285 -$ -$ 285 -$ -$ 285 -$ -$ 285 -$ -$
Rate Rider for Recovery of Hydro One Capital Contributions Variance - effective until Dec. 31, 2019 per kWh 0.00006$ 285 0.02$ 285 -$ 0.02-$ 285 -$ -$ 285 -$ -$ 285 -$ -$ 285 -$ -$
Rate Rider for Application of IFRS - 2014 Derecognition - effective until Dec. 31, 2019 per kWh 0.00092$ 285 0.26$ 285 -$ 0.26-$ 285 -$ -$ 285 -$ -$ 285 -$ -$ 285 -$ -$
Sub-Total A (excluding pass through) 34.80$ 26.65$ 8.15-$ -23.4% 27.32$ 0.66$ 2.5% 28.55$ 1.23$ 4.5% 29.89$ 1.34$ 4.7% 31.12$ 1.23$ 4.1%
Line Losses on Cost of Power per kWh 0.1190$ 11 1.28$ 0.1190$ 8 1.00$ 0.27-$ -21.5% 0.1190$ 8 1.00$ -$ 0.0% 0.1190$ 8 1.00$ -$ 0.0% 0.1190$ 8 1.00$ -$ 0.0% 0.1190$ 8 1.00$ -$ 0.0%
Rate Rider for Disposition of Deferral/Variance Accounts per kWh 0.00049-$ 285 0.14-$ 0.00040$ 285 0.11$ 0.25$ -181.6% 0.00040$ 285 0.11$ -$ 0.0% 285 -$ 0.11-$ 285 -$ -$ 285 -$ -$
Rate Rider for Disposition of Capacity Based Recovery Account - Applicable only for Class B Customers per kWh 0.00003$ 285 0.01$ 0.00002-$ 285 0.01-$ 0.01-$ -166.7% 0.00002-$ 285 0.01-$ -$ 0.0% 285 -$ 0.01$ 285 -$ -$ 285 -$ -$
Rate Rider for Disposition of Global Adjustment Account - (Applicable only for Non-RPP Customers) per kWh 0.00068$ -$ 0.00159-$ -$ 0.00159-$ - -$ -$ -$ -$ -$
Sub-Total B - Distribution (includes Sub-Total A) 35.95$ 27.76$ 8.19-$ -22.8% 28.43$ 0.66$ 2.4% 29.55$ 1.12$ 4.0% 30.89$ 1.34$ 4.5% 32.12$ 1.23$ 4.0%
RTSR - Network per kWh 0.00482$ 296 1.43$ 0.00549$ 293 1.61$ 0.19$ 13.0% 0.00549$ 293 1.61$ -$ 0.0% 0.00549$ 293 1.61$ -$ 0.0% 0.00549$ 293 1.61$ -$ 0.0% 0.00549$ 293 1.61$ -$ 0.0%
RTSR - Line and Transformation Connection per kWh 0.00444$ 296 1.31$ 0.00465$ 293 1.36$ 0.05$ 3.9% 0.00465$ 293 1.36$ -$ 0.0% 0.00465$ 293 1.36$ -$ 0.0% 0.00465$ 293 1.36$ -$ 0.0% 0.00465$ 293 1.36$ -$ 0.0%
Sub-Total C - Delivery (including Sub-Total B) 38.69$ 30.74$ 7.95-$ -20.6% 31.40$ 0.66$ 2.2% 32.53$ 1.12$ 3.6% 33.86$ 1.34$ 4.1% 35.09$ 1.23$ 3.6%
Wholesale Market Service Charge (WMSC) per kWh 0.0030$ 296 0.89$ 0.0030$ 293 0.88$ 0.01-$ -0.8% 0.0030$ 293 0.88$ -$ 0.0% 0.0030$ 293 0.88$ -$ 0.0% 0.0030$ 293 0.88$ -$ 0.0% 0.0030$ 293 0.88$ -$ 0.0%
Rural and Remote Rate Protection (RRRP) per kWh 0.0005$ 296 0.15$ 0.0005$ 293 0.15$ 0.00-$ -0.8% 0.0005$ 293 0.15$ -$ 0.0% 0.0005$ 293 0.15$ -$ 0.0% 0.0005$ 293 0.15$ -$ 0.0% 0.0005$ 293 0.15$ -$ 0.0%
Capacity Based Recovery (CBR) - Applicable for Class B Customers per kWh 0.0004$ 296 0.12$ 0.0004$ 293 0.12$ 0.00-$ -0.8% 0.0004$ 293 0.12$ -$ 0.0% 0.0004$ 293 0.12$ -$ 0.0% 0.0004$ 293 0.12$ -$ 0.0% 0.0004$ 293 0.12$ -$ 0.0%
Standard Supply Service Charge per 30 days 0.25$ 1 0.25$ 0.25$ 1 0.25$ -$ 0.0% 0.25$ 1 0.25$ -$ 0.0% 0.25$ 1 0.25$ -$ 0.0% 0.25$ 1 0.25$ -$ 0.0% 0.25$ 1 0.25$ -$ 0.0%
TOU - Off Peak per kWh 0.1010$ 182 18.42$ 0.1010$ 185 18.71$ 0.29$ 1.6% 0.1010$ 185 18.71$ -$ 0.0% 0.1010$ 185 18.71$ -$ 0.0% 0.1010$ 185 18.71$ -$ 0.0% 0.1010$ 185 18.71$ -$ 0.0%
TOU - Mid Peak per kWh 0.1440$ 51 7.39$ 0.1440$ 48 6.98$ 0.41-$ -5.6% 0.1440$ 48 6.98$ -$ 0.0% 0.1440$ 48 6.98$ -$ 0.0% 0.1440$ 48 6.98$ -$ 0.0% 0.1440$ 48 6.98$ -$ 0.0%
TOU - On Peak per kWh 0.2080$ 51 10.67$ 0.2080$ 51 10.67$ -$ 0.0% 0.2080$ 51 10.67$ -$ 0.0% 0.2080$ 51 10.67$ -$ 0.0% 0.2080$ 51 10.67$ -$ 0.0% 0.2080$ 51 10.67$ -$ 0.0%
Energy - RPP - Tier 1 per kWh 0.1190$ 285 33.92$ 0.1190$ 285 33.92$ -$ 0.0% 0.1190$ 285 33.92$ -$ 0.0% 0.1190$ 285 33.92$ -$ 0.0% 0.1190$ 285 33.92$ -$ 0.0% 0.1190$ 285 33.92$ -$ 0.0%
Energy - RPP - Tier 2 per kWh 0.1390$ - -$ 0.1390$ - -$ -$ 0.1390$ - -$ -$ 0.1390$ - -$ -$ 0.1390$ - -$ -$ 0.1390$ - -$ -$
Non-RPP Retailer Avg. Price per kWh 0.1164$ - -$ 0.1164$ - -$ -$ 0.1164$ - -$ -$ 0.1164$ - -$ -$ 0.1164$ - -$ -$ 0.1164$ - -$ -$
Average IESO Wholesale Market Price per kWh 0.1164$ - -$ 0.1164$ - -$ -$ 0.1164$ - -$ -$ 0.1164$ - -$ -$ 0.1164$ - -$ -$ 0.1164$ - -$ -$
Total Bill on RPP (before Taxes) 74.01$ 66.05$ 7.96-$ -10.8% 66.71$ 0.66$ 1.0% 67.84$ 1.12$ 1.7% 69.17$ 1.34$ 2.0% 70.40$ 1.23$ 1.8%
Ontario Electricity Rebate -31.8% 23.53-$ -31.80% 21.00-$ 2.53$ -10.8% -31.8% 21.21-$ 0.21-$ 1.0% -31.8% 21.57-$ 0.36-$ 1.7% -31.8% 22.00-$ 0.43-$ 2.0% -31.8% 22.39-$ 0.39-$ 1.8%
HST 13% 9.62$ 13% 8.59$ 1.03-$ -10.8% 13% 8.67$ 0.09$ 1.0% 13% 8.82$ 0.15$ 1.7% 13% 8.99$ 0.17$ 2.0% 13% 9.15$ 0.16$ 1.8%
60.09$ 53.63$ 6.46-$ -10.8% 54.17$ 0.54$ 1.0% 55.08$ 0.91$ 1.7% 56.17$ 1.09$ 2.0% 57.17$ 1.00$ 1.8%
Loss Factor (%) 3.76% 2.95% 2.95% 2.95% 2.95% 2.95%
$ Change % Change $ Change % Change
Total Bill on RPP (after Tax and Rebate)
Impact 2024 Proposed Impact
Charge Unit $ Change % Change $ Change % Change $ Change % Change
Impact 2021 Proposed Impact 2022 Proposed Impact 2023 Proposed2020 Proposed
OEB Appendix 2-W
Bill Impacts
UNMETERED SCATTERED LOAD SERVICE
2019 Board-Approved
November 1 - April 30 (Select this radio button for applications filed after Oct 31)May 1 - October 31
USL
Schedule 17-A – Smoothed 2020-2024 Tariff of Rates and Charges
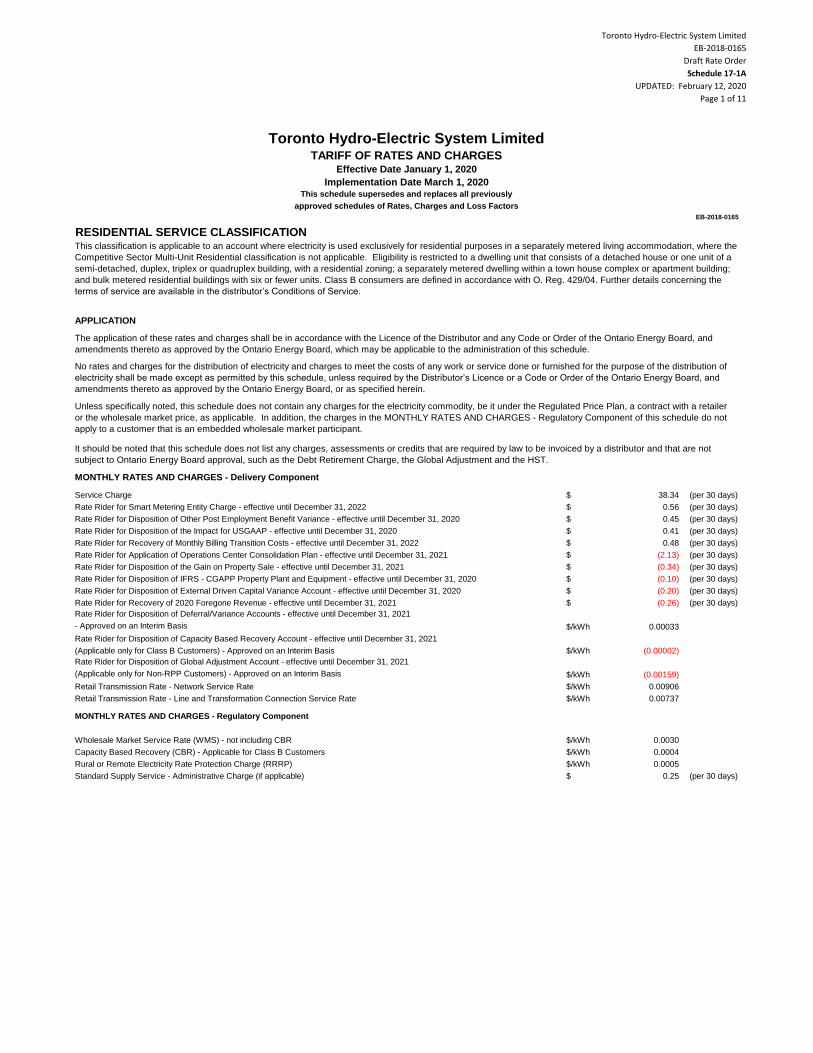
Toronto Hydro-Electric System Limited
EB-2018-0165
Draft Rate Order
Schedule 17-1A
UPDATED: February 12, 2020
Page 1 of 11
$ 38.34 (per 30 days)
$ 0.56 (per 30 days)
$ 0.45 (per 30 days)
$ 0.41 (per 30 days)
$ 0.48 (per 30 days)
$ (2.13) (per 30 days)
$ (0.34) (per 30 days)
$ (0.10) (per 30 days)
$ (0.20) (per 30 days)
$ (0.26) (per 30 days)
Rate Rider for Disposition of Deferral/Variance Accounts - effective until December 31, 2021
- Approved on an Interim Basis $/kWh 0.00033
Rate Rider for Disposition of Capacity Based Recovery Account - effective until December 31, 2021
(Applicable only for Class B Customers) - Approved on an Interim Basis $/kWh (0.00002)
Rate Rider for Disposition of Global Adjustment Account - effective until December 31, 2021
(Applicable only for Non-RPP Customers) - Approved on an Interim Basis $/kWh (0.00159)
$/kWh 0.00906
$/kWh 0.00737
$/kWh 0.0030
$/kWh 0.0004
$/kWh 0.0005
$ 0.25 (per 30 days)
Rural or Remote Electricity Rate Protection Charge (RRRP)
Standard Supply Service - Administrative Charge (if applicable)
Rate Rider for Recovery of 2020 Foregone Revenue - effective until December 31, 2021
Retail Transmission Rate - Network Service Rate
Retail Transmission Rate - Line and Transformation Connection Service Rate
MONTHLY RATES AND CHARGES - Regulatory Component
Wholesale Market Service Rate (WMS) - not including CBR
Capacity Based Recovery (CBR) - Applicable for Class B Customers
Rate Rider for Disposition of the Impact for USGAAP - effective until December 31, 2020
Rate Rider for Recovery of Monthly Billing Transition Costs - effective until December 31, 2022
Rate Rider for Application of Operations Center Consolidation Plan - effective until December 31, 2021
Rate Rider for Disposition of the Gain on Property Sale - effective until December 31, 2021
Rate Rider for Disposition of IFRS - CGAPP Property Plant and Equipment - effective until December 31, 2020
Rate Rider for Disposition of External Driven Capital Variance Account - effective until December 31, 2020
Unless specifically noted, this schedule does not contain any charges for the electricity commodity, be it under the Regulated Price Plan, a contract with a retailer
or the wholesale market price, as applicable. In addition, the charges in the MONTHLY RATES AND CHARGES - Regulatory Component of this schedule do not
apply to a customer that is an embedded wholesale market participant.
It should be noted that this schedule does not list any charges, assessments or credits that are required by law to be invoiced by a distributor and that are not
subject to Ontario Energy Board approval, such as the Debt Retirement Charge, the Global Adjustment and the HST.
MONTHLY RATES AND CHARGES - Delivery Component
Service Charge
Rate Rider for Smart Metering Entity Charge - effective until December 31, 2022
Rate Rider for Disposition of Other Post Employment Benefit Variance - effective until December 31, 2020
EB-2018-0165
RESIDENTIAL SERVICE CLASSIFICATIONThis classification is applicable to an account where electricity is used exclusively for residential purposes in a separately metered living accommodation, where the
Competitive Sector Multi-Unit Residential classification is not applicable. Eligibility is restricted to a dwelling unit that consists of a detached house or one unit of a
semi-detached, duplex, triplex or quadruplex building, with a residential zoning; a separately metered dwelling within a town house complex or apartment building;
and bulk metered residential buildings with six or fewer units. Class B consumers are defined in accordance with O. Reg. 429/04. Further details concerning the
terms of service are available in the distributor’s Conditions of Service.
APPLICATION
The application of these rates and charges shall be in accordance with the Licence of the Distributor and any Code or Order of the Ontario Energy Board, and
amendments thereto as approved by the Ontario Energy Board, which may be applicable to the administration of this schedule.
No rates and charges for the distribution of electricity and charges to meet the costs of any work or service done or furnished for the purpose of the distribution of
electricity shall be made except as permitted by this schedule, unless required by the Distributor’s Licence or a Code or Order of the Ontario Energy Board, and
amendments thereto as approved by the Ontario Energy Board, or as specified herein.
Toronto Hydro-Electric System LimitedTARIFF OF RATES AND CHARGES
Effective Date January 1, 2020
Implementation Date March 1, 2020This schedule supersedes and replaces all previously
approved schedules of Rates, Charges and Loss Factors

Toronto Hydro-Electric System Limited
EB-2018-0165
Draft Rate Order
Schedule 17-1A
UPDATED: February 12, 2020
Page 2 of 11
EB-2018-0165
Toronto Hydro-Electric System LimitedTARIFF OF RATES AND CHARGES
Effective Date January 1, 2020
Implementation Date March 1, 2020This schedule supersedes and replaces all previously
approved schedules of Rates, Charges and Loss Factors
$ 31.46 (per 30 days)
$ 0.56 (per 30 days)
$ 0.30 (per 30 days)
$ 0.27 (per 30 days)
$ (1.43) (per 30 days)
$ (0.23) (per 30 days)
$ (0.07) (per 30 days)
$ (0.14) (per 30 days)
$ (0.15) (per 30 days)
Rate Rider for Disposition of Deferral/Variance Accounts - effective until December 31, 2021
- Approved on an Interim Basis $/kWh 0.00025
Rate Rider for Disposition of Capacity Based Recovery Account - effective until December 31, 2021
(Applicable only for Class B Customers) - Approved on an Interim Basis $/kWh (0.00002)
Rate Rider for Disposition of Global Adjustment Account - effective until December 31, 2021
(Applicable only for Non-RPP Customers) - Approved on an Interim Basis $/kWh (0.00159)
$/kWh 0.00906
$/kWh 0.00737
$/kWh 0.0030
$/kWh 0.0004
$/kWh 0.0005
$ 0.25 (per 30 days)
Rural or Remote Electricity Rate Protection Charge (RRRP)
Standard Supply Service - Administrative Charge (if applicable)
Rate Rider for Recovery of 2020 Foregone Revenue - effective until December 31, 2021
Retail Transmission Rate - Network Service Rate
Retail Transmission Rate - Line and Transformation Connection Service Rate
MONTHLY RATES AND CHARGES - Regulatory Component
Wholesale Market Service Rate (WMS) - not including CBR
Capacity Based Recovery (CBR) - Applicable for Class B Customers
Rate Rider for Disposition of Other Post Employment Benefit Variance - effective until December 31, 2020
Rate Rider for Disposition of the Impact for USGAAP - effective until December 31, 2020
Rate Rider for Application of Operations Center Consolidation Plan - effective until December 31, 2021
Rate Rider for Disposition of the Gain on Property Sale - effective until December 31, 2021
Rate Rider for Disposition of IFRS - CGAPP Property Plant and Equipment - effective until December 31, 2020
Rate Rider for Disposition of External Driven Capital Variance Account - effective until December 31, 2020
No rates and charges for the distribution of electricity and charges to meet the costs of any work or service done or furnished for the purpose of the distribution of
electricity shall be made except as permitted by this schedule, unless required by the Distributor’s Licence or a Code or Order of the Ontario Energy Board, and
amendments thereto as approved by the Ontario Energy Board, or as specified herein.
Unless specifically noted, this schedule does not contain any charges for the electricity commodity, be it under the Regulated Price Plan, a contract with a retailer
or the wholesale market price, as applicable. In addition, the charges in the MONTHLY RATES AND CHARGES - Regulatory Component of this schedule do not
apply to a customer that is an embedded wholesale market participant.
It should be noted that this schedule does not list any charges, assessments or credits that are required by law to be invoiced by a distributor and that are not
subject to Ontario Energy Board approval, such as the Debt Retirement Charge, the Global Adjustment and the HST.
MONTHLY RATES AND CHARGES - Delivery Component
Service Charge
Rate Rider for Smart Metering Entity Charge - effective until December 31, 2022
COMPETITIVE SECTOR MULTI-UNIT RESIDENTIAL SERVICE CLASSIFICATION
This classification is applicable to an account where electricity is used exclusively for residential purposes in a multi- unit residential building, where unit metering is
provided using technology that is substantially similar to that employed by competitive sector sub-metering providers. Use of electricity in non-residential units of
multi-unit buildings does not qualify for this classification and will instead be subject to the applicable commercial classification. Class B consumers are defined in
accordance with O. Reg. 429/04. Further details concerning the terms of service are available in the distributor’s Conditions of Service.
APPLICATION
The application of these rates and charges shall be in accordance with the Licence of the Distributor and any Code or Order of the Ontario Energy Board, and
amendments thereto as approved by the Ontario Energy Board, which may be applicable to the administration of this schedule.

Toronto Hydro-Electric System Limited
EB-2018-0165
Draft Rate Order
Schedule 17-1A
UPDATED: February 12, 2020
Page 3 of 11
EB-2018-0165
Toronto Hydro-Electric System LimitedTARIFF OF RATES AND CHARGES
Effective Date January 1, 2020
Implementation Date March 1, 2020This schedule supersedes and replaces all previously
approved schedules of Rates, Charges and Loss Factors
$ 36.98 (per 30 days)
$ 0.56 (per 30 days)
$ 0.11 (per 30 days)
$/kWh 0.03421
$/kWh 0.00053
$/kWh 0.00048
$/kWh 0.00018
$/kWh (0.00248)
$/kWh (0.00040)
$/kWh (0.00012)
$/kWh (0.00023)
$/kWh 0.00010
Rate Rider for Disposition of Deferral/Variance Accounts - effective until December 31, 2021
- Approved on an Interim Basis $/kWh 0.00038
Rate Rider for Disposition of Capacity Based Recovery Account - effective until December 31, 2021
(Applicable only for Class B Customers) - Approved on an Interim Basis $/kWh (0.00002)
Rate Rider for Disposition of Global Adjustment Account - effective until December 31, 2021
(Applicable only for Non-RPP Customers) - Approved on an Interim Basis $/kWh (0.00159)
$/kWh 0.00882
$/kWh 0.00659
$/kWh 0.0030
$/kWh 0.0004
$/kWh 0.0005
$ 0.25 (per 30 days)
MONTHLY RATES AND CHARGES - Regulatory Component
Wholesale Market Service Rate (WMS) - not including CBR
Capacity Based Recovery (CBR) - Applicable for Class B Customers
Rural or Remote Electricity Rate Protection Charge (RRRP)
Standard Supply Service - Administrative Charge (if applicable)
Rate Rider for Disposition of the Gain on Property Sale - effective until December 31, 2021
Rate Rider for Disposition of IFRS - CGAPP Property Plant and Equipment - effective until December 31, 2020
Rate Rider for Disposition of External Driven Capital Variance Account - effective until December 31, 2020
Rate Rider for Recovery of 2020 Foregone Revenue - effective until December 31, 2021
Retail Transmission Rate - Network Service Rate
Retail Transmission Rate - Line and Transformation Connection Service Rate
Rate Rider for Recovery of 2020 Foregone Revenue - effective until December 31, 2021
Distribution Volumetric Rate
Rate Rider for Disposition of Other Post Employment Benefit Variance - effective until December 31, 2020
Rate Rider for Disposition of the Impact for USGAAP - effective until December 31, 2020
Rate Rider for Recovery of Monthly Billing Transition Costs - effective until December 31, 2022
Rate Rider for Application of Operations Center Consolidation Plan - effective until December 31, 2021
No rates and charges for the distribution of electricity and charges to meet the costs of any work or service done or furnished for the purpose of the distribution of
electricity shall be made except as permitted by this schedule, unless required by the Distributor’s Licence or a Code or Order of the Ontario Energy Board, and
amendments thereto as approved by the Ontario Energy Board, or as specified herein.
Unless specifically noted, this schedule does not contain any charges for the electricity commodity, be it under the Regulated Price Plan, a contract with a retailer
or the wholesale market price, as applicable. In addition, the charges in the MONTHLY RATES AND CHARGES - Regulatory Component of this schedule do not
apply to a customer that is an embedded wholesale market participant.
It should be noted that this schedule does not list any charges, assessments or credits that are required by law to be invoiced by a distributor and that are not
subject to Ontario Energy Board approval, such as the Debt Retirement Charge, the Global Adjustment and the HST.
MONTHLY RATES AND CHARGES - Delivery Component
Service Charge
Rate Rider for Smart Metering Entity Charge - effective until December 31, 2022
GENERAL SERVICE LESS THAN 50 KW SERVICE CLASSIFICATIONThis classification refers to a non-residential account whose monthly average peak demand is less than, or is forecast to be less than 50 kW. Class B consumers
are defined in accordance with O. Reg. 429/04. Further servicing details are available in the distributor’s Conditions of Service.
APPLICATION
The application of these rates and charges shall be in accordance with the Licence of the Distributor and any Code or Order of the Ontario Energy Board, and
amendments thereto as approved by the Ontario Energy Board, which may be applicable to the administration of this schedule.

Toronto Hydro-Electric System Limited
EB-2018-0165
Draft Rate Order
Schedule 17-1A
UPDATED: February 12, 2020
Page 4 of 11
EB-2018-0165
Toronto Hydro-Electric System LimitedTARIFF OF RATES AND CHARGES
Effective Date January 1, 2020
Implementation Date March 1, 2020This schedule supersedes and replaces all previously
approved schedules of Rates, Charges and Loss Factors
$ 49.14 (per 30 days)
$ (0.21) (per 30 days)
$/kVA 7.8922 (per 30 days)
$/kVA 0.0914 (per 30 days)
$/kVA 0.0827 (per 30 days)
$/kVA (0.4304) (per 30 days)
$/kVA (0.0690) (per 30 days)
$/kVA (0.0200) (per 30 days)
$/kVA (0.0407) (per 30 days)
$/kVA (0.0189) (per 30 days)
Rate Rider for Disposition of Deferral/Variance Accounts - effective until December 31, 2021
(Applicable only for Non-Wholesale Market Participants) - Approved on an Interim Basis $/kVA (0.0894) (per 30 days)
Rate Rider for Disposition of Deferral/Variance Accounts - effective until December 31, 2021
- Approved on an Interim Basis $/kVA 0.2422 (per 30 days)
Rate Rider for Disposition of Capacity Based Recovery Account - effective until December 31, 2021
(Applicable only for Class B Customers) - Approved on an Interim Basis $/kVA (0.0067) (per 30 days)
Rate Rider for Disposition of Global Adjustment Account - effective until December 31, 2021
(Applicable only for Non-RPP Customers) - Approved on an Interim Basis $/kWh (0.00159)
$/kW 2.9842 (per 30 days)
$/kW 2.3822 (per 30 days)
$/kWh 0.0030
$/kWh 0.0004
$/kWh 0.0005
$ 0.25 (per 30 days)
Rural or Remote Electricity Rate Protection Charge (RRRP)
Standard Supply Service - Administrative Charge (if applicable)
Rate Rider for Recovery of 2020 Foregone Revenue - effective until December 31, 2021
Retail Transmission Rate - Network Service Rate
Retail Transmission Rate - Line and Transformation Connection Service Rate
MONTHLY RATES AND CHARGES - Regulatory Component
Wholesale Market Service Rate (WMS) - not including CBR
Capacity Based Recovery (CBR) - Applicable for Class B Customers
Rate Rider for Disposition of Other Post Employment Benefit Variance - effective until December 31, 2020
Rate Rider for Disposition of the Impact for USGAAP - effective until December 31, 2020
Rate Rider for Application of Operations Center Consolidation Plan - effective until December 31, 2021
Rate Rider for Disposition of the Gain on Property Sale - effective until December 31, 2021
Rate Rider for Disposition of IFRS - CGAPP Property Plant and Equipment - effective until December 31, 2020
Rate Rider for Disposition of External Driven Capital Variance Account - effective until December 31, 2020
The rate rider for the disposition of Post 2011 Global Adjustment is only applicable to non-RPP Class B customers. It is not applicable to WMP, customers that
transitioned between Class A and Class B during the variance account accumulation period, or to customers that were in Class A for the entire period. Customers
who transitioned are to be charged or refunded their share of the variance disposed through customer specific billing adjustments. This rate rider is to be
consistently applied for the entire period to the sunset date of the rate rider. In addition, this rate rider is applicable to all new non-RPP Class B customers.
It should be noted that this schedule does not list any charges, assessments or credits that are required by law to be invoiced by a distributor and that are not
subject to Ontario Energy Board approval, such as the Debt Retirement Charge, the Global Adjustment and the HST.
MONTHLY RATES AND CHARGES - Delivery Component
Service Charge
Rate Rider for Recovery of 2020 Foregone Revenue - effective until December 31, 2021
Distribution Volumetric Rate
This classification refers to a non-residential account whose monthly average peak demand is equal to or greater than 50 kW but less than 1,000 kW, or is forecast
to be equal to or greater than 50 kW but less than 1,000 kW. This rate also applies to bulk metered residential apartment buildings or the house service of a
residential apartment building with more than 6 units. Class B consumers are defined in accordance with O. Reg. 429/04. Further servicing details are available in
the distributor’s Conditions of Service.
APPLICATION
The application of these rates and charges shall be in accordance with the Licence of the Distributor and any Code or Order of the Ontario Energy Board, and
amendments thereto as approved by the Ontario Energy Board, which may be applicable to the administration of this schedule.
No rates and charges for the distribution of electricity and charges to meet the costs of any work or service done or furnished for the purpose of the distribution of
electricity shall be made except as permitted by this schedule, unless required by the Distributor’s Licence or a Code or Order of the Ontario Energy Board, and
amendments thereto as approved by the Ontario Energy Board, or as specified herein.
Unless specifically noted, this schedule does not contain any charges for the electricity commodity, be it under the Regulated Price Plan, a contract with a retailer
or the wholesale market price, as applicable. In addition, the charges in the MONTHLY RATES AND CHARGES - Regulatory Component of this schedule do not
apply to a customer that is an embedded wholesale market participant.
The rate rider for the disposition of WMS - Sub-account CBR Class B is not applicable to wholesale market participants (WMP), customers that transitioned
between Class A and Class B during the variance account accumulation period, or to customers that were in Class A for the entire period. Customers who
transitioned are to be charged or refunded their share of the variance disposed through customer specific billing adjustments. This rate rider is to be consistently
applied for the entire period to the sunset date of the rate rider. In addition, this rate rider is applicable to all new Class B customers.
GENERAL SERVICE 50 TO 999 KW SERVICE CLASSIFICATION
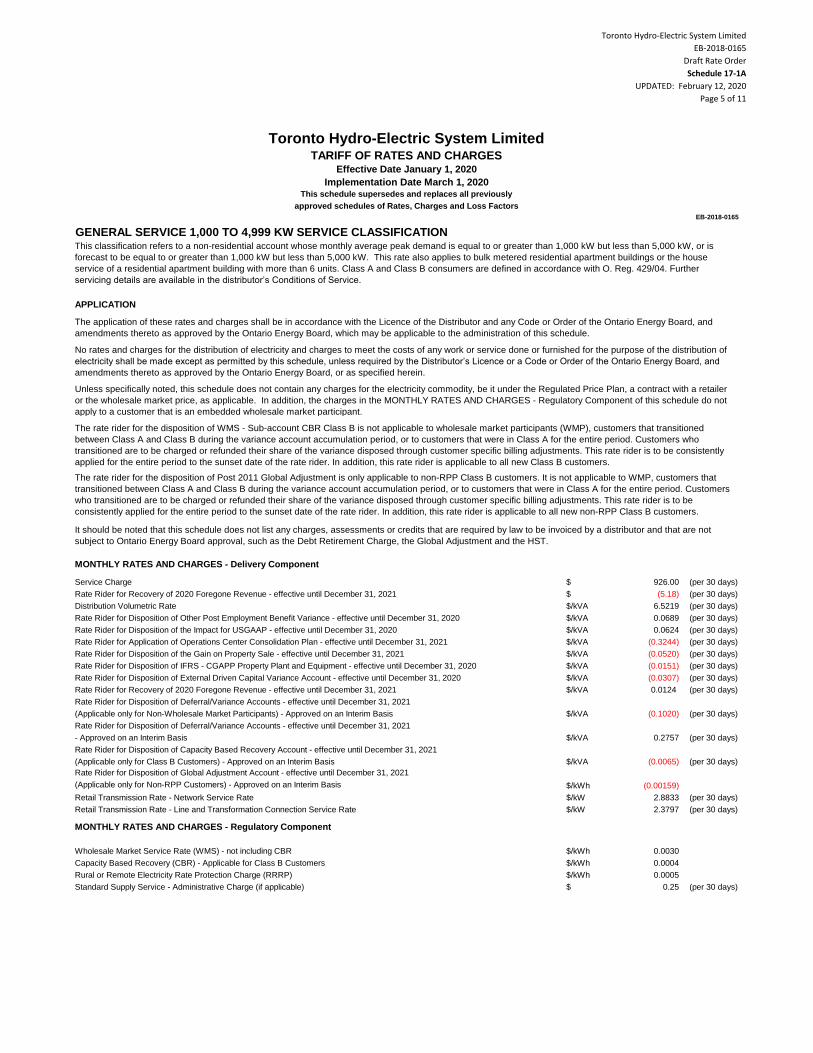
Toronto Hydro-Electric System Limited
EB-2018-0165
Draft Rate Order
Schedule 17-1A
UPDATED: February 12, 2020
Page 5 of 11
EB-2018-0165
Toronto Hydro-Electric System LimitedTARIFF OF RATES AND CHARGES
Effective Date January 1, 2020
Implementation Date March 1, 2020This schedule supersedes and replaces all previously
approved schedules of Rates, Charges and Loss Factors
$ 926.00 (per 30 days)
$ (5.18) (per 30 days)
$/kVA 6.5219 (per 30 days)
$/kVA 0.0689 (per 30 days)
$/kVA 0.0624 (per 30 days)
$/kVA (0.3244) (per 30 days)
$/kVA (0.0520) (per 30 days)
$/kVA (0.0151) (per 30 days)
$/kVA (0.0307) (per 30 days)
$/kVA 0.0124 (per 30 days)
Rate Rider for Disposition of Deferral/Variance Accounts - effective until December 31, 2021
(Applicable only for Non-Wholesale Market Participants) - Approved on an Interim Basis $/kVA (0.1020) (per 30 days)
Rate Rider for Disposition of Deferral/Variance Accounts - effective until December 31, 2021
- Approved on an Interim Basis $/kVA 0.2757 (per 30 days)
Rate Rider for Disposition of Capacity Based Recovery Account - effective until December 31, 2021
(Applicable only for Class B Customers) - Approved on an Interim Basis $/kVA (0.0065) (per 30 days)
Rate Rider for Disposition of Global Adjustment Account - effective until December 31, 2021
(Applicable only for Non-RPP Customers) - Approved on an Interim Basis $/kWh (0.00159)
$/kW 2.8833 (per 30 days)
$/kW 2.3797 (per 30 days)
$/kWh 0.0030
$/kWh 0.0004
$/kWh 0.0005
$ 0.25 (per 30 days)
MONTHLY RATES AND CHARGES - Regulatory Component
Wholesale Market Service Rate (WMS) - not including CBR
Capacity Based Recovery (CBR) - Applicable for Class B Customers
Rural or Remote Electricity Rate Protection Charge (RRRP)
Standard Supply Service - Administrative Charge (if applicable)
Rate Rider for Disposition of the Gain on Property Sale - effective until December 31, 2021
Rate Rider for Disposition of IFRS - CGAPP Property Plant and Equipment - effective until December 31, 2020
Rate Rider for Disposition of External Driven Capital Variance Account - effective until December 31, 2020
Rate Rider for Recovery of 2020 Foregone Revenue - effective until December 31, 2021
Retail Transmission Rate - Network Service Rate
Retail Transmission Rate - Line and Transformation Connection Service Rate
Service Charge
Rate Rider for Recovery of 2020 Foregone Revenue - effective until December 31, 2021
Distribution Volumetric Rate
Rate Rider for Disposition of Other Post Employment Benefit Variance - effective until December 31, 2020
Rate Rider for Disposition of the Impact for USGAAP - effective until December 31, 2020
Rate Rider for Application of Operations Center Consolidation Plan - effective until December 31, 2021
No rates and charges for the distribution of electricity and charges to meet the costs of any work or service done or furnished for the purpose of the distribution of
electricity shall be made except as permitted by this schedule, unless required by the Distributor’s Licence or a Code or Order of the Ontario Energy Board, and
amendments thereto as approved by the Ontario Energy Board, or as specified herein.
Unless specifically noted, this schedule does not contain any charges for the electricity commodity, be it under the Regulated Price Plan, a contract with a retailer
or the wholesale market price, as applicable. In addition, the charges in the MONTHLY RATES AND CHARGES - Regulatory Component of this schedule do not
apply to a customer that is an embedded wholesale market participant.
The rate rider for the disposition of WMS - Sub-account CBR Class B is not applicable to wholesale market participants (WMP), customers that transitioned
between Class A and Class B during the variance account accumulation period, or to customers that were in Class A for the entire period. Customers who
transitioned are to be charged or refunded their share of the variance disposed through customer specific billing adjustments. This rate rider is to be consistently
applied for the entire period to the sunset date of the rate rider. In addition, this rate rider is applicable to all new Class B customers.
The rate rider for the disposition of Post 2011 Global Adjustment is only applicable to non-RPP Class B customers. It is not applicable to WMP, customers that
transitioned between Class A and Class B during the variance account accumulation period, or to customers that were in Class A for the entire period. Customers
who transitioned are to be charged or refunded their share of the variance disposed through customer specific billing adjustments. This rate rider is to be
consistently applied for the entire period to the sunset date of the rate rider. In addition, this rate rider is applicable to all new non-RPP Class B customers.
It should be noted that this schedule does not list any charges, assessments or credits that are required by law to be invoiced by a distributor and that are not
subject to Ontario Energy Board approval, such as the Debt Retirement Charge, the Global Adjustment and the HST.
MONTHLY RATES AND CHARGES - Delivery Component
GENERAL SERVICE 1,000 TO 4,999 KW SERVICE CLASSIFICATIONThis classification refers to a non-residential account whose monthly average peak demand is equal to or greater than 1,000 kW but less than 5,000 kW, or is
forecast to be equal to or greater than 1,000 kW but less than 5,000 kW. This rate also applies to bulk metered residential apartment buildings or the house
service of a residential apartment building with more than 6 units. Class A and Class B consumers are defined in accordance with O. Reg. 429/04. Further
servicing details are available in the distributor’s Conditions of Service.
APPLICATION
The application of these rates and charges shall be in accordance with the Licence of the Distributor and any Code or Order of the Ontario Energy Board, and
amendments thereto as approved by the Ontario Energy Board, which may be applicable to the administration of this schedule.
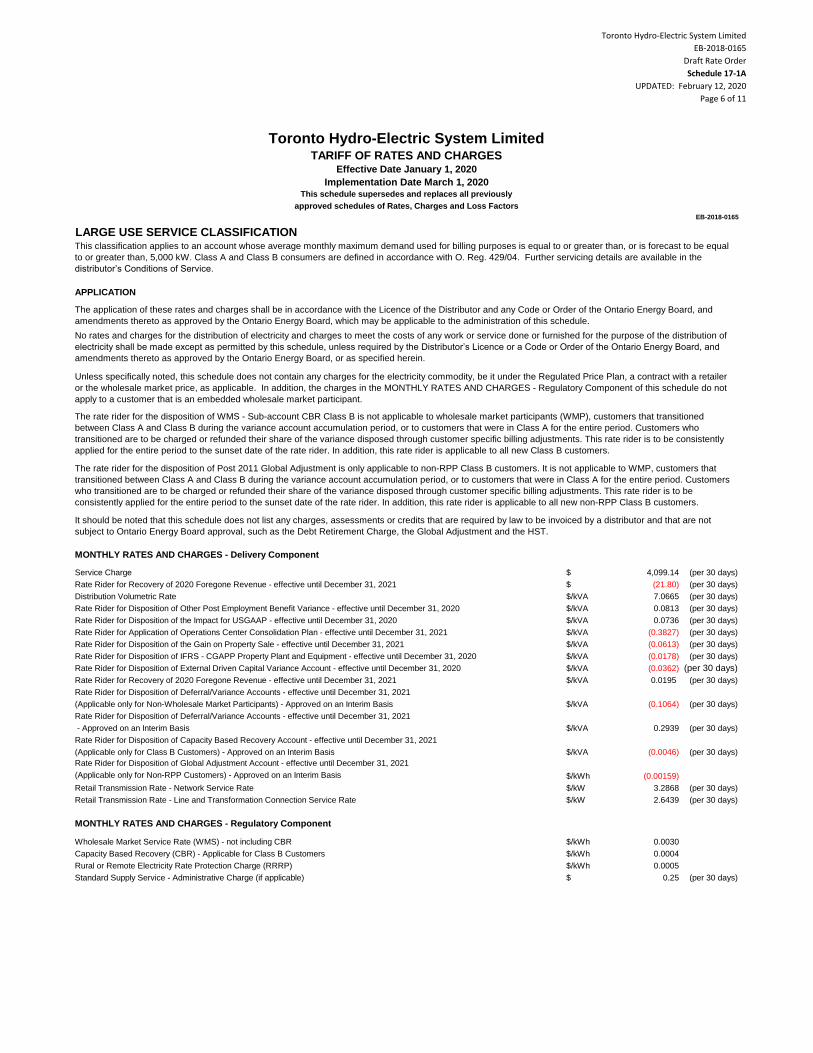
Toronto Hydro-Electric System Limited
EB-2018-0165
Draft Rate Order
Schedule 17-1A
UPDATED: February 12, 2020
Page 6 of 11
EB-2018-0165
Toronto Hydro-Electric System LimitedTARIFF OF RATES AND CHARGES
Effective Date January 1, 2020
Implementation Date March 1, 2020This schedule supersedes and replaces all previously
approved schedules of Rates, Charges and Loss Factors
$ 4,099.14 (per 30 days)
$ (21.80) (per 30 days)
$/kVA 7.0665 (per 30 days)
$/kVA 0.0813 (per 30 days)
$/kVA 0.0736 (per 30 days)
$/kVA (0.3827) (per 30 days)
$/kVA (0.0613) (per 30 days)
$/kVA (0.0178) (per 30 days)
$/kVA (0.0362) (per 30 days)
$/kVA 0.0195 (per 30 days)
Rate Rider for Disposition of Deferral/Variance Accounts - effective until December 31, 2021
(Applicable only for Non-Wholesale Market Participants) - Approved on an Interim Basis $/kVA (0.1064) (per 30 days)
Rate Rider for Disposition of Deferral/Variance Accounts - effective until December 31, 2021
- Approved on an Interim Basis $/kVA 0.2939 (per 30 days)
Rate Rider for Disposition of Capacity Based Recovery Account - effective until December 31, 2021
(Applicable only for Class B Customers) - Approved on an Interim Basis $/kVA (0.0046) (per 30 days)
Rate Rider for Disposition of Global Adjustment Account - effective until December 31, 2021
(Applicable only for Non-RPP Customers) - Approved on an Interim Basis $/kWh (0.00159)
$/kW 3.2868 (per 30 days)
$/kW 2.6439 (per 30 days)
$/kWh 0.0030
$/kWh 0.0004
$/kWh 0.0005
$ 0.25 (per 30 days)
Rural or Remote Electricity Rate Protection Charge (RRRP)
Standard Supply Service - Administrative Charge (if applicable)
Rate Rider for Recovery of 2020 Foregone Revenue - effective until December 31, 2021
Retail Transmission Rate - Network Service Rate
Retail Transmission Rate - Line and Transformation Connection Service Rate
MONTHLY RATES AND CHARGES - Regulatory Component
Wholesale Market Service Rate (WMS) - not including CBR
Capacity Based Recovery (CBR) - Applicable for Class B Customers
Rate Rider for Disposition of Other Post Employment Benefit Variance - effective until December 31, 2020
Rate Rider for Disposition of the Impact for USGAAP - effective until December 31, 2020
Rate Rider for Application of Operations Center Consolidation Plan - effective until December 31, 2021
Rate Rider for Disposition of the Gain on Property Sale - effective until December 31, 2021
Rate Rider for Disposition of IFRS - CGAPP Property Plant and Equipment - effective until December 31, 2020
Rate Rider for Disposition of External Driven Capital Variance Account - effective until December 31, 2020
The rate rider for the disposition of Post 2011 Global Adjustment is only applicable to non-RPP Class B customers. It is not applicable to WMP, customers that
transitioned between Class A and Class B during the variance account accumulation period, or to customers that were in Class A for the entire period. Customers
who transitioned are to be charged or refunded their share of the variance disposed through customer specific billing adjustments. This rate rider is to be
consistently applied for the entire period to the sunset date of the rate rider. In addition, this rate rider is applicable to all new non-RPP Class B customers.
It should be noted that this schedule does not list any charges, assessments or credits that are required by law to be invoiced by a distributor and that are not
subject to Ontario Energy Board approval, such as the Debt Retirement Charge, the Global Adjustment and the HST.
MONTHLY RATES AND CHARGES - Delivery Component
Service Charge
Rate Rider for Recovery of 2020 Foregone Revenue - effective until December 31, 2021
Distribution Volumetric Rate
This classification applies to an account whose average monthly maximum demand used for billing purposes is equal to or greater than, or is forecast to be equal
to or greater than, 5,000 kW. Class A and Class B consumers are defined in accordance with O. Reg. 429/04. Further servicing details are available in the
distributor’s Conditions of Service.
APPLICATION
The application of these rates and charges shall be in accordance with the Licence of the Distributor and any Code or Order of the Ontario Energy Board, and
amendments thereto as approved by the Ontario Energy Board, which may be applicable to the administration of this schedule.
No rates and charges for the distribution of electricity and charges to meet the costs of any work or service done or furnished for the purpose of the distribution of
electricity shall be made except as permitted by this schedule, unless required by the Distributor’s Licence or a Code or Order of the Ontario Energy Board, and
amendments thereto as approved by the Ontario Energy Board, or as specified herein.
Unless specifically noted, this schedule does not contain any charges for the electricity commodity, be it under the Regulated Price Plan, a contract with a retailer
or the wholesale market price, as applicable. In addition, the charges in the MONTHLY RATES AND CHARGES - Regulatory Component of this schedule do not
apply to a customer that is an embedded wholesale market participant.
The rate rider for the disposition of WMS - Sub-account CBR Class B is not applicable to wholesale market participants (WMP), customers that transitioned
between Class A and Class B during the variance account accumulation period, or to customers that were in Class A for the entire period. Customers who
transitioned are to be charged or refunded their share of the variance disposed through customer specific billing adjustments. This rate rider is to be consistently
applied for the entire period to the sunset date of the rate rider. In addition, this rate rider is applicable to all new Class B customers.
LARGE USE SERVICE CLASSIFICATION
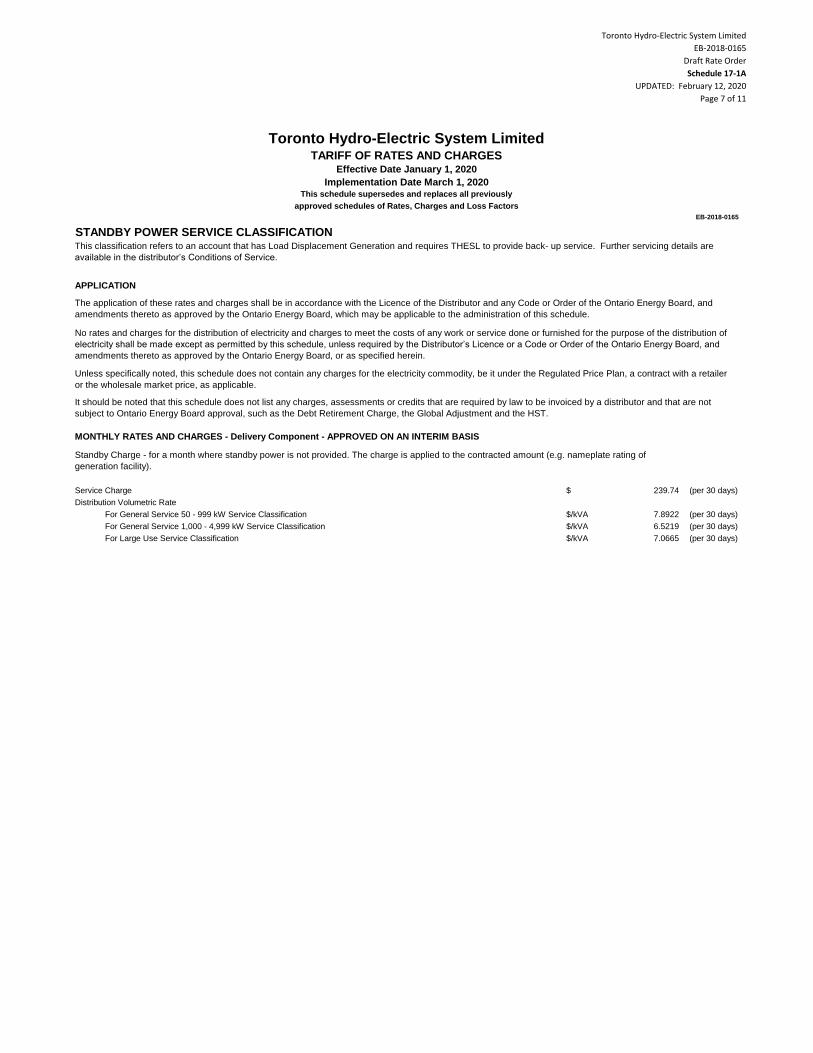
Toronto Hydro-Electric System Limited
EB-2018-0165
Draft Rate Order
Schedule 17-1A
UPDATED: February 12, 2020
Page 7 of 11
EB-2018-0165
Toronto Hydro-Electric System LimitedTARIFF OF RATES AND CHARGES
Effective Date January 1, 2020
Implementation Date March 1, 2020This schedule supersedes and replaces all previously
approved schedules of Rates, Charges and Loss Factors
$ 239.74 (per 30 days)
$/kVA 7.8922 (per 30 days)
$/kVA 6.5219 (per 30 days)
$/kVA 7.0665 (per 30 days)
Distribution Volumetric Rate
For General Service 50 - 999 kW Service Classification
For General Service 1,000 - 4,999 kW Service Classification
For Large Use Service Classification
No rates and charges for the distribution of electricity and charges to meet the costs of any work or service done or furnished for the purpose of the distribution of
electricity shall be made except as permitted by this schedule, unless required by the Distributor’s Licence or a Code or Order of the Ontario Energy Board, and
amendments thereto as approved by the Ontario Energy Board, or as specified herein.
Unless specifically noted, this schedule does not contain any charges for the electricity commodity, be it under the Regulated Price Plan, a contract with a retailer
or the wholesale market price, as applicable.
It should be noted that this schedule does not list any charges, assessments or credits that are required by law to be invoiced by a distributor and that are not
subject to Ontario Energy Board approval, such as the Debt Retirement Charge, the Global Adjustment and the HST.
MONTHLY RATES AND CHARGES - Delivery Component - APPROVED ON AN INTERIM BASIS
Standby Charge - for a month where standby power is not provided. The charge is applied to the contracted amount (e.g. nameplate rating of
generation facility).
Service Charge
STANDBY POWER SERVICE CLASSIFICATIONThis classification refers to an account that has Load Displacement Generation and requires THESL to provide back- up service. Further servicing details are
available in the distributor’s Conditions of Service.
APPLICATION
The application of these rates and charges shall be in accordance with the Licence of the Distributor and any Code or Order of the Ontario Energy Board, and
amendments thereto as approved by the Ontario Energy Board, which may be applicable to the administration of this schedule.
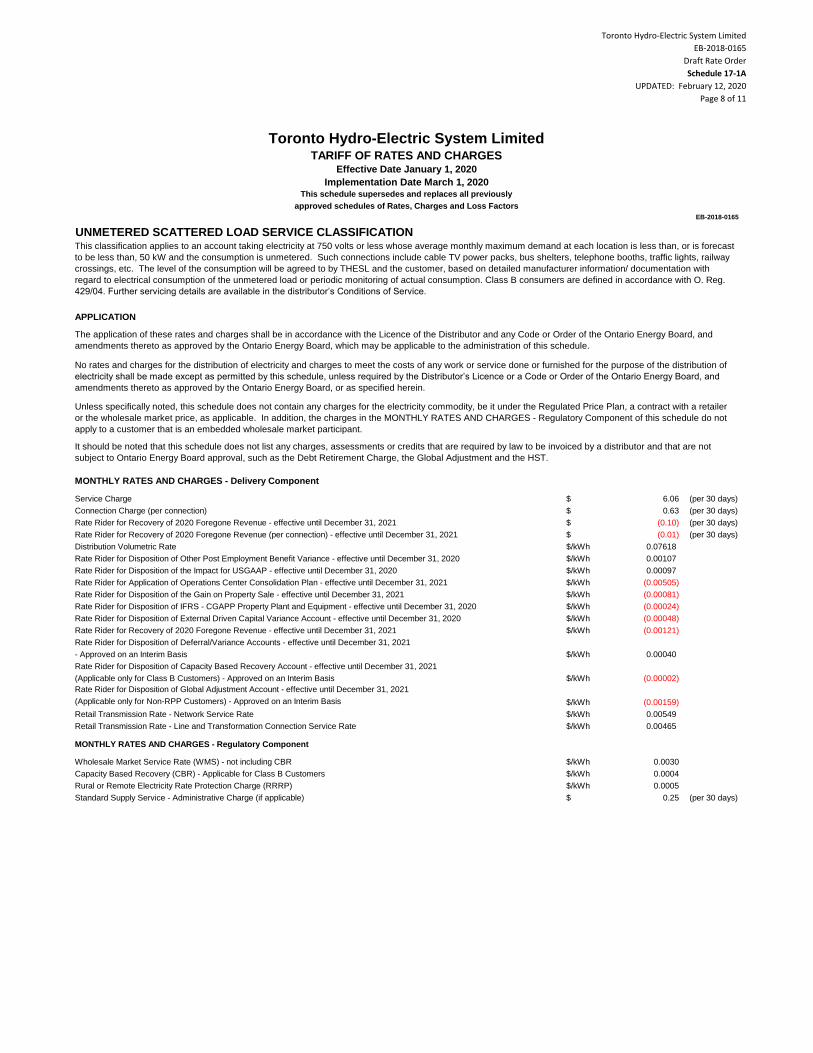
Toronto Hydro-Electric System Limited
EB-2018-0165
Draft Rate Order
Schedule 17-1A
UPDATED: February 12, 2020
Page 8 of 11
EB-2018-0165
Toronto Hydro-Electric System LimitedTARIFF OF RATES AND CHARGES
Effective Date January 1, 2020
Implementation Date March 1, 2020This schedule supersedes and replaces all previously
approved schedules of Rates, Charges and Loss Factors
$ 6.06 (per 30 days)
$ 0.63 (per 30 days)
$ (0.10) (per 30 days)
$ (0.01) (per 30 days)
$/kWh 0.07618
$/kWh 0.00107
$/kWh 0.00097
$/kWh (0.00505)
$/kWh (0.00081)
$/kWh (0.00024)
$/kWh (0.00048)
$/kWh (0.00121)
Rate Rider for Disposition of Deferral/Variance Accounts - effective until December 31, 2021
- Approved on an Interim Basis $/kWh 0.00040
Rate Rider for Disposition of Capacity Based Recovery Account - effective until December 31, 2021
(Applicable only for Class B Customers) - Approved on an Interim Basis $/kWh (0.00002)
Rate Rider for Disposition of Global Adjustment Account - effective until December 31, 2021
(Applicable only for Non-RPP Customers) - Approved on an Interim Basis $/kWh (0.00159)
$/kWh 0.00549
$/kWh 0.00465
$/kWh 0.0030
$/kWh 0.0004
$/kWh 0.0005
$ 0.25 (per 30 days)Standard Supply Service - Administrative Charge (if applicable)
Retail Transmission Rate - Network Service Rate
Retail Transmission Rate - Line and Transformation Connection Service Rate
MONTHLY RATES AND CHARGES - Regulatory Component
Wholesale Market Service Rate (WMS) - not including CBR
Capacity Based Recovery (CBR) - Applicable for Class B Customers
Rural or Remote Electricity Rate Protection Charge (RRRP)
Rate Rider for Disposition of the Impact for USGAAP - effective until December 31, 2020
Rate Rider for Application of Operations Center Consolidation Plan - effective until December 31, 2021
Rate Rider for Disposition of the Gain on Property Sale - effective until December 31, 2021
Rate Rider for Disposition of IFRS - CGAPP Property Plant and Equipment - effective until December 31, 2020
Rate Rider for Disposition of External Driven Capital Variance Account - effective until December 31, 2020
Rate Rider for Recovery of 2020 Foregone Revenue - effective until December 31, 2021
Service Charge
Connection Charge (per connection)
Rate Rider for Recovery of 2020 Foregone Revenue - effective until December 31, 2021
Rate Rider for Recovery of 2020 Foregone Revenue (per connection) - effective until December 31, 2021
Distribution Volumetric Rate
Rate Rider for Disposition of Other Post Employment Benefit Variance - effective until December 31, 2020
APPLICATION
The application of these rates and charges shall be in accordance with the Licence of the Distributor and any Code or Order of the Ontario Energy Board, and
amendments thereto as approved by the Ontario Energy Board, which may be applicable to the administration of this schedule.
No rates and charges for the distribution of electricity and charges to meet the costs of any work or service done or furnished for the purpose of the distribution of
electricity shall be made except as permitted by this schedule, unless required by the Distributor’s Licence or a Code or Order of the Ontario Energy Board, and
amendments thereto as approved by the Ontario Energy Board, or as specified herein.
Unless specifically noted, this schedule does not contain any charges for the electricity commodity, be it under the Regulated Price Plan, a contract with a retailer
or the wholesale market price, as applicable. In addition, the charges in the MONTHLY RATES AND CHARGES - Regulatory Component of this schedule do not
apply to a customer that is an embedded wholesale market participant.
It should be noted that this schedule does not list any charges, assessments or credits that are required by law to be invoiced by a distributor and that are not
subject to Ontario Energy Board approval, such as the Debt Retirement Charge, the Global Adjustment and the HST.
MONTHLY RATES AND CHARGES - Delivery Component
UNMETERED SCATTERED LOAD SERVICE CLASSIFICATIONThis classification applies to an account taking electricity at 750 volts or less whose average monthly maximum demand at each location is less than, or is forecast
to be less than, 50 kW and the consumption is unmetered. Such connections include cable TV power packs, bus shelters, telephone booths, traffic lights, railway
crossings, etc. The level of the consumption will be agreed to by THESL and the customer, based on detailed manufacturer information/ documentation with
regard to electrical consumption of the unmetered load or periodic monitoring of actual consumption. Class B consumers are defined in accordance with O. Reg.
429/04. Further servicing details are available in the distributor’s Conditions of Service.
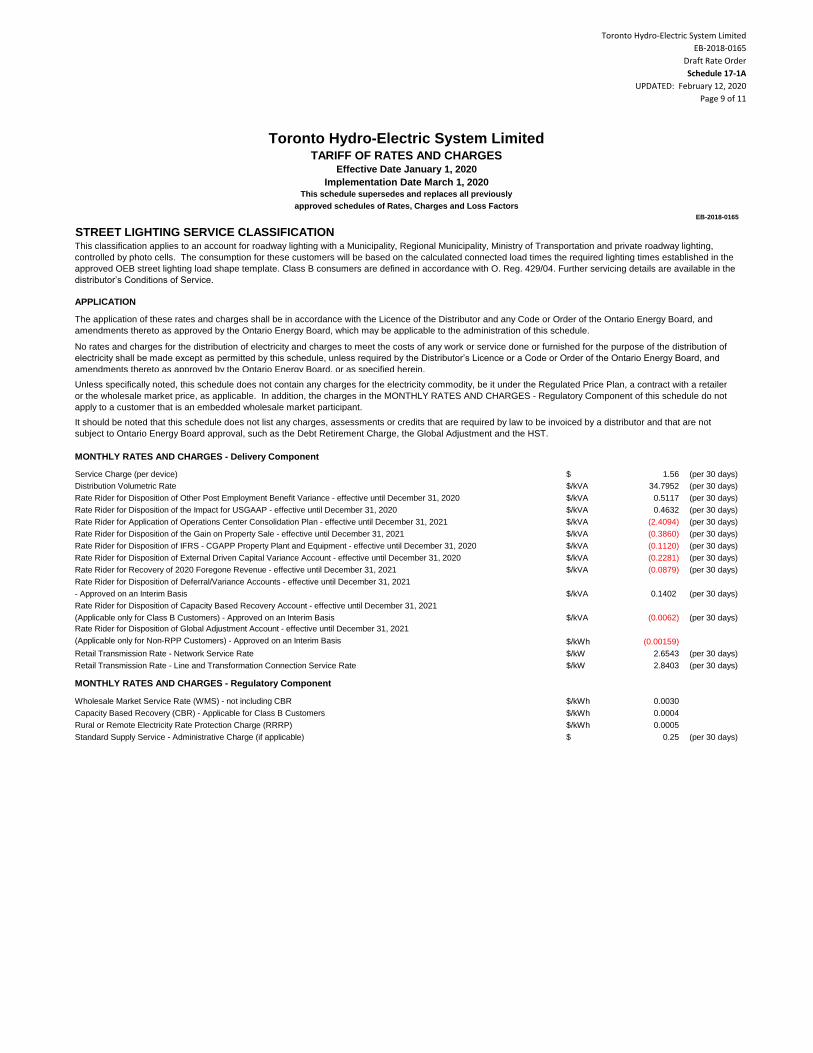
Toronto Hydro-Electric System Limited
EB-2018-0165
Draft Rate Order
Schedule 17-1A
UPDATED: February 12, 2020
Page 9 of 11
EB-2018-0165
Toronto Hydro-Electric System LimitedTARIFF OF RATES AND CHARGES
Effective Date January 1, 2020
Implementation Date March 1, 2020This schedule supersedes and replaces all previously
approved schedules of Rates, Charges and Loss Factors
$ 1.56 (per 30 days)
$/kVA 34.7952 (per 30 days)
$/kVA 0.5117 (per 30 days)
$/kVA 0.4632 (per 30 days)
$/kVA (2.4094) (per 30 days)
$/kVA (0.3860) (per 30 days)
$/kVA (0.1120) (per 30 days)
$/kVA (0.2281) (per 30 days)
$/kVA (0.0879) (per 30 days)
Rate Rider for Disposition of Deferral/Variance Accounts - effective until December 31, 2021
- Approved on an Interim Basis $/kVA 0.1402 (per 30 days)
Rate Rider for Disposition of Capacity Based Recovery Account - effective until December 31, 2021
(Applicable only for Class B Customers) - Approved on an Interim Basis $/kVA (0.0062) (per 30 days)
Rate Rider for Disposition of Global Adjustment Account - effective until December 31, 2021
(Applicable only for Non-RPP Customers) - Approved on an Interim Basis $/kWh (0.00159)
$/kW 2.6543 (per 30 days)
$/kW 2.8403 (per 30 days)
$/kWh 0.0030
$/kWh 0.0004
$/kWh 0.0005
$ 0.25 (per 30 days)Standard Supply Service - Administrative Charge (if applicable)
Retail Transmission Rate - Network Service Rate
Retail Transmission Rate - Line and Transformation Connection Service Rate
MONTHLY RATES AND CHARGES - Regulatory Component
Wholesale Market Service Rate (WMS) - not including CBR
Capacity Based Recovery (CBR) - Applicable for Class B Customers
Rural or Remote Electricity Rate Protection Charge (RRRP)
Rate Rider for Disposition of the Impact for USGAAP - effective until December 31, 2020
Rate Rider for Application of Operations Center Consolidation Plan - effective until December 31, 2021
Rate Rider for Disposition of the Gain on Property Sale - effective until December 31, 2021
Rate Rider for Disposition of IFRS - CGAPP Property Plant and Equipment - effective until December 31, 2020
Rate Rider for Disposition of External Driven Capital Variance Account - effective until December 31, 2020
Rate Rider for Recovery of 2020 Foregone Revenue - effective until December 31, 2021
Unless specifically noted, this schedule does not contain any charges for the electricity commodity, be it under the Regulated Price Plan, a contract with a retailer
or the wholesale market price, as applicable. In addition, the charges in the MONTHLY RATES AND CHARGES - Regulatory Component of this schedule do not
apply to a customer that is an embedded wholesale market participant.
It should be noted that this schedule does not list any charges, assessments or credits that are required by law to be invoiced by a distributor and that are not
subject to Ontario Energy Board approval, such as the Debt Retirement Charge, the Global Adjustment and the HST.
MONTHLY RATES AND CHARGES - Delivery Component
Service Charge (per device)
Distribution Volumetric Rate
Rate Rider for Disposition of Other Post Employment Benefit Variance - effective until December 31, 2020
STREET LIGHTING SERVICE CLASSIFICATIONThis classification applies to an account for roadway lighting with a Municipality, Regional Municipality, Ministry of Transportation and private roadway lighting,
controlled by photo cells. The consumption for these customers will be based on the calculated connected load times the required lighting times established in the
approved OEB street lighting load shape template. Class B consumers are defined in accordance with O. Reg. 429/04. Further servicing details are available in the
distributor’s Conditions of Service.
APPLICATION
The application of these rates and charges shall be in accordance with the Licence of the Distributor and any Code or Order of the Ontario Energy Board, and
amendments thereto as approved by the Ontario Energy Board, which may be applicable to the administration of this schedule.
No rates and charges for the distribution of electricity and charges to meet the costs of any work or service done or furnished for the purpose of the distribution of
electricity shall be made except as permitted by this schedule, unless required by the Distributor’s Licence or a Code or Order of the Ontario Energy Board, and
amendments thereto as approved by the Ontario Energy Board, or as specified herein.
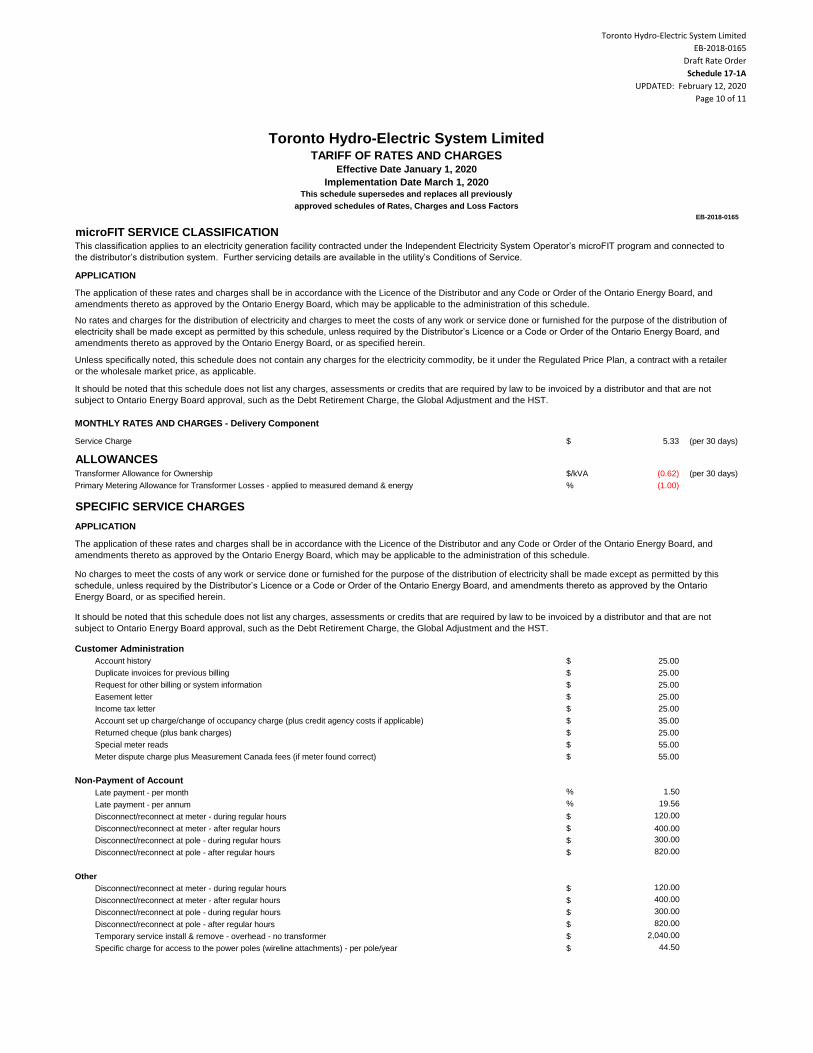
Toronto Hydro-Electric System Limited
EB-2018-0165
Draft Rate Order
Schedule 17-1A
UPDATED: February 12, 2020
Page 10 of 11
EB-2018-0165
Toronto Hydro-Electric System LimitedTARIFF OF RATES AND CHARGES
Effective Date January 1, 2020
Implementation Date March 1, 2020This schedule supersedes and replaces all previously
approved schedules of Rates, Charges and Loss Factors
$ 5.33 (per 30 days)
ALLOWANCES$/kVA (0.62) (per 30 days)
% (1.00)
SPECIFIC SERVICE CHARGES
Customer Administration
$ 25.00
$ 25.00
$ 25.00
$ 25.00
$ 25.00
$ 35.00
$ 25.00
$ 55.00
$ 55.00
Non-Payment of Account
% 1.50
% 19.56
$ 120.00
$ 400.00
$ 300.00
$ 820.00
Other
$ 120.00
$ 400.00
$ 300.00
$ 820.00
$ 2,040.00
$ 44.50Specific charge for access to the power poles (wireline attachments) - per pole/year
Disconnect/reconnect at pole - after regular hours
Disconnect/reconnect at meter - during regular hours
Disconnect/reconnect at meter - after regular hours
Disconnect/reconnect at pole - during regular hours
Disconnect/reconnect at pole - after regular hours
Temporary service install & remove - overhead - no transformer
Meter dispute charge plus Measurement Canada fees (if meter found correct)
Late payment - per month
Late payment - per annum
Disconnect/reconnect at meter - during regular hours
Disconnect/reconnect at meter - after regular hours
Disconnect/reconnect at pole - during regular hours
Request for other billing or system information
Easement letter
Income tax letter
Account set up charge/change of occupancy charge (plus credit agency costs if applicable)
Returned cheque (plus bank charges)
Special meter reads
APPLICATION
The application of these rates and charges shall be in accordance with the Licence of the Distributor and any Code or Order of the Ontario Energy Board, and
amendments thereto as approved by the Ontario Energy Board, which may be applicable to the administration of this schedule.
No charges to meet the costs of any work or service done or furnished for the purpose of the distribution of electricity shall be made except as permitted by this
schedule, unless required by the Distributor’s Licence or a Code or Order of the Ontario Energy Board, and amendments thereto as approved by the Ontario
Energy Board, or as specified herein.
It should be noted that this schedule does not list any charges, assessments or credits that are required by law to be invoiced by a distributor and that are not
subject to Ontario Energy Board approval, such as the Debt Retirement Charge, the Global Adjustment and the HST.
Account history
Duplicate invoices for previous billing
Unless specifically noted, this schedule does not contain any charges for the electricity commodity, be it under the Regulated Price Plan, a contract with a retailer
or the wholesale market price, as applicable.
It should be noted that this schedule does not list any charges, assessments or credits that are required by law to be invoiced by a distributor and that are not
subject to Ontario Energy Board approval, such as the Debt Retirement Charge, the Global Adjustment and the HST.
MONTHLY RATES AND CHARGES - Delivery Component
Service Charge
Transformer Allowance for Ownership
Primary Metering Allowance for Transformer Losses - applied to measured demand & energy
microFIT SERVICE CLASSIFICATIONThis classification applies to an electricity generation facility contracted under the Independent Electricity System Operator’s microFIT program and connected to
the distributor’s distribution system. Further servicing details are available in the utility’s Conditions of Service.
APPLICATION
The application of these rates and charges shall be in accordance with the Licence of the Distributor and any Code or Order of the Ontario Energy Board, and
amendments thereto as approved by the Ontario Energy Board, which may be applicable to the administration of this schedule.
No rates and charges for the distribution of electricity and charges to meet the costs of any work or service done or furnished for the purpose of the distribution of
electricity shall be made except as permitted by this schedule, unless required by the Distributor’s Licence or a Code or Order of the Ontario Energy Board, and
amendments thereto as approved by the Ontario Energy Board, or as specified herein.
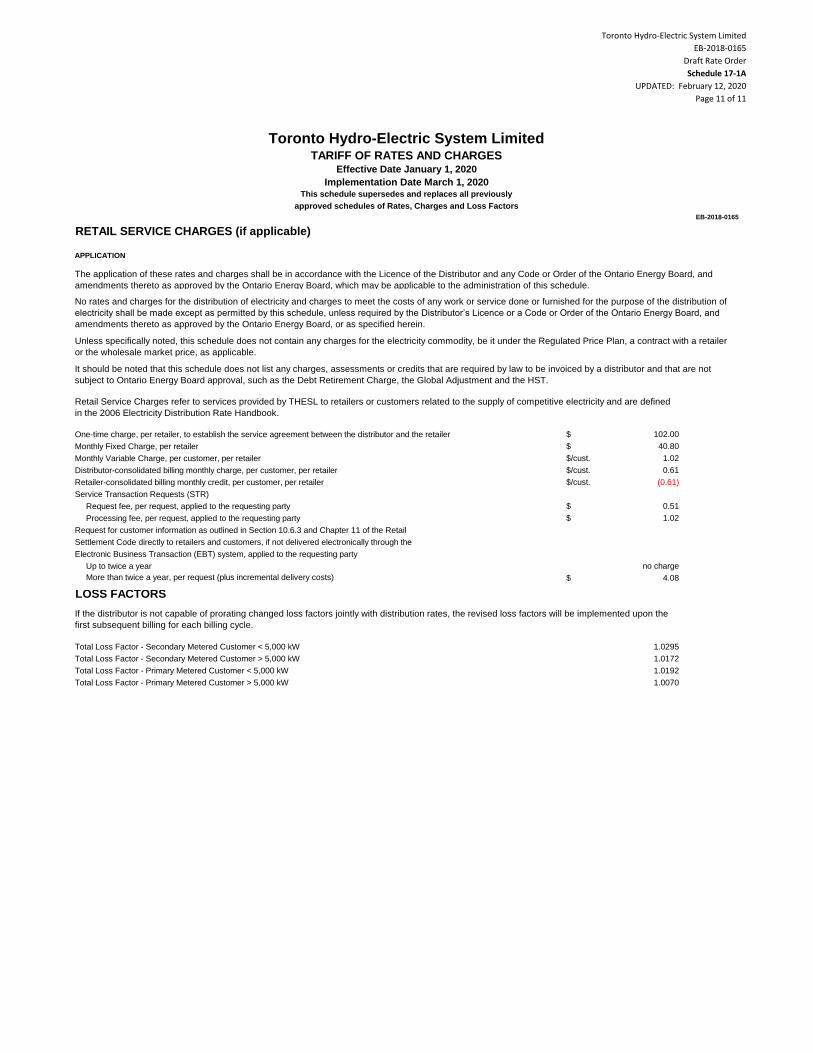
Toronto Hydro-Electric System Limited
EB-2018-0165
Draft Rate Order
Schedule 17-1A
UPDATED: February 12, 2020
Page 11 of 11
EB-2018-0165
Toronto Hydro-Electric System LimitedTARIFF OF RATES AND CHARGES
Effective Date January 1, 2020
Implementation Date March 1, 2020This schedule supersedes and replaces all previously
approved schedules of Rates, Charges and Loss Factors
RETAIL SERVICE CHARGES (if applicable)
$ 102.00
$ 40.80
$/cust. 1.02
$/cust. 0.61
$/cust. (0.61)
$ 0.51
$ 1.02
no charge
$ 4.08
LOSS FACTORS
1.0295
1.0172
1.0192
1.0070Total Loss Factor - Primary Metered Customer > 5,000 kW
Up to twice a year
More than twice a year, per request (plus incremental delivery costs)
If the distributor is not capable of prorating changed loss factors jointly with distribution rates, the revised loss factors will be implemented upon the
first subsequent billing for each billing cycle.
Total Loss Factor - Secondary Metered Customer < 5,000 kW
Total Loss Factor - Secondary Metered Customer > 5,000 kW
Total Loss Factor - Primary Metered Customer < 5,000 kW
Service Transaction Requests (STR)
Request fee, per request, applied to the requesting party
Processing fee, per request, applied to the requesting party
Request for customer information as outlined in Section 10.6.3 and Chapter 11 of the Retail
Settlement Code directly to retailers and customers, if not delivered electronically through the
Electronic Business Transaction (EBT) system, applied to the requesting party
Retail Service Charges refer to services provided by THESL to retailers or customers related to the supply of competitive electricity and are defined
in the 2006 Electricity Distribution Rate Handbook.
One-time charge, per retailer, to establish the service agreement between the distributor and the retailer
Monthly Fixed Charge, per retailer
Monthly Variable Charge, per customer, per retailer
Distributor-consolidated billing monthly charge, per customer, per retailer
Retailer-consolidated billing monthly credit, per customer, per retailer
APPLICATION
The application of these rates and charges shall be in accordance with the Licence of the Distributor and any Code or Order of the Ontario Energy Board, and
amendments thereto as approved by the Ontario Energy Board, which may be applicable to the administration of this schedule.
No rates and charges for the distribution of electricity and charges to meet the costs of any work or service done or furnished for the purpose of the distribution of
electricity shall be made except as permitted by this schedule, unless required by the Distributor’s Licence or a Code or Order of the Ontario Energy Board, and
amendments thereto as approved by the Ontario Energy Board, or as specified herein.
Unless specifically noted, this schedule does not contain any charges for the electricity commodity, be it under the Regulated Price Plan, a contract with a retailer
or the wholesale market price, as applicable.
It should be noted that this schedule does not list any charges, assessments or credits that are required by law to be invoiced by a distributor and that are not
subject to Ontario Energy Board approval, such as the Debt Retirement Charge, the Global Adjustment and the HST.
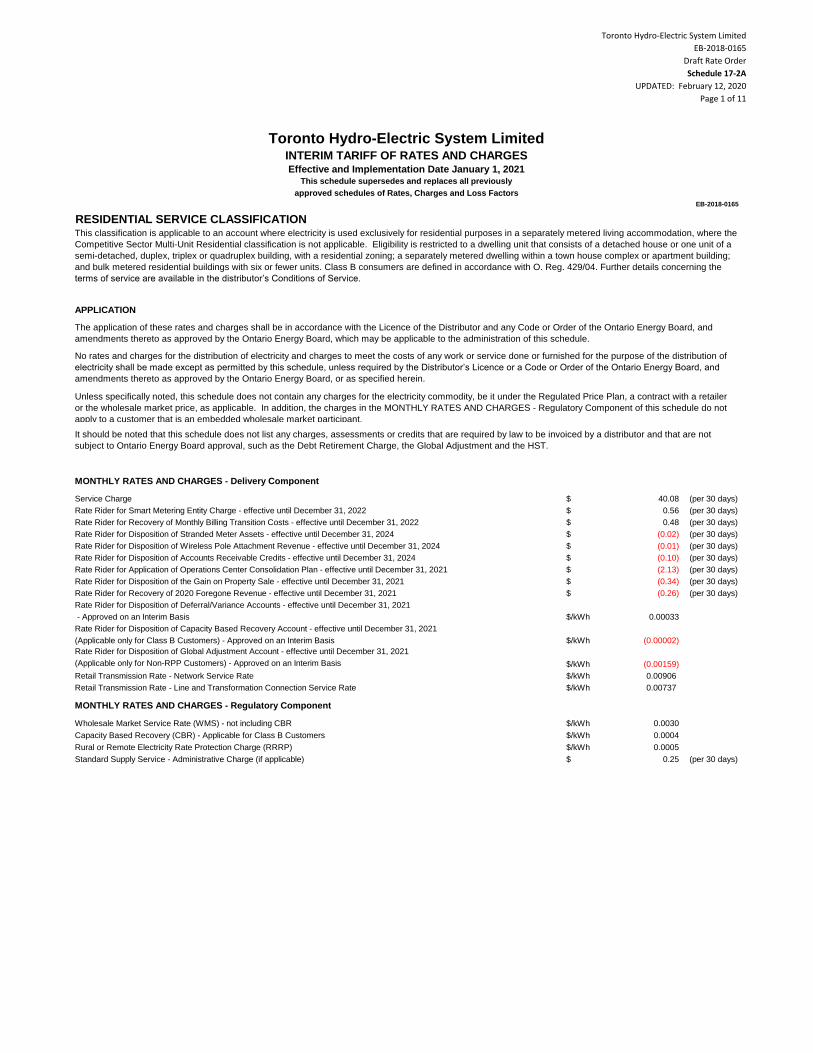
Toronto Hydro-Electric System Limited
EB-2018-0165
Draft Rate Order
Schedule 17-2A
UPDATED: February 12, 2020
Page 1 of 11
$ 40.08 (per 30 days)
$ 0.56 (per 30 days)
$ 0.48 (per 30 days)
$ (0.02) (per 30 days)
$ (0.01) (per 30 days)
$ (0.10) (per 30 days)
$ (2.13) (per 30 days)
$ (0.34) (per 30 days)
$ (0.26) (per 30 days)
Rate Rider for Disposition of Deferral/Variance Accounts - effective until December 31, 2021
- Approved on an Interim Basis $/kWh 0.00033
Rate Rider for Disposition of Capacity Based Recovery Account - effective until December 31, 2021
(Applicable only for Class B Customers) - Approved on an Interim Basis $/kWh (0.00002)
Rate Rider for Disposition of Global Adjustment Account - effective until December 31, 2021
(Applicable only for Non-RPP Customers) - Approved on an Interim Basis $/kWh (0.00159)
$/kWh 0.00906
$/kWh 0.00737
$/kWh 0.0030
$/kWh 0.0004
$/kWh 0.0005
$ 0.25 (per 30 days)
Toronto Hydro-Electric System LimitedINTERIM TARIFF OF RATES AND CHARGESEffective and Implementation Date January 1, 2021
This schedule supersedes and replaces all previously
approved schedules of Rates, Charges and Loss Factors
EB-2018-0165
It should be noted that this schedule does not list any charges, assessments or credits that are required by law to be invoiced by a distributor and that are not
subject to Ontario Energy Board approval, such as the Debt Retirement Charge, the Global Adjustment and the HST.
MONTHLY RATES AND CHARGES - Delivery Component
Service Charge
Rate Rider for Smart Metering Entity Charge - effective until December 31, 2022
Rate Rider for Recovery of Monthly Billing Transition Costs - effective until December 31, 2022
Rate Rider for Disposition of Stranded Meter Assets - effective until December 31, 2024
RESIDENTIAL SERVICE CLASSIFICATIONThis classification is applicable to an account where electricity is used exclusively for residential purposes in a separately metered living accommodation, where the
Competitive Sector Multi-Unit Residential classification is not applicable. Eligibility is restricted to a dwelling unit that consists of a detached house or one unit of a
semi-detached, duplex, triplex or quadruplex building, with a residential zoning; a separately metered dwelling within a town house complex or apartment building;
and bulk metered residential buildings with six or fewer units. Class B consumers are defined in accordance with O. Reg. 429/04. Further details concerning the
terms of service are available in the distributor’s Conditions of Service.
APPLICATION
The application of these rates and charges shall be in accordance with the Licence of the Distributor and any Code or Order of the Ontario Energy Board, and
amendments thereto as approved by the Ontario Energy Board, which may be applicable to the administration of this schedule.
No rates and charges for the distribution of electricity and charges to meet the costs of any work or service done or furnished for the purpose of the distribution of
electricity shall be made except as permitted by this schedule, unless required by the Distributor’s Licence or a Code or Order of the Ontario Energy Board, and
amendments thereto as approved by the Ontario Energy Board, or as specified herein.
Unless specifically noted, this schedule does not contain any charges for the electricity commodity, be it under the Regulated Price Plan, a contract with a retailer
or the wholesale market price, as applicable. In addition, the charges in the MONTHLY RATES AND CHARGES - Regulatory Component of this schedule do not
apply to a customer that is an embedded wholesale market participant.
Retail Transmission Rate - Line and Transformation Connection Service Rate
MONTHLY RATES AND CHARGES - Regulatory Component
Wholesale Market Service Rate (WMS) - not including CBR
Capacity Based Recovery (CBR) - Applicable for Class B Customers
Rural or Remote Electricity Rate Protection Charge (RRRP)
Standard Supply Service - Administrative Charge (if applicable)
Rate Rider for Disposition of Wireless Pole Attachment Revenue - effective until December 31, 2024
Rate Rider for Disposition of Accounts Receivable Credits - effective until December 31, 2024
Rate Rider for Application of Operations Center Consolidation Plan - effective until December 31, 2021
Rate Rider for Disposition of the Gain on Property Sale - effective until December 31, 2021
Rate Rider for Recovery of 2020 Foregone Revenue - effective until December 31, 2021
Retail Transmission Rate - Network Service Rate
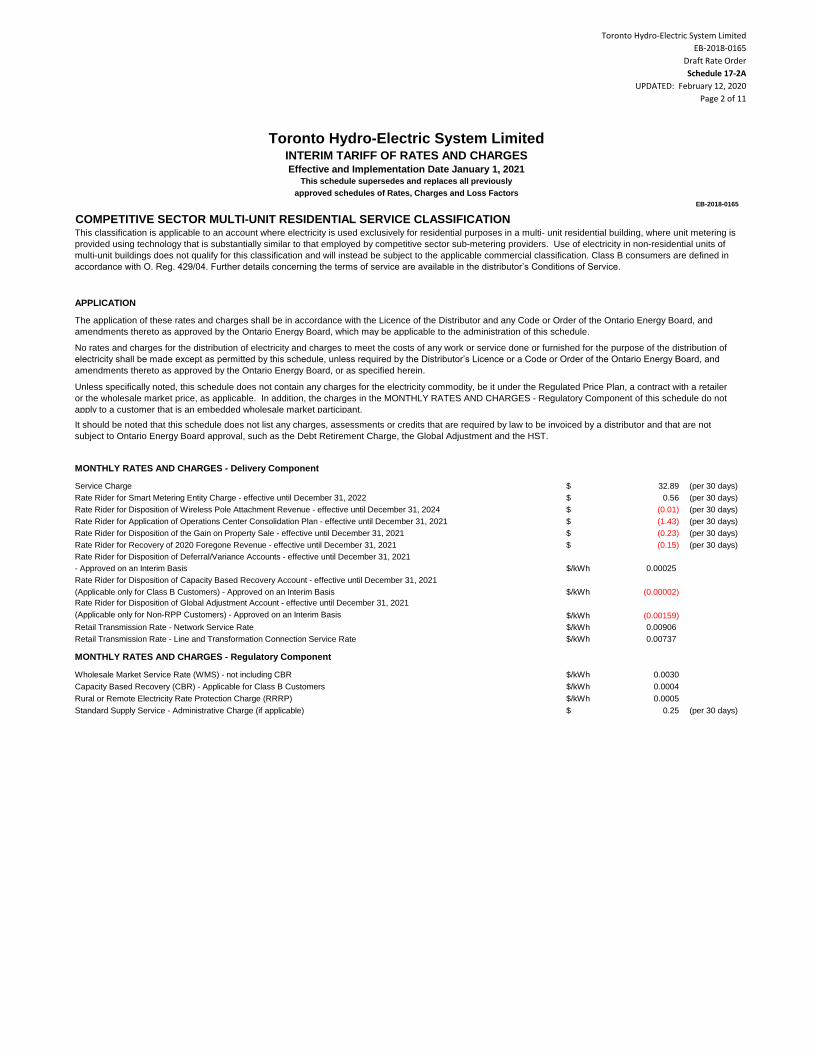
Toronto Hydro-Electric System Limited
EB-2018-0165
Draft Rate Order
Schedule 17-2A
UPDATED: February 12, 2020
Page 2 of 11
Toronto Hydro-Electric System LimitedINTERIM TARIFF OF RATES AND CHARGESEffective and Implementation Date January 1, 2021
This schedule supersedes and replaces all previously
approved schedules of Rates, Charges and Loss Factors
EB-2018-0165
$ 32.89 (per 30 days)
$ 0.56 (per 30 days)
$ (0.01) (per 30 days)
$ (1.43) (per 30 days)
$ (0.23) (per 30 days)
$ (0.15) (per 30 days)
Rate Rider for Disposition of Deferral/Variance Accounts - effective until December 31, 2021
- Approved on an Interim Basis $/kWh 0.00025
Rate Rider for Disposition of Capacity Based Recovery Account - effective until December 31, 2021
(Applicable only for Class B Customers) - Approved on an Interim Basis $/kWh (0.00002)
Rate Rider for Disposition of Global Adjustment Account - effective until December 31, 2021
(Applicable only for Non-RPP Customers) - Approved on an Interim Basis $/kWh (0.00159)
$/kWh 0.00906
$/kWh 0.00737
$/kWh 0.0030
$/kWh 0.0004
$/kWh 0.0005
$ 0.25 (per 30 days)
It should be noted that this schedule does not list any charges, assessments or credits that are required by law to be invoiced by a distributor and that are not
subject to Ontario Energy Board approval, such as the Debt Retirement Charge, the Global Adjustment and the HST.
MONTHLY RATES AND CHARGES - Delivery Component
Service Charge
Rate Rider for Smart Metering Entity Charge - effective until December 31, 2022
Rate Rider for Disposition of Wireless Pole Attachment Revenue - effective until December 31, 2024
Rate Rider for Application of Operations Center Consolidation Plan - effective until December 31, 2021
COMPETITIVE SECTOR MULTI-UNIT RESIDENTIAL SERVICE CLASSIFICATIONThis classification is applicable to an account where electricity is used exclusively for residential purposes in a multi- unit residential building, where unit metering is
provided using technology that is substantially similar to that employed by competitive sector sub-metering providers. Use of electricity in non-residential units of
multi-unit buildings does not qualify for this classification and will instead be subject to the applicable commercial classification. Class B consumers are defined in
accordance with O. Reg. 429/04. Further details concerning the terms of service are available in the distributor’s Conditions of Service.
APPLICATION
The application of these rates and charges shall be in accordance with the Licence of the Distributor and any Code or Order of the Ontario Energy Board, and
amendments thereto as approved by the Ontario Energy Board, which may be applicable to the administration of this schedule.
No rates and charges for the distribution of electricity and charges to meet the costs of any work or service done or furnished for the purpose of the distribution of
electricity shall be made except as permitted by this schedule, unless required by the Distributor’s Licence or a Code or Order of the Ontario Energy Board, and
amendments thereto as approved by the Ontario Energy Board, or as specified herein.
Unless specifically noted, this schedule does not contain any charges for the electricity commodity, be it under the Regulated Price Plan, a contract with a retailer
or the wholesale market price, as applicable. In addition, the charges in the MONTHLY RATES AND CHARGES - Regulatory Component of this schedule do not
apply to a customer that is an embedded wholesale market participant.
Capacity Based Recovery (CBR) - Applicable for Class B Customers
Rural or Remote Electricity Rate Protection Charge (RRRP)
Standard Supply Service - Administrative Charge (if applicable)
Rate Rider for Disposition of the Gain on Property Sale - effective until December 31, 2021
Rate Rider for Recovery of 2020 Foregone Revenue - effective until December 31, 2021
Retail Transmission Rate - Network Service Rate
Retail Transmission Rate - Line and Transformation Connection Service Rate
MONTHLY RATES AND CHARGES - Regulatory Component
Wholesale Market Service Rate (WMS) - not including CBR
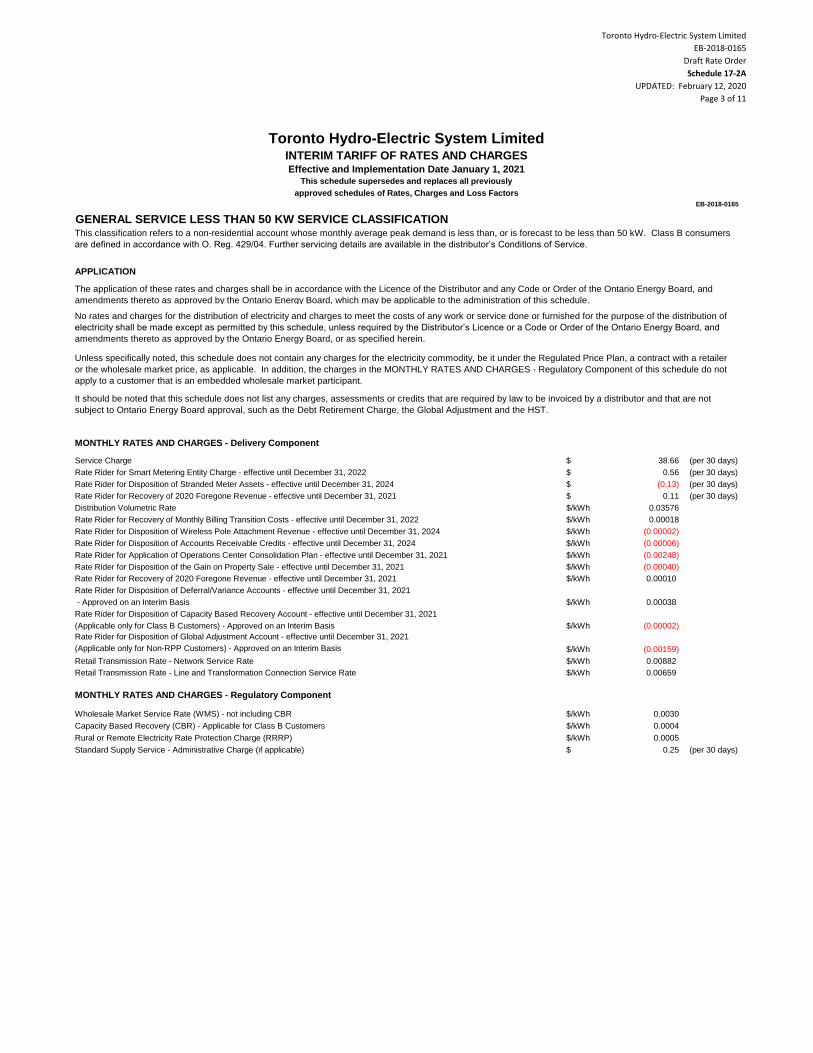
Toronto Hydro-Electric System Limited
EB-2018-0165
Draft Rate Order
Schedule 17-2A
UPDATED: February 12, 2020
Page 3 of 11
Toronto Hydro-Electric System LimitedINTERIM TARIFF OF RATES AND CHARGESEffective and Implementation Date January 1, 2021
This schedule supersedes and replaces all previously
approved schedules of Rates, Charges and Loss Factors
EB-2018-0165
$ 38.66 (per 30 days)
$ 0.56 (per 30 days)
$ (0.13) (per 30 days)
$ 0.11 (per 30 days)
$/kWh 0.03576
$/kWh 0.00018
$/kWh (0.00002)
$/kWh (0.00006)
$/kWh (0.00248)
$/kWh (0.00040)
$/kWh 0.00010
Rate Rider for Disposition of Deferral/Variance Accounts - effective until December 31, 2021
- Approved on an Interim Basis $/kWh 0.00038
Rate Rider for Disposition of Capacity Based Recovery Account - effective until December 31, 2021
(Applicable only for Class B Customers) - Approved on an Interim Basis $/kWh (0.00002)
Rate Rider for Disposition of Global Adjustment Account - effective until December 31, 2021
(Applicable only for Non-RPP Customers) - Approved on an Interim Basis $/kWh (0.00159)
$/kWh 0.00882
$/kWh 0.00659
$/kWh 0.0030
$/kWh 0.0004
$/kWh 0.0005
$ 0.25 (per 30 days)
GENERAL SERVICE LESS THAN 50 KW SERVICE CLASSIFICATIONThis classification refers to a non-residential account whose monthly average peak demand is less than, or is forecast to be less than 50 kW. Class B consumers
are defined in accordance with O. Reg. 429/04. Further servicing details are available in the distributor’s Conditions of Service.
APPLICATION
Rate Rider for Smart Metering Entity Charge - effective until December 31, 2022
Rate Rider for Disposition of Stranded Meter Assets - effective until December 31, 2024
Rate Rider for Recovery of 2020 Foregone Revenue - effective until December 31, 2021
Distribution Volumetric Rate
Rate Rider for Recovery of Monthly Billing Transition Costs - effective until December 31, 2022
Rate Rider for Disposition of Wireless Pole Attachment Revenue - effective until December 31, 2024
The application of these rates and charges shall be in accordance with the Licence of the Distributor and any Code or Order of the Ontario Energy Board, and
amendments thereto as approved by the Ontario Energy Board, which may be applicable to the administration of this schedule.
No rates and charges for the distribution of electricity and charges to meet the costs of any work or service done or furnished for the purpose of the distribution of
electricity shall be made except as permitted by this schedule, unless required by the Distributor’s Licence or a Code or Order of the Ontario Energy Board, and
amendments thereto as approved by the Ontario Energy Board, or as specified herein.
Unless specifically noted, this schedule does not contain any charges for the electricity commodity, be it under the Regulated Price Plan, a contract with a retailer
or the wholesale market price, as applicable. In addition, the charges in the MONTHLY RATES AND CHARGES - Regulatory Component of this schedule do not
apply to a customer that is an embedded wholesale market participant.
It should be noted that this schedule does not list any charges, assessments or credits that are required by law to be invoiced by a distributor and that are not
subject to Ontario Energy Board approval, such as the Debt Retirement Charge, the Global Adjustment and the HST.
MONTHLY RATES AND CHARGES - Delivery Component
Service Charge
MONTHLY RATES AND CHARGES - Regulatory Component
Wholesale Market Service Rate (WMS) - not including CBR
Capacity Based Recovery (CBR) - Applicable for Class B Customers
Rural or Remote Electricity Rate Protection Charge (RRRP)
Standard Supply Service - Administrative Charge (if applicable)
Rate Rider for Disposition of Accounts Receivable Credits - effective until December 31, 2024
Rate Rider for Application of Operations Center Consolidation Plan - effective until December 31, 2021
Rate Rider for Disposition of the Gain on Property Sale - effective until December 31, 2021
Rate Rider for Recovery of 2020 Foregone Revenue - effective until December 31, 2021
Retail Transmission Rate - Network Service Rate
Retail Transmission Rate - Line and Transformation Connection Service Rate
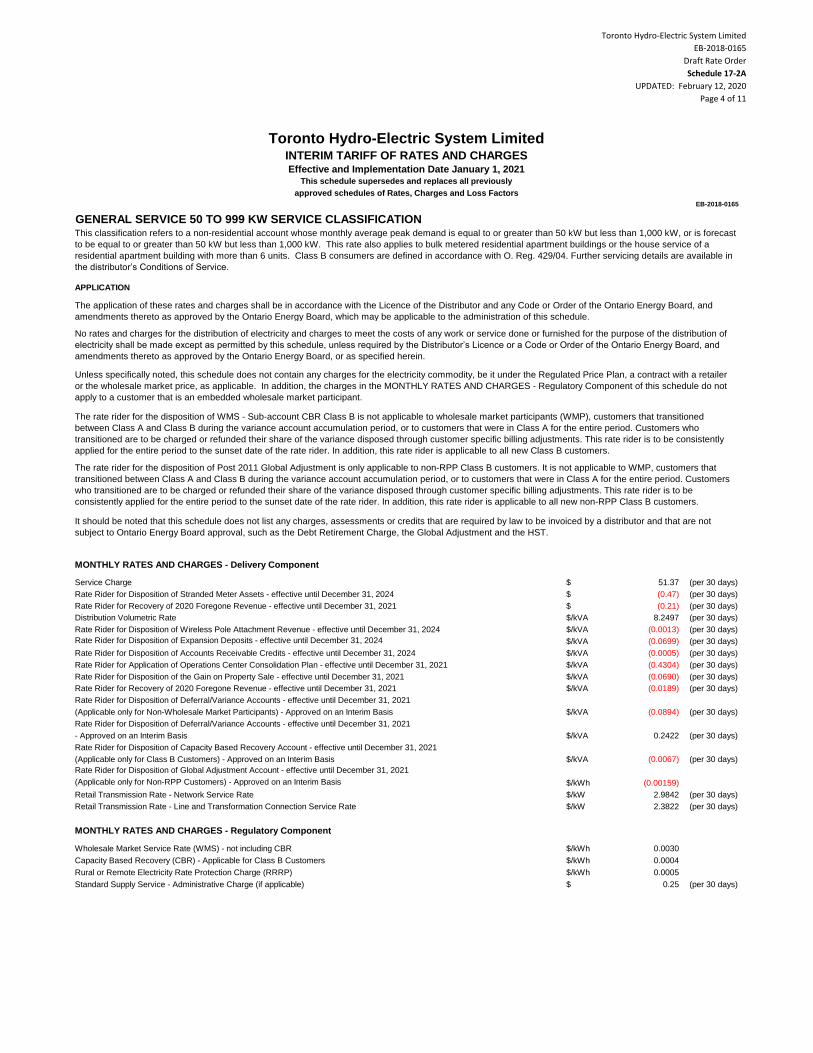
Toronto Hydro-Electric System Limited
EB-2018-0165
Draft Rate Order
Schedule 17-2A
UPDATED: February 12, 2020
Page 4 of 11
Toronto Hydro-Electric System LimitedINTERIM TARIFF OF RATES AND CHARGESEffective and Implementation Date January 1, 2021
This schedule supersedes and replaces all previously
approved schedules of Rates, Charges and Loss Factors
EB-2018-0165
$ 51.37 (per 30 days)
$ (0.47) (per 30 days)
$ (0.21) (per 30 days)
$/kVA 8.2497 (per 30 days)
$/kVA (0.0013) (per 30 days)
Rate Rider for Disposition of Expansion Deposits - effective until December 31, 2024 $/kVA (0.0699) (per 30 days)
$/kVA (0.0005) (per 30 days)
$/kVA (0.4304) (per 30 days)
$/kVA (0.0690) (per 30 days)
$/kVA (0.0189) (per 30 days)
Rate Rider for Disposition of Deferral/Variance Accounts - effective until December 31, 2021
(Applicable only for Non-Wholesale Market Participants) - Approved on an Interim Basis $/kVA (0.0894) (per 30 days)
Rate Rider for Disposition of Deferral/Variance Accounts - effective until December 31, 2021
- Approved on an Interim Basis $/kVA 0.2422 (per 30 days)
Rate Rider for Disposition of Capacity Based Recovery Account - effective until December 31, 2021
(Applicable only for Class B Customers) - Approved on an Interim Basis $/kVA (0.0067) (per 30 days)
Rate Rider for Disposition of Global Adjustment Account - effective until December 31, 2021
(Applicable only for Non-RPP Customers) - Approved on an Interim Basis $/kWh (0.00159)
$/kW 2.9842 (per 30 days)
$/kW 2.3822 (per 30 days)
$/kWh 0.0030
$/kWh 0.0004
$/kWh 0.0005
$ 0.25 (per 30 days)
GENERAL SERVICE 50 TO 999 KW SERVICE CLASSIFICATION
The rate rider for the disposition of Post 2011 Global Adjustment is only applicable to non-RPP Class B customers. It is not applicable to WMP, customers that
transitioned between Class A and Class B during the variance account accumulation period, or to customers that were in Class A for the entire period. Customers
who transitioned are to be charged or refunded their share of the variance disposed through customer specific billing adjustments. This rate rider is to be
consistently applied for the entire period to the sunset date of the rate rider. In addition, this rate rider is applicable to all new non-RPP Class B customers.
It should be noted that this schedule does not list any charges, assessments or credits that are required by law to be invoiced by a distributor and that are not
subject to Ontario Energy Board approval, such as the Debt Retirement Charge, the Global Adjustment and the HST.
MONTHLY RATES AND CHARGES - Delivery Component
Service Charge
Rate Rider for Disposition of Stranded Meter Assets - effective until December 31, 2024
Rate Rider for Recovery of 2020 Foregone Revenue - effective until December 31, 2021
This classification refers to a non-residential account whose monthly average peak demand is equal to or greater than 50 kW but less than 1,000 kW, or is forecast
to be equal to or greater than 50 kW but less than 1,000 kW. This rate also applies to bulk metered residential apartment buildings or the house service of a
residential apartment building with more than 6 units. Class B consumers are defined in accordance with O. Reg. 429/04. Further servicing details are available in
the distributor’s Conditions of Service.
APPLICATION
The application of these rates and charges shall be in accordance with the Licence of the Distributor and any Code or Order of the Ontario Energy Board, and
amendments thereto as approved by the Ontario Energy Board, which may be applicable to the administration of this schedule.
No rates and charges for the distribution of electricity and charges to meet the costs of any work or service done or furnished for the purpose of the distribution of
electricity shall be made except as permitted by this schedule, unless required by the Distributor’s Licence or a Code or Order of the Ontario Energy Board, and
amendments thereto as approved by the Ontario Energy Board, or as specified herein.
Unless specifically noted, this schedule does not contain any charges for the electricity commodity, be it under the Regulated Price Plan, a contract with a retailer
or the wholesale market price, as applicable. In addition, the charges in the MONTHLY RATES AND CHARGES - Regulatory Component of this schedule do not
apply to a customer that is an embedded wholesale market participant.
The rate rider for the disposition of WMS - Sub-account CBR Class B is not applicable to wholesale market participants (WMP), customers that transitioned
between Class A and Class B during the variance account accumulation period, or to customers that were in Class A for the entire period. Customers who
transitioned are to be charged or refunded their share of the variance disposed through customer specific billing adjustments. This rate rider is to be consistently
applied for the entire period to the sunset date of the rate rider. In addition, this rate rider is applicable to all new Class B customers.
Retail Transmission Rate - Network Service Rate
Retail Transmission Rate - Line and Transformation Connection Service Rate
MONTHLY RATES AND CHARGES - Regulatory Component
Wholesale Market Service Rate (WMS) - not including CBR
Capacity Based Recovery (CBR) - Applicable for Class B Customers
Rural or Remote Electricity Rate Protection Charge (RRRP)
Distribution Volumetric Rate
Rate Rider for Disposition of Wireless Pole Attachment Revenue - effective until December 31, 2024
Rate Rider for Disposition of Accounts Receivable Credits - effective until December 31, 2024
Rate Rider for Application of Operations Center Consolidation Plan - effective until December 31, 2021
Rate Rider for Disposition of the Gain on Property Sale - effective until December 31, 2021
Rate Rider for Recovery of 2020 Foregone Revenue - effective until December 31, 2021
Standard Supply Service - Administrative Charge (if applicable)
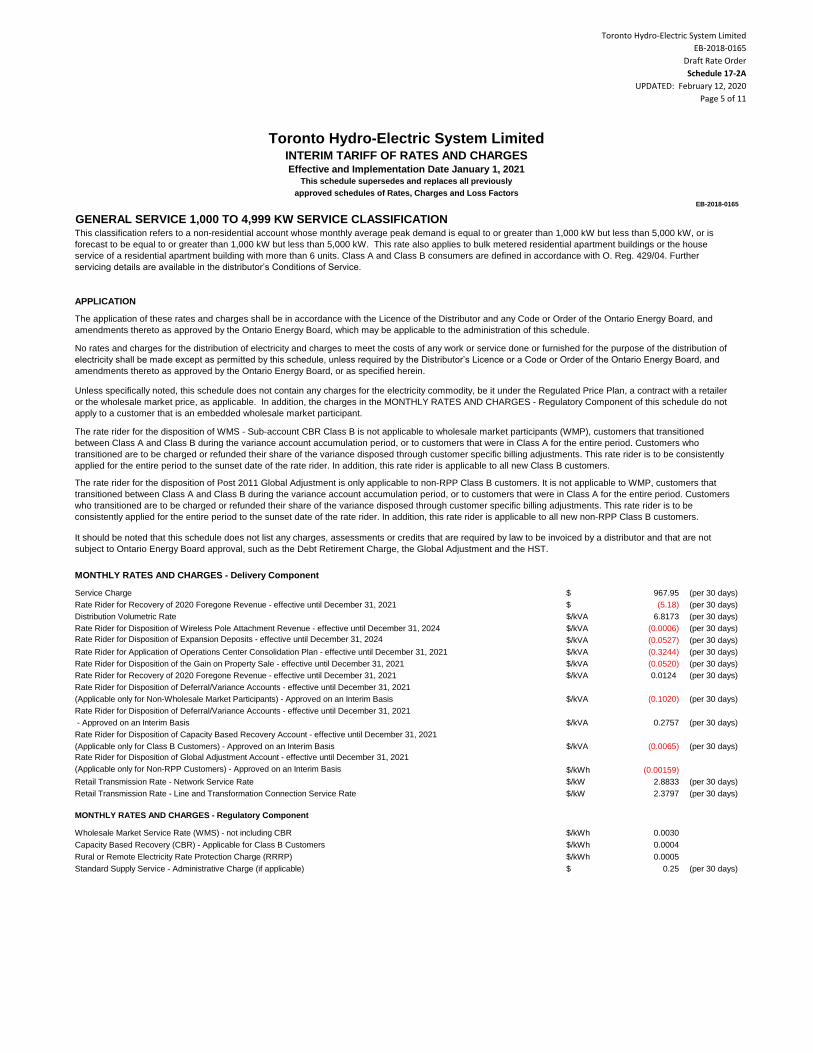
Toronto Hydro-Electric System Limited
EB-2018-0165
Draft Rate Order
Schedule 17-2A
UPDATED: February 12, 2020
Page 5 of 11
Toronto Hydro-Electric System LimitedINTERIM TARIFF OF RATES AND CHARGESEffective and Implementation Date January 1, 2021
This schedule supersedes and replaces all previously
approved schedules of Rates, Charges and Loss Factors
EB-2018-0165
$ 967.95 (per 30 days)
$ (5.18) (per 30 days)
$/kVA 6.8173 (per 30 days)
$/kVA (0.0006) (per 30 days)
Rate Rider for Disposition of Expansion Deposits - effective until December 31, 2024 $/kVA (0.0527) (per 30 days)
$/kVA (0.3244) (per 30 days)
$/kVA (0.0520) (per 30 days)
$/kVA 0.0124 (per 30 days)
Rate Rider for Disposition of Deferral/Variance Accounts - effective until December 31, 2021
(Applicable only for Non-Wholesale Market Participants) - Approved on an Interim Basis $/kVA (0.1020) (per 30 days)
Rate Rider for Disposition of Deferral/Variance Accounts - effective until December 31, 2021
- Approved on an Interim Basis $/kVA 0.2757 (per 30 days)
Rate Rider for Disposition of Capacity Based Recovery Account - effective until December 31, 2021
(Applicable only for Class B Customers) - Approved on an Interim Basis $/kVA (0.0065) (per 30 days)
Rate Rider for Disposition of Global Adjustment Account - effective until December 31, 2021
(Applicable only for Non-RPP Customers) - Approved on an Interim Basis $/kWh (0.00159)
$/kW 2.8833 (per 30 days)
$/kW 2.3797 (per 30 days)
$/kWh 0.0030
$/kWh 0.0004
$/kWh 0.0005
$ 0.25 (per 30 days)
Unless specifically noted, this schedule does not contain any charges for the electricity commodity, be it under the Regulated Price Plan, a contract with a retailer
or the wholesale market price, as applicable. In addition, the charges in the MONTHLY RATES AND CHARGES - Regulatory Component of this schedule do not
apply to a customer that is an embedded wholesale market participant.
The rate rider for the disposition of WMS - Sub-account CBR Class B is not applicable to wholesale market participants (WMP), customers that transitioned
between Class A and Class B during the variance account accumulation period, or to customers that were in Class A for the entire period. Customers who
transitioned are to be charged or refunded their share of the variance disposed through customer specific billing adjustments. This rate rider is to be consistently
applied for the entire period to the sunset date of the rate rider. In addition, this rate rider is applicable to all new Class B customers.
The rate rider for the disposition of Post 2011 Global Adjustment is only applicable to non-RPP Class B customers. It is not applicable to WMP, customers that
transitioned between Class A and Class B during the variance account accumulation period, or to customers that were in Class A for the entire period. Customers
who transitioned are to be charged or refunded their share of the variance disposed through customer specific billing adjustments. This rate rider is to be
consistently applied for the entire period to the sunset date of the rate rider. In addition, this rate rider is applicable to all new non-RPP Class B customers.
It should be noted that this schedule does not list any charges, assessments or credits that are required by law to be invoiced by a distributor and that are not
subject to Ontario Energy Board approval, such as the Debt Retirement Charge, the Global Adjustment and the HST.
MONTHLY RATES AND CHARGES - Delivery Component
Service Charge
GENERAL SERVICE 1,000 TO 4,999 KW SERVICE CLASSIFICATIONThis classification refers to a non-residential account whose monthly average peak demand is equal to or greater than 1,000 kW but less than 5,000 kW, or is
forecast to be equal to or greater than 1,000 kW but less than 5,000 kW. This rate also applies to bulk metered residential apartment buildings or the house
service of a residential apartment building with more than 6 units. Class A and Class B consumers are defined in accordance with O. Reg. 429/04. Further
servicing details are available in the distributor’s Conditions of Service.
APPLICATION
The application of these rates and charges shall be in accordance with the Licence of the Distributor and any Code or Order of the Ontario Energy Board, and
amendments thereto as approved by the Ontario Energy Board, which may be applicable to the administration of this schedule.
No rates and charges for the distribution of electricity and charges to meet the costs of any work or service done or furnished for the purpose of the distribution of
electricity shall be made except as permitted by this schedule, unless required by the Distributor’s Licence or a Code or Order of the Ontario Energy Board, and
amendments thereto as approved by the Ontario Energy Board, or as specified herein.
Retail Transmission Rate - Network Service Rate
Retail Transmission Rate - Line and Transformation Connection Service Rate
MONTHLY RATES AND CHARGES - Regulatory Component
Wholesale Market Service Rate (WMS) - not including CBR
Capacity Based Recovery (CBR) - Applicable for Class B Customers
Rural or Remote Electricity Rate Protection Charge (RRRP)
Rate Rider for Recovery of 2020 Foregone Revenue - effective until December 31, 2021
Distribution Volumetric Rate
Rate Rider for Disposition of Wireless Pole Attachment Revenue - effective until December 31, 2024
Rate Rider for Application of Operations Center Consolidation Plan - effective until December 31, 2021
Rate Rider for Disposition of the Gain on Property Sale - effective until December 31, 2021
Rate Rider for Recovery of 2020 Foregone Revenue - effective until December 31, 2021
Standard Supply Service - Administrative Charge (if applicable)
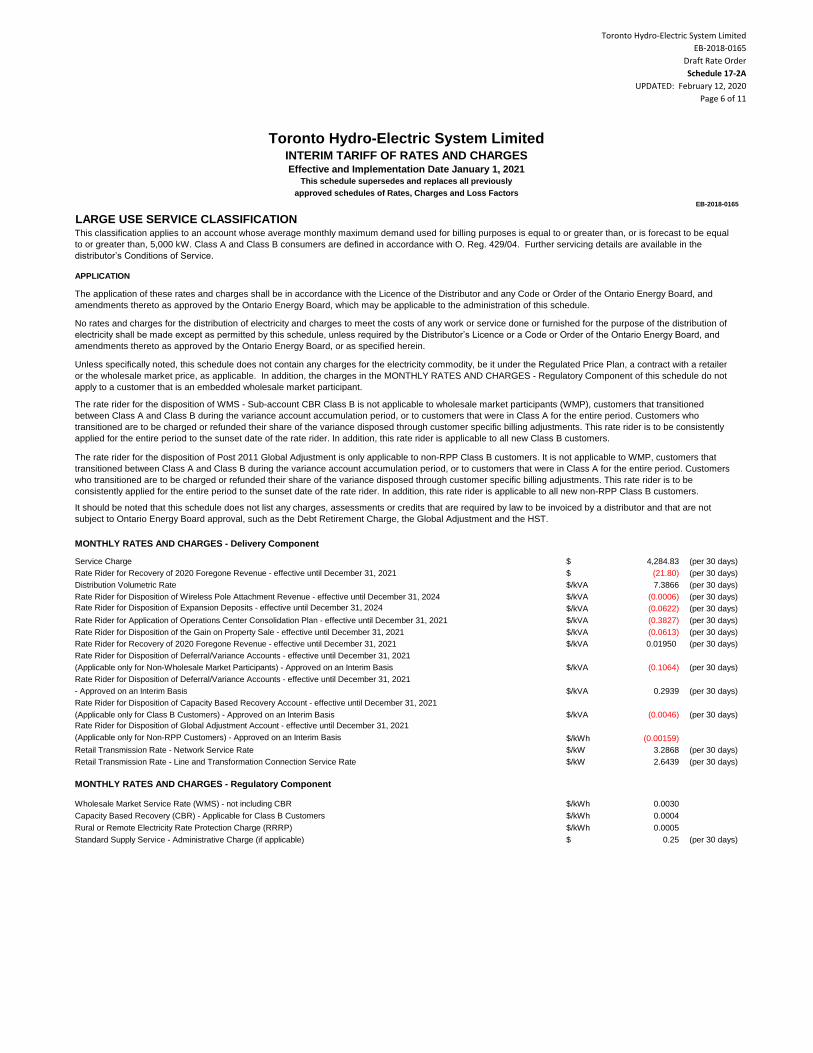
Toronto Hydro-Electric System Limited
EB-2018-0165
Draft Rate Order
Schedule 17-2A
UPDATED: February 12, 2020
Page 6 of 11
Toronto Hydro-Electric System LimitedINTERIM TARIFF OF RATES AND CHARGESEffective and Implementation Date January 1, 2021
This schedule supersedes and replaces all previously
approved schedules of Rates, Charges and Loss Factors
EB-2018-0165
$ 4,284.83 (per 30 days)
$ (21.80) (per 30 days)
$/kVA 7.3866 (per 30 days)
$/kVA (0.0006) (per 30 days)
Rate Rider for Disposition of Expansion Deposits - effective until December 31, 2024 $/kVA (0.0622) (per 30 days)
$/kVA (0.3827) (per 30 days)
$/kVA (0.0613) (per 30 days)
$/kVA 0.01950 (per 30 days)
Rate Rider for Disposition of Deferral/Variance Accounts - effective until December 31, 2021
(Applicable only for Non-Wholesale Market Participants) - Approved on an Interim Basis $/kVA (0.1064) (per 30 days)
Rate Rider for Disposition of Deferral/Variance Accounts - effective until December 31, 2021
- Approved on an Interim Basis $/kVA 0.2939 (per 30 days)
Rate Rider for Disposition of Capacity Based Recovery Account - effective until December 31, 2021
(Applicable only for Class B Customers) - Approved on an Interim Basis $/kVA (0.0046) (per 30 days)
Rate Rider for Disposition of Global Adjustment Account - effective until December 31, 2021
(Applicable only for Non-RPP Customers) - Approved on an Interim Basis $/kWh (0.00159)
$/kW 3.2868 (per 30 days)
$/kW 2.6439 (per 30 days)
$/kWh 0.0030
$/kWh 0.0004
$/kWh 0.0005
$ 0.25 (per 30 days)
Unless specifically noted, this schedule does not contain any charges for the electricity commodity, be it under the Regulated Price Plan, a contract with a retailer
or the wholesale market price, as applicable. In addition, the charges in the MONTHLY RATES AND CHARGES - Regulatory Component of this schedule do not
apply to a customer that is an embedded wholesale market participant.
The rate rider for the disposition of WMS - Sub-account CBR Class B is not applicable to wholesale market participants (WMP), customers that transitioned
between Class A and Class B during the variance account accumulation period, or to customers that were in Class A for the entire period. Customers who
transitioned are to be charged or refunded their share of the variance disposed through customer specific billing adjustments. This rate rider is to be consistently
applied for the entire period to the sunset date of the rate rider. In addition, this rate rider is applicable to all new Class B customers.
The rate rider for the disposition of Post 2011 Global Adjustment is only applicable to non-RPP Class B customers. It is not applicable to WMP, customers that
transitioned between Class A and Class B during the variance account accumulation period, or to customers that were in Class A for the entire period. Customers
who transitioned are to be charged or refunded their share of the variance disposed through customer specific billing adjustments. This rate rider is to be
consistently applied for the entire period to the sunset date of the rate rider. In addition, this rate rider is applicable to all new non-RPP Class B customers.
It should be noted that this schedule does not list any charges, assessments or credits that are required by law to be invoiced by a distributor and that are not
subject to Ontario Energy Board approval, such as the Debt Retirement Charge, the Global Adjustment and the HST.
MONTHLY RATES AND CHARGES - Delivery Component
Service Charge
LARGE USE SERVICE CLASSIFICATIONThis classification applies to an account whose average monthly maximum demand used for billing purposes is equal to or greater than, or is forecast to be equal
to or greater than, 5,000 kW. Class A and Class B consumers are defined in accordance with O. Reg. 429/04. Further servicing details are available in the
distributor’s Conditions of Service.
APPLICATION
The application of these rates and charges shall be in accordance with the Licence of the Distributor and any Code or Order of the Ontario Energy Board, and
amendments thereto as approved by the Ontario Energy Board, which may be applicable to the administration of this schedule.
No rates and charges for the distribution of electricity and charges to meet the costs of any work or service done or furnished for the purpose of the distribution of
electricity shall be made except as permitted by this schedule, unless required by the Distributor’s Licence or a Code or Order of the Ontario Energy Board, and
amendments thereto as approved by the Ontario Energy Board, or as specified herein.
Retail Transmission Rate - Network Service Rate
Retail Transmission Rate - Line and Transformation Connection Service Rate
MONTHLY RATES AND CHARGES - Regulatory Component
Wholesale Market Service Rate (WMS) - not including CBR
Capacity Based Recovery (CBR) - Applicable for Class B Customers
Rural or Remote Electricity Rate Protection Charge (RRRP)
Rate Rider for Recovery of 2020 Foregone Revenue - effective until December 31, 2021
Distribution Volumetric Rate
Rate Rider for Disposition of Wireless Pole Attachment Revenue - effective until December 31, 2024
Rate Rider for Application of Operations Center Consolidation Plan - effective until December 31, 2021
Rate Rider for Disposition of the Gain on Property Sale - effective until December 31, 2021
Rate Rider for Recovery of 2020 Foregone Revenue - effective until December 31, 2021
Standard Supply Service - Administrative Charge (if applicable)
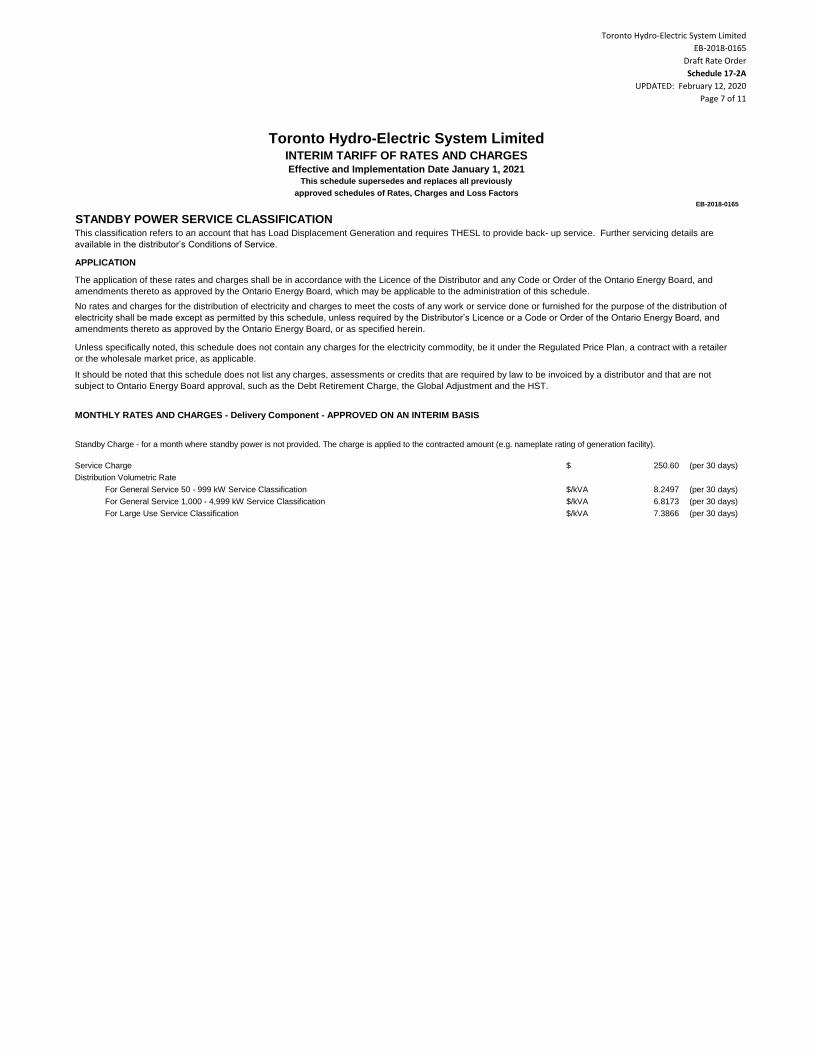
Toronto Hydro-Electric System Limited
EB-2018-0165
Draft Rate Order
Schedule 17-2A
UPDATED: February 12, 2020
Page 7 of 11
Toronto Hydro-Electric System LimitedINTERIM TARIFF OF RATES AND CHARGESEffective and Implementation Date January 1, 2021
This schedule supersedes and replaces all previously
approved schedules of Rates, Charges and Loss Factors
EB-2018-0165
$ 250.60 (per 30 days)
$/kVA 8.2497 (per 30 days)
$/kVA 6.8173 (per 30 days)
$/kVA 7.3866 (per 30 days)
Unless specifically noted, this schedule does not contain any charges for the electricity commodity, be it under the Regulated Price Plan, a contract with a retailer
or the wholesale market price, as applicable.
It should be noted that this schedule does not list any charges, assessments or credits that are required by law to be invoiced by a distributor and that are not
subject to Ontario Energy Board approval, such as the Debt Retirement Charge, the Global Adjustment and the HST.
MONTHLY RATES AND CHARGES - Delivery Component - APPROVED ON AN INTERIM BASIS
Standby Charge - for a month where standby power is not provided. The charge is applied to the contracted amount (e.g. nameplate rating of generation facility).
Service Charge
Distribution Volumetric Rate
STANDBY POWER SERVICE CLASSIFICATIONThis classification refers to an account that has Load Displacement Generation and requires THESL to provide back- up service. Further servicing details are
available in the distributor’s Conditions of Service.
APPLICATION
The application of these rates and charges shall be in accordance with the Licence of the Distributor and any Code or Order of the Ontario Energy Board, and
amendments thereto as approved by the Ontario Energy Board, which may be applicable to the administration of this schedule.
No rates and charges for the distribution of electricity and charges to meet the costs of any work or service done or furnished for the purpose of the distribution of
electricity shall be made except as permitted by this schedule, unless required by the Distributor’s Licence or a Code or Order of the Ontario Energy Board, and
amendments thereto as approved by the Ontario Energy Board, or as specified herein.
For General Service 50 - 999 kW Service Classification
For General Service 1,000 - 4,999 kW Service Classification
For Large Use Service Classification

Toronto Hydro-Electric System Limited
EB-2018-0165
Draft Rate Order
Schedule 17-2A
UPDATED: February 12, 2020
Page 8 of 11
Toronto Hydro-Electric System LimitedINTERIM TARIFF OF RATES AND CHARGESEffective and Implementation Date January 1, 2021
This schedule supersedes and replaces all previously
approved schedules of Rates, Charges and Loss Factors
EB-2018-0165
$ 6.33 (per 30 days)
$ 0.66 (per 30 days)
$ (0.10) (per 30 days)
$ (0.01) (per 30 days)
$/kWh 0.07963
$/kWh (0.00003)
Rate Rider for Disposition of Expansion Deposits - effective until December 31, 2024 $/kWh (0.00082)
$/kWh (0.00505)
$/kWh (0.00081)
$/kWh (0.00121)
Rate Rider for Disposition of Deferral/Variance Accounts - effective until December 31, 2021
- Approved on an Interim Basis $/kWh 0.00040
Rate Rider for Disposition of Capacity Based Recovery Account - effective until December 31, 2021
(Applicable only for Class B Customers) - Approved on an Interim Basis $/kWh (0.00002)
Rate Rider for Disposition of Global Adjustment Account - effective until December 31, 2021
(Applicable only for Non-RPP Customers) - Approved on an Interim Basis $/kWh (0.00159)
$/kWh 0.00549
$/kWh 0.00465
$/kWh 0.0030
$/kWh 0.0004
$/kWh 0.0005
$ 0.25 (per 30 days)
The application of these rates and charges shall be in accordance with the Licence of the Distributor and any Code or Order of the Ontario Energy Board, and
amendments thereto as approved by the Ontario Energy Board, which may be applicable to the administration of this schedule.
No rates and charges for the distribution of electricity and charges to meet the costs of any work or service done or furnished for the purpose of the distribution of
electricity shall be made except as permitted by this schedule, unless required by the Distributor’s Licence or a Code or Order of the Ontario Energy Board, and
amendments thereto as approved by the Ontario Energy Board, or as specified herein.
Unless specifically noted, this schedule does not contain any charges for the electricity commodity, be it under the Regulated Price Plan, a contract with a retailer
or the wholesale market price, as applicable. In addition, the charges in the MONTHLY RATES AND CHARGES - Regulatory Component of this schedule do not
apply to a customer that is an embedded wholesale market participant.
It should be noted that this schedule does not list any charges, assessments or credits that are required by law to be invoiced by a distributor and that are not
subject to Ontario Energy Board approval, such as the Debt Retirement Charge, the Global Adjustment and the HST.
MONTHLY RATES AND CHARGES - Delivery Component
Service Charge
UNMETERED SCATTERED LOAD SERVICE CLASSIFICATIONThis classification applies to an account taking electricity at 750 volts or less whose average monthly maximum demand at each location is less than, or is forecast
to be less than, 50 kW and the consumption is unmetered. Such connections include cable TV power packs, bus shelters, telephone booths, traffic lights, railway
crossings, etc. The level of the consumption will be agreed to by THESL and the customer, based on detailed manufacturer information/ documentation with
regard to electrical consumption of the unmetered load or periodic monitoring of actual consumption. Class B consumers are defined in accordance with O. Reg.
429/04. Further servicing details are available in the distributor’s Conditions of Service.
APPLICATION
Rate Rider for Disposition of the Gain on Property Sale - effective until December 31, 2021
Rate Rider for Recovery of 2020 Foregone Revenue - effective until December 31, 2021
Retail Transmission Rate - Network Service Rate
Retail Transmission Rate - Line and Transformation Connection Service Rate
MONTHLY RATES AND CHARGES - Regulatory Component
Wholesale Market Service Rate (WMS) - not including CBR
Connection Charge (per connection)
Rate Rider for Recovery of 2020 Foregone Revenue - effective until December 31, 2021
Rate Rider for Recovery of 2020 Foregone Revenue (per connection) - effective until December 31, 2021
Distribution Volumetric Rate
Rate Rider for Disposition of Wireless Pole Attachment Revenue - effective until December 31, 2024
Rate Rider for Application of Operations Center Consolidation Plan - effective until December 31, 2021
Capacity Based Recovery (CBR) - Applicable for Class B Customers
Rural or Remote Electricity Rate Protection Charge (RRRP)
Standard Supply Service - Administrative Charge (if applicable)
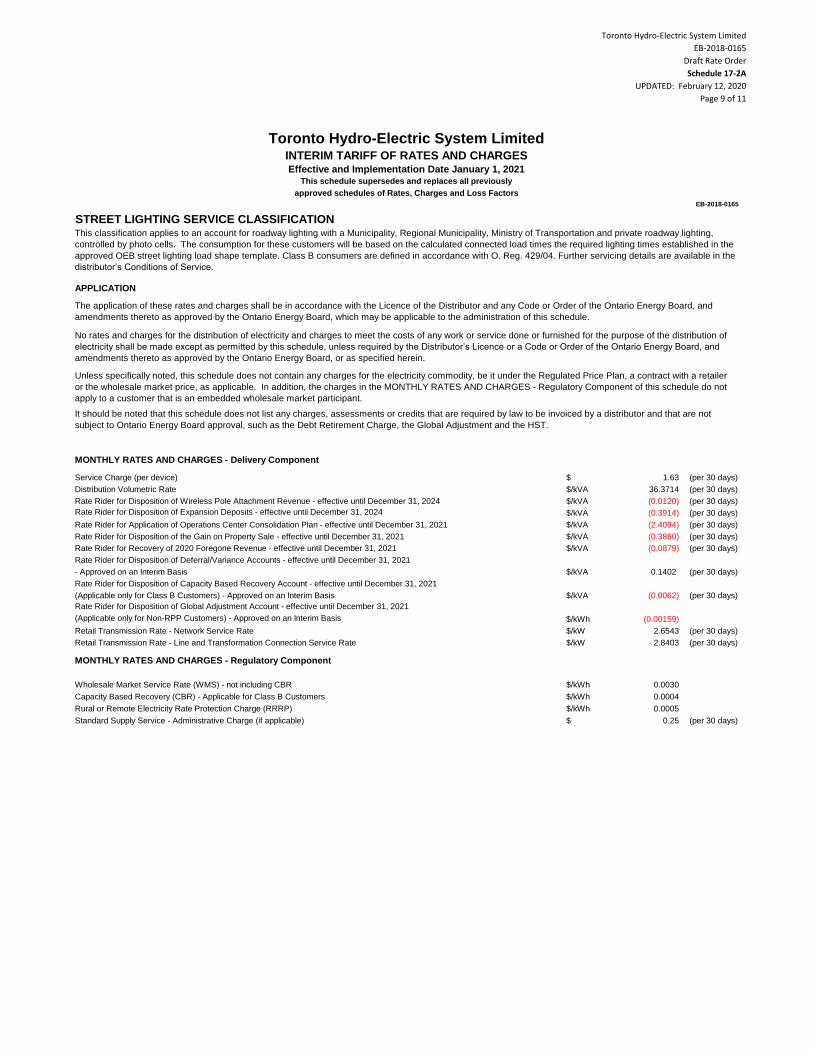
Toronto Hydro-Electric System Limited
EB-2018-0165
Draft Rate Order
Schedule 17-2A
UPDATED: February 12, 2020
Page 9 of 11
Toronto Hydro-Electric System LimitedINTERIM TARIFF OF RATES AND CHARGESEffective and Implementation Date January 1, 2021
This schedule supersedes and replaces all previously
approved schedules of Rates, Charges and Loss Factors
EB-2018-0165
$ 1.63 (per 30 days)
$/kVA 36.3714 (per 30 days)
$/kVA (0.0120) (per 30 days)
Rate Rider for Disposition of Expansion Deposits - effective until December 31, 2024 $/kVA (0.3914) (per 30 days)
$/kVA (2.4094) (per 30 days)
$/kVA (0.3860) (per 30 days)
$/kVA (0.0879) (per 30 days)
Rate Rider for Disposition of Deferral/Variance Accounts - effective until December 31, 2021
- Approved on an Interim Basis $/kVA 0.1402 (per 30 days)
Rate Rider for Disposition of Capacity Based Recovery Account - effective until December 31, 2021
(Applicable only for Class B Customers) - Approved on an Interim Basis $/kVA (0.0062) (per 30 days)
Rate Rider for Disposition of Global Adjustment Account - effective until December 31, 2021
(Applicable only for Non-RPP Customers) - Approved on an Interim Basis $/kWh (0.00159)
$/kW 2.6543 (per 30 days)
$/kW 2.8403 (per 30 days)
$/kWh 0.0030
$/kWh 0.0004
$/kWh 0.0005
$ 0.25 (per 30 days)
The application of these rates and charges shall be in accordance with the Licence of the Distributor and any Code or Order of the Ontario Energy Board, and
amendments thereto as approved by the Ontario Energy Board, which may be applicable to the administration of this schedule.
No rates and charges for the distribution of electricity and charges to meet the costs of any work or service done or furnished for the purpose of the distribution of
electricity shall be made except as permitted by this schedule, unless required by the Distributor’s Licence or a Code or Order of the Ontario Energy Board, and
amendments thereto as approved by the Ontario Energy Board, or as specified herein.
Unless specifically noted, this schedule does not contain any charges for the electricity commodity, be it under the Regulated Price Plan, a contract with a retailer
or the wholesale market price, as applicable. In addition, the charges in the MONTHLY RATES AND CHARGES - Regulatory Component of this schedule do not
apply to a customer that is an embedded wholesale market participant.
It should be noted that this schedule does not list any charges, assessments or credits that are required by law to be invoiced by a distributor and that are not
subject to Ontario Energy Board approval, such as the Debt Retirement Charge, the Global Adjustment and the HST.
MONTHLY RATES AND CHARGES - Delivery Component
Service Charge (per device)
STREET LIGHTING SERVICE CLASSIFICATIONThis classification applies to an account for roadway lighting with a Municipality, Regional Municipality, Ministry of Transportation and private roadway lighting,
controlled by photo cells. The consumption for these customers will be based on the calculated connected load times the required lighting times established in the
approved OEB street lighting load shape template. Class B consumers are defined in accordance with O. Reg. 429/04. Further servicing details are available in the
distributor’s Conditions of Service.
APPLICATION
Retail Transmission Rate - Line and Transformation Connection Service Rate
MONTHLY RATES AND CHARGES - Regulatory Component
Wholesale Market Service Rate (WMS) - not including CBR
Capacity Based Recovery (CBR) - Applicable for Class B Customers
Rural or Remote Electricity Rate Protection Charge (RRRP)
Standard Supply Service - Administrative Charge (if applicable)
Distribution Volumetric Rate
Rate Rider for Disposition of Wireless Pole Attachment Revenue - effective until December 31, 2024
Rate Rider for Application of Operations Center Consolidation Plan - effective until December 31, 2021
Rate Rider for Disposition of the Gain on Property Sale - effective until December 31, 2021
Rate Rider for Recovery of 2020 Foregone Revenue - effective until December 31, 2021
Retail Transmission Rate - Network Service Rate
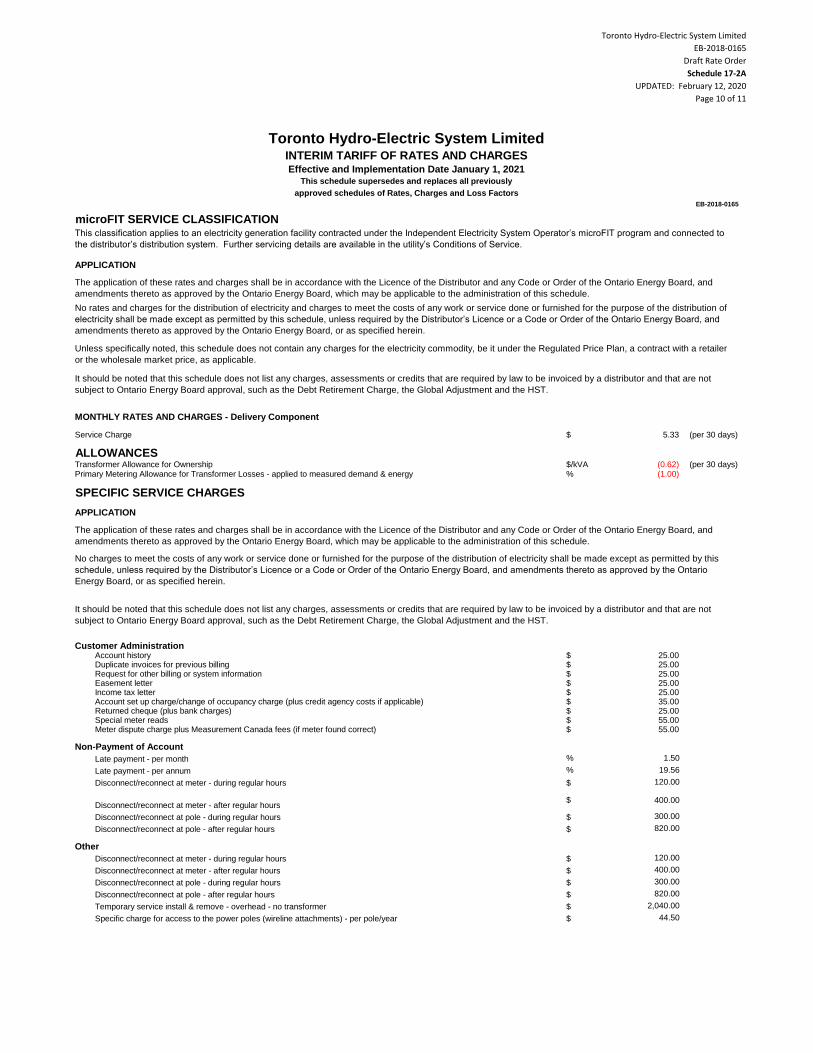
Toronto Hydro-Electric System Limited
EB-2018-0165
Draft Rate Order
Schedule 17-2A
UPDATED: February 12, 2020
Page 10 of 11
Toronto Hydro-Electric System LimitedINTERIM TARIFF OF RATES AND CHARGESEffective and Implementation Date January 1, 2021
This schedule supersedes and replaces all previously
approved schedules of Rates, Charges and Loss Factors
EB-2018-0165
$ 5.33 (per 30 days)
ALLOWANCES$/kVA (0.62) (per 30 days)% (1.00)
SPECIFIC SERVICE CHARGES
Customer Administration$ 25.00$ 25.00$ 25.00$ 25.00$ 25.00$ 35.00$ 25.00$ 55.00$ 55.00
Non-Payment of Account
% 1.50
% 19.56
$ 120.00
$ 400.00
$ 300.00
$ 820.00
Other
$ 120.00
$ 400.00
$ 300.00
$ 820.00
$ 2,040.00
$ 44.50
It should be noted that this schedule does not list any charges, assessments or credits that are required by law to be invoiced by a distributor and that are not
subject to Ontario Energy Board approval, such as the Debt Retirement Charge, the Global Adjustment and the HST.
MONTHLY RATES AND CHARGES - Delivery Component
Service Charge
Transformer Allowance for OwnershipPrimary Metering Allowance for Transformer Losses - applied to measured demand & energy
APPLICATION
microFIT SERVICE CLASSIFICATIONThis classification applies to an electricity generation facility contracted under the Independent Electricity System Operator’s microFIT program and connected to
the distributor’s distribution system. Further servicing details are available in the utility’s Conditions of Service.
APPLICATION
The application of these rates and charges shall be in accordance with the Licence of the Distributor and any Code or Order of the Ontario Energy Board, and
amendments thereto as approved by the Ontario Energy Board, which may be applicable to the administration of this schedule.
No rates and charges for the distribution of electricity and charges to meet the costs of any work or service done or furnished for the purpose of the distribution of
electricity shall be made except as permitted by this schedule, unless required by the Distributor’s Licence or a Code or Order of the Ontario Energy Board, and
amendments thereto as approved by the Ontario Energy Board, or as specified herein.
Unless specifically noted, this schedule does not contain any charges for the electricity commodity, be it under the Regulated Price Plan, a contract with a retailer
or the wholesale market price, as applicable.
Easement letterIncome tax letterAccount set up charge/change of occupancy charge (plus credit agency costs if applicable)Returned cheque (plus bank charges)Special meter readsMeter dispute charge plus Measurement Canada fees (if meter found correct)
The application of these rates and charges shall be in accordance with the Licence of the Distributor and any Code or Order of the Ontario Energy Board, and
amendments thereto as approved by the Ontario Energy Board, which may be applicable to the administration of this schedule.
No charges to meet the costs of any work or service done or furnished for the purpose of the distribution of electricity shall be made except as permitted by this
schedule, unless required by the Distributor’s Licence or a Code or Order of the Ontario Energy Board, and amendments thereto as approved by the Ontario
Energy Board, or as specified herein.
It should be noted that this schedule does not list any charges, assessments or credits that are required by law to be invoiced by a distributor and that are not
subject to Ontario Energy Board approval, such as the Debt Retirement Charge, the Global Adjustment and the HST.
Account historyDuplicate invoices for previous billingRequest for other billing or system information
Disconnect/reconnect at meter - during regular hours
Disconnect/reconnect at meter - after regular hours
Disconnect/reconnect at pole - during regular hours
Disconnect/reconnect at pole - after regular hours
Temporary service install & remove - overhead - no transformer
Specific charge for access to the power poles (wireline attachments) - per pole/year
Late payment - per month
Late payment - per annum
Disconnect/reconnect at meter - during regular hours
Disconnect/reconnect at meter - after regular hours
Disconnect/reconnect at pole - during regular hours
Disconnect/reconnect at pole - after regular hours

Toronto Hydro-Electric System Limited
EB-2018-0165
Draft Rate Order
Schedule 17-2A
UPDATED: February 12, 2020
Page 11 of 11
Toronto Hydro-Electric System LimitedINTERIM TARIFF OF RATES AND CHARGESEffective and Implementation Date January 1, 2021
This schedule supersedes and replaces all previously
approved schedules of Rates, Charges and Loss Factors
EB-2018-0165
RETAIL SERVICE CHARGES (if applicable)
$ 102.00
$ 40.80
$/cust. 1.02
$/cust. 0.61
$/cust. (0.61)
$ 0.51
$ 1.02
no charge
$ 4.08
LOSS FACTORS
1.0295
1.0172
1.0192
1.0070
One-time charge, per retailer, to establish the service agreement between the distributor and the retailer
Monthly Fixed Charge, per retailer
Monthly Variable Charge, per customer, per retailer
Distributor-consolidated billing monthly charge, per customer, per retailer
Retailer-consolidated billing monthly credit, per customer, per retailer
Service Transaction Requests (STR)
APPLICATION
The application of these rates and charges shall be in accordance with the Licence of the Distributor and any Code or Order of the Ontario Energy Board, and
amendments thereto as approved by the Ontario Energy Board, which may be applicable to the administration of this schedule.
No rates and charges for the distribution of electricity and charges to meet the costs of any work or service done or furnished for the purpose of the distribution of
electricity shall be made except as permitted by this schedule, unless required by the Distributor’s Licence or a Code or Order of the Ontario Energy Board, and
amendments thereto as approved by the Ontario Energy Board, or as specified herein.
Unless specifically noted, this schedule does not contain any charges for the electricity commodity, be it under the Regulated Price Plan, a contract with a retailer
or the wholesale market price, as applicable.
It should be noted that this schedule does not list any charges, assessments or credits that are required by law to be invoiced by a distributor and that are not
subject to Ontario Energy Board approval, such as the Debt Retirement Charge, the Global Adjustment and the HST.
Retail Service Charges refer to services provided by THESL to retailers or customers related to the supply of competitive electricity and are defined
in the 2006 Electricity Distribution Rate Handbook.
More than twice a year, per request (plus incremental delivery costs)
If the distributor is not capable of prorating changed loss factors jointly with distribution rates, the revised loss factors will be implemented upon the
first subsequent billing for each billing cycle.
Total Loss Factor - Secondary Metered Customer < 5,000 kW
Total Loss Factor - Secondary Metered Customer > 5,000 kW
Total Loss Factor - Primary Metered Customer < 5,000 kW
Total Loss Factor - Primary Metered Customer > 5,000 kW
Request fee, per request, applied to the requesting party
Processing fee, per request, applied to the requesting party
Request for customer information as outlined in Section 10.6.3 and Chapter 11 of the Retail
Settlement Code directly to retailers and customers, if not delivered electronically through the
Electronic Business Transaction (EBT) system, applied to the requesting party
Up to twice a year
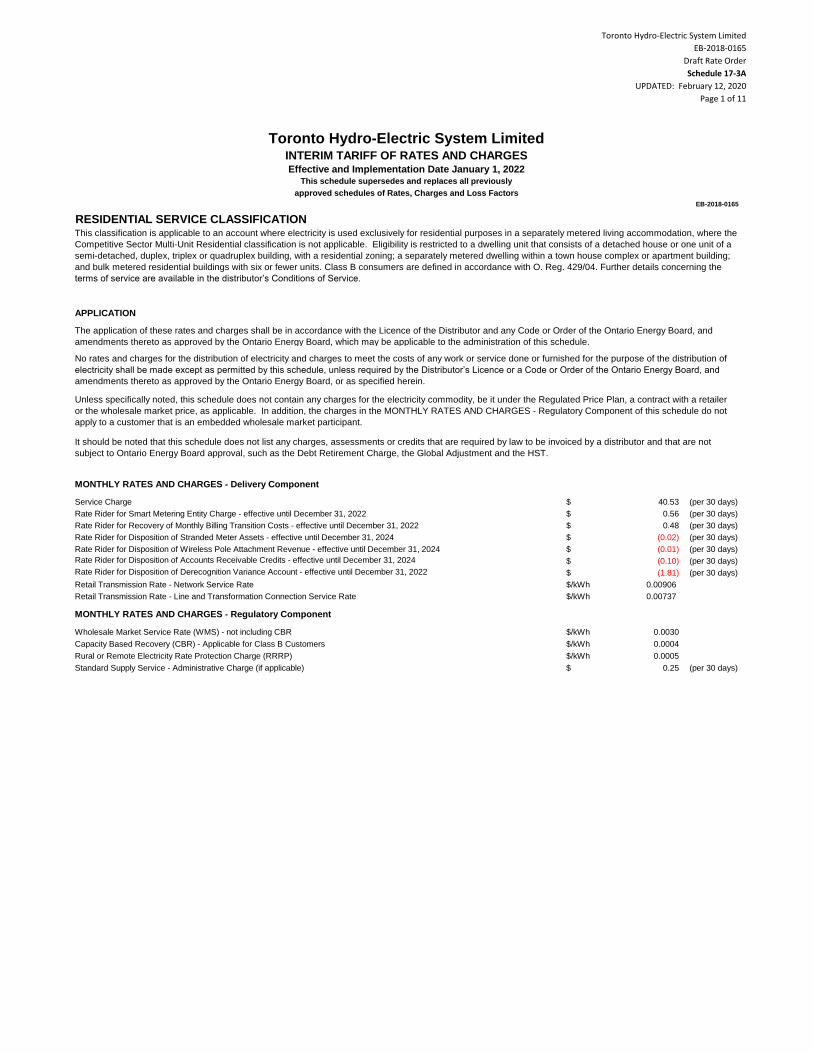
Toronto Hydro-Electric System Limited
EB-2018-0165
Draft Rate Order
Schedule 17-3A
UPDATED: February 12, 2020
Page 1 of 11
$ 40.53 (per 30 days)
$ 0.56 (per 30 days)
$ 0.48 (per 30 days)
$ (0.02) (per 30 days)
$ (0.01) (per 30 days)
Rate Rider for Disposition of Accounts Receivable Credits - effective until December 31, 2024 $ (0.10) (per 30 days)
Rate Rider for Disposition of Derecognition Variance Account - effective until December 31, 2022 $ (1.81) (per 30 days)
$/kWh 0.00906
$/kWh 0.00737
$/kWh 0.0030
$/kWh 0.0004
$/kWh 0.0005
$ 0.25 (per 30 days)
Rural or Remote Electricity Rate Protection Charge (RRRP)
Standard Supply Service - Administrative Charge (if applicable)
Rate Rider for Disposition of Wireless Pole Attachment Revenue - effective until December 31, 2024
Retail Transmission Rate - Network Service Rate
Retail Transmission Rate - Line and Transformation Connection Service Rate
MONTHLY RATES AND CHARGES - Regulatory Component
Wholesale Market Service Rate (WMS) - not including CBR
Capacity Based Recovery (CBR) - Applicable for Class B Customers
It should be noted that this schedule does not list any charges, assessments or credits that are required by law to be invoiced by a distributor and that are not
subject to Ontario Energy Board approval, such as the Debt Retirement Charge, the Global Adjustment and the HST.
MONTHLY RATES AND CHARGES - Delivery Component
Service Charge
Rate Rider for Smart Metering Entity Charge - effective until December 31, 2022
Rate Rider for Recovery of Monthly Billing Transition Costs - effective until December 31, 2022
Rate Rider for Disposition of Stranded Meter Assets - effective until December 31, 2024
RESIDENTIAL SERVICE CLASSIFICATIONThis classification is applicable to an account where electricity is used exclusively for residential purposes in a separately metered living accommodation, where the
Competitive Sector Multi-Unit Residential classification is not applicable. Eligibility is restricted to a dwelling unit that consists of a detached house or one unit of a
semi-detached, duplex, triplex or quadruplex building, with a residential zoning; a separately metered dwelling within a town house complex or apartment building;
and bulk metered residential buildings with six or fewer units. Class B consumers are defined in accordance with O. Reg. 429/04. Further details concerning the
terms of service are available in the distributor’s Conditions of Service.
APPLICATION
The application of these rates and charges shall be in accordance with the Licence of the Distributor and any Code or Order of the Ontario Energy Board, and
amendments thereto as approved by the Ontario Energy Board, which may be applicable to the administration of this schedule.
No rates and charges for the distribution of electricity and charges to meet the costs of any work or service done or furnished for the purpose of the distribution of
electricity shall be made except as permitted by this schedule, unless required by the Distributor’s Licence or a Code or Order of the Ontario Energy Board, and
amendments thereto as approved by the Ontario Energy Board, or as specified herein.
Unless specifically noted, this schedule does not contain any charges for the electricity commodity, be it under the Regulated Price Plan, a contract with a retailer
or the wholesale market price, as applicable. In addition, the charges in the MONTHLY RATES AND CHARGES - Regulatory Component of this schedule do not
apply to a customer that is an embedded wholesale market participant.
Toronto Hydro-Electric System LimitedINTERIM TARIFF OF RATES AND CHARGESEffective and Implementation Date January 1, 2022
This schedule supersedes and replaces all previously
approved schedules of Rates, Charges and Loss Factors
EB-2018-0165
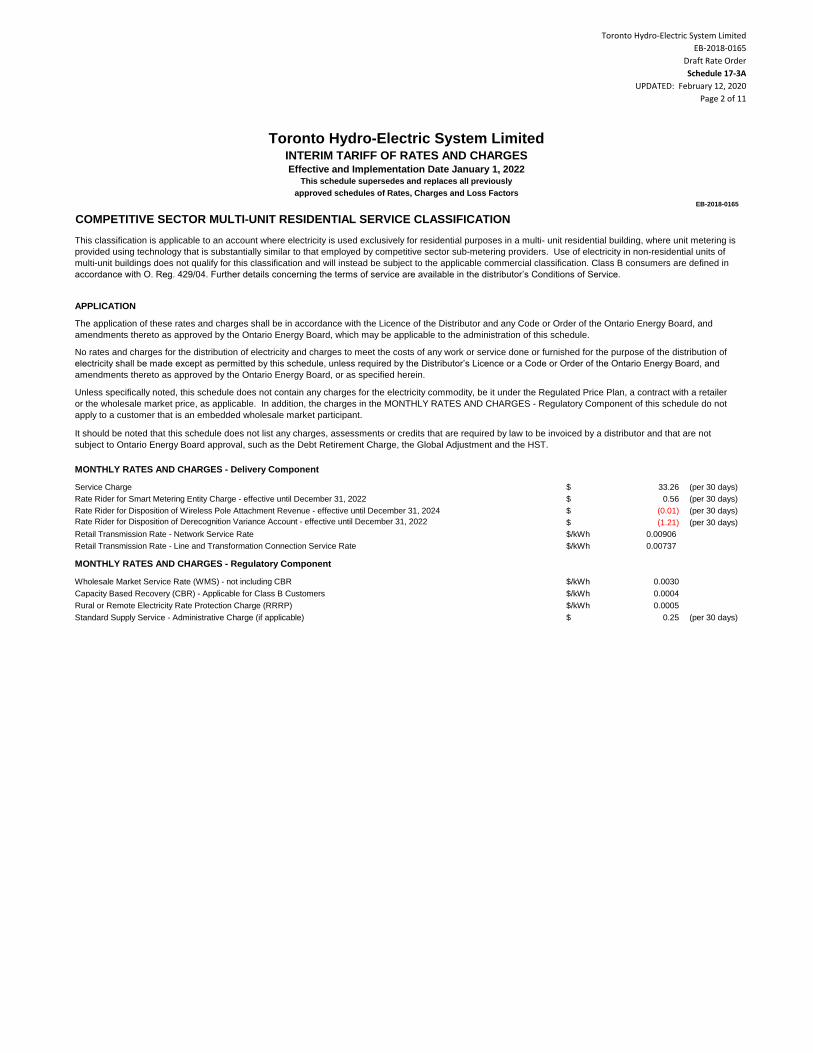
Toronto Hydro-Electric System Limited
EB-2018-0165
Draft Rate Order
Schedule 17-3A
UPDATED: February 12, 2020
Page 2 of 11
Toronto Hydro-Electric System LimitedINTERIM TARIFF OF RATES AND CHARGESEffective and Implementation Date January 1, 2022
This schedule supersedes and replaces all previously
approved schedules of Rates, Charges and Loss Factors
EB-2018-0165
$ 33.26 (per 30 days)
$ 0.56 (per 30 days)
$ (0.01) (per 30 days)
Rate Rider for Disposition of Derecognition Variance Account - effective until December 31, 2022 $ (1.21) (per 30 days)
$/kWh 0.00906
$/kWh 0.00737
$/kWh 0.0030
$/kWh 0.0004
$/kWh 0.0005
$ 0.25 (per 30 days)
Rural or Remote Electricity Rate Protection Charge (RRRP)
Standard Supply Service - Administrative Charge (if applicable)
Rate Rider for Disposition of Wireless Pole Attachment Revenue - effective until December 31, 2024
Retail Transmission Rate - Network Service Rate
Retail Transmission Rate - Line and Transformation Connection Service Rate
MONTHLY RATES AND CHARGES - Regulatory Component
Wholesale Market Service Rate (WMS) - not including CBR
Capacity Based Recovery (CBR) - Applicable for Class B Customers
No rates and charges for the distribution of electricity and charges to meet the costs of any work or service done or furnished for the purpose of the distribution of
electricity shall be made except as permitted by this schedule, unless required by the Distributor’s Licence or a Code or Order of the Ontario Energy Board, and
amendments thereto as approved by the Ontario Energy Board, or as specified herein.
Unless specifically noted, this schedule does not contain any charges for the electricity commodity, be it under the Regulated Price Plan, a contract with a retailer
or the wholesale market price, as applicable. In addition, the charges in the MONTHLY RATES AND CHARGES - Regulatory Component of this schedule do not
apply to a customer that is an embedded wholesale market participant.
It should be noted that this schedule does not list any charges, assessments or credits that are required by law to be invoiced by a distributor and that are not
subject to Ontario Energy Board approval, such as the Debt Retirement Charge, the Global Adjustment and the HST.
MONTHLY RATES AND CHARGES - Delivery Component
Service Charge
Rate Rider for Smart Metering Entity Charge - effective until December 31, 2022
COMPETITIVE SECTOR MULTI-UNIT RESIDENTIAL SERVICE CLASSIFICATION
This classification is applicable to an account where electricity is used exclusively for residential purposes in a multi- unit residential building, where unit metering is
provided using technology that is substantially similar to that employed by competitive sector sub-metering providers. Use of electricity in non-residential units of
multi-unit buildings does not qualify for this classification and will instead be subject to the applicable commercial classification. Class B consumers are defined in
accordance with O. Reg. 429/04. Further details concerning the terms of service are available in the distributor’s Conditions of Service.
APPLICATION
The application of these rates and charges shall be in accordance with the Licence of the Distributor and any Code or Order of the Ontario Energy Board, and
amendments thereto as approved by the Ontario Energy Board, which may be applicable to the administration of this schedule.
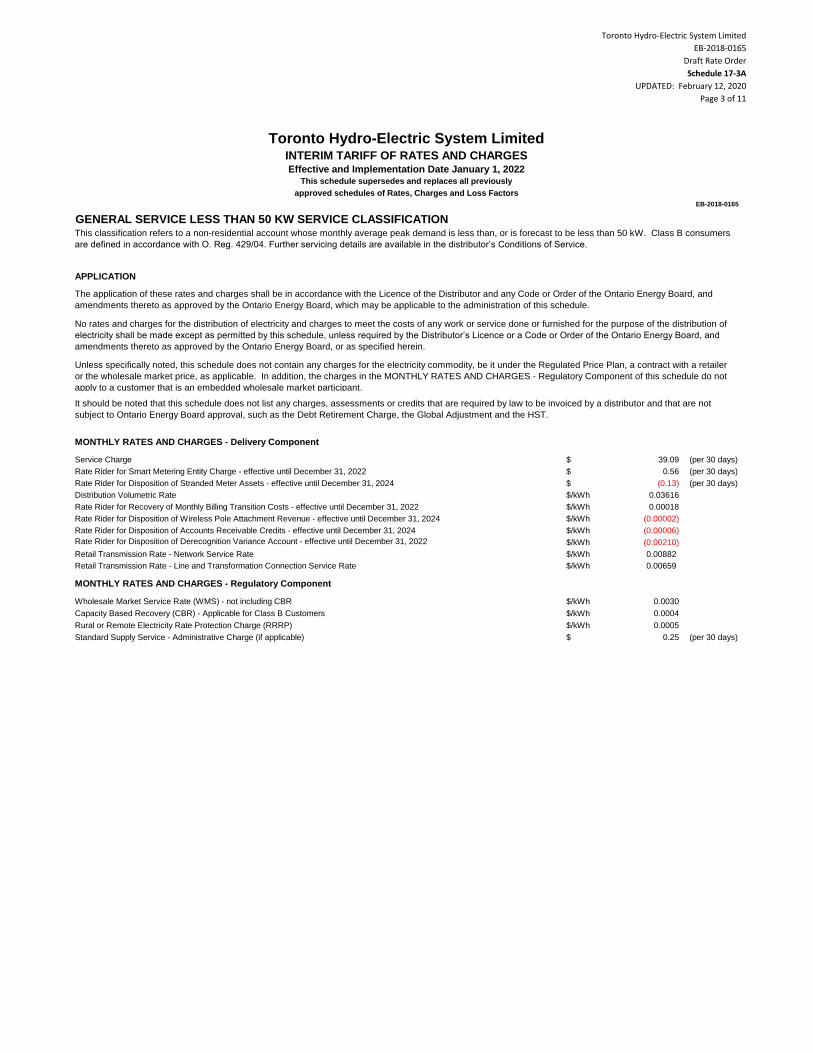
Toronto Hydro-Electric System Limited
EB-2018-0165
Draft Rate Order
Schedule 17-3A
UPDATED: February 12, 2020
Page 3 of 11
Toronto Hydro-Electric System LimitedINTERIM TARIFF OF RATES AND CHARGESEffective and Implementation Date January 1, 2022
This schedule supersedes and replaces all previously
approved schedules of Rates, Charges and Loss Factors
EB-2018-0165
$ 39.09 (per 30 days)
$ 0.56 (per 30 days)
$ (0.13) (per 30 days)
$/kWh 0.03616
$/kWh 0.00018
$/kWh (0.00002)
$/kWh (0.00006)
Rate Rider for Disposition of Derecognition Variance Account - effective until December 31, 2022 $/kWh (0.00210)
$/kWh 0.00882
$/kWh 0.00659
$/kWh 0.0030
$/kWh 0.0004
$/kWh 0.0005
$ 0.25 (per 30 days)
Retail Transmission Rate - Line and Transformation Connection Service Rate
MONTHLY RATES AND CHARGES - Regulatory Component
Wholesale Market Service Rate (WMS) - not including CBR
Capacity Based Recovery (CBR) - Applicable for Class B Customers
Rural or Remote Electricity Rate Protection Charge (RRRP)
Standard Supply Service - Administrative Charge (if applicable)
Rate Rider for Disposition of Stranded Meter Assets - effective until December 31, 2024
Distribution Volumetric Rate
Rate Rider for Recovery of Monthly Billing Transition Costs - effective until December 31, 2022
Rate Rider for Disposition of Wireless Pole Attachment Revenue - effective until December 31, 2024
Rate Rider for Disposition of Accounts Receivable Credits - effective until December 31, 2024
Retail Transmission Rate - Network Service Rate
No rates and charges for the distribution of electricity and charges to meet the costs of any work or service done or furnished for the purpose of the distribution of
electricity shall be made except as permitted by this schedule, unless required by the Distributor’s Licence or a Code or Order of the Ontario Energy Board, and
amendments thereto as approved by the Ontario Energy Board, or as specified herein.
Unless specifically noted, this schedule does not contain any charges for the electricity commodity, be it under the Regulated Price Plan, a contract with a retailer
or the wholesale market price, as applicable. In addition, the charges in the MONTHLY RATES AND CHARGES - Regulatory Component of this schedule do not
apply to a customer that is an embedded wholesale market participant.
It should be noted that this schedule does not list any charges, assessments or credits that are required by law to be invoiced by a distributor and that are not
subject to Ontario Energy Board approval, such as the Debt Retirement Charge, the Global Adjustment and the HST.
MONTHLY RATES AND CHARGES - Delivery Component
Service Charge
Rate Rider for Smart Metering Entity Charge - effective until December 31, 2022
GENERAL SERVICE LESS THAN 50 KW SERVICE CLASSIFICATIONThis classification refers to a non-residential account whose monthly average peak demand is less than, or is forecast to be less than 50 kW. Class B consumers
are defined in accordance with O. Reg. 429/04. Further servicing details are available in the distributor’s Conditions of Service.
APPLICATION
The application of these rates and charges shall be in accordance with the Licence of the Distributor and any Code or Order of the Ontario Energy Board, and
amendments thereto as approved by the Ontario Energy Board, which may be applicable to the administration of this schedule.
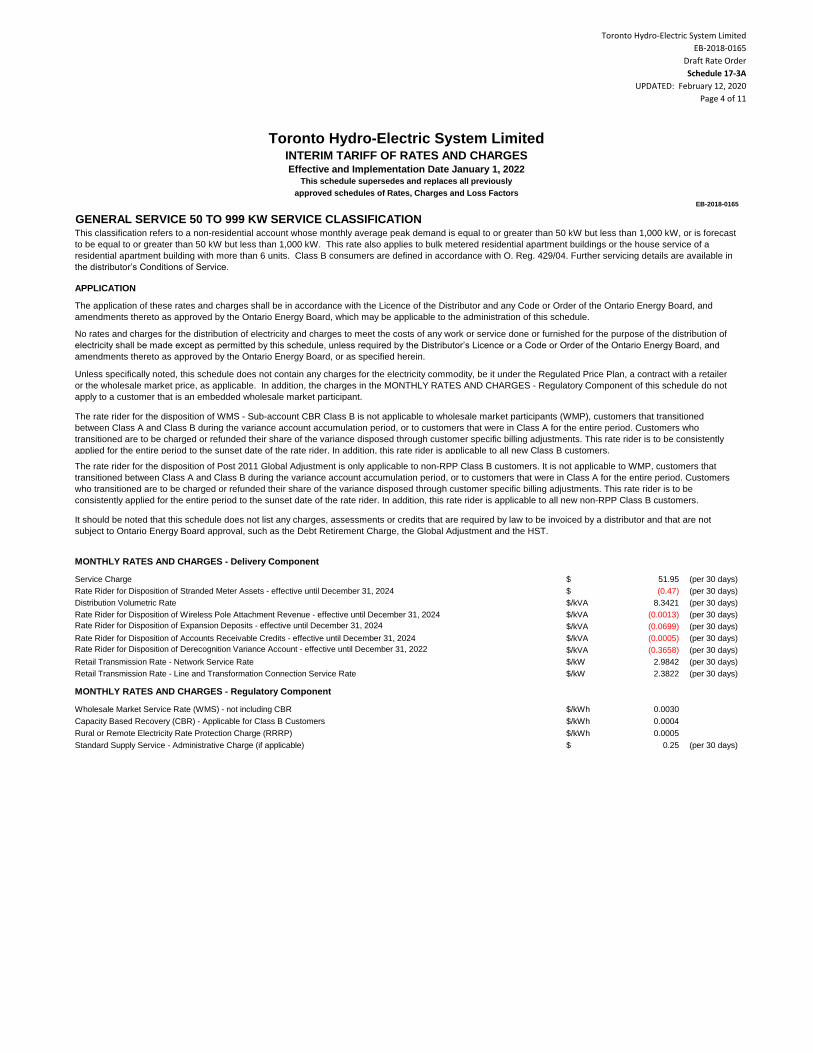
Toronto Hydro-Electric System Limited
EB-2018-0165
Draft Rate Order
Schedule 17-3A
UPDATED: February 12, 2020
Page 4 of 11
Toronto Hydro-Electric System LimitedINTERIM TARIFF OF RATES AND CHARGESEffective and Implementation Date January 1, 2022
This schedule supersedes and replaces all previously
approved schedules of Rates, Charges and Loss Factors
EB-2018-0165
$ 51.95 (per 30 days)
$ (0.47) (per 30 days)
$/kVA 8.3421 (per 30 days)
$/kVA (0.0013) (per 30 days)
Rate Rider for Disposition of Expansion Deposits - effective until December 31, 2024 $/kVA (0.0699) (per 30 days)
$/kVA (0.0005) (per 30 days)
Rate Rider for Disposition of Derecognition Variance Account - effective until December 31, 2022 $/kVA (0.3658) (per 30 days)
$/kW 2.9842 (per 30 days)
$/kW 2.3822 (per 30 days)
$/kWh 0.0030
$/kWh 0.0004
$/kWh 0.0005
$ 0.25 (per 30 days)
Wholesale Market Service Rate (WMS) - not including CBR
Capacity Based Recovery (CBR) - Applicable for Class B Customers
Rural or Remote Electricity Rate Protection Charge (RRRP)
Standard Supply Service - Administrative Charge (if applicable)
Distribution Volumetric Rate
Rate Rider for Disposition of Wireless Pole Attachment Revenue - effective until December 31, 2024
Rate Rider for Disposition of Accounts Receivable Credits - effective until December 31, 2024
Retail Transmission Rate - Network Service Rate
Retail Transmission Rate - Line and Transformation Connection Service Rate
MONTHLY RATES AND CHARGES - Regulatory Component
The rate rider for the disposition of WMS - Sub-account CBR Class B is not applicable to wholesale market participants (WMP), customers that transitioned
between Class A and Class B during the variance account accumulation period, or to customers that were in Class A for the entire period. Customers who
transitioned are to be charged or refunded their share of the variance disposed through customer specific billing adjustments. This rate rider is to be consistently
applied for the entire period to the sunset date of the rate rider. In addition, this rate rider is applicable to all new Class B customers.
The rate rider for the disposition of Post 2011 Global Adjustment is only applicable to non-RPP Class B customers. It is not applicable to WMP, customers that
transitioned between Class A and Class B during the variance account accumulation period, or to customers that were in Class A for the entire period. Customers
who transitioned are to be charged or refunded their share of the variance disposed through customer specific billing adjustments. This rate rider is to be
consistently applied for the entire period to the sunset date of the rate rider. In addition, this rate rider is applicable to all new non-RPP Class B customers.
It should be noted that this schedule does not list any charges, assessments or credits that are required by law to be invoiced by a distributor and that are not
subject to Ontario Energy Board approval, such as the Debt Retirement Charge, the Global Adjustment and the HST.
MONTHLY RATES AND CHARGES - Delivery Component
Service Charge
Rate Rider for Disposition of Stranded Meter Assets - effective until December 31, 2024
GENERAL SERVICE 50 TO 999 KW SERVICE CLASSIFICATIONThis classification refers to a non-residential account whose monthly average peak demand is equal to or greater than 50 kW but less than 1,000 kW, or is forecast
to be equal to or greater than 50 kW but less than 1,000 kW. This rate also applies to bulk metered residential apartment buildings or the house service of a
residential apartment building with more than 6 units. Class B consumers are defined in accordance with O. Reg. 429/04. Further servicing details are available in
the distributor’s Conditions of Service.
APPLICATION
The application of these rates and charges shall be in accordance with the Licence of the Distributor and any Code or Order of the Ontario Energy Board, and
amendments thereto as approved by the Ontario Energy Board, which may be applicable to the administration of this schedule.
No rates and charges for the distribution of electricity and charges to meet the costs of any work or service done or furnished for the purpose of the distribution of
electricity shall be made except as permitted by this schedule, unless required by the Distributor’s Licence or a Code or Order of the Ontario Energy Board, and
amendments thereto as approved by the Ontario Energy Board, or as specified herein.
Unless specifically noted, this schedule does not contain any charges for the electricity commodity, be it under the Regulated Price Plan, a contract with a retailer
or the wholesale market price, as applicable. In addition, the charges in the MONTHLY RATES AND CHARGES - Regulatory Component of this schedule do not
apply to a customer that is an embedded wholesale market participant.
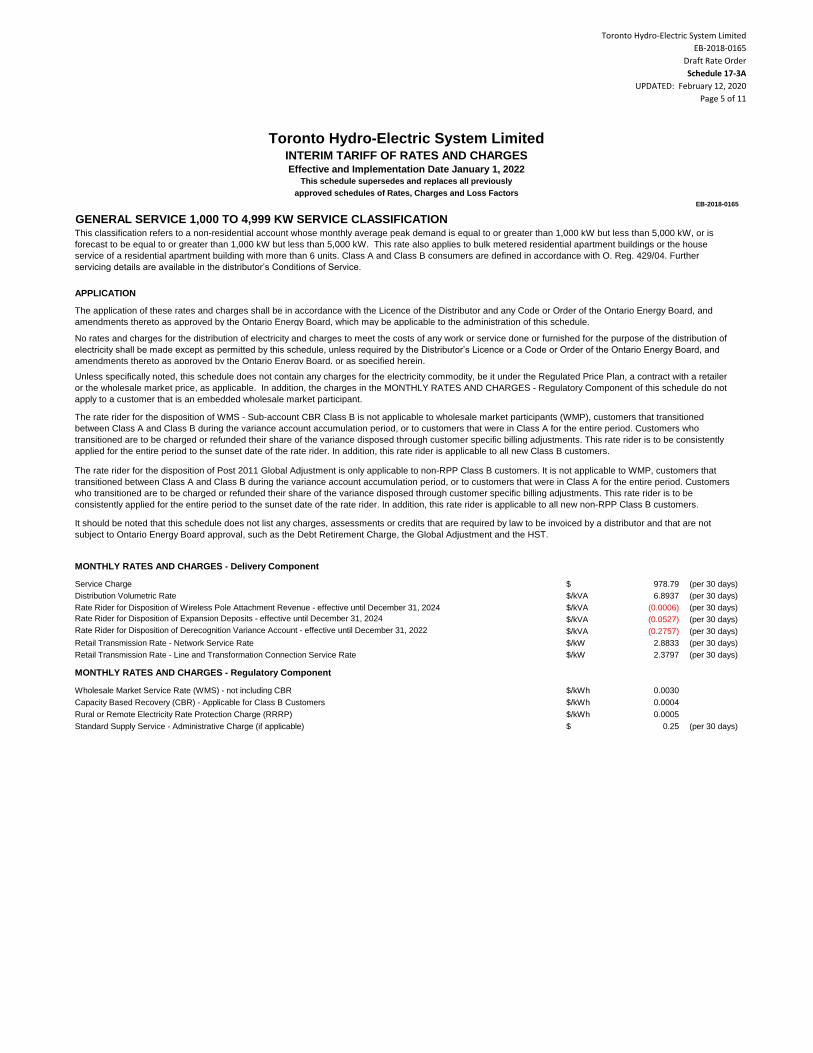
Toronto Hydro-Electric System Limited
EB-2018-0165
Draft Rate Order
Schedule 17-3A
UPDATED: February 12, 2020
Page 5 of 11
Toronto Hydro-Electric System LimitedINTERIM TARIFF OF RATES AND CHARGESEffective and Implementation Date January 1, 2022
This schedule supersedes and replaces all previously
approved schedules of Rates, Charges and Loss Factors
EB-2018-0165
$ 978.79 (per 30 days)
$/kVA 6.8937 (per 30 days)
$/kVA (0.0006) (per 30 days)
Rate Rider for Disposition of Expansion Deposits - effective until December 31, 2024 $/kVA (0.0527) (per 30 days)
Rate Rider for Disposition of Derecognition Variance Account - effective until December 31, 2022 $/kVA (0.2757) (per 30 days)
$/kW 2.8833 (per 30 days)
$/kW 2.3797 (per 30 days)
$/kWh 0.0030
$/kWh 0.0004
$/kWh 0.0005
$ 0.25 (per 30 days)
Retail Transmission Rate - Line and Transformation Connection Service Rate
MONTHLY RATES AND CHARGES - Regulatory Component
Wholesale Market Service Rate (WMS) - not including CBR
Capacity Based Recovery (CBR) - Applicable for Class B Customers
Rural or Remote Electricity Rate Protection Charge (RRRP)
Standard Supply Service - Administrative Charge (if applicable)
It should be noted that this schedule does not list any charges, assessments or credits that are required by law to be invoiced by a distributor and that are not
subject to Ontario Energy Board approval, such as the Debt Retirement Charge, the Global Adjustment and the HST.
MONTHLY RATES AND CHARGES - Delivery Component
Service Charge
Distribution Volumetric Rate
Rate Rider for Disposition of Wireless Pole Attachment Revenue - effective until December 31, 2024
Retail Transmission Rate - Network Service Rate
APPLICATION
The application of these rates and charges shall be in accordance with the Licence of the Distributor and any Code or Order of the Ontario Energy Board, and
amendments thereto as approved by the Ontario Energy Board, which may be applicable to the administration of this schedule.
No rates and charges for the distribution of electricity and charges to meet the costs of any work or service done or furnished for the purpose of the distribution of
electricity shall be made except as permitted by this schedule, unless required by the Distributor’s Licence or a Code or Order of the Ontario Energy Board, and
amendments thereto as approved by the Ontario Energy Board, or as specified herein.
Unless specifically noted, this schedule does not contain any charges for the electricity commodity, be it under the Regulated Price Plan, a contract with a retailer
or the wholesale market price, as applicable. In addition, the charges in the MONTHLY RATES AND CHARGES - Regulatory Component of this schedule do not
apply to a customer that is an embedded wholesale market participant.
The rate rider for the disposition of WMS - Sub-account CBR Class B is not applicable to wholesale market participants (WMP), customers that transitioned
between Class A and Class B during the variance account accumulation period, or to customers that were in Class A for the entire period. Customers who
transitioned are to be charged or refunded their share of the variance disposed through customer specific billing adjustments. This rate rider is to be consistently
applied for the entire period to the sunset date of the rate rider. In addition, this rate rider is applicable to all new Class B customers.
The rate rider for the disposition of Post 2011 Global Adjustment is only applicable to non-RPP Class B customers. It is not applicable to WMP, customers that
transitioned between Class A and Class B during the variance account accumulation period, or to customers that were in Class A for the entire period. Customers
who transitioned are to be charged or refunded their share of the variance disposed through customer specific billing adjustments. This rate rider is to be
consistently applied for the entire period to the sunset date of the rate rider. In addition, this rate rider is applicable to all new non-RPP Class B customers.
GENERAL SERVICE 1,000 TO 4,999 KW SERVICE CLASSIFICATIONThis classification refers to a non-residential account whose monthly average peak demand is equal to or greater than 1,000 kW but less than 5,000 kW, or is
forecast to be equal to or greater than 1,000 kW but less than 5,000 kW. This rate also applies to bulk metered residential apartment buildings or the house
service of a residential apartment building with more than 6 units. Class A and Class B consumers are defined in accordance with O. Reg. 429/04. Further
servicing details are available in the distributor’s Conditions of Service.
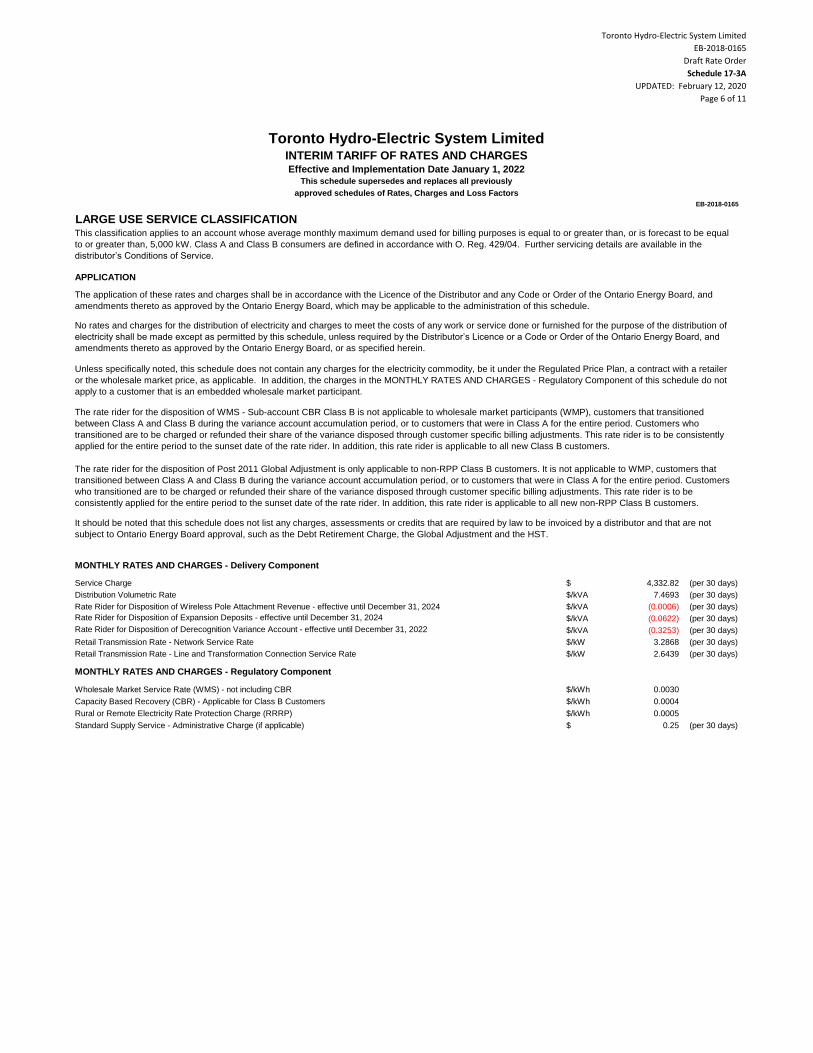
Toronto Hydro-Electric System Limited
EB-2018-0165
Draft Rate Order
Schedule 17-3A
UPDATED: February 12, 2020
Page 6 of 11
Toronto Hydro-Electric System LimitedINTERIM TARIFF OF RATES AND CHARGESEffective and Implementation Date January 1, 2022
This schedule supersedes and replaces all previously
approved schedules of Rates, Charges and Loss Factors
EB-2018-0165
$ 4,332.82 (per 30 days)
$/kVA 7.4693 (per 30 days)
$/kVA (0.0006) (per 30 days)
Rate Rider for Disposition of Expansion Deposits - effective until December 31, 2024 $/kVA (0.0622) (per 30 days)
Rate Rider for Disposition of Derecognition Variance Account - effective until December 31, 2022 $/kVA (0.3253) (per 30 days)
$/kW 3.2868 (per 30 days)
$/kW 2.6439 (per 30 days)
$/kWh 0.0030
$/kWh 0.0004
$/kWh 0.0005
$ 0.25 (per 30 days)
Rural or Remote Electricity Rate Protection Charge (RRRP)
Standard Supply Service - Administrative Charge (if applicable)
Rate Rider for Disposition of Wireless Pole Attachment Revenue - effective until December 31, 2024
Retail Transmission Rate - Network Service Rate
Retail Transmission Rate - Line and Transformation Connection Service Rate
MONTHLY RATES AND CHARGES - Regulatory Component
Wholesale Market Service Rate (WMS) - not including CBR
Capacity Based Recovery (CBR) - Applicable for Class B Customers
The rate rider for the disposition of WMS - Sub-account CBR Class B is not applicable to wholesale market participants (WMP), customers that transitioned
between Class A and Class B during the variance account accumulation period, or to customers that were in Class A for the entire period. Customers who
transitioned are to be charged or refunded their share of the variance disposed through customer specific billing adjustments. This rate rider is to be consistently
applied for the entire period to the sunset date of the rate rider. In addition, this rate rider is applicable to all new Class B customers.
The rate rider for the disposition of Post 2011 Global Adjustment is only applicable to non-RPP Class B customers. It is not applicable to WMP, customers that
transitioned between Class A and Class B during the variance account accumulation period, or to customers that were in Class A for the entire period. Customers
who transitioned are to be charged or refunded their share of the variance disposed through customer specific billing adjustments. This rate rider is to be
consistently applied for the entire period to the sunset date of the rate rider. In addition, this rate rider is applicable to all new non-RPP Class B customers.
It should be noted that this schedule does not list any charges, assessments or credits that are required by law to be invoiced by a distributor and that are not
subject to Ontario Energy Board approval, such as the Debt Retirement Charge, the Global Adjustment and the HST.
MONTHLY RATES AND CHARGES - Delivery Component
Service Charge
Distribution Volumetric Rate
LARGE USE SERVICE CLASSIFICATIONThis classification applies to an account whose average monthly maximum demand used for billing purposes is equal to or greater than, or is forecast to be equal
to or greater than, 5,000 kW. Class A and Class B consumers are defined in accordance with O. Reg. 429/04. Further servicing details are available in the
distributor’s Conditions of Service.
APPLICATION
The application of these rates and charges shall be in accordance with the Licence of the Distributor and any Code or Order of the Ontario Energy Board, and
amendments thereto as approved by the Ontario Energy Board, which may be applicable to the administration of this schedule.
No rates and charges for the distribution of electricity and charges to meet the costs of any work or service done or furnished for the purpose of the distribution of
electricity shall be made except as permitted by this schedule, unless required by the Distributor’s Licence or a Code or Order of the Ontario Energy Board, and
amendments thereto as approved by the Ontario Energy Board, or as specified herein.
Unless specifically noted, this schedule does not contain any charges for the electricity commodity, be it under the Regulated Price Plan, a contract with a retailer
or the wholesale market price, as applicable. In addition, the charges in the MONTHLY RATES AND CHARGES - Regulatory Component of this schedule do not
apply to a customer that is an embedded wholesale market participant.
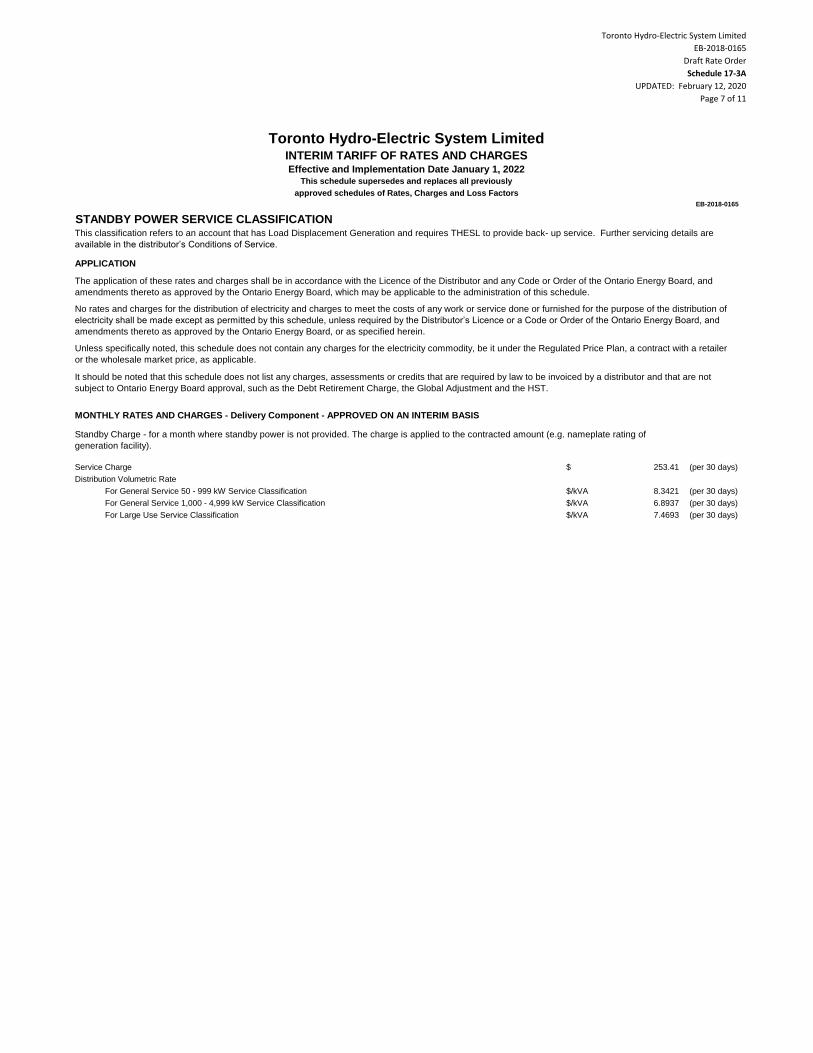
Toronto Hydro-Electric System Limited
EB-2018-0165
Draft Rate Order
Schedule 17-3A
UPDATED: February 12, 2020
Page 7 of 11
Toronto Hydro-Electric System LimitedINTERIM TARIFF OF RATES AND CHARGESEffective and Implementation Date January 1, 2022
This schedule supersedes and replaces all previously
approved schedules of Rates, Charges and Loss Factors
EB-2018-0165
$ 253.41 (per 30 days)
$/kVA 8.3421 (per 30 days)
$/kVA 6.8937 (per 30 days)
$/kVA 7.4693 (per 30 days)
Distribution Volumetric Rate
For General Service 50 - 999 kW Service Classification
For General Service 1,000 - 4,999 kW Service Classification
For Large Use Service Classification
No rates and charges for the distribution of electricity and charges to meet the costs of any work or service done or furnished for the purpose of the distribution of
electricity shall be made except as permitted by this schedule, unless required by the Distributor’s Licence or a Code or Order of the Ontario Energy Board, and
amendments thereto as approved by the Ontario Energy Board, or as specified herein.
Unless specifically noted, this schedule does not contain any charges for the electricity commodity, be it under the Regulated Price Plan, a contract with a retailer
or the wholesale market price, as applicable.
It should be noted that this schedule does not list any charges, assessments or credits that are required by law to be invoiced by a distributor and that are not
subject to Ontario Energy Board approval, such as the Debt Retirement Charge, the Global Adjustment and the HST.
MONTHLY RATES AND CHARGES - Delivery Component - APPROVED ON AN INTERIM BASIS
Standby Charge - for a month where standby power is not provided. The charge is applied to the contracted amount (e.g. nameplate rating of
generation facility).
Service Charge
STANDBY POWER SERVICE CLASSIFICATIONThis classification refers to an account that has Load Displacement Generation and requires THESL to provide back- up service. Further servicing details are
available in the distributor’s Conditions of Service.
APPLICATION
The application of these rates and charges shall be in accordance with the Licence of the Distributor and any Code or Order of the Ontario Energy Board, and
amendments thereto as approved by the Ontario Energy Board, which may be applicable to the administration of this schedule.
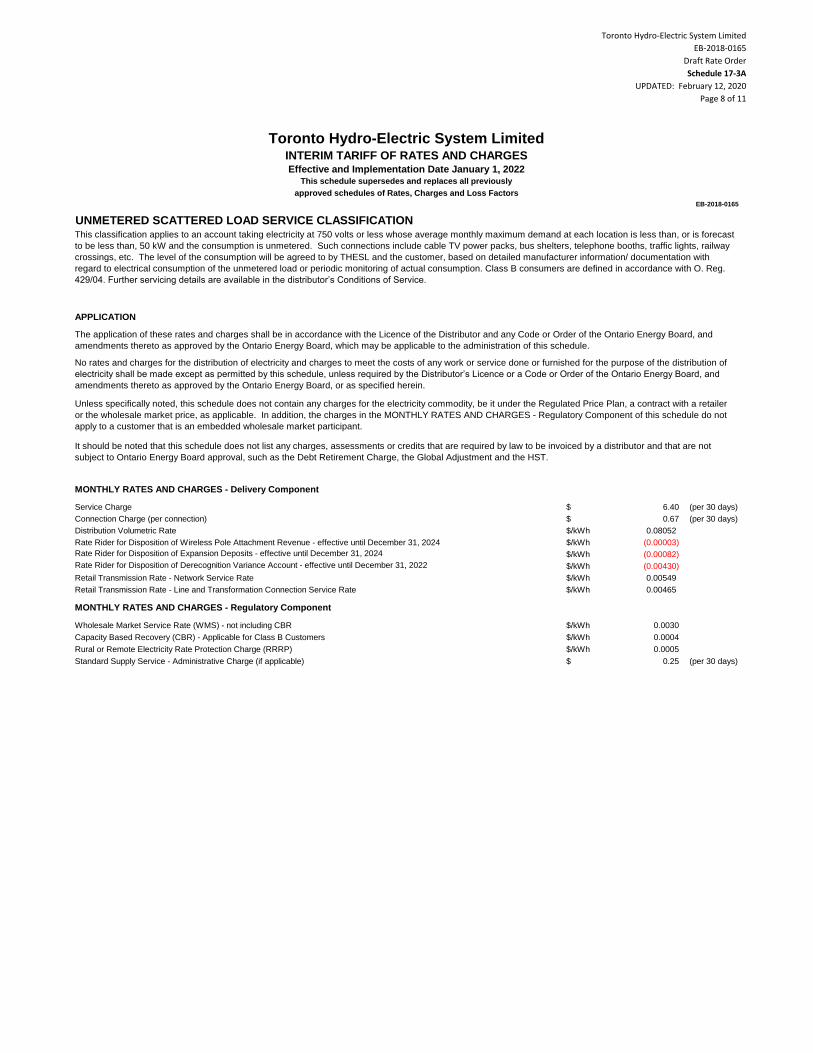
Toronto Hydro-Electric System Limited
EB-2018-0165
Draft Rate Order
Schedule 17-3A
UPDATED: February 12, 2020
Page 8 of 11
Toronto Hydro-Electric System LimitedINTERIM TARIFF OF RATES AND CHARGESEffective and Implementation Date January 1, 2022
This schedule supersedes and replaces all previously
approved schedules of Rates, Charges and Loss Factors
EB-2018-0165
$ 6.40 (per 30 days)
$ 0.67 (per 30 days)
$/kWh 0.08052
$/kWh (0.00003)
Rate Rider for Disposition of Expansion Deposits - effective until December 31, 2024 $/kWh (0.00082)
Rate Rider for Disposition of Derecognition Variance Account - effective until December 31, 2022 $/kWh (0.00430)
$/kWh 0.00549
$/kWh 0.00465
$/kWh 0.0030
$/kWh 0.0004
$/kWh 0.0005
$ 0.25 (per 30 days)
MONTHLY RATES AND CHARGES - Regulatory Component
Wholesale Market Service Rate (WMS) - not including CBR
Capacity Based Recovery (CBR) - Applicable for Class B Customers
Rural or Remote Electricity Rate Protection Charge (RRRP)
Standard Supply Service - Administrative Charge (if applicable)
Service Charge
Connection Charge (per connection)
Distribution Volumetric Rate
Rate Rider for Disposition of Wireless Pole Attachment Revenue - effective until December 31, 2024
Retail Transmission Rate - Network Service Rate
Retail Transmission Rate - Line and Transformation Connection Service Rate
APPLICATION
The application of these rates and charges shall be in accordance with the Licence of the Distributor and any Code or Order of the Ontario Energy Board, and
amendments thereto as approved by the Ontario Energy Board, which may be applicable to the administration of this schedule.
No rates and charges for the distribution of electricity and charges to meet the costs of any work or service done or furnished for the purpose of the distribution of
electricity shall be made except as permitted by this schedule, unless required by the Distributor’s Licence or a Code or Order of the Ontario Energy Board, and
amendments thereto as approved by the Ontario Energy Board, or as specified herein.
Unless specifically noted, this schedule does not contain any charges for the electricity commodity, be it under the Regulated Price Plan, a contract with a retailer
or the wholesale market price, as applicable. In addition, the charges in the MONTHLY RATES AND CHARGES - Regulatory Component of this schedule do not
apply to a customer that is an embedded wholesale market participant.
It should be noted that this schedule does not list any charges, assessments or credits that are required by law to be invoiced by a distributor and that are not
subject to Ontario Energy Board approval, such as the Debt Retirement Charge, the Global Adjustment and the HST.
MONTHLY RATES AND CHARGES - Delivery Component
UNMETERED SCATTERED LOAD SERVICE CLASSIFICATIONThis classification applies to an account taking electricity at 750 volts or less whose average monthly maximum demand at each location is less than, or is forecast
to be less than, 50 kW and the consumption is unmetered. Such connections include cable TV power packs, bus shelters, telephone booths, traffic lights, railway
crossings, etc. The level of the consumption will be agreed to by THESL and the customer, based on detailed manufacturer information/ documentation with
regard to electrical consumption of the unmetered load or periodic monitoring of actual consumption. Class B consumers are defined in accordance with O. Reg.
429/04. Further servicing details are available in the distributor’s Conditions of Service.
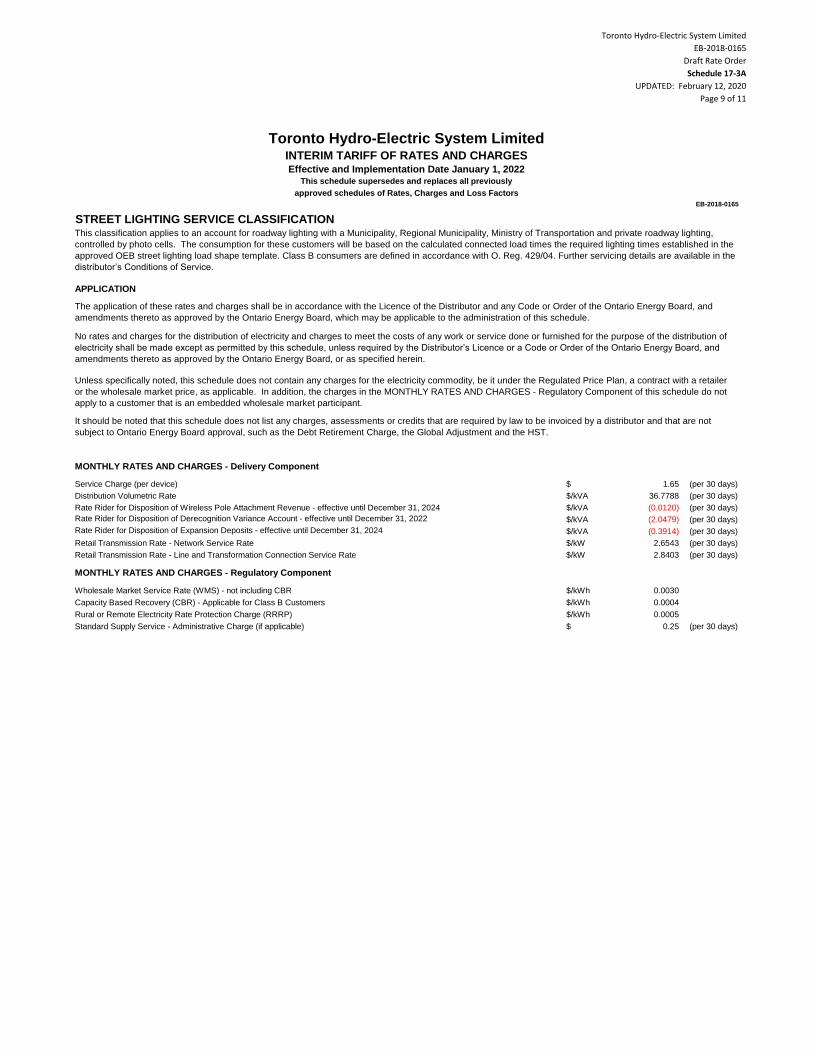
Toronto Hydro-Electric System Limited
EB-2018-0165
Draft Rate Order
Schedule 17-3A
UPDATED: February 12, 2020
Page 9 of 11
Toronto Hydro-Electric System LimitedINTERIM TARIFF OF RATES AND CHARGESEffective and Implementation Date January 1, 2022
This schedule supersedes and replaces all previously
approved schedules of Rates, Charges and Loss Factors
EB-2018-0165
$ 1.65 (per 30 days)
$/kVA 36.7788 (per 30 days)
$/kVA (0.0120) (per 30 days)
Rate Rider for Disposition of Derecognition Variance Account - effective until December 31, 2022 $/kVA (2.0479) (per 30 days)
Rate Rider for Disposition of Expansion Deposits - effective until December 31, 2024 $/kVA (0.3914) (per 30 days)
$/kW 2.6543 (per 30 days)
$/kW 2.8403 (per 30 days)
$/kWh 0.0030
$/kWh 0.0004
$/kWh 0.0005
$ 0.25 (per 30 days)
MONTHLY RATES AND CHARGES - Regulatory Component
Wholesale Market Service Rate (WMS) - not including CBR
Capacity Based Recovery (CBR) - Applicable for Class B Customers
Rural or Remote Electricity Rate Protection Charge (RRRP)
Standard Supply Service - Administrative Charge (if applicable)
MONTHLY RATES AND CHARGES - Delivery Component
Service Charge (per device)
Distribution Volumetric Rate
Rate Rider for Disposition of Wireless Pole Attachment Revenue - effective until December 31, 2024
Retail Transmission Rate - Network Service Rate
Retail Transmission Rate - Line and Transformation Connection Service Rate
This classification applies to an account for roadway lighting with a Municipality, Regional Municipality, Ministry of Transportation and private roadway lighting,
controlled by photo cells. The consumption for these customers will be based on the calculated connected load times the required lighting times established in the
approved OEB street lighting load shape template. Class B consumers are defined in accordance with O. Reg. 429/04. Further servicing details are available in the
distributor’s Conditions of Service.
APPLICATION
The application of these rates and charges shall be in accordance with the Licence of the Distributor and any Code or Order of the Ontario Energy Board, and
amendments thereto as approved by the Ontario Energy Board, which may be applicable to the administration of this schedule.
No rates and charges for the distribution of electricity and charges to meet the costs of any work or service done or furnished for the purpose of the distribution of
electricity shall be made except as permitted by this schedule, unless required by the Distributor’s Licence or a Code or Order of the Ontario Energy Board, and
amendments thereto as approved by the Ontario Energy Board, or as specified herein.
Unless specifically noted, this schedule does not contain any charges for the electricity commodity, be it under the Regulated Price Plan, a contract with a retailer
or the wholesale market price, as applicable. In addition, the charges in the MONTHLY RATES AND CHARGES - Regulatory Component of this schedule do not
apply to a customer that is an embedded wholesale market participant.
It should be noted that this schedule does not list any charges, assessments or credits that are required by law to be invoiced by a distributor and that are not
subject to Ontario Energy Board approval, such as the Debt Retirement Charge, the Global Adjustment and the HST.
STREET LIGHTING SERVICE CLASSIFICATION

Toronto Hydro-Electric System Limited
EB-2018-0165
Draft Rate Order
Schedule 17-3A
UPDATED: February 12, 2020
Page 10 of 11
Toronto Hydro-Electric System LimitedINTERIM TARIFF OF RATES AND CHARGESEffective and Implementation Date January 1, 2022
This schedule supersedes and replaces all previously
approved schedules of Rates, Charges and Loss Factors
EB-2018-0165
$ 5.33 (per 30 days)
ALLOWANCES$/kVA (0.62) (per 30 days)
% (1.00)
SPECIFIC SERVICE CHARGES
Customer Administration
$ 25.00
$ 25.00
$ 25.00
$ 25.00
$ 25.00
$ 35.00
$ 25.00
$ 55.00
$ 55.00
Non-Payment of Account
% 1.50
% 19.56
$ 120.00
$ 400.00
$ 300.00
$ 820.00
Other
$ 120.00
$ 400.00
$ 300.00
$ 820.00
$ 2,040.00
$ 44.50
Disconnect/reconnect at meter - after regular hours
Disconnect/reconnect at pole - during regular hours
Disconnect/reconnect at pole - after regular hours
Temporary service install & remove - overhead - no transformer
Specific charge for access to the power poles (wireline attachments) - per pole/year
Late payment - per annum
Disconnect/reconnect at meter - during regular hours
Disconnect/reconnect at meter - after regular hours
Disconnect/reconnect at pole - during regular hours
Disconnect/reconnect at pole - after regular hours
Disconnect/reconnect at meter - during regular hours
Income tax letter
Account set up charge/change of occupancy charge (plus credit agency costs if applicable)
Returned cheque (plus bank charges)
Special meter reads
Meter dispute charge plus Measurement Canada fees (if meter found correct)
Late payment - per month
No charges to meet the costs of any work or service done or furnished for the purpose of the distribution of electricity shall be made except as permitted by this
schedule, unless required by the Distributor’s Licence or a Code or Order of the Ontario Energy Board, and amendments thereto as approved by the Ontario
Energy Board, or as specified herein.
It should be noted that this schedule does not list any charges, assessments or credits that are required by law to be invoiced by a distributor and that are not
subject to Ontario Energy Board approval, such as the Debt Retirement Charge, the Global Adjustment and the HST.
Account history
Duplicate invoices for previous billing
Request for other billing or system information
Easement letter
MONTHLY RATES AND CHARGES - Delivery Component
Service Charge
Transformer Allowance for Ownership
Primary Metering Allowance for Transformer Losses - applied to measured demand & energy
APPLICATION
The application of these rates and charges shall be in accordance with the Licence of the Distributor and any Code or Order of the Ontario Energy Board, and
amendments thereto as approved by the Ontario Energy Board, which may be applicable to the administration of this schedule.
This classification applies to an electricity generation facility contracted under the Independent Electricity System Operator’s microFIT program and connected to
the distributor’s distribution system. Further servicing details are available in the utility’s Conditions of Service.
APPLICATION
The application of these rates and charges shall be in accordance with the Licence of the Distributor and any Code or Order of the Ontario Energy Board, and
amendments thereto as approved by the Ontario Energy Board, which may be applicable to the administration of this schedule.
No rates and charges for the distribution of electricity and charges to meet the costs of any work or service done or furnished for the purpose of the distribution of
electricity shall be made except as permitted by this schedule, unless required by the Distributor’s Licence or a Code or Order of the Ontario Energy Board, and
amendments thereto as approved by the Ontario Energy Board, or as specified herein.
Unless specifically noted, this schedule does not contain any charges for the electricity commodity, be it under the Regulated Price Plan, a contract with a retailer
or the wholesale market price, as applicable.
It should be noted that this schedule does not list any charges, assessments or credits that are required by law to be invoiced by a distributor and that are not
subject to Ontario Energy Board approval, such as the Debt Retirement Charge, the Global Adjustment and the HST.
microFIT SERVICE CLASSIFICATION

Toronto Hydro-Electric System Limited
EB-2018-0165
Draft Rate Order
Schedule 17-3A
UPDATED: February 12, 2020
Page 11 of 11
Toronto Hydro-Electric System LimitedINTERIM TARIFF OF RATES AND CHARGESEffective and Implementation Date January 1, 2022
This schedule supersedes and replaces all previously
approved schedules of Rates, Charges and Loss Factors
EB-2018-0165
RETAIL SERVICE CHARGES (if applicable)
$ 102.00
$ 40.80
$/cust. 1.02
$/cust. 0.61
$/cust. (0.61)
$ 0.51
$ 1.02
no charge
$ 4.08
LOSS FACTORS
1.0295
1.0172
1.0192
1.0070
If the distributor is not capable of prorating changed loss factors jointly with distribution rates, the revised loss factors will be implemented upon the
first subsequent billing for each billing cycle.
Total Loss Factor - Secondary Metered Customer < 5,000 kW
Total Loss Factor - Secondary Metered Customer > 5,000 kW
Total Loss Factor - Primary Metered Customer < 5,000 kW
Total Loss Factor - Primary Metered Customer > 5,000 kW
Processing fee, per request, applied to the requesting party
Request for customer information as outlined in Section 10.6.3 and Chapter 11 of the Retail
Settlement Code directly to retailers and customers, if not delivered electronically through the
Electronic Business Transaction (EBT) system, applied to the requesting party
Up to twice a year
More than twice a year, per request (plus incremental delivery costs)
Monthly Fixed Charge, per retailer
Monthly Variable Charge, per customer, per retailer
Distributor-consolidated billing monthly charge, per customer, per retailer
Retailer-consolidated billing monthly credit, per customer, per retailer
Service Transaction Requests (STR)
Request fee, per request, applied to the requesting party
The application of these rates and charges shall be in accordance with the Licence of the Distributor and any Code or Order of the Ontario Energy Board, and
amendments thereto as approved by the Ontario Energy Board, which may be applicable to the administration of this schedule.
No rates and charges for the distribution of electricity and charges to meet the costs of any work or service done or furnished for the purpose of the distribution of
electricity shall be made except as permitted by this schedule, unless required by the Distributor’s Licence or a Code or Order of the Ontario Energy Board, and
amendments thereto as approved by the Ontario Energy Board, or as specified herein.
Unless specifically noted, this schedule does not contain any charges for the electricity commodity, be it under the Regulated Price Plan, a contract with a retailer
or the wholesale market price, as applicable.
It should be noted that this schedule does not list any charges, assessments or credits that are required by law to be invoiced by a distributor and that are not
subject to Ontario Energy Board approval, such as the Debt Retirement Charge, the Global Adjustment and the HST.
Retail Service Charges refer to services provided by THESL to retailers or customers related to the supply of competitive electricity and are defined
in the 2006 Electricity Distribution Rate Handbook.
One-time charge, per retailer, to establish the service agreement between the distributor and the retailer
APPLICATION
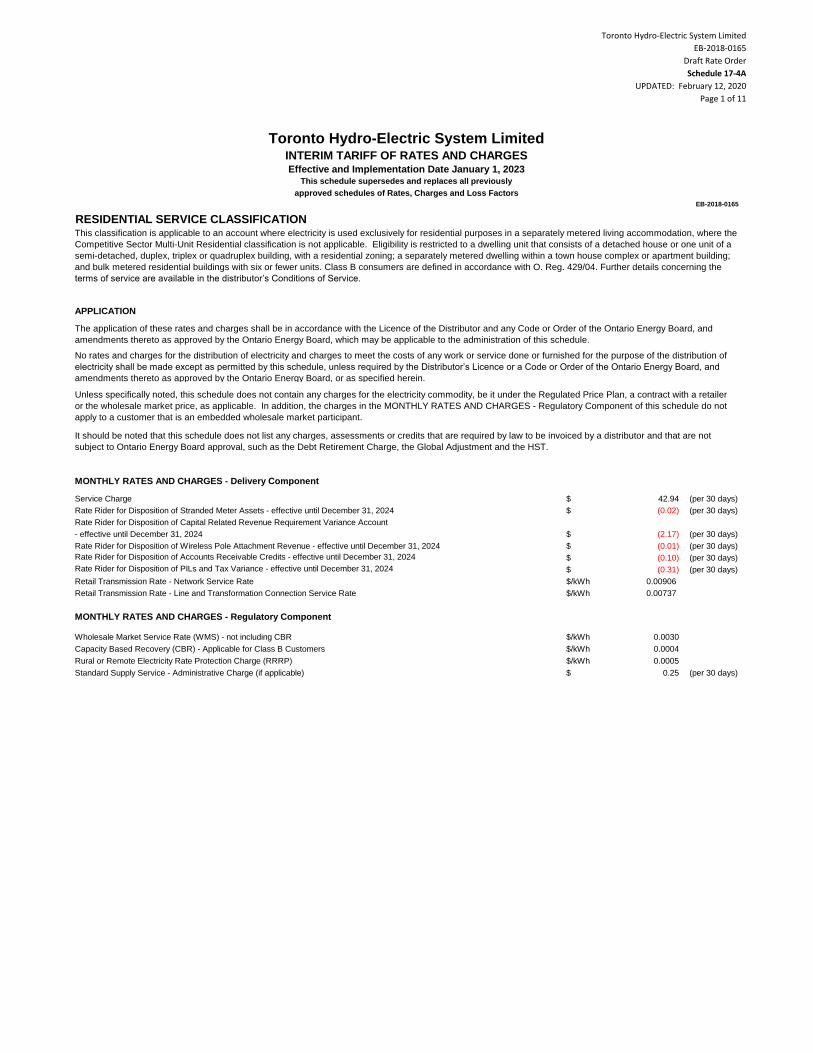
Toronto Hydro-Electric System Limited
EB-2018-0165
Draft Rate Order
Schedule 17-4A
UPDATED: February 12, 2020
Page 1 of 11
$ 42.94 (per 30 days)
$ (0.02) (per 30 days)
- effective until December 31, 2024 $ (2.17) (per 30 days)
$ (0.01) (per 30 days)
Rate Rider for Disposition of Accounts Receivable Credits - effective until December 31, 2024 $ (0.10) (per 30 days)
Rate Rider for Disposition of PILs and Tax Variance - effective until December 31, 2024 $ (0.31) (per 30 days)
$/kWh 0.00906
$/kWh 0.00737
$/kWh 0.0030
$/kWh 0.0004
$/kWh 0.0005
$ 0.25 (per 30 days)Standard Supply Service - Administrative Charge (if applicable)
Retail Transmission Rate - Network Service Rate
Retail Transmission Rate - Line and Transformation Connection Service Rate
MONTHLY RATES AND CHARGES - Regulatory Component
Wholesale Market Service Rate (WMS) - not including CBR
Capacity Based Recovery (CBR) - Applicable for Class B Customers
Rural or Remote Electricity Rate Protection Charge (RRRP)
It should be noted that this schedule does not list any charges, assessments or credits that are required by law to be invoiced by a distributor and that are not
subject to Ontario Energy Board approval, such as the Debt Retirement Charge, the Global Adjustment and the HST.
MONTHLY RATES AND CHARGES - Delivery Component
Service Charge
Rate Rider for Disposition of Stranded Meter Assets - effective until December 31, 2024
Rate Rider for Disposition of Capital Related Revenue Requirement Variance Account
Rate Rider for Disposition of Wireless Pole Attachment Revenue - effective until December 31, 2024
RESIDENTIAL SERVICE CLASSIFICATIONThis classification is applicable to an account where electricity is used exclusively for residential purposes in a separately metered living accommodation, where the
Competitive Sector Multi-Unit Residential classification is not applicable. Eligibility is restricted to a dwelling unit that consists of a detached house or one unit of a
semi-detached, duplex, triplex or quadruplex building, with a residential zoning; a separately metered dwelling within a town house complex or apartment building;
and bulk metered residential buildings with six or fewer units. Class B consumers are defined in accordance with O. Reg. 429/04. Further details concerning the
terms of service are available in the distributor’s Conditions of Service.
APPLICATION
The application of these rates and charges shall be in accordance with the Licence of the Distributor and any Code or Order of the Ontario Energy Board, and
amendments thereto as approved by the Ontario Energy Board, which may be applicable to the administration of this schedule.
No rates and charges for the distribution of electricity and charges to meet the costs of any work or service done or furnished for the purpose of the distribution of
electricity shall be made except as permitted by this schedule, unless required by the Distributor’s Licence or a Code or Order of the Ontario Energy Board, and
amendments thereto as approved by the Ontario Energy Board, or as specified herein.
Unless specifically noted, this schedule does not contain any charges for the electricity commodity, be it under the Regulated Price Plan, a contract with a retailer
or the wholesale market price, as applicable. In addition, the charges in the MONTHLY RATES AND CHARGES - Regulatory Component of this schedule do not
apply to a customer that is an embedded wholesale market participant.
Toronto Hydro-Electric System LimitedINTERIM TARIFF OF RATES AND CHARGESEffective and Implementation Date January 1, 2023
This schedule supersedes and replaces all previously
approved schedules of Rates, Charges and Loss Factors
EB-2018-0165
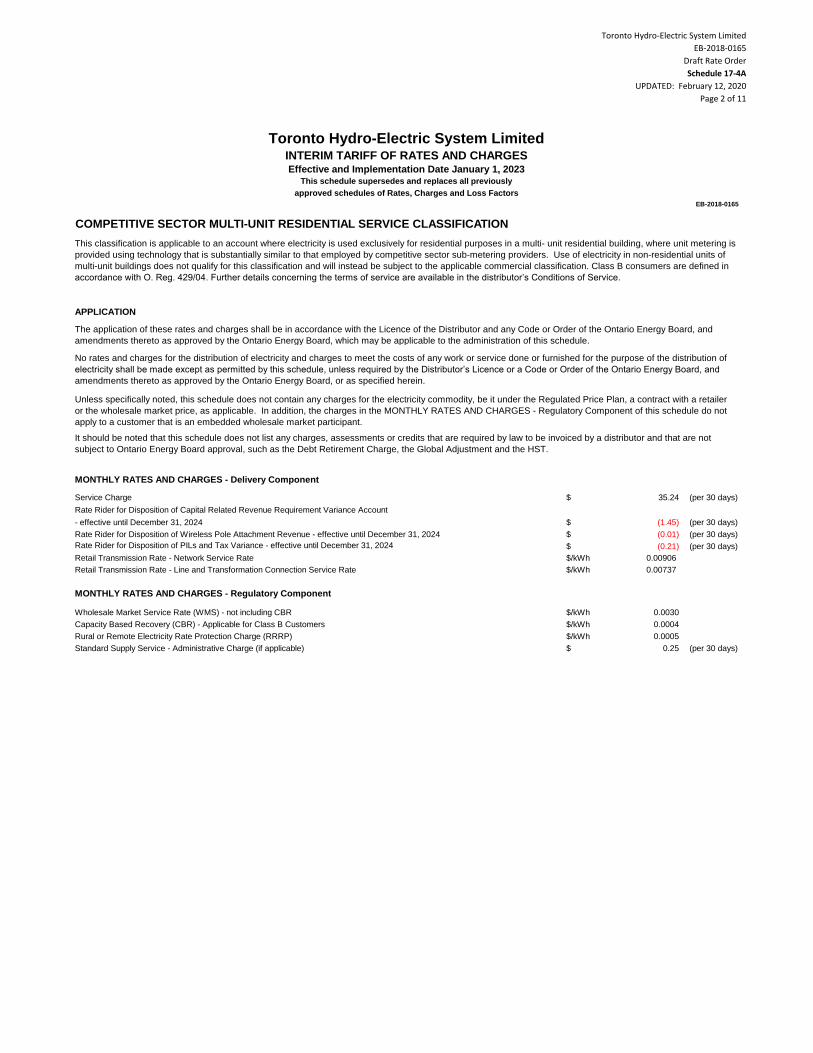
Toronto Hydro-Electric System Limited
EB-2018-0165
Draft Rate Order
Schedule 17-4A
UPDATED: February 12, 2020
Page 2 of 11
Toronto Hydro-Electric System LimitedINTERIM TARIFF OF RATES AND CHARGESEffective and Implementation Date January 1, 2023
This schedule supersedes and replaces all previously
approved schedules of Rates, Charges and Loss Factors
EB-2018-0165
$ 35.24 (per 30 days)
Rate Rider for Disposition of Capital Related Revenue Requirement Variance Account
- effective until December 31, 2024 $ (1.45) (per 30 days)
$ (0.01) (per 30 days)
Rate Rider for Disposition of PILs and Tax Variance - effective until December 31, 2024 $ (0.21) (per 30 days)
$/kWh 0.00906
$/kWh 0.00737
$/kWh 0.0030
$/kWh 0.0004
$/kWh 0.0005
$ 0.25 (per 30 days)
Retail Transmission Rate - Line and Transformation Connection Service Rate
MONTHLY RATES AND CHARGES - Regulatory Component
Wholesale Market Service Rate (WMS) - not including CBR
Capacity Based Recovery (CBR) - Applicable for Class B Customers
Rural or Remote Electricity Rate Protection Charge (RRRP)
Standard Supply Service - Administrative Charge (if applicable)
Unless specifically noted, this schedule does not contain any charges for the electricity commodity, be it under the Regulated Price Plan, a contract with a retailer
or the wholesale market price, as applicable. In addition, the charges in the MONTHLY RATES AND CHARGES - Regulatory Component of this schedule do not
apply to a customer that is an embedded wholesale market participant.
It should be noted that this schedule does not list any charges, assessments or credits that are required by law to be invoiced by a distributor and that are not
subject to Ontario Energy Board approval, such as the Debt Retirement Charge, the Global Adjustment and the HST.
MONTHLY RATES AND CHARGES - Delivery Component
Service Charge
Rate Rider for Disposition of Wireless Pole Attachment Revenue - effective until December 31, 2024
Retail Transmission Rate - Network Service Rate
COMPETITIVE SECTOR MULTI-UNIT RESIDENTIAL SERVICE CLASSIFICATION
This classification is applicable to an account where electricity is used exclusively for residential purposes in a multi- unit residential building, where unit metering is
provided using technology that is substantially similar to that employed by competitive sector sub-metering providers. Use of electricity in non-residential units of
multi-unit buildings does not qualify for this classification and will instead be subject to the applicable commercial classification. Class B consumers are defined in
accordance with O. Reg. 429/04. Further details concerning the terms of service are available in the distributor’s Conditions of Service.
APPLICATION
The application of these rates and charges shall be in accordance with the Licence of the Distributor and any Code or Order of the Ontario Energy Board, and
amendments thereto as approved by the Ontario Energy Board, which may be applicable to the administration of this schedule.
No rates and charges for the distribution of electricity and charges to meet the costs of any work or service done or furnished for the purpose of the distribution of
electricity shall be made except as permitted by this schedule, unless required by the Distributor’s Licence or a Code or Order of the Ontario Energy Board, and
amendments thereto as approved by the Ontario Energy Board, or as specified herein.
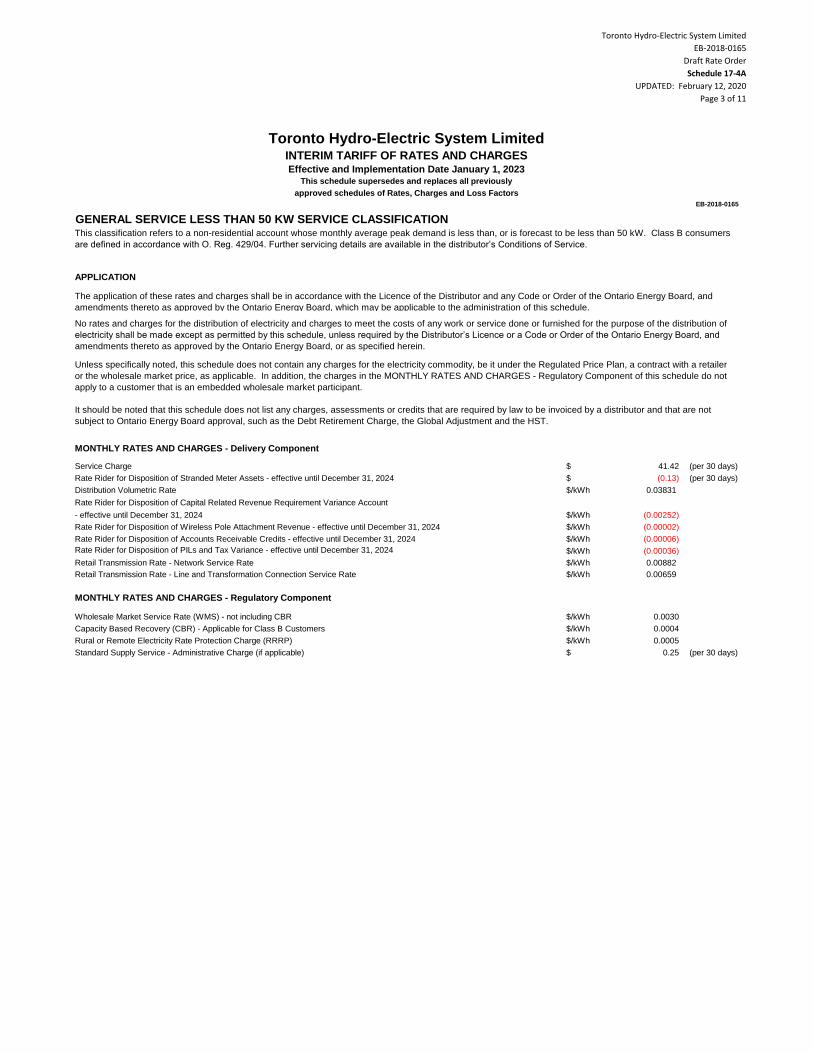
Toronto Hydro-Electric System Limited
EB-2018-0165
Draft Rate Order
Schedule 17-4A
UPDATED: February 12, 2020
Page 3 of 11
Toronto Hydro-Electric System LimitedINTERIM TARIFF OF RATES AND CHARGESEffective and Implementation Date January 1, 2023
This schedule supersedes and replaces all previously
approved schedules of Rates, Charges and Loss Factors
EB-2018-0165
$ 41.42 (per 30 days)
$ (0.13) (per 30 days)
$/kWh 0.03831
Rate Rider for Disposition of Capital Related Revenue Requirement Variance Account
- effective until December 31, 2024 $/kWh (0.00252)
$/kWh (0.00002)
$/kWh (0.00006)
Rate Rider for Disposition of PILs and Tax Variance - effective until December 31, 2024 $/kWh (0.00036)
$/kWh 0.00882
$/kWh 0.00659
$/kWh 0.0030
$/kWh 0.0004
$/kWh 0.0005
$ 0.25 (per 30 days)
Rural or Remote Electricity Rate Protection Charge (RRRP)
Standard Supply Service - Administrative Charge (if applicable)
Rate Rider for Disposition of Accounts Receivable Credits - effective until December 31, 2024
Retail Transmission Rate - Network Service Rate
Retail Transmission Rate - Line and Transformation Connection Service Rate
MONTHLY RATES AND CHARGES - Regulatory Component
Wholesale Market Service Rate (WMS) - not including CBR
Capacity Based Recovery (CBR) - Applicable for Class B Customers
It should be noted that this schedule does not list any charges, assessments or credits that are required by law to be invoiced by a distributor and that are not
subject to Ontario Energy Board approval, such as the Debt Retirement Charge, the Global Adjustment and the HST.
MONTHLY RATES AND CHARGES - Delivery Component
Service Charge
Rate Rider for Disposition of Stranded Meter Assets - effective until December 31, 2024
Distribution Volumetric Rate
Rate Rider for Disposition of Wireless Pole Attachment Revenue - effective until December 31, 2024
GENERAL SERVICE LESS THAN 50 KW SERVICE CLASSIFICATIONThis classification refers to a non-residential account whose monthly average peak demand is less than, or is forecast to be less than 50 kW. Class B consumers
are defined in accordance with O. Reg. 429/04. Further servicing details are available in the distributor’s Conditions of Service.
APPLICATION
The application of these rates and charges shall be in accordance with the Licence of the Distributor and any Code or Order of the Ontario Energy Board, and
amendments thereto as approved by the Ontario Energy Board, which may be applicable to the administration of this schedule.
No rates and charges for the distribution of electricity and charges to meet the costs of any work or service done or furnished for the purpose of the distribution of
electricity shall be made except as permitted by this schedule, unless required by the Distributor’s Licence or a Code or Order of the Ontario Energy Board, and
amendments thereto as approved by the Ontario Energy Board, or as specified herein.
Unless specifically noted, this schedule does not contain any charges for the electricity commodity, be it under the Regulated Price Plan, a contract with a retailer
or the wholesale market price, as applicable. In addition, the charges in the MONTHLY RATES AND CHARGES - Regulatory Component of this schedule do not
apply to a customer that is an embedded wholesale market participant.
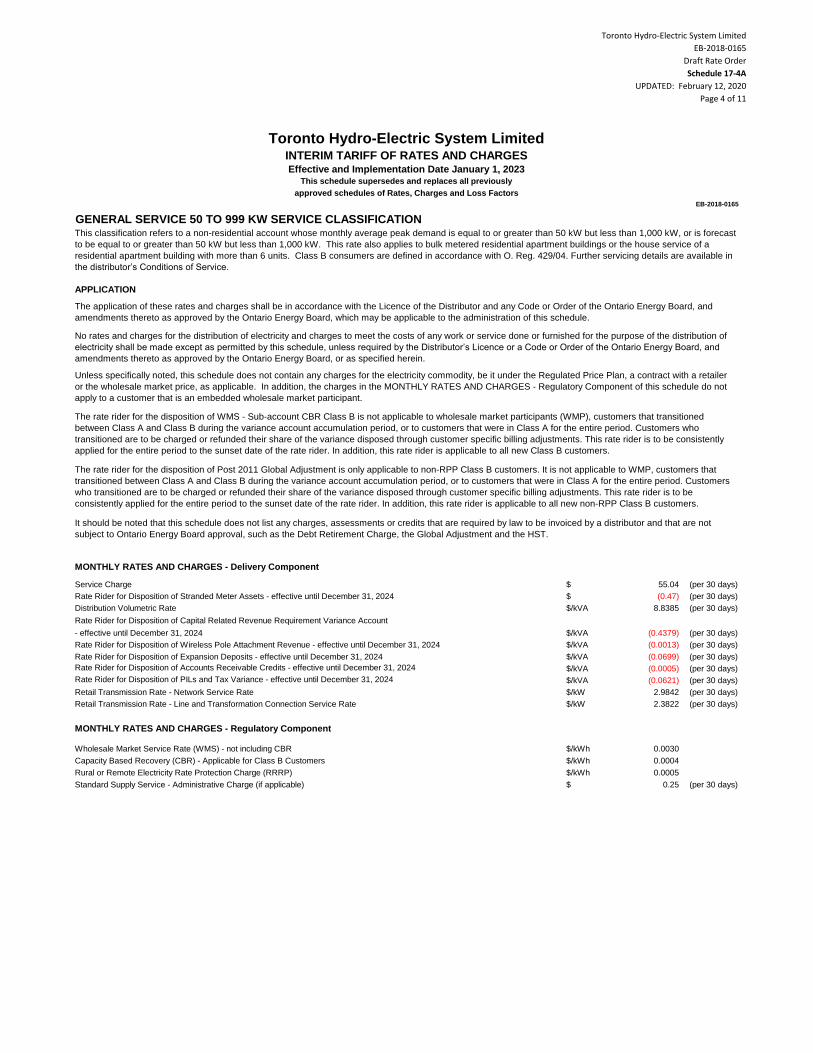
Toronto Hydro-Electric System Limited
EB-2018-0165
Draft Rate Order
Schedule 17-4A
UPDATED: February 12, 2020
Page 4 of 11
Toronto Hydro-Electric System LimitedINTERIM TARIFF OF RATES AND CHARGESEffective and Implementation Date January 1, 2023
This schedule supersedes and replaces all previously
approved schedules of Rates, Charges and Loss Factors
EB-2018-0165
$ 55.04 (per 30 days)
$ (0.47) (per 30 days)
$/kVA 8.8385 (per 30 days)
Rate Rider for Disposition of Capital Related Revenue Requirement Variance Account
- effective until December 31, 2024 $/kVA (0.4379) (per 30 days)
$/kVA (0.0013) (per 30 days)
$/kVA (0.0699) (per 30 days)
Rate Rider for Disposition of Accounts Receivable Credits - effective until December 31, 2024 $/kVA (0.0005) (per 30 days)
Rate Rider for Disposition of PILs and Tax Variance - effective until December 31, 2024 $/kVA (0.0621) (per 30 days)
$/kW 2.9842 (per 30 days)
$/kW 2.3822 (per 30 days)
$/kWh 0.0030
$/kWh 0.0004
$/kWh 0.0005
$ 0.25 (per 30 days)
Retail Transmission Rate - Line and Transformation Connection Service Rate
MONTHLY RATES AND CHARGES - Regulatory Component
Wholesale Market Service Rate (WMS) - not including CBR
Capacity Based Recovery (CBR) - Applicable for Class B Customers
Rural or Remote Electricity Rate Protection Charge (RRRP)
Standard Supply Service - Administrative Charge (if applicable)
Service Charge
Rate Rider for Disposition of Stranded Meter Assets - effective until December 31, 2024
Distribution Volumetric Rate
Rate Rider for Disposition of Wireless Pole Attachment Revenue - effective until December 31, 2024
Rate Rider for Disposition of Expansion Deposits - effective until December 31, 2024
Retail Transmission Rate - Network Service Rate
No rates and charges for the distribution of electricity and charges to meet the costs of any work or service done or furnished for the purpose of the distribution of
electricity shall be made except as permitted by this schedule, unless required by the Distributor’s Licence or a Code or Order of the Ontario Energy Board, and
amendments thereto as approved by the Ontario Energy Board, or as specified herein.
Unless specifically noted, this schedule does not contain any charges for the electricity commodity, be it under the Regulated Price Plan, a contract with a retailer
or the wholesale market price, as applicable. In addition, the charges in the MONTHLY RATES AND CHARGES - Regulatory Component of this schedule do not
apply to a customer that is an embedded wholesale market participant.
The rate rider for the disposition of WMS - Sub-account CBR Class B is not applicable to wholesale market participants (WMP), customers that transitioned
between Class A and Class B during the variance account accumulation period, or to customers that were in Class A for the entire period. Customers who
transitioned are to be charged or refunded their share of the variance disposed through customer specific billing adjustments. This rate rider is to be consistently
applied for the entire period to the sunset date of the rate rider. In addition, this rate rider is applicable to all new Class B customers.
The rate rider for the disposition of Post 2011 Global Adjustment is only applicable to non-RPP Class B customers. It is not applicable to WMP, customers that
transitioned between Class A and Class B during the variance account accumulation period, or to customers that were in Class A for the entire period. Customers
who transitioned are to be charged or refunded their share of the variance disposed through customer specific billing adjustments. This rate rider is to be
consistently applied for the entire period to the sunset date of the rate rider. In addition, this rate rider is applicable to all new non-RPP Class B customers.
It should be noted that this schedule does not list any charges, assessments or credits that are required by law to be invoiced by a distributor and that are not
subject to Ontario Energy Board approval, such as the Debt Retirement Charge, the Global Adjustment and the HST.
MONTHLY RATES AND CHARGES - Delivery Component
GENERAL SERVICE 50 TO 999 KW SERVICE CLASSIFICATIONThis classification refers to a non-residential account whose monthly average peak demand is equal to or greater than 50 kW but less than 1,000 kW, or is forecast
to be equal to or greater than 50 kW but less than 1,000 kW. This rate also applies to bulk metered residential apartment buildings or the house service of a
residential apartment building with more than 6 units. Class B consumers are defined in accordance with O. Reg. 429/04. Further servicing details are available in
the distributor’s Conditions of Service.
APPLICATION
The application of these rates and charges shall be in accordance with the Licence of the Distributor and any Code or Order of the Ontario Energy Board, and
amendments thereto as approved by the Ontario Energy Board, which may be applicable to the administration of this schedule.
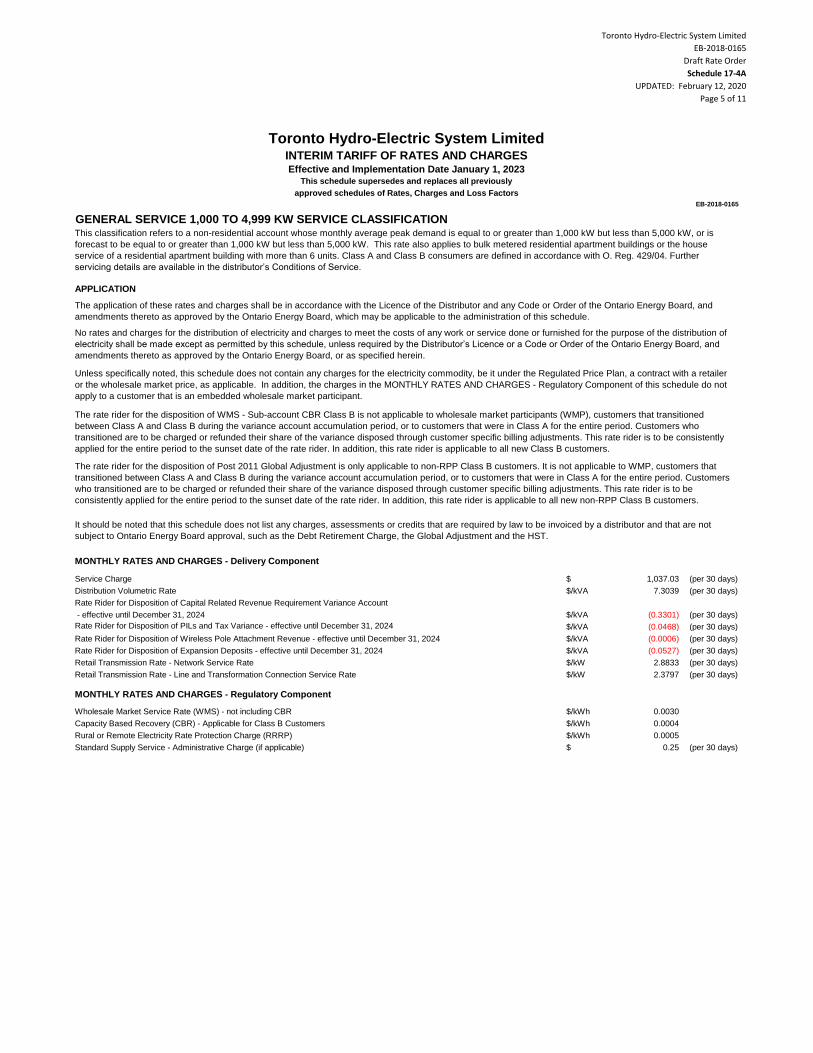
Toronto Hydro-Electric System Limited
EB-2018-0165
Draft Rate Order
Schedule 17-4A
UPDATED: February 12, 2020
Page 5 of 11
Toronto Hydro-Electric System LimitedINTERIM TARIFF OF RATES AND CHARGESEffective and Implementation Date January 1, 2023
This schedule supersedes and replaces all previously
approved schedules of Rates, Charges and Loss Factors
EB-2018-0165
$ 1,037.03 (per 30 days)
$/kVA 7.3039 (per 30 days)
Rate Rider for Disposition of Capital Related Revenue Requirement Variance Account
- effective until December 31, 2024 $/kVA (0.3301) (per 30 days)
Rate Rider for Disposition of PILs and Tax Variance - effective until December 31, 2024 $/kVA (0.0468) (per 30 days)
$/kVA (0.0006) (per 30 days)
$/kVA (0.0527) (per 30 days)
$/kW 2.8833 (per 30 days)
$/kW 2.3797 (per 30 days)
$/kWh 0.0030
$/kWh 0.0004
$/kWh 0.0005
$ 0.25 (per 30 days)
Wholesale Market Service Rate (WMS) - not including CBR
Capacity Based Recovery (CBR) - Applicable for Class B Customers
Rural or Remote Electricity Rate Protection Charge (RRRP)
Standard Supply Service - Administrative Charge (if applicable)
Rate Rider for Disposition of Wireless Pole Attachment Revenue - effective until December 31, 2024
Rate Rider for Disposition of Expansion Deposits - effective until December 31, 2024
Retail Transmission Rate - Network Service Rate
Retail Transmission Rate - Line and Transformation Connection Service Rate
MONTHLY RATES AND CHARGES - Regulatory Component
The rate rider for the disposition of WMS - Sub-account CBR Class B is not applicable to wholesale market participants (WMP), customers that transitioned
between Class A and Class B during the variance account accumulation period, or to customers that were in Class A for the entire period. Customers who
transitioned are to be charged or refunded their share of the variance disposed through customer specific billing adjustments. This rate rider is to be consistently
applied for the entire period to the sunset date of the rate rider. In addition, this rate rider is applicable to all new Class B customers.
The rate rider for the disposition of Post 2011 Global Adjustment is only applicable to non-RPP Class B customers. It is not applicable to WMP, customers that
transitioned between Class A and Class B during the variance account accumulation period, or to customers that were in Class A for the entire period. Customers
who transitioned are to be charged or refunded their share of the variance disposed through customer specific billing adjustments. This rate rider is to be
consistently applied for the entire period to the sunset date of the rate rider. In addition, this rate rider is applicable to all new non-RPP Class B customers.
It should be noted that this schedule does not list any charges, assessments or credits that are required by law to be invoiced by a distributor and that are not
subject to Ontario Energy Board approval, such as the Debt Retirement Charge, the Global Adjustment and the HST.
MONTHLY RATES AND CHARGES - Delivery Component
Service Charge
Distribution Volumetric Rate
GENERAL SERVICE 1,000 TO 4,999 KW SERVICE CLASSIFICATIONThis classification refers to a non-residential account whose monthly average peak demand is equal to or greater than 1,000 kW but less than 5,000 kW, or is
forecast to be equal to or greater than 1,000 kW but less than 5,000 kW. This rate also applies to bulk metered residential apartment buildings or the house
service of a residential apartment building with more than 6 units. Class A and Class B consumers are defined in accordance with O. Reg. 429/04. Further
servicing details are available in the distributor’s Conditions of Service.
APPLICATION
The application of these rates and charges shall be in accordance with the Licence of the Distributor and any Code or Order of the Ontario Energy Board, and
amendments thereto as approved by the Ontario Energy Board, which may be applicable to the administration of this schedule.
No rates and charges for the distribution of electricity and charges to meet the costs of any work or service done or furnished for the purpose of the distribution of
electricity shall be made except as permitted by this schedule, unless required by the Distributor’s Licence or a Code or Order of the Ontario Energy Board, and
amendments thereto as approved by the Ontario Energy Board, or as specified herein.
Unless specifically noted, this schedule does not contain any charges for the electricity commodity, be it under the Regulated Price Plan, a contract with a retailer
or the wholesale market price, as applicable. In addition, the charges in the MONTHLY RATES AND CHARGES - Regulatory Component of this schedule do not
apply to a customer that is an embedded wholesale market participant.
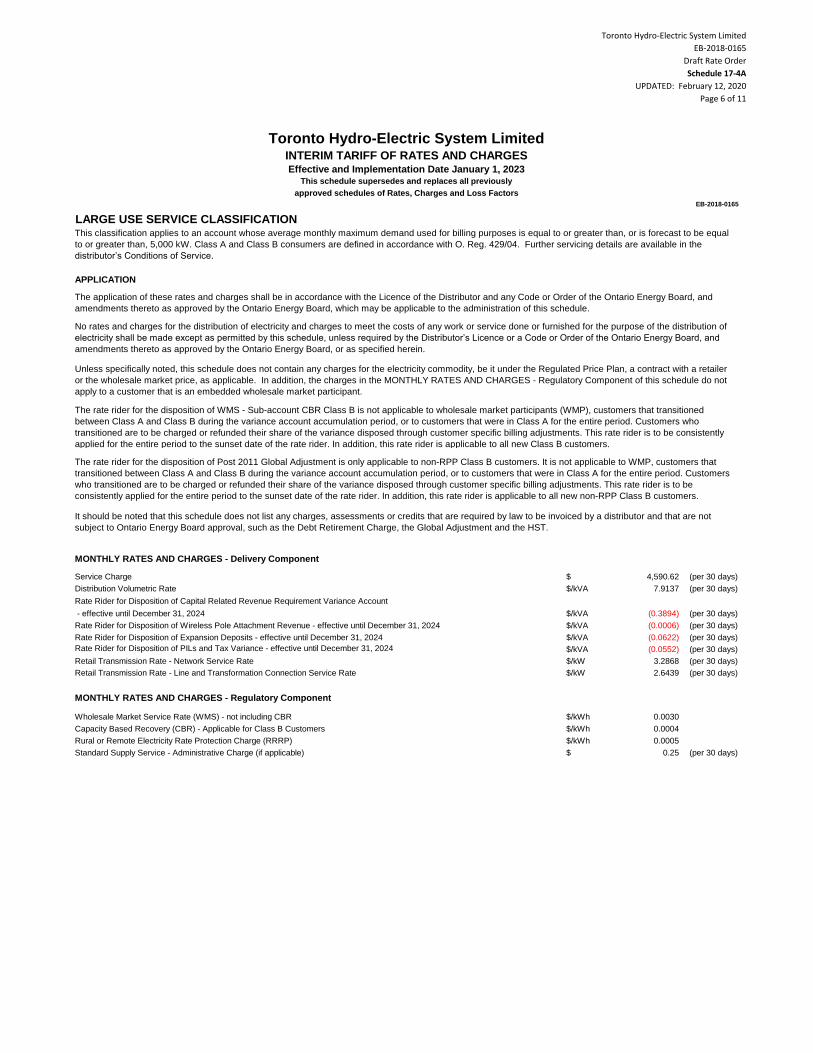
Toronto Hydro-Electric System Limited
EB-2018-0165
Draft Rate Order
Schedule 17-4A
UPDATED: February 12, 2020
Page 6 of 11
Toronto Hydro-Electric System LimitedINTERIM TARIFF OF RATES AND CHARGESEffective and Implementation Date January 1, 2023
This schedule supersedes and replaces all previously
approved schedules of Rates, Charges and Loss Factors
EB-2018-0165
$ 4,590.62 (per 30 days)
$/kVA 7.9137 (per 30 days)
Rate Rider for Disposition of Capital Related Revenue Requirement Variance Account
- effective until December 31, 2024 $/kVA (0.3894) (per 30 days)
$/kVA (0.0006) (per 30 days)
$/kVA (0.0622) (per 30 days)
Rate Rider for Disposition of PILs and Tax Variance - effective until December 31, 2024 $/kVA (0.0552) (per 30 days)
$/kW 3.2868 (per 30 days)
$/kW 2.6439 (per 30 days)
$/kWh 0.0030
$/kWh 0.0004
$/kWh 0.0005
$ 0.25 (per 30 days)Standard Supply Service - Administrative Charge (if applicable)
Retail Transmission Rate - Network Service Rate
Retail Transmission Rate - Line and Transformation Connection Service Rate
MONTHLY RATES AND CHARGES - Regulatory Component
Wholesale Market Service Rate (WMS) - not including CBR
Capacity Based Recovery (CBR) - Applicable for Class B Customers
Rural or Remote Electricity Rate Protection Charge (RRRP)
It should be noted that this schedule does not list any charges, assessments or credits that are required by law to be invoiced by a distributor and that are not
subject to Ontario Energy Board approval, such as the Debt Retirement Charge, the Global Adjustment and the HST.
MONTHLY RATES AND CHARGES - Delivery Component
Service Charge
Distribution Volumetric Rate
Rate Rider for Disposition of Wireless Pole Attachment Revenue - effective until December 31, 2024
Rate Rider for Disposition of Expansion Deposits - effective until December 31, 2024
APPLICATION
The application of these rates and charges shall be in accordance with the Licence of the Distributor and any Code or Order of the Ontario Energy Board, and
amendments thereto as approved by the Ontario Energy Board, which may be applicable to the administration of this schedule.
No rates and charges for the distribution of electricity and charges to meet the costs of any work or service done or furnished for the purpose of the distribution of
electricity shall be made except as permitted by this schedule, unless required by the Distributor’s Licence or a Code or Order of the Ontario Energy Board, and
amendments thereto as approved by the Ontario Energy Board, or as specified herein.
Unless specifically noted, this schedule does not contain any charges for the electricity commodity, be it under the Regulated Price Plan, a contract with a retailer
or the wholesale market price, as applicable. In addition, the charges in the MONTHLY RATES AND CHARGES - Regulatory Component of this schedule do not
apply to a customer that is an embedded wholesale market participant.
The rate rider for the disposition of WMS - Sub-account CBR Class B is not applicable to wholesale market participants (WMP), customers that transitioned
between Class A and Class B during the variance account accumulation period, or to customers that were in Class A for the entire period. Customers who
transitioned are to be charged or refunded their share of the variance disposed through customer specific billing adjustments. This rate rider is to be consistently
applied for the entire period to the sunset date of the rate rider. In addition, this rate rider is applicable to all new Class B customers.
The rate rider for the disposition of Post 2011 Global Adjustment is only applicable to non-RPP Class B customers. It is not applicable to WMP, customers that
transitioned between Class A and Class B during the variance account accumulation period, or to customers that were in Class A for the entire period. Customers
who transitioned are to be charged or refunded their share of the variance disposed through customer specific billing adjustments. This rate rider is to be
consistently applied for the entire period to the sunset date of the rate rider. In addition, this rate rider is applicable to all new non-RPP Class B customers.
LARGE USE SERVICE CLASSIFICATIONThis classification applies to an account whose average monthly maximum demand used for billing purposes is equal to or greater than, or is forecast to be equal
to or greater than, 5,000 kW. Class A and Class B consumers are defined in accordance with O. Reg. 429/04. Further servicing details are available in the
distributor’s Conditions of Service.

Toronto Hydro-Electric System Limited
EB-2018-0165
Draft Rate Order
Schedule 17-4A
UPDATED: February 12, 2020
Page 7 of 11
Toronto Hydro-Electric System LimitedINTERIM TARIFF OF RATES AND CHARGESEffective and Implementation Date January 1, 2023
This schedule supersedes and replaces all previously
approved schedules of Rates, Charges and Loss Factors
EB-2018-0165
$ 268.49 (per 30 days)
$/kVA 8.8385 (per 30 days)
$/kVA 7.3039 (per 30 days)
$/kVA 7.9137 (per 30 days)
For General Service 50 - 999 kW Service Classification
For General Service 1,000 - 4,999 kW Service Classification
For Large Use Service Classification
Unless specifically noted, this schedule does not contain any charges for the electricity commodity, be it under the Regulated Price Plan, a contract with a retailer
or the wholesale market price, as applicable.
It should be noted that this schedule does not list any charges, assessments or credits that are required by law to be invoiced by a distributor and that are not
subject to Ontario Energy Board approval, such as the Debt Retirement Charge, the Global Adjustment and the HST.
MONTHLY RATES AND CHARGES - Delivery Component - APPROVED ON AN INTERIM BASIS
Standby Charge - for a month where standby power is not provided. The charge is applied to the contracted amount (e.g. nameplate rating of
generation facility).
Service Charge
Distribution Volumetric Rate
STANDBY POWER SERVICE CLASSIFICATIONThis classification refers to an account that has Load Displacement Generation and requires THESL to provide back- up service. Further servicing details are
available in the distributor’s Conditions of Service.
APPLICATION
The application of these rates and charges shall be in accordance with the Licence of the Distributor and any Code or Order of the Ontario Energy Board, and
amendments thereto as approved by the Ontario Energy Board, which may be applicable to the administration of this schedule.
No rates and charges for the distribution of electricity and charges to meet the costs of any work or service done or furnished for the purpose of the distribution of
electricity shall be made except as permitted by this schedule, unless required by the Distributor’s Licence or a Code or Order of the Ontario Energy Board, and
amendments thereto as approved by the Ontario Energy Board, or as specified herein.
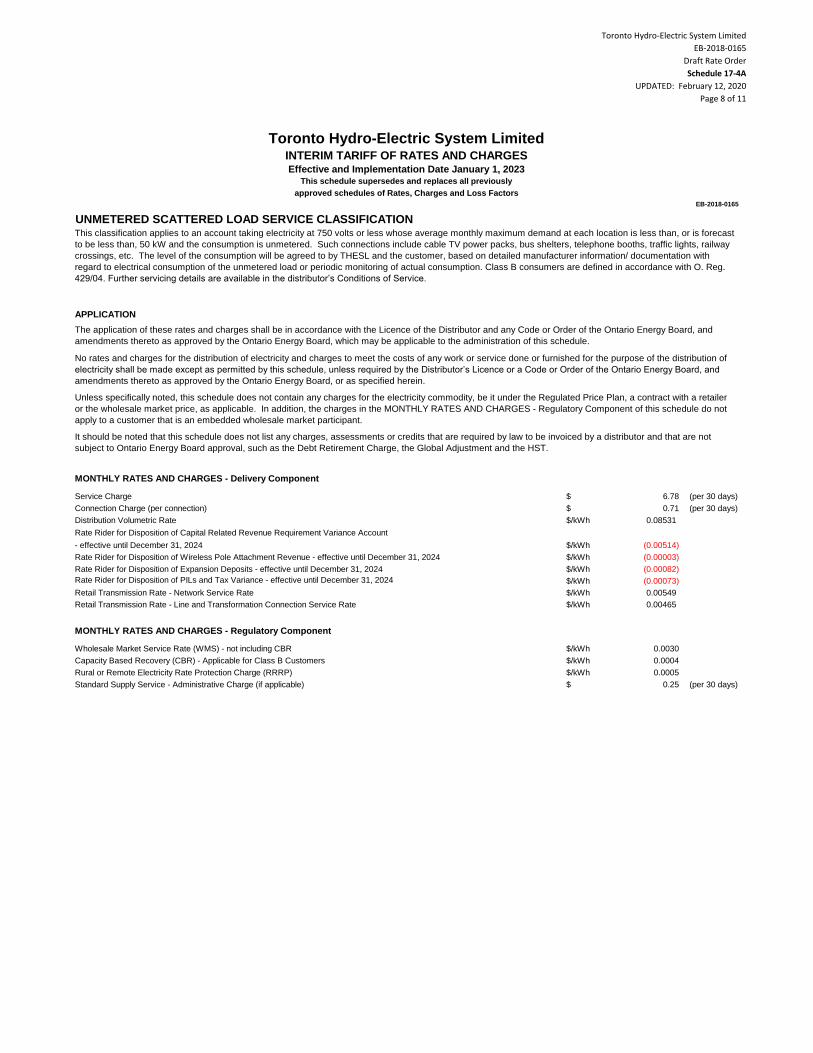
Toronto Hydro-Electric System Limited
EB-2018-0165
Draft Rate Order
Schedule 17-4A
UPDATED: February 12, 2020
Page 8 of 11
Toronto Hydro-Electric System LimitedINTERIM TARIFF OF RATES AND CHARGESEffective and Implementation Date January 1, 2023
This schedule supersedes and replaces all previously
approved schedules of Rates, Charges and Loss Factors
EB-2018-0165
$ 6.78 (per 30 days)
$ 0.71 (per 30 days)
$/kWh 0.08531
Rate Rider for Disposition of Capital Related Revenue Requirement Variance Account
- effective until December 31, 2024 $/kWh (0.00514)
$/kWh (0.00003)
$/kWh (0.00082)
Rate Rider for Disposition of PILs and Tax Variance - effective until December 31, 2024 $/kWh (0.00073)
$/kWh 0.00549
$/kWh 0.00465
$/kWh 0.0030
$/kWh 0.0004
$/kWh 0.0005
$ 0.25 (per 30 days)
MONTHLY RATES AND CHARGES - Regulatory Component
Wholesale Market Service Rate (WMS) - not including CBR
Capacity Based Recovery (CBR) - Applicable for Class B Customers
Rural or Remote Electricity Rate Protection Charge (RRRP)
Standard Supply Service - Administrative Charge (if applicable)
Connection Charge (per connection)
Distribution Volumetric Rate
Rate Rider for Disposition of Wireless Pole Attachment Revenue - effective until December 31, 2024
Rate Rider for Disposition of Expansion Deposits - effective until December 31, 2024
Retail Transmission Rate - Network Service Rate
Retail Transmission Rate - Line and Transformation Connection Service Rate
The application of these rates and charges shall be in accordance with the Licence of the Distributor and any Code or Order of the Ontario Energy Board, and
amendments thereto as approved by the Ontario Energy Board, which may be applicable to the administration of this schedule.
No rates and charges for the distribution of electricity and charges to meet the costs of any work or service done or furnished for the purpose of the distribution of
electricity shall be made except as permitted by this schedule, unless required by the Distributor’s Licence or a Code or Order of the Ontario Energy Board, and
amendments thereto as approved by the Ontario Energy Board, or as specified herein.
Unless specifically noted, this schedule does not contain any charges for the electricity commodity, be it under the Regulated Price Plan, a contract with a retailer
or the wholesale market price, as applicable. In addition, the charges in the MONTHLY RATES AND CHARGES - Regulatory Component of this schedule do not
apply to a customer that is an embedded wholesale market participant.
It should be noted that this schedule does not list any charges, assessments or credits that are required by law to be invoiced by a distributor and that are not
subject to Ontario Energy Board approval, such as the Debt Retirement Charge, the Global Adjustment and the HST.
MONTHLY RATES AND CHARGES - Delivery Component
Service Charge
UNMETERED SCATTERED LOAD SERVICE CLASSIFICATIONThis classification applies to an account taking electricity at 750 volts or less whose average monthly maximum demand at each location is less than, or is forecast
to be less than, 50 kW and the consumption is unmetered. Such connections include cable TV power packs, bus shelters, telephone booths, traffic lights, railway
crossings, etc. The level of the consumption will be agreed to by THESL and the customer, based on detailed manufacturer information/ documentation with
regard to electrical consumption of the unmetered load or periodic monitoring of actual consumption. Class B consumers are defined in accordance with O. Reg.
429/04. Further servicing details are available in the distributor’s Conditions of Service.
APPLICATION

Toronto Hydro-Electric System Limited
EB-2018-0165
Draft Rate Order
Schedule 17-4A
UPDATED: February 12, 2020
Page 9 of 11
Toronto Hydro-Electric System LimitedINTERIM TARIFF OF RATES AND CHARGESEffective and Implementation Date January 1, 2023
This schedule supersedes and replaces all previously
approved schedules of Rates, Charges and Loss Factors
EB-2018-0165
$ 1.75 (per 30 days)
$/kVA 38.9671 (per 30 days)
Rate Rider for Disposition of Capital Related Revenue Requirement Variance Account
- effective until December 31, 2024 $/kVA (2.4517) (per 30 days)
$/kVA (0.0120) (per 30 days)
$/kVA (0.3914) (per 30 days)
Rate Rider for Disposition of PILs and Tax Variance - effective until December 31, 2024 $/kVA (0.3476) (per 30 days)
$/kW 2.6543 (per 30 days)
$/kW 2.8403 (per 30 days)
$/kWh 0.0030
$/kWh 0.0004
$/kWh 0.0005
$ 0.25 (per 30 days)
Retail Transmission Rate - Line and Transformation Connection Service Rate
MONTHLY RATES AND CHARGES - Regulatory Component
Wholesale Market Service Rate (WMS) - not including CBR
Capacity Based Recovery (CBR) - Applicable for Class B Customers
Rural or Remote Electricity Rate Protection Charge (RRRP)
Standard Supply Service - Administrative Charge (if applicable)
MONTHLY RATES AND CHARGES - Delivery Component
Service Charge (per device)
Distribution Volumetric Rate
Rate Rider for Disposition of Wireless Pole Attachment Revenue - effective until December 31, 2024
Rate Rider for Disposition of Expansion Deposits - effective until December 31, 2024
Retail Transmission Rate - Network Service Rate
This classification applies to an account for roadway lighting with a Municipality, Regional Municipality, Ministry of Transportation and private roadway lighting,
controlled by photo cells. The consumption for these customers will be based on the calculated connected load times the required lighting times established in the
approved OEB street lighting load shape template. Class B consumers are defined in accordance with O. Reg. 429/04. Further servicing details are available in the
distributor’s Conditions of Service.
APPLICATION
The application of these rates and charges shall be in accordance with the Licence of the Distributor and any Code or Order of the Ontario Energy Board, and
amendments thereto as approved by the Ontario Energy Board, which may be applicable to the administration of this schedule.
No rates and charges for the distribution of electricity and charges to meet the costs of any work or service done or furnished for the purpose of the distribution of
electricity shall be made except as permitted by this schedule, unless required by the Distributor’s Licence or a Code or Order of the Ontario Energy Board, and
amendments thereto as approved by the Ontario Energy Board, or as specified herein.
Unless specifically noted, this schedule does not contain any charges for the electricity commodity, be it under the Regulated Price Plan, a contract with a retailer
or the wholesale market price, as applicable. In addition, the charges in the MONTHLY RATES AND CHARGES - Regulatory Component of this schedule do not
apply to a customer that is an embedded wholesale market participant.
It should be noted that this schedule does not list any charges, assessments or credits that are required by law to be invoiced by a distributor and that are not
subject to Ontario Energy Board approval, such as the Debt Retirement Charge, the Global Adjustment and the HST.
STREET LIGHTING SERVICE CLASSIFICATION
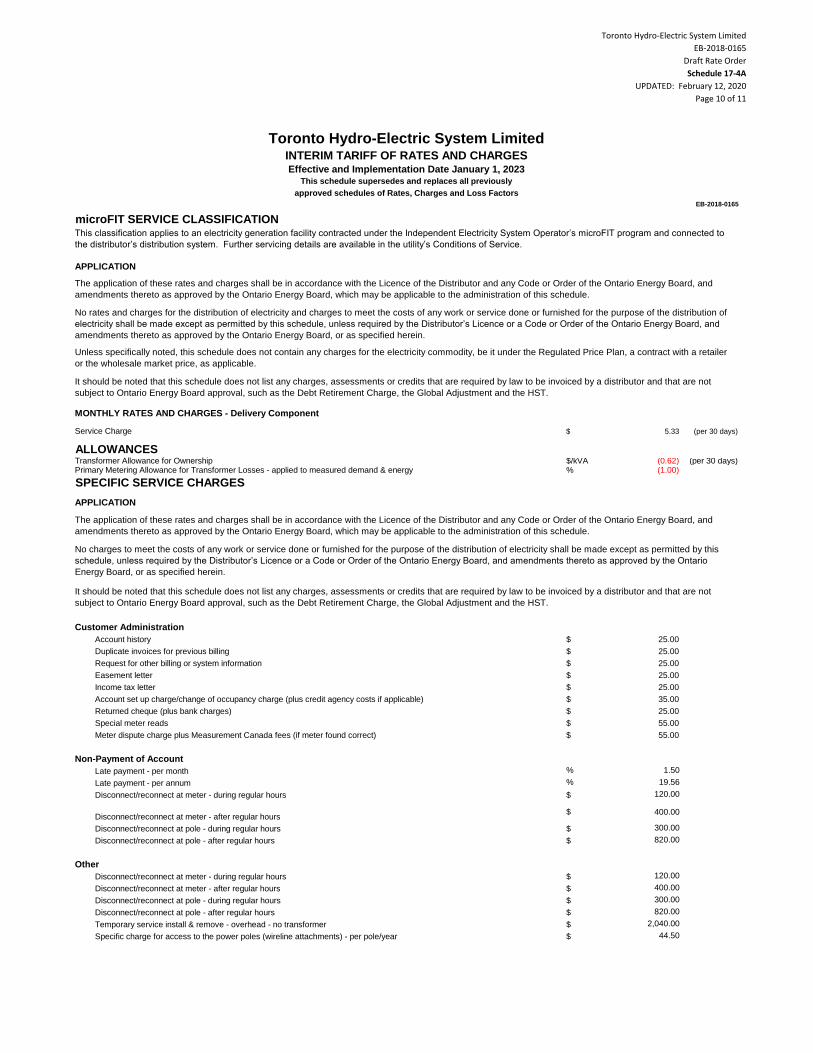
Toronto Hydro-Electric System Limited
EB-2018-0165
Draft Rate Order
Schedule 17-4A
UPDATED: February 12, 2020
Page 10 of 11
Toronto Hydro-Electric System LimitedINTERIM TARIFF OF RATES AND CHARGESEffective and Implementation Date January 1, 2023
This schedule supersedes and replaces all previously
approved schedules of Rates, Charges and Loss Factors
EB-2018-0165
$ 5.33 (per 30 days)
ALLOWANCES$/kVA (0.62) (per 30 days)% (1.00)
SPECIFIC SERVICE CHARGES
Customer Administration
$ 25.00
$ 25.00
$ 25.00
$ 25.00
$ 25.00
$ 35.00
$ 25.00
$ 55.00
$ 55.00
Non-Payment of Account
% 1.50
% 19.56
$ 120.00
$ 400.00
$ 300.00
$ 820.00
Other
$ 120.00
$ 400.00
$ 300.00
$ 820.00
$ 2,040.00
$ 44.50
Disconnect/reconnect at meter - during regular hours
Disconnect/reconnect at meter - after regular hours
Disconnect/reconnect at pole - during regular hours
Disconnect/reconnect at pole - after regular hours
Temporary service install & remove - overhead - no transformer
Specific charge for access to the power poles (wireline attachments) - per pole/year
Late payment - per month
Late payment - per annum
Disconnect/reconnect at meter - during regular hours
Disconnect/reconnect at meter - after regular hours
Disconnect/reconnect at pole - during regular hours
Disconnect/reconnect at pole - after regular hours
Easement letter
Income tax letter
Account set up charge/change of occupancy charge (plus credit agency costs if applicable)
Returned cheque (plus bank charges)
Special meter reads
Meter dispute charge plus Measurement Canada fees (if meter found correct)
The application of these rates and charges shall be in accordance with the Licence of the Distributor and any Code or Order of the Ontario Energy Board, and
amendments thereto as approved by the Ontario Energy Board, which may be applicable to the administration of this schedule.
No charges to meet the costs of any work or service done or furnished for the purpose of the distribution of electricity shall be made except as permitted by this
schedule, unless required by the Distributor’s Licence or a Code or Order of the Ontario Energy Board, and amendments thereto as approved by the Ontario
Energy Board, or as specified herein.
It should be noted that this schedule does not list any charges, assessments or credits that are required by law to be invoiced by a distributor and that are not
subject to Ontario Energy Board approval, such as the Debt Retirement Charge, the Global Adjustment and the HST.
Account history
Duplicate invoices for previous billing
Request for other billing or system information
It should be noted that this schedule does not list any charges, assessments or credits that are required by law to be invoiced by a distributor and that are not
subject to Ontario Energy Board approval, such as the Debt Retirement Charge, the Global Adjustment and the HST.
MONTHLY RATES AND CHARGES - Delivery Component
Service Charge
Transformer Allowance for OwnershipPrimary Metering Allowance for Transformer Losses - applied to measured demand & energy
APPLICATION
microFIT SERVICE CLASSIFICATIONThis classification applies to an electricity generation facility contracted under the Independent Electricity System Operator’s microFIT program and connected to
the distributor’s distribution system. Further servicing details are available in the utility’s Conditions of Service.
APPLICATION
The application of these rates and charges shall be in accordance with the Licence of the Distributor and any Code or Order of the Ontario Energy Board, and
amendments thereto as approved by the Ontario Energy Board, which may be applicable to the administration of this schedule.
No rates and charges for the distribution of electricity and charges to meet the costs of any work or service done or furnished for the purpose of the distribution of
electricity shall be made except as permitted by this schedule, unless required by the Distributor’s Licence or a Code or Order of the Ontario Energy Board, and
amendments thereto as approved by the Ontario Energy Board, or as specified herein.
Unless specifically noted, this schedule does not contain any charges for the electricity commodity, be it under the Regulated Price Plan, a contract with a retailer
or the wholesale market price, as applicable.

Toronto Hydro-Electric System Limited
EB-2018-0165
Draft Rate Order
Schedule 17-4A
UPDATED: February 12, 2020
Page 11 of 11
Toronto Hydro-Electric System LimitedINTERIM TARIFF OF RATES AND CHARGESEffective and Implementation Date January 1, 2023
This schedule supersedes and replaces all previously
approved schedules of Rates, Charges and Loss Factors
EB-2018-0165
RETAIL SERVICE CHARGES (if applicable)
$ 102.00
$ 40.80
$/cust. 1.02
$/cust. 0.61
$/cust. (0.61)
$ 0.51
$ 1.02
no charge
$ 4.08
LOSS FACTORS
1.0295
1.0172
1.0192
1.0070
More than twice a year, per request (plus incremental delivery costs)
If the distributor is not capable of prorating changed loss factors jointly with distribution rates, the revised loss factors will be implemented upon the
first subsequent billing for each billing cycle.
Total Loss Factor - Secondary Metered Customer < 5,000 kW
Total Loss Factor - Secondary Metered Customer > 5,000 kW
Total Loss Factor - Primary Metered Customer < 5,000 kW
Total Loss Factor - Primary Metered Customer > 5,000 kW
Request fee, per request, applied to the requesting party
Processing fee, per request, applied to the requesting party
Request for customer information as outlined in Section 10.6.3 and Chapter 11 of the Retail
Settlement Code directly to retailers and customers, if not delivered electronically through the
Electronic Business Transaction (EBT) system, applied to the requesting party
Up to twice a year
One-time charge, per retailer, to establish the service agreement between the distributor and the retailer
Monthly Fixed Charge, per retailer
Monthly Variable Charge, per customer, per retailer
Distributor-consolidated billing monthly charge, per customer, per retailer
Retailer-consolidated billing monthly credit, per customer, per retailer
Service Transaction Requests (STR)
APPLICATION
The application of these rates and charges shall be in accordance with the Licence of the Distributor and any Code or Order of the Ontario Energy Board, and
amendments thereto as approved by the Ontario Energy Board, which may be applicable to the administration of this schedule.
No rates and charges for the distribution of electricity and charges to meet the costs of any work or service done or furnished for the purpose of the distribution of
electricity shall be made except as permitted by this schedule, unless required by the Distributor’s Licence or a Code or Order of the Ontario Energy Board, and
amendments thereto as approved by the Ontario Energy Board, or as specified herein.
Unless specifically noted, this schedule does not contain any charges for the electricity commodity, be it under the Regulated Price Plan, a contract with a retailer
or the wholesale market price, as applicable.
It should be noted that this schedule does not list any charges, assessments or credits that are required by law to be invoiced by a distributor and that are not
subject to Ontario Energy Board approval, such as the Debt Retirement Charge, the Global Adjustment and the HST.
Retail Service Charges refer to services provided by THESL to retailers or customers related to the supply of competitive electricity and are defined
in the 2006 Electricity Distribution Rate Handbook.
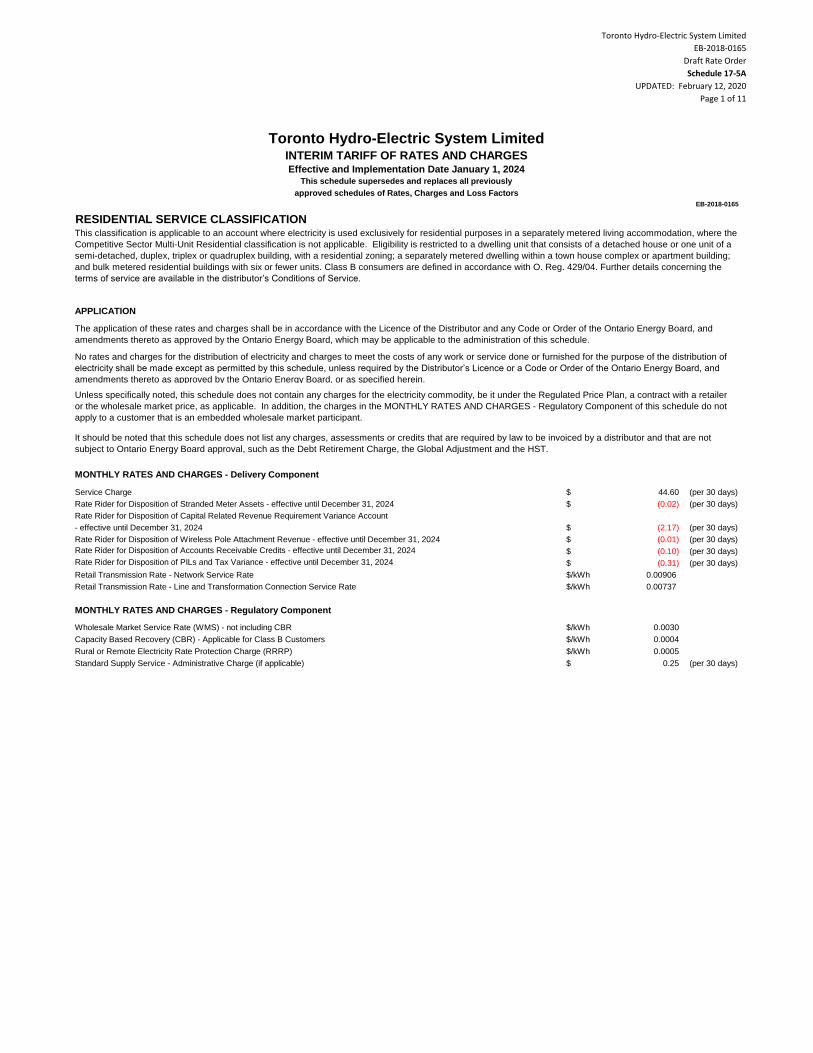
Toronto Hydro-Electric System Limited
EB-2018-0165
Draft Rate Order
Schedule 17-5A
UPDATED: February 12, 2020
Page 1 of 11
$ 44.60 (per 30 days)
$ (0.02) (per 30 days)
Rate Rider for Disposition of Capital Related Revenue Requirement Variance Account
- effective until December 31, 2024 $ (2.17) (per 30 days)
$ (0.01) (per 30 days)
Rate Rider for Disposition of Accounts Receivable Credits - effective until December 31, 2024 $ (0.10) (per 30 days)
Rate Rider for Disposition of PILs and Tax Variance - effective until December 31, 2024 $ (0.31) (per 30 days)
$/kWh 0.00906
$/kWh 0.00737
$/kWh 0.0030
$/kWh 0.0004
$/kWh 0.0005
$ 0.25 (per 30 days)
Retail Transmission Rate - Line and Transformation Connection Service Rate
MONTHLY RATES AND CHARGES - Regulatory Component
Wholesale Market Service Rate (WMS) - not including CBR
Capacity Based Recovery (CBR) - Applicable for Class B Customers
Rural or Remote Electricity Rate Protection Charge (RRRP)
Standard Supply Service - Administrative Charge (if applicable)
It should be noted that this schedule does not list any charges, assessments or credits that are required by law to be invoiced by a distributor and that are not
subject to Ontario Energy Board approval, such as the Debt Retirement Charge, the Global Adjustment and the HST.
MONTHLY RATES AND CHARGES - Delivery Component
Service Charge
Rate Rider for Disposition of Stranded Meter Assets - effective until December 31, 2024
Rate Rider for Disposition of Wireless Pole Attachment Revenue - effective until December 31, 2024
Retail Transmission Rate - Network Service Rate
RESIDENTIAL SERVICE CLASSIFICATIONThis classification is applicable to an account where electricity is used exclusively for residential purposes in a separately metered living accommodation, where the
Competitive Sector Multi-Unit Residential classification is not applicable. Eligibility is restricted to a dwelling unit that consists of a detached house or one unit of a
semi-detached, duplex, triplex or quadruplex building, with a residential zoning; a separately metered dwelling within a town house complex or apartment building;
and bulk metered residential buildings with six or fewer units. Class B consumers are defined in accordance with O. Reg. 429/04. Further details concerning the
terms of service are available in the distributor’s Conditions of Service.
APPLICATION
The application of these rates and charges shall be in accordance with the Licence of the Distributor and any Code or Order of the Ontario Energy Board, and
amendments thereto as approved by the Ontario Energy Board, which may be applicable to the administration of this schedule.
No rates and charges for the distribution of electricity and charges to meet the costs of any work or service done or furnished for the purpose of the distribution of
electricity shall be made except as permitted by this schedule, unless required by the Distributor’s Licence or a Code or Order of the Ontario Energy Board, and
amendments thereto as approved by the Ontario Energy Board, or as specified herein.
Unless specifically noted, this schedule does not contain any charges for the electricity commodity, be it under the Regulated Price Plan, a contract with a retailer
or the wholesale market price, as applicable. In addition, the charges in the MONTHLY RATES AND CHARGES - Regulatory Component of this schedule do not
apply to a customer that is an embedded wholesale market participant.
Toronto Hydro-Electric System LimitedINTERIM TARIFF OF RATES AND CHARGESEffective and Implementation Date January 1, 2024
This schedule supersedes and replaces all previously
approved schedules of Rates, Charges and Loss Factors
EB-2018-0165
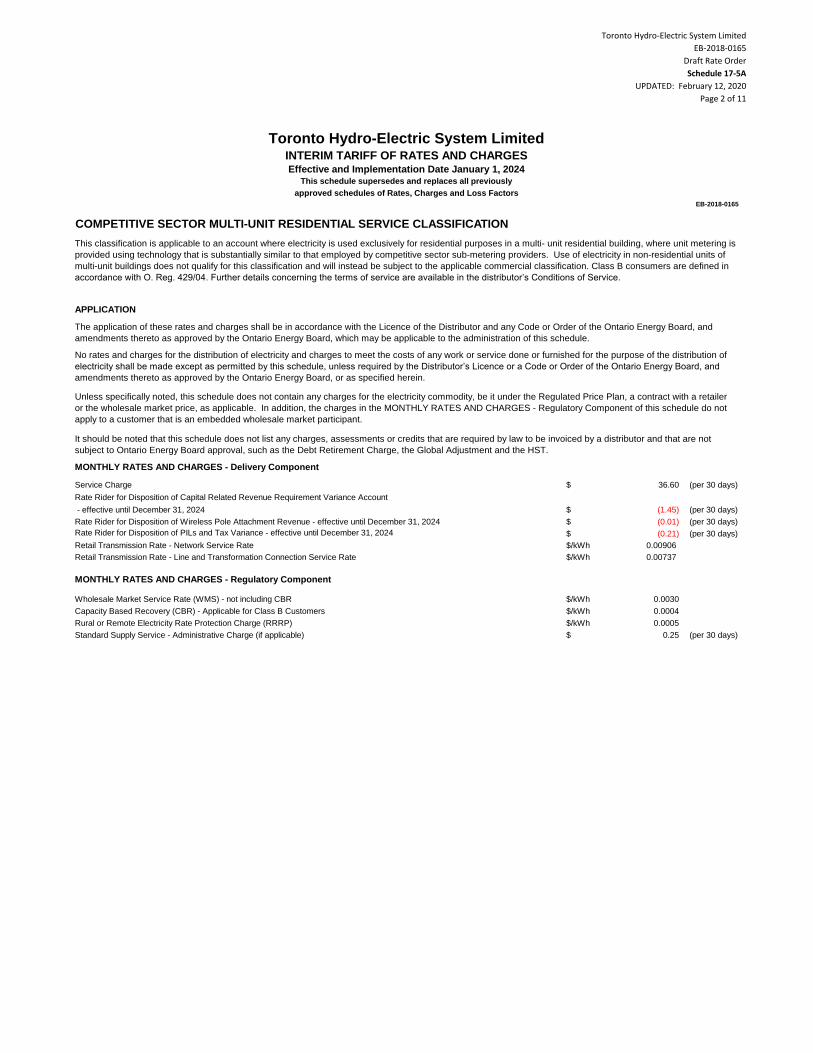
Toronto Hydro-Electric System Limited
EB-2018-0165
Draft Rate Order
Schedule 17-5A
UPDATED: February 12, 2020
Page 2 of 11
Toronto Hydro-Electric System LimitedINTERIM TARIFF OF RATES AND CHARGESEffective and Implementation Date January 1, 2024
This schedule supersedes and replaces all previously
approved schedules of Rates, Charges and Loss Factors
EB-2018-0165
$ 36.60 (per 30 days)
Rate Rider for Disposition of Capital Related Revenue Requirement Variance Account
- effective until December 31, 2024 $ (1.45) (per 30 days)
$ (0.01) (per 30 days)
Rate Rider for Disposition of PILs and Tax Variance - effective until December 31, 2024 $ (0.21) (per 30 days)
$/kWh 0.00906
$/kWh 0.00737
$/kWh 0.0030
$/kWh 0.0004
$/kWh 0.0005
$ 0.25 (per 30 days)
MONTHLY RATES AND CHARGES - Regulatory Component
Wholesale Market Service Rate (WMS) - not including CBR
Capacity Based Recovery (CBR) - Applicable for Class B Customers
Rural or Remote Electricity Rate Protection Charge (RRRP)
Standard Supply Service - Administrative Charge (if applicable)
It should be noted that this schedule does not list any charges, assessments or credits that are required by law to be invoiced by a distributor and that are not
subject to Ontario Energy Board approval, such as the Debt Retirement Charge, the Global Adjustment and the HST.
MONTHLY RATES AND CHARGES - Delivery Component
Service Charge
Rate Rider for Disposition of Wireless Pole Attachment Revenue - effective until December 31, 2024
Retail Transmission Rate - Network Service Rate
Retail Transmission Rate - Line and Transformation Connection Service Rate
COMPETITIVE SECTOR MULTI-UNIT RESIDENTIAL SERVICE CLASSIFICATION
This classification is applicable to an account where electricity is used exclusively for residential purposes in a multi- unit residential building, where unit metering is
provided using technology that is substantially similar to that employed by competitive sector sub-metering providers. Use of electricity in non-residential units of
multi-unit buildings does not qualify for this classification and will instead be subject to the applicable commercial classification. Class B consumers are defined in
accordance with O. Reg. 429/04. Further details concerning the terms of service are available in the distributor’s Conditions of Service.
APPLICATION
The application of these rates and charges shall be in accordance with the Licence of the Distributor and any Code or Order of the Ontario Energy Board, and
amendments thereto as approved by the Ontario Energy Board, which may be applicable to the administration of this schedule.
No rates and charges for the distribution of electricity and charges to meet the costs of any work or service done or furnished for the purpose of the distribution of
electricity shall be made except as permitted by this schedule, unless required by the Distributor’s Licence or a Code or Order of the Ontario Energy Board, and
amendments thereto as approved by the Ontario Energy Board, or as specified herein.
Unless specifically noted, this schedule does not contain any charges for the electricity commodity, be it under the Regulated Price Plan, a contract with a retailer
or the wholesale market price, as applicable. In addition, the charges in the MONTHLY RATES AND CHARGES - Regulatory Component of this schedule do not
apply to a customer that is an embedded wholesale market participant.
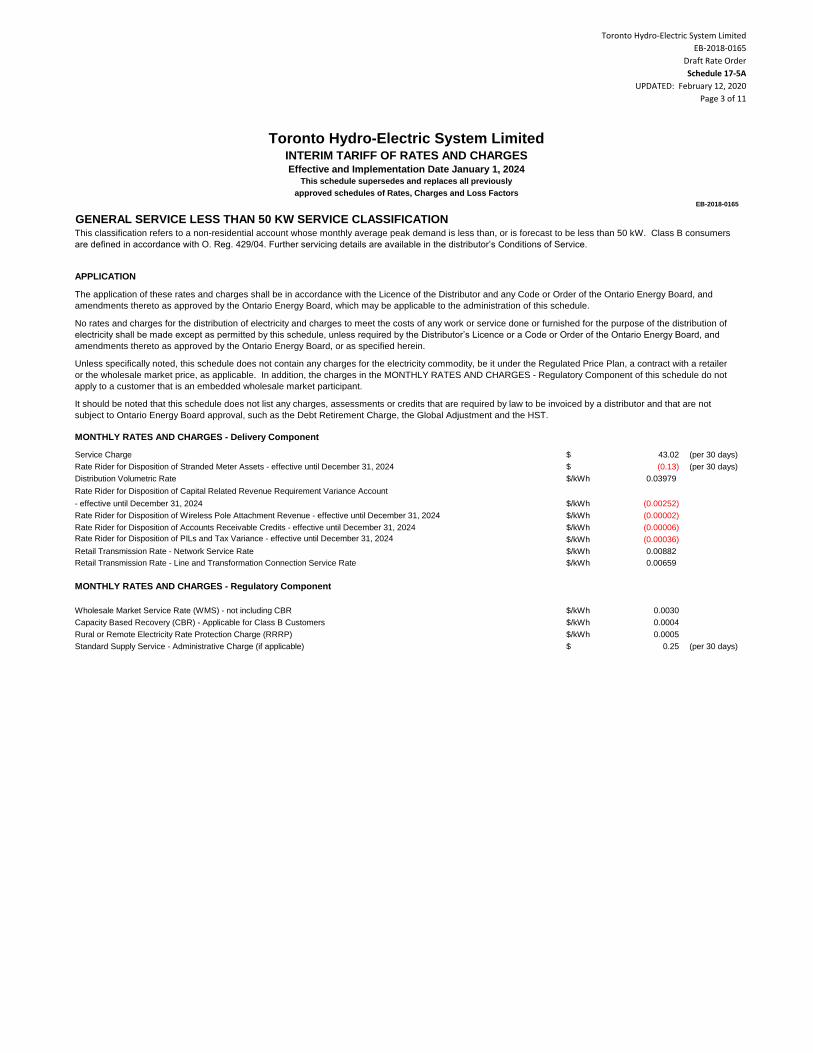
Toronto Hydro-Electric System Limited
EB-2018-0165
Draft Rate Order
Schedule 17-5A
UPDATED: February 12, 2020
Page 3 of 11
Toronto Hydro-Electric System LimitedINTERIM TARIFF OF RATES AND CHARGESEffective and Implementation Date January 1, 2024
This schedule supersedes and replaces all previously
approved schedules of Rates, Charges and Loss Factors
EB-2018-0165
$ 43.02 (per 30 days)
$ (0.13) (per 30 days)
$/kWh 0.03979
Rate Rider for Disposition of Capital Related Revenue Requirement Variance Account
- effective until December 31, 2024 $/kWh (0.00252)
$/kWh (0.00002)
$/kWh (0.00006)
Rate Rider for Disposition of PILs and Tax Variance - effective until December 31, 2024 $/kWh (0.00036)
$/kWh 0.00882
$/kWh 0.00659
$/kWh 0.0030
$/kWh 0.0004
$/kWh 0.0005
$ 0.25 (per 30 days)Standard Supply Service - Administrative Charge (if applicable)
Retail Transmission Rate - Network Service Rate
Retail Transmission Rate - Line and Transformation Connection Service Rate
MONTHLY RATES AND CHARGES - Regulatory Component
Wholesale Market Service Rate (WMS) - not including CBR
Capacity Based Recovery (CBR) - Applicable for Class B Customers
Rural or Remote Electricity Rate Protection Charge (RRRP)
MONTHLY RATES AND CHARGES - Delivery Component
Service Charge
Rate Rider for Disposition of Stranded Meter Assets - effective until December 31, 2024
Distribution Volumetric Rate
Rate Rider for Disposition of Wireless Pole Attachment Revenue - effective until December 31, 2024
Rate Rider for Disposition of Accounts Receivable Credits - effective until December 31, 2024
This classification refers to a non-residential account whose monthly average peak demand is less than, or is forecast to be less than 50 kW. Class B consumers
are defined in accordance with O. Reg. 429/04. Further servicing details are available in the distributor’s Conditions of Service.
APPLICATION
The application of these rates and charges shall be in accordance with the Licence of the Distributor and any Code or Order of the Ontario Energy Board, and
amendments thereto as approved by the Ontario Energy Board, which may be applicable to the administration of this schedule.
No rates and charges for the distribution of electricity and charges to meet the costs of any work or service done or furnished for the purpose of the distribution of
electricity shall be made except as permitted by this schedule, unless required by the Distributor’s Licence or a Code or Order of the Ontario Energy Board, and
amendments thereto as approved by the Ontario Energy Board, or as specified herein.
Unless specifically noted, this schedule does not contain any charges for the electricity commodity, be it under the Regulated Price Plan, a contract with a retailer
or the wholesale market price, as applicable. In addition, the charges in the MONTHLY RATES AND CHARGES - Regulatory Component of this schedule do not
apply to a customer that is an embedded wholesale market participant.
It should be noted that this schedule does not list any charges, assessments or credits that are required by law to be invoiced by a distributor and that are not
subject to Ontario Energy Board approval, such as the Debt Retirement Charge, the Global Adjustment and the HST.
GENERAL SERVICE LESS THAN 50 KW SERVICE CLASSIFICATION
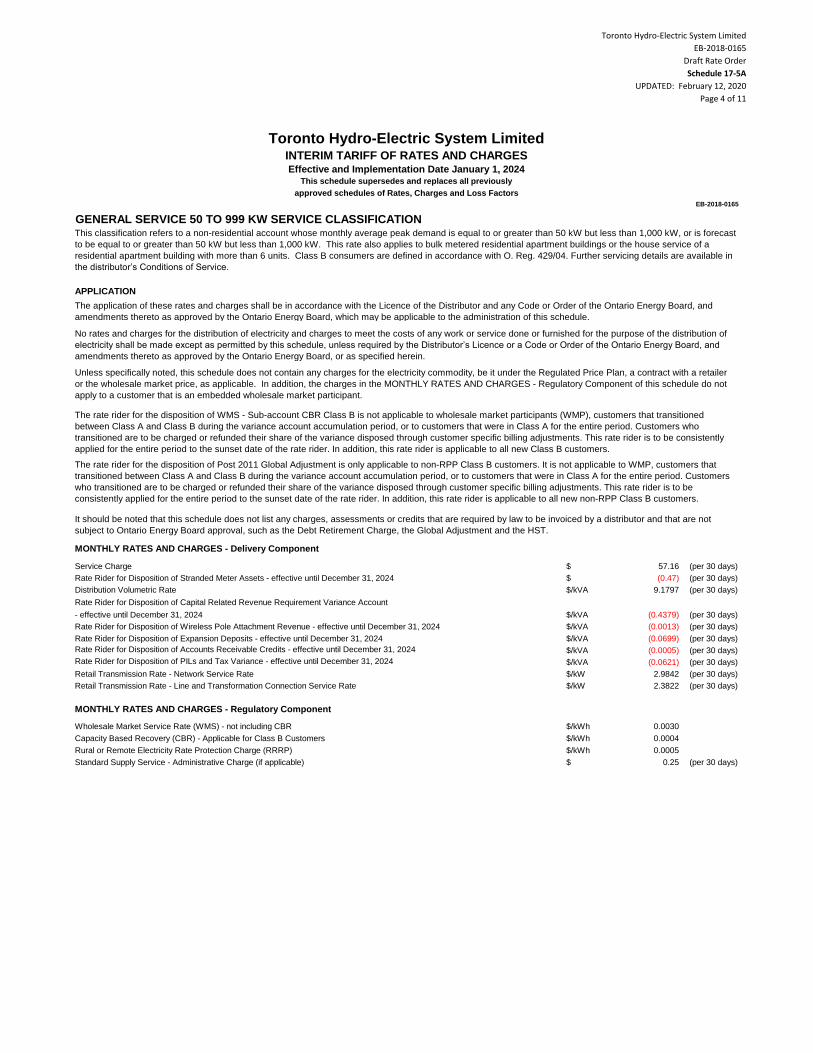
Toronto Hydro-Electric System Limited
EB-2018-0165
Draft Rate Order
Schedule 17-5A
UPDATED: February 12, 2020
Page 4 of 11
Toronto Hydro-Electric System LimitedINTERIM TARIFF OF RATES AND CHARGESEffective and Implementation Date January 1, 2024
This schedule supersedes and replaces all previously
approved schedules of Rates, Charges and Loss Factors
EB-2018-0165
$ 57.16 (per 30 days)
$ (0.47) (per 30 days)
$/kVA 9.1797 (per 30 days)
Rate Rider for Disposition of Capital Related Revenue Requirement Variance Account
- effective until December 31, 2024 $/kVA (0.4379) (per 30 days)
$/kVA (0.0013) (per 30 days)
$/kVA (0.0699) (per 30 days)
Rate Rider for Disposition of Accounts Receivable Credits - effective until December 31, 2024 $/kVA (0.0005) (per 30 days)
Rate Rider for Disposition of PILs and Tax Variance - effective until December 31, 2024 $/kVA (0.0621) (per 30 days)
$/kW 2.9842 (per 30 days)
$/kW 2.3822 (per 30 days)
$/kWh 0.0030
$/kWh 0.0004
$/kWh 0.0005
$ 0.25 (per 30 days)
MONTHLY RATES AND CHARGES - Regulatory Component
Wholesale Market Service Rate (WMS) - not including CBR
Capacity Based Recovery (CBR) - Applicable for Class B Customers
Rural or Remote Electricity Rate Protection Charge (RRRP)
Standard Supply Service - Administrative Charge (if applicable)
Rate Rider for Disposition of Stranded Meter Assets - effective until December 31, 2024
Distribution Volumetric Rate
Rate Rider for Disposition of Wireless Pole Attachment Revenue - effective until December 31, 2024
Rate Rider for Disposition of Expansion Deposits - effective until December 31, 2024
Retail Transmission Rate - Network Service Rate
Retail Transmission Rate - Line and Transformation Connection Service Rate
Unless specifically noted, this schedule does not contain any charges for the electricity commodity, be it under the Regulated Price Plan, a contract with a retailer
or the wholesale market price, as applicable. In addition, the charges in the MONTHLY RATES AND CHARGES - Regulatory Component of this schedule do not
apply to a customer that is an embedded wholesale market participant.
The rate rider for the disposition of WMS - Sub-account CBR Class B is not applicable to wholesale market participants (WMP), customers that transitioned
between Class A and Class B during the variance account accumulation period, or to customers that were in Class A for the entire period. Customers who
transitioned are to be charged or refunded their share of the variance disposed through customer specific billing adjustments. This rate rider is to be consistently
applied for the entire period to the sunset date of the rate rider. In addition, this rate rider is applicable to all new Class B customers.
The rate rider for the disposition of Post 2011 Global Adjustment is only applicable to non-RPP Class B customers. It is not applicable to WMP, customers that
transitioned between Class A and Class B during the variance account accumulation period, or to customers that were in Class A for the entire period. Customers
who transitioned are to be charged or refunded their share of the variance disposed through customer specific billing adjustments. This rate rider is to be
consistently applied for the entire period to the sunset date of the rate rider. In addition, this rate rider is applicable to all new non-RPP Class B customers.
It should be noted that this schedule does not list any charges, assessments or credits that are required by law to be invoiced by a distributor and that are not
subject to Ontario Energy Board approval, such as the Debt Retirement Charge, the Global Adjustment and the HST.
MONTHLY RATES AND CHARGES - Delivery Component
Service Charge
GENERAL SERVICE 50 TO 999 KW SERVICE CLASSIFICATIONThis classification refers to a non-residential account whose monthly average peak demand is equal to or greater than 50 kW but less than 1,000 kW, or is forecast
to be equal to or greater than 50 kW but less than 1,000 kW. This rate also applies to bulk metered residential apartment buildings or the house service of a
residential apartment building with more than 6 units. Class B consumers are defined in accordance with O. Reg. 429/04. Further servicing details are available in
the distributor’s Conditions of Service.
APPLICATION
The application of these rates and charges shall be in accordance with the Licence of the Distributor and any Code or Order of the Ontario Energy Board, and
amendments thereto as approved by the Ontario Energy Board, which may be applicable to the administration of this schedule.
No rates and charges for the distribution of electricity and charges to meet the costs of any work or service done or furnished for the purpose of the distribution of
electricity shall be made except as permitted by this schedule, unless required by the Distributor’s Licence or a Code or Order of the Ontario Energy Board, and
amendments thereto as approved by the Ontario Energy Board, or as specified herein.
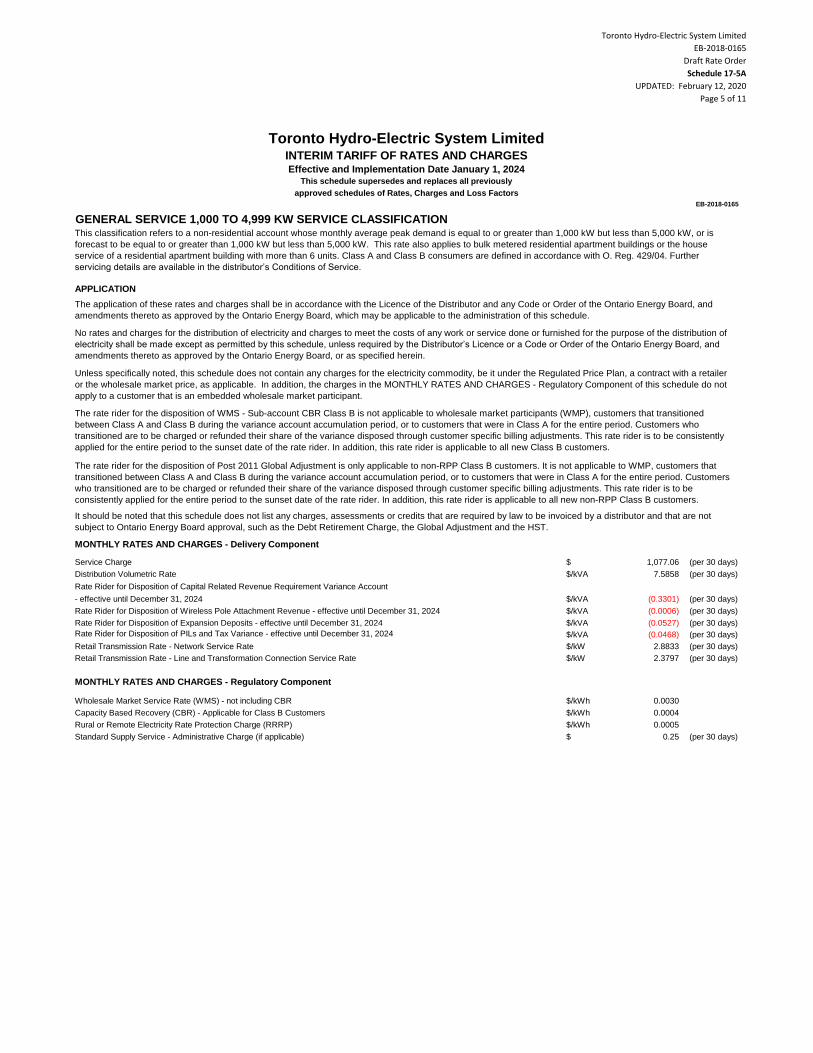
Toronto Hydro-Electric System Limited
EB-2018-0165
Draft Rate Order
Schedule 17-5A
UPDATED: February 12, 2020
Page 5 of 11
Toronto Hydro-Electric System LimitedINTERIM TARIFF OF RATES AND CHARGESEffective and Implementation Date January 1, 2024
This schedule supersedes and replaces all previously
approved schedules of Rates, Charges and Loss Factors
EB-2018-0165
$ 1,077.06 (per 30 days)
$/kVA 7.5858 (per 30 days)
Rate Rider for Disposition of Capital Related Revenue Requirement Variance Account
- effective until December 31, 2024 $/kVA (0.3301) (per 30 days)
$/kVA (0.0006) (per 30 days)
$/kVA (0.0527) (per 30 days)
Rate Rider for Disposition of PILs and Tax Variance - effective until December 31, 2024 $/kVA (0.0468) (per 30 days)
$/kW 2.8833 (per 30 days)
$/kW 2.3797 (per 30 days)
$/kWh 0.0030
$/kWh 0.0004
$/kWh 0.0005
$ 0.25 (per 30 days)
Capacity Based Recovery (CBR) - Applicable for Class B Customers
Rural or Remote Electricity Rate Protection Charge (RRRP)
Standard Supply Service - Administrative Charge (if applicable)
Rate Rider for Disposition of Expansion Deposits - effective until December 31, 2024
Retail Transmission Rate - Network Service Rate
Retail Transmission Rate - Line and Transformation Connection Service Rate
MONTHLY RATES AND CHARGES - Regulatory Component
Wholesale Market Service Rate (WMS) - not including CBR
The rate rider for the disposition of Post 2011 Global Adjustment is only applicable to non-RPP Class B customers. It is not applicable to WMP, customers that
transitioned between Class A and Class B during the variance account accumulation period, or to customers that were in Class A for the entire period. Customers
who transitioned are to be charged or refunded their share of the variance disposed through customer specific billing adjustments. This rate rider is to be
consistently applied for the entire period to the sunset date of the rate rider. In addition, this rate rider is applicable to all new non-RPP Class B customers.
It should be noted that this schedule does not list any charges, assessments or credits that are required by law to be invoiced by a distributor and that are not
subject to Ontario Energy Board approval, such as the Debt Retirement Charge, the Global Adjustment and the HST.
MONTHLY RATES AND CHARGES - Delivery Component
Service Charge
Distribution Volumetric Rate
Rate Rider for Disposition of Wireless Pole Attachment Revenue - effective until December 31, 2024
This classification refers to a non-residential account whose monthly average peak demand is equal to or greater than 1,000 kW but less than 5,000 kW, or is
forecast to be equal to or greater than 1,000 kW but less than 5,000 kW. This rate also applies to bulk metered residential apartment buildings or the house
service of a residential apartment building with more than 6 units. Class A and Class B consumers are defined in accordance with O. Reg. 429/04. Further
servicing details are available in the distributor’s Conditions of Service.
APPLICATION
The application of these rates and charges shall be in accordance with the Licence of the Distributor and any Code or Order of the Ontario Energy Board, and
amendments thereto as approved by the Ontario Energy Board, which may be applicable to the administration of this schedule.
No rates and charges for the distribution of electricity and charges to meet the costs of any work or service done or furnished for the purpose of the distribution of
electricity shall be made except as permitted by this schedule, unless required by the Distributor’s Licence or a Code or Order of the Ontario Energy Board, and
amendments thereto as approved by the Ontario Energy Board, or as specified herein.
Unless specifically noted, this schedule does not contain any charges for the electricity commodity, be it under the Regulated Price Plan, a contract with a retailer
or the wholesale market price, as applicable. In addition, the charges in the MONTHLY RATES AND CHARGES - Regulatory Component of this schedule do not
apply to a customer that is an embedded wholesale market participant.
The rate rider for the disposition of WMS - Sub-account CBR Class B is not applicable to wholesale market participants (WMP), customers that transitioned
between Class A and Class B during the variance account accumulation period, or to customers that were in Class A for the entire period. Customers who
transitioned are to be charged or refunded their share of the variance disposed through customer specific billing adjustments. This rate rider is to be consistently
applied for the entire period to the sunset date of the rate rider. In addition, this rate rider is applicable to all new Class B customers.
GENERAL SERVICE 1,000 TO 4,999 KW SERVICE CLASSIFICATION
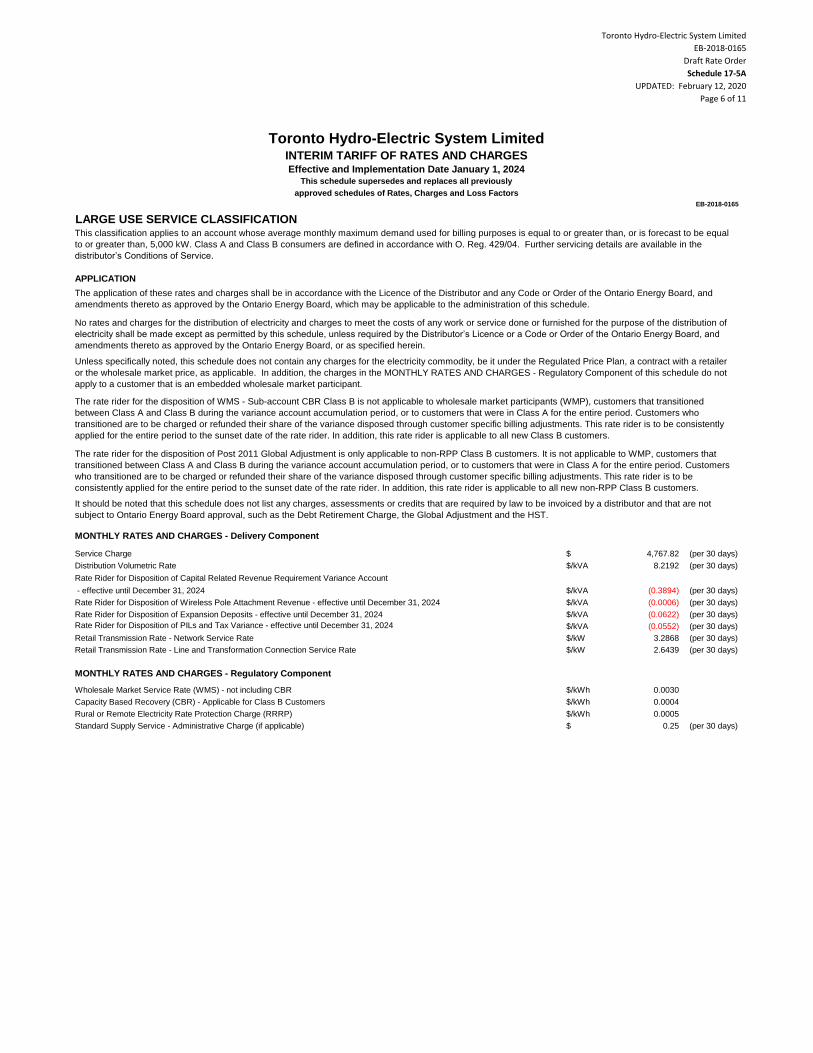
Toronto Hydro-Electric System Limited
EB-2018-0165
Draft Rate Order
Schedule 17-5A
UPDATED: February 12, 2020
Page 6 of 11
Toronto Hydro-Electric System LimitedINTERIM TARIFF OF RATES AND CHARGESEffective and Implementation Date January 1, 2024
This schedule supersedes and replaces all previously
approved schedules of Rates, Charges and Loss Factors
EB-2018-0165
$ 4,767.82 (per 30 days)
$/kVA 8.2192 (per 30 days)
Rate Rider for Disposition of Capital Related Revenue Requirement Variance Account
- effective until December 31, 2024 $/kVA (0.3894) (per 30 days)
$/kVA (0.0006) (per 30 days)
$/kVA (0.0622) (per 30 days)
Rate Rider for Disposition of PILs and Tax Variance - effective until December 31, 2024 $/kVA (0.0552) (per 30 days)
$/kW 3.2868 (per 30 days)
$/kW 2.6439 (per 30 days)
$/kWh 0.0030
$/kWh 0.0004
$/kWh 0.0005
$ 0.25 (per 30 days)
Retail Transmission Rate - Line and Transformation Connection Service Rate
MONTHLY RATES AND CHARGES - Regulatory Component
Wholesale Market Service Rate (WMS) - not including CBR
Capacity Based Recovery (CBR) - Applicable for Class B Customers
Rural or Remote Electricity Rate Protection Charge (RRRP)
Standard Supply Service - Administrative Charge (if applicable)
MONTHLY RATES AND CHARGES - Delivery Component
Service Charge
Distribution Volumetric Rate
Rate Rider for Disposition of Wireless Pole Attachment Revenue - effective until December 31, 2024
Rate Rider for Disposition of Expansion Deposits - effective until December 31, 2024
Retail Transmission Rate - Network Service Rate
The application of these rates and charges shall be in accordance with the Licence of the Distributor and any Code or Order of the Ontario Energy Board, and
amendments thereto as approved by the Ontario Energy Board, which may be applicable to the administration of this schedule.
No rates and charges for the distribution of electricity and charges to meet the costs of any work or service done or furnished for the purpose of the distribution of
electricity shall be made except as permitted by this schedule, unless required by the Distributor’s Licence or a Code or Order of the Ontario Energy Board, and
amendments thereto as approved by the Ontario Energy Board, or as specified herein.
Unless specifically noted, this schedule does not contain any charges for the electricity commodity, be it under the Regulated Price Plan, a contract with a retailer
or the wholesale market price, as applicable. In addition, the charges in the MONTHLY RATES AND CHARGES - Regulatory Component of this schedule do not
apply to a customer that is an embedded wholesale market participant.
The rate rider for the disposition of WMS - Sub-account CBR Class B is not applicable to wholesale market participants (WMP), customers that transitioned
between Class A and Class B during the variance account accumulation period, or to customers that were in Class A for the entire period. Customers who
transitioned are to be charged or refunded their share of the variance disposed through customer specific billing adjustments. This rate rider is to be consistently
applied for the entire period to the sunset date of the rate rider. In addition, this rate rider is applicable to all new Class B customers.
The rate rider for the disposition of Post 2011 Global Adjustment is only applicable to non-RPP Class B customers. It is not applicable to WMP, customers that
transitioned between Class A and Class B during the variance account accumulation period, or to customers that were in Class A for the entire period. Customers
who transitioned are to be charged or refunded their share of the variance disposed through customer specific billing adjustments. This rate rider is to be
consistently applied for the entire period to the sunset date of the rate rider. In addition, this rate rider is applicable to all new non-RPP Class B customers.
It should be noted that this schedule does not list any charges, assessments or credits that are required by law to be invoiced by a distributor and that are not
subject to Ontario Energy Board approval, such as the Debt Retirement Charge, the Global Adjustment and the HST.
LARGE USE SERVICE CLASSIFICATIONThis classification applies to an account whose average monthly maximum demand used for billing purposes is equal to or greater than, or is forecast to be equal
to or greater than, 5,000 kW. Class A and Class B consumers are defined in accordance with O. Reg. 429/04. Further servicing details are available in the
distributor’s Conditions of Service.
APPLICATION

Toronto Hydro-Electric System Limited
EB-2018-0165
Draft Rate Order
Schedule 17-5A
UPDATED: February 12, 2020
Page 7 of 11
Toronto Hydro-Electric System LimitedINTERIM TARIFF OF RATES AND CHARGESEffective and Implementation Date January 1, 2024
This schedule supersedes and replaces all previously
approved schedules of Rates, Charges and Loss Factors
EB-2018-0165
$ 278.85 (per 30 days)
$/kVA 9.1797 (per 30 days)
$/kVA 7.5858 (per 30 days)
$/kVA 8.2192 (per 30 days)
For General Service 1,000 - 4,999 kW Service Classification
For Large Use Service Classification
It should be noted that this schedule does not list any charges, assessments or credits that are required by law to be invoiced by a distributor and that are not
subject to Ontario Energy Board approval, such as the Debt Retirement Charge, the Global Adjustment and the HST.
MONTHLY RATES AND CHARGES - Delivery Component - APPROVED ON AN INTERIM BASIS
Standby Charge - for a month where standby power is not provided. The charge is applied to the contracted amount (e.g. nameplate rating of
generation facility).
Service Charge
Distribution Volumetric Rate
For General Service 50 - 999 kW Service Classification
STANDBY POWER SERVICE CLASSIFICATIONThis classification refers to an account that has Load Displacement Generation and requires THESL to provide back- up service. Further servicing details are
available in the distributor’s Conditions of Service.
APPLICATION
The application of these rates and charges shall be in accordance with the Licence of the Distributor and any Code or Order of the Ontario Energy Board, and
amendments thereto as approved by the Ontario Energy Board, which may be applicable to the administration of this schedule.
No rates and charges for the distribution of electricity and charges to meet the costs of any work or service done or furnished for the purpose of the distribution of
electricity shall be made except as permitted by this schedule, unless required by the Distributor’s Licence or a Code or Order of the Ontario Energy Board, and
amendments thereto as approved by the Ontario Energy Board, or as specified herein.
Unless specifically noted, this schedule does not contain any charges for the electricity commodity, be it under the Regulated Price Plan, a contract with a retailer
or the wholesale market price, as applicable.
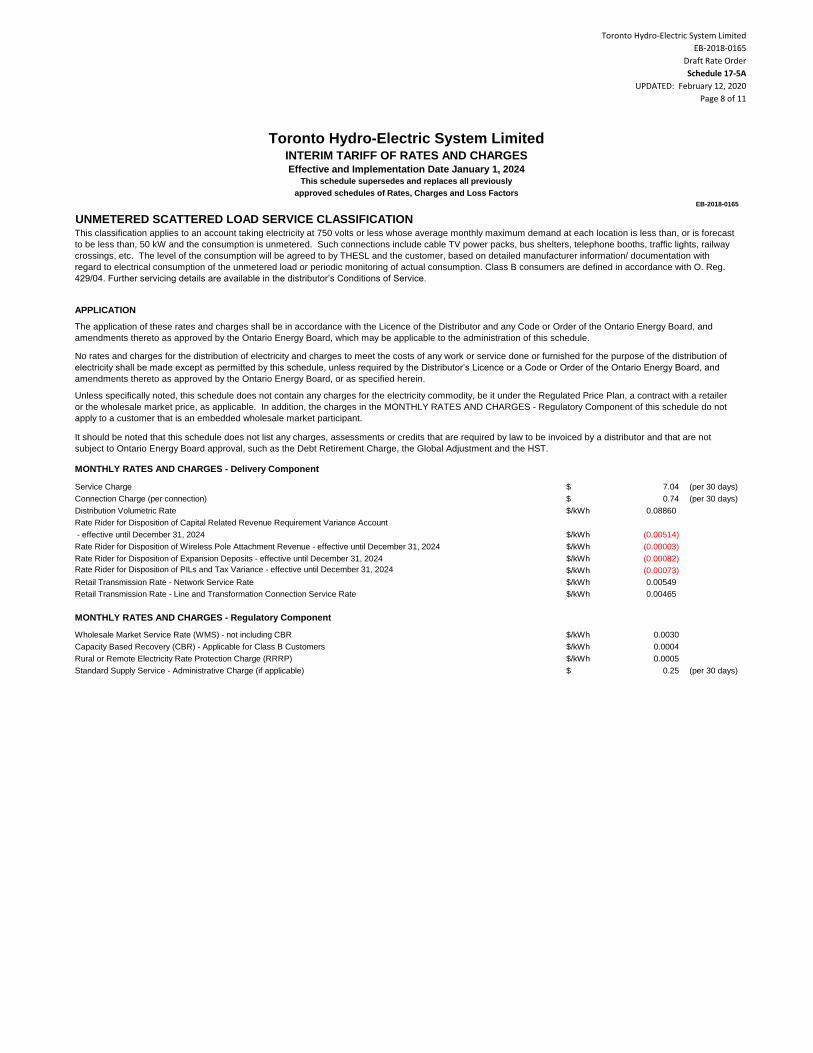
Toronto Hydro-Electric System Limited
EB-2018-0165
Draft Rate Order
Schedule 17-5A
UPDATED: February 12, 2020
Page 8 of 11
Toronto Hydro-Electric System LimitedINTERIM TARIFF OF RATES AND CHARGESEffective and Implementation Date January 1, 2024
This schedule supersedes and replaces all previously
approved schedules of Rates, Charges and Loss Factors
EB-2018-0165
$ 7.04 (per 30 days)
$ 0.74 (per 30 days)
$/kWh 0.08860
Rate Rider for Disposition of Capital Related Revenue Requirement Variance Account
- effective until December 31, 2024 $/kWh (0.00514)
$/kWh (0.00003)
$/kWh (0.00082)
Rate Rider for Disposition of PILs and Tax Variance - effective until December 31, 2024 $/kWh (0.00073)
$/kWh 0.00549
$/kWh 0.00465
$/kWh 0.0030
$/kWh 0.0004
$/kWh 0.0005
$ 0.25 (per 30 days)
Wholesale Market Service Rate (WMS) - not including CBR
Capacity Based Recovery (CBR) - Applicable for Class B Customers
Rural or Remote Electricity Rate Protection Charge (RRRP)
Standard Supply Service - Administrative Charge (if applicable)
Distribution Volumetric Rate
Rate Rider for Disposition of Wireless Pole Attachment Revenue - effective until December 31, 2024
Rate Rider for Disposition of Expansion Deposits - effective until December 31, 2024
Retail Transmission Rate - Network Service Rate
Retail Transmission Rate - Line and Transformation Connection Service Rate
MONTHLY RATES AND CHARGES - Regulatory Component
No rates and charges for the distribution of electricity and charges to meet the costs of any work or service done or furnished for the purpose of the distribution of
electricity shall be made except as permitted by this schedule, unless required by the Distributor’s Licence or a Code or Order of the Ontario Energy Board, and
amendments thereto as approved by the Ontario Energy Board, or as specified herein.
Unless specifically noted, this schedule does not contain any charges for the electricity commodity, be it under the Regulated Price Plan, a contract with a retailer
or the wholesale market price, as applicable. In addition, the charges in the MONTHLY RATES AND CHARGES - Regulatory Component of this schedule do not
apply to a customer that is an embedded wholesale market participant.
It should be noted that this schedule does not list any charges, assessments or credits that are required by law to be invoiced by a distributor and that are not
subject to Ontario Energy Board approval, such as the Debt Retirement Charge, the Global Adjustment and the HST.
MONTHLY RATES AND CHARGES - Delivery Component
Service Charge
Connection Charge (per connection)
UNMETERED SCATTERED LOAD SERVICE CLASSIFICATIONThis classification applies to an account taking electricity at 750 volts or less whose average monthly maximum demand at each location is less than, or is forecast
to be less than, 50 kW and the consumption is unmetered. Such connections include cable TV power packs, bus shelters, telephone booths, traffic lights, railway
crossings, etc. The level of the consumption will be agreed to by THESL and the customer, based on detailed manufacturer information/ documentation with
regard to electrical consumption of the unmetered load or periodic monitoring of actual consumption. Class B consumers are defined in accordance with O. Reg.
429/04. Further servicing details are available in the distributor’s Conditions of Service.
APPLICATION
The application of these rates and charges shall be in accordance with the Licence of the Distributor and any Code or Order of the Ontario Energy Board, and
amendments thereto as approved by the Ontario Energy Board, which may be applicable to the administration of this schedule.
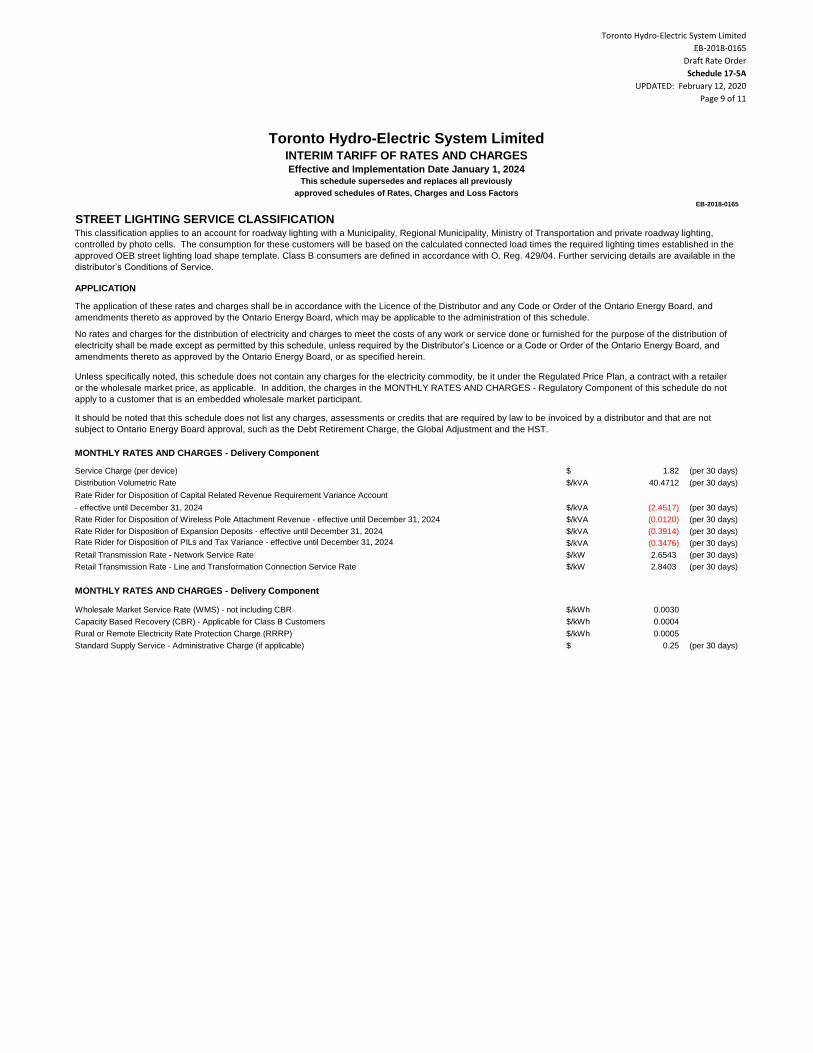
Toronto Hydro-Electric System Limited
EB-2018-0165
Draft Rate Order
Schedule 17-5A
UPDATED: February 12, 2020
Page 9 of 11
Toronto Hydro-Electric System LimitedINTERIM TARIFF OF RATES AND CHARGESEffective and Implementation Date January 1, 2024
This schedule supersedes and replaces all previously
approved schedules of Rates, Charges and Loss Factors
EB-2018-0165
$ 1.82 (per 30 days)
$/kVA 40.4712 (per 30 days)
Rate Rider for Disposition of Capital Related Revenue Requirement Variance Account
- effective until December 31, 2024 $/kVA (2.4517) (per 30 days)
$/kVA (0.0120) (per 30 days)
$/kVA (0.3914) (per 30 days)
Rate Rider for Disposition of PILs and Tax Variance - effective until December 31, 2024 $/kVA (0.3476) (per 30 days)
$/kW 2.6543 (per 30 days)
$/kW 2.8403 (per 30 days)
$/kWh 0.0030
$/kWh 0.0004
$/kWh 0.0005
$ 0.25 (per 30 days)
MONTHLY RATES AND CHARGES - Delivery Component
Wholesale Market Service Rate (WMS) - not including CBR
Capacity Based Recovery (CBR) - Applicable for Class B Customers
Rural or Remote Electricity Rate Protection Charge (RRRP)
Standard Supply Service - Administrative Charge (if applicable)
Service Charge (per device)
Distribution Volumetric Rate
Rate Rider for Disposition of Wireless Pole Attachment Revenue - effective until December 31, 2024
Rate Rider for Disposition of Expansion Deposits - effective until December 31, 2024
Retail Transmission Rate - Network Service Rate
Retail Transmission Rate - Line and Transformation Connection Service Rate
APPLICATION
The application of these rates and charges shall be in accordance with the Licence of the Distributor and any Code or Order of the Ontario Energy Board, and
amendments thereto as approved by the Ontario Energy Board, which may be applicable to the administration of this schedule.
No rates and charges for the distribution of electricity and charges to meet the costs of any work or service done or furnished for the purpose of the distribution of
electricity shall be made except as permitted by this schedule, unless required by the Distributor’s Licence or a Code or Order of the Ontario Energy Board, and
amendments thereto as approved by the Ontario Energy Board, or as specified herein.
Unless specifically noted, this schedule does not contain any charges for the electricity commodity, be it under the Regulated Price Plan, a contract with a retailer
or the wholesale market price, as applicable. In addition, the charges in the MONTHLY RATES AND CHARGES - Regulatory Component of this schedule do not
apply to a customer that is an embedded wholesale market participant.
It should be noted that this schedule does not list any charges, assessments or credits that are required by law to be invoiced by a distributor and that are not
subject to Ontario Energy Board approval, such as the Debt Retirement Charge, the Global Adjustment and the HST.
MONTHLY RATES AND CHARGES - Delivery Component
STREET LIGHTING SERVICE CLASSIFICATIONThis classification applies to an account for roadway lighting with a Municipality, Regional Municipality, Ministry of Transportation and private roadway lighting,
controlled by photo cells. The consumption for these customers will be based on the calculated connected load times the required lighting times established in the
approved OEB street lighting load shape template. Class B consumers are defined in accordance with O. Reg. 429/04. Further servicing details are available in the
distributor’s Conditions of Service.
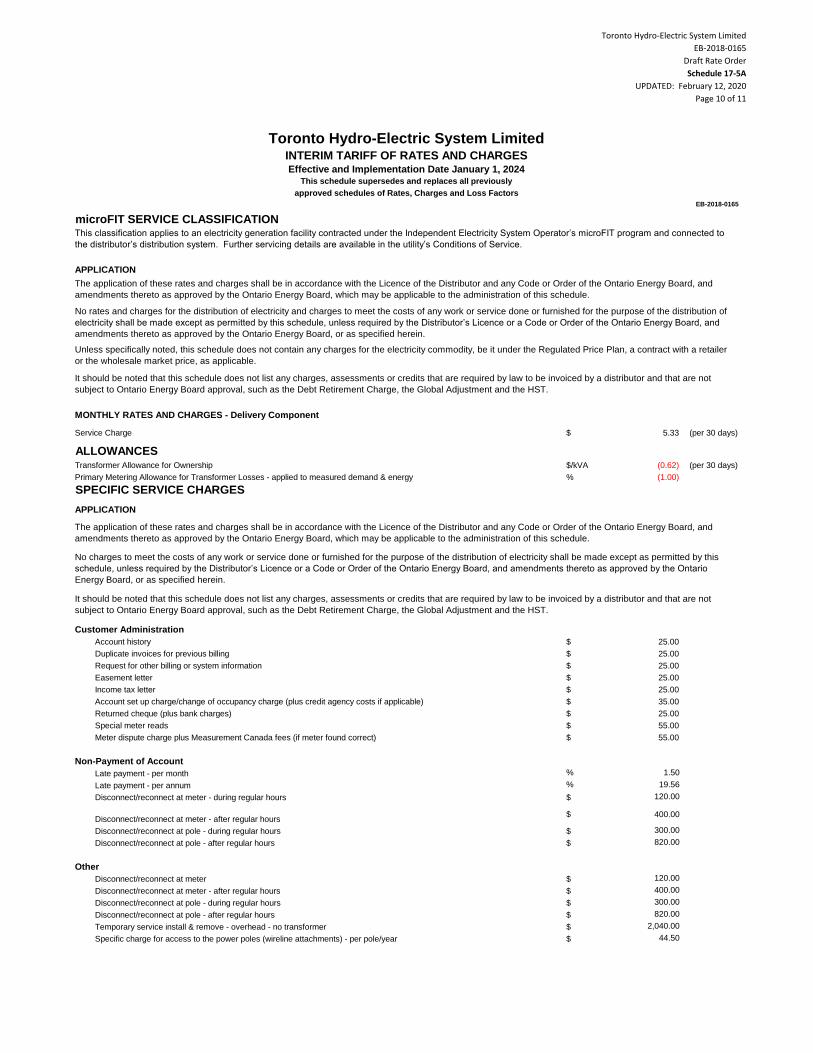
Toronto Hydro-Electric System Limited
EB-2018-0165
Draft Rate Order
Schedule 17-5A
UPDATED: February 12, 2020
Page 10 of 11
Toronto Hydro-Electric System LimitedINTERIM TARIFF OF RATES AND CHARGESEffective and Implementation Date January 1, 2024
This schedule supersedes and replaces all previously
approved schedules of Rates, Charges and Loss Factors
EB-2018-0165
$ 5.33 (per 30 days)
ALLOWANCES$/kVA (0.62) (per 30 days)
% (1.00)
SPECIFIC SERVICE CHARGES
Customer Administration
$ 25.00
$ 25.00
$ 25.00
$ 25.00
$ 25.00
$ 35.00
$ 25.00
$ 55.00
$ 55.00
Non-Payment of Account
% 1.50
% 19.56
$ 120.00
$ 400.00
$ 300.00
$ 820.00
Other
$ 120.00
$ 400.00
$ 300.00
$ 820.00
$ 2,040.00
$ 44.50
Disconnect/reconnect at meter - after regular hours
Disconnect/reconnect at pole - during regular hours
Disconnect/reconnect at pole - after regular hours
Temporary service install & remove - overhead - no transformer
Specific charge for access to the power poles (wireline attachments) - per pole/year
Late payment - per annum
Disconnect/reconnect at meter - during regular hours
Disconnect/reconnect at meter - after regular hours
Disconnect/reconnect at pole - during regular hours
Disconnect/reconnect at pole - after regular hours
Disconnect/reconnect at meter
Income tax letter
Account set up charge/change of occupancy charge (plus credit agency costs if applicable)
Returned cheque (plus bank charges)
Special meter reads
Meter dispute charge plus Measurement Canada fees (if meter found correct)
Late payment - per month
No charges to meet the costs of any work or service done or furnished for the purpose of the distribution of electricity shall be made except as permitted by this
schedule, unless required by the Distributor’s Licence or a Code or Order of the Ontario Energy Board, and amendments thereto as approved by the Ontario
Energy Board, or as specified herein.
It should be noted that this schedule does not list any charges, assessments or credits that are required by law to be invoiced by a distributor and that are not
subject to Ontario Energy Board approval, such as the Debt Retirement Charge, the Global Adjustment and the HST.
Account history
Duplicate invoices for previous billing
Request for other billing or system information
Easement letter
MONTHLY RATES AND CHARGES - Delivery Component
Service Charge
Transformer Allowance for Ownership
Primary Metering Allowance for Transformer Losses - applied to measured demand & energy
APPLICATION
The application of these rates and charges shall be in accordance with the Licence of the Distributor and any Code or Order of the Ontario Energy Board, and
amendments thereto as approved by the Ontario Energy Board, which may be applicable to the administration of this schedule.
This classification applies to an electricity generation facility contracted under the Independent Electricity System Operator’s microFIT program and connected to
the distributor’s distribution system. Further servicing details are available in the utility’s Conditions of Service.
APPLICATION
The application of these rates and charges shall be in accordance with the Licence of the Distributor and any Code or Order of the Ontario Energy Board, and
amendments thereto as approved by the Ontario Energy Board, which may be applicable to the administration of this schedule.
No rates and charges for the distribution of electricity and charges to meet the costs of any work or service done or furnished for the purpose of the distribution of
electricity shall be made except as permitted by this schedule, unless required by the Distributor’s Licence or a Code or Order of the Ontario Energy Board, and
amendments thereto as approved by the Ontario Energy Board, or as specified herein.
Unless specifically noted, this schedule does not contain any charges for the electricity commodity, be it under the Regulated Price Plan, a contract with a retailer
or the wholesale market price, as applicable.
It should be noted that this schedule does not list any charges, assessments or credits that are required by law to be invoiced by a distributor and that are not
subject to Ontario Energy Board approval, such as the Debt Retirement Charge, the Global Adjustment and the HST.
microFIT SERVICE CLASSIFICATION

Toronto Hydro-Electric System Limited
EB-2018-0165
Draft Rate Order
Schedule 17-5A
UPDATED: February 12, 2020
Page 11 of 11
Toronto Hydro-Electric System LimitedINTERIM TARIFF OF RATES AND CHARGESEffective and Implementation Date January 1, 2024
This schedule supersedes and replaces all previously
approved schedules of Rates, Charges and Loss Factors
EB-2018-0165
RETAIL SERVICE CHARGES (if applicable)
$ 102.00
$ 40.80
$/cust. 1.02
$/cust. 0.61
$/cust. (0.61)
$ 0.51
$ 1.02
no charge
$ 4.08
LOSS FACTORS
1.0295
1.0172
1.0192
1.0070
If the distributor is not capable of prorating changed loss factors jointly with distribution rates, the revised loss factors will be implemented upon the
first subsequent billing for each billing cycle.
Total Loss Factor - Secondary Metered Customer < 5,000 kW
Total Loss Factor - Secondary Metered Customer > 5,000 kW
Total Loss Factor - Primary Metered Customer < 5,000 kW
Total Loss Factor - Primary Metered Customer > 5,000 kW
Processing fee, per request, applied to the requesting party
Request for customer information as outlined in Section 10.6.3 and Chapter 11 of the Retail
Settlement Code directly to retailers and customers, if not delivered electronically through the
Electronic Business Transaction (EBT) system, applied to the requesting party
Up to twice a year
More than twice a year, per request (plus incremental delivery costs)
Monthly Fixed Charge, per retailer
Monthly Variable Charge, per customer, per retailer
Distributor-consolidated billing monthly charge, per customer, per retailer
Retailer-consolidated billing monthly credit, per customer, per retailer
Service Transaction Requests (STR)
Request fee, per request, applied to the requesting party
The application of these rates and charges shall be in accordance with the Licence of the Distributor and any Code or Order of the Ontario Energy Board, and
amendments thereto as approved by the Ontario Energy Board, which may be applicable to the administration of this schedule.
No rates and charges for the distribution of electricity and charges to meet the costs of any work or service done or furnished for the purpose of the distribution of
electricity shall be made except as permitted by this schedule, unless required by the Distributor’s Licence or a Code or Order of the Ontario Energy Board, and
amendments thereto as approved by the Ontario Energy Board, or as specified herein.
Unless specifically noted, this schedule does not contain any charges for the electricity commodity, be it under the Regulated Price Plan, a contract with a retailer
or the wholesale market price, as applicable.
It should be noted that this schedule does not list any charges, assessments or credits that are required by law to be invoiced by a distributor and that are not
subject to Ontario Energy Board approval, such as the Debt Retirement Charge, the Global Adjustment and the HST.
Retail Service Charges refer to services provided by THESL to retailers or customers related to the supply of competitive electricity and are defined
in the 2006 Electricity Distribution Rate Handbook.
One-time charge, per retailer, to establish the service agreement between the distributor and the retailer
APPLICATION
Schedule 17-B – Unsmoothed 2020-2024 Tariff of Rates and Charges
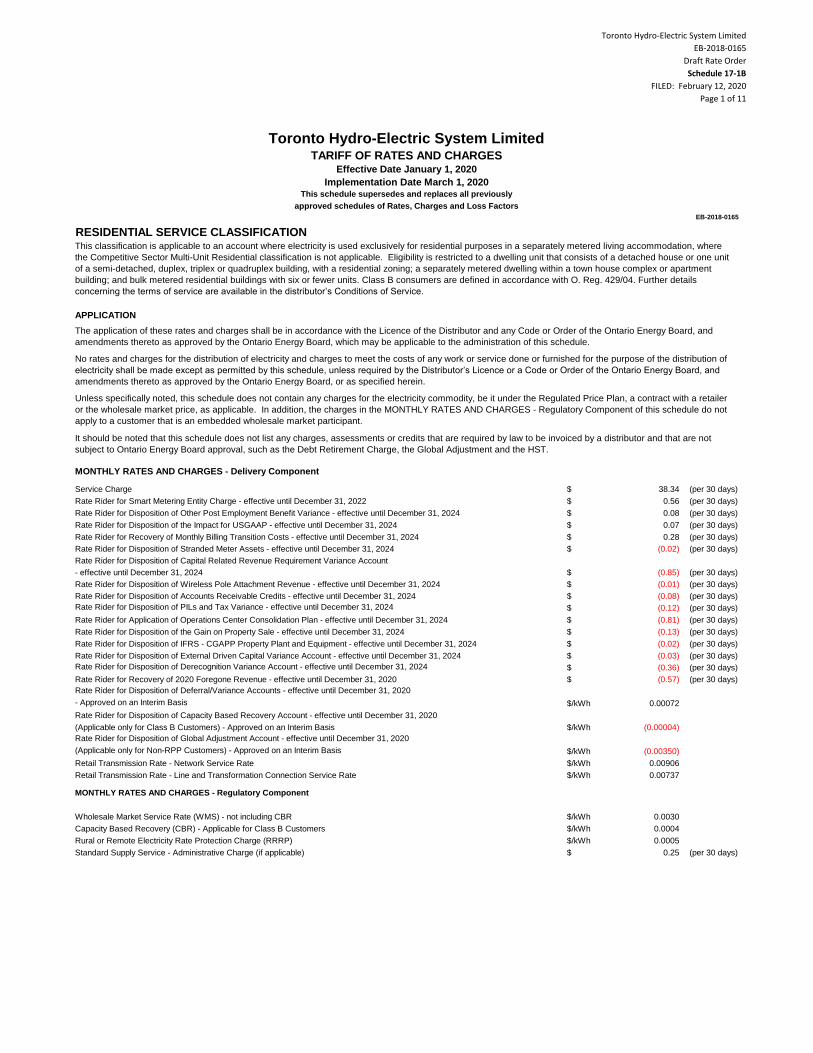
Toronto Hydro-Electric System Limited
EB-2018-0165
Draft Rate Order
Schedule 17-1B
FILED: February 12, 2020
Page 1 of 11
$ 38.34 (per 30 days)
$ 0.56 (per 30 days)
$ 0.08 (per 30 days)
$ 0.07 (per 30 days)
$ 0.28 (per 30 days)
$ (0.02) (per 30 days)
- effective until December 31, 2024 $ (0.85) (per 30 days)
$ (0.01) (per 30 days)
$ (0.08) (per 30 days)
Rate Rider for Disposition of PILs and Tax Variance - effective until December 31, 2024 $ (0.12) (per 30 days)
$ (0.81) (per 30 days)
$ (0.13) (per 30 days)
$ (0.02) (per 30 days)
$ (0.03) (per 30 days)
Rate Rider for Disposition of Derecognition Variance Account - effective until December 31, 2024 $ (0.36) (per 30 days)
$ (0.57) (per 30 days)
Rate Rider for Disposition of Deferral/Variance Accounts - effective until December 31, 2020
- Approved on an Interim Basis $/kWh 0.00072
Rate Rider for Disposition of Capacity Based Recovery Account - effective until December 31, 2020
(Applicable only for Class B Customers) - Approved on an Interim Basis $/kWh (0.00004)
Rate Rider for Disposition of Global Adjustment Account - effective until December 31, 2020
(Applicable only for Non-RPP Customers) - Approved on an Interim Basis $/kWh (0.00350)
$/kWh 0.00906
$/kWh 0.00737
$/kWh 0.0030
$/kWh 0.0004
$/kWh 0.0005
$ 0.25 (per 30 days)
Retail Transmission Rate - Line and Transformation Connection Service Rate
MONTHLY RATES AND CHARGES - Regulatory Component
Wholesale Market Service Rate (WMS) - not including CBR
Capacity Based Recovery (CBR) - Applicable for Class B Customers
Rural or Remote Electricity Rate Protection Charge (RRRP)
Standard Supply Service - Administrative Charge (if applicable)
Rate Rider for Application of Operations Center Consolidation Plan - effective until December 31, 2024
Rate Rider for Disposition of the Gain on Property Sale - effective until December 31, 2024
Rate Rider for Disposition of IFRS - CGAPP Property Plant and Equipment - effective until December 31, 2024
Rate Rider for Disposition of External Driven Capital Variance Account - effective until December 31, 2024
Rate Rider for Recovery of 2020 Foregone Revenue - effective until December 31, 2020
Retail Transmission Rate - Network Service Rate
Rate Rider for Disposition of the Impact for USGAAP - effective until December 31, 2024
Rate Rider for Recovery of Monthly Billing Transition Costs - effective until December 31, 2024
Rate Rider for Disposition of Stranded Meter Assets - effective until December 31, 2024
Rate Rider for Disposition of Capital Related Revenue Requirement Variance Account
Rate Rider for Disposition of Wireless Pole Attachment Revenue - effective until December 31, 2024
Rate Rider for Disposition of Accounts Receivable Credits - effective until December 31, 2024
Service Charge
Rate Rider for Smart Metering Entity Charge - effective until December 31, 2022
Rate Rider for Disposition of Other Post Employment Benefit Variance - effective until December 31, 2024
EB-2018-0165
RESIDENTIAL SERVICE CLASSIFICATIONThis classification is applicable to an account where electricity is used exclusively for residential purposes in a separately metered living accommodation, where
the Competitive Sector Multi-Unit Residential classification is not applicable. Eligibility is restricted to a dwelling unit that consists of a detached house or one unit
of a semi-detached, duplex, triplex or quadruplex building, with a residential zoning; a separately metered dwelling within a town house complex or apartment
building; and bulk metered residential buildings with six or fewer units. Class B consumers are defined in accordance with O. Reg. 429/04. Further details
concerning the terms of service are available in the distributor’s Conditions of Service.
APPLICATION
The application of these rates and charges shall be in accordance with the Licence of the Distributor and any Code or Order of the Ontario Energy Board, and
amendments thereto as approved by the Ontario Energy Board, which may be applicable to the administration of this schedule.
No rates and charges for the distribution of electricity and charges to meet the costs of any work or service done or furnished for the purpose of the distribution of
electricity shall be made except as permitted by this schedule, unless required by the Distributor’s Licence or a Code or Order of the Ontario Energy Board, and
amendments thereto as approved by the Ontario Energy Board, or as specified herein.
Toronto Hydro-Electric System LimitedTARIFF OF RATES AND CHARGES
Effective Date January 1, 2020
Implementation Date March 1, 2020This schedule supersedes and replaces all previously
approved schedules of Rates, Charges and Loss Factors
Unless specifically noted, this schedule does not contain any charges for the electricity commodity, be it under the Regulated Price Plan, a contract with a retailer
or the wholesale market price, as applicable. In addition, the charges in the MONTHLY RATES AND CHARGES - Regulatory Component of this schedule do not
apply to a customer that is an embedded wholesale market participant.
It should be noted that this schedule does not list any charges, assessments or credits that are required by law to be invoiced by a distributor and that are not
subject to Ontario Energy Board approval, such as the Debt Retirement Charge, the Global Adjustment and the HST.
MONTHLY RATES AND CHARGES - Delivery Component
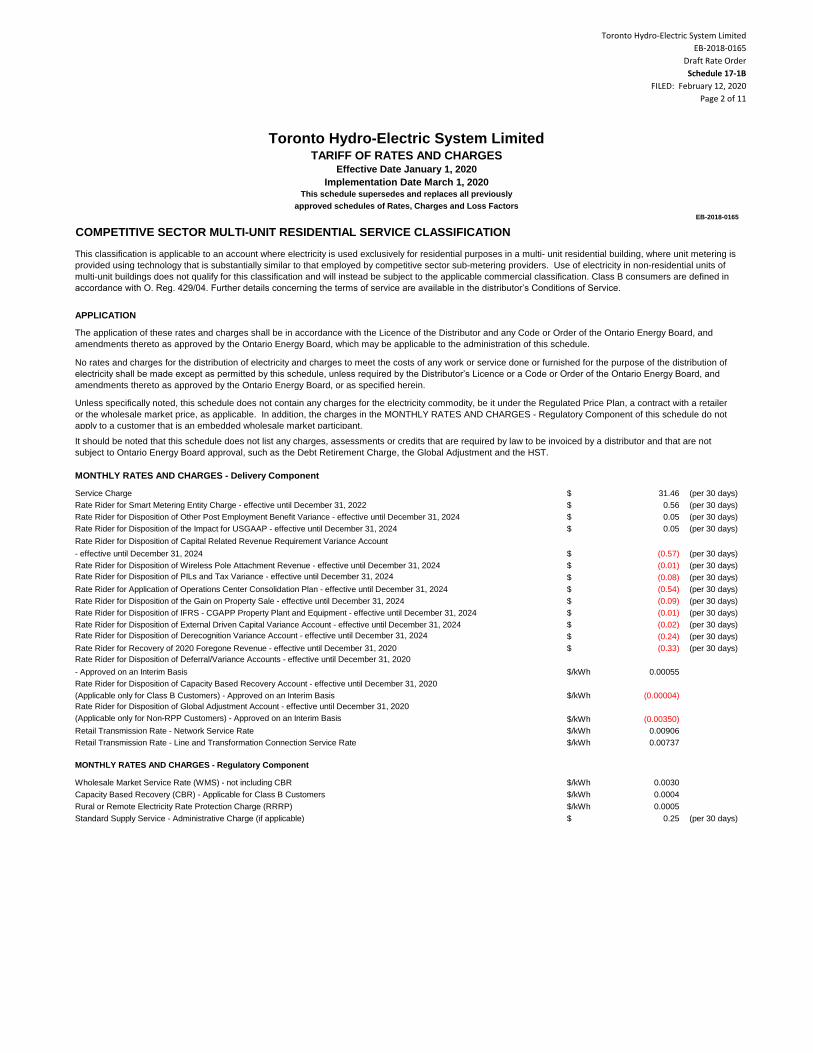
Toronto Hydro-Electric System Limited
EB-2018-0165
Draft Rate Order
Schedule 17-1B
FILED: February 12, 2020
Page 2 of 11
EB-2018-0165
Toronto Hydro-Electric System LimitedTARIFF OF RATES AND CHARGES
Effective Date January 1, 2020
Implementation Date March 1, 2020This schedule supersedes and replaces all previously
approved schedules of Rates, Charges and Loss Factors
$ 31.46 (per 30 days)
$ 0.56 (per 30 days)
$ 0.05 (per 30 days)
$ 0.05 (per 30 days)
Rate Rider for Disposition of Capital Related Revenue Requirement Variance Account
- effective until December 31, 2024 $ (0.57) (per 30 days)
$ (0.01) (per 30 days)
Rate Rider for Disposition of PILs and Tax Variance - effective until December 31, 2024 $ (0.08) (per 30 days)
$ (0.54) (per 30 days)
$ (0.09) (per 30 days)
$ (0.01) (per 30 days)
$ (0.02) (per 30 days)
Rate Rider for Disposition of Derecognition Variance Account - effective until December 31, 2024 $ (0.24) (per 30 days)
$ (0.33) (per 30 days)
Rate Rider for Disposition of Deferral/Variance Accounts - effective until December 31, 2020
- Approved on an Interim Basis $/kWh 0.00055
Rate Rider for Disposition of Capacity Based Recovery Account - effective until December 31, 2020
(Applicable only for Class B Customers) - Approved on an Interim Basis $/kWh (0.00004)
Rate Rider for Disposition of Global Adjustment Account - effective until December 31, 2020
(Applicable only for Non-RPP Customers) - Approved on an Interim Basis $/kWh (0.00350)
$/kWh 0.00906
$/kWh 0.00737
$/kWh 0.0030
$/kWh 0.0004
$/kWh 0.0005
$ 0.25 (per 30 days)Standard Supply Service - Administrative Charge (if applicable)
Retail Transmission Rate - Network Service Rate
Retail Transmission Rate - Line and Transformation Connection Service Rate
MONTHLY RATES AND CHARGES - Regulatory Component
Wholesale Market Service Rate (WMS) - not including CBR
Capacity Based Recovery (CBR) - Applicable for Class B Customers
Rural or Remote Electricity Rate Protection Charge (RRRP)
Rate Rider for Disposition of Wireless Pole Attachment Revenue - effective until December 31, 2024
Rate Rider for Application of Operations Center Consolidation Plan - effective until December 31, 2024
Rate Rider for Disposition of the Gain on Property Sale - effective until December 31, 2024
Rate Rider for Disposition of IFRS - CGAPP Property Plant and Equipment - effective until December 31, 2024
Rate Rider for Disposition of External Driven Capital Variance Account - effective until December 31, 2024
Rate Rider for Recovery of 2020 Foregone Revenue - effective until December 31, 2020
It should be noted that this schedule does not list any charges, assessments or credits that are required by law to be invoiced by a distributor and that are not
subject to Ontario Energy Board approval, such as the Debt Retirement Charge, the Global Adjustment and the HST.
MONTHLY RATES AND CHARGES - Delivery Component
Service Charge
Rate Rider for Smart Metering Entity Charge - effective until December 31, 2022
Rate Rider for Disposition of Other Post Employment Benefit Variance - effective until December 31, 2024
Rate Rider for Disposition of the Impact for USGAAP - effective until December 31, 2024
COMPETITIVE SECTOR MULTI-UNIT RESIDENTIAL SERVICE CLASSIFICATION
This classification is applicable to an account where electricity is used exclusively for residential purposes in a multi- unit residential building, where unit metering is
provided using technology that is substantially similar to that employed by competitive sector sub-metering providers. Use of electricity in non-residential units of
multi-unit buildings does not qualify for this classification and will instead be subject to the applicable commercial classification. Class B consumers are defined in
accordance with O. Reg. 429/04. Further details concerning the terms of service are available in the distributor’s Conditions of Service.
APPLICATION
The application of these rates and charges shall be in accordance with the Licence of the Distributor and any Code or Order of the Ontario Energy Board, and
amendments thereto as approved by the Ontario Energy Board, which may be applicable to the administration of this schedule.
No rates and charges for the distribution of electricity and charges to meet the costs of any work or service done or furnished for the purpose of the distribution of
electricity shall be made except as permitted by this schedule, unless required by the Distributor’s Licence or a Code or Order of the Ontario Energy Board, and
amendments thereto as approved by the Ontario Energy Board, or as specified herein.
Unless specifically noted, this schedule does not contain any charges for the electricity commodity, be it under the Regulated Price Plan, a contract with a retailer
or the wholesale market price, as applicable. In addition, the charges in the MONTHLY RATES AND CHARGES - Regulatory Component of this schedule do not
apply to a customer that is an embedded wholesale market participant.
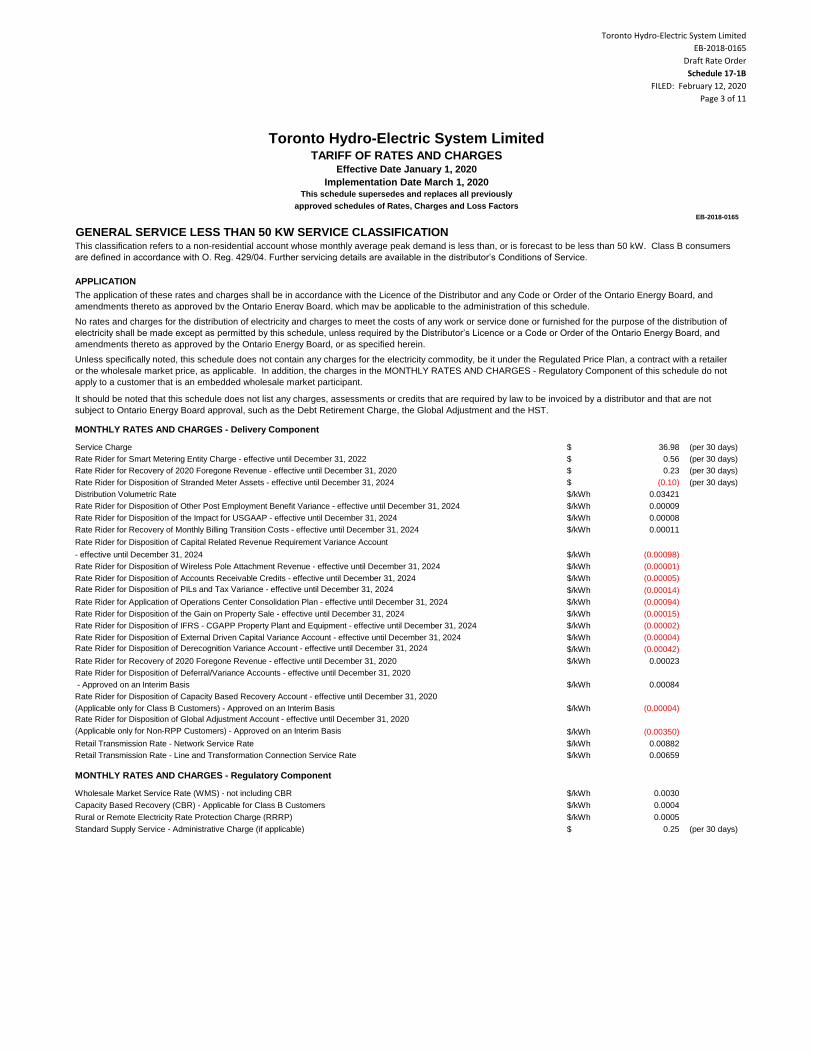
Toronto Hydro-Electric System Limited
EB-2018-0165
Draft Rate Order
Schedule 17-1B
FILED: February 12, 2020
Page 3 of 11
EB-2018-0165
Toronto Hydro-Electric System LimitedTARIFF OF RATES AND CHARGES
Effective Date January 1, 2020
Implementation Date March 1, 2020This schedule supersedes and replaces all previously
approved schedules of Rates, Charges and Loss Factors
$ 36.98 (per 30 days)
$ 0.56 (per 30 days)
$ 0.23 (per 30 days)
$ (0.10) (per 30 days)
$/kWh 0.03421
$/kWh 0.00009
$/kWh 0.00008
$/kWh 0.00011
Rate Rider for Disposition of Capital Related Revenue Requirement Variance Account
- effective until December 31, 2024 $/kWh (0.00098)
$/kWh (0.00001)
$/kWh (0.00005)
Rate Rider for Disposition of PILs and Tax Variance - effective until December 31, 2024 $/kWh (0.00014)
$/kWh (0.00094)
$/kWh (0.00015)
$/kWh (0.00002)
$/kWh (0.00004)
Rate Rider for Disposition of Derecognition Variance Account - effective until December 31, 2024 $/kWh (0.00042)
$/kWh 0.00023
Rate Rider for Disposition of Deferral/Variance Accounts - effective until December 31, 2020
- Approved on an Interim Basis $/kWh 0.00084
Rate Rider for Disposition of Capacity Based Recovery Account - effective until December 31, 2020
(Applicable only for Class B Customers) - Approved on an Interim Basis $/kWh (0.00004)
Rate Rider for Disposition of Global Adjustment Account - effective until December 31, 2020
(Applicable only for Non-RPP Customers) - Approved on an Interim Basis $/kWh (0.00350)
$/kWh 0.00882
$/kWh 0.00659
$/kWh 0.0030
$/kWh 0.0004
$/kWh 0.0005
$ 0.25 (per 30 days)Standard Supply Service - Administrative Charge (if applicable)
Retail Transmission Rate - Network Service Rate
Retail Transmission Rate - Line and Transformation Connection Service Rate
MONTHLY RATES AND CHARGES - Regulatory Component
Wholesale Market Service Rate (WMS) - not including CBR
Capacity Based Recovery (CBR) - Applicable for Class B Customers
Rural or Remote Electricity Rate Protection Charge (RRRP)
Rate Rider for Disposition of Accounts Receivable Credits - effective until December 31, 2024
Rate Rider for Application of Operations Center Consolidation Plan - effective until December 31, 2024
Rate Rider for Disposition of the Gain on Property Sale - effective until December 31, 2024
Rate Rider for Disposition of IFRS - CGAPP Property Plant and Equipment - effective until December 31, 2024
Rate Rider for Disposition of External Driven Capital Variance Account - effective until December 31, 2024
Rate Rider for Recovery of 2020 Foregone Revenue - effective until December 31, 2020
Rate Rider for Disposition of Stranded Meter Assets - effective until December 31, 2024
Distribution Volumetric Rate
Rate Rider for Disposition of Other Post Employment Benefit Variance - effective until December 31, 2024
Rate Rider for Disposition of the Impact for USGAAP - effective until December 31, 2024
Rate Rider for Recovery of Monthly Billing Transition Costs - effective until December 31, 2024
Rate Rider for Disposition of Wireless Pole Attachment Revenue - effective until December 31, 2024
Unless specifically noted, this schedule does not contain any charges for the electricity commodity, be it under the Regulated Price Plan, a contract with a retailer
or the wholesale market price, as applicable. In addition, the charges in the MONTHLY RATES AND CHARGES - Regulatory Component of this schedule do not
apply to a customer that is an embedded wholesale market participant.
It should be noted that this schedule does not list any charges, assessments or credits that are required by law to be invoiced by a distributor and that are not
subject to Ontario Energy Board approval, such as the Debt Retirement Charge, the Global Adjustment and the HST.
MONTHLY RATES AND CHARGES - Delivery Component
Service Charge
Rate Rider for Smart Metering Entity Charge - effective until December 31, 2022
Rate Rider for Recovery of 2020 Foregone Revenue - effective until December 31, 2020
GENERAL SERVICE LESS THAN 50 KW SERVICE CLASSIFICATIONThis classification refers to a non-residential account whose monthly average peak demand is less than, or is forecast to be less than 50 kW. Class B consumers
are defined in accordance with O. Reg. 429/04. Further servicing details are available in the distributor’s Conditions of Service.
APPLICATION
The application of these rates and charges shall be in accordance with the Licence of the Distributor and any Code or Order of the Ontario Energy Board, and
amendments thereto as approved by the Ontario Energy Board, which may be applicable to the administration of this schedule.
No rates and charges for the distribution of electricity and charges to meet the costs of any work or service done or furnished for the purpose of the distribution of
electricity shall be made except as permitted by this schedule, unless required by the Distributor’s Licence or a Code or Order of the Ontario Energy Board, and
amendments thereto as approved by the Ontario Energy Board, or as specified herein.
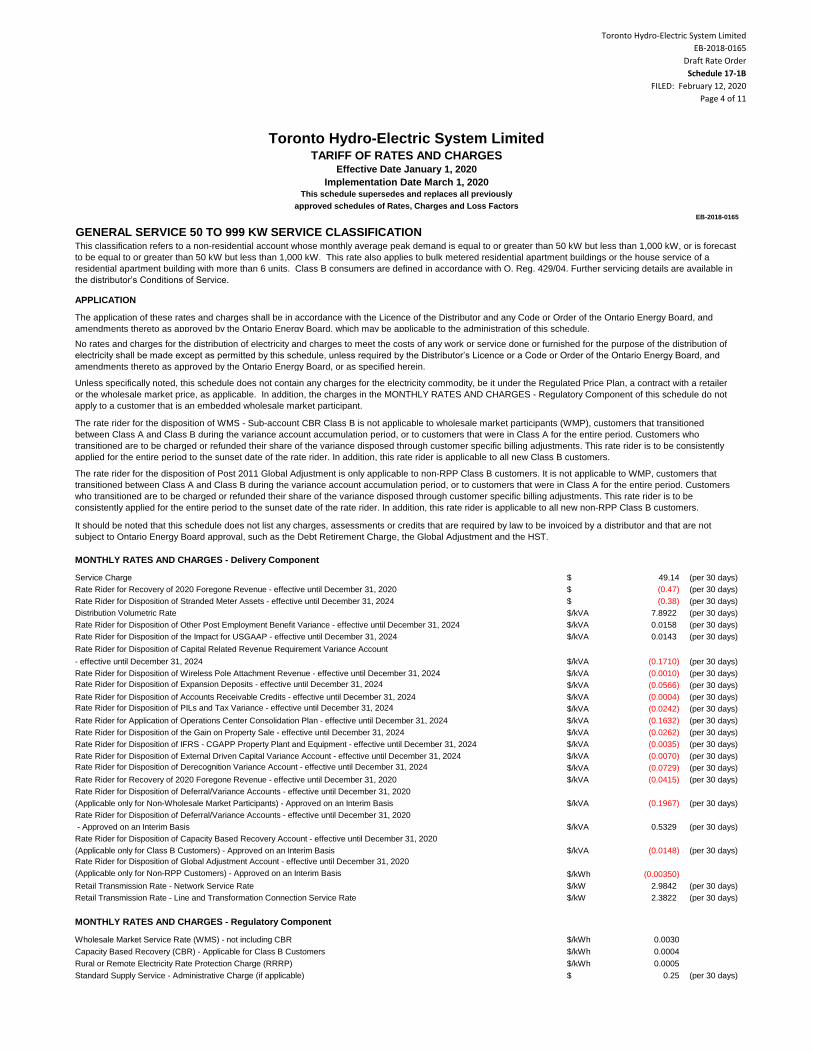
Toronto Hydro-Electric System Limited
EB-2018-0165
Draft Rate Order
Schedule 17-1B
FILED: February 12, 2020
Page 4 of 11
EB-2018-0165
Toronto Hydro-Electric System LimitedTARIFF OF RATES AND CHARGES
Effective Date January 1, 2020
Implementation Date March 1, 2020This schedule supersedes and replaces all previously
approved schedules of Rates, Charges and Loss Factors
$ 49.14 (per 30 days)
$ (0.47) (per 30 days)
$ (0.38) (per 30 days)
$/kVA 7.8922 (per 30 days)
$/kVA 0.0158 (per 30 days)
$/kVA 0.0143 (per 30 days)
Rate Rider for Disposition of Capital Related Revenue Requirement Variance Account
- effective until December 31, 2024 $/kVA (0.1710) (per 30 days)
$/kVA (0.0010) (per 30 days)
Rate Rider for Disposition of Expansion Deposits - effective until December 31, 2024 $/kVA (0.0566) (per 30 days)
$/kVA (0.0004) (per 30 days)
Rate Rider for Disposition of PILs and Tax Variance - effective until December 31, 2024 $/kVA (0.0242) (per 30 days)
$/kVA (0.1632) (per 30 days)
$/kVA (0.0262) (per 30 days)
$/kVA (0.0035) (per 30 days)
$/kVA (0.0070) (per 30 days)
Rate Rider for Disposition of Derecognition Variance Account - effective until December 31, 2024 $/kVA (0.0729) (per 30 days)
$/kVA (0.0415) (per 30 days)
Rate Rider for Disposition of Deferral/Variance Accounts - effective until December 31, 2020
(Applicable only for Non-Wholesale Market Participants) - Approved on an Interim Basis $/kVA (0.1967) (per 30 days)
Rate Rider for Disposition of Deferral/Variance Accounts - effective until December 31, 2020
- Approved on an Interim Basis $/kVA 0.5329 (per 30 days)
Rate Rider for Disposition of Capacity Based Recovery Account - effective until December 31, 2020
(Applicable only for Class B Customers) - Approved on an Interim Basis $/kVA (0.0148) (per 30 days)
Rate Rider for Disposition of Global Adjustment Account - effective until December 31, 2020
(Applicable only for Non-RPP Customers) - Approved on an Interim Basis $/kWh (0.00350)
$/kW 2.9842 (per 30 days)
$/kW 2.3822 (per 30 days)
$/kWh 0.0030
$/kWh 0.0004
$/kWh 0.0005
$ 0.25 (per 30 days)Standard Supply Service - Administrative Charge (if applicable)
Retail Transmission Rate - Network Service Rate
Retail Transmission Rate - Line and Transformation Connection Service Rate
MONTHLY RATES AND CHARGES - Regulatory Component
Wholesale Market Service Rate (WMS) - not including CBR
Capacity Based Recovery (CBR) - Applicable for Class B Customers
Rural or Remote Electricity Rate Protection Charge (RRRP)
Rate Rider for Disposition of Accounts Receivable Credits - effective until December 31, 2024
Rate Rider for Application of Operations Center Consolidation Plan - effective until December 31, 2024
Rate Rider for Disposition of the Gain on Property Sale - effective until December 31, 2024
Rate Rider for Disposition of IFRS - CGAPP Property Plant and Equipment - effective until December 31, 2024
Rate Rider for Disposition of External Driven Capital Variance Account - effective until December 31, 2024
Rate Rider for Recovery of 2020 Foregone Revenue - effective until December 31, 2020
Rate Rider for Recovery of 2020 Foregone Revenue - effective until December 31, 2020
Rate Rider for Disposition of Stranded Meter Assets - effective until December 31, 2024
Distribution Volumetric Rate
Rate Rider for Disposition of Other Post Employment Benefit Variance - effective until December 31, 2024
Rate Rider for Disposition of the Impact for USGAAP - effective until December 31, 2024
Rate Rider for Disposition of Wireless Pole Attachment Revenue - effective until December 31, 2024
Unless specifically noted, this schedule does not contain any charges for the electricity commodity, be it under the Regulated Price Plan, a contract with a retailer
or the wholesale market price, as applicable. In addition, the charges in the MONTHLY RATES AND CHARGES - Regulatory Component of this schedule do not
apply to a customer that is an embedded wholesale market participant.
The rate rider for the disposition of WMS - Sub-account CBR Class B is not applicable to wholesale market participants (WMP), customers that transitioned
between Class A and Class B during the variance account accumulation period, or to customers that were in Class A for the entire period. Customers who
transitioned are to be charged or refunded their share of the variance disposed through customer specific billing adjustments. This rate rider is to be consistently
applied for the entire period to the sunset date of the rate rider. In addition, this rate rider is applicable to all new Class B customers.
The rate rider for the disposition of Post 2011 Global Adjustment is only applicable to non-RPP Class B customers. It is not applicable to WMP, customers that
transitioned between Class A and Class B during the variance account accumulation period, or to customers that were in Class A for the entire period. Customers
who transitioned are to be charged or refunded their share of the variance disposed through customer specific billing adjustments. This rate rider is to be
consistently applied for the entire period to the sunset date of the rate rider. In addition, this rate rider is applicable to all new non-RPP Class B customers.
It should be noted that this schedule does not list any charges, assessments or credits that are required by law to be invoiced by a distributor and that are not
subject to Ontario Energy Board approval, such as the Debt Retirement Charge, the Global Adjustment and the HST.
MONTHLY RATES AND CHARGES - Delivery Component
Service Charge
GENERAL SERVICE 50 TO 999 KW SERVICE CLASSIFICATIONThis classification refers to a non-residential account whose monthly average peak demand is equal to or greater than 50 kW but less than 1,000 kW, or is forecast
to be equal to or greater than 50 kW but less than 1,000 kW. This rate also applies to bulk metered residential apartment buildings or the house service of a
residential apartment building with more than 6 units. Class B consumers are defined in accordance with O. Reg. 429/04. Further servicing details are available in
the distributor’s Conditions of Service.
APPLICATION
The application of these rates and charges shall be in accordance with the Licence of the Distributor and any Code or Order of the Ontario Energy Board, and
amendments thereto as approved by the Ontario Energy Board, which may be applicable to the administration of this schedule.
No rates and charges for the distribution of electricity and charges to meet the costs of any work or service done or furnished for the purpose of the distribution of
electricity shall be made except as permitted by this schedule, unless required by the Distributor’s Licence or a Code or Order of the Ontario Energy Board, and
amendments thereto as approved by the Ontario Energy Board, or as specified herein.
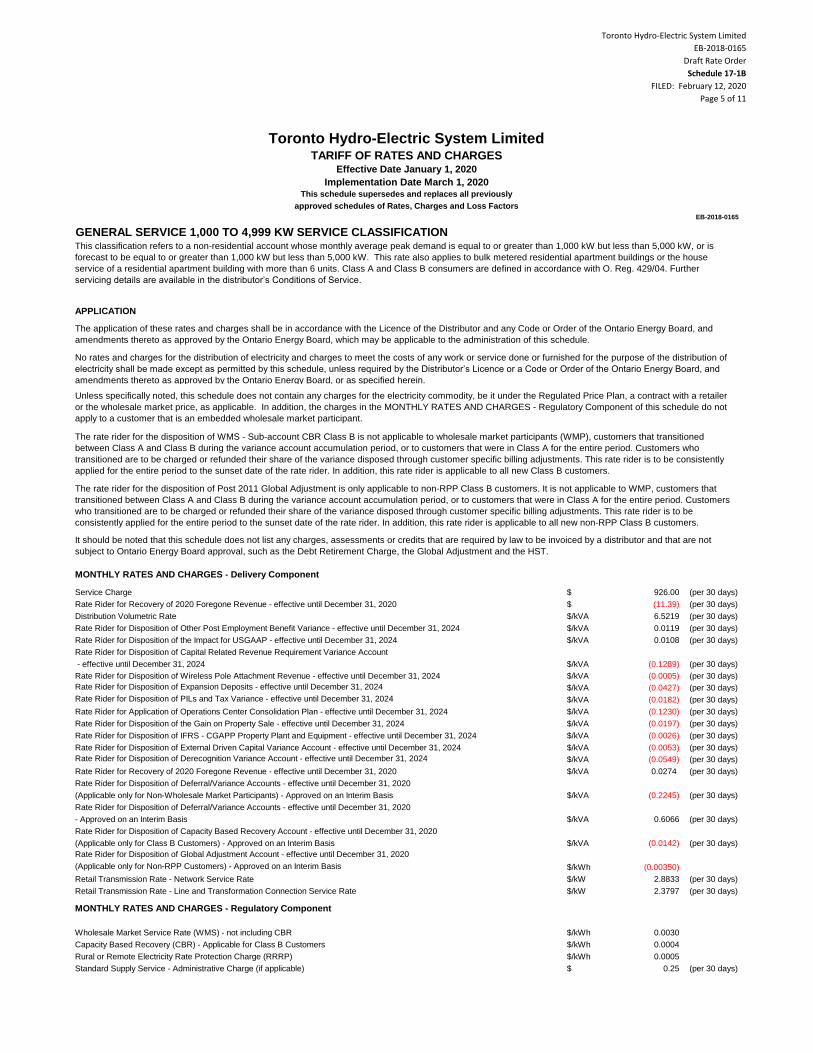
Toronto Hydro-Electric System Limited
EB-2018-0165
Draft Rate Order
Schedule 17-1B
FILED: February 12, 2020
Page 5 of 11
EB-2018-0165
Toronto Hydro-Electric System LimitedTARIFF OF RATES AND CHARGES
Effective Date January 1, 2020
Implementation Date March 1, 2020This schedule supersedes and replaces all previously
approved schedules of Rates, Charges and Loss Factors
$ 926.00 (per 30 days)
$ (11.39) (per 30 days)
$/kVA 6.5219 (per 30 days)
$/kVA 0.0119 (per 30 days)
$/kVA 0.0108 (per 30 days)
Rate Rider for Disposition of Capital Related Revenue Requirement Variance Account
- effective until December 31, 2024 $/kVA (0.1289) (per 30 days)
$/kVA (0.0005) (per 30 days)
Rate Rider for Disposition of Expansion Deposits - effective until December 31, 2024 $/kVA (0.0427) (per 30 days)
Rate Rider for Disposition of PILs and Tax Variance - effective until December 31, 2024 $/kVA (0.0182) (per 30 days)
$/kVA (0.1230) (per 30 days)
$/kVA (0.0197) (per 30 days)
$/kVA (0.0026) (per 30 days)
$/kVA (0.0053) (per 30 days)
Rate Rider for Disposition of Derecognition Variance Account - effective until December 31, 2024 $/kVA (0.0549) (per 30 days)
$/kVA 0.0274 (per 30 days)
Rate Rider for Disposition of Deferral/Variance Accounts - effective until December 31, 2020
(Applicable only for Non-Wholesale Market Participants) - Approved on an Interim Basis $/kVA (0.2245) (per 30 days)
Rate Rider for Disposition of Deferral/Variance Accounts - effective until December 31, 2020
- Approved on an Interim Basis $/kVA 0.6066 (per 30 days)
Rate Rider for Disposition of Capacity Based Recovery Account - effective until December 31, 2020
(Applicable only for Class B Customers) - Approved on an Interim Basis $/kVA (0.0142) (per 30 days)
Rate Rider for Disposition of Global Adjustment Account - effective until December 31, 2020
(Applicable only for Non-RPP Customers) - Approved on an Interim Basis $/kWh (0.00350)
$/kW 2.8833 (per 30 days)
$/kW 2.3797 (per 30 days)
$/kWh 0.0030
$/kWh 0.0004
$/kWh 0.0005
$ 0.25 (per 30 days)
MONTHLY RATES AND CHARGES - Regulatory Component
Wholesale Market Service Rate (WMS) - not including CBR
Capacity Based Recovery (CBR) - Applicable for Class B Customers
Rural or Remote Electricity Rate Protection Charge (RRRP)
Standard Supply Service - Administrative Charge (if applicable)
Rate Rider for Disposition of the Gain on Property Sale - effective until December 31, 2024
Rate Rider for Disposition of IFRS - CGAPP Property Plant and Equipment - effective until December 31, 2024
Rate Rider for Disposition of External Driven Capital Variance Account - effective until December 31, 2024
Rate Rider for Recovery of 2020 Foregone Revenue - effective until December 31, 2020
Retail Transmission Rate - Network Service Rate
Retail Transmission Rate - Line and Transformation Connection Service Rate
Rate Rider for Recovery of 2020 Foregone Revenue - effective until December 31, 2020
Distribution Volumetric Rate
Rate Rider for Disposition of Other Post Employment Benefit Variance - effective until December 31, 2024
Rate Rider for Disposition of the Impact for USGAAP - effective until December 31, 2024
Rate Rider for Disposition of Wireless Pole Attachment Revenue - effective until December 31, 2024
Rate Rider for Application of Operations Center Consolidation Plan - effective until December 31, 2024
Unless specifically noted, this schedule does not contain any charges for the electricity commodity, be it under the Regulated Price Plan, a contract with a retailer
or the wholesale market price, as applicable. In addition, the charges in the MONTHLY RATES AND CHARGES - Regulatory Component of this schedule do not
apply to a customer that is an embedded wholesale market participant.
The rate rider for the disposition of WMS - Sub-account CBR Class B is not applicable to wholesale market participants (WMP), customers that transitioned
between Class A and Class B during the variance account accumulation period, or to customers that were in Class A for the entire period. Customers who
transitioned are to be charged or refunded their share of the variance disposed through customer specific billing adjustments. This rate rider is to be consistently
applied for the entire period to the sunset date of the rate rider. In addition, this rate rider is applicable to all new Class B customers.
The rate rider for the disposition of Post 2011 Global Adjustment is only applicable to non-RPP Class B customers. It is not applicable to WMP, customers that
transitioned between Class A and Class B during the variance account accumulation period, or to customers that were in Class A for the entire period. Customers
who transitioned are to be charged or refunded their share of the variance disposed through customer specific billing adjustments. This rate rider is to be
consistently applied for the entire period to the sunset date of the rate rider. In addition, this rate rider is applicable to all new non-RPP Class B customers.
It should be noted that this schedule does not list any charges, assessments or credits that are required by law to be invoiced by a distributor and that are not
subject to Ontario Energy Board approval, such as the Debt Retirement Charge, the Global Adjustment and the HST.
MONTHLY RATES AND CHARGES - Delivery Component
Service Charge
GENERAL SERVICE 1,000 TO 4,999 KW SERVICE CLASSIFICATIONThis classification refers to a non-residential account whose monthly average peak demand is equal to or greater than 1,000 kW but less than 5,000 kW, or is
forecast to be equal to or greater than 1,000 kW but less than 5,000 kW. This rate also applies to bulk metered residential apartment buildings or the house
service of a residential apartment building with more than 6 units. Class A and Class B consumers are defined in accordance with O. Reg. 429/04. Further
servicing details are available in the distributor’s Conditions of Service.
APPLICATION
The application of these rates and charges shall be in accordance with the Licence of the Distributor and any Code or Order of the Ontario Energy Board, and
amendments thereto as approved by the Ontario Energy Board, which may be applicable to the administration of this schedule.
No rates and charges for the distribution of electricity and charges to meet the costs of any work or service done or furnished for the purpose of the distribution of
electricity shall be made except as permitted by this schedule, unless required by the Distributor’s Licence or a Code or Order of the Ontario Energy Board, and
amendments thereto as approved by the Ontario Energy Board, or as specified herein.
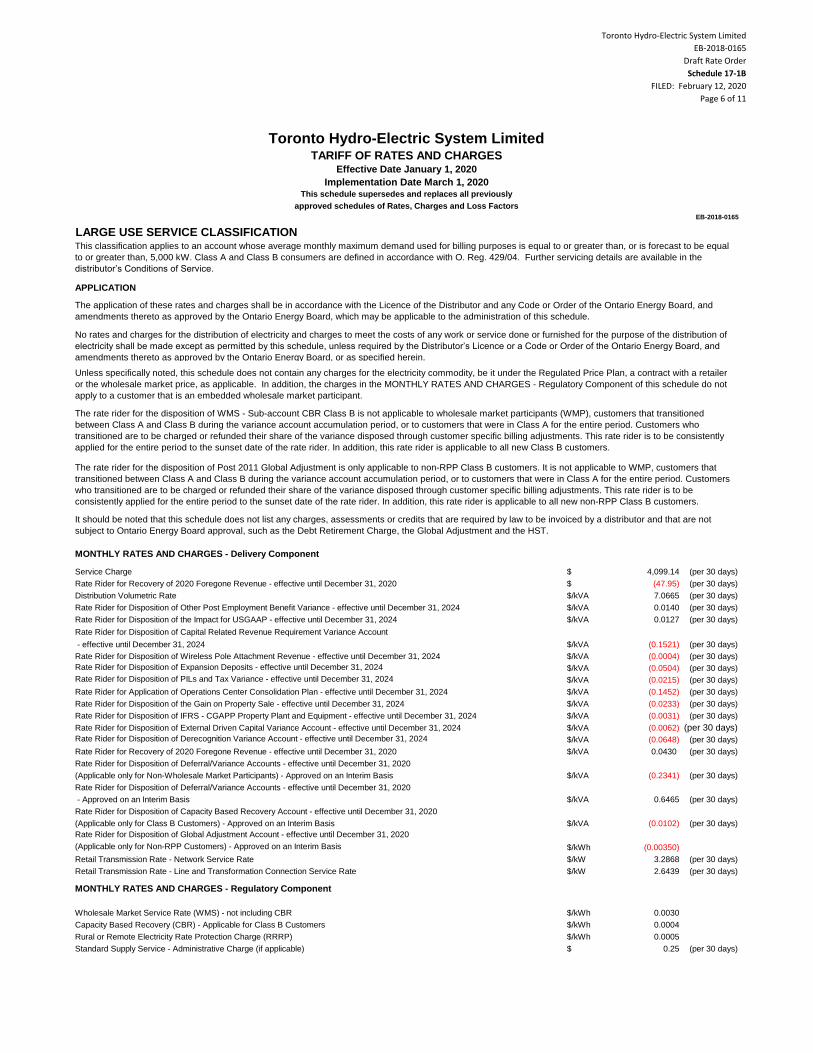
Toronto Hydro-Electric System Limited
EB-2018-0165
Draft Rate Order
Schedule 17-1B
FILED: February 12, 2020
Page 6 of 11
EB-2018-0165
Toronto Hydro-Electric System LimitedTARIFF OF RATES AND CHARGES
Effective Date January 1, 2020
Implementation Date March 1, 2020This schedule supersedes and replaces all previously
approved schedules of Rates, Charges and Loss Factors
$ 4,099.14 (per 30 days)
$ (47.95) (per 30 days)
$/kVA 7.0665 (per 30 days)
$/kVA 0.0140 (per 30 days)
$/kVA 0.0127 (per 30 days)
Rate Rider for Disposition of Capital Related Revenue Requirement Variance Account
- effective until December 31, 2024 $/kVA (0.1521) (per 30 days)
$/kVA (0.0004) (per 30 days)
Rate Rider for Disposition of Expansion Deposits - effective until December 31, 2024 $/kVA (0.0504) (per 30 days)
Rate Rider for Disposition of PILs and Tax Variance - effective until December 31, 2024 $/kVA (0.0215) (per 30 days)
$/kVA (0.1452) (per 30 days)
$/kVA (0.0233) (per 30 days)
$/kVA (0.0031) (per 30 days)
$/kVA (0.0062) (per 30 days)
Rate Rider for Disposition of Derecognition Variance Account - effective until December 31, 2024 $/kVA (0.0648) (per 30 days)
$/kVA 0.0430 (per 30 days)
Rate Rider for Disposition of Deferral/Variance Accounts - effective until December 31, 2020
(Applicable only for Non-Wholesale Market Participants) - Approved on an Interim Basis $/kVA (0.2341) (per 30 days)
Rate Rider for Disposition of Deferral/Variance Accounts - effective until December 31, 2020
- Approved on an Interim Basis $/kVA 0.6465 (per 30 days)
Rate Rider for Disposition of Capacity Based Recovery Account - effective until December 31, 2020
(Applicable only for Class B Customers) - Approved on an Interim Basis $/kVA (0.0102) (per 30 days)
Rate Rider for Disposition of Global Adjustment Account - effective until December 31, 2020
(Applicable only for Non-RPP Customers) - Approved on an Interim Basis $/kWh (0.00350)
$/kW 3.2868 (per 30 days)
$/kW 2.6439 (per 30 days)
$/kWh 0.0030
$/kWh 0.0004
$/kWh 0.0005
$ 0.25 (per 30 days)
Capacity Based Recovery (CBR) - Applicable for Class B Customers
Rural or Remote Electricity Rate Protection Charge (RRRP)
Standard Supply Service - Administrative Charge (if applicable)
Rate Rider for Disposition of External Driven Capital Variance Account - effective until December 31, 2024
Rate Rider for Recovery of 2020 Foregone Revenue - effective until December 31, 2020
Retail Transmission Rate - Network Service Rate
Retail Transmission Rate - Line and Transformation Connection Service Rate
MONTHLY RATES AND CHARGES - Regulatory Component
Wholesale Market Service Rate (WMS) - not including CBR
Rate Rider for Disposition of Other Post Employment Benefit Variance - effective until December 31, 2024
Rate Rider for Disposition of the Impact for USGAAP - effective until December 31, 2024
Rate Rider for Disposition of Wireless Pole Attachment Revenue - effective until December 31, 2024
Rate Rider for Application of Operations Center Consolidation Plan - effective until December 31, 2024
Rate Rider for Disposition of the Gain on Property Sale - effective until December 31, 2024
Rate Rider for Disposition of IFRS - CGAPP Property Plant and Equipment - effective until December 31, 2024
The rate rider for the disposition of Post 2011 Global Adjustment is only applicable to non-RPP Class B customers. It is not applicable to WMP, customers that
transitioned between Class A and Class B during the variance account accumulation period, or to customers that were in Class A for the entire period. Customers
who transitioned are to be charged or refunded their share of the variance disposed through customer specific billing adjustments. This rate rider is to be
consistently applied for the entire period to the sunset date of the rate rider. In addition, this rate rider is applicable to all new non-RPP Class B customers.
It should be noted that this schedule does not list any charges, assessments or credits that are required by law to be invoiced by a distributor and that are not
subject to Ontario Energy Board approval, such as the Debt Retirement Charge, the Global Adjustment and the HST.
MONTHLY RATES AND CHARGES - Delivery Component
Service Charge
Rate Rider for Recovery of 2020 Foregone Revenue - effective until December 31, 2020
Distribution Volumetric Rate
This classification applies to an account whose average monthly maximum demand used for billing purposes is equal to or greater than, or is forecast to be equal
to or greater than, 5,000 kW. Class A and Class B consumers are defined in accordance with O. Reg. 429/04. Further servicing details are available in the
distributor’s Conditions of Service.
APPLICATION
The application of these rates and charges shall be in accordance with the Licence of the Distributor and any Code or Order of the Ontario Energy Board, and
amendments thereto as approved by the Ontario Energy Board, which may be applicable to the administration of this schedule.
No rates and charges for the distribution of electricity and charges to meet the costs of any work or service done or furnished for the purpose of the distribution of
electricity shall be made except as permitted by this schedule, unless required by the Distributor’s Licence or a Code or Order of the Ontario Energy Board, and
amendments thereto as approved by the Ontario Energy Board, or as specified herein.
Unless specifically noted, this schedule does not contain any charges for the electricity commodity, be it under the Regulated Price Plan, a contract with a retailer
or the wholesale market price, as applicable. In addition, the charges in the MONTHLY RATES AND CHARGES - Regulatory Component of this schedule do not
apply to a customer that is an embedded wholesale market participant.
The rate rider for the disposition of WMS - Sub-account CBR Class B is not applicable to wholesale market participants (WMP), customers that transitioned
between Class A and Class B during the variance account accumulation period, or to customers that were in Class A for the entire period. Customers who
transitioned are to be charged or refunded their share of the variance disposed through customer specific billing adjustments. This rate rider is to be consistently
applied for the entire period to the sunset date of the rate rider. In addition, this rate rider is applicable to all new Class B customers.
LARGE USE SERVICE CLASSIFICATION

Toronto Hydro-Electric System Limited
EB-2018-0165
Draft Rate Order
Schedule 17-1B
FILED: February 12, 2020
Page 7 of 11
EB-2018-0165
Toronto Hydro-Electric System LimitedTARIFF OF RATES AND CHARGES
Effective Date January 1, 2020
Implementation Date March 1, 2020This schedule supersedes and replaces all previously
approved schedules of Rates, Charges and Loss Factors
$ 239.74 (per 30 days)
$/kVA 7.8922 (per 30 days)
$/kVA 6.5219 (per 30 days)
$/kVA 7.0665 (per 30 days)
Service Charge
Distribution Volumetric Rate
For General Service 50 - 999 kW Service Classification
For General Service 1,000 - 4,999 kW Service Classification
For Large Use Service Classification
The application of these rates and charges shall be in accordance with the Licence of the Distributor and any Code or Order of the Ontario Energy Board, and
amendments thereto as approved by the Ontario Energy Board, which may be applicable to the administration of this schedule.
No rates and charges for the distribution of electricity and charges to meet the costs of any work or service done or furnished for the purpose of the distribution of
electricity shall be made except as permitted by this schedule, unless required by the Distributor’s Licence or a Code or Order of the Ontario Energy Board, and
amendments thereto as approved by the Ontario Energy Board, or as specified herein.
Unless specifically noted, this schedule does not contain any charges for the electricity commodity, be it under the Regulated Price Plan, a contract with a retailer
or the wholesale market price, as applicable.
It should be noted that this schedule does not list any charges, assessments or credits that are required by law to be invoiced by a distributor and that are not
subject to Ontario Energy Board approval, such as the Debt Retirement Charge, the Global Adjustment and the HST.
MONTHLY RATES AND CHARGES - Delivery Component - APPROVED ON AN INTERIM BASIS
Standby Charge - for a month where standby power is not provided. The charge is applied to the contracted amount (e.g. nameplate rating of
generation facility).
STANDBY POWER SERVICE CLASSIFICATIONThis classification refers to an account that has Load Displacement Generation and requires THESL to provide back- up service. Further servicing details are
available in the distributor’s Conditions of Service.
APPLICATION
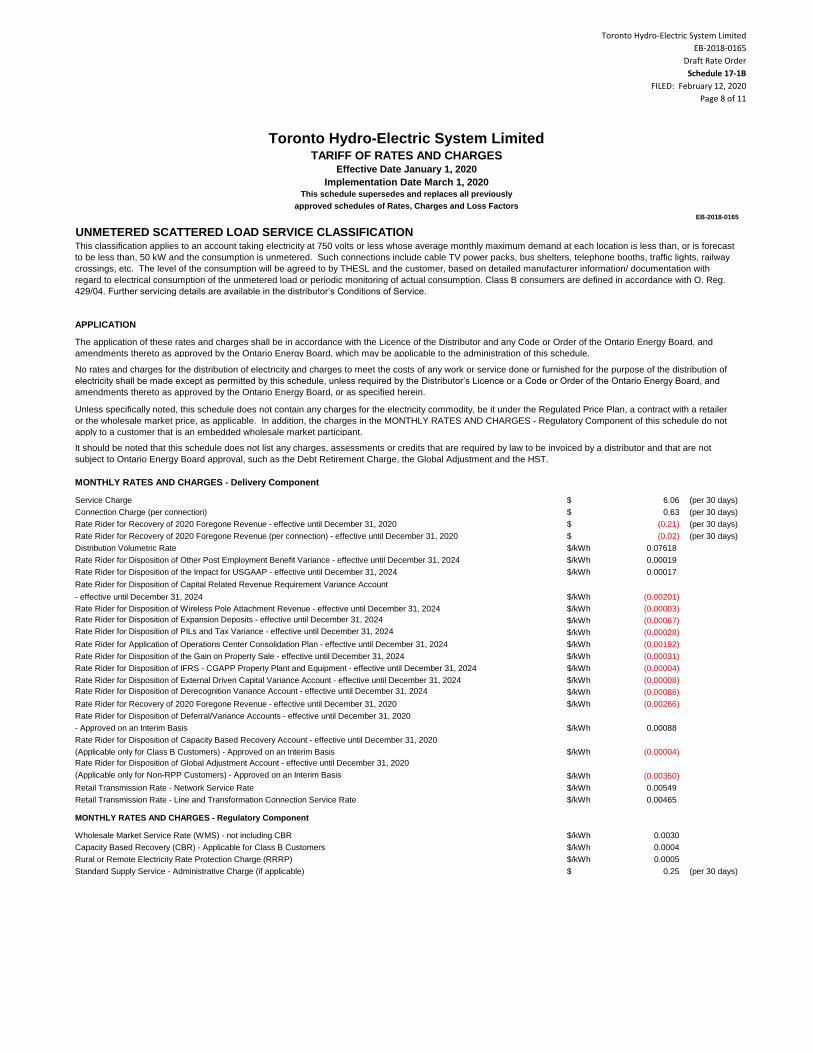
Toronto Hydro-Electric System Limited
EB-2018-0165
Draft Rate Order
Schedule 17-1B
FILED: February 12, 2020
Page 8 of 11
EB-2018-0165
Toronto Hydro-Electric System LimitedTARIFF OF RATES AND CHARGES
Effective Date January 1, 2020
Implementation Date March 1, 2020This schedule supersedes and replaces all previously
approved schedules of Rates, Charges and Loss Factors
$ 6.06 (per 30 days)
$ 0.63 (per 30 days)
$ (0.21) (per 30 days)
$ (0.02) (per 30 days)
$/kWh 0.07618
$/kWh 0.00019
$/kWh 0.00017
Rate Rider for Disposition of Capital Related Revenue Requirement Variance Account
- effective until December 31, 2024 $/kWh (0.00201)
$/kWh (0.00003)
Rate Rider for Disposition of Expansion Deposits - effective until December 31, 2024 $/kWh (0.00067)
Rate Rider for Disposition of PILs and Tax Variance - effective until December 31, 2024 $/kWh (0.00028)
$/kWh (0.00192)
$/kWh (0.00031)
$/kWh (0.00004)
$/kWh (0.00008)
Rate Rider for Disposition of Derecognition Variance Account - effective until December 31, 2024 $/kWh (0.00086)
$/kWh (0.00266)
Rate Rider for Disposition of Deferral/Variance Accounts - effective until December 31, 2020
- Approved on an Interim Basis $/kWh 0.00088
Rate Rider for Disposition of Capacity Based Recovery Account - effective until December 31, 2020
(Applicable only for Class B Customers) - Approved on an Interim Basis $/kWh (0.00004)
Rate Rider for Disposition of Global Adjustment Account - effective until December 31, 2020
(Applicable only for Non-RPP Customers) - Approved on an Interim Basis $/kWh (0.00350)
$/kWh 0.00549
$/kWh 0.00465
$/kWh 0.0030
$/kWh 0.0004
$/kWh 0.0005
$ 0.25 (per 30 days)
Capacity Based Recovery (CBR) - Applicable for Class B Customers
Rural or Remote Electricity Rate Protection Charge (RRRP)
Standard Supply Service - Administrative Charge (if applicable)
Rate Rider for Disposition of External Driven Capital Variance Account - effective until December 31, 2024
Rate Rider for Recovery of 2020 Foregone Revenue - effective until December 31, 2020
Retail Transmission Rate - Network Service Rate
Retail Transmission Rate - Line and Transformation Connection Service Rate
MONTHLY RATES AND CHARGES - Regulatory Component
Wholesale Market Service Rate (WMS) - not including CBR
Rate Rider for Disposition of Other Post Employment Benefit Variance - effective until December 31, 2024
Rate Rider for Disposition of the Impact for USGAAP - effective until December 31, 2024
Rate Rider for Disposition of Wireless Pole Attachment Revenue - effective until December 31, 2024
Rate Rider for Application of Operations Center Consolidation Plan - effective until December 31, 2024
Rate Rider for Disposition of the Gain on Property Sale - effective until December 31, 2024
Rate Rider for Disposition of IFRS - CGAPP Property Plant and Equipment - effective until December 31, 2024
MONTHLY RATES AND CHARGES - Delivery Component
Service Charge
Connection Charge (per connection)
Rate Rider for Recovery of 2020 Foregone Revenue - effective until December 31, 2020
Rate Rider for Recovery of 2020 Foregone Revenue (per connection) - effective until December 31, 2020
Distribution Volumetric Rate
This classification applies to an account taking electricity at 750 volts or less whose average monthly maximum demand at each location is less than, or is forecast
to be less than, 50 kW and the consumption is unmetered. Such connections include cable TV power packs, bus shelters, telephone booths, traffic lights, railway
crossings, etc. The level of the consumption will be agreed to by THESL and the customer, based on detailed manufacturer information/ documentation with
regard to electrical consumption of the unmetered load or periodic monitoring of actual consumption. Class B consumers are defined in accordance with O. Reg.
429/04. Further servicing details are available in the distributor’s Conditions of Service.
APPLICATION
The application of these rates and charges shall be in accordance with the Licence of the Distributor and any Code or Order of the Ontario Energy Board, and
amendments thereto as approved by the Ontario Energy Board, which may be applicable to the administration of this schedule.
No rates and charges for the distribution of electricity and charges to meet the costs of any work or service done or furnished for the purpose of the distribution of
electricity shall be made except as permitted by this schedule, unless required by the Distributor’s Licence or a Code or Order of the Ontario Energy Board, and
amendments thereto as approved by the Ontario Energy Board, or as specified herein.
Unless specifically noted, this schedule does not contain any charges for the electricity commodity, be it under the Regulated Price Plan, a contract with a retailer
or the wholesale market price, as applicable. In addition, the charges in the MONTHLY RATES AND CHARGES - Regulatory Component of this schedule do not
apply to a customer that is an embedded wholesale market participant.
It should be noted that this schedule does not list any charges, assessments or credits that are required by law to be invoiced by a distributor and that are not
subject to Ontario Energy Board approval, such as the Debt Retirement Charge, the Global Adjustment and the HST.
UNMETERED SCATTERED LOAD SERVICE CLASSIFICATION
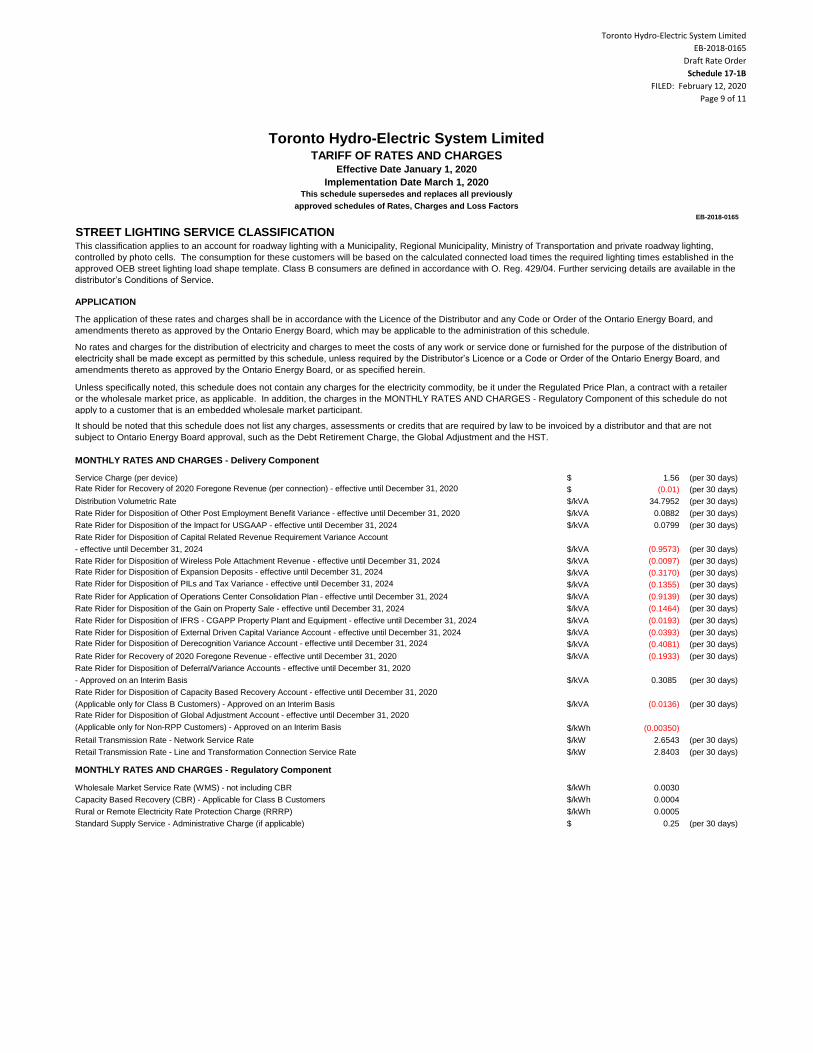
Toronto Hydro-Electric System Limited
EB-2018-0165
Draft Rate Order
Schedule 17-1B
FILED: February 12, 2020
Page 9 of 11
EB-2018-0165
Toronto Hydro-Electric System LimitedTARIFF OF RATES AND CHARGES
Effective Date January 1, 2020
Implementation Date March 1, 2020This schedule supersedes and replaces all previously
approved schedules of Rates, Charges and Loss Factors
$ 1.56 (per 30 days)
Rate Rider for Recovery of 2020 Foregone Revenue (per connection) - effective until December 31, 2020 $ (0.01) (per 30 days)
$/kVA 34.7952 (per 30 days)
$/kVA 0.0882 (per 30 days)
$/kVA 0.0799 (per 30 days)
Rate Rider for Disposition of Capital Related Revenue Requirement Variance Account
- effective until December 31, 2024 $/kVA (0.9573) (per 30 days)
$/kVA (0.0097) (per 30 days)
Rate Rider for Disposition of Expansion Deposits - effective until December 31, 2024 $/kVA (0.3170) (per 30 days)
Rate Rider for Disposition of PILs and Tax Variance - effective until December 31, 2024 $/kVA (0.1355) (per 30 days)
$/kVA (0.9139) (per 30 days)
$/kVA (0.1464) (per 30 days)
$/kVA (0.0193) (per 30 days)
$/kVA (0.0393) (per 30 days)
Rate Rider for Disposition of Derecognition Variance Account - effective until December 31, 2024 $/kVA (0.4081) (per 30 days)
$/kVA (0.1933) (per 30 days)
Rate Rider for Disposition of Deferral/Variance Accounts - effective until December 31, 2020
- Approved on an Interim Basis $/kVA 0.3085 (per 30 days)
Rate Rider for Disposition of Capacity Based Recovery Account - effective until December 31, 2020
(Applicable only for Class B Customers) - Approved on an Interim Basis $/kVA (0.0136) (per 30 days)
Rate Rider for Disposition of Global Adjustment Account - effective until December 31, 2020
(Applicable only for Non-RPP Customers) - Approved on an Interim Basis $/kWh (0.00350)
$/kW 2.6543 (per 30 days)
$/kW 2.8403 (per 30 days)
$/kWh 0.0030
$/kWh 0.0004
$/kWh 0.0005
$ 0.25 (per 30 days)
Wholesale Market Service Rate (WMS) - not including CBR
Capacity Based Recovery (CBR) - Applicable for Class B Customers
Rural or Remote Electricity Rate Protection Charge (RRRP)
Standard Supply Service - Administrative Charge (if applicable)
Rate Rider for Disposition of IFRS - CGAPP Property Plant and Equipment - effective until December 31, 2024
Rate Rider for Disposition of External Driven Capital Variance Account - effective until December 31, 2024
Rate Rider for Recovery of 2020 Foregone Revenue - effective until December 31, 2020
Retail Transmission Rate - Network Service Rate
Retail Transmission Rate - Line and Transformation Connection Service Rate
MONTHLY RATES AND CHARGES - Regulatory Component
Distribution Volumetric Rate
Rate Rider for Disposition of Other Post Employment Benefit Variance - effective until December 31, 2020
Rate Rider for Disposition of the Impact for USGAAP - effective until December 31, 2024
Rate Rider for Disposition of Wireless Pole Attachment Revenue - effective until December 31, 2024
Rate Rider for Application of Operations Center Consolidation Plan - effective until December 31, 2024
Rate Rider for Disposition of the Gain on Property Sale - effective until December 31, 2024
The application of these rates and charges shall be in accordance with the Licence of the Distributor and any Code or Order of the Ontario Energy Board, and
amendments thereto as approved by the Ontario Energy Board, which may be applicable to the administration of this schedule.
No rates and charges for the distribution of electricity and charges to meet the costs of any work or service done or furnished for the purpose of the distribution of
electricity shall be made except as permitted by this schedule, unless required by the Distributor’s Licence or a Code or Order of the Ontario Energy Board, and
amendments thereto as approved by the Ontario Energy Board, or as specified herein.
Unless specifically noted, this schedule does not contain any charges for the electricity commodity, be it under the Regulated Price Plan, a contract with a retailer
or the wholesale market price, as applicable. In addition, the charges in the MONTHLY RATES AND CHARGES - Regulatory Component of this schedule do not
apply to a customer that is an embedded wholesale market participant.
It should be noted that this schedule does not list any charges, assessments or credits that are required by law to be invoiced by a distributor and that are not
subject to Ontario Energy Board approval, such as the Debt Retirement Charge, the Global Adjustment and the HST.
MONTHLY RATES AND CHARGES - Delivery Component
Service Charge (per device)
STREET LIGHTING SERVICE CLASSIFICATIONThis classification applies to an account for roadway lighting with a Municipality, Regional Municipality, Ministry of Transportation and private roadway lighting,
controlled by photo cells. The consumption for these customers will be based on the calculated connected load times the required lighting times established in the
approved OEB street lighting load shape template. Class B consumers are defined in accordance with O. Reg. 429/04. Further servicing details are available in the
distributor’s Conditions of Service.
APPLICATION
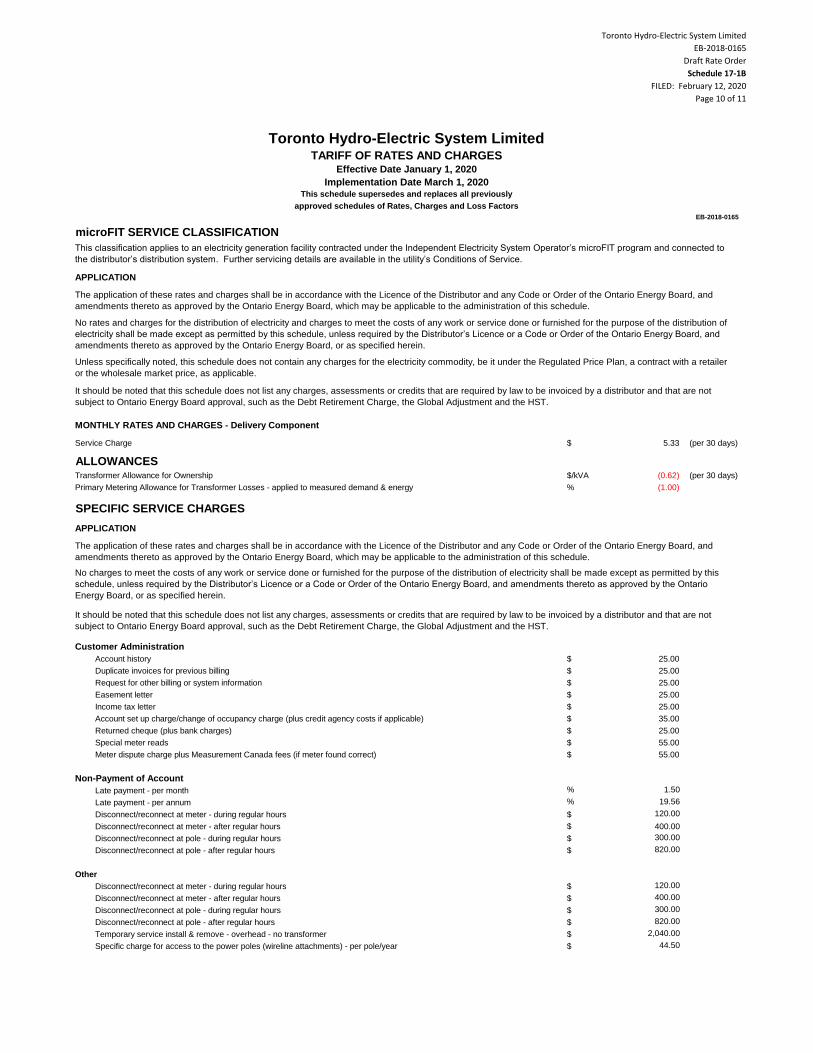
Toronto Hydro-Electric System Limited
EB-2018-0165
Draft Rate Order
Schedule 17-1B
FILED: February 12, 2020
Page 10 of 11
EB-2018-0165
Toronto Hydro-Electric System LimitedTARIFF OF RATES AND CHARGES
Effective Date January 1, 2020
Implementation Date March 1, 2020This schedule supersedes and replaces all previously
approved schedules of Rates, Charges and Loss Factors
$ 5.33 (per 30 days)
ALLOWANCES$/kVA (0.62) (per 30 days)
% (1.00)
SPECIFIC SERVICE CHARGES
Customer Administration
$ 25.00
$ 25.00
$ 25.00
$ 25.00
$ 25.00
$ 35.00
$ 25.00
$ 55.00
$ 55.00
Non-Payment of Account
% 1.50
% 19.56
$ 120.00
$ 400.00
$ 300.00
$ 820.00
Other
$ 120.00
$ 400.00
$ 300.00
$ 820.00
$ 2,040.00
$ 44.50
Disconnect/reconnect at pole - during regular hours
Disconnect/reconnect at pole - after regular hours
Temporary service install & remove - overhead - no transformer
Specific charge for access to the power poles (wireline attachments) - per pole/year
Disconnect/reconnect at meter - during regular hours
Disconnect/reconnect at meter - after regular hours
Disconnect/reconnect at pole - during regular hours
Disconnect/reconnect at pole - after regular hours
Disconnect/reconnect at meter - during regular hours
Disconnect/reconnect at meter - after regular hours
Account set up charge/change of occupancy charge (plus credit agency costs if applicable)
Returned cheque (plus bank charges)
Special meter reads
Meter dispute charge plus Measurement Canada fees (if meter found correct)
Late payment - per month
Late payment - per annum
It should be noted that this schedule does not list any charges, assessments or credits that are required by law to be invoiced by a distributor and that are not
subject to Ontario Energy Board approval, such as the Debt Retirement Charge, the Global Adjustment and the HST.
Account history
Duplicate invoices for previous billing
Request for other billing or system information
Easement letter
Income tax letter
Service Charge
Transformer Allowance for Ownership
Primary Metering Allowance for Transformer Losses - applied to measured demand & energy
APPLICATION
The application of these rates and charges shall be in accordance with the Licence of the Distributor and any Code or Order of the Ontario Energy Board, and
amendments thereto as approved by the Ontario Energy Board, which may be applicable to the administration of this schedule.
No charges to meet the costs of any work or service done or furnished for the purpose of the distribution of electricity shall be made except as permitted by this
schedule, unless required by the Distributor’s Licence or a Code or Order of the Ontario Energy Board, and amendments thereto as approved by the Ontario
Energy Board, or as specified herein.
APPLICATION
The application of these rates and charges shall be in accordance with the Licence of the Distributor and any Code or Order of the Ontario Energy Board, and
amendments thereto as approved by the Ontario Energy Board, which may be applicable to the administration of this schedule.
No rates and charges for the distribution of electricity and charges to meet the costs of any work or service done or furnished for the purpose of the distribution of
electricity shall be made except as permitted by this schedule, unless required by the Distributor’s Licence or a Code or Order of the Ontario Energy Board, and
amendments thereto as approved by the Ontario Energy Board, or as specified herein.
Unless specifically noted, this schedule does not contain any charges for the electricity commodity, be it under the Regulated Price Plan, a contract with a retailer
or the wholesale market price, as applicable.
It should be noted that this schedule does not list any charges, assessments or credits that are required by law to be invoiced by a distributor and that are not
subject to Ontario Energy Board approval, such as the Debt Retirement Charge, the Global Adjustment and the HST.
MONTHLY RATES AND CHARGES - Delivery Component
microFIT SERVICE CLASSIFICATION
This classification applies to an electricity generation facility contracted under the Independent Electricity System Operator’s microFIT program and connected to
the distributor’s distribution system. Further servicing details are available in the utility’s Conditions of Service.
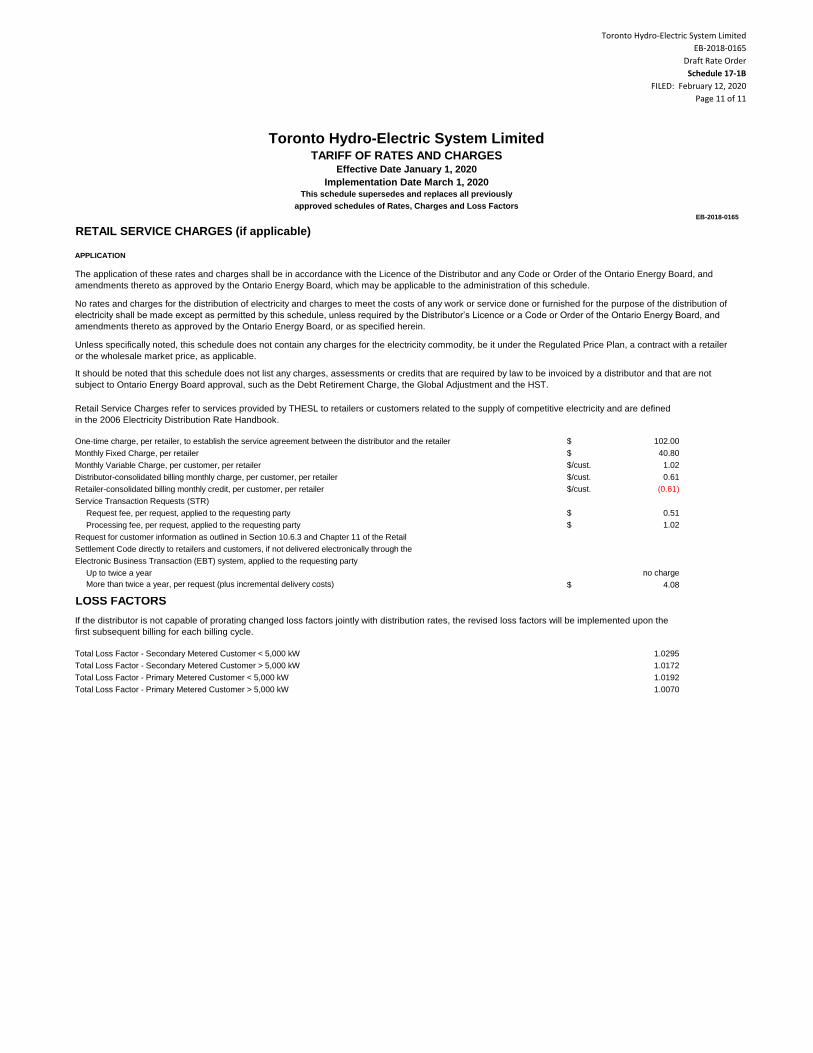
Toronto Hydro-Electric System Limited
EB-2018-0165
Draft Rate Order
Schedule 17-1B
FILED: February 12, 2020
Page 11 of 11
EB-2018-0165
Toronto Hydro-Electric System LimitedTARIFF OF RATES AND CHARGES
Effective Date January 1, 2020
Implementation Date March 1, 2020This schedule supersedes and replaces all previously
approved schedules of Rates, Charges and Loss Factors
RETAIL SERVICE CHARGES (if applicable)
$ 102.00
$ 40.80
$/cust. 1.02
$/cust. 0.61
$/cust. (0.61)
$ 0.51
$ 1.02
no charge
$ 4.08
LOSS FACTORS
1.0295
1.0172
1.0192
1.0070
Total Loss Factor - Secondary Metered Customer < 5,000 kW
Total Loss Factor - Secondary Metered Customer > 5,000 kW
Total Loss Factor - Primary Metered Customer < 5,000 kW
Total Loss Factor - Primary Metered Customer > 5,000 kW
Request for customer information as outlined in Section 10.6.3 and Chapter 11 of the Retail
Settlement Code directly to retailers and customers, if not delivered electronically through the
Electronic Business Transaction (EBT) system, applied to the requesting party
Up to twice a year
More than twice a year, per request (plus incremental delivery costs)
If the distributor is not capable of prorating changed loss factors jointly with distribution rates, the revised loss factors will be implemented upon the
first subsequent billing for each billing cycle.
Monthly Variable Charge, per customer, per retailer
Distributor-consolidated billing monthly charge, per customer, per retailer
Retailer-consolidated billing monthly credit, per customer, per retailer
Service Transaction Requests (STR)
Request fee, per request, applied to the requesting party
Processing fee, per request, applied to the requesting party
No rates and charges for the distribution of electricity and charges to meet the costs of any work or service done or furnished for the purpose of the distribution of
electricity shall be made except as permitted by this schedule, unless required by the Distributor’s Licence or a Code or Order of the Ontario Energy Board, and
amendments thereto as approved by the Ontario Energy Board, or as specified herein.
Unless specifically noted, this schedule does not contain any charges for the electricity commodity, be it under the Regulated Price Plan, a contract with a retailer
or the wholesale market price, as applicable.
It should be noted that this schedule does not list any charges, assessments or credits that are required by law to be invoiced by a distributor and that are not
subject to Ontario Energy Board approval, such as the Debt Retirement Charge, the Global Adjustment and the HST.
Retail Service Charges refer to services provided by THESL to retailers or customers related to the supply of competitive electricity and are defined
in the 2006 Electricity Distribution Rate Handbook.
One-time charge, per retailer, to establish the service agreement between the distributor and the retailer
Monthly Fixed Charge, per retailer
APPLICATION
The application of these rates and charges shall be in accordance with the Licence of the Distributor and any Code or Order of the Ontario Energy Board, and
amendments thereto as approved by the Ontario Energy Board, which may be applicable to the administration of this schedule.

Toronto Hydro-Electric System Limited
EB-2018-0165
Draft Rate Order
Schedule 17-2B
FILED: February 12, 2020
Page 1 of 11
$ 40.08 (per 30 days)
$ 0.56 (per 30 days)
$ 0.08 (per 30 days)
$ 0.07 (per 30 days)
$ 0.28 (per 30 days)
$ (0.02) (per 30 days)
- effective until December 31, 2024 $ (0.85) (per 30 days)
$ (0.01) (per 30 days)
$ (0.08) (per 30 days)
Rate Rider for Disposition of PILs and Tax Variance - effective until December 31, 2024 $ (0.12) (per 30 days)
$ (0.81) (per 30 days)
$ (0.13) (per 30 days)
$ (0.02) (per 30 days)
$ (0.03) (per 30 days)
Rate Rider for Disposition of Derecognition Variance Account - effective until December 31, 2024 $ (0.36) (per 30 days)
$/kWh 0.00906
$/kWh 0.00737
$/kWh 0.0030
$/kWh 0.0004
$/kWh 0.0005
$ 0.25 (per 30 days)
Wholesale Market Service Rate (WMS) - not including CBR
Capacity Based Recovery (CBR) - Applicable for Class B Customers
Rural or Remote Electricity Rate Protection Charge (RRRP)
Standard Supply Service - Administrative Charge (if applicable)
Rate Rider for Disposition of the Gain on Property Sale - effective until December 31, 2024
Rate Rider for Disposition of IFRS - CGAPP Property Plant and Equipment - effective until December 31, 2024
Rate Rider for Disposition of External Driven Capital Variance Account - effective until December 31, 2024
Retail Transmission Rate - Network Service Rate
Retail Transmission Rate - Line and Transformation Connection Service Rate
MONTHLY RATES AND CHARGES - Regulatory Component
Rate Rider for Recovery of Monthly Billing Transition Costs - effective until December 31, 2024
Rate Rider for Disposition of Stranded Meter Assets - effective until December 31, 2024
Rate Rider for Disposition of Capital Related Revenue Requirement Variance Account
Rate Rider for Disposition of Wireless Pole Attachment Revenue - effective until December 31, 2024
Rate Rider for Disposition of Accounts Receivable Credits - effective until December 31, 2024
Rate Rider for Application of Operations Center Consolidation Plan - effective until December 31, 2024
It should be noted that this schedule does not list any charges, assessments or credits that are required by law to be invoiced by a distributor and that are not
subject to Ontario Energy Board approval, such as the Debt Retirement Charge, the Global Adjustment and the HST.
MONTHLY RATES AND CHARGES - Delivery Component
Service Charge
Rate Rider for Smart Metering Entity Charge - effective until December 31, 2022
Rate Rider for Disposition of Other Post Employment Benefit Variance - effective until December 31, 2024
Rate Rider for Disposition of the Impact for USGAAP - effective until December 31, 2024
RESIDENTIAL SERVICE CLASSIFICATIONThis classification is applicable to an account where electricity is used exclusively for residential purposes in a separately metered living accommodation, where
the Competitive Sector Multi-Unit Residential classification is not applicable. Eligibility is restricted to a dwelling unit that consists of a detached house or one unit
of a semi-detached, duplex, triplex or quadruplex building, with a residential zoning; a separately metered dwelling within a town house complex or apartment
building; and bulk metered residential buildings with six or fewer units. Class B consumers are defined in accordance with O. Reg. 429/04. Further details
concerning the terms of service are available in the distributor’s Conditions of Service.
APPLICATION
The application of these rates and charges shall be in accordance with the Licence of the Distributor and any Code or Order of the Ontario Energy Board, and
amendments thereto as approved by the Ontario Energy Board, which may be applicable to the administration of this schedule.
No rates and charges for the distribution of electricity and charges to meet the costs of any work or service done or furnished for the purpose of the distribution of
electricity shall be made except as permitted by this schedule, unless required by the Distributor’s Licence or a Code or Order of the Ontario Energy Board, and
amendments thereto as approved by the Ontario Energy Board, or as specified herein.
Unless specifically noted, this schedule does not contain any charges for the electricity commodity, be it under the Regulated Price Plan, a contract with a retailer
or the wholesale market price, as applicable. In addition, the charges in the MONTHLY RATES AND CHARGES - Regulatory Component of this schedule do not
apply to a customer that is an embedded wholesale market participant.
Toronto Hydro-Electric System LimitedINTERIM TARIFF OF RATES AND CHARGESEffective and Implementation Date January 1, 2021
This schedule supersedes and replaces all previously
approved schedules of Rates, Charges and Loss Factors
EB-2018-0165

Toronto Hydro-Electric System Limited
EB-2018-0165
Draft Rate Order
Schedule 17-2B
FILED: February 12, 2020
Page 2 of 11
Toronto Hydro-Electric System LimitedINTERIM TARIFF OF RATES AND CHARGESEffective and Implementation Date January 1, 2021
This schedule supersedes and replaces all previously
approved schedules of Rates, Charges and Loss Factors
EB-2018-0165
$ 32.89 (per 30 days)
$ 0.56 (per 30 days)
$ 0.05 (per 30 days)
$ 0.05 (per 30 days)
Rate Rider for Disposition of Capital Related Revenue Requirement Variance Account
- effective until December 31, 2024 $ (0.57) (per 30 days)
$ (0.01) (per 30 days)
Rate Rider for Disposition of PILs and Tax Variance - effective until December 31, 2024 $ (0.08) (per 30 days)
$ (0.54) (per 30 days)
$ (0.09) (per 30 days)
$ (0.01) (per 30 days)
$ (0.02) (per 30 days)
Rate Rider for Disposition of Derecognition Variance Account - effective until December 31, 2024 $ (0.24) (per 30 days)
$/kWh 0.00906
$/kWh 0.00737
$/kWh 0.0030
$/kWh 0.0004
$/kWh 0.0005
$ 0.25 (per 30 days)
Wholesale Market Service Rate (WMS) - not including CBR
Capacity Based Recovery (CBR) - Applicable for Class B Customers
Rural or Remote Electricity Rate Protection Charge (RRRP)
Standard Supply Service - Administrative Charge (if applicable)
Rate Rider for Disposition of the Gain on Property Sale - effective until December 31, 2024
Rate Rider for Disposition of IFRS - CGAPP Property Plant and Equipment - effective until December 31, 2024
Rate Rider for Disposition of External Driven Capital Variance Account - effective until December 31, 2024
Retail Transmission Rate - Network Service Rate
Retail Transmission Rate - Line and Transformation Connection Service Rate
MONTHLY RATES AND CHARGES - Regulatory Component
Service Charge
Rate Rider for Smart Metering Entity Charge - effective until December 31, 2022
Rate Rider for Disposition of Other Post Employment Benefit Variance - effective until December 31, 2024
Rate Rider for Disposition of the Impact for USGAAP - effective until December 31, 2024
Rate Rider for Disposition of Wireless Pole Attachment Revenue - effective until December 31, 2024
Rate Rider for Application of Operations Center Consolidation Plan - effective until December 31, 2024
APPLICATION
The application of these rates and charges shall be in accordance with the Licence of the Distributor and any Code or Order of the Ontario Energy Board, and
amendments thereto as approved by the Ontario Energy Board, which may be applicable to the administration of this schedule.
No rates and charges for the distribution of electricity and charges to meet the costs of any work or service done or furnished for the purpose of the distribution of
electricity shall be made except as permitted by this schedule, unless required by the Distributor’s Licence or a Code or Order of the Ontario Energy Board, and
amendments thereto as approved by the Ontario Energy Board, or as specified herein.
Unless specifically noted, this schedule does not contain any charges for the electricity commodity, be it under the Regulated Price Plan, a contract with a retailer
or the wholesale market price, as applicable. In addition, the charges in the MONTHLY RATES AND CHARGES - Regulatory Component of this schedule do not
apply to a customer that is an embedded wholesale market participant.
It should be noted that this schedule does not list any charges, assessments or credits that are required by law to be invoiced by a distributor and that are not
subject to Ontario Energy Board approval, such as the Debt Retirement Charge, the Global Adjustment and the HST.
MONTHLY RATES AND CHARGES - Delivery Component
COMPETITIVE SECTOR MULTI-UNIT RESIDENTIAL SERVICE CLASSIFICATION
This classification is applicable to an account where electricity is used exclusively for residential purposes in a multi- unit residential building, where unit metering is
provided using technology that is substantially similar to that employed by competitive sector sub-metering providers. Use of electricity in non-residential units of
multi-unit buildings does not qualify for this classification and will instead be subject to the applicable commercial classification. Class B consumers are defined in
accordance with O. Reg. 429/04. Further details concerning the terms of service are available in the distributor’s Conditions of Service.
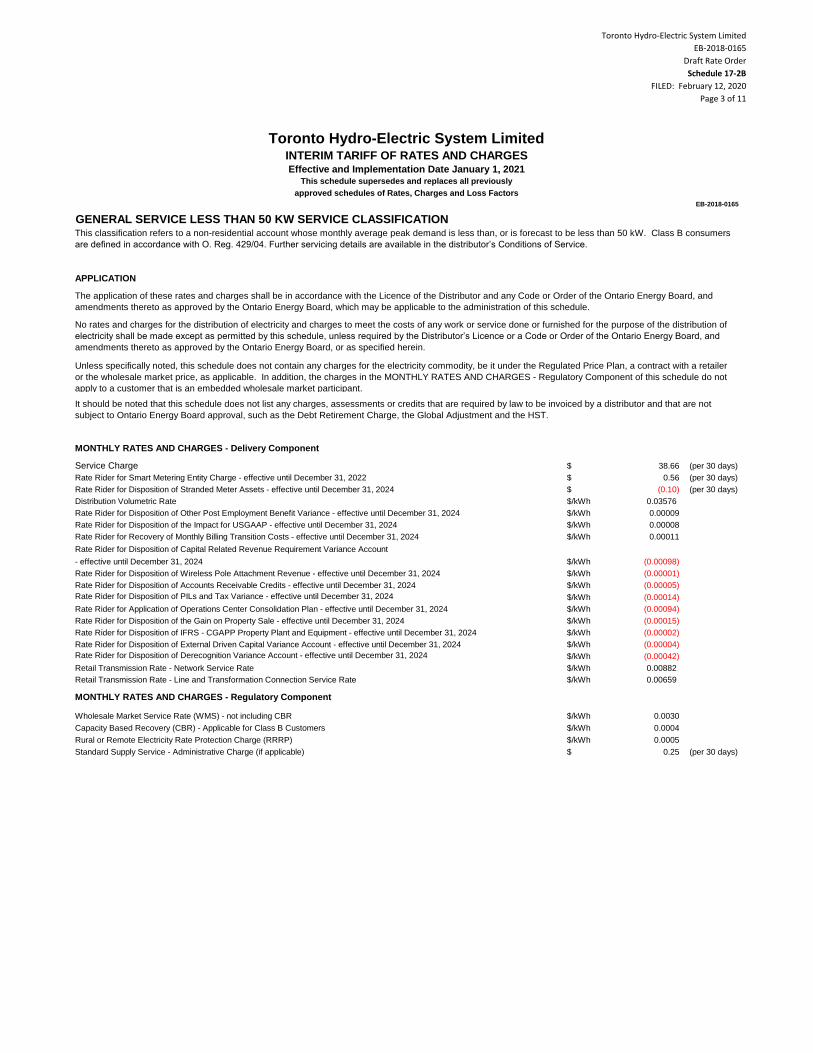
Toronto Hydro-Electric System Limited
EB-2018-0165
Draft Rate Order
Schedule 17-2B
FILED: February 12, 2020
Page 3 of 11
Toronto Hydro-Electric System LimitedINTERIM TARIFF OF RATES AND CHARGESEffective and Implementation Date January 1, 2021
This schedule supersedes and replaces all previously
approved schedules of Rates, Charges and Loss Factors
EB-2018-0165
$ 38.66 (per 30 days)
$ 0.56 (per 30 days)
$ (0.10) (per 30 days)
$/kWh 0.03576
$/kWh 0.00009
$/kWh 0.00008
$/kWh 0.00011
Rate Rider for Disposition of Capital Related Revenue Requirement Variance Account
- effective until December 31, 2024 $/kWh (0.00098)
$/kWh (0.00001)
$/kWh (0.00005)
Rate Rider for Disposition of PILs and Tax Variance - effective until December 31, 2024 $/kWh (0.00014)
$/kWh (0.00094)
$/kWh (0.00015)
$/kWh (0.00002)
$/kWh (0.00004)
Rate Rider for Disposition of Derecognition Variance Account - effective until December 31, 2024 $/kWh (0.00042)
$/kWh 0.00882
$/kWh 0.00659
$/kWh 0.0030
$/kWh 0.0004
$/kWh 0.0005
$ 0.25 (per 30 days)
Rural or Remote Electricity Rate Protection Charge (RRRP)
Standard Supply Service - Administrative Charge (if applicable)
Rate Rider for Disposition of External Driven Capital Variance Account - effective until December 31, 2024
Retail Transmission Rate - Network Service Rate
Retail Transmission Rate - Line and Transformation Connection Service Rate
MONTHLY RATES AND CHARGES - Regulatory Component
Wholesale Market Service Rate (WMS) - not including CBR
Capacity Based Recovery (CBR) - Applicable for Class B Customers
Rate Rider for Recovery of Monthly Billing Transition Costs - effective until December 31, 2024
Rate Rider for Disposition of Wireless Pole Attachment Revenue - effective until December 31, 2024
Rate Rider for Disposition of Accounts Receivable Credits - effective until December 31, 2024
Rate Rider for Application of Operations Center Consolidation Plan - effective until December 31, 2024
Rate Rider for Disposition of the Gain on Property Sale - effective until December 31, 2024
Rate Rider for Disposition of IFRS - CGAPP Property Plant and Equipment - effective until December 31, 2024
Service Charge
Rate Rider for Smart Metering Entity Charge - effective until December 31, 2022
Rate Rider for Disposition of Stranded Meter Assets - effective until December 31, 2024
Distribution Volumetric Rate
Rate Rider for Disposition of Other Post Employment Benefit Variance - effective until December 31, 2024
Rate Rider for Disposition of the Impact for USGAAP - effective until December 31, 2024
APPLICATION
The application of these rates and charges shall be in accordance with the Licence of the Distributor and any Code or Order of the Ontario Energy Board, and
amendments thereto as approved by the Ontario Energy Board, which may be applicable to the administration of this schedule.
No rates and charges for the distribution of electricity and charges to meet the costs of any work or service done or furnished for the purpose of the distribution of
electricity shall be made except as permitted by this schedule, unless required by the Distributor’s Licence or a Code or Order of the Ontario Energy Board, and
amendments thereto as approved by the Ontario Energy Board, or as specified herein.
Unless specifically noted, this schedule does not contain any charges for the electricity commodity, be it under the Regulated Price Plan, a contract with a retailer
or the wholesale market price, as applicable. In addition, the charges in the MONTHLY RATES AND CHARGES - Regulatory Component of this schedule do not
apply to a customer that is an embedded wholesale market participant.
It should be noted that this schedule does not list any charges, assessments or credits that are required by law to be invoiced by a distributor and that are not
subject to Ontario Energy Board approval, such as the Debt Retirement Charge, the Global Adjustment and the HST.
MONTHLY RATES AND CHARGES - Delivery Component
GENERAL SERVICE LESS THAN 50 KW SERVICE CLASSIFICATIONThis classification refers to a non-residential account whose monthly average peak demand is less than, or is forecast to be less than 50 kW. Class B consumers
are defined in accordance with O. Reg. 429/04. Further servicing details are available in the distributor’s Conditions of Service.
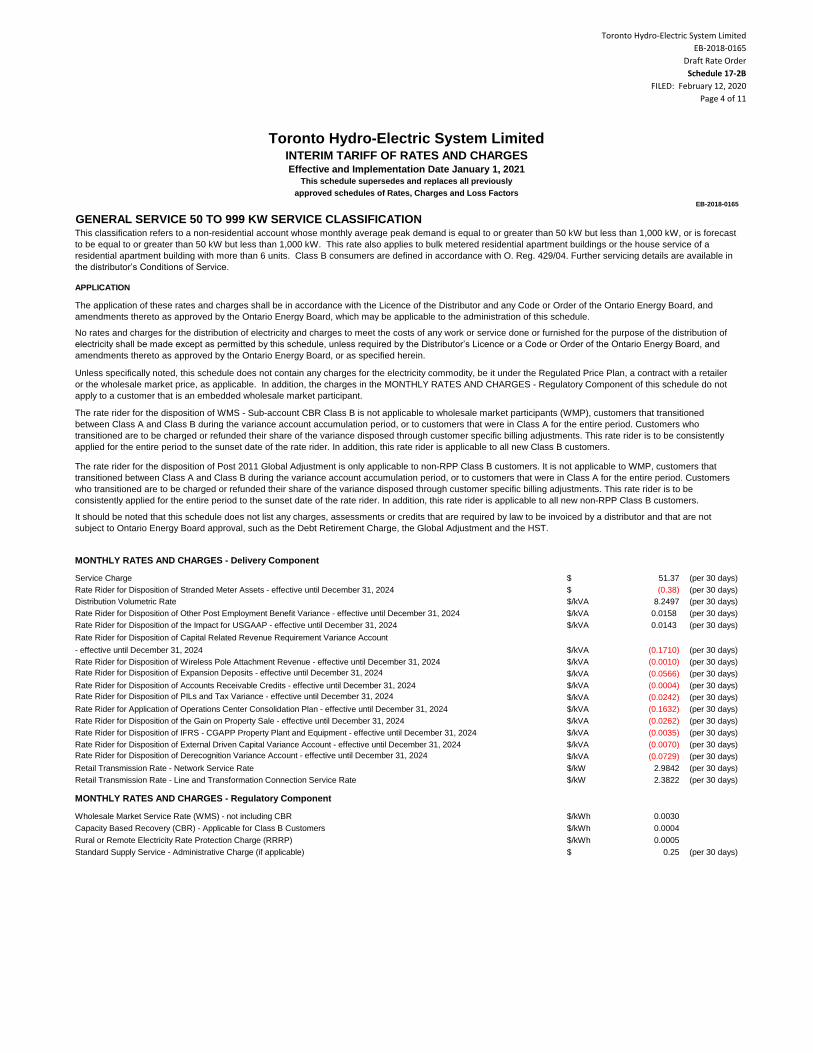
Toronto Hydro-Electric System Limited
EB-2018-0165
Draft Rate Order
Schedule 17-2B
FILED: February 12, 2020
Page 4 of 11
Toronto Hydro-Electric System LimitedINTERIM TARIFF OF RATES AND CHARGESEffective and Implementation Date January 1, 2021
This schedule supersedes and replaces all previously
approved schedules of Rates, Charges and Loss Factors
EB-2018-0165
$ 51.37 (per 30 days)
$ (0.38) (per 30 days)
$/kVA 8.2497 (per 30 days)
$/kVA 0.0158 (per 30 days)
$/kVA 0.0143 (per 30 days)
Rate Rider for Disposition of Capital Related Revenue Requirement Variance Account
- effective until December 31, 2024 $/kVA (0.1710) (per 30 days)
$/kVA (0.0010) (per 30 days)
Rate Rider for Disposition of Expansion Deposits - effective until December 31, 2024 $/kVA (0.0566) (per 30 days)
$/kVA (0.0004) (per 30 days)
Rate Rider for Disposition of PILs and Tax Variance - effective until December 31, 2024 $/kVA (0.0242) (per 30 days)
$/kVA (0.1632) (per 30 days)
$/kVA (0.0262) (per 30 days)
$/kVA (0.0035) (per 30 days)
$/kVA (0.0070) (per 30 days)
Rate Rider for Disposition of Derecognition Variance Account - effective until December 31, 2024 $/kVA (0.0729) (per 30 days)
$/kW 2.9842 (per 30 days)
$/kW 2.3822 (per 30 days)
$/kWh 0.0030
$/kWh 0.0004
$/kWh 0.0005
$ 0.25 (per 30 days)
Retail Transmission Rate - Line and Transformation Connection Service Rate
MONTHLY RATES AND CHARGES - Regulatory Component
Wholesale Market Service Rate (WMS) - not including CBR
Capacity Based Recovery (CBR) - Applicable for Class B Customers
Rural or Remote Electricity Rate Protection Charge (RRRP)
Standard Supply Service - Administrative Charge (if applicable)
Rate Rider for Disposition of Accounts Receivable Credits - effective until December 31, 2024
Rate Rider for Application of Operations Center Consolidation Plan - effective until December 31, 2024
Rate Rider for Disposition of the Gain on Property Sale - effective until December 31, 2024
Rate Rider for Disposition of IFRS - CGAPP Property Plant and Equipment - effective until December 31, 2024
Rate Rider for Disposition of External Driven Capital Variance Account - effective until December 31, 2024
Retail Transmission Rate - Network Service Rate
Service Charge
Rate Rider for Disposition of Stranded Meter Assets - effective until December 31, 2024
Distribution Volumetric Rate
Rate Rider for Disposition of Other Post Employment Benefit Variance - effective until December 31, 2024
Rate Rider for Disposition of the Impact for USGAAP - effective until December 31, 2024
Rate Rider for Disposition of Wireless Pole Attachment Revenue - effective until December 31, 2024
No rates and charges for the distribution of electricity and charges to meet the costs of any work or service done or furnished for the purpose of the distribution of
electricity shall be made except as permitted by this schedule, unless required by the Distributor’s Licence or a Code or Order of the Ontario Energy Board, and
amendments thereto as approved by the Ontario Energy Board, or as specified herein.
Unless specifically noted, this schedule does not contain any charges for the electricity commodity, be it under the Regulated Price Plan, a contract with a retailer
or the wholesale market price, as applicable. In addition, the charges in the MONTHLY RATES AND CHARGES - Regulatory Component of this schedule do not
apply to a customer that is an embedded wholesale market participant.
The rate rider for the disposition of WMS - Sub-account CBR Class B is not applicable to wholesale market participants (WMP), customers that transitioned
between Class A and Class B during the variance account accumulation period, or to customers that were in Class A for the entire period. Customers who
transitioned are to be charged or refunded their share of the variance disposed through customer specific billing adjustments. This rate rider is to be consistently
applied for the entire period to the sunset date of the rate rider. In addition, this rate rider is applicable to all new Class B customers.
The rate rider for the disposition of Post 2011 Global Adjustment is only applicable to non-RPP Class B customers. It is not applicable to WMP, customers that
transitioned between Class A and Class B during the variance account accumulation period, or to customers that were in Class A for the entire period. Customers
who transitioned are to be charged or refunded their share of the variance disposed through customer specific billing adjustments. This rate rider is to be
consistently applied for the entire period to the sunset date of the rate rider. In addition, this rate rider is applicable to all new non-RPP Class B customers.
It should be noted that this schedule does not list any charges, assessments or credits that are required by law to be invoiced by a distributor and that are not
subject to Ontario Energy Board approval, such as the Debt Retirement Charge, the Global Adjustment and the HST.
MONTHLY RATES AND CHARGES - Delivery Component
GENERAL SERVICE 50 TO 999 KW SERVICE CLASSIFICATIONThis classification refers to a non-residential account whose monthly average peak demand is equal to or greater than 50 kW but less than 1,000 kW, or is forecast
to be equal to or greater than 50 kW but less than 1,000 kW. This rate also applies to bulk metered residential apartment buildings or the house service of a
residential apartment building with more than 6 units. Class B consumers are defined in accordance with O. Reg. 429/04. Further servicing details are available in
the distributor’s Conditions of Service.
APPLICATION
The application of these rates and charges shall be in accordance with the Licence of the Distributor and any Code or Order of the Ontario Energy Board, and
amendments thereto as approved by the Ontario Energy Board, which may be applicable to the administration of this schedule.
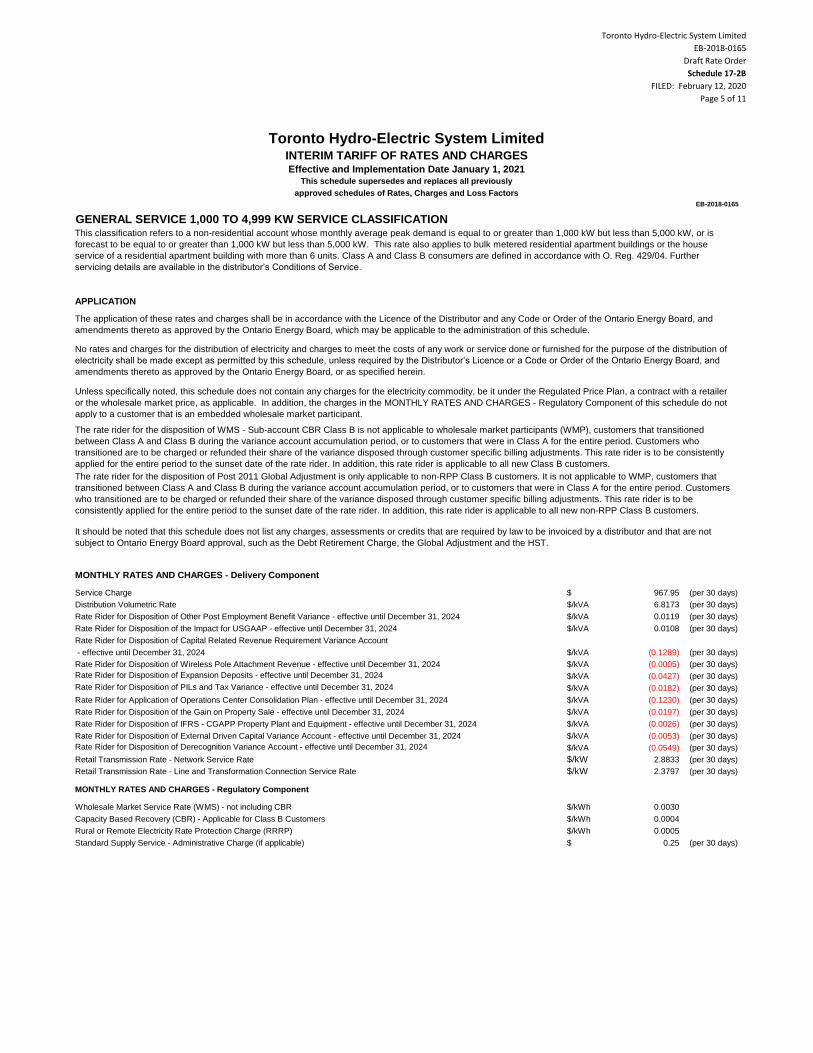
Toronto Hydro-Electric System Limited
EB-2018-0165
Draft Rate Order
Schedule 17-2B
FILED: February 12, 2020
Page 5 of 11
Toronto Hydro-Electric System LimitedINTERIM TARIFF OF RATES AND CHARGESEffective and Implementation Date January 1, 2021
This schedule supersedes and replaces all previously
approved schedules of Rates, Charges and Loss Factors
EB-2018-0165
$ 967.95 (per 30 days)
$/kVA 6.8173 (per 30 days)
$/kVA 0.0119 (per 30 days)
$/kVA 0.0108 (per 30 days)
Rate Rider for Disposition of Capital Related Revenue Requirement Variance Account
- effective until December 31, 2024 $/kVA (0.1289) (per 30 days)
$/kVA (0.0005) (per 30 days)
Rate Rider for Disposition of Expansion Deposits - effective until December 31, 2024 $/kVA (0.0427) (per 30 days)
Rate Rider for Disposition of PILs and Tax Variance - effective until December 31, 2024 $/kVA (0.0182) (per 30 days)
$/kVA (0.1230) (per 30 days)
$/kVA (0.0197) (per 30 days)
$/kVA (0.0026) (per 30 days)
$/kVA (0.0053) (per 30 days)
Rate Rider for Disposition of Derecognition Variance Account - effective until December 31, 2024 $/kVA (0.0549) (per 30 days)
$/kW 2.8833 (per 30 days)
$/kW 2.3797 (per 30 days)
$/kWh 0.0030
$/kWh 0.0004
$/kWh 0.0005
$ 0.25 (per 30 days)
Rural or Remote Electricity Rate Protection Charge (RRRP)
Standard Supply Service - Administrative Charge (if applicable)
Rate Rider for Disposition of External Driven Capital Variance Account - effective until December 31, 2024
Retail Transmission Rate - Network Service Rate
Retail Transmission Rate - Line and Transformation Connection Service Rate
MONTHLY RATES AND CHARGES - Regulatory Component
Wholesale Market Service Rate (WMS) - not including CBR
Capacity Based Recovery (CBR) - Applicable for Class B Customers
Rate Rider for Disposition of Other Post Employment Benefit Variance - effective until December 31, 2024
Rate Rider for Disposition of the Impact for USGAAP - effective until December 31, 2024
Rate Rider for Disposition of Wireless Pole Attachment Revenue - effective until December 31, 2024
Rate Rider for Application of Operations Center Consolidation Plan - effective until December 31, 2024
Rate Rider for Disposition of the Gain on Property Sale - effective until December 31, 2024
Rate Rider for Disposition of IFRS - CGAPP Property Plant and Equipment - effective until December 31, 2024
The rate rider for the disposition of WMS - Sub-account CBR Class B is not applicable to wholesale market participants (WMP), customers that transitioned
between Class A and Class B during the variance account accumulation period, or to customers that were in Class A for the entire period. Customers who
transitioned are to be charged or refunded their share of the variance disposed through customer specific billing adjustments. This rate rider is to be consistently
applied for the entire period to the sunset date of the rate rider. In addition, this rate rider is applicable to all new Class B customers.
The rate rider for the disposition of Post 2011 Global Adjustment is only applicable to non-RPP Class B customers. It is not applicable to WMP, customers that
transitioned between Class A and Class B during the variance account accumulation period, or to customers that were in Class A for the entire period. Customers
who transitioned are to be charged or refunded their share of the variance disposed through customer specific billing adjustments. This rate rider is to be
consistently applied for the entire period to the sunset date of the rate rider. In addition, this rate rider is applicable to all new non-RPP Class B customers.
It should be noted that this schedule does not list any charges, assessments or credits that are required by law to be invoiced by a distributor and that are not
subject to Ontario Energy Board approval, such as the Debt Retirement Charge, the Global Adjustment and the HST.
MONTHLY RATES AND CHARGES - Delivery Component
Service Charge
Distribution Volumetric Rate
GENERAL SERVICE 1,000 TO 4,999 KW SERVICE CLASSIFICATIONThis classification refers to a non-residential account whose monthly average peak demand is equal to or greater than 1,000 kW but less than 5,000 kW, or is
forecast to be equal to or greater than 1,000 kW but less than 5,000 kW. This rate also applies to bulk metered residential apartment buildings or the house
service of a residential apartment building with more than 6 units. Class A and Class B consumers are defined in accordance with O. Reg. 429/04. Further
servicing details are available in the distributor’s Conditions of Service.
APPLICATION
The application of these rates and charges shall be in accordance with the Licence of the Distributor and any Code or Order of the Ontario Energy Board, and
amendments thereto as approved by the Ontario Energy Board, which may be applicable to the administration of this schedule.
No rates and charges for the distribution of electricity and charges to meet the costs of any work or service done or furnished for the purpose of the distribution of
electricity shall be made except as permitted by this schedule, unless required by the Distributor’s Licence or a Code or Order of the Ontario Energy Board, and
amendments thereto as approved by the Ontario Energy Board, or as specified herein.
Unless specifically noted, this schedule does not contain any charges for the electricity commodity, be it under the Regulated Price Plan, a contract with a retailer
or the wholesale market price, as applicable. In addition, the charges in the MONTHLY RATES AND CHARGES - Regulatory Component of this schedule do not
apply to a customer that is an embedded wholesale market participant.
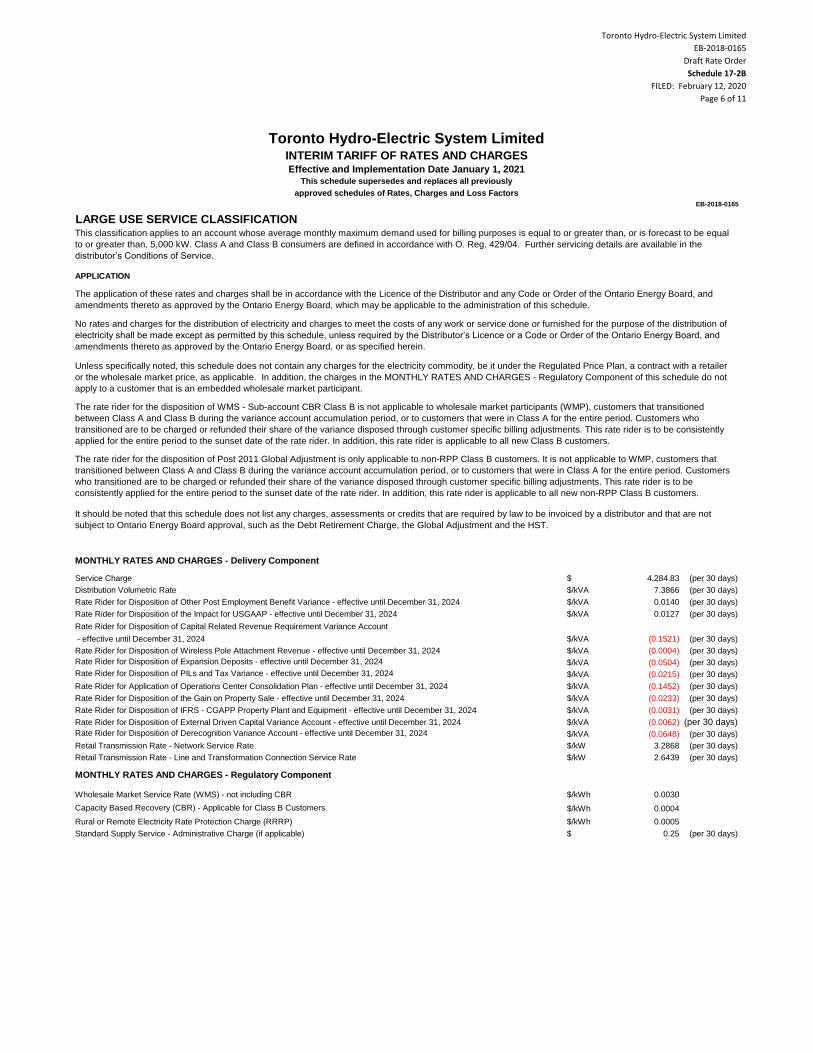
Toronto Hydro-Electric System Limited
EB-2018-0165
Draft Rate Order
Schedule 17-2B
FILED: February 12, 2020
Page 6 of 11
Toronto Hydro-Electric System LimitedINTERIM TARIFF OF RATES AND CHARGESEffective and Implementation Date January 1, 2021
This schedule supersedes and replaces all previously
approved schedules of Rates, Charges and Loss Factors
EB-2018-0165
$ 4,284.83 (per 30 days)
$/kVA 7.3866 (per 30 days)
$/kVA 0.0140 (per 30 days)
$/kVA 0.0127 (per 30 days)
Rate Rider for Disposition of Capital Related Revenue Requirement Variance Account
- effective until December 31, 2024 $/kVA (0.1521) (per 30 days)
$/kVA (0.0004) (per 30 days)
Rate Rider for Disposition of Expansion Deposits - effective until December 31, 2024 $/kVA (0.0504) (per 30 days)
Rate Rider for Disposition of PILs and Tax Variance - effective until December 31, 2024 $/kVA (0.0215) (per 30 days)
$/kVA (0.1452) (per 30 days)
$/kVA (0.0233) (per 30 days)
$/kVA (0.0031) (per 30 days)
$/kVA (0.0062) (per 30 days)
Rate Rider for Disposition of Derecognition Variance Account - effective until December 31, 2024 $/kVA (0.0648) (per 30 days)
$/kW 3.2868 (per 30 days)
$/kW 2.6439 (per 30 days)
$/kWh 0.0030
$/kWh 0.0004
$/kWh 0.0005
$ 0.25 (per 30 days)
Wholesale Market Service Rate (WMS) - not including CBR
Capacity Based Recovery (CBR) - Applicable for Class B Customers
Rural or Remote Electricity Rate Protection Charge (RRRP)
Standard Supply Service - Administrative Charge (if applicable)
Rate Rider for Disposition of the Gain on Property Sale - effective until December 31, 2024
Rate Rider for Disposition of IFRS - CGAPP Property Plant and Equipment - effective until December 31, 2024
Rate Rider for Disposition of External Driven Capital Variance Account - effective until December 31, 2024
Retail Transmission Rate - Network Service Rate
Retail Transmission Rate - Line and Transformation Connection Service Rate
MONTHLY RATES AND CHARGES - Regulatory Component
Service Charge
Distribution Volumetric Rate
Rate Rider for Disposition of Other Post Employment Benefit Variance - effective until December 31, 2024
Rate Rider for Disposition of the Impact for USGAAP - effective until December 31, 2024
Rate Rider for Disposition of Wireless Pole Attachment Revenue - effective until December 31, 2024
Rate Rider for Application of Operations Center Consolidation Plan - effective until December 31, 2024
No rates and charges for the distribution of electricity and charges to meet the costs of any work or service done or furnished for the purpose of the distribution of
electricity shall be made except as permitted by this schedule, unless required by the Distributor’s Licence or a Code or Order of the Ontario Energy Board, and
amendments thereto as approved by the Ontario Energy Board, or as specified herein.
Unless specifically noted, this schedule does not contain any charges for the electricity commodity, be it under the Regulated Price Plan, a contract with a retailer
or the wholesale market price, as applicable. In addition, the charges in the MONTHLY RATES AND CHARGES - Regulatory Component of this schedule do not
apply to a customer that is an embedded wholesale market participant.
The rate rider for the disposition of WMS - Sub-account CBR Class B is not applicable to wholesale market participants (WMP), customers that transitioned
between Class A and Class B during the variance account accumulation period, or to customers that were in Class A for the entire period. Customers who
transitioned are to be charged or refunded their share of the variance disposed through customer specific billing adjustments. This rate rider is to be consistently
applied for the entire period to the sunset date of the rate rider. In addition, this rate rider is applicable to all new Class B customers.
The rate rider for the disposition of Post 2011 Global Adjustment is only applicable to non-RPP Class B customers. It is not applicable to WMP, customers that
transitioned between Class A and Class B during the variance account accumulation period, or to customers that were in Class A for the entire period. Customers
who transitioned are to be charged or refunded their share of the variance disposed through customer specific billing adjustments. This rate rider is to be
consistently applied for the entire period to the sunset date of the rate rider. In addition, this rate rider is applicable to all new non-RPP Class B customers.
It should be noted that this schedule does not list any charges, assessments or credits that are required by law to be invoiced by a distributor and that are not
subject to Ontario Energy Board approval, such as the Debt Retirement Charge, the Global Adjustment and the HST.
MONTHLY RATES AND CHARGES - Delivery Component
LARGE USE SERVICE CLASSIFICATIONThis classification applies to an account whose average monthly maximum demand used for billing purposes is equal to or greater than, or is forecast to be equal
to or greater than, 5,000 kW. Class A and Class B consumers are defined in accordance with O. Reg. 429/04. Further servicing details are available in the
distributor’s Conditions of Service.
APPLICATION
The application of these rates and charges shall be in accordance with the Licence of the Distributor and any Code or Order of the Ontario Energy Board, and
amendments thereto as approved by the Ontario Energy Board, which may be applicable to the administration of this schedule.
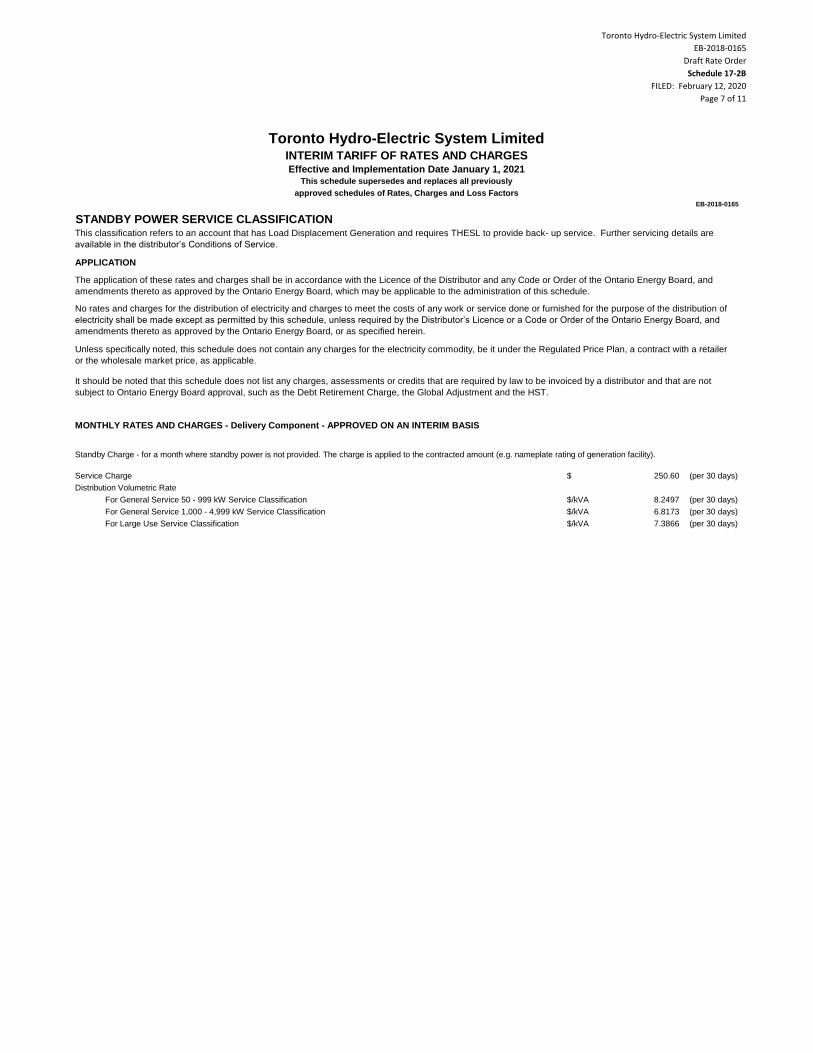
Toronto Hydro-Electric System Limited
EB-2018-0165
Draft Rate Order
Schedule 17-2B
FILED: February 12, 2020
Page 7 of 11
Toronto Hydro-Electric System LimitedINTERIM TARIFF OF RATES AND CHARGESEffective and Implementation Date January 1, 2021
This schedule supersedes and replaces all previously
approved schedules of Rates, Charges and Loss Factors
EB-2018-0165
$ 250.60 (per 30 days)
$/kVA 8.2497 (per 30 days)
$/kVA 6.8173 (per 30 days)
$/kVA 7.3866 (per 30 days)
Standby Charge - for a month where standby power is not provided. The charge is applied to the contracted amount (e.g. nameplate rating of generation facility).
Service Charge
Distribution Volumetric Rate
For General Service 50 - 999 kW Service Classification
For General Service 1,000 - 4,999 kW Service Classification
For Large Use Service Classification
APPLICATION
The application of these rates and charges shall be in accordance with the Licence of the Distributor and any Code or Order of the Ontario Energy Board, and
amendments thereto as approved by the Ontario Energy Board, which may be applicable to the administration of this schedule.
No rates and charges for the distribution of electricity and charges to meet the costs of any work or service done or furnished for the purpose of the distribution of
electricity shall be made except as permitted by this schedule, unless required by the Distributor’s Licence or a Code or Order of the Ontario Energy Board, and
amendments thereto as approved by the Ontario Energy Board, or as specified herein.
Unless specifically noted, this schedule does not contain any charges for the electricity commodity, be it under the Regulated Price Plan, a contract with a retailer
or the wholesale market price, as applicable.
It should be noted that this schedule does not list any charges, assessments or credits that are required by law to be invoiced by a distributor and that are not
subject to Ontario Energy Board approval, such as the Debt Retirement Charge, the Global Adjustment and the HST.
MONTHLY RATES AND CHARGES - Delivery Component - APPROVED ON AN INTERIM BASIS
STANDBY POWER SERVICE CLASSIFICATIONThis classification refers to an account that has Load Displacement Generation and requires THESL to provide back- up service. Further servicing details are
available in the distributor’s Conditions of Service.
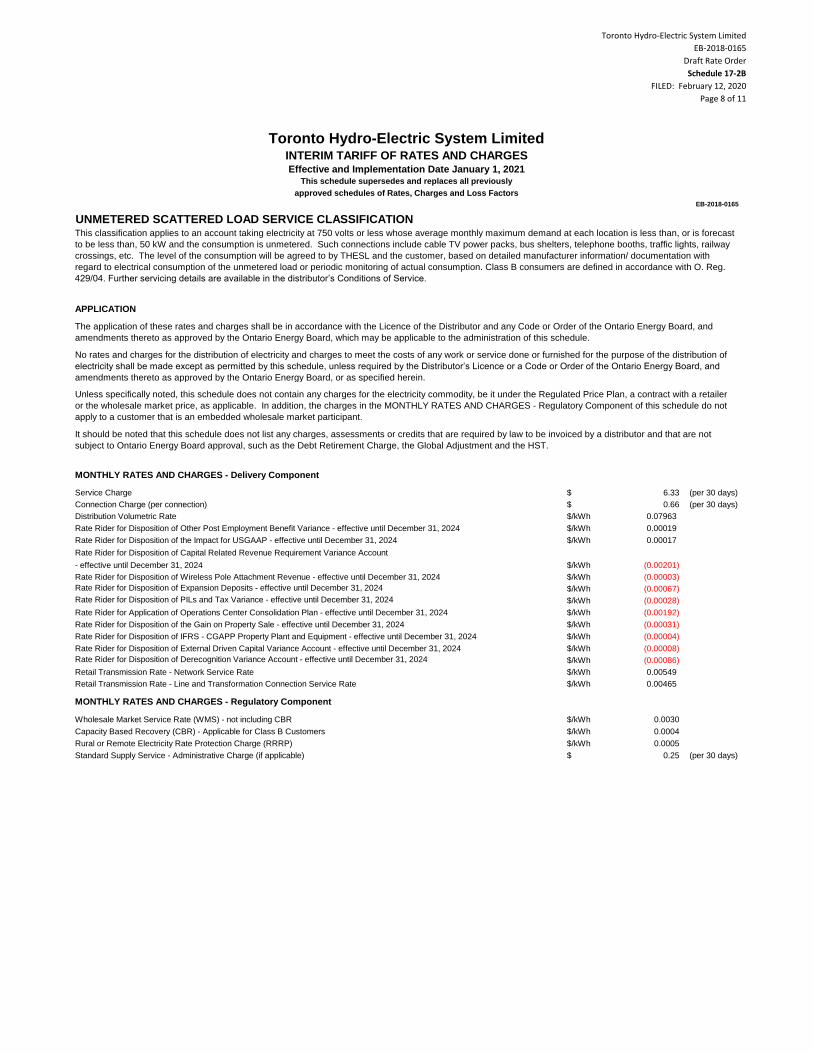
Toronto Hydro-Electric System Limited
EB-2018-0165
Draft Rate Order
Schedule 17-2B
FILED: February 12, 2020
Page 8 of 11
Toronto Hydro-Electric System LimitedINTERIM TARIFF OF RATES AND CHARGESEffective and Implementation Date January 1, 2021
This schedule supersedes and replaces all previously
approved schedules of Rates, Charges and Loss Factors
EB-2018-0165
$ 6.33 (per 30 days)
$ 0.66 (per 30 days)
$/kWh 0.07963
$/kWh 0.00019
$/kWh 0.00017
Rate Rider for Disposition of Capital Related Revenue Requirement Variance Account
- effective until December 31, 2024 $/kWh (0.00201)
$/kWh (0.00003)
Rate Rider for Disposition of Expansion Deposits - effective until December 31, 2024 $/kWh (0.00067)
Rate Rider for Disposition of PILs and Tax Variance - effective until December 31, 2024 $/kWh (0.00028)
$/kWh (0.00192)
$/kWh (0.00031)
$/kWh (0.00004)
$/kWh (0.00008)
Rate Rider for Disposition of Derecognition Variance Account - effective until December 31, 2024 $/kWh (0.00086)
$/kWh 0.00549
$/kWh 0.00465
$/kWh 0.0030
$/kWh 0.0004
$/kWh 0.0005
$ 0.25 (per 30 days)Standard Supply Service - Administrative Charge (if applicable)
Retail Transmission Rate - Network Service Rate
Retail Transmission Rate - Line and Transformation Connection Service Rate
MONTHLY RATES AND CHARGES - Regulatory Component
Wholesale Market Service Rate (WMS) - not including CBR
Capacity Based Recovery (CBR) - Applicable for Class B Customers
Rural or Remote Electricity Rate Protection Charge (RRRP)
Rate Rider for Disposition of the Impact for USGAAP - effective until December 31, 2024
Rate Rider for Disposition of Wireless Pole Attachment Revenue - effective until December 31, 2024
Rate Rider for Application of Operations Center Consolidation Plan - effective until December 31, 2024
Rate Rider for Disposition of the Gain on Property Sale - effective until December 31, 2024
Rate Rider for Disposition of IFRS - CGAPP Property Plant and Equipment - effective until December 31, 2024
Rate Rider for Disposition of External Driven Capital Variance Account - effective until December 31, 2024
It should be noted that this schedule does not list any charges, assessments or credits that are required by law to be invoiced by a distributor and that are not
subject to Ontario Energy Board approval, such as the Debt Retirement Charge, the Global Adjustment and the HST.
MONTHLY RATES AND CHARGES - Delivery Component
Service Charge
Connection Charge (per connection)
Distribution Volumetric Rate
Rate Rider for Disposition of Other Post Employment Benefit Variance - effective until December 31, 2024
UNMETERED SCATTERED LOAD SERVICE CLASSIFICATIONThis classification applies to an account taking electricity at 750 volts or less whose average monthly maximum demand at each location is less than, or is forecast
to be less than, 50 kW and the consumption is unmetered. Such connections include cable TV power packs, bus shelters, telephone booths, traffic lights, railway
crossings, etc. The level of the consumption will be agreed to by THESL and the customer, based on detailed manufacturer information/ documentation with
regard to electrical consumption of the unmetered load or periodic monitoring of actual consumption. Class B consumers are defined in accordance with O. Reg.
429/04. Further servicing details are available in the distributor’s Conditions of Service.
APPLICATION
The application of these rates and charges shall be in accordance with the Licence of the Distributor and any Code or Order of the Ontario Energy Board, and
amendments thereto as approved by the Ontario Energy Board, which may be applicable to the administration of this schedule.
No rates and charges for the distribution of electricity and charges to meet the costs of any work or service done or furnished for the purpose of the distribution of
electricity shall be made except as permitted by this schedule, unless required by the Distributor’s Licence or a Code or Order of the Ontario Energy Board, and
amendments thereto as approved by the Ontario Energy Board, or as specified herein.
Unless specifically noted, this schedule does not contain any charges for the electricity commodity, be it under the Regulated Price Plan, a contract with a retailer
or the wholesale market price, as applicable. In addition, the charges in the MONTHLY RATES AND CHARGES - Regulatory Component of this schedule do not
apply to a customer that is an embedded wholesale market participant.
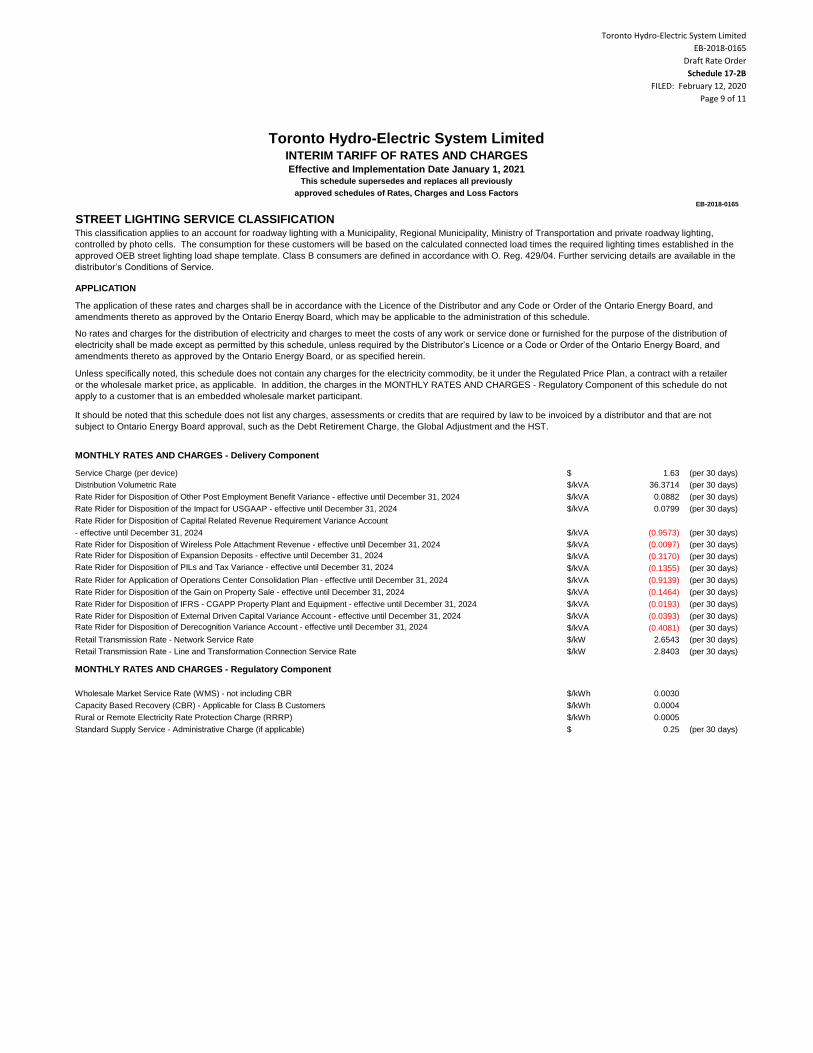
Toronto Hydro-Electric System Limited
EB-2018-0165
Draft Rate Order
Schedule 17-2B
FILED: February 12, 2020
Page 9 of 11
Toronto Hydro-Electric System LimitedINTERIM TARIFF OF RATES AND CHARGESEffective and Implementation Date January 1, 2021
This schedule supersedes and replaces all previously
approved schedules of Rates, Charges and Loss Factors
EB-2018-0165
$ 1.63 (per 30 days)
$/kVA 36.3714 (per 30 days)
$/kVA 0.0882 (per 30 days)
$/kVA 0.0799 (per 30 days)
Rate Rider for Disposition of Capital Related Revenue Requirement Variance Account
- effective until December 31, 2024 $/kVA (0.9573) (per 30 days)
$/kVA (0.0097) (per 30 days)
Rate Rider for Disposition of Expansion Deposits - effective until December 31, 2024 $/kVA (0.3170) (per 30 days)
Rate Rider for Disposition of PILs and Tax Variance - effective until December 31, 2024 $/kVA (0.1355) (per 30 days)
$/kVA (0.9139) (per 30 days)
$/kVA (0.1464) (per 30 days)
$/kVA (0.0193) (per 30 days)
$/kVA (0.0393) (per 30 days)
Rate Rider for Disposition of Derecognition Variance Account - effective until December 31, 2024 $/kVA (0.4081) (per 30 days)
$/kW 2.6543 (per 30 days)
$/kW 2.8403 (per 30 days)
$/kWh 0.0030
$/kWh 0.0004
$/kWh 0.0005
$ 0.25 (per 30 days)Standard Supply Service - Administrative Charge (if applicable)
Retail Transmission Rate - Network Service Rate
Retail Transmission Rate - Line and Transformation Connection Service Rate
MONTHLY RATES AND CHARGES - Regulatory Component
Wholesale Market Service Rate (WMS) - not including CBR
Capacity Based Recovery (CBR) - Applicable for Class B Customers
Rural or Remote Electricity Rate Protection Charge (RRRP)
Rate Rider for Disposition of the Impact for USGAAP - effective until December 31, 2024
Rate Rider for Disposition of Wireless Pole Attachment Revenue - effective until December 31, 2024
Rate Rider for Application of Operations Center Consolidation Plan - effective until December 31, 2024
Rate Rider for Disposition of the Gain on Property Sale - effective until December 31, 2024
Rate Rider for Disposition of IFRS - CGAPP Property Plant and Equipment - effective until December 31, 2024
Rate Rider for Disposition of External Driven Capital Variance Account - effective until December 31, 2024
Unless specifically noted, this schedule does not contain any charges for the electricity commodity, be it under the Regulated Price Plan, a contract with a retailer
or the wholesale market price, as applicable. In addition, the charges in the MONTHLY RATES AND CHARGES - Regulatory Component of this schedule do not
apply to a customer that is an embedded wholesale market participant.
It should be noted that this schedule does not list any charges, assessments or credits that are required by law to be invoiced by a distributor and that are not
subject to Ontario Energy Board approval, such as the Debt Retirement Charge, the Global Adjustment and the HST.
MONTHLY RATES AND CHARGES - Delivery Component
Service Charge (per device)
Distribution Volumetric Rate
Rate Rider for Disposition of Other Post Employment Benefit Variance - effective until December 31, 2024
STREET LIGHTING SERVICE CLASSIFICATIONThis classification applies to an account for roadway lighting with a Municipality, Regional Municipality, Ministry of Transportation and private roadway lighting,
controlled by photo cells. The consumption for these customers will be based on the calculated connected load times the required lighting times established in the
approved OEB street lighting load shape template. Class B consumers are defined in accordance with O. Reg. 429/04. Further servicing details are available in the
distributor’s Conditions of Service.
APPLICATION
The application of these rates and charges shall be in accordance with the Licence of the Distributor and any Code or Order of the Ontario Energy Board, and
amendments thereto as approved by the Ontario Energy Board, which may be applicable to the administration of this schedule.
No rates and charges for the distribution of electricity and charges to meet the costs of any work or service done or furnished for the purpose of the distribution of
electricity shall be made except as permitted by this schedule, unless required by the Distributor’s Licence or a Code or Order of the Ontario Energy Board, and
amendments thereto as approved by the Ontario Energy Board, or as specified herein.
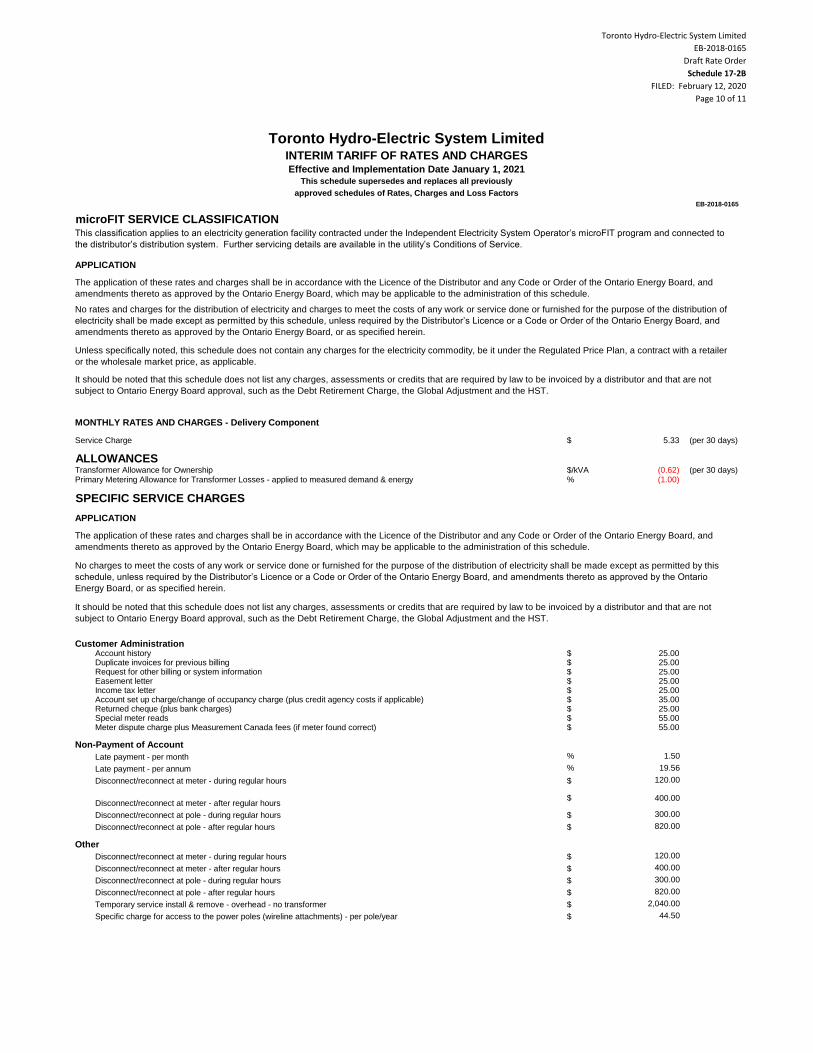
Toronto Hydro-Electric System Limited
EB-2018-0165
Draft Rate Order
Schedule 17-2B
FILED: February 12, 2020
Page 10 of 11
Toronto Hydro-Electric System LimitedINTERIM TARIFF OF RATES AND CHARGESEffective and Implementation Date January 1, 2021
This schedule supersedes and replaces all previously
approved schedules of Rates, Charges and Loss Factors
EB-2018-0165
$ 5.33 (per 30 days)
ALLOWANCES$/kVA (0.62) (per 30 days)% (1.00)
SPECIFIC SERVICE CHARGES
Customer Administration$ 25.00$ 25.00$ 25.00$ 25.00$ 25.00$ 35.00$ 25.00$ 55.00$ 55.00
Non-Payment of Account
% 1.50
% 19.56
$ 120.00
$ 400.00
$ 300.00
$ 820.00
Other
$ 120.00
$ 400.00
$ 300.00
$ 820.00
$ 2,040.00
$ 44.50Specific charge for access to the power poles (wireline attachments) - per pole/year
Disconnect/reconnect at pole - after regular hours
Disconnect/reconnect at meter - during regular hours
Disconnect/reconnect at meter - after regular hours
Disconnect/reconnect at pole - during regular hours
Disconnect/reconnect at pole - after regular hours
Temporary service install & remove - overhead - no transformer
Meter dispute charge plus Measurement Canada fees (if meter found correct)
Late payment - per month
Late payment - per annum
Disconnect/reconnect at meter - during regular hours
Disconnect/reconnect at meter - after regular hours
Disconnect/reconnect at pole - during regular hours
Request for other billing or system informationEasement letterIncome tax letterAccount set up charge/change of occupancy charge (plus credit agency costs if applicable)Returned cheque (plus bank charges)Special meter reads
APPLICATION
The application of these rates and charges shall be in accordance with the Licence of the Distributor and any Code or Order of the Ontario Energy Board, and
amendments thereto as approved by the Ontario Energy Board, which may be applicable to the administration of this schedule.
No charges to meet the costs of any work or service done or furnished for the purpose of the distribution of electricity shall be made except as permitted by this
schedule, unless required by the Distributor’s Licence or a Code or Order of the Ontario Energy Board, and amendments thereto as approved by the Ontario
Energy Board, or as specified herein.
It should be noted that this schedule does not list any charges, assessments or credits that are required by law to be invoiced by a distributor and that are not
subject to Ontario Energy Board approval, such as the Debt Retirement Charge, the Global Adjustment and the HST.
Account historyDuplicate invoices for previous billing
Unless specifically noted, this schedule does not contain any charges for the electricity commodity, be it under the Regulated Price Plan, a contract with a retailer
or the wholesale market price, as applicable.
It should be noted that this schedule does not list any charges, assessments or credits that are required by law to be invoiced by a distributor and that are not
subject to Ontario Energy Board approval, such as the Debt Retirement Charge, the Global Adjustment and the HST.
MONTHLY RATES AND CHARGES - Delivery Component
Service Charge
Transformer Allowance for OwnershipPrimary Metering Allowance for Transformer Losses - applied to measured demand & energy
microFIT SERVICE CLASSIFICATIONThis classification applies to an electricity generation facility contracted under the Independent Electricity System Operator’s microFIT program and connected to
the distributor’s distribution system. Further servicing details are available in the utility’s Conditions of Service.
APPLICATION
The application of these rates and charges shall be in accordance with the Licence of the Distributor and any Code or Order of the Ontario Energy Board, and
amendments thereto as approved by the Ontario Energy Board, which may be applicable to the administration of this schedule.
No rates and charges for the distribution of electricity and charges to meet the costs of any work or service done or furnished for the purpose of the distribution of
electricity shall be made except as permitted by this schedule, unless required by the Distributor’s Licence or a Code or Order of the Ontario Energy Board, and
amendments thereto as approved by the Ontario Energy Board, or as specified herein.

Toronto Hydro-Electric System Limited
EB-2018-0165
Draft Rate Order
Schedule 17-2B
FILED: February 12, 2020
Page 11 of 11
Toronto Hydro-Electric System LimitedINTERIM TARIFF OF RATES AND CHARGESEffective and Implementation Date January 1, 2021
This schedule supersedes and replaces all previously
approved schedules of Rates, Charges and Loss Factors
EB-2018-0165
RETAIL SERVICE CHARGES (if applicable)
$ 102.00
$ 40.80
$/cust. 1.02
$/cust. 0.61
$/cust. (0.61)
$ 0.51
$ 1.02
no charge
$ 4.08
LOSS FACTORS
1.0295
1.0172
1.0192
1.0070Total Loss Factor - Primary Metered Customer > 5,000 kW
Up to twice a year
More than twice a year, per request (plus incremental delivery costs)
If the distributor is not capable of prorating changed loss factors jointly with distribution rates, the revised loss factors will be implemented upon the
first subsequent billing for each billing cycle.
Total Loss Factor - Secondary Metered Customer < 5,000 kW
Total Loss Factor - Secondary Metered Customer > 5,000 kW
Total Loss Factor - Primary Metered Customer < 5,000 kW
Service Transaction Requests (STR)
Request fee, per request, applied to the requesting party
Processing fee, per request, applied to the requesting party
Request for customer information as outlined in Section 10.6.3 and Chapter 11 of the Retail
Settlement Code directly to retailers and customers, if not delivered electronically through the
Electronic Business Transaction (EBT) system, applied to the requesting party
Retail Service Charges refer to services provided by THESL to retailers or customers related to the supply of competitive electricity and are defined
in the 2006 Electricity Distribution Rate Handbook.
One-time charge, per retailer, to establish the service agreement between the distributor and the retailer
Monthly Fixed Charge, per retailer
Monthly Variable Charge, per customer, per retailer
Distributor-consolidated billing monthly charge, per customer, per retailer
Retailer-consolidated billing monthly credit, per customer, per retailer
APPLICATION
The application of these rates and charges shall be in accordance with the Licence of the Distributor and any Code or Order of the Ontario Energy Board, and
amendments thereto as approved by the Ontario Energy Board, which may be applicable to the administration of this schedule.
No rates and charges for the distribution of electricity and charges to meet the costs of any work or service done or furnished for the purpose of the distribution of
electricity shall be made except as permitted by this schedule, unless required by the Distributor’s Licence or a Code or Order of the Ontario Energy Board, and
amendments thereto as approved by the Ontario Energy Board, or as specified herein.
Unless specifically noted, this schedule does not contain any charges for the electricity commodity, be it under the Regulated Price Plan, a contract with a retailer
or the wholesale market price, as applicable.
It should be noted that this schedule does not list any charges, assessments or credits that are required by law to be invoiced by a distributor and that are not
subject to Ontario Energy Board approval, such as the Debt Retirement Charge, the Global Adjustment and the HST.
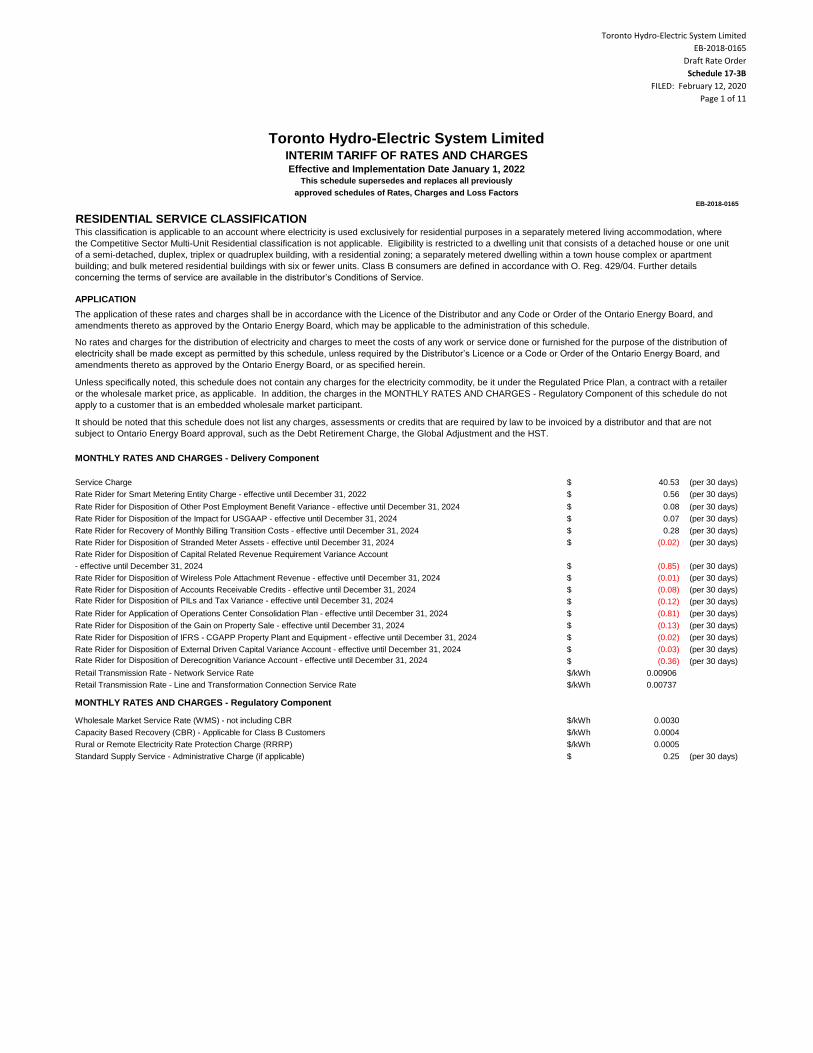
Toronto Hydro-Electric System Limited
EB-2018-0165
Draft Rate Order
Schedule 17-3B
FILED: February 12, 2020
Page 1 of 11
$ 40.53 (per 30 days)
$ 0.56 (per 30 days)
$ 0.08 (per 30 days)
$ 0.07 (per 30 days)
$ 0.28 (per 30 days)
$ (0.02) (per 30 days)
- effective until December 31, 2024 $ (0.85) (per 30 days)
$ (0.01) (per 30 days)
$ (0.08) (per 30 days)
Rate Rider for Disposition of PILs and Tax Variance - effective until December 31, 2024 $ (0.12) (per 30 days)
$ (0.81) (per 30 days)
$ (0.13) (per 30 days)
$ (0.02) (per 30 days)
$ (0.03) (per 30 days)
Rate Rider for Disposition of Derecognition Variance Account - effective until December 31, 2024 $ (0.36) (per 30 days)
$/kWh 0.00906
$/kWh 0.00737
$/kWh 0.0030
$/kWh 0.0004
$/kWh 0.0005
$ 0.25 (per 30 days)
Wholesale Market Service Rate (WMS) - not including CBR
Capacity Based Recovery (CBR) - Applicable for Class B Customers
Rural or Remote Electricity Rate Protection Charge (RRRP)
Standard Supply Service - Administrative Charge (if applicable)
Rate Rider for Disposition of the Gain on Property Sale - effective until December 31, 2024
Rate Rider for Disposition of IFRS - CGAPP Property Plant and Equipment - effective until December 31, 2024
Rate Rider for Disposition of External Driven Capital Variance Account - effective until December 31, 2024
Retail Transmission Rate - Network Service Rate
Retail Transmission Rate - Line and Transformation Connection Service Rate
MONTHLY RATES AND CHARGES - Regulatory Component
Rate Rider for Recovery of Monthly Billing Transition Costs - effective until December 31, 2024
Rate Rider for Disposition of Stranded Meter Assets - effective until December 31, 2024
Rate Rider for Disposition of Capital Related Revenue Requirement Variance Account
Rate Rider for Disposition of Wireless Pole Attachment Revenue - effective until December 31, 2024
Rate Rider for Disposition of Accounts Receivable Credits - effective until December 31, 2024
Rate Rider for Application of Operations Center Consolidation Plan - effective until December 31, 2024
It should be noted that this schedule does not list any charges, assessments or credits that are required by law to be invoiced by a distributor and that are not
subject to Ontario Energy Board approval, such as the Debt Retirement Charge, the Global Adjustment and the HST.
MONTHLY RATES AND CHARGES - Delivery Component
Service Charge
Rate Rider for Smart Metering Entity Charge - effective until December 31, 2022
Rate Rider for Disposition of Other Post Employment Benefit Variance - effective until December 31, 2024
Rate Rider for Disposition of the Impact for USGAAP - effective until December 31, 2024
RESIDENTIAL SERVICE CLASSIFICATIONThis classification is applicable to an account where electricity is used exclusively for residential purposes in a separately metered living accommodation, where
the Competitive Sector Multi-Unit Residential classification is not applicable. Eligibility is restricted to a dwelling unit that consists of a detached house or one unit
of a semi-detached, duplex, triplex or quadruplex building, with a residential zoning; a separately metered dwelling within a town house complex or apartment
building; and bulk metered residential buildings with six or fewer units. Class B consumers are defined in accordance with O. Reg. 429/04. Further details
concerning the terms of service are available in the distributor’s Conditions of Service.
APPLICATION
The application of these rates and charges shall be in accordance with the Licence of the Distributor and any Code or Order of the Ontario Energy Board, and
amendments thereto as approved by the Ontario Energy Board, which may be applicable to the administration of this schedule.
No rates and charges for the distribution of electricity and charges to meet the costs of any work or service done or furnished for the purpose of the distribution of
electricity shall be made except as permitted by this schedule, unless required by the Distributor’s Licence or a Code or Order of the Ontario Energy Board, and
amendments thereto as approved by the Ontario Energy Board, or as specified herein.
Unless specifically noted, this schedule does not contain any charges for the electricity commodity, be it under the Regulated Price Plan, a contract with a retailer
or the wholesale market price, as applicable. In addition, the charges in the MONTHLY RATES AND CHARGES - Regulatory Component of this schedule do not
apply to a customer that is an embedded wholesale market participant.
Toronto Hydro-Electric System LimitedINTERIM TARIFF OF RATES AND CHARGESEffective and Implementation Date January 1, 2022
This schedule supersedes and replaces all previously
approved schedules of Rates, Charges and Loss Factors
EB-2018-0165
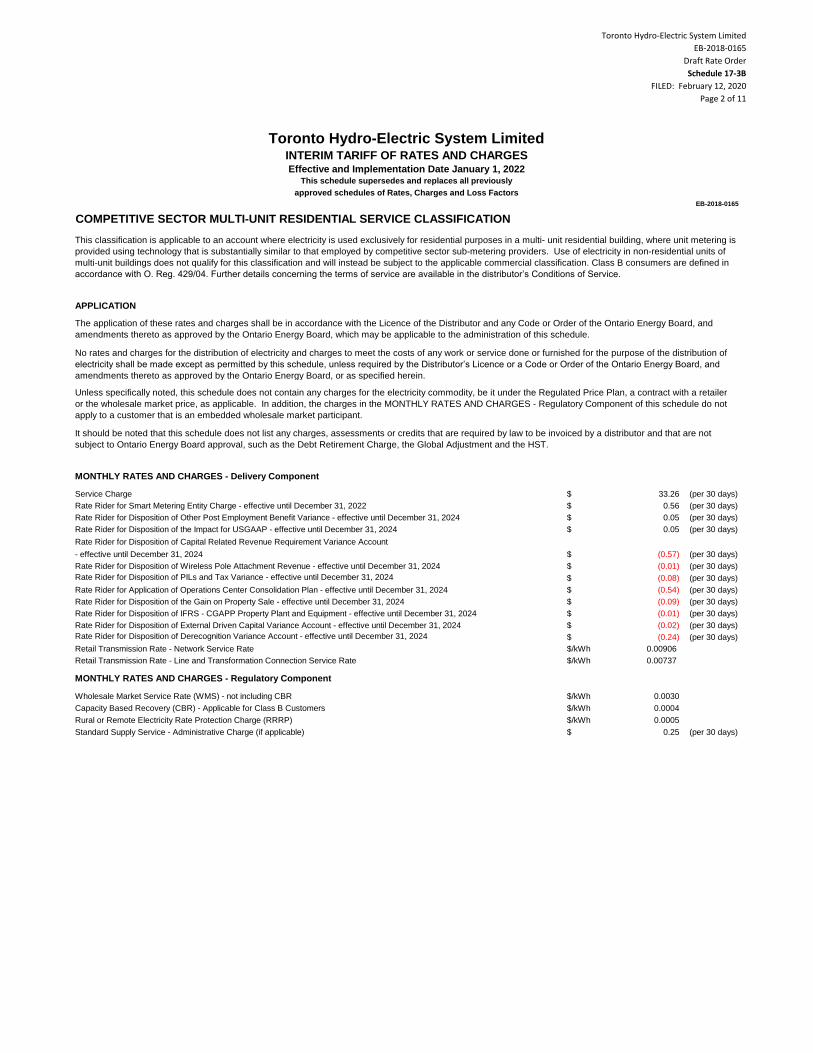
Toronto Hydro-Electric System Limited
EB-2018-0165
Draft Rate Order
Schedule 17-3B
FILED: February 12, 2020
Page 2 of 11
Toronto Hydro-Electric System LimitedINTERIM TARIFF OF RATES AND CHARGESEffective and Implementation Date January 1, 2022
This schedule supersedes and replaces all previously
approved schedules of Rates, Charges and Loss Factors
EB-2018-0165
$ 33.26 (per 30 days)
$ 0.56 (per 30 days)
$ 0.05 (per 30 days)
$ 0.05 (per 30 days)
Rate Rider for Disposition of Capital Related Revenue Requirement Variance Account
- effective until December 31, 2024 $ (0.57) (per 30 days)
$ (0.01) (per 30 days)
Rate Rider for Disposition of PILs and Tax Variance - effective until December 31, 2024 $ (0.08) (per 30 days)
$ (0.54) (per 30 days)
$ (0.09) (per 30 days)
$ (0.01) (per 30 days)
$ (0.02) (per 30 days)
Rate Rider for Disposition of Derecognition Variance Account - effective until December 31, 2024 $ (0.24) (per 30 days)
$/kWh 0.00906
$/kWh 0.00737
$/kWh 0.0030
$/kWh 0.0004
$/kWh 0.0005
$ 0.25 (per 30 days)
Wholesale Market Service Rate (WMS) - not including CBR
Capacity Based Recovery (CBR) - Applicable for Class B Customers
Rural or Remote Electricity Rate Protection Charge (RRRP)
Standard Supply Service - Administrative Charge (if applicable)
Rate Rider for Disposition of the Gain on Property Sale - effective until December 31, 2024
Rate Rider for Disposition of IFRS - CGAPP Property Plant and Equipment - effective until December 31, 2024
Rate Rider for Disposition of External Driven Capital Variance Account - effective until December 31, 2024
Retail Transmission Rate - Network Service Rate
Retail Transmission Rate - Line and Transformation Connection Service Rate
MONTHLY RATES AND CHARGES - Regulatory Component
Service Charge
Rate Rider for Smart Metering Entity Charge - effective until December 31, 2022
Rate Rider for Disposition of Other Post Employment Benefit Variance - effective until December 31, 2024
Rate Rider for Disposition of the Impact for USGAAP - effective until December 31, 2024
Rate Rider for Disposition of Wireless Pole Attachment Revenue - effective until December 31, 2024
Rate Rider for Application of Operations Center Consolidation Plan - effective until December 31, 2024
APPLICATION
The application of these rates and charges shall be in accordance with the Licence of the Distributor and any Code or Order of the Ontario Energy Board, and
amendments thereto as approved by the Ontario Energy Board, which may be applicable to the administration of this schedule.
No rates and charges for the distribution of electricity and charges to meet the costs of any work or service done or furnished for the purpose of the distribution of
electricity shall be made except as permitted by this schedule, unless required by the Distributor’s Licence or a Code or Order of the Ontario Energy Board, and
amendments thereto as approved by the Ontario Energy Board, or as specified herein.
Unless specifically noted, this schedule does not contain any charges for the electricity commodity, be it under the Regulated Price Plan, a contract with a retailer
or the wholesale market price, as applicable. In addition, the charges in the MONTHLY RATES AND CHARGES - Regulatory Component of this schedule do not
apply to a customer that is an embedded wholesale market participant.
It should be noted that this schedule does not list any charges, assessments or credits that are required by law to be invoiced by a distributor and that are not
subject to Ontario Energy Board approval, such as the Debt Retirement Charge, the Global Adjustment and the HST.
MONTHLY RATES AND CHARGES - Delivery Component
COMPETITIVE SECTOR MULTI-UNIT RESIDENTIAL SERVICE CLASSIFICATION
This classification is applicable to an account where electricity is used exclusively for residential purposes in a multi- unit residential building, where unit metering is
provided using technology that is substantially similar to that employed by competitive sector sub-metering providers. Use of electricity in non-residential units of
multi-unit buildings does not qualify for this classification and will instead be subject to the applicable commercial classification. Class B consumers are defined in
accordance with O. Reg. 429/04. Further details concerning the terms of service are available in the distributor’s Conditions of Service.
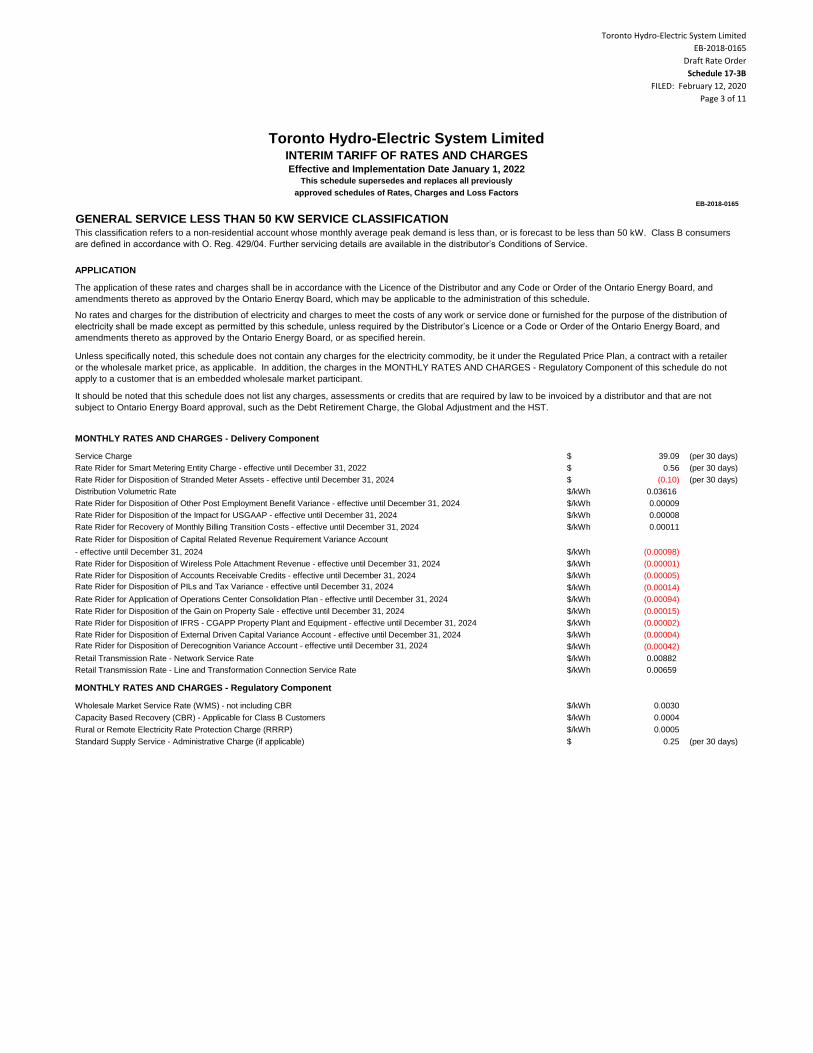
Toronto Hydro-Electric System Limited
EB-2018-0165
Draft Rate Order
Schedule 17-3B
FILED: February 12, 2020
Page 3 of 11
Toronto Hydro-Electric System LimitedINTERIM TARIFF OF RATES AND CHARGESEffective and Implementation Date January 1, 2022
This schedule supersedes and replaces all previously
approved schedules of Rates, Charges and Loss Factors
EB-2018-0165
$ 39.09 (per 30 days)
$ 0.56 (per 30 days)
$ (0.10) (per 30 days)
$/kWh 0.03616
$/kWh 0.00009
$/kWh 0.00008
$/kWh 0.00011
Rate Rider for Disposition of Capital Related Revenue Requirement Variance Account
- effective until December 31, 2024 $/kWh (0.00098)
$/kWh (0.00001)
$/kWh (0.00005)
Rate Rider for Disposition of PILs and Tax Variance - effective until December 31, 2024 $/kWh (0.00014)
$/kWh (0.00094)
$/kWh (0.00015)
$/kWh (0.00002)
$/kWh (0.00004)
Rate Rider for Disposition of Derecognition Variance Account - effective until December 31, 2024 $/kWh (0.00042)
$/kWh 0.00882
$/kWh 0.00659
$/kWh 0.0030
$/kWh 0.0004
$/kWh 0.0005
$ 0.25 (per 30 days)
Rural or Remote Electricity Rate Protection Charge (RRRP)
Standard Supply Service - Administrative Charge (if applicable)
Rate Rider for Disposition of External Driven Capital Variance Account - effective until December 31, 2024
Retail Transmission Rate - Network Service Rate
Retail Transmission Rate - Line and Transformation Connection Service Rate
MONTHLY RATES AND CHARGES - Regulatory Component
Wholesale Market Service Rate (WMS) - not including CBR
Capacity Based Recovery (CBR) - Applicable for Class B Customers
Rate Rider for Recovery of Monthly Billing Transition Costs - effective until December 31, 2024
Rate Rider for Disposition of Wireless Pole Attachment Revenue - effective until December 31, 2024
Rate Rider for Disposition of Accounts Receivable Credits - effective until December 31, 2024
Rate Rider for Application of Operations Center Consolidation Plan - effective until December 31, 2024
Rate Rider for Disposition of the Gain on Property Sale - effective until December 31, 2024
Rate Rider for Disposition of IFRS - CGAPP Property Plant and Equipment - effective until December 31, 2024
Service Charge
Rate Rider for Smart Metering Entity Charge - effective until December 31, 2022
Rate Rider for Disposition of Stranded Meter Assets - effective until December 31, 2024
Distribution Volumetric Rate
Rate Rider for Disposition of Other Post Employment Benefit Variance - effective until December 31, 2024
Rate Rider for Disposition of the Impact for USGAAP - effective until December 31, 2024
APPLICATION
The application of these rates and charges shall be in accordance with the Licence of the Distributor and any Code or Order of the Ontario Energy Board, and
amendments thereto as approved by the Ontario Energy Board, which may be applicable to the administration of this schedule.
No rates and charges for the distribution of electricity and charges to meet the costs of any work or service done or furnished for the purpose of the distribution of
electricity shall be made except as permitted by this schedule, unless required by the Distributor’s Licence or a Code or Order of the Ontario Energy Board, and
amendments thereto as approved by the Ontario Energy Board, or as specified herein.
Unless specifically noted, this schedule does not contain any charges for the electricity commodity, be it under the Regulated Price Plan, a contract with a retailer
or the wholesale market price, as applicable. In addition, the charges in the MONTHLY RATES AND CHARGES - Regulatory Component of this schedule do not
apply to a customer that is an embedded wholesale market participant.
It should be noted that this schedule does not list any charges, assessments or credits that are required by law to be invoiced by a distributor and that are not
subject to Ontario Energy Board approval, such as the Debt Retirement Charge, the Global Adjustment and the HST.
MONTHLY RATES AND CHARGES - Delivery Component
GENERAL SERVICE LESS THAN 50 KW SERVICE CLASSIFICATIONThis classification refers to a non-residential account whose monthly average peak demand is less than, or is forecast to be less than 50 kW. Class B consumers
are defined in accordance with O. Reg. 429/04. Further servicing details are available in the distributor’s Conditions of Service.

Toronto Hydro-Electric System Limited
EB-2018-0165
Draft Rate Order
Schedule 17-3B
FILED: February 12, 2020
Page 4 of 11
Toronto Hydro-Electric System LimitedINTERIM TARIFF OF RATES AND CHARGESEffective and Implementation Date January 1, 2022
This schedule supersedes and replaces all previously
approved schedules of Rates, Charges and Loss Factors
EB-2018-0165
$ 51.95 (per 30 days)
$ (0.38) (per 30 days)
$/kVA 8.3421 (per 30 days)
$/kVA 0.0158 (per 30 days)
$/kVA 0.0143 (per 30 days)
Rate Rider for Disposition of Capital Related Revenue Requirement Variance Account
- effective until December 31, 2024 $/kVA (0.1710) (per 30 days)
$/kVA (0.0010) (per 30 days)
Rate Rider for Disposition of Expansion Deposits - effective until December 31, 2024 $/kVA (0.0566) (per 30 days)
$/kVA (0.0004) (per 30 days)
Rate Rider for Disposition of PILs and Tax Variance - effective until December 31, 2024 $/kVA (0.0242) (per 30 days)
$/kVA (0.1632) (per 30 days)
$/kVA (0.0262) (per 30 days)
$/kVA (0.0035) (per 30 days)
$/kVA (0.0070) (per 30 days)
Rate Rider for Disposition of Derecognition Variance Account - effective until December 31, 2024 $/kVA (0.0729) (per 30 days)
$/kW 2.9842 (per 30 days)
$/kW 2.3822 (per 30 days)
$/kWh 0.0030
$/kWh 0.0004
$/kWh 0.0005
$ 0.25 (per 30 days)
Retail Transmission Rate - Line and Transformation Connection Service Rate
MONTHLY RATES AND CHARGES - Regulatory Component
Wholesale Market Service Rate (WMS) - not including CBR
Capacity Based Recovery (CBR) - Applicable for Class B Customers
Rural or Remote Electricity Rate Protection Charge (RRRP)
Standard Supply Service - Administrative Charge (if applicable)
Rate Rider for Disposition of Accounts Receivable Credits - effective until December 31, 2024
Rate Rider for Application of Operations Center Consolidation Plan - effective until December 31, 2024
Rate Rider for Disposition of the Gain on Property Sale - effective until December 31, 2024
Rate Rider for Disposition of IFRS - CGAPP Property Plant and Equipment - effective until December 31, 2024
Rate Rider for Disposition of External Driven Capital Variance Account - effective until December 31, 2024
Retail Transmission Rate - Network Service Rate
Service Charge
Rate Rider for Disposition of Stranded Meter Assets - effective until December 31, 2024
Distribution Volumetric Rate
Rate Rider for Disposition of Other Post Employment Benefit Variance - effective until December 31, 2024
Rate Rider for Disposition of the Impact for USGAAP - effective until December 31, 2024
Rate Rider for Disposition of Wireless Pole Attachment Revenue - effective until December 31, 2024
No rates and charges for the distribution of electricity and charges to meet the costs of any work or service done or furnished for the purpose of the distribution of
electricity shall be made except as permitted by this schedule, unless required by the Distributor’s Licence or a Code or Order of the Ontario Energy Board, and
amendments thereto as approved by the Ontario Energy Board, or as specified herein.
Unless specifically noted, this schedule does not contain any charges for the electricity commodity, be it under the Regulated Price Plan, a contract with a retailer
or the wholesale market price, as applicable. In addition, the charges in the MONTHLY RATES AND CHARGES - Regulatory Component of this schedule do not
apply to a customer that is an embedded wholesale market participant.
The rate rider for the disposition of WMS - Sub-account CBR Class B is not applicable to wholesale market participants (WMP), customers that transitioned
between Class A and Class B during the variance account accumulation period, or to customers that were in Class A for the entire period. Customers who
transitioned are to be charged or refunded their share of the variance disposed through customer specific billing adjustments. This rate rider is to be consistently
applied for the entire period to the sunset date of the rate rider. In addition, this rate rider is applicable to all new Class B customers.
The rate rider for the disposition of Post 2011 Global Adjustment is only applicable to non-RPP Class B customers. It is not applicable to WMP, customers that
transitioned between Class A and Class B during the variance account accumulation period, or to customers that were in Class A for the entire period. Customers
who transitioned are to be charged or refunded their share of the variance disposed through customer specific billing adjustments. This rate rider is to be
consistently applied for the entire period to the sunset date of the rate rider. In addition, this rate rider is applicable to all new non-RPP Class B customers.
It should be noted that this schedule does not list any charges, assessments or credits that are required by law to be invoiced by a distributor and that are not
subject to Ontario Energy Board approval, such as the Debt Retirement Charge, the Global Adjustment and the HST.
MONTHLY RATES AND CHARGES - Delivery Component
GENERAL SERVICE 50 TO 999 KW SERVICE CLASSIFICATIONThis classification refers to a non-residential account whose monthly average peak demand is equal to or greater than 50 kW but less than 1,000 kW, or is forecast
to be equal to or greater than 50 kW but less than 1,000 kW. This rate also applies to bulk metered residential apartment buildings or the house service of a
residential apartment building with more than 6 units. Class B consumers are defined in accordance with O. Reg. 429/04. Further servicing details are available in
the distributor’s Conditions of Service.
APPLICATION
The application of these rates and charges shall be in accordance with the Licence of the Distributor and any Code or Order of the Ontario Energy Board, and
amendments thereto as approved by the Ontario Energy Board, which may be applicable to the administration of this schedule.
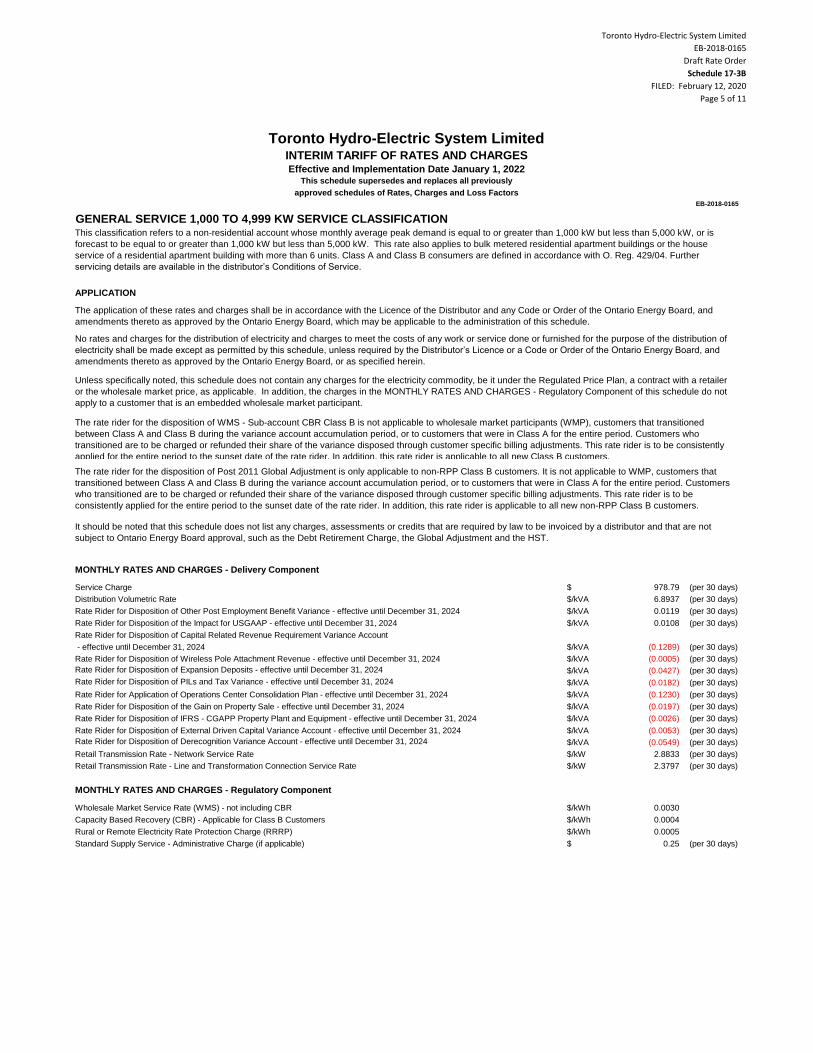
Toronto Hydro-Electric System Limited
EB-2018-0165
Draft Rate Order
Schedule 17-3B
FILED: February 12, 2020
Page 5 of 11
Toronto Hydro-Electric System LimitedINTERIM TARIFF OF RATES AND CHARGESEffective and Implementation Date January 1, 2022
This schedule supersedes and replaces all previously
approved schedules of Rates, Charges and Loss Factors
EB-2018-0165
$ 978.79 (per 30 days)
$/kVA 6.8937 (per 30 days)
$/kVA 0.0119 (per 30 days)
$/kVA 0.0108 (per 30 days)
Rate Rider for Disposition of Capital Related Revenue Requirement Variance Account
- effective until December 31, 2024 $/kVA (0.1289) (per 30 days)
$/kVA (0.0005) (per 30 days)
Rate Rider for Disposition of Expansion Deposits - effective until December 31, 2024 $/kVA (0.0427) (per 30 days)
Rate Rider for Disposition of PILs and Tax Variance - effective until December 31, 2024 $/kVA (0.0182) (per 30 days)
$/kVA (0.1230) (per 30 days)
$/kVA (0.0197) (per 30 days)
$/kVA (0.0026) (per 30 days)
$/kVA (0.0053) (per 30 days)
Rate Rider for Disposition of Derecognition Variance Account - effective until December 31, 2024 $/kVA (0.0549) (per 30 days)
$/kW 2.8833 (per 30 days)
$/kW 2.3797 (per 30 days)
$/kWh 0.0030
$/kWh 0.0004
$/kWh 0.0005
$ 0.25 (per 30 days)
Rural or Remote Electricity Rate Protection Charge (RRRP)
Standard Supply Service - Administrative Charge (if applicable)
Rate Rider for Disposition of External Driven Capital Variance Account - effective until December 31, 2024
Retail Transmission Rate - Network Service Rate
Retail Transmission Rate - Line and Transformation Connection Service Rate
MONTHLY RATES AND CHARGES - Regulatory Component
Wholesale Market Service Rate (WMS) - not including CBR
Capacity Based Recovery (CBR) - Applicable for Class B Customers
Rate Rider for Disposition of Other Post Employment Benefit Variance - effective until December 31, 2024
Rate Rider for Disposition of the Impact for USGAAP - effective until December 31, 2024
Rate Rider for Disposition of Wireless Pole Attachment Revenue - effective until December 31, 2024
Rate Rider for Application of Operations Center Consolidation Plan - effective until December 31, 2024
Rate Rider for Disposition of the Gain on Property Sale - effective until December 31, 2024
Rate Rider for Disposition of IFRS - CGAPP Property Plant and Equipment - effective until December 31, 2024
The rate rider for the disposition of WMS - Sub-account CBR Class B is not applicable to wholesale market participants (WMP), customers that transitioned
between Class A and Class B during the variance account accumulation period, or to customers that were in Class A for the entire period. Customers who
transitioned are to be charged or refunded their share of the variance disposed through customer specific billing adjustments. This rate rider is to be consistently
applied for the entire period to the sunset date of the rate rider. In addition, this rate rider is applicable to all new Class B customers.
The rate rider for the disposition of Post 2011 Global Adjustment is only applicable to non-RPP Class B customers. It is not applicable to WMP, customers that
transitioned between Class A and Class B during the variance account accumulation period, or to customers that were in Class A for the entire period. Customers
who transitioned are to be charged or refunded their share of the variance disposed through customer specific billing adjustments. This rate rider is to be
consistently applied for the entire period to the sunset date of the rate rider. In addition, this rate rider is applicable to all new non-RPP Class B customers.
It should be noted that this schedule does not list any charges, assessments or credits that are required by law to be invoiced by a distributor and that are not
subject to Ontario Energy Board approval, such as the Debt Retirement Charge, the Global Adjustment and the HST.
MONTHLY RATES AND CHARGES - Delivery Component
Service Charge
Distribution Volumetric Rate
GENERAL SERVICE 1,000 TO 4,999 KW SERVICE CLASSIFICATIONThis classification refers to a non-residential account whose monthly average peak demand is equal to or greater than 1,000 kW but less than 5,000 kW, or is
forecast to be equal to or greater than 1,000 kW but less than 5,000 kW. This rate also applies to bulk metered residential apartment buildings or the house
service of a residential apartment building with more than 6 units. Class A and Class B consumers are defined in accordance with O. Reg. 429/04. Further
servicing details are available in the distributor’s Conditions of Service.
APPLICATION
The application of these rates and charges shall be in accordance with the Licence of the Distributor and any Code or Order of the Ontario Energy Board, and
amendments thereto as approved by the Ontario Energy Board, which may be applicable to the administration of this schedule.
No rates and charges for the distribution of electricity and charges to meet the costs of any work or service done or furnished for the purpose of the distribution of
electricity shall be made except as permitted by this schedule, unless required by the Distributor’s Licence or a Code or Order of the Ontario Energy Board, and
amendments thereto as approved by the Ontario Energy Board, or as specified herein.
Unless specifically noted, this schedule does not contain any charges for the electricity commodity, be it under the Regulated Price Plan, a contract with a retailer
or the wholesale market price, as applicable. In addition, the charges in the MONTHLY RATES AND CHARGES - Regulatory Component of this schedule do not
apply to a customer that is an embedded wholesale market participant.

Toronto Hydro-Electric System Limited
EB-2018-0165
Draft Rate Order
Schedule 17-3B
FILED: February 12, 2020
Page 6 of 11
Toronto Hydro-Electric System LimitedINTERIM TARIFF OF RATES AND CHARGESEffective and Implementation Date January 1, 2022
This schedule supersedes and replaces all previously
approved schedules of Rates, Charges and Loss Factors
EB-2018-0165
$ 4,332.82 (per 30 days)
$/kVA 7.4693 (per 30 days)
$/kVA 0.0140 (per 30 days)
$/kVA 0.0127 (per 30 days)
Rate Rider for Disposition of Capital Related Revenue Requirement Variance Account
- effective until December 31, 2024 $/kVA (0.1521) (per 30 days)
$/kVA (0.0004) (per 30 days)
Rate Rider for Disposition of Expansion Deposits - effective until December 31, 2024 $/kVA (0.0504) (per 30 days)
Rate Rider for Disposition of PILs and Tax Variance - effective until December 31, 2024 $/kVA (0.0215) (per 30 days)
$/kVA (0.1452) (per 30 days)
$/kVA (0.0233) (per 30 days)
$/kVA (0.0031) (per 30 days)
$/kVA (0.0062) (per 30 days)
Rate Rider for Disposition of Derecognition Variance Account - effective until December 31, 2024 $/kVA (0.0648) (per 30 days)
$/kW 3.2868 (per 30 days)
$/kW 2.6439 (per 30 days)
$/kWh 0.0030
$/kWh 0.0004
$/kWh 0.0005
$ 0.25 (per 30 days)
Wholesale Market Service Rate (WMS) - not including CBR
Capacity Based Recovery (CBR) - Applicable for Class B Customers
Rural or Remote Electricity Rate Protection Charge (RRRP)
Standard Supply Service - Administrative Charge (if applicable)
Rate Rider for Disposition of the Gain on Property Sale - effective until December 31, 2024
Rate Rider for Disposition of IFRS - CGAPP Property Plant and Equipment - effective until December 31, 2024
Rate Rider for Disposition of External Driven Capital Variance Account - effective until December 31, 2024
Retail Transmission Rate - Network Service Rate
Retail Transmission Rate - Line and Transformation Connection Service Rate
MONTHLY RATES AND CHARGES - Regulatory Component
Service Charge
Distribution Volumetric Rate
Rate Rider for Disposition of Other Post Employment Benefit Variance - effective until December 31, 2024
Rate Rider for Disposition of the Impact for USGAAP - effective until December 31, 2024
Rate Rider for Disposition of Wireless Pole Attachment Revenue - effective until December 31, 2024
Rate Rider for Application of Operations Center Consolidation Plan - effective until December 31, 2024
No rates and charges for the distribution of electricity and charges to meet the costs of any work or service done or furnished for the purpose of the distribution of
electricity shall be made except as permitted by this schedule, unless required by the Distributor’s Licence or a Code or Order of the Ontario Energy Board, and
amendments thereto as approved by the Ontario Energy Board, or as specified herein.
Unless specifically noted, this schedule does not contain any charges for the electricity commodity, be it under the Regulated Price Plan, a contract with a retailer
or the wholesale market price, as applicable. In addition, the charges in the MONTHLY RATES AND CHARGES - Regulatory Component of this schedule do not
apply to a customer that is an embedded wholesale market participant.
The rate rider for the disposition of WMS - Sub-account CBR Class B is not applicable to wholesale market participants (WMP), customers that transitioned
between Class A and Class B during the variance account accumulation period, or to customers that were in Class A for the entire period. Customers who
transitioned are to be charged or refunded their share of the variance disposed through customer specific billing adjustments. This rate rider is to be consistently
applied for the entire period to the sunset date of the rate rider. In addition, this rate rider is applicable to all new Class B customers.
The rate rider for the disposition of Post 2011 Global Adjustment is only applicable to non-RPP Class B customers. It is not applicable to WMP, customers that
transitioned between Class A and Class B during the variance account accumulation period, or to customers that were in Class A for the entire period. Customers
who transitioned are to be charged or refunded their share of the variance disposed through customer specific billing adjustments. This rate rider is to be
consistently applied for the entire period to the sunset date of the rate rider. In addition, this rate rider is applicable to all new non-RPP Class B customers.
It should be noted that this schedule does not list any charges, assessments or credits that are required by law to be invoiced by a distributor and that are not
subject to Ontario Energy Board approval, such as the Debt Retirement Charge, the Global Adjustment and the HST.
MONTHLY RATES AND CHARGES - Delivery Component
LARGE USE SERVICE CLASSIFICATIONThis classification applies to an account whose average monthly maximum demand used for billing purposes is equal to or greater than, or is forecast to be equal
to or greater than, 5,000 kW. Class A and Class B consumers are defined in accordance with O. Reg. 429/04. Further servicing details are available in the
distributor’s Conditions of Service.
APPLICATION
The application of these rates and charges shall be in accordance with the Licence of the Distributor and any Code or Order of the Ontario Energy Board, and
amendments thereto as approved by the Ontario Energy Board, which may be applicable to the administration of this schedule.
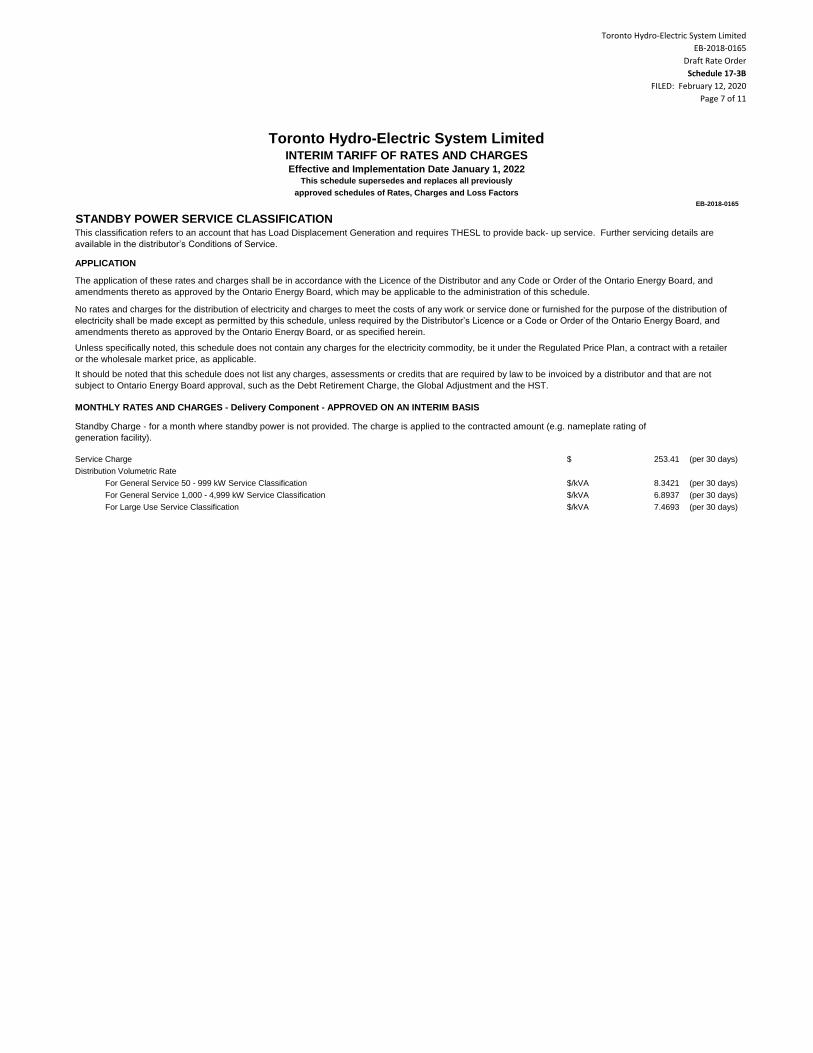
Toronto Hydro-Electric System Limited
EB-2018-0165
Draft Rate Order
Schedule 17-3B
FILED: February 12, 2020
Page 7 of 11
Toronto Hydro-Electric System LimitedINTERIM TARIFF OF RATES AND CHARGESEffective and Implementation Date January 1, 2022
This schedule supersedes and replaces all previously
approved schedules of Rates, Charges and Loss Factors
EB-2018-0165
$ 253.41 (per 30 days)
$/kVA 8.3421 (per 30 days)
$/kVA 6.8937 (per 30 days)
$/kVA 7.4693 (per 30 days)
Standby Charge - for a month where standby power is not provided. The charge is applied to the contracted amount (e.g. nameplate rating of
generation facility).
Service Charge
Distribution Volumetric Rate
For General Service 50 - 999 kW Service Classification
For General Service 1,000 - 4,999 kW Service Classification
For Large Use Service Classification
APPLICATION
The application of these rates and charges shall be in accordance with the Licence of the Distributor and any Code or Order of the Ontario Energy Board, and
amendments thereto as approved by the Ontario Energy Board, which may be applicable to the administration of this schedule.
No rates and charges for the distribution of electricity and charges to meet the costs of any work or service done or furnished for the purpose of the distribution of
electricity shall be made except as permitted by this schedule, unless required by the Distributor’s Licence or a Code or Order of the Ontario Energy Board, and
amendments thereto as approved by the Ontario Energy Board, or as specified herein.
Unless specifically noted, this schedule does not contain any charges for the electricity commodity, be it under the Regulated Price Plan, a contract with a retailer
or the wholesale market price, as applicable.
It should be noted that this schedule does not list any charges, assessments or credits that are required by law to be invoiced by a distributor and that are not
subject to Ontario Energy Board approval, such as the Debt Retirement Charge, the Global Adjustment and the HST.
MONTHLY RATES AND CHARGES - Delivery Component - APPROVED ON AN INTERIM BASIS
STANDBY POWER SERVICE CLASSIFICATIONThis classification refers to an account that has Load Displacement Generation and requires THESL to provide back- up service. Further servicing details are
available in the distributor’s Conditions of Service.
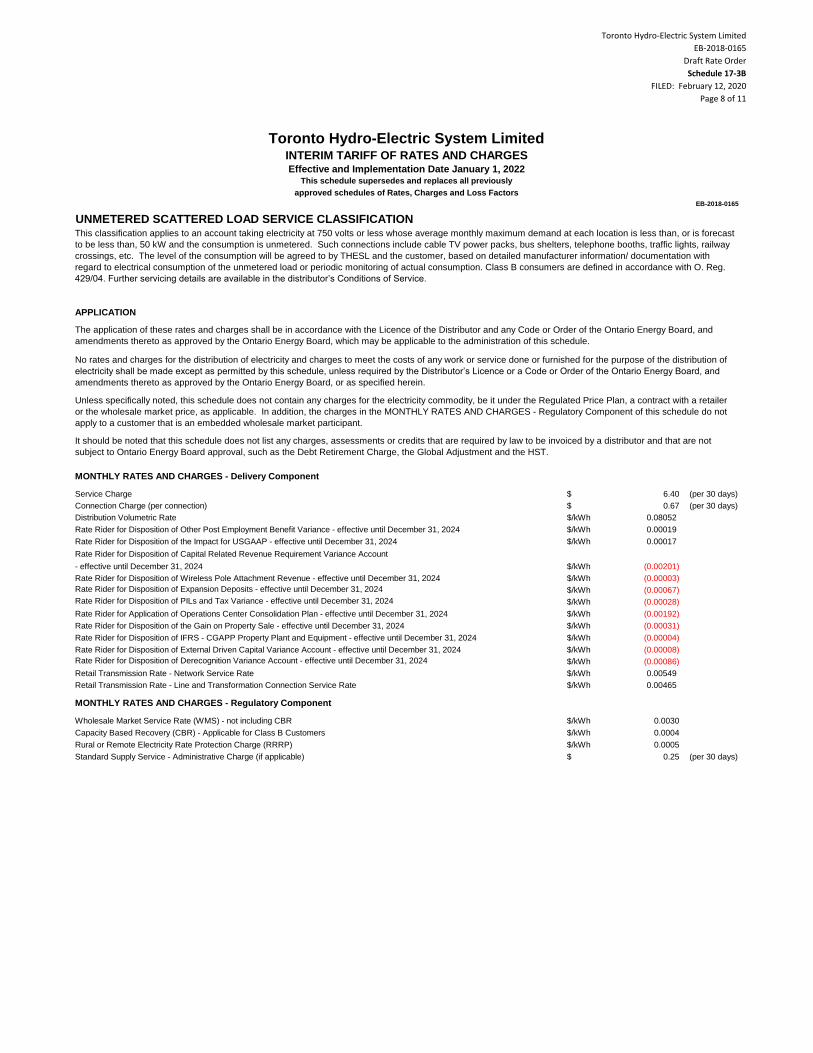
Toronto Hydro-Electric System Limited
EB-2018-0165
Draft Rate Order
Schedule 17-3B
FILED: February 12, 2020
Page 8 of 11
Toronto Hydro-Electric System LimitedINTERIM TARIFF OF RATES AND CHARGESEffective and Implementation Date January 1, 2022
This schedule supersedes and replaces all previously
approved schedules of Rates, Charges and Loss Factors
EB-2018-0165
$ 6.40 (per 30 days)
$ 0.67 (per 30 days)
$/kWh 0.08052
$/kWh 0.00019
$/kWh 0.00017
Rate Rider for Disposition of Capital Related Revenue Requirement Variance Account
- effective until December 31, 2024 $/kWh (0.00201)
$/kWh (0.00003)
Rate Rider for Disposition of Expansion Deposits - effective until December 31, 2024 $/kWh (0.00067)
Rate Rider for Disposition of PILs and Tax Variance - effective until December 31, 2024 $/kWh (0.00028)
$/kWh (0.00192)
$/kWh (0.00031)
$/kWh (0.00004)
$/kWh (0.00008)
Rate Rider for Disposition of Derecognition Variance Account - effective until December 31, 2024 $/kWh (0.00086)
$/kWh 0.00549
$/kWh 0.00465
$/kWh 0.0030
$/kWh 0.0004
$/kWh 0.0005
$ 0.25 (per 30 days)Standard Supply Service - Administrative Charge (if applicable)
Retail Transmission Rate - Network Service Rate
Retail Transmission Rate - Line and Transformation Connection Service Rate
MONTHLY RATES AND CHARGES - Regulatory Component
Wholesale Market Service Rate (WMS) - not including CBR
Capacity Based Recovery (CBR) - Applicable for Class B Customers
Rural or Remote Electricity Rate Protection Charge (RRRP)
Rate Rider for Disposition of the Impact for USGAAP - effective until December 31, 2024
Rate Rider for Disposition of Wireless Pole Attachment Revenue - effective until December 31, 2024
Rate Rider for Application of Operations Center Consolidation Plan - effective until December 31, 2024
Rate Rider for Disposition of the Gain on Property Sale - effective until December 31, 2024
Rate Rider for Disposition of IFRS - CGAPP Property Plant and Equipment - effective until December 31, 2024
Rate Rider for Disposition of External Driven Capital Variance Account - effective until December 31, 2024
It should be noted that this schedule does not list any charges, assessments or credits that are required by law to be invoiced by a distributor and that are not
subject to Ontario Energy Board approval, such as the Debt Retirement Charge, the Global Adjustment and the HST.
MONTHLY RATES AND CHARGES - Delivery Component
Service Charge
Connection Charge (per connection)
Distribution Volumetric Rate
Rate Rider for Disposition of Other Post Employment Benefit Variance - effective until December 31, 2024
UNMETERED SCATTERED LOAD SERVICE CLASSIFICATIONThis classification applies to an account taking electricity at 750 volts or less whose average monthly maximum demand at each location is less than, or is forecast
to be less than, 50 kW and the consumption is unmetered. Such connections include cable TV power packs, bus shelters, telephone booths, traffic lights, railway
crossings, etc. The level of the consumption will be agreed to by THESL and the customer, based on detailed manufacturer information/ documentation with
regard to electrical consumption of the unmetered load or periodic monitoring of actual consumption. Class B consumers are defined in accordance with O. Reg.
429/04. Further servicing details are available in the distributor’s Conditions of Service.
APPLICATION
The application of these rates and charges shall be in accordance with the Licence of the Distributor and any Code or Order of the Ontario Energy Board, and
amendments thereto as approved by the Ontario Energy Board, which may be applicable to the administration of this schedule.
No rates and charges for the distribution of electricity and charges to meet the costs of any work or service done or furnished for the purpose of the distribution of
electricity shall be made except as permitted by this schedule, unless required by the Distributor’s Licence or a Code or Order of the Ontario Energy Board, and
amendments thereto as approved by the Ontario Energy Board, or as specified herein.
Unless specifically noted, this schedule does not contain any charges for the electricity commodity, be it under the Regulated Price Plan, a contract with a retailer
or the wholesale market price, as applicable. In addition, the charges in the MONTHLY RATES AND CHARGES - Regulatory Component of this schedule do not
apply to a customer that is an embedded wholesale market participant.
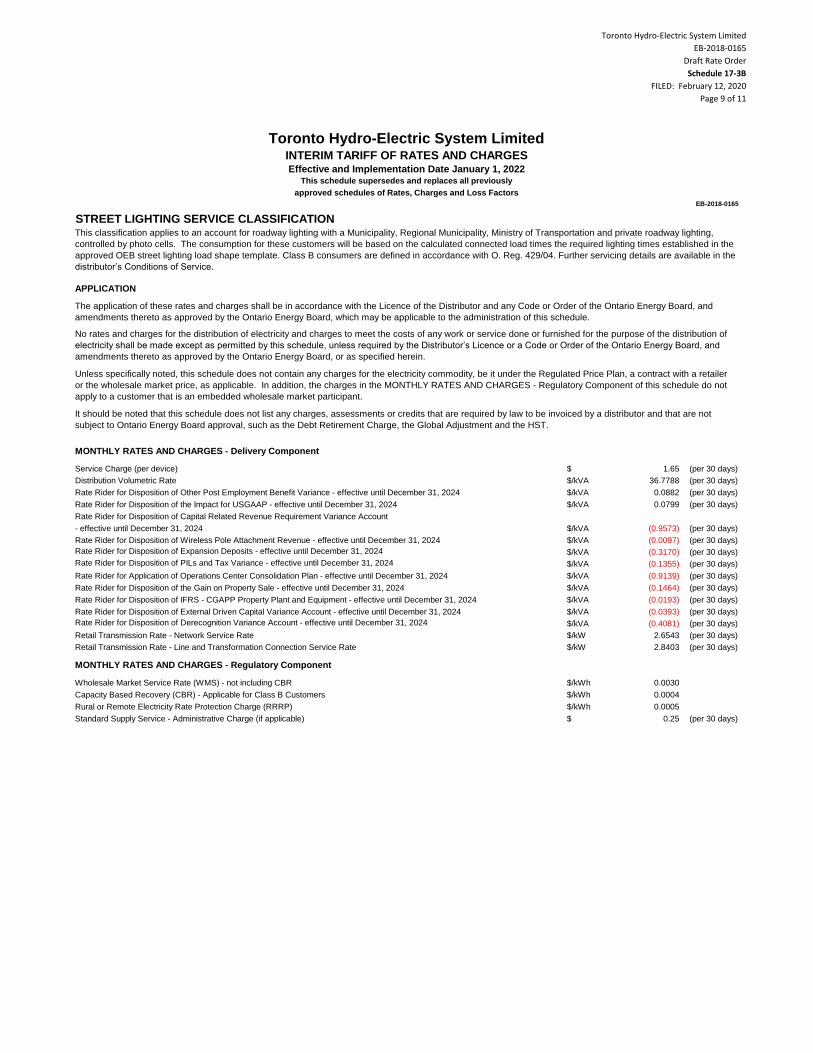
Toronto Hydro-Electric System Limited
EB-2018-0165
Draft Rate Order
Schedule 17-3B
FILED: February 12, 2020
Page 9 of 11
Toronto Hydro-Electric System LimitedINTERIM TARIFF OF RATES AND CHARGESEffective and Implementation Date January 1, 2022
This schedule supersedes and replaces all previously
approved schedules of Rates, Charges and Loss Factors
EB-2018-0165
$ 1.65 (per 30 days)
$/kVA 36.7788 (per 30 days)
$/kVA 0.0882 (per 30 days)
$/kVA 0.0799 (per 30 days)
Rate Rider for Disposition of Capital Related Revenue Requirement Variance Account
- effective until December 31, 2024 $/kVA (0.9573) (per 30 days)
$/kVA (0.0097) (per 30 days)
Rate Rider for Disposition of Expansion Deposits - effective until December 31, 2024 $/kVA (0.3170) (per 30 days)
Rate Rider for Disposition of PILs and Tax Variance - effective until December 31, 2024 $/kVA (0.1355) (per 30 days)
$/kVA (0.9139) (per 30 days)
$/kVA (0.1464) (per 30 days)
$/kVA (0.0193) (per 30 days)
$/kVA (0.0393) (per 30 days)
Rate Rider for Disposition of Derecognition Variance Account - effective until December 31, 2024 $/kVA (0.4081) (per 30 days)
$/kW 2.6543 (per 30 days)
$/kW 2.8403 (per 30 days)
$/kWh 0.0030
$/kWh 0.0004
$/kWh 0.0005
$ 0.25 (per 30 days)Standard Supply Service - Administrative Charge (if applicable)
Retail Transmission Rate - Network Service Rate
Retail Transmission Rate - Line and Transformation Connection Service Rate
MONTHLY RATES AND CHARGES - Regulatory Component
Wholesale Market Service Rate (WMS) - not including CBR
Capacity Based Recovery (CBR) - Applicable for Class B Customers
Rural or Remote Electricity Rate Protection Charge (RRRP)
Rate Rider for Disposition of the Impact for USGAAP - effective until December 31, 2024
Rate Rider for Disposition of Wireless Pole Attachment Revenue - effective until December 31, 2024
Rate Rider for Application of Operations Center Consolidation Plan - effective until December 31, 2024
Rate Rider for Disposition of the Gain on Property Sale - effective until December 31, 2024
Rate Rider for Disposition of IFRS - CGAPP Property Plant and Equipment - effective until December 31, 2024
Rate Rider for Disposition of External Driven Capital Variance Account - effective until December 31, 2024
Unless specifically noted, this schedule does not contain any charges for the electricity commodity, be it under the Regulated Price Plan, a contract with a retailer
or the wholesale market price, as applicable. In addition, the charges in the MONTHLY RATES AND CHARGES - Regulatory Component of this schedule do not
apply to a customer that is an embedded wholesale market participant.
It should be noted that this schedule does not list any charges, assessments or credits that are required by law to be invoiced by a distributor and that are not
subject to Ontario Energy Board approval, such as the Debt Retirement Charge, the Global Adjustment and the HST.
MONTHLY RATES AND CHARGES - Delivery Component
Service Charge (per device)
Distribution Volumetric Rate
Rate Rider for Disposition of Other Post Employment Benefit Variance - effective until December 31, 2024
STREET LIGHTING SERVICE CLASSIFICATIONThis classification applies to an account for roadway lighting with a Municipality, Regional Municipality, Ministry of Transportation and private roadway lighting,
controlled by photo cells. The consumption for these customers will be based on the calculated connected load times the required lighting times established in the
approved OEB street lighting load shape template. Class B consumers are defined in accordance with O. Reg. 429/04. Further servicing details are available in the
distributor’s Conditions of Service.
APPLICATION
The application of these rates and charges shall be in accordance with the Licence of the Distributor and any Code or Order of the Ontario Energy Board, and
amendments thereto as approved by the Ontario Energy Board, which may be applicable to the administration of this schedule.
No rates and charges for the distribution of electricity and charges to meet the costs of any work or service done or furnished for the purpose of the distribution of
electricity shall be made except as permitted by this schedule, unless required by the Distributor’s Licence or a Code or Order of the Ontario Energy Board, and
amendments thereto as approved by the Ontario Energy Board, or as specified herein.
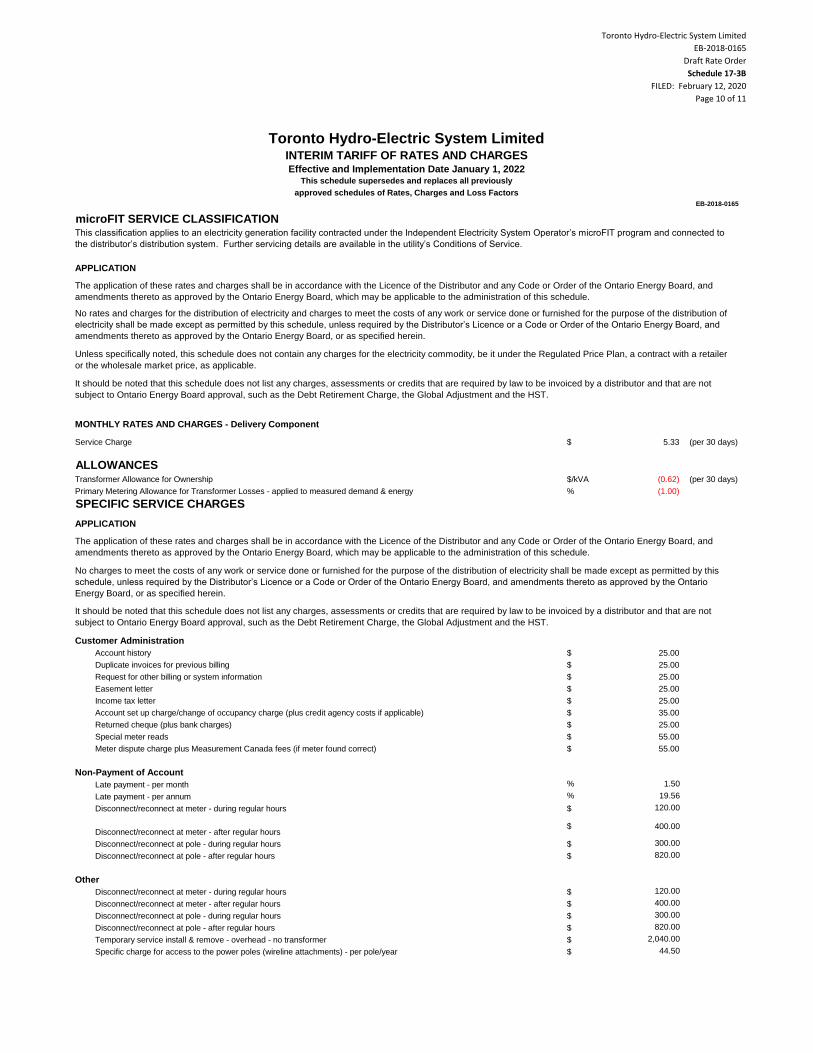
Toronto Hydro-Electric System Limited
EB-2018-0165
Draft Rate Order
Schedule 17-3B
FILED: February 12, 2020
Page 10 of 11
Toronto Hydro-Electric System LimitedINTERIM TARIFF OF RATES AND CHARGESEffective and Implementation Date January 1, 2022
This schedule supersedes and replaces all previously
approved schedules of Rates, Charges and Loss Factors
EB-2018-0165
$ 5.33 (per 30 days)
ALLOWANCES$/kVA (0.62) (per 30 days)
% (1.00)
SPECIFIC SERVICE CHARGES
Customer Administration
$ 25.00
$ 25.00
$ 25.00
$ 25.00
$ 25.00
$ 35.00
$ 25.00
$ 55.00
$ 55.00
Non-Payment of Account
% 1.50
% 19.56
$ 120.00
$ 400.00
$ 300.00
$ 820.00
Other
$ 120.00
$ 400.00
$ 300.00
$ 820.00
$ 2,040.00
$ 44.50Specific charge for access to the power poles (wireline attachments) - per pole/year
Disconnect/reconnect at pole - after regular hours
Disconnect/reconnect at meter - during regular hours
Disconnect/reconnect at meter - after regular hours
Disconnect/reconnect at pole - during regular hours
Disconnect/reconnect at pole - after regular hours
Temporary service install & remove - overhead - no transformer
Meter dispute charge plus Measurement Canada fees (if meter found correct)
Late payment - per month
Late payment - per annum
Disconnect/reconnect at meter - during regular hours
Disconnect/reconnect at meter - after regular hours
Disconnect/reconnect at pole - during regular hours
Request for other billing or system information
Easement letter
Income tax letter
Account set up charge/change of occupancy charge (plus credit agency costs if applicable)
Returned cheque (plus bank charges)
Special meter reads
APPLICATION
The application of these rates and charges shall be in accordance with the Licence of the Distributor and any Code or Order of the Ontario Energy Board, and
amendments thereto as approved by the Ontario Energy Board, which may be applicable to the administration of this schedule.
No charges to meet the costs of any work or service done or furnished for the purpose of the distribution of electricity shall be made except as permitted by this
schedule, unless required by the Distributor’s Licence or a Code or Order of the Ontario Energy Board, and amendments thereto as approved by the Ontario
Energy Board, or as specified herein.
It should be noted that this schedule does not list any charges, assessments or credits that are required by law to be invoiced by a distributor and that are not
subject to Ontario Energy Board approval, such as the Debt Retirement Charge, the Global Adjustment and the HST.
Account history
Duplicate invoices for previous billing
Unless specifically noted, this schedule does not contain any charges for the electricity commodity, be it under the Regulated Price Plan, a contract with a retailer
or the wholesale market price, as applicable.
It should be noted that this schedule does not list any charges, assessments or credits that are required by law to be invoiced by a distributor and that are not
subject to Ontario Energy Board approval, such as the Debt Retirement Charge, the Global Adjustment and the HST.
MONTHLY RATES AND CHARGES - Delivery Component
Service Charge
Transformer Allowance for Ownership
Primary Metering Allowance for Transformer Losses - applied to measured demand & energy
microFIT SERVICE CLASSIFICATIONThis classification applies to an electricity generation facility contracted under the Independent Electricity System Operator’s microFIT program and connected to
the distributor’s distribution system. Further servicing details are available in the utility’s Conditions of Service.
APPLICATION
The application of these rates and charges shall be in accordance with the Licence of the Distributor and any Code or Order of the Ontario Energy Board, and
amendments thereto as approved by the Ontario Energy Board, which may be applicable to the administration of this schedule.
No rates and charges for the distribution of electricity and charges to meet the costs of any work or service done or furnished for the purpose of the distribution of
electricity shall be made except as permitted by this schedule, unless required by the Distributor’s Licence or a Code or Order of the Ontario Energy Board, and
amendments thereto as approved by the Ontario Energy Board, or as specified herein.

Toronto Hydro-Electric System Limited
EB-2018-0165
Draft Rate Order
Schedule 17-3B
FILED: February 12, 2020
Page 11 of 11
Toronto Hydro-Electric System LimitedINTERIM TARIFF OF RATES AND CHARGESEffective and Implementation Date January 1, 2022
This schedule supersedes and replaces all previously
approved schedules of Rates, Charges and Loss Factors
EB-2018-0165
RETAIL SERVICE CHARGES (if applicable)
$ 102.00
$ 40.80
$/cust. 1.02
$/cust. 0.61
$/cust. (0.61)
$ 0.51
$ 1.02
no charge
$ 4.08
LOSS FACTORS
1.0295
1.0172
1.0192
1.0070Total Loss Factor - Primary Metered Customer > 5,000 kW
Up to twice a year
More than twice a year, per request (plus incremental delivery costs)
If the distributor is not capable of prorating changed loss factors jointly with distribution rates, the revised loss factors will be implemented upon the first subsequent
billing for each billing cycle.
Total Loss Factor - Secondary Metered Customer < 5,000 kW
Total Loss Factor - Secondary Metered Customer > 5,000 kW
Total Loss Factor - Primary Metered Customer < 5,000 kW
Service Transaction Requests (STR)
Request fee, per request, applied to the requesting party
Processing fee, per request, applied to the requesting party
Request for customer information as outlined in Section 10.6.3 and Chapter 11 of the Retail
Settlement Code directly to retailers and customers, if not delivered electronically through the
Electronic Business Transaction (EBT) system, applied to the requesting party
Retail Service Charges refer to services provided by THESL to retailers or customers related to the supply of competitive electricity and are defined
in the 2006 Electricity Distribution Rate Handbook.
One-time charge, per retailer, to establish the service agreement between the distributor and the retailer
Monthly Fixed Charge, per retailer
Monthly Variable Charge, per customer, per retailer
Distributor-consolidated billing monthly charge, per customer, per retailer
Retailer-consolidated billing monthly credit, per customer, per retailer
APPLICATION
The application of these rates and charges shall be in accordance with the Licence of the Distributor and any Code or Order of the Ontario Energy Board, and
amendments thereto as approved by the Ontario Energy Board, which may be applicable to the administration of this schedule.
No rates and charges for the distribution of electricity and charges to meet the costs of any work or service done or furnished for the purpose of the distribution of
electricity shall be made except as permitted by this schedule, unless required by the Distributor’s Licence or a Code or Order of the Ontario Energy Board, and
amendments thereto as approved by the Ontario Energy Board, or as specified herein.
Unless specifically noted, this schedule does not contain any charges for the electricity commodity, be it under the Regulated Price Plan, a contract with a retailer
or the wholesale market price, as applicable.
It should be noted that this schedule does not list any charges, assessments or credits that are required by law to be invoiced by a distributor and that are not
subject to Ontario Energy Board approval, such as the Debt Retirement Charge, the Global Adjustment and the HST.
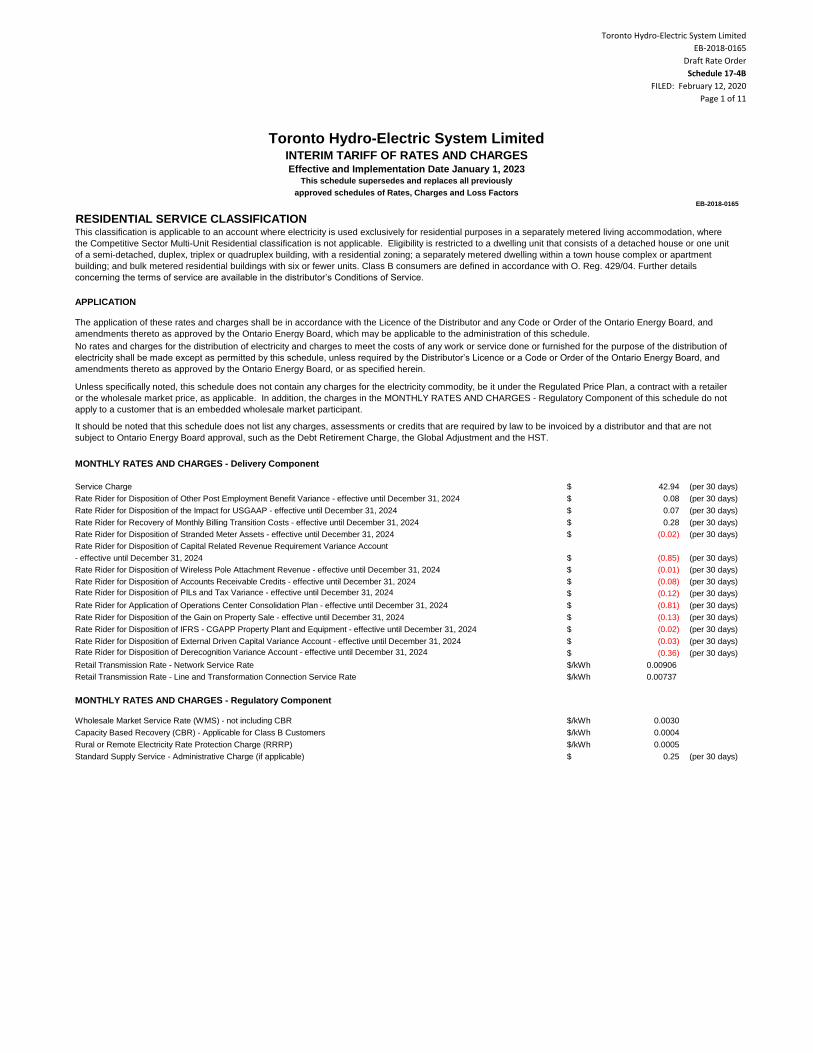
Toronto Hydro-Electric System Limited
EB-2018-0165
Draft Rate Order
Schedule 17-4B
FILED: February 12, 2020
Page 1 of 11
$ 42.94 (per 30 days)
$ 0.08 (per 30 days)
$ 0.07 (per 30 days)
$ 0.28 (per 30 days)
$ (0.02) (per 30 days)
- effective until December 31, 2024 $ (0.85) (per 30 days)
$ (0.01) (per 30 days)
$ (0.08) (per 30 days)
Rate Rider for Disposition of PILs and Tax Variance - effective until December 31, 2024 $ (0.12) (per 30 days)
$ (0.81) (per 30 days)
$ (0.13) (per 30 days)
$ (0.02) (per 30 days)
$ (0.03) (per 30 days)
Rate Rider for Disposition of Derecognition Variance Account - effective until December 31, 2024 $ (0.36) (per 30 days)
$/kWh 0.00906
$/kWh 0.00737
$/kWh 0.0030
$/kWh 0.0004
$/kWh 0.0005
$ 0.25 (per 30 days)
Capacity Based Recovery (CBR) - Applicable for Class B Customers
Rural or Remote Electricity Rate Protection Charge (RRRP)
Standard Supply Service - Administrative Charge (if applicable)
Rate Rider for Disposition of IFRS - CGAPP Property Plant and Equipment - effective until December 31, 2024
Rate Rider for Disposition of External Driven Capital Variance Account - effective until December 31, 2024
Retail Transmission Rate - Network Service Rate
Retail Transmission Rate - Line and Transformation Connection Service Rate
MONTHLY RATES AND CHARGES - Regulatory Component
Wholesale Market Service Rate (WMS) - not including CBR
Rate Rider for Disposition of Stranded Meter Assets - effective until December 31, 2024
Rate Rider for Disposition of Capital Related Revenue Requirement Variance Account
Rate Rider for Disposition of Wireless Pole Attachment Revenue - effective until December 31, 2024
Rate Rider for Disposition of Accounts Receivable Credits - effective until December 31, 2024
Rate Rider for Application of Operations Center Consolidation Plan - effective until December 31, 2024
Rate Rider for Disposition of the Gain on Property Sale - effective until December 31, 2024
It should be noted that this schedule does not list any charges, assessments or credits that are required by law to be invoiced by a distributor and that are not
subject to Ontario Energy Board approval, such as the Debt Retirement Charge, the Global Adjustment and the HST.
MONTHLY RATES AND CHARGES - Delivery Component
Service Charge
Rate Rider for Disposition of Other Post Employment Benefit Variance - effective until December 31, 2024
Rate Rider for Disposition of the Impact for USGAAP - effective until December 31, 2024
Rate Rider for Recovery of Monthly Billing Transition Costs - effective until December 31, 2024
RESIDENTIAL SERVICE CLASSIFICATIONThis classification is applicable to an account where electricity is used exclusively for residential purposes in a separately metered living accommodation, where
the Competitive Sector Multi-Unit Residential classification is not applicable. Eligibility is restricted to a dwelling unit that consists of a detached house or one unit
of a semi-detached, duplex, triplex or quadruplex building, with a residential zoning; a separately metered dwelling within a town house complex or apartment
building; and bulk metered residential buildings with six or fewer units. Class B consumers are defined in accordance with O. Reg. 429/04. Further details
concerning the terms of service are available in the distributor’s Conditions of Service.
APPLICATION
The application of these rates and charges shall be in accordance with the Licence of the Distributor and any Code or Order of the Ontario Energy Board, and
amendments thereto as approved by the Ontario Energy Board, which may be applicable to the administration of this schedule.
No rates and charges for the distribution of electricity and charges to meet the costs of any work or service done or furnished for the purpose of the distribution of
electricity shall be made except as permitted by this schedule, unless required by the Distributor’s Licence or a Code or Order of the Ontario Energy Board, and
amendments thereto as approved by the Ontario Energy Board, or as specified herein.
Unless specifically noted, this schedule does not contain any charges for the electricity commodity, be it under the Regulated Price Plan, a contract with a retailer
or the wholesale market price, as applicable. In addition, the charges in the MONTHLY RATES AND CHARGES - Regulatory Component of this schedule do not
apply to a customer that is an embedded wholesale market participant.
Toronto Hydro-Electric System LimitedINTERIM TARIFF OF RATES AND CHARGESEffective and Implementation Date January 1, 2023
This schedule supersedes and replaces all previously
approved schedules of Rates, Charges and Loss Factors
EB-2018-0165
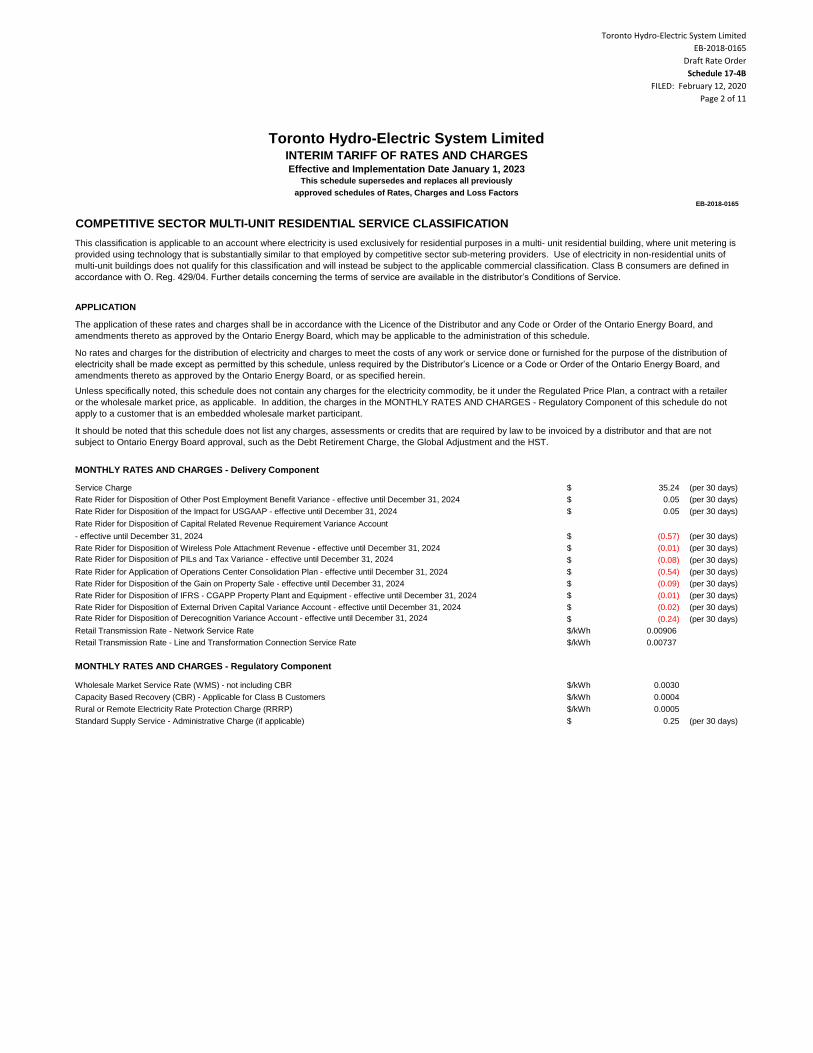
Toronto Hydro-Electric System Limited
EB-2018-0165
Draft Rate Order
Schedule 17-4B
FILED: February 12, 2020
Page 2 of 11
Toronto Hydro-Electric System LimitedINTERIM TARIFF OF RATES AND CHARGESEffective and Implementation Date January 1, 2023
This schedule supersedes and replaces all previously
approved schedules of Rates, Charges and Loss Factors
EB-2018-0165
$ 35.24 (per 30 days)
$ 0.05 (per 30 days)
$ 0.05 (per 30 days)
Rate Rider for Disposition of Capital Related Revenue Requirement Variance Account
- effective until December 31, 2024 $ (0.57) (per 30 days)
$ (0.01) (per 30 days)
Rate Rider for Disposition of PILs and Tax Variance - effective until December 31, 2024 $ (0.08) (per 30 days)
$ (0.54) (per 30 days)
$ (0.09) (per 30 days)
$ (0.01) (per 30 days)
$ (0.02) (per 30 days)
Rate Rider for Disposition of Derecognition Variance Account - effective until December 31, 2024 $ (0.24) (per 30 days)
$/kWh 0.00906
$/kWh 0.00737
$/kWh 0.0030
$/kWh 0.0004
$/kWh 0.0005
$ 0.25 (per 30 days)
Rural or Remote Electricity Rate Protection Charge (RRRP)
Standard Supply Service - Administrative Charge (if applicable)
Rate Rider for Disposition of External Driven Capital Variance Account - effective until December 31, 2024
Retail Transmission Rate - Network Service Rate
Retail Transmission Rate - Line and Transformation Connection Service Rate
MONTHLY RATES AND CHARGES - Regulatory Component
Wholesale Market Service Rate (WMS) - not including CBR
Capacity Based Recovery (CBR) - Applicable for Class B Customers
Rate Rider for Disposition of Other Post Employment Benefit Variance - effective until December 31, 2024
Rate Rider for Disposition of the Impact for USGAAP - effective until December 31, 2024
Rate Rider for Disposition of Wireless Pole Attachment Revenue - effective until December 31, 2024
Rate Rider for Application of Operations Center Consolidation Plan - effective until December 31, 2024
Rate Rider for Disposition of the Gain on Property Sale - effective until December 31, 2024
Rate Rider for Disposition of IFRS - CGAPP Property Plant and Equipment - effective until December 31, 2024
The application of these rates and charges shall be in accordance with the Licence of the Distributor and any Code or Order of the Ontario Energy Board, and
amendments thereto as approved by the Ontario Energy Board, which may be applicable to the administration of this schedule.
No rates and charges for the distribution of electricity and charges to meet the costs of any work or service done or furnished for the purpose of the distribution of
electricity shall be made except as permitted by this schedule, unless required by the Distributor’s Licence or a Code or Order of the Ontario Energy Board, and
amendments thereto as approved by the Ontario Energy Board, or as specified herein.
Unless specifically noted, this schedule does not contain any charges for the electricity commodity, be it under the Regulated Price Plan, a contract with a retailer
or the wholesale market price, as applicable. In addition, the charges in the MONTHLY RATES AND CHARGES - Regulatory Component of this schedule do not
apply to a customer that is an embedded wholesale market participant.
It should be noted that this schedule does not list any charges, assessments or credits that are required by law to be invoiced by a distributor and that are not
subject to Ontario Energy Board approval, such as the Debt Retirement Charge, the Global Adjustment and the HST.
MONTHLY RATES AND CHARGES - Delivery Component
Service Charge
COMPETITIVE SECTOR MULTI-UNIT RESIDENTIAL SERVICE CLASSIFICATION
This classification is applicable to an account where electricity is used exclusively for residential purposes in a multi- unit residential building, where unit metering is
provided using technology that is substantially similar to that employed by competitive sector sub-metering providers. Use of electricity in non-residential units of
multi-unit buildings does not qualify for this classification and will instead be subject to the applicable commercial classification. Class B consumers are defined in
accordance with O. Reg. 429/04. Further details concerning the terms of service are available in the distributor’s Conditions of Service.
APPLICATION

Toronto Hydro-Electric System Limited
EB-2018-0165
Draft Rate Order
Schedule 17-4B
FILED: February 12, 2020
Page 3 of 11
Toronto Hydro-Electric System LimitedINTERIM TARIFF OF RATES AND CHARGESEffective and Implementation Date January 1, 2023
This schedule supersedes and replaces all previously
approved schedules of Rates, Charges and Loss Factors
EB-2018-0165
$ 41.42 (per 30 days)
$ (0.10) (per 30 days)
$/kWh 0.03831
$/kWh 0.00009
$/kWh 0.00008
$/kWh 0.00011
Rate Rider for Disposition of Capital Related Revenue Requirement Variance Account
- effective until December 31, 2024 $/kWh (0.00098)
$/kWh (0.00001)
$/kWh (0.00005)
Rate Rider for Disposition of PILs and Tax Variance - effective until December 31, 2024 $/kWh (0.00014)
$/kWh (0.00094)
$/kWh (0.00015)
$/kWh (0.00002)
$/kWh (0.00004)
Rate Rider for Disposition of Derecognition Variance Account - effective until December 31, 2024 $/kWh (0.00042)
$/kWh 0.00882
$/kWh 0.00659
$/kWh 0.0030
$/kWh 0.0004
$/kWh 0.0005
$ 0.25 (per 30 days)
MONTHLY RATES AND CHARGES - Regulatory Component
Wholesale Market Service Rate (WMS) - not including CBR
Capacity Based Recovery (CBR) - Applicable for Class B Customers
Rural or Remote Electricity Rate Protection Charge (RRRP)
Standard Supply Service - Administrative Charge (if applicable)
Rate Rider for Application of Operations Center Consolidation Plan - effective until December 31, 2024
Rate Rider for Disposition of the Gain on Property Sale - effective until December 31, 2024
Rate Rider for Disposition of IFRS - CGAPP Property Plant and Equipment - effective until December 31, 2024
Rate Rider for Disposition of External Driven Capital Variance Account - effective until December 31, 2024
Retail Transmission Rate - Network Service Rate
Retail Transmission Rate - Line and Transformation Connection Service Rate
Distribution Volumetric Rate
Rate Rider for Disposition of Other Post Employment Benefit Variance - effective until December 31, 2024
Rate Rider for Disposition of the Impact for USGAAP - effective until December 31, 2024
Rate Rider for Recovery of Monthly Billing Transition Costs - effective until December 31, 2024
Rate Rider for Disposition of Wireless Pole Attachment Revenue - effective until December 31, 2024
Rate Rider for Disposition of Accounts Receivable Credits - effective until December 31, 2024
No rates and charges for the distribution of electricity and charges to meet the costs of any work or service done or furnished for the purpose of the distribution of
electricity shall be made except as permitted by this schedule, unless required by the Distributor’s Licence or a Code or Order of the Ontario Energy Board, and
amendments thereto as approved by the Ontario Energy Board, or as specified herein.
Unless specifically noted, this schedule does not contain any charges for the electricity commodity, be it under the Regulated Price Plan, a contract with a retailer
or the wholesale market price, as applicable. In addition, the charges in the MONTHLY RATES AND CHARGES - Regulatory Component of this schedule do not
apply to a customer that is an embedded wholesale market participant.
It should be noted that this schedule does not list any charges, assessments or credits that are required by law to be invoiced by a distributor and that are not
subject to Ontario Energy Board approval, such as the Debt Retirement Charge, the Global Adjustment and the HST.
MONTHLY RATES AND CHARGES - Delivery Component
Service Charge
Rate Rider for Disposition of Stranded Meter Assets - effective until December 31, 2024
GENERAL SERVICE LESS THAN 50 KW SERVICE CLASSIFICATIONThis classification refers to a non-residential account whose monthly average peak demand is less than, or is forecast to be less than 50 kW. Class B consumers
are defined in accordance with O. Reg. 429/04. Further servicing details are available in the distributor’s Conditions of Service.
APPLICATION
The application of these rates and charges shall be in accordance with the Licence of the Distributor and any Code or Order of the Ontario Energy Board, and
amendments thereto as approved by the Ontario Energy Board, which may be applicable to the administration of this schedule.
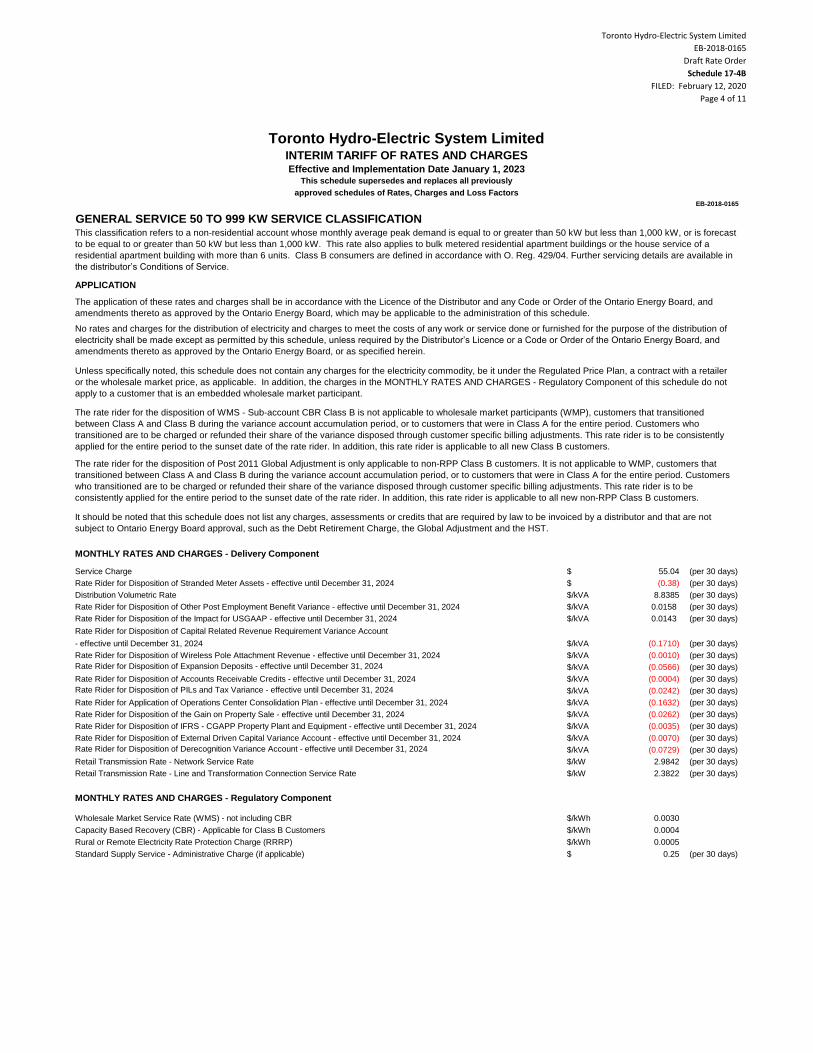
Toronto Hydro-Electric System Limited
EB-2018-0165
Draft Rate Order
Schedule 17-4B
FILED: February 12, 2020
Page 4 of 11
Toronto Hydro-Electric System LimitedINTERIM TARIFF OF RATES AND CHARGESEffective and Implementation Date January 1, 2023
This schedule supersedes and replaces all previously
approved schedules of Rates, Charges and Loss Factors
EB-2018-0165
$ 55.04 (per 30 days)
$ (0.38) (per 30 days)
$/kVA 8.8385 (per 30 days)
$/kVA 0.0158 (per 30 days)
$/kVA 0.0143 (per 30 days)
Rate Rider for Disposition of Capital Related Revenue Requirement Variance Account
- effective until December 31, 2024 $/kVA (0.1710) (per 30 days)
$/kVA (0.0010) (per 30 days)
Rate Rider for Disposition of Expansion Deposits - effective until December 31, 2024 $/kVA (0.0566) (per 30 days)
$/kVA (0.0004) (per 30 days)
Rate Rider for Disposition of PILs and Tax Variance - effective until December 31, 2024 $/kVA (0.0242) (per 30 days)
$/kVA (0.1632) (per 30 days)
$/kVA (0.0262) (per 30 days)
$/kVA (0.0035) (per 30 days)
$/kVA (0.0070) (per 30 days)
Rate Rider for Disposition of Derecognition Variance Account - effective until December 31, 2024 $/kVA (0.0729) (per 30 days)
$/kW 2.9842 (per 30 days)
$/kW 2.3822 (per 30 days)
$/kWh 0.0030
$/kWh 0.0004
$/kWh 0.0005
$ 0.25 (per 30 days)
Capacity Based Recovery (CBR) - Applicable for Class B Customers
Rural or Remote Electricity Rate Protection Charge (RRRP)
Standard Supply Service - Administrative Charge (if applicable)
Rate Rider for Disposition of IFRS - CGAPP Property Plant and Equipment - effective until December 31, 2024
Rate Rider for Disposition of External Driven Capital Variance Account - effective until December 31, 2024
Retail Transmission Rate - Network Service Rate
Retail Transmission Rate - Line and Transformation Connection Service Rate
MONTHLY RATES AND CHARGES - Regulatory Component
Wholesale Market Service Rate (WMS) - not including CBR
Rate Rider for Disposition of Other Post Employment Benefit Variance - effective until December 31, 2024
Rate Rider for Disposition of the Impact for USGAAP - effective until December 31, 2024
Rate Rider for Disposition of Wireless Pole Attachment Revenue - effective until December 31, 2024
Rate Rider for Disposition of Accounts Receivable Credits - effective until December 31, 2024
Rate Rider for Application of Operations Center Consolidation Plan - effective until December 31, 2024
Rate Rider for Disposition of the Gain on Property Sale - effective until December 31, 2024
The rate rider for the disposition of Post 2011 Global Adjustment is only applicable to non-RPP Class B customers. It is not applicable to WMP, customers that
transitioned between Class A and Class B during the variance account accumulation period, or to customers that were in Class A for the entire period. Customers
who transitioned are to be charged or refunded their share of the variance disposed through customer specific billing adjustments. This rate rider is to be
consistently applied for the entire period to the sunset date of the rate rider. In addition, this rate rider is applicable to all new non-RPP Class B customers.
It should be noted that this schedule does not list any charges, assessments or credits that are required by law to be invoiced by a distributor and that are not
subject to Ontario Energy Board approval, such as the Debt Retirement Charge, the Global Adjustment and the HST.
MONTHLY RATES AND CHARGES - Delivery Component
Service Charge
Rate Rider for Disposition of Stranded Meter Assets - effective until December 31, 2024
Distribution Volumetric Rate
This classification refers to a non-residential account whose monthly average peak demand is equal to or greater than 50 kW but less than 1,000 kW, or is forecast
to be equal to or greater than 50 kW but less than 1,000 kW. This rate also applies to bulk metered residential apartment buildings or the house service of a
residential apartment building with more than 6 units. Class B consumers are defined in accordance with O. Reg. 429/04. Further servicing details are available in
the distributor’s Conditions of Service.
APPLICATION
The application of these rates and charges shall be in accordance with the Licence of the Distributor and any Code or Order of the Ontario Energy Board, and
amendments thereto as approved by the Ontario Energy Board, which may be applicable to the administration of this schedule.
No rates and charges for the distribution of electricity and charges to meet the costs of any work or service done or furnished for the purpose of the distribution of
electricity shall be made except as permitted by this schedule, unless required by the Distributor’s Licence or a Code or Order of the Ontario Energy Board, and
amendments thereto as approved by the Ontario Energy Board, or as specified herein.
Unless specifically noted, this schedule does not contain any charges for the electricity commodity, be it under the Regulated Price Plan, a contract with a retailer
or the wholesale market price, as applicable. In addition, the charges in the MONTHLY RATES AND CHARGES - Regulatory Component of this schedule do not
apply to a customer that is an embedded wholesale market participant.
The rate rider for the disposition of WMS - Sub-account CBR Class B is not applicable to wholesale market participants (WMP), customers that transitioned
between Class A and Class B during the variance account accumulation period, or to customers that were in Class A for the entire period. Customers who
transitioned are to be charged or refunded their share of the variance disposed through customer specific billing adjustments. This rate rider is to be consistently
applied for the entire period to the sunset date of the rate rider. In addition, this rate rider is applicable to all new Class B customers.
GENERAL SERVICE 50 TO 999 KW SERVICE CLASSIFICATION
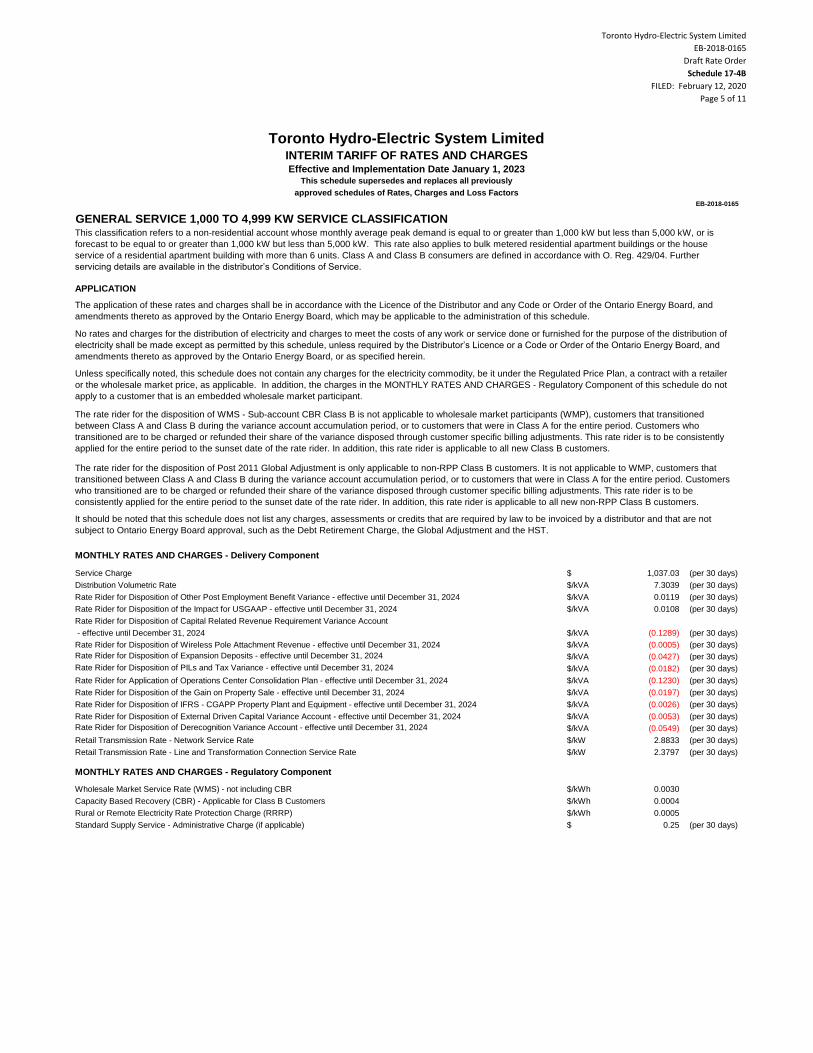
Toronto Hydro-Electric System Limited
EB-2018-0165
Draft Rate Order
Schedule 17-4B
FILED: February 12, 2020
Page 5 of 11
Toronto Hydro-Electric System LimitedINTERIM TARIFF OF RATES AND CHARGESEffective and Implementation Date January 1, 2023
This schedule supersedes and replaces all previously
approved schedules of Rates, Charges and Loss Factors
EB-2018-0165
$ 1,037.03 (per 30 days)
$/kVA 7.3039 (per 30 days)
$/kVA 0.0119 (per 30 days)
$/kVA 0.0108 (per 30 days)
Rate Rider for Disposition of Capital Related Revenue Requirement Variance Account
- effective until December 31, 2024 $/kVA (0.1289) (per 30 days)
$/kVA (0.0005) (per 30 days)
Rate Rider for Disposition of Expansion Deposits - effective until December 31, 2024 $/kVA (0.0427) (per 30 days)
Rate Rider for Disposition of PILs and Tax Variance - effective until December 31, 2024 $/kVA (0.0182) (per 30 days)
$/kVA (0.1230) (per 30 days)
$/kVA (0.0197) (per 30 days)
$/kVA (0.0026) (per 30 days)
$/kVA (0.0053) (per 30 days)
Rate Rider for Disposition of Derecognition Variance Account - effective until December 31, 2024 $/kVA (0.0549) (per 30 days)
$/kW 2.8833 (per 30 days)
$/kW 2.3797 (per 30 days)
$/kWh 0.0030
$/kWh 0.0004
$/kWh 0.0005
$ 0.25 (per 30 days)
MONTHLY RATES AND CHARGES - Regulatory Component
Wholesale Market Service Rate (WMS) - not including CBR
Capacity Based Recovery (CBR) - Applicable for Class B Customers
Rural or Remote Electricity Rate Protection Charge (RRRP)
Standard Supply Service - Administrative Charge (if applicable)
Rate Rider for Application of Operations Center Consolidation Plan - effective until December 31, 2024
Rate Rider for Disposition of the Gain on Property Sale - effective until December 31, 2024
Rate Rider for Disposition of IFRS - CGAPP Property Plant and Equipment - effective until December 31, 2024
Rate Rider for Disposition of External Driven Capital Variance Account - effective until December 31, 2024
Retail Transmission Rate - Network Service Rate
Retail Transmission Rate - Line and Transformation Connection Service Rate
MONTHLY RATES AND CHARGES - Delivery Component
Service Charge
Distribution Volumetric Rate
Rate Rider for Disposition of Other Post Employment Benefit Variance - effective until December 31, 2024
Rate Rider for Disposition of the Impact for USGAAP - effective until December 31, 2024
Rate Rider for Disposition of Wireless Pole Attachment Revenue - effective until December 31, 2024
The application of these rates and charges shall be in accordance with the Licence of the Distributor and any Code or Order of the Ontario Energy Board, and
amendments thereto as approved by the Ontario Energy Board, which may be applicable to the administration of this schedule.
No rates and charges for the distribution of electricity and charges to meet the costs of any work or service done or furnished for the purpose of the distribution of
electricity shall be made except as permitted by this schedule, unless required by the Distributor’s Licence or a Code or Order of the Ontario Energy Board, and
amendments thereto as approved by the Ontario Energy Board, or as specified herein.
Unless specifically noted, this schedule does not contain any charges for the electricity commodity, be it under the Regulated Price Plan, a contract with a retailer
or the wholesale market price, as applicable. In addition, the charges in the MONTHLY RATES AND CHARGES - Regulatory Component of this schedule do not
apply to a customer that is an embedded wholesale market participant.
The rate rider for the disposition of WMS - Sub-account CBR Class B is not applicable to wholesale market participants (WMP), customers that transitioned
between Class A and Class B during the variance account accumulation period, or to customers that were in Class A for the entire period. Customers who
transitioned are to be charged or refunded their share of the variance disposed through customer specific billing adjustments. This rate rider is to be consistently
applied for the entire period to the sunset date of the rate rider. In addition, this rate rider is applicable to all new Class B customers.
The rate rider for the disposition of Post 2011 Global Adjustment is only applicable to non-RPP Class B customers. It is not applicable to WMP, customers that
transitioned between Class A and Class B during the variance account accumulation period, or to customers that were in Class A for the entire period. Customers
who transitioned are to be charged or refunded their share of the variance disposed through customer specific billing adjustments. This rate rider is to be
consistently applied for the entire period to the sunset date of the rate rider. In addition, this rate rider is applicable to all new non-RPP Class B customers.
It should be noted that this schedule does not list any charges, assessments or credits that are required by law to be invoiced by a distributor and that are not
subject to Ontario Energy Board approval, such as the Debt Retirement Charge, the Global Adjustment and the HST.
GENERAL SERVICE 1,000 TO 4,999 KW SERVICE CLASSIFICATIONThis classification refers to a non-residential account whose monthly average peak demand is equal to or greater than 1,000 kW but less than 5,000 kW, or is
forecast to be equal to or greater than 1,000 kW but less than 5,000 kW. This rate also applies to bulk metered residential apartment buildings or the house
service of a residential apartment building with more than 6 units. Class A and Class B consumers are defined in accordance with O. Reg. 429/04. Further
servicing details are available in the distributor’s Conditions of Service.
APPLICATION
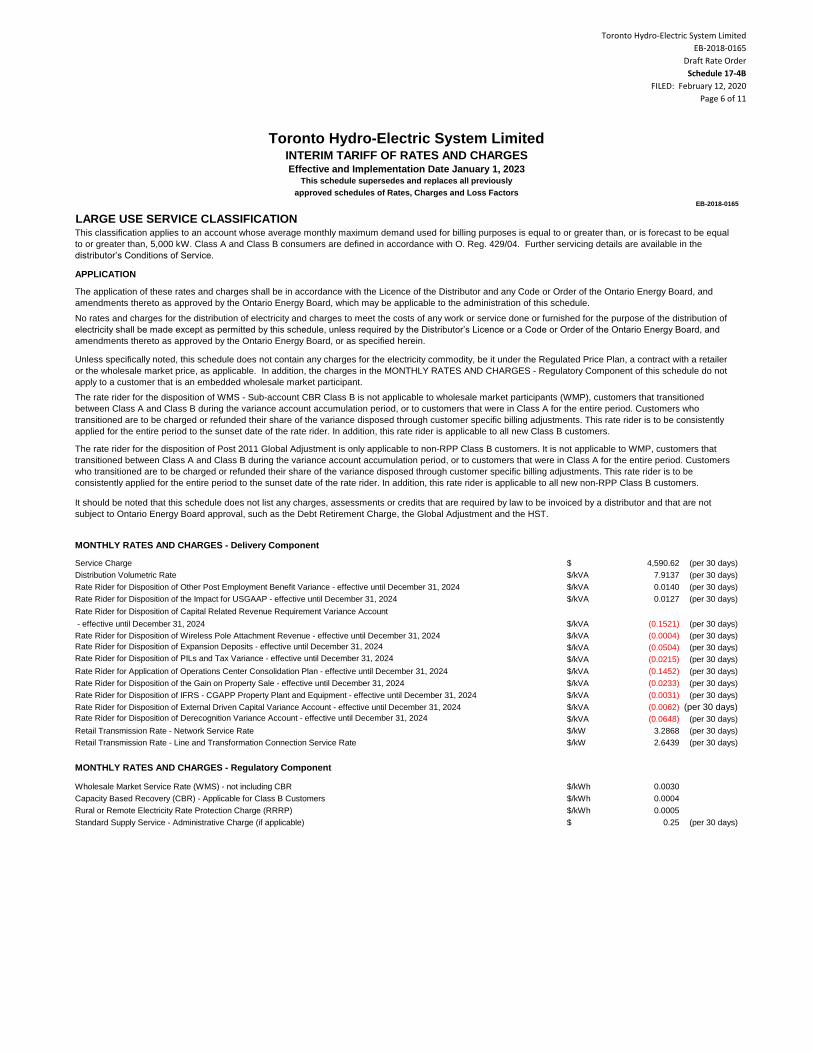
Toronto Hydro-Electric System Limited
EB-2018-0165
Draft Rate Order
Schedule 17-4B
FILED: February 12, 2020
Page 6 of 11
Toronto Hydro-Electric System LimitedINTERIM TARIFF OF RATES AND CHARGESEffective and Implementation Date January 1, 2023
This schedule supersedes and replaces all previously
approved schedules of Rates, Charges and Loss Factors
EB-2018-0165
$ 4,590.62 (per 30 days)
$/kVA 7.9137 (per 30 days)
$/kVA 0.0140 (per 30 days)
$/kVA 0.0127 (per 30 days)
Rate Rider for Disposition of Capital Related Revenue Requirement Variance Account
- effective until December 31, 2024 $/kVA (0.1521) (per 30 days)
$/kVA (0.0004) (per 30 days)
Rate Rider for Disposition of Expansion Deposits - effective until December 31, 2024 $/kVA (0.0504) (per 30 days)
Rate Rider for Disposition of PILs and Tax Variance - effective until December 31, 2024 $/kVA (0.0215) (per 30 days)
$/kVA (0.1452) (per 30 days)
$/kVA (0.0233) (per 30 days)
$/kVA (0.0031) (per 30 days)
$/kVA (0.0062) (per 30 days)
Rate Rider for Disposition of Derecognition Variance Account - effective until December 31, 2024 $/kVA (0.0648) (per 30 days)
$/kW 3.2868 (per 30 days)
$/kW 2.6439 (per 30 days)
$/kWh 0.0030
$/kWh 0.0004
$/kWh 0.0005
$ 0.25 (per 30 days)
Rural or Remote Electricity Rate Protection Charge (RRRP)
Standard Supply Service - Administrative Charge (if applicable)
Rate Rider for Disposition of External Driven Capital Variance Account - effective until December 31, 2024
Retail Transmission Rate - Network Service Rate
Retail Transmission Rate - Line and Transformation Connection Service Rate
MONTHLY RATES AND CHARGES - Regulatory Component
Wholesale Market Service Rate (WMS) - not including CBR
Capacity Based Recovery (CBR) - Applicable for Class B Customers
Rate Rider for Disposition of Other Post Employment Benefit Variance - effective until December 31, 2024
Rate Rider for Disposition of the Impact for USGAAP - effective until December 31, 2024
Rate Rider for Disposition of Wireless Pole Attachment Revenue - effective until December 31, 2024
Rate Rider for Application of Operations Center Consolidation Plan - effective until December 31, 2024
Rate Rider for Disposition of the Gain on Property Sale - effective until December 31, 2024
Rate Rider for Disposition of IFRS - CGAPP Property Plant and Equipment - effective until December 31, 2024
The rate rider for the disposition of WMS - Sub-account CBR Class B is not applicable to wholesale market participants (WMP), customers that transitioned
between Class A and Class B during the variance account accumulation period, or to customers that were in Class A for the entire period. Customers who
transitioned are to be charged or refunded their share of the variance disposed through customer specific billing adjustments. This rate rider is to be consistently
applied for the entire period to the sunset date of the rate rider. In addition, this rate rider is applicable to all new Class B customers.
The rate rider for the disposition of Post 2011 Global Adjustment is only applicable to non-RPP Class B customers. It is not applicable to WMP, customers that
transitioned between Class A and Class B during the variance account accumulation period, or to customers that were in Class A for the entire period. Customers
who transitioned are to be charged or refunded their share of the variance disposed through customer specific billing adjustments. This rate rider is to be
consistently applied for the entire period to the sunset date of the rate rider. In addition, this rate rider is applicable to all new non-RPP Class B customers.
It should be noted that this schedule does not list any charges, assessments or credits that are required by law to be invoiced by a distributor and that are not
subject to Ontario Energy Board approval, such as the Debt Retirement Charge, the Global Adjustment and the HST.
MONTHLY RATES AND CHARGES - Delivery Component
Service Charge
Distribution Volumetric Rate
LARGE USE SERVICE CLASSIFICATIONThis classification applies to an account whose average monthly maximum demand used for billing purposes is equal to or greater than, or is forecast to be equal
to or greater than, 5,000 kW. Class A and Class B consumers are defined in accordance with O. Reg. 429/04. Further servicing details are available in the
distributor’s Conditions of Service.
APPLICATION
The application of these rates and charges shall be in accordance with the Licence of the Distributor and any Code or Order of the Ontario Energy Board, and
amendments thereto as approved by the Ontario Energy Board, which may be applicable to the administration of this schedule.
No rates and charges for the distribution of electricity and charges to meet the costs of any work or service done or furnished for the purpose of the distribution of
electricity shall be made except as permitted by this schedule, unless required by the Distributor’s Licence or a Code or Order of the Ontario Energy Board, and
amendments thereto as approved by the Ontario Energy Board, or as specified herein.
Unless specifically noted, this schedule does not contain any charges for the electricity commodity, be it under the Regulated Price Plan, a contract with a retailer
or the wholesale market price, as applicable. In addition, the charges in the MONTHLY RATES AND CHARGES - Regulatory Component of this schedule do not
apply to a customer that is an embedded wholesale market participant.
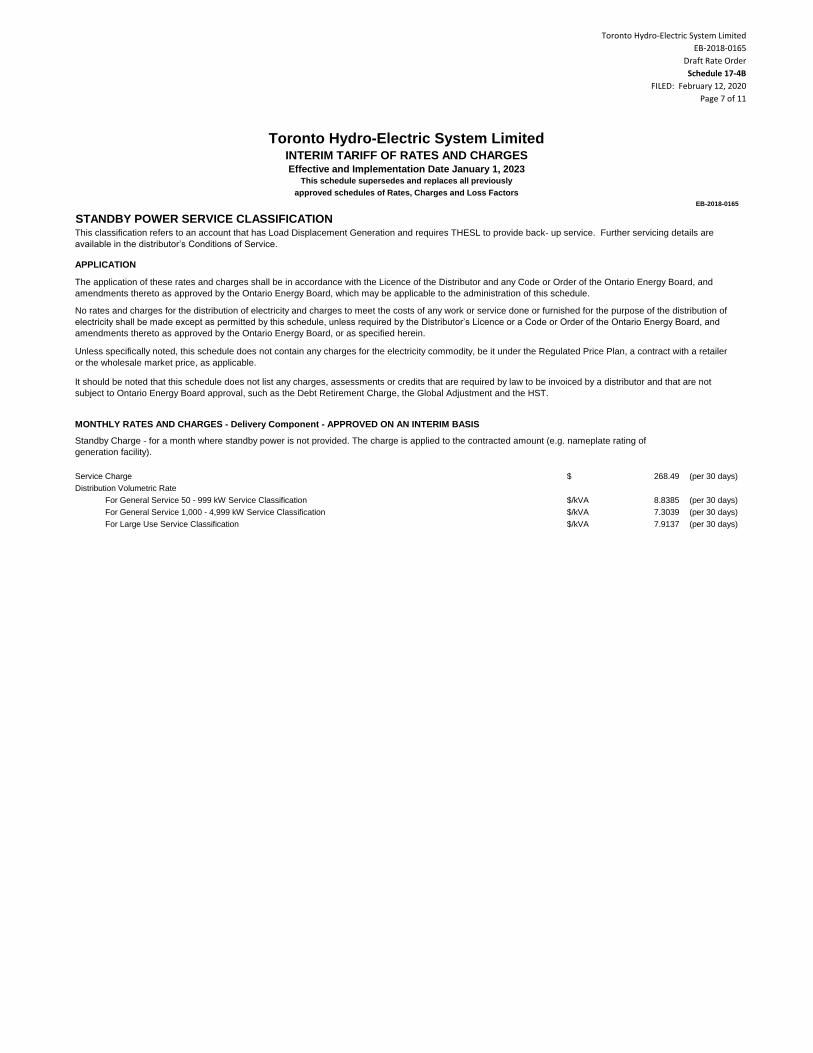
Toronto Hydro-Electric System Limited
EB-2018-0165
Draft Rate Order
Schedule 17-4B
FILED: February 12, 2020
Page 7 of 11
Toronto Hydro-Electric System LimitedINTERIM TARIFF OF RATES AND CHARGESEffective and Implementation Date January 1, 2023
This schedule supersedes and replaces all previously
approved schedules of Rates, Charges and Loss Factors
EB-2018-0165
$ 268.49 (per 30 days)
$/kVA 8.8385 (per 30 days)
$/kVA 7.3039 (per 30 days)
$/kVA 7.9137 (per 30 days)
Distribution Volumetric Rate
For General Service 50 - 999 kW Service Classification
For General Service 1,000 - 4,999 kW Service Classification
For Large Use Service Classification
No rates and charges for the distribution of electricity and charges to meet the costs of any work or service done or furnished for the purpose of the distribution of
electricity shall be made except as permitted by this schedule, unless required by the Distributor’s Licence or a Code or Order of the Ontario Energy Board, and
amendments thereto as approved by the Ontario Energy Board, or as specified herein.
Unless specifically noted, this schedule does not contain any charges for the electricity commodity, be it under the Regulated Price Plan, a contract with a retailer
or the wholesale market price, as applicable.
It should be noted that this schedule does not list any charges, assessments or credits that are required by law to be invoiced by a distributor and that are not
subject to Ontario Energy Board approval, such as the Debt Retirement Charge, the Global Adjustment and the HST.
MONTHLY RATES AND CHARGES - Delivery Component - APPROVED ON AN INTERIM BASIS
Standby Charge - for a month where standby power is not provided. The charge is applied to the contracted amount (e.g. nameplate rating of
generation facility).
Service Charge
STANDBY POWER SERVICE CLASSIFICATIONThis classification refers to an account that has Load Displacement Generation and requires THESL to provide back- up service. Further servicing details are
available in the distributor’s Conditions of Service.
APPLICATION
The application of these rates and charges shall be in accordance with the Licence of the Distributor and any Code or Order of the Ontario Energy Board, and
amendments thereto as approved by the Ontario Energy Board, which may be applicable to the administration of this schedule.
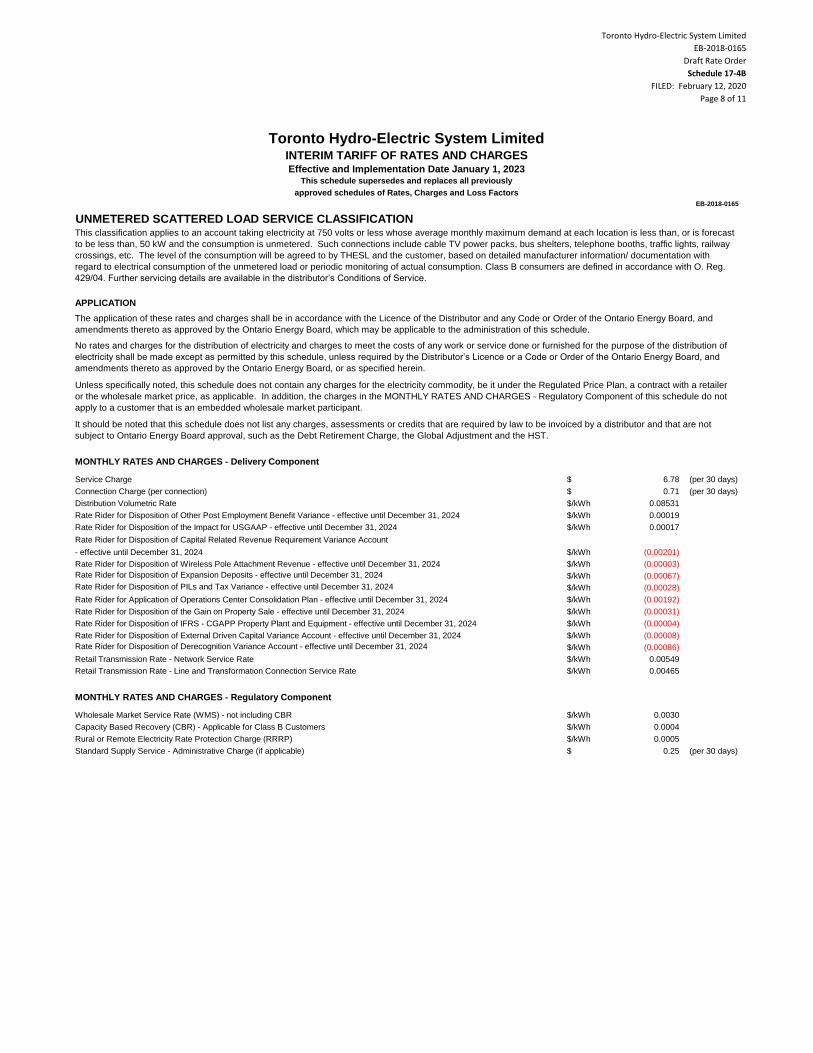
Toronto Hydro-Electric System Limited
EB-2018-0165
Draft Rate Order
Schedule 17-4B
FILED: February 12, 2020
Page 8 of 11
Toronto Hydro-Electric System LimitedINTERIM TARIFF OF RATES AND CHARGESEffective and Implementation Date January 1, 2023
This schedule supersedes and replaces all previously
approved schedules of Rates, Charges and Loss Factors
EB-2018-0165
$ 6.78 (per 30 days)
$ 0.71 (per 30 days)
$/kWh 0.08531
$/kWh 0.00019
$/kWh 0.00017
Rate Rider for Disposition of Capital Related Revenue Requirement Variance Account
- effective until December 31, 2024 $/kWh (0.00201)
$/kWh (0.00003)
Rate Rider for Disposition of Expansion Deposits - effective until December 31, 2024 $/kWh (0.00067)
Rate Rider for Disposition of PILs and Tax Variance - effective until December 31, 2024 $/kWh (0.00028)
$/kWh (0.00192)
$/kWh (0.00031)
$/kWh (0.00004)
$/kWh (0.00008)
Rate Rider for Disposition of Derecognition Variance Account - effective until December 31, 2024 $/kWh (0.00086)
$/kWh 0.00549
$/kWh 0.00465
$/kWh 0.0030
$/kWh 0.0004
$/kWh 0.0005
$ 0.25 (per 30 days)
MONTHLY RATES AND CHARGES - Regulatory Component
Wholesale Market Service Rate (WMS) - not including CBR
Capacity Based Recovery (CBR) - Applicable for Class B Customers
Rural or Remote Electricity Rate Protection Charge (RRRP)
Standard Supply Service - Administrative Charge (if applicable)
Rate Rider for Application of Operations Center Consolidation Plan - effective until December 31, 2024
Rate Rider for Disposition of the Gain on Property Sale - effective until December 31, 2024
Rate Rider for Disposition of IFRS - CGAPP Property Plant and Equipment - effective until December 31, 2024
Rate Rider for Disposition of External Driven Capital Variance Account - effective until December 31, 2024
Retail Transmission Rate - Network Service Rate
Retail Transmission Rate - Line and Transformation Connection Service Rate
Service Charge
Connection Charge (per connection)
Distribution Volumetric Rate
Rate Rider for Disposition of Other Post Employment Benefit Variance - effective until December 31, 2024
Rate Rider for Disposition of the Impact for USGAAP - effective until December 31, 2024
Rate Rider for Disposition of Wireless Pole Attachment Revenue - effective until December 31, 2024
APPLICATION
The application of these rates and charges shall be in accordance with the Licence of the Distributor and any Code or Order of the Ontario Energy Board, and
amendments thereto as approved by the Ontario Energy Board, which may be applicable to the administration of this schedule.
No rates and charges for the distribution of electricity and charges to meet the costs of any work or service done or furnished for the purpose of the distribution of
electricity shall be made except as permitted by this schedule, unless required by the Distributor’s Licence or a Code or Order of the Ontario Energy Board, and
amendments thereto as approved by the Ontario Energy Board, or as specified herein.
Unless specifically noted, this schedule does not contain any charges for the electricity commodity, be it under the Regulated Price Plan, a contract with a retailer
or the wholesale market price, as applicable. In addition, the charges in the MONTHLY RATES AND CHARGES - Regulatory Component of this schedule do not
apply to a customer that is an embedded wholesale market participant.
It should be noted that this schedule does not list any charges, assessments or credits that are required by law to be invoiced by a distributor and that are not
subject to Ontario Energy Board approval, such as the Debt Retirement Charge, the Global Adjustment and the HST.
MONTHLY RATES AND CHARGES - Delivery Component
UNMETERED SCATTERED LOAD SERVICE CLASSIFICATIONThis classification applies to an account taking electricity at 750 volts or less whose average monthly maximum demand at each location is less than, or is forecast
to be less than, 50 kW and the consumption is unmetered. Such connections include cable TV power packs, bus shelters, telephone booths, traffic lights, railway
crossings, etc. The level of the consumption will be agreed to by THESL and the customer, based on detailed manufacturer information/ documentation with
regard to electrical consumption of the unmetered load or periodic monitoring of actual consumption. Class B consumers are defined in accordance with O. Reg.
429/04. Further servicing details are available in the distributor’s Conditions of Service.
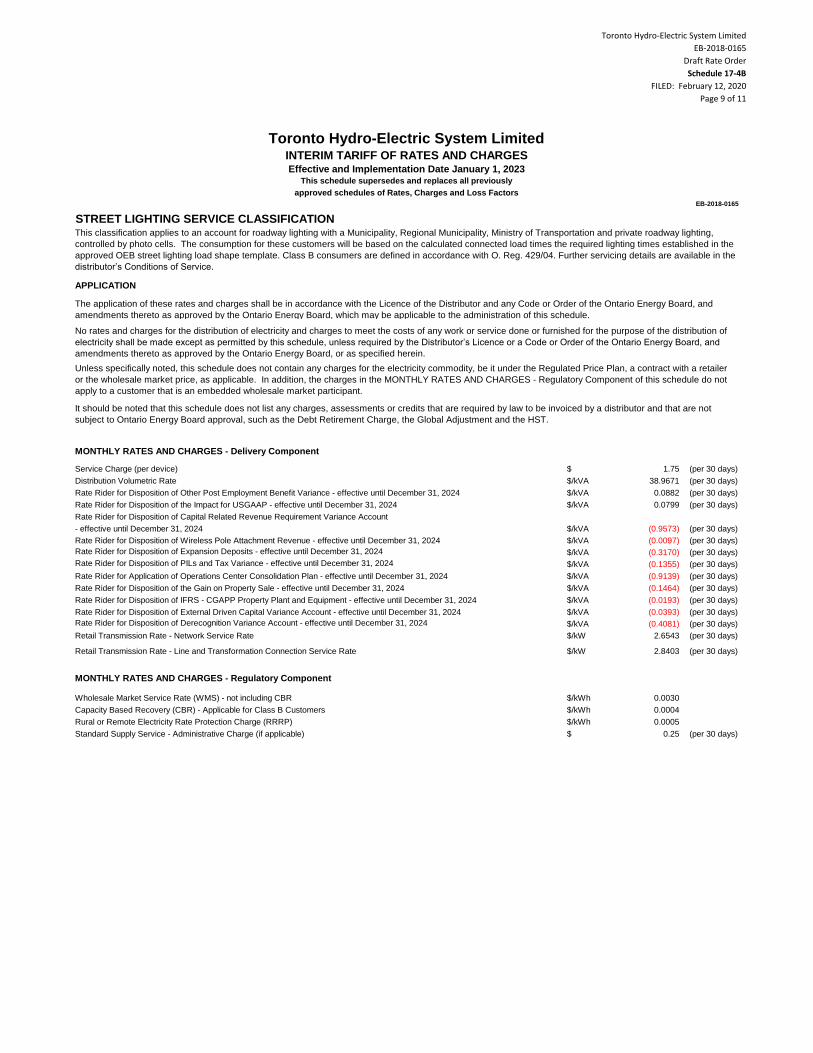
Toronto Hydro-Electric System Limited
EB-2018-0165
Draft Rate Order
Schedule 17-4B
FILED: February 12, 2020
Page 9 of 11
Toronto Hydro-Electric System LimitedINTERIM TARIFF OF RATES AND CHARGESEffective and Implementation Date January 1, 2023
This schedule supersedes and replaces all previously
approved schedules of Rates, Charges and Loss Factors
EB-2018-0165
$ 1.75 (per 30 days)
$/kVA 38.9671 (per 30 days)
$/kVA 0.0882 (per 30 days)
$/kVA 0.0799 (per 30 days)
Rate Rider for Disposition of Capital Related Revenue Requirement Variance Account
- effective until December 31, 2024 $/kVA (0.9573) (per 30 days)
$/kVA (0.0097) (per 30 days)
Rate Rider for Disposition of Expansion Deposits - effective until December 31, 2024 $/kVA (0.3170) (per 30 days)
Rate Rider for Disposition of PILs and Tax Variance - effective until December 31, 2024 $/kVA (0.1355) (per 30 days)
$/kVA (0.9139) (per 30 days)
$/kVA (0.1464) (per 30 days)
$/kVA (0.0193) (per 30 days)
$/kVA (0.0393) (per 30 days)
Rate Rider for Disposition of Derecognition Variance Account - effective until December 31, 2024 $/kVA (0.4081) (per 30 days)
$/kW 2.6543 (per 30 days)
$/kW 2.8403 (per 30 days)
$/kWh 0.0030
$/kWh 0.0004
$/kWh 0.0005
$ 0.25 (per 30 days)
MONTHLY RATES AND CHARGES - Regulatory Component
Wholesale Market Service Rate (WMS) - not including CBR
Capacity Based Recovery (CBR) - Applicable for Class B Customers
Rural or Remote Electricity Rate Protection Charge (RRRP)
Standard Supply Service - Administrative Charge (if applicable)
Rate Rider for Application of Operations Center Consolidation Plan - effective until December 31, 2024
Rate Rider for Disposition of the Gain on Property Sale - effective until December 31, 2024
Rate Rider for Disposition of IFRS - CGAPP Property Plant and Equipment - effective until December 31, 2024
Rate Rider for Disposition of External Driven Capital Variance Account - effective until December 31, 2024
Retail Transmission Rate - Network Service Rate
Retail Transmission Rate - Line and Transformation Connection Service Rate
MONTHLY RATES AND CHARGES - Delivery Component
Service Charge (per device)
Distribution Volumetric Rate
Rate Rider for Disposition of Other Post Employment Benefit Variance - effective until December 31, 2024
Rate Rider for Disposition of the Impact for USGAAP - effective until December 31, 2024
Rate Rider for Disposition of Wireless Pole Attachment Revenue - effective until December 31, 2024
This classification applies to an account for roadway lighting with a Municipality, Regional Municipality, Ministry of Transportation and private roadway lighting,
controlled by photo cells. The consumption for these customers will be based on the calculated connected load times the required lighting times established in the
approved OEB street lighting load shape template. Class B consumers are defined in accordance with O. Reg. 429/04. Further servicing details are available in the
distributor’s Conditions of Service.
APPLICATION
The application of these rates and charges shall be in accordance with the Licence of the Distributor and any Code or Order of the Ontario Energy Board, and
amendments thereto as approved by the Ontario Energy Board, which may be applicable to the administration of this schedule.
No rates and charges for the distribution of electricity and charges to meet the costs of any work or service done or furnished for the purpose of the distribution of
electricity shall be made except as permitted by this schedule, unless required by the Distributor’s Licence or a Code or Order of the Ontario Energy Board, and
amendments thereto as approved by the Ontario Energy Board, or as specified herein.
Unless specifically noted, this schedule does not contain any charges for the electricity commodity, be it under the Regulated Price Plan, a contract with a retailer
or the wholesale market price, as applicable. In addition, the charges in the MONTHLY RATES AND CHARGES - Regulatory Component of this schedule do not
apply to a customer that is an embedded wholesale market participant.
It should be noted that this schedule does not list any charges, assessments or credits that are required by law to be invoiced by a distributor and that are not
subject to Ontario Energy Board approval, such as the Debt Retirement Charge, the Global Adjustment and the HST.
STREET LIGHTING SERVICE CLASSIFICATION
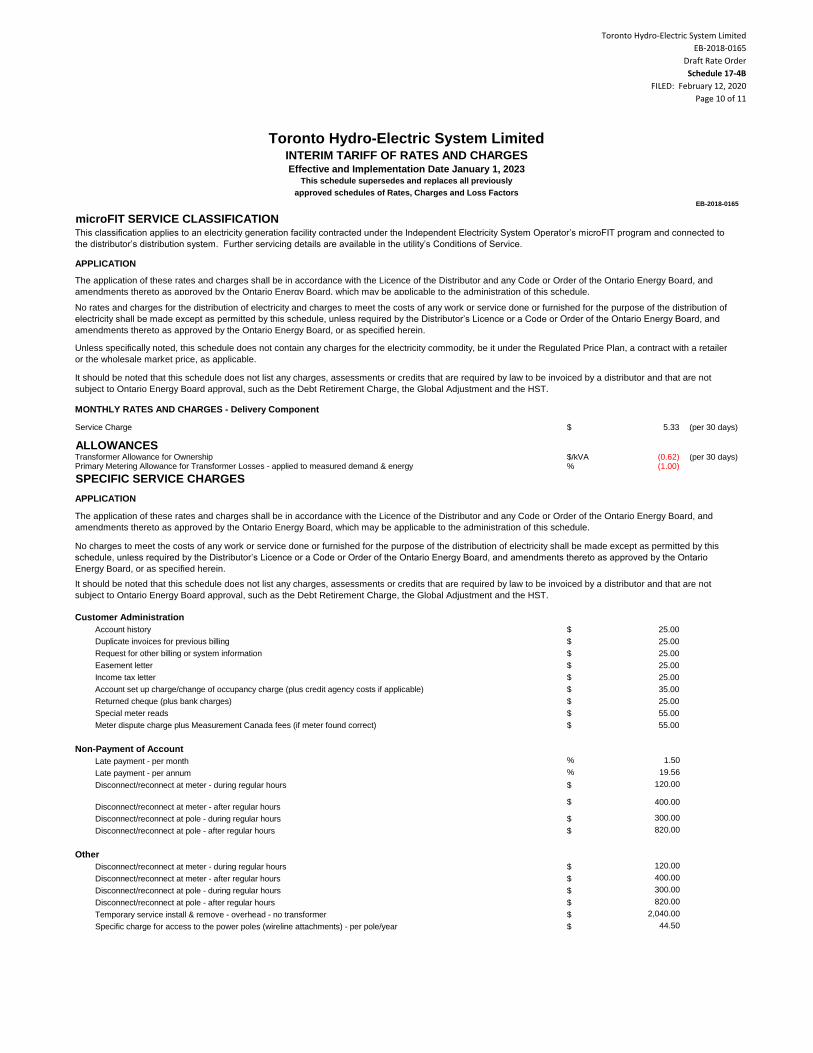
Toronto Hydro-Electric System Limited
EB-2018-0165
Draft Rate Order
Schedule 17-4B
FILED: February 12, 2020
Page 10 of 11
Toronto Hydro-Electric System LimitedINTERIM TARIFF OF RATES AND CHARGESEffective and Implementation Date January 1, 2023
This schedule supersedes and replaces all previously
approved schedules of Rates, Charges and Loss Factors
EB-2018-0165
$ 5.33 (per 30 days)
ALLOWANCES$/kVA (0.62) (per 30 days)% (1.00)
SPECIFIC SERVICE CHARGES
Customer Administration
$ 25.00
$ 25.00
$ 25.00
$ 25.00
$ 25.00
$ 35.00
$ 25.00
$ 55.00
$ 55.00
Non-Payment of Account
% 1.50
% 19.56
$ 120.00
$ 400.00
$ 300.00
$ 820.00
Other
$ 120.00
$ 400.00
$ 300.00
$ 820.00
$ 2,040.00
$ 44.50
Disconnect/reconnect at meter - after regular hours
Disconnect/reconnect at pole - during regular hours
Disconnect/reconnect at pole - after regular hours
Temporary service install & remove - overhead - no transformer
Specific charge for access to the power poles (wireline attachments) - per pole/year
Late payment - per annum
Disconnect/reconnect at meter - during regular hours
Disconnect/reconnect at meter - after regular hours
Disconnect/reconnect at pole - during regular hours
Disconnect/reconnect at pole - after regular hours
Disconnect/reconnect at meter - during regular hours
Income tax letter
Account set up charge/change of occupancy charge (plus credit agency costs if applicable)
Returned cheque (plus bank charges)
Special meter reads
Meter dispute charge plus Measurement Canada fees (if meter found correct)
Late payment - per month
No charges to meet the costs of any work or service done or furnished for the purpose of the distribution of electricity shall be made except as permitted by this
schedule, unless required by the Distributor’s Licence or a Code or Order of the Ontario Energy Board, and amendments thereto as approved by the Ontario
Energy Board, or as specified herein.
It should be noted that this schedule does not list any charges, assessments or credits that are required by law to be invoiced by a distributor and that are not
subject to Ontario Energy Board approval, such as the Debt Retirement Charge, the Global Adjustment and the HST.
Account history
Duplicate invoices for previous billing
Request for other billing or system information
Easement letter
MONTHLY RATES AND CHARGES - Delivery Component
Service Charge
Transformer Allowance for OwnershipPrimary Metering Allowance for Transformer Losses - applied to measured demand & energy
APPLICATION
The application of these rates and charges shall be in accordance with the Licence of the Distributor and any Code or Order of the Ontario Energy Board, and
amendments thereto as approved by the Ontario Energy Board, which may be applicable to the administration of this schedule.
This classification applies to an electricity generation facility contracted under the Independent Electricity System Operator’s microFIT program and connected to
the distributor’s distribution system. Further servicing details are available in the utility’s Conditions of Service.
APPLICATION
The application of these rates and charges shall be in accordance with the Licence of the Distributor and any Code or Order of the Ontario Energy Board, and
amendments thereto as approved by the Ontario Energy Board, which may be applicable to the administration of this schedule.
No rates and charges for the distribution of electricity and charges to meet the costs of any work or service done or furnished for the purpose of the distribution of
electricity shall be made except as permitted by this schedule, unless required by the Distributor’s Licence or a Code or Order of the Ontario Energy Board, and
amendments thereto as approved by the Ontario Energy Board, or as specified herein.
Unless specifically noted, this schedule does not contain any charges for the electricity commodity, be it under the Regulated Price Plan, a contract with a retailer
or the wholesale market price, as applicable.
It should be noted that this schedule does not list any charges, assessments or credits that are required by law to be invoiced by a distributor and that are not
subject to Ontario Energy Board approval, such as the Debt Retirement Charge, the Global Adjustment and the HST.
microFIT SERVICE CLASSIFICATION
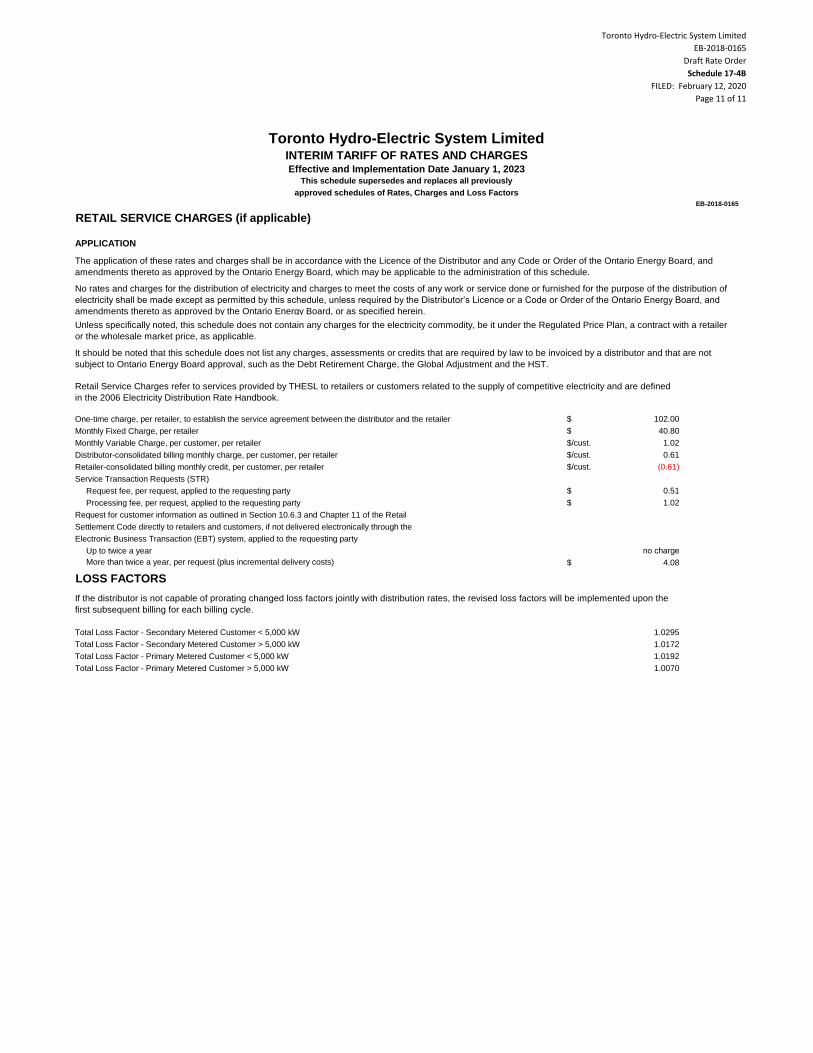
Toronto Hydro-Electric System Limited
EB-2018-0165
Draft Rate Order
Schedule 17-4B
FILED: February 12, 2020
Page 11 of 11
Toronto Hydro-Electric System LimitedINTERIM TARIFF OF RATES AND CHARGESEffective and Implementation Date January 1, 2023
This schedule supersedes and replaces all previously
approved schedules of Rates, Charges and Loss Factors
EB-2018-0165
RETAIL SERVICE CHARGES (if applicable)
$ 102.00
$ 40.80
$/cust. 1.02
$/cust. 0.61
$/cust. (0.61)
$ 0.51
$ 1.02
no charge
$ 4.08
LOSS FACTORS
1.0295
1.0172
1.0192
1.0070
If the distributor is not capable of prorating changed loss factors jointly with distribution rates, the revised loss factors will be implemented upon the
first subsequent billing for each billing cycle.
Total Loss Factor - Secondary Metered Customer < 5,000 kW
Total Loss Factor - Secondary Metered Customer > 5,000 kW
Total Loss Factor - Primary Metered Customer < 5,000 kW
Total Loss Factor - Primary Metered Customer > 5,000 kW
Processing fee, per request, applied to the requesting party
Request for customer information as outlined in Section 10.6.3 and Chapter 11 of the Retail
Settlement Code directly to retailers and customers, if not delivered electronically through the
Electronic Business Transaction (EBT) system, applied to the requesting party
Up to twice a year
More than twice a year, per request (plus incremental delivery costs)
Monthly Fixed Charge, per retailer
Monthly Variable Charge, per customer, per retailer
Distributor-consolidated billing monthly charge, per customer, per retailer
Retailer-consolidated billing monthly credit, per customer, per retailer
Service Transaction Requests (STR)
Request fee, per request, applied to the requesting party
The application of these rates and charges shall be in accordance with the Licence of the Distributor and any Code or Order of the Ontario Energy Board, and
amendments thereto as approved by the Ontario Energy Board, which may be applicable to the administration of this schedule.
No rates and charges for the distribution of electricity and charges to meet the costs of any work or service done or furnished for the purpose of the distribution of
electricity shall be made except as permitted by this schedule, unless required by the Distributor’s Licence or a Code or Order of the Ontario Energy Board, and
amendments thereto as approved by the Ontario Energy Board, or as specified herein.
Unless specifically noted, this schedule does not contain any charges for the electricity commodity, be it under the Regulated Price Plan, a contract with a retailer
or the wholesale market price, as applicable.
It should be noted that this schedule does not list any charges, assessments or credits that are required by law to be invoiced by a distributor and that are not
subject to Ontario Energy Board approval, such as the Debt Retirement Charge, the Global Adjustment and the HST.
Retail Service Charges refer to services provided by THESL to retailers or customers related to the supply of competitive electricity and are defined
in the 2006 Electricity Distribution Rate Handbook.
One-time charge, per retailer, to establish the service agreement between the distributor and the retailer
APPLICATION

Toronto Hydro-Electric System Limited
EB-2018-0165
Draft Rate Order
Schedule 17-5B
FILED: February 12, 2020
Page 1 of 11
$ 44.60 (per 30 days)
$ 0.08 (per 30 days)
$ 0.07 (per 30 days)
$ 0.28 (per 30 days)
$ (0.02) (per 30 days)
- effective until December 31, 2024 $ (0.85) (per 30 days)
$ (0.01) (per 30 days)
$ (0.08) (per 30 days)
Rate Rider for Disposition of PILs and Tax Variance - effective until December 31, 2024 $ (0.12) (per 30 days)
$ (0.81) (per 30 days)
$ (0.13) (per 30 days)
$ (0.02) (per 30 days)
$ (0.03) (per 30 days)
Rate Rider for Disposition of Derecognition Variance Account - effective until December 31, 2024 $ (0.36) (per 30 days)
$/kWh 0.00906
$/kWh 0.00737
$/kWh 0.0030
$/kWh 0.0004
$/kWh 0.0005
$ 0.25 (per 30 days)
Capacity Based Recovery (CBR) - Applicable for Class B Customers
Rural or Remote Electricity Rate Protection Charge (RRRP)
Standard Supply Service - Administrative Charge (if applicable)
Rate Rider for Disposition of IFRS - CGAPP Property Plant and Equipment - effective until December 31, 2024
Rate Rider for Disposition of External Driven Capital Variance Account - effective until December 31, 2024
Retail Transmission Rate - Network Service Rate
Retail Transmission Rate - Line and Transformation Connection Service Rate
MONTHLY RATES AND CHARGES - Regulatory Component
Wholesale Market Service Rate (WMS) - not including CBR
Rate Rider for Disposition of Stranded Meter Assets - effective until December 31, 2024
Rate Rider for Disposition of Capital Related Revenue Requirement Variance Account
Rate Rider for Disposition of Wireless Pole Attachment Revenue - effective until December 31, 2024
Rate Rider for Disposition of Accounts Receivable Credits - effective until December 31, 2024
Rate Rider for Application of Operations Center Consolidation Plan - effective until December 31, 2024
Rate Rider for Disposition of the Gain on Property Sale - effective until December 31, 2024
It should be noted that this schedule does not list any charges, assessments or credits that are required by law to be invoiced by a distributor and that are not
subject to Ontario Energy Board approval, such as the Debt Retirement Charge, the Global Adjustment and the HST.
MONTHLY RATES AND CHARGES - Delivery Component
Service Charge
Rate Rider for Disposition of Other Post Employment Benefit Variance - effective until December 31, 2024
Rate Rider for Disposition of the Impact for USGAAP - effective until December 31, 2024
Rate Rider for Recovery of Monthly Billing Transition Costs - effective until December 31, 2024
RESIDENTIAL SERVICE CLASSIFICATIONThis classification is applicable to an account where electricity is used exclusively for residential purposes in a separately metered living accommodation, where
the Competitive Sector Multi-Unit Residential classification is not applicable. Eligibility is restricted to a dwelling unit that consists of a detached house or one unit
of a semi-detached, duplex, triplex or quadruplex building, with a residential zoning; a separately metered dwelling within a town house complex or apartment
building; and bulk metered residential buildings with six or fewer units. Class B consumers are defined in accordance with O. Reg. 429/04. Further details
concerning the terms of service are available in the distributor’s Conditions of Service.
APPLICATION
The application of these rates and charges shall be in accordance with the Licence of the Distributor and any Code or Order of the Ontario Energy Board, and
amendments thereto as approved by the Ontario Energy Board, which may be applicable to the administration of this schedule.
No rates and charges for the distribution of electricity and charges to meet the costs of any work or service done or furnished for the purpose of the distribution of
electricity shall be made except as permitted by this schedule, unless required by the Distributor’s Licence or a Code or Order of the Ontario Energy Board, and
amendments thereto as approved by the Ontario Energy Board, or as specified herein.
Unless specifically noted, this schedule does not contain any charges for the electricity commodity, be it under the Regulated Price Plan, a contract with a retailer
or the wholesale market price, as applicable. In addition, the charges in the MONTHLY RATES AND CHARGES - Regulatory Component of this schedule do not
apply to a customer that is an embedded wholesale market participant.
Toronto Hydro-Electric System LimitedINTERIM TARIFF OF RATES AND CHARGESEffective and Implementation Date January 1, 2024
This schedule supersedes and replaces all previously
approved schedules of Rates, Charges and Loss Factors
EB-2018-0165
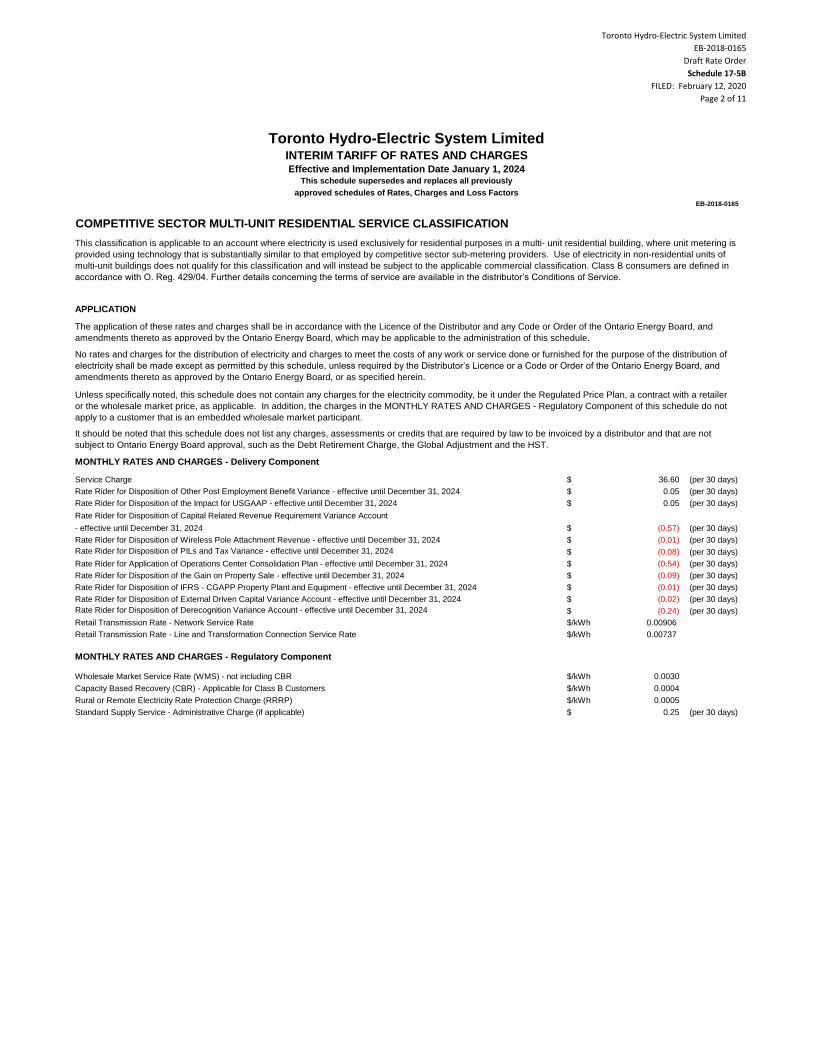
Toronto Hydro-Electric System Limited
EB-2018-0165
Draft Rate Order
Schedule 17-5B
FILED: February 12, 2020
Page 2 of 11
Toronto Hydro-Electric System LimitedINTERIM TARIFF OF RATES AND CHARGESEffective and Implementation Date January 1, 2024
This schedule supersedes and replaces all previously
approved schedules of Rates, Charges and Loss Factors
EB-2018-0165
$ 36.60 (per 30 days)
$ 0.05 (per 30 days)
$ 0.05 (per 30 days)
Rate Rider for Disposition of Capital Related Revenue Requirement Variance Account
- effective until December 31, 2024 $ (0.57) (per 30 days)
$ (0.01) (per 30 days)
Rate Rider for Disposition of PILs and Tax Variance - effective until December 31, 2024 $ (0.08) (per 30 days)
$ (0.54) (per 30 days)
$ (0.09) (per 30 days)
$ (0.01) (per 30 days)
$ (0.02) (per 30 days)
Rate Rider for Disposition of Derecognition Variance Account - effective until December 31, 2024 $ (0.24) (per 30 days)
$/kWh 0.00906
$/kWh 0.00737
$/kWh 0.0030
$/kWh 0.0004
$/kWh 0.0005
$ 0.25 (per 30 days)
Rural or Remote Electricity Rate Protection Charge (RRRP)
Standard Supply Service - Administrative Charge (if applicable)
Rate Rider for Disposition of External Driven Capital Variance Account - effective until December 31, 2024
Retail Transmission Rate - Network Service Rate
Retail Transmission Rate - Line and Transformation Connection Service Rate
MONTHLY RATES AND CHARGES - Regulatory Component
Wholesale Market Service Rate (WMS) - not including CBR
Capacity Based Recovery (CBR) - Applicable for Class B Customers
Rate Rider for Disposition of Other Post Employment Benefit Variance - effective until December 31, 2024
Rate Rider for Disposition of the Impact for USGAAP - effective until December 31, 2024
Rate Rider for Disposition of Wireless Pole Attachment Revenue - effective until December 31, 2024
Rate Rider for Application of Operations Center Consolidation Plan - effective until December 31, 2024
Rate Rider for Disposition of the Gain on Property Sale - effective until December 31, 2024
Rate Rider for Disposition of IFRS - CGAPP Property Plant and Equipment - effective until December 31, 2024
The application of these rates and charges shall be in accordance with the Licence of the Distributor and any Code or Order of the Ontario Energy Board, and
amendments thereto as approved by the Ontario Energy Board, which may be applicable to the administration of this schedule.
No rates and charges for the distribution of electricity and charges to meet the costs of any work or service done or furnished for the purpose of the distribution of
electricity shall be made except as permitted by this schedule, unless required by the Distributor’s Licence or a Code or Order of the Ontario Energy Board, and
amendments thereto as approved by the Ontario Energy Board, or as specified herein.
Unless specifically noted, this schedule does not contain any charges for the electricity commodity, be it under the Regulated Price Plan, a contract with a retailer
or the wholesale market price, as applicable. In addition, the charges in the MONTHLY RATES AND CHARGES - Regulatory Component of this schedule do not
apply to a customer that is an embedded wholesale market participant.
It should be noted that this schedule does not list any charges, assessments or credits that are required by law to be invoiced by a distributor and that are not
subject to Ontario Energy Board approval, such as the Debt Retirement Charge, the Global Adjustment and the HST.
MONTHLY RATES AND CHARGES - Delivery Component
Service Charge
COMPETITIVE SECTOR MULTI-UNIT RESIDENTIAL SERVICE CLASSIFICATION
This classification is applicable to an account where electricity is used exclusively for residential purposes in a multi- unit residential building, where unit metering is
provided using technology that is substantially similar to that employed by competitive sector sub-metering providers. Use of electricity in non-residential units of
multi-unit buildings does not qualify for this classification and will instead be subject to the applicable commercial classification. Class B consumers are defined in
accordance with O. Reg. 429/04. Further details concerning the terms of service are available in the distributor’s Conditions of Service.
APPLICATION
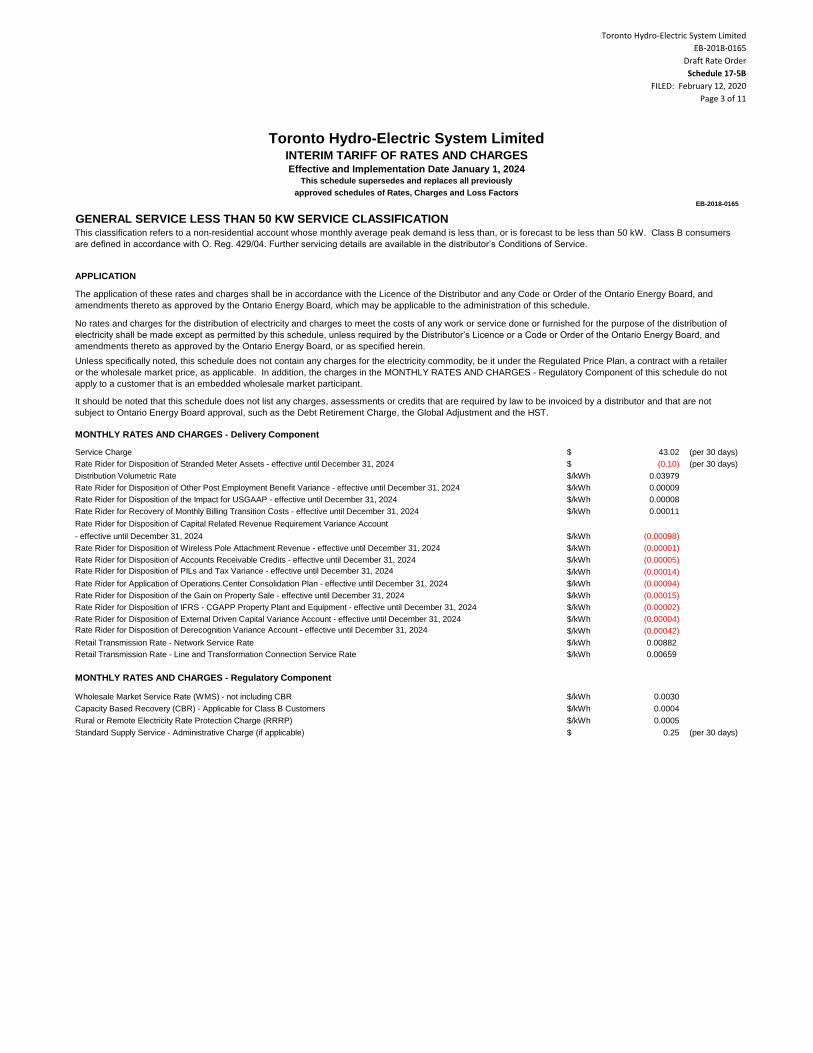
Toronto Hydro-Electric System Limited
EB-2018-0165
Draft Rate Order
Schedule 17-5B
FILED: February 12, 2020
Page 3 of 11
Toronto Hydro-Electric System LimitedINTERIM TARIFF OF RATES AND CHARGESEffective and Implementation Date January 1, 2024
This schedule supersedes and replaces all previously
approved schedules of Rates, Charges and Loss Factors
EB-2018-0165
$ 43.02 (per 30 days)
$ (0.10) (per 30 days)
$/kWh 0.03979
$/kWh 0.00009
$/kWh 0.00008
$/kWh 0.00011
Rate Rider for Disposition of Capital Related Revenue Requirement Variance Account
- effective until December 31, 2024 $/kWh (0.00098)
$/kWh (0.00001)
$/kWh (0.00005)
Rate Rider for Disposition of PILs and Tax Variance - effective until December 31, 2024 $/kWh (0.00014)
$/kWh (0.00094)
$/kWh (0.00015)
$/kWh (0.00002)
$/kWh (0.00004)
Rate Rider for Disposition of Derecognition Variance Account - effective until December 31, 2024 $/kWh (0.00042)
$/kWh 0.00882
$/kWh 0.00659
$/kWh 0.0030
$/kWh 0.0004
$/kWh 0.0005
$ 0.25 (per 30 days)
MONTHLY RATES AND CHARGES - Regulatory Component
Wholesale Market Service Rate (WMS) - not including CBR
Capacity Based Recovery (CBR) - Applicable for Class B Customers
Rural or Remote Electricity Rate Protection Charge (RRRP)
Standard Supply Service - Administrative Charge (if applicable)
Rate Rider for Application of Operations Center Consolidation Plan - effective until December 31, 2024
Rate Rider for Disposition of the Gain on Property Sale - effective until December 31, 2024
Rate Rider for Disposition of IFRS - CGAPP Property Plant and Equipment - effective until December 31, 2024
Rate Rider for Disposition of External Driven Capital Variance Account - effective until December 31, 2024
Retail Transmission Rate - Network Service Rate
Retail Transmission Rate - Line and Transformation Connection Service Rate
Distribution Volumetric Rate
Rate Rider for Disposition of Other Post Employment Benefit Variance - effective until December 31, 2024
Rate Rider for Disposition of the Impact for USGAAP - effective until December 31, 2024
Rate Rider for Recovery of Monthly Billing Transition Costs - effective until December 31, 2024
Rate Rider for Disposition of Wireless Pole Attachment Revenue - effective until December 31, 2024
Rate Rider for Disposition of Accounts Receivable Credits - effective until December 31, 2024
No rates and charges for the distribution of electricity and charges to meet the costs of any work or service done or furnished for the purpose of the distribution of
electricity shall be made except as permitted by this schedule, unless required by the Distributor’s Licence or a Code or Order of the Ontario Energy Board, and
amendments thereto as approved by the Ontario Energy Board, or as specified herein.
Unless specifically noted, this schedule does not contain any charges for the electricity commodity, be it under the Regulated Price Plan, a contract with a retailer
or the wholesale market price, as applicable. In addition, the charges in the MONTHLY RATES AND CHARGES - Regulatory Component of this schedule do not
apply to a customer that is an embedded wholesale market participant.
It should be noted that this schedule does not list any charges, assessments or credits that are required by law to be invoiced by a distributor and that are not
subject to Ontario Energy Board approval, such as the Debt Retirement Charge, the Global Adjustment and the HST.
MONTHLY RATES AND CHARGES - Delivery Component
Service Charge
Rate Rider for Disposition of Stranded Meter Assets - effective until December 31, 2024
GENERAL SERVICE LESS THAN 50 KW SERVICE CLASSIFICATIONThis classification refers to a non-residential account whose monthly average peak demand is less than, or is forecast to be less than 50 kW. Class B consumers
are defined in accordance with O. Reg. 429/04. Further servicing details are available in the distributor’s Conditions of Service.
APPLICATION
The application of these rates and charges shall be in accordance with the Licence of the Distributor and any Code or Order of the Ontario Energy Board, and
amendments thereto as approved by the Ontario Energy Board, which may be applicable to the administration of this schedule.
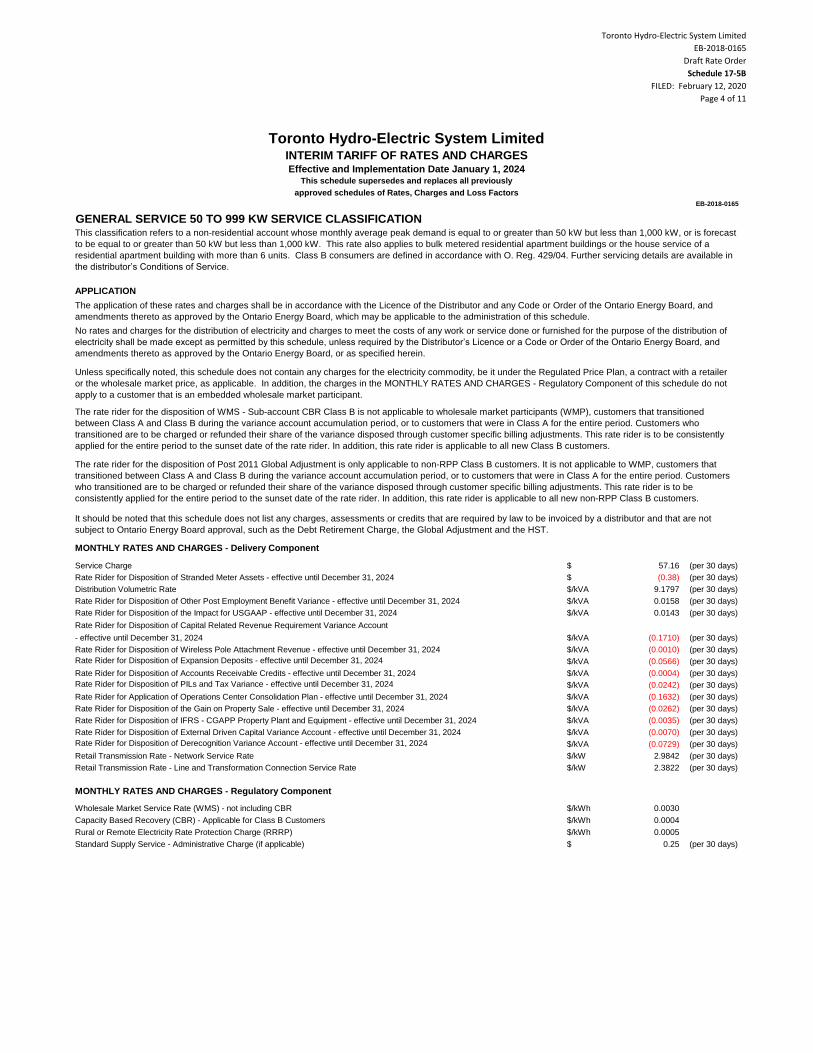
Toronto Hydro-Electric System Limited
EB-2018-0165
Draft Rate Order
Schedule 17-5B
FILED: February 12, 2020
Page 4 of 11
Toronto Hydro-Electric System LimitedINTERIM TARIFF OF RATES AND CHARGESEffective and Implementation Date January 1, 2024
This schedule supersedes and replaces all previously
approved schedules of Rates, Charges and Loss Factors
EB-2018-0165
$ 57.16 (per 30 days)
$ (0.38) (per 30 days)
$/kVA 9.1797 (per 30 days)
$/kVA 0.0158 (per 30 days)
$/kVA 0.0143 (per 30 days)
Rate Rider for Disposition of Capital Related Revenue Requirement Variance Account
- effective until December 31, 2024 $/kVA (0.1710) (per 30 days)
$/kVA (0.0010) (per 30 days)
Rate Rider for Disposition of Expansion Deposits - effective until December 31, 2024 $/kVA (0.0566) (per 30 days)
$/kVA (0.0004) (per 30 days)
Rate Rider for Disposition of PILs and Tax Variance - effective until December 31, 2024 $/kVA (0.0242) (per 30 days)
$/kVA (0.1632) (per 30 days)
$/kVA (0.0262) (per 30 days)
$/kVA (0.0035) (per 30 days)
$/kVA (0.0070) (per 30 days)
Rate Rider for Disposition of Derecognition Variance Account - effective until December 31, 2024 $/kVA (0.0729) (per 30 days)
$/kW 2.9842 (per 30 days)
$/kW 2.3822 (per 30 days)
$/kWh 0.0030
$/kWh 0.0004
$/kWh 0.0005
$ 0.25 (per 30 days)
Capacity Based Recovery (CBR) - Applicable for Class B Customers
Rural or Remote Electricity Rate Protection Charge (RRRP)
Standard Supply Service - Administrative Charge (if applicable)
Rate Rider for Disposition of IFRS - CGAPP Property Plant and Equipment - effective until December 31, 2024
Rate Rider for Disposition of External Driven Capital Variance Account - effective until December 31, 2024
Retail Transmission Rate - Network Service Rate
Retail Transmission Rate - Line and Transformation Connection Service Rate
MONTHLY RATES AND CHARGES - Regulatory Component
Wholesale Market Service Rate (WMS) - not including CBR
Rate Rider for Disposition of Other Post Employment Benefit Variance - effective until December 31, 2024
Rate Rider for Disposition of the Impact for USGAAP - effective until December 31, 2024
Rate Rider for Disposition of Wireless Pole Attachment Revenue - effective until December 31, 2024
Rate Rider for Disposition of Accounts Receivable Credits - effective until December 31, 2024
Rate Rider for Application of Operations Center Consolidation Plan - effective until December 31, 2024
Rate Rider for Disposition of the Gain on Property Sale - effective until December 31, 2024
The rate rider for the disposition of Post 2011 Global Adjustment is only applicable to non-RPP Class B customers. It is not applicable to WMP, customers that
transitioned between Class A and Class B during the variance account accumulation period, or to customers that were in Class A for the entire period. Customers
who transitioned are to be charged or refunded their share of the variance disposed through customer specific billing adjustments. This rate rider is to be
consistently applied for the entire period to the sunset date of the rate rider. In addition, this rate rider is applicable to all new non-RPP Class B customers.
It should be noted that this schedule does not list any charges, assessments or credits that are required by law to be invoiced by a distributor and that are not
subject to Ontario Energy Board approval, such as the Debt Retirement Charge, the Global Adjustment and the HST.
MONTHLY RATES AND CHARGES - Delivery Component
Service Charge
Rate Rider for Disposition of Stranded Meter Assets - effective until December 31, 2024
Distribution Volumetric Rate
This classification refers to a non-residential account whose monthly average peak demand is equal to or greater than 50 kW but less than 1,000 kW, or is forecast
to be equal to or greater than 50 kW but less than 1,000 kW. This rate also applies to bulk metered residential apartment buildings or the house service of a
residential apartment building with more than 6 units. Class B consumers are defined in accordance with O. Reg. 429/04. Further servicing details are available in
the distributor’s Conditions of Service.
APPLICATION
The application of these rates and charges shall be in accordance with the Licence of the Distributor and any Code or Order of the Ontario Energy Board, and
amendments thereto as approved by the Ontario Energy Board, which may be applicable to the administration of this schedule.
No rates and charges for the distribution of electricity and charges to meet the costs of any work or service done or furnished for the purpose of the distribution of
electricity shall be made except as permitted by this schedule, unless required by the Distributor’s Licence or a Code or Order of the Ontario Energy Board, and
amendments thereto as approved by the Ontario Energy Board, or as specified herein.
Unless specifically noted, this schedule does not contain any charges for the electricity commodity, be it under the Regulated Price Plan, a contract with a retailer
or the wholesale market price, as applicable. In addition, the charges in the MONTHLY RATES AND CHARGES - Regulatory Component of this schedule do not
apply to a customer that is an embedded wholesale market participant.
The rate rider for the disposition of WMS - Sub-account CBR Class B is not applicable to wholesale market participants (WMP), customers that transitioned
between Class A and Class B during the variance account accumulation period, or to customers that were in Class A for the entire period. Customers who
transitioned are to be charged or refunded their share of the variance disposed through customer specific billing adjustments. This rate rider is to be consistently
applied for the entire period to the sunset date of the rate rider. In addition, this rate rider is applicable to all new Class B customers.
GENERAL SERVICE 50 TO 999 KW SERVICE CLASSIFICATION
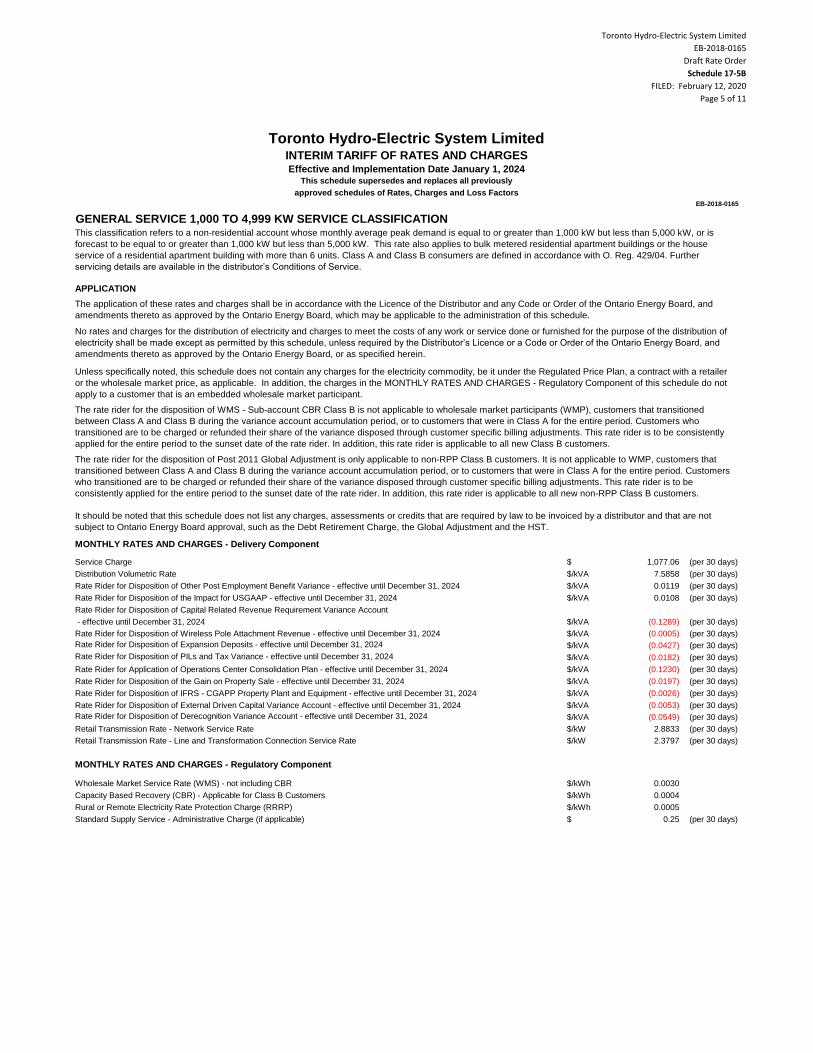
Toronto Hydro-Electric System Limited
EB-2018-0165
Draft Rate Order
Schedule 17-5B
FILED: February 12, 2020
Page 5 of 11
Toronto Hydro-Electric System LimitedINTERIM TARIFF OF RATES AND CHARGESEffective and Implementation Date January 1, 2024
This schedule supersedes and replaces all previously
approved schedules of Rates, Charges and Loss Factors
EB-2018-0165
$ 1,077.06 (per 30 days)
$/kVA 7.5858 (per 30 days)
$/kVA 0.0119 (per 30 days)
$/kVA 0.0108 (per 30 days)
Rate Rider for Disposition of Capital Related Revenue Requirement Variance Account
- effective until December 31, 2024 $/kVA (0.1289) (per 30 days)
$/kVA (0.0005) (per 30 days)
Rate Rider for Disposition of Expansion Deposits - effective until December 31, 2024 $/kVA (0.0427) (per 30 days)
Rate Rider for Disposition of PILs and Tax Variance - effective until December 31, 2024 $/kVA (0.0182) (per 30 days)
$/kVA (0.1230) (per 30 days)
$/kVA (0.0197) (per 30 days)
$/kVA (0.0026) (per 30 days)
$/kVA (0.0053) (per 30 days)
Rate Rider for Disposition of Derecognition Variance Account - effective until December 31, 2024 $/kVA (0.0549) (per 30 days)
$/kW 2.8833 (per 30 days)
$/kW 2.3797 (per 30 days)
$/kWh 0.0030
$/kWh 0.0004
$/kWh 0.0005
$ 0.25 (per 30 days)
MONTHLY RATES AND CHARGES - Regulatory Component
Wholesale Market Service Rate (WMS) - not including CBR
Capacity Based Recovery (CBR) - Applicable for Class B Customers
Rural or Remote Electricity Rate Protection Charge (RRRP)
Standard Supply Service - Administrative Charge (if applicable)
Rate Rider for Application of Operations Center Consolidation Plan - effective until December 31, 2024
Rate Rider for Disposition of the Gain on Property Sale - effective until December 31, 2024
Rate Rider for Disposition of IFRS - CGAPP Property Plant and Equipment - effective until December 31, 2024
Rate Rider for Disposition of External Driven Capital Variance Account - effective until December 31, 2024
Retail Transmission Rate - Network Service Rate
Retail Transmission Rate - Line and Transformation Connection Service Rate
MONTHLY RATES AND CHARGES - Delivery Component
Service Charge
Distribution Volumetric Rate
Rate Rider for Disposition of Other Post Employment Benefit Variance - effective until December 31, 2024
Rate Rider for Disposition of the Impact for USGAAP - effective until December 31, 2024
Rate Rider for Disposition of Wireless Pole Attachment Revenue - effective until December 31, 2024
The application of these rates and charges shall be in accordance with the Licence of the Distributor and any Code or Order of the Ontario Energy Board, and
amendments thereto as approved by the Ontario Energy Board, which may be applicable to the administration of this schedule.
No rates and charges for the distribution of electricity and charges to meet the costs of any work or service done or furnished for the purpose of the distribution of
electricity shall be made except as permitted by this schedule, unless required by the Distributor’s Licence or a Code or Order of the Ontario Energy Board, and
amendments thereto as approved by the Ontario Energy Board, or as specified herein.
Unless specifically noted, this schedule does not contain any charges for the electricity commodity, be it under the Regulated Price Plan, a contract with a retailer
or the wholesale market price, as applicable. In addition, the charges in the MONTHLY RATES AND CHARGES - Regulatory Component of this schedule do not
apply to a customer that is an embedded wholesale market participant.
The rate rider for the disposition of WMS - Sub-account CBR Class B is not applicable to wholesale market participants (WMP), customers that transitioned
between Class A and Class B during the variance account accumulation period, or to customers that were in Class A for the entire period. Customers who
transitioned are to be charged or refunded their share of the variance disposed through customer specific billing adjustments. This rate rider is to be consistently
applied for the entire period to the sunset date of the rate rider. In addition, this rate rider is applicable to all new Class B customers.
The rate rider for the disposition of Post 2011 Global Adjustment is only applicable to non-RPP Class B customers. It is not applicable to WMP, customers that
transitioned between Class A and Class B during the variance account accumulation period, or to customers that were in Class A for the entire period. Customers
who transitioned are to be charged or refunded their share of the variance disposed through customer specific billing adjustments. This rate rider is to be
consistently applied for the entire period to the sunset date of the rate rider. In addition, this rate rider is applicable to all new non-RPP Class B customers.
It should be noted that this schedule does not list any charges, assessments or credits that are required by law to be invoiced by a distributor and that are not
subject to Ontario Energy Board approval, such as the Debt Retirement Charge, the Global Adjustment and the HST.
GENERAL SERVICE 1,000 TO 4,999 KW SERVICE CLASSIFICATIONThis classification refers to a non-residential account whose monthly average peak demand is equal to or greater than 1,000 kW but less than 5,000 kW, or is
forecast to be equal to or greater than 1,000 kW but less than 5,000 kW. This rate also applies to bulk metered residential apartment buildings or the house
service of a residential apartment building with more than 6 units. Class A and Class B consumers are defined in accordance with O. Reg. 429/04. Further
servicing details are available in the distributor’s Conditions of Service.
APPLICATION
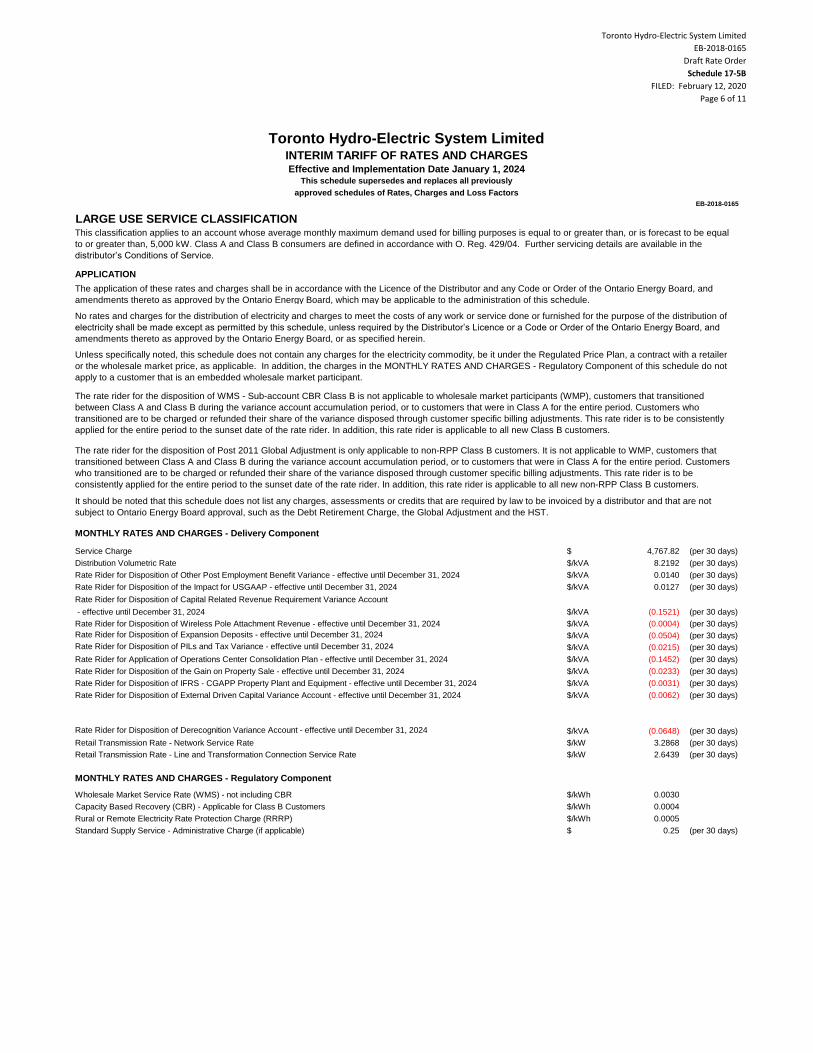
Toronto Hydro-Electric System Limited
EB-2018-0165
Draft Rate Order
Schedule 17-5B
FILED: February 12, 2020
Page 6 of 11
Toronto Hydro-Electric System LimitedINTERIM TARIFF OF RATES AND CHARGESEffective and Implementation Date January 1, 2024
This schedule supersedes and replaces all previously
approved schedules of Rates, Charges and Loss Factors
EB-2018-0165
$ 4,767.82 (per 30 days)
$/kVA 8.2192 (per 30 days)
$/kVA 0.0140 (per 30 days)
$/kVA 0.0127 (per 30 days)
Rate Rider for Disposition of Capital Related Revenue Requirement Variance Account
- effective until December 31, 2024 $/kVA (0.1521) (per 30 days)
$/kVA (0.0004) (per 30 days)
Rate Rider for Disposition of Expansion Deposits - effective until December 31, 2024 $/kVA (0.0504) (per 30 days)
Rate Rider for Disposition of PILs and Tax Variance - effective until December 31, 2024 $/kVA (0.0215) (per 30 days)
$/kVA (0.1452) (per 30 days)
$/kVA (0.0233) (per 30 days)
$/kVA (0.0031) (per 30 days)
$/kVA (0.0062) (per 30 days)
Rate Rider for Disposition of Derecognition Variance Account - effective until December 31, 2024 $/kVA (0.0648) (per 30 days)
$/kW 3.2868 (per 30 days)
$/kW 2.6439 (per 30 days)
$/kWh 0.0030
$/kWh 0.0004
$/kWh 0.0005
$ 0.25 (per 30 days)
Rural or Remote Electricity Rate Protection Charge (RRRP)
Standard Supply Service - Administrative Charge (if applicable)
Rate Rider for Disposition of External Driven Capital Variance Account - effective until December 31, 2024
Retail Transmission Rate - Network Service Rate
Retail Transmission Rate - Line and Transformation Connection Service Rate
MONTHLY RATES AND CHARGES - Regulatory Component
Wholesale Market Service Rate (WMS) - not including CBR
Capacity Based Recovery (CBR) - Applicable for Class B Customers
Rate Rider for Disposition of Other Post Employment Benefit Variance - effective until December 31, 2024
Rate Rider for Disposition of the Impact for USGAAP - effective until December 31, 2024
Rate Rider for Disposition of Wireless Pole Attachment Revenue - effective until December 31, 2024
Rate Rider for Application of Operations Center Consolidation Plan - effective until December 31, 2024
Rate Rider for Disposition of the Gain on Property Sale - effective until December 31, 2024
Rate Rider for Disposition of IFRS - CGAPP Property Plant and Equipment - effective until December 31, 2024
The rate rider for the disposition of WMS - Sub-account CBR Class B is not applicable to wholesale market participants (WMP), customers that transitioned
between Class A and Class B during the variance account accumulation period, or to customers that were in Class A for the entire period. Customers who
transitioned are to be charged or refunded their share of the variance disposed through customer specific billing adjustments. This rate rider is to be consistently
applied for the entire period to the sunset date of the rate rider. In addition, this rate rider is applicable to all new Class B customers.
The rate rider for the disposition of Post 2011 Global Adjustment is only applicable to non-RPP Class B customers. It is not applicable to WMP, customers that
transitioned between Class A and Class B during the variance account accumulation period, or to customers that were in Class A for the entire period. Customers
who transitioned are to be charged or refunded their share of the variance disposed through customer specific billing adjustments. This rate rider is to be
consistently applied for the entire period to the sunset date of the rate rider. In addition, this rate rider is applicable to all new non-RPP Class B customers.
It should be noted that this schedule does not list any charges, assessments or credits that are required by law to be invoiced by a distributor and that are not
subject to Ontario Energy Board approval, such as the Debt Retirement Charge, the Global Adjustment and the HST.
MONTHLY RATES AND CHARGES - Delivery Component
Service Charge
Distribution Volumetric Rate
LARGE USE SERVICE CLASSIFICATIONThis classification applies to an account whose average monthly maximum demand used for billing purposes is equal to or greater than, or is forecast to be equal
to or greater than, 5,000 kW. Class A and Class B consumers are defined in accordance with O. Reg. 429/04. Further servicing details are available in the
distributor’s Conditions of Service.
APPLICATION
The application of these rates and charges shall be in accordance with the Licence of the Distributor and any Code or Order of the Ontario Energy Board, and
amendments thereto as approved by the Ontario Energy Board, which may be applicable to the administration of this schedule.
No rates and charges for the distribution of electricity and charges to meet the costs of any work or service done or furnished for the purpose of the distribution of
electricity shall be made except as permitted by this schedule, unless required by the Distributor’s Licence or a Code or Order of the Ontario Energy Board, and
amendments thereto as approved by the Ontario Energy Board, or as specified herein.
Unless specifically noted, this schedule does not contain any charges for the electricity commodity, be it under the Regulated Price Plan, a contract with a retailer
or the wholesale market price, as applicable. In addition, the charges in the MONTHLY RATES AND CHARGES - Regulatory Component of this schedule do not
apply to a customer that is an embedded wholesale market participant.

Toronto Hydro-Electric System Limited
EB-2018-0165
Draft Rate Order
Schedule 17-5B
FILED: February 12, 2020
Page 7 of 11
Toronto Hydro-Electric System LimitedINTERIM TARIFF OF RATES AND CHARGESEffective and Implementation Date January 1, 2024
This schedule supersedes and replaces all previously
approved schedules of Rates, Charges and Loss Factors
EB-2018-0165
$ 278.85 (per 30 days)
$/kVA 9.1797 (per 30 days)
$/kVA 7.5858 (per 30 days)
$/kVA 8.2192 (per 30 days)
Distribution Volumetric Rate
For General Service 50 - 999 kW Service Classification
For General Service 1,000 - 4,999 kW Service Classification
For Large Use Service Classification
No rates and charges for the distribution of electricity and charges to meet the costs of any work or service done or furnished for the purpose of the distribution of
electricity shall be made except as permitted by this schedule, unless required by the Distributor’s Licence or a Code or Order of the Ontario Energy Board, and
amendments thereto as approved by the Ontario Energy Board, or as specified herein.
Unless specifically noted, this schedule does not contain any charges for the electricity commodity, be it under the Regulated Price Plan, a contract with a retailer
or the wholesale market price, as applicable.
It should be noted that this schedule does not list any charges, assessments or credits that are required by law to be invoiced by a distributor and that are not
subject to Ontario Energy Board approval, such as the Debt Retirement Charge, the Global Adjustment and the HST.
MONTHLY RATES AND CHARGES - Delivery Component - APPROVED ON AN INTERIM BASIS
Standby Charge - for a month where standby power is not provided. The charge is applied to the contracted amount (e.g. nameplate rating of
generation facility).
Service Charge
STANDBY POWER SERVICE CLASSIFICATIONThis classification refers to an account that has Load Displacement Generation and requires THESL to provide back- up service. Further servicing details are
available in the distributor’s Conditions of Service.
APPLICATION
The application of these rates and charges shall be in accordance with the Licence of the Distributor and any Code or Order of the Ontario Energy Board, and
amendments thereto as approved by the Ontario Energy Board, which may be applicable to the administration of this schedule.
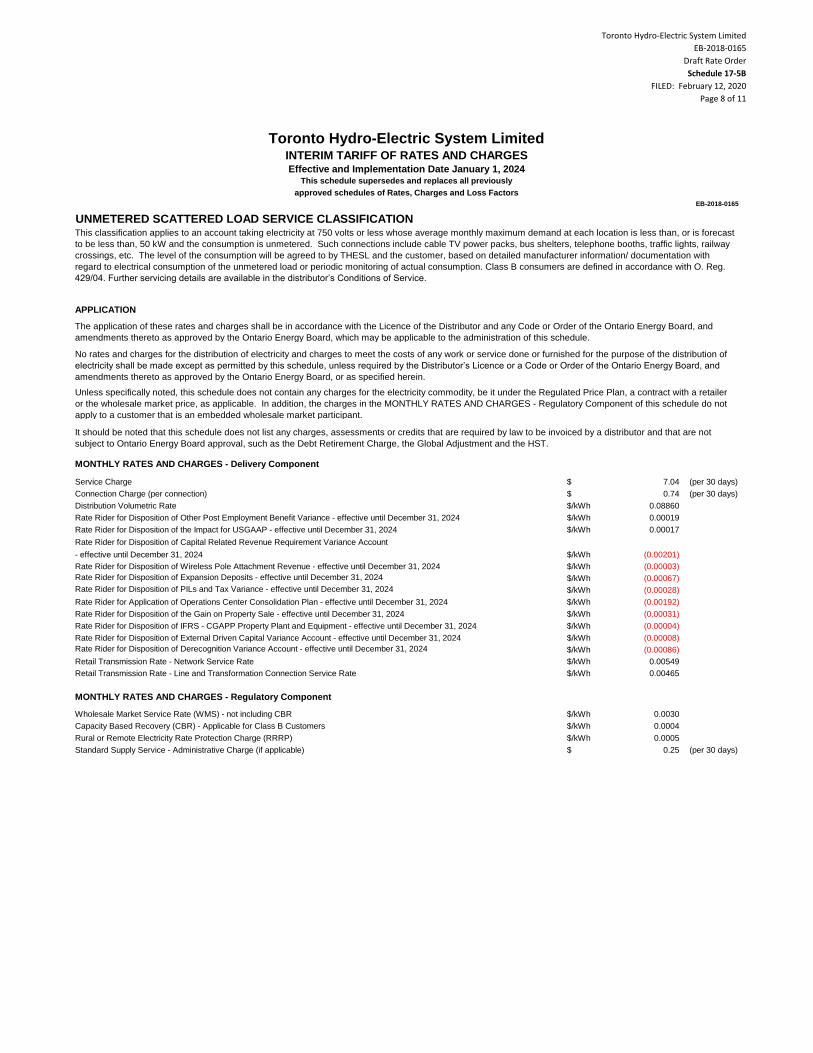
Toronto Hydro-Electric System Limited
EB-2018-0165
Draft Rate Order
Schedule 17-5B
FILED: February 12, 2020
Page 8 of 11
Toronto Hydro-Electric System LimitedINTERIM TARIFF OF RATES AND CHARGESEffective and Implementation Date January 1, 2024
This schedule supersedes and replaces all previously
approved schedules of Rates, Charges and Loss Factors
EB-2018-0165
$ 7.04 (per 30 days)
$ 0.74 (per 30 days)
$/kWh 0.08860
$/kWh 0.00019
$/kWh 0.00017
Rate Rider for Disposition of Capital Related Revenue Requirement Variance Account
- effective until December 31, 2024 $/kWh (0.00201)
$/kWh (0.00003)
Rate Rider for Disposition of Expansion Deposits - effective until December 31, 2024 $/kWh (0.00067)
Rate Rider for Disposition of PILs and Tax Variance - effective until December 31, 2024 $/kWh (0.00028)
$/kWh (0.00192)
$/kWh (0.00031)
$/kWh (0.00004)
$/kWh (0.00008)
Rate Rider for Disposition of Derecognition Variance Account - effective until December 31, 2024 $/kWh (0.00086)
$/kWh 0.00549
$/kWh 0.00465
$/kWh 0.0030
$/kWh 0.0004
$/kWh 0.0005
$ 0.25 (per 30 days)
MONTHLY RATES AND CHARGES - Regulatory Component
Wholesale Market Service Rate (WMS) - not including CBR
Capacity Based Recovery (CBR) - Applicable for Class B Customers
Rural or Remote Electricity Rate Protection Charge (RRRP)
Standard Supply Service - Administrative Charge (if applicable)
Rate Rider for Application of Operations Center Consolidation Plan - effective until December 31, 2024
Rate Rider for Disposition of the Gain on Property Sale - effective until December 31, 2024
Rate Rider for Disposition of IFRS - CGAPP Property Plant and Equipment - effective until December 31, 2024
Rate Rider for Disposition of External Driven Capital Variance Account - effective until December 31, 2024
Retail Transmission Rate - Network Service Rate
Retail Transmission Rate - Line and Transformation Connection Service Rate
Service Charge
Connection Charge (per connection)
Distribution Volumetric Rate
Rate Rider for Disposition of Other Post Employment Benefit Variance - effective until December 31, 2024
Rate Rider for Disposition of the Impact for USGAAP - effective until December 31, 2024
Rate Rider for Disposition of Wireless Pole Attachment Revenue - effective until December 31, 2024
APPLICATION
The application of these rates and charges shall be in accordance with the Licence of the Distributor and any Code or Order of the Ontario Energy Board, and
amendments thereto as approved by the Ontario Energy Board, which may be applicable to the administration of this schedule.
No rates and charges for the distribution of electricity and charges to meet the costs of any work or service done or furnished for the purpose of the distribution of
electricity shall be made except as permitted by this schedule, unless required by the Distributor’s Licence or a Code or Order of the Ontario Energy Board, and
amendments thereto as approved by the Ontario Energy Board, or as specified herein.
Unless specifically noted, this schedule does not contain any charges for the electricity commodity, be it under the Regulated Price Plan, a contract with a retailer
or the wholesale market price, as applicable. In addition, the charges in the MONTHLY RATES AND CHARGES - Regulatory Component of this schedule do not
apply to a customer that is an embedded wholesale market participant.
It should be noted that this schedule does not list any charges, assessments or credits that are required by law to be invoiced by a distributor and that are not
subject to Ontario Energy Board approval, such as the Debt Retirement Charge, the Global Adjustment and the HST.
MONTHLY RATES AND CHARGES - Delivery Component
UNMETERED SCATTERED LOAD SERVICE CLASSIFICATIONThis classification applies to an account taking electricity at 750 volts or less whose average monthly maximum demand at each location is less than, or is forecast
to be less than, 50 kW and the consumption is unmetered. Such connections include cable TV power packs, bus shelters, telephone booths, traffic lights, railway
crossings, etc. The level of the consumption will be agreed to by THESL and the customer, based on detailed manufacturer information/ documentation with
regard to electrical consumption of the unmetered load or periodic monitoring of actual consumption. Class B consumers are defined in accordance with O. Reg.
429/04. Further servicing details are available in the distributor’s Conditions of Service.

Toronto Hydro-Electric System Limited
EB-2018-0165
Draft Rate Order
Schedule 17-5B
FILED: February 12, 2020
Page 9 of 11
Toronto Hydro-Electric System LimitedINTERIM TARIFF OF RATES AND CHARGESEffective and Implementation Date January 1, 2024
This schedule supersedes and replaces all previously
approved schedules of Rates, Charges and Loss Factors
EB-2018-0165
$ 1.82 (per 30 days)
$/kVA 40.4712 (per 30 days)
$/kVA 0.0882 (per 30 days)
$/kVA 0.0799 (per 30 days)
Rate Rider for Disposition of Capital Related Revenue Requirement Variance Account
- effective until December 31, 2024 $/kVA (0.9573) (per 30 days)
$/kVA (0.0097) (per 30 days)
Rate Rider for Disposition of Expansion Deposits - effective until December 31, 2024 $/kVA (0.3170) (per 30 days)
Rate Rider for Disposition of PILs and Tax Variance - effective until December 31, 2024 $/kVA (0.1355) (per 30 days)
$/kVA (0.9139) (per 30 days)
$/kVA (0.1464) (per 30 days)
$/kVA (0.0193) (per 30 days)
$/kVA (0.0393) (per 30 days)
Rate Rider for Disposition of Derecognition Variance Account - effective until December 31, 2024 $/kVA (0.4081) (per 30 days)
$/kW 2.6543 (per 30 days)
$/kW 2.8403 (per 30 days)
$/kWh 0.0030
$/kWh 0.0004
$/kWh 0.0005
$ 0.25 (per 30 days)
MONTHLY RATES AND CHARGES - Delivery Component
Wholesale Market Service Rate (WMS) - not including CBR
Capacity Based Recovery (CBR) - Applicable for Class B Customers
Rural or Remote Electricity Rate Protection Charge (RRRP)
Standard Supply Service - Administrative Charge (if applicable)
Rate Rider for Application of Operations Center Consolidation Plan - effective until December 31, 2024
Rate Rider for Disposition of the Gain on Property Sale - effective until December 31, 2024
Rate Rider for Disposition of IFRS - CGAPP Property Plant and Equipment - effective until December 31, 2024
Rate Rider for Disposition of External Driven Capital Variance Account - effective until December 31, 2024
Retail Transmission Rate - Network Service Rate
Retail Transmission Rate - Line and Transformation Connection Service Rate
MONTHLY RATES AND CHARGES - Delivery Component
Service Charge (per device)
Distribution Volumetric Rate
Rate Rider for Disposition of Other Post Employment Benefit Variance - effective until December 31, 2024
Rate Rider for Disposition of the Impact for USGAAP - effective until December 31, 2024
Rate Rider for Disposition of Wireless Pole Attachment Revenue - effective until December 31, 2024
This classification applies to an account for roadway lighting with a Municipality, Regional Municipality, Ministry of Transportation and private roadway lighting,
controlled by photo cells. The consumption for these customers will be based on the calculated connected load times the required lighting times established in the
approved OEB street lighting load shape template. Class B consumers are defined in accordance with O. Reg. 429/04. Further servicing details are available in the
distributor’s Conditions of Service.
APPLICATION
The application of these rates and charges shall be in accordance with the Licence of the Distributor and any Code or Order of the Ontario Energy Board, and
amendments thereto as approved by the Ontario Energy Board, which may be applicable to the administration of this schedule.
No rates and charges for the distribution of electricity and charges to meet the costs of any work or service done or furnished for the purpose of the distribution of
electricity shall be made except as permitted by this schedule, unless required by the Distributor’s Licence or a Code or Order of the Ontario Energy Board, and
amendments thereto as approved by the Ontario Energy Board, or as specified herein.
Unless specifically noted, this schedule does not contain any charges for the electricity commodity, be it under the Regulated Price Plan, a contract with a retailer
or the wholesale market price, as applicable. In addition, the charges in the MONTHLY RATES AND CHARGES - Regulatory Component of this schedule do not
apply to a customer that is an embedded wholesale market participant.
It should be noted that this schedule does not list any charges, assessments or credits that are required by law to be invoiced by a distributor and that are not
subject to Ontario Energy Board approval, such as the Debt Retirement Charge, the Global Adjustment and the HST.
STREET LIGHTING SERVICE CLASSIFICATION

Toronto Hydro-Electric System Limited
EB-2018-0165
Draft Rate Order
Schedule 17-5B
FILED: February 12, 2020
Page 10 of 11
Toronto Hydro-Electric System LimitedINTERIM TARIFF OF RATES AND CHARGESEffective and Implementation Date January 1, 2024
This schedule supersedes and replaces all previously
approved schedules of Rates, Charges and Loss Factors
EB-2018-0165
$ 5.33 (per 30 days)
ALLOWANCES$/kVA (0.62) (per 30 days)
% (1.00)
SPECIFIC SERVICE CHARGES
Customer Administration
$ 25.00
$ 25.00
$ 25.00
$ 25.00
$ 25.00
$ 35.00
$ 25.00
$ 55.00
$ 55.00
Non-Payment of Account
% 1.50
% 19.56
$ 120.00
$ 400.00
$ 300.00
$ 820.00
Other
$ 120.00
$ 400.00
$ 300.00
$ 820.00
$ 2,040.00
$ 44.50
Disconnect/reconnect at meter - after regular hours
Disconnect/reconnect at pole - during regular hours
Disconnect/reconnect at pole - after regular hours
Temporary service install & remove - overhead - no transformer
Specific charge for access to the power poles (wireline attachments) - per pole/year
Late payment - per annum
Disconnect/reconnect at meter - during regular hours
Disconnect/reconnect at meter - after regular hours
Disconnect/reconnect at pole - during regular hours
Disconnect/reconnect at pole - after regular hours
Disconnect/reconnect at meter
Income tax letter
Account set up charge/change of occupancy charge (plus credit agency costs if applicable)
Returned cheque (plus bank charges)
Special meter reads
Meter dispute charge plus Measurement Canada fees (if meter found correct)
Late payment - per month
No charges to meet the costs of any work or service done or furnished for the purpose of the distribution of electricity shall be made except as permitted by this
schedule, unless required by the Distributor’s Licence or a Code or Order of the Ontario Energy Board, and amendments thereto as approved by the Ontario
Energy Board, or as specified herein.
It should be noted that this schedule does not list any charges, assessments or credits that are required by law to be invoiced by a distributor and that are not
subject to Ontario Energy Board approval, such as the Debt Retirement Charge, the Global Adjustment and the HST.
Account history
Duplicate invoices for previous billing
Request for other billing or system information
Easement letter
MONTHLY RATES AND CHARGES - Delivery Component
Service Charge
Transformer Allowance for Ownership
Primary Metering Allowance for Transformer Losses - applied to measured demand & energy
APPLICATION
The application of these rates and charges shall be in accordance with the Licence of the Distributor and any Code or Order of the Ontario Energy Board, and
amendments thereto as approved by the Ontario Energy Board, which may be applicable to the administration of this schedule.
This classification applies to an electricity generation facility contracted under the Independent Electricity System Operator’s microFIT program and connected to
the distributor’s distribution system. Further servicing details are available in the utility’s Conditions of Service.
APPLICATION
The application of these rates and charges shall be in accordance with the Licence of the Distributor and any Code or Order of the Ontario Energy Board, and
amendments thereto as approved by the Ontario Energy Board, which may be applicable to the administration of this schedule.
No rates and charges for the distribution of electricity and charges to meet the costs of any work or service done or furnished for the purpose of the distribution of
electricity shall be made except as permitted by this schedule, unless required by the Distributor’s Licence or a Code or Order of the Ontario Energy Board, and
amendments thereto as approved by the Ontario Energy Board, or as specified herein.
Unless specifically noted, this schedule does not contain any charges for the electricity commodity, be it under the Regulated Price Plan, a contract with a retailer
or the wholesale market price, as applicable.
It should be noted that this schedule does not list any charges, assessments or credits that are required by law to be invoiced by a distributor and that are not
subject to Ontario Energy Board approval, such as the Debt Retirement Charge, the Global Adjustment and the HST.
microFIT SERVICE CLASSIFICATION
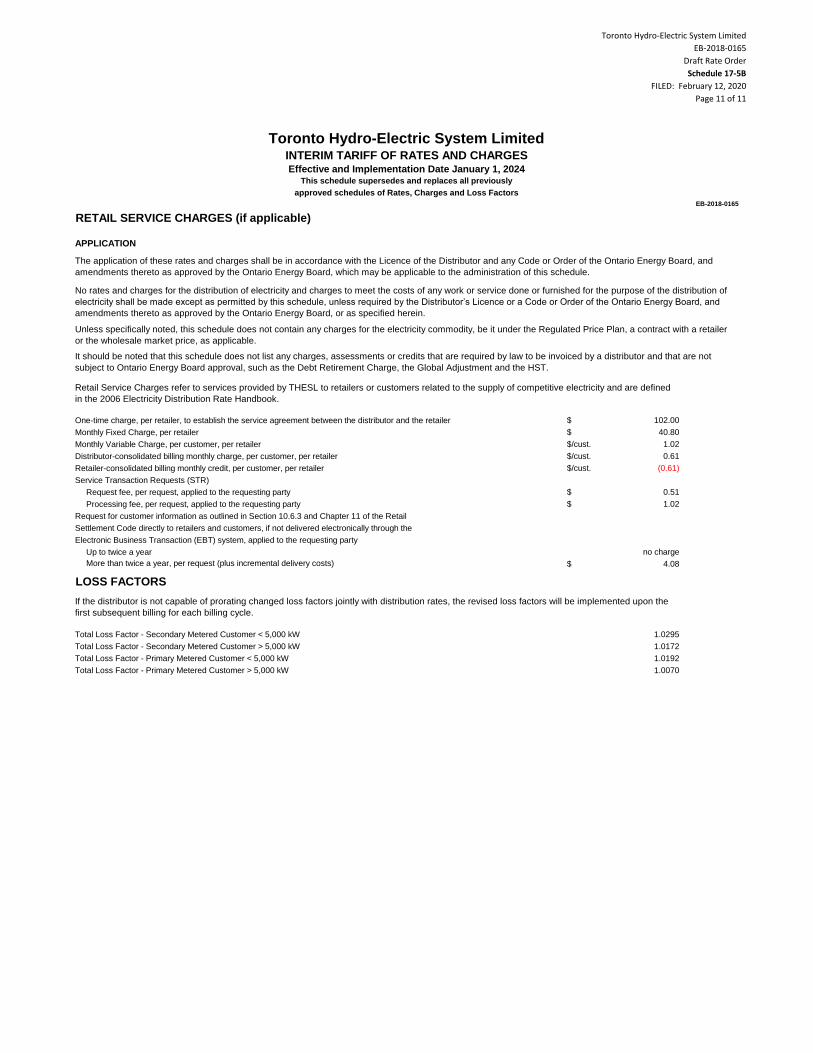
Toronto Hydro-Electric System Limited
EB-2018-0165
Draft Rate Order
Schedule 17-5B
FILED: February 12, 2020
Page 11 of 11
Toronto Hydro-Electric System LimitedINTERIM TARIFF OF RATES AND CHARGESEffective and Implementation Date January 1, 2024
This schedule supersedes and replaces all previously
approved schedules of Rates, Charges and Loss Factors
EB-2018-0165
RETAIL SERVICE CHARGES (if applicable)
$ 102.00
$ 40.80
$/cust. 1.02
$/cust. 0.61
$/cust. (0.61)
$ 0.51
$ 1.02
no charge
$ 4.08
LOSS FACTORS
1.0295
1.0172
1.0192
1.0070
If the distributor is not capable of prorating changed loss factors jointly with distribution rates, the revised loss factors will be implemented upon the
first subsequent billing for each billing cycle.
Total Loss Factor - Secondary Metered Customer < 5,000 kW
Total Loss Factor - Secondary Metered Customer > 5,000 kW
Total Loss Factor - Primary Metered Customer < 5,000 kW
Total Loss Factor - Primary Metered Customer > 5,000 kW
Processing fee, per request, applied to the requesting party
Request for customer information as outlined in Section 10.6.3 and Chapter 11 of the Retail
Settlement Code directly to retailers and customers, if not delivered electronically through the
Electronic Business Transaction (EBT) system, applied to the requesting party
Up to twice a year
More than twice a year, per request (plus incremental delivery costs)
Monthly Fixed Charge, per retailer
Monthly Variable Charge, per customer, per retailer
Distributor-consolidated billing monthly charge, per customer, per retailer
Retailer-consolidated billing monthly credit, per customer, per retailer
Service Transaction Requests (STR)
Request fee, per request, applied to the requesting party
The application of these rates and charges shall be in accordance with the Licence of the Distributor and any Code or Order of the Ontario Energy Board, and
amendments thereto as approved by the Ontario Energy Board, which may be applicable to the administration of this schedule.
No rates and charges for the distribution of electricity and charges to meet the costs of any work or service done or furnished for the purpose of the distribution of
electricity shall be made except as permitted by this schedule, unless required by the Distributor’s Licence or a Code or Order of the Ontario Energy Board, and
amendments thereto as approved by the Ontario Energy Board, or as specified herein.
Unless specifically noted, this schedule does not contain any charges for the electricity commodity, be it under the Regulated Price Plan, a contract with a retailer
or the wholesale market price, as applicable.
It should be noted that this schedule does not list any charges, assessments or credits that are required by law to be invoiced by a distributor and that are not
subject to Ontario Energy Board approval, such as the Debt Retirement Charge, the Global Adjustment and the HST.
Retail Service Charges refer to services provided by THESL to retailers or customers related to the supply of competitive electricity and are defined
in the 2006 Electricity Distribution Rate Handbook.
One-time charge, per retailer, to establish the service agreement between the distributor and the retailer
APPLICATION
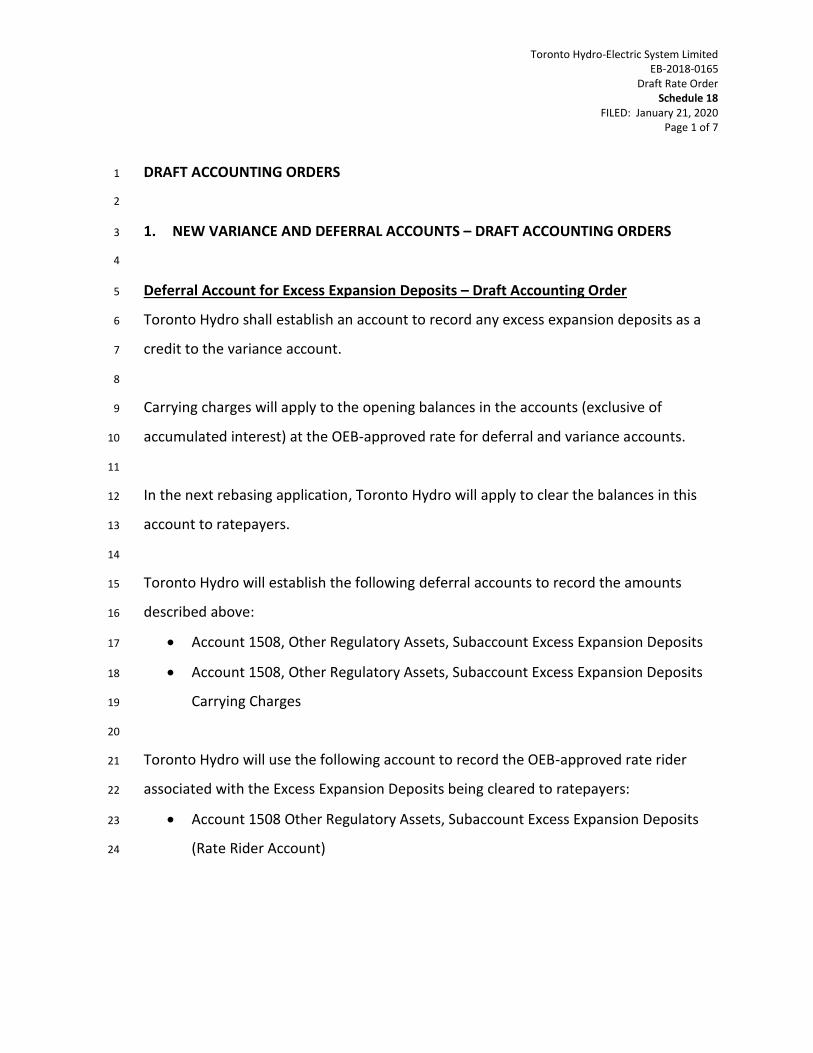
Toronto Hydro-Electric System Limited EB-2018-0165
Draft Rate Order Schedule 18
FILED: January 21, 2020 Page 1 of 7
DRAFT ACCOUNTING ORDERS 1
2
1. NEW VARIANCE AND DEFERRAL ACCOUNTS – DRAFT ACCOUNTING ORDERS 3
4
Deferral Account for Excess Expansion Deposits – Draft Accounting Order 5
Toronto Hydro shall establish an account to record any excess expansion deposits as a 6
credit to the variance account. 7
8
Carrying charges will apply to the opening balances in the accounts (exclusive of 9
accumulated interest) at the OEB-approved rate for deferral and variance accounts. 10
11
In the next rebasing application, Toronto Hydro will apply to clear the balances in this 12
account to ratepayers. 13
14
Toronto Hydro will establish the following deferral accounts to record the amounts 15
described above: 16
• Account 1508, Other Regulatory Assets, Subaccount Excess Expansion Deposits 17
• Account 1508, Other Regulatory Assets, Subaccount Excess Expansion Deposits 18
Carrying Charges 19
20
Toronto Hydro will use the following account to record the OEB-approved rate rider 21
associated with the Excess Expansion Deposits being cleared to ratepayers: 22
• Account 1508 Other Regulatory Assets, Subaccount Excess Expansion Deposits 23
(Rate Rider Account) 24
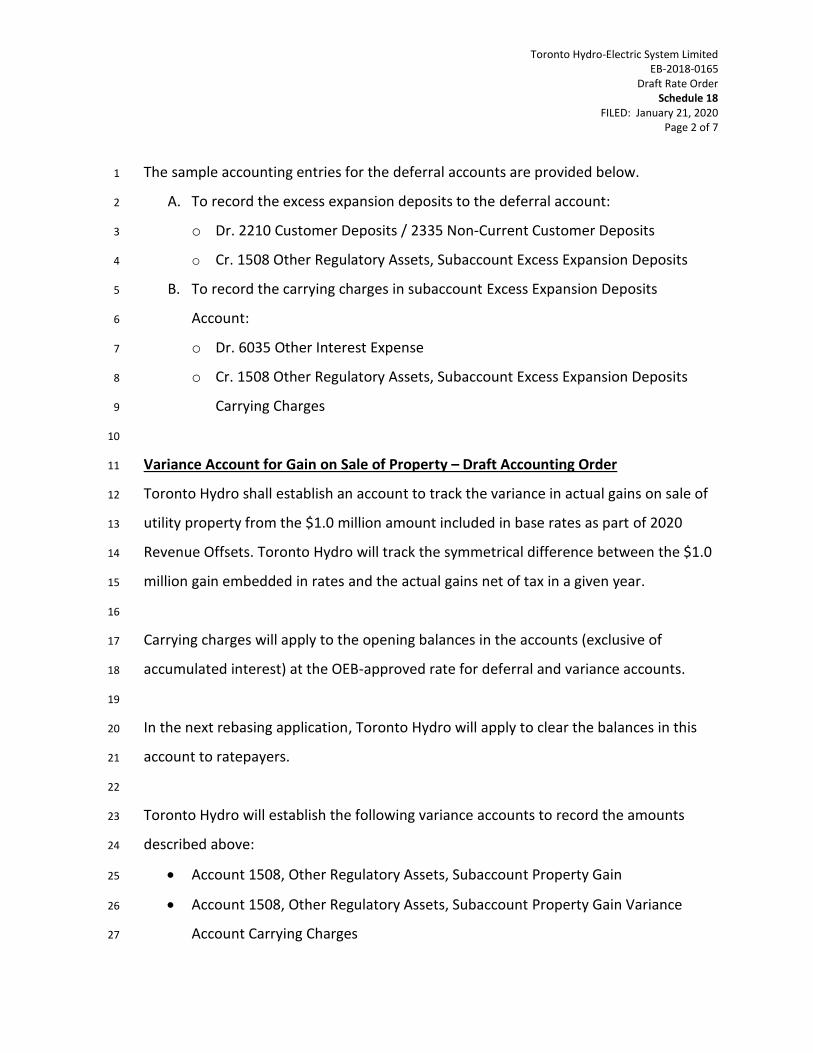
Toronto Hydro-Electric System Limited EB-2018-0165
Draft Rate Order Schedule 18
FILED: January 21, 2020 Page 2 of 7
The sample accounting entries for the deferral accounts are provided below. 1
A. To record the excess expansion deposits to the deferral account: 2
o Dr. 2210 Customer Deposits / 2335 Non-Current Customer Deposits 3
o Cr. 1508 Other Regulatory Assets, Subaccount Excess Expansion Deposits 4
B. To record the carrying charges in subaccount Excess Expansion Deposits 5
Account: 6
o Dr. 6035 Other Interest Expense 7
o Cr. 1508 Other Regulatory Assets, Subaccount Excess Expansion Deposits 8
Carrying Charges 9
10
Variance Account for Gain on Sale of Property – Draft Accounting Order 11
Toronto Hydro shall establish an account to track the variance in actual gains on sale of 12
utility property from the $1.0 million amount included in base rates as part of 2020 13
Revenue Offsets. Toronto Hydro will track the symmetrical difference between the $1.0 14
million gain embedded in rates and the actual gains net of tax in a given year. 15
16
Carrying charges will apply to the opening balances in the accounts (exclusive of 17
accumulated interest) at the OEB-approved rate for deferral and variance accounts. 18
19
In the next rebasing application, Toronto Hydro will apply to clear the balances in this 20
account to ratepayers. 21
22
Toronto Hydro will establish the following variance accounts to record the amounts 23
described above: 24
• Account 1508, Other Regulatory Assets, Subaccount Property Gain 25
• Account 1508, Other Regulatory Assets, Subaccount Property Gain Variance 26
Account Carrying Charges 27
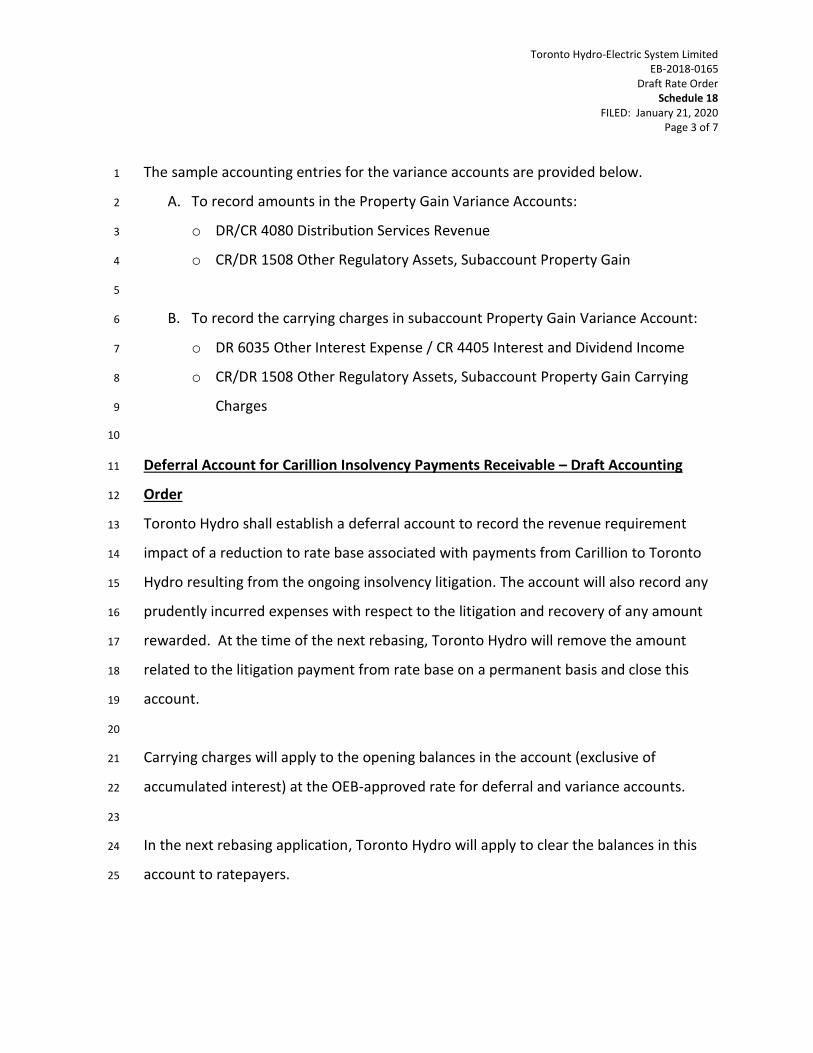
Toronto Hydro-Electric System Limited EB-2018-0165
Draft Rate Order Schedule 18
FILED: January 21, 2020 Page 3 of 7
The sample accounting entries for the variance accounts are provided below. 1
A. To record amounts in the Property Gain Variance Accounts: 2
o DR/CR 4080 Distribution Services Revenue 3
o CR/DR 1508 Other Regulatory Assets, Subaccount Property Gain 4
5
B. To record the carrying charges in subaccount Property Gain Variance Account: 6
o DR 6035 Other Interest Expense / CR 4405 Interest and Dividend Income 7
o CR/DR 1508 Other Regulatory Assets, Subaccount Property Gain Carrying 8
Charges 9
10
Deferral Account for Carillion Insolvency Payments Receivable – Draft Accounting 11
Order 12
Toronto Hydro shall establish a deferral account to record the revenue requirement 13
impact of a reduction to rate base associated with payments from Carillion to Toronto 14
Hydro resulting from the ongoing insolvency litigation. The account will also record any 15
prudently incurred expenses with respect to the litigation and recovery of any amount 16
rewarded. At the time of the next rebasing, Toronto Hydro will remove the amount 17
related to the litigation payment from rate base on a permanent basis and close this 18
account. 19
20
Carrying charges will apply to the opening balances in the account (exclusive of 21
accumulated interest) at the OEB-approved rate for deferral and variance accounts. 22
23
In the next rebasing application, Toronto Hydro will apply to clear the balances in this 24
account to ratepayers. 25
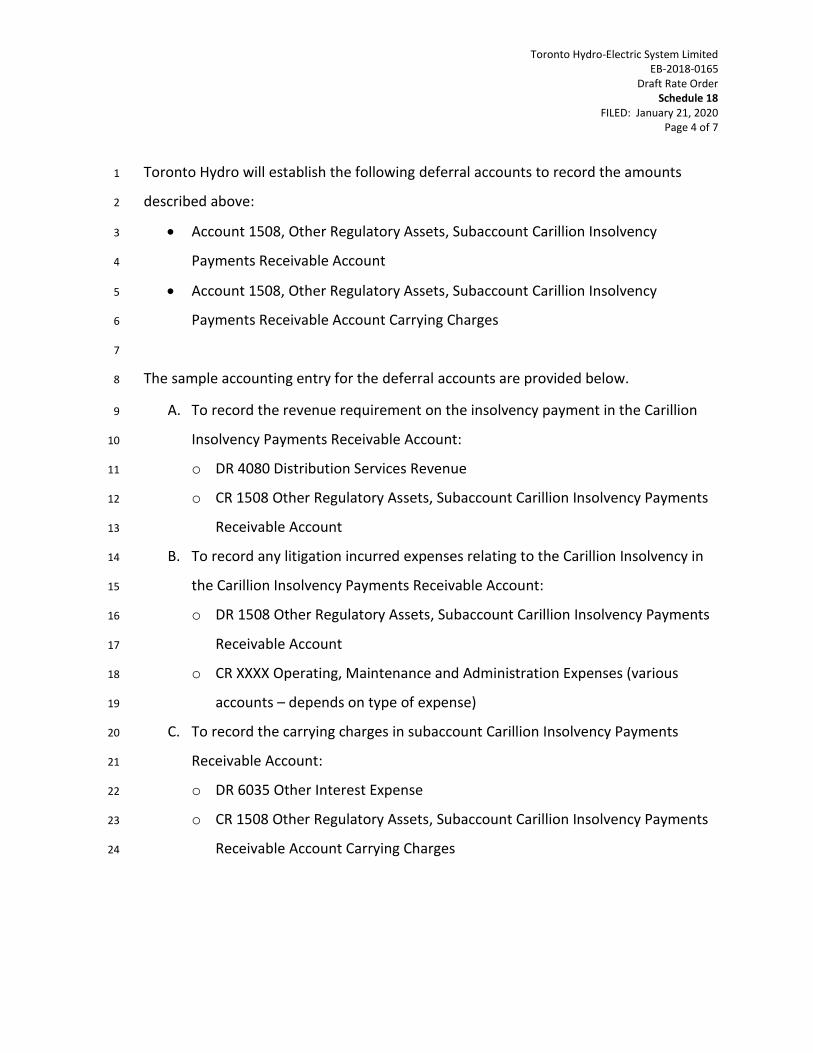
Toronto Hydro-Electric System Limited EB-2018-0165
Draft Rate Order Schedule 18
FILED: January 21, 2020 Page 4 of 7
Toronto Hydro will establish the following deferral accounts to record the amounts 1
described above: 2
• Account 1508, Other Regulatory Assets, Subaccount Carillion Insolvency 3
Payments Receivable Account 4
• Account 1508, Other Regulatory Assets, Subaccount Carillion Insolvency 5
Payments Receivable Account Carrying Charges 6
7
The sample accounting entry for the deferral accounts are provided below. 8
A. To record the revenue requirement on the insolvency payment in the Carillion 9
Insolvency Payments Receivable Account: 10
o DR 4080 Distribution Services Revenue 11
o CR 1508 Other Regulatory Assets, Subaccount Carillion Insolvency Payments 12
Receivable Account 13
B. To record any litigation incurred expenses relating to the Carillion Insolvency in 14
the Carillion Insolvency Payments Receivable Account: 15
o DR 1508 Other Regulatory Assets, Subaccount Carillion Insolvency Payments 16
Receivable Account 17
o CR XXXX Operating, Maintenance and Administration Expenses (various 18
accounts – depends on type of expense) 19
C. To record the carrying charges in subaccount Carillion Insolvency Payments 20
Receivable Account: 21
o DR 6035 Other Interest Expense 22
o CR 1508 Other Regulatory Assets, Subaccount Carillion Insolvency Payments 23
Receivable Account Carrying Charges 24
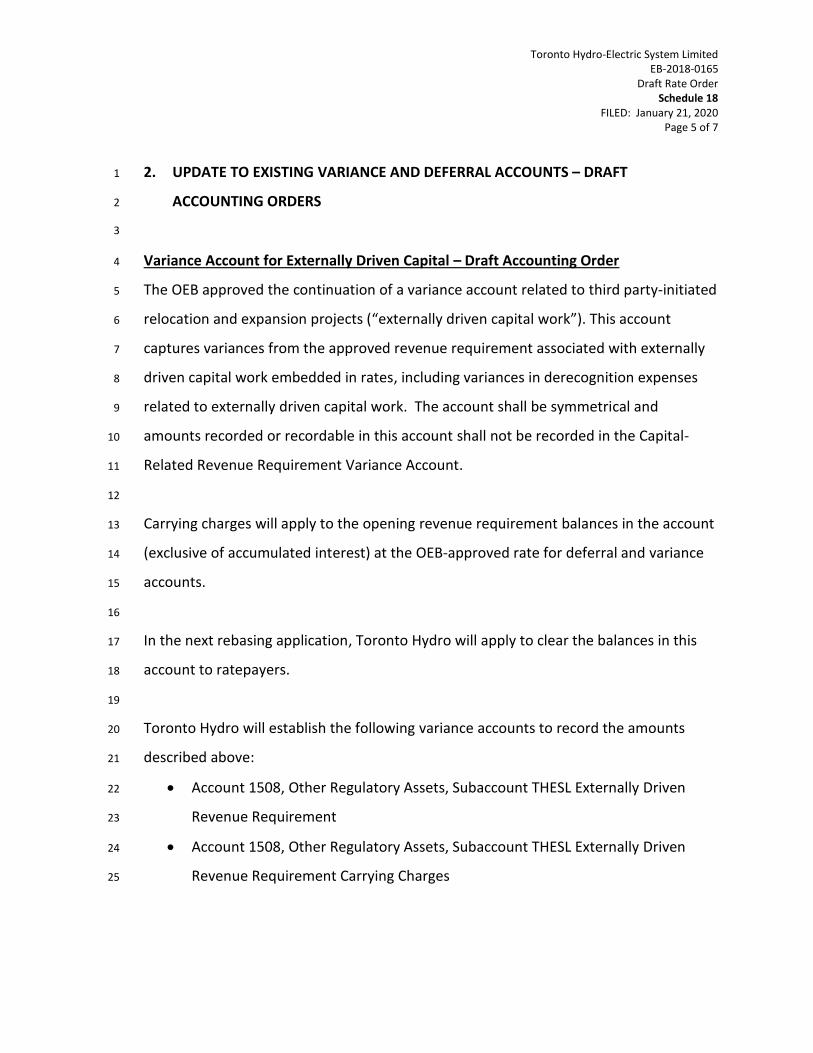
Toronto Hydro-Electric System Limited EB-2018-0165
Draft Rate Order Schedule 18
FILED: January 21, 2020 Page 5 of 7
2. UPDATE TO EXISTING VARIANCE AND DEFERRAL ACCOUNTS – DRAFT 1
ACCOUNTING ORDERS 2
3
Variance Account for Externally Driven Capital – Draft Accounting Order 4
The OEB approved the continuation of a variance account related to third party-initiated 5
relocation and expansion projects (“externally driven capital work”). This account 6
captures variances from the approved revenue requirement associated with externally 7
driven capital work embedded in rates, including variances in derecognition expenses 8
related to externally driven capital work. The account shall be symmetrical and 9
amounts recorded or recordable in this account shall not be recorded in the Capital-10
Related Revenue Requirement Variance Account. 11
12
Carrying charges will apply to the opening revenue requirement balances in the account 13
(exclusive of accumulated interest) at the OEB-approved rate for deferral and variance 14
accounts. 15
16
In the next rebasing application, Toronto Hydro will apply to clear the balances in this 17
account to ratepayers. 18
19
Toronto Hydro will establish the following variance accounts to record the amounts 20
described above: 21
• Account 1508, Other Regulatory Assets, Subaccount THESL Externally Driven 22
Revenue Requirement 23
• Account 1508, Other Regulatory Assets, Subaccount THESL Externally Driven 24
Revenue Requirement Carrying Charges 25
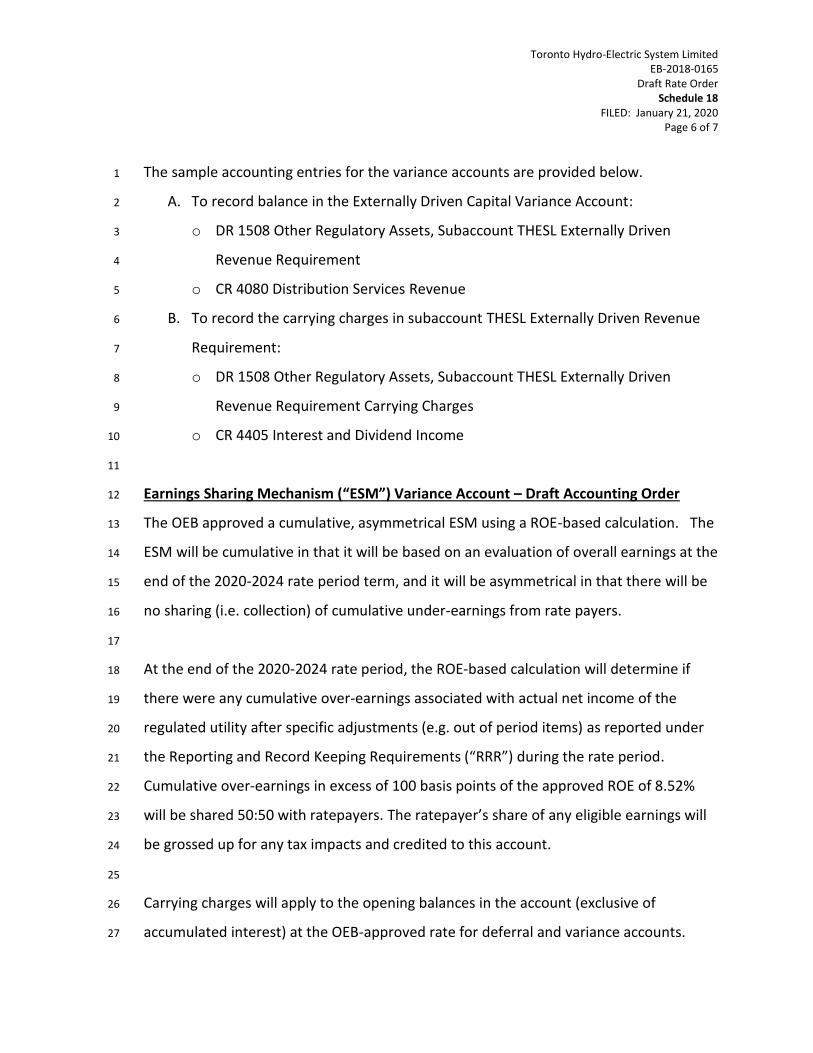
Toronto Hydro-Electric System Limited EB-2018-0165
Draft Rate Order Schedule 18
FILED: January 21, 2020 Page 6 of 7
The sample accounting entries for the variance accounts are provided below. 1
A. To record balance in the Externally Driven Capital Variance Account: 2
o DR 1508 Other Regulatory Assets, Subaccount THESL Externally Driven 3
Revenue Requirement 4
o CR 4080 Distribution Services Revenue 5
B. To record the carrying charges in subaccount THESL Externally Driven Revenue 6
Requirement: 7
o DR 1508 Other Regulatory Assets, Subaccount THESL Externally Driven 8
Revenue Requirement Carrying Charges 9
o CR 4405 Interest and Dividend Income 10
11
Earnings Sharing Mechanism (“ESM”) Variance Account – Draft Accounting Order 12
The OEB approved a cumulative, asymmetrical ESM using a ROE-based calculation. The 13
ESM will be cumulative in that it will be based on an evaluation of overall earnings at the 14
end of the 2020-2024 rate period term, and it will be asymmetrical in that there will be 15
no sharing (i.e. collection) of cumulative under-earnings from rate payers. 16
17
At the end of the 2020-2024 rate period, the ROE-based calculation will determine if 18
there were any cumulative over-earnings associated with actual net income of the 19
regulated utility after specific adjustments (e.g. out of period items) as reported under 20
the Reporting and Record Keeping Requirements (“RRR”) during the rate period. 21
Cumulative over-earnings in excess of 100 basis points of the approved ROE of 8.52% 22
will be shared 50:50 with ratepayers. The ratepayer’s share of any eligible earnings will 23
be grossed up for any tax impacts and credited to this account. 24
25
Carrying charges will apply to the opening balances in the account (exclusive of 26
accumulated interest) at the OEB-approved rate for deferral and variance accounts. 27
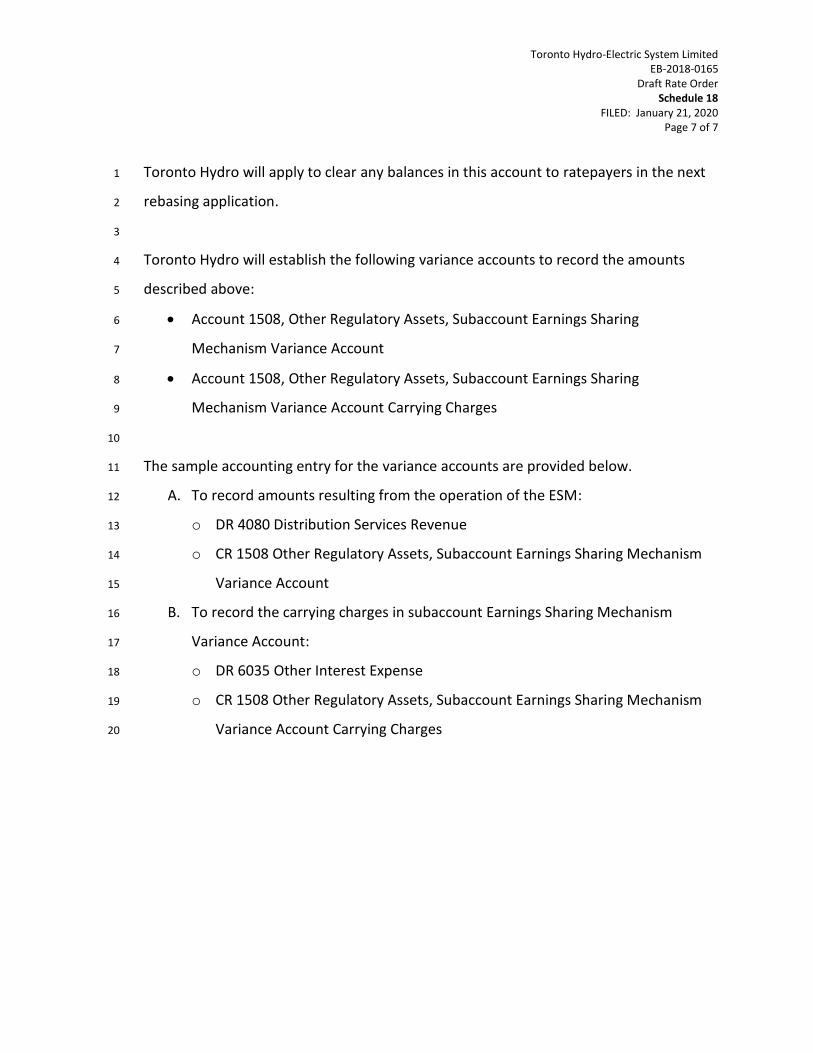
Toronto Hydro-Electric System Limited EB-2018-0165
Draft Rate Order Schedule 18
FILED: January 21, 2020 Page 7 of 7
Toronto Hydro will apply to clear any balances in this account to ratepayers in the next 1
rebasing application. 2
3
Toronto Hydro will establish the following variance accounts to record the amounts 4
described above: 5
• Account 1508, Other Regulatory Assets, Subaccount Earnings Sharing 6
Mechanism Variance Account 7
• Account 1508, Other Regulatory Assets, Subaccount Earnings Sharing 8
Mechanism Variance Account Carrying Charges 9
10
The sample accounting entry for the variance accounts are provided below. 11
A. To record amounts resulting from the operation of the ESM: 12
o DR 4080 Distribution Services Revenue 13
o CR 1508 Other Regulatory Assets, Subaccount Earnings Sharing Mechanism 14
Variance Account 15
B. To record the carrying charges in subaccount Earnings Sharing Mechanism 16
Variance Account: 17
o DR 6035 Other Interest Expense 18
o CR 1508 Other Regulatory Assets, Subaccount Earnings Sharing Mechanism 19
Variance Account Carrying Charges 20