get active toronto 2011 community report
TRANSCRIPT
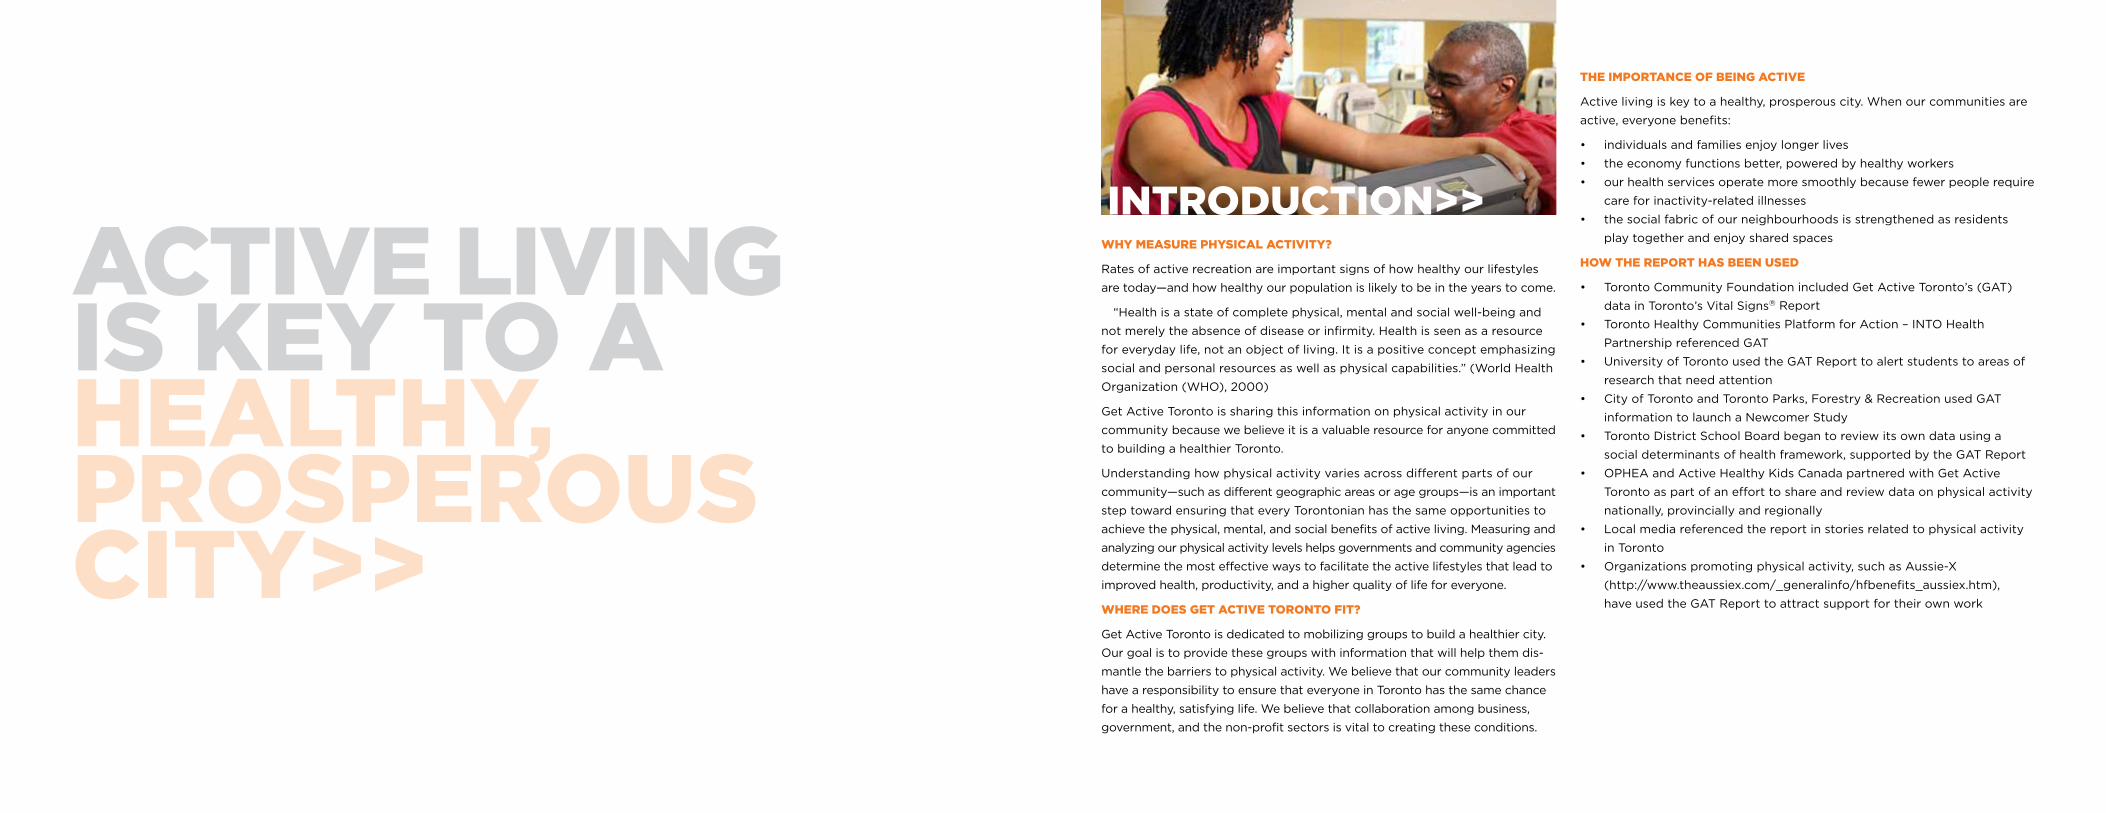
Why measure physical activity?
Rates of active recreation are important signs of how healthy our lifestyles
are today—and how healthy our population is likely to be in the years to come.
“Health is a state of complete physical, mental and social well-being and
not merely the absence of disease or infirmity. Health is seen as a resource
for everyday life, not an object of living. It is a positive concept emphasizing
social and personal resources as well as physical capabilities.” (World Health
Organization (WHO), 2000)
Get Active Toronto is sharing this information on physical activity in our
community because we believe it is a valuable resource for anyone committed
to building a healthier Toronto.
Understanding how physical activity varies across different parts of our
community—such as different geographic areas or age groups—is an important
step toward ensuring that every Torontonian has the same opportunities to
achieve the physical, mental, and social benefits of active living. Measuring and
analyzing our physical activity levels helps governments and community agencies
determine the most effective ways to facilitate the active lifestyles that lead to
improved health, productivity, and a higher quality of life for everyone.
Where DOes Get active tOrONtO Fit?
Get Active Toronto is dedicated to mobilizing groups to build a healthier city.
Our goal is to provide these groups with information that will help them dis-
mantle the barriers to physical activity. We believe that our community leaders
have a responsibility to ensure that everyone in Toronto has the same chance
for a healthy, satisfying life. We believe that collaboration among business,
government, and the non-profit sectors is vital to creating these conditions.
the impOrtaNce OF BeiNG active
Active living is key to a healthy, prosperous city. When our communities are
active, everyone benefits:
• individualsandfamiliesenjoylongerlives
• theeconomyfunctionsbetter,poweredbyhealthyworkers
• ourhealthservicesoperatemoresmoothlybecausefewerpeoplerequire
care for inactivity-related illnesses
• thesocialfabricofourneighbourhoodsisstrengthenedasresidents
play together and enjoy shared spaces
hOW the repOrt has BeeN useD
• TorontoCommunityFoundationincludedGetActiveToronto’s(GAT)
datainToronto’sVitalSigns® Report
• TorontoHealthyCommunitiesPlatformforAction–INTOHealth
PartnershipreferencedGAT
• UniversityofTorontousedtheGATReporttoalertstudentstoareasof
research that need attention
• CityofTorontoandTorontoParks,Forestry&RecreationusedGAT
informationtolaunchaNewcomerStudy
• TorontoDistrictSchoolBoardbegantoreviewitsowndatausinga
social determinants of health framework, supported by the GAT Report
• OPHEAandActiveHealthyKidsCanadapartneredwithGetActive
Toronto as part of an effort to share and review data on physical activity
nationally, provincially and regionally
• Localmediareferencedthereportinstoriesrelatedtophysicalactivity
in Toronto
• Organizationspromotingphysicalactivity,suchasAussie-X
(http://www.theaussiex.com/_generalinfo/hfbenefits_aussiex.htm),
have used the GAT Report to attract support for their own work
active liviNG is Key tO a healthy, prOsperOus city>>
iNtrODuctiON>>
tOrONtONiaNs NeeD tO Get active
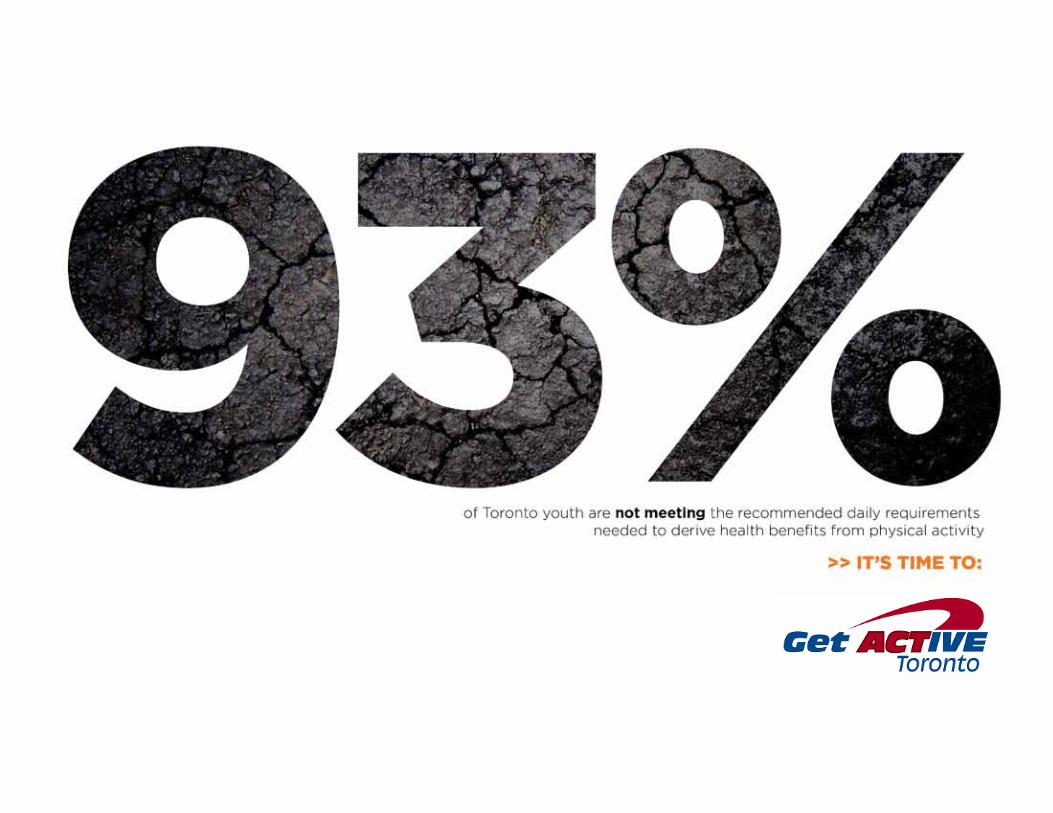
Thereportshowslowself-reportedlevelsofphysicalactivityinToronto’syouth
andadults.Evidenceshowsthatself-reportedlevelsofactivitytendto
over-estimateactualactivitylevels.AnewStatisticsCanadasurveymeasuring
physicalactivityshowedthatonly7%ofCanadianchildrenandyouthaged6to
19meettheWHOandCanadianguidelinesforrecommendedphysicalactivity.
AlocalsurveyshowedToronto’syouthareinlinewithnationalaverages.
AmongCanadiansaged15to70,only15%meetrecommendedactivitylevels.
sOme GrOups Face mOre Barriers tO healthy liviNG
Below-averageratesofphysicalactivitypersistamongwomenandgirls,
newcomers, and persons in lower income groups. More research is needed
to better understand how social context creates barriers to increased physical
activityamongsomegroups.Someofthisresearchhasrecentlybegun.
This year, Get Active Toronto carried out a number of focus groups with
young girls to explore their physical activity patterns in detail; a summary
oftheresultsisincludedinthisreport.TorontoPublicHealthisalsointhe
processofstudyingthephysicalactivitypatternsofToronto’snewcomers.
the GOOD NeWs
Although physical activity levels have not changed substantially in the recent
past, there are a number of positive signs to report.
• OverthepastdecadetheproportionofTorontonianswhocyclegrew
from48%(1999)to54%(2009)
• In2010,TorontowasnamedoneofthemostwalkablecitiesinCanada
• TheTorontoDistrictSchoolBoardreportsthatattheelementarylevel
there has been a gradual and steady increase in interschool athletic par-
ticipation over the past five years, despite declines in enrolment
• Atthesecondarylevel,in2009-10thenumberofteamsandthenumber
of student participants were at their highest level in five years
Many groups across the city are actively involved in promoting increased
physicalactivity.Someofthesearehighlightedinthisreportwhilemany
more are listed on our web site: www.getactivetoronto.com
iNDicatOrs
An indicator is a way of measuring physical activity, as well as its enablers
andbarriers.Someindicatorsaredirectmeasuresofphysicalactivity,such
as time spent engaged in particular activities. Other indicators are condi-
tions that facilitate or hinder physical activity participation, such as access
to recreational spaces.
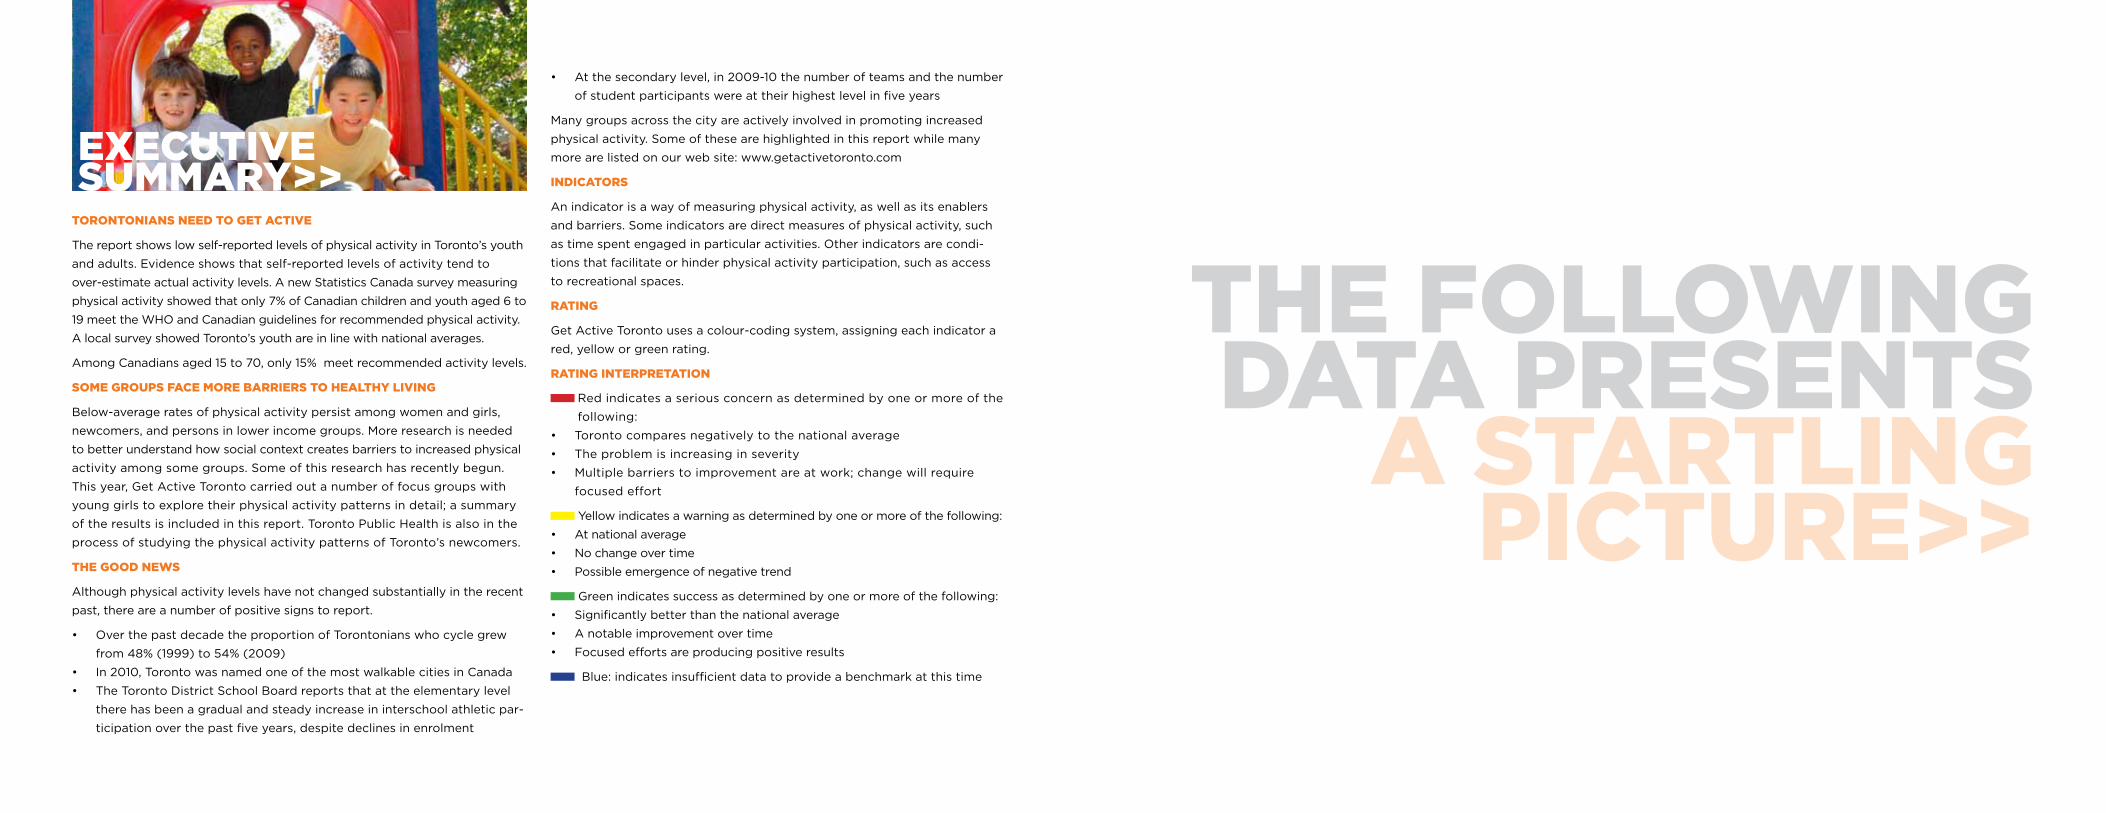
ratiNG
Get Active Toronto uses a colour-coding system, assigning each indicator a
red, yellow or green rating.
ratiNG iNterpretatiON
Red indicates a serious concern as determined by one or more of the
following:
• Torontocomparesnegativelytothenationalaverage
• Theproblemisincreasinginseverity
• Multiplebarrierstoimprovementareatwork;changewillrequire
focused effort
Yellow indicates a warning as determined by one or more of the following:
• Atnationalaverage
• Nochangeovertime
• Possibleemergenceofnegativetrend
Green indicates success as determined by one or more of the following:
• Significantlybetterthanthenationalaverage
• Anotableimprovementovertime
• Focusedeffortsareproducingpositiveresults
Blue:indicatesinsufficientdatatoprovideabenchmarkatthistime
eXecutive summary>>
the FOllOWiNG Data preseNts
a startliNG picture>>
chilDreN & yOuth>>physical activity levels
Component Summary
ActiveLeisure/
PhysicalActivity
Levels
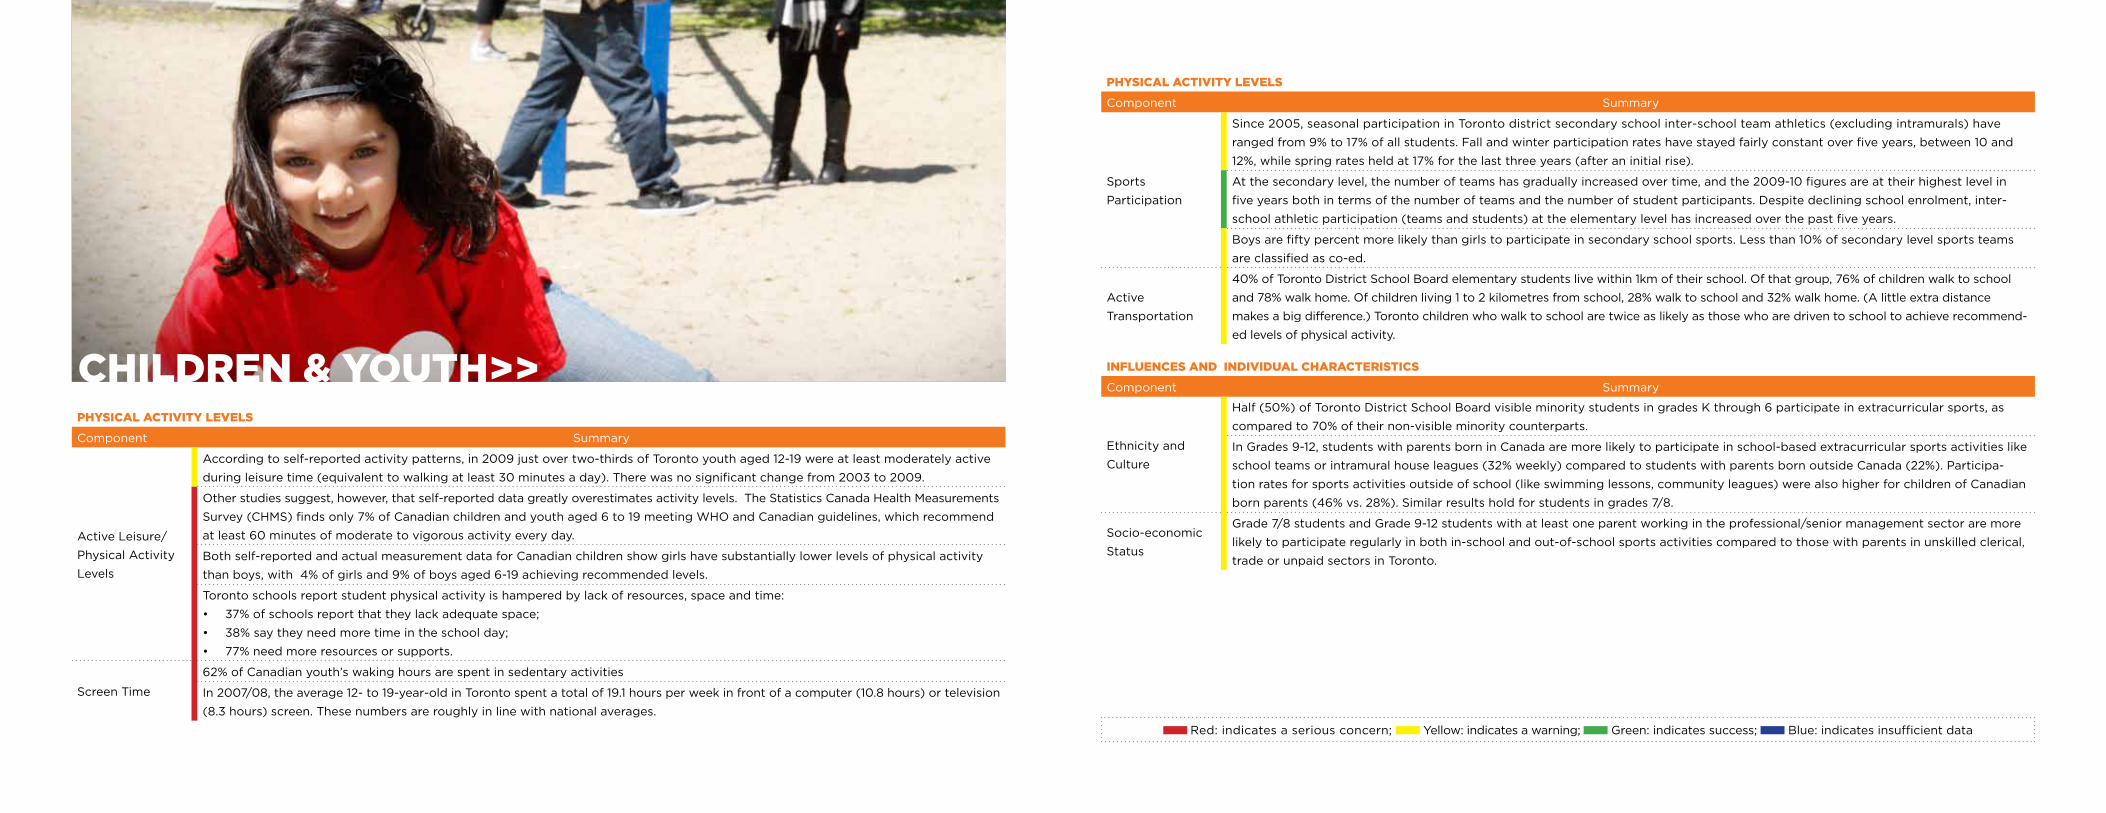
According to self-reported activity patterns, in 2009 just over two-thirds of Toronto youth aged 12-19 were at least moderately active
during leisure time (equivalent to walking at least 30 minutes a day). There was no significant change from 2003 to 2009.
Otherstudiessuggest,however,thatself-reporteddatagreatlyoverestimatesactivitylevels.TheStatisticsCanadaHealthMeasurements
Survey(CHMS)findsonly7%ofCanadianchildrenandyouthaged6to19meetingWHOandCanadianguidelines,whichrecommend
atleast60minutesofmoderatetovigorousactivityeveryday.
Bothself-reportedandactualmeasurementdataforCanadianchildrenshowgirlshavesubstantiallylowerlevelsofphysicalactivity
thanboys,with4%ofgirlsand9%ofboysaged6-19achievingrecommendedlevels.
Toronto schools report student physical activity is hampered by lack of resources, space and time:
• 37%ofschoolsreportthattheylackadequatespace;
• 38%saytheyneedmoretimeintheschoolday;
• 77%needmoreresourcesorsupports.
ScreenTime
62%ofCanadianyouth’swakinghoursarespentinsedentaryactivities
In 2007/08, the average 12- to 19-year-old in Toronto spent a total of 19.1 hours per week in front of a computer (10.8 hours) or television
(8.3 hours) screen. These numbers are roughly in line with national averages.
physical activity levels
Component Summary
Sports
Participation
Since2005,seasonalparticipationinTorontodistrictsecondaryschoolinter-schoolteamathletics(excludingintramurals)have
rangedfrom9%to17%ofallstudents.Fallandwinterparticipationrateshavestayedfairlyconstantoverfiveyears,between10and
12%, while spring rates held at 17% for the last three years (after an initial rise).
At the secondary level, the number of teams has gradually increased over time, and the 2009-10 figures are at their highest level in
fiveyearsbothintermsofthenumberofteamsandthenumberofstudentparticipants.Despitedecliningschoolenrolment,inter-
school athletic participation (teams and students) at the elementary level has increased over the past five years.
Boysarefiftypercentmorelikelythangirlstoparticipateinsecondaryschoolsports.Lessthan10%ofsecondarylevelsportsteams
are classified as co-ed.
Active
Transportation
40%ofTorontoDistrictSchoolBoardelementarystudentslivewithin1kmoftheirschool.Ofthatgroup,76%ofchildrenwalktoschool
and 78% walk home. Of children living 1 to 2 kilometres from school, 28% walk to school and 32% walk home. (A little extra distance
makes a big difference.) Toronto children who walk to school are twice as likely as those who are driven to school to achieve recommend-
ed levels of physical activity.
iNFlueNces aND iNDiviDual characteristics
Component Summary
Ethnicityand
Culture
Half(50%)ofTorontoDistrictSchoolBoardvisibleminoritystudentsingradesKthrough6participateinextracurricularsports,as
compared to 70% of their non-visible minority counterparts.
InGrades9-12,studentswithparentsborninCanadaaremorelikelytoparticipateinschool-basedextracurricularsportsactivitieslike
schoolteamsorintramuralhouseleagues(32%weekly)comparedtostudentswithparentsbornoutsideCanada(22%).Participa-
tionratesforsportsactivitiesoutsideofschool(likeswimminglessons,communityleagues)werealsohigherforchildrenofCanadian
bornparents(46%vs.28%).Similarresultsholdforstudentsingrades7/8.
Socio-economic
Status
Grade 7/8 students and Grade 9-12 students with at least one parent working in the professional/senior management sector are more
likely to participate regularly in both in-school and out-of-school sports activities compared to those with parents in unskilled clerical,
trade or unpaid sectors in Toronto.
Red: indicates a serious concern; Yellow: indicates a warning; Green: indicates success; Blue:indicatesinsufficientdata
physical activity levels
Component Summary
ActiveLeisure/
PhysicalActivity
Levels
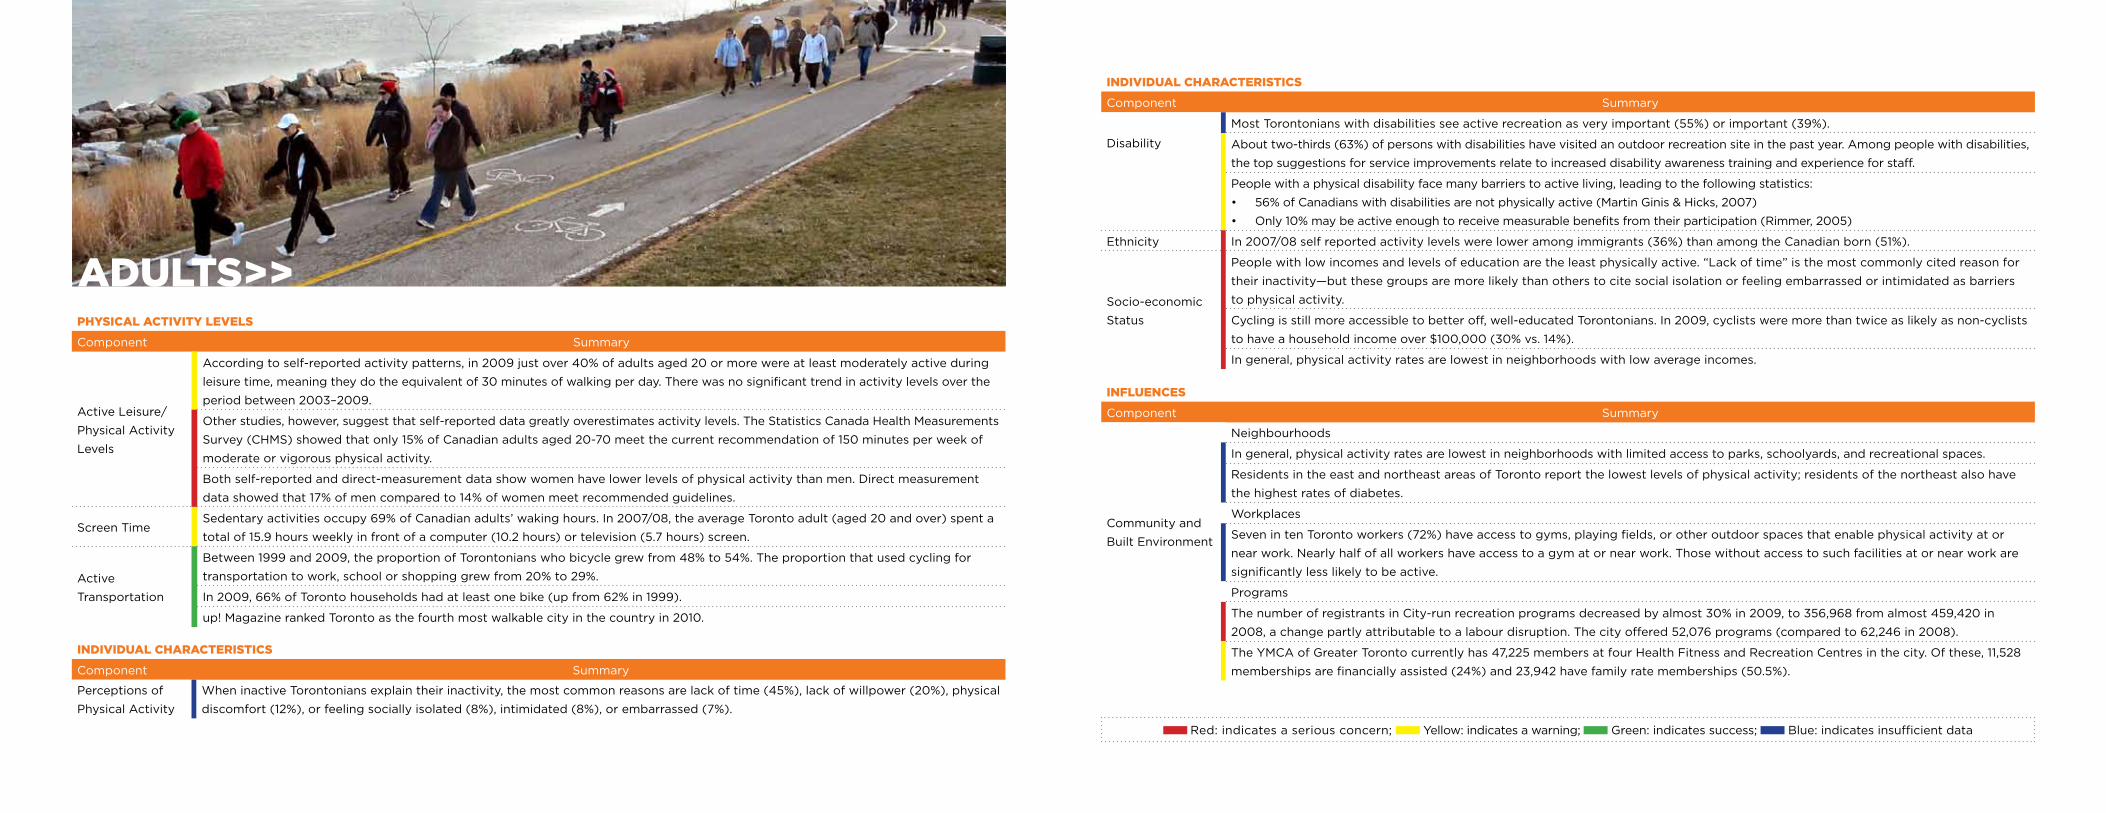
According to self-reported activity patterns, in 2009 just over 40% of adults aged 20 or more were at least moderately active during
leisure time, meaning they do the equivalent of 30 minutes of walking per day. There was no significant trend in activity levels over the
periodbetween2003–2009.
Otherstudies,however,suggestthatself-reporteddatagreatlyoverestimatesactivitylevels.TheStatisticsCanadaHealthMeasurements
Survey(CHMS)showedthatonly15%ofCanadianadultsaged20-70meetthecurrentrecommendationof150minutesperweekof
moderate or vigorous physical activity.
Bothself-reportedanddirect-measurementdatashowwomenhavelowerlevelsofphysicalactivitythanmen.Directmeasurement
data showed that 17% of men compared to 14% of women meet recommended guidelines.
ScreenTimeSedentaryactivitiesoccupy69%ofCanadianadults’wakinghours.In2007/08,theaverageTorontoadult(aged20andover)spenta
totalof15.9hoursweeklyinfrontofacomputer(10.2hours)ortelevision(5.7hours)screen.
Active
Transportation
Between1999and2009,theproportionofTorontonianswhobicyclegrewfrom48%to54%.Theproportionthatusedcyclingfor
transportation to work, school or shopping grew from 20% to 29%.
In2009,66%ofTorontohouseholdshadatleastonebike(upfrom62%in1999).
up! Magazine ranked Toronto as the fourth most walkable city in the country in 2010.
iNDiviDual characteristics
Component Summary
Perceptionsof
PhysicalActivity
WheninactiveTorontoniansexplaintheirinactivity,themostcommonreasonsarelackoftime(45%),lackofwillpower(20%),physical
discomfort (12%), or feeling socially isolated (8%), intimidated (8%), or embarrassed (7%).
iNDiviDual characteristics
Component Summary
Disability
MostTorontonianswithdisabilitiesseeactiverecreationasveryimportant(55%)orimportant(39%).
Abouttwo-thirds(63%)ofpersonswithdisabilitieshavevisitedanoutdoorrecreationsiteinthepastyear.Amongpeoplewithdisabilities,
the top suggestions for service improvements relate to increased disability awareness training and experience for staff.
Peoplewithaphysicaldisabilityfacemanybarrierstoactiveliving,leadingtothefollowingstatistics:
• 56%ofCanadianswithdisabilitiesarenotphysicallyactive(MartinGinis&Hicks,2007)
• Only10%maybeactiveenoughtoreceivemeasurablebenefitsfromtheirparticipation(Rimmer,2005)
Ethnicity In2007/08selfreportedactivitylevelswereloweramongimmigrants(36%)thanamongtheCanadianborn(51%).
Socio-economic
Status
Peoplewithlowincomesandlevelsofeducationaretheleastphysicallyactive.“Lackoftime”isthemostcommonlycitedreasonfor
their inactivity—but these groups are more likely than others to cite social isolation or feeling embarrassed or intimidated as barriers
to physical activity.
Cyclingisstillmoreaccessibletobetteroff,well-educatedTorontonians.In2009,cyclistsweremorethantwiceaslikelyasnon-cyclists
to have a household income over $100,000 (30% vs. 14%).
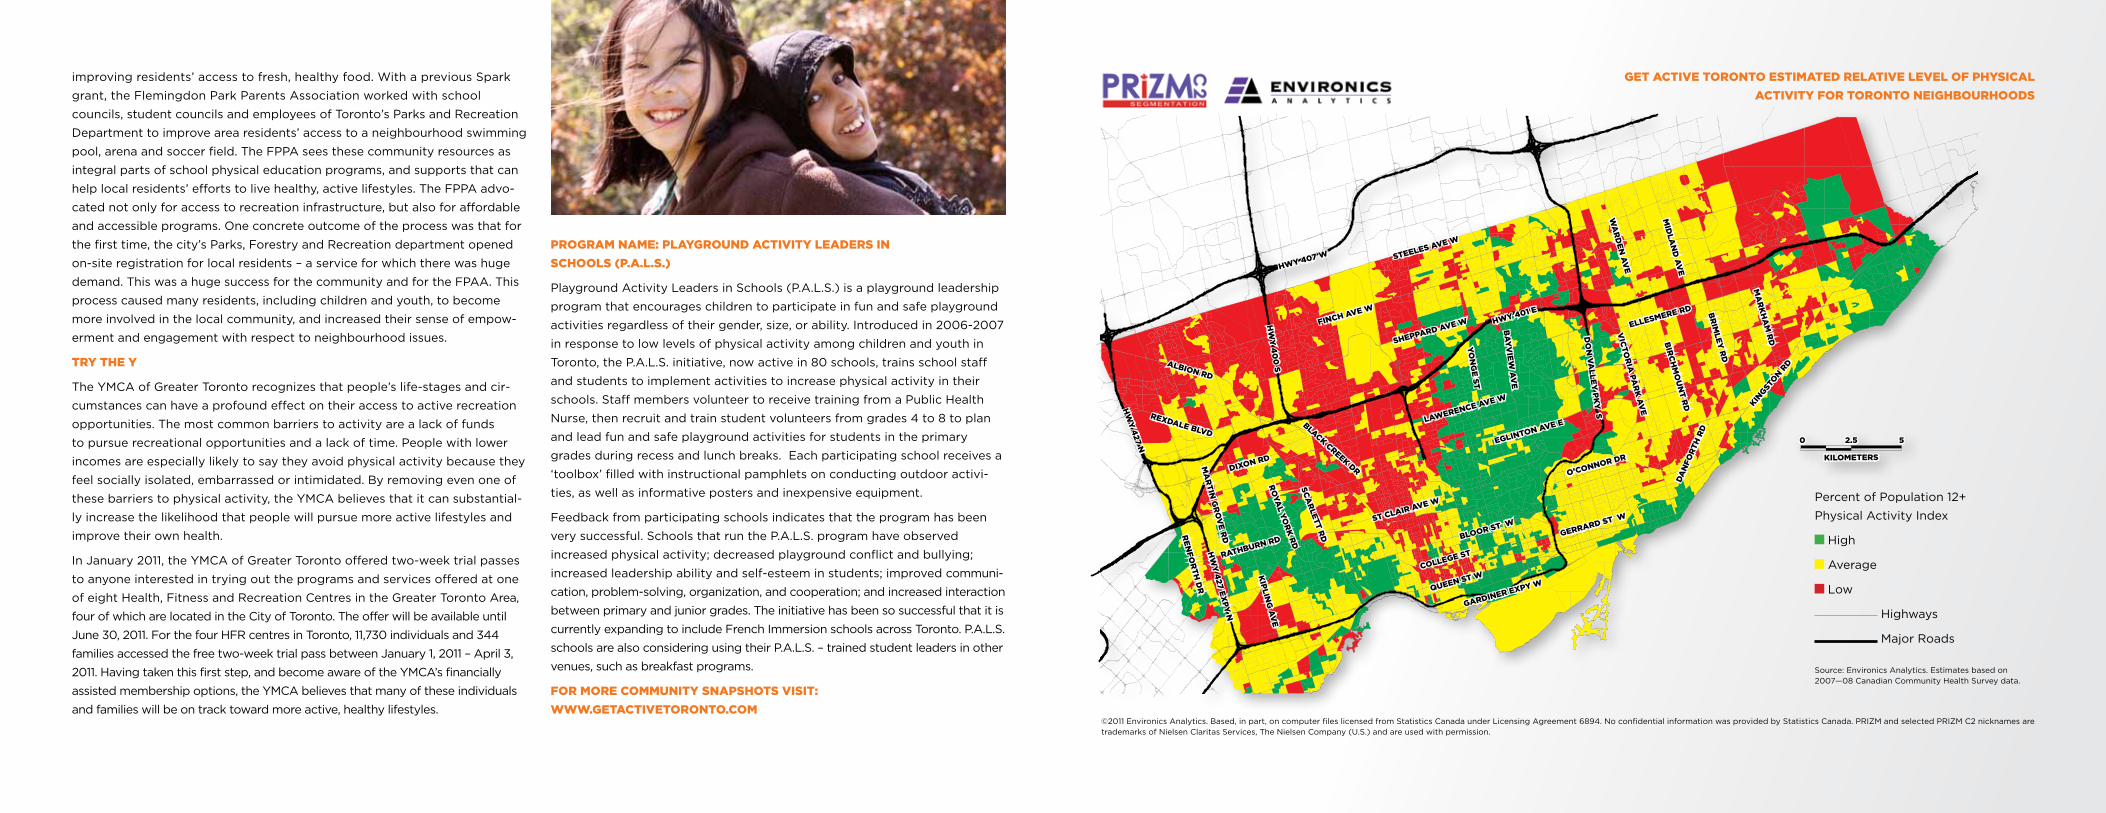
In general, physical activity rates are lowest in neighborhoods with low average incomes.
iNFlueNces
Component Summary
Communityand
BuiltEnvironment
Neighbourhoods
In general, physical activity rates are lowest in neighborhoods with limited access to parks, schoolyards, and recreational spaces.
Residents in the east and northeast areas of Toronto report the lowest levels of physical activity; residents of the northeast also have
the highest rates of diabetes.
Workplaces
SevenintenTorontoworkers(72%)haveaccesstogyms,playingfields,orotheroutdoorspacesthatenablephysicalactivityator
nearwork.Nearlyhalfofallworkershaveaccesstoagymatornearwork.Thosewithoutaccesstosuchfacilitiesatornearworkare
significantly less likely to be active.
Programs
ThenumberofregistrantsinCity-runrecreationprogramsdecreasedbyalmost30%in2009,to356,968fromalmost459,420in
2008,achangepartlyattributabletoalabourdisruption.Thecityoffered52,076programs(comparedto62,246in2008).
TheYMCAofGreaterTorontocurrentlyhas47,225membersatfourHealthFitnessandRecreationCentresinthecity.Ofthese,11,528
membershipsarefinanciallyassisted(24%)and23,942havefamilyratememberships(50.5%).
aDults>>
Red: indicates a serious concern; Yellow: indicates a warning; Green: indicates success; Blue:indicatesinsufficientdata
>>>> >>
>>
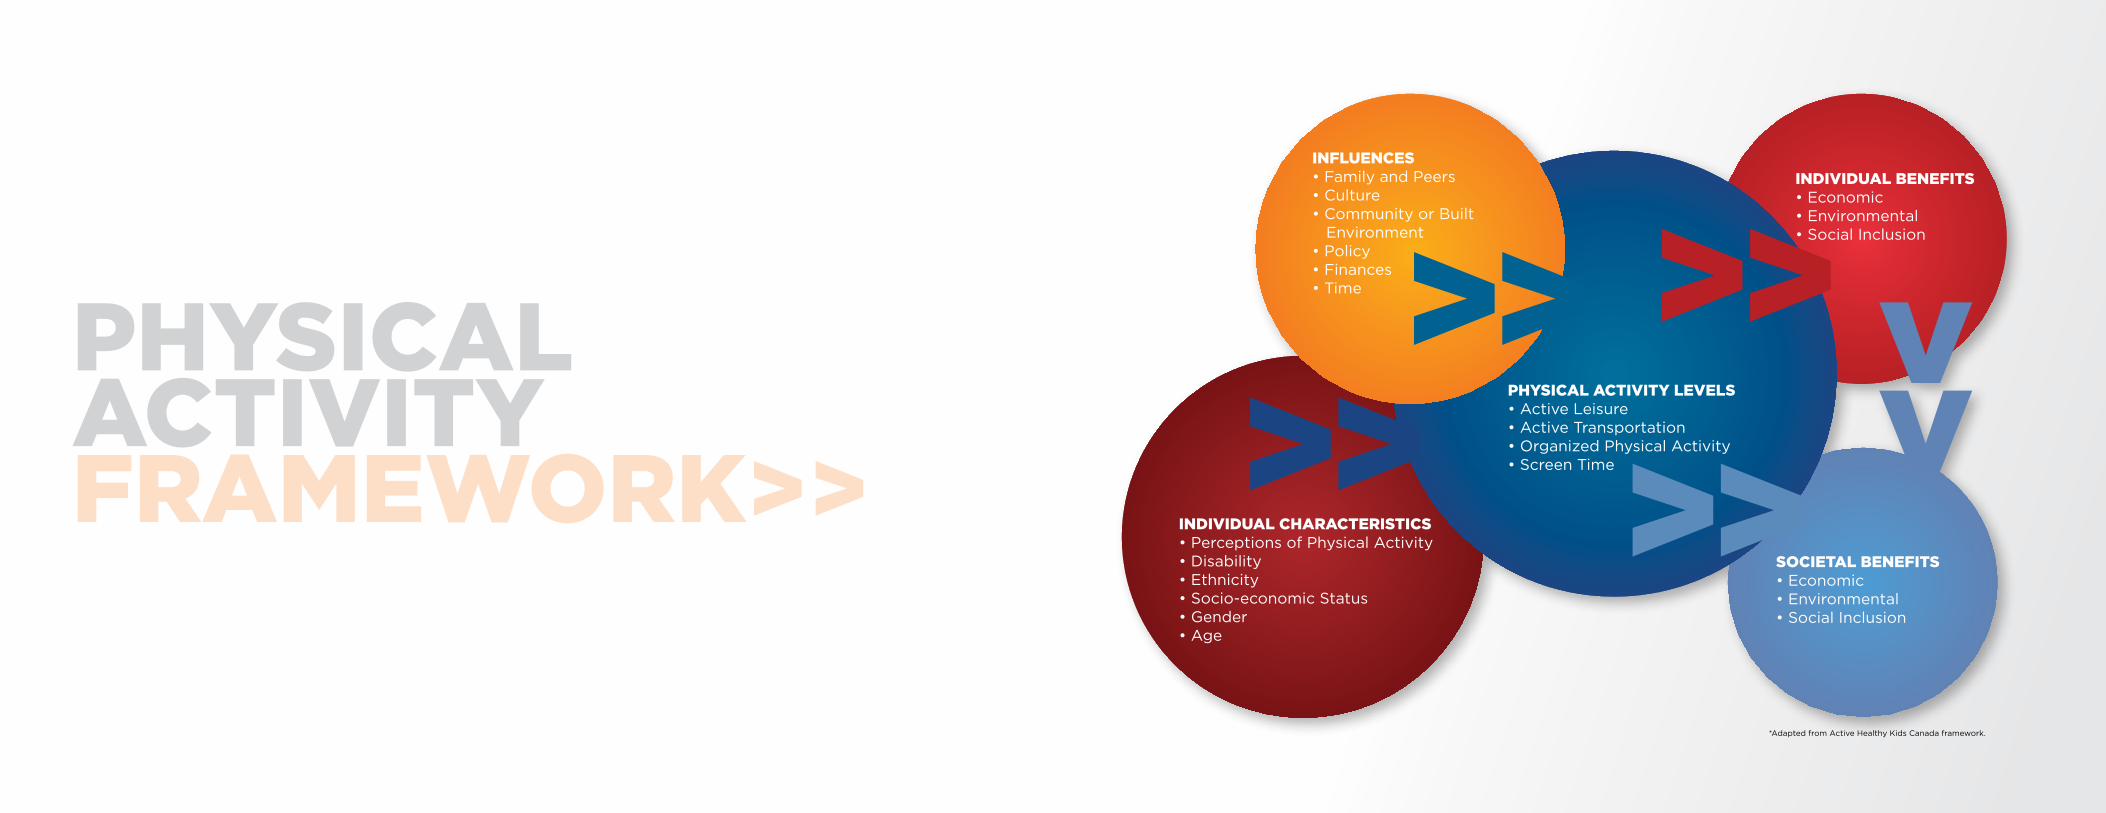
>>INFLUENCES• Family and Peers• Culture• Community or Built Environment• Policy• Finances• Time
PHYSICAL ACTIVITY LEVELS• Active Leisure• Active Transportation• Organized Physical Activity• Screen Time
SOCIETAL BENEFITS• Economic• Environmental• Social Inclusion
INDIVIDUAL BENEFITS• Economic• Environmental• Social Inclusion
INDIVIDUAL CHARACTERISTICS• Perceptions of Physical Activity• Disability• Ethnicity• Socio-economic Status• Gender• Age
physical activity FrameWOrK>>
*AdaptedfromActiveHealthyKidsCanadaframework.
OrGaNiZatiONs:
• Developco-edsportsteamsforallschoolagedsports
• Studyattitudestowardphysicalactivity,especiallyinwomenwhoare
less active
• Researchlowphysicalactivityratesincorrelationwiththesocialdeterminants
of health. How do age, gender, ethnicity, income, and geography affect
physical activity levels?
• ResearchtheuniquebarriersToronto’snewcomerpopulationsfacewith
regard to physical activity
• Designprogramsandinitiativestoaddresslowphysicalactivityratesin
specific Toronto population groups. To enhance your impact, consider part-
nering with other organizations that focus on the groups you want to reach
• Createphysicalactivityprogramsthatengagewholefamilies
• UseGATdatainfundingapplicationsforprogramsandinitiativesthat
will increase activity
• Sponsorphysicalactivityprogramsandinitiativesinyourcommunity
• Implementwellnessprogramsandincentivesinyourworkplace
• Needtosupportandeducateteachersandphysicalactivityleaderson
the importance of inclusive physical activity that promotes healthy
living opportunities for children and youth living with disabilities (need
for workshops and events)
iNDiviDuals:
• Createopportunitiestobephysicallyactive—onthewaytowork/school/
home, and at work/school/home
• Findanactivityyouenjoy;makephysicalactivityFUN
• Bephysicallyactivewithafriend
• Setahealthgoalthatincludesactivityandaskyourphysiciantotrackit
a NOte ON the sOcial DetermiNaNts OF health
HealthCanadadefinestheSocialDeterminantsofHealthas:incomeand
social status, social support networks, education and literacy, employment/
working conditions, social environments, physical environments, personal
health practices and coping skills, healthy child development, biology and
genetic endowment, health services, gender, and culture.
How do these factors shape opportunities for and barriers to physical activity
inToronto?Dr.ParissaSafai,atYorkUniversityhasbeenreflectingonthisquestion.
aN eXcerpt:
Change Rooms and Change Agents: The Struggle against Barriers to Opportu-
nities for Physical Activity and Sport in Ethnocultural Communities in Toronto
ParissaSafai
York University
“What are the lived barriers experienced by racial, ethnic, religious, and
linguistic minorities and migrants in the city, broadly, and around physical
activity and health specifically?
Immigrants to Canada face particular challenges in sport and physical activity.
Doherty and Taylor (2007) interviewed 85 youth who had recently moved to
Canada, and found that they face a number of barriers to full participation
in sport. These include language and cultural differences, social exclusion,
school and/or part-time work, family commitments, financial cost, and cultur-
ally specific issues such as the appropriateness of required clothing. Many of
these barriers are affected by gender, with women generally regarding them
as more significant constraints than men (see also Nakamura, 2002).
Sport and physical activity is a site where social inclusion and mutual obligation
can occur in the city yet relatively little is known about the potential effects
of sport and physical activity on genuine and long-lasting community inclusion
recOmmeNDatiONs>>
and the conditions needed for
the effective and long-term
utilization of sport and physical
activity for community inclu-
sion and engagement. This in
spite of the consistent evidence
that newcomers in Toronto
experience heightened levels of
unemployment and workplace
discrimination, higher rates of
poverty, higher rates of food
insecurity, increased incidence
of illness (e.g., diabetes), and
greater social marginalization
(Toronto’s Vital Signs® Reports
2009 and 2010, Toronto Community Foundation). With regard to sport and
physical activity, the recent report from Get Active Toronto (YMCA of Greater
Toronto, 2010) — a collaborative effort between the city and several public-
private entities — identified a number of disturbing trends around physical
activity participation for ethnocultural groups… More importantly, the report
identified the lack of sufficient data around physical activity participation for
visible minorities and newcomers in Toronto.”
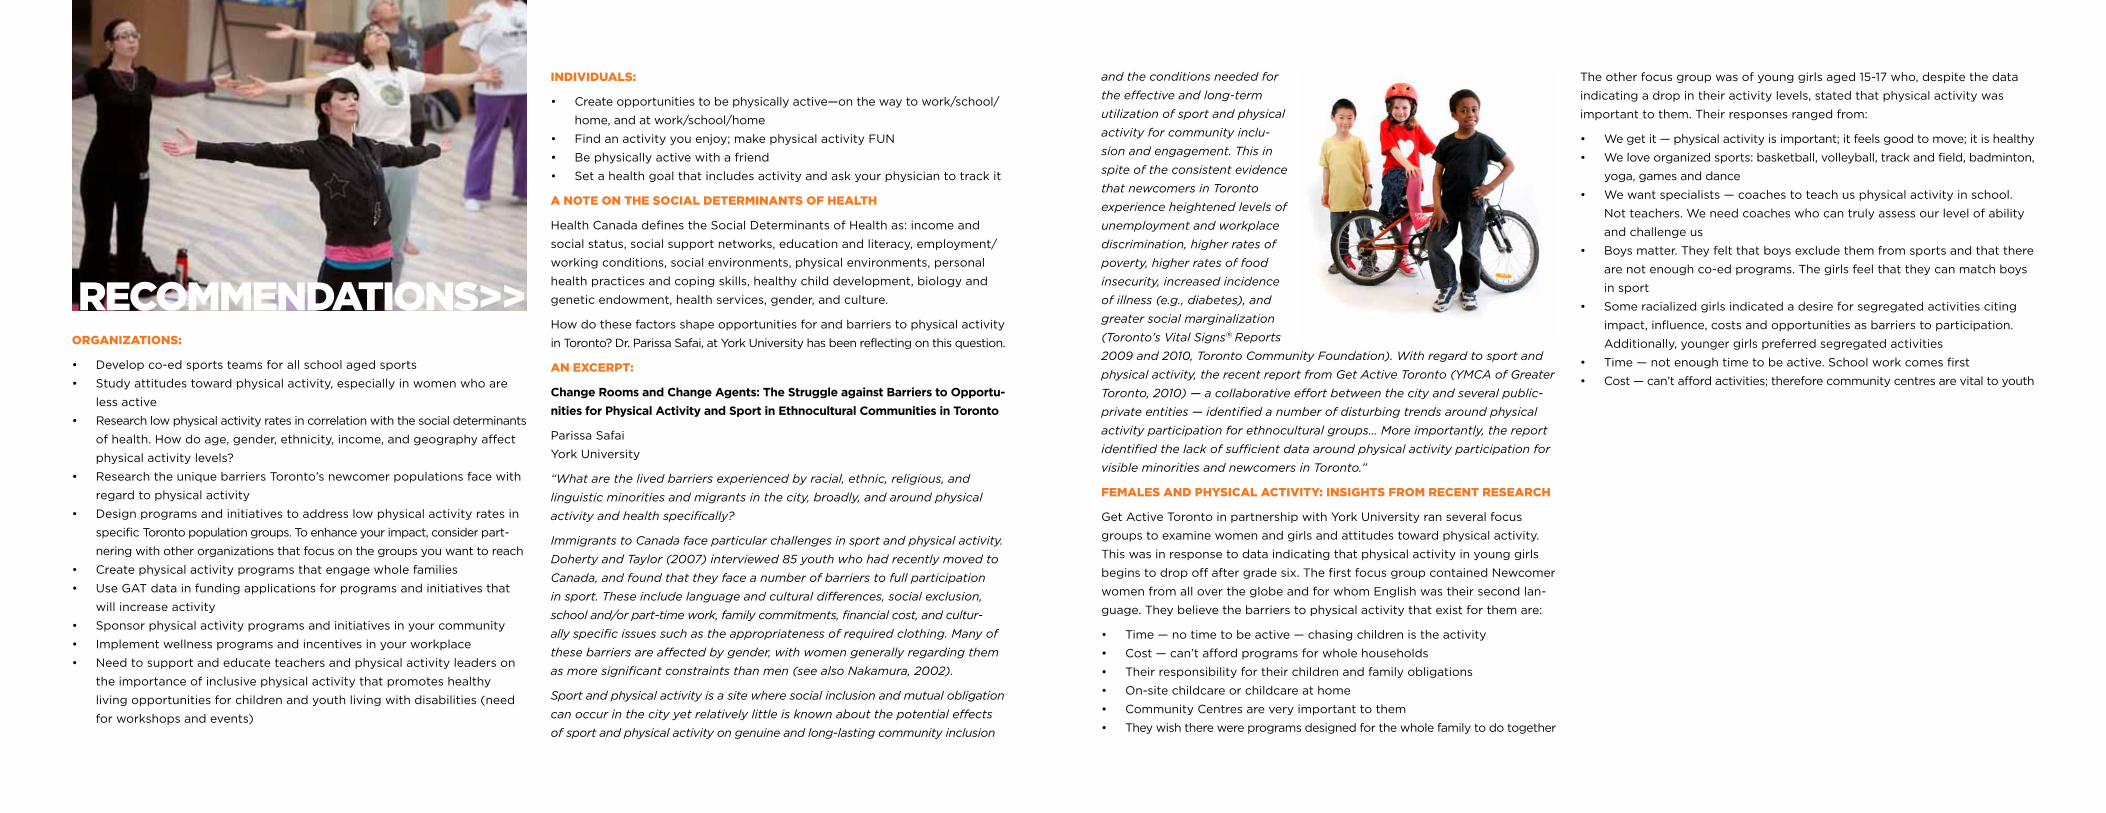
Females aND physical activity: iNsiGhts FrOm receNt research
Get Active Toronto in partnership with York University ran several focus
groups to examine women and girls and attitudes toward physical activity.
This was in response to data indicating that physical activity in young girls
beginstodropoffaftergradesix.ThefirstfocusgroupcontainedNewcomer
womenfromallovertheglobeandforwhomEnglishwastheirsecondlan-
guage. They believe the barriers to physical activity that exist for them are:
• Time—notimetobeactive—chasingchildrenistheactivity
• Cost—can’taffordprogramsforwholehouseholds
• Theirresponsibilityfortheirchildrenandfamilyobligations
• On-sitechildcareorchildcareathome
• CommunityCentresareveryimportanttothem
• Theywishtherewereprogramsdesignedforthewholefamilytodotogether
Theotherfocusgroupwasofyounggirlsaged15-17who,despitethedata
indicating a drop in their activity levels, stated that physical activity was
important to them. Their responses ranged from:
• Wegetit—physicalactivityisimportant;itfeelsgoodtomove;itishealthy
• Weloveorganizedsports:basketball,volleyball,trackandfield,badminton,
yoga, games and dance
• Wewantspecialists—coachestoteachusphysicalactivityinschool.
Notteachers.Weneedcoacheswhocantrulyassessourlevelofability
and challenge us
• Boysmatter.Theyfeltthatboysexcludethemfromsportsandthatthere
are not enough co-ed programs. The girls feel that they can match boys
in sport
• Someracializedgirlsindicatedadesireforsegregatedactivitiesciting
impact, influence, costs and opportunities as barriers to participation.
Additionally, younger girls preferred segregated activities
• Time—notenoughtimetobeactive.Schoolworkcomesfirst
• Cost—can’taffordactivities;thereforecommunitycentresarevitaltoyouth
cultureliNK settlemeNt services aND the
tOrONtO cyclists uNiON
Project Name: The Partnership for Integration and Sustainable Transportation
ThePartnershipforIntegrationandSustainableTransportationisajoint
initiativeofCultureLinkSettlementServicesandtheTorontoCyclistsUnion.
Workingwithcitizens,communitygroups,bikeshopsandtheCityofToronto,
this initiative promotes the integration of newcomers in the Greater Toronto
Area by promoting cycling as an affordable, healthy, safe and convenient
transportation option. The group encourages newcomers to engage in cycling
advocacy, a gateway to broader civic engagement in their new communities.
Guided by values of sustainability, empowerment, equity, inclusion, health,
social justice, and cultural competence, they promote cycling in an inclusive,
friendly and inviting manner.
AcornerstoneoftheinitiativeistheTorontoCyclistsHandbook,amanual
for safe, comfortable cycling in Toronto. It covers the rules of the road, bike
parts and maintenance, dressing for the weather, community resources and
more.WiththesupportoftheVitalTorontofundattheTorontoCommunity
Foundation,theTorontoCyclistsHandbookisavailablein17languages.
The group holds free workshops and has also launched a “bike host” program,
which matches newcomers with established Toronto cyclists. Host cyclists
help familiarize newcomers by showing them the easiest and safest roots, and
sourcesforaffordablebikesandequipment.ThePartnershipforIntegrationand
SustainableTransportationinitiativehasbeensosuccessfulinTorontothat
themodelisnowbeingadoptedandadaptedbyvariousVancouver-based
cycling groups.
saN rOmaNOWay revitaliZatiON assOciatiON
Project Name: Strong Women
StrongWomenisaninnovativenewprogramthataddressesanimportant
servicegapintheSanRomanowayandwiderJane/Finchcommunityby
bringing age-appropriate recreational opportunities to girls and young
womenages13–18.WiththesupportoftheVitalTorontoFundattheToronto
CommunityFoundation,StrongWomenprovidesyoungwomenfromthis
area with recreational and leadership opportunities that encourage lifelong
healthy living; it does so in a girls-only setting, which is rare in Toronto.
ThroughStrongWomen,thisgroupofyouthdevelopsanunderstanding
of the importance of fitness and recreation, knowledge of proper fitness
techniques and nutrition, improved physical fitness, peer mentoring skills,
experience planning recreational activities, and increased self confidence.
The program combines structured training with youth-directed activities,
encouraging participants to feel a sense of ownership over the program
Participants’storiesindicatethatStrongWomenhaschangedthelivesof
many young women living in this community.
FlemiNGtON parK pareNts assOciatiON - tOrONtO
Project Name: Educate the Residents to Advocate for Healthier Community
AccesstohealthyfoodisanongoingchallengeinToronto’sFlemingdon
Parkarea,withresidentshavingtotravelconsiderabledistancestobuy
food. To help promote a community-driven response to this problem, the
FlemingdonParkParentsAssociation(FPPA)hasinitiatedaprocessthat
will bring local politicians and community members together to work on
it’s time tO Get active tOrONtO>>
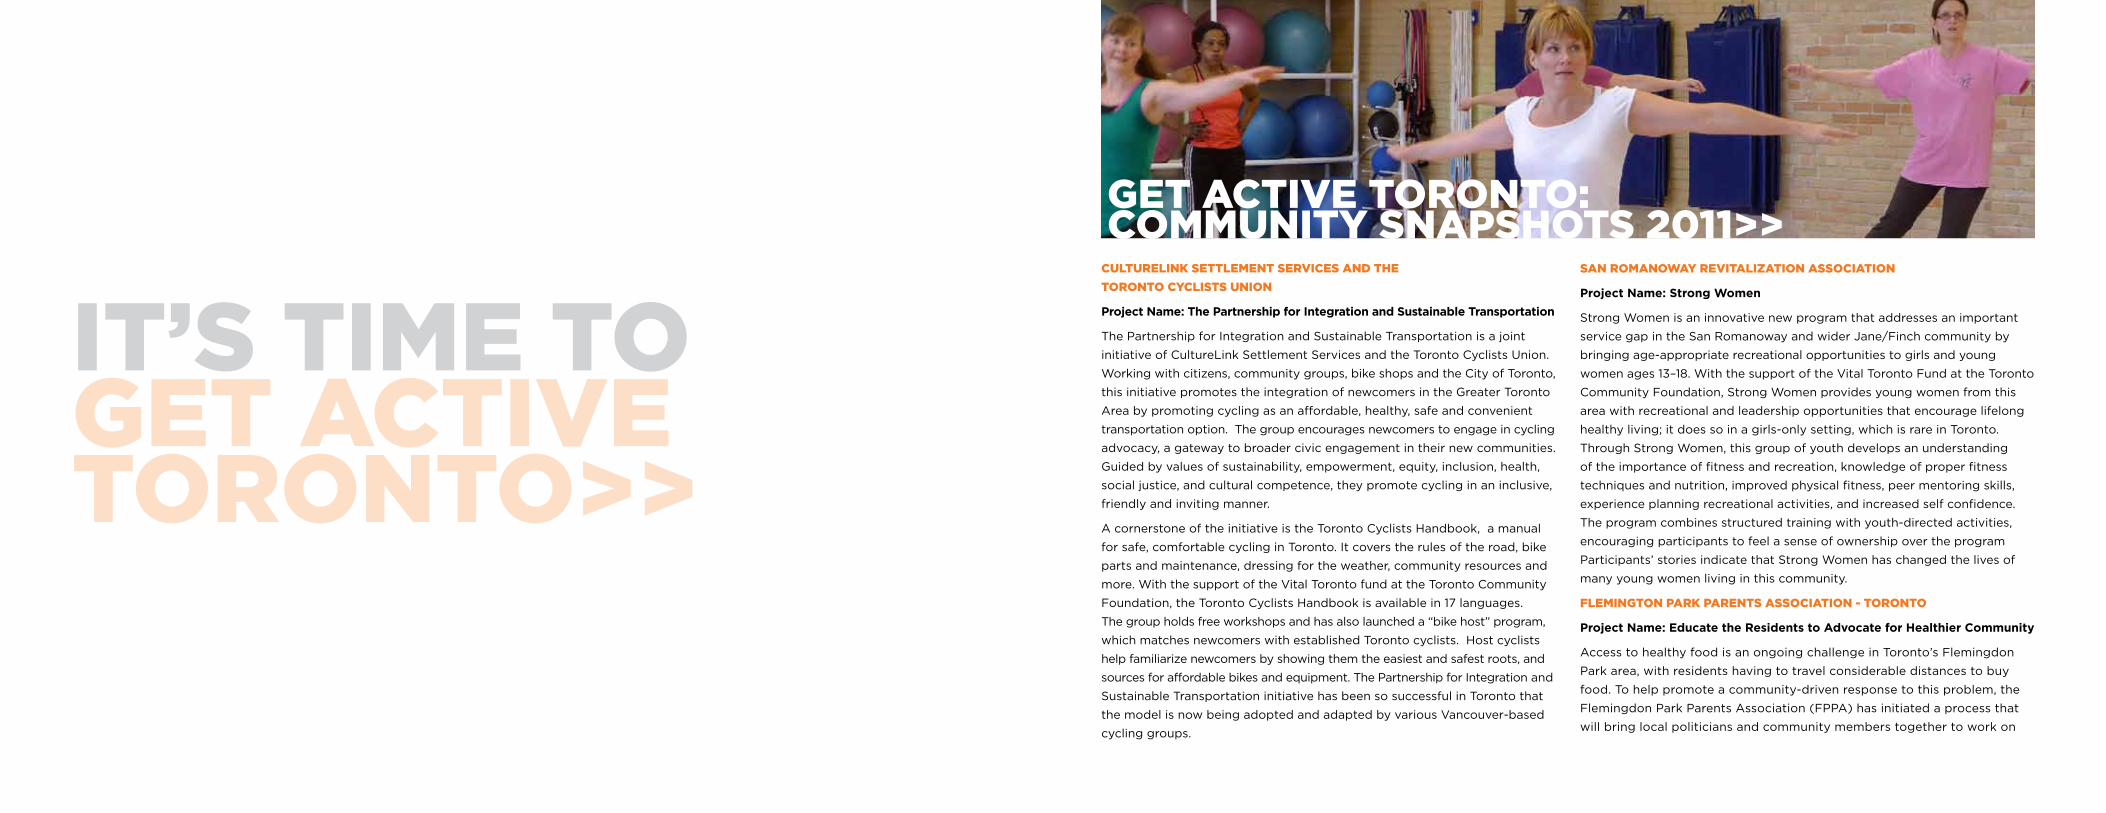
Get active tOrONtO: cOmmuNity sNapshOts 2011>>
improvingresidents’accesstofresh,healthyfood.WithapreviousSpark
grant,theFlemingdonParkParentsAssociationworkedwithschool
councils,studentcouncilsandemployeesofToronto’sParksandRecreation
Departmenttoimprovearearesidents’accesstoaneighbourhoodswimming
pool,arenaandsoccerfield.TheFPPAseesthesecommunityresourcesas
integral parts of school physical education programs, and supports that can
helplocalresidents’effortstolivehealthy,activelifestyles.TheFPPAadvo-
cated not only for access to recreation infrastructure, but also for affordable
and accessible programs. One concrete outcome of the process was that for
thefirsttime,thecity’sParks,ForestryandRecreationdepartmentopened
on-siteregistrationforlocalresidents–aserviceforwhichtherewashuge
demand.ThiswasahugesuccessforthecommunityandfortheFPAA.This
process caused many residents, including children and youth, to become
more involved in the local community, and increased their sense of empow-
erment and engagement with respect to neighbourhood issues.
try the y
TheYMCAofGreaterTorontorecognizesthatpeople’slife-stagesandcir-
cumstances can have a profound effect on their access to active recreation
opportunities. The most common barriers to activity are a lack of funds
topursuerecreationalopportunitiesandalackoftime.Peoplewithlower
incomes are especially likely to say they avoid physical activity because they
feelsociallyisolated,embarrassedorintimidated.Byremovingevenoneof
thesebarrierstophysicalactivity,theYMCAbelievesthatitcansubstantial-
ly increase the likelihood that people will pursue more active lifestyles and
improve their own health.
InJanuary2011,theYMCAofGreaterTorontoofferedtwo-weektrialpasses
to anyone interested in trying out the programs and services offered at one
ofeightHealth,FitnessandRecreationCentresintheGreaterTorontoArea,
fourofwhicharelocatedintheCityofToronto.Theofferwillbeavailableuntil
June30,2011.ForthefourHFRcentresinToronto,11,730individualsand344
familiesaccessedthefreetwo-weektrialpassbetweenJanuary1,2011–April3,
2011.Havingtakenthisfirststep,andbecomeawareoftheYMCA’sfinancially
assistedmembershipoptions,theYMCAbelievesthatmanyoftheseindividuals
and families will be on track toward more active, healthy lifestyles.
prOGram Name: playGrOuND activity leaDers iN
schOOls (p.a.l.s.)
PlaygroundActivityLeadersinSchools(P.A.L.S.)isaplaygroundleadership
program that encourages children to participate in fun and safe playground
activitiesregardlessoftheirgender,size,orability.Introducedin2006-2007
in response to low levels of physical activity among children and youth in
Toronto,theP.A.L.S.initiative,nowactivein80schools,trainsschoolstaff
and students to implement activities to increase physical activity in their
schools.StaffmembersvolunteertoreceivetrainingfromaPublicHealth
Nurse,thenrecruitandtrainstudentvolunteersfromgrades4to8toplan
and lead fun and safe playground activities for students in the primary
gradesduringrecessandlunchbreaks.Eachparticipatingschoolreceivesa
‘toolbox’filledwithinstructionalpamphletsonconductingoutdooractivi-
ties, as well as informative posters and inexpensive equipment.
Feedbackfromparticipatingschoolsindicatesthattheprogramhasbeen
verysuccessful.SchoolsthatruntheP.A.L.S.programhaveobserved
increased physical activity; decreased playground conflict and bullying;
increased leadership ability and self-esteem in students; improved communi-
cation, problem-solving, organization, and cooperation; and increased interaction
between primary and junior grades. The initiative has been so successful that it is
currentlyexpandingtoincludeFrenchImmersionschoolsacrossToronto.P.A.L.S.
schoolsarealsoconsideringusingtheirP.A.L.S.–trainedstudentleadersinother
venues, such as breakfast programs.
FOr mOre cOmmuNity sNapshOts visit:
WWW.GetactivetOrONtO.cOm
GARDINER EXPY WQUEEN ST WCOLLEGE ST
BLOOR ST WGERRARD ST W
O’CONNOR DR
EGLINTON AVE E
ELLESMERE RD
HWY 401 E
LAWERENCE AVE W
SHEPPARD AVE W
STEELES AVE W
FINCH AVE W
HWY 407 W
DA
NF
OR
TH
RD
0 2.5
KILOMETERS
5
KING
STON
RD
DO
N V
AL
LE
Y P
KY
S
VIC
TO
RIA
PA
RK
AV
E
BIR
CH
MO
UN
T R
D
BR
IML
EY
RD
MA
RK
HA
M R
D
MID
LA
ND
AV
E
WA
RD
EN
AV
E
BA
YV
IEW
AV
E
YO
NG
E S
T
KIP
LIN
G A
VE
MA
RT
IN G
RO
VE
RDRE
NF
OR
TH
DR
HW
Y 4
27
EX
PY
N
HW
Y 4
27
N
SC
AR
LE
TT
RD
RO
YA
L Y
OR
K R
D
HW
Y 4
00
S
BLACK CREEK DR
REXDALE BLVD
ALBION RD
ST CLAIR AVE W
RATHBURN RD
DIXON RD
PercentofPopulation12+
PhysicalActivityIndex
High
Average
Low
Highways
Major Roads
Source:EnvironicsAnalytics.Estimatesbasedon2007—08CanadianCommunityHealthSurveydata.
Get active tOrONtO estimateD relative level OF physical
activity FOr tOrONtO NeiGhBOurhOODs
©2011EnvironicsAnalytics.Based,inpart,oncomputerfileslicensedfromStatisticsCanadaunderLicensingAgreement6894.NoconfidentialinformationwasprovidedbyStatisticsCanada.PRIZMandselectedPRIZMC2nicknamesaretrademarksofNielsenClaritasServices,TheNielsenCompany(U.S.)andareusedwithpermission.
creDits:
Chair:
JanKestle–President,EnvironicsAnalytics
Report:
DougNorris–PhD.,SeniorVPandChiefDemographer,
EnvironicsAnalytics
NadienGodkewitsch–ProgramOfficer,TorontoCommunity
Foundation
MattMayer–SeniorSpecialist,MissionInformation,Mission
ContentTeam,HeartandStrokeFoundationofOntario
CindyDuval–ProjectManager,ResearchCoordination&
Support,YMCAofGreaterToronto
ParissaSafai–PhD.,SchoolofKinesiologyandHealth
Science,FacultyofHealth,YorkUniversity
CherylPritlove-MSc.Kinesiology,HealthSciences,YorkUni-
versity.,PhD.candidate.
KellyArbour-Nicitopoulos–PhD.,HealthandExercise
PsychologyfacultyofPhysicalEducationandHealth,
University of Toronto
JoyceBernstein–PhD.,Epidemiologist,CityofToronto
PublicHealth
VirginiaDimoglou–ProjectManager,ResearchCoordination
&Support,YMCAofGreaterToronto
SallyErling–ResearchCoordinator,ResearchandInformation
Services,TorontoDistrictSchoolBoard
JillValentine–DevelopmentManager,ParasportOntario
CatrionaDelaney–Manager,GetActiveToronto
sOurces:
• CityofToronto2010BicycleCounthttp://www.toronto.ca/cycling/pdf/
bicycle_count_report_2010.pdf
• TorontoWalkingStrategyhttp://www.toronto.ca/transportation/walking/
walking_strategy.htm
• TorontoBikePlanhttp://www.toronto.ca/cycling/bikeplan/index.htm
• CityofToronto.2009.Lawrence-AllenCyclingandWalkingStudy.Draft
Report, available from http://www.toronto.ca/planning/lawrence_allen.htm
• TorontoBicycle/Motor-VehicleCollisionStudy(2003)http://www.to-
ronto.ca/transportation/publications/bicycle_motor-vehicle/index.htm
• Reynoldset.al.2010.ActiveTransportationinUrbanAreas:Exploring
HealthBenefitsandRisks.NationalCollaboratingCentreforEnviron-
mental Health. http://www.ncceh.ca/sites/default/files/Active_Transpor-
tation_in_Urban_Areas_June_2010.pdf
• VictoriaTransportPolicyInstitute.HealthandFitness:StrategiesThat
ImprovePublicHealthThroughPhysicalActivity.TDMEncyclopedia.
Lastupdated13December2010,http://www.vtpi.org/tdm/tdm102.htm
• MakingthecaseforActiveTransportationhttp://www.cflri.ca/eng/ac-
tive_transportation/index.php
• 2009SurveyofPhysicalActivityinCanadianMunicipalities:Municipal
OpportunitiesforPhysicalActivityhttp://www.cflri.ca/eng/statistics/sur
veys/2009PhysicalActivityMonitorMunicipalities.php
• Fuller,D.2010.PhysicalActivityLevelsRelatedtoanUrbanBicycleShar-
ingProgram:BIXIMontreal.AlbertaCentreForActiveLivingResearch
Update 17(4): 1-2. http://www.centre4activeliving.ca/publications/
research-update/2010/dec-urban-bicycle.pdf
• TDSBAthleticsParticipationbyGender(2005-2010)
• TDSBAthleticsParticipationRatesbySportsSeason2005-10
• TDSBStudentcensusdata
• Metrolinx
• PhysicalactivityofCanadianadults:Accelerometerresultsfromthe2007
to2009CanadianHealthMeasuresSurvey,byRachelC.Colley,Didier
Garriguet,IanJanssen,CoraL.Craig,JanineClarkeandMarkS.Tremblay
• PhysicalactivityofCanadianchildrenandyouth:Accelerometerresults
fromthe2007to2009CanadianHealthMeasuresSurvey,byRachelC.
Colley,DidierGarriguet,IanJanssen,CoraL.Craig,JanineClarkeand
MarkS.Tremblay
• TorontoVitalSigns®,TorontoCommunityFoundation,2010,www.tcf.ca/
vitalinitiatives/vitalsigns.ca
• SchoolConnectedness–GuyFaulkner–July2007
• RecreationResearchandMulticulturalCommunitiesOutreachProject
• ResultsfromtheBuiltEnvironmentAndActiveTransport(BEAT)Project,
MichelleStone,PhD.andGuyFaulknerPhD.,UniversityofToronto
• Adolescentgirlsperceivedbarrierstoparticipationinphysicalactivity,
2006DwyerJJ,AllisonKR,GoldenbergER,FeinAJ,YoshidaKK,Boutilier
MA., University of Guelph
larGe surveys/ceNsus
• CanadianCommunityHealthSurveySurveysdonein2003,2005and
2007/08
• 2007/08.SampleSizeforTorontoAges12-19was461;Ages12+was
4415)
• 2006Census
• TorontoDistrictSchoolBoardStudentCensusSurvey2006:Grades7-8
and Grades 9-12
• 2008TorontoDistrictSchoolBoardParentCensusSurvey,Kindergarten
toGrade6
small lOcal surveys
• CityofToronto2009RecreationandPhysicalFitnessMunicipalSurvey
(Ipsos Reid; sample size 300)
• CityofTorontoCyclingStudyTrackingReport(1999and2009)
(Ipsos Reid; sample size 1000)
• 2009EnvironicsSurveyModuleforGetActiveToronto(sample500)
• GettingServicesRightforTorontonianswithDisabilities:Demographics
andServiceDeliveryExpectations.2006SurveydoneforToronto
Parks,ForestryandRecreation(667respondentstosampleofprogram
participants identified by agencies)
aDmiNistrative prOGram Data
• TorontoDistrictSchoolBoardStudentadministrativedata
• TorontoParks,ForestryandRecreationadministrativeprogramdata
• YMCAGTAprogramdata
Other stuDies
• PhysicalActivityandDiabetes,Chapter7inNeighbourhoodEnvironments
andResourcesforHealthyLiving—AFocusonDiabetesinToronto,ICES
Atlas.Toronto:InstituteforClinicalEvaluativeSciences;2007.
• “ActiveschooltransportationintheGreaterTorontoArea,Canada:An
explorationoftrendsinspaceandtime(1986–2006)”RonN.Buliung,
RaktimMitra,GuyFaulkner,JournalofPreventiveMedicine,2009.Data
derivedfromTransportationTomorrowSurvey(TTS);samplesize4000
in2006
Get active tOrONtO GOverNiNG chair:
MedhatMahdy,President&CEO,YMCAofGreaterToronto
strateGic caBiNet memBers:
TomAnselmi,ExecutiveVicePresidentandCOO,MapleLeafSportsandEntertainment
RahulBhardwaj,President&CEO,TorontoCommunityFoundation
Dr.DavidMcKeown,MedicalOfficerofHealth,CityofToronto,DepartmentofPublicHealth
the Get active tOrONtO GOverNiNG BOarD