3-d seismic structure of kii peninsula in southwest japan: evidence for slab dehydration in the...
TRANSCRIPT

www.elsevier.com/locate/tecto
Tectonophysics 364 (2003) 191–213
3-D seismic structure of Kii Peninsula in southwest Japan:
evidence for slab dehydration in the forearc
Mohamed K. Salah*, Dapeng Zhao
Geodynamics Research Center, Ehime University, Matsuyama 790-8577, Japan
Received 15 May 2002; accepted 12 February 2003
Abstract
Kii Peninsula is located in the forearc region of southwest Japan and has distinct structural and tectonic features
characterized by high seismicity in the crust and the subducting Philippine Sea slab, high surface heat flow, high 3He/4He
isotopic ratio, and a local change in the geometry of the subducting slab. We have tried to determine detailed 3-D P and S
wave velocity structures of this region using a large number of high-quality arrival time data recorded by dense seismic
networks on the Japan Islands. From the obtained seismic velocities, we further estimated 3-D distributions of Poisson ratio,
crack density, saturation rate and porosity parameter in the study area. Our results show significant heterogeneities in the
crust and upper mantle wedge characterized by low seismic velocities, high Poisson ratio, high values of crack density,
saturation rate and porosity. These results suggest the existence of fluids in the crust and mantle wedge resulting from the
dehydration of the subducting Philippine Sea slab, which can explain the observed geophysical and geochemical features in
Kii Peninsula.
D 2003 Elsevier Science B.V. All rights reserved.
Keywords: Kii Peninsula; Seismic tomography; Crack density; Saturation rate; Poisson ratio; Porosity parameter
1. Introduction and Nagasaki, 1996). The difference in arc orientation
The Kii Peninsula is located in the forearc region
of the Southwestern Japan Arc, where the Philippine
Sea plate has been subducting northwestward beneath
the Eurasian plate since the Middle Miocene (Fig. 1).
The Philippine Sea plate resumed subduction at ca. 6
Ma after a halt or slowdown of subduction during the
period 10–6 Ma (Kamata and Kodama, 1994; Itoh
0040-1951/03/$ - see front matter D 2003 Elsevier Science B.V. All right
doi:10.1016/S0040-1951(03)00059-3
* Corresponding author. Tel.: +81-89-927-9652; fax: +81-89-
927-9640.
E-mail address: [email protected] (M.K. Salah).
led to oblique subduction of the Philippine Sea plate
beneath the Southwest Japan Arc through the Nankai
Trough and normal subduction beneath the Ryukyu
Arc through the Ryukyu Trench (Fig. 1b). One of the
major geologic events in the Southwest Japan Arc is
the acceleration of dextral-fault movement along the
Median Tectonic Line (MTL) which extends 900 km
in an east–west direction (Kamata and Kodama,
1999).
Geophysical and geochemical studies of the region
yield basic clues to the understanding of the tectonic
framework and suggested that the Kii Peninsula is a
special region in southwest Japan. Seismological
s reserved.

Fig. 1. (a) Distribution of active and Quaternary volcanoes on the Japan Islands. Curved lines show the trenches, which represent the major plate
boundaries around the Japanese region. Black square shows the present study area. (b) Index map showing the tectonic framework around the
Japanese Islands (after Kamata and Kodama, 1999). HVZ, Hohi Volcanic Zone; MTL, Median Tectonic Line.
M.K. Salah, D. Zhao / Tectonophysics 364 (2003) 191–213192

M.K. Salah, D. Zhao / Tectonophysics 364 (2003) 191–213 193
monitoring has been carried out in the region (Mizoue
et al., 1971, 1983; Nakamura, 1992). Mizoue et al.
(1971) detected seismic reflectors in the crust. Mizoue
et al. (1983) mapped seismicity in detail and found
that earthquake foci cluster at three different depths.
Magnetotelluric measurements by Fuji-ta et al. (1997)
revealed two upper crustal anomalies: one is a sub-
horizontal conductive layer dipping northwest, at
depths of 5–10 km; the other is a resistive block at
depths of 2–15 km. The former is interpreted as a
flysh unit, whereas the latter is consistent with the
high-velocity structure detected by refraction experi-
ments and may be a lost continental fragment of the
Kuroshio paleoland. Sano and Wakita (1985) and
Wakita et al. (1987) studied the geographical distri-
bution of the 3He/4He ratio in the Kinki district which
is located in the southwestern corner of Kii. They
found that the ratio in Kinki is strikingly different
from those found in the rest of the Japanese Islands,
including Shikoku which lies next to Kinki. They
suggested the presence of a shallow magma body
beneath the area from observations of high emanation
of 3He of magmatic origin, high-temperature hot
springs, high terrestrial heat flow, hypocentral distri-
bution of microearthquakes, a local irregularity in the
geometry of the subducting Philippine Sea plate, and
the presence of molten materials inferred from the
characteristic phases of reflected waves in seismo-
grams. Seno et al. (2001) studied the seismicity in the
subducting Philippine Sea plate beneath southwest
Japan and suggested that, in the Kii Peninsula area,
aqueous fluids released from the serpentinized mantle
may have initiated partial melting in the mantle
wedge, as indicated by the presence of high 3He/4He
ratio in the natural gases and the shallow seismic
swarms in this region (Wakita et al., 1987).
The availability of dense seismic networks in Japan
has allowed us to collect a large number of high-
quality data from local microearthquakes. We applied
a tomography method to body-wave arrival times to
estimate P and S wave velocities and from these we
tried to deduce variations in lithology and physical
properties of rocks. Because rocks with differing
physical states can have similar seismic velocities,
seismic velocity alone is not a sensitive indicator of
variable rock property. For this reason, it is often useful
to consider ratios and products of seismic parameters
to differentiate three-dimensional variations in the sub-
surface. A brief review of how rock properties relate to
seismic velocity and attenuation can be found in
Sanders et al. (1995) and Lees and Wu (2000).
Poisson ratio is a useful indicator of lithology and
geofluids. Its average value is 0.25 for Earth’s crust
and upper mantle (Holbrook et al., 1988). Further-
more, Poisson ratio is sensitive to cracks and their
aspect ratios in rock matrix (Koch, 1992). The product
of compressional and shear wave velocities, VpVs, on
the other hand, has been used to delineate porosity in
sedimentary rocks (e.g. Iverson et al., 1989; Serrano et
al., 2002). It has been observed that lower VpVs
indicates an increase of porosity. O’Connell and
Budiansky (1974) (hereafter we call it OB74) devel-
oped a self-consistent theory that relates changes in
seismic velocity and Poisson ratio to crack density and
saturation rate of rocks. Although many previous
researchers have studied the effects of microcracks
and fluids on elastic properties of rocks and their role
in earthquake dynamics, little work is done to inves-
tigate the in situ status and distribution of cracks and
fluids in the Earth’s crust. The determination of
distributions of cracks and fluids can improve our
understanding of the generating process of large
crustal earthquakes (e.g. Zhao and Mizuno, 1999).
Although tomographic studies for the entire Japan
Islands have been conducted by Zhao et al. (1994,
2000), there has been no detailed tomography study
for the Kii area. Previous studies have shown that the
Kii Peninsula region has distinct structural and tec-
tonic features compared to the rest forearc areas in
southwest Japan. The aim of this work is to determine
detailed three-dimensional structure of seismic veloc-
ity and a few other geophysical parameters and
correlate them with geophysical and geochemical
measurements carried out so far in southwest Japan
to better understand the structure and seismotectonics
of the Japan subduction zone.
2. Data selection
Fig. 2 shows the 3-D distribution of 3648 local
earthquakes that we used in the present study. We
have used 488 aftershocks of the January 17, 1995
Kobe earthquake (M 7.2) recorded by 37 permanent
and 30 portable stations (Fig. 3), 2858 events selected
from the Japan University Network Earthquake Cata-

Fig. 2. 3-D distribution of the 3648 events used in this study.
M.K. Salah, D. Zhao / Tectonophysics 364 (2003) 191–213194
log (JUNEC) (July 1985–December 1994), and 302
events recorded by the High Sensitivity Seismograph
Network (Hi-net) which is installed and maintained by
the National Research Institute for Earth Science and
Disaster Prevention (NIED). These events are located
between latitudes 33–36j5VN and longitudes 134–
137jE, with focal depths shallower than 100 km.
Each event is recorded by at least 10 stations. The
error in the hypocentral location does not exceed 3 km
for all events. We tried to select events that have a
uniform distribution in the study area; however, we
can see that earthquakes tend to cluster in the south-
western corner of Kii Peninsula and along the after-
shock area of the 1995 Kobe earthquake. The majority
of the crustal events have focal depths between 0 and
20 km. Most of the intermediate-depth events are
confined to the southwestern part of the study area
and occurred in the subducting Philippine Sea
slab. These 3648 events generated 92,119 P and
48,600 S arrivals recorded by the seismic stations
shown in Fig. 3. The accuracy of arrival times is better
than 0.1 s for most of the data. The 30 portable
seismic stations are distributed mainly in the after-
shock area of the 1995 Kobe earthquake and were
deployed following the Kobe mainshock (Hirata et al.,
1996). The JUNEC stations are operated by eight
national universities in Japan and are equipped with
short-period and broadband seismographs (Tsuboi et
al., 1989). The NIED Hi-net is a newly established
seismic network (Obara, 2002). Each station consists

Fig. 3. Distribution of Hi-net (solid circles), JUNEC (solid squares) and portable (solid triangles) seismic stations used in the present study.
M.K. Salah, D. Zhao / Tectonophysics 364 (2003) 191–213 195
of a three-component velocity seismometer with a
natural frequency of 1 Hz installed at the bottom of
a borehole with a depth of 100–200 m. The data are
digitized at each station with a sampling frequency of
100 Hz, and then the data packets attached with the
absolute time information from a Global Positioning
System clock are transmitted to the data center
(Obara, 2002). The 3648 events were recorded by a
total of 146 seismic stations in the study area (59
JUNEC stations, 30 Portable stations and 57 Hi-net
stations). We can see that these stations cover the
study area densely and uniformly (Fig. 3).
3. Methods and analysis
In this study, we have used the tomography
method of Zhao et al. (1992a) to determine the 3-
D P and S wave velocity (Vp, Vs) structures in the
study area. Although the conceptual approach of this
method is derived from Aki and Lee (1976), it has
some additional features. The technique can deal
with the complex geometry of seismic velocity
discontinuities existing in the study area such as
the Moho, Conrad or the subducting slab boundary,
and it uses an efficient 3-D ray tracing scheme to
compute travel times and ray paths. We set up a 3-D
grid in the study area with a grid spacing of 15 km
in the horizontal direction, 6–10 and 10–18 km in
depth in the crust and upper mantle, respectively
(Fig. 4). Hypocenter locations and velocities at the
grid nodes are taken as unknown parameters. The
velocity at any point in the model is calculated by
linearly interpolating the velocities at the eight grid
nodes surrounding that point. For details of the
method, see Zhao et al. (1992a, 1994).
The interpretation of tomographic images is not an
easy job. For example, a given velocity anomaly can
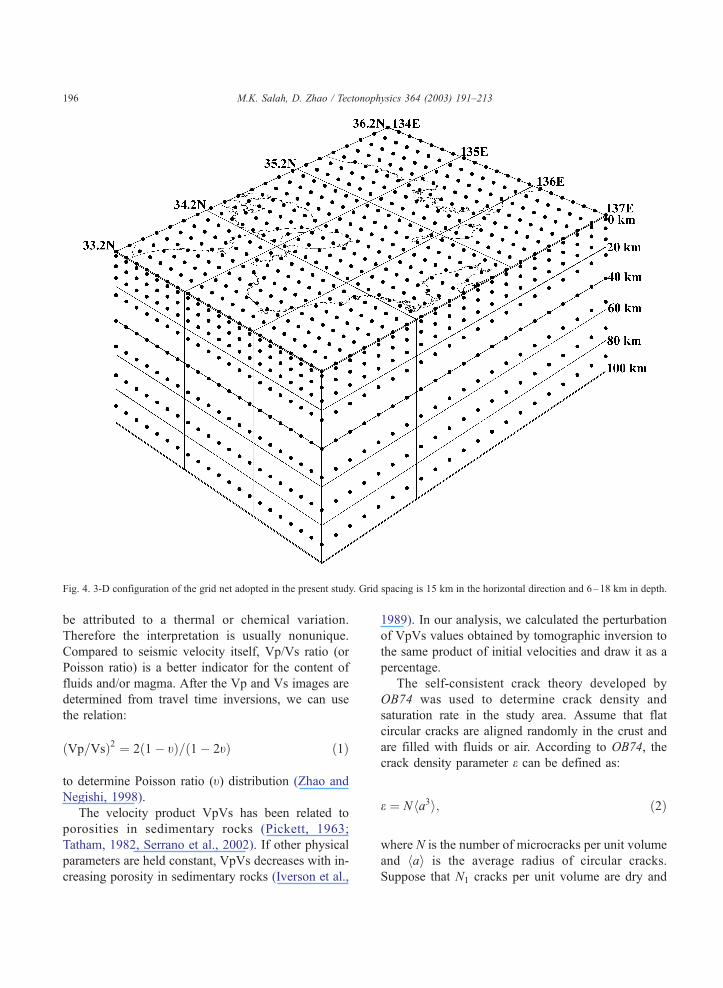
Fig. 4. 3-D configuration of the grid net adopted in the present study. Grid spacing is 15 km in the horizontal direction and 6–18 km in depth.
M.K. Salah, D. Zhao / Tectonophysics 364 (2003) 191–213196
be attributed to a thermal or chemical variation.
Therefore the interpretation is usually nonunique.
Compared to seismic velocity itself, Vp/Vs ratio (or
Poisson ratio) is a better indicator for the content of
fluids and/or magma. After the Vp and Vs images are
determined from travel time inversions, we can use
the relation:
ðVp=VsÞ2 ¼ 2ð1� tÞ=ð1� 2tÞ ð1Þ
to determine Poisson ratio (t) distribution (Zhao and
Negishi, 1998).
The velocity product VpVs has been related to
porosities in sedimentary rocks (Pickett, 1963;
Tatham, 1982, Serrano et al., 2002). If other physical
parameters are held constant, VpVs decreases with in-
creasing porosity in sedimentary rocks (Iverson et al.,
1989). In our analysis, we calculated the perturbation
of VpVs values obtained by tomographic inversion to
the same product of initial velocities and draw it as a
percentage.
The self-consistent crack theory developed by
OB74 was used to determine crack density and
saturation rate in the study area. Assume that flat
circular cracks are aligned randomly in the crust and
are filled with fluids or air. According to OB74, the
crack density parameter e can be defined as:
e ¼ Nha3i; ð2Þ
where N is the number of microcracks per unit volume
and hai is the average radius of circular cracks.
Suppose that N1 cracks per unit volume are dry and
M.K. Salah, D. Zhao / Tectonophysics 364 (2003) 191–213 197
that N2 =N�N1 cracks are saturated, the saturation
rate f is defined as:
f ¼ N2
N: ð3Þ
With such definitions of crack density and saturation
rate, OB74 showed that the shape and aspect ratio of
spheroidal cracks would affect little on the relation
between e, f and seismic velocity. The OB74 theory
predicts the following relations:
K=K ¼ 1� 16
9
1� t2
1� 2t
� �ð1� fÞe; ð4Þ
E=E ¼ 1� 16
45
�1� t2
�3ð1� fÞ þ 4
2� t
� �e; ð5Þ
G=G ¼ 1� 32
45
�1� t
�1� f þ 3
2� t
� �e; ð6Þ
e ¼ 45
16
t � t1� t2
� �
� ð2� tÞ½ð1� fÞð1þ 3tÞð2� tÞ � 2ð1� 2tÞ ; ð7Þ
where K, E, G and t are bulk modulus, Young’s
modulus, shear modulus and Poisson ratio for the
cracked volume, respectively. K, E, G and t are the
same quantities for the uncracked volume. The fol-
lowing general relations hold between seismic veloc-
ity and elastic moduli:
Vp=Vp ¼
ffiffiffiffiffiffiffiffiffiffiffiffiffiffiffiffiffiffiffiffiffiffiffiffiffiffiffiffiffiffiffiffiffið1� tÞð1þ tÞKð1þ tÞð1� tÞK
s; ð8Þ
Vs=Vs ¼ffiffiffiffiffiffiffiffiffiffiG=G
q; ð9Þ
Vp=Vs
Vp=Vs¼
ffiffiffiffiffiffiffiffiffiffiffiffiffiffiffiffiffiffiffiffiffiffiffiffiffiffiffiffiffiffiffið1� tÞð1� 2tÞð1� 2tÞð1� tÞ
s; ð10Þ
where Vp, Vs are P and S wave velocities for cracked
volume. Vp and Vs are velocities for uncracked rocks.
Thus crack density (e) and saturation rate (f) can be
estimated from observed seismic velocity and Poisson
ratio using Eqs. (4)–(10). Zhao and Mizuno (1999)
applied this theory to estimate the 3-D distribution of
crack density and saturation rate in the source area of
the 1995 Kobe earthquake. Since temperature and
lithologic changes would also affect seismic veloc-
ities, one should be careful when applying the OB74
crack theory to tomographic results. Information on
surface heat flow, geotherms, surface geology and
lithology in a study area should be referred to clarify
what are the main reasons for the changes of seismic
velocity. One should be particularly careful for vol-
canic areas where velocity variations may be mainly
caused by high temperature (Zhao et al., 1996).
The crack theory has been further developed since
the work of OB74 by, e.g. Bruner (1976), Davis and
Knopoff (1995) and Takei (2002). They pointed out
that the OB74 theory becomes less accurate for cases
of large crack density. However, our tomography
shows that the changes of seismic velocities (Vp, Vs)
are less than 5–6%, which leads to e < 0.25. Hence weconsider the OB74 model is viable for our study area,
at least to the first order. One distinctive advantage of
theOB74model is its conciseness. Therefore we prefer
to use the OB74 model in this work.
4. Results and resolution
The crust and uppermost mantle under our study
area consist of three layers separated by the Conrad
and Moho discontinuities. In the three layers, the
initial values of Vp are 6.0, 6.7 and 7.75 km/s,
respectively. The corresponding values of Vs are
3.5, 3.8 and 4.35 km/s, respectively. The Conrad
depth is 15–18 km, and the Moho depth is 34–35
km in the study area (Zhao et al., 1992b). The lateral
depth variations of the Conrad and Moho discontinu-
ities (Zhao et al., 1992b) were taken into account in
the 3-D ray tracing and the tomographic inversion.
However, we found that the velocity changes due to
the Conrad and Moho depth variations are less than
0.5% in the final tomographic images.
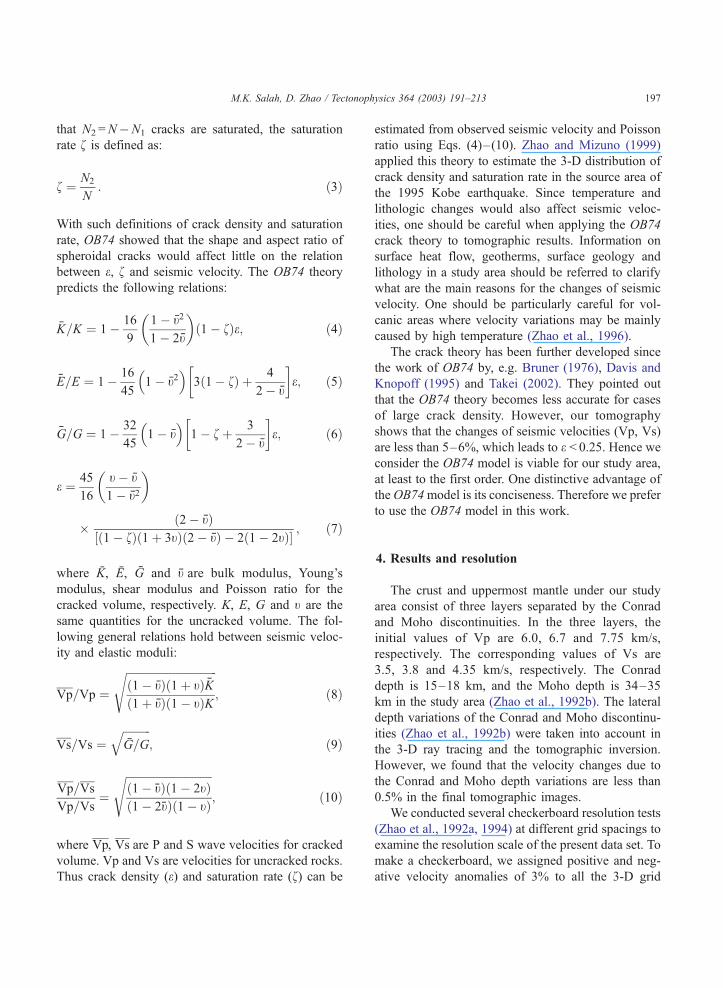
We conducted several checkerboard resolution tests
(Zhao et al., 1992a, 1994) at different grid spacings to
examine the resolution scale of the present data set. To
make a checkerboard, we assigned positive and neg-
ative velocity anomalies of 3% to all the 3-D grid
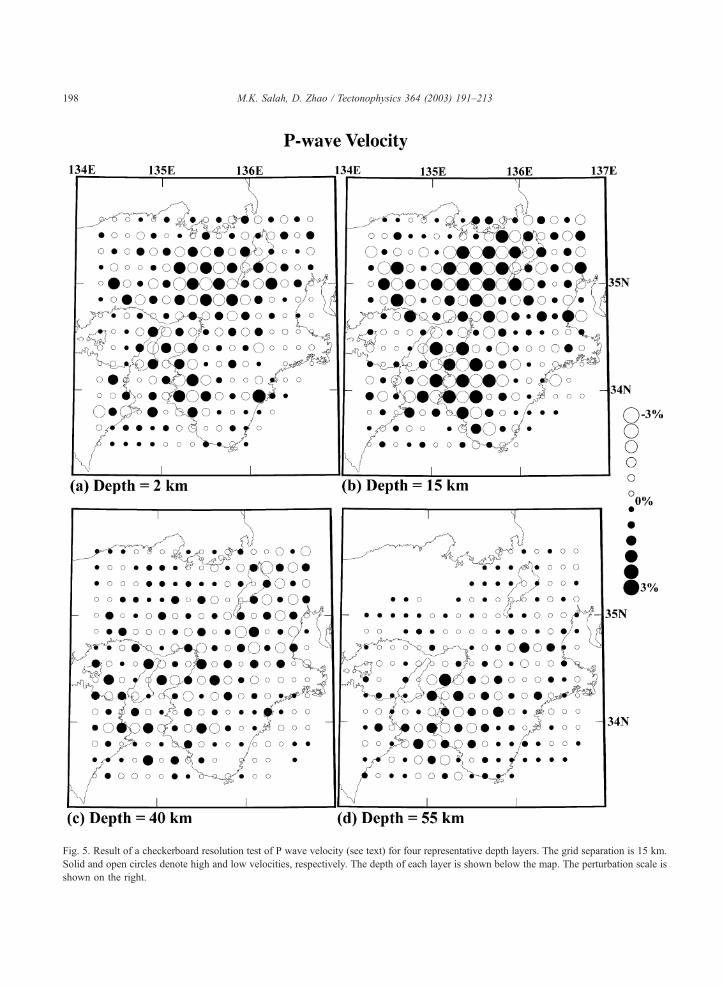
Fig. 5. Result of a checkerboard resolution test of P wave velocity (see text) for four representative depth layers. The grid separation is 15 km.
Solid and open circles denote high and low velocities, respectively. The depth of each layer is shown below the map. The perturbation scale is
shown on the right.
M.K. Salah, D. Zhao / Tectonophysics 364 (2003) 191–213198

Fig. 6. The same as Fig. 5 but for S wave velocity.
M.K. Salah, D. Zhao / Tectonophysics 364 (2003) 191–213 199
Fig. 7. Distribution of P wave velocity images (in %) at four depth slices. The perturbation scale is shown on the right. Circles and crosses
denote low and high velocities, respectively. Star represents the epicenter of the 1995 Kobe mainshock. Thin lines show active faults. MTL is
Median Tectonic Line. The depth to each layer is shown below the map.
M.K. Salah, D. Zhao / Tectonophysics 364 (2003) 191–213200
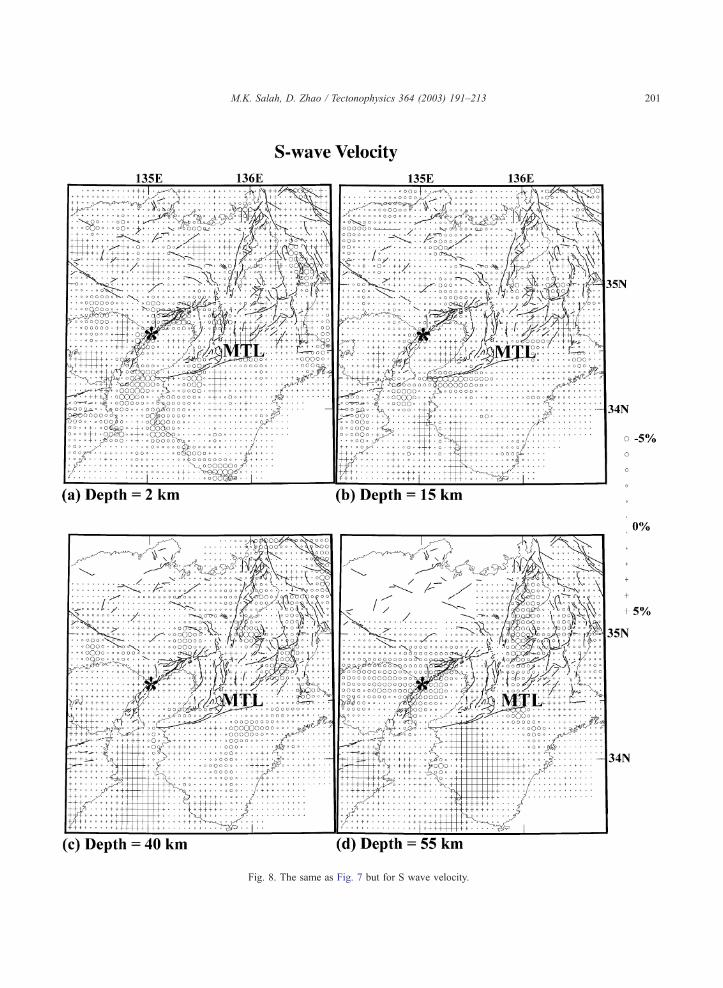
Fig. 8. The same as Fig. 7 but for S wave velocity.
M.K. Salah, D. Zhao / Tectonophysics 364 (2003) 191–213 201

Fig. 9. The same as Fig. 7 but for Poisson ratio. Circles and crosses denote high and low values of Poisson ratio, respectively. The perturbation
scale (from + 10% to � 10%) is shown on the right.
M.K. Salah, D. Zhao / Tectonophysics 364 (2003) 191–213202

Fig. 10. Percent perturbations of VpVs at four crustal layers. Circles and crosses denote low and high values of VpVs, respectively. Star
represents the location of the 1995 Kobe mainshock. Thin lines show active faults. MTL is Median Tectonic Line. The perturbation scale is
shown on the right.
M.K. Salah, D. Zhao / Tectonophysics 364 (2003) 191–213 203
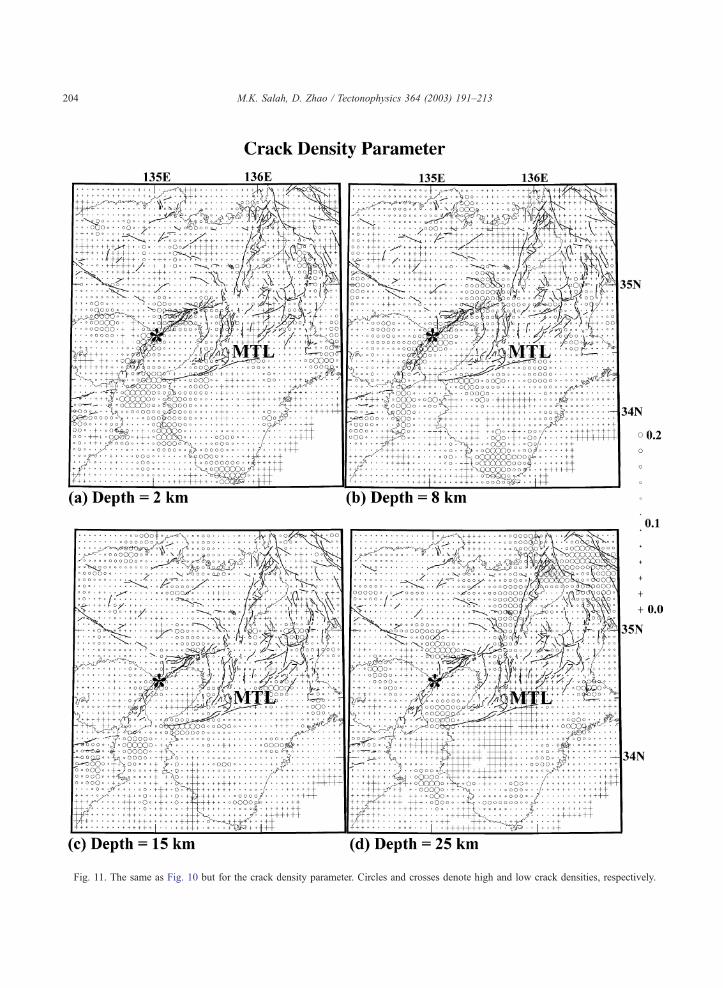
Fig. 11. The same as Fig. 10 but for the crack density parameter. Circles and crosses denote high and low crack densities, respectively.
M.K. Salah, D. Zhao / Tectonophysics 364 (2003) 191–213204

Fig. 12. The same as Fig. 10 but for saturation rate. Circles and crosses denote high and low saturation rate, respectively.
M.K. Salah, D. Zhao / Tectonophysics 364 (2003) 191–213 205
M.K. Salah, D. Zhao / Tectonophysics 364 (2003) 191–213206
nodes. Synthetic arrival times are calculated for the
checkerboard model. Numbers of stations, events and
ray paths in the synthetic data are the same as those in
the real data. The inverted image of the checkerboard
suggests where the resolution is good and where it is
poor. Figs. 5 and 6 show the results of the tests at four
representative layers for both Vp and Vs structures
with a grid spacing of 15 km in the horizontal
direction. The resolution is generally good for the
crust and the upper mantle layers where most of the
events are located. However, some edge portions have
relatively poor resolution, which was expected. On the
other hand, in the checkerboard resolution test with a
grid spacing of 25 km in horizontal direction (not
shown), all parts have very good resolution and the
synthetic anomalies are generally well recovered.
Figs. 7–12 show the Vp, Vs, Poisson ratio (t),porosity parameter (VpVs), crack density (e) and
saturation rate (f) distributions at four representative
depth layers. We have also conducted a number of
inversions by adopting different initial models and
different grid spacing, and using slightly different data
sets. We found that the overall pattern of the velocity
structure as shown here is stable and the change in the
amplitude of the velocity anomalies is generally small
( < 0.5%). In the following, we discuss the main
features of Vp, Vs and Poisson ratio in the crust and
upper mantle. For the other geophysical parameters,
we will restrict our discussion on only crustal layers
because values of crack density, saturation rate and
porosity thus obtained are valid only in the crust
(OB74, Iverson et al., 1989).
Large velocity variations are imaged in the study
area. For the crustal layers, Vp and Vs are generally
low along the Median Tectonic Line and the western
part of Kii Peninsula. Low Vs is also seen along the
aftershock area of the 1995 Kobe earthquake. On the
other hand, higher than average seismic velocities are
observed in the southern and eastern parts of the
peninsula. In the crust, Poisson ratio is generally high
along the aftershock area of the 1995 Kobe earth-
quake and most of the southern and western parts of
Kii Peninsula (Fig. 9a,b).
At shallow depth layers (depths 2 and 8 km), higher
values of porosity, crack density and saturation rate are
revealed along most parts of the Median Tectonic Line
and the aftershock area of the 1995 Kobe earthquake
(Figs. 10–12). However, some areas in the lower crust
show high values for both porosity and crack density,
which is in good agreement with the lithological
(mainly acidic) composition of that area (Fuji-ta et
al., 1997). In this region, there is no volcano, and
hence changes in Vp, Vs, Poisson ratio (t) and
porosity parameter (VpVs) could be attributed mainly
to cracks and fluids rather than high temperature (Zhao
and Negishi, 1998), though a fraction of the velocity
changes may be caused by lithological variations. We
can clearly notice that the crack density and saturation
rate show considerable heterogeneity and their overall
pattern is similar to that of Vs and Poisson ratio
distributions, respectively. High crack density (e) areasare generally consistent with high saturation rate (f)areas (Figs. 11 and 12).
In the upper mantle layers (40 and 55 km depths),
low Vp and low Vs anomalies are clearly seen along
or south of the Median Tectonic Line (Figs. 7 and 8).
High Vp, high Vs and low Poisson ratio anomalies at
55 km depth under Kii Peninsula may show the image
of the subducting Philippine Sea slab.
5. Discussion
The origin of lateral heterogeneity in seismic veloc-
ities in the crust andmantle is one of the most important
issues in the geodynamical application of seismic
tomography. In particular, distinguishing thermal and
chemical origins of heterogeneity is critical because the
dynamic significance of heterogeneity is quite different
for the two cases (Karato and Karki, 2001). For
example, when lateral variation in seismic velocity is
due to lateral variation in temperature, then low- (high-)
velocity regions represent higher (lower) than average
temperatures and should have lower (higher) density.
When velocity heterogeneity is due to chemical heter-
ogeneity, however, such a conclusion may not be valid.
According to Karato and Karki (2001), the velocity and
density heterogeneity in the upper mantle is affected
significantly by the heterogeneity in chemical compo-
sition. On the other hand, seismic velocity variations
are generally attributed to temperature changes in
volcanic areas, and to fluids and cracks in the forearc
region in southwest Japan (Zhao et al., 2000).
In the present study area, many researchers have
conducted various geophysical and geochemical stud-
ies. Sano and Wakita (1985) and Wakita et al. (1987)
M.K. Salah, D. Zhao / Tectonophysics 364 (2003) 191–213 207
found that the geographical distribution of 3He/4He
ratio reflects well the geotectonic structure of the
Japanese Islands. In northeastern (NE) Japan, a clear
geographical difference in the 3He/4He ratio exists
between the forearc and back arc regions. The ratio is
lower in the forearc region and higher along the
volcanic front (Fig. 1a) and in the back arc side. These
results suggest that the mantle-derived helium in the
volcanic areas is associated with the diapiric uprise of
magma. On the contrary, in southwestern (SW) Japan
there is no clear geographical contrast in the 3He/4He
ratio. Some samples in western Kii Peninsula show
high 3He/4He ratios, which is consistent with the
distribution of terrestrial heat flow data and reflects
that the geotectonic structure in Kii is different from
those of other regions of Japan. They interpreted the
high 3He/4He ratios observed in Kinki and Chugoku
district as indicative of renewed or incipient magma-
tism due to a descending young and warm slab. An area
with a diameter of 100 km in southwest Kii, which
exhibits anomalously high 3He/4He ratio is calledKinki
spot (Wakita et al., 1987). Since 3He is the primordial
component derived from the mantle, any difference in
the concentration in a sample can be regarded as a dif-
ference in the contribution from the mantle, irrespec-
tive of changes in sample type (Wakita et al., 1987).
In an analogous study in the southern Apennine
axial zone, Italy, Italiano et al. (2000) found that there
is a significant contribution of mantle-helium to gas
manifestations, which strongly suggests that the
studied emissions are related to melts intruded into
the crust. However, these melts are present in the form
of dike-shaped intrusions rather than a proper magma
chamber (Italiano et al., 2000). Therefore, the observed
systematic distribution of higher content of 3He in the
back arc region and lower in the forearc region has
been interpreted as generated by magmatic activities.
Although high emanation of 3He is indicative of
the presence of a magma source beneath Kii, no
Quaternary volcanism is observed in the area. The
past volcanisms in the Middle Miocene and the Upper
Cretaceous are not sufficient to explain the observed
high 3He/4He ratios. For this reason, it was suggested
that diapiric rise of magma is expected to occur in the
region (Wakita et al., 1987).
Seno et al. (2001) studied seismicity in different
segments of the Philippine Sea plate in southwest
Japan and found that slab seismicity beneath Kii
Peninsula is exceptional where slab events occur
down to a depth of 80 km, deeper than in other areas.
Moreover, in this area, Hori et al. (1985) detected
events that do not accompany later crustal phases and
suggested that these events might occur within the
mantle portion of the Philippine Sea slab. This implies
in turn that, beneath Kii Peninsula, dehydration of the
serpentinized mantle of the Philippine Sea slab is
occurring, and that the mantle portion of the Philip-
pine Sea slab subducting beneath this area was
hydrated before subduction (Seno et al., 2001).
Finally, aqueous fluids released from the serpentinized
mantle may have initiated partial melting in the
mantle wedge. Similarly, a tomographic study of the
Juan de Fuca plate that is subducting beneath the
North American plate revealed an extensive low
velocity zone above the subducted slab at about 45
km depth (Zhao et al., 2001). This low velocity zone
is interpreted as a result of the presence of hydrated
(serpentinized) mantle, with a supply of water from
the metamorphic dehydration of the subducted slab.
In this work we have detected low-velocity, high-
Poisson ratio, low-VpVs, high crack density and high
saturation rate anomalies in the crust and upper mantle
under Kii Peninsula (Figs. 7–12 and 13–15 along
vertical cross sections). All these results suggest the
existence of fluids resulting from the dehydration of
the subducting Philippine Sea slab, which is also
supported by former geophysical and geochemical
observations. Low velocity anomalies are visible in
the top 15 km of the crust (Figs. 13–15). A clear Y-
shaped low Vp anomaly is visible that extends from
the upper mantle to the upper crust, while Poisson ratio
only shows minor or moderately high values (Fig. 14).
Nakajima et al. (2001) investigated the 3-D structure of
Vp, Vs and Vp/Vs beneath NE Japan and found
differences in Vp/Vs ratio with depth. The average
value of Vp/Vs ratio is f 1.69 in the upper crust,
f 1.75 in the lower crust, and f 1.77 in the upper-
most mantle. They stated that these differences in Vp/
Vs ratios mainly reflect the lithological variations with
depth and interpreted the low-V and low-Vp/Vs areas
beneath active volcanoes in the upper crust by the
presence of H2O and low-V and high-Vp/Vs areas in
the lower crust and the mantle wedge are caused by
inclusions of partial melts within rocks. Watanabe
(1993) proposed that Vp/Vs ratio can be used to
distinguish partially molten rocks and rocks containing
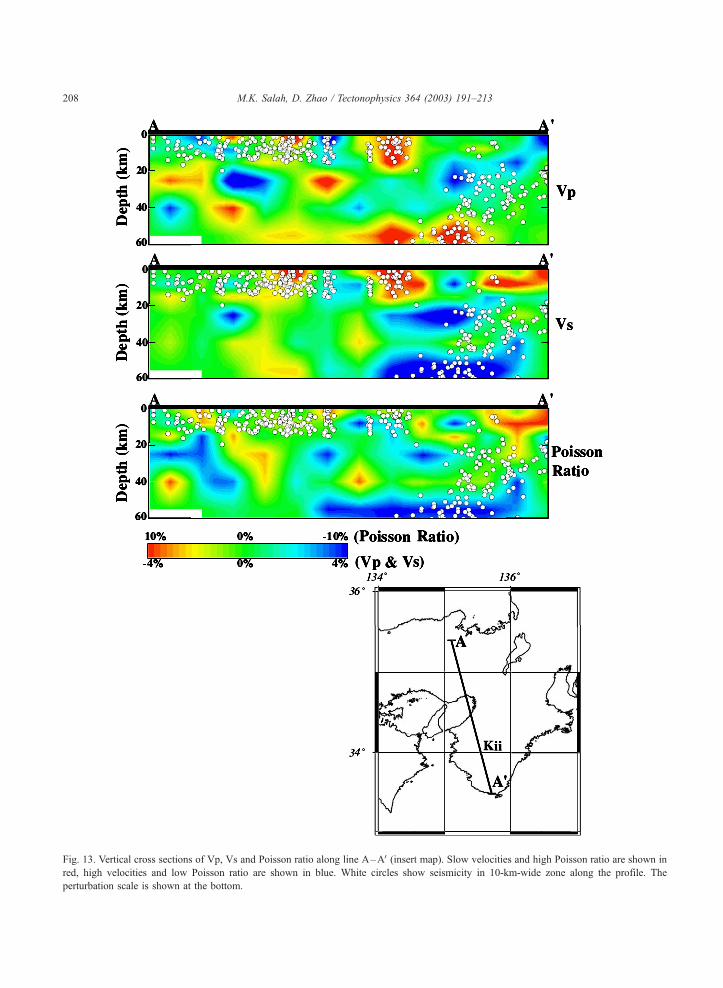
Fig. 13. Vertical cross sections of Vp, Vs and Poisson ratio along line A–AV(insert map). Slow velocities and high Poisson ratio are shown in
red, high velocities and low Poisson ratio are shown in blue. White circles show seismicity in 10-km-wide zone along the profile. The
perturbation scale is shown at the bottom.
M.K. Salah, D. Zhao / Tectonophysics 364 (2003) 191–213208

Fig. 14. The same as Fig. 13 but along cross section B–BV.
M.K. Salah, D. Zhao / Tectonophysics 364 (2003) 191–213 209

Fig. 15. The same as Fig. 13 but along cross section C–CV. Star shows the hypocenter of the January 17, 1995, Kobe earthquake (M 7.2).
M.K. Salah, D. Zhao / Tectonophysics 364 (2003) 191–213210

M.K. Salah, D. Zhao / Tectonophysics 364 (2003) 191–213 211
water. Vp/Vs increases with increasing fluid fraction
for a rhyolite melt. On the other hand, for water, Vp/Vs
decreases as the fluid fraction increases to 10 vol.%,
then it increases. Taking into account these studies, we
consider that the low-V and average to slightly high
Poisson ratio under Kii Peninsula at crustal depths are
related to the presence of fluids. The low velocity and
high Poisson ratio in the upper mantle wedge above
the slab may contain a small amount of melts. It is still
difficult to say conclusively whether these fluids are
water or partial melts.
Heat flow values are generally low in the forearc
region and higher in the back arc region but Yamano et
al. (1984) observed a high value of terrestrial heat flow
Fig. 16. Shallow (0–20 km depths) (a, b) and deep (20–50 km depths) seis
to December 1989 (a, c) and from January 1990 to December 1994 (b, d
in the forearc region of southwest Japan. The anom-
alously high terrestrial heat flow is detected in the
western part of the Kii Peninsula (e.g. Okubo, 1993).
The value is approximately two times higher than that
found in the forearc region and is almost identical to
that in the back arc region.
Long-continuing swarm activities of shallow earth-
quakes have been observed in and around Kii Pen-
insula (Mizoue et al., 1983). It has been suggested that
fluids are related to earthquake occurrence and swarm
activities (e.g. Sano et al., 1986; Wakita et al., 1987;
Scholz, 1990). Fig. 16 shows the crustal and slab
seismicity in two time intervals. It is clear that the
Kinki spot area has intense and continuous seismicity,
micity (c, d) in southwest Japan. Seismicity occurred from July 1985
), respectively.
M.K. Salah, D. Zhao / Tectonophysics 364 (2003) 191–213212
which may be related to the abundant fluid compo-
nents in this region.
Fuji-ta et al. (1997) studied the crustal structure of
Kii Peninsula using the magnetotelluric (MT) method
and found two upper crustal anomalies. One is a
subhorizontal conductive layer dipping northwest at
5–10 km depth while the other is a resistive block at 2–
15 km depth. The location of the resistor and conductor
bodies agrees well with high and low velocity anoma-
lies we found in this study (see Figs. 2 and 4 in Fuji-ta et
al., 1997 and compare themwith the velocity anomalies
in the cross sections in our Figs. 13–15).
6. Conclusions
1. A large number of local earthquake arrival times are
used to determine detailed 3-D seismic velocity and
Poisson ratio structures in Kii Peninsula in south-
west Japan. From the obtained Vp and Vs, we
further estimated 3-D distribution of Poisson ratio,
crack density, saturation rate and porosity in this
region. The availability of the six physical param-
eters enables us to better understand the structure
and tectonics of the southwest Japan forearc region.
2. Low velocity and high Poisson ratio anomalies are
revealed under Kii Peninsula in the crust and the
mantle wedge above the subducting Philippine Sea
slab, suggesting the existence of fluids resulting
from the slab dehydration. This may explain the
geophysical and geochemical observations in Kii,
such as the microearthquake swarm activities, high
terrestrial heat flow and high 3He/4He isotopic ratio.
3. A low velocity and high Poisson ratio anomaly is
detected at the source area of the 1995 Kobe earth-
quake (M 7.2), which confirmed the previous results
by Zhao et al. (1996). We found that this anomaly
further extends to the upper mantle wedge just above
the subducting Philippine Sea slab. This result indi-
cates that the fluids that contributed to the initiation
of the Kobe earthquake (Zhao et al., 1996) come
from the dehydration of the Philippine Sea slab.
Acknowledgements
We thank H. Tani for his help at the data pro-
cessing stage. Two anonymous reviewers provided
helpful comments, which improved the manuscript.
Some figures in this paper were made using Generic
Mapping Tools (GMT) software written by Wessel
and Smith (1998). This work was partially supported
by a grant (Kiban-B No. 11440134) from the Japan
Society for the Promotion of Science.
References
Aki, K., Lee, W.H.K., 1976. Determination of the three-dimension-
al velocity anomalies under a seismic array using first P arrival
times from local earthquakes: Part 1. A homogeneous initial
model. J. Geophys. Res. 81, 4381–4399.
Bruner, W., 1976. Comment on ‘‘Seismic velocities in dry and
saturated cracked solids’’ by R. O’Connell and B. Budiansky.
J. Geophys. Res. 81, 2573–2576.
Davis, P., Knopoff, L., 1995. The elastic modulus of media con-
taining strongly interacting antiplane cracks. J. Geophys. Res.
100, 18253–18258.
Fuji-ta, K., Ogawa, Y., Yamaguchi, S., Yaskawa, K., 1997. Magne-
totelluric imaging of the SW Japan forearc—a lost paleoland
revealed? Phys. Earth Planet. Inter. 102, 231–238.
Hirata, N., and the Urgent Observation Group for the 1995 Hyogo-
Ken Nanbu earthquake, 1996. Urgent joint observation of after-
shocks of the 1995 Hyogo-Ken Nanbu earthquake. J. Phys.
Earth 44, 317–328.
Holbrook, W.S., Gajewski, P., Kramer, A., Prodehl, C., 1988. An
interpretation of wide-angle compressional and shear wave data
in southwest Germany: Poisson ratio and petrological implica-
tions. J. Geophys. Res. 93, 12081–12106.
Hori, S., Inoue, H., Fukao, Y., Ukawa, M., 1985. Seismic detection
of the untransformed ‘basaltic’ oceanic crust subducting into the
mantle. Geophys. J. R. Astron. Soc. 83, 169–197.
Italiano, F., Martelli, M., Martinelli, G., Nuccio, P.M., 2000. Geo-
chemical evidence of melt intrusions along lithospheric faults of
the Southern Apennines, Italy: geodynamic and seismogenic
implications. J. Geophys. Res. 105, 13569–13578.
Itoh, Y., Nagasaki, Y., 1996. Crustal shortening of southwest Japan
in the Late Miocene. Isl. Arc 5, 337–353.
Iverson, W.P., Fahmy, B.A., Smithson, S.B., 1989. VpVs from
mode converted P-SV reflections. Geophysics 54, 843–852.
Kamata, H., Kodama, K., 1994. Tectonics of an arc–arc junction:
an example from Kyushu Island at the junction of the South-
west Japan Arc and the Ryukyu Arc. Tectonophysics 233,
69–81.
Kamata, H., Kodama, K., 1999. Volcanic history and tectonics of
the Southwest Japan Arc. Isl. Arc 8, 393–403.
Karato, S., Karki, B.B., 2001. Origin of lateral variation of seismic
wave velocities and density in the deep mantle. J. Geophys. Res.
106, 21771–21783.
Koch, M., 1992. Bootstrap inversion for vertical and lateral varia-
tions of the S wave structure and the Vp/Vs ratio from shallow
earthquakes in the Rhinegraben seismic zone, Germany. Tecto-
nophysics 210, 91–115.

M.K. Salah, D. Zhao / Tectonophysics 364 (2003) 191–213 213
Lees, J.M., Wu, H., 2000. Poisson ratio and porosity at Coso
geothermal area, California. J. Volcanol. Geotherm. Res. 95,
157–173.
Mizoue, M., Nakamura, M., Seto, N., Ishiketa, Y., 1971. Crustal
structure from travel times of reflected and refracted seismic
waves recorded at Wakayama micro-earthquake observatory
and its substations. Bull. Earthq. Res. Inst. Univ. Tokyo 49,
33–62.
Mizoue, M., Nakamura, M., Seto, N., Ishiketa, Y., Yokota, T., 1983.
Three-layered distribution of microearthquakes in relation to fo-
cal mechanism variation in the Kii Peninsula, southwestern Hon-
shu, Japan. Bull. Earthq. Res. Inst. Univ. Tokyo 58, 287–310.
Nakajima, J., Matsuzawa, T., Hasegawa, A., Zhao, D., 2001. Three-
dimensional structure of Vp, Vs, and Vp/Vs beneath northeast-
ern Japan: implications for arc magmatism and fluids. J. Geo-
phys. Res. 106, 21843–21857.
Nakamura, M., 1992. History and future of earthquake monitoring in
the Kii Peninsula. Bull. Earthq. Res. Inst. Univ. Tokyo 8, 41–48.
Obara, K., 2002. Nonvolcanic deep tremor associated with subduc-
tion in southwest Japan. Science 296, 1679–1681.
O’Connell, R.J., Budiansky, B., 1974. Seismic velocities in dry and
saturated cracked solids. J. Geophys. Res. 79, 5412–5426.
Okubo, Y., 1993. Temperature gradient map of the Japanese Islands.
J. Geotherm. Res. Soc. Jpn. 15, 1–21.
Pickett, G.R., 1963. Acoustic character logs and their application in
formation evaluation. J. Pet. Technol. 15, 650–667.
Sanders, C.O., Ponko, S.C., Nixon, L.D., Schwart, E.A., 1995.
Seismological evidences for magmatic and hydrothermal struc-
ture in Long Valley caldera from local earthquake attenuation
and velocity tomography. J. Geophys. Res. 100, 8311–8326.
Sano, Y., Wakita, H., 1985. Geographical distribution of 3He/4He
ratios in Japan: implications for arc tectonics and incipient mag-
matism. J. Geophys. Res. 90, 8729–8741.
Sano, Y., Nakamura, Y., Wakita, H., Notsu, K., Kobayashi, Y.,
1986. 3He/4He ratio anomalies associated with the 1984 western
Nagano earthquake: possibly induced by a diapiric magma.
J. Geophys. Res. 91, 12291–12295.
Scholz, C.H., 1990. The Mechanics of Earthquakes and Faulting.
Cambridge Univ. Press, New York. 439 pp.
Seno, T., Zhao, D., Kobayashi, Y., Nakamura, M., 2001. Dehydra-
tion of serpentinized slab mantle: seismic evidence from south-
west Japan. Earth Planets Space 53, 861–871.
Serrano, I., Zhao, D., Morales, J., 2002. 3-D crustal structure of the
extensional Granada Basin in the convergent boundary between
the Eurasian and African plates. Tectonophysics 344, 61–79.
Takei, Y., 2002. Effect of pore geometry on Vp/Vs: from equili-
brium geometry to crack. J. Geophys. Res. 107, 10.1029/
2001JB000522.
Tatham, R.H., 1982. Vp/Vs and lithology. Geophysics 47, 333–344.
Tsuboi, S., Koketsu, K., Takano, K., Miyatake, T., Abe, K., Hagi-
wara, Y., 1989. Hypocenter determination procedure of Japan
University Network Earthquake Catalog. J. Seismol. Soc. Jpn.
42, 277–284.
Wakita, H., Sano, Y., Mizoue, M., 1987. High 3He emanation and
seismic swarms observed in a nonvolcanic, forearc region.
J. Geophys. Res. 92, 12539–12546.
Watanabe, T., 1993. Effects of water and melt on seismic velocities
and their application to characterization of seismic reflectors.
Geophys. Res. Lett. 20, 2933–2936.
Wessel, P., Smith, W.H.F., 1998. New improved version of Ge-
neric Mapping Tools released. EOS Trans. Am. Geophys.
Union 79, 579.
Yamano, M., Honda, S., Uyeda, S., 1984. Nankai Trough—as a hot
trench? Mar. Geophys. Res. 6, 187–203.
Zhao, D., Mizuno, T., 1999. Crack density and saturation rate in
the 1995 Kobe earthquake region. Geophys. Res. Lett. 26,
3213–3216.
Zhao, D., Negishi, H., 1998. The 1995 Kobe earthquake: seismic
image of the source zone and its implications for the rupture
nucleation. J. Geophys. Res. 103, 9967–9986.
Zhao, D., Hasegawa, A., Horiuchi, S., 1992a. Tomographic imag-
ing of P and S wave velocity structure beneath northeastern
Japan. J. Geophys. Res. 97, 19909–19928.
Zhao, D., Horiuchi, S., Hasegawa, A., 1992b. Seismic velocity
structure of the crust beneath the Japan Islands. Tectonophysics
212, 289–301.
Zhao, D., Hasegawa, A., Kanamori, H., 1994. Deep structure of
Japan subduction zones as derived from local, regional and tele-
seismic events. J. Geophys. Res. 99, 22313–22329.
Zhao, D., Kanamori, H., Negishi, H., 1996. Tomography of the
source area of the 1995 Kobe earthquake: evidence for fluids
at the hypocenter? Science 274, 1891–1894.
Zhao, D., Ochi, F., Hasegawa, A., Yamamoto, A., 2000. Evidence
for the location and cause of large crustal earthquakes in Japan.
J. Geophys. Res. 105, 13579–13594.
Zhao, D., Wang, K., Rogers, G.C., Peacock, S.M., 2001. Tomo-
graphic image of low P velocity anomalies above slab in
northern Cascadia subduction zone. Earth Planets Space 53,
285–293.