2030 indonesia roadmap - climate investment funds
TRANSCRIPT
2030 Indonesia RoadmapMultiplying the Transition:
Market-based solutions for catalyzing clean
energy investment in emerging economies
Sandra Esser
Caroline Chua
Antoine Vagneur-Jones
October 2021

1
About Climate Investment Funds (CIF) About BloombergNEF (BNEF)
BloombergNEF (BNEF) is a strategic research provider covering
global commodity markets and the disruptive technologies driving
the transition to a low-carbon economy. Our expert coverage
assesses pathways for the power, transport, industry, buildings
and agriculture sectors to adapt to the energy transition. We help
commodity trading, corporate strategy, finance and policy
professionals navigate change and generate opportunities.
The Climate Investment Funds (CIF) is one of the world’s largest and
most ambitious climate finance mechanisms. Founded in 2008, it
represents one of the first global efforts to invest in a dedicated climate
finance vehicle. The CIF emerged from recognition by world leaders
that climate change and development are inextricably intertwined. The
CIF’s creation also recognized a need to fill a gap in the international
climate finance architecture—to deliver climate-smart investment at
scale. The CIF supports developing and emerging economies in shifting
to low carbon and climate resilient development.
BloombergNEF is working with the Climate Investment Funds to identify how financial intermediaries can mobilize clean energy investment in
emerging markets. In the context of post-pandemic sustainable recoveries and the need to meet international climate commitments such as the
Nationally Determined Contributions (NDCs), accelerating the global energy transition is now more pressing than ever. BNEF sees electrification
through clean power and transport as the basis of decarbonization, and therefore, as the backbone of the energy transition. With investors’
appetite for ESG products at an all-time high and capital needs for clean energy investment in many emerging markets often unmet, this project
looks at how to better match this supply and demand. This slide deck serves to support the dialog with stakeholders on this topic.
About
2
Source: BloombergNEF. Note: Numbers include renewable energy, electrified transport, electrified heat, energy storage, carbon capture and storage and hydrogen.
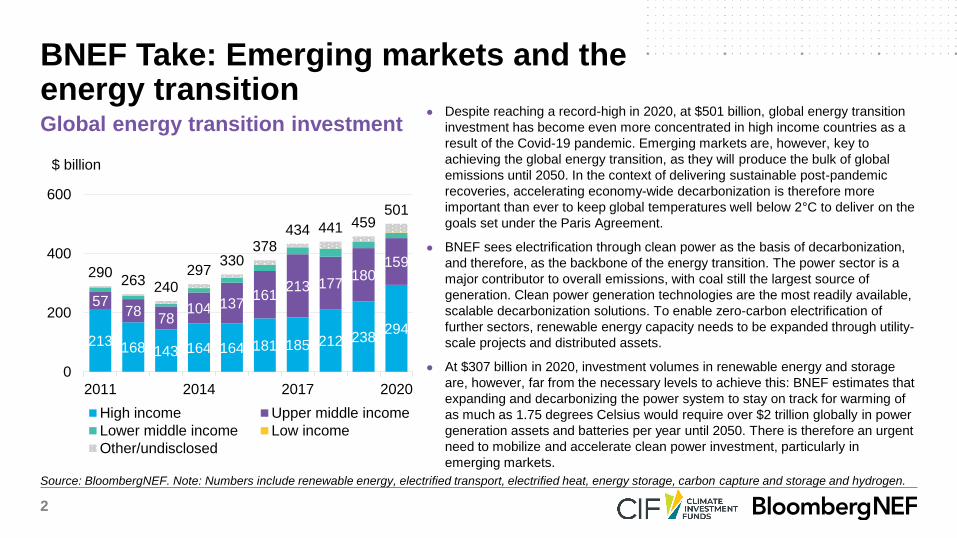
Global energy transition investment● Despite reaching a record-high in 2020, at $501 billion, global energy transition
investment has become even more concentrated in high income countries as a
result of the Covid-19 pandemic. Emerging markets are, however, key to
achieving the global energy transition, as they will produce the bulk of global
emissions until 2050. In the context of delivering sustainable post-pandemic
recoveries, accelerating economy-wide decarbonization is therefore more
important than ever to keep global temperatures well below 2°C to deliver on the
goals set under the Paris Agreement.
● BNEF sees electrification through clean power as the basis of decarbonization,
and therefore, as the backbone of the energy transition. The power sector is a
major contributor to overall emissions, with coal still the largest source of
generation. Clean power generation technologies are the most readily available,
scalable decarbonization solutions. To enable zero-carbon electrification of
further sectors, renewable energy capacity needs to be expanded through utility-
scale projects and distributed assets.
● At $307 billion in 2020, investment volumes in renewable energy and storage
are, however, far from the necessary levels to achieve this: BNEF estimates that
expanding and decarbonizing the power system to stay on track for warming of
as much as 1.75 degrees Celsius would require over $2 trillion globally in power
generation assets and batteries per year until 2050. There is therefore an urgent
need to mobilize and accelerate clean power investment, particularly in
emerging markets.
BNEF Take: Emerging markets and the energy transition
213 168 143 164 164 181 185 212 238294
5778
78104 137
161213 177
180159
290263 240
297330
378434 441 459
501
0
200
400
600
2011 2014 2017 2020
$ billion
High income Upper middle income
Lower middle income Low income
Other/undisclosed
3
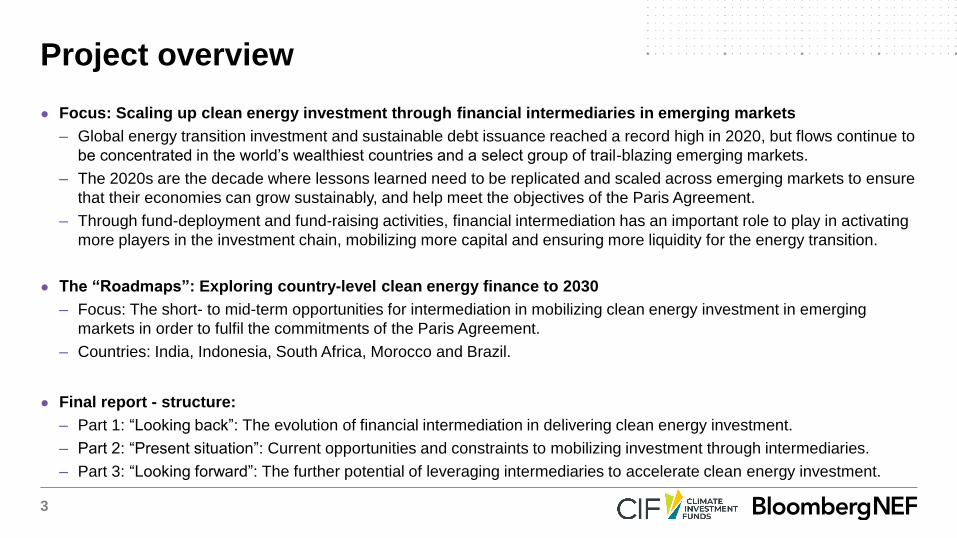
● Focus: Scaling up clean energy investment through financial intermediaries in emerging markets
– Global energy transition investment and sustainable debt issuance reached a record high in 2020, but flows continue to
be concentrated in the world’s wealthiest countries and a select group of trail-blazing emerging markets.
– The 2020s are the decade where lessons learned need to be replicated and scaled across emerging markets to ensure
that their economies can grow sustainably, and help meet the objectives of the Paris Agreement.
– Through fund-deployment and fund-raising activities, financial intermediation has an important role to play in activating
more players in the investment chain, mobilizing more capital and ensuring more liquidity for the energy transition.
● The “Roadmaps”: Exploring country-level clean energy finance to 2030
– Focus: The short- to mid-term opportunities for intermediation in mobilizing clean energy investment in emerging
markets in order to fulfil the commitments of the Paris Agreement.
– Countries: India, Indonesia, South Africa, Morocco and Brazil.
● Final report - structure:
– Part 1: “Looking back”: The evolution of financial intermediation in delivering clean energy investment.
– Part 2: “Present situation”: Current opportunities and constraints to mobilizing investment through intermediaries.
– Part 3: “Looking forward”: The further potential of leveraging intermediaries to accelerate clean energy investment.
Project overview
4
● Ministry of Energy and Mineral Resources (2021) Strategic Plan 2020-2024
● Ministry of Energy and Mineral Resources (2019) Indonesian Electricity Supply Business Plan 2019-2028
● Ministry of Energy and Mineral Resources (2014) National Energy Policy
● Ministry of Energy and Mineral Resources (2009) Electricity Law (No. 30/2009)
Indonesia: Key references and background reading
5
Indonesia contents
State of the energy transition 6
Financial ecosystem, capacity and financing needs 21
Leveraging intermediaries to accelerate clean power investment 30
6
State of the energy transitionIndonesia
7
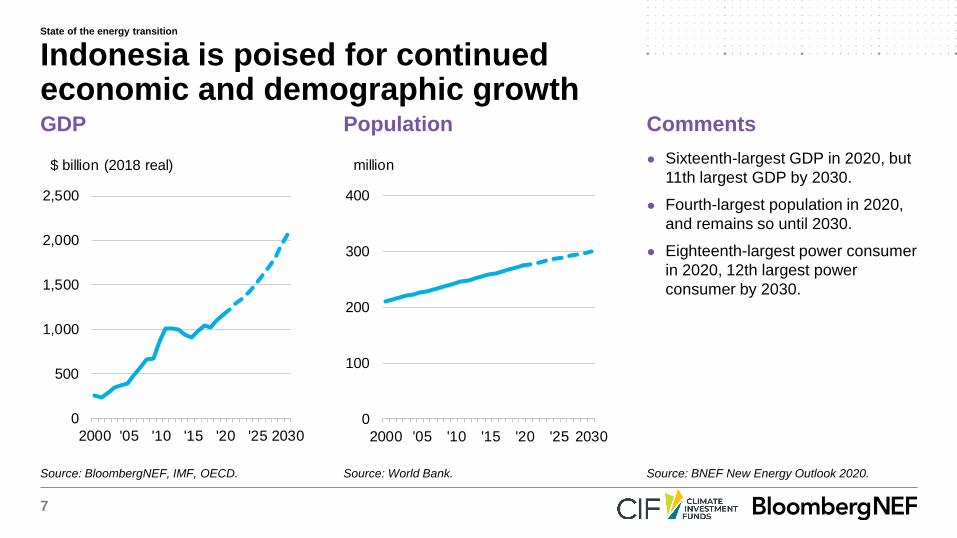
● Sixteenth-largest GDP in 2020, but
11th largest GDP by 2030.
● Fourth-largest population in 2020,
and remains so until 2030.
● Eighteenth-largest power consumer
in 2020, 12th largest power
consumer by 2030.
GDP Population Comments
Indonesia is poised for continued economic and demographic growth
Source: BloombergNEF, IMF, OECD. Source: World Bank. Source: BNEF New Energy Outlook 2020.
0
100
200
300
400
2000 '05 '10 '15 '20 '25 2030
million
0
500
1,000
1,500
2,000
2,500
2000 '05 '10 '15 '20 '25 2030
$ billion (2018 real)
State of the energy transition
8
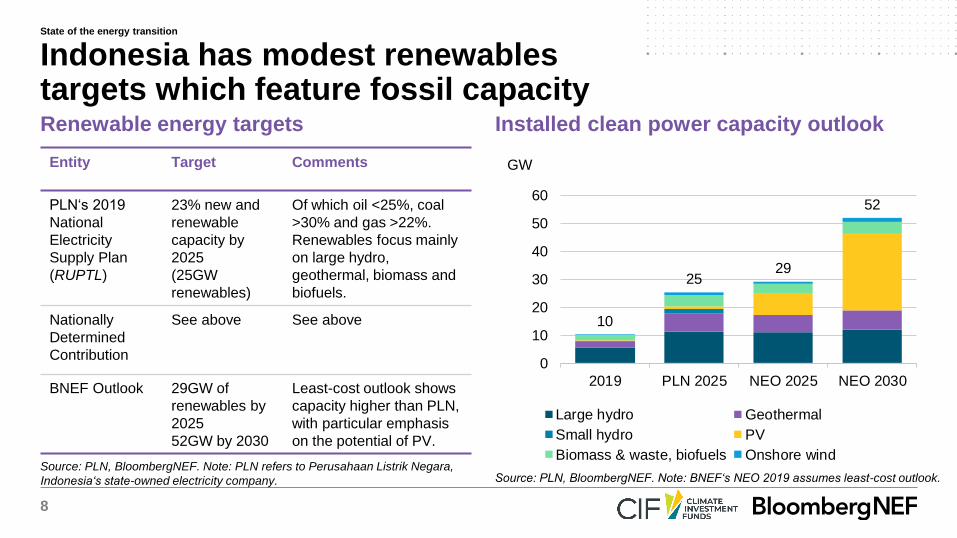
Source: PLN, BloombergNEF. Note: BNEF‘s NEO 2019 assumes least-cost outlook.Source: PLN, BloombergNEF. Note: PLN refers to Perusahaan Listrik Negara,
Indonesia‘s state-owned electricity company.
Renewable energy targets Installed clean power capacity outlook
Entity Target Comments
PLN‘s 2019
National
Electricity
Supply Plan
(RUPTL)
23% new and
renewable
capacity by
2025
(25GW
renewables)
Of which oil <25%, coal
>30% and gas >22%.
Renewables focus mainly
on large hydro,
geothermal, biomass and
biofuels.
Nationally
Determined
Contribution
See above See above
BNEF Outlook 29GW of
renewables by
2025
52GW by 2030
Least-cost outlook shows
capacity higher than PLN,
with particular emphasis
on the potential of PV.
Indonesia has modest renewables targets which feature fossil capacity
10
2529
52
0
10
20
30
40
50
60
2019 PLN 2025 NEO 2025 NEO 2030
GW
Large hydro Geothermal
Small hydro PV
Biomass & waste, biofuels Onshore wind
State of the energy transition
9
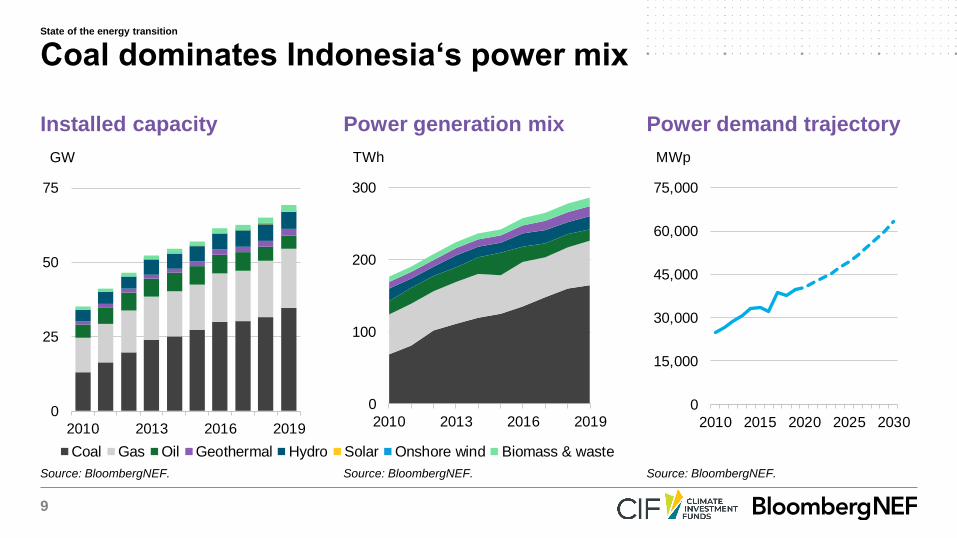
Installed capacity Power generation mix Power demand trajectory
Coal dominates Indonesia‘s power mix
Source: BloombergNEF. Source: BloombergNEF. Source: BloombergNEF.
0
25
50
75
2010 2013 2016 2019
GW
0
100
200
300
2010 2013 2016 2019
TWh
0
15,000
30,000
45,000
60,000
75,000
2010 2015 2020 2025 2030
MWp
Coal Gas Oil Geothermal Hydro Solar Onshore wind Biomass & waste
State of the energy transition
10
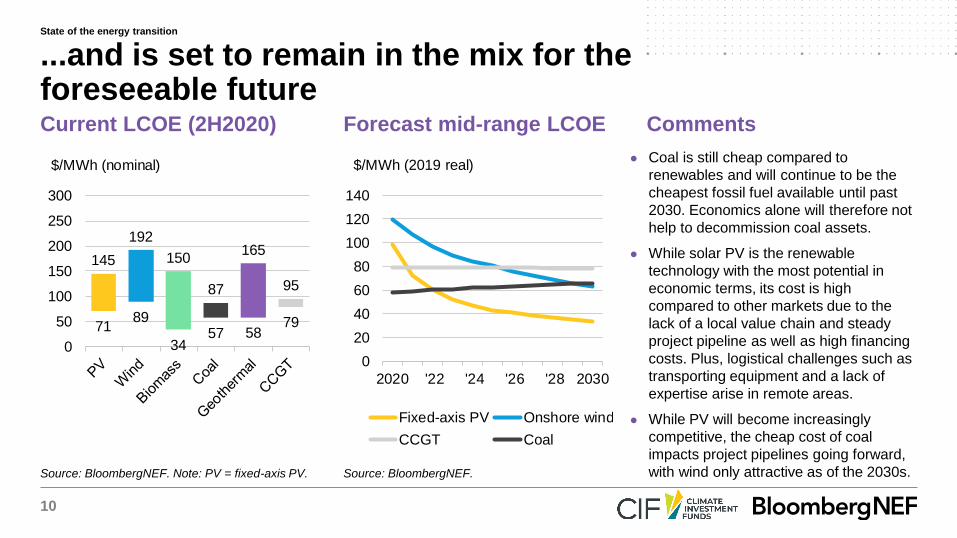
● Coal is still cheap compared to
renewables and will continue to be the
cheapest fossil fuel available until past
2030. Economics alone will therefore not
help to decommission coal assets.
● While solar PV is the renewable
technology with the most potential in
economic terms, its cost is high
compared to other markets due to the
lack of a local value chain and steady
project pipeline as well as high financing
costs. Plus, logistical challenges such as
transporting equipment and a lack of
expertise arise in remote areas.
● While PV will become increasingly
competitive, the cheap cost of coal
impacts project pipelines going forward,
with wind only attractive as of the 2030s.
Current LCOE (2H2020) Forecast mid-range LCOE Comments
...and is set to remain in the mix for the foreseeable future
Source: BloombergNEF. Note: PV = fixed-axis PV. Source: BloombergNEF.
7189
3457 58
79
145
192
150
87
165
95
0
50
100
150
200
250
300
$/MWh (nominal)
0
20
40
60
80
100
120
140
2020 '22 '24 '26 '28 2030
$/MWh (2019 real)
Fixed-axis PV Onshore wind
CCGT Coal
State of the energy transition

11
Source: BloombergNEF. Note: Green = available, yellow = somewhat available, red = not available.
Generation
System Operation
Transmission
Distribution
Sales/Retail
Consumption
Residential Commercial Industrial
IPPs (Independent
Power Producers)
- (37%)
PLN
(Perusahaan
Listrik Negara)
PLN owns and operate all
distribution network
Majority
publicly owned
Majority
privately owned
Mixed
ownership Power Seller Power Buyer
Reg
ula
tor:
ME
MR
(M
inis
try o
f E
nerg
y a
nd M
inera
l R
eso
urc
es)
PLN controls most of the generation
assets. Independent Power
Producers provide only a quarter of
the total capacity
PLN is the only system operator
PLN
(Perusahaan
Listrik Negara)
- (63%)
PLN owns and operates all transmission
network
There are no private retailers.
PLN provide electricity retail
services to all grid-connected
consumers
Power sector
fundamentals
Status Comments
Utility unbundling⚫
Single buyer market
Private participation⚫
Only generation is open through
tenders
Bilateral contracts⚫
On-site only
Off-grid generation⚫
C&I, residential and minigrids
Purchase obligation⚫
No standardized rules
Cost-reflective
tariffs ⚫Determined by Energy Ministry
Wholesale market⚫
No wholesale market
Standardized PPAs⚫
Signed in IDR (can be indexed to USD)
The Indonesian power sector is built around a state-owned monopoly
State of the energy transition
12
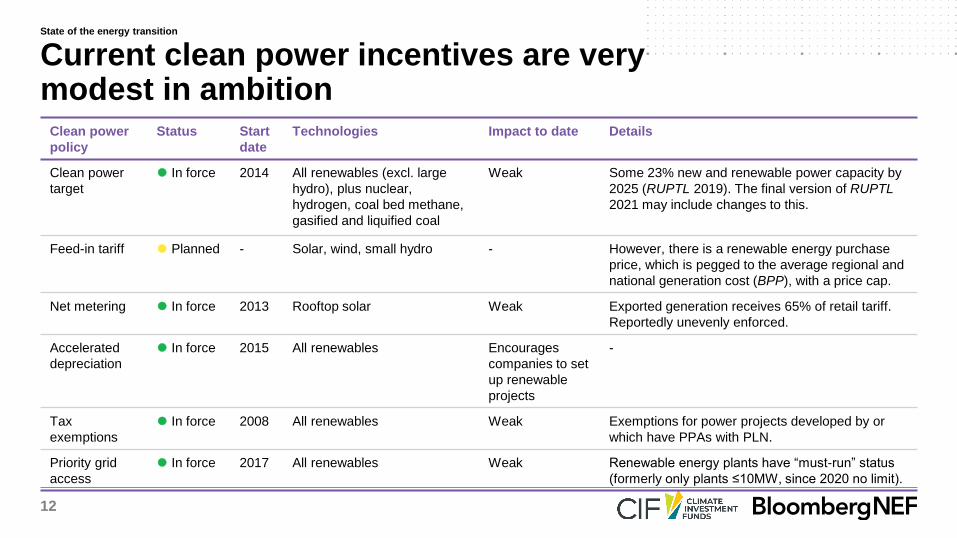
Clean power
policy
Status Start
date
Technologies Impact to date Details
Clean power
target
⚫ In force 2014 All renewables (excl. large
hydro), plus nuclear,
hydrogen, coal bed methane,
gasified and liquified coal
Weak Some 23% new and renewable power capacity by
2025 (RUPTL 2019). The final version of RUPTL
2021 may include changes to this.
Feed-in tariff ⚫ Planned - Solar, wind, small hydro - However, there is a renewable energy purchase
price, which is pegged to the average regional and
national generation cost (BPP), with a price cap.
Net metering ⚫ In force 2013 Rooftop solar Weak Exported generation receives 65% of retail tariff.
Reportedly unevenly enforced.
Accelerated
depreciation
⚫ In force 2015 All renewables Encourages
companies to set
up renewable
projects
-
Tax
exemptions
⚫ In force 2008 All renewables Weak Exemptions for power projects developed by or
which have PPAs with PLN.
Priority grid
access
⚫ In force 2017 All renewables Weak Renewable energy plants have “must-run” status
(formerly only plants ≤10MW, since 2020 no limit).
Current clean power incentives are very modest in ambition
State of the energy transition
13
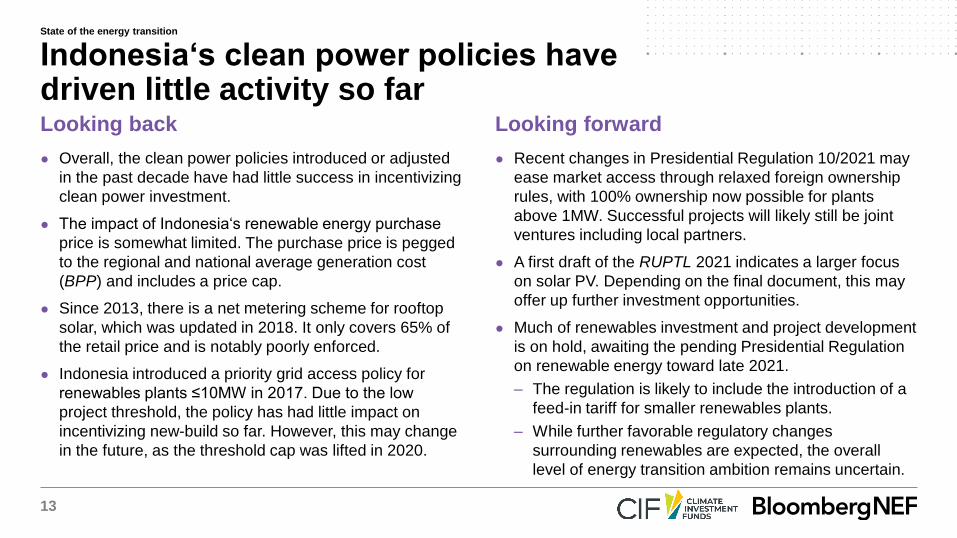
Looking back Looking forward
● Overall, the clean power policies introduced or adjusted
in the past decade have had little success in incentivizing
clean power investment.
● The impact of Indonesia‘s renewable energy purchase
price is somewhat limited. The purchase price is pegged
to the regional and national average generation cost
(BPP) and includes a price cap.
● Since 2013, there is a net metering scheme for rooftop
solar, which was updated in 2018. It only covers 65% of
the retail price and is notably poorly enforced.
● Indonesia introduced a priority grid access policy for
renewables plants ≤10MW in 2017. Due to the low
project threshold, the policy has had little impact on
incentivizing new-build so far. However, this may change
in the future, as the threshold cap was lifted in 2020.
● Recent changes in Presidential Regulation 10/2021 may
ease market access through relaxed foreign ownership
rules, with 100% ownership now possible for plants
above 1MW. Successful projects will likely still be joint
ventures including local partners.
● A first draft of the RUPTL 2021 indicates a larger focus
on solar PV. Depending on the final document, this may
offer up further investment opportunities.
● Much of renewables investment and project development
is on hold, awaiting the pending Presidential Regulation
on renewable energy toward late 2021.
– The regulation is likely to include the introduction of a
feed-in tariff for smaller renewables plants.
– While further favorable regulatory changes
surrounding renewables are expected, the overall
level of energy transition ambition remains uncertain.
Indonesia‘s clean power policies have driven little activity so far
State of the energy transition
14
Key bottlenecks
● The major bottleneck of the Indonesian power sector is
the lack of a clear procurement pipeline and current
thermal overcapacity under PLN‘s highly regulated single
buyer market structure. A weak incentivizing framework
for clean power further hampers the development of the
renewables market. While generation is open to IPPs,
tenders are limited, with invitations to pre-qualify only
issued periodically. The tender processes can also lack
transparency, with the results often not published.
● Licensing and permitting procedures for new projects
tend to be lengthy.
● Renewables must directly compete with subsidized coal
under the BPP.
● Foreign ownership is not allowed for plants <1MW, as
these are reserved for cooperatives and SMEs.
...with many regulatory bottlenecks hampering the market
BNEF Take: Power market (over-)regulationThe lack of a clear project pipeline communicated
by the government and the current oversupply of
fossil capacity in key load areas is hindering the
build-out of renewables projects. Together with
occasionally poor regulatory enforcement and a
general high risk perception of the market, this
makes the Indonesian power market difficult to
access. A clear political commitment to
decarbonization, in addition to a transparent
project pipeline and attractive clean power
incentives would help to create investment
opportunities.
State of the energy transition
15
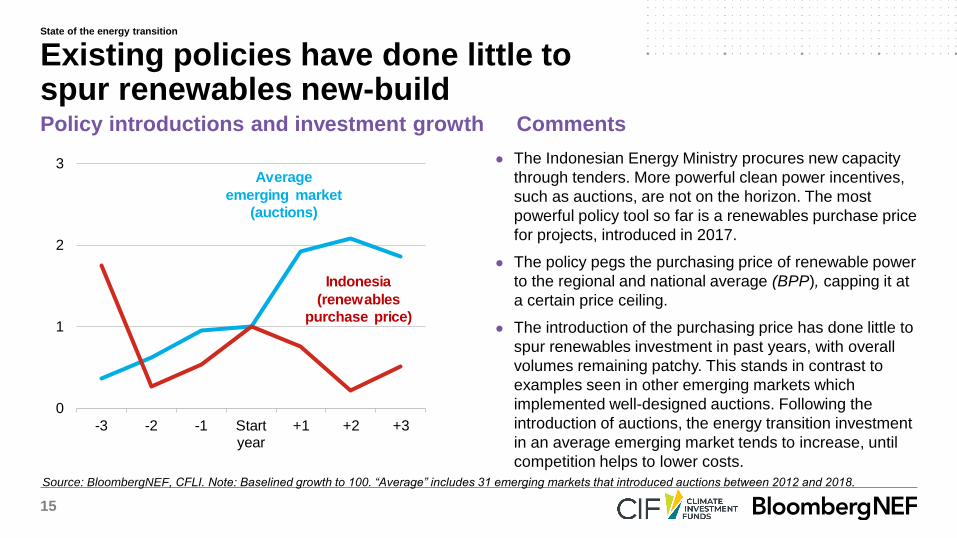
Source: BloombergNEF, CFLI. Note: Baselined growth to 100. “Average” includes 31 emerging markets that introduced auctions between 2012 and 2018.
Policy introductions and investment growth Comments
● The Indonesian Energy Ministry procures new capacity
through tenders. More powerful clean power incentives,
such as auctions, are not on the horizon. The most
powerful policy tool so far is a renewables purchase price
for projects, introduced in 2017.
● The policy pegs the purchasing price of renewable power
to the regional and national average (BPP), capping it at
a certain price ceiling.
● The introduction of the purchasing price has done little to
spur renewables investment in past years, with overall
volumes remaining patchy. This stands in contrast to
examples seen in other emerging markets which
implemented well-designed auctions. Following the
introduction of auctions, the energy transition investment
in an average emerging market tends to increase, until
competition helps to lower costs.
Existing policies have done little to spur renewables new-build
0
1
2
3
-3 -2 -1 Startyear
+1 +2 +3
Indonesia
(renewables
purchase price)
Average
emerging market
(auctions)
State of the energy transition

16
Source: BloombergNEF.
Access to electricity in Indonesia Comments
● Being an archipelago, Indonesia faces high geographical
constraints in rolling out a national grid and secure,
affordable supply. Remote areas in Eastern Indonesia
are yet to achieve complete electrification despite strong
progess, with reliability of power supply a further issue.
● Diesel generators are the most commonly used solution,
yet involve high fuel costs and pollution.
● Off-grid solutions such as mini-grids or the hybridization
of diesel generators with solar modules offer potential to
advance electrification and supply-reliability goals.
● Given regulatory constraints under PLN‘s monopoly, the
mini-grid market has proved challenging to private sector
developers. The development of mini-grids has therefore
mainly been led by DFIs, with local governments, co-
operatives, village-owned enterprises and communities
responsible for their operation upon completion.
Full access to steady electricity supply remains a challenge in remote areas
0%
20%
40%
60%
80%
100%
2010 2013 2016 2019
Electrification rate
National Rural Urban
State of the energy transition
17
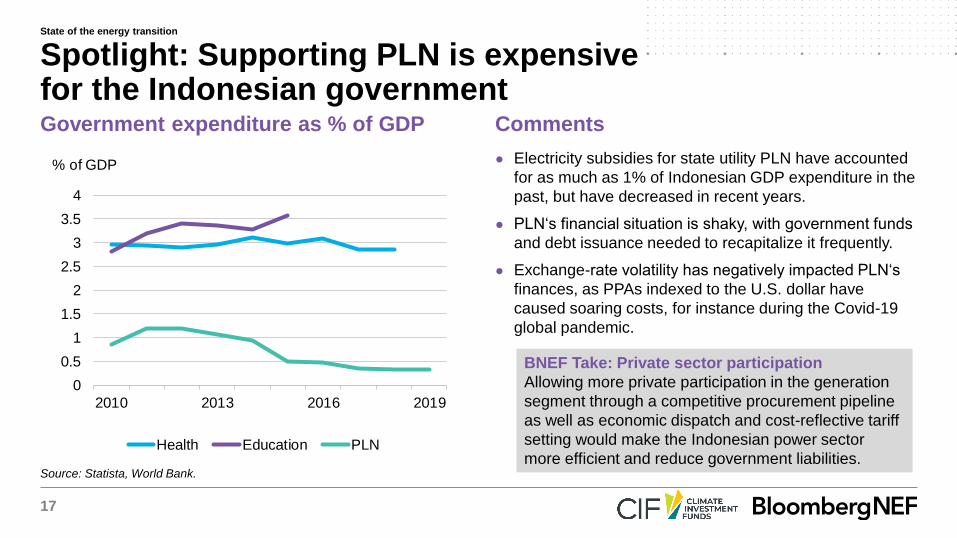
Source: Statista, World Bank.
Government expenditure as % of GDP Comments
● Electricity subsidies for state utility PLN have accounted
for as much as 1% of Indonesian GDP expenditure in the
past, but have decreased in recent years.
● PLN‘s financial situation is shaky, with government funds
and debt issuance needed to recapitalize it frequently.
● Exchange-rate volatility has negatively impacted PLN‘s
finances, as PPAs indexed to the U.S. dollar have
caused soaring costs, for instance during the Covid-19
global pandemic.
Spotlight: Supporting PLN is expensive for the Indonesian government
BNEF Take: Private sector participation
Allowing more private participation in the generation
segment through a competitive procurement pipeline
as well as economic dispatch and cost-reflective tariff
setting would make the Indonesian power sector
more efficient and reduce government liabilities.
0
0.5
1
1.5
2
2.5
3
3.5
4
2010 2013 2016 2019
% of GDP
Health Education PLN
State of the energy transition
18
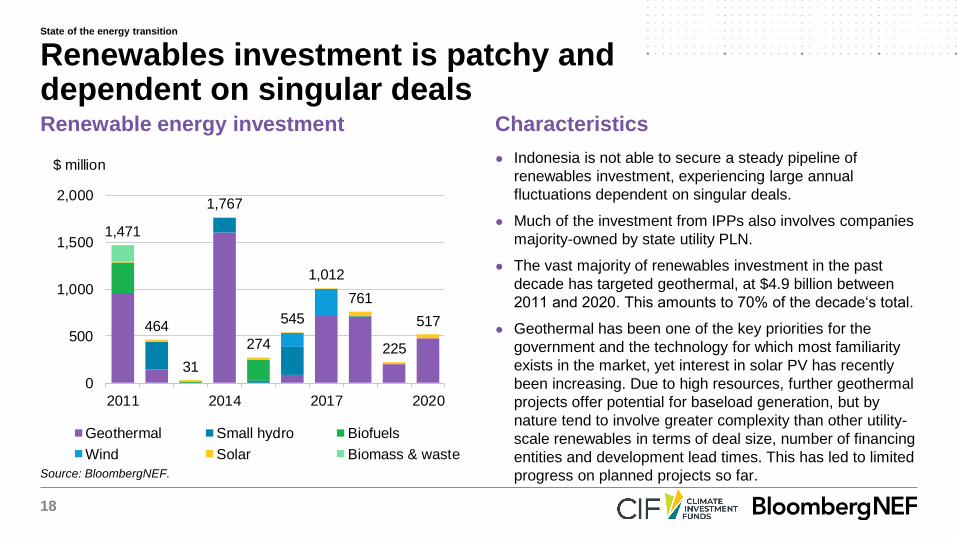
Source: BloombergNEF.
Renewable energy investment Characteristics
● Indonesia is not able to secure a steady pipeline of
renewables investment, experiencing large annual
fluctuations dependent on singular deals.
● Much of the investment from IPPs also involves companies
majority-owned by state utility PLN.
● The vast majority of renewables investment in the past
decade has targeted geothermal, at $4.9 billion between
2011 and 2020. This amounts to 70% of the decade‘s total.
● Geothermal has been one of the key priorities for the
government and the technology for which most familiarity
exists in the market, yet interest in solar PV has recently
been increasing. Due to high resources, further geothermal
projects offer potential for baseload generation, but by
nature tend to involve greater complexity than other utility-
scale renewables in terms of deal size, number of financing
entities and development lead times. This has led to limited
progress on planned projects so far.
Renewables investment is patchy and dependent on singular deals
1,471
464
31
1,767
274
545
1,012
761
225
517
0
500
1,000
1,500
2,000
2011 2014 2017 2020
$ million
Geothermal Small hydro Biofuels
Wind Solar Biomass & waste
State of the energy transition
19
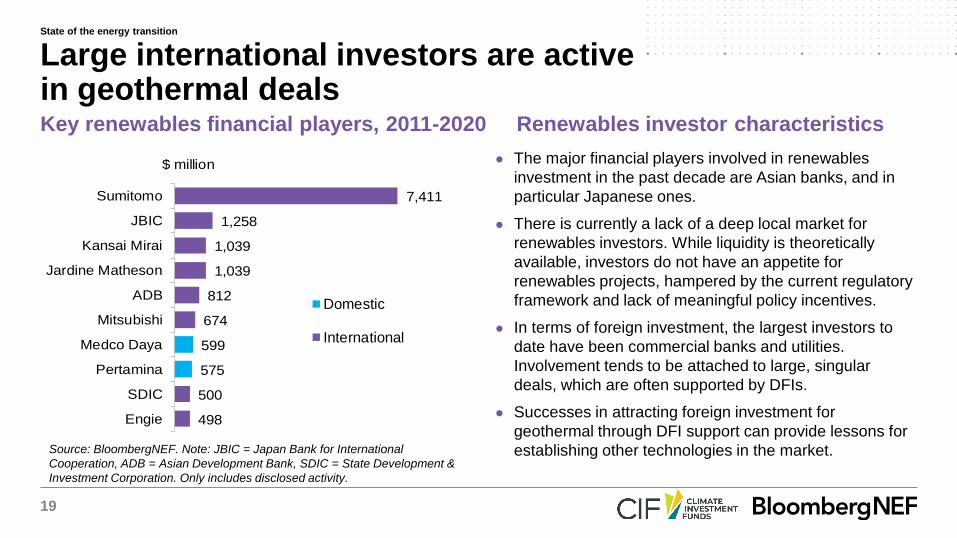
Source: BloombergNEF. Note: JBIC = Japan Bank for International
Cooperation, ADB = Asian Development Bank, SDIC = State Development &
Investment Corporation. Only includes disclosed activity.
Key renewables financial players, 2011-2020 Renewables investor characteristics
● The major financial players involved in renewables
investment in the past decade are Asian banks, and in
particular Japanese ones.
● There is currently a lack of a deep local market for
renewables investors. While liquidity is theoretically
available, investors do not have an appetite for
renewables projects, hampered by the current regulatory
framework and lack of meaningful policy incentives.
● In terms of foreign investment, the largest investors to
date have been commercial banks and utilities.
Involvement tends to be attached to large, singular
deals, which are often supported by DFIs.
● Successes in attracting foreign investment for
geothermal through DFI support can provide lessons for
establishing other technologies in the market.
Large international investors are active in geothermal deals
498
500
575
599
674
812
1,039
1,039
1,258
7,411
Engie
SDIC
Pertamina
Medco Daya
Mitsubishi
ADB
Jardine Matheson
Kansai Mirai
JBIC
Sumitomo
$ million
Domestic
International
State of the energy transition
20
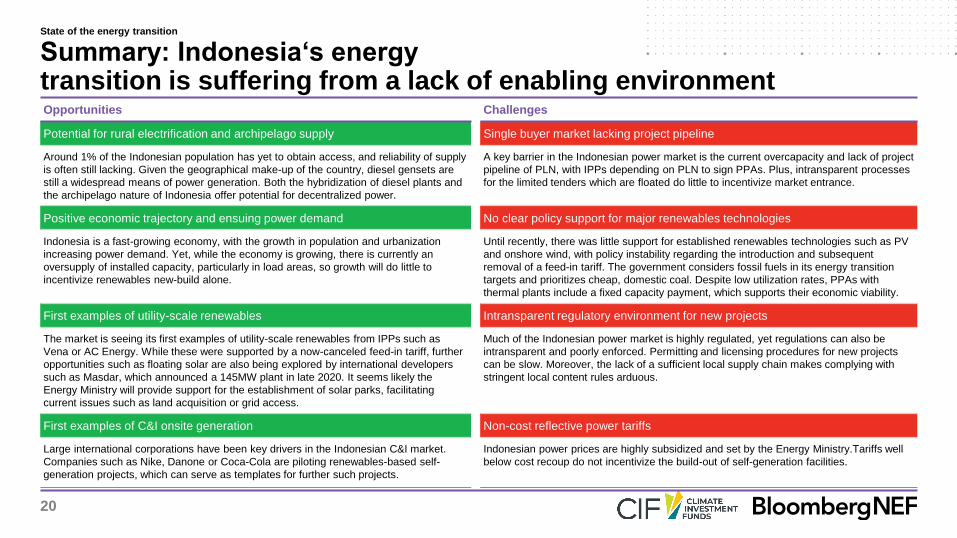
Opportunities Challenges
Potential for rural electrification and archipelago supply Single buyer market lacking project pipeline
Around 1% of the Indonesian population has yet to obtain access, and reliability of supply
is often still lacking. Given the geographical make-up of the country, diesel gensets are
still a widespread means of power generation. Both the hybridization of diesel plants and
the archipelago nature of Indonesia offer potential for decentralized power.
A key barrier in the Indonesian power market is the current overcapacity and lack of project
pipeline of PLN, with IPPs depending on PLN to sign PPAs. Plus, intransparent processes
for the limited tenders which are floated do little to incentivize market entrance.
Positive economic trajectory and ensuing power demand No clear policy support for major renewables technologies
Indonesia is a fast-growing economy, with the growth in population and urbanization
increasing power demand. Yet, while the economy is growing, there is currently an
oversupply of installed capacity, particularly in load areas, so growth will do little to
incentivize renewables new-build alone.
Until recently, there was little support for established renewables technologies such as PV
and onshore wind, with policy instability regarding the introduction and subsequent
removal of a feed-in tariff. The government considers fossil fuels in its energy transition
targets and prioritizes cheap, domestic coal. Despite low utilization rates, PPAs with
thermal plants include a fixed capacity payment, which supports their economic viability.
First examples of utility-scale renewables Intransparent regulatory environment for new projects
The market is seeing its first examples of utility-scale renewables from IPPs such as
Vena or AC Energy. While these were supported by a now-canceled feed-in tariff, further
opportunities such as floating solar are also being explored by international developers
such as Masdar, which announced a 145MW plant in late 2020. It seems likely the
Energy Ministry will provide support for the establishment of solar parks, facilitating
current issues such as land acquisition or grid access.
Much of the Indonesian power market is highly regulated, yet regulations can also be
intransparent and poorly enforced. Permitting and licensing procedures for new projects
can be slow. Moreover, the lack of a sufficient local supply chain makes complying with
stringent local content rules arduous.
First examples of C&I onsite generation Non-cost reflective power tariffs
Large international corporations have been key drivers in the Indonesian C&I market.
Companies such as Nike, Danone or Coca-Cola are piloting renewables-based self-
generation projects, which can serve as templates for further such projects.
Indonesian power prices are highly subsidized and set by the Energy Ministry.Tariffs well
below cost recoup do not incentivize the build-out of self-generation facilities.
Summary: Indonesia‘s energytransition is suffering from a lack of enabling environment
State of the energy transition

21
Financial ecosystem, capacity and financing needsIndonesia
22
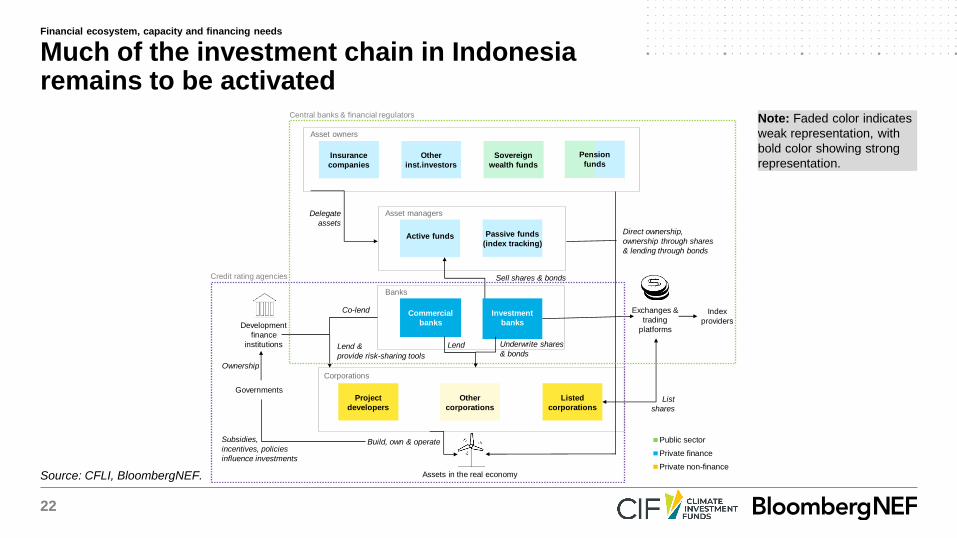
Source: CFLI, BloombergNEF.
Much of the investment chain in Indonesia remains to be activated
Note: Faded color indicates
weak representation, with
bold color showing strong
representation.Pension
funds
Insurance
companies
Other
inst.investors
Sovereign
wealth funds
Active funds Passive funds
(index tracking)
Commercial
banks
Project
developers
Listed
corporations
Pensio
nnds
Asset owners
Other
corporations
Asset managers
Banks
Pension
funds
Corporations
Investment
banks
Delegate
assets
Sell shares & bonds
Exchanges &
trading
platforms
Index
providersDevelopment
finance
institutions
Co-lend
Lend &
provide risk-sharing tools
Governments
Build, own & operateSubsidies,
incentives, policies
influence investments
List
shares
Assets in the real economy
Lend Underwrite shares
& bonds
Ownership
Direct ownership,
ownership through shares
& lending through bonds
0
0.02
1
Public sector
Private finance
Private non-finance
Central banks & financial regulators
Credit rating agencies
Financial ecosystem, capacity and financing needs
23
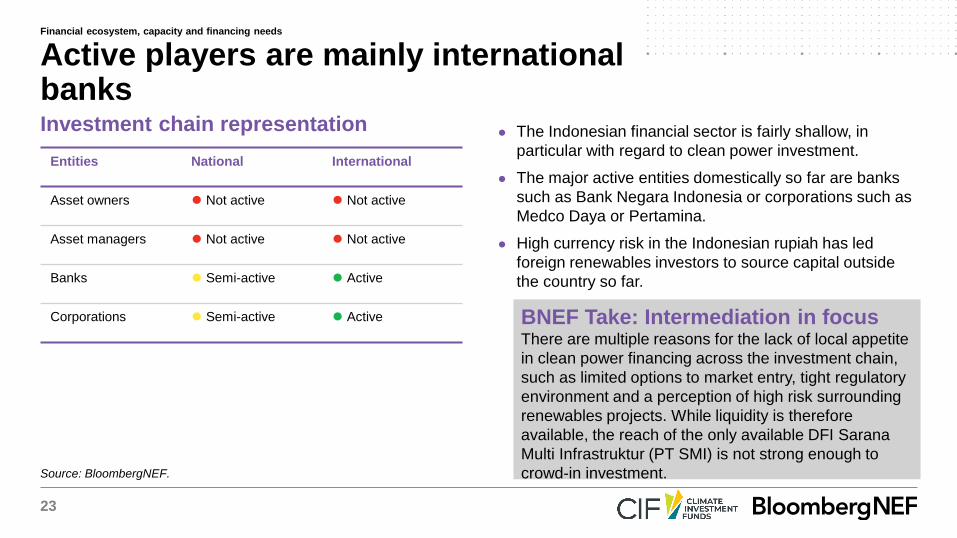
Source: BloombergNEF.
Investment chain representation
BNEF Take: Intermediation in focusThere are multiple reasons for the lack of local appetite
in clean power financing across the investment chain,
such as limited options to market entry, tight regulatory
environment and a perception of high risk surrounding
renewables projects. While liquidity is therefore
available, the reach of the only available DFI Sarana
Multi Infrastruktur (PT SMI) is not strong enough to
crowd-in investment.
Entities National International
Asset owners ⚫ Not active ⚫ Not active
Asset managers ⚫ Not active ⚫ Not active
Banks ⚫ Semi-active ⚫ Active
Corporations ⚫ Semi-active ⚫ Active
● The Indonesian financial sector is fairly shallow, in
particular with regard to clean power investment.
● The major active entities domestically so far are banks
such as Bank Negara Indonesia or corporations such as
Medco Daya or Pertamina.
● High currency risk in the Indonesian rupiah has led
foreign renewables investors to source capital outside
the country so far.
Active players are mainly international banks
Financial ecosystem, capacity and financing needs
24
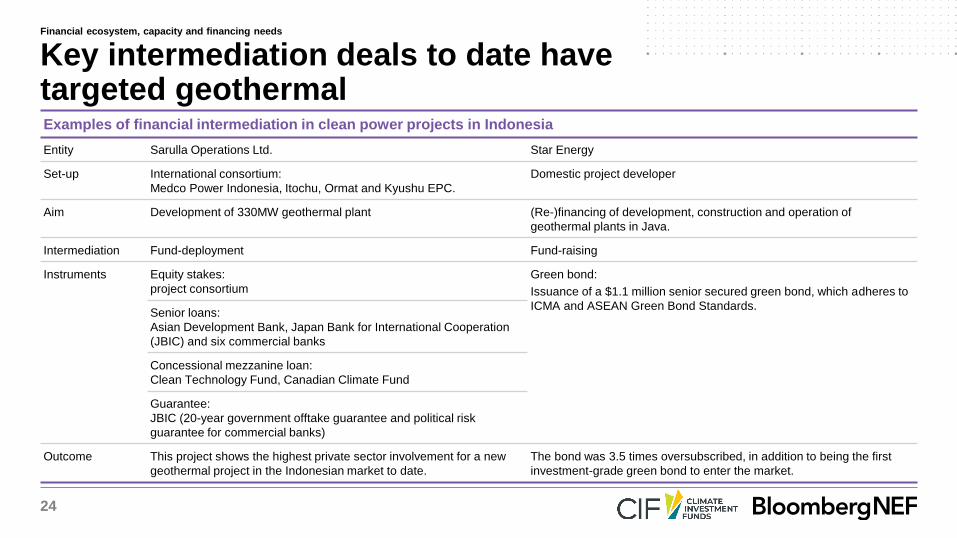
Examples of financial intermediation in clean power projects in Indonesia
Entity Sarulla Operations Ltd. Star Energy
Set-up International consortium:
Medco Power Indonesia, Itochu, Ormat and Kyushu EPC.
Domestic project developer
Aim Development of 330MW geothermal plant (Re-)financing of development, construction and operation of
geothermal plants in Java.
Intermediation Fund-deployment Fund-raising
Instruments Equity stakes:
project consortium
Green bond:
Issuance of a $1.1 million senior secured green bond, which adheres to
ICMA and ASEAN Green Bond Standards.Senior loans:
Asian Development Bank, Japan Bank for International Cooperation
(JBIC) and six commercial banks
Concessional mezzanine loan:
Clean Technology Fund, Canadian Climate Fund
Guarantee:
JBIC (20-year government offtake guarantee and political risk
guarantee for commercial banks)
Outcome This project shows the highest private sector involvement for a new
geothermal project in the Indonesian market to date.
The bond was 3.5 times oversubscribed, in addition to being the first
investment-grade green bond to enter the market.
Key intermediation deals to date have targeted geothermal
Financial ecosystem, capacity and financing needs
25
Source: World Bank. Note: 2019 data.
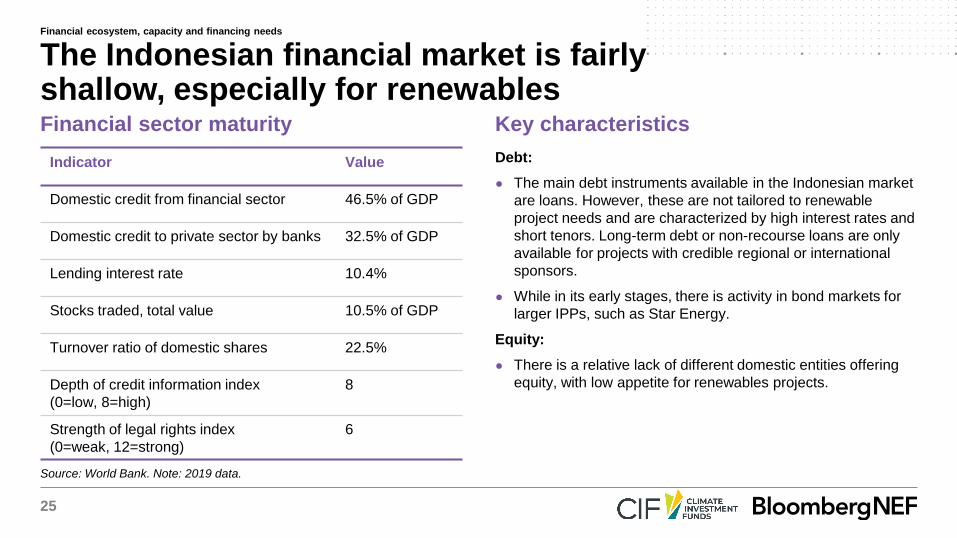
Financial sector maturity Key characteristics
Indicator Value
Domestic credit from financial sector 46.5% of GDP
Domestic credit to private sector by banks 32.5% of GDP
Lending interest rate 10.4%
Stocks traded, total value 10.5% of GDP
Turnover ratio of domestic shares 22.5%
Depth of credit information index
(0=low, 8=high)
8
Strength of legal rights index
(0=weak, 12=strong)
6
Debt:
● The main debt instruments available in the Indonesian market
are loans. However, these are not tailored to renewable
project needs and are characterized by high interest rates and
short tenors. Long-term debt or non-recourse loans are only
available for projects with credible regional or international
sponsors.
● While in its early stages, there is activity in bond markets for
larger IPPs, such as Star Energy.
Equity:
● There is a relative lack of different domestic entities offering
equity, with low appetite for renewables projects.
The Indonesian financial market is fairly shallow, especially for renewables
Financial ecosystem, capacity and financing needs
26
Source: BloombergNEF. Note: Data includes all sub-industries.
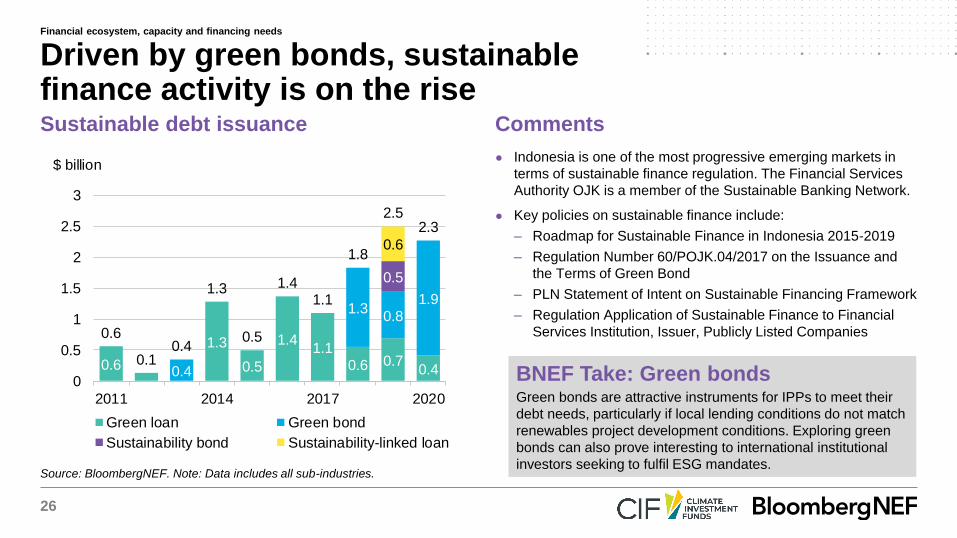
Sustainable debt issuance Comments
● Indonesia is one of the most progressive emerging markets in
terms of sustainable finance regulation. The Financial Services
Authority OJK is a member of the Sustainable Banking Network.
● Key policies on sustainable finance include:
– Roadmap for Sustainable Finance in Indonesia 2015-2019
– Regulation Number 60/POJK.04/2017 on the Issuance and
the Terms of Green Bond
– PLN Statement of Intent on Sustainable Financing Framework
– Regulation Application of Sustainable Finance to Financial
Services Institution, Issuer, Publicly Listed Companies
Driven by green bonds, sustainable finance activity is on the rise
BNEF Take: Green bondsGreen bonds are attractive instruments for IPPs to meet their
debt needs, particularly if local lending conditions do not match
renewables project development conditions. Exploring green
bonds can also prove interesting to international institutional
investors seeking to fulfil ESG mandates.
0.6
1.3
0.5
1.41.1
0.6 0.70.40.4
1.30.8
1.9
0.5
0.6
0.6
0.10.4
1.3
0.5
1.41.1
1.8
2.52.3
0
0.5
1
1.5
2
2.5
3
2011 2014 2017 2020
$ billion
Green loan Green bond
Sustainability bond Sustainability-linked loan
Financial ecosystem, capacity and financing needs
27
Source: BloombergNEF. Note: Sustainable debt here only includes issuances from the power industry (utilities, renewable energy and power generation).
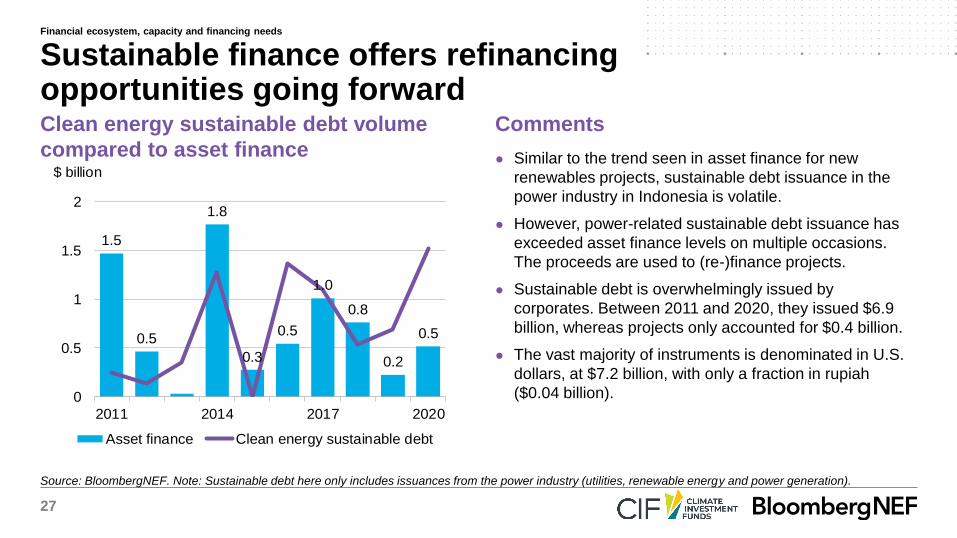
Clean energy sustainable debt volume
compared to asset finance
Comments
● Similar to the trend seen in asset finance for new
renewables projects, sustainable debt issuance in the
power industry in Indonesia is volatile.
● However, power-related sustainable debt issuance has
exceeded asset finance levels on multiple occasions.
The proceeds are used to (re-)finance projects.
● Sustainable debt is overwhelmingly issued by
corporates. Between 2011 and 2020, they issued $6.9
billion, whereas projects only accounted for $0.4 billion.
● The vast majority of instruments is denominated in U.S.
dollars, at $7.2 billion, with only a fraction in rupiah
($0.04 billion).
Sustainable finance offers refinancing opportunities going forward
1.5
0.5
1.8
0.3
0.5
1.0
0.8
0.2
0.5
0
0.5
1
1.5
2
2011 2014 2017 2020
$ billion
Asset finance Clean energy sustainable debt
Financial ecosystem, capacity and financing needs
28
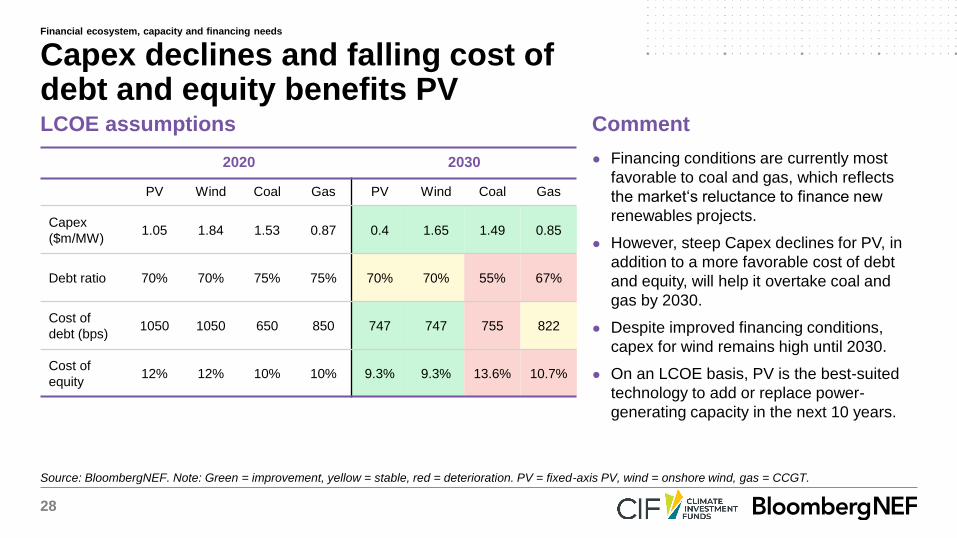
Source: BloombergNEF. Note: Green = improvement, yellow = stable, red = deterioration. PV = fixed-axis PV, wind = onshore wind, gas = CCGT.
LCOE assumptions Comment
2020 2030
PV Wind Coal Gas PV Wind Coal Gas
Capex
($m/MW) 1.05 1.84 1.53 0.87 0.4 1.65 1.49 0.85
Debt ratio 70% 70% 75% 75% 70% 70% 55% 67%
Cost of
debt (bps)1050 1050 650 850 747 747 755 822
Cost of
equity12% 12% 10% 10% 9.3% 9.3% 13.6% 10.7%
● Financing conditions are currently most
favorable to coal and gas, which reflects
the market‘s reluctance to finance new
renewables projects.
● However, steep Capex declines for PV, in
addition to a more favorable cost of debt
and equity, will help it overtake coal and
gas by 2030.
● Despite improved financing conditions,
capex for wind remains high until 2030.
● On an LCOE basis, PV is the best-suited
technology to add or replace power-
generating capacity in the next 10 years.
Capex declines and falling cost of debt and equity benefits PV
Financial ecosystem, capacity and financing needs
29
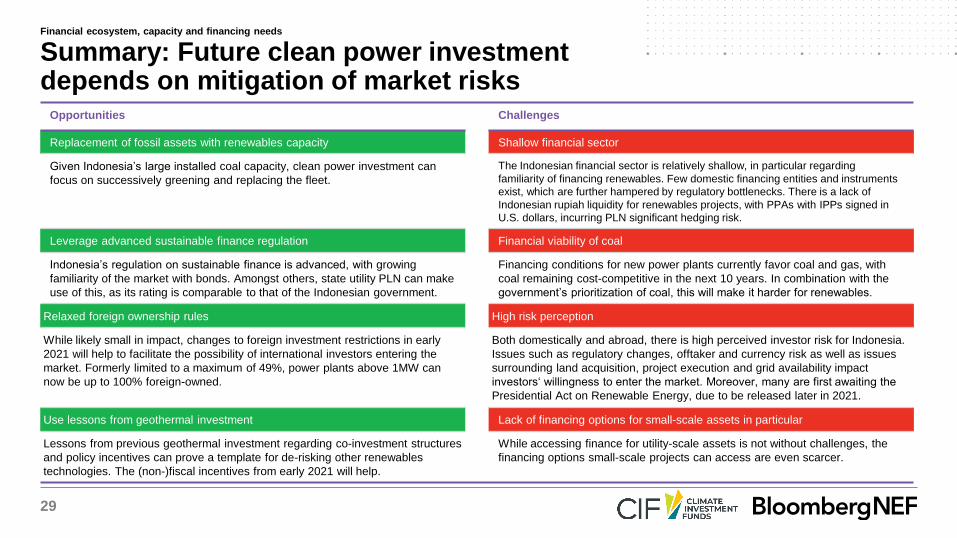
Opportunities Challenges
Replacement of fossil assets with renewables capacity Shallow financial sector
Given Indonesia’s large installed coal capacity, clean power investment can
focus on successively greening and replacing the fleet.
The Indonesian financial sector is relatively shallow, in particular regarding
familiarity of financing renewables. Few domestic financing entities and instruments
exist, which are further hampered by regulatory bottlenecks. There is a lack of
Indonesian rupiah liquidity for renewables projects, with PPAs with IPPs signed in
U.S. dollars, incurring PLN significant hedging risk.
Leverage advanced sustainable finance regulation Financial viability of coal
Indonesia’s regulation on sustainable finance is advanced, with growing
familiarity of the market with bonds. Amongst others, state utility PLN can make
use of this, as its rating is comparable to that of the Indonesian government.
Financing conditions for new power plants currently favor coal and gas, with
coal remaining cost-competitive in the next 10 years. In combination with the
government’s prioritization of coal, this will make it harder for renewables.
Relaxed foreign ownership rules High risk perception
While likely small in impact, changes to foreign investment restrictions in early
2021 will help to facilitate the possibility of international investors entering the
market. Formerly limited to a maximum of 49%, power plants above 1MW can
now be up to 100% foreign-owned.
Both domestically and abroad, there is high perceived investor risk for Indonesia.
Issues such as regulatory changes, offtaker and currency risk as well as issues
surrounding land acquisition, project execution and grid availability impact
investors‘ willingness to enter the market. Moreover, many are first awaiting the
Presidential Act on Renewable Energy, due to be released later in 2021.
Use lessons from geothermal investment Lack of financing options for small-scale assets in particular
Lessons from previous geothermal investment regarding co-investment structures
and policy incentives can prove a template for de-risking other renewables
technologies. The (non-)fiscal incentives from early 2021 will help.
While accessing finance for utility-scale assets is not without challenges, the
financing options small-scale projects can access are even scarcer.
Summary: Future clean power investment depends on mitigation of market risks
Financial ecosystem, capacity and financing needs
30
Leveraging intermediaries to accelerate clean power investmentIndonesia
31
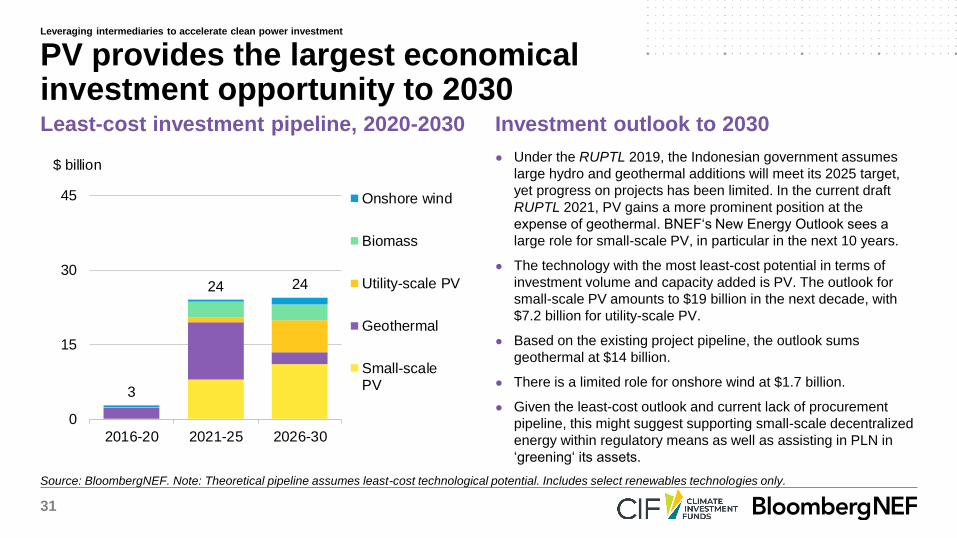
Source: BloombergNEF. Note: Theoretical pipeline assumes least-cost technological potential. Includes select renewables technologies only.
Least-cost investment pipeline, 2020-2030 Investment outlook to 2030
● Under the RUPTL 2019, the Indonesian government assumes
large hydro and geothermal additions will meet its 2025 target,
yet progress on projects has been limited. In the current draft
RUPTL 2021, PV gains a more prominent position at the
expense of geothermal. BNEF‘s New Energy Outlook sees a
large role for small-scale PV, in particular in the next 10 years.
● The technology with the most least-cost potential in terms of
investment volume and capacity added is PV. The outlook for
small-scale PV amounts to $19 billion in the next decade, with
$7.2 billion for utility-scale PV.
● Based on the existing project pipeline, the outlook sums
geothermal at $14 billion.
● There is a limited role for onshore wind at $1.7 billion.
● Given the least-cost outlook and current lack of procurement
pipeline, this might suggest supporting small-scale decentralized
energy within regulatory means as well as assisting in PLN in
‘greening‘ its assets.
PV provides the largest economical investment opportunity to 2030
3
24 24
0
15
30
45
2016-20 2021-25 2026-30
$ billion
Onshore wind
Biomass
Utility-scale PV
Geothermal
Small-scalePV
Leveraging intermediaries to accelerate clean power investment
32
Source: CFLI, BloombergNEF.
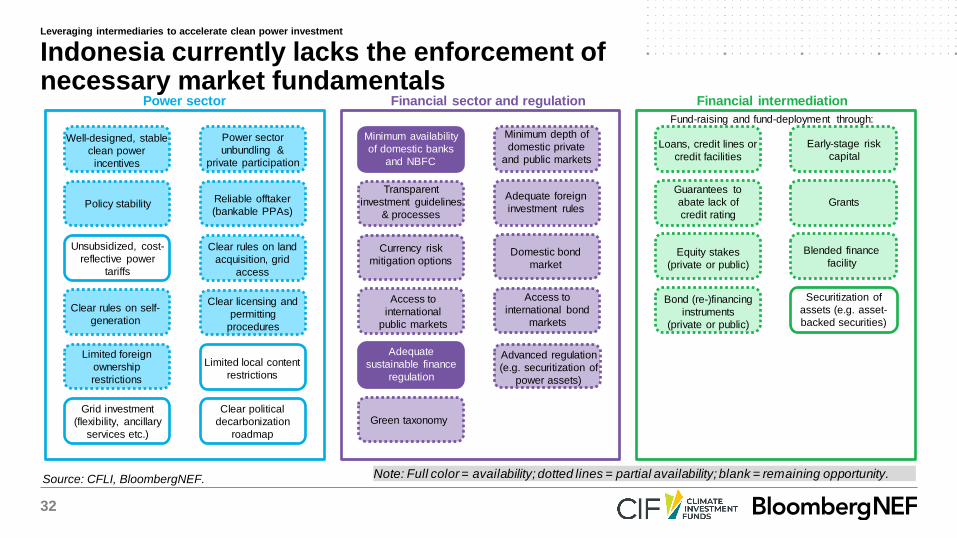
Indonesia currently lacks the enforcement of necessary market fundamentals
Leveraging intermediaries to accelerate clean power investment
Power sector
Fund-raising and fund-deployment through:
Financial intermediation
Loans, credit lines or
credit facilities
Early-stage risk
capital
Grants
Guarantees to
abate lack of
credit rating
Bond (re-)financing
instruments
(private or public)
Blended finance
facilityEquity stakes
(private or public)
Securitization of
assets (e.g. asset-
backed securities)
Note: Full color = availability; dotted lines = partial availability; blank = remaining opportunity.
Well-designed, stable
clean power
incentives
Policy stability
Unsubsidized, cost-
reflective power
tariffs
Clear rules on self-
generation
Grid investment
(flexibility, ancillary
services etc.)
Limited foreign
ownership
restrictions
Power sector
unbundling &
private participation
Reliable offtaker
(bankable PPAs)
Clear licensing and
permitting
procedures
Limited local content
restrictions
Clear rules on land
acquisition, grid
access
Clear political
decarbonization
roadmap
Financial sector and regulation
Transparent
investment guidelines
& processes
Adequate foreign
investment rules
Currency risk
mitigation options
Minimum availability
of domestic banks
and NBFC
Minimum depth of
domestic private
and public markets
Access to
international bond
markets
Access to
international
public markets
Advanced regulation
(e.g. securitization of
power assets)
Adequate
sustainable finance
regulation
Domestic bond
market
Green taxonomy
33
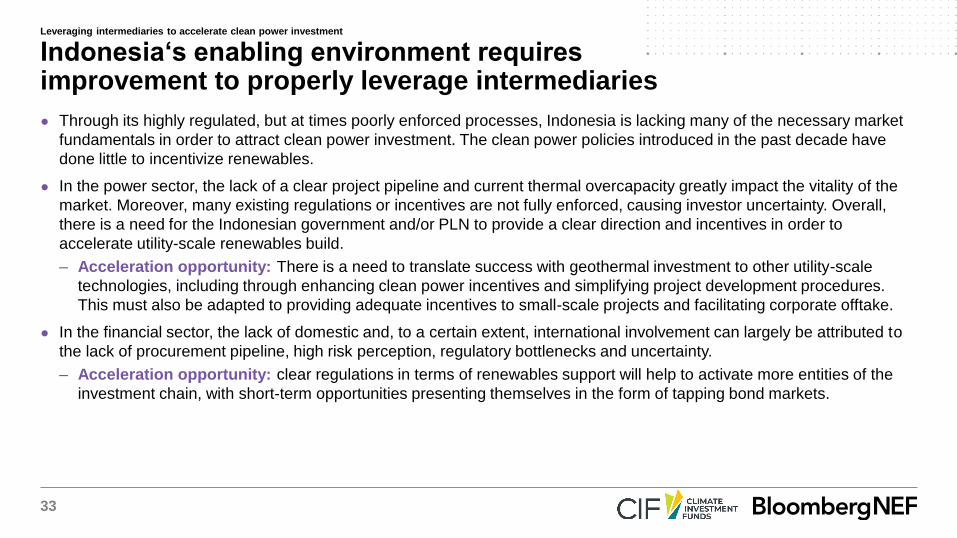
● Through its highly regulated, but at times poorly enforced processes, Indonesia is lacking many of the necessary market
fundamentals in order to attract clean power investment. The clean power policies introduced in the past decade have
done little to incentivize renewables.
● In the power sector, the lack of a clear project pipeline and current thermal overcapacity greatly impact the vitality of the
market. Moreover, many existing regulations or incentives are not fully enforced, causing investor uncertainty. Overall,
there is a need for the Indonesian government and/or PLN to provide a clear direction and incentives in order to
accelerate utility-scale renewables build.
– Acceleration opportunity: There is a need to translate success with geothermal investment to other utility-scale
technologies, including through enhancing clean power incentives and simplifying project development procedures.
This must also be adapted to providing adequate incentives to small-scale projects and facilitating corporate offtake.
● In the financial sector, the lack of domestic and, to a certain extent, international involvement can largely be attributed to
the lack of procurement pipeline, high risk perception, regulatory bottlenecks and uncertainty.
– Acceleration opportunity: clear regulations in terms of renewables support will help to activate more entities of the
investment chain, with short-term opportunities presenting themselves in the form of tapping bond markets.
Indonesia‘s enabling environment requires improvement to properly leverage intermediaries
Leveraging intermediaries to accelerate clean power investment
34
Investment opportunities Enabling environment opportunities
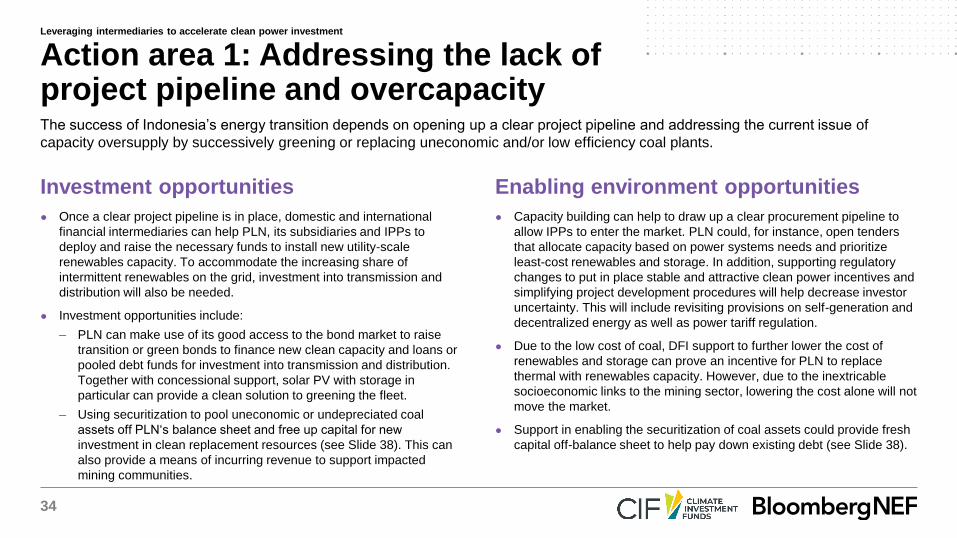
● Once a clear project pipeline is in place, domestic and international
financial intermediaries can help PLN, its subsidiaries and IPPs to
deploy and raise the necessary funds to install new utility-scale
renewables capacity. To accommodate the increasing share of
intermittent renewables on the grid, investment into transmission and
distribution will also be needed.
● Investment opportunities include:
– PLN can make use of its good access to the bond market to raise
transition or green bonds to finance new clean capacity and loans or
pooled debt funds for investment into transmission and distribution.
Together with concessional support, solar PV with storage in
particular can provide a clean solution to greening the fleet.
– Using securitization to pool uneconomic or undepreciated coal
assets off PLN‘s balance sheet and free up capital for new
investment in clean replacement resources (see Slide 38). This can
also provide a means of incurring revenue to support impacted
mining communities.
● Capacity building can help to draw up a clear procurement pipeline to
allow IPPs to enter the market. PLN could, for instance, open tenders
that allocate capacity based on power systems needs and prioritize
least-cost renewables and storage. In addition, supporting regulatory
changes to put in place stable and attractive clean power incentives and
simplifying project development procedures will help decrease investor
uncertainty. This will include revisiting provisions on self-generation and
decentralized energy as well as power tariff regulation.
● Due to the low cost of coal, DFI support to further lower the cost of
renewables and storage can prove an incentive for PLN to replace
thermal with renewables capacity. However, due to the inextricable
socioeconomic links to the mining sector, lowering the cost alone will not
move the market.
● Support in enabling the securitization of coal assets could provide fresh
capital off-balance sheet to help pay down existing debt (see Slide 38).
Action area 1: Addressing the lack of project pipeline and overcapacityThe success of Indonesia’s energy transition depends on opening up a clear project pipeline and addressing the current issue of
capacity oversupply by successively greening or replacing uneconomic and/or low efficiency coal plants.
Leveraging intermediaries to accelerate clean power investment
35
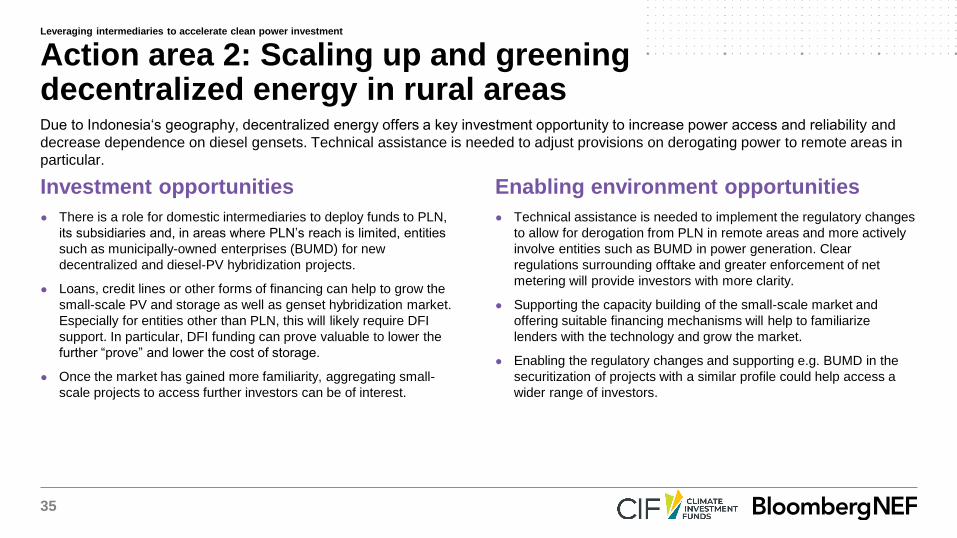
Investment opportunities Enabling environment opportunities
● There is a role for domestic intermediaries to deploy funds to PLN,
its subsidiaries and, in areas where PLN’s reach is limited, entities
such as municipally-owned enterprises (BUMD) for new
decentralized and diesel-PV hybridization projects.
● Loans, credit lines or other forms of financing can help to grow the
small-scale PV and storage as well as genset hybridization market.
Especially for entities other than PLN, this will likely require DFI
support. In particular, DFI funding can prove valuable to lower the
further “prove” and lower the cost of storage.
● Once the market has gained more familiarity, aggregating small-
scale projects to access further investors can be of interest.
● Technical assistance is needed to implement the regulatory changes
to allow for derogation from PLN in remote areas and more actively
involve entities such as BUMD in power generation. Clear
regulations surrounding offtake and greater enforcement of net
metering will provide investors with more clarity.
● Supporting the capacity building of the small-scale market and
offering suitable financing mechanisms will help to familiarize
lenders with the technology and grow the market.
● Enabling the regulatory changes and supporting e.g. BUMD in the
securitization of projects with a similar profile could help access a
wider range of investors.
Action area 2: Scaling up and greening decentralized energy in rural areasDue to Indonesia‘s geography, decentralized energy offers a key investment opportunity to increase power access and reliability and
decrease dependence on diesel gensets. Technical assistance is needed to adjust provisions on derogating power to remote areas in
particular.
Leveraging intermediaries to accelerate clean power investment
36
Investment opportunities Enabling environment opportunities
● Financial intermediation has a role to play in offering suitable
financing mechanisms to C&I entities where the regulatory
environment allows.
● While international C&I will likely continue to rely on international
capital, DFIs can support domestic banks and NBFC in deploying
funds to small-scale PV and storage projects of SMEs.
● Once these more traditional instruments have been proven on the
market, securitization of projects with a similar profile can be
considered as a next step to access further investors.
● While large international corporations have piloted this model,
financial access for local C&I might require DFI support, particularly
for SMEs. DFI support can help to cultivate market familiarity and the
development of self-generation projects coupled with storage
through loans, credit lines or other forms of financing facilities. At a
later stage, it can be useful to explore and support the securitization
of assets for projects with a similar profile.
● DFI funds could be particularly helpful to “prove” and bring down the
cost of small-scale storage.
Action area 3: Scaling up the self-generation marketIn addition to greening the utility-scale fleet, efforts need to be made to spread the renewables market in breadth too. Installing self-
generation facilities can improve power reliability for large industrials and commercials. There is a need to develop suitable financing
mechanisms for smaller commercial users, which are currently underserved.
Leveraging intermediaries to accelerate clean power investment
37
Investment opportunities Enabling environment opportunities
● In order to better activate domestic intermediaries and familiarize
them with fund-deployment to renewables, DFIs could support
Indonesia’s national development bank PT SMI (or an entity) in
providing de-risking mechanisms like first-loss positions or
guarantees.
● This is largely an enabling environment activity, yet technical
assistance combined with DFI funds can help PT SMI to develop and
offer various risk mitigation instruments such as full or partial
guarantees. Alternatively, a project preparation facility using blended
finance could prove another way to offer risk mitigation instruments.
● Once enabling environment issues have been addressed, it will be
useful to support the development of the local financial market for
more rupiah-based liquidity. Current PPAs in U.S. dollars incur
significant costs to PLN through forex and hedging risk, which was
exacerbated during Covid.
Action area 4: Activating the domestic financial sectorIn light of the constrained renewables investment environment in Indonesia due to the lack of project pipeline, thermal overcapacity and
regulatory environment, many local financial players are not sufficiently familiar with renewables financing, with many IPP projects to
date financed in overseas currency.
Leveraging intermediaries to accelerate clean power investment

38
Investment opportunities Enabling environment opportunities
● Once a clear government commitment has been set, domestic and
international intermediaries can raise finance to decommission coal
assets and replace these with least-cost renewables and storage. At the
outset, this will likely require DFI support.
● PLN, its subsidiaries and IPPs that have PPAs with PLN can for
instance raise green/transition bonds on the project or corporate level.
As PLN has good access to the bond market, this could prove a useful
avenue to take. In addition, using securitization to pool and refinance
uneconomic or underused coal plants off-balance sheet can provide
funding for clean replacement capacity. Depending on the design, part
of the revenue could support communities impacted by the coal
transition.
● Further innovative financing mechanisms provided purely by DFIs such
as decarbonization loans can prove valuable in establishing the market.
● The coal transition is a challenge that requires a clear decarbonization
commitment from the highest political level and collaboration between a
variety of stakeholders, from mine operators holding long-term coal
offtake contracts with PLN to mining sector employees. Technical
assistance needs to support these dialogs and processes, such as the
renegotiation of fuel supply contracts or exiting coal PPAs with IPPs.
● PLN will likely require support in structuring the adequate financial
instruments to decommission coal assets. Technical assistance in
adjusting regulation to allow for securitization of assets can not only be
useful in terms of raising debt to pay down coal assets but can also be a
valuable mechanism to raise finance for impacted communities, such as
for job training programs. DFI support is likely necessary to initially
“prove” such a financing mechanism.
● DFI support to collaboration with institutional investors could additionally
facilitate pre-identifying lenders and designing bonds to match their
investment criteria.
Action area 5: Enabling a just transition away from coalThe decarbonization of Indonesia‘s power sector will depend on supporting PLN on its energy transition journey, addressing the current
issue of capacity oversupply, and replacing uneconomic or undepreciated coal assets with clean capacity. This will require advisory
services to PLN and support in implementing suitable financing instruments.
Leveraging intermediaries to accelerate clean power investment
39
Copyright
© Bloomberg Finance L.P. 2021. This publication is the copyright of Bloomberg Finance L.P. in connection with BloombergNEF. No portion of this document may be
photocopied, reproduced, scanned into an electronic system or transmitted, forwarded or distributed in any way without prior consent of BloombergNEF.
Disclaimer
The BloombergNEF ("BNEF"), service/information is derived from selected public sources. Bloomberg Finance L.P. and its affiliates, in providing the
service/information, believe that the information it uses comes from reliable sources, but do not guarantee the accuracy or completeness of this information, which is
subject to change without notice, and nothing in this document shall be construed as such a guarantee. The statements in this service/document reflect the current
judgment of the authors of the relevant articles or features, and do not necessarily reflect the opinion of Bloomberg Finance L.P., Bloomberg L.P. or any of their
affiliates (“Bloomberg”). Bloomberg disclaims any liability arising from use of this document, its contents and/or this service. Nothing herein shall constitute or be
construed as an offering of financial instruments or as investment advice or recommendations by Bloomberg of an investment or other strategy (e.g., whether or not
to “buy”, “sell”, or “hold” an investment). The information available through this service is not based on consideration of a subscriber’s individual circumstances and
should not be considered as information sufficient upon which to base an investment decision. You should determine on your own whether you agree with the
content. This service should not be construed as tax or accounting advice or as a service designed to facilitate any subscriber’s compliance with its tax, accounting or
other legal obligations. Employees involved in this service may hold positions in the companies mentioned in the services/information.
The data included in these materials are for illustrative purposes only. The BLOOMBERG TERMINAL service and Bloomberg data products (the “Services”) are
owned and distributed by Bloomberg Finance L.P. (“BFLP”) except (i) in Argentina, Australia and certain jurisdictions in the Pacific islands, Bermuda, China, India,
Japan, Korea and New Zealand, where Bloomberg L.P. and its subsidiaries (“BLP”) distribute these products, and (ii) in Singapore and the jurisdictions serviced by
Bloomberg’s Singapore office, where a subsidiary of BFLP distributes these products. BLP provides BFLP and its subsidiaries with global marketing and operational
support and service. Certain features, functions, products and services are available only to sophisticated investors and only where permitted. BFLP, BLP and their
affiliates do not guarantee the accuracy of prices or other information in the Services. Nothing in the Services shall constitute or be construed as an offering of
financial instruments by BFLP, BLP or their affiliates, or as investment advice or recommendations by BFLP, BLP or their affi liates of an investment strategy or
whether or not to “buy”, “sell” or “hold” an investment. Information available via the Services should not be considered as information sufficient upon which to base an
investment decision. The following are trademarks and service marks of BFLP, a Delaware limited partnership, or its subsidiaries: BLOOMBERG, BLOOMBERG
ANYWHERE, BLOOMBERG MARKETS, BLOOMBERG NEWS, BLOOMBERG PROFESSIONAL, BLOOMBERG TERMINAL and BLOOMBERG.COM. Absence of
any trademark or service mark from this list does not waive Bloomberg’s intellectual property rights in that name, mark or logo. All rights reserved. © 2021 Bloomberg.
Copyright and disclaimer
Coverage.
Clean energy
Advanced transport
Commodities
Digital industry
BloombergNEF (BNEF) is a leading provider
of primary research on clean energy,
advanced transport, digital industry,
innovative materials, and commodities.
BNEF’s global team leverages the world’s
most sophisticated data sets to create clear
perspectives and in-depth forecasts that
frame the financial, economic and policy
implications of industry-transforming trends
and technologies.
BNEF research and analysis is accessible via
web and mobile platforms, as well as on the
Bloomberg Terminal.
Client enquiries:
Bloomberg Terminal: press <Help> key twice
Email: [email protected]
Learn more:
about.bnef.com | @BloombergNEF