2022-2026 - financial plan highlights - city of burnaby
TRANSCRIPT
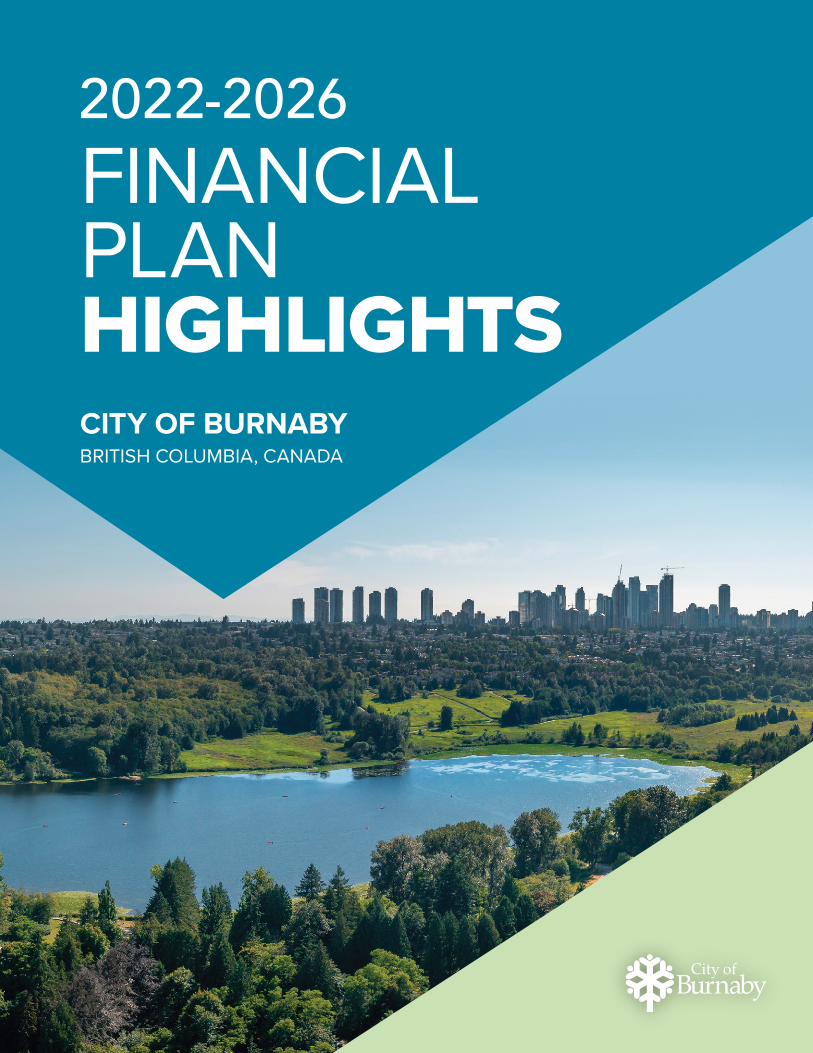
2022-2026
CITY OF BURNABYBRITISH COLUMBIA, CANADA
FINANCIAL PLAN HIGHLIGHTS
Burnaby’s Vision:
A world-class city committed to creating and sustaining the best quality of life for our entire community.
Burnaby is located on the ancestral and unceded homelands of the hən̓q̓əmin̓əm̓ and Sḵwxw̱ú7mesh speaking peoples.
TABLE OF CONTENTS3 INTRODUCTION
4 BUDGET TIMELINE
5 STRATEGIES THAT INFLUENCE THE BUDGET
6 FINANCIAL POLICIES
7 TAX RATE SUMMARY
9 FINANCIAL PLAN SUMMARY
11 OPERATING PLAN SUMMARY
12 OPERATING BUDGET REVENUES
13 OPERATING BUDGET EXPENDITURES
15 CAPITAL PLAN
19 CAPITAL HIGHLIGHTS
23 PUBLIC CONSULTATION – 2022-2026 FINANCIAL PLAN
2 | 2022-2026 FINANCIAL PLAN HIGHLIGHTS 32022-2026 FINANCIAL PLAN HIGHLIGHTS |
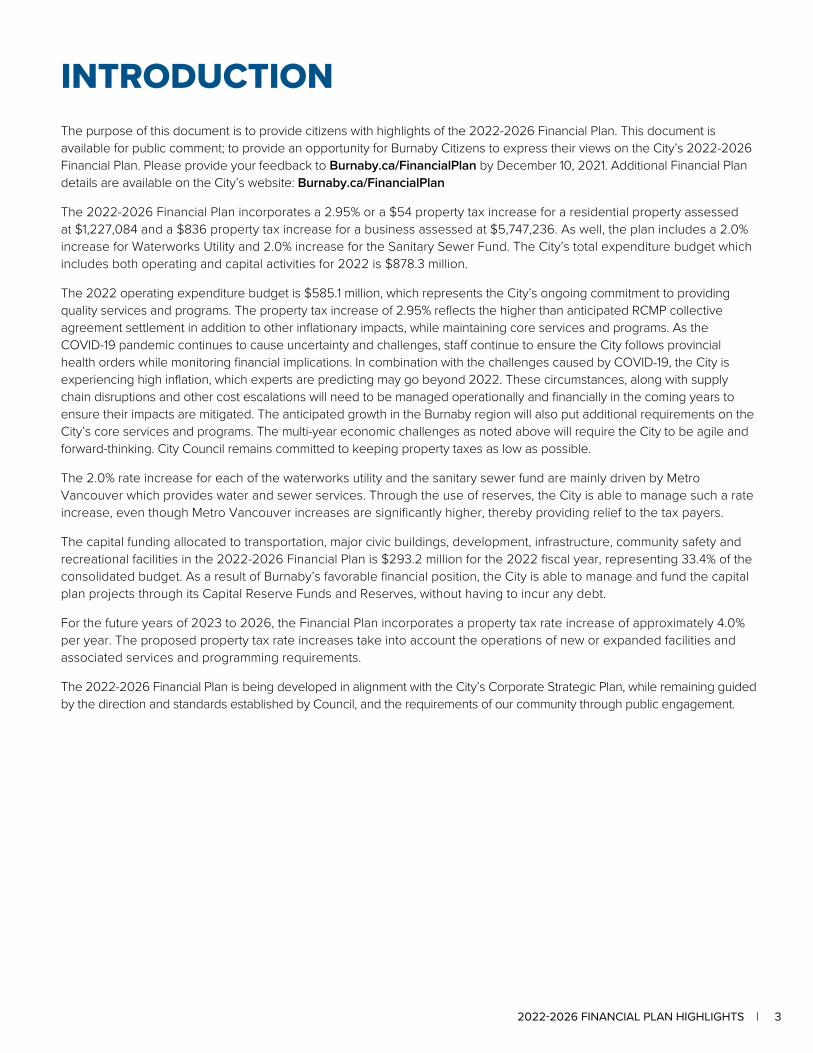
INTRODUCTIONThe purpose of this document is to provide citizens with highlights of the 2022-2026 Financial Plan. This document is available for public comment; to provide an opportunity for Burnaby Citizens to express their views on the City’s 2022-2026 Financial Plan. Please provide your feedback to Burnaby.ca/FinancialPlan by December 10, 2021. Additional Financial Plan details are available on the City’s website: Burnaby.ca/FinancialPlan
The 2022-2026 Financial Plan incorporates a 2.95% or a $54 property tax increase for a residential property assessed at $1,227,084 and a $836 property tax increase for a business assessed at $5,747,236. As well, the plan includes a 2.0% increase for Waterworks Utility and 2.0% increase for the Sanitary Sewer Fund. The City’s total expenditure budget which includes both operating and capital activities for 2022 is $878.3 million.
The 2022 operating expenditure budget is $585.1 million, which represents the City’s ongoing commitment to providing quality services and programs. The property tax increase of 2.95% reflects the higher than anticipated RCMP collective agreement settlement in addition to other inflationary impacts, while maintaining core services and programs. As the COVID-19 pandemic continues to cause uncertainty and challenges, staff continue to ensure the City follows provincial health orders while monitoring financial implications. In combination with the challenges caused by COVID-19, the City is experiencing high inflation, which experts are predicting may go beyond 2022. These circumstances, along with supply chain disruptions and other cost escalations will need to be managed operationally and financially in the coming years to ensure their impacts are mitigated. The anticipated growth in the Burnaby region will also put additional requirements on the City’s core services and programs. The multi-year economic challenges as noted above will require the City to be agile and forward-thinking. City Council remains committed to keeping property taxes as low as possible.
The 2.0% rate increase for each of the waterworks utility and the sanitary sewer fund are mainly driven by Metro Vancouver which provides water and sewer services. Through the use of reserves, the City is able to manage such a rate increase, even though Metro Vancouver increases are significantly higher, thereby providing relief to the tax payers.
The capital funding allocated to transportation, major civic buildings, development, infrastructure, community safety and recreational facilities in the 2022-2026 Financial Plan is $293.2 million for the 2022 fiscal year, representing 33.4% of the consolidated budget. As a result of Burnaby’s favorable financial position, the City is able to manage and fund the capital plan projects through its Capital Reserve Funds and Reserves, without having to incur any debt.
For the future years of 2023 to 2026, the Financial Plan incorporates a property tax rate increase of approximately 4.0% per year. The proposed property tax rate increases take into account the operations of new or expanded facilities and associated services and programming requirements.
The 2022-2026 Financial Plan is being developed in alignment with the City’s Corporate Strategic Plan, while remaining guided by the direction and standards established by Council, and the requirements of our community through public engagement.
2 | 2022-2026 FINANCIAL PLAN HIGHLIGHTS 32022-2026 FINANCIAL PLAN HIGHLIGHTS |
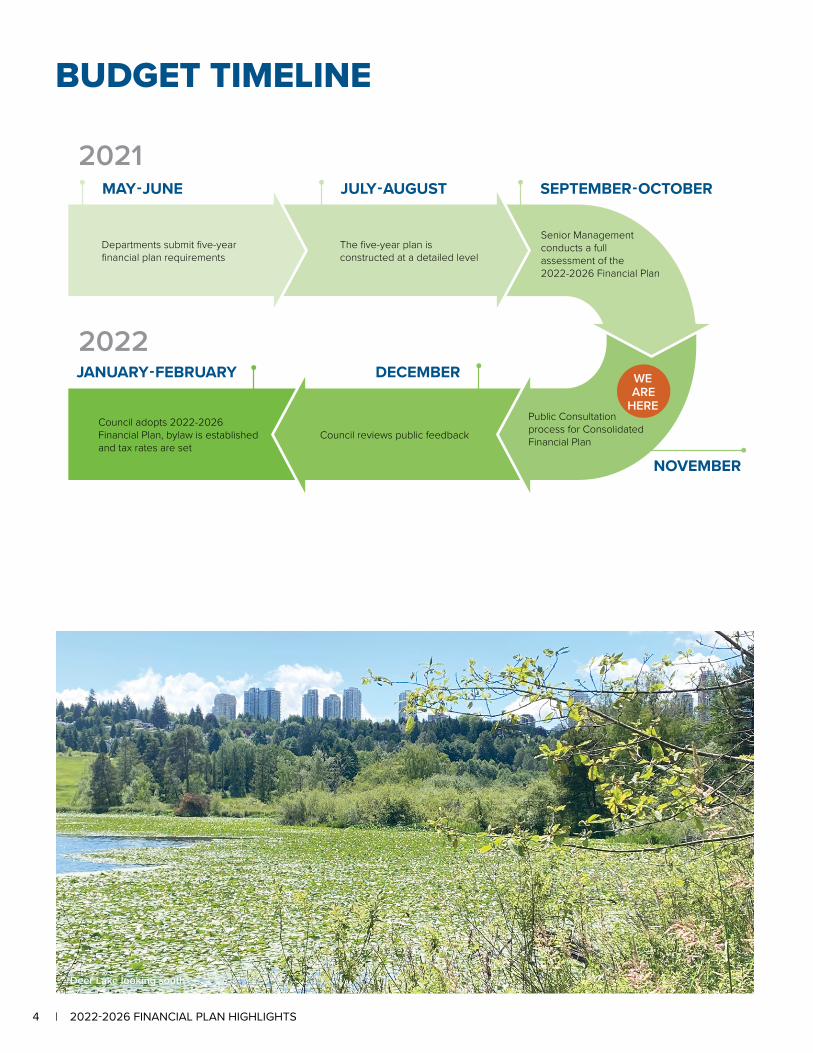
BUDGET TIMELINE
Council adopts 2022-2026 Financial Plan, bylaw is established and tax rates are set
Council reviews public feedback
MAY - JUNE JULY - AUGUST SEPTEMBER - OCTOBER
NOVEMBER
DECEMBERJANUARY - FEBRUARY
2021
2022
Public Consultation process for Consolidated Financial Plan
WE ARE
HERE
Senior Management conducts a full assessment of the 2022-2026 Financial Plan
The five-year plan is constructed at a detailed level
Departments submit five-year financial plan requirements
Deer Lake looking south
4 | 2022-2026 FINANCIAL PLAN HIGHLIGHTS 52022-2026 FINANCIAL PLAN HIGHLIGHTS |
STRATEGIES THAT INFLUENCE THE BUDGET
Corporate Strategic PlanThe City of Burnaby’s vision is to be a world-class city committed to creating and sustaining the best quality of life for our entire community. In Burnaby, the path to achieving our vision rests on our core values: Community, Integrity, Respect, Innovation and Passion, as outlined in the Corporate Strategic Plan (CSP). These values describe how we do our work, and are the principles that guide our actions and decisions. The CSP is founded upon and guided by the goals that the City has established through a series of forward-thinking, long-term plans, including the Council-adopted trilogy of sustainability strategies (social, environmental and economic), the Official Community Plan and other city policies that establish the planning and resource context for our work.
The CSP outlines six goals that describe the focus areas of our work, and help us prioritize our efforts and resources.
1 2 3 4 5 6A SAFE
COMMUNITYA CONNECTEDCOMMUNITY
AN INCLUSIVECOMMUNITY
A HEALTHYCOMMUNITY
A DYNAMICCOMMUNITY
A THRIVINGORGANIZATION
INTEGRATEDPLANNING
FRAMEWORK
C
ORP
ORA
TE S
TRAT
EGIC PLAN (CSP)
ACTION PLAN (AP)
FINANCIAL PLAN
(FP)
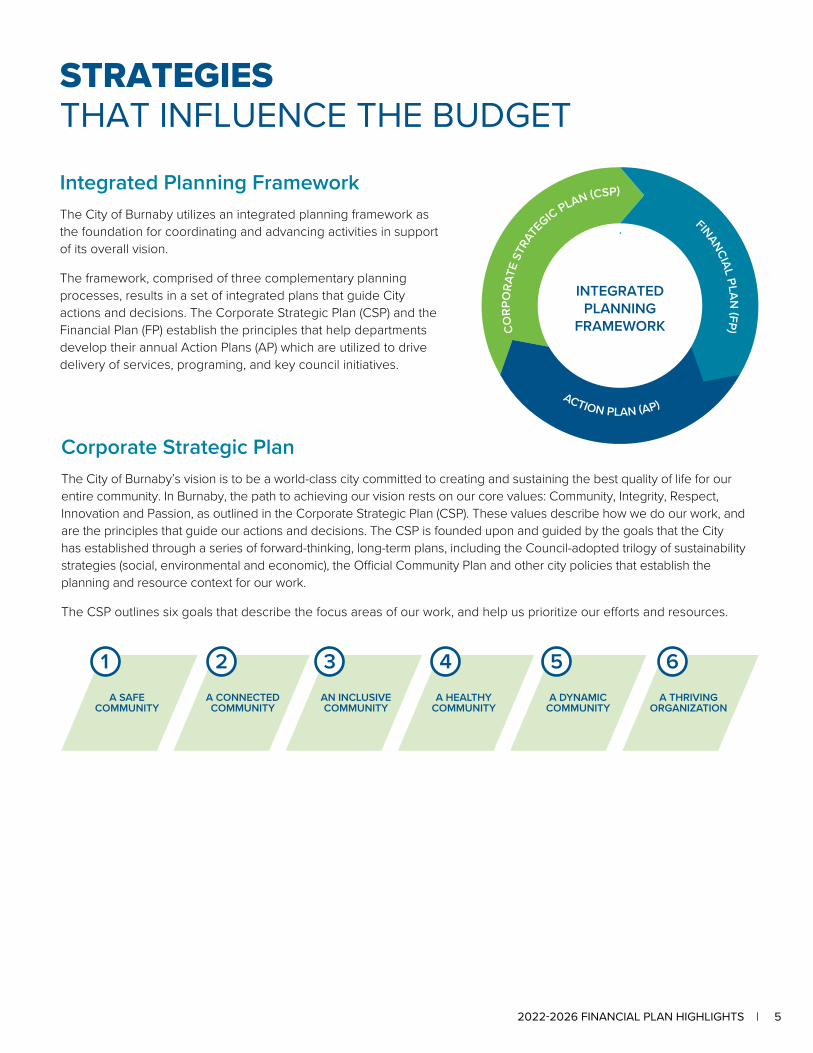
Integrated Planning FrameworkThe City of Burnaby utilizes an integrated planning framework as the foundation for coordinating and advancing activities in support of its overall vision.
The framework, comprised of three complementary planning processes, results in a set of integrated plans that guide City actions and decisions. The Corporate Strategic Plan (CSP) and the Financial Plan (FP) establish the principles that help departments develop their annual Action Plans (AP) which are utilized to drive delivery of services, programing, and key council initiatives.
4 | 2022-2026 FINANCIAL PLAN HIGHLIGHTS 52022-2026 FINANCIAL PLAN HIGHLIGHTS |
FINANCIAL POLICIESWhen compiling the City of Burnaby’s five-year financial plan, the following policies are used as a framework to ensure proper fiscal accountability, long-term sustainability, and stewardship over the City’s funds:
Balanced Five-Year BudgetIn compliance with Section 165 of the Community Charter, the City’s five-year financial plan must be balanced.
The total of proposed expenditures and transfers to other funds for a year must not exceed the total of proposed funding sources and transfers from other funds for the year.
Public ConsultationThe City’s five-year financial plan must be available for public consultation prior to the plan being adopted.
Basis of BudgetingThe budget is prepared using the accrual method of accounting. This is consistent with Public Sector Accounting Board (PSAB) requirements.
Tangible Capital Asset PolicyTangible capital assets are also budgeted according to PSAB standards.
Asset Management PlansThe City’s Asset Management Plans (AMPs) guide staff in managing infrastructure effectively and efficiently.
Debt ManagementStrong capital Reserve Funds and Reserves levels are critical in achieving community goals and provide Council the financial flexibility and leverage to sustain and improve the City’s civic infrastructure requirements which allows the City to remain debt free.
Investment Income GuidelinesCity investments are represented by a single investment portfolio with longer term investments focusing on safety, social responsibility, liquidity and a fair market yield.
Internal Carbon Pricing PolicyBurnaby’s Internal Carbon Price has been set at $150/tonne of CO2e for 2022 to align with Metro Vancouver’s carbon price. The Carbon Price is used to aid in decision making.
6 | 2022-2026 FINANCIAL PLAN HIGHLIGHTS 72022-2026 FINANCIAL PLAN HIGHLIGHTS |
TAX RATE SUMMARY
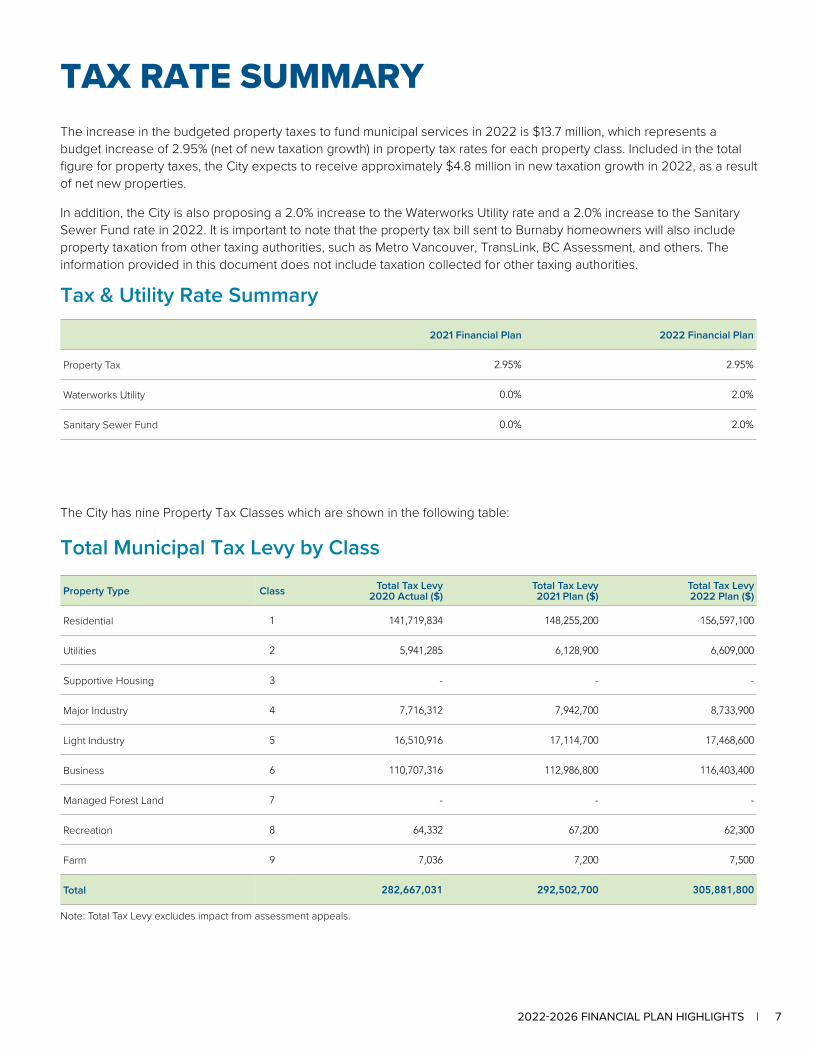
The City has nine Property Tax Classes which are shown in the following table:
Total Municipal Tax Levy by Class
Property Type Class Total Tax Levy 2020 Actual ($)
Total Tax Levy 2021 Plan ($)
Total Tax Levy 2022 Plan ($)
Residential 1 141,719,834 148,255,200 156,597,100
Utilities 2 5,941,285 6,128,900 6,609,000
Supportive Housing 3 - - -
Major Industry 4 7,716,312 7,942,700 8,733,900
Light Industry 5 16,510,916 17,114,700 17,468,600
Business 6 110,707,316 112,986,800 116,403,400
Managed Forest Land 7 - - -
Recreation 8 64,332 67,200 62,300
Farm 9 7,036 7,200 7,500
Total 282,667,031 292,502,700 305,881,800
Note: Total Tax Levy excludes impact from assessment appeals.
The increase in the budgeted property taxes to fund municipal services in 2022 is $13.7 million, which represents a budget increase of 2.95% (net of new taxation growth) in property tax rates for each property class. Included in the total figure for property taxes, the City expects to receive approximately $4.8 million in new taxation growth in 2022, as a result of net new properties.
In addition, the City is also proposing a 2.0% increase to the Waterworks Utility rate and a 2.0% increase to the Sanitary Sewer Fund rate in 2022. It is important to note that the property tax bill sent to Burnaby homeowners will also include property taxation from other taxing authorities, such as Metro Vancouver, TransLink, BC Assessment, and others. The information provided in this document does not include taxation collected for other taxing authorities.
Tax & Utility Rate Summary
2021 Financial Plan 2022 Financial Plan
Property Tax 2.95% 2.95%
Waterworks Utility 0.0% 2.0%
Sanitary Sewer Fund 0.0% 2.0%
6 | 2022-2026 FINANCIAL PLAN HIGHLIGHTS 72022-2026 FINANCIAL PLAN HIGHLIGHTS |
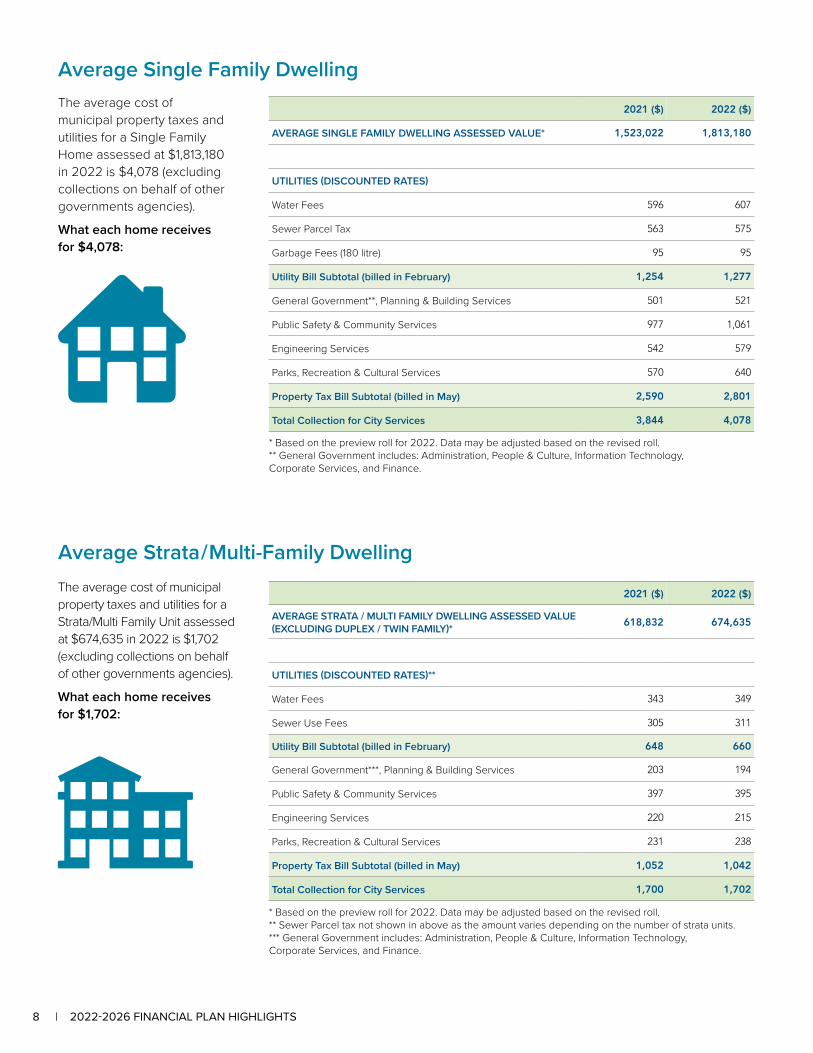
2021 ($) 2022 ($)
AVERAGE STRATA / MULTI FAMILY DWELLING ASSESSED VALUE (EXCLUDING DUPLEX / TWIN FAMILY)* 618,832 674,635
UTILITIES (DISCOUNTED RATES)**
Water Fees 343 349
Sewer Use Fees 305 311
Utility Bill Subtotal (billed in February) 648 660
General Government***, Planning & Building Services 203 194
Public Safety & Community Services 397 395
Engineering Services 220 215
Parks, Recreation & Cultural Services 231 238
Property Tax Bill Subtotal (billed in May) 1,052 1,042
Total Collection for City Services 1,700 1,702
* Based on the preview roll for 2022. Data may be adjusted based on the revised roll.** Sewer Parcel tax not shown in above as the amount varies depending on the number of strata units.*** General Government includes: Administration, People & Culture, Information Technology, Corporate Services, and Finance.
The average cost of municipal property taxes and utilities for a Strata/Multi Family Unit assessed at $674,635 in 2022 is $1,702 (excluding collections on behalf of other governments agencies).
What each home receives for $1,702:
Average Strata / Multi-Family Dwelling
* Based on the preview roll for 2022. Data may be adjusted based on the revised roll.** General Government includes: Administration, People & Culture, Information Technology, Corporate Services, and Finance.
Average Single Family DwellingThe average cost of municipal property taxes and utilities for a Single Family Home assessed at $1,813,180 in 2022 is $4,078 (excluding collections on behalf of other governments agencies).
What each home receives for $4,078:
2021 ($) 2022 ($)
AVERAGE SINGLE FAMILY DWELLING ASSESSED VALUE* 1,523,022 1,813,180
UTILITIES (DISCOUNTED RATES)
Water Fees 596 607
Sewer Parcel Tax 563 575
Garbage Fees (180 litre) 95 95
Utility Bill Subtotal (billed in February) 1,254 1,277
General Government**, Planning & Building Services 501 521
Public Safety & Community Services 977 1,061
Engineering Services 542 579
Parks, Recreation & Cultural Services 570 640
Property Tax Bill Subtotal (billed in May) 2,590 2,801
Total Collection for City Services 3,844 4,078
8 | 2022-2026 FINANCIAL PLAN HIGHLIGHTS 92022-2026 FINANCIAL PLAN HIGHLIGHTS |
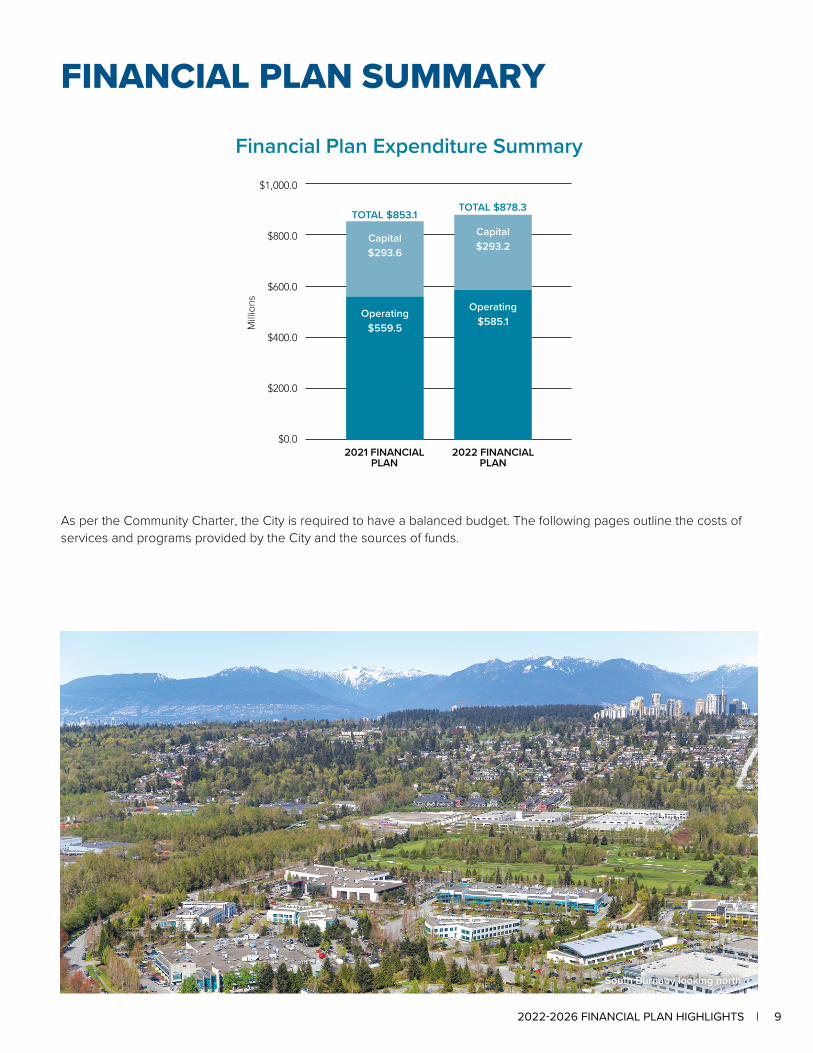
FINANCIAL PLAN SUMMARY
Financial Plan Expenditure Summary
$1,000.0
$800.0
$600.0
$400.0
$200.0
$0.0
Milli
ons
2021 FINANCIAL PLAN
2022 FINANCIALPLAN
TOTAL $853.1TOTAL $878.3
Capital$293.6
Operating$559.5
Capital$293.2
Operating$585.1
As per the Community Charter, the City is required to have a balanced budget. The following pages outline the costs of services and programs provided by the City and the sources of funds.
South Burnaby looking north
8 | 2022-2026 FINANCIAL PLAN HIGHLIGHTS 92022-2026 FINANCIAL PLAN HIGHLIGHTS |
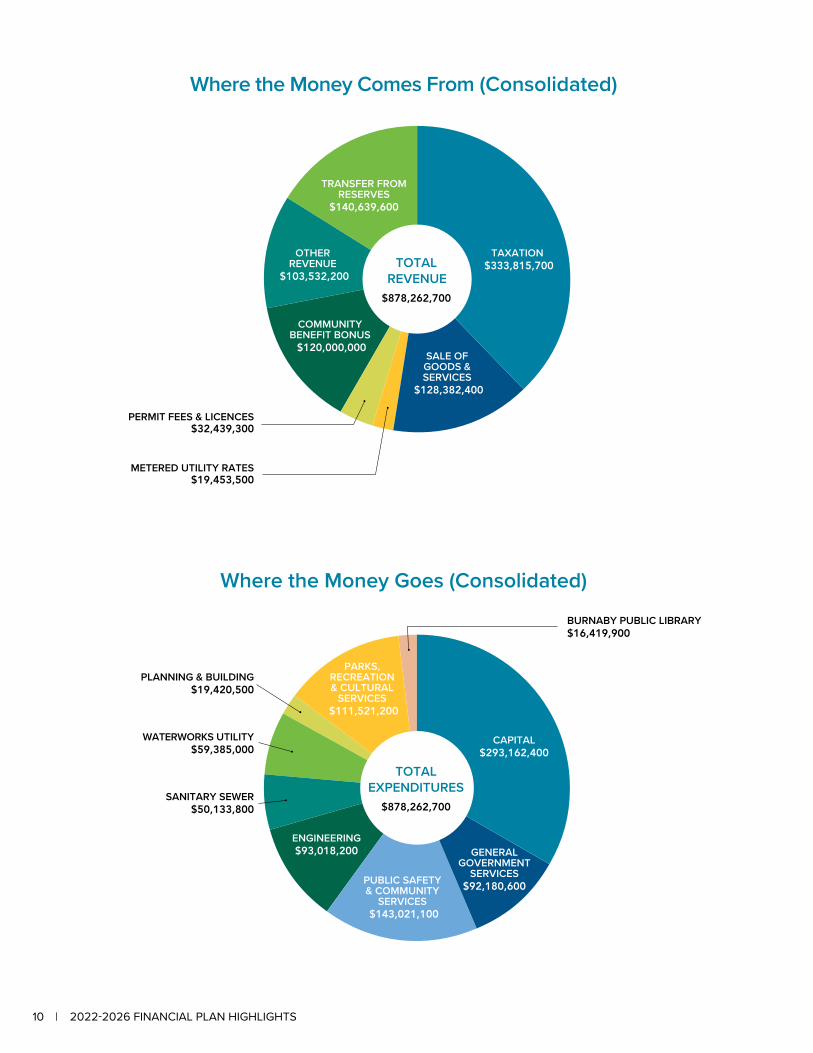
Where the Money Comes From (Consolidated)
Where the Money Goes (Consolidated)
TOTAL REVENUE
$878,262,700
TAXATION $333,815,700
TRANSFER FROM RESERVES
$140,639,600
OTHER REVENUE
$103,532,200
SALE OF GOODS & SERVICES
$128,382,400
PERMIT FEES & LICENCES $32,439,300
METERED UTILITY RATES $19,453,500
COMMUNITYBENEFIT BONUS $120,000,000
TOTAL EXPENDITURES
$878,262,700
CAPITAL $293,162,400
PUBLIC SAFETY & COMMUNITY
SERVICES $143,021,100
ENGINEERING$93,018,200
SANITARY SEWER$50,133,800
WATERWORKS UTILITY$59,385,000
PLANNING & BUILDING $19,420,500
PARKS, RECREATION & CULTURAL
SERVICES $111,521,200
BURNABY PUBLIC LIBRARY$16,419,900
GENERAL GOVERNMENT
SERVICES$92,180,600
10 | 2022-2026 FINANCIAL PLAN HIGHLIGHTS 112022-2026 FINANCIAL PLAN HIGHLIGHTS |
OPERATING PLAN SUMMARYThe City’s Operating Plan of $585.1 million includes budgeted operating expenditures from the City’s General Revenue Fund, Waterworks Utility and Sanitary Sewer Fund.
The General Revenue Fund includes a property tax increase of 2.95%, after allowing for new property tax growth of $4.8 million. The property tax rate increase accounts for the higher than anticipated RCMP collective agreement, collective agreement wage increases for CUPE and Fire staff and other inflationary increases associated to core services and programs.
Both the Waterworks Utility and the Sanitary Sewer Fund are self-sustaining and debt free; utility tax rate increases do not impact property taxation. Both utilities provide funding for infrastructure replacements and enhancements along with ongoing maintenance and operations for the City’s water supply and sewer system. The majority of these utility operating costs are driven by the Greater Vancouver Water District (GVWD) for providing the water supply to the City and the Greater Vancouver Sewage and Drainage District (GVS&DD) for sanitary sewer treatment. Both GVWD and GVS&DD are managed by Metro Vancouver.
The 2022 rate increase for the Waterworks Utility is 2.0%. As well, the 2022 rate increase for the Sanitary Sewer Fund is 2.0%. Through the use of reserves, the City is able to manage a 2.0% rate increase for each of these utilities in 2022 which is significantly lower than the Metro Vancouver increases to the City. The substantial rate increases by Metro Vancouver outlined in their five-year plan are primarily related to major water and sewer infrastructure projects. For the years 2023 to 2026, utility rates will be heavily impacted by Metro Vancouver increases; however, similar to 2022 the City will aim to utilize reserves to help absorb some of the significant impacts to Burnaby residents.
As future years’ estimates are based on current assumptions, these estimates may become increasingly inaccurate over time. However, future year estimates are an indication of priorities, as well as inflationary impacts, and will be updated annually. For the years 2023 to 2026, the Financial Plan incorporates a property tax rate increase of approximately 4.0% per year. The property tax rate increases take into account the operations of new or expanded facilities such as the new Rosemary Brown Arena and the redevelopment of Burnaby Lake Aquatic and Area; along with associated services and programming requirements.
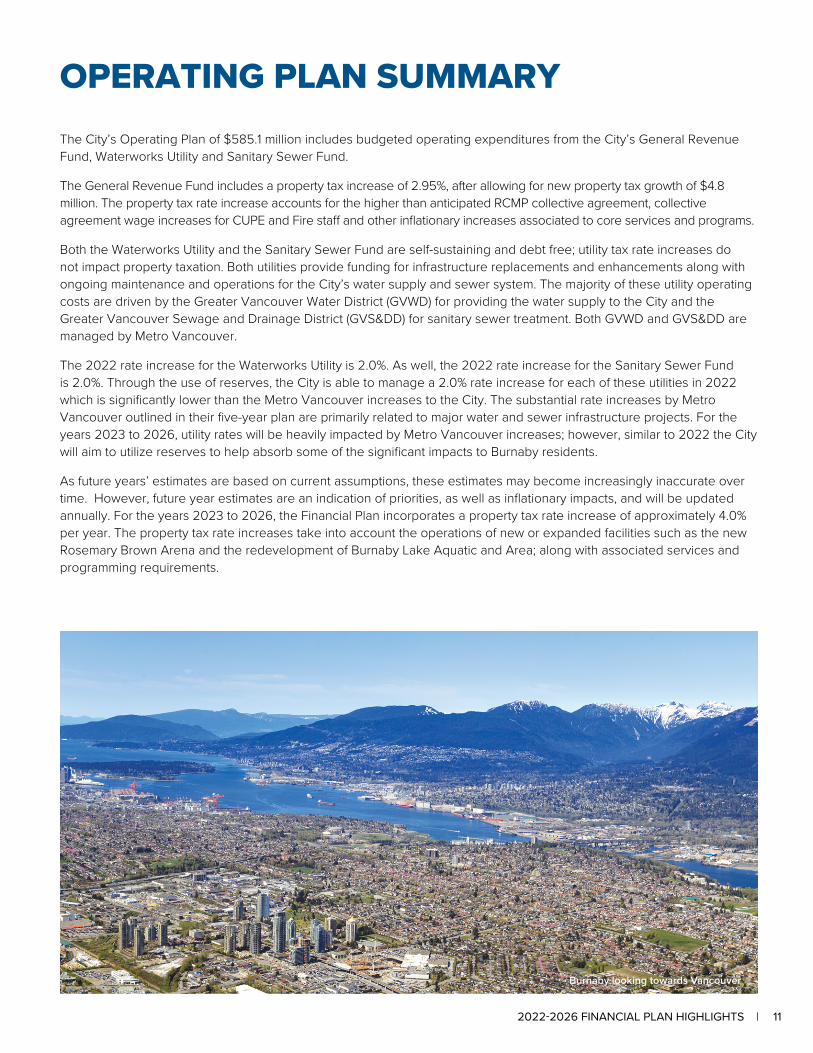
Burnaby looking towards Vancouver
10 | 2022-2026 FINANCIAL PLAN HIGHLIGHTS 112022-2026 FINANCIAL PLAN HIGHLIGHTS |
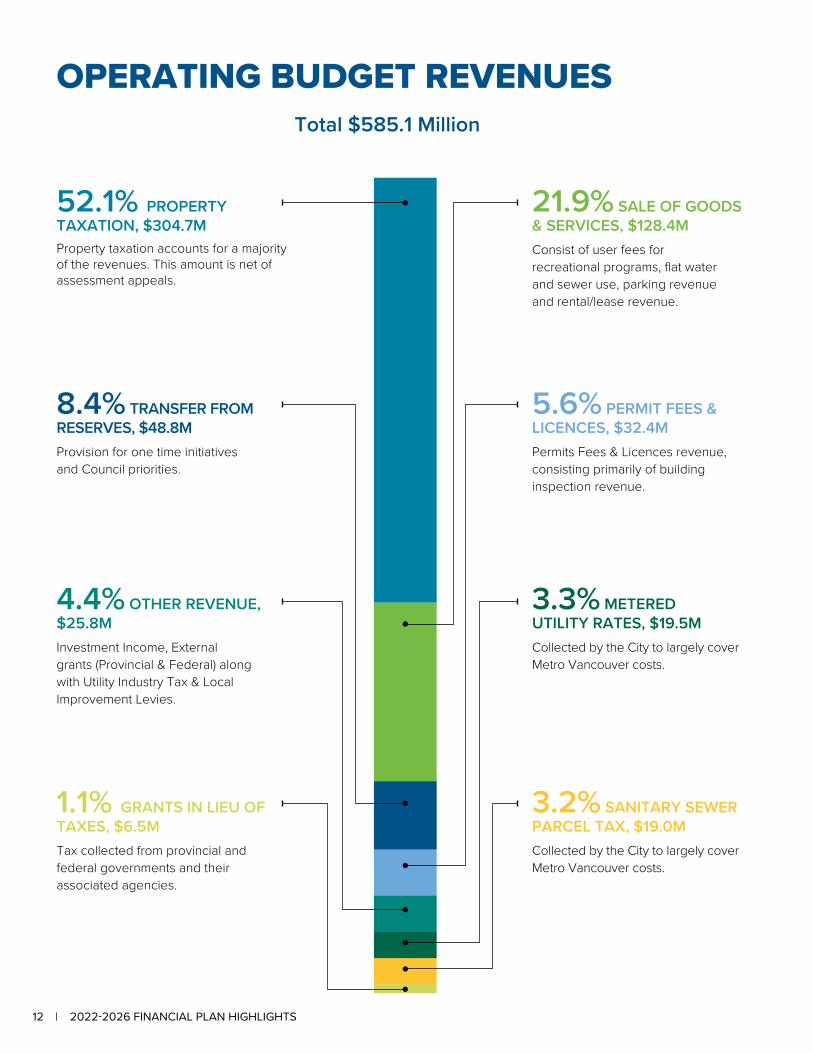
OPERATING BUDGET REVENUESTotal $585.1 Million
52.1% PROPERTY TAXATION, $304.7MProperty taxation accounts for a majority of the revenues. This amount is net of assessment appeals.
21.9% SALE OF GOODS & SERVICES, $128.4MConsist of user fees for recreational programs, flat water and sewer use, parking revenue and rental/lease revenue.
8.4% TRANSFER FROM RESERVES, $48.8MProvision for one time initiatives and Council priorities.
3.3% METERED UTILITY RATES, $19.5MCollected by the City to largely cover Metro Vancouver costs.
5.6% PERMIT FEES & LICENCES, $32.4MPermits Fees & Licences revenue, consisting primarily of building inspection revenue.
4.4% OTHER REVENUE, $25.8MInvestment Income, External grants (Provincial & Federal) along with Utility Industry Tax & Local Improvement Levies.
3.2% SANITARY SEWER PARCEL TAX, $19.0MCollected by the City to largely cover Metro Vancouver costs.
1.1% GRANTS IN LIEU OF TAXES, $6.5MTax collected from provincial and federal governments and their associated agencies.
12 | 2022-2026 FINANCIAL PLAN HIGHLIGHTS 132022-2026 FINANCIAL PLAN HIGHLIGHTS |
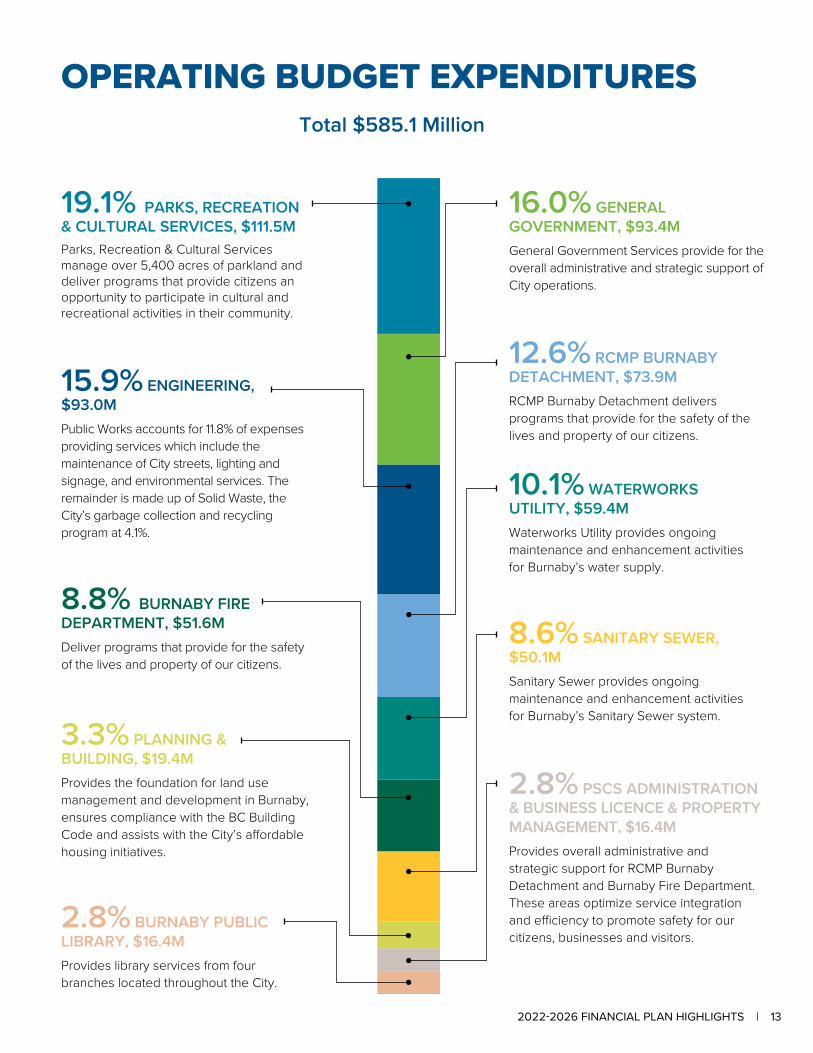
OPERATING BUDGET EXPENDITURESTotal $585.1 Million
19.1% PARKS, RECREATION & CULTURAL SERVICES, $111.5MParks, Recreation & Cultural Services manage over 5,400 acres of parkland and deliver programs that provide citizens an opportunity to participate in cultural and recreational activities in their community.
16.0% GENERAL GOVERNMENT, $93.4MGeneral Government Services provide for the overall administrative and strategic support of City operations.
15.9% ENGINEERING, $93.0MPublic Works accounts for 11.8% of expenses providing services which include the maintenance of City streets, lighting and signage, and environmental services. The remainder is made up of Solid Waste, the City’s garbage collection and recycling program at 4.1%.
10.1% WATERWORKS UTILITY, $59.4MWaterworks Utility provides ongoing maintenance and enhancement activities for Burnaby’s water supply.
12.6% RCMP BURNABY DETACHMENT, $73.9MRCMP Burnaby Detachment delivers programs that provide for the safety of the lives and property of our citizens.
8.8% BURNABY FIRE DEPARTMENT, $51.6MDeliver programs that provide for the safety of the lives and property of our citizens.
8.6% SANITARY SEWER, $50.1MSanitary Sewer provides ongoing maintenance and enhancement activities for Burnaby’s Sanitary Sewer system.
3.3% PLANNING & BUILDING, $19.4MProvides the foundation for land use management and development in Burnaby, ensures compliance with the BC Building Code and assists with the City’s affordable housing initiatives.
2.8% PSCS ADMINISTRATION & BUSINESS LICENCE & PROPERTY MANAGEMENT, $16.4MProvides overall administrative and strategic support for RCMP Burnaby Detachment and Burnaby Fire Department. These areas optimize service integration and efficiency to promote safety for our citizens, businesses and visitors.
2.8% BURNABY PUBLIC LIBRARY, $16.4MProvides library services from four branches located throughout the City.
12 | 2022-2026 FINANCIAL PLAN HIGHLIGHTS 132022-2026 FINANCIAL PLAN HIGHLIGHTS |
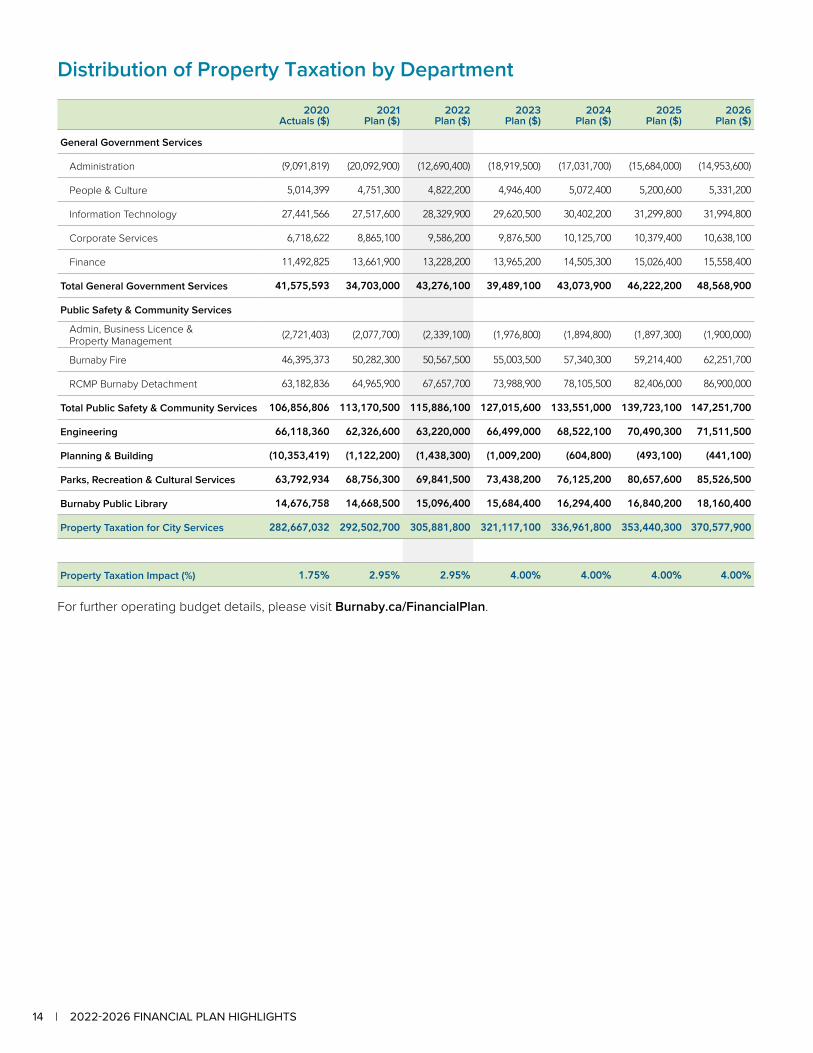
Distribution of Property Taxation by Department
2020 Actuals ($)
2021 Plan ($)
2022 Plan ($)
2023 Plan ($)
2024 Plan ($)
2025 Plan ($)
2026 Plan ($)
General Government Services
Administration (9,091,819) (20,092,900) (12,690,400) (18,919,500) (17,031,700) (15,684,000) (14,953,600)
People & Culture 5,014,399 4,751,300 4,822,200 4,946,400 5,072,400 5,200,600 5,331,200
Information Technology 27,441,566 27,517,600 28,329,900 29,620,500 30,402,200 31,299,800 31,994,800
Corporate Services 6,718,622 8,865,100 9,586,200 9,876,500 10,125,700 10,379,400 10,638,100
Finance 11,492,825 13,661,900 13,228,200 13,965,200 14,505,300 15,026,400 15,558,400
Total General Government Services 41,575,593 34,703,000 43,276,100 39,489,100 43,073,900 46,222,200 48,568,900
Public Safety & Community Services
Admin, Business Licence & Property Management (2,721,403) (2,077,700) (2,339,100) (1,976,800) (1,894,800) (1,897,300) (1,900,000)
Burnaby Fire 46,395,373 50,282,300 50,567,500 55,003,500 57,340,300 59,214,400 62,251,700
RCMP Burnaby Detachment 63,182,836 64,965,900 67,657,700 73,988,900 78,105,500 82,406,000 86,900,000
Total Public Safety & Community Services 106,856,806 113,170,500 115,886,100 127,015,600 133,551,000 139,723,100 147,251,700
Engineering 66,118,360 62,326,600 63,220,000 66,499,000 68,522,100 70,490,300 71,511,500
Planning & Building (10,353,419) (1,122,200) (1,438,300) (1,009,200) (604,800) (493,100) (441,100)
Parks, Recreation & Cultural Services 63,792,934 68,756,300 69,841,500 73,438,200 76,125,200 80,657,600 85,526,500
Burnaby Public Library 14,676,758 14,668,500 15,096,400 15,684,400 16,294,400 16,840,200 18,160,400
Property Taxation for City Services 282,667,032 292,502,700 305,881,800 321,117,100 336,961,800 353,440,300 370,577,900
Property Taxation Impact (%) 1.75% 2.95% 2.95% 4.00% 4.00% 4.00% 4.00%
For further operating budget details, please visit Burnaby.ca/FinancialPlan.
14 | 2022-2026 FINANCIAL PLAN HIGHLIGHTS 152022-2026 FINANCIAL PLAN HIGHLIGHTS |
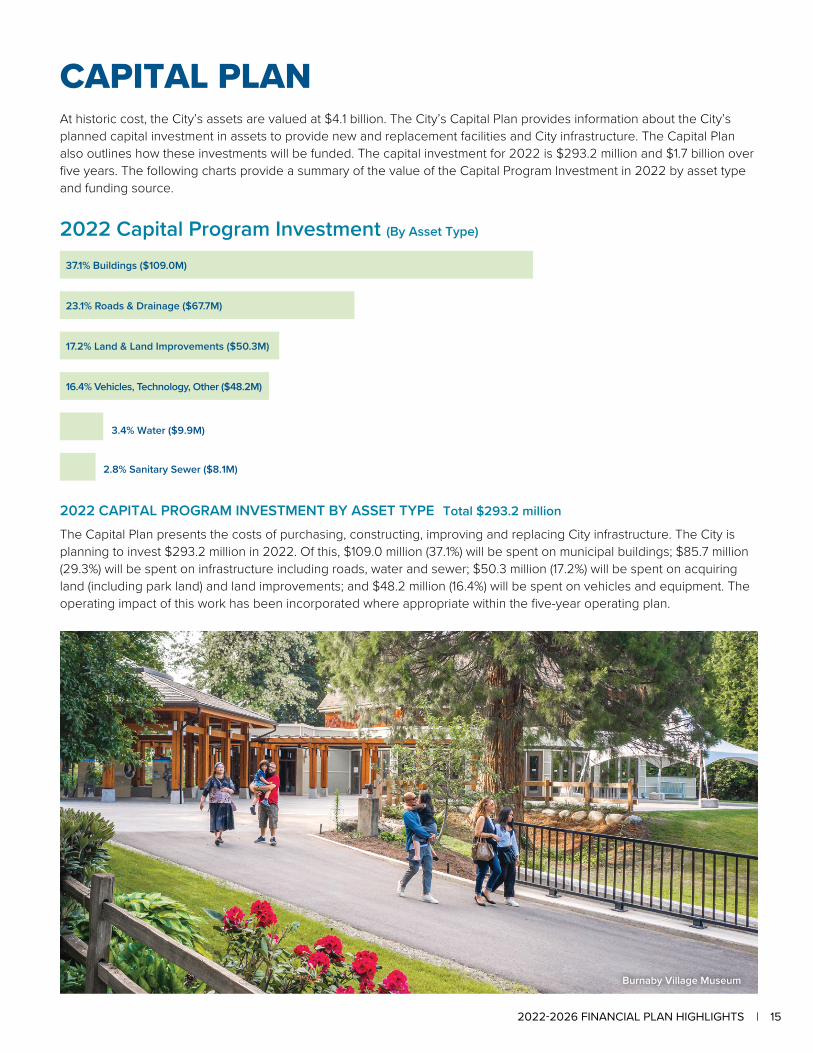
CAPITAL PLANAt historic cost, the City’s assets are valued at $4.1 billion. The City’s Capital Plan provides information about the City’s planned capital investment in assets to provide new and replacement facilities and City infrastructure. The Capital Plan also outlines how these investments will be funded. The capital investment for 2022 is $293.2 million and $1.7 billion over five years. The following charts provide a summary of the value of the Capital Program Investment in 2022 by asset type and funding source.
2022 Capital Program Investment (By Asset Type)
16.4% Vehicles, Technology, Other ($48.2M)
17.2% Land & Land Improvements ($50.3M)
23.1% Roads & Drainage ($67.7M)
37.1% Buildings ($109.0M)
2022 CAPITAL PROGRAM INVESTMENT BY ASSET TYPE Total $293.2 million
The Capital Plan presents the costs of purchasing, constructing, improving and replacing City infrastructure. The City is planning to invest $293.2 million in 2022. Of this, $109.0 million (37.1%) will be spent on municipal buildings; $85.7 million (29.3%) will be spent on infrastructure including roads, water and sewer; $50.3 million (17.2%) will be spent on acquiring land (including park land) and land improvements; and $48.2 million (16.4%) will be spent on vehicles and equipment. The operating impact of this work has been incorporated where appropriate within the five-year operating plan.
3.4% Water ($9.9M)
2.8% Sanitary Sewer ($8.1M)
Burnaby Village Museum
14 | 2022-2026 FINANCIAL PLAN HIGHLIGHTS 152022-2026 FINANCIAL PLAN HIGHLIGHTS |
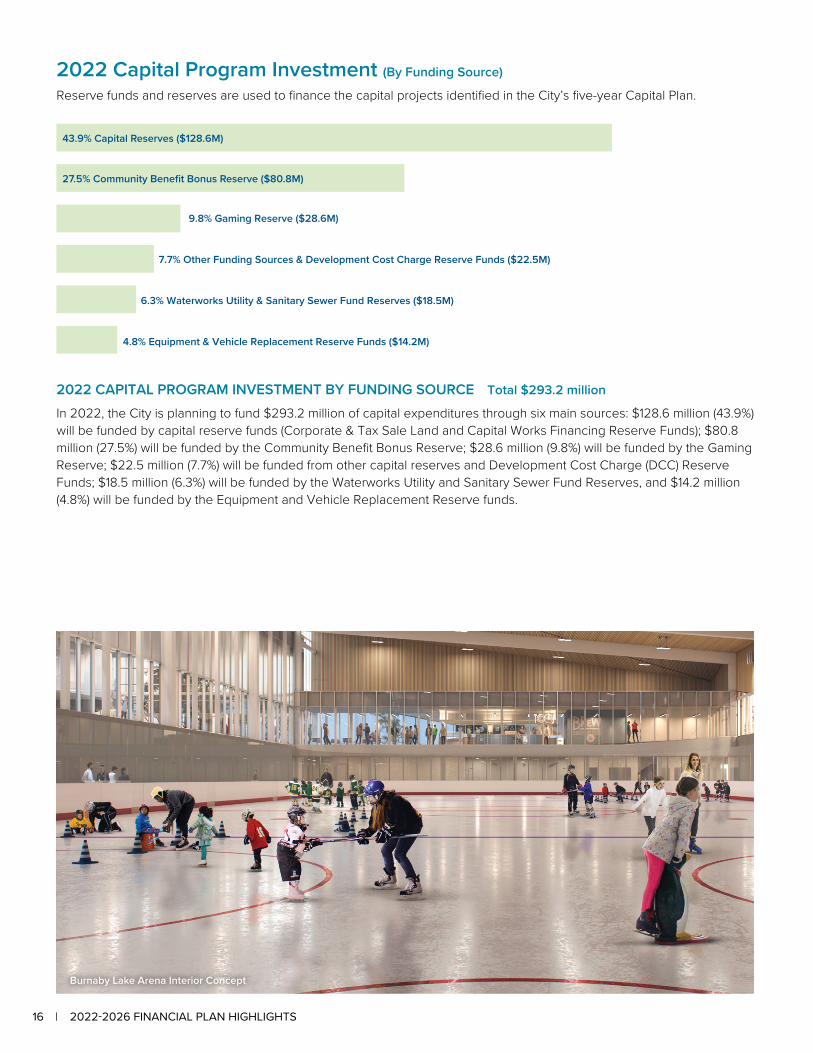
2022 Capital Program Investment (By Funding Source)
Reserve funds and reserves are used to finance the capital projects identified in the City’s five-year Capital Plan.
27.5% Community Benefit Bonus Reserve ($80.8M)
43.9% Capital Reserves ($128.6M)
2022 CAPITAL PROGRAM INVESTMENT BY FUNDING SOURCE Total $293.2 million
In 2022, the City is planning to fund $293.2 million of capital expenditures through six main sources: $128.6 million (43.9%) will be funded by capital reserve funds (Corporate & Tax Sale Land and Capital Works Financing Reserve Funds); $80.8 million (27.5%) will be funded by the Community Benefit Bonus Reserve; $28.6 million (9.8%) will be funded by the Gaming Reserve; $22.5 million (7.7%) will be funded from other capital reserves and Development Cost Charge (DCC) Reserve Funds; $18.5 million (6.3%) will be funded by the Waterworks Utility and Sanitary Sewer Fund Reserves, and $14.2 million (4.8%) will be funded by the Equipment and Vehicle Replacement Reserve funds.
9.8% Gaming Reserve ($28.6M)
7.7% Other Funding Sources & Development Cost Charge Reserve Funds ($22.5M)
6.3% Waterworks Utility & Sanitary Sewer Fund Reserves ($18.5M)
4.8% Equipment & Vehicle Replacement Reserve Funds ($14.2M)
Burnaby Lake Arena Interior Concept
16 | 2022-2026 FINANCIAL PLAN HIGHLIGHTS 172022-2026 FINANCIAL PLAN HIGHLIGHTS |
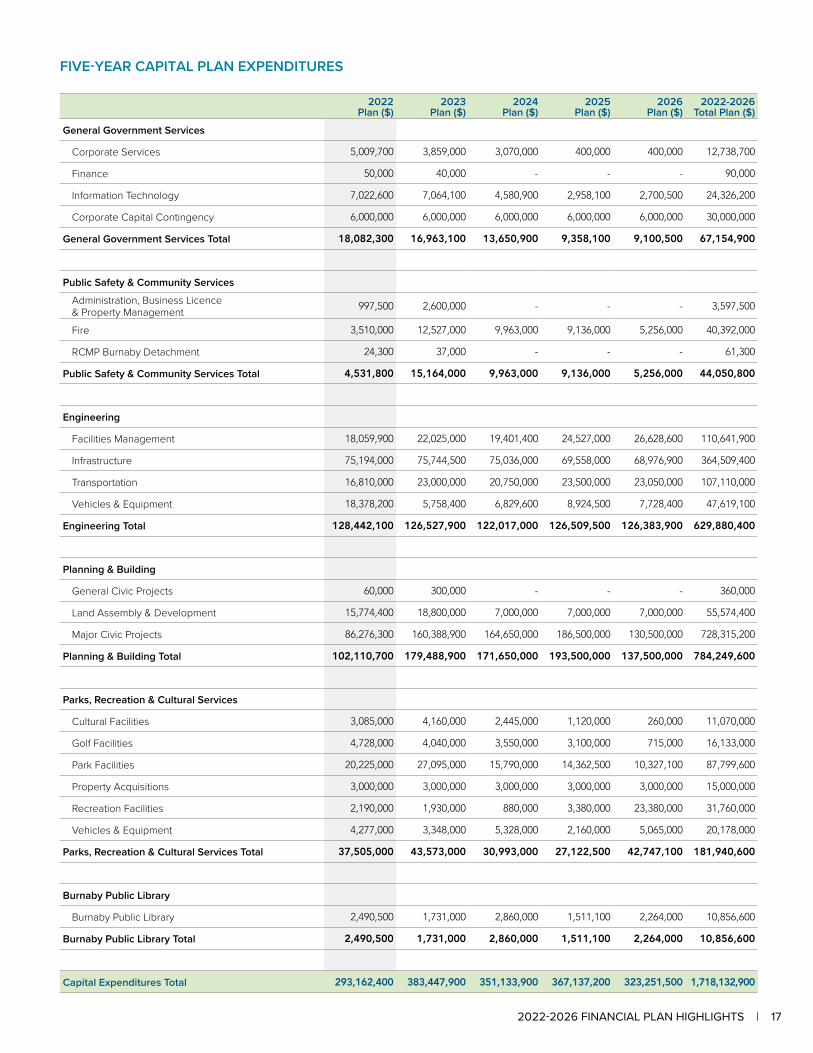
FIVE-YEAR CAPITAL PLAN EXPENDITURES
2022 Plan ($)
2023 Plan ($)
2024 Plan ($)
2025 Plan ($)
2026 Plan ($)
2022-2026 Total Plan ($)
General Government Services
Corporate Services 5,009,700 3,859,000 3,070,000 400,000 400,000 12,738,700
Finance 50,000 40,000 - - - 90,000
Information Technology 7,022,600 7,064,100 4,580,900 2,958,100 2,700,500 24,326,200
Corporate Capital Contingency 6,000,000 6,000,000 6,000,000 6,000,000 6,000,000 30,000,000
General Government Services Total 18,082,300 16,963,100 13,650,900 9,358,100 9,100,500 67,154,900
Public Safety & Community Services
Administration, Business Licence & Property Management 997,500 2,600,000 - - - 3,597,500
Fire 3,510,000 12,527,000 9,963,000 9,136,000 5,256,000 40,392,000
RCMP Burnaby Detachment 24,300 37,000 - - - 61,300
Public Safety & Community Services Total 4,531,800 15,164,000 9,963,000 9,136,000 5,256,000 44,050,800
Engineering
Facilities Management 18,059,900 22,025,000 19,401,400 24,527,000 26,628,600 110,641,900
Infrastructure 75,194,000 75,744,500 75,036,000 69,558,000 68,976,900 364,509,400
Transportation 16,810,000 23,000,000 20,750,000 23,500,000 23,050,000 107,110,000
Vehicles & Equipment 18,378,200 5,758,400 6,829,600 8,924,500 7,728,400 47,619,100
Engineering Total 128,442,100 126,527,900 122,017,000 126,509,500 126,383,900 629,880,400
Planning & Building
General Civic Projects 60,000 300,000 - - - 360,000
Land Assembly & Development 15,774,400 18,800,000 7,000,000 7,000,000 7,000,000 55,574,400
Major Civic Projects 86,276,300 160,388,900 164,650,000 186,500,000 130,500,000 728,315,200
Planning & Building Total 102,110,700 179,488,900 171,650,000 193,500,000 137,500,000 784,249,600
Parks, Recreation & Cultural Services
Cultural Facilities 3,085,000 4,160,000 2,445,000 1,120,000 260,000 11,070,000
Golf Facilities 4,728,000 4,040,000 3,550,000 3,100,000 715,000 16,133,000
Park Facilities 20,225,000 27,095,000 15,790,000 14,362,500 10,327,100 87,799,600
Property Acquisitions 3,000,000 3,000,000 3,000,000 3,000,000 3,000,000 15,000,000
Recreation Facilities 2,190,000 1,930,000 880,000 3,380,000 23,380,000 31,760,000
Vehicles & Equipment 4,277,000 3,348,000 5,328,000 2,160,000 5,065,000 20,178,000
Parks, Recreation & Cultural Services Total 37,505,000 43,573,000 30,993,000 27,122,500 42,747,100 181,940,600
Burnaby Public Library
Burnaby Public Library 2,490,500 1,731,000 2,860,000 1,511,100 2,264,000 10,856,600
Burnaby Public Library Total 2,490,500 1,731,000 2,860,000 1,511,100 2,264,000 10,856,600
Capital Expenditures Total 293,162,400 383,447,900 351,133,900 367,137,200 323,251,500 1,718,132,900
16 | 2022-2026 FINANCIAL PLAN HIGHLIGHTS 172022-2026 FINANCIAL PLAN HIGHLIGHTS |
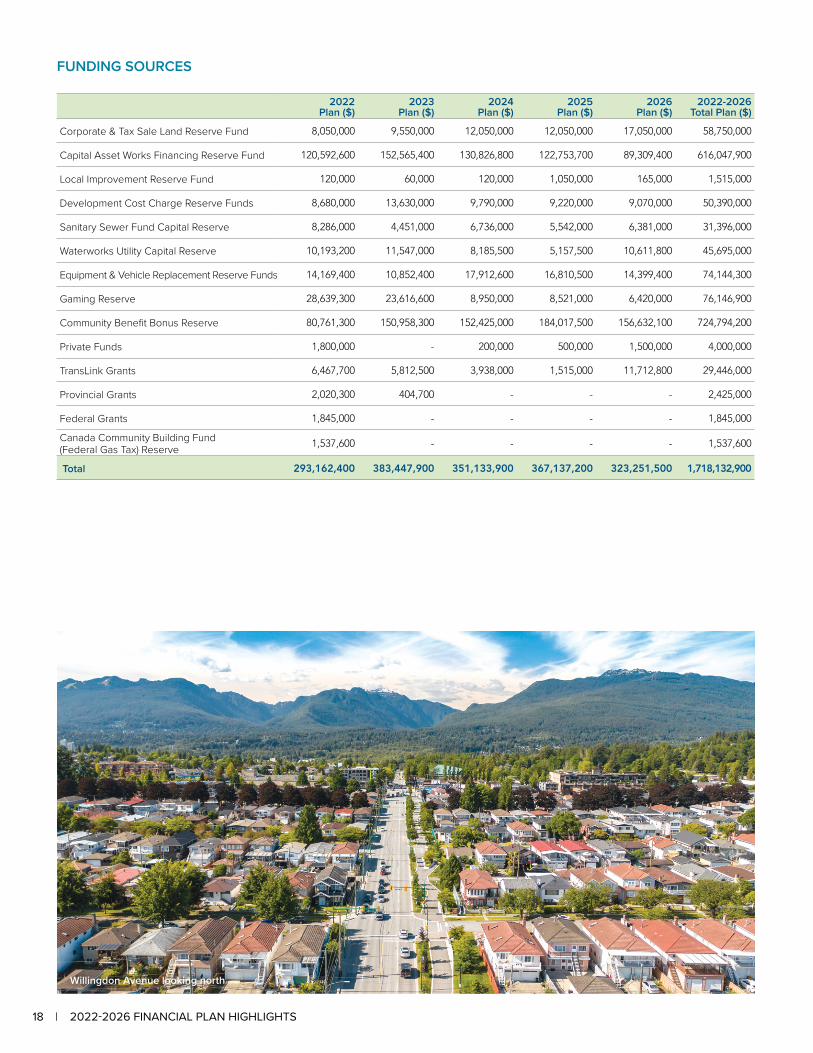
FUNDING SOURCES
2022 Plan ($)
2023 Plan ($)
2024 Plan ($)
2025 Plan ($)
2026 Plan ($)
2022-2026 Total Plan ($)
Corporate & Tax Sale Land Reserve Fund 8,050,000 9,550,000 12,050,000 12,050,000 17,050,000 58,750,000
Capital Asset Works Financing Reserve Fund 120,592,600 152,565,400 130,826,800 122,753,700 89,309,400 616,047,900
Local Improvement Reserve Fund 120,000 60,000 120,000 1,050,000 165,000 1,515,000
Development Cost Charge Reserve Funds 8,680,000 13,630,000 9,790,000 9,220,000 9,070,000 50,390,000
Sanitary Sewer Fund Capital Reserve 8,286,000 4,451,000 6,736,000 5,542,000 6,381,000 31,396,000
Waterworks Utility Capital Reserve 10,193,200 11,547,000 8,185,500 5,157,500 10,611,800 45,695,000
Equipment & Vehicle Replacement Reserve Funds 14,169,400 10,852,400 17,912,600 16,810,500 14,399,400 74,144,300
Gaming Reserve 28,639,300 23,616,600 8,950,000 8,521,000 6,420,000 76,146,900
Community Benefit Bonus Reserve 80,761,300 150,958,300 152,425,000 184,017,500 156,632,100 724,794,200
Private Funds 1,800,000 - 200,000 500,000 1,500,000 4,000,000
TransLink Grants 6,467,700 5,812,500 3,938,000 1,515,000 11,712,800 29,446,000
Provincial Grants 2,020,300 404,700 - - - 2,425,000
Federal Grants 1,845,000 - - - - 1,845,000
Canada Community Building Fund (Federal Gas Tax) Reserve 1,537,600 - - - - 1,537,600
Total 293,162,400 383,447,900 351,133,900 367,137,200 323,251,500 1,718,132,900
Willingdon Avenue looking north
18 | 2022-2026 FINANCIAL PLAN HIGHLIGHTS 192022-2026 FINANCIAL PLAN HIGHLIGHTS |
CAPITAL HIGHLIGHTS The information provided in this section highlights some of the key capital projects that are included within the five-year Capital Plan. For a full list of capital projects, please visit Burnaby.ca/FinancialPlan
Capital Highlights 2022 Plan ($)
2023 Plan ($)
2024 Plan ($)
2025 Plan ($)
2026 Plan ($)
2022-2026 Total Plan ($)
Civic Facilities Electric Vehicle Charging Infrastructure 2,073,000 3,059,000 2,470,000 - - 7,602,000
Parks Registration System 937,600 532,800 - - - 1,470,400
Sidewalk Expansion Program 13,700,000 8,550,000 10,000,000 10,000,000 10,000,000 52,250,000
Cycling Corridors 900,000 5,000,000 10,000,000 10,000,000 10,000,000 35,900,000
Burnaby District Energy System 1,000,000 2,500,000 5,000,000 5,000,000 10,000,000 23,500,000
Burnaby Green Recycling of Organic Waste Facility 275,000 1,000,000 5,000,000 5,000,000 5,000,000 16,275,000
Burnaby Lake Aquatic & Arena Facility 20,000,000 35,000,000 35,000,000 35,000,000 30,000,000 155,000,000
Rosemary Brown Arena 17,274,800 5,758,300 - - - 23,033,100
Laurel Street Works Yard Redevelopment 13,125,000 10,675,000 - - - 23,800,000
Pedestrian Overpass Across Highway 1 2,012,100 10,000,000 7,850,000 - - 19,862,100
Front Desk at Edmonds Community Centre
18 | 2022-2026 FINANCIAL PLAN HIGHLIGHTS 192022-2026 FINANCIAL PLAN HIGHLIGHTS |
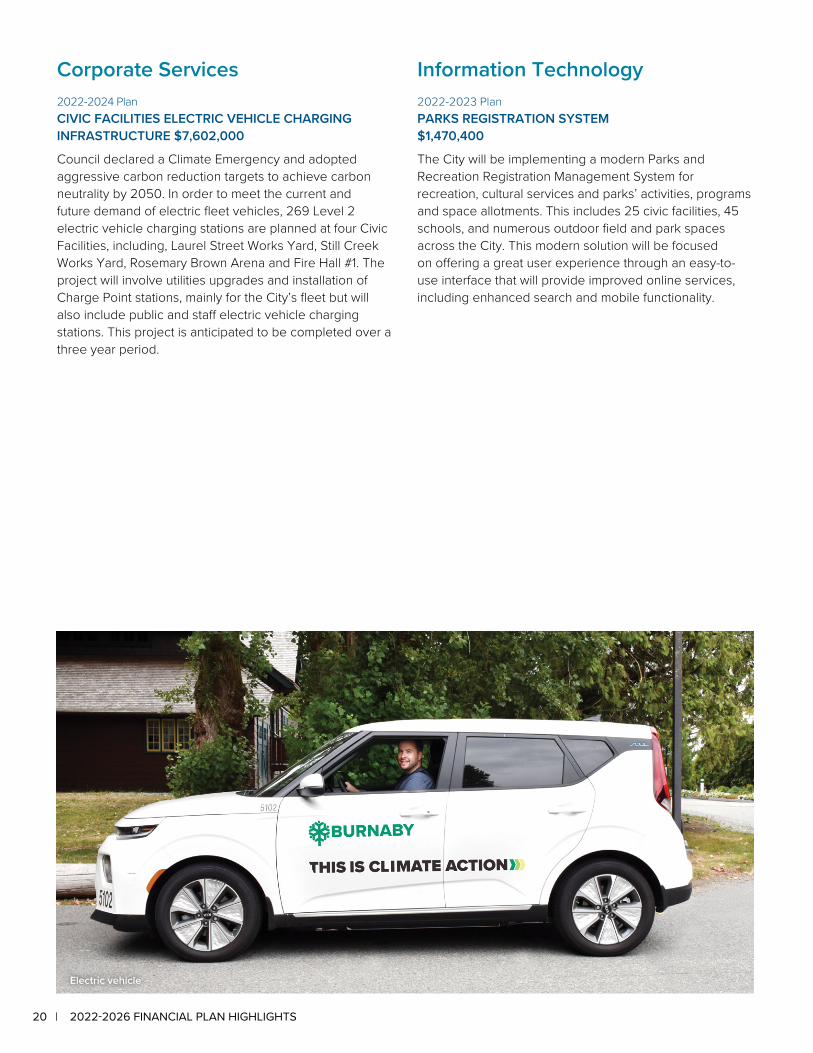
Corporate Services2022-2024 PlanCIVIC FACILITIES ELECTRIC VEHICLE CHARGING INFRASTRUCTURE $7,602,000
Council declared a Climate Emergency and adopted aggressive carbon reduction targets to achieve carbon neutrality by 2050. In order to meet the current and future demand of electric fleet vehicles, 269 Level 2 electric vehicle charging stations are planned at four Civic Facilities, including, Laurel Street Works Yard, Still Creek Works Yard, Rosemary Brown Arena and Fire Hall #1. The project will involve utilities upgrades and installation of Charge Point stations, mainly for the City’s fleet but will also include public and staff electric vehicle charging stations. This project is anticipated to be completed over a three year period.
Information Technology2022-2023 PlanPARKS REGISTRATION SYSTEM$1,470,400
The City will be implementing a modern Parks and Recreation Registration Management System for recreation, cultural services and parks’ activities, programs and space allotments. This includes 25 civic facilities, 45 schools, and numerous outdoor field and park spaces across the City. This modern solution will be focused on offering a great user experience through an easy-to-use interface that will provide improved online services, including enhanced search and mobile functionality.
Electric vehicle
20 | 2022-2026 FINANCIAL PLAN HIGHLIGHTS 212022-2026 FINANCIAL PLAN HIGHLIGHTS |
Engineering 2022-2026 PlanSIDEWALK EXPANSION PROGRAM$52,250,000
The Burnaby Transportation and Climate Action Plans both seek to complete the City’s sidewalk network to meet safety, mode split, and emissions targets. One of the Big Moves in the current draft of the Transportation Plan is to complete 80% of the pedestrian network by 2030. Staff have developed a framework to prioritize where sidewalks are needed the most. The evaluation framework consists of ten factors. Five are based on pedestrian demand and five are based on pedestrian safety & equity. In addition, boulevard trees would also be replaced and added as necessary, in order to complete the public realm.
2022-2026 PlanBURNABY DISTRICT ENERGY SYSTEM (DES)$23,500,000
On January 25, 2021, Metro Vancouver provided City staff a report that recovering waste heat from the Metro Vancouver Waste-to-Energy facility is a feasible project that would benefit the residents of Burnaby with safe, reliable, and cost competitive thermal energy. The project also provides a significant amount of greenhouse gas (GHG) credits that would further the City’s Climate Action goals. The study also concluded that there is an abundant amount of heat available at the Waste-to-Energy facility and the system can be expanded beyond to Vancouver and New Westminster, which would solidify the feasibility and cost effectiveness of the DES. The feasibility study concluded that a DES serving the Metrotown Town Center, Edmonds Town Center, and River District in Vancouver can provide clean, reliable and cost competitive thermal energy to customers.
2022-2026 PlanCYCLING CORRIDORS$35,900,000
The Transportation Plan update process has identified a proposed Phase 1 Cycling Network consisting of approximately 80 km of higher priority cycling corridors to be implemented by 2030. This will help the City achieve its Climate Action and Model Split Goals of 75% non-auto travel in the City by 2050. Corridor prioritization and design will be needed for future street upgrade projects across the City. Streets requiring roadway upgrades are typically arterial or collector roads prioritized to be upgraded with sidewalks, multi-use paths, and traffic calming measures, beautification, and intersection improvements. The City will undertake a comprehensive community and stakeholder engagement process to identify needs and priorities for each active transportation project.
2022-2026 PlanBURNABY GREEN RECYCLING OF ORGANIC WASTE (BURNABY GROW) FACILITY$16,275,000
The City of Burnaby currently sends 30,000 tons of green waste for processing to a private facility at a cost of $2.2 million annually. Changes in the regulatory environment for composting facilities and other marketplace changes are predicted to increase costs by 25% to 30%. The City of Burnaby’s environmental leadership and unique regional location support the development of a facility to process the City’s green waste into compost and renewable natural gas. There is also a potential to generate significant revenue from providing processing services to neighboring municipalities. The feasibility study for this project is now complete. The next phase of the project is to undertake a rezoning for the required land, confirm preliminary costing & design, and begin planning of the execution strategy for construction & operations for this state of the art composting plant.
20 | 2022-2026 FINANCIAL PLAN HIGHLIGHTS 212022-2026 FINANCIAL PLAN HIGHLIGHTS |
Planning & Building 2022-2026 PlanBURNABY LAKE AQUATIC & ARENA FACILITY $155,000,000
This project is for the redevelopment of CG Brown Pool and Burnaby Lake Arena to construct a new competition-level aquatic center, leisure aquatic center, arena, and community centre.
2022-2023 PlanLAUREL STREET WORKS YARD REDEVELOPMENT $23,800,000
This project is currently underway to replace the aging works yard facility at 5780 Laurel Street to ensure effective and efficient public works and infrastructure services.
The new facility will include space for public works operations (road, water and drainage), central stores (warehousing for stock materials and parts), welding, paint and carpentry shops, a data centre, fleet storage and repairs, and offices (engineering and emergency operations centre).
2022-2023 PlanROSEMARY BROWN ARENA$23,033,100
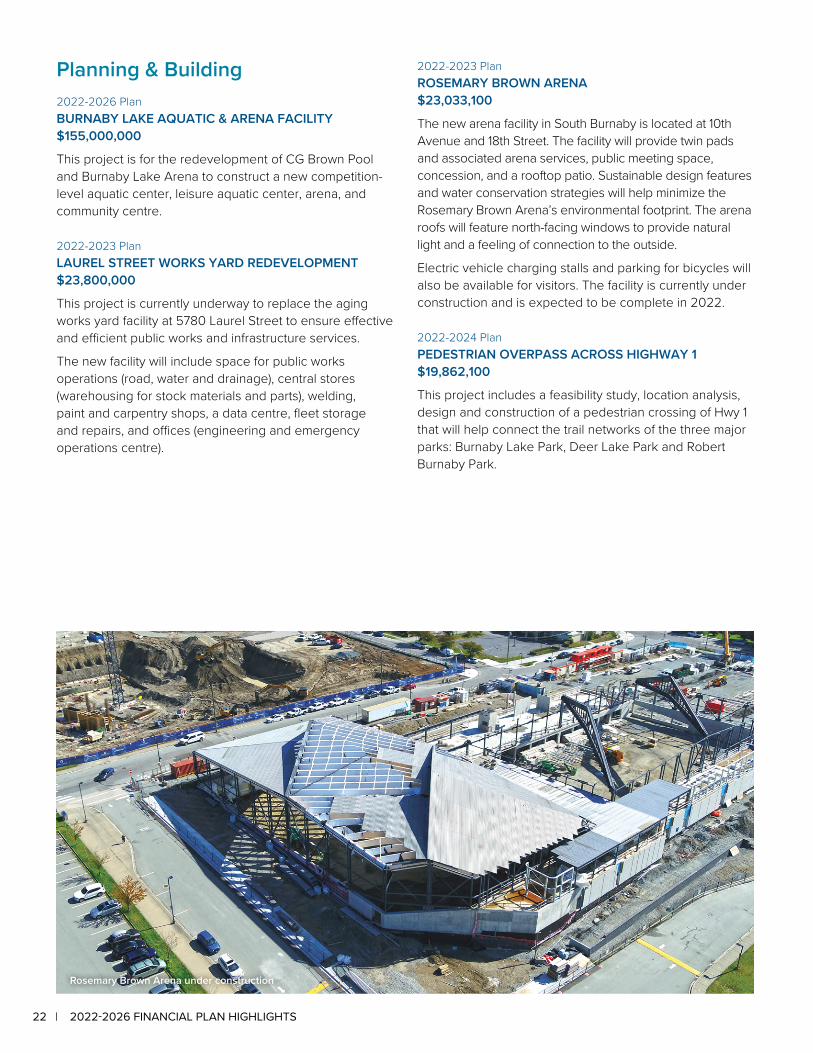
The new arena facility in South Burnaby is located at 10th Avenue and 18th Street. The facility will provide twin pads and associated arena services, public meeting space, concession, and a rooftop patio. Sustainable design features and water conservation strategies will help minimize the Rosemary Brown Arena’s environmental footprint. The arena roofs will feature north-facing windows to provide natural light and a feeling of connection to the outside.
Electric vehicle charging stalls and parking for bicycles will also be available for visitors. The facility is currently under construction and is expected to be complete in 2022.
2022-2024 PlanPEDESTRIAN OVERPASS ACROSS HIGHWAY 1 $19,862,100
This project includes a feasibility study, location analysis, design and construction of a pedestrian crossing of Hwy 1 that will help connect the trail networks of the three major parks: Burnaby Lake Park, Deer Lake Park and Robert Burnaby Park.
Rosemary Brown Arena under construction
22 | 2022-2026 FINANCIAL PLAN HIGHLIGHTS 232022-2026 FINANCIAL PLAN HIGHLIGHTS |
Burnaby City Council is committed to financial, social and environmental sustainability. To achieve this goal, the City focuses on providing excellent policing and fire protection services, upgrading roads, water and sewer infrastructure, and ensuring our parks and recreation facilities meet the needs of our community. The City also recognizes the importance of ongoing maintenance and replacement of existing facilities for citizens. As a result, the proposed 2022 operating expenditure budget of $585.1 million and capital plan of $293.2 million is being allocated to provide quality City services and programs for Burnaby citizens.
PUBLIC CONSULTATION 2022-2026 FINANCIAL PLAN
We want to hear from you!The City’s 2022-2026 Financial Plan will be presented to Council on January 24, 2022 which incorporates a property tax rate increase of 2.95%, a 2.0% increase in Sanitary Sewer Fund and a 2.0% increase in Waterworks Utility. We would like your views on the budget and, in particular, municipal services and priorities. The Financial Plan Highlights and additional information is available for viewing on our website at Burnaby.ca/FinancialPlan
In order to allow enough time for Council to consider your comments before final approval of the five-year Financial Plan, please provide your comments by Friday, December 10, 2021 at Burnaby.ca/FinancialPlan
22 | 2022-2026 FINANCIAL PLAN HIGHLIGHTS 232022-2026 FINANCIAL PLAN HIGHLIGHTS |

2022-2026 Financial Plan HighlightsCity of Burnaby, British Columbia, Canada