2017 annual report
TRANSCRIPT
Taiwan Stock Exchange Market Observation Post System: http://mops.twse.com.tw MIC annual report is available at: ht tp: / /www.micb2b.com
Marketech International Corp.
2017 Annual Report
Printed on May 10, 2018
Notice to readers
This English-version annual report is a summary translation of the Chinese version and is not an
official document of the shareholders’ meeting. If there is any discrepancy between the English and
Chinese versions,the Chinese version shall prevail.
Stock Code:6196
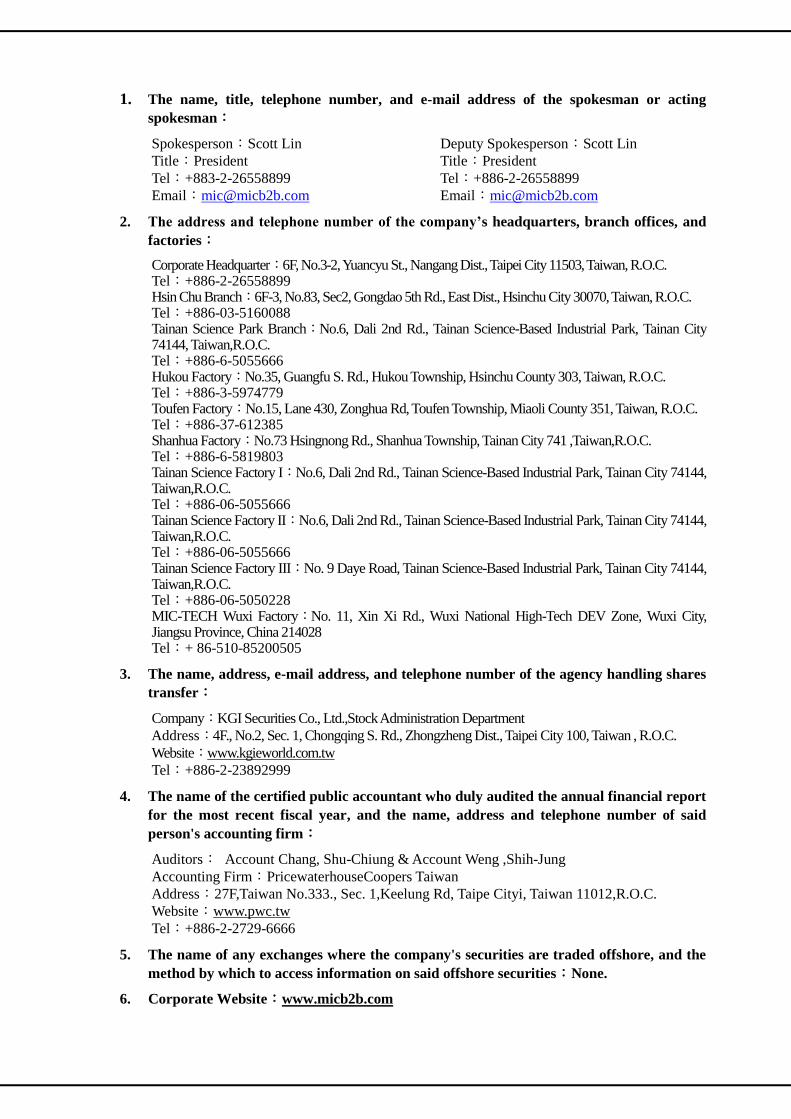
1. The name, title, telephone number, and e-mail address of the spokesman or acting
spokesman:
Spokesperson:Scott Lin Deputy Spokesperson:Scott Lin
Title:President Title:President
Tel:+883-2-26558899 Tel:+886-2-26558899
Email:[email protected] Email:[email protected]
2. The address and telephone number of the company’s headquarters, branch offices, and
factories:
Corporate Headquarter:6F, No.3-2, Yuancyu St., Nangang Dist., Taipei City 11503, Taiwan, R.O.C. Tel:+886-2-26558899 Hsin Chu Branch:6F-3, No.83, Sec2, Gongdao 5th Rd., East Dist., Hsinchu City 30070, Taiwan, R.O.C. Tel:+886-03-5160088 Tainan Science Park Branch:No.6, Dali 2nd Rd., Tainan Science-Based Industrial Park, Tainan City 74144, Taiwan,R.O.C. Tel:+886-6-5055666 Hukou Factory:No.35, Guangfu S. Rd., Hukou Township, Hsinchu County 303, Taiwan, R.O.C. Tel:+886-3-5974779 Toufen Factory:No.15, Lane 430, Zonghua Rd, Toufen Township, Miaoli County 351, Taiwan, R.O.C. Tel:+886-37-612385 Shanhua Factory:No.73 Hsingnong Rd., Shanhua Township, Tainan City 741 ,Taiwan,R.O.C. Tel:+886-6-5819803 Tainan Science Factory I:No.6, Dali 2nd Rd., Tainan Science-Based Industrial Park, Tainan City 74144, Taiwan,R.O.C. Tel:+886-06-5055666 Tainan Science Factory II:No.6, Dali 2nd Rd., Tainan Science-Based Industrial Park, Tainan City 74144, Taiwan,R.O.C. Tel:+886-06-5055666 Tainan Science Factory III:No. 9 Daye Road, Tainan Science-Based Industrial Park, Tainan City 74144, Taiwan,R.O.C. Tel:+886-06-5050228 MIC-TECH Wuxi Factory:No. 11, Xin Xi Rd., Wuxi National High-Tech DEV Zone, Wuxi City, Jiangsu Province, China 214028 Tel:+ 86-510-85200505
3. The name, address, e-mail address, and telephone number of the agency handling shares
transfer:
Company:KGI Securities Co., Ltd.,Stock Administration Department
Address:4F., No.2, Sec. 1, Chongqing S. Rd., Zhongzheng Dist., Taipei City 100, Taiwan , R.O.C.
Website:www.kgieworld.com.tw
Tel:+886-2-23892999
4. The name of the certified public accountant who duly audited the annual financial report
for the most recent fiscal year, and the name, address and telephone number of said
person's accounting firm:
Auditors: Account Chang, Shu-Chiung & Account Weng ,Shih-Jung
Accounting Firm:PricewaterhouseCoopers Taiwan
Address:27F,Taiwan No.333., Sec. 1,Keelung Rd, Taipe Cityi, Taiwan 11012,R.O.C.
Website:www.pwc.tw
Tel:+886-2-2729-6666
5. The name of any exchanges where the company's securities are traded offshore, and the
method by which to access information on said offshore securities:None.
6. Corporate Website:www.micb2b.com
Contents
Part 1 Letter to Shareholders……………………….…………………………. 1
Part 2 Company Profile…………..…………………………………………….. 5
1.Date of Incorporation…………………………………………..……. 5
2.Company History…………………………………………………….. 5
Part 3 Corporate Governance Report……………………………………….... 10
1.Organization……………………………………………………….…. 10
2.Directors, Supervisors, President, VicePresident, Assistant Vice
President and Department Heads………………………………..….
13
3.The remunerations dispensed to the Directors, Supervisors,
President and Vice President in the most recent fiscal year…..……
17
4.Implementation of Corporate Governance …………………..……... 24
5.Information Regarding the Company’s Audit Fee and
Independence…………………………………………….……………
40
6.Information on Replacement of Certified Public Accountant……… 41
7.The Chairman, President and the Manager in charge of finance or
accounting matters who has worked for the independent auditor
or related parties in the most recent year………..………………..…
41
8.Information on shareholding transfer and pledge by Directors,
Supervisors, Department Heads and Shareholders with over 10%
shareholding in the most recent year and up to the printing of the
annual report……………………………………………………….….
42
9.Relationship information among the Top Ten Shareholders and any
one is a related party pr a relative within the second degree of
kinship of another
43
10.The shareholding of the same invested company by the Company,
the Directors, the Supervisors, the Managers or other business
that is controlled by the Company directly or
indirectly……………………………………………………….………
44
Part 4 Capital Overview………………………………………….….…..…….. 45
1. Capital and Shares……………………………………….….……… 45
2. Bonds………………………………………………………….……… 50
3. Preferred Stock…………………………………………...…………. 51
4. Global Depository Receipts…………………………………………. 51
5.Employee Stock Options………………………………………..……. 52
6. New Restricted Employee Shares…………………………………... 54
7.Status of New Issuance in Connection with Mergers and
Acquisitions……………………………………………………………
54
8.Financing Plans and Implementation…………………..…………... 54
Part 5 Operational Highlights………………………………………….……… 56
1. BusinessActivities…………………………………………………… 56
2. Market and Sales Overview………………………..……………….. 141
3.Human Resources ……………………………………………..……… 156
4.Environmental Protection Expenditure………….…………………. 156
5.Labor Relations………………………..………………………..……. 156
6.Important Contracts………………………………………………… 159
Part 6 Financial Information………………...……..………………………… 161
1.Condensed Balance Sheets and Statements of Comprehensive
Income for the past 5 fiscal years, and the name of the Certified
Public Accountant and the Auditors Opinion given thereby……..
161
2.Financial Analysis in the past 5 fiscal years…………………..…… 165
3.Supervisors’ or Audit Committee’s Report in the most recent
fiscal year…...………………………………………………………..
169
4. Consolidated Financial Statement in the most recent fiscal year... 170
5. Separate Financial Statement of the Parent Company and
Related Party in the most recent fiscal year and during the
current fiscal year up to the date of printing of the annual
report………………………….……………………………………..
170
6.Financial difficulties of the Company and Related Party in the
most recent fiscal year and during the current fiscal year up to
the date of printing of the annual
report.…………………………………………………………..…….
170
Part 7 Review of Financial Conditions, Operating Results, and Risk
Management…………………………………………………………….
171
1.Analysis of Financial Position……………………..………………… 171
2.Analysis of Financial Performance ………………..……………….. 173
3.Analysis of Cash Flow……………………………………………….. 175
4.The Effect upon Financial Operations of any major capital
expenditures during the most recent fiscal year………………..….
177
5.Investment Policy in the most recent fiscal year, Main Causes for
profits or losses, Improvement Plans and the Investment Plans
for the coming year……………………….………………………….
177
6.Analysis of Risk Mangement…………………………………….….. 192
7.Other Important Matters……………………………...…………….. 194
Part 8 Special Disclosures……………………….. …………………………… 195
1.Information related to the Company’s Affiliates……………… 195
2.Private Placement Securities in the most recent fiscal year and
during the current fiscal year up tothe date of printing of the
annual report…………………………………………………………..
205
3.The Shares in the Company Held or Disposal of by subsidiaries in
the most recent fiscal year and during the current fiscal year up
to the date of printing of the annual report……...…………………
205
4.Other Disclosures…………………………………………..………… 205
Part 9 Any of the situations listed in Article 36, paragraph3,
subparagraph 2 of the Securities and Exchange Act of Taiwan,
which might materially affect Shareholders’ Equity or the price of
the Company Securities, has occurred during the most recent fiscal
year or during the current fiscal year up to the date of printing of
the annual report……………………….……………………………
205
Part 1. Letter to Shareholders
1. Preface
Dear shareholders, ladies, and gentlemen,
This year is going to mark the 30th anniversary of MIC. The company has been like a warship riding the
wind and waves for almost 30 years and continuously made major achievements, relying on the efforts
of all my colleagues. There is a Chinese old saying, “Fortune always appreciates hardworking, kind,
honest, genuine, and professional people”. MIC stands proudly in the top of the competitive high-tech
industry and devotes itself to serve each of our clients with its six core values of integrity, care,
professionalism, innovation, dedication, and teamwork. The accumulated experience and reputation are
our most valuable assets. In 2017, MIC announced its new results with both revenue and net profit hit
record high. Looking to 2018, we have a long way to go and go all out.
MIC’s consolidated revenuetotaled NT$20.212 billionin 2017, compared with NT$18.651 billion in
2016, up 8.37% year-on-year (YoY). Annual operating profit of NT$800 million, the annual growth rate
of 14.34%, the net profit after tax reached NT$649 million, up 26.91% YoY, and the consolidated
earnings per share was NT$3.77. The annual revenues, net profit, and earning per share all set a record
high success.
According to SEMI, the market value of global semiconductor in 2017 is 20% more than the previous
year. With the continuous demand of new technologies and new production capacity, SEMI
optimistically predicts that the global semiconductor market will reach a new high, and the overall
market is expected to challenge a record of $500 billion by 2019. In 2017, the semiconductor industry
performed quite well on revenue, equipment, and silicon wafer shipments. The semiconductor material
market in 2017 is increased 10% over 2016. By 2018, it is estimated that there will be 4% growth rate,
and Taiwan will maintain its status of the world’s largest buyer of semiconductor materials. As a result
of the booming market, MIC has seen a significant increase in orders since August 2017, with orders on
hand worth of NT$15 billion by the end of December, 2017, up 36% from the previous year.
MIC is about to enter the thirtieth year, and I can only express my gratitude through this letter. I am
deeply grateful to all the shareholders who support MIC, to the clients who recognize MIC, to the
third-party partners who collaborate with MIC, and to all my colleagues for their hard work. Next year,
MIC will continue to strive for excellence to serve our clients, create lucrative profit and shareholder
return, and fulfill our social responsibilities toestablishoutstanding industrial values of Taiwan.
Margaret Kao
Chairman & CEO
~1~
2. Business Report
2.1 The operating results of 2017
2.1.1 Operating results
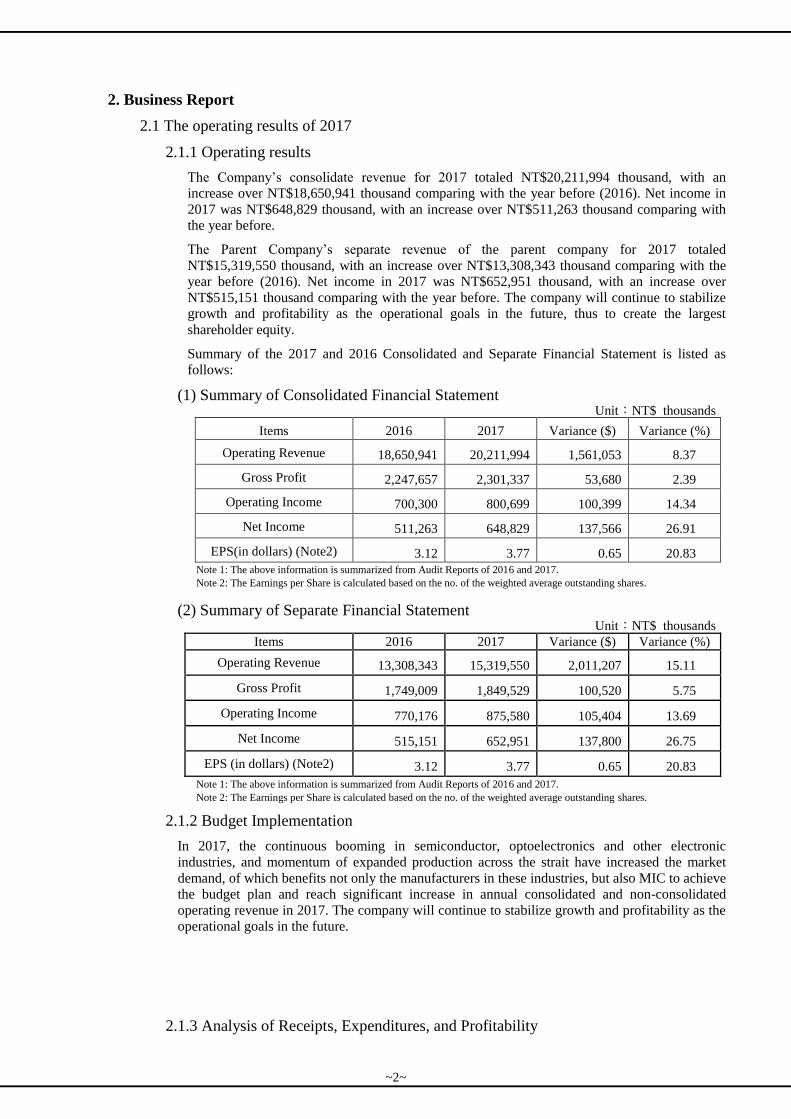
The Company’s consolidate revenue for 2017 totaled NT$20,211,994 thousand, with an
increase over NT$18,650,941 thousand comparing with the year before (2016). Net income in
2017 was NT$648,829 thousand, with an increase over NT$511,263 thousand comparing with
the year before.
The Parent Company’s separate revenue of the parent company for 2017 totaled
NT$15,319,550 thousand, with an increase over NT$13,308,343 thousand comparing with the
year before (2016). Net income in 2017 was NT$652,951 thousand, with an increase over
NT$515,151 thousand comparing with the year before. The company will continue to stabilize
growth and profitability as the operational goals in the future, thus to create the largest
shareholder equity.
Summary of the 2017 and 2016 Consolidated and Separate Financial Statement is listed as
follows:
(1) Summary of Consolidated Financial Statement Unit:NT$ thousands
Items 2016 2017 Variance ($) Variance (%)
Operating Revenue 18,650,941 20,211,994 1,561,053 8.37
Gross Profit 2,247,657 2,301,337 53,680 2.39
Operating Income 700,300 800,699 100,399 14.34
Net Income 511,263 648,829 137,566 26.91
EPS(in dollars) (Note2) 3.12 3.77 0.65 20.83
Note 1: The above information is summarized from Audit Reports of 2016 and 2017.
Note 2: The Earnings per Share is calculated based on the no. of the weighted average outstanding shares.
(2) Summary of Separate Financial Statement Unit:NT$ thousands
Items 2016 2017 Variance ($) Variance (%)
Operating Revenue 13,308,343 15,319,550 2,011,207 15.11
Gross Profit 1,749,009 1,849,529 100,520 5.75
Operating Income 770,176 875,580 105,404 13.69
Net Income 515,151 652,951 137,800 26.75
EPS (in dollars) (Note2) 3.12 3.77 0.65 20.83
Note 1: The above information is summarized from Audit Reports of 2016 and 2017.
Note 2: The Earnings per Share is calculated based on the no. of the weighted average outstanding shares.
2.1.2 Budget Implementation
In 2017, the continuous booming in semiconductor, optoelectronics and other electronic
industries, and momentum of expanded production across the strait have increased the market
demand, of which benefits not only the manufacturers in these industries, but also MIC to achieve
the budget plan and reach significant increase in annual consolidated and non-consolidated
operating revenue in 2017. The company will continue to stabilize growth and profitability as the
operational goals in the future.
2.1.3 Analysis of Receipts, Expenditures, and Profitability
~2~
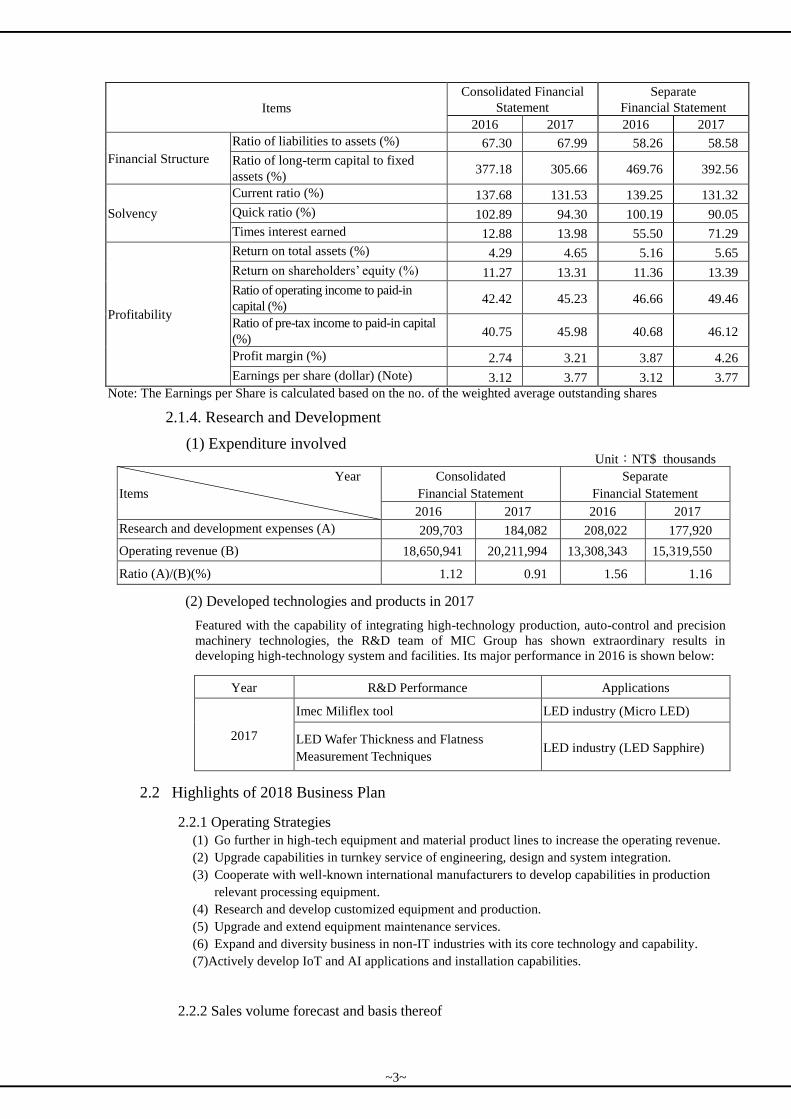
Items
Consolidated Financial
Statement
Separate
Financial Statement
2016 2017 2016 2017
Financial Structure
Ratio of liabilities to assets (%) 67.30 67.99 58.26 58.58
Ratio of long-term capital to fixed
assets (%) 377.18 305.66 469.76 392.56
Solvency
Current ratio (%) 137.68 131.53 139.25 131.32
Quick ratio (%) 102.89 94.30 100.19 90.05
Times interest earned 12.88 13.98 55.50 71.29
Profitability
Return on total assets (%) 4.29 4.65 5.16 5.65
Return on shareholders’ equity (%) 11.27 13.31 11.36 13.39
Ratio of operating income to paid-in
capital (%) 42.42 45.23 46.66 49.46
Ratio of pre-tax income to paid-in capital
(%) 40.75 45.98 40.68 46.12
Profit margin (%) 2.74 3.21 3.87 4.26
Earnings per share (dollar) (Note) 3.12 3.77 3.12 3.77
Note: The Earnings per Share is calculated based on the no. of the weighted average outstanding shares
2.1.4. Research and Development
(1) Expenditure involved Unit:NT$ thousands
Year
Items
Consolidated
Financial Statement
Separate
Financial Statement
2016 2017 2016 2017
Research and development expenses (A) 209,703 184,082 208,022 177,920
Operating revenue (B) 18,650,941 20,211,994 13,308,343 15,319,550
Ratio (A)/(B)(%) 1.12 0.91 1.56 1.16
(2) Developed technologies and products in 2017
Featured with the capability of integrating high-technology production, auto-control and precision
machinery technologies, the R&D team of MIC Group has shown extraordinary results in
developing high-technology system and facilities. Its major performance in 2016 is shown below:
Year R&D Performance Applications
2017
Imec Miliflex tool LED industry (Micro LED)
LED Wafer Thickness and Flatness
Measurement Techniques LED industry (LED Sapphire)
2.2 Highlights of 2018 Business Plan
2.2.1 Operating Strategies
(1) Go further in high-tech equipment and material product lines to increase the operating revenue.
(2) Upgrade capabilities in turnkey service of engineering, design and system integration.
(3) Cooperate with well-known international manufacturers to develop capabilities in production
relevant processing equipment.
(4) Research and develop customized equipment and production.
(5) Upgrade and extend equipment maintenance services.
(6) Expand and diversity business in non-IT industries with its core technology and capability.
(7)Actively develop IoT and AI applications and installation capabilities.
2.2.2 Sales volume forecast and basis thereof
~3~
The “Global Economic Prospects” published by the World Bank forecasts global economic growth
to edge up to 3.1% in 2018, which is higher than the 3% of 2017. The Directorate-General of
Budget, Accounting and Statistics (DGBAS), Executive Yuan has published the economic growth
rate of 2017, which is 2.86%, and forecasted that the economic growth rate of 2018 will be 2.42%.
DGBAS expressed that the country’s economy now had a steady growth and will have an
“optimistic development” in the future.
SEMI (Semiconductor Equipment and Materials International) expressed that, following the
continuously increased production capabilities of the Mainland Chinese wafer plants, the
semiconductor equipment demand would increase in 2018; it is expected that the global
semiconductor equipment expenditure will reach USD63 billion with a growth of 11% comparing
with 2017. Industrial Economics and Knowledge (IEK) Center of Industrial Technology Research
Institute indicated that the business cycle for panel display will reach the peak in 2018: until now, 4
out of 10.5G lines will have a mass production and 8 to 9 are still in the planning stage.
Looking into 2018, MIC Group has maintained its foot in Taiwan while heading towards Asia. It is
expected to see a growth in MIC’s operating performance this year comparing with the year before.
2.2.3 Important Production and Sales Policies
(1) To integrate MIC Group’s business units and build up the Company’s core technology.
(2) To provide customers on-time solutions that satisfy the customer demand in order to increase
the Company’s competitiveness in sales.
(3) To provide customer a full line service through synergy of the company’s business units.
(4) To enhance sales office’s supply service to provide appropriate and on-time integrated services.
(5) To enhance its relationship with customers in Asia and to extend the Company’s capability to
provide local services.
2.3 Future Development Strategy
Centered on four major business groups – business agency, engineering design, system applications, and
R&D and Manufacturing – MIC aims to further diversify its services and to include non-IT customers in
order to expand its business in Asia.
Regarding the management system, MIS has implemented ISO9001, ISO14001 and OHSAS18001 work
standards to enhance its work quality and efficiency to ensure the Group’s competitiveness, to make
employees confident, to bring customers a good protection and to maximize shareholders’’ benefits.
2.4 Impacts of External Competitive Environment, Regulatory Environment and Macroeconomic Environment
Impacted by the fierce competition of macroeconomic environment, the industry generally has the costs
increased and profitability decreased. MIC Group is now making effort on the project and purchase
management in order to enhance our competitiveness in the industry by controlling the costs and
expenditure. As for the regulations, amendments concerning the protection of our environment,
consumers and investors, as well as our social responsibilities were made, creating more restrictions on
the business and turning the macroeconomic environment even more complicated. MIC Group will
therefore provide even more professional services to confront the incoming challenges. Upholding the
spirit of “innovation”, we aim to provide an “integrated” and “differentiated” service to expand our
market and make the Group even more advantageous.
A Good Health and All the Bests to our Shareholders.
Sincerely yours,
Chairman of the Board: Margaret Kao
President: Scott Lin
Accounting Director: Chung Chi-Wen
~4~
Part 2. Company Profile
1. Date of Incorporation: December 27, 1988
2. Company History:
2.1 Company History
1988 Marketech Intermational Corp. was established with paid-in capital of NT$ 5 millionin December.
1989 Cooperated with US TPI Systems and introduced the hi-tech products as well as technologiesin February.
1991 Increased paid-in capital of NT$ 5million.
1994 Increased paid-in capital of NT$ 10 millionin June.
1995 Set up MIC’s 1st semiconductor cleaning roomin June.
1995 Increased paid-in capital of NT$ 9 millionin March.
1997 Started oversea business expansion from Singapore in July.
1997 Tainan representative office was established to support customers in Tainan Science Park in October.
1997 Co-marketed with J.P.C. to expand business in oversea marketsin December.
1998 Set up MIC’s 2nd semiconductor cleaning room in January.
1998 Changed company organization and name to Marketech International Corp.
Increased paid-in capital of NT$ 13 million and converted retained earnings of NT$ 13 million into paid-in capital in September.
2000 Divisions of Equipment & Material and Chemical Engineering received ISO 9002 certification in September.
2000 Increased paid-in capital of NT$ 31.47 million and converted retained earnings of NT$ 113.23 million into paid-in capital in October.
Hsin Chu office was officially opened.
2000 MIC-TECH VENTURES ASIA PACIFIC INC. was established and in charge of investment projects in Chinain December.
2001 Increased paid-in capital of NT$ 18 millionin January.
2001 MARKET GO PROFITS LTD. was established and in charge of oversea investment projectsin February.
Acquired MARKETECH INTEGRATED PTE LTD.
2001 MIC-Tech (WuXi) Co., Ltd. was established and in charge of equipment manufacturing businessin May.
MIC-Tech ShangHai Corp. Ltd. was established and in charge of trading business in China.
2001 Increased paid-in capital of NT$ 60 million and converted retained earnings of NT$ 172,39 million into paid-in capital in May.
2001 Hsin Chu branch office was establishedin July.
2001 Tao Yuan bonded warehouse was established and operatedin August.
2001 Received ISO 9001 certification (modified version by year 2000)in September.
2001 Exclusive agent for selling semiconductor backend packaging detection equipment in Taiwan was licensed in October.
Kaohsiung representative office was established to provide customers in time service.
Tainan bonded warehouse was established to speed up material supply for production.
2001 Beijing branch of MIC-Tech (WuXi) Co., Ltd. was establishedin December.
2001 AcquiredShanghai Puritic Co., Ltd. to expand business in China in January.
2002 Officially listed on Emerging Stock Market in April.
2002 Appointed 2 independent directors and 1 independent supervisorin May.
~5~
2002 Increased paid-in capital of NT$ 50 million and converted retained earningsof NT$ 157.027 million into paid-in capital in June.
2002 Officially listed on OTC Market in October.
2003 Issued MIC’s 1stdomestic unsecured convertible bond of NT$ 500 million in January.
2003 Started building Hu Kou factory in February.
Fuzhou Jiwei System Integrated Co., Ltd. was established to expand the business in South China.
2003 Got approval to set up official office in Tainan Science Park in May.
2003 MIC-Tech Electronics Engineering Corp. was established in June.
2003 Executed retained earnings of NT$ 189.28175 million transferred to paid-in capital in August.
2003 Tainan Science Park branch office was established in August.
2003 Hu Kuo factory was official opened in September.
2003 Started building Shan Hua factory in October.
2003 Issued MIC’s 2nddomestic unsecured convertible bond of NT$ 580 millionin October.
2004 Converted unsecured convertible bond of NT$ 6.09951 million into paid-in capital in February.
2004 Started building Tainan Science Park factory in March.
2004 Worked as OEM of US equipment supplierin March.
2004 Officially listed on Taiwan Security Exchange Market in May.
2004 Executed retained earnings of NT$ 195.50165 million transferred to paid-in capital in August.
2004 Shan Hua factory was officially opened and operated in September.
2004 MIC-TECH GLOBAL CORP. was established in October.
2005 Converted unsecured convertible bond of NT$ 178,570 into paid-in capital in January.
2005 Tainan Science Park factory was officially opened and operated in May.
2005 Wu Xi factory was officially opened and operated in June.
2005 Executed retained earnings of NT$ 226.95569 million transferred to paid-in capital in August.
2005 Relocated headquarter to Nangang Soft Park in November.
2006 Worked as OEM of US well-known flat panel display equipment supplier.
Worked as OEM of Japan Lasertech in March.
2006 Executed retained earnings of NT$ 207.26012 million transferred to paid-in capital in Septeber.
2006 Phase I of Tou Fen factory was officially opened and operated in November.
2007 Received ISO 14001 and OHSAS 18001 certification in January.
2007 Cancelled registry of treasury stock and decreased paid-in capital of NT$ 13.41 million in Sptember.
2007 Converted unsecured convertible bond of NT$ 30,760 into paid-in capital in December.
2008 Started building Phase II of Tainan Science Park factory in January.
2008 Phase II of Tainan Science Park factory was officially opened and operated in July.
2009 Marketech International Sdn. Bhd. was established for business expansion in Malaysia in February.
~6~
2009 Executed capital surplus of NT$ 146.90251 million transferred to paid-in capital in October.
2010 MIC-Tech Viet Nam Co., Ltd. was established for business expansion in Vietnam in January .
2010 Increased paid-in capital of NT$ 1.51 million through employees’ subscription of new common stocks in March.
2011 Increased paid-in capital of NT$ 15.21 million through employees’ subscription of new common stocks in April.
2011 Transferred semiconductor thermal process from Japan HiKE in June.
2011 Recognized as certified AEO company by Custom Administration,Minister of Financein June.
2011 Increased paid-in capital of NT$ 3.48 million through employees’ subscription of new common stocks in July.
2011 Hoa Phong Marketech Co., Ltd. was established for business expansion in Vietnam in July.
2011 Increased paid-in capital of NT$ 2.95 million through employees’ subscription of new common stocks in October.
2012 Increased paid-in capital of NT$ 5.8 million through employees’ subscription of new common stocks in April.
2012 Increased paid-in capital of NT$ 0.89 million through employees’ subscription of new common stocks in July.
2013 Increased paid-in capital of NT$ 0.33 million through employees’ subscription of new common stocks in April.
2013 Phase III of Tou Fen factory was officially opened and operated in June.
2014 Marketech Engineering Pte. Ltd. was established in January.
2014 Increased paid-in capital of NT$ 0.13 million through employees’ subscription of new common stocks in April.
2014 Marketech Integrated Construction Co., Ltd. was established for business expansion in Myanmar in April.
2015 Established the subsidiary (Marketech Integrated Manufacturing Company Limited) in Myanmar in March.
2015 Started to build factory in Myanmar in December.
2015 Received the SA8000 certification in December
2016 PT Marketech International Indonesia set-up
2016 Central Taiwan Science Park Branch set-up
2017 Converted unsecured convertible bond of NT$ 64.32 million into paid-in capital in April.
2017 Marketech Netherlands B.V. set-up
2017 Converted unsecured convertible bond of NT$ 35.36 million into paid-in capital in July.
2017 Converted unsecured convertible bond of NT$ 4.09 million and Employee stock options of NT$ 10.25 million into paid-in capital in October.
2018 Converted unsecured convertible bond of NT$ 1.46 million and Employee stock options of NT$ 3.97 million into paid-in capital in January.
2018 Converted unsecured convertible bond of NT$ 8.72 million and Employee stock options of NT$ 3.73 million into paid-in capital in April.
2.2 Merger and acquisition (up to date):None
~7~
2.3 Invested entities (up to date)
Unit:In Thousand of New Taiwan Dollars; %
Invested Investee Functions
December 31, 2017 March 31, 2018
Investment
Amount
Shareholdin
g
Compositio
n
Book Value Amount of
Original
Investment
Shareholdin
g
Compositio
n
Book Value
Marketech
International Corp.
Market Go Profits Ltd. Engaged in holding and
reinvestment affairs
1,245,570 100.00% 1,038,755 1,245,570 100.00% 1,028,976
Marketech
International Corp.
Marketech Integrated Pte.
Ltd.
Engaged in automatic supply
systems business in
semiconductor industry
192,522 100.00% (6,081) 192,522 100.00% (6,172)
Marketech
International Corp.
Headquarter International
Ltd.
Engaged in holding and
reinvestment affairs
42,475 100.00% 37,958 42,475 100.00% 37,109
Marketech
International Corp.
Tiger United Finance Ltd. Engaged in holding and
reinvestment affairs
46,475 100.00% 37,107 46,475 100.00% 36,128
Marketech
International Corp.
MIC-Tech Global Corp. Engaged in international business
19,147 100.00% 7,706 19,147 100.00% 8,108
Marketech
International Corp. MIC-Tech Viet Nam Co.,
Ltd.
Engaged in selling lant
equipments & supplies and
providing, installation &
maintenance service
39,345 100.00% 30,802 39,345 100.00% 30,171
Marketech
International Corp.
Marketech Co. Ltd. Engaged in engineering
contractingand maintenance
service
29,922 100.00% 4,002 29,922 100.00% 2,651
Marketech
International Corp.
Marketech Engineering Pte.
Ltd.
Engaged in mechanical and electrical installation and engineering business
10,129 100.00% 2,448 10,129 100.00% 4,822
Marketech
International Corp. Marketech Integrated
Manufacturing Company
Limited
Design, production and assembly
of automated production
machine, equipment and
component
438,298 100.00% 396,325 438,298 100.00% 391,140
Marketech
International Corp. eZoom Information ,Inc.
Engaged in development, sales and consultancy of MIS software & hardware
67,737 100.00% 31,690 97,737 100.00% 54,855
Marketech
International Corp.
Glory Technology Service
Inc.
Engaged in sales and installation
of telecom equipment
31,019 34.11% 46,153 31,019 29.24% 46,009
Marketech
International Corp.
MIC Techno Co., Ltd. Engaged in sales of panel
equipment and material
2,000 20.00% 1,849 2,000 20.00% 1,845
Marketech
International Corp.
PT Marketech International
Indonesis
international trade on machinery
and components.
38,042 99.92% 35,649 38,042 99.92% 34,792
Marketech
International Corp. Marketech International
Sdn. Bhd.
Engaged in engineering
contracting and maintenance
service
44,262 51.12% 29,533 45,476 51.12% 32,575
Marketech
International Corp.
ADAT Technology CO.,
LTD.
Software research and
development, application and
services; electronic information
provisioning and equipment sales
10,000 83.33% 6,029 10,000 83.33% 4,582
Marketech
International Corp. Marketech Ntherlands B.V.
Machinery, equipment, parts and
related international trade
operation and technical services
10,671 100.00% 10,453 10,671 100.00% 9,825
Market Go
Profits Ltd.
MIC-Tech Ventures
Asia Pacific Inc.
Engaged in holding and
reinvestment affairs 1,240,073 100.00% 1,037,010 1,240,073 100.00% 1,027,270
Marketech Marketech Engaged in engineering
contractingand maintenance 42,319 48.88% 29,378 43,480 48.88% 32,284
~8~
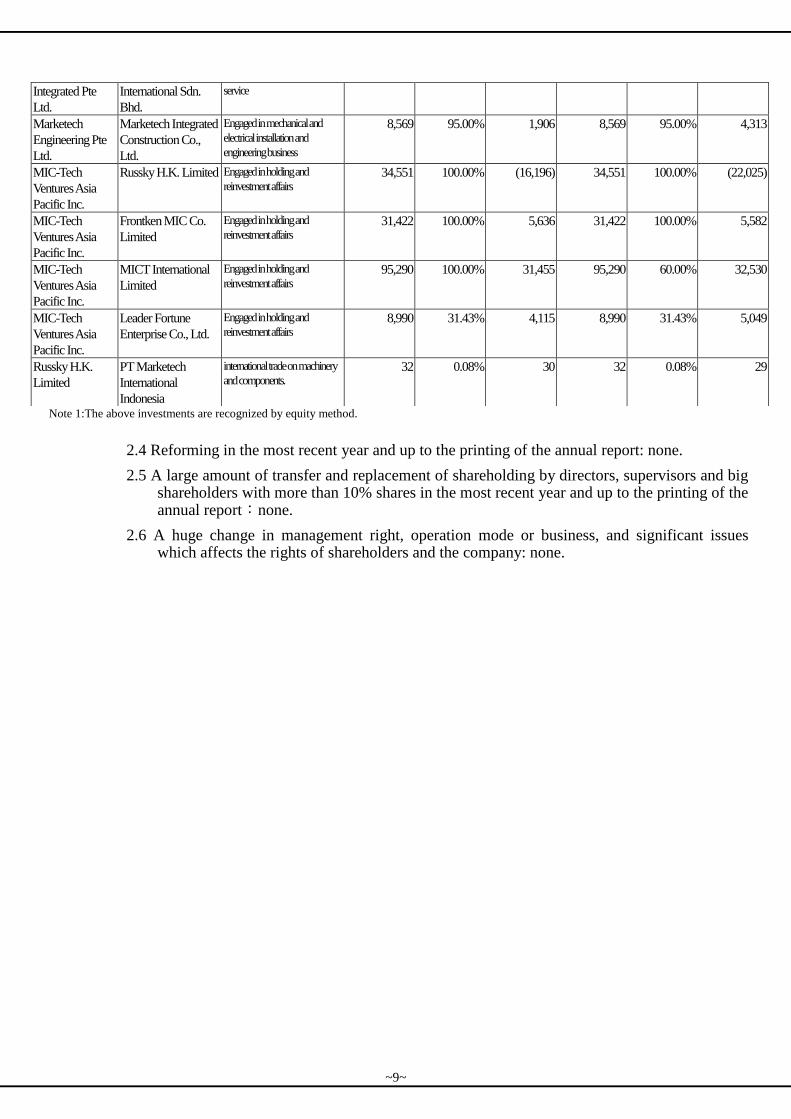
Note 1:The above investments are recognized by equity method.
2.4 Reforming in the most recent year and up to the printing of the annual report: none.
2.5 A large amount of transfer and replacement of shareholding by directors, supervisors and big shareholders with more than 10% shares in the most recent year and up to the printing of the annual report:none.
2.6 A huge change in management right, operation mode or business, and significant issues which affects the rights of shareholders and the company: none.
Integrated Pte
Ltd.
International Sdn.
Bhd.
service
Marketech
Engineering Pte
Ltd.
Marketech Integrated
Construction Co.,
Ltd.
Engaged in mechanical and
electrical installation and
engineering business
8,569 95.00% 1,906 8,569 95.00% 4,313
MIC-Tech
Ventures Asia
Pacific Inc.
Russky H.K. Limited Engaged in holding and
reinvestment affairs 34,551 100.00% (16,196) 34,551 100.00% (22,025)
MIC-Tech
Ventures Asia
Pacific Inc.
Frontken MIC Co.
Limited
Engaged in holding and
reinvestment affairs 31,422 100.00% 5,636 31,422 100.00% 5,582
MIC-Tech
Ventures Asia
Pacific Inc.
MICT International
Limited
Engaged in holding and
reinvestment affairs 95,290 100.00% 31,455 95,290 60.00% 32,530
MIC-Tech
Ventures Asia
Pacific Inc.
Leader Fortune
Enterprise Co., Ltd.
Engaged in holding and
reinvestment affairs 8,990 31.43% 4,115 8,990 31.43% 5,049
Russky H.K.
Limited
PT Marketech
International
Indonesia
international trade on machinery
and components. 32 0.08% 30 32 0.08% 29
~9~
Part 3. Corporate Governance Report
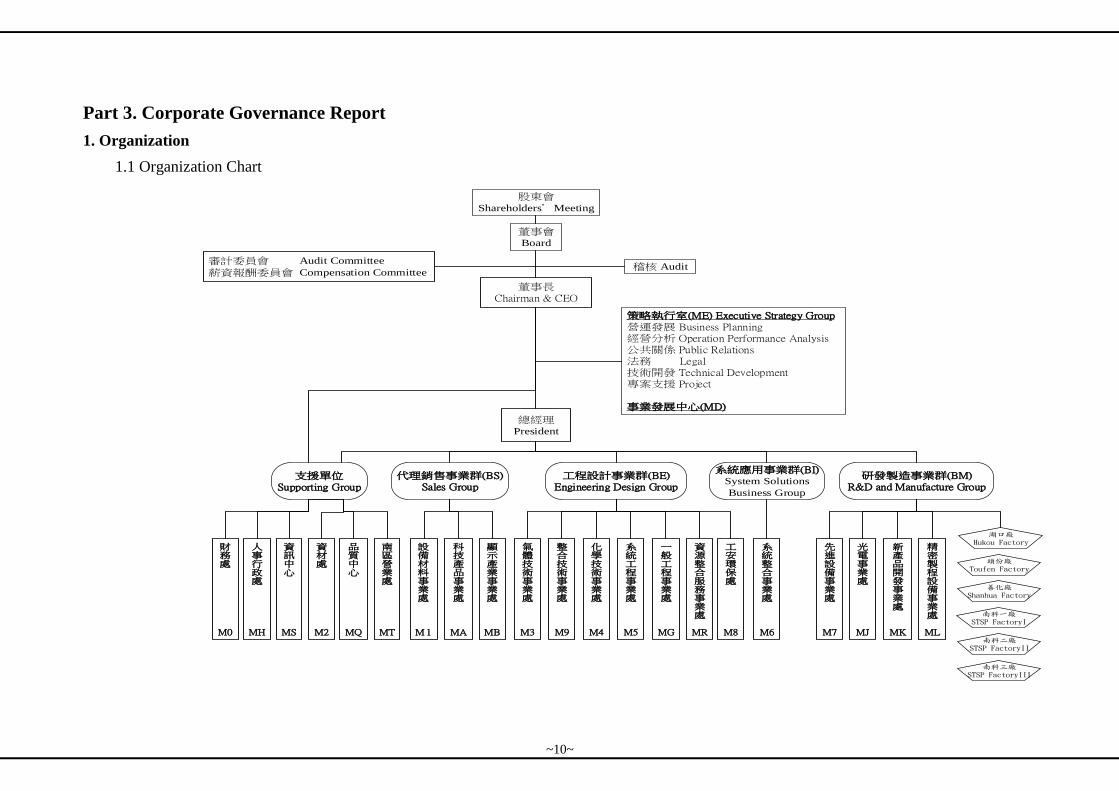
1. Organization
1.1 Organization Chart
董事長Chairman & CEO
總經理President
先進設備事業處
M7
研發製造事業群(BM)R&D and Manufacture Group
策略執行室(ME) Executive Strategy Group 營運發展 Business Planning經營分析 Operation Performance Analysis公共關係 Public Relations法務 Legal技術開發 Technical Development專案支援 Project
事業發展中心(MD)
系統應用事業群(BI)System Solutions
Business Group
光電事業處
MJ
新產品開發事業處
MK
品質中心
MQ
南區營業處
MT
資材處
M2
人事行政處
MH
財務處
M0
支援單位Supporting Group
工程設計事業群(BE)Engineering Design Group
資訊中心
MS
董事會Board
科技產品事業處
MA
顯示產業事業處
MB
代理銷售事業群(BS)Sales Group
系統整合事業處
M6
整合技術事業處
M9
系統工程事業處
M5
工安環保處
M8
一般工程事業處
MG
資源整合服務事業處
MR
設備材料事業處
M 1
氣體技術事業處
M3
化學技術事業處
M4
湖口廠Hukou Factory
善化廠Shanhua Factory
南科一廠STSP FactoryI
頭份廠Toufen Factory
精密製程設備事業處
ML
股東會Shareholders�Meeting
稽核 Audit審計委員會 Audit Committee
薪資報酬委員會 Compensation Committee
南科二廠STSP FactoryII
南科三廠STSP FactoryIII
~10~
1.2 Major corporate functions
Division Functions
Executive Strategy office
Analyzes the overall business and schemes the business strategy, Assesses the investment projects and the new product line Implements andimproves robust management practices. Plans, co-ordinates and executes assigned projects. Conforms to all business activities with legal compliance. Establishes and maintains public relations, and coordination amongdivision.
Enterprise Development Center
Integrate and develop the various offshore subsidiaries’ sales agent, engineering design (the technology, general, transportation, petrochemical, and the like), system application, manufacture, trade development and related five major group businesses.
Audit Office Conducts inspection and evaluates internal controls withinvarious divisions. Assists subsidiaries with internal audit tasks. Evaluates the robustness of internal control systems andrelated policies. Determines whether the internal controlsystemscontinues to be effective, and assesses the progressmade by each department, while offering suggestions toimprove the company's operations
Finance & Accounting Division
Financing deployment and capital management Stock affairs Accounting transactions management Financial reports and analysis Tax planning and filing
Euipment & Material Division
Provides the hi-tech manufacturing process and testing equipment and supplies Provides in time after service, technical support, and maintenance.
Logistics Division Responsible for the purchasing, shipping and warehousing of materials,equipment and tools. Develops a robust supplier system that facilitates order tracking and strategic purchases Handles processes such as import, export, and bonded warehouses.
Gas Engineering Division
Provides total solution of UHP gas system which includes gas piping and equipment. Provides gas gabinet (GC) and valve manifold box (VMB) certified with SEMI. Represents variety of gases, chemicals, equipment and consuming parts from worldwide. Specialized in UHP gas/ liquid system module OEM and ODM.
Chemical Engineering Division
Turnkey projects for Central Chemical Supply System (CCSS), including system design, manufacturing, construction and installation Testing and providing on-site maintenance service for equipment Replacement of chemical and gas supply materials Operations of the monitoring and control system.
System Engineering Division
Constructs cleanrooms for local high-tech and bio tech industries; providesconstruction services for electromechanical engineeringprojects such as planning, design, supervision and turnkeysolutions. Constructs pumping station facilities, waste water treatment facilities, pumping station automation, air pollution control and other environmental protection facilities. Represents boiler and waste solvents. Providesinstallation services for energy and recycle facilities. Acted as the agent of Japan’s A-Win wind turbine facility to provide the installation service of power and resource regeneration facilities.
Optoelectronics Division
Design and production of automated LCD production facilities Production of LCD production checking facilities as an OEM Design and production of LED production facilities Software design and development Design and production of automated logistics or specialized machines for biotechnology and other industries.
System Integration Division
The surveillance of factory services for high-technology and power-generation industry Facility automation
~11~
Division Functions
Production surveillance design, construction, installation and tests Multimedia and Inspection Division
The development services of 3C / multimedia core technology, application technology and application products.
ISEP Division Enhances employees' safety and health within the company;implements an OHSAS 18001-compliant occupationalhealth and safety system. Improves environmental management within the company;implements an ISO 14001-compliant environmentalmanagement system.
Turnkey Engineering Division
Spacial planning and project schedule management for the integration of high-technology industry, including removing, moving in, installing, planning, designing and constructing the facilities as well as the turnkey testing for the distribution system of the secondary supply machine. Supplying factories and customers with the demand of building or reconstructing factory offices the infrastructure (civil engineering, machinery and power-generating equipment, air-conditioning, internal installation, water supply and discharge etc.), clean room and production system. From the design, planning, construction management and the transfer after launched the operations.
Hi-Tech Producs Division
Provides production and testing equipment, instruments, parts and materials for Semiconductor Back-end packaging and testing, and Light-Emitting Diod Provides after service, technical support and maintenance services.
Display Industry Division
Provides production for flat panel displays, color filter and testing equipment, instruments, parts and materials Provides after service, technical support and maintenance service.
Human Resource & Administration Division
The planning, establishment and execution of the group’s human resource, general affairs and administration related system and management.
Information & System Division
Development and management of information systems andnetworks. Responsible for the development, maintenance and securitymanagement of various information systems and databases. Software access control, introductionand maintenance.
Q.C. Center Develops, implements, enhances and improves ISO 9001 quality management system.
Southern Taiwan Representative Division
Coordinating the business development of southern market, coordinating the business integration internally and providing supports for the south and administration / general affairs.
General Engineering Division
Provides machinery and electric engineering services include design、consultant & construction of petro-chemical plant、traditional industry、intelligent buildings engineering、hospital building、office、shopping mall、hotel and transportation system.
Resources Services Division
Handles all engineering demand involving in consulting, planning, design, maintenance, repair, or alteration. Provides services including equipment relocation, trading or sales of new and used equipment, and relocation implementation.
Advanced ManufacturingDivision
The OEM production of LCD monitor production and testing facilities The OEM production of semiconductor production related facility module The OEM production of solar energy related production facility modules.
New Product DevelopmentDivision
Expanding and developing the category and quantity of testing facilities, production equipments, passive elements, LED, IC and other new products.
Precision Process Equipment Enterprise Division
The flat monitor processing and LCD production automation equipment’s design/manufacture, the flat monitor processing and LCD process screening equipment’s OEM manufacture; the LED process equipment’s design/manufacture; the CIM software design development; the biotech industry and other industries’ logistics and dedicated servers’ automated design/manufacture.
~12~
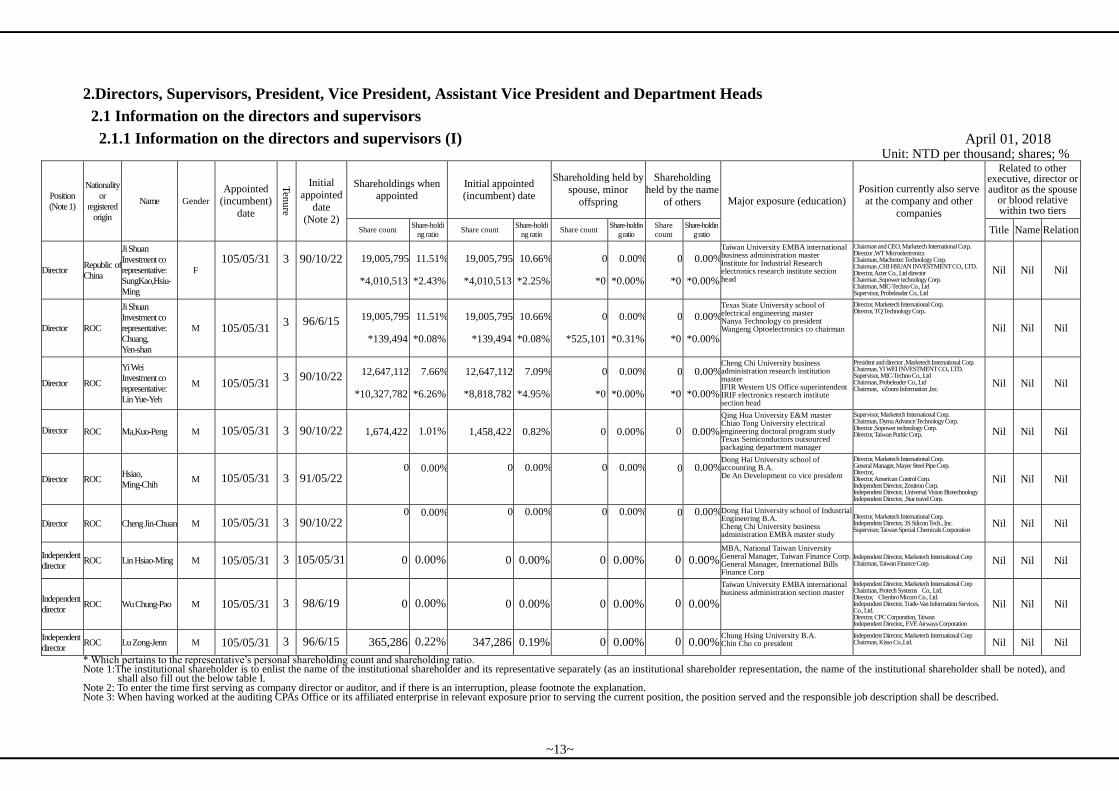
2.Directors, Supervisors, President, Vice President, Assistant Vice President and Department Heads
2.1 Information on the directors and supervisors
2.1.1 Information on the directors and supervisors (I) April 01, 2018 Unit: NTD per thousand; shares; %
Position
(Note 1)
Nationality
or
registered
origin
Name Gender
Appointed (incumbent)
date
Ten
ure
Initial
appointed
date (Note 2)
Shareholdings when appointed
Initial appointed (incumbent) date
Shareholding held by
spouse, minor
offspring
Shareholding
held by the name
of others Major exposure (education) Position currently also serve
at the company and other
companies
Related to other executive, director or auditor as the spouse
or blood relative within two tiers
Share count Share-holdi
ng ratio Share count
Share-holdi
ng ratio Share count
Share-holdin
g ratio
Share
count
Share-holdin
g ratio Title Name Relation
Director Republic of
China
Ji Shuan
Investment co
representative:
SungKao,Hsiu-
Ming
F
105/05/31
3
90/10/22
19,005,795
*4,010,513
11.51%
*2.43%
19,005,795
*4,010,513
10.66%
*2.25%
0
*0
0.00%
*0.00%
0
*0
0.00%
*0.00%
Taiwan University EMBA international business administration master Institute for Industrial Research electronics research institute section head
Chairman and CEO, Marketech International Corp. Director ,WT Microelectronics Chairman, Machrotec Technology Corp. Chairman ,CHI HSUAN INVESTMENT CO., LTD. Director, Acter Co., Ltd director Chairman ,Sopower technology Corp. Chairman, MIC-Techno Co., Ltd Supervisor, Probeleader Co., Ltd
Nil Nil Nil
Director ROC
Ji Shuan
Investment co
representative:
Chuang,
Yen-shan
M 105/05/31 3
96/6/15
19,005,795
*139,494
11.51%
*0.08%
19,005,795
*139,494
10.66%
*0.08%
0
*525,101
0.00%
*0.31%
0
*0
0.00%
*0.00%
Texas State University school of electrical engineering master Nanya Technology co president Wangeng Optoelectronics co chairman
Director, Marketech International Corp. Director, TQ Technology Corp..
Nil Nil Nil
Director ROC
Yi Wei
Investment co
representative:
Lin Yue-Yeh
M 105/05/31 3
90/10/22
12,647,112
*10,327,782
7.66%
*6.26%
12,647,112
*8,818,782
7.09%
*4.95%
0
*0
0.00%
*0.00%
0
*0
0.00%
*0.00%
Cheng Chi University business administration research institution master IFIR Western US Office superintendent IRIF electronics research institute section head
President and director ,Marketech International Corp. Chairman, YI WEI INVESTMENT CO., LTD. Supervisor, MIC-Techno Co., Ltd Chairman, Probeleader Co., Ltd Chairman, eZoom Information ,Inc.
Nil Nil Nil
Director ROC Ma,Kuo-Peng M 105/05/31 3 90/10/22 1,674,422 1.01% 1,458,422 0.82% 0 0.00% 0 0.00%
Qing Hua University E&M master Chiao Tong University electrical engineering doctoral program study Texas Semiconductors outsourced packaging department manager
Supervisor, Marketech International Corp. Chairman, Dyma Advance Technology Corp. Director ,Sopower technology Corp. Director, Taiwan Puritic Corp. Nil Nil Nil
Director ROC Hsiao,
Ming-Chih M 105/05/31 3 91/05/22
0
0.00%
0
0.00%
0
0.00%
0
0.00%
Dong Hai University school of accounting B.A. De An Development co vice president
Director, Marketech International Corp. General Manager, Mayer Steel Pipe Corp. Director,. Director, American Control Corp. Independent Director, Zenitron Corp. Independent Director, Universal Vision Biotechnology Independent Director, ,Star travel Corp.
Nil Nil Nil
Director ROC Cheng Jin-Chuan M 105/05/31 3 90/10/22 0
0.00%
0
0.00%
0
0.00%
0
0.00%
Dong Hai University school of Industrial Engineering B.A. Cheng Chi University business administration EMBA master study
Director, Marketech International Corp. Independent Director, 3S Silicon Tech., Inc. Supervisor, Taiwan Special Chemicals Corporation
Nil Nil Nil
Independent
director ROC Lin Hsiao-Ming M 105/05/31 3 105/05/31 0 0.00% 0 0.00% 0 0.00% 0 0.00%
MBA, National Taiwan University General Manager, Taiwan Finance Corp. General Manager, International Bills Finance Corp
Independent Director, Marketech International Corp Chairman, Taiwan Finance Corp. Nil Nil Nil
Independent
director ROC Wu Chung-Pao M 105/05/31 3 98/6/19 0 0.00% 0 0.00% 0 0.00% 0 0.00%
Taiwan University EMBA international business administration section master
Independent Director, Marketech International Corp Chairman, Protech Systems Co., Ltd. Director, Chenbro Micom Co., Ltd. Independent Director, Trade-Van Information Services, Co., Ltd. Director, CPC Corporation, Taiwan Independent Director,, EVE Airways Corporation
Nil Nil Nil
Independent
director ROC Lu Zong-Jenn M 105/05/31 3 96/6/15 365,286 0.22% 347,286 0.19% 0 0.00% 0 0.00%
Chung Hsing University B.A. Chin Cho co president
Independent Director, Marketech International Corp Chairman, Kisso Co.,Ltd.
Nil Nil Nil
* Which pertains to the representative’s personal shareholding count and shareholding ratio. Note 1:The institutional shareholder is to enlist the name of the institutional shareholder and its representative separately (as an institutional shareholder representation, the name of the institutional shareholder shall be noted), and
shall also fill out the below table I. Note 2: To enter the time first serving as company director or auditor, and if there is an interruption, please footnote the explanation. Note 3: When having worked at the auditing CPAs Office or its affiliated enterprise in relevant exposure prior to serving the current position, the position served and the responsible job description shall be described.
~13~
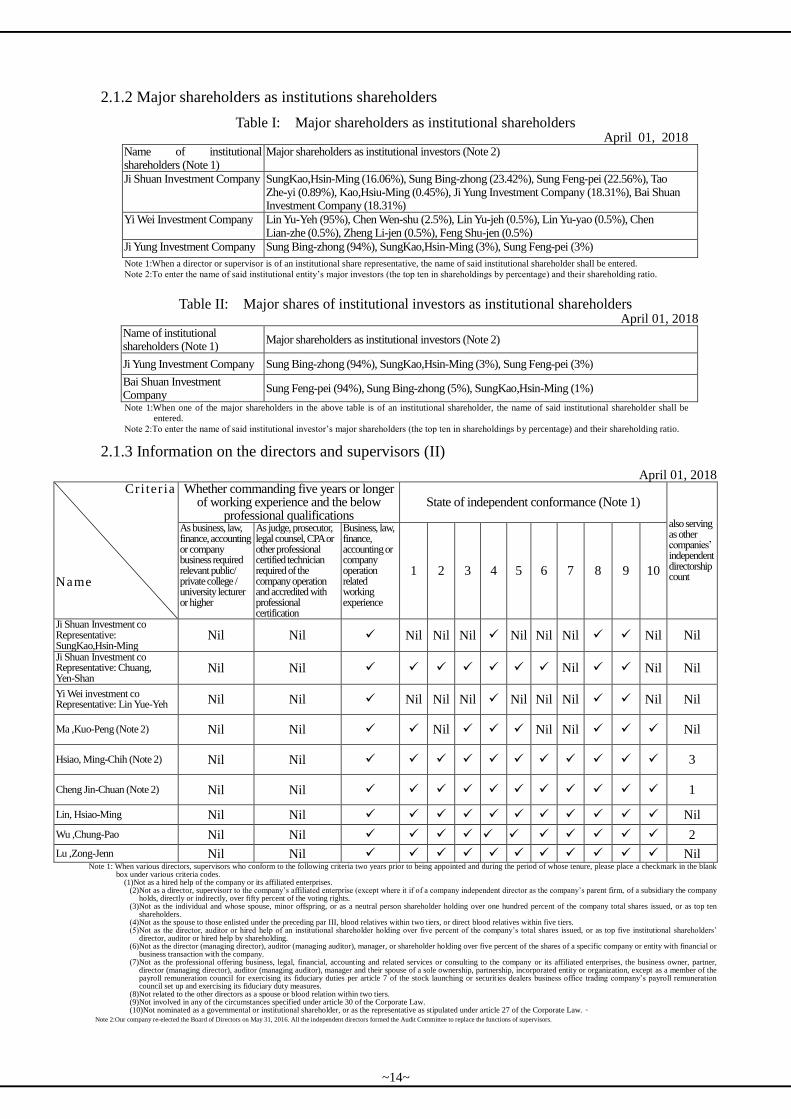
2.1.2 Major shareholders as institutions shareholders
Table I: Major shareholders as institutional shareholders April 01, 2018
Name of institutional shareholders (Note 1)
Major shareholders as institutional investors (Note 2)
Ji Shuan Investment Company SungKao,Hsin-Ming (16.06%), Sung Bing-zhong (23.42%), Sung Feng-pei (22.56%), Tao Zhe-yi (0.89%), Kao,Hsiu-Ming (0.45%), Ji Yung Investment Company (18.31%), Bai Shuan Investment Company (18.31%)
Yi Wei Investment Company Lin Yu-Yeh (95%), Chen Wen-shu (2.5%), Lin Yu-jeh (0.5%), Lin Yu-yao (0.5%), Chen Lian-zhe (0.5%), Zheng Li-jen (0.5%), Feng Shu-jen (0.5%)
Ji Yung Investment Company Sung Bing-zhong (94%), SungKao,Hsin-Ming (3%), Sung Feng-pei (3%)
Note 1:When a director or supervisor is of an institutional share representative, the name of said institutional shareholder shall be entered.
Note 2:To enter the name of said institutional entity’s major investors (the top ten in shareholdings by percentage) and their shareholding ratio.
Table II: Major shares of institutional investors as institutional shareholders April 01, 2018
Name of institutional shareholders (Note 1)
Major shareholders as institutional investors (Note 2)
Ji Yung Investment Company Sung Bing-zhong (94%), SungKao,Hsin-Ming (3%), Sung Feng-pei (3%)
Bai Shuan Investment Company
Sung Feng-pei (94%), Sung Bing-zhong (5%), SungKao,Hsin-Ming (1%)
Note 1:When one of the major shareholders in the above table is of an institutional shareholder, the name of said institutional shareholder shall be
entered.
Note 2:To enter the name of said institutional investor’s major shareholders (the top ten in shareholdings by percentage) and their shareholding ratio.
2.1.3 Information on the directors and supervisors (II)
April 01, 2018 Cri ter ia
Name
Whether commanding five years or longer of working experience and the below
professional qualifications State of independent conformance (Note 1)
also serving as other companies’ independent directorship count
As business, law, finance, accounting or company business required relevant public/ private college / university lecturer or higher
As judge, prosecutor, legal counsel, CPA or other professional certified technician required of the company operation and accredited with professional certification
Business, law, finance, accounting or company operation related working experience
1 2 3 4 5 6 7 8 9 10
Ji Shuan Investment co Representative: SungKao,Hsin-Ming
Nil Nil Nil Nil Nil Nil Nil Nil Nil Nil
Ji Shuan Investment co Representative: Chuang, Yen-Shan
Nil Nil Nil Nil Nil
Yi Wei investment co Representative: Lin Yue-Yeh Nil Nil Nil Nil Nil Nil Nil Nil Nil Nil
Ma ,Kuo-Peng (Note 2) Nil Nil Nil Nil Nil Nil
Hsiao, Ming-Chih (Note 2) Nil Nil 3
Cheng Jin-Chuan (Note 2) Nil Nil 1
Lin, Hsiao-Ming Nil Nil Nil
Wu ,Chung-Pao Nil Nil 2
Lu ,Zong-Jenn Nil Nil Nil Note 1: When various directors, supervisors who conform to the following criteria two years prior to being appointed and during the period of whose tenure, please place a checkmark in the blank
box under various criteria codes. (1)Not as a hired help of the company or its affiliated enterprises.
(2)Not as a director, supervisorr to the company’s affiliated enterprise (except where it if of a company independent director as the company’s parent firm, of a subsidiary the company holds, directly or indirectly, over fifty percent of the voting rights.
(3)Not as the individual and whose spouse, minor offspring, or as a neutral person shareholder holding over one hundred percent of the company total shares issued, or as top ten shareholders.
(4)Not as the spouse to those enlisted under the preceding par III, blood relatives within two tiers, or direct blood relatives within five tiers. (5)Not as the director, auditor or hired help of an institutional shareholder holding over five percent of the company’s total shares issued, or as top five institutional shareholders’
director, auditor or hired help by shareholding. (6)Not as the director (managing director), auditor (managing auditor), manager, or shareholder holding over five percent of the shares of a specific company or entity with financial or
business transaction with the company. (7)Not as the professional offering business, legal, financial, accounting and related services or consulting to the company or its affiliated enterprises, the business owner, partner,
director (managing director), auditor (managing auditor), manager and their spouse of a sole ownership, partnership, incorporated entity or organization, except as a member of the payroll remuneration council for exercising its fiduciary duties per article 7 of the stock launching or securit ies dealers business office trading company’s payroll remuneration council set up and exercising its fiduciary duty measures.
(8)Not related to the other directors as a spouse or blood relation within two tiers. (9)Not involved in any of the circumstances specified under article 30 of the Corporate Law. (10)Not nominated as a governmental or institutional shareholder, or as the representative as stipulated under article 27 of the Corporate Law.。
Note 2:Our company re-elected the Board of Directors on May 31, 2016. All the independent directors formed the Audit Committee to replace the functions of supervisors.
~14~

2.2 Information on the president, vice president, senior manager, various departmental and branch organization supervisors April 01, 2018
Unit: NTD per thousand; share; %
Title (Note 1)
Nation-
ality Name Gender
Appointed (incumbent)
date
Shareholdings held Shareholdings held
by spouse, minor
offspring
Shareholdings held
under the name of
others Main exposure (education) (Note 2) The position who also
currently serves at other
companies
Managers related as spouse or within
two tiers of blood relation
Share count Share-hold
ing ratio
Share
count
Share-hold
ing ratio
Share
count
Share-hold
ing ratio Title Name Relation
Chairman
and CEO ROC
Sung Kao,
Hsin-Ming F 78/01/01 4,010,513 2.25% 0 0.00% 0 0.00%
Taiwan University EMBA int’l business
administration section MBA, Institute for Industrial Research electronics laboratory
section head
Wen Hua Technology Corp dire tor
Shu Shuan Investment co chairman
Ji Shuan Engineering Technology Co
diretor
Sheng Hui Engineering Technology Co
chairman
Hua Shuan Technology Co chairman
Li Wei Electronics Co auditor
Nil Nil Nil
President ROC Lin
Yue-Yeh M 93/07/01 8,818,782 4.95% 0 0.00% 0 0.00%
Cheng Chi University business administration research institute master Institute for Industrial Research western USA office superintendent IFIE electronics research institute section head
Yi Wei Investment Co chairman Hua Shuan Technology Co auditor Li Wei Electronics Corp chairman Chairman, eZoom Information ,Inc.
Nil Nil Nil
Group
GM ROC
Chen
Jian-tsuen (Note 3)
M 99/04/01 75,000 0.04% 0 0.00% 0 0.00% Tamkang University school of applied
physics B.A. Nil Nil Nil Nil
Group
VGM ROC
Wei Jian-ming
M 99/04/01 0 0.00% 0 0.00% 0 0.00% State of Connecticut University USA information science doctoral Rainbow QX Technologies Corp president Axonet Inc president and CEO
Nil Nil Nil Nil
Divison
GM ROC
Huang
Zhong-wen (Note 4)
M 99/02/01 66,283 0.04% 0 0.00% 0 0.00% Murray State University USA business administration research institute master Asia Word Hotel departmental superintendent
Nil Nil Nil Nil
Divison
GM ROC
Chang
Ruei-ru
(Note 4)
M 99/02/01 58,348 0.03% 0 0.00% 0 0.00% Taiwan Technology University EMBA global strategy section master China Precision Diecast co technical section head Jia Rong Company sales superintendent
Nil Nil Nil Nil
Divison
VGM ROC
Li Ruei-wen
(Note 5)
M 106/02/01 0 0.00% 31,700 0.02% 0 0.00% National Chiao Tung University Department of Communications Engineering B.A. Applied Materials Taiwan Quality Assuranc manager.
Nil Nil Nil Nil
Divison
VGM ROC
Lin
Chih-jen (Note 6)
M
107/04/11 57,000 0.03% 45,000 0.03% 0 0.00% Master, Graduate School of Environmental Engineering, National Cheng Kung University Nil Nil Nil Nil
Divison
VGM ROC
Lu
Chien-kuo
(Note 6)
M
107/04/11 35,029 0.02% 0 0.00% 0 0.00%
B.A., Department of Electronic Engineering, Minghsin University of Science and technology EMBA Accreditation program, National Chiao Tung University Graduate School of Biotech Healthcare Management, National Yang-Ming University
Nil Nil Nil Nil
Divison
VGM ROC
Hsu Ta-chang
(Note 6)
M
107/04/11 20,000 0.01% 0 0.00% 0 0.00% Master, Graduate School of Civil Engineering, Texas A&M University Nil Nil Nil Nil
Divison
VGM ROC
Lo Ssu-yuan (Note 6)
M
107/04/11 0 0.00% 0 0.00% 0 0.00%
B.A., Department of Mechanical Engineering, Hsiuping University of Science and Technology Deputy Section Head, Rexon Industrial Corporation Limited
Nil Nil Nil Nil
~15~
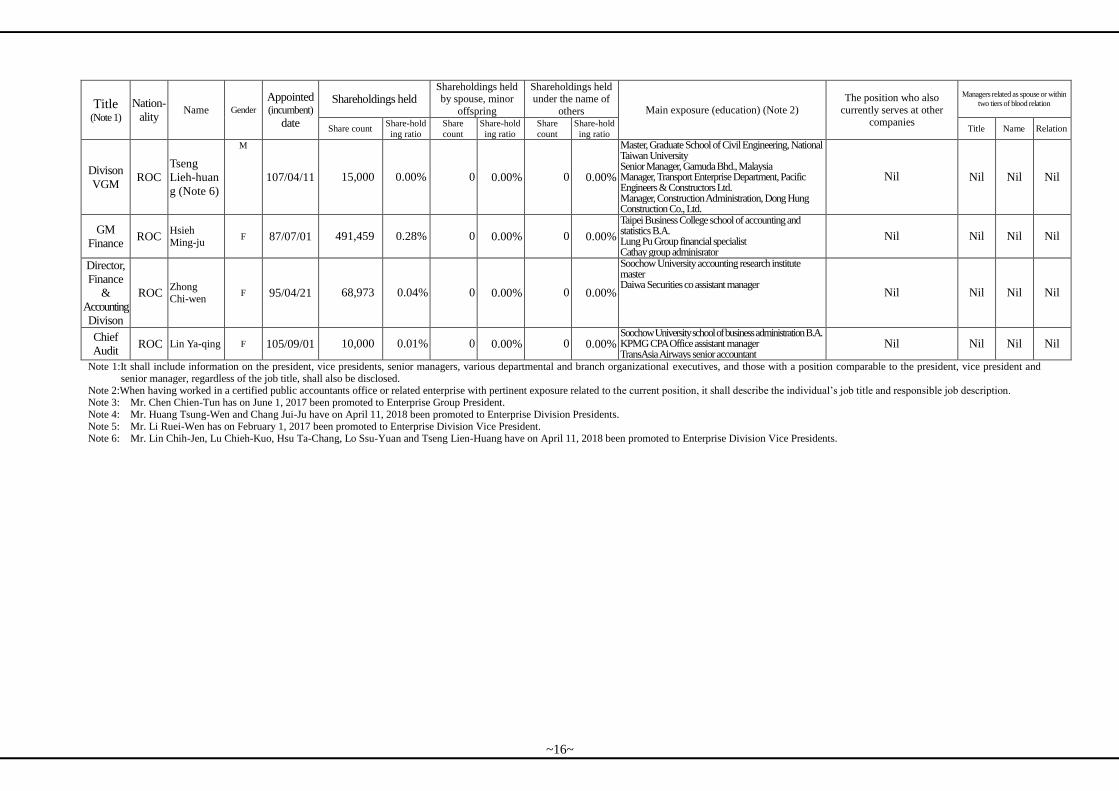
Title (Note 1)
Nation-
ality Name Gender
Appointed (incumbent)
date
Shareholdings held Shareholdings held by spouse, minor
offspring
Shareholdings held under the name of
others Main exposure (education) (Note 2)
The position who also
currently serves at other companies
Managers related as spouse or within
two tiers of blood relation
Share count Share-hold
ing ratio
Share
count
Share-hold
ing ratio
Share
count
Share-hold
ing ratio Title Name Relation
Divison
VGM ROC
Tseng
Lieh-huan
g (Note 6)
M
107/04/11 15,000 0.00% 0 0.00% 0 0.00%
Master, Graduate School of Civil Engineering, National Taiwan University Senior Manager, Gamuda Bhd., Malaysia Manager, Transport Enterprise Department, Pacific Engineers & Constructors Ltd. Manager, Construction Administration, Dong Hung Construction Co., Ltd.
Nil Nil Nil Nil
GM
Finance ROC
Hsieh Ming-ju
F 87/07/01 491,459 0.28% 0 0.00% 0 0.00% Taipei Business College school of accounting and statistics B.A. Lung Pu Group financial specialist Cathay group adminisrator
Nil Nil Nil Nil
Director,
Finance
&
Accounting
Divison
ROC Zhong Chi-wen
F 95/04/21 68,973 0.04% 0 0.00% 0 0.00%
Soochow University accounting research institute master Daiwa Securities co assistant manager
Nil Nil Nil Nil
Chief
Audit ROC Lin Ya-qing F 105/09/01 10,000 0.01% 0 0.00% 0 0.00%
Soochow University school of business administration B.A. KPMG CPA Office assistant manager TransAsia Airways senior accountant
Nil Nil Nil Nil
Note 1:It shall include information on the president, vice presidents, senior managers, various departmental and branch organizational executives, and those with a position comparable to the president, vice president and senior manager, regardless of the job title, shall also be disclosed.
Note 2:When having worked in a certified public accountants office or related enterprise with pertinent exposure related to the current position, it shall describe the individual’s job title and responsible job description. Note 3: Mr. Chen Chien-Tun has on June 1, 2017 been promoted to Enterprise Group President. Note 4: Mr. Huang Tsung-Wen and Chang Jui-Ju have on April 11, 2018 been promoted to Enterprise Division Presidents. Note 5: Mr. Li Ruei-Wen has on February 1, 2017 been promoted to Enterprise Division Vice President. Note 6: Mr. Lin Chih-Jen, Lu Chieh-Kuo, Hsu Ta-Chang, Lo Ssu-Yuan and Tseng Lien-Huang have on April 11, 2018 been promoted to Enterprise Division Vice Presidents.
~16~
3. The remunerations dispensed to the Directors, Supervisors, President and Vice President in the most recent fiscal year
The company, when in one of the following circumstances, shall disclose the remunerations dispensed to its directors or auditors individually;
and the rest may adopt the means of a consolidated tally as coordinated with a scale by which to disclose the names, or by means of disclosing
the names and remunerations individually (when adopting individual disclosure, please enter individually the position, name and amount,
without having to fill out a table of remunerations by scale):
3.1 When there is after-tax deficit in the most recent two years’ individual entity or individual financial statements, it is a must to reveal
every director and supervisor’s remuneration, except those that already have after-tax net profit and the said profit is enough to cover the
deficit.
3.2 If the circumstance of shares held by the directors should fall short for three consecutive months or longer in the most recent year, the
remunerations of individual directors shall be disclosed; when the circumstance of shares held by the auditors should fall short by three
consecutive months or longer in the most recent years, the remunerations of individual auditors shall be disclosed.
3.3 If the directors or auditors’ average mortgaging percentage exceeds 50% in any given three months in the most recent year, the particular
month of the remunerations of the individual directors or auditors with a mortgaging ratio exceeding 50% shall be disclosed.
(Note: the entire directors’ monthly average mortgaging ratio: the entire directors’ mortgaged share count / the entire directors’ shareholdings (including the
retained voting right trust share count); the entire auditors monthly average mortgaging ratio: the entire auditors mortgaging share count / the entire auditors
shareholdings (including the retained voting right trust share count).
3.4 When the entire directors and auditors collecting the directors and auditors remunerations in all companies stated in the financial
statements to the after-tax net earnings should exceed two percent, and that the remunerations the individual directors or auditors collect
also exceed NT$15 million, the individual remunerations of the directors or auditors shall be disclosed.
In the absence of any of the foresaid par 3.1 to par 3.4 circumstances among company directors and auditors, the company has therefore adopted
the means of consolidated tally, as coordinated with scale in disclosing the names.
~17~
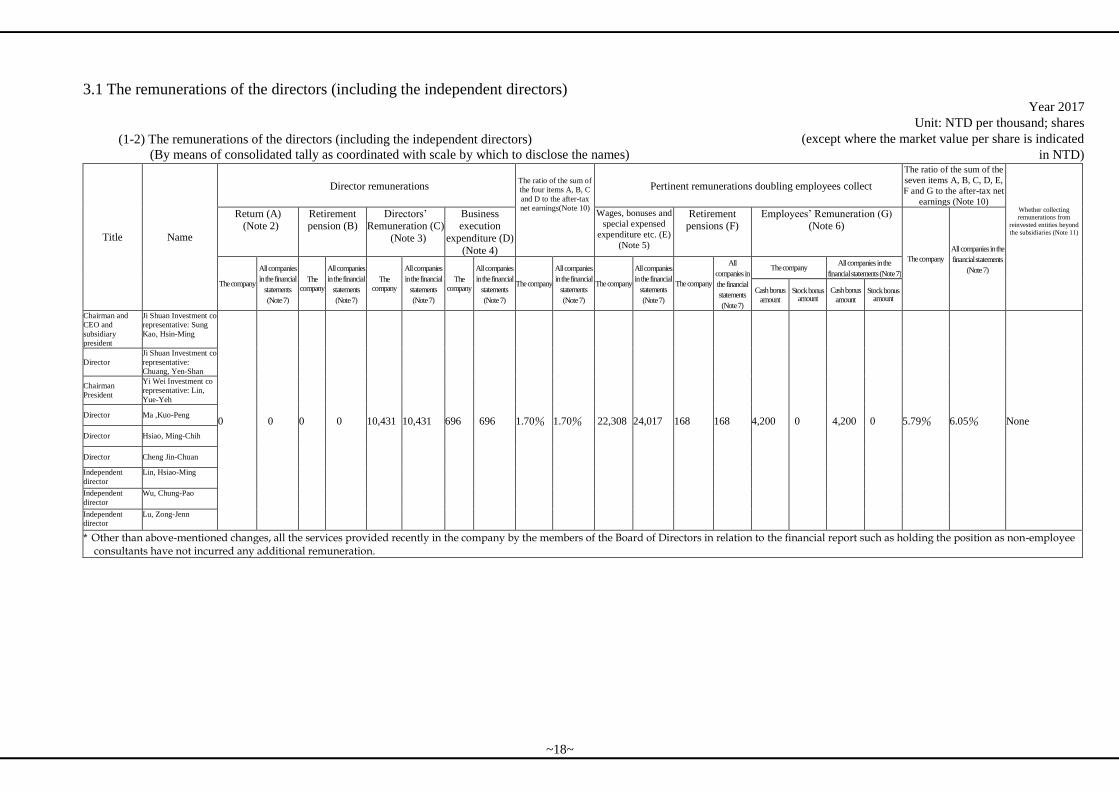
3.1 The remunerations of the directors (including the independent directors)
(1-2) The remunerations of the directors (including the independent directors)
(By means of consolidated tally as coordinated with scale by which to disclose the names)
Year 2017
Unit: NTD per thousand; shares
(except where the market value per share is indicated
in NTD)
Title Name
Director remunerations The ratio of the sum of
the four items A, B, C
and D to the after-tax
net earnings(Note 10)
Pertinent remunerations doubling employees collect The ratio of the sum of the
seven items A, B, C, D, E,
F and G to the after-tax net
earnings (Note 10) Whether collecting remunerations from
reinvested entities beyond
the subsidiaries (Note 11)
Return (A) (Note 2)
Retirement pension (B)
Directors’ Remuneration (C)
(Note 3)
Business execution
expenditure (D)
(Note 4)
Wages, bonuses and
special expensed
expenditure etc. (E)
(Note 5)
Retirement pensions (F)
Employees’ Remuneration (G) (Note 6)
The company All companies in the
financial statements
(Note 7) The company
All companies
in the financial
statements
(Note 7)
The
company
All companies
in the financial
statements
(Note 7)
The
company
All companies
in the financial
statements
(Note 7)
The
company
All companies
in the financial
statements
(Note 7)
The company
All companies
in the financial
statements
(Note 7)
The company
All companies
in the financial
statements
(Note 7)
The company
All
companies in
the financial
statements
(Note 7)
The company All companies in the
financial statements (Note 7)
Cash bonus
amount
Stock bonus amount
Cash bonus
amount
Stock bonus amount
Chairman and
CEO and
subsidiary
president
Ji Shuan Investment co
representative: Sung
Kao, Hsin-Ming
0 0 0 0 10,431 10,431 696 696 1.70% 1.70% 22,308 24,017 168 168 4,200 0 4,200 0 5.79% 6.05% None
Director
Ji Shuan Investment co
representative:
Chuang, Yen-Shan
Chairman
President
Yi Wei Investment co
representative: Lin,
Yue-Yeh
Director Ma ,Kuo-Peng
Director Hsiao, Ming-Chih
Director Cheng Jin-Chuan
Independent
director
Lin, Hsiao-Ming
Independent
director
Wu, Chung-Pao
Independent
director
Lu, Zong-Jenn
* Other than above-mentioned changes, all the services provided recently in the company by the members of the Board of Directors in relation to the financial report such as holding the position as non-employee consultants have not incurred any additional remuneration.
~18~
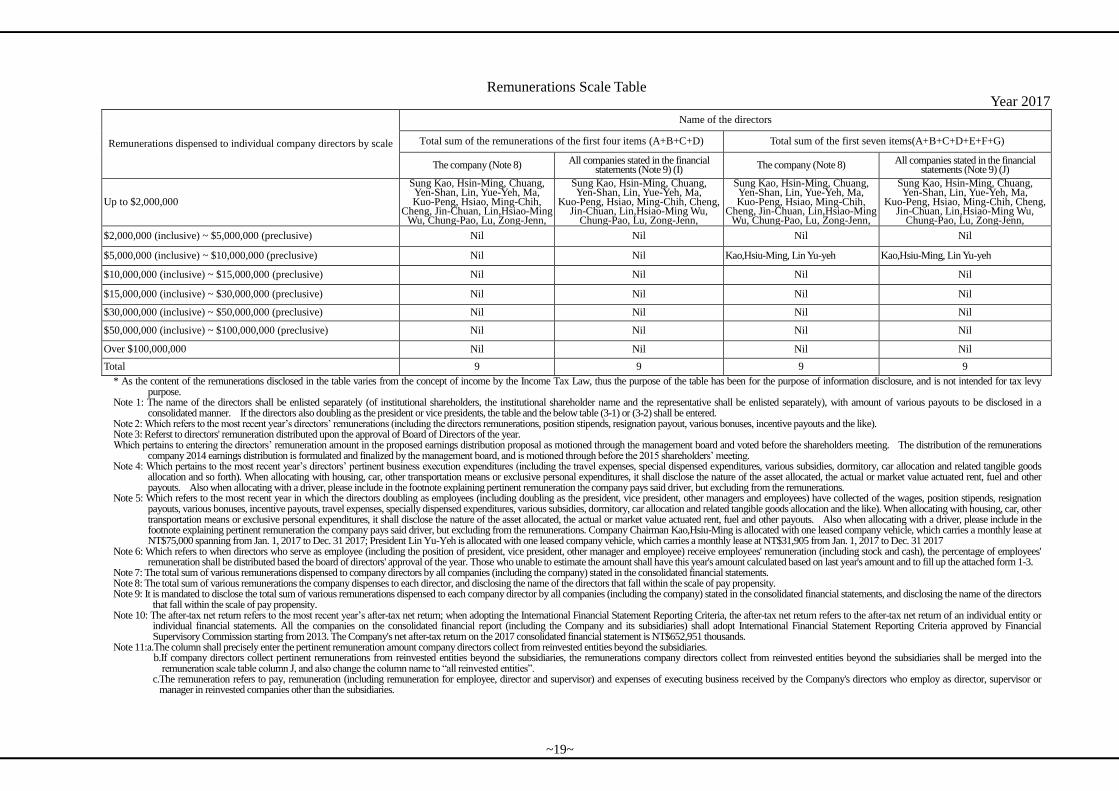
Remunerations Scale Table
Year 2017
Remunerations dispensed to individual company directors by scale
Name of the directors
Total sum of the remunerations of the first four items (A+B+C+D) Total sum of the first seven items(A+B+C+D+E+F+G)
The company (Note 8) All companies stated in the financial statements (Note 9) (I) The company (Note 8) All companies stated in the financial
statements (Note 9) (J)
Up to $2,000,000
Sung Kao, Hsin-Ming, Chuang, Yen-Shan, Lin, Yue-Yeh, Ma, Kuo-Peng, Hsiao, Ming-Chih,
Cheng, Jin-Chuan, Lin,Hsiao-Ming Wu, Chung-Pao, Lu, Zong-Jenn,
Sung Kao, Hsin-Ming, Chuang, Yen-Shan, Lin, Yue-Yeh, Ma,
Kuo-Peng, Hsiao, Ming-Chih, Cheng, Jin-Chuan, Lin,Hsiao-Ming Wu,
Chung-Pao, Lu, Zong-Jenn,
Sung Kao, Hsin-Ming, Chuang, Yen-Shan, Lin, Yue-Yeh, Ma, Kuo-Peng, Hsiao, Ming-Chih,
Cheng, Jin-Chuan, Lin,Hsiao-Ming Wu, Chung-Pao, Lu, Zong-Jenn,
Sung Kao, Hsin-Ming, Chuang, Yen-Shan, Lin, Yue-Yeh, Ma,
Kuo-Peng, Hsiao, Ming-Chih, Cheng, Jin-Chuan, Lin,Hsiao-Ming Wu,
Chung-Pao, Lu, Zong-Jenn,
$2,000,000 (inclusive) ~ $5,000,000 (preclusive) Nil Nil Nil Nil
$5,000,000 (inclusive) ~ $10,000,000 (preclusive) Nil Nil Kao,Hsiu-Ming, Lin Yu-yeh Kao,Hsiu-Ming, Lin Yu-yeh
$10,000,000 (inclusive) ~ $15,000,000 (preclusive) Nil Nil Nil Nil
$15,000,000 (inclusive) ~ $30,000,000 (preclusive) Nil Nil Nil Nil
$30,000,000 (inclusive) ~ $50,000,000 (preclusive) Nil Nil Nil Nil
$50,000,000 (inclusive) ~ $100,000,000 (preclusive) Nil Nil Nil Nil
Over $100,000,000 Nil Nil Nil Nil
Total 9 9 9 9
* As the content of the remunerations disclosed in the table varies from the concept of income by the Income Tax Law, thus the purpose of the table has been for the purpose of information disclosure, and is not intended for tax levy purpose.
Note 1: The name of the directors shall be enlisted separately (of institutional shareholders, the institutional shareholder name and the representative shall be enlisted separately), with amount of various payouts to be disclosed in a consolidated manner. If the directors also doubling as the president or vice presidents, the table and the below table (3-1) or (3-2) shall be entered.
Note 2: Which refers to the most recent year’s directors’ remunerations (including the directors remunerations, position stipends, resignation payout, various bonuses, incentive payouts and the like). Note 3: Referst to directors' remuneration distributed upon the approval of Board of Directors of the year. Which pertains to entering the directors’ remuneration amount in the proposed earnings distribution proposal as motioned through the management board and voted before the shareholders meeting. The distribution of the remunerations
company 2014 earnings distribution is formulated and finalized by the management board, and is motioned through before the 2015 shareholders’ meeting. Note 4: Which pertains to the most recent year’s directors’ pertinent business execution expenditures (including the travel expenses, special dispensed expenditures, various subsidies, dormitory, car allocation and related tangible goods
allocation and so forth). When allocating with housing, car, other transportation means or exclusive personal expenditures, it shall disclose the nature of the asset allocated, the actual or market value actuated rent, fuel and other payouts. Also when allocating with a driver, please include in the footnote explaining pertinent remuneration the company pays said driver, but excluding from the remunerations.
Note 5: Which refers to the most recent year in which the directors doubling as employees (including doubling as the president, vice president, other managers and employees) have collected of the wages, position stipends, resignation payouts, various bonuses, incentive payouts, travel expenses, specially dispensed expenditures, various subsidies, dormitory, car allocation and related tangible goods allocation and the like). When allocating with housing, car, other transportation means or exclusive personal expenditures, it shall disclose the nature of the asset allocated, the actual or market value actuated rent, fuel and other payouts. Also when allocating with a driver, please include in the footnote explaining pertinent remuneration the company pays said driver, but excluding from the remunerations. Company Chairman Kao,Hsiu-Ming is allocated with one leased company vehicle, which carries a monthly lease at NT$75,000 spanning from Jan. 1, 2017 to Dec. 31 2017; President Lin Yu-Yeh is allocated with one leased company vehicle, which carries a monthly lease at NT$31,905 from Jan. 1, 2017 to Dec. 31 2017
Note 6: Which refers to when directors who serve as employee (including the position of president, vice president, other manager and employee) receive employees' remuneration (including stock and cash), the percentage of employees' remuneration shall be distributed based the board of directors' approval of the year. Those who unable to estimate the amount shall have this year's amount calculated based on last year's amount and to fill up the attached form 1-3.
Note 7: The total sum of various remunerations dispensed to company directors by all companies (including the company) stated in the consolidated financial statements. Note 8: The total sum of various remunerations the company dispenses to each director, and disclosing the name of the directors that fall within the scale of pay propensity. Note 9: It is mandated to disclose the total sum of various remunerations dispensed to each company director by all companies (including the company) stated in the consolidated financial statements, and disclosing the name of the directors
that fall within the scale of pay propensity. Note 10: The after-tax net return refers to the most recent year’s after-tax net return; when adopting the International Financial Statement Reporting Criteria, the after-tax net return refers to the after-tax net return of an individual entity or
individual financial statements. All the companies on the consolidated financial report (including the Company and its subsidiaries) shall adopt International Financial Statement Reporting Criteria approved by Financial Supervisory Commission starting from 2013. The Company's net after-tax return on the 2017 consolidated financial statement is NT$652,951 thousands.
Note 11:a.The column shall precisely enter the pertinent remuneration amount company directors collect from reinvested entities beyond the subsidiaries. b.If company directors collect pertinent remunerations from reinvested entities beyond the subsidiaries, the remunerations company directors collect from reinvested entities beyond the subsidiaries shall be merged into the
remuneration scale table column J, and also change the column name to “all reinvested entities”. c.The remuneration refers to pay, remuneration (including remuneration for employee, director and supervisor) and expenses of executing business received by the Company's directors who employ as director, supervisor or
manager in reinvested companies other than the subsidiaries.
~19~
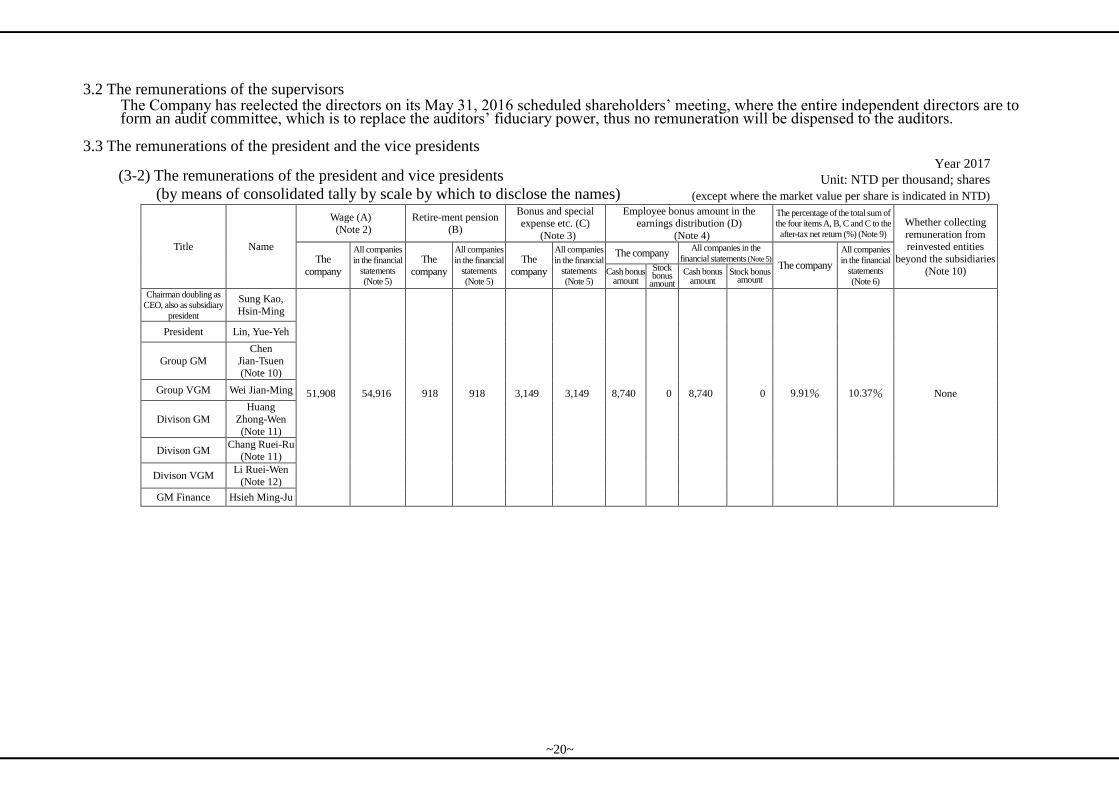
3.2 The remunerations of the supervisors The Company has reelected the directors on its May 31, 2016 scheduled shareholders’ meeting, where the entire independent directors are to form an audit committee, which is to replace the auditors’ fiduciary power, thus no remuneration will be dispensed to the auditors.
3.3 The remunerations of the president and the vice presidents
(3-2) The remunerations of the president and vice presidents
(by means of consolidated tally by scale by which to disclose the names)
Year 2017
Unit: NTD per thousand; shares
(except where the market value per share is indicated in NTD)
Title Name
Wage (A)
(Note 2)
Retire-ment pension
(B)
Bonus and special expense etc. (C)
(Note 3)
Employee bonus amount in the earnings distribution (D)
(Note 4)
The percentage of the total sum of
the four items A, B, C and C to the
after-tax net return (%) (Note 9) Whether collecting
remuneration from reinvested entities
beyond the subsidiaries
(Note 10) The
company
All companies
in the financial
statements
(Note 5)
The
company
All companies
in the financial
statements
(Note 5)
The
company
All companies
in the financial
statements
(Note 5)
The company All companies in the
financial statements (Note 5) The company
All companies
in the financial
statements
(Note 6) Cash bonus
amount
Stock bonus
amount
Cash bonus amount
Stock bonus amount
Chairman doubling as
CEO, also as subsidiary
president
Sung Kao,
Hsin-Ming
51,908 54,916 918 918 3,149 3,149 8,740 0 8,740 0 9.91% 10.37% None
President Lin, Yue-Yeh
Group GM
Chen
Jian-Tsuen (Note 10)
Group VGM Wei Jian-Ming
Divison GM
Huang
Zhong-Wen
(Note 11)
Divison GM Chang Ruei-Ru
(Note 11)
Divison VGM Li Ruei-Wen
(Note 12)
GM Finance Hsieh Ming-Ju
~20~
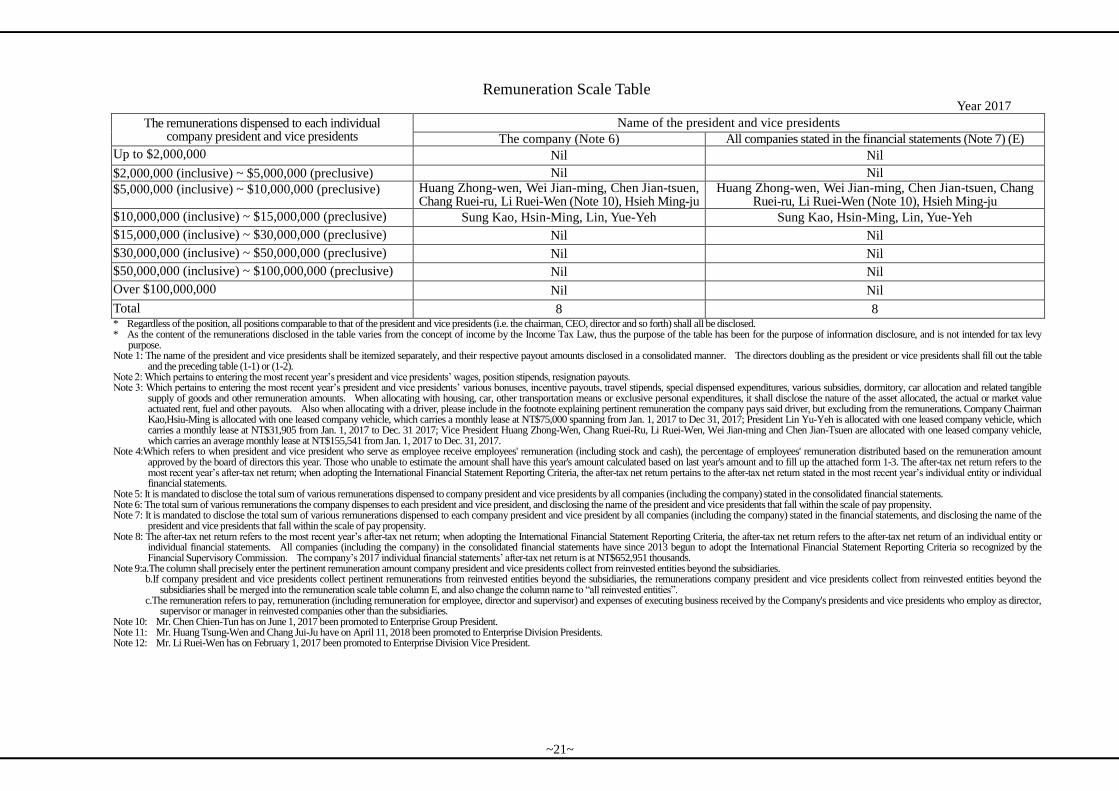
Remuneration Scale Table
Year 2017
The remunerations dispensed to each individual company president and vice presidents
Name of the president and vice presidents
The company (Note 6) All companies stated in the financial statements (Note 7) (E)
Up to $2,000,000 Nil Nil
$2,000,000 (inclusive) ~ $5,000,000 (preclusive) Nil Nil
$5,000,000 (inclusive) ~ $10,000,000 (preclusive) Huang Zhong-wen, Wei Jian-ming, Chen Jian-tsuen, Chang Ruei-ru, Li Ruei-Wen (Note 10), Hsieh Ming-ju
Huang Zhong-wen, Wei Jian-ming, Chen Jian-tsuen, Chang Ruei-ru, Li Ruei-Wen (Note 10), Hsieh Ming-ju
$10,000,000 (inclusive) ~ $15,000,000 (preclusive) Sung Kao, Hsin-Ming, Lin, Yue-Yeh Sung Kao, Hsin-Ming, Lin, Yue-Yeh
$15,000,000 (inclusive) ~ $30,000,000 (preclusive) Nil Nil
$30,000,000 (inclusive) ~ $50,000,000 (preclusive) Nil Nil
$50,000,000 (inclusive) ~ $100,000,000 (preclusive) Nil Nil
Over $100,000,000 Nil Nil
Total 8 8 * Regardless of the position, all positions comparable to that of the president and vice presidents (i.e. the chairman, CEO, director and so forth) shall all be disclosed. * As the content of the remunerations disclosed in the table varies from the concept of income by the Income Tax Law, thus the purpose of the table has been for the purpose of information disclosure, and is not intended for tax levy
purpose. Note 1: The name of the president and vice presidents shall be itemized separately, and their respective payout amounts disclosed in a consolidated manner. The directors doubling as the president or vice presidents shall fill out the table
and the preceding table (1-1) or (1-2). Note 2: Which pertains to entering the most recent year’s president and vice presidents’ wages, position stipends, resignation payouts. Note 3: Which pertains to entering the most recent year’s president and vice presidents’ various bonuses, incentive payouts, travel stipends, special dispensed expenditures, various subsidies, dormitory, car allocation and related tangible
supply of goods and other remuneration amounts. When allocating with housing, car, other transportation means or exclusive personal expenditures, it shall disclose the nature of the asset allocated, the actual or market value actuated rent, fuel and other payouts. Also when allocating with a driver, please include in the footnote explaining pertinent remuneration the company pays said driver, but excluding from the remunerations. Company Chairman Kao,Hsiu-Ming is allocated with one leased company vehicle, which carries a monthly lease at NT$75,000 spanning from Jan. 1, 2017 to Dec 31, 2017; President Lin Yu-Yeh is allocated with one leased company vehicle, which carries a monthly lease at NT$31,905 from Jan. 1, 2017 to Dec. 31 2017; Vice President Huang Zhong-Wen, Chang Ruei-Ru, Li Ruei-Wen, Wei Jian-ming and Chen Jian-Tsuen are allocated with one leased company vehicle, which carries an average monthly lease at NT$155,541 from Jan. 1, 2017 to Dec. 31, 2017.
Note 4:Which refers to when president and vice president who serve as employee receive employees' remuneration (including stock and cash), the percentage of employees' remuneration distributed based on the remuneration amount approved by the board of directors this year. Those who unable to estimate the amount shall have this year's amount calculated based on last year's amount and to fill up the attached form 1-3. The after-tax net return refers to the most recent year’s after-tax net return; when adopting the International Financial Statement Reporting Criteria, the after-tax net return pertains to the after-tax net return stated in the most recent year’s individual entity or individual financial statements.
Note 5: It is mandated to disclose the total sum of various remunerations dispensed to company president and vice presidents by all companies (including the company) stated in the consolidated financial statements. Note 6: The total sum of various remunerations the company dispenses to each president and vice president, and disclosing the name of the president and vice presidents that fall within the scale of pay propensity. Note 7: It is mandated to disclose the total sum of various remunerations dispensed to each company president and vice president by all companies (including the company) stated in the financial statements, and disclosing the name of the
president and vice presidents that fall within the scale of pay propensity. Note 8: The after-tax net return refers to the most recent year’s after-tax net return; when adopting the International Financial Statement Reporting Criteria, the after-tax net return refers to the after-tax net return of an individual entity or
individual financial statements. All companies (including the company) in the consolidated financial statements have since 2013 begun to adopt the International Financial Statement Reporting Criteria so recognized by the Financial Supervisory Commission. The company’s 2017 individual financial statements’ after-tax net return is at NT$652,951 thousands.
Note 9:a.The column shall precisely enter the pertinent remuneration amount company president and vice presidents collect from reinvested entities beyond the subsidiaries. b.If company president and vice presidents collect pertinent remunerations from reinvested entities beyond the subsidiaries, the remunerations company president and vice presidents collect from reinvested entities beyond the
subsidiaries shall be merged into the remuneration scale table column E, and also change the column name to “all reinvested entities”. c.The remuneration refers to pay, remuneration (including remuneration for employee, director and supervisor) and expenses of executing business received by the Company's presidents and vice presidents who employ as director,
supervisor or manager in reinvested companies other than the subsidiaries. Note 10: Mr. Chen Chien-Tun has on June 1, 2017 been promoted to Enterprise Group President. Note 11: Mr. Huang Tsung-Wen and Chang Jui-Ju have on April 11, 2018 been promoted to Enterprise Division Presidents. Note 12: Mr. Li Ruei-Wen has on February 1, 2017 been promoted to Enterprise Division Vice President.
~21~
3.4 Name of the managers received the employee remuneration and the deployment of remuneration.
Year 2017 Unit: NTD per thousand; shares
(Except where the market value of each share is indicated in NTD)
Position
(Note 1 & Note 2)
Name
(Note1 & Note 2) Stock Amount Cash Amount Total
Percent of the total amount to the
after-tax net return (%)
Managers
Chairman and CEO Sung Kao,
Hsin-Ming
0 9,360 9,360 1.43%
President Lin, Yue-Yeh
Group GM Chen Jian-Tsuen
(Note 5)
Group VGM Wei Jian-Ming
Divison GM Huang Zhong-Wen
(Note 6)
Divison GM Chang Ruei-Ru
(Note 6)
Divison VGM Li Ruei-Wen(Note 7)
GM Finance Hsieh Ming-Ju
Director, Finance &
Accounting Divison Zhong Chi-Wen
Note 1: Individual's name and job title shall be disclosed. However, it is a must disclose the state of distributing profits. The Company's Board of Directors plans to distribute NT$0 for the employee enumeration for above managers' employee remunerations.
Note 2:Which refers to when managers who serve as employee receive employees' remuneration (including stock and cash), the percentage of employees' remuneration distributed based on the remuneration amount approved by the board of directors this year. Those who unable to estimate the amount shall have this year's amount calculated based on last year's amount. The after-tax net return refers to the most recent year’s after-tax net return; when adopting the International Financial Statement Reporting Criteria, the after-tax net return pertains to the after-tax net return stated in the most recent year’s individual entity or individual financial statements.
Note 3: Of the applicable scope of managers, as stipulated under the former Securities and Futures Management Council, Ministry of Economic Affairs March 27, 2003 Taiwan MOF Securities III No. 0920001301 directive, its scope is as follows: (1)The president and those on the comparable level. (2)The vice presidents and those on the comparable level. (3)The senior managers and those on the comparable level. (4)The finance department executives. (5)Accounting department executives. (6)Other individuals empowered with managing company affairs and as authorized signatories.
Note 4: Directors, president and vice president who have received employees' remuneration (including stock and cash) shall fill out attached form 1-2 and this form. Note 5: Mr. Chen Chien-Tun has on June 1, 2017 been promoted to Enterprise Group President. Note 6: Mr. Huang Tsung-Wen and Chang Jui-Ju have on April 11, 2018 been promoted to Enterprise Division Presidents. Note 7: Mr. Li Ruei-Wen has on February 1, 2017 been promoted to Enterprise Division Vice President.
~22~
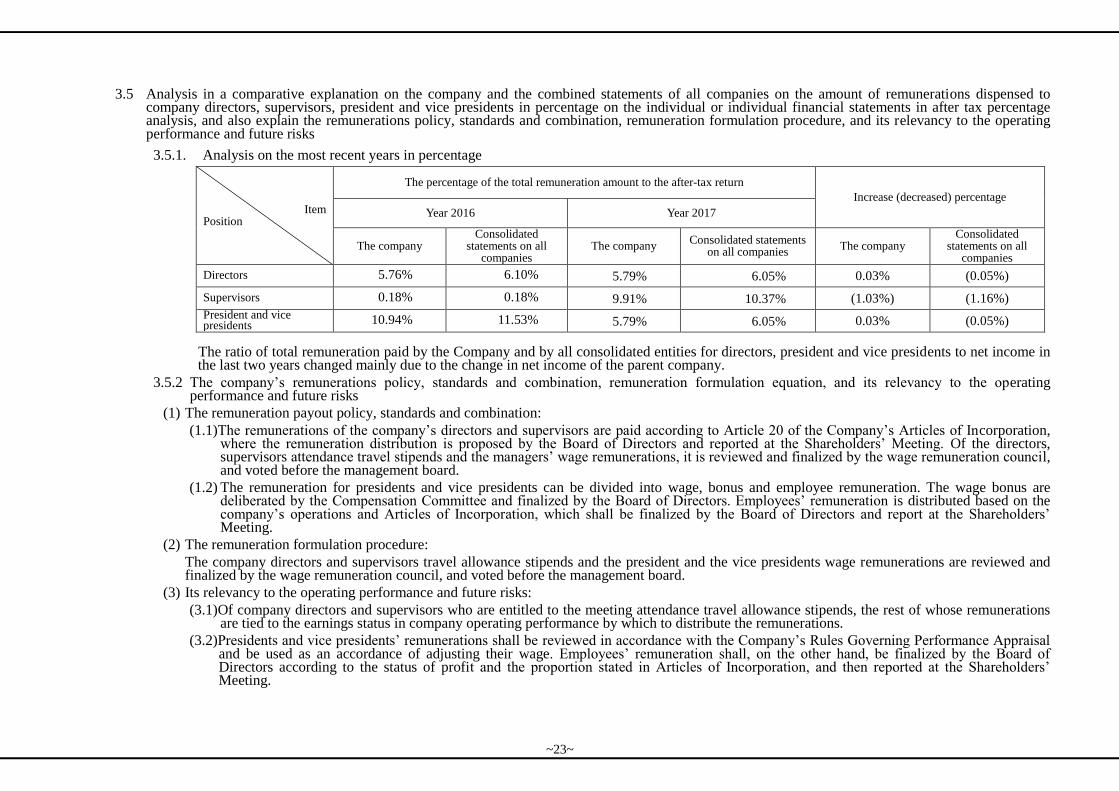
3.5 Analysis in a comparative explanation on the company and the combined statements of all companies on the amount of remunerations dispensed to company directors, supervisors, president and vice presidents in percentage on the individual or individual financial statements in after tax percentage analysis, and also explain the remunerations policy, standards and combination, remuneration formulation procedure, and its relevancy to the operating performance and future risks
3.5.1. Analysis on the most recent years in percentage
Item Position
The percentage of the total remuneration amount to the after-tax return
Increase (decreased) percentage
Year 2016 Year 2017
The company Consolidated
statements on all companies
The company Consolidated statements
on all companies The company
Consolidated statements on all
companies
Directors 5.76% 6.10% 5.79% 6.05% 0.03% (0.05%)
Supervisors 0.18% 0.18% 9.91% 10.37% (1.03%) (1.16%)
President and vice presidents 10.94% 11.53% 5.79% 6.05% 0.03% (0.05%)
The ratio of total remuneration paid by the Company and by all consolidated entities for directors, president and vice presidents to net income in the last two years changed mainly due to the change in net income of the parent company.
3.5.2 The company’s remunerations policy, standards and combination, remuneration formulation equation, and its relevancy to the operating performance and future risks
(1) The remuneration payout policy, standards and combination:
(1.1)The remunerations of the company’s directors and supervisors are paid according to Article 20 of the Company’s Articles of Incorporation, where the remuneration distribution is proposed by the Board of Directors and reported at the Shareholders’ Meeting. Of the directors, supervisors attendance travel stipends and the managers’ wage remunerations, it is reviewed and finalized by the wage remuneration council, and voted before the management board.
(1.2) The remuneration for presidents and vice presidents can be divided into wage, bonus and employee remuneration. The wage bonus are deliberated by the Compensation Committee and finalized by the Board of Directors. Employees’ remuneration is distributed based on the company’s operations and Articles of Incorporation, which shall be finalized by the Board of Directors and report at the Shareholders’ Meeting.
(2) The remuneration formulation procedure:
The company directors and supervisors travel allowance stipends and the president and the vice presidents wage remunerations are reviewed and finalized by the wage remuneration council, and voted before the management board.
(3) Its relevancy to the operating performance and future risks:
(3.1)Of company directors and supervisors who are entitled to the meeting attendance travel allowance stipends, the rest of whose remunerations are tied to the earnings status in company operating performance by which to distribute the remunerations.
(3.2)Presidents and vice presidents’ remunerations shall be reviewed in accordance with the Company’s Rules Governing Performance Appraisal and be used as an accordance of adjusting their wage. Employees’ remuneration shall, on the other hand, be finalized by the Board of Directors according to the status of profit and the proportion stated in Articles of Incorporation, and then reported at the Shareholders’ Meeting.
~23~
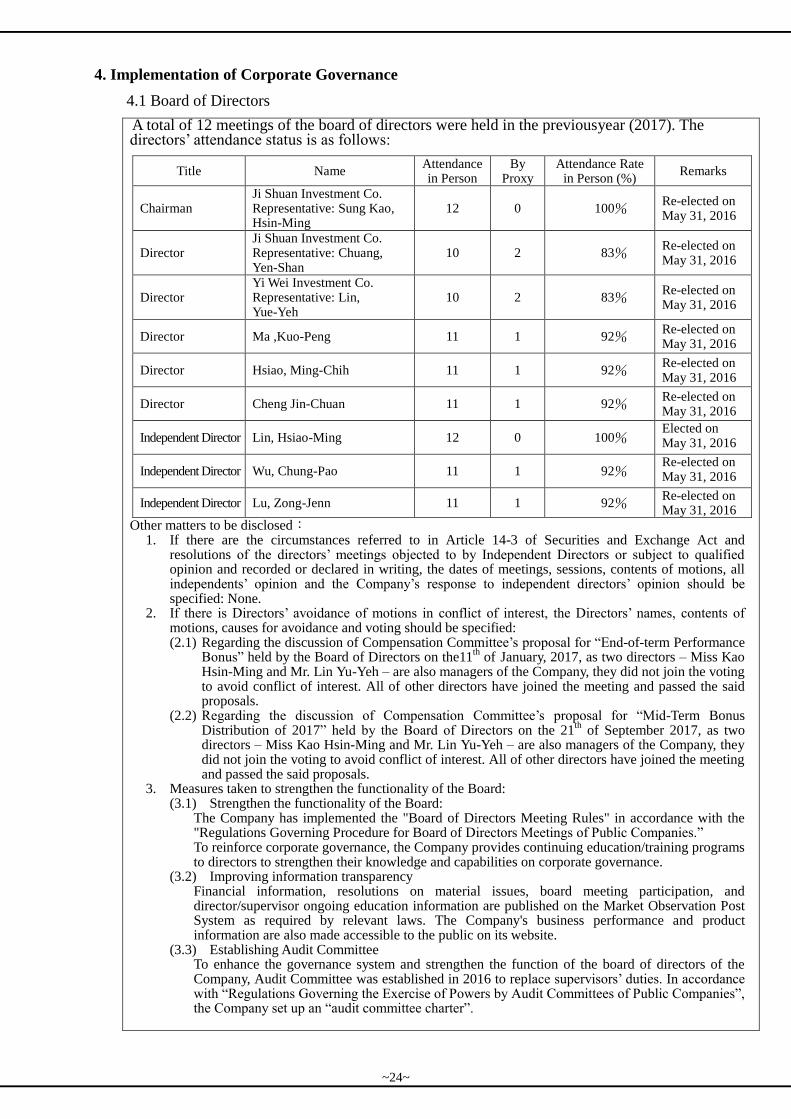
4. Implementation of Corporate Governance
4.1 Board of Directors
A total of 12 meetings of the board of directors were held in the previousyear (2017). The directors’ attendance status is as follows:
Title Name Attendance in Person
By Proxy
Attendance Rate in Person (%)
Remarks
Chairman Ji Shuan Investment Co. Representative: Sung Kao, Hsin-Ming
12 0 100% Re-elected on May 31, 2016
Director Ji Shuan Investment Co. Representative: Chuang, Yen-Shan
10 2 83% Re-elected on May 31, 2016
Director Yi Wei Investment Co. Representative: Lin, Yue-Yeh
10 2 83% Re-elected on May 31, 2016
Director Ma ,Kuo-Peng 11 1 92% Re-elected on May 31, 2016
Director Hsiao, Ming-Chih 11 1 92% Re-elected on May 31, 2016
Director Cheng Jin-Chuan 11 1 92% Re-elected on May 31, 2016
Independent Director Lin, Hsiao-Ming 12 0 100% Elected on May 31, 2016
Independent Director Wu, Chung-Pao 11 1 92% Re-elected on May 31, 2016
Independent Director Lu, Zong-Jenn 11 1 92% Re-elected on May 31, 2016
Other matters to be disclosed: 1. If there are the circumstances referred to in Article 14-3 of Securities and Exchange Act and
resolutions of the directors’ meetings objected to by Independent Directors or subject to qualified opinion and recorded or declared in writing, the dates of meetings, sessions, contents of motions, all independents’ opinion and the Company’s response to independent directors’ opinion should be specified: None.
2. If there is Directors’ avoidance of motions in conflict of interest, the Directors’ names, contents of motions, causes for avoidance and voting should be specified: (2.1) Regarding the discussion of Compensation Committee’s proposal for “End-of-term Performance
Bonus” held by the Board of Directors on the11th of January, 2017, as two directors – Miss Kao
Hsin-Ming and Mr. Lin Yu-Yeh – are also managers of the Company, they did not join the voting to avoid conflict of interest. All of other directors have joined the meeting and passed the said proposals.
(2.2) Regarding the discussion of Compensation Committee’s proposal for “Mid-Term Bonus Distribution of 2017” held by the Board of Directors on the 21
th of September 2017, as two
directors – Miss Kao Hsin-Ming and Mr. Lin Yu-Yeh – are also managers of the Company, they did not join the voting to avoid conflict of interest. All of other directors have joined the meeting and passed the said proposals.
3. Measures taken to strengthen the functionality of the Board: (3.1) Strengthen the functionality of the Board:
The Company has implemented the "Board of Directors Meeting Rules" in accordance with the "Regulations Governing Procedure for Board of Directors Meetings of Public Companies.” To reinforce corporate governance, the Company provides continuing education/training programs to directors to strengthen their knowledge and capabilities on corporate governance.
(3.2) Improving information transparency Financial information, resolutions on material issues, board meeting participation, and director/supervisor ongoing education information are published on the Market Observation Post System as required by relevant laws. The Company's business performance and product information are also made accessible to the public on its website.
(3.3) Establishing Audit Committee To enhance the governance system and strengthen the function of the board of directors of the Company, Audit Committee was established in 2016 to replace supervisors’ duties. In accordance with “Regulations Governing the Exercise of Powers by Audit Committees of Public Companies”, the Company set up an “audit committee charter”.
~24~
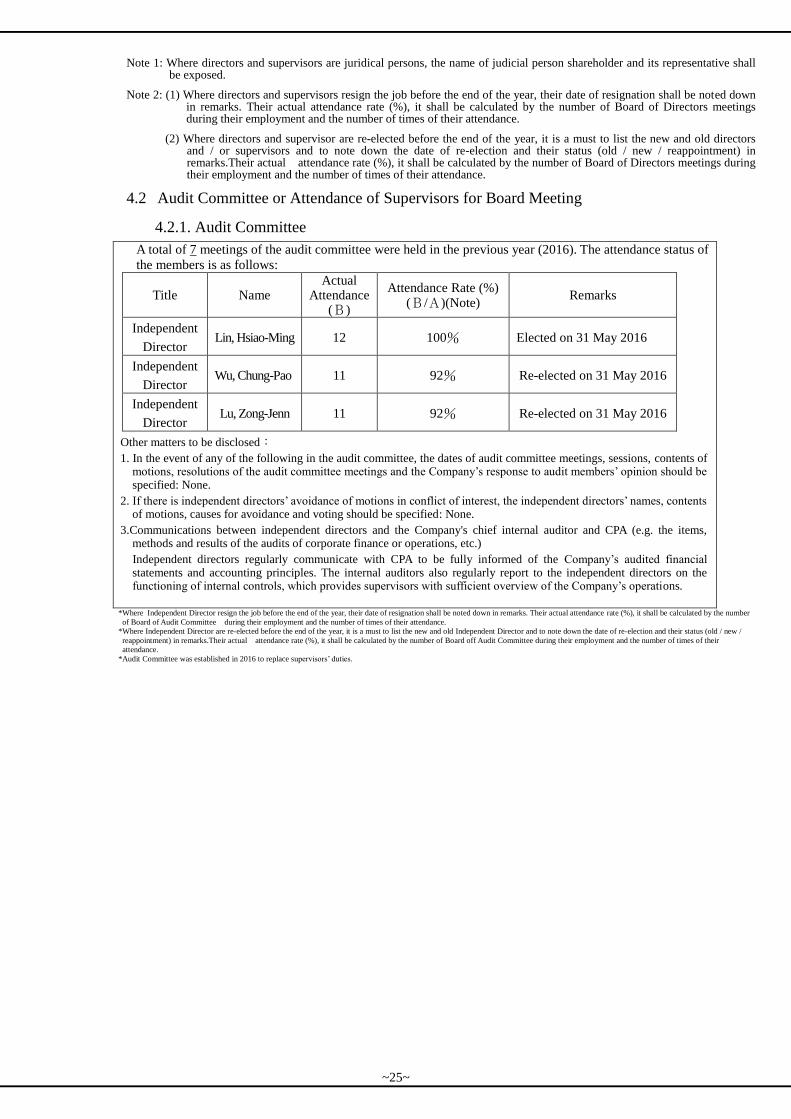
Note 1: Where directors and supervisors are juridical persons, the name of judicial person shareholder and its representative shall be exposed.
Note 2: (1) Where directors and supervisors resign the job before the end of the year, their date of resignation shall be noted down in remarks. Their actual attendance rate (%), it shall be calculated by the number of Board of Directors meetings during their employment and the number of times of their attendance.
(2) Where directors and supervisor are re-elected before the end of the year, it is a must to list the new and old directors and / or supervisors and to note down the date of re-election and their status (old / new / reappointment) in remarks.Their actual attendance rate (%), it shall be calculated by the number of Board of Directors meetings during their employment and the number of times of their attendance.
4.2 Audit Committee or Attendance of Supervisors for Board Meeting
4.2.1. Audit Committee
A total of 7 meetings of the audit committee were held in the previous year (2016). The attendance status of
the members is as follows:
Title Name Actual
Attendance (B)
Attendance Rate (%) (B/A)(Note)
Remarks
Independent
Director Lin, Hsiao-Ming 12 100% Elected on 31 May 2016
Independent
Director Wu, Chung-Pao 11 92% Re-elected on 31 May 2016
Independent
Director Lu, Zong-Jenn 11 92% Re-elected on 31 May 2016
Other matters to be disclosed:
1. In the event of any of the following in the audit committee, the dates of audit committee meetings, sessions, contents of motions, resolutions of the audit committee meetings and the Company’s response to audit members’ opinion should be specified: None.
2. If there is independent directors’ avoidance of motions in conflict of interest, the independent directors’ names, contents of motions, causes for avoidance and voting should be specified: None.
3.Communications between independent directors and the Company's chief internal auditor and CPA (e.g. the items, methods and results of the audits of corporate finance or operations, etc.)
Independent directors regularly communicate with CPA to be fully informed of the Company’s audited financial statements and accounting principles. The internal auditors also regularly report to the independent directors on the functioning of internal controls, which provides supervisors with sufficient overview of the Company’s operations.
*Where Independent Director resign the job before the end of the year, their date of resignation shall be noted down in remarks. Their actual attendance rate (%), it shall be calculated by the number
of Board of Audit Committee during their employment and the number of times of their attendance.
*Where Independent Director are re-elected before the end of the year, it is a must to list the new and old Independent Director and to note down the date of re-election and their status (old / new /
reappointment) in remarks.Their actual attendance rate (%), it shall be calculated by the number of Board off Audit Committee during their employment and the number of times of their
attendance.
*Audit Committee was established in 2016 to replace supervisors’ duties.
~25~
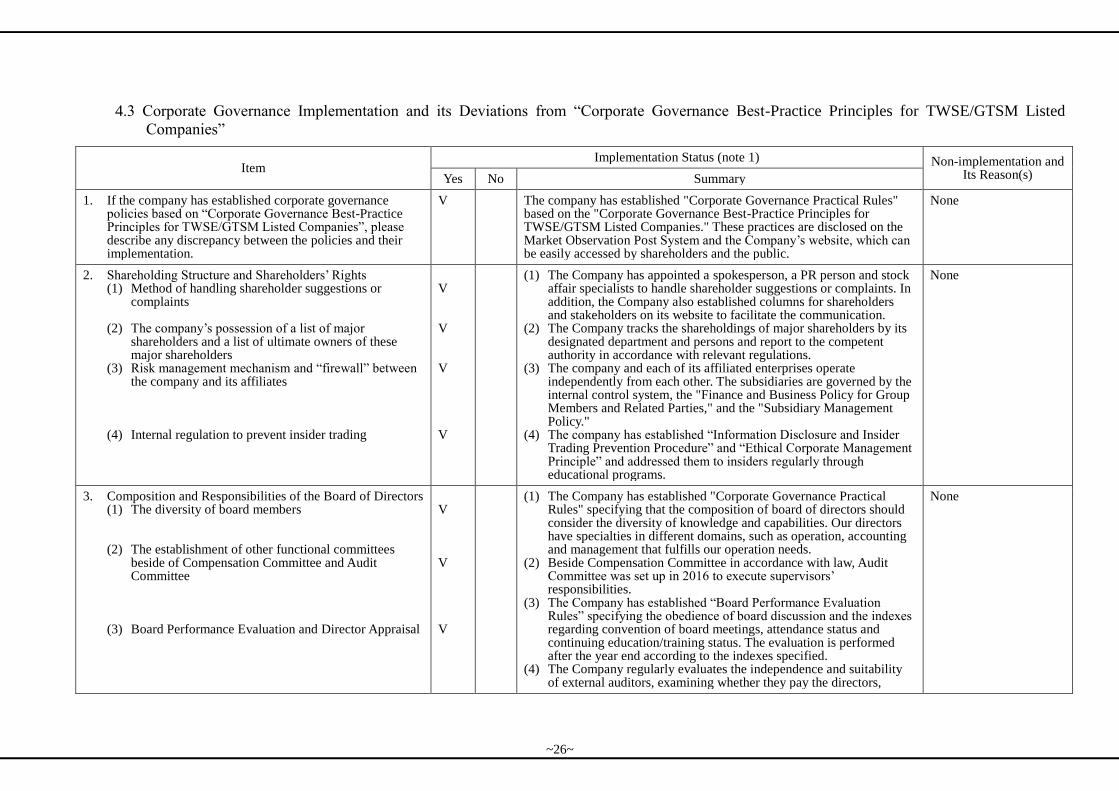
4.3 Corporate Governance Implementation and its Deviations from “Corporate Governance Best-Practice Principles for TWSE/GTSM Listed
Companies”
Item Implementation Status (note 1) Non-implementation and
Its Reason(s) Yes No Summary
1. If the company has established corporate governance policies based on “Corporate Governance Best-Practice Principles for TWSE/GTSM Listed Companies”, please describe any discrepancy between the policies and their implementation.
V The company has established "Corporate Governance Practical Rules" based on the "Corporate Governance Best-Practice Principles for TWSE/GTSM Listed Companies." These practices are disclosed on the Market Observation Post System and the Company’s website, which can be easily accessed by shareholders and the public.
None
2. Shareholding Structure and Shareholders’ Rights (1) Method of handling shareholder suggestions or
complaints
(2) The company’s possession of a list of major shareholders and a list of ultimate owners of these major shareholders
(3) Risk management mechanism and “firewall” between the company and its affiliates
(4) Internal regulation to prevent insider trading
V V V V
(1) The Company has appointed a spokesperson, a PR person and stock affair specialists to handle shareholder suggestions or complaints. In addition, the Company also established columns for shareholders and stakeholders on its website to facilitate the communication.
(2) The Company tracks the shareholdings of major shareholders by its designated department and persons and report to the competent authority in accordance with relevant regulations.
(3) The company and each of its affiliated enterprises operate independently from each other. The subsidiaries are governed by the internal control system, the "Finance and Business Policy for Group Members and Related Parties," and the "Subsidiary Management Policy."
(4) The company has established “Information Disclosure and Insider Trading Prevention Procedure” and “Ethical Corporate Management Principle” and addressed them to insiders regularly through educational programs.
None
3. Composition and Responsibilities of the Board of Directors (1) The diversity of board members
(2) The establishment of other functional committees beside of Compensation Committee and Audit Committee
(3) Board Performance Evaluation and Director Appraisal
V V V
(1) The Company has established "Corporate Governance Practical Rules" specifying that the composition of board of directors should consider the diversity of knowledge and capabilities. Our directors have specialties in different domains, such as operation, accounting and management that fulfills our operation needs.
(2) Beside Compensation Committee in accordance with law, Audit Committee was set up in 2016 to execute supervisors’ responsibilities.
(3) The Company has established “Board Performance Evaluation Rules” specifying the obedience of board discussion and the indexes regarding convention of board meetings, attendance status and continuing education/training status. The evaluation is performed after the year end according to the indexes specified.
(4) The Company regularly evaluates the independence and suitability of external auditors, examining whether they pay the directors,
None
~26~

(4) Regular evaluation of external auditors’ independence V
supervisors, shareholders of the Company or not, and confirming that they are not interested parties. The assessment of the independence and suitability of the external auditors is also reported to the board meetings and approved by the audit committee. If necessary, the external auditors may be invited to attend the board meetings to ensure their independence and suitability. External auditors should avoid conflicts of interest against assignments or themselves, and its rotation should follow relevant rules.
4. Does a listed company establish full (part)-time governance units or personnel in charge of governing relevant matters (including but not limited to providing directors and supervisors with the information to do their business, holding board meetings and shareholders’ meetings in accordance with law, dealing with company registration and change of registration, making the minutes of board meetings and shareholders’ meetings?
V Executive Strategy Office is responsible for corporate governance, and some associated units may provide directors and supervisors with the information to do their business, hold board meetings and shareholders’ meetings in accordance with law, deal with company registration and change of registration, make the minutes of board meetings and shareholders’ meetings, etc.
5. Communication Channel with Stakeholders V The Company has designated PR Department to handle stakeholders’ complaints and suggestions promptly. The Company also set up Stakeholder Center on its website that the issues brought up by stakeholders will be handled and replied on a case by case basis, as needed.
None
6. Share Transfer Agent and Registrar V In addition to its own stock affairs specialists, the Company also has appointed “KGI Securities” as the share transfer agent and registrar.
None
7. Information Disclosure (1) Establishment of a corporate website to disclose
information regarding the Company’s financials, business and corporate governance status
(2) Other information disclosure channels (e.g., maintaining an English-language website, appointing responsible people to handle information collection and disclosure, appointing spokespersons, webcasting investors conference)
V V
(1) The Company’s financials, business and corporate governance status
are published on the Market Observation Post System regularly. The Company fully discloses business and financial information on its official website, including monthly revenue, financial statements, corporate governance, etc.
(2) The Company has designated a responsible person of Finance & Accounting Division to handle information collection and disclosure and has appointed a spokesperson.
None
8. Other important information to facilitate better understanding of the company’s corporate governance practices (e.g., employee rights, employee wellness, investor relations, supplier relations, rights of stakeholders, directors’ training records, the implementation of risk management policies and risk evaluation measures, the implementation of customer relations policies, and
V (1) Employee rights: The process of recruitment is open and fair. Employees are provided with benefits such as health checkups and insurance. The rights of handicapped and aboriginal employees are under well protection.
(2) Employee wellness: The Company provides employees with a fair working environment and an organized training system for career development.
None
~27~
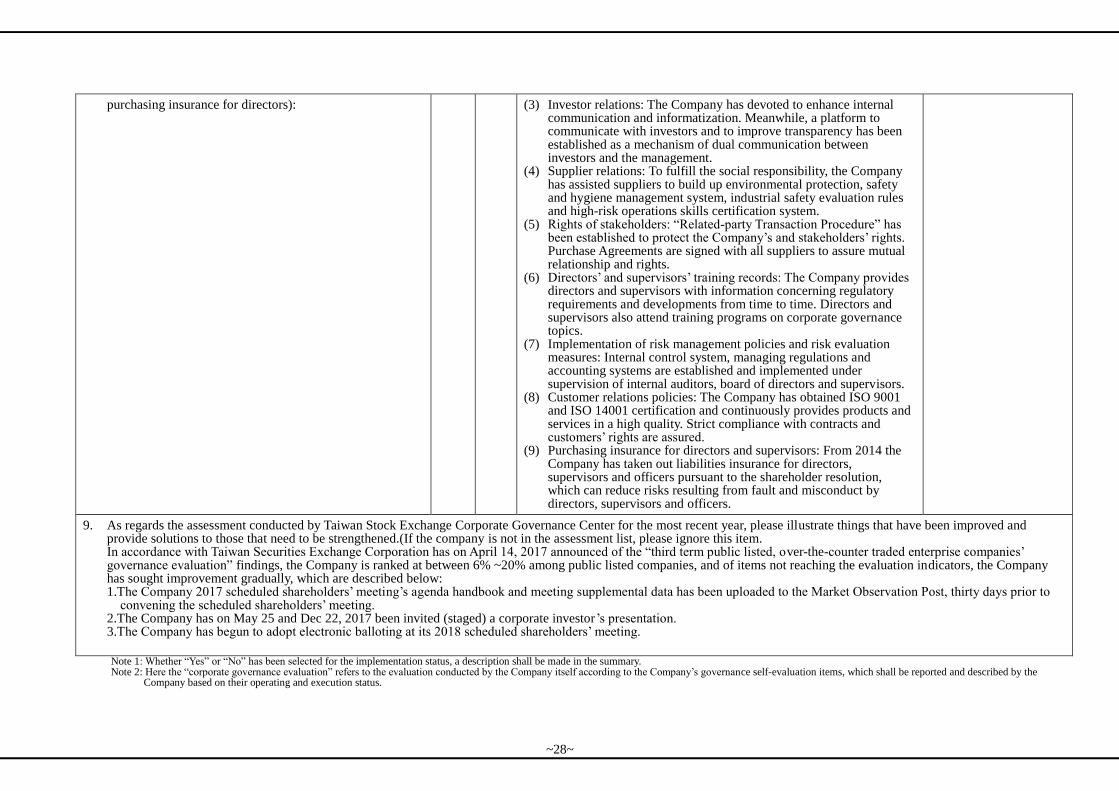
purchasing insurance for directors): (3) Investor relations: The Company has devoted to enhance internal communication and informatization. Meanwhile, a platform to communicate with investors and to improve transparency has been established as a mechanism of dual communication between investors and the management.
(4) Supplier relations: To fulfill the social responsibility, the Company has assisted suppliers to build up environmental protection, safety and hygiene management system, industrial safety evaluation rules and high-risk operations skills certification system.
(5) Rights of stakeholders: “Related-party Transaction Procedure” has been established to protect the Company’s and stakeholders’ rights. Purchase Agreements are signed with all suppliers to assure mutual relationship and rights.
(6) Directors’ and supervisors’ training records: The Company provides directors and supervisors with information concerning regulatory requirements and developments from time to time. Directors and supervisors also attend training programs on corporate governance topics.
(7) Implementation of risk management policies and risk evaluation measures: Internal control system, managing regulations and accounting systems are established and implemented under supervision of internal auditors, board of directors and supervisors.
(8) Customer relations policies: The Company has obtained ISO 9001 and ISO 14001 certification and continuously provides products and services in a high quality. Strict compliance with contracts and customers’ rights are assured.
(9) Purchasing insurance for directors and supervisors: From 2014 the Company has taken out liabilities insurance for directors, supervisors and officers pursuant to the shareholder resolution, which can reduce risks resulting from fault and misconduct by directors, supervisors and officers.
9. As regards the assessment conducted by Taiwan Stock Exchange Corporate Governance Center for the most recent year, please illustrate things that have been improved and provide solutions to those that need to be strengthened.(If the company is not in the assessment list, please ignore this item. In accordance with Taiwan Securities Exchange Corporation has on April 14, 2017 announced of the “third term public listed, over-the-counter traded enterprise companies’ governance evaluation” findings, the Company is ranked at between 6% ~20% among public listed companies, and of items not reaching the evaluation indicators, the Company has sought improvement gradually, which are described below: 1.The Company 2017 scheduled shareholders’ meeting’s agenda handbook and meeting supplemental data has been uploaded to the Market Observation Post, thirty days prior to
convening the scheduled shareholders’ meeting. 2.The Company has on May 25 and Dec 22, 2017 been invited (staged) a corporate investor’s presentation. 3.The Company has begun to adopt electronic balloting at its 2018 scheduled shareholders’ meeting.
Note 1: Whether “Yes” or “No” has been selected for the implementation status, a description shall be made in the summary. Note 2: Here the “corporate governance evaluation” refers to the evaluation conducted by the Company itself according to the Company’s governance self-evaluation items, which shall be reported and described by the
Company based on their operating and execution status.
~28~
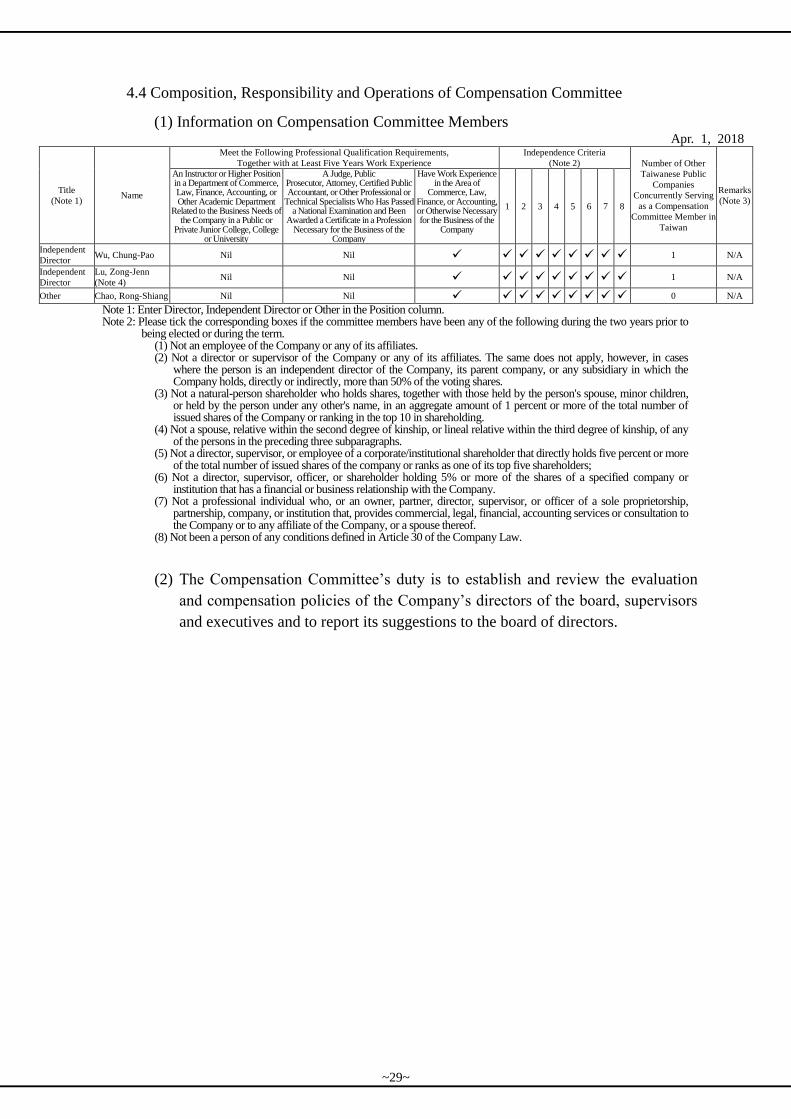
4.4 Composition, Responsibility and Operations of Compensation Committee
(1) Information on Compensation Committee Members Apr. 1, 2018
Title
(Note 1) Name
Meet the Following Professional Qualification Requirements,
Together with at Least Five Years Work Experience
Independence Criteria
(Note 2) Number of Other
Taiwanese Public
Companies
Concurrently Serving
as a Compensation
Committee Member in
Taiwan
Remarks
(Note 3)
An Instructor or Higher Position in a Department of Commerce, Law, Finance, Accounting, or Other Academic Department
Related to the Business Needs of the Company in a Public or
Private Junior College, College or University
A Judge, Public Prosecutor, Attorney, Certified Public Accountant, or Other Professional or
Technical Specialists Who Has Passed a National Examination and Been
Awarded a Certificate in a Profession Necessary for the Business of the
Company
Have Work Experience in the Area of
Commerce, Law, Finance, or Accounting, or Otherwise Necessary for the Business of the
Company
1 2 3 4 5 6 7 8
Independent
Director Wu, Chung-Pao Nil Nil 1 N/A
Independent
Director
Lu, Zong-Jenn
(Note 4) Nil Nil 1 N/A
Other Chao, Rong-Shiang Nil Nil 0 N/A
Note 1: Enter Director, Independent Director or Other in the Position column. Note 2: Please tick the corresponding boxes if the committee members have been any of the following during the two years prior to
being elected or during the term. (1) Not an employee of the Company or any of its affiliates. (2) Not a director or supervisor of the Company or any of its affiliates. The same does not apply, however, in cases
where the person is an independent director of the Company, its parent company, or any subsidiary in which the Company holds, directly or indirectly, more than 50% of the voting shares.
(3) Not a natural-person shareholder who holds shares, together with those held by the person's spouse, minor children, or held by the person under any other's name, in an aggregate amount of 1 percent or more of the total number of issued shares of the Company or ranking in the top 10 in shareholding.
(4) Not a spouse, relative within the second degree of kinship, or lineal relative within the third degree of kinship, of any of the persons in the preceding three subparagraphs.
(5) Not a director, supervisor, or employee of a corporate/institutional shareholder that directly holds five percent or more of the total number of issued shares of the company or ranks as one of its top five shareholders;
(6) Not a director, supervisor, officer, or shareholder holding 5% or more of the shares of a specified company or institution that has a financial or business relationship with the Company.
(7) Not a professional individual who, or an owner, partner, director, supervisor, or officer of a sole proprietorship, partnership, company, or institution that, provides commercial, legal, financial, accounting services or consultation to the Company or to any affiliate of the Company, or a spouse thereof.
(8) Not been a person of any conditions defined in Article 30 of the Company Law.
(2) The Compensation Committee’s duty is to establish and review the evaluation
and compensation policies of the Company’s directors of the board, supervisors
and executives and to report its suggestions to the board of directors.
~29~
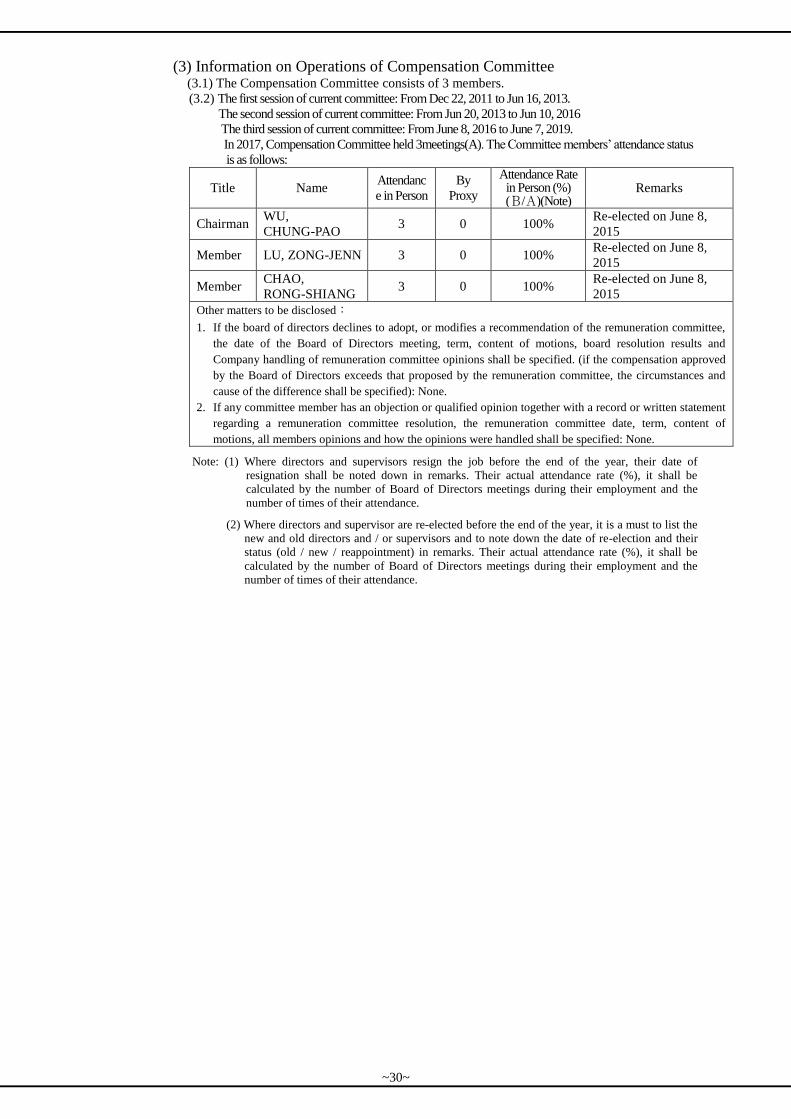
(3) Information on Operations of Compensation Committee (3.1) The Compensation Committee consists of 3 members.
(3.2) The first session of current committee: From Dec 22, 2011 to Jun 16, 2013.
The second session of current committee: From Jun 20, 2013 to Jun 10, 2016
The third session of current committee: From June 8, 2016 to June 7, 2019.
In 2017, Compensation Committee held 3meetings(A). The Committee members’ attendance status
is as follows:
Title Name Attendanc
e in Person
By
Proxy
Attendance Rate in Person (%) (B/A)(Note)
Remarks
Chairman WU,
CHUNG-PAO 3 0 100%
Re-elected on June 8,
2015
Member LU, ZONG-JENN 3 0 100% Re-elected on June 8,
2015
Member CHAO,
RONG-SHIANG 3 0 100%
Re-elected on June 8,
2015
Other matters to be disclosed:
1. If the board of directors declines to adopt, or modifies a recommendation of the remuneration committee,
the date of the Board of Directors meeting, term, content of motions, board resolution results and
Company handling of remuneration committee opinions shall be specified. (if the compensation approved
by the Board of Directors exceeds that proposed by the remuneration committee, the circumstances and
cause of the difference shall be specified): None.
2. If any committee member has an objection or qualified opinion together with a record or written statement
regarding a remuneration committee resolution, the remuneration committee date, term, content of
motions, all members opinions and how the opinions were handled shall be specified: None.
Note: (1) Where directors and supervisors resign the job before the end of the year, their date of
resignation shall be noted down in remarks. Their actual attendance rate (%), it shall be
calculated by the number of Board of Directors meetings during their employment and the
number of times of their attendance.
(2) Where directors and supervisor are re-elected before the end of the year, it is a must to list the
new and old directors and / or supervisors and to note down the date of re-election and their
status (old / new / reappointment) in remarks. Their actual attendance rate (%), it shall be
calculated by the number of Board of Directors meetings during their employment and the
number of times of their attendance.
~30~
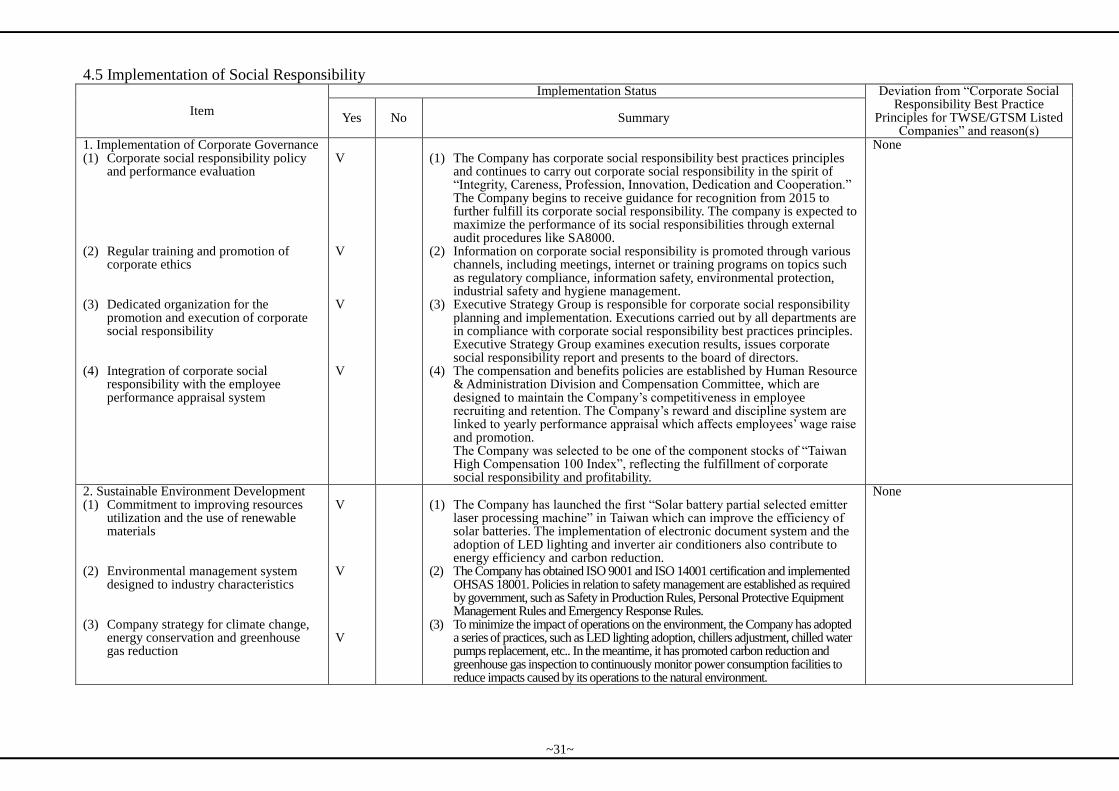
4.5 Implementation of Social Responsibility
Item
Implementation Status Deviation from “Corporate Social Responsibility Best Practice
Principles for TWSE/GTSM Listed Companies” and reason(s)
Yes No Summary
1. Implementation of Corporate Governance (1) Corporate social responsibility policy
and performance evaluation
(2) Regular training and promotion of corporate ethics
(3) Dedicated organization for the promotion and execution of corporate social responsibility
(4) Integration of corporate social responsibility with the employee performance appraisal system
V V V V
(1) The Company has corporate social responsibility best practices principles
and continues to carry out corporate social responsibility in the spirit of “Integrity, Careness, Profession, Innovation, Dedication and Cooperation.” The Company begins to receive guidance for recognition from 2015 to further fulfill its corporate social responsibility. The company is expected to maximize the performance of its social responsibilities through external audit procedures like SA8000.
(2) Information on corporate social responsibility is promoted through various channels, including meetings, internet or training programs on topics such as regulatory compliance, information safety, environmental protection, industrial safety and hygiene management.
(3) Executive Strategy Group is responsible for corporate social responsibility planning and implementation. Executions carried out by all departments are in compliance with corporate social responsibility best practices principles. Executive Strategy Group examines execution results, issues corporate social responsibility report and presents to the board of directors.
(4) The compensation and benefits policies are established by Human Resource & Administration Division and Compensation Committee, which are designed to maintain the Company’s competitiveness in employee recruiting and retention. The Company’s reward and discipline system are linked to yearly performance appraisal which affects employees’ wage raise and promotion. The Company was selected to be one of the component stocks of “Taiwan High Compensation 100 Index”, reflecting the fulfillment of corporate social responsibility and profitability.
None
2. Sustainable Environment Development (1) Commitment to improving resources
utilization and the use of renewable materials
(2) Environmental management system designed to industry characteristics
(3) Company strategy for climate change, energy conservation and greenhouse gas reduction
V V V
(1) The Company has launched the first “Solar battery partial selected emitter
laser processing machine” in Taiwan which can improve the efficiency of solar batteries. The implementation of electronic document system and the adoption of LED lighting and inverter air conditioners also contribute to energy efficiency and carbon reduction.
(2) The Company has obtained ISO 9001 and ISO 14001 certification and implemented OHSAS 18001. Policies in relation to safety management are established as required by government, such as Safety in Production Rules, Personal Protective Equipment Management Rules and Emergency Response Rules.
(3) To minimize the impact of operations on the environment, the Company has adopted a series of practices, such as LED lighting adoption, chillers adjustment, chilled water pumps replacement, etc.. In the meantime, it has promoted carbon reduction and greenhouse gas inspection to continuously monitor power consumption facilities to reduce impacts caused by its operations to the natural environment.
None
~31~
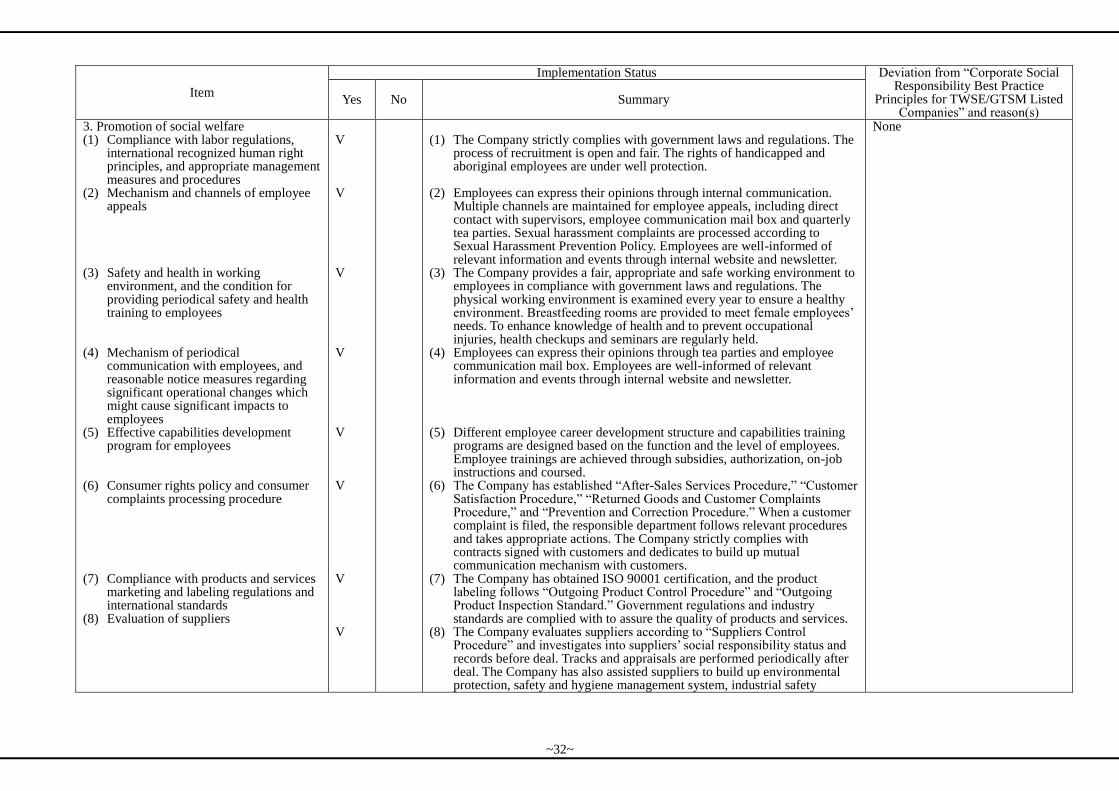
Item
Implementation Status Deviation from “Corporate Social Responsibility Best Practice
Principles for TWSE/GTSM Listed Companies” and reason(s)
Yes No Summary
3. Promotion of social welfare (1) Compliance with labor regulations,
international recognized human right principles, and appropriate management measures and procedures
(2) Mechanism and channels of employee appeals
(3) Safety and health in working environment, and the condition for providing periodical safety and health training to employees
(4) Mechanism of periodical communication with employees, and reasonable notice measures regarding significant operational changes which might cause significant impacts to employees
(5) Effective capabilities development program for employees
(6) Consumer rights policy and consumer complaints processing procedure
(7) Compliance with products and services
marketing and labeling regulations and international standards
(8) Evaluation of suppliers
V V V V V V V V
(1) The Company strictly complies with government laws and regulations. The
process of recruitment is open and fair. The rights of handicapped and aboriginal employees are under well protection.
(2) Employees can express their opinions through internal communication.
Multiple channels are maintained for employee appeals, including direct contact with supervisors, employee communication mail box and quarterly tea parties. Sexual harassment complaints are processed according to Sexual Harassment Prevention Policy. Employees are well-informed of relevant information and events through internal website and newsletter.
(3) The Company provides a fair, appropriate and safe working environment to employees in compliance with government laws and regulations. The physical working environment is examined every year to ensure a healthy environment. Breastfeeding rooms are provided to meet female employees’ needs. To enhance knowledge of health and to prevent occupational injuries, health checkups and seminars are regularly held.
(4) Employees can express their opinions through tea parties and employee communication mail box. Employees are well-informed of relevant information and events through internal website and newsletter.
(5) Different employee career development structure and capabilities training
programs are designed based on the function and the level of employees. Employee trainings are achieved through subsidies, authorization, on-job instructions and coursed.
(6) The Company has established “After-Sales Services Procedure,” “Customer Satisfaction Procedure,” “Returned Goods and Customer Complaints Procedure,” and “Prevention and Correction Procedure.” When a customer complaint is filed, the responsible department follows relevant procedures and takes appropriate actions. The Company strictly complies with contracts signed with customers and dedicates to build up mutual communication mechanism with customers.
(7) The Company has obtained ISO 90001 certification, and the product labeling follows “Outgoing Product Control Procedure” and “Outgoing Product Inspection Standard.” Government regulations and industry standards are complied with to assure the quality of products and services.
(8) The Company evaluates suppliers according to “Suppliers Control Procedure” and investigates into suppliers’ social responsibility status and records before deal. Tracks and appraisals are performed periodically after deal. The Company has also assisted suppliers to build up environmental protection, safety and hygiene management system, industrial safety
None
~32~
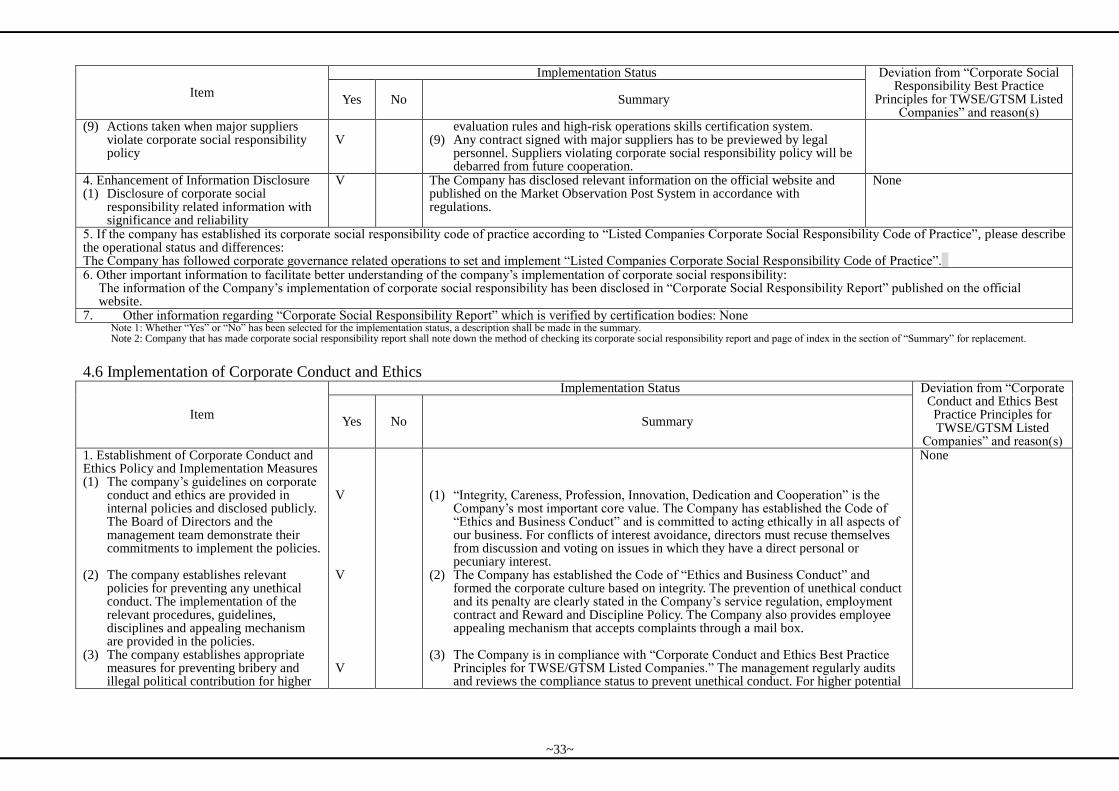
Item
Implementation Status Deviation from “Corporate Social Responsibility Best Practice
Principles for TWSE/GTSM Listed Companies” and reason(s)
Yes No Summary
(9) Actions taken when major suppliers violate corporate social responsibility policy
V
evaluation rules and high-risk operations skills certification system. (9) Any contract signed with major suppliers has to be previewed by legal
personnel. Suppliers violating corporate social responsibility policy will be debarred from future cooperation.
4. Enhancement of Information Disclosure (1) Disclosure of corporate social
responsibility related information with significance and reliability
V The Company has disclosed relevant information on the official website and published on the Market Observation Post System in accordance with regulations.
None
5. If the company has established its corporate social responsibility code of practice according to “Listed Companies Corporate Social Responsibility Code of Practice”, please describe the operational status and differences: The Company has followed corporate governance related operations to set and implement “Listed Companies Corporate Social Responsibility Code of Practice”. 6. Other important information to facilitate better understanding of the company’s implementation of corporate social responsibility: The information of the Company’s implementation of corporate social responsibility has been disclosed in “Corporate Social Responsibility Report” published on the official
website. 7. Other information regarding “Corporate Social Responsibility Report” which is verified by certification bodies: None
Note 1: Whether “Yes” or “No” has been selected for the implementation status, a description shall be made in the summary. Note 2: Company that has made corporate social responsibility report shall note down the method of checking its corporate social responsibility report and page of index in the section of “Summary” for replacement.
4.6 Implementation of Corporate Conduct and Ethics
Item
Implementation Status Deviation from “Corporate Conduct and Ethics Best Practice Principles for TWSE/GTSM Listed
Companies” and reason(s)
Yes No Summary
1. Establishment of Corporate Conduct and Ethics Policy and Implementation Measures (1) The company’s guidelines on corporate
conduct and ethics are provided in internal policies and disclosed publicly. The Board of Directors and the management team demonstrate their commitments to implement the policies.
(2) The company establishes relevant policies for preventing any unethical conduct. The implementation of the relevant procedures, guidelines, disciplines and appealing mechanism are provided in the policies.
(3) The company establishes appropriate measures for preventing bribery and illegal political contribution for higher
V V V
(1) “Integrity, Careness, Profession, Innovation, Dedication and Cooperation” is the
Company’s most important core value. The Company has established the Code of “Ethics and Business Conduct” and is committed to acting ethically in all aspects of our business. For conflicts of interest avoidance, directors must recuse themselves from discussion and voting on issues in which they have a direct personal or pecuniary interest.
(2) The Company has established the Code of “Ethics and Business Conduct” and formed the corporate culture based on integrity. The prevention of unethical conduct and its penalty are clearly stated in the Company’s service regulation, employment contract and Reward and Discipline Policy. The Company also provides employee appealing mechanism that accepts complaints through a mail box.
(3) The Company is in compliance with “Corporate Conduct and Ethics Best Practice
Principles for TWSE/GTSM Listed Companies.” The management regularly audits and reviews the compliance status to prevent unethical conduct. For higher potential
None
~33~
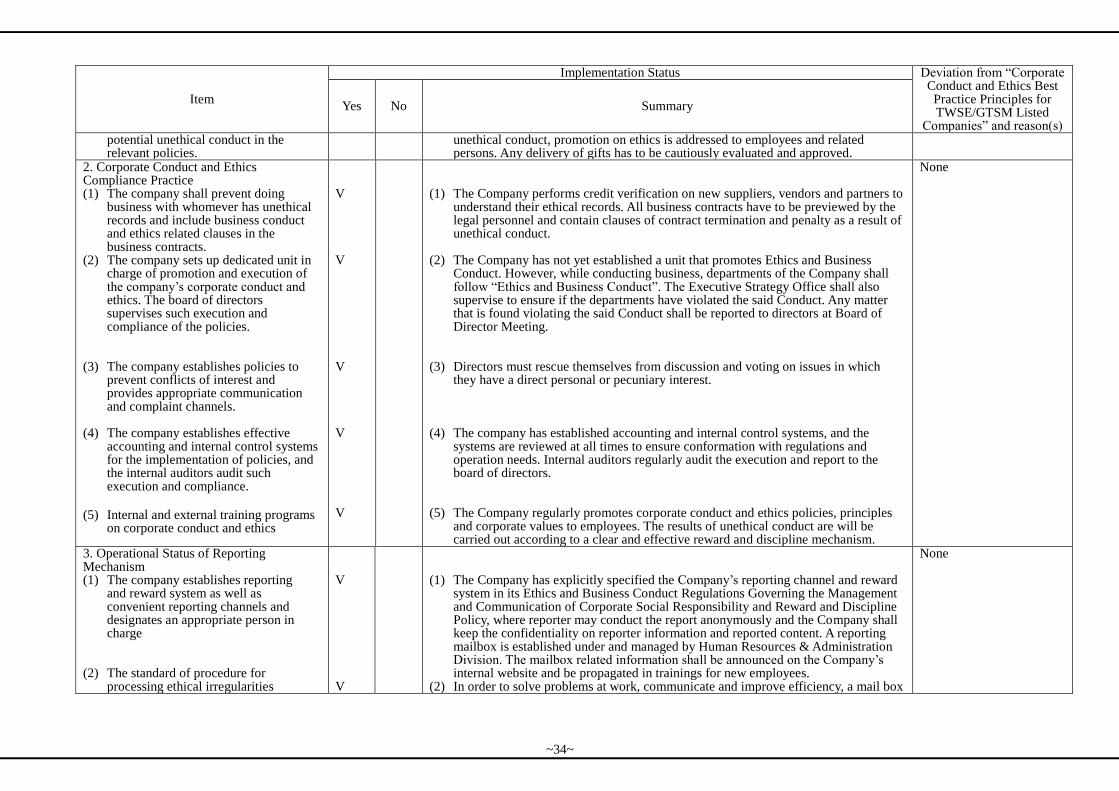
Item
Implementation Status Deviation from “Corporate Conduct and Ethics Best Practice Principles for TWSE/GTSM Listed
Companies” and reason(s)
Yes No Summary
potential unethical conduct in the relevant policies.
unethical conduct, promotion on ethics is addressed to employees and related persons. Any delivery of gifts has to be cautiously evaluated and approved.
2. Corporate Conduct and Ethics Compliance Practice (1) The company shall prevent doing
business with whomever has unethical records and include business conduct and ethics related clauses in the business contracts.
(2) The company sets up dedicated unit in charge of promotion and execution of the company’s corporate conduct and ethics. The board of directors supervises such execution and compliance of the policies.
(3) The company establishes policies to prevent conflicts of interest and provides appropriate communication and complaint channels.
(4) The company establishes effective accounting and internal control systems for the implementation of policies, and the internal auditors audit such execution and compliance.
(5) Internal and external training programs
on corporate conduct and ethics
V V V V V
(1) The Company performs credit verification on new suppliers, vendors and partners to
understand their ethical records. All business contracts have to be previewed by the legal personnel and contain clauses of contract termination and penalty as a result of unethical conduct.
(2) The Company has not yet established a unit that promotes Ethics and Business
Conduct. However, while conducting business, departments of the Company shall follow “Ethics and Business Conduct”. The Executive Strategy Office shall also supervise to ensure if the departments have violated the said Conduct. Any matter that is found violating the said Conduct shall be reported to directors at Board of Director Meeting.
(3) Directors must rescue themselves from discussion and voting on issues in which they have a direct personal or pecuniary interest.
(4) The company has established accounting and internal control systems, and the
systems are reviewed at all times to ensure conformation with regulations and operation needs. Internal auditors regularly audit the execution and report to the board of directors.
(5) The Company regularly promotes corporate conduct and ethics policies, principles
and corporate values to employees. The results of unethical conduct are will be carried out according to a clear and effective reward and discipline mechanism.
None
3. Operational Status of Reporting Mechanism (1) The company establishes reporting
and reward system as well as convenient reporting channels and designates an appropriate person in charge
(2) The standard of procedure for processing ethical irregularities
V V
(1) The Company has explicitly specified the Company’s reporting channel and reward system in its Ethics and Business Conduct Regulations Governing the Management and Communication of Corporate Social Responsibility and Reward and Discipline Policy, where reporter may conduct the report anonymously and the Company shall keep the confidentiality on reporter information and reported content. A reporting mailbox is established under and managed by Human Resources & Administration Division. The mailbox related information shall be announced on the Company’s internal website and be propagated in trainings for new employees.
(2) In order to solve problems at work, communicate and improve efficiency, a mail box
None
~34~
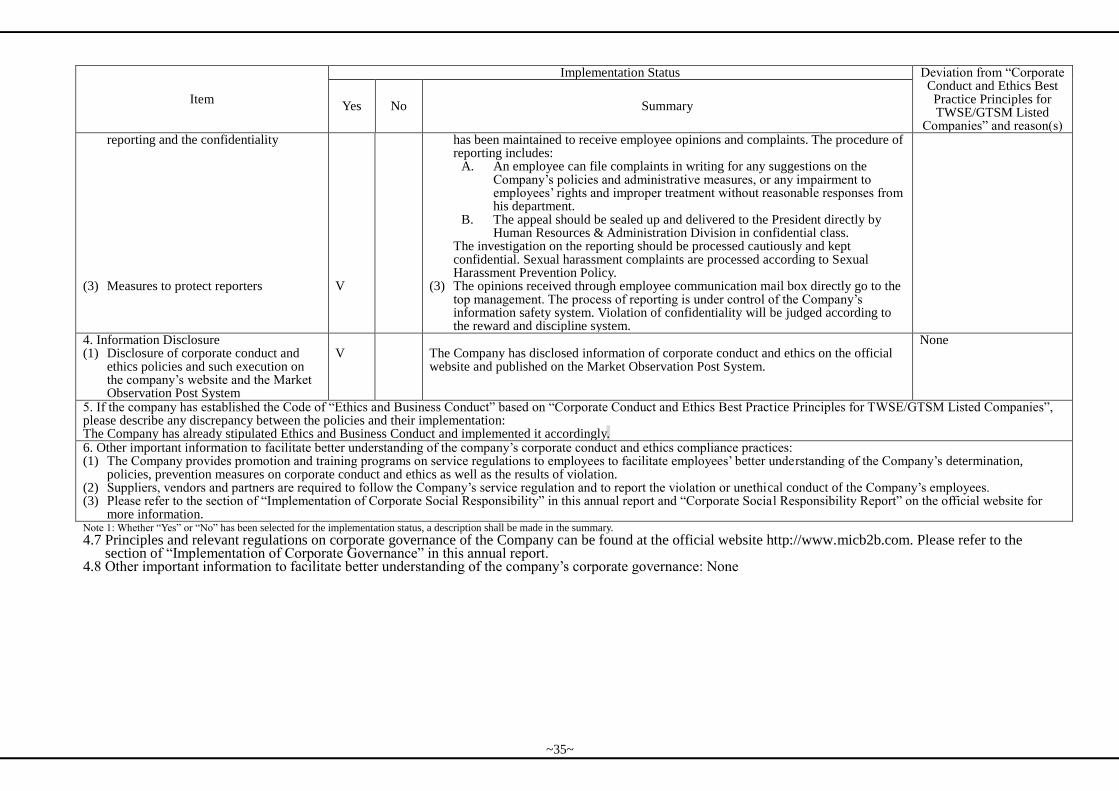
Item
Implementation Status Deviation from “Corporate Conduct and Ethics Best Practice Principles for TWSE/GTSM Listed
Companies” and reason(s)
Yes No Summary
reporting and the confidentiality
(3) Measures to protect reporters
V
has been maintained to receive employee opinions and complaints. The procedure of reporting includes:
A. An employee can file complaints in writing for any suggestions on the Company’s policies and administrative measures, or any impairment to employees’ rights and improper treatment without reasonable responses from his department.
B. The appeal should be sealed up and delivered to the President directly by Human Resources & Administration Division in confidential class.
The investigation on the reporting should be processed cautiously and kept confidential. Sexual harassment complaints are processed according to Sexual Harassment Prevention Policy.
(3) The opinions received through employee communication mail box directly go to the top management. The process of reporting is under control of the Company’s information safety system. Violation of confidentiality will be judged according to the reward and discipline system.
4. Information Disclosure (1) Disclosure of corporate conduct and
ethics policies and such execution on the company’s website and the Market Observation Post System
V
The Company has disclosed information of corporate conduct and ethics on the official website and published on the Market Observation Post System.
None
5. If the company has established the Code of “Ethics and Business Conduct” based on “Corporate Conduct and Ethics Best Practice Principles for TWSE/GTSM Listed Companies”, please describe any discrepancy between the policies and their implementation: The Company has already stipulated Ethics and Business Conduct and implemented it accordingly. 6. Other important information to facilitate better understanding of the company’s corporate conduct and ethics compliance practices: (1) The Company provides promotion and training programs on service regulations to employees to facilitate employees’ better understanding of the Company’s determination,
policies, prevention measures on corporate conduct and ethics as well as the results of violation. (2) Suppliers, vendors and partners are required to follow the Company’s service regulation and to report the violation or unethical conduct of the Company’s employees. (3) Please refer to the section of “Implementation of Corporate Social Responsibility” in this annual report and “Corporate Social Responsibility Report” on the official website for
more information. Note 1: Whether “Yes” or “No” has been selected for the implementation status, a description shall be made in the summary.
4.7 Principles and relevant regulations on corporate governance of the Company can be found at the official website http://www.micb2b.com. Please refer to the section of “Implementation of Corporate Governance” in this annual report.
4.8 Other important information to facilitate better understanding of the company’s corporate governance: None
~35~
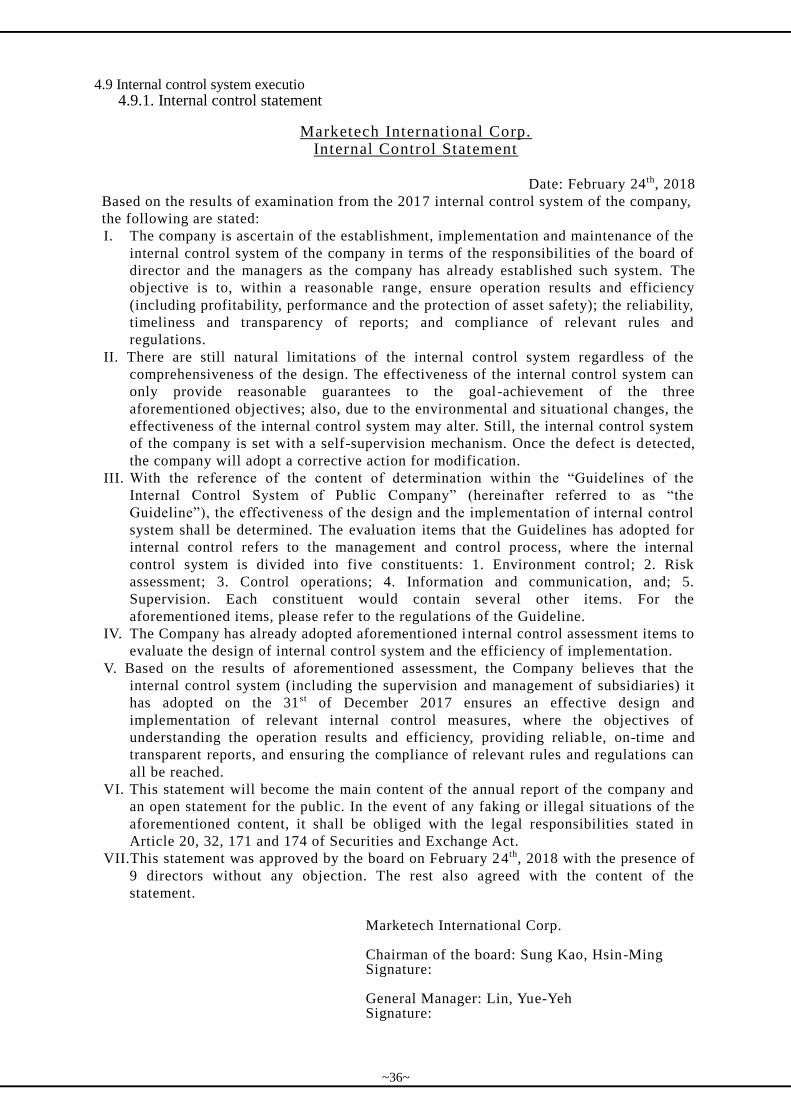
4.9 Internal control system executio 4.9.1. Internal control statement
Marketech International Corp.
Internal Control Statement
Date: February 24th, 2018
Based on the results of examination from the 2017 internal control system of the company,
the following are stated:
I. The company is ascertain of the establishment, implementation and maintenance of the
internal control system of the company in terms of the responsibilities of the board of
director and the managers as the company has already established such system. The
objective is to, within a reasonable range, ensure operation results and efficiency
(including profitability, performance and the protection of asset safety); the reliability,
timeliness and transparency of reports; and compliance of relevant rules and
regulations.
II. There are still natural limitations of the internal control system regardless of the
comprehensiveness of the design. The effectiveness of the internal control system can
only provide reasonable guarantees to the goal -achievement of the three
aforementioned objectives; also, due to the environmental and situational changes, the
effectiveness of the internal control system may alter. Still, the internal control system
of the company is set with a self-supervision mechanism. Once the defect is detected,
the company will adopt a corrective action for modification.
III. With the reference of the content of determination within the “Guidelines of the
Internal Control System of Public Company” (hereinafter referred to as “the
Guideline”), the effectiveness of the design and the implementation of internal control
system shall be determined. The evaluation items that the Guidelines has adopted for
internal control refers to the management and control process, where the internal
control system is divided into five constituents: 1. Environment control; 2. Risk
assessment; 3. Control operations; 4. Information and communication, and; 5.
Supervision. Each constituent would contain several other items. For the
aforementioned items, please refer to the regulations of the Guideline.
IV. The Company has already adopted aforementioned internal control assessment items to
evaluate the design of internal control system and the efficiency of implementation.
V. Based on the results of aforementioned assessment, the Company believes that the
internal control system (including the supervision and management of subsidiaries) it
has adopted on the 31st of December 2017 ensures an effective design and
implementation of relevant internal control measures, where the objectives of
understanding the operation results and efficiency, providing reliab le, on-time and
transparent reports, and ensuring the compliance of relevant rules and regulations can
all be reached.
VI. This statement will become the main content of the annual report of the company and
an open statement for the public. In the event of any faking or illegal situations of the
aforementioned content, it shall be obliged with the legal responsibilities stated in
Article 20, 32, 171 and 174 of Securities and Exchange Act.
VII.This statement was approved by the board on February 24th, 2018 with the presence of
9 directors without any objection. The rest also agreed with the content of the
statement.
Marketech International Corp.
Chairman of the board: Sung Kao, Hsin-Ming Signature:
General Manager: Lin, Yue-Yeh Signature:
~36~
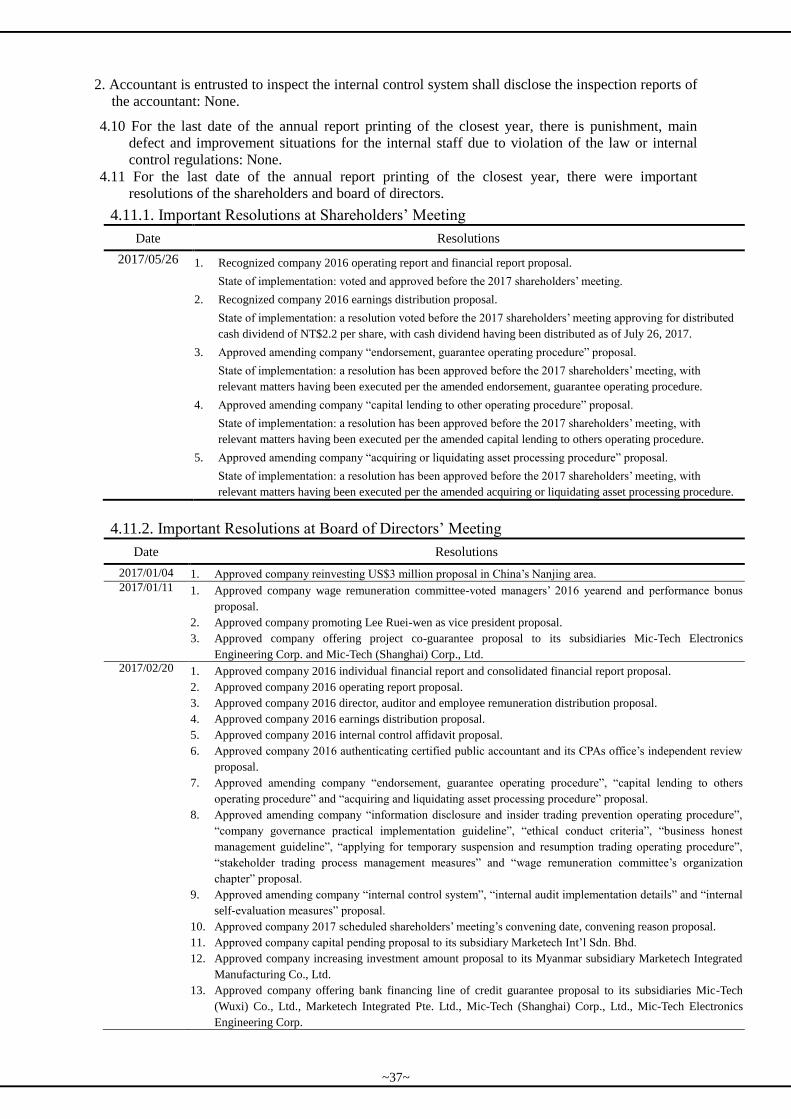
2. Accountant is entrusted to inspect the internal control system shall disclose the inspection reports of
the accountant: None.
4.10 For the last date of the annual report printing of the closest year, there is punishment, main
defect and improvement situations for the internal staff due to violation of the law or internal
control regulations: None.
4.11 For the last date of the annual report printing of the closest year, there were important
resolutions of the shareholders and board of directors.
4.11.1. Important Resolutions at Shareholders’ Meeting
Date Resolutions
2017/05/26 1. Recognized company 2016 operating report and financial report proposal.
State of implementation: voted and approved before the 2017 shareholders’ meeting.
2. Recognized company 2016 earnings distribution proposal.
State of implementation: a resolution voted before the 2017 shareholders’ meeting approving for distributed
cash dividend of NT$2.2 per share, with cash dividend having been distributed as of July 26, 2017.
3. Approved amending company “endorsement, guarantee operating procedure” proposal.
State of implementation: a resolution has been approved before the 2017 shareholders’ meeting, with
relevant matters having been executed per the amended endorsement, guarantee operating procedure.
4. Approved amending company “capital lending to other operating procedure” proposal.
State of implementation: a resolution has been approved before the 2017 shareholders’ meeting, with
relevant matters having been executed per the amended capital lending to others operating procedure.
5. Approved amending company “acquiring or liquidating asset processing procedure” proposal.
State of implementation: a resolution has been approved before the 2017 shareholders’ meeting, with
relevant matters having been executed per the amended acquiring or liquidating asset processing procedure.
4.11.2. Important Resolutions at Board of Directors’ Meeting
Date Resolutions
2017/01/04 1. Approved company reinvesting US$3 million proposal in China’s Nanjing area. 2017/01/11 1. Approved company wage remuneration committee-voted managers’ 2016 yearend and performance bonus
proposal.
2. Approved company promoting Lee Ruei-wen as vice president proposal.
3. Approved company offering project co-guarantee proposal to its subsidiaries Mic-Tech Electronics
Engineering Corp. and Mic-Tech (Shanghai) Corp., Ltd. 2017/02/20 1. Approved company 2016 individual financial report and consolidated financial report proposal.
2. Approved company 2016 operating report proposal.
3. Approved company 2016 director, auditor and employee remuneration distribution proposal.
4. Approved company 2016 earnings distribution proposal.
5. Approved company 2016 internal control affidavit proposal.
6. Approved company 2016 authenticating certified public accountant and its CPAs office’s independent review
proposal.
7. Approved amending company “endorsement, guarantee operating procedure”, “capital lending to others
operating procedure” and “acquiring and liquidating asset processing procedure” proposal.
8. Approved amending company “information disclosure and insider trading prevention operating procedure”,
“company governance practical implementation guideline”, “ethical conduct criteria”, “business honest
management guideline”, “applying for temporary suspension and resumption trading operating procedure”,
“stakeholder trading process management measures” and “wage remuneration committee’s organization
chapter” proposal.
9. Approved amending company “internal control system”, “internal audit implementation details” and “internal
self-evaluation measures” proposal.
10. Approved company 2017 scheduled shareholders’ meeting’s convening date, convening reason proposal.
11. Approved company capital pending proposal to its subsidiary Marketech Int’l Sdn. Bhd.
12. Approved company increasing investment amount proposal to its Myanmar subsidiary Marketech Integrated
Manufacturing Co., Ltd.
13. Approved company offering bank financing line of credit guarantee proposal to its subsidiaries Mic-Tech
(Wuxi) Co., Ltd., Marketech Integrated Pte. Ltd., Mic-Tech (Shanghai) Corp., Ltd., Mic-Tech Electronics
Engineering Corp.
~37~
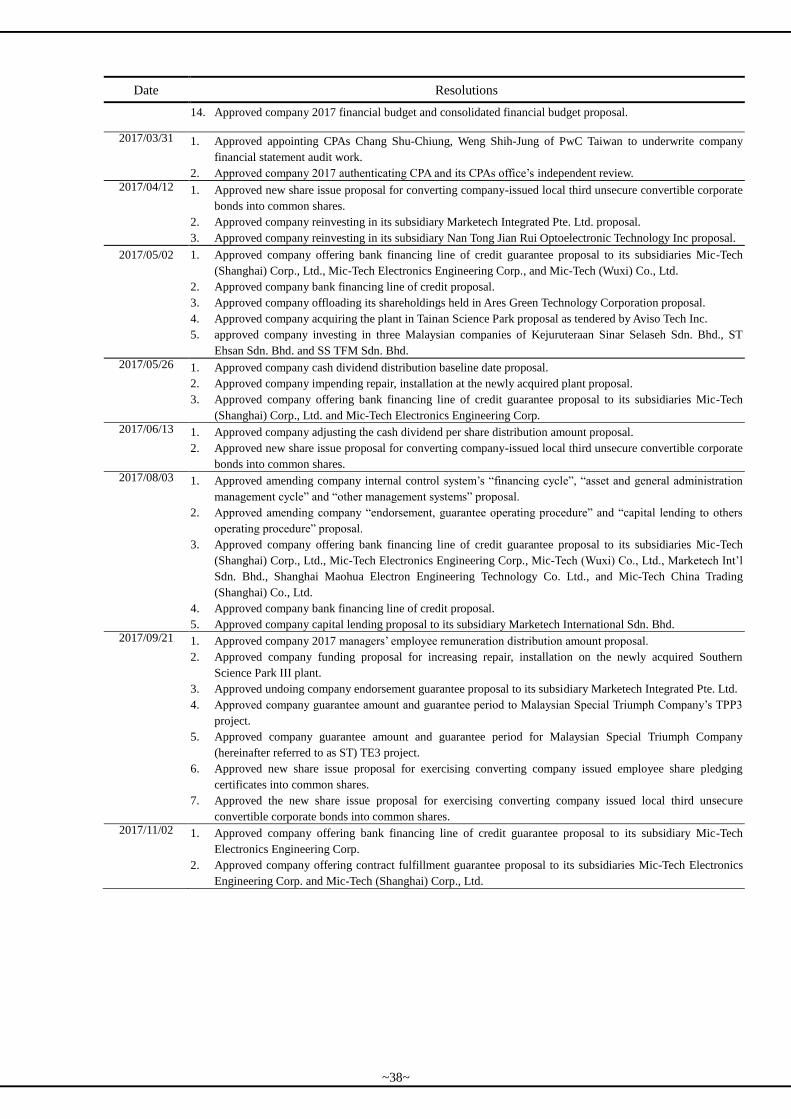
Date Resolutions
14. Approved company 2017 financial budget and consolidated financial budget proposal.
2017/03/31 1. Approved appointing CPAs Chang Shu-Chiung, Weng Shih-Jung of PwC Taiwan to underwrite company
financial statement audit work.
2. Approved company 2017 authenticating CPA and its CPAs office’s independent review.
2017/04/12 1. Approved new share issue proposal for converting company-issued local third unsecure convertible corporate
bonds into common shares.
2. Approved company reinvesting in its subsidiary Marketech Integrated Pte. Ltd. proposal.
3. Approved company reinvesting in its subsidiary Nan Tong Jian Rui Optoelectronic Technology Inc proposal.
2017/05/02 1. Approved company offering bank financing line of credit guarantee proposal to its subsidiaries Mic-Tech
(Shanghai) Corp., Ltd., Mic-Tech Electronics Engineering Corp., and Mic-Tech (Wuxi) Co., Ltd.
2. Approved company bank financing line of credit proposal.
3. Approved company offloading its shareholdings held in Ares Green Technology Corporation proposal.
4. Approved company acquiring the plant in Tainan Science Park proposal as tendered by Aviso Tech Inc.
5. approved company investing in three Malaysian companies of Kejuruteraan Sinar Selaseh Sdn. Bhd., ST
Ehsan Sdn. Bhd. and SS TFM Sdn. Bhd.
2017/05/26 1. Approved company cash dividend distribution baseline date proposal.
2. Approved company impending repair, installation at the newly acquired plant proposal.
3. Approved company offering bank financing line of credit guarantee proposal to its subsidiaries Mic-Tech
(Shanghai) Corp., Ltd. and Mic-Tech Electronics Engineering Corp. 2017/06/13 1. Approved company adjusting the cash dividend per share distribution amount proposal.
2. Approved new share issue proposal for converting company-issued local third unsecure convertible corporate
bonds into common shares. 2017/08/03 1. Approved amending company internal control system’s “financing cycle”, “asset and general administration
management cycle” and “other management systems” proposal.
2. Approved amending company “endorsement, guarantee operating procedure” and “capital lending to others
operating procedure” proposal.
3. Approved company offering bank financing line of credit guarantee proposal to its subsidiaries Mic-Tech
(Shanghai) Corp., Ltd., Mic-Tech Electronics Engineering Corp., Mic-Tech (Wuxi) Co., Ltd., Marketech Int’l
Sdn. Bhd., Shanghai Maohua Electron Engineering Technology Co. Ltd., and Mic-Tech China Trading
(Shanghai) Co., Ltd.
4. Approved company bank financing line of credit proposal.
5. Approved company capital lending proposal to its subsidiary Marketech International Sdn. Bhd. 2017/09/21 1. Approved company 2017 managers’ employee remuneration distribution amount proposal.
2. Approved company funding proposal for increasing repair, installation on the newly acquired Southern
Science Park III plant.
3. Approved undoing company endorsement guarantee proposal to its subsidiary Marketech Integrated Pte. Ltd.
4. Approved company guarantee amount and guarantee period to Malaysian Special Triumph Company’s TPP3
project.
5. Approved company guarantee amount and guarantee period for Malaysian Special Triumph Company
(hereinafter referred to as ST) TE3 project.
6. Approved new share issue proposal for exercising converting company issued employee share pledging
certificates into common shares.
7. Approved the new share issue proposal for exercising converting company issued local third unsecure
convertible corporate bonds into common shares. 2017/11/02 1. Approved company offering bank financing line of credit guarantee proposal to its subsidiary Mic-Tech
Electronics Engineering Corp.
2. Approved company offering contract fulfillment guarantee proposal to its subsidiaries Mic-Tech Electronics
Engineering Corp. and Mic-Tech (Shanghai) Corp., Ltd.
~38~
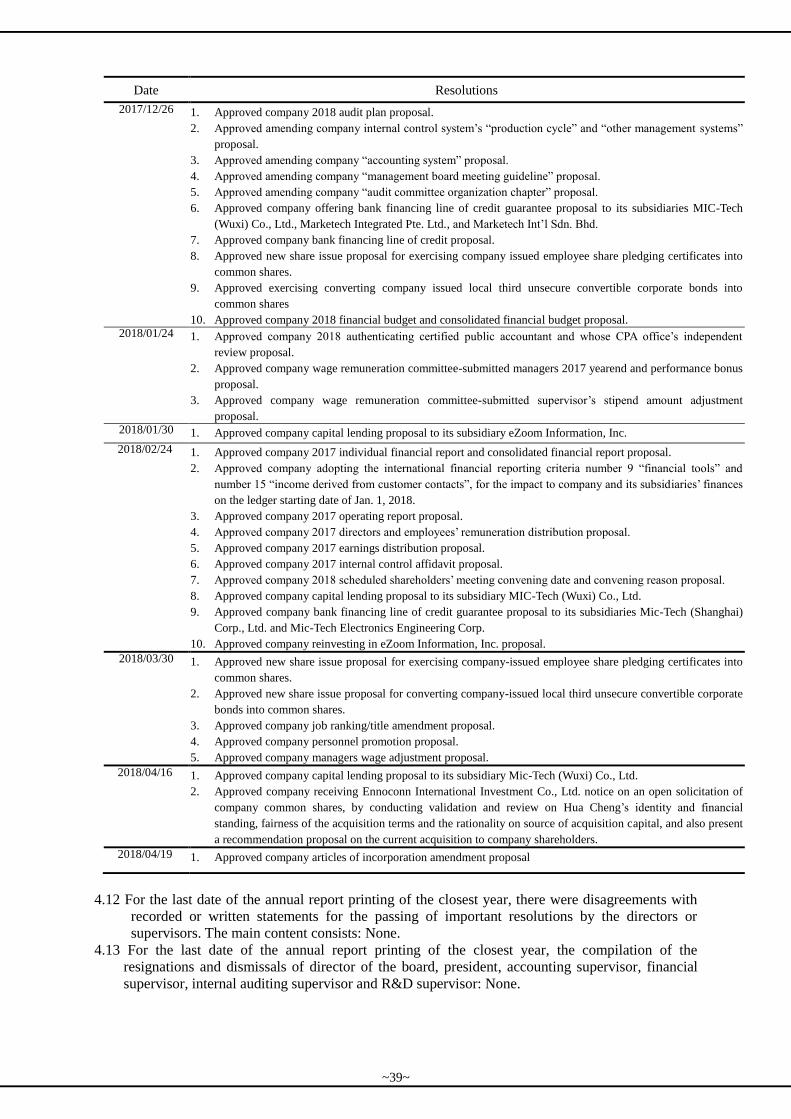
Date Resolutions
2017/12/26 1. Approved company 2018 audit plan proposal.
2. Approved amending company internal control system’s “production cycle” and “other management systems”
proposal.
3. Approved amending company “accounting system” proposal.
4. Approved amending company “management board meeting guideline” proposal.
5. Approved amending company “audit committee organization chapter” proposal.
6. Approved company offering bank financing line of credit guarantee proposal to its subsidiaries MIC-Tech
(Wuxi) Co., Ltd., Marketech Integrated Pte. Ltd., and Marketech Int’l Sdn. Bhd.
7. Approved company bank financing line of credit proposal.
8. Approved new share issue proposal for exercising company issued employee share pledging certificates into
common shares.
9. Approved exercising converting company issued local third unsecure convertible corporate bonds into
common shares
10. Approved company 2018 financial budget and consolidated financial budget proposal. 2018/01/24 1. Approved company 2018 authenticating certified public accountant and whose CPA office’s independent
review proposal.
2. Approved company wage remuneration committee-submitted managers 2017 yearend and performance bonus
proposal.
3. Approved company wage remuneration committee-submitted supervisor’s stipend amount adjustment
proposal. 2018/01/30 1. Approved company capital lending proposal to its subsidiary eZoom Information, Inc.
2018/02/24 1. Approved company 2017 individual financial report and consolidated financial report proposal.
2. Approved company adopting the international financial reporting criteria number 9 “financial tools” and
number 15 “income derived from customer contacts”, for the impact to company and its subsidiaries’ finances
on the ledger starting date of Jan. 1, 2018.
3. Approved company 2017 operating report proposal.
4. Approved company 2017 directors and employees’ remuneration distribution proposal.
5. Approved company 2017 earnings distribution proposal.
6. Approved company 2017 internal control affidavit proposal.
7. Approved company 2018 scheduled shareholders’ meeting convening date and convening reason proposal.
8. Approved company capital lending proposal to its subsidiary MIC-Tech (Wuxi) Co., Ltd.
9. Approved company bank financing line of credit guarantee proposal to its subsidiaries Mic-Tech (Shanghai)
Corp., Ltd. and Mic-Tech Electronics Engineering Corp.
10. Approved company reinvesting in eZoom Information, Inc. proposal.
2018/03/30 1. Approved new share issue proposal for exercising company-issued employee share pledging certificates into
common shares.
2. Approved new share issue proposal for converting company-issued local third unsecure convertible corporate
bonds into common shares.
3. Approved company job ranking/title amendment proposal.
4. Approved company personnel promotion proposal.
5. Approved company managers wage adjustment proposal.
2018/04/16 1. Approved company capital lending proposal to its subsidiary Mic-Tech (Wuxi) Co., Ltd.
2. Approved company receiving Ennoconn International Investment Co., Ltd. notice on an open solicitation of
company common shares, by conducting validation and review on Hua Cheng’s identity and financial
standing, fairness of the acquisition terms and the rationality on source of acquisition capital, and also present
a recommendation proposal on the current acquisition to company shareholders.
2018/04/19 1. Approved company articles of incorporation amendment proposal
4.12 For the last date of the annual report printing of the closest year, there were disagreements with
recorded or written statements for the passing of important resolutions by the directors or
supervisors. The main content consists: None.
4.13 For the last date of the annual report printing of the closest year, the compilation of the
resignations and dismissals of director of the board, president, accounting supervisor, financial
supervisor, internal auditing supervisor and R&D supervisor: None.
~39~
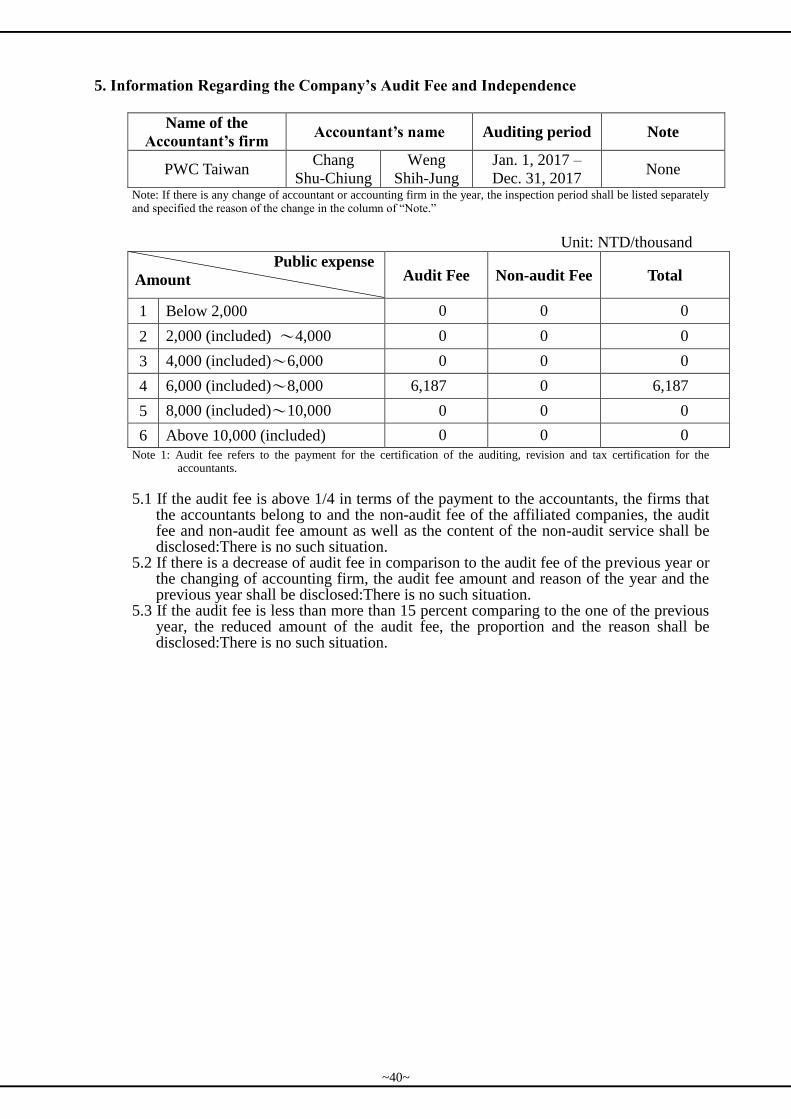
5. Information Regarding the Company’s Audit Fee and Independence
Name of the
Accountant’s firm Accountant’s name Auditing period Note
PWC Taiwan Chang
Shu-Chiung
Weng
Shih-Jung
Jan. 1, 2017 –
Dec. 31, 2017 None
Note: If there is any change of accountant or accounting firm in the year, the inspection period shall be listed separately and specified the reason of the change in the column of “Note.”
Unit: NTD/thousand
Public expense
Amount Audit Fee Non-audit Fee Total
1 Below 2,000 0 0 0
2 2,000 (included) ~4,000 0 0 0
3 4,000 (included)~6,000 0 0 0
4 6,000 (included)~8,000 6,187 0 6,187
5 8,000 (included)~10,000 0 0 0
6 Above 10,000 (included) 0 0 0
Note 1: Audit fee refers to the payment for the certification of the auditing, revision and tax certification for the accountants.
5.1 If the audit fee is above 1/4 in terms of the payment to the accountants, the firms that
the accountants belong to and the non-audit fee of the affiliated companies, the audit fee and non-audit fee amount as well as the content of the non-audit service shall be disclosed:There is no such situation.
5.2 If there is a decrease of audit fee in comparison to the audit fee of the previous year or the changing of accounting firm, the audit fee amount and reason of the year and the previous year shall be disclosed:There is no such situation.
5.3 If the audit fee is less than more than 15 percent comparing to the one of the previous year, the reduced amount of the audit fee, the proportion and the reason shall be disclosed:There is no such situation.
~40~
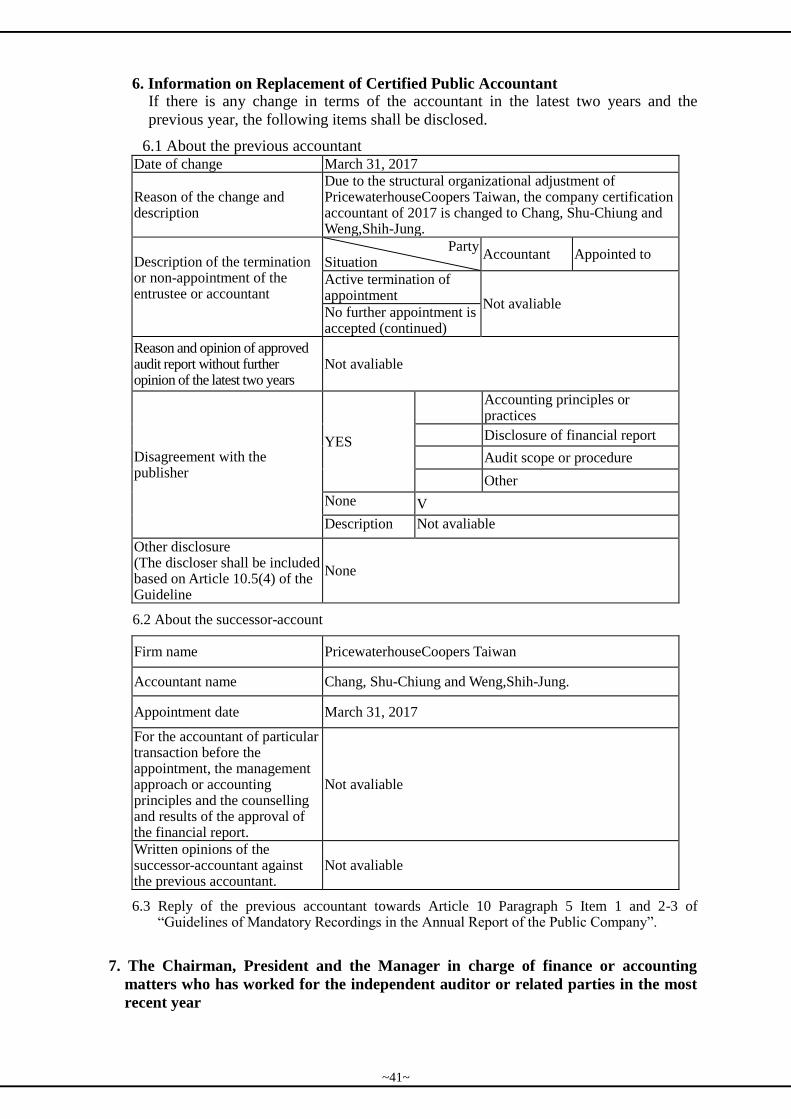
6. Information on Replacement of Certified Public Accountant If there is any change in terms of the accountant in the latest two years and the
previous year, the following items shall be disclosed.
6.1 About the previous accountant Date of change March 31, 2017
Reason of the change and description
Due to the structural organizational adjustment of PricewaterhouseCoopers Taiwan, the company certification accountant of 2017 is changed to Chang, Shu-Chiung and Weng,Shih-Jung.
Description of the termination or non-appointment of the entrustee or accountant
Party Situation
Accountant Appointed to
Active termination of appointment
Not avaliable No further appointment is accepted (continued)
Reason and opinion of approved audit report without further opinion of the latest two years
Not avaliable
Disagreement with the publisher
YES
Accounting principles or practices
Disclosure of financial report
Audit scope or procedure
Other
None V
Description Not avaliable
Other disclosure (The discloser shall be included based on Article 10.5(4) of the Guideline
None
6.2 About the successor-account
Firm name PricewaterhouseCoopers Taiwan
Accountant name Chang, Shu-Chiung and Weng,Shih-Jung.
Appointment date March 31, 2017
For the accountant of particular transaction before the appointment, the management approach or accounting principles and the counselling and results of the approval of the financial report.
Not avaliable
Written opinions of the successor-accountant against the previous accountant.
Not avaliable
6.3 Reply of the previous accountant towards Article 10 Paragraph 5 Item 1 and 2-3 of “Guidelines of Mandatory Recordings in the Annual Report of the Public Company”.
7. The Chairman, President and the Manager in charge of finance or accounting
matters who has worked for the independent auditor or related parties in the most
recent year
~41~
8. Information on shareholding transfer and pledge by Directors, Supervisors,
Department Heads and Shareholders with over 10% shareholding in the most
recent year and up to the printing of the annual report
8.1 The equity changes or modification of pledge of the directors, supervisors, managers and
shareholders with more than 10% of the shares.
Unit: share
Title (Note 1) Name
2017 Till March 31, 2018 The increased
(decreased) number
of possessed shares
The increased
(decreased) number
of pledged shares
The increased
(decreased) number
of possessed shares
The increased
(decreased) number
of pledged shares
Director (two seats) Jia Shuan Investment
Company (Note 2) 0 0 0 0
Director Yi Wei Investment
Company 0 0 0 0
Independent director Wu, Chung -pao 0 0 0 0
Independent director Lu, Zong-Jenn (18,000) 0 0 0
Independent director Lin, Hsiao-Ming 0 0 0 0
Director Ma, Guo-peng (216,000) 0 0 0
Director Hsiao, Min-chih 0 0 0 0
Director Cheng, Chin-chuan 0 0 0 0
Chairman and CEO Kao,Hsiu-Ming 0 0 0 0
President Lin, Yue-yeh (909,000) 0 (258,000) 0
Group GM Chen Jian-Tsuen
(Note 3) 0 0 40,000 0
Group VGM Wei Jian-Ming 0 0 0 0
Divison GM Huang, Zhong-wen
(Note 4) 35,000 0 0 0
Divison GM Chang Ruei-Ru
(Note 4) 0 0 35,000 0
Divison VGM Li Ruei-wen (Note 5) 0 0 (8,000) 0
Vice General
Manager and
Financial Supervisor
Hsieh, Ming-Ju 40,000 0 0 0
Accounting
Supervisor Zhong, Chi-wen 25,000 0 0 0
Note 1: Shareholderswith more than 10% of the shares shall be specified as the biggest shareholder of the company and belisted separately.
Note 2: Ji Shuan Investment Company has more than 10% of the shares which makes it the biggest shareholder.
Note 3: Mr. Chen Chien-Tun has on June 1, 2017 been promoted to Enterprise Group President.
Note 4: Mr. Huang Tsung-Wen and Chang Jui-Ju have on April 11, 2018 been promoted to Enterprise Division Presidents.
Note 5: Mr. Li Ruei-Wen has on February 1, 2017 been promoted to Enterprise Division Vice President.
8.2 Equity transfer
Directors, supervisors, managers and other shareholders with more than 10% of shares have
no right to transfer the equity to other persons.
8.3 Share pledge
Directors, supervisors, managers and other shareholders with more than 10% of shares have
no right to pledge.
~42~
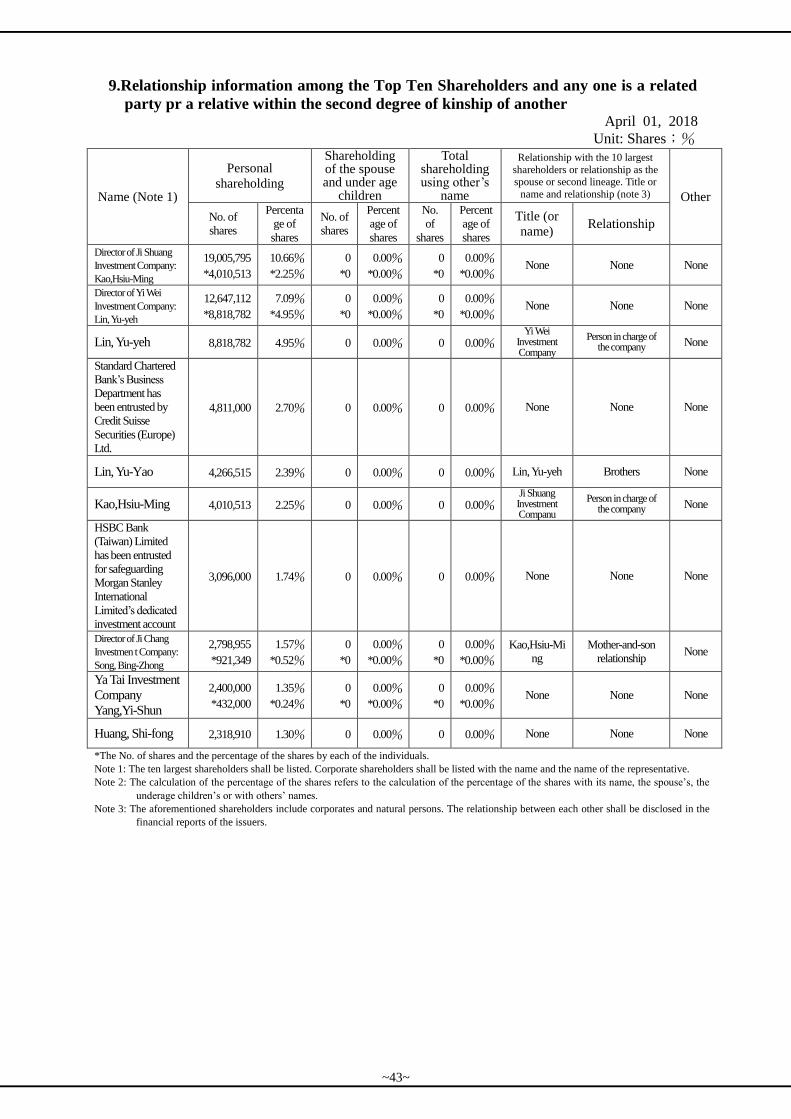
9.Relationship information among the Top Ten Shareholders and any one is a related
party pr a relative within the second degree of kinship of another April 01, 2018
Unit: Shares;%
Name (Note 1)
Personal
shareholding
Shareholding of the spouse and under age
children
Total shareholding using other’s
name
Relationship with the 10 largest
shareholders or relationship as the spouse or second lineage. Title or
name and relationship (note 3) Other
No. of
shares
Percenta
ge of
shares
No. of
shares
Percent
age of
shares
No.
of
shares
Percent
age of
shares
Title (or
name) Relationship
Director of Ji Shuang
Investment Company:
Kao,Hsiu-Ming
19,005,795
*4,010,513
10.66%
*2.25%
0
*0
0.00%
*0.00%
0
*0
0.00%
*0.00% None None None
Director of Yi Wei
Investment Company:
Lin, Yu-yeh
12,647,112
*8,818,782
7.09%
*4.95%
0
*0
0.00%
*0.00%
0
*0
0.00%
*0.00% None None None
Lin, Yu-yeh 8,818,782 4.95% 0 0.00% 0 0.00% Yi Wei
Investment Company
Person in charge of the company None
Standard Chartered
Bank’s Business
Department has
been entrusted by
Credit Suisse
Securities (Europe)
Ltd.
4,811,000 2.70% 0 0.00% 0 0.00% None None None
Lin, Yu-Yao 4,266,515 2.39% 0 0.00% 0 0.00% Lin, Yu-yeh Brothers None
Kao,Hsiu-Ming 4,010,513 2.25% 0 0.00% 0 0.00% Ji Shuang Investment Companu
Person in charge of the company None
HSBC Bank
(Taiwan) Limited
has been entrusted
for safeguarding
Morgan Stanley
International
Limited’s dedicated
investment account
3,096,000 1.74% 0 0.00% 0 0.00% None None None
Director of Ji Chang
Investmen t Company:
Song, Bing-Zhong
2,798,955
*921,349
1.57%
*0.52%
0
*0
0.00%
*0.00%
0
*0
0.00%
*0.00%
Kao,Hsiu-Mi
ng
Mother-and-son
relationship None
Ya Tai Investment
Company
Yang,Yi-Shun
2,400,000
*432,000
1.35%
*0.24%
0
*0
0.00%
*0.00%
0
*0
0.00%
*0.00% None None None
Huang, Shi-fong 2,318,910 1.30% 0 0.00% 0 0.00% None None None
*The No. of shares and the percentage of the shares by each of the individuals.
Note 1: The ten largest shareholders shall be listed. Corporate shareholders shall be listed with the name and the name of the representative.
Note 2: The calculation of the percentage of the shares refers to the calculation of the percentage of the shares with its name, the spouse’s, the
underage children’s or with others’ names.
Note 3: The aforementioned shareholders include corporates and natural persons. The relationship between each other shall be disclosed in the
financial reports of the issuers.
~43~
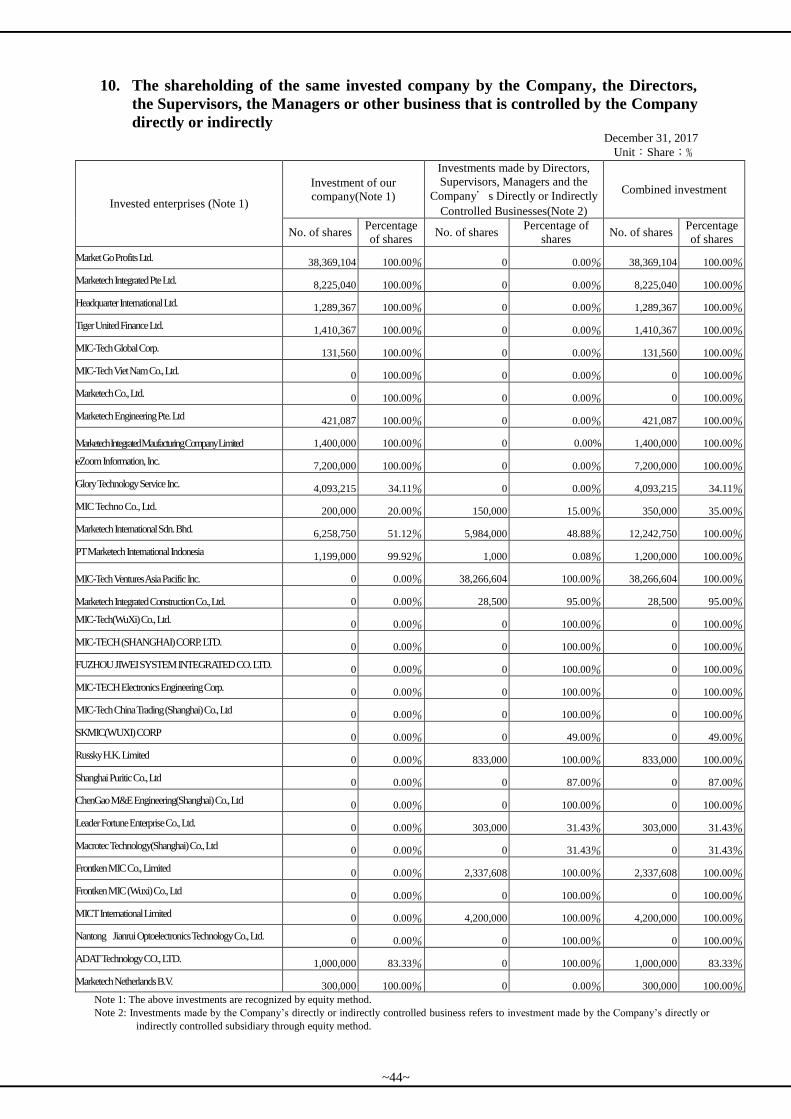
10. The shareholding of the same invested company by the Company, the Directors,
the Supervisors, the Managers or other business that is controlled by the Company
directly or indirectly December 31, 2017
Unit:Share;﹪
Invested enterprises (Note 1)
Investment of our
company(Note 1)
Investments made by Directors,
Supervisors, Managers and the
Company’s Directly or Indirectly
Controlled Businesses(Note 2)
Combined investment
No. of shares Percentage
of shares No. of shares
Percentage of
shares No. of shares
Percentage
of shares
Market Go Profits Ltd. 38,369,104 100.00% 0 0.00% 38,369,104 100.00%
Marketech Integrated Pte Ltd. 8,225,040 100.00% 0 0.00% 8,225,040 100.00%
Headquarter International Ltd. 1,289,367 100.00% 0 0.00% 1,289,367 100.00%
Tiger United Finance Ltd. 1,410,367 100.00% 0 0.00% 1,410,367 100.00%
MIC-Tech Global Corp. 131,560 100.00% 0 0.00% 131,560 100.00%
MIC-Tech Viet Nam Co., Ltd. 0 100.00% 0 0.00% 0 100.00%
Marketech Co., Ltd. 0 100.00% 0 0.00% 0 100.00%
Marketech Engineering Pte. Ltd 421,087 100.00% 0 0.00% 421,087 100.00%
Marketech Integrated Maufacturing Company Limited 1,400,000 100.00% 0 0.00% 1,400,000 100.00%
eZoom Information, Inc. 7,200,000 100.00% 0 0.00% 7,200,000 100.00%
Glory Technology Service Inc. 4,093,215 34.11% 0 0.00% 4,093,215 34.11%
MIC Techno Co., Ltd. 200,000 20.00% 150,000 15.00% 350,000 35.00%
Marketech International Sdn. Bhd. 6,258,750 51.12% 5,984,000 48.88% 12,242,750 100.00%
PT Marketech International Indonesia 1,199,000 99.92% 1,000 0.08% 1,200,000 100.00%
MIC-Tech Ventures Asia Pacific Inc. 0 0.00% 38,266,604 100.00% 38,266,604 100.00%
Marketech Integrated Construction Co., Ltd. 0 0.00% 28,500 95.00% 28,500 95.00%
MIC-Tech(WuXi) Co., Ltd. 0 0.00% 0 100.00% 0 100.00%
MIC-TECH (SHANGHAI) CORP. LTD. 0 0.00% 0 100.00% 0 100.00%
FUZHOU JIWEI SYSTEM INTEGRATED CO. LTD. 0 0.00% 0 100.00% 0 100.00%
MIC-TECH Electronics Engineering Corp. 0 0.00% 0 100.00% 0 100.00%
MIC-Tech China Trading (Shanghai) Co., Ltd 0 0.00% 0 100.00% 0 100.00%
SKMIC(WUXI) CORP 0 0.00% 0 49.00% 0 49.00%
Russky H.K. Limited 0 0.00% 833,000 100.00% 833,000 100.00%
Shanghai Puritic Co., Ltd 0 0.00% 0 87.00% 0 87.00%
ChenGao M&E Engineering(Shanghai) Co., Ltd 0 0.00% 0 100.00% 0 100.00%
Leader Fortune Enterprise Co., Ltd. 0 0.00% 303,000 31.43% 303,000 31.43%
Macrotec Technology(Shanghai) Co., Ltd 0 0.00% 0 31.43% 0 31.43%
Frontken MIC Co., Limited 0 0.00% 2,337,608 100.00% 2,337,608 100.00%
Frontken MIC (Wuxi) Co., Ltd 0 0.00% 0 100.00% 0 100.00%
MICT International Limited 0 0.00% 4,200,000 100.00% 4,200,000 100.00%
Nantong Jianrui Optoelectronics Technology Co., Ltd. 0 0.00% 0 100.00% 0 100.00%
ADAT Technology CO., LTD. 1,000,000 83.33% 0 100.00% 1,000,000 83.33%
Marketech Netherlands B.V. 300,000 100.00% 0 0.00% 300,000 100.00%
Note 1: The above investments are recognized by equity method.
Note 2: Investments made by the Company’s directly or indirectly controlled business refers to investment made by the Company’s directly or
indirectly controlled subsidiary through equity method.
~44~
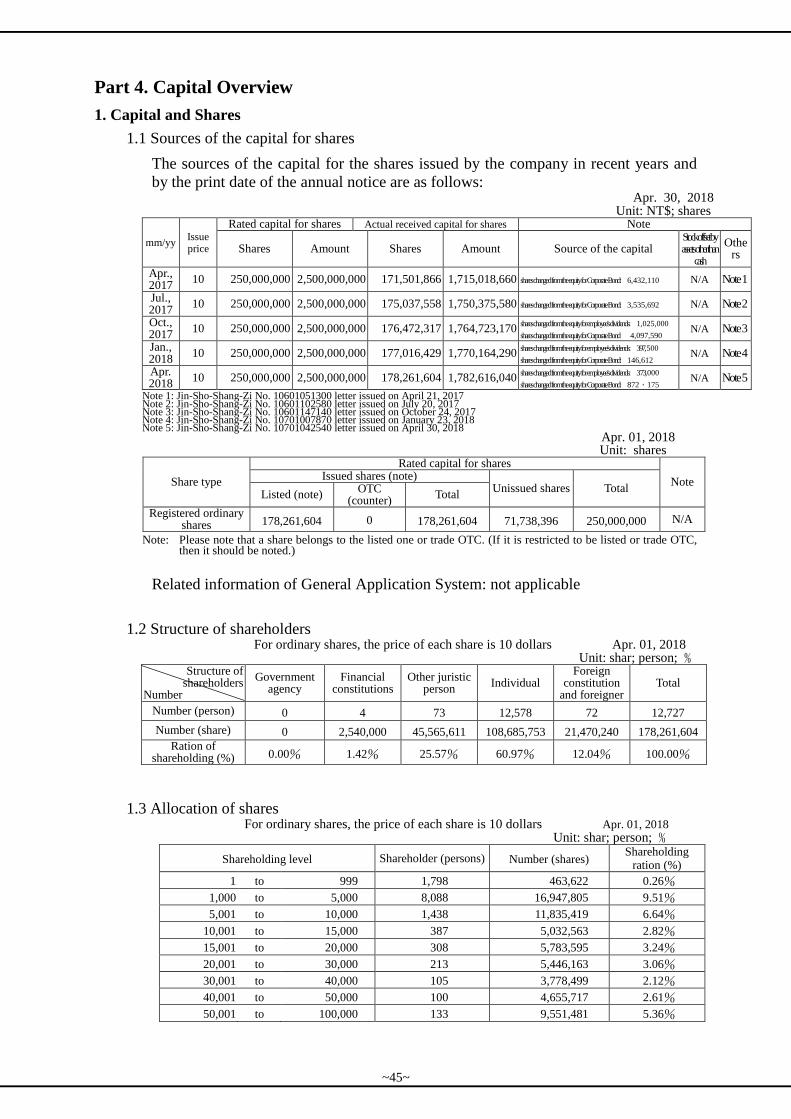
Part 4. Capital Overview
1. Capital and Shares
1.1 Sources of the capital for shares
The sources of the capital for the shares issued by the company in recent years and
by the print date of the annual notice are as follows: Apr. 30, 2018
Unit: NT$; shares
mm/yy Issue price
Rated capital for shares Actual received capital for shares Note
Shares Amount Shares Amount Source of the capital Stock offset by assets other than
cash
Others
Apr., 2017
10 250,000,000 2,500,000,000 171,501,866 1,715,018,660 shares changed from the equity for Corporate Bond: 6,432,110 N/A Note 1
Jul., 2017
10 250,000,000 2,500,000,000 175,037,558 1,750,375,580 shares changed from the equity for Corporate Bond: 3,535,692 N/A Note 2
Oct., 2017
10 250,000,000 2,500,000,000 176,472,317 1,764,723,170 shares changed from the equity for employee's dividends: 1,025,000
shares changed from the equity for Corporate Bond 4,097,590 N/A Note 3
Jan., 2018
10 250,000,000 2,500,000,000 177,016,429 1,770,164,290 shares changed from the equity for employee's dividends: 397,500
shares changed from the equity for Corporate Bond: 146,612 N/A Note 4
Apr. 2018
10 250,000,000 2,500,000,000 178,261,604 1,782,616,040 shares changed from the equity for employee's dividends: 3 73,000
shares changed from the equity for Corporate Bond: 872,175 N/A Note 5
Note 1: Jin-Sho-Shang-Zi No. 10601051300 letter issued on April 21, 2017 Note 2: Jin-Sho-Shang-Zi No. 10601102580 letter issued on July 20, 2017 Note 3: Jin-Sho-Shang-Zi No. 10601147140 letter issued on October 24, 2017 Note 4: Jin-Sho-Shang-Zi No. 10701007870 letter issued on January 23, 2018 Note 5: Jin-Sho-Shang-Zi No. 10701042540 letter issued on April 30, 2018 Apr. 01, 2018
Unit: shares
Share type
Rated capital for shares
Note Issued shares (note)
Unissued shares Total Listed (note)
OTC (counter)
Total
Registered ordinary shares 178,261,604 0 178,261,604 71,738,396 250,000,000 N/A
Note: Please note that a share belongs to the listed one or trade OTC. (If it is restricted to be listed or trade OTC, then it should be noted.)
Related information of General Application System: not applicable
1.2 Structure of shareholders For ordinary shares, the price of each share is 10 dollars Apr. 01, 2018
Unit: shar; person; ﹪ Structure of
shareholders Number
Government agency
Financial constitutions
Other juristic person
Individual Foreign
constitution and foreigner
Total
Number (person) 0 4 73 12,578 72 12,727
Number (share) 0 2,540,000 45,565,611 108,685,753 21,470,240 178,261,604
Ration of shareholding (%) 0.00% 1.42% 25.57% 60.97% 12.04% 100.00%
1.3 Allocation of shares For ordinary shares, the price of each share is 10 dollars Apr. 01, 2018
Unit: shar; person; ﹪
Shareholding level Shareholder (persons) Number (shares) Shareholding
ration (%)
1 to 999 1,798 463,622 0.26%
1,000 to 5,000 8,088 16,947,805 9.51%
5,001 to 10,000 1,438 11,835,419 6.64%
10,001 to 15,000 387 5,032,563 2.82%
15,001 to 20,000 308 5,783,595 3.24%
20,001 to 30,000 213 5,446,163 3.06%
30,001 to 40,000 105 3,778,499 2.12%
40,001 to 50,000 100 4,655,717 2.61%
50,001 to 100,000 133 9,551,481 5.36%
~45~
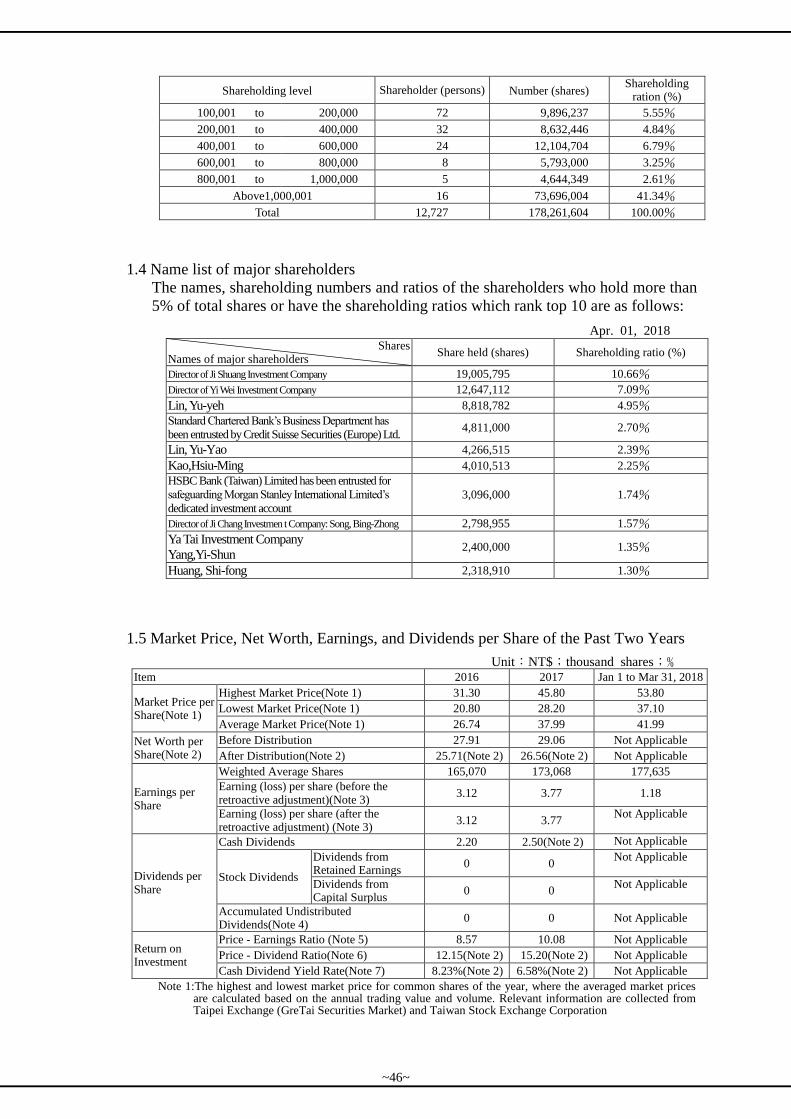
Shareholding level Shareholder (persons) Number (shares) Shareholding
ration (%)
100,001 to 200,000 72 9,896,237 5.55%
200,001 to 400,000 32 8,632,446 4.84%
400,001 to 600,000 24 12,104,704 6.79%
600,001 to 800,000 8 5,793,000 3.25%
800,001 to 1,000,000 5 4,644,349 2.61%
Above1,000,001 16 73,696,004 41.34%
Total 12,727 178,261,604 100.00%
1.4 Name list of major shareholders
The names, shareholding numbers and ratios of the shareholders who hold more than
5% of total shares or have the shareholding ratios which rank top 10 are as follows:
Apr. 01, 2018 Shares
Names of major shareholders Share held (shares) Shareholding ratio (%)
Director of Ji Shuang Investment Company 19,005,795 10.66%
Director of Yi Wei Investment Company 12,647,112 7.09%
Lin, Yu-yeh 8,818,782 4.95%
Standard Chartered Bank’s Business Department has
been entrusted by Credit Suisse Securities (Europe) Ltd. 4,811,000 2.70%
Lin, Yu-Yao 4,266,515 2.39%
Kao,Hsiu-Ming 4,010,513 2.25%
HSBC Bank (Taiwan) Limited has been entrusted for
safeguarding Morgan Stanley International Limited’s
dedicated investment account
3,096,000 1.74%
Director of Ji Chang Investmen t Company: Song, Bing-Zhong 2,798,955 1.57%
Ya Tai Investment Company
Yang,Yi-Shun 2,400,000 1.35%
Huang, Shi-fong 2,318,910 1.30%
1.5 Market Price, Net Worth, Earnings, and Dividends per Share of the Past Two Years
Unit:NT$;thousand shares;﹪ Item 2016 2017 Jan 1 to Mar 31, 2018
Market Price per Share(Note 1)
Highest Market Price(Note 1) 31.30 45.80 53.80
Lowest Market Price(Note 1) 20.80 28.20 37.10
Average Market Price(Note 1) 26.74 37.99 41.99
Net Worth per Share(Note 2)
Before Distribution 27.91 29.06 Not Applicable
After Distribution(Note 2) 25.71(Note 2) 26.56(Note 2) Not Applicable
Earnings per Share
Weighted Average Shares 165,070 173,068 177,635
Earning (loss) per share (before the retroactive adjustment)(Note 3)
3.12 3.77 1.18
Earning (loss) per share (after the retroactive adjustment) (Note 3)
3.12 3.77 Not Applicable
Dividends per Share
Cash Dividends 2.20 2.50(Note 2) Not Applicable
Stock Dividends
Dividends from Retained Earnings
0 0 Not Applicable
Dividends from Capital Surplus
0 0 Not Applicable
Accumulated Undistributed Dividends(Note 4)
0 0 Not Applicable
Return on Investment
Price - Earnings Ratio (Note 5) 8.57 10.08 Not Applicable
Price - Dividend Ratio(Note 6) 12.15(Note 2) 15.20(Note 2) Not Applicable
Cash Dividend Yield Rate(Note 7) 8.23%(Note 2) 6.58%(Note 2) Not Applicable
Note 1:The highest and lowest market price for common shares of the year, where the averaged market prices are calculated based on the annual trading value and volume. Relevant information are collected from Taipei Exchange (GreTai Securities Market) and Taiwan Stock Exchange Corporation
~46~
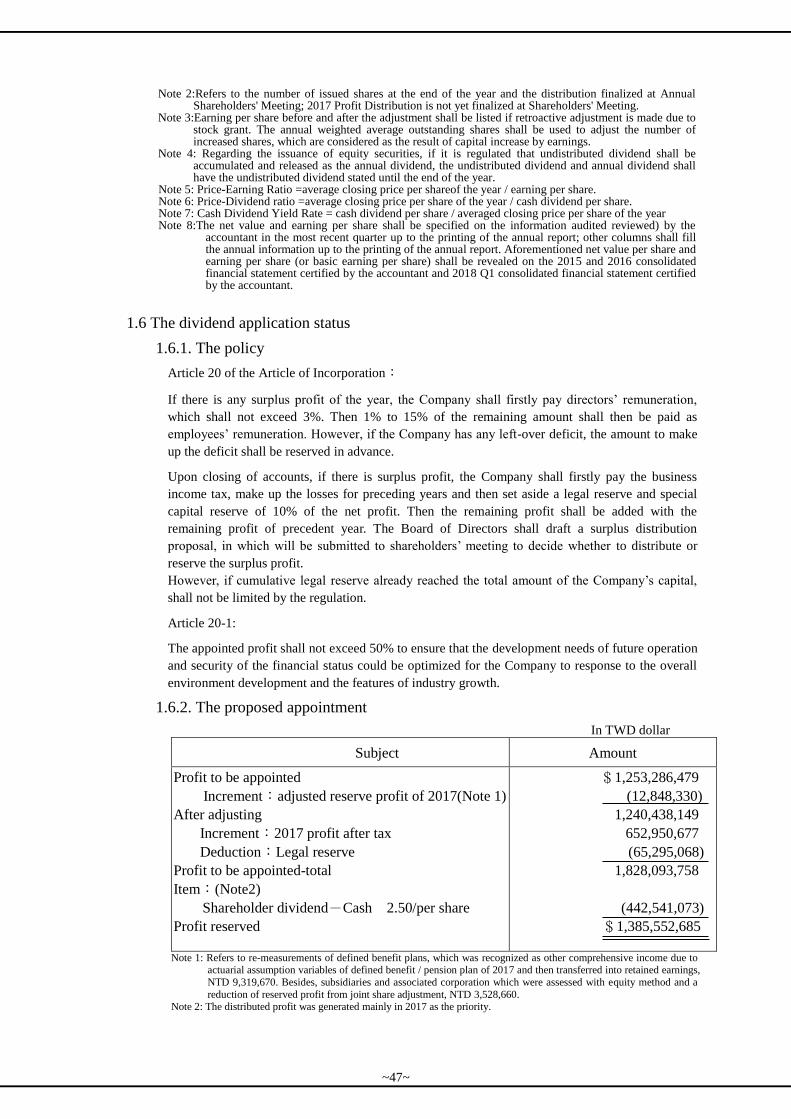
Note 2:Refers to the number of issued shares at the end of the year and the distribution finalized at Annual
Shareholders' Meeting; 2017 Profit Distribution is not yet finalized at Shareholders' Meeting. Note 3:Earning per share before and after the adjustment shall be listed if retroactive adjustment is made due to
stock grant. The annual weighted average outstanding shares shall be used to adjust the number of increased shares, which are considered as the result of capital increase by earnings.
Note 4: Regarding the issuance of equity securities, if it is regulated that undistributed dividend shall be accumulated and released as the annual dividend, the undistributed dividend and annual dividend shall have the undistributed dividend stated until the end of the year.
Note 5: Price-Earning Ratio =average closing price per shareof the year / earning per share. Note 6: Price-Dividend ratio =average closing price per share of the year / cash dividend per share. Note 7: Cash Dividend Yield Rate = cash dividend per share / averaged closing price per share of the year Note 8:The net value and earning per share shall be specified on the information audited reviewed) by the
accountant in the most recent quarter up to the printing of the annual report; other columns shall fill the annual information up to the printing of the annual report. Aforementioned net value per share and earning per share (or basic earning per share) shall be revealed on the 2015 and 2016 consolidated financial statement certified by the accountant and 2018 Q1 consolidated financial statement certified by the accountant.
1.6 The dividend application status
1.6.1. The policy
Article 20 of the Article of Incorporation:
If there is any surplus profit of the year, the Company shall firstly pay directors’ remuneration,
which shall not exceed 3%. Then 1% to 15% of the remaining amount shall then be paid as
employees’ remuneration. However, if the Company has any left-over deficit, the amount to make
up the deficit shall be reserved in advance.
Upon closing of accounts, if there is surplus profit, the Company shall firstly pay the business
income tax, make up the losses for preceding years and then set aside a legal reserve and special
capital reserve of 10% of the net profit. Then the remaining profit shall be added with the
remaining profit of precedent year. The Board of Directors shall draft a surplus distribution
proposal, in which will be submitted to shareholders’ meeting to decide whether to distribute or
reserve the surplus profit.
However, if cumulative legal reserve already reached the total amount of the Company’s capital,
shall not be limited by the regulation.
Article 20-1:
The appointed profit shall not exceed 50% to ensure that the development needs of future operation
and security of the financial status could be optimized for the Company to response to the overall
environment development and the features of industry growth.
1.6.2. The proposed appointment
In TWD dollar
Subject Amount
Profit to be appointed
Increment:adjusted reserve profit of 2017(Note 1)
After adjusting
Increment:2017 profit after tax
Deduction:Legal reserve
Profit to be appointed-total
Item:(Note2)
Shareholder dividend-Cash 2.50/per share
Profit reserved
$1,253,286,479
(12,848,330)
1,240,438,149
652,950,677
(65,295,068)
1,828,093,758
(442,541,073)
$1,385,552,685
Note 1: Refers to re-measurements of defined benefit plans, which was recognized as other comprehensive income due to actuarial assumption variables of defined benefit / pension plan of 2017 and then transferred into retained earnings,
NTD 9,319,670. Besides, subsidiaries and associated corporation which were assessed with equity method and a
reduction of reserved profit from joint share adjustment, NTD 3,528,660. Note 2: The distributed profit was generated mainly in 2017 as the priority.
~47~
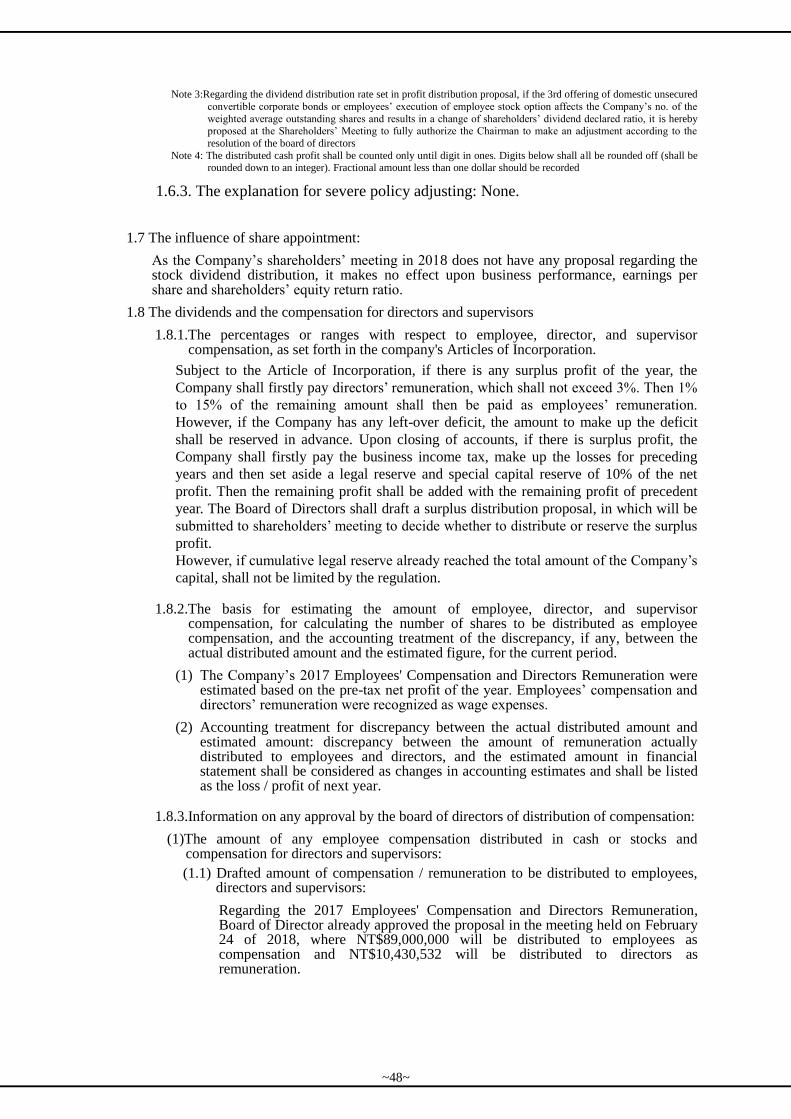
Note 3:Regarding the dividend distribution rate set in profit distribution proposal, if the 3rd offering of domestic unsecured
convertible corporate bonds or employees’ execution of employee stock option affects the Company’s no. of the
weighted average outstanding shares and results in a change of shareholders’ dividend declared ratio, it is hereby proposed at the Shareholders’ Meeting to fully authorize the Chairman to make an adjustment according to the
resolution of the board of directors
Note 4: The distributed cash profit shall be counted only until digit in ones. Digits below shall all be rounded off (shall be rounded down to an integer). Fractional amount less than one dollar should be recorded
1.6.3. The explanation for severe policy adjusting: None.
1.7 The influence of share appointment:
As the Company’s shareholders’ meeting in 2018 does not have any proposal regarding the stock dividend distribution, it makes no effect upon business performance, earnings per share and shareholders’ equity return ratio.
1.8 The dividends and the compensation for directors and supervisors
1.8.1.The percentages or ranges with respect to employee, director, and supervisor compensation, as set forth in the company's Articles of Incorporation.
Subject to the Article of Incorporation, if there is any surplus profit of the year, the
Company shall firstly pay directors’ remuneration, which shall not exceed 3%. Then 1%
to 15% of the remaining amount shall then be paid as employees’ remuneration.
However, if the Company has any left-over deficit, the amount to make up the deficit
shall be reserved in advance. Upon closing of accounts, if there is surplus profit, the
Company shall firstly pay the business income tax, make up the losses for preceding
years and then set aside a legal reserve and special capital reserve of 10% of the net
profit. Then the remaining profit shall be added with the remaining profit of precedent
year. The Board of Directors shall draft a surplus distribution proposal, in which will be
submitted to shareholders’ meeting to decide whether to distribute or reserve the surplus
profit.
However, if cumulative legal reserve already reached the total amount of the Company’s
capital, shall not be limited by the regulation.
1.8.2.The basis for estimating the amount of employee, director, and supervisor compensation, for calculating the number of shares to be distributed as employee compensation, and the accounting treatment of the discrepancy, if any, between the actual distributed amount and the estimated figure, for the current period.
(1) The Company’s 2017 Employees' Compensation and Directors Remuneration were estimated based on the pre-tax net profit of the year. Employees’ compensation and directors’ remuneration were recognized as wage expenses.
(2) Accounting treatment for discrepancy between the actual distributed amount and estimated amount: discrepancy between the amount of remuneration actually distributed to employees and directors, and the estimated amount in financial statement shall be considered as changes in accounting estimates and shall be listed as the loss / profit of next year.
1.8.3.Information on any approval by the board of directors of distribution of compensation:
(1)The amount of any employee compensation distributed in cash or stocks and compensation for directors and supervisors:
(1.1) Drafted amount of compensation / remuneration to be distributed to employees, directors and supervisors:
Regarding the 2017 Employees' Compensation and Directors Remuneration, Board of Director already approved the proposal in the meeting held on February 24 of 2018, where NT$89,000,000 will be distributed to employees as compensation and NT$10,430,532 will be distributed to directors as remuneration.
~48~
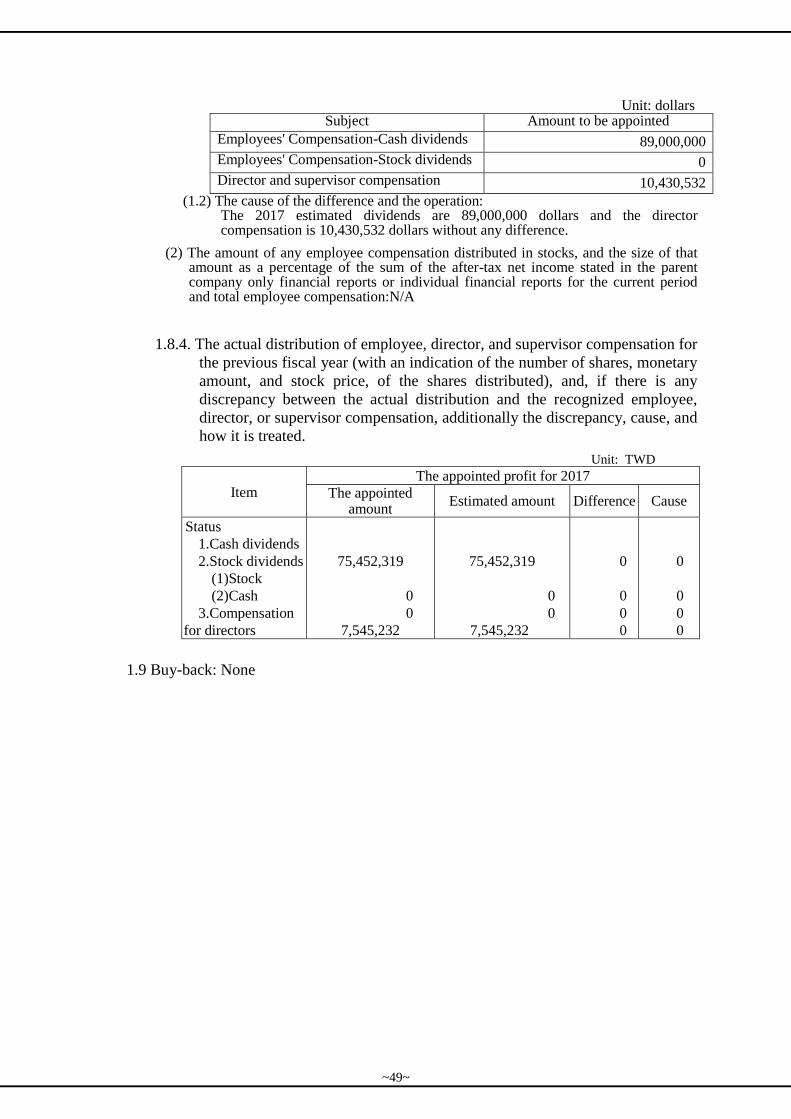
Unit: dollars Subject Amount to be appointed
Employees' Compensation-Cash dividends 89,000,000
Employees' Compensation-Stock dividends 0
Director and supervisor compensation 10,430,532
(1.2) The cause of the difference and the operation: The 2017 estimated dividends are 89,000,000 dollars and the director compensation is 10,430,532 dollars without any difference.
(2) The amount of any employee compensation distributed in stocks, and the size of that amount as a percentage of the sum of the after-tax net income stated in the parent company only financial reports or individual financial reports for the current period and total employee compensation:N/A
1.8.4. The actual distribution of employee, director, and supervisor compensation for
the previous fiscal year (with an indication of the number of shares, monetary
amount, and stock price, of the shares distributed), and, if there is any
discrepancy between the actual distribution and the recognized employee,
director, or supervisor compensation, additionally the discrepancy, cause, and
how it is treated.
Unit: TWD
Item The appointed profit for 2017
The appointed amount
Estimated amount Difference Cause
Status
1.Cash dividends
2.Stock dividends
(1)Stock
(2)Cash
3.Compensation
for directors
75,452,319
0
0
7,545,232
75,452,319
0
0
7,545,232
0
0
0
0
0
0
0
0
1.9 Buy-back: None
~49~
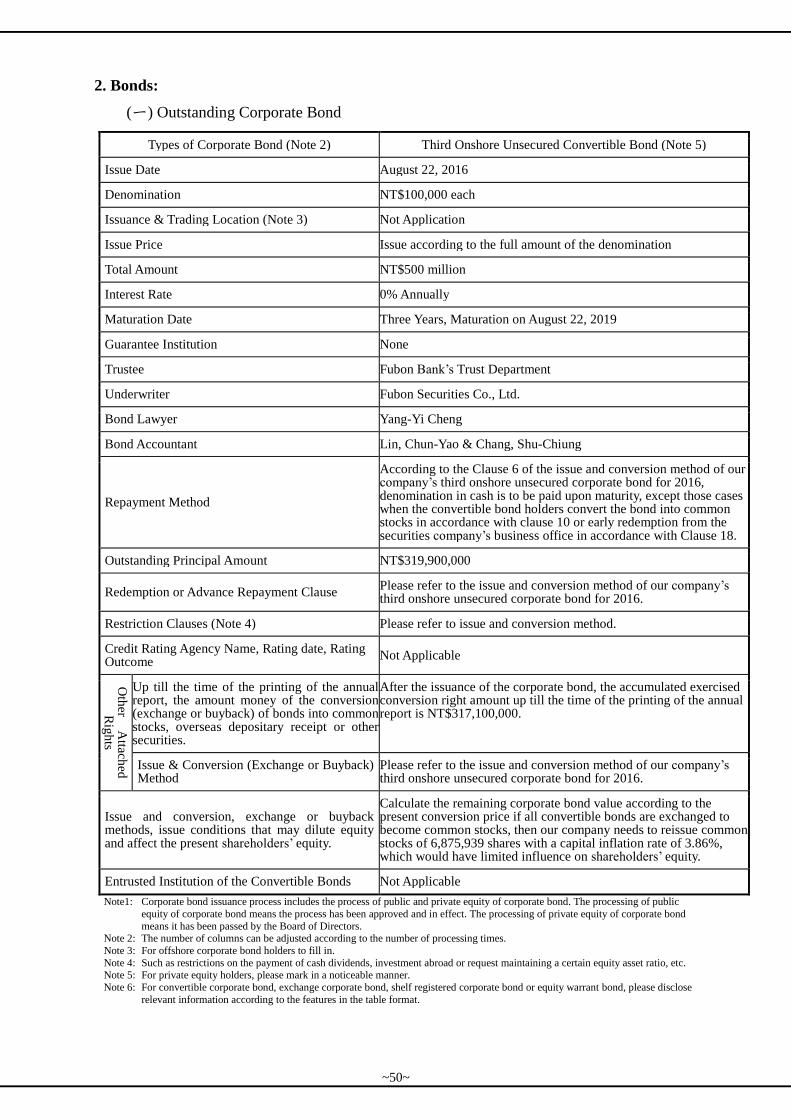
2. Bonds:
(一) Outstanding Corporate Bond
Types of Corporate Bond (Note 2) Third Onshore Unsecured Convertible Bond (Note 5)
Issue Date August 22, 2016
Denomination NT$100,000 each
Issuance & Trading Location (Note 3) Not Application
Issue Price Issue according to the full amount of the denomination
Total Amount NT$500 million
Interest Rate 0% Annually
Maturation Date Three Years, Maturation on August 22, 2019
Guarantee Institution None
Trustee Fubon Bank’s Trust Department
Underwriter Fubon Securities Co., Ltd.
Bond Lawyer Yang-Yi Cheng
Bond Accountant Lin, Chun-Yao & Chang, Shu-Chiung
Repayment Method
According to the Clause 6 of the issue and conversion method of our company’s third onshore unsecured corporate bond for 2016, denomination in cash is to be paid upon maturity, except those cases when the convertible bond holders convert the bond into common stocks in accordance with clause 10 or early redemption from the securities company’s business office in accordance with Clause 18.
Outstanding Principal Amount NT$319,900,000
Redemption or Advance Repayment Clause Please refer to the issue and conversion method of our company’s third onshore unsecured corporate bond for 2016.
Restriction Clauses (Note 4) Please refer to issue and conversion method.
Credit Rating Agency Name, Rating date, Rating Outcome
Not Applicable O
ther
A
ttached
R
igh
ts Up till the time of the printing of the annual report, the amount money of the conversion (exchange or buyback) of bonds into common stocks, overseas depositary receipt or other securities.
After the issuance of the corporate bond, the accumulated exercised conversion right amount up till the time of the printing of the annual report is NT$317,100,000.
Issue & Conversion (Exchange or Buyback) Method
Please refer to the issue and conversion method of our company’s third onshore unsecured corporate bond for 2016.
Issue and conversion, exchange or buyback methods, issue conditions that may dilute equity and affect the present shareholders’ equity.
Calculate the remaining corporate bond value according to the present conversion price if all convertible bonds are exchanged to become common stocks, then our company needs to reissue common stocks of 6,875,939 shares with a capital inflation rate of 3.86%, which would have limited influence on shareholders’ equity.
Entrusted Institution of the Convertible Bonds Not Applicable
Note1: Corporate bond issuance process includes the process of public and private equity of corporate bond. The processing of public
equity of corporate bond means the process has been approved and in effect. The processing of private equity of corporate bond
means it has been passed by the Board of Directors. Note 2: The number of columns can be adjusted according to the number of processing times.
Note 3: For offshore corporate bond holders to fill in.
Note 4: Such as restrictions on the payment of cash dividends, investment abroad or request maintaining a certain equity asset ratio, etc. Note 5: For private equity holders, please mark in a noticeable manner.
Note 6: For convertible corporate bond, exchange corporate bond, shelf registered corporate bond or equity warrant bond, please disclose
relevant information according to the features in the table format.
~50~
(二) Convertible Corporate Bond Information
Unit: New Taiwan Dollar
Types of Corporate Bond (Note 1) Third Onshore Unsecured Convertible Bond
Item / Year Year 2017 From the beginning of 2018 till March 31,
2018 (Note 4)
Market Price of
Convertible Corporate
Bond (Note 2)
Maximum 162.00 175.00
Minimum 109.00 153.00
Average 130.89 157.78
Conversion Price 26.60 26.60
Issue Date & Conversion Price at
Issuance
Issue Date: August 22, 2016
Conversion Price at Issuance: NT$28/Share
Obligation Method for Executing the
Conversion (Note 3) Issue new shares
Note 1: The number of columns can be adjusted according to the number of processing times.
Note 2: If there are multiple trading locations for offshore corporate bond, please list the prices according to trading locations.
Note 3: Deliver issued shares or new shares.
Note 4: The annual information should be filled up to the time of the printing of the annual report.
(3) Shelf registered corporate bond: None
(4) Information on equity warrant bond: None
3. Preferred Stock:None
4. Global Depository Receipts:None
~51~
5. Employee Stock Options:
5.1 Unexpired employee subscription warrants issued by the company in existence as of
the date of printing of the annual report, and the effect of such warrants upon
shareholders' equity.
April 30 of 2017
Types of Employee Subscription Warrants (Note 2)
1st Employee Subscription Warrants of 2015
Report Effective Date July 15, 2015
Issuance (handling) date (Note4)
September 11, 2015
Number of issued units 3,956,000 units
Every unit can subscribe one common stock
Percentage of issued subscription shares to total issued shares (%)
2.2192%(Note 6)
Validity of share subscription (stock option)
September 11 2017 to September 10 2021
Method of Performance (Note 3)
To issue new shares
Period with limitations in share subscription and the ratio (%)
Share subscribers may, two years after the second day of the issuance date, perform their share subscription according to below schedule. The proportion of performing share subscription accumulated during the share subscription warrant granting period.
After 2 years 50﹪ After 3 years 75﹪ After 4 years 100﹪
Acquired number of shares 1,795,500 shares
Amount of subscribed shares NT$31,062,150
Number of non-subscribed shares
2,059,500 shares
The subscription price of each share for people have not yet subscribed the share.
NT$17.30
Percentage of non-subscribed shares to total issued shares (%)(%)
1.1553%(Note6)
Effect of warrant upon equity to shareholders
The validity employees’ share subscription warrant is 6 years. Share subscribers shall, starting 2 years after the second day of the issuance date, implement it three times in three years, which helps to lessen effect on the equity to original shareholders year by year. Therefore, the dilution effect is somehow limited.
Note 1: The status of processing employee share subscription warrants may refer to ongoing public or private placement for employee share subscription warrants. The ongoing public placement for employee share subscription warrants refer to those that have become effective, whereas ongoing private placement for employee share subscription warrants refers to those that have passed resolution of the Shareholders’ Meeting
Note 2: The number of columns shall be adjusted according to the number of times of holding it. Note 3: Shall note down the consignment of issued shares or issuance of new shares Note 4: Those with different issuance and hAAAandling dates shall have them listed separately. Note 5: Those that belong to private placement shall be marked in obvious ways. Note 6: Here the “total issued shares” in “Percentage of issued subscription shares to total issued shares (%)” is
calculated based on the total number of issued shares up to the printing of the annual report (April 30 of 2018) , which is 178,261,604 shares.
Note 7: The Company’s 1st Employee Stock Option Certificates (Share Subscription Warrants) Plan of 2015 was approved by the competent authority to issue 4,000,000 units. The Company has, on September 11 of 2015, issued 3,956,000 units. Up to the printing of the annual report (April 30 of 2018), the number of approved non-issued employee share subscription warranty is 44,000 units.
~52~
5.2 Up to the printing of the annual report, the name and acquisition / subscription status of managers who have acquired employee sha re su
bscription warrants and the top ten employees who have acquired share subscription warrants and are eligible to subscribe the sharess.
April 30, 2018
Noe 1: Managers or employees (those who already resigned or dead shall be noted down accordingly), their names and job titles shall be revealed. However, their status of acquisition and subscription shall be stated in a summarized form.
Noe 2: The number of columns shall be adjusted according to the number of times of holding it. Noe 3:The top ten employeesrefer to employees who have acquired share subscription warrants and are eligible to subscribe the shares. However, managers are excluded in the case. Noe 4: Here the “total issued shares” refers to the total number of issued shares up to the printing of the annual report (April 30 of 2018) , which is 178,261,604 shares. Noe 5:When the rights of the employ stock option have been executed, the option price should be disclosed. Noe 6:When the rights of the employ stock option have not been executed, the adjusted option price according to the issue method should be disclosed. Noe 7:Mr. Ruei-Wen Li was promoted to become the Deputy General Manager on February 1, 2017. Note 8: Vice Presidents Mr. Lin Chih-Jen, Lu Chieh-Kuo, Hsu Ta-Chang, Lo Ssu-Yuan and Tseng Lien-Huang took office on April 11, 2018
Job Title (Note 1) Nam e
Nu mb er o f sh a re
su b sc r ip t i on wi th
su b sc r ip t i on ( t h ou san d
sh a re s )
Pe rc en t ag e o f sh a re
su b sc r ip t i on su b sc r ip t i on t o t h e t o t a l
i s su ed sh a r es
Performed (Note 2) To be Performed (Note 2)
Qu an t i t y of sh a re
su b sc r ip t i on ( t h ou san d
sh a re s )
P r i c e o f sh a re
su b sc r ip t i on (N T$ )
Amou n t o f sh a re
su b sc r ip t i on (N T$ 1 ,0 0 0 )
Qu an t i t y of sh a re
su b sc r ip t i on t o t h e t o t a l
i s su ed sh a re s
Qu an t i t y of sh a re
su b sc r ip t i on ( t h ou san d
sh a re s )
P r i c e o f sh a re
su b sc r ip t i on (N T$ )
Amou n t o f sh a re
su b sc r ip t i on (N T$ 1 ,0 0 0 )
Qu an t i t y of sh a re
su b sc r ip t i on t o t h e t o t a l
i s su ed sh a re s
Managers
Group GM C he n C h i e n - Tu n
7 1 5 0 .4 0 % 3 2 2 17.30 5,570.60 0.18% 3 9 3 17.30 6,798.90 0.22%
Divison GM H u a n g Ts u n g - We n
Divison GM C ha n g J u i - J u
Divison VGM Li Ruei-wen (Note 7)
Divison VGM Lin Chih-jen (Note 8)
Divison VGM Lu Chieh-Kuo (Note 8)
Divison VGM Hsu Ta-chang (Note 8)
Divison VGM Lo Ssu-yuan (Note 8)
Divison VGM Tseng Lien-huang (Note 8)
Vice General Manager /
Supervisor of Financial
Department
H s ie h M i n g - C h u
Supervisor of Accounting
Department C h u n g C h i - We n
Employees
(Note 3)
Top Ten Employees
Hou Kun-Yu
600 0.34% 297.5 17.30 5,146.75 0.17% 302.5 17.30 5,233.25 0.17%
Hou Fu-Chia
Chen Kuo-Ching
Li Chi-Ming
Lin Tzu-Min
Yang Yuan-Chih
Li Te-ching
Chung Li-kai
Huang,Yin-nan
Liu,Chign-pao
~53~
6. New Restricted Employee Shares:
6.1 As to the report was printed, the related regulation was not applicable.
6.2 The top-10 employees applicable for the share limitation: N/A
7. Status of New Issuance in Connection with Mergers and Acquisitions:
7.1 Share issuance for merger: N/A
7.2 Share issuance for acquisition: N/A
8. Financing Plans and Implementation:
Our company issued the third onshore unsecured convertible corporate bond on August 22,
2016, and the execution of the plan for the use of the fund is as follows:
8.1 Plan
8.1.1. Planned total amount of fund required: NT$500 million.
8.1.2. The source of fund: Issued 5000 third onshore unsecured convertible bonds
with the denomination of NT$100,000 per bond. The issuance
is according to the full amount of the denomination with 3-year
maturity and 0% interest rate. The expected amount of fund
raised is NT$500 million.
8.1.3. Planned project and the progress of the use of the fund
Unit: NT$1000
Planned Project Expected
Completion Date
Total Fund
Required
The planned progress of the
use of fund
Year 2016
Season 3
Repayment of bank loans Season 3 of 2016 500,000 500,000
Total 500,000 500,000
8.1.4. Expected Possible Benefits
The purpose of this financing plan of our company is to repay the bank loan of
NT$500 million. Using the bank loan interest rate to calculate our repayment,
it is expected that our company can save the actual interest expenditure of
NT$1.667 million in 2016. Hereafter, it is expected that our company can save
actual interest expenditure of NT$5 million per year. Moreover, this plan can
strengthen our company’s financial structure as well as enhance our current
ratio and quick ratio. In addition, the conversion of convertible corporate bond
can contribute to the soundness of our financial structure, which can be
beneficial to the overall operational development of our company.
~54~
8.2 Implementation Status
The Company’s 3rd
offering of domestic unsecured convertible corporate bonds was
completed on August 22, 2016 and implemented in the third quarter of 2016
according to the schedule.
Unit: NT$ thousands; %
Project Implementation
Situation
Implementation Status Reasons for advanced or
delayed progress, and
improvement plan. Amount of
Expenditure
Implementation
Progress
Repayment of
Bank Loans
Scheduled 500,000 100% The implementation is
completed according to the
schedule. Actual 500,000 100%
~55~
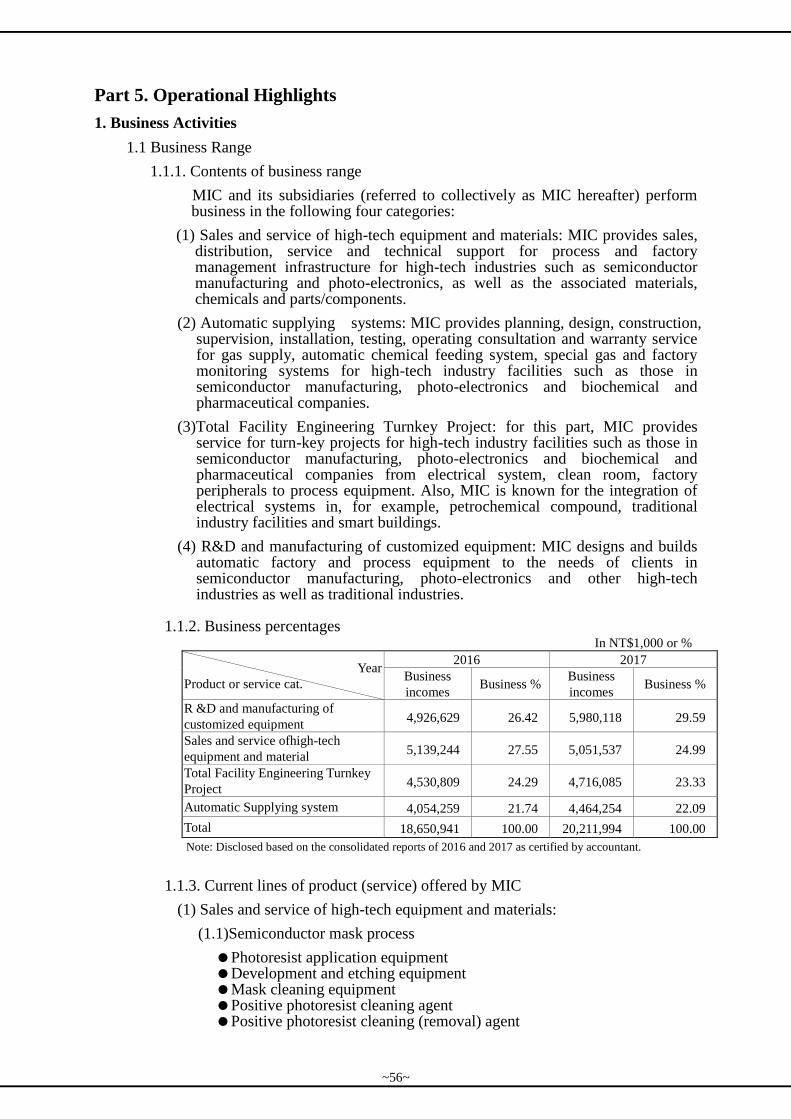
Part 5. Operational Highlights
1. Business Activities
1.1 Business Range
1.1.1. Contents of business range
MIC and its subsidiaries (referred to collectively as MIC hereafter) perform business in the following four categories:
(1) Sales and service of high-tech equipment and materials: MIC provides sales, distribution, service and technical support for process and factory management infrastructure for high-tech industries such as semiconductor manufacturing and photo-electronics, as well as the associated materials, chemicals and parts/components.
(2) Automatic supplying systems: MIC provides planning, design, construction, supervision, installation, testing, operating consultation and warranty service for gas supply, automatic chemical feeding system, special gas and factory monitoring systems for high-tech industry facilities such as those in semiconductor manufacturing, photo-electronics and biochemical and pharmaceutical companies.
(3)Total Facility Engineering Turnkey Project: for this part, MIC provides service for turn-key projects for high-tech industry facilities such as those in semiconductor manufacturing, photo-electronics and biochemical and pharmaceutical companies from electrical system, clean room, factory peripherals to process equipment. Also, MIC is known for the integration of electrical systems in, for example, petrochemical compound, traditional industry facilities and smart buildings.
(4) R&D and manufacturing of customized equipment: MIC designs and builds automatic factory and process equipment to the needs of clients in semiconductor manufacturing, photo-electronics and other high-tech industries as well as traditional industries.
1.1.2. Business percentages In NT$1,000 or %
Year
Product or service cat.
2016 2017
Business
incomes Business %
Business
incomes Business %
R &D and manufacturing of
customized equipment 4,926,629 26.42 5,980,118 29.59
Sales and service ofhigh-tech
equipment and material 5,139,244 27.55 5,051,537 24.99
Total Facility Engineering Turnkey
Project 4,530,809 24.29 4,716,085 23.33
Automatic Supplying system 4,054,259 21.74 4,464,254 22.09
Total 18,650,941 100.00 20,211,994 100.00
Note: Disclosed based on the consolidated reports of 2016 and 2017 as certified by accountant.
1.1.3. Current lines of product (service) offered by MIC
(1) Sales and service of high-tech equipment and materials:
(1.1)Semiconductor mask process
Photoresist application equipment Development and etching equipment Mask cleaning equipment Positive photoresist cleaning agent Positive photoresist cleaning (removal) agent
~56~
Chromium etching solution
Positive photoresist development solution
Mask flatness measuring equipment
Mask circuit design software
Mask Laser Pattern Generator
Mask Inspection
Mask Laser Repair
EUV Mask Reflectometer
EUV Mask Pellicle Transmission Measurement Tool
Mask Critical Dimension Measurement Tool
(1.2)IC manufacturing process
Wafer defect inspection equipment
Wafer defect inspection equipment for residual chemicals and electric
charges
X-Ray film measurement system
Vertical furnace
Batch-type BCD process tool
MMT plasma Nitridation/Oxidation system
Ion Implanter
4-point probe electric resistance measurement system
Wafer backside/edge inspection tool
Chemical/mechanical wafer cleaning brush
Chemical/mechanical abrasive discs
Silicon carbide (SiC) chips
Silicon carbide (SiC) Powder
Special gas for manufacturing process
Unique chemical solution for the production process of filming
(TDMAS, TDMAH etc.)
Wafer chemical cleaning etching solution for production
Oring for production
Graphite material / component for production
Ceramic material / component for production
Quartz process kit for furnace tool
Temperature and humidity control equipments for Track machine
Chemical filter for Scanner and Track
Chemical filter for factory gas
Lens filter for Scanner
Photoresists for production
Stripper for production
Filter for solutions used in the production
Thinner and wafer edge bead removal for production
Production parameter analysis software
Physical parameter measurement systems
IC rear end: TR FVI
Integrated Gas Delivery System
TAISEI cleaning room / machine antiseismic design
~57~
THK seismic isolation plate
4-point probe measurement system
Single wafer heating equipment
Dicing UV cure system
Wafer overlay error measurement system
High-Quality cleanroom wiper
Multi-functional cofocal microscopy
(1.3) IC packaging process
WLCSP Ball Mounter
WLCSP Inspection & Repair
WLCSP Solder ball composition and thickness XRF metrology
Macroscopic and microscopic examiners
IC coplanarity examiner
Defoaming mixer
Coplanarity tester (stamp-sized flash memory card)
Die Attach
Under Fill
PR Stripper
EBR
Cu/Silver Alloy Bonding wire
(1.4) LCD and color filter processes
Dry etching system
Laser cutting tools for glass/COP/PET/PI
Defect inspection and repair for color filters
Glass substrate transportation
Automated warehouse
Automatic guided vehicles and railed vehicles
Cofocal laser microscopes
Mask inspection system
Etching, photoresist removal, cleaning, developing, glass regeneration
tools and sealants
Polarizing, sealant removal, regeneration and cleaning tools and FA
systems
Module lamination equipment
Aging equipment
Liquid crystal injector
Sealing machine
3D non-contact shape inspector
Roll-to-roll embossing
TFT materials: photoresist, metal targets
CF materials: sensitive separator, BM photoresist, White Color
photoresist、QD Material
CELL materials: glass cleaning bands/ Brush, glass cutting wheels,
ODF Sealant, Grinding Wheel
LCM materials: Anti-water Glue、Protect Glue
LCM materials: inductors
~58~
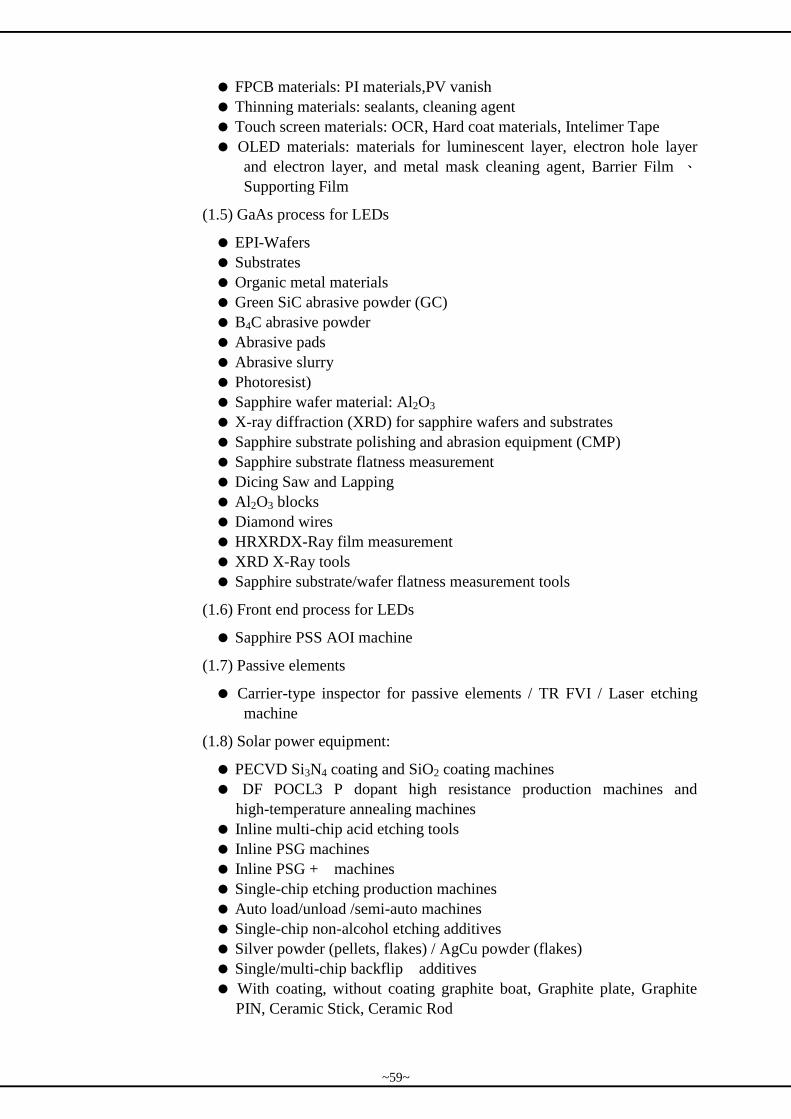
FPCB materials: PI materials,PV vanish
Thinning materials: sealants, cleaning agent
Touch screen materials: OCR, Hard coat materials, Intelimer Tape
OLED materials: materials for luminescent layer, electron hole layer
and electron layer, and metal mask cleaning agent, Barrier Film 、Supporting Film
(1.5) GaAs process for LEDs
EPI-Wafers
Substrates
Organic metal materials
Green SiC abrasive powder (GC)
B4C abrasive powder
Abrasive pads
Abrasive slurry
Photoresist)
Sapphire wafer material: Al2O3
X-ray diffraction (XRD) for sapphire wafers and substrates
Sapphire substrate polishing and abrasion equipment (CMP)
Sapphire substrate flatness measurement
Dicing Saw and Lapping
Al2O3 blocks
Diamond wires
HRXRDX-Ray film measurement
XRD X-Ray tools
Sapphire substrate/wafer flatness measurement tools
(1.6) Front end process for LEDs
Sapphire PSS AOI machine
(1.7) Passive elements
Carrier-type inspector for passive elements / TR FVI / Laser etching
machine
(1.8) Solar power equipment:
PECVD Si3N4 coating and SiO2 coating machines
DF POCL3 P dopant high resistance production machines and
high-temperature annealing machines
Inline multi-chip acid etching tools
Inline PSG machines
Inline PSG + machines
Single-chip etching production machines
Auto load/unload /semi-auto machines
Single-chip non-alcohol etching additives
Silver powder (pellets, flakes) / AgCu powder (flakes)
Single/multi-chip backflip additives
With coating, without coating graphite boat, Graphite plate, Graphite
PIN, Ceramic Stick, Ceramic Rod
~59~
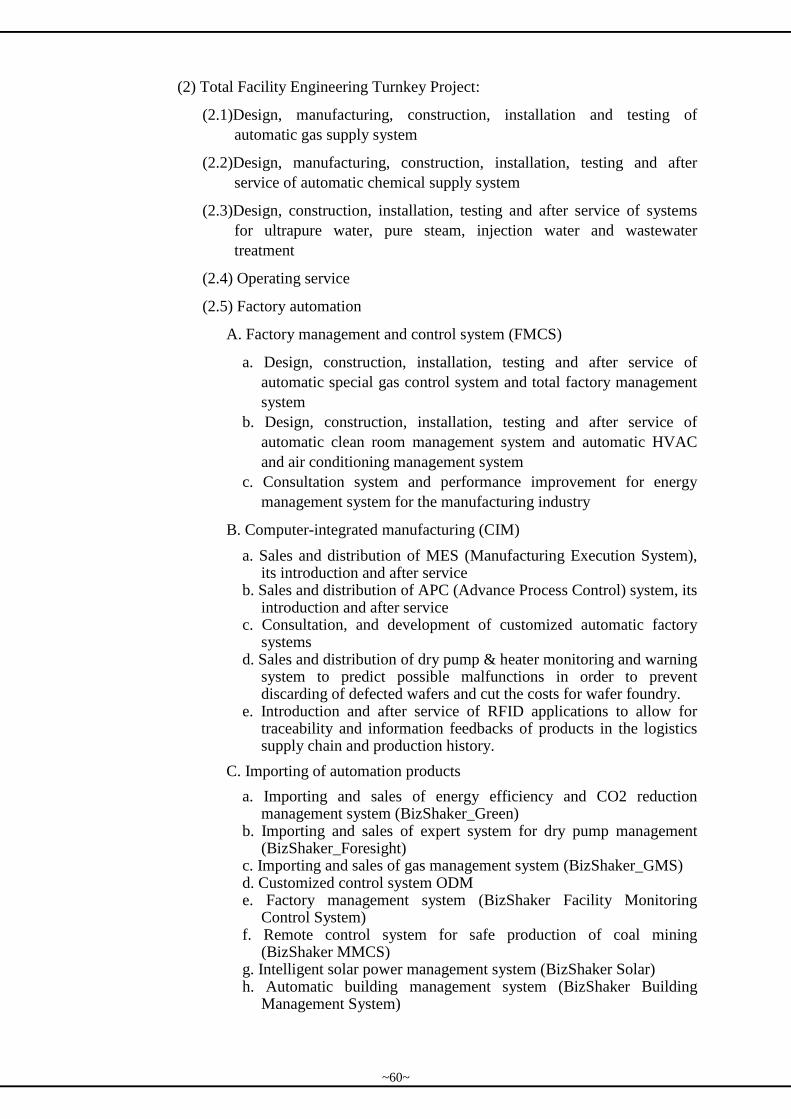
(2) Total Facility Engineering Turnkey Project:
(2.1)Design, manufacturing, construction, installation and testing of
automatic gas supply system
(2.2)Design, manufacturing, construction, installation, testing and after
service of automatic chemical supply system
(2.3)Design, construction, installation, testing and after service of systems
for ultrapure water, pure steam, injection water and wastewater
treatment
(2.4) Operating service
(2.5) Factory automation
A. Factory management and control system (FMCS)
a. Design, construction, installation, testing and after service of
automatic special gas control system and total factory management
system
b. Design, construction, installation, testing and after service of
automatic clean room management system and automatic HVAC
and air conditioning management system
c. Consultation system and performance improvement for energy
management system for the manufacturing industry
B. Computer-integrated manufacturing (CIM)
a. Sales and distribution of MES (Manufacturing Execution System), its introduction and after service
b. Sales and distribution of APC (Advance Process Control) system, its introduction and after service
c. Consultation, and development of customized automatic factory systems
d. Sales and distribution of dry pump & heater monitoring and warning system to predict possible malfunctions in order to prevent discarding of defected wafers and cut the costs for wafer foundry.
e. Introduction and after service of RFID applications to allow for traceability and information feedbacks of products in the logistics supply chain and production history.
C. Importing of automation products
a. Importing and sales of energy efficiency and CO2 reduction management system (BizShaker_Green)
b. Importing and sales of expert system for dry pump management (BizShaker_Foresight)
c. Importing and sales of gas management system (BizShaker_GMS) d. Customized control system ODM e. Factory management system (BizShaker Facility Monitoring
Control System) f. Remote control system for safe production of coal mining
(BizShaker MMCS) g. Intelligent solar power management system (BizShaker Solar) h. Automatic building management system (BizShaker Building
Management System)
~60~
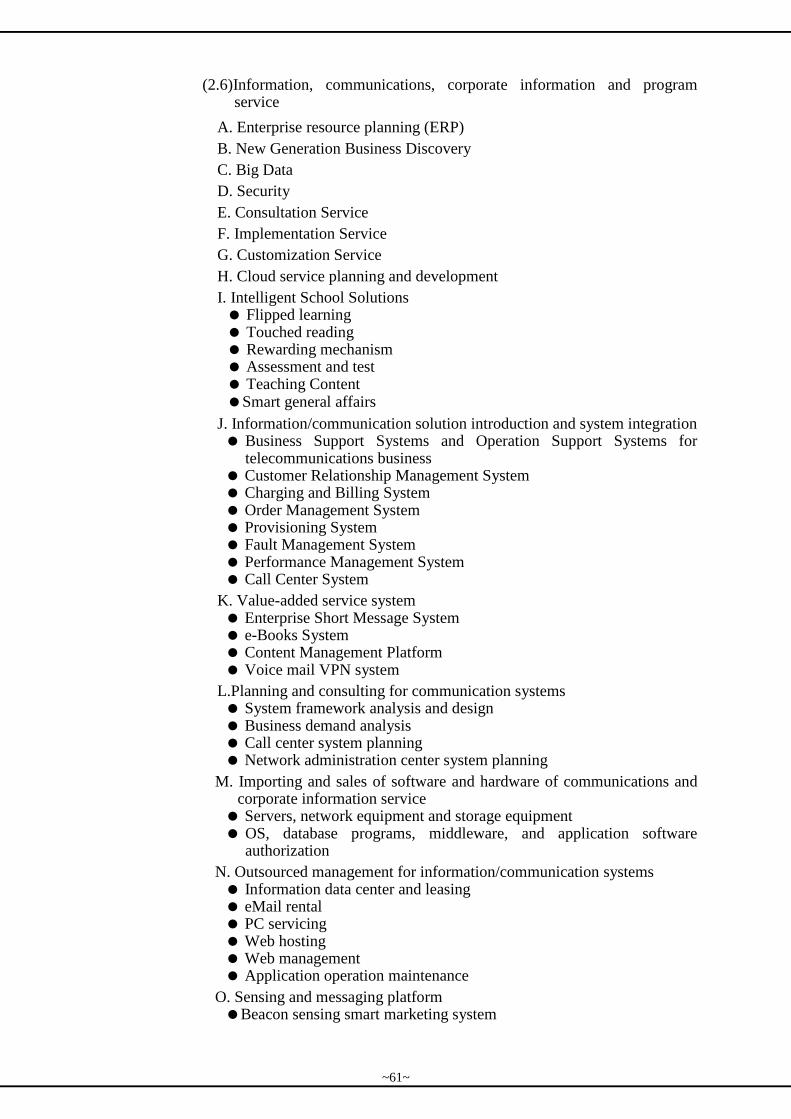
(2.6)Information, communications, corporate information and program service
A. Enterprise resource planning (ERP)
B. New Generation Business Discovery
C. Big Data
D. Security
E. Consultation Service
F. Implementation Service
G. Customization Service
H. Cloud service planning and development
I. Intelligent School Solutions Flipped learning Touched reading Rewarding mechanism Assessment and test Teaching Content Smart general affairs
J. Information/communication solution introduction and system integration Business Support Systems and Operation Support Systems for
telecommunications business Customer Relationship Management System Charging and Billing System Order Management System Provisioning System Fault Management System Performance Management System Call Center System
K. Value-added service system Enterprise Short Message System e-Books System Content Management Platform Voice mail VPN system
L.Planning and consulting for communication systems System framework analysis and design Business demand analysis Call center system planning Network administration center system planning
M. Importing and sales of software and hardware of communications and corporate information service Servers, network equipment and storage equipment OS, database programs, middleware, and application software
authorization
N. Outsourced management for information/communication systems Information data center and leasing eMail rental PC servicing Web hosting Web management Application operation maintenance
O. Sensing and messaging platform Beacon sensing smart marketing system
~61~
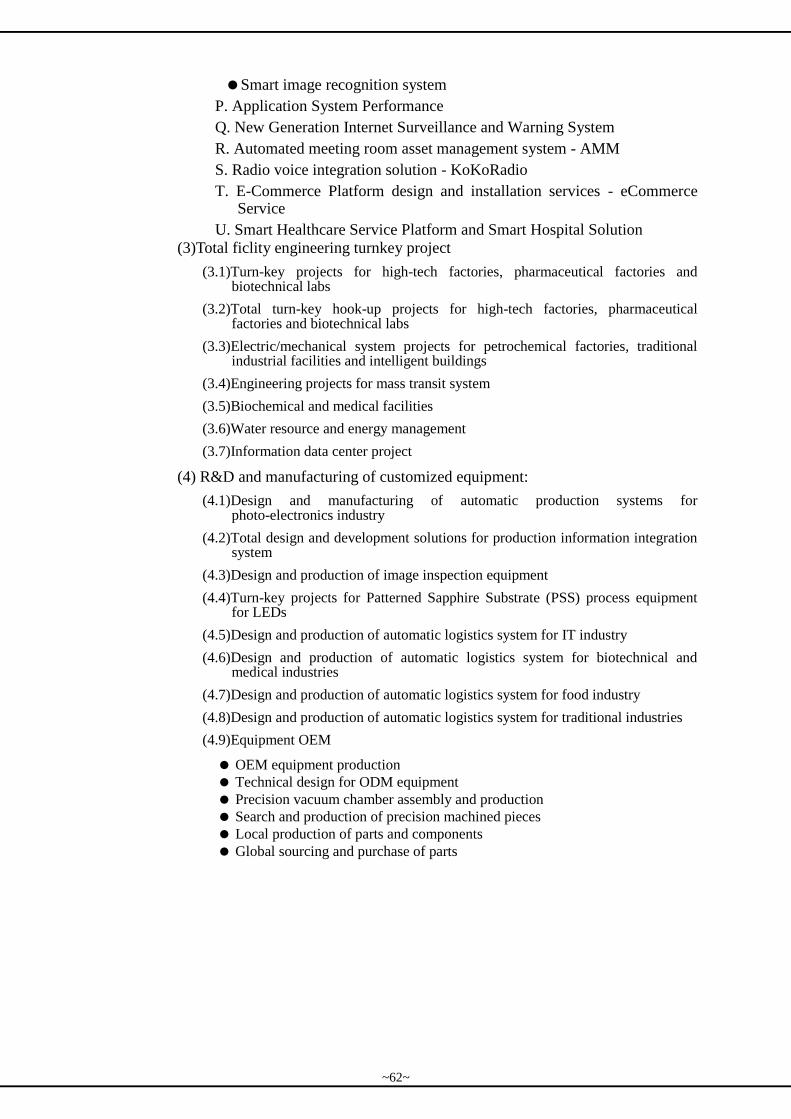
Smart image recognition system
P. Application System Performance
Q. New Generation Internet Surveillance and Warning System
R. Automated meeting room asset management system - AMM
S. Radio voice integration solution - KoKoRadio
T. E-Commerce Platform design and installation services - eCommerce Service
U. Smart Healthcare Service Platform and Smart Hospital Solution
(3)Total ficlity engineering turnkey project
(3.1)Turn-key projects for high-tech factories, pharmaceutical factories and biotechnical labs
(3.2)Total turn-key hook-up projects for high-tech factories, pharmaceutical factories and biotechnical labs
(3.3)Electric/mechanical system projects for petrochemical factories, traditional industrial facilities and intelligent buildings
(3.4)Engineering projects for mass transit system
(3.5)Biochemical and medical facilities
(3.6)Water resource and energy management
(3.7)Information data center project
(4) R&D and manufacturing of customized equipment:
(4.1)Design and manufacturing of automatic production systems for photo-electronics industry
(4.2)Total design and development solutions for production information integration system
(4.3)Design and production of image inspection equipment
(4.4)Turn-key projects for Patterned Sapphire Substrate (PSS) process equipment for LEDs
(4.5)Design and production of automatic logistics system for IT industry
(4.6)Design and production of automatic logistics system for biotechnical and medical industries
(4.7)Design and production of automatic logistics system for food industry
(4.8)Design and production of automatic logistics system for traditional industries
(4.9)Equipment OEM
OEM equipment production
Technical design for ODM equipment
Precision vacuum chamber assembly and production
Search and production of precision machined pieces
Local production of parts and components
Global sourcing and purchase of parts
~62~
1.1.4. New product planning and development (service)
(1) Expansion off depth and breadth of imported product lines to set foot in the semiconductor testing at the rear end and LCM for TFT-LCD
(2) Development of total high-tech factory integration capability, lateral integration of engineering ability for pure water and process cooling, upward integration with ME engineering and total factory solution and downward development of integrated connection with process equipment in the factory.
(3) Development of design and installation of facilities for typical industries, such as petrochemical and traditional factories
(4) Development of HMI for automatic delivery system and system service patterns (5) LED wafer process equipment (6) Automatic testing techniques (7) CIM techniques (8) Continue to work with original manufacturers for the development of
equipment modules, and develop process equipment or join force with clients for customization of process equipment based on market demands and clients’ needs.
(9) Development of ESD (Electronic static Discharge) real-time monitoring system, manufacturing industry project program outsourcing, and energy analysis for manufacturing facilities and processes.
(10) Information/communications, corporate information and software service
(10.1) Importing or development of important service elements in digital content
service platform, including:
Payment gateway that deals with payment verification and transactions
Digital rights management used for the management of download and play
authorization for digital contents and content encryption/decryption.
Mobile device management: management of firmware, OS, web browsers,
content players and APPs at the intelligent end to provide the service
platform that telecommunication clients need for 4G service development.
(10.2) R&D project for corporate service platform products:
Information action inquiries for corporate decision making
Information action inquiries for corporate business
New generation corporate information management system
Corporate decision making analysis products
(10.3) Development of the technology of Big Data information analysis platform
(10.4) Development of the IoT power consumption application technology
(10.5) A collaborated research on information security technology
(10.6) Self service kiosk and cloud management platform, including ordering,
ticketing and retailing services, which can save man power and enhance
convenience.) (11) Augmented reality cloud recognition and content management platform, a new
type of marketing instruments for enterprises or stores which provides original AR contents and can be freely updated and maintained.
(12)PHM(Prognostic and Health Management): Regarding the MOCVD/PECVD/Dry Pump equipment defect pre-diagnosis system, it provides an early warning, reduces product defects and increases the utilization of facilities.
(12.1) NRF (Next n-Run failure): PHM NRF function can predict whether the
critical components will fail during the next n-run process.
(12.2) RUL (Remaining Useful Life): PHM RUL function can predict the
remaining life of the critical components.
(12.3)PHM benefits:
Early detect the abnormal pattern of components and find the source of
failure quickly.
Immediately predict whether components will fail during the next n-runs
process to reduce cost of consumables.
~63~
Estimate remaining useful life of critical components to optimize the
maintenance schedules. (13) Industry 4.0 Expert Consultant Team: MIC can provide intelligent
machinery/robot technical services, Internet of things technical services, manufacturing digital services, big data technology services, etc. For automation technology services, MIC can provide automated material storage and transportation technology, automated manufacturing technology, automation system integration planning technology, etc.
(14) Image Security and Surveillance System: System designed based on on-site environment, which integrates and optimizes existing CCTV recordings to provide intuitive, smart and blindspotless surveillance system.
(15) Smart Healthcare Service Platform and Smart Hospital:Healthcare Platform、Medical Equipment Cloud、Community Health Station and Smart Treatment, etc.
1.2 Current status of industry
1.2.1 Current status and development of industry
MIC’s revenues come mostly from selling and maintenance of equipment and materials for ICs, TFT-LCDs, LEDs, color filters, GaAs, IC packaging, flip-chip substrates, and solar panels in high-tech and traditional industries in addition to the planning, design, construction, installation and testing automatic management systems for gases, chemicals and monitoring systems used in high-tech industries. Since 2003, MIC has started the manufacturing of process equipment in addition to the original design, manufacturing and installation of factory equipment. MIC is always on the lookout for any opportunity to join force of major players around the world and build up our own OEM and ODM capabilities, strengthen local ODM development and ultimate establish our own edge in the competitive market. The following provides the breakdown of the industries that MIC is involved
(1)IC (Semiconductor) Industry
Current Status and development of Worldwide IC industry
The top ten list puts Apple in second place behind Samsung in terms of
semiconductor spending, with Gartner reporting the iPhone producer spent
approximately $38.754 billion on the components in all of 2017, giving it a
market share of 9.2 percent. Compared to the $30.39 billion reportedly spent
in 2016, this is said to represent a growth in spending by Apple of 27.5
percent.
Ahead of Apple, Samsung spent $31.426 billion on the chips in 2016, just
over a billion more than Apple did in the same year. In 2017, Samsung is
claimed to have spent $43.108 billion on the chips, a 37.2 percent
year-on-year increase and $4.3 billion more than Apple's expenditure in the
same period, giving the South Korean electronics giant a 10.3 percent share
of the market.
Combined together, Samsung and Apple consumed $81.8 billion in
semiconductors in 2017, according to the report, an increase of more than
$20 billion compared to what they spent in total the previous year.
~64~
Table 1. Preliminary Ranking of Top 10 Companies by Semiconductor
Design TAM, Worldwide, (Millions of Dollars)
Trailing behind Apple is Dell in third, spending $15.702 billion in 2017,
followed by Lenovo's $14.671 billion expenditure, and Huawei's $14.259
billion. The rest of the list consists of BBK Electronics, HP Inc., Hewlett
Packard Enterprises, LG, and Western Digital.
It is reported approximately $419.72 billion was spent on semiconductors in
2017 across the entire market, representing an overall growth in spending of
22.2 percent.
While the increased semiconductor spending could be attributed to higher
sales of products, price increases of DRAM and NAND flash memory also
played a part raising costs for the firms. Supply shortages forced price rises
for memory throughout the year, as well as supply issues in fields such as
microcontrollers, caused prices to inflate, and the majority of hardware
producers are effectively forced to spend more to acquire the
harder-to-attain components.
According to Gartner, the top 10 producers included in the list accounted for
40 percent of the total semiconductor market in 2017, up from 31 percent
from ten years ago. The firm expects the trend to continue, predicting that
the top 10 producers will account for more than 45 percent of total market
spending by 2021.
10 nm nodes began mass production in 2017, with the revenue expected to
reach about $3.72 billion, accounting for more than 95% of the yearly
foundry revenue growth.
The 2017 top ten ranking of foundries remains the same as last year, with
TSMC, GloFo and UMC in the first, second, and third slots
~65~
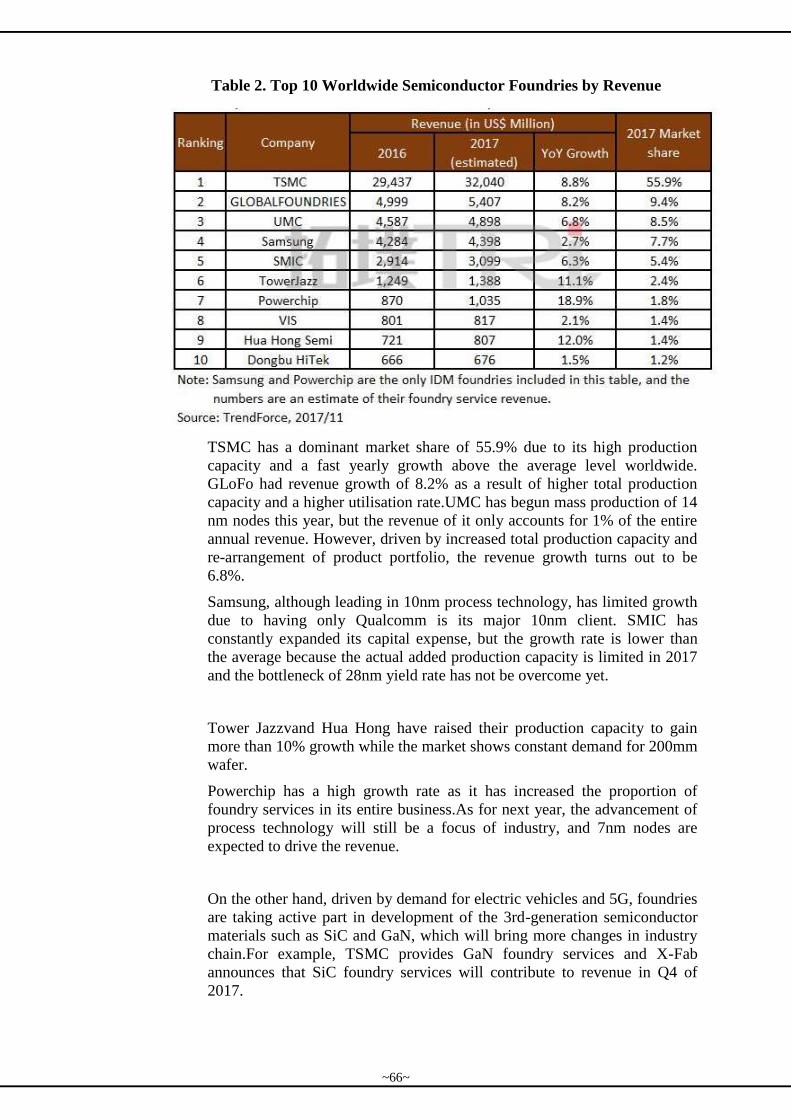
Table 2. Top 10 Worldwide Semiconductor Foundries by Revenue
TSMC has a dominant market share of 55.9% due to its high production
capacity and a fast yearly growth above the average level worldwide.
GLoFo had revenue growth of 8.2% as a result of higher total production
capacity and a higher utilisation rate.UMC has begun mass production of 14
nm nodes this year, but the revenue of it only accounts for 1% of the entire
annual revenue. However, driven by increased total production capacity and
re-arrangement of product portfolio, the revenue growth turns out to be
6.8%.
Samsung, although leading in 10nm process technology, has limited growth
due to having only Qualcomm is its major 10nm client. SMIC has
constantly expanded its capital expense, but the growth rate is lower than
the average because the actual added production capacity is limited in 2017
and the bottleneck of 28nm yield rate has not be overcome yet.
Tower Jazzvand Hua Hong have raised their production capacity to gain
more than 10% growth while the market shows constant demand for 200mm
wafer.
Powerchip has a high growth rate as it has increased the proportion of
foundry services in its entire business.As for next year, the advancement of
process technology will still be a focus of industry, and 7nm nodes are
expected to drive the revenue.
On the other hand, driven by demand for electric vehicles and 5G, foundries
are taking active part in development of the 3rd-generation semiconductor
materials such as SiC and GaN, which will bring more changes in industry
chain.For example, TSMC provides GaN foundry services and X-Fab
announces that SiC foundry services will contribute to revenue in Q4 of
2017.
~66~
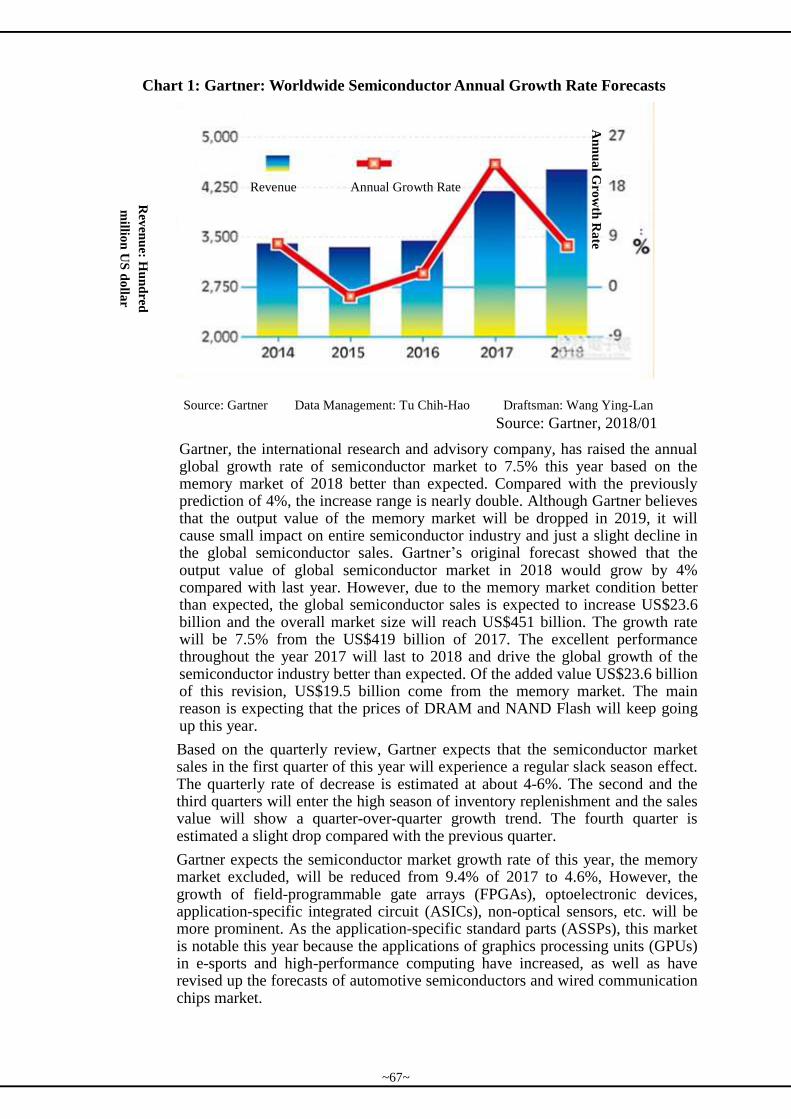
Chart 1: Gartner: Worldwide Semiconductor Annual Growth Rate Forecasts
Source: Gartner, 2018/01
Gartner, the international research and advisory company, has raised the annual global growth rate of semiconductor market to 7.5% this year based on the memory market of 2018 better than expected. Compared with the previously prediction of 4%, the increase range is nearly double. Although Gartner believes that the output value of the memory market will be dropped in 2019, it will cause small impact on entire semiconductor industry and just a slight decline in the global semiconductor sales. Gartner’s original forecast showed that the output value of global semiconductor market in 2018 would grow by 4% compared with last year. However, due to the memory market condition better than expected, the global semiconductor sales is expected to increase US$23.6 billion and the overall market size will reach US$451 billion. The growth rate will be 7.5% from the US$419 billion of 2017. The excellent performance throughout the year 2017 will last to 2018 and drive the global growth of the semiconductor industry better than expected. Of the added value US$23.6 billion of this revision, US$19.5 billion come from the memory market. The main reason is expecting that the prices of DRAM and NAND Flash will keep going up this year.
Based on the quarterly review, Gartner expects that the semiconductor market sales in the first quarter of this year will experience a regular slack season effect. The quarterly rate of decrease is estimated at about 4-6%. The second and the third quarters will enter the high season of inventory replenishment and the sales value will show a quarter-over-quarter growth trend. The fourth quarter is estimated a slight drop compared with the previous quarter.
Gartner expects the semiconductor market growth rate of this year, the memory market excluded, will be reduced from 9.4% of 2017 to 4.6%, However, the growth of field-programmable gate arrays (FPGAs), optoelectronic devices, application-specific integrated circuit (ASICs), non-optical sensors, etc. will be more prominent. As the application-specific standard parts (ASSPs), this market is notable this year because the applications of graphics processing units (GPUs) in e-sports and high-performance computing have increased, as well as have revised up the forecasts of automotive semiconductors and wired communication chips market.
Rev
enu
e: Hu
nd
red
millio
n U
S d
olla
r
An
nu
al G
row
th R
ate
Source: Gartner Data Management: Tu Chih-Hao Draftsman: Wang Ying-Lan
Revenue Annual Growth Rate
~67~
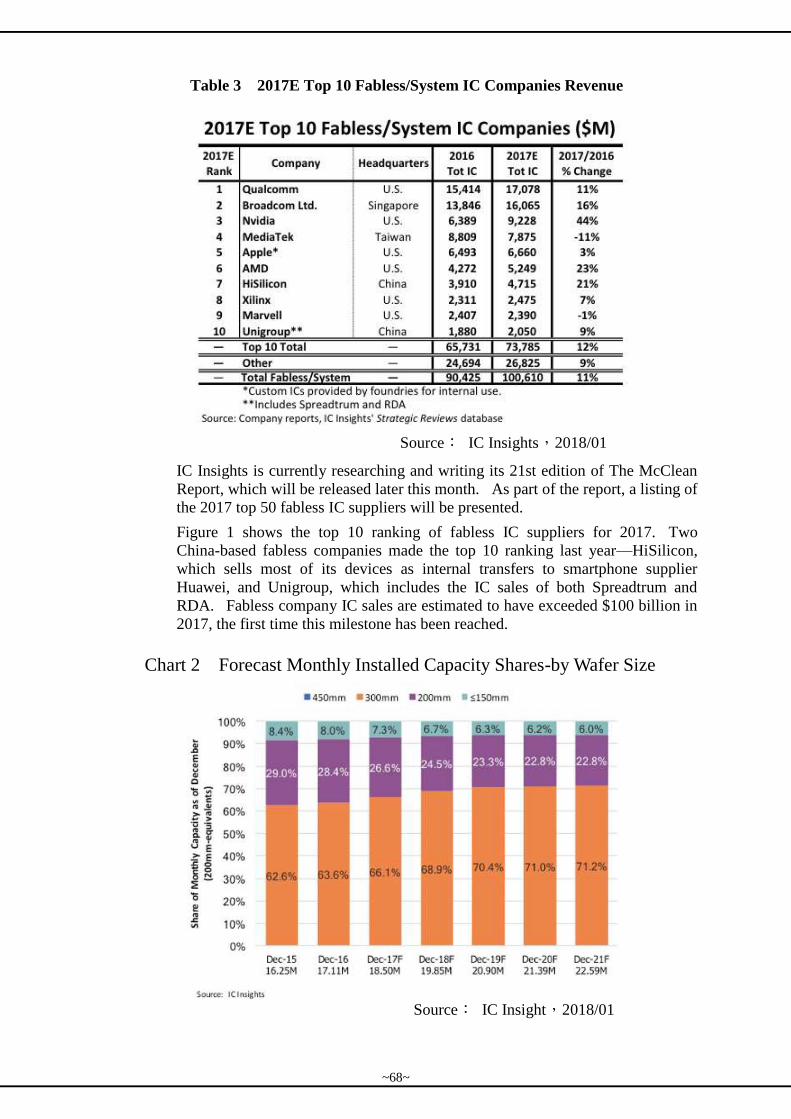
Table 3 2017E Top 10 Fabless/System IC Companies Revenue
Source: IC Insights,2018/01
IC Insights is currently researching and writing its 21st edition of The McClean
Report, which will be released later this month. As part of the report, a listing of
the 2017 top 50 fabless IC suppliers will be presented.
Figure 1 shows the top 10 ranking of fabless IC suppliers for 2017. Two
China-based fabless companies made the top 10 ranking last year—HiSilicon,
which sells most of its devices as internal transfers to smartphone supplier
Huawei, and Unigroup, which includes the IC sales of both Spreadtrum and
RDA. Fabless company IC sales are estimated to have exceeded $100 billion in
2017, the first time this milestone has been reached.
Chart 2 Forecast Monthly Installed Capacity Shares-by Wafer Size
Source: IC Insight,2018/01
~68~
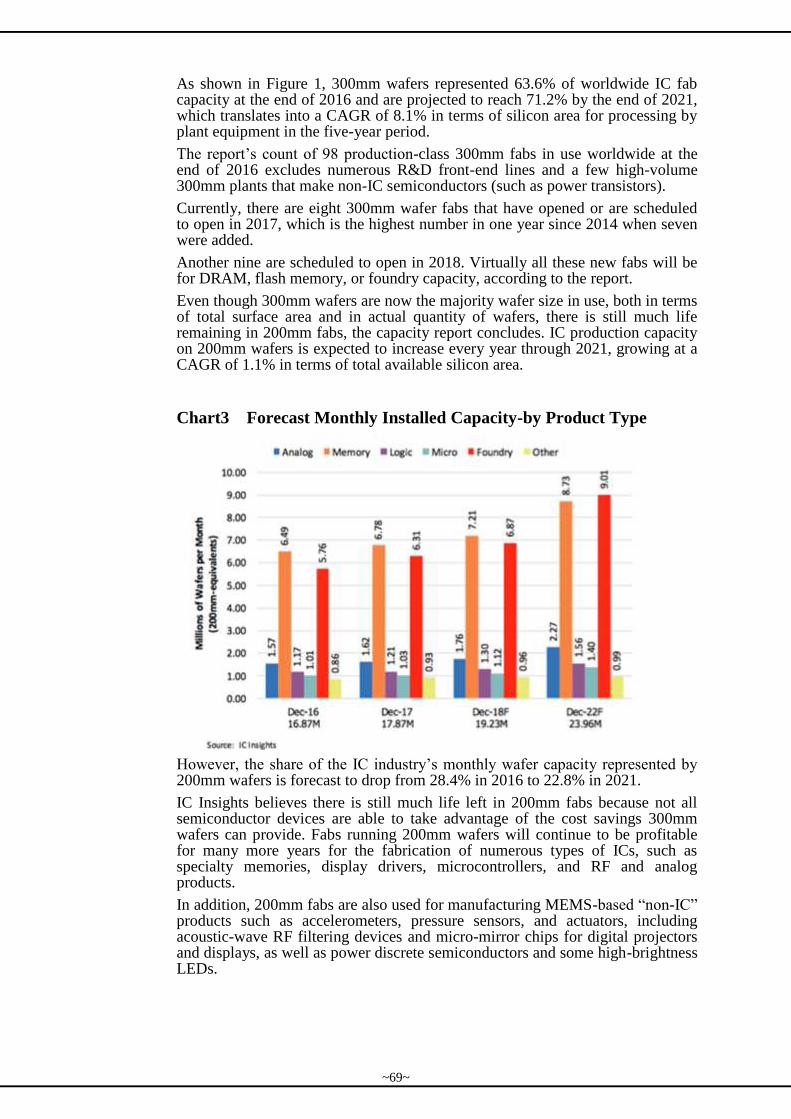
As shown in Figure 1, 300mm wafers represented 63.6% of worldwide IC fab capacity at the end of 2016 and are projected to reach 71.2% by the end of 2021, which translates into a CAGR of 8.1% in terms of silicon area for processing by plant equipment in the five-year period.
The report’s count of 98 production-class 300mm fabs in use worldwide at the end of 2016 excludes numerous R&D front-end lines and a few high-volume 300mm plants that make non-IC semiconductors (such as power transistors).
Currently, there are eight 300mm wafer fabs that have opened or are scheduled to open in 2017, which is the highest number in one year since 2014 when seven were added.
Another nine are scheduled to open in 2018. Virtually all these new fabs will be for DRAM, flash memory, or foundry capacity, according to the report.
Even though 300mm wafers are now the majority wafer size in use, both in terms of total surface area and in actual quantity of wafers, there is still much life remaining in 200mm fabs, the capacity report concludes. IC production capacity on 200mm wafers is expected to increase every year through 2021, growing at a CAGR of 1.1% in terms of total available silicon area.
Chart3 Forecast Monthly Installed Capacity-by Product Type
However, the share of the IC industry’s monthly wafer capacity represented by 200mm wafers is forecast to drop from 28.4% in 2016 to 22.8% in 2021.
IC Insights believes there is still much life left in 200mm fabs because not all semiconductor devices are able to take advantage of the cost savings 300mm wafers can provide. Fabs running 200mm wafers will continue to be profitable for many more years for the fabrication of numerous types of ICs, such as specialty memories, display drivers, microcontrollers, and RF and analog products.
In addition, 200mm fabs are also used for manufacturing MEMS-based “non-IC” products such as accelerometers, pressure sensors, and actuators, including acoustic-wave RF filtering devices and micro-mirror chips for digital projectors and displays, as well as power discrete semiconductors and some high-brightness LEDs.
~69~
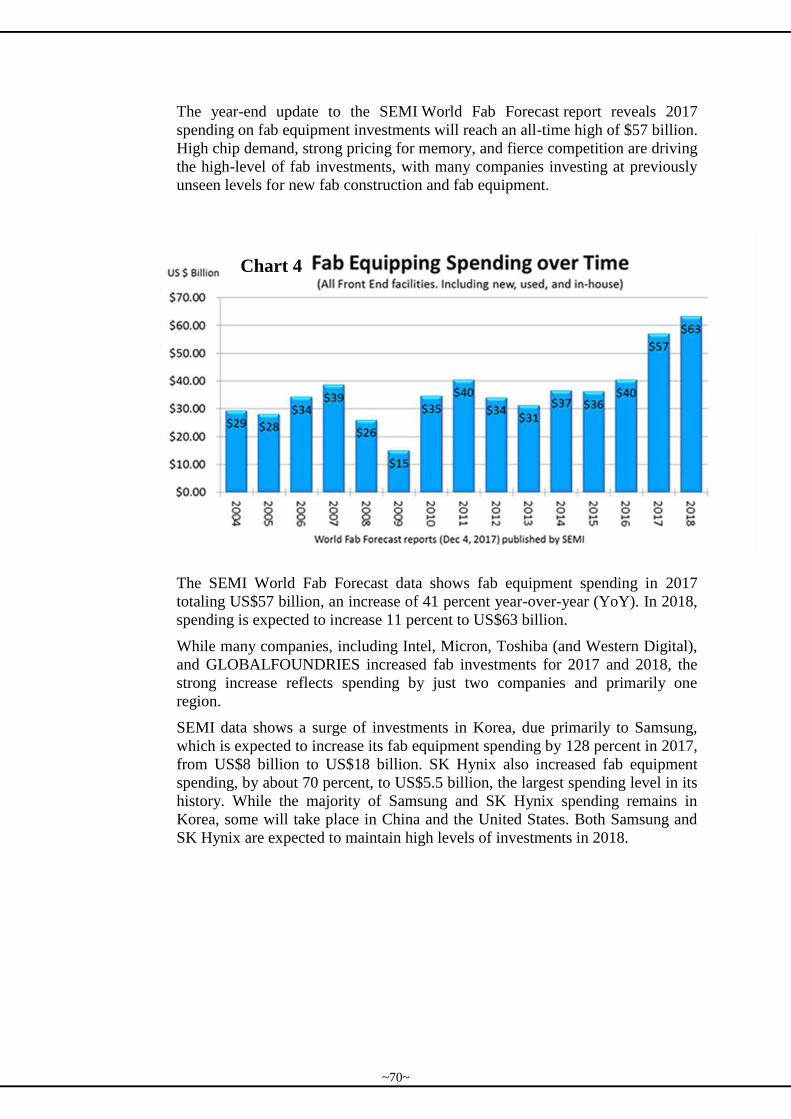
The year-end update to the SEMI World Fab Forecast report reveals 2017
spending on fab equipment investments will reach an all-time high of $57 billion.
High chip demand, strong pricing for memory, and fierce competition are driving
the high-level of fab investments, with many companies investing at previously
unseen levels for new fab construction and fab equipment.
Chart 4
The SEMI World Fab Forecast data shows fab equipment spending in 2017
totaling US$57 billion, an increase of 41 percent year-over-year (YoY). In 2018,
spending is expected to increase 11 percent to US$63 billion.
While many companies, including Intel, Micron, Toshiba (and Western Digital),
and GLOBALFOUNDRIES increased fab investments for 2017 and 2018, the
strong increase reflects spending by just two companies and primarily one
region.
SEMI data shows a surge of investments in Korea, due primarily to Samsung,
which is expected to increase its fab equipment spending by 128 percent in 2017,
from US$8 billion to US$18 billion. SK Hynix also increased fab equipment
spending, by about 70 percent, to US$5.5 billion, the largest spending level in its
history. While the majority of Samsung and SK Hynix spending remains in
Korea, some will take place in China and the United States. Both Samsung and
SK Hynix are expected to maintain high levels of investments in 2018.
~70~
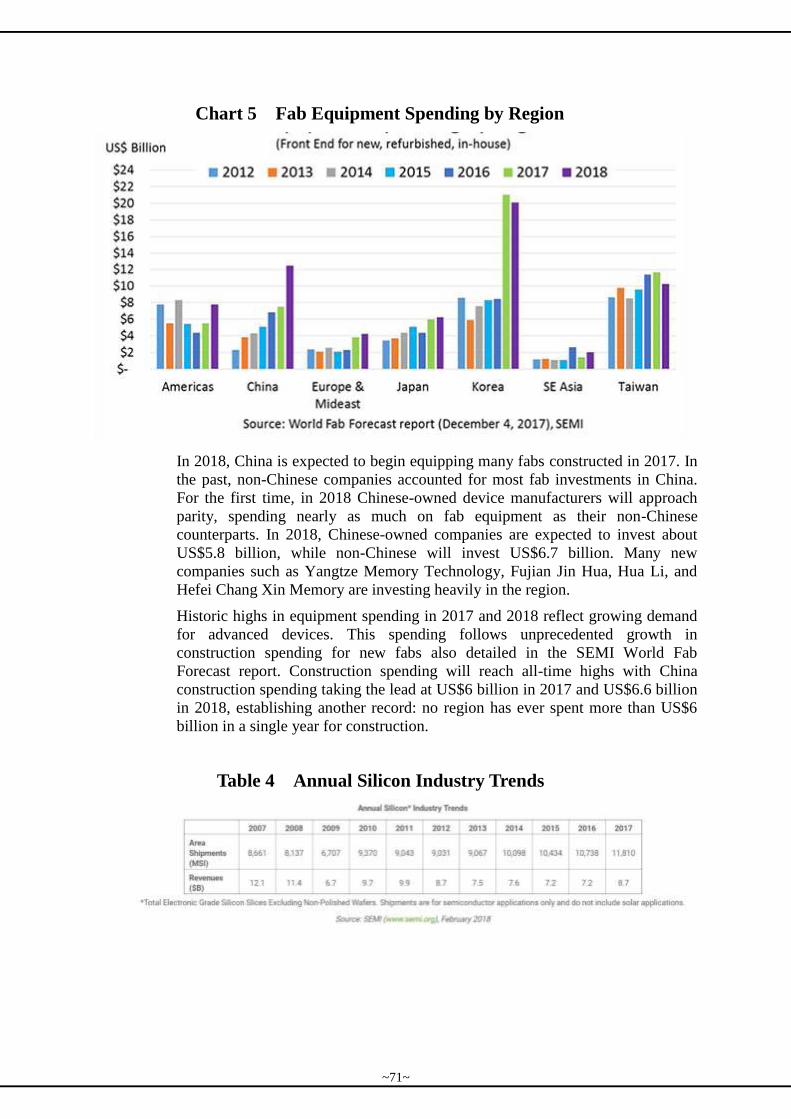
Chart 5 Fab Equipment Spending by Region
In 2018, China is expected to begin equipping many fabs constructed in 2017. In
the past, non-Chinese companies accounted for most fab investments in China.
For the first time, in 2018 Chinese-owned device manufacturers will approach
parity, spending nearly as much on fab equipment as their non-Chinese
counterparts. In 2018, Chinese-owned companies are expected to invest about
US$5.8 billion, while non-Chinese will invest US$6.7 billion. Many new
companies such as Yangtze Memory Technology, Fujian Jin Hua, Hua Li, and
Hefei Chang Xin Memory are investing heavily in the region.
Historic highs in equipment spending in 2017 and 2018 reflect growing demand
for advanced devices. This spending follows unprecedented growth in
construction spending for new fabs also detailed in the SEMI World Fab
Forecast report. Construction spending will reach all-time highs with China
construction spending taking the lead at US$6 billion in 2017 and US$6.6 billion
in 2018, establishing another record: no region has ever spent more than US$6
billion in a single year for construction.
Table 4 Annual Silicon Industry Trends
~71~
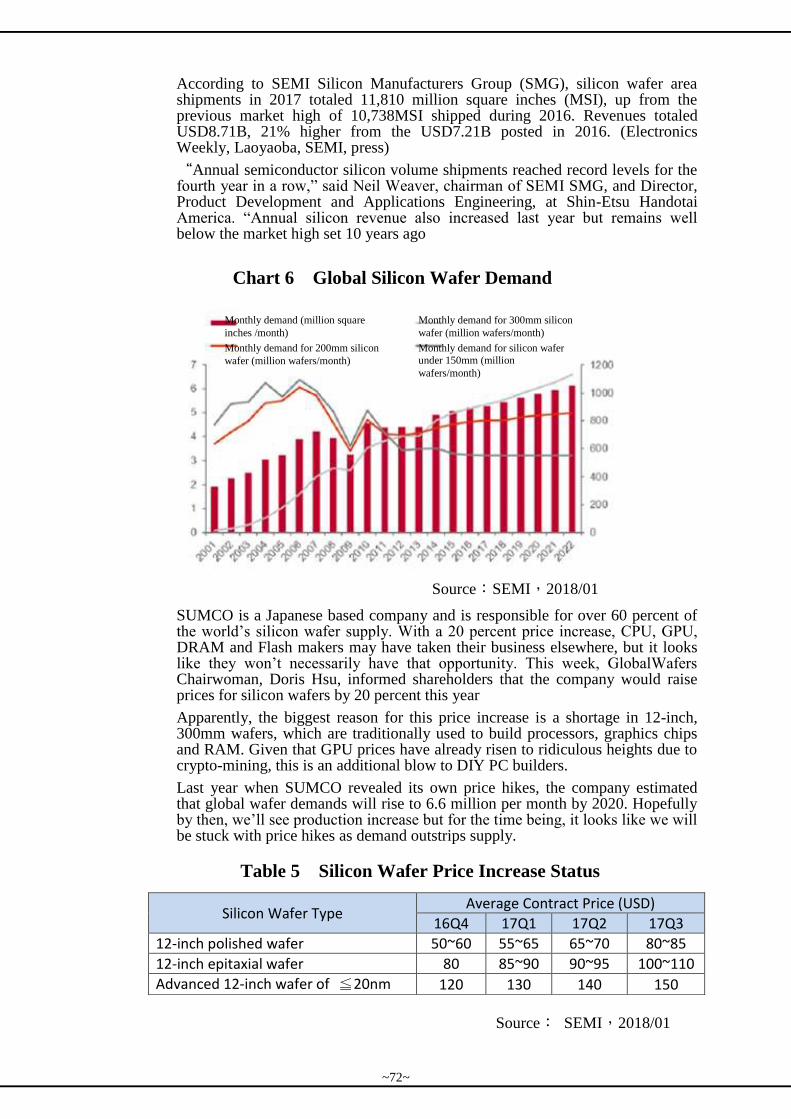
According to SEMI Silicon Manufacturers Group (SMG), silicon wafer area shipments in 2017 totaled 11,810 million square inches (MSI), up from the previous market high of 10,738MSI shipped during 2016. Revenues totaled USD8.71B, 21% higher from the USD7.21B posted in 2016. (Electronics Weekly, Laoyaoba, SEMI, press)
“Annual semiconductor silicon volume shipments reached record levels for the fourth year in a row,” said Neil Weaver, chairman of SEMI SMG, and Director, Product Development and Applications Engineering, at Shin-Etsu Handotai America. “Annual silicon revenue also increased last year but remains well below the market high set 10 years ago
Chart 6 Global Silicon Wafer Demand
Source:SEMI,2018/01
SUMCO is a Japanese based company and is responsible for over 60 percent of the world’s silicon wafer supply. With a 20 percent price increase, CPU, GPU, DRAM and Flash makers may have taken their business elsewhere, but it looks like they won’t necessarily have that opportunity. This week, GlobalWafers Chairwoman, Doris Hsu, informed shareholders that the company would raise prices for silicon wafers by 20 percent this year
Apparently, the biggest reason for this price increase is a shortage in 12-inch, 300mm wafers, which are traditionally used to build processors, graphics chips and RAM. Given that GPU prices have already risen to ridiculous heights due to crypto-mining, this is an additional blow to DIY PC builders.
Last year when SUMCO revealed its own price hikes, the company estimated that global wafer demands will rise to 6.6 million per month by 2020. Hopefully by then, we’ll see production increase but for the time being, it looks like we will be stuck with price hikes as demand outstrips supply.
Table 5 Silicon Wafer Price Increase Status
Source: SEMI,2018/01
Silicon Wafer Type Average Contract Price (USD)
16Q4 17Q1 17Q2 17Q3
12-inch polished wafer 50~60 55~65 65~70 80~85
12-inch epitaxial wafer 80 85~90 90~95 100~110
Advanced 12-inch wafer of ≦20nm 120 130 140 150
Monthly demand (million square
inches /month)
Monthly demand for 300mm silicon
wafer (million wafers/month)
Monthly demand for 200mm silicon
wafer (million wafers/month)
Monthly demand for silicon wafer
under 150mm (million
wafers/month)
~72~
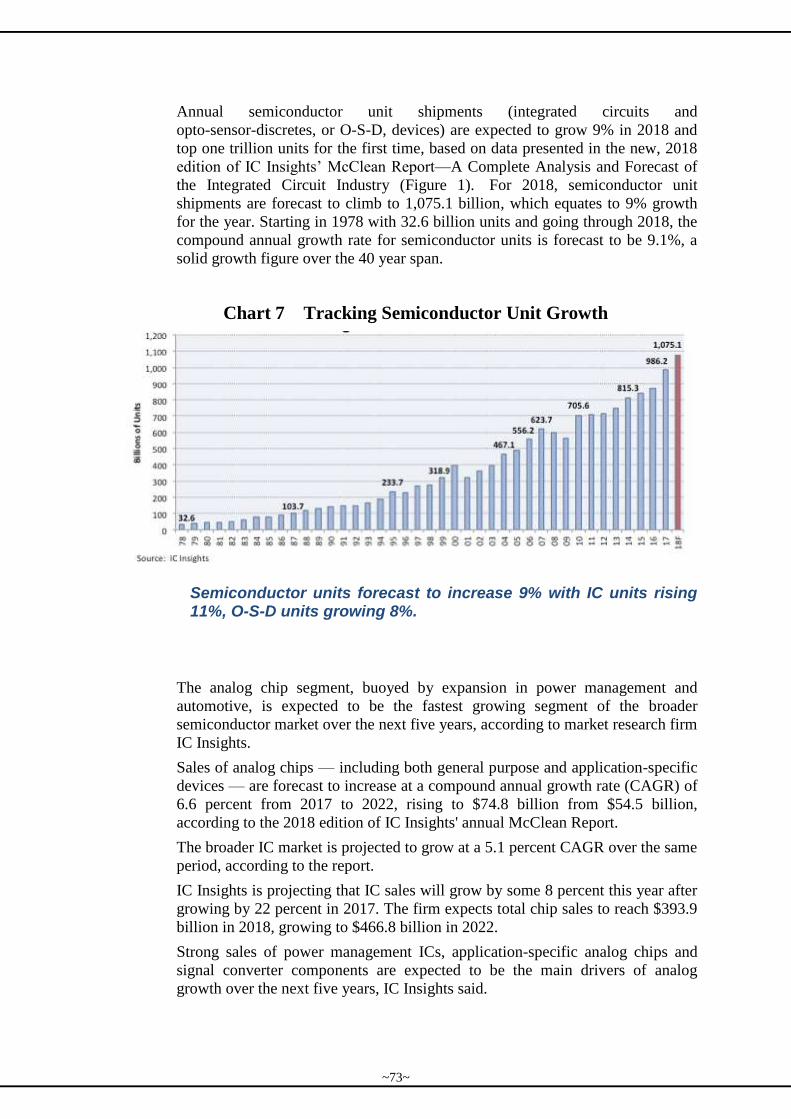
Annual semiconductor unit shipments (integrated circuits and
opto-sensor-discretes, or O-S-D, devices) are expected to grow 9% in 2018 and
top one trillion units for the first time, based on data presented in the new, 2018
edition of IC Insights’ McClean Report—A Complete Analysis and Forecast of
the Integrated Circuit Industry (Figure 1). For 2018, semiconductor unit
shipments are forecast to climb to 1,075.1 billion, which equates to 9% growth
for the year. Starting in 1978 with 32.6 billion units and going through 2018, the
compound annual growth rate for semiconductor units is forecast to be 9.1%, a
solid growth figure over the 40 year span.
Chart 7 Tracking Semiconductor Unit Growth
Semiconductor units forecast to increase 9% with IC units rising 11%, O-S-D units growing 8%.
The analog chip segment, buoyed by expansion in power management and
automotive, is expected to be the fastest growing segment of the broader
semiconductor market over the next five years, according to market research firm
IC Insights.
Sales of analog chips — including both general purpose and application-specific
devices — are forecast to increase at a compound annual growth rate (CAGR) of
6.6 percent from 2017 to 2022, rising to $74.8 billion from $54.5 billion,
according to the 2018 edition of IC Insights' annual McClean Report.
The broader IC market is projected to grow at a 5.1 percent CAGR over the same
period, according to the report.
IC Insights is projecting that IC sales will grow by some 8 percent this year after
growing by 22 percent in 2017. The firm expects total chip sales to reach $393.9
billion in 2018, growing to $466.8 billion in 2022.
Strong sales of power management ICs, application-specific analog chips and
signal converter components are expected to be the main drivers of analog
growth over the next five years, IC Insights said.
~73~
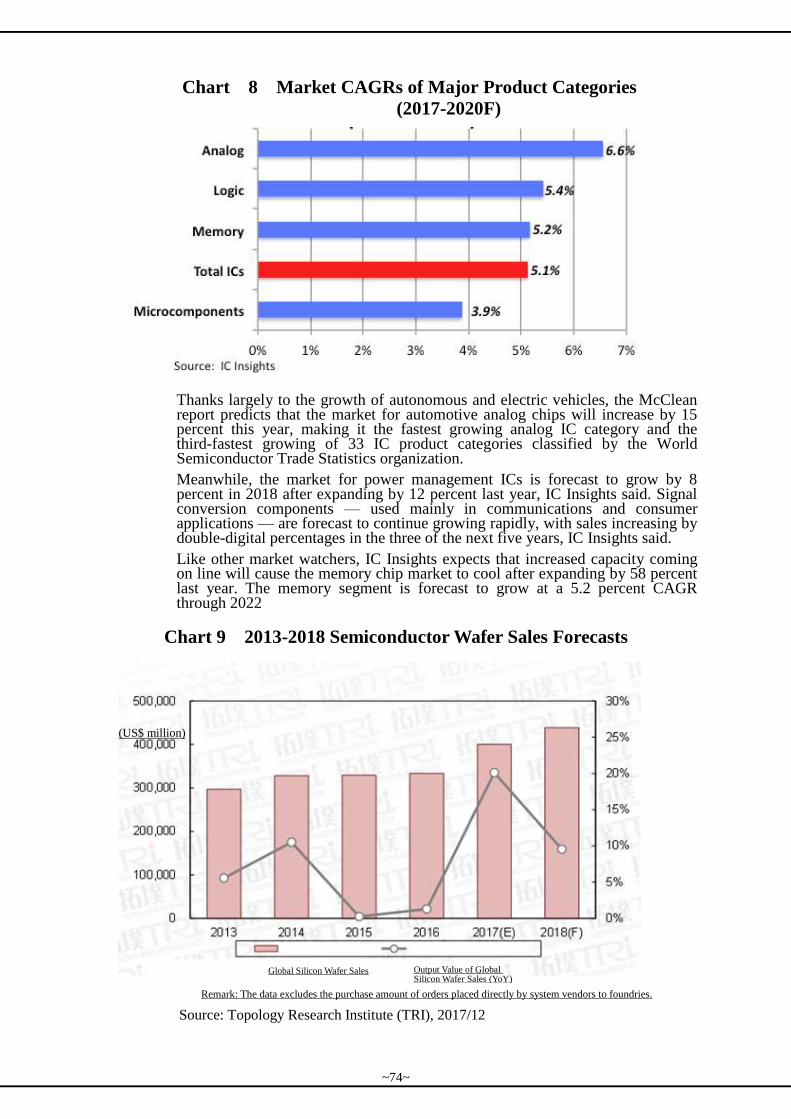
Chart 8 Market CAGRs of Major Product Categories
(2017-2020F)
Thanks largely to the growth of autonomous and electric vehicles, the McClean report predicts that the market for automotive analog chips will increase by 15 percent this year, making it the fastest growing analog IC category and the third-fastest growing of 33 IC product categories classified by the World Semiconductor Trade Statistics organization.
Meanwhile, the market for power management ICs is forecast to grow by 8 percent in 2018 after expanding by 12 percent last year, IC Insights said. Signal conversion components — used mainly in communications and consumer applications — are forecast to continue growing rapidly, with sales increasing by double-digital percentages in the three of the next five years, IC Insights said.
Like other market watchers, IC Insights expects that increased capacity coming on line will cause the memory chip market to cool after expanding by 58 percent last year. The memory segment is forecast to grow at a 5.2 percent CAGR through 2022
Chart 9 2013-2018 Semiconductor Wafer Sales Forecasts
Source: Topology Research Institute (TRI), 2017/12
Global Silicon Wafer Sales Output Value of Global Silicon Wafer Sales (YoY)
Remark: The data excludes the purchase amount of orders placed directly by system vendors to foundries.
(US$ million)
~74~
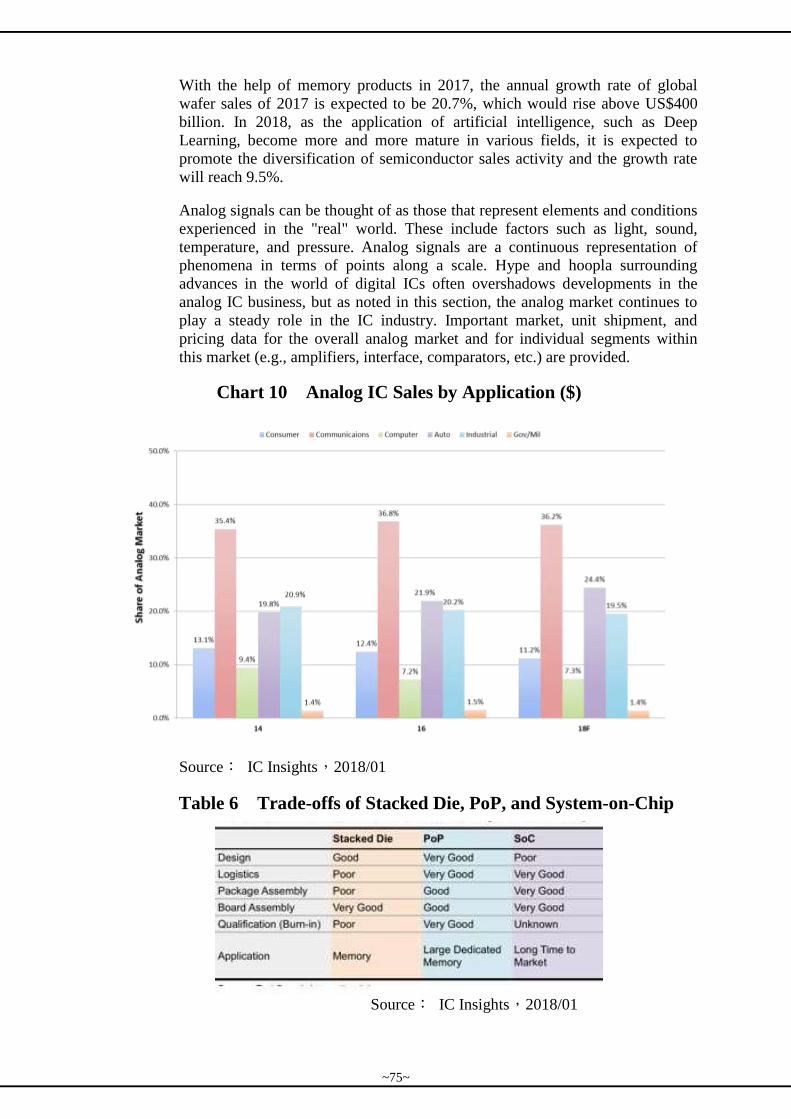
With the help of memory products in 2017, the annual growth rate of global
wafer sales of 2017 is expected to be 20.7%, which would rise above US$400
billion. In 2018, as the application of artificial intelligence, such as Deep
Learning, become more and more mature in various fields, it is expected to
promote the diversification of semiconductor sales activity and the growth rate
will reach 9.5%.
Analog signals can be thought of as those that represent elements and conditions
experienced in the "real" world. These include factors such as light, sound,
temperature, and pressure. Analog signals are a continuous representation of
phenomena in terms of points along a scale. Hype and hoopla surrounding
advances in the world of digital ICs often overshadows developments in the
analog IC business, but as noted in this section, the analog market continues to
play a steady role in the IC industry. Important market, unit shipment, and
pricing data for the overall analog market and for individual segments within
this market (e.g., amplifiers, interface, comparators, etc.) are provided.
Chart 10 Analog IC Sales by Application ($)
Source: IC Insights,2018/01
Table 6 Trade-offs of Stacked Die, PoP, and System-on-Chip
Source: IC Insights,2018/01
~75~
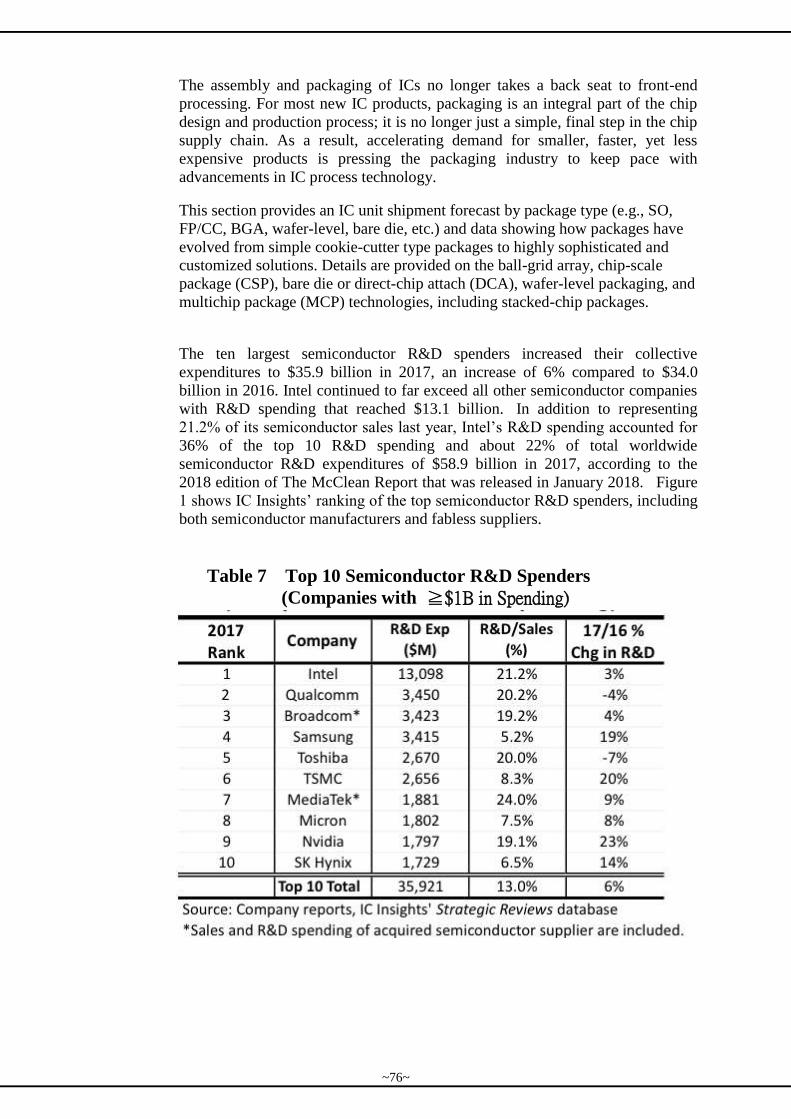
The assembly and packaging of ICs no longer takes a back seat to front-end
processing. For most new IC products, packaging is an integral part of the chip
design and production process; it is no longer just a simple, final step in the chip
supply chain. As a result, accelerating demand for smaller, faster, yet less
expensive products is pressing the packaging industry to keep pace with
advancements in IC process technology.
This section provides an IC unit shipment forecast by package type (e.g., SO,
FP/CC, BGA, wafer-level, bare die, etc.) and data showing how packages have
evolved from simple cookie-cutter type packages to highly sophisticated and
customized solutions. Details are provided on the ball-grid array, chip-scale
package (CSP), bare die or direct-chip attach (DCA), wafer-level packaging, and
multichip package (MCP) technologies, including stacked-chip packages.
The ten largest semiconductor R&D spenders increased their collective
expenditures to $35.9 billion in 2017, an increase of 6% compared to $34.0
billion in 2016. Intel continued to far exceed all other semiconductor companies
with R&D spending that reached $13.1 billion. In addition to representing
21.2% of its semiconductor sales last year, Intel’s R&D spending accounted for
36% of the top 10 R&D spending and about 22% of total worldwide
semiconductor R&D expenditures of $58.9 billion in 2017, according to the
2018 edition of The McClean Report that was released in January 2018. Figure
1 shows IC Insights’ ranking of the top semiconductor R&D spenders, including
both semiconductor manufacturers and fabless suppliers.
Table 7 Top 10 Semiconductor R&D Spenders
(Companies with ≧$1B in Spending)
Figure
~76~
Intel’s R&D expenditures increased just 3% in 2017, below its 8% average annual growth rate since 2001, according to the new report. Still, Intel’s R&D spending exceeded the combined R&D spending of the next four companies—Qualcomm, Broadcom, Samsung, and Toshiba—listed in the ranking.
Underscoring the growing cost of developing new IC technologies, Intel’s R&D-to-sales ratio has climbed significantly over the past 20 years. In 2017, Intel’s R&D spending as a percent of sales was 21.2%, down from an all-time high of 24.0% in 2015. In 2010, the ratio was 16.4%, 14.5% in 2005, 16.0% in 2000, and just 9.3% in 1995.
Qualcomm—the industry’s largest fabless IC supplier—was again ranked as second-largest R&D spender, a position it first achieved in 2012. Qualcomm’s semiconductor-related R&D spending was down 4% in 2017, after a 7% drop in 2016, and it was close to being passed up by third place Broadcom and fourth placed Samsung, whose R&D spending increased 4% and 19%, respectively.
Despite increasing its R&D expenditures by 19% in 2017, Samsung had the lowest investment-intensity level among the top-10 R&D spenders with research and development funding at 5.2% of sales last year. Samsung’s 49% increase in semiconductor revenue in 2017 (driven by strong growth in DRAM and NAND flash memory) lowered its R&D as a percent of sales ratio from 6.5% in 2016. Micron Technology’s revenues surged 77% in 2017, but its research and development expenditures grew 8%, resulting in an R&D/sales ratio of 7.5% compared to 12.5% in 2016. Similarly, SK Hynix’s sales climbed 79% in 2017, while its research and development spending increased 14% in the year, which resulted in an R&D/sakes ratio of 6.5% versus 10.2% in 2016.
Fifth-ranked Toshiba and sixth-ranked Taiwan Semiconductor Manufacturing Co. (TSMC) each allocated about the same amount for R&D spending in 2017. Toshiba’s R&D spending was down 7% while TSMC had one of the largest increases in R&D spending among the top 10 companies shown in the figure. TSMC’s R&D expenditures grew by 20% as the foundry raced rivals Samsung and GlobalFoundries in launching new process technologies, while its sales rose 9% to $32.2 billion in the year.
Rounding out the top-10 list were MediaTek, Micron, Nvidia, which moved from 11th place in 2016 to 9th position to displace NXP in the 2017 ranking, and SK Hynix. Collectively, the top-10 R&D spenders increased their outlays by 6% in 2017, two points more than the 4% R&D increase for the entire semiconductor industry. Combined R&D spending by the top 10 exceeded total spending by the rest of the semiconductor companies ($35.9 billion versus $23.0 billion) in 2017.
A total of 18 semiconductor suppliers allocated more than more than $1.0 billion for R&D spending 2017. The other eight manufacturers were NXP, TI ST, AMD, Renesas, Sony, Analog Devices, and GlobalFoundries.
According to SEMI’s 2017 development status of global semiconductor market, 2017 was a record-setting year for semiconductor industry, which had a growth of 20% compared with the previous year. It is expected that the global semiconductor market will set a new high in 2018 and the overall market will challenge US$500 billion level until 2019.
~77~
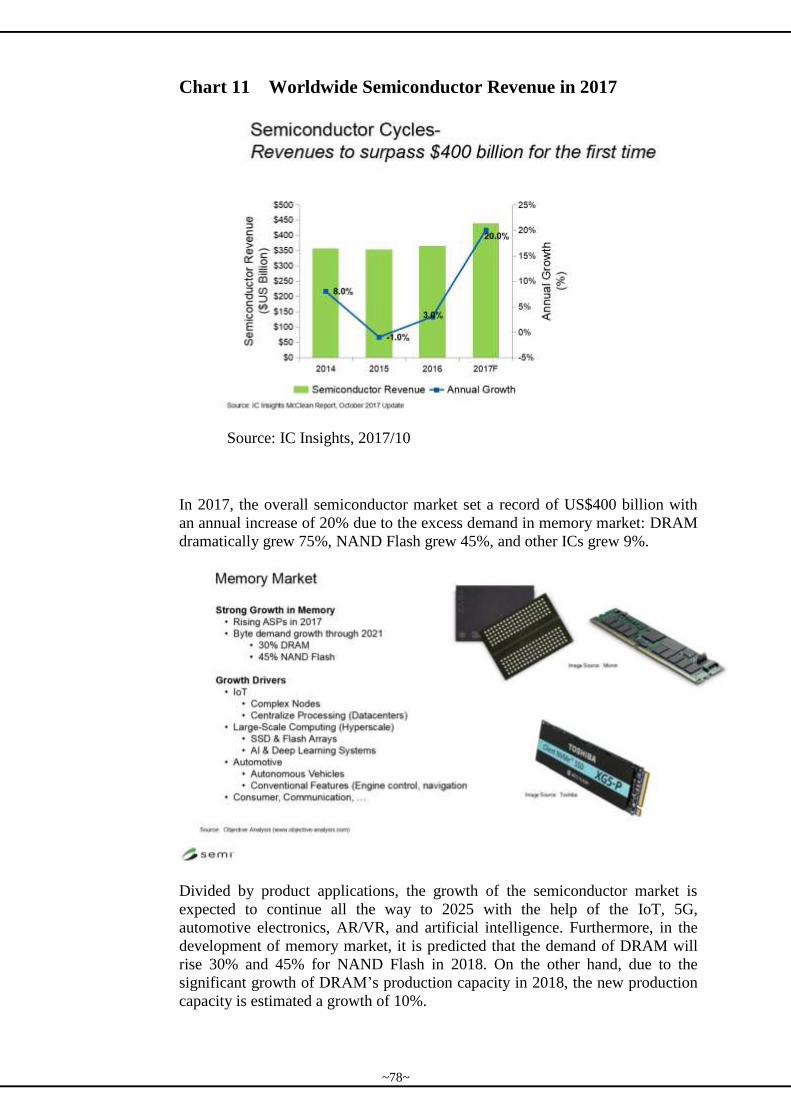
Chart 11 Worldwide Semiconductor Revenue in 2017
Source: IC Insights, 2017/10
In 2017, the overall semiconductor market set a record of US$400 billion with
an annual increase of 20% due to the excess demand in memory market: DRAM
dramatically grew 75%, NAND Flash grew 45%, and other ICs grew 9%.
Divided by product applications, the growth of the semiconductor market is
expected to continue all the way to 2025 with the help of the IoT, 5G,
automotive electronics, AR/VR, and artificial intelligence. Furthermore, in the
development of memory market, it is predicted that the demand of DRAM will
rise 30% and 45% for NAND Flash in 2018. On the other hand, due to the
significant growth of DRAM’s production capacity in 2018, the new production
capacity is estimated a growth of 10%.
~78~
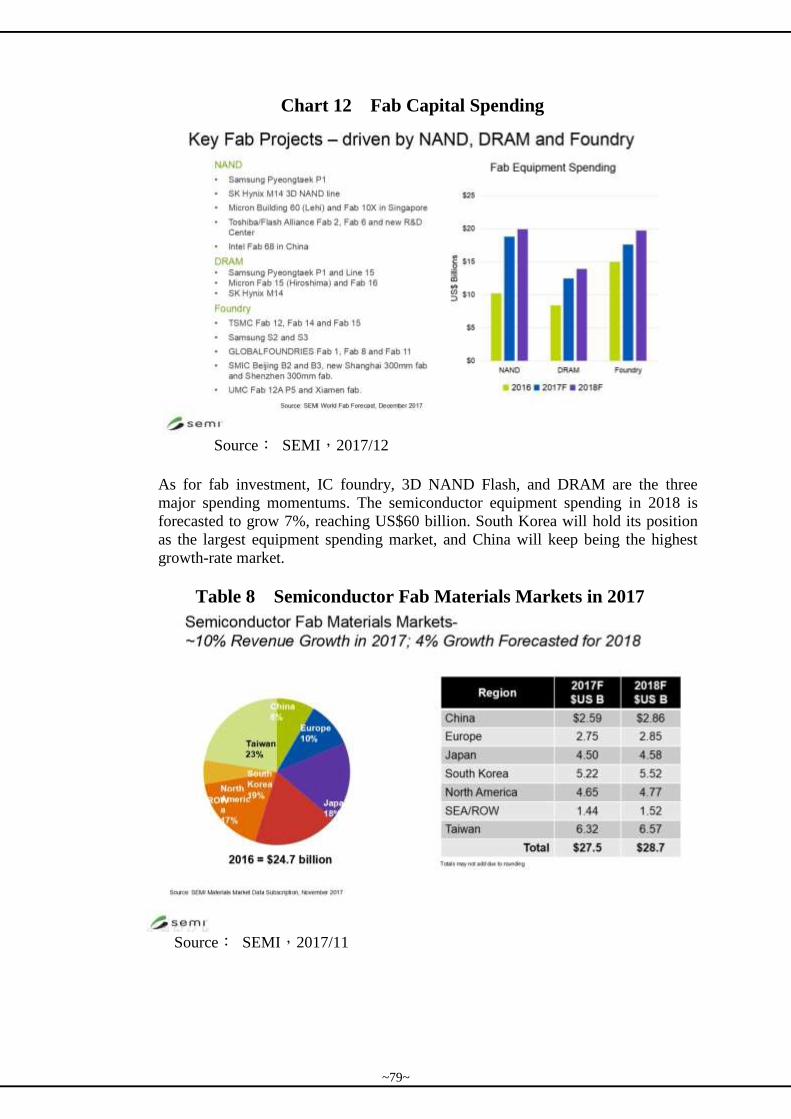
Chart 12 Fab Capital Spending
Source: SEMI,2017/12
As for fab investment, IC foundry, 3D NAND Flash, and DRAM are the three
major spending momentums. The semiconductor equipment spending in 2018 is
forecasted to grow 7%, reaching US$60 billion. South Korea will hold its position
as the largest equipment spending market, and China will keep being the highest
growth-rate market.
Table 8 Semiconductor Fab Materials Markets in 2017
Source: SEMI,2017/11
~79~
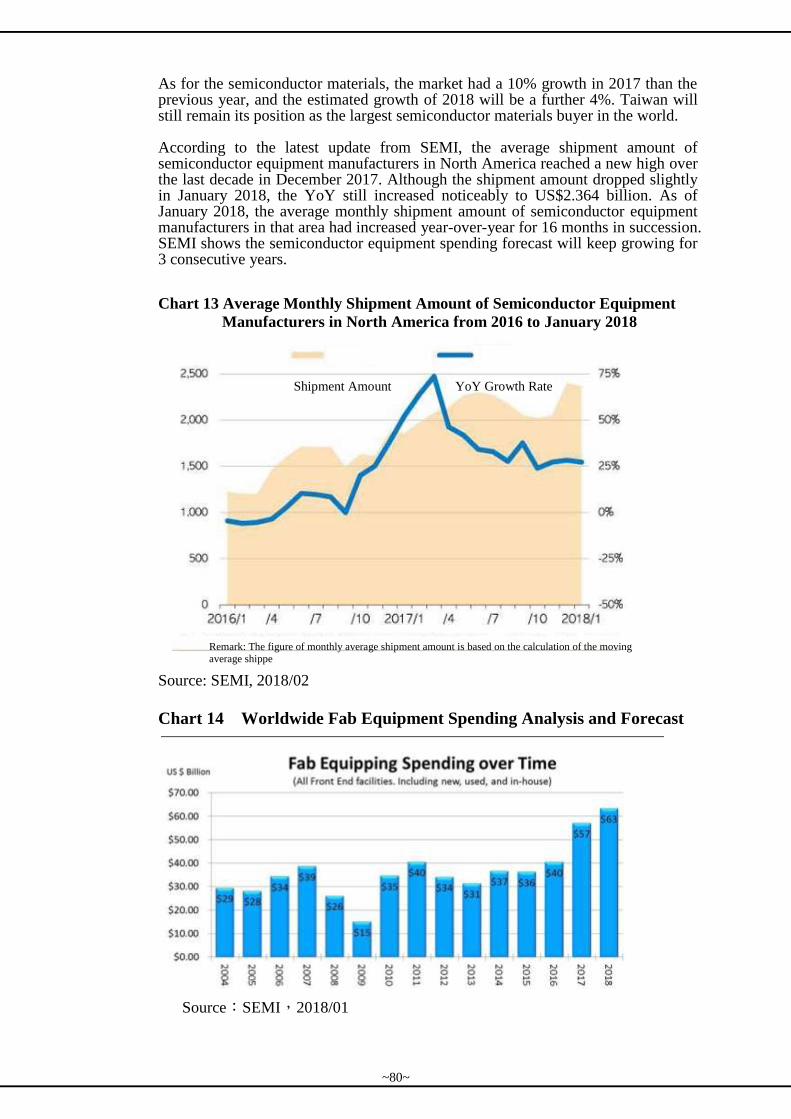
As for the semiconductor materials, the market had a 10% growth in 2017 than the previous year, and the estimated growth of 2018 will be a further 4%. Taiwan will still remain its position as the largest semiconductor materials buyer in the world. According to the latest update from SEMI, the average shipment amount of semiconductor equipment manufacturers in North America reached a new high over the last decade in December 2017. Although the shipment amount dropped slightly in January 2018, the YoY still increased noticeably to US$2.364 billion. As of January 2018, the average monthly shipment amount of semiconductor equipment manufacturers in that area had increased year-over-year for 16 months in succession. SEMI shows the semiconductor equipment spending forecast will keep growing for 3 consecutive years.
Chart 13 Average Monthly Shipment Amount of Semiconductor Equipment
Manufacturers in North America from 2016 to January 2018
Source: SEMI, 2018/02
Chart 14 Worldwide Fab Equipment Spending Analysis and Forecast
Source:SEMI,2018/01
Shipment Amount YoY Growth Rate
Remark: The figure of monthly average shipment amount is based on the calculation of the moving average shippe
~80~
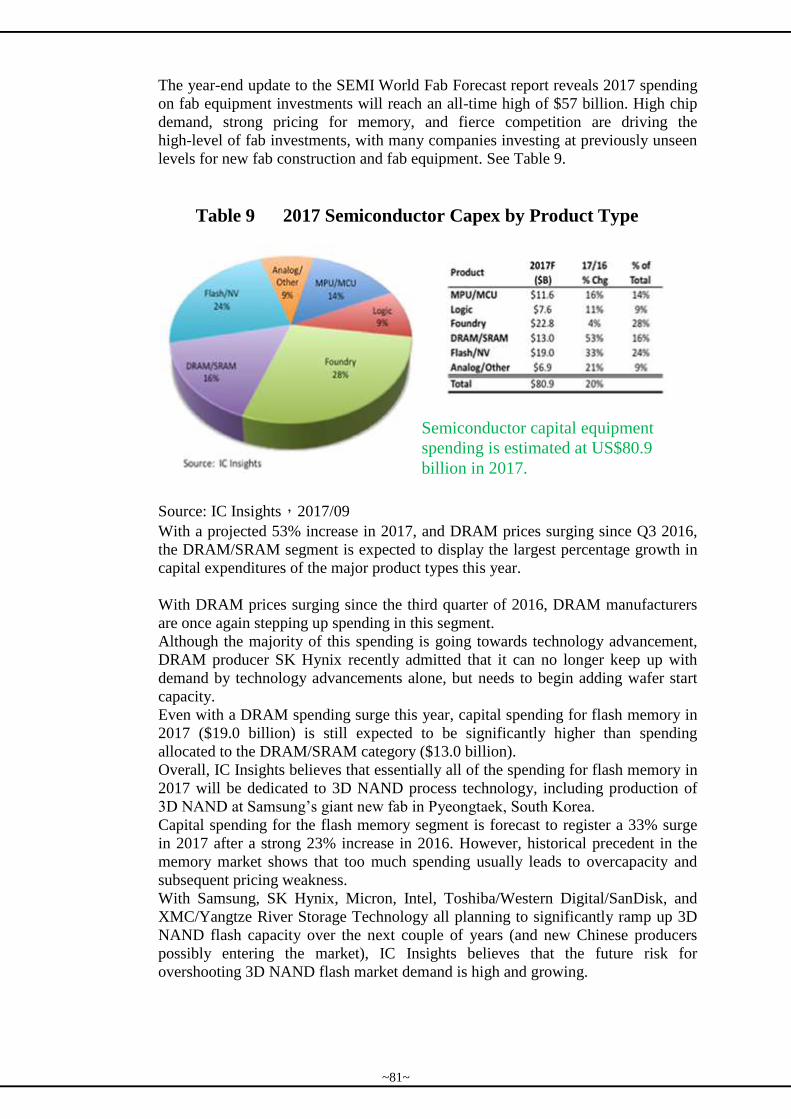
The year-end update to the SEMI World Fab Forecast report reveals 2017 spending
on fab equipment investments will reach an all-time high of $57 billion. High chip
demand, strong pricing for memory, and fierce competition are driving the
high-level of fab investments, with many companies investing at previously unseen
levels for new fab construction and fab equipment. See Table 9.
Table 9 2017 Semiconductor Capex by Product Type
Source: IC Insights,2017/09
With a projected 53% increase in 2017, and DRAM prices surging since Q3 2016,
the DRAM/SRAM segment is expected to display the largest percentage growth in
capital expenditures of the major product types this year.
With DRAM prices surging since the third quarter of 2016, DRAM manufacturers
are once again stepping up spending in this segment.
Although the majority of this spending is going towards technology advancement,
DRAM producer SK Hynix recently admitted that it can no longer keep up with
demand by technology advancements alone, but needs to begin adding wafer start
capacity.
Even with a DRAM spending surge this year, capital spending for flash memory in
2017 ($19.0 billion) is still expected to be significantly higher than spending
allocated to the DRAM/SRAM category ($13.0 billion).
Overall, IC Insights believes that essentially all of the spending for flash memory in
2017 will be dedicated to 3D NAND process technology, including production of
3D NAND at Samsung’s giant new fab in Pyeongtaek, South Korea.
Capital spending for the flash memory segment is forecast to register a 33% surge
in 2017 after a strong 23% increase in 2016. However, historical precedent in the
memory market shows that too much spending usually leads to overcapacity and
subsequent pricing weakness.
With Samsung, SK Hynix, Micron, Intel, Toshiba/Western Digital/SanDisk, and
XMC/Yangtze River Storage Technology all planning to significantly ramp up 3D
NAND flash capacity over the next couple of years (and new Chinese producers
possibly entering the market), IC Insights believes that the future risk for
overshooting 3D NAND flash market demand is high and growing.
Semiconductor capital equipment
spending is estimated at US$80.9
billion in 2017.
~81~
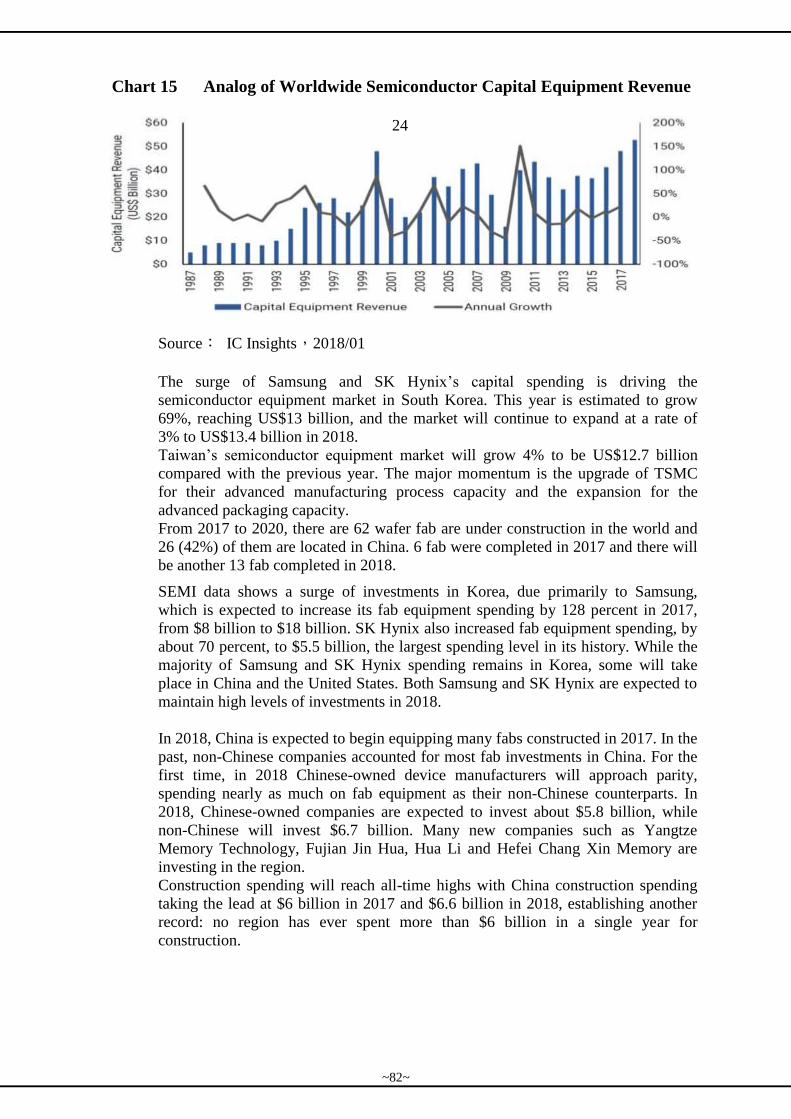
Chart 15 Analog of Worldwide Semiconductor Capital Equipment Revenue
Source: IC Insights,2018/01
The surge of Samsung and SK Hynix’s capital spending is driving the
semiconductor equipment market in South Korea. This year is estimated to grow
69%, reaching US$13 billion, and the market will continue to expand at a rate of
3% to US$13.4 billion in 2018.
Taiwan’s semiconductor equipment market will grow 4% to be US$12.7 billion
compared with the previous year. The major momentum is the upgrade of TSMC
for their advanced manufacturing process capacity and the expansion for the
advanced packaging capacity.
From 2017 to 2020, there are 62 wafer fab are under construction in the world and
26 (42%) of them are located in China. 6 fab were completed in 2017 and there will
be another 13 fab completed in 2018.
SEMI data shows a surge of investments in Korea, due primarily to Samsung,
which is expected to increase its fab equipment spending by 128 percent in 2017,
from $8 billion to $18 billion. SK Hynix also increased fab equipment spending, by
about 70 percent, to $5.5 billion, the largest spending level in its history. While the
majority of Samsung and SK Hynix spending remains in Korea, some will take
place in China and the United States. Both Samsung and SK Hynix are expected to
maintain high levels of investments in 2018.
In 2018, China is expected to begin equipping many fabs constructed in 2017. In the
past, non-Chinese companies accounted for most fab investments in China. For the
first time, in 2018 Chinese-owned device manufacturers will approach parity,
spending nearly as much on fab equipment as their non-Chinese counterparts. In
2018, Chinese-owned companies are expected to invest about $5.8 billion, while
non-Chinese will invest $6.7 billion. Many new companies such as Yangtze
Memory Technology, Fujian Jin Hua, Hua Li and Hefei Chang Xin Memory are
investing in the region.
Construction spending will reach all-time highs with China construction spending
taking the lead at $6 billion in 2017 and $6.6 billion in 2018, establishing another
record: no region has ever spent more than $6 billion in a single year for
construction.
24
~82~

Chart 16 Analog of Worldwide Semiconductor Capital Equipment Revenue
Table 10 Top 10 Fab Equipment Buyers 2013 2017E 2018F
1 TSMC (C) Samsung (C) Samsung (C)
2 Samsung (C) TSMC (C) Intel (C)
3 Intel Intel (C) TSMC (C)
4 SK Hynix (C) Micron Micron
5 GlobalFoundries SK Hynix (C) Flash Alliance
6 Micron Flash Alliance SK Hynix (C)
7 Flash Alliance UMC (C) GlobalFoundries (C)
8 UMC (C) GlobalFoundries UMC (C)
9 SMIC (C) Nanya Technologies SMIC (C)
10 Sony SMIC (C) Yangtze Memory
Technology (C)
Total $31.0 B $43.5 B 46.6 B
Wafer
Equipment
Market Share
87% 88% 86%
China’s Wafer
Equipment
Spending
$3.9 B $5.5 B $8.3 B
Source: Metal Industries Research & Development Centre
hund
red m
illion U
S d
ollar
Others
Europe
Japan
North America
Taiwan
China
South Korea
~83~
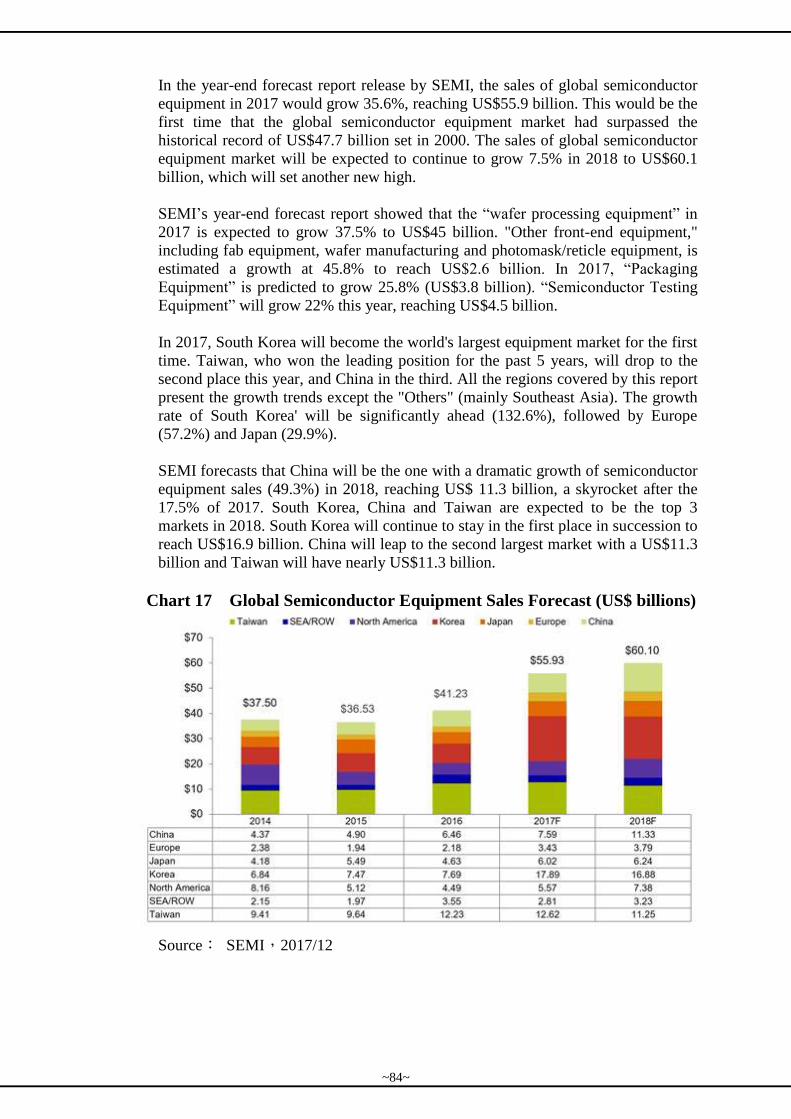
In the year-end forecast report release by SEMI, the sales of global semiconductor
equipment in 2017 would grow 35.6%, reaching US$55.9 billion. This would be the
first time that the global semiconductor equipment market had surpassed the
historical record of US$47.7 billion set in 2000. The sales of global semiconductor
equipment market will be expected to continue to grow 7.5% in 2018 to US$60.1
billion, which will set another new high.
SEMI’s year-end forecast report showed that the “wafer processing equipment” in
2017 is expected to grow 37.5% to US$45 billion. "Other front-end equipment,"
including fab equipment, wafer manufacturing and photomask/reticle equipment, is
estimated a growth at 45.8% to reach US$2.6 billion. In 2017, “Packaging
Equipment” is predicted to grow 25.8% (US$3.8 billion). “Semiconductor Testing
Equipment” will grow 22% this year, reaching US$4.5 billion.
In 2017, South Korea will become the world's largest equipment market for the first
time. Taiwan, who won the leading position for the past 5 years, will drop to the
second place this year, and China in the third. All the regions covered by this report
present the growth trends except the "Others" (mainly Southeast Asia). The growth
rate of South Korea' will be significantly ahead (132.6%), followed by Europe
(57.2%) and Japan (29.9%).
SEMI forecasts that China will be the one with a dramatic growth of semiconductor
equipment sales (49.3%) in 2018, reaching US$ 11.3 billion, a skyrocket after the
17.5% of 2017. South Korea, China and Taiwan are expected to be the top 3
markets in 2018. South Korea will continue to stay in the first place in succession to
reach US$16.9 billion. China will leap to the second largest market with a US$11.3
billion and Taiwan will have nearly US$11.3 billion.
Chart 17 Global Semiconductor Equipment Sales Forecast (US$ billions)
Source: SEMI,2017/12
~84~

Chart 18 Global Semiconductor Equipment Purchase
Source: SEMI,2018/01
SEMI’s statistic shows the global semiconductor output value of 2017 surpass
US$400 billion for the first time, the YoY growth rate of 20%. The output value
and growth rate both set historical records. The equipment and materials
manufacturers also share the glory. SEMI is optimistic that the growth can last till
2019, as well as positive to the semiconductor industry.
SEMI predicts that the YoY growth rate of semiconductor industry will be
approximately 5-8% this year which may set another new high and will keep
growing next year to US$500 billion for the first time.
SEMI predicts that the fab construction related spending will reach US$13 billion
this year. Once a new fab is completed, the following equipment spending will be
remarkable in 2019 and 2020. The front-end equipment purchase amount of this
year will increase from $56 billion of last year to $63 billion.
The price of silicon wafers is raised by the materials cost as well. The average cost
of last year had a 17% increase, mainly driven by 12-inch silicon wafers. SEMI says
that, even if the price of silicon wafers double, it is in the same level of 2011.
Global Semiconductor
Equipment Purchase
Analysis Hundred million US dollars
Remark: Estimation for 2018
Source: SEMI
~85~
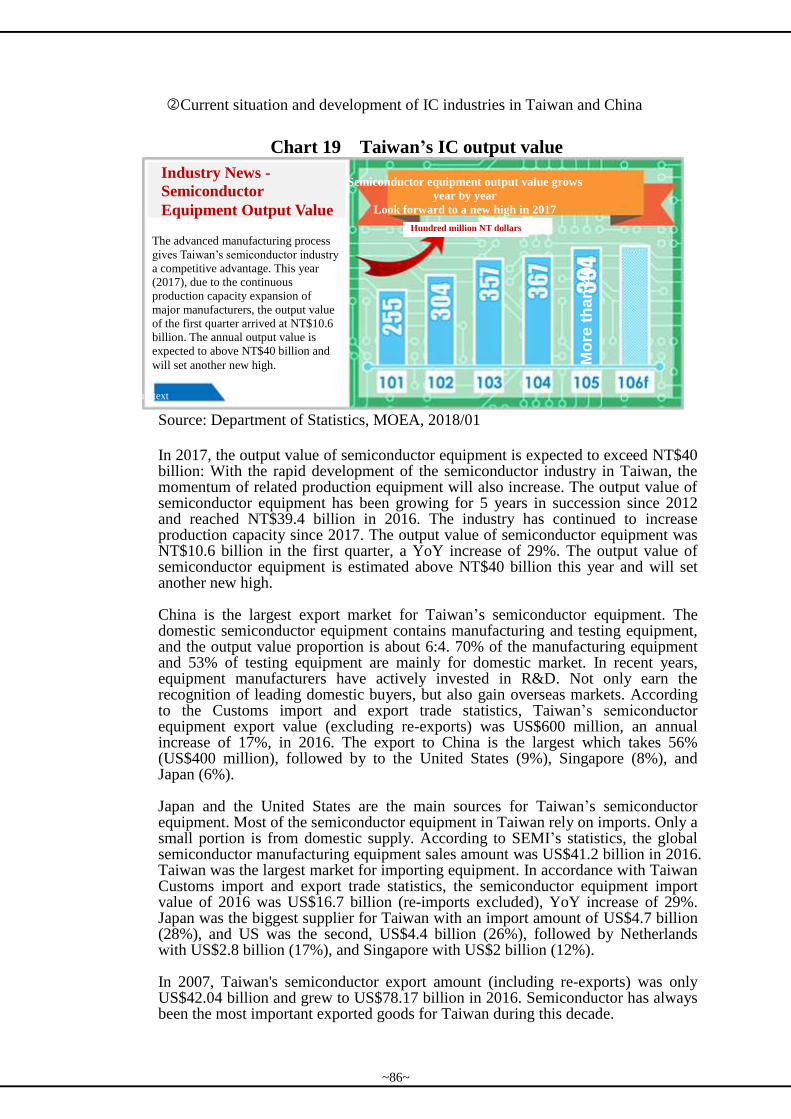
Current situation and development of IC industries in Taiwan and China
Chart 19 Taiwan’s IC output value
Source: Department of Statistics, MOEA, 2018/01
In 2017, the output value of semiconductor equipment is expected to exceed NT$40 billion: With the rapid development of the semiconductor industry in Taiwan, the momentum of related production equipment will also increase. The output value of semiconductor equipment has been growing for 5 years in succession since 2012 and reached NT$39.4 billion in 2016. The industry has continued to increase production capacity since 2017. The output value of semiconductor equipment was NT$10.6 billion in the first quarter, a YoY increase of 29%. The output value of semiconductor equipment is estimated above NT$40 billion this year and will set another new high. China is the largest export market for Taiwan’s semiconductor equipment. The domestic semiconductor equipment contains manufacturing and testing equipment, and the output value proportion is about 6:4. 70% of the manufacturing equipment and 53% of testing equipment are mainly for domestic market. In recent years, equipment manufacturers have actively invested in R&D. Not only earn the recognition of leading domestic buyers, but also gain overseas markets. According to the Customs import and export trade statistics, Taiwan’s semiconductor equipment export value (excluding re-exports) was US$600 million, an annual increase of 17%, in 2016. The export to China is the largest which takes 56% (US$400 million), followed by to the United States (9%), Singapore (8%), and Japan (6%). Japan and the United States are the main sources for Taiwan’s semiconductor equipment. Most of the semiconductor equipment in Taiwan rely on imports. Only a small portion is from domestic supply. According to SEMI’s statistics, the global semiconductor manufacturing equipment sales amount was US$41.2 billion in 2016. Taiwan was the largest market for importing equipment. In accordance with Taiwan Customs import and export trade statistics, the semiconductor equipment import value of 2016 was US$16.7 billion (re-imports excluded), YoY increase of 29%. Japan was the biggest supplier for Taiwan with an import amount of US$4.7 billion (28%), and US was the second, US$4.4 billion (26%), followed by Netherlands with US$2.8 billion (17%), and Singapore with US$2 billion (12%). In 2007, Taiwan's semiconductor export amount (including re-exports) was only US$42.04 billion and grew to US$78.17 billion in 2016. Semiconductor has always been the most important exported goods for Taiwan during this decade.
Industry News -
Semiconductor
Equipment Output Value
The advanced manufacturing process
gives Taiwan’s semiconductor industry
a competitive advantage. This year
(2017), due to the continuous
production capacity expansion of
major manufacturers, the output value
of the first quarter arrived at NT$10.6
billion. The annual output value is
expected to above NT$40 billion and
will set another new high.
Semiconductor equipment output value grows
year by year
Look forward to a new high in 2017
Hundred million NT dollars
Read full text
Mo
re t
han
400
~86~
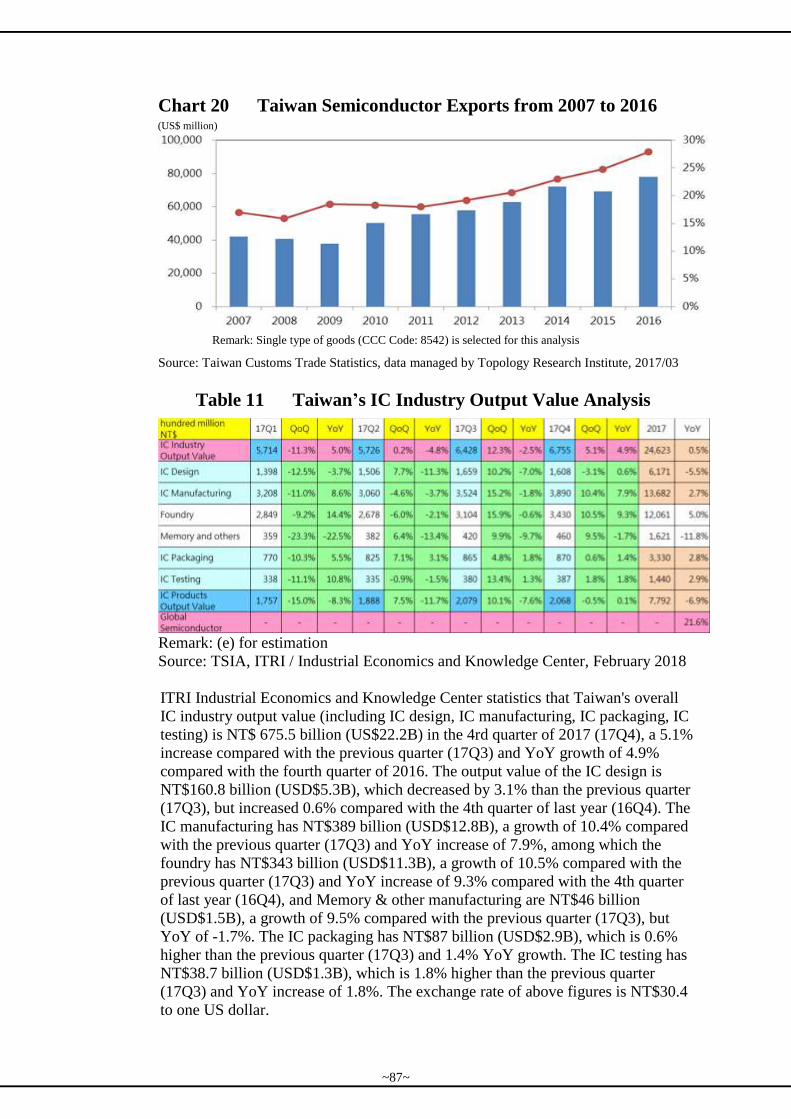
Chart 20 Taiwan Semiconductor Exports from 2007 to 2016
Remark: Single type of goods (CCC Code: 8542) is selected for this analysis
Source: Taiwan Customs Trade Statistics, data managed by Topology Research Institute, 2017/03
Table 11 Taiwan’s IC Industry Output Value Analysis
Remark: (e) for estimation
Source: TSIA, ITRI / Industrial Economics and Knowledge Center, February 2018
ITRI Industrial Economics and Knowledge Center statistics that Taiwan's overall
IC industry output value (including IC design, IC manufacturing, IC packaging, IC
testing) is NT$ 675.5 billion (US$22.2B) in the 4rd quarter of 2017 (17Q4), a 5.1%
increase compared with the previous quarter (17Q3) and YoY growth of 4.9%
compared with the fourth quarter of 2016. The output value of the IC design is
NT$160.8 billion (USD$5.3B), which decreased by 3.1% than the previous quarter
(17Q3), but increased 0.6% compared with the 4th quarter of last year (16Q4). The
IC manufacturing has NT$389 billion (USD$12.8B), a growth of 10.4% compared
with the previous quarter (17Q3) and YoY increase of 7.9%, among which the
foundry has NT$343 billion (USD$11.3B), a growth of 10.5% compared with the
previous quarter (17Q3) and YoY increase of 9.3% compared with the 4th quarter
of last year (16Q4), and Memory & other manufacturing are NT$46 billion
(USD$1.5B), a growth of 9.5% compared with the previous quarter (17Q3), but
YoY of -1.7%. The IC packaging has NT$87 billion (USD$2.9B), which is 0.6%
higher than the previous quarter (17Q3) and 1.4% YoY growth. The IC testing has
NT$38.7 billion (USD$1.3B), which is 1.8% higher than the previous quarter
(17Q3) and YoY increase of 1.8%. The exchange rate of above figures is NT$30.4
to one US dollar.
(US$ million)
~87~
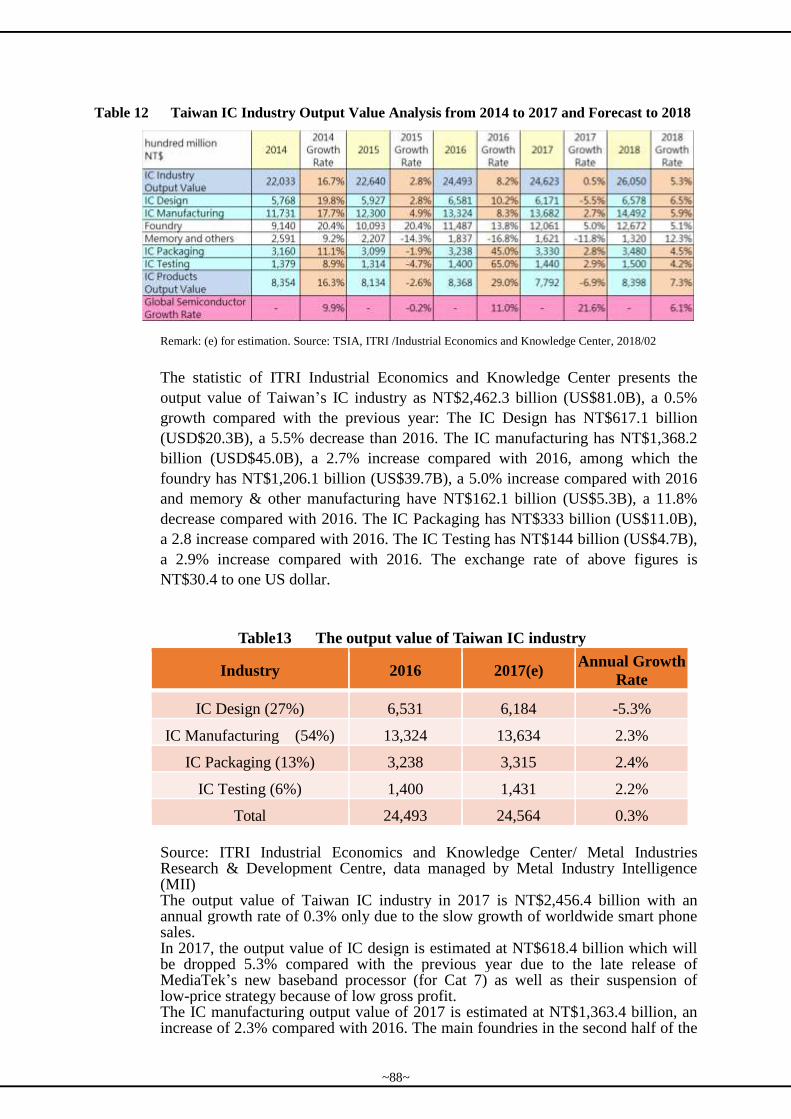
Table 12 Taiwan IC Industry Output Value Analysis from 2014 to 2017 and Forecast to 2018
Remark: (e) for estimation. Source: TSIA, ITRI /Industrial Economics and Knowledge Center, 2018/02
The statistic of ITRI Industrial Economics and Knowledge Center presents the
output value of Taiwan’s IC industry as NT$2,462.3 billion (US$81.0B), a 0.5%
growth compared with the previous year: The IC Design has NT$617.1 billion
(USD$20.3B), a 5.5% decrease than 2016. The IC manufacturing has NT$1,368.2
billion (USD$45.0B), a 2.7% increase compared with 2016, among which the
foundry has NT$1,206.1 billion (US$39.7B), a 5.0% increase compared with 2016
and memory & other manufacturing have NT$162.1 billion (US$5.3B), a 11.8%
decrease compared with 2016. The IC Packaging has NT$333 billion (US$11.0B),
a 2.8 increase compared with 2016. The IC Testing has NT$144 billion (US$4.7B),
a 2.9% increase compared with 2016. The exchange rate of above figures is
NT$30.4 to one US dollar.
Table13 The output value of Taiwan IC industry
Industry 2016 2017(e) Annual Growth
Rate
IC Design (27%) 6,531 6,184 -5.3%
IC Manufacturing (54%) 13,324 13,634 2.3%
IC Packaging (13%) 3,238 3,315 2.4%
IC Testing (6%) 1,400 1,431 2.2%
Total 24,493 24,564 0.3%
Source: ITRI Industrial Economics and Knowledge Center/ Metal Industries Research & Development Centre, data managed by Metal Industry Intelligence (MII) The output value of Taiwan IC industry in 2017 is NT$2,456.4 billion with an annual growth rate of 0.3% only due to the slow growth of worldwide smart phone sales. In 2017, the output value of IC design is estimated at NT$618.4 billion which will be dropped 5.3% compared with the previous year due to the late release of MediaTek’s new baseband processor (for Cat 7) as well as their suspension of low-price strategy because of low gross profit. The IC manufacturing output value of 2017 is estimated at NT$1,363.4 billion, an increase of 2.3% compared with 2016. The main foundries in the second half of the
~88~
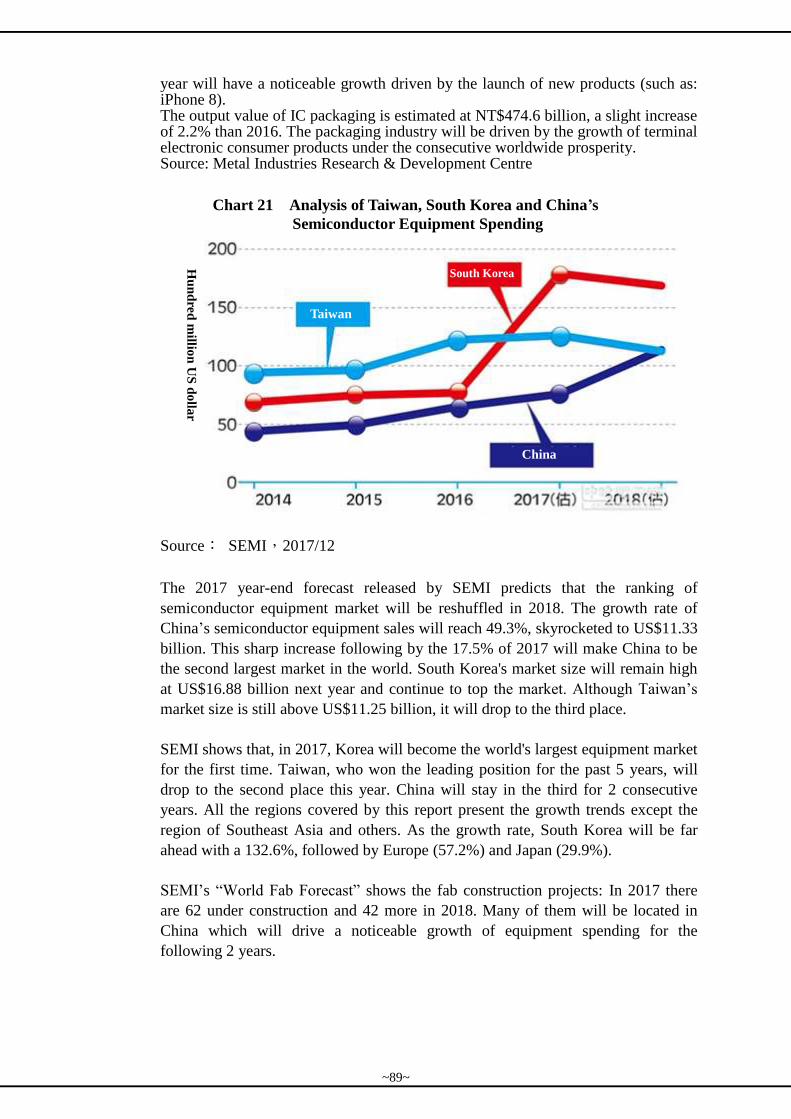
year will have a noticeable growth driven by the launch of new products (such as: iPhone 8). The output value of IC packaging is estimated at NT$474.6 billion, a slight increase of 2.2% than 2016. The packaging industry will be driven by the growth of terminal electronic consumer products under the consecutive worldwide prosperity. Source: Metal Industries Research & Development Centre
Source: SEMI,2017/12
The 2017 year-end forecast released by SEMI predicts that the ranking of
semiconductor equipment market will be reshuffled in 2018. The growth rate of
China’s semiconductor equipment sales will reach 49.3%, skyrocketed to US$11.33
billion. This sharp increase following by the 17.5% of 2017 will make China to be
the second largest market in the world. South Korea's market size will remain high
at US$16.88 billion next year and continue to top the market. Although Taiwan’s
market size is still above US$11.25 billion, it will drop to the third place.
SEMI shows that, in 2017, Korea will become the world's largest equipment market
for the first time. Taiwan, who won the leading position for the past 5 years, will
drop to the second place this year. China will stay in the third for 2 consecutive
years. All the regions covered by this report present the growth trends except the
region of Southeast Asia and others. As the growth rate, South Korea will be far
ahead with a 132.6%, followed by Europe (57.2%) and Japan (29.9%).
SEMI’s “World Fab Forecast” shows the fab construction projects: In 2017 there
are 62 under construction and 42 more in 2018. Many of them will be located in
China which will drive a noticeable growth of equipment spending for the
following 2 years.
Chart 21 Analysis of Taiwan, South Korea and China’s
Semiconductor Equipment Spending
Hu
nd
red
millio
n U
S d
olla
r
Taiwan
South Korea
China
~89~
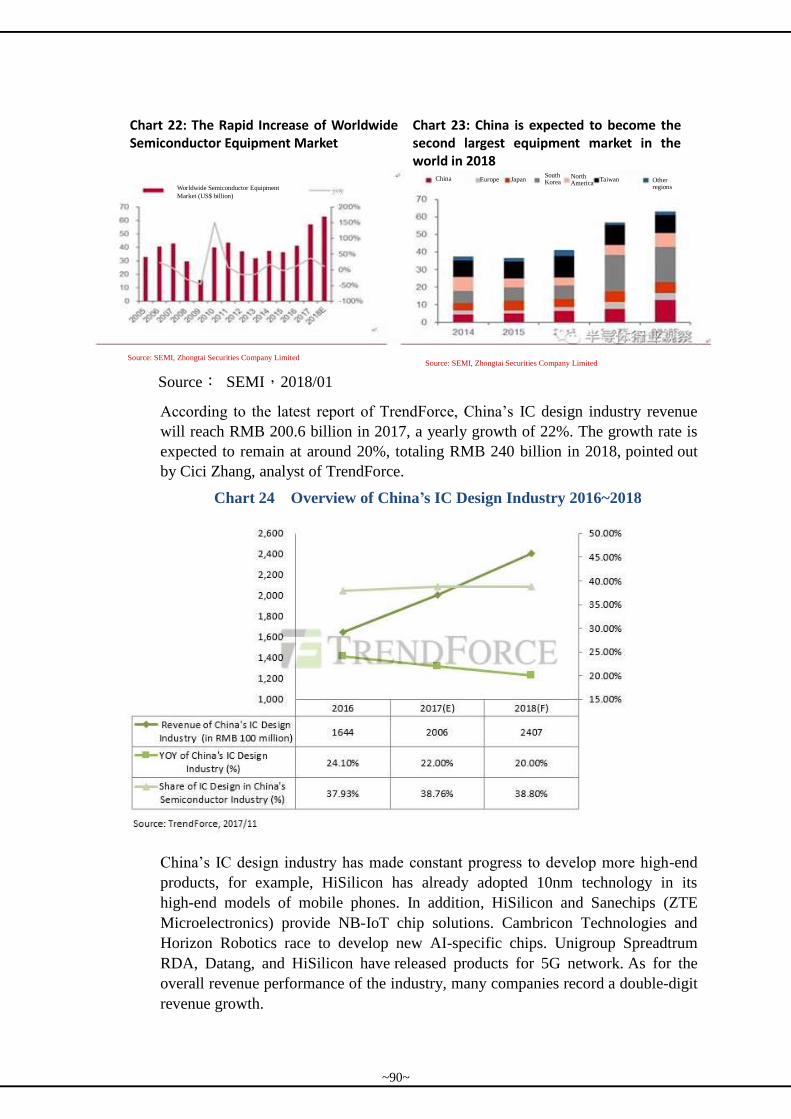
Chart 22: The Rapid Increase of Worldwide Semiconductor Equipment Market
Chart 23: China is expected to become the second largest equipment market in the world in 2018
Source: SEMI,2018/01
According to the latest report of TrendForce, China’s IC design industry revenue
will reach RMB 200.6 billion in 2017, a yearly growth of 22%. The growth rate is
expected to remain at around 20%, totaling RMB 240 billion in 2018, pointed out
by Cici Zhang, analyst of TrendForce.
Chart 24 Overview of China’s IC Design Industry 2016~2018
China’s IC design industry has made constant progress to develop more high-end
products, for example, HiSilicon has already adopted 10nm technology in its
high-end models of mobile phones. In addition, HiSilicon and Sanechips (ZTE
Microelectronics) provide NB-IoT chip solutions. Cambricon Technologies and
Horizon Robotics race to develop new AI-specific chips. Unigroup Spreadtrum
RDA, Datang, and HiSilicon have released products for 5G network. As for the
overall revenue performance of the industry, many companies record a double-digit
revenue growth.
Worldwide Semiconductor Equipment
Market (US$ billion)
Source: SEMI, Zhongtai Securities Company Limited
China Europe Japan South Korea
North America
Taiwan Other regions
Source: SEMI, Zhongtai Securities Company Limited
~90~
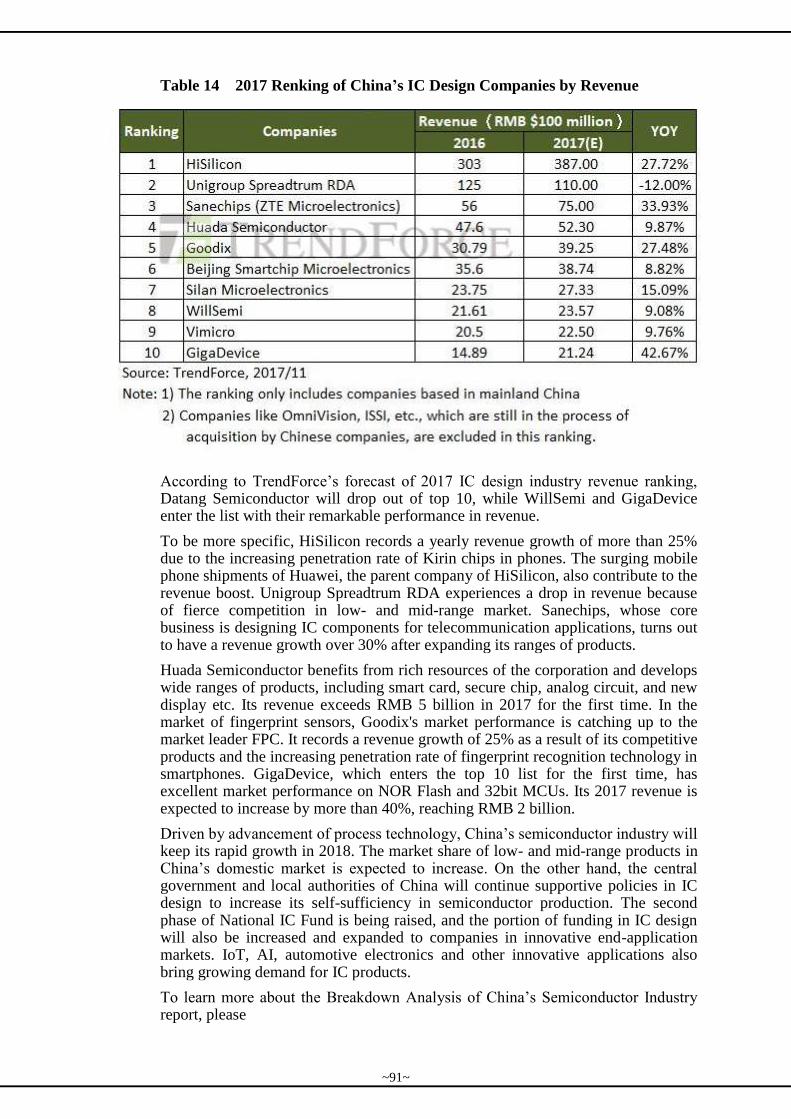
Table 14 2017 Renking of China’s IC Design Companies by Revenue
According to TrendForce’s forecast of 2017 IC design industry revenue ranking, Datang Semiconductor will drop out of top 10, while WillSemi and GigaDevice enter the list with their remarkable performance in revenue.
To be more specific, HiSilicon records a yearly revenue growth of more than 25% due to the increasing penetration rate of Kirin chips in phones. The surging mobile phone shipments of Huawei, the parent company of HiSilicon, also contribute to the revenue boost. Unigroup Spreadtrum RDA experiences a drop in revenue because of fierce competition in low- and mid-range market. Sanechips, whose core business is designing IC components for telecommunication applications, turns out to have a revenue growth over 30% after expanding its ranges of products.
Huada Semiconductor benefits from rich resources of the corporation and develops wide ranges of products, including smart card, secure chip, analog circuit, and new display etc. Its revenue exceeds RMB 5 billion in 2017 for the first time. In the market of fingerprint sensors, Goodix's market performance is catching up to the market leader FPC. It records a revenue growth of 25% as a result of its competitive products and the increasing penetration rate of fingerprint recognition technology in smartphones. GigaDevice, which enters the top 10 list for the first time, has excellent market performance on NOR Flash and 32bit MCUs. Its 2017 revenue is expected to increase by more than 40%, reaching RMB 2 billion.
Driven by advancement of process technology, China’s semiconductor industry will keep its rapid growth in 2018. The market share of low- and mid-range products in China’s domestic market is expected to increase. On the other hand, the central government and local authorities of China will continue supportive policies in IC design to increase its self-sufficiency in semiconductor production. The second phase of National IC Fund is being raised, and the portion of funding in IC design will also be increased and expanded to companies in innovative end-application markets. IoT, AI, automotive electronics and other innovative applications also bring growing demand for IC products.
To learn more about the Breakdown Analysis of China’s Semiconductor Industry report, please
~91~
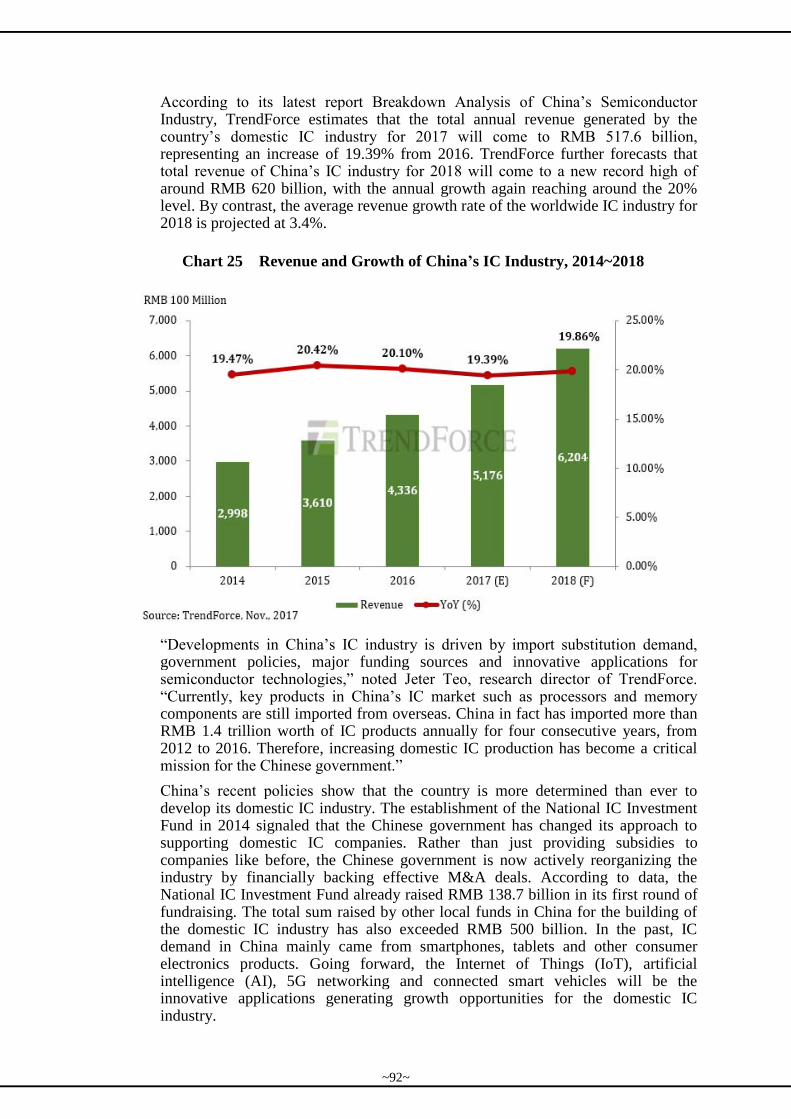
According to its latest report Breakdown Analysis of China’s Semiconductor Industry, TrendForce estimates that the total annual revenue generated by the country’s domestic IC industry for 2017 will come to RMB 517.6 billion, representing an increase of 19.39% from 2016. TrendForce further forecasts that total revenue of China’s IC industry for 2018 will come to a new record high of around RMB 620 billion, with the annual growth again reaching around the 20% level. By contrast, the average revenue growth rate of the worldwide IC industry for 2018 is projected at 3.4%.
Chart 25 Revenue and Growth of China’s IC Industry, 2014~2018
“Developments in China’s IC industry is driven by import substitution demand, government policies, major funding sources and innovative applications for semiconductor technologies,” noted Jeter Teo, research director of TrendForce. “Currently, key products in China’s IC market such as processors and memory components are still imported from overseas. China in fact has imported more than RMB 1.4 trillion worth of IC products annually for four consecutive years, from 2012 to 2016. Therefore, increasing domestic IC production has become a critical mission for the Chinese government.”
China’s recent policies show that the country is more determined than ever to develop its domestic IC industry. The establishment of the National IC Investment Fund in 2014 signaled that the Chinese government has changed its approach to supporting domestic IC companies. Rather than just providing subsidies to companies like before, the Chinese government is now actively reorganizing the industry by financially backing effective M&A deals. According to data, the National IC Investment Fund already raised RMB 138.7 billion in its first round of fundraising. The total sum raised by other local funds in China for the building of the domestic IC industry has also exceeded RMB 500 billion. In the past, IC demand in China mainly came from smartphones, tablets and other consumer electronics products. Going forward, the Internet of Things (IoT), artificial intelligence (AI), 5G networking and connected smart vehicles will be the innovative applications generating growth opportunities for the domestic IC industry.
~92~
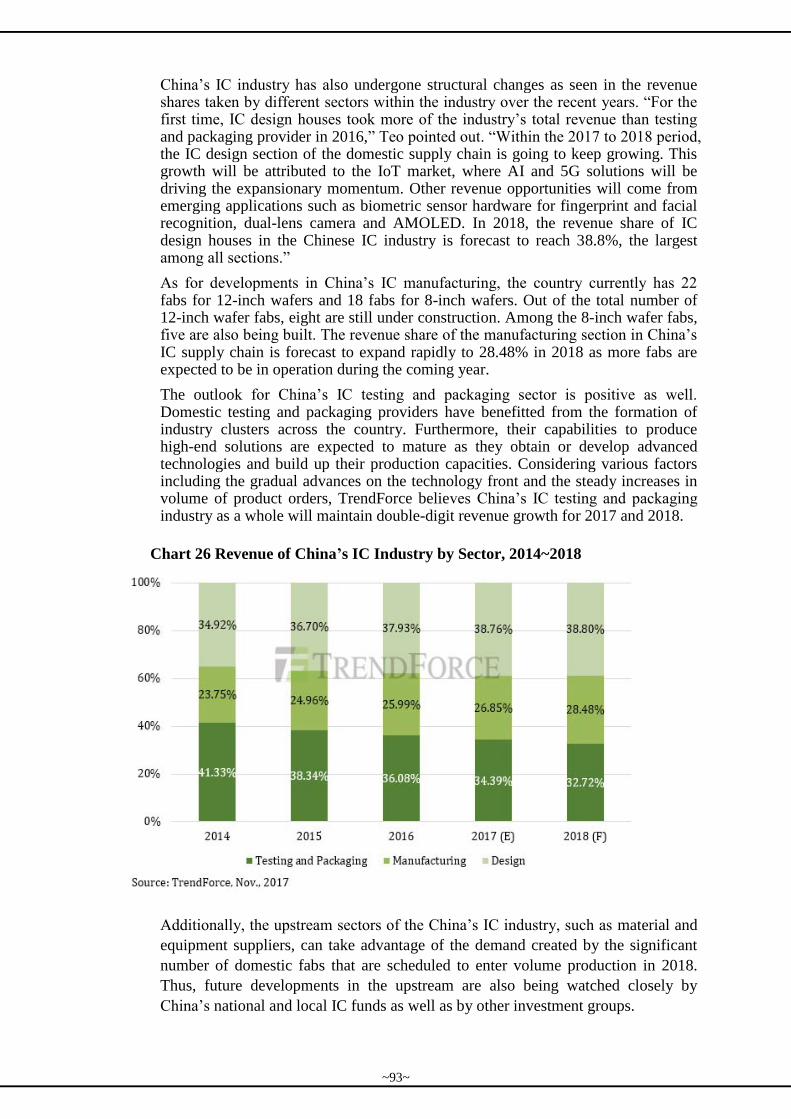
China’s IC industry has also undergone structural changes as seen in the revenue shares taken by different sectors within the industry over the recent years. “For the first time, IC design houses took more of the industry’s total revenue than testing and packaging provider in 2016,” Teo pointed out. “Within the 2017 to 2018 period, the IC design section of the domestic supply chain is going to keep growing. This growth will be attributed to the IoT market, where AI and 5G solutions will be driving the expansionary momentum. Other revenue opportunities will come from emerging applications such as biometric sensor hardware for fingerprint and facial recognition, dual-lens camera and AMOLED. In 2018, the revenue share of IC design houses in the Chinese IC industry is forecast to reach 38.8%, the largest among all sections.”
As for developments in China’s IC manufacturing, the country currently has 22 fabs for 12-inch wafers and 18 fabs for 8-inch wafers. Out of the total number of 12-inch wafer fabs, eight are still under construction. Among the 8-inch wafer fabs, five are also being built. The revenue share of the manufacturing section in China’s IC supply chain is forecast to expand rapidly to 28.48% in 2018 as more fabs are expected to be in operation during the coming year.
The outlook for China’s IC testing and packaging sector is positive as well. Domestic testing and packaging providers have benefitted from the formation of industry clusters across the country. Furthermore, their capabilities to produce high-end solutions are expected to mature as they obtain or develop advanced technologies and build up their production capacities. Considering various factors including the gradual advances on the technology front and the steady increases in volume of product orders, TrendForce believes China’s IC testing and packaging industry as a whole will maintain double-digit revenue growth for 2017 and 2018.
Chart 26 Revenue of China’s IC Industry by Sector, 2014~2018
Additionally, the upstream sectors of the China’s IC industry, such as material and
equipment suppliers, can take advantage of the demand created by the significant
number of domestic fabs that are scheduled to enter volume production in 2018.
Thus, future developments in the upstream are also being watched closely by
China’s national and local IC funds as well as by other investment groups.
~93~
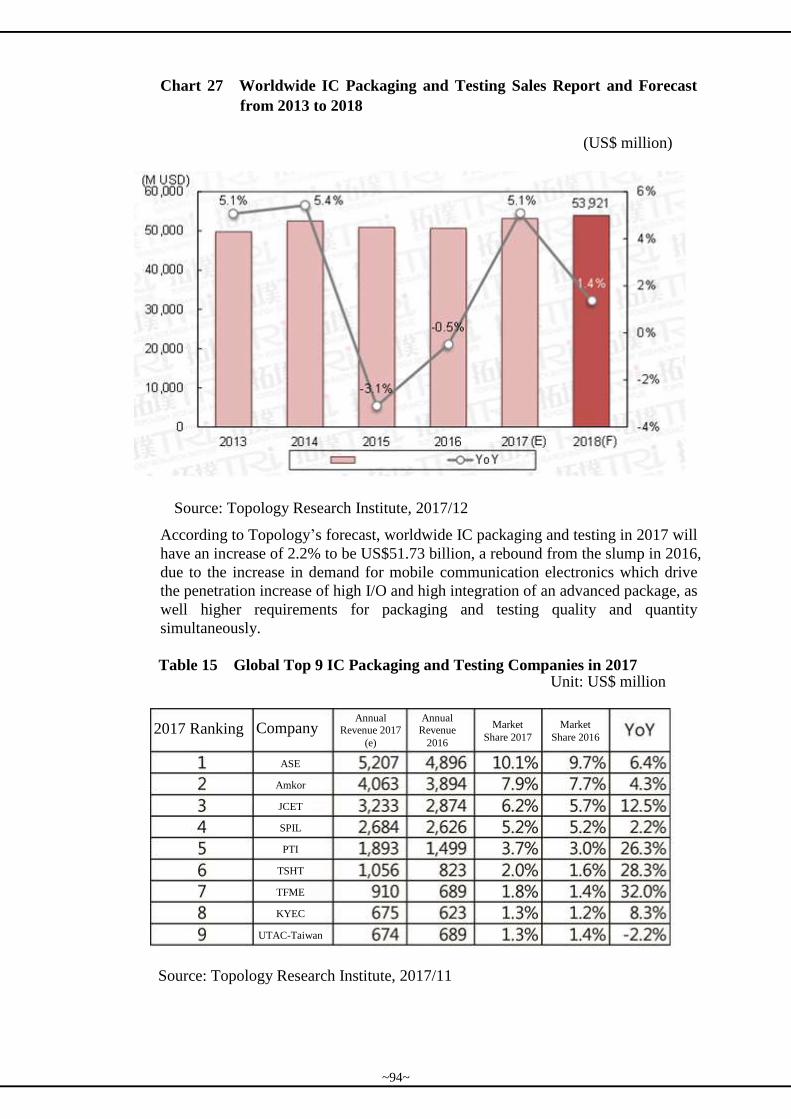
Chart 27 Worldwide IC Packaging and Testing Sales Report and Forecast
from 2013 to 2018
(US$ million)
Source: Topology Research Institute, 2017/12
According to Topology’s forecast, worldwide IC packaging and testing in 2017 will
have an increase of 2.2% to be US$51.73 billion, a rebound from the slump in 2016,
due to the increase in demand for mobile communication electronics which drive
the penetration increase of high I/O and high integration of an advanced package, as
well higher requirements for packaging and testing quality and quantity
simultaneously.
Table 15 Global Top 9 IC Packaging and Testing Companies in 2017 Unit: US$ million
Source: Topology Research Institute, 2017/11
2017 Ranking Company Annual
Revenue 2017
(e)
Annual Revenue
2016
Market
Share 2017
Market
Share 2016
ASE
Amkor
JCET
SPIL
PTI
TSHT
TFME
KYEC
UTAC-Taiwan
~94~
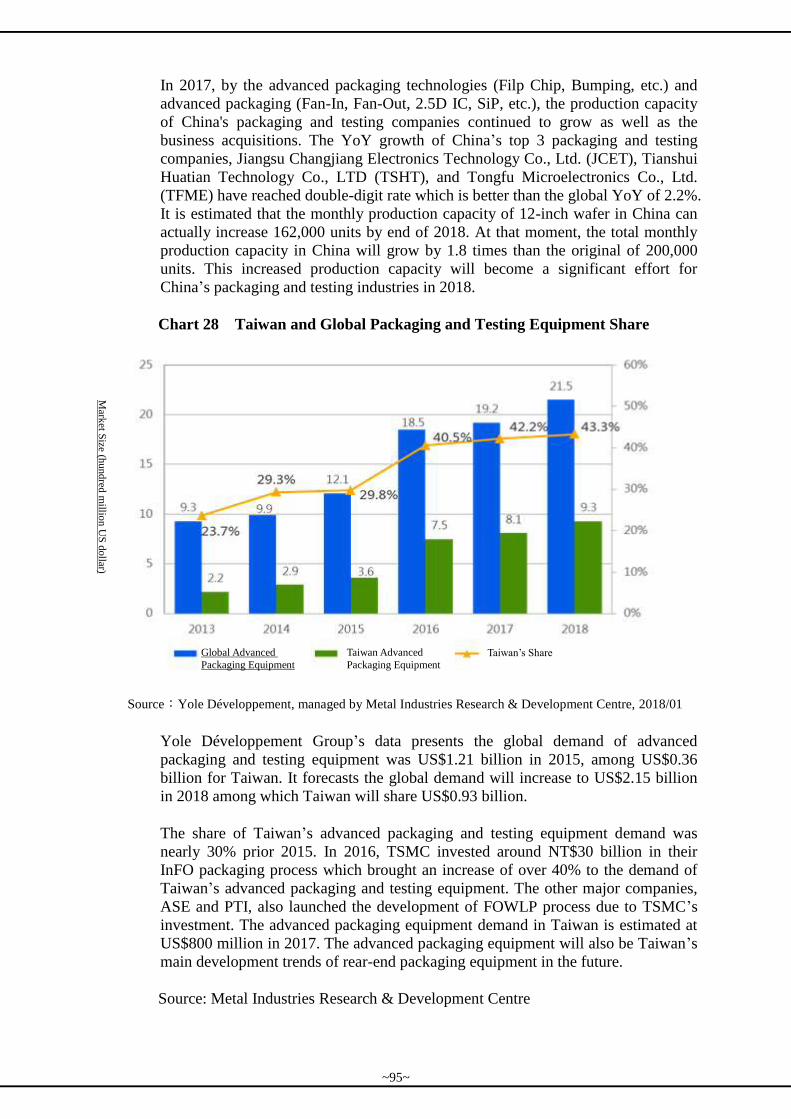
In 2017, by the advanced packaging technologies (Filp Chip, Bumping, etc.) and
advanced packaging (Fan-In, Fan-Out, 2.5D IC, SiP, etc.), the production capacity
of China's packaging and testing companies continued to grow as well as the
business acquisitions. The YoY growth of China’s top 3 packaging and testing
companies, Jiangsu Changjiang Electronics Technology Co., Ltd. (JCET), Tianshui
Huatian Technology Co., LTD (TSHT), and Tongfu Microelectronics Co., Ltd.
(TFME) have reached double-digit rate which is better than the global YoY of 2.2%.
It is estimated that the monthly production capacity of 12-inch wafer in China can
actually increase 162,000 units by end of 2018. At that moment, the total monthly
production capacity in China will grow by 1.8 times than the original of 200,000
units. This increased production capacity will become a significant effort for
China’s packaging and testing industries in 2018.
Chart 28 Taiwan and Global Packaging and Testing Equipment Share
Source:Yole Développement, managed by Metal Industries Research & Development Centre, 2018/01
Yole Développement Group’s data presents the global demand of advanced
packaging and testing equipment was US$1.21 billion in 2015, among US$0.36
billion for Taiwan. It forecasts the global demand will increase to US$2.15 billion
in 2018 among which Taiwan will share US$0.93 billion.
The share of Taiwan’s advanced packaging and testing equipment demand was
nearly 30% prior 2015. In 2016, TSMC invested around NT$30 billion in their
InFO packaging process which brought an increase of over 40% to the demand of
Taiwan’s advanced packaging and testing equipment. The other major companies,
ASE and PTI, also launched the development of FOWLP process due to TSMC’s
investment. The advanced packaging equipment demand in Taiwan is estimated at
US$800 million in 2017. The advanced packaging equipment will also be Taiwan’s
main development trends of rear-end packaging equipment in the future.
Source: Metal Industries Research & Development Centre
Global Advanced
Packaging Equipment
Mark
et Size (h
und
red m
illion U
S d
ollar)
Taiwan Advanced
Packaging Equipment Taiwan’s Share
~95~
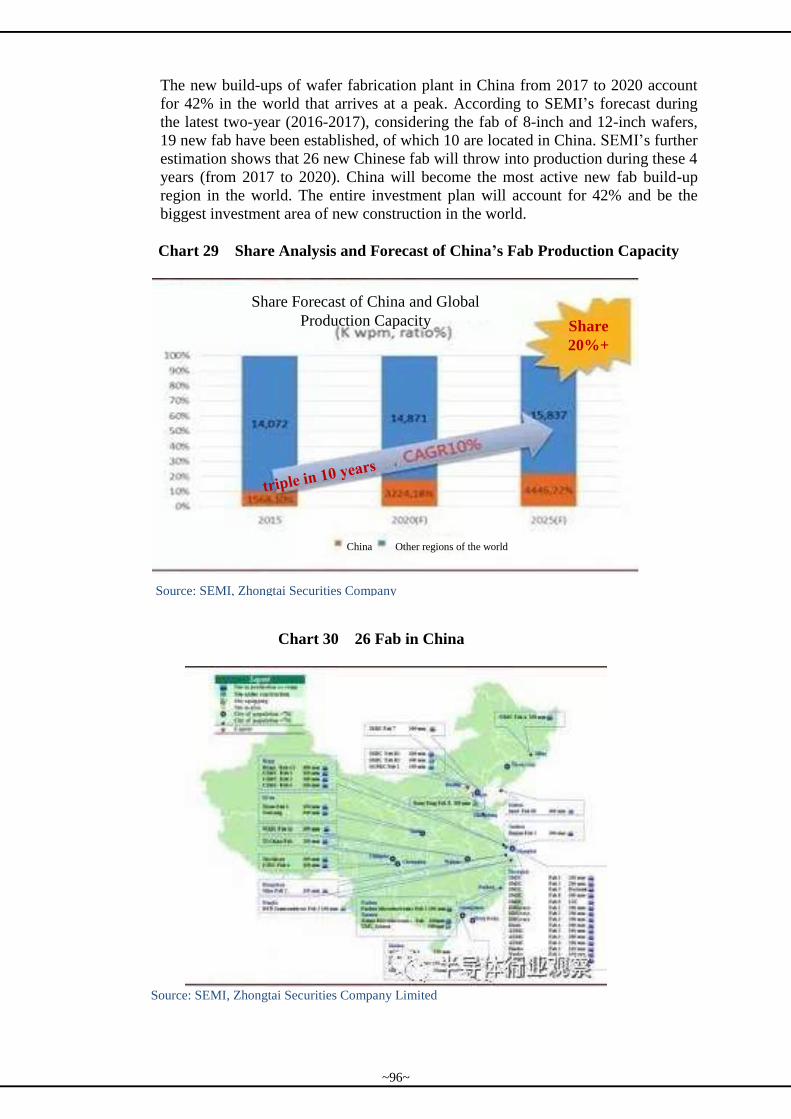
The new build-ups of wafer fabrication plant in China from 2017 to 2020 account
for 42% in the world that arrives at a peak. According to SEMI’s forecast during
the latest two-year (2016-2017), considering the fab of 8-inch and 12-inch wafers,
19 new fab have been established, of which 10 are located in China. SEMI’s further
estimation shows that 26 new Chinese fab will throw into production during these 4
years (from 2017 to 2020). China will become the most active new fab build-up
region in the world. The entire investment plan will account for 42% and be the
biggest investment area of new construction in the world.
Chart 29 Share Analysis and Forecast of China’s Fab Production Capacity
Chart 30 26 Fab in China
Source: SEMI, Zhongtai Securities Company Limited
Share Forecast of China and Global
Production Capacity Share
20%+
China Other regions of the world
Source: SEMI, Zhongtai Securities Company
Limited
~96~
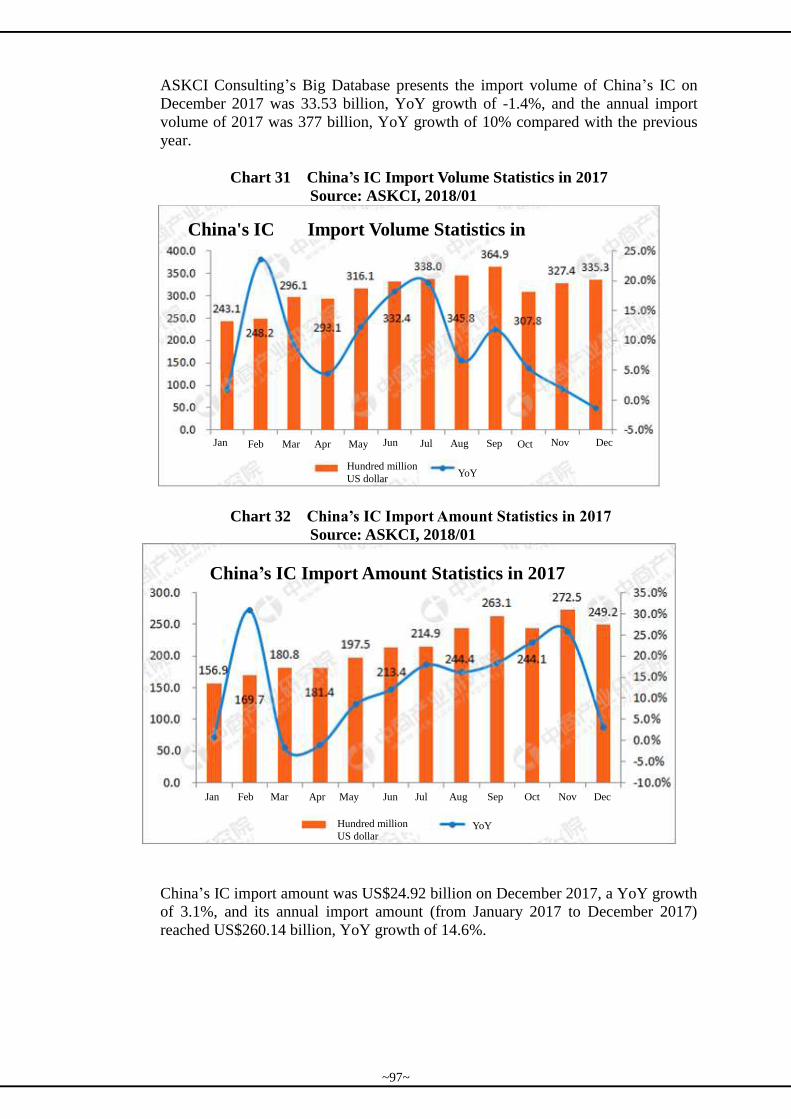
ASKCI Consulting’s Big Database presents the import volume of China’s IC on
December 2017 was 33.53 billion, YoY growth of -1.4%, and the annual import
volume of 2017 was 377 billion, YoY growth of 10% compared with the previous
year.
Chart 31 China’s IC Import Volume Statistics in 2017
Source: ASKCI, 2018/01
Chart 32 China’s IC Import Amount Statistics in 2017
Source: ASKCI, 2018/01
China’s IC import amount was US$24.92 billion on December 2017, a YoY growth
of 3.1%, and its annual import amount (from January 2017 to December 2017)
reached US$260.14 billion, YoY growth of 14.6%.
YoY
China’s IC Import Amount Statistics in 2017
Hundred million
US dollar YoY
China's IC Import Volume Statistics in
2017
Hundred million
US dollar
Jan Feb Mar Apr May Jun Jul Aug Sep Oct Nov Dec
Jan Feb Mar Apr May Jun Jul Aug Sep Oct Nov Dec
~97~
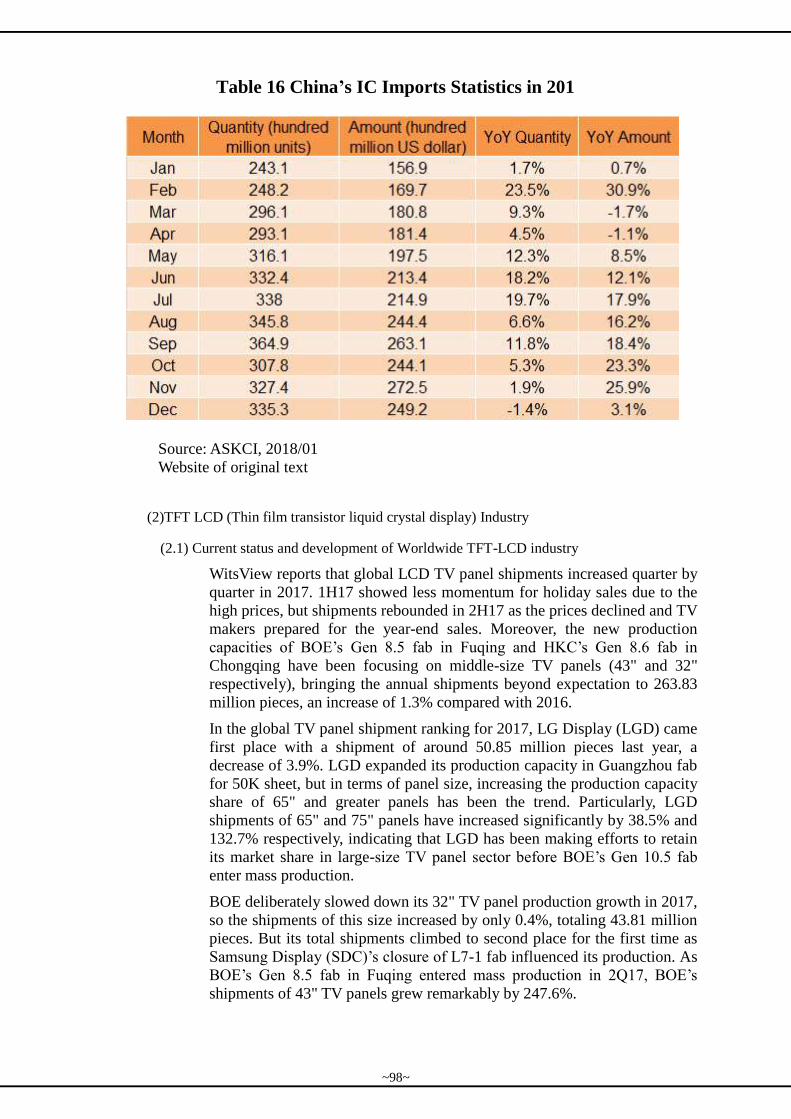
Table 16 China’s IC Imports Statistics in 201
Source: ASKCI, 2018/01
Website of original text
(2)TFT LCD (Thin film transistor liquid crystal display) Industry
(2.1) Current status and development of Worldwide TFT-LCD industry
WitsView reports that global LCD TV panel shipments increased quarter by
quarter in 2017. 1H17 showed less momentum for holiday sales due to the
high prices, but shipments rebounded in 2H17 as the prices declined and TV
makers prepared for the year-end sales. Moreover, the new production
capacities of BOE’s Gen 8.5 fab in Fuqing and HKC’s Gen 8.6 fab in
Chongqing have been focusing on middle-size TV panels (43" and 32"
respectively), bringing the annual shipments beyond expectation to 263.83
million pieces, an increase of 1.3% compared with 2016.
In the global TV panel shipment ranking for 2017, LG Display (LGD) came
first place with a shipment of around 50.85 million pieces last year, a
decrease of 3.9%. LGD expanded its production capacity in Guangzhou fab
for 50K sheet, but in terms of panel size, increasing the production capacity
share of 65" and greater panels has been the trend. Particularly, LGD
shipments of 65" and 75" panels have increased significantly by 38.5% and
132.7% respectively, indicating that LGD has been making efforts to retain
its market share in large-size TV panel sector before BOE’s Gen 10.5 fab
enter mass production.
BOE deliberately slowed down its 32" TV panel production growth in 2017,
so the shipments of this size increased by only 0.4%, totaling 43.81 million
pieces. But its total shipments climbed to second place for the first time as
Samsung Display (SDC)’s closure of L7-1 fab influenced its production. As
BOE’s Gen 8.5 fab in Fuqing entered mass production in 2Q17, BOE’s
shipments of 43" TV panels grew remarkably by 247.6%.
~98~
Innolux’s Gen 8.6 fab entered mass production in early 2017, but the yield
rate and output were less than expectation in the first half of 2017. In the
second half, high pricing of panels led to shrinking demand, resulting in
Innolux’s slow-moving and excess stocks. In addition, Innolux announced
to enter the TV assembly market, which made its clients more conservative
in making orders. Fortunately Innolux figured out the solutions of pricing
and stock problems, and ended up with shipments of 41.8 million pieces, an
increase of 0.2%, ranking the third.
SDC’s shipments saw a substantial decline of 15.4% last year since the
closure of its L7-1 fab. Its overall TV panel shipments turned out to be 39.6
million pieces, the highest decline among the six major panel makers.
Although its shipments have dropped out of top 3, SDC has improved
capacity utilization by simplifying its product mix, and has invested in
production equipment of UHD and large-size panels to increase the value of
its products. As for product portfolio, SDC took initiatives to develop UHD
panels, whose proportion came to 54.6% among all of SDC’s products, and
also remained a major supplier of large-size panels (55", 65" and 75").
Particularly, its market share of 65" sector was as high as 36.3%, showing
definite advantages over its competitors.
China Star Optoelectronics Technology (CSOT) kept increasing the
shipments after the capacity of the second phase of its second Gen 8.5 fab
was expanded to 140K sheet. CSOT’s final shipments recorded 38.64
million pieces, an increase of 16.8% compared with 2016. Particularly, 55"
panels recorded a 19.4% shipment growth, as CSOT’s capacity expansion
came mainly from this size. As for the growth by shipment area, CSOT
recorded a 19.6% YoY increase, the highest among the six major panel
makers.
TV panel shipments for AU Optronics (AUO) in 2017 came to around 27.21
million pieces, 0.1% down from the 2016. AUO continued to optimize its
product portfolio and increased the proportion of large-size panels, so it
finally recorded a 5.1% growth of shipment area. In addition, AUO also put
focus on increasing the proportion of UHD products, reaching 44% of all its
products, the third highest number following LGD and SDC.
Table 17 Top LCD TV Panel Suppliers by Global Shipments for 2017
(Unit: in K pcs)
Source:WitsView, Jan., 2018
As for 2018, WitsView points out that the panel makers will continue to
increase the production shares of large-size panels and UHD panels to boost
the revenue and profit. The penetration rate of UHD panels is expected to
~99~
reach 42% in 2018, an increase of 7.4 percentage points compared with
2017, says WitsView. Regarding the new production capacity, BOE’s Gen
10.5 fab produces mainly large-size TV panels (65" and 75"), but CEC’s
two fabs still put their priorities at middle-size ones (32" and 50").
Meanwhile, replacement of CRT TV sets with 32" and 23.6" LCD ones is
still ongoing in emerging markets, making the average panel size grow
slower to 45.8 inches, only 1.3 inches up from 2017. Overall speaking,
global TV panel shipments this year will have chance to hit a
second-highest number in history, reaching 269.49 million pieces, an annual
increase of 2.2%.
In addition, OLED TV market shows remarkable performance in 2017,
resulting in global shipments of 1.5 million units, a 72% rise compared with
2016. WitsView expects that LG Electronics (LGE) and SONY will
continue to expand their OLED offerings in the high-end market, both
brands will record slight shipment rise in 2018.
According to WitsView, global shipments of branded LCD TV sets for
2017 totaled 211 million units, a decrease of 4.1% compared with 2016. In
2018, TV brands will focus on large-size, high-resolution products, and also
develop high-end products like QLED and OLED TVs, hoping to push sales
and regain profits by specifications upgrade.
In terms of product plans of major TV brands, Samsung, LG and Sony, etc.
are now actively developing their product mix of large-size TV sets (65'',
75'' or greater). The proportion of 65'' TVs or greater will increase from
5.5% in 2017 to 7 % in 2018. BOE Gen 10.5 will offer 65'' and 75'' panels
to the market after 1Q18, which may lower TV makers’ costs of purchasing
large-size panels.
In the high-end market, OLED TVs and QLED TVs remain two competing
camps. Led by Samsung Electronics, QLED camp will maintain an overall
higher market share than OLED camp. On the other hand, OLED TVs are
expected to raise the market share to 1.1% in 2018 since LGD expands its
production capacity, gradually narrowing the gap with QLED camp.
With the increasingly fierce competition, the TV market is faced with
homogeneous products and squeezed profits, so specs upgrade has become
the key to driving new purchases and ensuring profitability. Therefore,
China's Gen 10.5 or more advanced fabs will play an important role in
promoting upgrade of TV size and resolution. In addition, QLED TVs and
OLED TVs will also create product differentiation in high-end market,
which will bring more highlights to the 2018 TV market.
According to WitsView, the total shipments of PC monitor panels and
notebook panels in 2017 were 314.94 million pieces, a YoY increase of 3%.
In 2018, IT panel makers will focus on reducing border size, increasing
viewing angle and resolution. Vendors also aim to drive shipments through
specification upgrade. It is expected that the total shipments of PC monitor
panels and notebook panels will reach 326.37 million pieces in 2018, a YoY
increase of 3.6%.
The shipments of monitor panels have witnessed continuous decline due to
saturation of market and panel size increases, says WitsView. The number
of monitor panels shipped worldwide was 137.59 million units in 2017, a
YoY decline of 1.6%. On the other hand, demand for notebook panels kept
~100~
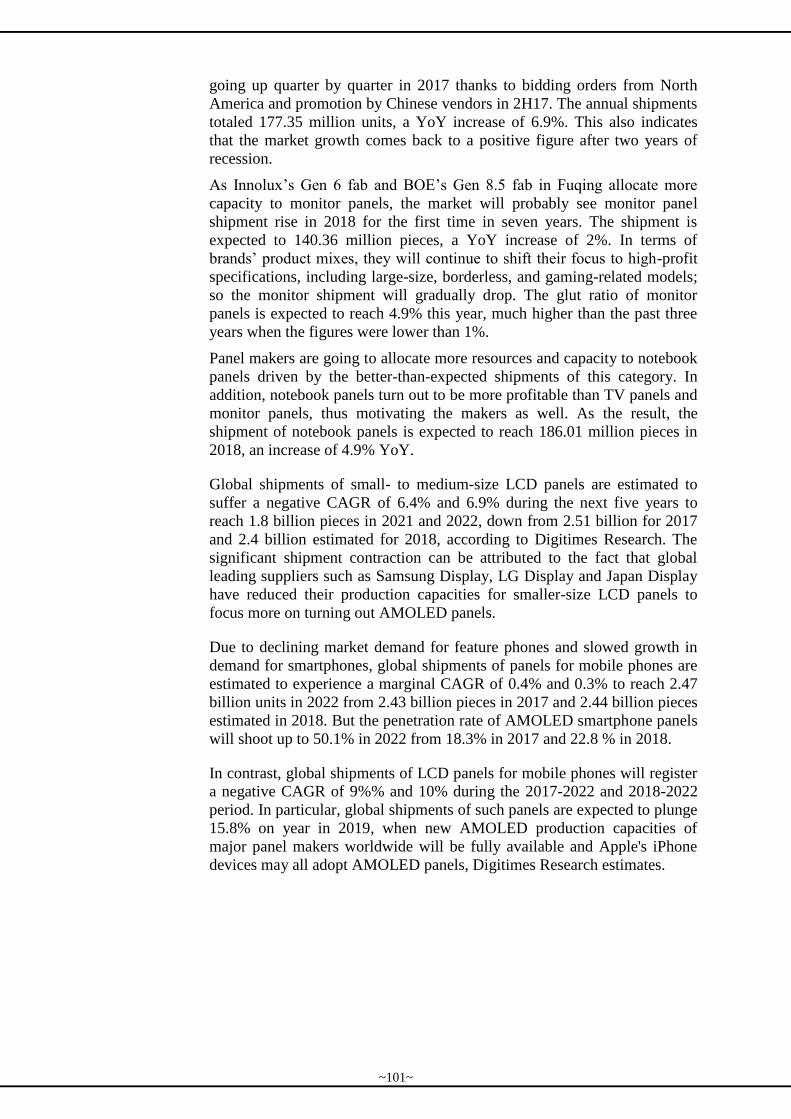
going up quarter by quarter in 2017 thanks to bidding orders from North
America and promotion by Chinese vendors in 2H17. The annual shipments
totaled 177.35 million units, a YoY increase of 6.9%. This also indicates
that the market growth comes back to a positive figure after two years of
recession.
As Innolux’s Gen 6 fab and BOE’s Gen 8.5 fab in Fuqing allocate more
capacity to monitor panels, the market will probably see monitor panel
shipment rise in 2018 for the first time in seven years. The shipment is
expected to 140.36 million pieces, a YoY increase of 2%. In terms of
brands’ product mixes, they will continue to shift their focus to high-profit
specifications, including large-size, borderless, and gaming-related models;
so the monitor shipment will gradually drop. The glut ratio of monitor
panels is expected to reach 4.9% this year, much higher than the past three
years when the figures were lower than 1%.
Panel makers are going to allocate more resources and capacity to notebook
panels driven by the better-than-expected shipments of this category. In
addition, notebook panels turn out to be more profitable than TV panels and
monitor panels, thus motivating the makers as well. As the result, the
shipment of notebook panels is expected to reach 186.01 million pieces in
2018, an increase of 4.9% YoY.
Global shipments of small- to medium-size LCD panels are estimated to
suffer a negative CAGR of 6.4% and 6.9% during the next five years to
reach 1.8 billion pieces in 2021 and 2022, down from 2.51 billion for 2017
and 2.4 billion estimated for 2018, according to Digitimes Research. The
significant shipment contraction can be attributed to the fact that global
leading suppliers such as Samsung Display, LG Display and Japan Display
have reduced their production capacities for smaller-size LCD panels to
focus more on turning out AMOLED panels.
Due to declining market demand for feature phones and slowed growth in
demand for smartphones, global shipments of panels for mobile phones are
estimated to experience a marginal CAGR of 0.4% and 0.3% to reach 2.47
billion units in 2022 from 2.43 billion pieces in 2017 and 2.44 billion pieces
estimated in 2018. But the penetration rate of AMOLED smartphone panels
will shoot up to 50.1% in 2022 from 18.3% in 2017 and 22.8 % in 2018.
In contrast, global shipments of LCD panels for mobile phones will register
a negative CAGR of 9%% and 10% during the 2017-2022 and 2018-2022
period. In particular, global shipments of such panels are expected to plunge
15.8% on year in 2019, when new AMOLED production capacities of
major panel makers worldwide will be fully available and Apple's iPhone
devices may all adopt AMOLED panels, Digitimes Research estimates.
~101~
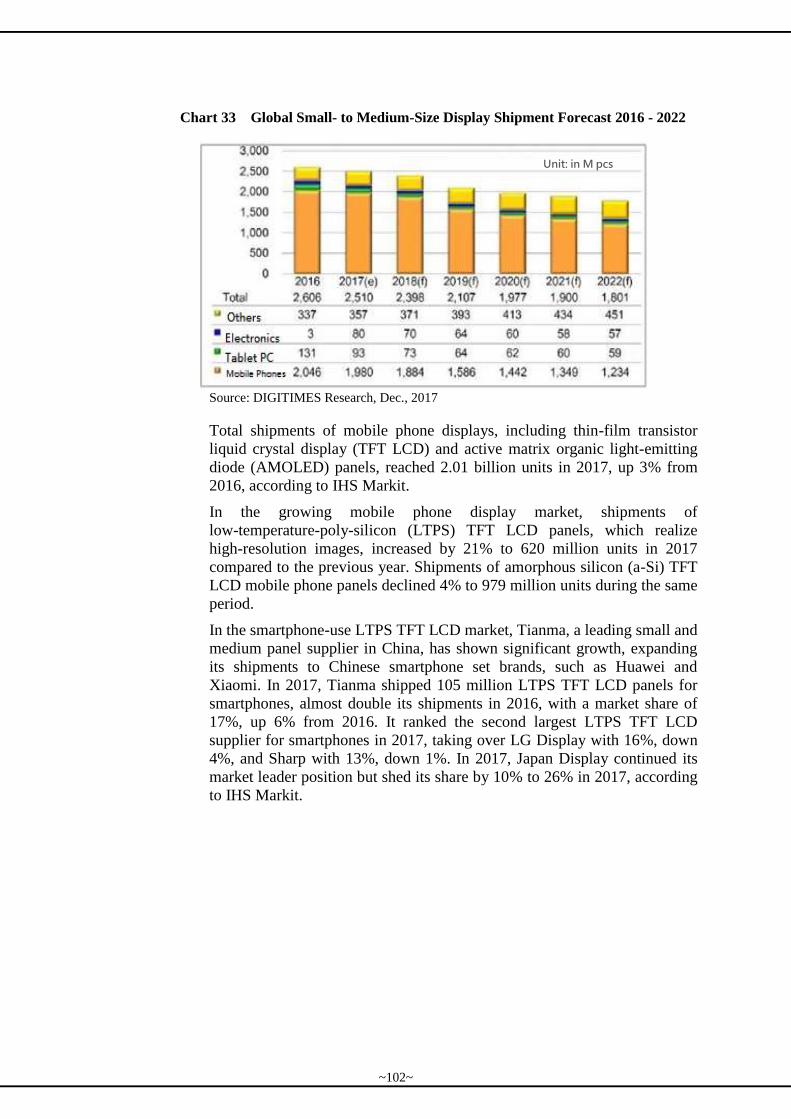
Chart 33 Global Small- to Medium-Size Display Shipment Forecast 2016 - 2022
Source: DIGITIMES Research, Dec., 2017
Total shipments of mobile phone displays, including thin-film transistor
liquid crystal display (TFT LCD) and active matrix organic light-emitting
diode (AMOLED) panels, reached 2.01 billion units in 2017, up 3% from
2016, according to IHS Markit.
In the growing mobile phone display market, shipments of
low-temperature-poly-silicon (LTPS) TFT LCD panels, which realize
high-resolution images, increased by 21% to 620 million units in 2017
compared to the previous year. Shipments of amorphous silicon (a-Si) TFT
LCD mobile phone panels declined 4% to 979 million units during the same
period.
In the smartphone-use LTPS TFT LCD market, Tianma, a leading small and
medium panel supplier in China, has shown significant growth, expanding
its shipments to Chinese smartphone set brands, such as Huawei and
Xiaomi. In 2017, Tianma shipped 105 million LTPS TFT LCD panels for
smartphones, almost double its shipments in 2016, with a market share of
17%, up 6% from 2016. It ranked the second largest LTPS TFT LCD
supplier for smartphones in 2017, taking over LG Display with 16%, down
4%, and Sharp with 13%, down 1%. In 2017, Japan Display continued its
market leader position but shed its share by 10% to 26% in 2017, according
to IHS Markit.
Unit: in M pcs
~102~
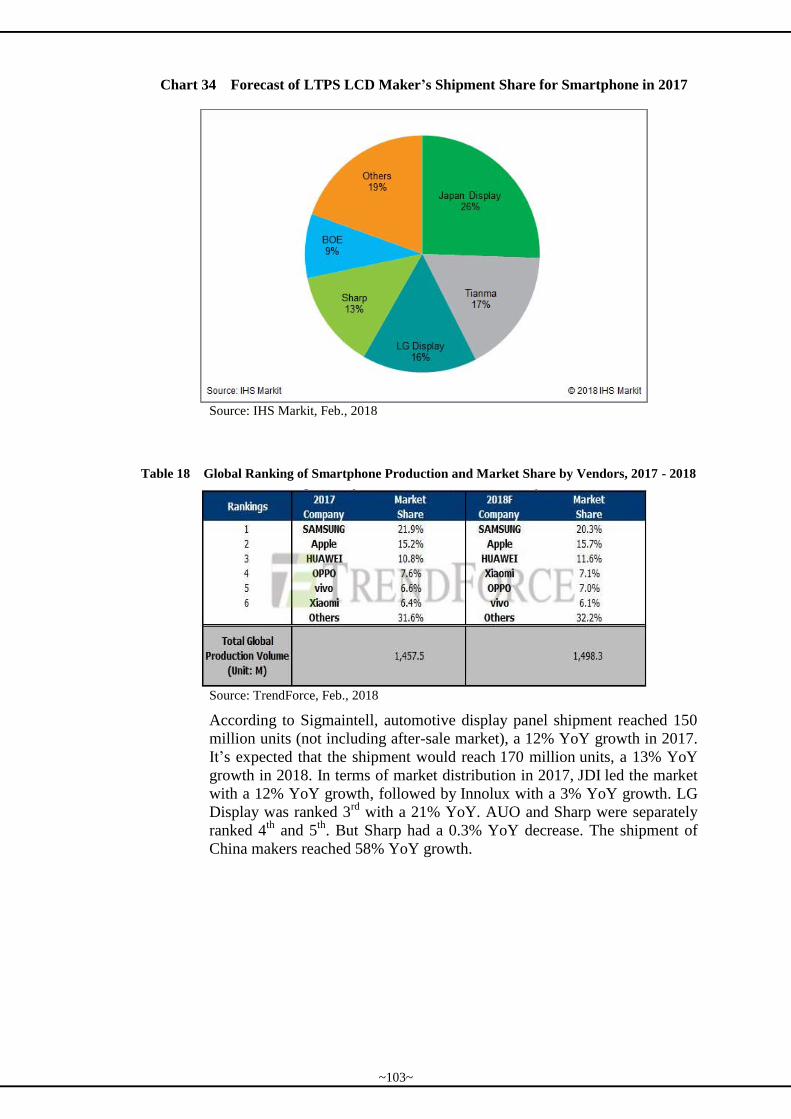
Chart 34 Forecast of LTPS LCD Maker’s Shipment Share for Smartphone in 2017
Source: IHS Markit, Feb., 2018
Table 18 Global Ranking of Smartphone Production and Market Share by Vendors, 2017 - 2018
Source: TrendForce, Feb., 2018
According to Sigmaintell, automotive display panel shipment reached 150
million units (not including after-sale market), a 12% YoY growth in 2017.
It’s expected that the shipment would reach 170 million units, a 13% YoY
growth in 2018. In terms of market distribution in 2017, JDI led the market
with a 12% YoY growth, followed by Innolux with a 3% YoY growth. LG
Display was ranked 3rd
with a 21% YoY. AUO and Sharp were separately
ranked 4th
and 5th
. But Sharp had a 0.3% YoY decrease. The shipment of
China makers reached 58% YoY growth.
~103~
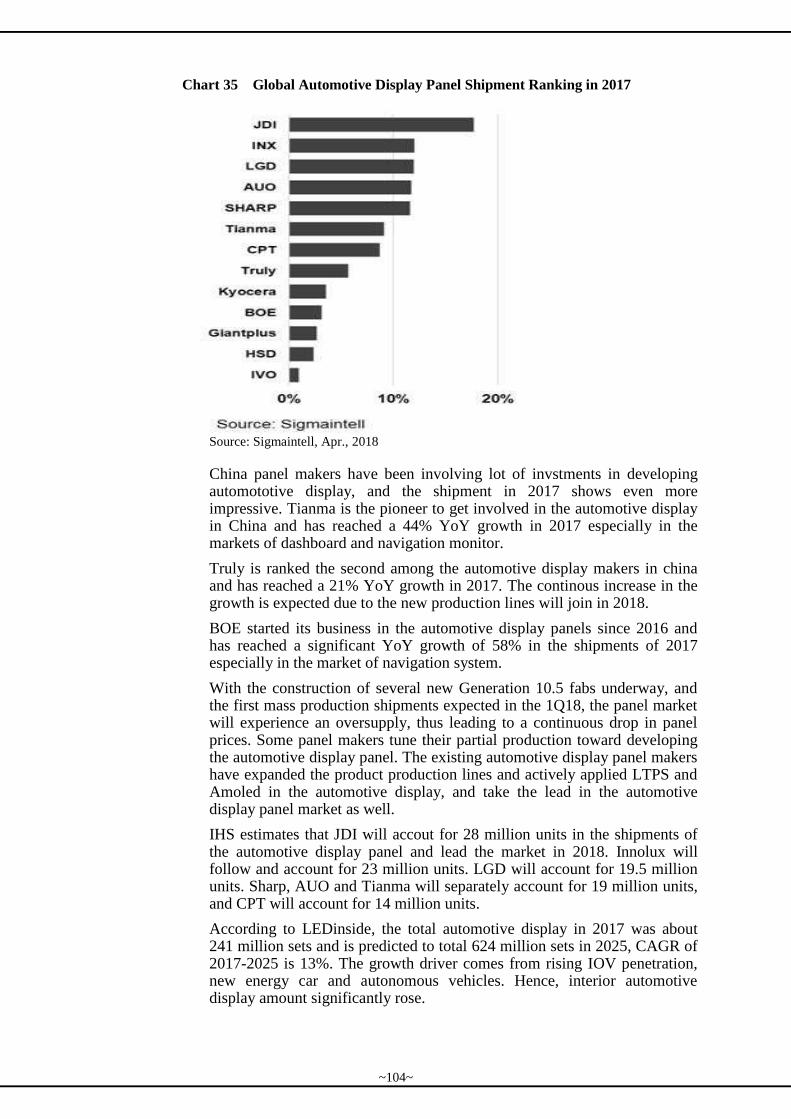
Chart 35 Global Automotive Display Panel Shipment Ranking in 2017
Source: Sigmaintell, Apr., 2018
China panel makers have been involving lot of invstments in developing automototive display, and the shipment in 2017 shows even more impressive. Tianma is the pioneer to get involved in the automotive display in China and has reached a 44% YoY growth in 2017 especially in the markets of dashboard and navigation monitor.
Truly is ranked the second among the automotive display makers in china and has reached a 21% YoY growth in 2017. The continous increase in the growth is expected due to the new production lines will join in 2018.
BOE started its business in the automotive display panels since 2016 and has reached a significant YoY growth of 58% in the shipments of 2017 especially in the market of navigation system.
With the construction of several new Generation 10.5 fabs underway, and the first mass production shipments expected in the 1Q18, the panel market will experience an oversupply, thus leading to a continuous drop in panel prices. Some panel makers tune their partial production toward developing the automotive display panel. The existing automotive display panel makers have expanded the product production lines and actively applied LTPS and Amoled in the automotive display, and take the lead in the automotive display panel market as well.
IHS estimates that JDI will accout for 28 million units in the shipments of the automotive display panel and lead the market in 2018. Innolux will follow and account for 23 million units. LGD will account for 19.5 million units. Sharp, AUO and Tianma will separately account for 19 million units, and CPT will account for 14 million units.
According to LEDinside, the total automotive display in 2017 was about 241 million sets and is predicted to total 624 million sets in 2025, CAGR of 2017-2025 is 13%. The growth driver comes from rising IOV penetration, new energy car and autonomous vehicles. Hence, interior automotive display amount significantly rose.
~104~
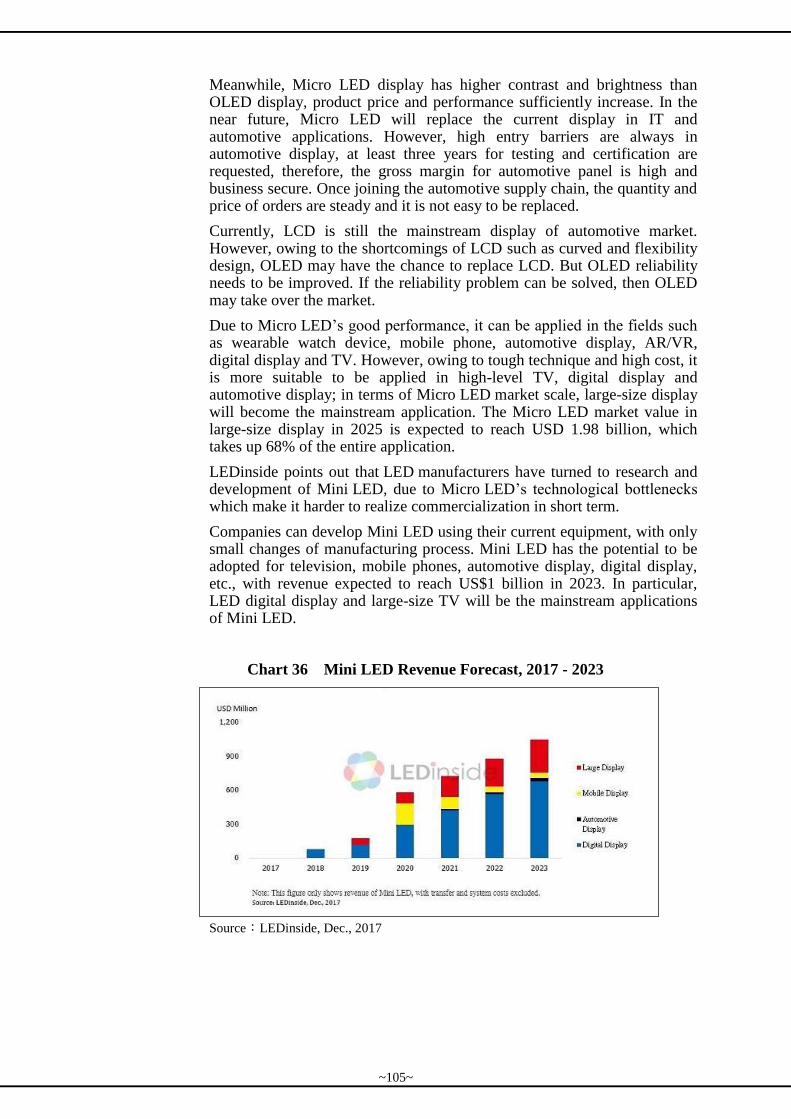
Meanwhile, Micro LED display has higher contrast and brightness than OLED display, product price and performance sufficiently increase. In the near future, Micro LED will replace the current display in IT and automotive applications. However, high entry barriers are always in automotive display, at least three years for testing and certification are requested, therefore, the gross margin for automotive panel is high and business secure. Once joining the automotive supply chain, the quantity and price of orders are steady and it is not easy to be replaced.
Currently, LCD is still the mainstream display of automotive market. However, owing to the shortcomings of LCD such as curved and flexibility design, OLED may have the chance to replace LCD. But OLED reliability needs to be improved. If the reliability problem can be solved, then OLED may take over the market.
Due to Micro LED’s good performance, it can be applied in the fields such as wearable watch device, mobile phone, automotive display, AR/VR, digital display and TV. However, owing to tough technique and high cost, it is more suitable to be applied in high-level TV, digital display and automotive display; in terms of Micro LED market scale, large-size display will become the mainstream application. The Micro LED market value in large-size display in 2025 is expected to reach USD 1.98 billion, which takes up 68% of the entire application.
LEDinside points out that LED manufacturers have turned to research and development of Mini LED, due to Micro LED’s technological bottlenecks which make it harder to realize commercialization in short term.
Companies can develop Mini LED using their current equipment, with only small changes of manufacturing process. Mini LED has the potential to be adopted for television, mobile phones, automotive display, digital display, etc., with revenue expected to reach US$1 billion in 2023. In particular, LED digital display and large-size TV will be the mainstream applications of Mini LED.
Chart 36 Mini LED Revenue Forecast, 2017 - 2023
Source:LEDinside, Dec., 2017
~105~
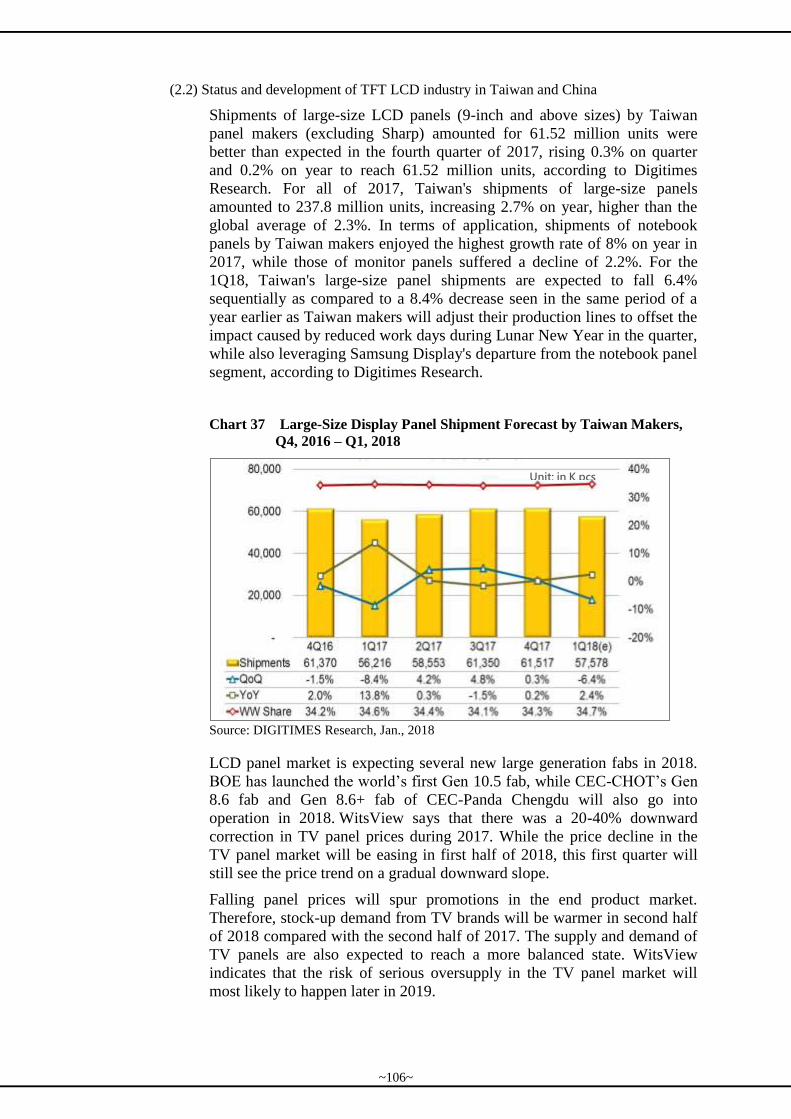
(2.2) Status and development of TFT LCD industry in Taiwan and China
Shipments of large-size LCD panels (9-inch and above sizes) by Taiwan
panel makers (excluding Sharp) amounted for 61.52 million units were
better than expected in the fourth quarter of 2017, rising 0.3% on quarter
and 0.2% on year to reach 61.52 million units, according to Digitimes
Research. For all of 2017, Taiwan's shipments of large-size panels
amounted to 237.8 million units, increasing 2.7% on year, higher than the
global average of 2.3%. In terms of application, shipments of notebook
panels by Taiwan makers enjoyed the highest growth rate of 8% on year in
2017, while those of monitor panels suffered a decline of 2.2%. For the
1Q18, Taiwan's large-size panel shipments are expected to fall 6.4%
sequentially as compared to a 8.4% decrease seen in the same period of a
year earlier as Taiwan makers will adjust their production lines to offset the
impact caused by reduced work days during Lunar New Year in the quarter,
while also leveraging Samsung Display's departure from the notebook panel
segment, according to Digitimes Research.
Chart 37 Large-Size Display Panel Shipment Forecast by Taiwan Makers,
Q4, 2016 – Q1, 2018
Source: DIGITIMES Research, Jan., 2018
LCD panel market is expecting several new large generation fabs in 2018.
BOE has launched the world’s first Gen 10.5 fab, while CEC-CHOT’s Gen
8.6 fab and Gen 8.6+ fab of CEC-Panda Chengdu will also go into
operation in 2018. WitsView says that there was a 20-40% downward
correction in TV panel prices during 2017. While the price decline in the
TV panel market will be easing in first half of 2018, this first quarter will
still see the price trend on a gradual downward slope.
Falling panel prices will spur promotions in the end product market.
Therefore, stock-up demand from TV brands will be warmer in second half
of 2018 compared with the second half of 2017. The supply and demand of
TV panels are also expected to reach a more balanced state. WitsView
indicates that the risk of serious oversupply in the TV panel market will
most likely to happen later in 2019.
Unit: in K pcs
~106~
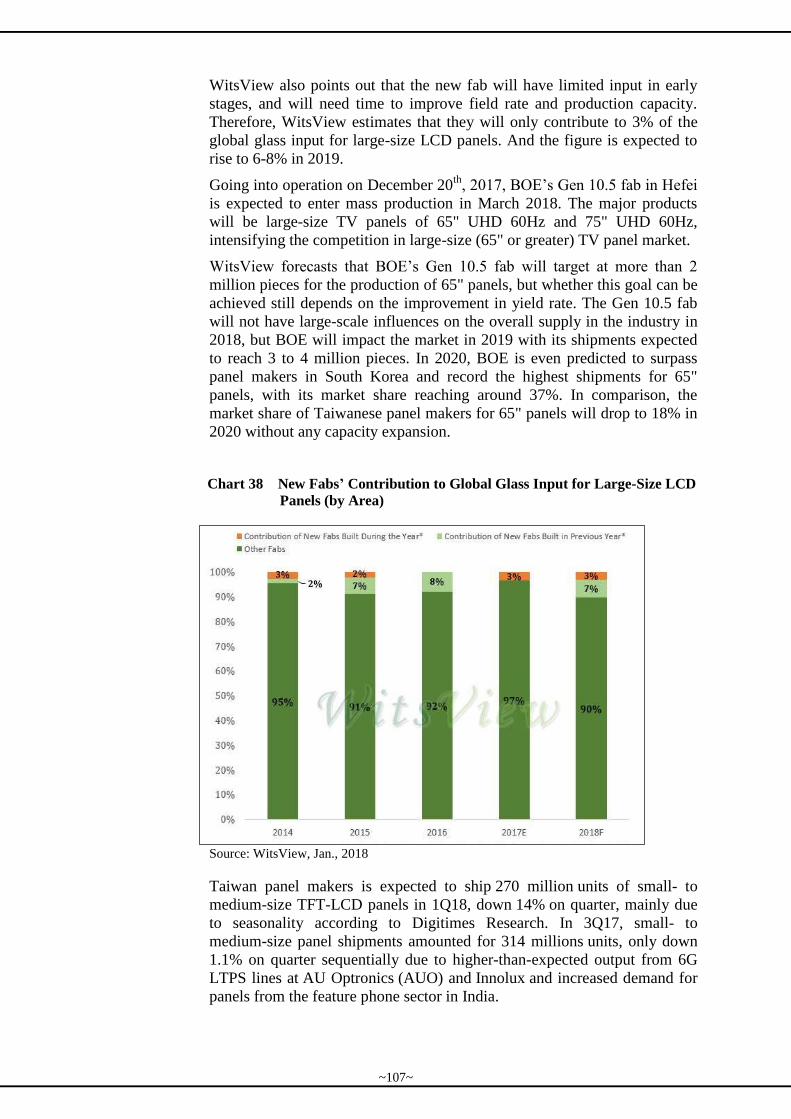
WitsView also points out that the new fab will have limited input in early
stages, and will need time to improve field rate and production capacity.
Therefore, WitsView estimates that they will only contribute to 3% of the
global glass input for large-size LCD panels. And the figure is expected to
rise to 6-8% in 2019.
Going into operation on December 20th
, 2017, BOE’s Gen 10.5 fab in Hefei
is expected to enter mass production in March 2018. The major products
will be large-size TV panels of 65" UHD 60Hz and 75" UHD 60Hz,
intensifying the competition in large-size (65" or greater) TV panel market.
WitsView forecasts that BOE’s Gen 10.5 fab will target at more than 2
million pieces for the production of 65" panels, but whether this goal can be
achieved still depends on the improvement in yield rate. The Gen 10.5 fab
will not have large-scale influences on the overall supply in the industry in
2018, but BOE will impact the market in 2019 with its shipments expected
to reach 3 to 4 million pieces. In 2020, BOE is even predicted to surpass
panel makers in South Korea and record the highest shipments for 65"
panels, with its market share reaching around 37%. In comparison, the
market share of Taiwanese panel makers for 65" panels will drop to 18% in
2020 without any capacity expansion.
Chart 38 New Fabs’ Contribution to Global Glass Input for Large-Size LCD
Panels (by Area)
Source: WitsView, Jan., 2018
Taiwan panel makers is expected to ship 270 million units of small- to
medium-size TFT-LCD panels in 1Q18, down 14% on quarter, mainly due
to seasonality according to Digitimes Research. In 3Q17, small- to
medium-size panel shipments amounted for 314 millions units, only down
1.1% on quarter sequentially due to higher-than-expected output from 6G
LTPS lines at AU Optronics (AUO) and Innolux and increased demand for
panels from the feature phone sector in India.
~107~
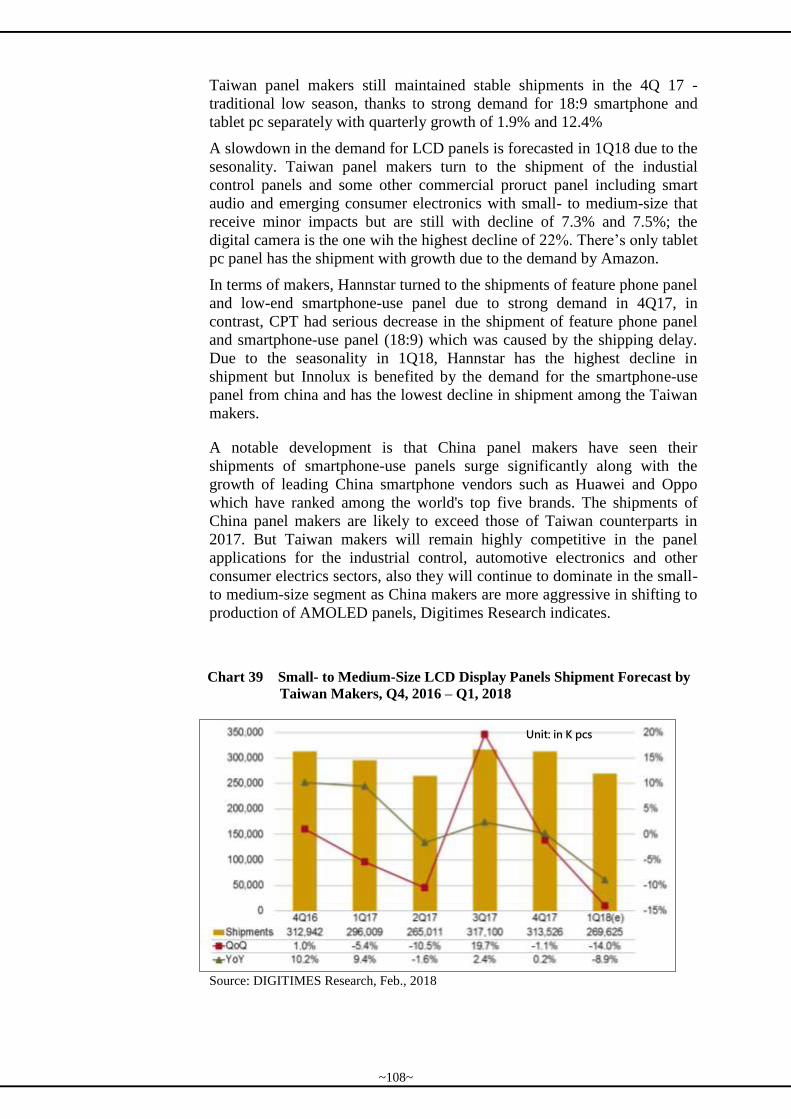
Taiwan panel makers still maintained stable shipments in the 4Q 17 -
traditional low season, thanks to strong demand for 18:9 smartphone and
tablet pc separately with quarterly growth of 1.9% and 12.4%
A slowdown in the demand for LCD panels is forecasted in 1Q18 due to the
sesonality. Taiwan panel makers turn to the shipment of the industial
control panels and some other commercial proruct panel including smart
audio and emerging consumer electronics with small- to medium-size that
receive minor impacts but are still with decline of 7.3% and 7.5%; the
digital camera is the one wih the highest decline of 22%. There’s only tablet
pc panel has the shipment with growth due to the demand by Amazon.
In terms of makers, Hannstar turned to the shipments of feature phone panel
and low-end smartphone-use panel due to strong demand in 4Q17, in
contrast, CPT had serious decrease in the shipment of feature phone panel
and smartphone-use panel (18:9) which was caused by the shipping delay.
Due to the seasonality in 1Q18, Hannstar has the highest decline in
shipment but Innolux is benefited by the demand for the smartphone-use
panel from china and has the lowest decline in shipment among the Taiwan
makers.
A notable development is that China panel makers have seen their
shipments of smartphone-use panels surge significantly along with the
growth of leading China smartphone vendors such as Huawei and Oppo
which have ranked among the world's top five brands. The shipments of
China panel makers are likely to exceed those of Taiwan counterparts in
2017. But Taiwan makers will remain highly competitive in the panel
applications for the industrial control, automotive electronics and other
consumer electrics sectors, also they will continue to dominate in the small-
to medium-size segment as China makers are more aggressive in shifting to
production of AMOLED panels, Digitimes Research indicates.
Chart 39 Small- to Medium-Size LCD Display Panels Shipment Forecast by
Taiwan Makers, Q4, 2016 – Q1, 2018
Source: DIGITIMES Research, Feb., 2018
Unit: in K pcs
~108~
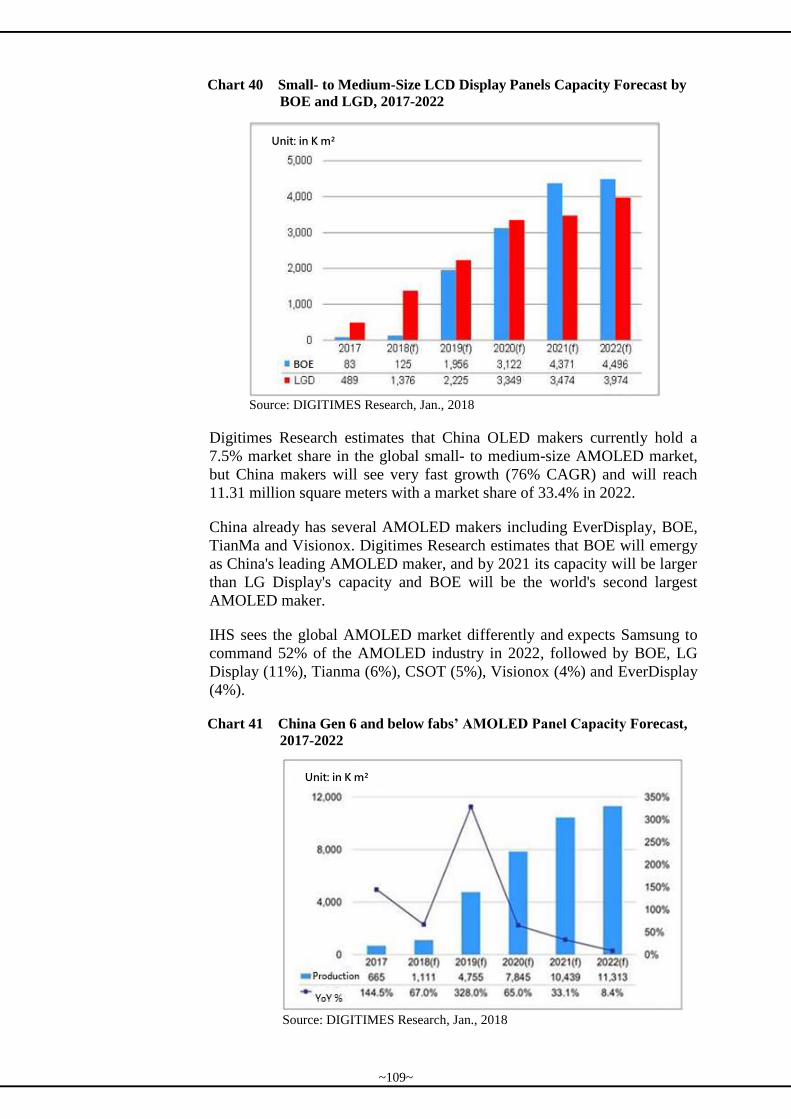
Chart 40 Small- to Medium-Size LCD Display Panels Capacity Forecast by
BOE and LGD, 2017-2022
Source: DIGITIMES Research, Jan., 2018
Digitimes Research estimates that China OLED makers currently hold a
7.5% market share in the global small- to medium-size AMOLED market,
but China makers will see very fast growth (76% CAGR) and will reach
11.31 million square meters with a market share of 33.4% in 2022.
China already has several AMOLED makers including EverDisplay, BOE,
TianMa and Visionox. Digitimes Research estimates that BOE will emergy
as China's leading AMOLED maker, and by 2021 its capacity will be larger
than LG Display's capacity and BOE will be the world's second largest
AMOLED maker.
IHS sees the global AMOLED market differently and expects Samsung to
command 52% of the AMOLED industry in 2022, followed by BOE, LG
Display (11%), Tianma (6%), CSOT (5%), Visionox (4%) and EverDisplay
(4%).
Chart 41 China Gen 6 and below fabs’ AMOLED Panel Capacity Forecast,
2017-2022
Source: DIGITIMES Research, Jan., 2018
Unit: in K m²
Unit: in K m²
~109~
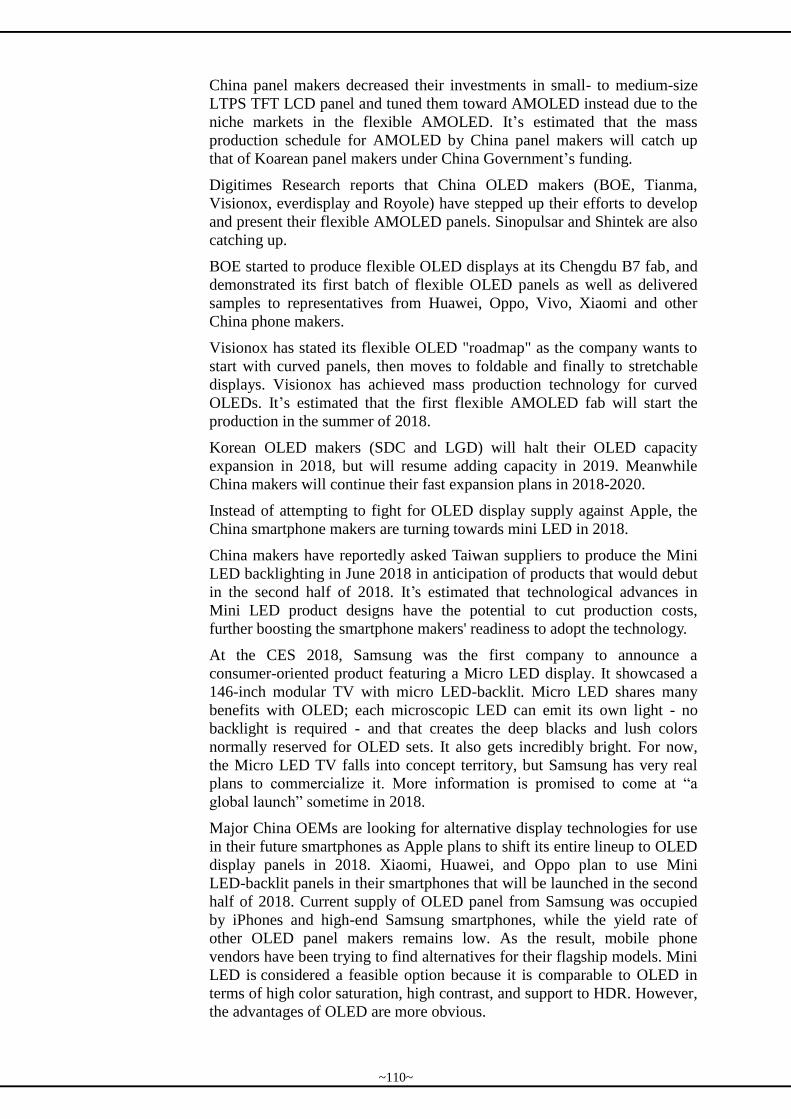
China panel makers decreased their investments in small- to medium-size
LTPS TFT LCD panel and tuned them toward AMOLED instead due to the
niche markets in the flexible AMOLED. It’s estimated that the mass
production schedule for AMOLED by China panel makers will catch up
that of Koarean panel makers under China Government’s funding.
Digitimes Research reports that China OLED makers (BOE, Tianma,
Visionox, everdisplay and Royole) have stepped up their efforts to develop
and present their flexible AMOLED panels. Sinopulsar and Shintek are also
catching up.
BOE started to produce flexible OLED displays at its Chengdu B7 fab, and
demonstrated its first batch of flexible OLED panels as well as delivered
samples to representatives from Huawei, Oppo, Vivo, Xiaomi and other
China phone makers.
Visionox has stated its flexible OLED "roadmap" as the company wants to
start with curved panels, then moves to foldable and finally to stretchable
displays. Visionox has achieved mass production technology for curved
OLEDs. It’s estimated that the first flexible AMOLED fab will start the
production in the summer of 2018.
Korean OLED makers (SDC and LGD) will halt their OLED capacity
expansion in 2018, but will resume adding capacity in 2019. Meanwhile
China makers will continue their fast expansion plans in 2018-2020.
Instead of attempting to fight for OLED display supply against Apple, the
China smartphone makers are turning towards mini LED in 2018.
China makers have reportedly asked Taiwan suppliers to produce the Mini
LED backlighting in June 2018 in anticipation of products that would debut
in the second half of 2018. It’s estimated that technological advances in
Mini LED product designs have the potential to cut production costs,
further boosting the smartphone makers' readiness to adopt the technology.
At the CES 2018, Samsung was the first company to announce a
consumer-oriented product featuring a Micro LED display. It showcased a
146-inch modular TV with micro LED-backlit. Micro LED shares many
benefits with OLED; each microscopic LED can emit its own light - no
backlight is required - and that creates the deep blacks and lush colors
normally reserved for OLED sets. It also gets incredibly bright. For now,
the Micro LED TV falls into concept territory, but Samsung has very real
plans to commercialize it. More information is promised to come at “a
global launch” sometime in 2018.
Major China OEMs are looking for alternative display technologies for use
in their future smartphones as Apple plans to shift its entire lineup to OLED
display panels in 2018. Xiaomi, Huawei, and Oppo plan to use Mini
LED-backlit panels in their smartphones that will be launched in the second
half of 2018. Current supply of OLED panel from Samsung was occupied
by iPhones and high-end Samsung smartphones, while the yield rate of
other OLED panel makers remains low. As the result, mobile phone
vendors have been trying to find alternatives for their flagship models. Mini
LED is considered a feasible option because it is comparable to OLED in
terms of high color saturation, high contrast, and support to HDR. However,
the advantages of OLED are more obvious.
~110~
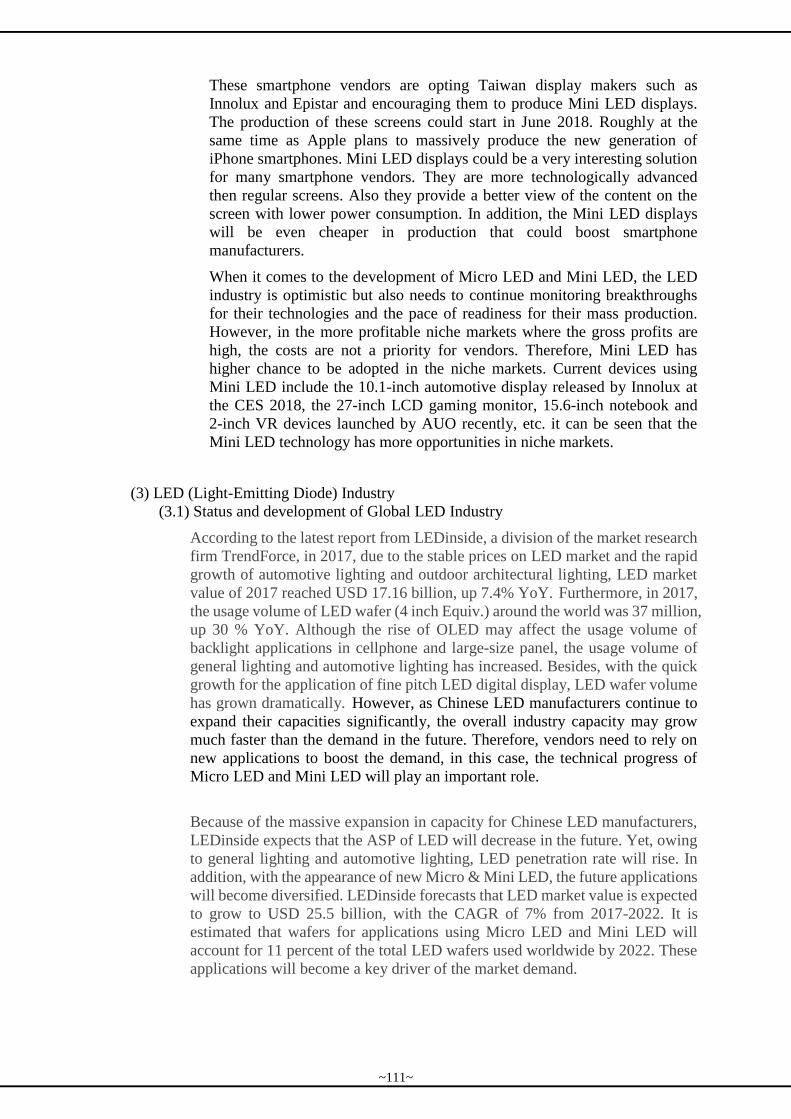
These smartphone vendors are opting Taiwan display makers such as
Innolux and Epistar and encouraging them to produce Mini LED displays.
The production of these screens could start in June 2018. Roughly at the
same time as Apple plans to massively produce the new generation of
iPhone smartphones. Mini LED displays could be a very interesting solution
for many smartphone vendors. They are more technologically advanced
then regular screens. Also they provide a better view of the content on the
screen with lower power consumption. In addition, the Mini LED displays
will be even cheaper in production that could boost smartphone
manufacturers.
When it comes to the development of Micro LED and Mini LED, the LED
industry is optimistic but also needs to continue monitoring breakthroughs
for their technologies and the pace of readiness for their mass production.
However, in the more profitable niche markets where the gross profits are
high, the costs are not a priority for vendors. Therefore, Mini LED has
higher chance to be adopted in the niche markets. Current devices using
Mini LED include the 10.1-inch automotive display released by Innolux at
the CES 2018, the 27-inch LCD gaming monitor, 15.6-inch notebook and
2-inch VR devices launched by AUO recently, etc. it can be seen that the
Mini LED technology has more opportunities in niche markets.
(3) LED (Light-Emitting Diode) Industry
(3.1) Status and development of Global LED Industry
According to the latest report from LEDinside, a division of the market research
firm TrendForce, in 2017, due to the stable prices on LED market and the rapid
growth of automotive lighting and outdoor architectural lighting, LED market
value of 2017 reached USD 17.16 billion, up 7.4% YoY. Furthermore, in 2017,
the usage volume of LED wafer (4 inch Equiv.) around the world was 37 million,
up 30 % YoY. Although the rise of OLED may affect the usage volume of
backlight applications in cellphone and large-size panel, the usage volume of
general lighting and automotive lighting has increased. Besides, with the quick
growth for the application of fine pitch LED digital display, LED wafer volume
has grown dramatically. However, as Chinese LED manufacturers continue to
expand their capacities significantly, the overall industry capacity may grow
much faster than the demand in the future. Therefore, vendors need to rely on
new applications to boost the demand, in this case, the technical progress of
Micro LED and Mini LED will play an important role.
Because of the massive expansion in capacity for Chinese LED manufacturers,
LEDinside expects that the ASP of LED will decrease in the future. Yet, owing
to general lighting and automotive lighting, LED penetration rate will rise. In
addition, with the appearance of new Micro & Mini LED, the future applications
will become diversified. LEDinside forecasts that LED market value is expected
to grow to USD 25.5 billion, with the CAGR of 7% from 2017-2022. It is
estimated that wafers for applications using Micro LED and Mini LED will
account for 11 percent of the total LED wafers used worldwide by 2022. These
applications will become a key driver of the market demand.
~111~
Chart 42 LED Wafer Volume Forecast for Applications Using Micro LED & Mini LED by 2022
Source: LEDinside,2018/3
As to high-brightness LED chips, the global production of high-brightness LED
chips is expected to grow 2.8% year-on-year to USD13.18 billion in 2017,
forecasts Digitimes Research. The momentum of global LED industry reached
its peak in 2014 and then gradullay slowed down. In 2017, there will be 303.75
billion high-brightness LED chips shipped globally, increasing 23.9% on year.
The biggest growth is in lighting, increasing 39.2%. Digitimes Research
estimates the global production of high-brightness LED chips to grow 4.8% to
USD13.81 billion in 2018, then at 2-5% annually during 2018-2022. It is due to
that LED lighting penetration will approach saturation. Also, the production
value for backlighting applications will continue to decline, while backlighting
applications for handsets will drop significantly. And the applications which
have double-digit growth such as automotive and displays only represent slight
shares of the market.
A. Development by region
Europe has been the largest market for LED lighting and is expected to
continuously be the major share of the gobal LED market. The growth is mainly
contributed by the demand for outdoor lighting applications as a result of the
strict energy efficiency laws. The demand for residential lishting also drives the
market growth. In addition, new opportunities will emerge while EU
implementing its Green Paper.
North America is another important and growing market for LED lighting. New
products in compliance with energy efficieny standard and high disposable
income provide the momentum for the growth of LED lighting applications. The
United States in particular is the target market for all LED lighting
manufacturers.
~112~
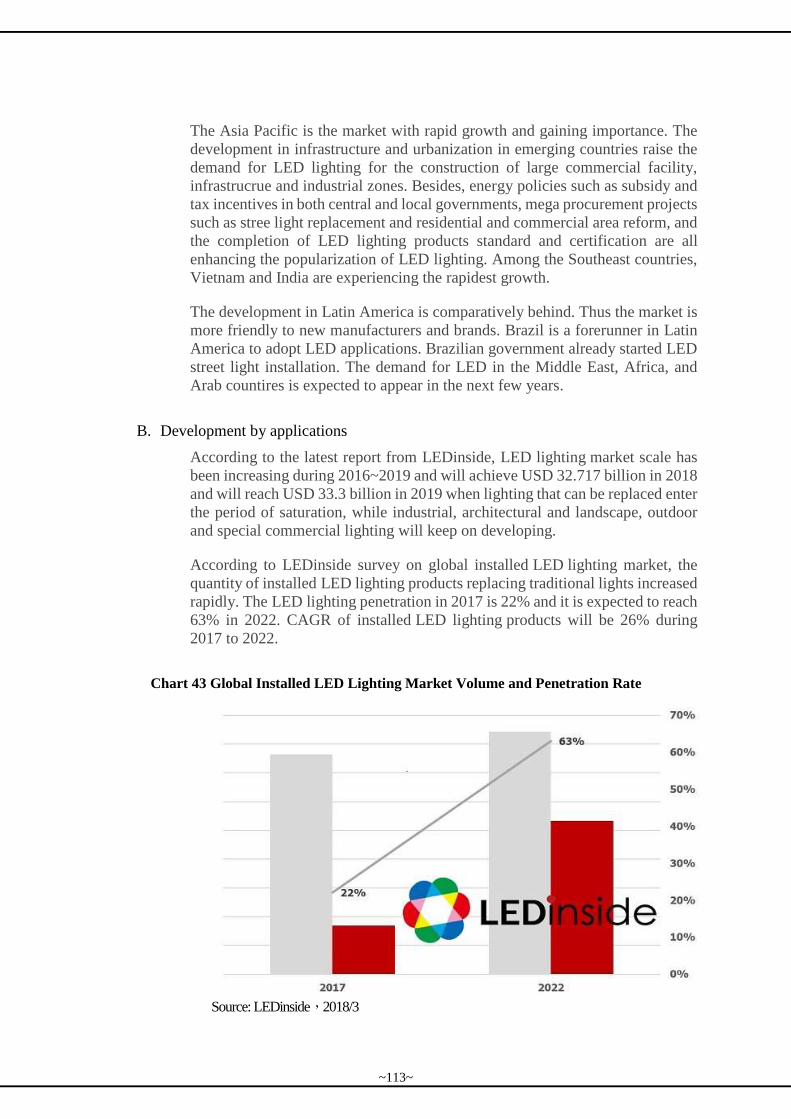
The Asia Pacific is the market with rapid growth and gaining importance. The
development in infrastructure and urbanization in emerging countries raise the
demand for LED lighting for the construction of large commercial facility,
infrastrucrue and industrial zones. Besides, energy policies such as subsidy and
tax incentives in both central and local governments, mega procurement projects
such as stree light replacement and residential and commercial area reform, and
the completion of LED lighting products standard and certification are all
enhancing the popularization of LED lighting. Among the Southeast countries,
Vietnam and India are experiencing the rapidest growth.
The development in Latin America is comparatively behind. Thus the market is
more friendly to new manufacturers and brands. Brazil is a forerunner in Latin
America to adopt LED applications. Brazilian government already started LED
street light installation. The demand for LED in the Middle East, Africa, and
Arab countires is expected to appear in the next few years.
B. Development by applications
According to the latest report from LEDinside, LED lighting market scale has
been increasing during 2016~2019 and will achieve USD 32.717 billion in 2018
and will reach USD 33.3 billion in 2019 when lighting that can be replaced enter
the period of saturation, while industrial, architectural and landscape, outdoor
and special commercial lighting will keep on developing.
According to LEDinside survey on global installed LED lighting market, the
quantity of installed LED lighting products replacing traditional lights increased
rapidly. The LED lighting penetration in 2017 is 22% and it is expected to reach
63% in 2022. CAGR of installed LED lighting products will be 26% during
2017 to 2022.
Chart 43 Global Installed LED Lighting Market Volume and Penetration Rate
Source: LEDinside,2018/3
~113~
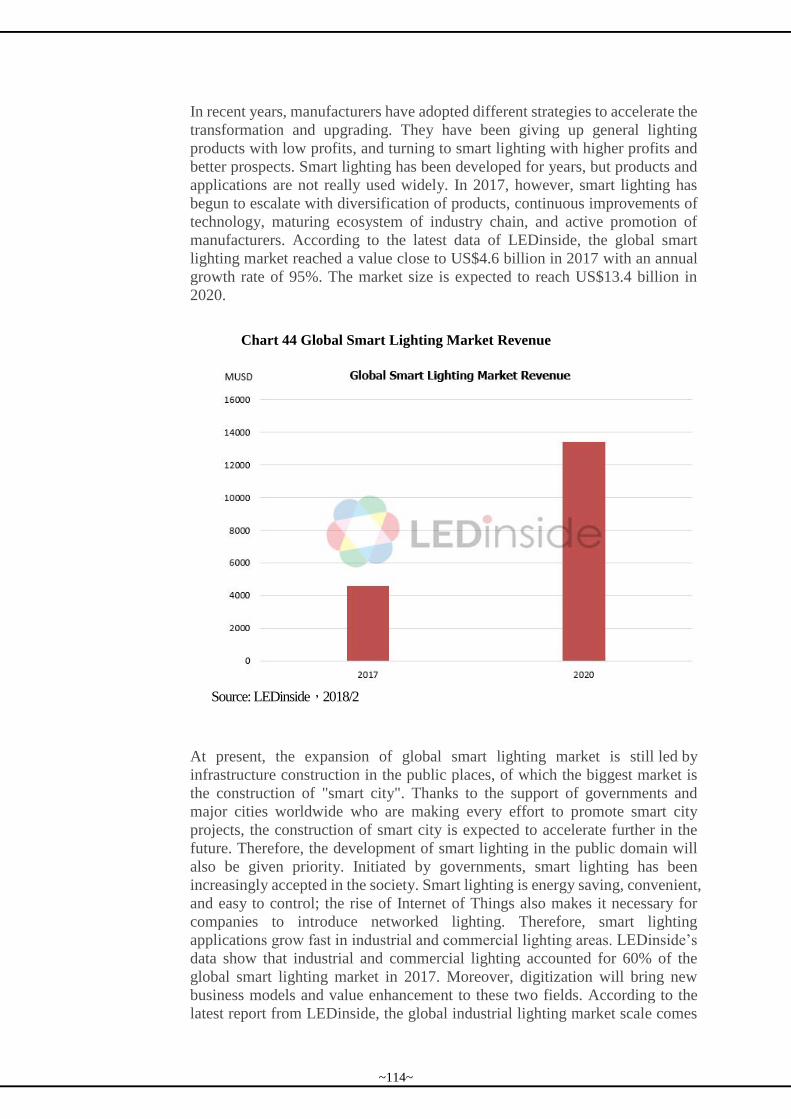
In recent years, manufacturers have adopted different strategies to accelerate the
transformation and upgrading. They have been giving up general lighting
products with low profits, and turning to smart lighting with higher profits and
better prospects. Smart lighting has been developed for years, but products and
applications are not really used widely. In 2017, however, smart lighting has
begun to escalate with diversification of products, continuous improvements of
technology, maturing ecosystem of industry chain, and active promotion of
manufacturers. According to the latest data of LEDinside, the global smart
lighting market reached a value close to US$4.6 billion in 2017 with an annual
growth rate of 95%. The market size is expected to reach US$13.4 billion in
2020.
Chart 44 Global Smart Lighting Market Revenue
Source: LEDinside,2018/2
At present, the expansion of global smart lighting market is still led by
infrastructure construction in the public places, of which the biggest market is
the construction of "smart city". Thanks to the support of governments and
major cities worldwide who are making every effort to promote smart city
projects, the construction of smart city is expected to accelerate further in the
future. Therefore, the development of smart lighting in the public domain will
also be given priority. Initiated by governments, smart lighting has been
increasingly accepted in the society. Smart lighting is energy saving, convenient,
and easy to control; the rise of Internet of Things also makes it necessary for
companies to introduce networked lighting. Therefore, smart lighting
applications grow fast in industrial and commercial lighting areas. LEDinside’s
data show that industrial and commercial lighting accounted for 60% of the
global smart lighting market in 2017. Moreover, digitization will bring new
business models and value enhancement to these two fields. According to the
latest report from LEDinside, the global industrial lighting market scale comes
~114~
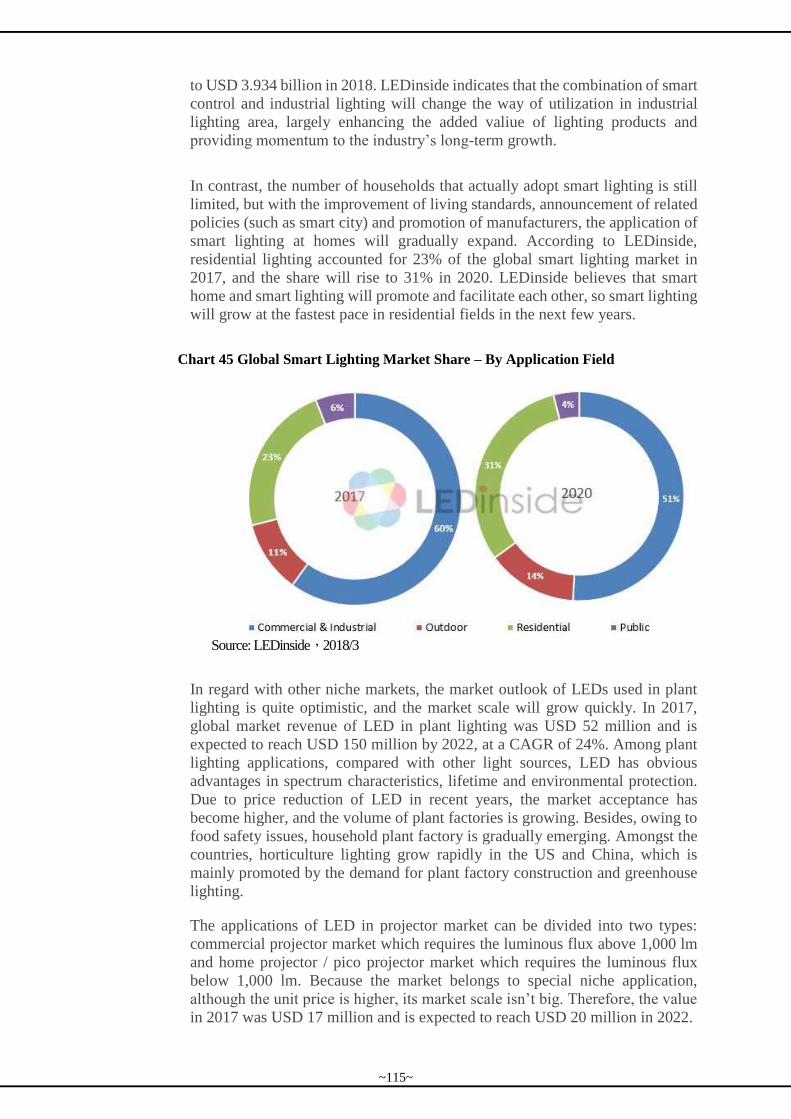
to USD 3.934 billion in 2018. LEDinside indicates that the combination of smart
control and industrial lighting will change the way of utilization in industrial
lighting area, largely enhancing the added valiue of lighting products and
providing momentum to the industry’s long-term growth.
In contrast, the number of households that actually adopt smart lighting is still
limited, but with the improvement of living standards, announcement of related
policies (such as smart city) and promotion of manufacturers, the application of
smart lighting at homes will gradually expand. According to LEDinside,
residential lighting accounted for 23% of the global smart lighting market in
2017, and the share will rise to 31% in 2020. LEDinside believes that smart
home and smart lighting will promote and facilitate each other, so smart lighting
will grow at the fastest pace in residential fields in the next few years.
Chart 45 Global Smart Lighting Market Share – By Application Field
Source: LEDinside,2018/3
In regard with other niche markets, the market outlook of LEDs used in plant
lighting is quite optimistic, and the market scale will grow quickly. In 2017,
global market revenue of LED in plant lighting was USD 52 million and is
expected to reach USD 150 million by 2022, at a CAGR of 24%. Among plant
lighting applications, compared with other light sources, LED has obvious
advantages in spectrum characteristics, lifetime and environmental protection.
Due to price reduction of LED in recent years, the market acceptance has
become higher, and the volume of plant factories is growing. Besides, owing to
food safety issues, household plant factory is gradually emerging. Amongst the
countries, horticulture lighting grow rapidly in the US and China, which is
mainly promoted by the demand for plant factory construction and greenhouse
lighting.
The applications of LED in projector market can be divided into two types:
commercial projector market which requires the luminous flux above 1,000 lm
and home projector / pico projector market which requires the luminous flux
below 1,000 lm. Because the market belongs to special niche application,
although the unit price is higher, its market scale isn’t big. Therefore, the value
in 2017 was USD 17 million and is expected to reach USD 20 million in 2022.
~115~
C. Development by products
In view of the demand for LED applications in 2017~2022, DIGITIMES
Research estimates that automotive and display applications will show high
growth, at CAGR of 14-15% and 9~12% respectively while the growth rate of
lighting application will below 10%. LED backlights for TVs, notebooks and
monitors are expected to decline slightly. During 2017 an 2018, the decline of
backlights for tablets will be higher than aforstated IT products but are expectd
to slow down afterwards. Mobile applications will decline most due to the
adoption of OLED panel will continue to increase, reaching 50% by 2022,
which will upset the demand for LED backlights. According to LEDinside, the
size of global OLED lighting panel market has reached about US$153 million in
2017. China’s OLED display industry is estimated to see production capacity
expansion in 2018, substantially improving the yield rate in OLED industry and
lowering the costs. OLED lighting will also have chance to improve the
performance-cost ratio due to the entire market’s status quo. Hence, the size of
OLED lighting market is expected to reach more than 1.1 billion by 2020.
Since the market of high-brightness LED grows slightly, LED manufacturers
are turning to new sources of light with high growth potentials, such as IR
LED, UV LED, Mini LED and Micro LED, indicated by DIGITIMES
Research. The new applications of IR LED is diversified, including popular
consumer goods, biometric identification, automotive ADAS and IoT related
intelligent sensing. As to UV LED market, UV-A LED is steadily growing,
while UV-B and UV-C LED will grow significantly in the future for their
applications in dermatology and disinfection.
According to DIGITEMS Research’s analysis, the mass applications of Mini
LED can be expected. In addition to Mini LED display, the backlight for
display which emphasizes high contrast and regional control attributes is also
adopted. Micro LED although is a popular topic in the industry, the technology
for mass production is not yet solved. Thus it is difficult to forecast it’s market
scale. Micro LED relatd products are expected to come to market from 2018.
D. Industry trends
LEDinside analyzed top 10 LED demand and supply market trends in 2018 as
below:
Mobile Market- Mini LED Backlight Products Have the Chance to Be
Introduced into Mobile Phone Backlight Application in 2018
The recent supply of AMOLED panel is tight. Except Samsung and Apple,
other Android manufacturers may face the hardship of the lacking of OLED
panel. Therefore, to make the products stand out, other manufacturers will
combine Mini LED with flexible substrate to achieve high curved backlight.
Related products of Mini LED backlight applications are expected to be
released in 2018.
~116~
TV Market- WCG and QD (Quantum Dot) are the Technology
Directions to Make Differentiation for TV Manufacturers
In response to wide color gamut (WCG) solutions, TV manufacturers
emphasize HDR and have the demand for WCG at the same time, and with
the approach of WCG on HDR market, the percentage of wide color gamut
in 2018 will have the chance to increase. For HDR, the basic demand is
about NTSC 85%, and it may become higher in the future. This will cause
NTSC 85% solution’s usage of B LED +R (KSF) G(Phosphor), B LED+R
(Nitride) G (Phosphor) and BG LED +R(KSF) increase. On NTSC ≧100%
project, now except QDEF, Korean manufacturers have developed QD In
Open Cell. Due to QD’s material, it only needs blue light LED chip, and no
longer requires traditional phosphor powders. Therefore, in the future, the
phosphor usage volume will decrease as the QD in Open cell increases.
General Lighting Market- The Time it Takes to Make the Market
Become Saturated for Potential LED Lamp Installation is 10 Years.
The potential LED lighting installation around the world is about 60-70
billion. The period of growth for LED lighting industry is in 2012 to 2016.
LED lighting industry has finished the installation of 11.872 billion LED
lighting products all over the world. Similar plans of global lighting
challenge receive wide responses from lighting industries. It is expected that
before 2020, there will be 6-7 billion LED lighting being used per year. It
will realize the goal of reducing energy consumption and greenhouse gas
emissions.
Architectural and Landscape Lighting Market- Evening Economy
Boosts Architectural and Landscape Lighting Market
Viewing from the demand, all cities put a lot of efforts in increasing the
ranks and constructing travel attractions. Especially in China that every
cities spend lots of money creating evening economy. With the combination
of dynamic image control technology with LED screen, they create cultural
experience by the form of light and music shows at riverside, coast, lakeside
and city square. There are 300 prefectural-level cities and 2,800 county-level
cities in China. If only 5% of the cities promote lighting engineering per
year, it can bring the demand of architectural and landscape lighting market
worth billions of US dollars.
Automotive Lighting- Fast-Growing China Represents the Largest
Automotive Market Opportunities Worldwide
China is currently the largest automobile market in the world, and the total
passenger vehicle sales in the country for 2018 are forecast to grow by
7.14% annually to reach 25.5 million cars. China’s demand growth is
supported by several factors. First, the country’s second and third-tier cities
are seeing new economic developments and growths. Second, the expansion
and upgrading of the country’s transportation infrastructure encourage
vehicle growth as well as the replacement of traditional two- and
~117~
three-wheelers by four-wheeled automobiles. The vehicle per capita in
China has gone up from a low of 100 and is on a gradual path to catch up to
the per capita figures of the developed countries (ranging from 500 to 800).
The third major factor that drives the Chinese car market is the various
government policies that support the development of domestic vehicle
brands.
Automotive Market- LED Usage Volume for Automotive Panels is On
the Rise
Automobile design is adopting newer display technologies, and automotive
panels are being used in dashboards, CIDs and entertainment displays. The
configuration of the automotive panels on dashboards have transitioned
from 3.5- to 10-inch panels (stitching type) to one integrated display sized
10.3 to 12.5 inches. The size and format of panels for CIDs have also
changed. Initially, a CID consists of a 6- to 9-inch panels showing basic
controls. Now, a CID can be a large panel sized 10.1 to 17 inches and
designed for showing the operational details of the entire vehicle. Similarly,
the development entertainment displays have transitioned from 7- to 9-inch
panels for embedded displays to larger panels sized 10.3 to 11.4 inches for
non-embedded displays. In addition to the increase in size, some basic
specification requirements that automotive panels must have include wide
viewing angle and high brightness. Other design-related needs that have also
emerged such as curved and irregularly shaped panel structures. Because of
the above-mentioned trends, the total global LED market value in
automotive panels is projected to increase sharply from USD 67 million in
2016 to USD 173 million in 2021, with the CAGR during this period at
21%.
Digital Display Market- Mini LED Becomes the Focus among Digital
Display and Challenges Medium-Density Retina Display Technology
Although Micro LED is popular, the challenges that mass transfer bring are
hard to overcome in the short term. It takes time to industrialize. For digital
display industry, high-density retina display technology is the threat to
current market, however, it brings new opportunity with the market
development through display technology and brand channel as well.
Therefore, Mini LED, the technology between fine pitch LED and Micro
LED, becomes popular among digital display companies. With COB
packaging, it is possible to make the pitch below P0.7 for digital display.
Infrared LED Market- IR LED Market Value Will Grow at CAGR of
15% in 2016-2021
Because some Chinese manufacturers take part in the infrared LED chip
market, some mainstream Infrared LED prices decrease rapidly. However,
with the release of various new applications, such as industrial surveillance
security, virtual reality, and facial and iris recognition, infrared LED market
value continues to grow. LEDinside expects that infrared LED market
(exclude optical sensors market) in 2017 is about USD 441 million. In 2021,
it is expected to increase at USD 699 million.
~118~
UV-C LED Price Driver Market Scale
Prices of UV-C LEDs can vary widely on account of wavelength
specification, product quality, lifespan and order volume. Besides great
differences in quotation, this year’s UV-C LED market is also influenced by
the introduction of new materials and more efficient chip manufacturing
technologies. By adopting flip-chip and vertical-chip solutions, UV-C LEDs
can work with high-power drivers to achieve greater levels of brightness.
Unlike UV-A LEDs that target the curing application, UV-C LEDs are
targeting the market for consumer lighting products. UV-C LED suppliers
such as LG Innotek, Seoul Viosys and Bioraytron are currently expanding
the consumer market with affordable products. As these suppliers price their
offerings aggressively, they also make it difficult for new market entrants to
develop and promote their UV-C products.
LED Chip Market Reboot the Expansion Plan
There is a new peak of expansion for LED chip industry in 2017. Because
the current prices of LED chip are low, also, the tier-one LED chip
manufacturers in China have the advantages in cost, the orders focus on
Chinese LED manufacturers. Under the condition of full capacity, the
tier-one LED chip manufacturers in China start to reboot the expansion plan.
LEDinside predicts that the number of new equipment in 2017 will reach
401 sets (Equiv. K465i). It becomes the peak period for expanding capacity
in recent years.
(3.2) Status and development of LED Industry in Taiwan and China
Taiwan’s lighting industry has a long history. Lots of the manufacturers
entered into LED lighting industry, many of which are SMEs, and most of
them were transferring their product line from traditional lighting to LED
lighting or expanding from LED components and parts to LED lighting
applications. Overall, the industrial chain of Taiwan LED industry is complete
from LED components, including epitaxy, chip, package, module, to critical
parts such as control IC, driver circuit, power supply unit, radiator, second
optical lens, and to the design and manufacturing of lamps.
According to Photonics Industry & Technology Devlopment Association’s
data, the market value of Taiwan LED lighting industry of 2016 was around
NTD 23.498 billion growing 9% YoY and the market value of 2017 are
expected to reach NTD 24.438 billion growing 4% YoY. The market value of
LED lighting industry continues to rise as Taiwan LED component companies
successfully built collaboration relationships with the U.S. and European brand
makers and distributors.
~119~
Chart 46 Taiwan LED Lighting Market Value and Growth Rate
Source: PIDA,2017/7
According to “China LED Industry Competition Analysis And Enterprises
Competitive Strategy Report in 2018~2023” published by Qianzhan Business
Information, indoor lighting represents the largest share of China LED market
value, accounting for 48.37%, while landscape lighting and display accounts
for 9.65% and 7.20% respectively.
Chart 47 The Composition of China LED Market Value by Product
Source: Qianzhan Business Information,2018/4
~120~
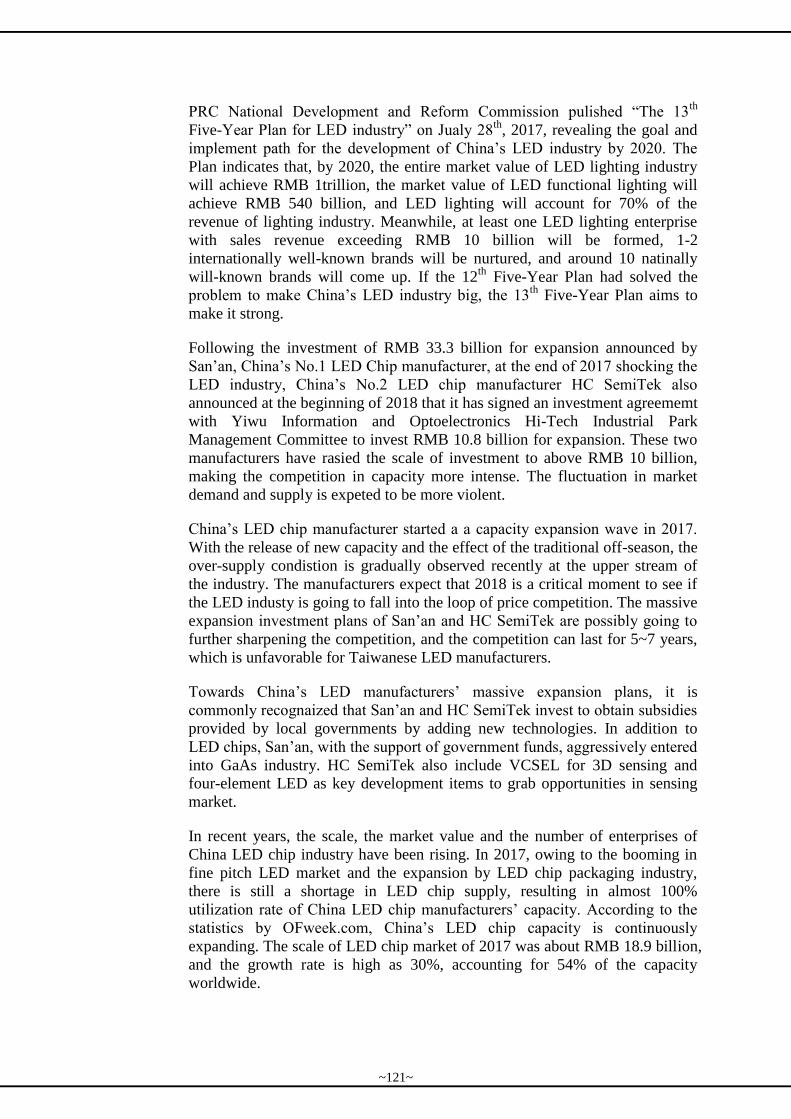
PRC National Development and Reform Commission pulished “The 13th
Five-Year Plan for LED industry” on Jualy 28th
, 2017, revealing the goal and
implement path for the development of China’s LED industry by 2020. The
Plan indicates that, by 2020, the entire market value of LED lighting industry
will achieve RMB 1trillion, the market value of LED functional lighting will
achieve RMB 540 billion, and LED lighting will account for 70% of the
revenue of lighting industry. Meanwhile, at least one LED lighting enterprise
with sales revenue exceeding RMB 10 billion will be formed, 1-2
internationally well-known brands will be nurtured, and around 10 natinally
will-known brands will come up. If the 12th
Five-Year Plan had solved the
problem to make China’s LED industry big, the 13th
Five-Year Plan aims to
make it strong.
Following the investment of RMB 33.3 billion for expansion announced by
San’an, China’s No.1 LED Chip manufacturer, at the end of 2017 shocking the
LED industry, China’s No.2 LED chip manufacturer HC SemiTek also
announced at the beginning of 2018 that it has signed an investment agreememt
with Yiwu Information and Optoelectronics Hi-Tech Industrial Park
Management Committee to invest RMB 10.8 billion for expansion. These two
manufacturers have rasied the scale of investment to above RMB 10 billion,
making the competition in capacity more intense. The fluctuation in market
demand and supply is expeted to be more violent.
China’s LED chip manufacturer started a a capacity expansion wave in 2017.
With the release of new capacity and the effect of the traditional off-season, the
over-supply condistion is gradually observed recently at the upper stream of
the industry. The manufacturers expect that 2018 is a critical moment to see if
the LED industy is going to fall into the loop of price competition. The massive
expansion investment plans of San’an and HC SemiTek are possibly going to
further sharpening the competition, and the competition can last for 5~7 years,
which is unfavorable for Taiwanese LED manufacturers.
Towards China’s LED manufacturers’ massive expansion plans, it is
commonly recognaized that San’an and HC SemiTek invest to obtain subsidies
provided by local governments by adding new technologies. In addition to
LED chips, San’an, with the support of government funds, aggressively entered
into GaAs industry. HC SemiTek also include VCSEL for 3D sensing and
four-element LED as key development items to grab opportunities in sensing
market.
In recent years, the scale, the market value and the number of enterprises of
China LED chip industry have been rising. In 2017, owing to the booming in
fine pitch LED market and the expansion by LED chip packaging industry,
there is still a shortage in LED chip supply, resulting in almost 100%
utilization rate of China LED chip manufacturers’ capacity. According to the
statistics by OFweek.com, China’s LED chip capacity is continuously
expanding. The scale of LED chip market of 2017 was about RMB 18.9 billion,
and the growth rate is high as 30%, accounting for 54% of the capacity
worldwide.
~121~
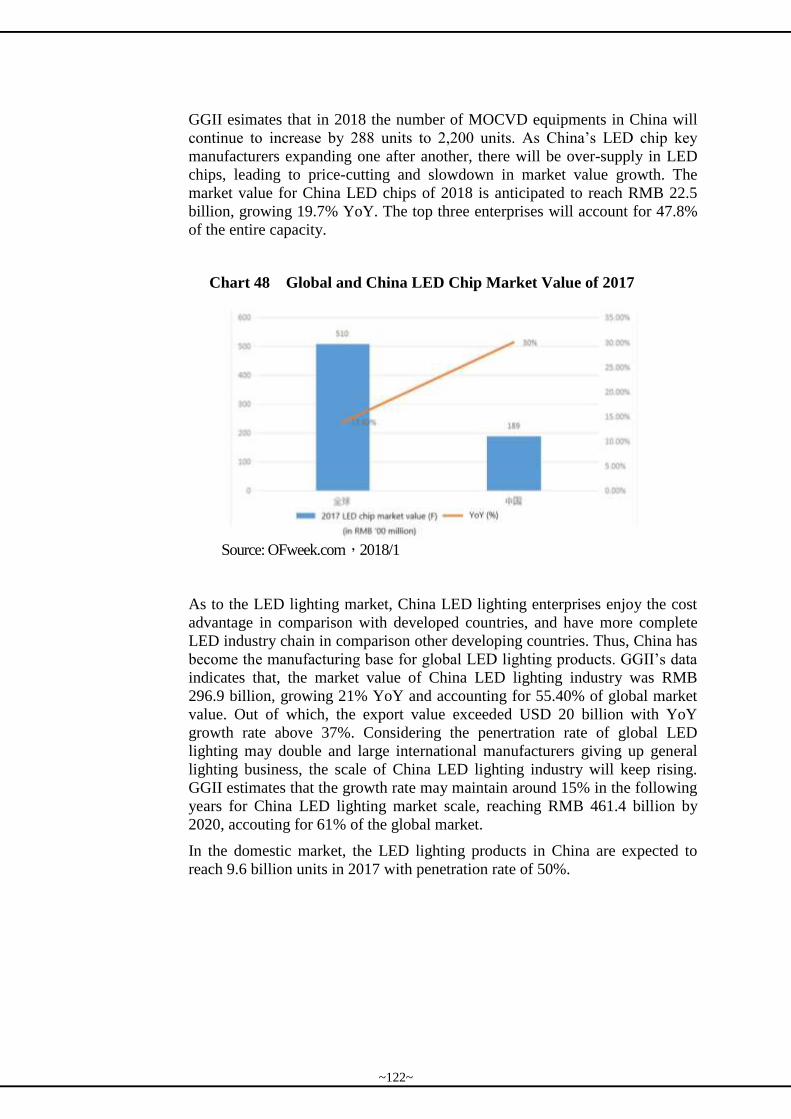
GGII esimates that in 2018 the number of MOCVD equipments in China will
continue to increase by 288 units to 2,200 units. As China’s LED chip key
manufacturers expanding one after another, there will be over-supply in LED
chips, leading to price-cutting and slowdown in market value growth. The
market value for China LED chips of 2018 is anticipated to reach RMB 22.5
billion, growing 19.7% YoY. The top three enterprises will account for 47.8%
of the entire capacity.
Chart 48 Global and China LED Chip Market Value of 2017
Source: OFweek.com,2018/1
As to the LED lighting market, China LED lighting enterprises enjoy the cost
advantage in comparison with developed countries, and have more complete
LED industry chain in comparison other developing countries. Thus, China has
become the manufacturing base for global LED lighting products. GGII’s data
indicates that, the market value of China LED lighting industry was RMB
296.9 billion, growing 21% YoY and accounting for 55.40% of global market
value. Out of which, the export value exceeded USD 20 billion with YoY
growth rate above 37%. Considering the penertration rate of global LED
lighting may double and large international manufacturers giving up general
lighting business, the scale of China LED lighting industry will keep rising.
GGII estimates that the growth rate may maintain around 15% in the following
years for China LED lighting market scale, reaching RMB 461.4 billion by
2020, accouting for 61% of the global market.
In the domestic market, the LED lighting products in China are expected to
reach 9.6 billion units in 2017 with penetration rate of 50%.
~122~
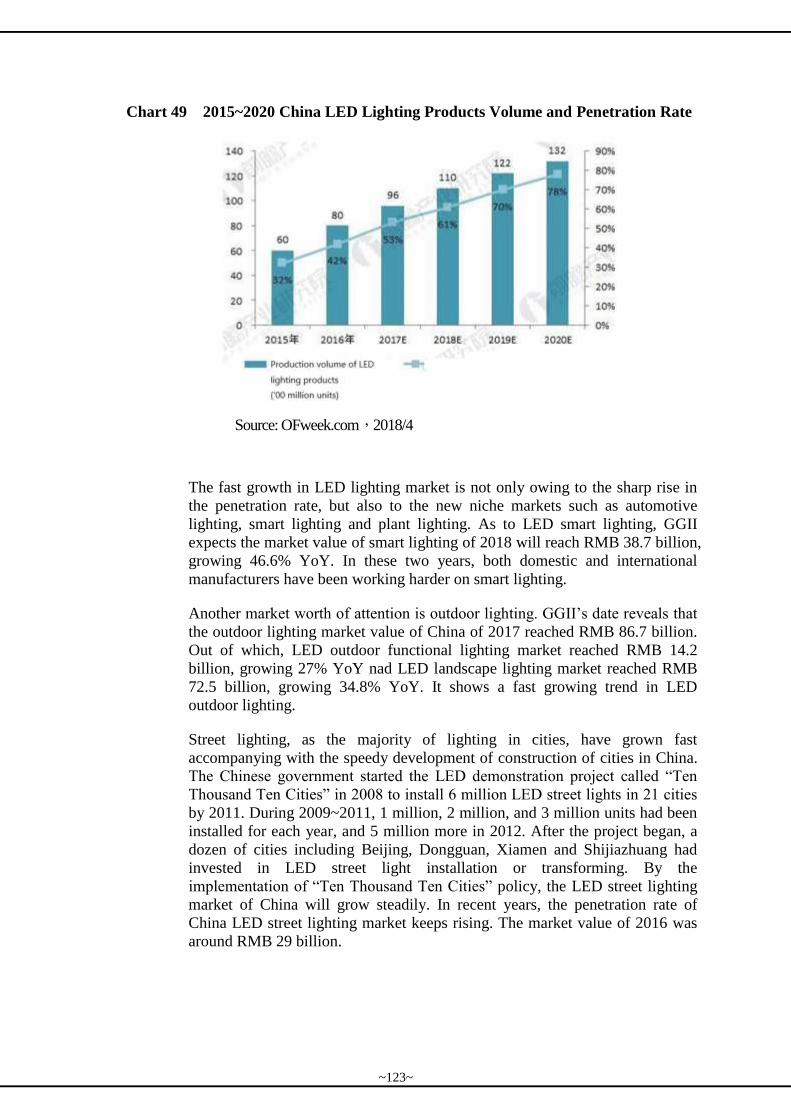
Chart 49 2015~2020 China LED Lighting Products Volume and Penetration Rate
Source: OFweek.com,2018/4
The fast growth in LED lighting market is not only owing to the sharp rise in
the penetration rate, but also to the new niche markets such as automotive
lighting, smart lighting and plant lighting. As to LED smart lighting, GGII
expects the market value of smart lighting of 2018 will reach RMB 38.7 billion,
growing 46.6% YoY. In these two years, both domestic and international
manufacturers have been working harder on smart lighting.
Another market worth of attention is outdoor lighting. GGII’s date reveals that
the outdoor lighting market value of China of 2017 reached RMB 86.7 billion.
Out of which, LED outdoor functional lighting market reached RMB 14.2
billion, growing 27% YoY nad LED landscape lighting market reached RMB
72.5 billion, growing 34.8% YoY. It shows a fast growing trend in LED
outdoor lighting.
Street lighting, as the majority of lighting in cities, have grown fast
accompanying with the speedy development of construction of cities in China.
The Chinese government started the LED demonstration project called “Ten
Thousand Ten Cities” in 2008 to install 6 million LED street lights in 21 cities
by 2011. During 2009~2011, 1 million, 2 million, and 3 million units had been
installed for each year, and 5 million more in 2012. After the project began, a
dozen of cities including Beijing, Dongguan, Xiamen and Shijiazhuang had
invested in LED street light installation or transforming. By the
implementation of “Ten Thousand Ten Cities” policy, the LED street lighting
market of China will grow steadily. In recent years, the penetration rate of
China LED street lighting market keeps rising. The market value of 2016 was
around RMB 29 billion.
~123~
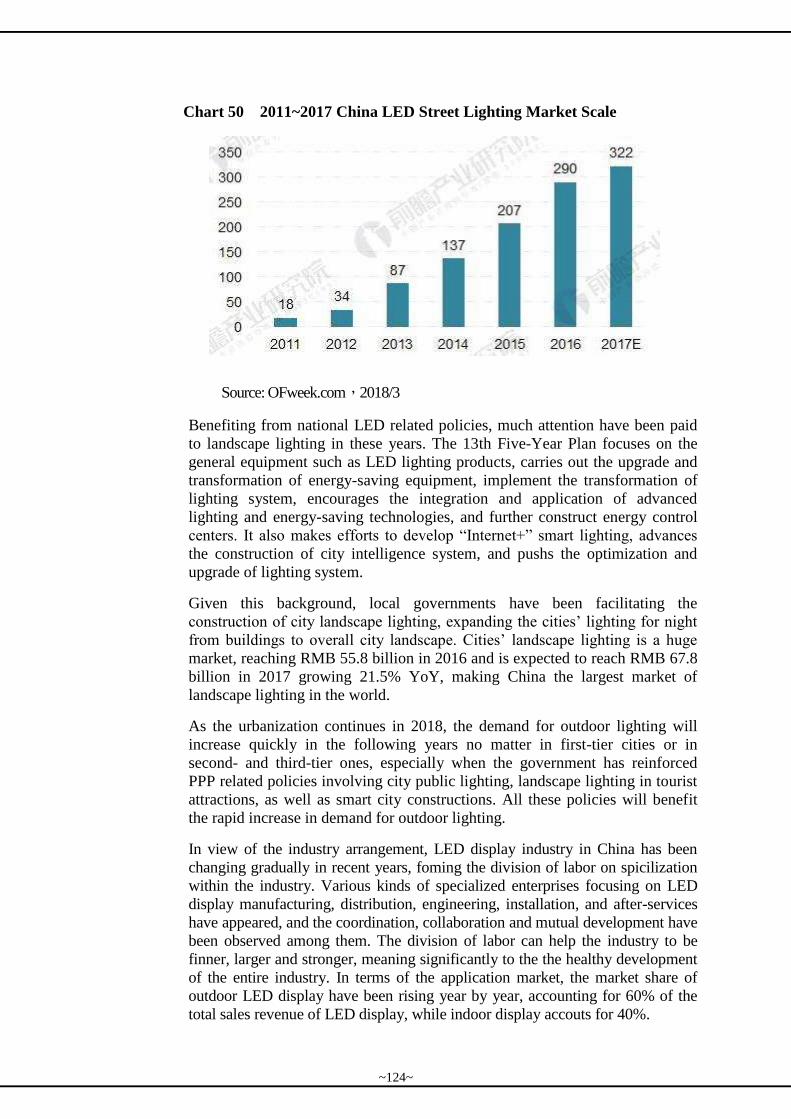
Chart 50 2011~2017 China LED Street Lighting Market Scale
Source: OFweek.com,2018/3
Benefiting from national LED related policies, much attention have been paid
to landscape lighting in these years. The 13th Five-Year Plan focuses on the
general equipment such as LED lighting products, carries out the upgrade and
transformation of energy-saving equipment, implement the transformation of
lighting system, encourages the integration and application of advanced
lighting and energy-saving technologies, and further construct energy control
centers. It also makes efforts to develop “Internet+” smart lighting, advances
the construction of city intelligence system, and pushs the optimization and
upgrade of lighting system.
Given this background, local governments have been facilitating the
construction of city landscape lighting, expanding the cities’ lighting for night
from buildings to overall city landscape. Cities’ landscape lighting is a huge
market, reaching RMB 55.8 billion in 2016 and is expected to reach RMB 67.8
billion in 2017 growing 21.5% YoY, making China the largest market of
landscape lighting in the world.
As the urbanization continues in 2018, the demand for outdoor lighting will
increase quickly in the following years no matter in first-tier cities or in
second- and third-tier ones, especially when the government has reinforced
PPP related policies involving city public lighting, landscape lighting in tourist
attractions, as well as smart city constructions. All these policies will benefit
the rapid increase in demand for outdoor lighting.
In view of the industry arrangement, LED display industry in China has been
changing gradually in recent years, foming the division of labor on spicilization
within the industry. Various kinds of specialized enterprises focusing on LED
display manufacturing, distribution, engineering, installation, and after-services
have appeared, and the coordination, collaboration and mutual development have
been observed among them. The division of labor can help the industry to be
finner, larger and stronger, meaning significantly to the the healthy development
of the entire industry. In terms of the application market, the market share of
outdoor LED display have been rising year by year, accounting for 60% of the
total sales revenue of LED display, while indoor display accouts for 40%.
~124~
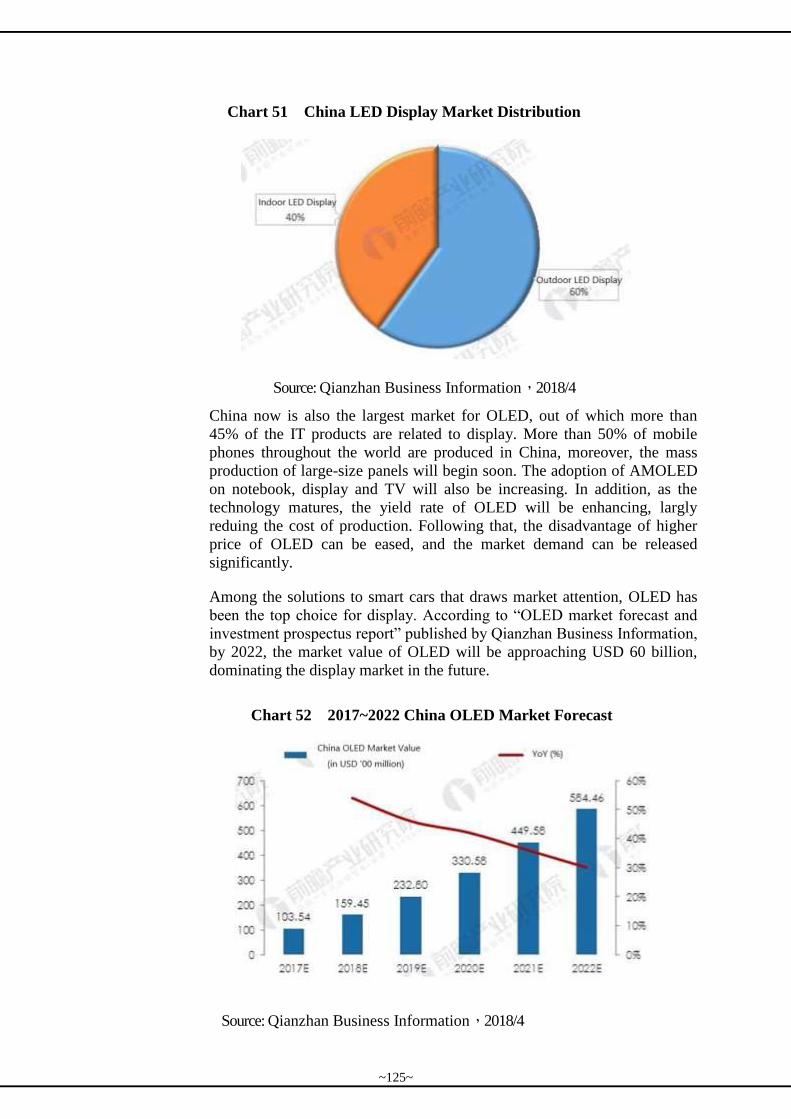
Chart 51 China LED Display Market Distribution
Source: Qianzhan Business Information,2018/4
China now is also the largest market for OLED, out of which more than
45% of the IT products are related to display. More than 50% of mobile
phones throughout the world are produced in China, moreover, the mass
production of large-size panels will begin soon. The adoption of AMOLED
on notebook, display and TV will also be increasing. In addition, as the
technology matures, the yield rate of OLED will be enhancing, largly
reduing the cost of production. Following that, the disadvantage of higher
price of OLED can be eased, and the market demand can be released
significantly.
Among the solutions to smart cars that draws market attention, OLED has
been the top choice for display. According to “OLED market forecast and
investment prospectus report” published by Qianzhan Business Information,
by 2022, the market value of OLED will be approaching USD 60 billion,
dominating the display market in the future.
Chart 52 2017~2022 China OLED Market Forecast
Source: Qianzhan Business Information,2018/4
~125~
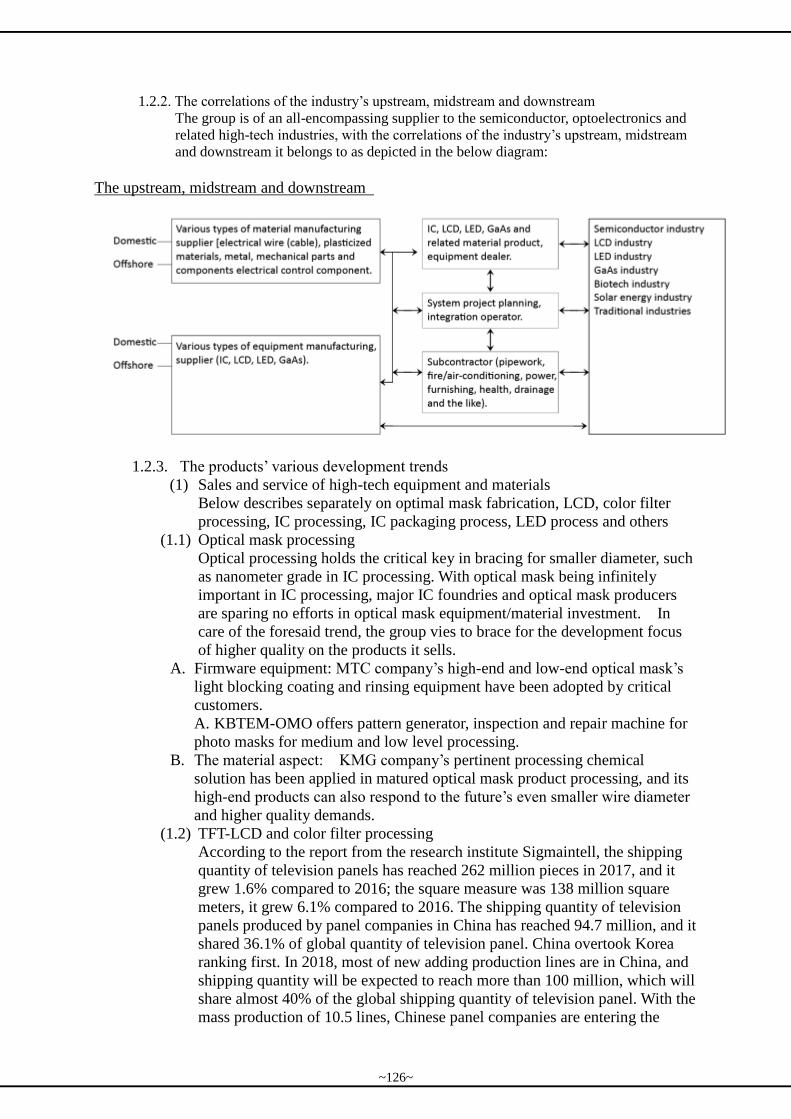
1.2.2. The correlations of the industry’s upstream, midstream and downstream
The group is of an all-encompassing supplier to the semiconductor, optoelectronics and
related high-tech industries, with the correlations of the industry’s upstream, midstream
and downstream it belongs to as depicted in the below diagram:
The upstream, midstream and downstream
1.2.3. The products’ various development trends
(1) Sales and service of high-tech equipment and materials
Below describes separately on optimal mask fabrication, LCD, color filter
processing, IC processing, IC packaging process, LED process and others
(1.1) Optical mask processing
Optical processing holds the critical key in bracing for smaller diameter, such
as nanometer grade in IC processing. With optical mask being infinitely
important in IC processing, major IC foundries and optical mask producers
are sparing no efforts in optical mask equipment/material investment. In
care of the foresaid trend, the group vies to brace for the development focus
of higher quality on the products it sells.
A. Firmware equipment: MTC company’s high-end and low-end optical mask’s
light blocking coating and rinsing equipment have been adopted by critical
customers.
A. KBTEM-OMO offers pattern generator, inspection and repair machine for
photo masks for medium and low level processing.
B. The material aspect: KMG company’s pertinent processing chemical
solution has been applied in matured optical mask product processing, and its
high-end products can also respond to the future’s even smaller wire diameter
and higher quality demands.
(1.2) TFT-LCD and color filter processing
According to the report from the research institute Sigmaintell, the shipping quantity of television panels has reached 262 million pieces in 2017, and it
grew 1.6% compared to 2016; the square measure was 138 million square
meters, it grew 6.1% compared to 2016. The shipping quantity of television
panels produced by panel companies in China has reached 94.7 million, and it
shared 36.1% of global quantity of television panel. China overtook Korea
ranking first. In 2018, most of new adding production lines are in China, and
shipping quantity will be expected to reach more than 100 million, which will
share almost 40% of the global shipping quantity of television panel. With the
mass production of 10.5 lines, Chinese panel companies are entering the
~126~
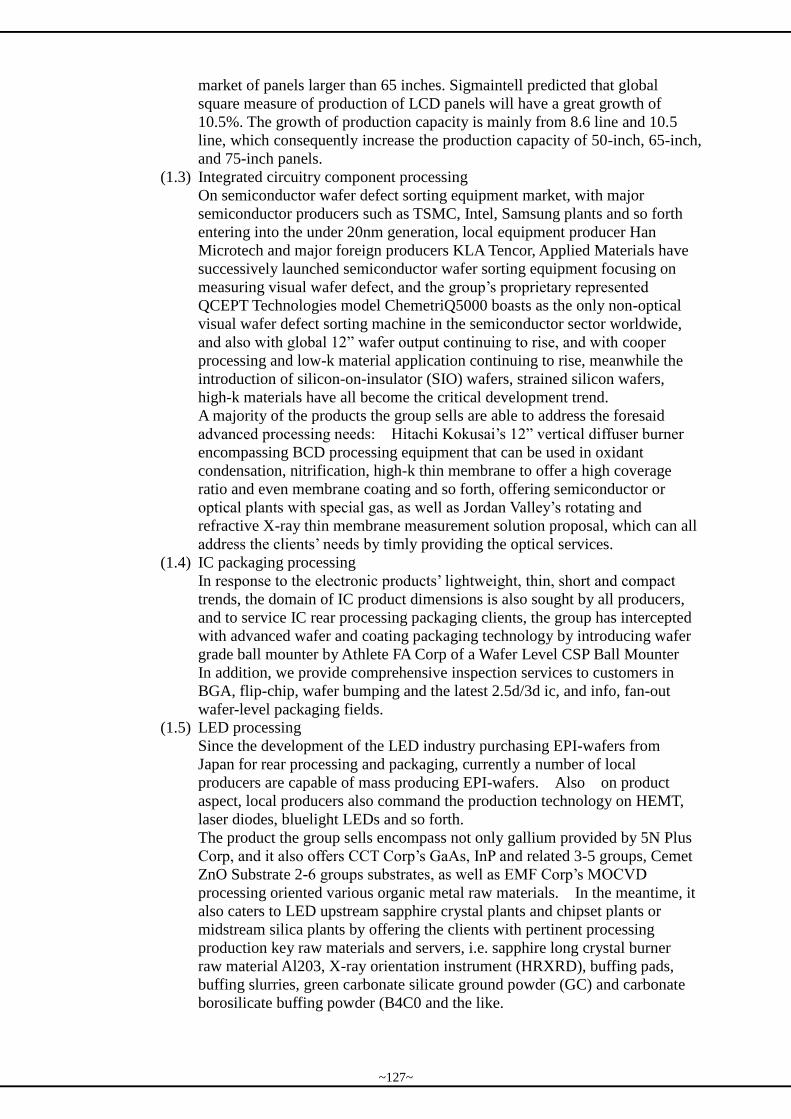
market of panels larger than 65 inches. Sigmaintell predicted that global
square measure of production of LCD panels will have a great growth of
10.5%. The growth of production capacity is mainly from 8.6 line and 10.5
line, which consequently increase the production capacity of 50-inch, 65-inch,
and 75-inch panels.
(1.3) Integrated circuitry component processing
On semiconductor wafer defect sorting equipment market, with major
semiconductor producers such as TSMC, Intel, Samsung plants and so forth
entering into the under 20nm generation, local equipment producer Han
Microtech and major foreign producers KLA Tencor, Applied Materials have
successively launched semiconductor wafer sorting equipment focusing on
measuring visual wafer defect, and the group’s proprietary represented
QCEPT Technologies model ChemetriQ5000 boasts as the only non-optical
visual wafer defect sorting machine in the semiconductor sector worldwide,
and also with global 12” wafer output continuing to rise, and with cooper
processing and low-k material application continuing to rise, meanwhile the
introduction of silicon-on-insulator (SIO) wafers, strained silicon wafers,
high-k materials have all become the critical development trend.
A majority of the products the group sells are able to address the foresaid
advanced processing needs: Hitachi Kokusai’s 12” vertical diffuser burner
encompassing BCD processing equipment that can be used in oxidant
condensation, nitrification, high-k thin membrane to offer a high coverage
ratio and even membrane coating and so forth, offering semiconductor or
optical plants with special gas, as well as Jordan Valley’s rotating and
refractive X-ray thin membrane measurement solution proposal, which can all
address the clients’ needs by timly providing the optical services.
(1.4) IC packaging processing
In response to the electronic products’ lightweight, thin, short and compact
trends, the domain of IC product dimensions is also sought by all producers,
and to service IC rear processing packaging clients, the group has intercepted
with advanced wafer and coating packaging technology by introducing wafer
grade ball mounter by Athlete FA Corp of a Wafer Level CSP Ball Mounter
In addition, we provide comprehensive inspection services to customers in
BGA, flip-chip, wafer bumping and the latest 2.5d/3d ic, and info, fan-out
wafer-level packaging fields.
(1.5) LED processing
Since the development of the LED industry purchasing EPI-wafers from
Japan for rear processing and packaging, currently a number of local
producers are capable of mass producing EPI-wafers. Also on product
aspect, local producers also command the production technology on HEMT,
laser diodes, bluelight LEDs and so forth.
The product the group sells encompass not only gallium provided by 5N Plus
Corp, and it also offers CCT Corp’s GaAs, InP and related 3-5 groups, Cemet
ZnO Substrate 2-6 groups substrates, as well as EMF Corp’s MOCVD
processing oriented various organic metal raw materials. In the meantime, it
also caters to LED upstream sapphire crystal plants and chipset plants or
midstream silica plants by offering the clients with pertinent processing
production key raw materials and servers, i.e. sapphire long crystal burner
raw material Al203, X-ray orientation instrument (HRXRD), buffing pads,
buffing slurries, green carbonate silicate ground powder (GC) and carbonate
borosilicate buffing powder (B4C0 and the like.
~127~
(1.6) Solar energy industry
On solar energy single multi-crystal production chipsets, with the cost
dropping to a certain level at present, with little room for price reduction,
other wearable material costs continue to follow high efficiency and a
reduction on production cost; what can be done in the future is on server
purchasing and cost amortization, which will ultimately affect the producers’
end product production and cost competitiveness. Moreover, with
Taiwanese silver slurry plants accounting for a foothold on the front and back
silver slurry processing, there is a great demand for voluminous, stable
quality silver slurry powder producers, and the group has secured the
representation right fro major silver powder producers to be able to offer a
stable supply volume, and that as silver powder is not only used in the PV
industry, and it can even cross over to the LCD and passive components
industries.
(1.7) Other testing and laboratory use equipment
In recent years, Taiwan’s IC industry, FPD industry, LED industry have
achieved a certain scale, and comparatively equipment, material companies
supporting the foresaid industry processing have mushroomed in their
inceptions. To satisfy small medium high-tech firms and research
laboratories’ needs, the group has also launched the latest Lasertec new
product of a hybrid laser microscope.
(2) Automatic supplying system
(2.1) Gas automated supply system
With significant room to grow on the semiconductor, optoelectronics,
biotech and other high-tech industries at present, whether it is in Taiwan,
Mainland China or Singapore, it also triggers other relevant industries to
buoy. Particularly so is how the gas automated supply system plays an
infinitely important role in a plant facility, and it is also one of the
indispensible, critical facility in a high-tech plant.
No change is expected in the gas automated supply system, whether it be
in the implementing technology, project design or gas supply equipment
and so forth at present or in the future, yet in light of the low price
competition, new competitors, local or foreign, continue to join in the race.
Through many years of efforts, the group has become one of the primary
industry suppliers, in terms of the operating scaled and technical
sophistication. In the future, the group vies to put its competitive focus
on optimizing the cost control model, in a bid to bring the clients with high
quality, high efficiency total solution proposals.
(2.2) Chemical automated supply system
With the chemical automated supply system being a requisite chemical
conveying supply facility in high-tech industry plant launching, where not
only the existing IC, FPD, LED industries’ production expansions have put
an increase on plant launching project demands, and with other peripheral
supporting companies that although small in scale but for quality demand
also require installing and operating such automated supply system on
production equipment and at materials factories. Focusing on the future
technical aspect, unless there is innovative development on the use of
chemical materials, the current system design, equipment and
implementation will continue to undergo changes corresponding to the
customer’s processing change, and exactly for is service uniqueness, and
~128~
high technical thresholds, the saturating market will prevent potential
rivals from entering into the market.
(2.3) Special gas monitoring system
The special gas monitoring system is of a necessary design in the high-tech
industry’s plant launching safety measures, and besides the existing IC,
LCD, LED industry production expansion, which expands the monitoring
system’s market, other peripheral related industries are also in need of
introducing the system for the safety and monitoring demands on
production-related equipment or materials.
(2.4) Logistical service operation
For the lack of manpower and for professional consideration, various IC,
FPD, LED plants are turning to outsourcing some of their operations to
professional task-sharing service has also become a future trend. In the
next few years, there are plans to begin outsourcing the facility system
operations to outside task-sharing, such as the gas, chemical, pure water,
E&M systems, as to the facility equipment and other aspects, there is no
such necessity for task-sharing so far.
The group is currently pursuing the total chemical management (TCM),
total gas management (TGM) and total water management (TWM) work,
which will facilitate offering more comprehensive and all-encompassing
services; as for the facility operating service for small and medium plants,
currently a set of comprehensive facility operating contracts have been
signed, and the group vies to actively underwrite projects by choosing the
suitable customers as a breakthrough to the operation.
(2.5) Factory automated operation
A. Facility management control system (FMCS)
The system remains a critical investment in the high-tech industry in
inducting the facility monitoring on plant facility into the plant launching,
and for the future, besides the high-tech sector, other industries are poised
to add such type of automated facility monitoring facility needs with
technological progress, with which to excel the adequacy ratio on plant
facility, ensuring a smooth factory production, manufacturing flow in the
future, thus offering aggregated market demand, but relatively with
increasing number of competing companies.
B. Computer-integrated manufacturing (CIM)
In the face of an industrial trend of smart manufacturing, it is important to
draw support from ERP/CIM/MES to achieve automated, digitized and
smart manufacturing, and adjust management decisions through effectively
collecting and managing the rapidly changing information within
manufacturing plants, to accelerate adaptation and response speeds.
Marketech International Corp. not only informatizes all website systems
through its computer-integrated manufacturing operations, but also know
the importance to connect different modules (ERP/CIM/MES) with one
another. All the website information should "talk to one another" for M2M
connection during the manufacturing process, and communicate through
the networking platform, to provide customers with sophisticated services
in their manufacturing process, including production management,
equipment monitoring, processing improvement, energy consumption, and
offer customers smart plant solutions for increased production capacity,
improved yield and reduced energy consumption.
~129~
C. Automated product representation operation
The product integrates cloud technology and Web framework, and also
provides a highly extendable firmware/software framework, which can be
applied in specific applications of energy saving and carbon reduction,
equipment status monitoring and so forth, with which to provide the client
end to rapidly introduction a solution proposal, making it a future
automated product development trend.
(2.6) Information communication, enterprise information and software services
At present, enterprises, when faced with future diverse and drastically
variable interactive environment, often need to confront the unknown by
grasping the known technology, to require utilizing the existing resources,
and further need to convert a variety of data into information, or even
utilize the cloud platform in analyzing large data in order to derive high
quality analyses and decision reference data, which can enhance an
enterprise to confront the rapid changing speed at decision making, as
coordinated with the cloud and mobile equipment interacting to conduct
the internal resources integration, by which to adjust the operating pace,
maintain the customers’ loyalty to the enterprise’s products for aggregating
the positive effect.
With mobile broadband innovative technology and applied services
development being a focal development orientation by governmental
department and in the computer information industry in 2015, the
integration of logistical networks, digital streamlining and cloud
technology can be used to develop innovative applications encompassing
the aspects of intelligent cities, smart homes and so forth. In light of
which, the group vies not only to continue culminating the
telecommunication operators’ system integration services, and when faced
with the rush of big data and software service, we will continue to devote
our efforts in “destructive innovative” by using the service orientation
build on the existing business mode as the software development backbone
to introduce an open-ended API management, with data science and
figurative analysis as the software services core framework by developing
an O2O (online-to-online) enterprise real-tie competitive biding platform,
which will utilize said open-ended framework and cloud service spirit,
offering even lower system launching and operating costs, offering the
enterprise owners with more flexible cloud enterprise services.
The group will broach it by integrating the logistical sensor equipment and
digital content management platform in conducting interior positioning,
guided purchasing and browsing on business application services
development, which can be applied in settings such as department stores,
showrooms, museums, malls and so forth; it is anticipate to utilize precise
business marketing scenario in a bid to create a win-win value cycle
between the owners and the consumers. It will also offer enterprise
information system integration management, consulting advisory and
solution proposal related services, and also to provide the contents closer
to market needs on digital content service, integrated information,
communications, and mobile applications, as well as cloud service
platform. While the MingStar serial products have accumulated the
group’s vital information assets, the company’s enterprise computerized
services offering enriching practical experience can also act as a critical
collaboration partners to various enterprise information strategies in an
~130~
attempt to echo to the market demands, and to create greater gains and
value.
(3) Total Facility Engineering Turnkey Project
(3.1) High tech/biotech and pharmaceutical plant facility planning, design, work
implementation and turnkey testing
With high-tech IC, FPD, LCD and related industries confronting a slowing
demand and the global economic slowdown tsunami, dragging down
peripheral industries to facing the issue of a slowdown in plant expansion,
these companies facing the conundrum in how best to utilize their
manpower with precise efficiency have turned to integrating professional
operators as a future trend.
With market competition becoming ever fierce, it not only put pressure on
professional operators offering the professional service, even the
customers themselves can no longer distance themselves from the
turbulent change. In terms of how best to effective control the investment
cost, fully grasp the plant launching and mass production engineering
project and securing high quality plant launching result which will enable
the customer to meet or exceed their expectations of product acceptance
ratios, and successfully putting forth the first step with competitiveness
once the clients complete the plant launching has become the market trend,
which the group has commanded the comprehensive service capabilities.
The group, with long term operation and focus, has culminated enterprise
units with varied disciplines, and is currently streamlining to the change in
market demand modes by speeding up the integration work among varied
units embracing towards a single service window, by which to offer the
customers with a brand-new package professional services, which will cut
down the working interface, reduce the pairing difficulties, and in turn
excelling the efficiency, and reducing the cost expenditure and plant
launching time.
The group’s ability to rapidly grasp the market pulses and respond as early
by actively venturing into the market and also strengthening its technical
sophistication and integrating working capability, together with actively
expanding into the biotech and pharmaceutical plant launching operations,
encompassing civil work, steel structure, interior furbishing, E&M, clean
room, gas, chemical, water systems, pharmaceutical special needs among
other plant logistical systems, secondary logistics with primary turnkey
professional track record has garnered the clients’ recognition and
confidence, preparing it to further expand the market operations in the
future.
(3.2) High-tech factory equipment/server integrated server installation project
(total turnkey hookup projects)
In response to high-tech plant launching’s rapid timing and the demand of
budget and cost control, project turnkey integration emerges as an optimal
solution proposal at present.
The group is renowned for commanding a most authoritative overall
planning, design capability and work implementation team in the industry.
It has rendered many major high-tech plant equipment/service integration
and hookup projects and general petrochemical projects. Despite there
are other operators joining the domain at present, the group however still
holds a respectable leading edge.
~131~
(3.3) Other industries
In response to plant expansions in the field of petrochemistry and
traditional industries, the Group has engaged in developments with past
experiences in the construction of technology plants. In addition to
high-tech plants, we have also been involved in plant expansions of
traditional industries and construction projects of public works. At present,
the Company has dealt with public works and plant expansions of
traditional industries, such as water purification, sewage treatment, water
reclaim and purification, pumping station construction and automation,
hoping to expand the business area by diversified operations.
(4)R&D and manufacturing of Customized equipment
As the processing equipment required of the local high-tech industry still
relying on foreign imports, and for the lack of major local producers
venturing into the industry, yet as the processing continues to evolve in
generations with rapid high-tech development, foreign original equipment
manufacturers will no doubt gradually release their older technology in
order to focus on bracing towards new generation technology development,
and the older processing equipment manufacturing or operational
maintenance/repair will gradually rely on local producers. Moreover, as
driven by low cost and large-scale equipment (specifically referring to the
TFT-LCD industry), it further drives foreign original equipment
manufacturers to seek collaboration partners in Taiwan.
The group, in care of the trend, has significantly increased its R&D
budgets in recent years, particularly focusing on customized equipment by
stepping up on its design, assembly and testing capability, fostering a few
projects currently in progression. The group anticipated to steadfastly
emerge in the market, in anticipation to entering the industry at a most
competitive stance, gearing to contribute its efforts to the processing
equipment industry that somewhat lags on the island.
As Mainland China’s demand for customized equipment needs is yet
another scenario, due to its lagging population bonus, as the rising labor
wage continues to marginalize the enterprises burdens, while its urban
development policy further resulting in frequent labor shortages, MIC is
poised to rise riding on its customized automated equipment design and
manufacturing capability, as supported by its mainland Chinese
subsidiaries supporting mainland’s twelfth five-year plan, to experience a
dynamic development in the civil industry, with many projects currently in
progression.
1.2.4Competitive status
(1)Sales and service of high-tech equipment and materials:
(1.1) Lasertec company’s color filter testing and repair system
With color filter’s primary rivals are V-tech, Takano, NTN and such
companies, to seize next generation large size market orders, all producers
are aggressively turning t lowering the cost and excelling the functions,
together with the governments’ localization strategy incentives, the servers’
manufacturing and production lines have been shifted completely to
Taiwan, and with the cost significantly reduced, it offers certain help in
securing the orders.
~132~
(1.2) MTC company’s optical mask coater equipment
With MTC’s optical mask light blocking coaters facing increasing rivals in
the market, MTC remains the primary supplier. On optical mask cleaners,
German Hamatech, Japanese Sigama are primary rivals, while MTC relies
on its fine processing experience and innovative design to gain a
competitive edge on optical mask cleaners.
(1.3) HiKE company’s batch type burner equipment
With the primary rival is Tokyo Dynamics, current TSMC N20 plant
expansion has the server count exceeding the rival’s, and on the next
generation processing server adaptation, the group has secured rather
respectable result collaborating with TSMC R&D department; also on
memory market, with Hua Ya and Mei Kuang further collaborating, it is
expected to gain further growth.
(1.4) Corning Tropel company’s testing server
It accounts for around an 80% market share in the precision processing
industry, around a 60% market share in the wafer industry, with primary
rival being FRT, but Corning Tropel continues to reign in technology.
(1.5) Bruker-JV company’s testing server
It accounts for over 40% of the market share in Taiwan and Mainland
China, with around 100 servers installed, and when competing with
foreign suppliers, although varied in technology, it continues to command
ceratin competitiveness for the pricing advantage.
(1.6) Formosa company’s positive charged material
With fierce competitiveness on positive charged materials in Mainland
China, there are in excess of 15 lithium producers, all taking to the price
fight, while the group, as a non-sole representation, only occupies less than
10% of the market in Mainland China, and is positioned at a middle-lower
level.
(1.7) Cobot company’s microelectronic material
With the main competitor being Mainland China’s An Ji Microelectronics,
and with state project capital backing, CMP is poise to cause certain threat
to the microelectronics material Cobot supplies on the low-end domain.
(1.8) Dog-A company’s OLED aging equipment
It mainly pertains to supply Apple processing plants with original certified
equipment for Apple producers and processors, and currently Dong-A
caters to Apple processing plants with sale and after-sale service proejcts.
(2)Automatic Supplying system
(2.1) Gas automated supply system
With the gas automated supply systems being a rather matured industry in
Taiwan, thus the requisite competitive edge rests more than on a stable
quality, low cost remains a major concern.
The group has successfully developed with gas material vendors a
modualized panel to command a competitive edg in pricing and production
speed; in product development aspect, it is able to offer customized
product catering to the client’s needs; in onsite maintenance/repair aspect,
the reasoned software/firmware engineers are able to provide speedy,
real-time services.
(2.2) Chemical automated supply system
MIC created its own brand in 2000, and since then, the whole chemical
automated supply system has been copied to semiconductor industry and
optoelectronic industry. From 2005, MIC took advantage of this chemical
~133~
automated supply system to complete the establishment of several 300mm
fabs with systems engineering, ranked one of the top brands. The group
has its own brand so that the price is more competitive, and services
quality is improved. As a result, we have not only won high reputation
from our customers, but also accounted for high market share in
newly-established high-technology market.
(2.3) Special gas monitoring system
For a decrease of manpower and for professional consideration,
outsourcing some of the operations is an existing situation in Europe, the
U.S. and Japan. In Taiwan, currently only TCM (Total Chemical
Management) and TGM (Total Gas Management) & Total Water
Management (TWM) in facility system would do outsourcing to provide
equipment maintenance, replacement of chemical and gas supply materials,
monitoring and control system, etc. Main providers of technical services
are certainly the original equipment suppliers, but still no independent and
professional “technical services providers” exist.
The group has taken assignments of operations in facility system for more
than 20 years, and the works included total chemical management (TCM),
total gas management (TGM) and total water management (TWM), We
offer more comprehensive and all-encompassing services. As a
well-operated company, employee promotion, annual adjustment in
salary and good welfares are all ensured. Accordingly, our employees
show great loyalty and high efficiency in working, and are also
recommended by our customers word of mouth
(2.4) Factory automated operation
A. Special gas and facility management control system (GMS & FMCS)
A. This kind of service is heading towards comprehensive and
integrated service, main customers of which are IC and LCD plants in
Taiwan and China. They tend to seek for cooperation with stable and
all-encompassing companies, like Mitec, where skilled personnel and
technical support sufficient. In this way, system-integrated competitors
with relatively less capital, workforce and technique can hardly enter
the market, which makes the threshold higher, and by contrast, it is
more difficult to compete.
B. Computer-integrated manufacturing (CIM)
B. Taiwan's manufacturer must pay attention to the transparency of
production in the future, to immediately adjust the production with
product traceability, and respond to customer needs for additional
business value. "Lean production", which presents an approach that
integrates management with technology, is not likely to succeed on the
first try. Enterprises should identify thier key technologies based on
industrial characteristics when turning to Industry 4.0. The difference
between Industry 4.0 and traditional industries lies not only in the
degree of automation and informatization, but in the use of
cyber-physical system (CPS), big data and other technologies to achieve
smart factory. Therefore, the core technologies of Industry 4.0 are IoT
(for collection of all-round information), big data (for analysis and
forecasting), intelligent robot, and cyber-physical system, which will be
integrated by Marketech International Corp. in terms of its
computer-integrated manufacturing to make productions more
responsive.
~134~
C. Automated product representation operation
T The group provides customers with purpose-specific automated
products and customized services which feature fast-integrating
advantages and short establishment period. Meanwhile, every system
can be inter-compatible and integrated, breaking the traditional frame.
Hence, a huge flexibility and agility of expansion can be supplied to
customers to help them completely understand the whole picture of
developing information strategy planning. Unlike general automated
products with multi functions on the market, great performance and
results can be presented immediately under this operation, which makes
our products more competitive and valuable.
D. Prognostic and Health Management
This management system can reduce product defects and increase the
utilization of facilities, and it has become a trend. However, as the
strength of manufacturing industry in Taiwan, semiconductor and
optoelectronic industries have no sound solutions to improve defects
and utilization. As a result, based on the expertise in system integration
for more than twenty years, the Company cooperated with a domestic
professional corporation, Industrial Technology Research Center, to
establish Prognostic and Health Management using big data analysis.
The system was first developed by Taiwanese, providing a sound
solution from in-time monitoring of the status of equipment to
predicting breakdown and management of the remaining service life. In
the meantime, it can be perfectly integrated with parts retailers to
optimize products maintenance, so the products are highly competitive.
(2.5) Information communication, enterprise information and software services
Telecom companies have paid close attention to integration of
communication technology in recent years. The providers of associated
solutions have expanded from telecom suppliers, like Ericsson, NSN and
ALU to top information suppliers, such as HP, Oracle and IBM. Most of
these international companies can only provide deliverables of their own
products in Taiwan. Our group plays a role in cross-brand integrating,
offering localized and tailored products, and long-term maintenance, etc.
At present, large-scale companies providing relevant integrated services in
Taiwan are International Integrated Systems, Inc., Stark Technology Inc.,
SYSTEX, and so on.These suppliers have devoted themselves to the
telecom market, so they have respective scope of business and market
share. However, for the layout of new 4G telecom companies, some brand
new markets can still be developed. Enterprise Resource Planning (ERP)
and business exploration software are still our group’s focus.
(3)Total Facility Engineering Turnkey Project
Although there are many world-class companies for high technology
integration system business, their focuses are on design or engineering
construction monitoring for initial factory arrangement or clean room
engineering. However, high technology has become more and more mature,
and the cost of factory building is gradually lower so that the competition space
of these world class companies are oppressed automatically. Furthermore, the
complexity and the profession of integrated system business compel those
world class vendors to focus only on design, construction monitoring and
special high-level clean room items for high unit prices initial at the early
~135~
stage of factory arrangement. This allows the Group to fold an extreme
commercial opportunity and competitive advantages.
From equipment expansion integration supply systems of large IC and LCD
fabs to project planning, design, construction and test, a different competition
field is differentiated from the companies mentioned previously, which only
pays attention to design and construction monitoring of initial factory
arrangement. Additionally, for special factory building requirement of middle
and small factories or foreign customers, the barrier for foreign vendors to
enter such field is always difficult due to cost and localized services after sales
This situation allows the Group to become one of the few professional vendors
that can get across such a threshold in the industry.
To maintain competitive advantages and reduce cost, high technology
industries have shifted low-level products to China, which even makes market
competition expanded from Taiwan to China and Southeast Asia. Accordingly,
the Group has developed and deployed in such a large Chinese market with a
great result.
As the demand for expansion of electronic industry market has been polarized,
apart from satisfying the customers of electronic market currently, we are
engaged in development of biotechnology and pharmaceutical related business
in order to meet the needs of customers with various kinds.
(4)R&D and manufacturing of Customized equipment
The suppliers of TFT-LCD processing equipment currently are from overseas,
mainly from Japan, the U.S. and German. For instance, CVD equipment is
primarily supplied by American AMAT and Japanese TEL. Relevant
processing equipment is produced by OEM in Taiwan, such as AOI equipment,
CF repairing and inspection equipment and Laser repairing equipment. In
addition, for system of automated packaging of food, as the drinks market is
large, the demand for automated facilities is also high. The subsidiary of the
Group in China highlights customers’ needs, and is an expert in the integration
of automated facilities at the later stage of food production. It not only caters to
customers’ needs to design, produce, test and install on its own, but also
provides annual components overhaul and comprehensive services.
1.3 Technology and R&D status
1.3.1. The operating business’s technical level and R&D
The group, at its initial inception, primarily caters to TSMC, UMC and related
IC manufacturing companies, and through the close-knit cooperation with
globally renowned semiconductor and electronic materials plants, it has
introduced various high-tech products when Taiwan’s semiconductor industry is
at a budding stage, and as it has also utilize the opportunity of collaborating with
globally renowned producers to steadfastly introduce the technology to laid a
sound foundation on the group’s automated supply system and integrated system
professional know-how.
In the aspect of gas automated system and integration projects, the group
commands relevant professional design personnel in semiconductor, mechanical
automated control and chemical engineering and related domains, and also relies
on equipment distributor’s orientation training and pertinent technology
outsourced orientation training to absorb local and foreign peers’ technology,
and also work through the interactive exchange with key customers and local
vendors in fully discerning the producers and users’ needs, to develop on its own
the international SEMI certified highly clean special gas supply system
~136~
equipment, technology and know-how. In recent years, the group’s major
customers in semiconductor foundries include TSMC, China Semiconductors,
Singapore’s SSMC, Philips among other companies, and in optoelectronics
plants of Optronics, Shu Ming, Ding Yuan, Lian Ya among other plants.
In the aspect of chemical supply systems, it has in 1991 first built MXIC FABI,
with then technology originated from U.S. System Chemistry Inc. supplying the
servers, and the company charged with implementing the pipework project, and
also installing the testing equipment servers, and the U.S. original manufacturer
has assisted in completing relevant projects, which sets off a foundation of the
company’s chemical supply system engineering technology. Upon completing
MXIC FABI, it successively undertakes projects from HMC, TSMC FABII,
Winbond FAB II, Mosel FAB II, while System Chemistry Inc. has progressed
from initially assisting to complete the projects to only supplying the servers,
while the company has completed all system installation and tuning by itself.
With experience accumulated over time in plant launching, the company has
turned to designing and assembling the servers on its own, and has from 1994 to
2000 successively underwrote TSMC, UMC, Nanya and other major plants’
fabrication foundry small supply systems. With a wealth of experience
accumulated through instilling these small supply systems, and also through
absorbing local and foreign information and ongoing communication exchange
with the clients over time, it begins in 2001 to 2005 to underwrite large-scale
chemical supply system facility launching projects for Chan Mao Chimei, Rite
Tek, Lian Zhong, Fei Bao, China Picture Tube 4.5 generation and 6 generation
plants among other optoelectronics plants, and has also participated n MEMC
plant expansion facility turnkey design project, in 2008 to 2009 it successively
completes Ace More, Ba Yang, Da Shin, Wen Mao and Chun Chang
optoelectronics pants’ facility launching projects, and in 2010 to 2011, it has
participated in TSMC FAB 12, 14, 15 plants and Chu Hwa and other plants’
expansion facility turnkey projects. In 2012 to 2013, it underwrites Meade
Advance, Wen Mao, Ace More expansion turnkey design projects. From 2014
to 2015, it participates in Micro Technology, CNS plant launching and related
turnkey projects. IIn 2017, in participates in Wen Mao plants’ expansion facility
turnkey project, JNC turnkey project, and the first phase of water treatment plant
at STSP. In 2017, joined TSMC’s Chemical supply system in Nanjing
The group has, in recent years, actively delved into customized equipment R&D
and technical development, particularly focusing on stepping up customized
equipment design, assembly and testing capability, with currently developed
projects include the TFT LCD industry’s computer-integrated manufacturing
(CIM), 8G panel conveyor, dense packer (panel packer), and 8G checker
firmware/software, as well as solar energy battery cell module segment
equipment, image screening equipment and solar energy battery cell laser
graphic device and the like, and it has further strived to embrace the IT, biotech,
medicine, food and traditional brick-and-mortar industry’s logistical automation
design and manufacturing development; moreover, it further participates in the
Ministry of Economic Affairs led industry high tech project using the LED as the
light source on LCD backlight module cores.
Thanks to the groups’ efforts in automated supply system and integrated system
operations in more than two decades, it enables the group technical capability
and project executive capability to garner widespread customer recognition, and
when envisioning the local two trillion dual star industry development
technology, and with customized processing equipment market becoming ever
prevalent, the group vies to continue venturing into the customized equipment
~137~
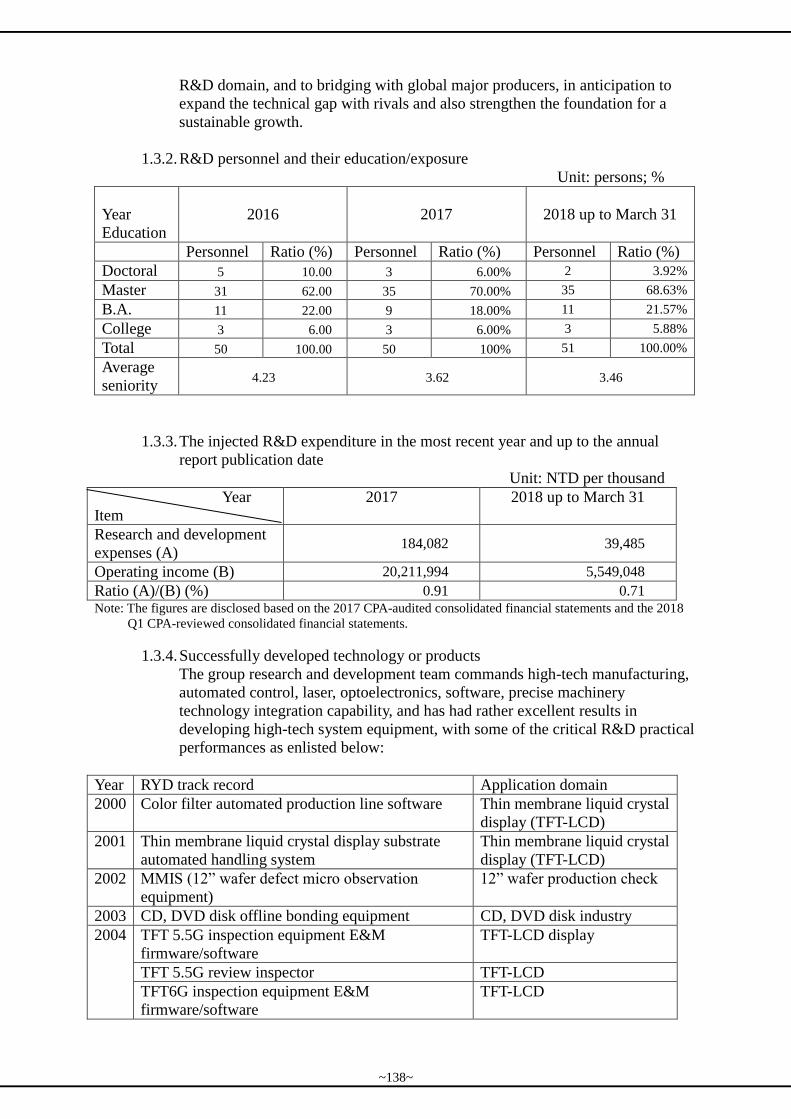
R&D domain, and to bridging with global major producers, in anticipation to
expand the technical gap with rivals and also strengthen the foundation for a
sustainable growth.
1.3.2. R&D personnel and their education/exposure
Unit: persons; %
Year
Education
2016 2017 2018 up to March 31
Personnel Ratio (%) Personnel Ratio (%) Personnel Ratio (%)
Doctoral 5 10.00 3 6.00% 2 3.92%
Master 31 62.00 35 70.00% 35 68.63%
B.A. 11 22.00 9 18.00% 11 21.57%
College 3 6.00 3 6.00% 3 5.88%
Total 50 100.00 50 100% 51 100.00%
Average
seniority 4.23 3.62 3.46
1.3.3. The injected R&D expenditure in the most recent year and up to the annual
report publication date
Unit: NTD per thousand
Year
Item
2017 2018 up to March 31
Research and development
expenses (A) 184,082 39,485
Operating income (B) 20,211,994 5,549,048
Ratio (A)/(B) (%) 0.91 0.71
Note: The figures are disclosed based on the 2017 CPA-audited consolidated financial statements and the 2018
Q1 CPA-reviewed consolidated financial statements.
1.3.4. Successfully developed technology or products
The group research and development team commands high-tech manufacturing,
automated control, laser, optoelectronics, software, precise machinery
technology integration capability, and has had rather excellent results in
developing high-tech system equipment, with some of the critical R&D practical
performances as enlisted below:
Year RYD track record Application domain
2000 Color filter automated production line software Thin membrane liquid crystal
display (TFT-LCD)
2001 Thin membrane liquid crystal display substrate
automated handling system
Thin membrane liquid crystal
display (TFT-LCD)
2002 MMIS (12” wafer defect micro observation
equipment)
12” wafer production check
2003 CD, DVD disk offline bonding equipment CD, DVD disk industry
2004 TFT 5.5G inspection equipment E&M
firmware/software
TFT-LCD display
TFT 5.5G review inspector TFT-LCD
TFT6G inspection equipment E&M
firmware/software
TFT-LCD
~138~
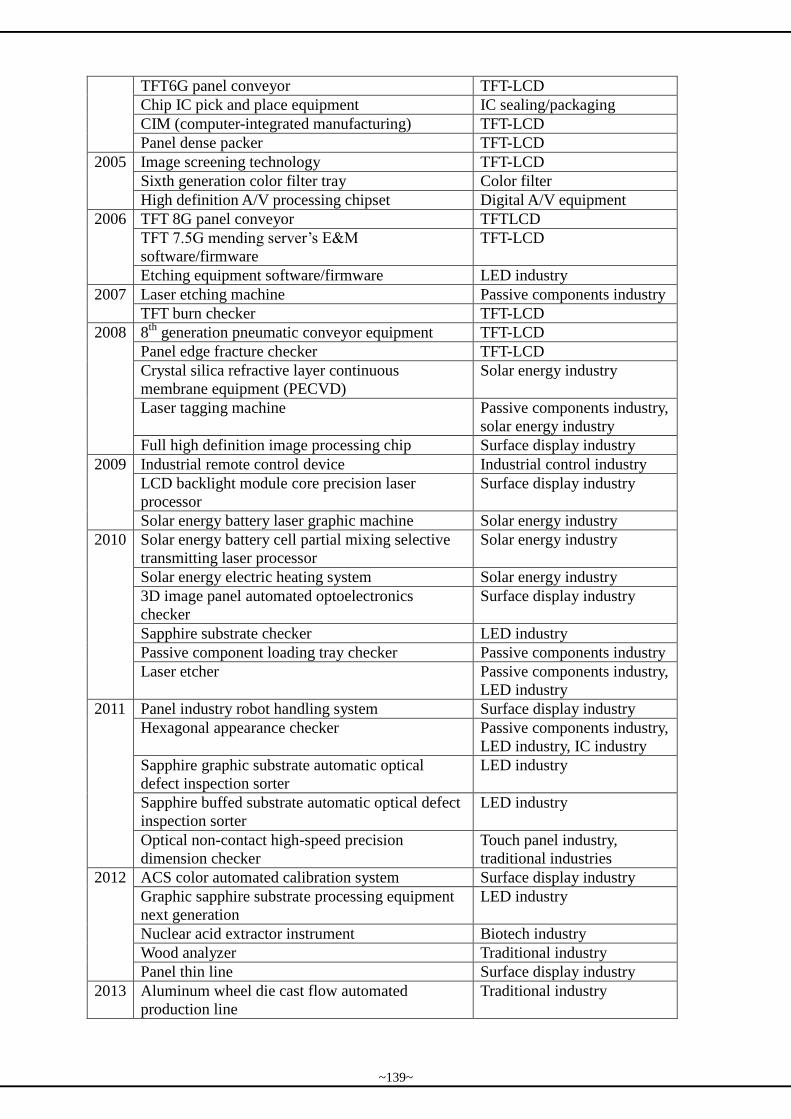
TFT6G panel conveyor TFT-LCD
Chip IC pick and place equipment IC sealing/packaging
CIM (computer-integrated manufacturing) TFT-LCD
Panel dense packer TFT-LCD
2005 Image screening technology TFT-LCD
Sixth generation color filter tray Color filter
High definition A/V processing chipset Digital A/V equipment
2006 TFT 8G panel conveyor TFTLCD
TFT 7.5G mending server’s E&M
software/firmware
TFT-LCD
Etching equipment software/firmware LED industry
2007 Laser etching machine Passive components industry
TFT burn checker TFT-LCD
2008 8th
generation pneumatic conveyor equipment TFT-LCD
Panel edge fracture checker TFT-LCD
Crystal silica refractive layer continuous
membrane equipment (PECVD)
Solar energy industry
Laser tagging machine Passive components industry,
solar energy industry
Full high definition image processing chip Surface display industry
2009 Industrial remote control device Industrial control industry
LCD backlight module core precision laser
processor
Surface display industry
Solar energy battery laser graphic machine Solar energy industry
2010 Solar energy battery cell partial mixing selective
transmitting laser processor
Solar energy industry
Solar energy electric heating system Solar energy industry
3D image panel automated optoelectronics
checker
Surface display industry
Sapphire substrate checker LED industry
Passive component loading tray checker Passive components industry
Laser etcher Passive components industry,
LED industry
2011 Panel industry robot handling system Surface display industry
Hexagonal appearance checker Passive components industry,
LED industry, IC industry
Sapphire graphic substrate automatic optical
defect inspection sorter
LED industry
Sapphire buffed substrate automatic optical defect
inspection sorter
LED industry
Optical non-contact high-speed precision
dimension checker
Touch panel industry,
traditional industries
2012 ACS color automated calibration system Surface display industry
Graphic sapphire substrate processing equipment
next generation
LED industry
Nuclear acid extractor instrument Biotech industry
Wood analyzer Traditional industry
Panel thin line Surface display industry
2013 Aluminum wheel die cast flow automated
production line
Traditional industry
~139~
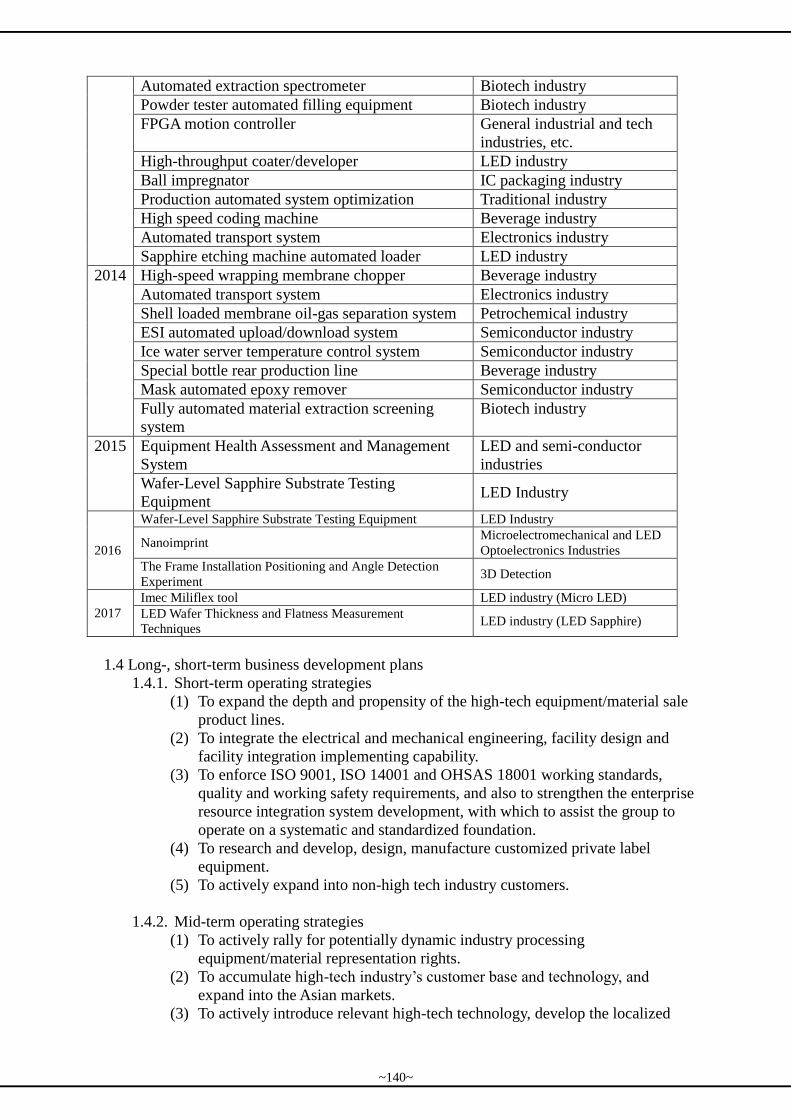
Automated extraction spectrometer Biotech industry
Powder tester automated filling equipment Biotech industry
FPGA motion controller General industrial and tech
industries, etc.
High-throughput coater/developer LED industry
Ball impregnator IC packaging industry
Production automated system optimization Traditional industry
High speed coding machine Beverage industry
Automated transport system Electronics industry
Sapphire etching machine automated loader LED industry
2014 High-speed wrapping membrane chopper Beverage industry
Automated transport system Electronics industry
Shell loaded membrane oil-gas separation system Petrochemical industry
ESI automated upload/download system Semiconductor industry
Ice water server temperature control system Semiconductor industry
Special bottle rear production line Beverage industry
Mask automated epoxy remover Semiconductor industry
Fully automated material extraction screening
system
Biotech industry
2015 Equipment Health Assessment and Management
System
LED and semi-conductor
industries
Wafer-Level Sapphire Substrate Testing
Equipment LED Industry
2016
Wafer-Level Sapphire Substrate Testing Equipment LED Industry
Nanoimprint Microelectromechanical and LED
Optoelectronics Industries The Frame Installation Positioning and Angle Detection
Experiment 3D Detection
2017
Imec Miliflex tool LED industry (Micro LED)
LED Wafer Thickness and Flatness Measurement
Techniques LED industry (LED Sapphire)
1.4 Long-, short-term business development plans
1.4.1. Short-term operating strategies
(1) To expand the depth and propensity of the high-tech equipment/material sale
product lines.
(2) To integrate the electrical and mechanical engineering, facility design and
facility integration implementing capability.
(3) To enforce ISO 9001, ISO 14001 and OHSAS 18001 working standards,
quality and working safety requirements, and also to strengthen the enterprise
resource integration system development, with which to assist the group to
operate on a systematic and standardized foundation.
(4) To research and develop, design, manufacture customized private label
equipment.
(5) To actively expand into non-high tech industry customers.
1.4.2. Mid-term operating strategies
(1) To actively rally for potentially dynamic industry processing
equipment/material representation rights.
(2) To accumulate high-tech industry’s customer base and technology, and
expand into the Asian markets.
(3) To actively introduce relevant high-tech technology, develop the localized
~140~
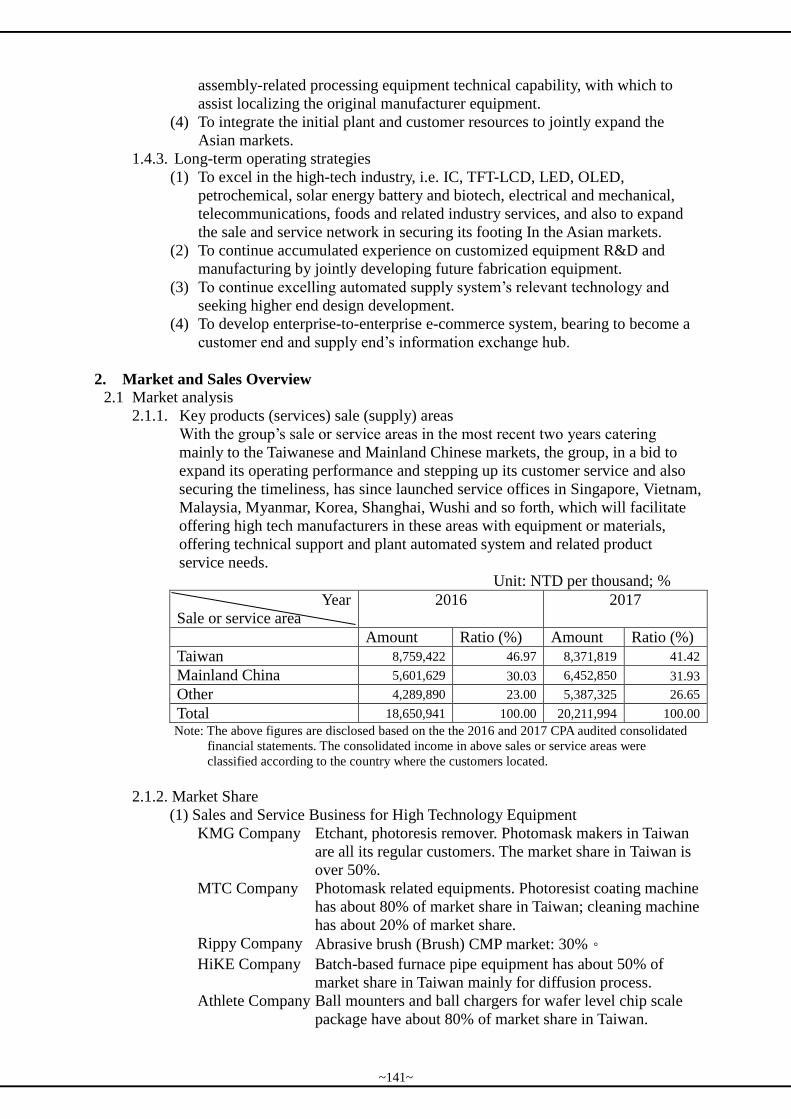
assembly-related processing equipment technical capability, with which to
assist localizing the original manufacturer equipment.
(4) To integrate the initial plant and customer resources to jointly expand the
Asian markets.
1.4.3. Long-term operating strategies
(1) To excel in the high-tech industry, i.e. IC, TFT-LCD, LED, OLED,
petrochemical, solar energy battery and biotech, electrical and mechanical,
telecommunications, foods and related industry services, and also to expand
the sale and service network in securing its footing In the Asian markets.
(2) To continue accumulated experience on customized equipment R&D and
manufacturing by jointly developing future fabrication equipment.
(3) To continue excelling automated supply system’s relevant technology and
seeking higher end design development.
(4) To develop enterprise-to-enterprise e-commerce system, bearing to become a
customer end and supply end’s information exchange hub.
2. Market and Sales Overview
2.1 Market analysis
2.1.1. Key products (services) sale (supply) areas
With the group’s sale or service areas in the most recent two years catering
mainly to the Taiwanese and Mainland Chinese markets, the group, in a bid to
expand its operating performance and stepping up its customer service and also
securing the timeliness, has since launched service offices in Singapore, Vietnam,
Malaysia, Myanmar, Korea, Shanghai, Wushi and so forth, which will facilitate
offering high tech manufacturers in these areas with equipment or materials,
offering technical support and plant automated system and related product
service needs.
Unit: NTD per thousand; %
Year
Sale or service area
2016 2017
Amount Ratio (%) Amount Ratio (%)
Taiwan 8,759,422 46.97 8,371,819 41.42
Mainland China 5,601,629 30.03 6,452,850 31.93
Other 4,289,890 23.00 5,387,325 26.65
Total 18,650,941 100.00 20,211,994 100.00
Note: The above figures are disclosed based on the the 2016 and 2017 CPA audited consolidated
financial statements. The consolidated income in above sales or service areas were
classified according to the country where the customers located.
2.1.2. Market Share
(1) Sales and Service Business for High Technology Equipment
KMG Company Etchant, photoresis remover. Photomask makers in Taiwan
are all its regular customers. The market share in Taiwan is
over 50%.
MTC Company Photomask related equipments. Photoresist coating machine
has about 80% of market share in Taiwan; cleaning machine
has about 20% of market share.
Rippy Company Abrasive brush (Brush) CMP market: 30%。
HiKE Company Batch-based furnace pipe equipment has about 50% of
market share in Taiwan mainly for diffusion process.
Athlete Company Ball mounters and ball chargers for wafer level chip scale
package have about 80% of market share in Taiwan.
~141~
Cabot Company CMP grinding liquid. Currently, the market share in China is
above 90% with an absolute advantage with respect to market
share in high-end field.
Corning Tropel
Company
Planeness gauge. The market share is about 80% in the
precision industry.
Bruker- JV
Company
High resolution diffractometer. The market share is above
40% and the installation quantity has been up to about 100
machines now in Taiwan.
Formosa
Company
Positive materials. The market share is below 10% in China.
(2) Automatic Supply System
(2.1)Gas Automatic Supply System
For gas supply equipment, the gas cabinet used by semiconductor fabs and
photoelectric plants are all designed, soldered, assembled, tested, installed
and guaranteed by the Company in our own plants. There is no difference
for valve manifold box (VMB). Since the building speed and quantity for
new plants are not as before, the competition for gas automatic supply
system is getting more and more intense. With respect to development
strategy, the Group still focuses on introducing certification of high standard
and specification requested by large companies, such as TSMC and UMC.
We also engage in development of LED plants, solar energy plants and
research units etc. in order to increase market share of equipments and profit
rate.
(2.2)Chemistry Automatic Supply System
For this system, Air-Liquid, Mitsubishi, Sumitomo, Kanto and the Group
keep as competitors with each other.
The Group has a 30% to 35% of market share for business. Currently, we
have our own brand both to enhance price competitiveness, and to maintain
and increase market share.
(2.3)Plant Automation Business
Facility monitoring control system (FMCS): The major suppliers in Taiwan
are the Company and the automation business department of MITAC. In
response to drastic price competition and drastically increased raw material
cost, in addition to original technical capability, the Group complies with the
trend of technological development by introducing wireless technology
solution to improve competitiveness and reduce cost.
(2.4) Information communication and software services
A.Information communication services
With logistics network emerging as one of the popular topics sought by
the communications industry in recent years, which is of one of the 5G
critical application realms, it extends the discussion on a host of
application scenarios and also triggers the development of the
upstream/downstream industries. With ever-evolving new equipment,
applications, and standards that are poised to elevate Taiwan as one of
the critical IT industry hubs, which the group naturally is actively
participating in it.
Based on what the Market Intelligence & Consulting Institute of
Institute for Information Industry has announced of the 2018 mobile
communications industry’s nine major development trends, in which it
mentions that the 3GPP would complete the 5G NR NSA (4G core
network + 5G access network) protocol in 2018, which is expected to
~142~
cut down the operators’ initial period’s enormous injection cost and risk,
and which also helps to bridge the 5G large-scale authentication and
commercial development to begin early in 2019. The relevant local
telecommunications operators, thanks to the NB-IoT service’s
successive commercial transformation, and how the NB-IoT is launched
on the existing network coverages, utilizing the mobile communications
technology for safeguarding the data transmission security, operating on
a simple communications module, is poised to significantly reduce the
logistics network’s equipment cost. Coupled with a low power
consumption characteristic, which brings a battery power supply lasting
for several years, and also with a further excelled signal amplification
than the existing 4G network, which can not only covers the entire
Taiwan and can also penetrate into basements, remote areas and in
conduits, and which can also support more equipment accessing
simultaneously, presenting various industries with infinite business
opportunities and a brand-new commerce mode, making a forward
breakthrough in connecting all things on the earth for a better future.
B.Business information service aspect
Besides continues to supply the group-required professional information
services, the group further ventures into enterprise commerce
exploration, enterprise resource systems, enterprise information
infrastructure development, and related professional services.
(2.5) The equipment health/ fail pre-diagnosis and management system
The company has instilled the first-ever locally researched and developed
critical equipment’s health/ fail pre-diagnosis and management system
catering to the semiconductor and optoelectronics industries. It is at
present aggressively intercepting into the light-emitting diode (LED)
industry’s equipment and dry vacuum pump applications. The company
vies to continue venturing into the high-tech industry’s deposition, photo
lithography, etching equipment or precision equipment, and related
domains.
(3) Total Facility Engineering Turnkey Project
(3.1)Plant plan, design, construction and test (turn-key) for high
technology/biotechnology and pharmaceutical plants.
Due to drastic demand change in high technology IC, FPD and LED etc.
industries, a company desires to reduce and employ labor effectively, so
that the assistance from a professional vendor with integration capability
has become a trend.
Since the competition is getting more and more intense, not only
professional vendors providing professional services are facing pressure,
but also customers themselves should engage in solutions. It is already a
trend to control investment cost effectively, and handle engineering
schedules of plant building and mass production sufficiently together with
high quality plant building result for the yield of products of customers to
meet or exceed expectation, and for customers to initiate competitiveness
smoothly after plants are built. The group has already had such
comprehensive service capability.
Because of operation and concentration for long time, the Group has
developed business units with different professional technologies, which,
currently, comply with market demand type change, accelerate integration
of different professional units, target to single service window, provide
~143~
customers with complete and new professional services, reduce work
interfaces, reduce engagement difficulty, and correspondingly, improve
efficiency, reduce cost expense and time to build plants.
Due fast handling of market trend and early response, the Group has
invested in the market actively and enhanced technology level together
with integrated construction capability, and has developed biotechnology
and pharmaceutical plant building business actively, including construction,
steel structure, internal installation, electro mechanics, clean room, gas,
chemistry, water systems, special pharmaceutical requirement plant
systems, secondary distribution etc. These turn-key professional
performance wins admission and trust from customers. In the future, the
market business will be further expanded.
(3.2) Total Turn Key Hook-up Project for High Technology Plant Equipment
Machines
In response to fast high technology plant building and requirement of
budget cost control, turn-key integration is the best solution now.
The Group has the publicly certified entire plan, design capability and
construction teams in the industry. A lot of integral linking projects have
been executed for a variety of large technical plant equipment machines.
Although other vendors join this field now, the Group still keeps a leading
advantage.
(3.3)Other Industries
In response to plant expansions in the field of petrochemistry and
traditional industries, the Group has engaged in developments with past
experiences in the construction of technology plants. In addition to
high-tech plants, we have also been involved in plant expansions of
traditional industries and construction projects of public works. At present,
the Company has dealt with public works and plant expansions of
traditional industries, such as water purification, sewage treatment, water
reclaim and purification, pumping station construction and automation,
hoping to expand the business area by diversified operations.
(4) R&D and Manufacturing of Customized Equipment
Such high technology equipments are still dominated by foreign vendors in
Taiwan now. However, the Group has devoted to LED production equipments
and LCD automation equipments with related customization experiences and
performance, such as, manufacturing of Conveyor, LOADER/UN-LOADER,
Packer and AOI system for LCD industry, and plasma etching equipment, solar
energy battery module segment equipment and image detection equipment in
LED industry. Additionally, for process equipments in LED industry,
corresponding automation equipments, such as auto film advancing machine
and so forth have been developed with respect to fineness and labor reduction.
Our factories of subsidiaries in China also design what we design, make food
machines, and assist in large Japanese OEM companies to produce thermal
cycling system. We engage in equipment sales and installation, maintenance
and process R&D with vendors all over the world in order to sell such high
technology equipments to America, Japan and Korea etc.
In recent year, such technology has been promoted to traditional industries and
biotechnology industry to increase production benefits of non-high technology
industries by means of high technology equipment technology.
2.1.3. Future Supply and Demand in the Market and Growth Prospect
(1) Sales and Service Business for High Technology Equipment
~144~
(1.1)Equipment Business
The international research and consulting institute Gartner, global revenue
of semiconductor industry was 419.7 billion USD in 2017, and it grew
22.2% compared to 2016. The scarcity of memory had boosted revenue of
memory market by 64% growth, which shared 31% of the revenue of
semiconductor in 2017. Market Intelligence Center of Institute for
Information Industry stated, based on the global developing trend of
semiconductor industry in 2017, the demand of 3C end products became
steady, which will boost the price of memory; also with the growing
demand of automobile electronics and industrial semiconductor, the global
market scale of semiconductor will have a growth of 9.8% compared to
2016, and reach 372.1 billion USD. Looking forward to 2018, Gartner
predicted that the market of semiconductor will grow 4% again and reach
427.4 billion USD. Under the global growing trend of semiconductor,
Market Intelligence Center of Institute for Information Industry expected
the global market of semiconductor will have a small growth of 2.1% in
2018.
According to the annual McClean Report of 2018 from IC Insights, from
2017 to 2022, the sales of analog chips (including universal equipment and
special equipment) is expected to grow with 6.6% compound annual
growth rate, from 54.5 billion USD growing to 74.8 billion USD. IC
Insights predicted, the sales of integrated circuit will have about 8 %
growth in 2018, and the growth rate was about 22% in 2017. This
Company predicted that the sales of chips would reach 393.9 billion USD,
and reach 466.8 billion USD in 2022.
IC Insights’ research reported, due to the price of memories like DRAM
and NAND Flash in 2018 are growing much higher than expected, the
growth rate of semiconductor market in 2018 were changed from 8% to
15%; even if DRAM was deducted from semiconductor market, the
growth rate in 2018 would still be changed up to 10%. Besides, the growth
rate of market scale of DRAM was highly changed up to 37% and NAND
Flash up to 17%.
In terms of panel industry, DIGITIMES Research predicted that shipping
quantity of big-sized (9-inch and above) TFT-LCD panel would be 235
million pieces for Taiwanese companies (excluding Sharp) in 2018, which
declines 0.8%; the main reason of the declining is the mass production of
panels from the new production lines in China, which will bring down the
shares of Taiwanese panel companies. The reduction and elimination of
PC panels of Korean Companies have already reflected on their shipping
quantity. Panel industry in Taiwan will lack of practical favorable factors
next year.
According to the prediction of DIGITIMES Research, the production
amount of high brightness LED will grow 4.8% and reach 13.81 billion
USD (approximately 408.4 billion NTD) in 2018, and the annual growth
rate will be between 2% and 5% in 2022.
From the demand and application of LED from 2017 to 2022, DIGITIMES
Research predicted that automobile applications and monitors are the ones
with potentials for high growth in the future, the compounded annual
growth rate will be 14%~15% and 9%~12% respectively.
(1.2)Material Business
Materials are sold for supporting production requirement of factories of
customers all over the world. Therefore, the sales of various related
~145~
materials would increase in response to outputs of various industries. With
respect to supply, increase of customer satisfaction in technology, cost and
after sales service is focused to increase market share.
(2) Automation System Business
(2.1)Gas Automatic Supply System
MIC Group not only ensures continus orders from existing customers, but
also actively develops new customers and orders. Despite the intense
competition, the Company will be able to earn a place in the gas dispense
system market owing to years of solid foundation, research and
development resources it continuously invests in, as well as innovative gas
dispense systems developed with customers with advanced technologies. (2.2)Chemistry Automatic Supply System
With respect to supply, all competitors are engaging in localized
production now in order to reduce cost and increase delivery speed.
(2.3)Running Service Business
Judging from the current industry situation, existing customers will
continue to designate the original manufacturers to supply equipment for
operations. Under the pressure of cost reduction, outsourcing is an
inevitable trend. If the professional ability of an outsourced company is
recognized by customers and "suppliers", the professional operation
business volume will greatly increase in response to market demands.
(2.4)Plant Automation Business
A. Facility Monitoring Control System (FMCS)
This system is an important investment that introduces facility
monitoring for whole plant into factory building in high technology
industry. In addition to high technology, other industries will also
increase the demands for such automatic plant monitoring facility due
to advanced technique. However, expansion of potential market demand
results in the trend of increased participant companies.
B. Automatic Special Gas Monitoring System (GMS)
GMS, like the central brain, is a design necessary for safety measure in
building factories for high technology industry. Additionally, because
life and security of people are involved, the threshold for new
competitors is very high. The Group can still be one of the leaders in
this field as long as the technological function keeps improved. This
should be an apparent fact. Such monitoring system market has
increased due to production expansion of original IC, LCD and LED
industries. Other peripheral related industries also have to introduce use
of such system because of production related equipments or materials
with respect to security and monitoring requirements.
C. Manufacturing Integration Business (CIM, Computer-Integrated
Manufacturing)
With the advent of Industry 4.0, all industries are turning to automation,
digitization and smart plant. MIC helps enterprises with Customer
Relationship Management (CRM) and Supply Chain Management
(SCM) systems, and establish a horizontal integration system. We also
integrate Enterprise Resource Planning (ERP), Computer-Integrated
Manufacturing (CIM) and Manufacturing Execution System (MES), to
strengthen the vertical integration system. Through horizontal, vertical
and related systematic integration, we achieve massive custom, efficient
production, independent decision-making and fault prediction targets to
meet customer needs.
~146~
D. Information & Communication and Software Services
Products combined cloud technology and Web structure, together with
high extensibility of software and hardware structures, are applied to
energy saving and carbon reduction, equipment status monitoring
special applications to provide clients with quick introduction solutions.
E. Prognostic and Health Management
Especially for semiconductor and optoelectronic industries, how to
reduce product defects and increase the utilization of facilities has been
the most significant issue in every manufacturing industry. The
Company developed the first Taiwanese-built prognostic and health
management system focusing on important instruments in
semiconductor and optoelectronic industries. As technology has
advanced, the demand for monitoring remotely the health state of
equipment and predicting breakdown will also increase in other
industries, like precision machinery.
F. Business opportunity of IoT’s Application
According to the prediction of IDC, the disbursed amount of IoT will
increase 14.6% and reach 772.5 billion USD in 2018. IDC predicted that
the disbursed amount will be 674 billion USD in 2017, and the
disbursed amount will exceed 1 trillion USD in 2020 and 1.1 trillion
USD in 2021. The compounded annual growth rate between 2017 and
2021 is expected to be 14.4%.
Taiwanese market is expected to be influenced by ten major trends in
2018:
1. Global and Taiwan’s GDP will mostly be contributed from
“digitalization” in 2021
2. Formation of companies’ digital smart platforms promoted by digital
technology
3. Cloud at the Edge will accelerate companies’ adoption of cloud
technology, and the application environment of cloud service will
become diverse and complicated
4. Artificial intelligence will enter the end use
5. Information safety will be capable of “learning” and “prediction”
6. Digital transformation is speeding up and microservices will be the
major trend
7. Blockchain will dramatically grow
8. Gradual formation of open business mechanism
9. NB-IoT’s win in the LPWAN market
10. The advent of Gaming 3.0
(3) Integrated System Business
Although there are many world-class companies for high technology
integration system business, their focuses are on design or engineering
construction monitoring for initial factory arrangement or clean room
engineering. However, the technologies of high technology industries become
more and more mature such that cost of factory building is lower and lower, so
that the competition space of these world class companies are oppressed
automatically. Furthermore, the complexity and the profession of integrated
system business compel those world class vendors to focus only on design,
construction monitoring and special high-level clean room items for high unit
prices initial factory arrangement stage. This allows the Group to fold an
extreme commercial opportunity and competitive advantages.
From equipment expansion integration supply systems of large IC and LCD
~147~
fabs to project plan, design, construction and test, a different competition field
is differentiated from design and construction monitoring of initial factory
arrangement, to which the companies mentioned above pay attention to.
Additionally, for special factory building requirement of middle and small
factories or foreign customers, the barrier for foreign vendors to enter such
field is always difficult due to cost and local after sales service convenience, so
that the Group is one of the few professional vendors that can get across such a
threshold in the industry.
To maintain competitive advantages and reduce cost, high technology
industries have shifted low-level products to China, such that market
competition has expanded from Taiwan to China and Southeast Asia.
Accordingly, the Group has developed and deployed in such a large Chinese
market with a great result.
With saturating electronic industry market, factory expansion and building
have slowed down. We are engaged in development of biotechnology and
pharmaceutical related business in order to develop another blue sea market. In
addition, Southeast Asian business is being developed actively to distribute
market risk. Accordingly, business has been developed in Singapore, Vietnam,
Malaysia and Myanmar actively.
(4) Customized Equipment R&D and Manufacturing Business
In addition to market growth, use of localized equipment as possible is also a
trend in photoelectric industry. As such, not only cost can be reduced, but also
"efficient" and "monopoly" is possible in development of new products.
The large environment mentioned above is very advantageous to development
of customized equipment assemblage, maintenance and process R&D for the
Company. With several years of efforts, there have been several ongoing
projects running smoothly. In addition to continuous development of talents,
the Company employs experts to join operation team in order to occupy a
position when there is an opportunity.
2.1.4. Competition Niche
(1) Wide business range capable of reducing single industry business cycle risk
effectively.
(2) High technological level facilitating to win whole plan turn-key engineering
business because there are few vendors with both automatic supply system
and process equipment linking integration capabilities in our nation.
(3) Providing customers with diversified services, based on which deepness and
breadth of products can be further expanded from process equipment, material
agent, automatic supply system and integration system to localized
assemblage, manufacturing design (OEM, ODM), installation, maintenance
service.
(4) Business sites are located in Taiwan, China, Singapore, Malaysia, Vietnam,
Myanmar, Korea, Japan and United States for providing customers with local
services and handling local market.
(5) We have robust operation team and rich experiences, and excellent
professional staffs, and integrate transversely related technologies of various
business divisions, go into different industries deeply, and deploy related
business in Asia.
~148~
2.1.5. Advantageous and Disadvantageous Factors of Development Vision and
Response Strategy
(1) Advantageous Factors
(1.1)The business of the Company covers, for example, IC, TFT- LCD, LED, IC
packaging, OLED, petrochemical, lithium iron battery, solar cell, electro
mechanics, telecom, food industries, which are still the industries with
large growth for the coming 10 years in Taiwan, China and Southeast Asian
region. The coming growth trend is a definite fact although there is still
business cycle.
(1.2)As for high technology equipment material sales and service business, the
Group and various suppliers have keep long term cooperative partnership.
In addition to business transaction, we also obtain long term common
interest with each other through cooperative production plan actively.
(1.3) The high industry has grown quickly in Taiwan such that talents in
building factories are insufficient for all companies. In the future, the
professional vendor with "integrated system" capability will be
advantageous of attracting talents. For 28 years, the Company has
introduced foreign technologies and developed integration in depth as the
only one choice in our nation now. Moreover, the companies with such
capabilities in Europe and America are very rare. Furthermore, under
"localization" requirement in our nation, the development of the Company
is far superior to other European and American companies.
(1.4)In order to reduce production cost and excessively large equipment (e.g.,
process equipment beyond 8.5G TFT-LCD) factors, the opportunity that
foreign vendors search for OEM cooperation has increased. Currently, the
customized equipment manufacturing business of the Group has been
developed for many years, and cooperation projects with multiple original
vendors are ongoing. The development with respect to capability of such
technology facilitates to R&D of future equipments of high technology
industry and accelerates improvement of both manufacturing quality and
quantity for introducing foreign process equipments into Taiwan.
(1.5)The Company has been approved with ISO 9001 international quality
certification and ISO 14001, OHSAS 18001 certifications to provide
customers better service quality.
(2) Disadvantageous Factors and Countermeasure
(2.1)The growth of high technology industry grows excessively fast and
graduate talents are insufficient. Moreover, excellent professional talents of
the Group are susceptible to be poached by other companies and
customers.
Countermeasure:
Provide internal trainings for talents actively in order to improve
comprehensively product design and technical abilities, and realize
professional experiences and R&D results with effective accumulation,
together with offering bonus, share allotment and stock option certification
programs for employees in order for employees to be more stable and in
order to hire good talents.
(2.2)After participation in WTO (World Trade Organization), foreign operation
sites have entered our nation such that market competition is more and
more intense. Therefore, partial products may suffer from reduction of
price and product gross margin due to competition with companies in the
same industry and mature market.
~149~
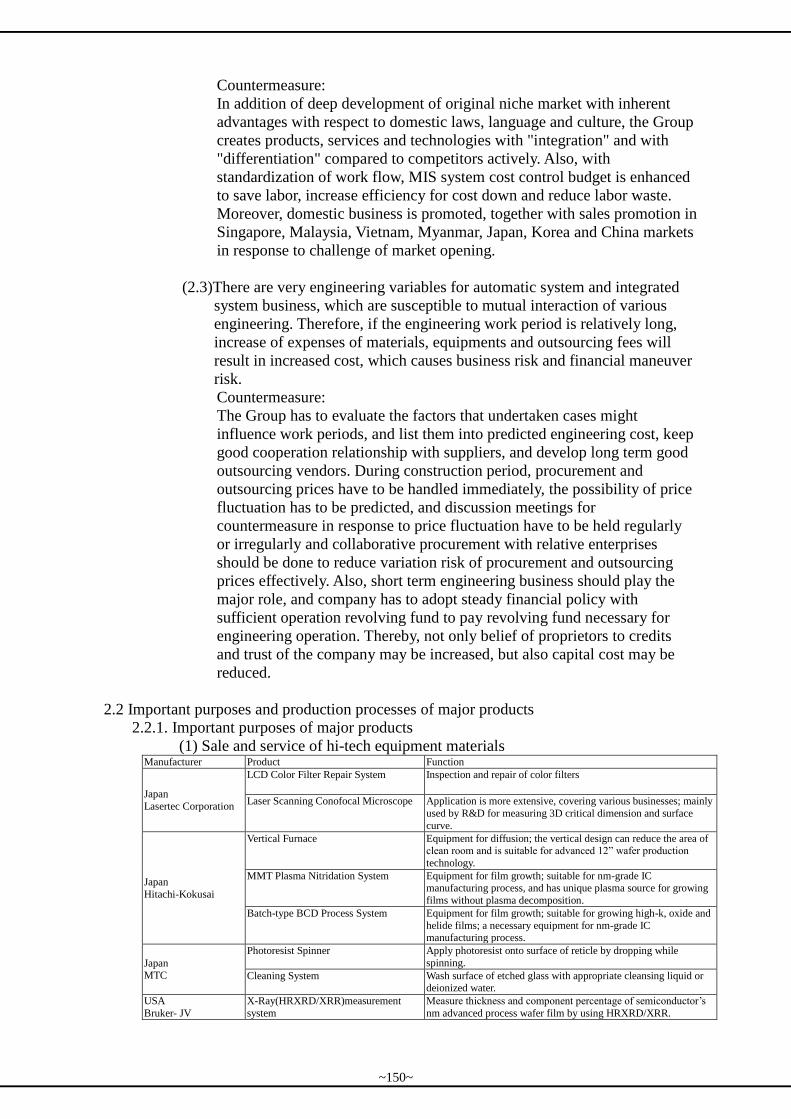
Countermeasure:
In addition of deep development of original niche market with inherent
advantages with respect to domestic laws, language and culture, the Group
creates products, services and technologies with "integration" and with
"differentiation" compared to competitors actively. Also, with
standardization of work flow, MIS system cost control budget is enhanced
to save labor, increase efficiency for cost down and reduce labor waste.
Moreover, domestic business is promoted, together with sales promotion in
Singapore, Malaysia, Vietnam, Myanmar, Japan, Korea and China markets
in response to challenge of market opening.
(2.3)There are very engineering variables for automatic system and integrated
system business, which are susceptible to mutual interaction of various
engineering. Therefore, if the engineering work period is relatively long,
increase of expenses of materials, equipments and outsourcing fees will
result in increased cost, which causes business risk and financial maneuver
risk.
Countermeasure:
The Group has to evaluate the factors that undertaken cases might
influence work periods, and list them into predicted engineering cost, keep
good cooperation relationship with suppliers, and develop long term good
outsourcing vendors. During construction period, procurement and
outsourcing prices have to be handled immediately, the possibility of price
fluctuation has to be predicted, and discussion meetings for
countermeasure in response to price fluctuation have to be held regularly
or irregularly and collaborative procurement with relative enterprises
should be done to reduce variation risk of procurement and outsourcing
prices effectively. Also, short term engineering business should play the
major role, and company has to adopt steady financial policy with
sufficient operation revolving fund to pay revolving fund necessary for
engineering operation. Thereby, not only belief of proprietors to credits
and trust of the company may be increased, but also capital cost may be
reduced.
2.2 Important purposes and production processes of major products
2.2.1. Important purposes of major products
(1) Sale and service of hi-tech equipment materials Manufacturer Product Function
Japan
Lasertec Corporation
LCD Color Filter Repair System Inspection and repair of color filters
Laser Scanning Conofocal Microscope Application is more extensive, covering various businesses; mainly
used by R&D for measuring 3D critical dimension and surface
curve.
Japan
Hitachi-Kokusai
Vertical Furnace Equipment for diffusion; the vertical design can reduce the area of clean room and is suitable for advanced 12” wafer production
technology.
MMT Plasma Nitridation System Equipment for film growth; suitable for nm-grade IC manufacturing process, and has unique plasma source for growing
films without plasma decomposition.
Batch-type BCD Process System Equipment for film growth; suitable for growing high-k, oxide and
helide films; a necessary equipment for nm-grade IC manufacturing process.
Japan MTC
Photoresist Spinner Apply photoresist onto surface of reticle by dropping while
spinning.
Cleaning System Wash surface of etched glass with appropriate cleansing liquid or deionized water.
USA
Bruker- JV
X-Ray(HRXRD/XRR)measurement
system
Measure thickness and component percentage of semiconductor’s
nm advanced process wafer film by using HRXRD/XRR.
~150~
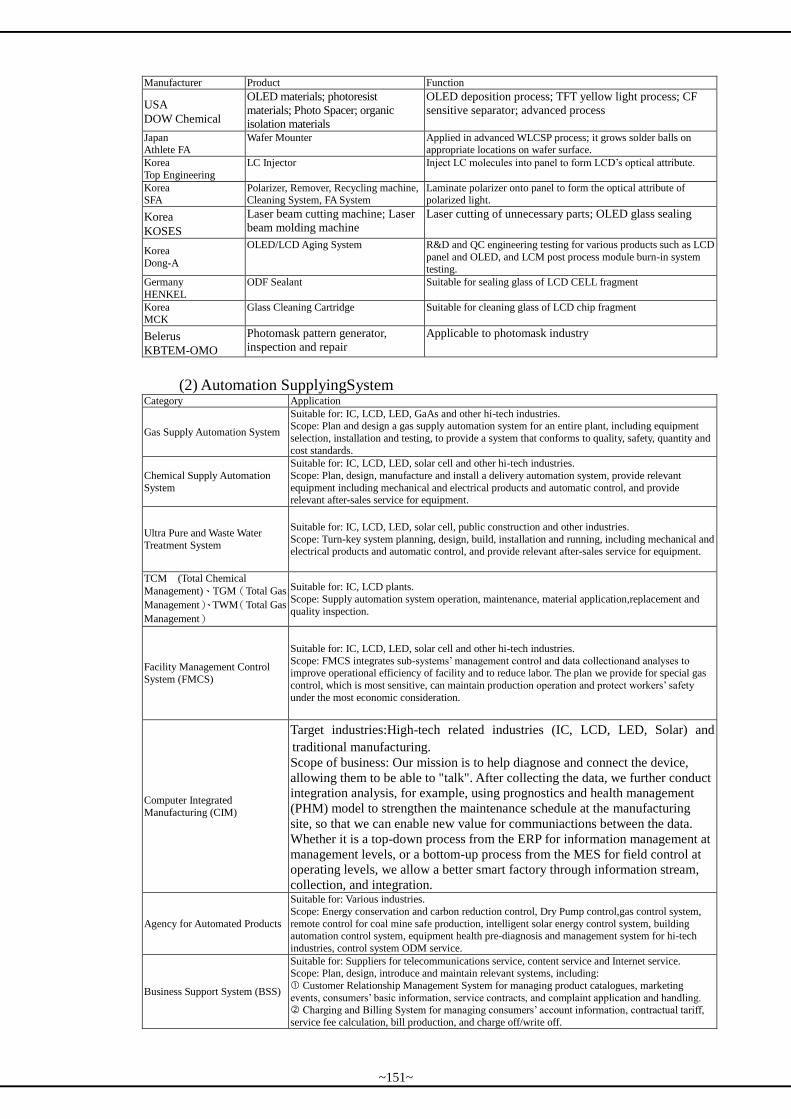
Manufacturer Product Function
USA
DOW Chemical
OLED materials; photoresist
materials; Photo Spacer; organic
isolation materials
OLED deposition process; TFT yellow light process; CF
sensitive separator; advanced process
Japan Athlete FA
Wafer Mounter Applied in advanced WLCSP process; it grows solder balls on appropriate locations on wafer surface.
Korea
Top Engineering
LC Injector Inject LC molecules into panel to form LCD’s optical attribute.
Korea SFA
Polarizer, Remover, Recycling machine, Cleaning System, FA System
Laminate polarizer onto panel to form the optical attribute of polarized light.
Korea
KOSES
Laser beam cutting machine; Laser
beam molding machine
Laser cutting of unnecessary parts; OLED glass sealing
Korea
Dong-A
OLED/LCD Aging System R&D and QC engineering testing for various products such as LCD
panel and OLED, and LCM post process module burn-in system testing.
Germany
HENKEL
ODF Sealant Suitable for sealing glass of LCD CELL fragment
Korea MCK
Glass Cleaning Cartridge Suitable for cleaning glass of LCD chip fragment
Belerus
KBTEM-OMO
Photomask pattern generator,
inspection and repair
Applicable to photomask industry
(2) Automation SupplyingSystem Category Application
Gas Supply Automation System
Suitable for: IC, LCD, LED, GaAs and other hi-tech industries. Scope: Plan and design a gas supply automation system for an entire plant, including equipment
selection, installation and testing, to provide a system that conforms to quality, safety, quantity and
cost standards.
Chemical Supply Automation
System
Suitable for: IC, LCD, LED, solar cell and other hi-tech industries.
Scope: Plan, design, manufacture and install a delivery automation system, provide relevant
equipment including mechanical and electrical products and automatic control, and provide relevant after-sales service for equipment.
Ultra Pure and Waste Water
Treatment System
Suitable for: IC, LCD, LED, solar cell, public construction and other industries.
Scope: Turn-key system planning, design, build, installation and running, including mechanical and electrical products and automatic control, and provide relevant after-sales service for equipment.
TCM (Total Chemical
Management)、TGM(Total Gas
Management)、TWM(Total Gas
Management)
Suitable for: IC, LCD plants.
Scope: Supply automation system operation, maintenance, material application,replacement and
quality inspection.
Facility Management Control
System (FMCS)
Suitable for: IC, LCD, LED, solar cell and other hi-tech industries.
Scope: FMCS integrates sub-systems’ management control and data collectionand analyses to improve operational efficiency of facility and to reduce labor. The plan we provide for special gas
control, which is most sensitive, can maintain production operation and protect workers’ safety
under the most economic consideration.
Computer Integrated
Manufacturing (CIM)
Target industries:High-tech related industries (IC, LCD, LED, Solar) and
traditional manufacturing.
Scope of business: Our mission is to help diagnose and connect the device,
allowing them to be able to "talk". After collecting the data, we further conduct
integration analysis, for example, using prognostics and health management
(PHM) model to strengthen the maintenance schedule at the manufacturing
site, so that we can enable new value for communiactions between the data.
Whether it is a top-down process from the ERP for information management at
management levels, or a bottom-up process from the MES for field control at
operating levels, we allow a better smart factory through information stream,
collection, and integration.
Agency for Automated Products
Suitable for: Various industries.
Scope: Energy conservation and carbon reduction control, Dry Pump control,gas control system,
remote control for coal mine safe production, intelligent solar energy control system, building automation control system, equipment health pre-diagnosis and management system for hi-tech
industries, control system ODM service.
Business Support System (BSS)
Suitable for: Suppliers for telecommunications service, content service and Internet service. Scope: Plan, design, introduce and maintain relevant systems, including:
Customer Relationship Management System for managing product catalogues, marketing
events, consumers’ basic information, service contracts, and complaint application and handling. Charging and Billing System for managing consumers’ account information, contractual tariff,
service fee calculation, bill production, and charge off/write off.
~151~
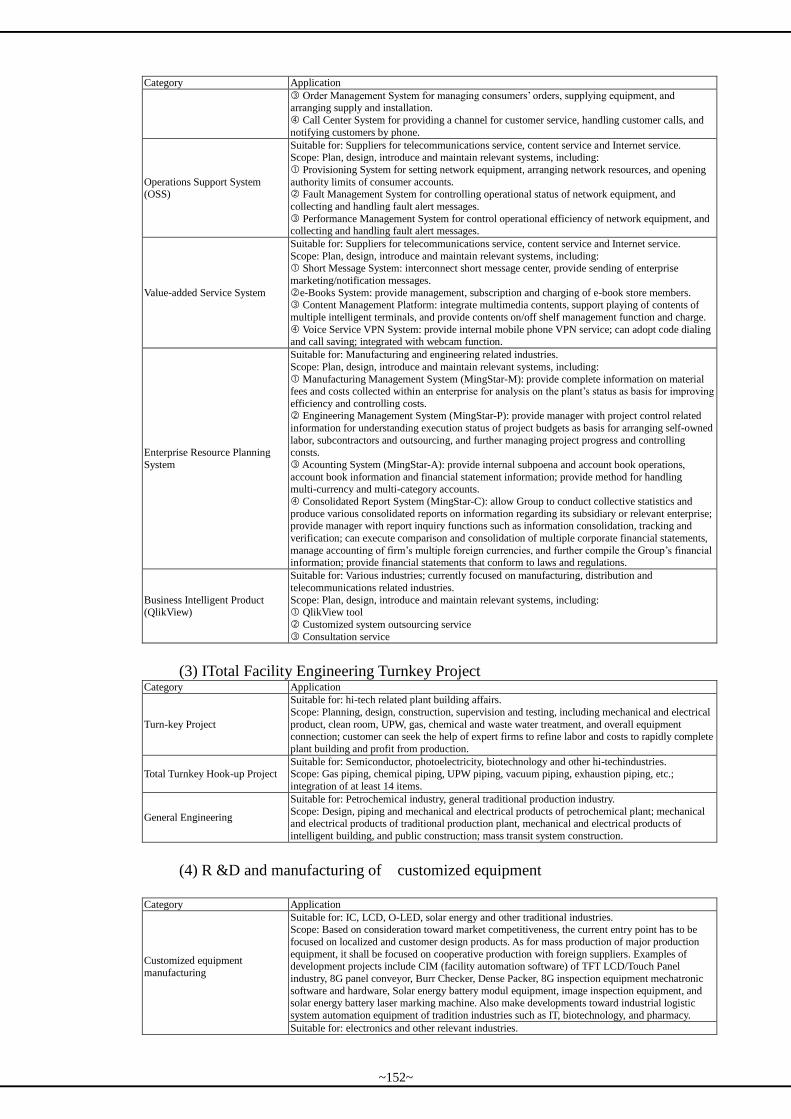
Category Application
Order Management System for managing consumers’ orders, supplying equipment, and arranging supply and installation.
Call Center System for providing a channel for customer service, handling customer calls, and
notifying customers by phone.
Operations Support System (OSS)
Suitable for: Suppliers for telecommunications service, content service and Internet service. Scope: Plan, design, introduce and maintain relevant systems, including:
Provisioning System for setting network equipment, arranging network resources, and opening
authority limits of consumer accounts. Fault Management System for controlling operational status of network equipment, and
collecting and handling fault alert messages.
Performance Management System for control operational efficiency of network equipment, and collecting and handling fault alert messages.
Value-added Service System
Suitable for: Suppliers for telecommunications service, content service and Internet service.
Scope: Plan, design, introduce and maintain relevant systems, including: Short Message System: interconnect short message center, provide sending of enterprise
marketing/notification messages.
e-Books System: provide management, subscription and charging of e-book store members. Content Management Platform: integrate multimedia contents, support playing of contents of
multiple intelligent terminals, and provide contents on/off shelf management function and charge.
Voice Service VPN System: provide internal mobile phone VPN service; can adopt code dialing and call saving; integrated with webcam function.
Enterprise Resource Planning
System
Suitable for: Manufacturing and engineering related industries.
Scope: Plan, design, introduce and maintain relevant systems, including:
Manufacturing Management System (MingStar-M): provide complete information on material fees and costs collected within an enterprise for analysis on the plant’s status as basis for improving
efficiency and controlling costs. Engineering Management System (MingStar-P): provide manager with project control related
information for understanding execution status of project budgets as basis for arranging self-owned
labor, subcontractors and outsourcing, and further managing project progress and controlling consts.
Acounting System (MingStar-A): provide internal subpoena and account book operations,
account book information and financial statement information; provide method for handling multi-currency and multi-category accounts.
Consolidated Report System (MingStar-C): allow Group to conduct collective statistics and
produce various consolidated reports on information regarding its subsidiary or relevant enterprise; provide manager with report inquiry functions such as information consolidation, tracking and
verification; can execute comparison and consolidation of multiple corporate financial statements,
manage accounting of firm’s multiple foreign currencies, and further compile the Group’s financial information; provide financial statements that conform to laws and regulations.
Business Intelligent Product (QlikView)
Suitable for: Various industries; currently focused on manufacturing, distribution and
telecommunications related industries.
Scope: Plan, design, introduce and maintain relevant systems, including: QlikView tool
Customized system outsourcing service
Consultation service
(3) ITotal Facility Engineering Turnkey Project Category Application
Turn-key Project
Suitable for: hi-tech related plant building affairs.
Scope: Planning, design, construction, supervision and testing, including mechanical and electrical
product, clean room, UPW, gas, chemical and waste water treatment, and overall equipment connection; customer can seek the help of expert firms to refine labor and costs to rapidly complete
plant building and profit from production.
Total Turnkey Hook-up Project Suitable for: Semiconductor, photoelectricity, biotechnology and other hi-techindustries. Scope: Gas piping, chemical piping, UPW piping, vacuum piping, exhaustion piping, etc.;
integration of at least 14 items.
General Engineering
Suitable for: Petrochemical industry, general traditional production industry.
Scope: Design, piping and mechanical and electrical products of petrochemical plant; mechanical and electrical products of traditional production plant, mechanical and electrical products of
intelligent building, and public construction; mass transit system construction.
(4) R &D and manufacturing of customized equipment
Category Application
Customized equipment
manufacturing
Suitable for: IC, LCD, O-LED, solar energy and other traditional industries. Scope: Based on consideration toward market competitiveness, the current entry point has to be
focused on localized and customer design products. As for mass production of major production
equipment, it shall be focused on cooperative production with foreign suppliers. Examples of development projects include CIM (facility automation software) of TFT LCD/Touch Panel
industry, 8G panel conveyor, Burr Checker, Dense Packer, 8G inspection equipment mechatronic
software and hardware, Solar energy battery modul equipment, image inspection equipment, and solar energy battery laser marking machine. Also make developments toward industrial logistic
system automation equipment of tradition industries such as IT, biotechnology, and pharmacy.
Suitable for: electronics and other relevant industries.
~152~
Category Application
Scope: 1. Automation integration system for filling and packing palletizer in beverage industry. 2. Automation integration system for filling and packing palletizer in food industry.
3. Assembly automation system in electronic industry.
2.2.2. Production process of major product
Our high-tech equipment material sales and service are not production businesses,
thus there is no manufacturing process. Our plant affairs and process system
planning and integration service, and production process of customized equipment
R&D and manufacturing are as follows:
(1) Workflow of Total Facility Engineering Turnkey Projectand Automatic
Supplying system
報價或投標
接獲訂單或簽訂合約
成立專案並指派專案主持人
施工管理
預算編製 專案進度擬定
計劃擬定 施工圖繪製
完工驗收
專案完工驗收
結案
保固服務
安全衛生管理 進度品質管理
(2) Production process of R&D and manufacturingcustomized equipment
2.3 Status of major material supply
For a hi-tech equipment sales and service business, the products we are authorized to sell
as an agent are from long-term cooperating firms, thus the supplying is quite stable.
Regarding plant affairs and process system planning and integration, stocked items are
mainly raw materials required for piping constructions, such as pipe sitting materials and
control valves. Because construction collaborations with owners are handled as projects,
suitable equipment and materials are assigned by customers according to contractual
requirements. Therefore, suppliers differ with the items purchased for each project and
their specifications. However, as the quality of important construction materials, such as
Quote or tender
Establish project and
assign project manager
Construction management
Completion and handover
Expert completion and handover
Case closed
Warranty
Expert progress drafting
Construction drawings
Progress and quality management
Budget planning
Plan establishment
Safety and health management
Accept order or sign contract
Demand and
development
System
structure
Design Review Contrac
t out
Purchase and
inspection Assemble Test run Delivery
~153~
pipe fitting, affects the stability and safety of an automation supply system, we adopt the
strategy of long-term cooperation with two to three outstanding pipe fitting suppliers. As
for customized equipment R&D and manufacturing, supply and quality of materials are
normal and steady without any supply shortage or interruption.
2.4 Name of customer with over ten percent of total purchase (sales) in one year for the
previous two years and its amount and ratio of purchase (sales), explain the reason for the
variation
2.4.1. Information of customer with over ten percent of total sales (service) in one year
for the previous two years: Unit: thousand NTD; %
2016 2017 As of March 31, 2018
Item Name Amount
Net ratio of
annual sales
(%)
Relationship
with issuer Name Amount
Net ratio of
annual sales
(%)
Relationship
with issuer Name Amount
Net ratio of
annual sales
(%)
Relationship
with issuer
1 Customer A 2,966,910 15.91 Non-related Customer A 2,823,781 13.97 Non-related Customer A 589,499 10.62 Non-related
2 Customer B 1,885,260 10.11 Non-related Customer B 2,102,001 10.40 Non-related Customer B - - Non-related
Other 13,798,771 73.98
Other 15,286,212 75.63
Other 4,959,549 89.38
Net sales 18,650,941 100.00
Net sales 20,211,994 100.00
Net sales 5,549,048 100.00
Note 1: The names of customers with over ten percent of total sales for the previous two years and their amount and ratio of
sales are listed, but if the contract forbids disclosure of customer names or whether the counterparties are individuals
and non-related parties, codes may be used. The above net sales refer to the net revenue from goods sold and service rendered.
Note 2: Listed company or company that has its stock listed and traded on the stock exchange shall have the information stated
up to the season of the printing of the annual report. Besides, it is also a must to note whether the financial information has or has not been certified and reviewed by accountant.
Note 3: The above information shall be revealed on the 2016 and 2017 consolidated financial statement certified by the
accountant and 2018 Q1 consolidated financial statement certified by the accountant.
Variation analysis:
We act as an agent for multiple critical materials and equipment required by
semiconductor and photoelectric businesses, and we collaborate with OEM in
developing related equipment modules. Our steady goods supply and elevated
added values, such as technical support, have won the trust of customers. As we
have years of technical and managerial experience as well as outstanding
construction performance, our expert system integration construction services for
automation gas and chemical supply system and plant affiars control system are
highly praised by our customers. As for related equipment module development
through collaboration with OEM, our steady goods supply and elevated added
values, such as technical support, have won the trust of customers. We have built
solid and close suplly value chain system with customers, thus in the recent two
years, the status of our sales and service targets are quite stable without any changes
or abnormality.
2.4.2. Information of major purchasing customer with over ten percent of total purchase
in one year for the previous two years
No purchase by firm or outsourcing has exceeded 10% of total purchase
(outsourcing) in one year for the previous two years.
2.5 Yield and output value for the recent two years Unit: thousand NTD
Major merchandise (dept.) / Yield & output
value / Year
2016 2017
Capacity Yield Output value Capacity Yield Output value
Sales and service ofhigh-tech equipment and
materials Note Note
4,264,156
Note Note
4,194,072
Automation supply system 3,553,783 3,952,008
Total Facility Engineering Turnkey Project 4,475,825 4,666,010
~154~
Major merchandise (dept.) / Yield & output value / Year
2016 2017
Capacity Yield Output value Capacity Yield Output value
R&Dand manufacturing of customized
equipment 4,109,520 5,098,567
Total 16,403,284 17,910,657
Note 1: We supply materials and equipment required by semiconductor and photoelectric businesses, and we provide
construction contracting service of automation supply system and total integration system. Application of these
materials and equipment extends to high-tech industries, such as semiconductor, photoelectrics and solar energy, thus there are numerous types of products and no uniform unit for quantity statistics. The plant construction projects
we contract are created based on owners’ requirements, thus the nature of each project is different and each project
has its own uniqueness. As the production and marketing output values cannot be calculated, the statistics are gathered according to product or service category.
Note 2: The above information is revealed in the CPA certified consolidated financial reports for 2016 and 2017.
Variation analysis:
Our group benefited from the continual economic upturn of the semiconductor,
optoelectronics, and other electronics industries in 2017 as well as the momentum
of the cross-strait expansion. Thus, our orders on demand from clients from all
different industries had risen, resulting in our consolidated revenue increase in 2017
compared to the previous year. Thus, our value of output had increased as well.
2.6 Sales volume for the recent two years Unit: thousand NTD
Major merchandise (dept.) / Sales volume / Year
2016 2017
Region Region
Taiwan China Other Taiwan China Other
Sales and service for hi-tech equipment and materials
2,728,294 2,307,626 103,324 2,914,350 2,019,396 117,791
Automation supply system 2,852,069 837,503 364,687 2,294,836 1,849,811 319,607
Total Facility Engineering Turnkey Project 2,452,198 2,035,404 43,207 2,648,646 1,799,931 267,508
R&D and manufacturing of customized
equipment 726,861 421,096 3,778,672 513,987 783,712 4,682,419
Total 8,759,422 5,601,629 4,289,890 8,371,819 6,452,850 5,387,325
Note 1: We supply materials and equipment required by semiconductor and photoelectric businesses, and we provide
construction contracting service of automation supply system and total integration system. Application of these
materials and equipment extends to high-tech industries, such as semiconductor, photoelectrics and solar energy, thus there are numerous types of products and no uniform unit for quantity statistics. The plant construction
projects we contract are created based on owners’ requirements, thus the nature of each project is different and each project has its own uniqueness. As the production and marketing output values cannot be calculated, the
statistics are gathered according to product or service category.
Note 2: The above information is revealed in the CPA certified consolidated financial reports for 2016 and 2017.
Variation analysis:
In the past two years, our group mainly focused on providing sales services to
Taiwan (Republic of China, R.O.C) and China. From the changes in our sales
figures, our analysis is that our group benefited from the continual economic upturn
of the semiconductor, optoelectronics, and other electronics industries in 2017 as
well as the momentum of the cross-strait expansion. Thus, our orders on demand
from clients from all different industries had risen, resulting in our consolidated
revenue increase in 2017 compared to the previous year. All in all, the changes in
the consolidated revenue of Marketech International Corporation according to sales
and regional categories are due to reasonable causes such as customer demand,
market demand and supply, the nature of engineering works, and continued
relationships in cooperation. There was no occurrence of significant unusual
situations.
~155~
3. Human Resources
The employee profile for the recent two years and as of the printing date of annual reports
is as follows: Unit: person(s); %
Item/Year 2016 2017 As of March 31, 2018
Number of
employees
Direct worker 727 727 829
Indirect worker 758 758 797
Total 1,485 1,485 1,626
Average age 35.22 37.59 36.81
Average years of service 6.68 7.68 7.16
Education
distribution
ratio (%)
Doctor 0.86 0.86 0.55
Master 12.23 12.23 11.69
University 42.23 42.23 41.33
Junior college 29.39 29.39 29.46
Other 15.29 15.29 17.84
4. Environmental Protection Expenditure
For the previous year and as of the printing date of annual reports, provide the total
amount of losses (including damages) and penalties due to environmental pollution, and
dexcribe future countermeasures (including improvement measures) and possible
expenses (including estimated amounts of losses, penalties and damages that may occur if
the countermeasures are not adopted; for those that cannot be reasonably estimated,
explain the reason): None.
The business we operate does not cause any pollution. When semiconductor process
consumable materials, such as chemical-mechanical polishing liquid, have to be
discarded due to uncontrolled temperature or humidity or expiration, or when raw
materials have to be discarded during production process, they are removed and
transported by expert waste treatment firms as regulated. All air, water, waste, toxin and
noise levels are qualified through inspection by local government authorities. Plant affairs
and process sytem planning and integration services refer to hi-tech industrial facility
design, planning, construction and installation. The construction process does not
generate pollutants such as waste water or waste gas. Regarding machine to be self
designed and assembled as required by customer, because the assemlying is carried out in
a clean room, thus it does not generate pollutants such as waste water or waste gas. In
addition, the wastes generated from production or assembly are divided and bagged by
categories in accordance with government regulations and owner norms before they are
handed over to qualified expert waste treatment firms. Furthermore, our products do not
involve regulations of EU Environmental Directive (RoHS), thus we are not affected by
RoHS. There is no environmental pollution involved in our business.
5. Labor Relations
5.1 List each employee benefit practice, continuing education, training, retirement system
and their implementation, as well as labor-capital agreements and each employee
rights maintenance measure
5.1.1. Employee benefit practices
To promote labor harmony, bring together unity amongst employees and take care of
employee benefits, we provided not only the social insurance regulated by local
governments but also employee’s group insurance and physical examination. We have
setup nursery rooms, reading spaces and dormitories in part of the office areas, as well
as provide shuttle buses, for our employees. Our Employee Benefit Committee or
personnel administrative unit is responsible for promoting employee benefit practices,
~156~
such as incentive tour, group seminar, outdoors activity and year-end party, and
providing assistance in communicating labor-capital opinions.
5.1.2. Employee continuing education
To cope with the industrial environment and technology development that are
changing rapidly, we provide employee funds every year for subsidizing employees’
learning to create employees with competitiveness and potential, allowing employees
to elaborate learning results, apply new knowledge and develop creations, and
acquiring rich profits.
5.1.3. Employee training
To enhance employee literacy and working skills, as well as strengthen work
efficiency and quality, we established the “Regulations for Guidance for New
Employees”, the “Regulations for Educational Training Expense Write-off and
Language Subsidy Management” and the “Procedure for Human Resource Control”;
guidance and educational training are imiplemented once new employees report to
work. Industrial safety training is held regularly to maintain work safety. We have
planned annual educational training programs for implementing general training and
expert training for employees of all levels and functions to train excellent professional
talents and further enhance operational performance as well as effectively develop and
use human resources.
5.1.4. Retirement system and its implementation
(1) Employees of the Company and its domestic subsidiaries who choose the old labor
pension system
Retirement includes voluntary retirement and compulsory retirement. An employee
who has served the Company for 25 years or is 55 years old and has worked for
over 15 years or is over 60 years old may apply for voluntary retirement. An
employee who is over 65 years old or is not qualified for the job due to state of
insanity or physically disabled must be compelled to retire. Pension payment and
calculation shall be handled in accordance with the regulations of the Labor
Standards Act.
(2) Employees of the Company and its domestic subsidiaries who choose the new
labor pension system
(2.1) For an employee who chooses the new system, 6% of his/her wage will be
allocated monthly to a personal account at the Bureau of Labor Insurance in
accordance with the labor pension. For voluntary allocation, the wage withheld
will be remitted to a personal account at the Bureau of Labor Insurance in
accordance with the voluntary allocation rate.
(2.2) Monthly retirement payment: according to the annuity table, the amount
calculated using bases of life expectancy and interests for an employee’s
personal pension account and accumulated gains is the retirement payment paid
regularly.
(2.3) Lump-sum retirement payment: collect the capital of the employee personal
pension account and accumulated gains all at once. The abovementioned
annuity table, life expectancy, interest and amount calculation shall be establied
by the Bureau of Labar Insurance and filed to the central competent authority
for approval.
(2.4) An employee who is over 60 years old and has worked for over 15 years may
apply for monthly retirement payment. But an employee who has not worked
for over 15 years shall apply for lump-sum retirement payment.
(3) In accordance with the Labor Act of the People’s Republic of China, a certain ratio
of the wage of an employee working at a subsidiary in China is allocated monthly
as endowment insurance funds. Part of the amount allocated will be designated as
social funds for management and usage by the government; the rest will be
~157~
remitted to the employee’s personal account to ensure his/her basic living
requirements in old age and provide stable and reliable living sources.
(4) Other subsidiaries conform to related regulations of the Labor Act established by
the local government, and allocate an amount of certain ratio for retirement
payment according to the wage cap to ensure his/her living rights in old age.
5.1.5. Labor-capital agreements and employee rights maintenance measures
We see labor and capital as one, and handle industrial relations in accordance with
the operational principles of co-existence and co-prosperity, thus we value the
opinions of employees. Employees may communicate living or work related
problems through our formal or informal channels. Through the opportunity for
two-way communication, the Company and employees can further understand and
recognize each other, gather common consensus and achieve together excellent
performance.
(1) Industrial coordination mechanism:
Establish unions or industrial meetings in accordance with regulations stipulated by
local governments for two-way communication between the Company and
employees regarding issues such as government orders, working environment and
safety and health, as well as for strengthening a mutual trusting relation between
each other.
(2) Beneficial activities:
We have an Employee Benefit Committee, of which members are warm-hearted
workers good at communication. They are designated by employees and elected
through public and fair election, thus they can provide complete insights on behalf
of employees toward the Company’s banefit measures during committee meetings
and achieve full communication and consensus. In addition, to advocate
recreational activities, we hold on irregular basis tours and sports competitions. We
also encourage employees to organize different clubs to enhance communication
through cross-departmental organizations and harmonized atmosphere.
(3) Physical examination:
To maintain employees’ health, we implement physical examination every year at
the Company’s cost. Special physical examination is implemented every year for
employees engaged in special operations.
(4) Group insurance:
In addition to the basic security of social insurance, we have planned group
insurance to provide injury and illness treatment for compensating insufficiencies in
the basic security of social insurance. Travel accident insurance is provided for
employees on business trip abroad, of which the premium is paid fully by the
Company.
5.2 For the recent year and as of the printing date of annual reports, list the losses incurred
by industrial conflicts, and disclose estimated amounts and responsive measures for
losses that may occur now or in the future; if a loss cannot be estimated reasonably,
state the reason
We have always valued employee benefits and our industrial relations are harmonious,
thus no industrial disputes were encountered. We will continue to follow our principles
in the future for industrial relations to be more stable and harmonized and achieve
mutual benefits.
~158~
6. Important Contracts
Listed below are significant agreements that are still effective as of the printing date of
annualreports and due in the recent year:
Nature Contracting party Commencement date and termination
date Mainn contents Restriction terms
Agency
agreement
KMG, USA
From 1992.03.27; automatically
extended annually if not terminated in
writing by either party forty-five days
in advance
Distribution rights
to chemicals such as
semiconductor
photoresist liquid
For use in Taiwan
Agency
agreement
Hitachi Kokusai,
Japan
From 2003.10.01; automatically
extended annually unless wishes to
terminate the agreement and proposes
termination thirty days in advance
Distribution rights
to furnace
For use in Taiwan, China
Agency
agreement
IHI Corporation,
Japan
From 2000.09.01; automatically
extended annually if not terminated in
writing by either party six months in
advance
Maintenance and
distributions rights
to main equipment
for panel production
process
For use in Taiwan, China
Agency
agreement
K C Tech Co., Ltd.,
Korea
From 2006.10.31; automatically
extended annually if not terminated in
writing by either party sixty days in
advance
Cleaning equipment
for LCD industrial
wet production
For use in Taiwan, China
Agency
agreement
Lasertec
Corporation, Japan
From 2004.06.30; automatically
extended annually if not terminated in
writing by either party three months
in advance
Maintenance and
distributions rights
to color filter tester
and laser
microscope
For use in Taiwan, China,
Hong Kong, Malaysia
Agency
agreement
Lapmaster SFT
Corporation, Japan
From 2001.05.08; automatically
extended annually if not terminated in
writing by either party sixty days in
advance
Distribution rights
to polishing and
measuring related
equipment for
semiconductor
production process
For use in China
Agency
agreement
TEX E. G . Co.,
Ltd. , Japan
From 2003.12.01; automatically
extended for two years every two
years if not terminated by either party
in writing two months in advance
Distribution rights
to robotic arm
For use in Taiwan (AIPC)
Agency
agreement
Rippey Corporation,
USA
From 2002.02.02; automatically
extended annually if not terminated in
writing by either party ninety days in
advance
Distribution rights
to polishing brush
for semiconductor
production process
For use in China
Agency
agreement
Symco Corp.
(Ryoka), Japan
From 2004.03.17; effective for two
years; automatically extended
annually if no termination notification
is proposed one month in advance
Distribution rights
to photo tester
For use in Taiwan, China
Agency
agreement
Top Engineering Co.,
Ltd., Korea
From Feb. 28 of 2006, the validity is
one year and if no written notification
for terminating the contract is sent to
the Party 60 days before the expiry
date, the contract will be renewed
automatically.
The proxy right for
ODF one-time
crystal injector
For use in Taiwan (AUO,
CMO, Innolux), China
Agency
agreement
Integrated Process
Systems, Ltd. , Korea
From 2008.10.15 to 2009.10.15;
effective for one year; automatically
extended annualy if no termination
notification is proposed by either
party sixty days in advance
Distribution rights
to dry etching
equipment
For use in Taiwan (CMO,
Toppoly, CPT&Hannstar),
China (SVA, Tianma,
IVO, BOE&IRICO)
Agency
agreement
Spiro Technology
Systems, Inc. , USA
From 2011.09.01 to 2012.08.31;
effective for one year; automatically
extended annualy if no termination
notification is proposed by either
party ninety days in advance
Distribution rights
to BizShaker Family
of products
None
Agency
agreement
QlikTech
International Markets
AB, Sweden
From 2014.09.01 to 2015.08.31;
effective for one year
Distribution rights
to Software Called
Qlikview
For use in Taiwan
Agency
agreement
Shinhan Diamond
Industrial Co., Ltd. ,
Korea
From 2014.04.07 to 2017.04.06;
effectiveforone year
Distribution rights
to diamond tools
For use in China
~159~
Nature Contracting party Commencement date and termination
date Mainn contents Restriction terms
Agency
agreement
Cabot
Miroelectronics
Corporation, USA
From 2015.03.31 to 2017.03.31;
effective for two years
Distribution rights
to microelectronic
materials
For use in China
Agency
agreement
Coring Tropel, USA From 2006.06.12; automatically
extendedupon expiration if there are
no objections
Distribution rights
to inspection
equipment
For use in Taiwan, China
Agency
agreement
Bruker-JV,USA From 2016.02.01; automatically
extendedupon expiration if there are
no objections
Sales, installation
and service of
inspection
equipment
For use in Taiwan, China
Agency
agreement
Revasum From 2015.03.01; automatically
extended annually if not terminated in
writing by either party ninty days in
advance
CMP、Grinder For use in China
Agency
agreement
Athlete FA
Corporation, Japan
From 2015.05.30; automatically
extended annually unless wishes to
terminate the agreement and proposes
termination thirty days in advance
Ball Mounter,Ball
Repair
For use in China
Agency
agreement
Holon Corporation,
Japan
From 2016.03.20; automatically
extended annually unless wishes to
terminate the agreement and proposes
termination ninty days in advance
SEM CD Z7 &
Z7-DX
For use in China
Agency
agreement
Belerus
KBTEM-OMO
From 2016.10.05; effective for two
years; automatically extended
annually if no termination notification
is proposed one month in advance
For use in Taiwan
~160~
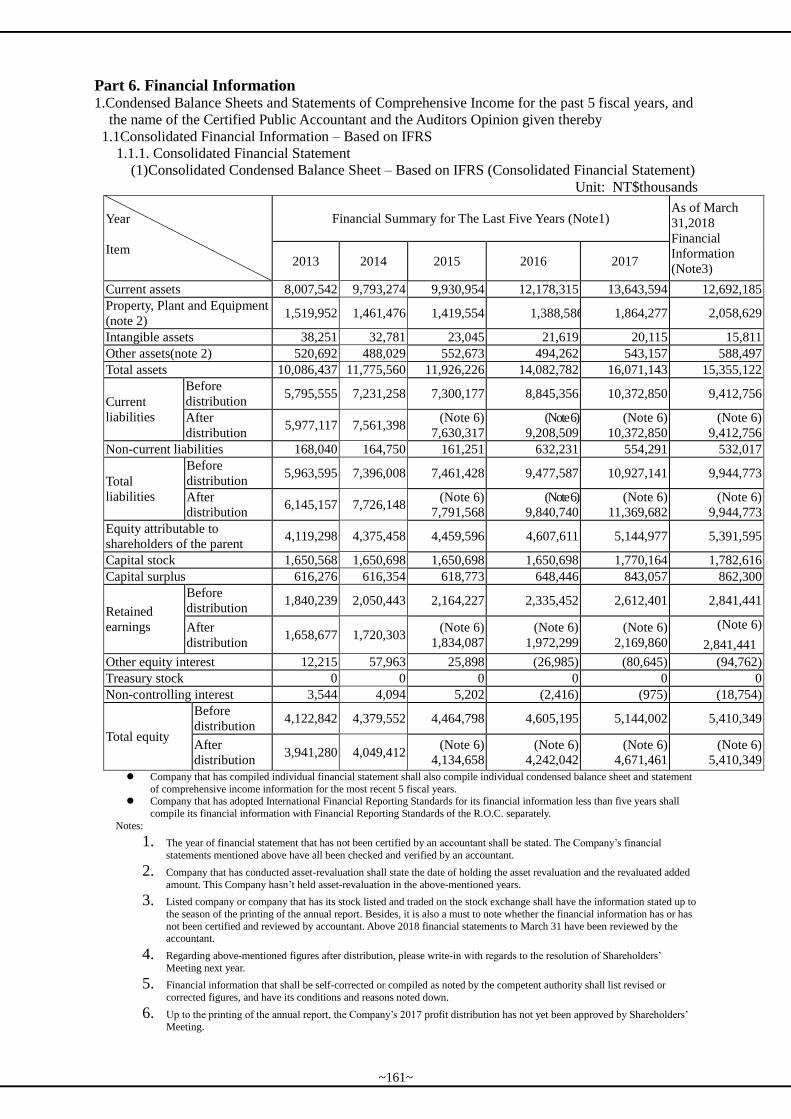
Part 6. Financial Information 1.Condensed Balance Sheets and Statements of Comprehensive Income for the past 5 fiscal years, and
the name of the Certified Public Accountant and the Auditors Opinion given thereby
1.1Consolidated Financial Information – Based on IFRS
1.1.1. Consolidated Financial Statement
(1)Consolidated Condensed Balance Sheet – Based on IFRS (Consolidated Financial Statement)
Unit: NT$thousands
Year
Item
Financial Summary for The Last Five Years (Note1) As of March
31,2018
Financial
Information
(Note3) 2013 2014 2015 2016 2017
Current assets 8,007,542 9,793,274 9,930,954 12,178,315 13,643,594 12,692,185
Property, Plant and Equipment
(note 2) 1,519,952 1,461,476 1,419,554 1,388,586 1,864,277 2,058,629
Intangible assets 38,251 32,781 23,045 21,619 20,115 15,811
Other assets(note 2) 520,692 488,029 552,673 494,262 543,157 588,497
Total assets 10,086,437 11,775,560 11,926,226 14,082,782 16,071,143 15,355,122
Current
liabilities
Before
distribution 5,795,555 7,231,258 7,300,177 8,845,356 10,372,850 9,412,756
After
distribution 5,977,117 7,561,398
(Note 6)
7,630,317
(Note 6)
9,208,509
(Note 6)
10,372,850
(Note 6)
9,412,756
Non-current liabilities 168,040 164,750 161,251 632,231 554,291 532,017
Total
liabilities
Before
distribution 5,963,595 7,396,008 7,461,428 9,477,587 10,927,141 9,944,773
After
distribution 6,145,157 7,726,148
(Note 6)
7,791,568
(Note 6)
9,840,740
(Note 6)
11,369,682
(Note 6)
9,944,773
Equity attributable to
shareholders of the parent 4,119,298 4,375,458 4,459,596 4,607,611 5,144,977 5,391,595
Capital stock 1,650,568 1,650,698 1,650,698 1,650,698 1,770,164 1,782,616
Capital surplus 616,276 616,354 618,773 648,446 843,057 862,300
Retained
earnings
Before
distribution 1,840,239 2,050,443 2,164,227 2,335,452 2,612,401 2,841,441
After
distribution 1,658,677 1,720,303
(Note 6)
1,834,087
(Note 6)
1,972,299
(Note 6)
2,169,860
(Note 6)
2,841,441
Other equity interest 12,215 57,963 25,898 (26,985) (80,645) (94,762)
Treasury stock 0 0 0 0 0 0
Non-controlling interest 3,544 4,094 5,202 (2,416) (975) (18,754)
Total equity
Before
distribution 4,122,842 4,379,552 4,464,798 4,605,195 5,144,002 5,410,349
After
distribution 3,941,280 4,049,412
(Note 6)
4,134,658
(Note 6)
4,242,042
(Note 6)
4,671,461
(Note 6)
5,410,349
Company that has compiled individual financial statement shall also compile individual condensed balance sheet and statement
of comprehensive income information for the most recent 5 fiscal years. Company that has adopted International Financial Reporting Standards for its financial information less than five years shall
compile its financial information with Financial Reporting Standards of the R.O.C. separately.
Notes:
1. The year of financial statement that has not been certified by an accountant shall be stated. The Company’s financial
statements mentioned above have all been checked and verified by an accountant.
2. Company that has conducted asset-revaluation shall state the date of holding the asset revaluation and the revaluated added
amount. This Company hasn’t held asset-revaluation in the above-mentioned years.
3. Listed company or company that has its stock listed and traded on the stock exchange shall have the information stated up to
the season of the printing of the annual report. Besides, it is also a must to note whether the financial information has or has
not been certified and reviewed by accountant. Above 2018 financial statements to March 31 have been reviewed by the accountant.
4. Regarding above-mentioned figures after distribution, please write-in with regards to the resolution of Shareholders’
Meeting next year.
5. Financial information that shall be self-corrected or compiled as noted by the competent authority shall list revised or
corrected figures, and have its conditions and reasons noted down.
6. Up to the printing of the annual report, the Company’s 2017 profit distribution has not yet been approved by Shareholders’
Meeting.
~161~
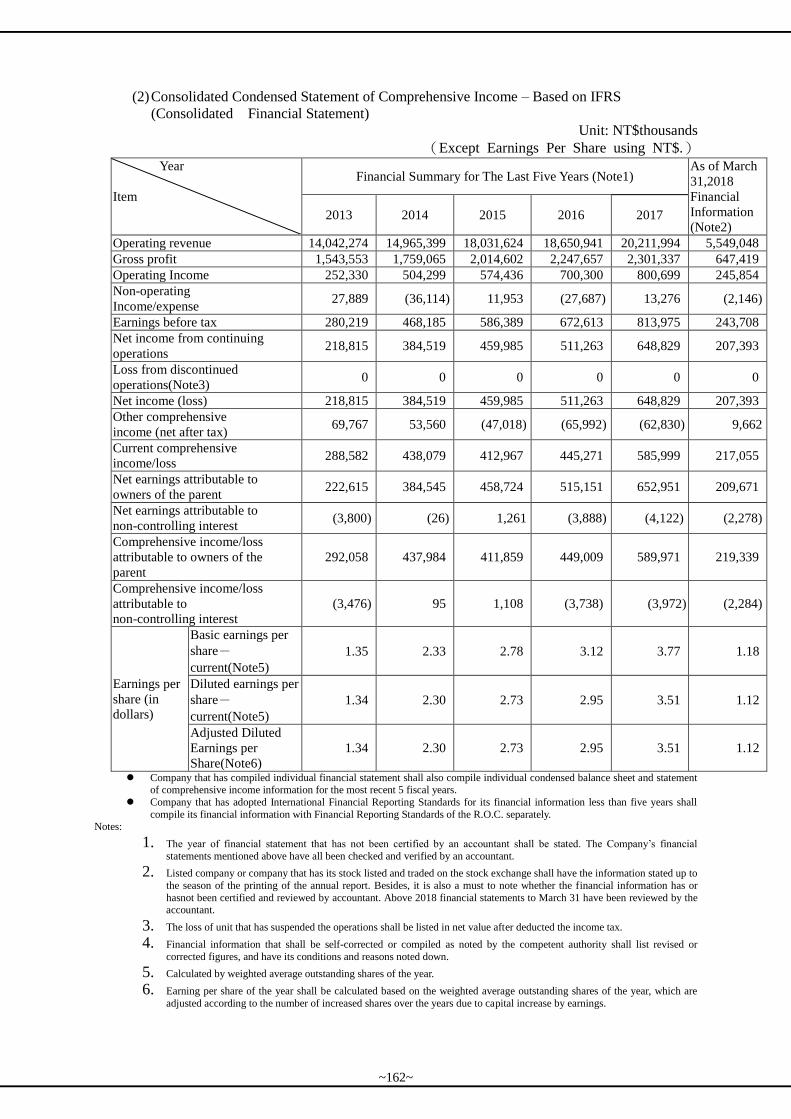
(2) Consolidated Condensed Statement of Comprehensive Income – Based on IFRS
(Consolidated Financial Statement)
Unit: NT$thousands
(Except Earnings Per Share using NT$.)
Year
Item
Financial Summary for The Last Five Years (Note1) As of March
31,2018
Financial
Information
(Note2) 2013 2014 2015 2016 2017
Operating revenue 14,042,274 14,965,399 18,031,624 18,650,941 20,211,994 5,549,048
Gross profit 1,543,553 1,759,065 2,014,602 2,247,657 2,301,337 647,419
Operating Income 252,330 504,299 574,436 700,300 800,699 245,854
Non-operating
Income/expense 27,889 (36,114) 11,953 (27,687) 13,276 (2,146)
Earnings before tax 280,219 468,185 586,389 672,613 813,975 243,708
Net income from continuing
operations 218,815 384,519 459,985 511,263 648,829 207,393
Loss from discontinued
operations(Note3) 0 0 0 0 0 0
Net income (loss) 218,815 384,519 459,985 511,263 648,829 207,393
Other comprehensive
income (net after tax) 69,767 53,560 (47,018) (65,992) (62,830) 9,662
Current comprehensive
income/loss 288,582 438,079 412,967 445,271 585,999 217,055
Net earnings attributable to
owners of the parent 222,615 384,545 458,724 515,151 652,951 209,671
Net earnings attributable to
non-controlling interest (3,800) (26) 1,261 (3,888) (4,122) (2,278)
Comprehensive income/loss
attributable to owners of the
parent
292,058 437,984 411,859 449,009 589,971 219,339
Comprehensive income/loss
attributable to
non-controlling interest
(3,476) 95 1,108 (3,738) (3,972) (2,284)
Earnings per
share (in
dollars)
Basic earnings per
share-
current(Note5)
1.35 2.33 2.78 3.12 3.77 1.18
Diluted earnings per
share-
current(Note5)
1.34 2.30 2.73 2.95 3.51 1.12
Adjusted Diluted
Earnings per
Share(Note6)
1.34 2.30 2.73 2.95 3.51 1.12
Company that has compiled individual financial statement shall also compile individual condensed balance sheet and statement of comprehensive income information for the most recent 5 fiscal years.
Company that has adopted International Financial Reporting Standards for its financial information less than five years shall
compile its financial information with Financial Reporting Standards of the R.O.C. separately.
Notes:
1. The year of financial statement that has not been certified by an accountant shall be stated. The Company’s financial
statements mentioned above have all been checked and verified by an accountant.
2. Listed company or company that has its stock listed and traded on the stock exchange shall have the information stated up to
the season of the printing of the annual report. Besides, it is also a must to note whether the financial information has or
hasnot been certified and reviewed by accountant. Above 2018 financial statements to March 31 have been reviewed by the accountant.
3. The loss of unit that has suspended the operations shall be listed in net value after deducted the income tax.
4. Financial information that shall be self-corrected or compiled as noted by the competent authority shall list revised or
corrected figures, and have its conditions and reasons noted down.
5. Calculated by weighted average outstanding shares of the year.
6. Earning per share of the year shall be calculated based on the weighted average outstanding shares of the year, which are
adjusted according to the number of increased shares over the years due to capital increase by earnings.
~162~
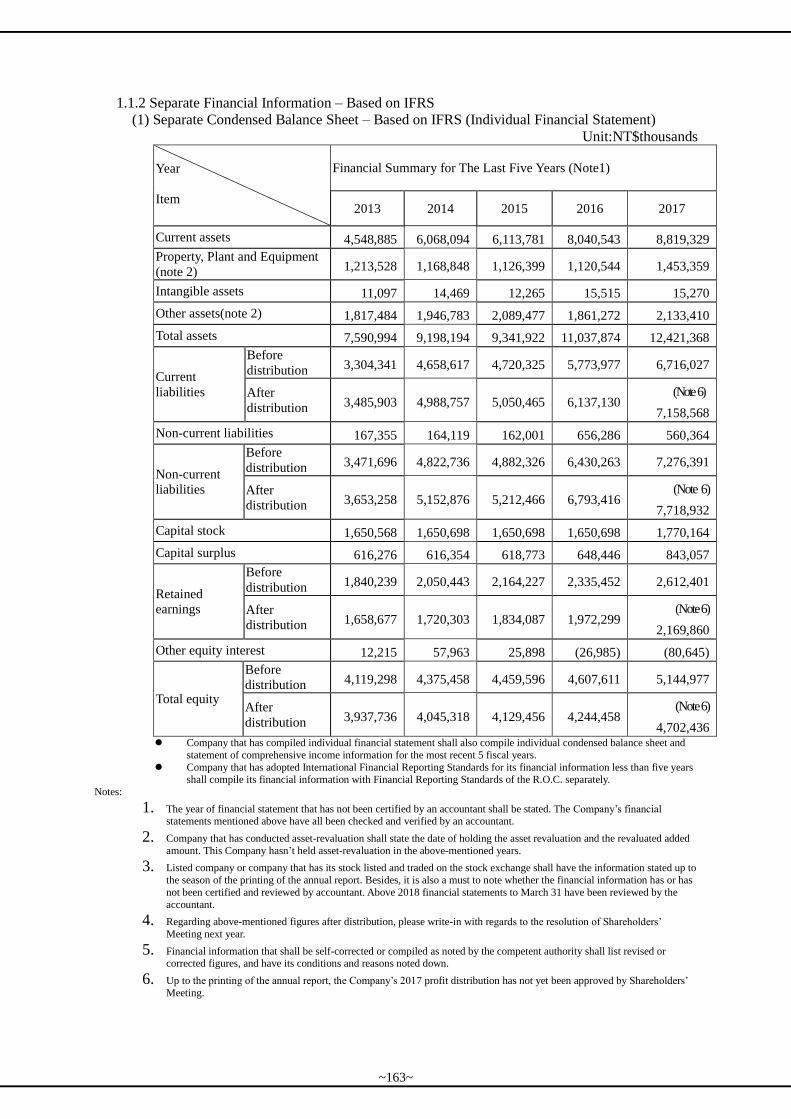
1.1.2 Separate Financial Information – Based on IFRS
(1) Separate Condensed Balance Sheet – Based on IFRS (Individual Financial Statement)
Unit:NT$thousands
Year
Item
Financial Summary for The Last Five Years (Note1)
2013 2014 2015 2016 2017
Current assets 4,548,885 6,068,094 6,113,781 8,040,543 8,819,329
Property, Plant and Equipment
(note 2) 1,213,528 1,168,848 1,126,399 1,120,544 1,453,359
Intangible assets 11,097 14,469 12,265 15,515 15,270
Other assets(note 2) 1,817,484 1,946,783 2,089,477 1,861,272 2,133,410
Total assets 7,590,994 9,198,194 9,341,922 11,037,874 12,421,368
Current
liabilities
Before
distribution 3,304,341 4,658,617 4,720,325 5,773,977 6,716,027
After
distribution 3,485,903 4,988,757 5,050,465 6,137,130 (Note 6)
7,158,568
Non-current liabilities 167,355 164,119 162,001 656,286 560,364
Non-current
liabilities
Before
distribution 3,471,696 4,822,736 4,882,326 6,430,263 7,276,391
After
distribution 3,653,258 5,152,876 5,212,466 6,793,416 (Note 6)
7,718,932
Capital stock 1,650,568 1,650,698 1,650,698 1,650,698 1,770,164
Capital surplus 616,276 616,354 618,773 648,446 843,057
Retained
earnings
Before
distribution 1,840,239 2,050,443 2,164,227 2,335,452 2,612,401
After
distribution 1,658,677 1,720,303 1,834,087 1,972,299 (Note 6)
2,169,860
Other equity interest 12,215 57,963 25,898 (26,985) (80,645)
Total equity
Before
distribution 4,119,298 4,375,458 4,459,596 4,607,611 5,144,977
After
distribution 3,937,736 4,045,318 4,129,456 4,244,458 (Note 6)
4,702,436 Company that has compiled individual financial statement shall also compile individual condensed balance sheet and
statement of comprehensive income information for the most recent 5 fiscal years.
Company that has adopted International Financial Reporting Standards for its financial information less than five years shall compile its financial information with Financial Reporting Standards of the R.O.C. separately.
Notes:
1. The year of financial statement that has not been certified by an accountant shall be stated. The Company’s financial statements mentioned above have all been checked and verified by an accountant.
2. Company that has conducted asset-revaluation shall state the date of holding the asset revaluation and the revaluated added
amount. This Company hasn’t held asset-revaluation in the above-mentioned years.
3. Listed company or company that has its stock listed and traded on the stock exchange shall have the information stated up to
the season of the printing of the annual report. Besides, it is also a must to note whether the financial information has or has
not been certified and reviewed by accountant. Above 2018 financial statements to March 31 have been reviewed by the
accountant.
4. Regarding above-mentioned figures after distribution, please write-in with regards to the resolution of Shareholders’
Meeting next year.
5. Financial information that shall be self-corrected or compiled as noted by the competent authority shall list revised or corrected figures, and have its conditions and reasons noted down.
6. Up to the printing of the annual report, the Company’s 2017 profit distribution has not yet been approved by Shareholders’
Meeting.
~163~
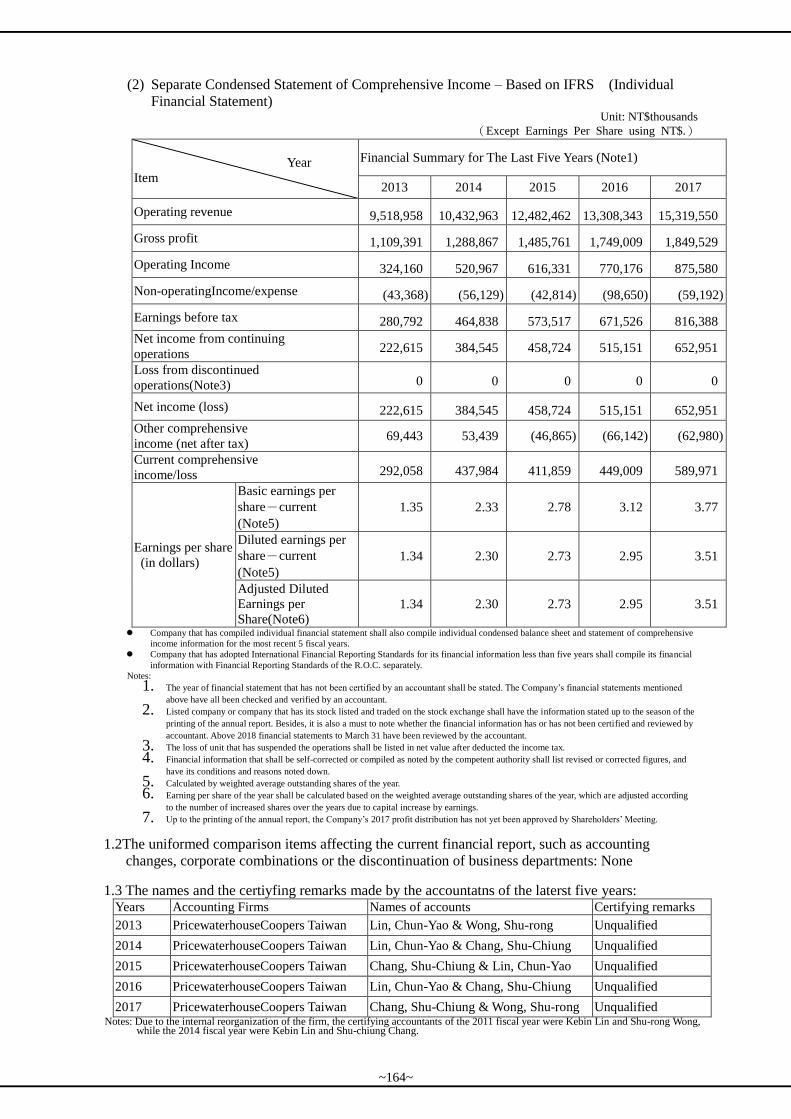
(2) Separate Condensed Statement of Comprehensive Income – Based on IFRS (Individual
Financial Statement) Unit: NT$thousands
(Except Earnings Per Share using NT$.)
Year
Item
Financial Summary for The Last Five Years (Note1)
2013 2014 2015 2016 2017
Operating revenue 9,518,958 10,432,963 12,482,462 13,308,343 15,319,550
Gross profit 1,109,391 1,288,867 1,485,761 1,749,009 1,849,529
Operating Income 324,160 520,967 616,331 770,176 875,580
Non-operatingIncome/expense (43,368) (56,129) (42,814) (98,650) (59,192)
Earnings before tax 280,792 464,838 573,517 671,526 816,388
Net income from continuing
operations 222,615 384,545 458,724 515,151 652,951
Loss from discontinued
operations(Note3) 0 0 0 0 0
Net income (loss) 222,615 384,545 458,724 515,151 652,951
Other comprehensive
income (net after tax) 69,443 53,439 (46,865) (66,142) (62,980)
Current comprehensive
income/loss 292,058 437,984 411,859 449,009 589,971
Earnings per share
(in dollars)
Basic earnings per
share-current
(Note5)
1.35 2.33 2.78 3.12 3.77
Diluted earnings per
share-current
(Note5)
1.34 2.30 2.73 2.95 3.51
Adjusted Diluted
Earnings per
Share(Note6)
1.34 2.30 2.73 2.95 3.51
Company that has compiled individual financial statement shall also compile individual condensed balance sheet and statement of comprehensive
income information for the most recent 5 fiscal years.
Company that has adopted International Financial Reporting Standards for its financial information less than five years shall compile its financial
information with Financial Reporting Standards of the R.O.C. separately.
Notes:
1. The year of financial statement that has not been certified by an accountant shall be stated. The Company’s financial statements mentioned
above have all been checked and verified by an accountant.
2. Listed company or company that has its stock listed and traded on the stock exchange shall have the information stated up to the season of the
printing of the annual report. Besides, it is also a must to note whether the financial information has or has not been certified and reviewed by
accountant. Above 2018 financial statements to March 31 have been reviewed by the accountant.
3. The loss of unit that has suspended the operations shall be listed in net value after deducted the income tax.
4. Financial information that shall be self-corrected or compiled as noted by the competent authority shall list revised or corrected figures, and
have its conditions and reasons noted down.
5. Calculated by weighted average outstanding shares of the year.
6. Earning per share of the year shall be calculated based on the weighted average outstanding shares of the year, which are adjusted according
to the number of increased shares over the years due to capital increase by earnings.
7. Up to the printing of the annual report, the Company’s 2017 profit distribution has not yet been approved by Shareholders’ Meeting.
1.2The uniformed comparison items affecting the current financial report, such as accounting
changes, corporate combinations or the discontinuation of business departments: None
1.3 The names and the certiyfing remarks made by the accountatns of the laterst five years: Years Accounting Firms Names of accounts Certifying remarks
2013 PricewaterhouseCoopers Taiwan Lin, Chun-Yao & Wong, Shu-rong Unqualified
2014 PricewaterhouseCoopers Taiwan Lin, Chun-Yao & Chang, Shu-Chiung Unqualified
2015 PricewaterhouseCoopers Taiwan Chang, Shu-Chiung & Lin, Chun-Yao Unqualified
2016 PricewaterhouseCoopers Taiwan Lin, Chun-Yao & Chang, Shu-Chiung Unqualified
2017 PricewaterhouseCoopers Taiwan Chang, Shu-Chiung & Wong, Shu-rong Unqualified Notes: Due to the internal reorganization of the firm, the certifying accountants of the 2011 fiscal year were Kebin Lin and Shu-rong Wong,
while the 2014 fiscal year were Kebin Lin and Shu-chiung Chang.
~164~
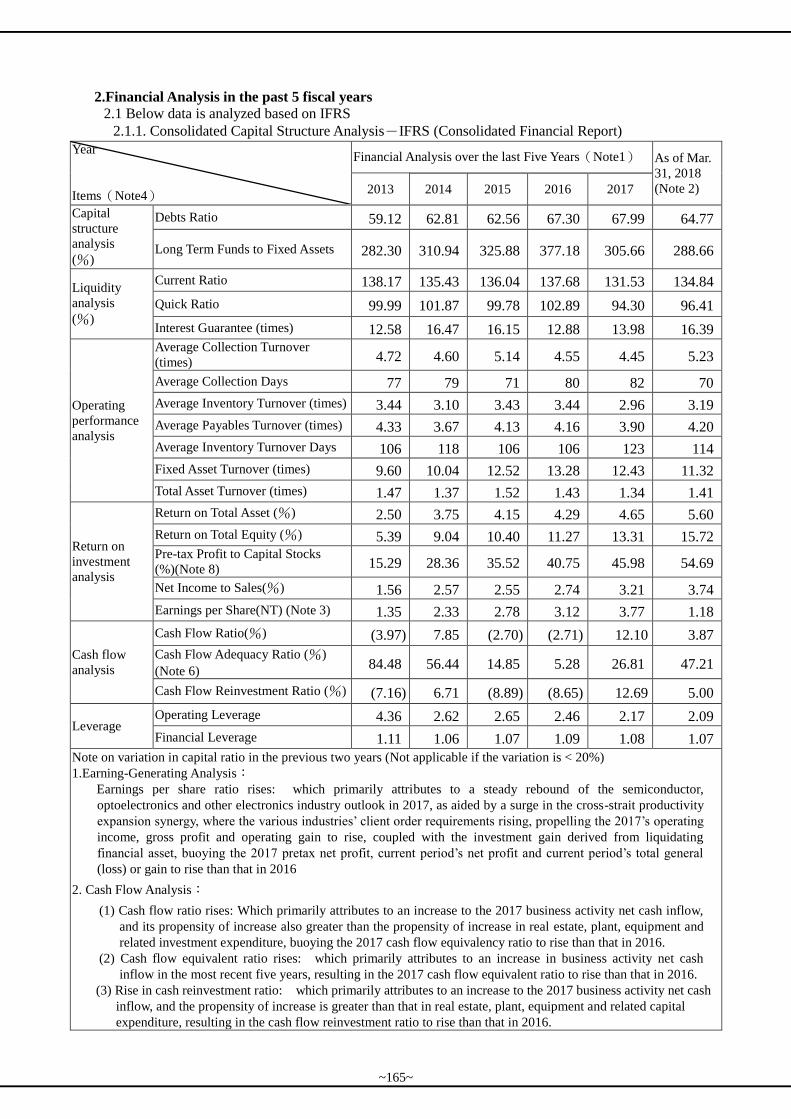
2.Financial Analysis in the past 5 fiscal years
2.1 Below data is analyzed based on IFRS
2.1.1. Consolidated Capital Structure Analysis-IFRS (Consolidated Financial Report)
Year
Items(Note4)
Financial Analysis over the last Five Years(Note1) As of Mar.
31, 2018
(Note 2) 2013 2014 2015 2016 2017
Capital
structure
analysis
(%)
Debts Ratio 59.12 62.81 62.56 67.30 67.99 64.77
Long Term Funds to Fixed Assets 282.30 310.94 325.88 377.18 305.66 288.66
Liquidity
analysis
(%)
Current Ratio 138.17 135.43 136.04 137.68 131.53 134.84
Quick Ratio 99.99 101.87 99.78 102.89 94.30 96.41
Interest Guarantee (times) 12.58 16.47 16.15 12.88 13.98 16.39
Operating
performance
analysis
Average Collection Turnover
(times) 4.72 4.60 5.14 4.55 4.45 5.23
Average Collection Days 77 79 71 80 82 70
Average Inventory Turnover (times) 3.44 3.10 3.43 3.44 2.96 3.19
Average Payables Turnover (times) 4.33 3.67 4.13 4.16 3.90 4.20
Average Inventory Turnover Days 106 118 106 106 123 114
Fixed Asset Turnover (times) 9.60 10.04 12.52 13.28 12.43 11.32
Total Asset Turnover (times) 1.47 1.37 1.52 1.43 1.34 1.41
Return on
investment
analysis
Return on Total Asset (%) 2.50 3.75 4.15 4.29 4.65 5.60
Return on Total Equity (%) 5.39 9.04 10.40 11.27 13.31 15.72
Pre-tax Profit to Capital Stocks
(%)(Note 8) 15.29 28.36 35.52 40.75 45.98 54.69
Net Income to Sales(%) 1.56 2.57 2.55 2.74 3.21 3.74
Earnings per Share(NT) (Note 3) 1.35 2.33 2.78 3.12 3.77 1.18
Cash flow
analysis
Cash Flow Ratio(%) (3.97) 7.85 (2.70) (2.71) 12.10 3.87
Cash Flow Adequacy Ratio (%)
(Note 6) 84.48 56.44 14.85 5.28 26.81 47.21
Cash Flow Reinvestment Ratio (%) (7.16) 6.71 (8.89) (8.65) 12.69 5.00
Leverage Operating Leverage 4.36 2.62 2.65 2.46 2.17 2.09
Financial Leverage 1.11 1.06 1.07 1.09 1.08 1.07
Note on variation in capital ratio in the previous two years (Not applicable if the variation is < 20%)
1.Earning-Generating Analysis:
Earnings per share ratio rises: which primarily attributes to a steady rebound of the semiconductor,
optoelectronics and other electronics industry outlook in 2017, as aided by a surge in the cross-strait productivity
expansion synergy, where the various industries’ client order requirements rising, propelling the 2017’s operating
income, gross profit and operating gain to rise, coupled with the investment gain derived from liquidating
financial asset, buoying the 2017 pretax net profit, current period’s net profit and current period’s total general
(loss) or gain to rise than that in 2016
2. Cash Flow Analysis:
(1) Cash flow ratio rises: Which primarily attributes to an increase to the 2017 business activity net cash inflow,
and its propensity of increase also greater than the propensity of increase in real estate, plant, equipment and
related investment expenditure, buoying the 2017 cash flow equivalency ratio to rise than that in 2016.
(2) Cash flow equivalent ratio rises: which primarily attributes to an increase in business activity net cash
inflow in the most recent five years, resulting in the 2017 cash flow equivalent ratio to rise than that in 2016.
(3) Rise in cash reinvestment ratio: which primarily attributes to an increase to the 2017 business activity net cash
inflow, and the propensity of increase is greater than that in real estate, plant, equipment and related capital
expenditure, resulting in the cash flow reinvestment ratio to rise than that in 2016.
~165~
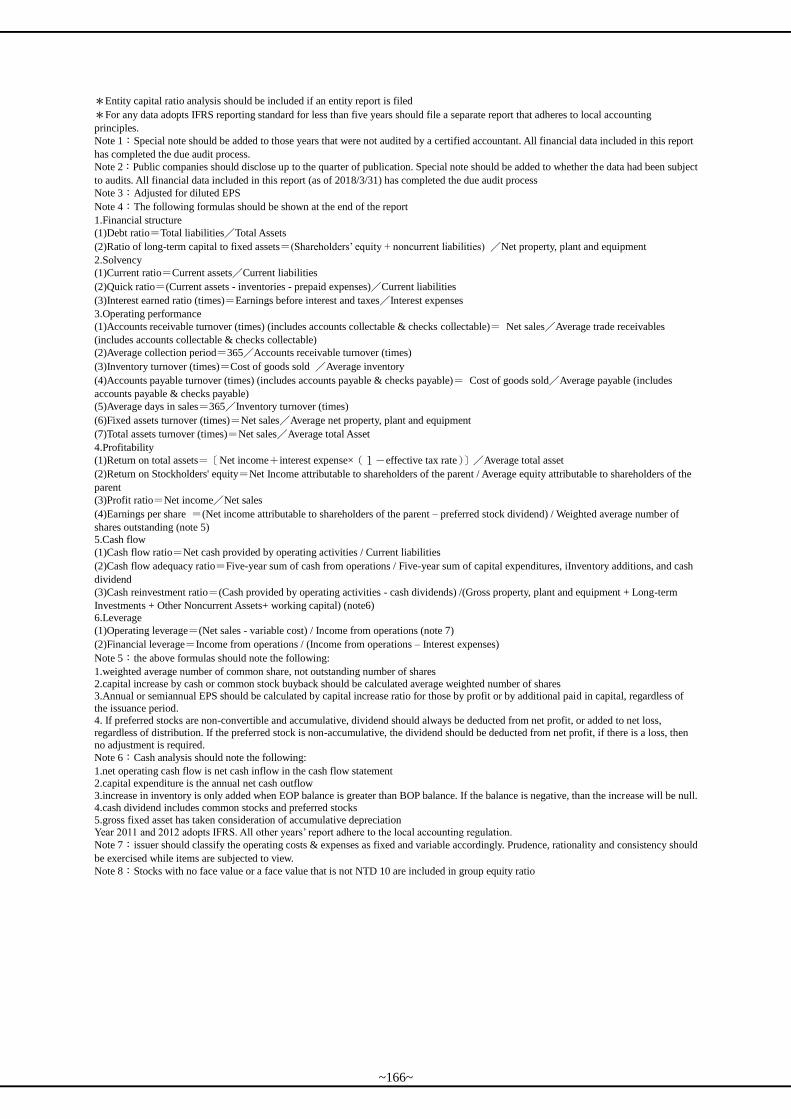
*Entity capital ratio analysis should be included if an entity report is filed
*For any data adopts IFRS reporting standard for less than five years should file a separate report that adheres to local accounting
principles.
Note 1:Special note should be added to those years that were not audited by a certified accountant. All financial data included in this report
has completed the due audit process.
Note 2:Public companies should disclose up to the quarter of publication. Special note should be added to whether the data had been subject
to audits. All financial data included in this report (as of 2018/3/31) has completed the due audit process
Note 3:Adjusted for diluted EPS
Note 4:The following formulas should be shown at the end of the report
1.Financial structure
(1)Debt ratio=Total liabilities/Total Assets
(2)Ratio of long-term capital to fixed assets=(Shareholders’ equity + noncurrent liabilities) /Net property, plant and equipment
2.Solvency
(1)Current ratio=Current assets/Current liabilities
(2)Quick ratio=(Current assets - inventories - prepaid expenses)/Current liabilities
(3)Interest earned ratio (times)=Earnings before interest and taxes/Interest expenses
3.Operating performance
(1)Accounts receivable turnover (times) (includes accounts collectable & checks collectable)= Net sales/Average trade receivables
(includes accounts collectable & checks collectable)
(2)Average collection period=365/Accounts receivable turnover (times)
(3)Inventory turnover (times)=Cost of goods sold /Average inventory
(4)Accounts payable turnover (times) (includes accounts payable & checks payable)= Cost of goods sold/Average payable (includes
accounts payable & checks payable)
(5)Average days in sales=365/Inventory turnover (times)
(6)Fixed assets turnover (times)=Net sales/Average net property, plant and equipment
(7)Total assets turnover (times)=Net sales/Average total Asset
4.Profitability
(1)Return on total assets=〔Net income+interest expense×(1-effective tax rate)〕/Average total asset
(2)Return on Stockholders' equity=Net Income attributable to shareholders of the parent / Average equity attributable to shareholders of the
parent
(3)Profit ratio=Net income/Net sales
(4)Earnings per share =(Net income attributable to shareholders of the parent – preferred stock dividend) / Weighted average number of
shares outstanding (note 5)
5.Cash flow
(1)Cash flow ratio=Net cash provided by operating activities / Current liabilities
(2)Cash flow adequacy ratio=Five-year sum of cash from operations / Five-year sum of capital expenditures, iInventory additions, and cash
dividend
(3)Cash reinvestment ratio=(Cash provided by operating activities - cash dividends) /(Gross property, plant and equipment + Long-term
Investments + Other Noncurrent Assets+ working capital) (note6)
6.Leverage
(1)Operating leverage=(Net sales - variable cost) / Income from operations (note 7)
(2)Financial leverage=Income from operations / (Income from operations – Interest expenses)
Note 5:the above formulas should note the following:
1.weighted average number of common share, not outstanding number of shares
2.capital increase by cash or common stock buyback should be calculated average weighted number of shares 3.Annual or semiannual EPS should be calculated by capital increase ratio for those by profit or by additional paid in capital, regardless of
the issuance period. 4. If preferred stocks are non-convertible and accumulative, dividend should always be deducted from net profit, or added to net loss,
regardless of distribution. If the preferred stock is non-accumulative, the dividend should be deducted from net profit, if there is a loss, then
no adjustment is required.
Note 6:Cash analysis should note the following:
1.net operating cash flow is net cash inflow in the cash flow statement
2.capital expenditure is the annual net cash outflow
3.increase in inventory is only added when EOP balance is greater than BOP balance. If the balance is negative, than the increase will be null. 4.cash dividend includes common stocks and preferred stocks
5.gross fixed asset has taken consideration of accumulative depreciation
Year 2011 and 2012 adopts IFRS. All other years’ report adhere to the local accounting regulation.
Note 7:issuer should classify the operating costs & expenses as fixed and variable accordingly. Prudence, rationality and consistency should
be exercised while items are subjected to view.
Note 8:Stocks with no face value or a face value that is not NTD 10 are included in group equity ratio
~166~
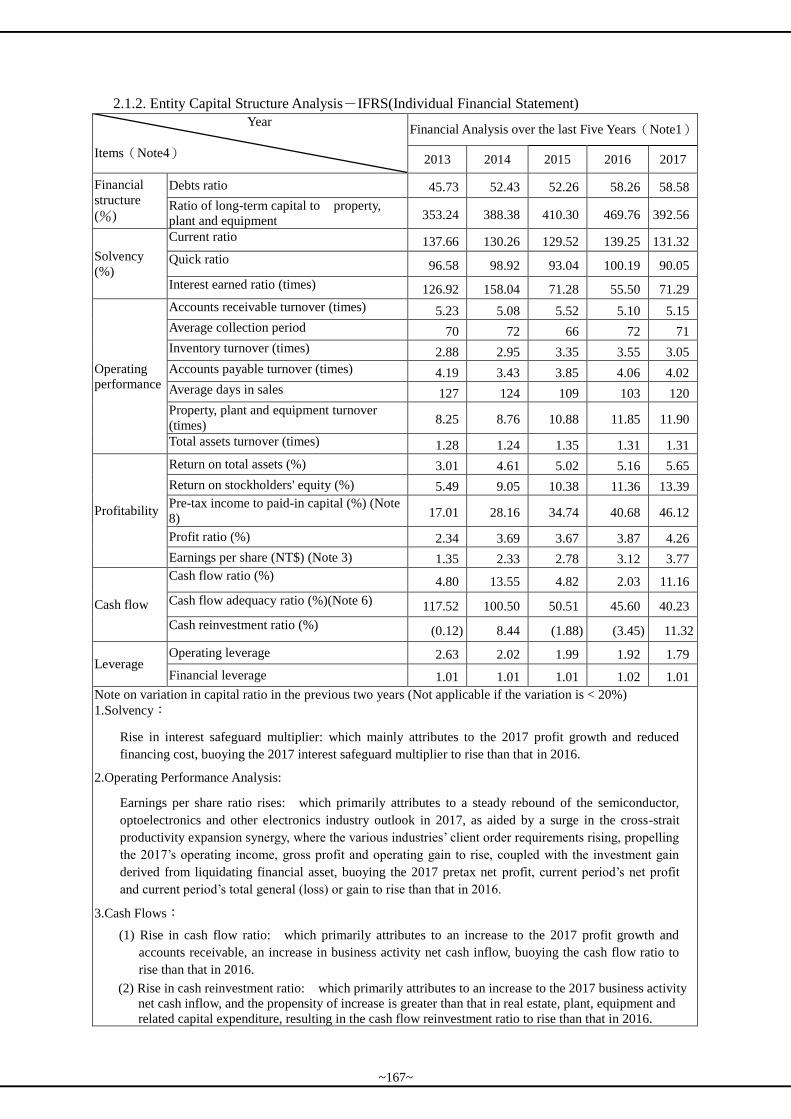
2.1.2. Entity Capital Structure Analysis-IFRS(Individual Financial Statement)
Year
Items(Note4)
Financial Analysis over the last Five Years(Note1)
2013 2014 2015 2016 2017
Financial
structure
(%)
Debts ratio 45.73 52.43 52.26 58.26 58.58
Ratio of long-term capital to property,
plant and equipment 353.24 388.38 410.30 469.76 392.56
Solvency
(%)
Current ratio 137.66 130.26 129.52 139.25 131.32
Quick ratio 96.58 98.92 93.04 100.19 90.05
Interest earned ratio (times) 126.92 158.04 71.28 55.50 71.29
Operating
performance
Accounts receivable turnover (times) 5.23 5.08 5.52 5.10 5.15
Average collection period 70 72 66 72 71
Inventory turnover (times) 2.88 2.95 3.35 3.55 3.05
Accounts payable turnover (times) 4.19 3.43 3.85 4.06 4.02
Average days in sales 127 124 109 103 120
Property, plant and equipment turnover
(times) 8.25 8.76 10.88 11.85 11.90
Total assets turnover (times) 1.28 1.24 1.35 1.31 1.31
Profitability
Return on total assets (%) 3.01 4.61 5.02 5.16 5.65
Return on stockholders' equity (%) 5.49 9.05 10.38 11.36 13.39
Pre-tax income to paid-in capital (%) (Note
8) 17.01 28.16 34.74 40.68 46.12
Profit ratio (%) 2.34 3.69 3.67 3.87 4.26
Earnings per share (NT$) (Note 3) 1.35 2.33 2.78 3.12 3.77
Cash flow
Cash flow ratio (%) 4.80 13.55 4.82 2.03 11.16
Cash flow adequacy ratio (%)(Note 6) 117.52 100.50 50.51 45.60 40.23
Cash reinvestment ratio (%) (0.12) 8.44 (1.88) (3.45) 11.32
Leverage Operating leverage 2.63 2.02 1.99 1.92 1.79
Financial leverage 1.01 1.01 1.01 1.02 1.01
Note on variation in capital ratio in the previous two years (Not applicable if the variation is < 20%)
1.Solvency:
Rise in interest safeguard multiplier: which mainly attributes to the 2017 profit growth and reduced
financing cost, buoying the 2017 interest safeguard multiplier to rise than that in 2016.
2.Operating Performance Analysis:
Earnings per share ratio rises: which primarily attributes to a steady rebound of the semiconductor,
optoelectronics and other electronics industry outlook in 2017, as aided by a surge in the cross-strait
productivity expansion synergy, where the various industries’ client order requirements rising, propelling
the 2017’s operating income, gross profit and operating gain to rise, coupled with the investment gain
derived from liquidating financial asset, buoying the 2017 pretax net profit, current period’s net profit
and current period’s total general (loss) or gain to rise than that in 2016.
3.Cash Flows:
(1) Rise in cash flow ratio: which primarily attributes to an increase to the 2017 profit growth and
accounts receivable, an increase in business activity net cash inflow, buoying the cash flow ratio to
rise than that in 2016.
(2) Rise in cash reinvestment ratio: which primarily attributes to an increase to the 2017 business activity
net cash inflow, and the propensity of increase is greater than that in real estate, plant, equipment and
related capital expenditure, resulting in the cash flow reinvestment ratio to rise than that in 2016.
~167~
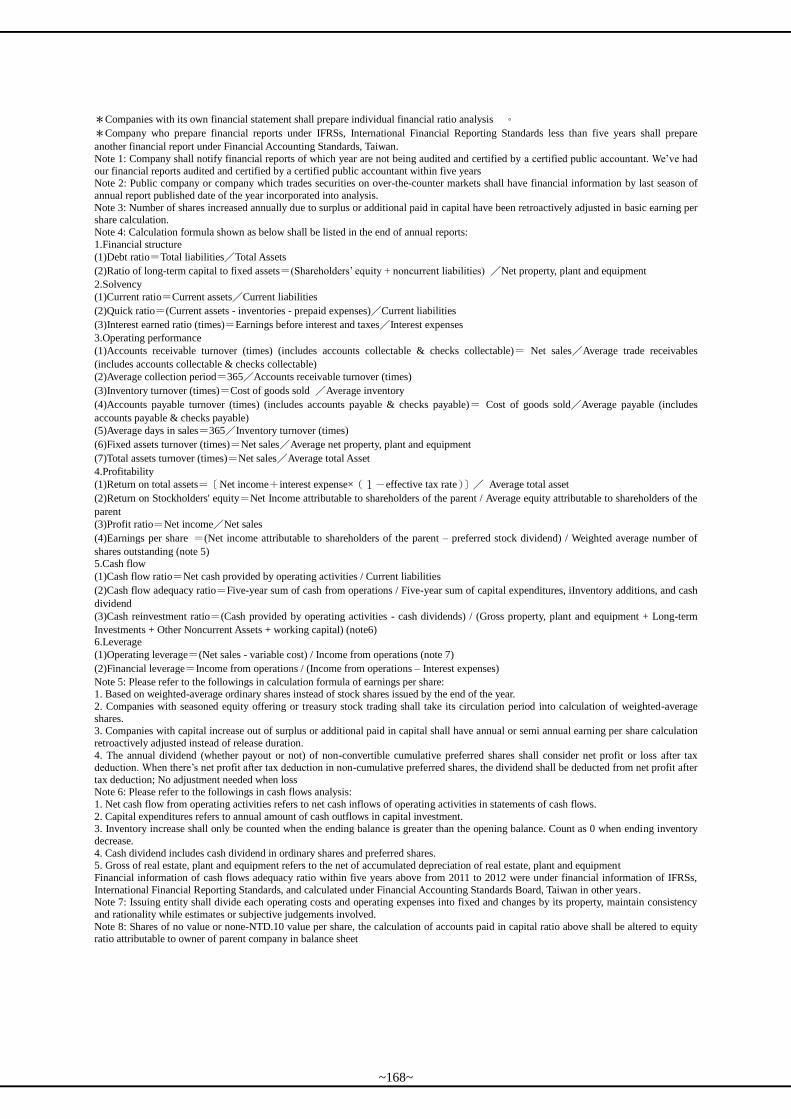
*Companies with its own financial statement shall prepare individual financial ratio analysis 。
*Company who prepare financial reports under IFRSs, International Financial Reporting Standards less than five years shall prepare
another financial report under Financial Accounting Standards, Taiwan.
Note 1: Company shall notify financial reports of which year are not being audited and certified by a certified public accountant. We’ve had
our financial reports audited and certified by a certified public accountant within five years Note 2: Public company or company which trades securities on over-the-counter markets shall have financial information by last season of
annual report published date of the year incorporated into analysis.
Note 3: Number of shares increased annually due to surplus or additional paid in capital have been retroactively adjusted in basic earning per share calculation.
Note 4: Calculation formula shown as below shall be listed in the end of annual reports:
1.Financial structure
(1)Debt ratio=Total liabilities/Total Assets
(2)Ratio of long-term capital to fixed assets=(Shareholders’ equity + noncurrent liabilities) /Net property, plant and equipment
2.Solvency
(1)Current ratio=Current assets/Current liabilities
(2)Quick ratio=(Current assets - inventories - prepaid expenses)/Current liabilities
(3)Interest earned ratio (times)=Earnings before interest and taxes/Interest expenses
3.Operating performance
(1)Accounts receivable turnover (times) (includes accounts collectable & checks collectable)= Net sales/Average trade receivables
(includes accounts collectable & checks collectable)
(2)Average collection period=365/Accounts receivable turnover (times)
(3)Inventory turnover (times)=Cost of goods sold /Average inventory
(4)Accounts payable turnover (times) (includes accounts payable & checks payable)= Cost of goods sold/Average payable (includes
accounts payable & checks payable)
(5)Average days in sales=365/Inventory turnover (times)
(6)Fixed assets turnover (times)=Net sales/Average net property, plant and equipment
(7)Total assets turnover (times)=Net sales/Average total Asset
4.Profitability
(1)Return on total assets=〔Net income+interest expense×(1-effective tax rate)〕/ Average total asset
(2)Return on Stockholders' equity=Net Income attributable to shareholders of the parent / Average equity attributable to shareholders of the
parent
(3)Profit ratio=Net income/Net sales
(4)Earnings per share =(Net income attributable to shareholders of the parent – preferred stock dividend) / Weighted average number of
shares outstanding (note 5) 5.Cash flow
(1)Cash flow ratio=Net cash provided by operating activities / Current liabilities
(2)Cash flow adequacy ratio=Five-year sum of cash from operations / Five-year sum of capital expenditures, iInventory additions, and cash
dividend
(3)Cash reinvestment ratio=(Cash provided by operating activities - cash dividends) / (Gross property, plant and equipment + Long-term
Investments + Other Noncurrent Assets + working capital) (note6) 6.Leverage
(1)Operating leverage=(Net sales - variable cost) / Income from operations (note 7)
(2)Financial leverage=Income from operations / (Income from operations – Interest expenses)
Note 5: Please refer to the followings in calculation formula of earnings per share: 1. Based on weighted-average ordinary shares instead of stock shares issued by the end of the year.
2. Companies with seasoned equity offering or treasury stock trading shall take its circulation period into calculation of weighted-average
shares. 3. Companies with capital increase out of surplus or additional paid in capital shall have annual or semi annual earning per share calculation
retroactively adjusted instead of release duration.
4. The annual dividend (whether payout or not) of non-convertible cumulative preferred shares shall consider net profit or loss after tax deduction. When there’s net profit after tax deduction in non-cumulative preferred shares, the dividend shall be deducted from net profit after
tax deduction; No adjustment needed when loss Note 6: Please refer to the followings in cash flows analysis:
1. Net cash flow from operating activities refers to net cash inflows of operating activities in statements of cash flows.
2. Capital expenditures refers to annual amount of cash outflows in capital investment.
3. Inventory increase shall only be counted when the ending balance is greater than the opening balance. Count as 0 when ending inventory
decrease.
4. Cash dividend includes cash dividend in ordinary shares and preferred shares. 5. Gross of real estate, plant and equipment refers to the net of accumulated depreciation of real estate, plant and equipment
Financial information of cash flows adequacy ratio within five years above from 2011 to 2012 were under financial information of IFRSs,
International Financial Reporting Standards, and calculated under Financial Accounting Standards Board, Taiwan in other years. Note 7: Issuing entity shall divide each operating costs and operating expenses into fixed and changes by its property, maintain consistency
and rationality while estimates or subjective judgements involved.
Note 8: Shares of no value or none-NTD.10 value per share, the calculation of accounts paid in capital ratio above shall be altered to equity ratio attributable to owner of parent company in balance sheet
~168~
3. Audit Committee’s Report in the most recent fiscal year
Marketech International Corp.
Audit Committee Audit Report
To: Members of the 2018 Shareholders’ Meeting
We, as the Audit Committee of MIC Group, have audited the 2017 Business Report,
Financial Statements and Earnings Distribution Proposal made and submitted by the board of
directors. The said Financial Statements were audited by Independent Accountant Chang
Shu-Chiung and Independent Accountant Weng Shih-Jung of Pricewaterhouse Coopers (PwC)
Taiwan, and are supported with an audit report issued by PwC. We believe that there is no
inconsistent information of aforementioned Business Report, Financial Statements and
Earnings Distribution Proposal and hereby submit these documents to you according to
Article 14-4 of Securities and Exchange Act and Article 219 of the Company Act.
Sincerely yours,
Chairperson of Audit Committee, Lin Hsiao-Min
February 26, 2018
~169~
4. Consolidated Financial Statement in the most recent fiscal year:please refer to this year’s
report page 206 to 297
5. Separate Financial Statement of the Parent Company and Related Party in the most recent
fiscal year and during the current fiscal year up to the date of printing of the annual report:please refer to this year’s report page 298 to 376
6. Financial difficulties of the Company and Related Party in the most recent fiscal year and
during the current fiscal year up to the date of printing of the annual report: None.
~170~
Part 7 Review of Financial Conditions, Operating Results, and Risk Management 1. Analysis of Financial Position
1.1 Analysis of the consolidated financial situation (consolidated financial statement)
1.1.1. The last two annual balance sheets reported significant changes and impact on the assets and
liabilities, owing to:
Unit: NT$thousands;﹪
Year
Description As of December
31,2017
As of December
31,.2016
Difference
Amount ﹪
Current assets 13,643,594 12,178,315 1,465,279 12.03
Property, plant and equipment 1,864,277 1,388,586 475,691 34.26
Intangible assets 20,115 21,619 (1,504) (6.96)
Other assets 543,157 494,262 48,895 9.89
Total assets 16,071,143 14,082,782 1,988,361 14.12
Current liabilities 10,372,850 8,845,356 1,527,494 17.27
Non-current liabilities 554,291 632,231 (77,940) (12.33)
Total liabilities 10,927,141 9,477,587 1,449,554 15.29
Capital stock 1,770,164 1,650,698 119,466 7.24
Capital surplus 843,057 648,446 194,611 30.01
Retained earnings 2,612,401 2,335,452 276,949 11.86
Other equity interest (80,645) (26,985) (53,660) (198.85)
Equity attributable to
shareholders of the parent 5,144,977 4,607,611 537,366 11.66
Non-controlling interests (975) (2,416) 1,441 59.64
Total equity 5,144,002 4,605,195 538,807 11.70
Analysis of ratio of change: (if the change is greater than 20% and the amount changed is
NT$10,000,000)
(1) Increase in real estate, plant and equipment: which primarily stems from plant purchase and
additional production-related equipment purchase in 2017, and pushes the real estate, plant
and equipment by the end of 2017 to rise than that in 2016.
(2) Increase in capital reserve: which primarily attributes to company issuing
convertible corporate bond holders exercising converting into the common shares in
2017, resulting in a premium on the issuance of common shares.
(3) Decrease in other equity: which primarily stems from U.S. dollar exchange rate depreciation
in 2017, pushing the exchange differential on converted foreign operating entities’ financial
statements to drop. The exchange differential arisen from structured financial statement
conversion reduces than that in 2016.
1.1.2. If significant changes are felt, they should be indicated in future response plans:
Changes in the Group’s last two annual balance sheets did not have any significant impact. The
group continued to focus on improving the business performance, the stability of its earnings
and the company’s financial structure in order to reduce the financial burden.
~171~
1.2 Analysis of the individual financial situation (individual financial statement)
1.2.1. The last two annual balance sheets reported significant changes and impact on the Assets and
Liabilities, owing to:
Unit : NT$ thousands ; % Year
Description As of December
31,2017
As of December
31,2016
Difference
Amount ﹪
Current assets 8,819,329 8,040,543 778,786 9.69
Property, plant and equipment 1,453,359 1,120,544 332,815 29.70
Intangible assets 15,270 15,515 (245) (1.58)
Other current assets 2,133,410 1,861,272 272,138 14.62
Total assets 12,421,368 11,037,874 1,383,494 12.53
Current liabilities 6,716,027 5,773,977 942,050 16.32
Non-current liabilities 560,364 656,286 (95,922) (14.62)
Total liabilities 7,276,391 6,430,263 846,128 13.16
Capital stock 1,770,164 1,650,698 119,466 7.24
Capital surplus 843,057 648,446 194,611 30.11
Retained earnings 2,612,401 2,335,452 276,949 11.86
Other equity interest (80,645) (26,985) (53,660) (198.85)
Total equity 5,144,977 4,607,611 537,366 11.66
Analysis of ratio of change: (if the change is greater than 20% and the amount changed is
NT$10,000,000) (1) Increase in real estate, plant and equipment: which primarily stems from plant purchase and
additional production-related equipment purchase in 2017, and pushes the real estate, plant and
equipment by the end of 2017 to rise than that in 2016.
(2) Increase in capital reserve: which primarily attributes to company issuing convertible corporate
bond holders exercising converting into the common shares in 2017, resulting in a premium on the
issuance of common shares.
(3) Decrease in other equity: which primarily stems from U.S. dollar exchange rate depreciation in
2017, pushing the exchange differential on converted foreign operating entities’ financial
statements to drop. The exchange differential arisen from structured financial statement conversion
reduces than that in 2016.
1.2.2. If significant changes are felt, they should be indicated in future response plans:
Changes in the company’s last two annual balance sheets did not have any significant impact.
The company continued to focus on improving the business performance, the stability of its
earnings and the company’s financial structure in order to reduce the financial burden.
~172~
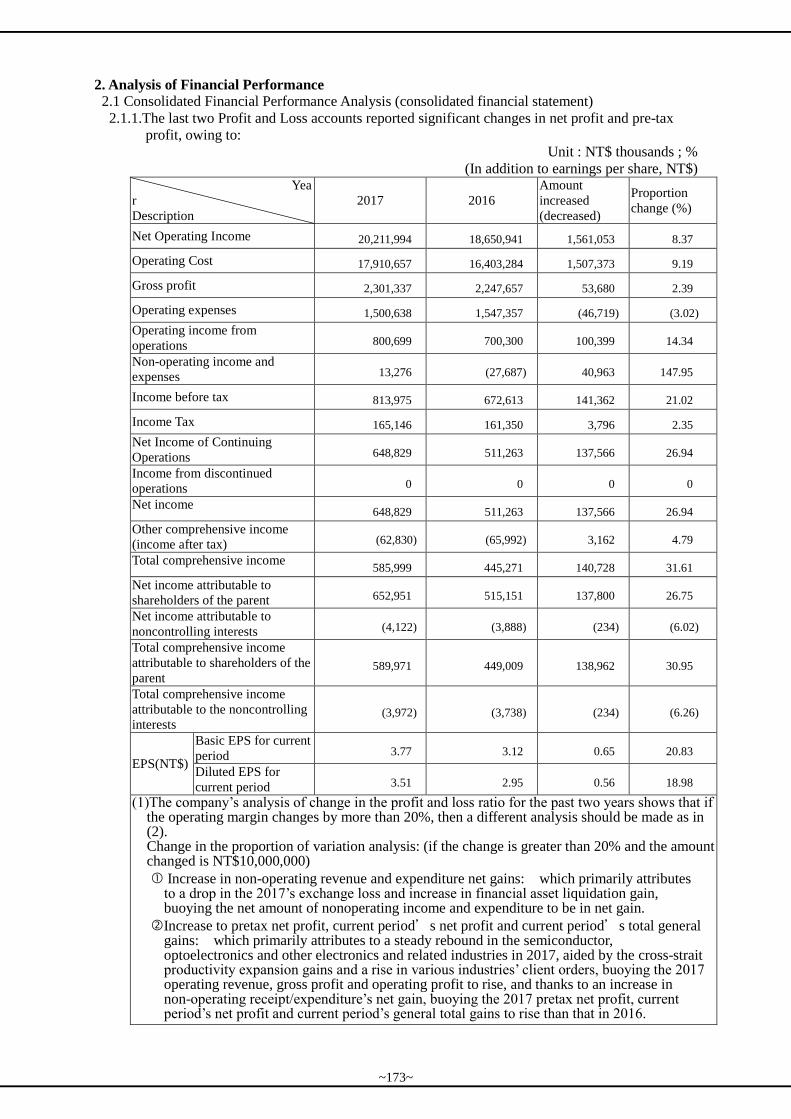
2. Analysis of Financial Performance
2.1 Consolidated Financial Performance Analysis (consolidated financial statement)
2.1.1.The last two Profit and Loss accounts reported significant changes in net profit and pre-tax
profit, owing to:
Unit : NT$ thousands ; %
(In addition to earnings per share, NT$) Yea
r
Description
2017 2016
Amount
increased
(decreased)
Proportion
change (%)
Net Operating Income 20,211,994 18,650,941 1,561,053 8.37
Operating Cost 17,910,657 16,403,284 1,507,373 9.19
Gross profit 2,301,337 2,247,657 53,680 2.39
Operating expenses 1,500,638 1,547,357 (46,719) (3.02)
Operating income from
operations 800,699 700,300 100,399 14.34
Non-operating income and
expenses 13,276 (27,687) 40,963 147.95
Income before tax 813,975 672,613 141,362 21.02
Income Tax 165,146 161,350 3,796 2.35
Net Income of Continuing
Operations 648,829 511,263 137,566 26.94
Income from discontinued
operations 0 0 0 0
Net income 648,829 511,263 137,566 26.94
Other comprehensive income
(income after tax) (62,830) (65,992) 3,162 4.79
Total comprehensive income 585,999 445,271 140,728 31.61
Net income attributable to
shareholders of the parent 652,951 515,151 137,800 26.75
Net income attributable to
noncontrolling interests (4,122) (3,888) (234) (6.02)
Total comprehensive income
attributable to shareholders of the
parent 589,971 449,009 138,962 30.95
Total comprehensive income
attributable to the noncontrolling
interests (3,972) (3,738) (234) (6.26)
EPS(NT$)
Basic EPS for current
period 3.77 3.12 0.65 20.83
Diluted EPS for
current period 3.51 2.95 0.56 18.98
(1)The company’s analysis of change in the profit and loss ratio for the past two years shows that if the operating margin changes by more than 20%, then a different analysis should be made as in (2).
Change in the proportion of variation analysis: (if the change is greater than 20% and the amount changed is NT$10,000,000)
Increase in non-operating revenue and expenditure net gains: which primarily attributes to a drop in the 2017’s exchange loss and increase in financial asset liquidation gain, buoying the net amount of nonoperating income and expenditure to be in net gain.
Increase to pretax net profit, current period’s net profit and current period’s total general gains: which primarily attributes to a steady rebound in the semiconductor, optoelectronics and other electronics and related industries in 2017, aided by the cross-strait productivity expansion gains and a rise in various industries’ client orders, buoying the 2017 operating revenue, gross profit and operating profit to rise, and thanks to an increase in non-operating receipt/expenditure’s net gain, buoying the 2017 pretax net profit, current period’s net profit and current period’s general total gains to rise than that in 2016.
~173~
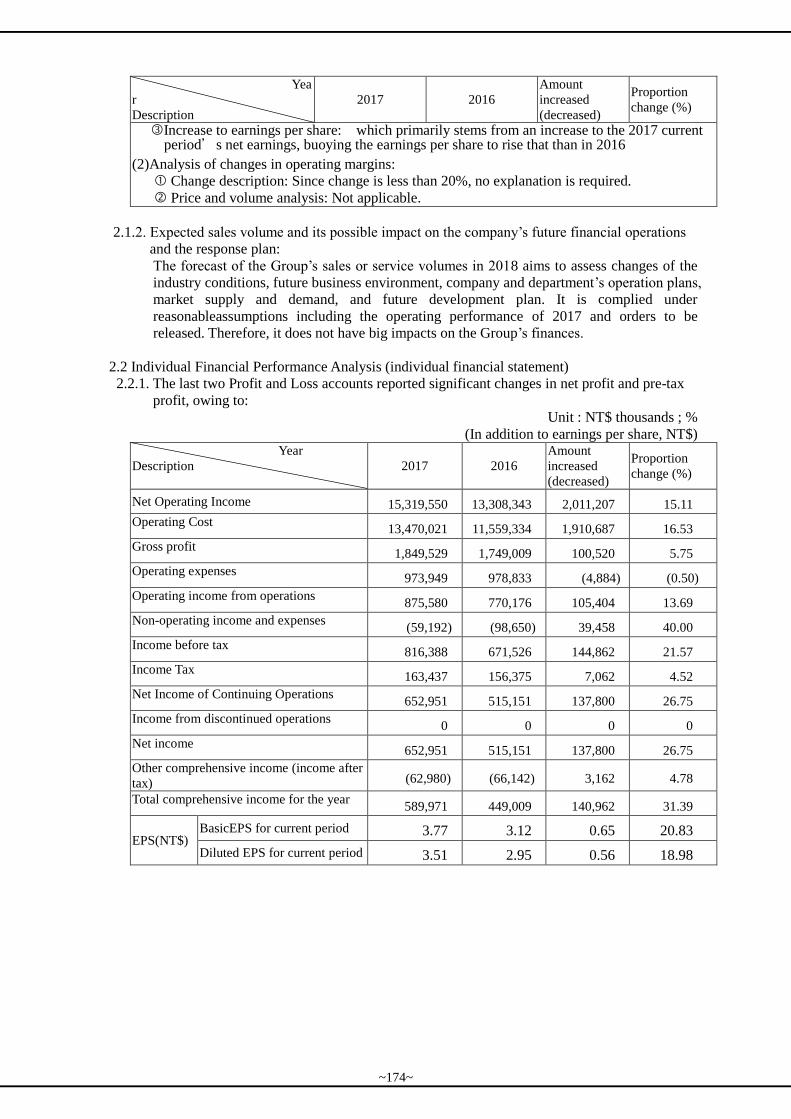
Yea
r
Description
2017 2016
Amount
increased
(decreased)
Proportion
change (%)
Increase to earnings per share: which primarily stems from an increase to the 2017 current period’s net earnings, buoying the earnings per share to rise that than in 2016
(2)Analysis of changes in operating margins:
Change description: Since change is less than 20%, no explanation is required.
Price and volume analysis: Not applicable.
2.1.2. Expected sales volume and its possible impact on the company’s future financial operations
and the response plan:
The forecast of the Group’s sales or service volumes in 2018 aims to assess changes of the
industry conditions, future business environment, company and department’s operation plans,
market supply and demand, and future development plan. It is complied under
reasonableassumptions including the operating performance of 2017 and orders to be
released. Therefore, it does not have big impacts on the Group’s finances.
2.2 Individual Financial Performance Analysis (individual financial statement)
2.2.1. The last two Profit and Loss accounts reported significant changes in net profit and pre-tax
profit, owing to:
Unit : NT$ thousands ; %
(In addition to earnings per share, NT$) Year
Description 2017 2016
Amount
increased
(decreased)
Proportion
change (%)
Net Operating Income 15,319,550 13,308,343 2,011,207 15.11
Operating Cost 13,470,021 11,559,334 1,910,687 16.53
Gross profit 1,849,529 1,749,009 100,520 5.75
Operating expenses 973,949 978,833 (4,884) (0.50)
Operating income from operations 875,580 770,176 105,404 13.69
Non-operating income and expenses (59,192) (98,650) 39,458 40.00
Income before tax 816,388 671,526 144,862 21.57
Income Tax 163,437 156,375 7,062 4.52
Net Income of Continuing Operations 652,951 515,151 137,800 26.75
Income from discontinued operations 0 0 0 0
Net income 652,951 515,151 137,800 26.75
Other comprehensive income (income after
tax) (62,980) (66,142) 3,162 4.78
Total comprehensive income for the year 589,971 449,009 140,962 31.39
EPS(NT$) BasicEPS for current period 3.77 3.12 0.65 20.83
Diluted EPS for current period 3.51 2.95 0.56 18.98
~174~
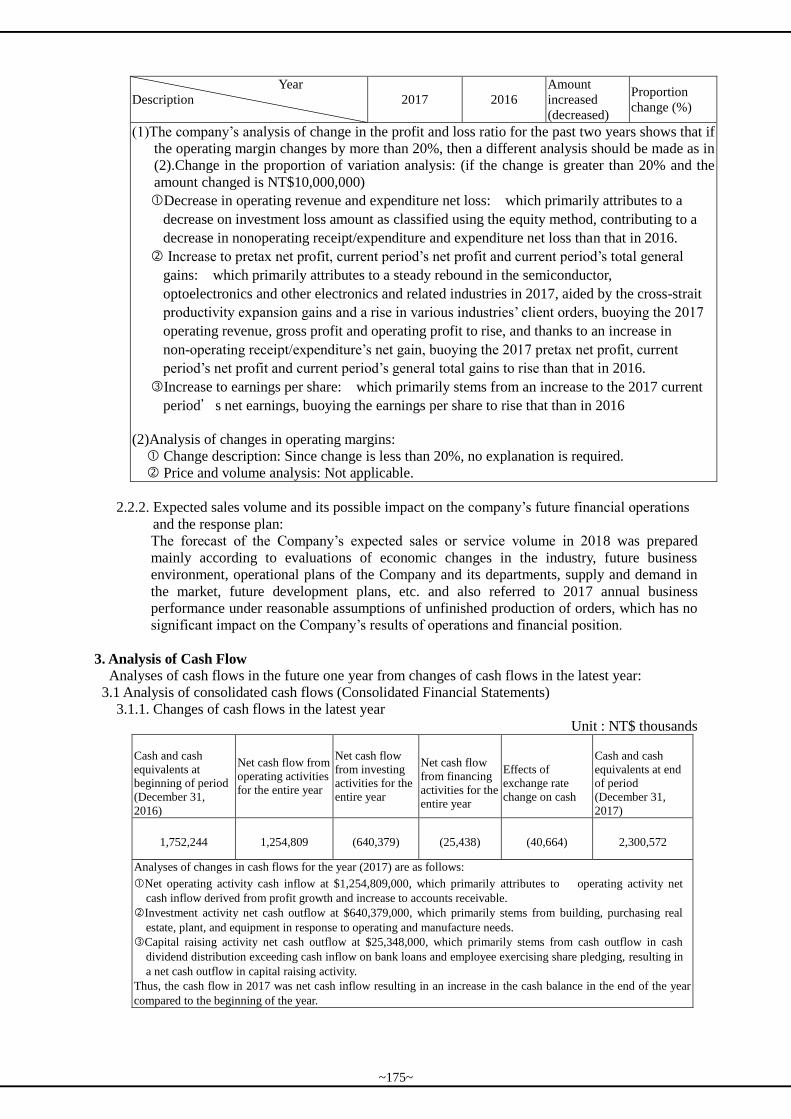
Year
Description 2017 2016
Amount
increased
(decreased)
Proportion
change (%)
(1)The company’s analysis of change in the profit and loss ratio for the past two years shows that if
the operating margin changes by more than 20%, then a different analysis should be made as in
(2).Change in the proportion of variation analysis: (if the change is greater than 20% and the
amount changed is NT$10,000,000)
Decrease in operating revenue and expenditure net loss: which primarily attributes to a
decrease on investment loss amount as classified using the equity method, contributing to a
decrease in nonoperating receipt/expenditure and expenditure net loss than that in 2016.
Increase to pretax net profit, current period’s net profit and current period’s total general
gains: which primarily attributes to a steady rebound in the semiconductor,
optoelectronics and other electronics and related industries in 2017, aided by the cross-strait
productivity expansion gains and a rise in various industries’ client orders, buoying the 2017
operating revenue, gross profit and operating profit to rise, and thanks to an increase in
non-operating receipt/expenditure’s net gain, buoying the 2017 pretax net profit, current
period’s net profit and current period’s general total gains to rise than that in 2016.
Increase to earnings per share: which primarily stems from an increase to the 2017 current
period’s net earnings, buoying the earnings per share to rise that than in 2016
(2)Analysis of changes in operating margins:
Change description: Since change is less than 20%, no explanation is required.
Price and volume analysis: Not applicable.
2.2.2. Expected sales volume and its possible impact on the company’s future financial operations
and the response plan:
The forecast of the Company’s expected sales or service volume in 2018 was prepared
mainly according to evaluations of economic changes in the industry, future business
environment, operational plans of the Company and its departments, supply and demand in
the market, future development plans, etc. and also referred to 2017 annual business
performance under reasonable assumptions of unfinished production of orders, which has no
significant impact on the Company’s results of operations and financial position.
3. Analysis of Cash Flow
Analyses of cash flows in the future one year from changes of cash flows in the latest year:
3.1 Analysis of consolidated cash flows (Consolidated Financial Statements)
3.1.1. Changes of cash flows in the latest year
Unit : NT$ thousands
Cash and cash
equivalents at
beginning of period
(December 31,
2016)
Net cash flow from
operating activities
for the entire year
Net cash flow
from investing
activities for the
entire year
Net cash flow
from financing
activities for the
entire year
Effects of
exchange rate
change on cash
Cash and cash
equivalents at end
of period
(December 31,
2017)
1,752,244 1,254,809 (640,379) (25,438) (40,664) 2,300,572
Analyses of changes in cash flows for the year (2017) are as follows:
Net operating activity cash inflow at $1,254,809,000, which primarily attributes to operating activity net
cash inflow derived from profit growth and increase to accounts receivable.
Investment activity net cash outflow at $640,379,000, which primarily stems from building, purchasing real
estate, plant, and equipment in response to operating and manufacture needs.
Capital raising activity net cash outflow at $25,348,000, which primarily stems from cash outflow in cash
dividend distribution exceeding cash inflow on bank loans and employee exercising share pledging, resulting in
a net cash outflow in capital raising activity.
Thus, the cash flow in 2017 was net cash inflow resulting in an increase in the cash balance in the end of the year
compared to the beginning of the year.
~175~
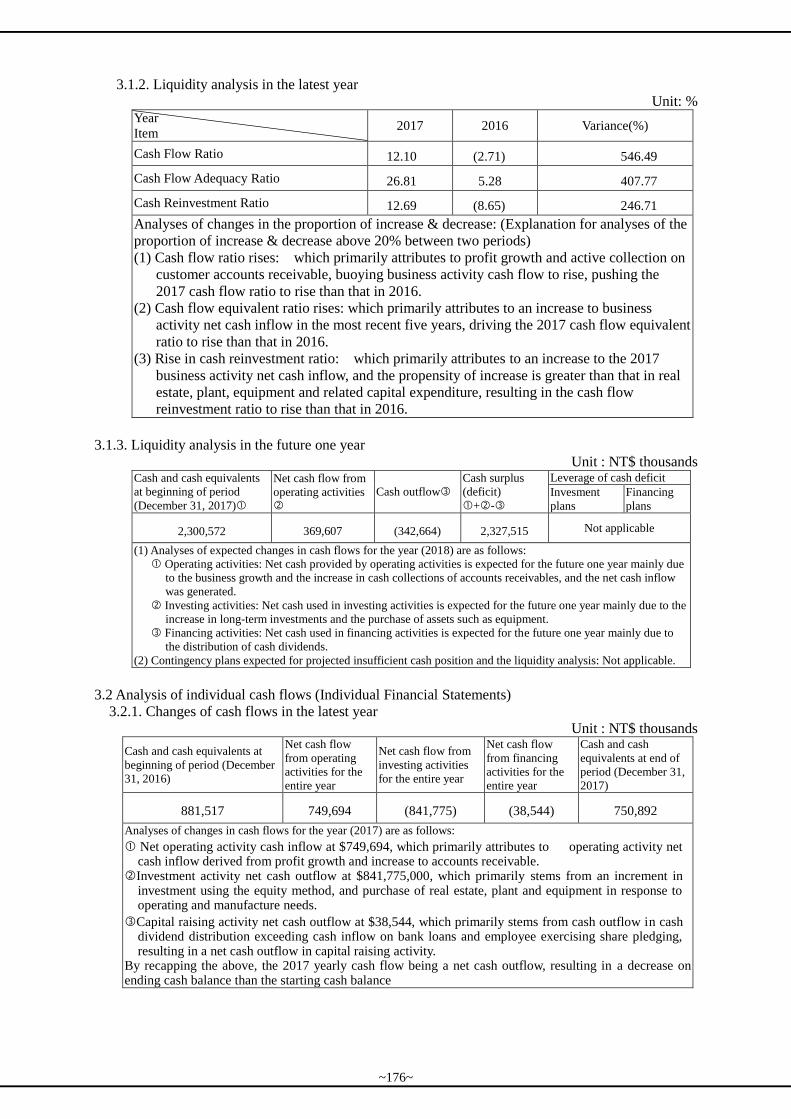
3.1.2. Liquidity analysis in the latest year
Unit: % Year
Item 2017 2016 Variance(%)
Cash Flow Ratio 12.10 (2.71) 546.49
Cash Flow Adequacy Ratio 26.81 5.28 407.77
Cash Reinvestment Ratio 12.69 (8.65) 246.71
Analyses of changes in the proportion of increase & decrease: (Explanation for analyses of the
proportion of increase & decrease above 20% between two periods)
(1) Cash flow ratio rises: which primarily attributes to profit growth and active collection on
customer accounts receivable, buoying business activity cash flow to rise, pushing the
2017 cash flow ratio to rise than that in 2016.
(2) Cash flow equivalent ratio rises: which primarily attributes to an increase to business
activity net cash inflow in the most recent five years, driving the 2017 cash flow equivalent
ratio to rise than that in 2016.
(3) Rise in cash reinvestment ratio: which primarily attributes to an increase to the 2017
business activity net cash inflow, and the propensity of increase is greater than that in real
estate, plant, equipment and related capital expenditure, resulting in the cash flow
reinvestment ratio to rise than that in 2016.
3.1.3. Liquidity analysis in the future one year
Unit : NT$ thousands Cash and cash equivalents
at beginning of period
(December 31, 2017)
Net cash flow from
operating activities
Cash outflow
Cash surplus
(deficit)
+-
Leverage of cash deficit
Invesment
plans
Financing
plans
2,300,572 369,607 (342,664) 2,327,515 Not applicable
(1) Analyses of expected changes in cash flows for the year (2018) are as follows:
Operating activities: Net cash provided by operating activities is expected for the future one year mainly due
to the business growth and the increase in cash collections of accounts receivables, and the net cash inflow
was generated.
Investing activities: Net cash used in investing activities is expected for the future one year mainly due to the
increase in long-term investments and the purchase of assets such as equipment.
Financing activities: Net cash used in financing activities is expected for the future one year mainly due to
the distribution of cash dividends.
(2) Contingency plans expected for projected insufficient cash position and the liquidity analysis: Not applicable.
3.2 Analysis of individual cash flows (Individual Financial Statements)
3.2.1. Changes of cash flows in the latest year
Unit : NT$ thousands
Cash and cash equivalents at
beginning of period (December
31, 2016)
Net cash flow
from operating
activities for the
entire year
Net cash flow from
investing activities
for the entire year
Net cash flow
from financing
activities for the
entire year
Cash and cash
equivalents at end of
period (December 31,
2017)
881,517 749,694 (841,775) (38,544) 750,892
Analyses of changes in cash flows for the year (2017) are as follows:
Net operating activity cash inflow at $749,694, which primarily attributes to operating activity net cash inflow derived from profit growth and increase to accounts receivable.
Investment activity net cash outflow at $841,775,000, which primarily stems from an increment in investment using the equity method, and purchase of real estate, plant and equipment in response to operating and manufacture needs.
Capital raising activity net cash outflow at $38,544, which primarily stems from cash outflow in cash dividend distribution exceeding cash inflow on bank loans and employee exercising share pledging, resulting in a net cash outflow in capital raising activity.
By recapping the above, the 2017 yearly cash flow being a net cash outflow, resulting in a decrease on ending cash balance than the starting cash balance
~176~
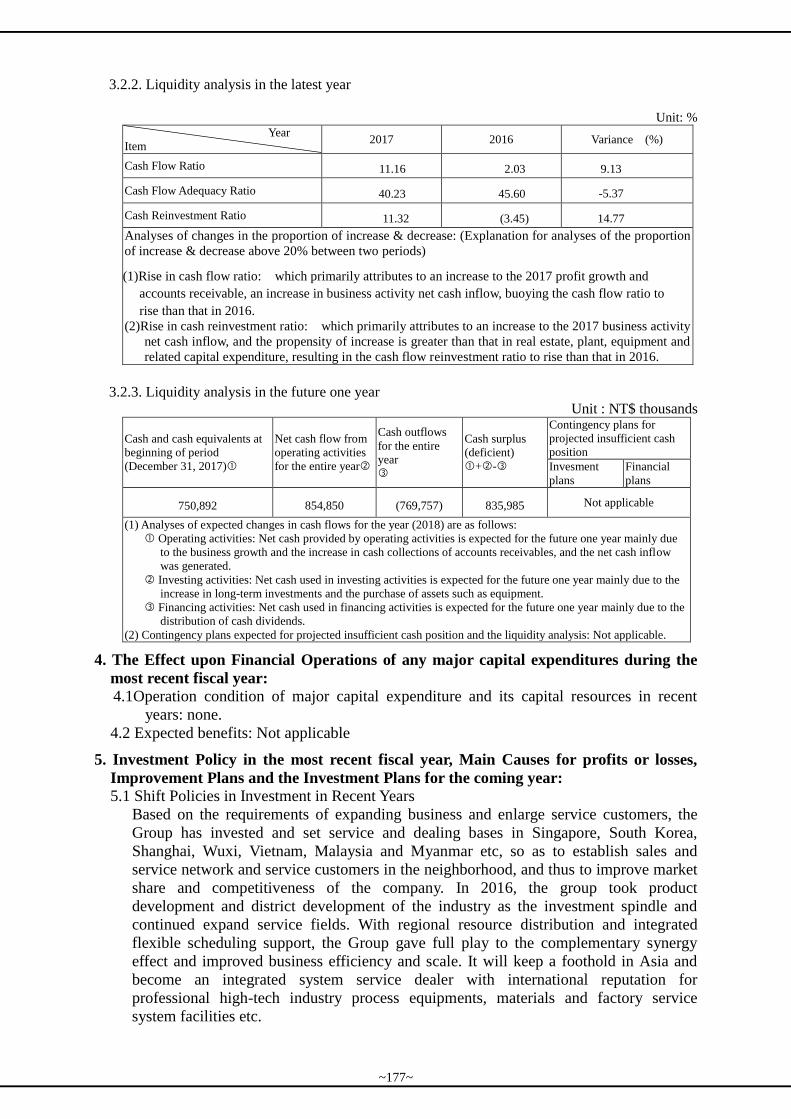
3.2.2. Liquidity analysis in the latest year
Unit: %
Year
Item 2017 2016 Variance (%)
Cash Flow Ratio 11.16 2.03 9.13
Cash Flow Adequacy Ratio 40.23 45.60 -5.37
Cash Reinvestment Ratio 11.32 (3.45) 14.77
Analyses of changes in the proportion of increase & decrease: (Explanation for analyses of the proportion
of increase & decrease above 20% between two periods)
(1)Rise in cash flow ratio: which primarily attributes to an increase to the 2017 profit growth and
accounts receivable, an increase in business activity net cash inflow, buoying the cash flow ratio to
rise than that in 2016.
(2)Rise in cash reinvestment ratio: which primarily attributes to an increase to the 2017 business activity
net cash inflow, and the propensity of increase is greater than that in real estate, plant, equipment and
related capital expenditure, resulting in the cash flow reinvestment ratio to rise than that in 2016.
3.2.3. Liquidity analysis in the future one year
Unit : NT$ thousands
Cash and cash equivalents at
beginning of period
(December 31, 2017)
Net cash flow from
operating activities
for the entire year
Cash outflows
for the entire
year
Cash surplus
(deficient)
+-
Contingency plans for
projected insufficient cash
position
Invesment
plans
Financial
plans
750,892 854,850 (769,757) 835,985 Not applicable
(1) Analyses of expected changes in cash flows for the year (2018) are as follows:
Operating activities: Net cash provided by operating activities is expected for the future one year mainly due
to the business growth and the increase in cash collections of accounts receivables, and the net cash inflow
was generated.
Investing activities: Net cash used in investing activities is expected for the future one year mainly due to the
increase in long-term investments and the purchase of assets such as equipment.
Financing activities: Net cash used in financing activities is expected for the future one year mainly due to the
distribution of cash dividends.
(2) Contingency plans expected for projected insufficient cash position and the liquidity analysis: Not applicable.
4. The Effect upon Financial Operations of any major capital expenditures during the
most recent fiscal year:
4.1Operation condition of major capital expenditure and its capital resources in recent
years: none.
4.2 Expected benefits: Not applicable
5. Investment Policy in the most recent fiscal year, Main Causes for profits or losses,
Improvement Plans and the Investment Plans for the coming year:
5.1 Shift Policies in Investment in Recent Years
Based on the requirements of expanding business and enlarge service customers, the
Group has invested and set service and dealing bases in Singapore, South Korea,
Shanghai, Wuxi, Vietnam, Malaysia and Myanmar etc, so as to establish sales and
service network and service customers in the neighborhood, and thus to improve market
share and competitiveness of the company. In 2016, the group took product
development and district development of the industry as the investment spindle and
continued expand service fields. With regional resource distribution and integrated
flexible scheduling support, the Group gave full play to the complementary synergy
effect and improved business efficiency and scale. It will keep a foothold in Asia and
become an integrated system service dealer with international reputation for
professional high-tech industry process equipments, materials and factory service
system facilities etc.
~177~
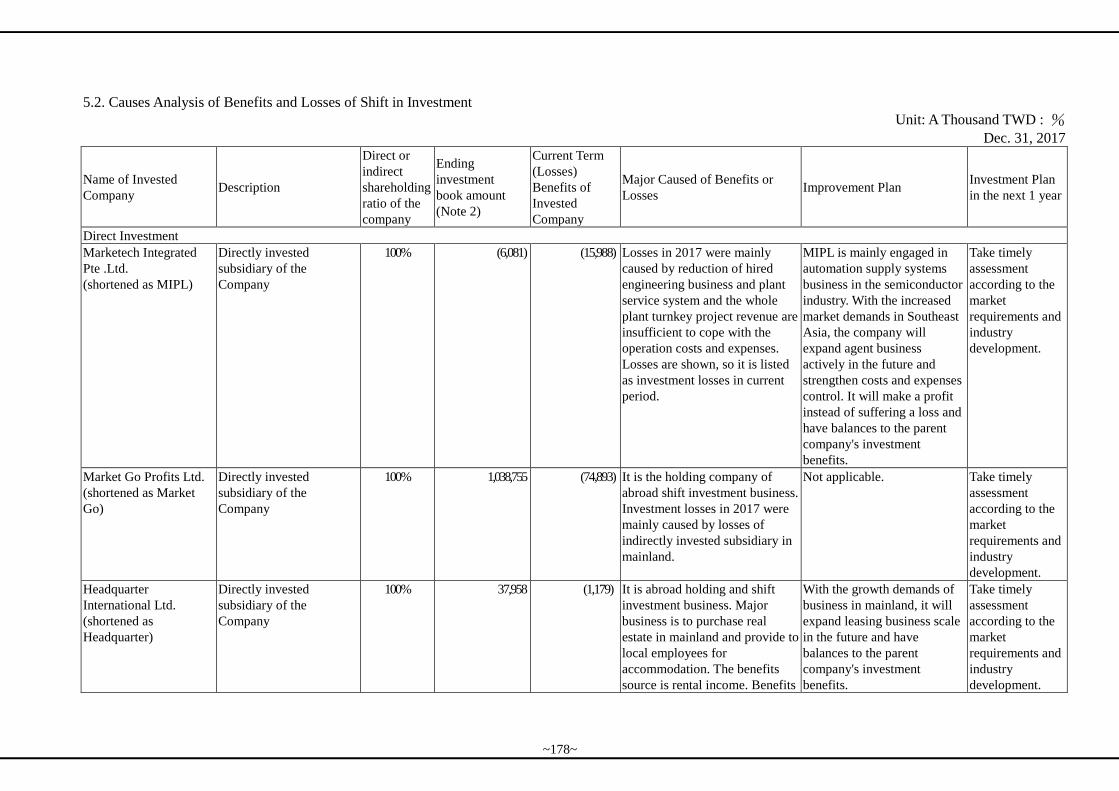
5.2. Causes Analysis of Benefits and Losses of Shift in Investment
Unit: A Thousand TWD : %
Dec. 31, 2017
Name of Invested
Company Description
Direct or
indirect
shareholding
ratio of the
company
Ending
investment
book amount
(Note 2)
Current Term
(Losses)
Benefits of
Invested
Company
Major Caused of Benefits or
Losses Improvement Plan
Investment Plan
in the next 1 year
Direct Investment
Marketech Integrated
Pte .Ltd.
(shortened as MIPL)
Directly invested
subsidiary of the
Company
100% (6,081) (15,988) Losses in 2017 were mainly
caused by reduction of hired
engineering business and plant
service system and the whole
plant turnkey project revenue are
insufficient to cope with the
operation costs and expenses.
Losses are shown, so it is listed
as investment losses in current
period.
MIPL is mainly engaged in
automation supply systems
business in the semiconductor
industry. With the increased
market demands in Southeast
Asia, the company will
expand agent business
actively in the future and
strengthen costs and expenses
control. It will make a profit
instead of suffering a loss and
have balances to the parent
company's investment
benefits.
Take timely
assessment
according to the
market
requirements and
industry
development.
Market Go Profits Ltd.
(shortened as Market
Go)
Directly invested
subsidiary of the
Company
100% 1,038,755 (74,893) It is the holding company of
abroad shift investment business.
Investment losses in 2017 were
mainly caused by losses of
indirectly invested subsidiary in
mainland.
Not applicable. Take timely
assessment
according to the
market
requirements and
industry
development.
Headquarter
International Ltd.
(shortened as
Headquarter)
Directly invested
subsidiary of the
Company
100% 37,958 (1,179) It is abroad holding and shift
investment business. Major
business is to purchase real
estate in mainland and provide to
local employees for
accommodation. The benefits
source is rental income. Benefits
With the growth demands of
business in mainland, it will
expand leasing business scale
in the future and have
balances to the parent
company's investment
benefits.
Take timely
assessment
according to the
market
requirements and
industry
development.
~178~
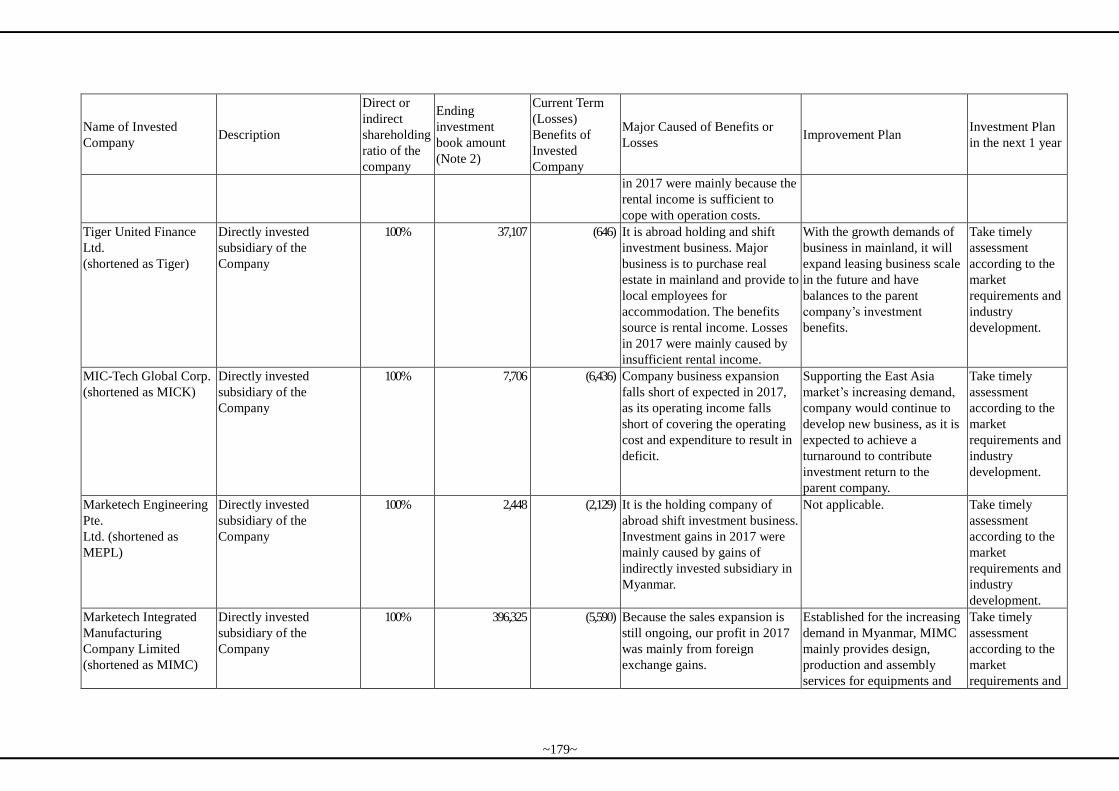
Name of Invested
Company Description
Direct or
indirect
shareholding
ratio of the
company
Ending
investment
book amount
(Note 2)
Current Term
(Losses)
Benefits of
Invested
Company
Major Caused of Benefits or
Losses Improvement Plan
Investment Plan
in the next 1 year
in 2017 were mainly because the
rental income is sufficient to
cope with operation costs.
Tiger United Finance
Ltd.
(shortened as Tiger)
Directly invested
subsidiary of the
Company
100% 37,107 (646) It is abroad holding and shift
investment business. Major
business is to purchase real
estate in mainland and provide to
local employees for
accommodation. The benefits
source is rental income. Losses
in 2017 were mainly caused by
insufficient rental income.
With the growth demands of
business in mainland, it will
expand leasing business scale
in the future and have
balances to the parent
company’s investment
benefits.
Take timely
assessment
according to the
market
requirements and
industry
development.
MIC-Tech Global Corp.
(shortened as MICK)
Directly invested
subsidiary of the
Company
100% 7,706 (6,436) Company business expansion
falls short of expected in 2017,
as its operating income falls
short of covering the operating
cost and expenditure to result in
deficit.
Supporting the East Asia
market’s increasing demand,
company would continue to
develop new business, as it is
expected to achieve a
turnaround to contribute
investment return to the
parent company.
Take timely
assessment
according to the
market
requirements and
industry
development.
Marketech Engineering
Pte.
Ltd. (shortened as
MEPL)
Directly invested
subsidiary of the
Company
100% 2,448 (2,129) It is the holding company of
abroad shift investment business.
Investment gains in 2017 were
mainly caused by gains of
indirectly invested subsidiary in
Myanmar.
Not applicable. Take timely
assessment
according to the
market
requirements and
industry
development.
Marketech Integrated
Manufacturing
Company Limited
(shortened as MIMC)
Directly invested
subsidiary of the
Company
100% 396,325 (5,590) Because the sales expansion is
still ongoing, our profit in 2017
was mainly from foreign
exchange gains.
Established for the increasing
demand in Myanmar, MIMC
mainly provides design,
production and assembly
services for equipments and
Take timely
assessment
according to the
market
requirements and
~179~
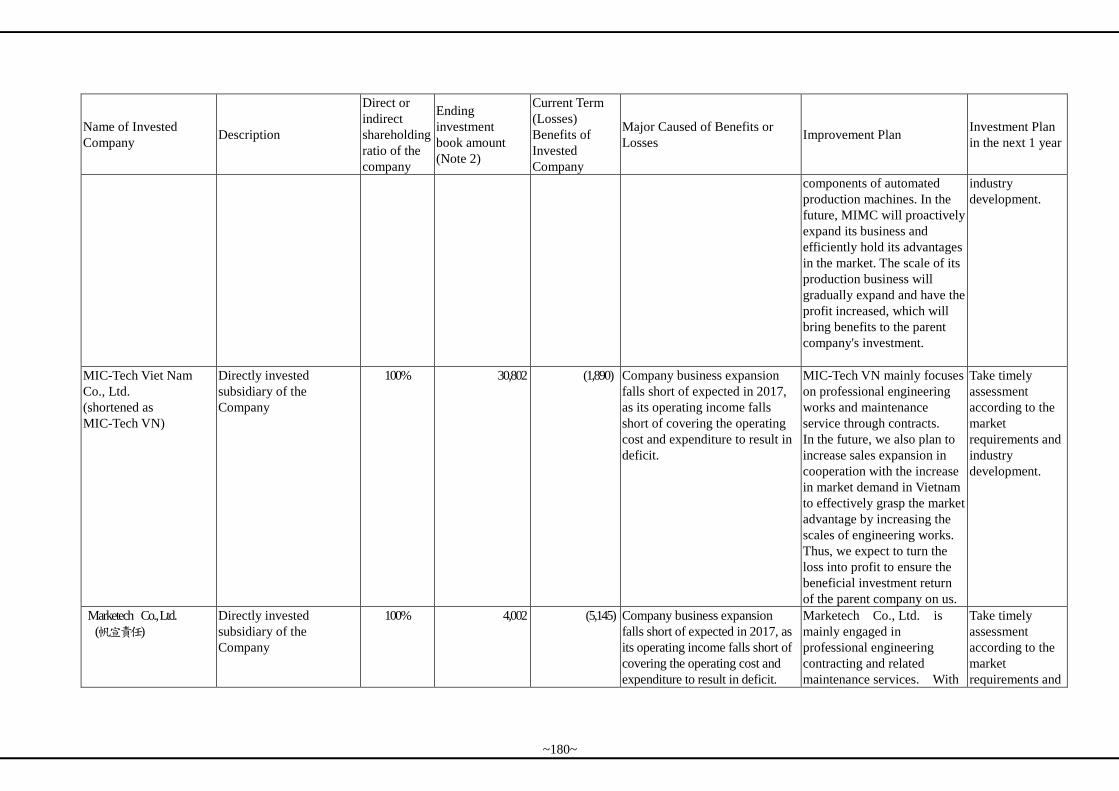
Name of Invested
Company Description
Direct or
indirect
shareholding
ratio of the
company
Ending
investment
book amount
(Note 2)
Current Term
(Losses)
Benefits of
Invested
Company
Major Caused of Benefits or
Losses Improvement Plan
Investment Plan
in the next 1 year
components of automated
production machines. In the
future, MIMC will proactively
expand its business and
efficiently hold its advantages
in the market. The scale of its
production business will
gradually expand and have the
profit increased, which will
bring benefits to the parent
company's investment.
industry
development.
MIC-Tech Viet Nam
Co., Ltd.
(shortened as
MIC-Tech VN)
Directly invested
subsidiary of the
Company
100% 30,802 (1,890) Company business expansion
falls short of expected in 2017,
as its operating income falls
short of covering the operating
cost and expenditure to result in
deficit.
MIC-Tech VN mainly focuses
on professional engineering
works and maintenance
service through contracts.
In the future, we also plan to
increase sales expansion in
cooperation with the increase
in market demand in Vietnam
to effectively grasp the market
advantage by increasing the
scales of engineering works.
Thus, we expect to turn the
loss into profit to ensure the
beneficial investment return
of the parent company on us.
Take timely
assessment
according to the
market
requirements and
industry
development.
Marketech Co., Ltd.
(帆宣責任)
Directly invested
subsidiary of the
Company
100% 4,002 (5,145) Company business expansion
falls short of expected in 2017, as
its operating income falls short of
covering the operating cost and
expenditure to result in deficit.
Marketech Co., Ltd. is
mainly engaged in
professional engineering
contracting and related
maintenance services. With
Take timely
assessment
according to the
market
requirements and
~180~
Name of Invested
Company Description
Direct or
indirect
shareholding
ratio of the
company
Ending
investment
book amount
(Note 2)
Current Term
(Losses)
Benefits of
Invested
Company
Major Caused of Benefits or
Losses Improvement Plan
Investment Plan
in the next 1 year
the increased market demands
in Vietnam, the company will
expand business actively and
master the advantages of
existed markets in future.
Engineering business will be
expanded gradually. It will
make a profit instead of
suffering a loss and have
balances to the parent
company's investment
benefits.
industry
development.
PT Marketech International
Indonesia
( PTMII)
Directly invested
subsidiary of the
Company
99.92% 35,649 124 Company business was still in
development in 2017, affecting
its current period’s profitability
mainly by bank interest receipt
and exchange gains.
PTMII mainly focuses on
international trade on
machinery and components.
In the future, we also plan to
increase sales expansion in
cooperation with the increase
in market demand in
Indonesia to effectively grasp
the market advantage by
increasing the scales of
international trade. Thus, we
expect to increase profit to
ensure the beneficial
investment return of the
parent company on us.
Take timely
assessment
according to the
market
requirements and
industry
development.
eZoom Information, Inc.
(shortened as
“eZoom”)
Directly invested
subsidiary of the
Company
100% 31,690 (1,835) Company business expansion
falls short of expected in 2017,
as its income in computer
information and cloud
computing and related
EZoom is mainly engaged in
software building tenders and
self-developed software
business with cloud
application services. The
Take timely
assessment
according to the
market
requirements and
~181~
Name of Invested
Company Description
Direct or
indirect
shareholding
ratio of the
company
Ending
investment
book amount
(Note 2)
Current Term
(Losses)
Benefits of
Invested
Company
Major Caused of Benefits or
Losses Improvement Plan
Investment Plan
in the next 1 year
integration technology falls
short of covering the operating
cost and expenditure to result in
deficit.
company is now in business
and human power integration
stage. It will expand
information and cloud
business. It will make a profit
instead of suffering a loss and
have balances to the parent
company's investment
benefits.
industry
development.
ADAT Technology Co.,
LTD. (shortened as
“ADAT”)
Invested company of the
Company adopting equity
method
83.33% 6,029 (4,765) Company business was still in
development in 2017, resulting
in operating losses.
ADAT primarily operates in
information software R&D,
application and services, and
with said company currently
at operations and manpower
integrating stage, it is actively
developing its information
and AI business, and is
expected to contribute
investment gains to the parent
company.
Take timely
assessment
according to the
market
requirements and
industry
development.
Glory Technology
Service Inc. (shortened
as “Glory)
Invested company of the
Company adopting equity
method
34.11% 46,153 9,152 Main benefits in 2017 were
caused by actively business
expanding and effectively
grasping the market tendency, so
that the business income and
profits were all in growth
tendency.
The company will continue
developing new business to
increase benefits.
Take timely
assessment
according to the
market
requirements and
industry
development.
MIC techno Co., Ltd. Invested company of the
Company adopting equity
method
20% 1,849 (76) Company business expansion
falls short of expected in 2017, as
its operating income falls short of
covering the operating cost and
expenditure to result in deficit.
Huaxuan is mainly engaged in
panel equipments and
materials sales. The company
will continue developing new
business to increase benefits,
Take timely
assessment
according to the
market
requirements and
~182~
Name of Invested
Company Description
Direct or
indirect
shareholding
ratio of the
company
Ending
investment
book amount
(Note 2)
Current Term
(Losses)
Benefits of
Invested
Company
Major Caused of Benefits or
Losses Improvement Plan
Investment Plan
in the next 1 year
including development and
marketing of laminating
machine. The company will
enter into touch panel area,
and seek sales and OEM
opportunities of touch panel
materials and products. It will
improve operation
performance.
industry
development.
Marketech Ntherlands
B.V. (shortened as
MNBV)
Invested company of the
Company adopting equity
method
100% 10,453 (211) Company business was still in
development in 2017, resulting
in operating losses.
MNBV primarily operates in
machinery, equipment, parts
sales and technical services,
with said company currently
at operations and manpower
integrating stage, it is actively
expanding its operations and
effectively seizing its market
edge, and is expected to
achieve a turnaround, to
contribute investment gains to
the parent company.
Take timely
assessment
according to the
market
requirements and
industry
development.
Marketech International
Sdn. Bhd.
(shortened as MISB)
Invested company of the
Company adopting equity
method
51.12% 29,533 5,079 Its 2017 profitability mainly
attributes to a steady business
development, buoying its
revenue and profitability
growth, and which also suffices
to cover its operating cost and
expenditure.
MISB mainly engages in the
contracting services of
automated supply systems for
the semiconductor industry.
While the demand in
South-East Asia is increasing,
the Company aims to
proactively expand its
business while mastering its
advantages in current market
and the scale of its
Take timely
assessment
according to the
market
requirements and
industry
development.
~183~
Name of Invested
Company Description
Direct or
indirect
shareholding
ratio of the
company
Ending
investment
book amount
(Note 2)
Current Term
(Losses)
Benefits of
Invested
Company
Major Caused of Benefits or
Losses Improvement Plan
Investment Plan
in the next 1 year
engineering services will
gradually increased with an
expectation to turn the deficit
into surplus profits. This
surely will bring positive
influences to the parent
company's investment.
Indirect investment
MIC-Tech Ventures
Asia Pacific Inc.
(shortened as
MIC-Tech Ventures)
Shift invested subsidiary
of SubsidiaryMarket Go
100% 1,037,010 (74,747) It is the holding company of
abroad shift investment business.
Investment losses in 2017 were
mainly caused by losses of
directly and indirectly invested
subsidiary in mainland.
Not applicable. Take timely
assessment
according to the
market
requirements and
industry
development.
Marketech International
Sdn. Bhd.
(shortened as MISB)
Shift invested subsidiary
of Subsidiary MIPL
48.88% 29,378 5,079 Its 2017 profitability mainly
attributes to a steady business
development, buoying its
revenue and profitability
growth, and which also suffices
to cover its operating cost and
expenditure.
MISB is mainly engaged in
automation supply systems
business in the semiconductor
industry. With the increased
market demands in Southeast
Asia, he company will expand
business actively and master
the advantages of existed
markets in future. Engineering
business will be expanded
gradually. It will make a profit
instead of suffering a loss and
have balances to the parent
company's investment
benefits.
Take timely
assessment
according to the
market
requirements and
industry
development.
Marketech Integrated
Construction Co., Ltd.
Shift invested subsidiary
of Subsidiary MEPL
95% 1,906 (2,101) Company business expansion
falls short of expected in 2017,
MICCis mainly engaged in
mechanical and electrical
Take timely
assessment
~184~
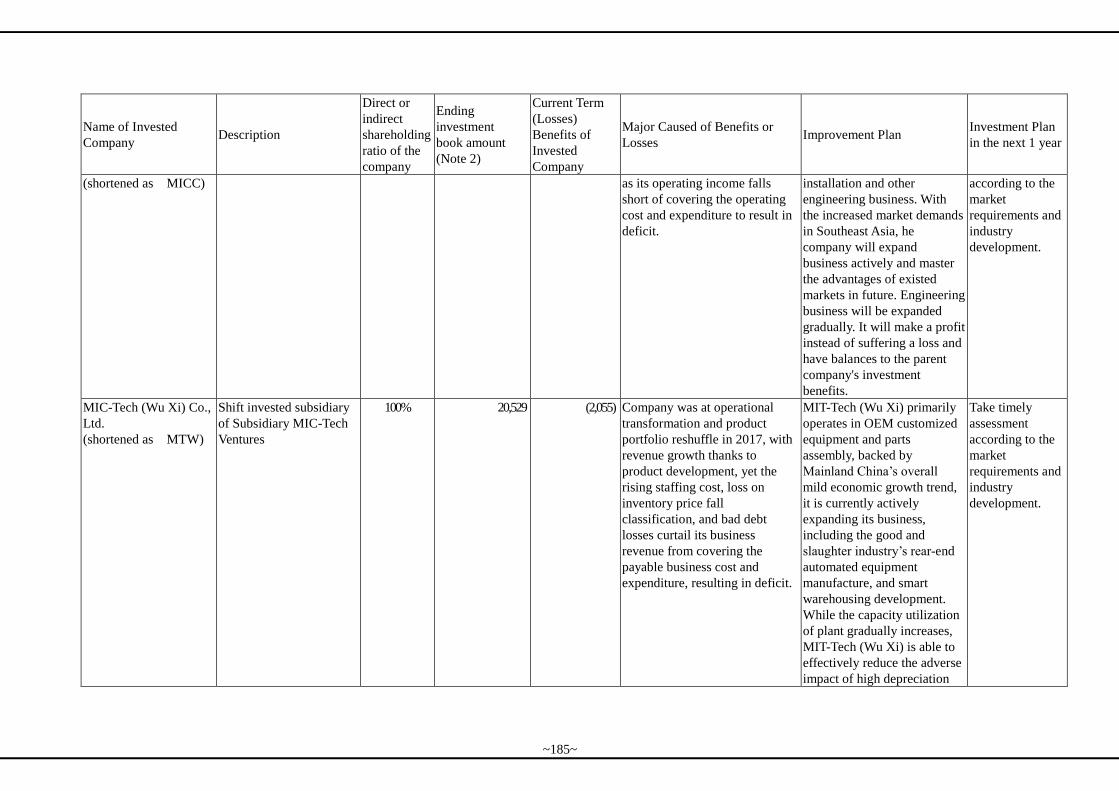
Name of Invested
Company Description
Direct or
indirect
shareholding
ratio of the
company
Ending
investment
book amount
(Note 2)
Current Term
(Losses)
Benefits of
Invested
Company
Major Caused of Benefits or
Losses Improvement Plan
Investment Plan
in the next 1 year
(shortened as MICC) as its operating income falls
short of covering the operating
cost and expenditure to result in
deficit.
installation and other
engineering business. With
the increased market demands
in Southeast Asia, he
company will expand
business actively and master
the advantages of existed
markets in future. Engineering
business will be expanded
gradually. It will make a profit
instead of suffering a loss and
have balances to the parent
company's investment
benefits.
according to the
market
requirements and
industry
development.
MIC-Tech (Wu Xi) Co.,
Ltd.
(shortened as MTW)
Shift invested subsidiary
of Subsidiary MIC-Tech
Ventures
100% 20,529 (2,055) Company was at operational
transformation and product
portfolio reshuffle in 2017, with
revenue growth thanks to
product development, yet the
rising staffing cost, loss on
inventory price fall
classification, and bad debt
losses curtail its business
revenue from covering the
payable business cost and
expenditure, resulting in deficit.
MIT-Tech (Wu Xi) primarily
operates in OEM customized
equipment and parts
assembly, backed by
Mainland China’s overall
mild economic growth trend,
it is currently actively
expanding its business,
including the good and
slaughter industry’s rear-end
automated equipment
manufacture, and smart
warehousing development.
While the capacity utilization
of plant gradually increases,
MIT-Tech (Wu Xi) is able to
effectively reduce the adverse
impact of high depreciation
Take timely
assessment
according to the
market
requirements and
industry
development.
~185~
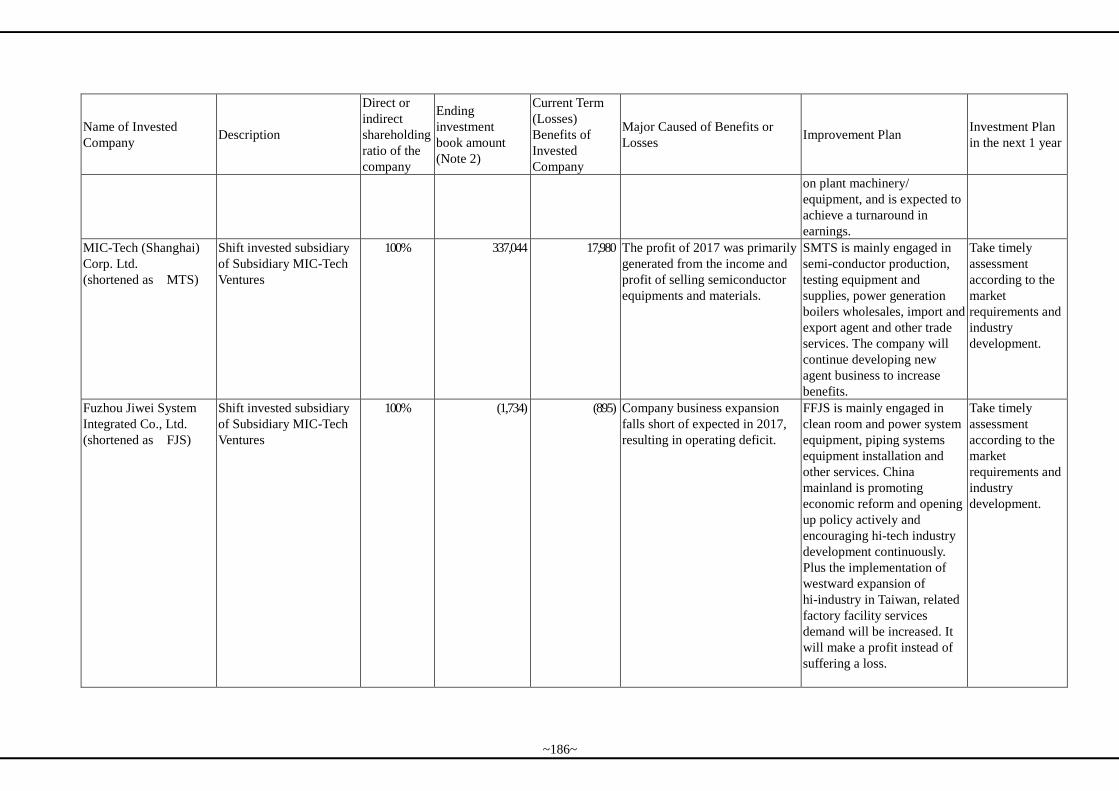
Name of Invested
Company Description
Direct or
indirect
shareholding
ratio of the
company
Ending
investment
book amount
(Note 2)
Current Term
(Losses)
Benefits of
Invested
Company
Major Caused of Benefits or
Losses Improvement Plan
Investment Plan
in the next 1 year
on plant machinery/
equipment, and is expected to
achieve a turnaround in
earnings.
MIC-Tech (Shanghai)
Corp. Ltd.
(shortened as MTS)
Shift invested subsidiary
of Subsidiary MIC-Tech
Ventures
100% 337,044 17,980 The profit of 2017 was primarily
generated from the income and
profit of selling semiconductor
equipments and materials.
SMTS is mainly engaged in
semi-conductor production,
testing equipment and
supplies, power generation
boilers wholesales, import and
export agent and other trade
services. The company will
continue developing new
agent business to increase
benefits.
Take timely
assessment
according to the
market
requirements and
industry
development.
Fuzhou Jiwei System
Integrated Co., Ltd.
(shortened as FJS)
Shift invested subsidiary
of Subsidiary MIC-Tech
Ventures
100% (1,734) (895) Company business expansion
falls short of expected in 2017,
resulting in operating deficit.
FFJS is mainly engaged in
clean room and power system
equipment, piping systems
equipment installation and
other services. China
mainland is promoting
economic reform and opening
up policy actively and
encouraging hi-tech industry
development continuously.
Plus the implementation of
westward expansion of
hi-industry in Taiwan, related
factory facility services
demand will be increased. It
will make a profit instead of
suffering a loss.
Take timely
assessment
according to the
market
requirements and
industry
development.
~186~
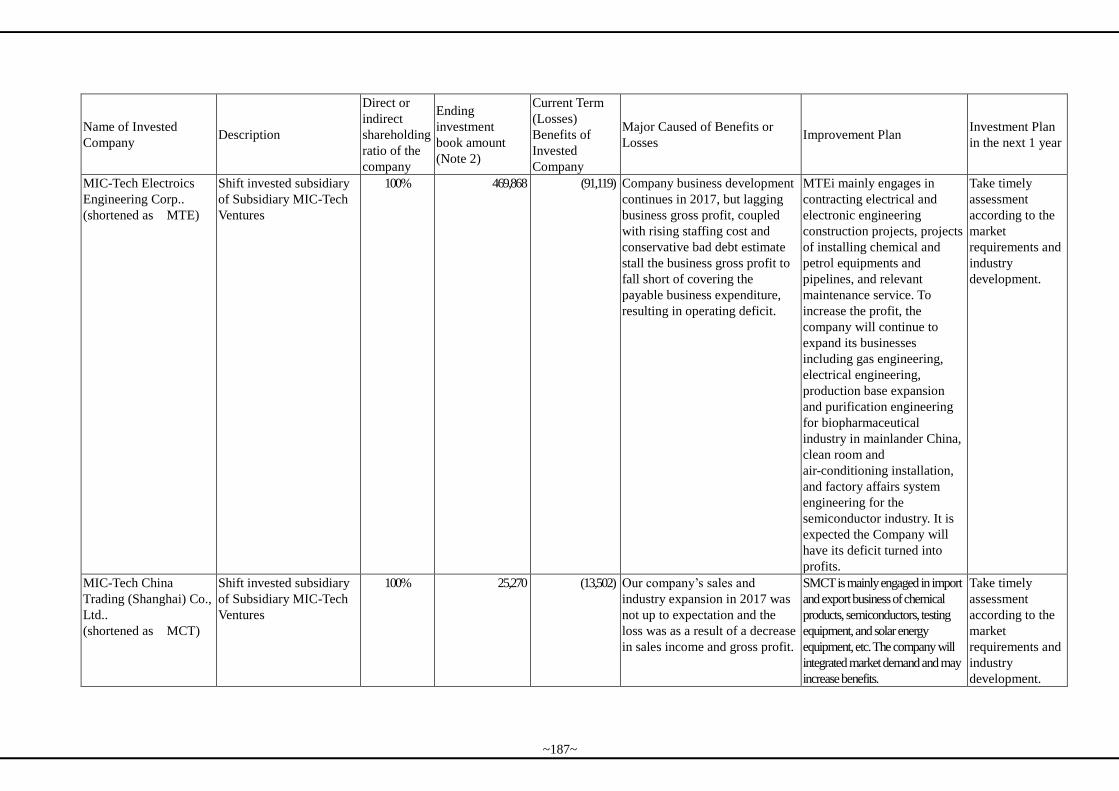
Name of Invested
Company Description
Direct or
indirect
shareholding
ratio of the
company
Ending
investment
book amount
(Note 2)
Current Term
(Losses)
Benefits of
Invested
Company
Major Caused of Benefits or
Losses Improvement Plan
Investment Plan
in the next 1 year
MIC-Tech Electroics
Engineering Corp..
(shortened as MTE)
Shift invested subsidiary
of Subsidiary MIC-Tech
Ventures
100% 469,868 (91,119) Company business development
continues in 2017, but lagging
business gross profit, coupled
with rising staffing cost and
conservative bad debt estimate
stall the business gross profit to
fall short of covering the
payable business expenditure,
resulting in operating deficit.
MTEi mainly engages in
contracting electrical and
electronic engineering
construction projects, projects
of installing chemical and
petrol equipments and
pipelines, and relevant
maintenance service. To
increase the profit, the
company will continue to
expand its businesses
including gas engineering,
electrical engineering,
production base expansion
and purification engineering
for biopharmaceutical
industry in mainlander China,
clean room and
air-conditioning installation,
and factory affairs system
engineering for the
semiconductor industry. It is
expected the Company will
have its deficit turned into
profits.
Take timely
assessment
according to the
market
requirements and
industry
development.
MIC-Tech China
Trading (Shanghai) Co.,
Ltd..
(shortened as MCT)
Shift invested subsidiary
of Subsidiary MIC-Tech
Ventures
100% 25,270 (13,502) Our company’s sales and
industry expansion in 2017 was
not up to expectation and the
loss was as a result of a decrease
in sales income and gross profit.
SMCT is mainly engaged in import
and export business of chemical
products, semiconductors, testing
equipment, and solar energy
equipment, etc. The company will
integrated market demand and may
increase benefits.
Take timely
assessment
according to the
market
requirements and
industry
development.
~187~
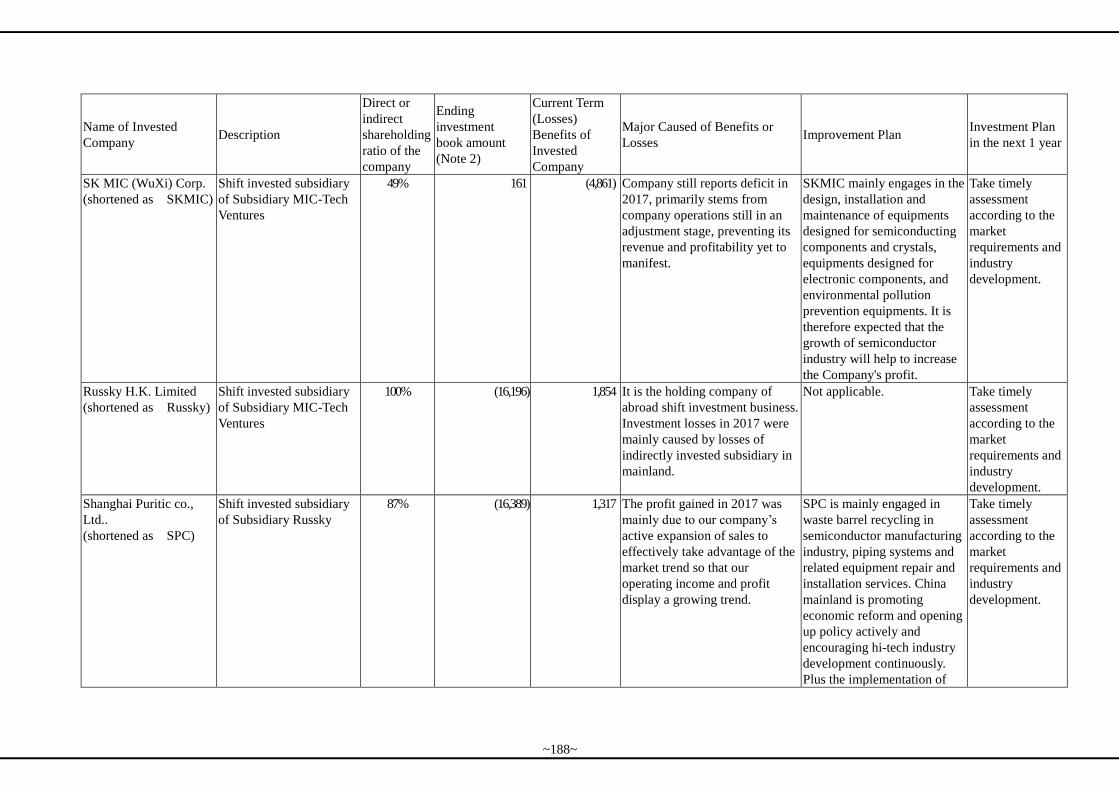
Name of Invested
Company Description
Direct or
indirect
shareholding
ratio of the
company
Ending
investment
book amount
(Note 2)
Current Term
(Losses)
Benefits of
Invested
Company
Major Caused of Benefits or
Losses Improvement Plan
Investment Plan
in the next 1 year
SK MIC (WuXi) Corp.
(shortened as SKMIC)
Shift invested subsidiary
of Subsidiary MIC-Tech
Ventures
49% 161 (4,861) Company still reports deficit in
2017, primarily stems from
company operations still in an
adjustment stage, preventing its
revenue and profitability yet to
manifest.
SKMIC mainly engages in the
design, installation and
maintenance of equipments
designed for semiconducting
components and crystals,
equipments designed for
electronic components, and
environmental pollution
prevention equipments. It is
therefore expected that the
growth of semiconductor
industry will help to increase
the Company's profit.
Take timely
assessment
according to the
market
requirements and
industry
development.
Russky H.K. Limited
(shortened as Russky)
Shift invested subsidiary
of Subsidiary MIC-Tech
Ventures
100% (16,196) 1,854 It is the holding company of
abroad shift investment business.
Investment losses in 2017 were
mainly caused by losses of
indirectly invested subsidiary in
mainland.
Not applicable. Take timely
assessment
according to the
market
requirements and
industry
development.
Shanghai Puritic co.,
Ltd..
(shortened as SPC)
Shift invested subsidiary
of Subsidiary Russky
87% (16,389) 1,317 The profit gained in 2017 was
mainly due to our company’s
active expansion of sales to
effectively take advantage of the
market trend so that our
operating income and profit
display a growing trend.
SPC is mainly engaged in
waste barrel recycling in
semiconductor manufacturing
industry, piping systems and
related equipment repair and
installation services. China
mainland is promoting
economic reform and opening
up policy actively and
encouraging hi-tech industry
development continuously.
Plus the implementation of
Take timely
assessment
according to the
market
requirements and
industry
development.
~188~
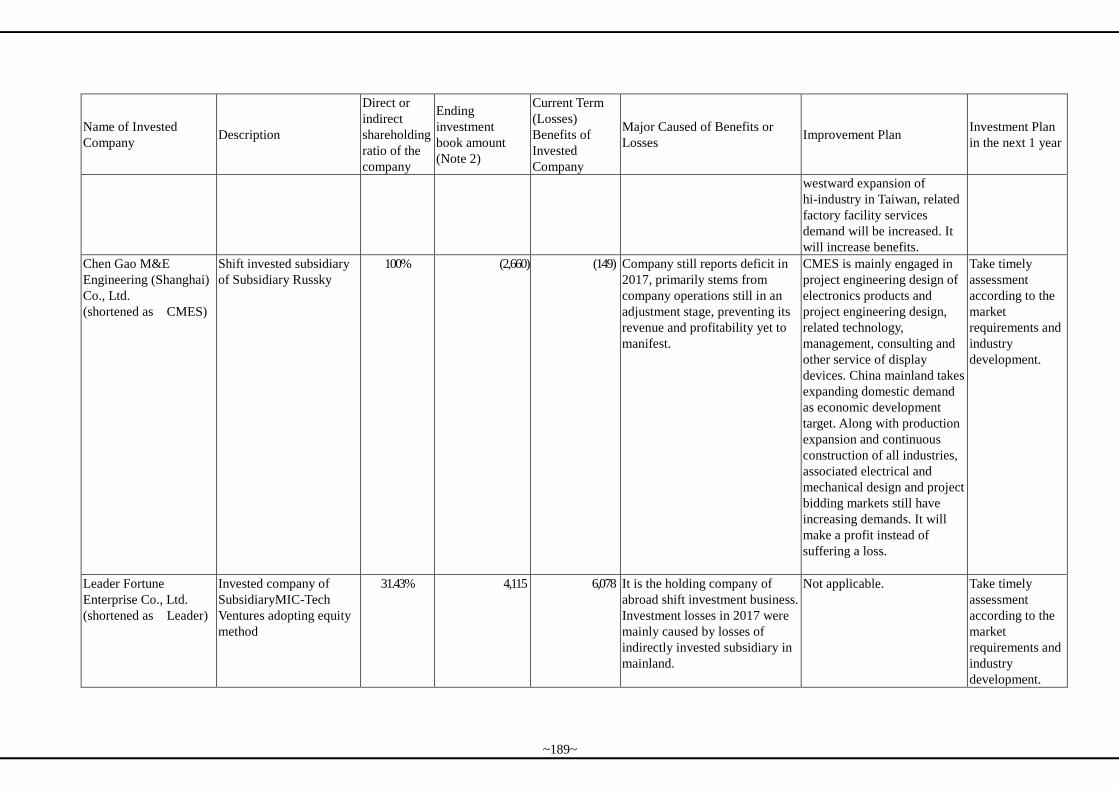
Name of Invested
Company Description
Direct or
indirect
shareholding
ratio of the
company
Ending
investment
book amount
(Note 2)
Current Term
(Losses)
Benefits of
Invested
Company
Major Caused of Benefits or
Losses Improvement Plan
Investment Plan
in the next 1 year
westward expansion of
hi-industry in Taiwan, related
factory facility services
demand will be increased. It
will increase benefits.
Chen Gao M&E
Engineering (Shanghai)
Co., Ltd.
(shortened as CMES)
Shift invested subsidiary
of Subsidiary Russky
100% (2,660) (149) Company still reports deficit in
2017, primarily stems from
company operations still in an
adjustment stage, preventing its
revenue and profitability yet to
manifest.
CMES is mainly engaged in
project engineering design of
electronics products and
project engineering design,
related technology,
management, consulting and
other service of display
devices. China mainland takes
expanding domestic demand
as economic development
target. Along with production
expansion and continuous
construction of all industries,
associated electrical and
mechanical design and project
bidding markets still have
increasing demands. It will
make a profit instead of
suffering a loss.
Take timely
assessment
according to the
market
requirements and
industry
development.
Leader Fortune
Enterprise Co., Ltd.
(shortened as Leader)
Invested company of
SubsidiaryMIC-Tech
Ventures adopting equity
method
31.43% 4,115 6,078 It is the holding company of
abroad shift investment business.
Investment losses in 2017 were
mainly caused by losses of
indirectly invested subsidiary in
mainland.
Not applicable. Take timely
assessment
according to the
market
requirements and
industry
development.
~189~
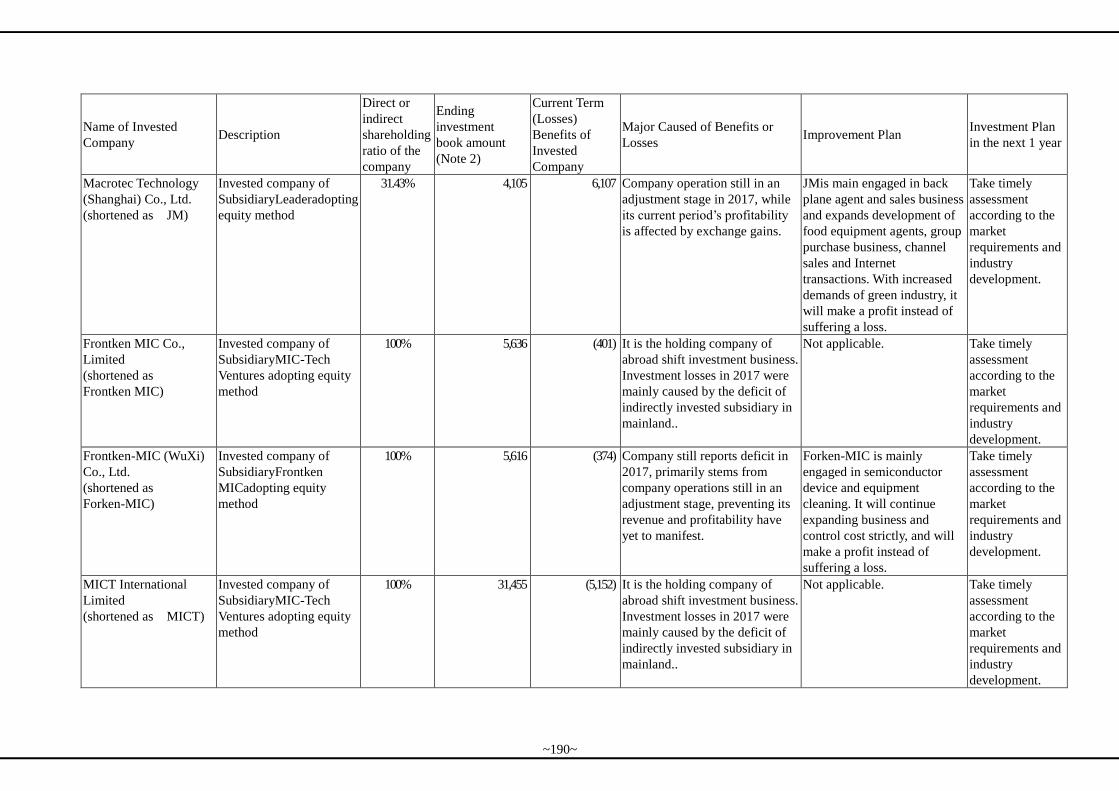
Name of Invested
Company Description
Direct or
indirect
shareholding
ratio of the
company
Ending
investment
book amount
(Note 2)
Current Term
(Losses)
Benefits of
Invested
Company
Major Caused of Benefits or
Losses Improvement Plan
Investment Plan
in the next 1 year
Macrotec Technology
(Shanghai) Co., Ltd.
(shortened as JM)
Invested company of
SubsidiaryLeaderadopting
equity method
31.43% 4,105 6,107 Company operation still in an
adjustment stage in 2017, while
its current period’s profitability
is affected by exchange gains.
JMis main engaged in back
plane agent and sales business
and expands development of
food equipment agents, group
purchase business, channel
sales and Internet
transactions. With increased
demands of green industry, it
will make a profit instead of
suffering a loss.
Take timely
assessment
according to the
market
requirements and
industry
development.
Frontken MIC Co.,
Limited
(shortened as
Frontken MIC)
Invested company of
SubsidiaryMIC-Tech
Ventures adopting equity
method
100% 5,636 (401) It is the holding company of
abroad shift investment business.
Investment losses in 2017 were
mainly caused by the deficit of
indirectly invested subsidiary in
mainland..
Not applicable. Take timely
assessment
according to the
market
requirements and
industry
development.
Frontken-MIC (WuXi)
Co., Ltd.
(shortened as
Forken-MIC)
Invested company of
SubsidiaryFrontken
MICadopting equity
method
100% 5,616 (374) Company still reports deficit in
2017, primarily stems from
company operations still in an
adjustment stage, preventing its
revenue and profitability have
yet to manifest.
Forken-MIC is mainly
engaged in semiconductor
device and equipment
cleaning. It will continue
expanding business and
control cost strictly, and will
make a profit instead of
suffering a loss.
Take timely
assessment
according to the
market
requirements and
industry
development.
MICT International
Limited
(shortened as MICT)
Invested company of
SubsidiaryMIC-Tech
Ventures adopting equity
method
100% 31,455 (5,152) It is the holding company of
abroad shift investment business.
Investment losses in 2017 were
mainly caused by the deficit of
indirectly invested subsidiary in
mainland..
Not applicable. Take timely
assessment
according to the
market
requirements and
industry
development.
~190~
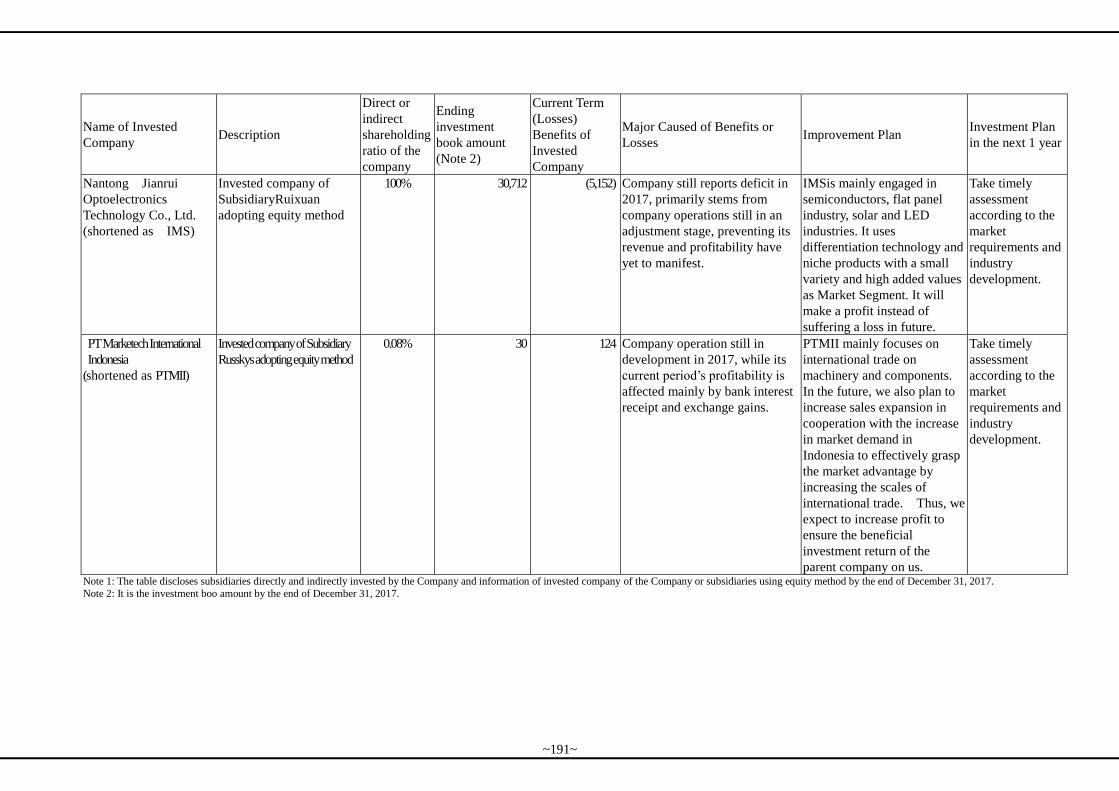
Name of Invested
Company Description
Direct or
indirect
shareholding
ratio of the
company
Ending
investment
book amount
(Note 2)
Current Term
(Losses)
Benefits of
Invested
Company
Major Caused of Benefits or
Losses Improvement Plan
Investment Plan
in the next 1 year
Nantong Jianrui
Optoelectronics
Technology Co., Ltd.
(shortened as IMS)
Invested company of
SubsidiaryRuixuan
adopting equity method
100% 30,712 (5,152) Company still reports deficit in
2017, primarily stems from
company operations still in an
adjustment stage, preventing its
revenue and profitability have
yet to manifest.
IMSis mainly engaged in
semiconductors, flat panel
industry, solar and LED
industries. It uses
differentiation technology and
niche products with a small
variety and high added values
as Market Segment. It will
make a profit instead of
suffering a loss in future.
Take timely
assessment
according to the
market
requirements and
industry
development.
PT Marketech International
Indonesia
(shortened as PTMII)
Invested company of Subsidiary
Russkys adopting equity method
0.08% 30 124 Company operation still in
development in 2017, while its
current period’s profitability is
affected mainly by bank interest
receipt and exchange gains.
PTMII mainly focuses on
international trade on
machinery and components.
In the future, we also plan to
increase sales expansion in
cooperation with the increase
in market demand in
Indonesia to effectively grasp
the market advantage by
increasing the scales of
international trade. Thus, we
expect to increase profit to
ensure the beneficial
investment return of the
parent company on us.
Take timely
assessment
according to the
market
requirements and
industry
development.
Note 1: The table discloses subsidiaries directly and indirectly invested by the Company and information of invested company of the Company or subsidiaries using equity method by the end of December 31, 2017.
Note 2: It is the investment boo amount by the end of December 31, 2017.
~191~
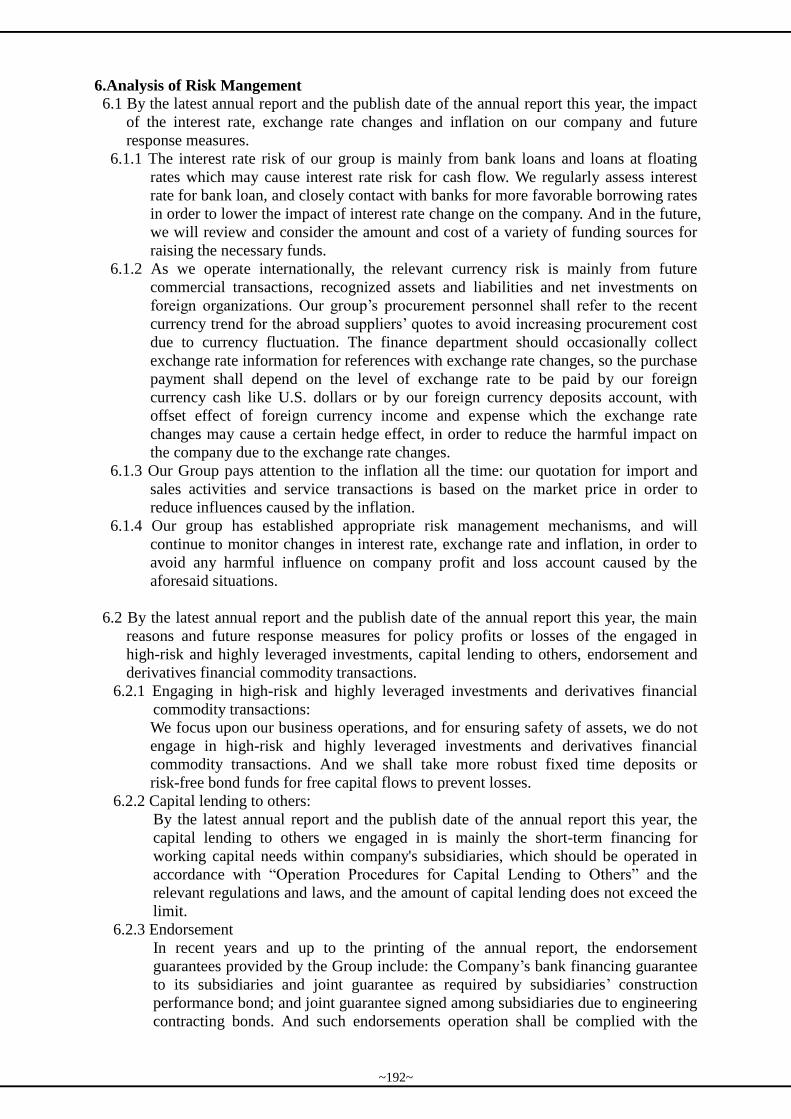
6.Analysis of Risk Mangement
6.1 By the latest annual report and the publish date of the annual report this year, the impact
of the interest rate, exchange rate changes and inflation on our company and future
response measures.
6.1.1 The interest rate risk of our group is mainly from bank loans and loans at floating
rates which may cause interest rate risk for cash flow. We regularly assess interest
rate for bank loan, and closely contact with banks for more favorable borrowing rates
in order to lower the impact of interest rate change on the company. And in the future,
we will review and consider the amount and cost of a variety of funding sources for
raising the necessary funds.
6.1.2 As we operate internationally, the relevant currency risk is mainly from future
commercial transactions, recognized assets and liabilities and net investments on
foreign organizations. Our group’s procurement personnel shall refer to the recent
currency trend for the abroad suppliers’ quotes to avoid increasing procurement cost
due to currency fluctuation. The finance department should occasionally collect
exchange rate information for references with exchange rate changes, so the purchase
payment shall depend on the level of exchange rate to be paid by our foreign
currency cash like U.S. dollars or by our foreign currency deposits account, with
offset effect of foreign currency income and expense which the exchange rate
changes may cause a certain hedge effect, in order to reduce the harmful impact on
the company due to the exchange rate changes.
6.1.3 Our Group pays attention to the inflation all the time: our quotation for import and
sales activities and service transactions is based on the market price in order to
reduce influences caused by the inflation.
6.1.4 Our group has established appropriate risk management mechanisms, and will
continue to monitor changes in interest rate, exchange rate and inflation, in order to
avoid any harmful influence on company profit and loss account caused by the
aforesaid situations.
6.2 By the latest annual report and the publish date of the annual report this year, the main
reasons and future response measures for policy profits or losses of the engaged in
high-risk and highly leveraged investments, capital lending to others, endorsement and
derivatives financial commodity transactions.
6.2.1 Engaging in high-risk and highly leveraged investments and derivatives financial
commodity transactions:
We focus upon our business operations, and for ensuring safety of assets, we do not
engage in high-risk and highly leveraged investments and derivatives financial
commodity transactions. And we shall take more robust fixed time deposits or
risk-free bond funds for free capital flows to prevent losses.
6.2.2 Capital lending to others:
By the latest annual report and the publish date of the annual report this year, the
capital lending to others we engaged in is mainly the short-term financing for
working capital needs within company's subsidiaries, which should be operated in
accordance with “Operation Procedures for Capital Lending to Others” and the
relevant regulations and laws, and the amount of capital lending does not exceed the
limit.
6.2.3 Endorsement
In recent years and up to the printing of the annual report, the endorsement
guarantees provided by the Group include: the Company’s bank financing guarantee
to its subsidiaries and joint guarantee as required by subsidiaries’ construction
performance bond; and joint guarantee signed among subsidiaries due to engineering
contracting bonds. And such endorsements operation shall be complied with the
~192~
“Endorsement Operation Procedure” and the relevant regulations and laws, and the
amount of endorsements does not exceed the limit.
6.3 The future R&D Plan and estimated R&D cost of the latest year and by the annual
report’s publish date.
6.3.1 The future R&D plan
Our company’s research and development team has integration capability of
high-tech process, automatic control and precision machinery technology in
developing high-tech system equipment, which has achieved superb results. Some
key technologies are briefly described as below:
The Latest Annual R&D Plan Process
Technology Automatic Control Precision Machinery
LED wafer thickness and flatness
measurement technology
PSS process Precision measurement 3D measurement probe, robotic
arm platform
6.3.2 The estimated R&D cost:
The Latest Annual R&D Plan Current
progress
Further required
R&D Cost
Expected Mass
Production Start Time
Key Factors Influencing
Success of Future R&D
LED wafer thickness and flatness measurement technology
98% NT$0 2018 Yield rate and examination speed required by the product
6.4 By the latest annual report and the publish date of the annual report this year, the impact
of important domestic and international policy and legislation changes on the
company's financial operations and response measures.
Recent domestic and foreign policy and legislation changes have no obvious effects on
our current operations. We will closely monitor the important domestic and foreign
policy and legislation changes, and under the quickest condition, assist in the company's
internal transformation and change to enhance the overall operation capacity.
6.5 The impact of technological and industry changes on the company's finances and the
response measures for the most recent year and the latest annual report:
The company has dedicated staff that collects the latest industry dynamics and market
information. With a strong management team and experienced and excellent
professionals, the company has rich experience in market development, customer
relationship management, marketing and adaptiveness to industry changes, allowing
itself to flexibly react to market dynamics, customer demand, technological
development and supply and demand. The company also actively integrates and
introduces advanced products and technology in the role of a supplier and a marketer,
instantly and consistently delivers products and the supporting services of applications.
Overall, technological change can bring more opportunities to the company's business
development.
As the market development has gradually shifted to Asia, and with the globalization
strategy and the establishment of oversea operations of the technology industry in
general, the company establishes offices in China (Shanghai, Wuxi and others),
Singapore, Malaysia, Vietnam, Myanmar, Indonesia and Korea to expand its business
and serve more clients. In response to technological development, the company
provides international sales of advanced technology, high-tech equipments and
materials to reduce the communication barrier.
The company will make good use of technological and industry changes to enhance its
business management capacity and reduce cost to improve the overall competitiveness.
6.6 The impact of image change on the company's risk management and the response
measures for the most recent year and the latest annual report:
The corporate image has always been about modesty and stability. The company also
operates honestly and maintains the shareholders' best interests for the company
~193~
philosophy. In addition to improving business growth, the company also strives for
transparency and enhances the relationship with shareholders and various investment
institutions. If the media or the outside parties have any questions, the company
maintains its openness and transparency and quickly offers explanation to achieve
active communication.
6.7 The expected benefits, possible risk and the response measures of acquisitions of the
most recent year and the latest annual report: None.
6.8 The expected benefits, possible risk and the response measures of plant expansion of the
most recent year and the latest annual report:
6.8.1 The group has newly added of its Tainan Science-based Industrial Park III plant in
the current year in response of a productivity expansion for maintaining a high
shipping demand and resolving production area deficiency, and as the groups’
Tainan Science-based Industrial Park plants are in full capacity, a new Tainan
Science-based Industrial Park III plant has been added, as evaluated from a
sustainable management approach, which is conducive in excelling the group’s
operational development and overall compatibility.
6.8.2 The group has added a new Myanmar plant for making an inroad into the ASEAN
market, by which to instill a competitive edge in the Southeast Asia market, and
to support the group’s existing development in ASEAN countries and venturing
into other markets, which is conducive in excelling the group’s market
expansion.
6.9 The risks and the response measures of purchase and sales of the most recent year and
the latest annual report:
1. Risks and the response measures for purchase: None.
2. Risks and the response measures for sales: None.
6.10 The impact and the risks of directors, supervisors and major shareholders with more
than ten percent of the equity and the transfer or change of equity in large volume and
the response measures for the most recent year and the latest annual report:
There is no large equity transfer for the directors and major shareholders with more
than ten percent of the equity.
6.11 The impact and risks of changes in right to operate and the response measures for the
most recent year and the latest annual report:
The company has never experienced ownership change since its founding.
6.12 For the most recent year and the latest annual report, any litigation and non-litigation
cases of the company, directors, supervisors, general manager, person in charge, major
shareholders with more than ten percent of the equity and the subsidiaries should be
clearly listed. For the results that can potentially present huge impact to the rights of
shareholders and share price, the dispute, money, lawsuits starting date and the major
parties to the suit should be disclosed:None
6.13 Other major risks and the response measures of the most recent year and the latest
annual report:None
7.Other Important Matters: None.
~194~
Part 8. Special Disclosures
1.Information related to the Company’s Affiliates
1.1 Consolidated report on subsidiaries
1.1.1. Organization profile of subsidiaries
(1) Organizational chart of subsidiaries
(2) Controlled company and affiliation under the presumption of Article 369-3 of the Company Law: None.
(3) Affiliation with personnel, finances or business operations directly or indirectly controlled by the company under the second item of Article 369-2 of
the Company Law: None.
~195~
1.1.2. Basic information of subsidiaries
Company Name Date of establishment Address Paid in capital
Main businesses or production Original currency NTD (in thousands)
Marketech Integrated Pte. Ltd. Jul. 10, 1997 86 KaKi Bukit Industrial Terrace, Singapore
416166 SGD 8,225,040 183,089 Handles the business of automated supply system in the
semiconductor industry
Market Go Profits Ltd. Dec. 20, 2000 P.O. Box 957 Offshore Incorporations Centre,
Road Town, Tortola, British Virgin Islands USD 38,369,104 1,141,865 Engaged in holdings and reinvestment
Headquarter International Ltd. Dec. 10, 2002 P.O. Box 957 Offshore Incorporations Centre, Road Town, Tortola, British Virgin Islands USD 1,289,367 38,372 Engaged in holdings and reinvestment
Tiger United Finance Ltd. Oct. 9, 2002 P.O. Box 957 Offshore Incorporations Centre,
Road Town, Tortola, British Virgin Islands USD 1,410,367 41,973 Engaged in holdings and reinvestment
MIC-Tech Global Corp. Oct. 18, 2004
RM918,Hyundai Office Bldg,9-4,Sunae
1-dong,Bundang-gu,Seongnam-si, Gyeonggi-do,Korea
ARW 657,800,000 18,497 General international trade
MIC-Tech Viet Nam Co., Ltd. Jan. 22, 2010 7F, No 36, Hoang Cau street, O Cho Dua Ward, Dong Da District,Ha Noi City, Vietnam USD 1,300,000 38,688
Trading, installation and maintenance of various industrial machinery, equipments and supplies
Marketech Co., Ltd.
Jun 13, 2001
No 72 , Le Thanh Ton Street , Ben Nghe
Ward , 1 District .Ho Chi Minh City, Viet Nam USD 1,000,000 29,760 Construction contracting and the related repair business
MIC-Tech Ventures Asia Pacific Inc.
Feb. 1, 2001
Huntlaw Building, P.O. Box 2804, George
Town, Grand Cayman, Cayman Islands USD 38,266,604 1,138,814 Engaged in holdings and reinvestment
Marketech International Sdn. Bhd. Feb. 10, 2009 36-02, Bilik 2, Jalan Molek 1/10Taman Molek, 81400 Johor Bahru Johor, Malaysia MYR 12,242,750 86,581
Handles the business of automated supply system in the semiconductor industry
Russky H.K. Limited Dec .17, 1992 Rm 1401, The Centre Mark, 287-299 Queen's
Road Central, Hong Kong USD 833,000 24,790 Engaged in holdings and reinvestment
Marketech Engineering Pte. Ltd. Nov. 28, 2013 86 Kaki Bukit Industrial Terrace Singapore
416166 SGD 421,087 9,373
Handles mechanical and electrical installation and
engineering businesses
Marketech Integrated Construction Co.,
Ltd. Mar. 19, 2014
67/A, Htan Tapin Street, Kamayut Township,
Yangon USD 300,000 8,928
Handles mechanical and electrical installation and
engineering businesses
Marketech Integrated Manufacturing
Company Limited
Mar. 19, 2015 Lot No. B12, Tailawa Special Economic Zone
A, Yangon Region, Myanmar USD 14,000,000 416,640
Design, production and assembly services for
equipments and components of automated production
machines.
PT. Marketech International Indonesia Oct. 18, 2016 VIP Chamber#2, Wisma GKBI Lt. 39 J1. Jend. Sudirman No. 28, Jakarta Pusat, Indonesia
USD 1,200,000 35,712 Trading machinery and equipment
~196~
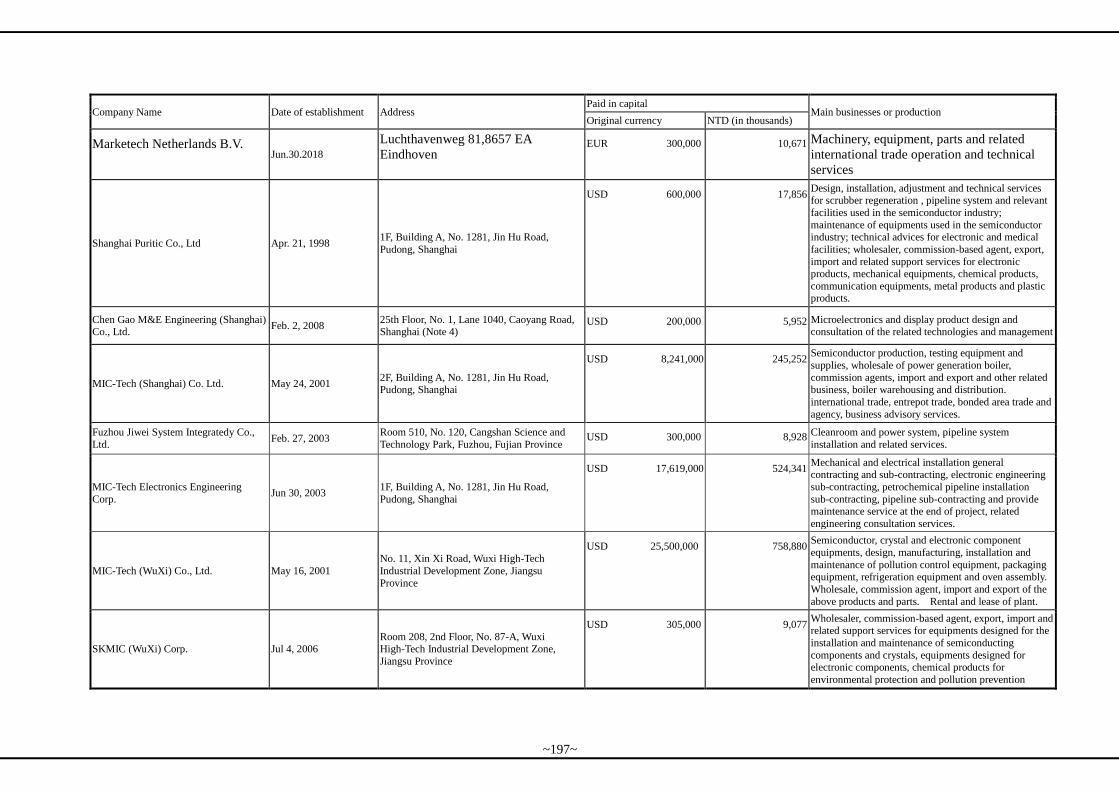
Company Name Date of establishment Address Paid in capital
Main businesses or production Original currency NTD (in thousands)
Marketech Netherlands B.V. Jun.30.2018
Luchthavenweg 81,8657 EA
Eindhoven EUR 300,000 10,671 Machinery, equipment, parts and related
international trade operation and technical
services
Shanghai Puritic Co., Ltd Apr. 21, 1998 1F, Building A, No. 1281, Jin Hu Road,
Pudong, Shanghai
USD 600,000 17,856 Design, installation, adjustment and technical services for scrubber regeneration , pipeline system and relevant
facilities used in the semiconductor industry;
maintenance of equipments used in the semiconductor industry; technical advices for electronic and medical
facilities; wholesaler, commission-based agent, export,
import and related support services for electronic products, mechanical equipments, chemical products,
communication equipments, metal products and plastic products.
Chen Gao M&E Engineering (Shanghai) Co., Ltd.
Feb. 2, 2008 25th Floor, No. 1, Lane 1040, Caoyang Road, Shanghai (Note 4)
USD 200,000 5,952 Microelectronics and display product design and consultation of the related technologies and management
MIC-Tech (Shanghai) Co. Ltd. May 24, 2001 2F, Building A, No. 1281, Jin Hu Road, Pudong, Shanghai
USD 8,241,000 245,252 Semiconductor production, testing equipment and
supplies, wholesale of power generation boiler,
commission agents, import and export and other related business, boiler warehousing and distribution.
international trade, entrepot trade, bonded area trade and
agency, business advisory services.
Fuzhou Jiwei System Integratedy Co.,
Ltd. Feb. 27, 2003
Room 510, No. 120, Cangshan Science and
Technology Park, Fuzhou, Fujian Province USD 300,000 8,928 Cleanroom and power system, pipeline system
installation and related services.
MIC-Tech Electronics Engineering
Corp. Jun 30, 2003
1F, Building A, No. 1281, Jin Hu Road,
Pudong, Shanghai
USD 17,619,000 524,341 Mechanical and electrical installation general contracting and sub-contracting, electronic engineering
sub-contracting, petrochemical pipeline installation
sub-contracting, pipeline sub-contracting and provide maintenance service at the end of project, related
engineering consultation services.
MIC-Tech (WuXi) Co., Ltd. May 16, 2001
No. 11, Xin Xi Road, Wuxi High-Tech
Industrial Development Zone, Jiangsu
Province
USD 25,500,000 758,880 Semiconductor, crystal and electronic component
equipments, design, manufacturing, installation and
maintenance of pollution control equipment, packaging equipment, refrigeration equipment and oven assembly.
Wholesale, commission agent, import and export of the
above products and parts. Rental and lease of plant.
SKMIC (WuXi) Corp. Jul 4, 2006 Room 208, 2nd Floor, No. 87-A, Wuxi High-Tech Industrial Development Zone,
Jiangsu Province
USD 305,000 9,077 Wholesaler, commission-based agent, export, import and related support services for equipments designed for the
installation and maintenance of semiconducting
components and crystals, equipments designed for electronic components, chemical products for
environmental protection and pollution prevention
~197~
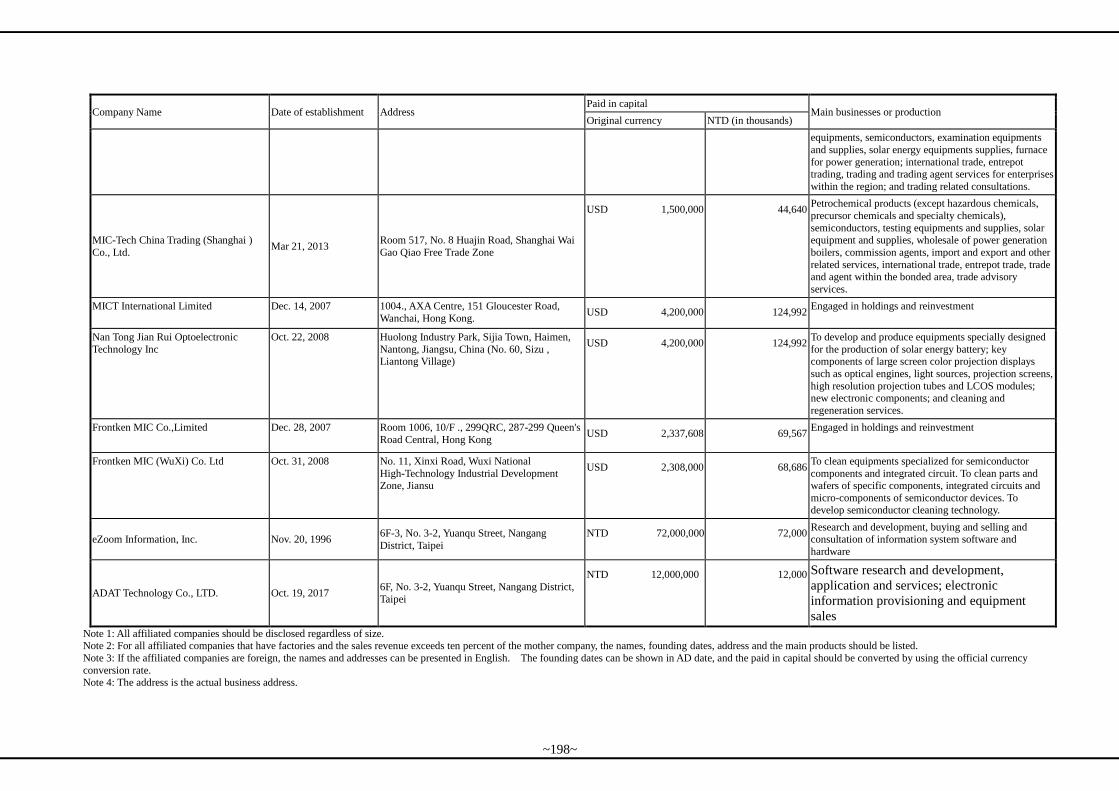
Company Name Date of establishment Address Paid in capital
Main businesses or production Original currency NTD (in thousands)
equipments, semiconductors, examination equipments
and supplies, solar energy equipments supplies, furnace
for power generation; international trade, entrepot trading, trading and trading agent services for enterprises
within the region; and trading related consultations.
MIC-Tech China Trading (Shanghai )
Co., Ltd. Mar 21, 2013
Room 517, No. 8 Huajin Road, Shanghai Wai
Gao Qiao Free Trade Zone
USD 1,500,000 44,640 Petrochemical products (except hazardous chemicals,
precursor chemicals and specialty chemicals),
semiconductors, testing equipments and supplies, solar equipment and supplies, wholesale of power generation
boilers, commission agents, import and export and other
related services, international trade, entrepot trade, trade and agent within the bonded area, trade advisory
services.
MICT International Limited Dec. 14, 2007 1004., AXA Centre, 151 Gloucester Road,
Wanchai, Hong Kong. USD 4,200,000 124,992
Engaged in holdings and reinvestment
Nan Tong Jian Rui Optoelectronic
Technology Inc
Oct. 22, 2008 Huolong Industry Park, Sijia Town, Haimen,
Nantong, Jiangsu, China (No. 60, Sizu , Liantong Village)
USD 4,200,000 124,992 To develop and produce equipments specially designed
for the production of solar energy battery; key components of large screen color projection displays
such as optical engines, light sources, projection screens,
high resolution projection tubes and LCOS modules; new electronic components; and cleaning and
regeneration services.
Frontken MIC Co.,Limited Dec. 28, 2007 Room 1006, 10/F ., 299QRC, 287-299 Queen's
Road Central, Hong Kong USD 2,337,608 69,567
Engaged in holdings and reinvestment
Frontken MIC (WuXi) Co. Ltd Oct. 31, 2008 No. 11, Xinxi Road, Wuxi National
High-Technology Industrial Development Zone, Jiansu
USD 2,308,000 68,686 To clean equipments specialized for semiconductor
components and integrated circuit. To clean parts and wafers of specific components, integrated circuits and
micro-components of semiconductor devices. To develop semiconductor cleaning technology.
eZoom Information, Inc. Nov. 20, 1996 6F-3, No. 3-2, Yuanqu Street, Nangang
District, Taipei
NTD 72,000,000 72,000 Research and development, buying and selling and consultation of information system software and
hardware
ADAT Technology Co., LTD. Oct. 19, 2017 6F, No. 3-2, Yuanqu Street, Nangang District,
Taipei
NTD 12,000,000 12,000 Software research and development,
application and services; electronic
information provisioning and equipment
sales
Note 1: All affiliated companies should be disclosed regardless of size. Note 2: For all affiliated companies that have factories and the sales revenue exceeds ten percent of the mother company, the names, founding dates, address and the main products should be listed.
Note 3: If the affiliated companies are foreign, the names and addresses can be presented in English. The founding dates can be shown in AD date, and the paid in capital should be converted by using the official currency
conversion rate. Note 4: The address is the actual business address.
~198~
1.1.3.Shareholders in commonand Its Subsidiaries with Deemed Control and Subordination:
Unit: NTD in thousands; shares: %
Presumed
reasons
Name
(Note 1)
Shareholding (Note
2) Date of
establishment Address Paid in Capital
Main areas of
business Shares Share ratios
Not applicable Note 1: Fill in the corporate name if the corporate shareholder is the same. Fill in the individual name if the individual shareholder is the
same. For individual shareholders, only fill in the presumed reasons, name and the shares in holding.
Note 2: Fill in the shareholding information of the shareholder in the controlling company.
1.1.4. Businesses covered by the overall affiliation
(1) Industries covered by the company and the subsidiaries
(1.1)Semiconductor (including mask, wafer fabrication, packaging and testing),
optoelectronics (color filter, TFT-LCD, LTPS TFT LCD, polarizer, LED, OLED,
GaAs), solar power industries and others (SAW filter, biotechnology and MEMS)
and their pipeline construction and turnkey project contracting.
(1.2) Electronics, circuits and construction pipeline businesses
(1.3)General investment
(1.4) Trading of chemical products and materials
(1.5) Sales and installation of boilers and equipments
(1.6) Research and development and manufacturing of customized equipments
(2) Business dealings and division of labor between the subsidiaries: The company and its subsidiaries that it deals business with are involved in high-technology
products related sales agent activities and services, factory affairs, production and system
integration services and equipment production. The companies have adopted division of
work based on their specialization in terms of their cooperation: The Company is
responsible for the expansion of domestic and foreign market and related services as well as
the overall operational planning, control, execution and technical instructions for its
subsidiaries; eZoon aims to build ICT and cloud computation integrated technology as its
core competitiveness, integrate the Group business and sources, and collaborate with the
Group to conduct a comprehensive marketing in order to maximize the overall effectiveness
and to expand business opportunity. Marketech Integrated Pte. Ltd., Marketech
International Sdn. Bhd., Mic-Tech Viet Nam Co., Ltd., Hoa Phong Marketech Co., Ltd.,
Marketech Intergrated Construction Co., Ltd. and Marketech Integrated Manufacturing
Company Limited are responsible not only for developing the South-East Asia market, but
also for constructing pipelines required for Semiconductor and general industry customers
in Mainlander China to expand their production capacity and the production, installation
and maintenance of equipments. Besides, they also support the engineering of factory affair
systems required for customers in the Greater China region to build plants. MIC-Tech
(Shanghai) Co. Ltd., Wuxi Qihua Electronic Technology Co., Ltd., Wuxi Hanhua Electronic
Technology Co., Ltd., Shanghai Puritic Co., Ltd., Shanghai Jiwei Electronic System
Engineering Co., Ltd., Fuzhou Jiwei System Technology Co., Ltd., Shanghai Sheng Kao
Mechanical and Electrical Engineering Design Co., Ltd., TPP-MIC (Wuxi) Co., Ltd., Nan
Tong Jian Rui Optoelectronic Technology Inc, Frontken MIC Co. Limited and Shanghai
Fan-Ya Trade Co., Ltd. are responsible for expanding the market of the Greater China
region. These companies are specialized in fields of sales agent activities, equipment
production, installation and maintenance, and factory affair system engineering for
chemicals used to satisfy the domestic market of the Greater China. To respond to the
demand of Korea’s semiconductor and TFT industries, MIC-Tech Global Corp. is appointed
to expand the East Asia market. The parent company and the subsidiaries provide
complementary synergy through distribution of regional resources and the integrated
support.
~199~
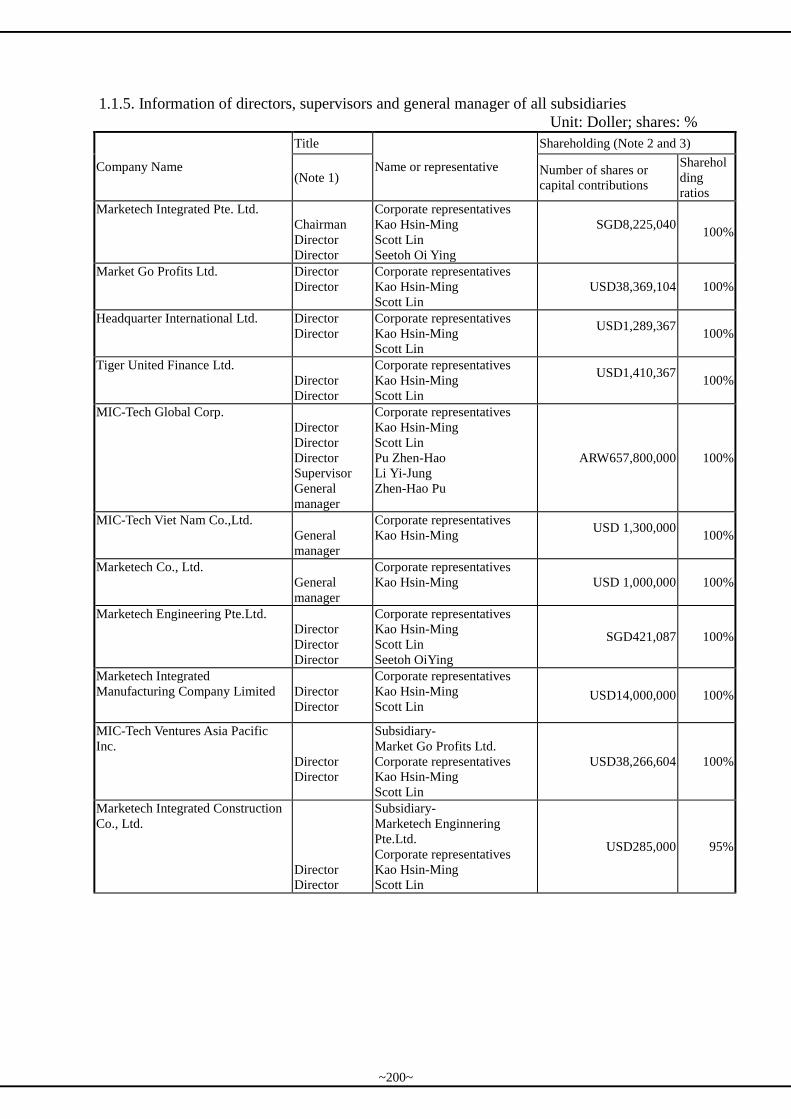
1.1.5. Information of directors, supervisors and general manager of all subsidiaries
Unit: Doller; shares: %
Company Name
Title
Name or representative
Shareholding (Note 2 and 3)
(Note 1) Number of shares or
capital contributions
Sharehol
ding
ratios
Marketech Integrated Pte. Ltd.
Chairman
Director
Director
Corporate representatives
Kao Hsin-Ming
Scott Lin
Seetoh Oi Ying
SGD8,225,040
100%
Market Go Profits Ltd. Director
Director
Corporate representatives
Kao Hsin-Ming
Scott Lin
USD38,369,104 100%
Headquarter International Ltd. Director
Director
Corporate representatives
Kao Hsin-Ming
Scott Lin
USD1,289,367
100%
Tiger United Finance Ltd.
Director
Director
Corporate representatives
Kao Hsin-Ming
Scott Lin
USD1,410,367
100%
MIC-Tech Global Corp.
Director
Director
Director
Supervisor
General
manager
Corporate representatives
Kao Hsin-Ming
Scott Lin
Pu Zhen-Hao
Li Yi-Jung
Zhen-Hao Pu
ARW657,800,000 100%
MIC-Tech Viet Nam Co.,Ltd.
General
manager
Corporate representatives
Kao Hsin-Ming USD 1,300,000
100%
Marketech Co., Ltd.
General
manager
Corporate representatives
Kao Hsin-Ming USD 1,000,000 100%
Marketech Engineering Pte.Ltd.
Director
Director
Director
Corporate representatives
Kao Hsin-Ming
Scott Lin
Seetoh OiYing
SGD421,087 100%
Marketech Integrated
Manufacturing Company Limited
Director
Director
Corporate representatives
Kao Hsin-Ming
Scott Lin USD14,000,000 100%
MIC-Tech Ventures Asia Pacific
Inc.
Director
Director
Subsidiary-
Market Go Profits Ltd.
Corporate representatives
Kao Hsin-Ming
Scott Lin
USD38,266,604 100%
Marketech Integrated Construction
Co., Ltd.
Director
Director
Subsidiary-
Marketech Enginnering
Pte.Ltd.
Corporate representatives
Kao Hsin-Ming
Scott Lin
USD285,000 95%
~200~
Company Name
Title
Name or representative
Shareholding (Note 2 and 3)
(Note 1) Number of shares or
capital contributions
Sharehol
ding
ratios
Marketech International Sdn.Bhd.
Director
Director
Director
Director
Director
Corporate representatives
Kao Hsin-Ming
Scott Lin
Subsidiary-
Marketech Integrated Pte Ltd.
Corporate representative
Ma Kuo-peng
Individual representative
Mohd Salleh Bin Mohamad
Siti Zaleha Binti Mohd Salim
MYR12,242,750 100%
Russky H.K. Limited
Director
Director
Subsidiary-
MIC-Tech Ventures Asia
Pacific Inc. Corporate
representatives
Kao Hsin-Ming
Scott Lin
USD833,000
100%
Frontken MIC Co. Limited
Director
Director
Subsidiary
MIC-Tech Ventures Asia
Pacific Inc.
Corporate representatives
Kao Hsin-Ming
Scott Lin
USD1,013,200
100%
PT Marketech International
Indonesia
Director
supervisorma
Corporate representatives
Kao Hsin-Ming
Scott Lin
USD 1,200,000
100%
Marketech Netherlands B.V.
Director
Director
Director
Corporate representatives
Kao Hsin-Ming
Scott Lin
Ma Kuo-peng
EUR 300,000
100%
Shanghai Puritic Co., Ltd
Chairman
Director
Director
Director
supervisorma
nager
Director
Director
Subsidiary-
Russky H.K. Limited
corporate representatives
Kao Hsin-Ming
Ma Kuo-peng
Scott Lin
Li Yi-Jung
Kao Hsin-Ming
Corporate representatives
from other firms
Shouhei Fukaya
Osamu Watanabe
USD803,000 87%
Chen Gao M&E Engineering
(Shanghai) Co., Ltd.
Chairman
Director
Director
Director
Supervisor
Subsidiary-
Russky H.K. Limited
corporate representatives
Li Yi-Jung
Kao Hsin-Ming
Scott Lin
Li De-Qing
USD200,000 100%
~201~
Company Name
Title
Name or representative
Shareholding (Note 2 and 3)
(Note 1) Number of shares or
capital contributions
Sharehol
ding
ratios
MIC-Tech (Shanghai) Corp. Ltd.
Chairman
Director
Director
General
manager
Subsidiary-
MIC-Tech Ventures Asia
Pacific Inc. corporate
representative
Kao Hsin-Ming
Scott Lin
Ma Kuo-peng
Kao Hsin-Ming
USD 8,241,000
100%
Fuzhou Jiwei System Integrated
Co., Ltd.
Chairman
Director
Director
General
manager
Subsidiary-
MIC-Tech Ventures Asia
Pacific Inc.corporate
representatives
Kao Hsin-Ming
Ma Kuo-peng
Scott Lin
Kao Hsin-Ming
USD300,000
100%
MIC-Tech Electyonics Engineering
Corp.
Chairman
Director
Director
Supervisor
Subsidiary-
MIC-Tech Ventures Asia
Pacific Inc corporate
representatives
Kao Hsin-Ming
Ma Kuo-peng
Scott Lin
Li Yi-Jung
USD 17,619,000
100%
MIC-Tech(WuXi) Co., Ltd.
Chairman
Director
Director
Supervisor
General
manager
Subsidiary-
MIC-Tech Ventures Asia
Pacific Inc corporate
representatives
Kao Hsin-Ming
Ma Kuo-peng
Scott Lin
Li Yi-Jung
Kao Hsin-Ming
USD25,500,000
100%
SKMIC (WuXi) CORP.
Director
Director
Supervisor
Chairman
Subsidiary-
MIC-Tech Ventures Asia
Pacific Inc. corporate
representatives
Kao Hsin-Ming
Scott Lin
Song Dong-Xuan
corporate representatives
from other firms
Jin Ren-Shou
USD149,450
49%
MIC-Tech China Trading
(Shanghai)Co., Ltd
Chairman
Director
Director
Director
Supervisor
Subsidiary
MIC-Tech Ventures Asia
Pacific Inc.
Corporate representatives
Kao Hsin-Ming
Scott Lin
Ma Kuo-peng
Li Yi-Jung
USD 1,500,000
100%
~202~
Company Name
Title
Name or representative
Shareholding (Note 2 and 3)
(Note 1) Number of shares or
capital contributions
Sharehol
ding
ratios
MICT International Limited
Director
Director
Subsidiary
MIC-Tech Ventures Asia
Pacific Inc.
Corporate representatives
Kao Hsin-Ming
Scott Lin
USD3,096,716 100%
Nan Tong Jian Rui Optoelectronic
Technology Inc
Chairman
Director
Director
Supervisor
President
Subsidiary
MICT International Limited
Co1`rporate representatives
Hou Fu-Jia
Kao Hsin-Ming
Wang,Chien-Yuan
Scott Lin
Lu Hsueh-Heng
USD3,096,716 100%
Frontken MIC(WuXi) Co. Limited
Chairman
Director
Director
Director
Superviso
manager
Subsidiary
Frontken MIC Co. Limited
Corporative representative
Kao Hsin-Ming
Scott Lin
Ma Kuo-peng
Hee Kok Hiong
Li Yi-Jung
Hou Fu-Jia
USD1,013,200 100%
eZoom Information, Inc.
Director
Director
Director
Supervisor
Corporate representatives
Kao Hsin-Ming
Scott Lin
Chuang Yan-Shan
Ma Kuo-peng
7,200,000 shares 100%
ADTA Technology Co., LTD
Chairman
Director
Supervisor
Director
Corporate representatives
Scott Lin
Kao Hsin-Ming
Li Yi-Jung
corporate representatives
from other firms
Su Kai-hung
1,000,000 shares 100%
Note 1: If the affiliated company is a foreign firm, list the person with the corresponding title.
Note 2: If the invested firm is a limited company, please fill in the number of shares and the shareholding ratios. For others, please fill in the paid in capital and the contribution ratio and provide explanation notes.
Note 3: When the directors and the supervisors are corporates, the related information of the representatives should be disclosed.
~203~
(2) Operation profile of subsidiaries
(2.1) Financial position and operating results of the affiliated companies Unit: NTD in thousands
Company Name Capital Total
assets
Total
liabilities
Net
worth
Operating
income
Operating
(loss) gain
(Loss) gain
of the
period
(after tax)
Earning
per share
(loss)
(NTD)
(after tax)
Marketech Integrated Pte. Ltd. 183,089 98,108 104,189 (6,081) 126,361 (20,195) (15,988) -
Market Go Profits Ltd. 1,141,865 1,038,755 - 1,038,755 - (146) (74,893) -
Headquarter International Ltd. 38,372 38,299 341 37,958 2,232 (743) (1,179) -
Tiger United Finance Ltd. 41,973 37,617 510 37,107 2,552 (146) (646) -
MIC-Tech Global Corp. 18,497 13,591 5,885 7,706 76,933 (4,334) (6,436) -
MIC-Tech Viet Nam Co., Ltd. 38,688 33,655 2,853 30,802 26,998 (929) (1,890) -
Marketech Co., Ltd. 29,760 7,911 3,909 4,002 5,079 (5,096) (5,145) -
Marketech Engineering Ptd. Ltd. 9,373 2,532 84 2,448 - (139) (2,129) -
MIC-Tech Ventures Asia Pacific Inc. 1,138,814 1,054,648 17,638 1,037,010 296,019 14,028 (74,747) -
Marketech International Sdn.Bhd. 86,581 134,236 76,464 57,772 185,099 944 5,079 -
Marketech Integrated Construction
Co., Ltd. 8,928 4,798 2,792 2,006 10,896 (2,234) (2,101) -
Marketech Integrated Manufacturing
Company Limited 416,640 403,466 7,141 396,325 - (3,933) (5,590) -
Russky H.K. Limited 24,790 2,853 19,049 (16,196) - (63) 1,854 -
Frontken MIC Co. Limited 69,567 5,636 - 5,636 - (27) (401) -
PT Marketech International Indonesia 35,712 35,681 - 35,681 - (211) 124 -
Marketech Netherlands B.V. 10,671 10,497 44 10,453 - (211) (211) -
Shanghai Puritic Co., Ltd 17,856 214,877 233,715 (18,838) 229,214 4,963 1,317 -
ChenGao M&E Engineering
(Shanghai) Co., Ltd. 5,952 397 3,057 (2,660) - (24) (149) -
MIC-Tech (Shanghai) Corp. Ltd. 245,252 1,254,551 917,507 337,044 1,428,959 32,538 17,980 -
Fuzhou Jiwei System Integrated Co.,
Ltd. 8,928 543 2,277 (1,734) - (845) (895) -
MIC-Tech Electronics Engineering
Corp. 524,341 2,192,916 1,723,048 469,868 1,920,038 (61,740) (91,119) -
MIC-Tech(WuXi) Co., Ltd. 758,880 715,308 691,471 23,837 549,548 1,221 (2,055) -
SKMIC (WuXi) CORP. 9,077 472 144 328 340 (4,786) (4,861) -
MIC-Tech China Trading
(Shanghai)Co., Ltd 44,640 123,599 98,329 25,270 122,789 (8,126) (13,502) -
MICT International Limited 124,992 30,712 - 30,712 - - (5,152) -
Nan Tong Jian Rui Optoelectronic
Technology Inc 124,992 55,341 24,629 30,712 21,577 (2,339) (5,152) -
Frontken MIC (WuXi) Co. Ltd 68,686 5,616 - 5,616 - (152) (374) -
eZoom Information, Inc. 72,000 53,238 22,533 30,705 98,634 (3,890) (1,835) (0.25)
ADAT Technology Co., LTD 12,000 7,887 652 7,235 - (4,767) (4,765) (3.97)
Note 1: If any of the above affiliated companies is foreign, the number should presented in NTD using the currency exchange rate of the
report date. Note 2: Earnings (loss) per share is calculated based on the number of shares outstanding of each company on December 31st, 2017.
~204~
1.2 The consolidated financial statements of affiliated companies: In 2016, The companies
that should be included in the consolidated financial reports of affiliated companies
based on ”Criteria Governing Preparation of Affiliation Reports, Consolidated
Business Reports and Consolidated Financial Statements of Affiliated Enterprises” and
the companies that should be included in the consolidated financial reports of
subsidiaries based on "Consolidated and separate financial statements" of International
Accounting Standards Section 27 are the same. The related information that should
be disclosed in the consolidated financial statements of affiliated companies are also
already disclosed in the consolidated financial reports for subsidiaries, so that the
consolidated financial statements of affiliated companies will not be published
separately. Please refer to the consolidated reports from page 229 to 310 of this annual
report.
1.3 Affiliation report: Not applicable.
2.Private Placement Securities in the most recent fiscal year and during the current fiscal year
up to the date of printing of the annual report: None.
3.The Shares in the Company Held or Disposal of by subsidiaries in the most recent fiscal
year and during the current fiscal year up to the date of printing of the annual report: None.
4.Other Disclosures : None.
Part 9 Any of the situations listed in Article 36, aragraph3,subparagraph
2 of the Securities and Exchange Act of Taiwan, which might
materially affect Shareholders’ Equity or the price of the Company
Securities, has occurred during the most recent fiscal year or
during the current fiscal year up to the date of printing of the
annual report: None.
~205~
MARKETECH INTERNATIONAL CORP.
AND SUBSIDIARIES
CONSOLIDATED FINANCIAL STATEMENTS AND
REPORT OF INDEPENDENT ACCOUNTANTS
DECEMBER 31, 2017 AND 2016
~206~
Marketech International Corp.
Declaration of Consolidated Financial Statements of Affiliated Enterprises
For the year ended December 31, 2017, pursuant to “Criteria Governing Preparation of Affiliation
Reports, Consolidated Business Reports and Consolidated Financial Statements of Affiliated
Enterprises,” the company that is required to be included in the consolidated financial statements of
affiliates, is the same as the company required to be included in the consolidated financial statements of
parent and subsidiary companies under International Financial Reporting Standard 10. Also, if relevant
information that should be disclosed in the consolidated financial statements of affiliates has all been
disclosed in the consolidated financial statements of parent and subsidiary companies, it shall not be
required to prepare separate consolidated financial statements of affiliates.
Hereby declare,
Marketech International Corp.
Margaret Kao
February 24, 2018
~207~
~208~
~209~
~210~
~211~
~212~
~213~
~214~
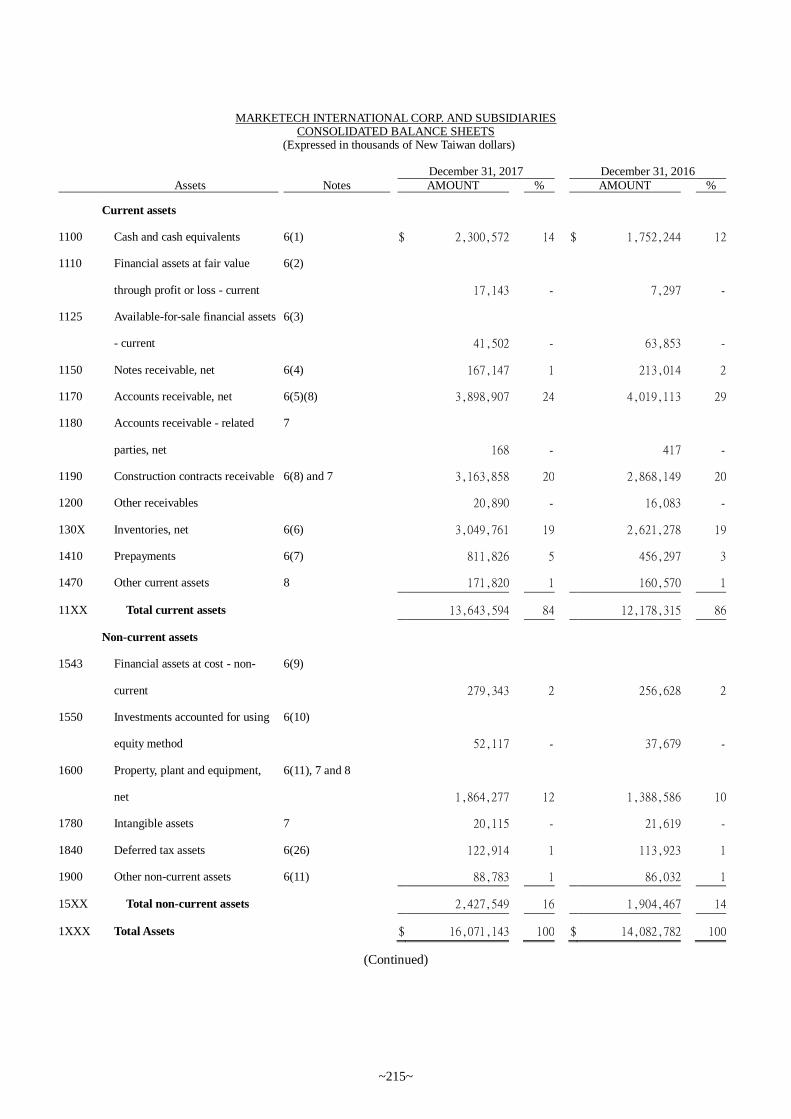
MARKETECH INTERNATIONAL CORP. AND SUBSIDIARIES CONSOLIDATED BALANCE SHEETS
(Expressed in thousands of New Taiwan dollars)
December 31, 2017 December 31, 2016 Assets Notes AMOUNT % AMOUNT %
Current assets
1100 Cash and cash equivalents 6(1) $ 2,300,572 14 $ 1,752,244 12
1110 Financial assets at fair value
through profit or loss - current
6(2)
17,143 - 7,297 -
1125 Available-for-sale financial assets
- current
6(3)
41,502 - 63,853 -
1150 Notes receivable, net 6(4) 167,147 1 213,014 2
1170 Accounts receivable, net 6(5)(8) 3,898,907 24 4,019,113 29
1180 Accounts receivable - related
parties, net
7
168 - 417 -
1190 Construction contracts receivable 6(8) and 7 3,163,858 20 2,868,149 20
1200 Other receivables 20,890 - 16,083 -
130X Inventories, net 6(6) 3,049,761 19 2,621,278 19
1410 Prepayments 6(7) 811,826 5 456,297 3
1470 Other current assets 8 171,820 1 160,570 1
11XX Total current assets 13,643,594 84 12,178,315 86
Non-current assets
1543 Financial assets at cost - non-
current
6(9)
279,343 2 256,628 2
1550 Investments accounted for using
equity method
6(10)
52,117 - 37,679 -
1600 Property, plant and equipment,
net
6(11), 7 and 8
1,864,277 12 1,388,586 10
1780 Intangible assets 7 20,115 - 21,619 -
1840 Deferred tax assets 6(26) 122,914 1 113,923 1
1900 Other non-current assets 6(11) 88,783 1 86,032 1
15XX Total non-current assets 2,427,549 16 1,904,467 14
1XXX Total Assets $ 16,071,143 100 $ 14,082,782 100
(Continued)
~215~
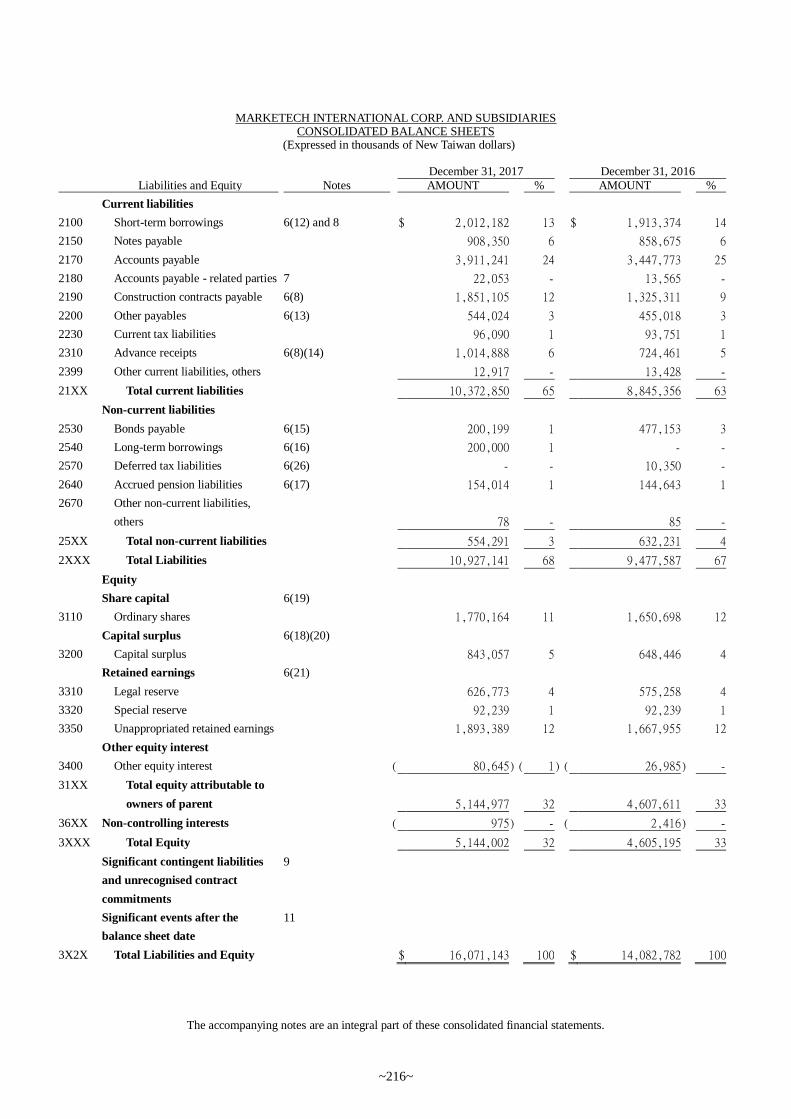
MARKETECH INTERNATIONAL CORP. AND SUBSIDIARIES CONSOLIDATED BALANCE SHEETS
(Expressed in thousands of New Taiwan dollars)
The accompanying notes are an integral part of these consolidated financial statements.
December 31, 2017 December 31, 2016 Liabilities and Equity Notes AMOUNT % AMOUNT %
Current liabilities 2100 Short-term borrowings 6(12) and 8 $ 2,012,182 13 $ 1,913,374 14 2150 Notes payable 908,350 6 858,675 6 2170 Accounts payable 3,911,241 24 3,447,773 25 2180 Accounts payable - related parties 7 22,053 - 13,565 - 2190 Construction contracts payable 6(8) 1,851,105 12 1,325,311 9 2200 Other payables 6(13) 544,024 3 455,018 3 2230 Current tax liabilities 96,090 1 93,751 1 2310 Advance receipts 6(8)(14) 1,014,888 6 724,461 5 2399 Other current liabilities, others 12,917 - 13,428 - 21XX Total current liabilities 10,372,850 65 8,845,356 63 Non-current liabilities 2530 Bonds payable 6(15) 200,199 1 477,153 3 2540 Long-term borrowings 6(16) 200,000 1 - - 2570 Deferred tax liabilities 6(26) - - 10,350 - 2640 Accrued pension liabilities 6(17) 154,014 1 144,643 1 2670 Other non-current liabilities,
others
78 - 85 - 25XX Total non-current liabilities 554,291 3 632,231 4 2XXX Total Liabilities 10,927,141 68 9,477,587 67 Equity Share capital 6(19) 3110 Ordinary shares 1,770,164 11 1,650,698 12 Capital surplus 6(18)(20) 3200 Capital surplus 843,057 5 648,446 4 Retained earnings 6(21) 3310 Legal reserve 626,773 4 575,258 4 3320 Special reserve 92,239 1 92,239 1 3350 Unappropriated retained earnings 1,893,389 12 1,667,955 12 Other equity interest 3400 Other equity interest ( 80,645 ) ( 1 ) ( 26,985 ) - 31XX Total equity attributable to
owners of parent
5,144,977 32 4,607,611 33 36XX Non-controlling interests ( 975 ) - ( 2,416 ) - 3XXX Total Equity 5,144,002 32 4,605,195 33 Significant contingent liabilities
and unrecognised contract
commitments
9
Significant events after the
balance sheet date
11
3X2X Total Liabilities and Equity $ 16,071,143 100 $ 14,082,782 100
~216~
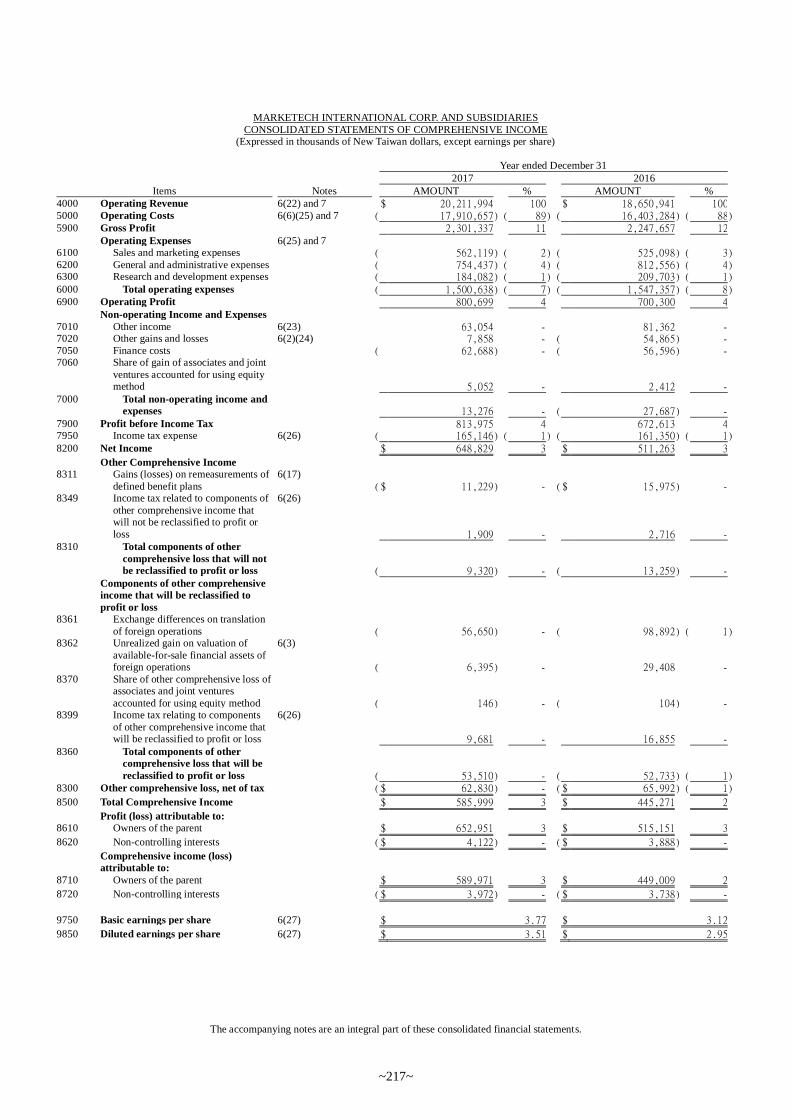
MARKETECH INTERNATIONAL CORP. AND SUBSIDIARIES
CONSOLIDATED STATEMENTS OF COMPREHENSIVE INCOME (Expressed in thousands of New Taiwan dollars, except earnings per share)
The accompanying notes are an integral part of these consolidated financial statements.
Year ended December 31
2017 2016
Items Notes AMOUNT % AMOUNT %
4000 Operating Revenue 6(22) and 7 $ 20,211,994 100 $ 18,650,941 100 5000 Operating Costs 6(6)(25) and 7 ( 17,910,657 ) ( 89 ) ( 16,403,284 ) ( 88 ) 5900 Gross Profit 2,301,337 11 2,247,657 12 Operating Expenses 6(25) and 7 6100 Sales and marketing expenses ( 562,119 ) ( 2 ) ( 525,098 ) ( 3 ) 6200 General and administrative expenses ( 754,437 ) ( 4 ) ( 812,556 ) ( 4 ) 6300 Research and development expenses ( 184,082 ) ( 1 ) ( 209,703 ) ( 1 ) 6000 Total operating expenses ( 1,500,638 ) ( 7 ) ( 1,547,357 ) ( 8 ) 6900 Operating Profit 800,699 4 700,300 4 Non-operating Income and Expenses 7010 Other income 6(23) 63,054 - 81,362 - 7020 Other gains and losses 6(2)(24) 7,858 - ( 54,865 ) - 7050 Finance costs ( 62,688 ) - ( 56,596 ) - 7060 Share of gain of associates and joint
ventures accounted for using equity method
5,052 - 2,412 - 7000 Total non-operating income and
expenses
13,276 - ( 27,687 ) - 7900 Profit before Income Tax 813,975 4 672,613 4 7950 Income tax expense 6(26) ( 165,146 ) ( 1 ) ( 161,350 ) ( 1 ) 8200 Net Income $ 648,829 3 $ 511,263 3
Other Comprehensive Income 8311 Gains (losses) on remeasurements of
defined benefit plans
6(17)
( $ 11,229 ) - ( $ 15,975 ) - 8349 Income tax related to components of
other comprehensive income that will not be reclassified to profit or
loss
6(26)
1,909 - 2,716 - 8310 Total components of other
comprehensive loss that will not
be reclassified to profit or loss
( 9,320 ) - ( 13,259 ) - Components of other comprehensive
income that will be reclassified to
profit or loss
8361 Exchange differences on translation
of foreign operations
( 56,650 ) - ( 98,892 ) ( 1 ) 8362 Unrealized gain on valuation of
available-for-sale financial assets of foreign operations
6(3)
( 6,395 ) - 29,408 - 8370 Share of other comprehensive loss of
associates and joint ventures
accounted for using equity method
( 146 ) - ( 104 ) - 8399 Income tax relating to components
of other comprehensive income that will be reclassified to profit or loss
6(26)
9,681 - 16,855 - 8360 Total components of other
comprehensive loss that will be
reclassified to profit or loss
( 53,510 ) - ( 52,733 ) ( 1 ) 8300 Other comprehensive loss, net of tax ( $ 62,830 ) - ( $ 65,992 ) ( 1 )
8500 Total Comprehensive Income $ 585,999 3 $ 445,271 2
Profit (loss) attributable to: 8610 Owners of the parent $ 652,951 3 $ 515,151 3
8620 Non-controlling interests ( $ 4,122 ) - ( $ 3,888 ) -
Comprehensive income (loss)
attributable to:
8710 Owners of the parent $ 589,971 3 $ 449,009 2
8720 Non-controlling interests ( $ 3,972 ) - ( $ 3,738 ) -
9750 Basic earnings per share 6(27) $ 3.77 $ 3.12
9850 Diluted earnings per share 6(27) $ 3.51 $ 2.95
~217~
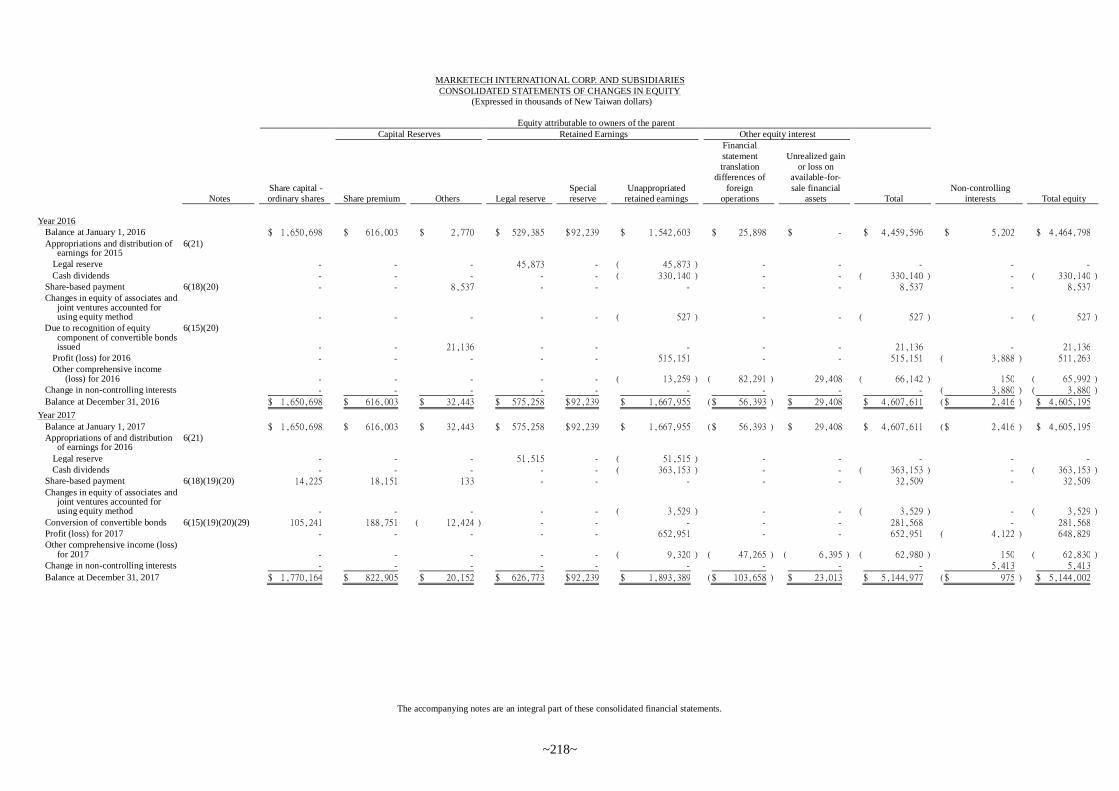
MARKETECH INTERNATIONAL CORP. AND SUBSIDIARIES
CONSOLIDATED STATEMENTS OF CHANGES IN EQUITY
(Expressed in thousands of New Taiwan dollars)
Equity attributable to owners of the parent
Capital Reserves Retained Earnings Other equity interest
Notes
Share capital -
ordinary shares
Share premium
Others
Legal reserve
Special
reserve
Unappropriated
retained earnings
Financial
statement
translation
differences of
foreign
operations
Unrealized gain
or loss on
available-for-
sale financial
assets
Total
Non-controlling
interests
Total equity
The accompanying notes are an integral part of these consolidated financial statements.
Year 2016 Balance at January 1, 2016 $ 1,650,698 $ 616,003 $ 2,770 $ 529,385 $ 92,239 $ 1,542,603 $ 25,898 $ - $ 4,459,596 $ 5,202 $ 4,464,798 Appropriations and distribution of
earnings for 2015 6(21)
Legal reserve - - - 45,873 - ( 45,873 ) - - - - - Cash dividends - - - - - ( 330,140 ) - - ( 330,140 ) - ( 330,140 ) Share-based payment 6(18)(20) - - 8,537 - - - - - 8,537 - 8,537 Changes in equity of associates and
joint ventures accounted for using equity method
- - - - - ( 527 ) - - ( 527 ) - ( 527 ) Due to recognition of equity
component of convertible bonds issued
6(15)(20)
- - 21,136 - - - - - 21,136 - 21,136 Profit (loss) for 2016 - - - - - 515,151 - - 515,151 ( 3,888 ) 511,263 Other comprehensive income
(loss) for 2016
- - - - - ( 13,259 ) ( 82,291 ) 29,408 ( 66,142 ) 150 ( 65,992 ) Change in non-controlling interests - - - - - - - - - ( 3,880 ) ( 3,880 ) Balance at December 31, 2016 $ 1,650,698 $ 616,003 $ 32,443 $ 575,258 $ 92,239 $ 1,667,955 ( $ 56,393 ) $ 29,408 $ 4,607,611 ( $ 2,416 ) $ 4,605,195 Year 2017 Balance at January 1, 2017 $ 1,650,698 $ 616,003 $ 32,443 $ 575,258 $ 92,239 $ 1,667,955 ( $ 56,393 ) $ 29,408 $ 4,607,611 ( $ 2,416 ) $ 4,605,195 Appropriations of and distribution
of earnings for 2016 6(21)
Legal reserve - - - 51,515 - ( 51,515 ) - - - - - Cash dividends - - - - - ( 363,153 ) - - ( 363,153 ) - ( 363,153 ) Share-based payment 6(18)(19)(20) 14,225 18,151 133 - - - - - 32,509 - 32,509 Changes in equity of associates and
joint ventures accounted for using equity method
- - - - - ( 3,529 ) - - ( 3,529 ) - ( 3,529 ) Conversion of convertible bonds 6(15)(19)(20)(29) 105,241 188,751 ( 12,424 ) - - - - - 281,568 - 281,568 Profit (loss) for 2017 - - - - - 652,951 - - 652,951 ( 4,122 ) 648,829 Other comprehensive income (loss)
for 2017
- - - - - ( 9,320 ) ( 47,265 ) ( 6,395 ) ( 62,980 ) 150 ( 62,830 ) Change in non-controlling interests - - - - - - - - - 5,413 5,413 Balance at December 31, 2017 $ 1,770,164 $ 822,905 $ 20,152 $ 626,773 $ 92,239 $ 1,893,389 ( $ 103,658 ) $ 23,013 $ 5,144,977 ( $ 975 ) $ 5,144,002
~218~
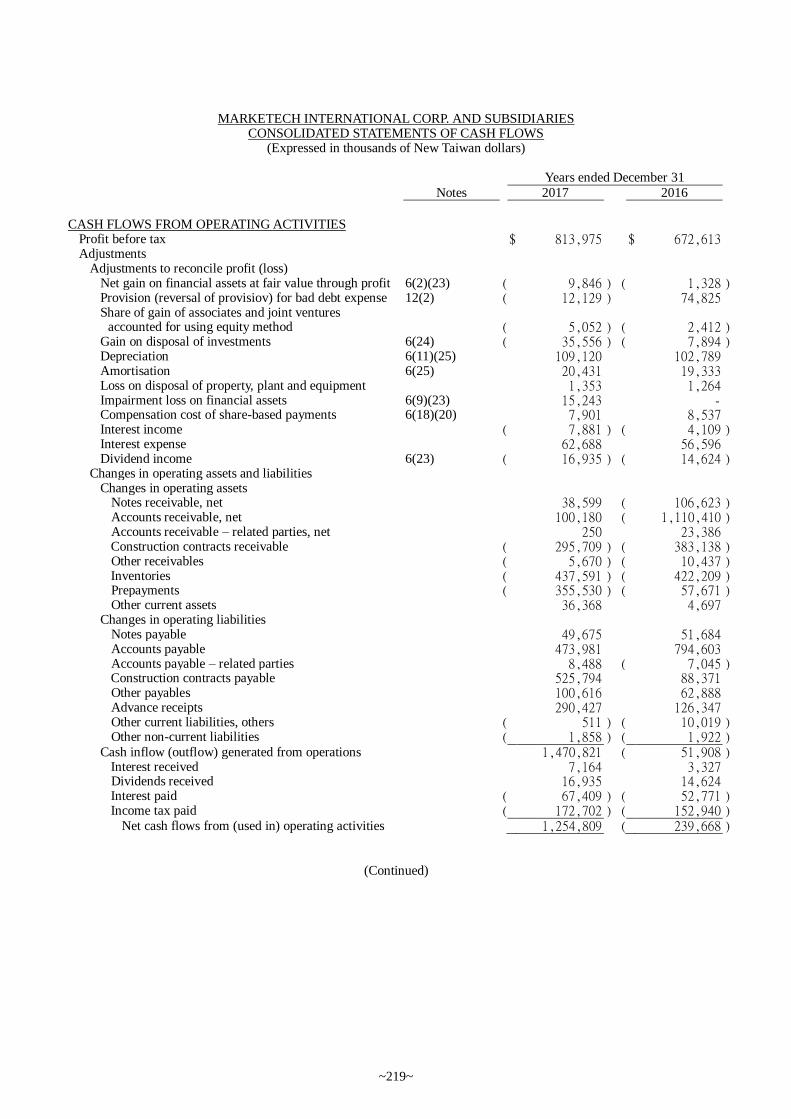
MARKETECH INTERNATIONAL CORP. AND SUBSIDIARIES CONSOLIDATED STATEMENTS OF CASH FLOWS
(Expressed in thousands of New Taiwan dollars)
Years ended December 31
Notes 2017 2016
CASH FLOWS FROM OPERATING ACTIVITIES Profit before tax $ 813,975 $ 672,613 Adjustments Adjustments to reconcile profit (loss) Net gain on financial assets at fair value through profit 6(2)(23) ( 9,846 ) ( 1,328 ) Provision (reversal of provisiov) for bad debt expense 12(2) ( 12,129 ) 74,825 Share of gain of associates and joint ventures
accounted for using equity method
( 5,052 ) ( 2,412 ) Gain on disposal of investments 6(24) ( 35,556 ) ( 7,894 ) Depreciation 6(11)(25) 109,120 102,789 Amortisation 6(25) 20,431 19,333 Loss on disposal of property, plant and equipment 1,353 1,264 Impairment loss on financial assets 6(9)(23) 15,243 - Compensation cost of share-based payments 6(18)(20) 7,901 8,537 Interest income ( 7,881 ) ( 4,109 ) Interest expense 62,688 56,596 Dividend income 6(23) ( 16,935 ) ( 14,624 ) Changes in operating assets and liabilities Changes in operating assets Notes receivable, net 38,599 ( 106,623 ) Accounts receivable, net 100,180 ( 1,110,410 ) Accounts receivable – related parties, net 250 23,386 Construction contracts receivable ( 295,709 ) ( 383,138 ) Other receivables ( 5,670 ) ( 10,437 ) Inventories ( 437,591 ) ( 422,209 ) Prepayments ( 355,530 ) ( 57,671 ) Other current assets 36,368 4,697 Changes in operating liabilities Notes payable 49,675 51,684 Accounts payable 473,981 794,603 Accounts payable – related parties 8,488 ( 7,045 ) Construction contracts payable 525,794 88,371 Other payables 100,616 62,888 Advance receipts 290,427 126,347 Other current liabilities, others ( 511 ) ( 10,019 ) Other non-current liabilities ( 1,858 ) ( 1,922 )
Cash inflow (outflow) generated from operations 1,470,821 ( 51,908 ) Interest received 7,164 3,327 Dividends received 16,935 14,624 Interest paid ( 67,409 ) ( 52,771 ) Income tax paid ( 172,702 ) ( 152,940 )
Net cash flows from (used in) operating activities 1,254,809 ( 239,668 )
(Continued)
~219~
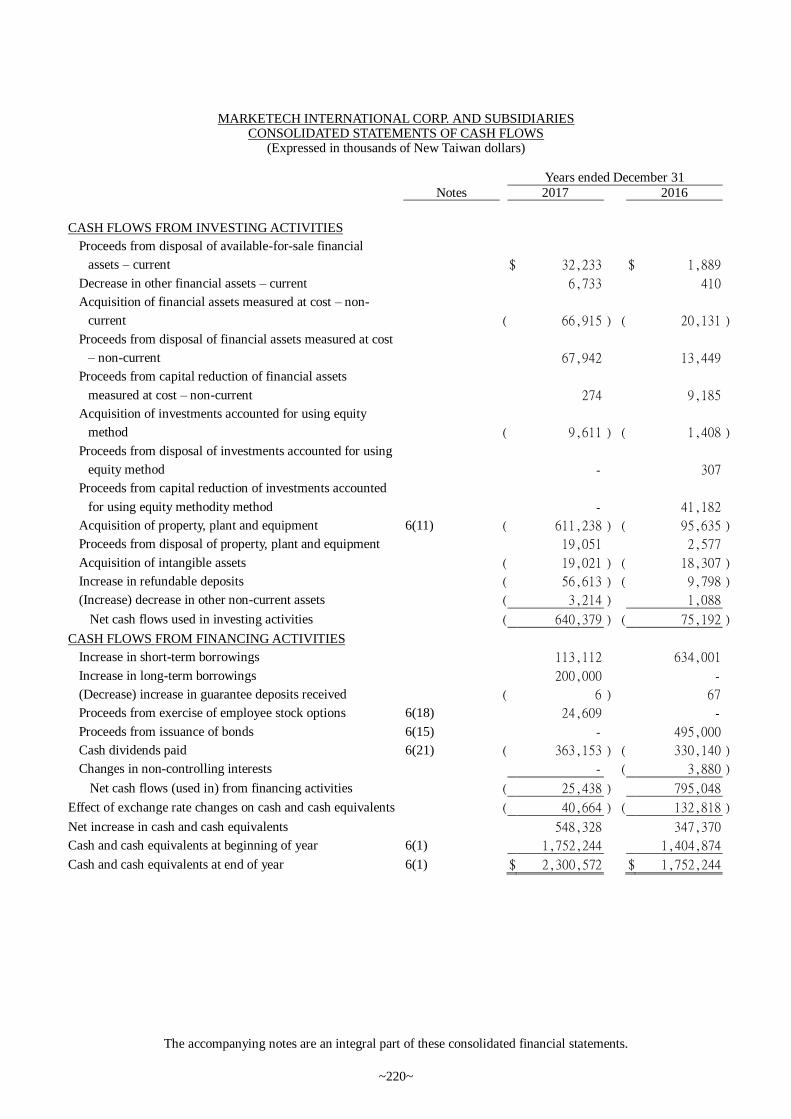
MARKETECH INTERNATIONAL CORP. AND SUBSIDIARIES CONSOLIDATED STATEMENTS OF CASH FLOWS
(Expressed in thousands of New Taiwan dollars)
Years ended December 31
Notes 2017 2016
The accompanying notes are an integral part of these consolidated financial statements.
CASH FLOWS FROM INVESTING ACTIVITIES
Proceeds from disposal of available-for-sale financial
assets – current
$ 32,233 $ 1,889
Decrease in other financial assets – current 6,733 410
Acquisition of financial assets measured at cost – non-
current
( 66,915 ) ( 20,131 )
Proceeds from disposal of financial assets measured at cost
– non-current
67,942 13,449
Proceeds from capital reduction of financial assets
measured at cost – non-current
274 9,185
Acquisition of investments accounted for using equity
method
( 9,611 ) ( 1,408 )
Proceeds from disposal of investments accounted for using
equity method
- 307
Proceeds from capital reduction of investments accounted
for using equity methodity method
- 41,182
Acquisition of property, plant and equipment 6(11) ( 611,238 ) ( 95,635 )
Proceeds from disposal of property, plant and equipment 19,051 2,577
Acquisition of intangible assets ( 19,021 ) ( 18,307 )
Increase in refundable deposits ( 56,613 ) ( 9,798 )
(Increase) decrease in other non-current assets ( 3,214 ) 1,088
Net cash flows used in investing activities ( 640,379 ) ( 75,192 )
CASH FLOWS FROM FINANCING ACTIVITIES
Increase in short-term borrowings 113,112 634,001
Increase in long-term borrowings 200,000 -
(Decrease) increase in guarantee deposits received ( 6 ) 67
Proceeds from exercise of employee stock options 6(18) 24,609 -
Proceeds from issuance of bonds 6(15) - 495,000
Cash dividends paid 6(21) ( 363,153 ) ( 330,140 )
Changes in non-controlling interests - ( 3,880 )
Net cash flows (used in) from financing activities ( 25,438 ) 795,048
Effect of exchange rate changes on cash and cash equivalents ( 40,664 ) ( 132,818 )
Net increase in cash and cash equivalents 548,328 347,370
Cash and cash equivalents at beginning of year 6(1) 1,752,244 1,404,874
Cash and cash equivalents at end of year 6(1) $ 2,300,572 $ 1,752,244
~220~
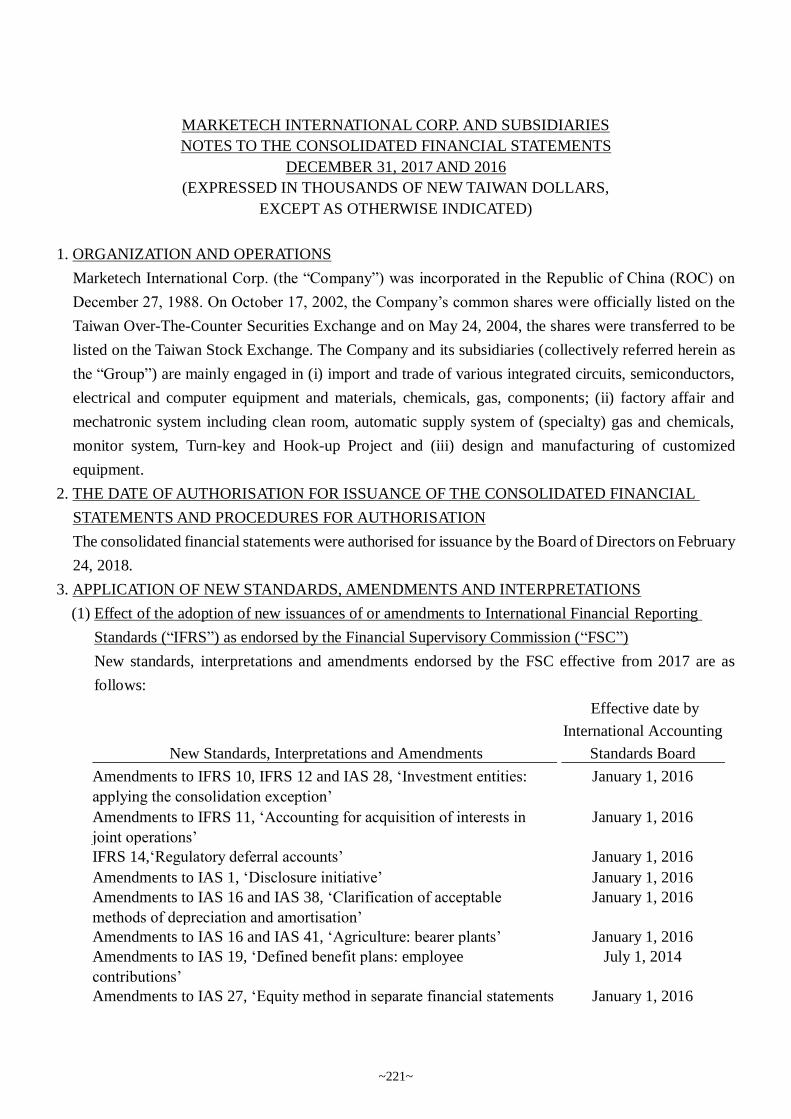
MARKETECH INTERNATIONAL CORP. AND SUBSIDIARIES
NOTES TO THE CONSOLIDATED FINANCIAL STATEMENTS
DECEMBER 31, 2017 AND 2016
(EXPRESSED IN THOUSANDS OF NEW TAIWAN DOLLARS,
EXCEPT AS OTHERWISE INDICATED)
1. ORGANIZATION AND OPERATIONS
Marketech International Corp. (the “Company”) was incorporated in the Republic of China (ROC) on
December 27, 1988. On October 17, 2002, the Company’s common shares were officially listed on the
Taiwan Over-The-Counter Securities Exchange and on May 24, 2004, the shares were transferred to be
listed on the Taiwan Stock Exchange. The Company and its subsidiaries (collectively referred herein as
the “Group”) are mainly engaged in (i) import and trade of various integrated circuits, semiconductors,
electrical and computer equipment and materials, chemicals, gas, components; (ii) factory affair and
mechatronic system including clean room, automatic supply system of (specialty) gas and chemicals,
monitor system, Turn-key and Hook-up Project and (iii) design and manufacturing of customized
equipment.
2. THE DATE OF AUTHORISATION FOR ISSUANCE OF THE CONSOLIDATED FINANCIAL
STATEMENTS AND PROCEDURES FOR AUTHORISATION
The consolidated financial statements were authorised for issuance by the Board of Directors on February
24, 2018.
3. APPLICATION OF NEW STANDARDS, AMENDMENTS AND INTERPRETATIONS
(1) Effect of the adoption of new issuances of or amendments to International Financial Reporting
Standards (“IFRS”) as endorsed by the Financial Supervisory Commission (“FSC”)
New standards, interpretations and amendments endorsed by the FSC effective from 2017 are as
follows:
New Standards, Interpretations and Amendments
Effective date by
International Accounting
Standards Board
Amendments to IFRS 10, IFRS 12 and IAS 28, ‘Investment entities:
applying the consolidation exception’
January 1, 2016
Amendments to IFRS 11, ‘Accounting for acquisition of interests in
joint operations’
January 1, 2016
IFRS 14,‘Regulatory deferral accounts’ January 1, 2016
Amendments to IAS 1, ‘Disclosure initiative’ January 1, 2016
Amendments to IAS 16 and IAS 38, ‘Clarification of acceptable
methods of depreciation and amortisation’
January 1, 2016
Amendments to IAS 16 and IAS 41, ‘Agriculture: bearer plants’ January 1, 2016
Amendments to IAS 19, ‘Defined benefit plans: employee
contributions’
July 1, 2014
Amendments to IAS 27, ‘Equity method in separate financial statements January 1, 2016
~221~
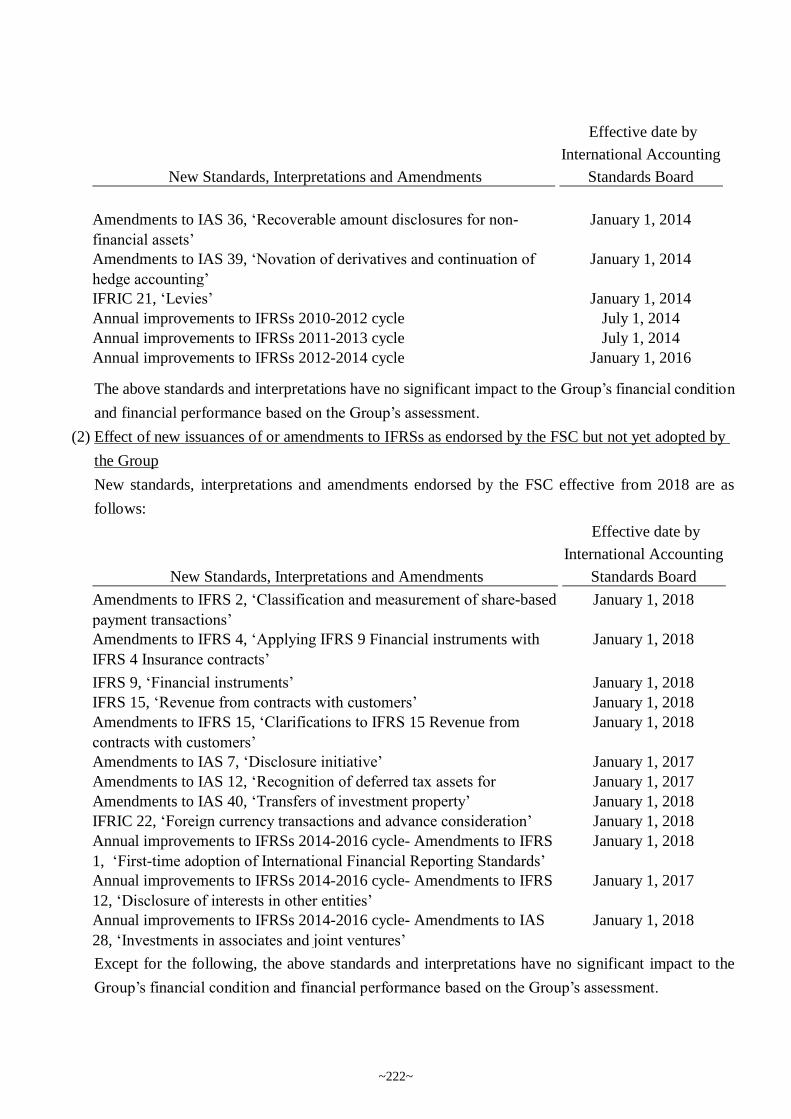
The above standards and interpretations have no significant impact to the Group’s financial condition
and financial performance based on the Group’s assessment.
(2) Effect of new issuances of or amendments to IFRSs as endorsed by the FSC but not yet adopted by
the Group
New standards, interpretations and amendments endorsed by the FSC effective from 2018 are as
follows:
Except for the following, the above standards and interpretations have no significant impact to the
Group’s financial condition and financial performance based on the Group’s assessment.
New Standards, Interpretations and Amendments
Effective date by
International Accounting
Standards Board
Amendments to IAS 36, ‘Recoverable amount disclosures for non-
financial assets’
January 1, 2014
Amendments to IAS 39, ‘Novation of derivatives and continuation of
hedge accounting’
January 1, 2014
IFRIC 21, ‘Levies’ January 1, 2014
Annual improvements to IFRSs 2010-2012 cycle July 1, 2014
Annual improvements to IFRSs 2011-2013 cycle July 1, 2014
Annual improvements to IFRSs 2012-2014 cycle January 1, 2016
New Standards, Interpretations and Amendments
Effective date by
International Accounting
Standards Board
Amendments to IFRS 2, ‘Classification and measurement of share-based
payment transactions’
January 1, 2018
Amendments to IFRS 4, ‘Applying IFRS 9 Financial instruments with
IFRS 4 Insurance contracts’
January 1, 2018
IFRS 9, ‘Financial instruments’ January 1, 2018
IFRS 15, ‘Revenue from contracts with customers’ January 1, 2018
Amendments to IFRS 15, ‘Clarifications to IFRS 15 Revenue from
contracts with customers’
January 1, 2018
Amendments to IAS 7, ‘Disclosure initiative’ January 1, 2017
Amendments to IAS 12, ‘Recognition of deferred tax assets for January 1, 2017
Amendments to IAS 40, ‘Transfers of investment property’ January 1, 2018
IFRIC 22, ‘Foreign currency transactions and advance consideration’ January 1, 2018
Annual improvements to IFRSs 2014-2016 cycle- Amendments to IFRS
1, ‘First-time adoption of International Financial Reporting Standards’
January 1, 2018
Annual improvements to IFRSs 2014-2016 cycle- Amendments to IFRS
12, ‘Disclosure of interests in other entities’
January 1, 2017
Annual improvements to IFRSs 2014-2016 cycle- Amendments to IAS
28, ‘Investments in associates and joint ventures’
January 1, 2018
~222~
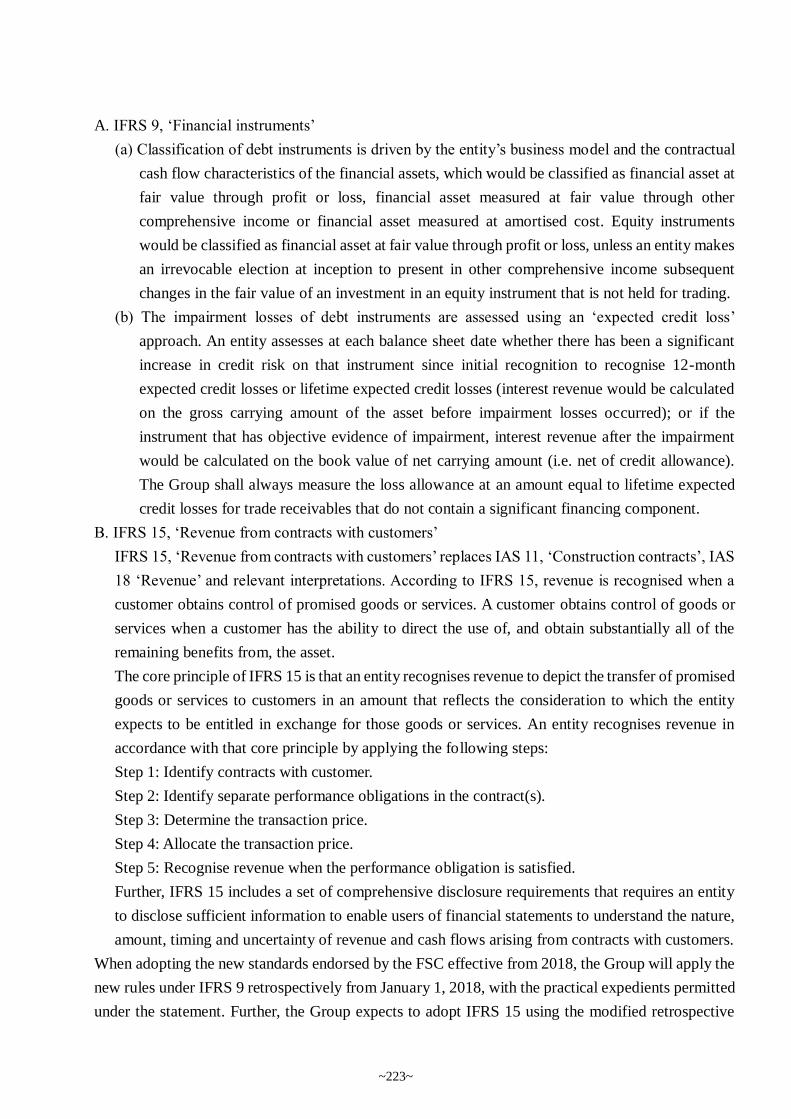
A. IFRS 9, ‘Financial instruments’
(a) Classification of debt instruments is driven by the entity’s business model and the contractual
cash flow characteristics of the financial assets, which would be classified as financial asset at
fair value through profit or loss, financial asset measured at fair value through other
comprehensive income or financial asset measured at amortised cost. Equity instruments
would be classified as financial asset at fair value through profit or loss, unless an entity makes
an irrevocable election at inception to present in other comprehensive income subsequent
changes in the fair value of an investment in an equity instrument that is not held for trading.
(b) The impairment losses of debt instruments are assessed using an ‘expected credit loss’
approach. An entity assesses at each balance sheet date whether there has been a significant
increase in credit risk on that instrument since initial recognition to recognise 12-month
expected credit losses or lifetime expected credit losses (interest revenue would be calculated
on the gross carrying amount of the asset before impairment losses occurred); or if the
instrument that has objective evidence of impairment, interest revenue after the impairment
would be calculated on the book value of net carrying amount (i.e. net of credit allowance).
The Group shall always measure the loss allowance at an amount equal to lifetime expected
credit losses for trade receivables that do not contain a significant financing component.
B. IFRS 15, ‘Revenue from contracts with customers’
IFRS 15, ‘Revenue from contracts with customers’ replaces IAS 11, ‘Construction contracts’, IAS
18 ‘Revenue’ and relevant interpretations. According to IFRS 15, revenue is recognised when a
customer obtains control of promised goods or services. A customer obtains control of goods or
services when a customer has the ability to direct the use of, and obtain substantially all of the
remaining benefits from, the asset.
The core principle of IFRS 15 is that an entity recognises revenue to depict the transfer of promised
goods or services to customers in an amount that reflects the consideration to which the entity
expects to be entitled in exchange for those goods or services. An entity recognises revenue in
accordance with that core principle by applying the following steps:
Step 1: Identify contracts with customer.
Step 2: Identify separate performance obligations in the contract(s).
Step 3: Determine the transaction price.
Step 4: Allocate the transaction price.
Step 5: Recognise revenue when the performance obligation is satisfied.
Further, IFRS 15 includes a set of comprehensive disclosure requirements that requires an entity
to disclose sufficient information to enable users of financial statements to understand the nature,
amount, timing and uncertainty of revenue and cash flows arising from contracts with customers.
When adopting the new standards endorsed by the FSC effective from 2018, the Group will apply the
new rules under IFRS 9 retrospectively from January 1, 2018, with the practical expedients permitted
under the statement. Further, the Group expects to adopt IFRS 15 using the modified retrospective
~223~
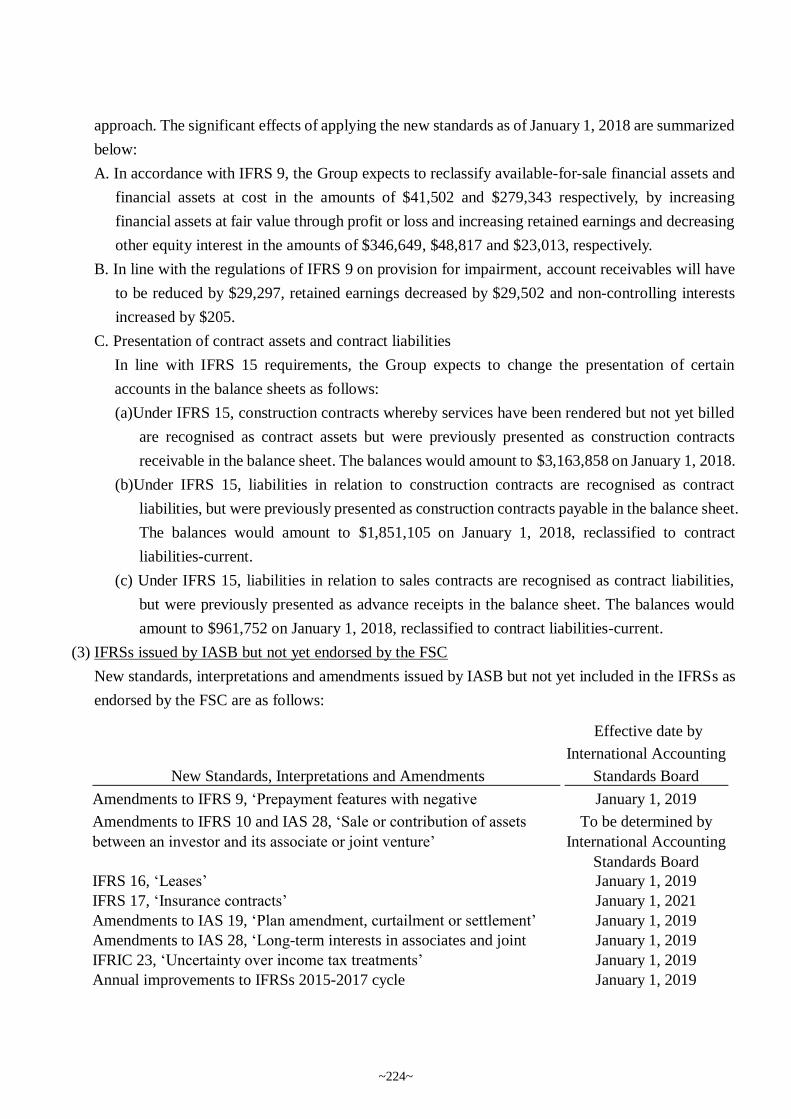
approach. The significant effects of applying the new standards as of January 1, 2018 are summarized
below:
A. In accordance with IFRS 9, the Group expects to reclassify available-for-sale financial assets and
financial assets at cost in the amounts of $41,502 and $279,343 respectively, by increasing
financial assets at fair value through profit or loss and increasing retained earnings and decreasing
other equity interest in the amounts of $346,649, $48,817 and $23,013, respectively.
B. In line with the regulations of IFRS 9 on provision for impairment, account receivables will have
to be reduced by $29,297, retained earnings decreased by $29,502 and non-controlling interests
increased by $205.
C. Presentation of contract assets and contract liabilities
In line with IFRS 15 requirements, the Group expects to change the presentation of certain
accounts in the balance sheets as follows:
(a)Under IFRS 15, construction contracts whereby services have been rendered but not yet billed
are recognised as contract assets but were previously presented as construction contracts
receivable in the balance sheet. The balances would amount to $3,163,858 on January 1, 2018.
(b)Under IFRS 15, liabilities in relation to construction contracts are recognised as contract
liabilities, but were previously presented as construction contracts payable in the balance sheet.
The balances would amount to $1,851,105 on January 1, 2018, reclassified to contract
liabilities-current.
(c) Under IFRS 15, liabilities in relation to sales contracts are recognised as contract liabilities,
but were previously presented as advance receipts in the balance sheet. The balances would
amount to $961,752 on January 1, 2018, reclassified to contract liabilities-current.
(3) IFRSs issued by IASB but not yet endorsed by the FSC
New standards, interpretations and amendments issued by IASB but not yet included in the IFRSs as
endorsed by the FSC are as follows:
New Standards, Interpretations and Amendments
Effective date by
International Accounting
Standards Board
Amendments to IFRS 9, ‘Prepayment features with negative
compensation’
January 1, 2019
Amendments to IFRS 10 and IAS 28, ‘Sale or contribution of assets
between an investor and its associate or joint venture’
To be determined by
International Accounting
Standards Board
IFRS 16, ‘Leases’ January 1, 2019
IFRS 17, ‘Insurance contracts’ January 1, 2021
Amendments to IAS 19, ‘Plan amendment, curtailment or settlement’ January 1, 2019
Amendments to IAS 28, ‘Long-term interests in associates and joint January 1, 2019
IFRIC 23, ‘Uncertainty over income tax treatments’ January 1, 2019
Annual improvements to IFRSs 2015-2017 cycle January 1, 2019
~224~
Except for the following, the above standards and interpretations have no significant impact to the
Group’s financial condition and financial performance based on the Group’s assessment. The
quantitative impact will be disclosed when the assessment is complete.
A. IFRS 16, ‘Leases’
IFRS 16, ‘Leases’, replaces IAS 17, ‘Leases’ and related interpretations and SICs. The standard
requires lessees to recognise a ‘right-of-use asset’ and a lease liability (except for those leases with
terms of 12 months or less and leases of low-value assets). The accounting stays the same for
lessors, which is to classify their leases as either finance leases or operating leases and account for
those two types of leases differently. IFRS 16 only requires enhanced disclosures to be provided
by lessors.
B. Amendments to IAS 28, ‘Long-term interests in associates and joint ventures’
The amendment clarifies that, for any long-term interest that, in substance, form part of the entity's
net investment in an associate or joint venture, an entity should apply IFRS 9 to such interests
before it applies IAS 28 to recognise losses.
4. SUMMARY OF SIGNIFICANT ACCOUNTING POLICIES
The principal accounting policies applied in the preparation of these consolidated financial statements
are set out below. These policies have been consistently applied to all the periods presented, unless
otherwise stated.
(1) Statement of compliance
The consolidated financial statements of the Group have been prepared in accordance with the
“Regulations Governing the Preparation of Financial Reports by Securities Issuers”, International
Financial Reporting Standards, International Accounting Standards, IFRIC Interpretations, and SIC
Interpretations as endorsed by the FSC (collectively referred herein as the “IFRSs”).
(2) Basis of preparation
A. Except for the following items, the consolidated financial statements have been prepared under
the historical cost convention:
(a) Financial assets and financial liabilities (including derivative instruments) at fair value through
profit or loss.
(b) Available-for-sale financial assets measured at fair value.
(c) Liabilities on cash-settled share-based payment arrangements measured at fair value.
(d) Defined benefit liabilities recognised based on the net amount of pension fund assets less
present value of defined benefit obligation.
B. The preparation of financial statements in conformity with IFRSs requires the use of certain
critical accounting estimates. It also requires management to exercise its judgement in the process
of applying the Group’s accounting policies. The areas involving a higher degree of judgement or
complexity, or areas where assumptions and estimates are significant to the consolidated financial
statements are disclosed in Note 5.
~225~
(3) Basis of consolidation
A. Basis for preparation of consolidated financial statements:
(a) All subsidiaries are included in the Group’s consolidated financial statements. Subsidiaries
are all entities (including structured entities) controlled by the Group. The Group controls an
entity when the Group is exposed, or has rights, to variable returns from its involvement with
the entity and has the ability to affect those returns through its power over the entity.
Consolidation of subsidiaries begins from the date the Group obtains control of the subsidiaries
and ceases when the Group loses control of the subsidiaries.
(b) Inter-company transactions, balances and unrealised gains or losses on transactions between
companies within the Group are eliminated. Accounting policies of subsidiaries have been
adjusted where necessary to ensure consistency with the policies adopted by the Group.
(c) Profit or loss and each component of other comprehensive income are attributed to the owners
of the parent and to the non-controlling interests. Total comprehensive income is attributed to
the owners of the parent and to the non-controlling interests even if this results in the non-
controlling interests having a deficit balance.
(d) Changes in a parent’s ownership interest in a subsidiary that do not result in the parent losing
control of the subsidiary (transactions with non-controlling interests) are accounted for as
equity transactions, i.e. transactions with owners in their capacity as owners. Any difference
between the amount by which the non-controlling interests are adjusted and the fair value of
the consideration paid or received is recognised directly in equity.
(e) When the Group loses control of a subsidiary, the Group remeasures any investment retained
in the former subsidiary at its fair value. That fair value is regarded as the fair value on initial
recognition of a financial asset or the cost on initial recognition of the associate or joint venture.
Any difference between fair value and carrying amount is recognised in profit or loss. All
amounts previously recognised in other comprehensive income in relation to the subsidiary
are reclassified to profit or loss on the same basis as would be required if the related assets or
liabilities were disposed of. That is, when the Group loses control of a subsidiary, all gains or
losses previously recognised in other comprehensive income in relation to the subsidiary
should be reclassified from equity to profit or loss, if such gains or losses would be reclassified
to profit or loss when the related assets or liabilities are disposed of.
B. The subsidiaries included in the consolidated financial statements:
~226~
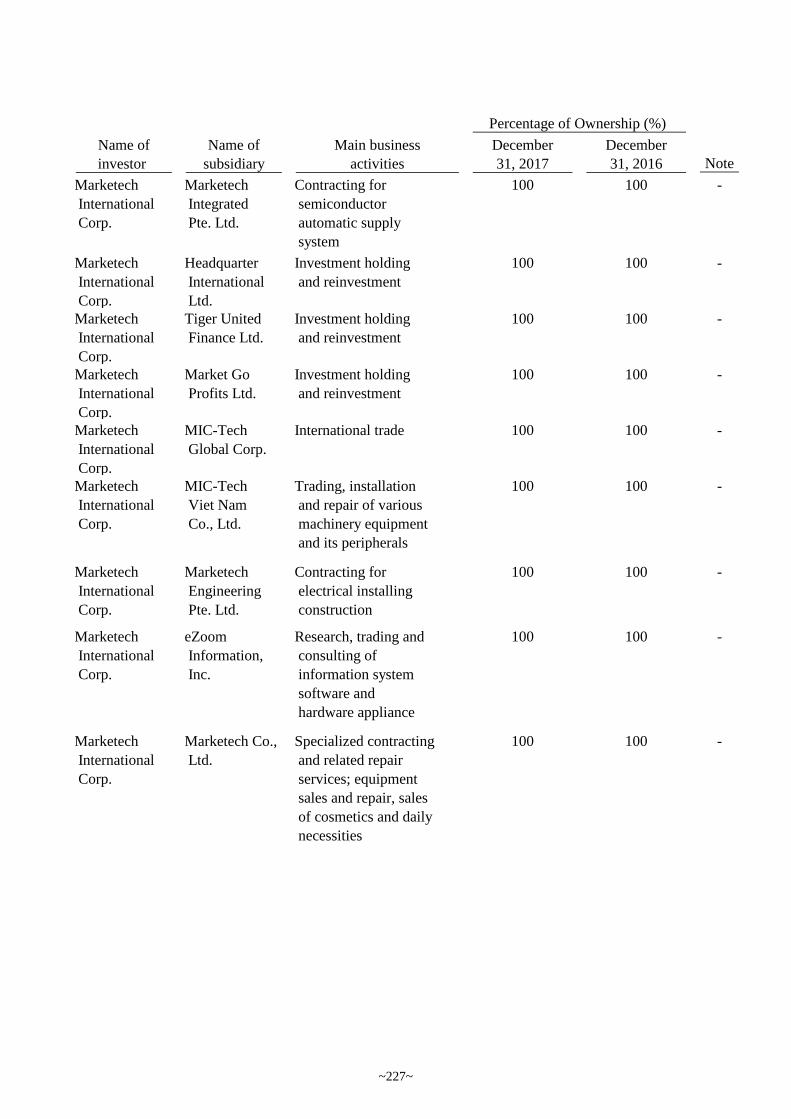
Name of Name of Main business December December
investor subsidiary activities 31, 2017 31, 2016 Note
Marketech
International
Corp.
Marketech
Integrated
Pte. Ltd.
Contracting for
semiconductor
automatic supply
system
100 100 -
Marketech
International
Corp.
Headquarter
International
Ltd.
Investment holding
and reinvestment
100 100 -
Marketech
International
Corp.
Tiger United
Finance Ltd.
Investment holding
and reinvestment
100 100 -
Marketech
International
Corp.
Market Go
Profits Ltd.
Investment holding
and reinvestment
100 100 -
Marketech
International
Corp.
MIC-Tech
Global Corp.
International trade 100 100 -
Marketech
International
Corp.
MIC-Tech
Viet Nam
Co., Ltd.
Trading, installation
and repair of various
machinery equipment
and its peripherals
100 100 -
Marketech
International
Corp.
Marketech
Engineering
Pte. Ltd.
Contracting for
electrical installing
construction
100 100 -
Marketech
International
Corp.
eZoom
Information,
Inc.
Research, trading and
consulting of
information system
software and
hardware appliance
100 100 -
Marketech
International
Corp.
Marketech Co.,
Ltd.
Specialized contracting
and related repair
services; equipment
sales and repair, sales
of cosmetics and daily
necessities
100 100 -
Percentage of Ownership (%)
~227~
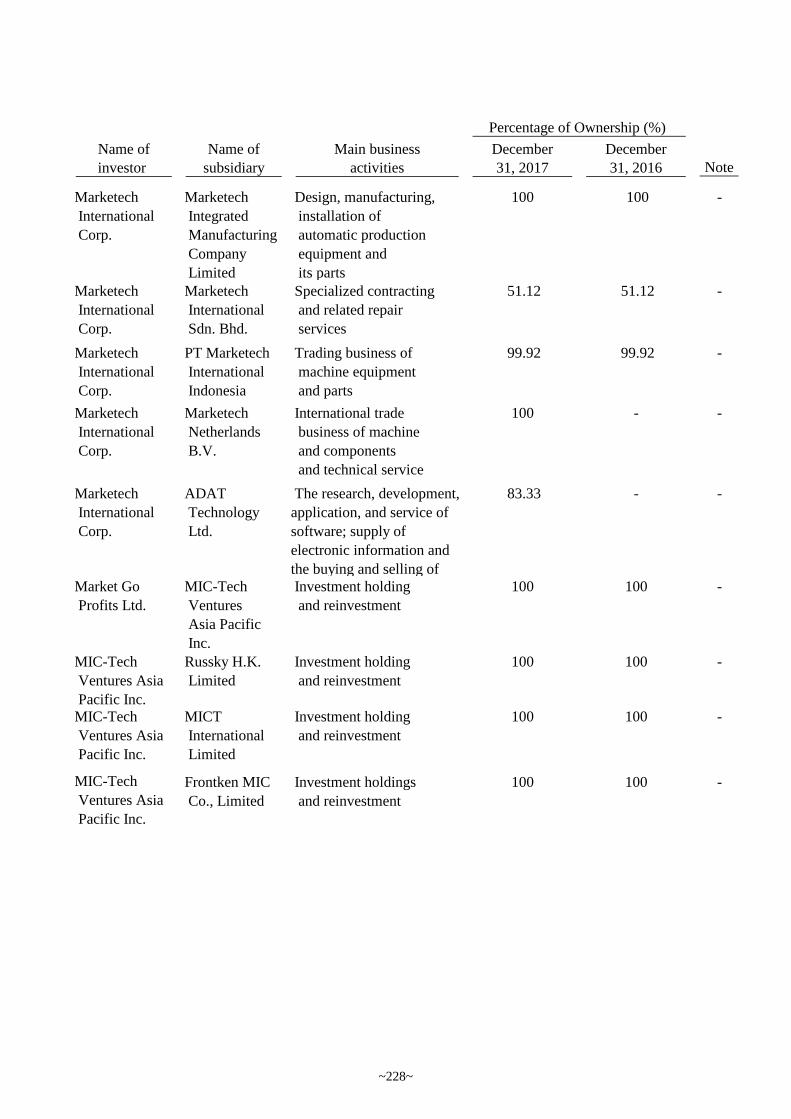
Name of Name of Main business December December
investor subsidiary activities 31, 2017 31, 2016 Note
Percentage of Ownership (%)
Marketech
International
Corp.
Marketech
Integrated
Manufacturing
Company
Limited
Design, manufacturing,
installation of
automatic production
equipment and
its parts
100 100 -
Marketech
International
Corp.
Marketech
International
Sdn. Bhd.
Specialized contracting
and related repair
services
51.12 51.12 -
Marketech
International
Corp.
PT Marketech
International
Indonesia
Trading business of
machine equipment
and parts
99.92 99.92 -
Marketech
International
Corp.
Marketech
Netherlands
B.V.
International trade
business of machine
and components
and technical service
100 - -
Marketech
International
Corp.
ADAT
Technology
Ltd.
The research, development,
application, and service of
software; supply of
electronic information and
the buying and selling of
83.33 - -
Market Go
Profits Ltd.
MIC-Tech
Ventures
Asia Pacific
Inc.
Investment holding
and reinvestment
100 100 -
MIC-Tech
Ventures Asia
Pacific Inc.
Russky H.K.
Limited
Investment holding
and reinvestment
100 100 -
MIC-Tech
Ventures Asia
Pacific Inc.
MICT
International
Limited
Investment holding
and reinvestment
100 100 -
MIC-Tech
Ventures Asia
Pacific Inc.
Frontken MIC
Co., Limited
Investment holdings
and reinvestment
100 100 -
~228~
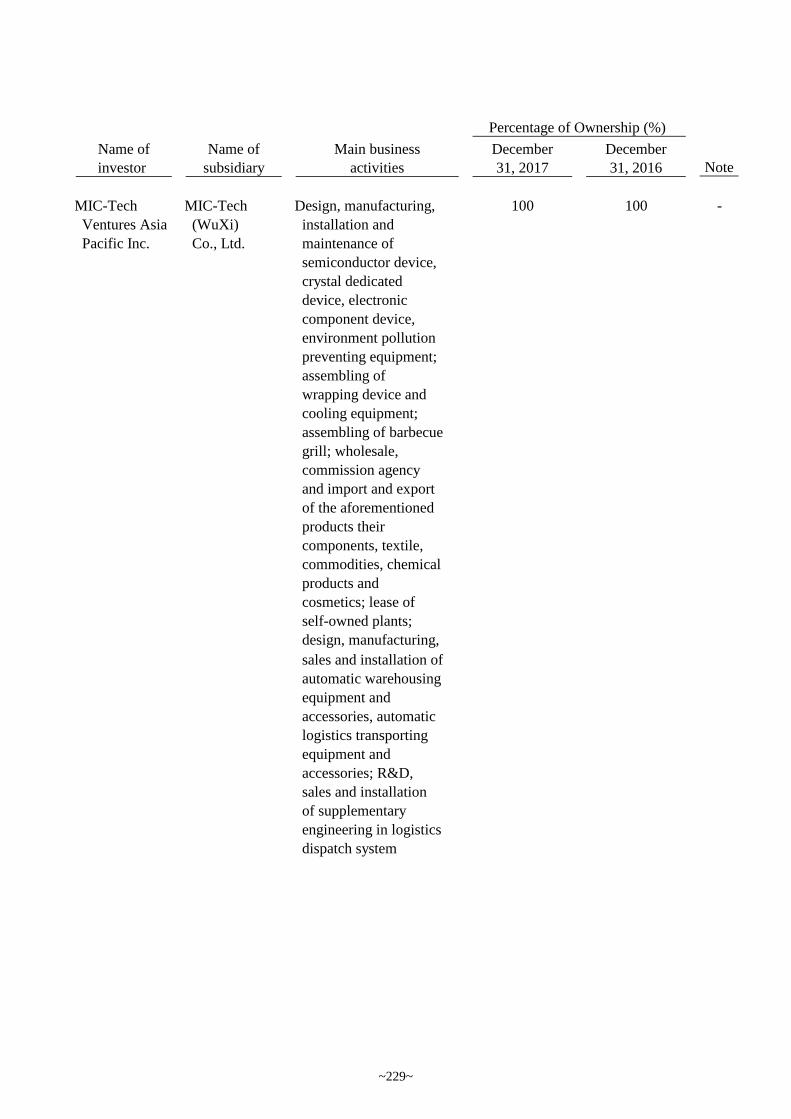
Name of Name of Main business December December
investor subsidiary activities 31, 2017 31, 2016 Note
Percentage of Ownership (%)
MIC-Tech
Ventures Asia
Pacific Inc.
MIC-Tech
(WuXi)
Co., Ltd.
Design, manufacturing,
installation and
maintenance of
semiconductor device,
crystal dedicated
device, electronic
component device,
environment pollution
preventing equipment;
assembling of
wrapping device and
cooling equipment;
assembling of barbecue
grill; wholesale,
commission agency
and import and export
of the aforementioned
products their
components, textile,
commodities, chemical
products and
cosmetics; lease of
self-owned plants;
design, manufacturing,
100 100 -
sales and installation of
automatic warehousing
equipment and
accessories, automatic
logistics transporting
equipment and
accessories; R&D,
sales and installation
of supplementary
engineering in logistics
dispatch system
~229~
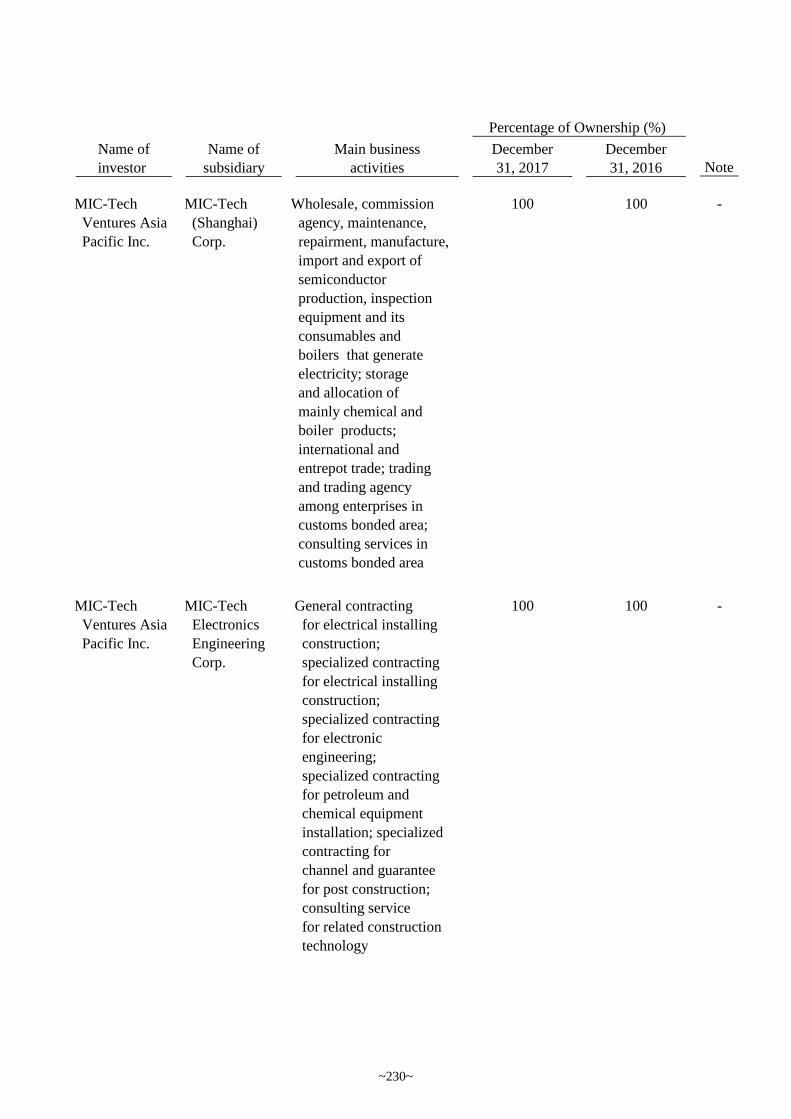
Name of Name of Main business December December
investor subsidiary activities 31, 2017 31, 2016 Note
Percentage of Ownership (%)
MIC-Tech
Ventures Asia
Pacific Inc.
MIC-Tech
(Shanghai)
Corp.
Wholesale, commission
agency, maintenance,
repairment, manufacture,
import and export of
semiconductor
production, inspection
equipment and its
consumables and
boilers that generate
electricity; storage
and allocation of
mainly chemical and
boiler products;
international and
entrepot trade; trading
and trading agency
among enterprises in
customs bonded area;
consulting services in
customs bonded area
100 100 -
MIC-Tech
Ventures Asia
Pacific Inc.
MIC-Tech
Electronics
Engineering
Corp.
General contracting
for electrical installing
construction;
specialized contracting
for electrical installing
construction;
specialized contracting
for electronic
engineering;
specialized contracting
for petroleum and
chemical equipment
installation; specialized
contracting for
channel and guarantee
for post construction;
consulting service
for related construction
technology
100 100 -
~230~
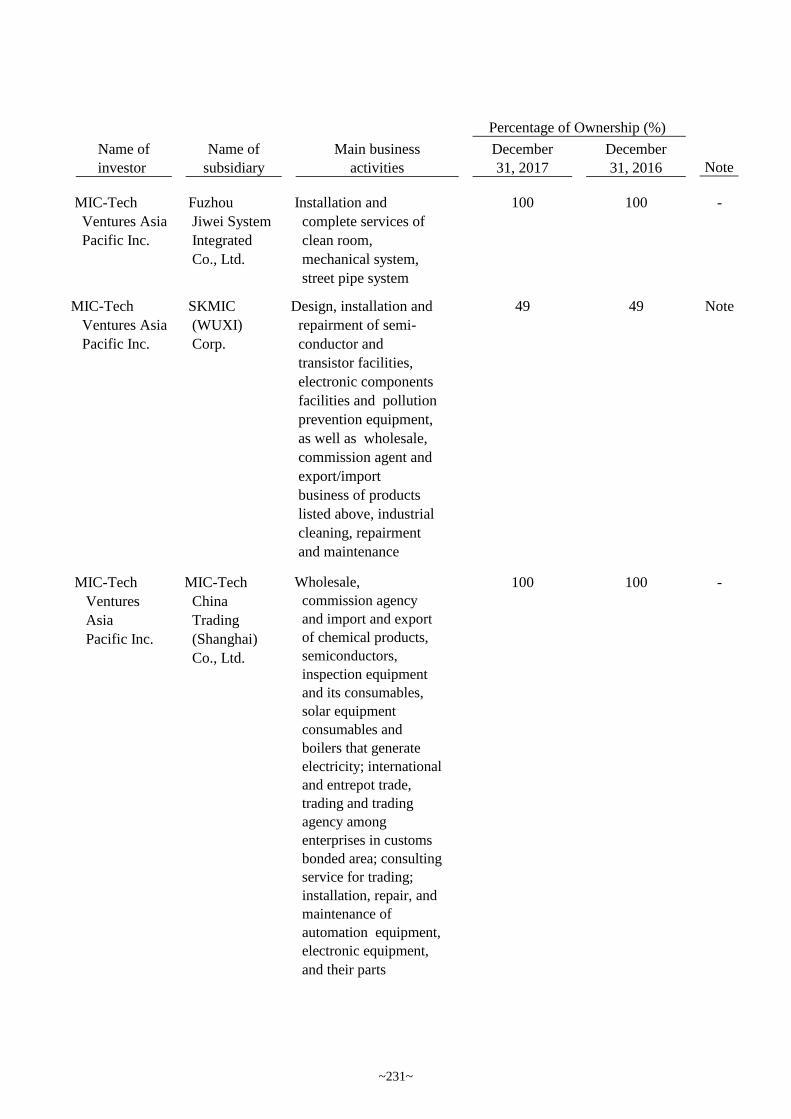
Name of Name of Main business December December
investor subsidiary activities 31, 2017 31, 2016 Note
Percentage of Ownership (%)
MIC-Tech
Ventures Asia
Pacific Inc.
Fuzhou
Jiwei System
Integrated
Co., Ltd.
Installation and
complete services of
clean room,
mechanical system,
street pipe system
100 100 -
MIC-Tech
Ventures Asia
Pacific Inc.
SKMIC
(WUXI)
Corp.
Design, installation and
repairment of semi-
conductor and
transistor facilities,
electronic components
facilities and pollution
prevention equipment,
as well as wholesale,
commission agent and
export/import
business of products
listed above, industrial
cleaning, repairment
and maintenance
49 49 Note
MIC-Tech
Ventures
Asia
Pacific Inc.
MIC-Tech
China
Trading
(Shanghai)
Co., Ltd.
Wholesale,
commission agency
and import and export
of chemical products,
semiconductors,
inspection equipment
and its consumables,
solar equipment
consumables and
boilers that generate
electricity; international
and entrepot trade,
trading and trading
agency among
enterprises in customs
bonded area; consulting
service for trading;
installation, repair, and
maintenance of
automation equipment,
electronic equipment,
and their parts
100 100 -
~231~
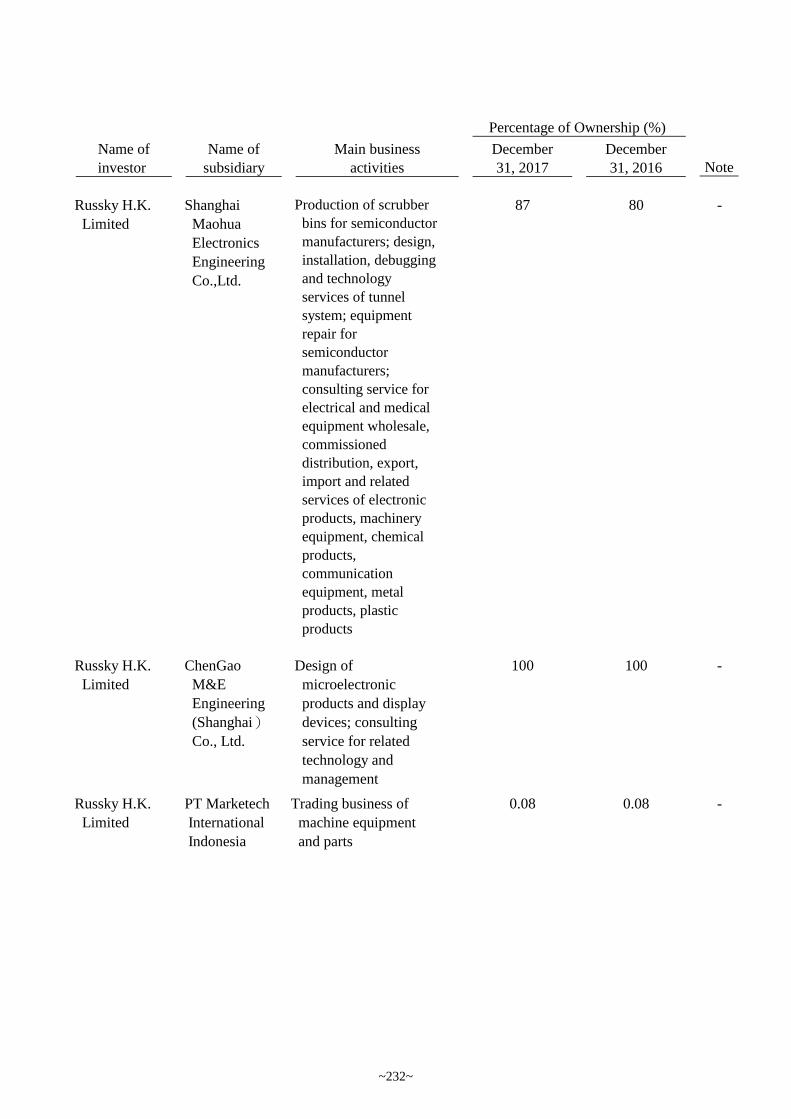
Name of Name of Main business December December
investor subsidiary activities 31, 2017 31, 2016 Note
Percentage of Ownership (%)
Russky H.K.
Limited
Shanghai
Maohua
Electronics
Engineering
Co.,Ltd.
Production of scrubber
bins for semiconductor
manufacturers; design,
installation, debugging
and technology
services of tunnel
system; equipment
repair for
semiconductor
manufacturers;
consulting service for
electrical and medical
equipment wholesale,
commissioned
distribution, export,
import and related
services of electronic
products, machinery
equipment, chemical
products,
communication
equipment, metal
products, plastic
products
87 80 -
Russky H.K.
Limited
ChenGao
M&E
Engineering
(Shanghai)
Co., Ltd.
Design of
microelectronic
products and display
devices; consulting
service for related
technology and
management
100 100 -
Russky H.K.
Limited
PT Marketech
International
Indonesia
Trading business of
machine equipment
and parts
0.08 0.08 -
~232~
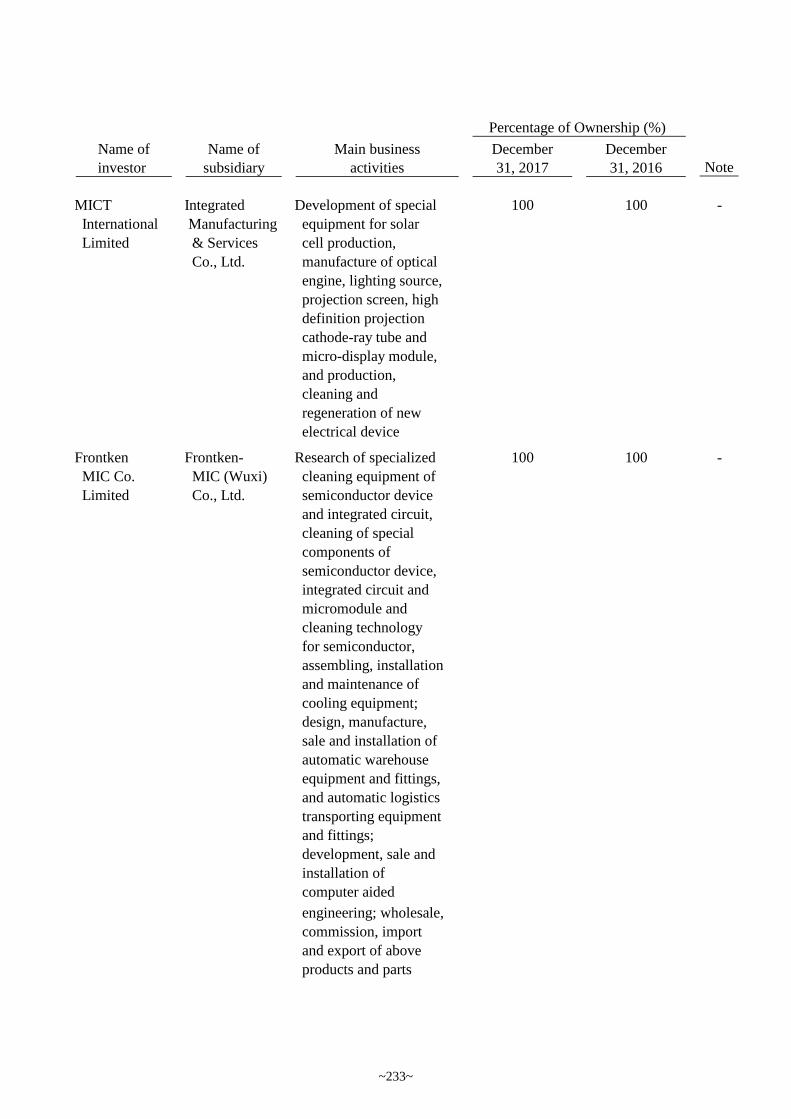
Name of Name of Main business December December
investor subsidiary activities 31, 2017 31, 2016 Note
Percentage of Ownership (%)
MICT
International
Limited
Integrated
Manufacturing
& Services
Co., Ltd.
Development of special
equipment for solar
cell production,
manufacture of optical
engine, lighting source,
projection screen, high
definition projection
cathode-ray tube and
micro-display module,
and production,
cleaning and
regeneration of new
electrical device
100 100 -
Frontken
MIC Co.
Limited
Frontken-
MIC (Wuxi)
Co., Ltd.
Research of specialized
cleaning equipment of
semiconductor device
and integrated circuit,
cleaning of special
components of
semiconductor device,
integrated circuit and
micromodule and
cleaning technology
for semiconductor,
assembling, installation
and maintenance of
cooling equipment;
design, manufacture,
sale and installation of
automatic warehouse
equipment and fittings,
and automatic logistics
transporting equipment
and fittings;
development, sale and
installation of
computer aided
100 100 -
engineering; wholesale,
commission, import
and export of above
products and parts
~233~
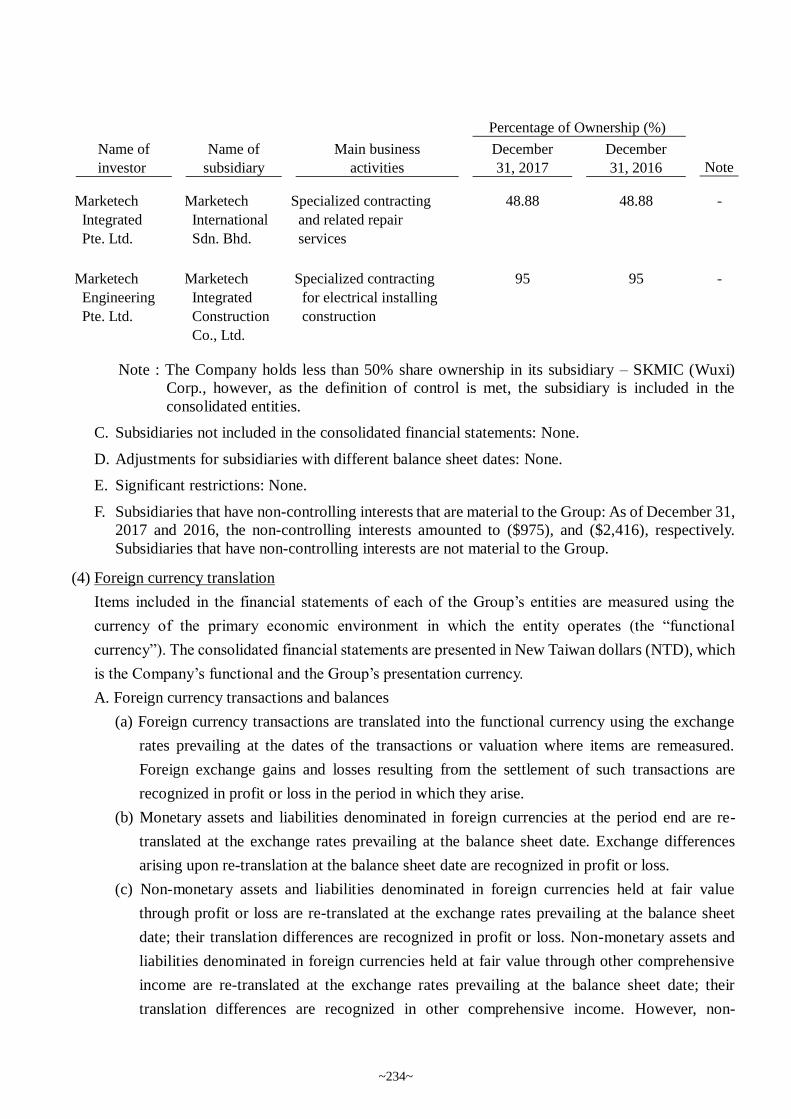
Note : The Company holds less than 50% share ownership in its subsidiary – SKMIC (Wuxi)
Corp., however, as the definition of control is met, the subsidiary is included in the
consolidated entities.
C. Subsidiaries not included in the consolidated financial statements: None.
D. Adjustments for subsidiaries with different balance sheet dates: None.
E. Significant restrictions: None.
F. Subsidiaries that have non-controlling interests that are material to the Group: As of December 31,
2017 and 2016, the non-controlling interests amounted to ($975), and ($2,416), respectively.
Subsidiaries that have non-controlling interests are not material to the Group.
(4) Foreign currency translation
Items included in the financial statements of each of the Group’s entities are measured using the
currency of the primary economic environment in which the entity operates (the “functional
currency”). The consolidated financial statements are presented in New Taiwan dollars (NTD), which
is the Company’s functional and the Group’s presentation currency.
A. Foreign currency transactions and balances
(a) Foreign currency transactions are translated into the functional currency using the exchange
rates prevailing at the dates of the transactions or valuation where items are remeasured.
Foreign exchange gains and losses resulting from the settlement of such transactions are
recognized in profit or loss in the period in which they arise.
(b) Monetary assets and liabilities denominated in foreign currencies at the period end are re-
translated at the exchange rates prevailing at the balance sheet date. Exchange differences
arising upon re-translation at the balance sheet date are recognized in profit or loss.
(c) Non-monetary assets and liabilities denominated in foreign currencies held at fair value
through profit or loss are re-translated at the exchange rates prevailing at the balance sheet
date; their translation differences are recognized in profit or loss. Non-monetary assets and
liabilities denominated in foreign currencies held at fair value through other comprehensive
income are re-translated at the exchange rates prevailing at the balance sheet date; their
translation differences are recognized in other comprehensive income. However, non-
Name of Name of Main business December December
investor subsidiary activities 31, 2017 31, 2016 Note
Percentage of Ownership (%)
Marketech
Integrated
Pte. Ltd.
Marketech
International
Sdn. Bhd.
Specialized contracting
and related repair
services
48.88 48.88 -
Marketech
Engineering
Pte. Ltd.
Marketech
Integrated
Construction
Co., Ltd.
Specialized contracting
for electrical installing
construction
95 95 -
~234~
monetary assets and liabilities denominated in foreign currencies that are not measured at fair
value are translated using the historical exchange rates at the dates of the initial transactions.
(d) Foreign exchange gains and loss based on the nature of those transactions are presented in the
statement of comprehensive income within other gains and losses.
B. Translation of foreign operations
(a) The operating results and financial position of all the group entities, associates and joint
arrangements that have a functional currency different from the presentation currency are
translated into the presentation currency as follows:
i . Assets and liabilities for each balance sheet presented are translated at the closing exchange
rate at the date of that balance sheet;
ii. Income and expenses for each statement of comprehensive income are translated at average
exchange rates of that period; and
iii. All resulting exchange differences are recognised in other comprehensive income.
(b) When the foreign operation partially disposed of or sold is an associate or joint arrangements,
exchange differences that were recorded in other comprehensive income are proportionately
reclassified to profit or loss as part of the gain or loss on sale. In addition, even when the Group
still retains partial interest in the former foreign associate or joint arrangements after losing
significant influence over the former foreign associate, or losing joint control of the former
joint arrangements, such transactions should be accounted for as disposal of all interest in these
foreign operations.
(c) When the foreign operation partially disposed of or sold is a subsidiary, cumulative exchange
differences that were recorded in other comprehensive income are proportionately transferred
to the non-controlling interest in this foreign operation. In addition, even when the Group still
retains partial interest in the former foreign subsidiary after losing control of the former foreign
subsidiary, such transactions should be accounted for as disposal of all interest in the foreign
operation.
(d) Goodwill and fair value adjustments arising on the acquisition of a foreign entity are treated
as assets and liabilities of the foreign entity and translated at the closing exchange rates at the
balance sheet date.
(5) Classification of current and non-current items
A. Assets that meet one of the following criteria are classified as current assets; otherwise they are
classified as non-current assets:
(a) Assets arising from operating activities that are expected to be realized, or are intended to be
sold or consumed within the normal operating cycle;
(b) Assets held mainly for trading purposes;
(c) Assets that are expected to be realized within twelve months from the balance sheet date;
~235~
(d) Cash and cash equivalents, excluding restricted cash and cash equivalents and those that are to
be exchanged or used to pay off liabilities more than twelve months after the balance sheet
date.
B. Liabilities that meet one of the following criteria are classified as current liabilities; otherwise they
are classified as non-current liabilities:
(a) Liabilities that are expected to be paid off within the normal operating cycle;
(b) Liabilities arising mainly from trading activities;
(c) Liabilities that are to be paid off within twelve months from the balance sheet date;
(d) Liabilities for which the repayment date cannot be extended unconditionally to more than
twelve months after the balance sheet date. Terms of a liability that could, at the option of the
counterparty, result in its settlement by the issue of equity instruments do not affect its
classification.
C. Assets and liabilities relating to undertaking construction are classified as a current and non-current
based on operating cycle.
(6) Cash equivalents
A. Cash and cash equivalents include petty cash, bank deposits and other short-term and highly liquid
investments in the statements of cash flows.
B. Cash equivalents refer to short-term, highly liquid investments that are readily convertible to
known amounts of cash and which are subject to an insignificant risk of changes in value. Time
deposits that meet the definition above and are held for the purpose of meeting short-term cash
commitments in operations are classified as cash equivalents.
(7) Financial assets at fair value through profit or loss
A. Financial assets at fair value through profit or loss are financial assets held for trading or financial
assets designated as at fair value through profit or loss on initial recognition. Financial assets are
classified in this category of held for trading if acquired principally for the purpose of selling in
the short-term.
B. On a regular way purchase or sale basis, financial assets at fair value through profit or loss are
recognized and derecognized using settlement date accounting.
C. Financial assets at fair value through profit or loss are initially recognized at fair value. Related
transaction costs are expensed in profit or loss. These financial assets are subsequently remeasured
and stated at fair value, and any changes in the fair value of these financial assets are recognized
in profit or loss.
(8) Available-for-sale financial assets
A. Available-for-sale financial assets are non-derivatives that are either designated in this category or
not classified in any of the other categories.
B. On a regular way purchase or sale basis, available-for-sale financial assets are recognized and
derecognized using trade date accounting.
~236~
C. Available-for-sale financial assets are initially recognized at fair value plus transaction costs.
These financial assets are subsequently remeasured and stated at fair value, and any changes in
the fair value of these financial assets are recognized in other comprehensive income.
Investments in equity instruments that do not have a quoted market price in an active market and
whose fair value cannot be reliably measured or derivatives that are linked to and must be settled
by delivery of such unquoted equity instruments are presented in ‘financial assets measured at
cost’.
(9) Notes and accounts receivable
Accounts receivable are loans and receivables originated by the entity. They are created by the entity
by selling goods or providing services to customers in the ordinary course of business. Accounts
receivable are initially recognized at fair value and subsequently measured at amortized cost using
the effective interest method, less provision for impairment. However, short-term accounts receivable
without bearing interest are subsequently measured at initial invoice amount as the effect of
discounting is immaterial.
(10) Impairment of financial assets
A. The Group assesses at each balance sheet date whether there is objective evidence that a financial
asset or a group of financial assets is impaired as a result of one or more events that occurred
after the initial recognition of the asset (a ‘loss event’) and that loss event (or events) has an
impact on the estimated future cash flows of the financial asset or group of financial assets that
can be reliably estimated.
B. The criteria that the Group uses to determine whether there is objective evidence of an impairment
loss is as follows:
(a) Significant financial difficulty of the issuer or debtor;
(b) A breach of contract, such as a default or delinquency in interest or principal payments;
(c) The Group, for economic or legal reasons relating to the borrower’s financial difficulty,
granted the borrower a concession that a lender would not otherwise consider;
(d) It becomes probable that the borrower will enter bankruptcy or other financial reorganisation;
(e) The disappearance of an active market for that financial asset because of financial difficulties;
(f) Observable data indicating that there is a measurable decrease in the estimated future cash
flows from a group of financial assets since the initial recognition of those assets, although
the decrease cannot yet be identified with the individual financial asset in the group, including
adverse changes in the payment status of borrowers in the group or national or local economic
conditions that correlate with defaults on the assets in the group;
(g) Information about significant changes with an adverse effect that have taken place in the
technology, market, economic or legal environment in which the issuer operates, and
indicates that the cost of the investment in the equity instrument may not be recovered;
(h) A significant or prolonged decline in the fair value of an investment in an equity instrument
below its cost.
~237~
C. When the Group assesses that there has been objective evidence of impairment and an impairment
loss has occurred, accounting for impairment is made as follows according to the category of
financial assets:
(a) Financial assets measured at amortised cost
The amount of the impairment loss is measured as the difference between the asset’s carrying
amount and the present value of estimated future cash flows discounted at the financial asset’s
original effective interest rate, and is recognised in profit or loss. If, in a subsequent period,
the amount of the impairment loss decreases and the decrease can be related objectively to
an event occurring after the impairment loss was recognised, the previously recognised
impairment loss is reversed through profit or loss to the extent that the carrying amount of
the asset does not exceed its amortised cost that would have been at the date of reversal had
the impairment loss not been recognised previously. Impairment loss is recognised and
reversed by adjusting the carrying amount of the asset through the use of an impairment
allowance account.
(b) Financial assets measured at cost
The amount of the impairment loss is measured as the difference between the asset’s carrying
amount and the present value of estimated future cash flows discounted at current market
return rate of similar financial asset, and is recognised in profit or loss. Impairment loss
recognised for this category shall not be reversed subsequently. Impairment loss is recognised
by adjusting the carrying amount of the asset directly.
(c) Available-for-sale financial assets
The amount of the impairment loss is measured as the difference between the asset’s
acquisition cost (less any principal repayment and amortisation) and current fair value, less
any impairment loss on that financial asset previously recognised in profit or loss, and is
reclassified from ‘other comprehensive income’ to ‘profit or loss’. If, in a subsequent period,
the fair value of an investment in a debt instrument increases, and the increase can be related
objectively to an event occurring after the impairment loss was recognised, then such
impairment loss is reversed through profit or loss. Impairment loss of an investment in an
equity instrument recognised in profit or loss shall not be reversed through profit or loss.
Impairment loss is recognised and reversed by adjusting the carrying amount of the asset
through the use of an impairment allowance account.
(11) Derecognition of financial assets
The Group derecognizes a financial asset when the contractual rights to receive the cash flows from
the financial asset expire.
(12) Inventories
Inventories are stated at the lower of cost and net realizable value. Cost is determined using the
weighted-average method. The cost of finished goods and work in progress comprises raw materials,
direct labour, other direct costs and related production overheads (allocated based on normal
~238~
operating capacity). It excludes borrowing costs. The item by item approach is used in applying the
lower of cost and net realizable value. Net realizable value is the estimated selling price in the
ordinary course of business, less the estimated cost of completion and applicable variable selling
expenses.
(13) Construction contracts
A. IAS 11, ‘Construction Contracts’, defines a construction contract as a contract specifically
negotiated for the construction of an asset. If the outcome of a construction contract can be
estimated reliably and it is probable that this contract would make a profit, contract revenue
should be recognized by reference to the stage of completion of the contract activity, using the
percentage-of-completion method of accounting, over the contract term. Contract costs are
expensed as incurred. The stage of completion of a contract is measured by the proportion of
contract costs incurred for work performed to date to the estimated total costs for the contract.
An expected loss where total contract costs will exceed total contract revenue on a construction
contract should be recognized as an expense as soon as such loss is probable. If the outcome of
a construction contract cannot be estimated reliably, contract revenue should be recognized only
to the extent of contract costs incurred that it is probable will be recoverable.
B. Contract revenue should include the revenue arising from variations from the original contract
work, claims and incentive payments that are agreed by the customer and can be measured
reliably.
C. The excess of the cumulative costs incurred plus recognized profits (less recognized losses) over
the progress billings on each construction contract is presented as an asset within ‘receivables
from customers on construction contracts’. While, the excess of the progress billings over the
cumulative costs incurred plus recognized profits (less recognized losses) on each construction
contract is presented as a liability within ‘Construction contracts payable’.
(14) Investments accounted for using equity method / associates
A. Associates are all entities over which the Group has significant influence but not control. In
general, it is presumed that the investor has significant influence, if an investor holds, directly or
indirectly 20 percent or more of the voting power of the investee. Investments in associates are
accounted for using the equity method and are initially recognized at cost.
B. The Group’s share of its associates’ post-acquisition profits or losses is recognised in profit or
loss, and its share of post-acquisition movements in other comprehensive income is recognised
in other comprehensive income. When the Group’s share of losses in an associate equals or
exceeds its interest in the associate, including any other unsecured receivables, the Group does
not recognise further losses, unless it has incurred legal or constructive obligations or made
payments on behalf of the associate.
~239~
C. When changes in an associate’s equity that are not recognised in profit or loss or other
comprehensive income of the associate and such changes not affecting the Group’s ownership
percentage of the associate, the Group recognises change in ownership interests in the associate
in ‘capital surplus’ in proportion to its ownership.
D. Unrealised gains on transactions between the Group and its associates are eliminated to the extent
of the Group’s interest in the associates. Unrealised losses are also eliminated unless the
transaction provides evidence of an impairment of the asset transferred. Accounting policies of
associates have been adjusted where necessary to ensure consistency with the policies adopted
by the Group.
E. In the case that an associate issues new shares and the Group does not subscribe or acquire new
shares proportionately, which results in a change in the Group’s ownership percentage of the
associate but maintains significant influence on the associate, then ‘capital surplus’ and
‘investments accounted for under the equity method’ shall be adjusted for the increase or
decrease of its share of equity interest. If the above condition causes a decrease in the Group’s
ownership percentage of the associate, in addition to the above adjustment, the amounts
previously recognised in other comprehensive income in relation to the associate are reclassified
to profit or loss proportionately on the same basis as would be required if the relevant assets or
liabilities were disposed of.
F. Upon loss of significant influence over an associate, the Group remeasures any investment
retained in the former associate at its fair value. Any difference between fair value and carrying
amount is recognised in profit or loss.
G. When the Group disposes its investment in an associate, if it loses significant influence over this
associate, the amounts previously recognised in other comprehensive income in relation to the
associate, are reclassified to profit or loss, on the same basis as would be required if the relevant
assets or liabilities were disposed of. If it still retains significant influence over this associate,
then the amounts previously recognised in other comprehensive income in relation to the
associate are reclassified to profit or loss proportionately in accordance with the aforementioned
approach.
H. When the Group disposes its investment in an associate, if it loses significant influence over this
associate, the amounts previously recognised as capital surplus in relation to the associate are
transferred to profit or loss. If it still retains significant influence over this associate, then the
amounts previously recognised as capital surplus in relation to the associate are transferred to
profit or loss proportionately.
(15) Property, plant and equipment
A. Property, plant and equipment are initially recorded at cost. Borrowing costs incurred during the
construction period are capitalized.
B. Subsequent costs are included in the asset’s carrying amount or recognized as a separate asset, as
appropriate, only when it is probable that future economic benefits associated with the item will
~240~
flow to the Group and the cost of the item can be measured reliably. The carrying amount of the
replaced part is derecognised. All other repairs and maintenance are charged to profit or loss
during the financial period in which they are incurred.
C. Land is not depreciated. Other property, plant and equipment apply cost model and are
depreciated using the straight-line method to allocate their cost over their estimated useful lives.
Each part of an item of property, plant, and equipment with a cost that is significant in relation
to the total cost of the item must be depreciated separately.
D. The assets’ residual values, useful lives and depreciation methods are reviewed, and adjusted if
appropriate, at each financial year-end. If expectations for the assets’ residual values and useful
lives differ from previous estimates or the patterns of consumption of the assets’ future economic
benefits embodied in the assets have changed significantly, any change is accounted for as a
change in estimate under IAS 8, ‘Accounting Policies, Changes in Accounting Estimates and
Errors’, from the date of the change. The estimated useful lives of property, plant and equipment
are as follows:
Buildings and structures t 2 ~ 55 years
Machinery and equipment 3 ~ 15 years
Other equipment uipment: 2 ~ 10 years
(16) Leases (leasee)
Payments made under an operating lease (net of any incentives received from the lessor) are
recognized in profit or loss on a straight-line basis over the lease term.
(17) Intangible assets
A. Computer software
Computer software is stated at cost and amortized on a straight-line basis over its estimated useful
life of 1 to 3 years.
B. Trademarks
Trademarks are acquired in a business combination.
C. Other intangible assets
Other intangible assets are technology royalties which are stated at cost and amortised on a
straight-line basis over the contract duration.
(18) Impairment of non-financial assets
A. The Group assesses at each balance sheet date the recoverable amounts of those assets where
there is an indication that they are impaired. An impairment loss is recognized for the amount by
which the asset’s carrying amount exceeds its recoverable amount. The recoverable amount is
the higher of an asset’s fair value less costs to sell or value in use. Except for goodwill, when the
circumstances or reasons for recognizing impairment loss for an asset in prior years no longer
exist or diminish, the impairment loss is reversed. The increased carrying amount due to reversal
should not be more than what the depreciated or amortized historical cost would have been if the
impairment had not been recognized.
~241~
B. Goodwill is evaluated annually and is recorded as cost less impairment loss. Impairment loss of
goodwill shall not be reversed.
C. For the purpose of impairment testing, goodwill acquired in a business combination is allocated
to each of the cash-generating units, or groups of cash-generating units, that is/are expected to
benefit from the synergies of the business combination. Each unit or group of units to which the
goodwill is allocated represents the lowest level within the entity at which the goodwill is
monitored for internal management purposes. Goodwill is monitored at the operating segment
level.
(19) Borrowings
Borrowings are recognized initially at fair value, net of transaction costs incurred. Borrowings are
subsequently stated at amortized cost; any difference between the proceeds (net of transaction costs)
and the redemption value is recognized in profit or loss over the period of the borrowings using the
effective interest method.
(20) Notes and accounts payable
Notes and accounts payable are obligations to pay for goods or services that have been acquired in
the ordinary course of business from suppliers. They are recognized initially at fair value and
subsequently measured at amortized cost using the effective interest method. However, short-term
accounts payable without bearing interest are subsequently measured at initial invoice amount as
the effect of discounting is immaterial.
(21) Derecognition of financial liabilities
A financial liability is derecognized when the obligation under the liability specified in the contract
is discharged or cancelled or expires.
(22) Financial liabilities and equity instruments
Convertible corporate bonds issued by the Company contain conversion options (that is, the
bondholders have the right to convert the bonds into the Company’s common shares by exchanging
a fixed amount of cash for a fixed number of common shares), call options and put options. The
Company classifies the bonds payable and derivative features embedded in convertible corporate
bonds on initial recognition as a financial asset, a financial liability or an equity instrument (‘capital
surplus - stock options’) in accordance with the substance of the contractual arrangement and the
definitions of a financial asset, a financial liability and an equity instrument. Convertible corporate
bonds are accounted for as follows:
A. Call options and put options embedded in convertible corporate bonds are recognized initially at
net fair value as ‘financial assets or financial liabilities at fair value through profit or loss’. They
are subsequently remeasured and stated at fair value on each balance sheet date; the gain or loss
is recognized as ‘gain or loss on valuation of financial assets or financial liabilities at fair value
through profit or loss’.
B. Bonds payable of convertible corporate bonds is initially recognised at fair value and
subsequently stated at amortised cost. Any difference between the proceeds and the redemption
~242~
value is accounted for as the premium or discount on bonds payable/ preference share liabilities
and presented as an addition to or deduction from bonds payable, which is amortised in profit or
loss as an adjustment to the ‘finance costs’ over the period of bond circulation using the effective
interest method.
C. Conversion options embedded in convertible corporate bonds issued by the Company, which
meet the definition of an equity instrument, are initially recognized in ‘capital surplus - stock
options’ at the residual amount of total issue price less amounts of ‘financial assets or financial
liabilities at fair value through profit or loss’ and ‘bonds payable - net’ as stated above.
Conversion options are not subsequently remeasured.
D. Any transaction costs directly attributable to the issuance of convertible corporate bonds are
allocated to the liability and equity components in proportion to the allocation of proceeds.
E. When bondholders exercise conversion options, the liability component of the bonds (including
‘bonds payable’ and ‘financial assets or financial liabilities at fair value through profit or loss’)
shall be remeasured on the conversion date. The book value of common shares issued due to the
conversion shall be based on the adjusted book value of the above-mentioned liability component
plus the book value of capital surplus - stock options.
(23) Financial guarantee contracts
A financial guarantee contract is a contract that requires the Group to make specified payments to
reimburse the holder for a loss it incurs because a specified debtor fails to make payment when due
in accordance with the original or modified terms of a debt instrument. A financial guarantee
contract is initially recognized at its fair value adjusted for transaction costs on the trade date. After
initial recognition, the financial guarantee is measured at the higher of the initial fair value less
cumulative amortization and the best estimate of the amount required to settle the present obligation
on each balance sheet date.
(24) Employee benefits
A. Short-term employee benefits
Short-term employee benefits are measured at the undiscounted amount of the benefits expected
to be paid in respect of service rendered by employees in a period and should be recognized as
expenses in that period when the employees render service.
B. Pensions
(a) Defined contribution plans
For defined contribution plans, the contributions are recognised as pension expenses when
they are due on an accrual basis. Prepaid contributions are recognised as an asset to the extent
of a cash refund or a reduction in the future payments.
(b) Defined benefit plans
i. Net obligation under a defined benefit plan is defined as the present value of an amount of
pension benefits that employees will receive on retirement for their services with the Group
in current period or prior periods. The liability recognised in the balance sheet in respect of
~243~
defined benefit pension plans is the present value of the defined benefit obligation at the
balance sheet date less the fair value of plan assets. The defined benefit net obligation is
calculated annually by independent actuaries using the projected unit credit method. The
rate used to discount is determined by using interest rates of government bonds (at the
balance sheet date) of a currency and term consistent with the currency and term of the
employment benefit obligations.
ii. Remeasurement arising on defined benefit plans are recognised in other comprehensive
income in the period in which they arise and are recorded as retained earnings.
iii. Past-service costs are recognised immediately in profit or loss.
C. Employees’ compensation and directors’ and supervisors’ remuneration
Employees’ compensation and directors’ and supervisors’ remuneration are recognized as
expenses and liabilities, provided that such recognition is required under legal obligation or
constructive obligation and those amounts can be reliably estimated. Any difference between the
resolved amounts and the subsequently actual distributed amounts is accounted for as changes in
estimates.
(25) Employee share-based payment
For the equity-settled share-based payment arrangements, the employee services received are
measured at the fair value of the equity instruments granted at the grant date, and are recognized as
compensation cost over the vesting period, with a corresponding adjustment to equity. The fair value
of the equity instruments granted shall reflect the impact of market vesting conditions and non-
market vesting conditions. Compensation cost is subject to adjustment based on the service
conditions that are expected to be satisfied and the estimates of the number of equity instruments
that are expected to vest under the non-market vesting conditions at each balance sheet date. And
ultimately, the amount of compensation cost recognized is based on the number of equity
instruments that eventually vest.
(26) Income tax
A. The tax expense for the period comprises current and deferred tax. Tax is recognized in profit or
loss, except to the extent that it relates to items recognized in other comprehensive income or
items recognized directly in equity, in which cases the tax is recognized in other comprehensive
income or equity.
B. The current income tax expense is calculated on the basis of the tax laws enacted or substantively
enacted at the balance sheet date in the countries where the Company and its subsidiaries operate
and generate taxable income. Management periodically evaluates positions taken in tax returns
with respect to situations in accordance with applicable tax regulations. It establishes provisions
where appropriate based on the amounts expected to be paid to the tax authorities. An additional
10% tax is levied on the unappropriated retained earnings and is recorded as income tax expense
in the year the stockholders resolve to retain the earnings.
~244~
C. Deferred tax is recognized, using the balance sheet liability method, on temporary differences
arising between the tax bases of assets and liabilities and their carrying amounts in the
consolidated balance sheet. However, the deferred tax is not accounted for if it arises from initial
recognition of goodwill or of an asset or liability in a transaction other than a business
combination that at the time of the transaction affects neither accounting nor taxable profit or
loss. Deferred tax is provided on temporary differences arising on investments in subsidiaries
and associates, except where the timing of the reversal of the temporary difference is controlled
by the Group and it is probable that the temporary difference will not reverse in the foreseeable
future. Deferred tax is determined using tax rates (and laws) that have been enacted or
substantially enacted by the balance sheet date and are expected to apply when the related
deferred tax asset is realised or the deferred tax liability is settled.
D. Deferred tax assets are recognized only to the extent that it is probable that future taxable profit
will be available against which the temporary differences can be utilized. At each balance sheet
date, unrecognized and recognized deferred tax assets are reassessed.
E. Current income tax assets and liabilities are offset and the net amount reported in the balance
sheet when there is a legally enforceable right to offset the recognized amounts and there is an
intention to settle on a net basis or realize the asset and settle the liability simultaneously.
Deferred tax assets and liabilities are offset on the balance sheet when the entity has the legally
enforceable right to offset current tax assets against current tax liabilities and they are levied by
the same taxation authority on either the same entity or different entities that intend to settle on
a net basis or realize the asset and settle the liability simultaneously.
F. A deferred tax asset shall be recognized for the carryforward of unused tax credits resulting from
acquisitions of equipment or technology, research and development expenditures and equity
investments to the extent that it is possible that future taxable profit will be available against
which the unused tax credits can be utilized.
(27) Share capital
Ordinary shares are classified as equity. Incremental costs directly attributable to the issue of new
shares or stock options are shown in equity as a deduction, net of tax, from the proceeds.
(28) Dividends
Dividends are recorded in the Company’s financial statements in the period in which they are
approved by the Company’s shareholders. Cash dividends are recorded as liabilities; stock dividends
are recorded as stock dividends to be distributed and are reclassified to ordinary shares on the
effective date of new shares issuance.
~245~
(29) Revenue recognition
A. Construction revenue
Details of construction revenue are provided in Note 4(13).
B. Sales of goods
Revenue is measured at the fair value of the consideration received or receivable for the sale of
goods (products) to external customers in the ordinary course of the Group’s activities. Revenue
arising from the sales of goods should be recognised when the Group has delivered the goods to
the customer, the amount of sales revenue can be measured reliably and it is probable that the
future economic benefits associated with the transaction will flow to the entity. The delivery of
goods (products) is completed when the significant risks and rewards of ownership have been
transferred to the customer, the Group retains neither continuing managerial involvement to the
degree usually associated with ownership nor effective control over the goods (products) sold,
and the customer has accepted the goods based on the sales contract or there is objective evidence
showing that all acceptance provisions have been satisfied.
(30) Business combinations
A. The Group uses the acquisition method to account for business combinations. The consideration
transferred for an acquisition is measured as the fair value of the assets transferred, liabilities
incurred or assumed and equity instruments issued at the acquisition date, plus the fair value of
any assets and liabilities resulting from a contingent consideration arrangement. All acquisition-
related costs are expensed as incurred. Identifiable assets acquired and liabilities and contingent
liabilities assumed in a business combination are measured initially at their fair values at the
acquisition date. For each business combination, the Group measures at the acquisition date
components of non-controlling interests in the acquiree that are present ownership interests and
entitle their holders to the proportionate share of the entity’s net assets in the event of liquidation
at either fair value or the present ownership instruments’ proportionate share in the recognised
amounts of the acquiree’s identifiable net assets. All other non-controlling interests should be
measured at the acquisition-date fair value.
B. The excess of the consideration transferred, the amount of any non-controlling interest in the
acquiree and the fair value of any previous equity interest in the acquiree over the fair value of
the identifiable assets acquired and the liabilities assumed is recorded as goodwill at the
acquisition date. If the total of consideration transferred, non-controlling interest in the acquiree
recognised and the fair value of previously held equity interest in the acquiree is less than the
fair value of the identifiable assets acquired and the liabilities assumed, the difference is
recognised directly in profit or loss on the acquisition date.
(31) Operating segments
Operating segments are reported in a manner consistent with the internal reporting provided to the
Chief Operating Decision-Maker. The Group’s Chief Operating Decision-Maker is responsible for
allocating resources and assessing performance of the operating segments.
~246~
5. CRITICAL ACCOUNTING JUDGEMENTS, ESTIMATES AND KEY SOURCES OF
ASSUMPTION UNCERTAINTY
The preparation of these consolidated financial statements requires management to make critical
judgements in applying the Group’s accounting policies and make critical assumptions and estimates
concerning future events. Assumptions and estimates may differ from the actual results and are
continually evaluated and adjusted based on historical experience and other factors. Such assumptions
and estimates have a significant risk of causing a material adjustment to the carrying amounts of assets
and liabilities within the next financial year; and the related information is addressed below:
(1) Critical judgements in applying the Company’s accounting policies
None.
(2) Critical accounting estimates and assumptions
A. Construction contract
The Company recognises contract revenue and profit based on management’s evaluation to
contract profit and percentage of completion. Management assesses and adjusts the contract profit
and cost during execution of the contract. The actual result of the total profit and cost may be
higher or lower than the estimation, and the effect is recognised in revenue and profit.
B. Evaluation of inventories
As inventories are stated at the lower of cost and net realisable value, the Company must determine
the net realisable value of inventories on balance sheet date using judgements and estimates. Due
to the rapid technology innovation, the Company evaluates the amounts of normal inventory
consumption, obsolete inventories or inventories without market selling value on balance sheet
date, and writes down the cost of inventories to the net realisable value. Such an evaluation of
inventories is principally based on the demand for the products within the specified period in the
future. Therefore, there might be material changes to the evaluation.
C. Assessing the doubtful accounts
During the process of assessing the doubtful accounts, the Group uses judgement and evaluation
to consider collectibility. The collectibility assessment is affected by various factors: customers’
financial conditions, historical transaction records, current economic conditions, etc. If the
collectibility of those accounts is in doubt, the Group will recognize allowance for uncollectible
accounts individually. The evaluation of allowance is based on the status as of balance sheets date
for reasonable expectations of future events. However, the actual results may be different than
estimation. Therefore, it may have significant changes.
~247~
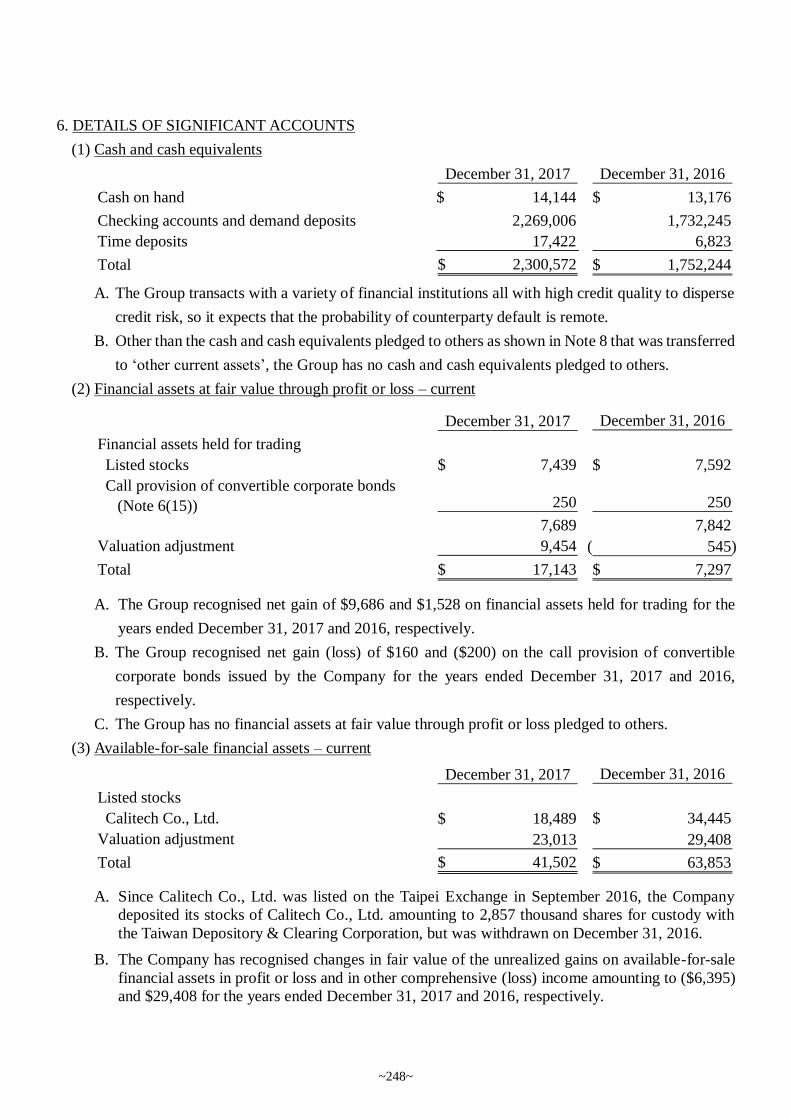
6. DETAILS OF SIGNIFICANT ACCOUNTS
(1) Cash and cash equivalents
A. The Group transacts with a variety of financial institutions all with high credit quality to disperse
credit risk, so it expects that the probability of counterparty default is remote.
B. Other than the cash and cash equivalents pledged to others as shown in Note 8 that was transferred
to ‘other current assets’, the Group has no cash and cash equivalents pledged to others.
(2) Financial assets at fair value through profit or loss – current
A. The Group recognised net gain of $9,686 and $1,528 on financial assets held for trading for the
years ended December 31, 2017 and 2016, respectively.
B. The Group recognised net gain (loss) of $160 and ($200) on the call provision of convertible
corporate bonds issued by the Company for the years ended December 31, 2017 and 2016,
respectively.
C. The Group has no financial assets at fair value through profit or loss pledged to others.
(3) Available-for-sale financial assets – current
A. Since Calitech Co., Ltd. was listed on the Taipei Exchange in September 2016, the Company
deposited its stocks of Calitech Co., Ltd. amounting to 2,857 thousand shares for custody with
the Taiwan Depository & Clearing Corporation, but was withdrawn on December 31, 2016.
B. The Company has recognised changes in fair value of the unrealized gains on available-for-sale
financial assets in profit or loss and in other comprehensive (loss) income amounting to ($6,395)
and $29,408 for the years ended December 31, 2017 and 2016, respectively.
December 31, 2017 December 31, 2016
Cash on hand $ 14,144 13,176$
Checking accounts and demand deposits 2,269,006 1,732,245
Time deposits 17,422 6,823
Total 2,300,572$ 1,752,244$
December 31, 2017 December 31, 2016
Financial assets held for trading
Listed stocks 7,439$ 7,592$
Call provision of convertible corporate bonds
(Note 6(15)) 250 250
7,689 7,842
Valuation adjustment 9,454 545)(
Total 17,143$ 7,297$
December 31, 2017 December 31, 2016
Listed stocks
Calitech Co., Ltd. 18,489$ 34,445$
Valuation adjustment 23,013 29,408
Total 41,502$ 63,853$
~248~
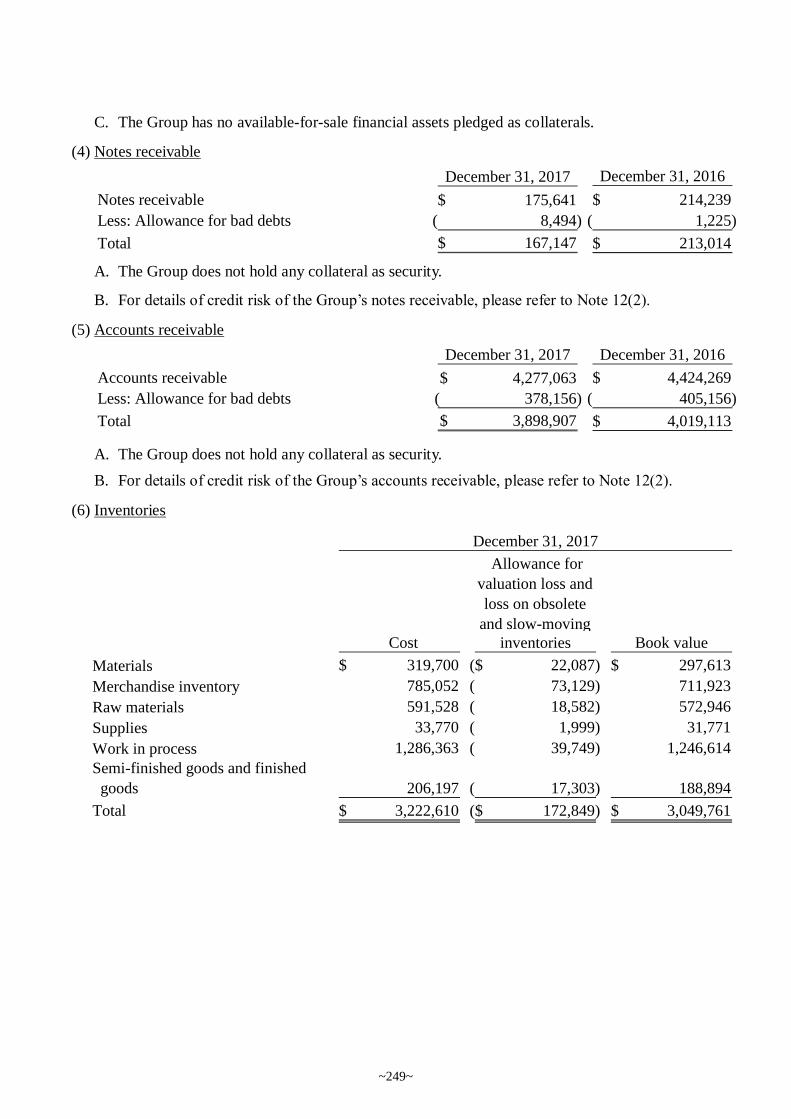
C. The Group has no available-for-sale financial assets pledged as collaterals.
(4) Notes receivable
A. The Group does not hold any collateral as security.
B. For details of credit risk of the Group’s notes receivable, please refer to Note 12(2).
(5) Accounts receivable
A. The Group does not hold any collateral as security.
B. For details of credit risk of the Group’s accounts receivable, please refer to Note 12(2).
(6) Inventories
December 31, 2017 December 31, 2016
Notes receivable 175,641$ 214,239$
Less: Allowance for bad debts 8,494)( 1,225)(
Total 167,147$ 213,014$
December 31, 2017 December 31, 2016
Accounts receivable 4,277,063$ 4,424,269$
Less: Allowance for bad debts 378,156)( 405,156)(
Total 3,898,907$ 4,019,113$
Allowance for
valuation loss and
loss on obsolete
and slow-moving
Cost inventories Book value
Materials 319,700$ 22,087)($ 297,613$
Merchandise inventory 785,052 73,129)( 711,923
Raw materials 591,528 18,582)( 572,946
Supplies 33,770 1,999)( 31,771
Work in process 1,286,363 39,749)( 1,246,614
Semi-finished goods and finished
goods 206,197 17,303)( 188,894
Total 3,222,610$ 172,849)($ 3,049,761$
December 31, 2017
~249~
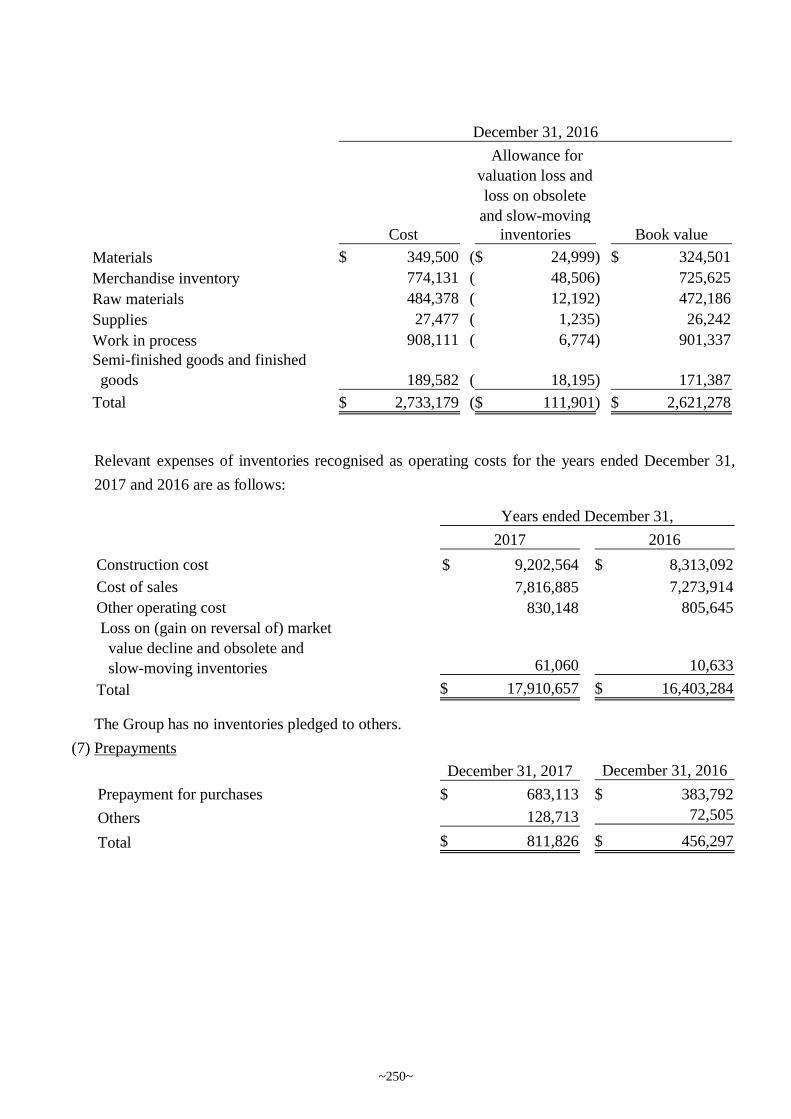
Relevant expenses of inventories recognised as operating costs for the years ended December 31,
2017 and 2016 are as follows:
The Group has no inventories pledged to others.
(7) Prepayments
Allowance for
valuation loss and
loss on obsolete
and slow-moving
Cost inventories Book value
Materials 349,500$ 24,999)($ 324,501$
Merchandise inventory 774,131 48,506)( 725,625
Raw materials 484,378 12,192)( 472,186
Supplies 27,477 1,235)( 26,242
Work in process 908,111 6,774)( 901,337
Semi-finished goods and finished
goods 189,582 18,195)( 171,387
Total 2,733,179$ 111,901)($ 2,621,278$
December 31, 2016
2017 2016
Construction cost 9,202,564$ 8,313,092$
Cost of sales 7,816,885 7,273,914
Other operating cost 830,148 805,645
Loss on (gain on reversal of) market
value decline and obsolete and
slow-moving inventories 61,060 10,633
Total 17,910,657$ 16,403,284$
Years ended December 31,
December 31, 2017 December 31, 2016
Prepayment for purchases 683,113$ 383,792$
Others 128,713 72,505
Total 811,826$ 456,297$
~250~
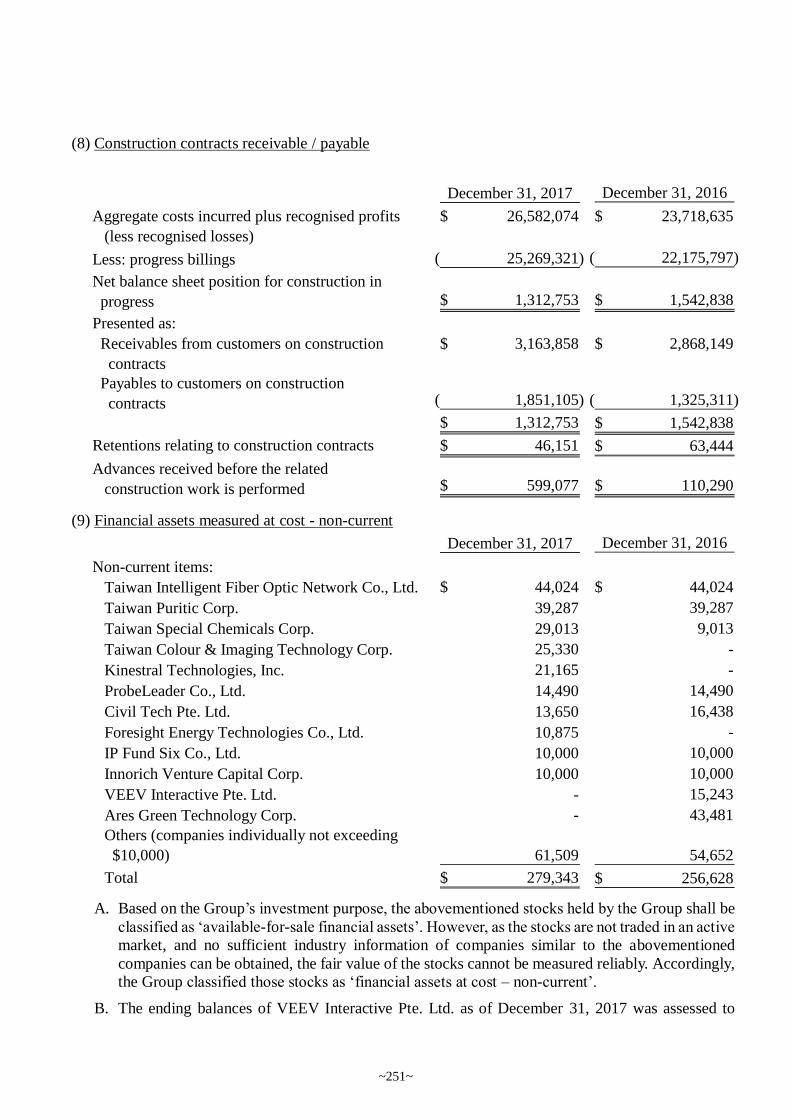
(8) Construction contracts receivable / payable
(9) Financial assets measured at cost - non-current
A. Based on the Group’s investment purpose, the abovementioned stocks held by the Group shall be
classified as ‘available-for-sale financial assets’. However, as the stocks are not traded in an active
market, and no sufficient industry information of companies similar to the abovementioned
companies can be obtained, the fair value of the stocks cannot be measured reliably. Accordingly,
the Group classified those stocks as ‘financial assets at cost – non-current’.
B. The ending balances of VEEV Interactive Pte. Ltd. as of December 31, 2017 was assessed to
December 31, 2017 December 31, 2016
Aggregate costs incurred plus recognised profits
(less recognised losses)
26,582,074$ 23,718,635$
Less: progress billings 25,269,321)( 22,175,797)(
Net balance sheet position for construction in
progress 1,312,753$ 1,542,838$
Presented as:
Receivables from customers on construction
contracts
3,163,858$ 2,868,149$
Payables to customers on construction
contracts 1,851,105)( 1,325,311)(
1,312,753$ 1,542,838$
Retentions relating to construction contracts 46,151$ 63,444$
Advances received before the related
construction work is performed 599,077$ 110,290$
December 31, 2017 December 31, 2016
Non-current items:
Taiwan Intelligent Fiber Optic Network Co., Ltd. 44,024$ 44,024$
Taiwan Puritic Corp. 39,287 39,287
Taiwan Special Chemicals Corp. 29,013 9,013
Taiwan Colour & Imaging Technology Corp. 25,330 -
Kinestral Technologies, Inc. 21,165 -
ProbeLeader Co., Ltd. 14,490 14,490
Civil Tech Pte. Ltd. 13,650 16,438
Foresight Energy Technologies Co., Ltd. 10,875 -
IP Fund Six Co., Ltd. 10,000 10,000
Innorich Venture Capital Corp. 10,000 10,000
VEEV Interactive Pte. Ltd. - 15,243
Ares Green Technology Corp. - 43,481
Others (companies individually not exceeding
$10,000) 61,509 54,652
Total 279,343$ 256,628$
~251~
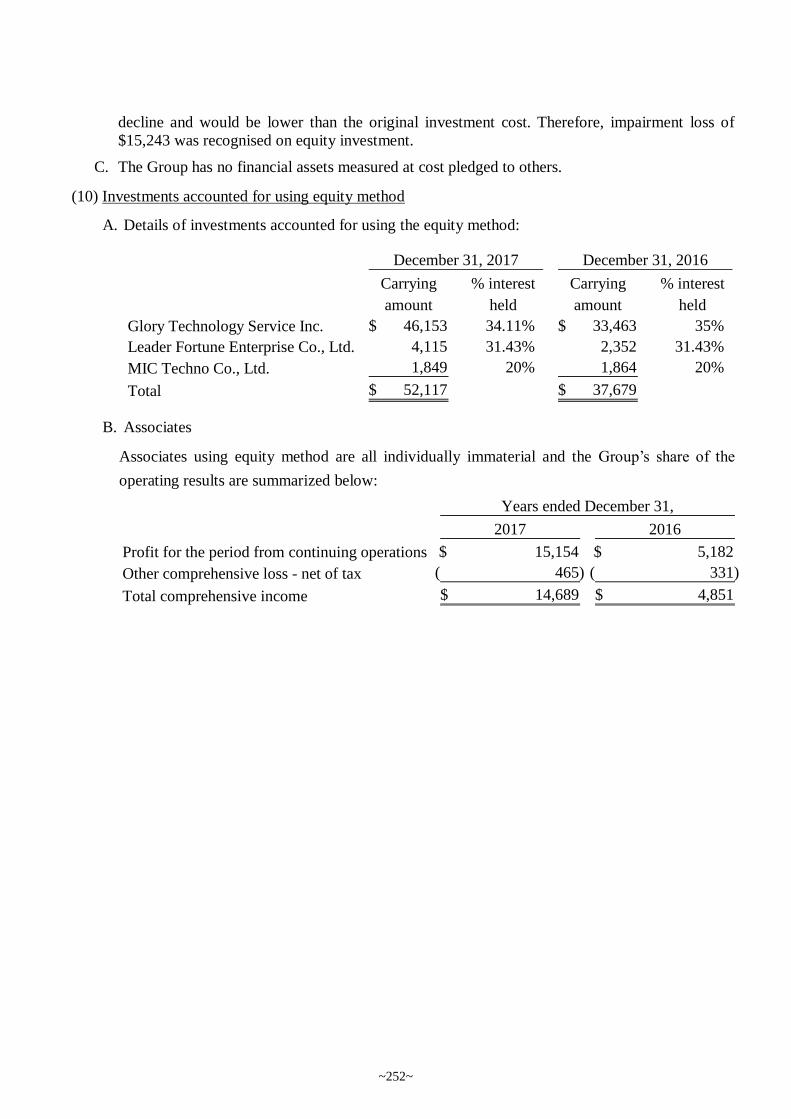
decline and would be lower than the original investment cost. Therefore, impairment loss of
$15,243 was recognised on equity investment.
C. The Group has no financial assets measured at cost pledged to others.
(10) Investments accounted for using equity method
A. Details of investments accounted for using the equity method:
B. Associates
Associates using equity method are all individually immaterial and the Group’s share of the
operating results are summarized below:
Carrying % interest Carrying % interest
amount held amount held
Glory Technology Service Inc. 46,153$ 34.11% 33,463$ 35%
Leader Fortune Enterprise Co., Ltd. 4,115 31.43% 2,352 31.43%
MIC Techno Co., Ltd. 1,849 20% 1,864 20%
Total 52,117$ 37,679$
December 31, 2017 December 31, 2016
2017 2016
Profit for the period from continuing operations $ 15,154 $ 5,182
Other comprehensive loss - net of tax 465)( 331)(
Total comprehensive income 14,689$ 4,851$
Years ended December 31,
~252~
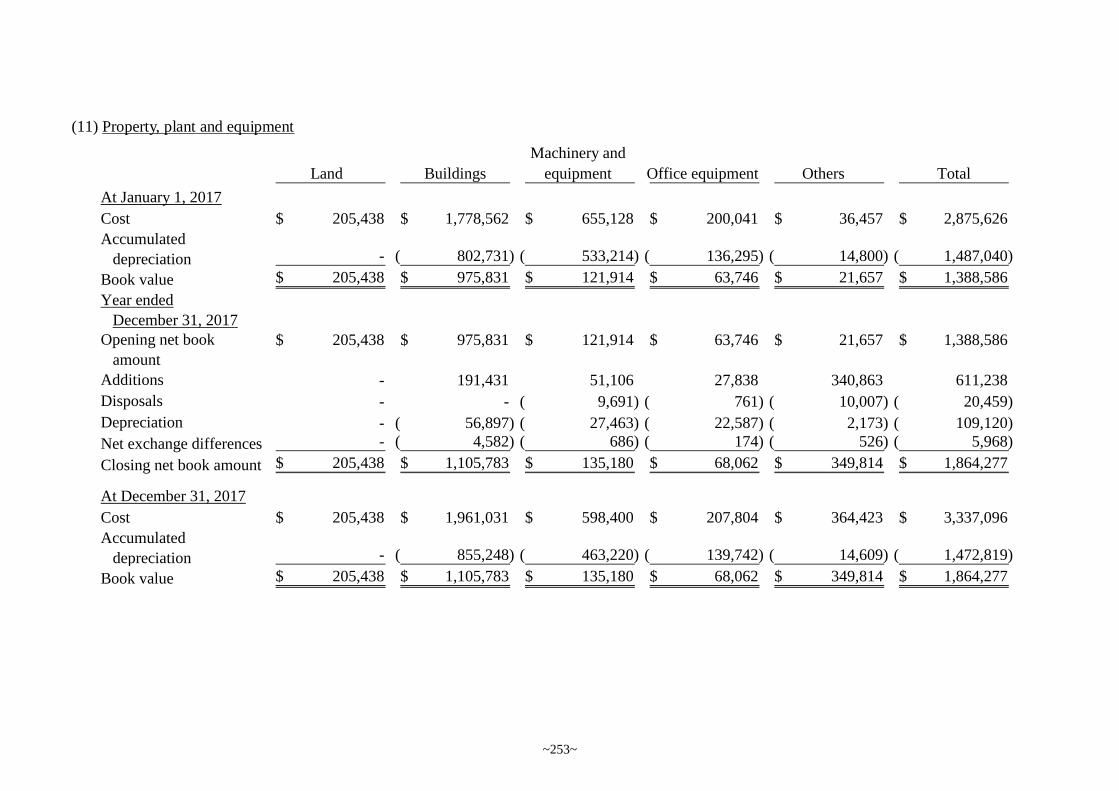
(11) Property, plant and equipment
Machinery and
Land Buildings equipment Office equipment Others Total
At January 1, 2017
Cost 205,438$ 1,778,562$ 655,128$ 200,041$ 36,457$ 2,875,626$
Accumulated
depreciation - 802,731)( 533,214)( 136,295)( 14,800)( 1,487,040)(
Book value 205,438$ 975,831$ 121,914$ 63,746$ 21,657$ 1,388,586$
Year ended
December 31, 2017
Opening net book
amount
205,438$ 975,831$ 121,914$ 63,746$ 21,657$ 1,388,586$
Additions - 191,431 51,106 27,838 340,863 611,238
Disposals - - 9,691)( 761)( 10,007)( 20,459)(
Depreciation - 56,897)( 27,463)( 22,587)( 2,173)( 109,120)(
Net exchange differences - 4,582)( 686)( 174)( 526)( 5,968)(
Closing net book amount 205,438$ 1,105,783$ 135,180$ 68,062$ 349,814$ 1,864,277$
At December 31, 2017
Cost 205,438$ 1,961,031$ 598,400$ 207,804$ 364,423$ 3,337,096$
Accumulated
depreciation - 855,248)( 463,220)( 139,742)( 14,609)( 1,472,819)(
Book value 205,438$ 1,105,783$ 135,180$ 68,062$ 349,814$ 1,864,277$
~253~
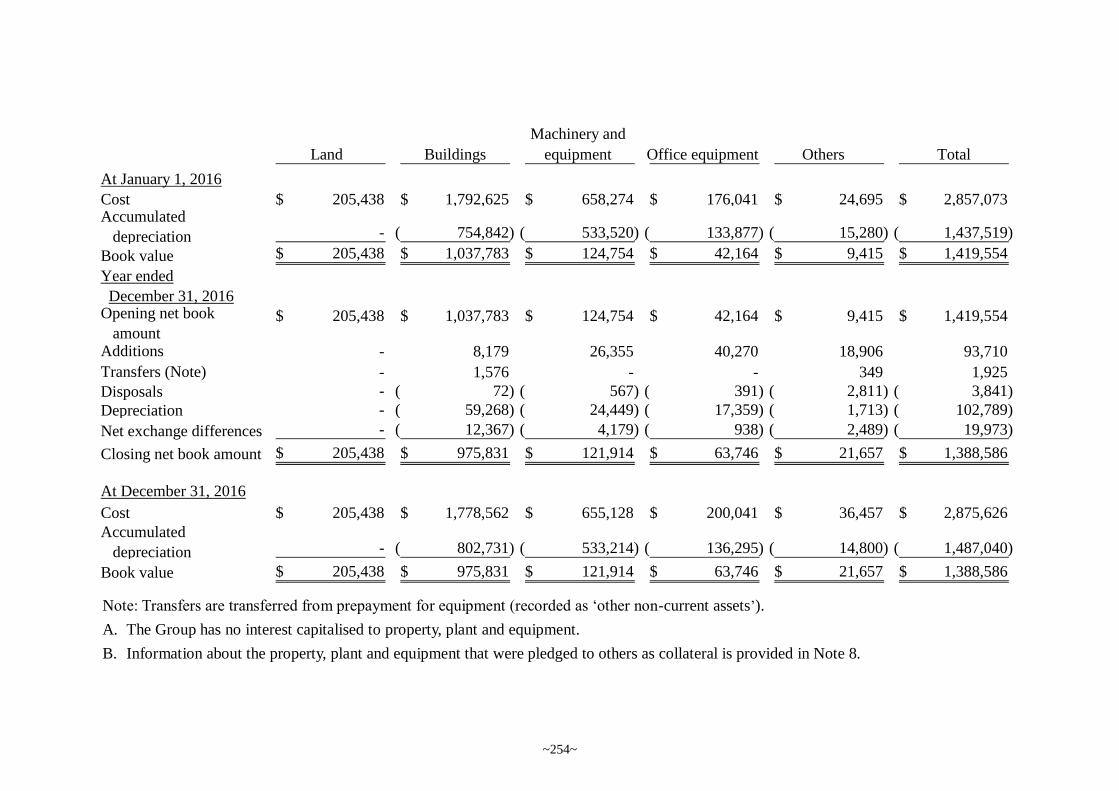
Note: Transfers are transferred from prepayment for equipment (recorded as ‘other non-current assets’).
A. The Group has no interest capitalised to property, plant and equipment.
B. Information about the property, plant and equipment that were pledged to others as collateral is provided in Note 8.
Machinery and
Land Buildings equipment Office equipment Others Total
At January 1, 2016
Cost 205,438$ 1,792,625$ 658,274$ 176,041$ 24,695$ 2,857,073$ Accumulated
depreciation - 754,842)( 533,520)( 133,877)( 15,280)( 1,437,519)(
Book value 205,438$ 1,037,783$ 124,754$ 42,164$ 9,415$ 1,419,554$
Year ended
December 31, 2016Opening net book
amount205,438$ 1,037,783$ 124,754$ 42,164$ 9,415$ 1,419,554$
Additions - 8,179 26,355 40,270 18,906 93,710
Transfers (Note) - 1,576 - - 349 1,925
Disposals - 72)( 567)( 391)( 2,811)( 3,841)(
Depreciation - 59,268)( 24,449)( 17,359)( 1,713)( 102,789)(
Net exchange differences - 12,367)( 4,179)( 938)( 2,489)( 19,973)(
Closing net book amount 205,438$ 975,831$ 121,914$ 63,746$ 21,657$ 1,388,586$
At December 31, 2016
Cost 205,438$ 1,778,562$ 655,128$ 200,041$ 36,457$ 2,875,626$
Accumulated
depreciation - 802,731)( 533,214)( 136,295)( 14,800)( 1,487,040)(
Book value 205,438$ 975,831$ 121,914$ 63,746$ 21,657$ 1,388,586$
~254~
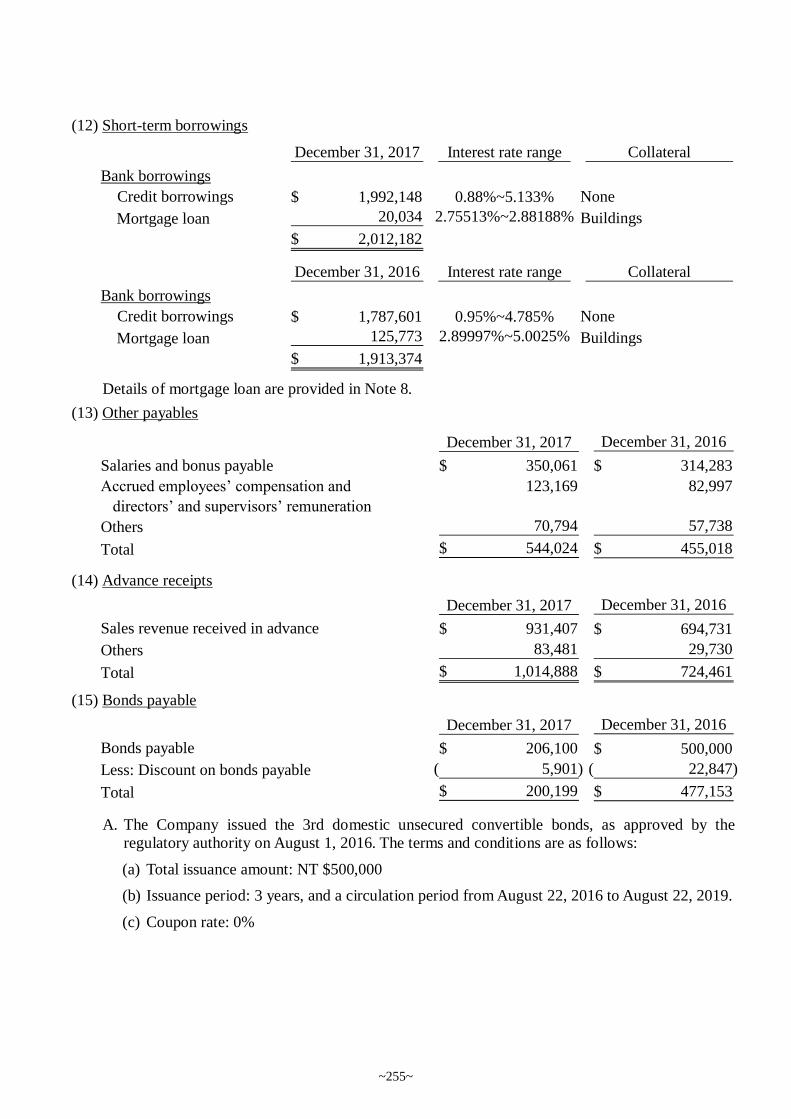
(12) Short-term borrowings
Details of mortgage loan are provided in Note 8.
(13) Other payables
(14) Advance receipts
(15) Bonds payable
A. The Company issued the 3rd domestic unsecured convertible bonds, as approved by the
regulatory authority on August 1, 2016. The terms and conditions are as follows:
(a) Total issuance amount: NT $500,000
(b) Issuance period: 3 years, and a circulation period from August 22, 2016 to August 22, 2019.
(c) Coupon rate: 0%
December 31, 2017 Interest rate range Collateral
Bank borrowings
Credit borrowings 1,992,148$ 0.88%~5.133% None
Mortgage loan 20,034 2.75513%~2.88188% Buildings
2,012,182$
December 31, 2016 Interest rate range Collateral
Bank borrowings
Credit borrowings 1,787,601$ 0.95%~4.785% None
Mortgage loan 125,773 2.89997%~5.0025% Buildings
1,913,374$
December 31, 2017 December 31, 2016
Salaries and bonus payable 350,061$ 314,283$
Accrued employees’ compensation and
directors’ and supervisors’ remuneration
123,169 82,997
Others 70,794 57,738
Total 544,024$ 455,018$
December 31, 2017 December 31, 2016
Sales revenue received in advance 931,407$ 694,731$
Others 83,481 29,730
Total 1,014,888$ 724,461$
December 31, 2017 December 31, 2016
Bonds payable 206,100$ 500,000$
Less: Discount on bonds payable 5,901)( 22,847)(
Total 200,199$ 477,153$
~255~
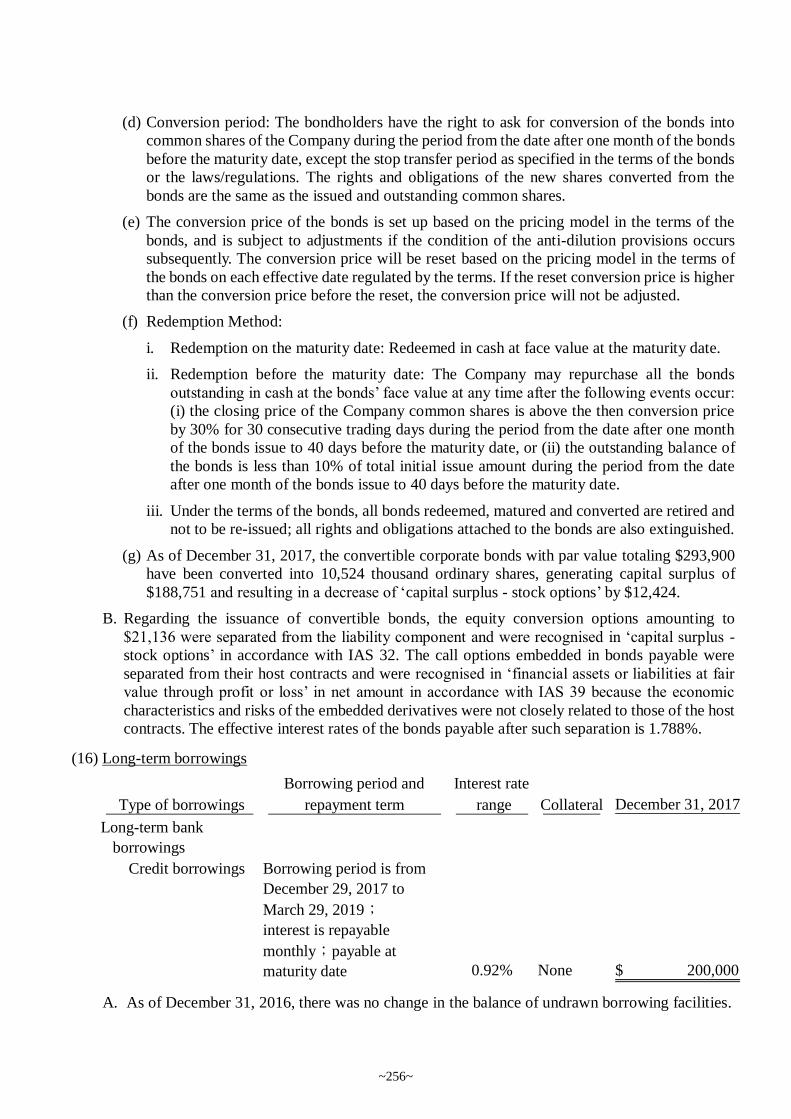
(d) Conversion period: The bondholders have the right to ask for conversion of the bonds into
common shares of the Company during the period from the date after one month of the bonds
before the maturity date, except the stop transfer period as specified in the terms of the bonds
or the laws/regulations. The rights and obligations of the new shares converted from the
bonds are the same as the issued and outstanding common shares.
(e) The conversion price of the bonds is set up based on the pricing model in the terms of the
bonds, and is subject to adjustments if the condition of the anti-dilution provisions occurs
subsequently. The conversion price will be reset based on the pricing model in the terms of
the bonds on each effective date regulated by the terms. If the reset conversion price is higher
than the conversion price before the reset, the conversion price will not be adjusted.
(f) Redemption Method:
i. Redemption on the maturity date: Redeemed in cash at face value at the maturity date.
ii. Redemption before the maturity date: The Company may repurchase all the bonds
outstanding in cash at the bonds’ face value at any time after the following events occur:
(i) the closing price of the Company common shares is above the then conversion price
by 30% for 30 consecutive trading days during the period from the date after one month
of the bonds issue to 40 days before the maturity date, or (ii) the outstanding balance of
the bonds is less than 10% of total initial issue amount during the period from the date
after one month of the bonds issue to 40 days before the maturity date.
iii. Under the terms of the bonds, all bonds redeemed, matured and converted are retired and
not to be re-issued; all rights and obligations attached to the bonds are also extinguished.
(g) As of December 31, 2017, the convertible corporate bonds with par value totaling $293,900
have been converted into 10,524 thousand ordinary shares, generating capital surplus of
$188,751 and resulting in a decrease of ‘capital surplus - stock options’ by $12,424.
B. Regarding the issuance of convertible bonds, the equity conversion options amounting to
$21,136 were separated from the liability component and were recognised in ‘capital surplus -
stock options’ in accordance with IAS 32. The call options embedded in bonds payable were
separated from their host contracts and were recognised in ‘financial assets or liabilities at fair
value through profit or loss’ in net amount in accordance with IAS 39 because the economic
characteristics and risks of the embedded derivatives were not closely related to those of the host
contracts. The effective interest rates of the bonds payable after such separation is 1.788%.
(16) Long-term borrowings
A. As of December 31, 2016, there was no change in the balance of undrawn borrowing facilities.
Borrowing period and Interest rate
Type of borrowings repayment term range Collateral December 31, 2017
Long-term bank
borrowings
Credit borrowings Borrowing period is from
December 29, 2017 to
March 29, 2019;
interest is repayable
monthly;payable at
maturity date 0.92% None 200,000$
~256~
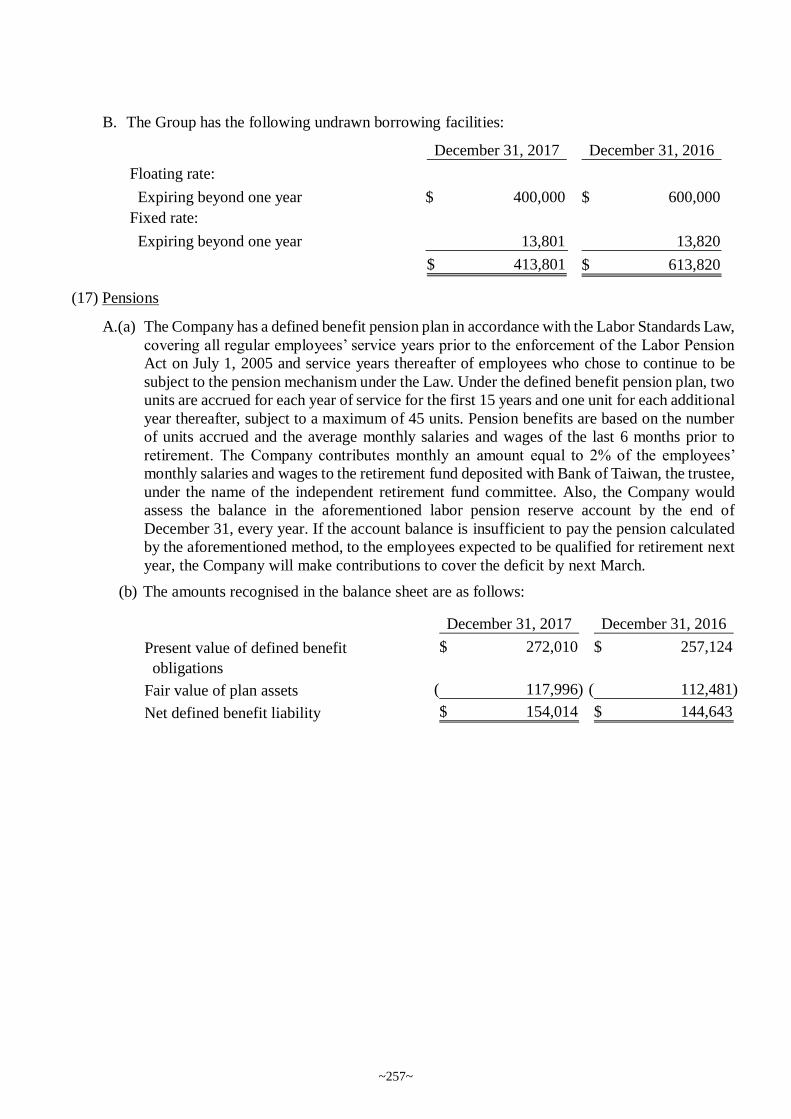
B. The Group has the following undrawn borrowing facilities:
(17) Pensions
A.(a) The Company has a defined benefit pension plan in accordance with the Labor Standards Law,
covering all regular employees’ service years prior to the enforcement of the Labor Pension
Act on July 1, 2005 and service years thereafter of employees who chose to continue to be
subject to the pension mechanism under the Law. Under the defined benefit pension plan, two
units are accrued for each year of service for the first 15 years and one unit for each additional
year thereafter, subject to a maximum of 45 units. Pension benefits are based on the number
of units accrued and the average monthly salaries and wages of the last 6 months prior to
retirement. The Company contributes monthly an amount equal to 2% of the employees’
monthly salaries and wages to the retirement fund deposited with Bank of Taiwan, the trustee,
under the name of the independent retirement fund committee. Also, the Company would
assess the balance in the aforementioned labor pension reserve account by the end of
December 31, every year. If the account balance is insufficient to pay the pension calculated
by the aforementioned method, to the employees expected to be qualified for retirement next
year, the Company will make contributions to cover the deficit by next March.
(b) The amounts recognised in the balance sheet are as follows:
December 31, 2017 December 31, 2016
Floating rate:
Expiring beyond one year $ 400,000 600,000$
Fixed rate:
Expiring beyond one year 13,801 13,820
413,801$ 613,820$
December 31, 2017 December 31, 2016
Present value of defined benefit
obligations
272,010$ 257,124$
Fair value of plan assets 117,996)( 112,481)(
Net defined benefit liability 154,014$ 144,643$
~257~
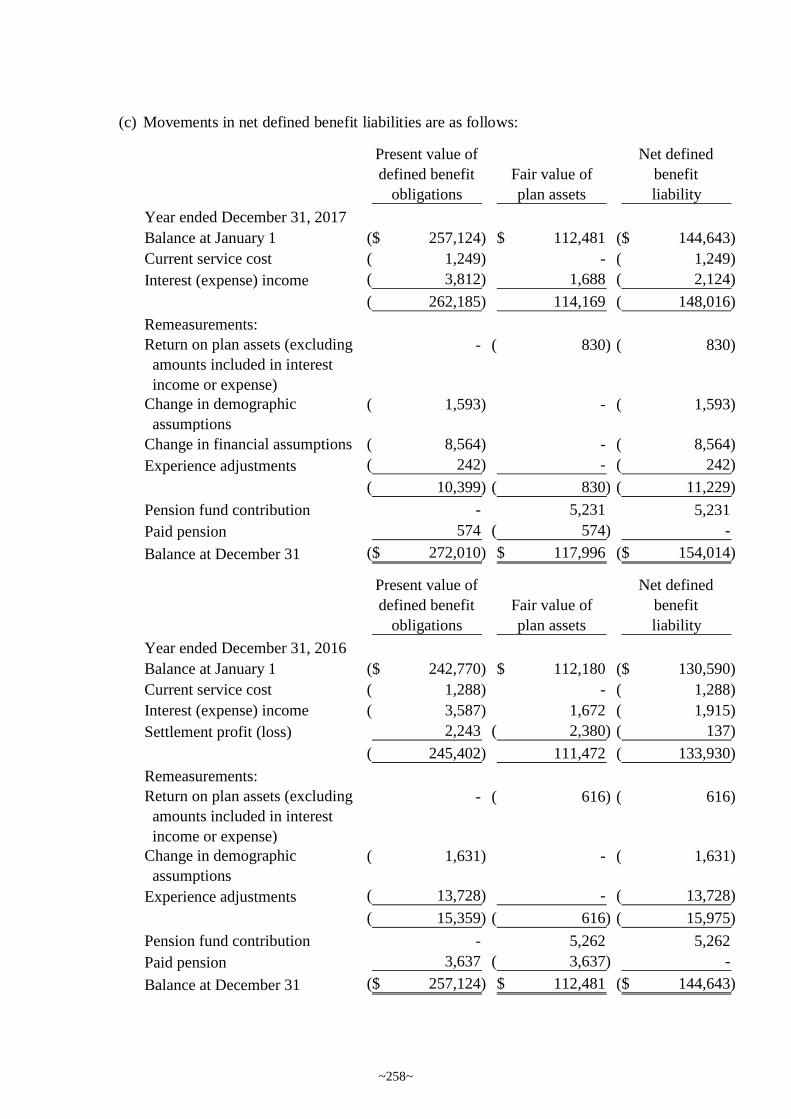
(c) Movements in net defined benefit liabilities are as follows:
Present value of
defined benefit Fair value of
Net defined
benefit
obligations plan assets liability
Year ended December 31, 2017
Balance at January 1 257,124)($ 112,481$ 144,643)($
Current service cost 1,249)( - 1,249)(
Interest (expense) income 3,812)( 1,688 2,124)(
262,185)( 114,169 148,016)(
Remeasurements:
Return on plan assets (excluding
amounts included in interest
income or expense)
- 830)( 830)(
Change in demographic
assumptions
1,593)( - 1,593)(
Change in financial assumptions 8,564)( - 8,564)(
Experience adjustments 242)( - 242)(
10,399)( 830)( 11,229)(
Pension fund contribution - 5,231 5,231
Paid pension 574 574)( -
Balance at December 31 272,010)($ 117,996$ 154,014)($
Present value of
defined benefit Fair value of
Net defined
benefit
obligations plan assets liability
Year ended December 31, 2016
Balance at January 1 242,770)($ 112,180$ 130,590)($
Current service cost 1,288)( - 1,288)(
Interest (expense) income 3,587)( 1,672 1,915)(
Settlement profit (loss) 2,243 2,380)( 137)(
245,402)( 111,472 133,930)(
Remeasurements:
Return on plan assets (excluding
amounts included in interest
income or expense)
- 616)( 616)(
Change in demographic
assumptions
1,631)( - 1,631)(
Experience adjustments 13,728)( - 13,728)(
15,359)( 616)( 15,975)(
Pension fund contribution - 5,262 5,262
Paid pension 3,637 3,637)( -
Balance at December 31 257,124)($ 112,481$ 144,643)($
~258~
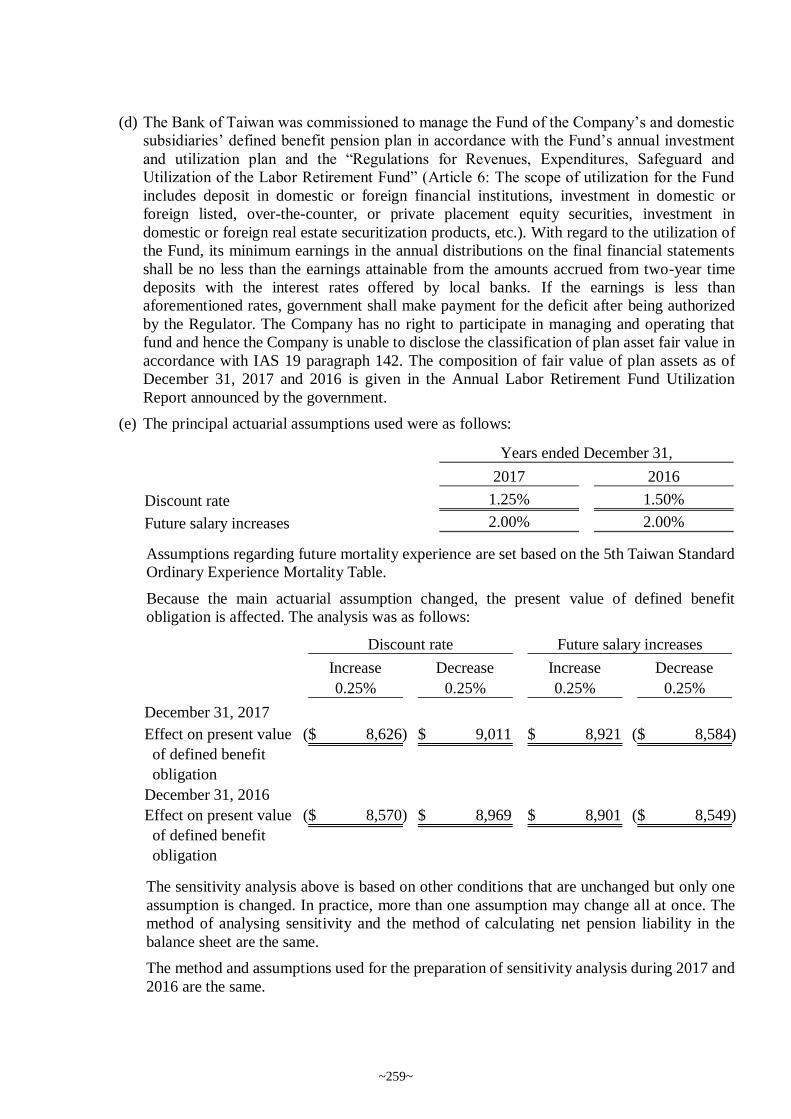
(d) The Bank of Taiwan was commissioned to manage the Fund of the Company’s and domestic
subsidiaries’ defined benefit pension plan in accordance with the Fund’s annual investment
and utilization plan and the “Regulations for Revenues, Expenditures, Safeguard and
Utilization of the Labor Retirement Fund” (Article 6: The scope of utilization for the Fund
includes deposit in domestic or foreign financial institutions, investment in domestic or
foreign listed, over-the-counter, or private placement equity securities, investment in
domestic or foreign real estate securitization products, etc.). With regard to the utilization of
the Fund, its minimum earnings in the annual distributions on the final financial statements
shall be no less than the earnings attainable from the amounts accrued from two-year time
deposits with the interest rates offered by local banks. If the earnings is less than
aforementioned rates, government shall make payment for the deficit after being authorized
by the Regulator. The Company has no right to participate in managing and operating that
fund and hence the Company is unable to disclose the classification of plan asset fair value in
accordance with IAS 19 paragraph 142. The composition of fair value of plan assets as of
December 31, 2017 and 2016 is given in the Annual Labor Retirement Fund Utilization
Report announced by the government.
(e) The principal actuarial assumptions used were as follows:
Assumptions regarding future mortality experience are set based on the 5th Taiwan Standard
Ordinary Experience Mortality Table.
Because the main actuarial assumption changed, the present value of defined benefit
obligation is affected. The analysis was as follows:
The sensitivity analysis above is based on other conditions that are unchanged but only one
assumption is changed. In practice, more than one assumption may change all at once. The
method of analysing sensitivity and the method of calculating net pension liability in the
balance sheet are the same.
The method and assumptions used for the preparation of sensitivity analysis during 2017 and
2016 are the same.
2017 2016
Discount rate 1.25% 1.50%
Future salary increases 2.00% 2.00%
Years ended December 31,
Increase Decrease Increase Decrease
0.25% 0.25% 0.25% 0.25%
December 31, 2017
Effect on present value
of defined benefit
obligation
8,626)($ 9,011$ 8,921$ 8,584)($
December 31, 2016
Effect on present value
of defined benefit
obligation
8,570)($ 8,969$ 8,901$ 8,549)($
Discount rate Future salary increases
~259~
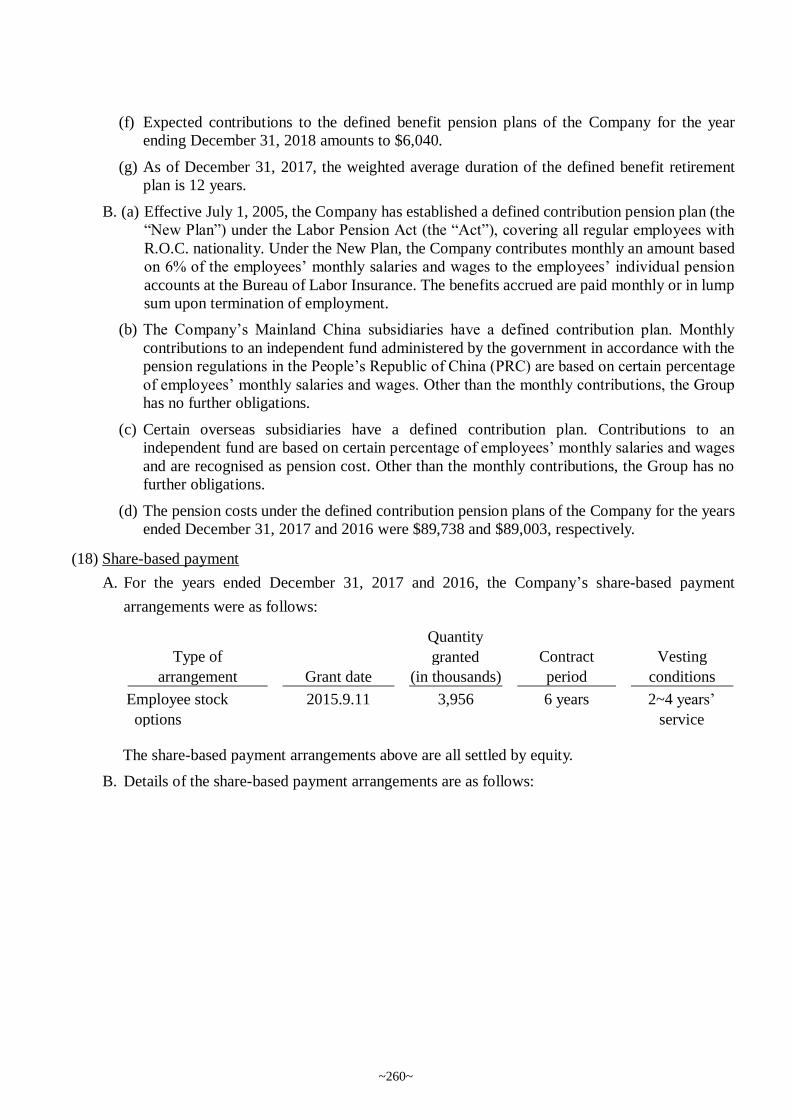
(f) Expected contributions to the defined benefit pension plans of the Company for the year
ending December 31, 2018 amounts to $6,040.
(g) As of December 31, 2017, the weighted average duration of the defined benefit retirement
plan is 12 years.
B. (a) Effective July 1, 2005, the Company has established a defined contribution pension plan (the
“New Plan”) under the Labor Pension Act (the “Act”), covering all regular employees with
R.O.C. nationality. Under the New Plan, the Company contributes monthly an amount based
on 6% of the employees’ monthly salaries and wages to the employees’ individual pension
accounts at the Bureau of Labor Insurance. The benefits accrued are paid monthly or in lump
sum upon termination of employment.
(b) The Company’s Mainland China subsidiaries have a defined contribution plan. Monthly
contributions to an independent fund administered by the government in accordance with the
pension regulations in the People’s Republic of China (PRC) are based on certain percentage
of employees’ monthly salaries and wages. Other than the monthly contributions, the Group
has no further obligations.
(c) Certain overseas subsidiaries have a defined contribution plan. Contributions to an
independent fund are based on certain percentage of employees’ monthly salaries and wages
and are recognised as pension cost. Other than the monthly contributions, the Group has no
further obligations.
(d) The pension costs under the defined contribution pension plans of the Company for the years
ended December 31, 2017 and 2016 were $89,738 and $89,003, respectively.
(18) Share-based payment
A. For the years ended December 31, 2017 and 2016, the Company’s share-based payment
arrangements were as follows:
The share-based payment arrangements above are all settled by equity.
B. Details of the share-based payment arrangements are as follows:
Type of
Quantity
granted Contract Vesting
arrangement Grant date (in thousands) period conditions
Employee stock
options
2015.9.11 3,956 6 years 2~4 years’
service
~260~
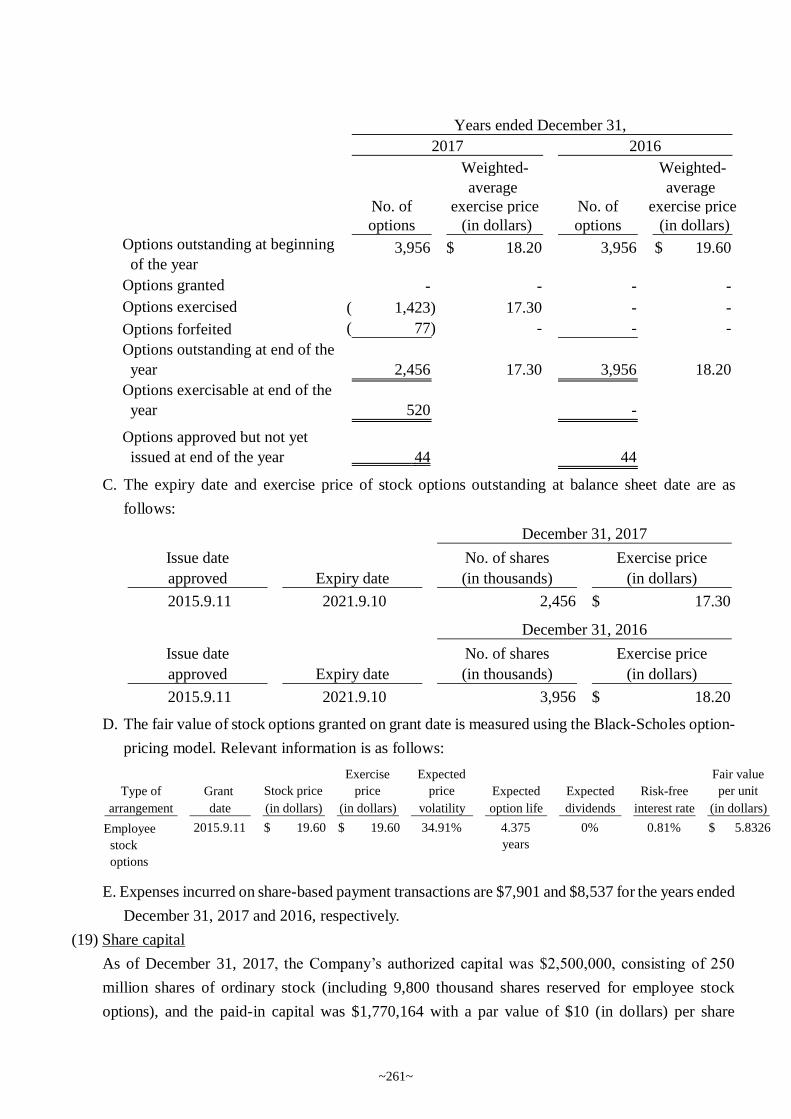
C. The expiry date and exercise price of stock options outstanding at balance sheet date are as
follows:
D. The fair value of stock options granted on grant date is measured using the Black-Scholes option-
pricing model. Relevant information is as follows:
E. Expenses incurred on share-based payment transactions are $7,901 and $8,537 for the years ended
December 31, 2017 and 2016, respectively.
(19) Share capital
As of December 31, 2017, the Company’s authorized capital was $2,500,000, consisting of 250
million shares of ordinary stock (including 9,800 thousand shares reserved for employee stock
options), and the paid-in capital was $1,770,164 with a par value of $10 (in dollars) per share
Weighted- Weighted-
average average
No. of exercise price No. of exercise price
options (in dollars) options (in dollars)
Options outstanding at beginning
of the year3,956 18.20$ 3,956 19.60$
Options granted - - - -
Options exercised 1,423)( 17.30 - -
Options forfeited 77)( - - -
Options outstanding at end of the
year 2,456 17.30 3,956 18.20
Options exercisable at end of the
year 520 -
Options approved but not yet
issued at end of the year 44 44
Years ended December 31,
2017 2016
Issue date No. of shares Exercise price
approved Expiry date (in thousands) (in dollars)
2015.9.11 2021.9.10 2,456 17.30$
December 31, 2017
Issue date No. of shares Exercise price
approved Expiry date (in thousands) (in dollars)
2015.9.11 2021.9.10 3,956 18.20$
December 31, 2016
Type of Grant Stock price
Exercise
price
Expected
price Expected Expected Risk-free
Fair value
per unit
arrangement date (in dollars) (in dollars) volatility option life dividends interest rate (in dollars)
Employee
stock
options
2015.9.11 $ 19.60 $ 19.60 34.91% 4.375
years
0% 0.81% $ 5.8326
~261~
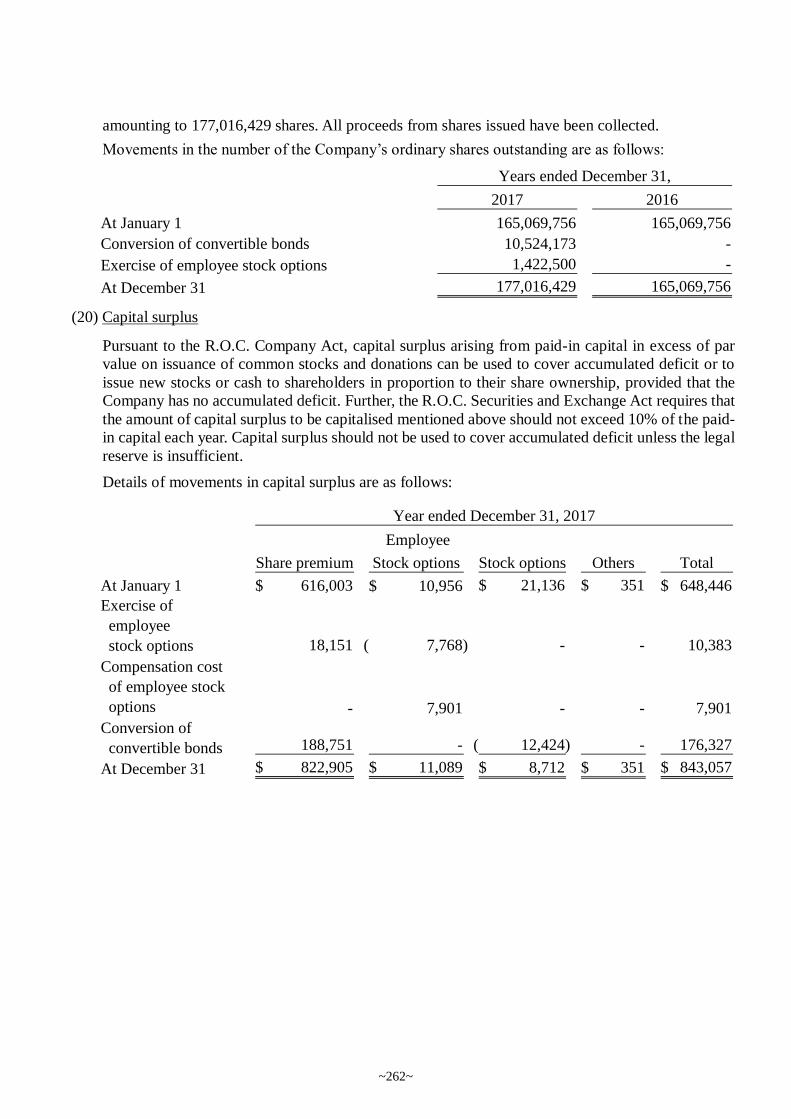
amounting to 177,016,429 shares. All proceeds from shares issued have been collected.
Movements in the number of the Company’s ordinary shares outstanding are as follows:
(20) Capital surplus
Pursuant to the R.O.C. Company Act, capital surplus arising from paid-in capital in excess of par
value on issuance of common stocks and donations can be used to cover accumulated deficit or to
issue new stocks or cash to shareholders in proportion to their share ownership, provided that the
Company has no accumulated deficit. Further, the R.O.C. Securities and Exchange Act requires that
the amount of capital surplus to be capitalised mentioned above should not exceed 10% of the paid-
in capital each year. Capital surplus should not be used to cover accumulated deficit unless the legal
reserve is insufficient.
Details of movements in capital surplus are as follows:
2017 2016
At January 1 165,069,756 165,069,756
Conversion of convertible bonds 10,524,173 -
Exercise of employee stock options 1,422,500 -
At December 31 177,016,429 165,069,756
Years ended December 31,
Employee
Share premium Stock options Stock options Others Total
At January 1 616,003$ 10,956$ 21,136$ 351$ 648,446$
Exercise of
employee
stock options 18,151 7,768)( - - 10,383
Compensation cost
of employee stock
options - 7,901 - - 7,901
Conversion of
convertible bonds 188,751 - 12,424)( - 176,327
At December 31 822,905$ 11,089$ 8,712$ 351$ 843,057$
Year ended December 31, 2017
~262~

(21) Retained earnings
A. Under the Company’s Articles of Incorporation, the current year’s earnings, if any, shall first be
used to pay all taxes and offset prior years’ operating losses and then 10% of the remaining
amount shall be set aside as legal reserve and special reserve. The remaining amount along with
the prior years’ unappropriated earnings are resolved by the Board of Directors and proposed to
the stockholders for appropriation or reserve.
B. The Company’s dividend policy is summarized below: in consideration of the overall
environment development and industrial growth, fulfilling future operation development needs
as priority and optimizing financial structure, distribution of dividends shall not exceed 50% of
the stock dividend distributed.
C. Except for covering accumulated deficit or issuing new stocks or cash to shareholders in
proportion to their share ownership, the legal reserve shall not be used for any other purpose.
The use of legal reserve for the issuance of stocks or cash to shareholders in proportion to their
share ownership is permitted, provided that the distribution of the reserve is limited to the portion
in excess of 25% of the Company’s paid-in capital.
D. (a) In accordance with the regulations, the Company shall set aside special reserve from the debit
balance on other equity items at the balance sheet date before distributing earnings. When
debit balance on other equity items is reversed subsequently, the reversed amount could be
included in the distributable earnings.
(b)The amounts previously set aside by the Company as special reserve on initial application of
IFRSs in accordance with Financial-Supervisory-Securities-Firms No. 1010012865, dated
April 6, 2012, shall be reversed proportionately when the relevant assets are used, disposed of
or reclassified subsequently.
E. (a) Details of 2016 and 2015 earnings appropriation resolved by the stockholders on May 26,
2017 and May 31, 2016, respectively are as follows:
Employee
Share premium Stock options Stock options Others Total
At January 1 616,003$ 2,419$ -$ 351$ 618,773$
Compensation cost
of employee stock
options - 8,537 - - 8,537
Due to recognition of
equity component of
convertible bonds
issued - - 21,136 - 21,136
At December 31 616,003$ 10,956$ 21,136$ 351$ 648,446$
Year ended December 31, 2016
~263~
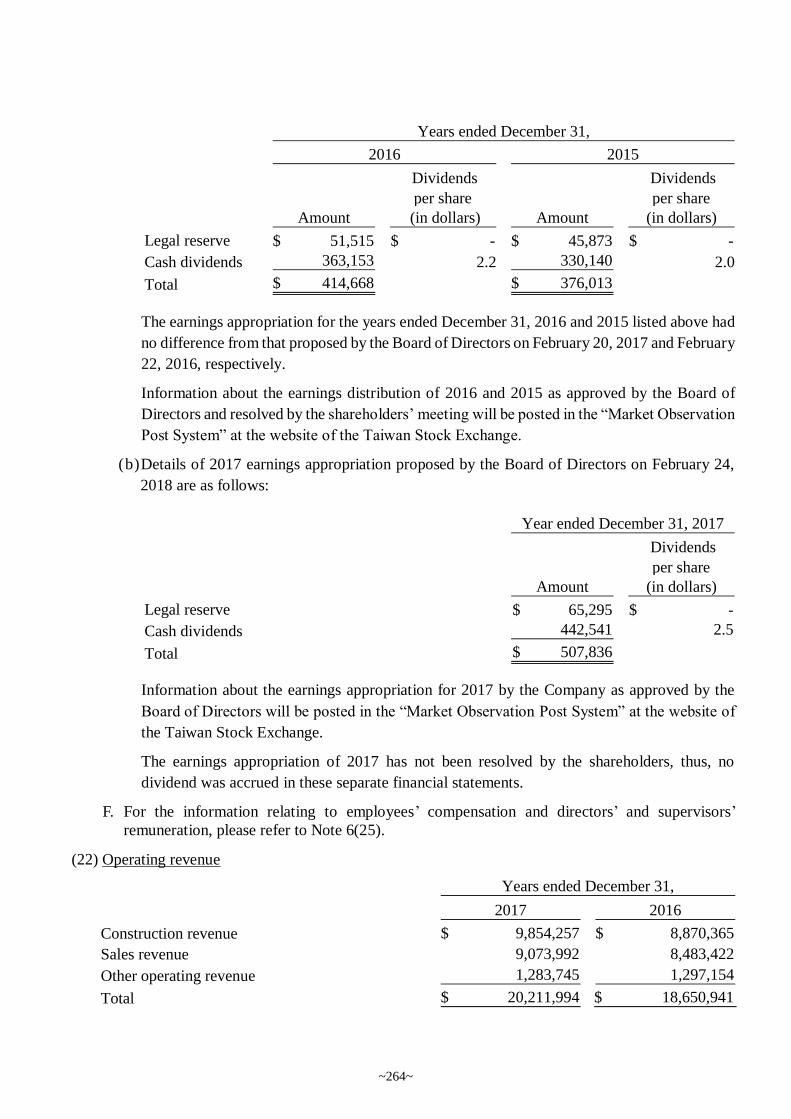
The earnings appropriation for the years ended December 31, 2016 and 2015 listed above had
no difference from that proposed by the Board of Directors on February 20, 2017 and February
22, 2016, respectively.
Information about the earnings distribution of 2016 and 2015 as approved by the Board of
Directors and resolved by the shareholders’ meeting will be posted in the “Market Observation
Post System” at the website of the Taiwan Stock Exchange.
(b)Details of 2017 earnings appropriation proposed by the Board of Directors on February 24,
2018 are as follows:
Information about the earnings appropriation for 2017 by the Company as approved by the
Board of Directors will be posted in the “Market Observation Post System” at the website of
the Taiwan Stock Exchange.
The earnings appropriation of 2017 has not been resolved by the shareholders, thus, no
dividend was accrued in these separate financial statements.
F. For the information relating to employees’ compensation and directors’ and supervisors’
remuneration, please refer to Note 6(25).
(22) Operating revenue
Dividends
per share
Dividends
per share
Amount (in dollars) Amount (in dollars)
Legal reserve 51,515$ -$ 45,873$ -$
Cash dividends 363,153 2.2 330,140 2.0
Total 414,668$ 376,013$
2016 2015
Years ended December 31,
Dividends
per share
Amount (in dollars)
Legal reserve 65,295$ -$
Cash dividends 442,541 2.5
Total 507,836$
Year ended December 31, 2017
2017 2016
Construction revenue 9,854,257$ 8,870,365$
Sales revenue 9,073,992 8,483,422
Other operating revenue 1,283,745 1,297,154
Total 20,211,994$ $ 18,650,941
Years ended December 31,
~264~
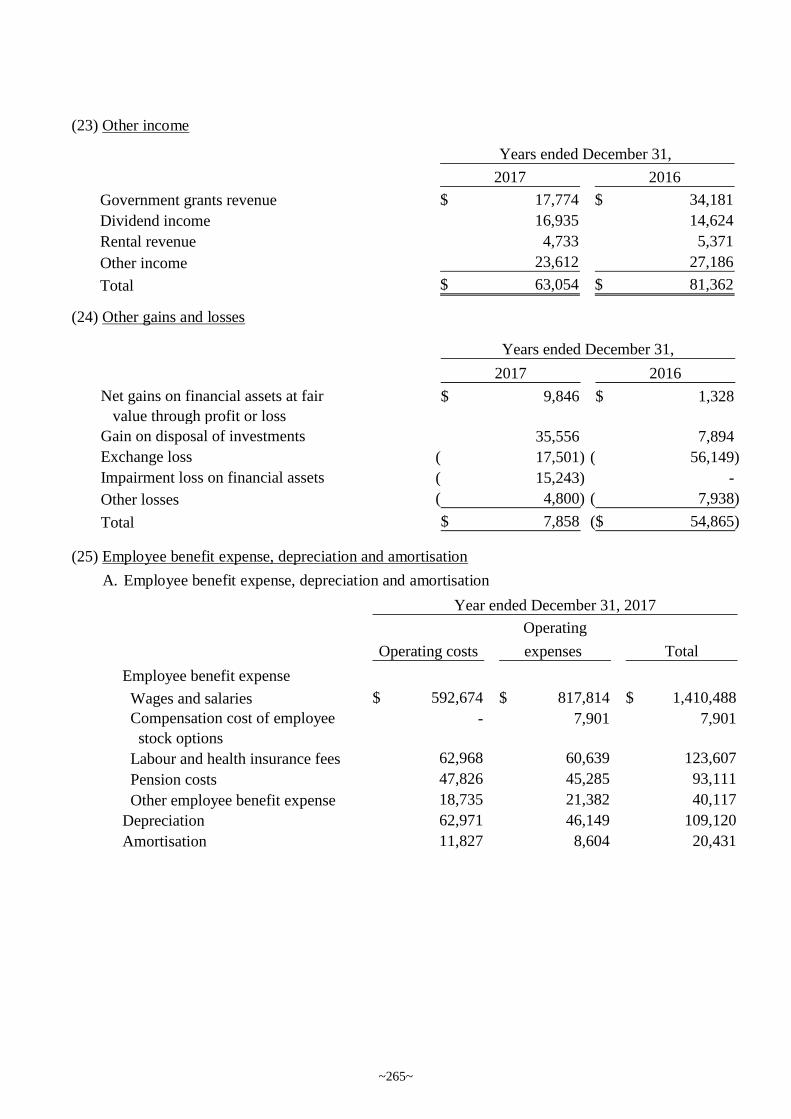
(23) Other income
(24) Other gains and losses
(25) Employee benefit expense, depreciation and amortisation
A. Employee benefit expense, depreciation and amortisation
2017 2016
Government grants revenue 17,774$ 34,181$
Dividend income 16,935 14,624
Rental revenue 4,733 5,371
Other income 23,612 27,186
Total 63,054$ 81,362$
Years ended December 31,
2017 2016
Net gains on financial assets at fair
value through profit or loss
9,846$ 1,328$
Gain on disposal of investments 35,556 7,894
Exchange loss 17,501)( 56,149)(
Impairment loss on financial assets 15,243)( -
Other losses 4,800)( 7,938)(
Total 7,858$ 54,865)($
Years ended December 31,
Operating
Operating costs expenses Total
Employee benefit expense
Wages and salaries 592,674$ 817,814$ 1,410,488$
Compensation cost of employee
stock options
- 7,901 7,901
Labour and health insurance fees 62,968 60,639 123,607
Pension costs 47,826 45,285 93,111
Other employee benefit expense 18,735 21,382 40,117
Depreciation 62,971 46,149 109,120
Amortisation 11,827 8,604 20,431
Year ended December 31, 2017
~265~
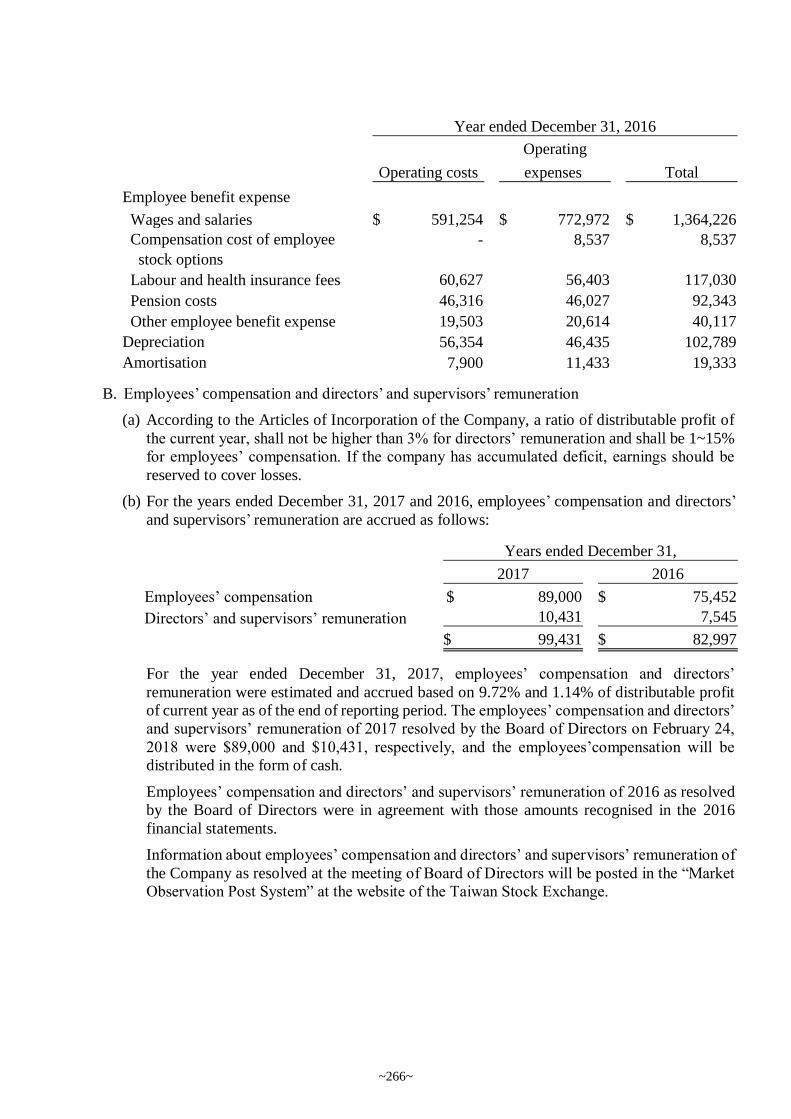
B. Employees’ compensation and directors’ and supervisors’ remuneration
(a) According to the Articles of Incorporation of the Company, a ratio of distributable profit of
the current year, shall not be higher than 3% for directors’ remuneration and shall be 1~15%
for employees’ compensation. If the company has accumulated deficit, earnings should be
reserved to cover losses.
(b) For the years ended December 31, 2017 and 2016, employees’ compensation and directors’
and supervisors’ remuneration are accrued as follows:
For the year ended December 31, 2017, employees’ compensation and directors’
remuneration were estimated and accrued based on 9.72% and 1.14% of distributable profit
of current year as of the end of reporting period. The employees’ compensation and directors’
and supervisors’ remuneration of 2017 resolved by the Board of Directors on February 24,
2018 were $89,000 and $10,431, respectively, and the employees’compensation will be
distributed in the form of cash.
Employees’ compensation and directors’ and supervisors’ remuneration of 2016 as resolved
by the Board of Directors were in agreement with those amounts recognised in the 2016
financial statements.
Information about employees’ compensation and directors’ and supervisors’ remuneration of
the Company as resolved at the meeting of Board of Directors will be posted in the “Market
Observation Post System” at the website of the Taiwan Stock Exchange.
Operating
Operating costs expenses Total
Employee benefit expense
Wages and salaries 591,254$ 772,972$ 1,364,226$
Compensation cost of employee
stock options
- 8,537 8,537
Labour and health insurance fees 60,627 56,403 117,030
Pension costs 46,316 46,027 92,343
Other employee benefit expense 19,503 20,614 40,117
Depreciation 56,354 46,435 102,789
Amortisation 7,900 11,433 19,333
Year ended December 31, 2016
2017 2016
Employees’ compensation 89,000$ 75,452$
Directors’ and supervisors’ remuneration 10,431 7,545
99,431$ 82,997$
Years ended December 31,
~266~
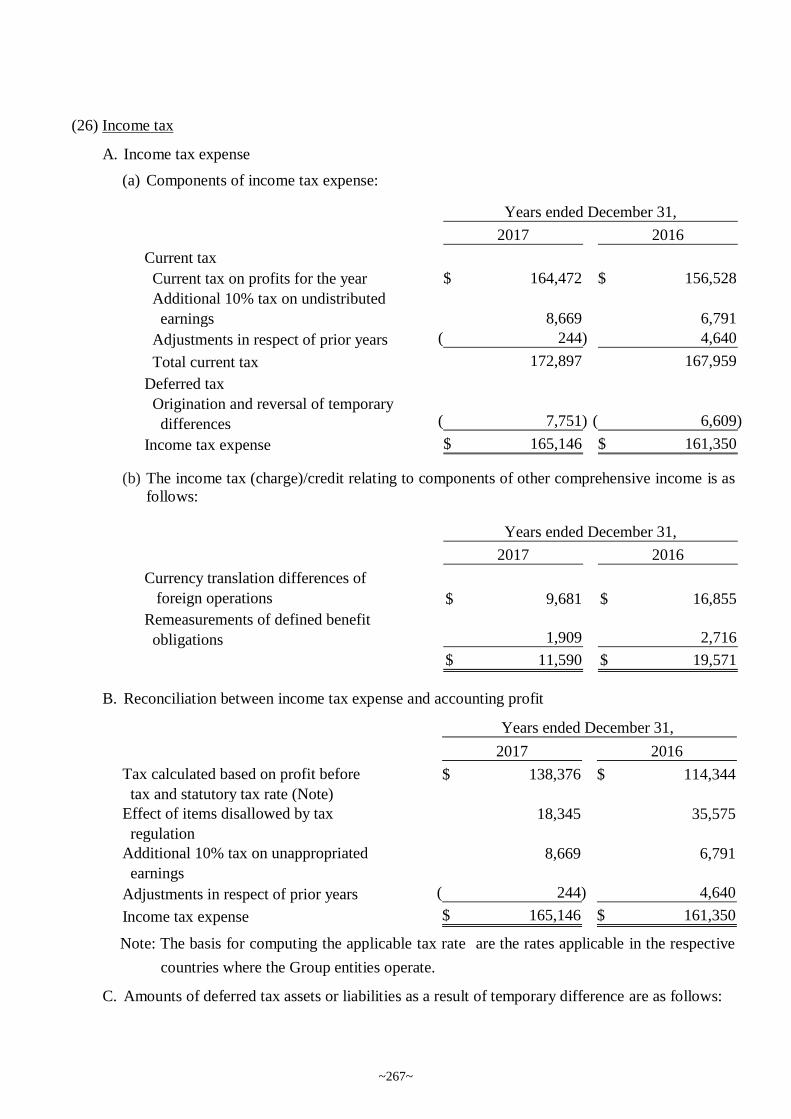
(26) Income tax
A. Income tax expense
(a) Components of income tax expense:
(b) The income tax (charge)/credit relating to components of other comprehensive income is as
follows:
B. Reconciliation between income tax expense and accounting profit
Note: The basis for computing the applicable tax rate are the rates applicable in the respective
countries where the Group entities operate.
C. Amounts of deferred tax assets or liabilities as a result of temporary difference are as follows:
2017 2016
Current tax
Current tax on profits for the year 164,472$ 156,528$
Additional 10% tax on undistributed
earnings 8,669 6,791
Adjustments in respect of prior years 244)( 4,640
Total current tax 172,897 167,959
Deferred tax
Origination and reversal of temporary
differences 7,751)( 6,609)(
Income tax expense 165,146$ 161,350$
Years ended December 31,
2017 2016
Currency translation differences of
foreign operations 9,681$ 16,855$
Remeasurements of defined benefit
obligations 1,909 2,716
11,590$ 19,571$
Years ended December 31,
2017 2016
Tax calculated based on profit before
tax and statutory tax rate (Note)
138,376$ 114,344$
Effect of items disallowed by tax
regulation
18,345 35,575
Additional 10% tax on unappropriated
earnings
8,669 6,791
Adjustments in respect of prior years 244)( 4,640
Income tax expense 165,146$ 161,350$
Years ended December 31,
~267~
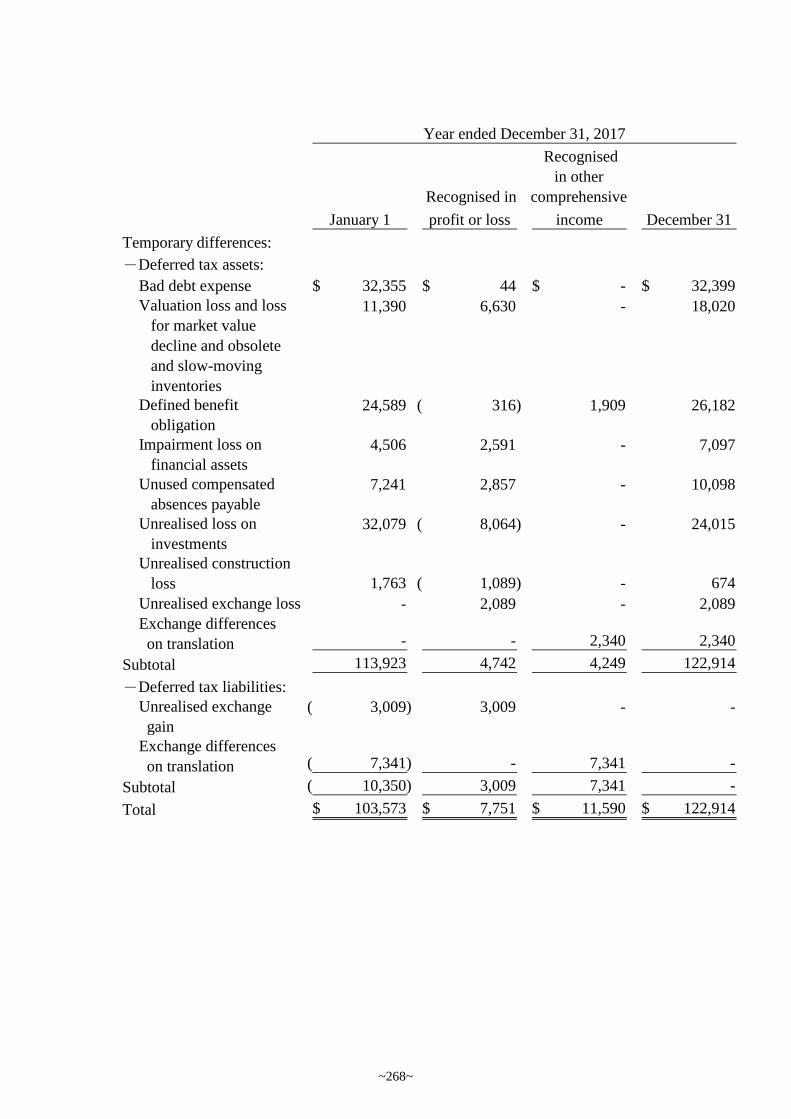
Recognised in
Recognised
in other
comprehensive
January 1 profit or loss income December 31
Temporary differences:
-Deferred tax assets:
Bad debt expense 32,355$ 44$ -$ 32,399$
Valuation loss and loss
for market value
decline and obsolete
and slow-moving
inventories
11,390 6,630 - 18,020
Defined benefit
obligation
24,589 316)( 1,909 26,182
Impairment loss on
financial assets
4,506 2,591 - 7,097
Unused compensated
absences payable
7,241 2,857 - 10,098
Unrealised loss on
investments
32,079 8,064)( - 24,015
Unrealised construction
loss 1,763 1,089)( - 674
Unrealised exchange loss - 2,089 - 2,089
Exchange differences
on translation - - 2,340 2,340
Subtotal 113,923 4,742 4,249 122,914
-Deferred tax liabilities:
Unrealised exchange
gain
3,009)( 3,009 - -
Exchange differences
on translation 7,341)( - 7,341 -
Subtotal 10,350)( 3,009 7,341 -
Total 103,573$ 7,751$ 11,590$ 122,914$
Year ended December 31, 2017
~268~
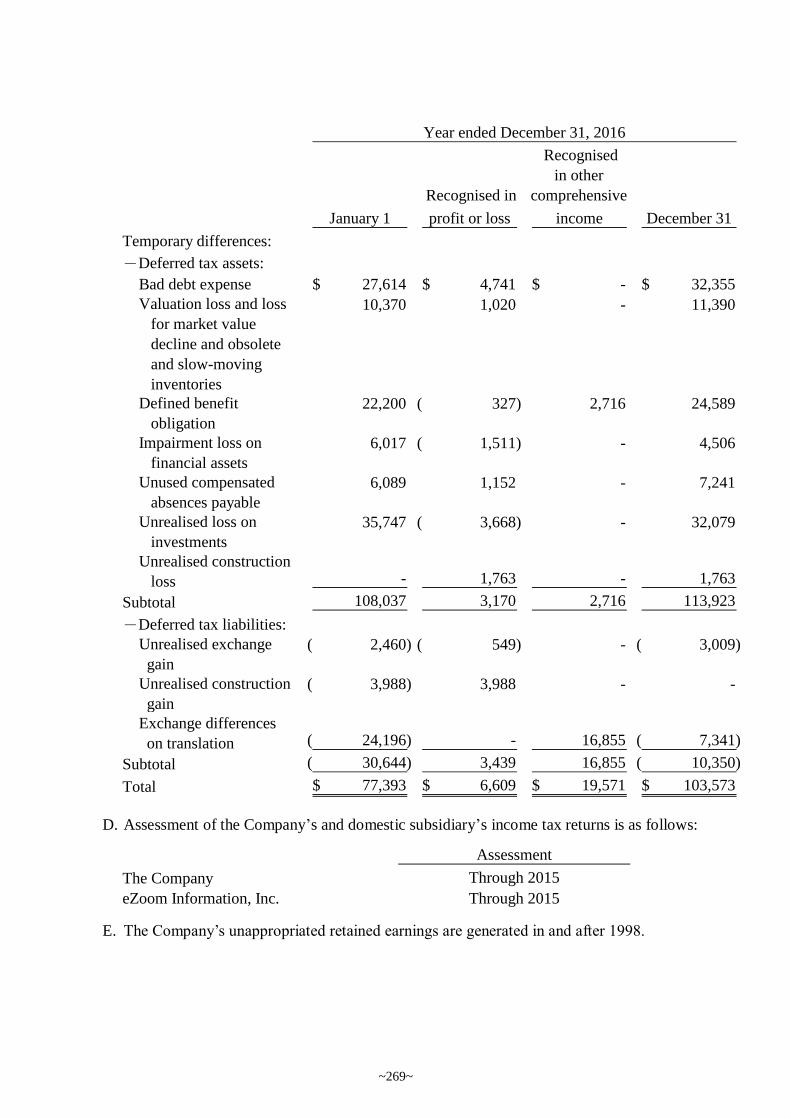
D. Assessment of the Company’s and domestic subsidiary’s income tax returns is as follows:
E. The Company’s unappropriated retained earnings are generated in and after 1998.
Recognised in
Recognised
in other
comprehensive
January 1 profit or loss income December 31
Temporary differences:
-Deferred tax assets:
Bad debt expense 27,614$ 4,741$ -$ 32,355$
Valuation loss and loss
for market value
decline and obsolete
and slow-moving
inventories
10,370 1,020 - 11,390
Defined benefit
obligation
22,200 327)( 2,716 24,589
Impairment loss on
financial assets
6,017 1,511)( - 4,506
Unused compensated
absences payable
6,089 1,152 - 7,241
Unrealised loss on
investments
35,747 3,668)( - 32,079
Unrealised construction
loss - 1,763 - 1,763
Subtotal 108,037 3,170 2,716 113,923
-Deferred tax liabilities:
Unrealised exchange
gain
2,460)( 549)( - 3,009)(
Unrealised construction
gain
3,988)( 3,988 - -
Exchange differences
on translation 24,196)( - 16,855 7,341)(
Subtotal 30,644)( 3,439 16,855 10,350)(
Total 77,393$ 6,609$ 19,571$ 103,573$
Year ended December 31, 2016
The Company
Assessment
Through 2015
eZoom Information, Inc. Through 2015
~269~
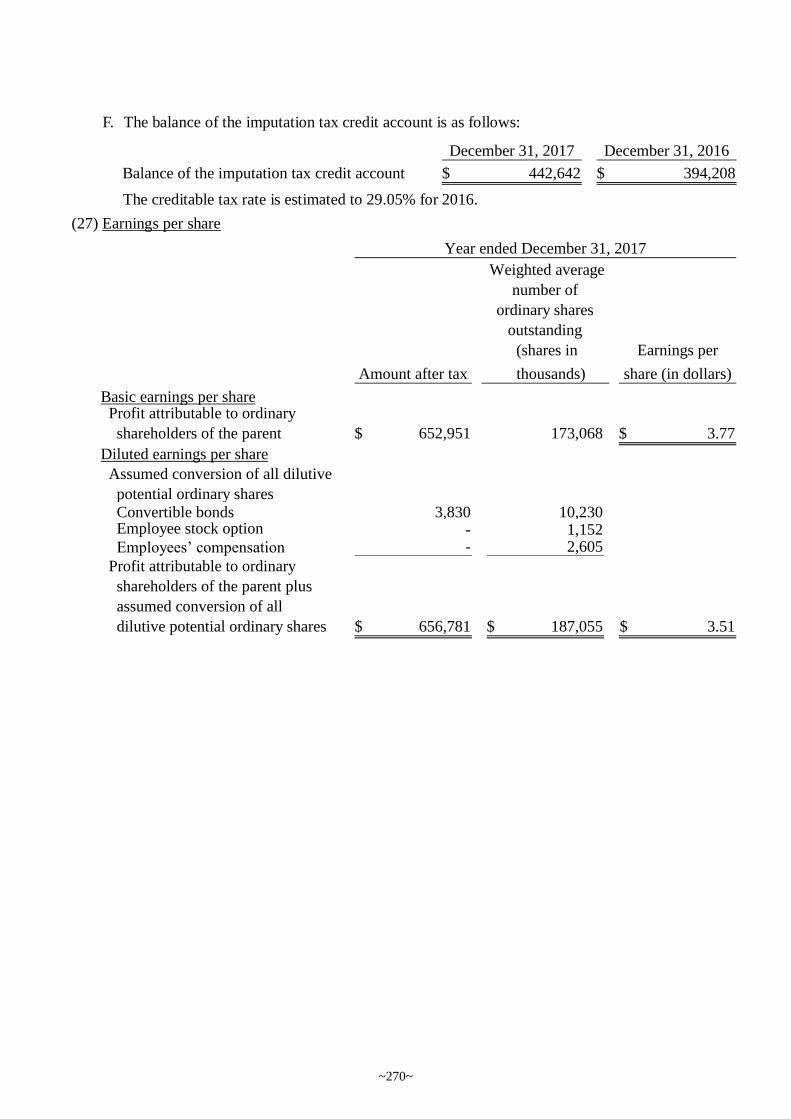
F. The balance of the imputation tax credit account is as follows:
The creditable tax rate is estimated to 29.05% for 2016.
(27) Earnings per share
December 31, 2017 December 31, 2016
Balance of the imputation tax credit account 442,642$ 394,208$
Weighted average
number of
ordinary shares
outstanding
(shares in Earnings per
Amount after tax thousands) share (in dollars)
Basic earnings per share Profit attributable to ordinary
shareholders of the parent 652,951$ 173,068 3.77$
Diluted earnings per share
Assumed conversion of all dilutive
potential ordinary shares
Convertible bonds 3,830 10,230 Employee stock option - 1,152 Employees’ compensation - 2,605
Profit attributable to ordinary
shareholders of the parent plus
assumed conversion of all
dilutive potential ordinary shares 656,781$ 187,055$ 3.51$
Year ended December 31, 2017
~270~
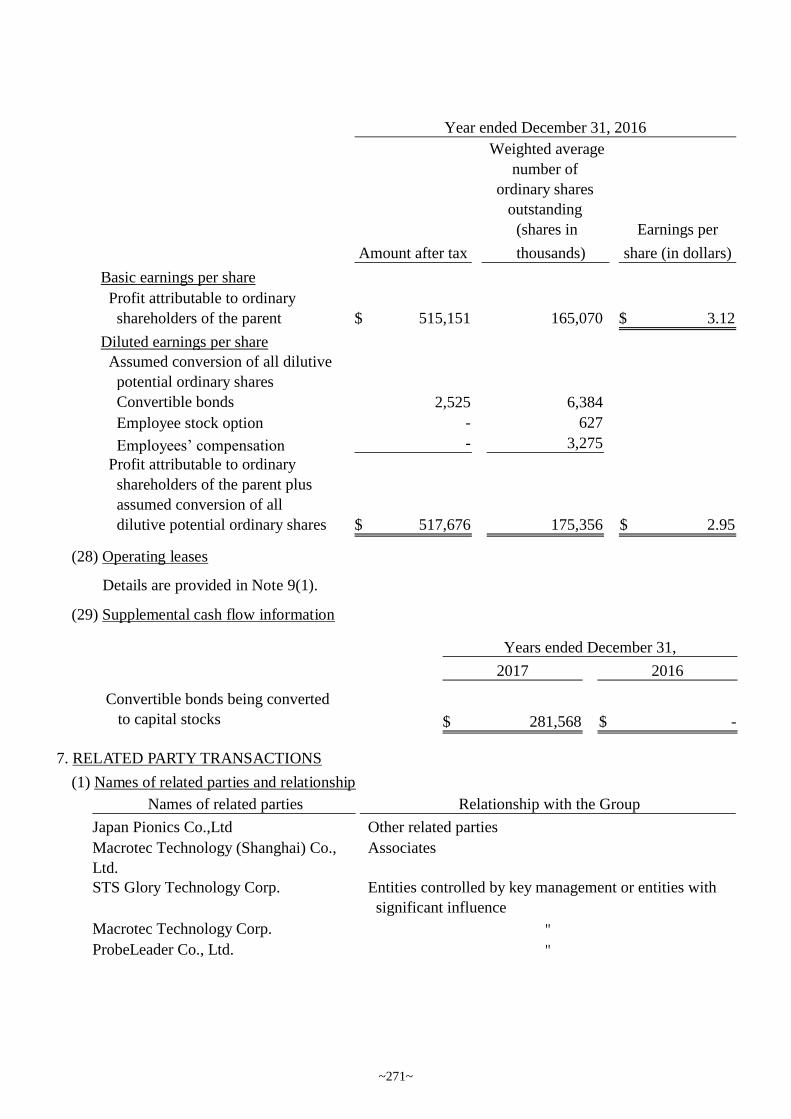
(28) Operating leases
Details are provided in Note 9(1).
(29) Supplemental cash flow information
7. RELATED PARTY TRANSACTIONS
(1) Names of related parties and relationship
Weighted average
number of
ordinary shares
outstanding
(shares in Earnings per
Amount after tax thousands) share (in dollars)
Basic earnings per share
Profit attributable to ordinary
shareholders of the parent 515,151$ 165,070 3.12$
Diluted earnings per share
Assumed conversion of all dilutive
potential ordinary shares
Convertible bonds 2,525 6,384
Employee stock option - 627
Employees’ compensation - 3,275
Profit attributable to ordinary
shareholders of the parent plus
assumed conversion of all
dilutive potential ordinary shares 517,676$ 175,356 2.95$
Year ended December 31, 2016
2017 2016
Convertible bonds being converted
to capital stocks 281,568$ -$
Years ended December 31,
Names of related parties Relationship with the Group
Japan Pionics Co.,Ltd Other related parties
Macrotec Technology (Shanghai) Co.,
Ltd.
Associates
STS Glory Technology Corp. Entities controlled by key management or entities with
significant influence
Macrotec Technology Corp. "ProbeLeader Co., Ltd. "
~271~
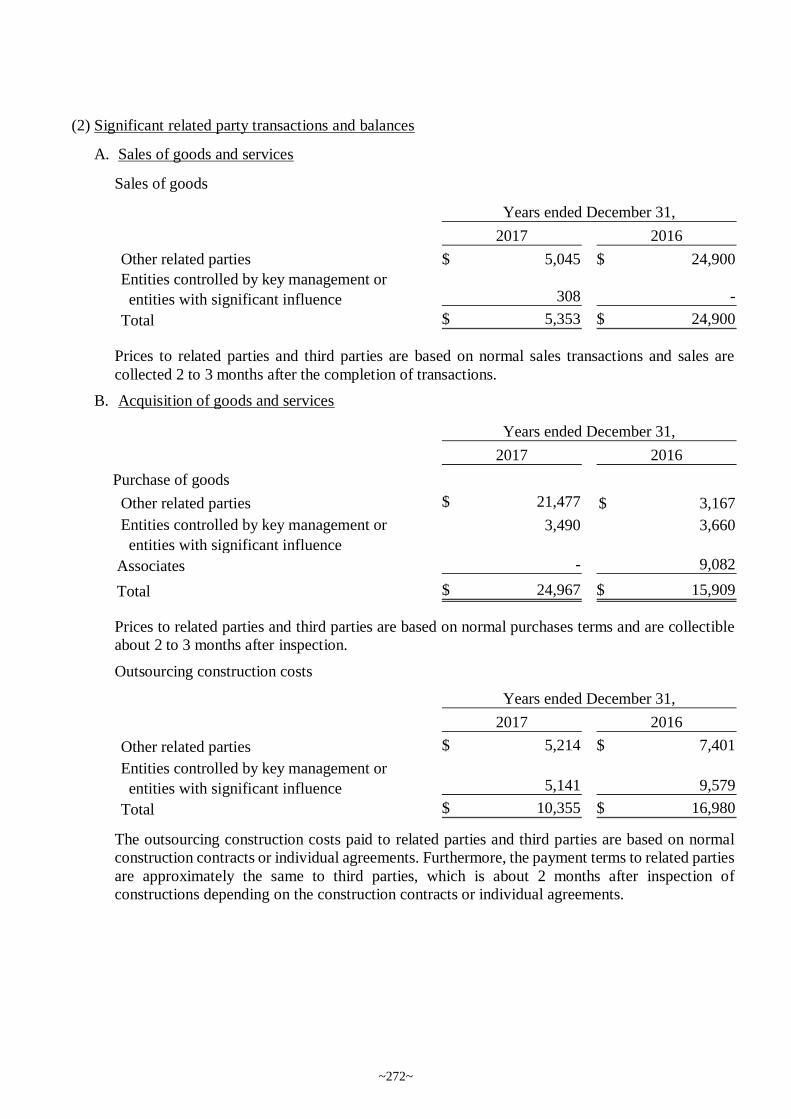
(2) Significant related party transactions and balances
A. Sales of goods and services
Sales of goods
Prices to related parties and third parties are based on normal sales transactions and sales are
collected 2 to 3 months after the completion of transactions.
B. Acquisition of goods and services
Prices to related parties and third parties are based on normal purchases terms and are collectible
about 2 to 3 months after inspection.
Outsourcing construction costs
The outsourcing construction costs paid to related parties and third parties are based on normal
construction contracts or individual agreements. Furthermore, the payment terms to related parties
are approximately the same to third parties, which is about 2 months after inspection of
constructions depending on the construction contracts or individual agreements.
2017 2016
Other related parties 5,045$ 24,900$
Entities controlled by key management or
entities with significant influence 308 -
Total 5,353$ 24,900$
Years ended December 31,
2017 2016
Purchase of goods
Other related parties 21,477$ 3,167$
Entities controlled by key management or
entities with significant influence
3,490 3,660
Associates - 9,082
Total 24,967$ 15,909$
Years ended December 31,
2017 2016
Other related parties 5,214$ 7,401$
Entities controlled by key management or
entities with significant influence 5,141 9,579
Total 10,355$ 16,980$
Years ended December 31,
~272~
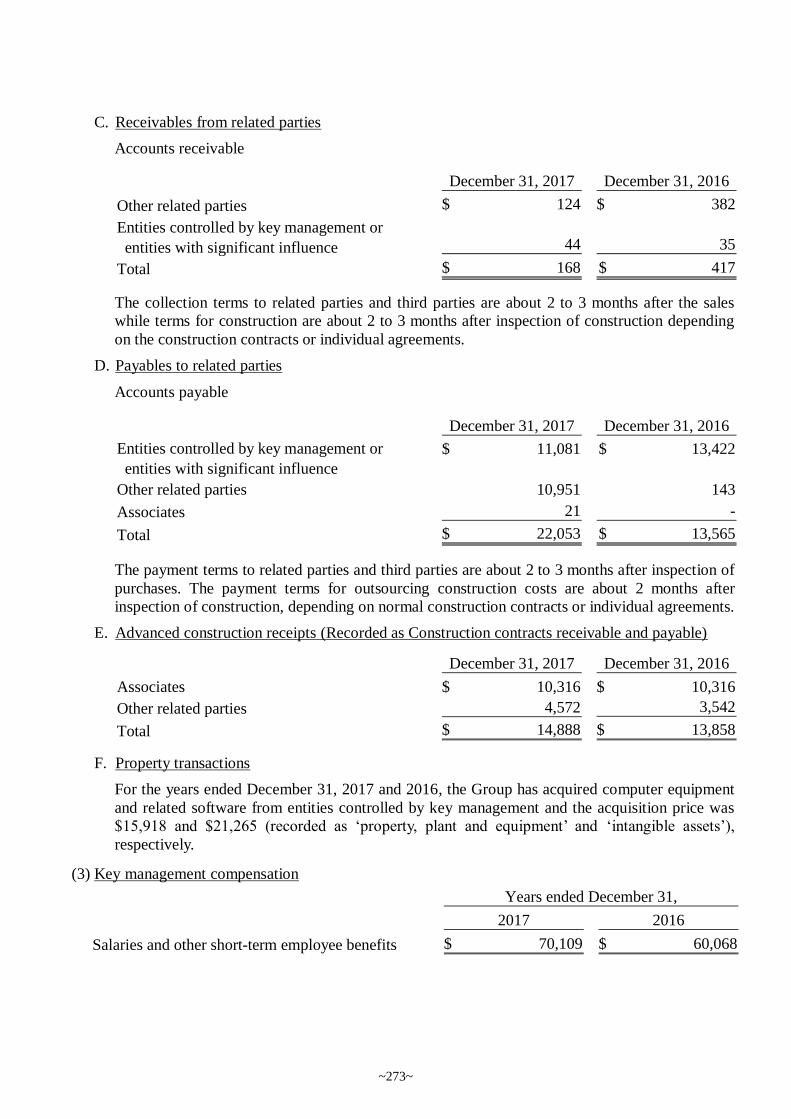
C. Receivables from related parties
Accounts receivable
The collection terms to related parties and third parties are about 2 to 3 months after the sales
while terms for construction are about 2 to 3 months after inspection of construction depending
on the construction contracts or individual agreements.
D. Payables to related parties
Accounts payable
The payment terms to related parties and third parties are about 2 to 3 months after inspection of
purchases. The payment terms for outsourcing construction costs are about 2 months after
inspection of construction, depending on normal construction contracts or individual agreements.
E. Advanced construction receipts (Recorded as Construction contracts receivable and payable)
F. Property transactions
For the years ended December 31, 2017 and 2016, the Group has acquired computer equipment
and related software from entities controlled by key management and the acquisition price was
$15,918 and $21,265 (recorded as ‘property, plant and equipment’ and ‘intangible assets’),
respectively.
(3) Key management compensation
December 31, 2017 December 31, 2016
Other related parties 124$ 382$
Entities controlled by key management or
entities with significant influence 44 35
Total 168$ 417$
December 31, 2017 December 31, 2016
Entities controlled by key management or
entities with significant influence
11,081$ 13,422$
Other related parties 10,951 143
Associates 21 -
Total 22,053$ 13,565$
December 31, 2017 December 31, 2016
Associates 10,316$ 10,316$
Other related parties 4,572 3,542
Total 14,888$ 13,858$
2017 2016
Salaries and other short-term employee benefits 70,109$ 60,068$
Years ended December 31,
~273~
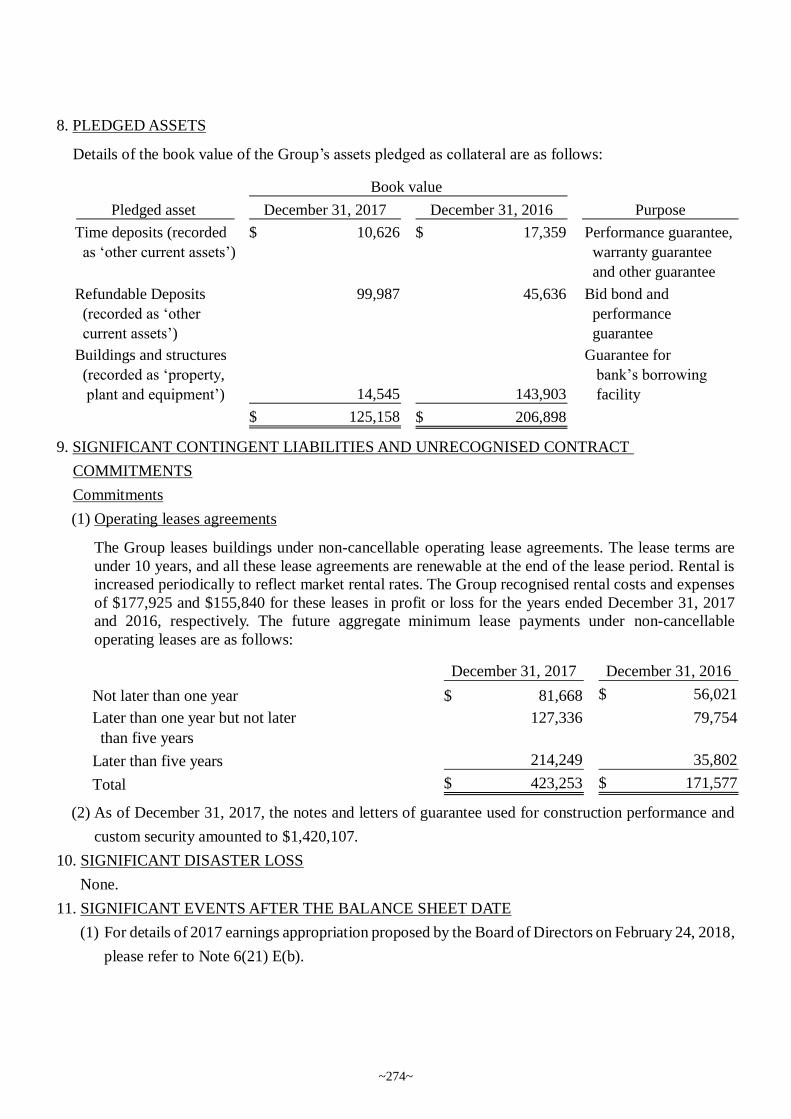
8. PLEDGED ASSETS
Details of the book value of the Group’s assets pledged as collateral are as follows:
9. SIGNIFICANT CONTINGENT LIABILITIES AND UNRECOGNISED CONTRACT
COMMITMENTS
Commitments
(1) Operating leases agreements
The Group leases buildings under non-cancellable operating lease agreements. The lease terms are
under 10 years, and all these lease agreements are renewable at the end of the lease period. Rental is
increased periodically to reflect market rental rates. The Group recognised rental costs and expenses
of $177,925 and $155,840 for these leases in profit or loss for the years ended December 31, 2017
and 2016, respectively. The future aggregate minimum lease payments under non-cancellable
operating leases are as follows:
(2) As of December 31, 2017, the notes and letters of guarantee used for construction performance and
custom security amounted to $1,420,107.
10. SIGNIFICANT DISASTER LOSS
None.
11. SIGNIFICANT EVENTS AFTER THE BALANCE SHEET DATE
(1) For details of 2017 earnings appropriation proposed by the Board of Directors on February 24, 2018,
please refer to Note 6(21) E(b).
Pledged asset December 31, 2017 December 31, 2016 Purpose
Time deposits (recorded
as ‘other current assets’)
10,626$ 17,359$ Performance guarantee,
warranty guarantee
and other guarantee
Refundable Deposits
(recorded as ‘other
current assets’)
99,987 45,636 Bid bond and
performance
guarantee
Buildings and structures
(recorded as ‘property,
plant and equipment’) 14,545 143,903
Guarantee for
bank’s borrowing
facility
125,158$ 206,898$
Book value
December 31, 2017 December 31, 2016
Not later than one year 81,668$ 56,021$
Later than one year but not later
than five years
127,336 79,754
Later than five years 214,249 35,802
Total 423,253$ 171,577$
~274~
(2) The amendments to the Income Tax Act were promulgated by the President of the Republic of China
on February 7, 2018, and went into effect on January 1, 2018. The material effects to the Company
are described as follows:
A. The Company’s applicable income tax rate will be raised from 17% to 20% effective from January
1, 2018. This will increase both the Company’s deferred tax assets and deferred tax liabilities by
3%, and (decrease) increase current income tax expenses accordingly.
B. The imputation tax system will be abolished, thus, the balance of the imputation credit account
on December 31, 2017 will become $0 as of January 1, 2018.
12. OTHERS
(1) Capital risk management
The Group’s main objective when managing capital is to maintain an optimal credit ranking and
capital ratio to support the operation and to maximize stockholders’ equity.
(2) Financial instruments
A. Fair value information of financial instruments
The carrying amounts of the Group’s financial instruments not measured at fair value are
including cash and cash equivalents, notes receivable, accounts receivable (including related
parties), construction contracts receivable (including related parties), other receivables (including
related parties), other financial assets (recorded as ‘other current assets’), refundable deposits
(recorded as ‘other non-current assets’), short-term borrowings, notes payable, accounts payable
(including related parties), construction contracts payable (including related parties), other
payables, long-term borrowings (including current portion) and guarantee deposits received
(recorded as ‘other non-current liabilities, others’) are approximate to their fair values. The fair
value information of financial instruments measured at fair value is provided in Note 12(3).
B. Financial risk management policies
The Group’s financial risk mainly arises from risks along with investments in financial
instruments and foreign exchange risk of foreign currency transactions. The Group always adopt
the restricted control standard for financial risk of all investments in financial instruments that
market risk, credit risk, liquidity risk and cash flow risk of any financial investment and
implementation has to be assessed and the ones with the least risks are chosen. For foreign
exchange risk of foreign currency transactions based on strategic risk management objectives,
the Group seeks the most optimised risk position and maintain appropriate liquidity position to
reach the best hedging strategy.
C. Significant financial risks and degrees of financial risks
(a) Market risk
Foreign exchange risk
The Group operates internationally and is exposed to foreign exchange risk arising from
various currency exposures, primarily with respect to the USD, RMB, JYP and EUR.
Foreign exchange risk arises from future commercial transactions, recognised assets and
liabilities and net investments in foreign operations. Foreign exchange risk arises when
future commercial transactions or recognised assets or liabilities are denominated in a
currency that is not the entity’s functional currency.
~275~
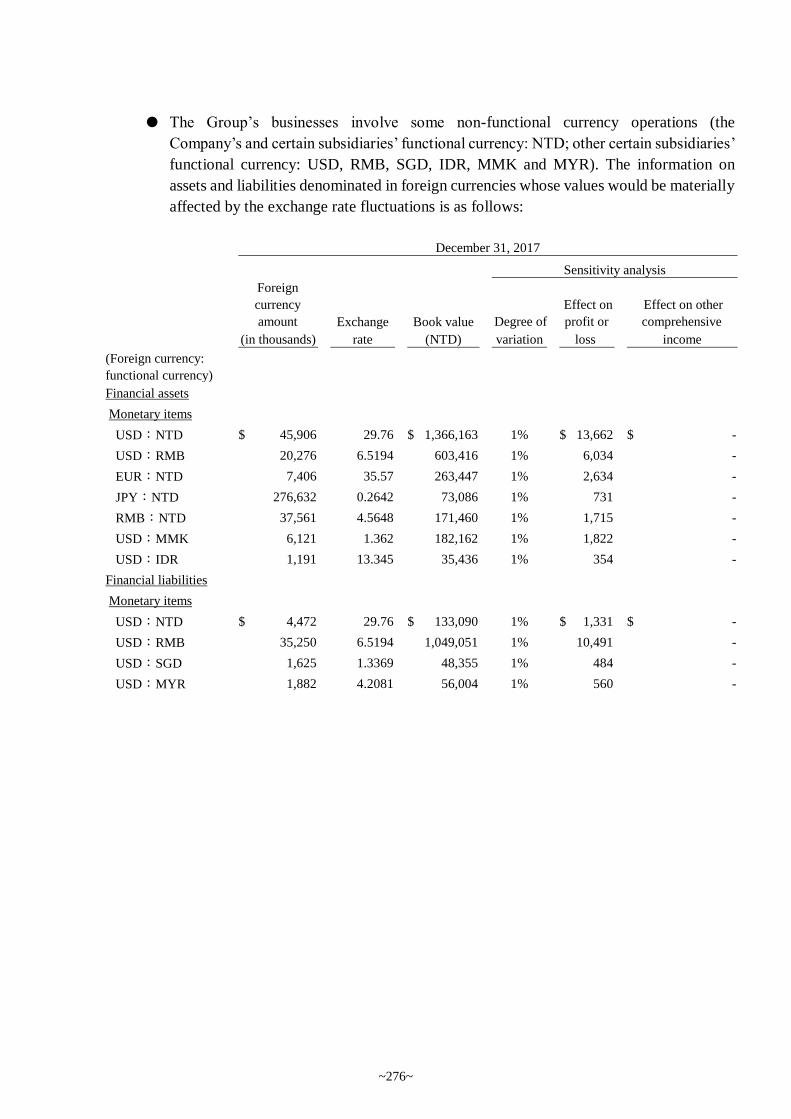
The Group’s businesses involve some non-functional currency operations (the
Company’s and certain subsidiaries’ functional currency: NTD; other certain subsidiaries’
functional currency: USD, RMB, SGD, IDR, MMK and MYR). The information on
assets and liabilities denominated in foreign currencies whose values would be materially
affected by the exchange rate fluctuations is as follows:
Foreign
currency
amount Exchange Book value Degree of
Effect on
profit or
Effect on other
comprehensive
(in thousands) rate (NTD) variation loss income
(Foreign currency:
functional currency)
Financial assets
Monetary items
USD:NTD 45,906$ 29.76 1,366,163$ 1% 13,662$ -$
USD:RMB 20,276 6.5194 603,416 1% 6,034 -
EUR:NTD 7,406 35.57 263,447 1% 2,634 -
JPY:NTD 276,632 0.2642 73,086 1% 731 -
RMB:NTD 37,561 4.5648 171,460 1% 1,715 -
USD:MMK 6,121 1.362 182,162 1% 1,822 -
USD:IDR 1,191 13.345 35,436 1% 354 -
Financial liabilities
Monetary items
USD:NTD 4,472$ 29.76 133,090$ 1% 1,331$ -$
USD:RMB 35,250 6.5194 1,049,051 1% 10,491 -
USD:SGD 1,625 1.3369 48,355 1% 484 -
USD:MYR 1,882 4.2081 56,004 1% 560 -
December 31, 2017
Sensitivity analysis
~276~
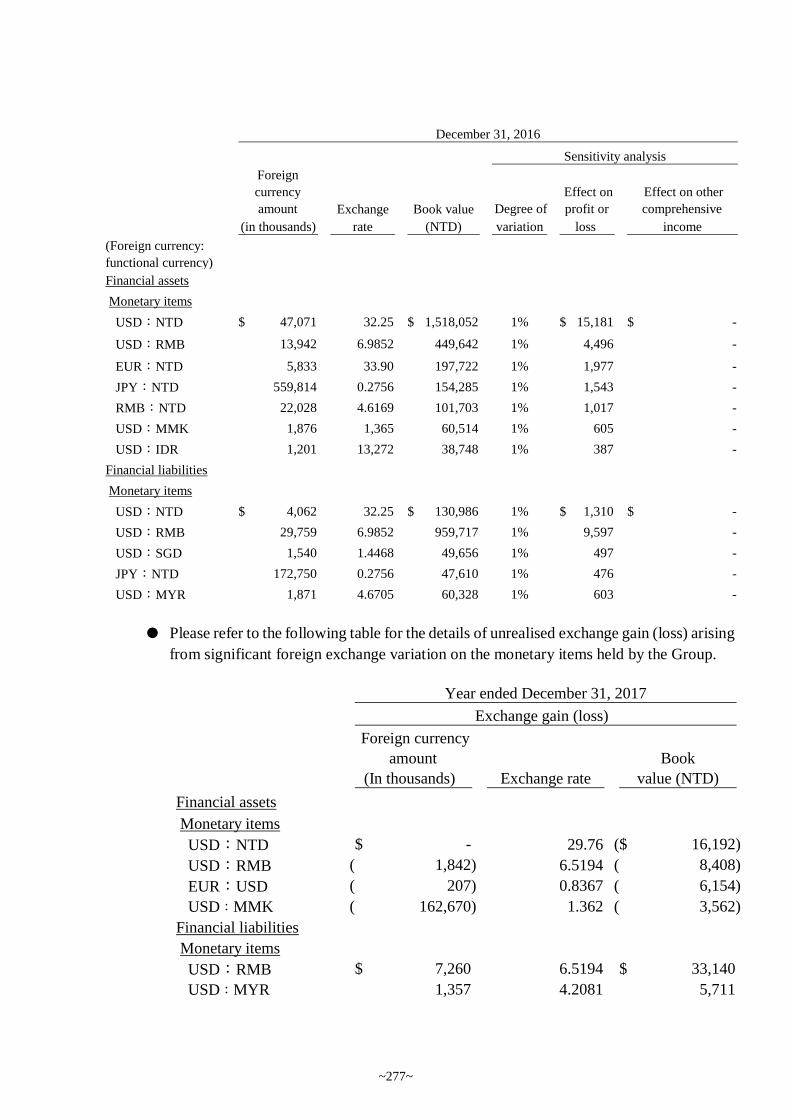
Please refer to the following table for the details of unrealised exchange gain (loss) arising
from significant foreign exchange variation on the monetary items held by the Group.
Foreign
currency
amount Exchange Book value Degree of
Effect on
profit or
Effect on other
comprehensive
(in thousands) rate (NTD) variation loss income
(Foreign currency:
functional currency)
Financial assets
Monetary items
USD:NTD 47,071$ 32.25 1,518,052$ 1% 15,181$ -$
USD:RMB 13,942 6.9852 449,642 1% 4,496 -
EUR:NTD 5,833 33.90 197,722 1% 1,977 -
JPY:NTD 559,814 0.2756 154,285 1% 1,543 -
RMB:NTD 22,028 4.6169 101,703 1% 1,017 -
USD:MMK 1,876 1,365 60,514 1% 605 -
USD:IDR 1,201 13,272 38,748 1% 387 -
Financial liabilities
Monetary items
USD:NTD 4,062$ 32.25 130,986$ 1% 1,310$ -$
USD:RMB 29,759 6.9852 959,717 1% 9,597 -
USD:SGD 1,540 1.4468 49,656 1% 497 -
JPY:NTD 172,750 0.2756 47,610 1% 476 -
USD:MYR 1,871 4.6705 60,328 1% 603 -
December 31, 2016
Sensitivity analysis
Foreign currency
amount Book
(In thousands) Exchange rate value (NTD)
Financial assets
Monetary items
USD:NTD -$ 29.76 16,192)($
USD:RMB 1,842)( 6.5194 8,408)(
EUR:USD 207)( 0.8367 6,154)(
USD:MMK 162,670)( 1.362 3,562)(
Financial liabilities
Monetary items
USD:RMB 7,260$ 6.5194 33,140$
USD:MYR 1,357 4.2081 5,711
Year ended December 31, 2017
Exchange gain (loss)
~277~
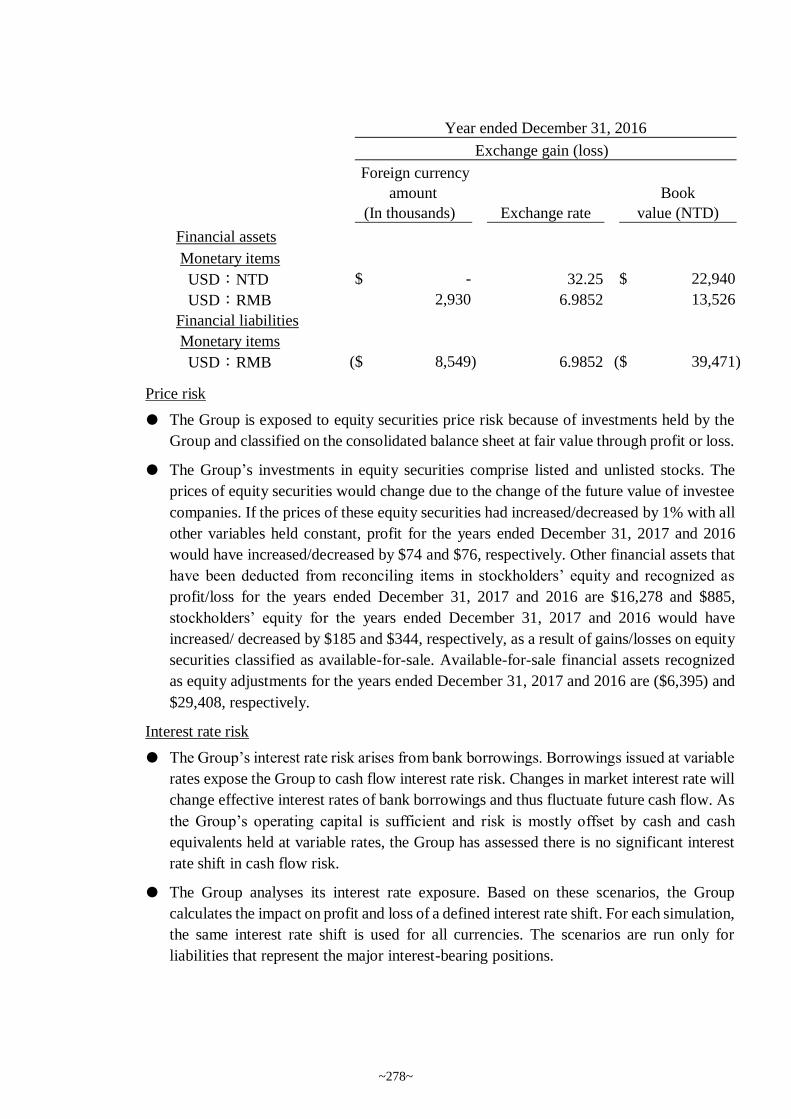
Price risk
The Group is exposed to equity securities price risk because of investments held by the
Group and classified on the consolidated balance sheet at fair value through profit or loss.
The Group’s investments in equity securities comprise listed and unlisted stocks. The
prices of equity securities would change due to the change of the future value of investee
companies. If the prices of these equity securities had increased/decreased by 1% with all
other variables held constant, profit for the years ended December 31, 2017 and 2016
would have increased/decreased by $74 and $76, respectively. Other financial assets that
have been deducted from reconciling items in stockholders’ equity and recognized as
profit/loss for the years ended December 31, 2017 and 2016 are $16,278 and $885,
stockholders’ equity for the years ended December 31, 2017 and 2016 would have
increased/ decreased by $185 and $344, respectively, as a result of gains/losses on equity
securities classified as available-for-sale. Available-for-sale financial assets recognized
as equity adjustments for the years ended December 31, 2017 and 2016 are ($6,395) and
$29,408, respectively.
Interest rate risk
The Group’s interest rate risk arises from bank borrowings. Borrowings issued at variable
rates expose the Group to cash flow interest rate risk. Changes in market interest rate will
change effective interest rates of bank borrowings and thus fluctuate future cash flow. As
the Group’s operating capital is sufficient and risk is mostly offset by cash and cash
equivalents held at variable rates, the Group has assessed there is no significant interest
rate shift in cash flow risk.
The Group analyses its interest rate exposure. Based on these scenarios, the Group
calculates the impact on profit and loss of a defined interest rate shift. For each simulation,
the same interest rate shift is used for all currencies. The scenarios are run only for
liabilities that represent the major interest-bearing positions.
Foreign currency
amount Book
(In thousands) Exchange rate value (NTD)
Financial assets
Monetary items
USD:NTD -$ 32.25 22,940$
USD:RMB 2,930 6.9852 13,526
Financial liabilities
Monetary items
USD:RMB 8,549)($ 6.9852 39,471)($
Year ended December 31, 2016
Exchange gain (loss)
~278~
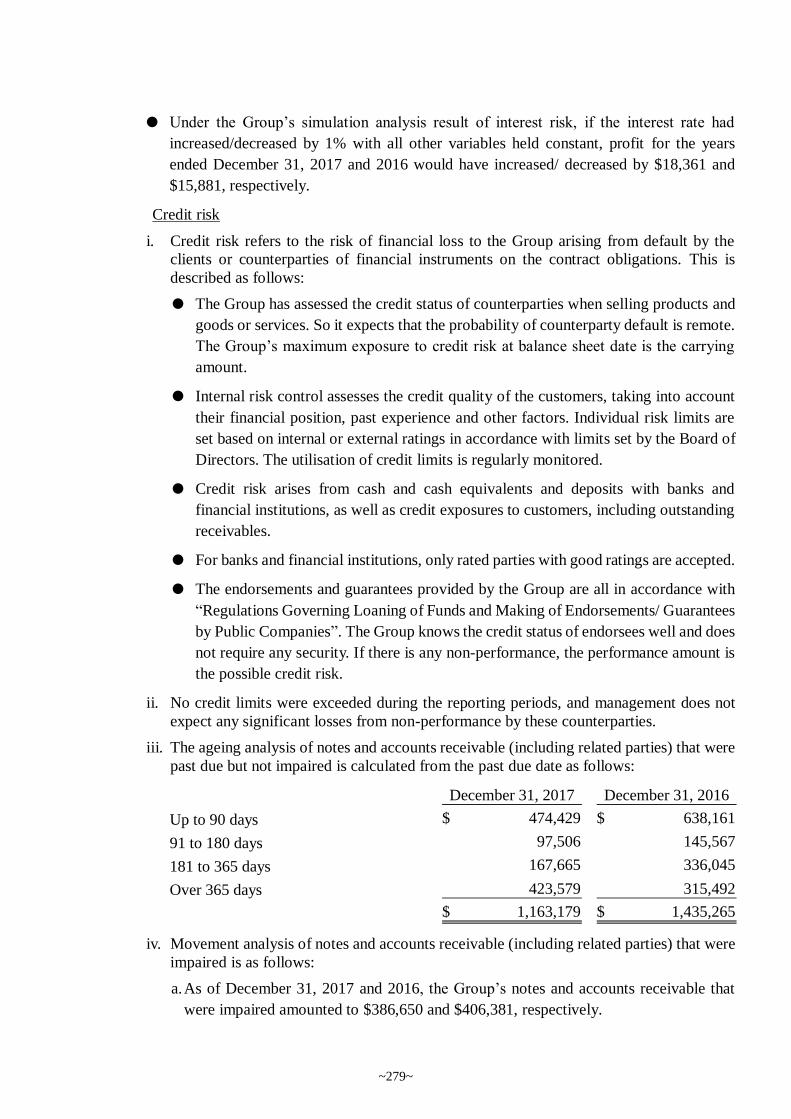
Under the Group’s simulation analysis result of interest risk, if the interest rate had
increased/decreased by 1% with all other variables held constant, profit for the years
ended December 31, 2017 and 2016 would have increased/ decreased by $18,361 and
$15,881, respectively.
Credit risk
i. Credit risk refers to the risk of financial loss to the Group arising from default by the
clients or counterparties of financial instruments on the contract obligations. This is
described as follows:
The Group has assessed the credit status of counterparties when selling products and
goods or services. So it expects that the probability of counterparty default is remote.
The Group’s maximum exposure to credit risk at balance sheet date is the carrying
amount.
Internal risk control assesses the credit quality of the customers, taking into account
their financial position, past experience and other factors. Individual risk limits are
set based on internal or external ratings in accordance with limits set by the Board of
Directors. The utilisation of credit limits is regularly monitored.
Credit risk arises from cash and cash equivalents and deposits with banks and
financial institutions, as well as credit exposures to customers, including outstanding
receivables.
For banks and financial institutions, only rated parties with good ratings are accepted.
The endorsements and guarantees provided by the Group are all in accordance with
“Regulations Governing Loaning of Funds and Making of Endorsements/ Guarantees
by Public Companies”. The Group knows the credit status of endorsees well and does
not require any security. If there is any non-performance, the performance amount is
the possible credit risk.
ii. No credit limits were exceeded during the reporting periods, and management does not
expect any significant losses from non-performance by these counterparties.
iii. The ageing analysis of notes and accounts receivable (including related parties) that were
past due but not impaired is calculated from the past due date as follows:
iv. Movement analysis of notes and accounts receivable (including related parties) that were
impaired is as follows:
a. As of December 31, 2017 and 2016, the Group’s notes and accounts receivable that
were impaired amounted to $386,650 and $406,381, respectively.
December 31, 2017 December 31, 2016
Up to 90 days 474,429$ 638,161$
91 to 180 days 97,506 145,567
181 to 365 days 167,665 336,045
Over 365 days 423,579 315,492
1,163,179$ 1,435,265$
~279~
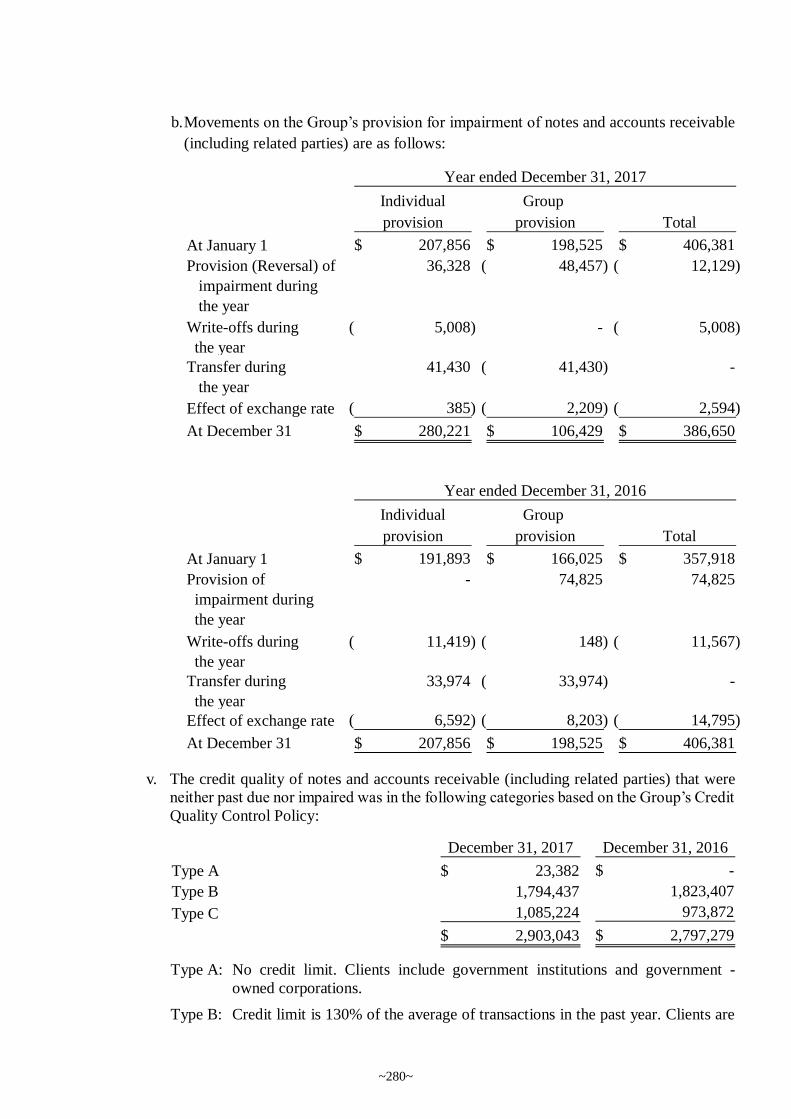
b. Movements on the Group’s provision for impairment of notes and accounts receivable
(including related parties) are as follows:
v. The credit quality of notes and accounts receivable (including related parties) that were
neither past due nor impaired was in the following categories based on the Group’s Credit
Quality Control Policy:
Type A: No credit limit. Clients include government institutions and government -
owned corporations.
Type B: Credit limit is 130% of the average of transactions in the past year. Clients are
Individual Group
provision provision Total
At January 1 207,856$ 198,525$ 406,381$
Provision (Reversal) of
impairment during
the year
36,328 48,457)( 12,129)(
Write-offs during
the year
5,008)( - 5,008)(
Transfer during
the year
41,430 41,430)( -
Effect of exchange rate 385)( 2,209)( 2,594)(
At December 31 280,221$ 106,429$ 386,650$
Year ended December 31, 2017
Individual Group
provision provision Total
At January 1 191,893$ 166,025$ 357,918$
Provision of
impairment during
the year
- 74,825 74,825
Write-offs during
the year
11,419)( 148)( 11,567)(
Transfer during
the year
33,974 33,974)( -
Effect of exchange rate 6,592)( 8,203)( 14,795)(
At December 31 207,856$ 198,525$ 406,381$
Year ended December 31, 2016
December 31, 2017 December 31, 2016
Type A 23,382$ -$
Type B 1,794,437 1,823,407
Type C 1,085,224 973,872
2,903,043$ 2,797,279$
~280~
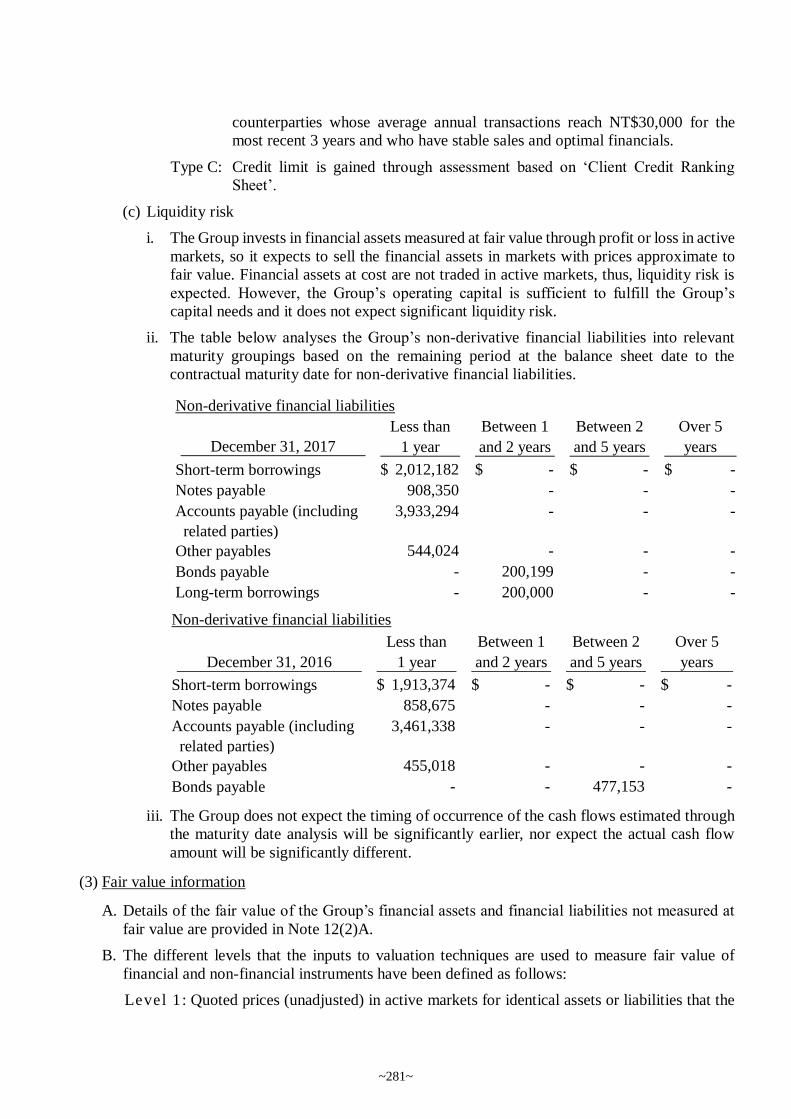
counterparties whose average annual transactions reach NT$30,000 for the
most recent 3 years and who have stable sales and optimal financials.
Type C: Credit limit is gained through assessment based on ‘Client Credit Ranking
Sheet’.
(c) Liquidity risk
i. The Group invests in financial assets measured at fair value through profit or loss in active
markets, so it expects to sell the financial assets in markets with prices approximate to
fair value. Financial assets at cost are not traded in active markets, thus, liquidity risk is
expected. However, the Group’s operating capital is sufficient to fulfill the Group’s
capital needs and it does not expect significant liquidity risk.
ii. The table below analyses the Group’s non-derivative financial liabilities into relevant
maturity groupings based on the remaining period at the balance sheet date to the
contractual maturity date for non-derivative financial liabilities.
iii. The Group does not expect the timing of occurrence of the cash flows estimated through
the maturity date analysis will be significantly earlier, nor expect the actual cash flow
amount will be significantly different.
(3) Fair value information
A. Details of the fair value of the Group’s financial assets and financial liabilities not measured at
fair value are provided in Note 12(2)A.
B. The different levels that the inputs to valuation techniques are used to measure fair value of
financial and non-financial instruments have been defined as follows:
Level 1: Quoted prices (unadjusted) in active markets for identical assets or liabilities that the
Non-derivative financial liabilities
Less than Between 1 Between 2 Over 5
December 31, 2017 1 year and 2 years and 5 years years
Short-term borrowings 2,012,182$ -$ -$ -$
Notes payable 908,350 - - -
Accounts payable (including
related parties)
3,933,294 - - -
Other payables 544,024 - - -
Bonds payable - 200,199 - -
Long-term borrowings - 200,000 - -
Non-derivative financial liabilities
Less than Between 1 Between 2 Over 5
December 31, 2016 1 year and 2 years and 5 years years
Short-term borrowings 1,913,374$ -$ -$ -$
Notes payable 858,675 - - -
Accounts payable (including
related parties)
3,461,338 - - -
Other payables 455,018 - - -
Bonds payable - - 477,153 -
~281~
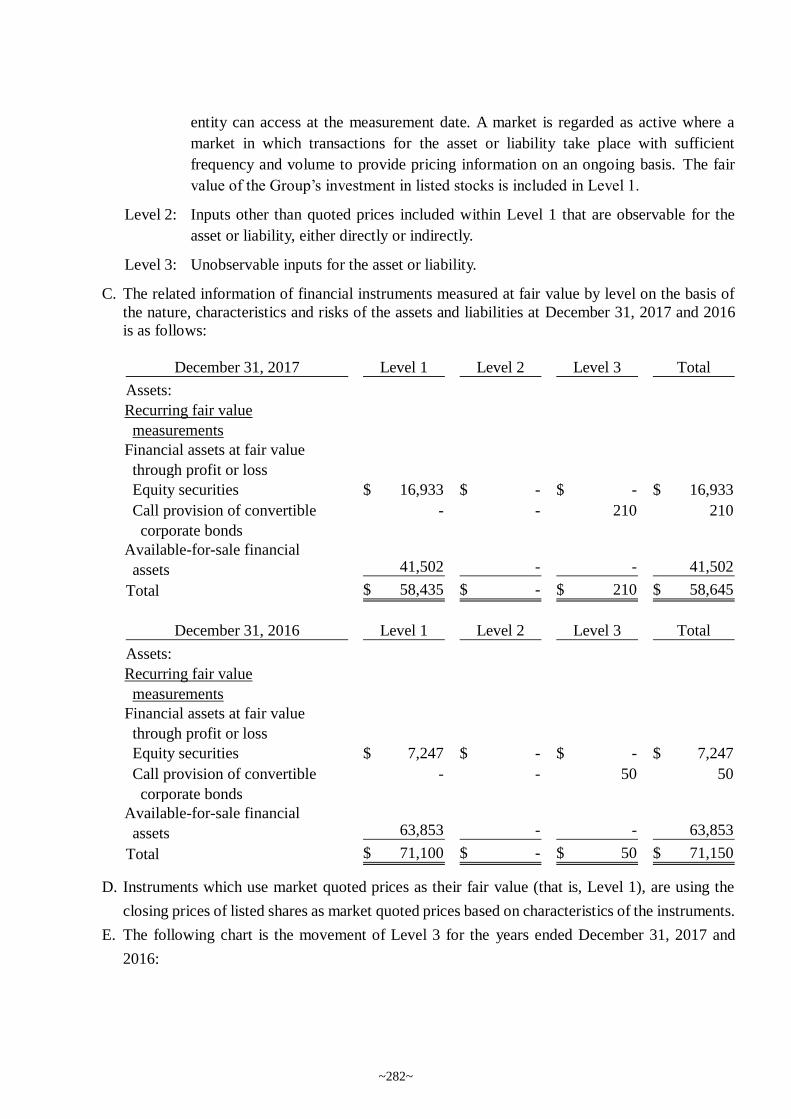
entity can access at the measurement date. A market is regarded as active where a
market in which transactions for the asset or liability take place with sufficient
frequency and volume to provide pricing information on an ongoing basis. The fair
value of the Group’s investment in listed stocks is included in Level 1.
Level 2: Inputs other than quoted prices included within Level 1 that are observable for the
asset or liability, either directly or indirectly.
Level 3: Unobservable inputs for the asset or liability.
C. The related information of financial instruments measured at fair value by level on the basis of
the nature, characteristics and risks of the assets and liabilities at December 31, 2017 and 2016
is as follows:
D. Instruments which use market quoted prices as their fair value (that is, Level 1), are using the
closing prices of listed shares as market quoted prices based on characteristics of the instruments.
E. The following chart is the movement of Level 3 for the years ended December 31, 2017 and
2016:
December 31, 2017 Level 1 Level 2 Level 3 Total
Assets:
Recurring fair value
measurements
Financial assets at fair value
through profit or loss
Equity securities 16,933$ -$ -$ 16,933$
Call provision of convertible
corporate bonds
- - 210 210
Available-for-sale financial
assets 41,502 - - 41,502
Total 58,435$ -$ 210$ 58,645$
December 31, 2016 Level 1 Level 2 Level 3 Total
Assets:
Recurring fair value
measurements
Financial assets at fair value
through profit or loss
Equity securities 7,247$ -$ -$ 7,247$
Call provision of convertible
corporate bonds
- - 50 50
Available-for-sale financial
assets 63,853 - - 63,853
Total 71,100$ -$ 50$ 71,150$
~282~
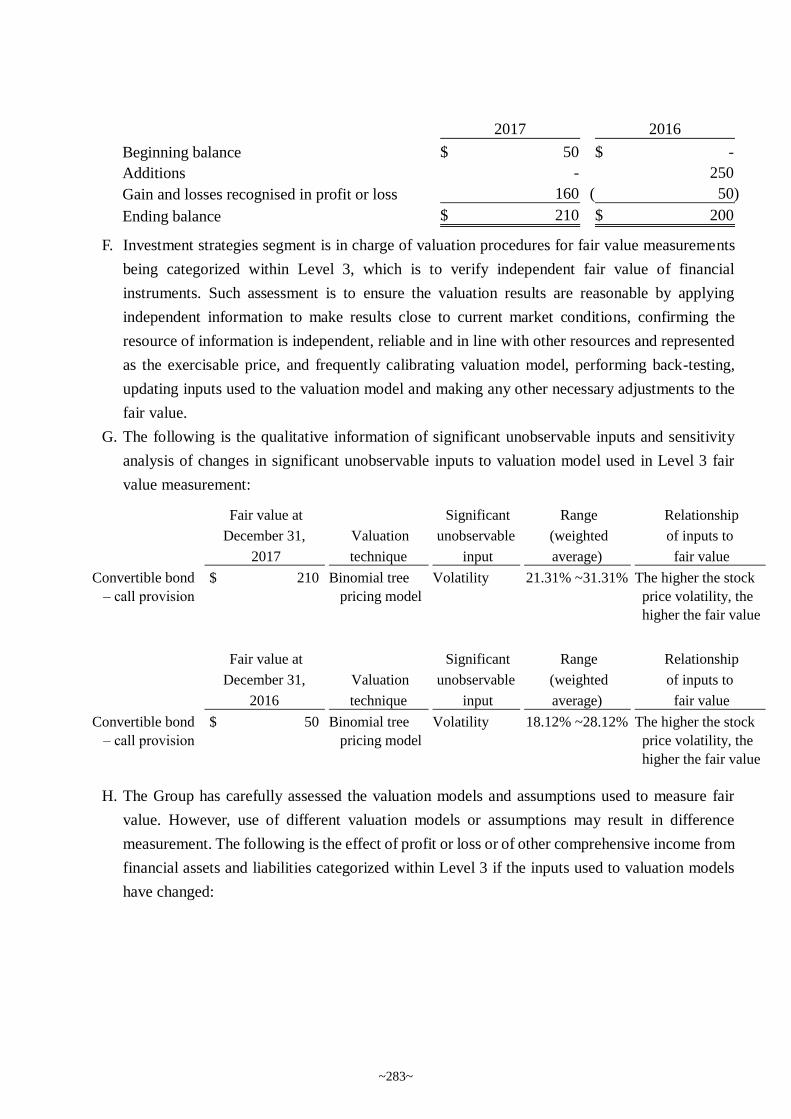
F. Investment strategies segment is in charge of valuation procedures for fair value measurements
being categorized within Level 3, which is to verify independent fair value of financial
instruments. Such assessment is to ensure the valuation results are reasonable by applying
independent information to make results close to current market conditions, confirming the
resource of information is independent, reliable and in line with other resources and represented
as the exercisable price, and frequently calibrating valuation model, performing back-testing,
updating inputs used to the valuation model and making any other necessary adjustments to the
fair value.
G. The following is the qualitative information of significant unobservable inputs and sensitivity
analysis of changes in significant unobservable inputs to valuation model used in Level 3 fair
value measurement:
H. The Group has carefully assessed the valuation models and assumptions used to measure fair
value. However, use of different valuation models or assumptions may result in difference
measurement. The following is the effect of profit or loss or of other comprehensive income from
financial assets and liabilities categorized within Level 3 if the inputs used to valuation models
have changed:
2017 2016
Beginning balance 50$ -$
Additions - 250
Gain and losses recognised in profit or loss 160 50)(
Ending balance 210$ 200$
Fair value at
December 31,
2017
Valuation
technique
Significant
unobservable
input
Range
(weighted
average)
Relationship
of inputs to
fair value
Convertible bond
– call provision
210$ Binomial tree
pricing model
Volatility 21.31% ~31.31% The higher the stock
price volatility, the
higher the fair value
Fair value at
December 31,
2016
Valuation
technique
Significant
unobservable
input
Range
(weighted
average)
Relationship
of inputs to
fair value
Convertible bond
– call provision
50$ Binomial tree
pricing model
Volatility 18.12% ~28.12% The higher the stock
price volatility, the
higher the fair value
~283~
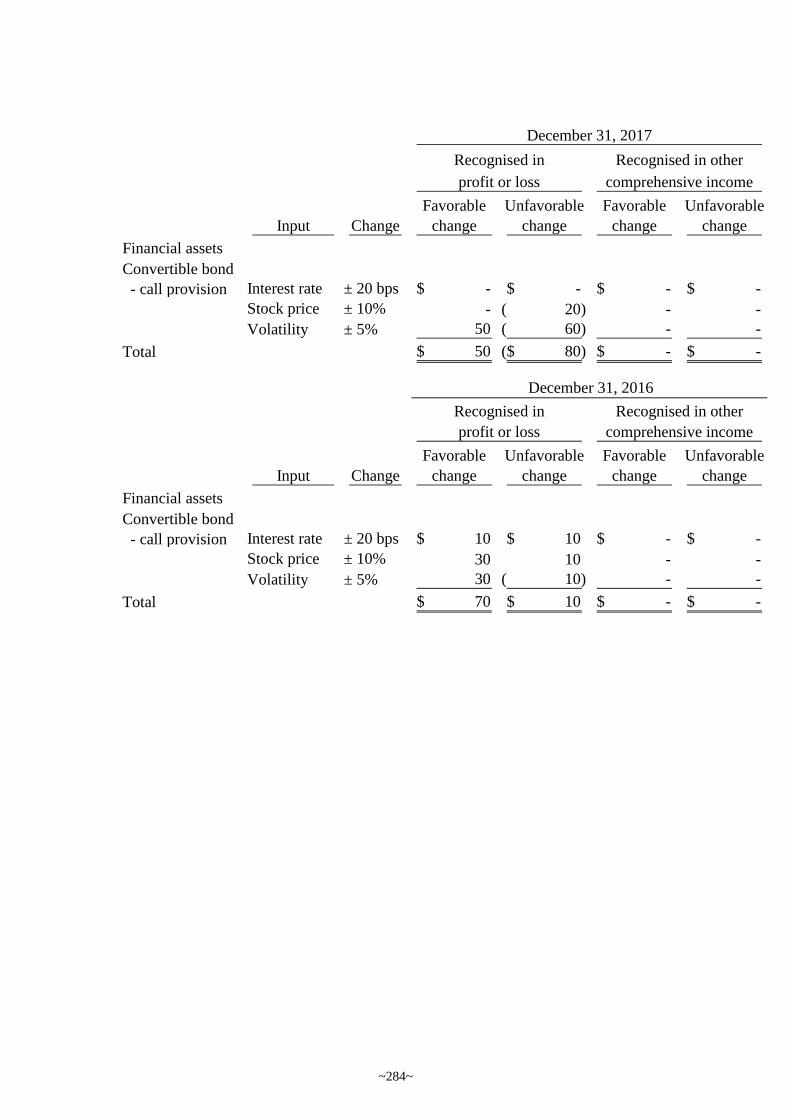
Favorable Unfavorable Favorable Unfavorable
Input Change change change change change
Financial assets
Convertible bond
- call provision Interest rate ± 20 bps -$ -$ -$ -$
Stock price ± 10% - 20)( - -
Volatility ± 5% 50 60)( - -
Total 50$ 80)($ -$ -$
December 31, 2017
profit or loss comprehensive income
Recognised in Recognised in other
Favorable Unfavorable Favorable Unfavorable
Input Change change change change change
Financial assets
Convertible bond
- call provision Interest rate ± 20 bps 10$ 10$ -$ -$
Stock price ± 10% 30 10 - -
Volatility ± 5% 30 10)( - -
Total 70$ 10$ -$ -$
December 31, 2016
profit or loss comprehensive income
Recognised in Recognised in other
~284~
13. SUPPLEMENTARY DISCLOSURES
(1) Significant transactions information
A. Loans to others: Please refer to table 1.
B. Provision of endorsements and guarantees to others: Please refer to table 2.
C. Holding of marketable securities at the end of the period (not including subsidiaries and
associates): Please refer to table 3.
D. Acquisition or sale of the same security with the accumulated cost exceeding NT$300 million or
20% of the Company’s paid-in capital: None.
E. Acquisition of real estate reaching NT$300 million or 20% of paid-in capital or more: None.
F. Disposal of real estate reaching NT$300 million or 20% of paid-in capital or more: None.
G. Purchases or sales of goods from or to related parties reaching NT$100 million or 20% of paid-
in capital or more: None.
H. Receivables from related parties reaching NT$100 million or 20% of paid-in capital or more:
None.
I. Trading in derivative instruments undertaken during the reporting periods: None.
J. Significant inter-company transactions during the reporting periods: Please refer to table 4.
(2) Information on investees
Names, locations and other information of investee companies (not including investees in Mainland
China):Please refer to table 5.
(3) Information on investments in Mainland China
A. Basic information: Please refer to table 6.
B. Significant transactions, either directly or indirectly through a third area, with investee companies
in the Mainland Area: Please refer to table 4.
~285~
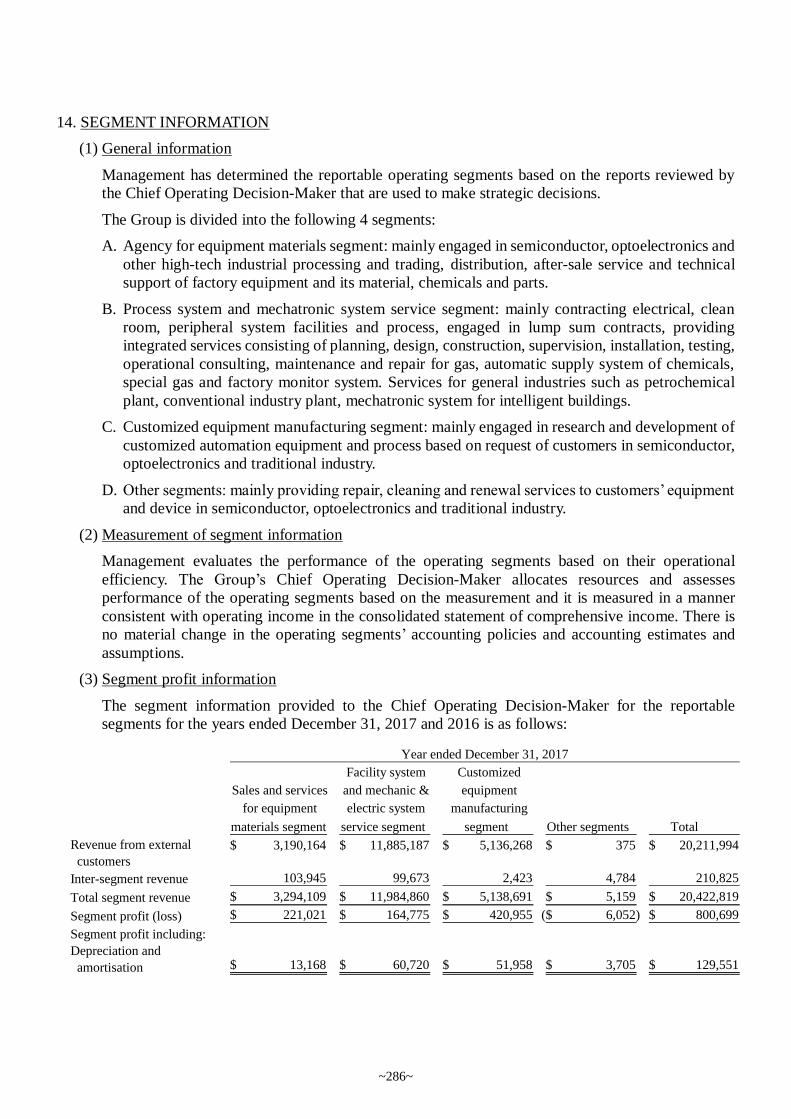
14. SEGMENT INFORMATION
(1) General information
Management has determined the reportable operating segments based on the reports reviewed by
the Chief Operating Decision-Maker that are used to make strategic decisions.
The Group is divided into the following 4 segments:
A. Agency for equipment materials segment: mainly engaged in semiconductor, optoelectronics and
other high-tech industrial processing and trading, distribution, after-sale service and technical
support of factory equipment and its material, chemicals and parts.
B. Process system and mechatronic system service segment: mainly contracting electrical, clean
room, peripheral system facilities and process, engaged in lump sum contracts, providing
integrated services consisting of planning, design, construction, supervision, installation, testing,
operational consulting, maintenance and repair for gas, automatic supply system of chemicals,
special gas and factory monitor system. Services for general industries such as petrochemical
plant, conventional industry plant, mechatronic system for intelligent buildings.
C. Customized equipment manufacturing segment: mainly engaged in research and development of
customized automation equipment and process based on request of customers in semiconductor,
optoelectronics and traditional industry.
D. Other segments: mainly providing repair, cleaning and renewal services to customers’ equipment
and device in semiconductor, optoelectronics and traditional industry.
(2) Measurement of segment information
Management evaluates the performance of the operating segments based on their operational
efficiency. The Group’s Chief Operating Decision-Maker allocates resources and assesses
performance of the operating segments based on the measurement and it is measured in a manner
consistent with operating income in the consolidated statement of comprehensive income. There is
no material change in the operating segments’ accounting policies and accounting estimates and
assumptions.
(3) Segment profit information
The segment information provided to the Chief Operating Decision-Maker for the reportable
segments for the years ended December 31, 2017 and 2016 is as follows:
Facility system Customized
Sales and services and mechanic & equipment
for equipment electric system manufacturing
materials segment service segment segment Other segments Total
Revenue from external
customers
3,190,164$ 11,885,187$ 5,136,268$ 375$ 20,211,994$
Inter-segment revenue 103,945 99,673 2,423 4,784 210,825
Total segment revenue 3,294,109$ 11,984,860$ 5,138,691$ 5,159$ 20,422,819$
Segment profit (loss) 221,021$ 164,775$ 420,955$ 6,052)($ 800,699$
Segment profit including:
Depreciation and
amortisation 13,168$ 60,720$ 51,958$ 3,705$ 129,551$
Year ended December 31, 2017
~286~

(4) Reconciliation for segment income (loss)
Sales and services between segments are carried out at arm’s length. The revenue and financial
information from external customers reported to the Chief Operating Decision-Maker is measured
in a manner consistent with that in the statement of comprehensive income. A reconciliation of
reportable segment income or loss to the income before tax from continuing operations for the years
ended December 31, 2017 and 2016 is provided as follows:
(5) Information on products
Details of revenue balance is as follows:
Facility system Customized
Sales and services and mechanic & equipment
for equipment electric system manufacturing
materials segment service segment segment Other segments Total
Revenue from external
customers
3,261,854$ 11,254,755$ 4,120,202$ 14,130$ 18,650,941$
Inter-segment revenue 160,425 99,364 15,684 5,681 281,154
Total segment revenue 3,422,279$ 11,354,119$ 4,135,886$ 19,811$ 18,932,095$
Segment profit (loss) 224,976$ 127,468$ 355,194$ 7,338)($ 700,300$
Segment profit including:
Depreciation and
amortisation 8,369$ 62,716$ 47,050$ 3,987$ 122,122$
Year ended December 31, 2016
2017 2016
Reportable segments income 806,751$ 707,638$
Other reportable segments loss 6,052)( 7,338)(
Total segments 800,699 700,300
Other gains and losses 55,651 21,015
Finance costs 62,688)( 56,596)(
Gain on disposal of investments 35,556 7,894
Impairment loss on financial assets 15,243)( -
Income before tax from continuing operations 813,975$ 672,613$
Years ended December 31,
2017 2016
R&D and manufacturing of customized
equipment
5,980,118$ 4,926,629$
Sales and service of high-tech equipment
and materials
5,051,537 5,139,244
Total Facility Engineering Turnkey Project 4,716,085 4,530,809
Automatic supplying system 4,464,254 4,054,259
Total 20,211,994$ 18,650,941$
Years ended December 31,
~287~
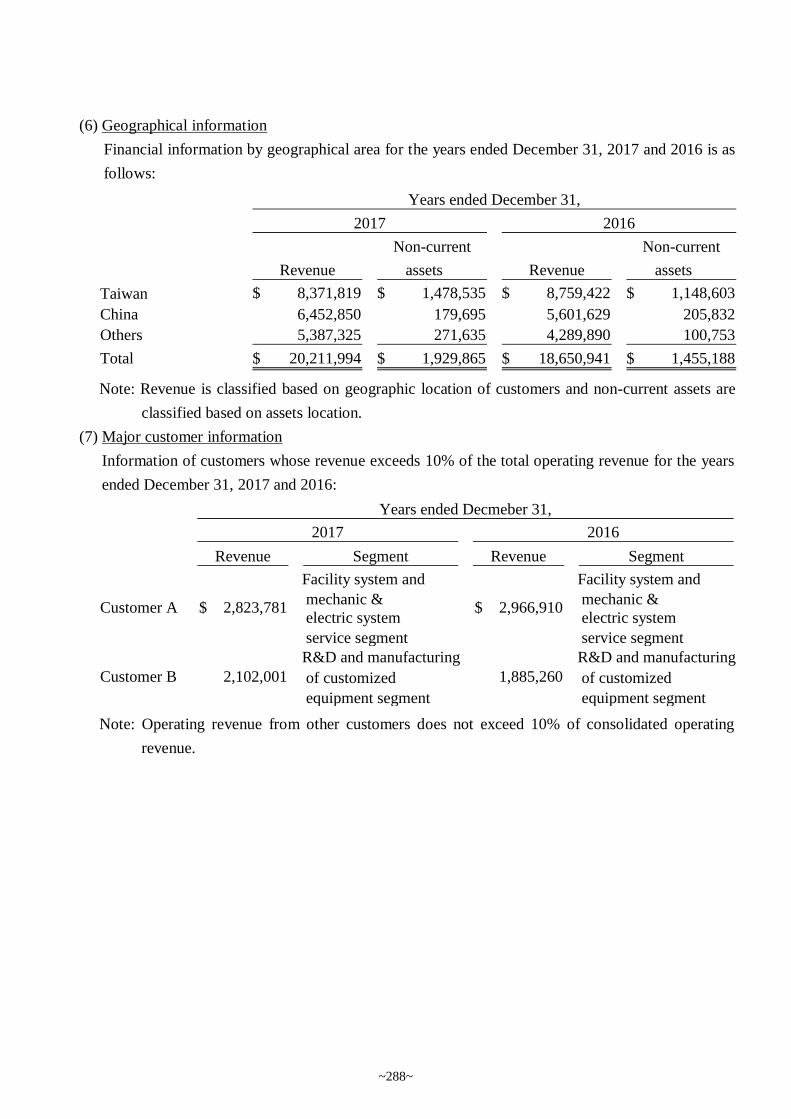
(6) Geographical information
Financial information by geographical area for the years ended December 31, 2017 and 2016 is as
follows:
Note: Revenue is classified based on geographic location of customers and non-current assets are
classified based on assets location.
(7) Major customer information
Information of customers whose revenue exceeds 10% of the total operating revenue for the years
ended December 31, 2017 and 2016:
Note: Operating revenue from other customers does not exceed 10% of consolidated operating
revenue.
Non-current Non-current
Revenue assets Revenue assets
Taiwan 8,371,819$ 1,478,535$ 8,759,422$ 1,148,603$
China 6,452,850 179,695 5,601,629 205,832
Others 5,387,325 271,635 4,289,890 100,753
Total 20,211,994$ 1,929,865$ 18,650,941$ 1,455,188$
Years ended December 31,
2017 2016
Revenue Segment Revenue Segment
Facility system and
mechanic &
Facility system and
mechanic &
electric system
service segment
electric system
service segment
R&D and manufacturing R&D and manufacturing
of customized
equipment segment
of customized
equipment segment
Customer B 2,102,001 1,885,260
Years ended Decmeber 31,
2017 2016
Customer A 2,823,781$ 2,966,910$
~288~

Item Value
0 Marketech International Corp. Marketech International Sdn.Bhd. Other receivables Y 87,522$ 55,056$ 55,056$ 4.616 2 -$ Operations -$ None - 2,057,991$ 2,057,991$ Note 4
1 MIC-Tech Electronics Engineering Corp. MIC-Tech (Shanghai) Corp. Other receivables Y 31,065 - - - 2 - Operations - None - 375,894 375,894 Note 5
1 MIC-Tech Electronics Engineering Corp.Integrated Manufacturing & Services
Co., Ltd.Other receivables Y 9,234 - - - 2 - Operations - None - 375,894 375,894 Note 5
1 MIC-Tech Electronics Engineering Corp.Fuzhou Jiwei System Integrated Co.,
Ltd. Other receivables Y 1,371 1,369 1,369 4.35 2 - Operations - None - 375,894 375,894 Note 5
1 MIC-Tech Electronics Engineering Corp.ChenGao M&E Engineering
(Shanghai) Co., Ltd.Other receivables Y 2,054 2,054 2,054 4.785 2 - Operations - None - 375,894 375,894 Note 5
1 MIC-Tech Electronics Engineering Corp.Shanghai Maohua Electronics
Engineering Co.,Ltd.Other receivables Y 61,707 57,060 57,060 4.35~4.785 2 - Operations - None - 187,947 375,894 Note 5
2 MIC-Tech (WuXi) Co., Ltd.Shanghai Maohua Electronics
Engineering Co.,Ltd.Other receivables Y 6,925 - - - 2 - Operations - None - 9,535 19,070 Note 5
2 MIC-Tech (WuXi) Co., Ltd.Integrated Manufacturing & Services
Co., Ltd.Other receivables Y 13,851 - - - 2 - Operations - None - 19,070 19,070 Note 5
3 MIC-Tech (Shanghai) Corp.Integrated Manufacturing & Services
Co., Ltd.Other receivables Y 19,198 16,890 16,890 5.0025 2 - Operations - None - 269,635 269,635 Note 5
3 MIC-Tech (Shanghai) Corp.Shanghai Maohua Electronics
Engineering Co.,Ltd.Other receivables Y 18,259 18,259 18,259 4.785 2 - Operations - None - 134,818 269,635 Note 5
3 MIC-Tech (Shanghai) Corp.MIC-Tech China Trading (Shanghai)
Co., Ltd. Other receivables Y 118,047 84,906 84,906 4.35~5.0025 2 - Operations - None - 269,635 269,635 Note 5
4 MIC-Tech Ventures Asia Pacific Inc.MIC-Tech Electronics Engineering
Corp.Other receivables Y 48,375 44,640 - 4.616 2 - Operations - None - 414,804 829,608 Note 4
Note 1:The numbers filled in for the loans provided by the Company or subsidiaries are as follows:
(1)The Company is ‘0’.
(2)The subsidiaries are numbered in order starting from ‘1’.
Note 2:Fill in the maximum outstanding balance of loans to others during the year ended December 31, 2017.
Note 3:Fill in the nature of the loan as follows:
(1)Fill in 1 for business transactions and the amount of business transactions when nature of the loan is related to business transactions, which is the amount of business transactions occurred between the creditor and borrower in the current year.
(2)Fill in 2 for short-term financing and the purpose of loan, for example, repayment of loan, acquisition of equipment, working capital, etc.
Note 4:Limit on the loans from the Company and MIC-Tech Ventures Asia Pacific Inc.:
(1)Limit on the accumulated balance of loans to others provided by the foreign companies whose voting rights are 100% owned directly and indirectly by the Company is 80% of the net assets based on the latest financial statements of subsidiaries who receive the loans. The following (2) and (3) do not apply to the limit.
(2)For business transactions, limit on loans granted for a single party is the amount of the transactions. The amount of the transactions is the higher value of purchasing and selling during current year on the year of financing.
(3)For short-term financing, limit on loans granted for a single party is 40% of the net assets of the lending companies. The amount of loans to a single party with short-term financing is the accumulated balance of the Company's short-term financing.
(4)Limit of the accumulated balance of loans from (2) and (3) is 40% of the net assets based on the latest financial statements of the lending companies.
Note 5:Limit on the loans provided by the Company’s mainland subsidiaries:
(1)Limit on the total loans to others provided by the Company’s mainland subsidiaries is 80% of the net assets based on the latest financial statements of the lending companies.
(2)Limit on the loans provided by the Company’s mainland subsidiaries granted for a single party are as follows:
(2-1)Limit on loans to a single party with business transactions is the higher value of purchasing and selling during current year on the year of financing, and can’t exceed the total business transactions amount within 12 month.
(2-2)For short-term financing between the Company’s mainland subsidiary and the foreign companies which the ultimate parent company holds 100% of the voting rights directly or indirectly, limit on loans granted for a single party is 80% of the net assets based on the latest financial statements of the lending companies.
(2-3)For short-term financing between the Company’s mainland subsidiaries and aforementioned associates, limit on loans granted for a single party is 40% of the net assets based on the latest financial statements of the lending companies. The amount of loans to a single party is the accumulated balance of the lending company's
short-term financing for single party.
Note 6:The ending balance is the amount resolved by the Board of Directors.
Collateral Limit on loans
granted to
a single party
Ceiling on
total loans
granted Footnote
Interest
rate (%)
Nature of
loan
(Note 3)
Amount of
transactions
with the
borrower
Reason
for short-term
financing
Allowance
for bad debts
MARKETECH INTERNATIONAL CORP. AND SUBSIDIARIES
Loans to others
For the year ended December 31, 2017
Table 1 Expressed in thousands of NTD
(Except as otherwise indicated)
Maximum outstanding
balance during
the year ended
December 31, 2017
(Note 2)
Balance at
December 31
, 2017
(Note 6)
Actual amount
drawn down
No.
(Note 1) Creditor Borrower
General
ledger account
Is a related
party
~289~
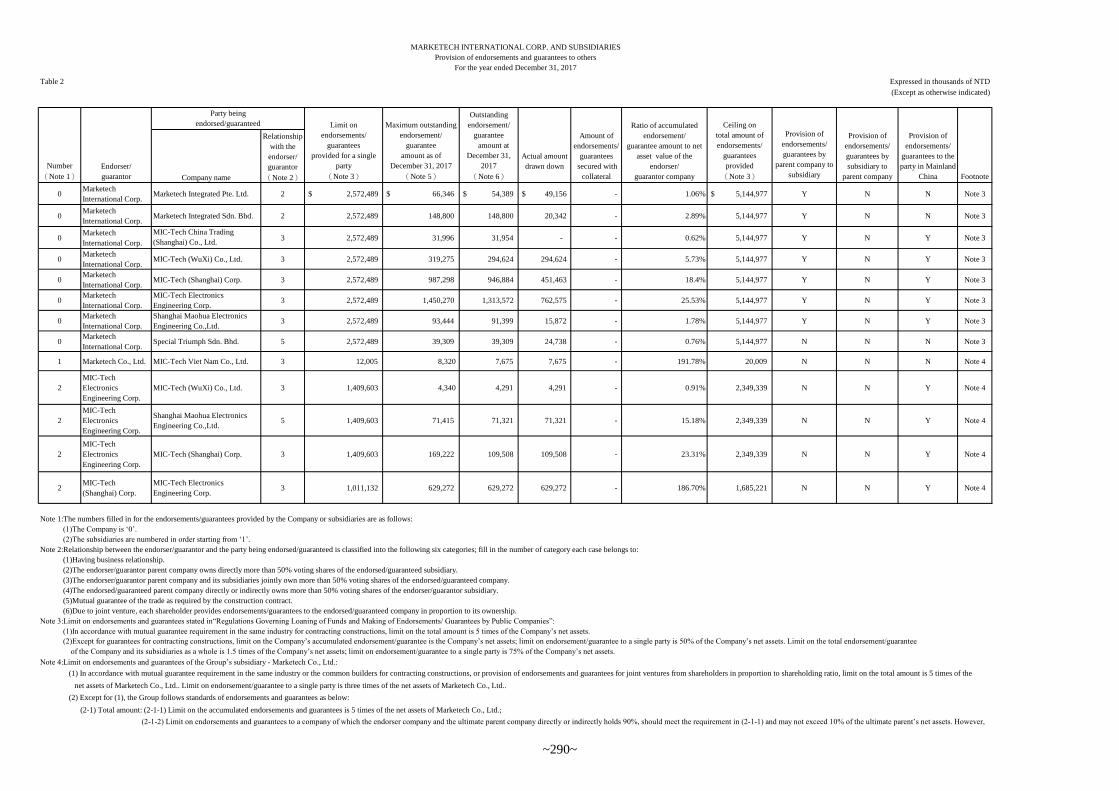
Company name
Relationship
with the
endorser/
guarantor
(Note 2)
0Marketech
International Corp.Marketech Integrated Pte. Ltd. 2 $ 2,572,489 $ 66,346 $ 54,389 $ 49,156 - 1.06% $ 5,144,977 Y N N Note 3
0Marketech
International Corp.Marketech Integrated Sdn. Bhd. 2 2,572,489 148,800 148,800 20,342 - 2.89% 5,144,977 Y N N Note 3
0Marketech
International Corp.
MIC-Tech China Trading
(Shanghai) Co., Ltd.3 2,572,489 31,996 31,954 - - 0.62% 5,144,977 Y N Y Note 3
0Marketech
International Corp.MIC-Tech (WuXi) Co., Ltd. 3 2,572,489 319,275 294,624 294,624 - 5.73% 5,144,977 Y N Y Note 3
0Marketech
International Corp.MIC-Tech (Shanghai) Corp. 3 2,572,489 987,298 946,884 451,463 - 18.4% 5,144,977 Y N Y Note 3
0Marketech
International Corp.
MIC-Tech Electronics
Engineering Corp.3 2,572,489 1,450,270 1,313,572 762,575 - 25.53% 5,144,977 Y N Y Note 3
0Marketech
International Corp.
Shanghai Maohua Electronics
Engineering Co.,Ltd.3 2,572,489 93,444 91,399 15,872 - 1.78% 5,144,977 Y N Y Note 3
0Marketech
International Corp.Special Triumph Sdn. Bhd. 5 2,572,489 39,309 39,309 24,738 - 0.76% 5,144,977 N N N Note 3
1 Marketech Co., Ltd. MIC-Tech Viet Nam Co., Ltd. 3 12,005 8,320 7,675 7,675 - 191.78% 20,009 N N N Note 4
2
MIC-Tech
Electronics
Engineering Corp.
MIC-Tech (WuXi) Co., Ltd. 3 1,409,603 4,340 4,291 4,291 - 0.91% 2,349,339 N N Y Note 4
2
MIC-Tech
Electronics
Engineering Corp.
Shanghai Maohua Electronics
Engineering Co.,Ltd.5 1,409,603 71,415 71,321 71,321 - 15.18% 2,349,339 N N Y Note 4
2
MIC-Tech
Electronics
Engineering Corp.
MIC-Tech (Shanghai) Corp. 3 1,409,603 169,222 109,508 109,508 - 23.31% 2,349,339 N N Y Note 4
2MIC-Tech
(Shanghai) Corp.
MIC-Tech Electronics
Engineering Corp.3 1,011,132 629,272 629,272 629,272 - 186.70% 1,685,221 N N Y Note 4
Note 1:The numbers filled in for the endorsements/guarantees provided by the Company or subsidiaries are as follows:
(1)The Company is ‘0’.
(2)The subsidiaries are numbered in order starting from ‘1’.
Note 2:Relationship between the endorser/guarantor and the party being endorsed/guaranteed is classified into the following six categories; fill in the number of category each case belongs to:
(1)Having business relationship.
(2)The endorser/guarantor parent company owns directly more than 50% voting shares of the endorsed/guaranteed subsidiary.
(3)The endorser/guarantor parent company and its subsidiaries jointly own more than 50% voting shares of the endorsed/guaranteed company.
(4)The endorsed/guaranteed parent company directly or indirectly owns more than 50% voting shares of the endorser/guarantor subsidiary.
(5)Mutual guarantee of the trade as required by the construction contract.
(6)Due to joint venture, each shareholder provides endorsements/guarantees to the endorsed/guaranteed company in proportion to its ownership.
Note 3:Limit on endorsements and guarantees stated in“Regulations Governing Loaning of Funds and Making of Endorsements/ Guarantees by Public Companies”:
(1)In accordance with mutual guarantee requirement in the same industry for contracting constructions, limit on the total amount is 5 times of the Company’s net assets.
Note 4:Limit on endorsements and guarantees of the Group’s subsidiary - Marketech Co., Ltd.:
(1) In accordance with mutual guarantee requirement in the same industry or the common builders for contracting constructions, or provision of endorsements and guarantees for joint ventures from shareholders in proportion to shareholding ratio, limit on the total amount is 5 times of the
net assets of Marketech Co., Ltd.. Limit on endorsement/guarantee to a single party is three times of the net assets of Marketech Co., Ltd..
(2) Except for (1), the Group follows standards of endorsements and guarantees as below:
(2-1) Total amount: (2-1-1) Limit on the accumulated endorsements and guarantees is 5 times of the net assets of Marketech Co., Ltd.;
(2-1-2) Limit on endorsements and guarantees to a company of which the endorser company and the ultimate parent company directly or indirectly holds 90%, should meet the requirement in (2-1-1) and may not exceed 10% of the ultimate parent’s net assets. However,
MARKETECH INTERNATIONAL CORP. AND SUBSIDIARIES
Provision of endorsements and guarantees to others
For the year ended December 31, 2017
Table 2 Expressed in thousands of NTD
(Except as otherwise indicated)
(2)Except for guarantees for contracting constructions, limit on the Company’s accumulated endorsement/guarantee is the Company’s net assets; limit on endorsement/guarantee to a single party is 50% of the Company’s net assets. Limit on the total endorsement/guarantee
of the Company and its subsidiaries as a whole is 1.5 times of the Company’s net assets; limit on endorsement/guarantee to a single party is 75% of the Company’s net assets.
Outstanding
endorsement/
guarantee
amount at
December 31,
2017
(Note 6)
Actual amount
drawn downNumber
(Note 1)
Endorser/
guarantor
Party being
endorsed/guaranteed Limit on
endorsements/
guarantees
provided for a single
party
(Note 3)
Maximum outstanding
endorsement/
guarantee
amount as of
December 31, 2017
(Note 5)
Provision of
endorsements/
guarantees to the
party in Mainland
China Footnote
Amount of
endorsements/
guarantees
secured with
collateral
Ratio of accumulated
endorsement/
guarantee amount to net
asset value of the
endorser/
guarantor company
Ceiling on
total amount of
endorsements/
guarantees
provided
(Note 3)
Provision of
endorsements/
guarantees by
parent company to
subsidiary
Provision of
endorsements/
guarantees by
subsidiary to
parent company
~290~
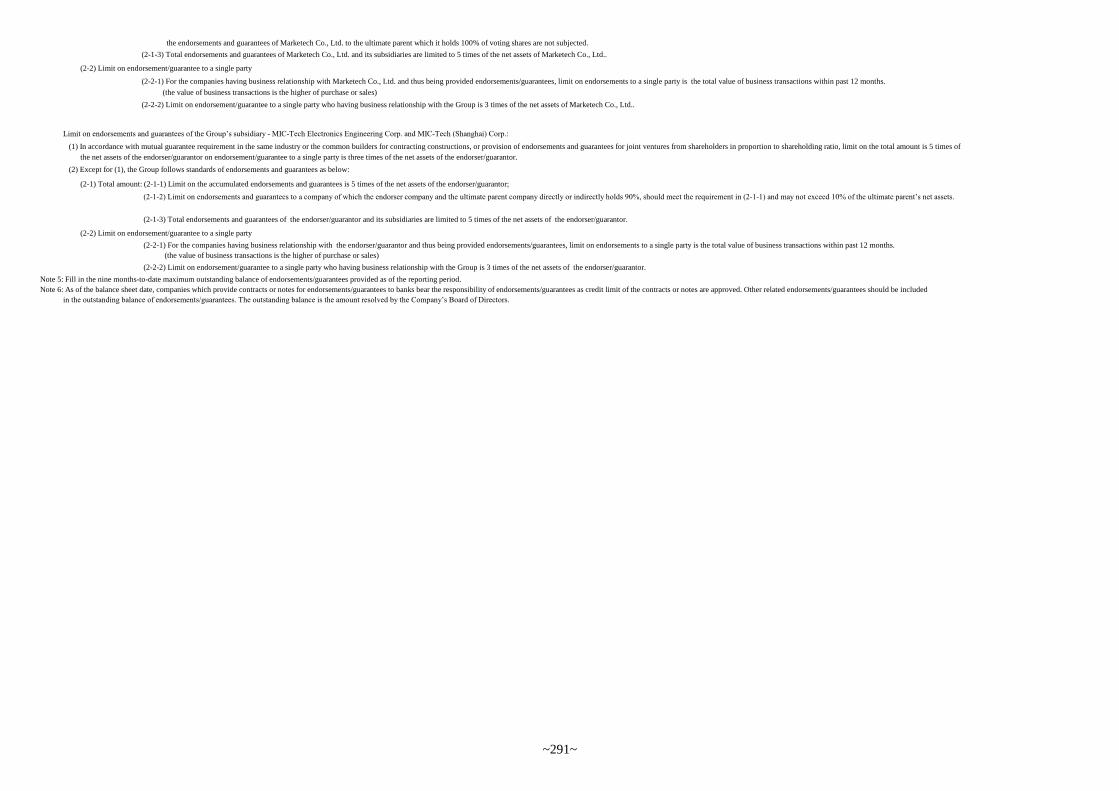
the endorsements and guarantees of Marketech Co., Ltd. to the ultimate parent which it holds 100% of voting shares are not subjected.
(2-1-3) Total endorsements and guarantees of Marketech Co., Ltd. and its subsidiaries are limited to 5 times of the net assets of Marketech Co., Ltd..
(2-2) Limit on endorsement/guarantee to a single party
(2-2-1) For the companies having business relationship with Marketech Co., Ltd. and thus being provided endorsements/guarantees, limit on endorsements to a single party is the total value of business transactions within past 12 months.
(the value of business transactions is the higher of purchase or sales)
(2-2-2) Limit on endorsement/guarantee to a single party who having business relationship with the Group is 3 times of the net assets of Marketech Co., Ltd..
Limit on endorsements and guarantees of the Group’s subsidiary - MIC-Tech Electronics Engineering Corp. and MIC-Tech (Shanghai) Corp.:
(1) In accordance with mutual guarantee requirement in the same industry or the common builders for contracting constructions, or provision of endorsements and guarantees for joint ventures from shareholders in proportion to shareholding ratio, limit on the total amount is 5 times of
the net assets of the endorser/guarantor on endorsement/guarantee to a single party is three times of the net assets of the endorser/guarantor.
(2) Except for (1), the Group follows standards of endorsements and guarantees as below:
(2-1) Total amount: (2-1-1) Limit on the accumulated endorsements and guarantees is 5 times of the net assets of the endorser/guarantor;
(2-1-2) Limit on endorsements and guarantees to a company of which the endorser company and the ultimate parent company directly or indirectly holds 90%, should meet the requirement in (2-1-1) and may not exceed 10% of the ultimate parent’s net assets.
However, the endorsements and guarantees of the endorser/guarantor to the ultimate parent which it holds 100% of voting shares are not subjected.
(2-1-3) Total endorsements and guarantees of the endorser/guarantor and its subsidiaries are limited to 5 times of the net assets of the endorser/guarantor.
(2-2) Limit on endorsement/guarantee to a single party
(2-2-1) For the companies having business relationship with the endorser/guarantor and thus being provided endorsements/guarantees, limit on endorsements to a single party is the total value of business transactions within past 12 months.
(the value of business transactions is the higher of purchase or sales)
(2-2-2) Limit on endorsement/guarantee to a single party who having business relationship with the Group is 3 times of the net assets of the endorser/guarantor.
Note 5: Fill in the nine months-to-date maximum outstanding balance of endorsements/guarantees provided as of the reporting period.
Note 6: As of the balance sheet date, companies which provide contracts or notes for endorsements/guarantees to banks bear the responsibility of endorsements/guarantees as credit limit of the contracts or notes are approved. Other related endorsements/guarantees should be included
in the outstanding balance of endorsements/guarantees. The outstanding balance is the amount resolved by the Company’s Board of Directors.
~291~
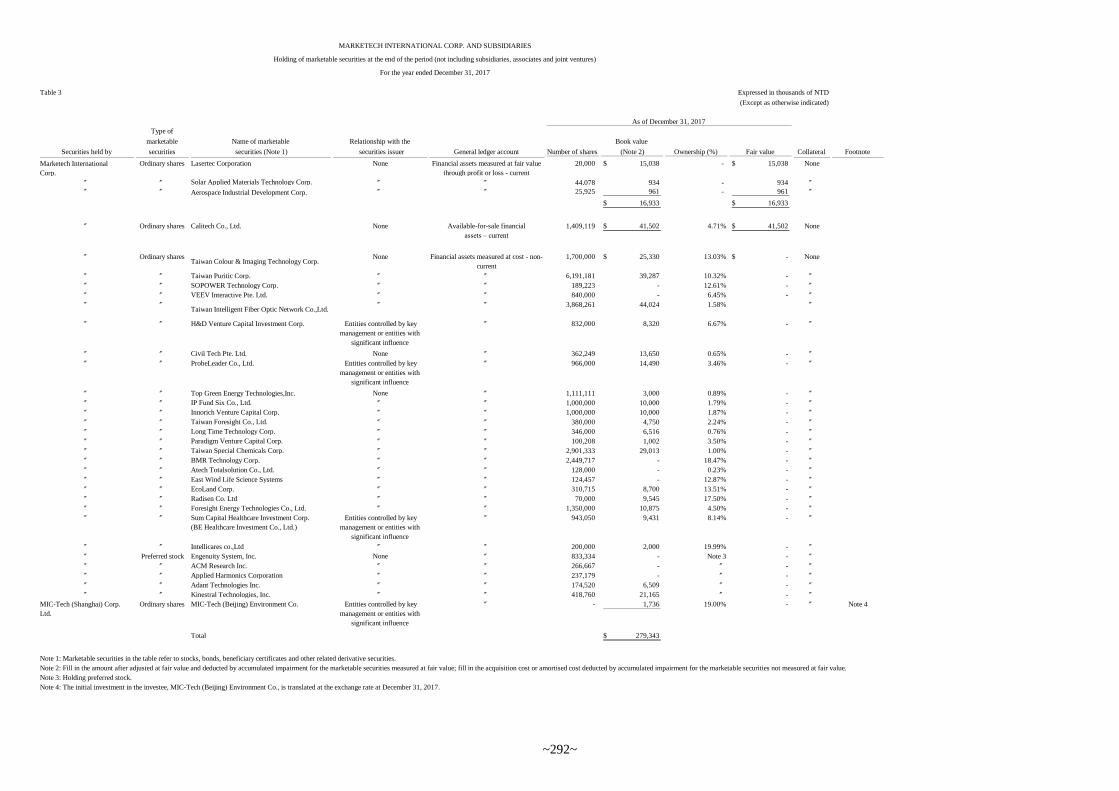
Number of shares
Book value
(Note 2) Ownership (%) Fair value
Marketech International
Corp.
Ordinary shares Lasertec Corporation None Financial assets measured at fair value
through profit or loss - current
20,000 15,038$ - 15,038$ None
〞 〞 Solar Applied Materials Technology Corp. 〞 〞 44,078 934 - 934 〞〞 〞 Aerospace Industrial Development Corp. 〞 〞 25,925 961 - 961 〞
16,933$ 16,933$
〞 Ordinary shares Calitech Co., Ltd. None Available-for-sale financial
assets – current
1,409,119 41,502$ 4.71% 41,502$ None
〞 Ordinary sharesTaiwan Colour & Imaging Technology Corp.
None Financial assets measured at cost - non-
current
1,700,000 25,330$ 13.03% -$ None
〞 〞 Taiwan Puritic Corp. 〞 〞 6,191,181 39,287 10.32% - 〞
〞 〞 SOPOWER Technology Corp. 〞 〞 189,223 - 12.61% - 〞
〞 〞 VEEV Interactive Pte. Ltd. 〞 〞 840,000 - 6.45% - 〞
〞 〞Taiwan Intelligent Fiber Optic Network Co.,Ltd.
〞 〞 3,868,261 44,024 1.58% 〞
〞 〞 H&D Venture Capital Investment Corp. Entities controlled by key
management or entities with
significant influence
〞 832,000 8,320 6.67% - 〞
〞 〞 Civil Tech Pte. Ltd. None 〞 362,249 13,650 0.65% - 〞
〞 〞 ProbeLeader Co., Ltd. Entities controlled by key
management or entities with
significant influence
〞 966,000 14,490 3.46% - 〞
〞 〞 Top Green Energy Technologies,Inc. None 〞 1,111,111 3,000 0.89% - 〞
〞 〞 IP Fund Six Co., Ltd. 〞 〞 1,000,000 10,000 1.79% - 〞
〞 〞 Innorich Venture Capital Corp. 〞 〞 1,000,000 10,000 1.87% - 〞
〞 〞 Taiwan Foresight Co., Ltd. 〞 〞 380,000 4,750 2.24% - 〞
〞 〞 Long Time Technology Corp. 〞 〞 346,000 6,516 0.76% - 〞
〞 〞 Paradigm Venture Capital Corp. 〞 〞 100,208 1,002 3.50% - 〞
〞 〞 Taiwan Special Chemicals Corp. 〞 〞 2,901,333 29,013 1.00% - 〞
〞 〞 BMR Technology Corp. 〞 〞 2,449,717 - 18.47% - 〞
〞 〞 Atech Totalsolution Co., Ltd. 〞 〞 128,000 - 0.23% - 〞
〞 〞 East Wind Life Science Systems 〞 〞 124,457 - 12.87% - 〞
〞 〞 EcoLand Corp. 〞 〞 310,715 8,700 13.51% - 〞
〞 〞 Radisen Co. Ltd 〞 〞 70,000 9,545 17.50% - 〞
〞 〞 Foresight Energy Technologies Co., Ltd. 〞 〞 1,350,000 10,875 4.50% - 〞
〞 〞 Sum Capital Healthcare Investment Corp.
(BE Healthcare Investment Co., Ltd.)
Entities controlled by key
management or entities with
significant influence
〞 943,050 9,431 8.14% - 〞
〞 〞 Intellicares co.,Ltd 〞 〞 200,000 2,000 19.99% - 〞
〞 Preferred stock Engenuity System, Inc. None 〞 833,334 - Note 3 - 〞
〞 〞 ACM Research Inc. 〞 〞 266,667 - 〞 - 〞
〞 〞 Applied Harmonics Corporation 〞 〞 237,179 - 〞 - 〞
〞 〞 Adant Technologies Inc. 〞 〞 174,520 6,509 〞 - 〞
〞 〞 Kinestral Technologies, Inc. 〞 〞 418,760 21,165 〞 - 〞
MIC-Tech (Shanghai) Corp.
Ltd.
Ordinary shares MIC-Tech (Beijing) Environment Co. Entities controlled by key
management or entities with
significant influence
〞 - 1,736 19.00% - 〞 Note 4
Total 279,343$
Note 1: Marketable securities in the table refer to stocks, bonds, beneficiary certificates and other related derivative securities.
Note 2: Fill in the amount after adjusted at fair value and deducted by accumulated impairment for the marketable securities measured at fair value; fill in the acquisition cost or amortised cost deducted by accumulated impairment for the marketable securities not measured at fair value.
Note 3: Holding preferred stock.
Note 4: The initial investment in the investee, MIC-Tech (Beijing) Environment Co., is translated at the exchange rate at December 31, 2017.
(Except as otherwise indicated)
FootnoteSecurities held by
Name of marketable
securities (Note 1)
Relationship with the
securities issuer General ledger account
As of December 31, 2017
MARKETECH INTERNATIONAL CORP. AND SUBSIDIARIES
Holding of marketable securities at the end of the period (not including subsidiaries, associates and joint ventures)
For the year ended December 31, 2017
Table 3
Type of
marketable
securities Collateral
Expressed in thousands of NTD
~292~

General ledger account Amount Transaction terms
Percentage of consolidated
total operating revenues or
total assets (Note 3)
0 Marketech International Corp. MIC-Tech (Shanghai) Corp. 1 Sales revenue 42,893$ 0.21%
0 Marketech International Corp. MIC-Tech (Shanghai) Corp. 1 Non-operating revenue 8,835 0.04%
0 Marketech International Corp. MIC-Tech Electronics Engineering Corp. 1 Non-operating revenue 18,975 0.09%
0 Marketech International Corp. MIC-Tech Electronics Engineering Corp. 1 Construction revenue 11,841 0.06%
0 Marketech International Corp. Marketech International Sdn. Bhd. 1 Other receivables 57,451 0.36%
0 Marketech International Corp. Shanghai Maohua Electronics Engineering Co.,Ltd. 1 Construction revenue 18,567 0.09%
1 eZoom Information, Inc. Marketech International Corp. 2 Services revenue 36,286 0.18%
2 MIC-Tech Global Corp. Marketech International Corp. 2 Sales revenue 43,609 0.22%
2 MIC-Tech Global Corp. MIC-Tech (Shanghai) Corp. 3 Sales revenue 10,113 0.05%
3 MIC-Tech Electronics Engineering Corp. Marketech International Corp. 3 Accounts payable 10,313 0.06%
3 MIC-Tech Electronics Engineering Corp. Shanghai Maohua Electronics Engineering Co.,Ltd. 3 Other receivables 57,060 0.36%
3 MIC-Tech Electronics Engineering Corp. Shanghai Maohua Electronics Engineering Co.,Ltd. 3 Accounts payable 9,795 0.06%
4Shanghai Maohua Electronics Engineering
Co.,Ltd.MIC-Tech Electronics Engineering Corp. 3 Construction revenue 15,735 0.08%
4Shanghai Maohua Electronics Engineering
Co.,Ltd.Marketech International Corp. 2 Construction revenue 8,874 0.04%
4Shanghai Maohua Electronics Engineering
Co.,Ltd.Marketech International Corp. 2 Accounts receivables 9,541 0.06%
5 MIC-Tech (Shanghai) Corp. Shanghai Maohua Electronics Engineering Co.,Ltd. 3 Other receivables 18,259 0.11%
5 MIC-Tech (Shanghai) Corp. Integrated Manufacturing & Services Co., Ltd. 3 Other receivables 16,890 0.11%
5 MIC-Tech (Shanghai) Corp. MIC-Tech China Trading (Shanghai) Co. Ltd. 3 Other receivables 84,906 0.53%
Note 1:The numbers filled in for the transaction company in respect of inter-company transactions are as follows:
(1)Parent company is ‘0’.
(2)The subsidiaries are numbered in order starting from ‘1’.
(1)Parent company to subsidiary.
(2)Subsidiary to parent company.
(3)Subsidiary to subsidiary.
Note 4: Individual amounts less than $5,000 are not disclosed.
Note 3:Regarding percentage of transaction amount to consolidated total operating revenues or total assets, it is computed based on period-end balance of transaction to consolidated total assets for balance sheet accounts and based on accumulated
transaction amount for the period to consolidated total operating revenues for income statement accounts.
Note 2:Relationship between transaction company and counterparty is classified into the following three categories (If transactions between parent company and subsidiaries or between subsidiaries refer to the same transaction, it is not required to
disclose twice. For example, if the parent company has already disclosed its transaction with a subsidiary, then the subsidiary is not required to disclose the transaction; for transactions between two subsidiaries, if one of the subsidiaries has
disclosed the transaction, then the other is not required to disclose the transaction.):
Number
(Note 1) Company name Counterparty
Relationship
(Note 2)
Transaction
(Except as otherwise indicated)
MARKETECH INTERNATIONAL CORP. AND SUBSIDIARIES
For the year ended December 31, 2017
Table 4 Expressed in thousands of NTD
Significant inter-company transactions during the reporting period
Sales revenue:
Prices and terms of sales of goods to related parties
are approximately the same to third parties. A certain
percentage of profit is negotiated for sale of services
with related parties.
Construction revenue:
The price of construction charges to related parties
and third parties are based on normal construction
contracts or individual agreements. Furthermore, the
collection terms to related parties are approximately
the same to third parties, which is about 2 to 3 months
after inspection of constructions depending on the
construction contracts or individual agreements.
~293~
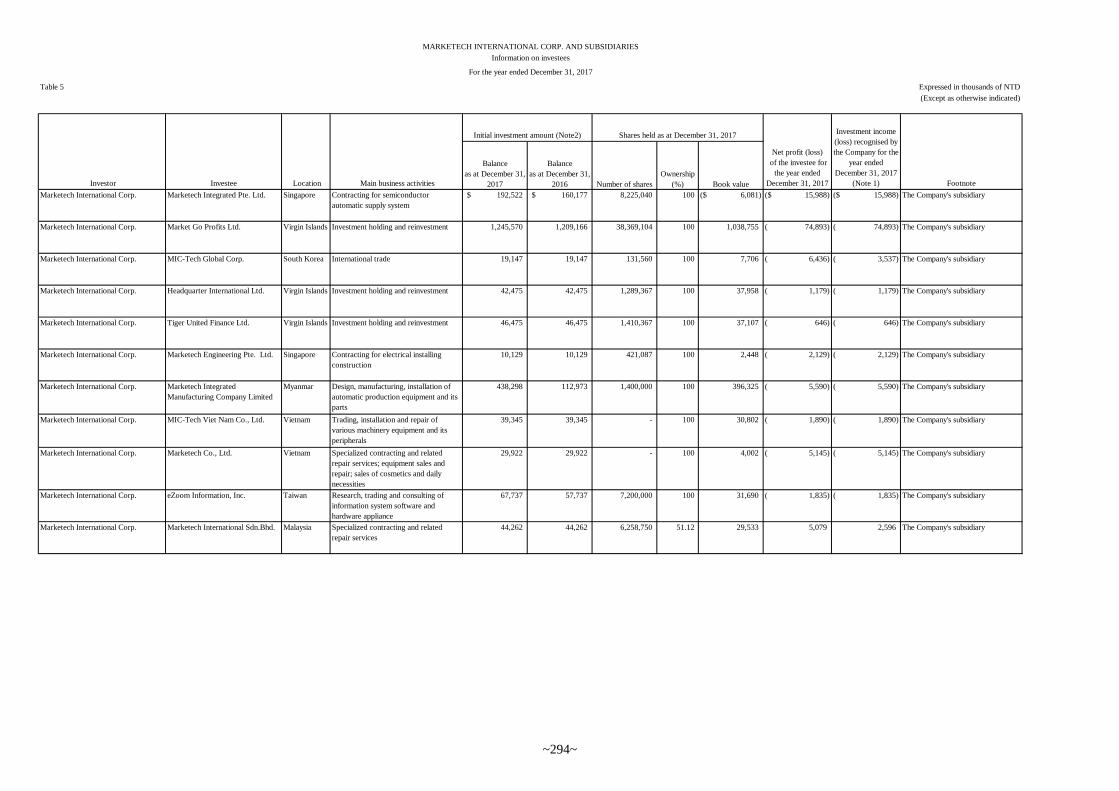
Balance
as at December 31,
2017
Balance
as at December 31,
2016 Number of shares
Ownership
(%) Book value
Marketech International Corp. Marketech Integrated Pte. Ltd. Singapore Contracting for semiconductor
automatic supply system
192,522$ 160,177$ 8,225,040 100 6,081)($ 15,988)($ 15,988)($ The Company's subsidiary
Marketech International Corp. Market Go Profits Ltd. Virgin Islands Investment holding and reinvestment 1,245,570 1,209,166 38,369,104 100 1,038,755 74,893)( 74,893)( The Company's subsidiary
Marketech International Corp. MIC-Tech Global Corp. South Korea International trade 19,147 19,147 131,560 100 7,706 6,436)( 3,537)( The Company's subsidiary
Marketech International Corp. Headquarter International Ltd. Virgin Islands Investment holding and reinvestment 42,475 42,475 1,289,367 100 37,958 1,179)( 1,179)( The Company's subsidiary
Marketech International Corp. Tiger United Finance Ltd. Virgin Islands Investment holding and reinvestment 46,475 46,475 1,410,367 100 37,107 646)( 646)( The Company's subsidiary
Marketech International Corp. Marketech Engineering Pte. Ltd. Singapore Contracting for electrical installing
construction
10,129 10,129 421,087 100 2,448 2,129)( 2,129)( The Company's subsidiary
Marketech International Corp. Marketech Integrated
Manufacturing Company Limited
Myanmar Design, manufacturing, installation of
automatic production equipment and its
parts
438,298 112,973 1,400,000 100 396,325 5,590)( 5,590)( The Company's subsidiary
Marketech International Corp. MIC-Tech Viet Nam Co., Ltd. Vietnam Trading, installation and repair of
various machinery equipment and its
peripherals
39,345 39,345 - 100 30,802 1,890)( 1,890)( The Company's subsidiary
Marketech International Corp. Marketech Co., Ltd. Vietnam Specialized contracting and related
repair services; equipment sales and
repair; sales of cosmetics and daily
necessities
29,922 29,922 - 100 4,002 5,145)( 5,145)( The Company's subsidiary
Marketech International Corp. eZoom Information, Inc. Taiwan Research, trading and consulting of
information system software and
hardware appliance
67,737 57,737 7,200,000 100 31,690 1,835)( 1,835)( The Company's subsidiary
Marketech International Corp. Marketech International Sdn.Bhd. Malaysia Specialized contracting and related
repair services
44,262 44,262 6,258,750 51.12 29,533 5,079 2,596 The Company's subsidiary
(Except as otherwise indicated)
MARKETECH INTERNATIONAL CORP. AND SUBSIDIARIES
Net profit (loss)
of the investee for
the year ended
December 31, 2017
Investment income
(loss) recognised by
the Company for the
year ended
December 31, 2017
(Note 1) Footnote Investor Investee Location Main business activities
Initial investment amount (Note2) Shares held as at December 31, 2017
Information on investees
For the year ended December 31, 2017
Table 5 Expressed in thousands of NTD
~294~
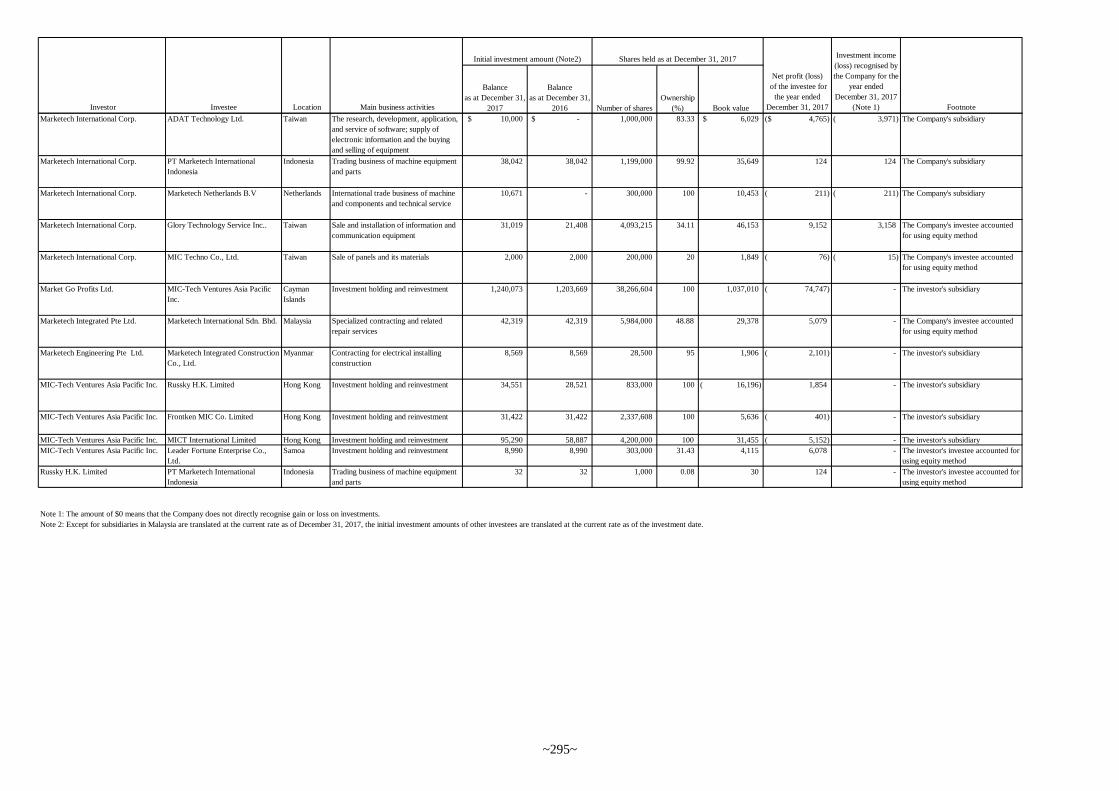
Balance
as at December 31,
2017
Balance
as at December 31,
2016 Number of shares
Ownership
(%) Book value
Net profit (loss)
of the investee for
the year ended
December 31, 2017
Investment income
(loss) recognised by
the Company for the
year ended
December 31, 2017
(Note 1) Footnote Investor Investee Location Main business activities
Initial investment amount (Note2) Shares held as at December 31, 2017
Marketech International Corp. ADAT Technology Ltd. Taiwan The research, development, application,
and service of software; supply of
electronic information and the buying
and selling of equipment
10,000$ -$ 1,000,000 83.33 6,029$ 4,765)($ 3,971)( The Company's subsidiary
Marketech International Corp. PT Marketech International
Indonesia
Indonesia Trading business of machine equipment
and parts
38,042 38,042 1,199,000 99.92 35,649 124 124 The Company's subsidiary
Marketech International Corp. Marketech Netherlands B.V Netherlands International trade business of machine
and components and technical service
10,671 - 300,000 100 10,453 211)( 211)( The Company's subsidiary
Marketech International Corp. Glory Technology Service Inc.. Taiwan Sale and installation of information and
communication equipment
31,019 21,408 4,093,215 34.11 46,153 9,152 3,158 The Company's investee accounted
for using equity method
Marketech International Corp. MIC Techno Co., Ltd. Taiwan Sale of panels and its materials 2,000 2,000 200,000 20 1,849 76)( 15)( The Company's investee accounted
for using equity method
Market Go Profits Ltd. MIC-Tech Ventures Asia Pacific
Inc.
Cayman
Islands
Investment holding and reinvestment 1,240,073 1,203,669 38,266,604 100 1,037,010 74,747)( - The investor's subsidiary
Marketech Integrated Pte Ltd. Marketech International Sdn. Bhd. Malaysia Specialized contracting and related
repair services
42,319 42,319 5,984,000 48.88 29,378 5,079 - The Company's investee accounted
for using equity method
Marketech Engineering Pte Ltd. Marketech Integrated Construction
Co., Ltd.
Myanmar Contracting for electrical installing
construction
8,569 8,569 28,500 95 1,906 2,101)( - The investor's subsidiary
MIC-Tech Ventures Asia Pacific Inc. Russky H.K. Limited Hong Kong Investment holding and reinvestment 34,551 28,521 833,000 100 16,196)( 1,854 - The investor's subsidiary
MIC-Tech Ventures Asia Pacific Inc. Frontken MIC Co. Limited Hong Kong Investment holding and reinvestment 31,422 31,422 2,337,608 100 5,636 401)( - The investor's subsidiary
MIC-Tech Ventures Asia Pacific Inc. MICT International Limited Hong Kong Investment holding and reinvestment 95,290 58,887 4,200,000 100 31,455 5,152)( - The investor's subsidiary
MIC-Tech Ventures Asia Pacific Inc. Leader Fortune Enterprise Co.,
Ltd.
Samoa Investment holding and reinvestment 8,990 8,990 303,000 31.43 4,115 6,078 - The investor's investee accounted for
using equity method
Russky H.K. Limited PT Marketech International
Indonesia
Indonesia Trading business of machine equipment
and parts
32 32 1,000 0.08 30 124 - The investor's investee accounted for
using equity method
Note 1: The amount of $0 means that the Company does not directly recognise gain or loss on investments.
Note 2: Except for subsidiaries in Malaysia are translated at the current rate as of December 31, 2017, the initial investment amounts of other investees are translated at the current rate as of the investment date.
~295~
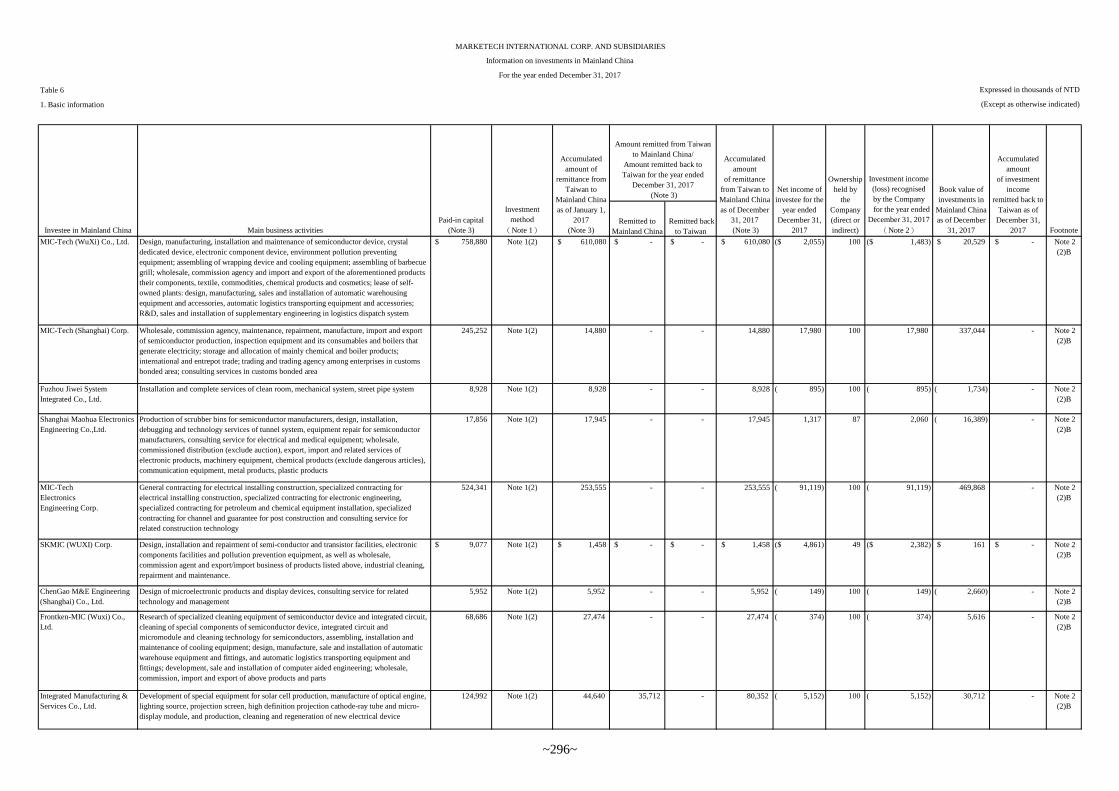
Table 6
1. Basic information
Remitted to
Mainland China
Remitted back
to Taiwan
MIC-Tech (WuXi) Co., Ltd. Design, manufacturing, installation and maintenance of semiconductor device, crystal
dedicated device, electronic component device, environment pollution preventing
equipment; assembling of wrapping device and cooling equipment; assembling of barbecue
grill; wholesale, commission agency and import and export of the aforementioned products
their components, textile, commodities, chemical products and cosmetics; lease of self-
owned plants: design, manufacturing, sales and installation of automatic warehousing
equipment and accessories, automatic logistics transporting equipment and accessories;
R&D, sales and installation of supplementary engineering in logistics dispatch system
758,880$ Note 1(2) $ 610,080 -$ -$ $ 610,080 2,055)($ 100 1,483)($ 20,529$ -$ Note 2
(2)B
MIC-Tech (Shanghai) Corp. Wholesale, commission agency, maintenance, repairment, manufacture, import and export
of semiconductor production, inspection equipment and its consumables and boilers that
generate electricity; storage and allocation of mainly chemical and boiler products;
international and entrepot trade; trading and trading agency among enterprises in customs
bonded area; consulting services in customs bonded area
245,252 Note 1(2) 14,880 - - 14,880 17,980 100 17,980 337,044 - Note 2
(2)B
Fuzhou Jiwei System
Integrated Co., Ltd.
Installation and complete services of clean room, mechanical system, street pipe system 8,928 Note 1(2) 8,928 - - 8,928 895)( 100 895)( 1,734)( - Note 2
(2)B
Shanghai Maohua Electronics
Engineering Co.,Ltd.
Production of scrubber bins for semiconductor manufacturers, design, installation,
debugging and technology services of tunnel system, equipment repair for semiconductor
manufacturers, consulting service for electrical and medical equipment; wholesale,
commissioned distribution (exclude auction), export, import and related services of
electronic products, machinery equipment, chemical products (exclude dangerous articles),
communication equipment, metal products, plastic products
17,856 Note 1(2) 17,945 - - 17,945 1,317 87 2,060 16,389)( - Note 2
(2)B
MIC-Tech
Electronics
Engineering Corp.
General contracting for electrical installing construction, specialized contracting for
electrical installing construction, specialized contracting for electronic engineering,
specialized contracting for petroleum and chemical equipment installation, specialized
contracting for channel and guarantee for post construction and consulting service for
related construction technology
524,341 Note 1(2) 253,555 - - 253,555 91,119)( 100 91,119)( 469,868 - Note 2
(2)B
SKMIC (WUXI) Corp. Design, installation and repairment of semi-conductor and transistor facilities, electronic
components facilities and pollution prevention equipment, as well as wholesale,
commission agent and export/import business of products listed above, industrial cleaning,
repairment and maintenance.
9,077$ Note 1(2) $ 1,458 -$ -$ $ 1,458 4,861)($ 49 2,382)($ 161$ -$ Note 2
(2)B
ChenGao M&E Engineering
(Shanghai) Co., Ltd.
Design of microelectronic products and display devices, consulting service for related
technology and management
5,952 Note 1(2) 5,952 - - 5,952 149)( 100 149)( 2,660)( - Note 2
(2)B
Frontken-MIC (Wuxi) Co.,
Ltd.
Research of specialized cleaning equipment of semiconductor device and integrated circuit,
cleaning of special components of semiconductor device, integrated circuit and
micromodule and cleaning technology for semiconductors, assembling, installation and
maintenance of cooling equipment; design, manufacture, sale and installation of automatic
warehouse equipment and fittings, and automatic logistics transporting equipment and
fittings; development, sale and installation of computer aided engineering; wholesale,
commission, import and export of above products and parts
68,686 Note 1(2) 27,474 - - 27,474 374)( 100 374)( 5,616 - Note 2
(2)B
Integrated Manufacturing &
Services Co., Ltd.
Development of special equipment for solar cell production, manufacture of optical engine,
lighting source, projection screen, high definition projection cathode-ray tube and micro-
display module, and production, cleaning and regeneration of new electrical device
124,992 Note 1(2) 44,640 35,712 - 80,352 5,152)( 100 5,152)( 30,712 - Note 2
(2)B
Accumulated
amount of
remittance from
Taiwan to
Mainland China
as of January 1,
2017
(Note 3)
MARKETECH INTERNATIONAL CORP. AND SUBSIDIARIES
Information on investments in Mainland China
For the year ended December 31, 2017
Expressed in thousands of NTD
(Except as otherwise indicated)
Accumulated
amount
of investment
income
remitted back to
Taiwan as of
December 31,
2017 Footnote
Amount remitted from Taiwan
to Mainland China/
Amount remitted back to
Taiwan for the year ended
December 31, 2017
(Note 3)
Accumulated
amount
of remittance
from Taiwan to
Mainland China
as of December
31, 2017
(Note 3)Investee in Mainland China Main business activities
Paid-in capital
(Note 3)
Investment
method
(Note 1)
Net income of
investee for the
year ended
December 31,
2017
Ownership
held by
the
Company
(direct or
indirect)
Investment income
(loss) recognised
by the Company
for the year ended
December 31, 2017
(Note 2)
Book value of
investments in
Mainland China
as of December
31, 2017
~296~
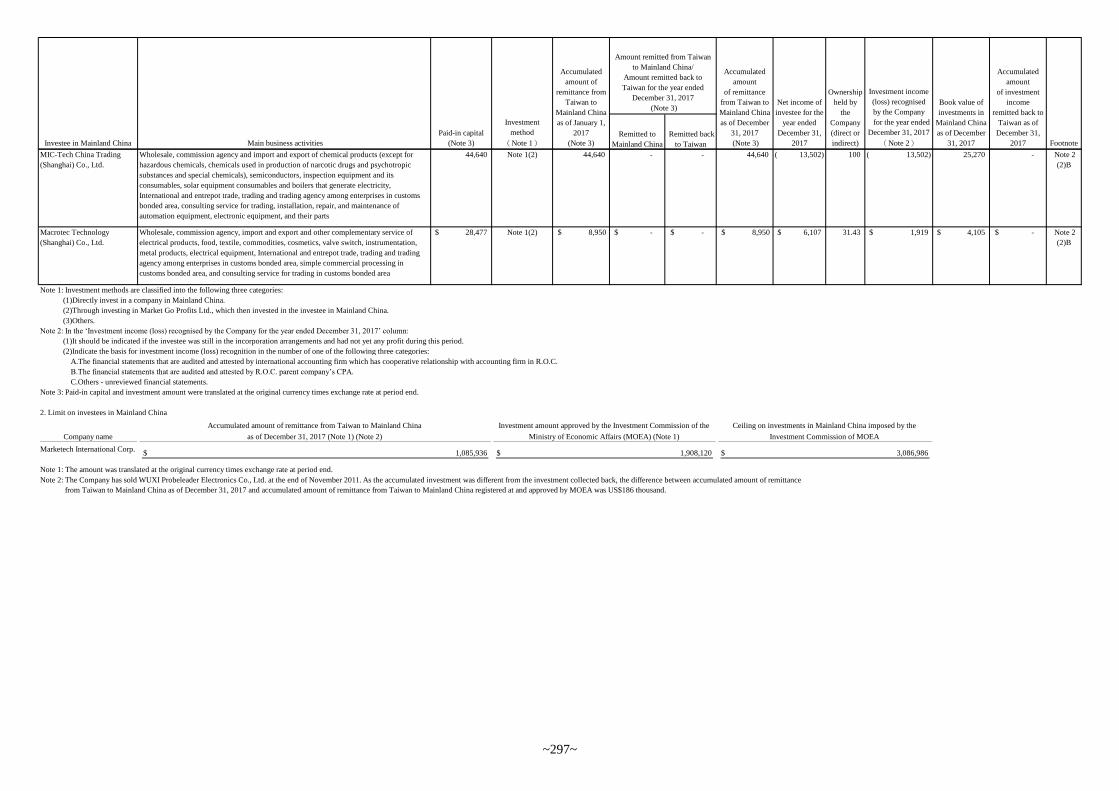
Remitted to
Mainland China
Remitted back
to Taiwan
Accumulated
amount of
remittance from
Taiwan to
Mainland China
as of January 1,
2017
(Note 3)
Accumulated
amount
of investment
income
remitted back to
Taiwan as of
December 31,
2017 Footnote
Amount remitted from Taiwan
to Mainland China/
Amount remitted back to
Taiwan for the year ended
December 31, 2017
(Note 3)
Accumulated
amount
of remittance
from Taiwan to
Mainland China
as of December
31, 2017
(Note 3)Investee in Mainland China Main business activities
Paid-in capital
(Note 3)
Investment
method
(Note 1)
Net income of
investee for the
year ended
December 31,
2017
Ownership
held by
the
Company
(direct or
indirect)
Investment income
(loss) recognised
by the Company
for the year ended
December 31, 2017
(Note 2)
Book value of
investments in
Mainland China
as of December
31, 2017
MIC-Tech China Trading
(Shanghai) Co., Ltd.
Wholesale, commission agency and import and export of chemical products (except for
hazardous chemicals, chemicals used in production of narcotic drugs and psychotropic
substances and special chemicals), semiconductors, inspection equipment and its
consumables, solar equipment consumables and boilers that generate electricity,
International and entrepot trade, trading and trading agency among enterprises in customs
bonded area, consulting service for trading, installation, repair, and maintenance of
automation equipment, electronic equipment, and their parts
44,640 Note 1(2) 44,640 - - 44,640 13,502)( 100 13,502)( 25,270 - Note 2
(2)B
Macrotec Technology
(Shanghai) Co., Ltd.
Wholesale, commission agency, import and export and other complementary service of
electrical products, food, textile, commodities, cosmetics, valve switch, instrumentation,
metal products, electrical equipment, International and entrepot trade, trading and trading
agency among enterprises in customs bonded area, simple commercial processing in
customs bonded area, and consulting service for trading in customs bonded area
28,477$ Note 1(2) $ 8,950 -$ -$ $ 8,950 6,107$ 31.43 1,919$ 4,105$ -$ Note 2
(2)B
Note 1: Investment methods are classified into the following three categories:
(1)Directly invest in a company in Mainland China.
(2)Through investing in Market Go Profits Ltd., which then invested in the investee in Mainland China.
(3)Others.
Note 2: In the ‘Investment income (loss) recognised by the Company for the year ended December 31, 2017’ column:
(1)It should be indicated if the investee was still in the incorporation arrangements and had not yet any profit during this period.
(2)Indicate the basis for investment income (loss) recognition in the number of one of the following three categories:
A.The financial statements that are audited and attested by international accounting firm which has cooperative relationship with accounting firm in R.O.C.
B.The financial statements that are audited and attested by R.O.C. parent company’s CPA.
C.Others - unreviewed financial statements.
Note 3: Paid-in capital and investment amount were translated at the original currency times exchange rate at period end.
2. Limit on investees in Mainland China
Company name
Marketech International Corp.
Note 1: The amount was translated at the original currency times exchange rate at period end.
Note 2: The Company has sold WUXI Probeleader Electronics Co., Ltd. at the end of November 2011. As the accumulated investment was different from the investment collected back, the difference between accumulated amount of remittance
from Taiwan to Mainland China as of December 31, 2017 and accumulated amount of remittance from Taiwan to Mainland China registered at and approved by MOEA was US$186 thousand.
Ceiling on investments in Mainland China imposed by the
Investment Commission of MOEA
3,086,986$
Accumulated amount of remittance from Taiwan to Mainland China
as of December 31, 2017 (Note 1) (Note 2)
1,085,936$
Investment amount approved by the Investment Commission of the
Ministry of Economic Affairs (MOEA) (Note 1)
1,908,120$
~297~
MARKETECH INTERNATIONAL CORP.
PARENT COMPANY ONLY FINANCIAL
STATEMENTS AND REPORT OF INDEPENDENT
ACCOUNTANTS
FOR THE YEARS ENDED DECEMBER 31, 2017 AND
2016
------------------------------------------------------------------------------------------------------------------------------------
For the convenience of readers and for information purpose only, the auditors’ report and the accompanying
financial statements have been translated into English from the original Chinese version prepared and used in
the Republic of China. In the event of any discrepancy between the English version and the original Chinese
version or any differences in the interpretation of the two versions, the Chinese-language auditors’ report and
financial statements shall prevail.
~298~
~299~
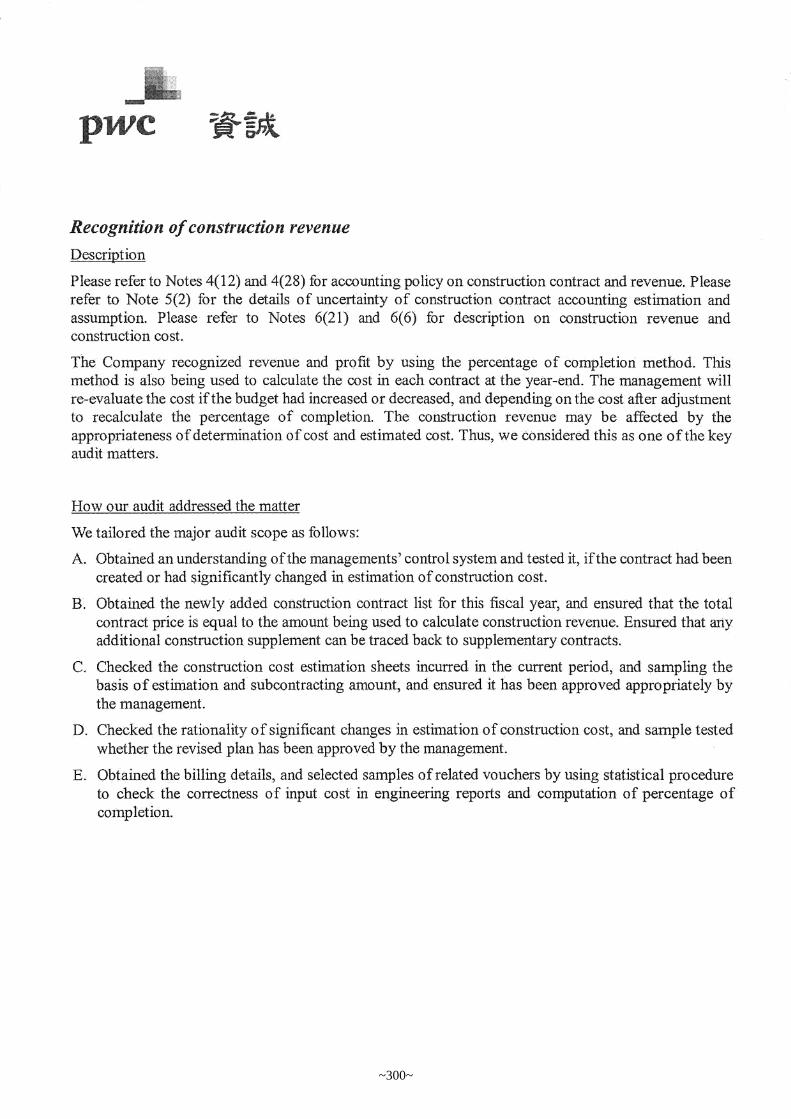
~300~
~301~
~302~
~303~
~304~

~305~
MARKETECH INTERNATIONAL CORP. PARENT COMPANY ONLY BALANCE SHEETS (Expressed in thousands of New Taiwan dollars)
December 31, 2017 December 31, 2016 Assets Notes AMOUNT % AMOUNT %
Current assets
1100 Cash and cash equivalents 6(1) $ 750,892 6 $ 881,517 8
1110 Financial assets at fair value
through profit or loss - current
6(2)
17,143 - 7,297 -
1125 Available-for-sale financial assets
- current
6(3)
41,502 - 63,853 1
1150 Notes receivable, net 6(4) 64,957 1 136,651 1
1170 Accounts receivable, net 6(5) 2,650,543 21 2,642,947 24
1180 Accounts receivable - related
parties, net
7
7,102 - 11,098 -
1190 Construction contracts receivable 6(7) and 7 2,398,711 19 1,935,864 17
1200 Other receivables 7 83,714 1 85,969 1
130X Inventories, net 6(6) 2,295,799 18 1,949,583 18
1410 Prepayments 475,970 4 305,882 3
1470 Other current assets 8 32,996 - 19,882 -
11XX Total current assets 8,819,329 70 8,040,543 73
Non-current assets
1543 Financial assets at cost-non-
current
6(8)
277,607 2 254,873 2
1550 Investments accounted for using
equity method
6(9)
1,716,459 15 1,471,719 14
1600 Property, plant and equipment,
net
6(10) and 7
1,453,359 12 1,120,544 10
1780 Intangible assets 7 15,270 - 15,515 -
1840 Deferred tax assets 6(25) 122,914 1 113,923 1
1900 Other non-current assets 6(10) 16,430 - 20,757 -
15XX Total non-current assets 3,602,039 30 2,997,331 27
1XXX Total Assets $ 12,421,368 100 $ 11,037,874 100
(Continued)
~306~
MARKETECH INTERNATIONAL CORP. PARENT COMPANY ONLY BALANCE SHEETS (Expressed in thousands of New Taiwan dollars)
The accompanying notes are an integral part of these parent company only financial statements.
December 31, 2017 December 31, 2016 Liabilities and Equity Notes AMOUNT % AMOUNT %
Current liabilities 2100 Short-term borrowings 6(11) $ 650,000 5 $ 550,000 5
2150 Notes payable 908,350 7 858,352 8 2170 Accounts payable 2,582,979 21 2,339,645 21
2180 Accounts payable - related parties 7 19,944 - 24,306 - 2190 Construction contracts payable 6(7) 1,278,326 10 1,136,463 10
2200 Other payables 6(12) 407,884 3 338,486 3 2230 Current tax liabilities 96,090 1 93,751 1
2310 Advance receipts 6(13) 760,815 6 423,408 4 2399 Other current liabilities, others 11,639 - 9,566 -
21XX Total current liabilities 6,716,027 53 5,773,977 52
Non-current liabilities
2530 Corporate bonds payable 6(14) 200,199 2 477,153 5 2540 Long-term borrowings 6(15) 200,000 3 - -
2570 Deferred tax liabilities 6(25) - - 10,350 - 2640 Net defined benefit liability -
non-current
6(16)
154,014 1 144,643 1 2670 Other non-current liabilities,
others
6(9)
6,151 - 24,140 -
25XX Total non-current liabilities 560,364 6 656,286 6
2XXX Total Liabilities 7,276,391 59 6,430,263 58
Equity
Share capital 6(18) 3110 Ordinary shares 1,770,164 14 1,650,698 15
Capital surplus 6(17)(19) 3200 Capital surplus 843,057 7 648,446 6
Retained earnings 6(20) 3310 Legal reserve 626,773 5 575,258 5
3320 Special reserve 92,239 1 92,239 1 3350 Unappropriated retained earnings 1,893,389 15 1,667,955 15
Other equity interest 3400 Other equity interest ( 80,645 ) ( 1 ) ( 26,985 ) -
3XXX Total Equity 5,144,977 41 4,607,611 42
Significant contingent liabilities
and unrecognised contract
commitments
9
Significant events after the
balance sheet date
11
3X2X Total Liabilities and Equity $ 12,421,368 100 $ 11,037,874 100
~307~
MARKETECH INTERNATIONAL CORP.
PARENT COMPANY ONLY STATEMENTS OF COMPREHENSIVE INCOME (Expressed in thousands of New Taiwan dollars, except for earnings per share)
The accompanying notes are an integral part of these parent company only financial statements.
Year ended December 31
2017 2016
Items Notes AMOUNT % AMOUNT %
4000 Operating Revenue 6(21) and 7 $ 15,319,550 100 $ 13,308,343 100 5000 Operating Costs 6(6)(24) and 7 ( 13,470,021 ) ( 88 ) ( 11,559,334 ) ( 87 ) 5900 Gross Profit 1,849,529 12 1,749,009 13 Operating Expenses 6(24) and 7 6100 Sales and marketing expenses ( 285,763 ) ( 2 ) ( 271,458 ) ( 2 ) 6200 General and administrative expenses ( 510,266 ) ( 3 ) ( 499,353 ) ( 4 ) 6300 Research and development expenses ( 177,920 ) - ( 208,022 ) ( 1 ) 6000 Total operating expenses ( 973,949 ) ( 5 ) ( 978,833 ) ( 7 ) 6900 Operating Profit 875,580 7 770,176 6 Non-operating Income and Expenses 7010 Other income 6(22) and 7 89,877 1 101,828 1 7020 Other gains and losses 6(2)(8)(23) ( 26,303 ) - ( 4,946 ) - 7050 Finance costs ( 11,615 ) - ( 12,322 ) - 7070 Share of loss of subsidiaries,
associates and joint ventures accounted for using equity method
( 111,151 ) ( 2 ) ( 183,210 ) ( 2 ) 7000 Total non-operating income and
expenses
( 59,192 ) ( 1 ) ( 98,650 ) ( 1 ) 7900 Profit before Income Tax 816,388 6 671,526 5 7950 Income tax expense 6(25) ( 163,437 ) ( 1 ) ( 156,375 ) ( 1 ) 8200 Net Income $ 652,951 5 $ 515,151 4
Other Comprehensive Income Components of other comprehensive
income that will not be reclassified to
profit or loss
8311 Gains (losses) on remeasurements of
defined benefit plans 6(16)
( $ 11,229 ) - ( $ 15,975 ) - 8349 Income tax related to components of
other comprehensive income that
will not be reclassified to profit or loss
6(25)
1,909 - 2,716 - 8310 Total components of other
comprehensive loss that will not
be reclassified to profit or loss
( 9,320 ) - ( 13,259 ) - Components of other comprehensive
income that will be reclassified to
profit or loss
8361 Exchange differences on translation
of foreign operations
( 56,800 ) - ( 99,042 ) ( 1 ) 8362 Unrealized gains on valuation of
available-for-sale financial assets 6(3)
( 6,395 ) - 29,408 - 8380 Total Share of other comprehensive
income of associates and joint
ventures accounted for using equity method, components of other
comprehensive income that will be reclassified to profit or loss
( 146 ) - ( 104 ) - 8399 Income tax relating to components
of other comprehensive income that
will be reclassified to profit or loss
6(25)
9,681 - 16,855 - 8360 Total components of other
comprehensive loss that will be
reclassified to profit or loss
( 53,660 ) - ( 52,883 ) ( 1 ) 8300 Other comprehensive loss, net of tax ( $ 62,980 ) - ( $ 66,142 ) ( 1 )
8500 Total Comprehensive Income $ 589,971 5 $ 449,009 3
9750 Basic earnings per share 6(26) $ 3.77 $ 3.12
9850 Diluted earnings per share 6(26) $ 3.51 $ 2.95
~308~
MARKETECH INTERNATIONAL CORP.
PARENT COMPANY ONLY STATEMENTS OF CHANGES IN EQUITY (Expressed in thousands of New Taiwan dollars)
Capital Reserves Retained Earnings Other equity interest
Notes
Share capital
- ordinary shares
Capital surplus -
share premium
Capital
surplus - others
Legal reserve
Special reserve
Unappropriated retained earnings
Financial statement
translation differences of
foreign operations
Unrealized gain or loss
on available-for-sale
financial assets
Total equity
Note: The stockholders have resolved to distribute directors' and supervisors' remuneration of $7,545 and employees' bonus of $75,452 for 2016 and distribute directors' and supervisors' remuneration of $6,197 and employees' bonus of $40,000 for 2015. All amounts have been deducted from the statements of comprehensive income.
The accompanying notes are an integral part of these parent company only financial statements.
Year ended December 31, 2016
Balance at January 1, 2016 $ 1,650,698 $ 616,003 $ 2,770 $ 529,385 $ 92,239 $ 1,542,603 $ 25,898 $ - $ 4,459,596
Appropriation and distribution of 2015 earnings: (Note) 6(20)
Legal reserve - - - 45,873 - ( 45,873 ) - - -
Cash dividends - - - - - ( 330,140 ) - - ( 330,140 )
Share-based payment 6(17)(19) - - 8,537 - - - - - 8,537
Changes in equity of subsidiaries, associates and joint ventures accounted for using equity method
- - - - - ( 527 ) - - ( 527 )
Due to recognition of equity component of convertible bonds issued
6(14)(19) - - 21,136 - - - - - 21,136
Profit for 2016 - - - - - 515,151 - - 515,151
Other comprehensive income (loss) for 2016 - - - - - ( 13,259 ) ( 82,291 ) 29,408 ( 66,142 )
Balance at December 31, 2016 $ 1,650,698 $ 616,003 $ 32,443 $ 575,258 $ 92,239 $ 1,667,955 ( $ 56,393 ) $ 29,408 $ 4,607,611
Year ended December31, 2017
Balance at January 1, 2017 $ 1,650,698 $ 616,003 $ 32,443 $ 575,258 $ 92,239 $ 1,667,955 ( $ 56,393 ) $ 29,408 $ 4,607,611
Appropriations of and distribution of earnings for 2016 6(20)
Legal reserve - - - 51,515 - ( 51,515 ) - - -
Cash dividends - - - - - ( 363,153 ) - - ( 363,153 )
Changes in equity of associates and joint ventures accounted for using equity method
- - - - - ( 3,529 ) - - ( 3,529 )
Share-based payment 6(17)(18)(19) 14,225 18,151 133 - - - - - 32,509
Conversion of convertible bonds 6(14)(18)(19)(28) 105,241 188,751 ( 12,424 ) - - - - - 281,568
Profit (loss) for 2017 - - - - - 652,951 - - 652,951
Other comprehensive loss for 2017 - - - - - ( 9,320 ) ( 47,265 ) ( 6,395 ) ( 62,980 )
Balance at December 31, 2017 $ 1,770,164 $ 822,905 $ 20,152 $ 626,773 $ 92,239 $ 1,893,389 ( $ 103,658 ) $ 23,013 $ 5,144,977
~309~
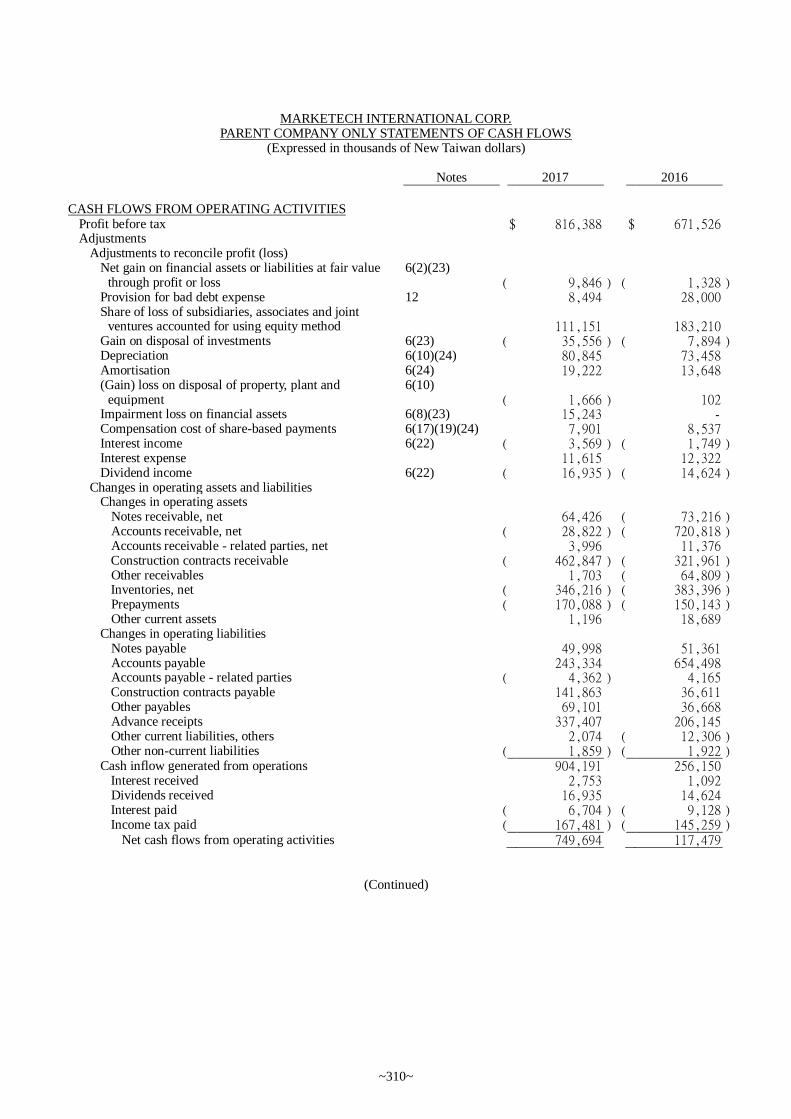
MARKETECH INTERNATIONAL CORP. PARENT COMPANY ONLY STATEMENTS OF CASH FLOWS
(Expressed in thousands of New Taiwan dollars)
Notes 2017 2016
CASH FLOWS FROM OPERATING ACTIVITIES Profit before tax $ 816,388 $ 671,526 Adjustments Adjustments to reconcile profit (loss) Net gain on financial assets or liabilities at fair value
through profit or loss 6(2)(23)
( 9,846 ) ( 1,328 ) Provision for bad debt expense 12 8,494 28,000 Share of loss of subsidiaries, associates and joint
ventures accounted for using equity method
111,151 183,210 Gain on disposal of investments 6(23) ( 35,556 ) ( 7,894 ) Depreciation 6(10)(24) 80,845 73,458 Amortisation 6(24) 19,222 13,648 (Gain) loss on disposal of property, plant and
equipment 6(10)
( 1,666 ) 102 Impairment loss on financial assets 6(8)(23) 15,243 - Compensation cost of share-based payments 6(17)(19)(24) 7,901 8,537 Interest income 6(22) ( 3,569 ) ( 1,749 ) Interest expense 11,615 12,322 Dividend income 6(22) ( 16,935 ) ( 14,624 ) Changes in operating assets and liabilities Changes in operating assets Notes receivable, net 64,426 ( 73,216 ) Accounts receivable, net ( 28,822 ) ( 720,818 ) Accounts receivable - related parties, net 3,996 11,376 Construction contracts receivable ( 462,847 ) ( 321,961 ) Other receivables 1,703 ( 64,809 ) Inventories, net ( 346,216 ) ( 383,396 ) Prepayments ( 170,088 ) ( 150,143 ) Other current assets 1,196 18,689 Changes in operating liabilities Notes payable 49,998 51,361 Accounts payable 243,334 654,498 Accounts payable - related parties ( 4,362 ) 4,165 Construction contracts payable 141,863 36,611 Other payables 69,101 36,668 Advance receipts 337,407 206,145 Other current liabilities, others 2,074 ( 12,306 ) Other non-current liabilities ( 1,859 ) ( 1,922 ) Cash inflow generated from operations 904,191 256,150 Interest received 2,753 1,092 Dividends received 16,935 14,624 Interest paid ( 6,704 ) ( 9,128 ) Income tax paid ( 167,481 ) ( 145,259 )
Net cash flows from operating activities 749,694 117,479
(Continued)
~310~
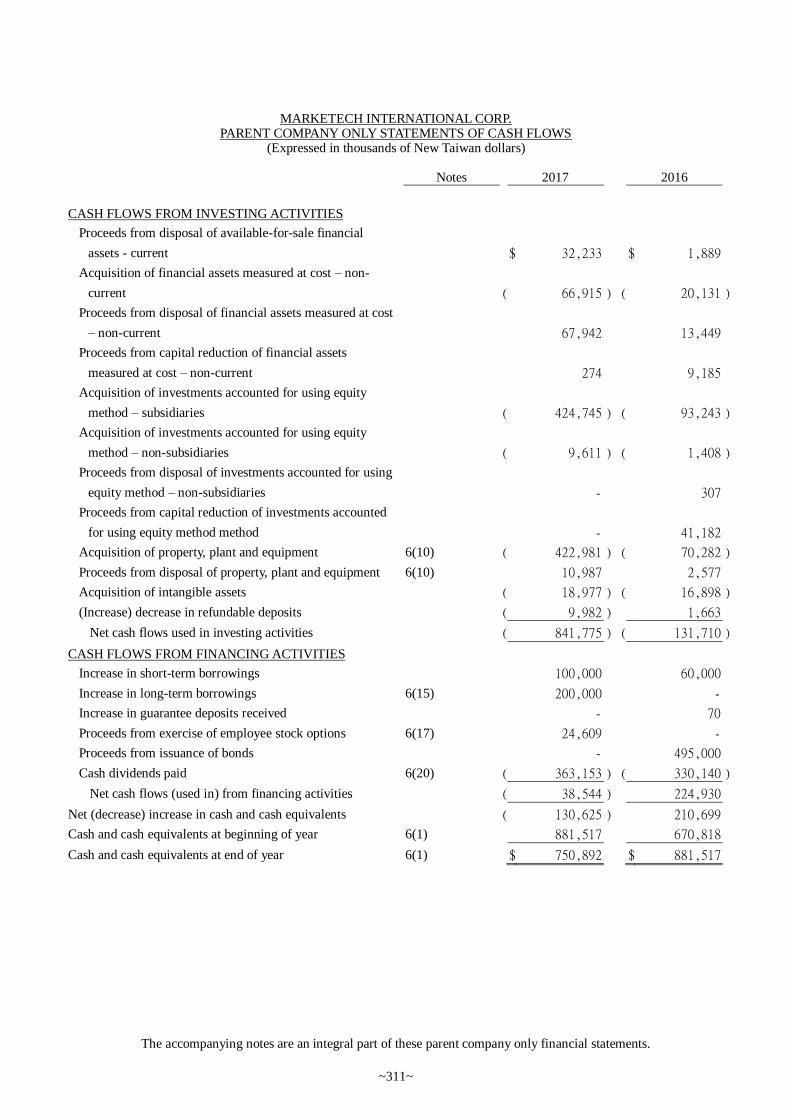
MARKETECH INTERNATIONAL CORP. PARENT COMPANY ONLY STATEMENTS OF CASH FLOWS
(Expressed in thousands of New Taiwan dollars)
Notes 2017 2016
The accompanying notes are an integral part of these parent company only financial statements.
CASH FLOWS FROM INVESTING ACTIVITIES
Proceeds from disposal of available-for-sale financial
assets - current
$ 32,233 $ 1,889
Acquisition of financial assets measured at cost – non-
current
( 66,915 ) ( 20,131 )
Proceeds from disposal of financial assets measured at cost
– non-current
67,942 13,449
Proceeds from capital reduction of financial assets
measured at cost – non-current
274 9,185
Acquisition of investments accounted for using equity
method – subsidiaries
( 424,745 ) ( 93,243 )
Acquisition of investments accounted for using equity
method – non-subsidiaries
( 9,611 ) ( 1,408 )
Proceeds from disposal of investments accounted for using
equity method – non-subsidiaries
- 307
Proceeds from capital reduction of investments accounted
for using equity method method
- 41,182
Acquisition of property, plant and equipment 6(10) ( 422,981 ) ( 70,282 )
Proceeds from disposal of property, plant and equipment 6(10) 10,987 2,577
Acquisition of intangible assets ( 18,977 ) ( 16,898 )
(Increase) decrease in refundable deposits ( 9,982 ) 1,663
Net cash flows used in investing activities ( 841,775 ) ( 131,710 )
CASH FLOWS FROM FINANCING ACTIVITIES
Increase in short-term borrowings 100,000 60,000
Increase in long-term borrowings 6(15) 200,000 -
Increase in guarantee deposits received - 70
Proceeds from exercise of employee stock options 6(17) 24,609 -
Proceeds from issuance of bonds - 495,000
Cash dividends paid 6(20) ( 363,153 ) ( 330,140 )
Net cash flows (used in) from financing activities ( 38,544 ) 224,930
Net (decrease) increase in cash and cash equivalents ( 130,625 ) 210,699
Cash and cash equivalents at beginning of year 6(1) 881,517 670,818
Cash and cash equivalents at end of year 6(1) $ 750,892 $ 881,517
~311~
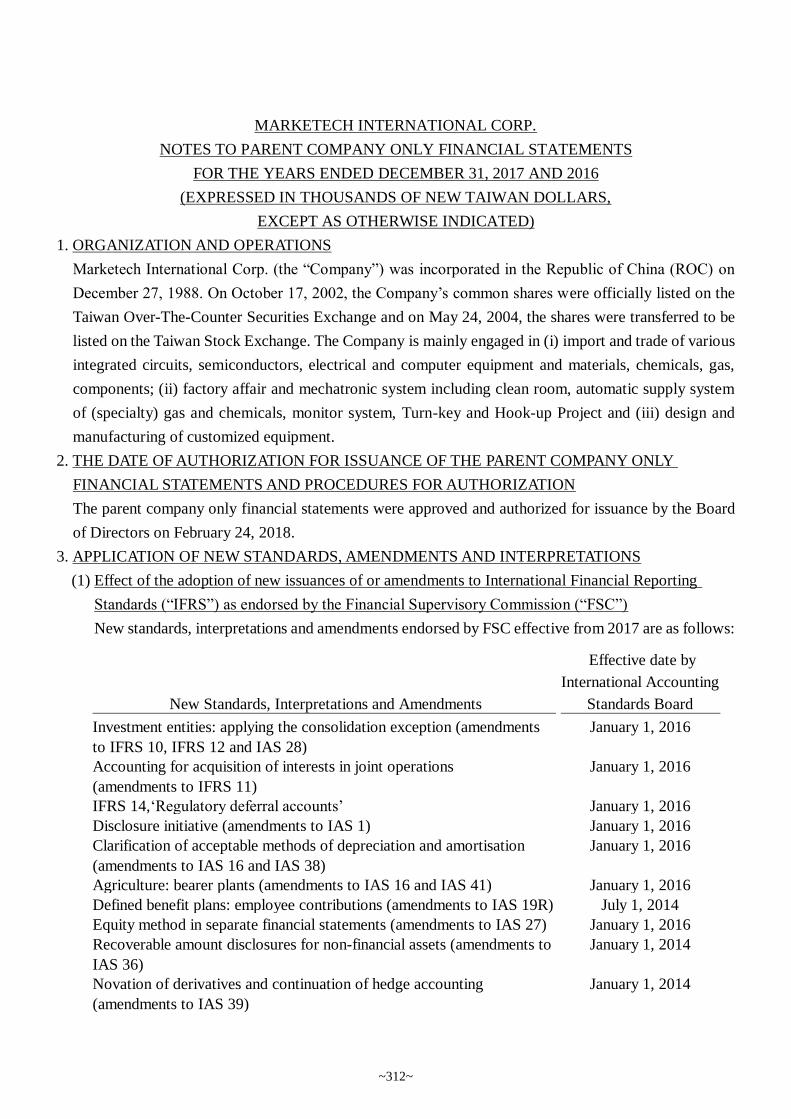
MARKETECH INTERNATIONAL CORP.
NOTES TO PARENT COMPANY ONLY FINANCIAL STATEMENTS
FOR THE YEARS ENDED DECEMBER 31, 2017 AND 2016
(EXPRESSED IN THOUSANDS OF NEW TAIWAN DOLLARS,
EXCEPT AS OTHERWISE INDICATED)
1. ORGANIZATION AND OPERATIONS
Marketech International Corp. (the “Company”) was incorporated in the Republic of China (ROC) on
December 27, 1988. On October 17, 2002, the Company’s common shares were officially listed on the
Taiwan Over-The-Counter Securities Exchange and on May 24, 2004, the shares were transferred to be
listed on the Taiwan Stock Exchange. The Company is mainly engaged in (i) import and trade of various
integrated circuits, semiconductors, electrical and computer equipment and materials, chemicals, gas,
components; (ii) factory affair and mechatronic system including clean room, automatic supply system
of (specialty) gas and chemicals, monitor system, Turn-key and Hook-up Project and (iii) design and
manufacturing of customized equipment.
2. THE DATE OF AUTHORIZATION FOR ISSUANCE OF THE PARENT COMPANY ONLY
FINANCIAL STATEMENTS AND PROCEDURES FOR AUTHORIZATION
The parent company only financial statements were approved and authorized for issuance by the Board
of Directors on February 24, 2018.
3. APPLICATION OF NEW STANDARDS, AMENDMENTS AND INTERPRETATIONS
(1) Effect of the adoption of new issuances of or amendments to International Financial Reporting
Standards (“IFRS”) as endorsed by the Financial Supervisory Commission (“FSC”)
New standards, interpretations and amendments endorsed by FSC effective from 2017 are as follows:
New Standards, Interpretations and Amendments
Effective date by
International Accounting
Standards Board
Investment entities: applying the consolidation exception (amendments
to IFRS 10, IFRS 12 and IAS 28)
January 1, 2016
Accounting for acquisition of interests in joint operations
(amendments to IFRS 11)
January 1, 2016
IFRS 14,‘Regulatory deferral accounts’ January 1, 2016
Disclosure initiative (amendments to IAS 1) January 1, 2016
Clarification of acceptable methods of depreciation and amortisation
(amendments to IAS 16 and IAS 38)
January 1, 2016
Agriculture: bearer plants (amendments to IAS 16 and IAS 41) January 1, 2016
Defined benefit plans: employee contributions (amendments to IAS 19R) July 1, 2014
Equity method in separate financial statements (amendments to IAS 27) January 1, 2016
Recoverable amount disclosures for non-financial assets (amendments to
IAS 36)
January 1, 2014
Novation of derivatives and continuation of hedge accounting
(amendments to IAS 39)
January 1, 2014
~312~
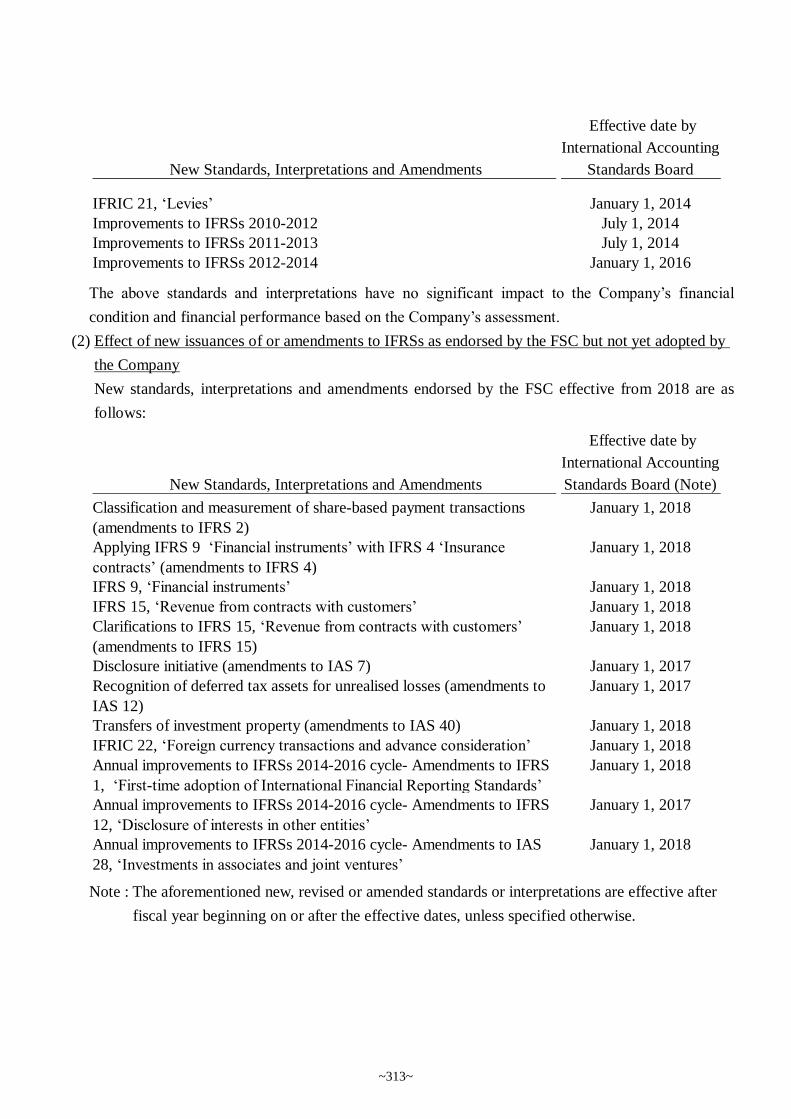
The above standards and interpretations have no significant impact to the Company’s financial
condition and financial performance based on the Company’s assessment.
(2) Effect of new issuances of or amendments to IFRSs as endorsed by the FSC but not yet adopted by
the Company
New standards, interpretations and amendments endorsed by the FSC effective from 2018 are as
follows:
Note : The aforementioned new, revised or amended standards or interpretations are effective after
fiscal year beginning on or after the effective dates, unless specified otherwise.
New Standards, Interpretations and Amendments
Effective date by
International Accounting
Standards Board
IFRIC 21, ‘Levies’ January 1, 2014
Improvements to IFRSs 2010-2012 July 1, 2014
Improvements to IFRSs 2011-2013 July 1, 2014
Improvements to IFRSs 2012-2014 January 1, 2016
New Standards, Interpretations and Amendments
Effective date by
International Accounting
Standards Board (Note)
Classification and measurement of share-based payment transactions
(amendments to IFRS 2)
January 1, 2018
Applying IFRS 9 ‘Financial instruments’ with IFRS 4 ‘Insurance
contracts’ (amendments to IFRS 4)
January 1, 2018
IFRS 9, ‘Financial instruments’ January 1, 2018
IFRS 15, ‘Revenue from contracts with customers’ January 1, 2018
Clarifications to IFRS 15, ‘Revenue from contracts with customers’
(amendments to IFRS 15)
January 1, 2018
Disclosure initiative (amendments to IAS 7) January 1, 2017
Recognition of deferred tax assets for unrealised losses (amendments to
IAS 12)
January 1, 2017
Transfers of investment property (amendments to IAS 40) January 1, 2018
IFRIC 22, ‘Foreign currency transactions and advance consideration’ January 1, 2018
Annual improvements to IFRSs 2014-2016 cycle- Amendments to IFRS
1, ‘First-time adoption of International Financial Reporting Standards’
January 1, 2018
Annual improvements to IFRSs 2014-2016 cycle- Amendments to IFRS
12, ‘Disclosure of interests in other entities’
January 1, 2017
Annual improvements to IFRSs 2014-2016 cycle- Amendments to IAS
28, ‘Investments in associates and joint ventures’
January 1, 2018
~313~
A. IFRS 9, ‘Financial instruments’
(a) Classification of debt instruments is driven by the entity’s business model and the contractual
cash flow characteristics of the financial assets, which would be classified as financial asset at
fair value through profit or loss, financial asset measured at fair value through other
comprehensive income or financial asset measured at amortised cost. Equity instruments
would be classified as financial asset at fair value through profit or loss, unless an entity makes
an irrevocable election at inception to present in other comprehensive income subsequent
changes in the fair value of an investment in an equity instrument that is not held for trading.
(b) The impairment losses of debt instruments are assessed using an ‘expected credit loss’
approach. An entity assesses at each balance sheet date whether there has been a significant
increase in credit risk on that instrument since initial recognition to recognise 12-month
expected credit losses or lifetime expected credit losses (interest revenue would be calculated
on the gross carrying amount of the asset before impairment losses occurred); or if the
instrument that has objective evidence of impairment, interest revenue after the impairment
would be calculated on the book value of net carrying amount (i.e. net of credit allowance).
The Company shall always measure the loss allowance at an amount equal to lifetime expected
credit losses for trade receivables that do not contain a significant financing component.
B. IFRS 15, ‘Revenue from contracts with customers’
IFRS 15, ‘Revenue from contracts with customers’ replaces IAS 11 ‘Construction contracts’, IAS
18 ‘Revenue’ and relevant interpretations. According to IFRS 15, revenue is recognised when a
customer obtains control of promised goods or services. A customer obtains control of goods or
services when a customer has the ability to direct the use of, and obtain substantially all of the
remaining benefits from, the asset.
The core principle of IFRS 15 is that an entity recognises revenue to depict the transfer of promised
goods or services to customers in an amount that reflects the consideration to which the entity
expects to be entitled in exchange for those goods or services. An entity recognises revenue in
accordance with that core principle by applying the following steps:
Step 1: Identify contracts with customer.
Step 2: Identify separate performance obligations in the contract(s).
Step 3: Determine the transaction price.
Step 4: Allocate the transaction price.
Step 5: Recognise revenue when the performance obligation is satisfied.
Further, IFRS 15 includes a set of comprehensive disclosure requirements that requires an entity
to disclose sufficient information to enable users of financial statements to understand the nature,
amount, timing and uncertainty of revenue and cash flows arising from contracts with customers.
~314~
When adopting the new standards endorsed by the FSC effective from 2018, the Company will
apply the new rules under IFRS 9 retrospectively from January 1, 2018, with the practical
expedients permitted under the statement. Further, the Company expects to adopt IFRS 15 using
the modified retrospective approach. The significant effects of applying the new standards as of
January 1, 2018 are summarized below:
A. In accordance with IFRS 9, the Company expects to reclassify available-for-sale financial
assets, financial assets at cost and investments accounted for using equity method in the
amounts of $41,502, $277,607 and $1,736 respectively, by increasing financial assets at fair
value through profit or loss and increasing retained earnings and decreasing other equity
interest in the amounts of $346,649, $48,817 and $23,013, respectively.
B. In line with the regulations of IFRS 9 on provision for impairment, investments accounted for
using equity method will have to be reduced by $29,502 and retained earnings decreased by
$29,502.
C. Presentation of contract assets and contract liabilities
In line with IFRS 15 requirements, the Company expects to change the presentation of certain
accounts in the balance sheets as follows:
(a) Under IFRS 15, construction contracts whereby services have been rendered but not yet
billed are recognised as contract assets but were previously presented as construction
contracts receivable in the balance sheet. The balances would amount to $2,398,711 on
January 1, 2018.
(b) Under IFRS 15, liabilities in relation to construction contracts are recognised as contract
liabilities, but were previously presented as construction contracts payable in the balance
sheet. The balances would amount to $1,278,326 on January 1, 2018, reclassified to
contract liabilities-current.
(c) Under IFRS 15, liabilities in relation to sales contracts are recognised as contract liabilities,
but were previously presented as advance receipts in the balance sheet. The balances would
amount to $709,754 on January 1, 2018, and be reclassified to contract liabilities-current.
~315~
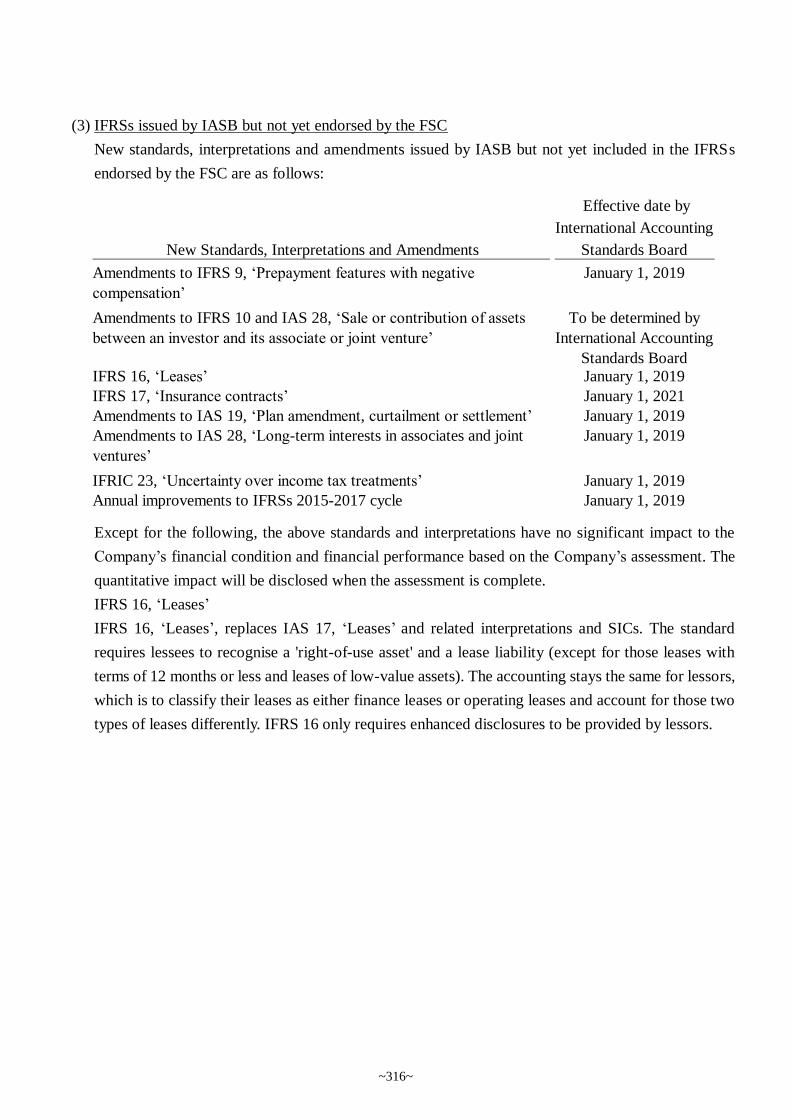
(3) IFRSs issued by IASB but not yet endorsed by the FSC
New standards, interpretations and amendments issued by IASB but not yet included in the IFRSs
endorsed by the FSC are as follows:
Except for the following, the above standards and interpretations have no significant impact to the
Company’s financial condition and financial performance based on the Company’s assessment. The
quantitative impact will be disclosed when the assessment is complete.
IFRS 16, ‘Leases’
IFRS 16, ‘Leases’, replaces IAS 17, ‘Leases’ and related interpretations and SICs. The standard
requires lessees to recognise a 'right-of-use asset' and a lease liability (except for those leases with
terms of 12 months or less and leases of low-value assets). The accounting stays the same for lessors,
which is to classify their leases as either finance leases or operating leases and account for those two
types of leases differently. IFRS 16 only requires enhanced disclosures to be provided by lessors.
New Standards, Interpretations and Amendments
Effective date by
International Accounting
Standards Board
Amendments to IFRS 9, ‘Prepayment features with negative
compensation’
January 1, 2019
Amendments to IFRS 10 and IAS 28, ‘Sale or contribution of assets
between an investor and its associate or joint venture’
To be determined by
International Accounting
Standards Board
IFRS 16, ‘Leases’ January 1, 2019
IFRS 17, ‘Insurance contracts’ January 1, 2021
Amendments to IAS 19, ‘Plan amendment, curtailment or settlement’ January 1, 2019
Amendments to IAS 28, ‘Long-term interests in associates and joint
ventures’
January 1, 2019
IFRIC 23, ‘Uncertainty over income tax treatments’ January 1, 2019
Annual improvements to IFRSs 2015-2017 cycle January 1, 2019
~316~
4. SUMMARY OF SIGNIFICANT ACCOUNTING POLICIES
The principal accounting policies applied in the preparation of the parent company only financial
statements are set out below. These policies have been consistently applied to all the periods presented,
unless otherwise stated.
(1) Statement of compliance
The parent company only financial statements of the Company have been prepared in accordance
with the “Regulations Governing the Preparation of Financial Reports by Securities Issuers”.
(2) Basis of preparation
A. Except for the following items, the parent company only financial statements have been prepared
under the historical cost convention:
(a) Financial assets and financial liabilities (including derivative instruments) at fair value through
profit or loss.
(b) Available-for-sale financial assets measured at fair value.
(c) Liabilities on cash-settled share-based payment arrangements measured at fair value.
(d) Defined benefit liabilities recognised based on the net amount of pension fund assets less
present value of defined benefit obligation.
B. The preparation of financial statements in conformity with International Financial Reporting
Standards, International Accounting Standards, IFRIC Interpretations, and SIC Interpretations as
endorsed by the FSC (collectively referred herein as the “IFRSs”) requires the use of certain
critical accounting estimates. It also requires management to exercise its judgment in the process
of applying the Company’s accounting policies. The areas involving a higher degree of judgment
or complexity, or areas where assumptions and estimates are significant to the separate financial
statements are disclosed in Note 5.
(3) Foreign currency translation
Items included in the financial statements of the Company are measured using the currency of the
primary economic environment in which the Company operates (the “functional currency”). The
parent company only financial statements are presented in New Taiwan dollars (NTD), which is the
Company’s functional and presentation currency.
A. Foreign currency transactions and balances
(a) Foreign currency transactions are translated into the functional currency using the exchange
rates prevailing at the dates of the transactions or valuation where items are remeasured.
Foreign exchange gains and losses resulting from the settlement of such transactions are
recognised in profit or loss in the period in which they arise.
(b) Monetary assets and liabilities denominated in foreign currencies at the period end are re-
translated at the exchange rates prevailing at the balance sheet date. Exchange differences
arising upon re-translation at the balance sheet date are recognised in profit or loss.
~317~
(c) Non-monetary assets and liabilities denominated in foreign currencies held at fair value
through profit or loss are re-translated at the exchange rates prevailing at the balance sheet
date; their translation differences are recognised in profit or loss. Non-monetary assets and
liabilities denominated in foreign currencies held at fair value through other comprehensive
income are re-translated at the exchange rates prevailing at the balance sheet date; their
translation differences are recognised in other comprehensive income. However, non-
monetary assets and liabilities denominated in foreign currencies that are not measured at fair
value are translated using the historical exchange rates at the dates of the initial transactions.
(d) All other foreign exchange gains and losses based on the nature of those transactions are
presented in the statement of comprehensive income within ‘other gains and losses’.
B. Translation of foreign operations
(a) The operating results and financial position of all the Company entities and associates that
have a functional currency different from the presentation currency are translated into the
presentation currency as follows:
i. Assets and liabilities for each balance sheet presented are translated at the closing exchange
rate at the date of that balance sheet;
ii. Income and expenses for each statement of comprehensive income are translated at average
exchange rates of that period; and
iii. All resulting exchange differences are recognised in other comprehensive income.
(b) When the foreign operation partially disposed of or sold is an associate, exchange differences
that were recorded in other comprehensive income are proportionately reclassified to profit or
loss as part of the gain or loss on sale. In addition, even when the Company still retains partial
interest in the former foreign associate or jointly controlled entity after losing significant
influence over the former foreign associate, or losing joint control of the former jointly
controlled entity, such transactions should be accounted for as disposal of all interest in these
foreign operations.
(c) When the foreign operation partially disposed of or sold is a subsidiary, cumulative exchange
differences that were recorded in other comprehensive income are proportionately transferred
to the non-controlling interest in this foreign operation. In addition, even when the Company
still retains partial interest in the former foreign subsidiary after losing control of the former
foreign subsidiary, such transactions should be accounted for as disposal of all interest in the
foreign operation.
(d) Goodwill and fair value adjustments arising on the acquisition of a foreign entity are treated
as assets and liabilities of the foreign entity and translated at the closing exchange rates at the
balance sheet date.
(4) Classification of current and non-current items
A. Assets that meet one of the following criteria are classified as current assets; otherwise they are
classified as non-current assets:
(a) Assets arising from operating activities that are expected to be realised, or are intended to be
sold or consumed within the normal operating cycle;
(b) Assets held mainly for trading purposes;
(c) Assets that are expected to be realised within twelve months from the balance sheet date;
~318~
(d) Cash and cash equivalents, excluding restricted cash and cash equivalents and those that are
to be exchanged or used to pay off liabilities more than twelve months after the balance sheet
date.
B. Liabilities that meet one of the following criteria are classified as current liabilities; otherwise they
are classified as non-current liabilities:
(a) Liabilities that are expected to be paid off within the normal operating cycle;
(b) Liabilities arising mainly from trading activities;
(c) Liabilities that are to be paid off within twelve months from the balance sheet date;
(d) Liabilities for which the repayment date cannot be extended unconditionally to more than
twelve months after the balance sheet date. Terms of a liability that could, at the option of the
counterparty, result in its settlement by the issue of equity instruments do not affect its
classification.
C. Assets and liabilities relating to the construction contracts are classified as current and non-
current based on the operating cycle.
(5) Cash and cash equivalents
A. Cash and cash equivalents include petty cash, bank deposits and other short-term and highly liquid
investments in the separate statements of cash flows.
B. Cash equivalents refer to short-term, highly liquid investments that are readily convertible to
known amounts of cash and which are subject to an insignificant risk of changes in value. Time
deposits that meet the definition above and are held for the purpose of meeting short-term cash commitments in operations are classified as cash equivalents.
(6) Financial assets at fair value through profit or loss
A. Financial assets at fair value through profit or loss are financial assets held for trading or financial
assets designated as at fair value through profit or loss on initial recognition. Financial assets are
classified in this category of held for trading if acquired principally for the purpose of selling in
the short-term.
B. On a regular way purchase or sale basis, financial assets held for trading, except for beneficiary
certificates, are recognised and derecognised using settlement date accounting. Others are
recognised and derecognised using trade date accounting. Financial assets initially designed at fair
value through profit or loss are recognised and derecognised using settlement date accounting.
C. Financial assets at fair value through profit or loss are initially recognised at fair value. Related
transaction costs are expensed in profit or loss. These financial assets are subsequently remeasured
and stated at fair value, and any changes in the fair value of these financial assets are recognised
in profit or loss.
(7) Available-for-sale financial assets
A. Available-for-sale financial assets are non-derivatives that are either designated in this category or
not classified in any of the other categories.
B. On a regular way purchase or sale basis, available-for-sale financial assets are recognised and
derecognised using trade date accounting.
~319~
C. Available-for-sale financial assets are initially recognised at fair value plus transaction costs.
These financial assets are subsequently remeasured and stated at fair value, and any changes in
the fair value of these financial assets are recognised in other comprehensive income.
Investments in equity instruments that do not have a quoted market price in an active market and
whose fair value cannot be reliably measured or derivatives that are linked to and must be settled
by delivery of such unquoted equity instruments are presented in ‘financial assets measured at
cost’.
(8) Notes and accounts receivable
Accounts receivable are loans and receivables originated by the entity. They are created by the entity
by selling goods or providing services to customers in the ordinary course of business. Accounts
receivable are initially recognised at fair value and subsequently measured at amortised cost using
the effective interest method, less provision for impairment. However, short-term accounts receivable
without bearing interest are subsequently measured at initial invoice amount as the effect of
discounting is immaterial.
(9) Impairment of financial assets
A. The Company assesses at each balance sheet date whether there is objective evidence that a
financial asset or a group of financial assets is impaired as a result of one or more events that
occurred after the initial recognition of the asset (a ‘loss event’) and that loss event (or events) has
an impact on the estimated future cash flows of the financial asset or group of financial assets that
can be reliably estimated.
B. The criteria that the Company uses to determine whether there is objective evidence of an
impairment loss is as follows:
(a) Significant financial difficulty of the issuer or debtor;
(b) A breach of contract, such as a default or delinquency in interest or principal payments;
(c) The Company, for economic or legal reasons relating to the borrower’s financial difficulty,
granted the borrower a concession that a lender would not otherwise consider;
(d) It becomes probable that the borrower will enter bankruptcy or other financial reorganisation;
(e) The disappearance of an active market for that financial asset because of financial difficulties;
(f) Observable data indicating that there is a measurable decrease in the estimated future cash
flows from a group of financial assets since the initial recognition of those assets, although the
decrease cannot yet be identified with the individual financial asset in the group, including
adverse changes in the payment status of borrowers in the group or national or local economic
conditions that correlate with defaults on the assets in the group;
(g) Information about significant changes with an adverse effect that have taken place in the
technology, market, economic or legal environment in which the issuer operates, and indicates
that the cost of the investment in the equity instrument may not be recovered;
(h) A significant or prolonged decline in the fair value of an investment in an equity instrument
below its cost.
C. When the Company assesses that there has been objective evidence of impairment and an
impairment loss has occurred, accounting for impairment is made as follows according to the
category of financial assets:
~320~
(a) Financial assets measured at amortised cost
The amount of the impairment loss is measured as the difference between the asset’s carrying
amount and the present value of estimated future cash flows discounted at the financial asset’s
original effective interest rate, and is recognised in profit or loss. If, in a subsequent period,
the amount of the impairment loss decreases and the decrease can be related objectively to an
event occurring after the impairment loss was recognised, the previously recognised
impairment loss is reversed through profit or loss to the extent that the carrying amount of the
asset does not exceed its amortised cost that would have been at the date of reversal had the
impairment loss not been recognised previously. Impairment loss is recognised and reversed
by adjusting the carrying amount of the asset through the use of an impairment allowance
account.
(b) Financial assets measured at cost
The amount of the impairment loss is measured as the difference between the asset’s carrying
amount and the present value of estimated future cash flows discounted at current market
return rate of similar financial asset, and is recognised in profit or loss. Impairment loss
recognised for this category shall not be reversed subsequently. Impairment loss is recognised
by adjusting the carrying amount of the asset directly.
(c) Available-for-sale financial assets
The amount of the impairment loss is measured as the difference between the asset’s
acquisition cost (less any principal repayment and amortisation) and current fair value, less
any impairment loss on that financial asset previously recognised in profit or loss, and is
reclassified from ‘other comprehensive income’ to ‘profit or loss’. If, in a subsequent period,
the fair value of an investment in a debt instrument increases, and the increase can be related
objectively to an event occurring after the impairment loss was recognised, then such
impairment loss is reversed through profit or loss. Impairment loss of an investment in an
equity instrument recognised in profit or loss shall not be reversed through profit or loss.
Impairment loss is recognised and reversed by adjusting the carrying amount of the asset
through the use of an impairment allowance account.
(10) Derecognition of financial assets
The Company derecognises a financial asset when the contractual rights to receive the cash flows
from the financial asset expire.
(11) Inventories
The perpetual inventory system is adopted for inventory recognition. Cost is the basis for recognition
and is determined using the weighted-average method. Costs include acquisition, manufacturing or
processing costs to make inventories available for sale or use. These exclude borrowing costs. The
item by item approach is used in applying the lower of cost and net realisable value for the measure
of the ending inventories. Net realisable value is the estimated selling price in the ordinary course
of business, less the estimated cost of completion and applicable variable selling expenses.
(12) Construction contracts
A. IAS 11, ‘Construction Contracts’, defines a construction contract as a contract specifically
negotiated for the construction of an asset. If the outcome of a construction contract can be
estimated reliably and it is probable that this contract would make a profit, contract revenue
should be recognised by reference to the stage of completion of the contract activity, using the
percentage-of-completion method of accounting, over the contract term. Contract costs are
~321~
expensed as incurred. The stage of completion of a contract is measured by the proportion of
contract costs incurred for work performed to date to the estimated total costs for the contract.
An expected loss where total contract costs will exceed total contract revenue on a construction
contract should be recognised as an expense as soon as such loss is probable. If the outcome of
a construction contract cannot be estimated reliably, contract revenue should be recognised only
to the extent of contract costs incurred that it is probable will be recoverable.
B. Contract revenue should include the revenue arising from variations from the original contract
work, claims and incentive payments that are agreed by the customer and can be measured
reliably.
C. The excess of the cumulative costs incurred plus recognised profits (less recognised losses) over
the progress billings on each construction contract is presented as an asset within ‘Construction
contracts receivable’. While, the excess of the progress billings over the cumulative costs
incurred plus recognised profits (less recognised losses) on each construction contract is
presented as a liability within ‘Construction contracts payable’.
(13) Investments accounted for using equity method / subsidiaries, associates and joint ventures
A. Investments in subsidiaries
(a) Subsidiaries are all entities (including structured entities) controlled by the Company. The
Company controls an entity when the Company is exposed, or has rights, to variable returns
from its involvement with the entity and has the ability to affect those returns through its
power over the entity.
(b) Unrealised profit (loss) occurred from the transactions between the Company and subsidiaries
have been offset. The accounting policies of the subsidiaries have been adjusted where
necessary to ensure consistency with the policies adopted by the Company.
(c) The Company's share of its subsidiaries' post-acquisition profits or losses is recognised in
profit or loss, and its share of post-acquisition movements in other comprehensive income is
recognised in other comprehensive income. When the Company’s share of losses in a
subsidiary equals or exceeds its interest in the subsidiary, the Company continues to recognise
losses proportionate to its ownership.
(d) If changes in shareholdings in subsidiaries do not result in loss in control (transactions with
non-controlling interest), transactions shall be considered as equity transactions, which are
transactions between owners. Difference of adjustment of non-controlling interest and fair
value of consideration paid or received is recognised in equity.
(e) When the Company loses its control in a subsidiary, the Company revalues the remaining
investment in the prior subsidiary at fair value. That fair value is regarded as the fair value
on initial recognition of a financial asset or the cost on initial recognition of the associate or
joint venture. Any difference between fair value and carrying amount is recognised in profit
or loss. All amounts previously recognised in other comprehensive income in relation to the
subsidiary are reclassified to profit or loss on the same basis as would be required if the
related assets or liabilities were disposed of. That is, when the Company loses control of a
subsidiary, all gains or losses previously recognised in other comprehensive income in
relation to the subsidiary should be reclassified from equity to profit or loss, if such gains or
losses would be reclassified to profit or loss when the related assets or liabilities are disposed
of.
~322~
B. Investments in associates
(a) Associates are all entities over which the Company has significant influence but not control.
In general, it is presumed that the investor has significant influence, if an investor holds,
directly or indirectly 20 percent or more of the voting power of the investee. Investments in
associates are accounted for using the equity method and are initially recognised at cost.
(b) The Company’s share of its associates’ post-acquisition profits or losses is recognised in
profit or loss, and its share of post-acquisition movements in other comprehensive income is
recognised in other comprehensive income. When the Company’s share of losses in an
associate equals or exceeds its interest in the associate, including any other unsecured
receivables, the Company does not recognise further losses, unless it has incurred legal or
constructive obligations or made payments on behalf of the associate.
(c) When changes in an associate’s equity that are not recognised in profit or loss or other
comprehensive income of the associate and such changes not affecting the Company’s
ownership percentage of the associate, the Company recognises change in ownership
interests in the associate in ‘capital surplus’ in proportion to its ownership.
(d) Unrealised gains on transactions between the Company and its associates are eliminated to
the extent of the Company’s interest in the associates. Unrealised losses are also eliminated
unless the transaction provides evidence of an impairment of the asset transferred.
Accounting policies of associates have been adjusted where necessary to ensure consistency
with the policies adopted by the Company.
(e) In the case that an associate issues new shares and the Company does not subscribe or acquire
new shares proportionately, which results in a change in the Company’s ownership
percentage of the associate but maintains significant influence on the associate, then ‘capital
surplus’ and ‘investments accounted for under the equity method’ shall be adjusted for the
increase or decrease of its share of equity interest. If the above condition causes a decrease
in the Company’s ownership percentage of the associate, in addition to the above adjustment,
the amounts previously recognised in other comprehensive income in relation to the associate
are reclassified to profit or loss proportionately on the same basis as would be required if the
relevant assets or liabilities were disposed of.
(f) Upon loss of significant influence over an associate, the Company remeasures any investment
retained in the former associate at its fair value. Any difference between fair value and
carrying amount is recognised in profit or loss.
(g) When the Company disposes its investment in an associate, if it loses significant influence
over this associate, the amounts previously recognised in other comprehensive income in
relation to the associate, are reclassified to profit or loss, on the same basis as would be
required if the relevant assets or liabilities were disposed of. If it still retains significant
influence over this associate, then the amounts previously recognised in other comprehensive
income in relation to the associate are reclassified to profit or loss proportionately in
accordance with the aforementioned approach.
(h) When the Company disposes its investment in an associate, if it loses significant influence
over this associate, the amounts previously recognised as capital surplus in relation to the
associate are transferred to profit or loss. If it still retains significant influence over this
associate, then the amounts previously recognised as capital surplus in relation to the
associate are transferred to profit or loss proportionately.
~323~
C. Pursuant to the “Regulations Governing the Preparation of Financial Reports by Securities
Issuers,” profit (loss) of the current period and other comprehensive income in the parent
company only financial statements shall equal to the amount attributable to owners of the parent
in the financial statements prepared for consolidation. Owners’ equity in the parent company
only financial statements shall equal to equity attributable to owners of the parent in the financial
statements prepared for consolidation.
(14) Property, plant and equipment
A. Property, plant and equipment are initially recorded at cost. Borrowing costs incurred during the
construction period are capitalised.
B. Subsequent costs are included in the asset’s carrying amount or recognised as a separate asset,
as appropriate, only when it is probable that future economic benefits associated with the item
will flow to the Company and the cost of the item can be measured reliably. The carrying amount
of the replaced part is derecognised. All other repairs and maintenance are charged to profit or
loss during the financial period in which they are incurred.
C. Land is not depreciated. Other property, plant and equipment apply cost model and are
depreciated using the straight-line method to allocate their cost over their estimated useful lives.
Each part of an item of property, plant, and equipment with a cost that is significant in relation
to the total cost of the item must be depreciated separately.
D. The assets’ residual values, useful lives and depreciation methods are reviewed, and adjusted if
appropriate, at each financial year-end. If expectations for the assets’ residual values and useful
lives differ from previous estimates or the patterns of consumption of the assets’ future economic
benefits embodied in the assets have changed significantly, any change is accounted for as a
change in estimate under IAS 8, ‘Accounting Policies, Changes in Accounting Estimates and
Errors’, from the date of the change. The estimated useful lives of property, plant and equipment
are as follows:
(15) Leases (leasee)
Payments made under an operating lease (net of any incentives received from the lessor) are
recognised in profit or loss on a straight-line basis over the lease term.
(16) Intangible assets
A. Computer software
Computer software is stated at cost and amortised on a straight-line basis over its estimated useful
life of 1 to 3 years.
B. Trademarks
Trademarks are acquired in a business combination.
C. Other intangible assets
Other intangible assets are technology royalties which are stated at cost and amortised on a
straight-line basis over the contract duration.
Buildings 2~55 years
Machinery and office equipment 3~15 years
Other equipment 2~10 years
~324~
(17) Impairment of non-financial assets
A. The Company assesses at each balance sheet date the recoverable amounts of those assets where
there is an indication that they are impaired. An impairment loss is recognised for the amount by
which the asset’s carrying amount exceeds its recoverable amount. The recoverable amount is
the higher of an asset’s fair value less costs to sell or value in use. Except for goodwill, when the
circumstances or reasons for recognising impairment loss for an asset in prior years no longer
exist or diminish, the impairment loss is reversed. The increased carrying amount due to reversal
should not be more than what the depreciated or amortised historical cost would have been if the
impairment had not been recognised.
B. Goodwill is evaluated annually and is recorded as cost less impairment loss. Impairment loss of
goodwill shall not be reversed.
C. For the purpose of impairment testing, goodwill acquired in a business combination is allocated
to each of the cash-generating units, or groups of cash-generating units, that is/are expected to
benefit from the synergies of the business combination. Each unit or group of units to which the
goodwill is allocated represents the lowest level within the entity at which the goodwill is
monitored for internal management purposes. Goodwill is monitored at the operating segment
level.
(18) Borrowings
Borrowings are recognised initially at fair value, net of transaction costs incurred. Borrowings are
subsequently stated at amortised cost; any difference between the proceeds (net of transaction costs)
and the redemption value is recognised in profit or loss over the period of the borrowings using the
effective interest method.
(19) Notes and accounts payable
Notes and accounts payable are obligations to pay for goods or services that have been acquired in
the ordinary course of business from suppliers. They are recognised initially at fair value and
subsequently measured at amortised cost using the effective interest method. However, short-term
accounts payable without bearing interest are subsequently measured at initial invoice amount as
the effect of discounting is immaterial.
(20) Derecognition of financial liabilities
A financial liability is derecognised when the obligation under the liability specified in the contract
is discharged or cancelled or expires.
(21) Financial liabilities and equity instruments
Convertible corporate bonds preference shares issued by the Company contain conversion options
(that is, the bondholders have the right to convert the bonds into the Company’s common shares by
exchanging a fixed amount of cash for a fixed number of common shares), call options and put
options. The Company classifies the bonds payable and derivative features embedded in convertible
corporate bonds on initial recognition as a financial asset, a financial liability or an equity instrument
(‘capital surplus—share options’) in accordance with the substance of the contractual arrangement
and the definitions of a financial asset, a financial liability and an equity instrument. Convertible
corporate bonds are accounted for as follows:
A. Call options and put options embedded in convertible corporate bonds are recognised initially at
net fair value as ‘financial assets or financial liabilities at fair value through profit or loss’. They
~325~
are subsequently remeasured and stated at fair value on each balance sheet date; the gain or loss
is recognised as ‘gain or loss on valuation of financial assets or financial liabilities at fair value
through profit or loss’.
B. Bonds payable of convertible corporate bonds is initially recognised at fair value and
subsequently stated at amortised cost. Any difference between the proceeds and the redemption
value is accounted for as the premium or discount on bonds payable and presented as an addition
to or deduction from bonds payable, which is amortised in profit or loss as an adjustment to the
‘finance costs’ over the period of bond circulation using the effective interest method.
C. Conversion options embedded in convertible corporate bonds issued by the Company, which
meet the definition of an equity instrument, are initially recognised in ‘capital surplus—share
options’ at the residual amount of total issue price less amounts of ‘financial assets or financial
liabilities at fair value through profit or loss’ and ‘bonds payable—net’ as stated above.
Conversion options are not subsequently remeasured.
D. Any transaction costs directly attributable to the issuance of convertible corporate bonds are
allocated to the liability and equity components in proportion to the allocation of proceeds.
E. When bondholders exercise conversion options, the liability component of the bonds (including
‘bonds payable’ and ‘financial assets or financial liabilities at fair value through profit or loss’)
shall be remeasured on the conversion date. The book value of common shares issued due to the
conversion shall be based on the adjusted book value of the above-mentioned liability component
plus the book value of capital surplus - share options.
(22) Financial guarantee contracts
A financial guarantee contract is a contract that requires the Company to make specified payments
to reimburse the holder for a loss it incurs because a specified debtor fails to make payment when
due in accordance with the original or modified terms of a debt instrument. A financial guarantee
contract is initially recognised at its fair value adjusted for transaction costs on the trade date. After
initial recognition, the financial guarantee is measured at the higher of the initial fair value less
cumulative amortisation and the best estimate of the amount required to settle the present obligation
on each balance sheet date.
(23) Employee benefits
A. Short-term employee benefits
Short-term employee benefits are measured at the undiscounted amount of the benefits expected
to be paid in respect of service rendered by employees in a period and should be recognised as
expenses in that period when the employees render service.
B. Pensions
(a) Defined contribution plans
For defined contribution plans, the contributions are recognised as pension expenses when
they are due on an accrual basis. Prepaid contributions are recognised as an asset to the extent
of a cash refund or a reduction in the future payments.
(b) Defined benefit plans
i. Net obligation under a defined benefit plan is defined as the present value of an amount
of pension benefits that employees will receive on retirement for their services with the
Company in current period or prior periods. The liability recognised in the balance sheet
~326~
in respect of defined benefit pension plans is the present value of the defined benefit
obligation at the balance sheet date less the fair value of plan assets. The defined benefit
net obligation is calculated annually by independent actuaries using the projected unit
credit method. The rate used to discount is determined by using interest rates of
government bonds (at the balance sheet date) of a currency and term consistent with the
currency and term of the employment benefit obligations.
ii. Remeasurement arising on defined benefit plans are recognised in other comprehensive
income in the period in which they arise and are recorded as retained earnings.
iii. Past service costs are recognised immediately in profit or loss.
C. Employees’ compensation and directors’ and supervisors’ remuneration
Employees’ compensation and directors’ and supervisors’ remuneration are recognised as
expenses and liabilities, provided that such recognition is required under legal obligation or
constructive obligation and those amounts can be reliably estimated. Any difference between the
resolved amounts and the subsequently actual distributed amounts is accounted for as changes in
estimates.
(24) Employee share-based payment
For the equity-settled share-based payment arrangements, the employee services received are
measured at the fair value of the equity instruments granted at the grant date, and are recognised as
compensation cost over the vesting period, with a corresponding adjustment to equity. The fair value
of the equity instruments granted shall reflect the impact of market vesting conditions and non-
market vesting conditions. Compensation cost is subject to adjustment based on the service
conditions that are expected to be satisfied and the estimates of the number of equity instruments
that are expected to vest under the non-market vesting conditions at each balance sheet date. And
ultimately, the amount of compensation cost recognised is based on the number of equity
instruments that eventually vest.
(25) Income tax
A. The tax expense for the period comprises current and deferred tax. Tax is recognised in profit or
loss, except to the extent that it relates to items recognised in other comprehensive income or
items recognised directly in equity, in which cases the tax is recognised in other comprehensive
income or equity.
B. The current income tax expense is calculated on the basis of the tax laws enacted or substantively
enacted at the balance sheet date in the countries where the Company and its subsidiaries operate
and generate taxable income. Management periodically evaluates positions taken in tax returns
with respect to situations in accordance with applicable tax regulations. It establishes provisions
where appropriate based on the amounts expected to be paid to the tax authorities. An additional
10% tax is levied on the unappropriated retained earnings and is recorded as income tax expense
in the year the stockholders resolve to retain the earnings.
C. Deferred tax is recognised, using the balance sheet liability method, on temporary differences
arising between the tax bases of assets and liabilities and their carrying amounts in the separate
balance sheet. However, the deferred tax is not accounted for if it arises from initial recognition
of goodwill or of an asset or liability in a transaction other than a business combination that at
the time of the transaction affects neither accounting nor taxable profit or loss. Deferred tax is
provided on temporary differences arising on investments in subsidiaries and associates, except
~327~
where the timing of the reversal of the temporary difference is controlled by the Company and it
is probable that the temporary difference will not reverse in the foreseeable future. Deferred tax
is determined using tax rates (and laws) that have been enacted or substantially enacted by the
balance sheet date and are expected to apply when the related deferred tax asset is realised or the
deferred tax liability is settled.
D. Deferred tax assets are recognised only to the extent that it is probable that future taxable profit
will be available against which the temporary differences can be utilised. At each balance sheet
date, unrecognised and recognised deferred tax assets are reassessed.
E. Current income tax assets and liabilities are offset and the net amount reported in the balance
sheet when there is a legally enforceable right to offset the recognised amounts and there is an
intention to settle on a net basis or realise the asset and settle the liability simultaneously.
Deferred tax assets and liabilities are offset on the balance sheet when the entity has the legally
enforceable right to offset current tax assets against current tax liabilities and they are levied by
the same taxation authority on either the same entity or different entities that intend to settle on
a net basis or realise the asset and settle the liability simultaneously.
F. A deferred tax asset shall be recognised for the carryforward of unused tax credits resulting from
research and development expenditures to the extent that it is possible that future taxable profit
will be available against which the unused tax credits can be utilised.
(26) Share capital
Ordinary shares are classified as equity. Incremental costs directly attributable to the issue of new
shares or stock options are shown in equity as a deduction, net of tax, from the proceeds.
(27) Dividends
Dividends are recorded in the Company’s financial statements in the period in which they are
approved by the Company’s shareholders. Cash dividends are recorded as liabilities; stock dividends
are recorded as stock dividends to be distributed and are reclassified to ordinary shares on the
effective date of new shares issuance.
(28) Revenue recognition
A. Construction revenue
Details of construction revenue are provided in Note 4(12).
B. Sales of goods
Revenue is measured at the fair value of the consideration received or receivable for the sale of
goods (products) to external customers in the ordinary course of the Company’s activities.
Revenue arising from the sales of goods should be recognised when the Company has delivered
the goods to the customer, the amount of sales revenue can be measured reliably and it is probable
that the future economic benefits associated with the transaction will flow to the entity. The
delivery of goods (products) is completed when the significant risks and rewards of ownership
have been transferred to the customer, the Company retains neither continuing managerial
involvement to the degree usually associated with ownership nor effective control over the goods
(products) sold, and the customer has accepted the goods based on the sales contract or there is
objective evidence showing that all acceptance provisions have been satisfied.
~328~
5. CRITICAL ACCOUNTING JUDGEMENTS, ESTIMATES AND KEY SOURCES OF
ASSUMPTION UNCERTAINTY
The preparation of these parent company only financial statements require management to make critical
judgements in applying the Company’s accounting policies and make critical assumptions and estimates
concerning future events. Assumptions and estimates may differ from the actual results and are
continually evaluated and adjusted based on historical experience and other factors. Such assumptions
and estimates have a significant risk of causing a material adjustment to the carrying amounts of assets
and liabilities within the next financial year; and the related information is addressed below:
(1) Critical judgements in applying the Company’s accounting policies
None.
(2) Critical accounting estimates and assumptions
A. Construction contracts
The Company recognises contract revenue and profit based on management’s evaluation of
contract profit and percentage of completion. Management assesses and adjusts the contract profit
and cost during execution of the contract. The actual result of the total profit and cost may be
higher or lower than the estimation, and the effect is recognised in revenue and profit.
B. Evaluation of inventories
As inventories are stated at the lower of cost and net realisable value, the Company must determine
the net realisable value of inventories on balance sheet date using judgements and estimates. Due
to the rapid technology innovation, the Company evaluates the amounts of normal inventory
consumption, obsolete inventories or inventories without market selling value on balance sheet
date, and writes down the cost of inventories to the net realisable value. Such an evaluation of
inventories is principally based on the demand for the products within the specified period in the
future. Therefore, there might be material changes to the evaluation.
C. Assessing the doubtful accounts
During the process of assessing the doubtful accounts, the Company uses judgement in evaluating
the collectability of receivables. The collectability assessment is affected by various factors:
customers’ financial conditions, historical transaction records, current economic conditions, etc.
If the collectability of those accounts is in doubt, the Company will recognize allowance for
uncollectible account individually. Since the evaluation of allowance is based on the status as of
balance sheet date for reasonable expectations of future events, the actual results may be different
than the estimation. Therefore, it may have significant changes.
6. DETAILS OF SIGNIFICANT ACCOUNTS
(1) Cash and cash equivalents
A. The Company transacts with a variety of financial institutions all with high credit quality to
disperse credit risk, so it expects that the probability of counterparty default is remote. The
December 31, 2017 December 31, 2016
Cash on hand 5,546$ 4,934$
Checking accounts and demand deposits 745,346 876,583
Total 750,892$ 881,517$
~329~
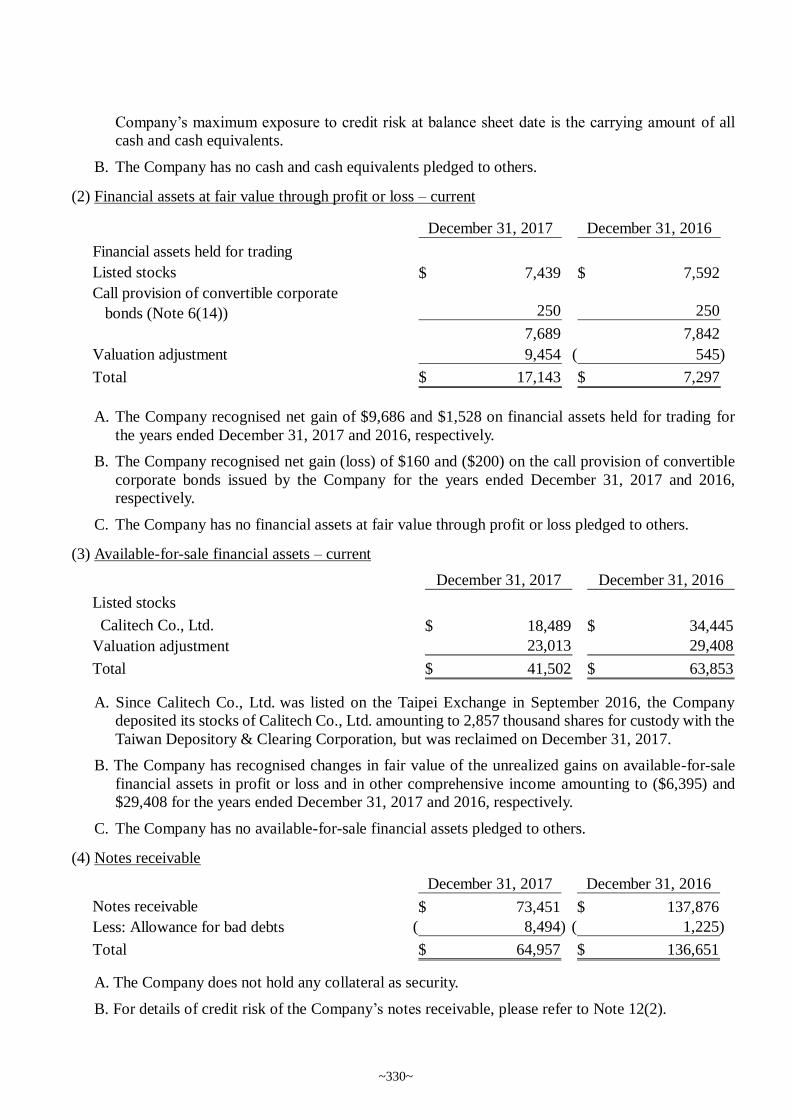
Company’s maximum exposure to credit risk at balance sheet date is the carrying amount of all
cash and cash equivalents.
B. The Company has no cash and cash equivalents pledged to others.
(2) Financial assets at fair value through profit or loss – current
A. The Company recognised net gain of $9,686 and $1,528 on financial assets held for trading for
the years ended December 31, 2017 and 2016, respectively.
B. The Company recognised net gain (loss) of $160 and ($200) on the call provision of convertible
corporate bonds issued by the Company for the years ended December 31, 2017 and 2016,
respectively.
C. The Company has no financial assets at fair value through profit or loss pledged to others.
(3) Available-for-sale financial assets – current
A. Since Calitech Co., Ltd. was listed on the Taipei Exchange in September 2016, the Company
deposited its stocks of Calitech Co., Ltd. amounting to 2,857 thousand shares for custody with the
Taiwan Depository & Clearing Corporation, but was reclaimed on December 31, 2017.
B. The Company has recognised changes in fair value of the unrealized gains on available-for-sale
financial assets in profit or loss and in other comprehensive income amounting to ($6,395) and
$29,408 for the years ended December 31, 2017 and 2016, respectively.
C. The Company has no available-for-sale financial assets pledged to others.
(4) Notes receivable
A. The Company does not hold any collateral as security.
B. For details of credit risk of the Company’s notes receivable, please refer to Note 12(2).
December 31, 2017 December 31, 2016
Financial assets held for trading
Listed stocks 7,439$ 7,592$
Call provision of convertible corporate
bonds (Note 6(14)) 250 250
7,689 7,842
Valuation adjustment 9,454 545)(
Total 17,143$ 7,297$
December 31, 2017 December 31, 2016
Listed stocks
Calitech Co., Ltd. 18,489$ 34,445$
Valuation adjustment 23,013 29,408
Total 41,502$ 63,853$
December 31, 2017 December 31, 2016
Notes receivable 73,451$ 137,876$
Less: Allowance for bad debts 8,494)( 1,225)(
Total 64,957$ 136,651$
~330~
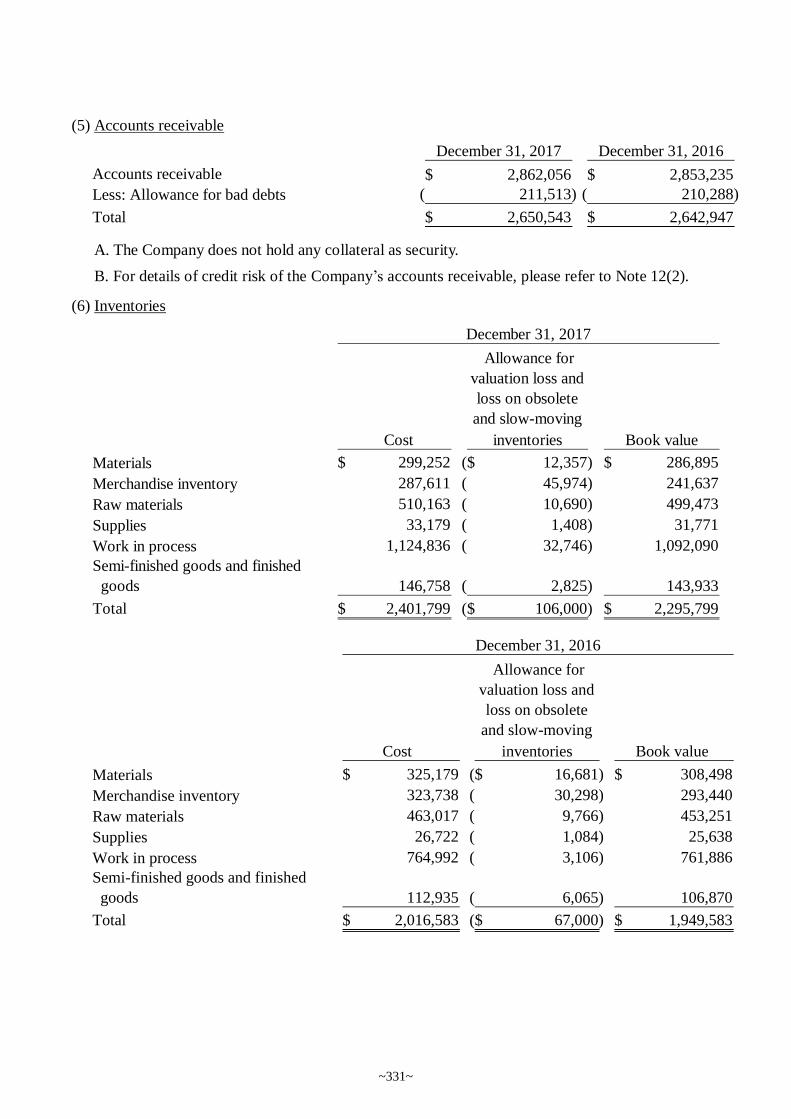
(5) Accounts receivable
A. The Company does not hold any collateral as security.
B. For details of credit risk of the Company’s accounts receivable, please refer to Note 12(2).
(6) Inventories
December 31, 2017 December 31, 2016
Accounts receivable 2,862,056$ 2,853,235$
Less: Allowance for bad debts 211,513)( 210,288)(
Total 2,650,543$ 2,642,947$
Allowance for
valuation loss and
loss on obsolete
and slow-moving
Cost inventories Book value
Materials 299,252$ 12,357)($ 286,895$
Merchandise inventory 287,611 45,974)( 241,637
Raw materials 510,163 10,690)( 499,473
Supplies 33,179 1,408)( 31,771
Work in process 1,124,836 32,746)( 1,092,090
Semi-finished goods and finished
goods 146,758 2,825)( 143,933
Total 2,401,799$ 106,000)($ 2,295,799$
December 31, 2017
Allowance for
valuation loss and
loss on obsolete
and slow-moving
Cost inventories Book value
Materials 325,179$ 16,681)($ 308,498$
Merchandise inventory 323,738 30,298)( 293,440
Raw materials 463,017 9,766)( 453,251
Supplies 26,722 1,084)( 25,638
Work in process 764,992 3,106)( 761,886
Semi-finished goods and finished
goods 112,935 6,065)( 106,870
Total 2,016,583$ 67,000)($ 1,949,583$
December 31, 2016
~331~

A. Relevant expenses of inventories recognised as operating costs for the years ended December 31,
2017 and 2016 are as follows:
B. The Company has no inventories pledged to others.
(7) Construction contracts receivable / payable
0 2017 2016
Construction cost 6,912,111$ 5,790,851$
Cost of sales 5,779,679 5,045,900
Other operating cost 739,231 716,583
Loss on (gain on reversal of) market value
decline and obsolete and slow-moving
inventories 39,000 6,000
Total 13,470,021$ 11,559,334$
Years ended December 31,
December 31, 2017 December 31, 2016
Aggregate costs incurred plus recognised profits
(less recognised losses)
19,519,144$ 17,639,143$
Less: Progress billings 18,398,759)( 16,839,742)(
Net balance sheet position for construction in
progress 1,120,385$ 799,401$
Presented as:
Construction contracts receivable 2,398,711$ 1,935,864$
Construction contracts payable 1,278,326)( 1,136,463)(
1,120,385$ 799,401$
Retentions relating to construction contracts 46,151$ 63,444$
Advances received before the related
construction work is performed -$ -$
~332~
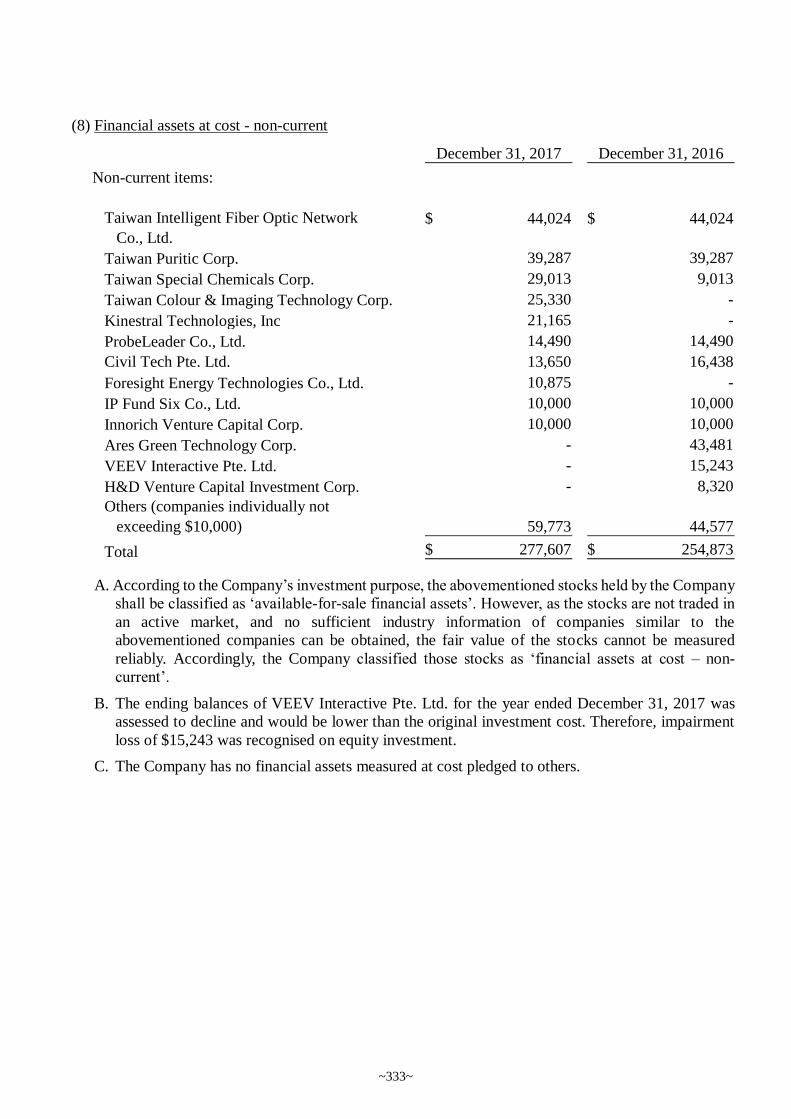
(8) Financial assets at cost - non-current
A. According to the Company’s investment purpose, the abovementioned stocks held by the Company
shall be classified as ‘available-for-sale financial assets’. However, as the stocks are not traded in
an active market, and no sufficient industry information of companies similar to the
abovementioned companies can be obtained, the fair value of the stocks cannot be measured
reliably. Accordingly, the Company classified those stocks as ‘financial assets at cost – non-
current’.
B. The ending balances of VEEV Interactive Pte. Ltd. for the year ended December 31, 2017 was
assessed to decline and would be lower than the original investment cost. Therefore, impairment
loss of $15,243 was recognised on equity investment.
C. The Company has no financial assets measured at cost pledged to others.
December 31, 2017 December 31, 2016
Non-current items:
Taiwan Intelligent Fiber Optic Network
Co., Ltd.
44,024$ 44,024$
Taiwan Puritic Corp. 39,287 39,287
Taiwan Special Chemicals Corp. 29,013 9,013
Taiwan Colour & Imaging Technology Corp. 25,330 -
Kinestral Technologies, Inc 21,165 -
ProbeLeader Co., Ltd. 14,490 14,490
Civil Tech Pte. Ltd. 13,650 16,438
Foresight Energy Technologies Co., Ltd. 10,875 -
IP Fund Six Co., Ltd. 10,000 10,000
Innorich Venture Capital Corp. 10,000 10,000
Ares Green Technology Corp. - 43,481
VEEV Interactive Pte. Ltd. - 15,243
H&D Venture Capital Investment Corp. - 8,320
Others (companies individually not
exceeding $10,000) 59,773 44,577
Total 277,607$ 254,873$
~333~
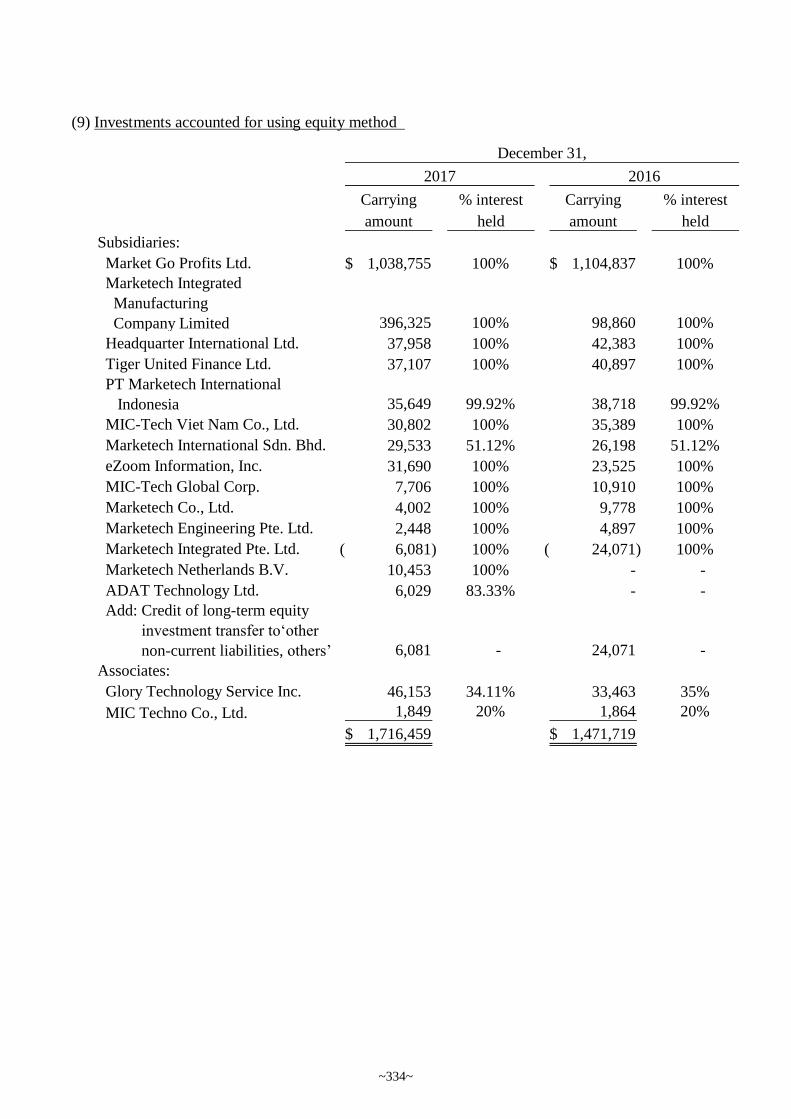
(9) Investments accounted for using equity method
Carrying % interest Carrying % interest
amount held amount held
Subsidiaries:
Market Go Profits Ltd. 1,038,755$ 100% 1,104,837$ 100%
Marketech Integrated
Manufacturing
Company Limited 396,325 100% 98,860 100%
Headquarter International Ltd. 37,958 100% 42,383 100%
Tiger United Finance Ltd. 37,107 100% 40,897 100%
PT Marketech International
Indonesia 35,649 99.92% 38,718 99.92%
MIC-Tech Viet Nam Co., Ltd. 30,802 100% 35,389 100%
Marketech International Sdn. Bhd. 29,533 51.12% 26,198 51.12%
eZoom Information, Inc. 31,690 100% 23,525 100%
MIC-Tech Global Corp. 7,706 100% 10,910 100%
Marketech Co., Ltd. 4,002 100% 9,778 100%
Marketech Engineering Pte. Ltd. 2,448 100% 4,897 100%
Marketech Integrated Pte. Ltd. 6,081)( 100% 24,071)( 100%
Marketech Netherlands B.V. 10,453 100% - -
ADAT Technology Ltd. 6,029 83.33% - -
Add: Credit of long-term equity
investment transfer to‘other
non-current liabilities, others’ 6,081 - 24,071 -
Associates:
Glory Technology Service Inc. 46,153 34.11% 33,463 35%
MIC Techno Co., Ltd. 1,849 20% 1,864 20%
1,716,459$ 1,471,719$
2017 2016
December 31,
~334~
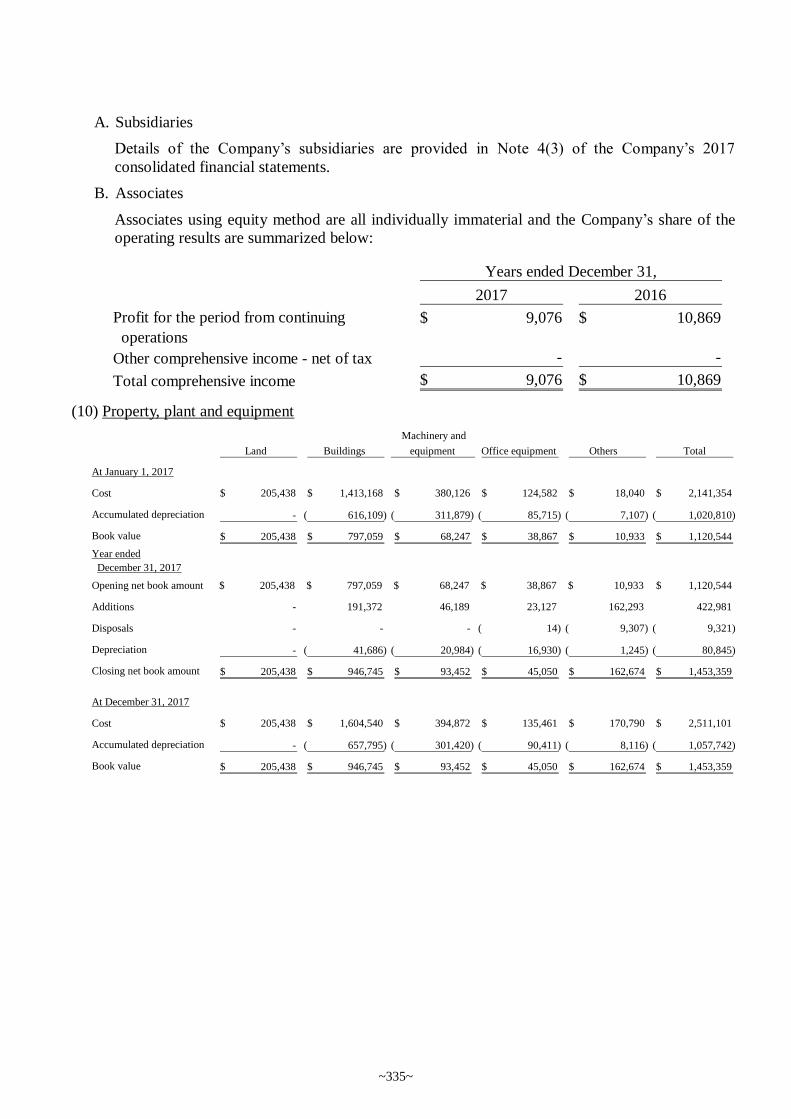
A. Subsidiaries
Details of the Company’s subsidiaries are provided in Note 4(3) of the Company’s 2017
consolidated financial statements.
B. Associates
Associates using equity method are all individually immaterial and the Company’s share of the
operating results are summarized below:
(10) Property, plant and equipment
2017 2016
Profit for the period from continuing
operations
9,076$ 10,869$
Other comprehensive income - net of tax - -
Total comprehensive income 9,076$ 10,869$
Years ended December 31,
Land Buildings
Machinery and
equipment Office equipment Others Total
At January 1, 2017
Cost 205,438$ 1,413,168$ 380,126$ 124,582$ 18,040$ 2,141,354$
Accumulated depreciation - 616,109)( 311,879)( 85,715)( 7,107)( 1,020,810)(
Book value 205,438$ 797,059$ 68,247$ 38,867$ 10,933$ 1,120,544$
Year ended
December 31, 2017
Opening net book amount $ 205,438 $ 797,059 $ 68,247 $ 38,867 $ 10,933 1,120,544$
Additions - 191,372 46,189 23,127 162,293 422,981
Disposals - - - ( 14) ( 9,307) 9,321)(
Depreciation - 41,686)( 20,984)( 16,930)( 1,245)( 80,845)(
Closing net book amount 205,438$ 946,745$ 93,452$ 45,050$ 162,674$ 1,453,359$
At December 31, 2017
Cost 205,438$ 1,604,540$ 394,872$ 135,461$ 170,790$ 2,511,101$
Accumulated depreciation - 657,795)( 301,420)( 90,411)( 8,116)( 1,057,742)(
Book value 205,438$ 946,745$ 93,452$ 45,050$ 162,674$ 1,453,359$
~335~
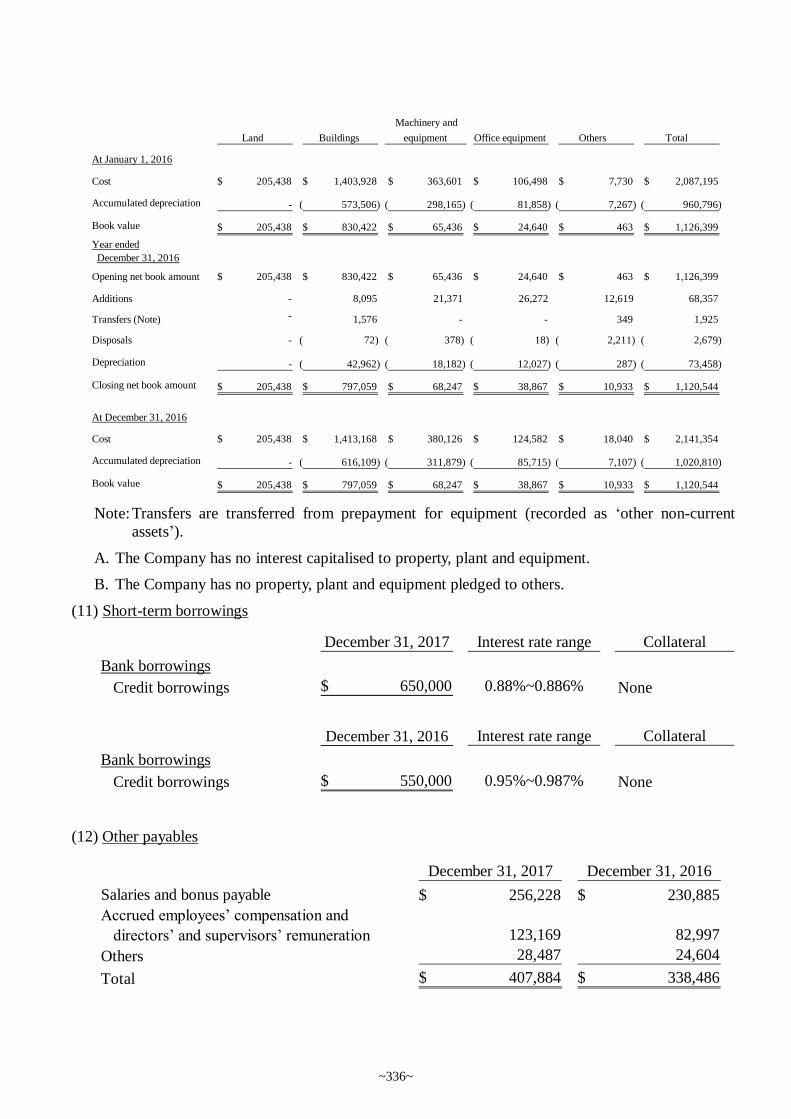
Note: Transfers are transferred from prepayment for equipment (recorded as ‘other non-current
assets’).
A. The Company has no interest capitalised to property, plant and equipment.
B. The Company has no property, plant and equipment pledged to others.
(11) Short-term borrowings
(12) Other payables
Land Buildings
Machinery and
equipment Office equipment Others Total
At January 1, 2016
Cost 205,438$ 1,403,928$ 363,601$ 106,498$ 7,730$ 2,087,195$
Accumulated depreciation - 573,506)( 298,165)( 81,858)( 7,267)( 960,796)(
Book value 205,438$ 830,422$ 65,436$ 24,640$ 463$ 1,126,399$
Year ended
December 31, 2016
Opening net book amount 205,438$ 830,422$ 65,436$ 24,640$ 463$ 1,126,399$
Additions - 8,095 21,371 26,272 12,619 68,357
Transfers (Note) - 1,576 - - 349 1,925
Disposals - ( 72) ( 378) ( 18) ( 2,211) 2,679)(
Depreciation - 42,962)( 18,182)( 12,027)( 287)( 73,458)(
Closing net book amount 205,438$ 797,059$ 68,247$ 38,867$ 10,933$ 1,120,544$
At December 31, 2016
Cost 205,438$ 1,413,168$ 380,126$ 124,582$ 18,040$ 2,141,354$
Accumulated depreciation - 616,109)( 311,879)( 85,715)( 7,107)( 1,020,810)(
Book value 205,438$ 797,059$ 68,247$ 38,867$ 10,933$ 1,120,544$
December 31, 2017 Interest rate range Collateral
Bank borrowings
Credit borrowings 650,000$ 0.88%~0.886% None
December 31, 2016 Interest rate range Collateral
Bank borrowings
Credit borrowings 550,000$ 0.95%~0.987% None
December 31, 2017 December 31, 2016
Salaries and bonus payable 256,228$ 230,885$
Accrued employees’ compensation and
directors’ and supervisors’ remuneration 123,169 82,997
Others 28,487 24,604
Total 407,884$ 338,486$
~336~
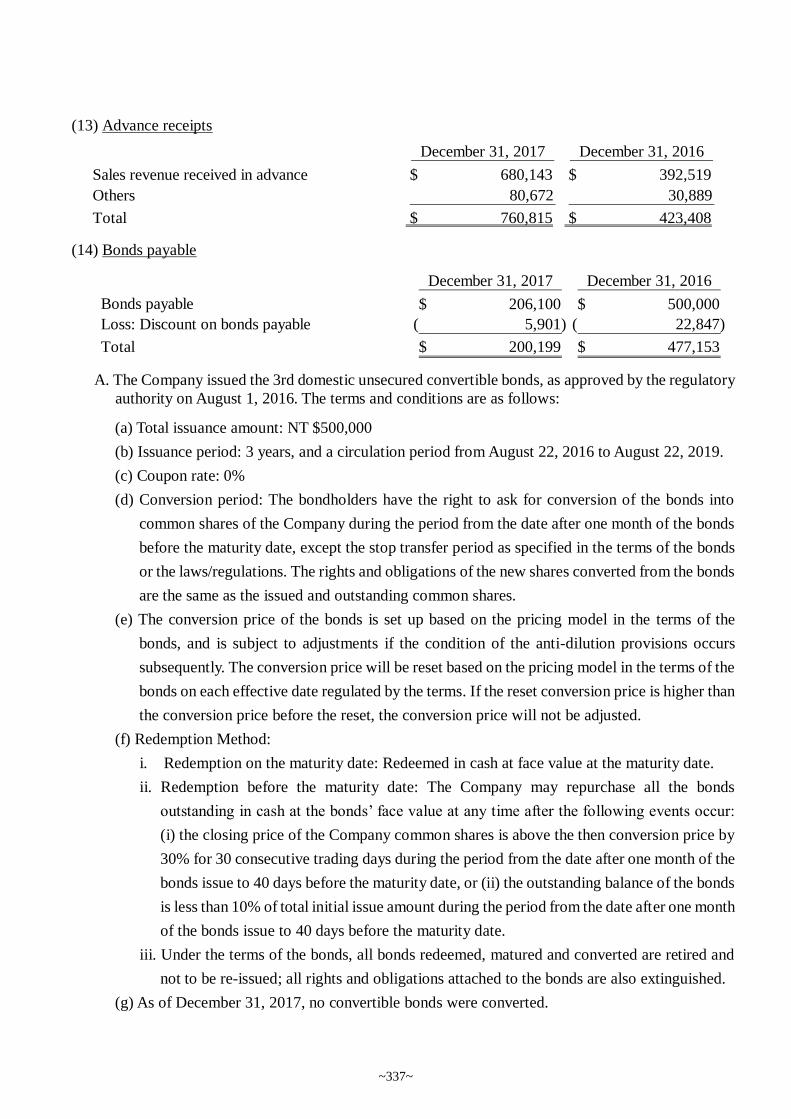
(13) Advance receipts
(14) Bonds payable
A. The Company issued the 3rd domestic unsecured convertible bonds, as approved by the regulatory
authority on August 1, 2016. The terms and conditions are as follows:
(a) Total issuance amount: NT $500,000
(b) Issuance period: 3 years, and a circulation period from August 22, 2016 to August 22, 2019.
(c) Coupon rate: 0%
(d) Conversion period: The bondholders have the right to ask for conversion of the bonds into
common shares of the Company during the period from the date after one month of the bonds
before the maturity date, except the stop transfer period as specified in the terms of the bonds
or the laws/regulations. The rights and obligations of the new shares converted from the bonds
are the same as the issued and outstanding common shares.
(e) The conversion price of the bonds is set up based on the pricing model in the terms of the
bonds, and is subject to adjustments if the condition of the anti-dilution provisions occurs
subsequently. The conversion price will be reset based on the pricing model in the terms of the
bonds on each effective date regulated by the terms. If the reset conversion price is higher than
the conversion price before the reset, the conversion price will not be adjusted.
(f) Redemption Method:
i. Redemption on the maturity date: Redeemed in cash at face value at the maturity date.
ii. Redemption before the maturity date: The Company may repurchase all the bonds
outstanding in cash at the bonds’ face value at any time after the following events occur:
(i) the closing price of the Company common shares is above the then conversion price by
30% for 30 consecutive trading days during the period from the date after one month of the
bonds issue to 40 days before the maturity date, or (ii) the outstanding balance of the bonds
is less than 10% of total initial issue amount during the period from the date after one month
of the bonds issue to 40 days before the maturity date.
iii. Under the terms of the bonds, all bonds redeemed, matured and converted are retired and
not to be re-issued; all rights and obligations attached to the bonds are also extinguished.
(g) As of December 31, 2017, no convertible bonds were converted.
December 31, 2017 December 31, 2016
Sales revenue received in advance $ 680,143 $ 392,519
Others 80,672 30,889
Total $ 760,815 $ 423,408
December 31, 2017 December 31, 2016
Bonds payable 206,100$ 500,000$
Loss: Discount on bonds payable 5,901)( 22,847)(
Total 200,199$ 477,153$
~337~
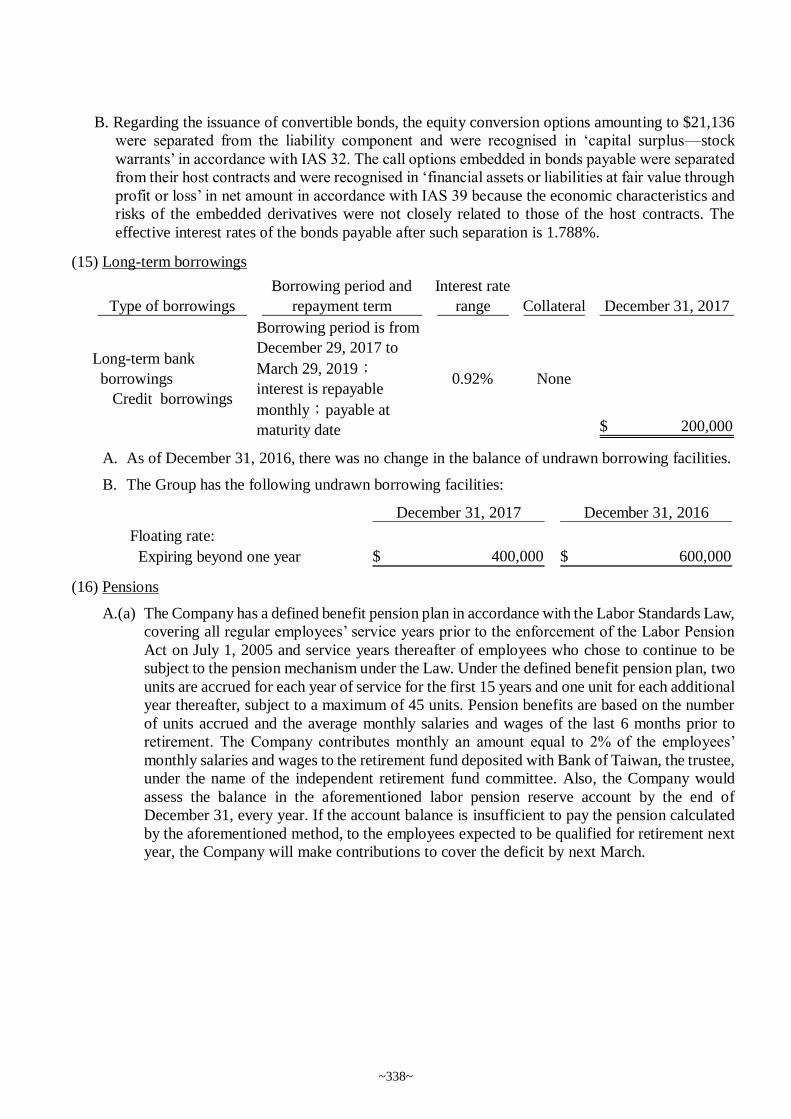
B. Regarding the issuance of convertible bonds, the equity conversion options amounting to $21,136
were separated from the liability component and were recognised in ‘capital surplus—stock
warrants’ in accordance with IAS 32. The call options embedded in bonds payable were separated
from their host contracts and were recognised in ‘financial assets or liabilities at fair value through
profit or loss’ in net amount in accordance with IAS 39 because the economic characteristics and
risks of the embedded derivatives were not closely related to those of the host contracts. The
effective interest rates of the bonds payable after such separation is 1.788%.
(15) Long-term borrowings
A. As of December 31, 2016, there was no change in the balance of undrawn borrowing facilities.
B. The Group has the following undrawn borrowing facilities:
(16) Pensions
A.(a) The Company has a defined benefit pension plan in accordance with the Labor Standards Law,
covering all regular employees’ service years prior to the enforcement of the Labor Pension
Act on July 1, 2005 and service years thereafter of employees who chose to continue to be
subject to the pension mechanism under the Law. Under the defined benefit pension plan, two
units are accrued for each year of service for the first 15 years and one unit for each additional
year thereafter, subject to a maximum of 45 units. Pension benefits are based on the number
of units accrued and the average monthly salaries and wages of the last 6 months prior to
retirement. The Company contributes monthly an amount equal to 2% of the employees’
monthly salaries and wages to the retirement fund deposited with Bank of Taiwan, the trustee,
under the name of the independent retirement fund committee. Also, the Company would
assess the balance in the aforementioned labor pension reserve account by the end of
December 31, every year. If the account balance is insufficient to pay the pension calculated
by the aforementioned method, to the employees expected to be qualified for retirement next
year, the Company will make contributions to cover the deficit by next March.
Borrowing period and Interest rate
Type of borrowings repayment term range Collateral December 31, 2017
Long-term bank
borrowings
Credit borrowings
Borrowing period is from
December 29, 2017 to
March 29, 2019;
interest is repayable
monthly;payable at
maturity date
0.92% None
200,000$
December 31, 2017 December 31, 2016
Floating rate:
Expiring beyond one year 400,000$ 600,000$
~338~
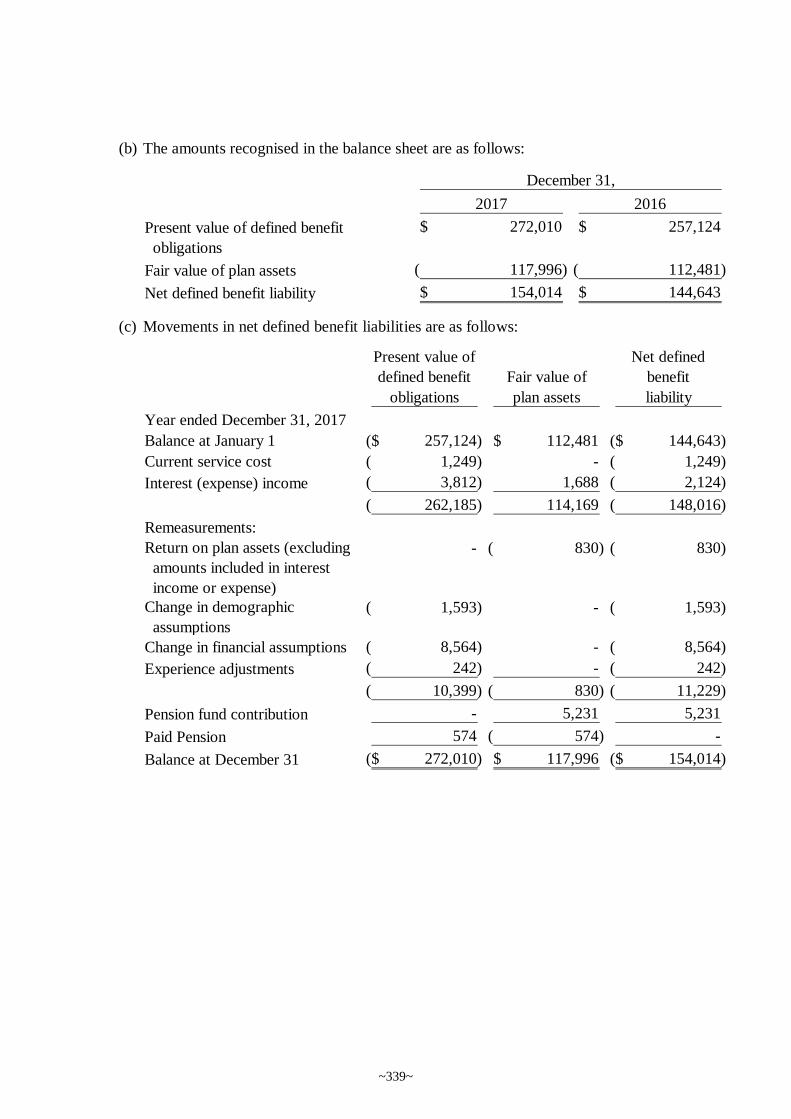
(b) The amounts recognised in the balance sheet are as follows:
(c) Movements in net defined benefit liabilities are as follows:
2017 2016
Present value of defined benefit
obligations
272,010$ 257,124$
Fair value of plan assets 117,996)( 112,481)(
Net defined benefit liability 154,014$ 144,643$
December 31,
Present value of
defined benefit Fair value of
Net defined
benefit
obligations plan assets liability
Year ended December 31, 2017
Balance at January 1 257,124)($ 112,481$ 144,643)($
Current service cost 1,249)( - 1,249)(
Interest (expense) income 3,812)( 1,688 2,124)(
262,185)( 114,169 148,016)(
Remeasurements:
Return on plan assets (excluding
amounts included in interest
income or expense)
- 830)( 830)(
Change in demographic
assumptions
1,593)( - 1,593)(
Change in financial assumptions 8,564)( - 8,564)(
Experience adjustments 242)( - 242)(
10,399)( 830)( 11,229)(
Pension fund contribution - 5,231 5,231
Paid Pension 574 574)( -
Balance at December 31 272,010)($ 117,996$ 154,014)($
~339~
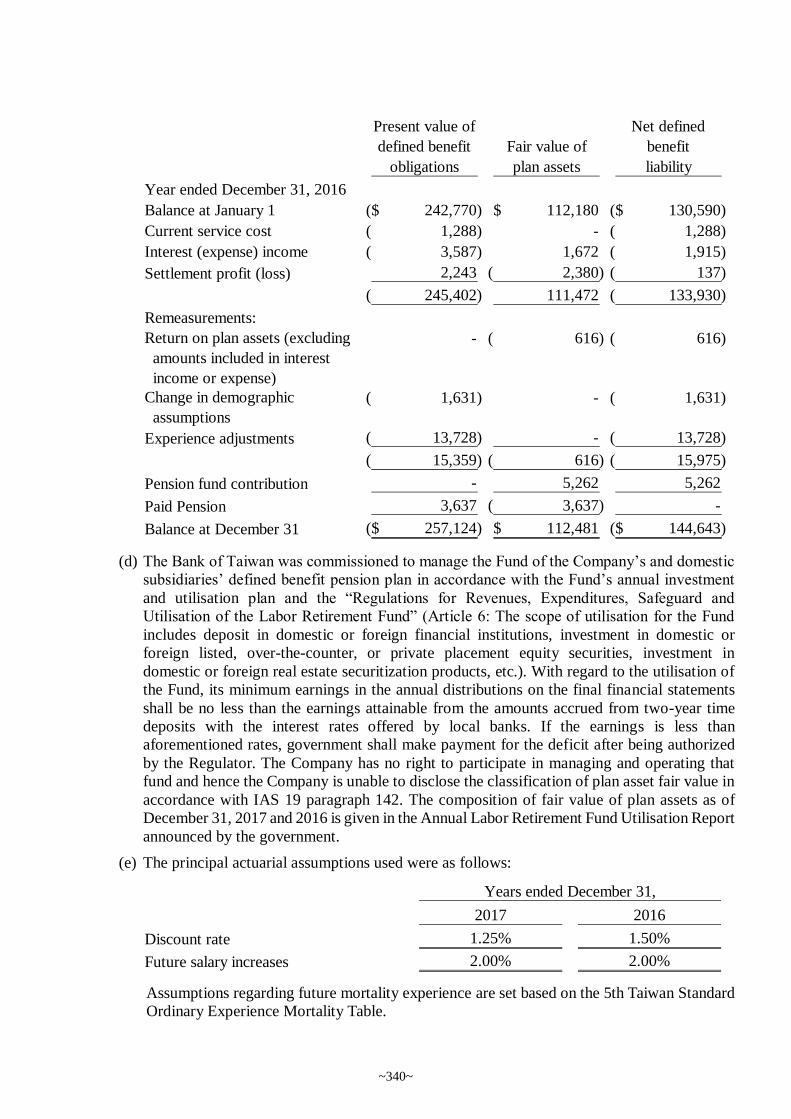
(d) The Bank of Taiwan was commissioned to manage the Fund of the Company’s and domestic
subsidiaries’ defined benefit pension plan in accordance with the Fund’s annual investment
and utilisation plan and the “Regulations for Revenues, Expenditures, Safeguard and
Utilisation of the Labor Retirement Fund” (Article 6: The scope of utilisation for the Fund
includes deposit in domestic or foreign financial institutions, investment in domestic or
foreign listed, over-the-counter, or private placement equity securities, investment in
domestic or foreign real estate securitization products, etc.). With regard to the utilisation of
the Fund, its minimum earnings in the annual distributions on the final financial statements
shall be no less than the earnings attainable from the amounts accrued from two-year time
deposits with the interest rates offered by local banks. If the earnings is less than
aforementioned rates, government shall make payment for the deficit after being authorized
by the Regulator. The Company has no right to participate in managing and operating that
fund and hence the Company is unable to disclose the classification of plan asset fair value in
accordance with IAS 19 paragraph 142. The composition of fair value of plan assets as of
December 31, 2017 and 2016 is given in the Annual Labor Retirement Fund Utilisation Report
announced by the government.
(e) The principal actuarial assumptions used were as follows:
Assumptions regarding future mortality experience are set based on the 5th Taiwan Standard
Ordinary Experience Mortality Table.
Present value of
defined benefit Fair value of
Net defined
benefit
obligations plan assets liability
Year ended December 31, 2016
Balance at January 1 242,770)($ 112,180$ 130,590)($
Current service cost 1,288)( - 1,288)(
Interest (expense) income 3,587)( 1,672 1,915)(
Settlement profit (loss) 2,243 2,380)( 137)(
245,402)( 111,472 133,930)(
Remeasurements:
Return on plan assets (excluding
amounts included in interest
income or expense)
- 616)( 616)(
Change in demographic
assumptions
1,631)( - 1,631)(
Experience adjustments 13,728)( - 13,728)(
15,359)( 616)( 15,975)(
Pension fund contribution - 5,262 5,262
Paid Pension 3,637 3,637)( -
Balance at December 31 257,124)($ 112,481$ 144,643)($
2017 2016
Discount rate 1.25% 1.50%
Future salary increases 2.00% 2.00%
Years ended December 31,
~340~
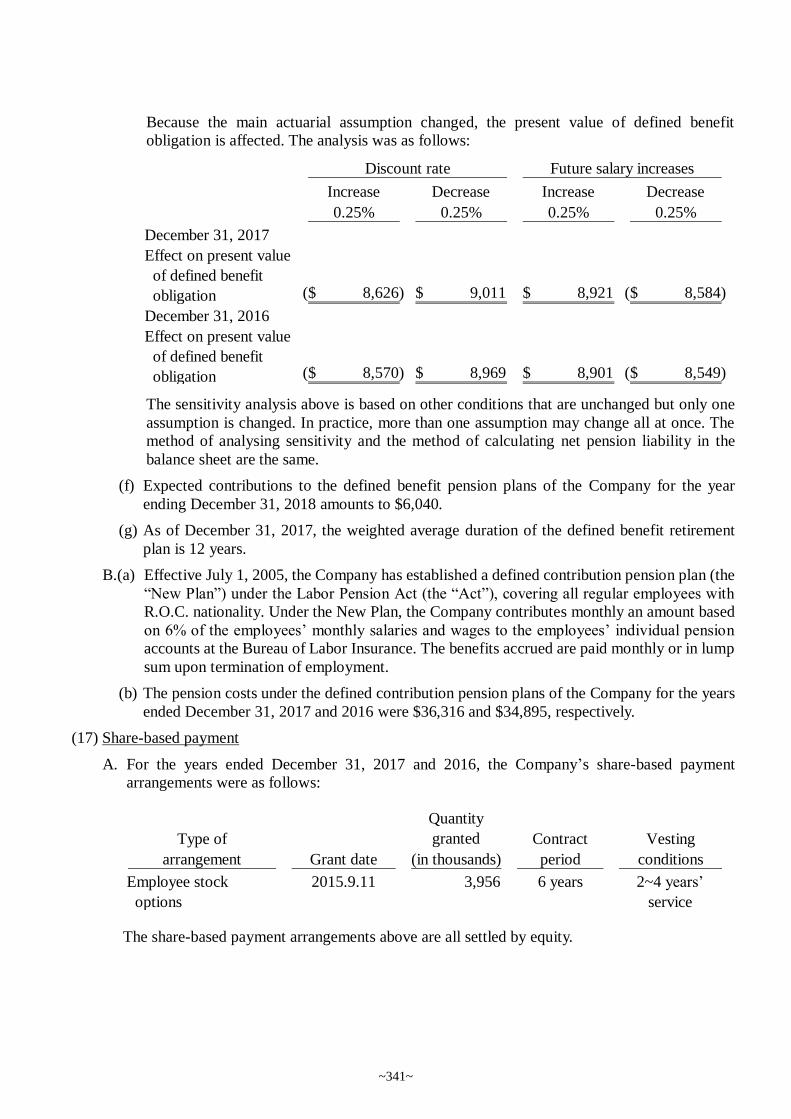
Because the main actuarial assumption changed, the present value of defined benefit
obligation is affected. The analysis was as follows:
The sensitivity analysis above is based on other conditions that are unchanged but only one
assumption is changed. In practice, more than one assumption may change all at once. The
method of analysing sensitivity and the method of calculating net pension liability in the
balance sheet are the same.
(f) Expected contributions to the defined benefit pension plans of the Company for the year
ending December 31, 2018 amounts to $6,040.
(g) As of December 31, 2017, the weighted average duration of the defined benefit retirement
plan is 12 years.
B.(a) Effective July 1, 2005, the Company has established a defined contribution pension plan (the
“New Plan”) under the Labor Pension Act (the “Act”), covering all regular employees with
R.O.C. nationality. Under the New Plan, the Company contributes monthly an amount based
on 6% of the employees’ monthly salaries and wages to the employees’ individual pension
accounts at the Bureau of Labor Insurance. The benefits accrued are paid monthly or in lump
sum upon termination of employment.
(b) The pension costs under the defined contribution pension plans of the Company for the years
ended December 31, 2017 and 2016 were $36,316 and $34,895, respectively.
(17) Share-based payment
A. For the years ended December 31, 2017 and 2016, the Company’s share-based payment
arrangements were as follows:
The share-based payment arrangements above are all settled by equity.
Increase Decrease Increase Decrease
0.25% 0.25% 0.25% 0.25%
December 31, 2017
Effect on present value
of defined benefit
obligation 8,626)($ 9,011$ 8,921$ 8,584)($
December 31, 2016
Effect on present value
of defined benefit
obligation 8,570)($ 8,969$ 8,901$ 8,549)($
Discount rate Future salary increases
Type of
Quantity
granted Contract Vesting
arrangement Grant date (in thousands) period conditions
Employee stock
options
2015.9.11 3,956 6 years 2~4 years’
service
~341~
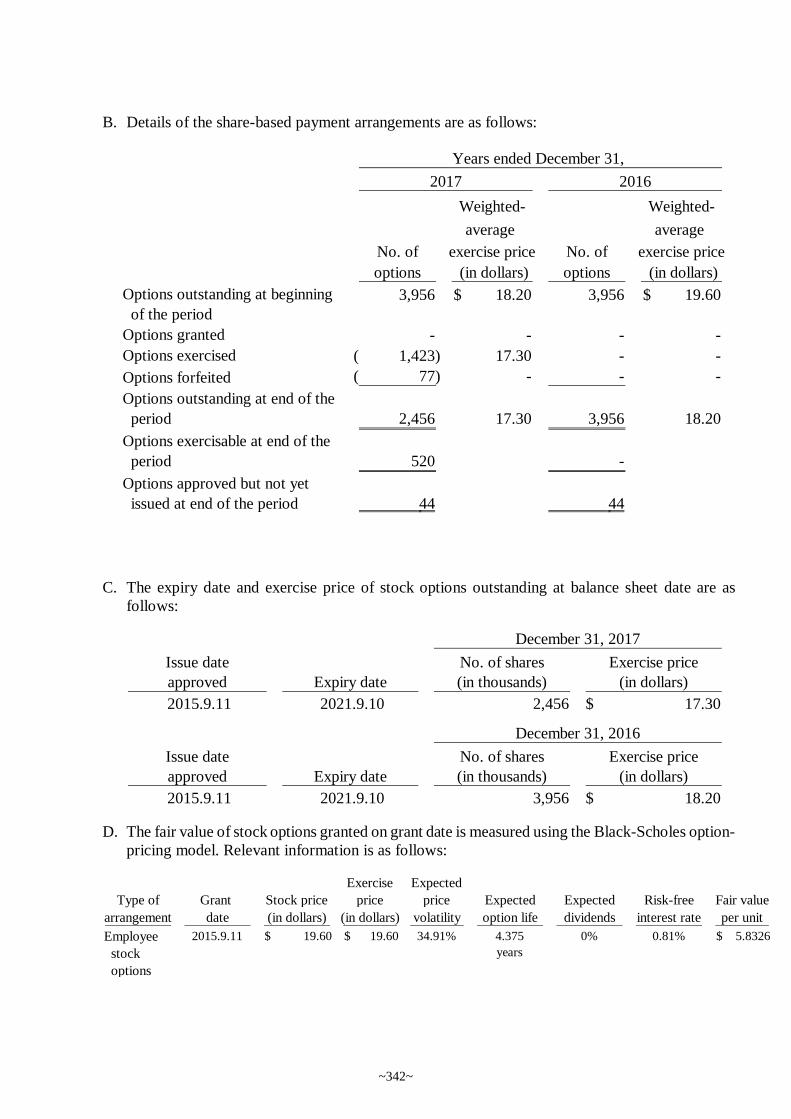
B. Details of the share-based payment arrangements are as follows:
C. The expiry date and exercise price of stock options outstanding at balance sheet date are as
follows:
D. The fair value of stock options granted on grant date is measured using the Black-Scholes option-
pricing model. Relevant information is as follows:
Weighted- Weighted-
average average
No. of exercise price No. of exercise price
options (in dollars) options (in dollars)
Options outstanding at beginning
of the period
3,956 18.20$ 3,956 19.60$
Options granted - - - -
Options exercised 1,423)( 17.30 - -
Options forfeited 77)( - - -
Options outstanding at end of the
period 2,456 17.30 3,956 18.20
Options exercisable at end of the
period 520 -
Options approved but not yet
issued at end of the period 44 44
Years ended December 31,
2017 2016
Issue date No. of shares Exercise price
approved Expiry date (in thousands) (in dollars)
2015.9.11 2021.9.10 2,456 17.30$
Issue date No. of shares Exercise price
approved Expiry date (in thousands) (in dollars)
2015.9.11 2021.9.10 3,956 18.20$
December 31, 2017
December 31, 2016
Type of Grant Stock price
Exercise
price
Expected
price Expected Expected Risk-free Fair value
arrangement date (in dollars) (in dollars) volatility option life dividends interest rate per unit
Employee
stock
options
2015.9.11 $ 19.60 $ 19.60 34.91% 4.375
years
0% 0.81% $ 5.8326
~342~
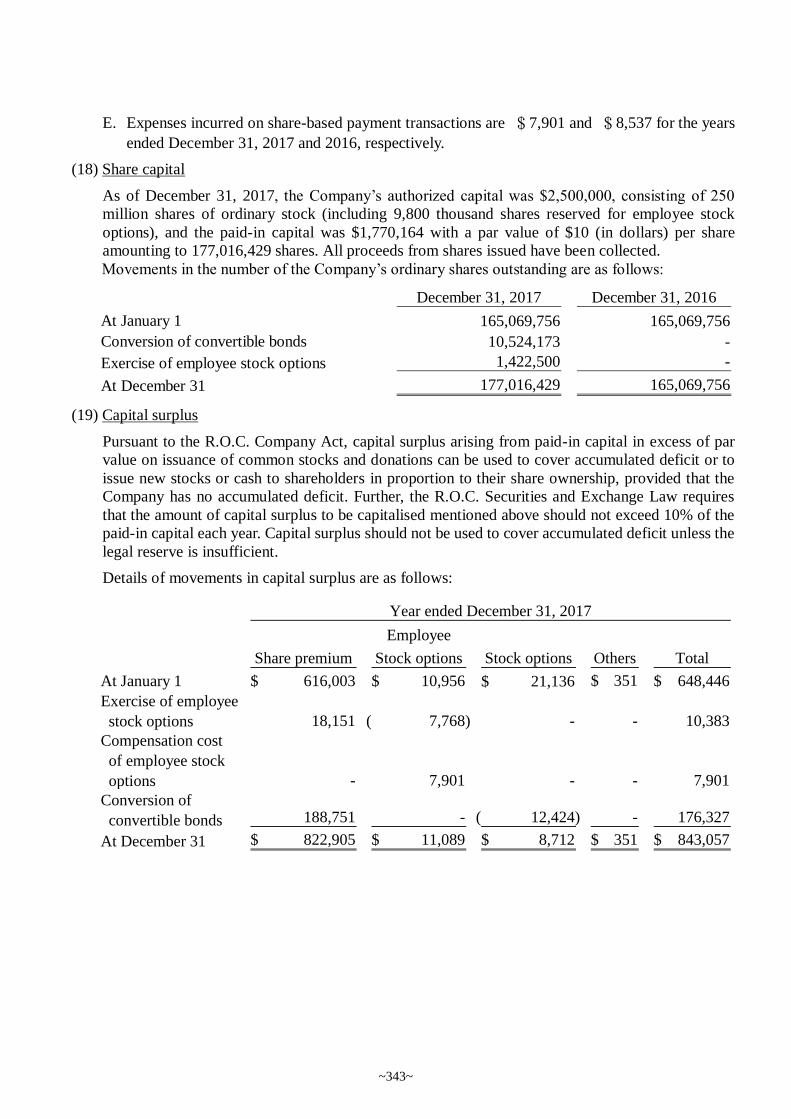
E. Expenses incurred on share-based payment transactions are $7,901 and $8,537 for the years
ended December 31, 2017 and 2016, respectively.
(18) Share capital
As of December 31, 2017, the Company’s authorized capital was $2,500,000, consisting of 250
million shares of ordinary stock (including 9,800 thousand shares reserved for employee stock
options), and the paid-in capital was $1,770,164 with a par value of $10 (in dollars) per share
amounting to 177,016,429 shares. All proceeds from shares issued have been collected.
Movements in the number of the Company’s ordinary shares outstanding are as follows:
(19) Capital surplus
Pursuant to the R.O.C. Company Act, capital surplus arising from paid-in capital in excess of par
value on issuance of common stocks and donations can be used to cover accumulated deficit or to
issue new stocks or cash to shareholders in proportion to their share ownership, provided that the
Company has no accumulated deficit. Further, the R.O.C. Securities and Exchange Law requires
that the amount of capital surplus to be capitalised mentioned above should not exceed 10% of the
paid-in capital each year. Capital surplus should not be used to cover accumulated deficit unless the
legal reserve is insufficient.
Details of movements in capital surplus are as follows:
December 31, 2017 December 31, 2016
At January 1 165,069,756 165,069,756
Conversion of convertible bonds 10,524,173 -
Exercise of employee stock options 1,422,500 -
At December 31 177,016,429 165,069,756
Employee
Share premium Stock options Stock options Others Total
At January 1 616,003$ 10,956$ 21,136$ 351$ 648,446$
Exercise of employee
stock options 18,151 7,768)( - - 10,383
Compensation cost
of employee stock
options - 7,901 - - 7,901
Conversion of
convertible bonds 188,751 - 12,424)( - 176,327
At December 31 822,905$ 11,089$ 8,712$ 351$ 843,057$
Year ended December 31, 2017
~343~
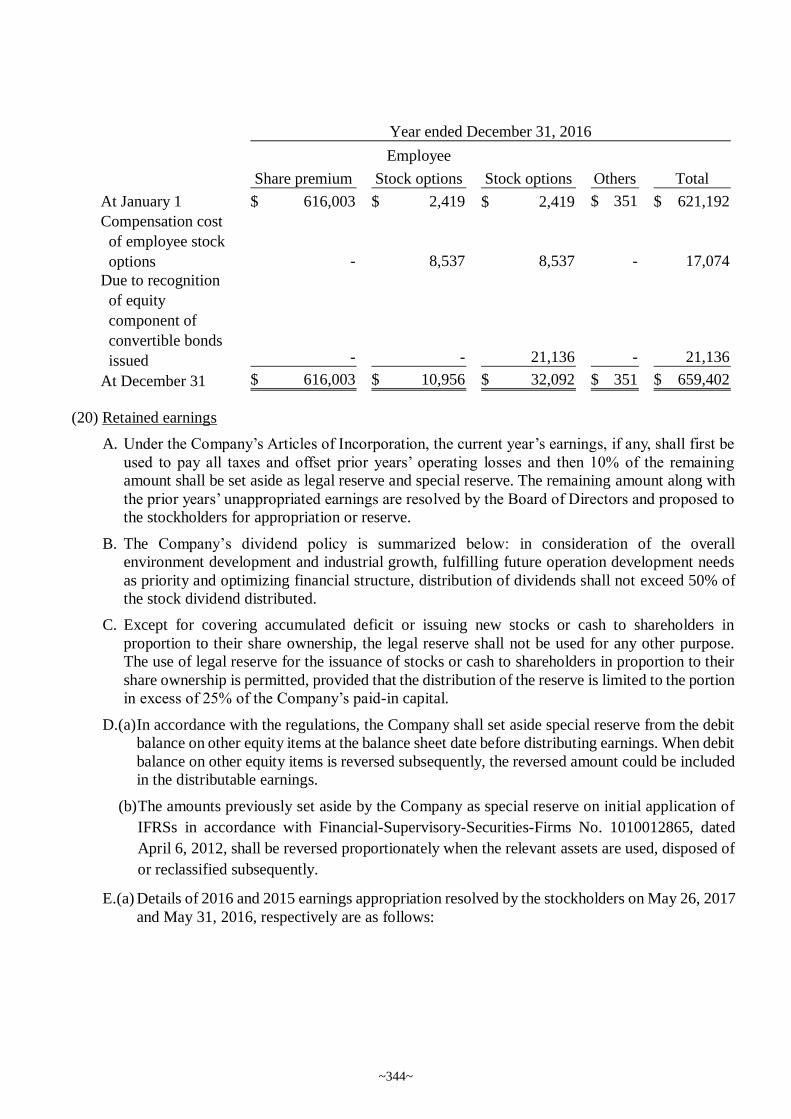
(20) Retained earnings
A. Under the Company’s Articles of Incorporation, the current year’s earnings, if any, shall first be
used to pay all taxes and offset prior years’ operating losses and then 10% of the remaining
amount shall be set aside as legal reserve and special reserve. The remaining amount along with
the prior years’ unappropriated earnings are resolved by the Board of Directors and proposed to
the stockholders for appropriation or reserve.
B. The Company’s dividend policy is summarized below: in consideration of the overall
environment development and industrial growth, fulfilling future operation development needs
as priority and optimizing financial structure, distribution of dividends shall not exceed 50% of
the stock dividend distributed.
C. Except for covering accumulated deficit or issuing new stocks or cash to shareholders in
proportion to their share ownership, the legal reserve shall not be used for any other purpose.
The use of legal reserve for the issuance of stocks or cash to shareholders in proportion to their
share ownership is permitted, provided that the distribution of the reserve is limited to the portion
in excess of 25% of the Company’s paid-in capital.
D.(a) In accordance with the regulations, the Company shall set aside special reserve from the debit
balance on other equity items at the balance sheet date before distributing earnings. When debit
balance on other equity items is reversed subsequently, the reversed amount could be included
in the distributable earnings.
(b) The amounts previously set aside by the Company as special reserve on initial application of
IFRSs in accordance with Financial-Supervisory-Securities-Firms No. 1010012865, dated
April 6, 2012, shall be reversed proportionately when the relevant assets are used, disposed of
or reclassified subsequently.
E.(a) Details of 2016 and 2015 earnings appropriation resolved by the stockholders on May 26, 2017
and May 31, 2016, respectively are as follows:
Employee
Share premium Stock options Stock options Others Total
At January 1 616,003$ 2,419$ 2,419$ 351$ 621,192$
Compensation cost
of employee stock
options - 8,537 8,537 - 17,074
Due to recognition
of equity
component of
convertible bonds
issued - - 21,136 - 21,136
At December 31 616,003$ 10,956$ 32,092$ 351$ 659,402$
Year ended December 31, 2016
~344~
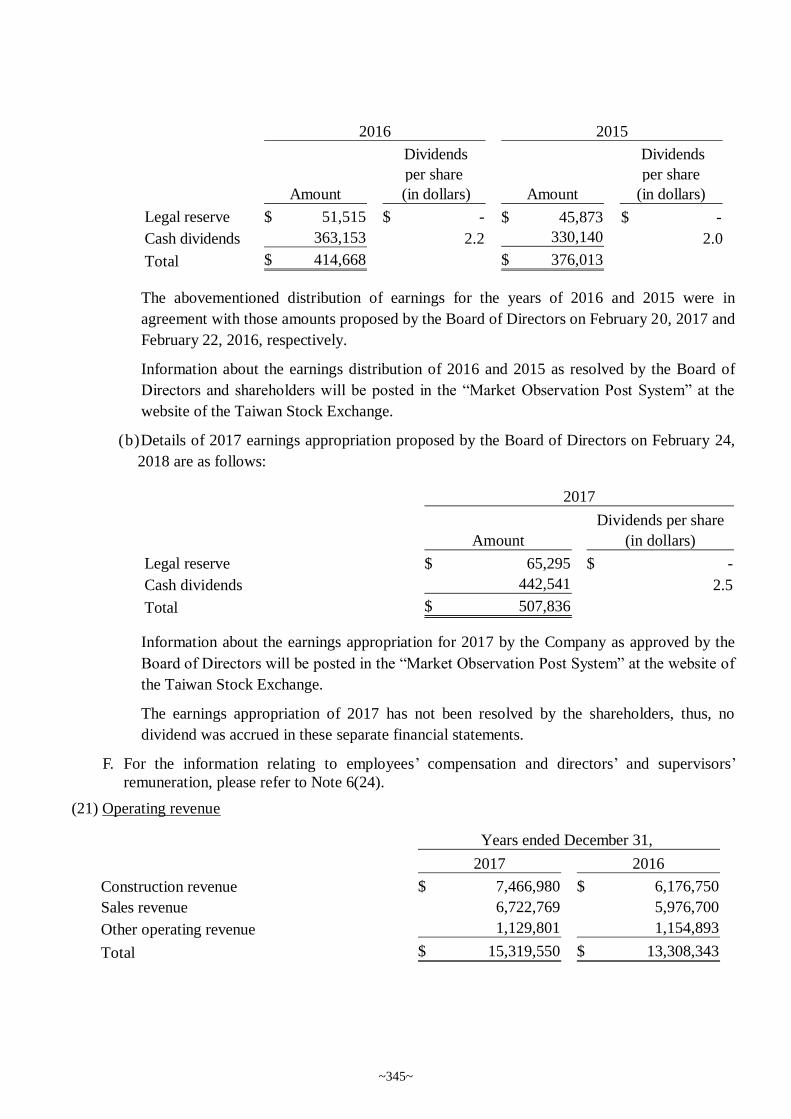
The abovementioned distribution of earnings for the years of 2016 and 2015 were in
agreement with those amounts proposed by the Board of Directors on February 20, 2017 and
February 22, 2016, respectively.
Information about the earnings distribution of 2016 and 2015 as resolved by the Board of
Directors and shareholders will be posted in the “Market Observation Post System” at the
website of the Taiwan Stock Exchange.
(b)Details of 2017 earnings appropriation proposed by the Board of Directors on February 24,
2018 are as follows:
Information about the earnings appropriation for 2017 by the Company as approved by the
Board of Directors will be posted in the “Market Observation Post System” at the website of
the Taiwan Stock Exchange.
The earnings appropriation of 2017 has not been resolved by the shareholders, thus, no
dividend was accrued in these separate financial statements.
F. For the information relating to employees’ compensation and directors’ and supervisors’
remuneration, please refer to Note 6(24).
(21) Operating revenue
Dividends
per share
Dividends
per share
Amount (in dollars) Amount (in dollars)
Legal reserve 51,515$ -$ 45,873$ -$
Cash dividends 363,153 2.2 330,140 2.0
Total 414,668$ 376,013$
2016 2015
Dividends per share
Amount (in dollars)
Legal reserve 65,295$ -$
Cash dividends 442,541 2.5
Total 507,836$
2017
2017 2016
Construction revenue 7,466,980$ 6,176,750$
Sales revenue 6,722,769 5,976,700
Other operating revenue 1,129,801 1,154,893
Total 15,319,550$ 13,308,343$
Years ended December 31,
~345~
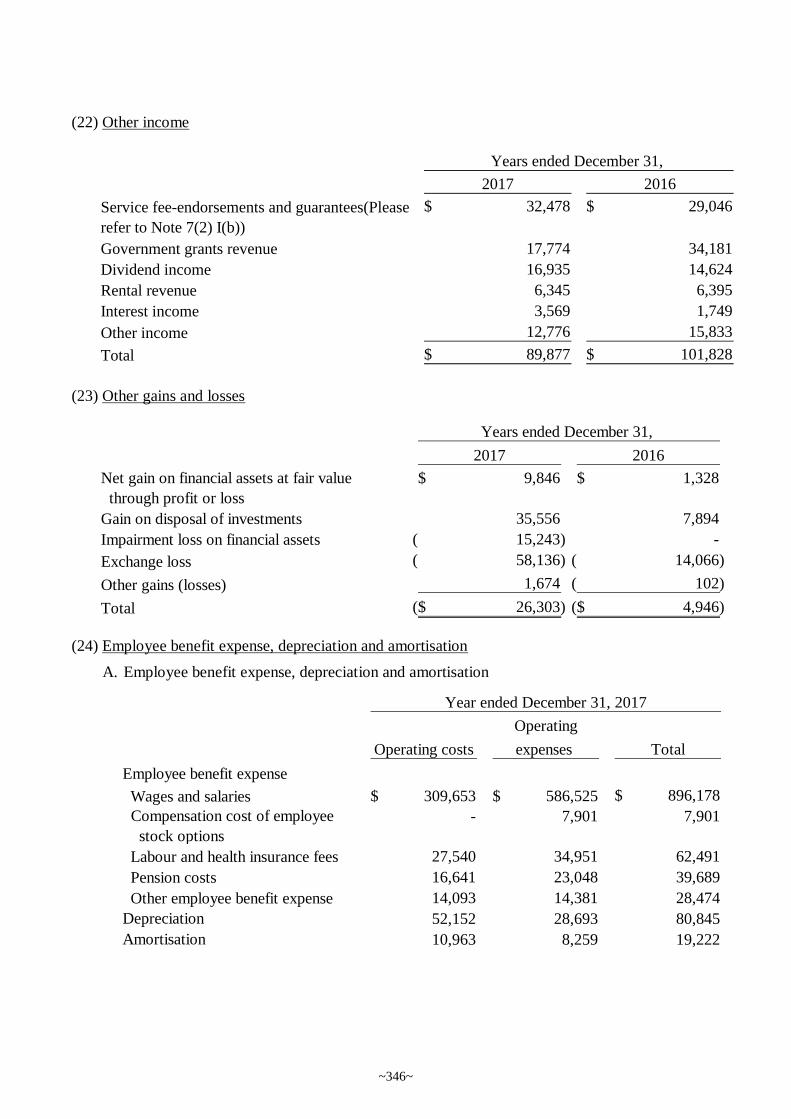
(22) Other income
(23) Other gains and losses
(24) Employee benefit expense, depreciation and amortisation
A. Employee benefit expense, depreciation and amortisation
2017 2016
Service fee-endorsements and guarantees(Please
refer to Note 7(2) I(b))
32,478$ 29,046$
Government grants revenue 17,774 34,181
Dividend income 16,935 14,624
Rental revenue 6,345 6,395
Interest income 3,569 1,749
Other income 12,776 15,833
Total 89,877$ 101,828$
Years ended December 31,
2017 2016
Net gain on financial assets at fair value
through profit or loss
9,846$ 1,328$
Gain on disposal of investments 35,556 7,894
Impairment loss on financial assets 15,243)( -
Exchange loss 58,136)( 14,066)(
Other gains (losses) 1,674 102)(
Total 26,303)($ 4,946)($
Years ended December 31,
Operating
Operating costs expenses Total
Employee benefit expense
Wages and salaries 309,653$ 586,525$ 896,178$
Compensation cost of employee
stock options
- 7,901 7,901
Labour and health insurance fees 27,540 34,951 62,491
Pension costs 16,641 23,048 39,689
Other employee benefit expense 14,093 14,381 28,474
Depreciation 52,152 28,693 80,845
Amortisation 10,963 8,259 19,222
Year ended December 31, 2017
~346~
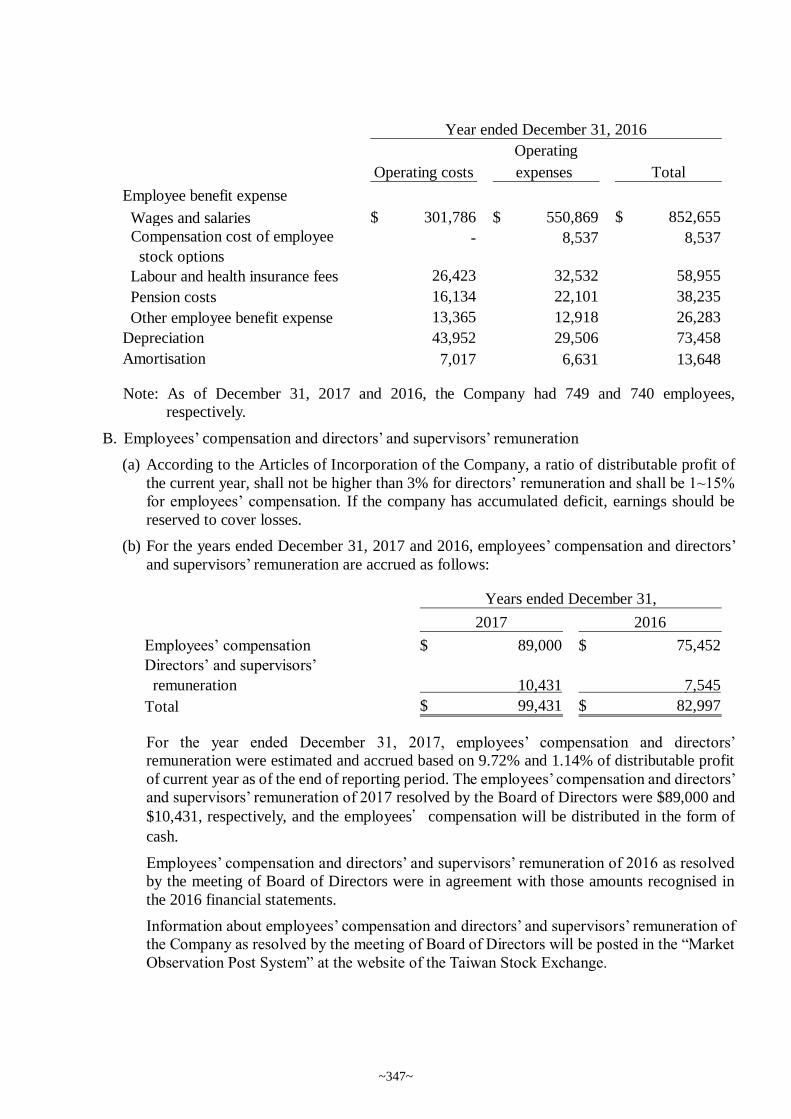
Note: As of December 31, 2017 and 2016, the Company had 749 and 740 employees,
respectively.
B. Employees’ compensation and directors’ and supervisors’ remuneration
(a) According to the Articles of Incorporation of the Company, a ratio of distributable profit of
the current year, shall not be higher than 3% for directors’ remuneration and shall be 1~15%
for employees’ compensation. If the company has accumulated deficit, earnings should be
reserved to cover losses.
(b) For the years ended December 31, 2017 and 2016, employees’ compensation and directors’
and supervisors’ remuneration are accrued as follows:
For the year ended December 31, 2017, employees’ compensation and directors’
remuneration were estimated and accrued based on 9.72% and 1.14% of distributable profit
of current year as of the end of reporting period. The employees’ compensation and directors’
and supervisors’ remuneration of 2017 resolved by the Board of Directors were $89,000 and
$10,431, respectively, and the employees’compensation will be distributed in the form of
cash.
Employees’ compensation and directors’ and supervisors’ remuneration of 2016 as resolved
by the meeting of Board of Directors were in agreement with those amounts recognised in
the 2016 financial statements.
Information about employees’ compensation and directors’ and supervisors’ remuneration of
the Company as resolved by the meeting of Board of Directors will be posted in the “Market
Observation Post System” at the website of the Taiwan Stock Exchange.
Operating
Operating costs expenses Total
Employee benefit expense
Wages and salaries 301,786$ 550,869$ 852,655$
Compensation cost of employee
stock options
- 8,537 8,537
Labour and health insurance fees 26,423 32,532 58,955
Pension costs 16,134 22,101 38,235
Other employee benefit expense 13,365 12,918 26,283
Depreciation 43,952 29,506 73,458
Amortisation 7,017 6,631 13,648
Year ended December 31, 2016
2017 2016
Employees’ compensation 89,000$ 75,452$
Directors’ and supervisors’
remuneration 10,431 7,545
Total 99,431$ 82,997$
Years ended December 31,
~347~
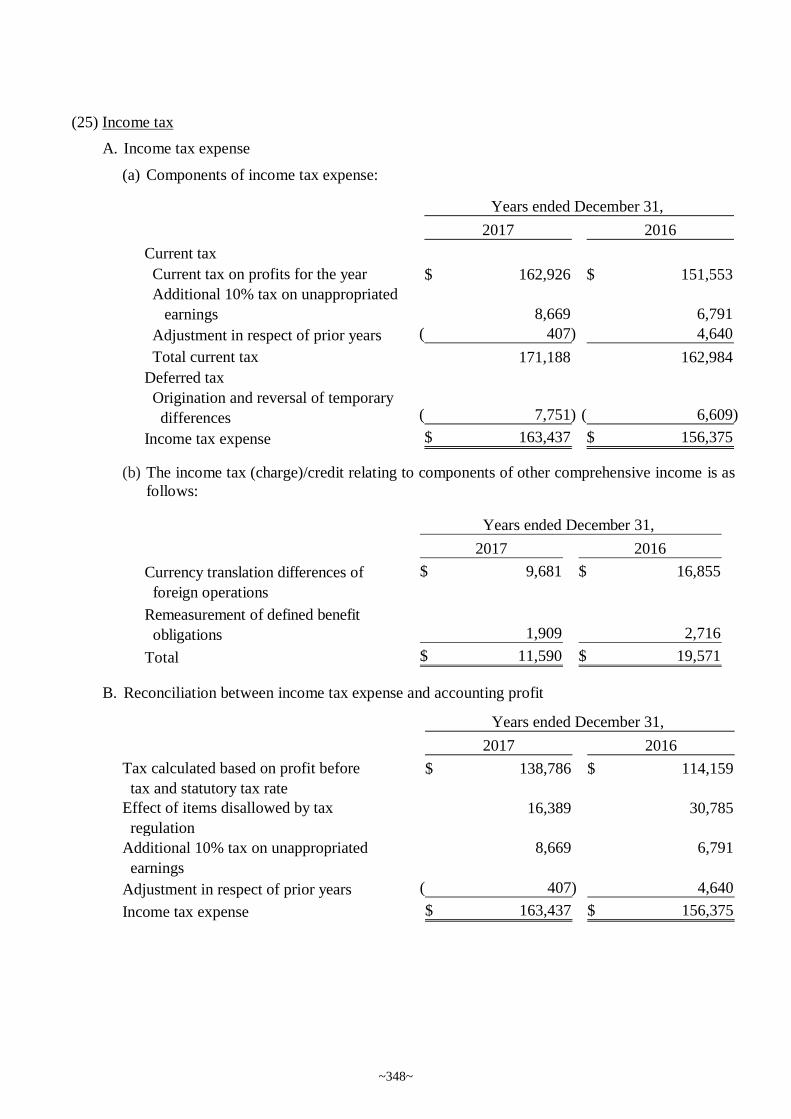
(25) Income tax
A. Income tax expense
(a) Components of income tax expense:
(b) The income tax (charge)/credit relating to components of other comprehensive income is as
follows:
B. Reconciliation between income tax expense and accounting profit
2017 2016
Current tax
Current tax on profits for the year 162,926$ 151,553$
Additional 10% tax on unappropriated
earnings 8,669 6,791
Adjustment in respect of prior years 407)( 4,640
Total current tax 171,188 162,984
Deferred tax
Origination and reversal of temporary
differences 7,751)( 6,609)(
Income tax expense 163,437$ 156,375$
Years ended December 31,
2017 2016
Currency translation differences of
foreign operations
9,681$ 16,855$
Remeasurement of defined benefit
obligations 1,909 2,716
Total 11,590$ 19,571$
Years ended December 31,
2017 2016
Tax calculated based on profit before
tax and statutory tax rate
138,786$ 114,159$
Effect of items disallowed by tax
regulation
16,389 30,785
Additional 10% tax on unappropriated
earnings
8,669 6,791
Adjustment in respect of prior years 407)( 4,640
Income tax expense 163,437$ 156,375$
Years ended December 31,
~348~
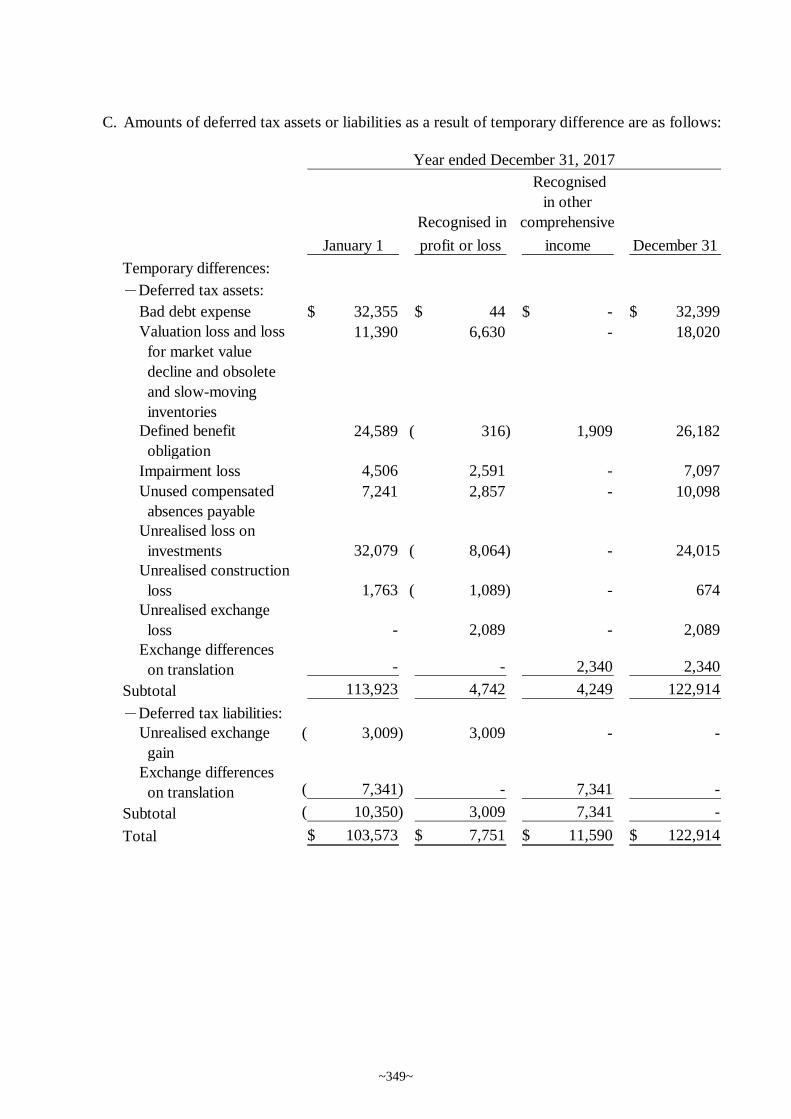
C. Amounts of deferred tax assets or liabilities as a result of temporary difference are as follows:
Recognised in
Recognised
in other
comprehensive
January 1 profit or loss income December 31
Temporary differences:
-Deferred tax assets:
Bad debt expense 32,355$ 44$ -$ 32,399$
Valuation loss and loss
for market value
decline and obsolete
and slow-moving
inventories
11,390 6,630 - 18,020
Defined benefit
obligation
24,589 316)( 1,909 26,182
Impairment loss 4,506 2,591 - 7,097
Unused compensated
absences payable
7,241 2,857 - 10,098
Unrealised loss on
investments 32,079 8,064)( - 24,015
Unrealised construction
loss 1,763 1,089)( - 674
Unrealised exchange
loss - 2,089 - 2,089
Exchange differences
on translation - - 2,340 2,340
Subtotal 113,923 4,742 4,249 122,914
-Deferred tax liabilities:
Unrealised exchange
gain
3,009)( 3,009 - -
Exchange differences
on translation 7,341)( - 7,341 -
Subtotal 10,350)( 3,009 7,341 -
Total 103,573$ 7,751$ 11,590$ 122,914$
Year ended December 31, 2017
~349~
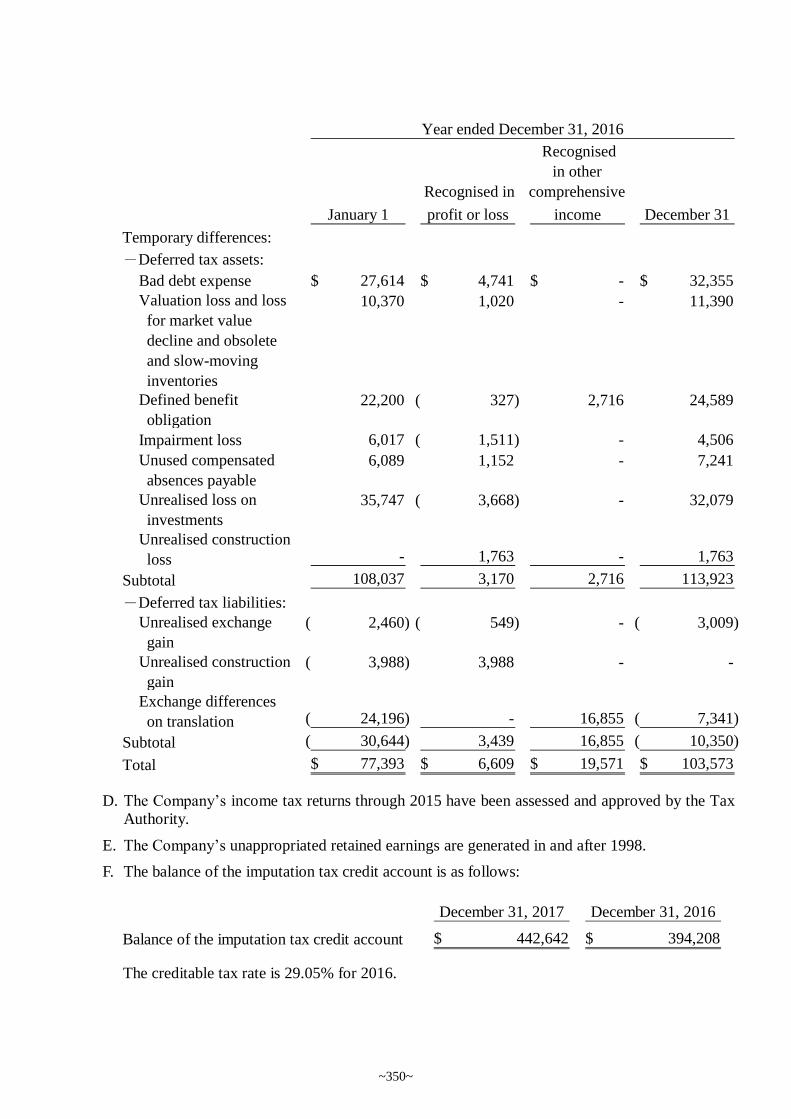
D. The Company’s income tax returns through 2015 have been assessed and approved by the Tax
Authority.
E. The Company’s unappropriated retained earnings are generated in and after 1998.
F. The balance of the imputation tax credit account is as follows:
The creditable tax rate is 29.05% for 2016.
Recognised in
Recognised
in other
comprehensive
January 1 profit or loss income December 31
Temporary differences:
-Deferred tax assets:
Bad debt expense 27,614$ 4,741$ -$ 32,355$
Valuation loss and loss
for market value
decline and obsolete
and slow-moving
inventories
10,370 1,020 - 11,390
Defined benefit
obligation
22,200 327)( 2,716 24,589
Impairment loss 6,017 1,511)( - 4,506
Unused compensated
absences payable
6,089 1,152 - 7,241
Unrealised loss on
investments
35,747 3,668)( - 32,079
Unrealised construction
loss - 1,763 - 1,763
Subtotal 108,037 3,170 2,716 113,923
-Deferred tax liabilities:
Unrealised exchange
gain
2,460)( 549)( - 3,009)(
Unrealised construction
gain
3,988)( 3,988 - -
Exchange differences
on translation 24,196)( - 16,855 7,341)(
Subtotal 30,644)( 3,439 16,855 10,350)(
Total 77,393$ 6,609$ 19,571$ 103,573$
Year ended December 31, 2016
December 31, 2017 December 31, 2016
Balance of the imputation tax credit account 442,642$ 394,208$
~350~
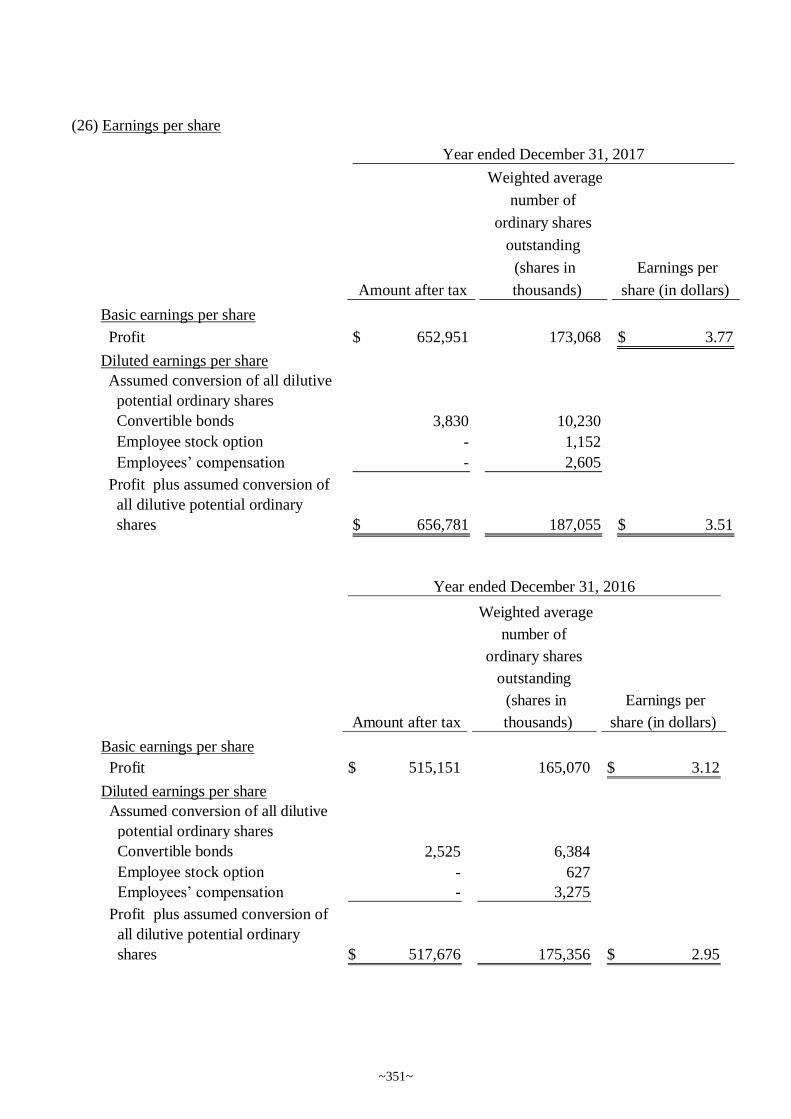
(26) Earnings per share
Amount after tax
Weighted average
number of
ordinary shares
outstanding
(shares in
thousands)
Earnings per
share (in dollars)
Basic earnings per share
Profit 652,951$ 173,068 3.77$
Diluted earnings per share
Assumed conversion of all dilutive
potential ordinary shares
Convertible bonds 3,830 10,230
Employee stock option - 1,152
Employees’ compensation - 2,605
Profit plus assumed conversion of
all dilutive potential ordinary
shares 656,781$ 187,055 3.51$
Year ended December 31, 2017
Amount after tax
Weighted average
number of
ordinary shares
outstanding
(shares in
thousands)
Earnings per
share (in dollars)
Basic earnings per share
Profit 515,151$ 165,070 3.12$
Diluted earnings per share
Assumed conversion of all dilutive
potential ordinary shares
Convertible bonds 2,525 6,384
Employee stock option - 627
Employees’ compensation - 3,275
Profit plus assumed conversion of
all dilutive potential ordinary
shares 517,676$ 175,356 2.95$
Year ended December 31, 2016
~351~
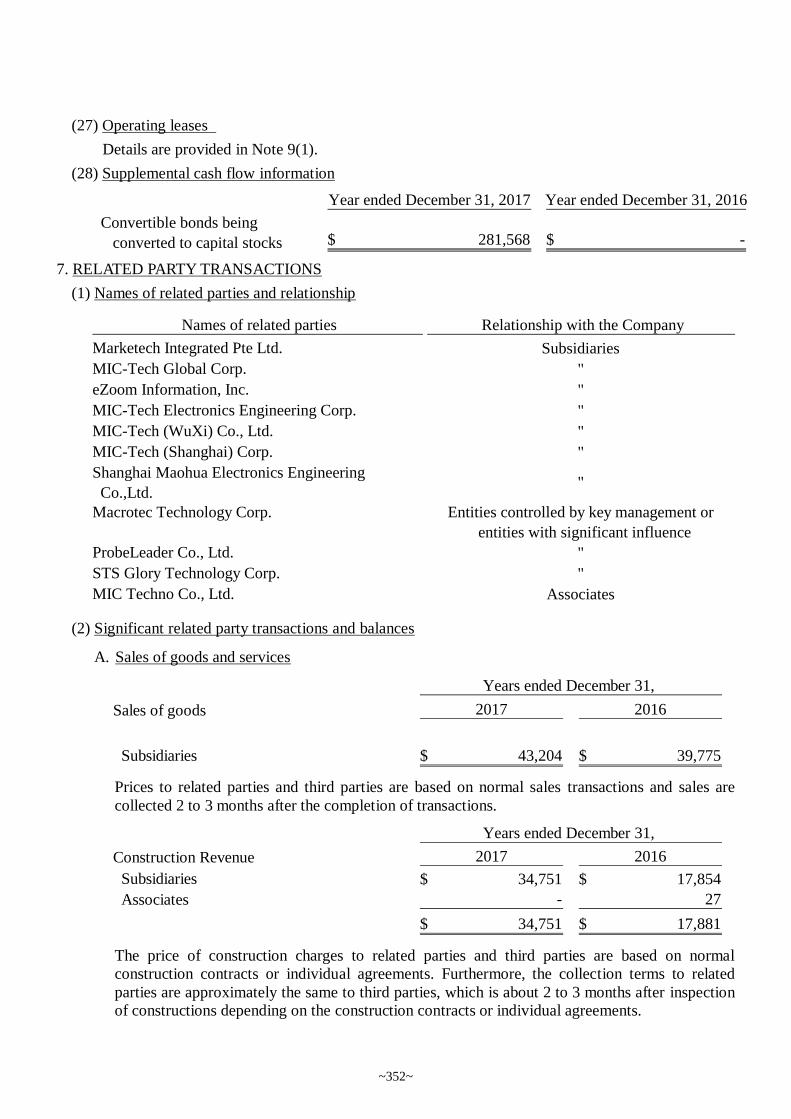
(27) Operating leases
Details are provided in Note 9(1).
(28) Supplemental cash flow information
7. RELATED PARTY TRANSACTIONS
(1) Names of related parties and relationship
(2) Significant related party transactions and balances
A. Sales of goods and services
Prices to related parties and third parties are based on normal sales transactions and sales are
collected 2 to 3 months after the completion of transactions.
The price of construction charges to related parties and third parties are based on normal
construction contracts or individual agreements. Furthermore, the collection terms to related
parties are approximately the same to third parties, which is about 2 to 3 months after inspection
of constructions depending on the construction contracts or individual agreements.
Year ended December 31, 2017 Year ended December 31, 2016
Convertible bonds being
converted to capital stocks 281,568$ -$
Names of related parties Relationship with the Company
Marketech Integrated Pte Ltd. Subsidiaries
MIC-Tech Global Corp. "
eZoom Information, Inc. "
MIC-Tech Electronics Engineering Corp. "
MIC-Tech (WuXi) Co., Ltd. "
MIC-Tech (Shanghai) Corp. "
Shanghai Maohua Electronics Engineering
Co.,Ltd."
Macrotec Technology Corp. Entities controlled by key management or
entities with significant influence
ProbeLeader Co., Ltd. "
STS Glory Technology Corp. "
MIC Techno Co., Ltd. Associates
Sales of goods 2017 2016
Subsidiaries 43,204$ 39,775$
Years ended December 31,
Construction Revenue 2017 2016
Subsidiaries 34,751$ 17,854$
Associates - 27
34,751$ 17,881$
Years ended December 31,
~352~
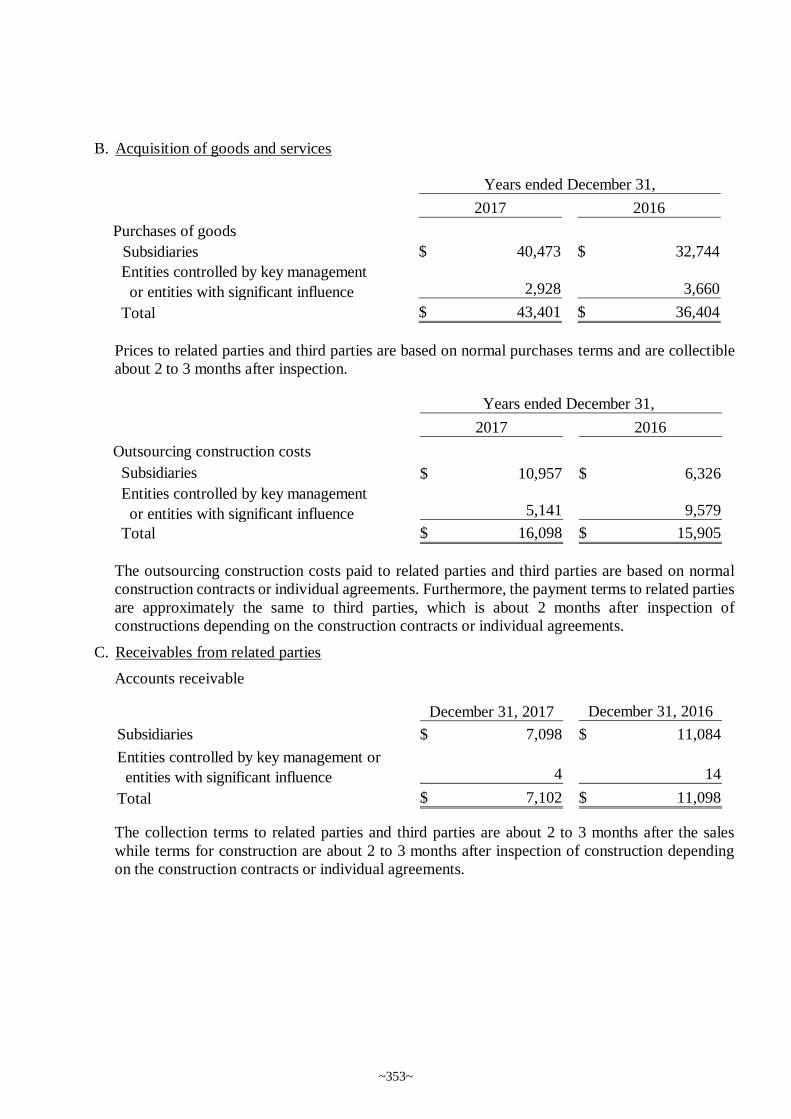
B. Acquisition of goods and services
Prices to related parties and third parties are based on normal purchases terms and are collectible
about 2 to 3 months after inspection.
The outsourcing construction costs paid to related parties and third parties are based on normal
construction contracts or individual agreements. Furthermore, the payment terms to related parties
are approximately the same to third parties, which is about 2 months after inspection of
constructions depending on the construction contracts or individual agreements.
C. Receivables from related parties
Accounts receivable
The collection terms to related parties and third parties are about 2 to 3 months after the sales
while terms for construction are about 2 to 3 months after inspection of construction depending
on the construction contracts or individual agreements.
2017 2016
Purchases of goods
Subsidiaries 40,473$ 32,744$
Entities controlled by key management
or entities with significant influence 2,928 3,660
Total 43,401$ 36,404$
Years ended December 31,
2017 2016
Outsourcing construction costs
Subsidiaries 10,957$ 6,326$
Entities controlled by key management
or entities with significant influence 5,141 9,579
Total 16,098$ 15,905$
Years ended December 31,
December 31, 2017 December 31, 2016
Subsidiaries 7,098$ 11,084$
Entities controlled by key management or
entities with significant influence 4 14
Total 7,102$ 11,098$
~353~
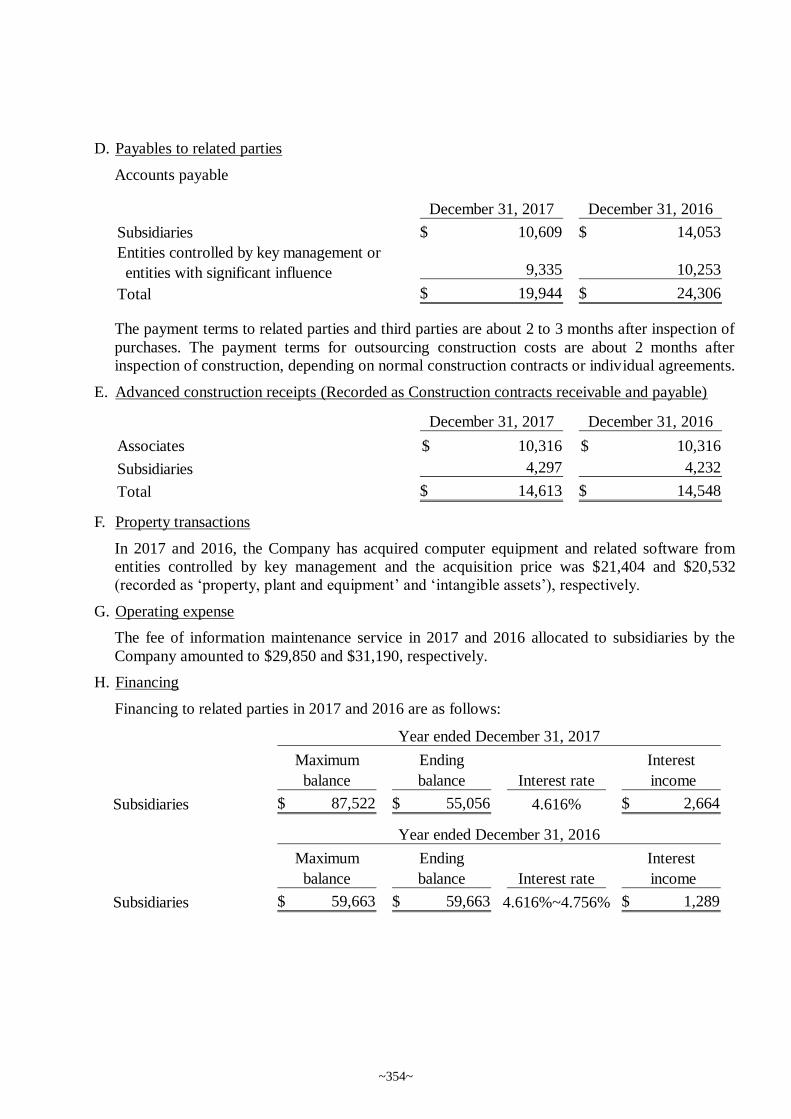
D. Payables to related parties
Accounts payable
The payment terms to related parties and third parties are about 2 to 3 months after inspection of
purchases. The payment terms for outsourcing construction costs are about 2 months after
inspection of construction, depending on normal construction contracts or individual agreements.
E. Advanced construction receipts (Recorded as Construction contracts receivable and payable)
F. Property transactions
In 2017 and 2016, the Company has acquired computer equipment and related software from
entities controlled by key management and the acquisition price was $21,404 and $20,532
(recorded as ‘property, plant and equipment’ and ‘intangible assets’), respectively.
G. Operating expense
The fee of information maintenance service in 2017 and 2016 allocated to subsidiaries by the
Company amounted to $29,850 and $31,190, respectively.
H. Financing
Financing to related parties in 2017 and 2016 are as follows:
December 31, 2017 December 31, 2016
Subsidiaries 10,609$ 14,053$
Entities controlled by key management or
entities with significant influence 9,335 10,253
Total 19,944$ 24,306$
December 31, 2017 December 31, 2016
Associates 10,316$ 10,316$
Subsidiaries 4,297 4,232
Total 14,613$ 14,548$
Maximum Ending Interest
balance balance Interest rate income
Subsidiaries 87,522$ 55,056$ 4.616% 2,664$
Year ended December 31, 2017
Maximum Ending Interest
balance balance Interest rate income
Subsidiaries 59,663$ 59,663$ 4.616%~4.756% 1,289$
Year ended December 31, 2016
~354~
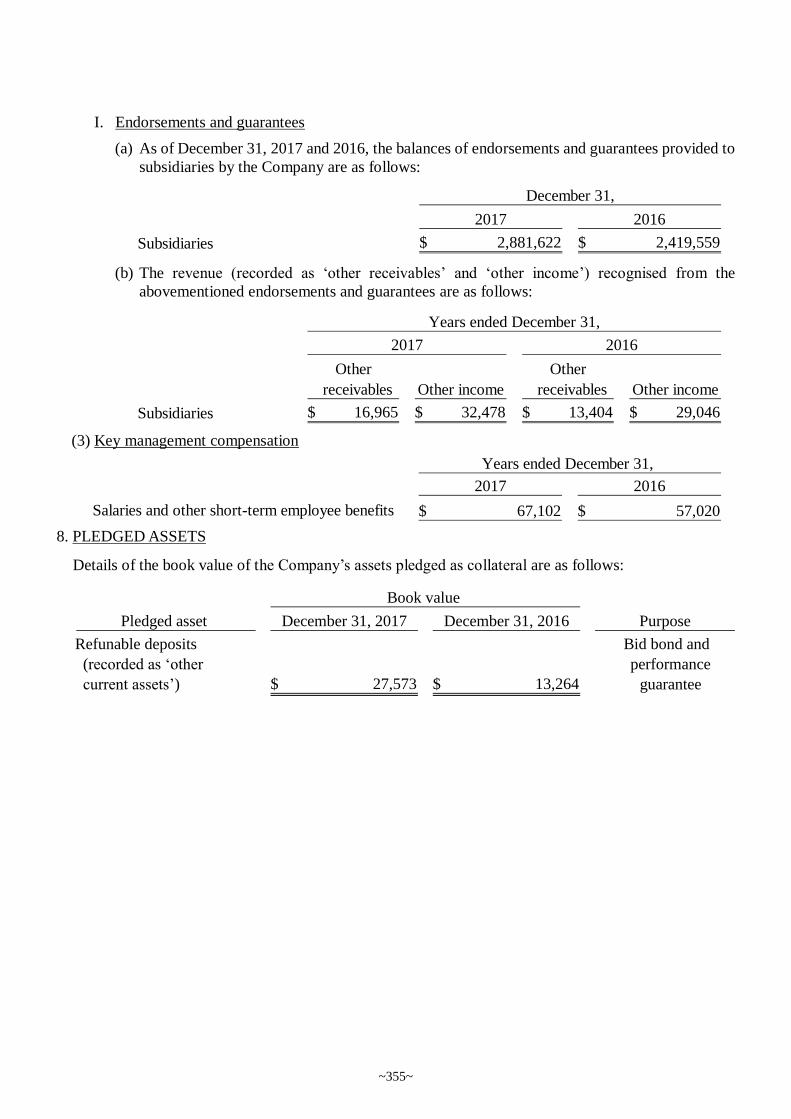
I. Endorsements and guarantees
(a) As of December 31, 2017 and 2016, the balances of endorsements and guarantees provided to
subsidiaries by the Company are as follows:
(b) The revenue (recorded as ‘other receivables’ and ‘other income’) recognised from the
abovementioned endorsements and guarantees are as follows:
(3) Key management compensation
8. PLEDGED ASSETS
Details of the book value of the Company’s assets pledged as collateral are as follows:
2017 2016
Subsidiaries 2,881,622$ 2,419,559$
December 31,
Other Other
receivables Other income receivables Other income
Subsidiaries 16,965$ 32,478$ 13,404$ 29,046$
Years ended December 31,
2017 2016
2017 2016
Salaries and other short-term employee benefits 67,102$ 57,020$
Years ended December 31,
Pledged asset December 31, 2017 December 31, 2016 Purpose
Refunable deposits
(recorded as ‘other
current assets’) 27,573$ 13,264$
Bid bond and
performance
guarantee
Book value
~355~
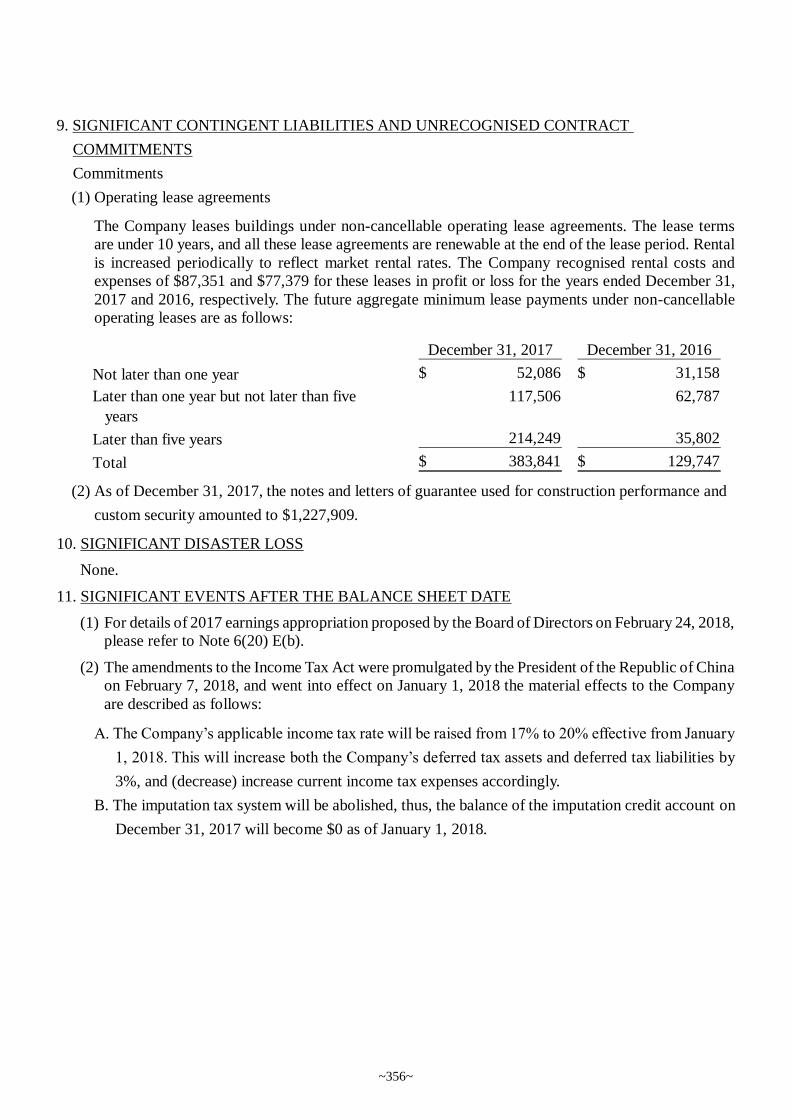
9. SIGNIFICANT CONTINGENT LIABILITIES AND UNRECOGNISED CONTRACT
COMMITMENTS
Commitments
(1) Operating lease agreements
The Company leases buildings under non-cancellable operating lease agreements. The lease terms
are under 10 years, and all these lease agreements are renewable at the end of the lease period. Rental
is increased periodically to reflect market rental rates. The Company recognised rental costs and
expenses of $87,351 and $77,379 for these leases in profit or loss for the years ended December 31,
2017 and 2016, respectively. The future aggregate minimum lease payments under non-cancellable
operating leases are as follows:
(2) As of December 31, 2017, the notes and letters of guarantee used for construction performance and
custom security amounted to $1,227,909.
10. SIGNIFICANT DISASTER LOSS
None.
11. SIGNIFICANT EVENTS AFTER THE BALANCE SHEET DATE
(1) For details of 2017 earnings appropriation proposed by the Board of Directors on February 24, 2018,
please refer to Note 6(20) E(b).
(2) The amendments to the Income Tax Act were promulgated by the President of the Republic of China
on February 7, 2018, and went into effect on January 1, 2018 the material effects to the Company
are described as follows:
A. The Company’s applicable income tax rate will be raised from 17% to 20% effective from January
1, 2018. This will increase both the Company’s deferred tax assets and deferred tax liabilities by
3%, and (decrease) increase current income tax expenses accordingly.
B. The imputation tax system will be abolished, thus, the balance of the imputation credit account on
December 31, 2017 will become $0 as of January 1, 2018.
December 31, 2017 December 31, 2016
Not later than one year 52,086$ 31,158$
Later than one year but not later than five
years
117,506 62,787
Later than five years 214,249 35,802
Total 383,841$ 129,747$
~356~
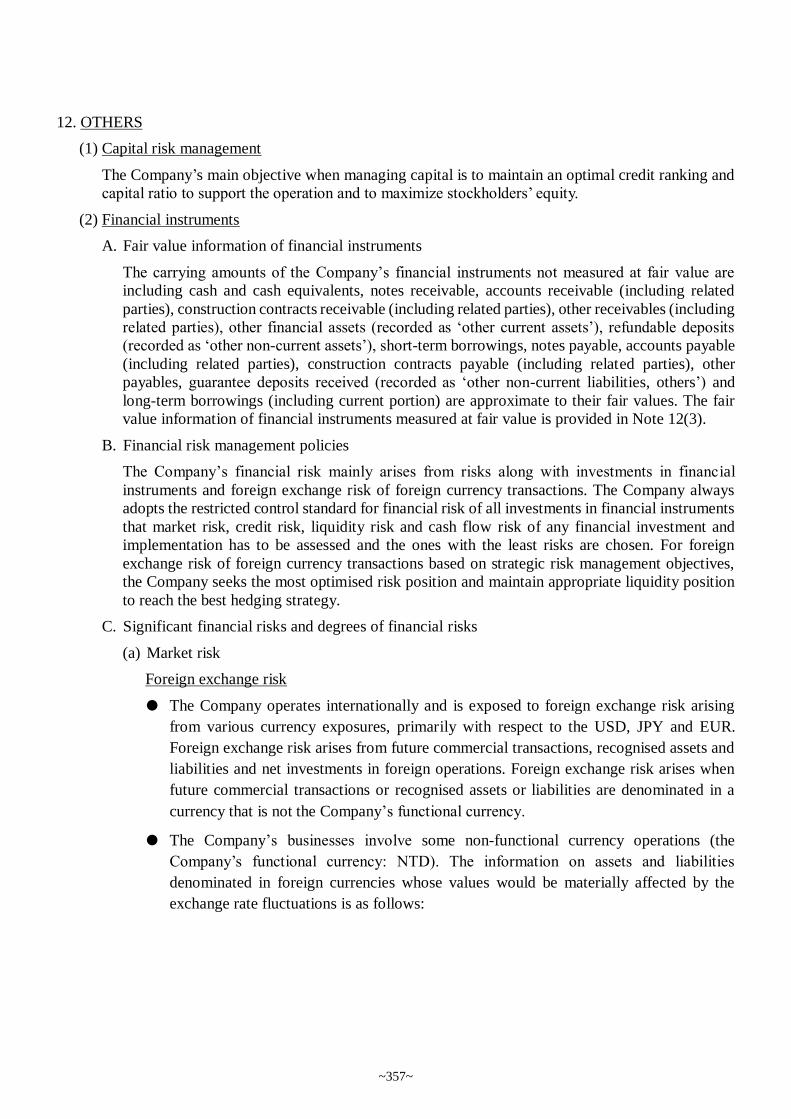
12. OTHERS
(1) Capital risk management
The Company’s main objective when managing capital is to maintain an optimal credit ranking and
capital ratio to support the operation and to maximize stockholders’ equity.
(2) Financial instruments
A. Fair value information of financial instruments
The carrying amounts of the Company’s financial instruments not measured at fair value are
including cash and cash equivalents, notes receivable, accounts receivable (including related
parties), construction contracts receivable (including related parties), other receivables (including
related parties), other financial assets (recorded as ‘other current assets’), refundable deposits
(recorded as ‘other non-current assets’), short-term borrowings, notes payable, accounts payable
(including related parties), construction contracts payable (including related parties), other
payables, guarantee deposits received (recorded as ‘other non-current liabilities, others’) and
long-term borrowings (including current portion) are approximate to their fair values. The fair
value information of financial instruments measured at fair value is provided in Note 12(3).
B. Financial risk management policies
The Company’s financial risk mainly arises from risks along with investments in financial
instruments and foreign exchange risk of foreign currency transactions. The Company always
adopts the restricted control standard for financial risk of all investments in financial instruments
that market risk, credit risk, liquidity risk and cash flow risk of any financial investment and
implementation has to be assessed and the ones with the least risks are chosen. For foreign
exchange risk of foreign currency transactions based on strategic risk management objectives,
the Company seeks the most optimised risk position and maintain appropriate liquidity position
to reach the best hedging strategy.
C. Significant financial risks and degrees of financial risks
(a) Market risk
Foreign exchange risk
The Company operates internationally and is exposed to foreign exchange risk arising
from various currency exposures, primarily with respect to the USD, JPY and EUR.
Foreign exchange risk arises from future commercial transactions, recognised assets and
liabilities and net investments in foreign operations. Foreign exchange risk arises when
future commercial transactions or recognised assets or liabilities are denominated in a
currency that is not the Company’s functional currency.
The Company’s businesses involve some non-functional currency operations (the
Company’s functional currency: NTD). The information on assets and liabilities
denominated in foreign currencies whose values would be materially affected by the
exchange rate fluctuations is as follows:
~357~
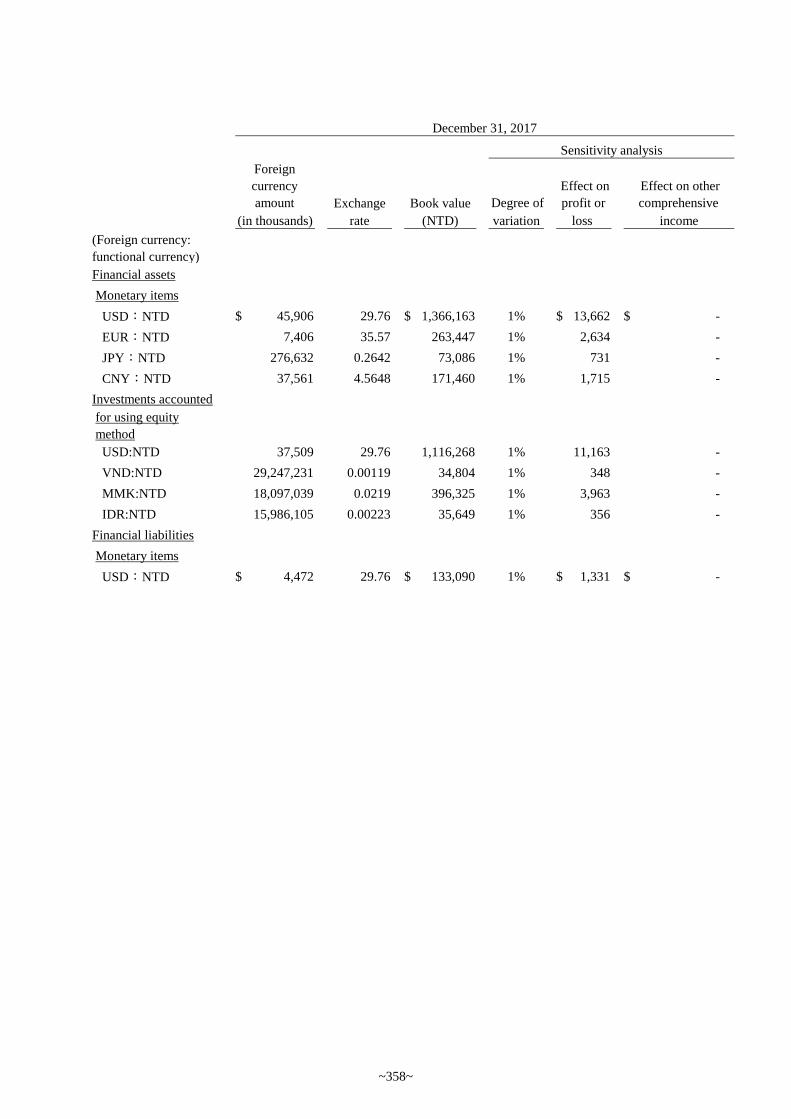
Foreign
currency
amount Exchange Book value Degree of
Effect on
profit or
Effect on other
comprehensive
(in thousands) rate (NTD) variation loss income
(Foreign currency:
functional currency)
Financial assets
Monetary items
USD:NTD 45,906$ 29.76 1,366,163$ 1% 13,662$ -$
EUR:NTD 7,406 35.57 263,447 1% 2,634 -
JPY:NTD 276,632 0.2642 73,086 1% 731 -
CNY:NTD 37,561 4.5648 171,460 1% 1,715 -
Investments accounted
for using equity
method
USD:NTD 37,509 29.76 1,116,268 1% 11,163 -
VND:NTD 29,247,231 0.00119 34,804 1% 348 -
MMK:NTD 18,097,039 0.0219 396,325 1% 3,963 -
IDR:NTD 15,986,105 0.00223 35,649 1% 356 -
Financial liabilities
Monetary items
USD:NTD 4,472$ 29.76 133,090$ 1% 1,331$ -$
December 31, 2017
Sensitivity analysis
~358~
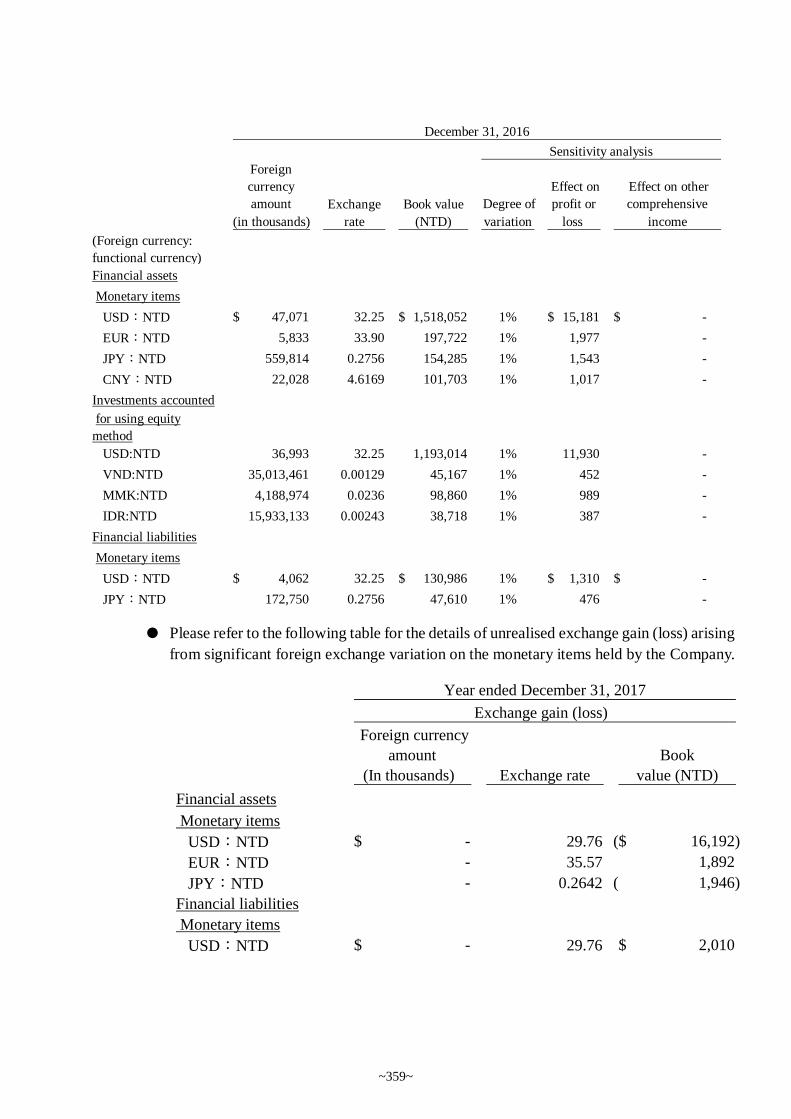
Please refer to the following table for the details of unrealised exchange gain (loss) arising
from significant foreign exchange variation on the monetary items held by the Company.
Foreign
currency
amount Exchange Book value Degree of
Effect on
profit or
Effect on other
comprehensive
(in thousands) rate (NTD) variation loss income
(Foreign currency:
functional currency)
Financial assets
Monetary items
USD:NTD 47,071$ 32.25 1,518,052$ 1% 15,181$ -$
EUR:NTD 5,833 33.90 197,722 1% 1,977 -
JPY:NTD 559,814 0.2756 154,285 1% 1,543 -
CNY:NTD 22,028 4.6169 101,703 1% 1,017 -
Investments accounted
for using equity
method
USD:NTD 36,993 32.25 1,193,014 1% 11,930 -
VND:NTD 35,013,461 0.00129 45,167 1% 452 -
MMK:NTD 4,188,974 0.0236 98,860 1% 989 -
IDR:NTD 15,933,133 0.00243 38,718 1% 387 -
Financial liabilities
Monetary items
USD:NTD 4,062$ 32.25 130,986$ 1% 1,310$ -$
JPY:NTD 172,750 0.2756 47,610 1% 476 -
December 31, 2016
Sensitivity analysis
Foreign currency
amount Book
(In thousands) Exchange rate value (NTD)
Financial assets
Monetary items
USD:NTD -$ 29.76 16,192)($
EUR:NTD - 35.57 1,892
JPY:NTD - 0.2642 1,946)(
Financial liabilities
Monetary items
USD:NTD -$ 29.76 2,010$
Year ended December 31, 2017
Exchange gain (loss)
~359~
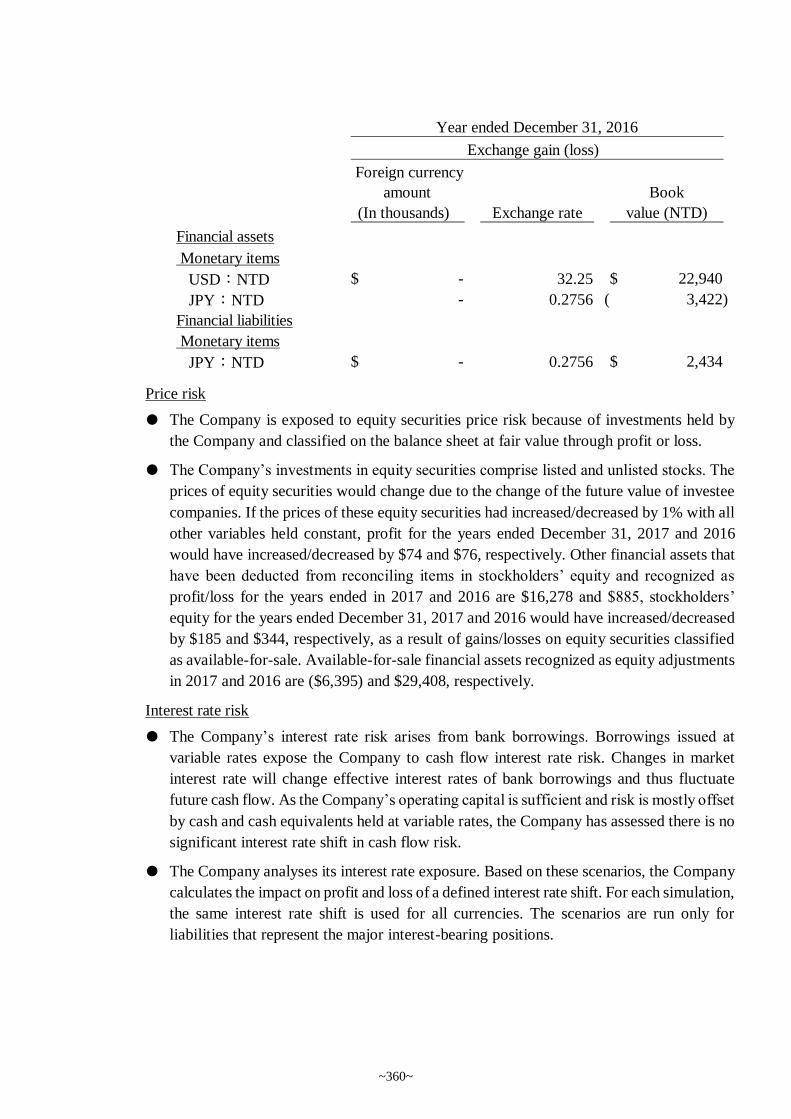
Price risk
The Company is exposed to equity securities price risk because of investments held by
the Company and classified on the balance sheet at fair value through profit or loss.
The Company’s investments in equity securities comprise listed and unlisted stocks. The
prices of equity securities would change due to the change of the future value of investee
companies. If the prices of these equity securities had increased/decreased by 1% with all
other variables held constant, profit for the years ended December 31, 2017 and 2016
would have increased/decreased by $74 and $76, respectively. Other financial assets that
have been deducted from reconciling items in stockholders’ equity and recognized as
profit/loss for the years ended in 2017 and 2016 are $16,278 and $885, stockholders’
equity for the years ended December 31, 2017 and 2016 would have increased/decreased
by $185 and $344, respectively, as a result of gains/losses on equity securities classified
as available-for-sale. Available-for-sale financial assets recognized as equity adjustments
in 2017 and 2016 are ($6,395) and $29,408, respectively.
Interest rate risk
The Company’s interest rate risk arises from bank borrowings. Borrowings issued at
variable rates expose the Company to cash flow interest rate risk. Changes in market
interest rate will change effective interest rates of bank borrowings and thus fluctuate
future cash flow. As the Company’s operating capital is sufficient and risk is mostly offset
by cash and cash equivalents held at variable rates, the Company has assessed there is no
significant interest rate shift in cash flow risk.
The Company analyses its interest rate exposure. Based on these scenarios, the Company
calculates the impact on profit and loss of a defined interest rate shift. For each simulation,
the same interest rate shift is used for all currencies. The scenarios are run only for
liabilities that represent the major interest-bearing positions.
Foreign currency
amount Book
(In thousands) Exchange rate value (NTD)
Financial assets
Monetary items
USD:NTD -$ 32.25 22,940$
JPY:NTD - 0.2756 3,422)(
Financial liabilities
Monetary items
JPY:NTD -$ 0.2756 2,434$
Year ended December 31, 2016
Exchange gain (loss)
~360~
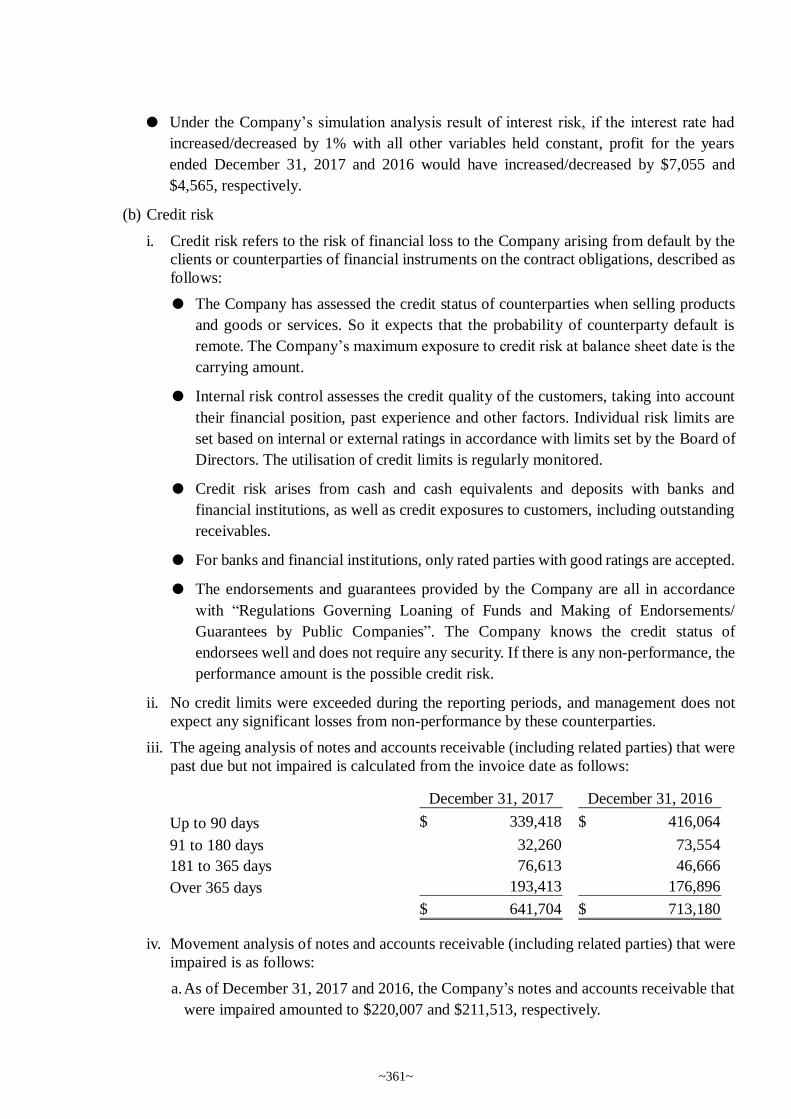
Under the Company’s simulation analysis result of interest risk, if the interest rate had
increased/decreased by 1% with all other variables held constant, profit for the years
ended December 31, 2017 and 2016 would have increased/decreased by $7,055 and
$4,565, respectively.
(b) Credit risk
i. Credit risk refers to the risk of financial loss to the Company arising from default by the
clients or counterparties of financial instruments on the contract obligations, described as
follows:
The Company has assessed the credit status of counterparties when selling products
and goods or services. So it expects that the probability of counterparty default is
remote. The Company’s maximum exposure to credit risk at balance sheet date is the
carrying amount.
Internal risk control assesses the credit quality of the customers, taking into account
their financial position, past experience and other factors. Individual risk limits are
set based on internal or external ratings in accordance with limits set by the Board of
Directors. The utilisation of credit limits is regularly monitored.
Credit risk arises from cash and cash equivalents and deposits with banks and
financial institutions, as well as credit exposures to customers, including outstanding
receivables.
For banks and financial institutions, only rated parties with good ratings are accepted.
The endorsements and guarantees provided by the Company are all in accordance
with “Regulations Governing Loaning of Funds and Making of Endorsements/
Guarantees by Public Companies”. The Company knows the credit status of
endorsees well and does not require any security. If there is any non-performance, the
performance amount is the possible credit risk.
ii. No credit limits were exceeded during the reporting periods, and management does not
expect any significant losses from non-performance by these counterparties.
iii. The ageing analysis of notes and accounts receivable (including related parties) that were
past due but not impaired is calculated from the invoice date as follows:
iv. Movement analysis of notes and accounts receivable (including related parties) that were
impaired is as follows:
a. As of December 31, 2017 and 2016, the Company’s notes and accounts receivable that
were impaired amounted to $220,007 and $211,513, respectively.
December 31, 2017 December 31, 2016
Up to 90 days 339,418$ 416,064$
91 to 180 days 32,260 73,554
181 to 365 days 76,613 46,666
Over 365 days 193,413 176,896
641,704$ 713,180$
~361~
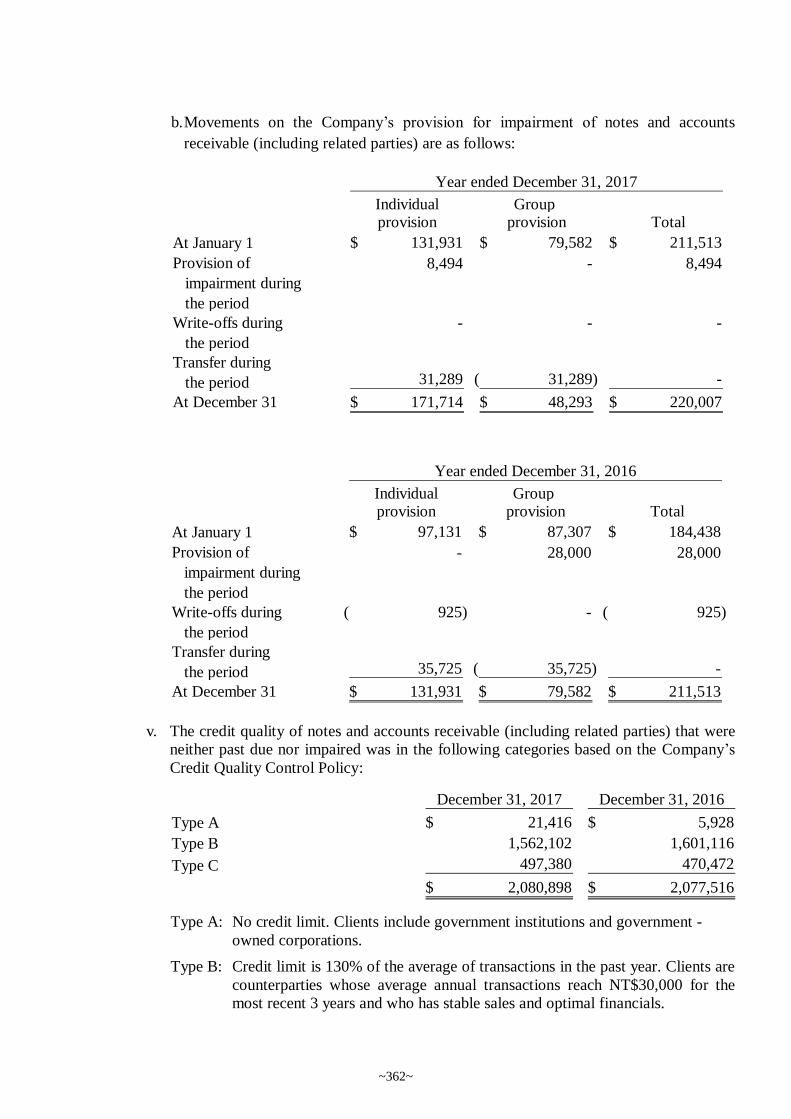
b. Movements on the Company’s provision for impairment of notes and accounts
receivable (including related parties) are as follows:
v. The credit quality of notes and accounts receivable (including related parties) that were
neither past due nor impaired was in the following categories based on the Company’s
Credit Quality Control Policy:
Type A: No credit limit. Clients include government institutions and government -
owned corporations.
Type B: Credit limit is 130% of the average of transactions in the past year. Clients are
counterparties whose average annual transactions reach NT$30,000 for the
most recent 3 years and who has stable sales and optimal financials.
Individual Group provision provision Total
At January 1 131,931$ 79,582$ 211,513$
Provision of
impairment during
the period
8,494 - 8,494
Write-offs during
the period
- - -
Transfer during
the period 31,289 31,289)( -
At December 31 171,714$ 48,293$ 220,007$
Year ended December 31, 2017
Individual Group provision provision Total
At January 1 97,131$ 87,307$ 184,438$
Provision of
impairment during
the period
- 28,000 28,000
Write-offs during
the period
925)( - 925)(
Transfer during
the period 35,725 35,725)( -
At December 31 131,931$ 79,582$ 211,513$
Year ended December 31, 2016
December 31, 2017 December 31, 2016
Type A 21,416$ 5,928$
Type B 1,562,102 1,601,116
Type C 497,380 470,472
2,080,898$ 2,077,516$
~362~
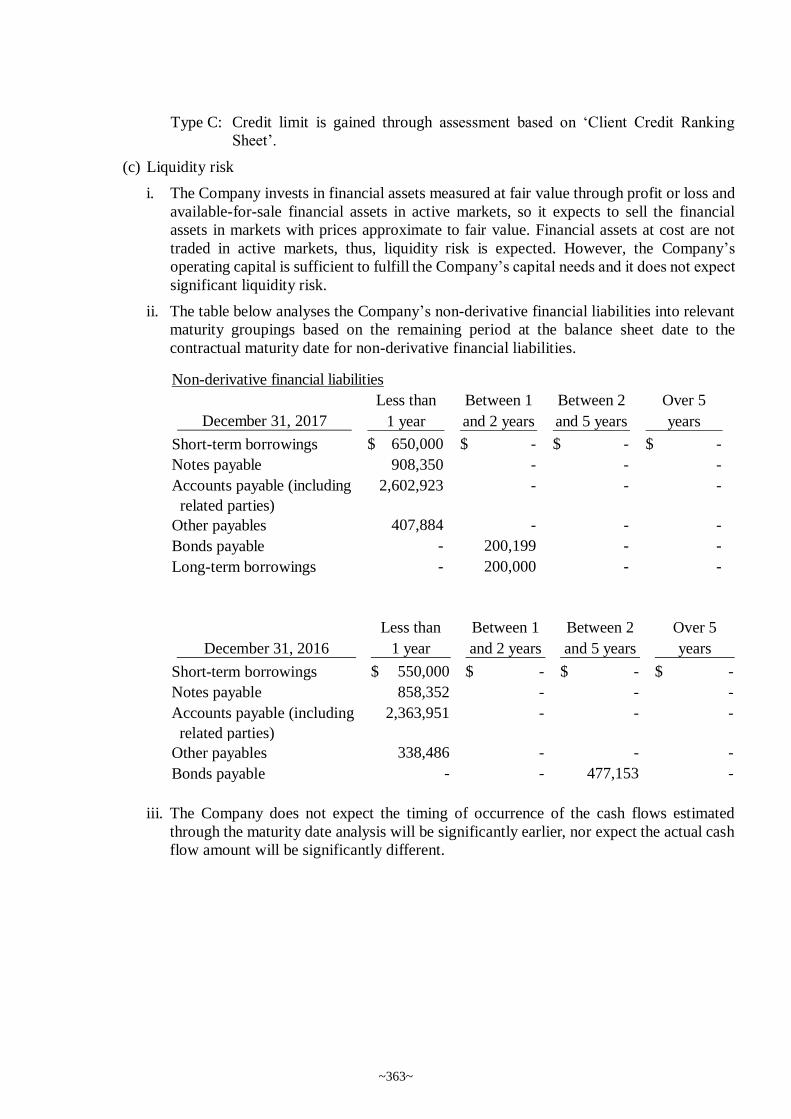
Type C: Credit limit is gained through assessment based on ‘Client Credit Ranking
Sheet’.
(c) Liquidity risk
i. The Company invests in financial assets measured at fair value through profit or loss and
available-for-sale financial assets in active markets, so it expects to sell the financial
assets in markets with prices approximate to fair value. Financial assets at cost are not
traded in active markets, thus, liquidity risk is expected. However, the Company’s
operating capital is sufficient to fulfill the Company’s capital needs and it does not expect
significant liquidity risk.
ii. The table below analyses the Company’s non-derivative financial liabilities into relevant
maturity groupings based on the remaining period at the balance sheet date to the
contractual maturity date for non-derivative financial liabilities.
iii. The Company does not expect the timing of occurrence of the cash flows estimated
through the maturity date analysis will be significantly earlier, nor expect the actual cash
flow amount will be significantly different.
Non-derivative financial liabilities
Less than Between 1 Between 2 Over 5
December 31, 2017 1 year and 2 years and 5 years years
Short-term borrowings 650,000$ -$ -$ -$
Notes payable 908,350 - - -
Accounts payable (including
related parties)
2,602,923 - - -
Other payables 407,884 - - -
Bonds payable - 200,199 - -
Long-term borrowings - 200,000 - -
Less than Between 1 Between 2 Over 5
December 31, 2016 1 year and 2 years and 5 years years
Short-term borrowings 550,000$ -$ -$ -$
Notes payable 858,352 - - -
Accounts payable (including
related parties)
2,363,951 - - -
Other payables 338,486 - - -
Bonds payable - - 477,153 -
~363~
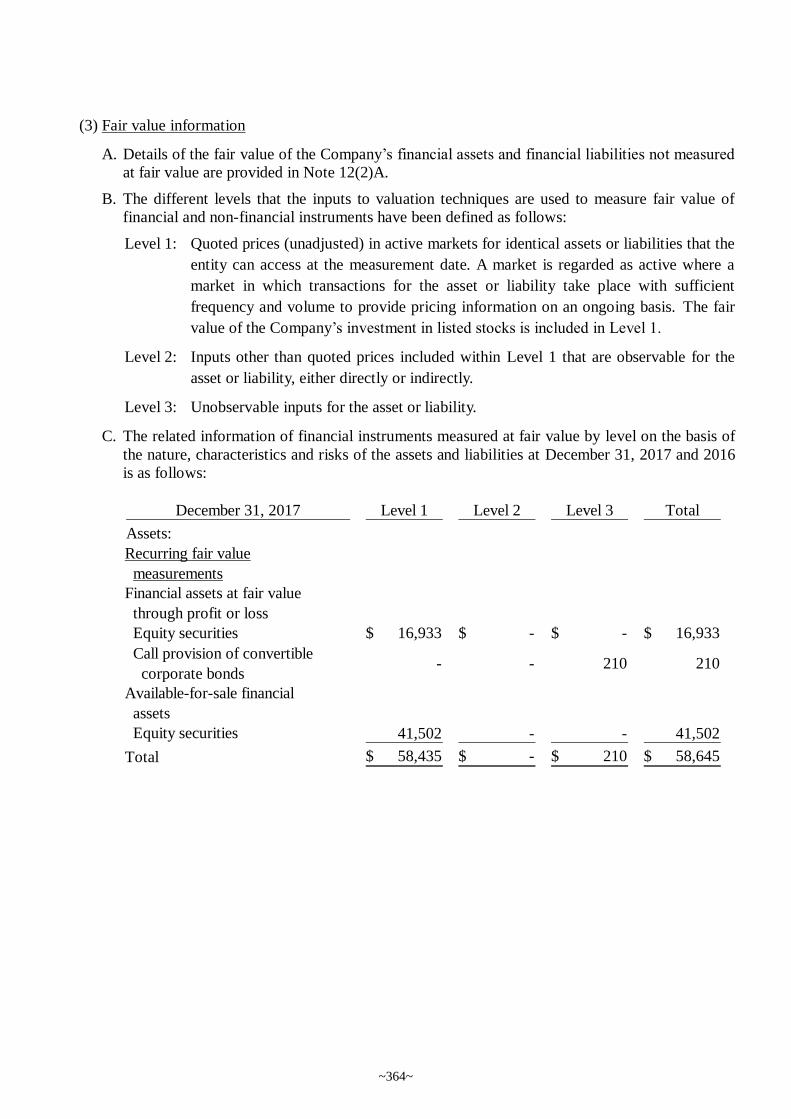
(3) Fair value information
A. Details of the fair value of the Company’s financial assets and financial liabilities not measured
at fair value are provided in Note 12(2)A.
B. The different levels that the inputs to valuation techniques are used to measure fair value of
financial and non-financial instruments have been defined as follows:
Level 1: Quoted prices (unadjusted) in active markets for identical assets or liabilities that the
entity can access at the measurement date. A market is regarded as active where a
market in which transactions for the asset or liability take place with sufficient
frequency and volume to provide pricing information on an ongoing basis. The fair
value of the Company’s investment in listed stocks is included in Level 1.
Level 2: Inputs other than quoted prices included within Level 1 that are observable for the
asset or liability, either directly or indirectly.
Level 3: Unobservable inputs for the asset or liability.
C. The related information of financial instruments measured at fair value by level on the basis of
the nature, characteristics and risks of the assets and liabilities at December 31, 2017 and 2016
is as follows:
December 31, 2017 Level 1 Level 2 Level 3 Total
Assets:
Recurring fair value
measurements
Financial assets at fair value
through profit or loss
Equity securities 16,933$ -$ -$ 16,933$
Call provision of convertible
corporate bonds- - 210 210
Available-for-sale financial
assets
Equity securities 41,502 - - 41,502
Total 58,435$ -$ 210$ 58,645$
~364~
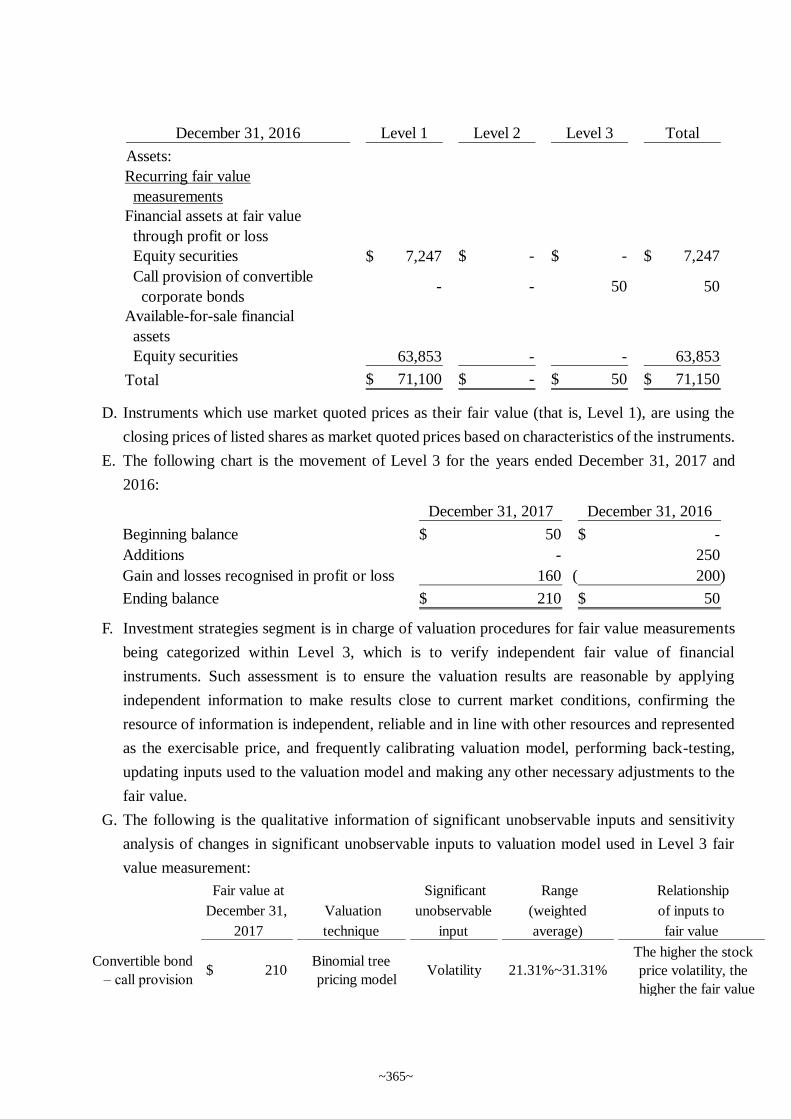
D. Instruments which use market quoted prices as their fair value (that is, Level 1), are using the
closing prices of listed shares as market quoted prices based on characteristics of the instruments.
E. The following chart is the movement of Level 3 for the years ended December 31, 2017 and
2016:
F. Investment strategies segment is in charge of valuation procedures for fair value measurements
being categorized within Level 3, which is to verify independent fair value of financial
instruments. Such assessment is to ensure the valuation results are reasonable by applying
independent information to make results close to current market conditions, confirming the
resource of information is independent, reliable and in line with other resources and represented
as the exercisable price, and frequently calibrating valuation model, performing back-testing,
updating inputs used to the valuation model and making any other necessary adjustments to the
fair value.
G. The following is the qualitative information of significant unobservable inputs and sensitivity
analysis of changes in significant unobservable inputs to valuation model used in Level 3 fair
value measurement:
December 31, 2016 Level 1 Level 2 Level 3 Total
Assets:
Recurring fair value
measurements
Financial assets at fair value
through profit or loss
Equity securities 7,247$ -$ -$ 7,247$
Call provision of convertible
corporate bonds- - 50 50
Available-for-sale financial
assets
Equity securities 63,853 - - 63,853
Total 71,100$ -$ 50$ 71,150$
December 31, 2017 December 31, 2016
Beginning balance 50$ -$
Additions - 250
Gain and losses recognised in profit or loss 160 200)(
Ending balance 210$ 50$
Fair value at
December 31,
2017
Valuation
technique
Significant
unobservable
input
Range
(weighted
average)
Relationship
of inputs to
fair value
Convertible bond
– call provision210$
Binomial tree
pricing modelVolatility 21.31%~31.31%
The higher the stock
price volatility, the
higher the fair value
~365~
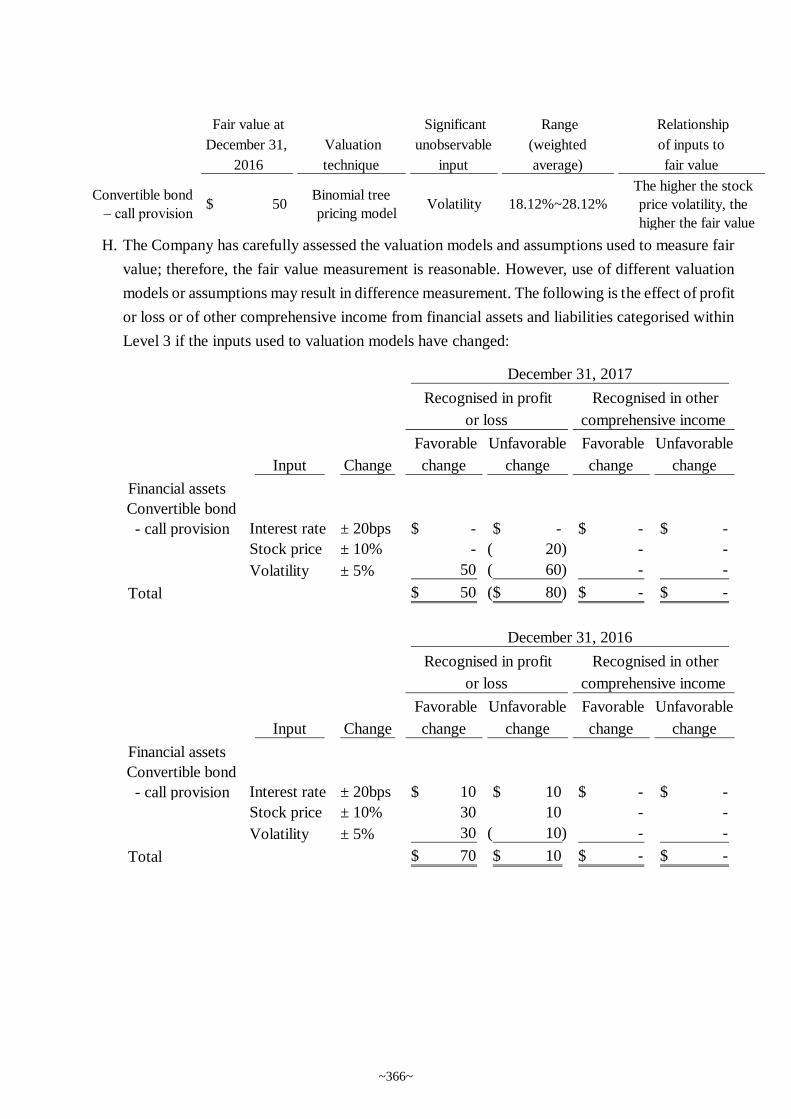
H. The Company has carefully assessed the valuation models and assumptions used to measure fair
value; therefore, the fair value measurement is reasonable. However, use of different valuation
models or assumptions may result in difference measurement. The following is the effect of profit
or loss or of other comprehensive income from financial assets and liabilities categorised within
Level 3 if the inputs used to valuation models have changed:
Fair value at
December 31,
2016
Valuation
technique
Significant
unobservable
input
Range
(weighted
average)
Relationship
of inputs to
fair value
Convertible bond
– call provision50$
Binomial tree
pricing modelVolatility 18.12%~28.12%
The higher the stock
price volatility, the
higher the fair value
Input Change
Favorable
change
Unfavorable
change
Favorable
change
Unfavorable
change
Financial assets
Convertible bond
- call provision Interest rate ± 20bps -$ -$ -$ -$
Stock price ± 10% - 20)( - -
Volatility ± 5% 50 60)( - -
Total 50$ 80)($ -$ -$
Recognised in profit
or loss
Recognised in other
comprehensive income
December 31, 2017
Input Change
Favorable
change
Unfavorable
change
Favorable
change
Unfavorable
change
Financial assets
Convertible bond
- call provision Interest rate ± 20bps 10$ 10$ -$ -$
Stock price ± 10% 30 10 - -
Volatility ± 5% 30 10)( - -
Total 70$ 10$ -$ -$
December 31, 2016
Recognised in profit
or loss
Recognised in other
comprehensive income
~366~
13. SUPPLEMENTARY DISCLOSURES
(1) Significant transactions information
A. Loans to others: Please refer to table 1.
B. Provision of endorsements and guarantees to others: Please refer to table 2.
C. Holding of marketable securities at the end of the period (not including subsidiaries and
associates): Please refer to table 3.
D. Acquisition or sale of the same security with the accumulated cost exceeding NT$300 million or
20% of the Company’s paid-in capital:None.
E. Acquisition of real estate reaching NT$300 million or 20% of paid-in capital or more: None.
F. Disposal of real estate reaching NT$300 million or 20% of paid-in capital or more: None.
G. Purchases or sales of goods from or to related parties reaching NT$100 million or 20% of paid-
in capital or more: None.
H. Receivables from related parties reaching NT$100 million or 20% of paid-in capital or more:
None.
I. Trading in derivative instruments undertaken during the reporting periods: None.
J. Significant inter-company transactions during the reporting periods: Please refer to table 4.
(2) Information on investees
Names, locations and other information of investee companies (not including investees in Mainland
China):Please refer to table 5.
(3) Information on investments in Mainland China
A. Basic information: Please refer to table 6.
B. Significant transactions, either directly or indirectly through a third area, with investee companies
in the Mainland Area: Please refer to table 4.
14. SEGMENT INFORMATION
Not applicable.
~367~
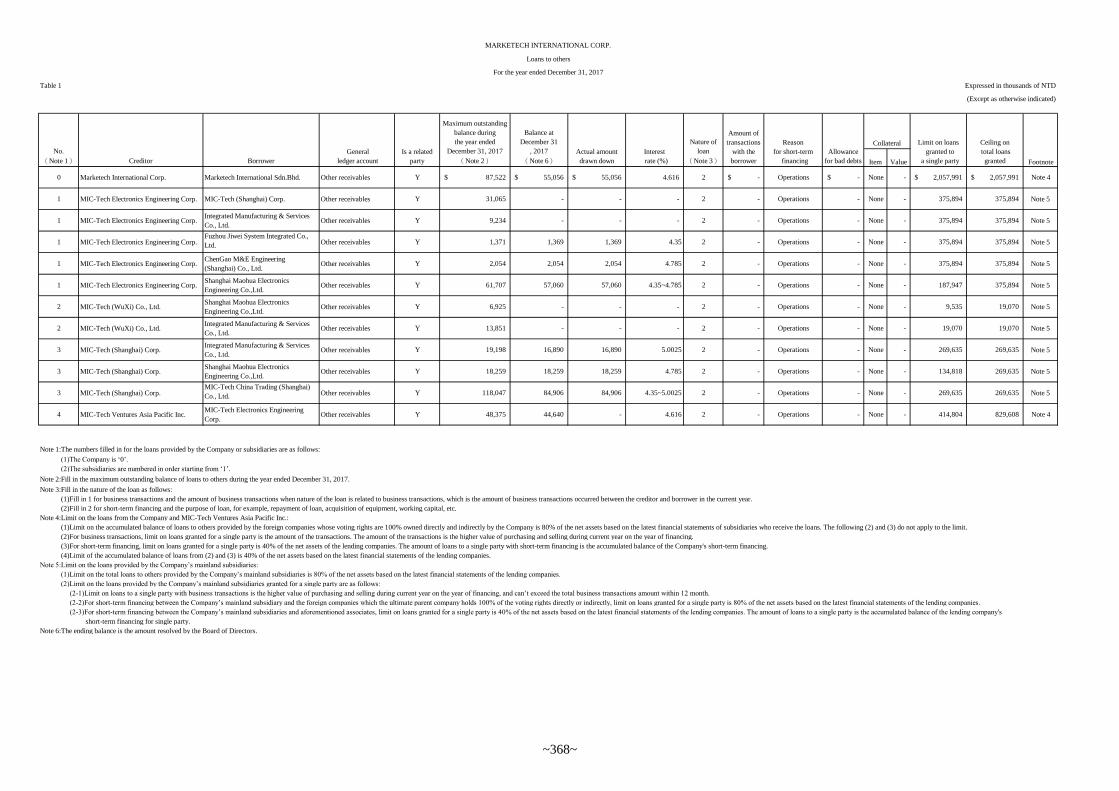
Item Value
0 Marketech International Corp. Marketech International Sdn.Bhd. Other receivables Y 87,522$ 55,056$ 55,056$ 4.616 2 -$ Operations -$ None - 2,057,991$ 2,057,991$ Note 4
1 MIC-Tech Electronics Engineering Corp. MIC-Tech (Shanghai) Corp. Other receivables Y 31,065 - - - 2 - Operations - None - 375,894 375,894 Note 5
1 MIC-Tech Electronics Engineering Corp.Integrated Manufacturing & Services
Co., Ltd.Other receivables Y 9,234 - - - 2 - Operations - None - 375,894 375,894 Note 5
1 MIC-Tech Electronics Engineering Corp.Fuzhou Jiwei System Integrated Co.,
Ltd. Other receivables Y 1,371 1,369 1,369 4.35 2 - Operations - None - 375,894 375,894 Note 5
1 MIC-Tech Electronics Engineering Corp.ChenGao M&E Engineering
(Shanghai) Co., Ltd.Other receivables Y 2,054 2,054 2,054 4.785 2 - Operations - None - 375,894 375,894 Note 5
1 MIC-Tech Electronics Engineering Corp.Shanghai Maohua Electronics
Engineering Co.,Ltd.Other receivables Y 61,707 57,060 57,060 4.35~4.785 2 - Operations - None - 187,947 375,894 Note 5
2 MIC-Tech (WuXi) Co., Ltd.Shanghai Maohua Electronics
Engineering Co.,Ltd.Other receivables Y 6,925 - - - 2 - Operations - None - 9,535 19,070 Note 5
2 MIC-Tech (WuXi) Co., Ltd.Integrated Manufacturing & Services
Co., Ltd.Other receivables Y 13,851 - - - 2 - Operations - None - 19,070 19,070 Note 5
3 MIC-Tech (Shanghai) Corp.Integrated Manufacturing & Services
Co., Ltd.Other receivables Y 19,198 16,890 16,890 5.0025 2 - Operations - None - 269,635 269,635 Note 5
3 MIC-Tech (Shanghai) Corp.Shanghai Maohua Electronics
Engineering Co.,Ltd.Other receivables Y 18,259 18,259 18,259 4.785 2 - Operations - None - 134,818 269,635 Note 5
3 MIC-Tech (Shanghai) Corp.MIC-Tech China Trading (Shanghai)
Co., Ltd. Other receivables Y 118,047 84,906 84,906 4.35~5.0025 2 - Operations - None - 269,635 269,635 Note 5
4 MIC-Tech Ventures Asia Pacific Inc.MIC-Tech Electronics Engineering
Corp.Other receivables Y 48,375 44,640 - 4.616 2 - Operations - None - 414,804 829,608 Note 4
Note 1:The numbers filled in for the loans provided by the Company or subsidiaries are as follows:
(1)The Company is ‘0’.
(2)The subsidiaries are numbered in order starting from ‘1’.
Note 2:Fill in the maximum outstanding balance of loans to others during the year ended December 31, 2017.
Note 3:Fill in the nature of the loan as follows:
(1)Fill in 1 for business transactions and the amount of business transactions when nature of the loan is related to business transactions, which is the amount of business transactions occurred between the creditor and borrower in the current year.
(2)Fill in 2 for short-term financing and the purpose of loan, for example, repayment of loan, acquisition of equipment, working capital, etc.
Note 4:Limit on the loans from the Company and MIC-Tech Ventures Asia Pacific Inc.:
(1)Limit on the accumulated balance of loans to others provided by the foreign companies whose voting rights are 100% owned directly and indirectly by the Company is 80% of the net assets based on the latest financial statements of subsidiaries who receive the loans. The following (2) and (3) do not apply to the limit.
(2)For business transactions, limit on loans granted for a single party is the amount of the transactions. The amount of the transactions is the higher value of purchasing and selling during current year on the year of financing.
(3)For short-term financing, limit on loans granted for a single party is 40% of the net assets of the lending companies. The amount of loans to a single party with short-term financing is the accumulated balance of the Company's short-term financing.
(4)Limit of the accumulated balance of loans from (2) and (3) is 40% of the net assets based on the latest financial statements of the lending companies.
Note 5:Limit on the loans provided by the Company’s mainland subsidiaries:
(1)Limit on the total loans to others provided by the Company’s mainland subsidiaries is 80% of the net assets based on the latest financial statements of the lending companies.
(2)Limit on the loans provided by the Company’s mainland subsidiaries granted for a single party are as follows:
(2-1)Limit on loans to a single party with business transactions is the higher value of purchasing and selling during current year on the year of financing, and can’t exceed the total business transactions amount within 12 month.
(2-2)For short-term financing between the Company’s mainland subsidiary and the foreign companies which the ultimate parent company holds 100% of the voting rights directly or indirectly, limit on loans granted for a single party is 80% of the net assets based on the latest financial statements of the lending companies.
(2-3)For short-term financing between the Company’s mainland subsidiaries and aforementioned associates, limit on loans granted for a single party is 40% of the net assets based on the latest financial statements of the lending companies. The amount of loans to a single party is the accumulated balance of the lending company's
short-term financing for single party.
Note 6:The ending balance is the amount resolved by the Board of Directors.
Maximum outstanding
balance during
the year ended
December 31, 2017
(Note 2)
Balance at
December 31
, 2017
(Note 6)
Actual amount
drawn down
No.
(Note 1) Creditor Borrower
General
ledger account
Is a related
party
MARKETECH INTERNATIONAL CORP.
Loans to others
For the year ended December 31, 2017
Table 1 Expressed in thousands of NTD
(Except as otherwise indicated)
Collateral Limit on loans
granted to
a single party
Ceiling on
total loans
granted Footnote
Interest
rate (%)
Nature of
loan
(Note 3)
Amount of
transactions
with the
borrower
Reason
for short-term
financing
Allowance
for bad debts
~368~

Company name
Relationship
with the
endorser/
guarantor
(Note 2)
0Marketech
International Corp.Marketech Integrated Pte. Ltd. 2 $ 2,572,489 $ 66,346 $ 54,389 $ 49,156 - 1.06% $ 5,144,977 Y N N Note 3
0Marketech
International Corp.Marketech Integrated Sdn. Bhd. 2 2,572,489 148,800 148,800 20,342 - 2.89% 5,144,977 Y N N Note 3
0Marketech
International Corp.
MIC-Tech China Trading
(Shanghai) Co., Ltd.3 2,572,489 31,996 31,954 - - 0.62% 5,144,977 Y N Y Note 3
0Marketech
International Corp.MIC-Tech (WuXi) Co., Ltd. 3 2,572,489 319,275 294,624 294,624 - 5.73% 5,144,977 Y N Y Note 3
0Marketech
International Corp.MIC-Tech (Shanghai) Corp. 3 2,572,489 987,298 946,884 451,463 - 18.4% 5,144,977 Y N Y Note 3
0Marketech
International Corp.
MIC-Tech Electronics
Engineering Corp.3 2,572,489 1,450,270 1,313,572 762,575 - 25.53% 5,144,977 Y N Y Note 3
0Marketech
International Corp.
Shanghai Maohua Electronics
Engineering Co.,Ltd.3 2,572,489 93,444 91,399 15,872 - 1.78% 5,144,977 Y N Y Note 3
0Marketech
International Corp.Special Triumph Sdn. Bhd. 5 2,572,489 39,309 39,309 24,738 - 0.76% 5,144,977 N N N Note 3
1 Marketech Co., Ltd. MIC-Tech Viet Nam Co., Ltd. 3 12,005 8,320 7,675 7,675 - 191.78% 20,009 N N N Note 4
2
MIC-Tech
Electronics
Engineering Corp.
MIC-Tech (WuXi) Co., Ltd. 3 1,409,603 4,340 4,291 4,291 - 0.91% 2,349,339 N N Y Note 4
2
MIC-Tech
Electronics
Engineering Corp.
Shanghai Maohua Electronics
Engineering Co.,Ltd.5 1,409,603 71,415 71,321 71,321 - 15.18% 2,349,339 N N Y Note 4
2
MIC-Tech
Electronics
Engineering Corp.
MIC-Tech (Shanghai) Corp. 3 1,409,603 169,222 109,508 109,508 - 23.31% 2,349,339 N N Y Note 4
2MIC-Tech
(Shanghai) Corp.
MIC-Tech Electronics
Engineering Corp.3 1,011,132 629,272 629,272 629,272 - 186.70% 1,685,221 N N Y Note 4
Note 1:The numbers filled in for the endorsements/guarantees provided by the Company or subsidiaries are as follows:
(1)The Company is ‘0’.
(2)The subsidiaries are numbered in order starting from ‘1’.
Note 2:Relationship between the endorser/guarantor and the party being endorsed/guaranteed is classified into the following six categories; fill in the number of category each case belongs to:
(1)Having business relationship.
(2)The endorser/guarantor parent company owns directly more than 50% voting shares of the endorsed/guaranteed subsidiary.
(3)The endorser/guarantor parent company and its subsidiaries jointly own more than 50% voting shares of the endorsed/guaranteed company.
(4)The endorsed/guaranteed parent company directly or indirectly owns more than 50% voting shares of the endorser/guarantor subsidiary.
(5)Mutual guarantee of the trade as required by the construction contract.
(6)Due to joint venture, each shareholder provides endorsements/guarantees to the endorsed/guaranteed company in proportion to its ownership.
Note 3:Limit on endorsements and guarantees stated in“Regulations Governing Loaning of Funds and Making of Endorsements/ Guarantees by Public Companies”:
(1)In accordance with mutual guarantee requirement in the same industry for contracting constructions, limit on the total amount is 5 times of the Company’s net assets.
Note 4:Limit on endorsements and guarantees of the Group’s subsidiary - Marketech Co., Ltd.:
(1) In accordance with mutual guarantee requirement in the same industry or the common builders for contracting constructions, or provision of endorsements and guarantees for joint ventures from shareholders in proportion to shareholding ratio, limit on the total amount is 5 times of the
net assets of Marketech Co., Ltd.. Limit on endorsement/guarantee to a single party is three times of the net assets of Marketech Co., Ltd..
(2) Except for (1), the Group follows standards of endorsements and guarantees as below:
(2-1) Total amount: (2-1-1) Limit on the accumulated endorsements and guarantees is 5 times of the net assets of Marketech Co., Ltd.;
(2-1-2) Limit on endorsements and guarantees to a company of which the endorser company and the ultimate parent company directly or indirectly holds 90%, should meet the requirement in (2-1-1) and may not exceed 10% of the ultimate parent’s net assets. However,
(2)Except for guarantees for contracting constructions, limit on the Company’s accumulated endorsement/guarantee is the Company’s net assets; limit on endorsement/guarantee to a single party is 50% of the Company’s net assets. Limit on the total endorsement/guarantee
of the Company and its subsidiaries as a whole is 1.5 times of the Company’s net assets; limit on endorsement/guarantee to a single party is 75% of the Company’s net assets.
Outstanding
endorsement/
guarantee
amount at
December 31,
2017
(Note 6)
Actual amount
drawn downNumber
(Note 1)
Endorser/
guarantor
Party being
endorsed/guaranteed Limit on
endorsements/
guarantees
provided for a single
party
(Note 3)
Maximum outstanding
endorsement/
guarantee
amount as of
December 31, 2017
(Note 5)
Provision of
endorsements/
guarantees to the
party in Mainland
China Footnote
Amount of
endorsements/
guarantees
secured with
collateral
Ratio of accumulated
endorsement/
guarantee amount to net
asset value of the
endorser/
guarantor company
Ceiling on
total amount of
endorsements/
guarantees
provided
(Note 3)
Provision of
endorsements/
guarantees by
parent company to
subsidiary
Provision of
endorsements/
guarantees by
subsidiary to
parent company
MARKETECH INTERNATIONAL CORP.
Provision of endorsements and guarantees to others
For the year ended December 31, 2017
Table 2 Expressed in thousands of NTD
(Except as otherwise indicated)
~369~
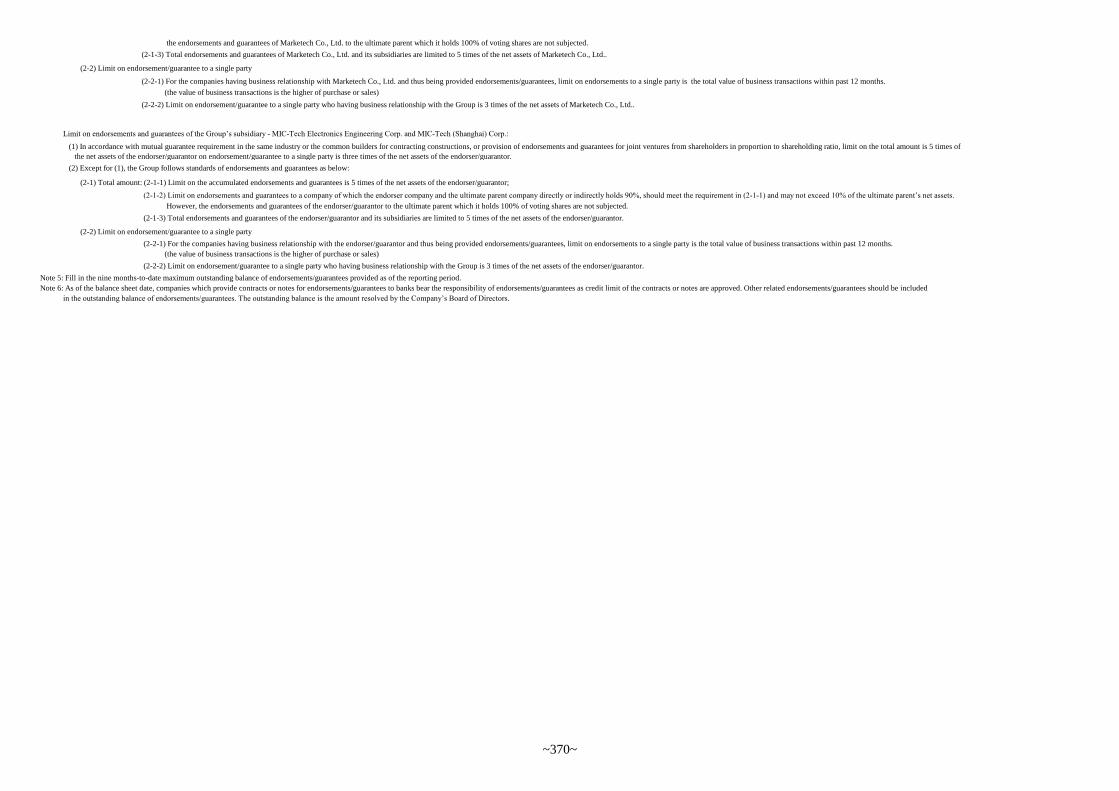
the endorsements and guarantees of Marketech Co., Ltd. to the ultimate parent which it holds 100% of voting shares are not subjected.
(2-1-3) Total endorsements and guarantees of Marketech Co., Ltd. and its subsidiaries are limited to 5 times of the net assets of Marketech Co., Ltd..
(2-2) Limit on endorsement/guarantee to a single party
(2-2-1) For the companies having business relationship with Marketech Co., Ltd. and thus being provided endorsements/guarantees, limit on endorsements to a single party is the total value of business transactions within past 12 months.
(the value of business transactions is the higher of purchase or sales)
(2-2-2) Limit on endorsement/guarantee to a single party who having business relationship with the Group is 3 times of the net assets of Marketech Co., Ltd..
Limit on endorsements and guarantees of the Group’s subsidiary - MIC-Tech Electronics Engineering Corp. and MIC-Tech (Shanghai) Corp.:
(1) In accordance with mutual guarantee requirement in the same industry or the common builders for contracting constructions, or provision of endorsements and guarantees for joint ventures from shareholders in proportion to shareholding ratio, limit on the total amount is 5 times of
the net assets of the endorser/guarantor on endorsement/guarantee to a single party is three times of the net assets of the endorser/guarantor.
(2) Except for (1), the Group follows standards of endorsements and guarantees as below:
(2-1) Total amount: (2-1-1) Limit on the accumulated endorsements and guarantees is 5 times of the net assets of the endorser/guarantor;
(2-1-2) Limit on endorsements and guarantees to a company of which the endorser company and the ultimate parent company directly or indirectly holds 90%, should meet the requirement in (2-1-1) and may not exceed 10% of the ultimate parent’s net assets.
However, the endorsements and guarantees of the endorser/guarantor to the ultimate parent which it holds 100% of voting shares are not subjected.
(2-1-3) Total endorsements and guarantees of the endorser/guarantor and its subsidiaries are limited to 5 times of the net assets of the endorser/guarantor.
(2-2) Limit on endorsement/guarantee to a single party
(2-2-1) For the companies having business relationship with the endorser/guarantor and thus being provided endorsements/guarantees, limit on endorsements to a single party is the total value of business transactions within past 12 months.
(the value of business transactions is the higher of purchase or sales)
(2-2-2) Limit on endorsement/guarantee to a single party who having business relationship with the Group is 3 times of the net assets of the endorser/guarantor.
Note 5: Fill in the nine months-to-date maximum outstanding balance of endorsements/guarantees provided as of the reporting period.
Note 6: As of the balance sheet date, companies which provide contracts or notes for endorsements/guarantees to banks bear the responsibility of endorsements/guarantees as credit limit of the contracts or notes are approved. Other related endorsements/guarantees should be included
in the outstanding balance of endorsements/guarantees. The outstanding balance is the amount resolved by the Company’s Board of Directors.
~370~
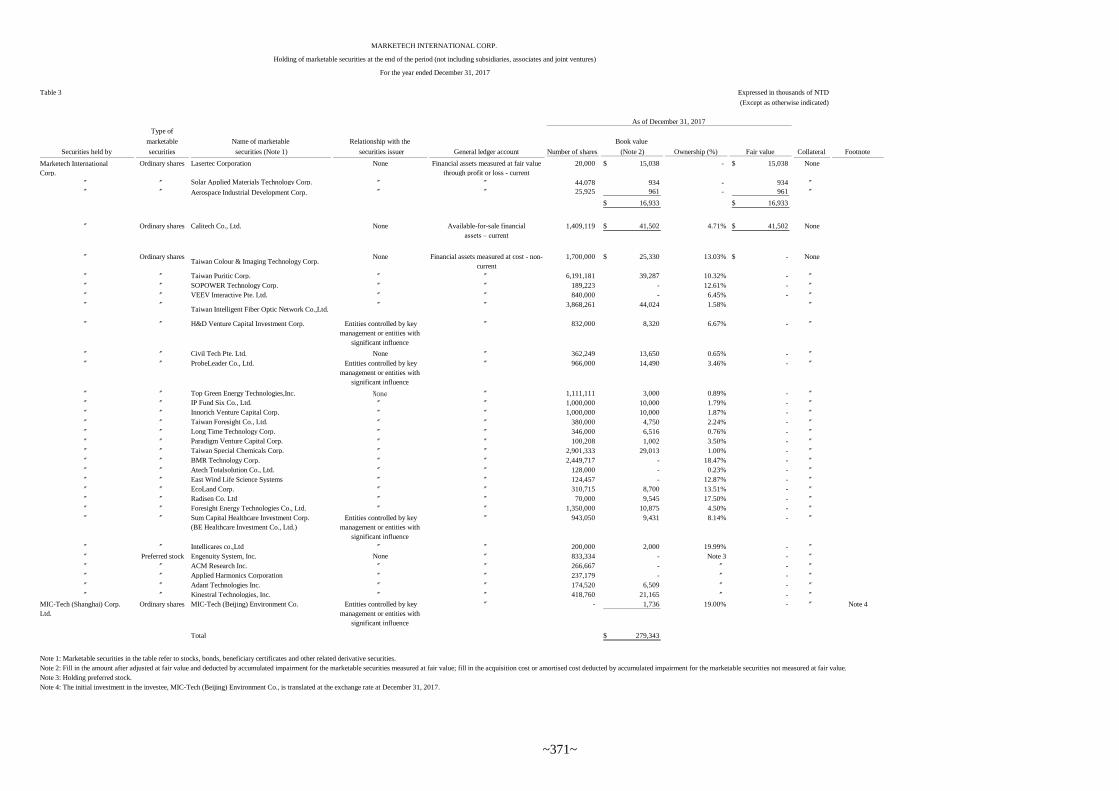
Number of shares
Book value
(Note 2) Ownership (%) Fair value
Marketech International
Corp.
Ordinary shares Lasertec Corporation None Financial assets measured at fair value
through profit or loss - current
20,000 15,038$ - 15,038$ None
〞 〞 Solar Applied Materials Technology Corp. 〞 〞 44,078 934 - 934 〞〞 〞 Aerospace Industrial Development Corp. 〞 〞 25,925 961 - 961 〞
16,933$ 16,933$
〞 Ordinary shares Calitech Co., Ltd. None Available-for-sale financial
assets – current
1,409,119 41,502$ 4.71% 41,502$ None
〞 Ordinary sharesTaiwan Colour & Imaging Technology Corp.
None Financial assets measured at cost - non-
current
1,700,000 25,330$ 13.03% -$ None
〞 〞 Taiwan Puritic Corp. 〞 〞 6,191,181 39,287 10.32% - 〞
〞 〞 SOPOWER Technology Corp. 〞 〞 189,223 - 12.61% - 〞
〞 〞 VEEV Interactive Pte. Ltd. 〞 〞 840,000 - 6.45% - 〞
〞 〞Taiwan Intelligent Fiber Optic Network Co.,Ltd.
〞 〞 3,868,261 44,024 1.58% 〞
〞 〞 H&D Venture Capital Investment Corp. Entities controlled by key
management or entities with
significant influence
〞 832,000 8,320 6.67% - 〞
〞 〞 Civil Tech Pte. Ltd. None 〞 362,249 13,650 0.65% - 〞
〞 〞 ProbeLeader Co., Ltd. Entities controlled by key
management or entities with
significant influence
〞 966,000 14,490 3.46% - 〞
〞 〞 Top Green Energy Technologies,Inc. None 〞 1,111,111 3,000 0.89% - 〞
〞 〞 IP Fund Six Co., Ltd. 〞 〞 1,000,000 10,000 1.79% - 〞
〞 〞 Innorich Venture Capital Corp. 〞 〞 1,000,000 10,000 1.87% - 〞
〞 〞 Taiwan Foresight Co., Ltd. 〞 〞 380,000 4,750 2.24% - 〞
〞 〞 Long Time Technology Corp. 〞 〞 346,000 6,516 0.76% - 〞
〞 〞 Paradigm Venture Capital Corp. 〞 〞 100,208 1,002 3.50% - 〞
〞 〞 Taiwan Special Chemicals Corp. 〞 〞 2,901,333 29,013 1.00% - 〞
〞 〞 BMR Technology Corp. 〞 〞 2,449,717 - 18.47% - 〞
〞 〞 Atech Totalsolution Co., Ltd. 〞 〞 128,000 - 0.23% - 〞
〞 〞 East Wind Life Science Systems 〞 〞 124,457 - 12.87% - 〞
〞 〞 EcoLand Corp. 〞 〞 310,715 8,700 13.51% - 〞
〞 〞 Radisen Co. Ltd 〞 〞 70,000 9,545 17.50% - 〞
〞 〞 Foresight Energy Technologies Co., Ltd. 〞 〞 1,350,000 10,875 4.50% - 〞
〞 〞 Sum Capital Healthcare Investment Corp.
(BE Healthcare Investment Co., Ltd.)
Entities controlled by key
management or entities with
significant influence
〞 943,050 9,431 8.14% - 〞
〞 〞 Intellicares co.,Ltd 〞 〞 200,000 2,000 19.99% - 〞
〞 Preferred stock Engenuity System, Inc. None 〞 833,334 - Note 3 - 〞
〞 〞 ACM Research Inc. 〞 〞 266,667 - 〞 - 〞
〞 〞 Applied Harmonics Corporation 〞 〞 237,179 - 〞 - 〞
〞 〞 Adant Technologies Inc. 〞 〞 174,520 6,509 〞 - 〞
〞 〞 Kinestral Technologies, Inc. 〞 〞 418,760 21,165 〞 - 〞
MIC-Tech (Shanghai) Corp.
Ltd.
Ordinary shares MIC-Tech (Beijing) Environment Co. Entities controlled by key
management or entities with
significant influence
〞 - 1,736 19.00% - 〞 Note 4
Total 279,343$
Note 1: Marketable securities in the table refer to stocks, bonds, beneficiary certificates and other related derivative securities.
Note 2: Fill in the amount after adjusted at fair value and deducted by accumulated impairment for the marketable securities measured at fair value; fill in the acquisition cost or amortised cost deducted by accumulated impairment for the marketable securities not measured at fair value.
Note 3: Holding preferred stock.
Note 4: The initial investment in the investee, MIC-Tech (Beijing) Environment Co., is translated at the exchange rate at December 31, 2017.
(Except as otherwise indicated)
FootnoteSecurities held by
Name of marketable
securities (Note 1)
Relationship with the
securities issuer General ledger account
As of December 31, 2017
MARKETECH INTERNATIONAL CORP.
Holding of marketable securities at the end of the period (not including subsidiaries, associates and joint ventures)
For the year ended December 31, 2017
Table 3
Type of
marketable
securities Collateral
Expressed in thousands of NTD
~371~
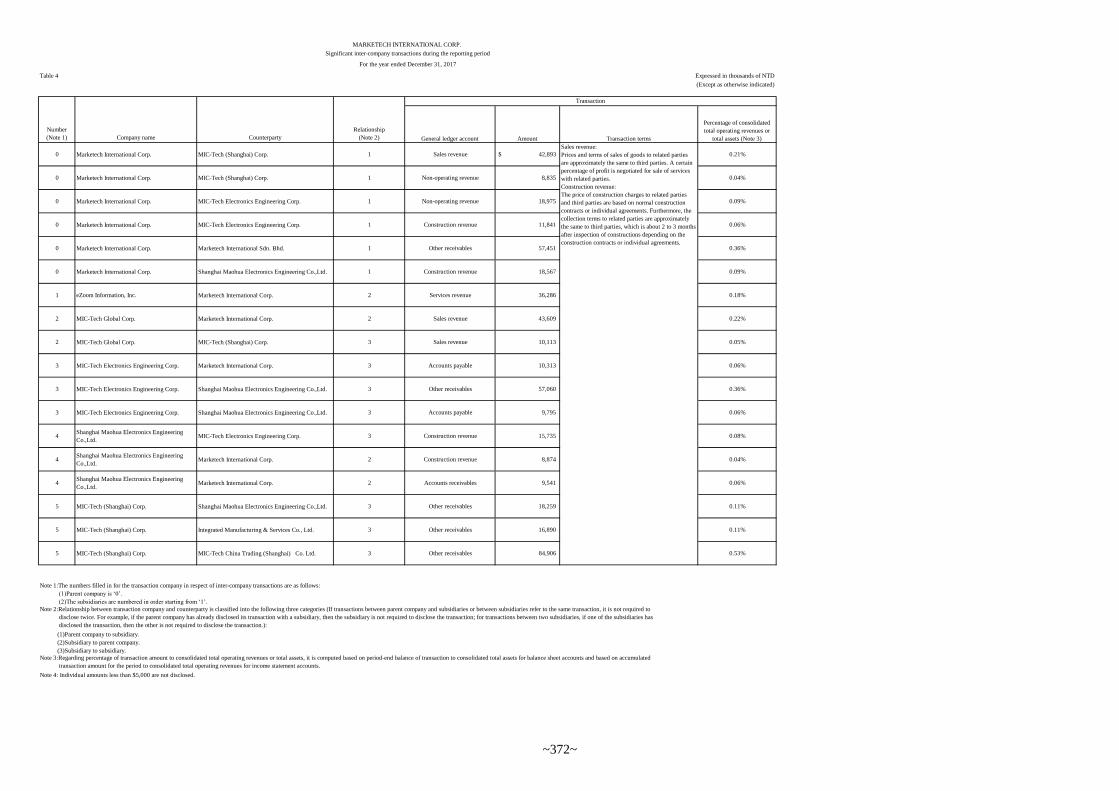
General ledger account Amount Transaction terms
Percentage of consolidated
total operating revenues or
total assets (Note 3)
0 Marketech International Corp. MIC-Tech (Shanghai) Corp. 1 Sales revenue 42,893$ 0.21%
0 Marketech International Corp. MIC-Tech (Shanghai) Corp. 1 Non-operating revenue 8,835 0.04%
0 Marketech International Corp. MIC-Tech Electronics Engineering Corp. 1 Non-operating revenue 18,975 0.09%
0 Marketech International Corp. MIC-Tech Electronics Engineering Corp. 1 Construction revenue 11,841 0.06%
0 Marketech International Corp. Marketech International Sdn. Bhd. 1 Other receivables 57,451 0.36%
0 Marketech International Corp. Shanghai Maohua Electronics Engineering Co.,Ltd. 1 Construction revenue 18,567 0.09%
1 eZoom Information, Inc. Marketech International Corp. 2 Services revenue 36,286 0.18%
2 MIC-Tech Global Corp. Marketech International Corp. 2 Sales revenue 43,609 0.22%
2 MIC-Tech Global Corp. MIC-Tech (Shanghai) Corp. 3 Sales revenue 10,113 0.05%
3 MIC-Tech Electronics Engineering Corp. Marketech International Corp. 3 Accounts payable 10,313 0.06%
3 MIC-Tech Electronics Engineering Corp. Shanghai Maohua Electronics Engineering Co.,Ltd. 3 Other receivables 57,060 0.36%
3 MIC-Tech Electronics Engineering Corp. Shanghai Maohua Electronics Engineering Co.,Ltd. 3 Accounts payable 9,795 0.06%
4Shanghai Maohua Electronics Engineering
Co.,Ltd.MIC-Tech Electronics Engineering Corp. 3 Construction revenue 15,735 0.08%
4Shanghai Maohua Electronics Engineering
Co.,Ltd.Marketech International Corp. 2 Construction revenue 8,874 0.04%
4Shanghai Maohua Electronics Engineering
Co.,Ltd.Marketech International Corp. 2 Accounts receivables 9,541 0.06%
5 MIC-Tech (Shanghai) Corp. Shanghai Maohua Electronics Engineering Co.,Ltd. 3 Other receivables 18,259 0.11%
5 MIC-Tech (Shanghai) Corp. Integrated Manufacturing & Services Co., Ltd. 3 Other receivables 16,890 0.11%
5 MIC-Tech (Shanghai) Corp. MIC-Tech China Trading (Shanghai) Co. Ltd. 3 Other receivables 84,906 0.53%
Note 1:The numbers filled in for the transaction company in respect of inter-company transactions are as follows:
(1)Parent company is ‘0’.
(2)The subsidiaries are numbered in order starting from ‘1’.
(1)Parent company to subsidiary.
(2)Subsidiary to parent company.
(3)Subsidiary to subsidiary.
Note 4: Individual amounts less than $5,000 are not disclosed.
Note 3:Regarding percentage of transaction amount to consolidated total operating revenues or total assets, it is computed based on period-end balance of transaction to consolidated total assets for balance sheet accounts and based on accumulated
transaction amount for the period to consolidated total operating revenues for income statement accounts.
Note 2:Relationship between transaction company and counterparty is classified into the following three categories (If transactions between parent company and subsidiaries or between subsidiaries refer to the same transaction, it is not required to
disclose twice. For example, if the parent company has already disclosed its transaction with a subsidiary, then the subsidiary is not required to disclose the transaction; for transactions between two subsidiaries, if one of the subsidiaries has
disclosed the transaction, then the other is not required to disclose the transaction.):
Number
(Note 1) Company name Counterparty
Relationship
(Note 2)
Transaction
(Except as otherwise indicated)
MARKETECH INTERNATIONAL CORP.
For the year ended December 31, 2017
Table 4 Expressed in thousands of NTD
Significant inter-company transactions during the reporting period
Sales revenue:
Prices and terms of sales of goods to related parties
are approximately the same to third parties. A certain
percentage of profit is negotiated for sale of services
with related parties.
Construction revenue:
The price of construction charges to related parties
and third parties are based on normal construction
contracts or individual agreements. Furthermore, the
collection terms to related parties are approximately
the same to third parties, which is about 2 to 3 months
after inspection of constructions depending on the
construction contracts or individual agreements.
~372~
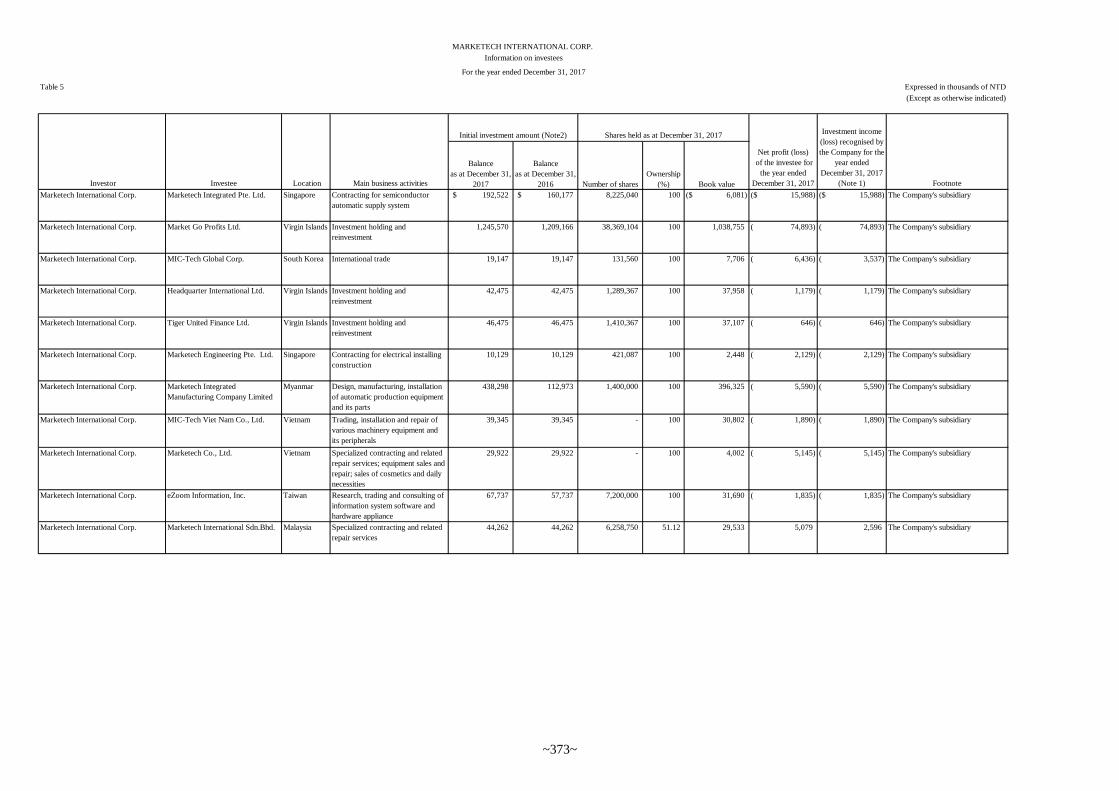
Balance
as at December 31,
2017
Balance
as at December 31,
2016 Number of shares
Ownership
(%) Book value
Marketech International Corp. Marketech Integrated Pte. Ltd. Singapore Contracting for semiconductor
automatic supply system
192,522$ 160,177$ 8,225,040 100 6,081)($ 15,988)($ 15,988)($ The Company's subsidiary
Marketech International Corp. Market Go Profits Ltd. Virgin Islands Investment holding and
reinvestment
1,245,570 1,209,166 38,369,104 100 1,038,755 74,893)( 74,893)( The Company's subsidiary
Marketech International Corp. MIC-Tech Global Corp. South Korea International trade 19,147 19,147 131,560 100 7,706 6,436)( 3,537)( The Company's subsidiary
Marketech International Corp. Headquarter International Ltd. Virgin Islands Investment holding and
reinvestment
42,475 42,475 1,289,367 100 37,958 1,179)( 1,179)( The Company's subsidiary
Marketech International Corp. Tiger United Finance Ltd. Virgin Islands Investment holding and
reinvestment
46,475 46,475 1,410,367 100 37,107 646)( 646)( The Company's subsidiary
Marketech International Corp. Marketech Engineering Pte. Ltd. Singapore Contracting for electrical installing
construction
10,129 10,129 421,087 100 2,448 2,129)( 2,129)( The Company's subsidiary
Marketech International Corp. Marketech Integrated
Manufacturing Company Limited
Myanmar Design, manufacturing, installation
of automatic production equipment
and its parts
438,298 112,973 1,400,000 100 396,325 5,590)( 5,590)( The Company's subsidiary
Marketech International Corp. MIC-Tech Viet Nam Co., Ltd. Vietnam Trading, installation and repair of
various machinery equipment and
its peripherals
39,345 39,345 - 100 30,802 1,890)( 1,890)( The Company's subsidiary
Marketech International Corp. Marketech Co., Ltd. Vietnam Specialized contracting and related
repair services; equipment sales and
repair; sales of cosmetics and daily
necessities
29,922 29,922 - 100 4,002 5,145)( 5,145)( The Company's subsidiary
Marketech International Corp. eZoom Information, Inc. Taiwan Research, trading and consulting of
information system software and
hardware appliance
67,737 57,737 7,200,000 100 31,690 1,835)( 1,835)( The Company's subsidiary
Marketech International Corp. Marketech International Sdn.Bhd. Malaysia Specialized contracting and related
repair services
44,262 44,262 6,258,750 51.12 29,533 5,079 2,596 The Company's subsidiary
(Except as otherwise indicated)
MARKETECH INTERNATIONAL CORP.
Net profit (loss)
of the investee for
the year ended
December 31, 2017
Investment income
(loss) recognised by
the Company for the
year ended
December 31, 2017
(Note 1) Footnote Investor Investee Location Main business activities
Initial investment amount (Note2) Shares held as at December 31, 2017
Information on investees
For the year ended December 31, 2017
Table 5 Expressed in thousands of NTD
~373~
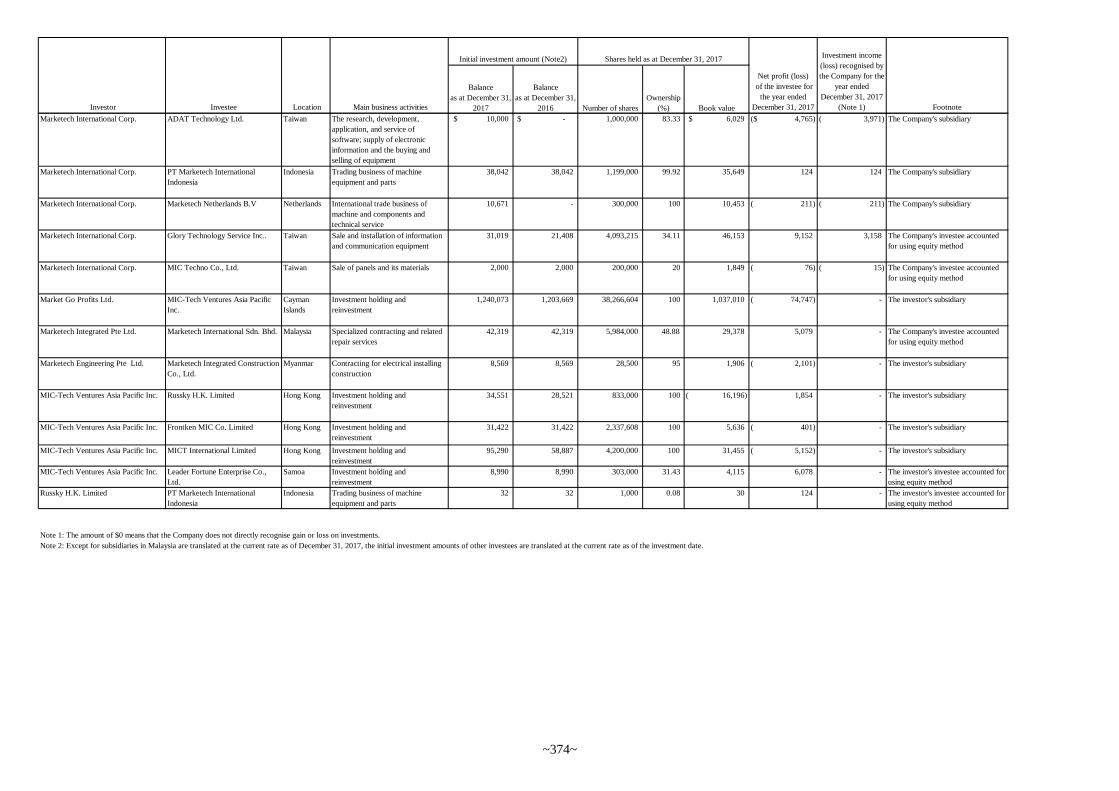
Balance
as at December 31,
2017
Balance
as at December 31,
2016 Number of shares
Ownership
(%) Book value
Net profit (loss)
of the investee for
the year ended
December 31, 2017
Investment income
(loss) recognised by
the Company for the
year ended
December 31, 2017
(Note 1) Footnote Investor Investee Location Main business activities
Initial investment amount (Note2) Shares held as at December 31, 2017
Marketech International Corp. ADAT Technology Ltd. Taiwan The research, development,
application, and service of
software; supply of electronic
information and the buying and
selling of equipment
10,000$ -$ 1,000,000 83.33 6,029$ 4,765)($ 3,971)( The Company's subsidiary
Marketech International Corp. PT Marketech International
Indonesia
Indonesia Trading business of machine
equipment and parts
38,042 38,042 1,199,000 99.92 35,649 124 124 The Company's subsidiary
Marketech International Corp. Marketech Netherlands B.V Netherlands International trade business of
machine and components and
technical service
10,671 - 300,000 100 10,453 211)( 211)( The Company's subsidiary
Marketech International Corp. Glory Technology Service Inc.. Taiwan Sale and installation of information
and communication equipment
31,019 21,408 4,093,215 34.11 46,153 9,152 3,158 The Company's investee accounted
for using equity method
Marketech International Corp. MIC Techno Co., Ltd. Taiwan Sale of panels and its materials 2,000 2,000 200,000 20 1,849 76)( 15)( The Company's investee accounted
for using equity method
Market Go Profits Ltd. MIC-Tech Ventures Asia Pacific
Inc.
Cayman
Islands
Investment holding and
reinvestment
1,240,073 1,203,669 38,266,604 100 1,037,010 74,747)( - The investor's subsidiary
Marketech Integrated Pte Ltd. Marketech International Sdn. Bhd. Malaysia Specialized contracting and related
repair services
42,319 42,319 5,984,000 48.88 29,378 5,079 - The Company's investee accounted
for using equity method
Marketech Engineering Pte Ltd. Marketech Integrated Construction
Co., Ltd.
Myanmar Contracting for electrical installing
construction
8,569 8,569 28,500 95 1,906 2,101)( - The investor's subsidiary
MIC-Tech Ventures Asia Pacific Inc. Russky H.K. Limited Hong Kong Investment holding and
reinvestment
34,551 28,521 833,000 100 16,196)( 1,854 - The investor's subsidiary
MIC-Tech Ventures Asia Pacific Inc. Frontken MIC Co. Limited Hong Kong Investment holding and
reinvestment
31,422 31,422 2,337,608 100 5,636 401)( - The investor's subsidiary
MIC-Tech Ventures Asia Pacific Inc. MICT International Limited Hong Kong Investment holding and
reinvestment
95,290 58,887 4,200,000 100 31,455 5,152)( - The investor's subsidiary
MIC-Tech Ventures Asia Pacific Inc. Leader Fortune Enterprise Co.,
Ltd.
Samoa Investment holding and
reinvestment
8,990 8,990 303,000 31.43 4,115 6,078 - The investor's investee accounted for
using equity method
Russky H.K. Limited PT Marketech International
Indonesia
Indonesia Trading business of machine
equipment and parts
32 32 1,000 0.08 30 124 - The investor's investee accounted for
using equity method
Note 1: The amount of $0 means that the Company does not directly recognise gain or loss on investments.
Note 2: Except for subsidiaries in Malaysia are translated at the current rate as of December 31, 2017, the initial investment amounts of other investees are translated at the current rate as of the investment date.
~374~
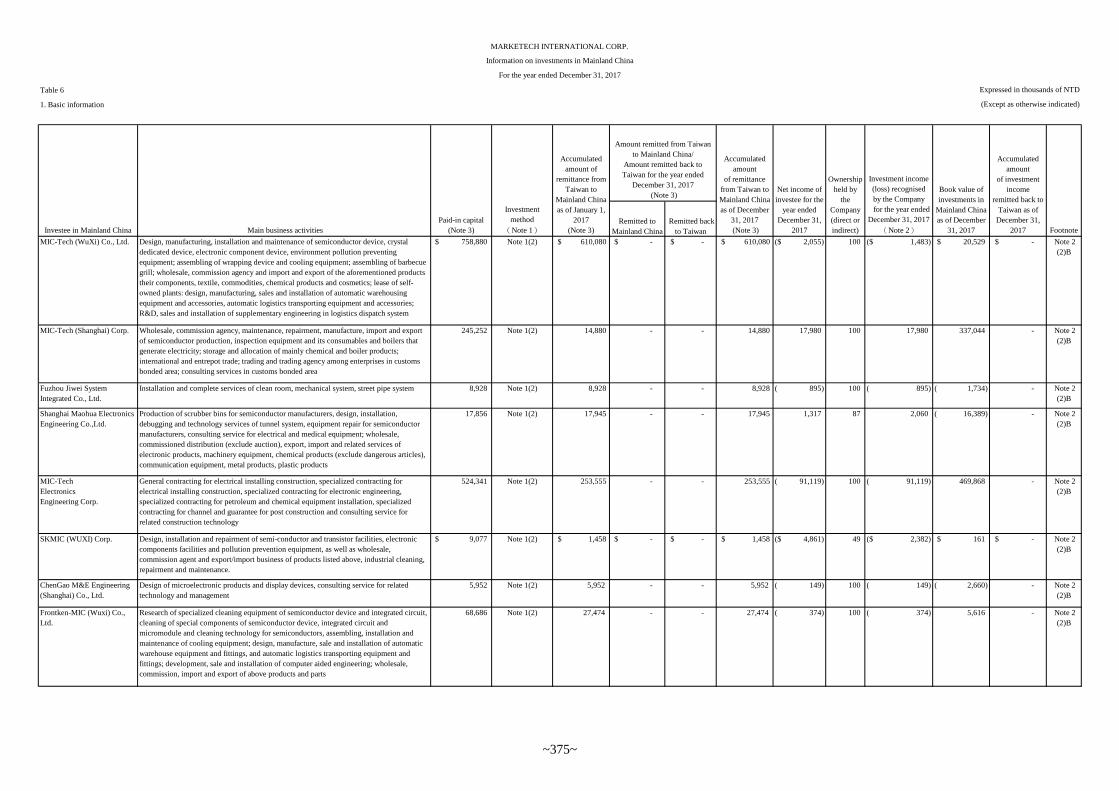
Table 6
1. Basic information
Remitted to
Mainland China
Remitted back
to Taiwan
MIC-Tech (WuXi) Co., Ltd. Design, manufacturing, installation and maintenance of semiconductor device, crystal
dedicated device, electronic component device, environment pollution preventing
equipment; assembling of wrapping device and cooling equipment; assembling of barbecue
grill; wholesale, commission agency and import and export of the aforementioned products
their components, textile, commodities, chemical products and cosmetics; lease of self-
owned plants: design, manufacturing, sales and installation of automatic warehousing
equipment and accessories, automatic logistics transporting equipment and accessories;
R&D, sales and installation of supplementary engineering in logistics dispatch system
758,880$ Note 1(2) $ 610,080 -$ -$ $ 610,080 2,055)($ 100 1,483)($ 20,529$ -$ Note 2
(2)B
MIC-Tech (Shanghai) Corp. Wholesale, commission agency, maintenance, repairment, manufacture, import and export
of semiconductor production, inspection equipment and its consumables and boilers that
generate electricity; storage and allocation of mainly chemical and boiler products;
international and entrepot trade; trading and trading agency among enterprises in customs
bonded area; consulting services in customs bonded area
245,252 Note 1(2) 14,880 - - 14,880 17,980 100 17,980 337,044 - Note 2
(2)B
Fuzhou Jiwei System
Integrated Co., Ltd.
Installation and complete services of clean room, mechanical system, street pipe system 8,928 Note 1(2) 8,928 - - 8,928 895)( 100 895)( 1,734)( - Note 2
(2)B
Shanghai Maohua Electronics
Engineering Co.,Ltd.
Production of scrubber bins for semiconductor manufacturers, design, installation,
debugging and technology services of tunnel system, equipment repair for semiconductor
manufacturers, consulting service for electrical and medical equipment; wholesale,
commissioned distribution (exclude auction), export, import and related services of
electronic products, machinery equipment, chemical products (exclude dangerous articles),
communication equipment, metal products, plastic products
17,856 Note 1(2) 17,945 - - 17,945 1,317 87 2,060 16,389)( - Note 2
(2)B
MIC-Tech
Electronics
Engineering Corp.
General contracting for electrical installing construction, specialized contracting for
electrical installing construction, specialized contracting for electronic engineering,
specialized contracting for petroleum and chemical equipment installation, specialized
contracting for channel and guarantee for post construction and consulting service for
related construction technology
524,341 Note 1(2) 253,555 - - 253,555 91,119)( 100 91,119)( 469,868 - Note 2
(2)B
SKMIC (WUXI) Corp. Design, installation and repairment of semi-conductor and transistor facilities, electronic
components facilities and pollution prevention equipment, as well as wholesale,
commission agent and export/import business of products listed above, industrial cleaning,
repairment and maintenance.
9,077$ Note 1(2) $ 1,458 -$ -$ $ 1,458 4,861)($ 49 2,382)($ 161$ -$ Note 2
(2)B
ChenGao M&E Engineering
(Shanghai) Co., Ltd.
Design of microelectronic products and display devices, consulting service for related
technology and management
5,952 Note 1(2) 5,952 - - 5,952 149)( 100 149)( 2,660)( - Note 2
(2)B
Frontken-MIC (Wuxi) Co.,
Ltd.
Research of specialized cleaning equipment of semiconductor device and integrated circuit,
cleaning of special components of semiconductor device, integrated circuit and
micromodule and cleaning technology for semiconductors, assembling, installation and
maintenance of cooling equipment; design, manufacture, sale and installation of automatic
warehouse equipment and fittings, and automatic logistics transporting equipment and
fittings; development, sale and installation of computer aided engineering; wholesale,
commission, import and export of above products and parts
68,686 Note 1(2) 27,474 - - 27,474 374)( 100 374)( 5,616 - Note 2
(2)B
Accumulated
amount
of investment
income
remitted back to
Taiwan as of
December 31,
2017 Footnote
Amount remitted from Taiwan
to Mainland China/
Amount remitted back to
Taiwan for the year ended
December 31, 2017
(Note 3)
Accumulated
amount
of remittance
from Taiwan to
Mainland China
as of December
31, 2017
(Note 3)Investee in Mainland China Main business activities
Paid-in capital
(Note 3)
Investment
method
(Note 1)
Net income of
investee for the
year ended
December 31,
2017
Ownership
held by
the
Company
(direct or
indirect)
Investment income
(loss) recognised
by the Company
for the year ended
December 31, 2017
(Note 2)
Book value of
investments in
Mainland China
as of December
31, 2017
MARKETECH INTERNATIONAL CORP.
Information on investments in Mainland China
For the year ended December 31, 2017
Expressed in thousands of NTD
(Except as otherwise indicated)
Accumulated
amount of
remittance from
Taiwan to
Mainland China
as of January 1,
2017
(Note 3)
~375~
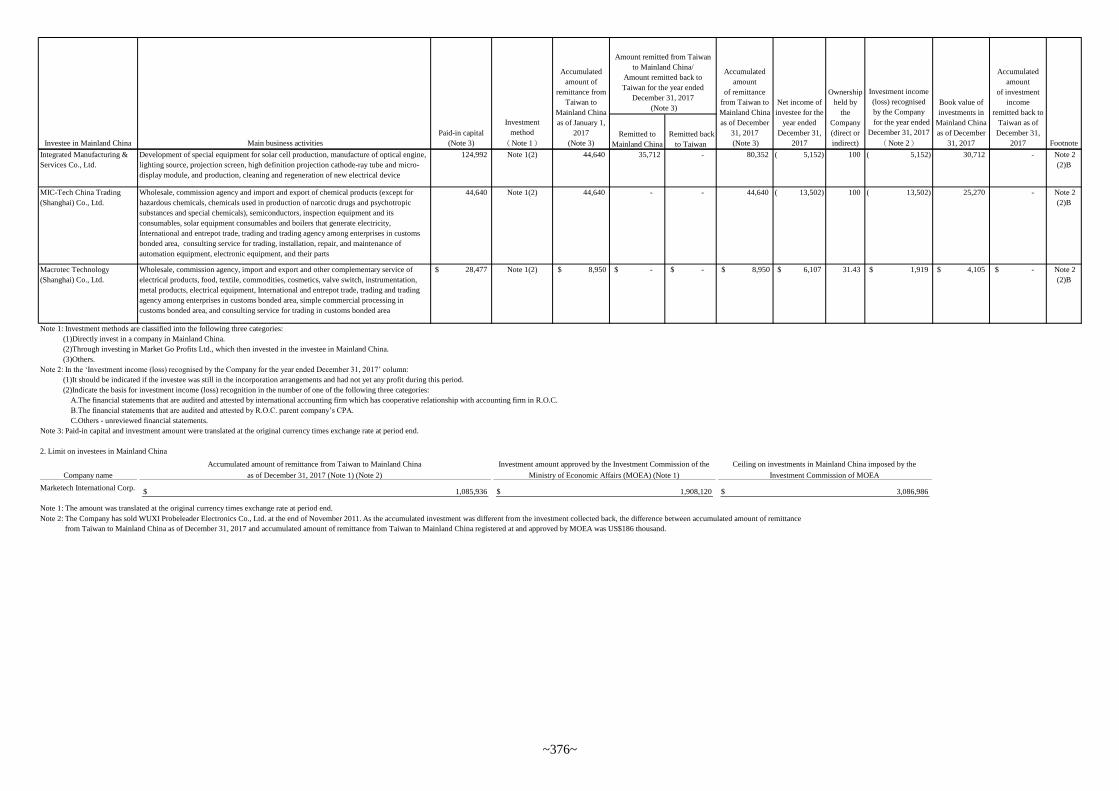
Remitted to
Mainland China
Remitted back
to Taiwan
Accumulated
amount
of investment
income
remitted back to
Taiwan as of
December 31,
2017 Footnote
Amount remitted from Taiwan
to Mainland China/
Amount remitted back to
Taiwan for the year ended
December 31, 2017
(Note 3)
Accumulated
amount
of remittance
from Taiwan to
Mainland China
as of December
31, 2017
(Note 3)Investee in Mainland China Main business activities
Paid-in capital
(Note 3)
Investment
method
(Note 1)
Net income of
investee for the
year ended
December 31,
2017
Ownership
held by
the
Company
(direct or
indirect)
Investment income
(loss) recognised
by the Company
for the year ended
December 31, 2017
(Note 2)
Book value of
investments in
Mainland China
as of December
31, 2017
Accumulated
amount of
remittance from
Taiwan to
Mainland China
as of January 1,
2017
(Note 3)
Integrated Manufacturing &
Services Co., Ltd.
Development of special equipment for solar cell production, manufacture of optical engine,
lighting source, projection screen, high definition projection cathode-ray tube and micro-
display module, and production, cleaning and regeneration of new electrical device
124,992 Note 1(2) 44,640 35,712 - 80,352 5,152)( 100 5,152)( 30,712 - Note 2
(2)B
MIC-Tech China Trading
(Shanghai) Co., Ltd.
Wholesale, commission agency and import and export of chemical products (except for
hazardous chemicals, chemicals used in production of narcotic drugs and psychotropic
substances and special chemicals), semiconductors, inspection equipment and its
consumables, solar equipment consumables and boilers that generate electricity,
International and entrepot trade, trading and trading agency among enterprises in customs
bonded area, consulting service for trading, installation, repair, and maintenance of
automation equipment, electronic equipment, and their parts
44,640 Note 1(2) 44,640 - - 44,640 13,502)( 100 13,502)( 25,270 - Note 2
(2)B
Macrotec Technology
(Shanghai) Co., Ltd.
Wholesale, commission agency, import and export and other complementary service of
electrical products, food, textile, commodities, cosmetics, valve switch, instrumentation,
metal products, electrical equipment, International and entrepot trade, trading and trading
agency among enterprises in customs bonded area, simple commercial processing in
customs bonded area, and consulting service for trading in customs bonded area
28,477$ Note 1(2) $ 8,950 -$ -$ $ 8,950 6,107$ 31.43 1,919$ 4,105$ -$ Note 2
(2)B
Note 1: Investment methods are classified into the following three categories:
(1)Directly invest in a company in Mainland China.
(2)Through investing in Market Go Profits Ltd., which then invested in the investee in Mainland China.
(3)Others.
Note 2: In the ‘Investment income (loss) recognised by the Company for the year ended December 31, 2017’ column:
(1)It should be indicated if the investee was still in the incorporation arrangements and had not yet any profit during this period.
(2)Indicate the basis for investment income (loss) recognition in the number of one of the following three categories:
A.The financial statements that are audited and attested by international accounting firm which has cooperative relationship with accounting firm in R.O.C.
B.The financial statements that are audited and attested by R.O.C. parent company’s CPA.
C.Others - unreviewed financial statements.
Note 3: Paid-in capital and investment amount were translated at the original currency times exchange rate at period end.
2. Limit on investees in Mainland China
Company name
Marketech International Corp.
Note 1: The amount was translated at the original currency times exchange rate at period end.
Note 2: The Company has sold WUXI Probeleader Electronics Co., Ltd. at the end of November 2011. As the accumulated investment was different from the investment collected back, the difference between accumulated amount of remittance
from Taiwan to Mainland China as of December 31, 2017 and accumulated amount of remittance from Taiwan to Mainland China registered at and approved by MOEA was US$186 thousand.
Ceiling on investments in Mainland China imposed by the
Investment Commission of MOEA
3,086,986$
Accumulated amount of remittance from Taiwan to Mainland China
as of December 31, 2017 (Note 1) (Note 2)
1,085,936$
Investment amount approved by the Investment Commission of the
Ministry of Economic Affairs (MOEA) (Note 1)
1,908,120$
~376~