2007 champlain migration health report
TRANSCRIPT
2007 Champlain Migration Health Report
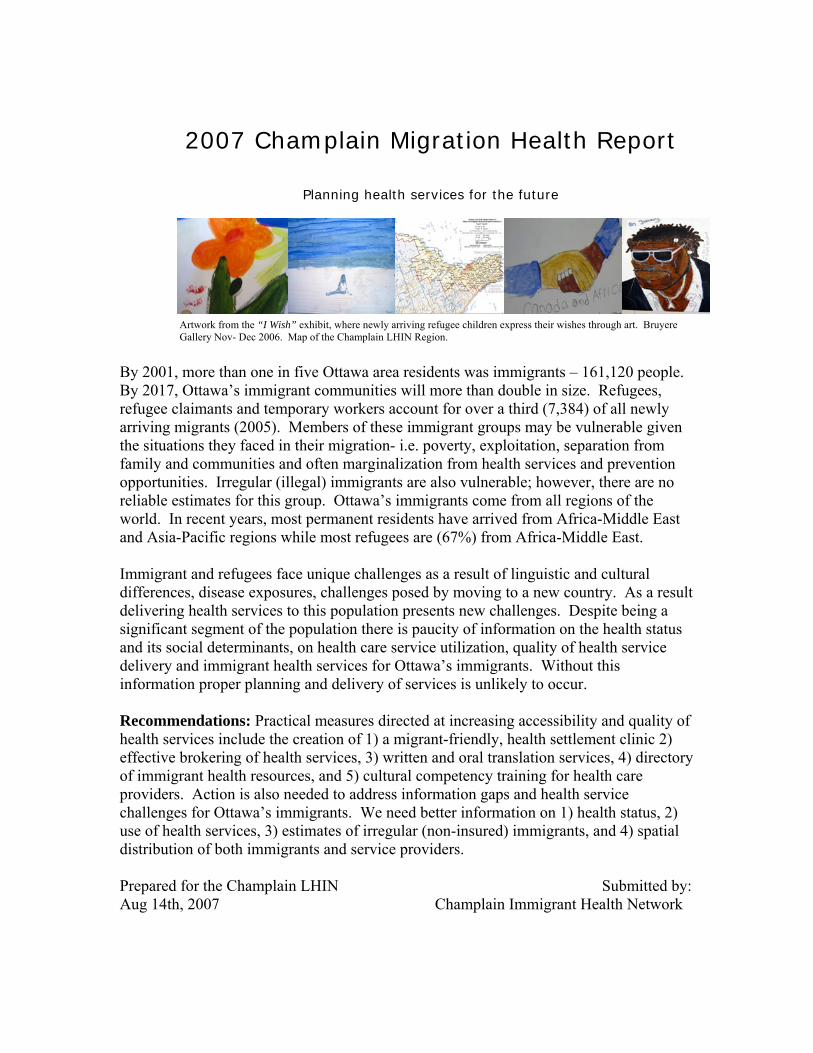
Planning health services for the future
Artwork from the “I Wish” exhibit, where newly arriving refugee children express their wishes through art. Bruyere Gallery Nov- Dec 2006. Map of the Champlain LHIN Region.
By 2001, more than one in five Ottawa area residents was immigrants – 161,120 people. By 2017, Ottawa’s immigrant communities will more than double in size. Refugees, refugee claimants and temporary workers account for over a third (7,384) of all newly arriving migrants (2005). Members of these immigrant groups may be vulnerable given the situations they faced in their migration- i.e. poverty, exploitation, separation from family and communities and often marginalization from health services and prevention opportunities. Irregular (illegal) immigrants are also vulnerable; however, there are no reliable estimates for this group. Ottawa’s immigrants come from all regions of the world. In recent years, most permanent residents have arrived from Africa-Middle East and Asia-Pacific regions while most refugees are (67%) from Africa-Middle East. Immigrant and refugees face unique challenges as a result of linguistic and cultural differences, disease exposures, challenges posed by moving to a new country. As a result delivering health services to this population presents new challenges. Despite being a significant segment of the population there is paucity of information on the health status and its social determinants, on health care service utilization, quality of health service delivery and immigrant health services for Ottawa’s immigrants. Without this information proper planning and delivery of services is unlikely to occur. Recommendations: Practical measures directed at increasing accessibility and quality of health services include the creation of 1) a migrant-friendly, health settlement clinic 2) effective brokering of health services, 3) written and oral translation services, 4) directory of immigrant health resources, and 5) cultural competency training for health care providers. Action is also needed to address information gaps and health service challenges for Ottawa’s immigrants. We need better information on 1) health status, 2) use of health services, 3) estimates of irregular (non-insured) immigrants, and 4) spatial distribution of both immigrants and service providers. Prepared for the Champlain LHIN Submitted by: Aug 14th, 2007 Champlain Immigrant Health Network
2007 Champlain Migration Health Report
Prepared for the Champlain Local Health Integrated Network Aug 14th, 2007
Submitted by: Champlain Immigrant Health Network
Kevin Pottie, Chair of the Champlain Immigrant Health Network Kevin Pottie, MD MClSc CCFP FCFP Kevin Pottie is an Associate Professor in Family Medicine and a Scientist in the Institute of Population Health and the C.T. Lamont Centre for Research in Primary Health Care at the University of Ottawa. He is a Founding Director of the Immigrant Health Visiting Friends and Relatives Program and the Bruyère Gallery: Culture, Art and Healing. He completed a Masters in Family Medicine at the University of Western Ontario, an AMS Senior Education Fellowship: ‘Medical Education in an Age of Pluralism’ and was a Canadian Institutes of Health Research “TUTOR-PHC” Fellow. He conducted research in post-war Republic of Georgia as a Medical Coordinator with Nobel Peace Prize laureates, Médecins Sans Frontières and has also worked in several other countries including Bolivia, Dominican Republic, Venezuela, Guatemala, Indonesia and Thailand. He is a recipient of the 2005 Commitment to Care Award, and the Ontario PAIRO 2002 Excellence in Clinical Teaching Award. His current research focuses developing Canadian Clinical Preventive Guidelines for new immigrants and refugees and examining association between social health determinants and self-reported health using the Longitudinal Survey of Immigrants to Canada.
Enrique Soto, PhD Enrique Soto is a Research Associate at the Institute of Population Health, University of Ottawa. Through a Fulbright scholarship he obtained a Masters of Arts and then a PhD in Sociology from the American University, Washington D.C. In Canada he has collaborated in projects focusing on improving preventive care delivery in primary health care settings in Ontario. He has over 10 years of experience in project coordination, social policy analysis and research on gender, self-employment and housing issues. He has worked in Central America, Mexico and the United States.
Executive Summary Overview: In 2001 immigrants represented 21% (168,120) of Ottawa area population. By 2017 it is expected that visible minorities will represent 28% of the area’s population. On average, during the period 1996-2005, 7,380 new permanent residents arrived
annually in the Ottawa area. Half were economic migrants and 1/5 were refugees. Between 1996 and 2005 the number of temporary residents in Ottawa grew by 66%
reaching 14,180 in 2005: they were foreign students (43%) refugee claimants (26%), and foreign workers (25%).
Over a third of Ottawa immigrants may be particularly vulnerable: Temporary workers, refugees and refugee claimants (7,384) represented, in 2005, 34% of all permanent and temporary Ottawa residents (21,575).
Ottawa’s immigrants are highly diverse, arriving from all continents. The majority of permanent residents currently come from Africa and the Middle East (38%, 2005) and from the Asia-Pacific region (32%, 2005).
The population of refugees has been predominantly of African-Middle East origin (67%, 2005).
Over a quarter (28%) of all permanent resident immigrants do not speak either one of Canada’s official languages.
Immigrants face specific systemic, provider and patient barriers that work against their timely access to quality health care services.
Recommendations:
1. Create a migrant-friendly health settlement clinic with urgent care services to improve access and reduce costs. A clinic linked with settlement services, local community health centres, and the Champlain Immigrant Health Network could improve service delivery and decrease pressures on emergency rooms and health services. Following successful models from Calgary (Calgary Refugee Health Program, and Montreal (PRAIDA), and the Minnesota Refugee Program, this specially designed settlement-linked community clinic would target vulnerable immigrants and provide primary health services for a 1 year period. It would handle sudden waves of refugees, introduce preventive health services (i.e. vaccination, screening and counselling) and help integrate newcomers into the region’s primary health system.
2. Champlain LHIN should officially request population estimates for non-
documented migrants from Statistics Canada. There is no reliable data on irregular immigrants for neither Canada nor Ottawa, this group remains invisible.
3. Research and understand the health and resource impacts on the medically
under-insured (those with no OHIP card) in the Ottawa region.
4. Create an Immigrant Health Resources Directory: Timely access to quality care for immigrants could be improved by creating a directory of health care
4
services targeting this population. Providers working with immigrants tend to be ‘invisible’ to each other, not to mention to the larger primary health care community.
5. Improve delivery of health care services:
a. Supporting more ethnic community brokering of health services, to help immigrants understand and navigate the health care system.
b. Developing centralized service coordination, for better management of health care services’ information, access, referrals, and patient follow-up;
c. Develop better oral and written translation services, for overcoming language barriers between immigrants and Canadian born providers.
d. Develop more cultural competency, for Canadian health care workers and professionals to be able to correctly diagnose, treat and form effective relationships with immigrants.
6. Assess the health status of immigrants in Ottawa. At this time there is no
published information on the health status of immigrants specifically for the Ottawa area. Studies on the Canadian immigrant population on the subject suggest that the ‘healthy immigrant effect’ (immigrants on arrival tend to be healthier than Canadians) may not be accurate for all subgroups of immigrants.
7. Research the social determinants of health for Ottawa’s immigrants. This
information is particularly important in identifying vulnerable immigrant populations, developing public health and community preventive programs, and in preparing for emerging health issues.
8. Research Ottawa immigrants’ preferences and use of health services. Such
knowledge would help planning service delivery improvement strategies.
9. Request spatial work/living distribution of Ottawa’s immigrants. This type of information would be valuable for identifying spatial ‘mismatches’ between immigrants’ residential areas and areas where health services are delivered, such information could be officially requested from Citizenship and Immigration Canada.
10. Develop guidelines for cultural competency: Cultural competency –behaviours
allowing effective cross-cultural work- has been put forward as a health service delivery model in Australia, a country with a culturally diverse population. Through the use of cultural competency guidelines, providers in Ottawa can better inform, consult and negotiate treatment for and with patients from different cultural backgrounds. Use of cultural competency guidelines can lead to improvements in delivering effective health services to Ottawa’s immigrants.
11. Develop and implement a Cultural Competency Support Program: Key
health programs in Ottawa (i.e. Community Diabetes Program at CHCs, Women’s

5
Health Clinic at the Ottawa Hospital) have shown interest in obtaining support related to improving delivery of services to immigrants.
12. Raise Awareness on Benefits of and Need for Cultural Competency- there is a
need to raise awareness for the need to enhance the cultural competency of health services for the Ottawa region. One approach could be to disseminate and gather support for adopting an adaptation of the Australian Cultural Competence Model.
1
1. Introduction
In 2006, immigrants represented 23% of Ottawa’s population. Ottawa is becoming an increasingly popular destination for newcomers to Canada and the current immigration influx is expected to continue. For instance, Ottawa receives more than 7000 immigrants annually, of which 1600 are refugees and refugee claimants. Although the effective planning and delivery of health services for newly arriving immigrants and refugees should take into consideration their cultural, ethnic, and linguistic backgrounds as well as their health and demographic characteristics, most health services available to immigrants are not attuned to their cultural characteristics or to specific health protective and risk factors of this population. In many instances, this is compounded by the fact many new immigrants are not medically insured to receive health care services. Aware of this situation, the Champlain Immigrant Health Network (CIHN) was created with the purpose of coordinating efforts among local organizations providing health services to immigrants. The Network identified the lack of a document focusing on the Champlain region’s immigrant population that brings together information on their health, demographic and cultural characteristics. This information is prepared for local health organizations and health program initiatives to help them better plan their work and to encourage immigrant responsive services. This report is a first step in that direction. Its purpose is to summarize published health and migration information that can be used as source for strategic planning of health and settlement service organizations in the Champlain Local Integrated Health Network. See Appendix for background details on the Champlain Immigrant Health Network.
2. Presence and Distribution of Immigrants to Ottawa According to Immigration Category
Ottawa’s metropolitan area (Ottawa and Gatineau) population reached 1.13 million in 2006, growing 5.9% compared to 2001, a growth figure that is higher than the 5.4% national average for the same period.1 In 2006, Ottawa was the fourth largest metropolitan area in the country after Toronto, Montreal and Vancouver. Although regional data is not available yet on the components of population growth, Statistics Canada reported in March 2007 that two-thirds of the nation’s population growth is due to net international migration.2 If both growth trends continue, national and Ottawa’s, it is reasonable to foresee a continued expansion of Ottawa’s immigrant communities. According to the 2001 Census, there were 168,120 immigrants in the Ottawa Census Metropolitan Area (the Ottawa area, for short; it includes the Ontario and Quebec sections of the city) in that year representing 21% of Ottawa’s population.3 The same figures for Ontario and Canada were 27% and 18%.3
2
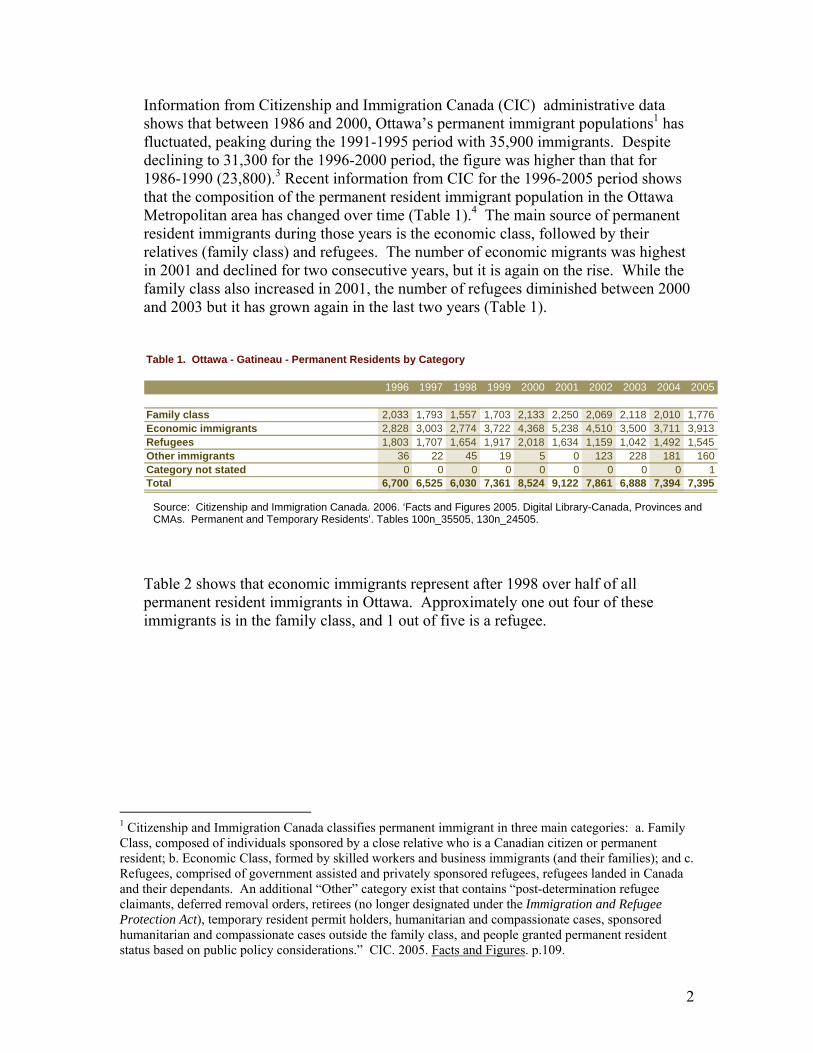
Information from Citizenship and Immigration Canada (CIC) administrative data shows that between 1986 and 2000, Ottawa’s permanent immigrant populations1 has fluctuated, peaking during the 1991-1995 period with 35,900 immigrants. Despite declining to 31,300 for the 1996-2000 period, the figure was higher than that for 1986-1990 (23,800).3 Recent information from CIC for the 1996-2005 period shows that the composition of the permanent resident immigrant population in the Ottawa Metropolitan area has changed over time (Table 1).4 The main source of permanent resident immigrants during those years is the economic class, followed by their relatives (family class) and refugees. The number of economic migrants was highest in 2001 and declined for two consecutive years, but it is again on the rise. While the family class also increased in 2001, the number of refugees diminished between 2000 and 2003 but it has grown again in the last two years (Table 1).
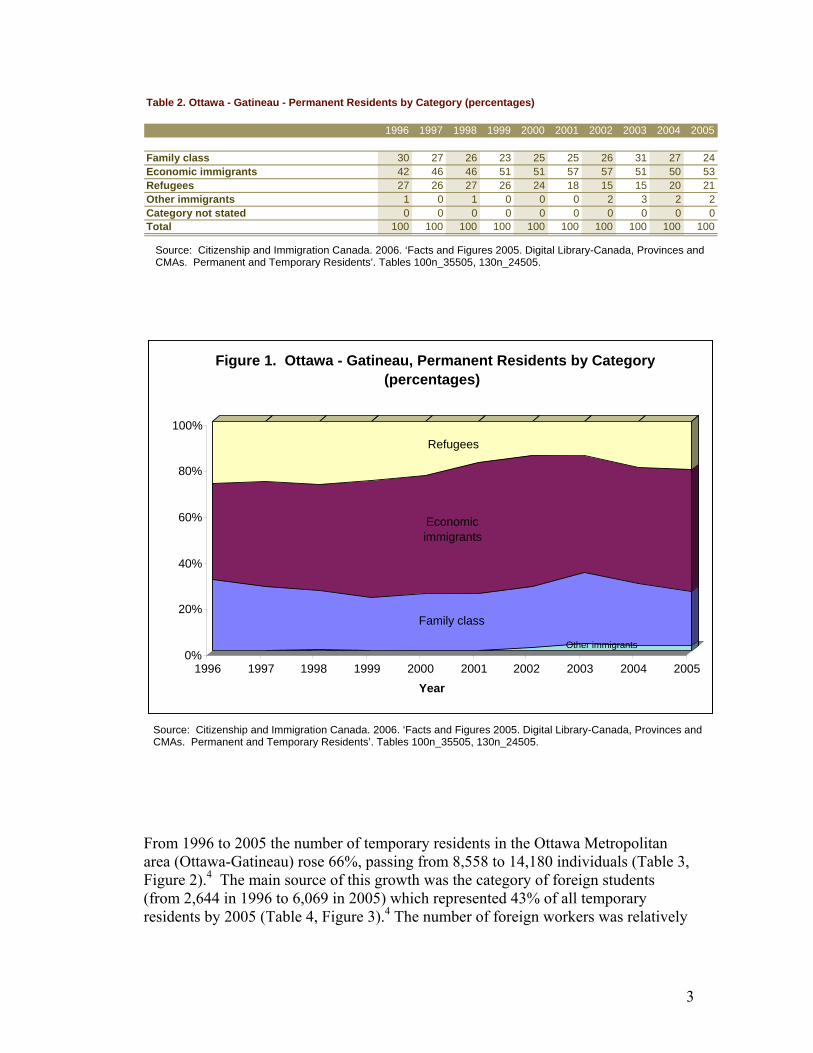
Table 2 shows that economic immigrants represent after 1998 over half of all permanent resident immigrants in Ottawa. Approximately one out four of these immigrants is in the family class, and 1 out of five is a refugee.
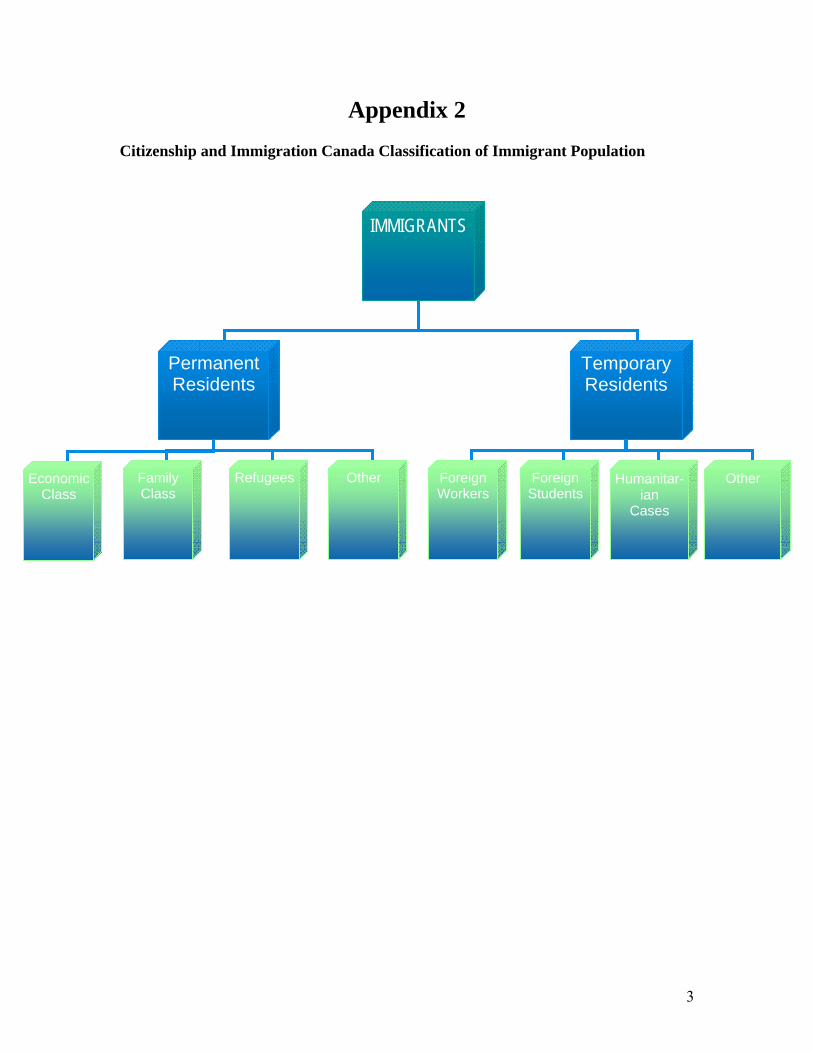
1 Citizenship and Immigration Canada classifies permanent immigrant in three main categories: a. Family Class, composed of individuals sponsored by a close relative who is a Canadian citizen or permanent resident; b. Economic Class, formed by skilled workers and business immigrants (and their families); and c. Refugees, comprised of government assisted and privately sponsored refugees, refugees landed in Canada and their dependants. An additional “Other” category exist that contains “post-determination refugee claimants, deferred removal orders, retirees (no longer designated under the Immigration and Refugee Protection Act), temporary resident permit holders, humanitarian and compassionate cases, sponsored humanitarian and compassionate cases outside the family class, and people granted permanent resident status based on public policy considerations.” CIC. 2005. Facts and Figures. p.109.
Table 1. Ottawa - Gatineau - Permanent Residents by Category
1996 1997 1998 1999 2000 2001 2002 2003 2004 2005
Family class 2,033 1,793 1,557 1,703 2,133 2,250 2,069 2,118 2,010 1,776Economic immigrants 2,828 3,003 2,774 3,722 4,368 5,238 4,510 3,500 3,711 3,913Refugees 1,803 1,707 1,654 1,917 2,018 1,634 1,159 1,042 1,492 1,545Other immigrants 36 22 45 19 5 0 123 228 181 160Category not stated 0 0 0 0 0 0 0 0 0 1Total 6,700 6,525 6,030 7,361 8,524 9,122 7,861 6,888 7,394 7,395
Source: Citizenship and Immigration Canada. 2006. ‘Facts and Figures 2005. Digital Library-Canada, Provinces and CMAs. Permanent and Temporary Residents’. Tables 100n_35505, 130n_24505.
3
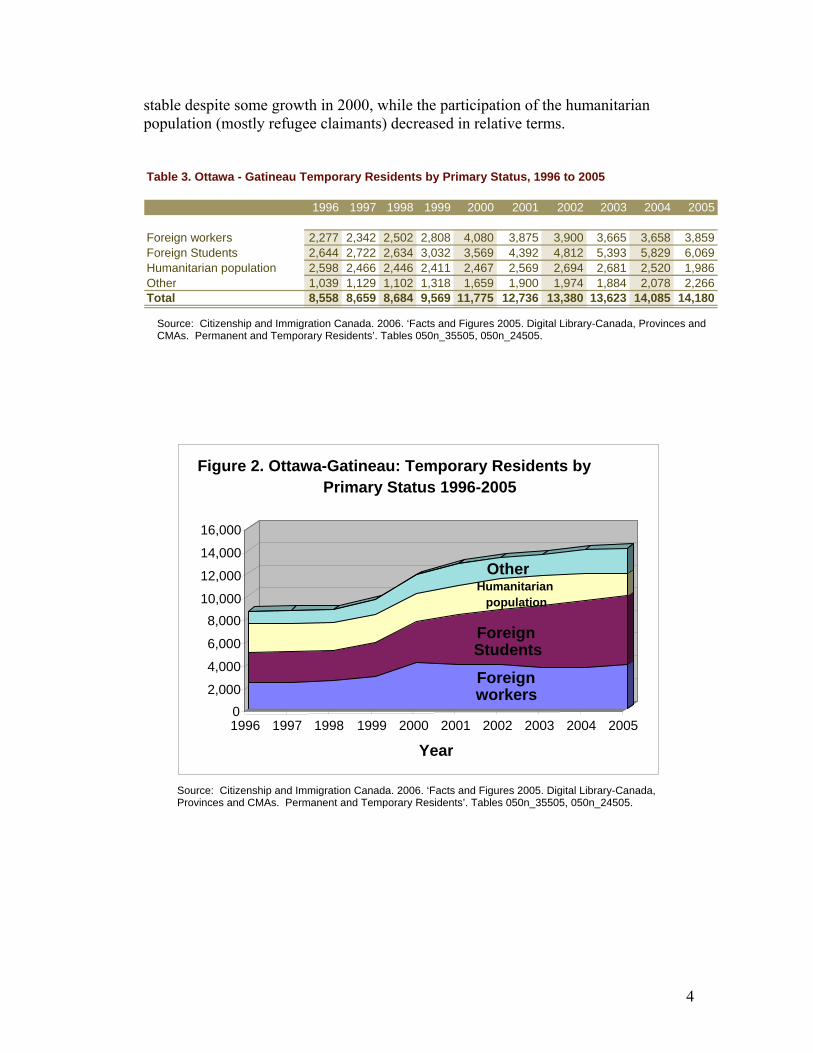
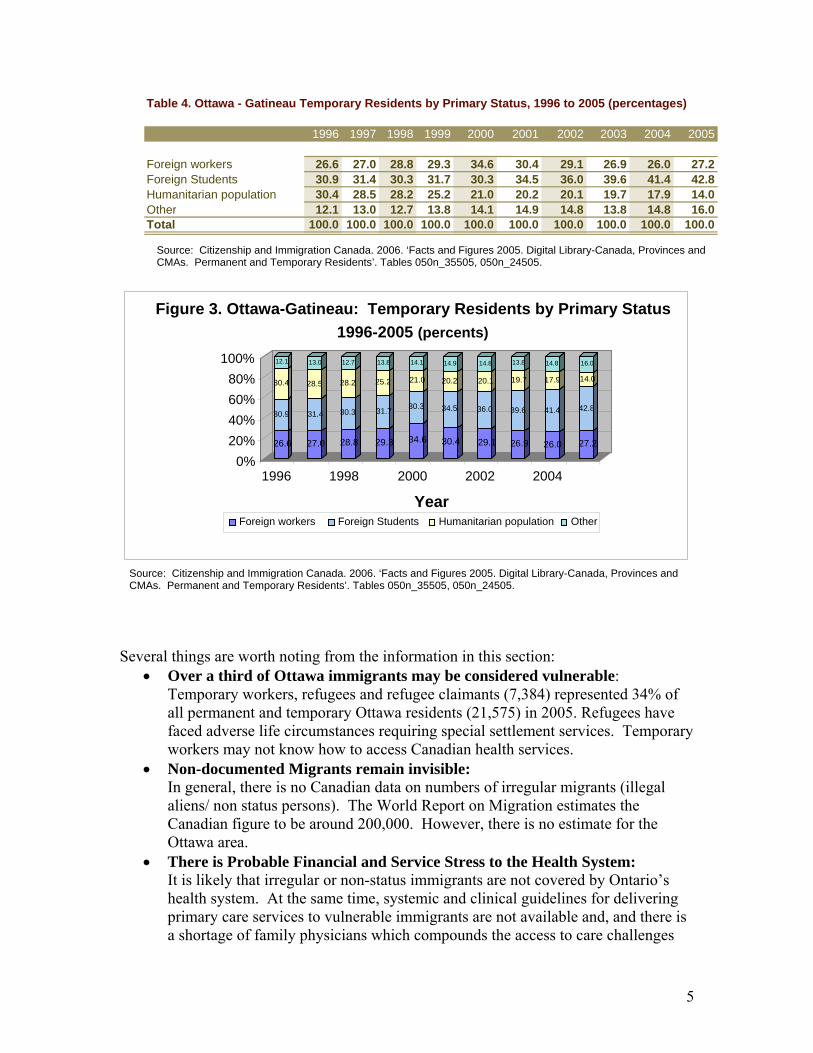
From 1996 to 2005 the number of temporary residents in the Ottawa Metropolitan area (Ottawa-Gatineau) rose 66%, passing from 8,558 to 14,180 individuals (Table 3, Figure 2).4 The main source of this growth was the category of foreign students (from 2,644 in 1996 to 6,069 in 2005) which represented 43% of all temporary residents by 2005 (Table 4, Figure 3).4 The number of foreign workers was relatively
Other immigrants
Family class
Economic immigrants
Refugees
0%
20%
40%
60%
80%
100%
1996 1997 1998 1999 2000 2001 2002 2003 2004 2005Year
Figure 1. Ottawa - Gatineau, Permanent Residents by Category (percentages)
Source: Citizenship and Immigration Canada. 2006. ‘Facts and Figures 2005. Digital Library-Canada, Provinces and CMAs. Permanent and Temporary Residents’. Tables 100n_35505, 130n_24505.
Table 2. Ottawa - Gatineau - Permanent Residents by Category (percentages)
1996 1997 1998 1999 2000 2001 2002 2003 2004 2005
Family class 30 27 26 23 25 25 26 31 27 24Economic immigrants 42 46 46 51 51 57 57 51 50 53Refugees 27 26 27 26 24 18 15 15 20 21Other immigrants 1 0 1 0 0 0 2 3 2 2Category not stated 0 0 0 0 0 0 0 0 0 0Total 100 100 100 100 100 100 100 100 100 100
Source: Citizenship and Immigration Canada. 2006. ‘Facts and Figures 2005. Digital Library-Canada, Provinces and CMAs. Permanent and Temporary Residents’. Tables 100n_35505, 130n_24505.
4
stable despite some growth in 2000, while the participation of the humanitarian population (mostly refugee claimants) decreased in relative terms.
Foreign workers
Foreign Students
Humanitarian population
Other
02,000
4,000
6,000
8,00010,000
12,000
14,000
16,000
1996 1997 1998 1999 2000 2001 2002 2003 2004 2005
Year
Figure 2. Ottawa-Gatineau: Temporary Residents by Primary Status 1996-2005
Table 3. Ottawa - Gatineau Temporary Residents by Primary Status, 1996 to 2005
1996 1997 1998 1999 2000 2001 2002 2003 2004 2005
Foreign workers 2,277 2,342 2,502 2,808 4,080 3,875 3,900 3,665 3,658 3,859Foreign Students 2,644 2,722 2,634 3,032 3,569 4,392 4,812 5,393 5,829 6,069Humanitarian population 2,598 2,466 2,446 2,411 2,467 2,569 2,694 2,681 2,520 1,986Other 1,039 1,129 1,102 1,318 1,659 1,900 1,974 1,884 2,078 2,266Total 8,558 8,659 8,684 9,569 11,775 12,736 13,380 13,623 14,085 14,180
Source: Citizenship and Immigration Canada. 2006. ‘Facts and Figures 2005. Digital Library-Canada, Provinces and CMAs. Permanent and Temporary Residents’. Tables 050n_35505, 050n_24505.
Source: Citizenship and Immigration Canada. 2006. ‘Facts and Figures 2005. Digital Library-Canada, Provinces and CMAs. Permanent and Temporary Residents’. Tables 050n_35505, 050n_24505.
5
Several things are worth noting from the information in this section:
• Over a third of Ottawa immigrants may be considered vulnerable: Temporary workers, refugees and refugee claimants (7,384) represented 34% of all permanent and temporary Ottawa residents (21,575) in 2005. Refugees have faced adverse life circumstances requiring special settlement services. Temporary workers may not know how to access Canadian health services.
• Non-documented Migrants remain invisible: In general, there is no Canadian data on numbers of irregular migrants (illegal aliens/ non status persons). The World Report on Migration estimates the Canadian figure to be around 200,000. However, there is no estimate for the Ottawa area.
• There is Probable Financial and Service Stress to the Health System: It is likely that irregular or non-status immigrants are not covered by Ontario’s health system. At the same time, systemic and clinical guidelines for delivering primary care services to vulnerable immigrants are not available and, and there is a shortage of family physicians which compounds the access to care challenges
26.6
30.9
30.4
12.1
27.0
31.4
28.5
13.0
28.8
30.3
28.2
12.7
29.3
31.7
25.2
13.8
34.6
30.3
21.0
14.1
30.4
34.5
20.2
14.9
29.1
36.0
20.1
14.8
26.9
39.6
19.7
13.8
26.0
41.4
17.9
14.8
27.2
42.8
14.0
16.0
0% 20%40%60%80%
100%
1996 1998 2000 2002 2004
Year
Figure 3. Ottawa-Gatineau: Temporary Residents by Primary Status 1996-2005 (percents)
Foreign workers Foreign Students Humanitarian population Other
Table 4. Ottawa - Gatineau Temporary Residents by Primary Status, 1996 to 2005 (percentages)
1996 1997 1998 1999 2000 2001 2002 2003 2004 2005
Foreign workers 26.6 27.0 28.8 29.3 34.6 30.4 29.1 26.9 26.0 27.2Foreign Students 30.9 31.4 30.3 31.7 30.3 34.5 36.0 39.6 41.4 42.8Humanitarian population 30.4 28.5 28.2 25.2 21.0 20.2 20.1 19.7 17.9 14.0Other 12.1 13.0 12.7 13.8 14.1 14.9 14.8 13.8 14.8 16.0Total 100.0 100.0 100.0 100.0 100.0 100.0 100.0 100.0 100.0 100.0
Source: Citizenship and Immigration Canada. 2006. ‘Facts and Figures 2005. Digital Library-Canada, Provinces and CMAs. Permanent and Temporary Residents’. Tables 050n_35505, 050n_24505.
Source: Citizenship and Immigration Canada. 2006. ‘Facts and Figures 2005. Digital Library-Canada, Provinces and CMAs. Permanent and Temporary Residents’. Tables 050n_35505, 050n_24505.
6
for newcomers. These circumstances may lead to frequent use by these groups of migrants of emergency services, walk-in clinics or of services at Community Health Centers (CHCs). Community Health Centres provide interdisciplinary primary care and respond to vulnerable person within their community, however their service capacity is limited. Since the use of emergency room services is much more expensive than those of a family physician or community health centers, their use by the vulnerable immigrant population could be resulting in financial stress for the health system.
Research Gaps and Recommendations:
• Credible estimates of the number of non-status immigrants in the Ottawa area are not available. The Champlain LHIN should officially request estimates from Statistics Canada. Statistics Canada is developing the technical capacity to produce these population estimates.
• Assuming that a shortage of services is propelling the use of emergency room services by newly arriving and vulnerable immigrants, we recommend the creation of a migrant-friendly prevention outreach health clinic with urgent care capacity that could serve to enhance the health settlement of the thousands of newly arriving immigrants and refugees and reduce hospital costs. A migrant friendly clinic would blend cultural, linguistic interpretive capacity with skilled and knowledgeable health workers, a model that has been successful in much of Europe.
• Medical insurance is a key determinant in access to health services. Currently health coverage is granted to immigrants in Ontario after a three month mandatory waiting period and to convention refugees upon landing. Additionally, a portion of immigrants may cease to enjoy health coverage because they loose their legal status (i.e. Expired visitors’ visas, temporary workers’ overstays, irregular migrants, and denied refugee claimants). Understanding the health and financial impact on both the health system and the medically under-insured should be considered a research priority.
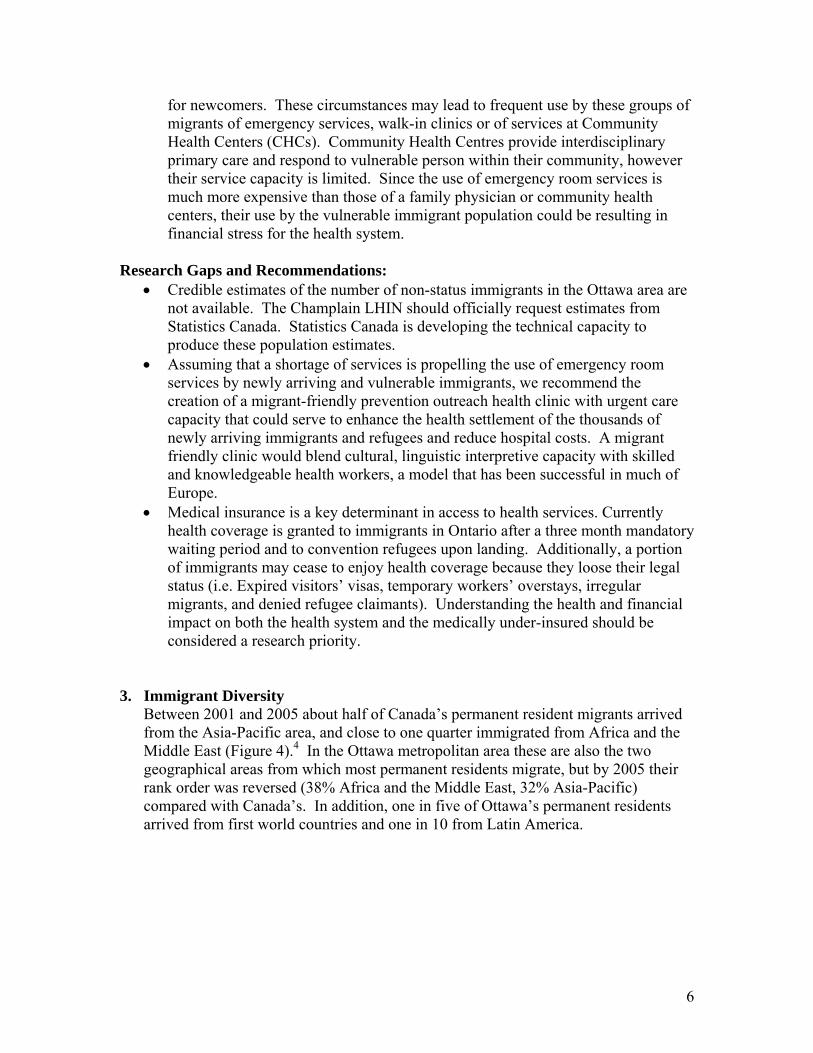
3. Immigrant Diversity Between 2001 and 2005 about half of Canada’s permanent resident migrants arrived from the Asia-Pacific area, and close to one quarter immigrated from Africa and the Middle East (Figure 4).4 In the Ottawa metropolitan area these are also the two geographical areas from which most permanent residents migrate, but by 2005 their rank order was reversed (38% Africa and the Middle East, 32% Asia-Pacific) compared with Canada’s. In addition, one in five of Ottawa’s permanent residents arrived from first world countries and one in 10 from Latin America.
7
The number of permanent residents in the Ottawa area has not changed dramatically during the five-year period for any of the source areas, except for a decline in the number of residents from Asia/Pacific and an even smaller decline in residents from the United States and Europe (Table 5).4 By 2005 the 10 top source countries of permanent residents for Ottawa (Ontario only) contributed 45% of them and in order of importance were China (12%), India (6%), the United Arab Emirates, United States, Lebanon, the Philippines, Haiti, Iran, United Kingdom, Pakistan, Saudi Arabia, Somalia, and Afghanistan.
Table 5. Ottawa - Gatineau - Permanent Residents by Source Area
2001 2002 2003 2004 2005
Africa and the Middle East 2,914 2,601 2,254 2,874 2,845Asia and Pacific 3,527 2,857 2,427 2,217 2,358South and Central America 948 950 815 794 811United States/Europe and United Kingdom 1,732 1,453 1,392 1,509 1,373Source area not stated 1 0 0 0 7Category not stated 0 0 0 0 1Total 9,122 7,861 6,888 7,394 7,395
Figure 4. Ottawa - Gatineau Permanet Residents by Source Area (percentages)
32 33 33 39 38
39 36 35 30 32
10 12 12 11 11
19 18 20 20 19
0%
20%
40%
60%
80%
100%
2001 2002 2003 2004 2005
Africa and the Middle East Asia and PacificSouth and Central America United States/Europe and United Kingdom
Source: Citizenship and Immigration Canada. 2006. ‘Facts and Figures 2005. Digital Library-Canada, Provinces and CMAs. Permanent and Temporary Residents’. Tables 290n_35505, 290n_24505.
Source: Citizenship and Immigration Canada. 2006. ‘Facts and Figures 2005. Digital Library-Canada, Provinces and CMAs. Permanent and Temporary Residents’. Tables 290n_35505, 290n_24505.
8
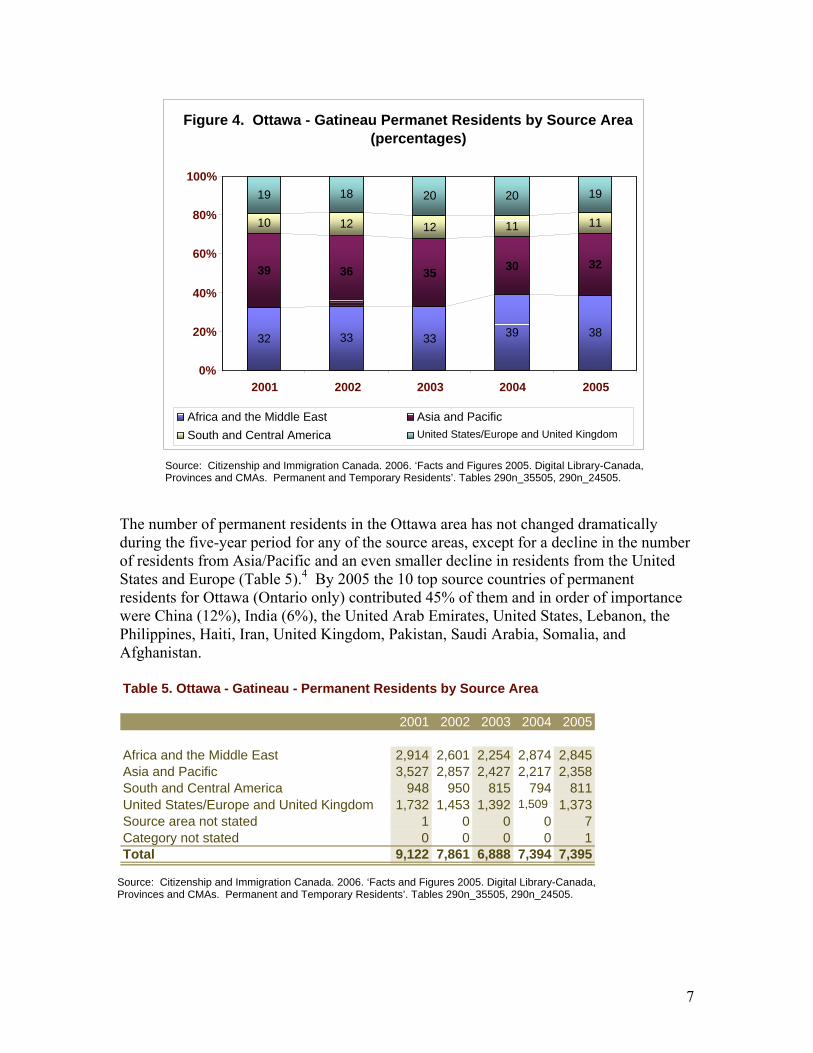
During this observation period, refugees represented between 12% and 17% of all permanent foreign born residents in the Ottawa metropolitan area, for a total of 1,268 in 2005 (Table 6).4 This refugee population is somewhat less diverse, with two thirds arriving from Africa and the Middle East while the Asia/Pacific component has declined to 15% (2005) from 25% (2003) (Figure 6). The top source countries, from where this group arrived in 2005 were, in decreasing order, Somalia, the Democratic Republic of Congo, Turkey, Lebanon, Rwanda, United States, Djibouti, Ethiopia, Mexico, Burundi, Peru, Colombia, Angola, Iraq and Libya.
Figure 6.Ottawa - Ontario Refugee Population by Source Area (percents)
61
60
63
67
67
20
24
25
17
15
4
6
6
8
10
15
10
6
8
7
2001
2002
2003
2004
2005
United States/Europe andUnited KingdomSouth and Central America
Asia and Pacific
Africa and the Middle East
Source: Citizenship and Immigration Canada. 2006. ‘Facts and Figures 2005. Digital Library-Canada, Provinces and CMAs. Permanent and Temporary Residents’. Table 290n_35505.
Table 6. Ottawa - Gatineau (Ontario) - Refugees by Source Area2001 2002 2003 2004 2005
Africa and the Middle East 837 606 537 835 848Asia and Pacific 273 243 217 214 194South and Central America 60 63 50 98 126United States/Europe and United Kingdom 201 98 49 95 94Source area not stated 0 0 0 0 6 Total 1,371 1,010 853 1,242 1,268Source: Citizenship and Immigration Canada. 2006. ‘Facts and Figures 2005. Digital Library-Canada, Provinces and CMAs. Permanent and Temporary Residents’. Table 290n_35505.
9
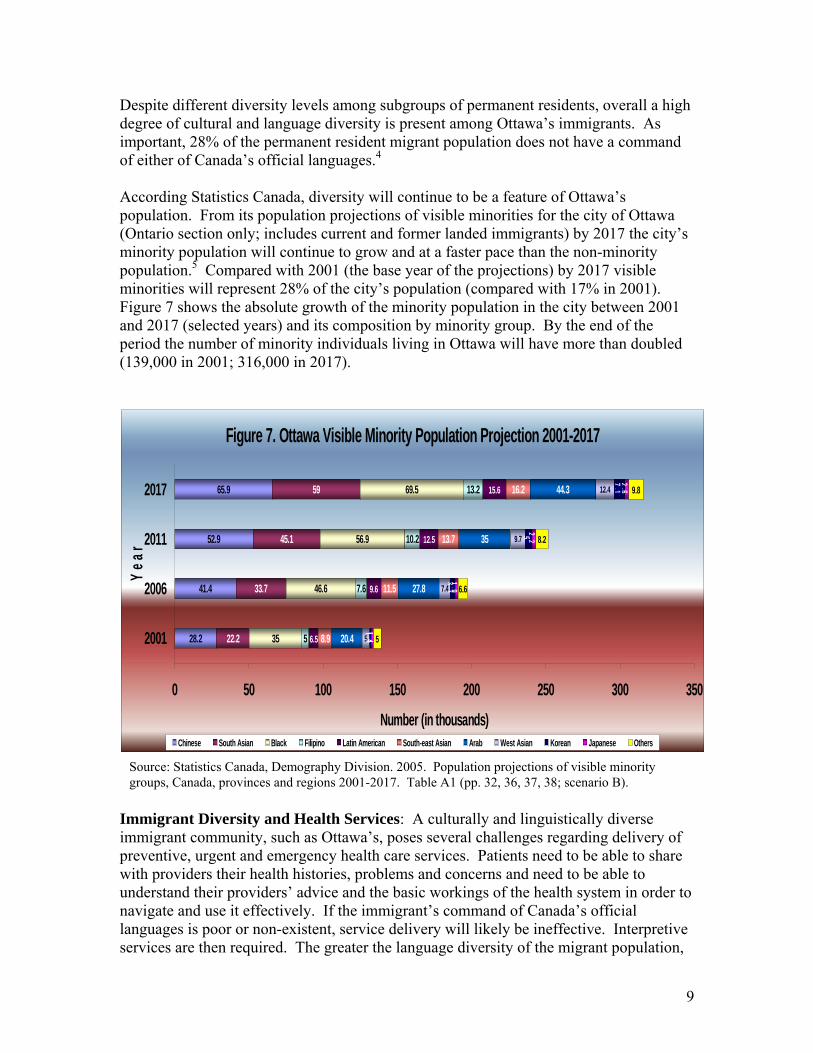
Despite different diversity levels among subgroups of permanent residents, overall a high degree of cultural and language diversity is present among Ottawa’s immigrants. As important, 28% of the permanent resident migrant population does not have a command of either of Canada’s official languages.4 According Statistics Canada, diversity will continue to be a feature of Ottawa’s population. From its population projections of visible minorities for the city of Ottawa (Ontario section only; includes current and former landed immigrants) by 2017 the city’s minority population will continue to grow and at a faster pace than the non-minority population.5 Compared with 2001 (the base year of the projections) by 2017 visible minorities will represent 28% of the city’s population (compared with 17% in 2001). Figure 7 shows the absolute growth of the minority population in the city between 2001 and 2017 (selected years) and its composition by minority group. By the end of the period the number of minority individuals living in Ottawa will have more than doubled (139,000 in 2001; 316,000 in 2017).
Figure 7. Ottawa Visible Minority Population Projection 2001-2017
28.2
41.4
52.9
65.9
22.2
33.7
45.1
59
35
46.6
56.9
69.5
5
7.6
10.2
13.2
6.5
9.6
12.5
15.6
8.9
11.5
13.7
16.2
20.4
27.8
35
44.3
5
7.4
9.7
12.4
1.3
3.3
5
7.1
1.4
1.9
2.2
2.6
5
6.6
8.2
9.8
0 50 100 150 200 250 300 350
2001
2006
2011
2017
Year
Number (in thousands)Chinese South Asian Black Filipino Latin American South-east Asian Arab West Asian Korean Japanese Others
Immigrant Diversity and Health Services: A culturally and linguistically diverse immigrant community, such as Ottawa’s, poses several challenges regarding delivery of preventive, urgent and emergency health care services. Patients need to be able to share with providers their health histories, problems and concerns and need to be able to understand their providers’ advice and the basic workings of the health system in order to navigate and use it effectively. If the immigrant’s command of Canada’s official languages is poor or non-existent, service delivery will likely be ineffective. Interpretive services are then required. The greater the language diversity of the migrant population,
Source: Statistics Canada, Demography Division. 2005. Population projections of visible minority groups, Canada, provinces and regions 2001-2017. Table A1 (pp. 32, 36, 37, 38; scenario B).
10
however, the harder it will be to offer quality interpretation in health care settings due to the variety of languages. Once this obstacle is addressed, the more nuanced barrier of intercultural communication emerges. Depending on their country of origin, immigrants’ perceptions on what is considered sickness and health, on forms and levels of pain, on expected patient and provider behaviour, just to name a few cultural health aspects, will vary widely. Research Gaps and Recommendations:
• Health Settlement Information and Services: In light of the challenges and costs of integrating persons of vast cultural and linguistic diversity, immigrant health resources and health service information should be coordinated through a centralized body and accessible Internet website. Cost-effective models for this currently exist, one good example being the Minnesota Refugee Program.
• Effective brokering of health services: Navigating our complex health system is difficult for native Canadians, and even more difficult for newcomers. Ottawa needs an efficient, centralized health settlement service to promote health and demystify services for newcomers. In Edmonton, with the financial support of the regional health authority, the Multicultural Health Brokers Co-Operative successfully brings together 16 different ethnic groups working with communities as lay health brokers.
• Language Translation and Interpretive Services: Effective communication is important to assure quality and safe health care. Yet, more than 25% of immigrants are not proficient in either official Canadian language and this proportion is likely to be higher among vulnerable immigrant populations (refugees, refugee claimants, temporary workers). Besides the strategic translation of health information as noted above, there is a need for timely and cost-effective interpretative services during medical consultations and/or the identification of providers and centres with expanded language capacities. Diverse interpretive services should be developed so as to be flexible enough to meet diverse health care settings: interpretation can be handled by hiring staff with diverse language skills and there is a need to develop efficient guidelines to facilitate the cost-effective use of professional interpreters.
• Cultural Competency: For Canadian health care workers and professionals to be able to correctly diagnose and treat immigrants, and for immigrants to fully understand and effectively use Ontario’s health services, it is essential that both immigrants and providers understand and become sensitive to those aspects of each others culture playing a role in the use and delivery of health services. See section 7 (below) for recommendations.
4. Health Status of Immigrants “Healthy Immigrant Effect”
Immigrants initially experience lower rates of disease and report better health status than their age-matched Canadian-born counterparts. This is called the “healthy immigrant effect”. Most studies comparing disease-specific mortality rates between immigrants and the general population confirm the healthy immigrant effect, as in the
11
case for cancer, heart disease and suicide.6,7 Several factors have been suggested to explain this phenomena: the demands of the relocation effort tend to screen out individuals with health problems and fewer resources to overcome them, the Canadian immigrant selection process excludes applicants with severe health conditions and accepts those with higher socioeconomic status (human and financial capital) which is normally associated with good health, and immigrants often arrive with family-oriented values and health-related behaviors that confer a health advantage. It has been pointed out, however, that the effect may not hold true for all immigrant subpopulations. In a study that compares age standardized mortality rates between refugee and non-refugee immigrants with the general Canadian population with information stratified by age, sex, region of origin and length of stay, found that general mortality rates were lower for all immigrants than for the Canadian-born.8 There were, however, differences within immigrant population sub-groups. With the passing of time, mortality risk increased for non-refugees. For male refugees the mortality risk did not significantly increase with time, as it did for other immigrants. In addition, regarding disease-specific mortality risks, they were higher for some immigrants than for nationals, for nasopharyngeal and liver cancer (male non-refugee immigrants), for AIDS (non-refugee immigrant females), liver cancer (refugee males and non-refugee immigrant females) and infectious diseases (refugee females).
Regarding immigrants’ perception of their own health, early population studies suggested that immigrants reported better health than the native born, in particular for recent immigrants upon arrival, but that it gradually declined to levels similar to the general population afterwards.9,10,11 Examining data from the National Population Health Survey (NPHS), Newbold and Danforth (2003) found that “with the exception of the most recent arrivals, immigrants experience worse health status across most dimensions relative to non-immigrants” (p. 1981) and that the effect is stronger among those that are older, with lower levels of education and income or those not participating in the labour force.12 Using 1994 to 2001 NPHS data Newbold evaluated the risks for declining self-assessed health (SAH) status for five cohorts of immigrants.13 Findings confirm worse self-reported health among immigrants compared with Canadian born, which are also associated with being male, black, speaking English/French, having low income, being unemployed, smoking and drinking. Using the same data set Ng et al identified that among recent immigrants, those of non-European origin are twice as likely to experience declines in self-reported health.14
Research Gaps and Recommendations:
• While there are databases from which the data could be obtained (such as the Longitudinal Survey of Immigrants to Canada, Canadian Community Health Survey, Ontario Vital Statistics and Mortality Database, etc.), no published reports exist on migrant subpopulation specific to the Ottawa region.
• Ottawa needs to find ways to assess the health status of its diverse communities. While there are socioeconomic and demographic profiles of
12
this population no in-depth analysis exist on how these factors influence their health status. This information is particularly important in identifying vulnerable immigrant populations, developing public health and community preventive programs, and in preparing for emerging health issues.
• Analysis of Ottawa immigrants’ health services use. There is an analysis gap on health care services use by the immigrant community, both in terms of service quality -ex. are immigrants accessing preventive care periodically?- and type of services/providers visited -ex. Do immigrants make more visits to emergency rooms or urgent care/walk-in clinics than Canadian born residents?
• Information on the spatial distribution of Ottawa’s immigrants. Differentials in health status between immigrants and the general population are influenced by geographical disparities in the availability of services. Spatial distribution information on immigrant population and health service provider can also identify spatial ‘mismatches’ between immigrants and services. This type of information is an important element when planning future service delivery for immigrant groups aimed at reducing health disparities.
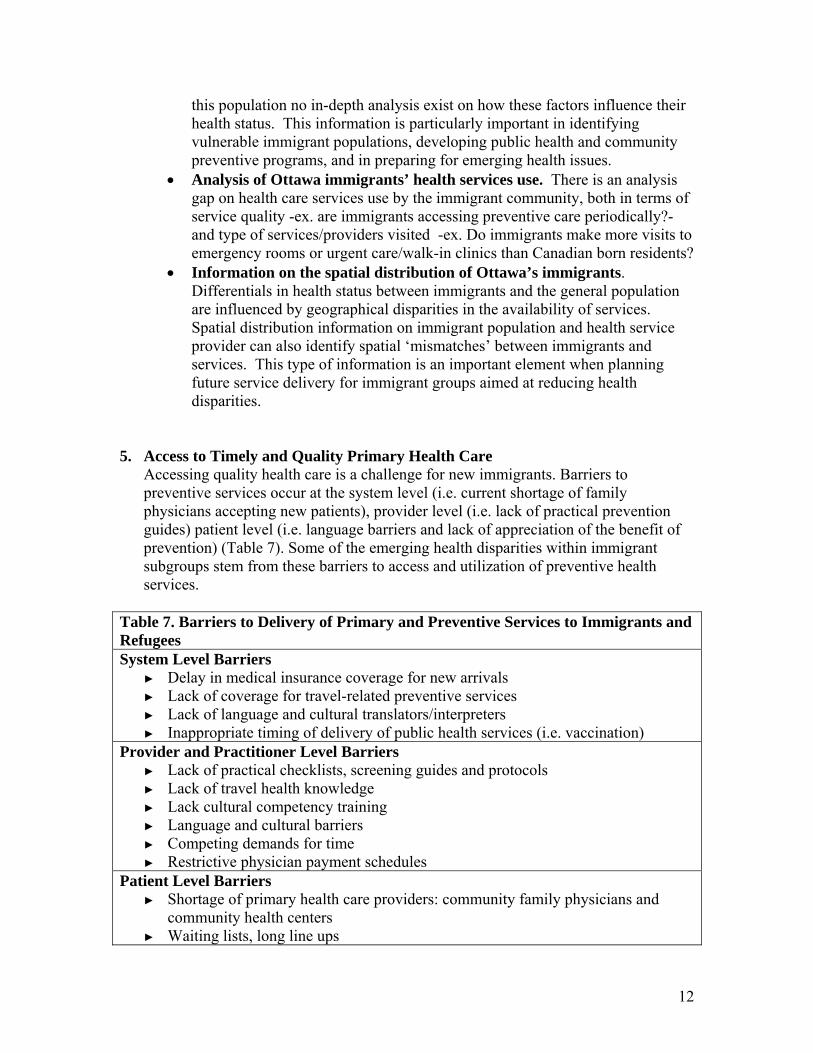
5. Access to Timely and Quality Primary Health Care Accessing quality health care is a challenge for new immigrants. Barriers to preventive services occur at the system level (i.e. current shortage of family physicians accepting new patients), provider level (i.e. lack of practical prevention guides) patient level (i.e. language barriers and lack of appreciation of the benefit of prevention) (Table 7). Some of the emerging health disparities within immigrant subgroups stem from these barriers to access and utilization of preventive health services.
Table 7. Barriers to Delivery of Primary and Preventive Services to Immigrants and Refugees System Level Barriers
► Delay in medical insurance coverage for new arrivals ► Lack of coverage for travel-related preventive services ► Lack of language and cultural translators/interpreters ► Inappropriate timing of delivery of public health services (i.e. vaccination)
Provider and Practitioner Level Barriers ► Lack of practical checklists, screening guides and protocols ► Lack of travel health knowledge ► Lack cultural competency training ► Language and cultural barriers ► Competing demands for time ► Restrictive physician payment schedules
Patient Level Barriers ► Shortage of primary health care providers: community family physicians and
community health centers ► Waiting lists, long line ups
13
► Limited personal finances ► Language and cultural barriers ► Fear of stigmatization (i.e. related to HIV/AIDS) ► Lack of understanding of system ► Lack of access to physician or continuous care ► Lack of medical insurance (i.e. no OHIP) ► Lack of experience in scheduling appointments ► Competing life demands (work, family communication, school, housing) ► Gender barriers ► Discrimination
Primary health care providers’ knowledge is generally based on Canadian best practice guidelines for screening and treating disease. This, however, could be a factor contributing to the disparities in quality of care for preventable and treatable conditions experienced by immigrant and refugee populations. Currently guidelines are being developed- Canadian Clinical Preventive Guidelines for newly arrived Immigrants and Refugees: website URL: http://www.intermed.med.uottawa.ca/research/immrefhealth/eng/index.- and implementation of these guidelines could play an important role for the Ottawa area. Research Gaps and Recommendations:
• Directory of Health Care Services for Immigrants in Ottawa: A first practical step for improving access to quality health services to refugees and immigrants is to identify providers already working with this population. While there are a number of organizations and individuals already actively caring for the health needs of immigrants, they remain ‘invisible’ to each other, not to mention to the larger primary health care community. In order to fill this gap, we suggest developing a systematic and efficient methodology for creating and annually updating a directory of local immigrant primary health care providers that is cost-effective and replicable. This is a relevant consideration if the goal is to maintain the resource up-to-date and for eventually applying the methodology to other geographical areas.
• Cultural Competency Enhancement: A necessary condition for proper immigrant health care service delivery is that providers improve their cultural competency. See section 7 (below) for recommendations.
6. Cultural competency guidelines for immigrant health programs:
Cultural competency, as defined by Cross et al15 is “a set of congruent behaviours, attitudes, and policies that come together in a system, agency or among professionals and enable that system, agency or those professionals to work effectively in cross-cultural situations”.16 Resulting from a process of consultation and of review of research and practice evidence, Australia’s NHMRC has advanced a model for increasing cultural competency in the health sector. It identifies four operative dimensions (systemic, organizational, professional and individual) to act upon and
14
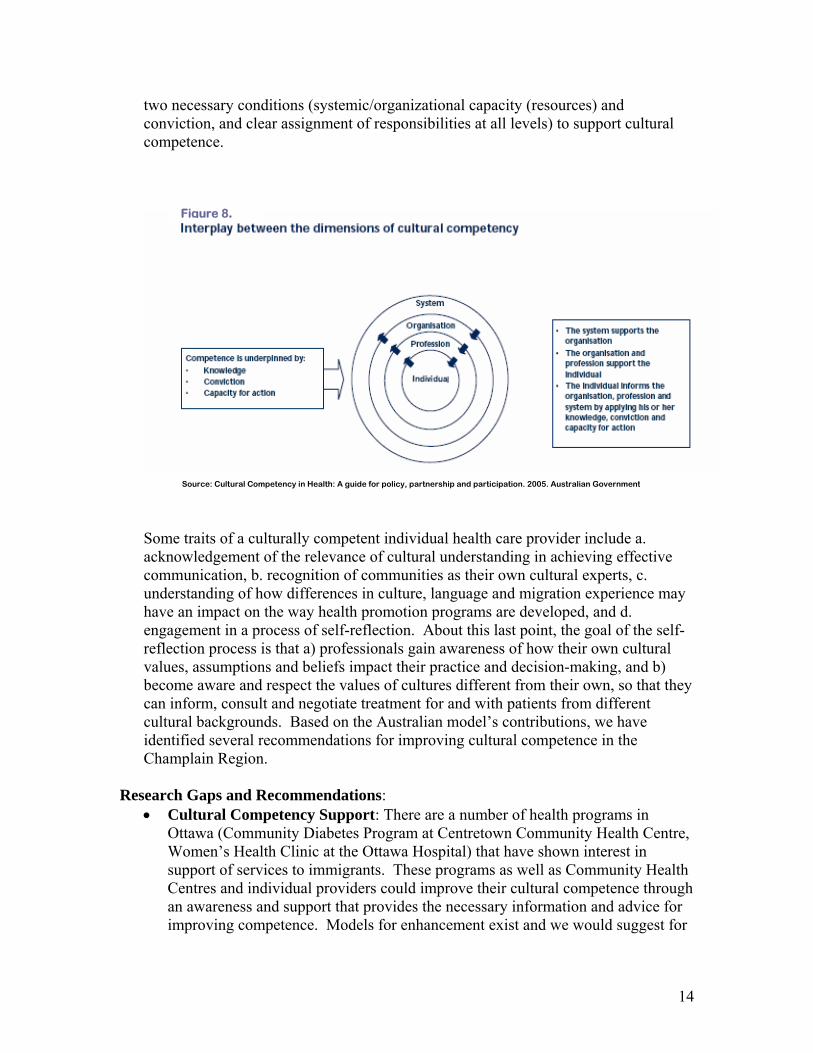
two necessary conditions (systemic/organizational capacity (resources) and conviction, and clear assignment of responsibilities at all levels) to support cultural competence.
Some traits of a culturally competent individual health care provider include a. acknowledgement of the relevance of cultural understanding in achieving effective communication, b. recognition of communities as their own cultural experts, c. understanding of how differences in culture, language and migration experience may have an impact on the way health promotion programs are developed, and d. engagement in a process of self-reflection. About this last point, the goal of the self-reflection process is that a) professionals gain awareness of how their own cultural values, assumptions and beliefs impact their practice and decision-making, and b) become aware and respect the values of cultures different from their own, so that they can inform, consult and negotiate treatment for and with patients from different cultural backgrounds. Based on the Australian model’s contributions, we have identified several recommendations for improving cultural competence in the Champlain Region.
Research Gaps and Recommendations:
• Cultural Competency Support: There are a number of health programs in Ottawa (Community Diabetes Program at Centretown Community Health Centre, Women’s Health Clinic at the Ottawa Hospital) that have shown interest in support of services to immigrants. These programs as well as Community Health Centres and individual providers could improve their cultural competence through an awareness and support that provides the necessary information and advice for improving competence. Models for enhancement exist and we would suggest for
Source: Cultural Competency in Health: A guide for policy, partnership and participation. 2005. Australian Government
Figure 8.
15
quality control and cost-effective coordination reasons, that these be coordinated through a central body for the Ottawa region.
• Raise Awareness on benefits of and need for cultural competency there is a need to raise awareness for the need to enhance the cultural competency of health services for the Ottawa region. One approach could be to disseminate and gather Support for adopting an adaptation of the Australian Cultural Competence Model.
• Increased Support: Support can be obtained by sharing information with health professionals on minority/immigrant/refugee groups –histories, specific health issues as context for understanding culture and health interactions.
• Improved capacity: Improving cultural competency capacity requires that health professionals know about the range of resources to support cross-cultural practice (interpreters, translated resources, community partners) and that they have developed the skills for accessing and using interpreters, translated resources and community partners.
16
References 1 2006 community profiles [homepage on the Internet]. Ottawa: Statistics Canada. 2007 April 4 [cited March 14, 2007]. Available from: http://proxy.bib.uottawa.ca:2206/english/census06/data/profiles/community/Index.cfm?Lang=E. 2 Population and dwelling counts [homepage on the Internet]. Ottawa: Statistics Canada. 2007 March 13 [cited March 15, 2007]. Available from: http://proxy.bib.uottawa.ca:2206/english/census06/data/popdwell/Table.cfm?T=201&S=3&O=D&RPP=150. 3 Strategic Research and Statistics in collaboration with Informetrica Limited. Recent immigrants in metropolitan areas, Ottawa: A comparative profile based on the 2001 census. Ottawa: Statistics Canada; 2005 April. 4 Facts and Figures 2005, Digital Library, [CD-Rom] Citizenship and Immigration Canada, Research and Evaluation Branch. Ottawa, ON; 2006. 5 Population projections of visible minority groups, Canada, provinces and regions, 2001-2017. Ottawa: Statistics Canada; 2005 March 22. Report No.: 91-541-XIE. 6 Sheth T, Nair C, Nargundkar M, Anand S, Yusuf S. Cardiovascular and cancer mortality among canadians of european, south asian and chinese origin from 1979 to 1993: An analysis of 1.2 million deaths. CMAJ. 1999 Sept 7;161(5):489. 7 Stranchan JH, Johansen C, Nair C. Canadian suicide mortality rates: First-generation immigrants versus Canadian-born. Health Reports. 1990 [cited March 15, 2007];2(4):327-41. 8 DesMeules M, Gold J, McDermott S, Cao Z, Payne J, Lafrance B, et al. Disparities in mortality patterns among Canadian immigrants and refugees, 1980-1998: Results of a national cohort study. J Immigr Health. 2005 October [cited March 15, 2007];7(4):221-32. 9 Ali J. Mental health of Canada’s immigrants. Health Reports [March 15, 2007]. 2002;13(Supplement):1-11. 10 Chen J, Wilkins R, Ng E. Health expectancy by immigrant status, 1986 and 1991. Health Reports. 1996 Winter;8(3):29-38. 11 Kinnon D. Canadian research on immigration and health. Ottawa: Health Canada; 1999. Report No.: Catalogue No. H21-149/1999E. 12 Newbold KB, Danforth J. Health status and Canada’s immigrant population. Soc Sci Med. 2003;57:1981-95. 13 Newbold KB. Self-rated health within the Canadian immigrant population risk and the healthy immigrant effect. Soc Sci Med. 2005;60:1359-70. 14 Ng E, Wilkins R, Gendron F, Berthelot JM. Dynamics of immigrants' health in canada: Evidence from the national population health survey. Ottawa: Statistics Canada; 2005. Report No.: 82-618. 15 Cross TL, Bazron BJ, Dennis KW, Isaacs MR. Towards a culturally competent system of care: Vol I. Washington, D.C.: National Technical Assistance Center for Children's Mental Health, Georgetown University Child Development Center; 1989.

17
16 Eisenbruch, M. (2004) The Lens of Culture, the Lens of Health: Toward a framework and toolkit for cultural competence. Resource Document, for UNESCO Asia-Pacific Regional Training Workshop on Cultural Mapping and Cultural Diversity Programming Lens to Safeguard Tangible and Intangible Cultural Expressions and Project Cultural Diversity, Bangkok, 15-19 December 2004. Centre for Ethnicity and Health, the University of New South Wales
1
Appendix 1 Champlain Immigrant Health Network (CIHN) Coordinated culturally relevant health settlement for immigrants Background: Immigrants represent an economically important and growing segment of the Ottawa population (23%). Due to their various cultural backgrounds and characteristics, the provision of health services for them present special challenges. Proper health care delivery for this subpopulation requires the effective integration of settlement, primary care, public health, and the immigration services. While there are a number of local agencies and organizations currently involved in providing such services, they lack a structure or network to coordinate their activities, leading in most cases to unclear roles, responsibilities and to a less effective service delivery. This network, by filling this coordination gap, will benefit first and foremost immigrant clients and secondly service providers. Network’s Main Objectives:
Develop a governance model that effectively links immigrants, the settlement community, CHCs and public health and primary care.
Establish a network of health professionals, settlement workers, and multicultural health brokers (Champlain Immigrant Health Network) dedicated to enhancing the health settlement (urgent care, preventive care, special immigrant clinics (CIC) of immigrants.
Build a community liaison program of multicultural health brokers that will facilitate health knowledge brokering with individuals and community groups.
Support community engagement and community involvement in decision making and enable opportunities for inter-connectedness among organizations
Partners: Organizations integrating the CIHN include the Champlain District Local Health Network, University of Ottawa, Ottawa Public Health, Bruyère Family Health Team, Community Health Centers in Ottawa2 and Catholic Immigration Centre. Current Structure: The network is composed of four main types of constituencies (physicians and other health professionals, settlement and social workers, multicultural heath brokers and users). All constituencies will be represented on the steering committee and day-to-day activities are administered by a management team. An advisory board will provide guidance, support on network functioning and activities and
2 Includes Carlington Community & Health Services, Centretown Community Health Centre, Pinecrest-Queensway Health & Community Services, Sandy Hill Community Health Centre, Somerset West Community Health Centre and South East Ottawa Centre for a Healthy Community.
2
a training committee will play a key role in supporting and designing training programs. Currently, the steering committee meets monthly. Core Components
• Health Settlement Program: Prevention Outreach Intervention- Preventive Care Program- Health Provider Network- Immigrant Health Interdisciplinary Consult Clinic
• Cultural and Linguistic Health Knowledge Brokering • Research and Program Evaluation
Priority Issues
• Timely delivery of Primary and Preventive Health Care • Effective knowledge brokering support with strong links with ethnic community • Integration of settlement, public health and primary care services • Special program development
3
Appendix 2 Citizenship and Immigration Canada Classification of Immigrant Population
IMMIGRANTS
Permanent Residents
Temporary Residents
Other Refugees Economic Class
Family Class
Foreign Workers
Foreign Students
Humanitar-ian
Cases
Other