2'. - msu libraries
TRANSCRIPT

. ‘:.”Sh:
‘ h).
* \m
3*. .
5’5 ‘.1:4
‘ o
‘2‘.
4.
,u
33*.
1L,z»
,1
w
\u
l.
v.
IRH31
vu~2
A.
12]..
.xv .72.
ix
..4(1.:
«Advvii
t. L
x
,3.
.3?
11.9.
:
nu.
..
.no.3..-
....¢./...u1
Q.
s
.x
g.
in...a
l5:31
.1;
;.5.
ahis.
.4.»5"r4
2-}:
“‘5';
“ -\
13'.
0"SK.
.1.
v.A“
l
.:t
.1
.0
~
iam.
.H#5
l.
mm
lllllllllllllllHill/J“ll(”Willill/lllllllllll819 2975
This is to certify that the
thesis entitled
IMMUNOHISTOCHEMICAL EVALUATION OF HUMAN p53 TUMOR
SUPPRESSOR PROTEIN CONTENT IN DUCTAL CARCINOMA IN SITU
(DCIS) OF THE BREAST
presented by
Mehri Aliasgharpour
has been accepted towards fulfillment
of the requirements for
Master's degreein Clinicgl Laboratory
Science
(
I
/ Major pr<(fessor
Dau::a§g;;L'-5. /?5Z>
0-7639 MSU is an Affirmative Action/Equal Opportunity Insiitution

_
LIBRARY
M'Chlgan State
University
.0
PLACE ll RETURN BOX tomanthis checkout from your noord.
TO AVOID FINEB rotum on or before data duo.
usu loAn Afflnnotlvo Action/Equal Opportunity mutation
W”3-9.1

WUNOHISTOCHEMICAL EVALUATION OF HUMAN p53 TUMOR
SUPPRESSOR PROTEIN CONTENT IN DUCTAL CARCINOMA IN SITU
(DCIS) OF THE BREAST
By
Mehri Aliasgharpour
A THESIS
Submitted to
Michigan State University
in partial fulfillment ofthe requirements
for the degree of
MASTER OF SCIENCE
Medical Technology Program
1 996

ABSTRACT
WUNOHISTOCI—IEMICAL EVALUATION OF HUMAN p53 TUMOR
SUPPRESSOR PROTEIN CONTENT IN DUCTAL CARCINOMA IN SITU (DCIS)
OF THE BREAST
By
Mehri Aliasgharpour
The p53 content of 100 human breast biopsies which were classified as (DCIS), were
evaluated by immunohistochemical method. From this population 15 specimen were
imrnunoreactive. All specimens were microscopically classified into histologic types ofDCIS
and nuclear grade. Most immunopositive specimens were classified as mixed histologic
types. NO relationship between nuclear grade and different histologic types ofDCIS was
noticed. The goal ofthis study was to establish a data base for long-term patient assessment.
Preliminary data indicates that the presence Ofimmunopositive p53 may be a valid predictive
indicator ofthe prognosis ofindividuals with DCIS.

ACKNOWLEDGMENTS
I would like to express my appreciation and gratitude to the members Ofmy
guidance committee for their valuable time and suggestions. Many thanks to Dr. Nikolay
Dimitrov, my project advisor, who provided this opportunity for me. Special thanks goes
to Dr. David Thome, for being there throughout my graduate years and an encouragement
during the writing ofmy thesis. I wish to thank Dr. John Gerlach for his counsel
throughout the project.
I also would like to acknowledge the histology technologists in different local
hospitals, especially Scott Marsh in St. Lawrence Pathology Department, for their help in
providing the DCIS tissue samples. Last, but not least, my sincere appreciation goes to
the Medical Technology Program stafi‘ at Michigan State University for all of their help
during my graduate assistantship in the program.
iii
TABLE OF CONTENTS
I. INTRODUCTION .................................................. 1
1.0 Cancer History ............................................ 1
1.1 Chemical Carcinogens ................................. 5
2.0 Proto Oncogenes Discovery Via Viral Oncogenes (Retroviruses) ...... 5
2.1 Oncogenes and The Mechanism ofAction .................. 7
3.0 Tumor Suppressor Genes .................................... 8
3.1 Mechanism of Action of Tumor Suppressor Genes .......... 9
3.2 History ofthe p53 Tumor Suppressor Protein ............... 9
3.3 The p53 Gene and Protein Structure ..................... 11
3.4 Functions ofThe p53 Tumor Suppressor Protein ........... 11
3.4.1 The Role ofp53 Protein in The Regulation ofThe DNA
Synthesis .................................... 13
3.4.2 The p53 Protein Role in Monitoring the Fidelity ofthe
Genome ..................................... 14
3.4.3 The p53 Protein Role in Genetic Instability .......... 19
3.4.4 The p53 Protein Role in Transactivation Ofthe Gene
Expression ................................... 19
4.0 Inactivation ofp53 Tumor Suppressor Protein ................... 20
4.1 Mutation of the p53 Gene ......................... 20
4.2 Formation OfProtein Complexes with Viral Oncoproteins ..... 22
4.3 Binding tO Cellular Gene Products (e.g. mdm-2 gene) ........ 23
4.4 Dislocation ofp53 between the cell compartments .......... 23
5.0 p53 Mutations Related to Cancer Etiology and Pathogenesis ........ 24
6.0. p53 as an Independent Tumor Marker in Cancer Progression and Prognosis
...................................................... 24
7.0 p53 as a Potential Target for Cancer Treatment .................. 25
8.0 The History ofBreast Cancer ................................ 26
8.1 Epidemiological Studies and Etiology Factors .............. 26
8.2 Normal Breast Anatomy .............................. 28
8.3 Clinical Overview ofBreast Cancer ...................... 30
8.3.1 Detection and Diagnosis ofBreast Cancer ........... 32
8.3.2 Types ofTreatment ofBreast Cancer .............. 33
9.0 Ductal Carcinoma in Situ ................................... 34
9.1 Types OfDCIS ..................................... 36
10.0 Breast Cancer and the p53 Tumor Suppressor Protein ............. 37
11.0 Objective ofthe Current Study ............................... 38
iv
II. OBJECTIVES .................................................... 42
III. MATERIALS AND METHODS ..................................... 43
1.0 Source ofTissue .......................................... 43
2.0 Immunohistochemistry Overview ............................. 43
3.0 Irnmunohistochemical Procedure ............................. 45
4.0 Positive and Negative Controls ............................... 46
5.0 Grading System .......................................... 46
6.0 Tumor Grading ........................................... 46
IV. RESULTS ...................................................... 48
1.0 Dilution ofthe monoclonal antibody Pb1801, Ab-2 ................ 48
2.0 Positive and negative control ................................ 48
3.0 Histologic Classification, Nuclear Grade, and p53 Content .......... 51
V. DISCUSSION ................................................ 53
APPENDIX ......................................................... 58
REFERENCES ...................................................... 61
LIST OF TABLES
Table 1: Highly Conserved Domains ofthe p53 Protein ....................... 21
Table 2: Checkerboard Analysis for Determination ofPrimary Antibody
Concentration ................................................ 48
Table 3: Histologic Types ofDCIS & p53 Immunostaining ..................... 51
Table 4: Nuclear Grading OfImmunopositive p53 DCIS Samples ................ 52
LIST OF FIGURES
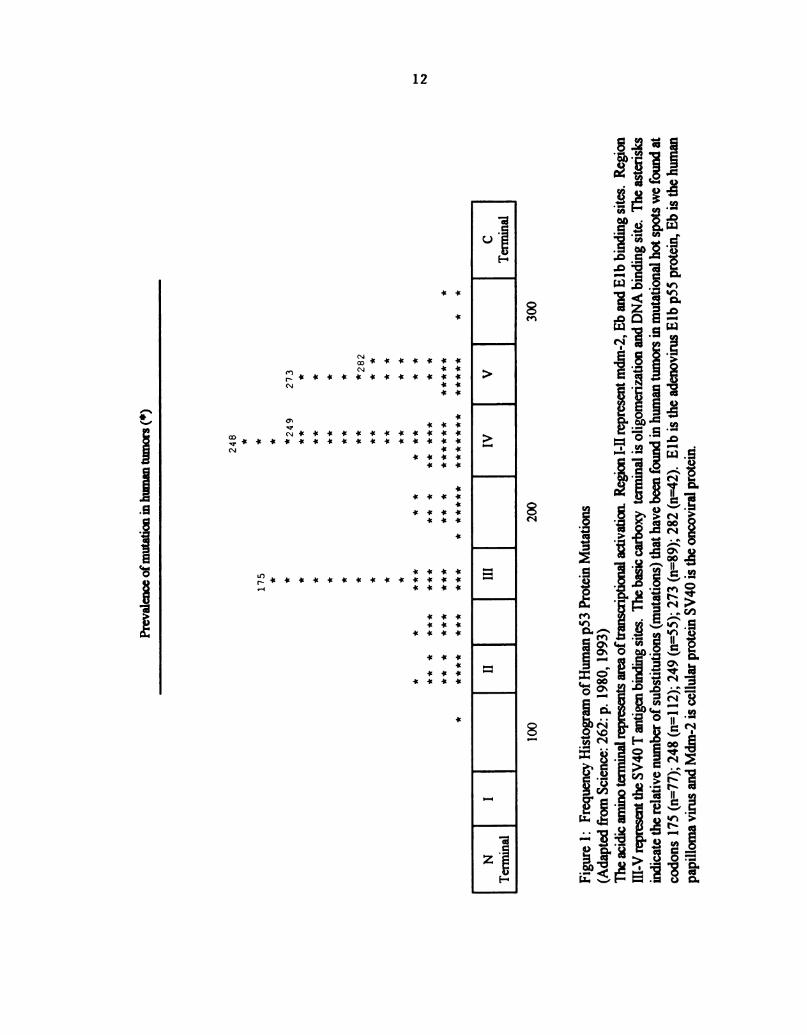
Figure 1: Frequency Histogram ofHuman p53 Protein Mutations ................ 12
Figure 2: The Eukaryotic Cell Cycle ...................................... 16
Figure 3: A Pathway Leading to Apoptosis ................................. 17
Figure 4: Regulatory Pathway Involving p53 Protein in Response to DNA Damage . . 18
Figure 5: The Anatomy ofthe Breast ..................................... 29
Figure 6: Avidin-Biotin Immunoenzymatic Technique ......................... 44
Figure 7: p53 Immunopositivity in Colon Tissue Section ....................... 49
Figure 8: p53 Immunonegativity in Colon Tissue Section ...................... 50
Figure 9: p53 Immunonegativity in Benign Breast Tissue Section ................ 50
Figure 10: The Results of% Conversion to Time in Years ..................... 55
vii
I. INTRODUCTION
Breast cancer is among the leading causes Ofcancer related deaths ofwomen in the
USA According to statistical analysis one in every eight women will develop breast cancer
in her life time (1). Early diagnosis and determination of invasiveness of the tumor is
important for management and outcome of patients with breast cancer. Nuclear
phosphoprotein p53 is among the markers used to evaluate the progression and invasiveness
Of several types of tumors (2). The focus of this research project is to evaluate the
accumulation ofthe p53 tumor suppressor protein in human ductal carcinoma in situ (DCIS),
a type of breast tumor, using a immunohistochemistry method. The goal of this project is
to determine if early detection of mutant p53 accumulation, may be an early indicator of
tumor aggressiveness and transformation to invasive breast cancer. A population ofn=100
of formalin-fixed, paraffin-embedded non-invasive intraductal breast carcinoma tissue
samples was used. Ifa correlation between p53 content and conversion to invasive breast
cancer can be established, early forms Of aggressive therapy may be directed on the basis Of
the study.
1.0 Cancer History
Cancer and related words (e.g., canker; cancre, chancre) are derived from the Latin
word cancer meaning “crab” (3). The ancient association between the crab and the disease
2
of cancer developed from the physical resemblance between the legs of a crab and the
radiating engorged veins surrounding a cancerous tumor. The word itself derives fi'om two
roots: “can” meaning “ to surroun ” and “cor” meaning “hard”. It is this image of a hard
surrounding that is distilled in the name (3).
The earliest description ofcancer appears in the Edwin Smith Papyrus from Egypt in
the seventeenth century BC. After providing the oldest written description ofa patient with
cancer, the physician advised “There is no treatment” (4). A thousand years later,
Hippocrates, the father of Medicine, described cancer as an imbalance between the black
humors (from the spleen) and the other three bodily humor: blood, phlegm and bile (5).
Although incorrect, the theory was the first (~400 BC.) to attribute the origin ofcancer to
natural causes (5). As Europe entered the Age ofReason, Bemardine Ramazzini, an Italian
physician, noted the high incidence of breast cancer in nuns and hypothesized that this was
in some way related to their celibate life style (3). The age ofcancer epidemiology had begun.
Another scientific report on cancer epidemiology, from 1775, (6) by Sir Percival Pott an
English physician, Observed that young men in their twenties who had been chimney sweeps
as boys had a high rate of deaths due to cancer of the scrotum (6). He suggested that the
causative agent might be chimney soot ( now known to be the tar) and recommended frequent
changing of clothing that trapped the soot, to reduce exposure to the “carcinogen”. Pott’s
study not only identified a putative carcinogenic agent but also demonstrated that a cancer
may develop many years after exposure to the causative agent. In other words, that there may
be an extended latent period (6).
The nineteenth century saw the birth of scientific oncology as microscopes of
sufficient quality for research on tissues become available. Johannes Muller, applied this
3
instrument to cancer research and began to correlate cellular pathology with clinical
syrmtoms (7). He established a cellular basis for tumor description. Subsequently, this work
was carried on by Virchow, who provided the scientific and microscopic basis for the modern
pathologic study ofthe cancer (7). However, both failed to recognize the cellular nature of
metastases. Virchow suggested that metastases could be compared to spread ofan infectious
agents. Once initiated in one part of the body, a tumor releases certain fluids which cause
changes in cells in distance tissue to become tumor like(7). Wilhelm Waldeyer ofBerlin did
not agree with this idea and he felt embolic transfer through the blood or lymph channels was
the mechanism (8). Thus the pathological basis ofmalignancy began to be understood and
pathology began to replace anatomy as the key basic medical science.
With the discovery ofthe radiation, viral, and chemical carcinogens in the twentieth
century the entire focus of cancer research changed. Radiation was recognized as a
carcinogen only seven years after the discovery ofX rays by Roentgen’s (9). In 1911 Peyton
Rous, at the Rockefeller Institute, described a sarcoma in chickens cased by what later
became known as the Rous Sarcoma Virus (10). In 1915 cancer was induced in laboratory
animals for the first time by Yamagiwa and Ichikawa, at Tokyo University (11). They applied
coal tar to rabbit skin. This experiment led to the identification Ofthe chemical carcinogenesis
with a firm scientific foundation and a research technique (11). In 1935 Peyton Rous
reported the differences between what he termed initiation and promotion (12). He defined
these terms using two different models of carcinogens; 1) studying the manner in which a
benign neoplasm, virus induced rabbit papilloma, transformed into a malignant lesion (12) and
2) Induction of skin tumors by the application Of coal tar (13). These classic experiments
confirmed by Berenblum and Shubik using corton Oil as the promoter and formed the
4
prototype for the way Carcinogenesis was conceptualized (14). In addition, they led to the
concept ofinitiation by one agent, followed by promotion by another and finally progression
ofthe tumor to a more malignant form. The initiator was viewed as able to cause cancer but
only after a prolonged time (14). The promoter was considered as an agent not capable
alone of causing cancer but able to potentiate the effects Of the initiator (14). The term
progress'on was defined by Rous to designate “the process by which tumors go from bad to
worse” (12,13).
Fould codified and expanded the concept ofmultistage carcinogenesis (15). Evidence
obtained twenty years after Rous’ work indicating that the first stage, initiation, is
characterized by damage to DNA while the second stage, promotion, usually does not
involve damage to the DNA but rather a stimulation of cellular proliferation. Promotion is
reversible and exhibits a distinct dose response and measurable threshold. The third stage,
progression, leads to morphological change and increased grades ofmalignant behavior, such
as invasion, metastasis, and drug resistance (12,13). Carcinogenic agents can mutate two
types ofgenes that regulate growth; prom-oncogenes that code for growth factors (16) and
tumor suppressor genes which code for growth suppression (17). In humans carcinogenesis
can be viewed as a process involving several steps (18), one ofwhich activates an oncogene
and another which inactivates a tumor suppressor gene. In the process of carcinogenesis (7),
the initial mutation in a cell may confer a survival advantage. If one ofthe descendants Of
that cell is hit by a second mutation that also confers additional survival advantage, the next
clone may grow even more vigorously. Such a sequence Of events leads to the selection of
a clone with the characteristics ofa neOplasm (7). This allows subclones to progress to even
5
greater stages ofvirulence characterized by invasion and metastatic spread that ultimately lead
to the death ofthe host (7).
1.1 Chemical Carcinogens
In spite of the vast array Of chemicals discovered to cause cancer in animals, there
remains very few chemicals (19), other than the tars associated with tobacco (20), for which
there is strong evidence of cancer causation in human. A large amount Ofwork, reaching
back to the l940s, indicated that carcinogenic agents posses a potent ability to damage
genes. A key discovery made by Ames (21), found that the carcinogenic potency of a number
ofchemical compounds is correlated with their mutagenic ability. The conclusion on chemical
carcinogens was that cells transformed due to gene mutations that were chemically induced
forms ofnormal cellular genes that become damaged (18). Until recently the nature ofthese
hypothetical target genes was totally unclear.
2.0 Proto Oncogenes Discovery Via Viral Oncogenes (Retroviruses)
In the late 1960 and early 1970s the role ofviruses in cancer formation was realized
to be a small fi'action ofthe total number and types of cancer formed in this country (18).
However, it is ironic that research on animal ribonucleic acid (RNA) tumor viruses
(retroviruses), which have no ability to cause human cancer provided the first key to
discovering the identity of cellular genes which may be responsible for tumors (18). These
retroviruses, which infect chickens, rodents, cats, and monkeys, are potently tumorigenic in
infected animals within weeks after initial exposure to the virus (18). One of these viruses,
the Rous sarcoma virus of chickens, was found to carry a specific gene that it uses to

6
transform infected cells from a normal to a malignant state (16). Such a transforming gene
was termed a viral oncogene. It clearly possessed great power, since the single oncogene
caniod into a chicken cell by the Rous sarcoma virus was able to redirect the entire biology
ofthe cell, forcing it to grow in a malignant fashion (16).
Harold Vannus and J. Michael Bishopin in 1976 found that the oncogene in the Rous
sarcoma virus was not genuinely a viral gene , instead, it arose from a pre-existing cellular
gene that had been captured by an ancestor ofthe Rous sarcoma virus (16). Once captured,
this gene was used by the virus to transform cells. The early ancestor ofthe Rous sarcoma
virus was capable of replicating in infected cells but unable to transform them, it instantly
gained tumorigenic potency by kidnapping this normal cellular gene called a prom-oncogene
(16).
In the end this work revealed much more about the cell than it did about the Rous
sarcoma virus (16). It pointed to the existence of a gene residing in the normal cellular
genome that possesses potent transforming ability when appropriately activated, in this case
by a retrovirus. It was proposed that nonviral carcinogens such as mutagenic chemical (19)
and X-rays (18) might also activate these prom-oncogenes. A cell carrying such a mutant
gene might respond by setting a deregulated growth pattern and in this way becoming a
malignant cell.
Although retrovirus associated oncogenes clarified the existence of normal cellular
genes (proto-oncogenes) in the normal cellular genome, it provided little information about
the origin of human cancer. After all, retroviruses like Rous sarcoma virus (16) are not
known to cause human infections. Therefore a possible and alternative route through which
prom-oncogenes could also be activated is through exposure to chemical mutagenes that

7
could change the deoxyribonucleic acid (DNA) sequence (19). Mutations induced by these
agents in the genome of target cells might be as effective as retroviruses in activating the ‘
latent carcinogenic potential ofprom-oncogenes (19).
2.1 Oncogenes and The Mechanism ofAction
Over the past decade the existence ofmutant prom-oncogenes in human tumors has
been demonstrated (18). In each case, a change in the sequence structure Of a gene was
pinpointed as being responsible for the converting ofprotwnwgme into an active oncogene.
In addition, understanding how normal cells regulate their growth made it possible to explain
the mechanism of action Ofmost if not all oncogenes (18,22).
The rate of growth and division of a normal cell, residing within a tissue is largely
controlled by its surroundings (18). A normal cell rarely decides on its own to proliferate.
Rather, hormone like polypeptide growth factors which are endocrine, paracrine, and/or
autocrine signals direct growth and division (22). These factors carry growth-stimulatory
(18) or growth-inhibitory signals (18). Each cell possesses complex machinery that enables
it to receive these signals, process them, and set a growth program including differentiation
( 18,22). The presence Of growth-activating factors in the extracellular space can be
recognized by the specific protein receptors that span the plasma membranes of the cells
(18,22). These factors bind to the extracellular domains ofspecific receptor and activate their
cytoplasmic domains to phosphorylate or dephosphorylate the target proteins (22). The
change in phosphorylation rate of target proteins are thought to act as intracellular signals
which stimulate cell division (18,22). Proto-oncogenes encode many ofthe proteins in this
complex signaling pathway that enable a normal cell to respond to exogenous growth factors
8
(18). Oncogene proteins participate in activating these signaling pathways even in the
absence ofstimulation by extracellular growth factors. In doing so, they force a cell to grow,
even when its mrroundings contain none ofthe features that are normally required to provoke
growth. The proteins encoded by the ras prom—oncogene and the ras oncogene, provide a
good example of this. The protein encoded by the ras proto-oncogene sit quietly in the
cytoplasm ofthe cell waiting for stimulation by a growth-factor receptor at the cell surface.
When such a receptor binds its growth factor or ligand , it sends a stimulatory signal to the
ras protein, which responds by releasing a number of secondary signals into the cell.
However, the ras protein specified by a ras oncogene acts much differently. It releases signals
into the cell continually, independent of prior stimulation by a growth-factor receptor. Thus
the cell is flooded with growth stimulatory factors in its surroundings, when in fact none are
present. As an immediate result, proliferation of a ras oncogene bearing cell becomes quite
autonomous (l8).
3 .0 Tumor Suppressor Genes
Since a normal cell requires multiple changes to its genome before it can take on the
characteristics associated with a cancer cell (7,18), examining the activated oncogenes (18)
in actual tumor cells indicate that activated oncogenes are only part ofthe picture. Another
class Of mutated genes, and their protein products, which seem to be equally as important,
are the tumor-suppressor genes (17). Indeed, normal cell growth and division appears to be
regulated by a finely tuned balance (18) between the action ofthe gene products of growth-
promoting prom-oncogenes (16,18) and the growth-suppressing factors from tumor
suppressor genes (17). When the latter are nonfunctional their negative effects on cell growth
9
are no longer felt and a cell may lose its ability to respond to external growth-inhibitory
factors and continues to grow and proliferate. An analogy is commonly used to describe this
balance. Activation of an oncogene is like the accelerator stuck to the floor and loss of
tumor suppression is like a defective braking system (18). The combination of the two is
disastrous with aggressive cell proliferation.
3.1 Mechanism of Action of Tumor Suppressor Genes
A number Oftumor-suppressor genes have been discovered over the past five years
(17,18). Their role in tumorigenesis appears as important as that of oncogenes. Tumor-
suppressor genes, like most all genes, are present in two cOpies per a cell (17,18). When one
ofthese copies is nonfirnctional cell growth is still normal relying on the remaining gene copy
(18). Only when the second copy is lost, does abnormal cell proliferation takes place. An
example ofsuch a case is retinoblastoma (RB) tumor suppressor gene (23) that require loss
of both copies of the gene before the cell behaves abnormally. Another possible genetic
mechanism with a similar end result, can be seen with p53 tumor suppressor protein. Ifone
mutated gene copy loses its growth-suppressing fiJnction and simultaneously the ability of
the remaining intact copy is suppressed by an interfering or blocking constituent (24).
3.2 History ofthe p53 Tumor Suppressor Protein
The p53 tumor suppressor protein was first identified as a cellular protein in 1979
that coirnmunnoprecipitated with the transforming protein of Siman Virus 40 (SV40), the
large T antigen in SV40 transformed cells. In these early experiments the purified SV40
large T antigen acquired fiom tumors, induced by SV40, was used to generate antisera (25).
10
When this antisera was used in whole cell preparations to immunoprecipitate large T antigen,
it was found that p53 also coprecipitated with the large T antigen . It was determined that
the coprecipitation of p53 with T antigen was due to binding. Since the large T antigen is
needed to maintain the transformed phenotype, it was suggested that this interaction is
important for transformation. Thus p53 came to be classified as a tumor antigen (25).
The wild type p53 is known to be expressed at low levels and has a short half-life
(20-30 minutes) in normal cells (26). However, in SV40 transformed cells (25) and tumor
derived cell lines from both human and nonhuman tumors (27), it was found that p53 was
loo-fold higher in concentration than that Observed in normal cells and the half-life was
increased to over 6 hours. Stable complex formation of p53 with viral oncoproteins like
SV40 suggested that this protein plays a role in the transformation of cells by this virus and
is critical in the regulation ofcell growth (25). Later it became clear that only mutant forms
ofp53 can contribute to cellular transformation (28,29). These findings were made when the
isolated genomic and complementary DNA define as (cDNA) clones of mutant p53 could
immortalize cells in culture, thus classified p53 as a dominant oncogene (28,29). This was
also demonstrated in a ras transformation assays (28). Several independently derived
mutations of p53, which map between amino acids 120 and 230, activate p53 to transform
rat embryo fibroblasts (REF) in culture with the ras oncogene (28). Mutant p53 alleles inhibit
normal p53 function and enable ras oncogene to transform REF cells (28). Over expression
of the wild-type p53 protein suppresses the formation of transformed cells (30,31) and in
addition, inhibits the growth Of established tumor cells (32,33). However, over expression
ofthe mutant p53 protein in tumor cells inhibit its negative regulatory function (34). These

11
observations have resulted in the redefinition ofthe role ofp53 to a tumor suppressor gene
(35,36).
3.3 The p53 Gene and Protein Structure
The p53 gene encompasses 16 to 20 kilo base (Kb) of DNA on the short arm of
human chromosome 17 at position 17p 13.1 (37,38). This gene is composed of 11 exons
(37,38). The p53 gene has been conserved during evolution. In cross-species comparison,
the p53 protein shows five highly (> 90%) conserved regions within the amino acid residues
13-19, 117-142, 171-181, 234-258, and 270-286 (39). These five evolutionary conserved
domains within the coding regions are regarded as essential to the function ofthe p53 (40).
The product of the p53 gene is a homodimeric 393-amino acid nuclear
phosphoprotein (~53 Kilo Dalton in molecular weight) (39). The p53 protein contains; 1) an
acidic amino terminal (amino acids 1-75) possessing the transcriptional activation region
followed by 2) a central and extended hydrophobic proline rich domain (amino acids 75-1 50).
and 3) a highly charged basic carboxy terminal domain (amino acids 275-390) containing
nuclear localization signals (41,42), the Oligomerization (43), and DNA binding domains (44)
(Fig 1). Oligomerization refers to multiple binding sites on the protein molecules which
results in formation Ofprotein complexes (43). The central region is the highly conserved
portion ofthe protein. The majority ofoncogenic mutations are located here (39).
3.4 Functions ofThe p53 Tumor Suppressor Protein
The p53 protein appears to have multiple firnctions including regulation of DNA
Pnewflenceofnnnafioninhunumuunxxs(‘)
248
* *
m
(K
r-G
* *249
2
**
m
P
**
**
**
**
**
¥ i i ¥ ¥ i ¥ # i
**
***
N
(D
N
i ¥'¥4I¥ fl ¥ ¥ ¥
¥ ¥ ¥ i
**
***
*i
***
**
****
***
**
***
***
**
**
****
***
**
*******
*****
*
*****
***
***
******
*******
*****
**
TI
III
III
[\I
\l
(2
Tennnufl
Tennnufl
100
200
300
Figure
1:
FrequencyHistogramofHumanp53
ProteinMutations
(AdaptedfromScience:262:
p.1980,1993)
TheacidicaminoterminalrepresentsareaoftranscriptionalactivationRegion
I-IIrepresentmdm-Z,EbandElbbinding
sites.Region
III-VrepresenttheSV40T
antigenbindingsites.Thebasiccarboxy
terminal
isOligomerizationandDNA
binding
site.The
asterisks
indicatetherelativenumberofsubstitutions(mutations)thathavebeenfoundinhumantumorsinmutationalhotspotswefoundat
codons
175(n=77);248(n=112);249(n=55);273(n=89);282(n=42).Elb
istheadenovirusElbp55
protein,Eb
isthehuman
papillomavirusandMdm-Z
iscellularproteinSV40
istheoncoviralprotein.
12
13
synthesis (25,45,46), repair (47) and programmed cell death (47,48,49,50), genetic
instability(51,52), and as a transactivator ofgene expression (53).
3.4.1 The Role ofp53 Protein in The Regulation ofThe DNA Synthesis
The majority of evidence supporting the role Of p53 in the regulation Of the DNA
synthesis comes from the association of wild type p53 with the SV40 large T antigen (25).
The SV40 large T antigen is required for the initiation ofviral DNA replication. Wild type
p53 can block T antigen initiation of DNA polymerase alpha (45). Also wild type, but not
mutant, p53 expression can inhibit viral DNA replication in vivo and in vitro (46,54). A
simplistic explanation for these observations is that in the normal cell p53 binds a
homologue(s) of T antigen involved in the initiation of cellular DNA synthesis (55). The
formation Of a complex with p53 could prevent the association Of this protein with DNA
polymerase alpha or another critical cellular protein negatively controlling cell growth (55).
The inability ofmutant p53 proteins to bind T antigen suggests the p53 mutants are no
longer capable of binding the appropriate cellular protein and regulating the cell growth
(25,56,57).
Another example ofcell growth regulation by p53 involves the p53 mutant for residue
135 (Ala to Val change) which is a temperature sensitive phenotype (58). At 32°C, the
protein acts like the wild-type (57) and at 37-39.5°C the protein is primarily in a mutant
conformation (59). At 32°C the protein does not cooperate with an activated ras gene in
REF in culture transformed by both this temperature sensitive p53 mutant and by ras (58).
It can also suppress the development oftransformed foci at 32°C (58). In addition, REF stop
growing at late G1, failing to enter the S phase when shified to 32°C (60). This growth
14
arrest occurs concomitantly with the translocation ofp53 (Ala 135, wild-type conformation)
protein fiom the cytoplasm into the nucleus and suggests that p53 must be in the nucleus to
exert growth regulatory effect (59,61,62). Whereas at 37-39.5°C this protein is localized in
the cell cytoplasm (59,61,62). Two hypotheses have been proposed to account for these
results; 1) In cells transformed both by the temperature-sensitive p53 mutant (Val 135) and
by ras, the mutant forms a complex with the endogenous rat wild-type p53 and keeps it in
the cytoplasm, where p53 is unable to block cell growth (59). A shift to 32°C results in the
movement Ofp53 into the nucleus and a block in cell growth, indicating that some dominant
loss-of-function mutations could work by regulating the entry into the nuclear compartment
(59,61,62). 2) Introduction of mutant p53 cDNA into a cell line that did not express
endogenous p53 produced tumors in animals. SO mutant p53 could gain a new function that
overcomes the negative regulation by small quantities ofwild-type p53 (63).
3.4.2 The p53 Protein Role in Monitoring the Fidelity of the Genome
The p53 gene product is among those proteins that appears to be involved in the
monitoring of the fidelity of molecular processes (47,48,49) such as DNA repair (47). In
response to DNA damage p53 protein accumulates (47). The mechanism which causes the
accumulation Ofp53 is unclear (47). However, it appears to primarily involve an increase in
synthesis (47). This may be induced at the transcriptional (47) and /or translational level
(64,65). A variety ofagents capable of causing DNA damage (64), increase p53 synthesis.
The mechanism Ofinduction appears to be related to general DNA helix distortion (47). The
induction Ofp53, in association with DNA damage, appears to be part ofthe cellular defense
mechanism that monitors genomic fidelity (47,48,49). The wild type p53 protein is a potent

15
inhibitor ofthe cell cycle (50, 65). Increase in wild type p53 cause G1 arrest in the cell cycle
(47, 50, 65). It has been theorized that this allows DNA repair to occur before the cell
divides (47, 50, 65). In this manner, the cell cycle is arrested before DNA synthesis and the
cell is given the opportunity repair the damaged DNA (47, 50). In several cancer cells with
mutant p53, it has been well documented that these cells fail to arrest in GI (47, 65).
The mechanism ofp53 cell cycle arrest appears to be the inhibition ofcyclin dependent
kinase (CDK) (50, 66). CDK is a constitutive enzyme to the cell cycle (67). Inhibition Ofthis
enzyme results in G1 arrest (66). The p53 inhibition ofCDK appears to be mediated by the
induction ofDNA synthesis at the transcriptional level (50, 68). p53 is known to induce the
synthesis ofa variety ofproteins. One example Of this that may explain this effect is p21 (50,
66,69,70). p21 is known to bind to and inhibit CDK activity (66, 69, 70).
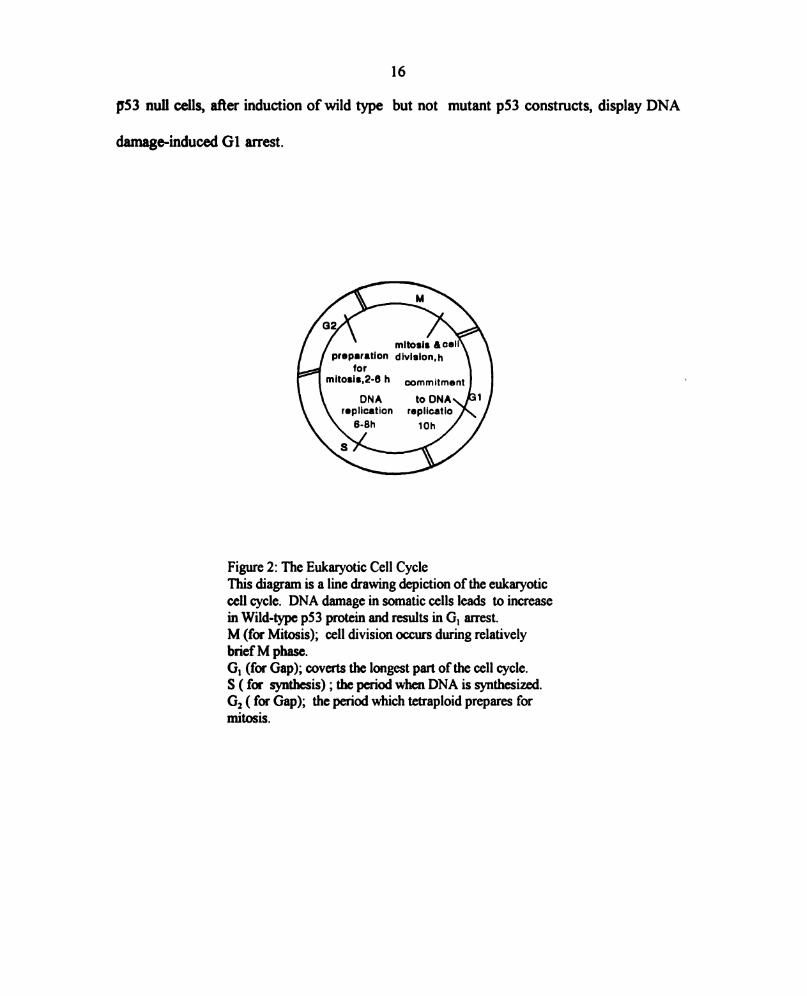
An example ofthis system can be seen in somatic cells with DNA damage (47) caused
by radiation (64, 65). This leads to an increase in wild-type p53 protein levels and results
in GI arrest ofthe cell cycle (Fig2). IfDNA repair does not successfiilly occur, the presence
Of the wild-type p53 alternatively induces programmed cell death or apoptosis (47, 48, 49,
71, 72) through an unknown mechanism (Fig. 3). Thus wild-type p53 function appears to be
a component of the cellular response to DNA damage (47,64) and p53 acts as one Of a
number ofnegative regulators ofthe cell cycle afier damage (47). Tumor cells that show p53
mutations or possess p53 protein inactivated by binding to host or viral proteins can not
arrest in G1 to allow DNA repair (25, 55). Kastan reported, in an elegant series of
experiments a pathway by which p53 may functions (65) (Fig. 4). His group reported that
cells bearing no p53 or mutant p53 do not display G1 arrest after DNA damage. However,
16
p53 null cells, afier induction of wild type but not mutant p53 constructs, display DNA
damage-induced G1 arrest.
mitosis Ace”
preparation dlvlslon.h
tor
mitoaia.2-6 h commitment
DNA to DNA
replication rapiieatio
6-8h 10h
Figure 2: The Eukaryotic Cell Cycle
This diagram is a line drawing depiction of the eukaryotic
cell cycle. DNA damage in somatic cells leads to increase
in Wild-type p53 protein and results in G1 arrest.
M (for Mitosis); cell division occurs during relatively
briefM phase.
G1 (for Gap); coverts the longest part of the cell cycle.
S ( for synthesis) ; the period when DNA is synthesized.
Ci2 ( for Gap); the period which tetraploid prepares for
mitosis.

17
No 1 p53
DNA damage > Survival with mutation
1 p53 ----------> DNA repair ---------->survival without mutation
Apoptosis
Figure 3: A Pathway Leading to Apoptosis
(Adapted fi'om Nature: 362: p. 786 (1993).
This path is initiated by DNA damage. Increase in wild type p53 concentration may lead to apoptosis
if DNA repair is not accomplished. Inactivation ofthe p53 pathway will result in the survival of cells
with mutation/s and may thus have a role in the development Ofcancer.

———>
Activationofmdm2
andGrowth
Suppressor
GenesT
DNA
Damage-->
p53
1-——>
InhibitionofDNA
Replication
*-->Gl
ArrestandDNA
Repair
--->
RepressionofGrowth
promotingGenes
Figure4:
RegulatoryPathwayInvolvingp53ProteininResponsetoDNADamage
(AdaptedfromGenes&
Development:
7:p.531,
1993).
DNAdamagingagentswillresultinaccumulationOfhighlevelsofp53
protein,causingsuppressionandactivationoftheabovementioned
functions
andresultinginG1
arrest.
18

19
3.4.3 The p53 Protein Role in Genetic Instability
Another example of p53 function in monitoring the fidelity of the genome is gene
amplification; an example ofgenetic instability (51, 52). Although the genetic basis for gene
amplification is not well understood, the available evidence suggests that it is mediated by
recombination between large segments ofchromosomes, resulting in arrays ofamplified genes
(73). It has been reported that normal cells in culture have stable karyotype and do not under
go gene amplification (51, 52). Whereas, most immortal and transformed cells are unstable
and do amplify (51, 52). In addition, the loss ofwild-type p53 has been shown to convert
normal cells to cells with the ability to undergo gene amplification (74). Tlsty described that
p53 null cells are markedly prone to amplification of known specific genes than are cells
bearing wild type p53. (75). This finding is consistent with the hypothesis that p53 is a
determinant of genetic stability in cells and may function as a cell cycle checkpoint protein
following DNA damage (65).
3.4.4 The p53 Protein Role in Transactivation ofthe Gene Expression
‘ As discussed above, the p53 tumor suppressor gene also appears to be a
transcription factor that can induce expression of several different genes containing specific
DNA binding sites (53, 76). For example, wild-type p53 binds to a consensus DNA binding
sites and activates transcription ofthe murine double minute 2 oncoprotein (mdm-Z) (77, 78,
79). It is likely that p53 exerts its biological activity as a transcription factor and this activity
is regulated by modifications and interactions with other suppressor gene products and proto-
oncogenes encoding nuclear transcription factors (24). Transcriptional transactivation
appears to be responsible for p53 transformation suppression activity too (24). This activity
20
is lost by the interaction ofp53 with the oncogenes ofthe DNA tumor vimses (80, 81, 82).
These viruses synthesize viral DNA that inhibit the ability ofp53 to bind DNA and act as a
transcription factor. Thus allowing the transformation of cells that are non-permissive for
virus replication.
4.0 Inactivation ofp53 Tumor Suppressor Protein
Loss of normal p53 function predispose cells to multiple deleterious effects.
Inactivation of p53 protein can occur through mutation (60, 83, 84), protein complex
formation with viral oncoproteins (80, 82), binding to cellular gene products (77, 78, 79), and
dislocation Ofp53 between the cell compartments (85).
4.1 Mutation of the p53 Gene
Alterations such as small or large allelic deletions (50, 60, 83, 84) structural
rearrangements (60, 83, 84) missense mutations (60, 83, 84),and germline mutations (86, 87) in
the p53 gene have been reported. Allelic losses in several tumor types, e.g, colorectal neoplasms
(50, 60), breast cancers (88, 89), esophageal carcinomas (90), lymphomas (91), and
osteosarcomas (92) have been reported. Ofthese, colon carcinomas (50, 60) have been studied
in the most detail (60) and it has been shown that 75-80% ofcolon cancers have lost both p53
alleles; through deletion and/or, through point mutation (60). The point mutations are usually
missense mutations that give rise to an altered protein (93, 94). In the pathogenesis of colon
carcinoma, these mutations typically arise during the conversion of a benign adenoma to an
invasive adenocarcinoma (95). The molecular mechanisms that underline tumor progression are
thought to include the clonal expansion of cells that previously acquired a mutation in cancer
2 1
related genes (95). A cell that carries a specific change in a critical gene might acquire a selective
growth advantage and become the dominant cell type as the tumor progresses (95). The most
common change ofp53 in human cancers is a point or missense mutation (73%), substitution of
one amino acid for the other, within the coding sequences ofthe p53 gene resulting in an altered
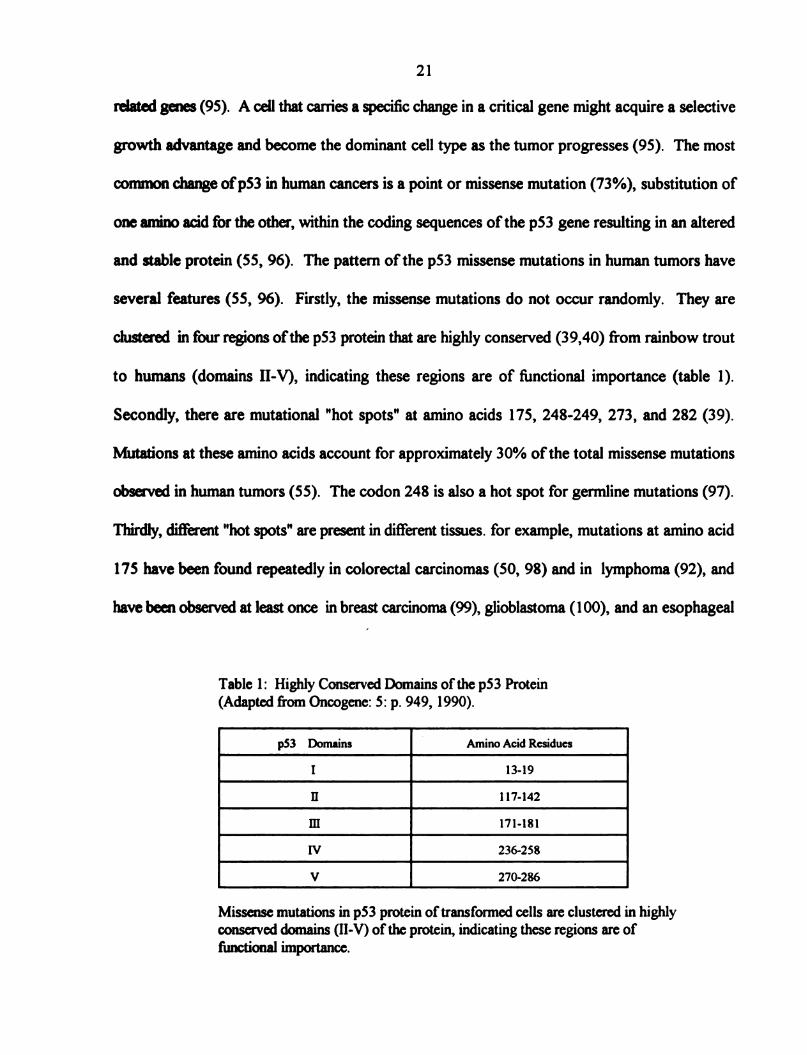
and stable protein (55, 96). The pattern ofthe p53 missense mutations in human tumors have
several features (55, 96). Firstly, the missense mutations do not occur randomly. They are
clustered in four regions ofthe p53 protein that are highly conserved (39,40) from rainbow trout
to humans (domains II-V), indicating these regions are of firnctional importance (table 1).
Secondly, there are mutational "hot spots" at anrino acids 175, 248-249, 273, and 282 (39).
Mutations at these anrino acids account for approximately 30% ofthe total missense mutations
observed in human tumors (55). The codon 248 is also a hot spot for germline mutations (97).
Thirdly, different "hot spots" are present in different tissues. for example, mutations at amino acid
175 have been found repeatedly in colorectal carcinomas (50, 98) and in lymphoma (92), and
have been observed at least once in breast carcinoma (99), glioblastoma (100), and an esophageal
Table 1: Highly Conserved Domains of the p53 Protein
(Adapted from Oncogene: 5: p. 949, 1990).
p53 Domains 1 Amino Acid Residues
I 13-19
H 117-142
111 171-181
IV 236-258
V 270-286
Missense mutations in p53 protein of transformed cells are clustered in highly
conserved domains (II-V) of the protein, indicating these regions are of
functional importance.
22
squamous cell carcinoma (101). An exception is lung carcinomas (55), where a mutation at
175 has not yet been observed.
In addition to the point mutation within the p53 tumor suppressor gene in a variety
ofsporadic tumors in man, p53 gennline mutations have been identified in a familial form of
cancer known as Li-Fraumeni syndrome (86, 87); a rare autosomal dominant syndrome. The
Li-Fraumeni disorder is characterized by diverse neoplasms at multiple sites, including breast
carcinoma, adrenocortical carcinoma, soft tissue sarcoma, brain tumors, osteosarcoma,
leukemia, and possibly other tumors. Tumors develop in the family members at unusually
early ages, and multiple primary tumors are frequent. Members in these families contain one
mutant p53 allele and one wild type allele. The wild-type allele present in the normal tissue
from these individuals is generally deleted in the tumor, while the mutant allele is retained.
It is therefore thought that Li-Fraumeni syndrome patients are predisposed to cancer because
one p53 allele is inactivated in the gennline and only the remaining allele needs to be altered
by somatic mutation (86, 87).
4.2 Formation ofProtein Complexes with Viral Oncoproteins
Complex formation of p53 with viral oncoproteins are highly pertinent to tumor
virus-mediated oncoproteins (102). It has been demonstrated that SV40 large T antigen (25)
(section; 3.2), adenovirus EIB protein (80), papillomavirus E6 protein (82), hepatitis Bx
antigen (HBxAg) (103), Epstein-Barr nuclear antigen-5 (EBNA-S) (104), and Epstein-Barr
virus (EBV) irnmediate-early protein ( BZLFl) (105), are capable of binding with p53.
While the formation ofviral protein complexes generally stabilize the p53 protein, other

23
possibilities exit the binding of p53 to papillomavirus E6 protein results in accelerated p53
degradation (102, 106, 107).
4.3 Binding to Cellular Gene Products (e.g. mdm-2 gene)
Besides viral oncogenes, p53 protein has also been implicated in the regulation of
transcription ofmany other cellular endogenous genes through its interactions with other
cellular proteins. For example, a cellular transcription factor murine double minute 2 (mdm-
2), binds to wild type p53 protein and inhibits its transcriptional activity. As discussed earlier
(section; 3.4.4), wild type p53 protein induces the expression of the mdm-2 gene product,
which contains specific DNA binding sequence (77, 78, 79). In tumor cells overexpressed
oncoprotein mdm-2 has been shown to increases the tumorgenic potential ofthe cells (108).
However, over expression ofwild type p53 in cells lead to the suppression of cell proliferation
(30, 31, 32, 33, 61). Thus it appears that p53 and mdm-2 proteins play a reciprocal roles in
regulating each other depending upon their levels or other possible variables such as different
spliced forms ofmdm-2 (78).
4.4 Dislocation ofp53 between the cell compartments
In one third of human breast cancers with wild type p53, the p53 protein failed to
translocate into the nucleus (85). Because p53 is a nuclear regulatory transcription factor,
only the p53 protein that is transferred into the nucleus can act as a negative regulator ofthe
cell proliferation (85). While the mechanism by which the wild type p53 could be retained in
the cytoplasm is not known, an interesting hypothesis has been derived from the fact that one
ofthe nuclear localization signals is located between amino acid residues 316 and 321 (85).

24
It is therefore possible that a growth regulatory signal could alter p53 protein possibly by
phosphorylation or dephosphorylation and exclude it from the nucleus (85).
5.0 p53 Mutations Related to Cancer Etiology and Pathogenesis
Recent laboratory data suggest that some carcinogens also cause point mutation in
the p53 gene. For example, exposure to one common carcinogen, ultraviolet (UV) light
(109, 110), is correlated with transition mutations at dipyrirnidine sites (i.e., CC to TT double
base change mutation), or mutations resulting fi'om G:C to T:A transversion occur commonly
in hepatocellular carcinomas, as a result of exposure to specific carcinogen (111, 112). This
mutation led to a serine substitution at residue 249 of the p53 gene in hepatocellular
carcinoma (111, 112). Lastly, exposure to cigarette smoke is correlated with G:C to T:A
transversions in lung, esophageal, and head and neck carcinomas (113, 114).
In addition to the exogenous mutagenic factors that lead to the formation ofaltered
p53 protein, endogenous mutagenesis can have the same effect. For example, the high
fiequency ofC to T transitions at CpG dinucleotides in colon carcinomas is consistent with
the endogenous mutational mechanism due to dearnination of 5-methylcytosine residue found
at CpG dinucleotides in mammalian genome (115). Thus analysis ofthe p53 mutations may
provide clues to the etiology and pathogenesis ofhuman cancers.
6.0. p53 as an Independent Tumor Marker in Cancer Progression and Prognosis
A number of clinical studies have reported that mutated forms of p53 are an
independent predictive factor ofan unfavorable prognosis (68). Although a p53 mutation can
occur at the earliest clinically detectable stages of the neoplastic process in some types of
25
cancer (116, 117), the fraction oftumors with an altered p53 gene is typically higher in late
stage tumors (118, 119). The gene product from the aberrant form ofthe p53, are correlated
with more aggressive tumors, early metastasis, and lower survival rates (68, 120). Nuclear
accumulation ofthe mutated p53 has been linked to poor prognosis in breast cancer (116,
117, 120, 121, 122, 123) and some other tumor types (88, 118, 124). In addition,
cytoplasmic mutant p53 accumulation has recently found to be an independent prognostic
marker for colorectal (125, 126) and breast cancers (127). Thus p53 accumulations appear
to be a valuable prognostic marker for certain cancers. The detection of altered p53 in these
tumors, may provide additional prognostic information thus serves as an indicator of high risk
patients for whom more aggressive therapy is required.
7.0 p53 as a Potential Target for Cancer Treatment
As discussed earlier (sec;3.2), wild type p53 acts as an effective tumor suppressor
protein in cells. Inactivation of normal p53 is associated with uncontrolled cell grth
(32,33) and development of large number ofhuman tumors (60, 83, 84). Determination of
the type and number of mutations in p53 and other cancer related genes in tissues fi'om
clinically healthy individuals may allow the identification ofthose at increased cancer risk and
their consequent protection by preventive measures (68). Evaluation of p53 as a prognostic
marker for certain cancers also eventually may permit the design of pharmacologic drug that
can block uncontrolled cell grth at the site of the defect and lead to more rational and
efi‘ective treatment for cancer (68).
26
8.0 The History ofBreast Cancer
Probably no disease affecting mankind in the last few years has caused more emotion,
confusion, or statistical evaluation than breast cancer. Much ofthe confirsion comes fi'om
a lack of knowledge of the disease and the basis for treatment (128). In the first three-
quarters, ofthis century knowledge about breast cancer has been acquired fi'om a combination
ofepidemiological studies, clinical observations, and practical experience with several types
oftreatment (129).
The precise description ofthe earliest stages ofhuman breast carcinoma is currently
unavailable. But it has been calculated (130) that in most cases, starting with the first cell
which becomes malignant, the tumor mass grows by successive doubling. It takes up to 7-8
years to reach the spherical volume of 1 cm in diameter.
8.1 Epidemiological Studies and Etiology Factors
Breast cancer is the most common cause of death from cancer for women in many
countries. Mortality figures vary, ranging fi'om 25-35 per 100,000 in great Britain, Denmark,
United States and Canada, to 2-5 per 100,000 in Japan, Mexico, and Venezuela. Breast
cancer also afi‘ects males, but the incidence is about 1% ofthe rate offemales (130).
Familial history of breast cancer is important. It has been observed that female
relatives ofwomen (mother, daughters, and especially sisters) with breast cancer are subject
to greater risk than the general population (130). The highest risk occurs in women whose
mothers had bilateral breast cancer prior to menopause (130). These women have a risk
factor nine times the average. Over 50% ofthese women will get breast cancer (130).
27
In 1915 T.H.C. Stevenson drew attention to the fact that after age of 45, the
mortality rate forbreast cancerwas markedly higher for single than for married women (131).
This confirmed several observations made in the seventeenth and eighteenth century, when
it was noticed that relatively large number of nuns were breast cancer patients (3).
In 1926 Elizabeth Lane-Clypon compared a series ofbreast cancer patients with a
group ofhealthy women (132). Her conclusion was that a significant number ofbreast cancer
patients had married late, were of a lower parity, had breast fed their babies less often, and
on average entered menopause at a later age. She also hypothesized familial relationships
associated with the condition. Her first report in which she presented a retrospective study
on the result of operative treatment will be discussed latter.
Subsequently, in 1929 Clemens Von Pirquet reported a bi-modal age distribution of
patients with breast cancer (129). One peak represented the patients who were 45 to 49 years
ofage at the time ofdiagnosis. The second peak was at about 65 years. This observation has
since been confirmed by several reports in Europe and in the United States.
Furthermore, in 1960 and 1964 F.de Waad and his associates also found that ovarian
estrogen and alternatively, adrenocortical estrogen disturbance may play an important part
in the formation ofbreast cancer (133). He divided breast cancerpopulation into two groups
on the basis ofthe presence or absence of certain signs, such as obesity, hypertension, and
decreased glucose tolerance. These signs were suggestive of adrenal estrogen production.
The conclusion was that the second statistical age peak (65 years in previous study) was
made up ofpatients showing signs ofimbalance in adrenal estrogen. In addition, they found
that a heredity tendency existed in this group.
28
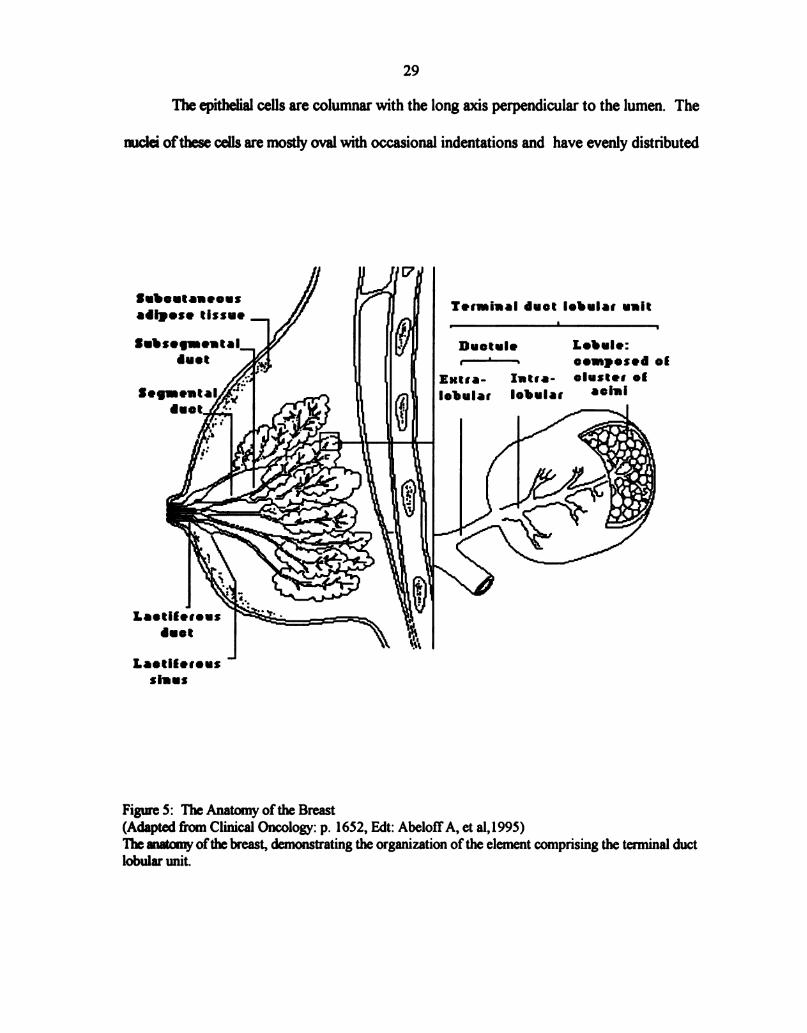
8.2 Normal Breast Anatomy
The normal anatomy ofthe breast has been studied in detail and has been shown that
each breast consist of numerous lobes (134). These lobes are formed at sixth week of
embryonic life from the epithelial cells (135). They are separated by layers of connective
tissue and surrounded by abundant adipose tissue (135, 136). Each lobe is networked with
lactiferous duct and lined by columnar epithelium (135). Beneath the areola each ofthe ducts
has a local dilation called the lactiferous sinus. Furthermore, each lobe is subdivided into
lobules. The smallest lobules consist of a cluster of rounded alveoli, which opens into the
smallest branches ofthe lactiferous ducts. These ducts unit to form larger ducts and end in
a single canal (136) (Fig. 5). The epithelium of the breast differs according to the state of
activity ofthe organ (136). In the gland ofa woman who is not pregnant, the alveoli are very
small and solid, and are filled with a mass of granular polyhedral cells (136). During
pregnancy the alveoli enlarge, and the cells undergo rapid multiplication. At the
commencement of lactation, the cells in the center of alveolus undergo fatty degeneration.
The peripheral cells of the alveolus remain, and forms a single layer of granular, short
columnar cells with spherical nuclei, lining the basement membrane (136).
It is generally agreed that histologically and ultrastructurally, the lining of the normal
nonlactating ducts (136, 137, 138) is composed oftwo fundamental types of cells; 1) the
epithelial cells forming the inner luminal layer and 2) myoepithelial cells that are arranged
between epithelial cells and basal lamina. In addition to these typical category of cells, are the
indeterminate cells. These are believed to represent either a progenitor from which epithelial
and myoepithelial cells can originate independently, or a transition of state between the two.
29
The epithelial cells are columnar with the long axis perpendicular to the lumen. The
nuclei ofthese cells are mostly oval with occasional indentations and have evenly distributed
Subcutaneous
adipose tissue
Zl'ersuiual duet lobules unit
T
8““..."flnuotulo Lobule:
duet M r—"—~ composed o!
Bartra- Intsa- cluster of
Iobular lobular 00““
""3:2§‘/
K
1 "if: 9:}
.’e. ‘
0 s
@l Wide-i2”
\
Lootilesous
duet
Laotllerous
sluus
Figure 5: The Anatomy ofthe Breast
(Adapted from Clinical Oncology: p. 1652, Edt: AbelotfA, et al,l995)
The matcnry ofthe breast, demonstrating the organization of the element comprising the terminal duct
lobular unit.
3O
chromatin. The nucleoli are fiequent and large in size. The endoplasmic reticulum is rough-
surfaced and golgi complex shows the usual parallel array of cisternae. Mitochondria are
ordinarily few and irregularly distributed.
Most myoepithelial cells are flat and have numerous fine filaments in their cytoplasm.
The other cytoplasmic organelles are scanty and occupy a limited portion of the cell.
Continuous with the intercellular spaces, is an area between epithelial and myoepithelial cells,
called the lamina lucida which is fiequently traversed by fine filamentous densities. The basal
lamina follows the contour of ducts and ductules as a single layered structure. Beneath it
there is a layer ofconnective tissue fibers that varies in thickness and is made up ofcollagen
fibers among which are a few bundles of elastic fibers. Peripheral to the connective tissue
fibers is a layer of fibroblasts that seems to constitute a boundary between the structures
described and the remainder ofthe stroma. Examining these structures and their relationship
to each other shows that ducts and ductules are enclosed by a continuous envelope
representing a complex structure whose components are contributed in part by the epithelium
and in part by the stroma (139). Stroma consists of plasma membranes of epithelial and
myoepithelial cells, intercellular spaces, lamina lucida, basal lamina, layer of connective tissue
fibers, and fibroblast. The change in morphology associated with mammary dysplasia is the
result of a firnctional interplay affecting, in varying degrees, both epithelial and stromal
structures.
8.3 Clinical Overview ofBreast Cancer
The majority of breast cancers arise from the epithelium ofthe lobules and ducts of
the gland (130). Sarcomas ofthe breast are rare. Both lobular and ductal carcinomas may

3 I
be non-invasive (in situ) or invasive (130).
Gallagher and Martin (1968-69) in a series of breast tumors with less than 5.0 cm
in diameter, showed that considerable alterations in the duct epithelium and supporting
cormective tissue were present (128, 140). Their hypothesis was that there is a continuous
development fi'om the normal mammary epithelium to hyperplasia then to noninvasive
intraductal disease and finally to invasive carcinoma (140). Based on their observations the
earliest change in the duct was a thickening ofthe epithelial layer due to an increase in the
mrmber of cells present. This could occur at irregular intervals along the duct with patches
ofnormal duct membrane intervening. As the changes progressed, the duct lining become
several cells deep accompanied by varying degrees of disarrangement and anaplasia (128).
These disarrangements in the duct lining finally range from duct hyperplasia to intraductal
non-invasive carcinoma more commonly known as ductal carcinoma in situ (DCIS) (128,
140). Moreover, the changes in the duct epithelium could be seen in a single or multiple foci.
Alterations in the basal laminae, such as gaps may lead to the progression of
intraductal carcinoma to an invasive breast cancer (138, 141, 142). The presence ofthese
gaps appear to initiate the invasive phase ofthe disease by helping groups of malignant cells
protrude into the stroma without losing continuity with the cells inside the duct. The size of
the gaps and associated cell protrusions may be limited and present only in a few sections.
Under these conditions the foci of invasion is too small as to be seen by light microscopy.
Thus the lesions of intraductal carcinomas may be markers for a breast likely to develop to
an invasive carcinoma (140).
Once the invasive carcinoma have been established, spread takes place via lymphatic
and the blood stream (130). The lymph nodes act as the main filter ofthe cells that have
32
escaped from the primary tumor. The tumor cells, once past the axillary filters, invade the
supraclavicular lymph nodes and then enter venous circulation. Through circulation
metastasis occur in other body organs such as the lung, the liver, and the brain (130).
Another type ofnon-invasive breast carcinomas is the lobular carcinoma in situ (130).
This form of breast cancer is probably more frequent and may remain silent for years. In
addition, it has been shown that in about 35% ofthe cases lobular carcinoma may eventually
become invasive (130). The invasion is as likely to occur in the opposite breast or elsewhere
in the same breast.
Another major lesion ofthe breast, which includes an in situ component, is Paget’s
disease ofthe nipple (130). This type spreads very slowly in the epidermis ofthe nipple, the
areola, and surrounding skin. At a latter stage, the tumor become invasive and develops as
a common mammary carcinoma (130).
8.3.1 Detection and Diagnosis ofBreast Cancer
Since early diagnosis of breast cancer is directly related to prognosis, attempts to
detect small tumors in asymptomatic women deserve special attention. About 80% ofbreast
tumors are first noted by the patients themselves and less are often discovered during general
clinical examination or by mammography (130). Tumors are rarely detectable by palpation
ifthey are less than 5 mm diameter. The mammogram can pick up most lesions before they
reach a palpable size (1 cm in diameter) and thus provide for earlier detection (130). Once
detected, tumors are biopsied. This procedure initially uses a fine needle to remove fluid or
a small amount oftissue from the breast lump. This is important in discriminating between
lumps which are fluid-filled cyst or a solid mass. Ifa solid mass, part or all of a tumor is taken

33
out for histological examination which will classify the tumor by type and stage of
development (130).
8.3.2 Types ofTreatment ofBreast Cancer
Different types of therapy have contributed to the present knowledge and to the
practical approach to the breast cancer. Below is a brief discussion of the development of
surgery, radiation therapy, hormonal treatment, and chemotherapy in the present century
(129). The use of surgery has been well established indicating that the postoperative
prognosis after a complete operation is related to the stage of the disease at the time of
operation In 1924 Lane-Claypon presented an important statistical surveys ofbreast cancer.
Her finding was that for those patients who underwent a radical mastectomy (removing
breast, supraclavicular and the internal mammary nodes alone) there was a survival of43.2%
after three years and 33.1% after five years. In addition, women who had been treated with
a non-radical operation had a three year survival rate of only 29.2% (143).
Many hospitals in Europe and United States started to use postoperative irradiation
(129) as an adjunct to surgery with the hope that cancer cells that may have been left behind
afier operation, would be killed. Thus radical mastectomy followed by X-ray became the
standard treatment for breast cancer in the first halfoftwentieth century and is still commonly
used today (129).
The modern era ofendocrine therapy started with the work ofHuggins in 1953 (144).
He introduced surgical ovariectomy to remove the main source of endogenous estrogens.
Since the adrenals appeared to be an additional source of steroid hormones not eliminated by
removal ofthe gonads, bilateral adrenalectomy was also instituted (144). Available

34
corticosteroids, were given for substitution for cases ofmetastic breast cancers unresponsive
to ovariectomy.
Modern chemotherapy started with the introduction of alkylating agents and
antimetabolites (129). In the beginning when single chemotherapeutic agent were employed,
the results were disappointing. Such drugs often had undesirable side effects which reduced
their value. Ever since drugs of different types have been used in succession, and
chemotherapy appears to be a valuable adjuvant in the treatment ofdisseminated breast cancer
(129). The success of all forms of therapy are dependent on early intervention and
appropriate identification of invasive versus non-invasive form oftumors which the type of
therapy applied.
9.0 Ductal Carcinoma in Situ (DCIS)
Ductal carcinoma in situ has become clinically important only since the advent of
routine, high quality mammography (145, 146). Historically, DCIS represented only 3 to
5 percent ofnewly detected cases of breast carcinoma (147) and is generally referred to as
tumors arising from duct epithelium that are confined within the lumen ofthe ducts or lobules
ofthe breast (147).
In the last decade numerous reports have dealt with the ultrastructural of the
neoplastic cells ofnoninvasive DCIS. Morphologically the epithelial cells (138) in DCIS
is characterized with a moderate density of cytoplasm that varies from cells to cells. There
is also a variable density in the distribution of the organelles. Mitochondria may show
considerable variations in size, shape, and internal organization. Occasional giant
mitochondria are seen, some with peculiar dense bodies ofunexplained origin. Frequently,
35
the cells contain a large amount of glycogen distributed either difi‘usely or randomly
throughout the cytoplasm. Cytoplasmic filaments are found in many ofthe neoplastic cells
are thick and irregularly clustered in groups. The nuclei show variations in size and shape
and nucleoli are fiequent and prominent. The chromatin distribution may be uneven. The
myoepithelial cells (138) are inconstantly present at the periphery of ducts harboring an
intraductal carcinoma. Even though they are commonly flattened out and somewhat distorted
by the increasing size of the ducts, they maintain their firndamental ultrastructural
characteristics and can be distinguished fiom the adjacent neoplastic cells. The intercellular
spaces vary fi'om the usual width to greatly dilated. In DCIS most of the ducts are
surrounded by basal laminae that are straight and vary fi'om irregularly thickened to markedly
attenuated (138). The continuity ofthe basal laminae is occasionally interrupted by gaps of
varying length (138, 141, 142). Where these gaps occur, a tumor cell or small groups of cells
protrude through the gaps into the stroma without losing continuity with the cells inside the
ducts initiating the invasive phase.
Ductal carcinoma in situ, also known as intraductal carcinoma in situ or noninvasive
ductal carcinoma, and lobular carcinoma in situ (LCIS) (130, 148) are both characterized by
a proliferation ofmalignant epithelial cells confined to the mammary ducts or lobules, without
light microscopic evidence ofinvasion though the basement membrane into the surrounding
stroma.
The cells that proliferate in lobular carcinoma in situ (LCIS) evolve from the epithelial
component and fill the lumen so as to form solid rounded units (148). These new neoplastic
cells are slightly larger than the normal cells lining the ducts and their cytoplasm is paler. As
36
the cells multiply, they fill and distend the normal ductal structures making up a breast lobule.
Although (LCIS) involves the mammary lobules, the ducts frequently are also affected (148).
9.1 Types ofDCIS
Ductal carcinoma in situ is heterogeneous in terms of its histopathologic grth
pattern, cell type, extent of growth, and biologic behavior (149). A recent classification
categorizes DCIS into cribriform, micropapillary, papillary, and solid forms (149). All types
ofDCIS may be found as “pure” or “mixed” forms (149). This classification is based on the
histologic growth pattern and considers comedo necrosis to be an independent feature of
DCIS rather than a specific histologic type (149). Necrosis refers to death of a cell or a
group ofcells within the central portion of affected ductules (149). Furthermore all forms of
DCIS can have significant necrosis.
'Ihe Cnbriform ofDCIS is characterized with holes and oval spaces. In addition, the
lamina has smooth borders and nuclei are small, dark, and of relatively uniform ovoid shape
(149).
Micropapillary forms ofDCIS consist ofthin, elongated layers of cellular elements
extending as papillae into the ductal lumina. They also exhibit bridging pattemwith other
papillations and have blunted tips. As is typical with micropapillary carcinoma, the nuclei are
large, and in some cases exhibit prominent nucleoli. Furthermore, budding of individual
papillae and aggregates oftumor cells lying free in lumens can be found (149).
Papillary forms ofDCIS are characterized by a relatively high density of papillae.
They are most often comprised of delicate fibrovascular stalks supporting epithelial but not
myoepithelial cells (149).
37
Finally, the solid type is represented by luminal obliteration ofinvolved ducts by tumor
cells. Ducts are also distended by uniform cellular elements. Histologically, it appears to
represent an advanced form ofclinging (149, 150) pattern which is considered to be an early
indicator of solid type (149). This pattern has been described as one, or several layers, of
ductal epithelial cells with overtly atypical nuclei (149).
10.0 Breast Cancer and the p53 Tumor Suppressor Protein
The p53 tumor suppressor protein was first associated with human mammary
neoplasia in 1982 where it was shown that 90% of patients with breast cancer, particularly
those with visceral metastases, had circulating antibodies to human p53 protein (151). This
data led to the hypothesis that “ p53 is altered in amount, and type in breast tumors” (151).
In another study the accumulation of p53 in breast carcinoma was associated with
point mutations within highly conserved regions ofthe p53 gene (96). These altered genes
encode stable proteins that can be detected by standard immunohistochenrical techniques
which detects both wild type and mutant form ofthe p53 protein. Since the wild type p53 has
a short half life (20-30 minutes) what is being detected by this method is considered to be
the mutant form ofthe p53 protein. In addition, a significant association between high levels
of p53 and late stages of the disease with metastatic tumor spread was found (116, 120).
Results of these and other studies (121, 122, 152), clearly indicate that immunohistologic
expression of p53 is associated with a clinically advanced and highly aggressive forms of
breast tumors.
There have been two studies in which accumulation of p53 tumor suppressor protein
in DCIS has been evaluated by immunohistochemistry methods (116, 117). In one, nuclear
38
p53 protein staining was observed in 16% of the 31 DCIS cases (116). In the other study,
immunohistochemical expression of p53 protein is presented in approximately 25% of 143
DCIS cases and is confined almost exclusively to the comedo form of DCIS, a morphologic
subtype ofin situ breast carcinoma thought to be more biologically aggressive (117).
11.0 Objective ofthe Current Study
The role ofp53 in initiation and progression ofcancer is unclear. However, a number
of studies have provided information indicating that it indeed plays a role by promoting
proliferation in some types oftumors (50, 116, 117, 119, 125, 126). Of specific interest to
this project is the possible use ofp53 protein accumulation as a predictive marker ofDCIS
progression to invasive breast carcinoma. Currently about 5% ofDCIS convert to invasive
forms ofbreast cancers.
The objective of this study is to screen tumor samples from 100 patients diagnosed
with DCIS for p53 content. These cases will be followed up to determine what percentage
ofthe DCIS samples convert to invasive form ofbreast carcinoma and correlate this to the
initial p53 content.
Similar studies have been performed in other tumor types. In early non-small-cell lung
cancer (NSCLC) presents with localized tumors about 30% ofthe time (124). Successful
surgical management with long term disease control is restricted to this early stage of the
disease. p53 point mutations are found in approximately 45% ofNSCLC (124). It has been
shown that the presence of p53 gene mutation in NSCLC patients may be independently
associated with a shortened survival. In addition, p53 gene mutation and thus accumulation
ofthe mutated p53 protein are by far the most common molecular changes detected in
39
NSCLC and this correlates with the spread oftumor into mediastinal and hilar lymph nodes
(124). Since the latter are well established prognostic factors for NSCLC, p53 alterations
may also be a useful predictor oftumor aggressiveness (124).
In low grade brain tumors only one p53 allele has been shown to be mutated (118).
Whereas, both alleles are mutated in high grade advanced form of the brain tumors.
Moreover, it has been suggested that mutation of p53 in brain tumors leads to a selective
growth advantage in vivo that seems to be a critical step in transformation from low grade
to high grade tumors (118).
It appears that p53 gene mutation, which produces mutated proteins, in squamous
cell carcinoma of the head and neck occur in low fiequency in noninvasive lesions and the
fi'equency increases as the invasive carcinomas progress (153). The significant frequency of
p53 mutations in early lesions of head and neck squamous cell carcinoma has been used to
predict the rate of progression (153).
It has been found that p53 mutations were associated with poor prognostic factors,
low response rates to chemotherapy, and shortened survival in three types of hematologic
malignancies including acute myeloid leukemia (AML), myelodysplastic syndromes (NDS),
and chronic lymphocytic leukenria (CLL) (154). Unexpectedly, mutations were less frequent
in patients with Burkitt’s lymphoma (BL) and Burkitt’s acute lymphoblastic leukemia (ALL).
The difference between these two cases has no obvious explanation (154).
This study will qualitatively evaluate p53 tumor suppressor protein expression in
breast tissue samples with ductal carcinoma in situ (DCIS). There are many different
methods crurently used for the detection ofp53 alterations. From the clinical stand point, p53
irnnrunohistochernistry appears to be the most practical and useful method for the qualitative
40
evaluation ofp53 alterations in precancer lesions and carcinomas (68). This technique allows
precise localization and identification ofthe cells that exhibit p53 alterations (68). Presence
ofmissense mutation/s in the p53 gene structure, lead to the prolong half life ofthe protein
(fi'om 6 to 20 minutes for normal to up to 6 hours for transformed cells) (60). The increase
in halflife is associated with stabilization ofthe protein. As discussed earlier (Sec.4.0) many
mutations in p53 gene are correlated not only with an increase in the half life but also with a
lack offimction (60, 83, 84).
Many monoclonal antibodies have been developed to epitopes on both wild type and
mutant p53 species (123, 155). The use of these monoclonal antibodies for
immunohistochemical detection and localization ofthe p53 protein has been widely applied
in both clinical and research laboratories. Depending on which monoclonal antibody is used
different aspects of p53 can be evaluated (155). The majority of mutations to p53 are
associated with amino acid substitution in the middle section and carboxy terminus of the
protein (39). Most ofthese mutations are associated with intracellular accumulation ofthis
protein (Sec. 4.1 & 4.4). Immunohistochemical analysis will only detect those mutations
associated with accumulation (55, 96). In normal cells, p53 is not detectable by
immunohistochemical evaluation (155). However, increases may occur in the absence of
mutation due to viral infection which increases the concentration ofthe binding proteins (Sec.
4.2). In most instances these mutations are associated with changes in epitope recognition
in the middle section and carboxy terminus. Thus the application ofmonoclonal antibody to
these sections ofthe protein in random samples may not detect p53 (155, 156). However,
the amino terminus appears to be conserved in most types of p53. Thus,
41
immunohistochemical evaluation of p53 using monoclonal antibody to the amino terminus
provides the best method for evaluation of this protein in tissue samples (155).
For this study monoclonal antibody PAb1801-Ab2 was chosen. This antibody is a
mouse monoclonal antibody generated by immunizing Balb/c mice with p53 protein and
fusing with NS-l mouse myeloma cells (157). The p53 Ab-2 reacts with a denatured stable
determinant of p53 (156). This antibody also reacts equally on frozen and forrnalin-fixed,
paraffin embedded sections (156). Furthermore, the p53 Ab-2 recognizes the p53 ofhuman
cellular origin only (158) and reacts with an epitope located near the amino end of all known
forms ofp53 (158). Thus allowing for the detection of accumulation of most forms of this
protein (158). The p53 antigen is not affected by normal processing. However, it has been
recently reported that long term storage of paraffin-embedded specimens at room
temperature may decrease the binding (159).
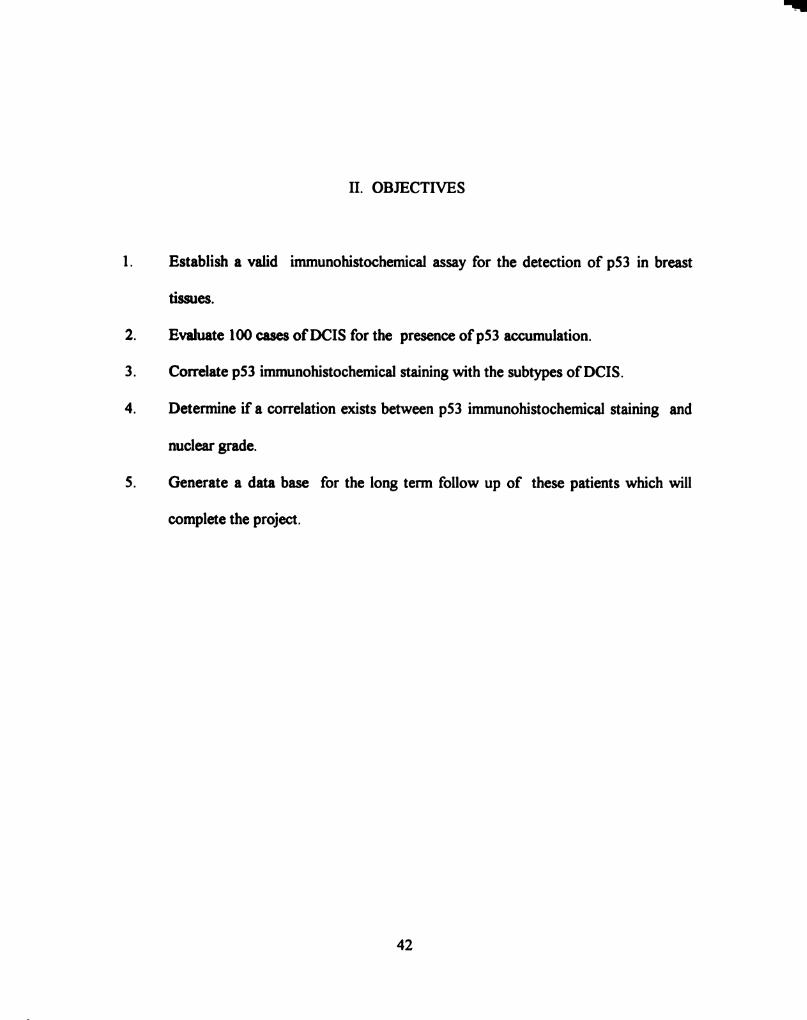
II. OBJECTIVES
Establish a valid immunohistochemical assay for the detection of p53 in breast
tissues.
Evaluate 100 cases ofDCIS for the presence ofp53 accumulation.
Correlate p53 immunohistochemical staining with the subtypes ofDCIS.
Determine if a correlation exists between p53 immunohistochemical staining and
nuclear grade.
Generate a data base for the long term follow up of these patients which will
complete the project.
42

III. MATERIALS AND METHODS
1.0 Source ofTissue
Samples were acquired fi'om women whom had had surgical removal of breast
tumor/lumps for pathologic evaluation. These samples were processed by routine procedures
afler immediate immersion in a 10% formal saline. Preserved samples were then subjected
to processing; dehydration and embedding in paraffin blocks. Five micron (51¢) sections were
cut and fixed on slides pretreated with poly-L-lysine to prevent detachment oftissues from
the glass slides. Sections were first evaluated microscopically, by a pathologist, after
standard hematoxylin and eosin staining (160). Tissue sections on glass slides were
forwarded to this laboratory on specimens which had been classified as DCIS by initial
pathologic evaluation. Along with these samples data on tumor histology and patients
characteristics were obtained from the pathology reports.
2.0 Irnmunohistochemistry Overview
The immunohistochemistry technique used was an enzyme linked method.
Deparafiinized sections were first incubated with monoclonal antibody (Ab I801,Ab-
2,0ncogenescience) (157). Afier binding non bound antibody was removed by washing.
Secondary biotinylated anti-mouse was added. Non-bound secondary antibody was
removed by washing and followed by incubation with Avidin-Biotinylated horseradish
43
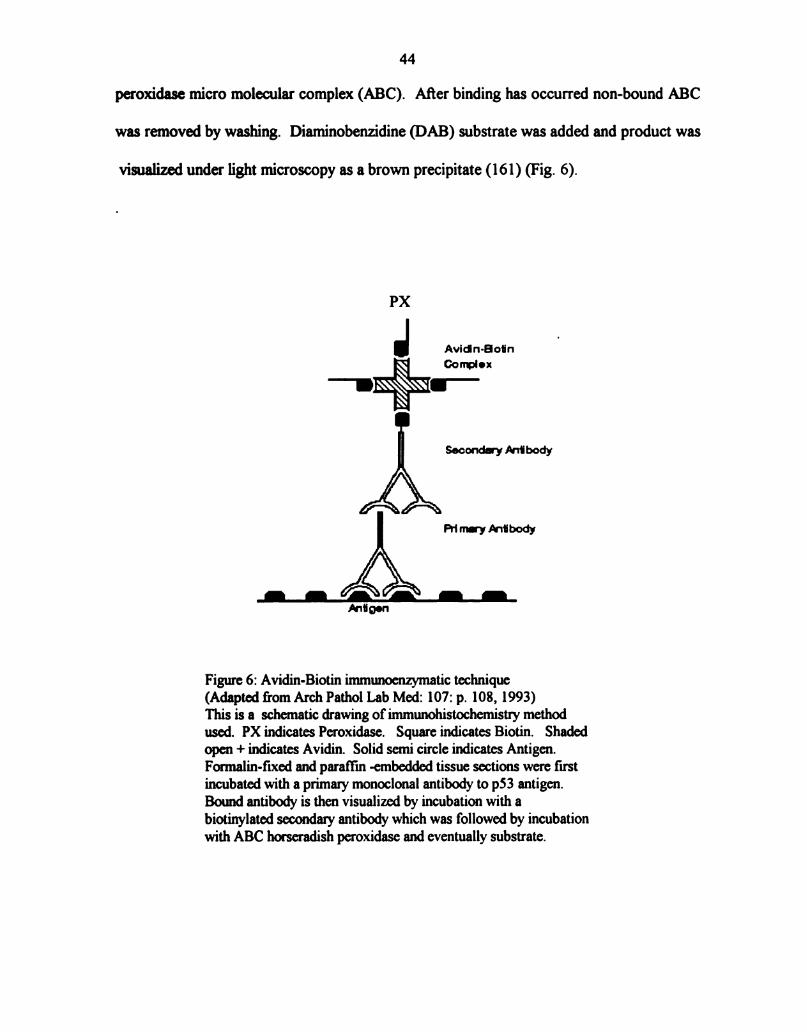
44
peroxidase micro molecular complex (ABC). After binding has occurred non-bound ABC
was removed by washing. Diaminobenzidine (DAB) substrate was added and product was
visualized under light microscopy as a brown precipitate (161) (Fig. 6).
PX
J Avidn-Botin
Oonplox
WINE.—
Sooonda'y Mibody
Priml-‘ntibody
Antigen
Figure 6: Avidin-Biotin irnmunoenzymatic technique
(Adapted from Arch Pathol Lab Med: 107: p. 108, 1993)
This is a schematic drawing of immunohistochemistry method
used. PX indicates Peroxidase. Square indicates Biotin. Shaded
open + indicates Avidin. Solid semi circle indicates Antigen.
Formalin-fixed and paraffin embedded tissue sections were fust
incubated with a primary monoclonal antibody to p53 antigen.
Bound antibody is then visualized by incubation with a
biotinylated secondary antibody which was followed by incubation
with ABC horseradish peroxidase and eventually substrate.
45
3.0 Immunohistochemical Procedure
Forrnalin-fixed, paraffin-embedded slides(5u) were cleared in xylene (see Appendix)
(3x for 5 mins each) and absolute alcohol (2x for 2 mins each). Slides were treated with
0.3% hydrogen peroxide-methanol (10mins) to remove endogenous peroxidase activity.
Following a distilled H20 (D-Hzo) rinse, the slides were pretreated with a 1 mg/ml solution
oftrypsin (see Appendix) for 5 minutes. Slides were treated for 30 minutes with phosphate
bufl'er solution (PBS,PH=7.4) (see Appendix) containing 0.15% bovine serum albumin. To
reduce background staining, slides were incubated in normal horse serum (5% in PBS) for 30
minutes. The normal horse serum was allowed to run ofi‘, and the slides were incubated
overnight with the primary antibody (see Appendix), fi'om Oncogene Science, at 4°C in a
moist chamber (162). The monoclonal p53 (Ab-2) recognizes both wild-type and mutant p53
forms. A dilution of 1:200 in PBS (0.5 ug/ml) was used for this antibody as well as the
negative control antibody. The negative control antibody was mouse myeloma IgG(see
Appendix) . Afier washing with PBS for 10 minutes at room temperature (RT),the slides
were incubated with the secondary biotinylated anti-mouse IgG antibody (Vector
Laboratories, BA-2000) for 30 minutes at RT. A dilution of 1:250 in PBS (0.6 ug/ml) for
secondary antibody was used. Following PBS wash, the slides were incubated with the
avidin-biotin-peroxidase reagent, (Vector Elite) for 60 minutes. Afier PBS wash for 10
minutes the antigen-antibody complex was visualized using 0.05% solution of
diaminobenzidine(DAB)tetrahydrochloride tablets in tris solution (pH=7.6) for 8 minutes (see
Appendix). The slides were counterstained with Mayer's hematoxylin for 5 minutes, blued
with Scotts tap water for another 5 minutes, dehydrated, and coverslipped (162).

46
4.0 Positive and Negative Controls
For each assay, formalin-fixed, paraffin-embedded tissue section of human colon
cancer was used as positive control to ensure interassay consistency. Colon carcinoma tissue
sections are known to have mutations of the p53 protein (60, 95). For the negative control
PBS (without antibody) and (purified mouse myeloma IgG,1:200) were used instead ofthe
primary antibody. Benign breast tissues were also studied for p53 immunoreactivity to role
out detection ofthe wild-type p53 by the primary antibody.
5.0 Grading System
The grading system was based on binding ofprimary anti p53 antibody and subsequent
evaluation of horse radish peroxidase activity which generates a brown precipitate. The
presence ofbrown precipitated in the nucleus oftumor cells was scored semiquantitatively
for the proportion ofthe cells stained that stained darkly within the tumor (163). This
staining was given scores fi'om 0 to 3; (0, no staining, 1-30% =l+ , 31-60%=2+, and
>60% =3+).
6.0 Tumor Grading
Each specimen was classified based on histologic presentation. Tumors were
classified according to the predominant cellular architectural pattern: solid, cribriforrn,
micropapillary, and papillary types. This classification was only applied when such a pattern
corresponded to more than 75% ofthe tumor. When no pattem predominated, the tumor was
classified as mixed.
47
Nuclear grade was defined as grades 1-3 in order of increasing pleomorphism with
regard to the invasive carcinoma (164). Pleomorphism ofthe nucleus and the presence of
nucleoli wee used as the criteria for grading. A nuclear grade was assigned in a
serniquantitative manner by comparative evaluation of nuclei in adjacent normal breast duct
as small (1-2X size), intermediate size (3-4x size), or large (5x size or more). Grade 1 nuclei
was characterized by monomorphism, small or intermediate size, and inconspicuous nucleoli
defined. Grade 2 nucleus showed moderate pleomorphism, small or intermediate size, and
was characterized by evident nucleoli. Grades 3 nuclei showed marked pleomorphism,
intermediate or large in size, and frequently contained multiple and conspicuous nucleoli
(164).
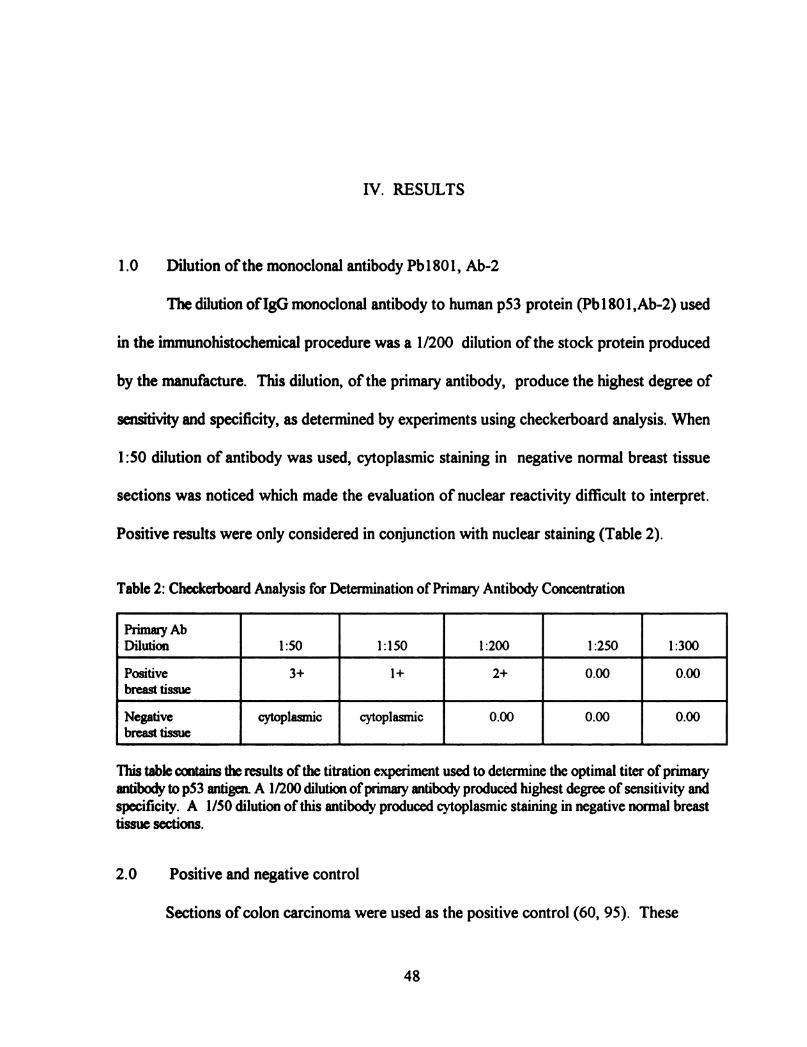
IV. RESULTS
1.0 Dilution ofthe monoclonal antibody Pb1801, Ab-2
The dilution ofIgG monoclonal antibody to human p53 protein (Pb1801,Ab-2) used
in the immunohistochemical procedure was a 1/200 dilution ofthe stock protein produced
by the manufacture. This dilution, of the primary antibody, produce the highest degree of
sensitivity and specificity, as determined by experiments using checkerboard analysis. When
1:50 dilution of antibody was used, cytoplasmic staining in negative normal breast tissue
sections was noticed which made the evaluation of nuclear reactivity difficult to interpret.
Positive results were only considered in conjunction with nuclear staining (Table 2).
Table 2: Checkerboard Analysis for Determination of Primary Antibody Concentration
Primary Ab
Dilution l :50 1:150 1:200 1:250 1:300
Positive 3+ 1+ 2+ 0.00 0.00
breast tissue
Negative cytoplasmic cytoplasmic 0.00 0.00 0.00
breast tissue
This table contains the results of the titration experiment used to determine the optimal titer ofprimary
antibody to p53 antigen A 1/200 dilution ofprimary antibody produced highest degree of sensitivity and
specificity. A 1/50 dilution of this antibody produced cytoplasmic staining in negative normal breast
tissue sections.
2.0 Positive and negative control
Sections ofcolon carcinoma were used as the positive control (60, 95). These
48
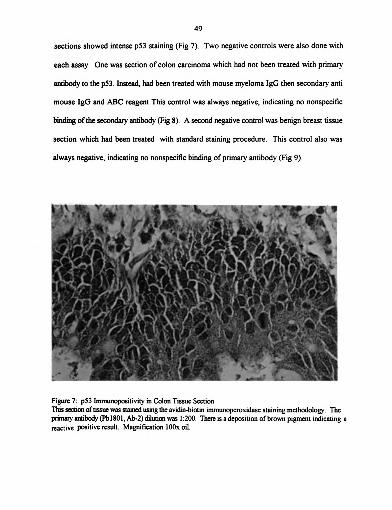
49
sections showed intense p53 staining (Fig 7). Two negative controls were also done with
each assay. One was section of colon carcinoma which had not been treated with primary
antibody to the p53. Instead, had been treated with mouse myeloma IgG then secondary anti
mouse IgG and ABC reagent This control was always negative, indicating no nonspecific
binding ofthe secondary antibody (Fig 8). A second negative control was benign breast tissue
section which had been treated with standard staining procedure. This control also was
always negative, indicating no nonspecific binding of primary antibody (Fig 9).
Figure 7: p53 Immunopositivity in Colon Tissue Section
This section oftissue was stained using the avidin-biotin immunoperoxidase staining methodology. The
primary mtibody (Pb1801, Ab-2) dilution was 1:200. There is a deposition of brown pigment indicating a
reactive positive result. Magnification 100x oil.

50
Figure 8: p53 Immunonegativity in Colon Tissue Section
Mouse Myeloma IgG was used instead of the Primary Antibody (Pb1801, Ab-2). There was no
deposition ofbrown pigment indicating a non-reactive result. Magnification 100x oil.
Figure 9: p53 Immunonegativity in Benign Breast Tissue Section
This section oftissue was stained using the avidin-biotin immunoperoxidase staining methodology. The
primary antibody (Pb1801, Ab-2) dilution was 1:200. There is no deposition of brown pigment
indicating a non-reactive result. Magnification 40x.
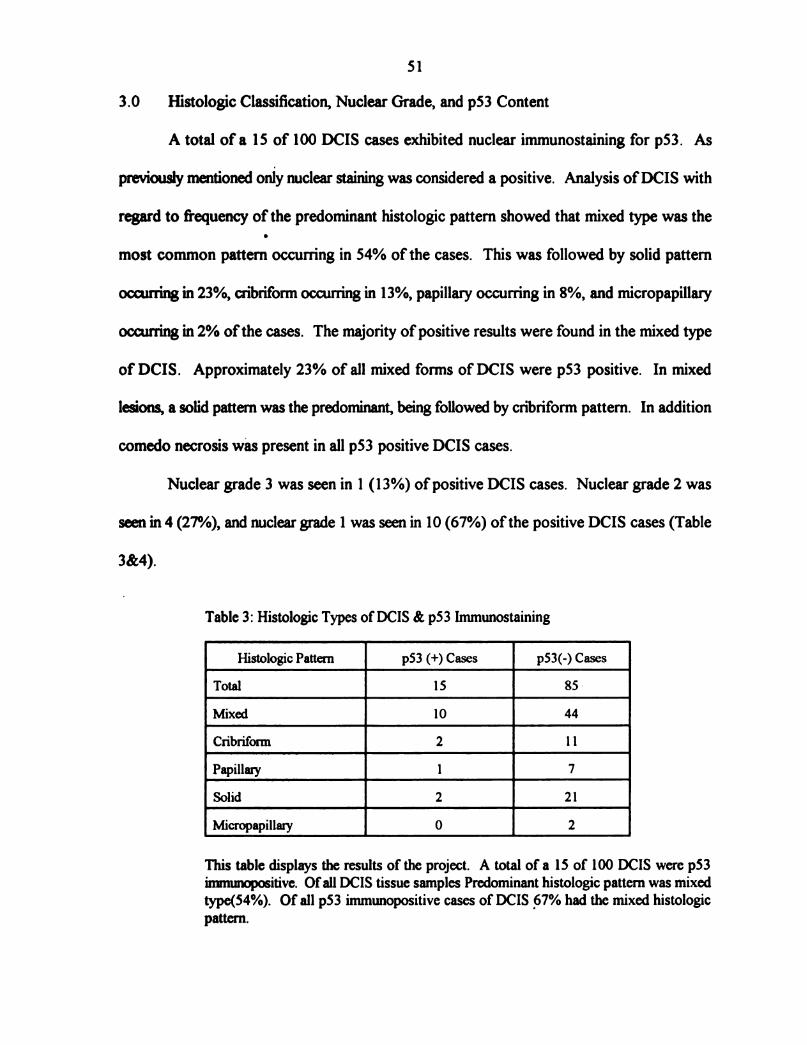
51
3.0 Histologic Classification, Nuclear Grade, and p53 Content
A total of a 15 of 100 DCIS cases exhibited nuclear immunostaining for p53. As
previously mentioned only nuclear staining was considered a positive. Analysis ofDCIS with
regard to frequency of the predominant histologic pattern showed that mixed type was the
most common patterri occurring in 54% of the cases. This was followed by solid pattern
occurring in 23%, cribriforrn occuning in 13%, papillary occurring in 8%, and nricropapillary
occurring in 2% ofthe cases. The majority of positive results were found in the mixed type
of DCIS. Approximately 23% of all mixed forms of DCIS were p53 positive. In mixed
lesions, a solid pattern was the predominant, being followed by cribrifonn pattern. In addition
comedo necrosis was present in all p53 positive DCIS cases.
Nuclear grade 3 was seen in 1 (13%) of positive DCIS cases. Nuclear grade 2 was
seen in 4 (27%), and nuclear grade 1 was seen in 10 (67%) ofthe positive DCIS cases (Table
3&4).
Table 3: Histologic Types ofDCIS & p53 Immunostaining
Histologic Pattern p53 (+) Cases p53(-) Cases
Total 15 85 -
Mixed 10 44
Cribriform 2 11
Papillary l 7
Solid 2 21
Micropapillary 0 2 This table displays the results of the project. A total of a 15 of 100 DCIS were p53
imrmrnopositive. Ofall DCIS tissue samples Predominant histologic pattern was mixed
type(54%). Of all p53 immunopositive cases of DCIS 67% had the mixed histologic
pattern.

52
Table 4: Nuclear Grading of Immunopositive p53 DCIS Samples
Histologic Pattern p53 Grade Nuclear Grade
Mixed:
Case #1 3+ 1
Case #2 1+ 2
Case #3 1+ 3
Case #4 1+ 1
Case #5 1+ 1
Case #6 1+ 1
Case #7 1+ 1
Case #8 1+ 1
Case #9 1+ 1
Case #10 1+ 1
Solid:
Case #1 2+ 1
Case #2 1+ 2
Cribriform:
Case #1 3+ 1
Case #2 2+ 2
Papillary:
Case #1 1+ 2
This is a table showing distribution ofp53 immunOpositive samples by histologic
pattem, p53 grade, and nuclear grade. Nuclear grade 1 is characterized by
monomorphism, small size, and inconspicuous nucleoli. Nuclear grade 2 nuclei is
characterized by moderate pleomorphism, intermediate size, & evident nucleoli.
Nuclear grade 3 nuclei is characterized by marked pleomorphism, large size, & multiple
nucleoli.
Nuclear grade 3 was noticed in one mixed pattern of the positive cases.
Nuclear grade 2 was noticed in four of the positive cases; one in mixed, one in solid,
One in cribriform, and one in papillary pattems. The rest of the cases showed nuclear
grade of 1.
V. DISCUSSION
Despite the fact that a number ofmolecular and cellular markers have been proposed
as prognostic indicators for breast cancer, p53 tumor suppressor protein appears to be
valuable prognostic marker for many types of carcinomas including breast tumors. Previous
studies have found a concordance of monoclonal antibody pbl801 immunohistochemical
nuclear pp53 protein accumulation and point mutations within highly conserved regions of
the p53 gene. These altered genes encode for p53 proteins with a higher level of stability
(27, 55, 96) that allows for accumulation of the protein and can be detected by standard
immunohistochemical techniques. From a clinical standpoint (68) this technique is a useful
and practical method in detection ofmutant forms ofthe p53 protein. Since the wild type p53
protein has an extremely short half life and thus intercellular concentration, what is being
detected by this method is the mutant form ofthe p53 protein.
The role ofp53 protein in initiation and progression of cancer is unclear. However,
studies provided information indicating a relationship between high level of p53 and clinically
advanced, highly aggressive forms of the breast tumors (2, 116, 117, 120). In breast
carcinoma, as it has been previously proposed (2), p53 mutation may occur relatively early
at the development of ductal carcinoma in situ (DCIS). These cells with mutated p53 then
may have a grth advantage that would result in clonal expansion of the neoplastic
population (2).
53
54
Ductal carcinoma in situ (DCIS) of the breast is generally referred to as tumors
arising from duct epithelium that is confined within the lumen ofthe ducts or lobules ofthe
breast (147). DCIS is heterogenous in terms of its histopathologic growth pattern, and
behavior (147). Histologically, DCIS is classified into cribriform, micropapillary, papillary,
ans solid patterns. Each ofthe DCIS patterns may be found as “pure” or “mixed” forms. In
addition, all forms ofDCIS may have an area of linear comedo necrosis with in the central
portion ofaffected ductule (147).
Objective ofthis study was to screen tumor samples from 100 patient diagnosed with
DCIS for p53 content. Then follow up these cases to determine what percentage ofthe DCIS
cases convert to invasive form of breast carcinoma and correlate this to the initial p53
content. Data presented here indicates that accumulation ofp53 protein , as assessed by
immunohistochemistry using monoclonal antibody Pb1801, (Ab-2), occurs at low frequency
(15%) in ductal carcinoma in situ ofthe breast (DCIS). The p53 immunostaining ofien was
seen in mixed histologic type ofthe DCIS. These findings are in accordance with the result
ofLennington et al (164) who provided evidence regarding the frequency of mixed patterns
in DCIS. In this study, the predominant pattern seen in p53 immunopositive mixed cases was
solid followed by cribriforrn type of DCIS. Furthermore, all p53 immunopositive DCIS
specimens exhibits comedo necrosis features. This is especially true in specimens with pure
cribrifonn and papillary types ofDCIS.
The significance ofnuclear grade for classifying DCIS into high and low nuclear grade
of malignancy has been emphasized by Bellamy et al (165). In their series of experiments
they found that conversion to the invasive form followed only in high nuclear grade DCIS,
regardless ofthe histologic pattern. This study showed no relationship between DCIS
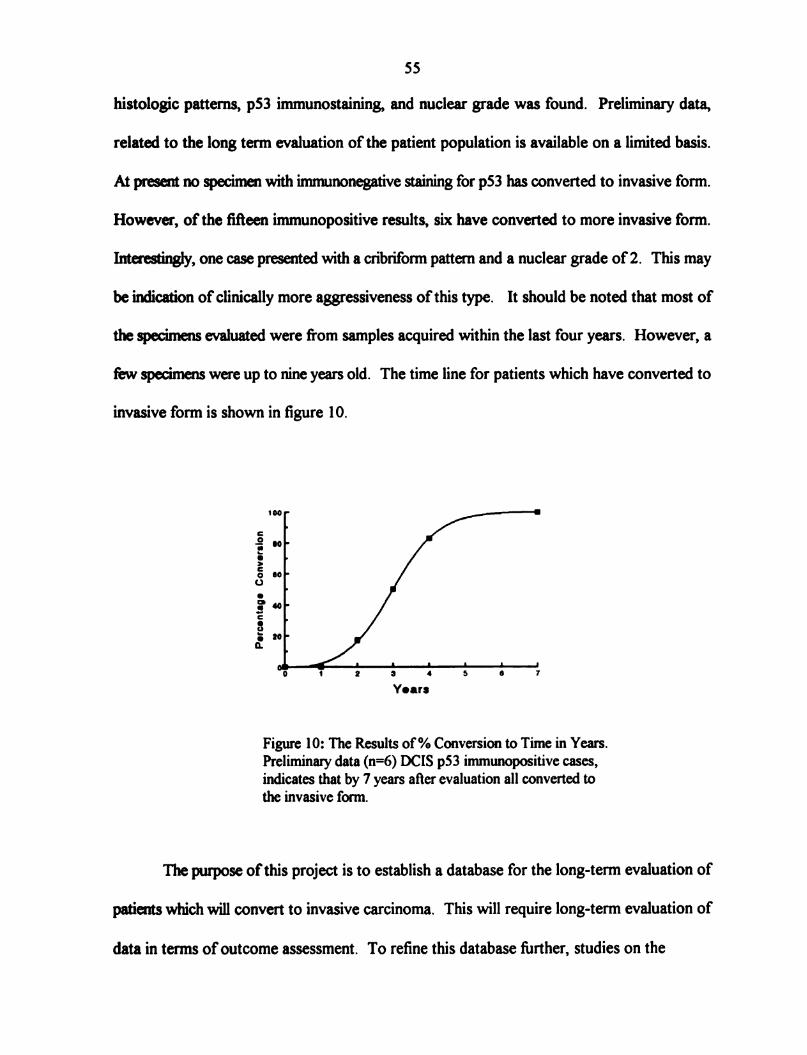
55
histologic patterns, p53 immunostaining, and nuclear grade was found. Preliminary data,
related to the long term evaluation of the patient population is available on a limited basis.
At present no specimen with irnmunonegative staining for p53 has converted to invasive form.
However, of the fifieen immunopositive results, six have converted to more invasive form.
Interestingly, one case presented with a cribrifonn pattern and a nuclear grade of 2. This may
be indication of clinically more aggressiveness ofthis type. It should be noted that most of
the specimens evaluated were from samples acquired within the last four years. However, a
few specimens were up to nine years old. The time line for patients which have converted to
invasive form is shown in figure 10.
Percentage
Conversion
Figure 10: The Results of% Conversion to Time in Years.
Preliminary data (n=6) DCIS p53 immunopositive cases,
indicates that by 7 years after evaluation all converted to
the invasive form.
The purpose ofthis project is to establish a database for the long-tenn evaluation of
patients which will convert to invasive carcinoma. This will require long-term evaluation of
data in terms ofoutcome assessment. To refine this database further, studies on the
56
population are needed using molecular techniques such as DNA sequencing and/or probe
analysis. These techniques may identify correlations between mutations and immunopositive
p53 accumulations that eventually will rule out occurrence of false positive and false negative
results. Using these techniques may provide a correlation between a given mutation and
prognosis.

APPENDIX
l)
2)
3)
4)
5)
6)
7)
8)
9)
10)
11)
APPENDIX
Reagents
Phosphate Buffered Saline (PBS), PH=7.4, 12mM total phosphates.
Analytical Xylene, (MSU Chemical Store).
Absolute Ethyl Alcohol, 200 proof, (MSU chemical Store).
Dehydrated Alcohol, (punctilious)
0.30% H202 tincture
Composed of: 0.3 ml 30% H202 , (Sigma, Cat# H 1009, St.Louis, MO,
USA) in 100 ml Methanol.
Methyl Alcohol
Chrom AR HPLC Grade, (MSU Chemical Store).
Trypsin solution
Composed of: 0.1 gr Trypsin Type 111 from Bovine Pancreac, Activity 11,100
IU/mg protein, (Sigma, Cat# T8253, St. Louis, MO, USA) in 1 ml 12mM
PBS .
0.15% Albumin Solution
Composed of: 0.15 gm Albumin, Bovine, Crystallized Lyophilized, Nitrogen
14.7%, (Sigma, Cat# A4378, St. Louis, MO, USA) in 100 ml 12mM PBS.
5% Normal Horse Serum (NHS)
Composed of: 10 ml Stock NHS (100%), (Gibco, Cat # 200-6050, Grand
Island, NY, USA) in 90 n1] 12mM PBS.
Mouse Monoclonal Antibody
Pab1801 p53(ab-2), (Oncogene Science, Unlondale, NY, USA).
Mouse IgGl (Myeloma) Purified, (ICN Biomedical Inc, Cat # 64-335, Costa
Mesa, Ca, USA).
Biotinylated Anti-Mouse IgG Antibody
BA—2000, (Vector Laboratories, Burlingame, CA, USA).
58
12)
13)
14)
15)
16)
17)
59
Avidin-Biotin-Peroxidase Complex Kit(ABC), (Vector Elite, Burlingame, CA,
USA)
Contains: Reagent A: Avidin DH Solution
Reagent B: Biotinylated Horseradish Peroxidase.
Tris Buffer, PH=7.6, 0.2M Ttis base
Substrate solution
Composed of: One Diaminobenzidine
Tetrahydrochloride (DAB)tablet, (Sigma, Cat# D-5905,
St.Louis, MO, USA). '
(10 mg substrate content), dissolved in 15 ml ofTris buffered
saline & 1211 of flesh 30% hydrogen peroxide that is added
prior to use .
Mayer’s Hematoxylin Solution, (Sigma, Cat# MHS-32, St.Louis, MO, USA).
Scott’s Tap Water (bluing agent), (Sigma, Cat # 55134, St. Louis, MO, USA).
Histological Mounting Medium, (Fisher Scientific, Cat # SP 15-100, Livonia,
MI, USA).

REFERENCES

10.
11.
12.
13.
14.
15.
16.
REFERENCES
Delrnolino L. et al. Carcinogenesis; 14(5):827-832, 1993.
Thor AD. Edgerton SM. et al. JNatl Cancer Inst; 84(11):845-855, 1992.
Webster ’s 771irdNew International Dictionary. Spring Fielld: Merriom, 1971.
Shimkim MB. Contrary to Nature. DHEW Publication No. (NIH) 76-720,
Washington, DC, 1977.
Boyd NF. The Epidemiology ofCancer: Principles andMethods. The Basic Science
of Oncology. (eds): Hill RP. Tannock LF. Chapter 1, pp. 1-4. Copyright 1987,
Pergarnon Books, Inc.
Pott. P. London: Hawkes. Clanks. Collins. 1775.
Groenwald SL. Hansenfi'ogge M. Cancer Nursing: Principles and Practice. pp129-
46.
Ttiolo VA. Cancer Res; 25275-106, 1965.
Frieben A. Fortschr Geb Roentgenstr; 6: 106, 1902.
Rous P. JAN“; 56: 198, 1911. (Reprinted JAMA; 250:1445-1445, 1983).
Yarnagiwa K. Ichikawa K. MitteilungenMedFacultat Kaiser] Univ T01910; 152295,
191 5.
Rous P. Beard JW. JExpthed; 622523-548, 1935.
Friedewald WF. Rous P. JExptlMed; 80:101-125, 1944.
Berenblum I. Shubik P. BrJ Cancer; 12379-382, 1947.
Foulds L. A Review. Cancer Res; 14:327-339, 19544.
Stehelin D. Varmus HE. et al. Nature; 260: 170-173, 1976.
61
17.
18.
19.
20.
21.
22.
23.
24.
25.
26.
27.
28.
29.
30.
31.
32.
33.
34.
35.
36.
37.
62
Weinberg RA. Science; 245:1138-1145, 1991.
Weinberg RA CA CancerJ Clin; 44:160-170, 1994.
Harris CC. Cancer Res; 51:5023-5044, 1991(suppl).
Gullen JW. Principles of Cancer Prevention: Tobaco. (eds): In Devita VT Jr,
Hellman S. Rosenberg SA. Cancer: Principles and Practice of Oncology.
Philadelphia: Lippincott, 1989.
McCann J. Ames BN. et al. Proc NatlAcadSci USA; 72:5135-5139, 1975.
Voet D. Voet JG. Eukatyotic Gene Expression. Biochmistry. (eds): Stiefel J.
Chapter 33, pp. 1076-1080. Copyright: Wiley J & sons, Inc. Canada 1990.
Hollingsworth RE Jr. Hensoy CE. et al. Curr Opin Genet Dev; 3:55-62, 1993.
Perry ME. Levine AJ. Curr Opin Genet Dev; 3:50-54, 1993.
Lane DP. Crawford LV. Nature; 278:261-263, 1979.
Rogel A. Popliker M. et al. Mol Cell Biol; S:2851-2855,1985.
Oren M. Maltzman W. et al. MolCellBiol;1:101-110, 1981.
Hind SP. Finlay C. et al. J Virol; 63:739-746, 1989.
Eliyahu D. Goldfinger N. et a1. Oncogene; 3:313-321, 1988.
Finly CA. Hinds PW. et al. Cell; 57:1083-1093, 1989.
Eliyahu D. Michalouitz D. et al. Proc Natl Acad Sci USA; 86:8763-8767, 1989.
Chen P1. Chen Y. et al. Science; 15%-1580,1990.
Baker SJ. Mankowitz S. Science; 249:912-915, 1990.
Herskowitz 1. Nature; 329:219-222, 1987.
Levine AJ. Momand J. Biochim Biophys Acta; 1032: 1 19-136,1990.
Lane DP. Benchimd S. Genes Devel; 4:1-8, 1990.
Mcbride OW. Merry D. et al. Proc Natl Acad Sci USA; 83: 130-134, 1986.

38.
39.
40.
41.
42.
43.
45.
46.
47.
48.
49.
50.
51.
52.
53.
54.
55.
56.
57.
58.
63
Miller C. Mohandas T. et al. Nature; 319:783-784, 1986.
Soussi T. Caron de Fromentelc. et al. Oncogene; 5:945-953, 1990.
Pavletich NP. Chambers KA. et al. Genes Dev; 722556-2564, 1993.
Shaulsky G. Goldfinger N. et al. Mol Cell Biol; 10:6565-6577, 1990.
Addison C. Jenkins JR et al. Oncogene; 5:423-426, 1990.
Milner J. MedcaleA. et al. Mol Cell Biol; 11:12-19, 1991.
Raycrofi L. Schmidt JR. et al. Mol Cell Biol. in press, 1991.
Gannon JV. Lane DP. Nature; 329:456-458, 1987.
Friedman PN. Kern SE. et al. Proc Natl Acad Sci USA; 87:9275-9279, 1990.
Nelson WG. Kastan MB. Mol Cell Biol; 14:1815-1823, 1994.
Lane DP. Nature; 362:786-787, 1993.
Hoffman B. Liebermann DA. Oncogene; 9:1807-1812, 1994.
Rand A Glenn KS. Et al. Cancer Letters; 98: 183-191, 1996.
Wright JA Smith HS. et al. Proc NatlAcad Sci USA; 87:1791-1795, 1990.
Tlsty T. Proc NatlAcad Sci USA; 87:3132-3136, 1990.
Vogelsteinie B. Kinzler KW. Cell; 702523-526, 1992.
Wang EH. Friedman PN. et al. Cell; 572379-392, 1989.
Finlay CA. Normal and malignant growth control br p53. Oncogene and tumor
suppressor genes in human malignancies. (eds): Christopher c. Benz & Edison T.
Liu. Chapter 17, pp. 327-344. Copyright 1993. Published by Kluwer Academic
Publishers: Boston.
Tan TH. Wallis J. et al. J Virol; 592574-583, 1986.
Bargonetti J. Friedman PN. et al. Cell; 65:1083-1091, 1991.
Michalovitz D. Halevy O. etal. Cell; 622671-680, 1990.
59.
61.
62.
63.
65.
66.
67.
68.
69.
70.
71.
72.
73.
74.
75.
76.
77.
78.
79.
80.
81.
64
Martinez J. Georgoffl. et al. Genes Dev; 52151-159, 1991.
Levine AJ. Momand J. et al. Nature; 351:453-456, 1991.
Ginsberg D. Oren M. et a1. Mol Cell Biol; 112582-585, 1991.
Gannon JV. Lane DP. Nature; 349: 802-806, 1991.
WolfD. Harris N. et al. Cell; 382119-126, 1984.
Kastan MB. Onyekwere O. et al. Cancer Res; 51:6304-6311, 1991.
Kuerbitz SJ. Plunkett BS. et al. Proc NatlAcad Sci USA; 89:7491-7495, 1992.
Dulic V. Kaufmann WK. et al. Cell; 76:1013-1023, 1994.
Sherr C. Cell; 7321059-1065, 1993.
Chang F. Syrjanen S. et al. J Clin Oncology; 13(4):1009-1022, 1995.
Xiong Y. Hannon GJ. et al. Nature; 366:701-704, 1993.
el Deiry WS. Harper JW. et al. Cancer Res; 54:1169-1174, 1994.
Lowe SW. Schmitt EM. et al. Nature (London); 362:847-849, 1993.
Clarke AR Purdie CA. et al. Nature (Londen); 362:849—852, 1993.
Smith KA. Gorman PA. et al. Cell; 63:1219-1227, 1990.
Livingstone LR. White A. et al. Cell; 702923-935, 1992.
Tlsty T. Forrester K. et al. MolCarcinogenesis;l1234-41, 1994.
Zambetti GP. Walker K. et al. Genes Dev; 6:1143-1152, 1992.
Harris CC. Hollstein M. New Eng!Med; 1318-1327, 1993.
Momand J. Zambetti GP. et al. Cell; 69:1237-1245, 1992.
Leach FS. Tokino T. et al. Cancr Res; 53:2231-2234,1993, (suppl).
Yew PR. Berk AJ. Nature: 357282-85, 1992.
Farmer G. Bargonetti J. et al. Nature;358:83-86, 1992.
82.
83.
84.
85.
86.
87.
88.
89.
90.
91.
92.
93.
94.
95.
96.
97.
98.
100.
101.
102.
103.
104.
65
Mietz JA Unger T. et al. EMBO J (in press), 1992.
Soussi T. Legros Y. et al. IntJ Cancer; 5721-9, 1994.
Chang F. Syrjanen . et al. Am J Gastroenterol; 882174-186, 1993.
M011 UM. Riou G. et al. Proc NatlAcad Sci USA; 89:7262-7266, 1992.
Malkin D. Cancer Genet Cytogenet; 66:83-92,1993.
Santibanez-KorefMF. Birch JM. et al. Lancet; 338:1490-1491, 1991.
Varley JM. Brammar WJ. et al. Oncogene; 62413-421, 1991.
Thompson AM. Anderson TJ. et al. IntJ Cancer; 502528-532, 1992.
Hollstein MC. MetcalfRA. et al. Proc Natl Acad Sci USA; 87:9958-9961, 1990.
Gaidano G. Ballerini P. et al. Proc Natl Acad Sci USA;88:5413-5417, 1991.
Diller L. Kassel J. et al. Mol Cell Biol; 10(11):5772-5781, 1990.
Baker SJ. et al. Science; 2442217-221, 1989.
Vogelstein B. Nature; 3482681-682, 1990.
Fearon ER. Vogelstein B. Cell; 61:759—767, 1990.
Hollstein M. Sidransky D. et al. Science; 253249-53, 1991.
Birch JM. Horrley AL. et al. Cancer Res; 54:1298-1304, 1994.
Baker SJ. Preisinger AC. et al. Cancer Res; 50:7717-7722, 1990.
Prosser J. Thompson AM. et al. Oncogene; 521573-1579,199O.
Nigro JM. Baker SJ. et al. Nature; 342:705-708, 1989.
Hollstein MC. Peri L. et al. Cancer Res; 51:4102-4106, 1991.
Levine AJ. Virology; 177:419-426, 1990.
Wang XW. Forrester K. et al. Proc Natl Acad Sci USA; 91:2230-2234, 1994.
Szekely L. Selivanova G. et al. Proc NatlAcad Sci USA ; 90:5455-5459, 1993.

105.
106.
107.
108.
109.
110.
111.
112.
113.
114.
115.
116.
117.
118.
119.
120.
121.
122.
123.
124.
125.
126.
66
Zhang Q. Gutsch D. et al. Mol Cell Biol; 14:1929-1938, 1994.
Scheflher M. Wemess BA. et al. Cell; 63:1129-1136, 1990.
Wemess BA. Levine AJ. et al. Science; 248276-79, 1990.
Fakharzadeh SS. Trusko SP. et al. EMBO J; 10:1565-1569, 1991.
Brash DE. Rudolph JA. et al. Proc Natl Acad Sci USA; 88: 10120-10128, 1991.
Kress S. Sutter C. et al. Cancer Res; 52:6400-6403, 1992.
Aguilar F. Hussain SP. et al. Proc NatlAcad Sci USA; 90:8586-8590, 1993.
Bressac B. Kew M. et al. Nature; 350:429-431, 1991.
Miller CW. Simon K. et al. Cancer Res; 52:1695-1698, 1992.
Takeshima Y. Seyama T. et al. Lancet; 342:1520-1521, 1993.
Lehman TA. Greenblatt M. et al. DrugMetab Rev; 26:221-235, 1994.
Humphrey PA Franquemont DW. et al. AppliedImmunohistochemistry 2(1):22-28,
1994.
Poller DN. Mbch B. et al. Human Path; 24(5):464-468, 1993.
Sidransky D. Mikkelson T. et al. Nature; 355:846-847, 1992.
Wade H. AsadaM. et al. Leukemia; 8:53-57, 1994.
Isola J. Visakorpi T. et al. JNatl Cancer Inst; 8421109-11 14, 1992.
Elledge RM. Fuqua SA. et al. Breast Cancer Res Treat; 27295-102, 1993.
MazarsR Spinardi L. et al. Cancer Res; 52:3918-3923, 1992.
Home GM. Anderson JJ. Et al. British J Cancer; 73: 29-39, 1996.
Mitsudomi T. Oyama T. et al. JNatl Cancer Inst; 85:2018-2023, 1993.
Sun XF. Carstensen JM. et al. Lancet; 340: 1369-1373, 1992.
Bosari S. Viale G. et al. JNatl Cancer Inst; 86:681-687, 1994.
127.
128.
129.
130.
131.
132.
133.
134.
135.
136.
137.
138.
139.
140.
141.
142.
67
Stenmark-Askmalm M. Sta] 0. et al. EurJ Cancer; 30A: 175-180, 1994.
Bond WH. Natural History ofBreast Cancer; Host Defence in Breast Cancer.
(eds): Stoll BA Chapter 6, pp. 95-110. Published by William Heinemann Medical
Books LID. London, 1975.
Moulin DE. The Nentieth Century; A Short History ofBreast Cancer. Chapter 10,
pp.88-104. Published by Kluwer Academic Publishers, 1989.
Breast; Manual ofClinical Oncology. (eds): Sherman CD. Calman KC. Eckhardt
S. Elsebai I. Firat D. Hossfeld DK.Paunier JP. Salvadori B. Part II, pp. 209-226.
Published by Spring verlag Berlin Heidelberg, 1987.
Petrakis NL. Seminar in Oncology; 62433-444, 1979.
Lane Claypon JE. Ministry ofHealth Reports on Public Health. No 23. London,
1926. Quoted by Pertrakis: op.cit (248) & Freqently by Haagensen: op.cit (4).
Waardfde. Baanders-van Halewijn EA. et al. Cancer;17:141-151, 1964.
Gray H. The Urogenital System. Anatomy of the Human Body (28ed). (eds):
Charles Mayo Goss, AB. MD. Chapter 17, pp. 1265-1337. Copyright Lea &
Febiger, Philadelphia. Reprinted in April 1967.
Borysenko M. Beringer T. Female Reproductive system. Functional Histology
. (Zed). Chapter 19, pp. 355-373. Little Brown & company. Boston/Toronto, 1984.
Bloom W. Fawcett DW. Mammary Gland Text Book ofHistology (10ed). Chapter
34, pp. 907-916. Saunders WB company Philadelphia/ London/ Toronto, 1972.
Tannenbaum M. Weiss M. et al. Cancer; 232958-978, 1969.
Takahashi N. Bull. Tokyo MedDent Univ, 52177-192, 1958.
The Epithelial Stroma! Junction of Normal and Dysplastic Mammary Glands.
Cancer, 252586-600, 1970.
Swain SM. Oncology; 3(3):25-1, 1989.
Sanpitak P. Cancer; 26:1186-1198, 1970.
Ozzello L. Intraepithelial Carcinoma of the Breast. New Fronters in Mammary
Pathology. (eds): Hollman KH.Vefley JM. Vol 2, pp. 147-164. New York, Plenum
Press, 1983.
143.
144.
145.
146.
147.
148.
149.
150.
151.
152.
153.
154.
155.
156.
157.
158.
159.
160.
161.
162.
163.
68
Lane-Claypon JE. Ministry ofhealth Reports on Public health & Medical Subjects.
no 32. London: His Majesty’s Stationary Office, 1924.
Huggin SC. Doa TLY. JAMA; 15121388-1394, 1953.
Lagios MD. Cancr Surv; 22383-402, 1983.
Margolin FR. Lagios MD. West JMed; 144246-48, 1986.
Lagios MD. Surgical Clinics ofNorth America; 70(4):853-871, 1990.
Gump FE. Surgical Clinics ofNrth America; 70(4):873-883, 1990.
Fisher ER. Costantine J. et al. Cancer; 75(6):]310—1319, 1995.
Azzopardi JG. London: W8. Sanders co, Ltd,131, 200. 1979.
Crawford DC. Bulbrook RD. Int J Cancer; 30:403-408, 1982.
Iwaya K. Tsuda H. et al. Jpn J Cancer Res; 822835-840, 1991.
Boyle JO. Hakim J. et al. Cancer Res; 53:4477-4480, 1993.
Preudhomme C. Dervite I. et al. J Clin Oncology; 13(4):812-820, 1995.
Vojtesek B. Bartek J. et al. JImmmuno Methods; 151:237-244, 1992.
Kerns B-JM. Jordan PA. et al. JHistochem Cytochem; 40:1047-1051, 1992.
Bank L. Matlashewski G. et al. Eur JBiochem; 1592529-534, 1986.
Arai N. Nomura D. et a1. Mol Cell Biol; 623232-3239, 1986.
Prioleau BA. Stuart J. Etal. New EnglandJMed; 332(22):]521-1522, 1995.
Bevelander G. Ramaley JA Introduction: Essentials ofHistology (8th Ed), pp. 1-6.
The CV. Mosby Company, USA: 1974.
Falini B. Taylor CR. Arch Pathol Lab Med; 1072105-117, 1983.
Quinlan D. Davidson AG. et al. Cancer Res; 5224828-4831, 1992.
Barnes DM. Dublin EA. et al. Human Path; 24(5):469-476, 1993.

69
164. Lennington WJ. Jensen RA. et al. Cancer; 732118-124, 1994.
165. Bellamy COC. McDonald C. et al. Human Path; 24:16-23, 1993.


V IBRQR SHICHIGRN STQTE UNI . L IE
illlllllllllllllllllllllllllllllllllllHll llllllllllll31 29301 3892975