1_popernack_allison_2017_ms.pdf - libraetd
TRANSCRIPT


1
Abstract Marine fastener alloys can be susceptible to hydrogen environmentally assisted cracking
(HEAC) in cathodically polarized seawater environments [1]–[3]. Understanding the controlling
mechanisms of HEAC is critical to developing accurate predictive models for structural
management of these material systems. Prior work has demonstrated that there is a potentially
strong influence of loading rate on the HEAC susceptibility in environments pertinent to
engineering applications [4]. The current work uses linear elastic fracture mechanics (LEFM)
based testing to characterize the stress intensity rate (dK/dt) dependence of HEAC behavior for
Monel K-500 (Ni-based superalloy) and MP98t (Co-based superalloy) in cathodically polarized
solutions. This work has been divided into three tasks to rigorously analyze the material behavior.
Task 1 addresses laboratory testing challenges and develops a functional protocol for
characterizing the HEAC resistance of high toughness, relatively low strength materials in mildly
aggressive environments using LEFM based techniques. In this paradigm, direct current potential
difference (dcPD) uniquely enables high fidelity detection of crack advance but was found to be
adversely influenced by specimen plasticity and non-HEAC based crack advance (e.g. crack tip
blunting, ductile tearing, etc.). A mitigation protocol was developed to truncate data prior to the
remaining ligament reaching the proportional limit and to decouple the effect of crack tip
plasticity from real crack growth. Task 2 utilized the protocol above to quantify the effect of the
stress intensity rate, dK/dt, on standard susceptibility metrics: the threshold stress intensity, KTH,
and the stage II crack growth rate, da/dtII, for Monel K-500 and MP98t [4]. MP98t was found to
be much less susceptible to HEAC than Monel K-500. For both materials, the KTH did not exhibit
a strong dependence on dK/dt, whereas the da/dtII increased as a power law function of dK/dt.
Task 3 explored the mechanistic underpinnings that govern the effect of loading rate on
the SCC behavior of each alloy. Traditional loading rate dependent arguments such as H diffusion
limitation and crack tip film rupture were not found to be consistent with the data and the
materials/environment/loading conditions. The dK/dt dependence was analyzed in the context
of prominent H-enhanced damage mechanisms: hydrogen enhanced local plasticity (HELP) and
hydrogen enhanced decohesion (HEDE) [5]. The observed increase in da/dt with increasing dK/dt
is considered to be due to one or both of the following two failure criteria, provided a dK/dt

2
independent of H concentration at the crack tip. In the first, failure requires a critical crack tip
strain to be exceeded for crack advance; and in the second, accelerated work-hardening
increases the crack tip stresses which enable decohesion. In both cases, elevated dK/dt would
cause elevated da/dt due to exceedance of the critical value in a shorter time increment. These
arguments do not influence KTH because crack growth does not occur below this value.

3
Table of Contents
Abstract ......................................................................................................................................................... 1
List of Figures ................................................................................................................................................ 5
1. Introduction .............................................................................................................................................. 8
1.1 Materials ............................................................................................................................................. 9
1.1.1 Monel K-500 ............................................................................................................................... 9
1.1.2 MP98t .......................................................................................................................................... 9
1.2 EAC Characterization Methods ........................................................................................................ 10
1.2.1 Background ............................................................................................................................... 10
1.2.2 LEFM-Based Characterization of EAC Properties of Monel K-500 ............................................ 13
1.3 HEAC Mechanisms ............................................................................................................................ 14
1.3.1 HEAC Mechanism in Monel K-500 ............................................................................................ 15
1.3.2 Loading Rate Effects .................................................................................................................. 18
1.4 Knowledge gaps, Objectives, and Tasks ........................................................................................... 21
2. Experimental procedure ........................................................................................................................ 22
2.1 Basic Material Characterization ....................................................................................................... 22
2.1.1 Monel K-500 .............................................................................................................................. 22
2.1.2 MP98t ........................................................................................................................................ 22
2.2 Mechanical Testing .......................................................................................................................... 23
2.2.1 Fracture Mechanics Testing ...................................................................................................... 23
2.2.1.1 Sample description ................................................................................................................. 23
2.2.1.2 Sample Preparation ................................................................................................................ 24
2.2.1.3 Load Application..................................................................................................................... 24
2.2.1.4 Direct Current Potential Difference (dcPD)............................................................................ 25
2.2.1.5 Fatigue precrack ...................................................................................................................... 26
2.2.1.6 Environmental Control ........................................................................................................... 27
2.2.1.7 K Test Protocol ....................................................................................................................... 28
2.2.1.8 Post-test Fatigue .................................................................................................................... 29
2.2.1.9 End of Test Procedure ............................................................................................................ 29
2.2.1.10 Post-Test Analysis ................................................................................................................ 30
2.2.1.10.1 Elastic-Plastic Analysis ....................................................................................................... 30
2.2.1.10.2 Post-test Correction Procedures ....................................................................................... 31
2.2.1.11 Metrics of Interest ............................................................................................................... 32

4
2.2.2 Electrical Resistance Measurements of Smooth Tensile Bars................................................... 32
3. Results and Discussion ............................................................................................................................ 33
3.1 Initial Data and Experimental Findings ............................................................................................ 33
3.1.1 dcPD Sensitivity ......................................................................................................................... 33
3.1.2 Initial Characterization of Growth Rate versus Stress Intensity ............................................... 35
3.2 Task 1: Identify the challenges associated with dcPD testing techniques to quantify IG-SCC
resistant materials using LEFM based techniques .................................................................................. 40
3.2.1 Inert Environment Testing Data ................................................................................................ 40
3.2.2 Broad Analysis of Inert Testing Data ........................................................................................ 42
3.2.3 Identify the phenomena responsible for of the da/dt vs K curve regions ................................ 43
3.2.3.1 Bulk Analysis............................................................................................................................ 43
3.2.3.1.1 Plane Strain Limit Load Analysis .......................................................................................... 43
3.2.3.1.2: Bulk Plasticity Analysis ........................................................................................................ 44
3.2.3.1.3 da/dt vs K curve comparison to fractography ..................................................................... 50
3.2.3.1.4 Fractography below the yield strength ................................................................................ 51
3.2.3.1.5 Fractography above the yield strength ................................................................................ 52
3.2.3.1.6 Comparison to environmental data ................................................................................... 52
3.2.3.1.7 Error Mitigation Procedure .................................................................................................. 55
3.2.3.2 Localized Crack Tip Plasticity .................................................................................................. 55
3.2.4 Corrections applied to MP98t environmental data ................................................................... 59
3.3 Task 2: Quantify the effect of dK/dt on the standard LEFM metrics KTH and da/dtII for Monel K-500
at relevant electrochemical polarization ................................................................................................ 63
3.3.1 IG-SCC Susceptibility Metrics .................................................................................................... 63
3.3.2 Fractography ............................................................................................................................. 65
3.3.3 Analysis of MP98t ...................................................................................................................... 67
3.3.3.1 dK/dt trends in MP98t ............................................................................................................ 67
3.3.4 Comparison between Monel K-500 and MP98t ...................................................................... 70
3.4 Task 3: Explore the mechanistic underpinnings that govern the effect of loading rate on the IG-
SCC behavior of each alloy ...................................................................................................................... 72
3.4.1 Loading Rate dependence of da/dt ........................................................................................... 73
3.4.1.1 Diffusion Limitation ................................................................................................................ 73
3.4.1.2 Defecting of a Crack Tip Protective Film ................................................................................ 73
3.4.1.3 Concurrent Plasticity and H Uptake ....................................................................................... 75
3.4.2 Effects on KTH ............................................................................................................................. 77

5
4. Conclusions ............................................................................................................................................ 79
References .................................................................................................................................................. 82
List of Figures Figure 1: Local potential vs normalized position, x, along the artificial crevice with aged Monel K-500 as a
function of external applied potential and exposure time in bulk 0.6 M NaCl solution. The crevice gap (G)
was 1mm. [4] .............................................................................................................................................. 16
Figure 2: CH-diff vs EA for a given crack length in Monel K-500 submersed in 0.6M NaCl [4] ....................... 17
Figure 3: The micromechanical models for KTH and da/dtII associated with their respective experimental
data for Monel K-500 with varying applied potential. ................................................................................ 18
Figure 4: KTH for rising displacement experiments on compact tension (CT) and double cantilever bending
(DCB) specimens of Al 2024 T351 in the S-L orientation, performed at various displacement rates. [41] 20
Figure 5: da/dt vs. dK/dt for Ti-6Al-4V plate in 3.5% NaCl, -0.500VSCE and moist air for various loading
rate and KJ levels. [63] ................................................................................................................................. 20
Figure 6: Side view of SENT sample test section......................................................................................... 24
Figure 7: Assembled environmental cell with sample for immersive testing in polarized environments. 27
Figure 8: The size of the plastic zone in front of the crack tip is related to the force concentrating
behavior. The plastic zone exists where the local stress exceeds σYS. Figure from Anderson [27] ............ 34
Figure 9: da/dt vs KJ data from all Monel K-500 experiments in 0.6 M NaCl with EA = -0.950 VSCE. Only the
historic correction for crack tip shorting has been made to this data set. ................................................. 36
Figure 10: Fracture surfaces of Monel K-500 in 0.6 M NaCl with EA = -0.950 VSCE, corresponding to the
data in Figure 9. The crack propagates form left to right in all micrographs except dK/dt = 4.0 MPa√m/hr
in which the crack propagated from bottom to top. The lines indicate transition points on the fracture
surface: continuous white = end of precrack, dashed white = start of post-test fatigue, black = start of
final failure. ................................................................................................................................................. 37
Figure 11: The three main fracture mechanisms displayed in this work: (a) transgranular (TG) fatigue, (b)
intergranular stress corrosion cracking (IG-SCC), (c) microvoid coalescence, ductile failure. ................... 38
Figure 12: The percent difference in crack length between the apparent dcPD value and the end of IGC
behavior compared to the apparent interrupted KJ for all tests in 0.6M NaCl, EA = -0.950 VSCE. ............... 39
Figure 13: The apparent da/dt vs KJ of Monel K-500 at fixed dK/dt in dry N2. I, II, and III correspond to
regions of near constant slope, indicating different controlling behaviors on the dcPD signal. ................ 41

6
Figure 14: Fracture surfaces of Monel K-500 in Dry N2, corresponding to the data in Figure 13. The crack
propagates from left to right in all micrographs except dK/dt = 4.0 MPa√m/hr in which the crack
propagated from bottom to top. The lines indicate transition points on the fracture surface: continuous
white = end of precrack, dashed white = start of post-test fatigue, black = start of final failure. If two
lines occupy the same space, the later occurring event is shown. ............................................................. 42
Figure 15: Comparison of the limit load, Po, and the applied load with apparent crack length of dK/dt =
4.0 MPa√m/hr in dry N2. ............................................................................................................................. 44
Figure 16: Compression stress-strain curve for Monel K-500. ................................................................... 45
Figure 17: A curve showing the derivative of the slope between incremented points on the compressive
stress-strain curve. Deviation from zero was used to define the proportional limit. ................................ 45
Figure 18: The change in measured dcPD voltage and actuator displacement with applied load of a
Monel K-500 smooth dog bone tensile test. The proportional limit (a) and the yield stress (b) are labeled.
.................................................................................................................................................................... 46
Figure 19: Experimentally recorded ΔV compared to the ΔV calculated based on elastic dimension
change with stress for the Monel K-500 dog bone tensile bar ................................................................... 47
Figure 20: The KJ of the proportional limit (PL) and yield strength (YS) are labeled for each dK/dt, Monel
K-500 dry N2 test. ........................................................................................................................................ 50
Figure 21: The fracture surface of Monel K-500 dK/dt = 3.0 MPa√m/hr focusing on the region that
occurred during the test. ............................................................................................................................ 51
Figure 22: Apparent crack growth data for dK/dt = 1.0 MPa√m/hr in 0.6M NaCl EA = -0.950VSCE and dry
N2. ................................................................................................................................................................ 53
Figure 23: The full fracture surface for Monel K-500 in 0.6M NaCl, -0.950VSCE, dK/dt = 3.0 MPam/hr.
Crack growth occurred from left to right. (a) is TG fatigue, (b) is IG-SCC, (c) is the stretch zone, (d) is TG
post-test fatigue, and (e) is ductile failure. ................................................................................................. 55
Figure 24: The data for Monel K-500 at fixed dK/dt tested in dry N2, cropped at the proportional limit,
each with the exponential fit at a fixed z value. ......................................................................................... 56
Figure 25: The resolution limit coefficient fit value (C) for each dK/dt in dry N2. The data has a linear fit.
.................................................................................................................................................................... 57
Figure 26: Graphically displaying the effect of removing the resolution limit from the environmental
crack growth data for Monel K-500 at dK/dt = 0.15 MPa√m/hr, -0.950VSCE .............................................. 58
Figure 27: Full environmental data set for Monel K-500 with corrections for shorting, truncation at the
proportional limit, and with localized crack tip plasticity removed. .......................................................... 59

7
Figure 28: Dry N2 curve for MP98t, dK/dt= 1.0 MPa√m/hr, dry N2. The equation for the resolution limit
(RL) is shown in the legend. ........................................................................................................................ 60
Figure 29: The Mode I environmental fracture surfaces of MP98t. The crack propagated from bottom to
top. .............................................................................................................................................................. 61
Figure 30: Crack growth rate vs K data for MP98t with corrections made for shorting, localized crack tip
plasticity, crack deflection, and truncation at the proportional limit. ........................................................ 62
Figure 31: Corrected data set for dK/dt = 0.15 MPa√m/hr with the illustrated locations of da/dtII and KTH.
.................................................................................................................................................................... 63
Figure 32: The KTH compared to dK/dt for Monel K-500 at 0.6M NaCl with -0.950VSCE ............................. 64
Figure 33: da/dtend compared to dK/dt for Monel K-500 at 0.6M NaCl with -0.950VSCE ............................ 64
Figure 34: IG-SCC fracture surfaces of Monel K-500 in 0.6 M NaCl with EA = -0.950 VSCE, at 1000x. .......... 66
Figure 35: KTH for MP98t for a range of dK/dt tested at -1.3 VSCE, 0.6M NaCl .......................................... 68
Figure 36: da/dtend for MP98t for a range of dK/dt tested at -1.3 VSCE, 0.6M NaCl .................................. 68
Figure 37: 1000x images of the Mode 1 environmental fracture of MP98t ............................................... 69
Figure 38: KTH for the environmental data sets of Monel K-500 and MP98t .............................................. 70
Figure 39: da/dtend for the environmental data sets of Monel K-500 and MP98t ...................................... 71
Figure 40: Representative Pourbaix diagram for Monel K-500 based on its two main components, Ni and
Cu. OLI generated ....................................................................................................................................... 75

8
1. Introduction Electrochemical degradation is a primary failure mode for many structural metal
materials that operate in marine environments, as such corrosion resistant materials and
corrosion preventive methods are critical for the longevity and safety of such engineering
components. Co- and Ni-based superalloys are used in submerged marine applications such as
fasteners on ocean vessels and North Sea offshore platforms due to their moderate strength,
high toughness, and corrosion resistance in submerged aqueous chloride environments [1].
However, these alloys are typically coupled with low alloy steels that are highly susceptible to
degradation in these environments and thus require the use of cathodic protection (CP) systems;
specifically, sacrificial anodes (typically Zn or Al-based) galvanically coupled with the steel. The
anode preferentially corrodes and protects the steel by creating a cathodically polarized local
environment [2], [6]. Typically the surrounding environment maintains a potential of ≈ -1.05 VSCE,
which effectively prevents corrosion of the steel in chloride environments [2]. The anodes extend
the life of the steel but have been shown to adversely affect Ni-superalloy fasteners, causing
unexpected failures during use [1]. Critically, the local cathodic environment will generate atomic
hydrogen (H) in sufficient quantities to enable embrittlement of the superalloy. This uptake of H
coupled with in-service loading can lead to intergranular (IG) failures [1]. Such in-service failures
justify the need for mechanistic understanding, screening protocols, and predictive models of
this environmentally assisted cracking (EAC) degradation mode.
Accelerated testing methods are used to characterize fastener material susceptibility and
improve material selection for structural management. These techniques scale from smooth bar
testing to pre-cracked fracture mechanics tests using quasi-static or dynamic loading. This wide
range of testing methods produces a correspondingly diverse range of metrics to quantify the
EAC behavior. Critically, the loading rate has been observed to strongly influence the EAC
susceptibility regardless of the testing method or metrics used to quantify the behavior [5-10].
Fracture mechanics testing is preferred as it most rigorously ensures similitude between the
testing technique and the relevant in-service part geometry and working conditions. As such, the
overarching aim of this work will be to investigate the effects of loading rate on the EAC behavior
that is quantified via high fidelity fracture mechanics based testing. This effort will be conducted

9
on two alloys that are commonly used in marine fastener applications (Monel K-500 and MP98t)
submerged in a cathodically polarized aqueous chloride environment.
1.1 Materials
1.1.1 Monel K-500
Procurement of Monel K-500, also designated as UNS N05500, is governed by the US
Federal Specification QQ-N-286; of note, but there is no standardized heat treatment procedure
[7]. Monel K-500 is an austenitic Ni-Cu solid solution that is precipitation-hardened by
homogeneously distributed γ’ (Ni3(Al, Ti)) intermetallic particles [8]. The γ’ phase has an ordered
L12 crystal structure with a very low misfit strain (<0.1% misfit strain) to the surrounding matrix.
Given this low misfit, γ’ forms as spherical particles and maintains this morphology even after
prolonged aging [9]. Carbide inclusions are also found in this material, but do not contribute
significantly to strengthening [9]. Monel K-500 demonstrates a KIC ranging from 198 to 340
MPa√m due to lot-to-lot variation [4].
Monel K-500 has been commonly used in offshore platform fasteners [1]–[3], [10]–[12]
and submarine components [13], [14] , but has experienced in-service failures attributed to a H-
based EAC failure mode. This is consistent with the known susceptibility of Ni to IG cracking when
exposed to cathodically polarized acidic and gaseous low pressure H2 environments [15], [16].
Specimens of Ni and Ni-Cu superalloys pre-charged with H showed IG cracking due to internal H
assisted cracking (IHAC) [17]–[21]. This susceptibility is acutely pertinent to marine applications
where cathodic polarization can induce H charging in Monel K-500. The basic metallurgy of
Monel K-500 underwent heat treatment renovations to reduce its susceptibility to hydrogen
embrittlement by annealing out the hardening effects of machining [1], but its susceptibility still
remains an issue [2], [3], [10]–[14].
1.1.2 MP98t
After in-service failures of Monel K-500, MP98t was specifically designed as a
replacement. MP98t is derived from MP159, a MULTIPHASE (MP) alloy developed by Dupont and
used as an aerospace fastener [22]. The base metallurgy is a γ’ precipitation hardened solid
solution Co-Ni-Cr alloy with excellent corrosion resistance in chloride electrolytes and resistance

10
to stress corrosion cracking [22]. Despite its favorable electrochemical qualities, MP159 has a
yield strength of 1800 MPa paired with a comparably insufficient fracture toughness for marine
fastener application [22]. MP159 properties were altered by adjusting aging time and amount of
cold work. Several combinations of additional processing were determined to lower the yield
strength to 1035 MPa and increase the fracture toughness to make it suitable for fastener
application [22]. The exact procedure is not disclosed and the final product is designated as
MP98t. Due to being cold worked in production, MP98t has an elongated grain structure
producing anisotropic mechanical properties. After the initial property criteria were met, MP98t
was evaluated for application as a fastener.
MP98t underwent the Fracture Toughness Review Process (FTRP) and the fastener
structural elements test (FSET) to prove its viability as a fastener material [22][23]. The FSET used
a minimum flaw size on a threaded shape, similar to bolt threads, and then a rapid impact load
[23]. MP98t yielded and exhibited ductile failure, a high energy fracture process as opposed to
low energy brittle failure [22]. The KIC of that MP98t lot was found to be 280 MPa√m [23]. The
physical properties of MP98t showed promise for its intended application; however, very little
EAC evaluation has been published for MP98t. Due to the similarities of their general make ups,
solid solution with strengthening precipitates, the trends that have been shown for Monel K-500
are expected to hold for MP98t.
1.2 EAC Characterization Methods
1.2.1 Background
Historically, the material selection process and management of EAC for alloys in strained
marine environments is often dictated by a “go/no-go” approach based on the results of
accelerated testing. Specifically, if testing indicates that the service environment and loading
conditions are below a threshold level of severity, then it is assumed that cracking will not occur
over the lifetime of the component. This highlights the critical importance of ensuring that the
testing techniques conservatively and rigorously capture the pertinent failure mechanisms in a
time-frame that is conducive to laboratory testing. Non-fracture mechanics testing has
progressed from rudimentary empirically-based legacy approaches (e.g. ASTM G39 [24], G30

11
[25]) to a more controlled slow strain rate tensile testing (ASTM G129 [26]), where changes in
the time to failure, ductility, and strength are monitored as a function of environment.
During ASTM G129 slow strain rate testing (SSRT), a constant strain rate is applied to a
tensile-loaded sample [26]. This method traditionally utilizes smooth or notched tensile sample
geometries to quantify environmental susceptibility. The sample geometry determines the
derivable metrics. Smooth cylindrical tensile specimens use change in ductility and time to failure
as metrics while notched samples use notch tensile strength to quantify changes due to the
applied environment. The notched specimens exhibit a relatively blunt machined notch; sharp
cracks are rarely associated with this method, but are briefly mentioned in the ASTM standard.
ASTM G129 states that its protocols are not intended to represent the service performance of a
material due to its accelerated timetable, only to act as a screening process to expose detrimental
behavior [26]. It has been reported that materials which experience failure in the laboratory
setting did not fail during service life and, notably for the smooth specimens, in-service failures
were not always replicated experimentally [26]. Marine fasteners do not fail via net-section
yielding like smooth SSRTs, rather typically by cracks initiating at some susceptible point on a
thread [1]. The smooth sample geometry does not consider the stress intensity of the fastener
threads, creating an inaccurate estimate of susceptibility. The metrics associated with the
smooth and notched sample geometries do not lend themselves to quantitative fracture analysis,
but can still be useful for identifying general mechanisms. As documented in the ASTM standard,
there is no method to measure crack initiation or growth in SSRTs, limiting the information from
this failure analysis [26]. In toto, while such simple tests enable an efficient and inexpensive
means to screen materials, quantitatively relating the data to in-service susceptibility is not fully
rigorous.
The fracture mechanics concept of similitude establishes that, independent of the
component geometry, for a constant crack tip driving force and environmental condition that the
material response will be constant [27]. The fracture driving force around the crack tip is
characterized by geometry-independent stress intensity (K) and generates a volume of plastic
deformation at the crack tip due to stress concentration, termed the plastic zone. The basic

12
function for K is shown in Equation 1, where KI is the Mode I stress intensity, σ is the applied far-
field stress, Y is a geometry factor that is a function of crack length (a) and the sample width (W).
KI = σ√πa Y (a
W) Equation 1
As such, controlled laboratory specimens can be used to generate data that will be directly
applicable to in-service components, so long as the geometry specific stress intensity solution is
known. Standardized protocols have been established to determine the relevant fracture
mechanics metrics using multiple samples (ASTM E1681 [28]) and a single sample (ASTM F1624
[29]). While these tests primarily focus on establishing the minimum threshold K necessary for
cracking in a given environment, a sub-critical crack growth rate (da/dt) can also be obtained.
The ASTM F1624 testing is commonly referred to as the “Rising Step Loading Technique (RSL)”
and is popular due to its testing efficiency. The protocol consists of subjecting a precracked
specimen to a constant load hold and monitoring for load drops that would indicate the
occurrence of crack advance. If no crack advance is observed after a given amount of time, then
the load is rapidly increased to a higher loading level. Such incremented steps in loading are
repeated until cracking is observed at which point the threshold stress intensity, KTH, can be
calculated. This protocol is performed at various overall loading rates to ensure that the loading
is sufficiently slow to prevent diffusion limitation.
While such fracture mechanics approaches represent a critical advance in quantitative
characterization of the EAC susceptibility, important limitations remain with regards to rigorously
quantifying crack growth kinetics, capturing the effects of dynamic loading, and the fidelity of the
crack monitoring techniques. Modern fracture mechanics testing approaches address these
shortcomings to enable a more conservative and rigorous characterization of the EAC behavior
by quantifying the crack growth rate, da/dt, and stress intensity, K, relationship of a wide range
of stress intensity values. Such efforts were pioneered by Dietzel and Clark-Landes and initial
attempts to codify such testing are reported in ISO/DIS7539-9 and in an augmented version of
ASTM G129 [26], [30]. Recent efforts extend these approaches by using high fidelity direct
current potential difference (dcPD) techniques to monitor the crack extension in real-time and
feed these data into a software controlled loading system [4]. This set-up enables quantification
of the crack growth kinetics at high fidelity and application of a wide range of fracture mechanics

13
informed loading conditions (e.g. different loading rates, holds, etc.). This set-up has been
successfully applied to characterize the environmental cracking susceptibility of steel [31]; Al-
[32]–[34]; Ti- [35], [36]; and Ni-based [4], [37], [38] alloys for a wide range of mechanical and
environmental conditions. Such data is critical to inform LEFM-based component life
management tools (e.g. SCCrack [39]) that enable probabilistic management of the
environmental cracking behavior of engineering components for a given material, starting crack
size, environment, and applied load [39]. Furthermore, these techniques enable targeted testing
and mechanistic insights that can lead to material development, informed material selection, and
more rigorous structural integrity management. While these state of the art testing techniques
offer unprecedented opportunities to characterize EAC susceptibility, challenges remain,
particularly for high toughness-moderate strength materials (e.g. Monel K-500) in mildly
aggressive environments. Specifically, decoupling the crack tip/bulk plasticity from true IG crack
growth, the onset of ductile crack advance below the fracture toughness [4], and plastic
contributions to the crack tip driving force. Such issues will be considered in detail in this work.
1.2.2 LEFM-Based Characterization of EAC Properties of Monel K-500
Using the aforementioned dcPD techniques, fracture mechanics testing with constant-
rising loading rates (and in some cases constant dK/dt) were applied to Monel K-500 to
quantitatively establish the effect of electrochemical polarization [4] and varying metallurgy [38]
on the EAC susceptibility and H-metal interactions [40]. Specifically, da/dt vs. K relationships
were generated from which the traditional EAC metrics of threshold stress intensity, KTH, and
stage II crack growth rate, da/dtII, were established. Such data was then used as inputs for
probabilistic LEFM based modeling of crack progression for an idealized component [39].
Critically; for identical environmental conditions (-0.800 VSCE and 0.6 M NaCl) and on the same
lot of material, testing performed using the RSL technique indicated immunity from IG-EAC,
whereas the slow rising loading, dK/dt = 0.33 MPa√m/hr, showed the material to be susceptible
[4]. This behavior suggests a strong role of loading rate on the EAC susceptibility of the Monel K-
500. Specifically, the RSL technique has a dK/dt of zero during the load hold, as such these
experiments suggest that increasing the dK/dt increased the EAC susceptibility. [4] Similar results
showing the non-conservative nature of the RSL testing technique were reported for Al-alloys

14
[41]. This behavior is significant from an engineering perspective in that it is necessary to ensure
that the loading rate used to characterize the EAC susceptibility is pertinent (or at least
conservative) for the loading conditions that the engineering component will encounter.
However, this finding is also interesting from a mechanistic perspective as it suggests that active
crack tip plasticity synergistically interacts with the crack tip environmental process to enhance
EAC susceptibility.
Prior efforts have convincingly argued for an H-embrittlement based mechanism that is
controlling the EAC behavior in Monel K-500 under cathodic polarization in aqueous chloride
environments. The subsequent section will outline the H-environment assisted cracking (HEAC)
findings relevant to Monel K-500 to provide the basis for the evaluation and understanding of
the observed loading rate effect.
1.3 HEAC Mechanisms
The mechanisms of hydrogen embrittlement are still controversial. The most popular
explanations are hydriding, Adsorption Induced Dislocation Emission (AIDE), Hydrogen Enhanced
Localized Plasticity (HELP), and Hydrogen Enhanced Decohesion (HEDE). Only EAC is considered
in this work, H generation at the crack tip surface is dominant. Some materials are prone to the
formation of a hydride ahead of the crack tip in the presence of a sufficiently high H concentration
[42]; the hydride cleaves for the crack to propagate. AIDE is explained as enhanced dislocation
emission from the surface due to adsorption of H at the crack tip. AIDE argues that the adsorption
of H at the surface facilitates the enhanced creation of dislocations that allow for increased
plastic deformation [43]–[45]. In the HELP model, H is hypothesized to decrease the dislocation-
dislocation interaction energy, thus enabling enhanced dislocation motion leading to increased
localized plasticity. Elevated dislocation densities occur in H-rich areas causing increased material
strength within the grains near the crack tip and creating slip steps on the grain surfaces that
behave as minute force concentrators [46]–[50]. Through HEDE, the cohesive forces within the
matrix or along the grain boundaries are reduced by the local H concentration, which facilitates
decohesion. Models propose that HEDE requires a critical concentration of H in the fracture
process zone, sufficient to degrade the Griffith toughness, kIG, of grain boundary cohesion, and a

15
local tensile stress to drive crack propagation [51]–[54]. Predictive micromechanical models have
been developed based on decohesion theory [55]–[57]. A combined HELP-HEDE mechanism has
recently gain support; specifically arguing that H induced reduction in fracture toughness is due
to the local hardening associated with HELP, that enables higher local stresses that enables
decohesion (HEDE) through an H degraded structure (e.g. matrix or grain boundary) [58]. The
total effect of each mechanism is a remarkable reduction in fracture toughness.
Prior work has evaluated the IG-EAC susceptibility of Monel K-500 using fracture
mechanics approaches. It is useful review these results in the context of the above mechanisms
to provide a baseline mechanistic framework in which the current study of loading rate effects
can be interpreted.
1.3.1 HEAC Mechanism in Monel K-500
The EAC behavior of Monel K-500 was previously characterized via fracture mechanics
testing of single edge notch tension (SENT) specimens loaded in 0.6 M NaCl at various applied
electrochemical potentials [4]. These data demonstrated that the EAC susceptibility vastly
increased with decreasing potential. While literature suggests a strong role of H for Ni-based
alloys in chloride environments and under cathodic polarization, recent work explicitly linked the
variation in the EAC behavior with changes in the expected crack tip diffusible H content, CH-diff
[4]. This was done by recognizing that HEAC is made possible by the generation of H at the crack
tip. The amount of H produced at a metal surface will be governed by the crack tip overpotential
for H production which can be calculated from the local crack tip pH and potential [4].
The subsurface diffusible H concentration at the crack tip as a function of applied
potential, EA, and crack depth parameter, x2/G, used to capture the geometric dependence for
equal-local potential within a crack. The concentration was calculated for Monel K-500 using
experimentally determined relationships between EA; local H overpotential, ηH; CH-diff, and x2/G.
All variables were found in relation to EA. The crack tip electrochemical behavior of Monel K-500
was simulated using an artificial crevice set-up. The profile of the potential drop, E, across the
surface of the crack with time at a constant EA is shown in Figure 1. A more positive potential
than the bulk applied EA occurs at the crack opening and continues to increase with crack depth.

16
The local potential of the crack decreases with time, nearing the applied potential with little
change after 1 hour, 3600s.
Figure 1:Local potential vs normalized position, x, along the artificial crevice with aged Monel K-500 as a function of external applied potential and exposure time in bulk 0.6 M NaCl solution. The crevice gap (G) was 1mm. [4]
The dependence of ηH on EA was calculated using local pH and the localized potential in
from Figure 1. Negative ηH supports net H production, creating an abundance of available H for
adsorption. Potentials below -0.90VSCE maintained negative ηH. The relationship of EA with ηH
and CH-diff was determined by thermal desorption spectroscopy (TDS) and barnacle cell analysis
on bulk samples. CH-diff was shown to increase with decreasing potential. By these relationships,
CH-diff as a function of EA and x2/G was found and is displayed in Figure 2. The dashed line is the
CH-diff vs EA for 10 cm< x2/G < 60 cm, equivalent to a K range of 20 to 80 MPa√m for the standard
SENT crack lengths and loading used in this work [4].

17
Figure 2: CH-diff vs EA for a given crack length in Monel K-500 submersed in 0.6M NaCl [4]
CH-diff is required to determine the crack tip stress-enhanced diffusible H concentration,
CHσ, for H decohesion based models of the susceptibility metrics KTH and da/dtII; Equation 2 and
3, respectively [35], [55]–[57]. KTH represents the value below which there is either insufficient
stress to enable decohesion and/or CH is below some critical value. The da/dtII plateau is where
the crack growth rate values are limited by the ability of the H to diffuse ahead of the crack tip.
These models fit the Monel K-500 environmental cracking behavior across all EA, as shown in
Figure 3. The KTH decreased and the da/dtII increased with increasing levels of cathodic
polarization [4].
KTH =1
β′exp
(kIG−αCHσ)2
α"σYS Equation 2
(da
dt)
II=
4DH
xcrit{erf −1 (1 −
CHσ−crit
CHσ)}
2
Equation 3
For Equation 2, β’ ((MPa√m)-1) and α” (MPa m) are constants in a dislocation-shielding
model of crack tip elastic stress, and α (MPa√m per atom fraction H) is a weighting factor which
defines lowering of the Griffith toughness (kIG, MPa√m) per unit H concentration. For Equation 3,
DH is the reversible-trap affected diffusivity of H, xcrit is the critical distance ahead of the crack tip

18
where H cracking nucleates for a discontinuous crack advance increment, and CHσ-crit is the critical
local concentration of H necessary for H cracking by decohesion at xcrit.
The H concentration is dynamically involved with active crack propagation. The H
overpotential is associated with the crack tip environment. H will redistribute to align with the
hydrostatic stress due to the crack tip stress field such that a crack will nucleate internally at the
maximum hydrostatic stress location and propagate back to the free surface [59]. The process
will systematically repeat, continuously attracting subsurface H to the fracture process zone.
Figure 3: The micromechanical models for KTH and da/dtII associated with their respective experimental data for Monel K-500 with varying applied potential.
There is no comparable documentation for MP98t, though similar trends should exist with
crack depth and time but with adjustments for potential due to the compositional and
microstructural differences of MP98t.
1.3.2 Loading Rate Effects
The effects of bulk scale loading rate on the hydrogen embrittlement behavior of
materials has been thoroughly studied in an effort to identify the controlling mechanisms for
multiple material systems. The degrading effects have been analyzed with and without the crack
tip context through SSRTs and LEFM-based testing, respectively.
SSRTs have identified the dependence of bulk HE on concurrent plasticity and H diffusion
time. Scully and Moran showed dramatic decreases in % reduction of area in HE aggressive
environments for AISI 4340 steel by focusing on these phenomena [60]. Sufficiently rapid strain

19
rates defect the protective oxide on the sample surface, creating a pathway for H into the
material when simultaneously immersed in an H-producing environment. Unstrained samples in
H charged environments with ample time for diffusion did not exhibit embrittling effects when
subsequently strained, proving the important role of defecting the oxide film. One mechanisms
of oxide destabilization is hypothesized to be dislocations arriving to the surface with a frequency
that reduces the oxide integrity [61]. The deleterious behavior becomes negligible above a
diffusion limiting strain rate that prevents time for an effective H concentration to form via
diffusion. These testing methods concluded that H absorption was the rate limiting factor while
H diffusion is necessary, but secondary for this alloy system [60]. The diffusion limiting nature of
hydrogen embrittlement was reiterated in work by Toribio using constant displacement rate
loading on notched cylindrical specimens of high strength steel [62]. A ratio of failure load in
environment to failure load in air versus bulk displacement rate was used to assess susceptibility.
The failure load plateaued at low displacement rate and increased with increasing rate, thus
losing the embrittling effect.
As outlined previously, SSRTs lack the crack tip sensitivity of LEFM techniques. The same
effects observed in SSRTs, protective films and concurrent plasticity, have strong influences on
individual crack growth behavior. The H uptake at a crack tip is a higher severity event than on a
smooth surface. The crack tip hydrostatic stresses cause a dilation of the lattice around a crack
tip which facilitates an elevated H concentration, causing a more rapid embrittlement effect.
Once inside the material, H actively diffuses from the crack tip toward the high stress fracture
process zone at the forefront of the crack tip [59]. The concentrated H effect changes the scope
of the behavior. The stress state and environmental considerations are different for a sharp crack
geometry as opposed to a smooth or notched specimen. These considerations are necessary for
accurate failure analysis.
LEFM based testing uses KTH and da/dtII to identify trends in susceptibility. The work by
Dietzel et al., shown in Figure 4, shows a strong dependence of KTH on displacement rate, dq/dt,
in Al 2024 [41]. The fixed KISCC at slow dq/dt supports the decohesion based mechanism put forth
by Gerberich. A minimum threshold stress is necessary to exceed the Griffith toughness after an
adequate H concentration is achieved, the lower plateau indicates sufficient time for H diffusion

20
to reduce the cohesive strength. The distinct step-wise increase in KTH indicates that the failure
process is limited by H diffusion at the higher loading rates. The same trend of decreasing EAC
susceptibility with increasing loading rate was noted in STA Beta-21S Ti in work by Somerday [36].
However, the opposite trend was observed for work on Ti-6Al-4V by Richey et al., shown in Figure
5, displays a power law trend of increasing EAC susceptibility (e.g. increasing da/dtII ) with
increasing dK/dt [63]. Coupled with the differences between the EAC susceptibility of Monel K-
500 characterized using the RSL and constant dK/dt testing, these literature findings motivate
the current study of the effect of dK/dt on the HEAC susceptibly of Monel K-500 and MP98t.
Figure 4: KTH for rising displacement experiments on compact tension (CT) and double cantilever bending (DCB) specimens of Al
2024 T351 in the S-L orientation, performed at various displacement rates. [41]
Figure 5: da/dt vs. dK/dt for Ti-6Al-4V plate in 3.5% NaCl, -0.500VSCE and moist air for various loading rate and KJ levels. [63]

21
1.4 Knowledge gaps, Objectives, and Tasks
The effects of dynamic loading in a H-rich environment have been explored in Al and Ti
systems [41], [63], but there is no work available Ni- or Co- based alloys over a significant range
of loading rates. LEFM-based approaches provide the most detailed results regarding crack EAC
crack growth kinetics of the test methods available. The measurement method will be
additionally analyzed and verified for application to high toughness, relatively low yield strength
alloys in low EAC susceptibility environments. The extent to which dK/dt affects the onset (KTH)
and rate of crack growth (da/dt) in addition to the controlling mechanism of these metrics for Ni-
and Co-based superalloys is unknown.
This study will quantitatively characterize and enhance the understanding of the effect of
dK/dt on the mechanism controlling HEAC in Ni- and Co-based superalloys. This information will
inform the future testing protocol for characterizing such alloys; specifically addressing what
dK/dt are appropriate/conservative for future accelerated testing procedures. The work to
complete this objective is divided into three tasks:
Task 1: Consider a range of dK/dt and identify and address the challenges associated with
data collection techniques to quantify the stress corrosion cracking (SCC) resistance using LEFM
based techniques
Task 2: Quantify the effect of dK/dt on the standard LEFM metrics KTH and da/dtII for two
different marine alloys at relevant electrochemical polarization(s)
Task 3: Explore the mechanistic underpinnings that govern the effect of loading rate on
the SCC behavior of each alloy.

22
2. Experimental procedure
2.1 Basic Material Characterization
2.1.1 Monel K-500
The Monel K-500 alloy considered in this study was received from the U.S. Naval Research
Laboratory (NRL) and underwent a multi-step heat treatment to maximize the strength limits
given in material specification QQ-N-286 [7]. The stock used in this study was procured from
Special Metals as a 114 mm diameter bar that had been direct-aged at 866 K for 16 hr, furnace
cooled at 14 K/hr to 811 K, held for 1 hr, furnace cooled at 14 K/hr to 755 K, held for 1 hr, then
air cooled to ambient temperature [38]. This material lot is designated as Monel K-500 NRL High
Strength.
The characteristics of this alloy which influence the fracture behavior have been analyzed
previously. Using ASTM 112-13, the grains were found to be equiaxed and the mean planar grain
diameter was found to be 11.2 μm [38], [64]. Room temperature compression testing was
performed on a cylinder cut parallel to the length of the bar to obtain the strain hardening
coefficients α and n using the Ramberg-Osgood analysis, the yield strength (σYS), and the elastic
modulus (E) shown in Table 1 [27], [38]. The composition of the alloy used in this study was
determined by inductively coupled plasma optical emission spectrometry (ICP-OES) and glow
discharge mass spectrometry (GDMS) is given in the Table 1 [38].
2.1.2 MP98t
The material for this study was received as a 3.2 by 3.2 cm square bar with an elongated
grain structure parallel to the length of the bar, termed the elongated direction. The exact
compositions of the alloy used in this study are given in weight percent in the Table 2. Previous
microstructural analysis was not available for MP98t.
Table 1: Test material properties
Material α n σYS (MPa) E (GPa)
Monel K-500 0.405 18.04 910 188
MP98t (Elongated Direction) 0.24 19.13 1480 224
MP98t (Normal Direction) 0.28 15.96 1130 199

23
Table 2: Wt% compositions of Monel K-500 [46] and MP98t, with P, S, and B in wppm (weight parts per million)
Material Ni Co Cu Cr Al Fe Mo Mn Si Ti C P S B
Monel K-500 63.44 0.02 30.74 - 3.2 0.91 - 0.85 0.1 0.57 0.14 40 17 2
MP98t 26.61 34.95 - 18.87 0.18 8.58 7.38 0.001 0.09 2.85 0.015 60 20 17
2.2 Mechanical Testing
The HEAC behavior of Monel K-500 and MP98T were quantitatively established in
aqueous chloride and inert environments via fracture mechanics based testing. Each sample
evaluated in this study underwent a fatigue precrack and a rising K, constant K-rate (dK/dt) test
in a controlled environment. Real-time direct current potential difference (dcPD) monitoring of
crack extension coupled with software controlled servo-hydraulic frames enables evaluation of
the effect of different rising K-rate (dK/dt) on HEAC behavior. This style of experimental set up
has been used to test the SCC susceptibility of several materials including other heat treatments
of Monel K-500 [38]. All analysis was handled post-test, including computational analysis of
experimental data and microscopic inspection of the samples.
2.2.1 Fracture Mechanics Testing
2.2.1.1 Sample description
Single edge notched tension specimens (SENT) with a rectangular gauged cross-section
were used. The geometry factor, Y(a/W), used in Equation 1 is defined for this sample geometry
in Equation 4 [65]. The gauged section of the MP98t samples had a thickness (B) of 2.66±0.02
mm and width (W) of 10.2±0.02 mm. Monel K-500 samples had thickness of 2.68±0.05 mm and
widths that varied between specimens (ranging from 10.67-12.51 mm). An electrical discharge
machined (EDM) notch was cut across the thickness to a depth of 0.20±0.02 mm. The loading axis
was perpendicular to the notch with Mode 1 crack growth occurring in the radial direction. In the
case of MP98t, also parallel to the elongated direction, as such, the mechanical properties
associated with the elongated direction are used for analysis.
Y (a
W) = √
2W
πatan
πa
2W∗
0.752+2.02(a
W)+0.37(1−sin
πa
2W)
3
cosπa
2W
Equation 4

24
2.2.1.2 Sample Preparation
Prior to each test, specimens were sonicated in acetone, methanol, and deionized water
for 15 minutes each to remove debris on the surface and inside the notch, then blown dry with
compressed air to prevent residue. The side view of an SENT test section prepared for a
submerged environment is shown in Figure 6. For electrochemical environments, the majority of
the surface was covered with 3M Electroplating Tape 470 and a butyl rubber-based lacquer,
Tolber Miccro XP-2000 Stop-off Lacquer (orange). A 1 mm width window of the test section about
the Mode I crack path was left exposed, this window was centered around the EDM notch and
extends to a ratio of exposed width to full sample width of 0.7. The masking lacquer and tape
limited the area that the applied environment could affect, protecting the sample from side
cracking and dcPD wires from electrochemical degradation during the HEAC test [37]. The sample
surface was left bare in inert environments.
Figure 6: Side view of SENT sample test section.
2.2.1.3 Load Application
An active feedback loop connecting the dcPD crack length measuring system and the
servo-hydraulic actuator controlling software from Fracture Technology Associates (FTA) was
established to accurately apply appropriate load and displacement during the sample precrack
and dK/dt controlled experiment. Crack length accuracy was of critical importance to actively
applying the necessary K. All testing was done in clevis grips that allowed for free rotation of the
sample in compliance with K-solution boundary conditions [65].
Lacquer
Tape
EDM Notch
Test Section Width (B)
Active dcPD Wires

25
2.2.1.4 Direct Current Potential Difference (dcPD)
The dcPD system correlates a change in electrical resistance to a crack length by the
Johnson’s Equation (Equation 5), allowing for active measurement of the crack growth rate [66].
This system has been rigorously utilized to analyze a wide range of cracking situations. The dcPD
system has been heavily used and is exceptionally accurate for materials testing that: (1) does
not approach the yield stress, proportional limit, or limit load of the material, such as fatigue
testing, (2) high strength materials with relatively low toughness, and (3) in environments the
promote cracking at low applied loads. These criteria are not met in by the conditions of interest
in this study. Monel K-500 exhibits a relatively high toughness with low strength and is examined
in a low HEAC susceptibility environment with a rising load. This unique combination of
properties requires a rigorous investigation of the method and development of a protocol to
ensure unambiguous characterization of HEAC, which will be explored in Task 1.
For both Monel K-500 and MP98t tests, a constant current of 4.000±0.001 A was applied
to the sample and the voltage between pairs of Alumel active wires spot welded 0.5 ±0.1 mm
above and below the notch and reference wires welded at the far edges of the gauge section was
collected. The signal from the active wires was amplified by 2000 times to distinguish the minute
changes in resistance due to plasticity and crack growth. The voltage change was interpreted
using Johnson’s Equation, Equation 5, in which V is the measured voltage, V0 is the initial voltage
value averaged during a 1 hour hold prior to test initiation, y is the distance between active wires,
W is the specimen width, a is the calculated crack length, and ao is the crack length at which Vo
was obtained. Johnson’s Equation was used to generate non-destructive instantaneous crack
length measurements [66], [67]. This method and current have been shown to resolve 0.1 μV
differences as 0.5 μm changes in crack growth [68].
𝑉
𝑉𝑜=
cosh−1[cosh(
𝜋𝑦2𝑊
)
cos(𝜋𝑎2𝑊
)]
cosh−1[cosh(
𝜋𝑦2𝑊
)
cos(𝜋𝑎𝑜2𝑊
)]
Equation 5
The measured voltage could be influenced by temperature, sample plasticity, electrical
shorting, and crack growth. Crack growth was the only factor of interest so the other influences
are accounted for or removed during data collection and post-test analysis. Temperature effects
on the voltage were removed by applying a polarity reversal and the readings were averaged

26
over 50 data points [68]. Additional corrections made to dcPD measurements will be discussed
in the Post-test Corrections and Task 1 of the Results and Discussion section.
2.2.1.5 Fatigue precrack
Monel K-500 and MP98t samples underwent similar precrack procedures in preparation
for the dK/dt testing. Precrack growth was monitored using the dcPD system and controlled
using FTA Fatigue Crack Growth software (FCGR). Prior to precracking, samples were placed
under a cycling 1 kN maximum load with a R=0.1 for 1 hour to determine initial dcPD voltages
associated with the EDM notch length, Vo of Johnson’s equation [68].
MP98t samples underwent one of two precrack procedures. Samples tested at a dK/dt of
0.2 and 2 MPa√m/hr were fatigue cracked at R=0.1 and a constant Kmax =12.9 MPa√m until a
crack length of 0.33 mm, followed by a K-shed from 15.6 to 15.0 MPa√m, ending at a crack length
of 1.00 mm. All other samples were fatigued at a constant maximum load equal to 10.253 kN
until a crack length of 0.40 mm, followed by a K-shed from 15.5 to 11 MPa√m, ending at a final
crack length of 1.00 mm.
Monel K-500 samples were fatigue cracked with a constant maximum load of 11.54 kN to
a crack length of 0.80 mm, followed by further cracking to 0.90 mm at R=0.1 and a constant Kmax
=20 MPa√m, before finally conducting a K-shed to 10 MPa√m to achieve a crack length of 1.00
mm. During the K-shed, crack growth would occasionally stop prior to 1.00 mm due to ΔK falling
below the crack growth threshold. For some specimens, a short loading sequence, where R values
included 0.1, 0.5, and 0.7 with a constant Kmax up to a crack length of 0.9mm, was imparted in an
attempt to mark the fracture surface and provide a visual crack length validation on the fracture
surface. Though this marker banding method is shown to be useful on some materials [69], it
was found to be ineffective in the current application, with no obviously observable differences
in the fracture surface. All fatigue procedures resided in frequency range of 1 and 25 Hz in
laboratory air, depending on the capabilities of the individual test frame. The final precrack length
calculated by dcPD, usually 1mm, was used as the initial value of the slow rising K test.

27
2.2.1.6 Environmental Control
All HEAC experiments were run in a 270 mL Plexiglas® cell with ports for 2L of 0.6 M NaCl
solution to be circulated through the cell at a rate of approximately 20 mL/min. The initial pH was
approximately 5.6 and typically rose to ≈6.6 at the conclusion of the test, with longer experiments
experiencing a larger rise in pH. A constant applied potential referenced to a standard calomel
electrode (SCE) was applied by a potentiostat operating in floating mode to avoid a ground loop.
A platinum coated Nb mesh counter electrode encircled the sample inside the cell and the
stripped end of copper wire was coiled around the bottom of the sample, outside the cell and
insulated from the metallic grip, to act as the working electrode. The constructed environmental
cell is shown in Figure 7.
Figure 7: Assembled environmental cell with sample for immersive testing in polarized environments.
The experimental matrix designed to capture the effect of dK/dt on the HEAC behavior
was established at electrochemical conditions that are considered aggressive, mild, and inert for
both materials is shown in Tables 3 and 4. Extensive prior testing of Monel K-500 at a dK/dt of
0.33-1 MPa√m/h has established the effect of different electrochemical conditions on the HEAC
susceptibility [4]. Specifically for a 0.6M NaCl electrolyte, polarization at -0.950 VSCE results in
HEAC, -0.850 VSCE produces lot-dependent mild HEAC , and no HEAC was observed in dry N2
environments [38]. A similar extensive fracture mechanics based characterization of the HEAC
behavior of MP98T was not available in the literature.
SCE
Sample
dcPD Counter Electrode
Working Electrode Masking Lacquer
Notch
Applied Load
Environmental Cell
Fluid outlet Fluid inlet
28
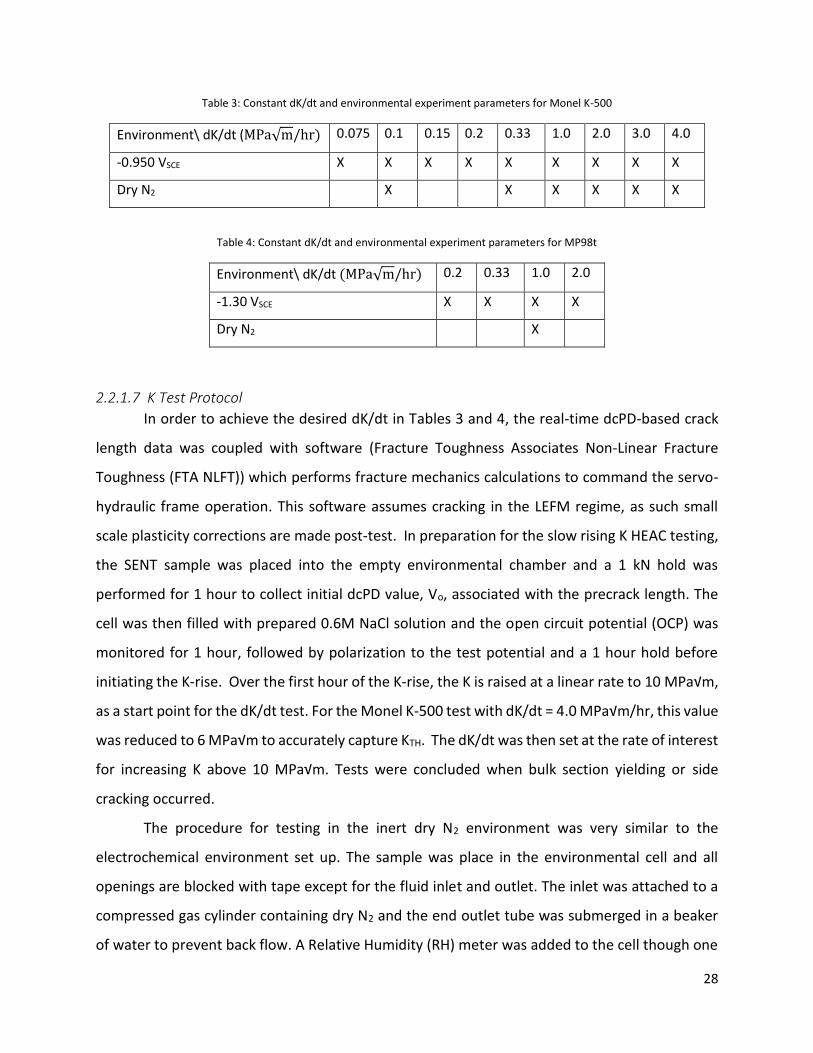
Table 3: Constant dK/dt and environmental experiment parameters for Monel K-500
Environment\ dK/dt (MPa√m/hr) 0.075 0.1 0.15 0.2 0.33 1.0 2.0 3.0 4.0
-0.950 VSCE X X X X X X X X X
Dry N2 X X X X X X
Table 4: Constant dK/dt and environmental experiment parameters for MP98t
Environment\ dK/dt (MPa√m/hr) 0.2 0.33 1.0 2.0
-1.30 VSCE X X X X
Dry N2 X
2.2.1.7 K Test Protocol
In order to achieve the desired dK/dt in Tables 3 and 4, the real-time dcPD-based crack
length data was coupled with software (Fracture Toughness Associates Non-Linear Fracture
Toughness (FTA NLFT)) which performs fracture mechanics calculations to command the servo-
hydraulic frame operation. This software assumes cracking in the LEFM regime, as such small
scale plasticity corrections are made post-test. In preparation for the slow rising K HEAC testing,
the SENT sample was placed into the empty environmental chamber and a 1 kN hold was
performed for 1 hour to collect initial dcPD value, Vo, associated with the precrack length. The
cell was then filled with prepared 0.6M NaCl solution and the open circuit potential (OCP) was
monitored for 1 hour, followed by polarization to the test potential and a 1 hour hold before
initiating the K-rise. Over the first hour of the K-rise, the K is raised at a linear rate to 10 MPa√m,
as a start point for the dK/dt test. For the Monel K-500 test with dK/dt = 4.0 MPa√m/hr, this value
was reduced to 6 MPa√m to accurately capture KTH. The dK/dt was then set at the rate of interest
for increasing K above 10 MPa√m. Tests were concluded when bulk section yielding or side
cracking occurred.
The procedure for testing in the inert dry N2 environment was very similar to the
electrochemical environment set up. The sample was place in the environmental cell and all
openings are blocked with tape except for the fluid inlet and outlet. The inlet was attached to a
compressed gas cylinder containing dry N2 and the end outlet tube was submerged in a beaker
of water to prevent back flow. A Relative Humidity (RH) meter was added to the cell though one

29
of the otherwise sealed ports. The cell was purged with N2 and the humidity was monitored.
After the RH reached 1.0%, the 1 hour 1kN load hold was initiated to determine the initial dcPD
values. The K-rate test began immediately at the conclusion of the 1 hour hold with the same
ramp up to 10 MPa√m and test rate continuation as the electrochemical tests. Inert testing was
used to inform on plastic zone behavior and bulk scale yielding. For dK/dt < 0.33 MPa√m/hr,
testing was halted when substantial information for a resolution limit (e.g. the amount of
electrical resistance attributed to the plastic zone) was established. The resolution limit protocol
is expanded upon in section 3.2.3.2. Tests at higher inert dK/dt were concluded when bulk section
yielding occurred.
2.2.1.8 Post-test Fatigue
Some samples, after experiencing the dK/dt test, were removed from their environment
and subjected to fatigue in order to physically mark the end of the test on the fracture surface.
Due to large end of test loads, the post-test fatigue was started at Kmax =35 MPa√m and R=0.3 to
surpass the crack tip retardation experienced at lower Kmax while preventing damage to the
preexisting fracture surface. Once stable crack growth was established, the Kmax would be
decreased to 25 MPa√m. In the Monel K-500 the post-test fatigue protocol produces a
transgranular crack morphology that is discernable form the intergranular stress corrosion
cracking (IG-SCC) and the ductile microvoid final failure.
2.2.1.9 End of Test Procedure
At the conclusion of the K-rate testing the specimen was removed from the environment
and loaded in tension until failure. The fractured specimen was then sonicated in acetone,
methanol, and deionized water for 15 minutes each to remove surface debris. After each step,
the surfaces were blown dry with compressed air to prevent residue. Fracture surfaces were cut
from the sample stubs and viewed in a scanning electron microscope (SEM) using secondary
mode (SE). Precrack and final crack lengths were determined by averaging seven or more equally
spaced measurement across the SEM fracture surface. These values could then be compared
with dcPD calculations for the precrack and final crack length. True crack length values for the
precrack and SCC, based on SEM measurements of fractographic markers, were used in the post
process analysis to develop the da/dt vs. KJ data.

30
2.2.1.10 Post-Test Analysis
2.2.1.10.1 Elastic-Plastic Analysis
To increase the accuracy of the analysis, the localized ligament plasticity was considered
by incorporating plastic J-analysis for Monel K-500. While the instantaneous elastic K was used
to control the test in the FTA NLFT software, the post-test analysis uses a Matlab script to analyze
the raw data (specimen dimensions, dcPD voltage, applied load, and time) and to calculate the
da/dt versus elastic-plastic stress intensity (KJ) relationships. Due to the high toughness relative
to the yield strength of Monel K-500, it was important to consider plasticity contributions to the
crack tip driving force. Specifically, KJ is comprised of elastic contributions calculated using the
well-established solution for SENT samples and the plastic contributions was derived from an
elastoplastic J-integral correction for stationary crack in a material that deforms by the Ramberg-
Osgood flow rules was applied to the data [27], [70]. The bulk ligament, not including the plastic
zone affected region, must remain LEFM in character for the J-analysis to be applied. These
calculations were done in accordance with Equation 6, assuming plane strain conditions (E’=E/(1-
ν2), where E is the elastic modulus and ν is Poisson’s ratio).
𝐾𝐽 = √(𝐽𝐸𝑙𝑎𝑠𝑡𝑖𝑐 + 𝐽𝑃𝑙𝑎𝑠𝑡𝑖𝑐)𝐸′ = √(𝐾𝐼
2
𝐸′+ 𝐽𝑃𝑙𝑎𝑠𝑡𝑖𝑐) 𝐸′ Equation 6
KI is calculated using the effective crack length, aeff, Equation 7, which accounts for the real crack
length, a, and the plastic zone. P is the applied load, Po is the limit load, and σYS is the yield
strength.
𝑎𝑒𝑓𝑓 = 𝑎 +1
6𝜋(1+(𝑃
𝑃𝑜)
2)
(𝑛−1
𝑛+1) (
𝐾𝐼
𝜎𝑌𝑆)
2
Equation 7
The plastic contribution in Equation 6 is described below in Equation 8. α and n are Ramberg-
Osgood constants, W is the sample width, and h1 is a constant dependent on the crack length to
width ratio (a/W) and n determined by interpolation of values from the EPRI tables [27]. The
material specific Ramberg-Osgood constants, yield strength, and elastic modulus determined via
compression testing are given in Table 1.
𝐽𝑃𝑙𝑎𝑠𝑡𝑖𝑐 =𝛼𝜎𝑌𝑆
2
𝐸𝑎
(𝑊−𝑎)
𝑊ℎ1(𝑛, 𝑎/𝑊) (
𝑃
𝑃𝑜)
𝑛+1
Equation 8

31
The limit load (P0) used in the J-analysis is described in Equation 9. β is 1.455 for plane strain in
an SEN(T) type sample and B is the thickness [70].
𝑃𝑜 = 𝛽 (√1 + (𝑎
𝑊−𝑎)
2
− (𝑎
𝑊−𝑎)) (𝑊 − 𝑎)𝐵𝜎𝑌𝑆 Equation 9
The procedure above enables calculation of the elastic-plastic crack tip driving force
values for the applied load and crack size of interest; however, it is still necessary to pair these
values with the relevant crack growth rate. To do so, and reduce noise, the data were then
binned such that at least 80 data points are included for each data set. The instantaneous crack
growth rate (da/dt) was then calculated using a seven point polynomial from ASTM E647-13
Appendix XI [71]. The da/dt vs KJ (or K for MP98t) data is used for behavioral analysis.
2.2.1.10.2 Post-test Correction Procedures
Due to the sensitivity of the dcPD system, the voltage induced by the change in electrical
resistance associated with electrical shorting, crack tip plasticity, and bulk ligament yielding
indicated false crack behavior. Electrical shorting in the crack wake due to the degradation of the
surface oxide film within a cathodically polarized environment caused the dcPD system to report
a crack length decrease after the initial polarization. Clearly such behavior is not realistic and
must be accounted for in post-processing. This shorting quickly disappeared as the crack mouth
opened and is considered false crack growth. Shorting is accounted for in the post-processing of
the data in accordance with the procedure described by Gangloff et. al [4].
The electrical resistance due to crack tip plasticity has previously been identified and has
traditionally been accounted for using a resolution limit [4], [38]. The level of crack tip plasticity
scales with increasing K [4] and establishes a functional resolution limit on growth rate below
which it is not possible to delineate real crack advance from plasticity effects. The resolution
limit was set by running a constant dK/dt test of a precracked SENT sample in an inert
environment where no real crack growth occurs below the KIC of the material. Any changes in
the dcPD readings would result from either crack tip plasticity, the plastic zone, or crack tip
blunting, extension of the crack front. Prior efforts have found that the expected blunting is
minimal for the applied K ranges of interest [4]. Initially, this behavior was hypothesized to be

32
associated with loading rate dependent enhanced plasticity in the precipitate free zones
proximate to impurity carbide particles [4]. However, a more detailed investigation will be
presented in the current study which suggests an alternate hypothesis.
2.2.1.11 Metrics of Interest
The threshold stress intensity (KTH) and the stage II crack growth rate are (da/dtII) are
common metrics for analyzing HEAC susceptibility [4]. KTH is functionally defined as the KJ at
which the resolution limit is surpassed. This is consistent with the contention that dcPD readings
above the resolution limit during the slow rising K test are considered real crack growth. da/dtII
is defined as the K-independent crack growth rate, this interpretation was not used in the final
analysis. The reasoning for this and the substitute metric used are outlined in Task 1.
2.2.2 Electrical Resistance Measurements of Smooth Tensile Bars
To help decouple the role of plasticity on the dcPD signal it was necessary to quantify the
bulk change in electrical resistance with increasing load in Monel K-500. A smooth dog bone style
tensile specimen with test section length of 34mm, width of 12.7mm, and thickness of 3.15mm
was used. A pair of dcPD wires, were welded 1.05 mm apart in the center of the thin side to
simulate an SENT without a crack. The test frame used hydraulic grips to grasp the enlarged
portion of the dog bone sample outside the test region. The test was run at a constant
displacement rate of 0.60 mm/hr and the dcPD data were recorded in the same manner as the
LEFM tests, though the collected data was not actively used to influence the loading protocol,
distinct from the LEFM testing. The test was allowed to run to final failure in lab air. The applied
load, actuator displacement, and dcPD voltage were recorded during the test.

33
3. Results and Discussion A strong loading rate effect has been demonstrated for several material systems in
aggressive environments [35], [41], [63]. The dcPD crack monitoring protocols have been shown
to provide high fidelity crack extension data however due to this high level of sensitivity it is
necessary to decouple the true crack growth from other plasticity based readings. As such,
identifying the physical phenomena corresponding to dcPD measurements is pertinent for
accurate data analysis. To ensure the rigor of the experimental data, the measurement methods
used in this work were investigated in relation to the material behavior of interest. This work has
be organized into three tasks to justify the advancements made to the analysis techniques in
addition to identifying the effects of loading rate on the environmental crack growth of Monel K-
500 and extends them to a similar material system, MP98t. After describing the initial data, Task
1 focuses on rigorously identifying the mechanical behavior that contributes to the crack growth
rate perceived by the dcPD system for the initial data set, Task 2 quantifies the loading rate
dependence of the HEAC susceptibility, and Task 3 explores the mechanisms responsible for the
trends identified in Task 2.
3.1 Initial Data and Experimental Findings
3.1.1 dcPD Sensitivity
The dcPD technique has been shown to have micro-volt level sensitivity, translating into
sub-micron level fidelity in monitoring crack extension. Informed interpretation of the dcPD
signal based on physical phenomenal is necessary for accurate analysis. Johnson’s Equation
(Equation 5 in the Experimental Methods) used for analyzing the voltage measured around the
crack tip assumes that the changes in the electrical resistance is due to crack growth based on a
reduction in cross-sectional area [66]. Equation 10 is the general equation for the electrical
resistance of a material; where R is the electrical resistance, ρ is the material resistivity, l is the
length of interest, and A is the cross-sectional area.
𝑅 = 𝜌𝑙
𝐴 Equation 10
This assumption is accurate so long as other electrical resistance generating phenomena
remain comparatively minute. In addition to crack growth, material loading can cause plastic
deformation which has been shown to generate electrical resistance [72]. The formation and

34
accumulation of dislocations changes the resistivity of a material by distorting the lattice to
reduce the electron mean free path [73].
Plastic deformation can be formed in a localized region in front of a crack tip due to stress
concentration [27]. The constrained region around the crack tip experiences an elevated stress
beyond the yield stress, enabling dislocation formation and motion. The size of the plastic zone,
rp, is depicted in Figure 8 and traditionally defined by Equation 11; where KI is the stress intensity
and σYS is the yield strength [27]. The plastic zone forms independently of fracture. Electrical
resistance due to the growth of the plastic zone prior to fracture has been detected using the
dcPD system. The “apparent” crack growth rate is quantified as the lower bound of crack growth
resolution for the dcPD system. In prior efforts, quantifiable crack growth was only considered,
after the dcPD signal surpasses this resolution limit [4].
Figure 8: The size of the plastic zone in front of the crack tip is related to the force concentrating behavior. The plastic zone
exists where the local stress exceeds σYS. Figure from Anderson [27]
𝑟𝑝 =1
𝜋(
𝐾𝐼
𝜎𝑌𝑆)
2
Equation 11
It was hypothesized that the magnitude of the resolution limit scales linearly with dK/dt.
As shown in Equation 11 the radius of the crack tip plastic zone is directly proportional to K2 such
that as dK/dt increases, dr/dt and therefore the apparent da/dt, when dependent only on the
plastic zone, should scale directly. This hypothesis has not yet been rigorously tested

35
experimentally, but its evaluation is necessary for quantifying the localized plasticity contribution
of each experimental dK/dt.
3.1.2 Initial Characterization of Growth Rate versus Stress Intensity
The environmental crack growth data for all tested dK/dt of Monel K-500 in 0.6M NaCl
solution polarized to -0.950 VSCE is displayed below in Figure 9 with the only historical correction
for shorting, described previously, taken into account. For each dK/dt the da/dt increases
monotonically. A low magnification view of the fracture surface for each test is examined in
secondary mode in the SEM in Figure 10. Each surfaces displays three principle fracture
morphologies representative of distinct behavior. The regions are highlighted in Figure 11 and
correspond to the regions in Figure 10: transgranular (2a), intergranular (2b), and microvoid
coalescence, or ductile failure (2c). The transgranular (TG) region corresponds to fatigue crack
growth, the intergranular region is the standard HEAC morphology for Monel K-500 [4], and the
microvoid region is consistent with final failure. While the fractography is useful in informing the
fracture mechanism, the crack growth rate interpreted by the dcPD system should quantitatively
correspond to these observed changes in morphology.
To evaluate the fidelity of the dcPD system, environmental tests of SENT samples at -
0.950VSCE at various dK/dt were interrupted at incremental KJ values and the total crack length
from the fractography (including the notch, precrack, and intergranular SCC growth) was
compared to the end-of-test dcPD measured crack length. The fracture surface measurements
were done at low magnification in secondary mode using an SEM. The KJ at which the test was
interrupted, the final SCC crack length, the final dcPD measured crack length, and the percent
difference between the two crack lengths for each dK/dt are listed in Table 5.

36
0 10 20 30 40 50 60 70 80 90 100 110 120
1E-8
1E-7
1E-6
1E-5
1E-4
dK/dt = 4.0 MPa sqrt.m/hr
dK/dt = 3.0 MPa sqrt.m/hr
dK/dt = 2.0 MPa sqrt.m/hr
dK/dt = 1.0 MPa sqrt.m/hr
dK/dt = 0.33 MPa sqrt.m/hr
dK/dt = 0.2 MPa sqrt.m/hr
dK/dt = 0.15 MPa sqrt.m/hr
dK/dt = 0.1 MPa sqrt.m/hr
dK/dt = 0.075 MPa sqrt.m/hr
Monel K-500
-0.950 VSCE
0.6M NaCl
da
/dt (m
m/s
)
KJ (MPa sqrt. m)
Figure 9: da/dt vs KJ data from all Monel K-500 experiments in 0.6 M NaCl with EA = -0.950 VSCE. Only the historic correction for
crack tip shorting has been made to this data set.
0.1 MPa√m/hr
0.2 MPa√m/hr 0.15 MPa√m/hr
0.075 MPa√m/hr

37
Figure 10: Fracture surfaces of Monel K-500 in 0.6 M NaCl with EA = -0.950 VSCE, corresponding to the data in Figure 9. The crack
propagates form left to right in all micrographs except dK/dt = 4.0 MPa√m/hr in which the crack propagated from bottom to
top. The lines indicate transition points on the fracture surface: continuous white = end of precrack, dashed white = start of
post-test fatigue, black = start of final failure.
4.0 MPa√m/hr
3.0 MPa√m/hr 2.0 MPa√m/hr
1.0 MPa√m/hr 0.33 MPa√m/hr

38
Figure 11: The three main fracture mechanisms displayed in this work: (a) transgranular (TG) fatigue, (b) intergranular stress
corrosion cracking (IG-SCC), (c) microvoid coalescence, ductile failure.
The percent difference in the final crack lengths ranges far larger than the acceptable
error of 5%. The percent difference in correlation with ending KJ is depicted in Figure 12. The
percent difference sharply increases with increasing K by a large stepwise shift from <5% to >30%
Table 5: Crack growth information for the Monel K-500 fixed dK/dt tests in 0.6 M NaCl, EA = -0.950 VSCE
dK/dt (MPa√m/hr) Precrack a (mm) End KJ (MPa√m) Final a (mm, SEM) Final a (mm, dcPD ) Percent Difference
0.075 1.22 27 1.36 1.35 0.5
0.1 1.05 82 1.66 2.54 34.8
0.15 1.11 41.5 1.28 1.25 2.2
0.2 1.05 101 1.80 2.57 30.0
0.33 1.08 63 1.63 1.58 3.2
1 1.19 120 1.83 2.80 34.6
2 1.01 100 1.48 2.30 35.6
3 1.12 74 1.39 1.51 8.0
4 1.09 95 1.16 2.03 42.8
(b)
(a)
(c)
(b)

39
error occurring around K = 70 MPa√m. The rapid increase in error with KJ,end suggests an error
causing phenomenon that is isolated to high KJ values. It is critical for the interpretation of the
dcPD data that the source of this error is understood. As such, identifying other contributions to
electrical resistance will be critically evaluated in Task 1.
20 40 60 80 100 120
0
10
20
30
40
50
% D
iffe
ren
ce
in
Cra
ck L
en
gth
End of test KJ (MPa sqrt. m)
Figure 12: The percent difference in crack length between the apparent dcPD value and the end of IGC behavior compared to
the apparent interrupted KJ for all tests in 0.6M NaCl, EA = -0.950 VSCE.

40
3.2 Task 1: Identify the challenges associated with dcPD testing techniques to quantify IG-SCC
resistant materials using LEFM based techniques
The large error in final crack length for experiments ending at high KJ, shown in Figure 12,
suggests that the causal error occurs only in the high KJ regime. Additional electrical resistance
generating phenomena beyond intergranular crack growth must be considered in order to
understand the error. The error causing phenomena can be concurrent with the high KJ crack
growth (plastic behavior) or a transition from IG-SCC to a different failure mechanism (ductile
tearing). By the current testing protocol, these effects are undetectable on the fracture surface.
Ductile tearing likely exhibits the same fracture morphology as the post-test failure behavior and
is therefore indistinguishable without a change in testing protocol. The hypothesized
phenomena are not environmentally dependent, and as such, can be more clearly analyzed in an
inert environment. Inert testing of SENTs has been previously used to quantify localized plasticity;
this work will expand the analysis to higher KJ to identify the pertinent behavior and its loading
rate dependence.
3.2.1 Inert Environment Testing Data
Precracked SENT samples of Monel K-500 were tested at a range of dK/dt, the same
loading protocols as the environmental tests, but in a dry N2 environment (RH<5%). The dcPD
calculated crack growth for all SENT tests in inert environments; dK/dt = 0.1, 0.33, 1.0, 2.0, 3.0,
and 4.0 MPa√m/hr; are shown in Figure 13. The fracture surfaces corresponding to each test are
displayed in Figure 14. The crack propagates form left to right in all micrographs, except dK/dt =
4.0 MPa√m/hr in which the crack propagated from bottom to top. Transition points in testing
protocol are indicated by lines on the fracture surface: continuous white equals end of precrack,
dashed white equals start of post-test fatigue, black equals start of final failure. dK/dt= 0.1, 1.0,
2.0, and 3.0 MPa√m/hr each underwent a post-test fatigue protocol, the remaining tests did not.
dK/dt= 0.33 and 4.0 MPa√m/hr were loaded to failure immediately after the dK/dt test protocol
concluded. The fracture surface for dK/dt = 0.1 MPa√m/hr will not be considered in the
proceeding analysis due to a rapid rise in load after the dK/dt test, but prior to the post test
fatigue. The KJ at which each test was ended, the precrack length, crack length at which the TG
post-test fatigue begins (for indicated dK/dt), and the dcPD final calculated crack length for each
dK/dt are included in Table 6.

41
Figure 13: The apparent da/dt vs KJ of Monel K-500 at fixed dK/dt in dry N2. I, II, and III correspond to regions of near constant
slope, indicating different controlling behaviors on the dcPD signal.
0 20 40 60 80 100
1E-8
1E-7
1E-6
1E-5
dK/dt=4.0 MPa sqrt.m/hr
dK/dt=3.0 MPa sqrt.m/hr
dK/dt=2.0 MPa sqrt.m/hr
dK/dt=1.0 MPa sqrt.m/hr
dK/dt=0.33 MPa sqrt.m/hr
dK/dt=0.1 MPa sqrt.m/hr
Monel K-500
Dry N2
da
/dt (m
m/s
)
KJ (MPa sqrt.m)
I
II
III
0.1 MPa√m/hr 0.33 MPa√m/hr
1.0 MPa√m/hr 2.0 MPa√m/hr

42
Figure 14: Fracture surfaces of Monel K-500 in Dry N2, corresponding to the data in Figure 13. The crack propagates from left to
right in all micrographs except dK/dt = 4.0 MPa√m/hr in which the crack propagated from bottom to top. The lines indicate
transition points on the fracture surface: continuous white = end of precrack, dashed white = start of post-test fatigue, black =
start of final failure. If two lines occupy the same space, the later occurring event is shown.
Table 6: The ductile crack length comparison between the SEM measured value and the apparent dcPD value for dry N2 samples.
dK/dt (MPa√m/hr) KJ end (MPa√m) Precrack a (mm) aend dK/dt (mm) adcPD (mm)
0.1 41 1.02 --------- 1.05
0.33 65 1.08 --------- 1.17
1.0 98 1.15 1.90 2.01
2.0 115 0.90 1.86 2.16
3.0 61 1.07 1.12 1.15
4.0 107 1.02 --------- 2.08
3.2.2 Broad Analysis of Inert Testing Data
The da/dt vs KJ in Figure 13 show that even though no crack growth should be occurring
below the K1C there is evidence of changing electrical resistance behavior in the dry N2
environment. There are two important observations (1) all plots demonstrate the same changes
of slope at roughly the same KJ, 45 and 65 MPa√m, and (2) the apparent da/dt for a given K
increases with increasing dK/dt. The curves were divided into three regimes based on the slope
of the da/dt curve. Regime I is the low KJ, Regime II is the intermediate KJ, and Regime III is high
KJ. The cause of each regime must be identified to determine the exact nature of the induced
3.0 MPa√m/hr 4.0 MPa√m/hr

43
error. The nature of this error is proposed to be either due to local crack tip plasticity, bulk plastic
behavior, ductile tearing, or a combination of these mechanisms. For this material, Regime I
behavior has been previously connected with localized crack tip plasticity [4] , which will be
expanded upon later in the analysis. The initial change in slope at KJ ≈ 45 MPa√m is not a newly
noted phenomenon. Inert testing by Gangloff et al. noted a similar change in slope and
speculated that the effect was due to subcritical crack growth [4]. Prior analysis does not
sufficiently describe the observed behavior.
This work seeks to identify the behavior measured by the dcPD system in an inert
environment and the responsible physical phenomena, such that they can be quantifiably
removed or accounted for in the environmental data. The material behavior was evaluated using
elastic-plastic fracture mechanics analysis and non-fracture mechanics based bulk ligament
plasticity analysis, then compared to the features on the fracture surface and recorded
experimental data.
3.2.3 Identify the phenomena responsible for of the da/dt vs K curve regions
The goal is to correlate the inert SENT behavior with established phenomena that have
historically been used as thresholds for mechanical behavior.
3.2.3.1 Bulk Analysis
3.2.3.1.1 Plane Strain Limit Load Analysis
The fracture mechanics behavior of Monel K-500 is first evaluated using an elastic-plastic
analysis. The importance of the J integral for plastic contributions in the applied stress intensity
has been previously discussed in the Experimental Methods. The limit load, P0, is a metric that
can be used to quantify the stress at which the bulk ligament is strongly influenced by plastic
behavior due to the expansion of the plastic zone in a cracked sample. The plane strain criteria
accounts for the constraint assumed by the sample geometry [70]. Equation 9 defines P0 for
plane strain in an SEN(T) type sample [70]. P0 was compared to the apparent crack length and
applied load for all dK/dt. Figure 15 depicts the technique used to determine if P0 was a factor in
the material behavior. As shown by dK/dt = 4.0 MPa√m/ hr, the applied loads are in all cases
below the P0 during the test; this holds true for all dK/dt tested. As such, it is not expected that

44
the crack tip plasticity will drastically influence the remaining ligament plastic behavior. This
elastic-plastic criteria does not adequately describe the changes in electrical resistance.
0.8 1.0 1.2 1.4 1.6 1.8 2.0 2.2
0
5
10
15
20
25
30
35
P
Po
Monel K-500
Dry N2
dK/dt = 4.0 MPa sqrt.m/hr
Lo
ad
(kN
)
Apparent Crack Length (mm)
Figure 15: Comparison of the limit load, Po, and the applied load with apparent crack length of dK/dt = 4.0 MPa√m/hr in dry N2.
3.2.3.1.2: Bulk Plasticity Analysis
The plastic behavior of the bulk ligament is now considered without crack tip effects.
Quantifying the stresses pertinent to the plastic behavior of Monel K-500 are essential for
interpreting the apparent da/dt curves. The compressive mechanical behavior of Monel K-500 is
shown in Figure 16. Bulk isotropy can be assumed for Monel K-500, because this material lot is
polycrystalline, no texture, equiaxed grains, and an average grain size of 11.2 μm which is
significantly smaller than the SENT cross-section [38].
Monel K-500 displays a standard stress-strain curve for alloys. The yield stress and the
proportional limit are considered for analysis. The proportional limit is the stress at which the
stress-strain curve first deviates from purely elastic linearity, indicating the initiation of plasticity
[74]. To quantify the stress of the proportional limit the compression stress-strain curve the
slope, E, was recorded between increment data points. Then the change in that slope with
relation to stress (dE= ΔE/Δσ) was calculated and displayed in Figure 17. During purely linear-
elastic behavior dE is near zero, deviation from linear-elastic behavior is identifiable by deviation
from zero. The proportional limit was quantified as the stress at which dE falls and remains below
-5. The yield stress was calculated using the traditional 0.2% offset method is used to determine

45
the start of bulk plastic deformation. Using these techniques the yield strength and proportional
limit were found to be 910 MPa and 620 MPa, respectively.
0.000 0.002 0.004 0.006 0.008 0.010
0
200
400
600
800
1000
Str
ess (
MP
a)
Strain
Monel K-500
Figure 16: Compression stress-strain curve for Monel K-500.
Figure 17: A curve showing the derivative of the slope between incremented points on the compressive stress-strain curve.
Deviation from zero was used to define the proportional limit.
Bulk scale plasticity generates electrical resistance; however, it has not been rigorously
analyzed over the full span of elastic-plastic behavior. To quantify the relationship between
electrical resistance and load for Monel K-500, a dog bone tensile sample was outfitted with dcPD
0 200 400 600 800 1000
-2000
-1500
-1000
-500
0
dE
Monel K-500
Compression test
In air
dE
(
E/)
Stress (MPa)
PL
0 200 400 600 800 1000
-1000
-750
-500
-250
0
250
dE
Stress (MPa)

46
monitoring system and loaded at a constant displacement rate until failure. Proportional limit
and the yield strength, as determined by the compression test, were compared to the tensile test
data to identify pertinent correlations. The load-displacement and load-voltage data from the
tensile test are shown in Figure 18. In Figure 18 load (a) corresponds to the proportional limit and
load (b) is the yield stress.
Figure 18: The change in measured dcPD voltage and actuator displacement with applied load of a Monel K-500 smooth dog
bone tensile test. The proportional limit (a) and the yield stress (b) are labeled.
The linear region in ΔV and displacement prior to the proportional limit is hypothesized
to be due to the elastic deformation of the sample due to tensile loading because no plastic
behavior is expected to occur below this stress. Electrical resistance can change either through
materials or by change in the dimensions of the examined volume (Equation 10). Plastic effects
dominate by increasing the resistivity. An elastic strain effect on resistivity has been noted in
some alloy systems, but prior work shows the effect to be negligible for Monel K-500 [75]. Thus,
elastic influences are limited to the change in dimension of the examined area. ΔV was calculated
by incorporating the elastic change in dimensions due to stress through Poisson’s ratio in
Equation 10. The calculated ΔV and the experimentally measured ΔV are compared in Figure 19.
0 10 20 30 40
0
2
4
6
8
10
0.0
0.5
1.0
1.5
2.0
V
Displacement
V
(V
)
Applied Load (kN)
Dis
pla
ce
me
nt (m
m)
(b)
(a)

47
0 5 10 15 20 25
0
1
2
3
4
5
V
(V
)
Applied Load (kN)
Calculated
Experimental
Monel K-500
Tensile Bar
Figure 19: Experimentally recorded ΔV compared to the ΔV calculated based on elastic dimension change with stress for the
Monel K-500 dog bone tensile bar
There is a large discrepancy between the calculated ΔV and the experimental value over
the full range of applied load prior to the proportional limit. This is suggests that there is an
additional effect occurring that is not adequately described by the incorporation of the standard
elastic stress-strain response to Equation 10.
When normalized by the volume of the examined area, the experimental voltage change
of the tensile bar was significantly less than the SENT type samples at the proportional limit. The
values are listed in Table 7. This suggests that the elastic contractions are not governing the
voltage change in the SENT samples. Rather the elevated electrical resistance effect is expected
in the SENT samples due to the increasing size of the crack tip plastic zone. This supports the
hypothesized mechanism of the resolution limit.
Table 7: The experimentally recorded ΔV for all dry N2 SENT tests compared to the tensile bar of Monel K-500
Test Description ΔV at the proportional limit (μV)
ΔV normalized by volume (μV/mm3)
Tensile Bar 1.18 0.029
dK/dt (MPa√m/hr)
0.1 3.97 0.150
0.33 3.71 0.117

48
1 3.28 0.122
2 2.35 0.077
3 3.99 0.139
4 4.79 0.132
At the proportional limit, deviation from elastic linearity occurs in the load-displacement
and the load-voltage curves. By the yield load linearity is re-established, though at a steeper
slope. The slope for both curves changes dramatically between the proportional limit and the
yield stress. With no other changing stimuli, the electrical resistance is shown to be directly
dependent on the mechanical stress in the remaining ligament.
To correlate the bulk ligament behavior observed in the tensile bar to the SENT samples
the KJ associated with the original crack length and the proportional limit and the yield strength
were determined for each environmental dK/dt and are displayed in Table 8. The stresses were
calculated using the applied load data and the remaining ligament area, assuming no crack
growth had occurred. This assumption was used to calculate a conservatively large KJ value. The
maximum possible crack growth calculated by the dcPD system up to the yield strength is <100
µm, a maximum of 1% of the remaining ligament after the precrack. The difference in KJ between
the stresses using the assumption of no crack growth and using the dcPD calculated crack length
is 1%. This value is sufficiently small as to not change the data interpretation.
The dK/dt = 0.1 MPa√m/hr test did not exceed the proportional limit and the dK/dt = 0.33
and 3.0 MPa√m/hr test did not exceed the yield strength. The apparent da/dt vs KJ for all inert
tests are plotted individually in Figure 20 with lines corresponding to the KJ metrics, with PL and
YS designating the proportional limit and yield strength, respectively.
Table 8: The KJ associated with the proportional limit and yield strength for each dK/dt dry N2 test.
dK/dt (MPa√m/hr) KProportional Limit (MPa√m) KYield Strength (MPa√m)
0.1 _____ _____
0.33 39.5 65.1
1.0 42.1 67.2
2.0 39.5 62.3

49
3.0 40.6 _____
4.0 40.1 65.8
0 20 40 60
1E-9
1E-8
1E-7
1E-6
dK/dt = 0.1
Monel K-500
Dry N2
da
/dt (m
m/s
)
KJ (MPa sqrt.m)
(MPa√m/hr)
(c)
(a) (b)

50
Figure 20: The KJ of the proportional limit (PL) and yield strength (YS) are labeled for each dK/dt, Monel K-500 dry N2 test.
In each case the calculated proportional limit and yield strength are well aligned with the
changes in slope on the da/dt vs KJ for all dK/dt. It appears that the bulk plastic behavior incites
the changes in slope observed in the dcPD data. However, the dcPD signal must be correlated to
the fracture surface to determine the nature of the electrical resistance change. If no crack
growth is evident then the electrical resistance is due solely to an increase in resistivity by
increasing dislocation density. If there is a notable change in the fractographic behavior then this
real crack extension (whether IG or ductile) must be considered as a source of electrical
resistance.
3.2.3.1.3 da/dt vs K curve comparison to fractography
The changes in slope in da/dt vs KJ have been related to bulk plastic behavior which has
been shown to generate a quantifiable change in electrical resistance. Previous work has
hypothesized that the change in slope, now correlated with the proportional limit, correlated
with a region of ductile crack extension at the high-constraint center of the specimen [4]. In light
of the correlations observed in Figure 20, additional investigation of this hypothesis is required.
Though crack growth is not expected to occur below the K1C, the fracture behavior for several of
the inert SENT tests was recorded. Tests were interrupted at incremental K and post-test fatigue
(e) (f)

51
was employed to encapsulate the test fractography between two transgranular morphology
regions. Their fracture surfaces were examined using the secondary mode in the SEM.
3.2.3.1.4 Fractography below the yield strength
A test at a dK/dt = 3.0 MPa√m/hr in dry N2, was interrupted at KJ = 61 MPa√m, after the
proportional limit, but prior to the yield strength. A macroscopic view of the fracture surface is
shown in Figure 14, and a higher magnification micrograph of the test area is shown in Figure 21.
Fracture occurs from bottom to top in Figure 21, progressing from a TG fatigue precrack to a 42
µm wide TG ductile fracture region and finally TG post-test fatigue.
Figure 21: The fracture surface of Monel K-500 dK/dt = 3.0 MPa√m/hr focusing on the region that occurred during the test.
The ductile TG region on the fracture surface indicates that the dcPD signal increase after the
proportional limit is not purely plastic, but that there is some crack extension involved. However
this behavior is distinct from the crack advance observed in prior work in that it is much smaller
and scale homogeneously distributed along the crack front rather than focused at the center of
the specimen. Critically, this advance can likely be attributed to crack tip blunting; the advance
of which can be estimated by the crack mouth opening displacement (CTOD), shown in Equation
12. Where a KJ = 61 MPa√m, yield strength (σYS) of 910 MPa, and modulus (E) of 188 GPa the
LEFM calculate CTOD is 27 μm which is reasonably well aligned with the observed region on the

52
fracture surface. The dcPD calculated crack length (72 μm) is 30 µm larger than the measured
crack length, suggesting that this blunting is likely augmented by a role of crack tip/bulk plasticity.
𝐶𝑇𝑂𝐷 =4𝐾2
𝜋𝐸𝜎𝑌𝑆 Equation 12
3.2.3.1.5 Fractography above the yield strength
Two inert tests, dK/dt = 1.0 and 2.0 MPa√m/hr, were interrupted at high KJ, 98 and 115
MPa√m, respectively, that surpassed the yield stress. The fracture surfaces are displayed in Figure
14. The slip-band transgranular nature of the fatigue precrack and the post-test fatigue are
separated by a brand of ductile transgranular failure. These fractographic features are distinctive
such that transitions are easily identifiable. This is indicative of a reduction in remaining ligament
area during the test, increasing electrical resistance. The ductile tearing behavior is not limited
to the triangular region noted in prior work, it extends across the sample thickness, as can be
seen on the fracture surfaces [4]. The ductile regions are measured to be 0.75 and 0.95 mm across
for dK/dt = 1.0 and 2.0 MPa√m/hr, respectively.
The reduction in cross-sectional area due to net-section yield and ductile tearing is a large
contribution to the da/dt vs K behavior in Regime III. While this is an interesting topic, the ductile
tearing mechanism for this material system is beyond the scope of this work. The percent
difference in crack length is still shown to increase with increasing end KJ, from 5.2% at KJ,end = 98
MPa√m (dK/dt = 1.0 MPa√m/hr) to 13.9% at KJ,end = 115 MPa√m (dK/dt = 2.0 MPa√m/hr). The
300 µm difference between the dcPD calculated crack length and the area observed suggests
that in addition to the ductile crack advance that the bulk plasticity contributes significantly to
the total electrical resistance of the sample. This analysis shows that after the yield strength, the
change in electrical resistance is due to a combined effect of reduction in cross-sectional area,
ductile crack advance, and bulk ligament plasticity. It should be noted that the ductile tearing is
only noticeable because post-test fatigue was employed; however, most environmental tests
were not subjected to this additional technique.
3.2.3.1.6 Comparison to environmental data
Now that mechanisms for dcPD error have been established in inert testing, the
environmental testing must be evaluated to determine if it is suffers from the same phenomena.

53
The da/dt vs KJ data for the inert and environmental dK/dt = 1.0 MPa√m/hr test are shown in
Figure 22. The data sets coincide at both low and high KJ, KJ = 20 and 60 MPa√m, respectively.
The coincidence at low K is used to determine the start of cracking by using the inert test as a
lower crack growth resolution limit. The high KJ coincidence has not been previously noted and
further suggest that the high KJ behavior is not environmentally dependent and/or is obfuscated
by the complications (e.g. blunting, tearing, and plasticity) detailed in the previous sections.
0 20 40 60 80 100
1E-8
1E-7
1E-6
1E-5
1E-4 dK/dt = 1.0 MPa sqrt.m/hr
Dry N2
dK/dt = 1.0 MPa sqrt.m/hr
-0.95VSCE
da
/dt (m
m/s
)
KJ (MPa sqrt.m)
Figure 22: Apparent crack growth data for dK/dt = 1.0 MPa√m/hr in 0.6M NaCl EA = -0.950VSCE and dry N2.
The coincidence of both plots at high KJ suggests that both tests are experiencing the
same electrical resistance phenomenon in Regime III. It has been established that ductile tearing
occurs during inert tests at high KJ by bounding the fracture surface with post-test fatigue. The
ductile tearing fractography is indistinguishable from the final failure morphology that occurs on
all samples. It is plausible that ductile tearing could occur during the environmental tests and not
be measurable on the fracture surface. The post-test fatigue protocol, that clearly delineates the
experimental regions, was not routinely applied to environmental tests. It was assumed that all
fracture that occurred in environment was intergranular and therefore, easily measured.
Quantifying an incorrect amount of crack extension would contribute to the error between the

54
dcPD calculation and the true crack length. It is likely that environmental tests are experiencing
a combination of ductile tearing and bulk scale plasticity at high KJ, akin to the inert tests.
One environmental test, dK/dt = 3.0 MPa√m/hr, was interrupted at KJ = 74 MPa√m and
post-test fatigue was performed on the sample. The remaining ligament, assuming the dcPD
interpretation of crack growth was correct as a conservative estimate, did surpass the yield
strength. The fracture surface of the dK/dt = 3.0 MPa√m/hr environmental test is displayed in
Figure 23. Region (a) is the TG precrack, (b) is the IG-SCC, (c) is a ductile morphology indicative of
a stretch zone, (d) is the TG post-test fatigue, and (e) is the final failure of the sample. The test
was halted soon after the yield load was reached so a complete ductile failure region adjacent to
the IG-SCC was not formed. The dcPD interpreted SCC final crack length of 1.51 mm lies between
the end of IG-SCC, 1.39 mm, and the stretch zone crack length, 1.67 mm. This length
inconsistency suggests that the length of the stretch zone on the fracture surface is does not
accurately describe the crack length at the end of the test.
The preceding sections have clearly demonstrated that for high KJ values that ductile
tearing, and bulk plasticity can compromise the accuracy of the dcPD signal. While the exact
origin of these phenomenon are alluded to here, a full mechanistic description of this behavior
is outside of the scope of the current study (but continuing in companion research). Critically,
the current efforts serve to identify the bounds outside of which the dcPD data begin to show
inaccuracies, thus establish a functional protocol for accurate data generation.

55
Figure 23: The full fracture surface for Monel K-500 in 0.6M NaCl, -0.950VSCE, dK/dt = 3.0 MPam/hr. Crack growth occurred from
left to right. (a) is TG fatigue, (b) is IG-SCC, (c) is the stretch zone, (d) is TG post-test fatigue, and (e) is ductile failure.
3.2.3.1.7 Error Mitigation Procedure
Ductile tearing is not considered to be representative of the environmental cracking
behavior of Monel K-500, and as such is not considered useful to the goals of this dK/dt
dependent analysis. The large error in the environmental cracking data occurs only at high KJ and
is predominately a combination of ductile tearing and bulk scale plasticity. After the proportional
limit, the material can no longer considered to be operating in the bulk LEFM regime. To avoid
including these erroneous effects the crack growth data is truncated at the proportional limit,
prior to which no bulk scale plasticity occurs. This data limitation will be considered for future
specimen design. Increasing the precrack length or adjusting the sample cross-section can
increase the KJ at which the proportional limit occurs.
3.2.3.2 Localized Crack Tip Plasticity
While the majority of the error can be removed by completely eliminating the data at K-
values above which the proportional limit is exceeded, there is still localized plasticity-based error
in the low KJ regime[27]. The data for all inert SENT testing prior to the proportional limit is shown
in Figure 24. Each da/dt vs KJ data set was fit with an exponential equation, displayed in Equation
(a) (b) (c) (d) (e)

56
13, such that the value of the exponential coefficient, z, was the same and the scaling trend could
be seen in the coefficients. The z term defines the slope of an exponential equation on a semi-
log plot. The C-values are plotted versus the dK/dt in Figure 25, the direct linear relationship
between these values confirms the hypothesis made by Gangloff et al. that the resolution limit
can be determined for any dK/dt based on a single inert da/dt vs K curve [4]. Specifically, that
the plastic zone size is a function of the K value, independent of the dK/dt, thus the local plasticity
induced growth rates should directly scale with loading rate. This is captured functionally by the
equation listed in Figure 24 thus is available for any future efforts at variable dK/dt.
10 20 30 40 50
1E-8
1E-7
1E-6
1E-5 dK/dt=4.0 MPa sqrt.m/hr
dK/dt=3.0 MPa sqrt.m/hr
dK/dt=1.0 MPa sqrt.m/hr
dK/dt=0.33 MPa sqrt.m/hr
dK/dt=0.1 MPa sqrt.m/hr
Exponential fits for each dK/dt
Ap
pa
ren
t d
a/d
t (m
m/s
)
KJ (MPa sqrt.m)
Figure 24: The data for Monel K-500 at fixed dK/dt tested in dry N2, cropped at the proportional limit, each with the exponential
fit at a fixed z value.
𝑑𝑎
𝑑𝑡𝑅𝐿= 𝐶𝑒𝑧∗𝐾 Equation 13
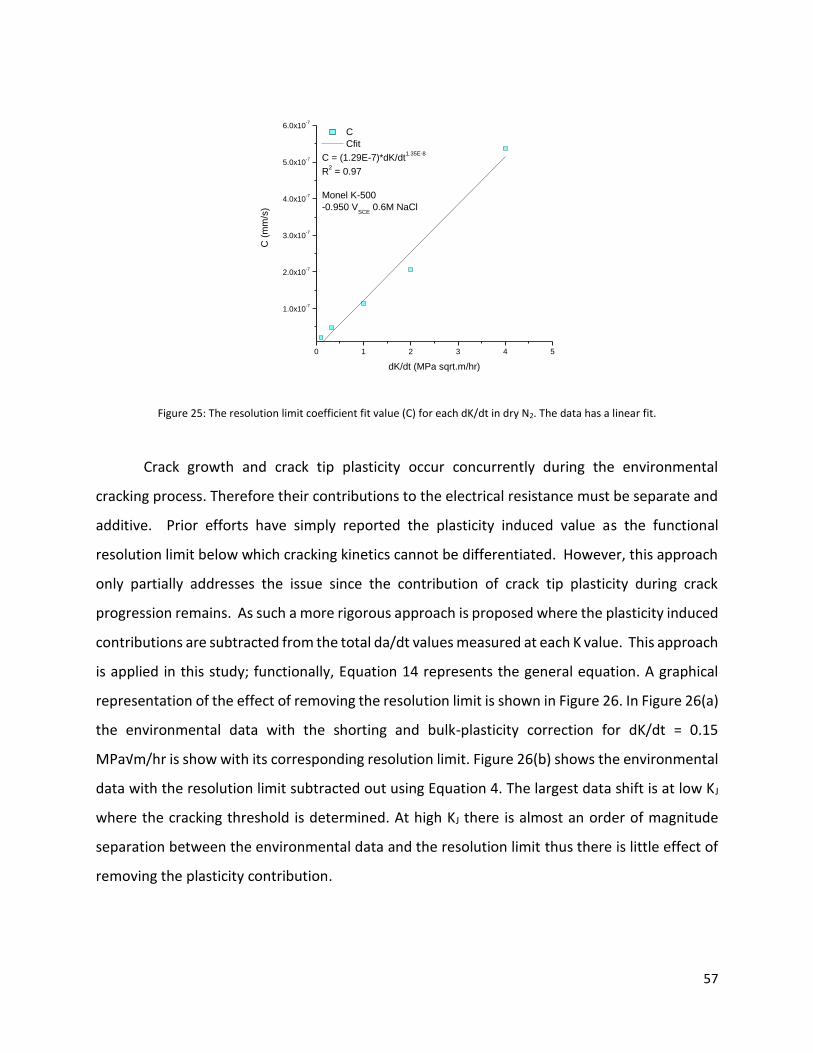
57
0 1 2 3 4 5
1.0x10⁻⁷
2.0x10⁻⁷
3.0x10⁻⁷
4.0x10⁻⁷
5.0x10⁻⁷
6.0x10⁻⁷
C (
mm
/s)
dK/dt (MPa sqrt.m/hr)
C
Cfit
C = (1.29E-7)*dK/dt1.35E-8
R2 = 0.97
Monel K-500
-0.950 VSCE
0.6M NaCl
Figure 25: The resolution limit coefficient fit value (C) for each dK/dt in dry N2. The data has a linear fit.
Crack growth and crack tip plasticity occur concurrently during the environmental
cracking process. Therefore their contributions to the electrical resistance must be separate and
additive. Prior efforts have simply reported the plasticity induced value as the functional
resolution limit below which cracking kinetics cannot be differentiated. However, this approach
only partially addresses the issue since the contribution of crack tip plasticity during crack
progression remains. As such a more rigorous approach is proposed where the plasticity induced
contributions are subtracted from the total da/dt values measured at each K value. This approach
is applied in this study; functionally, Equation 14 represents the general equation. A graphical
representation of the effect of removing the resolution limit is shown in Figure 26. In Figure 26(a)
the environmental data with the shorting and bulk-plasticity correction for dK/dt = 0.15
MPa√m/hr is show with its corresponding resolution limit. Figure 26(b) shows the environmental
data with the resolution limit subtracted out using Equation 4. The largest data shift is at low KJ
where the cracking threshold is determined. At high KJ there is almost an order of magnitude
separation between the environmental data and the resolution limit thus there is little effect of
removing the plasticity contribution.

58
Equation 14
10 15 20 25 30 35 40 45
1E-8
1E-7
1E-6 da/dt (-0.950V
SCE)
RL
Monel K-500
dK/dt = 0.15 MPa sqrt.m/hr
da
/dt (m
m/s
)
KJ (MPa sqrt.m)
15 20 25 30 35 40 45
1E-8
1E-7
1E-6 da/dt - RL
Monel K-500
dK/dt = 0.15 MPa sqrt.m/hr
da
/dt (m
m/s
)
KJ (MPa sqrt.m)
Figure 26: Graphically displaying the effect of removing the resolution limit from the environmental crack growth data for
Monel K-500 at dK/dt = 0.15 MPa√m/hr, -0.950VSCE
Using the corrective procedures justified above (truncating the data at the proportional
limit and subtracting out the resolution limit) effectively decouples the non-environmental
cracking, localized and bulk ligament plastic behavior from the environmental crack growth data
to produce the curves shown in Figure 27. The data set presented in Figure 27 will be analyzed in
Task 2 to quantify the loading rate effects on the environmental crack growth behavior of Monel
K-500.
da
dt(KJ)
crack growth=
da
dt(KJ)
experiment−
da
dt(KJ)
RL
(a) (b)

59
10 15 20 25 30 35 40 45
1E-9
1E-8
1E-7
1E-6
1E-5
dK/dt = 4.0 MPa sqrt.m/hr
dK/dt = 3.0 MPa sqrt.m/hr
dK/dt = 2.0 MPa sqrt.m/hr
dK/dt = 1.0 MPa sqrt.m/hr
dK/dt = 0.33 MPa sqrt.m/hr
dK/dt = 0.2 MPa sqrt.m/hr
dK/dt = 0.15 MPa sqrt.m/hr
dK/dt = 0.1 MPa sqrt.m/hr
Monel K-500
-0.950 VSCE
0.6M NaCl
da
/dt (m
m/s
)
KJ (MPa sqrt.m)
Figure 27: Full environmental data set for Monel K-500 with corrections for shorting, truncation at the proportional limit, and
with localized crack tip plasticity removed.
3.2.4 Corrections applied to MP98t environmental data The testing procedures for MP98t were conducted in the same manner as the Monel K-500 tests
with only an adjustment to the environmental conditions. The effect of dK/dt on MP98t was examined in
immersed 0.6M NaCl solution polarized to -1.30 VSCE at dK/dt = 0.2, 0.33, 1.0, and 2.0 MPa√m/hr. The
resolution limit was determined from an SENT test in dry N2 at dK/dt = 1.0 MPa√m/hr. A compression test
in same orientation as the tensile testing direction was conducted to determine the proportional limit and
the yield stress, 900 and 1470 MPa, respectively.
The data fidelity procedures developed for Monel K-500 in Task 1 were applied to MP98t due to
similarities in the inert material behavior. MP98t displays the same change in slope behavior of da/dt vs
K near the proportional limit, K = 56.2 MPa√m, as Monel K-500, as shown in Figure 28. This mutual
behavior supports the truncation of MP98t data sets at the proportional limit, to prevent the inclusion of
bulk scale plastic behavior in the crack growth analysis. The mechanics of linear scaling of the resolution
limit hold true for elastic-plastic materials. The linear scaling and subtraction of the resolution limit was
utilized to decouple crack tip plasticity from environmental crack growth data. The resolution limit for
dK/dt = 1.0 MPa√m/hr is labeled in Figure 28.

60
Figure 28: Dry N2 curve for MP98t, dK/dt= 1.0 MPa√m/hr, dry N2. The equation for the resolution limit (RL) is shown in the legend.
Interpreting the fracture behavior of MP98t was nontrivial. Over the course of all environmental
tests the fracture surface moves out of the Mode I plane by deflection. The entire Mode I plane for all
samples was transgranular, including the precrack region. The fatigue precrack procedure for all samples
was designed to end at 1 mm. The Mode I fracture surfaces for all environmental tests are shown in Figure
29. The only predominate feature on the fracture surface is the crack deflection (of note after crack
deflection the fracture morphology was intergranular which suggested an important role of property
anisotropy and grain directionality). The crack lengths at deflection are listed in Table 9. The crack length
of deflection is sufficiently longer than the intended 1 mm to rule out immediate crack deflection. As
such, MP98t shows no distinguishable transition between the fatigue precrack and the environmental
cracking; specifically there is a transgranular morphology for both. For MP98t data analysis the precrack
length is assumed to be 1 mm in all cases. With two invalidating dcPD factors noted, crack deflection and
the proportional limit, the lowest K occurring factor is the limiting value for each test. The values for crack
length and K for each limitation per dK/dt are displayed in Table 9. At low dK/dt, 0.2 and 0.33 MPa√m/hr,
the deflection is the limiting criteria; for high dK/dt, the proportional limit (PL) is limiting. Each data set
was truncated at the limiting K value prior to analysis. Figure 30 displays the complete MP98t data set for
testing at -1.30VSCE with all correction adjustments made.
10 20 30 40 50 60 70 80 90
1E-7
1E-6
1E-5
dK/dt = 1.0 MPa sqrt.m/hr
RL: da/dt = (2.70E-7)eK*2.19E-3
MP98t
Dry N2
da
/dt (m
m/s
)
K (MPa sqrt.m)
PL

61
Figure 29: The Mode I environmental fracture surfaces of MP98t. The crack propagated from bottom to top.
Table 9: Proportional limit and crack length deflection information for each environmental dK/dt tested for MP98t
dK/dt (MPa√m/hr) a of deflection (mm) a of PL (mm) K of deflection (MPa√m) K PL (MPa√m)
0.2 1.26 1.61 55.6 67.9
0.33 1.35 1.56 59.9 66.9
1 1.31 1.140 71.1 57.9
2 1.17 1.135 61.5 57.8
0.2 MPa√m/hr 0.33 MPa√m/hr
1.0 MPa√m/hr 2.0 MPa√m/hr

62
0 10 20 30 40 50 60 70 80
1E-7
1E-6
1E-5
dK/dt = 0.2 MPa sqrt.m/hr
dK/dt = 0.33 MPa sqrt.m/hr
dK/dt = 1.0 MPa sqrt.m/hr
dK/dt = 2.0 MPa sqrt.m/hr
MP98t
-1.3 VSCE
0.6M NaCl
da
/dt (m
m/s
)
K (MPa sqrt.m)
Figure 30: Crack growth rate vs K data for MP98t with corrections made for shorting, localized crack tip plasticity, crack
deflection, and truncation at the proportional limit.

63
3.3 Task 2: Quantify the effect of dK/dt on the standard LEFM metrics KTH and da/dtend for Monel
K-500 at relevant electrochemical polarization
3.3.1 IG-SCC Susceptibility Metrics
The loading rate effects on the environmental crack growth behavior were analyzed using
historical metrics and fractographic examination. The SCC susceptibility of a material has been
quantified by the stress intensity threshold (KTH) and stage II crack growth rate (da/dtII). The
determination method of these metrics is shown in Figure 31. The KTH, the K at which crack
growth begins, is defined in this work as the first positive data point after the resolution limit has
been removed. da/dtII, by its definition, could not be determined because no data set reached a
K-independent crack growth rate; instead, da/dtend is used. da/dtend is quantified as the last data
point prior to the proportional limit. The data across dK/dt for KTH and da/dtend are shown in
Figure 32 and 33, respectively.
Figure 31: Corrected data set for dK/dt = 0.15 MPa√m/hr with the illustrated locations of da/dtII and KTH.
15 20 25 30 35 40 45
1E-8
1E-7
1E-6 da/dt - RL
Monel K-500
dK/dt = 0.15 MPa sqrt.m/hr
da
/dt (m
m/s
)
KJ (MPa sqrt.m)
KTH
da/dtend

64
10-1
100
101
0
5
10
15
20
25
Monel K-500
-0.950VSCE
KT
H
dK/dt (MPa sqrt.m per hr)
Figure 32: The KTH compared to dK/dt for Monel K-500 at 0.6M NaCl with -0.950VSCE
0.1 1 10
10-7
10-6
10-5
da
/dt e
nd
(m
m/s
)
dK/dt (MPa sqrt.m /hr)
Figure 33: da/dtend compared to dK/dt for Monel K-500 at 0.6M NaCl with -0.950VSCE
KTH ranges from 11.9 to 23.2 MPa√m for Monel K-500 in a low susceptibility environment does
not show any systematic trends with loading rate. da/dtend, however, does display a visible trend
behavior with dK/dt. da/dtend was fit with the power law trend shown in Equation 15.
da/dtend = 1.13E-06(dK/dt)0.896 Equation 15

65
3.3.2 Fractography
High magnification micrographs from the fracture surfaces for all dK/dt in -0.950VSCE are
shown in Figure 34. All micrographs were taken near the precrack to avoid the effects of bulk
plasticity on the fracture surface. The KJ at which each micrograph is centered around is listed in
Table 10.
0.2 MPa√m/hr 0.15 MPa√m/hr
0.1 MPa√m/hr 0.075 MPa√m/hr

66
Figure 34: IG-SCC fracture surfaces of Monel K-500 in 0.6 M NaCl with EA = -0.950 VSCE, at 1000x.
Table 10: The K at which the micrographs in Figure 33 are centered around. Monel K-500, -0.950VSCE
dK/dt (MPa√m/hr) K view (MPa√m)
0.075 up to 27
0.1 45
0.15 37
0.2 43
3.0 MPa√m/hr 2.0 MPa√m/hr
1.0 MPa√m/hr 0.33 MPa√m/hr
4.0 MPa√m/hr

67
0.33 44
1.0 43
2.0 42
3.0 44
4.0 45
All fracture surfaces in Figure 34 strongly display intergranular fracture with dimpling. This
suggests that the IG failure is augmented by some degree of a ductile process; this is observed
for all dK/dt. There is no strong observable change in the fracture morphology across the range
of dK/dt examined for Monel K-500. The degree of dimpling is difficult to quantify; but,
qualitatively, there is not a distinguishable change across the dK/dt. All dK/dt exhibit secondary
cracking, out of plane cracking, but due to the reduction in IG-SCC fracture area associated with
increasing dK/dt, there is insufficient area for comparison at high dK/dt. There is no quantitative
or qualitative trend across the dK/dt in the fracture morphology.
3.3.3 Analysis of MP98t
3.3.3.1 dK/dt trends in MP98t
The KTH was determined in the same manner as the Monel K-500 samples, but additional
consideration was taken with da/dtend. Kend spans 5 MPa√m for MP98t. In order to reduce scatter
due to the range of Kend, a singular K of 55 MPa√m was used instead. KTH and da/dtend with
respect to dK/dt are shown in Figures 35 and 36, respectively. The environmental fractography
for each sample is displayed in Figure 37. The KJ at which each micrograph is centered around is
listed in Table 11.
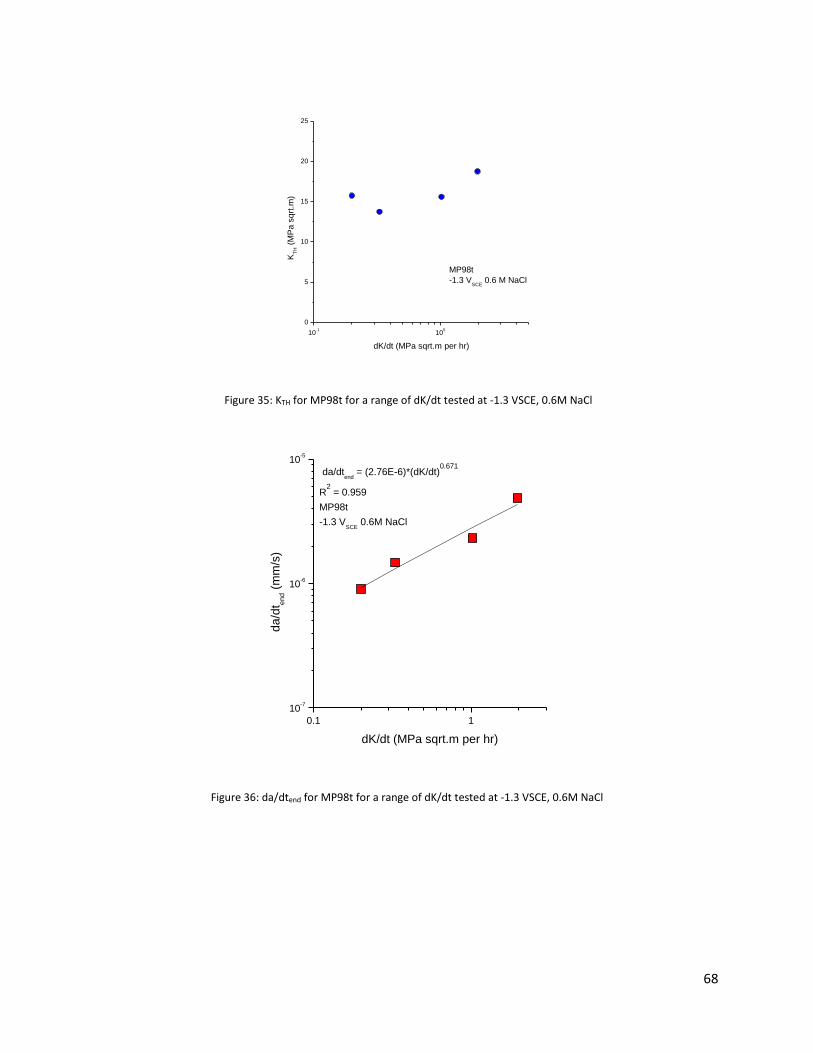
68
10-1
100
0
5
10
15
20
25
MP98t
-1.3 VSCE
0.6 M NaCl
KT
H (
MP
a s
qrt
.m)
dK/dt (MPa sqrt.m per hr)
Figure 35: KTH for MP98t for a range of dK/dt tested at -1.3 VSCE, 0.6M NaCl
0.1 1
10-7
10-6
10-5
da/dtend
= (2.76E-6)*(dK/dt)0.671
R2 = 0.959
MP98t
-1.3 VSCE
0.6M NaCl
da
/dt e
nd (
mm
/s)
dK/dt (MPa sqrt.m per hr)
Figure 36: da/dtend for MP98t for a range of dK/dt tested at -1.3 VSCE, 0.6M NaCl

69
Figure 37: 1000x images of the Mode 1 environmental fracture of MP98t
Table 11: K each micrograph in Figure 36 is centered around, with corresponding dK/dt. MP98t -1.30VSCE
dK/dt (MPa√m/hr) K view (MPa√m)
0.2 30
0.33 34
1 57
2 42
MP98t does not demonstrate a strong dependence of KTH on dK/dt, while the da/dtend
displays a power law dependence on dK/dt. MP98t displays only transgranular slip band cracking,
the same fracture behavior as the precrack with no dimpling areas. HEDE can manifest as
intergranular or transgranular fracture [43]. Aside from the full crack deflection, no secondary
cracking is visible. The fracture morphology does not change across the dK/dt span.
0.2 MPa√m/hr 0.33 MPa√m/hr
1.0 MPa√m/hr 2.0 MPa√m/hr

70
3.3.4 Comparison between Monel K-500 and MP98t
MP98t exhibits loading rate dependencies very similar to Monel K-500. The materials
display dK/dt independent KTH that range between 10 and 25 MPa√m, as shown in Figure 38.
The da/dtend share a power law fit and fall closely within the same range, as shown in Figure 39.
The most obvious difference in behavior is the fractography. Monel K-500 prominently
displayed intergranular facets while MP98t is solely slip band-like transgranular fracture.
Though the metric of these two materials fall closely in value, they were tested at different
potentials. MP98t was exposed to a significantly more negative cathodic polarization Monel K-
500. A strong trend has already been established between HEAC susceptibility and applied
potential [4]. The KTH would decrease and the da/dtend would increase in accordance with the
micromechanical decohesion models outlined in Equations 2 and 3. These data strongly
suggest that MP98t is significantly less susceptible to HEAC due to cathodic polarization in
aqueous chloride environments.
10-1
100
101
0
5
10
15
20
25
KTH
Monel K-500
KTH
MP98t
KT
H (M
Pa s
qrt
.m)
dK/dt (MPa sqrt.m per hr)
Figure 38: KTH for the environmental data sets of Monel K-500 and MP98t

71
0.1 1 10
10-7
10-6
10-5
da/dtend
Monel K-500
da/dtend
MP98t
da
/dt e
nd
(m
m/s
)
dK/dt (MPa sqrt.m /hr)
Figure 39: da/dtend for the environmental data sets of Monel K-500 and MP98t

72
3.4 Task 3: Explore the mechanistic underpinnings that govern the effect of loading rate on the IG-
SCC behavior of each alloy
This analysis aims to understand the observed influence of dK/dt on the da/dt and KTH
parameters in the context of the prevailing mechanistic interpretations in the H-embrittlement
field. The mechanisms of HEAC are controversial, with Hydrogen Enhanced Decohesion (HEDE)
and Hydrogen Enhanced Localized Plasticity (HELP) being most widely accepted. Fracture due to
HEDE in Ni-based alloys is caused by grain boundary decohesion due to a reduction in the intrinsic
grain boundary toughness caused by H; the magnitude of this effect will increase with increasing
H-concentration [5]. By contrast, the HELP mechanism proposes that H decreases the dislocation-
dislocation interaction energy thus enables a higher dislocation density in the fracture process
zone [5], [76]. A consensus is emerging around a combined HELP-HEDE mechanism, where
elevated localized strain hardening is enabled at the crack tip via HELP, this process conditions
the local grain boundary environment to augment the H-induced reduction in the grain boundary
toughness [77]. In this paradigm the final failure mechanism is attributed to decohesion [4], [58].
In the context of these mechanisms, the experimental dK/dt can influence the HEAC
susceptibility of a material by affecting the H-uptake process at the crack tip, the kinetics of H
diffusion in the process zone, and time-dependent H-dislocation interactions [4]. Such
considerations have been applied to understand the loading rate sensitivity HEAC in other alloys
(Al 2024, Ti-6Al-4V, and β-Ti [36], [41]), these prior efforts will be leveraged to inform the current
analysis. Monel K-500 and MP98t share similar trends for da/dt and KTH with dK/dt. Due to the
abundance of accessible prior work on Monel K-500, the analysis will be focused on this material,
but the same conclusions are expected to apply for MP98t. The data in Task 2 suggest two critical
questions which need to be addressed: (1) What is the mechanistic cause for the observed
increase in da/dt with increasing dK/dt? and (2) Why is a similar systematic loading rate
dependence not observed for the KTH data in Figure 32?

73
3.4.1 Loading Rate dependence of da/dt
3.4.1.1 Diffusion Limitation
Prior work on Monel K-500 has established good agreement between the decohesion
based micromechanical models by Gangloff and experimental data [4]. The model developed to
describe da/dtII is restated from Equation 3 [55], [57]. The variables are defined in the
Introduction.
(da
dt)
II=
4DH
xcrit{erf −1 (1 −
CHσ−crit
CHσ)}
2
Equation 3 (restated)
The da/dtend recorded in this work is not an exact equivalent to diffusion limited da/dtII
because KJ independent SCC growth was not achieved. However, da/dtend should still display the
same trend behavior as da/dtII because the values for da/dtend were determined within a constant
span of KJ for all tests. Critically, the K independent da/dtII in the context of the diffusion limited
micro-mechanical modeling paradigm assumes that the maximum rate of crack advance is rate
limited rate at which H can diffusion over some critical distance into the crack tip process zone
[55], [57], [78]. Specifically, H must be able to diffuse to the fracture process zone to be effective
in HEDE, thus da/dtII is a function of H lattice diffusion which has a time constraint. As such, is
reasonable that da/dtII would potentially be dependent on dK/dt if the loading rate is sufficiently
rapid relative to the diffusion rate such that H cannot fully diffuse to xcrit. In other words, if the
dK/dt outpaces the H diffusion, the HEDE mechanism will decline and da/dtII will decrease with
increasing dK/dt. This diffusion limited mechanism is proposed to be responsible for the
retardation of EAC at high dK/dt loading rates [30], [36], [41], [79]. Clearly, the current data show
the opposite trend of increasing da/dtend with increasing dK/dt (0.1 to 4 MPa√m) for Monel K-
500, which suggests that at these loading rates the diffusion kinetics are sufficiently rapid to not
be limiting the EAC. As such there must be an alternative mechanism causing the increased da/dt
over the dK/dt range examined.
3.4.1.2 Defecting of a Crack Tip Protective Film
Critically, HEAC requires the generation of H at the crack tip. Protective oxide layers at
the crack tip can prevent the absorption of atomic H and prevent the detrimental effects of HEAC
[61]. The stability of the crack tip protective film can be either electrochemically or mechanically

74
compromised; the mechanical rupture of this film would be caused by the crack tip strain rate
due to dynamic loading of the crack. Once the film is damaged, H can be adsorbed then absorbed
and diffuse into the material process zone. The extent of rupture and the regeneration rate of
the film in the crack tip environment influences the concentration of H that is absorbed. The crack
tip strain rate, ε CT, is a function of dK/dt, has been shown to directly affect the HEAC susceptibility
by destabilizing the film at high ε CT. While the exact form of the equation is controversial, the
crack tip strain rate is known to be a function of the K-value, dK/dt, da/dt and relevant material
properties (yield strength, elastic modulus, and Poisson’s ratio) [80], [81]. This protective film
rupture mechanism is hypothesized to govern the observed increase in da/dtII with increasing
dK/dt in the Ti-6Al-4V alloy loaded in a chloride electrolyte [63]. Materials whose susceptibility
is governed by this mechanism will exhibit a strong dK/dt dependence that will begin when the
crack tip strain rate is sufficient to first rupture the film. This dK/dt dependence will end when
either (1) the crack tip strain rate is sufficiently fast relative to the repassivation kinetics to
maintain constant solution contact with the base material or (2) sufficiently high dK/dt such that
the HEAC process becomes diffusion limited.
While this mechanism is logical in other alloy system and environment combinations, it
requires an electrochemically stable protective film in the anticipated crack tip environment. A
simplified Pourbaix diagram illustrates the bulk composition for this lot of Monel K-500 in
interaction with a 0.6M NaCl environment in Figure 40. At -0.950VSCE in the bulk pH range is from
5 to 6.5 (but a more basic pH is expected in the crack tip [40]) no stable film occurs. As such, it is
clear that the dependence of da/dtend on dK/dt is not controlled by the film
destabilization/rupture mechanism.

75
Figure 40: Representative Pourbaix diagram for Monel K-500 based on its two main components, Ni and Cu. OLI generated
3.4.1.3 Concurrent Plasticity and H Uptake
Critical research investigating HE of low alloy pressure vessel steels in H-gas environments
offers a mechanistic paradigm in which to analyzed the observed dependence of da/dtend on the
dK/dt [82]. Specifically, the work by Nibur et al. built on the HELP mechanism that contends that
H will lowers the dislocation-dislocation interaction energy, thus increases localized dislocation
mobility and enables an enhancement of the plastic damage evolution for a given applied loading
state [82]. Using a variety of experimental set-ups, this work demonstrated that concurrent
loading (thus plasticity evolution) and H2 environmental exposure, caused a drastic increase in
the susceptibility to the HE phenomenon. This behavior suggests that when the mechanical
loading and H-uptake occur independently the plastic damage state that evolves is not influenced
by the effects of H. For example, in a sample that is pre-strained then exposed to an H-producing
environment, the plastic damage was already set without the contribution of the HELP
mechanism and thus the subsequent introduction of H was not observed to enhance the
susceptibility. Critically, such a change in dislocation damage structure could impact the failure
process through (1) the coupled HELP-HEDE mechanism where the enhanced dislocation
structure results in increased local hardening, thus higher levels of local stress that promotes
HEDE, or (2) the plasticity-related hydrogen induced cracking (PRHIC) phenomenon where the
CuxNi
y (s)
0.0
1.0
-1.0
-0.5
0.5
-1.5
1.5
-2.0
VSC
E

76
crack advance is governed by the exceedance of a critical value of crack tip plastic strain [82],
[83].
The demonstrated importance of the concurrent loading and H-uptake reasonably
explains the observed differences between the RSL approach and the constant dK/dt (>0
MPa√m/hr) loading. Specifically, in the RSL approach the plasticity is induced during the rapid
step increases in the load (thus K) where the loading rate may be too rapid for H contribution.
Since the dislocation structure evolved during the step increase it was not enhanced by HELP.
The subsequent environmental exposure during the load-hold does not enable the full
detrimental influence of the HELP process, and thus demonstrates a lower susceptibility
compared to the concurrent loading of a constant dK/dt test. This is consistent with observed
behavior by Dietzel for 7xxx-series Al and ASTM D1141 steels [55].
While the concurrent loading hypothesis reasonably explains the difference between RSL
and the constant dK/dt (>0 MPa√m/hr) loading, it does not capture why increasing dK/dt should
result in faster da/dt. This behavior can be rationalized in the context of the failure criteria
associated with either the PRHIC or the coupled HELP-HEDE mechanism. For the PRHIC
mechanism crack extension will occur when the equivalent plastic shear strain exceeds some
critical value [82]. For a fixed K, the size of the relevant local plastic damage parameters will be
constant regardless of dK/dt. From a bulk perspective this parameter could be defined as the
plastic zone size. However, in the context of the proposed micro-mechanical strain based
fracture criteria, the relevant metric is proposed to be the equivalent plastic shear strain
proximate to the tip of a propagating Mode I crack [80], [82], [84]. For each dK/dt it is reasonable
to assume that there will be a constant crack tip H concentration since a constant crack tip
chemistry is expected, there is no influence of a passive film, and the loading rate is not causing
diffusion limitation. As such, in the context of the PRHIC failure criteria, for a given time
increment, a larger equivalent plastic strain would be accomplished by faster dK/dt. In other
words, the critical crack tip plastic strain criteria would be satisfied faster and a higher da/dt
would be expected. Similarly if the HELP-HEDE mechanism is controlling, the faster dK/dt would
enable faster development of the work-hardened structure thus faster enhancement of the crack
tip stresses that drive decohesion leading to increased da/dt. Both mechanisms, PHRIC and HELP-
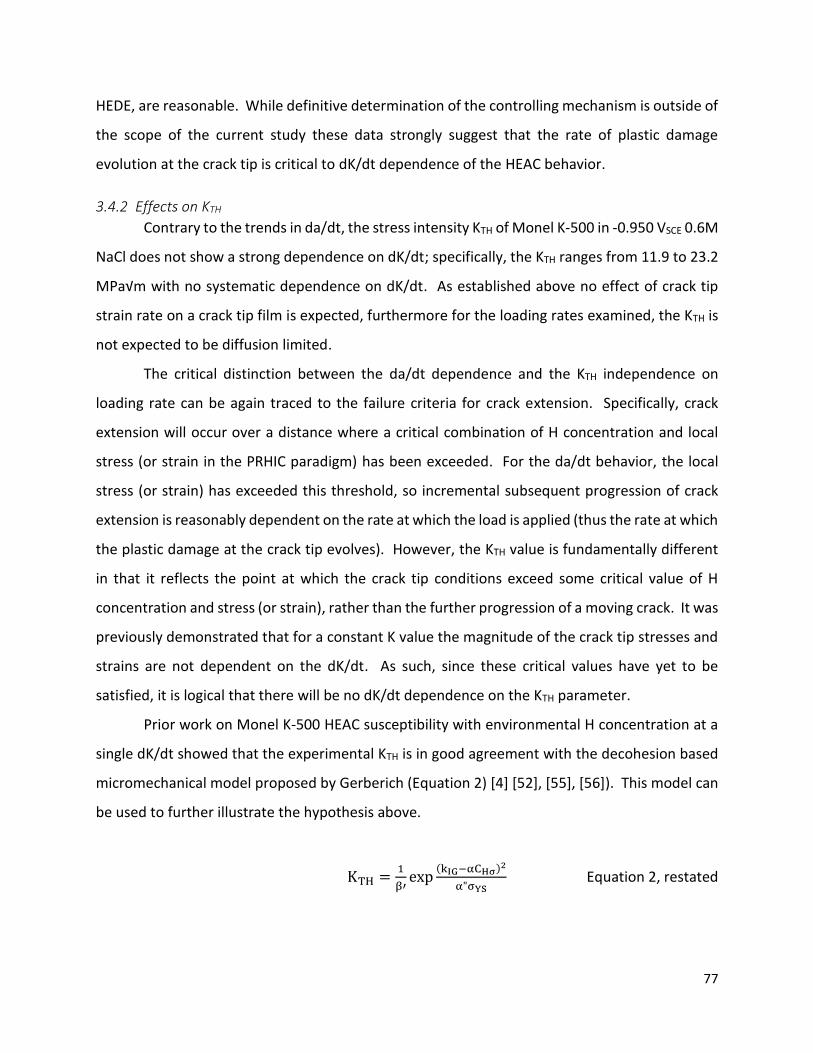
77
HEDE, are reasonable. While definitive determination of the controlling mechanism is outside of
the scope of the current study these data strongly suggest that the rate of plastic damage
evolution at the crack tip is critical to dK/dt dependence of the HEAC behavior.
3.4.2 Effects on KTH
Contrary to the trends in da/dt, the stress intensity KTH of Monel K-500 in -0.950 VSCE 0.6M
NaCl does not show a strong dependence on dK/dt; specifically, the KTH ranges from 11.9 to 23.2
MPa√m with no systematic dependence on dK/dt. As established above no effect of crack tip
strain rate on a crack tip film is expected, furthermore for the loading rates examined, the KTH is
not expected to be diffusion limited.
The critical distinction between the da/dt dependence and the KTH independence on
loading rate can be again traced to the failure criteria for crack extension. Specifically, crack
extension will occur over a distance where a critical combination of H concentration and local
stress (or strain in the PRHIC paradigm) has been exceeded. For the da/dt behavior, the local
stress (or strain) has exceeded this threshold, so incremental subsequent progression of crack
extension is reasonably dependent on the rate at which the load is applied (thus the rate at which
the plastic damage at the crack tip evolves). However, the KTH value is fundamentally different
in that it reflects the point at which the crack tip conditions exceed some critical value of H
concentration and stress (or strain), rather than the further progression of a moving crack. It was
previously demonstrated that for a constant K value the magnitude of the crack tip stresses and
strains are not dependent on the dK/dt. As such, since these critical values have yet to be
satisfied, it is logical that there will be no dK/dt dependence on the KTH parameter.
Prior work on Monel K-500 HEAC susceptibility with environmental H concentration at a
single dK/dt showed that the experimental KTH is in good agreement with the decohesion based
micromechanical model proposed by Gerberich (Equation 2) [4] [52], [55], [56]). This model can
be used to further illustrate the hypothesis above.
KTH =1
β′exp
(kIG−αCHσ)2
α"σYS Equation 2, restated

78
In this model the β’ and α” parameters are from a dislocation shielding based model of crack tip
stress, which are proposed to be independent of dK/dt (so long as there is a constant H-
concentration). The kIG is the intrinsic toughness of the boundary, and αCHσ represents the
degree to which this toughness is degraded by the local H concentration. Critically none of these
terms would be expected to be dependent on the loading rate; this reinforces proposal that the
KTH will only occur once a fixed combination of crack tip stress (or strain in different model) and
H-concentration for decohesion is reached.

79
4. Conclusions Ni-based superalloys are have a known susceptibility to hydrogen environmentally
assisted cracking (HEAC) in cathodically polarized aqueous salt solutions. Understanding the
controlling mechanisms of HEAC in addition to developing accurate predictive models are crucial
to the structural management of these material systems. Historic testing techniques such as
Rising Step Load and Slow Strain Rate Tests do not adequately replicate the service setting and
are prone to non-conservative behavior due to comparatively slow predicted crack growth. This
work uses Linear Elastic Fracture Mechanics (LEFM) based testing to analyze the stress intensity
rate (dK/dt) dependence of HEAC behavior for Monel K-500 and MP98t in cathodically polarized
solutions. The following conclusions from each task were established:
Task 1: Consider a range of dK/dt and identify and address the challenges associated with data
collection techniques to quantify the stress corrosion cracking (SCC) resistance using LEFM based
techniques
dcPD Characterization Challenges:
o During slow rising dK/dt fracture mechanics testing, Monel K-500 demonstrated
large errors between the dcPD calculated crack length and the IG-SCC crack length
on the fracture surface for tests that were ended at high K.
o Testing of Monel K-500 in inert environments showed changes in the electrical
resistance behavior, observed via the dcPD system. These changes were
dependent on the bulk ligament plastic behavior. Changes in slope of the apparent
da/dt correlated well with the proportional limit and the yield stress, which
suggests that they are not due to intrinsic changes in cracking behavior, but due
to artifacts associated with changes in resistivity.
o Inert tests that were ended at K > yield stress showed a region of transgranular
ductile tearing, identical to the final failure morphology, that had not been
previously documented. This behavior was not observed when testing was halted
prior to the yield strength.
o The dcPD signal observed during the inert tests is created by localized crack tip
plasticity, bulk ligament plasticity, and ductile tearing. These phenomena are not

80
completely distinguishable from true SCC in the calculated crack growth rate with
the current experimental procedure. For the ductile tearing to be noticeable on
the fracture surface, post-test fatigue with a transgranular fracture morphology is
necessary to separate the dK/dt behavior from the final failure.
Protocol Modifications
o Truncating the environmental data at the proportional limit prevents eliminates
the complicating effects of bulk scale plasticity and ductile tearing in the dcPD
signal. This allows a rigorous characterization of crack extensions due to IG-
SCC/EAC.
o Sample geometry can be optimized to increase the Kmax prior to bulk ligament
plasticity.
o The localized crack tip plasticity (the plastic zone) can be decoupled from the SCC
data by subtracting the resolution limit from the experimental data.
o The magnitude of the resolution limit was proven to scale linearly with dK/dt. Due
to this, all resolution limits for a given material can be determined from a single
inert test.
o These protocols for maintaining data integrity were applied successfully to the
MP98t data set.
Task 2: Quantify the effect of dK/dt on the standard LEFM metrics KTH and da/dtend for two
different marine alloys at relevant electrochemical polarization(s)
The quantitative metrics of MP98t and Monel K-500 fall closely to each other, but MP98t
was exposed to higher levels of cathodic polarization than Monel K-500. These data
illustrated that MP98t is far less susceptible to HEAC than Monel K-500 in cathodically
polarized aqueous chloride environments.
Monel K-500 displayed predominately intergranular fracture with small areas of dimpling.
The fracture morphology did not noticeably change across the dK/dt span.
MP98t displayed slip band transgranular fracture as its SCC failure mode. No ductile
behavior was detected in the Mode I crack region.

81
All MP98t samples tested at -1.30VSCE experienced out of plane cracking after a period of
Mode I crack growth. The nature of the crack deflection is not discussed in this work.
Task 3: The mechanistic underpinnings that govern the effect of loading rate on the SCC behavior
of each alloy were explored.
Both Monel K-500 and MP98t displayed dK/dt independent KTH while da/dtend had a
power law relationship with dK/dt.
For the loading rates examined, the metrics were found to not be dependent on the
behavior of a protective oxide film or any other diffusion limitation. These mechanisms
can impede H uptake when stable, are not supported by Monel K-500 in the tested
environment; preventing this from playing a role in Monel K-500’s HEAC behavior.
In these materials, the HEAC susceptibility is increased by concurrent strain and H uptake.
The crack growth rate was over an order of magnitude larger for a dK/dt = 0.33 MPa√m
test as compared to an RSL test of Monel K-500 in the same environmental conditions.
This behavior supports a HELP-based mechanism in which H decreases the dislocation-
dislocation interactions, allowing for increased plasticity and therefore hardening.
For dK/dt that are not diffusion limited, where a sufficient H concentration exists at the
fracture process zone, a threshold strain is required for crack advance. In this case,
elevated dK/dt would cause elevated da/dt. A HELP-HEDE mechanisms could also achieve
this same behavior through accelerated work-hardening and crack tip stress.
These arguments do not influence KTH because crack growth does not occur below this
value. The only time dependence of KTH in the decohesion based models comes through
in diffusion limitation of H.

82
References
[1] K. D. Efird, “Failure of Monel Ni-Cu-Al alloy K-500 bolts in seawater,” Mater. Perform.,
vol. 24, no. 4, pp. 37–40, 1985.
[2] L. H. Wolfe and M. W. Joosten, “Failures of nickel/copper bolts in subsea application,”
SPE Prod. Eng., vol. 3, no. 3, pp. 382–386, 1988.
[3] L. H. Wolfe, C. C. Burnette, and M. W. Joosten, “Hydrogen embrittlement of cathodically
protected subsea bolting alloys,” Mater. Performance;(United States), vol. 32, no. 7,
1993.
[4] R. P. Gangloff, H. M. Ha, J. T. Burns, and J. R. Scully, “Measurement and modeling of
hydrogen environment-assisted cracking in monel K-500,” Metall. Mater. Trans. A Phys.
Metall. Mater. Sci., vol. 45, no. 9, pp. 3814–3834, 2014.
[5] S. Lynch, “Hydrogen embrittlement phenomena and mechanisms,” in Gaseous Hydrogen
Embrittlement of Materials In Energy Technologies, Vol 1., R. Gangloff and B. Somerday,
Eds. 2012, pp. 274–346.
[6] Det Norske Veritas, “Cathodic protection design,” 2005.
[7] “QQ-N-286G. Federal specification for nickel-copper-aluminum alloy, wrought (UNS
N05500),” 2000.
[8] J. R. Davis, Nickel, cobalt, and their alloys. ASM international, 2000.
[9] -base alloy monel K-500,”
Mater. Sci. Eng., vol. 84, pp. 177–189, 1986.
[10] G. A. Scott, “Studbolting experience in the underwater environment of the North Sea,” in
Offshore Technology Conference, 1985.
[11] R. E. Butler, “Hydrogen Embrittlement of High-Strength Alloys in Marine Environments,”
Inst. Met., pp. 79–84, 1988.
[12] C. A. Clark, S. Driscoll, and P. Guha, “Development of a new fastener alloy resistant to
hydrogen embrittlement,” Br. Corros. J., vol. 27, no. 2, pp. 157–160, Jan. 1992.
[13] J. R. Scully and M. G. Vassilaros, “The Hydrogen Embrittlement Susceptibility of Monel
Alloy K-500,” in Electrochem. Soc. Fall 1983 Meeting, Washington, DC, 1983.

83
[14] R. D. Bayles, T. Lemieux, F. Martin, D. Lysogorski, T. Newbauer, W. Hyland, B. A. Green, E.
Hogan, T. Longazel, and P. Stencel, “Monel K-500 Hydrogen Embrittlement,” Nav. Surf.
Treat. Cent. MR2010 Proc. Present., 2010.
[15] R. H. Jones and S. M. Bruemmer, “Environment-Induced Cracking in Metals,” Environ.
Crack. Met., pp. 287–310, 1990.
[16] M. H. Kamdar, “Embrittlement of Nickel by Gaseous Hydrogen,” in Hydrogen in Metals,
Proceedings of the 2nd International Conference, 1977.
[17] D. H. Lassila and H. K. Birnbaum, “Intergranular fracture of nickel: the effect of hydrogen-
sulfur co-segregation,” Acta Metall., vol. 35, no. 7, pp. 1815–1822, Jul. 1987.
[18] D. H. Lassila and H. K. Birnbaum, “The effect of diffusive segregation on the fracture of
hydrogen charged nickel,” Acta Metall., vol. 36, no. 10, pp. 2821–2825, 1988.
[19] R. Otsuka, T. Maruno, and H. Tsuji, “Correlation Between Hydrogen Embrittlement and
Hydride Formation in Ni--Cu and Pd--Ag Alloys,” in International Congress on Metallic
Corrosion, 1984, vol. 2, pp. 270–277.
[20] N. R. Moody, S. L. Robinson, and W. M. Garrison Jr, “Hydrogen effects on the properties
and fracture modes of iron-based alloys,” Res Mech., vol. 30, no. 2, pp. 143–206, 1990.
[21] D. M. Symons, “A comparison of internal hydrogen embrittlement and hydrogen
environment embrittlement of X-750,” Eng. Fract. Mech., vol. 68, no. 6, pp. 751–771,
2001.
[22] B. P. Focht, E. M. and L’Heureux, “Development of Modified Alloy MP159 Bar for 150 ksi
Marine Grade Fasteners,” West Bethesda, MD, 2002.
[23] E. Focht, B. L’Heureux, and C. Roe, “Development of a Fastener Structural Element Test
for Certifying Navy Fastener Materials,” in Structural Integrity of Fasteners Including the
Effects of Environment and Stress Corrosion Cracking: 3rd Volume, ASTM International,
2007.
[24] “Standard Practice for Preparation and Use of Bent-Beam Stress-Corrosion Test
Specimens.” ASTM International, 2016.
[25] “Standard Practice for Making and Using U-Bend Stress-Corrosion Test Specimens.”
ASTM International, 2016.

84
[26] “Standard Practice for Slow Strain Rate Testing to Evaluate the Susceptibility of Metallic
Materials to Environmentally Assisted Cracking.” ASTM International, 2013.
[27] T. L. Anderson, Fracture mechanics: fundamentals and applications. CRC press, 2005.
[28] “Standard Test Method for Determining Threshold Stress Intensity Factor for
Environment-Assisted Cracking of Metallic Materials.” ASTM International, 2013.
[29] “Standard Test Method for Measurement of Hydrogen Embrittlement Threshold in Steel
by the Incremental Step Loading Technique.” ASTM International, 2012.
[30] J. D. Landes and W. Dietzel, “An analysis of creep deformation parameters. Part 2:
experimental study,” Eng. Fract. Mech., vol. 71, no. 16, pp. 2463–2474, 2004.
[31] G. L. Pioszak, “CHARACTERIZATION OF STRESS CORROSION CRACKING (SCC) IN ULTRA-
HIGH STRENGTH STAINLESS STEEL.”
[32] M. McMahon, P. Steiner, A. Lass, and J. Burns, “The Effect of Loading Orientation on the
Stress Corrosion Cracking of Al-Mg Alloys,” CORROSION, 2017.
[33] M. McMahon, P. Steiner, A. Lass, and J. Burns, “The Effect of Temper and Composition on
the Stress Corrosion Cracking of Al-Mg Alloys,” CORROSION, 2016.
[34] C. B. Crane and R. P. Gangloff, “Stress corrosion cracking of Al-Mg alloy 5083 sensitized at
low temperature,” Corrosion, vol. 72, no. 2, pp. 221–241, 2015.
[35] R. P. Gangloff and B. P. Somerday, Gaseous Hydrogen Embrittlement of Materials in
Energy Technologies: Mechanisms, Modelling and Future Developments. Elsevier, 2012.
[36] B. P. Somerday, L. M. Young, and R. P. Gangloff, “Crack tip mechanics effects on
environment-assisted cracking of beta-titanium alloys in aqueous NaCl,” Fatigue Fract.
Eng. Mater. Struct., vol. 23, no. 1, pp. 39–58, 2000.
[37] J. D. Dolph, “The Effect of Microstructure on the HEAC Behavior of Monel K-500,”
University of Virginia, 2015.
[38] Z. D. Harris, J. D. Dolph, G. L. Pioszak, B. C. Rincon Troconis, J. R. Scully, and J. T. Burns,
“The Effect of Microstructural Variation on the Hydrogen Environment-Assisted Cracking
of Monel K-500,” Metall. Mater. Trans. A, vol. 47, no. 7, pp. 3488–3510, 2016.
[39] R. P. Gangloff, “Probabilistic Fracture Mechanics Simulation of Stress Corrosion Cracking
Using Accelerated Laboratory Testing and Multi-Scale Modeling,” Corrosion, vol. 72, no.

85
7, pp. 862–880, 2016.
[40] J.-H. Ai, H. M. Ha, R. P. Gangloff, and J. R. Scully, “Hydrogen diffusion and trapping in a
precipitation-hardened nickel–copper–aluminum alloy Monel K-500 (UNS N05500),” Acta
Mater., vol. 61, no. 9, pp. 3186–3199, 2013.
[41] W. Dietzel, “Fracture mechanics approach to stress corrosion cracking,” in Anales de
Mecánica de la Fractura, 2001, vol. 18, pp. 1–7.
[42] D. G. Westlake, “Generalized Model For Hydrogen Embrittlement,” Trans ASM, vol. 62,
pp. 1000–1006, 1969.
[43] S. P. Lynch, “Mechanisms of hydrogen assisted cracking–a review,” in Hydrogen Effects
on Material Behaviour and Corrosion Deformation Interactions, 2003, pp. 449–466.
[44] S. P. Lynch, “Environmentally assisted cracking: overview of evidence for an adsorption-
induced localised-slip process,” Acta Metall., vol. 36, no. 10, pp. 2639–2661, 1988.
[45] S. P. Lynch, “Metallographic contributions to understanding mechanisms of
environmentally assisted cracking,” Metallography, vol. 23, no. 2, pp. 147–171, 1989.
[46] H. K. Birnbaum, “Mechanisms of hydrogen related fracture of metals,” in Hydrogen
effects on Material behavior, 1989, pp. 639–658.
[47] H. K. Birnbaum, I. M. Robertson, P. Sofronis, and D. Teter, “Mechanisms of hydrogen
related fracture--a review,” in Second International Conference on Corrosion-
Deformation Interactions. CDI’96, 1996, pp. 172–195.
[48] C. D. Beachem, “A new model for hydrogen-assisted cracking (hydrogen
‘embrittlement’),” Metall. Trans., vol. 3, no. 2, pp. 441–455, 1972.
[49] H. K. Birnbaum and P. Sofronis, “Hydrogen-enhanced localized plasticity—a mechanism
for hydrogen-related fracture,” Mater. Sci. Eng. A, vol. 176, no. 1–2, pp. 191–202, 1994.
[50] H. K. Birnbaum, I. M. Robertson, and P. Sofronis, “Hydrogen effects on plasticity,” in
Multiscale Phenomena in Plasticity: From Experiments to Phenomenology, Modelling and
Materials Engineering, Springer, 2000, pp. 367–381.
[51] R. A. Oriani, “A mechanistic theory of hydrogen embrittlement of steels,” Berichte der
Bunsengesellschaft für Phys. Chemie, vol. 76, no. 8, pp. 848–857, 1972.
[52] W. W. Gerberich and S. Chen, “Environment-induced cracking of metals, fundamental

86
processes: micromechanics,” Environ. Crack. Met. Natl. Assoc. Corros. Eng. Houston, TX,
pp. 167–187, 1990.
[53] W. W. Gerberich, P. G. Marsh, and J. W. Hoehn, “Hydrogen induced cracking
mechanisms—are there critical experiments?,” Hydrog. Eff. Mater., pp. 539–554, 1996.
[54] C. J. McMahon, “Hydrogen-induced intergranular fracture of steels,” Eng. Fract. Mech.,
vol. 68, no. 6, pp. 773–788, 2001.
[55] Y. Lee and R. P. Gangloff, “Measurement and Modeling of Hydrogen Environment--
Assisted Cracking of Ultra-High-Strength Steel,” Metall. Mater. Trans. A, vol. 38, no. 13,
pp. 2174–2190, 2007.
[56] R. P. Gangloff, “Science-based prognosis to manage structural alloy performance in
hydrogen,” Hydrog. Eff. Mater., pp. 1–21, 2009.
[57] M. M. Hall Jr and D. M. Symons, “Hydrogen assisted creep fracture model for low
potential stress corrosion cracking of Ni-Cr-Fe Alloys,” in Proc. Staehle Symp. on
Chemistry and Electrochemistry of Corrosion and SCC, ed. RH Jones (Warrendale, PA: The
Minerals, Metals, and Materials Society [TMS], 2001), 2001, p. 447.
[58] M. L. Martin, B. P. Somerday, R. O. Ritchie, P. Sofronis, and I. M. Robertson, “Hydrogen-
induced intergranular failure in nickel revisited,” Acta Mater., vol. 60, no. 6, pp. 2739–
2745, 2012.
[59] R. P. Gangloff, “Comprehensive Structural Integrity, Vol. I. Milne, RO Ritchie, and B.
Karihaloo.” Pergamon, San Diego, 2003.
[60] J. R. Scully and P. J. Moran, “Influence of strain on the environmental hydrogen-assisted
cracking of a high-strength steel in sodium chloride solution,” Corrosion, vol. 44, no. 3,
pp. 176–185, 1988.
[61] D. G. Kolman and J. R. Scully, “Continuum mechanics characterization of plastic
deformation-induced oxide film rupture,” Philos. Mag. A, vol. 79, no. 10, pp. 2313–2338,
1999.
[62] J. Toribio, “The role of crack tip strain rate in hydrogen assisted cracking,” Corros. Sci.,
vol. 39, no. 9, pp. 1687–1697, 1997.
[63] E. Richey and R. P. Gangloff, “Strain Rate Dependent Environment Assisted Cracking of

87
α/β-Ti Alloys in Chloride Solution,” in Environmentally Assisted Cracking: Predictive
Methods for Risk Assessment and Evaluation of Materials, Equipment, and Structures,
ASTM International, 2000.
[64] “Standard Test Methods for Determining Average Grain Size.” ASTM International, 2013.
[65] H. Tada, P. C. Paris, and G. R. Irwin, “The Stress Analysis of Cracks Handbook. The
American Society of Mechanical Engineers,” New York, 2000.
[66] H. H. Johnson, “Calibrating the electric potential method for studying slow crack
growth(Calibration of electric potential technique to study slow or steady crack growth in
high strength materials),” Mater. Res. Stand., vol. 5, pp. 442–445, 1965.
[67] D. Hellmann and K. H. Schwalbe, “Application of the electrical potential method to crack
length measurements using Johnson’s formula,” J. Test. Eval., vol. 9, no. 3, pp. 218–220,
1981.
[68] R. P. Gangloff, D. C. Slavik, R. S. Piascik, and R. H. Van Stone, “Direct current electrical
potential measurement of the growth of small cracks,” in Small-Crack Test Methods,
ASTM International, 1992.
[69] C. Ragazzo, R. Hertzberg, and R. Jaccard, “A Method for Generating Fatigue Marker
Bands Using a Constant Kmax Test Procedure BT - A Method for Generating Fatigue
Marker Bands Using a Constant Kmax Test Procedure,” 1995.
[70] V. Kumar, M. D. German, and C. F. Shih, “Engineering approach for elastic-plastic fracture
analysis,” General Electric Co., Schenectady, NY (USA). Corporate Research and
Development Dept., 1981.
[71] “Standard Test Method for Measurement of Fatigue Crack Growth Rates.” ASTM
International, 2013.
[72] M. Zehetbauer and V. Seumer, “Cold work hardening in stages IV and V of F.C.C. metals—
I. Experiments and interpretation,” Acta Metall. Mater., vol. 41, no. 2, pp. 577–588,
1993.
[73] T. Broom, “Lattice defects and the electrical resistivity of metals,” Adv. Phys., vol. 3, no.
9, pp. 26–83, Jan. 1954.
[74] N. E. Dowling, Mechanical behavior of materials. Pearson, 2012.

88
[75] G. C. Kuczynski, “Effect of Elastic Strain on the Electrical Resistance of Metals,” Phys.
Rev., vol. 94, no. 1, pp. 61–64, Apr. 1954.
[76] I. M. Robertson, P. Sofronis, A. Nagao, M. L. Martin, S. Wang, D. W. Gross, and K. E.
Nygren, “Hydrogen embrittlement understood,” Metall. Mater. Trans. B, vol. 46, no. 3,
pp. 1085–1103, 2015.
[77] Y. Ro, S. R. Agnew, and R. P. Gangloff, “Effect of Environment on Fatigue Crack Wake
Dislocation Structure in Al-Cu-Mg,” Metall. Mater. Trans. A, vol. 43, no. 7, pp. 2275–
2292, 2012.
[78] R. P. Gangloff, Hydrogen Effects on Material Behavior and Corrosion Deformation
Interactions. 2003.
[79] B. P. Somerday and R. P. Gangloff, “Effect of strength on environment-assisted cracking
of Ti–8V–6Cr–4Mo–4Zr–3Al in aqueous NaCl: Part II: Crack tip strain rate,” Mater. Sci.
Eng. A, vol. 254, no. 1, pp. 179–188, 1998.
[80] J. R. Rice, W. J. Drugan, and T.-L. Sham, “Elastic-plastic analysis of growing cracks,” in
Fracture Mechanics, ASTM International, 1980.
[81] J. R. Rice and E. P. Sorensen, “Continuing crack-tip deformation and fracture for plane-
strain crack growth in elastic-plastic solids,” J. Mech. Phys. Solids, vol. 26, no. 3, pp. 163–
186, 1978.
[82] K. A. Nibur, B. P. Somerday, C. S. Marchi, J. W. Foulk, M. Dadfarnia, and P. Sofronis, “The
Relationship Between Crack-Tip Strain and Subcritical Cracking Thresholds for Steels in
High-Pressure Hydrogen Gas,” Metall. Mater. Trans. A, vol. 44, no. 1, pp. 248–269, 2013.
[83] Y. Takeda and C. J. McMahon, “Strain controlled vs stress controlled hydrogen induced
fracture in a quenched and tempered steel,” Metall. Mater. Trans. A, vol. 12, no. 7, pp.
1255–1266, 1981.
[84] W. J. Drugan, J. R. Rice, and T. L. Sham, “Asymptotic analysis of growing plane strain
tensile cracks in elastic-ideally plastic solids,” J. Mech. Phys. Solids, vol. 30, no. 6, pp.
447–473, 1982.