16.1 - juniper networks
TRANSCRIPT

Network Management and Monitoring FeatureGuide for EX2300,EX3400, andEX4300Switches
Release
16.1
Modified: 2016-12-07
Copyright © 2016, Juniper Networks, Inc.

Juniper Networks, Inc.1133 InnovationWaySunnyvale, California 94089USA408-745-2000www.juniper.net
Juniper Networks, Junos, Steel-Belted Radius, NetScreen, and ScreenOS are registered trademarks of Juniper Networks, Inc. in the UnitedStates and other countries. The Juniper Networks Logo, the Junos logo, and JunosE are trademarks of Juniper Networks, Inc. All othertrademarks, service marks, registered trademarks, or registered service marks are the property of their respective owners.
Juniper Networks assumes no responsibility for any inaccuracies in this document. Juniper Networks reserves the right to change, modify,transfer, or otherwise revise this publication without notice.
Network Management and Monitoring Feature Guide for EX2300, EX3400, and EX4300 SwitchesRelease 16.1Copyright © 2016, Juniper Networks, Inc.All rights reserved.
The information in this document is current as of the date on the title page.
YEAR 2000 NOTICE
Juniper Networks hardware and software products are Year 2000 compliant. Junos OS has no known time-related limitations through theyear 2038. However, the NTP application is known to have some difficulty in the year 2036.
ENDUSER LICENSE AGREEMENT
The Juniper Networks product that is the subject of this technical documentation consists of (or is intended for use with) Juniper Networkssoftware. Use of such software is subject to the terms and conditions of the End User License Agreement (“EULA”) posted athttp://www.juniper.net/support/eula.html. By downloading, installing or using such software, you agree to the terms and conditions ofthat EULA.
Copyright © 2016, Juniper Networks, Inc.ii

Table of Contents
About the Documentation . . . . . . . . . . . . . . . . . . . . . . . . . . . . . . . . . . . . . . . . . . . xvii
Documentation and Release Notes . . . . . . . . . . . . . . . . . . . . . . . . . . . . . . . . xvii
Supported Platforms . . . . . . . . . . . . . . . . . . . . . . . . . . . . . . . . . . . . . . . . . . . . xvii
Using the Examples in This Manual . . . . . . . . . . . . . . . . . . . . . . . . . . . . . . . . xvii
Merging a Full Example . . . . . . . . . . . . . . . . . . . . . . . . . . . . . . . . . . . . . . xviii
Merging a Snippet . . . . . . . . . . . . . . . . . . . . . . . . . . . . . . . . . . . . . . . . . . xviii
Documentation Conventions . . . . . . . . . . . . . . . . . . . . . . . . . . . . . . . . . . . . . . xix
Documentation Feedback . . . . . . . . . . . . . . . . . . . . . . . . . . . . . . . . . . . . . . . . xxi
Requesting Technical Support . . . . . . . . . . . . . . . . . . . . . . . . . . . . . . . . . . . . . xxi
Self-Help Online Tools and Resources . . . . . . . . . . . . . . . . . . . . . . . . . . . xxi
Opening a Case with JTAC . . . . . . . . . . . . . . . . . . . . . . . . . . . . . . . . . . . . xxii
Part 1 Network Management andMonitoring
Chapter 1 Configuring Real-Time Performance Monitoring . . . . . . . . . . . . . . . . . . . . . . . 3
Understanding Real-Time Performance Monitoring on EX Series Switches . . . . . . 4
RPM Packet Collection . . . . . . . . . . . . . . . . . . . . . . . . . . . . . . . . . . . . . . . . . . . . 4
Tests and Probe Types . . . . . . . . . . . . . . . . . . . . . . . . . . . . . . . . . . . . . . . . . . . . 4
Hardware Timestamps . . . . . . . . . . . . . . . . . . . . . . . . . . . . . . . . . . . . . . . . . . . . 5
Limitations of RPM on EX Series Switches . . . . . . . . . . . . . . . . . . . . . . . . . . . . . 7
Configuring Real-Time Performance Monitoring (J-Web Procedure) . . . . . . . . . . . 7
Configuring the Interface for RPM Timestamping for Client/Server on an EX
Series Switch (CLI Procedure) . . . . . . . . . . . . . . . . . . . . . . . . . . . . . . . . . . . . . 14
Viewing Real-Time Performance Monitoring Information . . . . . . . . . . . . . . . . . . . 16
Chapter 2 Configuring Analyzers and Port Mirroring . . . . . . . . . . . . . . . . . . . . . . . . . . . . . 17
Understanding Port Mirroring and Analyzers on EX2300, EX3400, and EX4300
Switches . . . . . . . . . . . . . . . . . . . . . . . . . . . . . . . . . . . . . . . . . . . . . . . . . . . . . . . 18
Port Mirroring Overview . . . . . . . . . . . . . . . . . . . . . . . . . . . . . . . . . . . . . . . . . . . 18
Analyzer Overview . . . . . . . . . . . . . . . . . . . . . . . . . . . . . . . . . . . . . . . . . . . . . . . 19
Port Mirroring and Analyzer Terminologies . . . . . . . . . . . . . . . . . . . . . . . . . . . . 19
Configuration Guidelines for Port Mirroring and Analyzers on EX2300,
EX3400, and EX4300 Switches . . . . . . . . . . . . . . . . . . . . . . . . . . . . . . . . 21
Example: Configuring Mirroring for Local Monitoring of Employee Resource Use
on EX4300 Switches . . . . . . . . . . . . . . . . . . . . . . . . . . . . . . . . . . . . . . . . . . . . 23
Example: Configuring Mirroring for Remote Monitoring of Employee Resource
Use on EX4300 Switches . . . . . . . . . . . . . . . . . . . . . . . . . . . . . . . . . . . . . . . . . 30
iiiCopyright © 2016, Juniper Networks, Inc.

Example: Configuring Mirroring for Remote Monitoring of Employee Resource
Use Through a Transit Switch on EX4300 Switches . . . . . . . . . . . . . . . . . . . . 40
Configuring Mirroring on EX4300 Switches to Analyze Traffic (CLI
Procedure) . . . . . . . . . . . . . . . . . . . . . . . . . . . . . . . . . . . . . . . . . . . . . . . . . . . . . 47
Configuring an Analyzer for Local Traffic Analysis . . . . . . . . . . . . . . . . . . . . . . 48
Configuring an Analyzer for Remote Traffic Analysis . . . . . . . . . . . . . . . . . . . 48
Configuring Port Mirroring . . . . . . . . . . . . . . . . . . . . . . . . . . . . . . . . . . . . . . . . 49
Configuring Port Mirroring to Analyze Traffic (J-Web Procedure) . . . . . . . . . . . . . 50
Verifying Input and Output for Port Mirroring Analyzers on EX Series
Switches . . . . . . . . . . . . . . . . . . . . . . . . . . . . . . . . . . . . . . . . . . . . . . . . . . . . . . 53
Troubleshooting Port Mirroring Configuration Error Messages . . . . . . . . . . . . . . . . 54
An Analyzer Configuration Returns a “Multiple interfaces cannot be
configured as a member of Analyzer output VLAN” Error Message . . . . 54
Chapter 3 Configuring sFlow Monitoring Technology . . . . . . . . . . . . . . . . . . . . . . . . . . . . 57
Understanding How to Use sFlow Technology for Network Monitoring on an EX
Series Switch . . . . . . . . . . . . . . . . . . . . . . . . . . . . . . . . . . . . . . . . . . . . . . . . . . . 57
Sampling Mechanism and Architecture of sFlow Technology on EX Series
Switches . . . . . . . . . . . . . . . . . . . . . . . . . . . . . . . . . . . . . . . . . . . . . . . . . . . 57
Adaptive Sampling . . . . . . . . . . . . . . . . . . . . . . . . . . . . . . . . . . . . . . . . . . . . . . 58
sFlow Agent Address Assignment . . . . . . . . . . . . . . . . . . . . . . . . . . . . . . . . . . 59
Example: Configuring sFlowTechnology toMonitor Network Traffic on EXSeries
Switches . . . . . . . . . . . . . . . . . . . . . . . . . . . . . . . . . . . . . . . . . . . . . . . . . . . . . . 60
Configuring sFlow Technology for Network Monitoring (CLI Procedure) . . . . . . . . 64
Chapter 4 ConfiguringEthernetOAMLinkFaultManagementandConnectivityFaultManagement . . . . . . . . . . . . . . . . . . . . . . . . . . . . . . . . . . . . . . . . . . . . . . . . . . . . . 67
Understanding Ethernet OAM Link Fault Management for an EX Series
Switch . . . . . . . . . . . . . . . . . . . . . . . . . . . . . . . . . . . . . . . . . . . . . . . . . . . . . . . . 67
Understanding Ethernet OAM Connectivity Fault Management for an EX Series
Switch . . . . . . . . . . . . . . . . . . . . . . . . . . . . . . . . . . . . . . . . . . . . . . . . . . . . . . . . 69
Understanding Ethernet Frame Delay Measurements on Switches . . . . . . . . . . . 70
Ethernet Frame Delay Measurements . . . . . . . . . . . . . . . . . . . . . . . . . . . . . . . 70
Types of Ethernet Frame Delay Measurements . . . . . . . . . . . . . . . . . . . . . . . . 71
Limitations . . . . . . . . . . . . . . . . . . . . . . . . . . . . . . . . . . . . . . . . . . . . . . . . . . . . . 72
Example: Configuring Ethernet OAM Connectivity Fault Management on EX
Series Switches . . . . . . . . . . . . . . . . . . . . . . . . . . . . . . . . . . . . . . . . . . . . . . . . . 72
Example: Configuring Ethernet OAM Link Fault Management on EX Series
Switches . . . . . . . . . . . . . . . . . . . . . . . . . . . . . . . . . . . . . . . . . . . . . . . . . . . . . . 76
Configuring Ethernet OAM Connectivity Fault Management (CLI Procedure) . . . 79
Creating the Maintenance Domain . . . . . . . . . . . . . . . . . . . . . . . . . . . . . . . . . . 79
Configuring the Maintenance Domain MIP Half Function . . . . . . . . . . . . . . . 80
Creating a Maintenance Association . . . . . . . . . . . . . . . . . . . . . . . . . . . . . . . . 80
Configuring the Continuity Check Protocol . . . . . . . . . . . . . . . . . . . . . . . . . . . 80
Configuring a Maintenance Association End Point . . . . . . . . . . . . . . . . . . . . . 81
Configuring a Connectivity Fault Management Action Profile . . . . . . . . . . . . 82
Configuring the Linktrace Protocol . . . . . . . . . . . . . . . . . . . . . . . . . . . . . . . . . . 82
Configuring Ethernet OAM Link Fault Management (CLI Procedure) . . . . . . . . . . 83
Copyright © 2016, Juniper Networks, Inc.iv
Network Management and Monitoring Feature Guide for EX2300, EX3400, and EX4300 Switches

Chapter 5 Configuring Uplink Failure Detection . . . . . . . . . . . . . . . . . . . . . . . . . . . . . . . . 85
Understanding Uplink Failure Detection . . . . . . . . . . . . . . . . . . . . . . . . . . . . . . . . . 85
Uplink Failure Detection Overview . . . . . . . . . . . . . . . . . . . . . . . . . . . . . . . . . . 85
Failure Detection Pair . . . . . . . . . . . . . . . . . . . . . . . . . . . . . . . . . . . . . . . . . . . . 86
Configuring Interfaces for Uplink Failure Detection (CLI Procedure) . . . . . . . . . . . 87
Verifying That Uplink Failure Detection Is Working Correctly . . . . . . . . . . . . . . . . . 88
Chapter 6 Configuring Network Analytics . . . . . . . . . . . . . . . . . . . . . . . . . . . . . . . . . . . . . 89
Network Analytics Overview . . . . . . . . . . . . . . . . . . . . . . . . . . . . . . . . . . . . . . . . . . 89
Analytics Feature Overview . . . . . . . . . . . . . . . . . . . . . . . . . . . . . . . . . . . . . . . 90
Network Analytics Enhancements Overview . . . . . . . . . . . . . . . . . . . . . . . . . . 91
Summary of CLI Changes . . . . . . . . . . . . . . . . . . . . . . . . . . . . . . . . . . . . . . . . . 92
Understanding Enhanced Network Analytics Streaming Data . . . . . . . . . . . . . . . 97
Google Protocol Buffer (GPB) . . . . . . . . . . . . . . . . . . . . . . . . . . . . . . . . . . . . . 97
JavaScript Object Notation (JSON) . . . . . . . . . . . . . . . . . . . . . . . . . . . . . . . . . 99
Comma-separated Values (CSV) . . . . . . . . . . . . . . . . . . . . . . . . . . . . . . . . . 100
Tab-separated Values (TSV) . . . . . . . . . . . . . . . . . . . . . . . . . . . . . . . . . . . . . 100
Queue Statistics Output for JSON, CSV, and TSV . . . . . . . . . . . . . . . . . . . . . 100
Traffic Statistics Output for JSON, CSV, and TSV . . . . . . . . . . . . . . . . . . . . . . 101
Understanding Enhanced Analytics Local File Output . . . . . . . . . . . . . . . . . . . . . 102
Prototype File for the Google Protocol Buffer Stream Format . . . . . . . . . . . . . . . 104
Example: Configuring Enhanced Network Analytics Features . . . . . . . . . . . . . . . 105
Configuring Queue Monitoring . . . . . . . . . . . . . . . . . . . . . . . . . . . . . . . . . . . . . . . . 115
Configuring Traffic Monitoring . . . . . . . . . . . . . . . . . . . . . . . . . . . . . . . . . . . . . . . . . 117
Configuring a Local File for Network Analytics Data . . . . . . . . . . . . . . . . . . . . . . . 118
Configuring a Remote Collector for Streaming Analytics Data . . . . . . . . . . . . . . . 119
Chapter 7 Configuring SNMP . . . . . . . . . . . . . . . . . . . . . . . . . . . . . . . . . . . . . . . . . . . . . . . . 121
Configuring SNMP (J-Web Procedure) . . . . . . . . . . . . . . . . . . . . . . . . . . . . . . . . . . 121
Configuring the Local Engine ID . . . . . . . . . . . . . . . . . . . . . . . . . . . . . . . . . . . . . . . 124
Chapter 8 Monitoring and Troubleshooting . . . . . . . . . . . . . . . . . . . . . . . . . . . . . . . . . . . . 127
Monitoring Hosts Using the J-Web Ping Host Tool . . . . . . . . . . . . . . . . . . . . . . . . 127
Monitoring Network Traffic Using Traceroute . . . . . . . . . . . . . . . . . . . . . . . . . . . . 129
Part 2 Configuration Statements
Chapter 9 Realtime Performance Monitoring . . . . . . . . . . . . . . . . . . . . . . . . . . . . . . . . . . 133
data-fill . . . . . . . . . . . . . . . . . . . . . . . . . . . . . . . . . . . . . . . . . . . . . . . . . . . . . . . . . . 134
data-size . . . . . . . . . . . . . . . . . . . . . . . . . . . . . . . . . . . . . . . . . . . . . . . . . . . . . . . . . 135
destination-port . . . . . . . . . . . . . . . . . . . . . . . . . . . . . . . . . . . . . . . . . . . . . . . . . . . 136
dscp-code-point . . . . . . . . . . . . . . . . . . . . . . . . . . . . . . . . . . . . . . . . . . . . . . . . . . . 137
hardware-timestamp . . . . . . . . . . . . . . . . . . . . . . . . . . . . . . . . . . . . . . . . . . . . . . . 138
history-size . . . . . . . . . . . . . . . . . . . . . . . . . . . . . . . . . . . . . . . . . . . . . . . . . . . . . . . 139
moving-average-size . . . . . . . . . . . . . . . . . . . . . . . . . . . . . . . . . . . . . . . . . . . . . . . 140
one-way-hardware-timestamp . . . . . . . . . . . . . . . . . . . . . . . . . . . . . . . . . . . . . . . 140
port (RPM) . . . . . . . . . . . . . . . . . . . . . . . . . . . . . . . . . . . . . . . . . . . . . . . . . . . . . . . . 141
probe . . . . . . . . . . . . . . . . . . . . . . . . . . . . . . . . . . . . . . . . . . . . . . . . . . . . . . . . . . . . 142
probe-count . . . . . . . . . . . . . . . . . . . . . . . . . . . . . . . . . . . . . . . . . . . . . . . . . . . . . . 143
probe-interval . . . . . . . . . . . . . . . . . . . . . . . . . . . . . . . . . . . . . . . . . . . . . . . . . . . . . 144
vCopyright © 2016, Juniper Networks, Inc.
Table of Contents

probe-limit . . . . . . . . . . . . . . . . . . . . . . . . . . . . . . . . . . . . . . . . . . . . . . . . . . . . . . . 145
probe-server . . . . . . . . . . . . . . . . . . . . . . . . . . . . . . . . . . . . . . . . . . . . . . . . . . . . . . 146
probe-type . . . . . . . . . . . . . . . . . . . . . . . . . . . . . . . . . . . . . . . . . . . . . . . . . . . . . . . . 147
routing-instance . . . . . . . . . . . . . . . . . . . . . . . . . . . . . . . . . . . . . . . . . . . . . . . . . . . 148
routing-instances . . . . . . . . . . . . . . . . . . . . . . . . . . . . . . . . . . . . . . . . . . . . . . . . . . 149
rpm (Interfaces) . . . . . . . . . . . . . . . . . . . . . . . . . . . . . . . . . . . . . . . . . . . . . . . . . . . 150
source-address (Services) . . . . . . . . . . . . . . . . . . . . . . . . . . . . . . . . . . . . . . . . . . . 151
tcp . . . . . . . . . . . . . . . . . . . . . . . . . . . . . . . . . . . . . . . . . . . . . . . . . . . . . . . . . . . . . . 152
test . . . . . . . . . . . . . . . . . . . . . . . . . . . . . . . . . . . . . . . . . . . . . . . . . . . . . . . . . . . . . . 153
test-interval . . . . . . . . . . . . . . . . . . . . . . . . . . . . . . . . . . . . . . . . . . . . . . . . . . . . . . 154
thresholds . . . . . . . . . . . . . . . . . . . . . . . . . . . . . . . . . . . . . . . . . . . . . . . . . . . . . . . . 155
traps . . . . . . . . . . . . . . . . . . . . . . . . . . . . . . . . . . . . . . . . . . . . . . . . . . . . . . . . . . . . . 157
udp . . . . . . . . . . . . . . . . . . . . . . . . . . . . . . . . . . . . . . . . . . . . . . . . . . . . . . . . . . . . . 158
Chapter 10 Analyzers and Port Mirroring . . . . . . . . . . . . . . . . . . . . . . . . . . . . . . . . . . . . . . . 159
egress . . . . . . . . . . . . . . . . . . . . . . . . . . . . . . . . . . . . . . . . . . . . . . . . . . . . . . . . . . . 159
egress (Analyzer) . . . . . . . . . . . . . . . . . . . . . . . . . . . . . . . . . . . . . . . . . . . . . . . . . . 160
ingress (vlans) . . . . . . . . . . . . . . . . . . . . . . . . . . . . . . . . . . . . . . . . . . . . . . . . . . . . 160
ingress (Analyzer) . . . . . . . . . . . . . . . . . . . . . . . . . . . . . . . . . . . . . . . . . . . . . . . . . . 161
input (Analyzer) . . . . . . . . . . . . . . . . . . . . . . . . . . . . . . . . . . . . . . . . . . . . . . . . . . . 162
interface (Analyzer) . . . . . . . . . . . . . . . . . . . . . . . . . . . . . . . . . . . . . . . . . . . . . . . . 163
no-tag . . . . . . . . . . . . . . . . . . . . . . . . . . . . . . . . . . . . . . . . . . . . . . . . . . . . . . . . . . . 164
output (Mirroring) . . . . . . . . . . . . . . . . . . . . . . . . . . . . . . . . . . . . . . . . . . . . . . . . . . 165
vlan (Mirroring) . . . . . . . . . . . . . . . . . . . . . . . . . . . . . . . . . . . . . . . . . . . . . . . . . . . . 166
Chapter 11 sFlow Monitoring Technology . . . . . . . . . . . . . . . . . . . . . . . . . . . . . . . . . . . . . . 167
agent-id . . . . . . . . . . . . . . . . . . . . . . . . . . . . . . . . . . . . . . . . . . . . . . . . . . . . . . . . . . 167
collector . . . . . . . . . . . . . . . . . . . . . . . . . . . . . . . . . . . . . . . . . . . . . . . . . . . . . . . . . 168
disable (sFlow Monitoring Technology) . . . . . . . . . . . . . . . . . . . . . . . . . . . . . . . . 168
interfaces (sFlow Monitoring Technology) . . . . . . . . . . . . . . . . . . . . . . . . . . . . . . 169
polling-interval . . . . . . . . . . . . . . . . . . . . . . . . . . . . . . . . . . . . . . . . . . . . . . . . . . . . 170
sample-rate . . . . . . . . . . . . . . . . . . . . . . . . . . . . . . . . . . . . . . . . . . . . . . . . . . . . . . . 171
sflow . . . . . . . . . . . . . . . . . . . . . . . . . . . . . . . . . . . . . . . . . . . . . . . . . . . . . . . . . . . . 172
source-ip . . . . . . . . . . . . . . . . . . . . . . . . . . . . . . . . . . . . . . . . . . . . . . . . . . . . . . . . . 173
udp-port . . . . . . . . . . . . . . . . . . . . . . . . . . . . . . . . . . . . . . . . . . . . . . . . . . . . . . . . . 173
Chapter 12 Ethernet OAM Link Fault Management and Connectivity FaultManagement . . . . . . . . . . . . . . . . . . . . . . . . . . . . . . . . . . . . . . . . . . . . . . . . . . . . 175
action-profile (Applying to OAM CFM, for EX Series Switch Only) . . . . . . . . . . . . 177
age (EX Series Switch Only) . . . . . . . . . . . . . . . . . . . . . . . . . . . . . . . . . . . . . . . . . . 178
auto-discovery (EX Series Switch Only) . . . . . . . . . . . . . . . . . . . . . . . . . . . . . . . . 178
calculation-weight . . . . . . . . . . . . . . . . . . . . . . . . . . . . . . . . . . . . . . . . . . . . . . . . . 179
connectivity-fault-management (EX Series Switch Only) . . . . . . . . . . . . . . . . . . 180
continuity-check (EX Series Switch Only) . . . . . . . . . . . . . . . . . . . . . . . . . . . . . . . 181
cycle-time . . . . . . . . . . . . . . . . . . . . . . . . . . . . . . . . . . . . . . . . . . . . . . . . . . . . . . . . 182
delay . . . . . . . . . . . . . . . . . . . . . . . . . . . . . . . . . . . . . . . . . . . . . . . . . . . . . . . . . . . . 183
delay-variation . . . . . . . . . . . . . . . . . . . . . . . . . . . . . . . . . . . . . . . . . . . . . . . . . . . . 184
direction (EX Series Switch Only) . . . . . . . . . . . . . . . . . . . . . . . . . . . . . . . . . . . . . 185
hold-interval (OAM CFM, for EX Series Switch Only) . . . . . . . . . . . . . . . . . . . . . . 185
interface (OAM CFM, for EX Series Switch Only) . . . . . . . . . . . . . . . . . . . . . . . . . 186
Copyright © 2016, Juniper Networks, Inc.vi
Network Management and Monitoring Feature Guide for EX2300, EX3400, and EX4300 Switches

interval (EX Series Switch Only) . . . . . . . . . . . . . . . . . . . . . . . . . . . . . . . . . . . . . . . 187
iteration-period . . . . . . . . . . . . . . . . . . . . . . . . . . . . . . . . . . . . . . . . . . . . . . . . . . . . 188
level (EX Series Switch Only) . . . . . . . . . . . . . . . . . . . . . . . . . . . . . . . . . . . . . . . . . 188
linktrace (EX Series Switch Only) . . . . . . . . . . . . . . . . . . . . . . . . . . . . . . . . . . . . . 189
loss-threshold (EX Series Switch Only) . . . . . . . . . . . . . . . . . . . . . . . . . . . . . . . . 189
maintenance-association (EX Series Switch Only) . . . . . . . . . . . . . . . . . . . . . . . 190
maintenance-domain (EX Series Switch Only) . . . . . . . . . . . . . . . . . . . . . . . . . . . 191
measurement-type (OAM LFM) . . . . . . . . . . . . . . . . . . . . . . . . . . . . . . . . . . . . . . 192
mep (EX Series Switch Only) . . . . . . . . . . . . . . . . . . . . . . . . . . . . . . . . . . . . . . . . . 193
mip-half-function (EX Series Switch Only) . . . . . . . . . . . . . . . . . . . . . . . . . . . . . . 194
name-format (EX Series Switch Only) . . . . . . . . . . . . . . . . . . . . . . . . . . . . . . . . . 195
path-database-size (EX Series Switch Only) . . . . . . . . . . . . . . . . . . . . . . . . . . . . 195
performance-monitoring (OAM LFM) . . . . . . . . . . . . . . . . . . . . . . . . . . . . . . . . . . 196
remote-mep (EX Series Switch Only) . . . . . . . . . . . . . . . . . . . . . . . . . . . . . . . . . . 197
sla-iterator-profiles (OAM LFM) . . . . . . . . . . . . . . . . . . . . . . . . . . . . . . . . . . . . . . 198
action (OAM LFM) . . . . . . . . . . . . . . . . . . . . . . . . . . . . . . . . . . . . . . . . . . . . . . . . . 198
action-profile . . . . . . . . . . . . . . . . . . . . . . . . . . . . . . . . . . . . . . . . . . . . . . . . . . . . . 199
allow-remote-loopback . . . . . . . . . . . . . . . . . . . . . . . . . . . . . . . . . . . . . . . . . . . . 200
ethernet (OAM LFM) . . . . . . . . . . . . . . . . . . . . . . . . . . . . . . . . . . . . . . . . . . . . . . . 201
event (OAM LFM) . . . . . . . . . . . . . . . . . . . . . . . . . . . . . . . . . . . . . . . . . . . . . . . . . 204
event-thresholds . . . . . . . . . . . . . . . . . . . . . . . . . . . . . . . . . . . . . . . . . . . . . . . . . . 204
frame-error . . . . . . . . . . . . . . . . . . . . . . . . . . . . . . . . . . . . . . . . . . . . . . . . . . . . . . . 205
frame-period . . . . . . . . . . . . . . . . . . . . . . . . . . . . . . . . . . . . . . . . . . . . . . . . . . . . . 205
frame-period-summary . . . . . . . . . . . . . . . . . . . . . . . . . . . . . . . . . . . . . . . . . . . . 206
interface (OAM LFM) . . . . . . . . . . . . . . . . . . . . . . . . . . . . . . . . . . . . . . . . . . . . . . . 207
link-adjacency-loss . . . . . . . . . . . . . . . . . . . . . . . . . . . . . . . . . . . . . . . . . . . . . . . . 208
link-discovery . . . . . . . . . . . . . . . . . . . . . . . . . . . . . . . . . . . . . . . . . . . . . . . . . . . . . 208
link-down . . . . . . . . . . . . . . . . . . . . . . . . . . . . . . . . . . . . . . . . . . . . . . . . . . . . . . . . 209
link-event-rate . . . . . . . . . . . . . . . . . . . . . . . . . . . . . . . . . . . . . . . . . . . . . . . . . . . . 209
link-fault-management . . . . . . . . . . . . . . . . . . . . . . . . . . . . . . . . . . . . . . . . . . . . . 210
negotiation-options . . . . . . . . . . . . . . . . . . . . . . . . . . . . . . . . . . . . . . . . . . . . . . . . . 211
no-allow-link-events . . . . . . . . . . . . . . . . . . . . . . . . . . . . . . . . . . . . . . . . . . . . . . . . 211
oam . . . . . . . . . . . . . . . . . . . . . . . . . . . . . . . . . . . . . . . . . . . . . . . . . . . . . . . . . . . . . 212
pdu-interval . . . . . . . . . . . . . . . . . . . . . . . . . . . . . . . . . . . . . . . . . . . . . . . . . . . . . . . 214
pdu-threshold . . . . . . . . . . . . . . . . . . . . . . . . . . . . . . . . . . . . . . . . . . . . . . . . . . . . . 215
remote-loopback . . . . . . . . . . . . . . . . . . . . . . . . . . . . . . . . . . . . . . . . . . . . . . . . . . 215
symbol-period . . . . . . . . . . . . . . . . . . . . . . . . . . . . . . . . . . . . . . . . . . . . . . . . . . . . . 216
syslog (OAM LFM) . . . . . . . . . . . . . . . . . . . . . . . . . . . . . . . . . . . . . . . . . . . . . . . . . 216
Chapter 13 Uplink Failure Detection . . . . . . . . . . . . . . . . . . . . . . . . . . . . . . . . . . . . . . . . . . . 217
action (Uplink Failure Detection) . . . . . . . . . . . . . . . . . . . . . . . . . . . . . . . . . . . . . . 217
group (Uplink Failure Detection) . . . . . . . . . . . . . . . . . . . . . . . . . . . . . . . . . . . . . . 218
link-to-disable . . . . . . . . . . . . . . . . . . . . . . . . . . . . . . . . . . . . . . . . . . . . . . . . . . . . . 218
link-to-monitor . . . . . . . . . . . . . . . . . . . . . . . . . . . . . . . . . . . . . . . . . . . . . . . . . . . . 219
traceoptions (Uplink Failure Detection) . . . . . . . . . . . . . . . . . . . . . . . . . . . . . . . . 220
uplink-failure-detection . . . . . . . . . . . . . . . . . . . . . . . . . . . . . . . . . . . . . . . . . . . . . 221
Chapter 14 Network Analytics . . . . . . . . . . . . . . . . . . . . . . . . . . . . . . . . . . . . . . . . . . . . . . . . 223
address (Analytics Collector) . . . . . . . . . . . . . . . . . . . . . . . . . . . . . . . . . . . . . . . . 224
analytics . . . . . . . . . . . . . . . . . . . . . . . . . . . . . . . . . . . . . . . . . . . . . . . . . . . . . . . . . 225
viiCopyright © 2016, Juniper Networks, Inc.
Table of Contents

collector (Analytics) . . . . . . . . . . . . . . . . . . . . . . . . . . . . . . . . . . . . . . . . . . . . . . . . 229
depth-threshold . . . . . . . . . . . . . . . . . . . . . . . . . . . . . . . . . . . . . . . . . . . . . . . . . . . 230
export-profiles . . . . . . . . . . . . . . . . . . . . . . . . . . . . . . . . . . . . . . . . . . . . . . . . . . . . . 231
file (Analytics) . . . . . . . . . . . . . . . . . . . . . . . . . . . . . . . . . . . . . . . . . . . . . . . . . . . . 233
interface (Export Profiles) . . . . . . . . . . . . . . . . . . . . . . . . . . . . . . . . . . . . . . . . . . . 235
interfaces (Analytics Resource) . . . . . . . . . . . . . . . . . . . . . . . . . . . . . . . . . . . . . . 236
latency-threshold . . . . . . . . . . . . . . . . . . . . . . . . . . . . . . . . . . . . . . . . . . . . . . . . . . 237
local (Analytics Collector) . . . . . . . . . . . . . . . . . . . . . . . . . . . . . . . . . . . . . . . . . . . 238
resource (Analytics) . . . . . . . . . . . . . . . . . . . . . . . . . . . . . . . . . . . . . . . . . . . . . . . . 239
resource-profiles (Analytics) . . . . . . . . . . . . . . . . . . . . . . . . . . . . . . . . . . . . . . . . . 240
system (Analytics Resource) . . . . . . . . . . . . . . . . . . . . . . . . . . . . . . . . . . . . . . . . . 241
system (Export Profiles) . . . . . . . . . . . . . . . . . . . . . . . . . . . . . . . . . . . . . . . . . . . . 242
traceoptions (Analytics) . . . . . . . . . . . . . . . . . . . . . . . . . . . . . . . . . . . . . . . . . . . . 243
Chapter 15 SNMP . . . . . . . . . . . . . . . . . . . . . . . . . . . . . . . . . . . . . . . . . . . . . . . . . . . . . . . . . . 245
address . . . . . . . . . . . . . . . . . . . . . . . . . . . . . . . . . . . . . . . . . . . . . . . . . . . . . . . . . . 248
address-mask . . . . . . . . . . . . . . . . . . . . . . . . . . . . . . . . . . . . . . . . . . . . . . . . . . . . 248
agent-address . . . . . . . . . . . . . . . . . . . . . . . . . . . . . . . . . . . . . . . . . . . . . . . . . . . . 249
alarm (SNMP RMON) . . . . . . . . . . . . . . . . . . . . . . . . . . . . . . . . . . . . . . . . . . . . . . 250
authorization . . . . . . . . . . . . . . . . . . . . . . . . . . . . . . . . . . . . . . . . . . . . . . . . . . . . . . 251
bucket-size . . . . . . . . . . . . . . . . . . . . . . . . . . . . . . . . . . . . . . . . . . . . . . . . . . . . . . . 251
categories . . . . . . . . . . . . . . . . . . . . . . . . . . . . . . . . . . . . . . . . . . . . . . . . . . . . . . . . 252
client-list . . . . . . . . . . . . . . . . . . . . . . . . . . . . . . . . . . . . . . . . . . . . . . . . . . . . . . . . . 252
client-list-name . . . . . . . . . . . . . . . . . . . . . . . . . . . . . . . . . . . . . . . . . . . . . . . . . . . 253
clients . . . . . . . . . . . . . . . . . . . . . . . . . . . . . . . . . . . . . . . . . . . . . . . . . . . . . . . . . . . 253
commit-delay . . . . . . . . . . . . . . . . . . . . . . . . . . . . . . . . . . . . . . . . . . . . . . . . . . . . . 254
community (SNMP) . . . . . . . . . . . . . . . . . . . . . . . . . . . . . . . . . . . . . . . . . . . . . . . . 255
community . . . . . . . . . . . . . . . . . . . . . . . . . . . . . . . . . . . . . . . . . . . . . . . . . . . . . . . 256
community-name . . . . . . . . . . . . . . . . . . . . . . . . . . . . . . . . . . . . . . . . . . . . . . . . . 257
contact (SNMP) . . . . . . . . . . . . . . . . . . . . . . . . . . . . . . . . . . . . . . . . . . . . . . . . . . . 258
description . . . . . . . . . . . . . . . . . . . . . . . . . . . . . . . . . . . . . . . . . . . . . . . . . . . . . . . 258
description . . . . . . . . . . . . . . . . . . . . . . . . . . . . . . . . . . . . . . . . . . . . . . . . . . . . . . . 259
destination-port . . . . . . . . . . . . . . . . . . . . . . . . . . . . . . . . . . . . . . . . . . . . . . . . . . . 259
engine-id . . . . . . . . . . . . . . . . . . . . . . . . . . . . . . . . . . . . . . . . . . . . . . . . . . . . . . . . 260
event . . . . . . . . . . . . . . . . . . . . . . . . . . . . . . . . . . . . . . . . . . . . . . . . . . . . . . . . . . . . 261
falling-event-index . . . . . . . . . . . . . . . . . . . . . . . . . . . . . . . . . . . . . . . . . . . . . . . . . 261
falling-threshold . . . . . . . . . . . . . . . . . . . . . . . . . . . . . . . . . . . . . . . . . . . . . . . . . . . 262
falling-threshold . . . . . . . . . . . . . . . . . . . . . . . . . . . . . . . . . . . . . . . . . . . . . . . . . . . 263
falling-threshold-interval . . . . . . . . . . . . . . . . . . . . . . . . . . . . . . . . . . . . . . . . . . . 264
filter-duplicates . . . . . . . . . . . . . . . . . . . . . . . . . . . . . . . . . . . . . . . . . . . . . . . . . . . 264
filter-interfaces . . . . . . . . . . . . . . . . . . . . . . . . . . . . . . . . . . . . . . . . . . . . . . . . . . . . 265
group (Configuring Group Name) . . . . . . . . . . . . . . . . . . . . . . . . . . . . . . . . . . . . . 266
group (Defining Access Privileges for an SNMPv3 Group) . . . . . . . . . . . . . . . . . . 267
health-monitor . . . . . . . . . . . . . . . . . . . . . . . . . . . . . . . . . . . . . . . . . . . . . . . . . . . . 267
history . . . . . . . . . . . . . . . . . . . . . . . . . . . . . . . . . . . . . . . . . . . . . . . . . . . . . . . . . . . 268
interface (SNMP RMON History) . . . . . . . . . . . . . . . . . . . . . . . . . . . . . . . . . . . . . 269
interface (SNMP) . . . . . . . . . . . . . . . . . . . . . . . . . . . . . . . . . . . . . . . . . . . . . . . . . . 269
interval . . . . . . . . . . . . . . . . . . . . . . . . . . . . . . . . . . . . . . . . . . . . . . . . . . . . . . . . . . 270
interval . . . . . . . . . . . . . . . . . . . . . . . . . . . . . . . . . . . . . . . . . . . . . . . . . . . . . . . . . . 270
Copyright © 2016, Juniper Networks, Inc.viii
Network Management and Monitoring Feature Guide for EX2300, EX3400, and EX4300 Switches

interval . . . . . . . . . . . . . . . . . . . . . . . . . . . . . . . . . . . . . . . . . . . . . . . . . . . . . . . . . . . 271
location (SNMP) . . . . . . . . . . . . . . . . . . . . . . . . . . . . . . . . . . . . . . . . . . . . . . . . . . . 271
logical-system . . . . . . . . . . . . . . . . . . . . . . . . . . . . . . . . . . . . . . . . . . . . . . . . . . . . 272
message-processing-model . . . . . . . . . . . . . . . . . . . . . . . . . . . . . . . . . . . . . . . . . 273
name . . . . . . . . . . . . . . . . . . . . . . . . . . . . . . . . . . . . . . . . . . . . . . . . . . . . . . . . . . . . 273
nonvolatile . . . . . . . . . . . . . . . . . . . . . . . . . . . . . . . . . . . . . . . . . . . . . . . . . . . . . . . 274
notify . . . . . . . . . . . . . . . . . . . . . . . . . . . . . . . . . . . . . . . . . . . . . . . . . . . . . . . . . . . . 275
notify-filter (Applying to the Management Target) . . . . . . . . . . . . . . . . . . . . . . . 276
notify-filter (Configuring the Profile Name) . . . . . . . . . . . . . . . . . . . . . . . . . . . . . 276
notify-view . . . . . . . . . . . . . . . . . . . . . . . . . . . . . . . . . . . . . . . . . . . . . . . . . . . . . . . 277
oid . . . . . . . . . . . . . . . . . . . . . . . . . . . . . . . . . . . . . . . . . . . . . . . . . . . . . . . . . . . . . . 277
oid . . . . . . . . . . . . . . . . . . . . . . . . . . . . . . . . . . . . . . . . . . . . . . . . . . . . . . . . . . . . . . 278
owner . . . . . . . . . . . . . . . . . . . . . . . . . . . . . . . . . . . . . . . . . . . . . . . . . . . . . . . . . . . 278
parameters . . . . . . . . . . . . . . . . . . . . . . . . . . . . . . . . . . . . . . . . . . . . . . . . . . . . . . . 279
port . . . . . . . . . . . . . . . . . . . . . . . . . . . . . . . . . . . . . . . . . . . . . . . . . . . . . . . . . . . . . 279
read-view . . . . . . . . . . . . . . . . . . . . . . . . . . . . . . . . . . . . . . . . . . . . . . . . . . . . . . . . 280
request-type . . . . . . . . . . . . . . . . . . . . . . . . . . . . . . . . . . . . . . . . . . . . . . . . . . . . . . 281
rising-event-index . . . . . . . . . . . . . . . . . . . . . . . . . . . . . . . . . . . . . . . . . . . . . . . . . 282
rising-threshold . . . . . . . . . . . . . . . . . . . . . . . . . . . . . . . . . . . . . . . . . . . . . . . . . . . 283
rising-threshold . . . . . . . . . . . . . . . . . . . . . . . . . . . . . . . . . . . . . . . . . . . . . . . . . . . 284
rmon . . . . . . . . . . . . . . . . . . . . . . . . . . . . . . . . . . . . . . . . . . . . . . . . . . . . . . . . . . . . 284
rmon . . . . . . . . . . . . . . . . . . . . . . . . . . . . . . . . . . . . . . . . . . . . . . . . . . . . . . . . . . . . 285
routing-instance . . . . . . . . . . . . . . . . . . . . . . . . . . . . . . . . . . . . . . . . . . . . . . . . . . 286
routing-instance . . . . . . . . . . . . . . . . . . . . . . . . . . . . . . . . . . . . . . . . . . . . . . . . . . . 287
sample-type . . . . . . . . . . . . . . . . . . . . . . . . . . . . . . . . . . . . . . . . . . . . . . . . . . . . . . 287
security-level (Defining Access Privileges) . . . . . . . . . . . . . . . . . . . . . . . . . . . . . . 288
security-level (Generating SNMP Notifications) . . . . . . . . . . . . . . . . . . . . . . . . . 289
security-model (Access Privileges) . . . . . . . . . . . . . . . . . . . . . . . . . . . . . . . . . . . 290
security-model (Group) . . . . . . . . . . . . . . . . . . . . . . . . . . . . . . . . . . . . . . . . . . . . . 291
security-model (SNMP Notifications) . . . . . . . . . . . . . . . . . . . . . . . . . . . . . . . . . . 291
security-name (Security Group) . . . . . . . . . . . . . . . . . . . . . . . . . . . . . . . . . . . . . . 292
security-name (Community String) . . . . . . . . . . . . . . . . . . . . . . . . . . . . . . . . . . . 293
security-name (SNMP Notifications) . . . . . . . . . . . . . . . . . . . . . . . . . . . . . . . . . . 294
security-to-group . . . . . . . . . . . . . . . . . . . . . . . . . . . . . . . . . . . . . . . . . . . . . . . . . . 295
snmp . . . . . . . . . . . . . . . . . . . . . . . . . . . . . . . . . . . . . . . . . . . . . . . . . . . . . . . . . . . . 295
snmp . . . . . . . . . . . . . . . . . . . . . . . . . . . . . . . . . . . . . . . . . . . . . . . . . . . . . . . . . . . 296
snmp-community . . . . . . . . . . . . . . . . . . . . . . . . . . . . . . . . . . . . . . . . . . . . . . . . . 296
source-address . . . . . . . . . . . . . . . . . . . . . . . . . . . . . . . . . . . . . . . . . . . . . . . . . . . . 297
startup-alarm . . . . . . . . . . . . . . . . . . . . . . . . . . . . . . . . . . . . . . . . . . . . . . . . . . . . 298
syslog-subtag . . . . . . . . . . . . . . . . . . . . . . . . . . . . . . . . . . . . . . . . . . . . . . . . . . . . 298
tag . . . . . . . . . . . . . . . . . . . . . . . . . . . . . . . . . . . . . . . . . . . . . . . . . . . . . . . . . . . . . 299
tag-list . . . . . . . . . . . . . . . . . . . . . . . . . . . . . . . . . . . . . . . . . . . . . . . . . . . . . . . . . . 299
target-address . . . . . . . . . . . . . . . . . . . . . . . . . . . . . . . . . . . . . . . . . . . . . . . . . . . . 300
target-parameters . . . . . . . . . . . . . . . . . . . . . . . . . . . . . . . . . . . . . . . . . . . . . . . . . 301
targets . . . . . . . . . . . . . . . . . . . . . . . . . . . . . . . . . . . . . . . . . . . . . . . . . . . . . . . . . . 302
traceoptions (SNMP) . . . . . . . . . . . . . . . . . . . . . . . . . . . . . . . . . . . . . . . . . . . . . . 303
trap-group . . . . . . . . . . . . . . . . . . . . . . . . . . . . . . . . . . . . . . . . . . . . . . . . . . . . . . . 305
trap-options . . . . . . . . . . . . . . . . . . . . . . . . . . . . . . . . . . . . . . . . . . . . . . . . . . . . . . 306
type . . . . . . . . . . . . . . . . . . . . . . . . . . . . . . . . . . . . . . . . . . . . . . . . . . . . . . . . . . . . . 307
ixCopyright © 2016, Juniper Networks, Inc.
Table of Contents

type . . . . . . . . . . . . . . . . . . . . . . . . . . . . . . . . . . . . . . . . . . . . . . . . . . . . . . . . . . . . 308
v3 . . . . . . . . . . . . . . . . . . . . . . . . . . . . . . . . . . . . . . . . . . . . . . . . . . . . . . . . . . . . . . 309
vacm . . . . . . . . . . . . . . . . . . . . . . . . . . . . . . . . . . . . . . . . . . . . . . . . . . . . . . . . . . . . . 311
variable . . . . . . . . . . . . . . . . . . . . . . . . . . . . . . . . . . . . . . . . . . . . . . . . . . . . . . . . . . 312
version (SNMP) . . . . . . . . . . . . . . . . . . . . . . . . . . . . . . . . . . . . . . . . . . . . . . . . . . . . 312
view (Associating a MIB View with a Community) . . . . . . . . . . . . . . . . . . . . . . . . 313
view (Configuring a MIB View) . . . . . . . . . . . . . . . . . . . . . . . . . . . . . . . . . . . . . . . . 314
write-view . . . . . . . . . . . . . . . . . . . . . . . . . . . . . . . . . . . . . . . . . . . . . . . . . . . . . . . . 315
Part 3 Operational Commands
Chapter 16 Realtime Performance Monitoring . . . . . . . . . . . . . . . . . . . . . . . . . . . . . . . . . . 319
show services rpm active-servers . . . . . . . . . . . . . . . . . . . . . . . . . . . . . . . . . . . . . 320
show services rpm history-results . . . . . . . . . . . . . . . . . . . . . . . . . . . . . . . . . . . . . 321
show services rpm probe-results . . . . . . . . . . . . . . . . . . . . . . . . . . . . . . . . . . . . . 324
Chapter 17 General Commands . . . . . . . . . . . . . . . . . . . . . . . . . . . . . . . . . . . . . . . . . . . . . . 331
monitor traffic . . . . . . . . . . . . . . . . . . . . . . . . . . . . . . . . . . . . . . . . . . . . . . . . . . . . . 332
ping . . . . . . . . . . . . . . . . . . . . . . . . . . . . . . . . . . . . . . . . . . . . . . . . . . . . . . . . . . . . . 344
show pfe statistics bridge . . . . . . . . . . . . . . . . . . . . . . . . . . . . . . . . . . . . . . . . . . . 348
traceroute . . . . . . . . . . . . . . . . . . . . . . . . . . . . . . . . . . . . . . . . . . . . . . . . . . . . . . . . 353
Chapter 18 Analyzers and Port Mirroring . . . . . . . . . . . . . . . . . . . . . . . . . . . . . . . . . . . . . . . 357
show analyzer . . . . . . . . . . . . . . . . . . . . . . . . . . . . . . . . . . . . . . . . . . . . . . . . . . . . 358
Chapter 19 sFlow Monitoring Technology . . . . . . . . . . . . . . . . . . . . . . . . . . . . . . . . . . . . . . 361
show sflow . . . . . . . . . . . . . . . . . . . . . . . . . . . . . . . . . . . . . . . . . . . . . . . . . . . . . . . 362
show sflow interface . . . . . . . . . . . . . . . . . . . . . . . . . . . . . . . . . . . . . . . . . . . . . . . 364
show sflow collector . . . . . . . . . . . . . . . . . . . . . . . . . . . . . . . . . . . . . . . . . . . . . . . 366
clear sflow collectors statistics . . . . . . . . . . . . . . . . . . . . . . . . . . . . . . . . . . . . . . . 367
Chapter 20 Ethernet OAM Connectivity Fault Management . . . . . . . . . . . . . . . . . . . . . . 369
clear oam ethernet connectivity-fault-management delay-statistics . . . . . . . . 370
clear oam ethernet connectivity-fault-management sla-iterator-statistics . . . . 372
clear oam ethernet connectivity-fault-management statistics . . . . . . . . . . . . . . 373
monitor ethernet delay-measurement . . . . . . . . . . . . . . . . . . . . . . . . . . . . . . . . . 374
show oam ethernet connectivity-fault-management delay-statistics . . . . . . . . 379
show oam ethernet connectivity-fault-management forwarding-state . . . . . . . 383
show oam ethernet connectivity-fault-management interfaces . . . . . . . . . . . . . 387
show oam ethernet connectivity-fault-management path-database . . . . . . . . 393
show oam ethernet connectivity-fault-management mep-database . . . . . . . . 396
show oam ethernet connectivity-fault-management mip . . . . . . . . . . . . . . . . . 402
show oam ethernet connectivity-fault-management sla-iterator-statistics . . . 403
Chapter 21 Ethernet OAM Link Fault Management . . . . . . . . . . . . . . . . . . . . . . . . . . . . . 409
show oam ethernet link-fault-management . . . . . . . . . . . . . . . . . . . . . . . . . . . . 410
Chapter 22 Uplink Failure Detection . . . . . . . . . . . . . . . . . . . . . . . . . . . . . . . . . . . . . . . . . . . 415
show uplink-failure-detection . . . . . . . . . . . . . . . . . . . . . . . . . . . . . . . . . . . . . . . . 416
Copyright © 2016, Juniper Networks, Inc.x
Network Management and Monitoring Feature Guide for EX2300, EX3400, and EX4300 Switches

Chapter 23 SNMP . . . . . . . . . . . . . . . . . . . . . . . . . . . . . . . . . . . . . . . . . . . . . . . . . . . . . . . . . . . 419
clear snmp rmon history . . . . . . . . . . . . . . . . . . . . . . . . . . . . . . . . . . . . . . . . . . . . 420
clear snmp statistics . . . . . . . . . . . . . . . . . . . . . . . . . . . . . . . . . . . . . . . . . . . . . . . . 421
request snmp spoof-trap . . . . . . . . . . . . . . . . . . . . . . . . . . . . . . . . . . . . . . . . . . . . 423
show snmp health-monitor . . . . . . . . . . . . . . . . . . . . . . . . . . . . . . . . . . . . . . . . . . 429
show snmp inform-statistics . . . . . . . . . . . . . . . . . . . . . . . . . . . . . . . . . . . . . . . . 436
show snmp mib . . . . . . . . . . . . . . . . . . . . . . . . . . . . . . . . . . . . . . . . . . . . . . . . . . . 438
show snmp rmon . . . . . . . . . . . . . . . . . . . . . . . . . . . . . . . . . . . . . . . . . . . . . . . . . . 441
show snmp rmon history . . . . . . . . . . . . . . . . . . . . . . . . . . . . . . . . . . . . . . . . . . . . 445
show snmp statistics . . . . . . . . . . . . . . . . . . . . . . . . . . . . . . . . . . . . . . . . . . . . . . . 449
show snmp v3 . . . . . . . . . . . . . . . . . . . . . . . . . . . . . . . . . . . . . . . . . . . . . . . . . . . . 457
xiCopyright © 2016, Juniper Networks, Inc.
Table of Contents

Copyright © 2016, Juniper Networks, Inc.xii
Network Management and Monitoring Feature Guide for EX2300, EX3400, and EX4300 Switches

List of Figures
Part 1 Network Management andMonitoring
Chapter 1 Configuring Real-Time Performance Monitoring . . . . . . . . . . . . . . . . . . . . . . . 3
Figure 1: RPM Timestamps . . . . . . . . . . . . . . . . . . . . . . . . . . . . . . . . . . . . . . . . . . . . . 6
Chapter 2 Configuring Analyzers and Port Mirroring . . . . . . . . . . . . . . . . . . . . . . . . . . . . . 17
Figure 2: Network Topology for Local Mirroring Example . . . . . . . . . . . . . . . . . . . . 25
Figure 3: Remote Mirroring Network Topology Example . . . . . . . . . . . . . . . . . . . . . 31
Figure 4: Remote Mirroring Through a Transit Switch Network–Sample
Topology . . . . . . . . . . . . . . . . . . . . . . . . . . . . . . . . . . . . . . . . . . . . . . . . . . . . . . . 41
Chapter 3 Configuring sFlow Monitoring Technology . . . . . . . . . . . . . . . . . . . . . . . . . . . . 57
Figure 5: sFlow Technology Monitoring System . . . . . . . . . . . . . . . . . . . . . . . . . . . . 61
Chapter 4 ConfiguringEthernetOAMLinkFaultManagementandConnectivityFaultManagement . . . . . . . . . . . . . . . . . . . . . . . . . . . . . . . . . . . . . . . . . . . . . . . . . . . . . 67
Figure 6: Relationship Among MEPs, MIPs, and Maintenance Domain Levels . . . 70
Chapter 5 Configuring Uplink Failure Detection . . . . . . . . . . . . . . . . . . . . . . . . . . . . . . . . 85
Figure 7: Uplink Failure Detection Configuration on Switches . . . . . . . . . . . . . . . . 86
xiiiCopyright © 2016, Juniper Networks, Inc.

Copyright © 2016, Juniper Networks, Inc.xiv
Network Management and Monitoring Feature Guide for EX2300, EX3400, and EX4300 Switches

List of Tables
About the Documentation . . . . . . . . . . . . . . . . . . . . . . . . . . . . . . . . . . . . . . . . . xvii
Table 1: Notice Icons . . . . . . . . . . . . . . . . . . . . . . . . . . . . . . . . . . . . . . . . . . . . . . . . . xix
Table 2: Text and Syntax Conventions . . . . . . . . . . . . . . . . . . . . . . . . . . . . . . . . . . xix
Part 1 Network Management andMonitoring
Chapter 1 Configuring Real-Time Performance Monitoring . . . . . . . . . . . . . . . . . . . . . . . 3
Table 3: RPMProbeOwner, ConcurrentProbes, andProbeServersConfiguration
Fields . . . . . . . . . . . . . . . . . . . . . . . . . . . . . . . . . . . . . . . . . . . . . . . . . . . . . . . . . . 9
Table 4: Performance Probe Tests Configuration Fields . . . . . . . . . . . . . . . . . . . . . 10
Chapter 2 Configuring Analyzers and Port Mirroring . . . . . . . . . . . . . . . . . . . . . . . . . . . . . 17
Table 5: Mirroring Terminologies . . . . . . . . . . . . . . . . . . . . . . . . . . . . . . . . . . . . . . . 19
Table 6: Configuration Guidelines for Port Mirroring and Analyzers on EX2300,
EX3400, and EX4300 Switches . . . . . . . . . . . . . . . . . . . . . . . . . . . . . . . . . . . . 21
Table 7: Port Mirroring Configuration Settings . . . . . . . . . . . . . . . . . . . . . . . . . . . . . 51
Chapter 6 Configuring Network Analytics . . . . . . . . . . . . . . . . . . . . . . . . . . . . . . . . . . . . . 89
Table 8: Network Analytics CLI Changes . . . . . . . . . . . . . . . . . . . . . . . . . . . . . . . . . 92
Table 9: GPB Stream Format Message Header Information . . . . . . . . . . . . . . . . . 97
Table 10: Streamed Queue Statistics Data Output Fields . . . . . . . . . . . . . . . . . . . 101
Table 11: Streamed Traffic Statistics Data Output Fields . . . . . . . . . . . . . . . . . . . . 101
Table 12: Output Fields for Queue Statistics in Local Analytics File . . . . . . . . . . . 103
Table 13: Output Fields for Traffic Statistics in Local Analytics File . . . . . . . . . . . 103
Chapter 7 Configuring SNMP . . . . . . . . . . . . . . . . . . . . . . . . . . . . . . . . . . . . . . . . . . . . . . . . 121
Table 14: SNMP Configuration Page . . . . . . . . . . . . . . . . . . . . . . . . . . . . . . . . . . . . 121
Chapter 8 Monitoring and Troubleshooting . . . . . . . . . . . . . . . . . . . . . . . . . . . . . . . . . . . . 127
Table 15: J-Web Ping Host Field Summary . . . . . . . . . . . . . . . . . . . . . . . . . . . . . . . 127
Table 16: Traceroute field summary . . . . . . . . . . . . . . . . . . . . . . . . . . . . . . . . . . . . 129
Part 3 Operational Commands
Chapter 16 Realtime Performance Monitoring . . . . . . . . . . . . . . . . . . . . . . . . . . . . . . . . . . 319
Table 17: show services rpm active-servers Output Fields . . . . . . . . . . . . . . . . . . 320
Table 18: show services rpm history-results Output Fields . . . . . . . . . . . . . . . . . . 321
Table 19: show services rpm probe-results Output Fields . . . . . . . . . . . . . . . . . . 324
Chapter 17 General Commands . . . . . . . . . . . . . . . . . . . . . . . . . . . . . . . . . . . . . . . . . . . . . . 331
Table 20: Match Conditions for the monitor traffic Command . . . . . . . . . . . . . . 334
Table 21: Logical Operators for the monitor traffic Command . . . . . . . . . . . . . . . 336
xvCopyright © 2016, Juniper Networks, Inc.

Table 22: Arithmetic and Relational Operators for the monitor traffic
Command . . . . . . . . . . . . . . . . . . . . . . . . . . . . . . . . . . . . . . . . . . . . . . . . . . . . 337
Table 23: show pfe statistics bridge Output Fields . . . . . . . . . . . . . . . . . . . . . . . . 348
Table 24: traceroute Output Fields . . . . . . . . . . . . . . . . . . . . . . . . . . . . . . . . . . . . 355
Chapter 18 Analyzers and Port Mirroring . . . . . . . . . . . . . . . . . . . . . . . . . . . . . . . . . . . . . . . 357
Table 25: show analyzer Output Fields . . . . . . . . . . . . . . . . . . . . . . . . . . . . . . . . . 358
Chapter 19 sFlow Monitoring Technology . . . . . . . . . . . . . . . . . . . . . . . . . . . . . . . . . . . . . . 361
Table 26: show sflow Output Fields . . . . . . . . . . . . . . . . . . . . . . . . . . . . . . . . . . . 362
Table 27: show sflow interface Output Fields . . . . . . . . . . . . . . . . . . . . . . . . . . . . 364
Table 28: show sflow collector Output Fields . . . . . . . . . . . . . . . . . . . . . . . . . . . 366
Chapter 20 Ethernet OAM Connectivity Fault Management . . . . . . . . . . . . . . . . . . . . . . 369
Table 29: monitor ethernet delay-measurement one-way Output Fields . . . . . . 376
Table 30: monitor ethernet delay-measurement two-way Output Fields . . . . . . 376
Table 31: show oam ethernet connectivity-fault-management delay-statistics
and mep-statistics Output Fields . . . . . . . . . . . . . . . . . . . . . . . . . . . . . . . . . 380
Table 32: showoamethernet connectivity-fault-management forwarding-state
Output Fields . . . . . . . . . . . . . . . . . . . . . . . . . . . . . . . . . . . . . . . . . . . . . . . . . 383
Table33: showoamethernet connectivity-fault-management interfacesOutput
Fields . . . . . . . . . . . . . . . . . . . . . . . . . . . . . . . . . . . . . . . . . . . . . . . . . . . . . . . . 387
Table 34: show oam ethernet connectivity-fault-management linktrace
path-database Output Fields . . . . . . . . . . . . . . . . . . . . . . . . . . . . . . . . . . . . . 393
Table 35: show oam ethernet connectivity-fault-management mep-database
Output Fields . . . . . . . . . . . . . . . . . . . . . . . . . . . . . . . . . . . . . . . . . . . . . . . . . 396
Table 36: show oam ethernet connectivity-fault-management mip Output
Fields . . . . . . . . . . . . . . . . . . . . . . . . . . . . . . . . . . . . . . . . . . . . . . . . . . . . . . . . 402
Table 37: show oam ethernet connectivity-fault-management
sla-iterator-statistics Output Fields . . . . . . . . . . . . . . . . . . . . . . . . . . . . . . . 403
Chapter 21 Ethernet OAM Link Fault Management . . . . . . . . . . . . . . . . . . . . . . . . . . . . . 409
Table 38: show oam ethernet link-fault-management Output Fields . . . . . . . . . 410
Chapter 22 Uplink Failure Detection . . . . . . . . . . . . . . . . . . . . . . . . . . . . . . . . . . . . . . . . . . . 415
Table 39: show uplink-failure-detection Output Fields . . . . . . . . . . . . . . . . . . . . 416
Chapter 23 SNMP . . . . . . . . . . . . . . . . . . . . . . . . . . . . . . . . . . . . . . . . . . . . . . . . . . . . . . . . . . . 419
Table 40: show snmp health-monitor Output Fields . . . . . . . . . . . . . . . . . . . . . . 429
Table 41: show snmp inform-statistics Output Fields . . . . . . . . . . . . . . . . . . . . . 436
Table 42: show snmp mib Output Fields . . . . . . . . . . . . . . . . . . . . . . . . . . . . . . . 439
Table 43: show snmp rmon Output Fields . . . . . . . . . . . . . . . . . . . . . . . . . . . . . . . 441
Table 44: show smp rmon history Output Fields . . . . . . . . . . . . . . . . . . . . . . . . . 445
Table 45: show snmp statistics Output Fields . . . . . . . . . . . . . . . . . . . . . . . . . . . 450
Table 46: show snmp statistics subagents Output Fields . . . . . . . . . . . . . . . . . . 453
Table 47: show snmp v3 Output Fields . . . . . . . . . . . . . . . . . . . . . . . . . . . . . . . . . 458
Copyright © 2016, Juniper Networks, Inc.xvi
Network Management and Monitoring Feature Guide for EX2300, EX3400, and EX4300 Switches

About the Documentation
• Documentation and Release Notes on page xvii
• Supported Platforms on page xvii
• Using the Examples in This Manual on page xvii
• Documentation Conventions on page xix
• Documentation Feedback on page xxi
• Requesting Technical Support on page xxi
Documentation and Release Notes
To obtain the most current version of all Juniper Networks®technical documentation,
see the product documentation page on the Juniper Networks website at
http://www.juniper.net/techpubs/.
If the information in the latest release notes differs from the information in the
documentation, follow the product Release Notes.
Juniper Networks Books publishes books by Juniper Networks engineers and subject
matter experts. These books go beyond the technical documentation to explore the
nuances of network architecture, deployment, and administration. The current list can
be viewed at http://www.juniper.net/books.
Supported Platforms
For the features described in this document, the following platforms are supported:
• EX Series
Using the Examples in This Manual
If you want to use the examples in this manual, you can use the loadmerge or the load
merge relative command. These commands cause the software to merge the incoming
configuration into the current candidate configuration. The example does not become
active until you commit the candidate configuration.
If the example configuration contains the top level of the hierarchy (or multiple
hierarchies), the example is a full example. In this case, use the loadmerge command.
xviiCopyright © 2016, Juniper Networks, Inc.

If the example configuration does not start at the top level of the hierarchy, the example
is a snippet. In this case, use the loadmerge relative command. These procedures are
described in the following sections.
Merging a Full Example
Tomerge a full example, follow these steps:
1. From the HTML or PDF version of the manual, copy a configuration example into a
text file, save the file with a name, and copy the file to a directory on your routing
platform.
For example, copy the following configuration toa file andname the file ex-script.conf.
Copy the ex-script.conf file to the /var/tmp directory on your routing platform.
system {scripts {commit {file ex-script.xsl;
}}
}interfaces {fxp0 {disable;unit 0 {family inet {address 10.0.0.1/24;
}}
}}
2. Merge the contents of the file into your routing platform configuration by issuing the
loadmerge configuration mode command:
[edit]user@host# loadmerge /var/tmp/ex-script.confload complete
Merging a Snippet
Tomerge a snippet, follow these steps:
1. From the HTML or PDF version of themanual, copy a configuration snippet into a text
file, save the file with a name, and copy the file to a directory on your routing platform.
For example, copy the following snippet to a file and name the file
ex-script-snippet.conf. Copy the ex-script-snippet.conf file to the /var/tmp directory
on your routing platform.
commit {file ex-script-snippet.xsl; }
2. Move to the hierarchy level that is relevant for this snippet by issuing the following
configuration mode command:
Copyright © 2016, Juniper Networks, Inc.xviii
Network Management and Monitoring Feature Guide for EX2300, EX3400, and EX4300 Switches

[edit]user@host# edit system scripts[edit system scripts]
3. Merge the contents of the file into your routing platform configuration by issuing the
loadmerge relative configuration mode command:
[edit system scripts]user@host# loadmerge relative /var/tmp/ex-script-snippet.confload complete
For more information about the load command, see CLI Explorer.
Documentation Conventions
Table 1 on page xix defines notice icons used in this guide.
Table 1: Notice Icons
DescriptionMeaningIcon
Indicates important features or instructions.Informational note
Indicates a situation that might result in loss of data or hardware damage.Caution
Alerts you to the risk of personal injury or death.Warning
Alerts you to the risk of personal injury from a laser.Laser warning
Indicates helpful information.Tip
Alerts you to a recommended use or implementation.Best practice
Table 2 on page xix defines the text and syntax conventions used in this guide.
Table 2: Text and Syntax Conventions
ExamplesDescriptionConvention
To enter configuration mode, type theconfigure command:
user@host> configure
Represents text that you type.Bold text like this
xixCopyright © 2016, Juniper Networks, Inc.
About the Documentation

Table 2: Text and Syntax Conventions (continued)
ExamplesDescriptionConvention
user@host> show chassis alarms
No alarms currently active
Represents output that appears on theterminal screen.
Fixed-width text like this
• A policy term is a named structurethat defines match conditions andactions.
• Junos OS CLI User Guide
• RFC 1997,BGPCommunities Attribute
• Introduces or emphasizes importantnew terms.
• Identifies guide names.
• Identifies RFC and Internet draft titles.
Italic text like this
Configure themachine’s domain name:
[edit]root@# set system domain-namedomain-name
Represents variables (options for whichyou substitute a value) in commands orconfiguration statements.
Italic text like this
• To configure a stub area, include thestub statement at the [edit protocolsospf area area-id] hierarchy level.
• Theconsoleport is labeledCONSOLE.
Represents names of configurationstatements, commands, files, anddirectories; configurationhierarchy levels;or labels on routing platformcomponents.
Text like this
stub <default-metricmetric>;Encloses optional keywords or variables.< > (angle brackets)
broadcast | multicast
(string1 | string2 | string3)
Indicates a choice between themutuallyexclusive keywords or variables on eitherside of the symbol. The set of choices isoften enclosed in parentheses for clarity.
| (pipe symbol)
rsvp { # Required for dynamicMPLS onlyIndicates a comment specified on thesame lineas theconfiguration statementto which it applies.
# (pound sign)
community namemembers [community-ids ]
Encloses a variable for which you cansubstitute one or more values.
[ ] (square brackets)
[edit]routing-options {static {route default {nexthop address;retain;
}}
}
Identifies a level in the configurationhierarchy.
Indention and braces ( { } )
Identifies a leaf statement at aconfiguration hierarchy level.
; (semicolon)
GUI Conventions
• In the Logical Interfaces box, selectAll Interfaces.
• To cancel the configuration, clickCancel.
Representsgraphicaluser interface(GUI)items you click or select.
Bold text like this
Copyright © 2016, Juniper Networks, Inc.xx
Network Management and Monitoring Feature Guide for EX2300, EX3400, and EX4300 Switches

Table 2: Text and Syntax Conventions (continued)
ExamplesDescriptionConvention
In the configuration editor hierarchy,select Protocols>Ospf.
Separates levels in a hierarchy of menuselections.
> (bold right angle bracket)
Documentation Feedback
We encourage you to provide feedback, comments, and suggestions so that we can
improve the documentation. You can provide feedback by using either of the following
methods:
• Online feedback rating system—On any page of the Juniper Networks TechLibrary site
athttp://www.juniper.net/techpubs/index.html, simply click the stars to rate thecontent,
and use the pop-up form to provide us with information about your experience.
Alternately, you can use the online feedback form at
http://www.juniper.net/techpubs/feedback/.
• E-mail—Sendyourcommentsto [email protected]. Includethedocument
or topic name, URL or page number, and software version (if applicable).
Requesting Technical Support
Technical product support is available through the JuniperNetworksTechnicalAssistance
Center (JTAC). If you are a customer with an active J-Care or Partner Support Service
support contract, or are covered under warranty, and need post-sales technical support,
you can access our tools and resources online or open a case with JTAC.
• JTAC policies—For a complete understanding of our JTAC procedures and policies,
review the JTAC User Guide located at
http://www.juniper.net/us/en/local/pdf/resource-guides/7100059-en.pdf.
• Product warranties—For product warranty information, visit
http://www.juniper.net/support/warranty/.
• JTAC hours of operation—The JTAC centers have resources available 24 hours a day,
7 days a week, 365 days a year.
Self-Help Online Tools and Resources
For quick and easy problem resolution, Juniper Networks has designed an online
self-service portal called the Customer Support Center (CSC) that provides youwith the
following features:
• Find CSC offerings: http://www.juniper.net/customers/support/
• Search for known bugs: http://www2.juniper.net/kb/
• Find product documentation: http://www.juniper.net/techpubs/
• Find solutions and answer questions using our Knowledge Base: http://kb.juniper.net/
xxiCopyright © 2016, Juniper Networks, Inc.
About the Documentation

• Download the latest versions of software and review release notes:
http://www.juniper.net/customers/csc/software/
• Search technical bulletins for relevant hardware and software notifications:
http://kb.juniper.net/InfoCenter/
• Join and participate in the Juniper Networks Community Forum:
http://www.juniper.net/company/communities/
• Open a case online in the CSC Case Management tool: http://www.juniper.net/cm/
Toverify serviceentitlementbyproduct serial number, useourSerialNumberEntitlement
(SNE) Tool: https://tools.juniper.net/SerialNumberEntitlementSearch/
Opening a Casewith JTAC
You can open a case with JTAC on theWeb or by telephone.
• Use the Case Management tool in the CSC at http://www.juniper.net/cm/.
• Call 1-888-314-JTAC (1-888-314-5822 toll-free in the USA, Canada, and Mexico).
For international or direct-dial options in countries without toll-free numbers, see
http://www.juniper.net/support/requesting-support.html.
Copyright © 2016, Juniper Networks, Inc.xxii
Network Management and Monitoring Feature Guide for EX2300, EX3400, and EX4300 Switches

PART 1
Network Management and Monitoring
• Configuring Real-Time Performance Monitoring on page 3
• Configuring Analyzers and Port Mirroring on page 17
• Configuring sFlowMonitoring Technology on page 57
• Configuring Ethernet OAM Link Fault Management and Connectivity Fault
Management on page 67
• Configuring Uplink Failure Detection on page 85
• Configuring Network Analytics on page 89
• Configuring SNMP on page 121
1Copyright © 2016, Juniper Networks, Inc.

Copyright © 2016, Juniper Networks, Inc.2
Network Management and Monitoring Feature Guide for EX2300, EX3400, and EX4300 Switches

CHAPTER 1
Configuring Real-Time PerformanceMonitoring
• Understanding Real-Time Performance Monitoring on EX Series Switches on page 4
• Configuring Real-Time Performance Monitoring (J-Web Procedure) on page 7
• Configuring the Interface for RPM Timestamping for Client/Server on an EX Series
Switch (CLI Procedure) on page 14
• Viewing Real-Time Performance Monitoring Information on page 16
3Copyright © 2016, Juniper Networks, Inc.

Understanding Real-Time PerformanceMonitoring on EX Series Switches
Real-time performancemonitoring (RPM) enables you to configure active probes to
track andmonitor traffic across the network and to investigate network problems. You
can use RPMwith Juniper Networks EX Series Ethernet Switches.
The ways in which you can use RPM include:
• Monitor time delays between devices.
• Monitor time delays at the protocol level.
• Set thresholds to trigger SNMP traps when values are exceeded.
You can configure thresholds for round-trip time, ingress or egress delay, standard
deviation, jitter, successive lost probes, and total lost probes per test. (SNMP trap
results are stored in pingResultsTable, jnxPingResultsTable, jnxPingProbeHistoryTable,
and pingProbeHistoryTable.)
• Determine automatically whether a path exists between a host router or switch and
its configured BGP neighbors. You can view the results of the discovery using an SNMP
client.
• Use the history of the most recent 50 probes to analyze trends in your network and
predict future needs.
RPMprovidesMIB support with extensions for RFC 2925,Definitions of ManagedObjects
for Remote Ping, Traceroute, and Lookup Operations.
This topic includes:
• RPM Packet Collection on page 4
• Tests and Probe Types on page 4
• Hardware Timestamps on page 5
• Limitations of RPM on EX Series Switches on page 7
RPMPacket Collection
Probescollect packetsperdestinationandper application, includingping InternetControl
Message Protocol (ICMP) packets, User Datagram Protocol and Transmission Control
Protocol (UDP/TCP) packets with user-configured ports, user-configured Differentiated
Services code point (DSCP) type-of-service (ToS) packets, and Hypertext Transfer
Protocol (HTTP) packets.
Tests and Probe Types
A test can contain multiple probes. The probe type specifies the packet and protocol
contents of the probe.
EX Series switches support the following tests and probe types:
• Ping tests:
Copyright © 2016, Juniper Networks, Inc.4
Network Management and Monitoring Feature Guide for EX2300, EX3400, and EX4300 Switches

• ICMP echo probe
• ICMP timestamp probe
• HTTP tests:
• HTTP get probe (not available for BGP RPM services)
• HTTP get metadata probe
• UDP and TCP tests with user-configured ports:
• UDP echo probe
• TCP connection probe
• UDP timestamp probe
Hardware Timestamps
To account for latency or jitter in the communication of probemessages, you can enable
timestamping of the probe packets (hardware timestamps). If hardware timestamps
are not configured, then timers are generated at the software level and are less accurate
than they would have been with hardware timestamps.
NOTE: EX Series switches support hardware timestamps for UDP and ICMPprobes. EX Series switches do not support hardware timestamps for HTTPor TCP probes.
You can timestamp the following RPM probes to improve the measurement of latency
or jitter:
• ICMP ping
• ICMP ping timestamp
• UDP ping
• UDP ping timestamp
You should configure the requester (the RPM client) with hardware timestamps (see
Figure 1 on page 6) to get more meaningful results than you would get without the
timestamps.The responder (the RPM server) does not need to be configured to support
hardware timestamps. If the responder supports hardware timestamps, it timestamps
the RPMprobes. If the responder does not support hardware timestamps, RPM can only
report round-trip measurements that include the processing time on the responder.
NOTE: Hardware timestamps are supported on all EX Series switches.
Figure 1 on page 6 shows the timestamps:
5Copyright © 2016, Juniper Networks, Inc.
Chapter 1: Configuring Real-Time Performance Monitoring

Figure 1: RPM Timestamps
• T1 is the time the packet leaves the requester port.
• T2 is the time the responder receives the packet.
• T3 is the time the responder sends the response.
• T4 is the time the requester receives the response.
The round-trip time is (T2 – T1) + (T4 – T3). If the responder does not support hardware
timestamps, then the round-trip time is (T4 – T1) / 2, and thus includes the processing
time of the responder.
You can use RPM probes to find the following timemeasurements:
• Minimum round-trip time
• Maximum round-trip time
• Average round-trip time
• Standard deviation of the round-trip time
• Jitterof the round-trip time—Differencebetweentheminimumandmaximumround-trip
time
NOTE: See“Configuringthe InterfaceforRPMTimestampingforClient/Serveron an EX Series Switch (CLI Procedure)” on page 14 for information on howto configure hardware timestamps on the requester.
The RPM feature provides a configuration option to set one-way hardware timestamps.
Use one-way timestamps when you want information about one-way time, rather than
round-trip times, for packets to traverse the network between the requester and the
responder. As shown in Figure 1 on page 6, one-way timestamps represent the time T2
– T1 and the time from T4 – T3. Use one-way timestamps when you want to gather
information about delay in each direction and to find egress and ingress jitter values.
NOTE: For correct one-waymeasurement, the clocks of the requester andrespondermust be synchronized. If the clocks are not synchronized, one-wayjitter measurements and calculations can include significant variations, insome cases orders of magnitude greater than the round-trip times.
Copyright © 2016, Juniper Networks, Inc.6
Network Management and Monitoring Feature Guide for EX2300, EX3400, and EX4300 Switches

Whenyouenableone-way timestamps inaprobe, the followingone-waymeasurements
are reported:
• Minimum, maximum, standard deviation, and jitter measurements for egress and
ingress times
• Number of probes sent
• Number of probe responses received
• Percentage of lost probes
Limitations of RPM on EX Series Switches
• Two-Way Active Measurement Protocol (TWAMP) is not supported on EX Series
switches.
• EX Series switches do not support user-configured class-of-service (CoS) classifiers
or prioritizationofRPMpacketsover regular datapackets receivedonan input interface.
• Timestamps:
• If the responder does not support hardware timestamps, RPM can only report the
round-trip measurements and cannot calculate round-trip jitter.
• EX Series switches do not support hardware timestamps for HTTP and TCP probes.
• Timestamps apply only to IPv4 traffic.
RelatedDocumentation
For further details about RPM, see Junos OS Services Interfaces Configuration Guide•
• Configuring the Interface for RPM Timestamping for Client/Server on an EX Series
Switch (CLI Procedure) on page 14
• Configuring Real-Time Performance Monitoring (J-Web Procedure) on page 7
• Configuring SNMP (J-Web Procedure) on page 121
• Monitoring Network Traffic Using Traceroute on page 129
Configuring Real-Time PerformanceMonitoring (J-Web Procedure)
NOTE: This topic applies only to the J-Web Application package.
Real-timeperformancemonitoring (RPM) inEXSeries switches enables you to configure
and send probes to a specified target andmonitor the analyzed results to determine
packet loss, round-trip time, and jitter. Jitter is the difference in relative transit time
between two consecutive probes. You can set up probe owners and configure one or
more performance probe tests under each probe owner.
The ways in which you can use RPM include:
7Copyright © 2016, Juniper Networks, Inc.
Chapter 1: Configuring Real-Time Performance Monitoring
• Monitor time delays between devices.
• Monitor time delays at the protocol level.
• Set thresholds to trigger SNMP traps when threshold values are exceeded. You can
configure thresholds for round-trip time, ingress or egress delay, standard deviation,
jitter, successive lost probes, and total lost probes per test.
• Determineautomaticallywhetherapathexistsbetweenahost switchand itsconfigured
Border Gateway Protocol (BGP) neighbors. You can view the results of the discovery
using an SNMP client.
• Use the history of the most recent 50 probes to analyze trends in your network and
predict future needs.
Probescollectpacketsperdestinationandperapplication, includingPING InternetControl
Message Protocol (ICMP) packets, User Datagram Protocol and Transmission Control
Protocol (UDP/TCP) packets with user-configured ports, user-configured Differentiated
Services code point (DSCP) type-of-service (ToS) packets, and Hypertext Transfer
Protocol (HTTP) packets.
EX Series switches support the following tests and probe types:
• Ping tests:
• ICMP echo
• ICMP timestamp
• HTTP tests:
• HTTP get (not available for BGP RPM services)
• UDP and TCP tests with user-configured ports:
• UDP echo
• TCP connection
• UDP timestamp
To account for latency in the communication of probemessages, you can enable
timestamping of the probe packets. Youmust configure both the requester and the
responder to timestamp the RPM packets. The RPM features provides an additional
configuration option to set one-way hardware timestamps. Use one-way timestamps
when you want information about one-way, rather than round-trip, times for packets to
traverse the network between the requester and the responder.
Copyright © 2016, Juniper Networks, Inc.8
Network Management and Monitoring Feature Guide for EX2300, EX3400, and EX4300 Switches

NOTE:
• EXSeriesswitchessupporthardwaretimestampsforUDPand ICMPprobes.EX Series switches do not support hardware timestamps for HTTP or TCPprobes.
• If the responder does not support hardware timestamps, RPM can onlyreport the round-trip measurements, it cannot calculate round-trip jitter.
• In EX Series switches timestamps apply only to IPv4 traffic.
To configure RPM using the J-Web interface:
1. Select Troubleshoot > RPM > Configure RPM .
2. In the Configure RPM page, enter information as specified in Table 3 on page 9.
a. Click Add to set up theOwner Name and Performance Probe Tests.
b. Selectaprobeowner fromProbeOwners list andclickDelete to remove theselected
probe owner
c. Double-click one of the probe owners in Probe Owners list to display the list of
performance probe tests.
d. Double-click one of the performance probe tests to edit the test parameters.
3. Enter theMaximumNumber of Concurrent Probes and specify the Probe Servers.
4. Click Apply to apply the RPM probe settings.
Table 3: RPMProbe Owner, Concurrent Probes, and Probe Servers Configuration Fields
Your ActionFunctionField
1. Click Add and type an owner name.
2. InPerformanceProbeTests, clickAddto define the RPM test parameters.See Table 4 on page 10 forinformation on configuring RPM testparameters.
3. ClickOK to save the settings orCancel to exit from the windowwithout saving the changes.
Identifies a owner for whomone ormoreRPM tests are configured. In mostimplementations, the owner nameidentifies a network on which a set oftests is being run.
Probe Owners
Type a number from 1 through 500.Specifies the maximum number ofconcurrent probes allowed.
MaximumNumberofConcurrentProbes
9Copyright © 2016, Juniper Networks, Inc.
Chapter 1: Configuring Real-Time Performance Monitoring

Table 3: RPMProbe Owner, Concurrent Probes, and Probe Servers ConfigurationFields (continued)
Your ActionFunctionField
Set up the following servers:
• TCP Probe Server—Specifies the porton which the device is to receive andtransmit TCP probes. Type thenumber 7 (a standard TCP portnumber)oraportnumber from49160through 65535.
• UDPProbe Server—Specifies the porton which the device is to receive andtransmit UDP probes. Type thenumber 7 (a standard TCP portnumber)oraportnumber from49160through 65535.
Specifies the servers that act as receiversand transmitters for the probes.
Probe Servers
Table 4: Performance Probe Tests Configuration Fields
Your ActionFunctionField
Identification
Type a test name.Identifies the RPM test.Test Name
Type the IP address in dotted decimalnotation or the URL of the probe target.If the target is a URL, type a fully formedURL that includes http://.
Specifies the IPaddressor theURLof theprobe target.
Target (Address or URL)
Type the source address to be used forthe probe. If you do not supply this value,the packet uses the outgoing interface'saddress as the probe source address.
Specifies the IPaddress tobeusedas theprobe source address.
Source Address
Type the routing instance name. Therouting instanceappliesonly to icmp-pingand icmp-ping-timestamp probe types.The default routing instance is inet.0.
Specifies the routing instanceoverwhichthe probe is sent.
Routing Instance
Type a number from 0 through 255. Thedefault history size is 50.
Specifies the number of probe results tobe saved in the probe history.
History Size
Request Information
Copyright © 2016, Juniper Networks, Inc.10
Network Management and Monitoring Feature Guide for EX2300, EX3400, and EX4300 Switches

Table 4: Performance Probe Tests Configuration Fields (continued)
Your ActionFunctionField
Select a probe type from the list:
• http-get
• http-get-metadata
• icmp-ping
• icmp-ping-timestamp
• tcp-ping
• udp-ping
• udp-ping-timestamp
Specifies the type of probe to send aspart of the test.
Probe Type
Type a number from 1 through 255 .Sets thewait time (in seconds) betweenprobe transmissions.
Interval
Type a number from 0 through 86400 .Sets thewait time (in seconds) betweentests.
Test Interval
Type a number from 1 through 15.Sets the total number of probes to besent for each test.
Probe Count
Type a number from 0 through 255.Specifies the number of samples to beused in the statistical calculationoperations to be performed across anumber of the most recent samples.
Moving Average Size
Type the number 7 (a standard TCP orUDPportnumber)oraportnumber from49160 through 65535.
Specifies the TCP or UDP port to whichprobes are sent.
To use TCP or UDP probes, youmustconfigure the remote server as a probereceiver. Both the probe server and theremote server must be Juniper Networksnetwork devices configured to receiveand transmit RPM probes on the sameTCP or UDP port.
Destination Port
Type a valid 6-bit pattern.Specifies theDifferentiatedServicescodepoint (DSCP) bits. This value must be avalid 6-bit pattern.
DSCP Bits
Type a number from 0 through 65507.Specifies the size (in bytes) of the dataportion of the ICMP probes.
Data Size
Type a hexadecimal value from 1hthrough 800h .
Specifies the hexadecimal value of thedata portion of the ICMP probes.
Data Fill
Hardware Timestamp
Toenable timestamping, select thecheckbox.
Enables one-way hardware timestamp.OneWay Hardware Timestamp
11Copyright © 2016, Juniper Networks, Inc.
Chapter 1: Configuring Real-Time Performance Monitoring

Table 4: Performance Probe Tests Configuration Fields (continued)
Your ActionFunctionField
Select an interface from the list.Enables hardware timestamp on thespecified interface.
Destination Interface
MaximumProbe Thresholds
Type a number from 0 through 15.Sets the number of probes that can belost successively, if exceeded, triggers aprobe failure and generates a system logmessage.
Successive Lost Probes
Type a number from 0 through 15.Sets the number of probes that can belost , if exceeded, triggers a probe failureand generates a system logmessage.
Lost Probes
Type a number from 0 through60000000.
Sets the round-trip time (inmicroseconds), from the switch to theremote server, if exceeded, triggers aprobe failure and generates a system logmessage.
Round Trip Time
Type a number from 0 through60000000.
Sets the jitter (in microseconds), ifexceeded, triggers a probe failure andgenerates a system logmessage.
Jitter
Type a number from 0 through60000000.
Sets the maximum allowable standarddeviation (inmicroseconds), if exceeded,triggers a probe failure and generates asystem logmessage.
Standard Deviation
Type a number from 0 through60000000.
Sets the one-way time (inmicroseconds), from the switch to theremote server, if exceeded, triggers aprobe failure and generates a system logmessage.
Egress Time
Type a number from 0 through60000000 (microseconds).
Sets the one-way time (inmicroseconds), from the remote serverto the switch, if exceeded, triggers aprobe failure and generates a system logmessage.
Ingress Time
Type a number from 0 through60000000.
Sets the outbound-time jitter (inmicroseconds), if exceeded triggers aprobe failure and generates a system logmessage.
Jitter Egress Time
Type a number from 0 and 60000000.Sets the inbound-time jitter (inmicroseconds), if exceeded, triggers aprobe failure and generates a system logmessage.
Jitter Ingress Time
Copyright © 2016, Juniper Networks, Inc.12
Network Management and Monitoring Feature Guide for EX2300, EX3400, and EX4300 Switches

Table 4: Performance Probe Tests Configuration Fields (continued)
Your ActionFunctionField
Type a number from 0 through60000000.
Sets the maximum allowable standarddeviation of outbound times (inmicroseconds), if exceeded, triggers aprobe failure and generates a system logmessage.
Egress Standard Deviation
Type a number from 0 through60000000.
Sets the maximum allowable standarddeviation of inbound times (inmicroseconds), if exceeded, triggers aprobe failure and generates a system logmessage.
Ingress Standard Deviation
Traps
• To enable SNMP traps for thiscondition, select the check box.
• TodisableSNMPtraps, clear thecheckbox.
Generates SNMP traps when thethreshold for jitter in outbound time isexceeded.
Egress Jitter Exceeded
• To enable SNMP traps for thiscondition, select the check box.
• TodisableSNMPtraps, clear thecheckbox.
Generates SNMP traps when thethreshold for standard deviation inoutbound times is exceeded.
Egress Standard Deviation Exceeded
• To enable SNMP traps for thiscondition, select the check box.
• TodisableSNMPtraps, clear thecheckbox.
Generates SNMP traps when thethreshold for maximum outbound timeis exceeded.
Egress Time Exceeded
• To enable SNMP traps for thiscondition, select the check box.
• TodisableSNMPtraps, clear thecheckbox.
Generates SNMP traps when thethreshold for jitter in inbound time isexceeded.
Ingress Jitter Exceeded
• To enable SNMP traps for thiscondition, select the check box.
• TodisableSNMPtraps, clear thecheckbox.
Generates SNMP traps when thethreshold for standard deviation ininbound times is exceeded.
Ingress Standard Deviation Exceeded
• To enable SNMP traps for thiscondition, select the check box.
• TodisableSNMPtraps, clear thecheckbox.
Generates SNMP traps when thethreshold for maximum inbound time isexceeded.
Ingress Time Exceeded
• To enable SNMP traps for thiscondition, select the check box.
• TodisableSNMPtraps, clear thecheckbox.
Generates SNMP traps when thethreshold for jitter in round-trip time isexceeded.
Jitter Exceeded
13Copyright © 2016, Juniper Networks, Inc.
Chapter 1: Configuring Real-Time Performance Monitoring
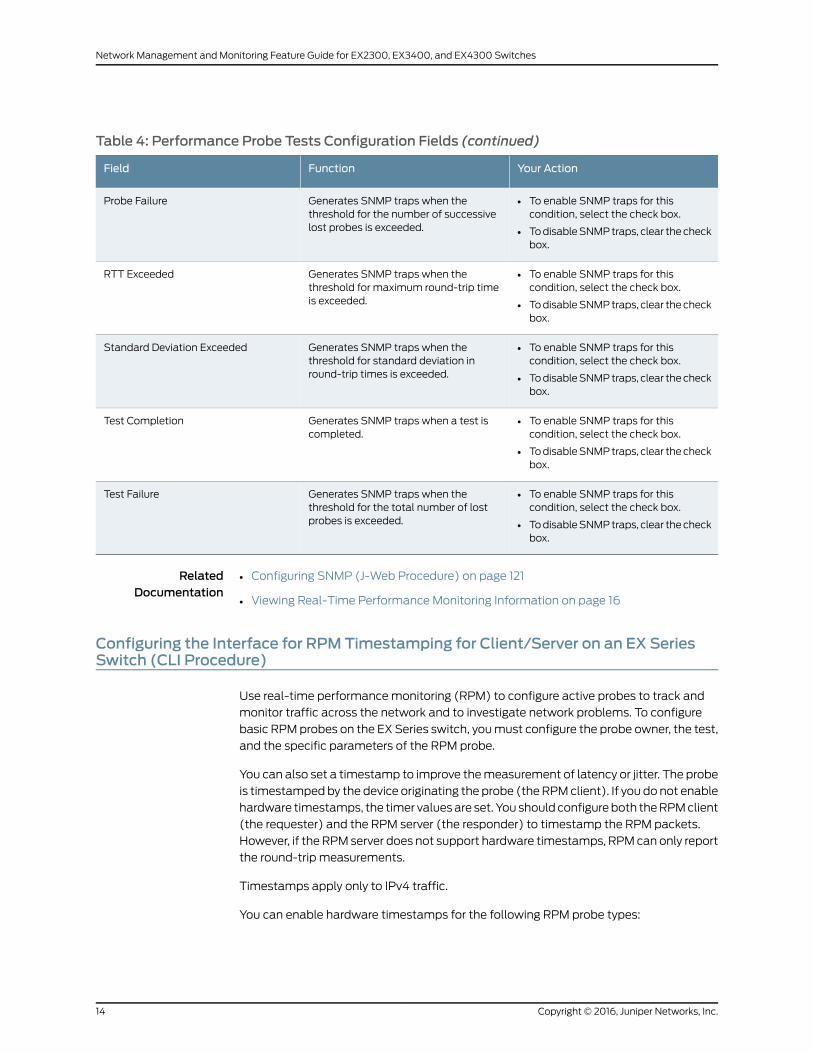
Table 4: Performance Probe Tests Configuration Fields (continued)
Your ActionFunctionField
• To enable SNMP traps for thiscondition, select the check box.
• TodisableSNMPtraps, clear thecheckbox.
Generates SNMP traps when thethreshold for the number of successivelost probes is exceeded.
Probe Failure
• To enable SNMP traps for thiscondition, select the check box.
• TodisableSNMPtraps, clear thecheckbox.
Generates SNMP traps when thethreshold for maximum round-trip timeis exceeded.
RTT Exceeded
• To enable SNMP traps for thiscondition, select the check box.
• TodisableSNMPtraps, clear thecheckbox.
Generates SNMP traps when thethreshold for standard deviation inround-trip times is exceeded.
Standard Deviation Exceeded
• To enable SNMP traps for thiscondition, select the check box.
• TodisableSNMPtraps, clear thecheckbox.
Generates SNMP traps when a test iscompleted.
Test Completion
• To enable SNMP traps for thiscondition, select the check box.
• TodisableSNMPtraps, clear thecheckbox.
Generates SNMP traps when thethreshold for the total number of lostprobes is exceeded.
Test Failure
RelatedDocumentation
Configuring SNMP (J-Web Procedure) on page 121•
• Viewing Real-Time Performance Monitoring Information on page 16
Configuring the Interface for RPMTimestamping for Client/Server on an EX SeriesSwitch (CLI Procedure)
Use real-time performancemonitoring (RPM) to configure active probes to track and
monitor traffic across the network and to investigate network problems. To configure
basic RPMprobes on the EX Series switch, youmust configure the probe owner, the test,
and the specific parameters of the RPM probe.
You can also set a timestamp to improve themeasurement of latency or jitter. The probe
is timestampedby the device originating the probe (theRPMclient). If you do not enable
hardware timestamps, the timer valuesare set. You should configureboth theRPMclient
(the requester) and the RPM server (the responder) to timestamp the RPM packets.
However, if the RPMserver does not support hardware timestamps, RPMcan only report
the round-trip measurements.
Timestamps apply only to IPv4 traffic.
You can enable hardware timestamps for the following RPM probe types:
Copyright © 2016, Juniper Networks, Inc.14
Network Management and Monitoring Feature Guide for EX2300, EX3400, and EX4300 Switches
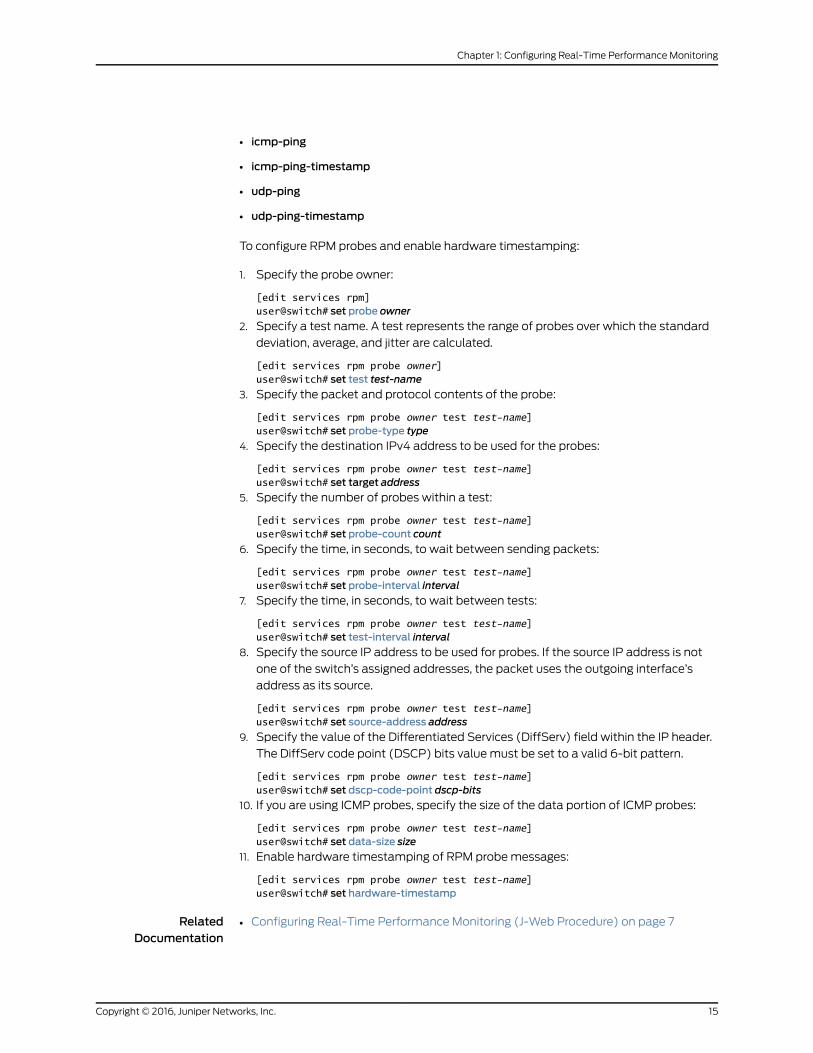
• icmp-ping
• icmp-ping-timestamp
• udp-ping
• udp-ping-timestamp
To configure RPM probes and enable hardware timestamping:
1. Specify the probe owner:
[edit services rpm]user@switch# set probe owner
2. Specify a test name. A test represents the range of probes over which the standard
deviation, average, and jitter are calculated.
[edit services rpm probe owner]user@switch# set test test-name
3. Specify the packet and protocol contents of the probe:
[edit services rpm probe owner test test-name]user@switch# set probe-type type
4. Specify the destination IPv4 address to be used for the probes:
[edit services rpm probe owner test test-name]user@switch# set target address
5. Specify the number of probes within a test:
[edit services rpm probe owner test test-name]user@switch# set probe-count count
6. Specify the time, in seconds, to wait between sending packets:
[edit services rpm probe owner test test-name]user@switch# set probe-interval interval
7. Specify the time, in seconds, to wait between tests:
[edit services rpm probe owner test test-name]user@switch# set test-interval interval
8. Specify the source IP address to be used for probes. If the source IP address is not
one of the switch’s assigned addresses, the packet uses the outgoing interface’s
address as its source.
[edit services rpm probe owner test test-name]user@switch# set source-address address
9. Specify the value of the Differentiated Services (DiffServ) field within the IP header.
The DiffServ code point (DSCP) bits value must be set to a valid 6-bit pattern.
[edit services rpm probe owner test test-name]user@switch# set dscp-code-point dscp-bits
10. If you are using ICMP probes, specify the size of the data portion of ICMP probes:
[edit services rpm probe owner test test-name]user@switch# set data-size size
11. Enable hardware timestamping of RPM probemessages:
[edit services rpm probe owner test test-name]user@switch# set hardware-timestamp
RelatedDocumentation
Configuring Real-Time Performance Monitoring (J-Web Procedure) on page 7•
15Copyright © 2016, Juniper Networks, Inc.
Chapter 1: Configuring Real-Time Performance Monitoring

• Understanding Real-Time Performance Monitoring on EX Series Switches on page 4
Viewing Real-Time PerformanceMonitoring Information
NOTE: This topic applies only to the J-Web Application package.
Real-timeperformancemonitoring (RPM)onEXSeries switchesenables you toconfigure
and send probes to a specified target andmonitor the analyzed results to determine
packet loss, round-trip time, and jitter. The J-Web interface provides a graphical view of
RPM information for EX Series switches.
To view the RPM information using the J-Web interface:
1. Select Troubleshoot >RPM >View RPM.
2. Select the Round Trip Time check box to display the graph with round-trip time
included. Clear the check-box to view the graph without the round-trip time.
3. From the Refresh Time list, select a refresh time interval for the graph.
RelatedDocumentation
• Configuring Real-Time Performance Monitoring (J-Web Procedure) on page 7
Copyright © 2016, Juniper Networks, Inc.16
Network Management and Monitoring Feature Guide for EX2300, EX3400, and EX4300 Switches

CHAPTER 2
Configuring Analyzers and Port Mirroring
• Understanding Port Mirroring and Analyzers on EX2300, EX3400, and EX4300
Switches on page 18
• Example: Configuring Mirroring for Local Monitoring of Employee Resource Use on
EX4300 Switches on page 23
• Example: Configuring Mirroring for Remote Monitoring of Employee Resource Use on
EX4300 Switches on page 30
• Example: Configuring Mirroring for Remote Monitoring of Employee Resource Use
Through a Transit Switch on EX4300 Switches on page 40
• ConfiguringMirroringonEX4300Switches toAnalyzeTraffic (CLIProcedure)onpage47
• Configuring Port Mirroring to Analyze Traffic (J-Web Procedure) on page 50
• Verifying InputandOutput forPortMirroringAnalyzersonEXSeriesSwitchesonpage53
• Troubleshooting Port Mirroring Configuration Error Messages on page 54
17Copyright © 2016, Juniper Networks, Inc.

UnderstandingPortMirroringandAnalyzersonEX2300,EX3400,andEX4300Switches
NOTE: This concept uses Junos OS for EX Series switches with support forthe Enhanced Layer 2 Software (ELS) configuration style. For ELS details,seeGetting Started with Enhanced Layer 2 Software.
Mirroringmight be needed for traffic analysis on a switch because a switch, unlike a hub,
does not broadcast packets to every port on the destination device. The switch sends
packets only to the port to which the destination device is connected.
JuniperNetworksEX2300,EX3400,andEX4300EthernetSwitchessupport the following
mirroring methods: port mirroring and analyzers. You can use port mirroring or analyzers
to facilitateanalyzing traffic on these switchesat thepacket level. Youmightuseanalyzers
as part of monitoring switch traffic for such purposes as enforcing policies concerning
network usage and file sharing and for identifying sources of problems on your network
by locating abnormal or heavy bandwidth usage by particular stations or applications.
Mirrored packets can be copied either to a local interface for local monitoring or to a
VLAN for remote monitoring. The following packets can be copied:
• Packets entering or exiting a port—You canmirror the packets in any combination ofpackets entering or exiting ports on up to 256 ports. For example, you can send copies
of the packets entering some ports and the packets exiting other ports to the same
local analyzer port or analyzer VLAN.
• Packets entering a VLAN—You canmirror the packets entering a VLAN to either alocal analyzer port or to an analyzer VLAN. You can configure multiple VLANs (up to
256 VLANs), including a VLAN range and PVLANs, as ingress input to an analyzer.
• Policy-based sample packets—You canmirror a policy-based sample of packets thatare entering a port or a VLAN. You configure a firewall filter to establish a policy to
select thepackets tobemirrored. Youcan send the sample toaport-mirroring instance
or to an analyzer VLAN.
This topic describes:
• Port Mirroring Overview on page 18
• Analyzer Overview on page 19
• Port Mirroring and Analyzer Terminologies on page 19
• Configuration Guidelines for Port Mirroring and Analyzers on EX2300, EX3400, and
EX4300 Switches on page 21
Port Mirroring Overview
You configure port mirroring on an EX2300, EX3400, or EX4300 switch to send copies
of unicast traffic to an output destination such as an interface, a routing-instance, or a
VLAN. Then, you cananalyze themirrored traffic by using aprotocol analyzer application.
Theprotocol analyzer applicationcan runeitheronacomputer connected to theanalyzer
Copyright © 2016, Juniper Networks, Inc.18
Network Management and Monitoring Feature Guide for EX2300, EX3400, and EX4300 Switches

output interfaceor ona remotemonitoring station. For the input traffic, you canconfigure
a firewall filter term to specify whether port mirroring must be applied to all packets at
the interface towhich the firewall filter is applied. Youcanapply a firewall filter configured
with the action port-mirror or port-mirror-instance name to the input or output logical
interfaces (including aggregated Ethernet logical interfaces), to traffic forwarded or
flooded to a VLAN, or traffic forwarded or flooded to a VPLS routing instance. EX2300,
EX3400, andEX4300switches support portmirroringofVPLS(familyethernet-switching
or family vpls) traffic and VPN traffic with family ccc in a Layer 2 environment. Within a
firewall filter term, youcanspecify theport-mirroringproperties under the then statement
in either of the following ways:
• Implicitly reference the port-mirroring properties in effect on the port.
• Explicitly reference a particular named instance of port mirroring.
You can configure portmirroring at the [edit forwarding-options port-mirroring] hierarchy
level.
NOTE: You can use port mirroring tomirror traffic on Layer 3 interfaces.Analyzers can be used tomirror bridged (Layer 2) packets. Tomirror routedpackets (Layer 3 packets), you can use the port mirroring configuration inwhich the family statement is set to inet or inet6.
Analyzer Overview
You can configure an analyzer to define both the input traffic and output traffic in the
same analyzer configuration. The input traffic to be analyzed can be traffic that enters
or exits an interface, or traffic that enters a VLAN. The analyzer configuration enables
you to send this traffic to an output interface, instance, or VLAN. You can configure an
analyzer at the [edit forwarding-options analyzer] hierarchy.
Port Mirroring and Analyzer Terminologies
Table 5 on page 19 lists some port mirroring terms and their descriptions.
Table 5: Mirroring Terminologies
DescriptionTerm
In a mirroring configuration (analyzer) on an EX2300, EX3400, or EX4300 switch, theanalyzer includes:
• The name of the analyzer
• Source (input) ports or VLAN
• A destination for mirrored packets (either a monitor port or a monitor VLAN)
Analyzer
19Copyright © 2016, Juniper Networks, Inc.
Chapter 2: Configuring Analyzers and Port Mirroring
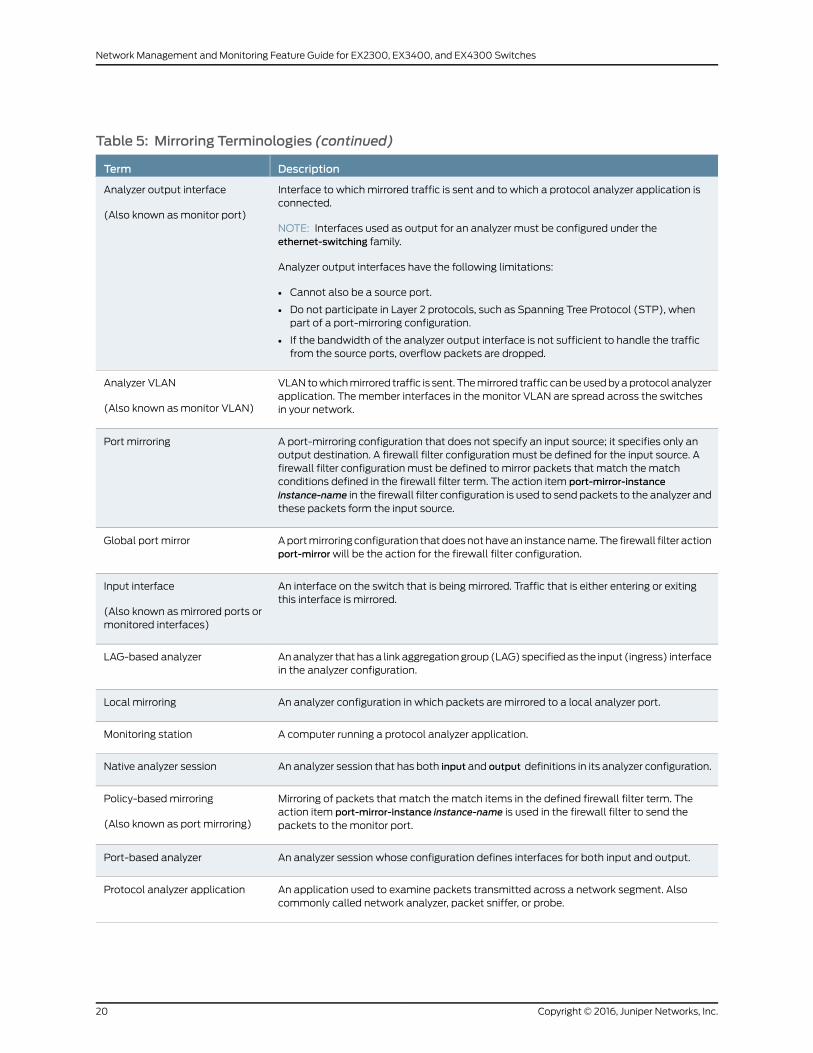
Table 5: Mirroring Terminologies (continued)
DescriptionTerm
Interface to which mirrored traffic is sent and to which a protocol analyzer application isconnected.
NOTE: Interfaces used as output for an analyzer must be configured under theethernet-switching family.
Analyzer output interfaces have the following limitations:
• Cannot also be a source port.
• Do not participate in Layer 2 protocols, such as Spanning Tree Protocol (STP), whenpart of a port-mirroring configuration.
• If the bandwidth of the analyzer output interface is not sufficient to handle the trafficfrom the source ports, overflow packets are dropped.
Analyzer output interface
(Also known asmonitor port)
VLANtowhichmirrored traffic is sent. Themirrored traffic canbeusedbyaprotocol analyzerapplication. Themember interfaces in the monitor VLAN are spread across the switchesin your network.
Analyzer VLAN
(Also known asmonitor VLAN)
A port-mirroring configuration that does not specify an input source; it specifies only anoutput destination. A firewall filter configuration must be defined for the input source. Afirewall filter configuration must be defined to mirror packets that match thematchconditions defined in the firewall filter term. The action item port-mirror-instanceinstance-name in the firewall filter configuration is used to send packets to the analyzer andthese packets form the input source.
Port mirroring
Aportmirroringconfiguration thatdoesnothavean instancename.The firewall filter actionport-mirrorwill be the action for the firewall filter configuration.
Global port mirror
An interface on the switch that is being mirrored. Traffic that is either entering or exitingthis interface is mirrored.
Input interface
(Also known asmirrored ports ormonitored interfaces)
Ananalyzer that hasa linkaggregationgroup (LAG)specifiedas the input (ingress) interfacein the analyzer configuration.
LAG-based analyzer
An analyzer configuration in which packets are mirrored to a local analyzer port.Local mirroring
A computer running a protocol analyzer application.Monitoring station
An analyzer session that has both input and output definitions in its analyzer configuration.Native analyzer session
Mirroring of packets that match thematch items in the defined firewall filter term. Theaction item port-mirror-instance instance-name is used in the firewall filter to send thepackets to the monitor port.
Policy-basedmirroring
(Also known as port mirroring)
An analyzer session whose configuration defines interfaces for both input and output.Port-based analyzer
An application used to examine packets transmitted across a network segment. Alsocommonly called network analyzer, packet sniffer, or probe.
Protocol analyzer application
Copyright © 2016, Juniper Networks, Inc.20
Network Management and Monitoring Feature Guide for EX2300, EX3400, and EX4300 Switches

Table 5: Mirroring Terminologies (continued)
DescriptionTerm
Functions the samewayas local portmirroring, except that themirrored traffic is not copiedto a local analyzer port but is flooded to an analyzer VLAN that you create specifically forthe purpose of receiving mirrored traffic.
Remote port mirroring
An analyzer sessionwhose configuration usesVLANs for both input andoutput or for eitherinput or output.
VLAN-based analyzer
Configuration Guidelines for Port Mirroring and Analyzers on EX2300, EX3400, and EX4300Switches
When you configure port mirroring or analyzers on EX2300, EX3400, and EX4300
switches, we recommend that you follow certain guidelines to ensure that you obtain
optimum benefit frommirroring. Additionally, we recommend that you disable mirroring
when you are not using it and that you select specific interfaces for which packets must
bemirrored (that is, select specific interfaces as input to the analyzer) in preference to
using the all keyword option, which will enable mirroring on all interfaces. Mirroring only
the necessary packets reduces any potential performance impact.
With local mirroring, traffic frommultiple ports is replicated to the analyzer output
interface. If the output interface for an analyzer reaches capacity, packets are dropped.
Thus, while configuring an analyzer, youmust considerwhether the traffic beingmirrored
exceeds the capacity of the analyzer output interface.
Table 6 on page 21 summarizes further configuration guidelines formirroring on EX2300,
EX3400, and EX4300 switches.
Table 6: Configuration Guidelines for Port Mirroring and Analyzers on EX2300, EX3400, andEX4300 Switches
CommentValue or SupportInformationGuideline
256Number of VLANs that you can use as ingress inputto an analyzer.
21Copyright © 2016, Juniper Networks, Inc.
Chapter 2: Configuring Analyzers and Port Mirroring

Table 6: Configuration Guidelines for Port Mirroring and Analyzers on EX2300, EX3400, andEX4300 Switches (continued)
CommentValue or SupportInformationGuideline
• You can configure a total of foursessions and you can enable only one ofthe following at any point in time:
• Amaximum of four port-mirroringsessions (including the globalport-mirroring session). SeeTable 5 on page 19 for a descriptionof global port mirror.
• Amaximumof fouranalyzer sessions.
• A combination of port-mirroring andanalyzer sessions, and the total of thiscombination must be four.
• You can configure more than thespecified number of port-mirroringinstancesoranalyzerson theswitch, butyou can enable only the specifiednumber for a session.
4Number of port-mirroring sessions and analyzersthat you can enable concurrently.
• Virtual Chassis ports(VCPs)
• Management Ethernetports (me0 or vme0)
• Integrated routing andbridging (IRB) interfaces;also known as routedVLAN interfaces (RVIs).
• VLAN-tagged Layer 3interfaces
Types of ports on which you cannot mirror traffic.
anyProtocol families that you can include in aport-mirroring configuration for remote traffic.
Ingress onlyTraffic directions that you can configure formirroring on ports in firewall-filter–basedconfigurations.
ApplicableMirrored packets exiting an interface reflectrewritten class-of-service (CoS) DSCP or 802.1pbits.
Packets with these errors are filtered outand thus are not sent to the analyzer.
ApplicablePackets with physical layer errors are not sent tothe local or remote analyzer.
Port mirroring for line-rate traffic is doneon a best-effort basis.
ApplicablePort mirroring does not support line-rate traffic.
Not supportedMirroring of packets egressing a VLAN.
SupportedPort-mirroringoranalyzeroutputonaLAG interface.
Copyright © 2016, Juniper Networks, Inc.22
Network Management and Monitoring Feature Guide for EX2300, EX3400, and EX4300 Switches

Table 6: Configuration Guidelines for Port Mirroring and Analyzers on EX2300, EX3400, andEX4300 Switches (continued)
CommentValue or SupportInformationGuideline
8Maximum number of child members on aport-mirroring or analyzer output LAG interface.
1Maximum number of interfaces in a remoteport-mirroring or analyzer VLAN.
Not SupportedEgressmirroringof host-generatedcontrol packets.
This functionality can be achieved byconfiguring port mirroring.
Not supportedConfiguring Layer 3 logical interfaces in the inputstanza of an analyzer.
ApplicableThe analyzer input and output stanzas containingmembersof thesameVLANor theVLAN itselfmustbe avoided.
RelatedDocumentation
Example: Configuring Mirroring for Local Monitoring of Employee Resource Use on
EX4300 Switches on page 23
•
• Example: Configuring Mirroring for Remote Monitoring of Employee Resource Use on
EX4300 Switches on page 30
• Configuring Port Mirroring to Analyze Traffic (J-Web Procedure) on page 50
• Configuring Mirroring on EX4300 Switches to Analyze Traffic (CLI Procedure) on
page 47
Example: ConfiguringMirroring for Local Monitoring of Employee Resource Use onEX4300 Switches
NOTE: This example uses Junos OS for EX Series switches with support forthe Enhanced Layer 2 Software (ELS) configuration style. If your switch runssoftware that does not support ELS, see Example: Configuring Port Mirroringfor LocalMonitoring of EmployeeResourceUse onEXSeries Switches. For ELSdetails, seeGetting Started with Enhanced Layer 2 Software.
EX4300 switches enable you to configure mirroring to send copies of packets to either
a local interface for local monitoring or to a VLAN for remote monitoring. You can use
mirroring to copy these packets:
• Packets entering or exiting a port
• Packets entering a VLAN
23Copyright © 2016, Juniper Networks, Inc.
Chapter 2: Configuring Analyzers and Port Mirroring

You can analyze the mirrored traffic by using a protocol analyzer application installed
on a system connected to the local destination interface (or running on a remote
monitoring station if you are sending mirrored traffic to an analyzer VLAN).
This example describes how to configure local mirroring on an EX4300 switch. This
example describes how to configure the switch to mirror traffic entering interfaces
connected to employee computers to an analyzer output interface on the same switch.
• Requirements on page 24
• Overview and Topology on page 24
• Mirroring All Employee Traffic for Local Analysis on page 25
• Mirroring Employee-to-Web Traffic for Local Analysis on page 26
• Verification on page 28
Requirements
This example uses the following hardware and software components:
• One EX4300 switch
• Junos OS Release 13.2X50-D10. or later for EX Series switches
Before you configuremirroring, be sure you have an understanding ofmirroring concepts.
For information about mirroring, see “Understanding Port Mirroring and Analyzers on
EX2300, EX3400, and EX4300 Switches” on page 18.
Overview and Topology
This topic includes two examples that describe how tomirror traffic entering ports on
the switch to a destination interface on the same switch (local mirroring). The first
example shows how tomirror all traffic entering the ports connected to employee
computers. The second example shows the same scenario, but includes a filter tomirror
only the employee traffic going to theWeb.
The interfaces ge-0/0/0 and ge-0/0/1 serve as connections for employee computers.
The interface ge0/0/10 is reserved for analysis of mirrored traffic. Connect a PC running
a protocol analyzer application to the analyzer output interface to analyze the mirrored
traffic.
NOTE: Multiple ports mirrored to one interface can cause buffer overflowand dropped packets.
Both examples use the network topology shown in Figure 2 on page 25.
Copyright © 2016, Juniper Networks, Inc.24
Network Management and Monitoring Feature Guide for EX2300, EX3400, and EX4300 Switches

Figure 2: Network Topology for Local Mirroring Example
Mirroring All Employee Traffic for Local Analysis
To configure mirroring for all employee traffic for local analysis, perform these tasks:
CLI QuickConfiguration
To quickly configure local mirroring for ingress traffic to the two ports connected to
employee computers, copy the following commands and paste them into the switch
terminal window:
[edit]user@swtich# set interfaces ge-0/0/0 unit 0 family ethernet-switchinguser@switch# set interfaces ge-0/0/1 unit 0 family inet 192.0.2.1/24user@switch# set interfaces ge-0/0/10 unit 0 family ethernet-switching vlanmembersanalyzer_vlan
user@switch# set vlans analyzer-vlan vlan-id 1000user@switch#set forwarding-optionsanalyzeremployee–monitor input ingress interfacege-0/0/0.0
user@switch#set forwarding-optionsanalyzeremployee–monitor input ingress interfacege-0/0/1.0
user@switch# set forwarding-options analyzer employee–monitor output interfacege-0/0/10.0
Step-by-StepProcedure
Toconfigureananalyzer calledemployee-monitorandspecify the input (source) interfaces
and the analyzer output interface:
1. Configure each interface connected to employee computers as an input interface
for the analyzer employee-monitor:
[edit forwarding-options]user@swtitch#setanalyzer(PortMirroring)employee-monitor input ingress interfacege–0/0/0.0
user@swtich# set analyzer employee-monitor input ingress interface ge–0/0/1.0
2. Configure the output interface of the analyzer as part of a VLAN
25Copyright © 2016, Juniper Networks, Inc.
Chapter 2: Configuring Analyzers and Port Mirroring

[edit forwarding-options]user@switch# set interfaces ge-0/0/10 unit 0 family ethernet-switching vlanmembers analyzer_vlan
[edit vlans]user@switch# set analyzer-vlan vlan-id 1000
3. Configure the output analyzer interface for the analyzer employee-monitor. Thiswill
be the destination interface for the mirrored packets:
[edit forwarding-options]user@switch# set analyzer employee-monitor output interface ge-0/0/10.0
Results Check the results of the configuration:
[edit]user@switch> showforwarding-options {analyzer employee-monitor {input {ingress {interface ge-0/0/0.0;
interface ge-0/0/1.0;}}output {interface {ge-0/0/10.0;
}}
}}
Mirroring Employee-to-Web Traffic for Local Analysis
To configure mirroring for employee toWeb traffic, perform these tasks:
CLI QuickConfiguration
To quickly configure local mirroring of traffic from the two ports connected to employee
computers, filtering so that only traffic to the externalWeb ismirrored, copy the following
commands and paste them into the switch terminal window:
[edit]user@switch# set forwarding-options port-mirroring instance employee–web–monitoroutput interface ge-0/0/10.0
user@switch# set firewall family ethernet-switching filter watch-employee termemployee-to-corp from destination-address 192.0.2.16/24
user@switch# set firewall family ethernet-switching filter watch-employee termemployee-to-corp from source-address 192.0.2.16/24
user@switch# set firewall family ethernet-switching filter watch-employee termemployee-to-corp then accept
user@switch# set firewall family ethernet-switching filter watch-employee termemployee-to-web from destination-port 80
user@switch# set firewall family ethernet-switching filter watch-employee termemployee-to-web then port-mirroring-instance employee-web-monitor
user@switch# set interfaces ge-0/0/0 unit 0 family ethernet-switching filter inputwatch-employee
Copyright © 2016, Juniper Networks, Inc.26
Network Management and Monitoring Feature Guide for EX2300, EX3400, and EX4300 Switches

user@switch# set interfaces ge-0/0/1 unit 0 family ethernet-switching filter inputwatch-employee
Step-by-StepProcedure
To configure local mirroring of employee toWeb traffic from the two ports connected
to employee computers:
1. Configure the local analyzer interface:
[edit interfaces]user@switch# set ge-0/0/10 unit 0 family ethernet-switching
2. Configure the employee-web-monitor output instance (the input to the instance
comes from the action of the filter):
[edit forwarding-options port-mirroring]user@switch# set instance employee-web-monitor output interface ge-0/0/10.0
3. Configurea firewall filter calledwatch-employee to sendmirroredcopiesofemployee
requests to theWeb to the employee-web-monitor instance. Accept all traffic to
and from the corporate subnet (destination or source address of 192.0.2.16/24).
Sendmirrored copies of all packets destined for the Internet (destination port 80)
to the employee-web-monitor instance.
[edit firewall family ethernet-switching]user@switch# set filter watch-employee term employee-to-corp fromdestination-address 192.0.2.16/24
user@switch# set filter watch-employee term employee-to-corp fromsource-address 192.0.2.16/24
user@switch# set filter watch-employee term employee-to-corp then acceptser@switch#setfilterwatch-employeetermemployee-to-webfromdestination-port80
user@switch# set filter watch-employee term employee-to-web thenport-mirroring-instance employee-web-monitor
4. Apply thewatch-employee filter to the appropriate ports:
[edit interfaces]user@switch# set ge-0/0/0 unit 0 family ethernet-switching filter inputwatch-employee
user@switch# set ge-0/0/1 unit 0 family ethernet-switching filter inputwatch-employee
Results Check the results of the configuration:
[edit]user@switch> showforwarding-options {port-mirroring {instance {employee-web-monitor {family ethernet-switching {output {interface ge-0/0/10.0;}
}}
}
27Copyright © 2016, Juniper Networks, Inc.
Chapter 2: Configuring Analyzers and Port Mirroring

}}...firewall family ethernet-switching {filter watch-employee {term employee-to-corp {from {destination-address 192.0.2.16/24;source-address 192.0.2.16/24;
}then accept {
}term employee-to-web {from {destination-port 80;
}then port-mirroring-instance employee-web-monitor;
}}
}...interfaces {ge-0/0/0 {unit 0 {family ethernet-switching {interface-mode trunk;vlanmembers [employee-vlan, voice-vlan];filter {input watch-employee;
}}
}}ge-0/0/1 {family ethernet-switching {filter {input watch-employee;
}}
}}
Verification
To confirm that the configuration is correct, perform these tasks:
• Verifying That the Analyzer Has Been Correctly Created on page 28
• Verifying That The Port-Mirroring Instance Is Configured Properly on page 29
Verifying That the Analyzer Has Been Correctly Created
Purpose Verify that the analyzer employee-monitor or employee-web-monitor has been created
on the switch with the appropriate input interfaces, and appropriate output interface.
Copyright © 2016, Juniper Networks, Inc.28
Network Management and Monitoring Feature Guide for EX2300, EX3400, and EX4300 Switches

Action You can use the show forwarding-options analyzer command to verify that the analyzer
is configured properly.
user@switch> show forwarding-options analyzer Analyzer name : employee-monitor Mirror rate : 1 Maximum packet length : 0 State : up Ingress monitored interfaces : ge-0/0/0.0 Ingress monitored interfaces : ge-0/0/1.0 Output interface : ge-0/0/10.0
Meaning This output shows that the analyzer employee-monitor has a ratio of 1 (mirroring every
packet, the default setting), the maximum size of the original packet that wasmirrored
(0 indicates the entire packet), the state of the configuration (is up indicates that the
analyzer is mirroring the traffic entering the ge-0/0/0, and ge-0/0/1 interfaces, and
sending themirrored traffic to thege-0/0/10 interface). If the stateof theoutput interface
is down or if the output interface is not configured, the value of state will be down and
the analyzer will not be programmed for mirroring.
Verifying That The Port-Mirroring Instance Is Configured Properly
Purpose Verify that the port-mirroring instance employee-web-monitor has been configured
properly on the switch with the appropriate input interfaces.
Action You can verify that the port-mirroring instance is configured properly by using the show
forwarding-options port-mirroring command.
user@switch> show forwarding-options port-mirroringInstance Name: employee-web-monitor Instance Id: 3 Input parameters: Rate : 1 Run-length : 0 Maximum-packet-length : 0 Output parameters: Family State Destination Next-hop ethernet-switching up ge-0/0/10.0
Meaning This output shows that the employee-web-monitor instance has a ratio of 1 (mirroring
every packet, the default), themaximum size of the original packet that wasmirrored (0
indicates an entire packet), the state of the configuration is up and port mirroring is
programmed, and thatmirrored traffic fromthe firewall filter action is sentouton interface
ge-0/0/10.0. If the stateof theoutput interface isdownor if the interface is not configured,
the value for state will be down and port mirroring will not be programmed for mirroring.
RelatedDocumentation
Example: Configuring Mirroring for Remote Monitoring of Employee Resource Use on
EX4300 Switches on page 30
•
29Copyright © 2016, Juniper Networks, Inc.
Chapter 2: Configuring Analyzers and Port Mirroring

• Configuring Mirroring on EX4300 Switches to Analyze Traffic (CLI Procedure) on
page 47
• Configuring Port Mirroring to Analyze Traffic (J-Web Procedure) on page 50
• UnderstandingPortMirroringandAnalyzersonEX2300,EX3400,andEX4300Switches
on page 18
Example: ConfiguringMirroring for RemoteMonitoring of Employee Resource Use onEX4300 Switches
NOTE: This example uses Junos OS for EX Series switches with support forthe Enhanced Layer 2 Software (ELS) configuration style. If your switch runssoftware that does not support ELS, see “Example: ConfiguringMirroring forRemote Monitoring of Employee Resource Use on EX4300 Switches” onpage30. For ELSdetails see:GettingStartedwith Enhanced Layer 2Software.
EX4300 switches enable you to configure mirroring to send copies of packets to either
a local interface for local monitoring or to a VLAN for remote monitoring. You can use
mirroring to copy these packets:
• Packets entering or exiting a port
• Packets entering a VLAN on EX4300 switches
You can analyze the mirrored traffic by using a protocol analyzer application running on
a remote monitoring station if you are sending mirrored traffic to an analyzer VLAN.
This topic includes two related examples that describe how tomirror traffic entering
ports on the switch to the remote-analyzer VLAN so that you can perform analysis from
a remotemonitoring station. The first example shows how tomirror all traffic entering
the ports connected to employee computers. The second example shows the same
scenario but includes a filter to mirror only the employee traffic going to theWeb.
BEST PRACTICE: Mirror only necessary packets to reduce potentialperformance impact. We recommend that you:
• Disable your configuredmirroring sessions when you are not using them.
• Specify individual interfaces as input to analyzers rather than specifyingall interfaces as input.
• Limit the amount of mirrored traffic by using firewall filters.
This example describes how to configure remote mirroring:
• Requirements on page 31
• Overview and Topology on page 31
Copyright © 2016, Juniper Networks, Inc.30
Network Management and Monitoring Feature Guide for EX2300, EX3400, and EX4300 Switches

• Mirroring All Employee Traffic for Remote Analysis on page 32
• Mirroring Employee-to-Web Traffic for Remote Analysis on page 35
• Verification on page 39
Requirements
This example uses the following hardware and software components:
• Junos OS Release 13.2X50-D10 or later for EX Series switches
• An EX4300 switch connected to another EX4300 switch
The diagram shows an EX4300 Virtual Chassis connected to an EX4300 destination
switch.
Before you configure remote mirroring, be sure that:
• You have an understanding of mirroring concepts.
• The interfaces that the analyzer will use as input interfaces have been configured on
the switch.
Overview and Topology
This topic includes two related examples that describe how to configuremirroring to the
remote-analyzer VLAN so that analysis can be performed from a remotemonitoring
station. The first example shows how to configure a switch to mirror all traffic from
employee computers. The second example shows the same scenario, but the setup
includes a filter to mirror only the employee traffic going to theWeb.
Figure 3 on page 31 shows the network topology for both these example scenarios.
Figure 3: RemoteMirroring Network Topology Example
31Copyright © 2016, Juniper Networks, Inc.
Chapter 2: Configuring Analyzers and Port Mirroring

In this example:
a. Interface ge-0/0/0 is a Layer 2 interface, and interface ge-0/0/1 is a Layer 3 interface
(both interfaces on the source switch) that serve as connections for employee
computers.
b. Interface ge-0/0/10 is a Layer 2 interface that connects the source switch to the
destination switch.
c. Interface ge-0/0/5 is a Layer 2 interface that connects the destination switch to the
remote monitoring station.
d. VLAN remote-analyzer is configuredonall switches in the topology tocarry themirrored
traffic.
Mirroring All Employee Traffic for Remote Analysis
Toconfigureananalyzer for remote traffic analysis for all incomingandoutgoingemployee
traffic, perform these tasks:
CLI QuickConfiguration
To quickly configure an analyzer for remote traffic analysis for incoming and outgoing
employee traffic, copy the following commands and paste them into the switch terminal
window:
• Copy and paste the following commands in the source switch terminal window:
[edit]set vlans remote-analyzer vlan-id 999set interfaces ge-0/0/10 unit 0 family ethernet-switching interface-mode trunkset interfaces ge-0/0/10 unit 0 family ethernet-switching vlanmembers 999set forwarding-options analyzer employee-monitor input ingress interface ge-0/0/0.0set forwarding-options analyzer employee-monitor input ingress interface ge-0/0/1.0set forwarding-options analyzer employee-monitor input egress interface ge-0/0/0.0set forwarding-options analyzer employee-monitor input egress interface ge-0/0/1.0set forwarding-options analyzer employee-monitor output vlan remote-analyzer
• Copy and paste the following commands in the destination switch terminal window:
[edit]set vlans remote-analyzer vlan-id 999set interfaces ge-0/0/10 unit 0 family ethernet-switching interface-mode trunkset interfaces ge-0/0/10 unit 0 family ethernet-switching vlanmembers 999set interfaces ge-0/0/5 unit 0 family ethernet-switching interface-mode trunkset forwarding-options analyzer employee-monitor input ingress vlan remote-analyzerset forwarding-options analyzer employee-monitor output interface ge-0/0/5.0
Step-by-StepProcedure
To configure basic remote port mirroring:
On the source switch:1.
• Configure the VLAN ID for the remote-analyzer VLAN:
[edit vlans]user@switch# set remote-analyzer vlan-id 999
• Configure the interface on the network port connected to the destination switch
for trunk mode and associate it with the remote-analyzer VLAN:
[edit interfaces]user@switch# set ge-0/0/10 unit 0 family ethernet-switching interface-mode trunk
Copyright © 2016, Juniper Networks, Inc.32
Network Management and Monitoring Feature Guide for EX2300, EX3400, and EX4300 Switches

user@switch# set ge-0/0/10 unit 0 family ethernet-switching vlanmembers 999
• Configure the employee-monitor analyzer:
[edit forwarding-options]user@switch# set analyzer employee-monitor input ingress interface ge-0/0/0.0user@switch# set analyzer employee-monitor input ingress interface ge-0/0/1.0user@switch# set instance employee-monitor input egress interface ge-0/0/0.0user@switch# set analyzer employee-monitor input egress interface ge-0/0/1.0user@switch# set analyzer employee-monitor output vlan remote-analyzer
2. On the destination switch:
• Configure the VLAN ID for the remote-analyzer VLAN:
[edit vlans]user@switch# set remote-analyzer vlan-id 999
• Configure the interface on the destination switch for trunk mode and associate
it with the remote-analyzer VLAN:
[edit interfaces]user@switch# set ge-0/0/10 unit 0 family ethernet-switching interface-mode trunkuser@switch# set ge-0/0/10 unit 0 family ethernet-switching vlanmembers 999
• Configure the interface connected to the destination switch for trunk mode:
[edit interfaces]user@switch# set ge-0/0/5 unit 0 family ethernet-switching interface-mode trunk
• Configure the employee-monitor analyzer:
[edit forwarding-options]user@switch# set analyzer employee-monitor input ingress vlan remote-analyzeruser@switch# set analyzer employee-monitor output interface ge-0/0/5.0
Results Check the results of the configuration on the source switch:
[edit]user@switch> showforwarding-options {analyzer employee-monitor {input {ingress {interface ge-0/0/0.0;interface ge-0/0/1.0;
}egress {interface ge-0/0/0.0;interface ge-0/0/1.0;
}}output {vlan {remote-analyzer;
}}
}}interfaces {ge-0/0/10 {unit 0 {
33Copyright © 2016, Juniper Networks, Inc.
Chapter 2: Configuring Analyzers and Port Mirroring

family ethernet-switching {interface-mode trunk;vlan {members 999;
}}
}}
}vlans {remote-analyzer {vlan-id 999;interface {ge-0/0/10.0}
}}
}
Check the results of the configuration on the destination switch:
[edit]user@switch> showinterfaces {ge0/0/5 {unit 0 {family ethernet-switching {interface-mode trunk;
}}
}ge-0/0/10 {unit 0 {family ethernet-switching {interface-mode trunk;vlan {members 999;
}}
}}
}vlans {remote-analyzer {vlan-id 999;interface {ge-0/0/10.0}
}}
}forwarding-options {analyzer employee-monitor {input {ingress {vlan remote-analyzer;
Copyright © 2016, Juniper Networks, Inc.34
Network Management and Monitoring Feature Guide for EX2300, EX3400, and EX4300 Switches

}}output {interface {ge-0/0/5.0;
}}
}}
Mirroring Employee-to-Web Traffic for Remote Analysis
To configure port mirroring for remote traffic analysis of employee- to-Web traffic,
perform these tasks:
CLI QuickConfiguration
To quickly configure port mirroring to mirror employee traffic to the external Web, copy
the following commands and paste them into the switch terminal window:
• Copy and paste the following commands in the source switch terminal window:
[edit]user@switch# set forwarding-optionsport-mirroring instanceemployee-web-monitoroutput vlan 999
user@switch# set vlans remote-analyzer vlan-id 999user@switch# set interfaces ge-0/0/10 unit 0 family ethernet-switching port modetrunk
user@switch#set interfacesge-0/0/10unit0familyethernet-switchingvlanmembers999
user@switch# set firewall family ethernet-switching filter watch-employee termemployee-to-corp from destination-address 192.0.2.16/24
user@switch# set firewall family ethernet-switching filter watch-employee termemployee-to-corp from source-address 192.0.2.16/24
user@switch# set firewall family ethernet-switching filter watch-employee termemployee-to-corp then accept
user@switch# set firewall family ethernet-switching filter watch-employee termemployee-to-web from destination-port 80
user@switch# set firewall family ethernet-switching filter watch-employee termemployee-to-web then port-mirror-instance employee-web-monitor
user@switch# set interfaces ge-0/0/0 unit 0 family ethernet-switching filter inputwatch-employee
user@switch# set interfaces ge-0/0/1 unit 0 family ethernet-switching filter inputwatch-employee
• Copy and paste the following commands in the destination switch terminal window:
[edit]user@switch# set vlans remote-analyzer vlan-id 999user@switch#set interfacesge-0/0/10unit0familyethernet-switching interface-modetrunk
user@switch#set interfacesge-0/0/10unit0familyethernet-switchingvlanmembers999
user@switch#set interfacesge-0/0/5unit0 familyethernet-switching interface-modetrunk
user@switch# set forwarding-options analyzer employee-web-monitor input ingressvlan remote-analyzer
user@switch#set forwarding-optionsanalyzeremployee-web-monitoroutput interfacege-0/0/5.0
35Copyright © 2016, Juniper Networks, Inc.
Chapter 2: Configuring Analyzers and Port Mirroring

Step-by-StepProcedure
To configure port mirroring of all traffic from the two ports connected to employee
computers to the remote-analyzer VLAN for use from a remotemonitoring station:
1. On the source switch:
• Configure the employee-web-monitor port mirroring instance:
[edit ]user@switch# set interfaces ge-0/0/10 unit 0 family ethernet-switching portmode trunk
user@switch# set forwarding-options port-mirroring instanceemployee-web-monitor output vlan 999
• Configure the VLAN ID for the remote-analyzer VLAN:
[edit vlans]user@switch# set remote-analyzer vlan-id 999
• Configure the interface to associate it with the remote-analyzer VLAN:
[edit interfaces]user@switch# setge-0/0/10unit0 familyethernet-switchingvlanmembers999
• Configure the firewall filter calledwatch-employee:
[edit firewall family ethernet-switching]user@switch# set filter watch-employee term employee-to-corp fromdestination-address 192.0.2.16/24
user@switch# set filter watch-employee term employee-to-corp fromsource-address 192.0.2.16/24
user@switch# set filter watch-employee term employee-to-corp then acceptuser@switch# set filter watch-employee term employee-to-web fromdestination-port 80
user@switch# set filter watch-employee term employee-to-web thenport-mirror-instance employee-web-monitor
• Apply the firewall filter to the employee interfaces:
[edit interfaces]user@switch# set ge-0/0/0 unit 0 family ethernet-switching filter inputwatch-employee
user@switch# set ge-0/0/1 unit 0 family ethernet-switching filter inputwatch-employee
2. On the destination switch:
• Configure the VLAN ID for the remote-analyzer VLAN:
[edit vlans]user@switch# set remote-analyzer vlan-id 999
• Configure the interface on the destination switch for trunk mode and associate
it with the remote-analyzer VLAN:
[edit interfaces]user@switch# set ge-0/0/10 unit 0 family ethernet-switching interface-modetrunk
user@switch# setge-0/0/10unit0 familyethernet-switchingvlanmembers999
• Configure the interface connected to the destination switch for trunk mode:
[edit interfaces]
Copyright © 2016, Juniper Networks, Inc.36
Network Management and Monitoring Feature Guide for EX2300, EX3400, and EX4300 Switches

user@switch# set ge-0/0/5 unit 0 family ethernet-switching interface-modetrunk
• Configure the employee-monitor analyzer:
[edit forwarding-options port-mirroring]user@switch# set instance employee-web-monitor input ingress vlanremote-analyzer
user@switch# set instance employee-web-monitor output interface ge-0/0/5.0
Results Check the results of the configuration on the source switch:
[edit]user@switch> showinterfaces {ge-0/0/10 {unit 0 {family ethernet-switching {interface-mode trunk;vlan {members remote-analyzer;
}}
}}ge-0/0/0 {unit 0 {family ethernet-switching {filter {input watch-employee;
}}
}}ge-0/0/1 {unit 0 {family ethernet-switching {filter {input watch-employee;
}}
}}
}firewall {family ethernet-switching {filter watch-employee {term employee-to-corp {from {source-address {192.0.2.16/24;
}destination-address {192.0.2.16/24;
}}
37Copyright © 2016, Juniper Networks, Inc.
Chapter 2: Configuring Analyzers and Port Mirroring

then accept;}term employee-to-web {from {destination-port 80;
}then port-mirror-instance employee-web-monitor;
}}
}}forwarding-options {analyzer employee-web-monitor {output {vlan {999;
}}
}vlans {remote-analyzer {vlan-id 999;
}}
Check the results of the configuration on the destination switch:
[edit]user@switch> showvlans {remote-analyzer {vlan-id 999;
}}interfaces {ge-0/0/10 {unit 0 {family ethernet-switching {interface-mode trunk;vlan {members remote-analyzer;
}}
}}ge-0/0/5 {unit 0 {family ethernet-switching {interface-mode trunk;
}}
}}forwarding-options {port-mirroring {instance employee-web-monitor {
Copyright © 2016, Juniper Networks, Inc.38
Network Management and Monitoring Feature Guide for EX2300, EX3400, and EX4300 Switches

input {ingress {vlan remote-analyzer;
}}output {interface {ge-0/0/5.0;
}}
}}
Verification
To confirm that the configuration is working properly, perform these tasks:
• Verifying That the Analyzer Has Been Correctly Created on page 39
Verifying That the Analyzer Has Been Correctly Created
Purpose Verify that the analyzer named employee-monitor or employee-web-monitor has been
created on the switch with the appropriate input interfaces and appropriate output
interface.
Action Youcanverify theanalyzer is configuredasexpectedbyusing the showforwarding-options
analyzer command. To view previously created analyzers that are disabled, go to the
J-Web interface.
To verify that the analyzer is configured as expectedwhilemonitoring all employee traffic
on the source switch, run the showanalyzercommandon the source switch. The following
output is displayed for this configuration example:
user@switch> show forwarding-options analyzer Analyzer name : employee-monitor Mirror rate : 1 Maximum packet length : 0 State : up Ingress monitored interfaces : ge-0/0/0.0 Ingress monitored interfaces : ge-0/0/1.0 Egress monitored interfaces : ge-0/0/0.0 Egress monitored interfaces : ge-0/0/1.0 Output VLAN : default-switch/remote-analyzer
Meaning This output shows that the employee-monitor instance has a ratio of 1 (mirroring every
packet, the default), the maximum size of the original packet that wasmirrored (0
indicates the entire packet), the state of the configuration is up (which indicates the
proper state and that the analyzer is programmed, and is mirroring the traffic entering
ge-0/0/0 and ge-0/0/1 and is sending the mirrored traffic to the VLAN called
remote-analyzer). If the state of the output interface is down or if the output interface is
not configured, the value of state will be down and the analyzer will not be programmed
for mirroring.
39Copyright © 2016, Juniper Networks, Inc.
Chapter 2: Configuring Analyzers and Port Mirroring

RelatedDocumentation
Example: Configuring Mirroring for Local Monitoring of Employee Resource Use on
EX4300 Switches on page 23
•
• Configuring Mirroring on EX4300 Switches to Analyze Traffic (CLI Procedure) on
page 47
• UnderstandingPortMirroringandAnalyzersonEX2300,EX3400,andEX4300Switches
on page 18
Example: ConfiguringMirroring for RemoteMonitoring of Employee Resource UseThrough a Transit Switch on EX4300 Switches
NOTE: This example uses Junos OS for EX Series switches with support forthe Enhanced Layer 2 Software (ELS) configuration style. If your switch runssoftware that does not support ELS, see Example: Configuring Port Mirroringfor Remote Monitoring of Employee Resource Use Through a Transit Switchon EX Series Switches . For ELS details, seeGetting Started with EnhancedLayer 2 Software.
EX4300 switches enable you to configure mirroring to send copies of packets to either
a local interface for local monitoring or to a VLAN for remote monitoring. You can use
mirroring to copy these packets:
• Packets entering or exiting a port
• Packets entering a VLAN on EX4300 switches
You can analyze the mirrored traffic by using a protocol analyzer application running on
a remote monitoring station if you are sending mirrored traffic to an analyzer VLAN.
This topic includes an example that describes how tomirror traffic entering ports on the
switch to the remote-analyzer VLAN through a transit switch, so that you can perform
analysis from a remotemonitoring station.
BEST PRACTICE: Mirror only necessary packets to reduce potentialperformance impact. We recommend that you:
• Disable your configuredmirroring sessions when you are not using them.
• Specify individual interfaces as input to analyzers rather than specifyingall interfaces as input.
• Limit the amount of mirrored traffic by using firewall filters.
This example describes how to configure remote mirroring through a transit switch:
• Requirements on page 41
• Overview and Topology on page 41
Copyright © 2016, Juniper Networks, Inc.40
Network Management and Monitoring Feature Guide for EX2300, EX3400, and EX4300 Switches

• MirroringAll EmployeeTraffic forRemoteAnalysisThroughaTransit Switchonpage42
• Verification on page 46
Requirements
This example uses the following hardware and software components:
• An EX4300 switch connected to another EX4300 switch through a third EX4300
switch
• Junos OS Release 13.2X50-D10 or later for EX Series switches
Before you configure remote mirroring, be sure that:
• You have an understanding of mirroring concepts.
• The interfaces that the analyzer will use as input interfaces have been configured on
the switch.
Overview and Topology
This example describes how tomirror traffic entering ports on the switch to the
remote-analyzer VLAN through a transit switch so that you can perform analysis from a
remotemonitoring station. The example shows how to configure a switch to mirror all
traffic from employee computers to a remote analyzer.
In this configuration, an analyzer session is required on the destination switch to mirror
incoming traffic from the analyzer VLAN to the egress interface to which the remote
monitoring station is connected. Youmust disable MAC learning on the transit switch
for the remote-analyzer VLAN so that MAC learning is disabled for all member interfaces
of the remote-analyzer VLAN on the transit switch.
Figure 4 on page 41 shows the network topology for this example.
Figure 4: RemoteMirroring Through a Transit Switch Network–SampleTopology
41Copyright © 2016, Juniper Networks, Inc.
Chapter 2: Configuring Analyzers and Port Mirroring

In this example:
• Interface ge-0/0/0 is a Layer 2 interface, and interface ge-0/0/1 is a Layer 3 interface
(both interfaces on the source switch) that serve as connections for employee
computers.
• Interface ge-0/0/10 is a Layer 2 interface that connects to the transit switch.
• Interface ge-0/0/11 is a Layer 2 interface on the transit switch.
• Interface ge-0/0/12 is a Layer 2 interface on the transit switch and connects to the
destination switch.
• Interface ge-0/0/13 is a Layer 2 interface on the destination switch .
• Interface ge-0/0/14 is a Layer 2 interface on the destination switch and connects to
the remote monitoring station.
• VLAN remote-analyzer is configuredonall switches in the topology to carry themirrored
traffic.
Mirroring All Employee Traffic for Remote Analysis Through a Transit Switch
To configuremirroring for remote traffic analysis through a transit switch, for all incoming
and outgoing employee traffic, perform these tasks:
CLI QuickConfiguration
To quickly configure mirroring for remote traffic analysis through a transit switch, for
incoming and outgoing employee traffic, copy the following commands and paste them
into the switch terminal window:
• Copy and paste the following commands in the source switch (monitored switch)
terminal window:
[edit]set vlans remote-analyzer vlan-id 999set interfaces ge-0/0/10 unit 0 family ethernet-switching interface-mode trunkset interfaces ge-0/0/10 unit 0 family ethernet-switching vlanmembers 999set forwarding-options analyzer employee-monitor input ingress interface ge-0/0/0.0set forwarding-options analyzer employee-monitor input ingress interface ge-0/0/1.0set forwarding-options analyzer employee-monitor input egress interface ge-0/0/0.0set forwarding-options analyzer employee-monitor input egress interface ge-0/0/1.0set forwarding-options analyzer employee-monitor output vlan remote-analyzer
• Copy and paste the following commands in the transit switch window:
[edit]set vlans remote-analyzer vlan-id 999set interfaces ge-0/0/11 unit 0 family ethernet-switching interface-mode trunkset vlans remote-analyzer interface ge-0/0/11set interfaces ge-0/0/12 unit 0 family ethernet-switching interface-mode trunkset vlans remote-analyzer interface ge-0/0/12set vlans remote-analyzer no-mac-learning
• Copy and paste the following commands in the destination switch window:
[edit]set vlans remote-analyzer vlan-id 999set interfaces ge-0/0/13 unit 0 family ethernet-switching interface-mode trunkset vlans remote-analyzer interface ge-0/0/13 ingressset interfaces ge-0/0/14 unit 0 family ethernet-switching interface-mode trunk
Copyright © 2016, Juniper Networks, Inc.42
Network Management and Monitoring Feature Guide for EX2300, EX3400, and EX4300 Switches

set forwarding-options analyzer employee-monitor input ingress vlan remote-analyzerset forwarding-options analyzer employee-monitor output interface ge-0/0/14.0
Step-by-StepProcedure
To configure remote mirroring through a transit switch:
On the source switch:1.
• Configure the VLAN ID for the remote-analyzer VLAN:
[edit vlans]user@switch# set remote-analyzer vlan-id 999
• Configure the interfaces on the network port connected to transit switch for trunk
mode and associate it with the remote-analyzer VLAN:
[edit interfaces]user@switch# set ge-0/0/10 unit 0 family ethernet-switching interface-mode trunkuser@switch# set ge-0/0/10 unit 0 family ethernet-switching vlanmembers 999
• Configure the employee-monitor analyzer:
[edit forwarding-options]user@switch# set analyzer employee-monitor input ingress interface ge-0/0/0.0user@switch# set analyzer employee-monitor input ingress interface ge-0/0/1.0user@switch# set analyzer employee-monitor input egress interface ge-0/0/0.0user@switch# set analyzer employee-monitor input egress interface ge-0/0/1.0user@switch# set analyzer employee-monitor output vlan remote-analyzer
2. On the transit switch:
• Configure the VLAN ID for the remote-analyzer VLAN:
[edit vlans]user@switch# set remote-analyzer vlan-id 999
• Configure the ge-0/0/11 interface for trunk mode, associate it with the
remote-analyzer VLAN:
[edit interfaces]user@switch# set ge-0/0/11 unit 0 family ethernet-switching interface-mode trunk
• Configure the ge-0/0/12 interface for trunk mode, associate it with the
remote-analyzer VLAN, and set the interface for egress traffic only:
[edit interfaces]user@switch# set ge-0/0/12 unit 0 family ethernet-switching interface-mode trunkuser@switch# set vlans remote-analyzer interface ge-0/0/12
• Configure the no-mac-learning option for the remote-analyzer VLAN to disable
MAC learning on all interfaces that are members of the remote-analyzer VLAN:
[edit interfaces]user@switch# set vlans remote-analyzer no-mac-learning
3. On the destination switch:
• Configure the VLAN ID for the remote-analyzer VLAN:
[edit vlans]user@switch# set remote-analyzer vlan-id 999
• Configure the ge-0/0/13 interface for trunk mode, associate it with the
remote-analyzer VLAN, and set the interface for ingress traffic only:
[edit interfaces]user@switch# set ge-0/0/13 unit 0 family ethernet-switching interface-mode trunk
43Copyright © 2016, Juniper Networks, Inc.
Chapter 2: Configuring Analyzers and Port Mirroring

user@switch# set vlans remote-analyzer interface ge-0/0/13 ingress
• Configure the interface connected to the remote monitoring station for trunk
mode:
[edit interfaces]user@switch# set ge-0/0/14 unit 0 family ethernet-switching interface-mode trunk
• Configure the employee-monitor analyzer:
[edit forwarding-options]user@switch# set analyzer employee-monitor input ingress vlan remote-analyzeruser@switch# set analyzer employee-monitor output interface ge-0/0/14.0
Results Check the results of the configuration on the source switch:
[edit]user@switch> showforwarding-options {analyzer employee-monitor {input {ingress {interface ge-0/0/0.0;interface ge-0/0/1.0;
}egress {interface ge-0/0/0.0;interface ge-0/0/1.0;
}}output {vlan {remote-analyzer;
}}
}}vlans {remote-analyzer {vlan-id 999;
}}interfaces {ge-0/0/10 {unit 0 {family ethernet-switching {interface-mode trunk;vlan {member 999;
}}
}}
}
Check the results of the configuration on the transit switch:
[edit]
Copyright © 2016, Juniper Networks, Inc.44
Network Management and Monitoring Feature Guide for EX2300, EX3400, and EX4300 Switches

user@switch> showvlans {remote-analyzer {vlan-id 999;interface {ge-0/0/11.0 {}ge-0/0/12.0 {}
}no-mac-learning;
}}interfaces {ge-0/0/11 {unit 0 {family ethernet-switching {interface-mode trunk;
}}
}ge-0/0/12 {unit 0 {family ethernet-switching {interface-mode trunk;
}}
}}
Check the results of the configuration on the destination switch:
[edit]user@switch> showvlans {remote-analyzer {vlan-id 999;interface {ge-0/0/13.0 {ingress;
}}
}}interfaces {ge-0/0/13 {unit 0 {family ethernet-switching {interface-mode trunk;
}}
}ge-0/0/14 {unit 0 {family ethernet-switching {interface-mode trunk;
45Copyright © 2016, Juniper Networks, Inc.
Chapter 2: Configuring Analyzers and Port Mirroring
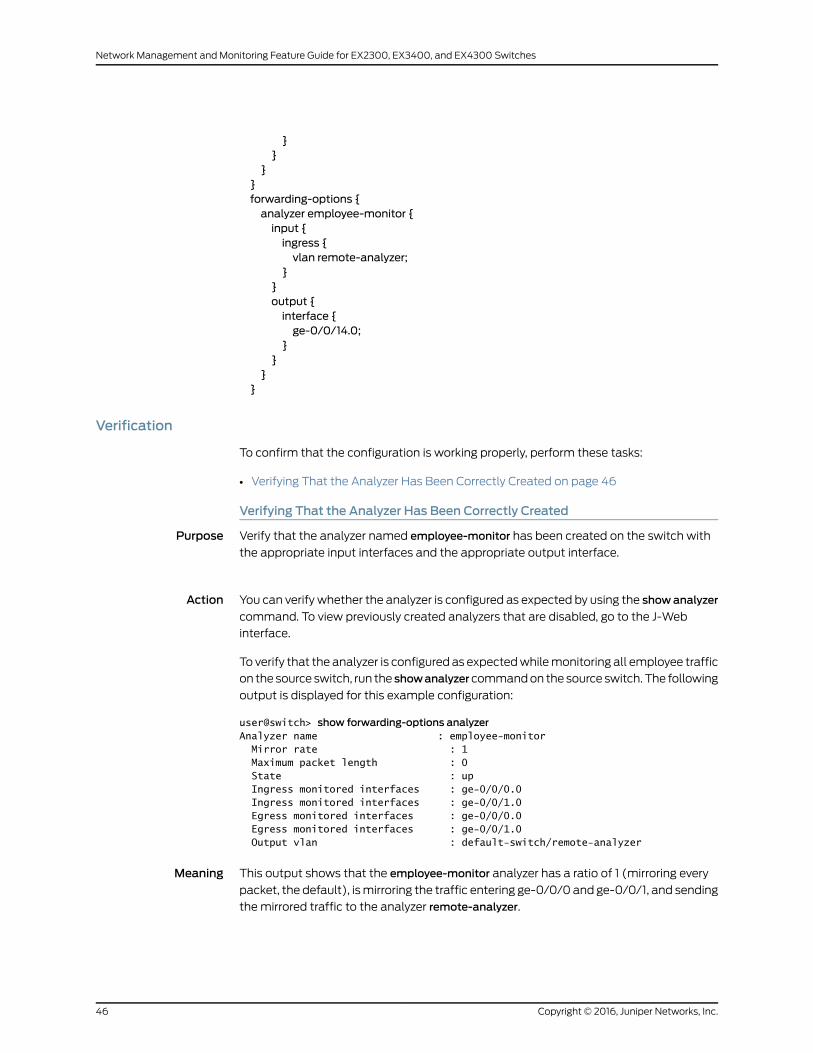
}}
}}forwarding-options {analyzer employee-monitor {input {ingress {vlan remote-analyzer;
}}output {interface {ge-0/0/14.0;
}}
}}
Verification
To confirm that the configuration is working properly, perform these tasks:
• Verifying That the Analyzer Has Been Correctly Created on page 46
Verifying That the Analyzer Has Been Correctly Created
Purpose Verify that the analyzer named employee-monitor has been created on the switch with
the appropriate input interfaces and the appropriate output interface.
Action You can verify whether the analyzer is configured as expected by using the showanalyzer
command. To view previously created analyzers that are disabled, go to the J-Web
interface.
To verify that the analyzer is configured as expectedwhilemonitoring all employee traffic
on the source switch, run the showanalyzercommandon the source switch. The following
output is displayed for this example configuration:
user@switch> show forwarding-options analyzerAnalyzer name : employee-monitor Mirror rate : 1 Maximum packet length : 0 State : up Ingress monitored interfaces : ge-0/0/0.0 Ingress monitored interfaces : ge-0/0/1.0 Egress monitored interfaces : ge-0/0/0.0 Egress monitored interfaces : ge-0/0/1.0 Output vlan : default-switch/remote-analyzer
Meaning This output shows that the employee-monitor analyzer has a ratio of 1 (mirroring every
packet, the default), ismirroring the traffic entering ge-0/0/0 and ge-0/0/1, and sending
the mirrored traffic to the analyzer remote-analyzer.
Copyright © 2016, Juniper Networks, Inc.46
Network Management and Monitoring Feature Guide for EX2300, EX3400, and EX4300 Switches

RelatedDocumentation
Example: Configuring Mirroring for Remote Monitoring of Employee Resource Use on
EX4300 Switches on page 30
•
• Example: Configuring Mirroring for Local Monitoring of Employee Resource Use on
EX4300 Switches on page 23
• Configuring Mirroring on EX4300 Switches to Analyze Traffic (CLI Procedure) on
page 47
• Configuring Port Mirroring to Analyze Traffic (J-Web Procedure) on page 50
• UnderstandingPortMirroringandAnalyzersonEX2300,EX3400,andEX4300Switches
on page 18
ConfiguringMirroring on EX4300 Switches to Analyze Traffic (CLI Procedure)
NOTE: This task uses Junos OS for EX Series switches with support for theEnhanced Layer 2 Software (ELS) configuration style. If your switch runssoftware that does not support ELS, seeConfiguring PortMirroring to AnalyzeTraffic (CLI Procedure). For ELS details, seeGetting Started with EnhancedLayer 2 Software.
EX4300 switches enable you to configure mirroring to send copies of packets to either
a local interface for local monitoring or to a VLAN for remote monitoring. You can use
mirroring to copy these packets:
• Packets entering or exiting a port
• Packets entering a VLAN
BEST PRACTICE: Mirror only necessary packets to reduce potentialperformance impact. We recommend that you:
• Disable your configuredmirroring configurations when you are not usingthem.
• Specify individual interfaces as input to analyzers rather than specifyingall interfaces as input.
• Limit the amount of mirrored traffic by using firewall filters.
NOTE: If youwant tocreateadditionalanalyzerswithoutdeleting theexistinganalyzers, then disable the existing analyzers by using the disable analyzer
analyzer-name statement from the command-line interface or the J-Web
configuration page for mirroring.
47Copyright © 2016, Juniper Networks, Inc.
Chapter 2: Configuring Analyzers and Port Mirroring

NOTE: Interfaces used as output for an analyzer must be configured underthe ethernet-switching family.
• Configuring an Analyzer for Local Traffic Analysis on page 48
• Configuring an Analyzer for Remote Traffic Analysis on page 48
• Configuring Port Mirroring on page 49
Configuring an Analyzer for Local Traffic Analysis
Tomirror interface traffic or VLAN traffic on the switch to an interface on the switch (by
using analyzers):
1. Choose a name for the analyzer and specify the input:
[edit forwarding-options]user@switch# set analyzer (Port Mirroring) analyzer-name input ingress interfaceinterface-name
For example, create an analyzer called employee-monitor for which the input traffic
is packets entering interfaces ge-0/0/0.0 and ge-0/0/1.0:
[edit forwarding-options]user@switch# set analyzer (Port Mirroring) employee-monitor input ingress interfacege–0/0/0.0[edit forwarding-options]user@switch# set analyzer employee-monitor input ingress interface ge–0/0/1.0
2. Configure the destination interface for the mirrored packets:
[edit forwarding-options]user@switch# set analyzer analyzer-name output interface interface-name
For example, configure ge-0/0/10.0 as the destination interface for the
employee-monitor analyzer:
[edit forwarding-options]user@switch# set analyzer employee-monitor output interface ge-0/0/10.0
Configuring an Analyzer for Remote Traffic Analysis
Tomirror traffic that is traversing interfacesoraVLANon theswitch toaVLANforanalysis
from a remote location (by using analyzers):
1. Configure a VLAN to carry the mirrored traffic:
[edit]user@switch# set vlans analyzer-name vlan-id vlan-ID
For example, define an analyzer VLAN called remote-analyzer and assign it a VLAN
ID of 999:
[edit]user@switch# set vlans remote-analyzer vlan-id 999
2. Set the uplink module interface that is connected to the distribution switch to trunk
mode and associate it with the analyzer VLAN:
[edit]user@switch# set interfaces interface-nameunit0familyethernet-switching interface-modetrunk vlanmembers vlan-ID
Copyright © 2016, Juniper Networks, Inc.48
Network Management and Monitoring Feature Guide for EX2300, EX3400, and EX4300 Switches

Forexample, set the interfacege-0/1/1 to trunkmodeandassociate itwith theanalyzer
VLAN ID 999:
[edit]user@switch# set interfaces ge-0/1/1 unit 0 family ethernet-switching interface-mode trunkvlanmembers 999
3. Configure the analyzer:
a. Define an analyzer and specify the traffic to bemirrored:
[edit forwarding-options]user@switch# set analyzer analyzer-name input ingress interface interface-name
For example, define the employee-monitor analyzer for which traffic to bemirrored
is packets entering interfaces ge-0/0/0.0 and ge-0/0/1.0:
[edit forwarding-options]user@switch# set analyzer employee-monitor input ingress interface ge-0/0/0.0[edit forwarding-options]user@switch# set analyzer employee-monitor input ingress interface ge-0/0/1.0
b. Specify the analyzer VLAN as the output for the analyzer:
[edit forwarding-options]user@switch# set analyzer analyzer-name output vlan vlan-ID
For example, specify the remote-analyzer VLAN as the output analyzer for the
employee-monitor analyzer:
[edit forwarding-options]user@switch# set analyzer employee-monitor output vlan 999
Configuring Port Mirroring
To filter packets to bemirrored to a port-mirroring instance, create the instance and then
use it as theaction in the firewall filter. Youcanuse firewall filters in both local and remote
mirroring configurations.
If the same port-mirroring instance is used in multiple filters or terms, the packets are
copied to the analyzer output port or analyzer VLAN only once.
To filter mirrored traffic, create a port-mirroring instance under the [edit
forwarding-options] hierarchy level, and then create a firewall filter. The filter can use
any of the availablematch conditions andmust haveport-mirror-instance instance-name
as an action. This action in the firewall filter configuration provides the input to the
port-mirroring instance.
To configure a port-mirroring instance with firewall filters:
1. Configure theport-mirroring instancename(here,employee-monitor)and theoutput:
a. For local analysis, set the output to the local interface to which you will connect
the computer running the protocol analyzer application:
[edit forwarding-options]user@switch# set port-mirroring instance employee-monitor output interfacege-0/0/10.0
b. For remote analysis, set the output to the remote-analyzer VLAN:
[edit forwarding-options]
49Copyright © 2016, Juniper Networks, Inc.
Chapter 2: Configuring Analyzers and Port Mirroring

user@switch# set port-mirroring instance employee-monitor output vlan 999
2. Create a firewall filter by using any of the available match conditions and assign
employee-monitor to the port-mirror-instance action:
This step shows a firewall filter example-filter, with two terms (no-analyzer and
to-analyzer):
a. Create the first term to define the traffic that should not pass through to the
port-mirroring instance employee-monitor:
[edit firewall family ethernet-switchinguser@switch# set filter example-filter term no-analyzer from source-addressip-address
user@switch# set filter example-filter term no-analyzer from destination-addressip-address
user@switch# set filter example-filter term no-analyzer then accept
b. Create the second term to define the traffic that should pass through to the
port-mirroring instance employee-monitor:
[edit firewall family ethernet-switching]user@switch# set filter example-filter term to-analyzer from destination-port 80user@switch# set filter example-filter term to-analyzer then port-mirror-instanceemployee–monitor
user@switch# set filter example-filter term to-analyzer then accept
3. Apply the firewall filter to the interfacesorVLANthatprovide input to theport-mirroring
instance:
[edit]user@switch# set interfaces ge-0/0/0 unit 0 family ethernet-switching filter inputexample-filter
ser@switch# set vlan remote-analyzer filter input example-filter
RelatedDocumentation
Example: Configuring Mirroring for Local Monitoring of Employee Resource Use on
EX4300 Switches on page 23
•
• Example: Configuring Mirroring for Remote Monitoring of Employee Resource Use on
EX4300 Switches on page 30
• Example: Configuring Firewall Filters for Port, VLAN, and Router Traffic on EX Series
Switches
• Understanding Port Mirroring on EX Series Switches
• Firewall Filters for EX Series Switches Overview
Configuring Port Mirroring to Analyze Traffic (J-Web Procedure)
NOTE: This topic applies only to the J-Web Application package.
Copyright © 2016, Juniper Networks, Inc.50
Network Management and Monitoring Feature Guide for EX2300, EX3400, and EX4300 Switches

EX Series switches allow you to configure port mirroring to send copies of packets to
either a local interface for local monitoring or to a VLAN for remote monitoring. You can
use port mirroring to copy these packets:
• Packets entering or exiting a port
• Packets entering a VLAN on EX2200, EX3200, EX3300, EX4200, EX4300, EX4500,
EX6200 switches
• Packets exiting a VLAN on EX8200 switches
To configure port mirroring on an EX Series switch using the J-Web interface:
1. Select Configure > Security > Port Mirroring.
The top of the screen displays analyzer details such as the name, status, analyzer
port, ratio, and loss priority.
The bottom of the screen lists ingress and egress ports of the selected analyzer.
NOTE: After youmake changes to the configuration on this page, youmust commit the changes for them to take effect. To commit all changesto the active configuration, select Commit Options > Commit. See Using
the Commit Options to Commit Configuration Changes for details aboutall commit options.
2. Click one of the following options:
• Add—Add an analyzer. Enter information as specified in Table 7 on page 51.
• Edit—Modify details of the selected analyzer. Enter information as specified in
Table 7 on page 51.
• Delete—Delete the selected analyzer.
• Enable/Disable—Enable or disable the selected analyzer (toggle).
NOTE: On EX2200, EX3200, EX4200, and EX4500 switches, only oneanalyzercanbeenabledatatime.OnEX8200switches,amaximumofsevenanalyzers can be enabled. On EX4300 switches amaximum of fourAnalyzers/Port Mirror instances can be enabled.
NOTE: When an analyzer is deleted or disabled, any filter association isremoved.
Table 7: Port Mirroring Configuration Settings
Your ActionFunctionField
Type a name for the analyzer.Specifies the name of the analyzer.Analyzer Name
51Copyright © 2016, Juniper Networks, Inc.
Chapter 2: Configuring Analyzers and Port Mirroring

Table 7: Port Mirroring Configuration Settings (continued)
Your ActionFunctionField
Enter a number from 0 through 2047.Specifies the ratio of packets to bemirrored. Forexample:
• A ratio of 1 sends copies of all packets.
• A ratio of 2047 sends copies of 1 out of every2047 packets.
Ratio
NOTE: This option is notsupported on EX4300switches.
Keep the default of low, unless the output isto a VLAN.
Specifies the losspriority of themirroredpackets.
By default, the switch applies a lower priority tomirrored data than to regular port-to-portdata—mirrored traffic is dropped in preferenceto regular traffic when capacity is exceeded.
For port-mirroring configurations with output toan analyzer VLAN, set the loss priority to high.
Loss Priority
NOTE: This option is notsupported on EX4300switches.
ClickSelect. In theSelectAnalyzerPort/VLANwindow, select either port or VLAN as theAnalyzer Type. Next, select the required portor VLAN. For an EX8200 Virtual Chassisconfiguration, select the member, FPC, andthe port (interface) from the list.
Specifies a local interface or VLAN to whichmirrored packets are sent.
NOTE: A VLANmust have only one associatedinterface tobe specified as ananalyzer interface.
Analyzer Port
Select the Analyzer Type from the list.Specifies the analyzer type.Analyzer Type
NOTE: This option issupported only on EX4300switches.
To enable this option, select the check box.Enable this option to skip checking for filters onport-mirroring instance.
No Filter check
NOTE: This option issupported only on EX4300switches.
Click Add. For an EX8200 Virtual Chassisconfiguration, select the member, FPC, andthe interface from the list.
ClickRemove to delete an ingress interface orVLAN.
Specifies interfaces or VLANs for which enteringtraffic is mirrored.
Ingress
Click Add and select Port or VLAN. For anEX8200 Virtual Chassis configuration, selectthe member, FPC, and the interface from thelist.
Click Remove to remove egress interfaces.
Specifies interfaces for which exiting traffic ismirrored.
Egress
RelatedDocumentation
Configuring Port Mirroring to Analyze Traffic (CLI Procedure)•
Copyright © 2016, Juniper Networks, Inc.52
Network Management and Monitoring Feature Guide for EX2300, EX3400, and EX4300 Switches

• Example: Configuring Port Mirroring for Local Monitoring of Employee Resource Use on
EX Series Switches
• Example: Configuring Port Mirroring for Remote Monitoring of Employee Resource Use
on EX Series Switches
• Understanding Port Mirroring on EX Series Switches
Verifying Input and Output for Port Mirroring Analyzers on EX Series Switches
Purpose Verify that an analyzer has been created on the switch and has the appropriate output
interfaces, and appropriate output interface.
Action You can verify the port mirror analyzer is configured as expected using the show analyzer
command.
[edit]user@switch> show analyzerAnalyzer name : employee-monitor Output VLAN : remote-analyzer Mirror ratio : 1 Loss priority : High Ingress monitored interfaces : ge-0/0/0.0 Ingress monitored interfaces : ge-0/0/1.0
You can view all of the port mirror analyzers configured on the switch, including any that
aredisabled, using the showethernet-switching-optionscommand inconfigurationmode.
user@switch# show ethernet-switching-optionsinactive: analyzer employee-web-monitor { loss-priority high; output {
analyzer employee-monitor { loss-priority high; input { ingress { interface ge-0/0/0.0; interface ge-0/0/1.0; } } output { vlan { remote-analyzer; } }}
Meaning This output shows that the employee-monitor analyzer has a ratio of 1 (mirroring every
packet, the default), a loss priority of high (set this option to high whenever the analyzer
output is to aVLAN), ismirroring the traffic entering ge-0/0/0 and ge-0/0/1, and sending
the mirrored traffic to the analyzer called remote-analyzer.
53Copyright © 2016, Juniper Networks, Inc.
Chapter 2: Configuring Analyzers and Port Mirroring

RelatedDocumentation
Configuring Port Mirroring to Analyze Traffic (J-Web Procedure) on page 50•
• Configuring Port Mirroring to Analyze Traffic (CLI Procedure)
• Example: Configuring Port Mirroring for Local Monitoring of Employee Resource Use on
EX Series Switches
• Example: Configuring Port Mirroring for Remote Monitoring of Employee Resource Use
on EX Series Switches
• Understanding Port Mirroring on EX Series Switches
Troubleshooting Port Mirroring Configuration Error Messages
Troubleshooting issues with port mirroring on EX Series switches:
1. An Analyzer Configuration Returns a “Multiple interfaces cannot be configured as a
member of Analyzer output VLAN” Error Message on page 54
An Analyzer Configuration Returns a “Multiple interfaces cannot be configured as amemberof Analyzer output VLAN” Error Message
Problem Description: In an analyzer configuration, if the VLAN to which mirrored traffic is sentcontains more than onemember interface, the following error message is displayed in
the CLI when you commit the analyzer configuration and the commit fails:
Multiple interfaces cannot be configured as a member of Analyzer output VLAN <vlan name>
Solution Youmust direct the mirrored traffic to a VLAN that has a single member interface. You
can do this by completing either of these tasks:
• Reconfigure the existing VLAN to contain a single member interface. You can choose
this method if you want to use the existing VLAN.
• Create a new VLANwith a single member interface and associate the VLANwith the
analyzer.
To reconfigure the existing VLAN to contain only onemember interface:
1. Removemember interfaces from the VLAN repeatedly by using either the delete vlan
command or the delete interface command until the VLAN contains a singlemember
interface:
• [edit]user@switch# delete vlan vlan-id interface interface-name
• [edit]user@switch# delete interface interface-name unit 0 family family-name vlanmembervlan-id
2. (Optional) Confirm that the VLAN contains only one interface:
[edit]user@switch# show vlans vlan-name
Copyright © 2016, Juniper Networks, Inc.54
Network Management and Monitoring Feature Guide for EX2300, EX3400, and EX4300 Switches
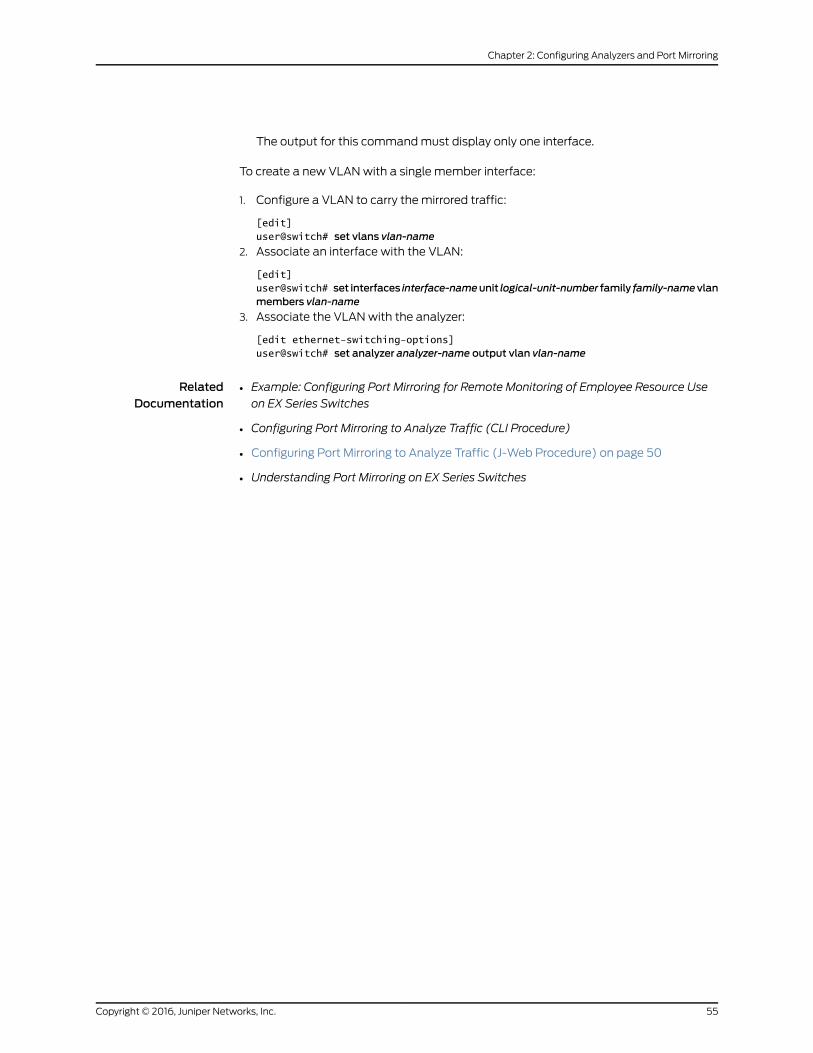
The output for this commandmust display only one interface.
To create a new VLANwith a single member interface:
1. Configure a VLAN to carry the mirrored traffic:
[edit]user@switch# set vlans vlan-name
2. Associate an interface with the VLAN:
[edit]user@switch# set interfaces interface-nameunit logical-unit-number family family-namevlanmembers vlan-name
3. Associate the VLANwith the analyzer:
[edit ethernet-switching-options]user@switch# set analyzer analyzer-name output vlan vlan-name
RelatedDocumentation
• Example: Configuring Port Mirroring for Remote Monitoring of Employee Resource Use
on EX Series Switches
• Configuring Port Mirroring to Analyze Traffic (CLI Procedure)
• Configuring Port Mirroring to Analyze Traffic (J-Web Procedure) on page 50
• Understanding Port Mirroring on EX Series Switches
55Copyright © 2016, Juniper Networks, Inc.
Chapter 2: Configuring Analyzers and Port Mirroring

Copyright © 2016, Juniper Networks, Inc.56
Network Management and Monitoring Feature Guide for EX2300, EX3400, and EX4300 Switches

CHAPTER 3
Configuring sFlow Monitoring Technology
• Understanding How to Use sFlow Technology for Network Monitoring on an EX Series
Switch on page 57
• Example: Configuring sFlow Technology to Monitor Network Traffic on EX Series
Switches on page 60
• Configuring sFlow Technology for Network Monitoring (CLI Procedure) on page 64
Understanding How to Use sFlow Technology for NetworkMonitoring on an EX SeriesSwitch
The sFlow technology is a monitoring technology for high-speed switched or routed
networks. sFlowmonitoring technology randomly samples network packets and sends
the samples to amonitoring station. You can configure sFlow technology on a Juniper
Networks EX Series Ethernet Switch to continuously monitor traffic at wire speed on all
interfaces simultaneously.
This topic describes:
• Sampling Mechanism and Architecture of sFlow Technology on EX Series
Switches on page 57
• Adaptive Sampling on page 58
• sFlow Agent Address Assignment on page 59
SamplingMechanism and Architecture of sFlow Technology on EX Series Switches
sFlow technology uses the following two sampling mechanisms:
• Packet-based sampling: Samples one packet out of a specified number of packets
from an interface enabled for sFlow technology.
• Time-based sampling: Samples interface statistics at a specified interval from an
interface enabled for sFlow technology.
The sampling information is used to create a network traffic visibility picture. The Juniper
Networks Junosoperating system(JunosOS) fully supports thesFlowstandarddescribed
in RFC 3176, InMon Corporation's sFlow: A Method for Monitoring Traffic in Switched and
Routed Networks.
57Copyright © 2016, Juniper Networks, Inc.

NOTE: sFlow technology on the switches samples only raw packet headers.A raw Ethernet packet is the complete Layer 2 network frame.
An sFlowmonitoring system consists of an sFlow agent embedded in the switch and a
centralized collector. The sFlow agent’s twomain activities are random sampling and
statistics gathering. The sFlowagent combines interface counters and flow samples and
sends themacross the network to the sFlow collector in UDP datagrams, directing those
datagrams to the IP address and UDP destination port of the collector. Each datagram
contains the following information:
• The IP address of the sFlow agent
• The number of samples
• The interface through which the packets entered the agent
• The interface through which the packets exited the agent
• The source and destination interface for the packets
• The source and destination VLAN for the packets
EX Series switches adopt the distributed sFlow architecture. The sFlow agent has two
separate sampling entities that are associated with each Packet Forwarding Engine.
These sampling entities are known as subagents. Each subagent has a unique ID that is
used by the collector to identify the data source. A subagent has its own independent
state and forwards its own sample packets to the sFlow agent. The sFlow agent is
responsible for packaging the samples into datagrams and sending them to the sFlow
collector. Because sampling is distributed across subagents, the protocol overhead
associated with sFlow technology is significantly reduced at the collector.
NOTE: You cannot configure sFlowmonitoring on a link aggregation group(LAG), but you can configure it individually on a LAGmember interface.
NOTE: If themastership assignment changes in a Virtual Chassis setup,sFlow technology continues to function.
Adaptive Sampling
The switches use adaptive sampling to ensure both sampling accuracy and efficiency.
Adaptive sampling is a process of monitoring the overall incoming traffic rate on the
network device and providing intelligent feedback to interfaces to dynamically adapt the
sampling rates on interfaces on the basis of traffic conditions. Interfaces on which
incoming traffic exceeds the system threshold are checked so that all violations can be
regulated without affecting the traffic on other interfaces. Every 12 seconds, the agent
checks interfaces to get the number of samples, and interfaces are grouped on the basis
of the slot that they belong to. The top five interfaces that produce the highest number
of samples are selected. Using the binary backoff algorithm, the sampling load on these
Copyright © 2016, Juniper Networks, Inc.58
Network Management and Monitoring Feature Guide for EX2300, EX3400, and EX4300 Switches

interfaces is reduced by half and allotted to interfaces that have a lower sampling rate.
Therefore, when the processor’s sampling limit is reached, the sampling rate is adapted
such that it doesnot load theprocessor any further. If the switch is rebooted, theadaptive
sampling rate is reset to the user-configured sampling rate. Also, if youmodify the
sampling rate, the adaptive sampling rate changes.
Theadvantageofadaptivesampling is that theswitchcontinues tooperateat itsoptimum
level evenwhen there is a change in the traffic patterns in the interfaces. You do not need
tomakeanychanges.Because thesampling rateadaptsdynamically tochangingnetwork
conditions, the resources are utilized optimally resulting in a high-performance network.
Infrequent sampling flowsmight not be reported in the sFlow information, but over time,
the majority of flows are reported. On the basis of the configured sampling rate N, 1 out
ofNpackets is captured and sent to the collector. This type of sampling does not provide
a result that is 100 percent accurate in the analysis, but it does provide a result of
quantifiable accuracy. A user-configured polling interval defines how often the sFlow
data for a specific interfaceare sent to the collector, but an sFlowagent canalso schedule
polling.
NOTE: sFlow technology on EX Series switches does not support gracefulrestart. When a graceful restart occurs, the adaptive sampling rate is set tothe user-configured sampling rate.
sFlow Agent Address Assignment
The sFlow collector uses the sFlow agent’s IP address to determine the source of the
sFlow data. You can configure the IP address of the sFlow agent to ensure that the agent
ID of the sFlow agent remains constant. If you do not configure the IP address of the
sFlow agent, an IP address is automatically assigned to the agent. This is the IP address
of one of the following interfaces configured on the switch taken in the given order of
priority:
1. Virtual management Ethernet (VME) interface
2. Management Ethernet interface
If neither of the preceding interfaces has been configured, the IP address of any Layer 3
interfaceor the routedVLAN interface (RVI) is assigned to theagent. At least one interface
must be configured on the switch for an IP address to be automatically assigned to the
agent. When the agent’s IP address is assigned automatically, the IP address is dynamic
and changes when the switch reboots.
sFlowdata can be used to provide network traffic visibility information. You can explicitly
configure the IP address to be assigned to source data (sFlow datagrams). If you do not
explicitly configure that address, the IP address of the configured Gigabit Ethernet
interface, 10-Gigabit Ethernet interface, or the RVI is used as the source IP address.
RelatedDocumentation
Example: Configuring sFlow Technology to Monitor Network Traffic on EX Series
Switches on page 60
•
59Copyright © 2016, Juniper Networks, Inc.
Chapter 3: Configuring sFlowMonitoring Technology

• Configuring sFlow Technology for Network Monitoring (CLI Procedure) on page 64
• Monitoring Interface Status and Traffic
Example: Configuring sFlow Technology toMonitor Network Traffic on EX SeriesSwitches
sFlow technology is a networking monitoring technology for high-speed switched or
routednetworks. It is a technology that isbasedonstatistical sampling.Youcanconfigure
sFlow technology to continuously monitor traffic at wire speed on all interfaces
simultaneously. sFlow data can be used to provide network traffic visibility information.
You can specify sampling rates for ingress and egress packets. Junos OS fully supports
the sFlow standard described in RFC 3176, InMon Corporation's sFlow: A Method for
Monitoring Traffic in Switched and Routed Networks.
This example describes how to configure and use sFlow technology to monitor network
traffic.
• Requirements on page 60
• Overview and Topology on page 60
• Configuration on page 61
• Verification on page 63
Requirements
This example uses the following hardware and software components:
• One EX Series switch
• Junos OS Release 9.3 or later for EX Series switches
Overview and Topology
sFlow technology samples network packets and sends the samples to amonitoring
station. You can specify sampling rates for ingress and egress packets. The information
gathered is used to create a network traffic visibility picture.
An sFlowmonitoring system consists of an sFlow agent embedded in the switch and a
centralized collector. The sFlow agent runs on the switch. It combines interface counters
and flow samples and sends them across the network to the sFlow collector.
Figure 5 on page 61 depicts the basic elements of the sFlow system.
Copyright © 2016, Juniper Networks, Inc.60
Network Management and Monitoring Feature Guide for EX2300, EX3400, and EX4300 Switches

Figure 5: sFlow TechnologyMonitoring System
Configuration
To configure sFlow technology, perform the following tasks:
CLI QuickConfiguration
To quickly configure sFlow technology, copy the following commands and paste them
into the switch terminal window:
[edit protocols]set sflow collector 10.204.32.46 udp-port 5600set sflow interfaces ge-0/0/0set sflow polling-interval 20set sflow sample-rate egress 1000
61Copyright © 2016, Juniper Networks, Inc.
Chapter 3: Configuring sFlowMonitoring Technology

Step-by-StepProcedure
To configure sFlow technology:
1. Configure the IP address and UDP port of the collector:
[edit protocols]user@switch# set sflow collector 10.204.32.46 udp-port 5600
NOTE: You can configure amaximum of 4 collectors.
The default UDP port is 6343.
2. Enable sFlow technology on a specific interface:
[edit protocols sflow]user@switch# set interfaces ge-0/0/0
NOTE: You cannot enable sFlow technology on a Layer 3 VLAN-taggedinterface.
You cannot enable sFlow technology on a link aggregation group (LAG)interface, but you can enable it on themember interfaces of a LAG.
3. Specify in seconds how often the sFlow agent polls the interface:
[edit protocols sflow]user@switch# set polling-interval 20
NOTE: The polling interval can be specified as a global parameter also.Specify 0 if you do not want to poll the interface.
4. Specify the rate at which egress packets must be sampled:
[edit protocols sflow]user@switch# set sample-rate egress 1000
NOTE: You can specify both egress and ingress sampling rates. If youset only the egress sampling rate, the ingress sampling rate will be
disabled.
NOTE: We recommend that you configure the same sampling rates onall the ports on a line card. If you configure different sampling rates aredifferent, the lowest value is used for all ports. You could still configuredifferent rates on different line cards.
Copyright © 2016, Juniper Networks, Inc.62
Network Management and Monitoring Feature Guide for EX2300, EX3400, and EX4300 Switches

Results Check the results of the configuration:
[edit protocols sflow]user@switch# show
polling-interval 20;sample-rate egress 1000;collector 10.204.32.46 {udp-port 5600;
}interfaces ge-0/0/0.0;
Verification
To confirm that the configuration is correct, perform these tasks:
• Verifying That sFlow Technology Is Configured Properly on page 63
• Verifying That sFlow Technology Is Enabled on the Specified Interface on page 63
• Verifying the sFlow Collector Configuration on page 64
Verifying That sFlow Technology Is Configured Properly
Purpose Verify that sFlow technology is configured properly.
Action Use the show sflow command:
user@switch> show sflowsFlow: EnabledSample limit: 300 packets/secondPolling interval: 20 secondsSample rate egress: 1:1000: EnabledSample rate ingress: 1:2048: DisabledAgent ID: 10.204.96.222
NOTE: The sampling limit cannot be configured and is set to 300packets/second per FPC.
Meaning The output shows that sFlow technology is enabled and specifies the values for the
sampling limit, polling interval, and the egress sampling rate.
Verifying That sFlow Technology Is Enabled on the Specified Interface
Purpose Verify that sFlow technology is enabled on the specified interfaces and display the
sampling parameters.
Action Use the show sflow interface command:
user@switch> show sflow interfaceInterface Status Sample rate Adapted sample rate Polling-interval
Egress Ingress Egress Ingress Egress Ingressge-0/0/0.0 Enabled Disabled 1000 2048 1000 2048 20
63Copyright © 2016, Juniper Networks, Inc.
Chapter 3: Configuring sFlowMonitoring Technology

Meaning The output indicates that sFlow technology is enabled on the ge-0/0/0.0 interface with
an egress sampling rate of 1000, a disabled ingress sampling rate, and a polling interval
of 20 seconds.
Verifying the sFlow Collector Configuration
Purpose Verify the sFlow collector's configuration.
Action Use the show sflow collector command:
user@switch> show sflow collector
Collector Udp-port No. of samples address10.204.32.46 5600 100010.204.32.76 3400 1000
Meaning The output displays the IP address of the collectors and the UDP ports. It also displays
the number of samples.
RelatedDocumentation
Configuring sFlow Technology for Network Monitoring (CLI Procedure) on page 64•
• Understanding How to Use sFlow Technology for Network Monitoring on an EX Series
Switch on page 57
Configuring sFlow Technology for Network Monitoring (CLI Procedure)
sFlow technology is a networkmonitoring technology for high-speed switched or routed
networks. It is a technology that is basedon statistical sampling. You can configure sFlow
technology to continuouslymonitor traffic atwire speedonall interfaces simultaneously.
Junos OS fully supports the sFlow standard described in RFC 3176, InMon Corporation's
sFlow: A Method for Monitoring Traffic in Switched and Routed Networks.
To configure sFlow features:
1. Configure the IP address and the UDP port of the collector:
[edit protocols]user@switch# set sflow collector ip4/ipv6-address udp-port port-number
The default UDP port is 6343,
2. Enable sFlow technology on a specific interface:
[edit protocols sflow]user@switch# set interfaces interface-name
NOTE: You cannot enable sFlow technology on a Layer 3 VLAN-taggedinterface.
You cannot enable sFlow technology on a link aggregation group (LAG),but you can enable it on themember interfaces of a LAG.
Copyright © 2016, Juniper Networks, Inc.64
Network Management and Monitoring Feature Guide for EX2300, EX3400, and EX4300 Switches
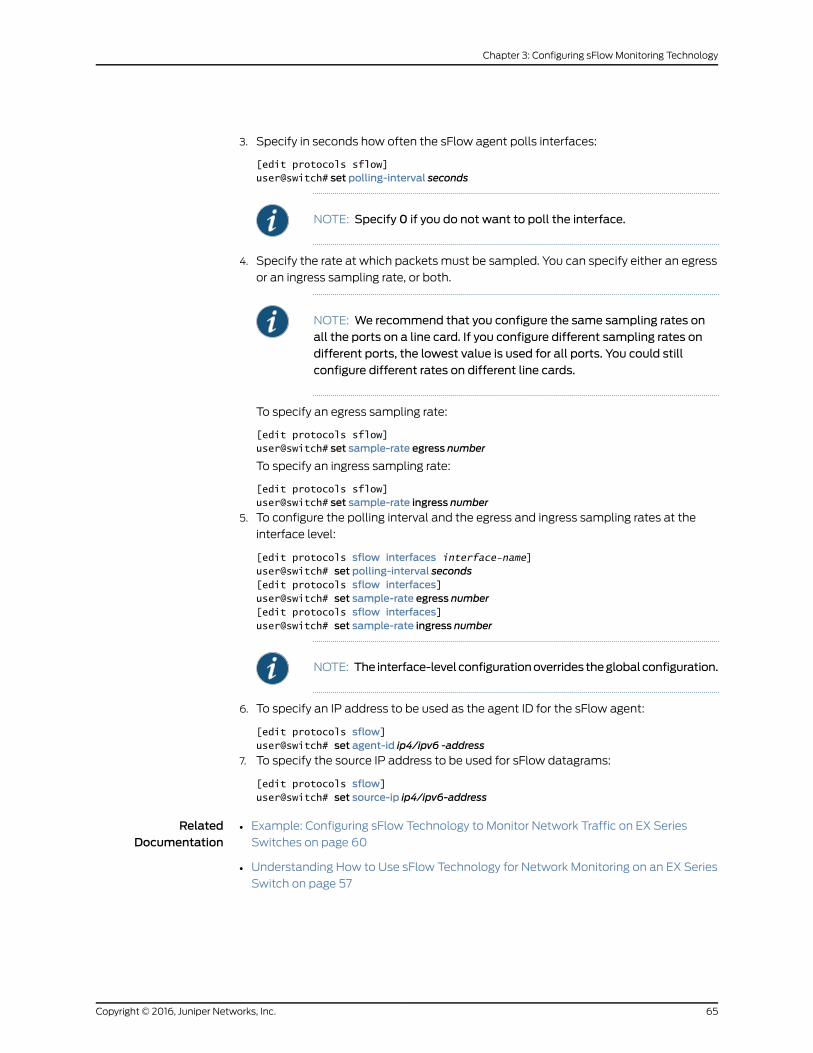
3. Specify in seconds how often the sFlow agent polls interfaces:
[edit protocols sflow]user@switch# set polling-interval seconds
NOTE: Specify 0 if you do not want to poll the interface.
4. Specify the rate at which packets must be sampled. You can specify either an egress
or an ingress sampling rate, or both.
NOTE: We recommend that you configure the same sampling rates onall the ports on a line card. If you configure different sampling rates ondifferent ports, the lowest value is used for all ports. You could stillconfigure different rates on different line cards.
To specify an egress sampling rate:
[edit protocols sflow]user@switch# set sample-rate egress number
To specify an ingress sampling rate:
[edit protocols sflow]user@switch# set sample-rate ingress number
5. To configure the polling interval and the egress and ingress sampling rates at the
interface level:
[edit protocols sflow interfaces interface-name]user@switch# set polling-interval seconds[edit protocols sflow interfaces]user@switch# set sample-rate egress number[edit protocols sflow interfaces]user@switch# set sample-rate ingress number
NOTE: The interface-level configurationoverrides theglobalconfiguration.
6. To specify an IP address to be used as the agent ID for the sFlow agent:
[edit protocols sflow]user@switch# set agent-id ip4/ipv6 -address
7. To specify the source IP address to be used for sFlow datagrams:
[edit protocols sflow]user@switch# set source-ip ip4/ipv6-address
RelatedDocumentation
• Example: Configuring sFlow Technology to Monitor Network Traffic on EX Series
Switches on page 60
• Understanding How to Use sFlow Technology for Network Monitoring on an EX Series
Switch on page 57
65Copyright © 2016, Juniper Networks, Inc.
Chapter 3: Configuring sFlowMonitoring Technology

Copyright © 2016, Juniper Networks, Inc.66
Network Management and Monitoring Feature Guide for EX2300, EX3400, and EX4300 Switches

CHAPTER 4
Configuring Ethernet OAM Link FaultManagement and Connectivity FaultManagement
• Understanding Ethernet OAM Link Fault Management for an EX Series
Switch on page 67
• Understanding Ethernet OAM Connectivity Fault Management for an EX Series
Switch on page 69
• Understanding Ethernet Frame Delay Measurements on Switches on page 70
• Example: Configuring Ethernet OAM Connectivity Fault Management on EX Series
Switches on page 72
• Example: Configuring Ethernet OAM Link Fault Management on EX Series
Switches on page 76
• ConfiguringEthernetOAMConnectivityFaultManagement (CLIProcedure)onpage79
• Configuring Ethernet OAM Link Fault Management (CLI Procedure) on page 83
Understanding Ethernet OAM Link Fault Management for an EX Series Switch
Juniper Networks Junos operating system (Junos OS) for Juniper Networks EX Series
Ethernet Switches allows the Ethernet interfaces on these switches to support the IEEE
802.3ahstandard for theOperation,Administration, andMaintenance (OAM)ofEthernet
in access networks. The standard defines OAM link fault management (LFM). You can
configure IEEE 802.3ah OAM LFM on point-to-point Ethernet links that are connected
either directly or through Ethernet repeaters. The IEEE 802.3ah standard meets the
requirement forOAMcapabilities evenasEthernetmoves frombeing solely anenterprise
technology to aWAN and access technology, and the standard remains
backward-compatible with existing Ethernet technology.
Ethernet OAM provides the tools that network management software and network
managers can use to determine how a network of Ethernet links is functioning. Ethernet
OAM should:
• Rely only on themedia access control (MAC) address or virtual LAN identifier for
troubleshooting.
67Copyright © 2016, Juniper Networks, Inc.

• Work independentlyof theactualEthernet transportand functionoverphysicalEthernet
ports or a virtual service such as pseudowire.
• Isolate faults over a flat (or single operator) network architecture or nested or
hierarchical (or multiprovider) networks.
The following OAM LFM features are supported on EX Series switches:
• Discovery and Link Monitoring
Thediscoveryprocess is triggeredautomaticallywhenOAM isenabledon the interface.
The discovery process permits Ethernet interfaces to discover andmonitor the peer
on the link if it also supports the IEEE 802.3ah standard. You can specify the discovery
mode used for IEEE 802.3ahOAM support. In activemode, the interface discovers and
monitors the peer on the link if the peer also supports IEEE802.3ahOAM functionality.
In passive mode, the peer initiates the discovery process. After the discovery process
has been initiated, both sides participate in discovery. The switch performs link
monitoring by sending periodic OAM protocol data units (PDUs) to advertise OAM
mode, configuration, and capabilities.
You can specify the number of OAM PDUs that an interface canmiss before the link
between peers is considered down.
• Remote Fault Detection
Remote fault detection uses flags and events. Flags are used to convey the following:
Link Fault means a loss of signal, Dying Gaspmeans an unrecoverable condition such
as a power failure, and Critical Event means an unspecified vendor-specific critical
event. You can specify the periodic OAM PDU sending interval for fault detection.The
EXSeries switchuses theEventNotificationOAMPDUtonotify the remoteOAMdevice
when a problem is detected. You can specify the action to be taken by the system
when the configured link-fault event occurs.
• Remote Loopback Mode
Remote loopback mode ensures link quality between the switch and a remote peer
during installationor troubleshooting. In thismode,when the interface receivesa frame
that is not an OAM PDU or a pause frame, it sends it back on the same interface on
which itwas received.The linkappears tobe in theactive state. Youcanuse the returned
loopback acknowledgement to test delay, jitter, and throughput.
Junos OS can place a remote DTE into loopback mode (if remote loopback mode is
supported by the remote DTE). When you place a remote DTE into loopback mode,
the interface receives the remote loopback request and puts the interface into remote
loopback mode. When the interface is in remote loopback mode, all frames except
OAM PDUs are looped back without any changes made to the frames. OAM PDUs
continue to be sent and processed.
RelatedDocumentation
Configuring Ethernet OAM Link Fault Management (CLI Procedure) on page 83•
• Example: Configuring Ethernet OAM Link Fault Management on EX Series Switches
on page 76
Copyright © 2016, Juniper Networks, Inc.68
Network Management and Monitoring Feature Guide for EX2300, EX3400, and EX4300 Switches

UnderstandingEthernetOAMConnectivity FaultManagement for anEXSeriesSwitch
Ethernet interfaceson JuniperNetworksEXSeriesEthernetSwitchesandJuniperNetworks
Junos operating system (Junos OS) for EX Series switches support the IEEE 802.1ag
standard for Operation, Administration, and Management (OAM). The IEEE 802.1ag
specification provides for Ethernet connectivity faultmanagement (CFM). CFMmonitors
Ethernet networks that might comprise one or more service instances for
network-compromising connectivity faults.
Themajor features of CFM are:
• Fault monitoring using the continuity check protocol. This is a neighbor discovery and
health check protocol that discovers andmaintains adjacencies at the VLAN or link
level.
• Path discovery and fault verification using the linktrace protocol.
• Fault isolation using the loopback protocol.
CFM partitions the service network into various administrative domains. For example,
operators, providers, and customers might be part of different administrative domains.
Each administrative domain is mapped into onemaintenance domain providing enough
information toperform itsownmanagement, thusavoiding securitybreachesandmaking
end-to-endmonitoring possible.
In aCFMmaintenancedomain, eachservice instance is calledamaintenanceassociation.
Amaintenance association can be thought of as a full mesh ofmaintenance association
endpoints (MEPs)having similar characteristics.MEPsareactiveCFMentities generating
and responding to CFM protocol messages. There is also amaintenance intermediate
point (MIP),which is aCFMentity similar to theMEP,butmorepassive (MIPsonly respond
to CFMmessages).
Eachmaintenancedomain isassociatedwithamaintenancedomain level from0through
7. Level allocation is based on the network hierarchy, where outer domains are assigned
a higher level than the inner domains. Configure customer end points to have the highest
maintenance domain level. Themaintenance domain level is a mandatory parameter
that indicates thenesting relationshipsbetweenvariousmaintenancedomains. The level
is embedded in each CFM frame. CFMmessages within a given level are processed by
MEPs at that same level.
To enable CFM on an Ethernet interface, youmust configure maintenance domains,
maintenance associations, andmaintenance association end points (MEPs).
Figure6onpage 70shows the relationships amongmaintenancedomains,maintenance
association end points (MEPs), andmaintenance intermediate points (MIPs) configured
on a switch.
69Copyright © 2016, Juniper Networks, Inc.
Chapter 4: Configuring Ethernet OAM Link Fault Management and Connectivity Fault Management

Figure 6: Relationship AmongMEPs, MIPs, andMaintenance DomainLevels
RelatedDocumentation
ConfiguringEthernetOAMConnectivityFaultManagement (CLIProcedure)onpage79•
• Junos OS Network Interfaces Configuration Guide
Understanding Ethernet Frame DelayMeasurements on Switches
Performancemanagement depends on the accurate measurement of service-level
agreement (SLA) objective parameters, which can include bandwidth and reliability. In
many cases, a service provider could be subject to penalties imposed by regulation,
statute, or contract if network performance is not within the bounds established for the
service.Onekeyperformanceobjective isdelay, alongwith its close relative, delay variation
(often called jitter). Some applications (such as bulk file transfer) will function just as
wellwithhighdelaysacross thenetworkandhighdelayvariations,whileotherapplications
(such as voice) can function only with low and stable delays. Many networks invoke
protocols or features available at Layer 3 (the packet layer) or higher tomeasure network
delays and jitter link by link. However, when the network consists of many Ethernet links,
there are few protocols and features available at Layer 2 (the frame layer) that allow
routers and switches to measure frame delay and jitter. This is where the ability to
configure andmonitor Ethernet frame delay is helpful.
This topic includes:
• Ethernet Frame Delay Measurements on page 70
• Types of Ethernet Frame Delay Measurements on page 71
• Limitations on page 72
Ethernet Frame DelayMeasurements
YoucanperformEthernet framedelaymeasurements (referred toasETH-DM inEthernet
specifications) on Juniper Networks EX Series Ethernet Switches. This feature allows
you to configure on-demand Operation, Administration, and Maintenance (OAM)
Copyright © 2016, Juniper Networks, Inc.70
Network Management and Monitoring Feature Guide for EX2300, EX3400, and EX4300 Switches

statements for the measurement of frame delay and frame delay variation (jitter). You
can configure Ethernet frame delay measurement in either one-way or two-way
(round-trip)mode togather framedelay statistics simultaneously frommultiple sessions.
Ethernet framedelaymeasurement provides fine control to operators for triggering delay
measurement on a given service and can be used to monitor SLAs.
Ethernet framedelaymeasurement also collects other useful information, such asworst
and best case delays, average delay, and average delay variation. It supports
software-assisted timestamping in the receive direction for delaymeasurements. It also
provides runtimedisplayofdelaystatisticswhen two-waydelaymeasurement is triggered.
Ethernet frame delay measurement records the last 100 samples collected per remote
maintenance association end point (MEP) or per connectivity fault management (CFM)
session. You can retrieve the history at any time using simple commands. You can clear
all Ethernet framedelaymeasurementstatisticsandPDUcounters. Ethernet framedelay
measurement is fully compliant with the ITU-T Y.1731 (OAM Functions and Mechanisms
for Ethernet-based Networks) specification.
Ethernet frame delay measurement uses the IEEE 802.1ag CFM infrastructure.
Generally, Ethernet framedelaymeasurements aremade in apeer fashion fromoneMEP
or CFM session to another. However, thesemeasurements are notmade tomaintenance
association intermediate points (MIPs).
For a complete description of Ethernet frame delay measurement, see the ITU-T Y.1731
EthernetServiceOAM topics in the JunosOSNetwork InterfacesLibrary forRoutingDevices.
Types of Ethernet Frame DelayMeasurements
There are two types of Ethernet frame delay measurements:
• One-way
• Two-way (round-trip)
For one-wayEthernet framedelaymeasurement, eitherMEPcan senda request to begin
a one-way delaymeasurement to its peerMEP. However, the statistics are collected only
at the receiver MEP. This feature requires the clocks at the transmitting and receiving
MEPs to be synchronized. If these clocks fall out of synchronization, only one-way delay
variation and average delay variation values are computed correctly (and will, therefore,
bevalid).Use the showcommandsat the receiverMEPtodisplayone-waydelay statistics.
For two-way (round-trip) Ethernet frame delay measurement, either MEP can send a
request to begin a two-way delay measurement to its peer MEP, which responds with
timestamp information. Run-time statistics are collected and displayed at the initiator
MEP. The clocks do not need to be synchronized at the transmitting and receiving MEPs.
Junos OS supports timestamps in delay measurement reply (DMR) frames to increase
the accuracy of delay calculations.
Use the show commands at the initiator MEP to display two-way delay statistics, and at
the receiver MEP to display one-way delay statistics.
71Copyright © 2016, Juniper Networks, Inc.
Chapter 4: Configuring Ethernet OAM Link Fault Management and Connectivity Fault Management

You can create an iterator profile to periodically transmit SLAmeasurement packets in
the form of ITU-Y.1731-compliant frames for delay measurement or loss measurement.
Limitations
The following are some limitations with regard to using Ethernet frame delay
measurement:
• Ethernet frame delay measurements are available only when distributed periodic
packet management (PPM) is enabled.
• The statistics collected are lost after a graceful Routing Engine switchover (GRES).
• You canmonitor only one session to the same remote MEP or MAC address.
• Accuracy is compromised when the system configuration changes (such as from
reconfiguration). We recommend performing Ethernet frame delay measurements on
a stable system.
RelatedDocumentation
ConfiguringMEP Interfaces onSwitches toSupport Ethernet FrameDelayMeasurements
(CLI Procedure)
•
• ConfiguringOne-Way Ethernet FrameDelayMeasurements onSwitches (CLI Procedure)
• Configuring Two-WayEthernet FrameDelayMeasurements onSwitches (CLI Procedure)
• Triggering an Ethernet Frame Delay Measurement Session on a Switch
Example: Configuring Ethernet OAMConnectivity Fault Management on EX SeriesSwitches
Ethernet interfaces on EX Series switches and Junos OS for EX Series switches support
the IEEE 802.1ag standard for Operation, Administration, and Management (OAM). The
IEEE 802.1ag specification provides for Ethernet connectivity fault management (CFM).
This example describes how to enable and configure OAM CFM on a Gigabit Ethernet
interface:
• Requirements on page 72
• Overview and Topology on page 73
• Configuring Ethernet OAM Connectivity Fault Management on Switch 1 on page 73
• Configuring Ethernet OAM Connectivity Fault Management on Switch 2 on page 74
• Verification on page 75
Requirements
This example uses the following hardware and software components:
• Junos OS Release 10.2 or later for EX Series switches
• Two EX Series switches connected by a point-to-point Gigabit Ethernet link
Copyright © 2016, Juniper Networks, Inc.72
Network Management and Monitoring Feature Guide for EX2300, EX3400, and EX4300 Switches

Overview and Topology
CFM can be used to monitor the physical link between two switches. In the following
example, two switches are connected by a point-to-point Gigabit Ethernet link. The link
between these two switches is monitored using CFM.
Configuring Ethernet OAMConnectivity Fault Management on Switch 1
CLI QuickConfiguration
To quickly configure Ethernet OAM CFM, copy the following commands and paste them
into the switch terminal window:
[edit protocols oam ethernet connectivity-fault-management maintenance-domain]set name-format character-stringsetmaintenance-domain private level 0setmaintenance-association private-maset continuity-check hold-interval 1s
Step-by-StepProcedure
To enable and configure OAM CFM on switch 1:
1. Specify the maintenance domain name format:
[edit protocols oam ethernet connectivity-fault-management maintenance-domain]user@switch1# set name-format character-string
2. Specify the maintenance domain name and themaintenance domain level:
[edit protocols oam ethernet connectivity-fault-management]user@switch1# setmaintenance-domain private level 0
3. Create amaintenance association:
[edit protocols oam ethernet connectivity-fault-management maintenance-domainprivate]user@switch1# setmaintenance-association private-ma
4. Enable the continuity check protocol and specify the continuity check hold interval:
[edit protocols oam ethernet connectivity-fault-management maintenance-domainprivate maintenance-association private-ma]user@switch1# set continuity-check hold-interval 1s
5. Configure the maintenance association end point (MEP):
[edit protocols oam ethernet connectivity-fault-management maintenance-domainprivate maintenance-association private-ma]user@switch1# setmep 100 interface ge-1/0/1 auto-discovery direction down
Results
Check the results of the configuration.
[edit]user@switch1 > show
protocols {oam {ethernet {connectivity-fault-management {maintenance-domain private {level 0;maintenance-association private-ma {continuity-check {interval 1s;
}
73Copyright © 2016, Juniper Networks, Inc.
Chapter 4: Configuring Ethernet OAM Link Fault Management and Connectivity Fault Management

mep 100 {interface ge-1/0/1;auto-discovery;direction down;
}}
}}
}
Configuring Ethernet OAMConnectivity Fault Management on Switch 2
CLI QuickConfiguration
To quickly configure Ethernet OAM CFM, copy the following commands and paste them
into the switch terminal window:
[edit protocols oam ethernet connectivity-fault-management maintenance-domain]set name-format character-stringsetmaintenance-domain private level 0setmaintenance-association private-maset continuity-check hold-interval 1s
Step-by-StepProcedure
The configuration on switch 2mirrors that on switch 2.
1. Specify the maintenance domain name format:
[edit protocols oam ethernet connectivity-fault-management]user@switch2# set name-format character-string
2. Specify the maintenance domain name and themaintenance domain level:
[edit protocols oam ethernet connectivity-fault-management]user@switch2# setmaintenance-domain private level 0
3. Create amaintenance association:
[edit protocols oam ethernet connectivity-fault-management maintenance-domainprivate]user@switch2# setmaintenance-association private-ma
4. Enable the continuity check protocol and specify the continuity check hold interval:
[edit protocols oam ethernet connectivity-fault-management maintenance-domainprivate maintenance-association private-ma]user@switch2# set continuity-check hold-interval 1s
5. Configure the maintenance association end point (MEP)
[edit protocols oam ethernet connectivity-fault-management maintenance-domainprivate maintenance-association private-ma]user@switch2# setmep 200 interface ge-0/2/5 auto-discovery direction down
Results
Check the results of the configuration.
[edit]user@switch2 > show
protocols {oam {ethernet {connectivity-fault-management {maintenance-domain private {level 0;
Copyright © 2016, Juniper Networks, Inc.74
Network Management and Monitoring Feature Guide for EX2300, EX3400, and EX4300 Switches

maintenance-association private-ma {continuity-check {interval 1s;
}mep 200 {interface ge-0/2/5;auto-discovery;direction down;
}}
}}
}
Verification
To confirm that the configuration is working properly, perform these tasks:
• Verifying That OAM CFMHas Been Configured Properly on page 75
Verifying That OAMCFMHas Been Configured Properly
Purpose Verify that OAM CFM has been configured properly.
Action Use the show oam ethernet connectivity-fault-management interfaces detail command:
user@switch1# show oam ethernet connectivity-fault-management interfaces detail
Sample Output
Interface name: ge-1/0/1.0, Interface status: Active, Link status: Up Maintenance domain name: private, Format: string, Level: 0 Maintenance association name: private-ma, Format: string Continuity-check status: enabled, Interval: 1ms, Loss-threshold: 3 frames MEP identifier: 100, Direction: down, MAC address: 00:90:69:0b:4b:94 MEP status: running Defects: Remote MEP not receiving CCM : no Erroneous CCM received : yes Cross-connect CCM received : no RDI sent by some MEP : yes Statistics: CCMs sent : 76 CCMs received out of sequence : 0 LBMs sent : 0 Valid in-order LBRs received : 0 Valid out-of-order LBRs received : 0 LBRs received with corrupted data : 0 LBRs sent : 0 LTMs sent : 0 LTMs received : 0 LTRs sent : 0 LTRs received : 0 Sequence number of next LTM request : 0 Remote MEP count: 2 Identifier MAC address State Interface 2001 00:90:69:0b:7f:71 ok ge-0/2/5.0
75Copyright © 2016, Juniper Networks, Inc.
Chapter 4: Configuring Ethernet OAM Link Fault Management and Connectivity Fault Management

Meaning When the output displays that continuity-check status is enabled and displays details
of the remote MEP, it means that connectivity fault management (CFM) has been
configured properly.
RelatedDocumentation
Understanding Ethernet OAMConnectivity Fault Management for an EX Series Switch
on page 69
•
• Junos OS Network Interfaces Configuration Guide
Example: Configuring Ethernet OAM Link Fault Management on EX Series Switches
Junos OS for EX Series switches allows the Ethernet interfaces on these switches to
support the IEEE 802.3ah standard for the Operation, Administration, and Maintenance
(OAM)ofEthernet inaccessnetworks. ThestandarddefinesOAMlink faultmanagement
(LFM). You can configure IEEE 802.3ah OAM LFM on point-to-point Ethernet links that
are connected either directly or through Ethernet repeaters.
This example describes how to enable and configure OAM LFM on a Gigabit Ethernet
interface:
• Requirements on page 76
• Overview and Topology on page 76
• Configuring Ethernet OAM Link Fault Management on Switch 1 on page 77
• Configuring Ethernet OAM Link Fault Management on Switch 2 on page 77
• Verification on page 78
Requirements
This example uses the following hardware and software components:
• Junos OS Release 9.4 or later for EX Series switches
• Two EX3200 or EX4200 switches connected directly
Overview and Topology
Junos OS for EX Series switches allows the Ethernet interfaces on these switches to
support the IEEE 802.3ah standard for the Operation, Administration, and Maintenance
(OAM)ofEthernet inaccessnetworks. ThestandarddefinesOAMlink faultmanagement
(LFM). You can configure IEEE 802.3ah OAM LFM on point-to-point Ethernet links that
are connected either directly or through Ethernet repeaters.
This exampleuses twoEX4200switchesconnecteddirectly. Before youbegin configuring
Ethernet OAM LFM on two switches, connect the two switches directly through a trunk
interface.
Copyright © 2016, Juniper Networks, Inc.76
Network Management and Monitoring Feature Guide for EX2300, EX3400, and EX4300 Switches

Configuring Ethernet OAM Link Fault Management on Switch 1
CLI QuickConfiguration
To quickly configure Ethernet OAM LFM, copy the following commands and paste them
into the switch terminal window:
[edit protocols oam ethernet link-fault-management]set interface ge-0/0/0set interface ge-0/0/0 link-discovery activeset interface ge-0/0/0 pdu-interval 800set interface ge-0/0/0 remote-loopback
Step-by-StepProcedure
To configure Ethernet OAM LFM on switch 1:
1. Enable IEEE 802.3ah OAM support on an interface:
[edit protocols oam ethernet link-fault-management]user@switch1# set interface (OAM LFM) ge-0/0/0
2. Specify that the interface initiates the discovery process by configuring the link
discovery mode to active:
[edit protocols oam ethernet link-fault-management]user@switch1# set interface ge-0/0/0 link-discovery active
3. Set the periodic OAM PDU-sending interval (in milliseconds) to 800 on switch 1:
[edit protocols oam ethernet link-fault-management]user@switch1# set interface pdu-interval 800
4. Set a remote interface into loopback mode so that all frames except OAM PDUs
are looped back without any changes made to the frames. Ensure that the remote
DTE supports remote loopback mode. To set the remote DTE in loopback mode
[edit protocols oam ethernet link-fault-management]user@switch1# set interface ge-0/0/0.0 remote-loopback
Results
Check the results of the configuration:
[edit]user@switch1# show
protocols {oam {ethernet {link-fault-management {interface ge-0/0/0 {pdu-interval 800;link-discovery active;remote-loopback;
}}
}}
Configuring Ethernet OAM Link Fault Management on Switch 2
CLI QuickConfiguration
To quickly configure Ethernet OAM LFM on switch 2, copy the following commands and
paste them into the switch terminal window:
[edit protocols oam ethernet link-fault-management ]
77Copyright © 2016, Juniper Networks, Inc.
Chapter 4: Configuring Ethernet OAM Link Fault Management and Connectivity Fault Management

set interface ge-0/0/1set interface ge-0/0/1 negotiation-options allow-remote-loopback
Step-by-StepProcedure
To configure Ethernet OAM LFM on switch 2:
Enable OAM on the peer interface on switch 2:1.
[edit protocols oam ethernet link-fault-management]user@switch2# set interface ge-0/0/1
2. Enable remote loopback support for the local interface:
[edit protocols oam ethernet link-fault-management]user@switch2# set interface ge-0/0/1 negotiation-options allow-remote-loopback
Results Check the results of the configuration:
[edit]user@switch2# show
protocols {oam {ethernet {link-fault-management {interface ge-0/0/1 {negotiation-options {allow-remote-loopback;
}}
}}
}
Verification
Verifying That OAM LFMHas Been Configured Properly
Purpose Verify that OAM LFM has been configured properly.
Action Use the show oam ethernet link-fault-management command:
user@switch1#show oam ethernet link-fault-management
Sample Output
Interface: ge-0/0/0.0Status: Running, Discovery state: Send AnyPeer address: 00:19:e2:50:3b:e1Flags:Remote-Stable Remote-State-Valid Local-Stable 0x50Remote entity information:Remote MUX action: forwarding, Remote parser action: forwardingDiscovery mode: active, Unidirectional mode: unsupportedRemote loopback mode: supported, Link events: supportedVariable requests: unsupported
Meaning When the output displays the MAC address and the discover state is Send Any, it means
that OAM LFM has been configured properly.
Copyright © 2016, Juniper Networks, Inc.78
Network Management and Monitoring Feature Guide for EX2300, EX3400, and EX4300 Switches

RelatedDocumentation
Configuring Ethernet OAM Link Fault Management (CLI Procedure) on page 83•
• Understanding Ethernet OAM Link Fault Management for an EX Series Switch on
page 67
Configuring Ethernet OAMConnectivity Fault Management (CLI Procedure)
Ethernet interfaceson JuniperNetworksEXSeriesEthernetSwitchesandJuniperNetworks
Junos OS for EX Series switches support the IEEE 802.1ag standard for Operation,
Administration, and Management (OAM). The IEEE 802.1ag specification provides for
Ethernet connectivity fault management (CFM).
This topic describes these tasks:
1. Creating the Maintenance Domain on page 79
2. Configuring the Maintenance Domain MIP Half Function on page 80
3. Creating a Maintenance Association on page 80
4. Configuring the Continuity Check Protocol on page 80
5. Configuring a Maintenance Association End Point on page 81
6. Configuring a Connectivity Fault Management Action Profile on page 82
7. Configuring the Linktrace Protocol on page 82
Creating theMaintenance Domain
Amaintenance domain comprises network entities such as operators, providers, and
customers. To enable connectivity fault management (CFM) on an Ethernet interface,
youmust create amaintenance domains, maintenance associations, and MEPs.
To create amaintenance domain:
1. Specify a name for the maintenance domain:
[edit protocols oam ethernet connectivity-fault-management]user@switch# setmaintenance-domain domain-name
2. Specify a format for the maintenance domain name. If you specify none, no name is
configured:
• A plain ASCII character string
• A domain name service (DNS) format
• Amedia access control (MAC) address plus a two-octet identifier in the range 0
through 65,535
• none
[edit protocols oam ethernet connectivity-fault-management maintenance-domaindomain-name]user@switch# set name-format format
For example, to specify the name format as MAC address plus a two-octet identifier:
[edit protocols oam ethernet connectivity-fault-management maintenance-domaindomain-name]
79Copyright © 2016, Juniper Networks, Inc.
Chapter 4: Configuring Ethernet OAM Link Fault Management and Connectivity Fault Management

user@switch# set name-formatmac+2oct
3. Configure the maintenance domain level, which is used to indicate the nesting
relationship between this domain and other domains. Use a value from 0 through 7:
[edit protocols oam ethernet connectivity-fault-management maintenance-domaindomain-name]user@switch# set level level
Configuring theMaintenance DomainMIP Half Function
MIP Half Function (MHF) divides themaintenance association intermediate point (MIP)
functionality into two unidirectional segments, improves visibility with minimal
configuration, and improves network coverage by increasing the number of points that
can bemonitored. MHF extends monitoring capability by responding to loop-back and
link-trace messages to help isolate faults. Whenever a MIP is configured, the MIP half
function value for all maintenance domains andmaintenance associations must be the
same.
To configure the MIP half function:
[edit protocols oam ethernet connectivity-fault-management maintenance-domaindomain-name]user@switch# setmip-half-function (none | default | explicit)
Creating aMaintenance Association
In aCFMmaintenancedomain, eachservice instance is calledamaintenanceassociation.
To create amaintenance association:
[edit protocols oam ethernet connectivity-fault-management maintenance-domaindomain-name]user@switch# setmaintenance-associationma-name
Configuring the Continuity Check Protocol
The continuity check protocol is used for fault detection by amaintenance association
endpoint (MEP)withinamaintenanceassociation.TheMEPperiodically sendscontinuity
checkmulticastmessages.The receivingMEPsuse thecontinuitycheckmessages(CCMs)
to build a MEP database of all MEPs in the maintenance association.
To configure the continuity check protocol:
1. Enable the continuity check protocol:
[edit protocols oam ethernet connectivity-fault-management maintenance-domaindomain-name maintenance-association ma-name]user@switch# set continuity-check
2. Specify the continuity check hold interval. The hold interval is the number of minutes
to wait before flushing the MEP database if no updates occur. The default value is 10
minutes.
[edit protocols oam ethernet connectivity-fault-management maintenance-domaindomain-name maintenance-association ma-name continuity-check]user@switch# set hold-interval number
Copyright © 2016, Juniper Networks, Inc.80
Network Management and Monitoring Feature Guide for EX2300, EX3400, and EX4300 Switches

3. Specify the CCM interval. The interval is the time between the transmission of CCMs.
You can specify 10minutes (10m), 1 minute (1m), 10 seconds (10s), 1 second (1s), 100
milliseconds (100ms), or 10 milliseconds (10ms).
[edit protocols oam ethernet connectivity-fault-management maintenance-domaindomain-name maintenance-association ma-name continuity-check]user@switch# set interval number
4. Specify the number of CCMs (that is, protocol data units) that can be lost before the
MEP is marked as down. The default number of protocol data units (PDUs) is 3.
[edit protocols oam ethernet connectivity-fault-management maintenance-domaindomain-name maintenance-association ma-name continuity-check]user@switch# set loss-threshold number
Configuring aMaintenance Association End Point
To configure a maintenance association end point:
1. Specify an ID for the MEP. The value can be from 1 through 8191.
[edit protocols oam ethernet connectivity-fault-management maintenance-domaindomain-name maintenance-association ma-name]user@switch# setmepmep-id]
2. Enablemaintenanceendpointautomaticdiscovery if youwant tohave theMEPaccept
continuity check messages (CCMs) from all remote MEPs of the samemaintenance
association:
[edit protocols oam ethernet connectivity-fault-management maintenance-domaindomain-name maintenance-association ma-name mep mep-iduser@switch# set auto-discovery
3. You can specify that CFMpackets (CCMs) be transmitted only in one direction for the
MEP, that is, the direction be set as down so that CCMs are transmitted only out of
(not into) the interface configured on this MEP.
[edit protocols oam ethernet connectivity-fault-management maintenance-domaindomain-name maintenance-association ma-name mep mep-id]user@switch# set direction down
4. Specify the logical interface to which the MEP is attached. It can be either an access
interface or a trunk interface. If you specify a trunk interface, the VLAN associated
with that interface must have a VLAN ID.
NOTE: You cannot associate an access interface that belongs tomultipleVLANs with the MEP.
[edit protocols oam ethernet connectivity-fault-management maintenance-domaindomain-name maintenance-association ma-name mep mep-id]user@switch# set interface interface-name
5. You can configure a remote MEP fromwhich CCMs are expected. If autodiscovery is
not enabled, the remote MEPmust be configured under themep statement. If the
remote MEP is not configured under themep statement, the CCMs from the remote
MEP are treated as errors.
[edit protocols oam ethernet connectivity-fault-management maintenance-domaindomain-name maintenance-association ma-name mep mep-id]user@switch# set remote-mepmep-id
81Copyright © 2016, Juniper Networks, Inc.
Chapter 4: Configuring Ethernet OAM Link Fault Management and Connectivity Fault Management

Configuring a Connectivity Fault Management Action Profile
You can configure an action profile and specify the action to be taken when any of the
configured events occur. Alternatively, you can configure an action profile and specify
default actions when connectivity to a remote MEP fails.
To configure an action profile:
1. Specify a name for an action profile:
[edit protocols oam ethernet connectivity-fault-management]user@switch# set action-profile profile-name
2. Configure the action of the action profile:
[edit protocols oam ethernet connectivity-fault-management action-profileprofile-name]user@switch# set action interface-down
3. Configure one or more events under the action profile, the occurrence of which will
trigger the corresponding action to be taken:
[edit protocols oam ethernet connectivity-fault-management action-profileprofile-name]user@switch# set event event
See Junos OS Network Interfaces Configuration Guide
Configuring the Linktrace Protocol
The linktrace protocol is used for path discovery between a pair of maintenance points.
Linktrace messages are triggered by an administrator using the traceroute command to
verify thepathbetweenapair ofMEPsunder thesamemaintenanceassociation. Linktrace
messages can also be used to verify the path between aMEP and aMIP under the same
maintenance domain.
To configure the linktrace protocol:
1. Configure the linktrace path age timer. If no response to a linktrace request is received,
the request and response entries are deleted after the age timer expires:
[edit protocols oam ethernet connectivity-fault-management]user@switch# set linktrace age time
2. Configure the number of linktrace reply entries to be stored per linktrace request:
[edit protocols oam ethernet connectivity-fault-management]user@switch# set linktrace path-database-size path-database-size
RelatedDocumentation
Example: Configuring Ethernet OAM Connectivity Fault Management on EX Series
Switches on page 72
•
• Understanding Ethernet OAMConnectivity Fault Management for an EX Series Switch
on page 69
• Junos OS Network Interfaces Configuration Guide
Copyright © 2016, Juniper Networks, Inc.82
Network Management and Monitoring Feature Guide for EX2300, EX3400, and EX4300 Switches

Configuring Ethernet OAM Link Fault Management (CLI Procedure)
Ethernet OAM link fault management (LFM) can be used for physical link-level fault
detectionandmanagement. The IEEE802.3ahLFMworksacrosspoint-to-pointEthernet
links either directly or through repeaters.
To configure Ethernet OAM LFM using the CLI:
1. Enable IEEE 802.3ah OAM support on an interface:
[edit protocols oam ethernet link-fault-management]user@switch# set interface interface-name
NOTE: You can configure Ethernet OAM LFM on aggregated interfaces.
NOTE: The remaining steps are optional. You can choose which of thesefeatures to configure for Ethernet OAM LFM on your switch.
2. Specifywhether the interfaceor thepeer initiates thediscovery processby configuring
the link discoverymode to active or passive (active= interface initiates; passive=peer
initiates):
[edit protocols oam ethernet link-fault-management]user@switch# set interface interface-name link-discovery active
3. Configure a periodic OAM PDU-sending interval (in milliseconds) for fault detection:
[edit protocols oam ethernet link-fault-management]user@switch# set interface pdu-interval interval
4. Specify the number of OAM PDUs that an interface canmiss before the link between
peers is considered down:
[edit protocols oam ethernet link-fault-management]user@switch# set interface interface-name pdu-threshold threshold-value
5. Configure event threshold values on an interface for the local errors that trigger the
sending of link event TLVs:
• Set the threshold value (in seconds) for sending frame-error events or taking the
action specified in the action profile:
[edit protocols oam ethernet link-fault-management]user@switch# set interface interface-name event-thresholds frame-error count
• Set the threshold value (in seconds) for sending frame-period events or taking the
action specified in the action profile:
[edit protocols oam ethernet link-fault-management]user@switch# set interface interface-name event-thresholds frame-period count
• Set the threshold value (in seconds) for sending frame-period-summary events or
taking the action specified in the action profile:
[edit protocols oam ethernet link-fault-management]user@switch# set interface interface-nameevent-thresholds frame-period-summarycount
83Copyright © 2016, Juniper Networks, Inc.
Chapter 4: Configuring Ethernet OAM Link Fault Management and Connectivity Fault Management

• Set the threshold value (in seconds) for sending symbol-period events or taking
the action specified in the action profile:
[edit protocols oam ethernet link-fault-management]user@switch# set interface interface-name event-thresholds symbol-period count
NOTE: You can disable the sending of link event TLVs.
To disable the sending of link event TLVs:
[edit protocols oam ethernet link-fault-management]user@switch# set interface interface-name negotiation-options no-allow-link-events
6. Create an action profile to define event fault flags and thresholds to be taken when
the link fault event occurs. Then apply the action profile to one or more interfaces.
(You can also apply multiple action profiles to a single interface.)
a. Name the action profile:
[edit protocols oam ethernet link-fault-management]user@switch# set action-profile profile-name
b. Specify actions to be taken by the systemwhen the link fault event occurs:
[edit protocols oam ethernet link-fault-management]user@switch# set action-profile profile-name action sysloguser@switch# set action-profile profile-name action link-down
c. Specify events for the action profile:
[edit protocols oam ethernet link-fault-management]user@switch# set action-profile profile-name event link-adjacency-loss
NOTE: For each action profile, youmust specify at least one link eventand one action. The actions are taken only when all of the events in theaction profile are true. If more than one action is specified, all actions areexecuted. You can set a low threshold for a specific action such as loggingtheerrorandsetahigh threshold foranotheractionsuchassystemlogging.
7. Set a remote interface into loopback mode so that all frames except OAM PDUs are
loopedbackwithoutanychangesmade to the frames.Set the remoteDTE in loopback
mode(the remoteDTEmustsupport remote-loopbackmode)andthenenable remote
loopback support for the local interface.
[edit protocols oam ethernet link-fault-management]user@switch# set interface interface-name remote-loopbackuser@switch# set interface interface-name negotiation-options allow-remote-loopback
RelatedDocumentation
• Example: Configuring Ethernet OAM Link Fault Management on EX Series Switches
on page 76
• Understanding Ethernet OAM Link Fault Management for an EX Series Switch on
page 67
Copyright © 2016, Juniper Networks, Inc.84
Network Management and Monitoring Feature Guide for EX2300, EX3400, and EX4300 Switches

CHAPTER 5
Configuring Uplink Failure Detection
• Understanding Uplink Failure Detection on page 85
• Configuring Interfaces for Uplink Failure Detection (CLI Procedure) on page 87
• Verifying That Uplink Failure Detection Is Working Correctly on page 88
Understanding Uplink Failure Detection
Uplink failure detection allows Juniper Networks EX Series Ethernet Switches to detect
link failure on uplink interfaces and to propagate the failure to the downlink interfaces
so that servers connected to those downlink interfaces can switch over to secondary
interfaces.
Uplink failure detection supports network adapter teaming and provides network
redundancy. In network adapter teaming, all the network interface cards (NICs) on a
serverareconfigured inaprimaryor secondary relationshipandshare thesame IPaddress.
When the primary link goes down, the server transparently shifts the connection to the
secondary link. With uplink failure detection, the switch monitors uplink interfaces for
link failures.When it detects a failure, it disables thedownlink interfaces.When the server
detectsdisableddownlink interfaces, it switchesover to the secondary link tohelpensure
balanced traffic flow on switches.
This topic describes:
• Uplink Failure Detection Overview on page 85
• Failure Detection Pair on page 86
Uplink Failure Detection Overview
Uplink failure detection allows switches tomonitor uplink interfaces to spot link failures.
When a switch detects a link failure, it automatically disables the downlink interfaces in
that group. The server that is connected to the disabled downlink interfaces triggers a
network-adapter failover to a secondary link to avoid any information drop.
Figure 7 on page 86 illustrates a typical setup for uplink failure detection.
85Copyright © 2016, Juniper Networks, Inc.

Figure 7: Uplink Failure Detection Configuration on Switches
SwitchSwitch
Server
Switch 1 Switch 2
link-to-monitor
link-to-disable
NIC1
NIC2
g040
577
For uplink failure detection, you specify a group of uplink interfaces to bemonitored and
downlink interfaces to be brought down when an uplink fails. The downlink interfaces
are bound to the uplink interfaces within the group. If all uplink interfaces in a group go
down, then the switch brings downall downlink interfaceswithin that group. If any uplink
interface returns to service, then the switch brings all downlink interfaces in that group
back to service.
NOTE: Routed VLAN interfaces (RVIs) cannot be configured as uplinkinterfaces to bemonitored.
The switch canmonitor both physical-interface links and logical-interface links for uplink
failures, but youmust put the two types of interfaces in separate groups.
NOTE: To detect failure of logical interfaces, the server must run some highlevel protocol such as keepalives between the switch and the server.
Failure Detection Pair
Uplink failure detection requires that you create groups that contain uplink interfaces
and downlink interfaces. Each group includes one of each of the following:
• A link-to-monitor interface—The link-to-monitor interfaces specify theuplink interfaces
the switch monitors. You can configure a maximum of 48 uplink interfaces as
link-to-monitor in a group.
Copyright © 2016, Juniper Networks, Inc.86
Network Management and Monitoring Feature Guide for EX2300, EX3400, and EX4300 Switches

• A link-to-disable interface—The link-to-disable interfaces specify the downlink
interfaces the switch disables when the switch detects an uplink failure. You can
configure a maximum of 48 downlink interfaces as link-to-disable in a group.
The link-to-disable interfaces are bound to the link-to-monitor interfaces within the
group. When a link-to-monitor interface returns to service, the switch automatically
enables all link-to-disable interfaces in the group.
RelatedDocumentation
Configuring Interfaces for Uplink Failure Detection (CLI Procedure) on page 87•
Configuring Interfaces for Uplink Failure Detection (CLI Procedure)
You can configure uplink failure detection on EXSeries switches to help ensure balanced
traffic flow. Using this feature, switches canmonitor and detect link failure on uplink
interfaces andcanpropagate the failure todownlink interfaces so that servers connected
to those downlink interfaces can switch over to secondary interfaces.
Follow these configuration guidelines:
• You can configure a maximum of 48 groups for each switch.
• You can configure a maximum of 48 uplink interfaces and 48 downlink interfaces in
each group.
• You can configure physical links and logical links in separate groups.
• Ensure that all the interfaces in the group are up. If the interfaces are down, uplink
failure detection does not work.
NOTE: Routed VLAN interfaces (RVIs) cannot be configured as uplinkinterfaces to bemonitored.
To configure uplink failure detection on a switch:
1. Specify a name for the group:
[edit protocols]user@switch# set uplink-failure-detection group group-name
2. Add an uplink interface to the group:
[edit protocols]user@switch# setuplink-failure-detectiongroupgroup-name link-to-monitor interface-name
3. Repeat Step 2 for adding each uplink interface to the group.
NOTE: An interfacecanbeconfiguredas link-to-monitor inmultiplegroups.
4. Add a downlink interface to the group:
[edit protocols]user@switch# set uplink-failure-detection group group-name link-to-disable interface-name
5. Repeat Step 4 for adding each downlink interface to the group.
87Copyright © 2016, Juniper Networks, Inc.
Chapter 5: Configuring Uplink Failure Detection

NOTE: After you have configured a group, use the showuplink-failure-detection group group-name command to verify that allinterfaces in the group are up.
RelatedDocumentation
Verifying That Uplink Failure Detection Is Working Correctly on page 88•
• Understanding Uplink Failure Detection on page 85
Verifying That Uplink Failure Detection IsWorking Correctly
Purpose Verify that the switch disables the downlink interface when it detects an uplink failure.
Action 1. View the current uplink-failure-detection status:
user@switch> show uplink-failure-detectionGroup : group1Uplink : ge-0/0/0*Downlink : ge-0/0/1*Failure Action : Inactive
NOTE: The asterisk (*) indicates that the link is up.
2. Disable the uplink interface:
[edit]user@switch# set interface ge-0/0/0 disable
3. Save the configuration on the switch.
4. View the current uplink-failure-detection status:
user@switch> show uplink-failure-detectionGroup : group1Uplink : ge-0/0/0Downlink : ge-0/0/1Failure Action : Active
Meaning The output in Step 1 shows that the uplink interface is up, and hence that the downlink
interface is also up, and that the status of Failure Action is Inactive.
The output in Step 4 shows that both the uplink and downlink interfaces are down and
that the status ofFailureAction is changed toActive. This output shows that uplink failure
detection is working.
RelatedDocumentation
• Configuring Interfaces for Uplink Failure Detection (CLI Procedure) on page 87
• Understanding Uplink Failure Detection on page 85
Copyright © 2016, Juniper Networks, Inc.88
Network Management and Monitoring Feature Guide for EX2300, EX3400, and EX4300 Switches

CHAPTER 6
Configuring Network Analytics
• Network Analytics Overview on page 89
• Understanding Enhanced Network Analytics Streaming Data on page 97
• Understanding Enhanced Analytics Local File Output on page 102
• Prototype File for the Google Protocol Buffer Stream Format on page 104
• Example: Configuring Enhanced Network Analytics Features on page 105
• Configuring Queue Monitoring on page 115
• Configuring Traffic Monitoring on page 117
• Configuring a Local File for Network Analytics Data on page 118
• Configuring a Remote Collector for Streaming Analytics Data on page 119
Network Analytics Overview
The network analytics feature provides visibility into the performance and behavior of
the data center infrastructure. This feature collects data from the switch, analyzes the
data using sophisticated algorithms, and captures the results in reports. Network
administrators can use the reports to help troubleshoot problems, make decisions, and
adjust resourcesasneeded.Theanalyticsmanager (analyticsm) in thePacketForwarding
Engine collects traffic and queue statistics, and the analytics daemon (analyticsd) in the
RoutingEngineanalyzes thedataandgenerates reports.Youcanenablenetworkanalytics
by configuring microburst monitoring and high-frequency traffic statistics monitoring.
NOTE: In Junos OS Release 13.2X51-D15, the network analytics feature wasenhanced, and extensive changes weremade to the CLI statements andhierarchies. If you upgrade to Junos OS Release 13.2X51-D15 or later from arelease prior to 13.2X51-D15, network analytics configurations committed inprevious releases will appear on your device, but the feature is disabled. Toenable this feature, youmust reconfigure it using the new CLI statementsand hierarchies.
89Copyright © 2016, Juniper Networks, Inc.

For more information, see:
• Analytics Feature Overview on page 90
• Network Analytics Enhancements Overview on page 91
• Summary of CLI Changes on page 92
Analytics Feature Overview
You enable network analytics by configuring queue (microburst) monitoring and
high-frequency traffic statistics monitoring.You usemicroburst monitoring to look at
traffic queue conditions in the network. A microburst occurrence indicates to the Packet
Forwarding Engine that a user-specified queue depth or latency threshold is reached.
The queue depth is the buffer (in bytes) containing the data, and latency is the time (in
nanoseconds or microseconds) the data stays in the queue.
You can configure queuemonitoring based on either queue depth or latency (but not
both), and configure the frequency (polling interval) at which the Packet Forwarding
Engine checks for microbursts and sends the data to the Routing Engine for processing.
Youmay configure queuemonitoring globally for all physical interfaces on the system,
or for a specific interface on the switch. However, the specified queuemonitoring interval
applies either toall interfaces, or none; youcannot configure the interval for each interface.
Youusehigh-frequency traffic statisticsmonitoring tocollect traffic statisticsat specified
polling intervals. Similar to the queuemonitoring interval, the traffic monitoring interval
applies either toall interfaces, or none; youcannot configure the interval for each interface.
Both traffic and queuemonitoring are disabled by default. Youmust configure each type
of monitoring using the CLI. In each case, the configuration for an interface always takes
precedence over the global configuration.
NOTE: Youcanconfigure traffic andqueuemonitoring forphysical interfacesonly; logical interfaces and Virtual Chassis port (VCP) interfaces are notsupported.
The analyticsd daemon in the Routing Engine generates local log files containing queue
and traffic statistics records. You can specify the log filename and size, and the number
of log files. If you do not configure a filename, the data is not saved.
You can display the local log file or specify a server to receive the streaming data
containing the queue and traffic statistics.
For each port, information for the last 10 records of traffic statistics and 100 records of
queue statistics is cached. Youmay view this information by using the show analytics
commands.
To store traceoptions data, you configure the traceoptions statement at the [edit services
analytics] hierarchy level.
Copyright © 2016, Juniper Networks, Inc.90
Network Management and Monitoring Feature Guide for EX2300, EX3400, and EX4300 Switches

Network Analytics Enhancements Overview
Beginning in Junos OS Release 13.2X51-D15, the network analytics feature provides the
following enhancements:
• Resources—Consist of interfaces and system. The interfaces resource allows you to
configurean interfacenameandanassociated resourceprofile name for each interface.
With the system resource, you can configure the polling intervals for queuemonitoring
and traffic monitoring, and an associated resource profile for the system.
• Resource profile—A template that contains the configurations for queue and traffic
monitoring, such as depth threshold and latency threshold values, and whether each
type of monitoring is enabled or disabled. Once a resource profile is configured, you
apply it to a system or interfaces resource.
• Collector—A server for collecting queue and traffic monitoring statistics, and can be a
local or remote server. You can configure a local server to store monitoring statistics
in a log file, or a remote server to receive streamed statistics data.
• Export profile—Youmust configure an export profile if youwish to send streaming data
to a remote collector. In the export profile, you define the category of streamed data
(system-wideor interface-specific) todetermine streamtype thecollectorwill receive.
You can specify both system and interface stream categories. System data includes
system information and status of queue and trafficmonitoring. Interface-specific data
includes interface information, queue and traffic statistics, and link, queue, and traffic
status.
• Google Protocol Buffer (GBP) stream format—A new streaming format formonitoring
statistics data that is sent to a remote collector in a single AnRecord message. This
stream format provides nine types of information, including:
• System information—General system information, including boot time, model
information, serial number, number of ports, and so on.
• System queue status—Queue status for the system in general.
• System traffic status—Traffic status for the system in general.
• Interface information—Includes SNMP index, slot, port, and other information.
• Queue statistics for interfaces—Queue statistics for specific interfaces.
• Traffic statistics for interfaces—Traffic statistics for specific interfaces.
• Link status for interfaces—Includes link speed, state, and so on.
• Queue status for interfaces—Queue status for specific interfaces.
• Traffic status for interfaces—Traffic status for specific interfaces.
• The analytics.proto file—Provides a template for the GBP stream format. This file can
be used for writing your analytics server application. To download the file, go to:
http://www.juniper.net/techpubs/en_US/junos13.2/topics/reference/proto-files/analytics-proto.txt
• Use of threshold values—The Analytics Manager (analyticsm) will generate a queue
statistics record when the lower queue depth or latency threshold value is exceeded.
91Copyright © 2016, Juniper Networks, Inc.
Chapter 6: Configuring Network Analytics

• User Datagram Protocol (UDP)—Additional transport protocol you can configure, in
addition to Transmission Control Protocol (TCP), for the remote streaming server port.
• Single file for local logging—Replaces the separate log files for queue and traffic
statistics.
• Change in latency measurement—Configuration and reporting of latency values have
changed frommicroseconds to nanoseconds.
• Change in reporting of the collection time in UTC format—Statistics collection time is
reported in microseconds instead of milliseconds.
• Newoperationalmodecommandshowanalyticscollector—Replaces theshowanalytics
streaming-server command.
• Changes in command output format—Include the following changes:
• Addition of unicast, multicast, and broadcast packet counters in queue and traffic
statistics.
• Reversal of the sequence of statistics information in the output. Themost recent
record is displayed at the beginning, and the oldest record at the end of the output.
• Removal of traffic or queuemonitoring status information from the global portion
of the show analytics configuration and show analytics status command output if
there is no global configuration.
• Addition of n/a to the interface-specific portion of the show analytics configuration
and show analytics status command output if a parameter is not configured (for
example, depth threshold or latency threshold).
Summary of CLI Changes
Beginning in Junos OS Release 13.2X51-D15, enhancements to the network analytics
feature result in changes in theCLIwhenyouconfigure the feature. SeeTable8onpage92
for a summary of CLI changes.
Table 8: Network Analytics CLI Changes
CLI for Junos OS Release 13.2X51-D15 andlater
CLI for Junos OS Release 13.2X50-D15 and13.2X51-D10Task
[edit services analytics]
resource {system {polling-interval {queue-monitoring interval;traffic-monitoring interval;
}}
}
[edit services analytics]
traffic-statistics {interval interval;
}queue-statistics {interval interval;
}
Configuring global queueand traffic monitoringpolling interval
Copyright © 2016, Juniper Networks, Inc.92
Network Management and Monitoring Feature Guide for EX2300, EX3400, and EX4300 Switches

Table 8: Network Analytics CLI Changes (continued)
CLI for Junos OS Release 13.2X51-D15 andlater
CLI for Junos OS Release 13.2X50-D15 and13.2X51-D10Task
[edit services analytics]
collector {local {file filename {files number;size size;
}}
}
[edit services analytics]
traffic-statistics {file filename;size size;files number;
}queue-statistics {file filename;size size;files number;
}
Configuring local files fortraffic and queue statisticsreporting
Requires defining a resource profile andapplying it to the system:
1. To define a resource profile:
[edit services analytics]
resource-profiles {profile-name{queue-monitoring;traffic-monitoring;depth-threshold {high number;low number;
}}
}
2. To apply a profile to the system:
[edit services analytics]
resource {system {resource-profile profile-name;
}}
[edit services analytics]
interfaces {all {queue-statistics;traffic-statistics;depth-threshold {high number;low number;
}}
}
Enabling queue statisticsand traffic monitoring, andspecifying the depththreshold for all interfaces(globally)
93Copyright © 2016, Juniper Networks, Inc.
Chapter 6: Configuring Network Analytics

Table 8: Network Analytics CLI Changes (continued)
CLI for Junos OS Release 13.2X51-D15 andlater
CLI for Junos OS Release 13.2X50-D15 and13.2X51-D10Task
Requires defining a resource profile andapplying it to the interface:
1. To define a resource profile:
[edit services analytics]
resource-profiles {profile-name{queue-monitoring;traffic-monitoring;latency-threshold {high number;low number;
}}
}
2. To apply a profile to the interface:
[edit services analytics]
resource {interfaces {interface-name {resource-profile profile-name;
}}
}
[edit services analytics]
interfaces {interface{queue-statistics;traffic-statistics;latency-thresholdhigh number;low number;
}}
Enabling queue statisticsand traffic monitoring, andspecifying the latencythreshold for one interface
Requiresdefining thestreamformat inanexportprofile and applying the profile to the collector.
1. To configure the stream format:
[edit services analytics]
export-profiles {profile-name {stream-format format;
}}
2. To apply an export profile to the collector:
[edit services analytics]
collector {address ip-address {port number {transport protocol {export-profile profile-name;
}}
}}
[edit services analytics]
streaming-servers {address ip-address {port number {stream-format format;
}}
}
Configuring the streamingdata format (JSON, CSV,or TSV) to send to aremote server
NOTE: Junos OS Release13.2X51-D15addedsupportfor the GPB stream formatand configuration of thetransport protocols (TCPor UDP).
Copyright © 2016, Juniper Networks, Inc.94
Network Management and Monitoring Feature Guide for EX2300, EX3400, and EX4300 Switches

Table 8: Network Analytics CLI Changes (continued)
CLI for Junos OS Release 13.2X51-D15 andlater
CLI for Junos OS Release 13.2X50-D15 and13.2X51-D10Task
Requiresdefininganexport profile andapplyingit to the collector:
1. To define an export profile:
[edit services analytics]
export-profiles {profile-name {interface {information;statistics {queue;traffic;
}status {link;queue;traffic;
}}system {information;status {queue;traffic;
}}
}}
2. To apply an export profile to the collector:
[edit services analytics]
collector {address ip-address {port number {export-profile profile-name;
}}
}
[edit services analytics]
streaming-servers {address ip-address {port number {stream-type type;stream-type type;
}}
}
Configuring the streamingmessage types (queue ortraffic statistics) to send toa remote server
95Copyright © 2016, Juniper Networks, Inc.
Chapter 6: Configuring Network Analytics

Table 8: Network Analytics CLI Changes (continued)
CLI for Junos OS Release 13.2X51-D15 andlater
CLI for Junos OS Release 13.2X50-D15 and13.2X51-D10Task
Configuration is available. Both TCP and UDPprotocols are supported, andcanbeconfiguredfor the same port.
[edit services analytics]
collector {address ip-address {port number1 {transport tcp;transport udp;
}port number2 {transport udp;
}}
}
No configuration is available. Only the TCPprotocol is supported.
Configuring the transportprotocol for sendingstreaming data to anexternal server
Issue the show analytics collector command.Issue the show analytics streaming-severcommand.
Show information aboutremote streaming server orcollector
Release History Table DescriptionRelease
In JunosOSRelease 13.2X51-D15, thenetworkanalytics featurewasenhanced,and extensive changes were made to the CLI statements and hierarchies.
13.2X51-D15
Beginning in Junos OS Release 13.2X51-D15, the network analytics featureprovides the following enhancements:
13.2X51-D15
Beginning in Junos OS Release 13.2X51-D15, enhancements to the networkanalytics feature result in changes in the CLI when you configure the feature.
13.2X51-D15
RelatedDocumentation
analytics on page 225•
Copyright © 2016, Juniper Networks, Inc.96
Network Management and Monitoring Feature Guide for EX2300, EX3400, and EX4300 Switches
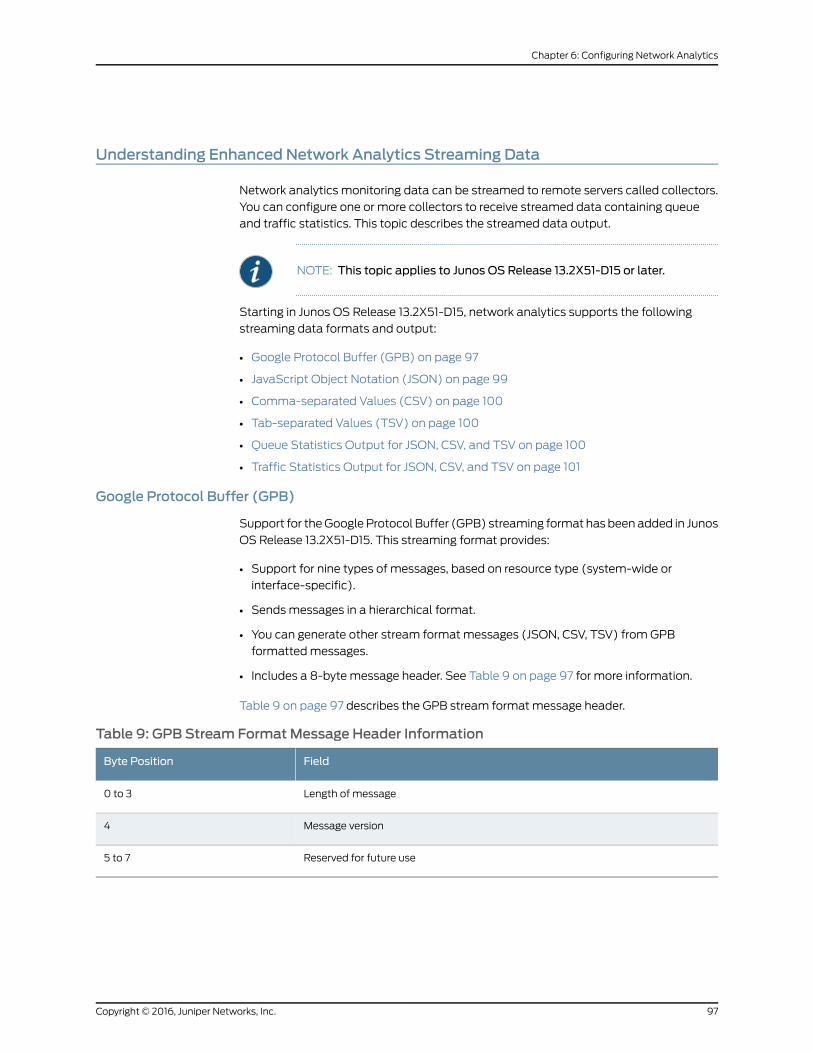
Understanding Enhanced Network Analytics Streaming Data
Network analytics monitoring data can be streamed to remote servers called collectors.
You can configure one or more collectors to receive streamed data containing queue
and traffic statistics. This topic describes the streamed data output.
NOTE: This topic applies to Junos OS Release 13.2X51-D15 or later.
Starting in Junos OS Release 13.2X51-D15, network analytics supports the following
streaming data formats and output:
• Google Protocol Buffer (GPB) on page 97
• JavaScript Object Notation (JSON) on page 99
• Comma-separated Values (CSV) on page 100
• Tab-separated Values (TSV) on page 100
• Queue Statistics Output for JSON, CSV, and TSV on page 100
• Traffic Statistics Output for JSON, CSV, and TSV on page 101
Google Protocol Buffer (GPB)
Support for theGoogle Protocol Buffer (GPB) streaming format has been added in Junos
OS Release 13.2X51-D15. This streaming format provides:
• Support for nine types of messages, based on resource type (system-wide or
interface-specific).
• Sendsmessages in a hierarchical format.
• You can generate other stream format messages (JSON, CSV, TSV) from GPB
formattedmessages.
• Includes a 8-byte message header. See Table 9 on page 97 for more information.
Table 9 on page 97 describes the GPB stream format message header.
Table 9: GPB Stream FormatMessage Header Information
FieldByte Position
Length of message0 to 3
Message version4
Reserved for future use5 to 7
97Copyright © 2016, Juniper Networks, Inc.
Chapter 6: Configuring Network Analytics

The following GPB prototype file (analytics.proto) provides details about the streamed
data:
package analytics;
// Traffic statistics related infomessage TrafficStatus { optional uint32 status = 1; optional uint32 poll_interval = 2;}
// Queue statistics related infomessage QueueStatus { optional uint32 status = 1; optional uint32 poll_interval = 2; optional uint64 lt_high = 3; optional uint64 lt_low = 4; optional uint64 dt_high = 5; optional uint64 dt_low = 6;}
message LinkStatus { optional uint64 speed = 1; optional uint32 duplex = 2; optional uint32 mtu = 3; optional bool state = 4; optional bool auto_negotiation= 5;}
message InterfaceInfo { optional uint32 snmp_index = 1; optional uint32 index = 2; optional uint32 slot = 3; optional uint32 port = 4; optional uint32 media_type = 5; optional uint32 capability = 6; optional uint32 porttype = 7;}
message InterfaceStatus { optional LinkStatus link = 1; optional QueueStatus queue_status = 2; optional TrafficStatus traffic_status = 3;}
message QueueStats { optional uint64 timestamp = 1; optional uint64 queue_depth = 2; optional uint64 latency = 3;}
message TrafficStats { optional uint64 timestamp = 1; optional uint64 rxpkt = 2; optional uint64 rxucpkt = 3; optional uint64 rxmcpkt = 4; optional uint64 rxbcpkt = 5; optional uint64 rxpps = 6; optional uint64 rxbyte = 7; optional uint64 rxbps = 8; optional uint64 rxcrcerr = 9;
Copyright © 2016, Juniper Networks, Inc.98
Network Management and Monitoring Feature Guide for EX2300, EX3400, and EX4300 Switches

optional uint64 rxdroppkt = 10; optional uint64 txpkt = 11; optional uint64 txucpkt = 12; optional uint64 txmcpkt = 13; optional uint64 txbcpkt = 14; optional uint64 txpps = 15; optional uint64 txbyte = 16; optional uint64 txbps = 17; optional uint64 txcrcerr = 18; optional uint64 txdroppkt = 19;}
message InterfaceStats { optional TrafficStats traffic_stats = 1; optional QueueStats queue_stats = 2;}
//Interface messagemessage Interface { required string name = 1; optional bool deleted = 2; optional InterfaceInfo information = 3; optional InterfaceStats stats = 4; optional InterfaceStatus status = 5;}
message SystemInfo { optional uint64 boot_time = 1; optional string model_info = 2; optional string serial_no = 3; optional uint32 max_ports = 4; optional string collector = 5; repeated string interface_list = 6;}
message SystemStatus { optional QueueStatus queue_status = 1; optional TrafficStatus traffic_status = 2;}
//System messagemessage System { required string name = 1; optional bool deleted = 2; optional SystemInfo information = 3; optional SystemStatus status = 4;}
message AnRecord { optional uint64 timestamp = 1; optional System system = 2; repeated Interface interface = 3;}
JavaScript Object Notation (JSON)
The JavaScript Object Notation (JSON) streaming format supports the following data:
• Queue statistics data. For example:
99Copyright © 2016, Juniper Networks, Inc.
Chapter 6: Configuring Network Analytics

{"record-type":"queue-stats","time":1383453988263,"router-id":"qfx5100-switch","port":"xe-0/0/18","latency":0,"queue-depth":208}
See Table 10 on page 101 for more information about queue statistics output fields.
• Traffic statistics. For example:
{"record-type":"traffic-stats","time":1383453986763,"router-id":"qfx5100-switch","port":"xe-0/0/16","rxpkt":26524223621,"rxpps":8399588,"rxbyte":3395100629632,"rxbps":423997832,"rxdrop":0,"rxerr":0,"txpkt":795746503,"txpps":0,"txbyte":101855533467,"txbps":0,"txdrop":0,"txerr":0}
See Table 11 on page 101 for more information about traffic statistics output fields.
Comma-separated Values (CSV)
The Comma-separated Values (CSV) streaming format supports the following data:
• Queue statistics. For example:
q,1383454067604,qfx5100-switch,xe-0/0/18,0,208
See Table 10 on page 101 for more information about queue statistics output fields.
• Traffic statistics. For example:
t,1383454072924,qfx5100-switch,xe-0/0/19,1274299748,82950,163110341556,85603312,0,0,27254178291,8300088,3488534810679,600002408,27268587050,3490379142400
See Table 11 on page 101 for more information about traffic statistics output fields.
Tab-separated Values (TSV)
The Tab-separated Values (TSV) streaming format supports the following data:
• Queue statistics. For example:
q 585870192561703872 qfx5100-switch xe-0/0/18 (null) 208 2
See Table 10 on page 101 for more information about queue statistics output fields.
• Traffic statistics. For example:
t 1383454139025 qfx5100-switch xe-0/0/19 1279874033 82022 163823850036 84801488 0 0 27811618258 8199630 3559887126455 919998736 27827356915 3561901685120
See Table 11 on page 101 for more information about traffic statistics output fields.
Queue Statistics Output for JSON, CSV, and TSV
Table 10 on page 101 describes the output fields for streamedqueue statistics data in the
order they appear.
Copyright © 2016, Juniper Networks, Inc.100
Network Management and Monitoring Feature Guide for EX2300, EX3400, and EX4300 Switches

Table 10: StreamedQueue Statistics Data Output Fields
DescriptionField
Type of statistics. Displayed as:
• queue-stats (JSON format)
• q (CSV or TSV format)
record-type
Time (in Unix epoch format) at which the statistics were captured.time
ID of the network analytics host device.router-id
Name of the physical port configured for network analytics.port
Traffic queue latency in milliseconds.latency
Depth of the traffic queue in bytes.queue depth
Traffic Statistics Output for JSON, CSV, and TSV
Table 11 on page 101 describes the output fields for streamed traffic statistics data in the
order they appear.
Table 11: Streamed Traffic Statistics Data Output Fields
DescriptionField
Type of statistics. Displayed as:
• traffic-stats (JSON format)
• t (CSV or TSV format)
record-type
Time (in Unix epoch format) at which the statistics were captured.time
ID of the network analytics host device.router-id
Name of the physical port configured for network analytics.port
Total packets received.rxpkt
Total packets received per second.rxpps
Total bytes received.rxbyte
Total bytes received per second.rxbps
Total incoming packets dropped.rxdrop
Total packets with errors.rxerr
Total packets transmitted.txpkt
101Copyright © 2016, Juniper Networks, Inc.
Chapter 6: Configuring Network Analytics

Table 11: Streamed Traffic Statistics Data Output Fields (continued)
DescriptionField
Total packets transmitted per second.txpps
Total bytes transmitted.txbyte
Total bytes transmitted per second.txbps
Total transmitted bytes dropped.txdrop
Total transmitted packets with errors (dropped).txerr
Release History Table DescriptionRelease
Starting in Junos OS Release 13.2X51-D15, network analytics supports thefollowing streaming data formats and output:
13.2X51-D15
RelatedDocumentation
Network Analytics Overview on page 89•
• Prototype File for the Google Protocol Buffer Stream Format on page 104
• address (Analytics Collector) on page 224
• collector (Analytics) on page 229
• show analytics collector
Understanding Enhanced Analytics Local File Output
The network analytics feature provides visibility into the performance and behavior of
the data center infrastructure. You enable network analytics by configuring queue or
traffic statistics monitoring, or both. In addition, you can configure a local file for storing
the traffic and queue statistics records.
NOTE: This topic describes the local file output in Junos OS Release13.2X51-D15 and later. For information about local file output from earlierreleases, see themonitor start (Analytics) topic.
Beginning in Junos OS Release 13.2X51-D15, the traffic and queuemonitoring statistics
can be stored locally in a single file. The following example shows the output from the
monitor start command.
root@qfx5100-33>monitor start anroot@qfx5100-33> *** an ***q,1393947567698432,qfx5100-33,xe-0/0/19,1098572,1373216q,1393947568702418,qfx5100-33,xe-0/0/19,1094912,1368640q,1393947569703415,qfx5100-33,xe-0/0/19,1103065,1378832
Copyright © 2016, Juniper Networks, Inc.102
Network Management and Monitoring Feature Guide for EX2300, EX3400, and EX4300 Switches

t,1393947569874528,qfx5100-33,xe-0/0/16,12603371884,12603371884,0,0,8426023,1613231610488,8628248712,0,3,5916761,5916761,0,0,0,757345408,0,0,0t,1393947569874528,qfx5100-33,xe-0/0/18,12601953614,12601953614,0,0,8446737,1613050071660,8649421552,0,5,131761619,131761619,0,0,84468,16865487232,86495888,0,0t,1393947569874528,qfx5100-33,xe-0/0/19,126009250,126009250,0,0,84469,16129184128,86496392,0,0,12584980342,12584980342,0,0,8446866,1610877487744,8649588432,12593703960,0q,1393947575698402,qfx5100-33,xe-0/0/19,1102233,1377792q,1393947576701398,qfx5100-33,xe-0/0/19,1107724,1384656
See Table 12 on page 103 for queue statistics output, and Table 13 on page 103 for traffic
statistics output. The fields in the tables are listed in the order they appear in the output
example.
Table 12: Output Fields for Queue Statistics in Local Analytics File
Example in OutputDescriptionField
qType of statistics (queue or traffic monitoring)Record type
1393947567698432Unix epoch (or Unix time) in microseconds at which thestatistics were captured.
Time (microseconds)
qfx5100-33ID of the network analytics host device.Router ID
xe-0/0/19Name of the physical port configured for network analytics.Port
1098572Traffic queue latency in nanoseconds.Latency (nanoseconds)
1373216Depth of the traffic queue in bytes.Queue depth (bytes)
Table 13: Output Fields for Traffic Statistics in Local Analytics File
Example in OutputDescriptionField
tType of statistics (queue or traffic monitoring)Record type
1393947569874528Unix epoch (or Unix time) inmicroseconds atwhich the statisticswere captured.
Time (microseconds)
qfx5100-33ID of the network analytics host device.Router ID
xe-0/0/16Name of the physical port configured for network analytics.Port
12603371884Total packets received.rxpkt
12603371884Total unicast packets received.rxucpkt
0Total multicast packets received.rxmcpkt
0Total broadcast packets received.rxbcpkt
103Copyright © 2016, Juniper Networks, Inc.
Chapter 6: Configuring Network Analytics

Table 13: Output Fields for Traffic Statistics in Local Analytics File (continued)
Example in OutputDescriptionField
8426023Total packets received per second.rxpps
1613231610488Total octets received.rxbyte
8628248712Total bytes received per second.rxbps
0Total incoming packets dropped.rxdroppkt
3CRC/Align errors received.rxcrcerr
5916761Total packets transmitted.txpkt
5916761Total unicast packets transmitted.txucpkt
0Total multicast packets transmitted.txmcpkt
0Total broadcast packets transmitted.txbcpkt
0Total packets transmitted per second.txpps
757345408Total octets transmitted.txbyte
0Bytes per second transmitted.txbps
0Total transmitted packets dropped.txdroppkt
0CRC/Align errors transmitted.txcrcerr
Release History Table DescriptionRelease
Beginning in Junos OS Release 13.2X51-D15, the traffic and queuemonitoringstatistics can be stored locally in a single file.
13.2X51-D15
RelatedDocumentation
Network Analytics Overview on page 89•
• analytics on page 225
Prototype File for the Google Protocol Buffer Stream Format
The Google Protocol Buffer (GBP) stream format is used for streamingmonitoring
statistics data to a remote collector in a single AnRecord message.
The analytics.proto file provides a template for the GBP stream format. This file can be
used for writing your analytics server application.
Copyright © 2016, Juniper Networks, Inc.104
Network Management and Monitoring Feature Guide for EX2300, EX3400, and EX4300 Switches

To download the GPB prototype file, go to:
http://www.juniper.net/techpubs/en_US/junos13.2/topics/reference/proto-files/analytics-proto.txt
RelatedDocumentation
Network Analytics Overview on page 89•
• analytics on page 225
• export-profiles on page 231
Example: Configuring Enhanced Network Analytics Features
This example shows how to configure the enhanced network analytics feature, including
queue and traffic monitoring.
• Requirements on page 105
• Overview on page 105
• Configuration on page 106
• Verification on page 111
Requirements
This example uses the following hardware and software components:
• A QFX5100 standalone switch
• A external streaming server to collect data
• Junos OS Release 13.2X51-D15 software
• TCP server software (for remote streaming servers)
Before you configure network analytics, be sure you have:
• Junos OS Release 13.2X51-D15 or later software installed and running on the QFX5100
switch.
• (Optional for streaming servers for the JSON, CSV, and TSV formats) TCP or UDP
server software set up for processing records separated by a newline character (\n)
on the remote streaming server.
• (Optional for streaming servers for theGPB format)TCPorUDPbuild streaming server
using the analytics.proto file.
• All other network devices running.
Overview
The network analytics feature provides visibility into the performance and behavior of
the data center infrastructure. This feature collects data from the switch, analyzes the
data using sophisticated algorithms, and captures the results in reports. Network
administrators can use the reports to help troubleshoot problems, make decisions, and
adjust resources as needed.
105Copyright © 2016, Juniper Networks, Inc.
Chapter 6: Configuring Network Analytics

You enable network analytics by first defining a resource profile template, and then
applying the profile to the system (for a global configuration) or to individual interfaces.
NOTE: You can configure queue and traffic monitoring on physical networkinterfaces only; logical interfaces and Virtual Chassis physical (VCP)interfaces are not supported.
Disabling of the queue or traffic monitoring supersedes the configuration(enabling) of this feature. You disable monitoring by applying a resourceprofile that includes the no-queue-monitoring or no-traffic-monitoring
configuration statement at the [edit services analytics resource-profiles]
hierarchy level.
Topology
In this example, theQFX5100switch is connected toanexternal server used for streaming
statistics data.
Configuration
To configure the network analytics features, perform these tasks:
• Configuring the Polling Interval for Queue and Traffic Monitoring on page 107
• Configuring a Local Statistics File on page 107
• Configuring and Applying a Resource Profile for the System on page 107
• Configuring and Applying a Resource Profile for an Interface on page 108
• Configuring an Export Profile and Collector for Streaming Data on page 108
CLI QuickConfiguration
To quickly configure this example, copy the following commands, paste them in a text
file, remove any line breaks, change any details necessary to match your network
configuration, and then copy andpaste the commands into theCLI at the [edit]hierarchy
level.
[edit]set services analytics resource system polling-interval queue-monitoring 1000set services analytics resource system polling-interval traffic-monitoring 5set services analytics collector local file an.statsset services analytics collector local file an files 3set services analytics collector local file an size 10mset services analytics resource-profiles sys-rp queue-monitoringset services analytics resource-profiles sys-rp traffic-monitoringset services analytics resource-profiles sys-rp depth-threshold high 999999 low 99set services analytics resource system resource-profile sys-rpset services analytics resource-profiles if-rp queue-monitoringset services analytics resource-profiles if-rp traffic-monitoringset services analytics resource-profiles if-rp latency-threshold high 2300 low 20set services analytics resource interfaces xe-0/0/16 resource-profile if-rpset services analytics resource interfaces xe-0/0/18 resource-profile if-rpset services analytics resource interfaces xe-0/0/19 resource-profile if-rpset services analytics export-profiles ep stream-format gpbset services analytics export-profiles ep interface information
Copyright © 2016, Juniper Networks, Inc.106
Network Management and Monitoring Feature Guide for EX2300, EX3400, and EX4300 Switches

set services analytics export-profiles ep interface statistics queueset services analytics export-profiles ep interface statistics trafficset services analytics export-profiles ep interface status linkset services analytics export-profiles ep system informationset services analytics export-profiles ep system status queueset services analytics export-profiles ep system status trafficsetservicesanalyticscollectoraddress 10.94.198.11port50001transport tcpexport-profileep
set services analytics collector address 10.94.184.25 port 50013 transport udpexport-profile ep
Configuring the Polling Interval for Queue and Traffic Monitoring
Step-by-StepProcedure
To configure the polling interval queue and traffic monitoring globally:
Configure the queuemonitoring polling interval (in milliseconds) for the system:1.
[edit]set services analytics resource system polling-interval queue-monitoring 1000
2. Configure the traffic monitoring polling interval (in seconds) for the system:
[edit]set services analytics resource system polling-interval traffic-monitoring 5
Configuring a Local Statistics File
Step-by-StepProcedure
To configure a file for local statistics collection:
Configure the filename:1.
[edit]set services analytics collector local file an.stats
2. Configure the number of files:
[edit]set services analytics collector local file an files 3
3. Configure the file size:
[edit]set services analytics collector local file an size 10m
Configuring and Applying a Resource Profile for the System
Step-by-StepProcedure
To define a resource profile template for queue and traffic monitoring resources:
Configure a resource profile and enable queuemonitoring:1.
[edit]set services analytics resource-profiles sys-rp queue-monitoring
2. Enable traffic monitoring in the profile:
[edit]set services analytics resource-profiles sys-rp traffic-monitoring
107Copyright © 2016, Juniper Networks, Inc.
Chapter 6: Configuring Network Analytics

3. Configure the depth-threshold (high and low values) for queuemonitoring in the
profile:
[edit]set services analytics resource-profiles sys-rp depth-threshold high 999999 low99
4. Apply the resource profile template to the system resource type for a global
configuration:
[edit]set services analytics resource system resource-profile sys-rp
Configuring and Applying a Resource Profile for an Interface
Step-by-StepProcedure
You can configure queue and traffic monitoring for one or more specific interfaces. The
interface-specific configuration supersedes the global (system) configuration. To define
a resource profile template for queue and traffic monitoring resources for an interface:
1. Configure a resource profile and enable queuemonitoring:
[edit]set services analytics resource-profiles if-rp queue-monitoring
2. Enable traffic monitoring in the profile:
[edit]set services analytics resource-profiles if-rp traffic-monitoring
3. Configure the latency-threshold (high and low values) for queuemonitoring in the
profile:
[edit]set services analytics resource-profiles if-rp latency-threshold high 2300 low 20
4. Apply the resource profile template to the interfaces resource type for specific
interfaces:
[edit]set services analytics resource interfaces xe-0/0/16 resource-profile if-rpset services analytics resource interfaces xe-0/0/18 resource-profile if-rpset services analytics resource interfaces xe-0/0/19 resource-profile if-rp
Configuring an Export Profile and Collector for Streaming Data
Step-by-StepProcedure
To configure a collector (streaming server) for receiving monitoring data:
Create an export profile and specify the stream format:1.
[edit]set services analytics export-profiles ep stream-format gpb
2. Configure the export profile to include interface information:
[edit]set services analytics export-profiles ep interface information
3. Configure the export profile to include interface queue statistics:
Copyright © 2016, Juniper Networks, Inc.108
Network Management and Monitoring Feature Guide for EX2300, EX3400, and EX4300 Switches

[edit]set services analytics export-profiles ep interface statistics queue
4. Configure the export profile to include interface traffic statistics:
[edit]set services analytics export-profiles ep interface statistics traffic
5. Configure the export profile to include interface status link information:
[edit]set services analytics export-profiles ep interface status link
6. Configure the export profile to include system information:
[edit]set services analytics export-profiles ep system information
7. Configure the export profile to include system queue status:
[edit]set services analytics export-profiles ep system status queue
8. Configure the export profile to include system traffic status:
[edit]set services analytics export-profiles ep system status traffic
9. Configure the transport protocol for the collector addresses and apply an export
profile:
[edit]set services analytics collector address 10.94.198.11 port 50001 transport tcpexport-profile ep
set services analytics collector address 10.94.184.25 port 50013 transport udpexport-profile ep
NOTE: If you configure the tcpor udpoption for the JSON, CSV, andTSV
formats, youmust also set up the TCP or UDP client software on theremote collector to process records that are separated by the newlinecharacter (\n) on the remote server.
If you configure the tcp or udp option for the GPB format, youmust also
set up the TCP or UDP build streaming server using the analytics.proto
file.
Results Display the results of the configuration:
[edit services analytics]user@switch# run show configurationservices {analytics {export-profiles {ep {stream-format gpb;interface {
109Copyright © 2016, Juniper Networks, Inc.
Chapter 6: Configuring Network Analytics

information;statistics {traffic;queue;
}status {link;
}}system {information;status {traffic;queue;
}}
}}resource-profiles {sys-rp {queue-monitoring;traffic-monitoring;depth-threshold high 99999 low 99;
}if-rp {queue-monitoring;traffic-monitoring;latency-threshold high 2300 low 20;
}}resource {system {resource-profile sys-rp;polling-interval {traffic-monitoring 5;queue-monitoring 1000;
}}interfaces {xe-0/0/16 {resource-profile if-rp;
}xe-0/0/18 {resource-profile if-rp;
}xe-0/0/19 {resource-profile if-rp;
}}
}collector {local {file an size 10m files 3;
}address 10.94.184.25 {port 50013 {
Copyright © 2016, Juniper Networks, Inc.110
Network Management and Monitoring Feature Guide for EX2300, EX3400, and EX4300 Switches

transport udp {export-profile ep;
}}
}address 10.94.198.11 {port 50001 {transport tcp {export-profile ep;
}}
}}
}}
Verification
Confirm that the configuration is correct and works as expected by performing these
tasks:
• Verifying the Network Analytics Configuration on page 111
• Verifying the Network Analytics Status on page 112
• Verifying the Collector Configuration on page 112
• Verifying Queue Statistics on page 113
• Verifying Traffic Statistics on page 113
Verifying the Network Analytics Configuration
Purpose Verify the configuration for network analytics.
Action From operational mode, enter the show analytics configuration command to display the
traffic and queuemonitoring configuration.
user@host> show analytics configurationTraffic monitoring status is enabledTraffic monitoring polling interval : 5 secondsQueue monitoring status is enabledQueue monitoring polling interval : 1000 millisecondsQueue depth high threshold : 99999 bytesQueue depth low threshold : 99 bytes
Interface Traffic Queue Queue depth Latency Statistics Statistics threshold threshold High Low High Low (bytes) (nanoseconds)xe-0/0/16 enabled enabled n/a n/a 2300 20xe-0/0/18 enabled enabled n/a n/a 2300 20xe-0/0/19 enabled enabled n/a n/a 2300 20
Meaning The output displays the traffic and queuemonitoring configuration information on the
switch.
111Copyright © 2016, Juniper Networks, Inc.
Chapter 6: Configuring Network Analytics

Verifying the Network Analytics Status
Purpose Verify the network analytics operational status of the switch.
Action From operational mode, enter the show analytics status global command to display
global traffic and queuemonitoring status.
user@host> show analytics status globalTraffic monitoring status is enabled Traffic monitoring pollng interval : 5 secondsQueue monitoring status is enabledQueue monitoring polling interval : 1000 millisecondsQueue depth high threshold : 99999 bytesQueue depth low threshold : 99 bytes
From operational mode, enter the show analytics status command to display both the
interface and global queuemonitoring status.
user@host> show analytics statusTraffic monitoring status is enabled Traffic monitoring pollng interval : 5 secondsQueue monitoring status is enabledQueue monitoring polling interval : 1000 millisecondsQueue depth high threshold : 99999 bytesQueue depth low threshold : 99 bytes
Interface Traffic Queue Queue depth Latency Statistics Statistics threshold threshold High Low High Low (bytes) (nanoseconds)xe-0/0/16 enabled enabled n/a n/a 2300 20 xe-0/0/18 enabled enabled n/a n/a 2300 20 xe-0/0/19 enabled enabled n/a n/a 2300 20
Meaning The output displays the global and interface status of traffic and queuemonitoring on
the switch.
Verifying the Collector Configuration
Action Verify the configuration for the collector for streamed data is working.
From operational mode, enter the show analytics collector command to display the
streaming servers configuration.
user@host> show analytics collectorAddress Port Transport Stream format State Sent10.94.184.25 50013 udp gpb n/a 48410.94.198.11 50001 tcp gpb In progress 0
Meaning The output displays the collector configuration.
NOTE: The connection state of a port configured with the udp transport
protocol is always displayed as n/a.
Copyright © 2016, Juniper Networks, Inc.112
Network Management and Monitoring Feature Guide for EX2300, EX3400, and EX4300 Switches

Verifying Queue Statistics
Purpose Verify that queue statistics collection is working.
Action From operational mode, enter the show analytics queue-statistics command to display
the queue statistics.
user@host> show analytics queue-statisticsCLI issued at 2014-03-04 15:37:03.116018Time Interface Queue-depth Latency (bytes) (nanoseconds)00:00:00.412371 ago xe-0/0/19 1384656 1107724 00:00:01.412395 ago xe-0/0/19 1375712 1100569 00:00:02.415366 ago xe-0/0/19 1385280 1108224 00:00:03.417395 ago xe-0/0/19 1381744 1105395 00:00:04.411392 ago xe-0/0/19 1368432 1094745 00:00:05.414387 ago xe-0/0/19 1374880 1099904 00:00:06.414365 ago xe-0/0/19 1373632 1098905 00:00:07.416386 ago xe-0/0/19 1370096 1096076 00:00:08.413384 ago xe-0/0/19 1377168 1101734 00:00:09.415379 ago xe-0/0/19 1370720 1096576 00:00:10.418374 ago xe-0/0/19 1381120 1104896 00:00:11.410376 ago xe-0/0/19 1383408 1106726 00:00:12.412372 ago xe-0/0/19 1382576 1106060 00:00:13.417371 ago xe-0/0/19 1387152 1109721 00:00:14.411368 ago xe-0/0/19 1375296 1100236 ---(more)---
Meaning The output displays queue-statistics information, with the latest record at the top of the
report.
Verifying Traffic Statistics
Purpose Verify that traffic statistics collection is working.
113Copyright © 2016, Juniper Networks, Inc.
Chapter 6: Configuring Network Analytics

Action From operational mode, enter the show analytics traffic-statistics command to display
the traffic statistics.
user@host> show analytics traffic-statisticsCLI issued at 2014-03-04 15:37:52.047136Time: 00:00:02.252377 ago, Physical interface: xe-0/0/19 Traffic Statistics: Receive Transmit Total octets: 15044882432 1502607382656 Total packets: 117538143 11739120146 Unicast packet: 117538143 11739120146 Multicast packets: 0 0 Broadcast packets: 0 0 Octets per second: 86488360 8649309384 Packets per second: 84461 8446590 CRC/Align errors: 0 0 Packets dropped: 0 11760298455Time: 00:00:02.252377 ago, Physical interface: xe-0/0/18 Traffic Statistics: Receive Transmit Total octets: 1504619929836 15782818944 Total packets: 11754843131 123303273 Unicast packet: 11754843131 123303273 Multicast packets: 0 0 Broadcast packets: 0 0 Octets per second: 8649134008 86487816 Packets per second: 8446458 84461 CRC/Align errors: 5 0 Packets dropped: 0 0Time: 00:00:02.252377 ago, Physical interface: xe-0/0/16 Traffic Statistics: Receive Transmit Total octets: 1504801437048 757345408 Total packets: 11756261156 5916761 Unicast packet: 11756261156 5916761 Multicast packets: 0 0 Broadcast packets: 0 0 Octets per second: 7910619496 0 Packets per second: 7725214 0 CRC/Align errors: 3 0 Packets dropped: 0 0
Meaning The output displays traffic-statistics information.
RelatedDocumentation
Network Analytics Overview on page 89•
• analytics on page 225
• show analytics status
• show analytics collector
Copyright © 2016, Juniper Networks, Inc.114
Network Management and Monitoring Feature Guide for EX2300, EX3400, and EX4300 Switches
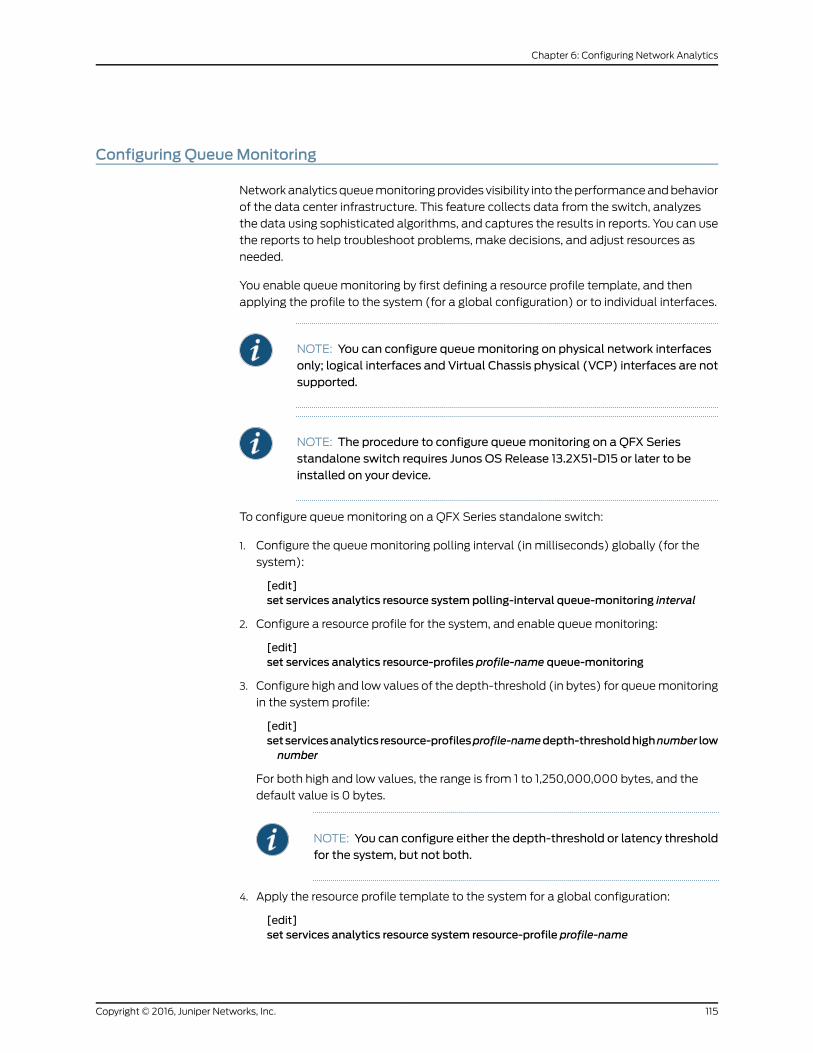
Configuring QueueMonitoring
Networkanalyticsqueuemonitoringprovides visibility into theperformanceandbehavior
of the data center infrastructure. This feature collects data from the switch, analyzes
the data using sophisticated algorithms, and captures the results in reports. You can use
the reports to help troubleshoot problems, make decisions, and adjust resources as
needed.
You enable queuemonitoring by first defining a resource profile template, and then
applying the profile to the system (for a global configuration) or to individual interfaces.
NOTE: You can configure queuemonitoring on physical network interfacesonly; logical interfaces and Virtual Chassis physical (VCP) interfaces are notsupported.
NOTE: The procedure to configure queuemonitoring on a QFX Seriesstandalone switch requires Junos OS Release 13.2X51-D15 or later to beinstalled on your device.
To configure queuemonitoring on a QFX Series standalone switch:
1. Configure the queuemonitoring polling interval (in milliseconds) globally (for the
system):
[edit]set services analytics resource system polling-interval queue-monitoring interval
2. Configure a resource profile for the system, and enable queuemonitoring:
[edit]set services analytics resource-profiles profile-name queue-monitoring
3. Configure high and low values of the depth-threshold (in bytes) for queuemonitoring
in the system profile:
[edit]setservicesanalytics resource-profilesprofile-namedepth-thresholdhighnumber lownumber
For both high and low values, the range is from 1 to 1,250,000,000 bytes, and the
default value is 0 bytes.
NOTE: You can configure either the depth-threshold or latency thresholdfor the system, but not both.
4. Apply the resource profile template to the system for a global configuration:
[edit]set services analytics resource system resource-profile profile-name
115Copyright © 2016, Juniper Networks, Inc.
Chapter 6: Configuring Network Analytics

5. Configure an interface-specific resource profile and enable queuemonitoring for the
interface:
[edit]set services analytics resource-profiles profile-name queue-monitoring
6. Configure the latency-threshold (high and low values) for queuemonitoring in the
interface-specific profile:
[edit]set services analytics resource-profiles profile-name latency-threshold high numberlow number
For both high and low values, the range is from 1 to 100,000,000 nanoseconds, and
the default value is 1,000,000 nanoseconds.
NOTE: You can configure either the depth-threshold or latency thresholdfor interfaces, but not both.
7. Apply the resource profile template for interfaces to one or more interfaces:
[edit]setservicesanalytics resource interfaces interface-name resource-profileprofile-name
NOTE: If aconflictarisesbetweenthesystemand interfaceconfigurations,the interface-specific configuration supersedes the global (system)configuration.
Release History Table DescriptionRelease
The procedure to configure queuemonitoring on a QFX Series standaloneswitch requires Junos OS Release 13.2X51-D15 or later to be installed on yourdevice.
13.2X51-D15
RelatedDocumentation
Network Analytics Overview on page 89•
• Example: Configuring Enhanced Network Analytics Features on page 105
• analytics on page 225
Copyright © 2016, Juniper Networks, Inc.116
Network Management and Monitoring Feature Guide for EX2300, EX3400, and EX4300 Switches

Configuring Traffic Monitoring
Networkanalyticsqueuemonitoringprovides visibility into theperformanceandbehavior
of the data center infrastructure. This feature collects data from the switch, analyzes
the data using sophisticated algorithms, and captures the results in reports. You can use
the reports to help troubleshoot problems, make decisions, and adjust resources as
needed.
You enable traffic monitoring by first defining a resource profile template, and then
applying the profile to the system (for a global configuration) or to individual interfaces.
NOTE: You can configure traffic monitoring on physical network interfacesonly; logical interfaces and Virtual Chassis physical (VCP) interfaces are notsupported.
NOTE: The procedure to configure traffic monitoring on a QFX Seriesstandalone switch requires Junos OS Release 13.2X51-D15 or later to beinstalled on your device.
To configure traffic monitoring on a QFX Series standalone switch:
1. Configure the traffic monitoring polling interval (in seconds) for the system:
[edit]set services analytics resource system polling-interval traffic-monitoring interval
2. Configure a resourceprofile for the system, andenable trafficmonitoring in theprofile:
[edit]set services analytics resource-profiles profile-name traffic-monitoring
3. Apply the resource profile to the system for a global configuration:
[edit]set services analytics resource system resource-profile profile-name
4. Configure a resource profile for interfaces, and enable traffic monitoring in the profile:
[edit]set services analytics resource-profiles profile-name traffic-monitoring
NOTE: If aconflictarisesbetweenthesystemand interfaceconfigurations,the interface-specific configuration supersedes the global (system)configuration.
5. Apply the resource profile template to one or more interfaces:
[edit]setservicesanalytics resource interfaces interface-name resource-profileprofile-name
117Copyright © 2016, Juniper Networks, Inc.
Chapter 6: Configuring Network Analytics

Release History Table DescriptionRelease
The procedure to configure traffic monitoring on a QFX Series standaloneswitch requires Junos OS Release 13.2X51-D15 or later to be installed on yourdevice.
13.2X51-D15
RelatedDocumentation
Network Analytics Overview on page 89•
• Example: Configuring Enhanced Network Analytics Features on page 105
• analytics on page 225
Configuring a Local File for Network Analytics Data
The network analytics feature provides visibility into the performance and behavior of
the data center infrastructure. This feature collects data from the switch, analyzes the
data using sophisticated algorithms, and captures the results in reports. Network
administrators can use the reports to help troubleshoot problems, make decisions, and
adjust resources as needed.
To save the queue and traffic statistics data in a local file, youmust configure a filename
to store it.
NOTE: The procedure to configure a local file for storing queue and trafficmonitoring statistics requires Junos OS Release 13.2X51-D15 or later to beinstalled on your device.
To configure a local file for storing queue and traffic monitoring statistics:
1. Configure a filename:
[edit]set services analytics collector local file filename
There is no default filename. If you do not configure a filename, network analytics
statistics are not saved locally.
2. Configure the number of files (from 2 to 1000 files):
[edit]set services analytics collector local file filename files number
3. Configure the file size (from 10 to 4095MB) in the format of xm:
[edit]set services analytics collector local file an size size
Copyright © 2016, Juniper Networks, Inc.118
Network Management and Monitoring Feature Guide for EX2300, EX3400, and EX4300 Switches

Release History Table DescriptionRelease
Theprocedure to configure a local file for storing queue and trafficmonitoringstatistics requires Junos OS Release 13.2X51-D15 or later to be installed onyour device.
13.2X51-D15
RelatedDocumentation
Network Analytics Overview on page 89•
• Example: Configuring Enhanced Network Analytics Features on page 105
• analytics on page 225
Configuring a Remote Collector for Streaming Analytics Data
The network analytics feature provides visibility into the performance and behavior of
the data center infrastructure. This feature collects data from the switch, analyzes the
data using sophisticated algorithms, and captures the results in reports. Network
administrators can use the reports to help troubleshoot problems, make decisions, and
adjust resources as needed.
You can configure an export profile to define the stream format and type of data, and
one or more remote servers (collectors) to receive streaming network analytics data.
NOTE: Theprocedure toconfigureacollector for receivingstreamedanalyticsdata requires Junos OS Release 13.2X51-D15 or later to be installed on yourdevice.
To configure a collector for receiving streamed analytics data:
1. Create an export profile and specify the stream format:
[edit]set services analytics export-profiles profile-name stream-format format
2. Configure the export profile to include interface information:
[edit]set services analytics export-profiles profile-name interface information
3. Configure the export profile to include interface queue statistics:
[edit]set services analytics export-profiles profile-name interface statistics queue
4. Configure the export profile to include interface traffic statistics:
[edit]set services analytics export-profiles profile-name interface statistics traffic
5. Configure the export profile to include interface status link information:
[edit]set services analytics export-profiles profile-name interface status link
119Copyright © 2016, Juniper Networks, Inc.
Chapter 6: Configuring Network Analytics

6. Configure the export profile to include system information:
[edit]set services analytics export-profiles profile-name system information
7. Configure the export profile to include system queue status:
[edit]set services analytics export-profiles profile-name system status queue
8. Configure the export profile to include system traffic status:
[edit]set services analytics export-profiles profile-name system status traffic
9. Configure the transport protocol for the collector addresses and apply the export
profile:
[edit]set services analytics collector address ip-address port port transport protocolexport-profile profile-name
set services analytics collector address ip-address port port transport protocolexport-profile profile-name
NOTE: If you configure the tcp or udp option for the JSON, CSV, and TSV
formats, youmust also set up the TCP or UDP client software on theremote collector to process records that are separated by the newlinecharacter (\n) on the remote server.
If you configure the tcp or udp option for the GPB format, youmust also
set up theTCPorUDPbuild streaming server using the analytics.proto file.
Release History Table DescriptionRelease
The procedure to configure a collector for receiving streamed analytics datarequires Junos OS Release 13.2X51-D15 or later to be installed on your device.
13.2X51-D15
RelatedDocumentation
• Network Analytics Overview on page 89
• Example: Configuring Enhanced Network Analytics Features on page 105
• analytics on page 225
Copyright © 2016, Juniper Networks, Inc.120
Network Management and Monitoring Feature Guide for EX2300, EX3400, and EX4300 Switches

CHAPTER 7
Configuring SNMP
• Configuring SNMP (J-Web Procedure) on page 121
• Configuring the Local Engine ID on page 124
Configuring SNMP (J-Web Procedure)
NOTE: This topic applies only to the J-Web Application package.
Youcanuse the J-Web interface todefinesystem identification information, createSNMP
communities, create SNMP trap groups, and configure health monitor options for EX
Series switches.
To configure SNMP features:
1. Select Configure > Services > SNMP.
2. Enter information into the configuration page for SNMP as described in
Table 14 on page 121.
3. To apply the configuration click Apply.
NOTE: After youmake changes to the configuration on this page, youmust commit the changes for them to take effect. To commit all changesto the active configuration, select Commit Options > Commit. See Using
the Commit Options to Commit Configuration Changes for details aboutall commit options.
Table 14: SNMPConfiguration Page
Your ActionFunctionField
Identification
Type contact information for the administrator ofthe system (such as name and phone number).
Free-form text string that specifies an administrativecontact for the system.
ContactInformation
121Copyright © 2016, Juniper Networks, Inc.

Table 14: SNMPConfiguration Page (continued)
Your ActionFunctionField
Type information that describes the systemFree-form text string that specifies a description for thesystem.
SystemDescription
Type the MAC address of Ethernet managementport 0.
Provides an administratively unique identifier of anSNMPv3 engine for system identification.
The local engine ID contains a prefix and a suffix. Theprefix is formatted according to specifications definedin RFC 3411. The suffix is defined by the local engine ID.Generally, the local engine ID suffix is the MAC addressof Ethernet management port 0.
Local Engine ID
Type location information for the system (labname or rack name, for example).
Free-form text string that specifies the location of thesystem.
SystemLocation
Type the hostname of the system.Free-form text string that overrides the systemhostname.
SystemOverrideName
Communities
To add a community, click Add
Type the name of the community being added.Specifies the name of the SNMP community.CommunityName
Select the authorization (either read-only orread-write) from the list.
Specifies the type of authorization (either read-only orread-write) for theSNMPcommunity being configured.
Authorization
Traps
To add a trap group, click Add.
Type the name of the group being added.Specifies the name of the SNMP trap group beingconfigured.
Trap GroupName
Copyright © 2016, Juniper Networks, Inc.122
Network Management and Monitoring Feature Guide for EX2300, EX3400, and EX4300 Switches

Table 14: SNMPConfiguration Page (continued)
Your ActionFunctionField
• To generate traps for authentication failures,select Authentication.
• To generate traps for chassis and environmentnotifications, select Chassis.
• To generate traps for configuration changes,select Configuration.
• To generate traps for link-related notifications(up-down transitions), select Link.
• To generate traps for remote operationnotifications, select Remote operations.
• To generate traps for remote networkmonitoring (RMON), select RMON alarm.
• To generate traps for routing protocolnotifications, select Routing.
• To generate traps on systemwarm and coldstarts, select Startup.
• To generate traps on Virtual RouterRedundancy Protocol (VRRP) events (such asnew-master or authentication failures), selectVRRP events.
Specifies which trap categories are added to the trapgroup being configured.
Categories
1. Enter the hostname or IP address, in dotteddecimal notation, of the target system toreceive the SNMP traps.
2. Click Add.
Specifies one or more hostnames or IP addresses forthe systems to receive SNMP traps generated by thetrap group being configured.
Targets
Health Monitoring
Select thecheckbox toenable thehealthmonitorand configure options. Clear the check box todisable the health monitor.
NOTE: If you select the Enable Health Monitoringcheckboxanddonot specify options, thenSNMPhealth monitoring is enabled with default values.
Enables the SNMP health monitor on the switch. Thehealth monitor periodically (over the time you specifyin the interval field) checks the following key indicatorsof switch health:
• Percentage of file storage used
• Percentage of Routing Engine CPU used
• Percentage of Routing Engine memory used
• Percentageofmemoryused for eachsystemprocess
• Percentage of CPU used by the forwarding process
• Percentage of memory used for temporary storageby the forwarding process
Enable HealthMonitoring
Enter an interval time, in seconds, from 1 through2147483647.
The default value is 300 seconds (5minutes).
Specifies thesampling frequency, in seconds,overwhichthe key health indicators are sampled and comparedwith the rising and falling thresholds.
For example, if you configure the interval as 100seconds, the values are checked every 100 seconds.
Interval
123Copyright © 2016, Juniper Networks, Inc.
Chapter 7: Configuring SNMP

Table 14: SNMPConfiguration Page (continued)
Your ActionFunctionField
Enter a value from 0 through 100. The defaultvalue is 90.
Specifies the value at which SNMP generates an event(trap and system logmessage) when the value of asampled indicator is increasing.
For example, if the rising threshold is 90 (the default),SNMP generates an event when the value of any keyindicator reaches or exceeds 90 percent.
RisingThreshold
Enter a value from 0 through 100. The defaultvalue is 80.
NOTE: The falling threshold value must be lessthan the rising threshold value.
Specifies the value at which SNMP generates an event(trap and system logmessage) when the value of asampled indicator is decreasing.
For example, if the falling threshold is 80 (the default),SNMP generates an event when the value of any keyindicator falls back to 80 percent or less.
FallingThreshold
RelatedDocumentation
Monitoring System Process Information•
• Monitoring System Properties
Configuring the Local Engine ID
By default, the local engine ID uses the default IP address of the router. The local engineID is the administratively unique identifier for the SNMPv3 engine. This statement isoptional. To configure the local engine ID, include the engine-id statement at the [editsnmp] hierarchy level:
[edit snmp]engine-id {(local engine-id-suffix | use-default-ip-address | use-mac-address);
}
• local engine-id-suffix—The engine ID suffix is explicitly configured.
• use-default-ip-address—The engine ID suffix is generated from the default IP address.
• use-mac-address—The SNMP engine identifier is generated from the Media Access
Control (MAC) address of the management interface on the router.
The local engine ID is defined as the administratively unique identifier of an SNMPv3
engine, and is used for identification, not for addressing. There are two parts of an engine
ID: prefix and suffix. The prefix is formatted according to the specifications defined in
RFC 3411, An Architecture for Describing Simple Network Management Protocol (SNMP)
Management Frameworks. You can configure the suffix here.
Copyright © 2016, Juniper Networks, Inc.124
Network Management and Monitoring Feature Guide for EX2300, EX3400, and EX4300 Switches

NOTE: SNMPv3 authentication and encryption keys are generated based onthe associated passwords and the engine ID. If you configure or change theengine ID, youmust commit the newengine ID before you configure SNMPv3users. Otherwise the keys generated from the configured passwords arebased on the previous engine ID. For the engine ID, we recommend using themaster IP address of the device if the device hasmultiple routing enginesandhas themaster IPaddress configured. Alternatively, you canuse theMACaddress of themanagement port if the device has only one Routing Engine.
RelatedDocumentation
• Minimum SNMPv3 Configuration on a Device Running Junos OS
• Example: SNMPv3 Configuration
125Copyright © 2016, Juniper Networks, Inc.
Chapter 7: Configuring SNMP

Copyright © 2016, Juniper Networks, Inc.126
Network Management and Monitoring Feature Guide for EX2300, EX3400, and EX4300 Switches

CHAPTER 8
Monitoring and Troubleshooting
• Monitoring Hosts Using the J-Web Ping Host Tool on page 127
• Monitoring Network Traffic Using Traceroute on page 129
Monitoring Hosts Using the J-Web Ping Host Tool
Purpose NOTE: This topic applies only to the J-Web Application package.
Use the J-Web ping host tool to verify that the host can be reached over the network.
The output is useful for diagnosing host and network connectivity problems. The switch
sends a series of ICMP echo (ping) requests to a specified host and receives ICMP echo
responses.
Action To use the J-Web ping host tool:
1. Select Troubleshoot>Ping Host.
2. Next to Advanced options, click the expand icon.
3. Enter information into the Ping Host page, as described in Table 15 on page 127.
The Remote Host field is the only required field.
4. Click Start.
The results of the ping operation are displayed in the main pane . If no options are
specified, each ping response is in the following format:
bytes bytes from ip-address: icmp_seq=number ttl=number time=time
5. To stop the ping operation before it is complete, clickOK.
Meaning Table 15 on page 127 lists the fields.
Table 15: J-Web Ping Host Field Summary
Your ActionFunctionField
Type thehostnameor IPaddressof thehost toping.Identifies the host to ping.Remote Host
Advanced Options
127Copyright © 2016, Juniper Networks, Inc.

Table 15: J-Web Ping Host Field Summary (continued)
Your ActionFunctionField
• To suppress the display of the hop hostnames,select the check box.
• To display the hop hostnames, clear the checkbox.
Determines whether to display hostnames of thehops along the path.
Don't ResolveAddresses
Select the interfaceonwhichping requestsare sentfrom the list. If you select any, the ping requests aresent on all interfaces.
Specifies the interface on which the ping requestsare sent.
Interface
Select the number of ping requests to send fromthe list.
Specifies the number of ping requests to send.Count
• To set the DF bit, select the check box.
• To clear the DF bit, clear the check box.
Specifies the Don't Fragment (DF) bit in the IPheader of the ping request packet.
Don't Fragment
• To record and display the path of the packet,select the check box.
• Tosuppress the recordinganddisplayof thepathof the packet, clear the check box.
Sets the record route option in the IP header of theping request packet. The path of the ping requestpacket is recordedwithin the packet and displayedin the main pane.
Record Route
Select the decimal value of the TOS field from thelist.
Specifies the type-of-service (TOS) value in the IPheader of the ping request packet.
Type-of-Service
Select the routing instance name from the list.Name of the routing instance for the ping attempt.Routing Instance
Select the interval from the list.Specifies the interval, in seconds, betweentransmissions of individual ping requests.
Interval
Type the size, in bytes, of the packet. The size canbe from0 through 65468. The switch adds 8 bytesof ICMP header to the size.
Specifies the size of the ping request packet.Packet Size
Type the source IP address.Specifies the source address of the ping requestpacket.
Source Address
Select the TTL value from the list.Specifies the time-to-live (TTL) hop count for theping request packet.
Time-to-Live
• To bypass the routing table and send the pingrequests to hosts on the specified interface only,select the check box.
• To route theping requestsusing the routing table,clear the check box.
Determines whether ping requests are routed bymeans of the routing table.
If the routing table is not used, ping requests aresent only to hosts on the interface specified in theInterface box. If the host is not on that interface,ping responses are not sent.
Bypass Routing
RelatedDocumentation
Monitoring Interface Status and Traffic•
Copyright © 2016, Juniper Networks, Inc.128
Network Management and Monitoring Feature Guide for EX2300, EX3400, and EX4300 Switches

Monitoring Network Traffic Using Traceroute
Purpose NOTE: This topic applies only to the J-Web Application package.
Use the Traceroute page in the J-Web interface to trace a route between the switch and
a remote host. You can use a traceroute task to display a list of waypoints between the
switch and a specified destination host. The output is useful for diagnosing a point of
failure in thepath fromtheswitchplatformto thedestinationhostandaddressingnetwork
traffic latency and throughput problems.
Action To use the traceroute tool:
1. Select Troubleshoot > Traceroute.
2. Next to Advanced options, click the expand icon.
3. Enter information into the Traceroute page.
The Remote Host field is the only required field.
4. Click Start.
5. To stop the traceroute operation before it is complete, clickOKwhile the results of
the traceroute operation are being displayed.
Meaning Theswitchgenerates the list ofwaypointsby sendinga series of ICMP traceroutepackets
in which the time-to-live (TTL) value in themessages sent to each successive waypoint
is incrementedby 1. (TheTTLvalueof the first traceroutepacket is set to 1.) In thismanner,
eachwaypoint along thepath to thedestinationhost replieswithaTimeExceededpacket
fromwhich the source IP address can be obtained.
The results of the traceroute operation are displayed in the main pane. If no options are
specified, each line of the traceroute display is in the following format:
hop-number host (ip-address) [as-number] time1 time2 time3
The switch sends a total of three traceroute packets to each waypoint along the path
and displays the round-trip time for each traceroute operation. If the switch times out
before receiving aTimeExceededmessage, an asterisk (*) is displayed for that round-trip
time.
Table 16: Traceroute field summary
Your ActionFunctionField
Type the hostname or IP address of thedestination host.
Identifies the destination host of the traceroute.Remote Host
Advanced Options
129Copyright © 2016, Juniper Networks, Inc.
Chapter 8: Monitoring and Troubleshooting

Table 16: Traceroute field summary (continued)
Your ActionFunctionField
To suppress the display of the hophostnames, select the check box.
Determines whether hostnames of the hops along thepath are displayed, in addition to IP addresses.
Don't ResolveAddresses
Type the gateway IP address.Specifies the IP address of the gateway to route through.Gateway
Type the source IP address.Specifies the source address of the outgoing traceroutepackets.
Source Address
To bypass the routing table and send thetraceroute packets to hosts on the specifiedinterface only, select the check box.
Determines whether traceroute packets are routed bymeansof the routing table. If the routing table is not used,traceroutepackets are sent only tohosts on the interfacespecified in the Interface box. If the host is not on thatinterface, traceroute responses are not sent.
Bypass Routing
From the list, select the interface on whichtraceroutepacketsare sent. If you select any,the traceroute requests are sent on allinterfaces.
Specifies the interface on which the traceroute packetsare sent.
Interface
From the list, select the TTL.Specifies themaximumtime-to-live (TTL) hopcount forthe traceroute request packet.
Time-to-live
From the list, select the decimal value of theTOS field.
Specifies the type-of-service (TOS) value to include inthe IP header of the traceroute request packet.
Type-of-Service
To display the AS numbers, select the checkbox.
Determines whether the autonomous system (AS)number of each intermediate hop between the routerand the destination host is displayed.
ResolveASNumbers
RelatedDocumentation
• Connecting and Configuring an EX Series Switch (CLI Procedure)
• Connecting and Configuring an EX Series Switch (J-Web Procedure)
• Configuring Gigabit Ethernet Interfaces (J-Web Procedure)
• Monitoring Interface Status and Traffic
Copyright © 2016, Juniper Networks, Inc.130
Network Management and Monitoring Feature Guide for EX2300, EX3400, and EX4300 Switches

PART 2
Configuration Statements
• Realtime Performance Monitoring on page 133
• Analyzers and Port Mirroring on page 159
• sFlowMonitoring Technology on page 167
• EthernetOAMLinkFaultManagementandConnectivity FaultManagementonpage 175
• Uplink Failure Detection on page 217
• Network Analytics on page 223
• SNMP on page 245
131Copyright © 2016, Juniper Networks, Inc.

Copyright © 2016, Juniper Networks, Inc.132
Network Management and Monitoring Feature Guide for EX2300, EX3400, and EX4300 Switches

CHAPTER 9
Realtime Performance Monitoring
• data-fill on page 134
• data-size on page 135
• destination-port on page 136
• dscp-code-point on page 137
• hardware-timestamp on page 138
• history-size on page 139
• moving-average-size on page 140
• one-way-hardware-timestamp on page 140
• port (RPM) on page 141
• probe on page 142
• probe-count on page 143
• probe-interval on page 144
• probe-limit on page 145
• probe-server on page 146
• probe-type on page 147
• routing-instance on page 148
• routing-instances on page 149
• rpm (Interfaces) on page 150
• source-address (Services) on page 151
• tcp on page 152
• test on page 153
• test-interval on page 154
• thresholds on page 155
• traps on page 157
• udp on page 158
133Copyright © 2016, Juniper Networks, Inc.

data-fill
Syntax data-fill data;data-fill-with-zeros data;
Hierarchy Level [edit services rpm bgp],[edit services rpm probe owner test test-name],[edit services rpm twamp client control-connection control-client-name]
Release Information Statement introduced before Junos OS Release 7.4.
Statement introduced in Junos OS Release 9.3 for EX Series switches.
Statement introduced in Junos OS Release 9.3 for PTX Series Packet Transport routers.
Statementat the[edit services rpmtwampclientcontrol-connectioncontrol-client-name]
hierarchy level introduced in Junos OS Release 15.1 for MX Series routers.
Description Specify the contents of the data portion of Internet Control Message Protocol (ICMP)
probes. The data-fill statement is not valid with the http-get or http-metadata-get probe
types. For TWAMPclient, if this knob is set, then fill the test packetwith zeros, if the knob
is not set then the data content is random value as indicated in RFC.
Options data—A hexadecimal value; for example, 0-9, A-F.
Required PrivilegeLevel
system—To view this statement in the configuration.
interface-control—To add this statement to the configuration.
RelatedDocumentation
• Configuring BGP Neighbor Discovery Through RPM
• Configuring RPM Probes
Copyright © 2016, Juniper Networks, Inc.134
Network Management and Monitoring Feature Guide for EX2300, EX3400, and EX4300 Switches

data-size
Syntax data-size size;
Hierarchy Level [edit services rpm bgp],[edit services rpm probe owner test test-name],[edit services rpm twamp client control-connection control-client-name test-sessionsession-name]
Release Information Statement introduced before Junos OS Release 7.4.
Statement introduced in Junos OS Release 9.3 for EX Series switches.
Statement introduced in Junos OS Release 13.2 for PTX Series Packet Transport routers.
Support at the [edit services rpm twamp client control-connection control-client-name]
hierarchy level introduced in Junos OS Release 15.1 for MX Series routers.
Description Specify the size of the data portion of ICMP probes. The data-size statement is not valid
with the http-get or http-metadata-get probe type.
Options size—0 through 65400 for RPM, for TWAMP the value is from 60 through 1400.
Default: 0 for RPM and 60 for TWAMP.
NOTE: If you configure the hardware timestamp feature (see ConfiguringRPM Timestamping):
• The default value of data-size is 32 bytes and 32 is theminimum value for
explicit configuration. The UDP timestamp probe type is an exception; itrequires aminimum data size of 52 bytes.
• The data size must be at least 100 bytes smaller than the default MTU ofthe interface of the RPM client interface.
Required PrivilegeLevel
system—To view this statement in the configuration.
interface-control—To add this statement to the configuration.
RelatedDocumentation
• Configuring BGP Neighbor Discovery Through RPM
135Copyright © 2016, Juniper Networks, Inc.
Chapter 9: Realtime Performance Monitoring

destination-port
Syntax destination-port port;
Hierarchy Level [edit services rpm bgp],[edit services rpm probe owner test test-name],[edit services rpm twamp client control-connection control-client-name]
Release Information Statement introduced before Junos OS Release 7.4.
Statement introduced in Junos OS Release 9.3 for EX Series switches.
Statement introduced in JunosOSRelease 13.2 for PTX Series Packet Transport Routers.
Support at the [edit services rpm twamp client control-connection control-client-name]
hierarchy level introduced in Junos OS Release 15.1 for MX Series routers.
Description Specify the User DatagramProtocol (UDP) or Transmission Control Protocol (TCP) port
to which a probe is sent. This statement is used only for TCP or UDP probe types.
The value for the destination-port can be only 7 when you configure the destination port
along with hardware timestamping. A constraint check prevents you for configuring any
other value for the destination port in this case.
This constraint does not apply when you are using one-way hardware timestamping
along with destination-port and either probe-type udp-ping or probe-type
udp-ping-timestamp.
Options Default: The default value for the port is 862 to which the TWAMP client establishescontrol connection.
port—Port number 7 or from 49,160 through 65,535.
NOTE: The specified port numbers are recommended for RPM only.
Required PrivilegeLevel
system—To view this statement in the configuration.
interface-control—To add this statement to the configuration.
RelatedDocumentation
• Configuring BGP Neighbor Discovery Through RPM
• Configuring RPM Probes
Copyright © 2016, Juniper Networks, Inc.136
Network Management and Monitoring Feature Guide for EX2300, EX3400, and EX4300 Switches

dscp-code-point
Syntax dscp-code-point dscp-bits;
Hierarchy Level [edit services rpm probe owner test test-name],[edit services rpm twamp client control-connection control-client-name test-sessionsession-name]
Release Information Statement introduced before Junos OS Release 7.4.
Statement introduced in Junos OS Release 9.3 for EX Series switches.
Statement introduced in Junos OS Release for PTX Series Packet Transport routers.
Support at the [edit services rpm twamp client control-connection control-client-name]
hierarchy level introduced in Junos OS Release 15.1 for MX Series routers.
Description Specify the value of the Differentiated Services (DiffServ) field within the IP header. The
DiffServ code point (DSCP) bits value must be set to a valid 6-bit pattern.
Options dscp-bits—A valid 6-bit pattern; for example, 001111, or one of the following configured
DSCP aliases:
• af11—Default: 001010
• af12—Default: 001100
• af13—Default: 001110
• af21—Default: 010010
• af22—Default: 010100
• af23—Default: 010110
• af31—Default: 011010
• af32—Default: 011100
• af33—Default: 011110
• af41—Default: 100010
• af42—Default:100100
• af43—Default:100110
• be—Default: 000000
• cs1—Default: 001000
• cs2—Default: 010000
• cs3—Default: 011000
• cs4—Default: 100000
• cs5—Default: 101000
• cs6—Default: 110000
• cs7—Default: 111000
137Copyright © 2016, Juniper Networks, Inc.
Chapter 9: Realtime Performance Monitoring

• ef—Default: 101110
• nc1—Default: 110000
• nc2—Default: 111000
Required PrivilegeLevel
interface—To view this statement in the configuration.
interface-control—To add this statement to the configuration.
RelatedDocumentation
• Configuring RPM Probes
• Two-Way Active Measurement Protocol Overview
hardware-timestamp
Syntax hardware-timestamp;
Hierarchy Level [edit services rpm probe owner test test-name]
Release Information Statement introduced in Junos OS Release 8.1.
Statement applied to MX Series routers in Junos OS Release 10.0.
Statement introduced in Junos OS Release 10.3 for EX Series switches.
Description Enable timestamping of RPM probemessages in the Packet Forwarding Engine host
processor. This feature is supportedonlywith icmp-ping, icmp-ping-timestamp,udp-ping,
and udp-ping-timestamp probe types.
Required PrivilegeLevel
interface—To view this statement in the configuration.
interface-control—To add this statement to the configuration.
Copyright © 2016, Juniper Networks, Inc.138
Network Management and Monitoring Feature Guide for EX2300, EX3400, and EX4300 Switches

history-size
Syntax history-size size;
Hierarchy Level [edit services rpm bgp],[edit services rpm probe owner test test-name],[edit services rpm twamp client control-connection control-client-name]
Release Information Statement introduced before Junos OS Release 7.4.
Statement introduced in Junos OS Release 9.3 for EX Series switches.
Statement introduced in Junos OS Release 13.2 for PTX Series Packet Transport routers.
Statementat the [edit services rpmtwampclientcontrol-connectioncontrol-client-name]
hierarchy level introduced in Junos OS Release 15.1 for MX Series routers.
Description Specify the number of stored history entries.
Options size—Value from 0 to 255.
Default: 50
Required PrivilegeLevel
interface—To view this statement in the configuration.
interface-control—To add this statement to the configuration.
RelatedDocumentation
• Configuring BGP Neighbor Discovery Through RPM
• Configuring RPM Probes
139Copyright © 2016, Juniper Networks, Inc.
Chapter 9: Realtime Performance Monitoring

moving-average-size
Syntax moving-average-size number;
Hierarchy Level [edit services rpm bgp],[edit services rpm probe owner test test-name],[edit services rpm twamp client control-connection control-client-name]
Release Information Statement introduced in Junos OS Release 8.5.
Statement introduced in Junos OS Release 9.3 for EX Series switches.
Statement Introduced in Junos OS Release 13.2 for PTX Series Packet Transport routers.
Statementat the [edit services rpmtwampclientcontrol-connectioncontrol-client-name]
hierarchy level introduced in Junos OS Release 15.1 for MX Series routers.
Description Enable statistical calculation operations to be performed across a configurable number
of the most recent samples.
Options number—Number of samples to be used in calculations.
Range: 0 through 255
Required PrivilegeLevel
interface—To view this statement in the configuration.
interface-control—To add this statement to the configuration.
RelatedDocumentation
• Configuring RPM Probes
one-way-hardware-timestamp
Syntax one-way-hardware-timestamp;
Hierarchy Level [edit services rpm probe owner test test-name]
Release Information Statement introduced in Junos OS Release 8.5.
Statement introduced in Junos OS Release 9.3 for EX Series switches.
Description Enable timestampingofRPMprobemessages forone-waydelayand jittermeasurements.
Youmust configure this statement along with the destination-interface statement to
invoke timestamping.This feature is supportedonlywith icmp-ping, icmp-ping-timestamp,
udp-ping, and udp-ping-timestamp probe types.
Required PrivilegeLevel
interface—To view this statement in the configuration.
interface-control—To add this statement to the configuration.
RelatedDocumentation
• Configuring RPM Timestamping
• destination-interface
• hardware-timestamp on page 138
Copyright © 2016, Juniper Networks, Inc.140
Network Management and Monitoring Feature Guide for EX2300, EX3400, and EX4300 Switches

port (RPM)
Syntax port number;
Hierarchy Level [edit services rpm probe-server (tcp | udp)]
Release Information Statement introduced before Junos OS Release 7.4.
Statement introduced in Junos OS Release 9.3 for EX Series switches.
Statement introduced in Junos OS Release 13.2 for PTX Series Packet Transport routers.
Description Specify the port number for the probe server.
Options number—Port number for the probe server. The value can be 7 or 49,160 through 65,535.
Required PrivilegeLevel
interface—To view this statement in the configuration.
interface-control—To add this statement to the configuration.
RelatedDocumentation
• Configuring RPM Receiver Servers
141Copyright © 2016, Juniper Networks, Inc.
Chapter 9: Realtime Performance Monitoring

probe
Syntax probe owner {test test-name {data-fill data;data-size size;destination-interface interface-name;destination-port port;dscp-code-point dscp-bits;hardware-timestamp;history-size size;inet6-options source-address ipv6-address;moving-average-size number;next-hop next-hop;one-way-hardware-timestamp;probe-count count;probe-interval seconds;probe-type type;routing-instance instance-name;source-address address;target (url url | address ipv4-address | inet6-url url | inet6-address ipv6-address);test-interval interval;thresholds{egress-timemicroseconds;ingress-timemicroseconds;jitter-egressmicroseconds;jitter-ingressmicroseconds;jitter-rttmicroseconds;rttmicroseconds;std-dev-egressmicroseconds;std-dev-ingressmicroseconds;std-dev-rttmicroseconds;successive-loss count;total-loss count;
}traps [trap-names];
}}
Hierarchy Level [edit services rpm]
Release Information Statement introduced before Junos OS Release 7.4.
Statement introduced in Junos OS Release 9.3 for EX Series switches.
Description Specifyanownername.Theownernamecombinedwith the testnamerepresentasingle
RPM configuration instance.
Options owner—Owner name up to 32 characters in length.
The remaining statements are explained separately.
Copyright © 2016, Juniper Networks, Inc.142
Network Management and Monitoring Feature Guide for EX2300, EX3400, and EX4300 Switches
Required PrivilegeLevel
system—To view this statement in the configuration.
interface-control—To add this statement to the configuration.
probe-count
Syntax probe-count count;
Hierarchy Level [edit services rpm bgp],[edit services rpm probe owner test test-name],[edit services rpm twamp client control-connection control-client-name test-sessionsession-name]
Release Information Statement introduced before Junos OS Release 7.4.
Statement introduced in Junos OS Release 9.3 for EX Series switches.
Statement introduced in Junos OS Release 13.2 for PTX Series Packet Transport routers.
Support at the [edit services rpm twamp client control-connection control-client-name]
hierarchy level introduced in Junos OS Release 15.1 for MX Series routers.
Description Specify the number of probes within a test.
Options count—1 through 15 for RPM, for TWAMP 1 through 4,294,967,290.
Required PrivilegeLevel
interface—To view this statement in the configuration.
interface-control—To add this statement to the configuration.
RelatedDocumentation
• Configuring BGP Neighbor Discovery Through RPM
• Configuring RPM Probes
143Copyright © 2016, Juniper Networks, Inc.
Chapter 9: Realtime Performance Monitoring
probe-interval
Syntax probe-interval interval;
Hierarchy Level [edit services rpm bgp],[edit services rpm probe owner test test-name],[edit services rpm twamp client control-connection control-client-name test-sessionsession-name]
Release Information Statement introduced before Junos OS Release 7.4.
Statement introduced in Junos OS Release 9.3 for EX Series switches.
Statement introduced in Junos OS Release 13.2 for PTX Series Packet Transport routers.
Support at the [edit services rpm twamp client control-connection control-client-name]
hierarchy level introduced in Junos OS Release 15.1 for MX Series routers.
Description Specify the time to wait between sending packets, in seconds.
Options interval—Number of seconds, from 1 through 255.
Required PrivilegeLevel
interface—To view this statement in the configuration.
interface-control—To add this statement to the configuration.
RelatedDocumentation
• Configuring BGP Neighbor Discovery Through RPM
• Configuring RPM Probes
• Two-Way Active Measurement Protocol Overview
Copyright © 2016, Juniper Networks, Inc.144
Network Management and Monitoring Feature Guide for EX2300, EX3400, and EX4300 Switches

probe-limit
Syntax probe-limit limit;
Hierarchy Level [edit services rpm]
Release Information Statement introduced before Junos OS Release 7.4.
Statement introduced in Junos OS Release 9.3 for EX Series switches.
Statement introduced in Junos OS Release 13.2 for PTX Series Packet Transport routers.
Description Configure the maximum number of concurrent probes allowed.
Options limit—Maximum number of concurrent probes allowed.
Range: (PTX Series Packet Transport routers only) 1 through 200(Other platforms) 1 through 500
Default: 100
Required PrivilegeLevel
interface—To view this statement in the configuration.
interface-control—To add this statement to the configuration.
RelatedDocumentation
• Limiting the Number of Concurrent RPM Probes
145Copyright © 2016, Juniper Networks, Inc.
Chapter 9: Realtime Performance Monitoring

probe-server
Syntax probe-server {tcp {destination-interface interface-name;port number;
}udp {destination-interface interface-name;port number;
}}
Hierarchy Level [edit services rpm]
Release Information Statement introduced before Junos OS Release 7.4.
Statement introduced in Junos OS Release 9.3 for EX Series switches.
Statement introduced in Junos OS Release 13.2 for PTX Series Packet Transport routers.
Description Specify the server to act as a receiver for the probes.
The remaining statements are explained separately.
NOTE: The destination-interface statement is not supported on PTX Series
routers.
Required PrivilegeLevel
interface—To view this statement in the configuration.
interface-control—To add this statement to the configuration.
RelatedDocumentation
• Configuring RPM Receiver Servers
Copyright © 2016, Juniper Networks, Inc.146
Network Management and Monitoring Feature Guide for EX2300, EX3400, and EX4300 Switches

probe-type
Syntax probe-type type;
Hierarchy Level [edit services rpm bgp],[edit services rpm probe owner test test-name]
Release Information Statement introduced before Junos OS Release 7.4.
Statement introduced in Junos OS Release 9.3 for EX Series switches.
Statement introduced in Junos OS Release 13.2 for PTX Series Packet Transport routers.
Description Specify the packet and protocol contents of a probe.
Options type—One of the following probe type values:
• http-get—(Not available at the [edit services rpm bgp] hierarchy level.) Sends a
Hypertext Transfer Protocol (HTTP) get request to a target URL.
• http-metadata-get—(Notavailableat the [edit services rpmbgp]hierarchy level.)Sends
an HTTP get request for metadata to a target URL.
• icmp-ping—Sends ICMP echo requests to a target address.
• icmp-ping-timestamp—Sends ICMP timestamp requests to a target address.
• tcp-ping—Sends TCP packets to a target.
• udp-ping—Sends UDP packets to a target.
• udp-ping-timestamp—Sends UDP timestamp requests to a target address.
Required PrivilegeLevel
interface—To view this statement in the configuration.
interface-control—To add this statement to the configuration.
RelatedDocumentation
• Configuring BGP Neighbor Discovery Through RPM
147Copyright © 2016, Juniper Networks, Inc.
Chapter 9: Realtime Performance Monitoring

routing-instance
Syntax routing-instance instance-name;
Hierarchy Level [edit services rpm probe owner test test-name][edit services rpm twamp client control-connection control-client-name]
Release Information Statement introduced before Junos OS Release 7.4.
Statement introduced in Junos OS Release 9.3 for EX Series switches.
Statement introduced in Junos OS Release 13.2 for PTX Series Packet Transport routers.
Support at the [edit services rpm twamp client control-connection control-client-name]
hierarchy level introduced in Junos OS Release 15.1 for MX Series routers.
Description Specify the routing instance used by the probes. The routing instance is also applicable
for control connection.
NOTE: Themedia interface fromwhere the TWAMP control and test or datapackets arrive and exit the si- logical interfacemust be a part of the same
routing instance.
Options instance-name—Routing instanceconfiguredat the [edit routing-instance]hierarchy level.
Default: Internet (IPv4) routing table inet.0.
Required PrivilegeLevel
interface—To view this statement in the configuration.
interface-control—To add this statement to the configuration.
RelatedDocumentation
• Configuring RPM Probes
• Two-Way Active Measurement Protocol Overview
Copyright © 2016, Juniper Networks, Inc.148
Network Management and Monitoring Feature Guide for EX2300, EX3400, and EX4300 Switches

routing-instances
Syntax routing-instances instance-name;
Hierarchy Level [edit services rpm bgp],[edit services rpm bgp logical-system logical-system-name]
Release Information Statement introduced in Junos OS Release 7.6.
Statement introduced in Junos OS Release 9.3 for EX Series switches.
Statement introduced in Junos OS Release 13.2 for PTX Series Packet Transport routers.
Description Specify the routing instance used by the probes.
Options instance-name—A routing instance configured at the [edit routing-instances] hierarchy
level.
Default: Internet routing table inet.0.
Required PrivilegeLevel
interface—To view this statement in the configuration.
interface-control—To add this statement to the configuration.
RelatedDocumentation
• Configuring BGP Neighbor Discovery Through RPM
149Copyright © 2016, Juniper Networks, Inc.
Chapter 9: Realtime Performance Monitoring

rpm (Interfaces)
Syntax rpm (client client | server server | twamp-client twamp-client | twamp-server twamp-server);
Hierarchy Level [edit interfaces interface-name unit logical-unit-number]
Release Information Statement introduced in Junos OS Release 8.1.
Statement introduced in Junos OS Release 9.3 for EX Series switches.
Statement introduced in Junos OS Release 15.1 for MX Series routers.
Description Associate an RPM or TWAMP client (router or switch that originates RPM or TWAMP
probes) or RPM or TWAMP server with a specified interface.
NOTE: The TWAMP client is applicable only for si- interfaces.
Options client—Identifier for RPM client router or switch.
server—Identifier for RPM server.
twamp-client—Identifier for RPM TWAMP client router.
twamp-server—Identifier for RPM TWAMP server.
Required PrivilegeLevel
interface—To view this statement in the configuration.
interface-control—To add this statement to the configuration.
RelatedDocumentation
• Configuring RPM Timestamping
Copyright © 2016, Juniper Networks, Inc.150
Network Management and Monitoring Feature Guide for EX2300, EX3400, and EX4300 Switches

source-address (Services)
Syntax source-address address;
Hierarchy Level [edit services rpm probe owner test test-name]
Release Information Statement introduced before Junos OS Release 7.4.
Statement introduced in Junos OS Release 9.3 for EX Series switches.
Statement introduced in Junos OS Release 13.2 for PTX Series Packet Transport routers.
Description Specify the source IP address used for probes. If the source IP address is not one of the
router’s or switch’s assigned addresses, the packet use the outgoing interface’s address
as its source.
The following addresses cannot be used for the source IP address used for probes:
• 0.0.0.0
• 127.0.0.0/8 (loopback)
• 224.0.0.0/4 (multicast)
• 255.255.255.255 (broadcast)
Options address—Valid IP address.
Required PrivilegeLevel
interface—To view this statement in the configuration.
interface-control—To add this statement to the configuration.
RelatedDocumentation
• Configuring RPM Probes
151Copyright © 2016, Juniper Networks, Inc.
Chapter 9: Realtime Performance Monitoring

tcp
Syntax tcp {destination-interface interface-name;port port;
}
Hierarchy Level [edit services rpm probe-server]
Release Information Statement introduced before Junos OS Release 7.4.
Statement introduced in Junos OS Release 9.3 for EX Series switches.
Statement introduced in Junos OS Release 13.2 for PTX Series Packet Transport routers.
Description Specify the port information for the TCP server.
The remaining statements are explained separately.
Required PrivilegeLevel
interface—To view this statement in the configuration.
interface-control—To add this statement to the configuration.
RelatedDocumentation
• Configuring RPM Receiver Servers
Copyright © 2016, Juniper Networks, Inc.152
Network Management and Monitoring Feature Guide for EX2300, EX3400, and EX4300 Switches

test
Syntax test test-name {data-fill data;data-size size;destination-interface interface-name;destination-port port;dscp-code-point dscp-bits;hardware-timestamp;history-size size;moving-average-size number;inet6-options;one-way-hardware-timestamp;probe-count count;probe-interval seconds;probe-type type;routing-instance instance-name;source-address address;target (url url | address address);test-interval interval;thresholds thresholds;traps traps;
}
Hierarchy Level [edit services rpm probe owner]
Release Information Statement introduced before Junos OS Release 7.4.
Statement introduced in Junos OS Release 9.3 for EX Series switches.
Statement introduced in Junos OS Release 13.2 for PTX Series Packet Transport routers.
inet6-options option added in Junos OS Release 14.1R4 for MX Series routers.
Description Specify the range of probes over which the standard deviation, average, and jitter are
calculated. The test name combined with the owner name represent a single RPM
configuration instance.
Options test-name—Test name. The name can be up to 32 characters in length.
The remaining statements are explained separately.
Required PrivilegeLevel
interface—To view this statement in the configuration.
interface-control—To add this statement to the configuration.
RelatedDocumentation
• Configuring RPM Probes
153Copyright © 2016, Juniper Networks, Inc.
Chapter 9: Realtime Performance Monitoring

test-interval
Syntax test-interval seconds;
Hierarchy Level [edit services rpm bgp],[edit services rpm probe owner test test-name],[edit services rpm twamp client control-connection control-client-name]
Release Information Statement introduced before Junos OS Release 7.4.
Statement introduced in Junos OS Release 9.3 for EX Series switches.
Statement introduced in Junos OS Release 13.2 for PTX Series Packet Transport routers.
Support at the [edit services rpm twamp client control-connection control-client-name]
hierarchy level introduced in Junos OS Release 15.1 for MX Series routers.
Description Specify the time to wait between tests, in seconds. A test interval of 0 seconds causes
the RPM test to stop after one iteration.
Options seconds—Number of seconds to wait between tests.
Range: [editservicesrpmbgp]and [editservicesrpmprobeowner test test-name]hierarchy
levels: 0 through 86,400
Range: [edit services rpmtwampclientcontrol-connectioncontrol-client-name]hierarchy
level: 1 through 255
Default: 1
Required PrivilegeLevel
interface—To view this statement in the configuration.
interface-control—To add this statement to the configuration.
RelatedDocumentation
• Configuring BGP Neighbor Discovery Through RPM
• Configuring RPM Probes
• Two-Way Active Measurement Protocol Overview
Copyright © 2016, Juniper Networks, Inc.154
Network Management and Monitoring Feature Guide for EX2300, EX3400, and EX4300 Switches

thresholds
Syntax thresholds thresholds;
Hierarchy Level [edit services rpm probe owner test test-name],[edit services rpm twamp client control-connection control-client-name]
Release Information Statement introduced before Junos OS Release 7.4.
Statement introduced in Junos OS Release 9.3 for EX Series switches.
Statement introduced in Junos OS Release 13.2 for PTX Packet Series Transport routers.
Support at the [edit services rpm twamp client control-connection control-client-name]
hierarchy level introduced in Junos OS Release 15.1 for MX Series routers.
Description Specify thresholds used for the probes. A system logmessage is generated when the
configured threshold is exceeded. Likewise, an SNMP trap (if configured) is generated
when a threshold is exceeded.
NOTE: If youconfigureavalueof zerousing the thresholdsoption for a certain
probe parameter, the generation of SNMP traps is disabled for thecorresponding probe attribute. For example, if you specify the set thresholds
jitter-egress 0 statement, it denotes that traps are not triggered when the
jitter in egress time threshold is met or exceeded.
Options thresholds—Specify one or more threshold measurements. The following options are
supported:
• egress-time—Measures maximum source-to-destination time per probe.
• ingress-time—Measures maximum destination-to-source time per probe.
• jitter-egress—Measures maximum source-to-destination jitter per test.
• jitter-ingress—Measures maximum destination-to- source jitter per test.
• jitter-rtt—Measuresmaximumjitterper test, from0through60,000,000microseconds.
• rtt—Measures maximum round-trip time per probe, in microseconds.
• std-dev-egress—Measures maximum source-to-destination standard deviation per
test.
• std-dev-ingress—Measures maximum destination-to-source standard deviation per
test.
• std-dev-rtt—Measures maximum standard deviation per test, in microseconds.
• successive-loss—Measures successive probe loss count, indicating probe failure.
• total-loss—Measures total probe loss count indicating test failure, from 0 through 15.
155Copyright © 2016, Juniper Networks, Inc.
Chapter 9: Realtime Performance Monitoring

Required PrivilegeLevel
interface—To view this statement in the configuration.
interface-control—To add this statement to the configuration.
RelatedDocumentation
• Configuring RPM Probes
• Two-Way Active Measurement Protocol Overview
Copyright © 2016, Juniper Networks, Inc.156
Network Management and Monitoring Feature Guide for EX2300, EX3400, and EX4300 Switches

traps
Syntax traps traps;
Hierarchy Level [edit services rpm probe owner test test-name],[edit services rpm twamp client control-connection control-client-name]
Release Information Statement introduced before Junos OS Release 7.4.
Statement introduced in Junos OS Release 9.3 for EX Series switches.
Statement introduced in Junos OS Release 13.2 for PTX Series Packet Transport routers.
Support at the [edit services rpm twamp client control-connection control-client-name]
hierarchy level introduced in Junos OS Release 15.1 for MX Series routers.
Description Set the trap bit to generate traps for probes. Traps are sent if the configured threshold
is met or exceeded.
Options traps—Specify one or more traps. The following options are supported:
• control-connection-closed—Generate traps when the control connection is closed.
• egress-jitter-exceeded—Generate traps when the jitter in egress time threshold is met
or exceeded.
• egress-std-dev-exceeded—Generate traps when the egress time standard deviation
threshold is met or exceeded.
• egress-time-exceeded—Generate traps when themaximum egress time threshold is
met or exceeded.
• ingress-jitter-exceeded—Generate trapswhen the jitter in ingress time threshold ismet
or exceeded.
• ingress-std-dev-exceeded—Generate traps when the ingress time standard deviation
threshold is met or exceeded.
• ingress-time-exceeded—Generate traps when themaximum ingress time threshold is
met or exceeded.
• jitter-exceeded—Generate traps when the jitter in round-trip time threshold is met or
exceeded.
• probe-failure—Generate traps when successive probe loss thresholds are crossed.
• rtt-exceeded—Generate traps when themaximum round-trip time threshold is met or
exceeded.
• std-dev-exceeded—Generate traps when the round-trip time standard deviation
threshold is met or exceeded.
• test-completion—Generate traps when a test is completed.
• test-failure—Generate traps when the total probe loss threshold is met or exceeded.
• test-iteration-done—Generate traps when all test sessions under control connections
complete one test iteration.
157Copyright © 2016, Juniper Networks, Inc.
Chapter 9: Realtime Performance Monitoring

NOTE: For RPM traps to be generated, youmust configure theremote-operationsSNMPtrapcategoryby including the categories statement
at the [edit snmp trap-group trap-group-name] hierarchy level.
Required PrivilegeLevel
interface—To view this statement in the configuration.
interface-control—To add this statement to the configuration.
RelatedDocumentation
• Configuring RPM Probes
• Two-Way Active Measurement Protocol Overview
udp
Syntax udp {destination-interface interface-name;port port;
}
Hierarchy Level [edit services rpm probe-server]
Release Information Statement introduced before Junos OS Release 7.4.
Statement introduced in Junos OS Release 9.3 for EX Series switches.
Statement introduced in Junos OS Release 13.2 for PTX Series Packet Transport routers.
Description Specify the port information for the UDP server.
The remaining statements are explained separately.
NOTE: The destination-interface statement is not supported on PTX Series
routers.
Required PrivilegeLevel
interface—To view this statement in the configuration.
interface-control—To add this statement to the configuration.
RelatedDocumentation
• Configuring RPM Receiver Servers
Copyright © 2016, Juniper Networks, Inc.158
Network Management and Monitoring Feature Guide for EX2300, EX3400, and EX4300 Switches

CHAPTER 10
Analyzers and Port Mirroring
• egress on page 159
• egress (Analyzer) on page 160
• ingress (vlans) on page 160
• ingress (Analyzer) on page 161
• input (Analyzer) on page 162
• interface (Analyzer) on page 163
• no-tag on page 164
• output (Mirroring) on page 165
• vlan (Mirroring) on page 166
egress
Syntax egress;
Hierarchy Level [edit vlans vlan-name vlan-id number interface interface-name]
Release Information Statement introduced in Junos OS Release 10.0 for EX Series switches.
Description Specify that the member interface of the VLAN allows only egress traffic.
Required PrivilegeLevel
system—To view this statement in the configuration.
system-control—To add this statement to the configuration.
RelatedDocumentation
• Example: Configuring Port Mirroring for Remote Monitoring of Employee Resource Use
Through a Transit Switch on EX Series Switches
159Copyright © 2016, Juniper Networks, Inc.

egress (Analyzer)
Syntax egress {bridge-domain bridge-domain-name;interface (all | interface-name);routing-instance {instance-name {bridge-domain bridge-domain-name;
}}
}
Hierarchy Level [edit forwarding-options analyzer analyzer-name input]
Release Information Statement introduced in Junos OS Release 13.2X50-D10 for EX Series switches.
Statement introduced in Junos OS Release 14.1 for MX Series routers.
Description Specify ports where traffic exiting the interface is to bemirrored in a mirroring
configuration.
The remaining statements are explained separately.
Required PrivilegeLevel
interface—To view this statement in the configuration.
interface-control—To add this statement to the configuration.
RelatedDocumentation
• Example:ConfiguringMirroring forRemoteMonitoringofEmployeeResourceUseThrough
a Transit Switch on EX9200 Switches
ingress (vlans)
Syntax ingress;
Hierarchy Level [edit vlans vlan-name vlan-id number interface interface-name]
Release Information Statement introduced in Junos OS Release 10.0 for EX Series switches.
Description Specify that the member interface of the VLAN allows only ingress traffic.
Required PrivilegeLevel
system—To view this statement in the configuration.
system-control—To add this statement to the configuration.
RelatedDocumentation
• Example: Configuring Port Mirroring for Remote Monitoring of Employee Resource Use
Through a Transit Switch on EX Series Switches
Copyright © 2016, Juniper Networks, Inc.160
Network Management and Monitoring Feature Guide for EX2300, EX3400, and EX4300 Switches

ingress (Analyzer)
Syntax ingress {bridge-domain bridge-domain-name;interface (all | interface-name);routing-instance {instance-name {bridge-domain bridge-domain-name;
}vlan (vlan-id | vlan-name);
}vlan (vlan-id | vlan-name);
}
Hierarchy Level [edit forwarding-options analyzer analyzer-name input]
Release Information Statement introduced in Junos OS Release 13.2X50-D10 for EX Series switches.
Statement introduced in Junos OS Release 14.1 for MX Series routers.
Description Configureports, routing instances, VLANs, or bridgedomains forwhich theentering traffic
is mirrored as part of a mirroring configuration.
The remaining statements are explained separately.
Required PrivilegeLevel
interface—To view this statement in the configuration.
interface-control—To add this statement to the configuration.
RelatedDocumentation
• Example:ConfiguringMirroring forRemoteMonitoringofEmployeeResourceUseThrough
a Transit Switch on EX9200 Switches
161Copyright © 2016, Juniper Networks, Inc.
Chapter 10: Analyzers and Port Mirroring

input (Analyzer)
Syntax input {egress {bridge-domain bridge-domain-name;interface (all | interface-name);routing-instance {instance-name {bridge-domain bridge-domain-name;
}}
}ingress {bridge-domain bridge-domain-name;interface (all | interface-name);routing-instance {instance-name {bridge-domain bridge-domain-name;
}vlan (vlan-id | vlan-name);
}vlan (vlan-id | vlan-name);
}maximum-packet-length bytes;rate number;
}
Hierarchy Level [edit forwarding-options analyzer analyzer-name]
Release Information Statement introduced in Junos OS Release 13.2X50-D10 for EX Series switches.
Statement introduced in Junos OS Release 14.1 for MX Series routers.
Description Define the traffic to bemirrored in a mirroring configuration—the definition can be a
combination of:
• Packets entering or exiting a port
• Packets entering or exiting a VLAN
• Packets entering or exiting a bridge domain
The remaining statements are explained separately.
Native analyzer sessions (that is, the [edit forwarding-options analyzer analyzer-name
input] hierarchy level for MX Series routers) can be configured without specifying input
parameters, which would mean that the instance uses default input values: rate = 1 and
maximum-packet-length = 0.
Default No default.
Required PrivilegeLevel
interface—To view this statement in the configuration.
interface-control—To add this statement to the configuration.
Copyright © 2016, Juniper Networks, Inc.162
Network Management and Monitoring Feature Guide for EX2300, EX3400, and EX4300 Switches

RelatedDocumentation
• Example: ConfiguringPortMirroringAnalyzers for LocalMonitoring of EmployeeResource
Use
• Example: Configuring Port Mirroring for Remote Monitoring of Employee Resource Use
• Understanding Port Mirroring Analyzers
interface (Analyzer)
Syntax interface (all | interface-name);
Hierarchy Level [edit forwarding-options analyzer analyzer-name input egress],[edit forwarding-options analyzer analyzer-name input ingress],[edit forwarding-options analyzer analyzer-name output]
Release Information Statement introduced in Junos OS Release 13.2X50-D10 for EX Series switches.
Statement introduced in Junos OS Release 14.1 for MX Series routers.
Description Configure the interfaces for which traffic is mirrored.
Options all—Apply mirroring to all interfaces on the network device. Mirroring a high volume of
traffic can be performance intensive for the device. Therefore, you should generally
select specific input interfaces in preference to using the all keyword, or use the all
keyword in combination with setting a ratio for statistical sampling. The all keyword
is not available for the [edit forwarding-options analyzer analyzer-name output]
hierarchy level.
interface-name—Apply mirroring to the specified interface only.
Required PrivilegeLevel
interface—To view this statement in the configuration.
interface-control—To add this statement to the configuration.
RelatedDocumentation
• Example: ConfiguringPortMirroringAnalyzers for LocalMonitoring of EmployeeResource
Use
• Example: Configuring Port Mirroring for Remote Monitoring of Employee Resource Use
• Understanding Port Mirroring Analyzers
163Copyright © 2016, Juniper Networks, Inc.
Chapter 10: Analyzers and Port Mirroring

no-tag
Syntax no-tag;
Hierarchy Level [edit [edit forwarding-options analyzer] Configuration Statement Hierarchy analyzer-nameoutput vlan (vlan-id | vlan-name)]
Release Information Statement introduced in Junos OS Release 11.3 for EX Series switches.
Hierarchy level [edit forwarding-options] introduced in Junos OS Release 13.2X50-D10
(ELS).
Description Specify that remote mirroring packets are not tagged.
Required PrivilegeLevel
system—To view this statement in the configuration.
system-control—To add this statement to the configuration.
RelatedDocumentation
• Example: Configuring Mirroring for Local Monitoring of Employee Resource Use on
EX4300 Switches on page 23
• Example: Configuring Mirroring for Remote Monitoring of Employee Resource Use on
EX4300 Switches on page 30
Copyright © 2016, Juniper Networks, Inc.164
Network Management and Monitoring Feature Guide for EX2300, EX3400, and EX4300 Switches
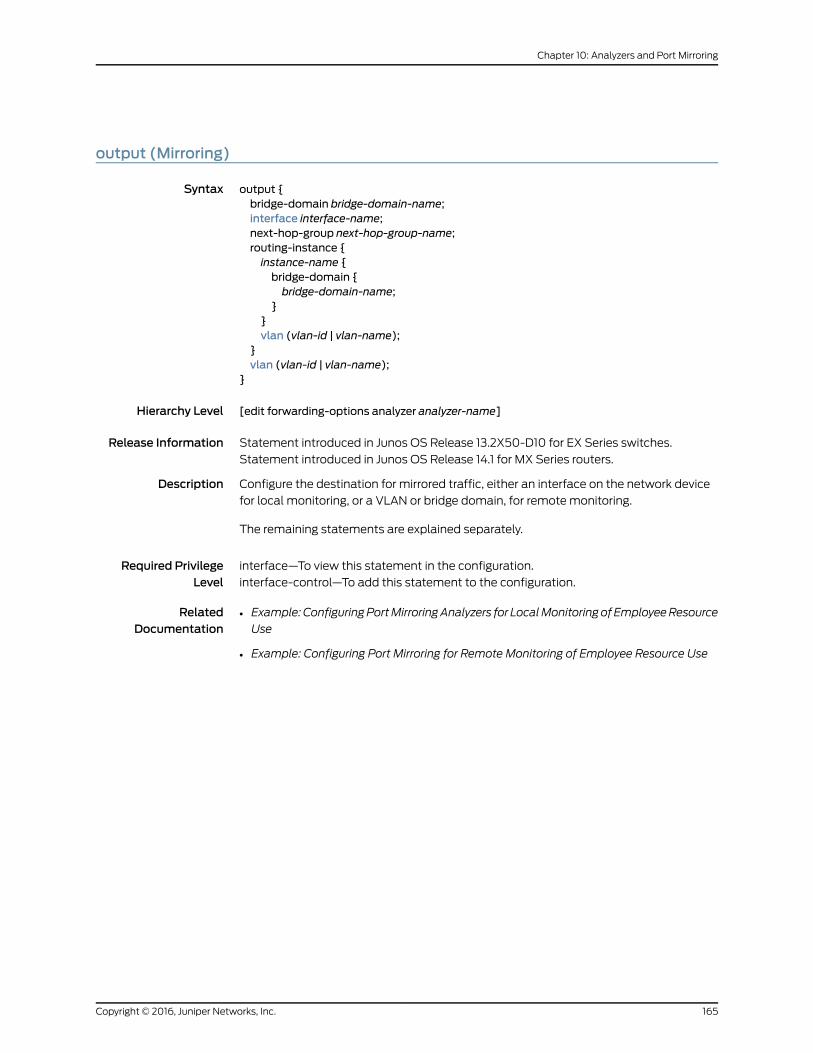
output (Mirroring)
Syntax output {bridge-domain bridge-domain-name;interface interface-name;next-hop-group next-hop-group-name;routing-instance {instance-name {bridge-domain {bridge-domain-name;
}}vlan (vlan-id | vlan-name);
}vlan (vlan-id | vlan-name);
}
Hierarchy Level [edit forwarding-options analyzer analyzer-name]
Release Information Statement introduced in Junos OS Release 13.2X50-D10 for EX Series switches.
Statement introduced in Junos OS Release 14.1 for MX Series routers.
Description Configure the destination for mirrored traffic, either an interface on the network device
for local monitoring, or a VLAN or bridge domain, for remote monitoring.
The remaining statements are explained separately.
Required PrivilegeLevel
interface—To view this statement in the configuration.
interface-control—To add this statement to the configuration.
RelatedDocumentation
• Example: ConfiguringPortMirroringAnalyzers for LocalMonitoring of EmployeeResource
Use
• Example: Configuring Port Mirroring for Remote Monitoring of Employee Resource Use
165Copyright © 2016, Juniper Networks, Inc.
Chapter 10: Analyzers and Port Mirroring

vlan (Mirroring)
Syntax vlan (vlan-id | vlan-name);
Hierarchy Level [edit forwarding-options analyzer analyzer-name input ingress],[edit forwarding-options analyzer analyzer-name input ingress routing-instanceinstance-name],
[edit forwarding-options analyzer analyzer-name output],[edit forwarding-options analyzer analyzer-name output routing-instance instance-name]
Release Information Statement introduced in Junos OS Release 13.2X50-D10 (ELS).
Description Configure mirrored traffic to be sent to a VLAN for remote monitoring.
Options vlan-id—Numeric VLAN identifier.
vlan-name—Name of the VLAN.
Required PrivilegeLevel
system—To view this statement in the configuration.
system-control—To add this statement to the configuration.
RelatedDocumentation
• Example:ConfiguringMirroring forRemoteMonitoringofEmployeeResourceUseThrough
a Transit Switch on EX9200 Switches
• Example: Configuring Port Mirroring for Remote Monitoring of Employee Resource Use
Copyright © 2016, Juniper Networks, Inc.166
Network Management and Monitoring Feature Guide for EX2300, EX3400, and EX4300 Switches

CHAPTER 11
sFlow Monitoring Technology
• agent-id on page 167
• collector on page 168
• disable (sFlowMonitoring Technology) on page 168
• interfaces (sFlowMonitoring Technology) on page 169
• polling-interval on page 170
• sample-rate on page 171
• sflow on page 172
• source-ip on page 173
• udp-port on page 173
agent-id
Syntax agent-id ip4/ipv6-address;
Hierarchy Level [edit protocols sflow]
Release Information Statement introduced in Junos OS Release 10.2 for EX Series switches.
Description Configure the IP address to be assigned as the agent ID for the sFlow agent. By assigning
an IP address, you ensure that the IP address is not dynamic. You can specify an IPv4 or
IPv6 address.
Required PrivilegeLevel
routing—To view this statement in the configuration.
routing-control—To add this statement to the configuration.
RelatedDocumentation
• Configuring sFlow Technology for Network Monitoring (CLI Procedure) on page 64
167Copyright © 2016, Juniper Networks, Inc.

collector
Syntax collector {ip4/ipv6-address;udp-port port-number;
}
Hierarchy Level [edit protocols sflow]
Release Information Statement introduced in Junos OS Release 9.3 for EX Series switches.
Description Configure a remote collector for sFlow network traffic monitoring. The switch sends
sFlowUDPdatagrams to this collector foranalysis. Youcanconfigureup to four collectors
on the switch. You configure a collector by specifying its IP address and a UDP port.
The remaining statements are explained separately.
Default The default port is 6343.
Required PrivilegeLevel
routing—To view this statement in the configuration.
routing-control—To add this statement to the configuration.
RelatedDocumentation
• Example: Configuring sFlow Technology to Monitor Network Traffic on EX Series
Switches on page 60
• Configuring sFlow Technology for Network Monitoring (CLI Procedure) on page 64
disable (sFlowMonitoring Technology)
Syntax disable;
Hierarchy Level [edit protocols sflow],[edit protocols sflow interfaces interface-name]
Release Information Statement introduced in Junos OS Release 9.3 for EX Series switches.
Description Disable the sFlowmonitoring protocol on all interfaces on the switch or on the specified
interface.
Required PrivilegeLevel
routing—To view this statement in the configuration.
routing-control—To add this statement to the configuration.
RelatedDocumentation
• Example: Configuring sFlow Technology to Monitor Network Traffic on EX Series
Switches on page 60
• Configuring sFlow Technology for Network Monitoring (CLI Procedure) on page 64
Copyright © 2016, Juniper Networks, Inc.168
Network Management and Monitoring Feature Guide for EX2300, EX3400, and EX4300 Switches

interfaces (sFlowMonitoring Technology)
Syntax interfaces interface-name {polling-interval seconds;sample-rate {egress number;ingress number;
}}
Hierarchy Level [edit protocols sflow]
Release Information Statement introduced in Junos OS Release 9.3 for EX Series switches.
Description Configure sFlow network traffic monitoring on the specified interface on the switch. You
can configure sFlow parameters such as polling interval and sampling ratewith different
values on different interfaces, and you can also disable sFlowmonitoring on individual
interfaces.
The remaining statements are explained separately.
Options interface-name—Name of the interface on which to configure sFlow parameters.
Required PrivilegeLevel
routing—To view this statement in the configuration.
routing-control—To add this statement to the configuration.
RelatedDocumentation
• Example: Configuring sFlow Technology to Monitor Network Traffic on EX Series
Switches on page 60
• Configuring sFlow Technology for Network Monitoring (CLI Procedure) on page 64
169Copyright © 2016, Juniper Networks, Inc.
Chapter 11: sFlowMonitoring Technology

polling-interval
Syntax polling-interval seconds;
Hierarchy Level [edit protocols sflow],[edit protocols sflow interfaces interface-name]
Release Information Statement introduced in Junos OS Release 9.3 for EX Series switches.
Description Configure the interval (in seconds) that the switch waits between port statistics update
messages. Polling refers to the switch gathering various statistics for the network
interfaces configured for sFlowmonitoring and exporting the statistics to the configured
sFlow collector.
Default If no polling interval is configured for a particular interface, the switch waits the number
of seconds that is configured as the polling interval in the global sFlow configuration. If
no polling interval is specified in the global configuration, the switch waits 20 seconds
betweenmessages.
Options seconds—Number of seconds between port statistics update messages. A value of 0
(zero) specifies that polling is disabled.
Range: 0 through 3600 seconds
Default: 20 seconds
Required PrivilegeLevel
routing—To view this statement in the configuration.
routing-control—To add this statement to the configuration.
RelatedDocumentation
• Configuring sFlow Technology for Network Monitoring (CLI Procedure) on page 64
• Example: Configuring sFlow Technology to Monitor Network Traffic on EX Series
Switches on page 60
Copyright © 2016, Juniper Networks, Inc.170
Network Management and Monitoring Feature Guide for EX2300, EX3400, and EX4300 Switches

sample-rate
Syntax sample-rate {egress number;ingress number;
}
Hierarchy Level [edit protocols sflow],[edit protocols sflow interfaces interface-name]
Release Information Statement introduced in Junos OS Release 9.3 for EX Series switches.
The option number (which immediately followed sample-rate) is no longer available and
options egress number and ingress number added in Junos OS Release 10.4 for EX Series
switches.
Description Specify the number of egress or ingress packets out of which one packet is sampled. If
no interface sampling ratesare configured, theglobal sampling rates takeeffect. If neither
is configured, by default both ingress and egress packet sampling are disabled.
Default By default, both egress and ingress sampling rates are disabled.
Options egress number—Value for egress sampling rate.
Range: 100 through 1,073,741,823
ingress number—Value for ingress sampling rate.
Range: 100 through 1,073,741,823
Required PrivilegeLevel
routing—To view this statement in the configuration.
routing-control—To add this statement to the configuration.
RelatedDocumentation
• Configuring sFlow Technology for Network Monitoring (CLI Procedure) on page 64
• Example: Configuring sFlow Technology to Monitor Network Traffic on EX Series
Switches on page 60
171Copyright © 2016, Juniper Networks, Inc.
Chapter 11: sFlowMonitoring Technology

sflow
Syntax sflow {agent-id ip-address;collector {ip-address;udp-port port-number;
}interfaces interface-name {disable;polling-interval seconds;sample-rate {egress number;ingress number;}
}polling-interval seconds;sample-rate {egress number;ingress number;}source-ip ip-address;
}
Hierarchy Level [edit protocols]
Release Information Statement introduced in Junos OS Release 9.3 for EX Series switches.
Options agent-id and source-ip added in Junos OS Release 10.2 for EX Series switches.
Description Configure sFlow technology to continuously monitor traffic at wire speed on specified
interfaces simultaneously. sFlow data can be used to provide network traffic visibility
information.
The remaining statements are explained separately.
Default sFlow technology is disabled by default.
Required PrivilegeLevel
routing—To view this statement in the configuration.
routing-control—To add this statement to the configuration.
RelatedDocumentation
• Example: Configuring sFlow Technology to Monitor Network Traffic on EX Series
Switches on page 60
• Configuring sFlow Technology for Network Monitoring (CLI Procedure) on page 64
Copyright © 2016, Juniper Networks, Inc.172
Network Management and Monitoring Feature Guide for EX2300, EX3400, and EX4300 Switches

source-ip
Syntax source-ip ip4/ipv6-address;
Hierarchy Level [edit protocols sflow]
Release Information Statement introduced in Junos OS Release 10.2 for EX Series switches.
Description Configure the IPaddress tobeused for the sFlowdatagrams.Byconfiguringan IPaddress,
you ensure that the IP address is not dynamic. You can specify an IPv4 or IPv6 address.
Required PrivilegeLevel
routing—To view this statement in the configuration.
routing-control—To add this statement to the configuration.
RelatedDocumentation
• Configuring sFlow Technology for Network Monitoring (CLI Procedure) on page 64
udp-port
Syntax udp-port port-number;
Hierarchy Level [edit protocols sflow collector]
Release Information Statement introduced in Junos OS Release 9.3 for EX Series switches.
Description Configure the UDP port for a remote collector for sFlow network traffic monitoring. The
switch sends sFlow UDP datagrams to the collector for analysis.
Options port-number—UDP port number for this collector.
Default: 6343
Required PrivilegeLevel
routing—To view this statement in the configuration.
routing-control—To add this statement to the configuration.
RelatedDocumentation
• Example: Configuring sFlow Technology to Monitor Network Traffic on EX Series
Switches on page 60
• Configuring sFlow Technology for Network Monitoring (CLI Procedure) on page 64
173Copyright © 2016, Juniper Networks, Inc.
Chapter 11: sFlowMonitoring Technology

Copyright © 2016, Juniper Networks, Inc.174
Network Management and Monitoring Feature Guide for EX2300, EX3400, and EX4300 Switches

CHAPTER 12
Ethernet OAM Link Fault Managementand Connectivity Fault Management
• action-profile (Applying to OAM CFM, for EX Series Switch Only) on page 177
• age (EX Series Switch Only) on page 178
• auto-discovery (EX Series Switch Only) on page 178
• calculation-weight on page 179
• connectivity-fault-management (EX Series Switch Only) on page 180
• continuity-check (EX Series Switch Only) on page 181
• cycle-time on page 182
• delay on page 183
• delay-variation on page 184
• direction (EX Series Switch Only) on page 185
• hold-interval (OAM CFM, for EX Series Switch Only) on page 185
• interface (OAM CFM, for EX Series Switch Only) on page 186
• interval (EX Series Switch Only) on page 187
• iteration-period on page 188
• level (EX Series Switch Only) on page 188
• linktrace (EX Series Switch Only) on page 189
• loss-threshold (EX Series Switch Only) on page 189
• maintenance-association (EX Series Switch Only) on page 190
• maintenance-domain (EX Series Switch Only) on page 191
• measurement-type (OAM LFM) on page 192
• mep (EX Series Switch Only) on page 193
• mip-half-function (EX Series Switch Only) on page 194
• name-format (EX Series Switch Only) on page 195
• path-database-size (EX Series Switch Only) on page 195
• performance-monitoring (OAM LFM) on page 196
• remote-mep (EX Series Switch Only) on page 197
175Copyright © 2016, Juniper Networks, Inc.

• sla-iterator-profiles (OAM LFM) on page 198
• action (OAM LFM) on page 198
• action-profile on page 199
• allow-remote-loopback on page 200
• ethernet (OAM LFM) on page 201
• event (OAM LFM) on page 204
• event-thresholds on page 204
• frame-error on page 205
• frame-period on page 205
• frame-period-summary on page 206
• interface (OAM LFM) on page 207
• link-adjacency-loss on page 208
• link-discovery on page 208
• link-down on page 209
• link-event-rate on page 209
• link-fault-management on page 210
• negotiation-options on page 211
• no-allow-link-events on page 211
• oam on page 212
• pdu-interval on page 214
• pdu-threshold on page 215
• remote-loopback on page 215
• symbol-period on page 216
• syslog (OAM LFM) on page 216
Copyright © 2016, Juniper Networks, Inc.176
Network Management and Monitoring Feature Guide for EX2300, EX3400, and EX4300 Switches

action-profile (Applying to OAMCFM, for EX Series Switch Only)
Syntax action-profile profile-name {action {interface-down;
}default-actions {interface-down;
}event {adjacency-loss;
}}
Hierarchy Level [edit protocols oam ethernet connectivity-fault-management]
[edit protocols oam ethernet connectivity-fault-managementmaintenance-domaindomain-namemaintenance-associationma-namemepmep-id remote-mepmep-id]
Release Information Statement introduced in Junos OS Release 10.2 for EX Series switches.
Description Configure a name and default action for an action profile.
Options profile-name—Name of the action profile.
action—Defines the action to be taken when connectivity to the remote MEP is lost.
interface-down—Brings the interface down when a remote MEP connectivity failure. is
detected.
default-actions—Defines the default action to be taken when connectivity to the remote
MEP is lost.
interface-down—Brings the interface down when a remote MEP connectivity failure is
detected.
event—Defines the event to bemonitored when a remote MEP connectivity failure is
detected.
adjacency-loss—Defines the connectivity loss to the remote MEP.
Required PrivilegeLevel
routing—To view this statement in the configuration.
routing-control—To add this statement to the configuration.
RelatedDocumentation
• ConfiguringEthernetOAMConnectivityFaultManagement (CLIProcedure)onpage79
• Junos OS Network Interfaces Configuration Guide
177Copyright © 2016, Juniper Networks, Inc.
Chapter 12: Ethernet OAM Link Fault Management and Connectivity Fault Management

age (EX Series Switch Only)
Syntax age (30m | 10m | 1m | 30s | 10s);
Hierarchy Level [edit protocols oam ethernet connectivity-fault-management linktrace]
Release Information Statement introduced in Junos OS Release 10.2 for EX Series switches.
Description Configure the time to wait (in minutes or seconds) for a response. If no response is
received, the request and response entry is deleted from the linktrace database.
Default 10 minutes
Required PrivilegeLevel
routing—To view this statement in the configuration.
routing-control—To add this statement to the configuration.
RelatedDocumentation
• ConfiguringEthernetOAMConnectivityFaultManagement (CLIProcedure)onpage79
• Junos OS Network Interfaces Configuration Guide
auto-discovery (EX Series Switch Only)
Syntax auto-discovery;
Hierarchy Level [edit protocols oam ethernet connectivity-fault-managementmaintenance-domaindomain-namemaintenance-associationma-namemepmep-id]
Release Information Statement introduced in Junos OS Release 10.2 for EX Series switches.
Description Enable the MEP to accept continuity check messages from all remote MEPs.
Required PrivilegeLevel
routing—To view this statement in the configuration.
routing-control—To add this statement to the configuration.
RelatedDocumentation
• ConfiguringEthernetOAMConnectivityFaultManagement (CLIProcedure)onpage79
• Junos OS Network Interfaces Configuration Guide
Copyright © 2016, Juniper Networks, Inc.178
Network Management and Monitoring Feature Guide for EX2300, EX3400, and EX4300 Switches

calculation-weight
Syntax calculation-weight {delay delay-value;delay-variation delay-variation-value;
}
Hierarchy Level [edit protocols oam ethernet connectivity-fault-management performance-monitoringsla-iterator-profiles profile-name]
Release Information Statement introduced in Junos OS Release 11.1.
Statement introduced in Junos OS Release 11.4 for EX Series switches.
Description Configure the calculation weight for delay and delay variation.
NOTE: This option is applicable only for two-way delaymeasurement.
The remaining statements are explained separately.
Required PrivilegeLevel
Configure—To enter configuration mode.
Control—Tomodify any configuration.
RelatedDocumentation
• Configuring an Iterator Profile
• Configuring an Iterator Profile on a Switch (CLI Procedure)
• delay on page 183
• delay-variation on page 184
179Copyright © 2016, Juniper Networks, Inc.
Chapter 12: Ethernet OAM Link Fault Management and Connectivity Fault Management

connectivity-fault-management (EX Series Switch Only)
Syntax connectivity-fault-management {action-profile profile-name {action {interface-down;
}default-actions {interface-down;
}event {adjacency-loss;
}}linktrace {age (30m | 10m | 1m | 30s | 10s);path-database-size path-database-size;
}maintenance-domain domain-name {level number;mip-half-function (none | default |explicit);name-format (character-string | none | dns | mac+2oct);maintenance-associationma-name {continuity-check {hold-intervalminutes;interface-status-tlv;interval (10m | 10s | 1m | 1s| 100ms);loss-threshold number;port-status-tlv;
}mepmep-id {auto-discovery;direction down;interface interface-name;remote-mepmep-id {action-profile profile-name;
}}
}}performance-monitoring {sla-iterator-profiles {profile-name {calculation-weight {delay delay-value;delay-variation delay-variation-value;
}cycle-time cycle-time-value;iteration-period iteration-period-value;measurement-type two-way-delay;passive;
}}
}
Copyright © 2016, Juniper Networks, Inc.180
Network Management and Monitoring Feature Guide for EX2300, EX3400, and EX4300 Switches

}
Hierarchy Level [edit protocols oam ethernet]
Release Information Statement introduced in Junos OS Release 10.2 for EX Series switches.
performance-monitoring introduced in Junos OS Release 11.4 for EX Series switches.
Description Configure connectivity fault management for IEEE 802.1ag Operation, Administration,
and Management (OAM) support.
The remaining statements are explained separately.
Required PrivilegeLevel
routing—To view this statement in the configuration.
routing-control—To add this statement to the configuration.
RelatedDocumentation
• ConfiguringEthernetOAMConnectivityFaultManagement (CLIProcedure)onpage79
• Junos OS Network Interfaces Configuration Guide
continuity-check (EX Series Switch Only)
Syntax continuity-check {hold-intervalminutes;interface-status-tlv;interval (10m | 10s | 1m | 1s| 100ms);loss-threshold number;port-status-tlv;
}
Hierarchy Level [edit protocols oam ethernet connectivity-fault-managementmaintenance-domaindomain-namemaintenance-associationma-name]
Release Information Statement introduced in Junos OS Release 10.2 for EX Series switches.
Description Specify continuity check protocol options.
The remaining statements are explained separately.
Options interface-status-tlv—Includes interface status TLV in CCM.
port-status-tlv—Includes port status TLV in CCM.
The remaining statements are explained separately.
Required PrivilegeLevel
routing—To view this statement in the configuration.
routing-control—To add this statement to the configuration.
RelatedDocumentation
• ConfiguringEthernetOAMConnectivityFaultManagement (CLIProcedure)onpage79
• Junos OS Network Interfaces Configuration Guide
181Copyright © 2016, Juniper Networks, Inc.
Chapter 12: Ethernet OAM Link Fault Management and Connectivity Fault Management

cycle-time
Syntax cycle-time cycle-time-value;
Hierarchy Level [edit protocols oam ethernet connectivity-fault-management performance-monitoringsla-iterator-profiles profile-name]
Release Information Statement introduced in Junos OS Release 11.1.
Statement introduced in Junos OS Release 11.4 for EX Series switches.
Description Configure the time (in milliseconds) taken between back-to-back transmissions of SLA
frames for a single connection.
Options cycle-time-value—Cycle time value in milliseconds.
Range: 10 through 3,600,000
Default: 1000
Required PrivilegeLevel
Configure—To enter configuration mode.
Control—Tomodify any configuration.
RelatedDocumentation
• Configuring an Iterator Profile
• Configuring an Iterator Profile on a Switch (CLI Procedure)
Copyright © 2016, Juniper Networks, Inc.182
Network Management and Monitoring Feature Guide for EX2300, EX3400, and EX4300 Switches

delay
Syntax delay delay-value;
Hierarchy Level [edit protocols oam ethernet connectivity-fault-management performance-monitoringsla-iterator-profiles profile-name calculation-weight]
Release Information Statement introduced in Junos OS Release 11.1.
Statement introduced in Junos OS Release 11.4 for EX Series switches.
Description Configure the calculation weight for delay.
Options delay-value—Calculation weight for delay.
NOTE: This option is applicable only for two-way delaymeasurement.
Range: 1 through 65,535
Default: 1
Required PrivilegeLevel
Configure—To enter configuration mode.
Control—Tomodify any configuration.
RelatedDocumentation
• Configuring an Iterator Profile
• Configuring an Iterator Profile on a Switch (CLI Procedure)
• calculation-weight on page 179
183Copyright © 2016, Juniper Networks, Inc.
Chapter 12: Ethernet OAM Link Fault Management and Connectivity Fault Management

delay-variation
Syntax delay-variation delay-variation-value;
Hierarchy Level [edit protocols oam ethernet connectivity-fault-management performance-monitoringsla-iterator-profiles profile-name calculation-weight]
Release Information Statement introduced in Junos OS Release 11.1.
Statement introduced in Junos OS Release 11.4 for EX Series switches.
Description Configure the calculation weight for delay variation.
Options delay-variation-value—Calculation weight for delay variation.
NOTE: This option is applicable only for two-way delaymeasurement.
Range: 1 through 65,535
Default: 1
Required PrivilegeLevel
Configure—To enter configuration mode.
Control—Tomodify any configuration.
RelatedDocumentation
• Configuring an Iterator Profile
• Configuring an Iterator Profile on a Switch (CLI Procedure)
• calculation-weight on page 179
Copyright © 2016, Juniper Networks, Inc.184
Network Management and Monitoring Feature Guide for EX2300, EX3400, and EX4300 Switches

direction (EX Series Switch Only)
Syntax direction down;
Hierarchy Level [edit protocols oam ethernet connectivity-fault-managementmaintenance-domaindomain-namemaintenance-associationma-namemepmep-id]
Release Information Statement introduced in Junos OS Release 10.2 for EX Series switches.
Description Specify that connectivity faultmanagement (CFM) packets (CCMs) be transmitted only
in one direction for the MEP, that is, the direction be set as down so that CCMs are
transmitted only out of (not into) the interface configured on this MEP.
Options down—DownMEP CCMs are transmitted only out (not into) of the interface configured
on this MEP.
Required PrivilegeLevel
routing—To view this statement in the configuration.
routing-control—To add this statement to the configuration.
RelatedDocumentation
• ConfiguringEthernetOAMConnectivityFaultManagement (CLIProcedure)onpage79
• Junos OS Network Interfaces Configuration Guide
hold-interval (OAMCFM, for EX Series Switch Only)
Syntax hold-intervalminutes;
Hierarchy Level [edit protocols oam ethernet connectivity-fault-managementmaintenance-domaindomain-namemaintenance-associationma-name continuity-check]
Release Information Statement introduced in Junos OS Release 10.2 for EX Series switches.
Description Configure the time towait before flushing themaintenance association end point (MEP)
database, if no updates occur.
Options minutes—Time to wait, in minutes.
Required PrivilegeLevel
routing—To view this statement in the configuration.
routing-control—To add this statement to the configuration.
RelatedDocumentation
• ConfiguringEthernetOAMConnectivityFaultManagement (CLIProcedure)onpage79
• Junos OS Network Interfaces Configuration Guide
185Copyright © 2016, Juniper Networks, Inc.
Chapter 12: Ethernet OAM Link Fault Management and Connectivity Fault Management

interface (OAMCFM, for EX Series Switch Only)
Syntax interface (interface-name | ((ge- | xe-) (fpc/pic/port | fpc/pic/port.unit-number |fpc/pic/port.unit-number vlan vlan-id)));
Hierarchy Level [edit protocols oam ethernet connectivity-fault-managementmaintenance-domaindomain-namemaintenance-associationma-namemepmep-id]
Release Information Statement introduced in Junos OS Release 10.2 for EX Series switches.
Description Configure IEEE802.1agOperation,Administration, andManagement (OAM)Connectivity
Fault Management (CFM) support for the specified interface.
Options interface-name—Interface to which the MEP is attached. It can be a physical Ethernet
interfaceor a logical interface. If the interface is a trunk interface, theVLANassociated
with the interface must have a VLAN ID.
Required PrivilegeLevel
routing—To view this statement in the configuration.
routing-control—To add this statement to the configuration.
RelatedDocumentation
• ConfiguringEthernetOAMConnectivityFaultManagement (CLIProcedure)onpage79
• Junos OS Network Interfaces Configuration Guide
Copyright © 2016, Juniper Networks, Inc.186
Network Management and Monitoring Feature Guide for EX2300, EX3400, and EX4300 Switches

interval (EX Series Switch Only)
Syntax interval (10m | 10s | 1m | 1s | 100ms | 10ms);
Hierarchy Level [edit protocols oam ethernet connectivity-fault-managementmaintenance-domaindomain-namemaintenance-associationma-name continuity-check]
Release Information Statement introduced in Junos OS Release 10.2 for EX Series switches.
Description Configure the time between continuity check messages.
Options 10m—10minutes.
10s—10 seconds.
1m—1minute.
1s—1 second.
100ms—100milliseconds.
10ms—10milliseconds.
Required PrivilegeLevel
routing—To view this statement in the configuration.
routing-control—To add this statement to the configuration.
RelatedDocumentation
• ConfiguringEthernetOAMConnectivityFaultManagement (CLIProcedure)onpage79
• Junos OS Network Interfaces Configuration Guide
187Copyright © 2016, Juniper Networks, Inc.
Chapter 12: Ethernet OAM Link Fault Management and Connectivity Fault Management

iteration-period
Syntax iteration-period iteration-period-value;
Hierarchy Level [edit protocols oam ethernet connectivity-fault-management performance-monitoringsla-iterator-profiles profile-name]
Release Information Statement introduced in Junos OS Release 11.1.
Statement introduced in Junos OS Release 11.4 for EX Series switches.
Description Configure the iteration period,which is themaximumnumber of cycles per iteration (that
is, the number of connections registered to an iterator cannot exceed this value).
Options iteration-period-value—Maximum number of cycles per iteration.
Range: 1 through 2000
Default: 2000
Required PrivilegeLevel
Configure—To enter configuration mode.
Control—Tomodify any configuration.
RelatedDocumentation
• Configuring an Iterator Profile
• Configuring an Iterator Profile on a Switch (CLI Procedure)
level (EX Series Switch Only)
Syntax level number;
Hierarchy Level [edit protocols oam ethernet connectivity-fault-managementmaintenance-domaindomain-name]
Release Information Statement introduced in Junos OS Release 10.2 for EX Series switches.
Description Configureanumber tobeused inCFMmessages to identify themaintenanceassociation.
Options number—Number used to identify the maintenance domain to which the CFMmessage
belongs.
Range: 0 through 7
Required PrivilegeLevel
routing—To view this statement in the configuration.
routing-control—To add this statement to the configuration.
RelatedDocumentation
• ConfiguringEthernetOAMConnectivityFaultManagement (CLIProcedure)onpage79
• Junos OS Network Interfaces Configuration Guide
Copyright © 2016, Juniper Networks, Inc.188
Network Management and Monitoring Feature Guide for EX2300, EX3400, and EX4300 Switches

linktrace (EX Series Switch Only)
Syntax linktrace {age (30m | 10m | 1m | 30s | 10s);path-database-size path-database-size;
}
Hierarchy Level [edit protocols oam ethernet connectivity-fault-management]
Release Information Statement introduced in Junos OS Release 10.2 for EX Series switches.
Description Configure connectivity fault management linktrace parameters.
The remaining statements are explained separately.
Required PrivilegeLevel
routing—To view this statement in the configuration.
routing-control—To add this statement to the configuration.
RelatedDocumentation
• ConfiguringEthernetOAMConnectivityFaultManagement (CLIProcedure)onpage79
• Junos OS Network Interfaces Configuration Guide
loss-threshold (EX Series Switch Only)
Syntax loss-threshold number;
Hierarchy Level [edit protocols oam ethernet connectivity-fault-managementmaintenance-domaindomain-namemaintenance-associationma-name continuity-check]
Release Information Statement introduced in Junos OS Release 10.2 for EX Series switches.
Description Configure the number of continuity check messages that can be lost before the remote
MEP is marked as down.
Options number—Number of continuity check messages that can be lost before the remote MEP
is marked down.
Required PrivilegeLevel
routing—To view this statement in the configuration.
routing-control—To add this statement to the configuration.
RelatedDocumentation
• ConfiguringEthernetOAMConnectivityFaultManagement (CLIProcedure)onpage79
• Junos OS Network Interfaces Configuration Guide
189Copyright © 2016, Juniper Networks, Inc.
Chapter 12: Ethernet OAM Link Fault Management and Connectivity Fault Management

maintenance-association (EX Series Switch Only)
Syntax maintenance-associationma-name {continuity-check {hold-intervalminutes;interface-status-tlv;interval (10m | 10s | 1m | 1s| 100ms);loss-threshold number;port-status-tlv;
}mepmep-id {auto-discovery;direction down;interface interface-name;remote-mepmep-id {action-profile profile-name;
}}
}
Hierarchy Level [edit protocols oam ethernet connectivity-fault-managementmaintenance-domaindomain-name]
Release Information Statement introduced in Junos OS Release 10.2 for EX Series switches.
Description Configure the name of the maintenance association in IEEE-compliant format.
Options ma-name—The name of the maintenance association within the maintenance domain.
The remaining statements are explained separately.
Required PrivilegeLevel
routing—To view this statement in the configuration.
routing-control—To add this statement to the configuration.
RelatedDocumentation
• ConfiguringEthernetOAMConnectivityFaultManagement (CLIProcedure)onpage79
• Junos OS Network Interfaces Configuration Guide
Copyright © 2016, Juniper Networks, Inc.190
Network Management and Monitoring Feature Guide for EX2300, EX3400, and EX4300 Switches
maintenance-domain (EX Series Switch Only)
Syntax maintenance-domain domain-name {level number;mip-half-function (none | default |explicit);name-format (character-string | none | dns | mac+2oct);maintenance-associationma-name {continuity-check {hold-intervalminutes;interface-status-tlv;interval (10m | 10s | 1m | 1s| 100ms);loss-threshold number;port-status-tlv;
}mepmep-id {auto-discovery;direction down;interface interface-name;remote-mepmep-id {action-profile profile-name;
}}
}}
Hierarchy Level [edit protocols oam ethernet connectivity-fault-management ]
Release Information Statement introduced in Junos OS Release 10.2 for EX Series switches.
Description Configure the name of the maintenance domain in IEEE-compliant format.
Options domain-name—The name for the maintenance domain.
The remaining statements are explained separately.
Required PrivilegeLevel
routing—To view this statement in the configuration.
routing-control—To add this statement to the configuration.
RelatedDocumentation
• ConfiguringEthernetOAMConnectivityFaultManagement (CLIProcedure)onpage79
• Junos OS Network Interfaces Configuration Guide
191Copyright © 2016, Juniper Networks, Inc.
Chapter 12: Ethernet OAM Link Fault Management and Connectivity Fault Management

measurement-type (OAM LFM)
Syntax measurement-type two-way-delay;
Hierarchy Level [edit protocols oam ethernet connectivity-fault-management performance-monitoringsla-iterator-profiles profile-name]
Release Information Statement introduced in Junos OS Release 11.4 for EX Series switches.
Description Configure the measurement type for the service-level agreement (SLA) frames. An SLA
frame is a type of packet used to measure frame loss in Ethernet connections.
Options two-way-delay—Use Y.1731-compliant two-way ETH-DM frames to measure frame loss.
Required PrivilegeLevel
Configure—To enter configuration mode.
Control—Tomodify any configuration.
RelatedDocumentation
• ConfiguringMEP Interfaces onSwitches toSupport Ethernet FrameDelayMeasurements
(CLI Procedure)
• ConfiguringOne-Way Ethernet FrameDelayMeasurements onSwitches (CLI Procedure)
• Configuring Two-WayEthernet FrameDelayMeasurements onSwitches (CLI Procedure)
Copyright © 2016, Juniper Networks, Inc.192
Network Management and Monitoring Feature Guide for EX2300, EX3400, and EX4300 Switches

mep (EX Series Switch Only)
Syntax mepmep-id {auto-discovery;direction down;interface interface-name;remote-mepmep-id {action-profile profile-name;
}}
Hierarchy Level [edit protocols oam ethernet connectivity-fault-managementmaintenance-domaindomain-namemaintenance-associationma-name]
Release Information Statement introduced in Junos OS Release 10.2 for EX Series switches.
Description Configure the numeric identifier of themaintenance association end point (MEP) within
the maintenance association.
Options mep-id—Numeric identifier of the MEP.
Range: 1 through 8191
The remaining statements are explained separately.
Required PrivilegeLevel
routing—To view this statement in the configuration.
routing-control—To add this statement to the configuration.
RelatedDocumentation
• ConfiguringEthernetOAMConnectivityFaultManagement (CLIProcedure)onpage79
• Junos OS Network Interfaces Configuration Guide
193Copyright © 2016, Juniper Networks, Inc.
Chapter 12: Ethernet OAM Link Fault Management and Connectivity Fault Management

mip-half-function (EX Series Switch Only)
Syntax mip-half-function (none | default | explicit);
Hierarchy Level [edit protocols oam ethernet connectivity-fault-managementmaintenance-domaindomain-name]
Release Information Statement introduced in Junos OS Release 10.2 for EX Series switches.
Description Specify the OAM Ethernet CFMmaintenance domain MIP half functions.
NOTE: Whenever a MIP is configured, the MIP half function value for allmaintenance domains andmaintenance associationsmust be the same.
Options none—Specify to not use the mip-half-function.
default—Specify to use the default mip-half-function.
explicit—Specify an explicit mip-half-function.
Required PrivilegeLevel
routing—To view this statement in the configuration.
routing-control—To add this statement to the configuration.
RelatedDocumentation
• ConfiguringEthernetOAMConnectivityFaultManagement (CLIProcedure)onpage79
• Junos OS Network Interfaces Configuration Guide
Copyright © 2016, Juniper Networks, Inc.194
Network Management and Monitoring Feature Guide for EX2300, EX3400, and EX4300 Switches

name-format (EX Series Switch Only)
Syntax name-format (character-string | none | dns | mac+2oct);
Hierarchy Level [edit protocols oam ethernet connectivity-fault-managementmaintenance-domaindomain-name]
Release Information Statement introduced in Junos OS Release 10.2 for EX Series switches.
Description Specify the format of the maintenance domain name.
Options character-string—The name is an ASCII character string.
none—Name format nonemeans that maintenance domain name is not used.
dns—Name is in domain name service (DNS) format. For example: www.juniper.net.
mac+2oct—Name is theMACaddressplusa two-octetmaintenanceassociation identifier.
For example: 08:00:22:33:44:55.100.
Default: character-string
Required PrivilegeLevel
routing—To view this statement in the configuration.
routing-control—To add this statement to the configuration.
RelatedDocumentation
• ConfiguringEthernetOAMConnectivityFaultManagement (CLIProcedure)onpage79
• Junos OS Network Interfaces Configuration Guide
path-database-size (EX Series Switch Only)
Syntax path-database-size path-database-size;
Hierarchy Level [edit protocols oam ethernet connectivity-fault-management linktrace]
Release Information Statement introduced in Junos OS Release 10.2 for EX Series switches.
Description Specify the number of linktrace reply entries to be stored per linktrace request.
Options path-database-size—Database size (number of entries stored per request).
Range: 1 through 500
Default: 100
Required PrivilegeLevel
routing—To view this statement in the configuration.
routing-control—To add this statement to the configuration.
RelatedDocumentation
• ConfiguringEthernetOAMConnectivityFaultManagement (CLIProcedure)onpage79
• Junos OS Network Interfaces Configuration Guide
195Copyright © 2016, Juniper Networks, Inc.
Chapter 12: Ethernet OAM Link Fault Management and Connectivity Fault Management

performance-monitoring (OAM LFM)
Syntax performance-monitoring {sla-iterator-profiles {profile-name {calculation-weight {delay delay-value;delay-variation delay-variation-value;
}cycle-time cycle-time-value;iteration-period iteration-period-value;measurement-type two-way-delay;passive;
}}
}
Hierarchy Level [edit protocols oam ethernet connectivity-fault-management]
Release Information Statement introduced in Junos OS Release 11.4 for EX Series switches.
Description Specify performancemonitoring support for Ethernet frame delay measurement.
The remaining statements are explained separately.
Required PrivilegeLevel
Configure—To enter configuration mode.
Control—Tomodify any configuration.
RelatedDocumentation
• ConfiguringMEP Interfaces onSwitches toSupport Ethernet FrameDelayMeasurements
(CLI Procedure)
• ConfiguringOne-Way Ethernet FrameDelayMeasurements onSwitches (CLI Procedure)
• Configuring Two-WayEthernet FrameDelayMeasurements onSwitches (CLI Procedure)
Copyright © 2016, Juniper Networks, Inc.196
Network Management and Monitoring Feature Guide for EX2300, EX3400, and EX4300 Switches

remote-mep (EX Series Switch Only)
Syntax remote-mepmep-id {action-profile profile-name;
}
Hierarchy Level [edit protocols oam ethernet connectivity-fault-managementmaintenance-domaindomain-namemaintenance-associationma-namemepmep-id ]
Release Information Statement introduced in Junos OS Release 10.2 for EX Series switches.
Description Specify the numeric identifier of the remote maintenance association end point (MEP)
within the maintenance association.
Options mep-id—Specify the numeric identifier of the MEP.
Range: 1 through 8191
The remaining statement is explained separately.
Required PrivilegeLevel
routing—To view this statement in the configuration.
routing-control—To add this statement to the configuration.
RelatedDocumentation
• ConfiguringEthernetOAMConnectivityFaultManagement (CLIProcedure)onpage79
• Junos OS Network Interfaces Configuration Guide
197Copyright © 2016, Juniper Networks, Inc.
Chapter 12: Ethernet OAM Link Fault Management and Connectivity Fault Management

sla-iterator-profiles (OAM LFM)
Syntax sla-iterator-profiles {profile-name {calculation-weight {delay delay-value;delay-variation delay-variation-value;
}cycle-time cycle-time-value;iteration-period iteration-period-value;measurement-type two-way-delay;passive;
}}
Hierarchy Level [edit protocols oam ethernet connectivity-fault-management performance-monitoring]
Release Information Statement introduced in Junos OS Release 11.4 for EX Series switches.
Description Configure an iterator application and specify the iterator profile options.
Options profile-name—Name of the iterator profile.
The remaining statements are explained separately.
Required PrivilegeLevel
Configure—To enter configuration mode.
Control—Tomodify any configuration.
RelatedDocumentation
• Configuring an Iterator Profile on a Switch (CLI Procedure)
action (OAM LFM)
Syntax action {syslog;link-down;
}
Hierarchy Level [edit protocols oam ethernet link-fault-management]
Release Information Statement introduced in Junos OS Release 9.4 for EX Series switches.
Description Define the action or actions to be taken when the OAM link fault management (LFM)
fault event occurs.
The remaining statements are explained separately.
Required PrivilegeLevel
routing—To view this statement in the configuration.
routing-control—To add this statement to the configuration.
RelatedDocumentation
• Configuring Ethernet OAM Link Fault Management (CLI Procedure) on page 83
Copyright © 2016, Juniper Networks, Inc.198
Network Management and Monitoring Feature Guide for EX2300, EX3400, and EX4300 Switches

action-profile
Syntax action-profile profile-name;action {syslog;link-down;
}event {link-adjacency-loss;link-event-rate {frame-error count;frame-period count;frame-period-summary count;symbol-period count;
}}
Hierarchy Level [edit protocols oam ethernet link-fault-management]
Release Information Statement introduced in Junos OS Release 9.4 for EX Series switches.
Description Configure an Ethernet OAM link fault management (LFM) action profile by specifying a
profile name.
The remaining statements are explained separately.
Options profile-name—Name of the action profile.
Required PrivilegeLevel
routing—To view this statement in the configuration.
routing-control—To add this statement to the configuration.
RelatedDocumentation
• Configuring Ethernet OAM Link Fault Management (CLI Procedure) on page 83
199Copyright © 2016, Juniper Networks, Inc.
Chapter 12: Ethernet OAM Link Fault Management and Connectivity Fault Management

allow-remote-loopback
Syntax allow-remote-loopback;
Hierarchy Level [edit protocols oam ethernet link-fault-management interface interface-name]
Release Information Statement introduced in Junos OS Release 9.4 for EX Series switches.
Description Advertise that the interface is capable of getting into loopback mode. Enable remote
loopback in EthernetOAM link faultmanagement (LFM) on all Ethernet interfaces or the
specified interface on the EX Series switch.
Required PrivilegeLevel
routing—To view this statement in the configuration.
routing-control—To add this statement to the configuration.
RelatedDocumentation
• Example: Configuring Ethernet OAM Link Fault Management on EX Series Switches
on page 76
• Configuring Ethernet OAM Link Fault Management (CLI Procedure) on page 83
Copyright © 2016, Juniper Networks, Inc.200
Network Management and Monitoring Feature Guide for EX2300, EX3400, and EX4300 Switches

ethernet (OAM LFM)
Syntax ethernet {connectivity-fault-management {action-profile profile-name {action {interface-down;
}default-actions {interface-down;
}event {adjacency-loss;
}}esp-traceoptions {file filename <files number> <no-stamp> <replace> <size size> <world-readable |no-world-readable>;
flag (all |error | esp | interface | krt | lib |normal |task |timer);}linktrace {age (30m | 10m | 1m | 30s | 10s);path-database-size path-database-size;
}maintenance-domain domain-name {level number;mip-half-function (none | default |explicit);name-format (character-string | none | dns | mac+2oct);maintenance-associationma-name {continuity-check {hold-intervalminutes;interface-status-tlv;interval (10m | 10s | 1m | 1s| 100ms);loss-threshold number;port-status-tlv;
}mepmep-id {auto-discovery;direction down;interface interface-name;priorityremote-mepmep-id {action-profile profile-name;sla-iterator-profile profile-name {data-tlv-size size;iteration-count count-value;priority priority-value;
}}
}short-name-format (character-string | vlan | 2octet | rfc-2685-vpn-id);
}}performance-monitoring {
201Copyright © 2016, Juniper Networks, Inc.
Chapter 12: Ethernet OAM Link Fault Management and Connectivity Fault Management

sla-iterator-profiles {profile-name {calculation-weight {delay delay-value;delay-variation delay-variation-value;
}cycle-time cycle-time-value;iteration-period iteration-period-value;measurement-type two-way-delay;passive;
}}
}traceoptions {file filename <files number> <match regex> <size size> <world-readable |no-world-readable>;
flag flag ;no-remote-trace;
}}link-fault-management {action-profile profile-name;action {syslog;link-down;
}event {link-adjacency-loss;link-event-rate {frame-error count;frame-period count;frame-period-summary count;symbol-period count;
}}
interface interface-name {link-discovery (active | passive);pdu-interval interval;pdu-threshold threshold-value;remote-loopback;event-thresholds {frame-errorcount;frame-period count;frame-period-summary count;symbol-period count;
}negotiation-options {allow-remote-loopback;no-allow-link-events;
}}traceoptions {file filename <files number> <match regex> <size size> <world-readable |no-world-readable>;
flag flag ;no-remote-trace;
Copyright © 2016, Juniper Networks, Inc.202
Network Management and Monitoring Feature Guide for EX2300, EX3400, and EX4300 Switches

}}
}
Hierarchy Level [edit protocols oam]
Release Information Statement introduced in Junos OS Release 9.4 for EX Series switches.
connectivity-fault-management introduced in JunosOSRelease 10.2 forEXSeriesswitches.
Description Provide IEEE 802.3ah Operation, Administration, and Maintenance (OAM) support for
Ethernet interfaces on EX Series switches or configure connectivity fault management
(CFM) for IEEE 802.1ag Operation, Administration, and Management (OAM) support on
the switches.
The remaining statements are explained separately.
Required PrivilegeLevel
routing—To view this statement in the configuration.
routing-control—To add this statement to the configuration.
RelatedDocumentation
• Example: Configuring Ethernet OAM Link Fault Management on EX Series Switches
on page 76
• Example: Configuring Ethernet OAM Connectivity Fault Management on EX Series
Switches on page 72
• Configuring Ethernet OAM Link Fault Management (CLI Procedure) on page 83
• ConfiguringEthernetOAMConnectivityFaultManagement (CLIProcedure)onpage79
203Copyright © 2016, Juniper Networks, Inc.
Chapter 12: Ethernet OAM Link Fault Management and Connectivity Fault Management
event (OAM LFM)
Syntax event {link-adjacency-loss;link-event-rate {frame-error count;frame-period count;frame-period-summary count;symbol-period count;
}}
Hierarchy Level [edit protocols oam ethernet link-fault-management action-profile profile-name]
Release Information Statement introduced in Junos OS Release 9.4 for EX Series switches.
Description Configure link events in an action profile for Ethernet OAM link faultmanagement (LFM).
The remaining statements are explained separately.
Required PrivilegeLevel
routing—To view this statement in the configuration.
routing-control—To add this statement to the configuration.
RelatedDocumentation
• Configuring Ethernet OAM Link Fault Management (CLI Procedure) on page 83
event-thresholds
Syntax event-thresholds {frame-error count;frame-period count;frame-period-summary count;symbol-period count;
}
Hierarchy Level [edit protocols oam ethernet link-fault-management interface interface-name]
Release Information Statement introduced in Junos OS Release 9.4 for EX Series switches.
Description Configure threshold limit values for link events in periodic OAM PDUs.
The remaining statements are explained separately.
Required PrivilegeLevel
routing—To view this statement in the configuration.
routing-control—To add this statement to the configuration.
RelatedDocumentation
• Configuring Ethernet OAM Link Fault Management (CLI Procedure) on page 83
Copyright © 2016, Juniper Networks, Inc.204
Network Management and Monitoring Feature Guide for EX2300, EX3400, and EX4300 Switches

frame-error
Syntax frame-error count;
Hierarchy Level [edit protocols oam ethernet link-fault-management event link-event-rate],[edit protocols oam ethernet link-fault-management interface interface-nameevent-thresholds]
Release Information Statement introduced in Junos OS Release 9.4 for EX Series switches.
Description Configure the thresholdvalue for sending frameerror eventsor taking theactionspecified
in the action profile.
Frame errors occur on the underlying physical layer. The threshold is reached when the
number of frame errors reaches the configured value.
Options count—Threshold count in seconds for frame error events.
Range: 1 through 100 seconds
Default: 1 second
Required PrivilegeLevel
routing—To view this statement in the configuration.
routing-control—To add this statement to the configuration.
RelatedDocumentation
• Configuring Ethernet OAM Link Fault Management (CLI Procedure) on page 83
frame-period
Syntax frame-period count;
Hierarchy Level [edit protocols oam ethernet link-fault-management event link-event-rate],[edit protocols oam ethernet link-fault-management interface interface-nameevent-thresholds]
Release Information Statement introduced in Junos OS Release 9.4 for EX Series switches.
Description Configure the number of frame errors within the last N frames that has exceeded a
threshold.
Frame errors occur on the underlying physical layer. The threshold is reached when the
number of frame errors reaches the configured value.
Options count—Threshold count in seconds for frame error events.
Range: 1 through 100 seconds
Required PrivilegeLevel
routing—To view this statement in the configuration.
routing-control—To add this statement to the configuration.
RelatedDocumentation
• Configuring Ethernet OAM Link Fault Management (CLI Procedure) on page 83
205Copyright © 2016, Juniper Networks, Inc.
Chapter 12: Ethernet OAM Link Fault Management and Connectivity Fault Management

frame-period-summary
Syntax frame-period-summary count;
Hierarchy Level [edit protocols oam ethernet link-fault-management event link-event-rate],[edit protocols oam ethernet link-fault-management interface interface-nameevent-thresholds]
Release Information Statement introduced in Junos OS Release 9.4 for EX Series switches.
Description Configure the threshold value for sending frame period summary error events or taking
the action specified in the action profile.
An errored frame second is any 1-second period that has at least one errored frame. This
event is generated if the number of errored frame seconds is equal to or greater than the
specified threshold for that period.
Options count—Threshold count in seconds for frame period summary error events.
Range: 1 through 100 seconds
Required PrivilegeLevel
routing—To view this statement in the configuration.
routing-control—To add this statement to the configuration.
RelatedDocumentation
• Configuring Ethernet OAM Link Fault Management (CLI Procedure) on page 83
Copyright © 2016, Juniper Networks, Inc.206
Network Management and Monitoring Feature Guide for EX2300, EX3400, and EX4300 Switches

interface (OAM LFM)
Syntax interface interface-name {link-discovery (active | passive);pdu-interval interval;pdu-threshold threshold-value;remote-loopback;event-thresholds {frame-errorcount;frame-period count;frame-period-summary count;symbol-period count;
}negotiation-options {allow-remote-loopback;no-allow-link-events;
}}
Hierarchy Level [edit protocols oam ethernet link-fault-management]
Release Information Statement introduced in Junos OS Release 9.4 for EX Series switches.
Description Configure Ethernet OAM link fault management (LFM) for all interfaces or for specific
interfaces.
The remaining statements are explained separately.
Options interface-name—Name of the interface to be enabled for IEEE 802.3ah OAM link fault
management (LFM) support.
Required PrivilegeLevel
routing—To view this statement in the configuration.
routing-control—To add this statement to the configuration.
RelatedDocumentation
• Example: Configuring Ethernet OAM Link Fault Management on EX Series Switches
on page 76
• Configuring Ethernet OAM Link Fault Management (CLI Procedure) on page 83
207Copyright © 2016, Juniper Networks, Inc.
Chapter 12: Ethernet OAM Link Fault Management and Connectivity Fault Management

link-adjacency-loss
Syntax link-adjacency-loss;
Hierarchy Level [edit protocols oam ethernet link-fault-management action-profile event]
Release Information Statement introduced in Junos OS Release 9.4 for EX Series switches.
Description Configure loss of adjacency event with the IEEE 802.3ah link fault management (LFM)
peer. When included, the loss of adjacency event triggers the action specified under the
action statement.
Required PrivilegeLevel
routing—To view this statement in the configuration.
routing-control—To add this statement to the configuration.
RelatedDocumentation
• Example: Configuring Ethernet OAM Link Fault Management on EX Series Switches
on page 76
• Configuring Ethernet OAM Link Fault Management (CLI Procedure) on page 83
link-discovery
Syntax link-discovery (active | passive);
Hierarchy Level [edit protocols oam ethernet link-fault-management interface interface-name]
Release Information Statement introduced in Junos OS Release 9.4 for EX Series switches.
Description Specify the discovery mode used for IEEE 802.3ah Operation, Administration, and
Maintenance (OAM) link fault management (LFM) support. The discovery process is
triggered automaticallywhenOAM802.3ah functionality is enabled on an interface. Link
monitoring is done when the interface sends periodic OAM PDUs.
Options active—In active mode, the interface discovers andmonitors the peer on the link if the
peer also supports IEEE 802.3ah OAM functionality.
passive—In passive mode, the peer initiates the discovery process.
Once the discovery process is initiated, both sides participate in discovery.
Required PrivilegeLevel
routing—To view this statement in the configuration.
routing-control—To add this statement to the configuration.
RelatedDocumentation
• Configuring Ethernet OAM Link Fault Management (CLI Procedure) on page 83
Copyright © 2016, Juniper Networks, Inc.208
Network Management and Monitoring Feature Guide for EX2300, EX3400, and EX4300 Switches

link-down
Syntax link-down;
Hierarchy Level [edit protocols oam ethernet link-fault-management action-profile action]
Release Information Statement introduced in Junos OS Release 9.4 for EX Series switches.
Description Mark the interface as down for transit traffic.
Required PrivilegeLevel
routing—To view this statement in the configuration.
routing-control—To add this statement to the configuration.
RelatedDocumentation
• Configuring Ethernet OAM Link Fault Management (CLI Procedure) on page 83
link-event-rate
Syntax link-event-rate {frame-error count;frame-period count;frame-period-summary count;symbol-period count;
}
Hierarchy Level [edit protocols oam ethernet link-fault-management action-profile event]
Release Information Statement introduced in Junos OS Release 9.4 for EX Series switches.
Description Configure the number of link fault management (LFM) events per second.
The remaining statements are explained separately.
Required PrivilegeLevel
routing—To view this statement in the configuration.
routing-control—To add this statement to the configuration.
RelatedDocumentation
• Configuring Ethernet OAM Link Fault Management (CLI Procedure) on page 83
209Copyright © 2016, Juniper Networks, Inc.
Chapter 12: Ethernet OAM Link Fault Management and Connectivity Fault Management

link-fault-management
Syntax link-fault-management {action-profile profile-name;action {syslog;link-down;
}event {link-adjacency-loss;link-event-rate {frame-error count;frame-period count;frame-period-summary count;symbol-period count;
}}
interface interface-name {link-discovery (active | passive);pdu-interval interval;pdu-threshold threshold-value;remote-loopback;event-thresholds {frame-errorcount;frame-period count;frame-period-summary count;symbol-period count;
}negotiation-options {allow-remote-loopback;no-allow-link-events;
}}
}
Hierarchy Level [edit protocols oam ethernet]
Release Information Statement introduced in Junos OS Release 9.4 for EX Series switches.
Description Configure Ethernet OAM link fault management (LFM) for all interfaces or for specific
interfaces.
The remaining statements are explained separately.
Required PrivilegeLevel
routing—To view this statement in the configuration.
routing-control—To add this statement to the configuration.
RelatedDocumentation
• Example: Configuring Ethernet OAM Link Fault Management on EX Series Switches
on page 76
• Configuring Ethernet OAM Link Fault Management (CLI Procedure) on page 83
Copyright © 2016, Juniper Networks, Inc.210
Network Management and Monitoring Feature Guide for EX2300, EX3400, and EX4300 Switches

negotiation-options
Syntax negotiation-options {allow-remote-loopback;no-allow-link-events;
}
Hierarchy Level [edit protocols oam ethernet link-fault-management interface interface-name]
Release Information Statement introduced in Junos OS Release 9.4 for EX Series switches.
Description Enable and disable IEEE 802.3ah Operation, Administration, and Maintenance (OAM)
link fault management (LFM) features for Ethernet interfaces.
The remaining statements are explained separately.
Required PrivilegeLevel
routing—To view this statement in the configuration.
routing-control—To add this statement to the configuration.
RelatedDocumentation
• Configuring Ethernet OAM Link Fault Management (CLI Procedure) on page 83
no-allow-link-events
Syntax no-allow-link-events;
Hierarchy Level [edit protocols oam ethernet link-fault-management interface interface-namenegotiation-options]
Release Information Statement introduced in Junos OS Release 9.4 for EX Series switches.
Description Disable the sending of link event TLVs.
Required PrivilegeLevel
routing—To view this statement in the configuration.
routing-control—To add this statement to the configuration.
RelatedDocumentation
• Configuring Ethernet OAM Link Fault Management (CLI Procedure) on page 83
211Copyright © 2016, Juniper Networks, Inc.
Chapter 12: Ethernet OAM Link Fault Management and Connectivity Fault Management

oam
Syntax oam {ethernet{connectivity-fault-management {action-profile profile-name {action {interface-down;
}default-actions {interface-down;
}event {adjacency-loss;
}}linktrace {age (30m | 10m | 1m | 30s | 10s);path-database-size path-database-size;
}maintenance-domain domain-name {level number;mip-half-function (none | default |explicit);name-format (character-string | none | dns | mac+2oct);maintenance-associationma-name {continuity-check {hold-intervalminutes;interface-status-tlv;interval (10m | 10s | 1m | 1s| 100ms);loss-threshold number;port-status-tlv;
}mepmep-id {auto-discovery;direction down;interface interface-name;remote-mepmep-id {action-profile profile-name;
}}
}}performance-monitoring {sla-iterator-profiles {profile-name {calculation-weight {delay delay-value;delay-variation delay-variation-value;
}cycle-time cycle-time-value;iteration-period iteration-period-value;measurement-type two-way-delay;passive;
}
Copyright © 2016, Juniper Networks, Inc.212
Network Management and Monitoring Feature Guide for EX2300, EX3400, and EX4300 Switches

}}
}link-fault-management {action-profile profile-name;action {syslog;link-down;
}event {link-adjacency-loss;link-event-rate {frame-error count;frame-period count;frame-period-summary count;symbol-period count;
}}
interface interface-name {link-discovery (active | passive);pdu-interval interval;pdu-threshold threshold-value;remote-loopback;event-thresholds {frame-errorcount;frame-period count;frame-period-summary count;symbol-period count;
}negotiation-options {allow-remote-loopback;no-allow-link-events;
}}
}}
Hierarchy Level [edit protocols]
Release Information Statement introduced in Junos OS Release 9.4 for EX Series switches.
connectivity-fault-management introduced in JunosOSRelease 10.2 forEXSeriesswitches.
Description Provide IEEE 802.3ah Operation, Administration, and Maintenance (OAM) link fault
management (LFM) support for Ethernet interfaces on EX Series switches or configure
connectivity fault management (CFM) for IEEE 802.1ag Operation, Administration, and
Management (OAM) support on the switches.
The remaining statements are explained separately.
Required PrivilegeLevel
interface—To view this statement in the configuration.
interface-control—To add this statement to the configuration.
213Copyright © 2016, Juniper Networks, Inc.
Chapter 12: Ethernet OAM Link Fault Management and Connectivity Fault Management

RelatedDocumentation
• Example: Configuring Ethernet OAM Link Fault Management on EX Series Switches
on page 76
• Example: Configuring Ethernet OAM Connectivity Fault Management on EX Series
Switches on page 72
• Configuring Ethernet OAM Link Fault Management (CLI Procedure) on page 83
• ConfiguringEthernetOAMConnectivityFaultManagement (CLIProcedure)onpage79
pdu-interval
Syntax pdu-interval interval;
Hierarchy Level [edit protocols oam ethernet link-fault-management interface interface-name]
Release Information Statement introduced in Junos OS Release 9.4 for EX Series switches.
Description Specify the periodic OAM PDU sending interval for fault detection. It is used for IEEE
802.3ah Operation, Administration, and Maintenance (OAM) link fault management
(LFM) support.
Options interval—Periodic OAM PDU sending interval.
Range: 400 through 1000milliseconds
Default: 1000milliseconds
Required PrivilegeLevel
routing—To view this statement in the configuration.
routing-control—To add this statement to the configuration.
RelatedDocumentation
• Example: Configuring Ethernet OAM Link Fault Management on EX Series Switches
on page 76
• Configuring Ethernet OAM Link Fault Management (CLI Procedure) on page 83
Copyright © 2016, Juniper Networks, Inc.214
Network Management and Monitoring Feature Guide for EX2300, EX3400, and EX4300 Switches

pdu-threshold
Syntax pdu-threshold threshold-value;
Hierarchy Level [edit protocols oam ethernet link-fault-management interface interface-name]
Release Information Statement introduced in Junos OS Release 9.4 for EX Series switches.
Description Configure howmany protocol data units (PDUs) are missed before declaring the peer
lost in Ethernet OAM link fault management (LFM) for all interfaces or for specific
interfaces.
Options threshold-value—Number of PDUsmissed before declaring the peer lost.
Range: 3 through 10 PDUs
Default: 3 PDUs
Required PrivilegeLevel
routing—To view this statement in the configuration.
routing-control—To add this statement to the configuration.
RelatedDocumentation
• Configuring Ethernet OAM Link Fault Management (CLI Procedure) on page 83
remote-loopback
Syntax remote-loopback;
Hierarchy Level [edit protocols oam ethernet link-fault-management interface interface-name]
Release Information Statement introduced in Junos OS Release 9.4 for EX Series switches.
Description Set the data terminal equipment (DTE) in loopback mode. Remove the statement from
the configuration to take the DTE out of loopback mode. It is used for IEEE 802.3ah
Operation,Administration,andMaintenance(OAM) link faultmanagement(LFM)support.
Required PrivilegeLevel
routing—To view this statement in the configuration.
routing-control—To add this statement to the configuration.
RelatedDocumentation
• Example: Configuring Ethernet OAM Link Fault Management on EX Series Switches
on page 76
• Configuring Ethernet OAM Link Fault Management (CLI Procedure) on page 83
215Copyright © 2016, Juniper Networks, Inc.
Chapter 12: Ethernet OAM Link Fault Management and Connectivity Fault Management

symbol-period
Syntax symbol-period count;
Hierarchy Level [edit protocols oam ethernet link-fault-management action-profile profile-name; eventlink-event-rate] ,
[edit protocols oam ethernet link-fault-management interface interface-nameevent-thresholds]
Release Information Statement introduced in Junos OS Release 9.4 for EX Series switches.
Description Configure the threshold for sending symbol period events or taking the action specified
in the action profile.
Symbol code errors occur on the underlying physical layer. The symbol period threshold
is reached when the number of symbol errors reaches the configured value within the
period. You cannot configure the default value to a different value.
Options count—Threshold count in seconds for symbol period events.
Range: 1 through 100 seconds
Required PrivilegeLevel
routing—To view this statement in the configuration.
routing-control—To add this statement to the configuration.
RelatedDocumentation
• Configuring Ethernet OAM Link Fault Management (CLI Procedure) on page 83
syslog (OAM LFM)
Syntax syslog;
Hierarchy Level [edit protocols oam ethernet link-fault-management action-profile profile-name; action]
Release Information Statement introduced in Junos OS Release 9.4 for EX Series switches.
Description Generate a system logmessage for the Ethernet Operation, Administration, and
Maintenance (OAM) link fault management (LFM) event.
Required PrivilegeLevel
routing—To view this statement in the configuration.
routing-control—To add this statement to the configuration.
RelatedDocumentation
• Configuring Ethernet OAM Link Fault Management (CLI Procedure) on page 83
Copyright © 2016, Juniper Networks, Inc.216
Network Management and Monitoring Feature Guide for EX2300, EX3400, and EX4300 Switches

CHAPTER 13
Uplink Failure Detection
• action (Uplink Failure Detection) on page 217
• group (Uplink Failure Detection) on page 218
• link-to-disable on page 218
• link-to-monitor on page 219
• traceoptions (Uplink Failure Detection) on page 220
• uplink-failure-detection on page 221
action (Uplink Failure Detection)
Syntax action {log;
}
Hierarchy Level [edit protocols uplink-failure-detection]
Release Information Statement introduced in Junos OS Release 12.1 for EX Series switches.
Description Define an action on uplink-failure-detection group state change.
Options log—Generate a system logmessage.
Required PrivilegeLevel
admin—To view this statement in the configuration.
admin-control—To add this statement to the configuration.
RelatedDocumentation
• Configuring Interfaces for Uplink Failure Detection (CLI Procedure) on page 87
217Copyright © 2016, Juniper Networks, Inc.

group (Uplink Failure Detection)
Syntax group group-name {link-to-monitor interface-name;link-to-disable interface-name;
}
Hierarchy Level [edit protocols uplink-failure-detection]
Release Information Statement introduced in Junos OS Release 11.1 for EX Series switches.
Description Configure a group of uplink and downlink interfaces for uplink failure detection.
Options group-name—Name of the uplink-failure-detection group.
The remaining statements are explained separately.
Required PrivilegeLevel
admin—To view this statement in the configuration.
admin-control—To add this statement to the configuration.
RelatedDocumentation
• Configuring Interfaces for Uplink Failure Detection (CLI Procedure) on page 87
link-to-disable
Syntax link-to-disable interface-name;
Hierarchy Level [edit protocols uplink-failure-detection group group-name]
Release Information Statement introduced in Junos OS Release 11.1 for EX Series switches.
Description Configure the downlink interfaces to be disabled when the switch detects an uplink
failure. The switch canmonitor a maximum of 48 downlink interfaces in a group.
Options interface-name—Name of the downlink interface or interface range in the group. The
interface can be a physical interface or a logical interface.
Required PrivilegeLevel
admin—To view this statement in the configuration.
admin-control—To add this statement to the configuration.
RelatedDocumentation
• Configuring Interfaces for Uplink Failure Detection (CLI Procedure) on page 87
Copyright © 2016, Juniper Networks, Inc.218
Network Management and Monitoring Feature Guide for EX2300, EX3400, and EX4300 Switches

link-to-monitor
Syntax link-to-monitor interface-name;
Hierarchy Level [edit protocols uplink-failure-detection group group-name]
Release Information Statement introduced in Junos OS Release 11.1 for EX Series switches.
Description Configure the uplink interfaces to bemonitored for uplink failure detection. The switch
canmonitor a maximum of 48 uplink interfaces in a group.
An interface can be configured as link-to-monitor in multiple groups.
Options interface-name—Nameof theuplink interfaceor interface range in thegroup.The interface
can be a physical interface or a logical interface.
Required PrivilegeLevel
admin—To view this statement in the configuration.
admin-control—To add this statement to the configuration.
RelatedDocumentation
• Configuring Interfaces for Uplink Failure Detection (CLI Procedure) on page 87
219Copyright © 2016, Juniper Networks, Inc.
Chapter 13: Uplink Failure Detection

traceoptions (Uplink Failure Detection)
Syntax traceoptions {file filename <files number> <no-stamp> <replace> <size size> <world-readable |no-world-readable>;
flag flag;}
Hierarchy Level [edit protocols uplink-failure-detection]
Release Information Statement introduced in Junos OS Release 12.1 for EX Series switches.
Description Define tracing operations for uplink failure detection.
Default The traceoptions feature is disabled by default.
Options file filename—Nameof the file to receive the output of the tracing operation. Enclose the
namewithin quotation marks.
files number—(Optional) Maximum number of trace files. When a trace file named
trace-file reaches its maximum size, it is renamed trace-file.0, then trace-file.1, and
so on, until the maximum number of trace files is reached ( xk to specify KB, xm to
specify MB, or xg to specify gigabytes), at which point the oldest trace file is
overwritten. If you specify a maximum number of files, you also must specify a
maximum file size with the size option.
Range: 2 through 1000
Default: 3 files
flag flag—Tracing operation to perform. To specify more than one tracing operation,
includemultiple flag statements. You can include the following flags:
• all—Trace everything.
• dcd—Trace ufdd interaction with dcd.
• groups—Trace uplink-failure-detection group handling.
• interface—Trace interface notifcation handlers of ufdd.
• parse—Trace configuration parsing.
no-stamp—(Optional) Do not place a timestamp on any trace file.
no-world-readable—(Optional) Restricted file access to the user who created the file.
size size—(Optional)Maximumsize of each trace file, in kilobytes (KB),megabytes (MB),
or gigabytes (GB). When a trace file named trace-file reaches its maximum size, it
is renamed trace-file.0, then trace-file.1, and so on, until the maximum number of
trace files is reached. Then the oldest trace file is overwritten. If you specify a
maximum number of files, you also must specify a maximum file size with the files
option.
Syntax: xk to specify KB, xm to specify MB, or xg to specify gigabytes
Copyright © 2016, Juniper Networks, Inc.220
Network Management and Monitoring Feature Guide for EX2300, EX3400, and EX4300 Switches

Range: 10 KB through 1 GB
Default: 128 KB
world-readable—(Optional) Enable unrestricted file access.
Required PrivilegeLevel
admin—To view this statement in the configuration.
admin-control—To add this statement to the configuration.
RelatedDocumentation
• Configuring Interfaces for Uplink Failure Detection (CLI Procedure) on page 87
uplink-failure-detection
Syntax uplink-failure-detection {action {log;
}group group-name {link-to-monitor interface-name;link-to-disable interface-name;
}traceoptions {file filename <files number> <no-stamp> <replace> <size size> <world-readable |no-world-readable>;
flag flag);}
}
Hierarchy Level [edit protocols]
Release Information Statement introduced in Junos OS Release 11.1 for EX Series switches.
Description Configure uplink and downlink interfaces in a group to monitor uplink failures and to
propagate uplink failures to the downlink interfaces.
The remaining statements are explained separately.
Required PrivilegeLevel
admin—To view this statement in the configuration.
admin-control—To add this statement to the configuration.
RelatedDocumentation
• Configuring Interfaces for Uplink Failure Detection (CLI Procedure) on page 87
221Copyright © 2016, Juniper Networks, Inc.
Chapter 13: Uplink Failure Detection

Copyright © 2016, Juniper Networks, Inc.222
Network Management and Monitoring Feature Guide for EX2300, EX3400, and EX4300 Switches

CHAPTER 14
Network Analytics
• address (Analytics Collector) on page 224
• analytics on page 225
• collector (Analytics) on page 229
• depth-threshold on page 230
• export-profiles on page 231
• file (Analytics) on page 233
• interface (Export Profiles) on page 235
• interfaces (Analytics Resource) on page 236
• latency-threshold on page 237
• local (Analytics Collector) on page 238
• resource (Analytics) on page 239
• resource-profiles (Analytics) on page 240
• system (Analytics Resource) on page 241
• system (Export Profiles) on page 242
• traceoptions (Analytics) on page 243
223Copyright © 2016, Juniper Networks, Inc.

address (Analytics Collector)
Syntax address ip-address {port number {transport protocol {export-profile profile-name;
}}
}
Hierarchy Level [edit services analytics collector]
Release Information Statement introduced in Junos OS Release 13.2 for the QFX Series.
Statement introduced in Junos OS Release 13.2X51-D25 for EX Series switches.
Description Configure theaddressof a remote server to receive streamedanalytics (queueand traffic
statistics) data.
NOTE: The address statement is not available in Junos OS Releases prior to
13.2X51-D15.
Options ip-address—IP address of the remote server receiving the streamed data.
port number—Port number of the remote server receiving the streaming data.
export-profile profile-name—Name of the export profile containing the parameters for
the analytics data being streamed.
transport protocol—A transport protocol used to stream data to the port.
Values:
• tcp—Transmission Control Procol (TCP)
• udp—User Datagram Protocol (UDP)
Required PrivilegeLevel
interface—To view this statement in the configuration.
interface-control—To add this statement to the configuration.
RelatedDocumentation
• Network Analytics Overview on page 89
• analytics on page 225
• show analytics collector
Copyright © 2016, Juniper Networks, Inc.224
Network Management and Monitoring Feature Guide for EX2300, EX3400, and EX4300 Switches

analytics
Syntax Junos OS Release 13.2X51-D15 and later:
analytics {collector {local {file filename {size size;files number;
}}address ip-address {port number {transport protocol {export-profile profile-name;
}}
}}export-profiles {profile-name {interface {information;statistics {queue;traffic;
}status {link;queue;traffic;
}}stream-format format;system {information;status {queue;traffic;
}}
}}resource {interfaces {interface-name {resource-profile name;
}}system {polling-interval {queue-monitoring interval;traffic-monitoring interval;
}
225Copyright © 2016, Juniper Networks, Inc.
Chapter 14: Network Analytics

resource-profile name;}
}resource-profiles {profile-name {depth-threshold {high number;low number;
}latency-threshold {high number;low number;
}no-queue-monitoring;no-traffic-monitoring;queue-monitoring;traffic-monitoring;
}}traceoptions {file filename {files number;size size;
}}
}
Copyright © 2016, Juniper Networks, Inc.226
Network Management and Monitoring Feature Guide for EX2300, EX3400, and EX4300 Switches
Junos OS Release 13.2X50-D15 and 13.2X51-D10 only:
analytics {interfaces {all {depth-threshold high number low number;latency-threshold high number low number;queue-statistics;no-queue-statistics;traffic-statistics;no-traffic-statistics;
}interface-name {depth-threshold high number low number;latency-threshold high number low number;queue-statistics;no-queue-statistics;traffic-statistics;no-traffic-statistics;
}}queue-statistics {file filename {files number-of-files;size size;
}interval interval;
}streaming-servers {address ip-address {port number {stream-format format;stream-type type
}}
}traceoptions {file filename {files number;size size;
}}traffic-statistics {file filename {files number-of-files;size size;
}interval interval;
}}
Hierarchy Level [edit services]
Release Information Statement introduced in Junos OS Release 13.2 for the QFX Series.
Statement introduced in Junos OS Release 13.2X51-D25 for EX Series switches.
227Copyright © 2016, Juniper Networks, Inc.
Chapter 14: Network Analytics

Description Configure the network analytics feature that includes monitoring for traffic and queue
statistics. Thenetwork analytics processes running on thePacket Forwarding Engine and
Routing Engine collect and analyze the data, and generate reports that may be saved in
log files or sent as streaming data to remote servers.
The remaining statements are explained separately.
Required PrivilegeLevel
interface—To view this statement in the configuration.
interface-control—To add this statement to the configuration.
RelatedDocumentation
• Network Analytics Overview on page 89
• show analytics traffic-statistics
• show analytics collector
• show analytics status
• show analytics queue-statistics
• show analytics configuration
Copyright © 2016, Juniper Networks, Inc.228
Network Management and Monitoring Feature Guide for EX2300, EX3400, and EX4300 Switches

collector (Analytics)
Syntax collector {local {file filename {size size;files number;
}}address ip-address {port number {transport protocol {export-profile profile-name;
}}
}}
Hierarchy Level [edit services analytics]
Release Information Statement introduced in Junos OS Release 13.2 for the QFX Series.
Statement introduced in Junos OS Release 13.2X51-D25 for EX Series switches.
Description Configure a local file for storing network analytics statistics and/or a remote server for
receiving streamed statistics data.
NOTE: The collector statement is not available in Junos OS Releases prior
to 13.2X51-D15.
The remaining statements are explained separately.
Required PrivilegeLevel
interface—To view this statement in the configuration.
interface-control—To add this statement to the configuration.
RelatedDocumentation
• Network Analytics Overview on page 89
229Copyright © 2016, Juniper Networks, Inc.
Chapter 14: Network Analytics

depth-threshold
Syntax depth-threshold {high number;low number;
}
Hierarchy Level [edit services analytics interfaces][edit services analytics resource-profiles]
Release Information Statement introduced in Junos OS Release 13.2 for the QFX Series.
Statement in the [edit services analytics resource-profiles] hierarchy level introduced in
Junos OS Release 13.2X51-D15.
Statement introduced in Junos OS Release 13.2X51-D25 for EX Series switches.
Description If network analytics queue statistics monitoring is enabled, specify the high and low
values (inbytes)of thequeuedepth (buffer) threshold. If youconfigureadepth threshold,
you cannot configure the latency threshold. You can configure the depth threshold for
one interface or all interfaces. Specify the high and low queue depth threshold numbers:
NOTE: The configuration for a specific interface supersedes the globalconfiguration for all interfaces.
Options high number—Specify the maximum value for the depth threshold.
Range: 1 to 1,250,000,000 bytes
Default:
• Junos OS Release 13.2X51-D10 or later—0 bytes
• Junos OS Release 13.2X50-D15—14,680,064 bytes (14 MB)
low number—Specify the minimum value for the depth threshold.
Range: 1 to 1,250,000,000 bytes
Default:
• Junos OS Release 13.2X51-D10 or later—0 bytes
• Junos OS Release 13.2X50-D15—1024 bytes (1 KB)
Required PrivilegeLevel
interface—To view this statement in the configuration.
interface-control—To add this statement to the configuration.
RelatedDocumentation
• Network Analytics Overview on page 89
• analytics on page 225
• latency-threshold on page 237
• resource-profiles (Analytics) on page 240
Copyright © 2016, Juniper Networks, Inc.230
Network Management and Monitoring Feature Guide for EX2300, EX3400, and EX4300 Switches

export-profiles
Syntax export-profiles {profile-name {interface {information;statistics {queue;traffic;
}status {link;queue;traffic;
}}stream-format format;system {information;status {queue;traffic;
}}
}}
Hierarchy Level [edit services analytics]
Release Information Statement introduced in Junos OS Release 13.2 for the QFX Series.
Statement introduced in Junos OS Release 13.2X51-D25 for EX Series switches.
Description Configure an profile to specify the network analytics data being streamed to remote
servers. Each profile is a template that defines the type of data being streamed.
NOTE: The export-profile statement is not available in Junos OS Releases
prior to 13.2X51-D15.
Options profile-name—Name of the export profile containing the configuration of the data being
streamed.
stream-format format—Format of the streaming data being sent to a server. Only one
format can be sent to each port on a server.
Values:
• csv—Comma-separated Values (CSV). Data sent in this format is newlineseparated, and each record contains one stream type (queue or traffic data) per
interface.Each record contains either a “q” for aqueue statistics, or a “t” for a traffic
statistics.
231Copyright © 2016, Juniper Networks, Inc.
Chapter 14: Network Analytics

• gpb—Google Protocol Buffer (GPB). Data sent in this format has a hierachicalformat, and is categorized by resource type (system or interfaces), which is
specified in themessageheader.Youcangeneratedata formatted inother formats
(CSV, TSV, and JSON) from GPB-encoded data.
Eachmessage includes a 8-byte header containing the following information:
• Bytes 0 to 3—Length of the message.
• Byte 4—Message version.
• Bytes 5 to 7—Reserved for future use.
NOTE: A schema file called analytics.proto containing the definitions
of the GPBmessages is available for downloading from the followinglocation:
http://www.juniper.net/techpubs/en_US/junos13.2/topics/reference/proto-files/analytics-proto.txt
• json—JavaScript Object Notation (JSON). Data sent in this format is newlineseparated, and each record contains one stream type (queue or traffic data) per
interface. Each record contains either “queue-statistics” or “traffic-statistics” in
the “record type” field.
• tsv—Tab-separated Values (TSV). Data sent in this format is newline separated,and each record contains one stream type (queue or traffic data) per interface.
Each record contains a “q” for a queue statistics, or a “t” for a traffic statistics.
The remaining statements are explained separately.
Required PrivilegeLevel
interface—To view this statement in the configuration.
interface-control—To add this statement to the configuration.
RelatedDocumentation
• Network Analytics Overview on page 89
• analytics on page 225
Copyright © 2016, Juniper Networks, Inc.232
Network Management and Monitoring Feature Guide for EX2300, EX3400, and EX4300 Switches

file (Analytics)
Syntax file filename {files number-of-files;size size;
}
Hierarchy Level [edit services analytics collector local][edit services analytics queue-statistics][edit services analytics traffic-statistics]
Release Information Statement introduced in Junos OS Release 13.2 for the QFX Series.
Statement introduced in Junos OS Release 13.2X51-D25 for EX Series switches.
Description Enable the logging of queue or traffic monitoring statistics in a local file. This statement
does not enable monitoring.
Default This feature is disabled by default.
Options filename—Specify a filename for storing queue and traffic monitoring statistics in the
Comma-separated Values (CSV) format. The file is stored in the /var/log/ directory
of your device.
If you do not specify a filename, the data is not stored in a file.
NOTE: In Junos OS Release 13.2X51-D15 or later, you configure a singlefilename to store both queue and traffic monitoring statistics. In JunosOS Release 13.2X51-D10 and earlier, you configure separate files forstoringmonitoring data, one for queue statistics, and another for trafficstatistics.
files number-of-files—Specify the number of files to store locally. After the number of
files with the maximum file size is reached, the system starts over and writes the
data to the first file.
Range: 2 to 1,000 files.
size size—Configure the file size in megabytes (MB).
Syntax: xm to specify MB.
Range: 10 to 4095MB
Required PrivilegeLevel
interface—To view this statement in the configuration.
interface-control—To add this statement to the configuration.
Release History Table Release Description
In Junos OS Release 13.2X51-D15 or later, you configure a single filename tostore both queue and traffic monitoring statistics.
13.2X51-D15
233Copyright © 2016, Juniper Networks, Inc.
Chapter 14: Network Analytics

In Junos OS Release 13.2X51-D10 and earlier, you configure separate files forstoring monitoring data, one for queue statistics, and another for trafficstatistics.
13.2X51-D10
RelatedDocumentation
• Network Analytics Overview on page 89
• analytics on page 225
Copyright © 2016, Juniper Networks, Inc.234
Network Management and Monitoring Feature Guide for EX2300, EX3400, and EX4300 Switches

interface (Export Profiles)
Syntax interface {information;statistics {queue;traffic;
}status {link;queue;traffic;
}}
Hierarchy Level [edit services analytics export-profiles]
Release Information Statement introduced in Junos OS Release 13.2 for the QFX Series.
Statement introduced in Junos OS Release 13.2X51-D25 for EX Series switches.
Description Configure an export profile for streaming network analytics data for a specific interface
to remote servers. Eachprofile is a template that defines the typeof databeing streamed
for that interface.
NOTE: The interface statement is not available in Junos OS Releases prior
to 13.2X51-D15.
Options information—Information about the specified interface, including SNMP index, interface
index, slot, port number, media type, capability, and port type.
statistics—Type of monitoring statistics to be streamed.
Values:
• queue
• traffic
status—Status information about the interface to be streamed.
Values:
• link
• queue
• traffic
Required PrivilegeLevel
interface—To view this statement in the configuration.
interface-control—To add this statement to the configuration.
235Copyright © 2016, Juniper Networks, Inc.
Chapter 14: Network Analytics

RelatedDocumentation
• Network Analytics Overview on page 89
• analytics on page 225
interfaces (Analytics Resource)
Syntax interfaces {interface-name {resource-profile profile-name;
}}
Hierarchy Level [edit services analytics resource]
Release Information Statement introduced in Junos OS Release 13.2 for the QFX Series.
Statement introduced in Junos OS Release 13.2X51-D25 for EX Series switches.
Description Apply the network analytics resource profile to an interface for which you wish to enable
queue or traffic statistics monitoring. The resource profile is a template that specifies
the parameters for queue and traffic monitoring, as well as for the depth and latency
thresholds.
NOTE: The interfaces statement in the [edit services analytics resource]
hierarchy is not available in Junos OS Releases prior to 13.2X51-D15.
Options interface-name—Name of the interface for which a resource profile has been configured.
resource-profile profile-name—Name of a resource profile containing the analytics
parameters that have been specified for interfaces. Information contained in a
resource profile includes the configuration of queue and trafficmonitoring (whether
enabledordisabled), andvalues for thedepthand latency thresholds (if applicable).
Required PrivilegeLevel
interface—To view this statement in the configuration.
interface-control—To add this statement to the configuration.
RelatedDocumentation
• Network Analytics Overview on page 89
• analytics on page 225
Copyright © 2016, Juniper Networks, Inc.236
Network Management and Monitoring Feature Guide for EX2300, EX3400, and EX4300 Switches

latency-threshold
Syntax latency-threshold {high number;low number;
}
Hierarchy Level [edit services analytics interfaces][edit services analytics resource-profiles]
Release Information Statement introduced in Junos OS Release 13.2 for the QFX Series.
Statement in the [edit services analytics resource-profiles] hierarchy level introduced in
Junos OS Release 13.2X51-D15.
Statement introduced in Junos OS Release 13.2X51-D25 for EX Series switches.
Description If network analytics queue statistics monitoring is enabled, specify the high and low
values (inmicroseconds) of the latency threshold of the queue. If you configure a latency
threshold, you cannot configure the depth threshold. You can configure the latency
threshold for one interface or all interfaces. Specify the high and low latency threshold
numbers:
NOTE: The configuration for a specific interface supersedes the globalconfiguration for all interfaces.
Options high number—Specify the maximum value for the latency threshold.
Range:
• Junos OS Release 13.2X51-D15 or later—1 to 100,000,000 nanoseconds (0.001 to
100,000microseconds)
• Junos OS Release 13.2X51-D10 or earlier—1 to 100,000microseconds
Default:
• Junos OS Release 13.2X51-D15 or later—1,000,000 nanoseconds (1000
microseconds or 1 millisecond)
• Junos OS Release 13.2X51-D10—1000microseconds
• Junos OS Release 13.2X50-D15—900microseconds
low number—Specify the minimum value for the latency threshold.
Range:
• Junos OS Release 13.2X51-D15 or later—1 to 100,000,000 nanoseconds
• Junos OS Release 13.2X51-D10 or earlier—1 to 100,000microseconds
Default:
• Junos OS Release 13.2X51-D15 or later—100 nanoseconds (0.1 microseconds)
237Copyright © 2016, Juniper Networks, Inc.
Chapter 14: Network Analytics

• Junos OS Release 13.2X51-D10—50microseconds
• Junos OS Release 13.2X50-D15—300microseconds
Required PrivilegeLevel
interface—To view this statement in the configuration.
interface-control—To add this statement to the configuration.
RelatedDocumentation
• Network Analytics Overview on page 89
• analytics on page 225
• depth-threshold on page 230
local (Analytics Collector)
Syntax local {file filename {size size;files number;
}}
Hierarchy Level [edit services analytics collector]
Release Information Statement introduced in Junos OS Release 13.2 for the QFX Series.
Statement introduced in Junos OS Release 13.2X51-D25 for EX Series switches.
Description Configure a local file for logging network analytics (queue and traffic) statistics.
NOTE: The local statement is not available in Junos OS Releases prior to
13.2X51-D15.
The remaining statements are explained separately.
Required PrivilegeLevel
interface—To view this statement in the configuration.
interface-control—To add this statement to the configuration.
RelatedDocumentation
• Network Analytics Overview on page 89
• collector (Analytics) on page 229
Copyright © 2016, Juniper Networks, Inc.238
Network Management and Monitoring Feature Guide for EX2300, EX3400, and EX4300 Switches

resource (Analytics)
Syntax resource {interfaces {interface-name {resource-profile profile-name;
}}system {polling-interval {queue-monitoring interval;traffic-monitoring interval;
}resource-profile profile-name;
}}
Hierarchy Level [edit services analytics]
Release Information Statement introduced in Junos OS Release 13.2 for the QFX Series.
Statement introduced in Junos OS Release 13.2X51-D25 for EX Series switches.
Description Configure network analytics resources such as resource profiles (for interfaces and
system), and polling intervals (for queue and traffic monitoring).
NOTE: The resource statement is not available in Junos OS Releases prior to
13.2X51-D15.
The remaining statements are explained separately.
Required PrivilegeLevel
interface—To view this statement in the configuration.
interface-control—To add this statement to the configuration.
RelatedDocumentation
• Network Analytics Overview on page 89
• analytics on page 225
239Copyright © 2016, Juniper Networks, Inc.
Chapter 14: Network Analytics

resource-profiles (Analytics)
Syntax resource-profiles {profile-name {depth-threshold {high number;low number;
}latency-threshold {high number;low number;
}no-queue-monitoring;no-traffic-monitoring;queue-monitoring;traffic-monitoring;
}}
Hierarchy Level [edit services analytics]
Release Information Statement introduced in Junos OS Release 13.2 for the QFX Series.
Statement introduced in Junos OS Release 13.2X51-D25 for EX Series switches.
Description Configure resource profiles that are used as templates for specifying network analytics
parameters. Youuse resourceprofiles toenableanddisablequeueand trafficmonitoring,
andspecifydepthand latency thresholdsasapplicable.Onceyouhavedefineda resource
profile, you can apply it specifically to individual interfaces, or globally to a system.
NOTE: The resource-profiles statement is not available in JunosOSReleases
prior to 13.2X51-D15.
The remaining statements are explained separately.
Options profile-name—Specify a name for the resource profile.
no-queue-monitoring—Disable queuemonitoring.
no-traffic-monitoring—Disable traffic monitoring.
queue-monitoring—Enable queuemonitoring.
traffic-monitoring—Enable traffic monitoring.
Required PrivilegeLevel
interface—To view this statement in the configuration.
interface-control—To add this statement to the configuration.
RelatedDocumentation
• Network Analytics Overview on page 89
• analytics on page 225
Copyright © 2016, Juniper Networks, Inc.240
Network Management and Monitoring Feature Guide for EX2300, EX3400, and EX4300 Switches

system (Analytics Resource)
Syntax system {polling-interval {queue-monitoring interval;traffic-monitoring interval;
}resource-profile profile-name;
}
Hierarchy Level [edit services analytics resource]
Release Information Statement introduced in Junos OS Release 13.2 for the QFX Series.
Statement introduced in Junos OS Release 13.2X51-D25 for EX Series switches.
Description Applyanetworkanalytics resourceprofile toasystemforwhich youwish toenablequeue
or traffic monitoring. The resource profile is a template that specifies the parameters for
queue and traffic monitoring, as well as for the depth and latency thresholds.
NOTE: The systemstatement in the [edit servicesanalytics resource]hierarchy
is not available in Junos OS Releases prior to 13.2X51-D15.
Options polling-interval—Configure the polling interval for queue and traffic monitoring:
queue-monitoring polling-interval—Configure the queuemonitoring interval in
milliseconds.
Range: 1 to 1000milliseconds (1 millisecond to 1 second) on devices other thanEX4300 switches.8 to 1000milliseconds (8milliseconds to 1 second) on EX4300
switches.
traffic-monitoringpolling-interval—Configure the trafficmonitoring interval in seconds.
Range: 1 to 300 seconds (1 second to 5minutes) on devices other than EX4300switches.5 to 300 seconds (5 seconds to 5minutes) on EX 4300 switches.
resource-profileprofile-name—Nameof a resource profile containing the global analytics
parameters that have been configured for the system. Information contained in a
resource profile includes the configuration of queue and trafficmonitoring (whether
enabledordisabled), andvalues for thedepthand latency thresholds (if applicable).
Required PrivilegeLevel
interface—To view this statement in the configuration.
interface-control—To add this statement to the configuration.
RelatedDocumentation
• Network Analytics Overview on page 89
• analytics on page 225
241Copyright © 2016, Juniper Networks, Inc.
Chapter 14: Network Analytics

system (Export Profiles)
Syntax system {information;status {queue;traffic;
}}
Hierarchy Level [edit services analytics export-profiles]
Release Information Statement introduced in Junos OS Release 13.2 for the QFX Series.
Statement introduced in Junos OS Release 13.2X51-D25 for EX Series switches.
Description Configure a system-wide export profile for streaming network analytics data to remote
servers. Each profile is a template that defines the type of data being streamed for that
system.
NOTE: The system statement is not available in Junos OS Releases prior to
13.2X51-D15.
Options information—Information about the system, including boot time, model, serial number,
maximum number of ports, collector information, and interface list.
status—System status information to be streamed.
Values:
• queue
• traffic
Required PrivilegeLevel
interface—To view this statement in the configuration.
interface-control—To add this statement to the configuration.
RelatedDocumentation
• Network Analytics Overview on page 89
• analytics on page 225
Copyright © 2016, Juniper Networks, Inc.242
Network Management and Monitoring Feature Guide for EX2300, EX3400, and EX4300 Switches

traceoptions (Analytics)
Syntax traceoptions {file filename;files number-of-files;size size;
}
Hierarchy Level [edit services analytics]
Release Information Statement introduced in Junos OS Release 13.2 for the QFX Series.
Statement introduced in Junos OS Release 13.2X51-D25 for EX Series switches.
Description Configure traceoptions for the network analytics daemon (analyticsd) running on the
Routing Engine.
Options file filename—Specify a filename for storing the traceoptions data. The file is stored in
the /var/log/ directory of your device.
If you do not specify a filename, the data is not stored in a file.
files number-of-files—Specify the number of files to store locally. After the number files
witsh the maximum file size is reached, the system starts over and writes the data
to the first file.
Range: 2 to 1,000 files.
size size—Configure the file size in megabytes (MB).
Syntax: xm to specify MB.
Range: 10 to 4095MB
Required PrivilegeLevel
interface—To view this statement in the configuration.
interface-control—To add this statement to the configuration.
RelatedDocumentation
• Network Analytics Overview on page 89
• analytics on page 225
243Copyright © 2016, Juniper Networks, Inc.
Chapter 14: Network Analytics

Copyright © 2016, Juniper Networks, Inc.244
Network Management and Monitoring Feature Guide for EX2300, EX3400, and EX4300 Switches

CHAPTER 15
SNMP
• address on page 248
• address-mask on page 248
• agent-address on page 249
• alarm (SNMP RMON) on page 250
• authorization on page 251
• bucket-size on page 251
• categories on page 252
• client-list on page 252
• client-list-name on page 253
• clients on page 253
• commit-delay on page 254
• community (SNMP) on page 255
• community on page 256
• community-name on page 257
• contact (SNMP) on page 258
• description on page 258
• description on page 259
• destination-port on page 259
• engine-id on page 260
• event on page 261
• falling-event-index on page 261
• falling-threshold on page 262
• falling-threshold on page 263
• falling-threshold-interval on page 264
• filter-duplicates on page 264
• filter-interfaces on page 265
• group (Configuring Group Name) on page 266
• group (Defining Access Privileges for an SNMPv3 Group) on page 267
245Copyright © 2016, Juniper Networks, Inc.

• health-monitor on page 267
• history on page 268
• interface (SNMP RMONHistory) on page 269
• interface (SNMP) on page 269
• interval on page 270
• interval on page 270
• interval on page 271
• location (SNMP) on page 271
• logical-system on page 272
• message-processing-model on page 273
• name on page 273
• nonvolatile on page 274
• notify on page 275
• notify-filter (Applying to the Management Target) on page 276
• notify-filter (Configuring the Profile Name) on page 276
• notify-view on page 277
• oid on page 277
• oid on page 278
• owner on page 278
• parameters on page 279
• port on page 279
• read-view on page 280
• request-type on page 281
• rising-event-index on page 282
• rising-threshold on page 283
• rising-threshold on page 284
• rmon on page 284
• rmon on page 285
• routing-instance on page 286
• routing-instance on page 287
• sample-type on page 287
• security-level (Defining Access Privileges) on page 288
• security-level (Generating SNMP Notifications) on page 289
• security-model (Access Privileges) on page 290
• security-model (Group) on page 291
• security-model (SNMP Notifications) on page 291
• security-name (Security Group) on page 292
Copyright © 2016, Juniper Networks, Inc.246
Network Management and Monitoring Feature Guide for EX2300, EX3400, and EX4300 Switches

• security-name (Community String) on page 293
• security-name (SNMP Notifications) on page 294
• security-to-group on page 295
• snmp on page 295
• snmp on page 296
• snmp-community on page 296
• source-address on page 297
• startup-alarm on page 298
• syslog-subtag on page 298
• tag on page 299
• tag-list on page 299
• target-address on page 300
• target-parameters on page 301
• targets on page 302
• traceoptions (SNMP) on page 303
• trap-group on page 305
• trap-options on page 306
• type on page 307
• type on page 308
• v3 on page 309
• vacm on page 311
• variable on page 312
• version (SNMP) on page 312
• view (Associating a MIB Viewwith a Community) on page 313
• view (Configuring a MIB View) on page 314
• write-view on page 315
247Copyright © 2016, Juniper Networks, Inc.
Chapter 15: SNMP

address
Syntax address address;
Hierarchy Level [edit snmp v3 target-address target-address-name]
Release Information Statement introduced before Junos OS Release 7.4.
Statement introduced in Junos OS Release 9.0 for EX Series switches.
Description Specify the SNMP target address.
Options address—IPv4 address of the system to receive traps or informs. Youmust specify an
address, not a hostname.
Required PrivilegeLevel
snmp—To view this statement in the configuration.
snmp-control—To add this statement to the configuration.
RelatedDocumentation
• Configuring the Address
address-mask
Syntax address-mask address-mask;
Hierarchy Level [edit snmp v3 target-address target-address-name]
Release Information Statement introduced before Junos OS Release 7.4.
Statement introduced in Junos OS Release 9.0 for EX Series switches.
Statement introduced in Junos OS Release 11.1 on the QFX Series.
Statement introduced in Junos OS Release 14.1X53-D20 for the OCX Series.
Description Verify the source addresses for a group of target addresses.
Options address-mask combined with the address defines a range of addresses.
Required PrivilegeLevel
snmp—To view this statement in the configuration.
snmp-control—To add this statement to the configuration.
RelatedDocumentation
• Configuring the Address Mask
Copyright © 2016, Juniper Networks, Inc.248
Network Management and Monitoring Feature Guide for EX2300, EX3400, and EX4300 Switches

agent-address
Syntax agent-address outgoing-interface;
Hierarchy Level [edit snmp trap-options]
Release Information Statement introduced before Junos OS Release 7.4.
Statement introduced in Junos OS Release 9.0 for EX Series switches.
Description Set the agent address of all SNMPv1 traps generated by this router or switch. Currently,
the only option is outgoing-interface, which sets the agent address of each SNMPv1 trap
to the address of the outgoing interface of that trap.
Options outgoing-interface—Value of the agent address of all SNMPv1 traps generated by this
routeror switch.Theoutgoing-interfaceoptionsets theagentaddressofeachSNMPv1
trap to the address of the outgoing interface of that trap.
Default: disabled (the agent address is not specified in SNMPv1 traps).
Required PrivilegeLevel
snmp—To view this statement in the configuration.
snmp-control—To add this statement to the configuration.
RelatedDocumentation
• Configuring the Agent Address for SNMP Traps
249Copyright © 2016, Juniper Networks, Inc.
Chapter 15: SNMP

alarm (SNMPRMON)
Syntax alarm index {description description;falling-event-index index;falling-threshold integer;falling-threshold-interval seconds;interval seconds;request-type (get-next-request | get-request | walk-request);rising-event-index index;rising-threshold integer;sample-type (absolute-value | delta-value);startup-alarm (falling-alarm | rising-alarm | rising-or-falling alarm);syslog-subtag syslog-subtag;variable oid-variable;
}
Hierarchy Level [edit snmp rmon]
Release Information Statement introduced before Junos OS Release 7.4.
Statement introduced in Junos OS Release 9.0 for EX Series switches.
Statement introduced in Junos OS Release 11.1 for the QFX Series.
Statement introduced in Junos OS Release 14.1X53-D20 for the OCX Series.
Description Configure RMON alarm entries.
Options index—Identifies this alarm entry as an integer.
The remaining statements are explained separately.
Required PrivilegeLevel
snmp—To view this statement in the configuration.
snmp-control—To add this statement to the configuration.
RelatedDocumentation
• Configuring an RMON Alarm Entry and Its Attributes
• event on page 261
• RMONMIB Event, Alarm, Log, and History Control Tables
• Monitoring RMONMIB Tables
• Understanding RMON
Copyright © 2016, Juniper Networks, Inc.250
Network Management and Monitoring Feature Guide for EX2300, EX3400, and EX4300 Switches

authorization
Syntax authorization authorization;
Hierarchy Level [edit snmp community community-name]
Release Information Statement introduced before Junos OS Release 7.4.
Statement introduced in Junos OS Release 9.0 for EX Series switches.
Statement introduced in Junos OS Release 11.1 for the QFX Series.
Description Set the access authorization for SNMP Get, GetBulk, GetNext, and Set requests.
Options authorization—Access authorization level:
• read-only—Enable Get, GetNext, and GetBulk requests.
• read-write—Enable all requests, including Set requests. Youmust configure a view to
enable Set requests.
Default: read-only
Required PrivilegeLevel
snmp—To view this statement in the configuration.
snmp-control—To add this statement to the configuration.
RelatedDocumentation
• Configuring SNMP Communities
bucket-size
Syntax bucket-size number;
Hierarchy Level [edit snmp rmon history]
Release Information Statement introduced in Junos OS Release 9.0 for EX Series switches.
Description Configure the sampling of Ethernet statistics for network fault diagnosis, planning, and
performance tuning.
Default 50
Options number—Number of discrete samples of Ethernet statistics requested.
Required PrivilegeLevel
snmp—To view this statement in the configuration.
snmp–control—To add this statement to the configuration.
RelatedDocumentation
• Configuring SNMP (J-Web Procedure) on page 121
• Junos OS Network Management Configuration Guide
251Copyright © 2016, Juniper Networks, Inc.
Chapter 15: SNMP

categories
Syntax categories {category;
}
Hierarchy Level [edit snmp trap-group group-name]
Release Information Statement introduced before Junos OS Release 7.4.
Statement introduced in Junos OS Release 9.0 for EX Series switches.
Description Define the types of traps that are sent to the targets of the named trap group.
Default If you omit the categories statement, all trap types are included in trap notifications.
Options category—Name of a trap type: authentication, chassis, configuration, link,
remote-operations, rmon-alarm, routing, services, sonet-alarms, startup, orvrrp-events.
Required PrivilegeLevel
snmp—To view this statement in the configuration.
snmp-control—To add this statement to the configuration.
RelatedDocumentation
• Configuring SNMP Trap Groups
client-list
Syntax client-list client-list-name {ip-addresses;
}
Hierarchy Level [edit snmp]
Release Information Statement introduced in Junos OS Release 8.5.
Statement introduced in Junos OS Release 9.0 for EX Series switches.
Statement introduced in Junos OS Release 11.1 for QFX Series switches.
Description Define a list of SNMP clients.
Options client-list-name—Name of the client list.
ip-addresses—IP addresses of the SNMP clients to be added to the client list,
Required PrivilegeLevel
snmp—To view this statement in the configuration.
snmp-control—To add this statement to the configuration.
RelatedDocumentation
• Adding a Group of Clients to an SNMP Community
Copyright © 2016, Juniper Networks, Inc.252
Network Management and Monitoring Feature Guide for EX2300, EX3400, and EX4300 Switches

client-list-name
Syntax client-list-name client-list-name;
Hierarchy Level [edit snmp community community-name]
Release Information Statement introduced in Junos OS Release 8.5.
Statement introduced in Junos OS Release 9.0 for EX Series switches.
Description Add a client list or prefix list to an SNMP community.
Options client-list-name—Name of the client list or prefix list.
Required PrivilegeLevel
snmp—To view this statement in the configuration.
snmp-control—To add this statement to the configuration.
RelatedDocumentation
• Adding a Group of Clients to an SNMP Community
clients
Syntax clients {address <restrict>;
}
Hierarchy Level [edit snmp community community-name]
Release Information Statement introduced before Junos OS Release 7.4.
Statement introduced in Junos OS Release 9.0 for EX Series switches.
Description Specify the IPv4 or IPv6 addresses of the SNMP client hosts that are authorized to use
this community.
Default If you omit the clients statement, all SNMP clients using this community string are
authorized to access the router.
Options address—Address of an SNMP client that is authorized to access this router. Youmust
specifyanaddress, notahostname.Tospecifymore thanoneclient, includemultiple
address options.
restrict—(Optional) Do not allow the specified SNMP client to access the router.
Required PrivilegeLevel
snmp—To view this statement in the configuration.
snmp-control—To add this statement to the configuration.
RelatedDocumentation
• Configuring SNMP Communities
253Copyright © 2016, Juniper Networks, Inc.
Chapter 15: SNMP

commit-delay
Syntax commit-delay seconds;
Hierarchy Level [edit snmp nonvolatile]
Release Information Statement introduced before Junos OS Release 7.4.
Statement introduced in Junos OS Release 9.0 for EX Series switches.
Description Configure the timer for the SNMP Set reply and start of the commit.
Options seconds—Delay between an affirmative SNMP Set reply and start of the commit.
Default: 5 seconds
Required PrivilegeLevel
snmp—To view this statement in the configuration.
snmp-control—To add this statement to the configuration.
RelatedDocumentation
• Configuring the Commit Delay Timer
Copyright © 2016, Juniper Networks, Inc.254
Network Management and Monitoring Feature Guide for EX2300, EX3400, and EX4300 Switches

community (SNMP)
Syntax community community-name {authorization authorization;client-list-name client-list-name;clients {address restrict;
}view view-name;
}
Hierarchy Level [edit snmp]
Release Information Statement introduced before Junos OS Release 7.4.
Statement introduced in Junos OS Release 9.0 for EX Series switches.
Description Define an SNMP community. An SNMP community authorizes SNMP clients based on
the source IP address of incoming SNMP request packets. A community also defines
which MIB objects are available and the operations (read-only or read-write) allowed
on those objects.
TheSNMPclientapplicationspecifiesanSNMPcommunityname inGet,GetBulk,GetNext,
and Set SNMP requests.
Default If you omit the community statement, all SNMP requests are denied.
Options community-name—Community string. If thename includesspaces, enclose it inquotation
marks (" ").
The remaining statements are explained separately.
Required PrivilegeLevel
snmp—To view this statement in the configuration.
snmp-control—To add this statement to the configuration.
RelatedDocumentation
• Configuring SNMP Communities
255Copyright © 2016, Juniper Networks, Inc.
Chapter 15: SNMP

community
Syntax community community-name;
Hierarchy Level [edit snmp rmon event index]
Release Information Statement introduced before Junos OS Release 7.4.
Statement introduced in Junos OS Release 9.0 for EX Series switches.
Description The trap group that is used when generating a trap (if eventType is configured to send
traps). If that trap group has the rmon-alarm trap category configured, a trap is sent to
all the targets configured for that trap group. The community string in the trapmatches
the name of the trap group (and hence, the value of eventCommunity). If nothing is
configured, traps are sent to each group with the rmon-alarm category set.
Options community-name—Identifies the trap group that is used when generating a trap if the
event is configured to send traps.
Required PrivilegeLevel
snmp—To view this statement in the configuration.
snmp-control—To add this statement to the configuration.
RelatedDocumentation
• Configuring an RMON Event Entry and Its Attributes
Copyright © 2016, Juniper Networks, Inc.256
Network Management and Monitoring Feature Guide for EX2300, EX3400, and EX4300 Switches

community-name
Syntax community-name community-name;
Hierarchy Level [edit snmp v3 snmp-community community-index]
Release Information Statement introduced before Junos OS Release 7.4.
Statement introduced in Junos OS Release 9.0 for EX Series switches.
Description The community name defines an SNMP community. The SNMP community authorizes
SNMPv1orSNMPv2clients. Theaccessprivilegesassociatedwith theconfigured security
name define which MIB objects are available and the operations (notify, read, or write)
allowed on those objects.
Options community-name—Community string for an SNMPv1 or SNMPv2c community. If
unconfigured, it is the same as the community index. If the name includes spaces,
enclose it in quotation marks (" ").
NOTE: Community namesmust be unique. You cannot configure the samecommunity name at the [edit snmp community] and [edit snmp v3
snmp-community community-index] hierarchy levels.
Thecommunitynameat the [editsnmpv3snmp-communitycommunity-index]
hierarchy level is encrypted and not displayed in the command-line interface(CLI).
Required PrivilegeLevel
snmp—To view this statement in the configuration.
snmp-control—To add this statement to the configuration.
RelatedDocumentation
• Configuring the SNMPv3 Community
257Copyright © 2016, Juniper Networks, Inc.
Chapter 15: SNMP

contact (SNMP)
Syntax contact contact;
Hierarchy Level [edit snmp]
Release Information Statement introduced before Junos OS Release 7.4.
Statement introduced in Junos OS Release 9.0 for EX Series switches.
Description Define the value of the MIB II sysContact object, which is the contact person for the
managed system.
Options contact—Nameof thecontactperson. If thename includesspaces, enclose it inquotation
marks (" ").
Required PrivilegeLevel
snmp—To view this statement in the configuration.
snmp-control—To add this statement to the configuration.
RelatedDocumentation
• Configuring the System Contact on a Device Running Junos OS
description
Syntax description description;
Hierarchy Level [edit snmp]
Release Information Statement introduced before Junos OS Release 7.4.
Statement introduced in Junos OS Release 9.0 for EX Series switches.
Statement introduced in Junos OS Release 11.1 for the QFX Series.
Description Define the value of theMIB II sysDescriptionobject,which is the description of the system
being managed.
Options description—System description. If the name includes spaces, enclose it in quotation
marks (" ").
Required PrivilegeLevel
snmp—To view this statement in the configuration.
snmp-control—To add this statement to the configuration.
RelatedDocumentation
• Configuring the System Description on a Device Running Junos OS
Copyright © 2016, Juniper Networks, Inc.258
Network Management and Monitoring Feature Guide for EX2300, EX3400, and EX4300 Switches

description
Syntax description description;
Hierarchy Level [edit snmp rmon alarm index],[edit snmp rmon event index]
Release Information Statement introduced before Junos OS Release 7.4.
Statement introduced in Junos OS Release 9.0 for EX Series switches.
Description Text description of alarm or event.
Options description—Textdescriptionof analarmor event entry. If thedescription includes spaces,
enclose it in quotation marks (" ").
Required PrivilegeLevel
snmp—To view this statement in the configuration.
snmp-control—To add this statement to the configuration.
RelatedDocumentation
• Configuring the Description
• Configuring an RMON Event Entry and Its Attributes
destination-port
Syntax destination-port port-number;
Hierarchy Level [edit snmp trap-group]
Release Information Statement introduced before Junos OS Release 7.4.
Statement introduced in Junos OS Release 9.0 for EX Series switches.
Description Assign a trap port number other than the default.
Default If you omit this statement, the default port is 162.
Options port-number—SNMP trap port number.
Required PrivilegeLevel
snmp—To view this statement in the configuration.
snmp-control—To add this statement to the configuration.
RelatedDocumentation
• Configuring SNMP Trap Groups
259Copyright © 2016, Juniper Networks, Inc.
Chapter 15: SNMP

engine-id
Syntax engine-id {(local engine-id-suffix | use-default-ip-address | use-mac-address);
}
Hierarchy Level [edit snmp]
Release Information Statement introduced before Junos OS Release 7.4.
Statement introduced in Junos OS Release 9.1 for EX Series switches.
Description The local engine ID is defined as the administratively unique identifier of an SNMPv3
engine, and is used for identification, not for addressing. There are two parts of an engine
ID: prefix and suffix. The prefix is formatted according to the specifications defined in
RFC 3411, An Architecture for Describing Simple Network Management Protocol (SNMP)
Management Frameworks. You can configure the suffix here.
NOTE: SNMPv3 authentication and encryption keys are generated based onthe associated passwords and the engine ID. If you configure or change theengine ID, youmust commit the newengine ID before you configure SNMPv3users. Otherwise the keys generated from the configured passwords arebased on the previous engine ID.
For theengine ID,we recommendusing theMACaddressof themanagementport.
Options local engine-id-suffix—Explicit setting for the engine ID suffix.
use-default-ip-address—The engine ID suffix is generated from the default IP address.
use-mac-address—The SNMP engine identifier is generated from the MAC address of
the management interface on the router.
Default: use-default-ip-address
Required PrivilegeLevel
snmp—To view this statement in the configuration.
snmp-control—To add this statement to the configuration.
RelatedDocumentation
• Configuring the Local Engine ID on page 124
Copyright © 2016, Juniper Networks, Inc.260
Network Management and Monitoring Feature Guide for EX2300, EX3400, and EX4300 Switches

event
Syntax event index {community community-name;description description;type type;
}
Hierarchy Level [edit snmp rmon]
Release Information Statement introduced before Junos OS Release 7.4.
Statement introduced in Junos OS Release 9.0 for EX Series switches.
Description Configure RMON event entries.
Options index—Identifier for a specific event entry.
The remaining statements are explained separately.
Required PrivilegeLevel
snmp—To view this statement in the configuration.
snmp-control—To add this statement to the configuration.
RelatedDocumentation
• Configuring an RMON Event Entry and Its Attributes
• alarm (SNMPRMON) on page 250
falling-event-index
Syntax falling-event-index index;
Hierarchy Level [edit snmp rmon alarm index]
Release Information Statement introduced before Junos OS Release 7.4.
Statement introduced in Junos OS Release 9.0 for EX Series switches.
Description The index of the event entry that is used when a falling threshold is crossed. If this value
is zero, no event is triggered.
Options index—Index of the event entry that is used when a falling threshold is crossed.
Range: 0 through 65,535
Default: 0
Required PrivilegeLevel
snmp—To view this statement in the configuration.
snmp-control—To add this statement to the configuration.
RelatedDocumentation
• Configuring the Falling Event Index or Rising Event Index
• rising-event-index on page 282
261Copyright © 2016, Juniper Networks, Inc.
Chapter 15: SNMP

falling-threshold
Syntax falling-threshold percentage;
Hierarchy Level [edit snmp ]
Release Information Statement introduced in Junos OS Release 8.0.
Statement introduced in Junos OS Release 9.0 for EX Series switches.
Description The lower threshold is expressed as a percentage of themaximumpossible value for the
sampled variable.When the current sampled value is less than or equal to this threshold,
and the value at the last sampling interval is greater than this threshold, a single event
is generated. A single event is also generated if the first sample after this entry becomes
valid is less than or equal to this threshold. After a falling event is generated, another
falling event cannot be generated until the sampled value rises above this threshold and
reaches the rising-threshold.
Options percentage—The lower threshold for the alarm entry.
Range: 1 through 100
Default: 70 percent of the maximum possible value
Required PrivilegeLevel
snmp—To view this statement in the configuration.
snmp-control—To add this statement to the configuration.
RelatedDocumentation
• Configuring the Falling Threshold or Rising Threshold
• rising-threshold on page 283
Copyright © 2016, Juniper Networks, Inc.262
Network Management and Monitoring Feature Guide for EX2300, EX3400, and EX4300 Switches

falling-threshold
Syntax falling-threshold integer;
Hierarchy Level [edit snmp rmon alarm index]
Release Information Statement introduced before Junos OS Release 7.4.
Statement introduced in Junos OS Release 9.0 for EX Series switches.
Description The lower threshold for the sampled variable. When the current sampled value is less
than or equal to this threshold, and the value at the last sampling interval is greater than
this threshold, a single event is generated. A single event is also generated if the first
sample after this entry becomes valid is less than or equal to this threshold, and the
associated startup-alarm value is equal to falling-alarm value or rising-or-falling-alarm
value. After a falling event is generated, another falling event cannot be generated until
the sampled value rises above this threshold and reaches the rising-threshold.
Options integer—The lower threshold for the alarm entry.
Range: -2,147,483,648 through 2,147,483,647
Default: 20 percent less than rising-threshold
Required PrivilegeLevel
snmp—To view this statement in the configuration.
snmp-control—To add this statement to the configuration.
RelatedDocumentation
• Configuring the Falling Threshold or Rising Threshold
• rising-threshold on page 284
263Copyright © 2016, Juniper Networks, Inc.
Chapter 15: SNMP

falling-threshold-interval
Syntax falling-threshold-interval seconds;
Hierarchy Level [edit snmp rmon alarm index]
Release Information Statement introduced in Junos OS Release 8.3.
Statement introduced in Junos OS Release 9.0 for EX Series switches.
Description Interval between samples when the rising threshold is crossed. Once the alarm crosses
the falling threshold, the regular sampling interval is used.
Options seconds—Time between samples, in seconds.
Range: 1 through 2,147,483,647 seconds
Default: 60 seconds
Required PrivilegeLevel
snmp—To view this statement in the configuration.
snmp-control—To add this statement to the configuration.
RelatedDocumentation
• Configuring the Falling Threshold Interval
• interval on page 271
filter-duplicates
Syntax filter-duplicates;
Hierarchy Level [edit snmp]
Release Information Statement introduced before Junos OS Release 7.4.
Statement introduced in Junos OS Release 9.0 for EX Series switches.
Description Filter duplicate Get, GetNext, or GetBulk SNMP requests.
Required PrivilegeLevel
snmp—To view this statement in the configuration.
snmp-control—To add this statement to the configuration.
RelatedDocumentation
• Filtering Duplicate SNMP Requests
Copyright © 2016, Juniper Networks, Inc.264
Network Management and Monitoring Feature Guide for EX2300, EX3400, and EX4300 Switches

filter-interfaces
Syntax filter-interfaces {interfaces {all-internal-interfaces;interface 1;interface 2;
}}
Hierarchy Level [edit snmp]
Release Information Statement introduced in Junos OS Release 9.4 for EX Series Switches.
Description Filter out information related to specific interfaces from the output of SNMP Get and
GetNext requests performed on interface-related MIBs.
Options all-internal-interfaces—Filters out information from SNMP Get and GetNext requests for
the specified interfaces.
interfaces—Specifies the interfaces to filter out fromtheoutputofSNMPGetandGetNext
requests.
Required PrivilegeLevel
snmp—To view this statement in the configuration.
snmp-control—To add this statement to the configuration.
RelatedDocumentation
• Filtering Interface Information Out of SNMP Get and GetNext Output
265Copyright © 2016, Juniper Networks, Inc.
Chapter 15: SNMP

group (Configuring Group Name)
Syntax group group-name {(default-context-prefix | context-prefix context-prefiix){security-model (any | usm | v1 | v2c) {security-level (authentication | none | privacy) {notify-view view-name;read-view view-name;write-view view-name;
}}
}}
Hierarchy Level [edit snmp v3 vacm access]
Release Information Statement introduced before Junos OS Release 7.4.
Statement introduced in Junos OS Release 9.0 for EX Series switches.
Statement introduced in Junos OS Release 11.1 for the QFX Series.
Statement introduced in Junos OS Release 14.1X53-D20 for the OCX Series.
Description Assign the security name to a group, and specify the SNMPv3 context applicable to the
group. The default-context-prefix statement, when included, adds all the contexts
configuredon thedevice to thegroup,whereas the context-prefixcontext-prefix statement
enables you to specify a context and to add that particular context to the group.
(Not applicable to the QFX Series and OCX Series.) When the context prefix is specified
as default (for example, context-prefix default), the context associated with the master
routing instance is added to the group. To specify a routing instance that is part of a
logical system, specify it as logical system/routing instance. For example, to specify routing
instance ri1 in logical system ls1, include context-prefix ls1/ri1.
The remaining statements under this hierarchy are explained separately.
Options group-name—SNMPv3 group name created for the SNMPv3 group.
Required PrivilegeLevel
snmp—To view this statement in the configuration.
snmp-control—To add this statement to the configuration.
RelatedDocumentation
• Configuring the Group
Copyright © 2016, Juniper Networks, Inc.266
Network Management and Monitoring Feature Guide for EX2300, EX3400, and EX4300 Switches

group (Defining Access Privileges for an SNMPv3 Group)
Syntax group group-name;
Hierarchy Level [edit snmp v3 vacm security-to-group security-model (usm | v1 | v2c)security-name security-name]
Release Information Statement introduced before Junos OS Release 7.4.
Statement introduced in Junos OS Release 9.0 for EX Series switches.
Statement introduced in Junos OS Release 11.1 for the QFX Series.
Statement introduced in Junos OS Release 14.1X53-D20 for the OCX Series.
Description Define access privileges granted to a group.
Options group-name—Identifies a collection of SNMP security names that belong to the same
access policy SNMP.
Required PrivilegeLevel
snmp—To view this statement in the configuration.
snmp-control—To add this statement to the configuration.
RelatedDocumentation
• Configuring the Group
health-monitor
Syntax health-monitor {falling-threshold percentage;interval seconds;rising-threshold percentage;
}
Hierarchy Level [edit snmp]
Release Information Statement introduced in Junos OS Release 8.0.
Statement introduced in Junos OS Release 9.0 for EX Series switches.
Description Configure health monitoring.
The remaining statements are explained separately.
Required PrivilegeLevel
snmp—To view this statement in the configuration.
snmp-control—To add this statement to the configuration.
RelatedDocumentation
• Configuring Health Monitoring on Devices Running Junos OS
267Copyright © 2016, Juniper Networks, Inc.
Chapter 15: SNMP
history
Syntax history history-index {bucket-size number;interface (SNMPRMONHistory) interface-name;interval seconds;owner owner-name;
}
Hierarchy Level [edit snmp rmon]
Release Information Statement introduced in Junos OS Release 9.0 for EX Series switches.
Description Configure RMON history group entries. This RMON feature can be used with the Simple
Network Management Protocol (SNMP) agent in the switch to monitor all the traffic
flowing among switches on all connected LAN segments. It collects statistics in
accordance with user-configurable parameters.
The history group controls the periodic statistical sampling of data from various types
of networks. This group contains configuration entries that specify an interface, polling
period, and other parameters. The interface (SNMPRMONHistory) interface-name
statement is mandatory. Other statements in the history group are optional.
Default Not configured.
Options history-index—Identifies this history entry as an integer.
Range: 1 through 655535
Required PrivilegeLevel
snmp—To view this statement in the configuration.
snmp–control—To add this statement to the configuration.
RelatedDocumentation
• Configuring SNMP (J-Web Procedure) on page 121
• Junos OS Network Management Configuration Guide
Copyright © 2016, Juniper Networks, Inc.268
Network Management and Monitoring Feature Guide for EX2300, EX3400, and EX4300 Switches

interface (SNMPRMONHistory)
Syntax interface interface-name;
Hierarchy Level [edit snmp rmon history history-index]
Release Information Statement introduced in Junos OS Release 9.0 for EX Series switches.
Description Specify the interface to bemonitored in the specified RMON history entry.
Only one interface can be specified for a particular RMON history index. There is a
one-to-one relationship between the interface and the history index. The interfacemust
be specified in order for the RMON history to be created.
Options interface-name—Specify the interface to bemonitored within the specified entry of the
RMON history of Ethernet statistics.
Required PrivilegeLevel
snmp—To view this statement in the configuration.
snmp–control—To add this statement to the configuration.
RelatedDocumentation
• Configuring SNMP (J-Web Procedure) on page 121
• Junos OS Network Management Configuration Guide
interface (SNMP)
Syntax interface [ interface-names ];
Hierarchy Level [edit snmp]
Release Information Statement introduced before Junos OS Release 7.4.
Statement introduced in Junos OS Release 9.0 for EX Series switches.
Statement introduced in Junos OS Release 11.1 for the QFX Series.
Statement introduced in Junos OS Release 14.1X53-D20 for the OCX Series.
Description Configure the interfaces on which SNMP requests can be accepted.
Default If you omit this statement, SNMP requests entering the router or switch through any
interface are accepted.
Options interface-names—Names of one or more logical interfaces.
Required PrivilegeLevel
snmp—To view this statement in the configuration.
snmp-control—To add this statement to the configuration.
RelatedDocumentation
• Configuring the Interfaces onWhich SNMP Requests Can Be Accepted
269Copyright © 2016, Juniper Networks, Inc.
Chapter 15: SNMP

interval
Syntax interval seconds;
Hierarchy Level [edit snmp rmon history]
Release Information Statement introduced in Junos OS Release 9.0 for EX Series switches.
Description Configure the interval over which data is to be sampled for the specified interface.
Default 1800 sec
Options seconds—Interval at which data is to be sampled for the specified interface.
Required PrivilegeLevel
snmp—To view this statement in the configuration.
snmp–control—To add this statement to the configuration.
interval
Syntax interval seconds;
Hierarchy Level [edit snmp health-monitor]
Release Information Statement introduced in Junos OS Release 8.0.
Statement introduced in Junos OS Release 9.0 for EX Series switches.
Description Interval between samples.
Options seconds—Time between samples, in seconds.
Range: 1 through 2147483647 seconds
Default: 300 seconds
Required PrivilegeLevel
snmp—To view this statement in the configuration.
snmp-control—To add this statement to the configuration.
RelatedDocumentation
• Configuring the Interval
Copyright © 2016, Juniper Networks, Inc.270
Network Management and Monitoring Feature Guide for EX2300, EX3400, and EX4300 Switches

interval
Syntax interval seconds;
Hierarchy Level [edit snmp rmon alarm index]
Release Information Statement introduced before Junos OS Release 7.4.
Statement introduced in Junos OS Release 9.0 for EX Series switches.
Description Interval between samples.
Options seconds—Time between samples, in seconds.
Range: 1 through 2,147,483,647 seconds
Default: 60 seconds
Required PrivilegeLevel
snmp—To view this statement in the configuration.
snmp-control—To add this statement to the configuration.
RelatedDocumentation
• Configuring the Interval
location (SNMP)
Syntax location location;
Hierarchy Level [edit snmp]
Release Information Statement introduced before Junos OS Release 7.4.
Statement introduced in Junos OS Release 9.0 for EX Series switches.
Description Define the value of the MIB II sysLocation object, which is the physical location of the
managed system.
Options location—Location of the local system. Youmust enclose the namewithin quotation
marks (" ").
Required PrivilegeLevel
snmp—To view this statement in the configuration.
snmp-control—To add this statement to the configuration.
RelatedDocumentation
• Configuring the System Location for a Device Running Junos OS
271Copyright © 2016, Juniper Networks, Inc.
Chapter 15: SNMP

logical-system
Syntax logical-system logical-system-name {routing-instance routing-instance-name;source-address address;
}
Hierarchy Level [edit snmp community community-name],[edit snmp trap-group],[edit snmp trap-options][edit snmp v3target-address target-address-name]
Release Information Statement introduced in Junos OS Release 9.3
Statement introduced in Junos OS Release 9.0 for EX Series switches.
Statement introduced in Junos OS Release 11.1 for the QFX Series.
NOTE: The logical-system statement replaces the logical-router statement,
and is backward-compatible with Junos OS Release 8.3 and later.
Description Specify a logical system name for SNMP v1 and v2c clients.
Includeat the [editsnmptrap-options]hierarchy level to specifya logical-systemaddress
as the source address of an SNMP trap.
Include at the [edit snmp v3 target-address] hierarchy level to specify a logical-system
name as the destination address for an SNMPv3 trap or inform.
Options logical-system-name–Name of the logical system.
routing-instance routing-instance-name–Statement tospecifya routing instanceassociated
with the logical system.
Required PrivilegeLevel
snmp—To view this statement in the configuration.
snmp-control—To add this statement to the configuration.
RelatedDocumentation
• Specifying a Routing Instance in an SNMPv1 or SNMPv2c Community
• Configuring the Trap Target Address
Copyright © 2016, Juniper Networks, Inc.272
Network Management and Monitoring Feature Guide for EX2300, EX3400, and EX4300 Switches

message-processing-model
Syntax message-processing-model (v1 | v2c | v3);
Hierarchy Level [edit snmp v3 target-parameters target-parameter-name parameters]
Release Information Statement introduced before Junos OS Release 7.4.
Statement introduced in Junos OS Release 9.0 for EX Series switches.
Statement introduced in Junos OS Release 11.1 for the QFX Series.
Description Configure themessageprocessingmodel tobeusedwhengeneratingSNMPnotifications.
Options v1—SNMPv1 message process model.
v2c—SNMPv2cmessage process model.
v3—SNMPv3message process model.
Required PrivilegeLevel
snmp—To view this statement in the configuration.
snmp-control—To add this statement to the configuration.
RelatedDocumentation
• Configuring the Message Processing Model
name
Syntax name name;
Hierarchy Level [edit snmp]
Release Information Statement introduced before Junos OS Release 7.4.
Statement introduced in Junos OS Release 9.0 for EX Series switches.
Description Set the system name from the command-line interface.
Options name—System name override.
Required PrivilegeLevel
snmp—To view this statement in the configuration.
snmp-control—To add this statement to the configuration.
RelatedDocumentation
• Configuring a Different System Name
273Copyright © 2016, Juniper Networks, Inc.
Chapter 15: SNMP

nonvolatile
Syntax nonvolatile {commit-delay seconds;
}
Hierarchy Level [edit snmp]
Release Information Statement introduced before Junos OS Release 7.4.
The commit-delay statement introduced in Junos OS Release 9.0 for EX Series switches.
Description Configure options for SNMP Set requests.
The statement is explained separately.
Required PrivilegeLevel
snmp—To view this statement in the configuration.
snmp-control—To add this statement to the configuration.
RelatedDocumentation
• Configuring the Commit Delay Timer
• commit-delay on page 254
Copyright © 2016, Juniper Networks, Inc.274
Network Management and Monitoring Feature Guide for EX2300, EX3400, and EX4300 Switches

notify
Syntax notify name {tag tag-name;type (trap | inform);
}
Hierarchy Level [edit snmp v3]
Release Information Statement introduced before Junos OS Release 7.4.
type inform option added in Junos OS Release 7.4.
Statement introduced in Junos OS Release 9.0 for EX Series switches.
Statement introduced in Junos OS Release 11.1 for the QFX Series.
Statement introduced in Junos OS Release 14.1X53-D20 for the OCX Series.
Description Selectmanagement targets for SNMPv3notifications aswell as the typeof notifications.
Notifications can be either traps or informs.
Options name—Name assigned to the notification.
tag-name—Notifications are sent to all targets configured with this tag.
type—Notification type is trap or inform. Traps are unconfirmed notifications. Informs are
confirmed notifications.
Required PrivilegeLevel
snmp—To view this statement in the configuration.
snmp-control—To add this statement to the configuration.
RelatedDocumentation
• Configuring the Inform Notification Type and Target Address
• Configuring the SNMPv3 Trap Notification
275Copyright © 2016, Juniper Networks, Inc.
Chapter 15: SNMP

notify-filter (Applying to theManagement Target)
Syntax notify-filter profile-name;
Hierarchy Level [edit snmp v3 target-parameters target-parameters-name]
Release Information Statement introduced before Junos OS Release 7.4.
Statement introduced in Junos OS Release 9.0 for EX Series switches.
Statement introduced in Junos OS Release 11.1 for the QFX Series.
Statement introduced in Junos OS Release 14.1X53-D20 for the OCX Series.
Description Specify the notify filter to be used by a specific set of target parameters.
Options profile-name—Name of the notify filter to apply to notifications.
Required PrivilegeLevel
snmp—To view this statement in the configuration.
snmp-control—To add this statement to the configuration.
RelatedDocumentation
• Applying the Trap Notification Filter
notify-filter (Configuring the Profile Name)
Syntax notify-filter profile-name {oid oid (include | exclude);
}
Hierarchy Level [edit snmp v3]
Release Information Statement introduced before Junos OS Release 7.4.
Statement introduced in Junos OS Release 9.0 for EX Series switches.
Statement introduced in Junos OS Release 11.1 for the QFX Series.
Statement introduced in Junos OS Release 14.1X53-D20 for the OCX Series.
Description Specify a group of MIB objects for which you define access. The notify filter limits the
type of traps or informs sent to the network management system.
Options profile-name—Name assigned to the notify filter.
The remaining statement is explained separately.
Required PrivilegeLevel
snmp—To view this statement in the configuration.
snmp-control—To add this statement to the configuration.
RelatedDocumentation
• Configuring the Trap Notification Filter
• oid on page 277
Copyright © 2016, Juniper Networks, Inc.276
Network Management and Monitoring Feature Guide for EX2300, EX3400, and EX4300 Switches

notify-view
Syntax notify-view view-name;
Hierarchy Level [edit snmp v3 vacm access group group-name (default-context-prefix | context-prefixcontext-prefix) security-model (any | usm | v1 | v2c) security-level (authentication | none |privacy)]
Release Information Statement introduced before Junos OS Release 7.4.
Statement introduced in Junos OS Release 9.0 for EX Series switches.
Statement introduced in Junos OS Release 11.1 for the QFX Series.
Statement introduced in Junos OS Release 14.1X53-D20 for the OCX Series.
Description Associate the notify viewwith a community (for SNMPv1 or SNMPv2c clients) or a group
name (for SNMPv3 clients).
Options view-name—Name of the view to which the SNMP user group has access.
Required PrivilegeLevel
snmp—To view this statement in the configuration.
snmp-control—To add this statement to the configuration.
RelatedDocumentation
• Configuring MIB Views
• Configuring the Notify View
oid
Syntax oid oid (include | exclude);
Hierarchy Level [edit snmp v3 notify-filter profile-name]
Release Information Statement introduced before Junos OS Release 7.4.
Statement introduced in Junos OS Release 9.0 for EX Series switches.
Description Specify an object identifier (OID) used to represent a subtree of MIB objects. This OID is
a prefix that the represented MIB objects have in common.
Options exclude—Exclude the subtree of MIB objects represented by the specified OID.
include—Include the subtree of MIB objects represented by the specified OID.
oid—Object identifier used to represent a subtree of MIB objects. All MIB objects
represented by this statement have the specified OID as a prefix. You can specify
the OID using either a sequence of dotted integers or a subtree name.
Required PrivilegeLevel
snmp—To view this statement in the configuration.
snmp-control—To add this statement to the configuration.
RelatedDocumentation
• Configuring the Trap Notification Filter
277Copyright © 2016, Juniper Networks, Inc.
Chapter 15: SNMP

oid
Syntax oid object-identifier (exclude | include);
Hierarchy Level [edit snmp view view-name]
Release Information Statement introduced before Junos OS Release 7.4.
Statement introduced in Junos OS Release 9.0 for EX Series switches.
Description Specify an object identifier (OID) used to represent a subtree of MIB objects.
Options exclude—Exclude the subtree of MIB objects represented by the specified OID.
include—Include the subtree of MIB objects represented by the specified OID.
object-identifier—OID used to represent a subtree of MIB objects. All MIB objects
represented by this statement have the specified OID as a prefix. You can specify
the OID using either a sequence of dotted integers or a subtree name.
Required PrivilegeLevel
snmp—To view this statement in the configuration.
snmp-control—To add this statement to the configuration.
RelatedDocumentation
• Configuring MIB Views
owner
Syntax owner owner-name;
Hierarchy Level [edit snmp rmon history]
Release Information Statement introduced in Junos OS Release 9.0 for EX Series switches.
Description Specify the user or group responsible for this configuration.
Options owner-name—The user or group responsible for this configuration.
Range: 0 through 32 alphanumeric characters
Required PrivilegeLevel
snmp—To view this statement in the configuration.
snmp–control—To add this statement to the configuration.
RelatedDocumentation
• Configuring SNMP (J-Web Procedure) on page 121
• Junos OS Network Management Configuration Guide
Copyright © 2016, Juniper Networks, Inc.278
Network Management and Monitoring Feature Guide for EX2300, EX3400, and EX4300 Switches

parameters
Syntax parameters {message-processing-model (v1 | v2c | v3);security-level (none | authentication | privacy);security-model (usm | v1 | v2c);security-name security-name;
}
Hierarchy Level [edit snmp v3 target-parameters target-parameters-name]
Release Information Statement introduced before Junos OS Release 7.4.
Statement introduced in Junos OS Release 9.0 for EX Series switches.
Statement introduced in Junos OS Release 11.1 for the QFX Series.
Description Configure a set of target parameters for message processing and security.
The remaining statements are explained separately.
Required PrivilegeLevel
snmp—To view this statement in the configuration.
snmp-control—To add this statement to the configuration.
RelatedDocumentation
• Defining and Configuring the Trap Target Parameters
port
Syntax port port-number;
Hierarchy Level [edit snmp v3 target-address target-address-name]
Release Information Statement introduced before Junos OS Release 7.4.
Statement introduced in Junos OS Release 9.0 for EX Series switches.
Statement introduced in Junos OS Release 11.1 for the QFX Series.
Description Configure a UDP port number for an SNMP target.
Default If you omit this statement, the default port is 162.
Options port-number—Port number for the SNMP target.
Required PrivilegeLevel
snmp—To view this statement in the configuration.
snmp-control—To add this statement to the configuration.
RelatedDocumentation
• Configuring the Port
279Copyright © 2016, Juniper Networks, Inc.
Chapter 15: SNMP

read-view
Syntax read-view view-name;
Hierarchy Level [edit snmp v3 vacm access group group-name (default-context-prefix | context-prefixcontext-prefix) security-model (any | usm | v1 | v2c) security-level (authentication | none |privacy)]
Release Information Statement introduced before Junos OS Release 7.4.
Statement introduced in Junos OS Release 9.0 for EX Series switches.
Statement introduced in Junos OS Release 11.1 for the QFX Series.
Description Associate the read-only view with a community (for SNMPv1 or SNMPv2c clients) or a
group name (for SNMPv3 clients).
Options view-name—The name of the view to which the SNMP user group has access.
Required PrivilegeLevel
snmp—To view this statement in the configuration.
snmp-control—To add this statement to the configuration.
RelatedDocumentation
• Configuring the Read View
• Configuring MIB Views
Copyright © 2016, Juniper Networks, Inc.280
Network Management and Monitoring Feature Guide for EX2300, EX3400, and EX4300 Switches

request-type
Syntax request-type (get-next-request | get-request | walk-request);
Hierarchy Level [edit snmp rmon alarm index]
Release Information Statement introduced in Junos OS Release 8.3.
Statement introduced in Junos OS Release 9.0 for EX Series switches.
Description Extendmonitoring toaspecificSNMPobject instance (get-request), or extendmonitoring
to all object instances belonging to a MIB branch (walk-request), or extendmonitoring
to the next object instance after the instance specified in the configuration
(get-next-request).
Options get-next-request—Performs an SNMP get next request.
get-request—Performs an SNMP get request.
walk-request—Performs an SNMPwalk request.
Default: walk-request
Required PrivilegeLevel
snmp—To view this statement in the configuration.
snmp-control—To add this statement to the configuration.
RelatedDocumentation
• Configuring the Request Type
• variable on page 312
281Copyright © 2016, Juniper Networks, Inc.
Chapter 15: SNMP

rising-event-index
Syntax rising-event-index index;
Hierarchy Level [edit snmp rmon alarm index]
Release Information Statement introduced before Junos OS Release 7.4.
Statement introduced in Junos OS Release 9.0 for EX Series switches.
Description Index of the event entry that is used when a rising threshold is crossed. If this value is
zero, no event is triggered.
Options index—Index of the event entry that is used when a rising threshold is crossed.
Range: 0 through 65,535
Default: 0
Required PrivilegeLevel
snmp—To view this statement in the configuration.
snmp-control—To add this statement to the configuration.
RelatedDocumentation
• Configuring the Falling Event Index or Rising Event Index
• falling-event-index on page 261
Copyright © 2016, Juniper Networks, Inc.282
Network Management and Monitoring Feature Guide for EX2300, EX3400, and EX4300 Switches

rising-threshold
Syntax rising-threshold percentage;
Hierarchy Level [edit snmp ]
Release Information Statement introduced in Junos OS Release 8.0.
Statement introduced in Junos OS Release 9.0 for EX Series switches.
Description The upper threshold is expressed as a percentage of the maximum possible value for
the sampled variable. When the current sampled value is greater than or equal to this
threshold, and the value at the last sampling interval is less than this threshold, a single
event is generated. A single event is also generated if the first sample after this entry
becomes valid is greater than or equal to this threshold. After a rising event is generated,
another risingeventcannotbegenerateduntil thesampledvalue fallsbelowthis threshold
and reaches the falling-threshold.
Options percentage—The lower threshold for the alarm entry.
Range: 1 through 100
Default: 80 percent of the maximum possible value
Required PrivilegeLevel
snmp—To view this statement in the configuration.
snmp-control—To add this statement to the configuration.
RelatedDocumentation
• falling-threshold on page 262
• Configuring the Falling Threshold or Rising Threshold
283Copyright © 2016, Juniper Networks, Inc.
Chapter 15: SNMP

rising-threshold
Syntax rising-threshold integer;
Hierarchy Level [edit snmp rmon alarm index]
Release Information Statement introduced before Junos OS Release 7.4.
Statement introduced in Junos OS Release 9.0 for EX Series switches.
Description Upper threshold for the sampled variable. When the current sampled value is greater
than or equal to this threshold, and the value at the last sampling interval is less than
this threshold, a single event is generated. A single event is also generated if the first
sample after this entry becomes valid is greater than or equal to this threshold, and the
associated startup alarmvalue is equal to the falling alarmor rising or falling alarmvalue.
After a rising event is generated, another rising event cannot be generated until the
sampled value falls below this threshold and reaches the falling threshold.
Options integer—The lower threshold for the alarm entry.
Range: –2,147,483,648 through 2,147,483,647
Required PrivilegeLevel
snmp—To view this statement in the configuration.
snmp-control—To add this statement to the configuration.
RelatedDocumentation
• Configuring the Falling Threshold or Rising Threshold
• falling-threshold on page 263
rmon
Syntax rmon { ... }
Hierarchy Level [edit snmp]
Release Information Statement introduced before Junos OS Release 7.4.
Statement introduced in Junos OS Release 9.0 for EX Series switches.
Description Configure Remote Monitoring.
Required PrivilegeLevel
snmp—To view this statement in the configuration.
snmp-control—To add this statement to the configuration.
RelatedDocumentation
• Configuring an RMON Alarm Entry and Its Attributes
Copyright © 2016, Juniper Networks, Inc.284
Network Management and Monitoring Feature Guide for EX2300, EX3400, and EX4300 Switches

rmon
Syntax rmon {history history-index {interface (SNMPRMONHistory) interface-name;bucket-size number;interval seconds;owner owner-name;
}}
Hierarchy Level [edit snmp]
Release Information Statement introduced in Junos OS Release 9.0 for EX Series switches.
Description RMON is an existing feature of Junos OS.
The RMON specification provides network administrators with comprehensive network
fault diagnosis, planning, andperformance tuning information. It delivers this information
in nine groups of monitoring elements, each providing specific sets of data to meet
common network monitoring requirements. Each group is optional, so that vendors do
not need to support all the groups within the MIB.
Junos OS supports RMON Statistics, History, Alarm, and Event groups. The EX Series
documentation describes only the rmon history statement, which was added with this
release.
The statements are explained separately.
Default Disabled.
Required PrivilegeLevel
snmp—To view this statement in the configuration.
snmp–control—To add this statement to the configuration.
RelatedDocumentation
• Configuring SNMP (J-Web Procedure) on page 121
• Junos OS Network Management Configuration Guide
285Copyright © 2016, Juniper Networks, Inc.
Chapter 15: SNMP

routing-instance
Syntax routing-instance routing-instance-name;
Hierarchy Level [edit snmp community community-name],[edit snmp community community-name logical-system logical-system-name],[edit snmp trap-group group]
Release Information Statement introduced in Junos OS Release 8.3.
Added to the [edit snmp community community-name] hierarchy level in Junos OS
Release 8.4.
Added to the [editsnmpcommunitycommunity-name logical-system logical-system-name]
hierarchy level in Junos OS Release 9.1.
Statement introduced in Junos OS Release 9.1 for EX Series switches.
Description Specify a routing instance for SNMPv1 and SNMPv2 trap targets. All targets configured
in the trap group use this routing instance.
If the routing instance is defined within a logical system, include the logical-system
logical-system-name statementat the [editsnmpcommunitycommunity-name]hierarchy
level and specify the routing-instance statement under the [edit snmp community
community-name logical-system logical system-name] hierarchy level.
Options routing-instance-name—Name of the routing instance.
Required PrivilegeLevel
snmp—To view this statement in the configuration.
snmp-control—To add this statement to the configuration.
RelatedDocumentation
• Configuring SNMP Trap Groups
• Configuring the Source Address for SNMP Traps
• Specifying a Routing Instance in an SNMPv1 or SNMPv2c Community
Copyright © 2016, Juniper Networks, Inc.286
Network Management and Monitoring Feature Guide for EX2300, EX3400, and EX4300 Switches

routing-instance
Syntax routing-instance routing-instance-name;
Hierarchy Level [edit snmp v3 target-address target-address-name]
Release Information Statement introduced in Junos OS Release 8.3.
Statement introduced in Junos OS Release 9.0 for EX Series switches.
Description Specify a routing instance for an SNMPv3 trap target.
Options routing-instance-name—Name of the routing instance.
To configure a routing instance within a logical system, specify the logical system name
followed by the routing instance name. Use a slash ( / ) to separate the two names
(for example, test-ls/test-ri). To configure the default routing instance on a logical
system, specify the logical system name followed by default (for example,
test-ls/default).
Required PrivilegeLevel
snmp—To view this statement in the configuration.
snmp-control—To add this statement to the configuration.
RelatedDocumentation
• Configuring the Trap Target Address
sample-type
Syntax sample-type (absolute-value | delta-value);
Hierarchy Level [edit snmp rmon alarm index]
Release Information Statement introduced before Junos OS Release 7.4.
Statement introduced in Junos OS Release 9.0 for EX Series switches.
Description Method of sampling the selected variable.
Options absolute-value—Actual value of the selected variable is used when comparing against
the thresholds.
delta-value—Differencebetweensamplesof theselectedvariable isusedwhencomparing
against the thresholds.
Required PrivilegeLevel
snmp—To view this statement in the configuration.
snmp-control—To add this statement to the configuration.
RelatedDocumentation
• Configuring the Sample Type
287Copyright © 2016, Juniper Networks, Inc.
Chapter 15: SNMP

security-level (Defining Access Privileges)
Syntax security-level (authentication | none | privacy) {notify-view view-name;read-view view-name;write-view view-name;
}
Hierarchy Level [edit snmp v3 vacm access group group-name (default-context-prefix | context-prefixcontext-prefix) security-model (any | usm | v1 | v2c)]
Release Information Statement introduced before Junos OS Release 7.4.
Statement introduced in Junos OS Release 9.0 for EX Series switches.
Statement introduced in Junos OS Release 11.1 for the QFX Series.
Description Define the security level used for access privileges.
Default none
Options authentication—Provide authentication but no encryption.
none—No authentication and no encryption.
privacy—Provide authentication and encryption.
Required PrivilegeLevel
snmp—To view this statement in the configuration.
snmp-control—To add this statement to the configuration.
RelatedDocumentation
• Configuring the Security Level
Copyright © 2016, Juniper Networks, Inc.288
Network Management and Monitoring Feature Guide for EX2300, EX3400, and EX4300 Switches

security-level (Generating SNMPNotifications)
Syntax security-level (authentication | none | privacy);
Hierarchy Level [edit snmp v3 target-parameters target-parameters-name parameters]
Release Information Statement introduced before Junos OS Release 7.4.
Statement introduced in Junos OS Release 9.0 for EX Series switches.
Statement introduced in Junos OS Release 11.1 for the QFX Series.
Description Configure the security level to use when generating SNMP notifications.
Default none
Options authentication—Provide authentication but no encryption.
none—No authentication and no encryption.
privacy—Provide authentication and encryption.
Required PrivilegeLevel
snmp—To view this statement in the configuration.
snmp-control—To add this statement to the configuration.
RelatedDocumentation
• Configuring the Security Level
289Copyright © 2016, Juniper Networks, Inc.
Chapter 15: SNMP

security-model (Access Privileges)
Syntax security-model (usm | v1 | v2c);
Hierarchy Level [edit snmp v3 vacm access group group-name (default-context-prefix | context-prefixcontext-prefix)]
Release Information Statement introduced before Junos OS Release 7.4.
Statement introduced in Junos OS Release 9.0 for EX Series switches.
Statement introduced in Junos OS Release 11.1 for the QFX Series.
Description Configure the security model for an SNMPv3 group. The security model is used to
determine access privileges for the group.
Options usm—SNMPv3 security model.
v1—SNMPv1 security model.
v2c—SNMPv2c security model.
Required PrivilegeLevel
snmp—To view this statement in the configuration.
snmp-control—To add this statement to the configuration.
RelatedDocumentation
• Configuring the Security Model
Copyright © 2016, Juniper Networks, Inc.290
Network Management and Monitoring Feature Guide for EX2300, EX3400, and EX4300 Switches

security-model (Group)
Syntax security-model (usm | v1 | v2c) {security-name security-name {group group-name;
}}
Hierarchy Level [edit snmp v3 vacm security-to-group]
Release Information Statement introduced before Junos OS Release 7.4.
Statement introduced in Junos OS Release 9.0 for EX Series switches.
Description Define a security model for a group.
Options usm—SNMPv3 security model.
v1—SNMPv1 security model.
v2c—SNMPv2c security model.
Required PrivilegeLevel
snmp—To view this statement in the configuration.
snmp-control—To add this statement to the configuration.
RelatedDocumentation
• Configuring the Security Model
security-model (SNMPNotifications)
Syntax security-model (usm | v1 | v2c);
Hierarchy Level [edit snmp v3 target-parameters target-parameters-name parameters]
Release Information Statement introduced before Junos OS Release 7.4.
Statement introduced in Junos OS Release 9.0 for EX Series switches.
Statement introduced in Junos OS Release 11.1 for the QFX Series.
Description Configure the securitymodel for an SNMPv3 group. The securitymodel is used for SNMP
notifications.
Options usm—SNMPv3 security model.
v1—SNMPv1 security model.
v2c—SNMPv2c security model.
Required PrivilegeLevel
snmp—To view this statement in the configuration.
snmp-control—To add this statement to the configuration.
RelatedDocumentation
• Configuring the Security Model
291Copyright © 2016, Juniper Networks, Inc.
Chapter 15: SNMP

security-name (Security Group)
Syntax security-name security-name {group group-name;
}
Hierarchy Level [edit snmp v3 vacm security-to-group security-model (usm | v1 | v2c)]
Release Information Statement introduced before Junos OS Release 7.4.
Statement introduced in Junos OS Release 9.0 for EX Series switches.
Description Associate a group or a community string with a configured security group.
Options security-name—Usernameconfiguredat the [editsnmpv3usmlocal-engineuserusername]
hierarchy level. ForSNMPv1andSNMPv2c, thesecurityname is thecommunity string
configured at the [edit snmp v3 snmp-community community-index] hierarchy level.
Required PrivilegeLevel
snmp—To view this statement in the configuration.
snmp-control—To add this statement to the configuration.
RelatedDocumentation
• Assigning Security Names to Groups
Copyright © 2016, Juniper Networks, Inc.292
Network Management and Monitoring Feature Guide for EX2300, EX3400, and EX4300 Switches

security-name (Community String)
Syntax security-name security-name;
Hierarchy Level [edit snmp v3 snmp-community community-index]
Release Information Statement introduced before Junos OS Release 7.4.
Statement introduced in Junos OS Release 9.0 for EX Series switches.
Statement introduced in Junos OS Release 11.1 for the QFX Series.
Description Associate a community string with the security name of a user. The community string,
which is used for SNMPv1 and SNMPv2c clients in an SNMPv3 system, is configured at
the [edit snmp v3 snmp-community community-index] hierarchy level.
Options security-name—Name that is used for messaging security and user access control.
NOTE: The security namemust match the configured security name at the[editsnmpv3target-parameters target-parameters-nameparameters]hierarchy
level when you configure traps or informs.
Required PrivilegeLevel
snmp—To view this statement in the configuration.
snmp-control—To add this statement to the configuration.
RelatedDocumentation
• Configuring the Security Names
293Copyright © 2016, Juniper Networks, Inc.
Chapter 15: SNMP

security-name (SNMPNotifications)
Syntax security-name security-name;
Hierarchy Level [edit snmp v3 target-parameters target-parameters-name parameters]
Release Information Statement introduced before Junos OS Release 7.4.
Statement introduced in Junos OS Release 9.0 for EX Series switches.
Statement introduced in Junos OS Release 11.1 for the QFX Series.
Description Configure the security name used when generating SNMP notifications.
Options security-name—If the SNMPv3 USM security model is used, identify the user when
generating the SNMP notification. If the v1 or v2c security models are used, identify
the SNMP community used when generating the notification.
NOTE: Theaccessprivileges for thegroupassociatedwith this securitynamemust allow this notification to be sent.
If you are using the v1 or v2 security models, the security name at the [edit
snmp v3 vacm security-to-group] hierarchy level must match the security
nameat the [edit snmpv3snmp-communitycommunity-index]hierarchy level.
Required PrivilegeLevel
snmp—To view this statement in the configuration.
snmp-control—To add this statement to the configuration.
RelatedDocumentation
• Configuring the Security Name
Copyright © 2016, Juniper Networks, Inc.294
Network Management and Monitoring Feature Guide for EX2300, EX3400, and EX4300 Switches

security-to-group
Syntax security-to-group {security-model (usm | v1 | v2c) {group group-name;security-name security-name;
}}
Hierarchy Level [edit snmp v3 vacm]
Release Information Statement introduced before Junos OS Release 7.4.
Statement introduced in Junos OS Release 9.0 for EX Series switches.
Statement introduced in Junos OS Release 11.1 for the QFX Series.
Description Configure the group to which a specific SNMPv3 security name belongs. The security
name is used for messaging security.
The remaining statements are explained separately.
Required PrivilegeLevel
snmp—To view this statement in the configuration.
snmp-control—To add this statement to the configuration.
RelatedDocumentation
• Assigning Security Model and Security Name to a Group
snmp
Syntax snmp { ... }
Hierarchy Level [edit]
Release Information Statement introduced before Junos OS Release 7.4.
Statement introduced in Junos OS Release 9.0 for EX Series switches.
Description Configure SNMP.
SNMPmodules cannot have the slash (/) character or the@ character in the name.
Required PrivilegeLevel
snmp—To view this statement in the configuration.
snmp-control—To add this statement to the configuration.
RelatedDocumentation
• Configuring SNMP on a Device Running Junos OS
295Copyright © 2016, Juniper Networks, Inc.
Chapter 15: SNMP

snmp
Syntax snmp {rmon {history index {interface (SNMPRMONHistory) interface-name;bucket-size number;interval seconds;owner owner-name;
}}
}
Hierarchy Level [edit]
Release Information Statement introduced in Junos OS Release 9.0 for EX Series switches.
Description Configure SNMP.
The statements are explained separately.
Required PrivilegeLevel
snmp—To view this statement in the configuration.
snmp–control—To add this statement to the configuration.
RelatedDocumentation
• Configuring SNMP (J-Web Procedure) on page 121
snmp-community
Syntax snmp-community community-index {community-name community-name;security-name security-name;tag tag-name;
}
Hierarchy Level [edit snmp v3]
Release Information Statement introduced before Junos OS Release 7.4.
Statement introduced in Junos OS Release 9.0 for EX Series switches.
Description Configure the SNMP community.
Options community-index—(Optional) String that identifies an SNMP community.
The remaining statements are explained separately.
Required PrivilegeLevel
snmp—To view this statement in the configuration.
snmp-control—To add this statement to the configuration.
RelatedDocumentation
• Configuring the SNMPv3 Community
Copyright © 2016, Juniper Networks, Inc.296
Network Management and Monitoring Feature Guide for EX2300, EX3400, and EX4300 Switches

source-address
Syntax source-address address;
Hierarchy Level [edit snmp trap-options]
Release Information Statement introduced before Junos OS Release 7.4.
Statement introduced in Junos OS Release 9.0 for EX Series switches.
Description Set the source address of every SNMP trap packet sent by this router to a single address
regardless of the outgoing interface. If the source address is not specified, the default is
to use the address of the outgoing interface as the source address.
Options address—Source address of SNMP traps. You can configure the source address of trap
packets two ways: lo0 or a valid IPv4 address configured on one of the router
interfaces. The value lo0 indicates that the source address of all SNMP trap packets
is set to the lowest loopback address configured at interface lo0.
Default: Disabled. (The source address is the address of the outgoing interface.)
Required PrivilegeLevel
snmp—To view this statement in the configuration.
snmp-control—To add this statement to the configuration.
RelatedDocumentation
• Configuring the Source Address for SNMP Traps
297Copyright © 2016, Juniper Networks, Inc.
Chapter 15: SNMP

startup-alarm
Syntax startup-alarm (falling-alarm | rising-alarm | rising-or-falling-alarm);
Hierarchy Level [edit snmp rmon alarm index]
Release Information Statement introduced before Junos OS Release 7.4.
Statement introduced in Junos OS Release 9.0 for EX Series switches.
Description The alarm that can be sent upon entry startup.
Options falling-alarm—Generated if the first sample after the alarm entry becomes active is less
than or equal to the falling threshold.
rising-alarm—Generated if the first sampleafter thealarmentrybecomesactive is greater
than or equal to the rising threshold.
rising-or-falling-alarm—Generated if the first sampleafter thealarmentrybecomesactive
satisfies either of the corresponding thresholds.
Default: rising-or-falling-alarm
Required PrivilegeLevel
snmp—To view this statement in the configuration.
snmp-control—To add this statement to the configuration.
RelatedDocumentation
• Configuring the Sample Type
syslog-subtag
Syntax syslog-subtag syslog-subtag;
Hierarchy Level [edit snmp rmon alarm index]
Release Information Statement introduced in Junos OS Release 8.5.
Statement introduced in Junos OS Release 9.0 for EX Series switches.
Description Add a tag to the system logmessage.
Options syslog-subtag syslog-subtag—Tagof notmore than80uppercase characters to beadded
to syslog messages.
Default: None
Required PrivilegeLevel
snmp—To view this statement in the configuration.
snmp-control—To add this statement to the configuration.
RelatedDocumentation
• Configuring the System Log Tag
Copyright © 2016, Juniper Networks, Inc.298
Network Management and Monitoring Feature Guide for EX2300, EX3400, and EX4300 Switches

tag
Syntax tag tag-name;
Hierarchy Level [edit snmp v3 notify name],[edit snmp v3 snmp-community community-index]
Release Information Statement introduced before Junos OS Release 7.4.
Statement introduced in Junos OS Release 9.0 for EX Series switches.
Description Configure a set of targets to receive traps or informs (for IPv4 packets only).
Options tag-name—Identifies the address of managers that are allowed to use a community
string.
Required PrivilegeLevel
snmp—To view this statement in the configuration.
snmp-control—To add this statement to the configuration.
RelatedDocumentation
• Configuring the Tag
• Configuring the SNMPv3 Trap Notification
tag-list
Syntax tag-list tag-list;
Hierarchy Level [edit snmp v3 target-address target-address-name]
Release Information Statement introduced before Junos OS Release 7.4.
Statement introduced in Junos OS Release 9.0 for EX Series switches.
Statement introduced in Junos OS Release 11.1 for the QFX Series.
Description Configure an SNMP tag list used to select target addresses.
Options tag-list—Define sets of target addresses (tags). To specify more than one tag, specify
the tag names as a space-separated list enclosed within double quotes.
Required PrivilegeLevel
snmp—To view this statement in the configuration.
snmp-control—To add this statement to the configuration.
RelatedDocumentation
• Configuring the Trap Target Address
299Copyright © 2016, Juniper Networks, Inc.
Chapter 15: SNMP

target-address
Syntax target-address target-address-name {address address;address-mask address-mask;logical-system logical-system;port port-number;retry-count number;routing-instance instance;tag-list tag-list;target-parameters target-parameters-name;timeout seconds;
}
Hierarchy Level [edit snmp v3]
Release Information Statement introduced before Junos OS Release 7.4.
Statement introduced in Junos OS Release 9.0 for EX Series switches.
Description Configure the address of an SNMPmanagement application and the parameters to be
used in sending notifications.
Options target-address-name—String that identifies the target address.
The remaining statements are explained separately.
Required PrivilegeLevel
snmp—To view this statement in the configuration.
snmp-control—To add this statement to the configuration.
RelatedDocumentation
• Configuring the Trap Target Address
Copyright © 2016, Juniper Networks, Inc.300
Network Management and Monitoring Feature Guide for EX2300, EX3400, and EX4300 Switches

target-parameters
Syntax At the [edit snmp v3] hierarchy level:
target-parameters target-parameters-name {profile-name;parameters {message-processing-model (v1 | v2c | V3);security-level (authentication | none | privacy);security-model (usm | v1 | v2c);security-name security-name;
}}
At the [edit snmp v3 target-address target-address-name] hierarchy level:
target-parameters target-parameters-name;
Hierarchy Level [edit snmp v3][edit snmp v3 target-address target-address-name]
Release Information Statement introduced before Junos OS Release 7.4.
Statement introduced in Junos OS Release 9.0 for EX Series switches.
Statement introduced in Junos OS Release 11.1 for the QFX Series.
Description Configure the message processing and security parameters for sending notifications to
a particularmanagement target. The target parameters are configured at the [edit snmp
v3] hierarchy level. The remaining statements at this level are explained separately.
Then apply the target parameters configured at the [edit snmp v3 target-parameters
target-parameters-name] hierarchy level to the target address configuration at the [edit
snmp v3] hierarchy level.
Required PrivilegeLevel
snmp—To view this statement in the configuration.
snmp-control—To add this statement to the configuration.
RelatedDocumentation
• Defining and Configuring the Trap Target Parameters
• Applying Target Parameters
301Copyright © 2016, Juniper Networks, Inc.
Chapter 15: SNMP

targets
Syntax targets {address;
}
Hierarchy Level [edit snmp trap-group group-name]
Release Information Statement introduced before Junos OS Release 7.4.
Statement introduced in Junos OS Release 9.0 for EX Series switches.
Description Configure one or more systems to receive SNMP traps.
Options address—IPv4or IPv6addressof the systemto receive traps.Youmust specify anaddress,
not a hostname.
Required PrivilegeLevel
snmp—To view this statement in the configuration.
snmp-control—To add this statement to the configuration.
RelatedDocumentation
• Configuring SNMP Trap Groups
Copyright © 2016, Juniper Networks, Inc.302
Network Management and Monitoring Feature Guide for EX2300, EX3400, and EX4300 Switches

traceoptions (SNMP)
Syntax traceoptions {file filename <files number> <match regular-expression> <size size> <world-readable |no-world-readable>;
flag flag;no-remote-trace;
}
Hierarchy Level [edit snmp]
Release Information Statement introduced before Junos OS Release 7.4.
file filename option added in Junos OS Release 8.1.
world-readable | no-world-readable option added in Junos OS Release 8.1.
match regular-expression option added in Junos OS Release 8.1.
Statement introduced in Junos OS Release 9.0 for EX Series switches.
Description The output of the tracing operations is placed into log files in the /var/log directory. Each
log file is named after the SNMP agent that generates it. Currently, the following logs are
created in the /var/log directory when the traceoptions statement is used:
• chassisd
• craftd
• ilmid
• mib2d
• rmopd
• serviced
• snmpd
Options file filename—By default, the name of the log file that records trace output is the name
of theprocessbeing traced (for example,mib2dor snmpd).Use this option to specify
another name.
files number—(Optional) Maximum number of trace files per SNMP subagent. When a
trace file (for example, snmpd) reaches its maximum size, it is archived by being
renamed to snmpd.0. The previous snmpd.1 is renamed to snmpd.2, and so on. The
oldest archived file is deleted.
Range: 2 through 1000 files
Default: 10 files
flag flag—Tracing operation to perform. To specify more than one tracing operation,
includemultiple flag statements:
• all—Log all SNMP events.
• general—Log general events.
303Copyright © 2016, Juniper Networks, Inc.
Chapter 15: SNMP

• interface-stats—Log physical and logical interface statistics.
• nonvolatile-sets—Log nonvolatile SNMP set request handling.
• pdu—Log SNMP request and response packets.
• protocol-timeouts—Log SNMP response timeouts.
• routing-socket—Log routing socket calls.
• subagent—Log subagent restarts.
• timer—Log internally generated events.
• varbind-error—Log variable binding errors.
match regular-expression—(Optional) Refine the output to include lines that contain the
regular expression.
size size—(Optional)Maximumsize, in kilobytes (KB), of each trace file before it is closed
and archived.
Range: 10 KB through 1 GB
Default: 1000 KB
world-readable | no-world-readable—(Optional) By default, log files can be accessed
only by the user who configures the tracing operation. Theworld-readable option
enables any user to read the file. To explicitly set the default behavior, use the
no-world-readable option.
Required PrivilegeLevel
snmp—To view this statement in the configuration.
snmp-control—To add this statement to the configuration.
RelatedDocumentation
• Tracing SNMP Activity on a Device Running Junos OS
Copyright © 2016, Juniper Networks, Inc.304
Network Management and Monitoring Feature Guide for EX2300, EX3400, and EX4300 Switches

trap-group
Syntax trap-group group-name {categories {category;
}destination-port port-number;routing-instance instance;targets {address;
}version (all | v1 | v2);
}
Hierarchy Level [edit snmp]
Release Information Statement introduced before Junos OS Release 7.4.
Statement introduced in Junos OS Release 9.0 for EX Series switches.
Statement introduced in Junos OS Release 14.1X53-D20 for OCX Series switches.
Description Create a named group of hosts to receive the specified trap notifications. The name of
the trap group is embedded in SNMP trap notification packets as one variable binding
(varbind) known as the community name. At least one trap groupmust be configured
for SNMP traps to be sent.
Options group-name—Nameof the trapgroup. If thename includes spaces, enclose it inquotation
marks (" ").
The remaining statements are explained separately.
Required PrivilegeLevel
snmp—To view this statement in the configuration.
snmp-control—To add this statement to the configuration.
RelatedDocumentation
• Configuring SNMP Trap Groups
305Copyright © 2016, Juniper Networks, Inc.
Chapter 15: SNMP

trap-options
Syntax trap-options {agent-address outgoing-interface;source-address address;
}
Hierarchy Level [edit snmp]
Release Information Statement introduced before Junos OS Release 7.4.
Statement introduced in Junos OS Release 9.0 for EX Series switches.
Description Using SNMP trap options, you can set the source address of every SNMP trap packet
sent by the router or switch to a single address, regardless of the outgoing interface. In
addition, youcanset theagentaddressof eachSNMPv1 trap. Formore informationabout
the contents of SNMPv1 traps, see RFC 1157.
The remaining statements are explained separately.
Default Disabled
Required PrivilegeLevel
snmp—To view this statement in the configuration.
snmp-control—To add this statement to the configuration.
RelatedDocumentation
• Configuring SNMP Trap Options
Copyright © 2016, Juniper Networks, Inc.306
Network Management and Monitoring Feature Guide for EX2300, EX3400, and EX4300 Switches

type
Syntax type type;
Hierarchy Level [edit snmp rmon event index]
Release Information Statement introduced before Junos OS Release 7.4.
Statement introduced in Junos OS Release 9.0 for EX Series switches.
Description Type of notification generated when a threshold is crossed.
Options type—Type of notification:
• log—Add an entry to logTable.
• log-and-trap—Send an SNMP trap andmake a log entry.
• none—No notifications are sent.
• snmptrap—Send an SNMP trap.
Default: log-and-trap
Required PrivilegeLevel
snmp—To view this statement in the configuration.
snmp-control—To add this statement to the configuration.
RelatedDocumentation
• Configuring an RMON Event Entry and Its Attributes
307Copyright © 2016, Juniper Networks, Inc.
Chapter 15: SNMP

type
Syntax type (inform | trap);
Hierarchy Level [edit snmp v3 notify name]
Release Information Statement introduced before Junos OS Release 7.4.
inform option added in Junos OS Release 7.4.
Statement introduced in Junos OS Release 9.0 for EX Series switches.
Statement introduced in Junos OS Release 11.1 for the QFX Series.
Description Configure the type of SNMP notification.
Options inform—Defines the type of notification as an inform. SNMP informs are confirmed
notifications.
trap—Defines the typeofnotificationasa trap.SNMPtrapsareunconfirmednotifications.
Required PrivilegeLevel
snmp—To view this statement in the configuration.
snmp-control—To add this statement to the configuration.
RelatedDocumentation
• Configuring SNMP Informs
• Configuring the SNMPv3 Trap Notification
Copyright © 2016, Juniper Networks, Inc.308
Network Management and Monitoring Feature Guide for EX2300, EX3400, and EX4300 Switches

v3
Syntax v3 {notify name {tag tag-name;type trap;
}notify-filter profile-name {oid object-identifier (include | exclude);
}snmp-community community-index {community-name community-name;security-name security-name;tag tag-name;
}target-address target-address-name {address address;address-mask address-mask;logical-system logical-system;port port-number;retry-count number;routing-instance instance;tag-list tag-list;target-parameters target-parameters-name;timeout seconds;
}target-parameters target-parameters-name {notify-filter profile-name;parameters {message-processing-model (v1 | v2c | V3);security-level (authentication | none | privacy);security-model (usm | v1 | v2c);security-name security-name;
}}usm {local-engine {user username {authentication-md5 {authentication-password authentication-password;
}authentication-sha {authentication-password authentication-password;
}authentication-none;privacy-aes128 {privacy-password privacy-password;
}privacy-des {privacy-password privacy-password;
}privacy-des {privacy-password privacy-password;
}
309Copyright © 2016, Juniper Networks, Inc.
Chapter 15: SNMP

privacy-none;}
}remote-engine engine-id {user username {authentication-md5 {authentication-password authentication-password;
}authentication-sha {authentication-password authentication-password;
}authentication-none;privacy-aes128 {privacy-password privacy-password;
}privacy-des {privacy-password privacy-password;
}privacy-3des {privacy-password privacy-password;
}privacy-none {privacy-password privacy-password;
}}
}}vacm {access {group group-name {(default-context-prefix | context-prefix context-prefix){security-model (any | usm | v1 | v2c) {security-level (authentication | none | privacy) {notify-view view-name;read-view view-name;write-view view-name;
}}
}}
}security-to-group {security-model (usm | v1 | v2c) {security-name security-name {group group-name;
}}
}}
}
Hierarchy Level [edit snmp]
Release Information Statement introduced before Junos OS Release 7.4.
Statement introduced in Junos OS Release 9.0 for EX Series switches.
Copyright © 2016, Juniper Networks, Inc.310
Network Management and Monitoring Feature Guide for EX2300, EX3400, and EX4300 Switches

Description Configure SNMPv3.
The remaining statements are explained separately.
Required PrivilegeLevel
snmp—To view this statement in the configuration.
snmp-control—To add this statement to the configuration.
RelatedDocumentation
• Minimum SNMPv3 Configuration on a Device Running Junos OS
vacm
Syntax vacm {access {group group-name {(default-context-prefix | context-prefix context-prefix){security-model (any | usm | v1 | v2c) {security-level (authentication | none | privacy) {notify-view view-name;read-view view-name;write-view view-name;
}}
}}
}security-to-group {security-model (usm | v1 | v2c);security-name security-name {group group-name;
}}
}
Hierarchy Level [edit snmp v3]
Release Information Statement introduced before Junos OS Release 7.4.
Statement introduced in Junos OS Release 9.0 for EX Series switches.
Description Configure view-based access control model (VACM) information.
The remaining statements are explained separately.
Required PrivilegeLevel
snmp—To view this statement in the configuration.
snmp-control—To add this statement to the configuration.
RelatedDocumentation
• Defining Access Privileges for an SNMP Group
311Copyright © 2016, Juniper Networks, Inc.
Chapter 15: SNMP

variable
Syntax variable oid-variable;
Hierarchy Level [edit snmp rmon alarm index]
Release Information Statement introduced before Junos OS Release 7.4.
Statement introduced in Junos OS Release 9.0 for EX Series switches.
Description Object identifier (OID) of MIB variable to bemonitored.
Options oid-variable—OID of the MIB variable that is being monitored. The OID can be a dotted
decimal (for example, 1.3.6.1.2.1.2.1.2.2.1.10.1). Alternatively, use the MIB object name
(for example, ifInOctets.1).
Required PrivilegeLevel
snmp—To view this statement in the configuration.
snmp-control—To add this statement to the configuration.
RelatedDocumentation
• Configuring the Variable
version (SNMP)
Syntax version (all | v1 | v2);
Hierarchy Level [edit snmp trap-group group-name]
Release Information Statement introduced before Junos OS Release 7.4.
Statement introduced in Junos OS Release 9.0 for EX Series switches.
Description Specify the version number of SNMP traps.
Default all—Send an SNMPv1 and SNMPv2 trap for every trap condition.
Options all—Send an SNMPv1 and SNMPv2 trap for every trap condition.
v1—Send SNMPv1 traps only.
v2—Send SNMPv2 traps only.
Required PrivilegeLevel
snmp—To view this statement in the configuration.
snmp-control—To add this statement to the configuration.
RelatedDocumentation
• Configuring SNMP Trap Groups
Copyright © 2016, Juniper Networks, Inc.312
Network Management and Monitoring Feature Guide for EX2300, EX3400, and EX4300 Switches

view (Associating aMIB Viewwith a Community)
Syntax view view-name;
Hierarchy Level [edit snmp community community-name]
Release Information Statement introduced before Junos OS Release 7.4.
Statement introduced in Junos OS Release 9.0 for EX Series switches.
Description Associate a view with a community. A view represents a group of MIB objects.
Options view-name—Name of the view. Youmust use a view name already configured in the view
statement at the [edit snmp] hierarchy level.
Required PrivilegeLevel
snmp—To view this statement in the configuration.
snmp-control—To add this statement to the configuration.
RelatedDocumentation
• Configuring SNMP Communities
313Copyright © 2016, Juniper Networks, Inc.
Chapter 15: SNMP

view (Configuring aMIB View)
Syntax view view-name {oid object-identifier (include | exclude);
}
Hierarchy Level [edit snmp]
Release Information Statement introduced before Junos OS Release 7.4.
Statement introduced in Junos OS Release 9.0 for EX Series switches.
Description Define aMIB view. AMIB view identifies a group ofMIB objects. EachMIB object in a view
has a common OID prefix. Each object identifier represents a subtree of the MIB object
hierarchy. The view statement uses a view to specify a group of MIB objects on which to
define access. To enable a view, youmust associate the view with a community by
including the view statement at the [edit snmp community community-name] hierarchy
level.
NOTE: To remove an OID completely, use the delete view all oid oid-number
command but omit the include parameter.
Options view-name—Name of the view.
The remaining statement is explained separately.
Required PrivilegeLevel
snmp—To view this statement in the configuration.
snmp-control—To add this statement to the configuration.
RelatedDocumentation
• Configuring MIB Views
• Associating MIB Views with an SNMP User Group
• community on page 255
Copyright © 2016, Juniper Networks, Inc.314
Network Management and Monitoring Feature Guide for EX2300, EX3400, and EX4300 Switches

write-view
Syntax write-view view-name;
Hierarchy Level [edit snmp v3 vacm access group group-name (default-context-prefix | context-prefixcontext-prefix) security-model (any | usm | v1 | v2c) security-level (authentication | none |privacy)]
Release Information Statement introduced before Junos OS Release 7.4.
Statement introduced in Junos OS Release 9.0 for EX Series switches.
Statement introduced in Junos OS Release 11.1 for the QFX Series switches.
Command introduced in Junos OS Release 14.1X53-D20 for the OCX Series.
Description Associate the write viewwith a community (for SNMPv1 or SNMPv2c clients) or a group
name (for SNMPv3 clients).
Options view-name—Name of the view for which the SNMP user group has write permission.
Required PrivilegeLevel
snmp—To view this statement in the configuration.
snmp-control—To add this statement to the configuration.
RelatedDocumentation
• Configuring MIB Views
• Configuring theWrite View
315Copyright © 2016, Juniper Networks, Inc.
Chapter 15: SNMP

Copyright © 2016, Juniper Networks, Inc.316
Network Management and Monitoring Feature Guide for EX2300, EX3400, and EX4300 Switches
PART 3
Operational Commands
• Realtime Performance Monitoring on page 319
• General Commands on page 331
• Analyzers and Port Mirroring on page 357
• sFlowMonitoring Technology on page 361
• Ethernet OAM Connectivity Fault Management on page 369
• Ethernet OAM Link Fault Management on page 409
• Uplink Failure Detection on page 415
• SNMP on page 419
317Copyright © 2016, Juniper Networks, Inc.

Copyright © 2016, Juniper Networks, Inc.318
Network Management and Monitoring Feature Guide for EX2300, EX3400, and EX4300 Switches

CHAPTER 16
Realtime Performance Monitoring
• show services rpm active-servers
• show services rpm history-results
• show services rpm probe-results
319Copyright © 2016, Juniper Networks, Inc.

show services rpm active-servers
Syntax show services rpm active-servers
Release Information Command introduced before Junos OS Release 7.4.
Command introduced in Junos OS Release 9.0 for EX Series switches.
Command introduced in Junos OS Release 13.2 for PTX Series Packet Transport routers.
Description Display the protocols and corresponding ports for which a router or switch is configured
as a real-time performancemonitoring (RPM) server.
Options This command has no options.
Required PrivilegeLevel
view
List of Sample Output show services rpm active-servers on page 320
Output Fields Table 17 on page 320 lists the output fields for the show services rpm active-servers
command. Output fields are listed in the approximate order in which they appear.
Table 17: show services rpm active-servers Output Fields
Field DescriptionField Name
Protocol configured on the receiving probe server. The protocol canbe the User Datagram Protocol (UDP) or the Transmission ControlProtocol (TCP).
Protocol
Port configured on the receiving probe server.Port
Output interface name for the probes.Destination interface name
Sample Output
show services rpm active-servers
user@host> show services rpm active-servers Protocol: TCP, Port: 50000, Destination interface name: lt-0/0/0.0 Protocol: UDP, Port: 50001, Destination interface name: lt-0/0/0.0
Copyright © 2016, Juniper Networks, Inc.320
Network Management and Monitoring Feature Guide for EX2300, EX3400, and EX4300 Switches

show services rpm history-results
Syntax show services rpm history-results<brief | detail><owner owner><since time><test name>
Release Information Command introduced before Junos OS Release 7.4.
Command introduced in Junos OS Release 9.0 for EX Series switches.
Command introduced in Junos OS Release 13.2 for PTX Series Packet Transport routers.
Description Display standard information about the results of the last 50 probes for each real-time
performancemonitoring (RPM) instance.
Options none—Display the results of the last 50 probes for all RPM instances.
brief | detail—(Optional) Display the specified level of output.
owner owner—(Optional) Display information for the specified probe owner.
since time—(Optional) Display information from the specified time. Specify time as
yyyy-mm-dd.hh:mm:ss.
test name—(Optional) Display information for the specified test.
Required PrivilegeLevel
view
List of Sample Output show services rpm history-results on page 322show services rpm history-results detail on page 322
Output Fields Table 18 on page 321 lists the output fields for the show services rpm history-results
command. Output fields are listed in the approximate order in which they appear.
Table 18: show services rpm history-results Output Fields
Level of OutputField DescriptionField Name
All levelsProbe owner.Owner
All levelsName of a test for a probe instance.Test
All levelsTimestampwhen the probe result was determined.Probe received
All levelsAverage ping round-trip time (RTT), in microseconds.Round trip time
detailResult of a particular probe performed by a remote host. The followinginformation is contained in the results:
• Response received—Timestampwhen the probe result was determined.
• Rtt—Average ping round-trip time (RTT), in microseconds.
Probe results
321Copyright © 2016, Juniper Networks, Inc.
Chapter 16: Realtime Performance Monitoring

Table 18: show services rpm history-results Output Fields (continued)
Level of OutputField DescriptionField Name
detailDisplays the results for the current test by probe at the time each probe wascompleted, as well as the status of the current test at the time the probe wascompleted.
Resultsovercurrenttest
detailNumber of probes sent with the current test.Probes sent
detailNumber of probe responses received within the current test.Probes received
detailPercentage of lost probes for the current test.Loss percentage
detailIncrement of measurement. Possible values are round-trip time delay and, forthe probe type icmp-pin-timestamp, the egress and ingress delay:
• Minimum—Minimum RTT, ingress delay, or egress delay measured over thecourse of the current test.
• Maximum—Maximum RTT, ingress delay, or egress delay measured over thecourse of the current test.
• Average—Average RTT, ingress delay, or egress delay measured over thecourse of the current test.
• Jitter—Difference, in microseconds, between themaximum andminimumRTTmeasured over the course of the current test.
• Stddev—Standarddeviationof the round-trip time, inmicroseconds,measuredover the course of the current test.
Measurement
Sample Output
show services rpm history-results
user@host> show services rpm history-results Owner, Test Probe received Round trip time p1, t1 Wed Aug 12 01:02:35 2009 315 usec p1, t1 Wed Aug 12 01:02:36 2009 266 usec p1, t1 Wed Aug 12 01:02:37 2009 314 usec p1, t1 Wed Aug 12 01:02:38 2009 388 usec p1, t1 Wed Aug 12 01:02:39 2009 316 usec p1, t1 Wed Aug 12 01:02:40 2009 271 usec p1, t1 Wed Aug 12 01:02:41 2009 314 usec p1, t1 Wed Aug 12 01:02:42 2009 1180 usec
show services rpm history-results detail
user@host> show services rpm history-results detail Owner: p1, Test: t1, Probe type: icmp-ping-timestamp Probe results: Response received, Wed Aug 12 01:02:35 2009, Client and server hardware timestamps Rtt: 315 usec Results over current test: Probes sent: 1, Probes received: 1, Loss percentage: 0 Measurement: Round trip time Samples: 1, Minimum: 315 usec, Maximum: 315 usec, Average: 315 usec, Peak to peak: 0 usec, Stddev: 0 usec, Sum: 315 usec
Copyright © 2016, Juniper Networks, Inc.322
Network Management and Monitoring Feature Guide for EX2300, EX3400, and EX4300 Switches

Owner: p1, Test: t1, Probe type: icmp-ping-timestamp Probe results: Response received, Wed Aug 12 01:02:36 2009, Client and server hardware timestamps Rtt: 266 usec, Round trip jitter: -50 usec, Round trip interarrival jitter: 3 usec Results over current test: Probes sent: 2, Probes received: 2, Loss percentage: 0 Measurement: Round trip time Samples: 2, Minimum: 266 usec, Maximum: 315 usec, Average: 291 usec, Peak to peak: 49 usec, Stddev: 24 usec, Sum: 581 usec Measurement: Negative round trip jitter Samples: 1, Minimum: 50 usec, Maximum: 50 usec, Average: 50 usec, Peak to peak: 0 usec, Stddev: 0 usec, Sum: 50 usec
Owner: p1, Test: t1, Probe type: icmp-ping-timestamp Probe results: Response received, Wed Aug 12 01:02:37 2009, Client and server hardware timestamps Rtt: 314 usec, Round trip jitter: 49 usec, Round trip interarrival jitter: 6 usec Results over current test: Probes sent: 3, Probes received: 3, Loss percentage: 0 Measurement: Round trip time Samples: 3, Minimum: 266 usec, Maximum: 315 usec, Average: 298 usec, Peak to peak: 49 usec, Stddev: 23 usec, Sum: 895 usec Measurement: Positive round trip jitter Samples: 1, Minimum: 49 usec, Maximum: 49 usec, Average: 49 usec, Peak to peak: 0 usec, Stddev: 0 usec, Sum: 49 usec Measurement: Negative round trip jitter Samples: 1, Minimum: 50 usec, Maximum: 50 usec, Average: 50 usec, Peak to peak: 0 usec, Stddev: 0 usec, Sum: 50 usec
Owner: p1, Test: t1, Probe type: icmp-ping-timestamp Probe results: Response received, Wed Aug 12 01:02:38 2009, Client and server hardware timestamps Rtt: 388 usec, Round trip jitter: 74 usec, Round trip interarrival jitter: 10 usec Results over current test: Probes sent: 4, Probes received: 4, Loss percentage: 0 Measurement: Round trip time Samples: 4, Minimum: 266 usec, Maximum: 388 usec, Average: 321 usec, Peak to peak: 122 usec, Stddev: 44 usec, Sum: 1283 usec Measurement: Positive round trip jitter Samples: 2, Minimum: 49 usec, Maximum: 74 usec, Average: 62 usec, Peak to peak: 25 usec, Stddev: 12 usec, Sum: 123 usec Measurement: Negative round trip jitter Samples: 1, Minimum: 50 usec, Maximum: 50 usec, Average: 50 usec, Peak to peak: 0 usec, Stddev: 0 usec, Sum: 50 usec
323Copyright © 2016, Juniper Networks, Inc.
Chapter 16: Realtime Performance Monitoring

show services rpm probe-results
Syntax show services rpm probe-results<owner owner><test name>
Release Information Command introduced before Junos OS Release 7.4.
Command introduced in Junos OS Release 9.0 for EX Series switches.
Command introduced in Junos OS Release 13.2 for PTX Series Packet Transport Series
routers.
Description Display the results of the most recent real-time performancemonitoring (RPM) probes.
Options none—Display all results of the most recent RPM probes.
owner owner—(Optional) Display information for the specified probe owner.
test name—(Optional) Display information for the specified test.
Required PrivilegeLevel
view
List of Sample Output show services rpm probe-results (IPv4 Targets) on page 327show services rpm probe-results (IPv6 Targets) on page 329show services rpm probe-results (BGPNeighbor Discovery) on page 330
Output Fields Table 19 on page 324 lists the output fields for the show services rpm probe-results
command. Output fields are listed in the approximate order in which they appear.
Table 19: show services rpm probe-results Output Fields
Field DescriptionField Name
Owner name. When you configure the probe owner statement at the [edit services rpm] hierarchylevel, this field displays the configured owner name. When you configure BGP neighbor discoverythrough RPM, the output for this field is Rpm-Bgp-Owner.
Owner
Nameof a test representing a collection of probes.When you configure the test test-name statementat the [edit services rpm probe owner] hierarchy level, the field displays the configured test name.When you configure BGP neighbor discovery through RPM, the output for this field is Rpm-BGP-Test-n, where n is a cumulative number.
Test
Destination IPv4 address used for the probes. This field is displayed when the probes are sent to theconfigured IPv4 targets or RPM servers.
Target address
Destination IPv6 address used for the probes. This field is displayed when the probes are sent to theconfigured IPv6 targets or RPM servers.
Target inet6-address
Source address used for the probes.Source address
Protocol configured on the receiving probe server: http-get, http-metadata-get, icmp-ping,icmp-ping-timestamp, tcp-ping, udp-ping, or udp-ping-timestamp.
Probe type
Copyright © 2016, Juniper Networks, Inc.324
Network Management and Monitoring Feature Guide for EX2300, EX3400, and EX4300 Switches

Table 19: show services rpm probe-results Output Fields (continued)
Field DescriptionField Name
Number of probes within a test.Test size
(BGP neighbor discovery) Name of the configured (if any) routing instance, logical system name, orboth, in which the probe is configured:
• When a routing instance is defined within a logical system, the logical system name is followed bythe routing instance name. A slash ( / ) is used to separate the two entities. For example, if therouting instance called R1 is configured within the logical system called LS, the name in the outputfield is LS/R1.
• Whena routing instance is configuredbut the default logical system is used, the name in the outputfield is the name of the routing instance.
• Whena logical system is configuredbut the default routing instance is used, the name in the outputfield is the name of the logical system followed by default. A slash (/) is used to separate the twoentities. For example, LS/default.
Routing Instance Name
Rawmeasurementofaparticularprobesampledonebya remotehost. Thisdata isprovidedseparatelyfrom the calculated results. The following information is contained in the rawmeasurement:
• Response received—Timestampwhen the probe result was determined.
• Clientandserverhardware timestamps—If timestampsare configured, anentry appearsat this point.
• Rtt—Average ping round-trip time (RTT), in microseconds.
• Egress jitter—Egress jitter, in microseconds.
• Ingress jitter—Ingress jitter, in microseconds.
• Round trip jitter—Round-trip jitter, in microseconds.
• Egress interarrival jitter—Egress interarrival jitter, in microseconds.
• Ingress interarrival jitter—Ingress interarrival jitter, in microseconds.
• Round trip interarrival jitter—Round-trip interarrival jitter, in microseconds.
Probe results
325Copyright © 2016, Juniper Networks, Inc.
Chapter 16: Realtime Performance Monitoring

Table 19: show services rpm probe-results Output Fields (continued)
Field DescriptionField Name
Probes are grouped into tests, and the statistics are calculated for each test. If a test contains 10probes, the average, minimum, andmaximum results are calculated from the results of those 10probes. If the command is issued while the test is in progress, the statistics use information from thecompleted probes.
• Probes sent—Number of probes sent within the current test.
• Probes received—Number of probe responses received within the current test.
• Loss percentage—Percentage of lost probes for the current test.
• Measurement—Measurement type. Possible values are round-trip time, positive round-trip jitter,negative round-trip jitter, egress time, positive egress jitter, negative egress jitter, ingress time,positive ingress jitter, negative ingress jitter, and, for theprobe type icmp-ping-timestamp, theegressdelay and ingress delay.
For eachmeasurement type, the following individual calculated results are provided:
• Samples—Number of probes.
• Minimum—MinimumRTT, ingress delay, or egress delaymeasured over the course of the currenttest.
• Maximum—MaximumRTT, ingress delay, or egress delaymeasuredover the course of the currenttest.
• Average—Average RTT, ingress delay, or egress delay measured over the course of the currenttest.
• Peak to peak—Peak-to-peak difference, in microseconds.
• Stddev—Standard deviation, in microseconds.
• Sum—Statistical sum.
Resultsovercurrent test
Results for themost recently completed test. If the command is issuedwhile the first test is in progress,this information is not displayed
• Probes sent—Number of probes sent for the most recently completed test.
• Probes received—Number of probe responses received for the most recently completed test.
• Loss percentage—Percentage of lost probes for the most recently completed test.
• Test completed—Time themost recent test was completed.
• Measurement—Measurement type. Possible values are round-trip time, positive round-trip jitter,negative round-trip jitter, egress time, positive egress jitter, negative egress jitter, ingress time,positive ingress jitter, negative ingress jitter, and, for theprobe type icmp-ping-timestamp, theegressdelay and ingress delay.
For eachmeasurement type, the following individual calculated results are provided:
• Samples—Number of probes.
• Minimum—MinimumRTT, ingressdelay, or egressdelaymeasured for themost recently completedtest.
• Maximum—Maximum RTT, ingress delay, or egress delay measured for the most recentlycompleted test.
• Average—Average RTT, ingress delay, or egress delaymeasured for themost recently completedtest.
• Peak to peak—Peak-to-peak difference, in microseconds.
• Stddev—Standard deviation, in microseconds.
• Sum—Statistical sum.
Results over last test
Copyright © 2016, Juniper Networks, Inc.326
Network Management and Monitoring Feature Guide for EX2300, EX3400, and EX4300 Switches

Table 19: show services rpm probe-results Output Fields (continued)
Field DescriptionField Name
Displays statisticsmade for all theprobes, independently of thegrouping into tests, aswell as statisticsfor the current test.
• Probes sent—Number of probes sent in all tests.
• Probes received—Number of probe responses received in all tests.
• Loss percentage—Percentage of lost probes in all tests.
• Measurement—Measurement type. Possible values are round-trip time, positive round-trip jitter,negative round-trip jitter, egress time, positive egress jitter, negative egress jitter, ingress time,positive ingress jitter, negative ingress jitter, and, for the probe types icmp-ping-timestamp andudp-ping-timestamp, the egress delay and ingress delay.
For eachmeasurement type, the following individual calculated results are provided:
• Samples—Number of probes.
• Minimum—MinimumRTT, ingress delay, or egress delaymeasured over the course of the currenttest.
• Maximum—MaximumRTT, ingress delay, or egress delaymeasuredover the course of the currenttest.
• Average—Average RTT, ingress delay, or egress delay measured over the course of the currenttest.
• Peak to peak—Peak-to-peak difference, in microseconds.
• Stddev—Standard deviation, in microseconds.
• Sum—Statistical sum.
Results over all tests
Displays error statistics for each probe.
• Invalidclient recv timestamp—Numberof client receive timestamp less thanclient send timestamp.
• Invalidserversendtimestamp—Numberof server sendtimestamp less thanserver receive timestamp.
• Invalid server processing time—Number of server side spent time greater than RTT.
NOTE: Error Stats is displayed in the output only if non-zero statistics exists.
Error Stats
Sample Output
show services rpm probe-results (IPv4 Targets)
user@host> show services rpm probe-results Owner: ADSN-J4300.ADSN-J2300.D2, Test: 75300002 Target address: 172.16.54.172, Source address: 10.206.0.1, Probe type: udp-ping-timestamp, Test size: 10 probes Probe results: Response received, Tue Feb 6 14:53:15 2007, Client and server hardware timestamps Rtt: 575 usec, Egress jitter: 5 usec, Ingress jitter: 8 usec, Round trip jitter: 12 usec, Egress interarrival jitter: 8 usec, Ingress interarrival jitter: 7 usec, Round trip interarrival jitter: 7 usec,
Round trip interarrival jitter: 669 usec Results over current test: Probes sent: 10, Probes received: 10, Loss percentage: 0 Measurement: Round trip time Samples: 10, Minimum: 805 usec, Maximum: 2859 usec, Average: 1644 usec, Peak to peak: 2054 usec, Stddev: 738 usec, Sum: xxxx usec
327Copyright © 2016, Juniper Networks, Inc.
Chapter 16: Realtime Performance Monitoring

Measurement: Positive round trip jitter Samples: 5, Minimum: 5 usec, Maximum: 2054 usec, Average: 876 usec, Peak to peak: 2049 usec, Stddev: 679 usec, Sum: xxxx usec Measurement: Negative round trip jitter Samples: 5, Minimum: 5 usec, Maximum: 1812 usec, Average: 926 usec, Peak to peak: 1807 usec, Stddev: 665 usec, Sum: xxxx usec Measurement: Egress time Samples: 10, Minimum: 805 usec, Maximum: 2859 usec, Average: 1644 usec, Peak to peak: 2054 usec, Stddev: 738 usec, Sum: xxxx usec Measurement: Positive Egress jitter Samples: 5, Minimum: 5 usec, Maximum: 2054 usec, Average: 876 usec, Peak to peak: 2049 usec, Stddev: 679 usec, Sum: xxxx usec Measurement: Negative Egress jitter Samples: 5, Minimum: 5 usec, Maximum: 1812 usec, Average: 926 usec, Peak to peak: 1807 usec, Stddev: 665 usec, Sum: xxxx usec Measurement: Ingress time Samples: 10, Minimum: 805 usec, Maximum: 2859 usec, Average: 1644 usec, Peak to peak: 2054 usec, Stddev: 738 usec, Sum: xxxx usec Measurement: Positive Ingress jitter Samples: 5, Minimum: 5 usec, Maximum: 2054 usec, Average: 876 usec, Peak to peak: 2049 usec, Stddev: 679 usec, Sum: xxxx usec Measurement: Negative Ingress jitter Samples: 5, Minimum: 5 usec, Maximum: 1812 usec, Average: 926 usec, Peak to peak: 1807 usec, Stddev: 665 usec, Sum: xxxx usec Results over last test: Probes sent: 10, Probes received: 10, Loss percentage: 0 Test completed on Tue Feb 6 14:53:16 2007 Measurement: Round trip time Samples: 10, Minimum: 805 usec, Maximum: 2859 usec, Average: 1644 usec, Peak to peak: 2054 usec, Stddev: 738 usec, Sum: xxxx usec Measurement: Positive round trip jitter Samples: 5, Minimum: 5 usec, Maximum: 2054 usec, Average: 876 usec, Peak to peak: 2049 usec, Stddev: 679 usec, Sum: xxxx usec Measurement: Negative round trip jitter Samples: 5, Minimum: 5 usec, Maximum: 1812 usec, Average: 926 usec, Peak to peak: 1807 usec, Stddev: 665 usec, Sum: xxxx usec Measurement: Egress time Samples: 10, Minimum: 805 usec, Maximum: 2859 usec, Average: 1644 usec, Peak to peak: 2054 usec, Stddev: 738 usec, Sum: xxxx usec Measurement: Positive Egress jitter Samples: 5, Minimum: 5 usec, Maximum: 2054 usec, Average: 876 usec, Peak to peak: 2049 usec, Stddev: 679 usec, Sum: xxxx usec Measurement: Negative Egress jitter Samples: 5, Minimum: 5 usec, Maximum: 1812 usec, Average: 926 usec, Peak to peak: 1807 usec, Stddev: 665 usec, Sum: xxxx usec Measurement: Ingress time Samples: 10, Minimum: 805 usec, Maximum: 2859 usec, Average: 1644 usec, Peak to peak: 2054 usec, Stddev: 738 usec, Sum: xxxx usec Measurement: Positive Ingress jitter Samples: 5, Minimum: 5 usec, Maximum: 2054 usec, Average: 876 usec, Peak to peak: 2049 usec, Stddev: 679 usec, Sum: xxxx usec Measurement: Negative Ingress jitter Samples: 5, Minimum: 5 usec, Maximum: 1812 usec, Average: 926 usec, Peak to peak: 1807 usec, Stddev: 665 usec, Sum: xxxx usec Results over all tests: Probes sent: 560, Probes received: 560, Loss percentage: 0 Measurement: Round trip time Samples: 560, Minimum: 805 usec, Maximum: 3114 usec, Average: 1756 usec,
Peak to peak: 2309 usec, Stddev: 519 usec, Sum: xxxx usec Measurement: Positive round trip jitter
Copyright © 2016, Juniper Networks, Inc.328
Network Management and Monitoring Feature Guide for EX2300, EX3400, and EX4300 Switches

Samples: 257, Minimum: 0 usec, Maximum: 2054 usec, Average: 597 usec, Peak to peak: 2054 usec, Stddev: 427 usec, Sum: xxxx usec Measurement: Negative round trip jitter Samples: 302, Minimum: 1 usec, Maximum: 1812 usec, Average: 511 usec, Peak to peak: 1811 usec, Stddev: 408 usec, Sum: xxxx usec Measurement: Egress time Samples: 10, Minimum: 805 usec, Maximum: 2859 usec, Average: 1644 usec, Peak to peak: 2054 usec, Stddev: 738 usec, Sum: xxxx usec Measurement: Positive Egress jitter Samples: 5, Minimum: 5 usec, Maximum: 2054 usec, Average: 876 usec, Peak to peak: 2049 usec, Stddev: 679 usec, Sum: xxxx usec Measurement: Negative Egress jitter Samples: 5, Minimum: 5 usec, Maximum: 1812 usec, Average: 926 usec, Peak to peak: 1807 usec, Stddev: 665 usec, Sum: xxxx usec Measurement: Ingress time Samples: 10, Minimum: 805 usec, Maximum: 2859 usec, Average: 1644 usec, Peak to peak: 2054 usec, Stddev: 738 usec, Sum: xxxx usec Measurement: Positive Ingress jitter Samples: 5, Minimum: 5 usec, Maximum: 2054 usec, Average: 876 usec, Peak to peak: 2049 usec, Stddev: 679 usec, Sum: xxxx usec Measurement: Negative Ingress jitter Samples: 5, Minimum: 5 usec, Maximum: 1812 usec, Average: 926 usec, Peak to peak: 1807 usec, Stddev: 665 usec, Sum: xxxx usec Error Stats: Invalid client recv timestamp: 3, Invalid server send timestamp: 0 Invalid server processing time: 0
show services rpm probe-results (IPv6 Targets)
user@host> show services rpm probe-results Owner: p, Test: t1 Target inet6-address: 2001:db8:0:1:2a0:a502:0:1da, Target Port : 34567 Test size: 1000000 probes Probe results: Response received, Mon Dec 16 10:48:07 2013, Client and server hardware timestamps Rtt: 236 usec, Round trip jitter: -10 usec, Round trip interarrival jitter: 484 usec Results over current test: Probes sent: 10, Probes received: 10, Loss percentage: 0 Measurement: Round trip time Samples: 10, Minimum: 231 usec, Maximum: 298 usec, Average: 268 usec, Peak to peak: 67 usec, Stddev: 24 usec, Sum: 2682 usec Measurement: Positive round trip jitter Samples: 3, Minimum: 15 usec, Maximum: 1841 usec, Average: 750 usec, Peak to peak: 1826 usec, Stddev: 787 usec, Sum: 2251 usec Measurement: Negative round trip jitter Samples: 7, Minimum: 10 usec, Maximum: 1244 usec, Average: 709 usec, Peak to peak: 1234 usec, Stddev: 466 usec, Sum: 4961 usec Results over last test: Probes sent: 10, Probes received: 10, Loss percentage: 0 Test completed on Mon Dec 16 10:48:07 2013 Measurement: Round trip time Samples: 10, Minimum: 231 usec, Maximum: 298 usec, Average: 268 usec, Peak to peak: 67 usec, Stddev: 24 usec, Sum: 2682 usec Measurement: Positive round trip jitter Samples: 3, Minimum: 15 usec, Maximum: 1841 usec, Average: 750 usec, Peak to peak: 1826 usec, Stddev: 787 usec, Sum: 2251 usec Measurement: Negative round trip jitter Samples: 7, Minimum: 10 usec, Maximum: 1244 usec, Average: 709 usec, Peak to peak: 1234 usec, Stddev: 466 usec, Sum: 4961 usec
329Copyright © 2016, Juniper Networks, Inc.
Chapter 16: Realtime Performance Monitoring

Results over all tests(From start of current control session): Probes sent: 490, Probes received: 488, Loss percentage: 0 Measurement: Round trip time Samples: 488, Minimum: 231 usec, Maximum: 306 usec, Average: 270 usec, Peak to peak: 75 usec, Stddev: 16 usec, Sum: 131586 usec Measurement: Positive round trip jitter Samples: 254, Minimum: 0 usec, Maximum: 10151 usec, Average: 157 usec, Peak to peak: 10151 usec, Stddev: 873 usec, Sum: 39817 usec Measurement: Negative round trip jitter Samples: 233, Minimum: 1 usec, Maximum: 10170 usec, Average: 171 usec, Peak to peak: 10169 usec, Stddev: 888 usec, Sum: 39889 usec
show services rpm probe-results (BGPNeighbor Discovery)
user@host> show services rpm probe-resultsOwner: Rpm-Bgp-Owner, Test: Rpm-Bgp-Test-1 Target address: 10.209.152.37, Probe type: icmp-ping, Test size: 5 probes Routing Instance Name: LS1/RI1 Probe results: Response received, Fri Oct 28 05:20:23 2005 Rtt: 662 usec Results over current test: Probes sent: 5, Probes received: 5, Loss percentage: 0 Measurement: Round trip time Minimum: 529 usec, Maximum: 662 usec, Average: 585 usec, Jitter: 133 usec, Stddev: 53 usec Results over all tests: Probes sent: 5, Probes received: 5, Loss percentage: 0 Measurement: Round trip time Minimum: 529 usec, Maximum: 662 usec, Average: 585 usec, Jitter: 133 usec, Stddev: 53 usec
Copyright © 2016, Juniper Networks, Inc.330
Network Management and Monitoring Feature Guide for EX2300, EX3400, and EX4300 Switches

CHAPTER 17
General Commands
• monitor traffic
• ping
• show pfe statistics bridge
• traceroute
331Copyright © 2016, Juniper Networks, Inc.

monitor traffic
Syntax monitor traffic<brief | detail | extensive><absolute-sequence><count count><interface interface-name><layer2-headers><matchingmatching><no-domain-names><no-promiscuous><no-resolve><no-timestamp><print-ascii><print-hex><resolve-timeout><size size>
Release Information Command introduced before Junos OS Release 7.4.
Command introduced in Junos OS Release 9.0 for EX Series switches.
Command introduced in Junos OS Release 11.1 for the QFX Series.
Command introduced in Junos OS Release 14.1X53-D20 for the OCX Series.
Description Display packet headers or packets received and sent from the Routing Engine.
NOTE:
• Using themonitor-traffic command can degrade router or switch
performance.
• Delays from DNS resolution can be eliminated by using the no-resolve
option.
NOTE: This command is not supported on the QFabric system.
Options none—(Optional) Display packet headers transmitted through fxp0. On a TXMatrix Plus
router, display packet headers transmitted through em0.
brief | detail | extensive—(Optional) Display the specified level of output.
absolute-sequence—(Optional) Display absolute TCP sequence numbers.
count count—(Optional) Specify the number of packet headers to display (0 through
1,000,000). Themonitor traffic command quits automatically after displaying the
number of packets specified.
Copyright © 2016, Juniper Networks, Inc.332
Network Management and Monitoring Feature Guide for EX2300, EX3400, and EX4300 Switches

interface interface-name—(Optional) Specify the interface on which themonitor traffic
command displays packet data. If no interface is specified, themonitor traffic
command displays packet data arriving on the lowest-numbered interface.
layer2-headers—(Optional) Display the link-level header on each line.
matchingmatching—(Optional) Display packet headers thatmatch a regular expression.
Usematching expressions to define the level of detail with which themonitor traffic
command filters and displays packet data.
no-domain-names—(Optional)Suppress thedisplayof thedomainportionofhostnames.
With the no-domain-names option enabled, themonitor traffic command displays
only team for the hostname team.company.net.
no-promiscuous—(Optional) Do not put the interface into promiscuous mode.
no-resolve—(Optional) Suppress reverse lookup of the IP addresses.
no-timestamp—(Optional) Suppress timestamps on displayed packets.
print-ascii—(Optional) Display each packet in ASCII format.
print-hex—(Optional) Display each packet, except the link-level header, in hexadecimal
format.
resolve-timeout timeout—(Optional) Amount of time the router or switch waits for each
reverse lookupbefore timingout. Youcanset the timeout for 1 through4,294,967,295
seconds. The default is 4 seconds. To display each packet, use the print-ascii,
print-hex, or extensive option.
size size—(Optional) Read but do not display up to the specified number of bytes for
each packet. When set to brief output, the default packet size is 96 bytes and is
adequate for capturing IP, ICMP, UDP, and TCP packet data. When set to detail and
extensive output, the default packet size is 1514. Themonitor traffic command
truncates displayed packets if the matched data exceeds the configured size.
Additional Information In themonitor traffic command, you can specify an expression to match by using the
matching option and including the expression in quotation marks:
monitor traffic matching "expression"
Replaceexpressionwithoneormoreof thematchconditions listed inTable20onpage334.
333Copyright © 2016, Juniper Networks, Inc.
Chapter 17: General Commands

Table 20: Match Conditions for themonitor traffic Command
DescriptionConditionMatch Type
Matches packets that contain the specifiedaddress or hostname.
Theprotocolmatch conditionsarp, ip, or rarp,or anyof thedirectionalmatchconditionscanbe prepended to the hostmatch condition.
host [address | hostname]Entity
Matches packets with source or destinationaddresses containing the specified networkaddress.
net address
Matches packets containing the specifiednetwork address and subnet mask.
net addressmaskmask
Matches packets containing the specifiedsource or destination TCP or UDP portnumber or port name.
In place of the numeric port address, you canspecify a text synonym, such as bgp (179),dhcp (67), ordomain (53) (theport numbersare also listed).
port (port-number | port-name)
Matches packets going to the specifieddestination. This match condition can beprepended to any of the entity typematchconditions.
dstDirectional
Matches packets from a specified source.This match condition can be prepended toany of the entity typematch conditions.
src
Matches packets that contain the specifiedsourceanddestinationaddresses.Thismatchcondition can be prepended to any of theentity typematch conditions.
src and dst
Matches packets containing either of thespecified addresses. This match conditioncan be prepended to any of the entity typematch conditions.
src or dst
Matches packets shorter than or equal to thespecified value, in bytes.
less valuePacket Length
Matches packets longer than or equal to thespecified value, in bytes.
greater value
Copyright © 2016, Juniper Networks, Inc.334
Network Management and Monitoring Feature Guide for EX2300, EX3400, and EX4300 Switches

Table 20: Match Conditions for themonitor traffic Command (continued)
DescriptionConditionMatch Type
Matches all AMT packets. Use the extensivelevel of output to decode the inner IGMPpackets in addition to the AMT outer packet.
amtProtocol
Matches all ARP packets.arp
Matches all Ethernet packets.ether
Matches broadcast or multicast Ethernetframes. This match condition can beprepended withsrc and dst.
ether (broadcast | multicast)
Matches packets with the specified Ethernetaddress or Ethernet packets of the specifiedprotocol type. The ether protocol argumentsarp, ip, and rarp are also independent matchconditions, so they must be preceded by abackslash (\)whenused in the etherprotocolmatch condition.
ether protocol (address | (arp | ip | rarp))
Matches all ICMP packets.icmp
Matches all IP packets.ip
Matches broadcast or multicast IP packets.ip (broadcast | multicast)
Matches packets with the specified addressor protocol type. The ip protocol argumentsicmp, tcp, and udp are also independentmatch conditions, so theymust be precededby a backslash (\) when used in the ipprotocolmatch condition.
ip protocol (address | (icmp | igrp | tcp | udp))
Matches all IS-IS routing messages.isis
Matches packetswhose headers contain thespecified IP protocol number.
proto ip-protocol-number
Matches all RARP packets.rarp
Matches all TCP datagrams.tcp
Matches all UDP datagrams.udp
To combine expressions, use the logical operators listed in Table 21 on page 336.
335Copyright © 2016, Juniper Networks, Inc.
Chapter 17: General Commands

Table 21: Logical Operators for themonitor traffic Command
DescriptionLogicalOperator (Highest toLowestPrecedence)
Logical NOT. If the first condition does not match, the next conditionis evaluated.
!
Logical AND. If the first condition matches, the next condition isevaluated. If the first condition does not match, the next condition isskipped.
&&
Logical OR. If the first conditionmatches, the next condition is skipped.If the first condition does not match, the next condition is evaluated.
||
Group operators to override default precedence order. Parentheses arespecial characters, each of which must be preceded by a backslash(\).
( )
You canuse relational operators to compare arithmetic expressions composedof integer
constants, binary operators, a length operator, and special packet data accessors. The
arithmetic expression matching condition uses the following syntax:
monitor traffic matching "ether[0] & 1 != 0""arithmetic_expression relational_operatorarithmetic_expression"
The packet data accessor uses the following syntax:
protocol [byte-offset <size>]
The optional size field represents the number of bytes examined in the packet header.
The available values are 1, 2, or 4 bytes. The following sample command captures all
multicast traffic:
user@host>monitor traffic matching "ether[0] & 1 != 0"
To specifymatch conditions that have a numeric value, use the arithmetic and relational
operators listed in Table 22 on page 337.
Copyright © 2016, Juniper Networks, Inc.336
Network Management and Monitoring Feature Guide for EX2300, EX3400, and EX4300 Switches

NOTE: Because the Packet Forwarding Engine removes Layer 2 headerinformation before sending packets to the Routing Engine:
• Themonitor traffic command cannot apply match conditions to inbound
traffic.
• Themonitor traffic interface commandalso cannot applymatch conditions
for Layer 3 and Layer 4 packet data, resulting in thematch pipe option (|
match) for this command for Layer 3 and Layer 4 packets not working
either. Therefore, ensure that you specify match conditions as describedin this command summary. Formore information aboutmatch conditions,see Table 20 on page 334.
• The802.1QVLANtag information included in theLayer2header is removedfromall inbound traffic packets. Because themonitor traffic interface ae[x]
command for aggregated Ethernet interfaces (such as ae0) only shows
inbound traffic data, the command does not show VLAN tag informationin the output.
Table 22: Arithmetic and Relational Operators for themonitor trafficCommand
DescriptionArithmetic or RelationalOperator
Arithmetic Operator
Addition operator.+
Subtraction operator.-
Division operator./
Bitwise AND.&
Bitwise exclusive OR.*
Bitwise inclusive OR.|
Relational Operator (Highest to Lowest Precedence)
If the first expression is less than or equal to the second, the packetmatches.
<=
If the first expression is greater than or equal to the second, thepacket matches.
>=
If the first expression is less than the second, the packet matches.<
If the first expression is greater than thesecond, thepacketmatches.>
337Copyright © 2016, Juniper Networks, Inc.
Chapter 17: General Commands

Table 22: Arithmetic and Relational Operators for themonitor trafficCommand (continued)
DescriptionArithmetic or RelationalOperator
If the compared expressions are equal, the packet matches.=
If the compared expressions are unequal, the packet matches.!=
Required PrivilegeLevel
trace
maintenance
List of Sample Output monitor traffic count on page 338monitor traffic detail count on page 338monitor traffic extensive (Absolute Sequence) on page 339monitor traffic extensive (Relative Sequence) on page 339monitor traffic extensive count on page 339monitor traffic interface on page 339monitor traffic matching on page 340monitor traffic (TXMatrix Plus Router) on page 340monitor traffic (QFX3500 Switch) on page 341monitor traffic matching icmp on page 341monitor traffic matching IP protocol number on page 342monitor traffic matching arp on page 342monitor traffic matching port on page 343
Output Fields When you enter this command, you are provided feedback on the status of your request.
Sample Output
monitor traffic count
user@host> monitor traffic count 2listening on fxp004:35:49.814125 In my-server.home.net.1295 > my-server.work.net.telnet: . ack4122529478 win 16798 (DF)04:35:49.814185 Out my-server.work.net.telnet > my-server.home.net.1295: P1:38(37) ack 0 win 17680 (DF) [tos 0x10]
monitor traffic detail count
user@host> monitor traffic detail count 2listening on fxp004:38:16.265864 In my-server.home.net.1295 > my-server.work.net.telnet: . ack 4122529971 win 17678 (DF) (ttl 121, id 6812)04:38:16.265926 Out my-server.work.net.telnet.telnet > my-server.home.net.1295: P 1:38(37) ack 0 win 17680 (DF) [tos 0x10] (ttl 6)
Copyright © 2016, Juniper Networks, Inc.338
Network Management and Monitoring Feature Guide for EX2300, EX3400, and EX4300 Switches

monitor traffic extensive (Absolute Sequence)
user@host> monitor traffic extensive no-domain-names no-resolve no-timestamp count 20matching "tcp" absolute-sequencelistening on fxp0 In 203.0.113.193.179 > 192.168.4.227.1024: . 4042780859:4042780859(0) ack 1845421797 win 16384 <nop,nop,timestamp 4935628 965951> [tos 0xc0] (ttl ) In 203.0.113.193.179 > 192.168.4.227.1024: P 4042780859:4042780912(53) ack 1845421797 win 16384 <nop,nop,timestamp 4935628 965951>: BGP [|BGP UPDAT) In 192.168.4.227.1024 > 203.0.113.193.179: P 1845421797:1845421852(55) ack 4042780912 win 16384 <nop,nop,timestamp 965951 4935628>: BGP [|BGP UPDAT)...
monitor traffic extensive (Relative Sequence)
user@host> monitor traffic extensive no-domain-names no-resolve no-timestamp count 20matching "tcp"listening on fxp0 In 172.24.248.221.1680 > 192.168.4.210.23: . 396159737:396159737(0) ack 1664980689 win 17574 (DF) (ttl 121, id 50003)Out 192.168.4.210.23 > 172.24.248.221.1680: P 1:40(39) ack 0 win 17680 (DF) [tos 0x10] (ttl 64, id 5394) In 203.0.113.193.179 > 192.168.4.227.1024: P 4042775817:4042775874(57) ack 1845416593 win 16384 <nop,nop,timestamp 4935379 965690>: BGP [|BGP UPDAT)...
monitor traffic extensive count
user@host> monitor traffic extensive count 5 no-domain-names no-resolvelistening on fxp013:18:17.406933 In 192.168.4.206.2723610880 > 172.17.28.8.2049: 40 null (ttl 64, id 38367)13:18:17.407577 In 172.17.28.8.2049 > 192.168.4.206.2723610880: reply ok 28 null (ttl 61, id 35495)13:18:17.541140 In 0:e0:1e:42:9c:e0 0:e0:1e:42:9c:e0 9000 60: 0000 0100 0000 0000 0000 0000 0000 0000 0000 0000 0000 0000 0000 0000 0000 0000 0000 0000 0000 0000 0000 0000 000013:18:17.591513In 172.24.248.156.4139 > 192.168.4.210.23: 3556964918:3556964918(0) ack 295526518 win 17601 (DF) (ttl 121, id 14)13:18:17.591568 Out 192.168.4.210.23 > 172.24.248.156.4139: P 1:40(39) ack 0 win 17680 (DF) [tos 0x10] (ttl 64, id 52376)
monitor traffic interface
user@host> monitor traffic interface fxp0listening on fxp0.018:17:28.800650 In server.home.net.723 > host1-0.lab.home.net.log 18:17:28.800733 Out host2-0.lab.home.net.login > server.home.net.7 18:17:28.817813 In host30.lab.home.net.syslog > host40.home0
339Copyright © 2016, Juniper Networks, Inc.
Chapter 17: General Commands

18:17:28.817846 In host30.lab.home.net.syslog > host40.home0...
monitor traffic matching
user@host> monitor traffic matching "net 192.168.1.0/24"verbose output suppressed, use <detail> or <extensive> for full protocol decodeAddress resolution is ON. Use <no-resolve> to avoid any reverse lookup delay.Address resolution timeout is 4s.Listening on fxp0, capture size 96 bytes
Reverse lookup for 192.168.1.255 failed (check DNS reachability).Other reverse lookup failures will not be reported.Use no-resolve to avoid reverse lookups on IP addresses.
21:55:54.003511 In IP truncated-ip - 18 bytes missing! 192.168.1.17.netbios-ns > 192.168.1.255.netbios-ns: UDP, length 5021:55:54.003585 Out IP truncated-ip - 18 bytes missing! 192.168.1.17.netbios-ns > 192.168.1.255.netbios-ns: UDP, length 5021:55:54.003864 In arp who-has 192.168.1.17 tell 192.168.1.9...
monitor traffic (TXMatrix Plus Router)
user@host> monitor trafficverbose output suppressed, use <detail> or <extensive> for full protocol decodeAddress resolution is ON. Use <no-resolve> to avoid any reverse lookup delay.Address resolution timeout is 4s.Listening on em0, capture size 96 bytes04:11:59.862121 Out IP truncated-ip - 25 bytes missing! summit-em0.example.net.syslog > sv-log-01.example.net.syslog: SYSLOG kernel.info, length: 5704:11:59.862303 Out IP truncated-ip - 25 bytes missing! summit-em0.example.net.syslog > sv-log-02.example.net.syslog: SYSLOG kernel.info, length: 5704:11:59.923948 In IP aj-em0.example.net.65235 > summit-em0.example.net.telnet: . ack 1087492766 win 33304 <nop,nop,timestamp 42366734 993490>04:11:59.923983 Out IP truncated-ip - 232 bytes missing! summit-em0.example.net.telnet > aj-em0.example.net.65235: P 1:241(240) ack 0 win 33304 <nop,nop,timestamp 993590 42366734>04:12:00.022900 In IP aj-em0.exmaple.net.65235 > summit-em0.example.net.telnet: . ack 241 win 33304 <nop,nop,timestamp 42366834 993590>04:12:00.141204 In IP truncated-ip - 40 bytes missing! ipg-lnx-shell1.example.net.46182 > summit-em0.example.net.telnet: P 2950530356:2950530404(48) ack 485494987 win 63712 <nop,nop,timestamp 1308555294 987086>04:12:00.141345 Out IP summit-em0.example.net.telnet > ipg-lnx-shell1.example.net.46182: P 1:6(5) ack 48 win 33304 <nop,nop,timestamp 993809 1308555294>04:12:00.141572 In IP ipg-lnx-shell1.example.net.46182 > summit-em0.example.net.telnet: .
Copyright © 2016, Juniper Networks, Inc.340
Network Management and Monitoring Feature Guide for EX2300, EX3400, and EX4300 Switches

ack 6 win 63712 <nop,nop,timestamp 1308555294 993809>04:12:00.141597 Out IP summit-em0.example.net.telnet > ipg-lnx-shell1.example.net.46182: P 6:10(4) ack 48 win 33304 <nop,nop,timestamp 993810 1308555294>04:12:00.141821 In IP ipg-lnx-shell1.example.net.46182 > summit-em0.exmaple.net.telnet: . ack 10 win 63712 <nop,nop,timestamp 1308555294 993810>04:12:00.141837 Out IP truncated-ip - 2 bytes missing! summit-em0.example.net.telnet > ipg-lnx-shell1.example.net.46182: P 10:20(10) ack 48 win 33304 <nop,nop,timestamp 993810 1308555294>04:12:00.142072 In IP ipg-lnx-shell1.example.net.46182 > summit-em0.example.net.telnet: . ack 20 win 63712 <nop,nop,timestamp 1308555294 993810>04:12:00.142089 Out IP summit-em0.example.net.telnet > ipg-lnx-shell1.example.net.46182: P 20:28(8) ack 48 win 33304 <nop,nop,timestamp 993810 1308555294>04:12:00.142321 In IP ipg-lnx-shell1.exmample.net.46182 > summit-em0.englab.example.net.telnet: . ack 28 win 63712 <nop,nop,timestamp 1308555294 993810>04:12:00.142337 Out IP truncated-ip - 1 bytes missing! summit-em0.example.net.telnet > ipg-lnx-shell.example.net.46182: P 28:37(9) ack 48 win 33304 <nop,nop,timestamp 993810 1308555294>...
monitor traffic (QFX3500 Switch)
user@switch> monitor trafficverbose output suppressed, use <detail> or <extensive> for full protocol decodeAddress resolution is ON. Use <no-resolve> to avoid any reverse lookup delay.Address resolution timeout is 4s.Listening on me4, capture size 96 bytesReverse lookup for 172.22.16.246 failed (check DNS reachability).Other reverse lookup failures will not be reported.Use <no-resolve> to avoid reverse lookups on IP addresses.16:35:32.240873 Out IP truncated-ip - 112 bytes missing! labqfx-me0.example.net.ssh > 172.22.16.246.telefinder: P 4200727624:4200727756(132) ack 2889954831 win 6553516:35:32.240900 Out IP truncated-ip - 176 bytes missing! labqfx-me0.example.net.ssh > 172.22.16.246.telefinder: P 132:328(196) ack 1 win 65535...
monitor traffic matching icmp
user@host> monitor traffic matching "icmp" no-resolveverbose output suppressed, use <detail> or <extensive> for full protocol decodeAddress resolution is OFF.Listening on me0, capture size 96 bytes
09:23:17.728737 In IP 172.19.10.9 > 10.10.211.93: ICMP echo request, id 1, seq 322, length 4009:23:17.728780 Out IP 10.10.211.93 > 172.19.10.9: ICMP echo reply, id 1, seq 322, length 40
341Copyright © 2016, Juniper Networks, Inc.
Chapter 17: General Commands

09:23:18.735848 In IP 172.19.10.9 > 10.10.211.93: ICMP echo request, id 1, seq 323, length 4009:23:18.735891 Out IP 10.10.211.93 > 172.19.10.9: ICMP echo reply, id 1, seq 323, length 4009:23:19.749732 In IP 172.19.10.9 > 10.10.211.93: ICMP echo request, id 1, seq 324, length 4009:23:19.749775 Out IP 10.10.211.93 > 172.19.10.9: ICMP echo reply, id 1, seq 324, length 4009:23:20.749747 In IP 172.19.10.9 > 10.10.211.93: ICMP echo request, id 1, seq 325, length 4009:23:20.749791 Out IP 10.10.211.93 > 172.19.10.9: ICMP echo reply, id 1, seq 325, length 40...
monitor traffic matching IP protocol number
user@host> monitor traffic matching "proto 89" no-resolveverbose output suppressed, use <detail> or <extensive> for full protocol decodeAddress resolution is OFF.Listening on me0, capture size 96 bytes
13:06:14.700311 In IP truncated-ip - 16 bytes missing! 10.94.211.254 > 224.0.0.5: OSPFv2, Hello, length 5613:06:16.067010 In IP truncated-ip - 20 bytes missing! 10.94.211.102 > 224.0.0.5: OSPFv2, Hello, length 6013:06:16.287566 In IP truncated-ip - 20 bytes missing! 10.94.211.142 > 224.0.0.5: OSPFv2, Hello, length 6013:06:20.758500 In IP truncated-ip - 16 bytes missing! 10.200.211.254 > 224.0.0.5: OSPFv2, Hello, length 5613:06:24.309882 In IP truncated-ip - 20 bytes missing! 10.94.211.102 > 224.0.0.5: OSPFv2, Hello, length 6013:06:24.396699 In IP truncated-ip - 16 bytes missing! 10.94.211.254 > 224.0.0.5: OSPFv2, Hello, length 5613:06:25.067386 In IP truncated-ip - 20 bytes missing! 10.94.211.142 > 224.0.0.5: OSPFv2, Hello, length 6013:06:29.499988 In IP truncated-ip - 16 bytes missing! 10.200.211.254 > 224.0.0.5: OSPFv2, Hello, length 5613:06:32.858753 In IP truncated-ip - 20 bytes missing! 10.94.211.102 > 224.0.0.5: OSPFv2, Hello, length 60...
monitor traffic matching arp
user@host> monitor traffic matching “arp” no-resolveverbose output suppressed, use <detail> or <extensive> for full protocol decodeAddress resolution is OFF.Listening on me0, capture size 96 bytes
11:57:54.664501 In arp who-has 10.10.213.109 (00:1f:d5:f3:28:30) tell 10.10.213.3111:57:56.828387 In arp who-has 10.10.213.233 (00:24:9d:06:77:4f) tell 10.10.213.3111:58:01.735803 In arp who-has 10.10.213.251 (88:e0:f4:1d:41:40) tell 10.10.213.3111:58:04.663241 In arp who-has 10.10.213.254 tell 10.94.211.17011:58:28.488191 In arp who-has 10.10.213.149 (00:e0:91:c2:ff:8d) tell 10.10.213.3111:58:41.858612 In arp who-has 10.10.213.148 tell 10.94.211.25411:58:42.621533 In arp who-has 10.10.213.254 (5f:5e:ac:79:49:81) tell 10.10.213.3111:58:44.533391 In arp who-has 10.10.213.186 tell 10.94.211.25411:58:45.170405 In arp who-has 10.10.213.186 tell 10.94.211.25411:58:45.770512 In arp who-has 10.10.213.186 tell 10.94.211.254
Copyright © 2016, Juniper Networks, Inc.342
Network Management and Monitoring Feature Guide for EX2300, EX3400, and EX4300 Switches

monitor traffic matching port
user@host> monitor traffic matching “port 22” no-resolveverbose output suppressed, use <detail> or <extensive> for full protocol decodeAddress resolution is OFF.Listening on me0, capture size 96 bytes
13:14:19.108089 In IP 192.0.2.22.56714 > 10.19.300.05.22: S 2210742342:2210742342(0) win 65535 <mss 1360,nop,wscale 7,nop,nop,sackOK>13:14:19.108165 Out IP 10.19.300.05.22 > 192.0.2.22.56714: S 23075150:23075150(0) ack 2210742343 win 65535 <mss 1460,nop,wscale 1,sackOK,eol>13:14:19.136883 In IP 192.0.2.22.56714 > 10.19.300.05.22: . ack 1 win 3276813:14:19.231364 Out IP truncated-ip - 1 bytes missing! 10.19.300.05.22 > 172.29.102.9.56714: P 1:22(21) ack 1 win 3332013:14:19.260174 In IP truncated-ip - 10 bytes missing! 192.0.2.22.56714 > 10.94.211.93.22: P 1:31(30) ack 22 win 3276713:14:19.284865 Out IP truncated-ip - 964 bytes missing! 10.19.300.05.22 > 172.29.102.9.56714: P 22:1006(984) ack 31 win 3332013:14:19.314549 In IP truncated-ip - 652 bytes missing! 192.0.2.22.56714 > 10.94.211.93.22: P 31:703(672) ack 1006 win 3276013:14:19.414135 Out IP 10.19.300.05.22 > 192.0.2.22.56714: . ack 703 win 3332013:14:19.443858 In IP 192.0.2.22.56714 > 10.19.300.05.22: P 703:719(16) ack 1006 win 3276013:14:19.467379 Out IP truncated-ip - 516 bytes missing! 10.19.300.05.22 > 172.29.102.9.56714: P 1006:1542(536) ack 719 win 3332013:14:19.734097 In IP 192.0.2.22.56714 > 10.19.300.05.22: . ack 1542 win 3276813:14:19.843574 In IP truncated-ip - 508 bytes missing! 192.0.2.22.56714 > 10.94.211.93.22: P 719:1247(528) ack 1542 win 32768...
343Copyright © 2016, Juniper Networks, Inc.
Chapter 17: General Commands

ping
List of Syntax Syntax on page 344
Syntax (QFX Series) on page 344
Syntax ping host<bypass-routing><count requests><detail><do-not-fragment><inet | inet6><interface source-interface><interval seconds><logical-system logical-system-name><loose-source value><mac-addressmac-address><no-resolve><pattern string><rapid><record-route><routing-instance routing-instance-name><size bytes><source source-address><strict ><strict-source value.><tos type-of-service><ttl value><verbose><vpls instance-name><wait seconds>
Syntax (QFX Series) ping host<bypass-routing><count requests><detail><do-not-fragment><inet><interface source-interface><interval seconds><logical-system logical-system-name><loose-source value><mac-addressmac-address><no-resolve><pattern string><rapid><record-route><routing-instance routing-instance-name><size bytes><source source-address><strict>< strict-source value><tos type-of-service><ttl value><verbose>
Copyright © 2016, Juniper Networks, Inc.344
Network Management and Monitoring Feature Guide for EX2300, EX3400, and EX4300 Switches

<wait seconds>
Release Information Command introduced before Junos OS Release 7.4.
Command introduced in Junos OS Release 9.0 for EX Series switches.
Command introduced in Junos OS Release 11.1 for the QFX Series.
Command introduced in Junos OS Release 14.1X53-D20 for the OCX Series.
Description Check host reachability and network connectivity. The ping command sends Internet
Control Message Protocol (ICMP) ECHO_REQUESTmessages to elicit ICMP
ECHO_RESPONSEmessages from the specified host. Press Ctrl+c to interrupt a ping
command.
Options host—IP address or hostname of the remote system to ping.
bypass-routing—(Optional) Bypass the normal routing tables and send ping requests
directly toa systemonanattachednetwork. If the system isnotonadirectly attached
network, an error is returned. Use this option to ping a local system through an
interface that has no route through it.
count requests—(Optional) Number of ping requests to send. The range of values is 1
through 2,000,000,000. The default value is an unlimited number of requests.
detail—(Optional) Include in theoutput the interfaceonwhich theping replywas received.
do-not-fragment—(Optional) Set the do-not-fragment (DF) flag in the IP header of the
ping packets. For IPv6 packets, this option disables fragmentation.
NOTE: In JunosOSRelease 11.1 and later,when issuing thepingcommand
for an IPv6 route with the do-not-fragment option, themaximum ping
packet size is calculated by subtracting 48 bytes (40 bytes for the IPV6header and 8 bytes for the ICMPheader) from theMTU. Therefore, if theping packet size (including the 48-byte header) is greater than theMTU,the ping operationmight fail.
inet—(Optional) Ping Packet Forwarding Engine IPv4 routes.
inet6—(Optional) Ping Packet Forwarding Engine IPv6 routes.
interface source-interface—(Optional) Interface to use to send the ping requests.
interval seconds—(Optional) How often to send ping requests. The range of values, in
seconds, is 1 through infinity. The default value is 1.
logical-system logical-system-name—(Optional) Name of logical system fromwhich to
send the ping requests.
Alternatively, enter the set cli logical-system logical-system-name command and
then run the ping command. To return to the main router or switch, enter the clear
cli logical-system command.
345Copyright © 2016, Juniper Networks, Inc.
Chapter 17: General Commands

loose-source value—(Optional) Intermediate loose source route entry (IPv4). Open a set
of values.
mac-addressmac-address—(Optional) Ping the physical or hardware address of the
remote system you are trying to reach.
no-resolve—(Optional) Do not attempt to determine the hostname that corresponds to
the IP address.
patternstring—(Optional)Specify ahexadecimal fill pattern to include in thepingpacket.
rapid—(Optional)Sendping requests rapidly. The results are reported ina singlemessage,
not in individual messages for each ping request. By default, five ping requests are
sent before the results are reported. To change the number of requests, include the
count option.
record-route—(Optional) Record and report the packet’s path (IPv4).
routing-instance routing-instance-name—(Optional) Nameof the routing instance for the
ping attempt.
size bytes—(Optional) Size of ping request packets. The range of values, in bytes, is 0
through 65,468. The default value is 56, which is effectively 64 bytes because 8
bytes of ICMP header data are added to the packet.
source source-address—(Optional) IP address of the outgoing interface. This address is
sent in the IP source address field of the ping request. If this option is not specified,
the default address is usually the loopback interface (lo.0).
strict—(Optional) Use the strict source route option (IPv4).
strict-source value—(Optional) Intermediate strict source route entry (IPv4). Open a set
of values.
tos type-of-service—(Optional) Set the type-of-service (ToS) field in the IP header of the
ping packets. The range of values is 0 through 255.
If the device configuration includes the dscp-code-point value statement at the [edit
class-of-service host-outbound-traffic] hierarchy level, the configured DSCP value
overrides the value specified in this command option. In this case, the ToS field of
ICMP echo request packets sent on behalf of this command carries the DSCP value
specified in the dscp-code-point configuration statement instead of the value you
specify in this command option.
ttl value—(Optional) Time-to-live (TTL) value to include in the ping request (IPv6). The
range of values is 0 through 255.
verbose—(Optional) Display detailed output.
vpls instance-name—(Optional) Ping the instance to which this VPLS belongs.
wait seconds—(Optional) Maximumwait time, in seconds, after the final packet is sent.
If this option is not specified, the default delay is 10 seconds. If this option is used
without the count option, a default count of 5 packets is used.
Copyright © 2016, Juniper Networks, Inc.346
Network Management and Monitoring Feature Guide for EX2300, EX3400, and EX4300 Switches

Required PrivilegeLevel
network
RelatedDocumentation
Configuring Junos OS ICMPv4 Rate Limit for ICMPv4 Routing Engine Messages•
List of Sample Output ping hostname on page 347ping hostname rapid on page 347ping hostname size count on page 347
Output Fields When you enter this command, you are provided feedback on the status of your request.
An exclamation point (!) indicates that an echo reply was received. A period (.) indicates
that an echo reply was not received within the timeout period. An x indicates that an
echo replywas receivedwith anerror code. Thesepackets are not counted in the received
packets count. They are accounted for separately.
Sample Output
ping hostname
user@host> ping device1.example.comPING device1.example.com (192.0.2.0): 56 data bytes64 bytes from 192.0.2.0: icmp_seq=0 ttl=253 time=1.028 ms64 bytes from 192.0.2.0: icmp_seq=1 ttl=253 time=1.053 ms64 bytes from 192.0.2.0: icmp_seq=2 ttl=253 time=1.025 ms64 bytes from 1192.0.2.0: icmp_seq=3 ttl=253 time=1.098 ms64 bytes from 192.0.2.0: icmp_seq=4 ttl=253 time=1.032 ms64 bytes from 192.0.2.0: icmp_seq=5 ttl=253 time=1.044 ms^C [abort]
ping hostname rapid
user@host> ping device1.example.com rapidPING device1.example.com (192.0.2.0): 56 data bytes!!!!!--- device1.example.com ping statistics ---5 packets transmitted, 5 packets received, 0% packet lossround-trip min/avg/max/stddev = 0.956/0.974/1.025/0.026 ms
ping hostname size count
user@host> ping device1.example.com size 200 count 5PING device1.example.com (192.0.2.0): 200 data bytes208 bytes from 192.0.2.0: icmp_seq=0 ttl=253 time=1.759 ms208 bytes from 192.0.2.0: icmp_seq=1 ttl=253 time=2.075 ms208 bytes from 192.0.2.0: icmp_seq=2 ttl=253 time=1.843 ms208 bytes from 192.0.2.0: icmp_seq=3 ttl=253 time=1.803 ms208 bytes from 192.0.2.0: icmp_seq=4 ttl=253 time=17.898 ms
--- device1.example.com ping statistics ---5 packets transmitted, 5 packets received, 0% packet lossround-trip min/avg/max = 1.759/5.075/17.898 ms
347Copyright © 2016, Juniper Networks, Inc.
Chapter 17: General Commands

show pfe statistics bridge
Syntax show pfe statistics bridge<fpc slot>
Release Information Command introduced in Junos OS Release 12.1 for EX Series switches.
Description Display information about the number of packets discarded in the ingress pipeline of the
Packet Forwarding Engine, packets discarded because of egress filtering or congestion
filtering, number of control packets, and general counters for dropped packets. You can
use this information to inform troubleshooting investigations.
Options none—Display bridge counter statistics for all Flexible PIC Concentrator (FPC) slots.
fpc slot—(Optional) Display bridge counter statistics for a specific FPC slot.
Required PrivilegeLevel
view
RelatedDocumentation
Monitoring System Process Information•
• Monitoring Switch Control Traffic
List of Sample Output show pfe statistics bridge (EX3200 and EX4200 Switches) on page 349showpfestatisticsbridge(EX8200SwitchesandEX8200VirtualChassis)onpage350show pfe statistics bridge fpc (EX8200 Switches and EX8200 VirtualChassis) on page 351showpfe statistics bridge fpc (EX8200-40XS (40-port SFP+) LineCard) onpage 351
Output Fields Table 23 on page 348 lists the output fields for the show pfe statistics bridge command.
Output fields are listed in the approximate order in which they appear.
Table 23: show pfe statistics bridge Output Fields
Field DescriptionField Name
Information about ingress counters:
• Received—Number of packets received by the bridge.
• VLAN Filtered—Number of packets discarded because of VLAN filtering.
• Security Filtered—Number of packets discarded because of security filtering.
• Other Discards—Number of packets dropped by the bridge for reasons other than VLAN orsecurity filtering.
Ingress Counters
Copyright © 2016, Juniper Networks, Inc.348
Network Management and Monitoring Feature Guide for EX2300, EX3400, and EX4300 Switches

Table 23: show pfe statistics bridge Output Fields (continued)
Field DescriptionField Name
Information about egress counters:
• Unicast—Number of unicast packets transmitted.
• Multicast—Number of multicast packets transmitted.
• Broadcast—Number of broadcast packets transmitted.
• Egress Filtered—Number of egress-filtered packets (regardless of port, priority, or mode).
• TailDrop—Number of packets filtered because of egress queue congestion.
• Forward Restrict—Number of packets filtered because of egress forward restrictions.
• CongestionFiltered—Numberofpackets filteredbecauseof transmit queue (TxQ)congestion.
• Control Packets—Number of control packets (sent to CPU, received from CPU, and sent toanalyzer).
Egress Counters
Information about drop counters:
• DropMode—Count mode of the counter.
• Drop Counter—Counter value.
Drop Counters
Information about general counters:
• DropMode—Count mode of the counter.
• Drop Counter—Counter value.
• Source Not Learnt—Number of source addresses that were not learnt because of internalcongestion.
General Counters
Information about multiplexer PFE for oversubscribed cards:
• DropMode—Count mode of the counter.
• Drop Count—Counter value.
MUXPFE
Sample Output
show pfe statistics bridge (EX3200 and EX4200 Switches)
user@switch> show pfe statistics bridgeSlot 0
PFE: 0 1 2-------------------------------------------------------------------- Ingress Counters ----Received: 0 52 0VLAN Filtered: 0 0 0Security Filtered: 0 0 0Other Discards: 0 0 0---- Egress Counters ----Unicast: 0 104 52Multicast: 0 0 0Broadcast: 0 0 0Egress Filtered: 0 0 0Congestion Filtered: 0 0 0Control Packets: 5 0 0---- General Counters ----Drop Mode: 0 0 0
349Copyright © 2016, Juniper Networks, Inc.
Chapter 17: General Commands

Drop Counter: 34217 36080 6367Source Not Learnt: 0 0 0
show pfe statistics bridge (EX8200 Switches and EX8200 Virtual Chassis)
user@switch> show pfe statistics bridgeSlot 0PFE: 0 1------------------------------------------------------------------------- Ingress Counters ----Received: 946 48VLAN Filtered: 0 0Security Filtered: 0 0Other Discards: 0 0---- Egress Counters ----Unicast: 0 0Multicast: 0 0Broadcast: 0 0Egress Filtered: 0 0TailDrop: 0 0Forward Restrict: 0 0Congestion Filtered: 0 0Control Packets: 4103 896---- Drop Counters ----Drop Mode: 0 0Drop Counter: 12528 2
Slot 1
PFE: 0 1------------------------------------------------------------------------- Ingress Counters ----Received: 0 0VLAN Filtered: 0 0Security Filtered: 0 0Other Discards: 0 0---- Egress Counters ----Unicast: 0 0Multicast: 0 0Broadcast: 0 0Egress Filtered: 0 0TailDrop: 0 0Forward Restrict: 0 0Congestion Filtered: 0 0Control Packets: 0 0---- Drop Counters ----Drop Mode: 0 0Drop Counter: 0 0
Slot 2
PFE: 0 1------------------------------------------------------------------------- Ingress Counters ----Received: 0 0VLAN Filtered: 0 0Security Filtered: 0 0Other Filtered: 0 0---- Egress Counters ----Unicast: 0 0Multicast: 0 0
Copyright © 2016, Juniper Networks, Inc.350
Network Management and Monitoring Feature Guide for EX2300, EX3400, and EX4300 Switches

Broadcast: 0 0Egress Filtered: 0 0TailDrop: 0 0Forward Restrict: 0 0Congestion Filtered: 0 0Control Packets: 0 0---- Drop Counters ----Drop Mode: 0 0Drop Counter: 0 0
show pfe statistics bridge fpc (EX8200 Switches and EX8200 Virtual Chassis)
user@switch> show pfe statistics bridge fpc 2Slot 2
PFE: 0 1------------------------------------------------------------------------- Ingress Counters ----Received: 0 0VLAN Filtered: 0 0Security Filtered: 0 0Other Discards: 0 0---- Egress Counters ----Unicast: 0 0Multicast: 0 0Broadcast: 0 0Egress Filtered: 0 0TailDrop: 0 0Forward Restrict: 0 0Congestion Filtered: 0 0Control Packets: 0 0---- Drop Counters ----Drop Mode: 0 0Drop Counter: 0 0
show pfe statistics bridge fpc (EX8200-40XS (40-port SFP+) Line Card)
user@switch> show pfe statistics bridge fpc 8Slot 8
PFE: 0 1 2 3------------------------------------------------------------------------- Ingress Counters ----Received: 0 3 0 0VLAN Filtered: 0 0 0 0Security Filtered: 0 0 0 0Other Discards: 0 1 0 0---- Egress Counters ----Unicast: 0 0 0 0Multicast: 0 0 0 0Broadcast: 0 0 0 0Egress Filtered: 0 0 0 0TailDrop: 0 0 0 0Forward Restrict: 0 0 0 0Congestion Filtered: 0 2 0 0Control Packets: 4 0 0 0---- Drop Counters ----Drop Mode: 0 0 0 0Drop Counter: 0 1 0 0
MUX PFE: 4 5
351Copyright © 2016, Juniper Networks, Inc.
Chapter 17: General Commands

---------------------------------------------------------------------Drop Mode: 0 0Drop Count: 0 0
Copyright © 2016, Juniper Networks, Inc.352
Network Management and Monitoring Feature Guide for EX2300, EX3400, and EX4300 Switches

traceroute
List of Syntax Syntax on page 353
Syntax (QFX Series and OCX Series) on page 353
Syntax traceroute host<as-number-lookup><bypass-routing><clns><gateway address><inet | inet6><interface interface-name><logical system logical-system-name><monitor host><mpls (ldp FEC address | rsvp label-switched-path-name)><no-resolve><propagate-ttl><routing-instance routing-instance-name><source source-address><tos value><ttl value><wait seconds>
Syntax (QFX Seriesand OCX Series)
traceroute host<as-number-lookup><bypass-routing><gateway address><inet><inet6><interface interface-name><monitor host><no-resolve><routing-instance routing-instance-name><source source-address><tos value><ttl value><wait seconds>
Release Information Command introduced before Junos OS Release 7.4.
Command introduced in Junos OS Release 9.0 for EX Series switches.
mpls option introduced in Junos OS Release 9.2.
propagate-ttl option introduced in Junos OS Release 12.1.
Command introduced in Junos OS Release 14.1X53-D20 for the OCX Series.
Support for IPv6 traceroute with as-number-lookup introduced with Junos OS Release
16.1.
Description Display the route that packets take to a specified network host. Use traceroute as a
debugging tool to locate points of failure in a network.
Options host—IP address or name of remote host.
as-number-lookup—(Optional) Display the autonomous system (AS) number of each
intermediate hop on the path from the host to the destination.
353Copyright © 2016, Juniper Networks, Inc.
Chapter 17: General Commands

bypass-routing—(Optional) Bypass the normal routing tables and send requests directly
to a system on an attached network. If the system is not on a directly attached
network, an error is returned. Use this option to display a route to a local system
through an interface that has no route through it.
clns—(Optional) Trace the route belonging to Connectionless Network Service (CLNS).
gateway address—(Optional) Address of a router or switch through which the route
transits.
inet | inet6—(Optional) Trace the route belonging to IPv4 or IPv6, respectively.
interface interface-name—(Optional) Name of the interface over which to send packets.
logical-system(all | logical-system-name)—(Optional)Performthisoperationonall logical
systems or on a particular logical system.
monitorhost—(Optional)Display real-timemonitoring information for the specifiedhost.
monitorhost—(Optional) Perform this operation to display real-timemonitoring
information.
monitorhost—(Optional) Perform this operation to display real-timemonitoring
information.
monitorhost—(Optional) Perform this operation to display real-timemonitoring
information.
mpls (ldp FEC address | rsvp label-switched-path name)—(Optional) See traceroutempls
ldp and traceroutempls rsvp.
no-resolve—(Optional) Do not attempt to determine the hostname that corresponds to
the IP address.
propagate-ttl—(Optional) On the PE routing device, use this option to view locally
generated Routing Engine transit traffic. This is applicable for MPLS L3VPN traffic
only.
Use for troubleshooting, when you want to view hop-by-hop information from the
localprovider router to the remoteprovider router,whenTTLdecrementing isdisabled
on the core network using the no-proagate-ttl configuration statement.
NOTE: Using propagate-ttlwith traceroute on the CE router does not
show hop-by-hop information.
routing-instance routing-instance-name—(Optional) Nameof the routing instance for the
traceroute attempt.
source source-address—(Optional) Source address of the outgoing traceroute packets.
Copyright © 2016, Juniper Networks, Inc.354
Network Management and Monitoring Feature Guide for EX2300, EX3400, and EX4300 Switches

tos value—(Optional) Value to include in the IP type-of-service (ToS) field. The range of
values is 0 through 255.
ttl value—(Optional) Maximum time-to-live value to include in the traceroute request.
The range of values is 0 through 128.
waitseconds—(Optional)Maximumtime towait for a response to the traceroute request.
Required PrivilegeLevel
network
RelatedDocumentation
traceroute monitor•
List of Sample Output traceroute on page 355traceroute as-number-lookup host on page 356traceroute no-resolve on page 356traceroute propogate-ttl on page 356traceroute (Between CE Routers, Layer 3 VPN) on page 356traceroute (Through anMPLS LSP) on page 356
Output Fields Table 24 on page 355 describes the output fields for the traceroute command. Output
fields are listed in the approximate order in which they appear.
Table 24: traceroute Output Fields
Field DescriptionField Name
IP address of the receiver.traceroute to
Maximum number of hops allowed.hopsmax
Size of packets being sent.byte packets
Number of hops from the source to the named router or switch.number-of-hops
Name of the router or switch for this hop.router-name
Address of the router or switch for this hop.address
Average round-trip time, in milliseconds (ms).Round trip time
Sample Output
traceroute
user@host> traceroute santacruztraceroute to host1.example.com (10.156.169.254), 30 hops max, 40 byte packets 1 blue23 (10.168.1.254) 2.370 ms 2.853 ms 0.367 ms 2 red14 (10.168.255.250) 0.778 ms 2.937 ms 0.446 ms 3 yellow (10.156.169.254) 7.737 ms 89.905 ms 0.834 ms
355Copyright © 2016, Juniper Networks, Inc.
Chapter 17: General Commands

traceroute as-number-lookup host
user@host> traceroute as-number-lookup 10.100.1.1traceroute to 10.100.1.1 (10.100.1.1), 30 hops max, 40 byte packets 1 10.39.1.1 (10.39.1.1) 0.779 ms 0.728 ms 0.562 ms 2 10.39.1.6 (10.39.1.6) [AS 32] 0.657 ms 0.611 ms 0.617 ms 3 10.100.1.1 (10.100.1.1) [AS 10, 40, 50] 0.880 ms 0.808 ms 0.774 ms
user@host> traceroute as-number-lookup 1::1traceroute6 to 1::1 (1::1) from 2001:b8::7, 64 hops max, 12 byte packets
user@host> traceroute 2001:b8::7 as-number-lookuptraceroute6 to 2001:b8::7 (2001:b8::7) from 2001:db8::9, 64 hops max, 12 byte packets 1 2001:db8::10 (2001:db8::10) [AS 18] 0.657 ms 17.319 ms 0.504 ms 2 2001:b8::7 (2001:b8::7) 0.949 ms 0.930 ms 0.739 ms
traceroute no-resolve
user@host> traceroute santacruz no-resolvetraceroute to host1.example.com (10.156.169.254), 30 hops max, 40 byte packets 1 10.168.1.254 0.458 ms 0.370 ms 0.365 ms 2 10.168.255.250 0.474 ms 0.450 ms 0.444 ms 3 10.156.169.254 0.931 ms 0.876 ms 0.862 ms
traceroute propogate-ttl
user@host> traceroute propagate-ttl 100.200.2.2 routing-instance VPN-Atraceroute to 100.200.2.2 (100.200.2.2) from 1.1.0.2, 30 hops max, 40 byte packets
1 1.2.0.2 (1.2.0.2) 2.456 ms 1.753 ms 1.672 ms MPLS Label=299776 CoS=0 TTL=1 S=0 MPLS Label=299792 CoS=0 TTL=1 S=1 2 1.3.0.2 (1.3.0.2) 1.213 ms 1.225 ms 1.166 ms MPLS Label=299792 CoS=0 TTL=1 S=1 3 100.200.2.2 (100.200.2.2) 1.422 ms 1.521 ms 1.443 ms
traceroute (Between CE Routers, Layer 3 VPN)
user@host> traceroute vpn09traceroute to host2.example.com (10.255.14.179), 30 hops max, 40 byte packets 1 10.39.10.21 (10.39.10.21) 0.598 ms 0.500 ms 0.461 ms 2 10.39.1.13 (10.39.1.13) 0.796 ms 0.775 ms 0.806 ms MPLS Label=100006 CoS=0 TTL=1 S=1 3 host2.example.com (10.255.14.179) 0.783 ms 0.716 ms 0.686
traceroute (Through anMPLS LSP)
user@host> traceroutempls1traceroute to 10.168.1.224 (10.168.1.224), 30 hops max, 40 byte packets 1 mpls1-sr0.company.net (10.168.200.101) 0.555 ms 0.393 ms 0.367 ms MPLS Label=1024 CoS=0 TTL=1 2 mpls5-lo0.company.net (10.168.1.224) 0.420 ms 0.394 ms 0.401 ms
Copyright © 2016, Juniper Networks, Inc.356
Network Management and Monitoring Feature Guide for EX2300, EX3400, and EX4300 Switches

CHAPTER 18
Analyzers and Port Mirroring
• show analyzer
357Copyright © 2016, Juniper Networks, Inc.

show analyzer
Syntax show analyzer analyzer-name
Release Information Command introduced in Junos OS Release 9.0 for EX Series switches.
Description Display information about analyzers configured for mirroring.
Options analyzer-name—(Optional) Displays the status of a specific analyzer on the switch.
Required PrivilegeLevel
view
RelatedDocumentation
Understanding Port Mirroring on EX Series Switches•
List of Sample Output show analyzer on page 358
Output Fields Table 25 on page 358 lists the output fields for the command-name command. Output
fields are listed in the approximate order in which they appear.
Table 25: show analyzer Output Fields
Field DescriptionField Name
Displays the name of the analyzer.Analyzer name
Specifies a local interface to which mirrored packets are sent. An analyzer canhave output to either an interface or a VLAN, not both.
Output interface
Specifies aVLAN towhichmirroredpackets are sent. Ananalyzer canhaveoutputto either an interface or a VLAN, not both.
Output VLAN
Displays the ratio of packets to bemirrored.Mirror ratio
Displays interfaces for which traffic exiting the interfaces is mirrored.Egress monitored interfaces
Displays interfaces for which traffic entering the interfaces is mirrored.Ingress monitored interfaces
Displays VLANs for which traffic entering the VLAN is mirrored.Ingress monitored VLANs
Sample Output
show analyzer
user@host> show analyzerAnalyzer name : employee-monitor Output interface : ge-0/0/10.0 Output VLAN : remote-analyzer Mirror ratio : 1 Loss priority : High Egress monitored interfaces : ge-0/0/3.0
Copyright © 2016, Juniper Networks, Inc.358
Network Management and Monitoring Feature Guide for EX2300, EX3400, and EX4300 Switches

Ingress monitored interfaces : ge-0/0/0.0 Ingress monitored interfaces : ge-0/0/1.0
359Copyright © 2016, Juniper Networks, Inc.
Chapter 18: Analyzers and Port Mirroring

Copyright © 2016, Juniper Networks, Inc.360
Network Management and Monitoring Feature Guide for EX2300, EX3400, and EX4300 Switches

CHAPTER 19
sFlow Monitoring Technology
• show sflow
• show sflow interface
• show sflow collector
• clear sflow collectors statistics
361Copyright © 2016, Juniper Networks, Inc.

show sflow
Syntax show sflow<collector><interface>
Release Information Command introduced in Junos OS Release 9.3 for EX Series switches.
Description Display default sFlow technology configuration information.
Options none—Display default sFlow technology configuration information.
collector—(Optional) Display standard status information about the specified sFlow
collector.
interface—(Optional) Display standard status information about the specified sFlow
interface.
Required PrivilegeLevel
view
RelatedDocumentation
show sflow interface on page 364•
• show sflow collector on page 366
• Example: Configuring sFlow Technology to Monitor Network Traffic on EX Series
Switches on page 60
• Configuring sFlow Technology for Network Monitoring (CLI Procedure) on page 64
List of Sample Output show sflow on page 363
Output Fields Table 26 on page 362 lists the output fields for the show sflow command. Output fields
are listed in the approximate order in which they appear.
Table 26: show sflowOutput Fields
Level of OutputField DescriptionField Name
All levelsStatus of the feature: enabled or disabled.sFlow
All levelsRate at which egress packets are sampled.Sample rate egress
All levelsRate at which ingress packets are sampled.Sample rate ingress
All levelsNumber of packets sampled per second. The sampling limitcannot be configured and is set to 300 packets per second.
Sample limit
All levelsInterval at which the sFlow agent polls the interface.Polling interval
All levelsThe IP address assigned to the sFlow agent.Agent ID
Copyright © 2016, Juniper Networks, Inc.362
Network Management and Monitoring Feature Guide for EX2300, EX3400, and EX4300 Switches

Table 26: show sflowOutput Fields (continued)
Level of OutputField DescriptionField Name
All levelsThe IP address for the sFlow datagram.Source IP address
Sample Output
show sflow
sFlow : EnabledSample rate egress : 1:1000Sample rate ingress : 1: 2048: DisabledSample limit : 300 packets/secondPolling interval : 20 secondsAgent ID : 10.93.54.7Source IP address : 10.93.54.7
363Copyright © 2016, Juniper Networks, Inc.
Chapter 19: sFlowMonitoring Technology

show sflow interface
Syntax show sflow interface
Release Information Command introduced in Junos OS Release 9.3 for EX Series switches.
Description Display the interfacesonwhichsFlowtechnology isenabledand thesamplingparameters.
Required PrivilegeLevel
view
RelatedDocumentation
show sflow on page 362•
• show sflow collector on page 366
• Example: Configuring sFlow Technology to Monitor Network Traffic on EX Series
Switches on page 60
• Configuring sFlow Technology for Network Monitoring (CLI Procedure) on page 64
List of Sample Output show sflow interface on page 364
Output Fields Table27onpage364 lists theoutput fields for the showsflow interfacecommand.Output
fields are listed in the approximate order in which they appear.
Table 27: show sflow interface Output Fields
Level of OutputField DescriptionField Name
All levelsInterfaces on which sFlow technology is enabled.Interface
All levelsIndicates whether egress sampling rate is enabled.Status Egress
All levelsIndicates whether ingress sampling rate is enabled.Status Ingress
All levelsRate at which egress packets are sampled.Sample rate Egress
All levelsRate at which ingress packets are sampled.Sample rate Ingress
All levelsAdapted rate at which egress packets are sampled.Adapted sample rate Egress
All levelsAdapted rate at which ingress packets are sampled.Adapted sample rate Ingress
All levelsThe interval at which the sFlow agent polls the interface.Polling-interval
Sample Output
show sflow interface
Interface Status Sample rate Adapted sample rate Polling-interval
Copyright © 2016, Juniper Networks, Inc.364
Network Management and Monitoring Feature Guide for EX2300, EX3400, and EX4300 Switches

Egress Ingress Egress Ingress Egress Ingressge-0/0/0.0 Enabled Disabled 1000 2048 1000 2048 20
365Copyright © 2016, Juniper Networks, Inc.
Chapter 19: sFlowMonitoring Technology

show sflow collector
Syntax show sflow collector
Release Information Command introduced in Junos OS Release 9.3 for EX Series switches.
Description Display a list of configured sFlow collectors and their properties.
Required PrivilegeLevel
view
RelatedDocumentation
show sflow on page 362•
• show sflow interface on page 364
• Example: Configuring sFlow Technology to Monitor Network Traffic on EX Series
Switches on page 60
• Configuring sFlow Technology for Network Monitoring (CLI Procedure) on page 64
List of Sample Output show sflow collector on page 366
Output Fields Table28onpage366 lists theoutput fields for the showsflowcollectorcommand.Output
fields are listed in the approximate order in which they appear.
Table 28: show sflow collector Output Fields
Level of OutputField DescriptionField Name
All levelsIP address of the collector.IP address
All levelsUDP port number.UDP port
All levelsNumber of samples sent to collector.No of samples
Sample Output
show sflow collector
IP-address UDP-Port No of samples10.204.32.46 5600 1000 100.204.32.76 3400 1000
Copyright © 2016, Juniper Networks, Inc.366
Network Management and Monitoring Feature Guide for EX2300, EX3400, and EX4300 Switches

clear sflow collectors statistics
Syntax clear sflow collectors statistics
Release Information Command introduced in JUNOS Release 9.5 for EX Series switches.
Description Clear the sFlow collector’s statistics.
Required PrivilegeLevel
clear
RelatedDocumentation
show sflow collector on page 366•
• Configuring sFlow Technology for Network Monitoring (CLI Procedure) on page 64
Sample Output
clear sflow collectors statistics
367Copyright © 2016, Juniper Networks, Inc.
Chapter 19: sFlowMonitoring Technology

Copyright © 2016, Juniper Networks, Inc.368
Network Management and Monitoring Feature Guide for EX2300, EX3400, and EX4300 Switches

CHAPTER 20
Ethernet OAM Connectivity FaultManagement
• clear oam ethernet connectivity-fault-management delay-statistics
• clear oam ethernet connectivity-fault-management sla-iterator-statistics
• clear oam ethernet connectivity-fault-management statistics
• monitor ethernet delay-measurement
• show oam ethernet connectivity-fault-management delay-statistics
• show oam ethernet connectivity-fault-management forwarding-state
• show oam ethernet connectivity-fault-management interfaces
• show oam ethernet connectivity-fault-management path-database
• show oam ethernet connectivity-fault-management mep-database
• show oam ethernet connectivity-fault-management mip
• show oam ethernet connectivity-fault-management sla-iterator-statistics
369Copyright © 2016, Juniper Networks, Inc.

clear oam ethernet connectivity-fault-management delay-statistics
Syntax clear oam ethernet connectivity-fault-management delay-statisticsmaintenance-associationmaintenance-association-namemaintenance-domainmaintenance-domain-name<logical-system logical-system-name><one-way><two-way>
Release Information Command introduced in Junos OS Release 9.6.
Command introduced in Junos OS Release 11.4 for EX Series switches.
Description OnMX Series routers and EX Series switches, clear ITU-T Y.1731 Ethernet frame delay
measurement (ETH-DM) delay statistics and ETH-DM frame counts.
Options maintenance-associationmaintenance-association-name—Clear ETH-DMdelay statistics
and ETH-DM frame counts for the specified maintenance association.
maintenance-domainmaintenance-domain-name—Clear ETH-DM delay statistics and
ETH-DM frame counts for the specified maintenance domain.
logical-system logical-system-name—(MX Series routers only) (Optional) Clear ETH-DM
delay statistics and ETH-DM frame counts for the specified logical system.
one-way—(Optional) Clear one-wayETH-DMdelay statistics andETH-DM framecounts
for the specified maintenance association, maintenance domain, or (on the routers
only) logical system.
two-way—(Optional)Clear two-wayETH-DMdelay statistics andETH-DMframecounts
for the specified maintenance association, maintenance domain, or (on the routers
only) logical system.
Required PrivilegeLevel
view
RelatedDocumentation
clear oam ethernet connectivity-fault-management statistics•
• show oam ethernet connectivity-fault-management delay-statistics on page 379
• show oam ethernet connectivity-fault-management interfaces
List of Sample Output clear oam ethernet connectivity-fault-management delay statistics on page 370
Output Fields When you enter this command, you are provided feedback on the status of your request.
Sample Output
clear oam ethernet connectivity-fault-management delay statistics
user@switch> clear oam ethernet connectivity-fault-management delay-statisticsmaintenance-domainmd1maintenance-associationma1Delay statistics entries cleared
Copyright © 2016, Juniper Networks, Inc.370
Network Management and Monitoring Feature Guide for EX2300, EX3400, and EX4300 Switches

371Copyright © 2016, Juniper Networks, Inc.
Chapter 20: Ethernet OAM Connectivity Fault Management

clear oam ethernet connectivity-fault-management sla-iterator-statistics
Syntax clear oam ethernet connectivity-fault-management sla-iterator-statisticsmaintenance-associationmaintenance-association-namemaintenance-domainmaintenance-domain-name<local-mep local-mep-id><remote-mep remote-mep-id>sla-iterator sla-iterator
Release Information Command introduced in Junos OS Release 11.4 for EX Series switches.
Command introduced in Junos OS Release 13.2 for MX Series routers.
Description Clear Ethernet Operation, Administration, and Maintenance (OAM) service-level
agreement (SLA) iterator statistics. ForMXSeries routers, clear theSLA iterator statistics
and proactive Ethernet synthetic loss measurement (ETH-SLM) statistics.
Options maintenance-associationmaintenance-association-name—Name of the maintenance
association.
maintenance-domainmaintenance-domain-name—Name of the maintenance domain.
local-mep local-mep-id—(Optional) Identifier of the local MEP.
remote-mep remote-mep-id—(Optional) Identifier of the remote MEP.
sla-iterator sla-iterator—Name of the SLA iterator profile.
Required PrivilegeLevel
view
List of Sample Output clearoamethernetconnectivity-fault-managementsla-iterator- statisticsonpage372
Output Fields When you enter this command, you are provided feedback on the status of your request.
Sample Output
clear oam ethernet connectivity-fault-management sla-iterator- statistics
user@switch> clear oam ethernet connectivity-fault-management sla-iterator-statisticsmaintenance-domainmd1maintenance-associationma1 local-mep 1 remote-mep 2 sla-iteratori1Iterator statistics entries cleared
Copyright © 2016, Juniper Networks, Inc.372
Network Management and Monitoring Feature Guide for EX2300, EX3400, and EX4300 Switches

clear oam ethernet connectivity-fault-management statistics
Syntax clear oam ethernet connectivity-fault-management statistics<interface ethernet-interface-name><levelmd-level>
Release Information Command introduced in Junos OS Release 10.2 for EX Series switches.
Description Clear all statistics maintained by CFM.
Options interfaceethernet-interface-name—(Optional)ClearCFMstatisticsonly forMEPsattached
to the specified Ethernet physical interface.
level level—(Optional) Clear CFM statistics only for MEPs within CFMmaintenance
domains (MDs) of the specified level.
Required PrivilegeLevel
clear
RelatedDocumentation
show oam ethernet connectivity-fault-management interfaces on page 387•
• show oam ethernet connectivity-fault-management path-database on page 393
• show oam ethernet connectivity-fault-managementmip on page 402
List of Sample Output clear oam ethernet connectivity-fault-management statistics on page 373
Output Fields When you enter this command, you are provided feedback on the status of your request.
Sample Output
clear oam ethernet connectivity-fault-management statistics
user@host> clear oam ethernet connectivity-fault-management statisticsCleared statistics of all CFM sessions
373Copyright © 2016, Juniper Networks, Inc.
Chapter 20: Ethernet OAM Connectivity Fault Management

monitor ethernet delay-measurement
Syntax monitor ethernet delay-measurementmaintenance-domainmd-namemaintenance-associationma-name (one-way | two-way) (remote-mac-address | mepremote-mep-id) <count count> <no-session-id-tlv> <priority 802.1p value> <size size><wait time>
Release Information Command introduced in Junos OS Release 11.4 for EX Series switches.
Description Start an ITU-T Y.1731 Ethernet frame delaymeasurement session between the specified
local connectivity fault management (CFM)maintenance association end point (MEP)
and the specified remote MEP, and display a summary of the frames exchanged in the
measurement session. Frame delay measurement statistics are stored at one of the
MEPs for later retrieval.
NOTE: If you attempt tomonitor delays to a nonexistent MAC address, youmust type Ctrl +C to explicitly quit themonitor ethernet delay-measurement
command and return to the CLI command prompt.
To start an Ethernet frame delaymeasurement session, the switch initiates an exchange
of frames carrying one-way or two-way frame delay measurement protocol data units
(PDUs)between the local and remoteMEPs.The framecounts—the typesofandnumber
of Ethernet frame delay measurement PDU frames exchanged to measure frame delay
times—are displayed as the run-time output of themonitor ethernet delay-measurement
command and are also stored at both the initiator and receiver MEPs for later retrieval.
Ethernet framedelaymeasurement statistics, describedbelow, aremeasuredandstored
at only one of the MEPs:
Frame delay—The difference, in microseconds, between the time a frame is sent and
when it is received.
Framedelay variation—Thedifference, inmicroseconds, betweenconsecutive framedelay
values. Frame delay variation is sometimes called “frame jitter.”
For one-way Ethernet frame delay measurement, only the receiver MEP (on the remote
system) collects statistics. For two-way Ethernet frame delay measurement, only the
initiator MEP (on the local system) collects statistics.
Options count count—(Optional) Number of frames to send to the specified peer MEP. The range
of values is 1 through 65,535 frames. The default value is 10 frames.
maintenance-associationma-name—Nameof an existing CFMmaintenance association.
maintenance-domainmd-name—Name of an existing CFMmaintenance domain.
mep remote-mep-id—Numeric identifier of the peer MEPwith which to perform Ethernet
frame delay measurement. The discovered MAC address of the peer MEP is used.
The range of values is 1 through 8191.
Copyright © 2016, Juniper Networks, Inc.374
Network Management and Monitoring Feature Guide for EX2300, EX3400, and EX4300 Switches

no-session-id-tlv—(Optional)Prevent insertionof the session IDTLV in the request frame.
one-way—Measurement type is one-way Ethernet frame delay measurement, which is
basedon thedifferencebetween the timeatwhich the initiatorMEPsendsaone-way
delay measurement request (1DM) frame and the time at which the receiver MEP
receives the frame.
priority 802.1p value—(Optional) Priority of the delay measurement request frame
supported by both one-way delaymeasurement and two-way delaymeasurement.
The range of values is from 0 through 7. The default value is zero.
remote-mac-address—Unicast MAC address of the peer MEP with which to perform
Ethernet frame delay measurement. Specify the MAC address as six hexadecimal
bytes in nn:nn:nn:nn:nn:nn format. Multicast MAC addresses are not supported.
size size—(Optional) Size of the data TLV to be included in the request frame. The range
of values is from 1 through 1400 bytes.
two-way—Measurement type is two-way Ethernet frame delay measurement, which is
basedon thedifferencebetween the timeatwhich the initiatorMEPsendsa two-way
delaymeasurementmessage (DMM) frame and the time at which the initiator MEP
receives an associated two-way delay measurement reply (DMR) frame from the
responder MEP, subtracting the time elapsed at the responder MEP.
wait time—(Optional) Number of seconds to wait between sending frames. The range
of values is from 1 through 255 seconds. The default value is 1 second.
Required PrivilegeLevel
trace andmaintenance
RelatedDocumentation
Configuring an Iterator Profile on a Switch (CLI Procedure)•
• show oam ethernet connectivity-fault-managementmep-database on page 396
• show oam ethernet connectivity-fault-managementmep-statistics
• show oam ethernet connectivity-fault-management delay-statistics on page 379
• clear oam ethernet connectivity-fault-management statistics on page 373
List of Sample Output monitor ethernet delay-measurement one-way on page 377monitor ethernet delay-measurement two-way on page 377monitor ethernet delay-measurement two-way (Invalid DMR FramesReceived) on page 377
Output Fields Themonitor ethernet delay-measurement command displays different output at the CLI,
depending on whether you start a one-way or two-way frame delay measurement:
• Table 29 on page 376 lists the run-time output fields for themonitor ethernet
delay-measurement one-way command.
• Table 30 on page 376 lists the run-time output fields for themonitor ethernet
delay-measurement two-way command.
375Copyright © 2016, Juniper Networks, Inc.
Chapter 20: Ethernet OAM Connectivity Fault Management

Output fields are listed in the approximate order in which they appear.
Table 29: monitor ethernet delay-measurement one-way Output Fields
Output Field DescriptionOutput Field Name
Unicast MAC address of the remote peer MEP.One-way ETH-DM requestto
Name of the Ethernet physical, logical, or trunk interface to which the local MEP is attached.Interface
PDU frames sent to the remote MEP in this ETH-DM session.1DM Frames sent
Total number of 1DM PDU frames sent to the remote MEP during this measurement session.Packets transmitted
Average two-way frame delay measured in this session.Average delay
Average frame jitter measured in this session.Average delay variation
Lowest two-way frame delay measured in this session.Best case delay
Highest two-way frame delay measured in this session.Worst case delay
NOTE: For one-way delay measurement, these CLI output fields display NA (“not applicable”) at the initiator MEP becauseone-way frame delay measurements occur at the receiver MEP.
Table 30: monitor ethernet delay-measurement two-way Output Fields
Output Field DescriptionOutput Field Name
Unicast MAC address of the remote peer MEP.Two-way Ethernet framedelaymeasurement requestto
Name of the Ethernet physical, logical, or trunk interface to which the local MEP is attached.Interface
Unicast MAC address of the remote MEP that transmitted this DMR frame in response to a DMMframe.
DMR received from
Two-way delay, in microseconds, for the initiator-transmitted DMM frame.Delay
Difference, in microseconds, between the current and previous delay values. This is also known asjitter.
Delay variation
Total number of DMM PDU frames sent to the remote MEP in this measurement session.Packets transmitted
Total number of DMR PDU frames received from the remote MEP in this measurement session.Valid packets received
Average two-way frame delay measured in this session.Average delay
Average frame jitter measured in this session.Average delay variation
Copyright © 2016, Juniper Networks, Inc.376
Network Management and Monitoring Feature Guide for EX2300, EX3400, and EX4300 Switches

Table 30: monitor ethernet delay-measurement two-way Output Fields (continued)
Output Field DescriptionOutput Field Name
Lowest two-way frame delay measured in this session.Best case delay
Highest two-way frame delay measured in this session.Worst case delay
Sample Output
monitor ethernet delay-measurement one-way
user@switch> monitor ethernet delay-measurement one-way 00:05:85:73:39:4amaintenance-domainmd6maintenance-associationma6 count 10One-way ETH-DM request to 00:05:85:73:39:4a, Interface xe-5/0/0.01DM Frames sent : 10--- Delay measurement statistics ---Packets transmitted: 10Average delay: NA, Average delay variation: NABest case delay: NA, Worst case delay: NA
monitor ethernet delay-measurement two-way
user@switch> monitor ethernet delay-measurement two-way 00:05:85:73:39:4amaintenance-domainmd6maintenance-associationma6 count 10Two-way ETH-DM request to 00:05:85:73:39:4a, Interface xe-5/0/0.0DMR received from 00:05:85:73:39:4a Delay: 100 usec Delay variation: 0 usecDMR received from 00:05:85:73:39:4a Delay: 92 usec Delay variation: 8 usecDMR received from 00:05:85:73:39:4a Delay: 92 usec Delay variation: 0 usecDMR received from 00:05:85:73:39:4a Delay: 111 usec Delay variation: 19 usecDMR received from 00:05:85:73:39:4a Delay: 110 usec Delay variation: 1 usecDMR received from 00:05:85:73:39:4a Delay: 119 usec Delay variation: 9 usecDMR received from 00:05:85:73:39:4a Delay: 122 usec Delay variation: 3 usecDMR received from 00:05:85:73:39:4a Delay: 92 usec Delay variation: 30 usecDMR received from 00:05:85:73:39:4a Delay: 92 usec Delay variation: 0 usecDMR received from 00:05:85:73:39:4a Delay: 108 usec Delay variation: 16 usec
--- Delay measurement statistics ---Packets transmitted: 10, Valid packets received: 10Average delay: 103 usec, Average delay variation: 8 usecBest case delay: 92 usec, Worst case delay: 122 usec
monitor ethernet delay-measurement two-way (Invalid DMR Frames Received)
user@switch> monitor ethernet delay-measurement two-way 00:05:85:73:39:4amaintenance-domainmd6maintenance-associationma6 count 10Two-way ETH-DM request to 00:05:85:73:39:4a, Interface xe-5/0/0.0DMR received from 00:05:85:73:39:4a Delay: 100 usec Delay variation: 0 usecDMR received from 00:05:85:73:39:4a Delay: 92 usec Delay variation: 8 usecDMR received from 00:05:85:73:39:4a Delay: 92 usec Delay variation: 0 usecDMR received from 00:05:85:73:39:4a Delay: 111 usec Delay variation: 19 usecDMR received from 00:05:85:73:39:4a Delay: 110 usec Delay variation: 1 usecDMR received from 00:05:85:73:39:4a Delay: 119 usec Delay variation: 9 usecDMR received from 00:05:85:73:39:4a Delay: 122 usec Delay variation: 3 usecDMR received from 00:05:85:73:39:4a Delay: 92 usec Delay variation: 30 usecDMR received from 00:05:85:73:39:4a with invalid timestamp(s).DMR received from 00:05:85:73:39:4a Delay: 108 usec Delay variation: 16 usec
--- Delay measurement statistics ---
377Copyright © 2016, Juniper Networks, Inc.
Chapter 20: Ethernet OAM Connectivity Fault Management

Packets transmitted: 10, Valid packets received: 9, Invalid packets received: 1Average delay: 105 usec, Average delay variation: 9 usecBest case delay: 92 usec, Worst case delay: 122 usec
Copyright © 2016, Juniper Networks, Inc.378
Network Management and Monitoring Feature Guide for EX2300, EX3400, and EX4300 Switches

show oam ethernet connectivity-fault-management delay-statistics
Syntax show oam ethernet connectivity-fault-management delay-statistics<count entry-count><local-mepmep-id><maintenance-associationma-name><maintenance-domainmd-name><remote-mep remote-mep-id>
Release Information Command introduced in Junos OS Release 9.5.
Command introduced in Junos OS Release 11.4 for EX Series switches.
Description OnMX Series routers with Ethernet interfaces on Dense Port Concentrators (DPCs),
display ETH-DM delay statistics.
On EX Series switches, display delay measurement results.
Options count entry-count—(Optional) Number of entries to display from the statistics table. The
range of values is 1 through 100. The default value is 100 entries.
local-mepmep-id—(Optional) Numeric identifier of the local MEP. OnMX Series routers,
the range of values is 1 through 8192. On EX Series switches, the range of values is 1
through 8191.
maintenance-associationma-name—Nameof an existing CFMmaintenance association.
maintenance-domainmd-name—Name of an existing connectivity fault management
(CFM)maintenance domain.
remote-mep remote-mep-id—(Optional) Numeric identifier of the remote MEP. On MX
Series routers, the range of values is 1 through8192. On EXSeries switches, the range
of values is 1 through 8191.
Required PrivilegeLevel
view
RelatedDocumentation
clear oam ethernet connectivity-fault-management statistics•
• clear oam ethernet connectivity-fault-management delay-statistics on page 370
• show oam ethernet connectivity-fault-management interfaces
• show oam ethernet connectivity-fault-management mep-database
• show oam ethernet connectivity-fault-management mep-statistics
List of Sample Output show oam ethernet connectivity-fault-management delay-statistics on page 381show oam ethernet connectivity-fault-management delay-statisticsremote-mep on page 381
Output Fields Table 31 on page 380 lists the output fields for the show oam ethernet
connectivity-fault-management delay-statistics command and the show oam ethernet
379Copyright © 2016, Juniper Networks, Inc.
Chapter 20: Ethernet OAM Connectivity Fault Management
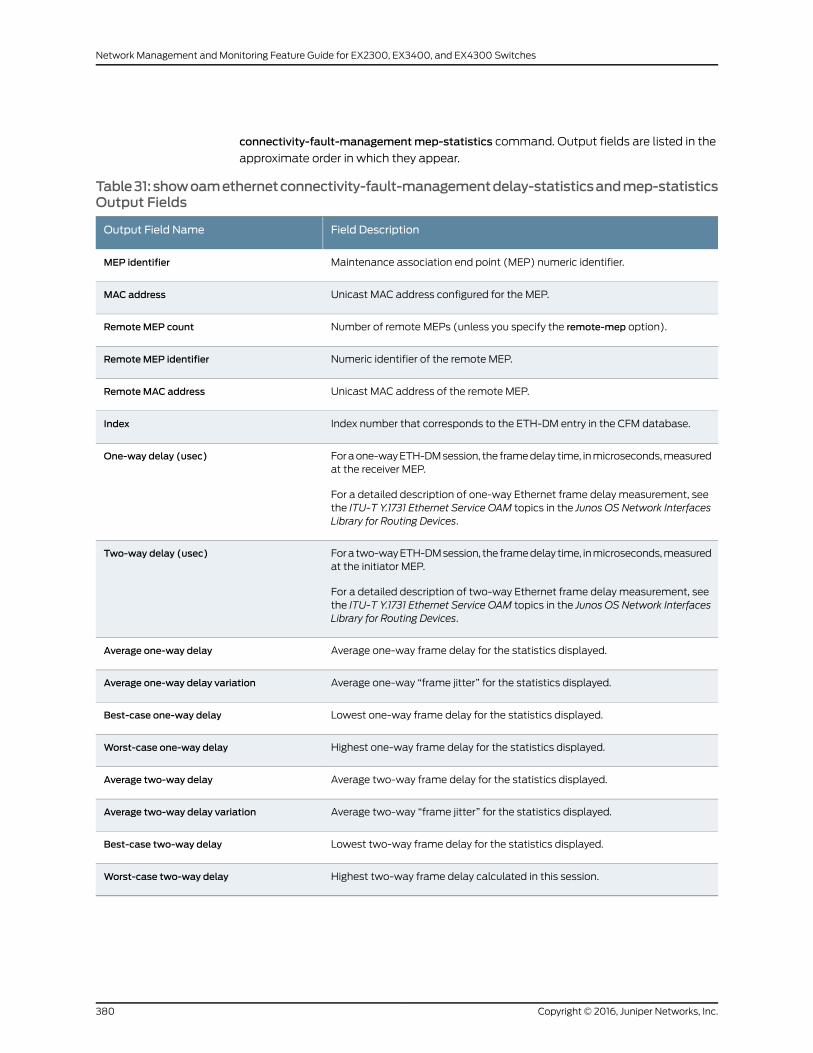
connectivity-fault-managementmep-statistics command. Output fields are listed in the
approximate order in which they appear.
Table31:showoamethernetconnectivity-fault-managementdelay-statisticsandmep-statisticsOutput Fields
Field DescriptionOutput Field Name
Maintenance association end point (MEP) numeric identifier.MEP identifier
Unicast MAC address configured for the MEP.MAC address
Number of remote MEPs (unless you specify the remote-mep option).RemoteMEP count
Numeric identifier of the remote MEP.RemoteMEP identifier
Unicast MAC address of the remote MEP.RemoteMAC address
Index number that corresponds to the ETH-DM entry in the CFM database.Index
Foraone-wayETH-DMsession, the framedelay time, inmicroseconds,measuredat the receiver MEP.
For a detailed description of one-way Ethernet frame delay measurement, seethe ITU-T Y.1731 Ethernet Service OAM topics in the Junos OS Network InterfacesLibrary for Routing Devices.
One-way delay (usec)
Fora two-wayETH-DMsession, the framedelay time, inmicroseconds,measuredat the initiator MEP.
For a detailed description of two-way Ethernet frame delay measurement, seethe ITU-T Y.1731 Ethernet Service OAM topics in the Junos OS Network InterfacesLibrary for Routing Devices.
Two-way delay (usec)
Average one-way frame delay for the statistics displayed.Average one-way delay
Average one-way “frame jitter” for the statistics displayed.Average one-way delay variation
Lowest one-way frame delay for the statistics displayed.Best-case one-way delay
Highest one-way frame delay for the statistics displayed.Worst-case one-way delay
Average two-way frame delay for the statistics displayed.Average two-way delay
Average two-way “frame jitter” for the statistics displayed.Average two-way delay variation
Lowest two-way frame delay for the statistics displayed.Best-case two-way delay
Highest two-way frame delay calculated in this session.Worst-case two-way delay
Copyright © 2016, Juniper Networks, Inc.380
Network Management and Monitoring Feature Guide for EX2300, EX3400, and EX4300 Switches

Sample Output
show oam ethernet connectivity-fault-managementdelay-statistics
user@switch> show oam ethernet connectivity-fault-management delay-statisticsmaintenance-domainmd6maintenance-associationma6MEP identifier: 100, MAC address: 00:05:85:73:7b:39Remote MEP count: 2 Remote MEP identifier: 101 Remote MAC address: 00:05:85:73:39:4a Delay measurement statistics: Index One-way delay Two-way delay (usec) (usec) 1 259 519 2 273 550 3 287 571 4 299 610 5 313 650 Average one-way delay : 286 usec Average one-way delay variation: 62 usec Best case one-way delay : 259 usec Worst case one-way delay : 313 usec Average two-way delay : 580 usec Average two-way delay variation: 26 usec Best case two-way delay : 519 usec Worst case two-way delay : 650 usec
Remote MEP identifier: 102 Remote MAC address: 00:04:55:63:39:5a Delay measurement statistics: Index One-way delay Two-way delay (usec) (usec) 1 29 58 2 23 59 3 27 56 4 29 62 5 33 68 Average one-way delay : 28 usec Average one-way delay variation: 3 usec Best case one-way delay : 23 usec Worst case one-way delay : 33 usec Average two-way delay : 60 usec Average two-way delay variation: 3 usec Best case two-way delay : 56 usec Worst case two-way delay : 68 usec
show oam ethernet connectivity-fault-management delay-statistics remote-mep
user@switch> show oam ethernet connectivity-fault-management delay-statisticsmaintenance-domainmd6maintenance-associationma6 remote-mep 101MEP identifier: 100, MAC address: 00:05:85:73:7b:39
Remote MEP identifier: 101 Remote MAC address: 00:05:85:73:39:4a Delay measurement statistics: Index One-way delay Two-way delay (usec) (usec) 1 259 519
381Copyright © 2016, Juniper Networks, Inc.
Chapter 20: Ethernet OAM Connectivity Fault Management

2 273 550 3 287 571 4 299 610 5 313 650 Average one-way delay : 286 usec Average one-way delay variation: 62 usec Best case one-way delay : 259 usec Worst case one-way delay : 313 usec Average two-way delay : 580 usec Average two-way delay variation: 26 usec Best case two-way delay : 519 usec Worst case two-way delay : 650 usec
Copyright © 2016, Juniper Networks, Inc.382
Network Management and Monitoring Feature Guide for EX2300, EX3400, and EX4300 Switches

show oam ethernet connectivity-fault-management forwarding-state
Syntax show oam ethernet connectivity-fault-management forwarding-stateinterface interface-name<brief | detail | extensive>
Release Information Command introduced in Junos OS Release 10.2 for EX Series switches.
Description Display IEEE 802.1ag Operation, Administration, and Management (OAM) connectivity
fault management forwarding state information for Ethernet interfaces.
Options interface interface-name—Display forwarding state information for the specified Ethernet
interface only.
brief | detail | extensive—(Optional) Display the specified level of output.
Required PrivilegeLevel
view
RelatedDocumentation
clear oam ethernet connectivity-fault-management statistics on page 373•
• show oam ethernet connectivity-fault-management path-database on page 393
• show oam ethernet connectivity-fault-managementmip on page 402
List of Sample Output show oam ethernet connectivity-fault-management forwarding-state on page 384show oam ethernet connectivity-fault-management forwarding-stateinterface on page 384show oam ethernet connectivity-fault-management forwarding-state interfacedetail on page 385show oam ethernet connectivity-fault-management forwarding-state interfaceinterface-name on page 386
Output Fields Table 32 on page 383 lists the output fields for the show oam ethernet
connectivity-fault-management forwarding-state command. Output fields are listed in
the approximate order in which they appear.
Table 32: show oam ethernet connectivity-fault-management forwarding-state Output Fields
Level of OutputField DescriptionField Name
All levelsInterface identifier.Interface name
All levelsFilter action for messages at the level.Filter action
All levelsNext-hop type.Nexthop type
briefNext-hop index number.Nexthop index
detailMaintenance domain (MD) level.Level
383Copyright © 2016, Juniper Networks, Inc.
Chapter 20: Ethernet OAM Connectivity Fault Management

Table 32: show oam ethernet connectivity-fault-management forwarding-state OutputFields (continued)
Level of OutputField DescriptionField Name
noneMEP direction configured.Direction
All levelsNumber of customer edge (CE) interfaces.CEs
Sample Output
show oam ethernetconnectivity-fault-management forwarding-state
user@host> show oam ethernet connectivity–fault-management forwarding-stateCEs: 3
Maintenance domain forwarding state:
Level Direction Filter action Nexthop Nexthop type index 0 Drop none 1 Drop none 2 Drop none 3 Drop none 4 Drop none 5 Drop none 6 Drop none 7 Drop none
show oam ethernetconnectivity-fault-management forwarding-state interface
user@host> show oam ethernet connectivity-fault-management forwarding-state interfaceInterface name: ge-3/0/0.0 Maintenance domain forwarding state:
Level Direction Filter action Nexthop Nexthop type index 0 Drop none 1 Drop none 2 Drop none 3 Drop none 4 Drop none 5 Drop none 6 Drop none 7 down Receive none
Interface name: xe-0/0/0.0Instance name: __+bd1__ Maintenance domain forwarding state:
Level Direction Filter action Nexthop Nexthop type index 0 Drop none
Copyright © 2016, Juniper Networks, Inc.384
Network Management and Monitoring Feature Guide for EX2300, EX3400, and EX4300 Switches

1 Drop none 2 Drop none 3 Drop none 4 Drop none 5 Drop none 6 Drop none 7 down Receive none
show oam ethernetconnectivity-fault-management forwarding-state interface detail
user@host> show oam ethernet connectivity-fault-management forwarding-state interfacedetailInterface name: ge-3/0/0.0
Level: 0 Filter action: Drop Nexthop type: none
Level: 1 Filter action: Drop Nexthop type: none
Level: 2 Filter action: Drop Nexthop type: none
Level: 3 Filter action: Drop Nexthop type: none
Level: 4 Filter action: Drop Nexthop type: none
Level: 5 Filter action: Drop Nexthop type: none
Level: 6 Filter action: Drop Nexthop type: none
Level: 7 Direction: down Filter action: Receive Nexthop type: none
Interface name: xe-0/0/0.0
Level: 0 Filter action: Drop Nexthop type: none
Level: 1 Filter action: Drop Nexthop type: none
...
385Copyright © 2016, Juniper Networks, Inc.
Chapter 20: Ethernet OAM Connectivity Fault Management

show oam ethernetconnectivity-fault-management forwarding-state interfaceinterface-name
user@host> show oam ethernet connectivity-fault-management forwarding-state interfaceinterface-name ge-3/0/0.0Interface name: ge-3/0/0.0
Maintenance domain forwarding state:
Level Direction Filter action Nexthop Nexthop type index 0 Drop none 1 Drop none 2 Drop none 3 Drop none 4 Drop none 5 Drop none 6 Drop none 7 down Receive none
Copyright © 2016, Juniper Networks, Inc.386
Network Management and Monitoring Feature Guide for EX2300, EX3400, and EX4300 Switches

show oam ethernet connectivity-fault-management interfaces
Syntax show oam ethernet connectivity-fault-management interfaces<ethernet-interface-name><levelmd-level><brief | detail | extensive>
Release Information Command introduced in Junos OS Release 10.2 for EX Series switches.
Description Display IEEE 802.1ag Operation, Administration, and Management (OAM) connectivity
fault management (CFM) database information for Ethernet interfaces.
Options brief | detail | extensive—(Optional) Display the specified level of output.
ethernet-interface-name—(Optional) Display CFM information only for CFM entities
attached to the specified Ethernet interface.
levelmd-level—(Optional) Display CFM information for CFM identities enclosed within
a maintenance domain of the specified level.
Required PrivilegeLevel
view
RelatedDocumentation
clear oam ethernet connectivity-fault-management statistics on page 373•
• show oam ethernet connectivity-fault-management path-database on page 393
• show oam ethernet connectivity-fault-managementmip on page 402
List of Sample Output show oam ethernet connectivity-fault-management interfaces on page 390show oam ethernet connectivity-fault-management interfaces detail on page 390show oamethernet connectivity-fault-management interfacesextensive on page 391show oam ethernet connectivity-fault-management interfaces level on page 392show oam ethernet connectivity-fault-management interfaces (TrunkInterfaces) on page 392
Output Fields Table 33 on page 387 lists the output fields for the show oam ethernet
connectivity-fault-management interfaces command. Output fields are listed in the
approximate order in which they appear.
Table 33: show oam ethernet connectivity-fault-management interfaces Output Fields
Level of OutputField DescriptionField Name
All levelsInterface identifier.Interface
All levelsLocal interface status.Interface status
All levelsLocal link status. Up, down, or oam-down.Link status
detail extensiveMaintenance domain name.Maintenancedomain name
387Copyright © 2016, Juniper Networks, Inc.
Chapter 20: Ethernet OAM Connectivity Fault Management

Table 33: show oam ethernet connectivity-fault-management interfaces OutputFields (continued)
Level of OutputField DescriptionField Name
detail extensiveMaintenance domain name format configured.Format(Maintenancedomain)
All levelsMaintenance domain level configured.Level
detail extensiveMaintenance association name.Maintenanceassociation name
detail extensiveMaintenance association name format configured.Format(Maintenanceassociation)
detail extensiveContinuity-check status.Continuity-checkstatus
detail extensiveContinuity-check message interval.Interval
detail extensiveLost continuity-check message threshold.Loss-threshold
All levelsMaintenance association end point (MEP) identifier.MEP identifier
All levelsNumber of MEP neighbors.Neighbours
detail extensiveMEP direction configured.Direction
detail extensiveMAC address configured for the MEP.MAC address
detail extensiveIndicates the status of the Connectivity Fault Management (CFM) protocolrunning on the MEP: Running, inactive, disabled, or unsupported.
MEP status
detail extensiveWhether the remoteMEP is not receiving connectivity checkmessages (CCMs).RemoteMEP notreceiving CCM
detail extensiveWhether erroneous CCMs have been received.Erroneous CCMreceived
detail extensiveWhether cross-connect CCMs have been received.Cross-connectCCMreceived
detail extensiveWhether the remote defect indication (RDI) bit is set in messages that havebeen received. The absence of the RDI bit in a CCM indicates that thetransmitting MEP is receiving CCMs from all configured MEPs.
RDI sent by someMEP
detail extensiveNumber of CCMs transmitted.CCMs sent
detail extensiveNumber of CCMs received out of sequence.CCMs received outof sequence
Copyright © 2016, Juniper Networks, Inc.388
Network Management and Monitoring Feature Guide for EX2300, EX3400, and EX4300 Switches

Table 33: show oam ethernet connectivity-fault-management interfaces OutputFields (continued)
Level of OutputField DescriptionField Name
detail extensiveNumber of loopback request messages (LBMs) sent.LBMs sent
detail extensiveNumber of loopback responsemessages (LBRs) received that were validmessages and in sequence.
Valid in-order LBRsreceived
detail extensiveNumber of LBRs received that were valid messages and not in sequence.Valid out-of-orderLBRs received
detail extensiveNumber of LBRs received that were corrupted.LBRs receivedwithcorrupted data
detail extensiveNumber of LBRs transmitted.LBRs sent
detail extensiveLinktrace messages (LTMs) transmitted.LTMs sent
detail extensiveLinktrace messages received.LTMs received
detail extensiveLinktrace responses (LTRs) transmitted.LTRs sent
detail extensiveLinktrace responses received.LTRs received
detail extensiveSequence number of next LTM request to be transmitted.Sequence numberofnextLTMrequest
detail extensiveIf the interface is attached to an initiator MEP for a one-way ETH-DM session:Number of one-way delay measurement (1DM) PDU frames sent to the peerMEP in this session.
For all other cases, this field displays 0.
1DMs sent
detail extensiveIf the interface is attached to a receiver MEP for a one-way ETH-DM session:Number of valid 1DM frames received.
For all other cases, this field displays 0.
Valid 1DMsreceived
detail extensiveIf the interface is attached to a receiver MEP for a one-way ETH-DM session:Number of invalid 1DM frames received.
For all other cases, this field displays 0.
Invalid 1DMsreceived
detail extensiveIf the interface is attached to an initiator MEP for a two-way ETH-DM session:Number of Delay Measurement Message (DMM) PDU frames sent to the peerMEP in this session.
For all other cases, this field displays 0.
DMMs sent
detail extensiveIf the interface is attached to a responder MEP for a two-way ETH-DM session:Number of Delay Measurement Reply (DMR) frames sent.
For all other cases, this field displays 0.
DMRs sent
389Copyright © 2016, Juniper Networks, Inc.
Chapter 20: Ethernet OAM Connectivity Fault Management

Table 33: show oam ethernet connectivity-fault-management interfaces OutputFields (continued)
Level of OutputField DescriptionField Name
detail extensiveIf the interface is attached to an initiator MEP for a two-way ETH-DM session:Number of valid DMRs received.
For all other cases, this field displays 0.
Valid DMRsreceived
detail extensiveIf the interface is attached to an initiator MEP for a two-way ETH-DM session:Number of invalid DMRs received.
For all other cases, this field displays 0.
Invalid DMRsreceived
extensiveNumber of remote MEPs.RemoteMEP count
extensiveMEP identifier of the remote MEP.Identifier (remoteMEP)
extensiveMAC address of the remote MEP.MAC address(remote MEP)
extensiveState of the remote MEP.State (remoteMEP)
extensiveInterface of the remote MEP.Interface (remoteMEP)
Sample Output
show oam ethernet connectivity-fault-management interfaces
user@host> show oam ethernet connectivity-fault-management interfacesInterface Link Status Level MEP Neighbours Identifierge-1/1/0.0 Up Active 0 2 1ge-1/1/0.1 Up Active 0 2 1ge-1/1/0.10 Up Active 0 2 1ge-1/1/0.100 Up Active 0 2 1ge-1/1/0.101 Up Active 0 2 1ge-1/1/0.102 Up Active 0 2 1ge-1/1/0.103 Up Active 0 2 1ge-1/1/0.104 Up Active 0 2 1ge-1/1/0.105 Up Active 0 2 1ge-1/1/0.106 Up Active 0 2 1
...
show oam ethernet connectivity-fault-management interfaces detail
user@host> show oam ethernet connectivity-fault-management interfaces detailInterface name: ge-5/2/9.0, Interface status: Active, Link status: Up Maintenance domain name: md0, Format: string, Level: 5 Maintenance association name: ma1, Format: string
Copyright © 2016, Juniper Networks, Inc.390
Network Management and Monitoring Feature Guide for EX2300, EX3400, and EX4300 Switches

Continuity-check status: enabled, Interval: 100ms, Loss-threshold: 3 frames MEP identifier: 1, Direction: down, MAC address: 00:90:69:0b:4b:94 MEP status: running Defects: Remote MEP not receiving CCM : no Erroneous CCM received : yes Cross-connect CCM received : no RDI sent by some MEP : yes Statistics: CCMs sent : 76 CCMs received out of sequence : 0 LBMs sent : 0 Valid in-order LBRs received : 0 Valid out-of-order LBRs received : 0 LBRs received with corrupted data : 0 LBRs sent : 0 LTMs sent : 0 LTMs received : 0 LTRs sent : 0 LTRs received : 0 Sequence number of next LTM request : 1320235363 1DMs sent : 0 Valid 1DMs received : 0 Invalid 1DMs received : 0 DMMs sent : 0 DMRs sent : 0 Valid DMRs received : 0 Invalid DMRs received : 0 Remote MEP count: 2 Identifier MAC address State Interface 2001 00:90:69:0b:7f:71 ok ge-5/2/9.0 4001 00:90:69:0b:09:c5 ok ge-5/2/9.0
show oam ethernet connectivity-fault-management interfacesextensive
user@host> show oam ethernet connectivity-fault-management interfaces extensiveInterface name: ge-5/2/9.0, Interface status: Active, Link status: Up Maintenance domain name: md0, Format: string, Level: 5 Maintenance association name: ma1, Format: string Continuity-check status: enabled, Interval: 100ms, Loss-threshold: 3 frames MEP identifier: 1, Direction: down, MAC address: 00:90:69:0b:4b:94 MEP status: running Defects: Remote MEP not receiving CCM : no Erroneous CCM received : yes Cross-connect CCM received : no RDI sent by some MEP : yes Statistics: CCMs sent : 76 CCMs received out of sequence : 0 LBMs sent : 0 Valid in-order LBRs received : 0 Valid out-of-order LBRs received : 0 LBRs received with corrupted data : 0 LBRs sent : 0 LTMs sent : 0 LTMs received : 0 LTRs sent : 0 LTRs received : 0
391Copyright © 2016, Juniper Networks, Inc.
Chapter 20: Ethernet OAM Connectivity Fault Management

Sequence number of next LTM request : 1542035464 1DMs sent : 0 Valid 1DMs received : 0 Invalid 1DMs received : 0 DMMs sent : 0 DMRs sent : 0 Valid DMRs received : 0 Invalid DMRs received : 0 Remote MEP count: 2 Identifier MAC address State Interface 2001 00:90:69:0b:7f:71 ok ge-5/2/9.0 4001 00:90:69:0b:09:c5 ok ge-5/2/9.0
show oam ethernet connectivity-fault-management interfaces level
user@host> show oam ethernet connectivity-fault-management interfaces level 7Interface Link Status Level MEP Neighbours Identifierge-3/0/0.0 Up Active 7 201 0xe-0/0/0.0 Up Active 7 203 1
show oam ethernet connectivity-fault-management interfaces (Trunk Interfaces)
user@host> show oam ethernet connectivity-fault-management interfaces
Interface Link Status Level MEP Neighbours
Identifierge-4/0/1.0, vlan 100 Up Active 5 100 0ge-10/3/10.4091, vlan 4091 Down Inactive 4 400 0ge-4/0/0.0 Up Active 6 200 0
user@host> show oam ethernet connectivity-fault-management interfaces ge-4/0/0.0
Interface Link Status Level MEP Neighbours
Identifierge-4/0/0.0 Up Active 6 200 0
user@host> showoamethernet connectivity-fault-management interfaces ge-4/0/1.0 vlan 100
Interface Link Status Level MEP Neighbours
Identifierge-4/0/1.0, vlan 100 Up Active 5 100 0
user@host> show oam ethernet connectivity-fault-management interfaces ge-10/3/10.4091vlan 4091
Interface Link Status Level MEP Neighbours
Identifierge-10/3/10.4091, vlan 4091 Down Inactive 4 400 0
Copyright © 2016, Juniper Networks, Inc.392
Network Management and Monitoring Feature Guide for EX2300, EX3400, and EX4300 Switches

show oam ethernet connectivity-fault-management path-database
Syntax show oam ethernet connectivity-fault-management path-database hostmaintenance-associationma-namemaintenance-domainmd-namemac-address
Release Information Command introduced in Junos OS Release 10.2 for EX Series switches.
Description Display IEEE 802.1ag Operation, Administration, and Management (OAM) connectivity
fault management maintenance linktrace database information.
Options mac-address—Display connectivity fault management path database information for
the specified MAC address of the remote host.
maintenance-associationma-name—Display connectivity fault management path
database information for the specified maintenance association.
maintenance-domainmd-name—Display connectivity fault management path database
information for the specified maintenance domain.
Required PrivilegeLevel
view
RelatedDocumentation
clear oam ethernet connectivity-fault-management statistics on page 373•
• show oam ethernet connectivity-fault-management interfaces on page 387
• show oam ethernet connectivity-fault-managementmip on page 402
List of Sample Output show oam ethernet connectivity-fault-management path-database on page 394show oam ethernet connectivity-fault-management linktrace path-database (Twotraceroute Commands) on page 394
Output Fields Table 34 on page 393 lists the output fields for the show oam ethernet
connectivity-fault-management path-database command. Output fields are listed in the
approximate order in which they appear.
Table34: showoamethernet connectivity-fault-management linktracepath-databaseOutputFields
Field DescriptionField Name
MAC address of the 802.1ag node to which the linktrace message is targeted.Linktrace to
Interface used by the local MEP to send the linktrace message (LTM).Interface
Maintenance domain identifier specified in the traceroute command.Maintenance Domain
Maintenance association identifier specified in the traceroute command.MaintenanceAssociation
Maintenance domain level configured for the maintenance domain.Level
393Copyright © 2016, Juniper Networks, Inc.
Chapter 20: Ethernet OAM Connectivity Fault Management

Table34: showoamethernet connectivity-fault-management linktracepath-databaseOutputFields (continued)
Field DescriptionField Name
MEP identifier of the local MEP originating the linktrace.Local Mep
Sequential hop count of the linktrace path.Hop
Number of hops remaining in the linktrace message (LTM). The time to live (TTL) is decremented ateach hop.
TTL
MAC address of the 802.1ag maintenance intermediate point (MIP) that is forwarding the LTM.SourceMAC address
MAC address of the 802.1ag node that is the next hop in the LTM path.Next hopMAC address
4-byte identifier maintained by the MEP. Each LTM uses a transaction identifier. The transactionidentifier is maintained globally across all maintenance domains. Use the transaction identifier tomatch an incoming linktrace responses (LTR), with a previously sent LTM.
Transaction Identifier
Sample Output
show oam ethernet connectivity-fault-management path-database
user@host> show oam ethernet connectivity-fault-management path-databasemaintenance-domainMD1maintenance-associationMA1 00:01:02:03:04:05Linktrace to 00:01:02:03:04:05, Interface : ge-5/0/0.0 Maintenance Domain: MD1, Level: 7 Maintenance Association: MA1, Local Mep: 1
Hop TTL Source MAC address Next hop MAC address Transaction Identifier:100001 1 63 00:00:aa:aa:aa:aa 00:00:bb:bb:bb:bb 2 62 00:00:bb:bb:bb:bb 00:00:cc:cc:cc:cc 3 61 00:00:cc:cc:cc:cc 00:01:02:03:04:05 4 60 00:01:02:03:04:05 00:00:00:00:00:00
show oam ethernet connectivity-fault-management linktrace path-database (Two traceroute Commands)
user@host> show oam ethernet connectivity-fault-management path-databasemaintenance-domainMD2maintenance-associationMA2 00:06:07:08:09:0ALinktrace to 00:06:07:08:09:0A, Interface : ge-5/0/1.0 Maintenance Domain: MD2, Level: 6 Maintenance Association: MA2, Local Mep: 10
Hop TTL Source MAC address Next hop MAC address Transaction Identifier:100002 1 63 00:00:aa:aa:aa:aa 00:00:bb:bb:bb:bb 2 62 00:00:bb:bb:bb:bb 00:00:cc:cc:cc:cc 3 61 00:00:cc:cc:cc:cc 00:06:07:08:09:0A 4 60 00:06:07:08:09:0A 00:00:00:00:00:00 Transaction Identifier:100003 1 63 00:00:aa:aa:aa:aa 00:00:bb:bb:bb:bb 2 62 00:00:bb:bb:bb:bb 00:00:cc:cc:cc:cc
Copyright © 2016, Juniper Networks, Inc.394
Network Management and Monitoring Feature Guide for EX2300, EX3400, and EX4300 Switches

3 61 00:00:cc:cc:cc:cc 00:06:07:08:09:0A 4 60 00:06:07:08:09:0A 00:00:00:00:00:00
395Copyright © 2016, Juniper Networks, Inc.
Chapter 20: Ethernet OAM Connectivity Fault Management
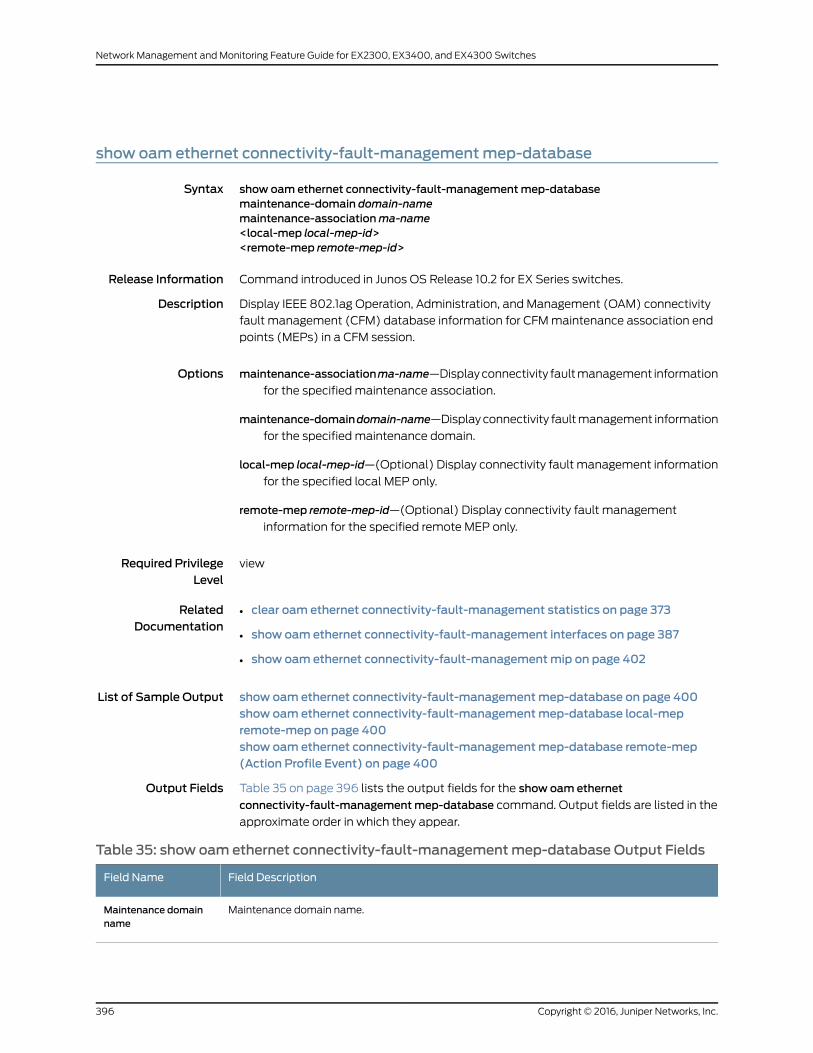
show oam ethernet connectivity-fault-managementmep-database
Syntax show oam ethernet connectivity-fault-managementmep-databasemaintenance-domain domain-namemaintenance-associationma-name<local-mep local-mep-id><remote-mep remote-mep-id>
Release Information Command introduced in Junos OS Release 10.2 for EX Series switches.
Description Display IEEE 802.1ag Operation, Administration, and Management (OAM) connectivity
fault management (CFM) database information for CFMmaintenance association end
points (MEPs) in a CFM session.
Options maintenance-associationma-name—Displayconnectivity faultmanagement information
for the specified maintenance association.
maintenance-domaindomain-name—Displayconnectivity faultmanagement information
for the specified maintenance domain.
local-mep local-mep-id—(Optional) Display connectivity fault management information
for the specified local MEP only.
remote-mep remote-mep-id—(Optional) Display connectivity fault management
information for the specified remote MEP only.
Required PrivilegeLevel
view
RelatedDocumentation
clear oam ethernet connectivity-fault-management statistics on page 373•
• show oam ethernet connectivity-fault-management interfaces on page 387
• show oam ethernet connectivity-fault-managementmip on page 402
List of Sample Output show oam ethernet connectivity-fault-managementmep-database on page 400show oam ethernet connectivity-fault-managementmep-database local-mepremote-mep on page 400show oam ethernet connectivity-fault-managementmep-database remote-mep(Action Profile Event) on page 400
Output Fields Table 35 on page 396 lists the output fields for the show oam ethernet
connectivity-fault-managementmep-database command. Output fields are listed in the
approximate order in which they appear.
Table 35: show oam ethernet connectivity-fault-managementmep-database Output Fields
Field DescriptionField Name
Maintenance domain name.Maintenance domainname
Copyright © 2016, Juniper Networks, Inc.396
Network Management and Monitoring Feature Guide for EX2300, EX3400, and EX4300 Switches

Table 35: show oam ethernet connectivity-fault-managementmep-database OutputFields (continued)
Field DescriptionField Name
Maintenance domain name format configured.Format (Maintenancedomain)
Maintenance domain level configured.Level
Maintenance association name.Maintenanceassociation name
Maintenance association name format configured.Format (Maintenanceassociation)
Continuity-check status.Continuity-checkstatus
Continuity-check message interval.Interval
Maintenance association end point (MEP) identifier.MEP identifier
MEP direction configured.Direction
MAC address configured for the MEP.MAC address
Whether automatic discovery is enabled or disabled.Auto-discovery
Priority used for CCMs and linktrace messages transmitted by the MEP.Priority
Interface identifier.Interface name
Local interface status.Interface status
Local link status.Link status
Whether the remote MEP is not receiving CCMs.RemoteMEP notreceiving CCM
Whether erroneous CCMs have been received.ErroneousCCMreceived
Whether cross-connect CCMs have been received.Cross-connect CCMreceived
Whether the remote defect indication (RDI) bit is set in messages that have been received. Theabsence of the RDI bit in a CCM indicates that the transmitting MEP is receiving CCMs from allconfigured MEPs.
RDI sent by someMEP
Number of CCMs transmitted.CCMs sent
Number of CCMs received out of sequence.CCMs received out ofsequence
397Copyright © 2016, Juniper Networks, Inc.
Chapter 20: Ethernet OAM Connectivity Fault Management

Table 35: show oam ethernet connectivity-fault-managementmep-database OutputFields (continued)
Field DescriptionField Name
Number of loopback messages (LBMs) sent.LBMs sent
Number of loopback responsemessages (LBRs) received that were validmessages and in sequence.Valid in-order LBRsreceived
Number of LBRs received that were valid messages and not in sequence.Validout-of-orderLBRsreceived
Number of LBRs received that were corrupted.LBRs receivedwithcorrupted data
Number of LBRs transmitted.LBRs sent
Linktrace messages (LTMs) transmitted.LTMs sent
Linktrace messages received.LTMs received
Linktrace responses (LTRs) transmitted.LTRs sent
Linktrace responses received.LTRs received
Sequence number of the next linktrace message request to be transmitted.Sequence number ofnext LTM request
If the MEP is an initiator for a one-way ETH-DM session: Number of one-way delay measurement(1DM) PDU frames sent to the peer MEP in this session.
For all other cases, this field displays 0.
1DMs sent
If the MEP is a receiver for a one-way ETH-DM session: Number of valid 1DM frames received.
For all other cases, this field displays 0.
Valid 1DMs received
If the MEP is a receiver for a one-way ETH-DM session: Number of invalid 1DM frames received.
For all other cases, this field displays 0.
Invalid 1DMs received
If the MEP is an initiator for a two-way ETH-DM session: Number of Delay Measurement Message(DMM) PDU frames sent to the peer MEP in this session.
For all other cases, this field displays 0.
DMMs sent
If the MEP is a responder for a ETH-DM session: Number of Delay Measurement Reply (DMR) framessent.
For all other cases, this field displays 0.
DMRs sent
Copyright © 2016, Juniper Networks, Inc.398
Network Management and Monitoring Feature Guide for EX2300, EX3400, and EX4300 Switches

Table 35: show oam ethernet connectivity-fault-managementmep-database OutputFields (continued)
Field DescriptionField Name
If the MEP is an initiator for a two-way ETH-DM session: Number of valid DMRs received.
For all other cases, this field displays 0.
Valid DMRs received
If the MEP is an initiator for a two-way ETH-DM session: Number of invalid DMRs received.
For all other cases, this field displays 0.
Invalid DMRs received
MEP identifier of the remote MEP.RemoteMEP identifier
State of the remote MEP: idle, start, ok, or failed.State (remoteMEP)
MAC address of the remote MEP.MAC address
Whether the remote MEPMAC address was learned using automatic discovery or configured.Type
Interfaceof the remoteMEP.A seven-digit number is appended if CFM is configured to runona routinginstance of type VPLS.
Interface
Date, time, and how long ago the remote MEP interface went from down to up. The format is Lastflapped: year-month-day hours:minutes:seconds timezone (hours:minutes:seconds ago). For example,Last flapped: 2002-04-26 10:52:40 PDT (04:33:20 ago).
Last flapped
Whether the remote defect indication (RDI) bit is set in messages that have been received ortransmitted.
Remote defectindication
• In the Maintenance domain section, displays the last transmitted port status TLV value.
• In the Remote MEP section, displays the last value of port status TLV received from the remoteMEP.
In the Action profile section, displays, the last occurred event port-status-tlv blocked event. Thisevent occurred due to the reception of blocked value in the port status TLV from remote MEP.
Port status TLV
• In the Maintenance domain section, displays the last transmitted interface status TLV value.
• In theRemoteMEP section, displays the last value of interface status TLV received from the remoteMEP.
In the Action profile section, if displays, the last occurred event interface-status-tlv event ( eitherlower-layer-down or down). This event occurred due to the reception of either lower or down valuein the interface status TLV from remote MEP.
Interface status TLV
Name of the action profile occurrence associated with a remote MEP.Action profile
When an action profile occurs, displays the last event that triggered it.Last event
When all the configured and occurred events (under action profile) are cleared, then the action takengets reverted (such as down interface ismadeup) and the corresponding time is noted anddisplayed.
Last event cleared
Action taken and the corresponding time of the action occurrence.Action
399Copyright © 2016, Juniper Networks, Inc.
Chapter 20: Ethernet OAM Connectivity Fault Management

Sample Output
show oam ethernet connectivity-fault-managementmep-database
user@host> show oam ethernet connectivity-fault-managementmep-databasemaintenance-domain vpls-vlan2000maintenance-association vpls-vlan200Maintenance domain name: vpls-vlan2000, Format: string, Level: 5 Maintenance association name: vpls-vlan200, Format: string Continuity-check status: enabled, Interval: 100ms, Loss-threshold: 3 frames MEP identifier: 200, Direction: up, MAC address: 00:19:e2:b0:74:01 Auto-discovery: enabled, Priority: 0 Interface name: ge-0/0/1.0, Interface status: Active, Link status: Up Defects: Remote MEP not receiving CCM : no Erroneous CCM received : no Cross-connect CCM received : no RDI sent by some MEP : no Statistics: CCMs sent : 1476 CCMs received out of sequence : 0 LBMs sent : 85 Remote MEP count: 1 Identifier MAC address State Interface 100 00:19:e2:b2:81:4b ok vt-0/1/10.1049088
show oam ethernet connectivity-fault-managementmep-database local-mep remote-mep
user@host> show oam ethernet connectivity-fault-managementmep-databasemaintenance-domain vpls-vlan2000maintenance-association vpls-vlan200 local-mep 200remote-mep 100Maintenance domain name: vpls-vlan2000, Format: string, Level: 5 Maintenance association name: vpls-vlan200, Format: string Continuity-check status: enabled, Interval: 100ms, Loss-threshold: 3 frames MEP identifier: 200, Direction: up, MAC address: 00:19:e2:b0:74:01 Auto-discovery: enabled, Priority: 0 Interface name: ge-0/0/1.0, Interface status: Active, Link status: Up
Remote MEP identifier: 100, State: ok MAC address: 00:19:e2:b2:81:4b, Type: Learned Interface: vt-0/1/10.1049088 Last flapped: Never Remote defect indication: false Port status TLV: none Interface status TLV: none
show oam ethernet connectivity-fault-managementmep-database remote-mep(Action Profile Event)
user@host> show oam ethernet connectivity-fault-managementmep-databasemaintenance-domainmd5maintenance-associationma5 remote-mep 200Maintenance domain name: md5, Format: string, Level: 5 Maintenance association name: ma5, Format: string Continuity-check status: enabled, Interval: 1s, Loss-threshold: 3 frames MEP identifier: 100, Direction: down, MAC address: 00:05:85:73:e8:ad Auto-discovery: enabled, Priority: 0 Interface status TLV: none, Port status TLV: none Interface name: ge-1/0/8.0, Interface status: Active, Link status: Up
Copyright © 2016, Juniper Networks, Inc.400
Network Management and Monitoring Feature Guide for EX2300, EX3400, and EX4300 Switches

Remote MEP identifier: 200, State: ok MAC address: 00:05:85:73:96:1f, Type: Configured Interface: ge-1/0/8.0 Last flapped: Never Remote defect indication: false Port status TLV: none Interface status TLV: lower-layer-down Action profile: juniper Last event: Interface-status-tlv lower-layer-down Action: Interface-down, Time: 2009-03-27 14:25:10 PDT (00:00:02 ago)
401Copyright © 2016, Juniper Networks, Inc.
Chapter 20: Ethernet OAM Connectivity Fault Management

show oam ethernet connectivity-fault-managementmip
Syntax show oam ethernet connectivity-fault-managementmip<qualifier>
Release Information Command introduced in Junos OS Release 10.2 for EX Series switches.
Description Displayall themaintenanceassociation intermediatepoints (MIPs) created in the system.
Specify qualifiers to display specific MIPs.
Options qualifier—(Optional) Display the specified MIP.
Required PrivilegeLevel
view
RelatedDocumentation
show oam ethernet connectivity-fault-management interfaces on page 387•
• show oam ethernet connectivity-fault-management path-database on page 393
List of Sample Output show oam ethernet connectivity-fault-managementmip on page 402
Output Fields Table 36 on page 402 lists the output fields for the show oam ethernet
connectivity-fault-managementmipcommand.Output fieldsare listed in theapproximate
order in which they appear.
Table 36: show oam ethernet connectivity-fault-managementmip Output Fields
Field DescriptionField Name
Header for the MIP information showing the MIP name.MIP information forinstance
Interface type-dpc/pic/port.unit-number.Interface
MIP level configured.Level
Sample Output
show oam ethernetconnectivity-fault-managementmip
user@host> show oam ethernet connectivity-fault-managementmipMIP information for __mip_name__
MIP information for default-switch bd1
Interface Level ge-3/0/0.0 7 ge-3/0/1.0 6 ge-3/0/3.0 6
Copyright © 2016, Juniper Networks, Inc.402
Network Management and Monitoring Feature Guide for EX2300, EX3400, and EX4300 Switches

show oam ethernet connectivity-fault-management sla-iterator-statistics
Syntax show oam ethernet connectivity-fault-management sla-iterator-statisticsmaintenance-domainmd-namemaintenance-associationma-namesla-iterator sla-iterator<local-mep local-mep-id><remote-mep remote-mep-id>
Release Information Command introduced in Junos OS Release 11.4 for EX Series switches.
Command introduced in Junos OS Release 9.6.
Command introduced in Junos OS Release 12.2 for ACX Series routers.
Command introduced in Junos OS Release 13.2 for MX Series routers (not on MPC3E
Hyperion cards).
Description Display the Ethernet Operation, Administration, and Maintenance (OAM) service-level
agreement (SLA) iterator statistics.
Options maintenance-domainmd-name—Name of an existing connectivity fault management
(CFM)maintenance domain.
maintenance-associationma-name—Nameof an existing CFMmaintenance association.
sla-iterator sla-iterator—Name of the iterator profile.
local-mep local-mep-id—(Optional) Numeric identifier of the local MEP. The range of
values is 1 through 8191.
remote-mep remote-mep-id—(Optional)Numeric identifier of the remoteMEP.The range
of values is 1 through 8192.
Required PrivilegeLevel
view
RelatedDocumentation
Configuring an Iterator Profile on a Switch (CLI Procedure)•
• clearoamethernetconnectivity-fault-managementsla-iterator-statisticsonpage372
List of Sample Output showoamethernetconnectivity-fault-managementsla-iterator-statisticsonpage406showoamethernetconnectivity-fault-managementsla-iterator-statistics(MXSeriesrouters) on page 406
Output Fields Table 37 on page 403 lists the output fields for the show oam ethernet
connectivity-fault-management sla-iterator-statistics command. Output fields are listed
in the approximate order in which they appear.
Table 37: show oam ethernet connectivity-fault-management sla-iterator-statistics OutputFields
Output Field DescriptionOutput Field Name
Name of the maintenance domain.Maintenance domain
403Copyright © 2016, Juniper Networks, Inc.
Chapter 20: Ethernet OAM Connectivity Fault Management

Table 37: show oam ethernet connectivity-fault-management sla-iterator-statistics OutputFields (continued)
Output Field DescriptionOutput Field Name
Level of the maintenance domain level configured.Level
Name of the maintenance association.Maintenance association
Numeric identifier of the local MEP.Local MEP id
Numeric identifier of the remote MEP.RemoteMEP id
Unicast MAC address of the remote MEP.RemoteMAC address
Name of iterator.Iterator name
Numeric identifier of the iterator.Iterator Id
Number of cycles (in milliseconds) taken between back-to-back transmission of SLA frames forthis connection
Iterator cycle time
Maximum number of cycles per iterationIteration period
Current status of iterator whether running or stopped.Iterator status
Status of iteration as infinite or finite.Infinite iterations
Date and time when the counter was reset.Counter reset time
Reason to reset counter.Reset reason
Calculation weight of delay.Delay weight
Calculation weight of delay variation.Delay variation weight
Delay measurement message (DMM) PDU frames sent to the peer MEP in this session.DMM sent
Number of DMM frames sent to the peer MEP in this session skipped during threshold hit.DMM skipped for thresholdhit
Number of DMM frames sent to the peer MEP in this session skipped during the last threshold hitwindow.
DMM skipped for thresholdhit window
Number of delay measurement reply (DMR) frames received.DMR received
Total number of DMR out of sequence packets received.DMR out of sequence
Total number of DMR frames received with invalid timestamps.DMR receivedwith invalidtime stamps
Copyright © 2016, Juniper Networks, Inc.404
Network Management and Monitoring Feature Guide for EX2300, EX3400, and EX4300 Switches
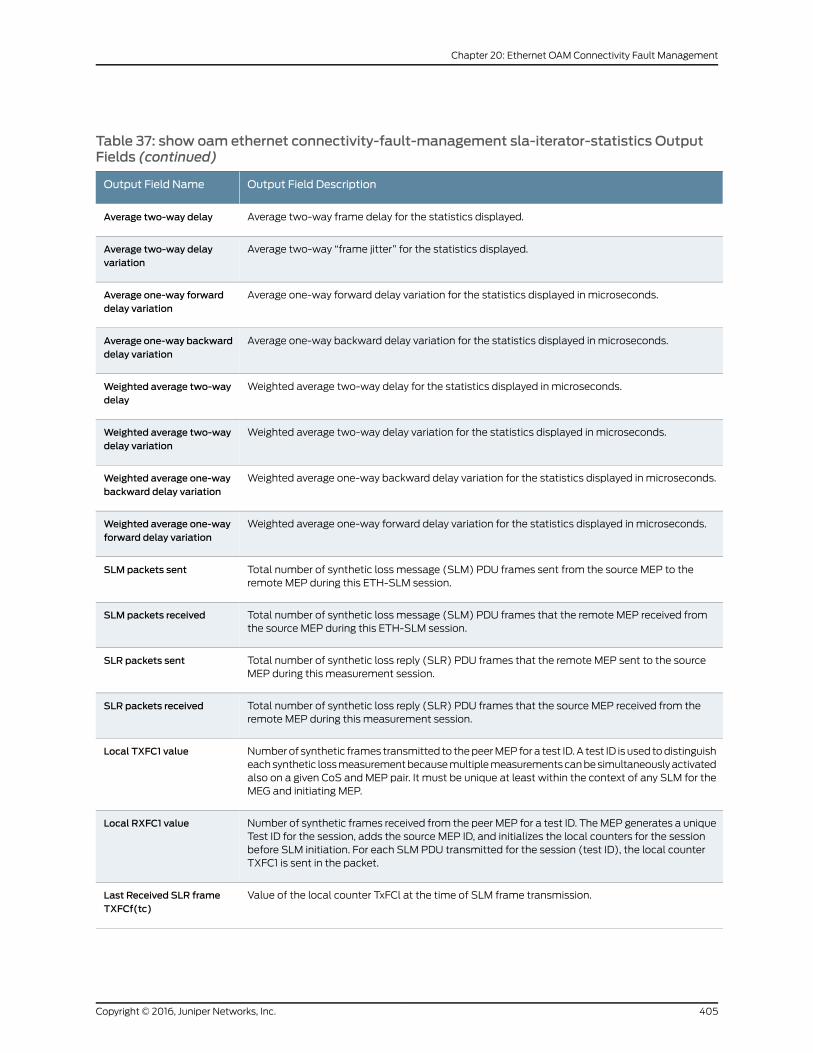
Table 37: show oam ethernet connectivity-fault-management sla-iterator-statistics OutputFields (continued)
Output Field DescriptionOutput Field Name
Average two-way frame delay for the statistics displayed.Average two-way delay
Average two-way “frame jitter” for the statistics displayed.Average two-way delayvariation
Average one-way forward delay variation for the statistics displayed in microseconds.Average one-way forwarddelay variation
Average one-way backward delay variation for the statistics displayed in microseconds.Average one-way backwarddelay variation
Weighted average two-way delay for the statistics displayed in microseconds.Weighted average two-waydelay
Weighted average two-way delay variation for the statistics displayed in microseconds.Weighted average two-waydelay variation
Weighted average one-way backward delay variation for the statistics displayed in microseconds.Weighted average one-waybackward delay variation
Weighted average one-way forward delay variation for the statistics displayed in microseconds.Weighted average one-wayforward delay variation
Total number of synthetic loss message (SLM) PDU frames sent from the source MEP to theremote MEP during this ETH-SLM session.
SLM packets sent
Total number of synthetic loss message (SLM) PDU frames that the remote MEP received fromthe source MEP during this ETH-SLM session.
SLM packets received
Total number of synthetic loss reply (SLR) PDU frames that the remote MEP sent to the sourceMEP during this measurement session.
SLR packets sent
Total number of synthetic loss reply (SLR) PDU frames that the source MEP received from theremote MEP during this measurement session.
SLR packets received
Numberof synthetic frames transmitted to thepeerMEP for a test ID.A test ID is used todistinguisheachsynthetic lossmeasurementbecausemultiplemeasurementscanbesimultaneouslyactivatedalso on a given CoS and MEP pair. It must be unique at least within the context of any SLM for theMEG and initiating MEP.
Local TXFC1 value
Number of synthetic frames received from the peer MEP for a test ID. TheMEP generates a uniqueTest ID for the session, adds the source MEP ID, and initializes the local counters for the sessionbefore SLM initiation. For each SLM PDU transmitted for the session (test ID), the local counterTXFC1 is sent in the packet.
Local RXFC1 value
Value of the local counter TxFCl at the time of SLM frame transmission.Last Received SLR frameTXFCf(tc)
405Copyright © 2016, Juniper Networks, Inc.
Chapter 20: Ethernet OAM Connectivity Fault Management

Table 37: show oam ethernet connectivity-fault-management sla-iterator-statistics OutputFields (continued)
Output Field DescriptionOutput Field Name
Value of the local counter RxFCl at the time of SLR frame transmission.Last Received SLR frameTXFCb(t
Count of frame loss associated with ingress data frames.Frame loss (near-end)
Count of frame loss associated with egress data frames.Frame loss (far-end)
Sample Output
show oam ethernet connectivity-fault-management sla-iterator-statistics
user@switch> show oam ethernet connectivity-fault-management sla-iterator-statisticssla-iterator i1 maintenance-domain default-1 maintenance-associationma1 local-mep 1remote-mep 2Iterator statistics:Maintenance domain: md6, Level: 6Maintenance association: ma6, Local MEP id: 1000Remote MEP id: 103, Remote MAC address: 00:90:69:0a:43:92Iterator name: i1, Iterator Id: 1Iterator cycle time: 10ms, Iteration period: 1 cyclesIterator status: running, Infinite iterations: trueCounter reset time: 2010-03-19 20:42:39 PDT (2d 18:24 ago)Reset reason: Adjacency flap
Iterator delay measurement statistics:Delay weight: 1, Delay variation weight: 1DMM sent : 23898520DMM skipped for threshold hit : 11000DMM skipped for threshold hit window : 0DMR received : 23851165DMR out of sequence : 1142DMR received with invalid time stamps : 36540Average two-way delay : 129 usecAverage two-way delay variation : 15 usecAverage one-way forward delay variation : 22 usecAverage one-way backward delay variation : 22 usecWeighted average two-way delay : 134 usecWeighted average two-way delay variation : 8 usecWeighted average one-way forward delay variation : 6 usecWeighted average one-way backward delay variation : 2 usec
Sample Output
show oam ethernet connectivity-fault-management sla-iterator-statistics (MX Series routers)
user@switch> show oam ethernet connectivity-fault-management sla-iterator-statisticsmaintenance-domainmdumaintenance-associationmaulocal-mep4remote-mep3sla-iteratorlmIterator statistics: Maintenance domain: 2, Level: 2 Maintenance association: W-160432000-001, Local MEP id: 2 Remote MEP id: 1, Remote MAC address: 00:90:69:0a:43:39
Copyright © 2016, Juniper Networks, Inc.406
Network Management and Monitoring Feature Guide for EX2300, EX3400, and EX4300 Switches

Iterator name: iter1, Iterator Id: 1 Iterator cycle time: 100ms, Iteration period: 10 cycles Iterator status: running, Infinite iterations: true Counter reset time: 2012-09-25 02:15:31 PDT (00:00:45 ago) Reset reason: Adjacency flap Iterator loss measurement statistics: LMM sent : 444 LMM skipped for threshold hit : 0 LMM skipped for threshold hit window: 0 LMR received : 444 LMR out of sequence : 0 LMR forwarding-class mismatch : 0 Accumulated transmit statistics: Near-end (CIR) : 0 Far-end (CIR) : 0 Near-end (EIR) : 0 Far-end (EIR) : 0 Accumulated receive statistics: Near-end (CIR) : 0 Far-end (CIR) : 0 Near-end (EIR) : 0 Far-end (EIR) : 0 Accumulated loss statistics: Near-end loss (CIR) : 0 Near-end loss-ratio (CIR) : 0 (0.00000%) Far-end loss (CIR) : 0 Far-end loss-ratio (CIR) : 0 (0.00000%) Near-end loss (CIR) : 0 Near-end loss-ratio (EIR) : 0 (0.00000%) Far-end loss (CIR) : 0 Far-end loss-ratio (EIR) : 0 (0.00000%) Last loss measurement statistics: Near-end (CIR) : 0 Far-end (CIR) : 0 Near-end (EIR) : 0 Far-end (EIR)
407Copyright © 2016, Juniper Networks, Inc.
Chapter 20: Ethernet OAM Connectivity Fault Management

Copyright © 2016, Juniper Networks, Inc.408
Network Management and Monitoring Feature Guide for EX2300, EX3400, and EX4300 Switches

CHAPTER 21
Ethernet OAM Link Fault Management
• show oam ethernet link-fault-management
409Copyright © 2016, Juniper Networks, Inc.

show oam ethernet link-fault-management
Syntax show oam ethernet link-fault-management<brief | detail><interface-name>
Release Information Command introduced in Junos OS Release 9.4 for EX Series switches.
Description Displays Operation, Administration, and Maintenance (OAM) link fault management
(LFM) information for Ethernet interfaces.
Options brief | detail—(Optional) Display the specified level of output.
interface-name—(Optional) Display link faultmanagement information for the specified
Ethernet interface only.
Required PrivilegeLevel
view
RelatedDocumentation
Example: Configuring Ethernet OAM Link Fault Management on EX Series Switches
on page 76
•
• Configuring Ethernet OAM Link Fault Management (CLI Procedure) on page 83
List of Sample Output show oam ethernet link-fault-management brief on page 414show oam ethernet link-fault-management detail on page 414
Output Fields Table 38 on page 410 lists the output fields for the show oam ethernet
link-fault-management command. Output fields are listed in the approximate order in
which they appear.
Table 38: show oam ethernet link-fault-management Output Fields
Level of OutputField DescriptionField Name
All levelsIndicates the status of the established link.
• Fail—A link fault condition exists.
• Running—A link fault condition does not exist.
Status
All levelsState of the discovery mechanism:
• PassiveWait
• Send Any
• Send Local Remote
• Send Local Remote Ok
Discovery state
All levelsAddress of the OAM peer.Peer address
Copyright © 2016, Juniper Networks, Inc.410
Network Management and Monitoring Feature Guide for EX2300, EX3400, and EX4300 Switches

Table 38: show oam ethernet link-fault-management Output Fields (continued)
Level of OutputField DescriptionField Name
All levelsInformation about the interface.
• Remote-Stable—Indicates remote OAM client acknowledgment of, andsatisfaction with local OAM state information. False indicates that remoteDTE has either not seen or is unsatisfied with local state information. Trueindicates that remote DTE has seen and is satisfied with local stateinformation.
• Local-Stable—Indicates localOAMclientacknowledgmentof, andsatisfactionwith remoteOAM state information. False indicates that local DTE either hasnot seen or is unsatisfied with remote state information. True indicates thatlocal DTE has seen and is satisfied with remote state information.
• Remote-State-Valid—Indicates the OAM client has received remote stateinformation found within Local Information TLVs of received InformationOAM PDUs. False indicates that OAM client has not seen remote stateinformation. True indicates that the OAM client has seen remote stateinformation.
Flags
All levelsIndicates the remote loopback status. An OAM entity can put its remote peerinto loopback mode using the Loopback control OAM PDU. In loopback mode,every frame received is transmitted back on the same port (except for OAMPDUs, which are needed to maintain the OAM session).
Remote loopbackstatus
All levelsRemote entity information.
• RemoteMUX action—Indicates the state of the multiplexer functions of theOAM sublayer. Device is forwarding non-OAM PDUs to the lower sublayer ordiscarding non-OAM PDUs.
• Remote parser action—Indicates the state of the parser function of the OAMsublayer. Device is forwarding non-OAM PDUs to higher sublayer, loopingback non-OAM PDUs to the lower sublayer, or discarding non-OAM PDUs.
• Discoverymode—Indicates whether discovery mode is active or inactive.
• Unidirectionalmode—Indicates the ability to operate a link in a unidirectionalmode for diagnostic purposes.
• Remote loopbackmode—Indicateswhether remote loopback is supported ornot supported.
• Link events—Indicates whether interpreting link events is supported or notsupported on the remote peer.
• Variable requests—Indicates whether variable requests are supported or notsupported. The Variable Request OAM PDU, is used to request one or moreMIB variables from the remote peer.
Remote entityinformation
OAMReceive Statistics
detailThe number of information PDUs received.Information
detailThe number of loopback control PDUs received.Event
detailThe number of variable request PDUs received.Variable request
detailThe number of variable response PDUs received.Variable response
detailThe number of loopback control PDUs received.Loopback control
411Copyright © 2016, Juniper Networks, Inc.
Chapter 21: Ethernet OAM Link Fault Management

Table 38: show oam ethernet link-fault-management Output Fields (continued)
Level of OutputField DescriptionField Name
detailThe number of vendor organization specific PDUs received.Organizationspecific
OAMTransmit Statistics
detailThe number of information PDUs transmitted.Information
detailThe number of event notification PDUs transmitted.Event
detailThe number of variable request PDUs transmitted.Variable request
detailThe number of variable response PDUs transmitted.Variable response
detailThe number of loopback control PDUs transmitted.Loopback control
detailThe number of vendor organization specific PDUs transmitted.Organizationspecific
OAMReceived Symbol Error Event information
detailThe number of symbol error event TLVs that have been received after the OAMsublayer was reset.
Events
detailThe symbol error event window in the received PDU.
The protocol default value is the number of symbols that can be received inone second on the underlying physical layer.
Window
detailThe number of errored symbols in the period required for the event to begenerated.
Threshold
detailThe number of symbol errors in the period reported in the received event PDU.Errors in period
detailThe number of errored symbols that have been reported in received event TLVsafter the OAM sublayer was reset.
Symbol errors are coding symbol errors.
Total errors
OAMReceived Frame Error Event Information
detailThe number of errored frameevent TLVs that have been received after theOAMsublayer was reset.
Events
detailThe duration of the window in terms of the number of 100ms period intervals.Window
detailThe number of detected errored frames required for the event to be generated.Threshold
detailThe number of detected errored frames in the period.Errors in period
Copyright © 2016, Juniper Networks, Inc.412
Network Management and Monitoring Feature Guide for EX2300, EX3400, and EX4300 Switches
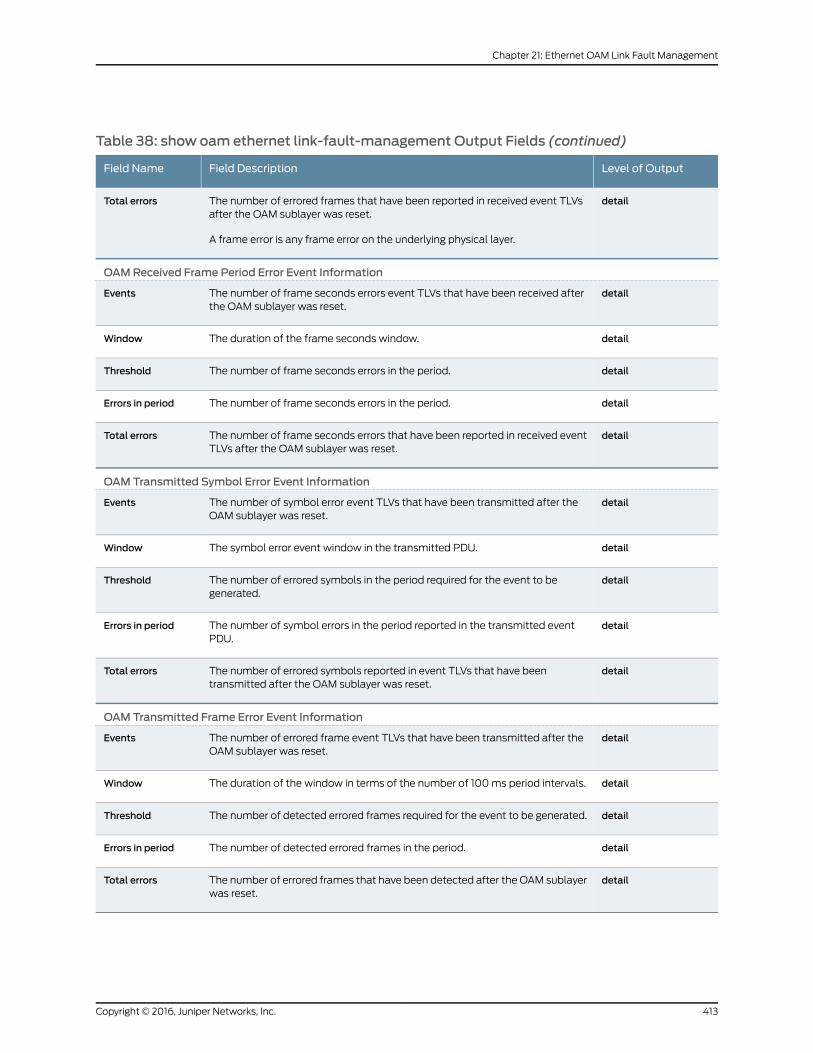
Table 38: show oam ethernet link-fault-management Output Fields (continued)
Level of OutputField DescriptionField Name
detailThe number of errored frames that have been reported in received event TLVsafter the OAM sublayer was reset.
A frame error is any frame error on the underlying physical layer.
Total errors
OAMReceived Frame Period Error Event Information
detailThe number of frame seconds errors event TLVs that have been received afterthe OAM sublayer was reset.
Events
detailThe duration of the frame seconds window.Window
detailThe number of frame seconds errors in the period.Threshold
detailThe number of frame seconds errors in the period.Errors in period
detailThe number of frame seconds errors that have been reported in received eventTLVs after the OAM sublayer was reset.
Total errors
OAMTransmitted Symbol Error Event Information
detailThe number of symbol error event TLVs that have been transmitted after theOAM sublayer was reset.
Events
detailThe symbol error event window in the transmitted PDU.Window
detailThe number of errored symbols in the period required for the event to begenerated.
Threshold
detailThe number of symbol errors in the period reported in the transmitted eventPDU.
Errors in period
detailThe number of errored symbols reported in event TLVs that have beentransmitted after the OAM sublayer was reset.
Total errors
OAMTransmitted Frame Error Event Information
detailThe number of errored frame event TLVs that have been transmitted after theOAM sublayer was reset.
Events
detailThe duration of the window in terms of the number of 100ms period intervals.Window
detailThe number of detected errored frames required for the event to be generated.Threshold
detailThe number of detected errored frames in the period.Errors in period
detailThe number of errored frames that have been detected after the OAM sublayerwas reset.
Total errors
413Copyright © 2016, Juniper Networks, Inc.
Chapter 21: Ethernet OAM Link Fault Management

Sample Output
show oam ethernet link-fault-management brief
user@host> show oam ethernet link-fault-management briefInterface: ge-0/0/1 Status: Running, Discovery state: Send Any Peer address: 00:90:69:72:2c:83 Flags:Remote-Stable Remote-State-Valid Local-Stable 0x50 Remote loopback status: Disabled on local port, Enabled on peer port Remote entity information: Remote MUX action: discarding, Remote parser action: loopback Discovery mode: active, Unidirectional mode: unsupported Remote loopback mode: supported, Link events: supported Variable requests: unsupported
show oam ethernet link-fault-management detail
user@host> show oam ethernet link-fault-management detail Interface: ge-0/0/1 Status: Running, Discovery state: Send Any Peer address: 00:90:69:0a:07:14 Flags:Remote-Stable Remote-State-Valid Local-Stable 0x50 OAM receive statistics: Information: 186365, Event: 0, Variable request: 0, Variable response: 0 Loopback control: 0, Organization specific: 0 OAM transmit statistics: Information: 186347, Event: 0, Variable request: 0, Variable response: 0 Loopback control: 0, Organization specific: 0 OAM received symbol error event information: Events: 0, Window: 0, Threshold: 0 Errors in period: 0, Total errors: 0 OAM received frame error event information: Events: 0, Window: 0, Threshold: 0 Errors in period: 0, Total errors: 0 OAM received frame period error event information: Events: 0, Window: 0, Threshold: 0 Errors in period: 0, Total errors: 0 OAM transmitted symbol error event information: Events: 0, Window: 0, Threshold: 1 Errors in period: 0, Total errors: 0 OAM transmitted frame error event information: Events: 0, Window: 0, Threshold: 1 Errors in period: 0, Total errors: 0 Remote entity information: Remote MUX action: forwarding, Remote parser action: forwarding Discovery mode: active, Unidirectional mode: unsupported Remote loopback mode: supported, Link events: supported Variable requests: unsupported
Copyright © 2016, Juniper Networks, Inc.414
Network Management and Monitoring Feature Guide for EX2300, EX3400, and EX4300 Switches

CHAPTER 22
Uplink Failure Detection
• show uplink-failure-detection
415Copyright © 2016, Juniper Networks, Inc.

show uplink-failure-detection
Syntax show uplink-failure-detection<group group-name>
Release Information Command introduced in Junos OS Release 11.1 for EX Series switches.
Description Display information about the uplink-failure-detection group, the member interfaces,
and their status.
Options none—Display information about all groups configured for uplink failure detection.
group group-name—(Optional) Display information about the specified group only.
Required PrivilegeLevel
view
RelatedDocumentation
Configuring Interfaces for Uplink Failure Detection (CLI Procedure) on page 87•
List of Sample Output show uplink-failure-detection on page 416
Output Fields Table39onpage416 lists theoutput fields for the showuplink-failure-detectioncommand.
Output fields are listed in the approximate order in which they appear.
Table 39: show uplink-failure-detection Output Fields
Field DescriptionField Name
Name of the group.Group
The uplink interface or interfaces configured as link-to-monitor.
NOTE: The asterisk (*) indicates that the link is up.
Uplink
The downlink interface or interfaces configured as link-to-disable.
NOTE: The asterisk (*) indicates that the link is up.
Downlink
Status of uplink failure detection:
• Active—The switch has detected an uplink failure and has brought the downlink down.
• Inactive—The uplink or uplinks are up.
Failure Action
Sample Output
show uplink-failure-detection
user@switch> show uplink-failure-detectionGroup : group1Uplink : ge-0/0/0*Downlink : ge-0/0/1*Failure Action : Inactive
Copyright © 2016, Juniper Networks, Inc.416
Network Management and Monitoring Feature Guide for EX2300, EX3400, and EX4300 Switches

Group : group2Uplink : ge-0/0/3.0Downlink : ge-0/0/4.0Failure Action : Active
417Copyright © 2016, Juniper Networks, Inc.
Chapter 22: Uplink Failure Detection

Copyright © 2016, Juniper Networks, Inc.418
Network Management and Monitoring Feature Guide for EX2300, EX3400, and EX4300 Switches

CHAPTER 23
SNMP
• clear snmp rmon history
• clear snmp statistics
• request snmp spoof-trap
• show snmp health-monitor
• show snmp inform-statistics
• show snmpmib
• show snmp rmon
• show snmp rmon history
• show snmp statistics
• show snmp v3
419Copyright © 2016, Juniper Networks, Inc.

clear snmp rmon history
Syntax clear snmp rmon history <interface-name | all>
Release Information Command introduced in Junos OS Release 9.0 for EX Series switches.
Description Delete the samples of Ethernet statistics collected, but do not delete the RMON history
configuration.
The clear snmp rmonhistory commanddeletes all the samples collected for the interface
configured for the history group, but not the configuration of that group. If you want to
delete the RMONhistory group configuration, youmust use the delete snmp rmonhistory
configuration-mode command.
Options interface-name—Delete the samples of Ethernet statistics collected for this interface.
all—Delete the samples of Ethernet statistics collected for all interfaces that have been
configured for RMONmonitoring.
Required PrivilegeLevel
clear
RelatedDocumentation
show snmp rmon history on page 445•
Copyright © 2016, Juniper Networks, Inc.420
Network Management and Monitoring Feature Guide for EX2300, EX3400, and EX4300 Switches

clear snmp statistics
Syntax clear snmp statistics
Release Information Command introduced before Junos OS Release 7.4.
Command introduced in Junos OS Release 9.0 for EX Series switches.
Command introduced in Junos OS Release 11.1 for the QFX Series.
Command introduced in Junos OS Release 14.1X53-D20 for the OCX Series.
Description Clear Simple Network Management Protocol (SNMP) statistics.
Options This command has no options.
Required PrivilegeLevel
clear
RelatedDocumentation
show snmp statistics on page 449•
List of Sample Output clear snmp statistics on page 421
Output Fields See show snmp statistics for an explanation of output fields.
Sample Output
clear snmp statistics
In the following example, SNMP statistics are displayed before and after the clear snmp
statistics command is issued:
user@host> show snmp statisticsSNMP statistics: Input: Packets: 8, Bad versions: 0, Bad community names: 0, Bad community uses: 0, ASN parse errors: 0, Too bigs: 0, No such names: 0, Bad values: 0, Read onlys: 0, General errors: 0, Total request varbinds: 8, Total set varbinds: 0, Get requests: 0, Get nexts: 8, Set requests: 0, Get responses: 0, Traps: 0, Silent drops: 0, Proxy drops 0 Output: Packets: 2298, Too bigs: 0, No such names: 0, Bad values: 0, General errors: 0, Get requests: 0, Get nexts: 0, Set requests: 0, Get responses: 8, Traps: 2290
user@host> clear snmp statistics
user@host> show snmp statisticsSNMP statistics: Input: Packets: 0, Bad versions: 0, Bad community names: 0, Bad community uses: 0, ASN parse errors: 0,
421Copyright © 2016, Juniper Networks, Inc.
Chapter 23: SNMP

Too bigs: 0, No such names: 0, Bad values: 0, Read onlys: 0, General errors: 0, Total request varbinds: 0, Total set varbinds: 0, Get requests: 0, Get nexts: 0, Set requests: 0, Get responses: 0, Traps: 0, Silent drops: 0, Proxy drops 0 Output: Packets: 0, Too bigs: 0, No such names: 0, Bad values: 0, General errors: 0, Get requests: 0, Get nexts: 0, Set requests: 0, Get responses: 0, Traps: 0
Copyright © 2016, Juniper Networks, Inc.422
Network Management and Monitoring Feature Guide for EX2300, EX3400, and EX4300 Switches

request snmp spoof-trap
Syntax request snmp spoof-trap<trap> variable-bindings <object> <instance> <value>
Release Information Command introduced in Junos OS Release 8.2.
Command introduced in Junos OS Release 9.0 for EX Series switches.
Command introduced in Junos OS Release 11.1 for the QFX Series.
Command introduced in Junos OS Release 14.1X53-D20 for the OCX Series.
Description Spoof (mimic) the behavior of a Simple Network Management Protocol (SNMP) trap.
Options <trap>—Name of the trap to spoof.
variable-bindings <object> <instance> <value>—(Optional) List of variables and values
to include in the trap. Each variable binding is specified as anobject name, the object
instance, and the value (for example, ifIndex[14] = 14). Enclose the list of variable
bindings in quotation marks (“ “) and use a comma to separate each object name,
instance, and value definition (for example, variable-bindings “ifIndex[14] = 14,
ifAdminStatus[14] = 1, ifOperStatus[14] = 2”). Objects included in the trap definition
thatdonothave instancesandvalues specifiedaspart of thecommandare included
in the trap and spoofed with automatically generated instances and values.
<dummy name>—A dummy trap name to display the list of available traps.
Questionmark (?)—Question mark? to display possible completions.
Required PrivilegeLevel
request
List of Sample Output request snmp spoof-trap (with Variable Bindings) on page 423request snmp spoof-trap (Illegal Trap Name) on page 423request snmp spoof-trap (QuestionMark ?) on page 427
Sample Output
request snmp spoof-trap (with Variable Bindings)
user@host> requestsnmpspoof-traplinkUpvariable-bindings“ifIndex[14]=14, ifAdminStatus[14]= 1, ifOperStatus[14] = 2”Spoof trap request result: trap sent successfully
request snmp spoof-trap (Illegal Trap Name)
user@host> request snmp spoof-trap xxSpoof trap request result: trap not found
Allowed Traps:adslAtucInitFailureTrap adslAtucPerfESsThreshTrap adslAtucPerfLofsThreshTrap adslAtucPerfLolsThreshTrap adslAtucPerfLossThreshTrap adslAtucPerfLprsThreshTrap adslAtucRateChangeTrap
423Copyright © 2016, Juniper Networks, Inc.
Chapter 23: SNMP

adslAturPerfESsThreshTrap adslAturPerfLofsThreshTrap adslAturPerfLossThreshTrap adslAturPerfLprsThreshTrap adslAturRateChangeTrap apsEventChannelMismatch apsEventFEPLF apsEventModeMismatch apsEventPSBF apsEventSwitchover authenticationFailure bfdSessDown bfdSessUp bgpBackwardTransition bgpEstablished coldStart dlswTrapCircuitDown dlswTrapCircuitUp dlswTrapTConnDown dlswTrapTConnPartnerReject dlswTrapTConnProtViolation dlswTrapTConnUp dsx1LineStatusChange dsx3LineStatusChange entConfigChange fallingAlarm frDLCIStatusChange ggsnTrapChanged ggsnTrapCleared ggsnTrapNew gmplsTunnelDown ifMauJabberTrap ipv6IfStateChange isisAreaMismatch isisAttemptToExceedMaxSequence isisAuthenticationFailure isisAuthenticationTypeFailure isisCorruptedLSPDetected isisDatabaseOverload isisIDLenMismatch isisLSPTooLargeToPropagate isisManualAddressDrops isisMaxAreaAddressesMismatch isisOriginatingLSPBufferSizeMismatch isisOwnLSPPurge isisProtocolsSupportedMismatch isisRejectedAdjacency isisSequenceNumberSkip isisVersionSkew jnxAccessAuthServerDisabled jnxAccessAuthServerEnabled jnxAccessAuthServiceDown jnxAccessAuthServiceUp jnxBfdSessDetectionTimeHigh jnxBfdSessTxIntervalHigh jnxBgpM2BackwardTransition jnxBgpM2Established jnxCmCfgChange jnxCmRescueChange jnxCollFlowOverload jnxCollFlowOverloadCleared
Copyright © 2016, Juniper Networks, Inc.424
Network Management and Monitoring Feature Guide for EX2300, EX3400, and EX4300 Switches

jnxCollFtpSwitchover jnxCollMemoryAvailable jnxCollMemoryUnavailable jnxCollUnavailableDest jnxCollUnavailableDestCleared jnxCollUnsuccessfulTransfer jnxDfcHardMemThresholdExceeded jnxDfcHardMemUnderThreshold jnxDfcHardPpsThresholdExceeded jnxDfcHardPpsUnderThreshold jnxDfcSoftMemThresholdExceeded jnxDfcSoftMemUnderThreshold jnxDfcSoftPpsThresholdExceeded jnxDfcSoftPpsUnderThreshold jnxEventTrap jnxExampleStartup jnxFEBSwitchover jnxFanFailure jnxFanOK jnxFruCheck jnxFruFailed jnxFruInsertion jnxFruOK jnxFruOffline jnxFruOnline jnxFruPowerOff jnxFruPowerOn jnxFruRemoval jnxHardDiskFailed jnxHardDiskMissing jnxJsAvPatternUpdateTrap jnxJsChassisClusterSwitchover jnxJsFwAuthCapacityExceeded jnxJsFwAuthFailure jnxJsFwAuthServiceDown jnxJsFwAuthServiceUp jnxJsNatAddrPoolThresholdStatus jnxJsScreenAttack jnxJsScreenCfgChange jnxLdpLspDown jnxLdpLspUp jnxLdpSesDown jnxLdpSesUp jnxMIMstCistPortLoopProtectStateChangeTrap jnxMIMstCistPortRootProtectStateChangeTrap jnxMIMstErrTrap jnxMIMstGenTrap jnxMIMstInvalidBpduRxdTrap jnxMIMstMstiPortLoopProtectStateChangeTrap jnxMIMstMstiPortRootProtectStateChangeTrap jnxMIMstNewRootTrap jnxMIMstProtocolMigrationTrap jnxMIMstRegionConfigChangeTrap jnxMIMstTopologyChgTrap jnxMacChangedNotification jnxMplsLdpInitSesThresholdExceeded jnxMplsLdpPathVectorLimitMismatch jnxMplsLdpSessionDown jnxMplsLdpSessionUp jnxOspfv3IfConfigError jnxOspfv3IfRxBadPacket
425Copyright © 2016, Juniper Networks, Inc.
Chapter 23: SNMP

jnxOspfv3IfStateChange jnxOspfv3LsdbApproachingOverflow jnxOspfv3LsdbOverflow jnxOspfv3NbrRestartHelperStatusChange jnxOspfv3NbrStateChange jnxOspfv3NssaTranslatorStatusChange jnxOspfv3RestartStatusChange jnxOspfv3VirtIfConfigError jnxOspfv3VirtIfRxBadPacket jnxOspfv3VirtIfStateChange jnxOspfv3VirtNbrRestartHelperStatusChange jnxOspfv3VirtNbrStateChange jnxOtnAlarmCleared jnxOtnAlarmSet jnxOverTemperature jnxPMonOverloadCleared jnxPMonOverloadSet jnxPingEgressJitterThresholdExceeded jnxPingEgressStdDevThresholdExceeded jnxPingEgressThresholdExceeded jnxPingIngressJitterThresholdExceeded jnxPingIngressStddevThresholdExceeded jnxPingIngressThresholdExceeded jnxPingRttJitterThresholdExceeded jnxPingRttStdDevThresholdExceeded jnxPingRttThresholdExceeded jnxPortBpduErrorStatusChangeTrap jnxPortLoopProtectStateChangeTrap jnxPortRootProtectStateChangeTrap jnxPowerSupplyFailure jnxPowerSupplyOK jnxRedundancySwitchover jnxRmonAlarmGetFailure jnxRmonGetOk jnxSecAccessIfMacLimitExceeded jnxSecAccessdsRateLimitCrossed jnxSonetAlarmCleared jnxSonetAlarmSet jnxSpSvcSetCpuExceeded jnxSpSvcSetCpuOk jnxSpSvcSetZoneEntered jnxSpSvcSetZoneExited jnxStormEventNotification jnxSyslogTrap jnxTemperatureOK jnxVccpPortDown jnxVccpPortUp jnxVpnIfDown jnxVpnIfUp jnxVpnPwDown jnxVpnPwUp jnxl2aldGlobalMacLimit jnxl2aldInterfaceMacLimit jnxl2aldRoutingInstMacLimit linkDown linkUp lldpRemTablesChange mfrMibTrapBundleLinkMismatch mplsLspChange mplsLspDown mplsLspInfoChange
Copyright © 2016, Juniper Networks, Inc.426
Network Management and Monitoring Feature Guide for EX2300, EX3400, and EX4300 Switches

mplsLspInfoDown mplsLspInfoPathDown mplsLspInfoPathUp mplsLspInfoUp mplsLspPathDown mplsLspPathUp mplsLspUp mplsNumVrfRouteMaxThreshExceeded mplsNumVrfRouteMidThreshExceeded mplsNumVrfSecIllglLblThrshExcd mplsTunnelDown mplsTunnelReoptimized mplsTunnelRerouted mplsTunnelUp mplsVrfIfDown mplsVrfIfUp mplsXCDown mplsXCUp msdpBackwardTransition msdpEstablished newRoot ospfIfAuthFailure ospfIfConfigError ospfIfRxBadPacket ospfIfStateChange ospfLsdbApproachingOverflow ospfLsdbOverflow ospfMaxAgeLsa ospfNbrStateChange ospfOriginateLsa ospfTxRetransmit ospfVirtIfAuthFailure ospfVirtIfConfigError ospfVirtIfRxBadPacket ospfVirtIfStateChange ospfVirtIfTxRetransmit ospfVirtNbrStateChange pethMainPowerUsageOffNotification pethMainPowerUsageOnNotification pethPsePortOnOffNotification pingProbeFailed pingTestCompleted pingTestFailed ptopoConfigChange risingAlarm rpMauJabberTrap sdlcLSStatusChange sdlcPortStatusChange topologyChange traceRoutePathChange traceRouteTestCompleted traceRouteTestFailed vrrpTrapAuthFailure vrrpTrapNewMaster warmStart
request snmp spoof-trap (QuestionMark ?)
user@host> request snmp spoof-trap ?Possible completions: <trap> The name of the trap to spoof
427Copyright © 2016, Juniper Networks, Inc.
Chapter 23: SNMP

adslAtucInitFailureTrap adslAtucPerfESsThreshTrap adslAtucPerfLofsThreshTrap adslAtucPerfLolsThreshTrap adslAtucPerfLossThreshTrap adslAtucPerfLprsThreshTrap adslAtucRateChangeTrap adslAturPerfESsThreshTrap adslAturPerfLofsThreshTrap adslAturPerfLossThreshTrap adslAturPerfLprsThreshTrap adslAturRateChangeTrap apsEventChannelMismatch apsEventFEPLF apsEventModeMismatch apsEventPSBF apsEventSwitchover authenticationFailure bfdSessDown bfdSessUp bgpBackwardTransition bgpEstablished coldStart dlswTrapCircuitDown dlswTrapCircuitUp ---(more 10%)---
Copyright © 2016, Juniper Networks, Inc.428
Network Management and Monitoring Feature Guide for EX2300, EX3400, and EX4300 Switches

show snmp health-monitor
Syntax show snmp health-monitor<alarms <detail>> | <logs>
Release Information Command introduced in Junos OS Release 8.0.
Command introduced in Junos OS Release 9.0 for EX Series switches.
Statement introduced in Junos OS Release 11.1 for the QFX Series.
Description Display informationaboutSimpleNetworkManagementProtocol (SNMP)healthmonitor
alarms and logs.
Options none—Display information about all health monitor alarms and logs.
alarms <detail>—(Optional) Display detailed information about health monitor alarms.
logs—(Optional) Display information about health monitor logs.
Required PrivilegeLevel
view
List of Sample Output show snmp health-monitor on page 431show snmp health-monitor alarms detail on page 433
Output Fields Table 40 on page 429 describes the output fields for the show snmp health-monitor
command. Output fields are listed in the approximate order in which they appear.
Table 40: show snmp health-monitor Output Fields
Level of OutputField DescriptionField Name
All levelsAlarm identifier.Alarm Index
All levelsDescription of the health monitor object instance being monitored.Variabledescription
All levelsName of the health monitor object instance being monitored.Variable name
All levelsCurrent value of the monitored variable in the most recent sample interval.Value
429Copyright © 2016, Juniper Networks, Inc.
Chapter 23: SNMP

Table 40: show snmp health-monitor Output Fields (continued)
Level of OutputField DescriptionField Name
All levelsState of the alarm or event entry:
• Alarms:
• active—Entry is fully configured and activated.
• falling threshold crossed—Value of the variable has crossed the lowerthreshold limit.
• rising threshold crossed—Value of the variable has crossed the upperthreshold limit.
• under creation—Entry is being configured and is not yet activated.
• startup—Alarm is waiting for the first sample of the monitored variable.
• object not available—Monitored variable of that type is not available to thehealth monitor agent.
• instance not available—Monitored variable's instance is not available tothe health monitor agent.
• object type invalid—Monitored variable is not a numeric value.
• object processing errored—An error occurred when themonitored variablewas processed.
• unknown—State is not one of the above.
State
detailObject ID to which the variable name is resolved. The format is x.x.x.x.Variable OID
detailMethodofsampling themonitoredvariableandcalculating thevalue tocompareagainst the upper and lower thresholds. It can have the value of absolute valueor delta value.
Sample type
detailAlarm that might be sent when this entry is first activated, depending on thefollowing criteria:
• Alarm is sent when one of the following situations exists:
• Value of the alarm is above or equal to the rising threshold and the startuptype is either rising alarm or rising or falling alarm.
• Valueof thealarm isbelowor equal to the falling thresholdand the startuptype is either falling alarm or rising or falling alarm.
• Alarm is not sent when one of the following situations exists:
• Value of the alarm is above or equal to the rising threshold and the startuptype is falling alarm.
• Valueof thealarm isbelowor equal to the falling thresholdand the startuptype is rising alarm.
• Value of the alarm is between the thresholds.
Startup alarm
detailName of the entry configured by the user. If the entry was created through theCLI, the owner hasmonitor prepended to it.
Owner
detailMechanism by which the entry was configured (Health Monitor).Creator
detailTime period between samples (in seconds).Sample interval
detailUpper limit threshold value as a percentage of the maximum possible value.Rising threshold
Copyright © 2016, Juniper Networks, Inc.430
Network Management and Monitoring Feature Guide for EX2300, EX3400, and EX4300 Switches

Table 40: show snmp health-monitor Output Fields (continued)
Level of OutputField DescriptionField Name
detailLower limit threshold value as a percentage of the maximum possible value.Falling threshold
detailEvent triggered when the rising threshold is crossed.Rising event index
detailEvent triggered when the falling threshold is crossed.Falling event index
Sample Output
show snmp health-monitor
user@host> show snmp health-monitor
Alarm Index Variable description Value State
32768 Health Monitor: root file system utilization jnxHrStoragePercentUsed.1 58 active
32769 Health Monitor: /config file system utilization jnxHrStoragePercentUsed.2 0 active
32770 Health Monitor: RE 0 CPU utilization jnxOperatingCPU.9.1.0.0 0 active
32773 Health Monitor: RE 0 Memory utilization jnxOperatingBuffer.9.1.0.0 35 active
32775 Health Monitor: jkernel daemon CPU utilization Init daemon 0 active Chassis daemon 50 active Firewall daemon 0 active Interface daemon 5 active SNMP daemon 11 active MIB2 daemon 42 active Sonet APS daemon 0 active VRRP daemon 0 active Alarm daemon 3 active PFE daemon 0 active CRAFT daemon 0 active Traffic sampling control daemon 0 active Ilmi daemon 0 active Remote operations daemon 0 active CoS daemon 0 active Pic Services Logging daemon 0 active Internal Routing Service Daemon 3 active Network Access Service daemon 0 active Forwarding UDP daemon 0 active Routing socket proxy daemon 0 active Disk Monitoring daemon 1 active Inet daemon 0 active Syslog daemon 0 active Adaptive Services PIC daemon 0 active ECC parity errors logging Daemon 0 active Layer 2 Tunneling Protocol daemon 0 active PPPoE daemon 3 active
431Copyright © 2016, Juniper Networks, Inc.
Chapter 23: SNMP

Redundancy device daemon 0 active PPP daemon 0 active Dynamic Flow Capture Daemon 0 active
32776 Health Monitor: jroute daemon CPU utilization Routing protocol daemon 1 active Management daemon 0 active Management daemon 0 active Command line interface 4 active Periodic Packet Management daemon 0 active Link Management daemon 0 active Pragmatic General Multicast daemon 0 active Bidirectional Forwarding Detection daemon 0 active SRC daemon 0 active audit daemon 0 active Event daemon 0 active
32777 Health Monitor: jcrypto daemon CPU utilization IPSec Key Management daemon 0 active
32779 Health Monitor: jkernel daemon Memory utilization Init daemon 47384 active Chassis daemon 20204 active Firewall daemon 1956 active Interface daemon 3340 active SNMP daemon 4540 active MIB2 daemon 3880 active Sonet APS daemon 2632 active VRRP daemon 2672 active Alarm daemon 1856 active PFE daemon 2600 active CRAFT daemon 2000 active Traffic sampling control daemon 3164 active Ilmi daemon 2132 active Remote operations daemon 2964 active CoS daemon 3044 active Pic Services Logging daemon 1944 active Internal Routing Service Daemon 1392 active Network Access Service daemon 1992 active Forwarding UDP daemon 1876 active Routing socket proxy daemon 1296 active Disk Monitoring daemon 1180 active Inet daemon 1296 active Syslog daemon 1180 active Adaptive Services PIC daemon 3220 active ECC parity errors logging Daemon 1100 active Layer 2 Tunneling Protocol daemon 3372 active PPPoE daemon 1424 active Redundancy device daemon 1820 active PPP daemon 2060 active Dynamic Flow Capture Daemon 10740 active 32780 Health Monitor: jroute daemon Memory utilization Routing protocol daemon 8104 active Management daemon 13360 active Management daemon 19252 active Command line interface 9912 active Periodic Packet Management daemon 1484 active Link Management daemon 2016 active Pragmatic General Multicast daemon 1968 active Bidirectional Forwarding Detection daemon 1956 active SRC daemon 1772 active
Copyright © 2016, Juniper Networks, Inc.432
Network Management and Monitoring Feature Guide for EX2300, EX3400, and EX4300 Switches

audit daemon 1772 active Event daemon 1808 active
32781 Health Monitor: jcrypto daemon Memory utilization IPSec Key Management daemon 5600 active
show snmp health-monitor alarms detail
user@host> show snmp health-monitor alarms detail
Alarm Index 32768: Variable name jnxHrStoragePercentUsed.1 Variable OID 1.3.6.1.4.1.2636.3.31.1.1.1.1.1 Sample type absolute value Startup alarm rising alarm Owner Health Monitor: root file system utilization Creator Health Monitor State active Sample interval 300 seconds Rising threshold 80 Falling threshold 70 Rising event index 32768 Falling event index 32768 Instance Value: 58 Instance State: active
Alarm Index 32769: Variable name jnxHrStoragePercentUsed.2 Variable OID 1.3.6.1.4.1.2636.3.31.1.1.1.1.2 Sample type absolute value Startup alarm rising alarm Owner Health Monitor: /config file system utilization Creator Health Monitor State active Sample interval 300 seconds Rising threshold 80 Falling threshold 70 Rising event index 32768 Falling event index 32768 Instance Value: 0 Instance State: active
Alarm Index 32770: Variable name jnxOperatingCPU.9.1.0.0 Variable OID 1.3.6.1.4.1.2636.3.1.13.1.8.9.1.0.0 Sample type absolute value Startup alarm rising alarm Owner Health Monitor: RE 0 CPU utilization
Creator Health Monitor State active Sample interval 300 seconds Rising threshold 80 Falling threshold 70 Rising event index 32768 Falling event index 32768 Instance Value: 0 Instance State: active
433Copyright © 2016, Juniper Networks, Inc.
Chapter 23: SNMP

Alarm Index 32773: Variable name jnxOperatingBuffer.9.1.0.0 Variable OID 1.3.6.1.4.1.2636.3.1.13.1.11.9.1.0.0 Sample type absolute value Startup alarm rising alarm Owner Health Monitor: RE 0 Memory utilization
Creator Health Monitor State active Sample interval 300 seconds Rising threshold 80 Falling threshold 70 Rising event index 32768 Falling event index 32768 Instance Value: 35 Instance State: active
Alarm Index 32775: Variable name sysApplElmtRunCPU.3 Variable OID 1.3.6.1.2.1.54.1.2.3.1.9.3 Sample type delta value Startup alarm rising alarm Owner Health Monitor: jkernel daemon CPU utilization Creator Health Monitor State active Sample interval 300 seconds Rising threshold 24000 Falling threshold 21000 Rising event index 32768 Falling event index 32768 Instance Name: sysApplElmtRunCPU.3.1.1 Instance Description: Init daemon Instance Value: 0 Instance State: active
Instance Name: sysApplElmtRunCPU.3.2.2786 Instance Description: Chassis daemon Instance Value: 50 Instance State: active
Instance Name: sysApplElmtRunCPU.3.3.2938 Instance Description: Firewall daemon Instance Value: 0 Instance State: active
Instance Name: sysApplElmtRunCPU.3.4.2942 Instance Description: Interface daemon Instance Value: 5 Instance State: active
Instance Name: sysApplElmtRunCPU.3.7.7332 Instance Description: SNMP daemon Instance Value: 11 Instance State: active
Instance Name: sysApplElmtRunCPU.3.9.2914 Instance Description: MIB2 daemon Instance Value: 42
Copyright © 2016, Juniper Networks, Inc.434
Network Management and Monitoring Feature Guide for EX2300, EX3400, and EX4300 Switches
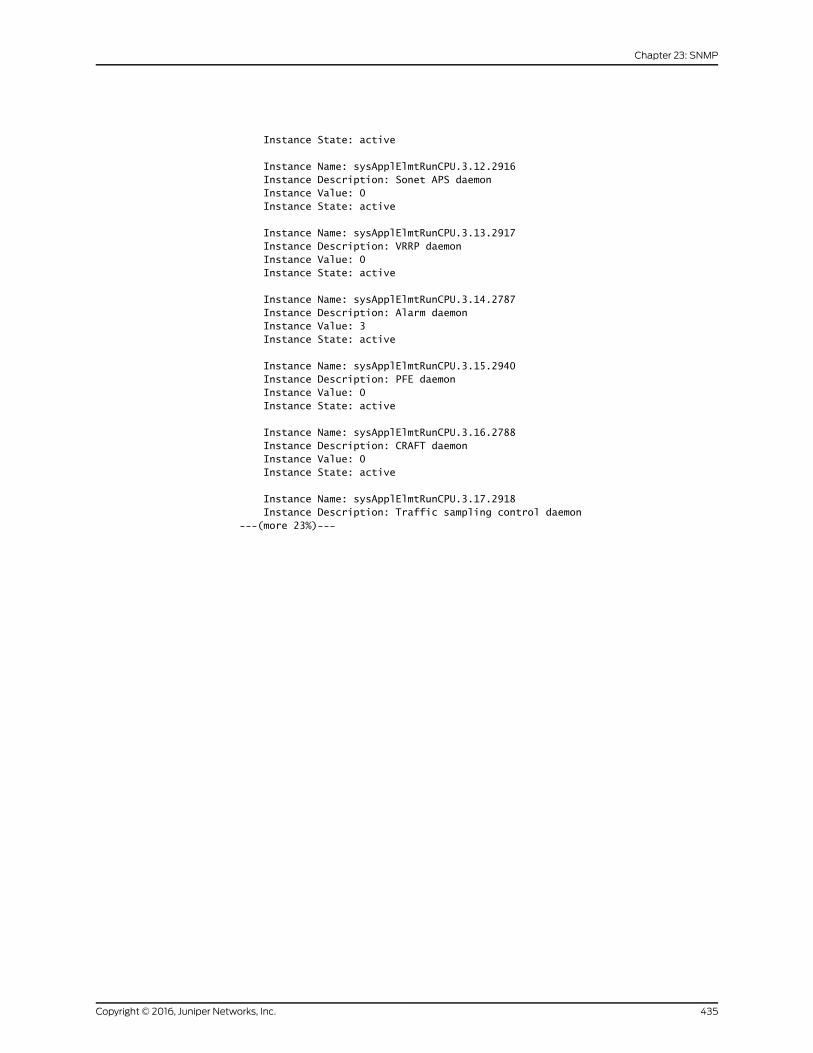
Instance State: active
Instance Name: sysApplElmtRunCPU.3.12.2916 Instance Description: Sonet APS daemon Instance Value: 0 Instance State: active
Instance Name: sysApplElmtRunCPU.3.13.2917 Instance Description: VRRP daemon Instance Value: 0 Instance State: active
Instance Name: sysApplElmtRunCPU.3.14.2787 Instance Description: Alarm daemon Instance Value: 3 Instance State: active
Instance Name: sysApplElmtRunCPU.3.15.2940 Instance Description: PFE daemon Instance Value: 0 Instance State: active
Instance Name: sysApplElmtRunCPU.3.16.2788 Instance Description: CRAFT daemon Instance Value: 0 Instance State: active
Instance Name: sysApplElmtRunCPU.3.17.2918 Instance Description: Traffic sampling control daemon---(more 23%)---
435Copyright © 2016, Juniper Networks, Inc.
Chapter 23: SNMP

show snmp inform-statistics
Syntax show snmp inform-statistics
Release Information Command introduced in Junos OS Release 7.4.
Command introduced in Junos OS Release 9.0 for EX Series switches.
Command introduced in Junos OS Release 11.1 for the QFX Series.
Command introduced in Junos OS Release 14.1X53-D20 for the OCX Series.
Description Display information about Simple Network Management Protocol (SNMP) inform
requests.
Options This command has no options.
Required PrivilegeLevel
view
List of Sample Output show snmp inform-statistics on page 436
Output Fields Table 41 on page 436 describes the output fields for the show snmp inform-statistics
command. Output fields are listed in the approximate order in which they appear.
Table 41: show snmp inform-statistics Output Fields
Field DescriptionField Name
Name of the device configured to receive and respond to SNMP informs.Target Name
IP address of the target device.Address
Number of informs sent to the target device and acknowledged by the target device.Sent
Number of informs held in memory pending a response from the target device.Pending
Number of informs discarded after the specified number of retransmissions to the target devicewereattempted.
Discarded
Numberof informs thatdidnot receiveanacknowledgement fromthe targetdevicewithin the timeoutspecified.
Timeouts
Connection failures that occurred (for example, when the target server returned invalid content oryou incorrectly configured the target address).
Probe Failures
Sample Output
show snmp inform-statistics
user@host> show snmp inform-statisticsInform Request Statistics: Target Name: TA1_v3_md5_none Address: 172.17.20.184 Sent: 176, Pending: 0 Discarded: 0, Timeouts: 0, Probe Failures: 0
Copyright © 2016, Juniper Networks, Inc.436
Network Management and Monitoring Feature Guide for EX2300, EX3400, and EX4300 Switches

Target Name: TA2_v3_sha_none Address: 192.168.110.59 Sent: 0, Pending: 4 Discarded: 84, Timeouts: 0, Probe Failures: 258 Target Name: TA5_v2_none Address: 172.17.20.184 Sent: 0, Pending: 0 Discarded: 2, Timeouts: 10, Probe Failures: 0
437Copyright © 2016, Juniper Networks, Inc.
Chapter 23: SNMP

show snmpmib
Syntax show snmpmib (get | get-next | walk) (ascii | decimal) object-id
Release Information Command introduced before Junos OS Release 7.4.
Command introduced in Junos OS Release 9.0 for EX Series switches.
ascii and decimal options introduced in Junos OS Release 9.6.
ascii and decimal options introduced in Junos OS Release 9.6 for EX Series switches.
Command introduced in Junos OS Release 11.1 for the QFX Series.
Command introduced in Junos OS Release 14.1X53-D20 for the OCX Series.
Description Display local Simple Network Management Protocol (SNMP) Management Information
Base (MIB) object values.
Options get—Retrieve and display one or more SNMP object values.
get-next—Retrieve and display the next SNMP object values.
walk—Retrieveanddisplay theSNMPobject values thatareassociatedwith the requested
object identifier (OID). When you use this option, the Junos OS displays the objects
below the subtree that you specify.
ascii—Display the SNMP object’s string indices as an ASCII-key representation.
decimal—Display the SNMP object values in the decimal (default) format. The decimal
option is the default option for this command. Therefore, issuing the showsnmpmib
(get | get-next |walk)decimal object-id and the showsnmpmib (get | get-next |walk)
object-id commands display the same output.
object-id—The object can be represented by a sequence of dotted integers (such as
1.3.6.1.2.1.2) or by its subtree name (such as interfaces). When entering multiple
objects, enclose the objects in quotation marks.
Required PrivilegeLevel
snmp—To view this statement in the configuration.
List of Sample Output show snmpmib get on page 439show snmpmib get (Multiple Objects) on page 439show snmpmib get (Layer 2 Policer) on page 439show snmpmib get-next on page 439show snmpmib get-next (Specify an OID) on page 439show snmpmibwalk on page 439show snmpmibwalk (QFX Series) on page 439show snmpmibwalk decimal on page 440show snmpmibwalk (ASCII) on page 440show snmpmibwalk (Multiple Indices) on page 440show snmpmibwalk decimal (Multiple Indices) on page 440
Output Fields Table42onpage439describes theoutput fields for the showsnmpmibcommand.Output
fields are listed in the approximate order in which they appear.
Copyright © 2016, Juniper Networks, Inc.438
Network Management and Monitoring Feature Guide for EX2300, EX3400, and EX4300 Switches

Table 42: show snmpmib Output Fields
Field DescriptionField Name
Object name and numeric instance value.name
Object value. The Junos OS translates OIDs into the correspondingobject names.
object value
Sample Output
show snmpmib get
user@host> show snmpmib get sysObjectID.0sysObjectID.0 = jnxProductNameM20
show snmpmib get (Multiple Objects)
user@host> show snmpmib get ?sysObjectID.0 sysUpTime.0?sysObjectID.0 = jnxProductNameM20sysUpTime.0 = 1640992
show snmpmib get (Layer 2 Policer)
user@host> show snmpmib get ifInOctets.25970ifInOctets.25970 = 7545720
show snmpmib get-next
user@host> show snmpmib get-next jnxMibsjnxBoxClass.0 = jnxProductLineM20.0
show snmpmib get-next (Specify an OID)
user@host> show snmpmib get-next 1.3.6.1sysDescr.0 = Juniper Networks, Inc. m20 internet router, kernel Junos OS Release: 2004-1 Build date: build date UTC Copyright (c) 1996-2004 Juniper Networks, Inc.
show snmpmibwalk
user@host> show snmpmibwalk systemsysDescr.0 = Juniper Networks, Inc. m20 internet router, kernel Junos OS Release #0: 2004-1 Build date: build date UTC Copyright (c) 1996-2004 Juniper Networks, Inc.sysObjectID.0 = jnxProductNameM20sysUpTime.0 = 1640992sysContact.0 = Your contactsysName.0 = my routersysLocation.0 = building 1sysServices.0 = 4
show snmpmibwalk (QFX Series)
user@switch> show snmpmibwalk systemsysDescr.0 = Juniper Networks, Inc. qfx3500s internet router, kernel JUNOS 11.1-20100926.0 #0: 2010-09-26 06:17:38 UTC Build date: 2010-09-26 06:00:10sysObjectID.0 = jnxProductQFX3500sysUpTime.0 = 138980301sysContact.0 = System Contact
439Copyright © 2016, Juniper Networks, Inc.
Chapter 23: SNMP

sysName.0 = LabQFX3500sysLocation.0 = LabsysServices.0 = 4
show snmpmibwalk decimal
user@host show snmpmibwalk decimal jnxUtilDatajnxUtilCounter32Value.102.114.101.100 = 100
show snmpmibwalk (ASCII)
show snmp mib walk ascii jnxUtilDatajnxUtilCounter32Value."fred" = 100
show snmpmibwalk (Multiple Indices)
show snmp mib walk ascii jnxFWCounterByteCountjnxFWCounterByteCount."fe-1/3/0.0-i"."CLASS_BE-fe-1/3/0.0-i".2 = 0jnxFWCounterByteCount."fe-1/3/0.0-i"."CLASS_CC-fe-1/3/0.0-i".2 = 0jnxFWCounterByteCount."fe-1/3/0.0-i"."CLASS_RT-fe-1/3/0.0-i".2 = 0.......
show snmpmibwalk decimal (Multiple Indices)
show snmp mib walk ascii jnxFWCounterByteCountjnxFWCounterByteCount."fe-1/3/0.0-i"."CLASS_BE-fe-1/3/0.0-i".2 = 0jnxFWCounterByteCount."fe-1/3/0.0-i"."CLASS_CC-fe-1/3/0.0-i".2 = 0jnxFWCounterByteCount."fe-1/3/0.0-i"."CLASS_RT-fe-1/3/0.0-i".2 = 0.......
Copyright © 2016, Juniper Networks, Inc.440
Network Management and Monitoring Feature Guide for EX2300, EX3400, and EX4300 Switches

show snmp rmon
Syntax show snmp rmon<alarms <brief | detail> | events <brief | detail> | logs>
Release Information Command introduced before Junos OS Release 7.4.
Command introduced in Junos OS Release 9.0 for EX Series switches.
Description Display information about Simple Network Management Protocol (SNMP) Remote
Monitoring (RMON) alarms and events.
Options none—Display information about all RMON alarms and events.
alarms—(Optional) Display information about RMON alarms.
brief | detail—(Optional) Display brief or detailed information about RMON alarms or
events.
events—(Optional) Display information about RMON events.
logs—(Optional) Display information about RMONmonitoring logs.
Required PrivilegeLevel
view
List of Sample Output show snmp rmon on page 443show snmp rmon alarms detail on page 443show snmp rmon events detail on page 444
Output Fields Table 43 on page 441 describes the output fields for the show snmp rmon command.
Output fields are listed in the approximate order in which they appear.
Table 43: show snmp rmonOutput Fields
Level of OutputField DescriptionField Name
All levelsAlarm identifier.Alarm Index
441Copyright © 2016, Juniper Networks, Inc.
Chapter 23: SNMP

Table 43: show snmp rmonOutput Fields (continued)
Level of OutputField DescriptionField Name
All levelsState of the alarm or event entry:
Alarms:
• active—Entry is fully configured and activated.
• fallingthresholdcrossed—Valueof thevariablehascrossed the lower thresholdlimit.
• risingthresholdcrossed—Valueof thevariablehascrossed theupper thresholdlimit.
• under creation—Entry is being configured and is not yet activated.
• startup—Alarm is waiting for the first sample of the monitored variable.
• object not available—Monitored variable of that type is not available to theSNMP agent.
• instance not available—Monitored variable's instance is not available to theSNMP agent.
• object type invalid—Monitored variable is not a numeric value.
• object processing errored—An error occurred when themonitored variablewas processed.
• unknown—State is not one of the above.
Events:
• active—Entry has been fully configured and activated.
• under creation—Entry is being configured and is not yet activated.
• unknown—State is not one of the above.
State
All levelsName of the SNMP object instance being monitored.Variable name
All levelsEvent identifier.Event Index
detailType of notification made when an event is triggered. It can be one of thefollowing:
• log—Asystem logmessage is generatedandanentry ismade to the log table.
• snmptrap—An SNMP trap is sent to the configured destination.
• log and trap—A system logmessage is generated, an entry is made to the logtable, and an SNMP trap is sent to the configured destination.
• none—Neither log nor trap will be sent.
Type
briefDate and time of the last event. It has the format yyyy-mm-dd hh:mm:sstimezone.
Last Event
detailIdentifies the trap group used for sending the SNMP trap.Community
detailObject ID to which the variable name is resolved. The format is x.x.x.x.Variable OID
detailMethodofsampling themonitoredvariableandcalculating thevalue tocompareagainst the upper and lower thresholds. It can have the value of absolute valueor delta value.
Sample type
Copyright © 2016, Juniper Networks, Inc.442
Network Management and Monitoring Feature Guide for EX2300, EX3400, and EX4300 Switches

Table 43: show snmp rmonOutput Fields (continued)
Level of OutputField DescriptionField Name
detailAlarm that might be sent when this entry is first activated, depending on thefollowing criteria:
• Alarm is sent when one of the following situations exists:
• Value of the alarm is above or equal to the rising threshold and the startuptype is either rising alarm or rising or falling alarm.
• Valueof thealarm isbelowor equal to the falling thresholdand the startuptype is either falling alarm or rising or falling alarm.
• Alarm is not sent when one of the following situations exists:
• Value of the alarm is above or equal to the rising threshold and the startuptype is falling alarm.
• Valueof thealarm isbelowor equal to the falling thresholdand the startuptype is rising alarm.
• Value of the alarm is between the thresholds.
Startup alarm
detailName of the entry configured by the user. If the entry was created through theCLI, the owner hasmonitor prepended to it.
Owner
detailMechanism by which the entry was configured (CLI or SNMP).Creator
detailTime period between samples (in seconds).Sample interval
detailUpper limit threshold value configured by the user.Rising threshold
detailLower limit threshold value configured by the user.Falling threshold
detailEvent triggered when the rising threshold is crossed.Rising event index
detailEvent triggered when the falling threshold is crossed.Falling event index
detailCurrent value of the monitored variable in the most recent sample interval.Current value
Sample Output
show snmp rmon
user@host> show snmp rmonAlarm Index State Variable name 1 falling threshold crossed ifInOctets.1
Event Index Type Last Event 1 log and trap 2002-01-30 01:13:01 PST
show snmp rmon alarms detail
user@host> show snmp rmon alarms detail
443Copyright © 2016, Juniper Networks, Inc.
Chapter 23: SNMP

Alarm Index 1: Variable name ifInOctets.1 Variable OID 1.3.6.1.2.1.2.2.1.10.1 Sample type delta value Startup alarm rising or falling alarm Owner monitor Creator CLI State falling threshold crossed Sample interval 60 seconds Rising threshold 100000 Falling threshold 80000 Rising event index 1 Falling event index 1 Current value 0
show snmp rmon events detail
user@host> show snmp rmon events detailEvent Index 1: Type log and trap Community boy-elroy Last event 2002-01-30 01:13:01 PST Creator CLI State active
Copyright © 2016, Juniper Networks, Inc.444
Network Management and Monitoring Feature Guide for EX2300, EX3400, and EX4300 Switches
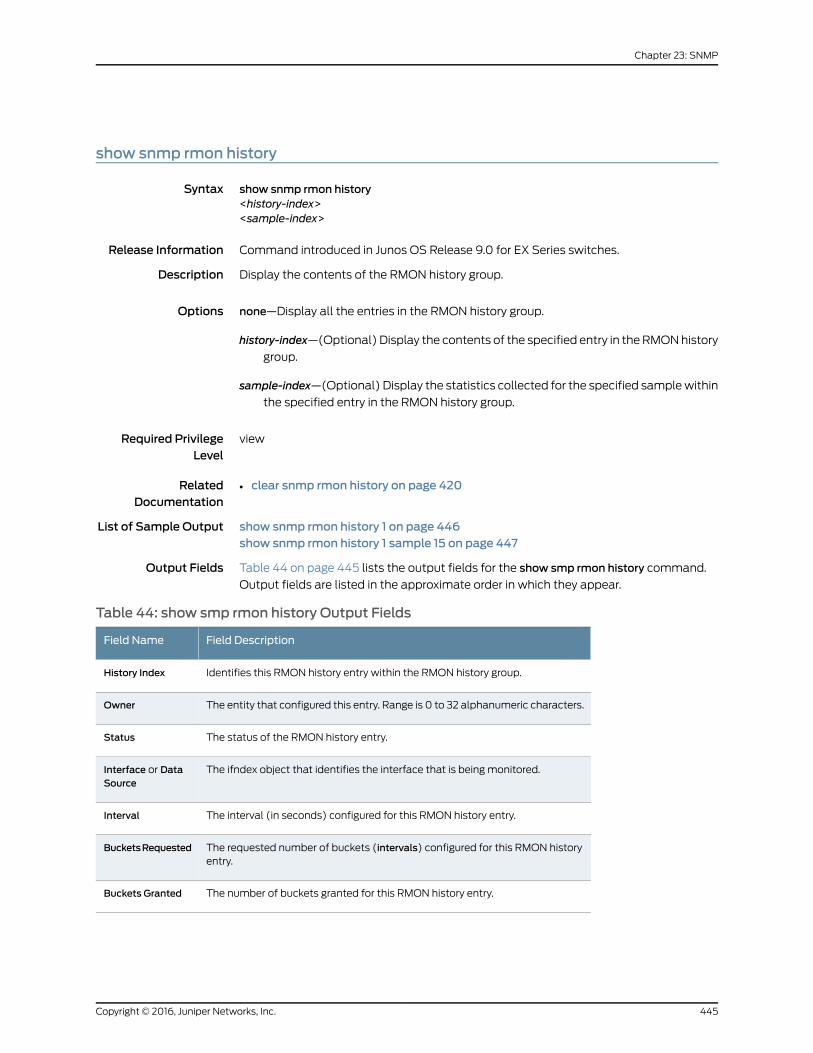
show snmp rmon history
Syntax show snmp rmon history<history-index><sample-index>
Release Information Command introduced in Junos OS Release 9.0 for EX Series switches.
Description Display the contents of the RMON history group.
Options none—Display all the entries in the RMON history group.
history-index—(Optional) Display the contents of the specified entry in the RMONhistory
group.
sample-index—(Optional) Display the statistics collected for the specified samplewithin
the specified entry in the RMON history group.
Required PrivilegeLevel
view
RelatedDocumentation
clear snmp rmon history on page 420•
List of Sample Output show snmp rmon history 1 on page 446show snmp rmon history 1 sample 15 on page 447
Output Fields Table 44 on page 445 lists the output fields for the show smp rmon history command.
Output fields are listed in the approximate order in which they appear.
Table 44: show smp rmon history Output Fields
Field DescriptionField Name
Identifies this RMON history entry within the RMON history group.History Index
The entity that configured this entry. Range is 0 to 32 alphanumeric characters.Owner
The status of the RMON history entry.Status
The ifndex object that identifies the interface that is being monitored.Interface or DataSource
The interval (in seconds) configured for this RMON history entry.Interval
The requested number of buckets (intervals) configured for this RMON historyentry.
BucketsRequested
The number of buckets granted for this RMON history entry.Buckets Granted
445Copyright © 2016, Juniper Networks, Inc.
Chapter 23: SNMP

Table 44: show smp rmon history Output Fields (continued)
Field DescriptionField Name
The sample statistics taken at the specified interval.
• Drop Events—Number of packets dropped by the input queue of the I/OManager ASIC. If the interface is saturated, this number increments once forevery packet that is dropped by the ASIC's REDmechanism.
• Octets—Total number of octets and packets. For Gigabit Ethernet IQ PICs,the received octets count varies by interface type.
• Packets—Total number of packets.
• Broadcast Packets—Number of broadcast packets.
• Multicast Packets—Number of multicast packets.
• CRC errors—Total number of packets received that had a length (excludingframing bits, but including FCS octets) of between 64 and 1518 octets,inclusive, and had either a bad FCS with an integral number of octets (FCSerror) or a bad FCS with a nonintegral number of octets (alignment error).
• Undersize Pkts—Number of packets received during this sampling intervalthat were less than 64 octets long (excluding framing bits but including FCSoctets) and were otherwise well formed.
• Oversize Pkts—Number of packets received during the sampling interval thatwere longer than 1518octets (excluding framingbits, but includingFCSoctets)but were otherwise well formed.
• Fragments—Total number of packets that were less than 64 octets in length(excluding framing bits, but including FCS octets), and had either an FCSerror or an alignment error. Fragment frames normally increment becauseboth runts (which are normal occurrences caused by collisions) and noisehits are counted.
• Jabbers—Number of frames that were longer than 1518 octets (excludingframing bits, but including FCS octets), and had either an FCS error or analignment error. This definition of jabber is different from the definition inIEEE-802.3 section 8.2.1.5 (10BASE5) and section 10.3.1.4 (10BASE2). Thesedocuments define jabber as the condition in which any packet exceeds 20ms. The allowed range to detect jabber is from 20ms to 150ms.
• Collisions—Number of Ethernet collisions. TheGigabit Ethernet PIC supportsonly full-duplex operation, so for Gigabit Ethernet PICs, this number shouldalways remain 0. If it is nonzero, there is a software bug.
• Utilization(%)—The best estimate of the mean physical layer networkutilization on this interface during this sampling interval, in hundredths of apercent.
Sample Index
Sample Output
show snmp rmon history 1
user@host> show snmp rmon history 1 History Index 1: Interface 171 Requested Buckets 50 Interval 10
Sample Index 1: Interval Start: Tue Feb 12 04:12:32 2008 Drop Events 0 Octets 486 Packets 2
Copyright © 2016, Juniper Networks, Inc.446
Network Management and Monitoring Feature Guide for EX2300, EX3400, and EX4300 Switches

Broadcast Packet 0 Multicast Packets 2 CRC errors 0 Undersize Pkts 0 Oversize Pkts 0 Fragments 0 Jabbers 0 Collisions 0 Utilization(%) 0
Sample Index 2: Interval Start: Tue Feb 12 04:12:42 2008 Drop Events 0 Octets 486 Packets 2 Broadcast Packet 0 Multicast Packets 2 CRC errors 0 Undersize Pkts 0 Oversize Pkts 0 Fragments 0 Jabbers 0 Collisions 0 Utilization(%) 0
Sample Index 3: Interval Start: Tue Feb 12 04:12:52 2008 Drop Events 0 Octets 486 Packets 2 Broadcast Packet 0 Multicast Packets 2 CRC errors 0 Undersize Pkts 0 Oversize Pkts 0 Fragments 0 Jabbers 0 Collisions 0 Utilization(%) 0
show snmp rmon history 1 sample 15
user@host> show snmp rmon history 1 sample 15 Index 1Owner = monitorStatus = validData Source = ifIndex.17Interval = 1800Buckets Requested = 50Buckets Granted = 50
Sample Index 44: Interval Start: Thu Jan 1 00:08:35 1970Drop Events = 0Octetes = 0Packets = 0Broadcast Pkts = 0 Multicast Pkts = 0CRC Errors = 0Undersize Pkts = 0Oversize Pkts = 0 Fragments = 0Jabbers = 0
447Copyright © 2016, Juniper Networks, Inc.
Chapter 23: SNMP

Collisions = 0 Utilization (%) = 0
Copyright © 2016, Juniper Networks, Inc.448
Network Management and Monitoring Feature Guide for EX2300, EX3400, and EX4300 Switches

show snmp statistics
Syntax show snmp statistics<subagents>
Release Information Command introduced before Junos OS Release 7.4.
Command introduced in Junos OS Release 9.0 for EX Series switches.
Command introduced in Junos OS Release 11.1 for the QFX Series.
Command introduced in Junos OS Release 14.1X53-D20 for OCX Series switches.
Option subagents introduced in Junos OS Release 14.2.
Description Display statistics about Simple Network Management Protocol (SNMP) packets sent
and received by the router or switch.
Options subagents—(Optional)Display the statistics of theprotocol dataunit (PDU), thenumber
of SNMP requests and responses per subagent, and the SNMP statistics received
from each subagent per logical system.
Required PrivilegeLevel
view
RelatedDocumentation
clear snmp statistics on page 421•
List of Sample Output show snmp statistics on page 454show snmp statistics subagents on page 454
Output Fields Table 45onpage450describes the output fields for the showsnmpstatistics command.
Output fields are listed in the approximate order in which they appear.
449Copyright © 2016, Juniper Networks, Inc.
Chapter 23: SNMP

Table 45: show snmp statistics Output Fields
Field DescriptionField Name
Information about received packets:
• Packets(snmpInPkts)—Total number of messages delivered to the SNMP entityfrom the transport service.
• Bad versions—(snmpInBadVersions) Total number of messages delivered to theSNMP entity that were for an unsupported SNMP version.
• Bad community names—(snmpInBadCommunityNames) Total number ofmessages delivered to the SNMP entity that used an SNMP community namenot known to the entity.
• Bad community uses—(snmpInBadCommunityUses) Total number of messagesdelivered to the SNMP entity that represented an SNMP operation that was notallowed by the SNMP community named in the message.
• ASN parse errors—(snmpInASNParseErrs) Total number of ASN.1 or BER errorsencountered by the SNMP entity when decoding received SNMPmessages.
• Too bigs—(snmpInTooBigs) Total number of SNMP PDUs delivered to the SNMPentity with an error status field of tooBig.
• Nosuchnames—(snmpInNoSuchNames)Total number of SNMPPDUs deliveredto the SNMP entity with an error status field of noSuchName.
• Bad values—(snmpInBadValues) Total number of SNMP PDUs delivered to theSNMP entity with an error status field of badValue.
• Read onlys—(snmpInReadOnlys) Total number of valid SNMP PDUs delivered tothe SNMP entity with an error status field of readOnly. Only incorrectimplementations of SNMP generate this error.
Input
Copyright © 2016, Juniper Networks, Inc.450
Network Management and Monitoring Feature Guide for EX2300, EX3400, and EX4300 Switches

Table 45: show snmp statistics Output Fields (continued)
Field DescriptionField Name
• General errors—(snmpInGenErrs) Total number of SNMP PDUs delivered to theSNMP entity with an error status field of genErr.
• Total requests varbinds—(snmpInTotalReqVars) Total number of MIB objectsretrieved successfully by the SNMP entity as a result of receiving valid SNMPGetRequest and GetNext PDUs.
• Total set varbinds—(snmpInSetVars) Total number of MIB objects modifiedsuccessfully by the SNMP entity as a result of receiving valid SNMP SetRequestPDUs.
• Get requests—(snmpInGetRequests) Total number of SNMP GetRequest PDUsthat have been accepted and processed by the SNMP entity.
• Get nexts—(snmpInGetNexts) Total number of SNMP GetNext PDUs that havebeen accepted and processed by the SNMP entity.
• Set requests—(snmpInSetRequests) Total number of SNMP SetRequest PDUsthat have been accepted and processed by the SNMP entity.
• Get responses—(snmpInGetResponses) Total number of SNMP GetResponsePDUs that have been accepted and processed by the SNMP entity.
• Traps—(snmpInTraps) Total number of SNMP traps generated by the SNMPentity.
• Silent drops—(snmpSilentDrops) Total number of GetRequest, GetNextRequest,GetBulkRequest, SetRequests, and InformRequest PDUs delivered to the SNMPentity that were silently dropped because the size of a reply containing analternate response PDUwith an empty variable-bindings field was greater thaneither a local constraint or the maximummessage size associated with theoriginator of the requests.
• Proxy drops—(snmpProxyDrops) Total number of GetRequest, GetNextRequest,GetBulkRequest, SetRequests, and InformRequest PDUs delivered to the SNMPentity that were silently dropped because the transmission of the message to aproxy target failed in such a way (other than a timeout) that no response PDUcould be returned.
• Commit pending drops—Number of SNMP packets for Set requests droppedbecauseofapreviouspendingSNMPSet requeston thecommittedconfiguration.
• Throttle drops—Number of SNMPpackets for any requests dropped reaching thethrottle limit.
Input (continued)
451Copyright © 2016, Juniper Networks, Inc.
Chapter 23: SNMP

Table 45: show snmp statistics Output Fields (continued)
Field DescriptionField Name
Information about SNMP version 3 packets:
• Unknown security models—(snmpUnknownSecurityModels) Total number ofpackets receivedby theSNMPengine thatweredroppedbecause they referenceda security model that was not known to or supported by the SNMP engine.
• Invalidmessages—(snmpInvalidMsgs)Number of packets received by the SNMPengine thatweredroppedbecause therewere invalidor inconsistent componentsin the SNMPmessage.
• Unknownpduhandlers—(snmpUnknownPDUHandlers)Numberofpackets receivedby theSNMPengine thatweredroppedbecause thePDUcontained in thepacketcould not be passed to an application responsible for handling the PDU type.
• Unavailable contexts—(snmpUnavailableContexts) Number of requests receivedfor a context that is known to the SNMP engine, but is currently unavailable.
• Unknowncontexts—(snmpUnknownContexts)Total number of requests receivedfor a context that is unknown to the SNMP engine.
• Unsupported security levels—(usmStatsUnsupportedSecLevels) Total number ofpackets receivedby theSNMPengine thatweredroppedbecause they requesteda security level unknown to the SNMP engine (or otherwise unavailable).
• Not in timewindows—(usmStatsNotInTimeWindows) Total number of packetsreceived by the SNMPengine thatwere dropped because they appeared outsidethe authoritative SNMP engine’s window.
• Unknownuser names—(usmStatsUnknownUserNames)Total number of packetsreceived by the SNMP engine that were dropped because they referenced a userthat was not known to the SNMP engine.
• Unknown engine ids—(usmStatsUnknownEngineIDs) Total number of packetsreceived by the SNMP engine that were dropped because they referenced anSNMP engine ID that was not known to the SNMP engine.
• Wrong digests—(usmStatsWrongDigests) Total number of packets received bythe SNMP engine that were dropped because they did not contain the expecteddigest value.
• Decryptionerrors—(usmStatsDecryptionErrors)Total number of packets receivedby the SNMP engine that were dropped because they could not be decrypted.
V3 Input
Copyright © 2016, Juniper Networks, Inc.452
Network Management and Monitoring Feature Guide for EX2300, EX3400, and EX4300 Switches

Table 45: show snmp statistics Output Fields (continued)
Field DescriptionField Name
Information about transmitted packets:
• Packets—(snmpOutPkts) Total number of messages passed from the SNMPentity to the transport service.
• Too bigs—(snmpOutTooBigs) Total number of SNMP PDUs generated by theSNMP entity with an error status field of tooBig.
• Nosuchnames—(snmpOutNoSuchNames)TotalnumberofSNMPPDUsdeliveredto the SNMP entity with an error status field of noSuchName.
• Bad values—(snmpOutBadValues) Total number of SNMP PDUs generated bythe SNMP entity with an error status field of badValue.
• General errors—(snmpOutGenErrs) Total number of SNMP PDUs generated bythe SNMP entity with an error status field of genErr.
• Get requests—(snmpOutGetRequests) Total number of SNMPGetRequest PDUsgenerated by the SNMP entity.
• Getnexts—(snmpOutGetNexts)Total number of SNMPGetNextPDUs generatedby the SNMP entity.
• Set requests—(snmpOutSetRequests) Total number of SNMP SetRequest PDUsgenerated by the SNMP entity.
• Get responses—(snmpOutGetResponses) Total number of SNMP GetResponsePDUs generated by the SNMP entity.
• Traps—(snmpOutTraps) Total number of SNMP traps generated by the SNMPentity.
Output
Table 46 on page 453 describes the output fields for the show snmp statistics subagents
command. Output fields are listed in the approximate order in which they appear.
Table 46: show snmp statistics subagents Output Fields
Field DescriptionField Name
Location of the SNMP subagent.Subagent
Number of PDUs requested by the SNMPmanager.Request PDUs
Number of response PDUs sent by the SNMP subagent.Response PDUs
NumberofvariablebindingsonthePDUs requestedby theSNMPmanager.
Request Variables
Number of variable bindings on the PDUs sent by the SNMPsubagent.
Response Variables
Average time taken by the SNMP subagent to send statisticsresponse.
Average Response Time
Maximum time taken by the SNMP subagent to send thestatistics response.
MaximumResponse Time
453Copyright © 2016, Juniper Networks, Inc.
Chapter 23: SNMP

Sample Output
show snmp statistics
user@host> show snmp statisticsSNMP statistics: Input: Packets: 246213, Bad versions: 12, Bad community names: 12, Bad community uses: 0, ASN parse errors: 96, Too bigs: 0, No such names: 0, Bad values: 0, Read onlys: 0, General errors: 0, Total request varbinds: 227084, Total set varbinds: 67, Get requests: 44942, Get nexts: 190371, Set requests: 10712, Get responses: 0, Traps: 0, Silent drops: 0, Proxy drops: 0, Commit pending drops: 0, Throttle drops: 0, V3 Input: Unknown security models: 0, Invalid messages: 0 Unknown pdu handlers: 0, Unavailable contexts: 0 Unknown contexts: 0, Unsupported security levels: 1 Not in time windows: 0, Unknown user names: 0 Unknown engine ids: 44, Wrong digests: 23, Decryption errors: 0 Output: Packets: 246093, Too bigs: 0, No such names: 31561, Bad values: 0, General errors: 2, Get requests: 0, Get nexts: 0, Set requests: 0, Get responses: 246025, Traps: 0
show snmp statistics subagents
user@host> show snmp statistics subagents
Subagent: /var/run/cosd-20 Request PDUs: 0, Response PDUs: 0, Request Variables: 0, Response Variables: 0, Average Response Time(ms): 0.00, Maximum Response Time(ms): 0.00
Subagent: /var/run/pfed-30 Request PDUs: 0, Response PDUs: 0, Request Variables: 0, Response Variables: 0, Average Response Time(ms): 0.00, Maximum Response Time(ms): 0.00
Subagent: /var/run/rmopd-15 Request PDUs: 0, Response PDUs: 0, Request Variables: 0, Response Variables: 0, Average Response Time(ms): 0.00, Maximum Response Time(ms): 0.00
Subagent: /var/run/chassisd-30 Request PDUs: 33116, Response PDUs: 33116, Request Variables: 33116, Response Variables: 33116, Average Response Time(ms): 1.83, Maximum Response Time(ms): 203.48
Subagent: /var/run/pkid-13 Request PDUs: 0, Response PDUs: 0, Request Variables: 0, Response Variables: 0, Average Response Time(ms): 0.00, Maximum Response Time(ms): 0.00
Copyright © 2016, Juniper Networks, Inc.454
Network Management and Monitoring Feature Guide for EX2300, EX3400, and EX4300 Switches

Subagent: /var/run/apsd-13 Request PDUs: 0, Response PDUs: 0, Request Variables: 0, Response Variables: 0, Average Response Time(ms): 0.00, Maximum Response Time(ms): 0.00
Subagent: /var/run/dfcd-32 Request PDUs: 0, Response PDUs: 0, Request Variables: 0, Response Variables: 0, Average Response Time(ms): 0.00, Maximum Response Time(ms): 0.00
Subagent: /var/run/mib2d-33 Request PDUs: 74211, Response PDUs: 74211, Request Variables: 74211, Response Variables: 74211, Average Response Time(ms): 2.30, Maximum Response Time(ms): 51.04
Subagent: /var/run/license-check-16 Request PDUs: 0, Response PDUs: 0, Request Variables: 0, Response Variables: 0, Average Response Time(ms): 0.00, Maximum Response Time(ms): 0.00
Subagent: /var/run/craftd-14 Request PDUs: 0, Response PDUs: 0, Request Variables: 0, Response Variables: 0, Average Response Time(ms): 0.00, Maximum Response Time(ms): 0.00
Subagent: /var/run/bfdd-19 Request PDUs: 0, Response PDUs: 0, Request Variables: 0, Response Variables: 0, Average Response Time(ms): 0.00, Maximum Response Time(ms): 0.00
Subagent: /var/run/smihelperd-24 Request PDUs: 0, Response PDUs: 0, Request Variables: 0, Response Variables: 0, Average Response Time(ms): 0.00, Maximum Response Time(ms): 0.00
Subagent: /var/run/cfmd-18 Request PDUs: 0, Response PDUs: 0, Request Variables: 0, Response Variables: 0, Average Response Time(ms): 0.00, Maximum Response Time(ms): 0.00
Subagent: /var/run/rpd_snmp Request PDUs: 0, Response PDUs: 0, Request Variables: 0, Response Variables: 0, Average Response Time(ms): 0.00, Maximum Response Time(ms): 0.00
Subagent: /var/run/l2tpd-18 Request PDUs: 0, Response PDUs: 0, Request Variables: 0, Response Variables: 0, Average Response Time(ms): 0.00, Maximum Response Time(ms): 0.00
455Copyright © 2016, Juniper Networks, Inc.
Chapter 23: SNMP

Copyright © 2016, Juniper Networks, Inc.456
Network Management and Monitoring Feature Guide for EX2300, EX3400, and EX4300 Switches

show snmp v3
Syntax show snmp v3<access <brief | detail> | community | general | groups | notify <filter> | target <address |parameters> | users>
Release Information Command introduced before Junos OS Release 7.4.
Command introduced in Junos OS Release 9.0 for EX Series switches.
Description Display the Simple Network Management Protocol version 3 (SNMPv3) operating
configuration.
Options none—Display all of the SNMPv3 operating configuration.
access—(Optional) Display SNMPv3 access information.
brief | detail—(Optional) Display brief or detailed information about SNMPv3 access
information.
community—(Optional) Display SNMPv3 community information.
general—(Optional) Display SNMPv3 general information.
groups—(Optional) Display SNMPv3 security-to-group information.
notify<filter>—(Optional)DisplaySNMPv3notify and, optionally, notify filter information.
target <address | parameters>—(Optional) Display SNMPv3 target and, optionally, either
target address or target parameter information.
users—(Optional) Display SNMPv3 user information.
Additional Information To edit the default display of the show snmp v3 command, specify options in the show
statement at the [edit snmp v3] hierarchy level.
Required PrivilegeLevel
view
List of Sample Output show snmp v3 on page 459
Output Fields Table47onpage458describes theoutput fields for theshowsnmpv3command.Output
fields are listed in the approximate order in which they appear.
457Copyright © 2016, Juniper Networks, Inc.
Chapter 23: SNMP

Table 47: show snmp v3 Output Fields
Field DescriptionField Name
Information about access control:
• Group—Group name for which the configured access privileges apply. The group, together with thecontext prefix and the security model and security level, forms the index for this table.
• Context prefix—SNMPv3 context for which the configured access privileges apply.
• Securitymodel/level—Securitymodel andsecurity level forwhich theconfigurationaccessprivilegesapply.
• Read view—Identifies the MIB view applied to SNMPv3 read operations.
• Write view—Identifies the MIB view applied to SNMPv3 write operations.
• Notify view—Identifies the MIB view applied to outbound SNMP notifications.
Access control
Information about local engine configuration:
• Local engine ID—Identifier that uniquely and unambiguously identifies the local SNMPv3 engine.
• Engine boots—Number of times the local SNMPv3 engine has rebooted or reinitialized since theengine ID was last changed.
• Engine time—Number of seconds since the local SNMPv3 engine was last rebooted or reinitialized.
• Maxmsg size—Maximummessage size the sender can accommodate.
Engine
Information about engine ID:
• Local engine ID—Identifier that uniquely and unambiguously identifies the local SNMPv3 engine.
• Engine boots—Number of times the local SNMPv3 engine has rebooted or reinitialized since theengine ID was last changed.
• Engine time—Number of seconds since the local SNMPv3 engine was last rebooted or reinitialized.
• Maxmsg size—Maximummessage size the sender can accommodate.
• Engine ID—SNMPv3 engine ID associated with each user.
• User—SNMPv3 user.
• Auth/Priv—Authentication and encryption algorithm available for use by each user.
• Storage—Indicates whether a user is saved to the configuration file (nonvolatile) or not (volatile).Applies only to users with active status.
• Status—Status of the conceptual row. Only rows with an active status are used by the SNMPv3engine.
Engine ID
Name of the group to which this entry belongs.Group name
Identifies the security model context for the security name.Security model
Usedwith thesecuritymodel; identifiesaspecific securityname instance. Eachsecuritymodel/securityname combination can be assigned to a specific group.
Security name
Indicates whether a user is saved to the configuration file (nonvolatile) or not (volatile). Applies onlyto users with active status.
Storage type
Status of the conceptual row. Only rows with active status are used by the SNMPv3 engine.Status
Copyright © 2016, Juniper Networks, Inc.458
Network Management and Monitoring Feature Guide for EX2300, EX3400, and EX4300 Switches

Sample Output
show snmp v3
user@host> show snmp v3Local engine ID: 80 00 0a 4c e04 31 32 33 34 Engine boots: 38Engine time: 64583 secondsMax msg size: 2048 bytes
Engine ID: local User Auth/Priv Storage Status user1 md5/des nonvolatile active user2 sha/none nonvolatile active user3 none/none nonvolatile active
Engine ID: 81 00 0a 4c 04 64 64 64 64 User Auth/Priv Storage Status UNEW md5/none nonvolatile activeGroup name Security Security Storage Status model name typeg1 usm user1 nonvolatile activeg2 usm user2 nonvolatile activeg3 usm user3 nonvolatile active
Access control:Group Context Security Read Write Notify prefix model/level view view viewg1 usm/privacy v1 v1 g2 usm/authent v1 v1 g3 usm/none v1 v1
459Copyright © 2016, Juniper Networks, Inc.
Chapter 23: SNMP

Copyright © 2016, Juniper Networks, Inc.460
Network Management and Monitoring Feature Guide for EX2300, EX3400, and EX4300 Switches