1314 imt student
TRANSCRIPT
Agenda Module Objectives
Assessment
Key Definitions
Operations Performance
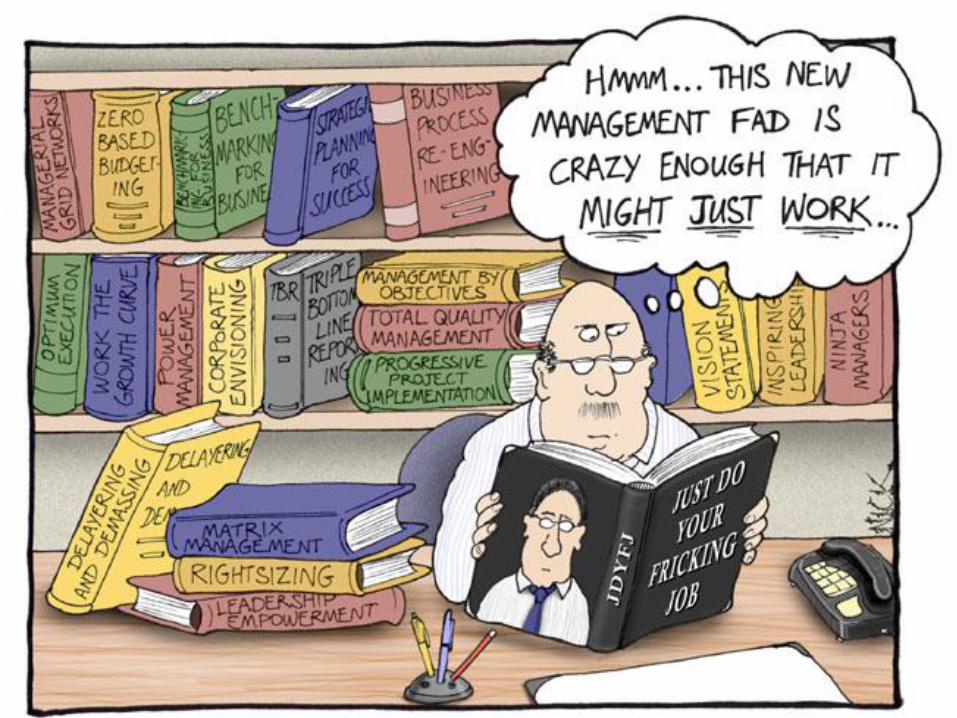
Substitutes for Strategy – TQM, Lean, BPR, 6δ
Capacity Strategy
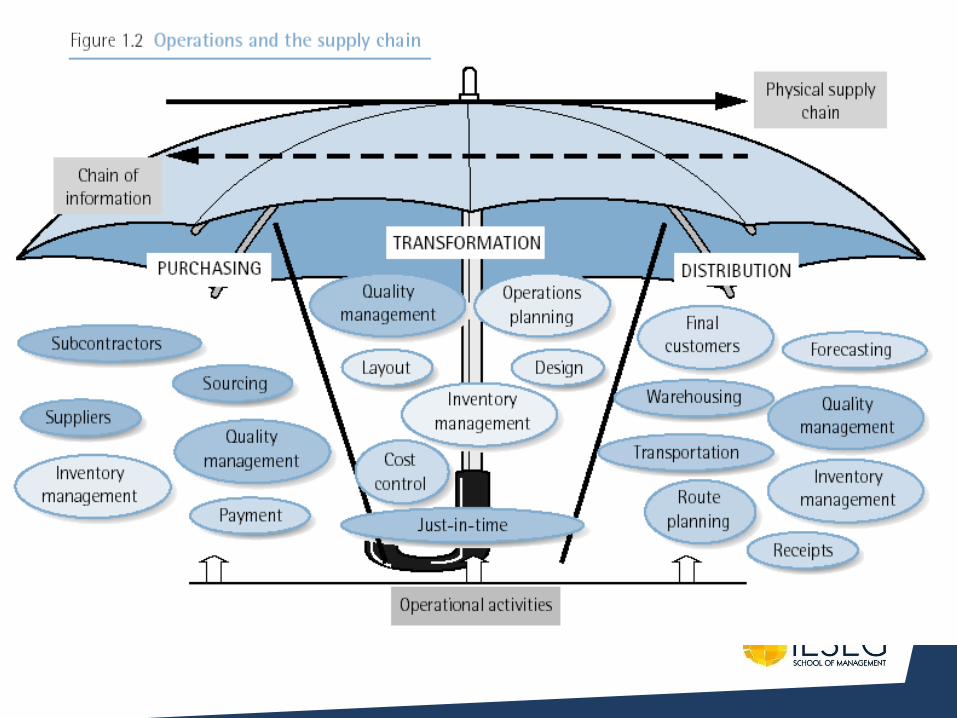
Purchasing, Supply Chain Management, Distribution
Key Paradigms
Key Problems, Risks
Key Solutions
Process technology strategy
Improvement strategy
Product and service development and organisation
Reverse Logistics and Green Logistics
Book Chapter Treatment Sequence Chapter 1 – What is operations strategy?
Chapter 2 – Operations Performance
Chapter 8 – Sustainable alignment
Chapter 9 – Substitutes for strategy ?
Chapter 3 – Capacity strategy
Chapter 4 – Supply network strategy
Chapter 5 – Process Technology strategy
Chapter 6 – Improvement Strategy
Chapter 7 – Product and service development and
organization
Chapter 10 – The process of operations strategy –
formulation and implementation
Module Objectives
To develop your skills and understanding to:
a) make and buy decisions
b) understand conventional supply chain processes
c) advanced concepts in supply chain management related to everyday
business operations
d) evaluate how supply chain management impacts other functions of the
company
d) key performance indicators
f) competing on time
g) transportation and logistics
h) security, tracking and value added supply chain services
i) e-logistics concepts
j) e-sales
k) e-purchase
l) e-supply
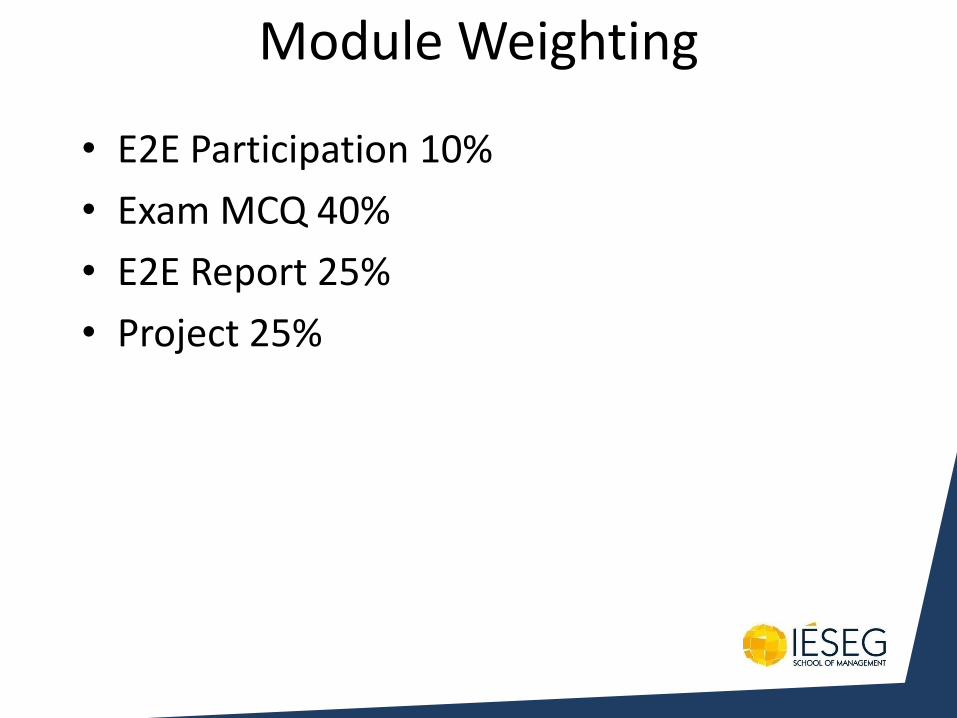
Module Weighting
• E2E Participation 10%
• Exam MCQ 40%
• E2E Report 25%
• Project 25%

These are the web sites that give you full text articles
• http://search.epnet.com
• Ask your librarian for a password
• http://search.proquest.com/advanced?accountid=120221
• PLAGERISM MEANS YOU CHEAT & YOU BREAK THE LAW!
– YOU GET ZERO, AND YOU GET TO HAVE A DISCIPLINARY HEARING! ENSURE YOU REFERENCE CITATIONS
– On the course ieseg-online site file 00 Plagiarism and Referencing.pdf is a file that explains how to reference different materials correctly
– Ensure you read instructions on how to reference your work. This is the difference between receiving your mark and zero.
– Last year 14 students received zero & called for disciplinary hearing.
– Maintain a disciplined approach to referencing for all courses because it will help you for your memoire / consulting project
– Wikipedia is not academically acceptable as a reference. – Last semester 4 groups received zero
– Turn it in - plagiarism Policy – 0-4% ‘okay’, 5-9 % ‘just okay’, 10 % plus not
assessed, 20 % plus – automatic disciplinary hearing
Try these
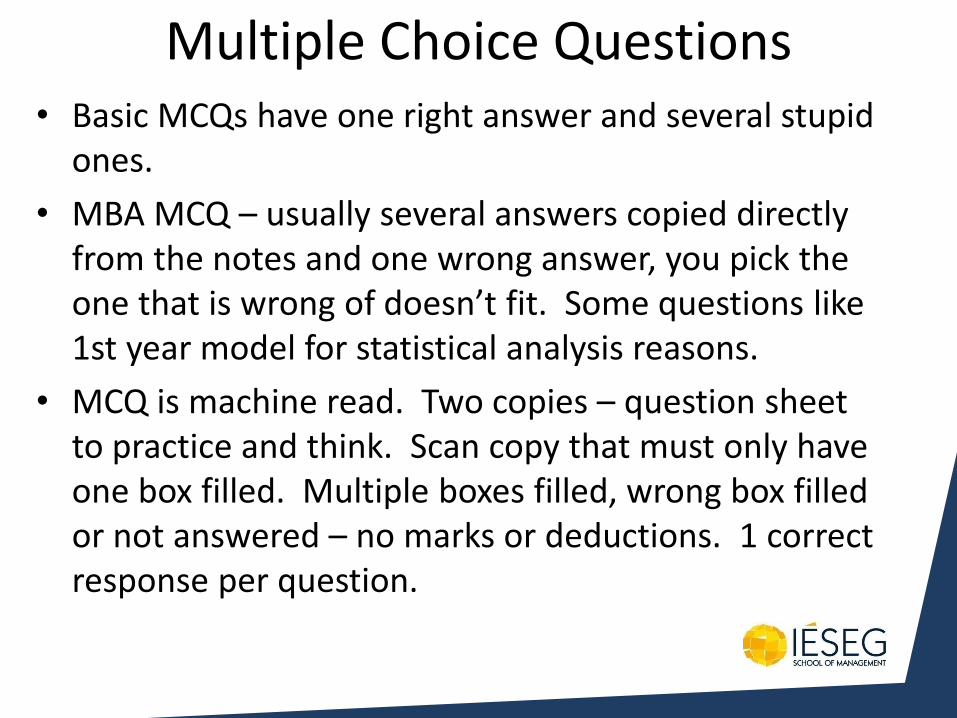
Multiple Choice Questions • Basic MCQs have one right answer and several stupid
ones.
• MBA MCQ – usually several answers copied directly from the notes and one wrong answer, you pick the one that is wrong of doesn’t fit. Some questions like 1st year model for statistical analysis reasons.
• MCQ is machine read. Two copies – question sheet to practice and think. Scan copy that must only have one box filled. Multiple boxes filled, wrong box filled or not answered – no marks or deductions. 1 correct response per question.
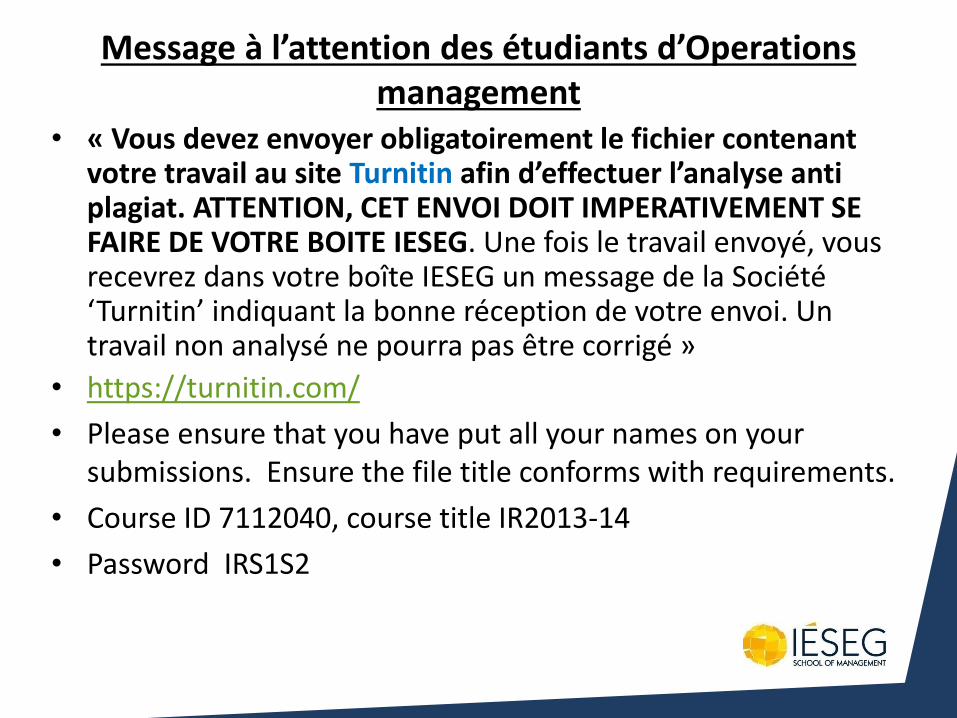
Message à l’attention des étudiants d’Operations management
• « Vous devez envoyer obligatoirement le fichier contenant votre travail au site Turnitin afin d’effectuer l’analyse anti plagiat. ATTENTION, CET ENVOI DOIT IMPERATIVEMENT SE FAIRE DE VOTRE BOITE IESEG. Une fois le travail envoyé, vous recevrez dans votre boîte IESEG un message de la Société ‘Turnitin’ indiquant la bonne réception de votre envoi. Un travail non analysé ne pourra pas être corrigé »
• https://turnitin.com/
• Please ensure that you have put all your names on your submissions. Ensure the file title conforms with requirements.
• Course ID 7112040, course title IR2013-14
• Password IRS1S2
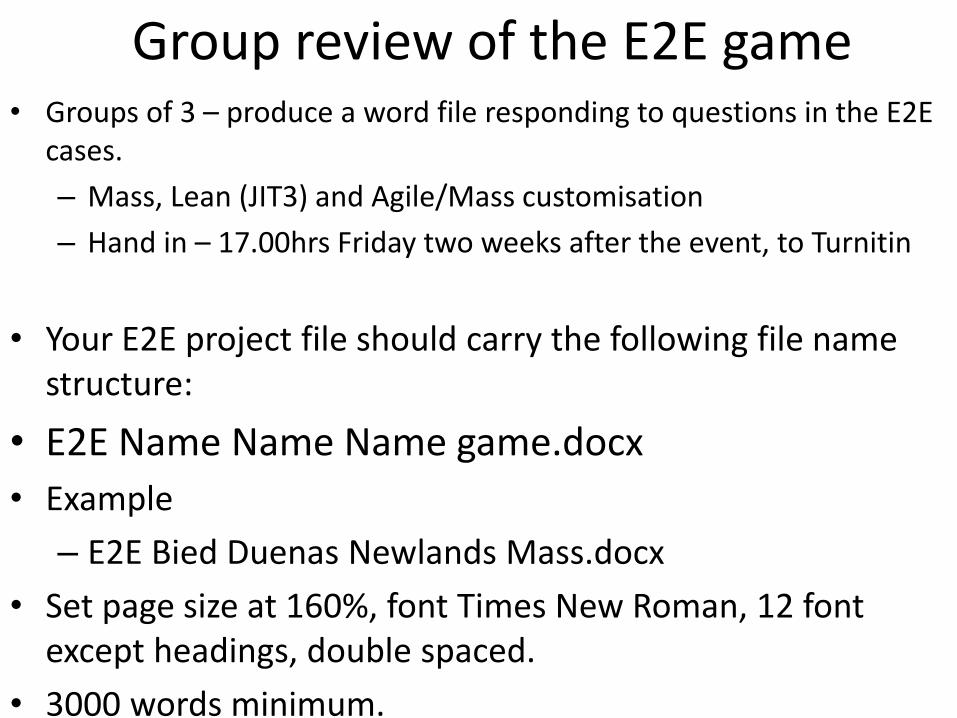
Group review of the E2E game • Groups of 3 – produce a word file responding to questions in the E2E
cases.
– Mass, Lean (JIT3) and Agile/Mass customisation
– Hand in – 17.00hrs Friday two weeks after the event, to Turnitin
• Your E2E project file should carry the following file name structure:
• E2E Name Name Name game.docx
• Example
– E2E Bied Duenas Newlands Mass.docx
• Set page size at 160%, font Times New Roman, 12 font except headings, double spaced.
• 3000 words minimum.
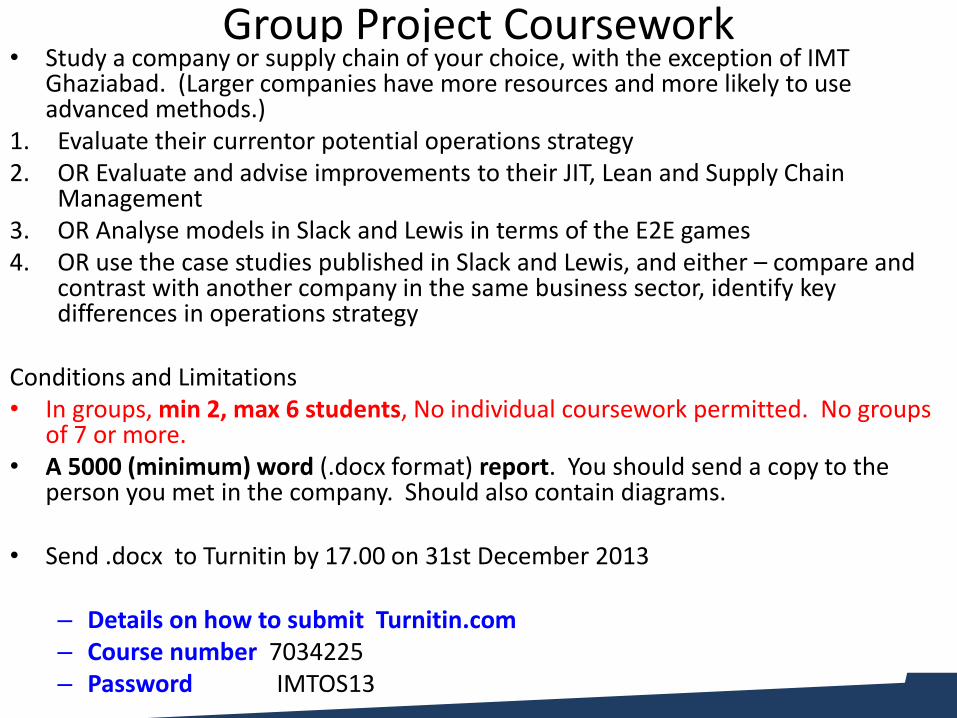
Group Project Coursework • Study a company or supply chain of your choice, with the exception of IMT
Ghaziabad. (Larger companies have more resources and more likely to use advanced methods.)
1. Evaluate their currentor potential operations strategy 2. OR Evaluate and advise improvements to their JIT, Lean and Supply Chain
Management 3. OR Analyse models in Slack and Lewis in terms of the E2E games 4. OR use the case studies published in Slack and Lewis, and either – compare and
contrast with another company in the same business sector, identify key differences in operations strategy
Conditions and Limitations • In groups, min 2, max 6 students, No individual coursework permitted. No groups
of 7 or more. • A 5000 (minimum) word (.docx format) report. You should send a copy to the
person you met in the company. Should also contain diagrams.
• Send .docx to Turnitin by 17.00 on 31st December 2013 – Details on how to submit Turnitin.com – Course number 7034225 – Password IMTOS13
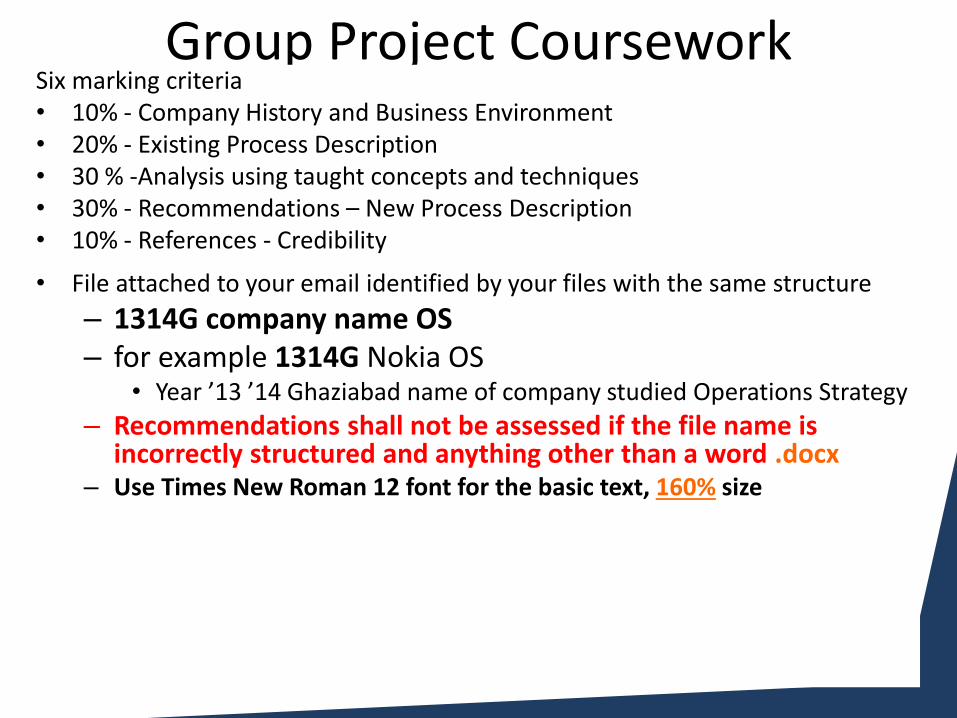
Group Project Coursework Marking Scheme
Six marking criteria • 10% - Company History and Business Environment • 20% - Existing Process Description • 30 % -Analysis using taught concepts and techniques • 30% - Recommendations – New Process Description • 10% - References - Credibility
• File attached to your email identified by your files with the same structure
– 1314G company name OS – for example 1314G Nokia OS
• Year ’13 ’14 Ghaziabad name of company studied Operations Strategy
– Recommendations shall not be assessed if the file name is incorrectly structured and anything other than a word .docx
– Use Times New Roman 12 font for the basic text, 160% size

Retrapage
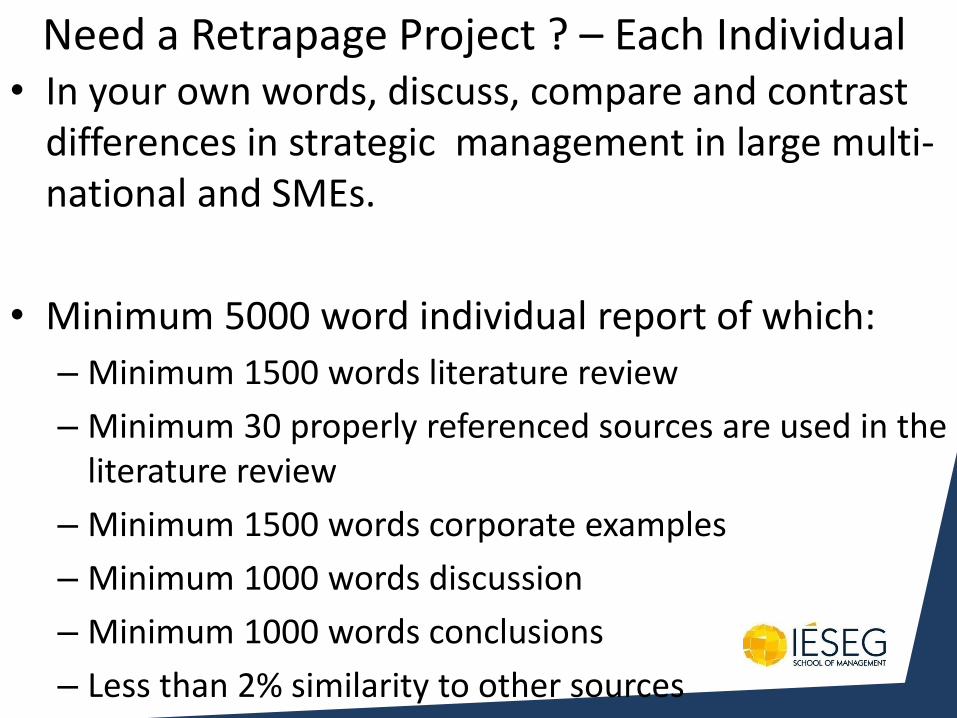
Need a Retrapage Project ? – Each Individual • In your own words, discuss, compare and contrast
differences in strategic management in large multi-national and SMEs.
• Minimum 5000 word individual report of which:
– Minimum 1500 words literature review
– Minimum 30 properly referenced sources are used in the literature review
– Minimum 1500 words corporate examples
– Minimum 1000 words discussion
– Minimum 1000 words conclusions
– Less than 2% similarity to other sources
Definitions and Preconceptions
What is operations?

http://asweb.artsci.uc.edu/german/172/krup.jpg
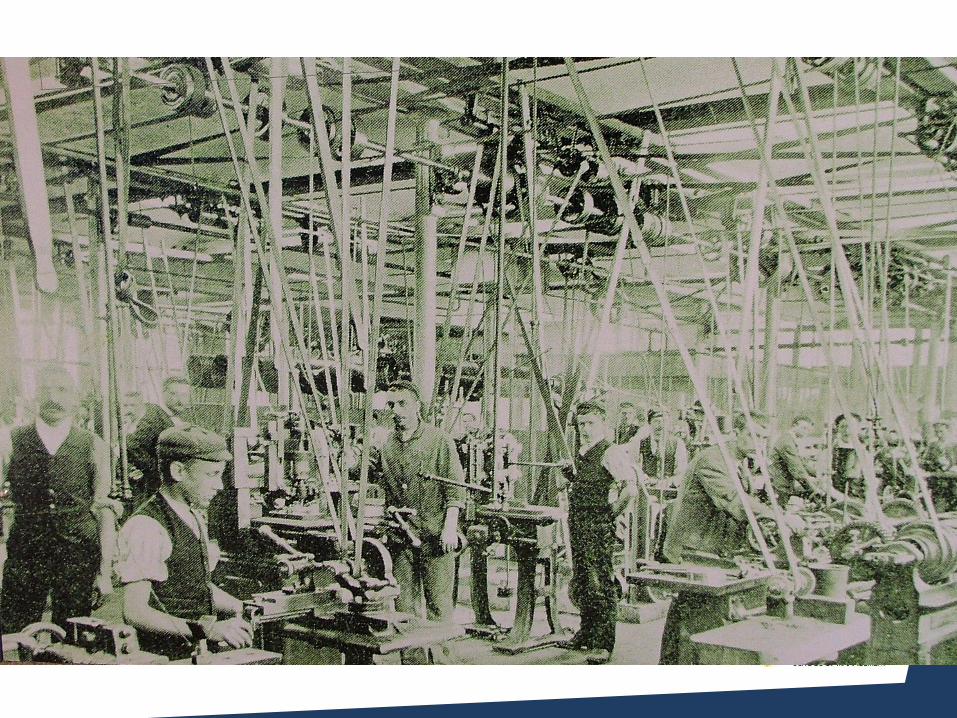
• Photo exhibited in National Car Museum, Coventry 2009
Making people serve a purpose

• http://www.baekdal.com/notes/work/meetings/
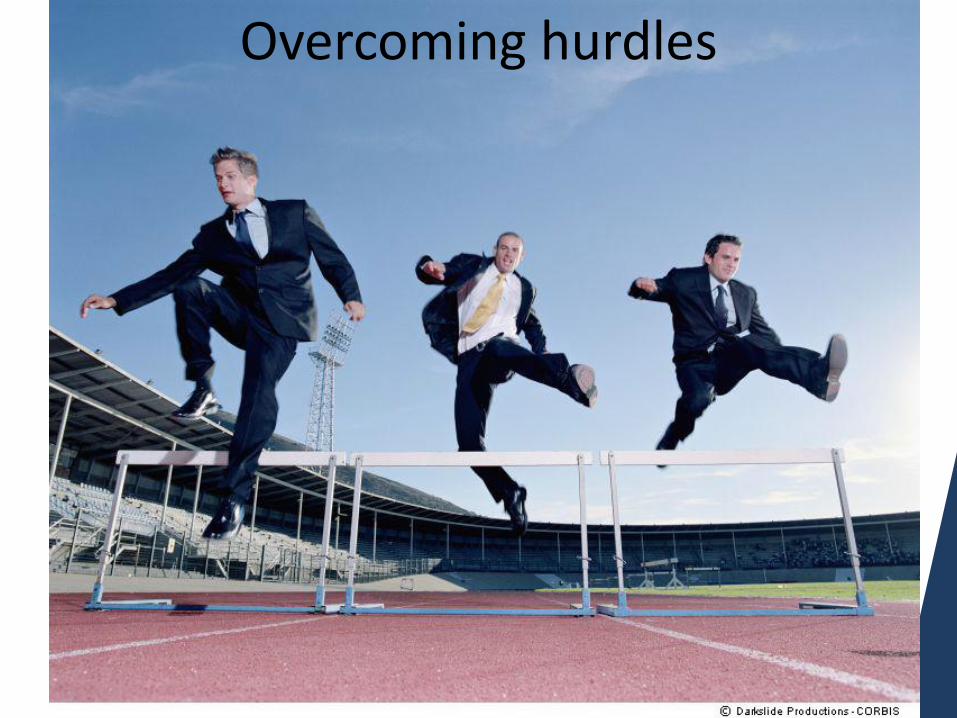
Overcoming hurdles

• http://www.defense.gov/photos/newsphoto.aspx?newsphotoid=6351
• http://www.defense.gov/dodcmsshare/newsphoto/2005-04/050314-F-0017M-004.jpg
Fire Fighting
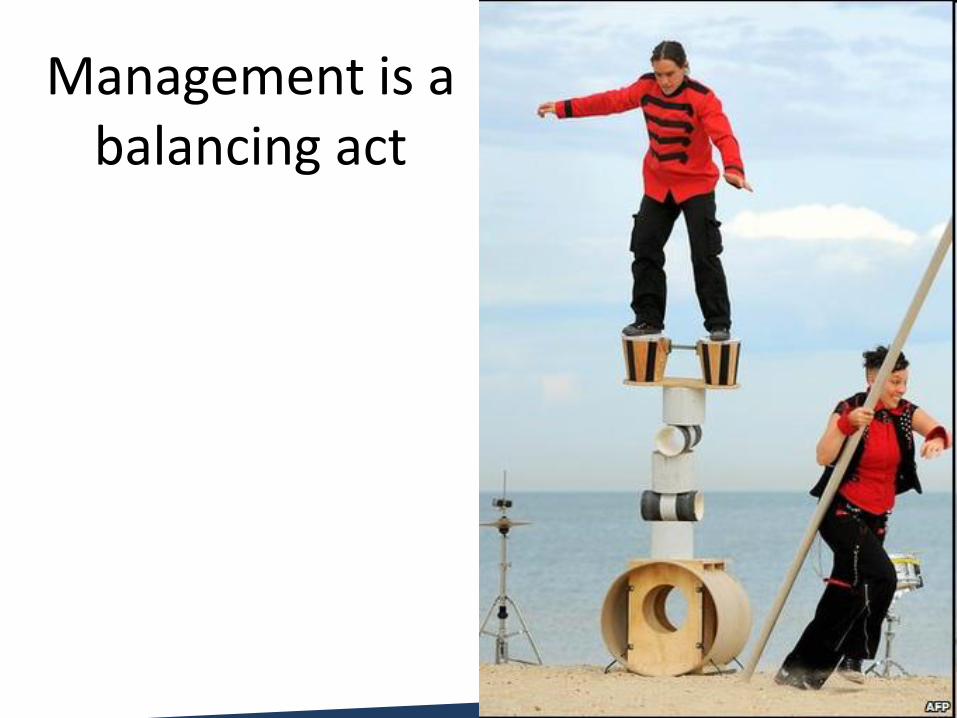
Management is a balancing act
• http://news.bbc.co.uk/2/hi/in_pictures/8629408.stm 200410

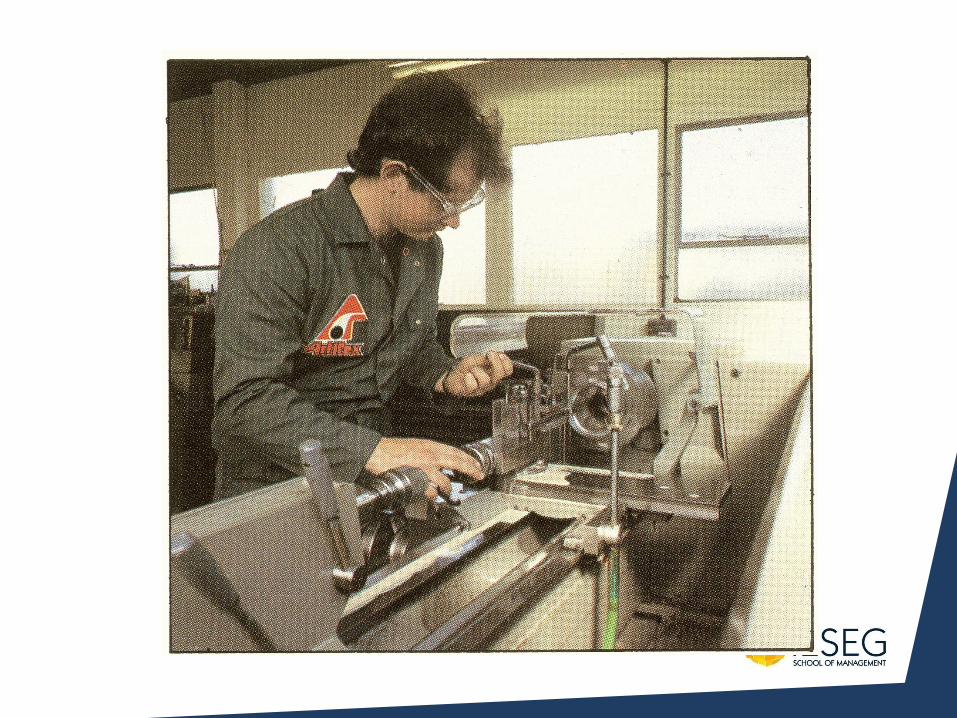
• Operations is
–Doing something for the customer to get paid
Make and supply a product Provide a service
What is strategy? • Strageos – commanding armies
• Need to revise the idea of planning and control
• Taylorism – 1880s worked fine. Produced results
• 2013? Mostly more educated workforce, unions, professional negotiators,
• The company is the union – no them and us, management and workers together
Planned or Emergent? • Work together to identify opportunities
• Not top down or bottom up
• Middle up-down and Hoshin Kanri are taking over
• New strategy every day (Semlar)
• Work place democracy (Semlar)
• Identify and eliminate risks
• If the customer doesn’t understand why we do it, we stop doing in (Lean)
• Benchmark and emulate
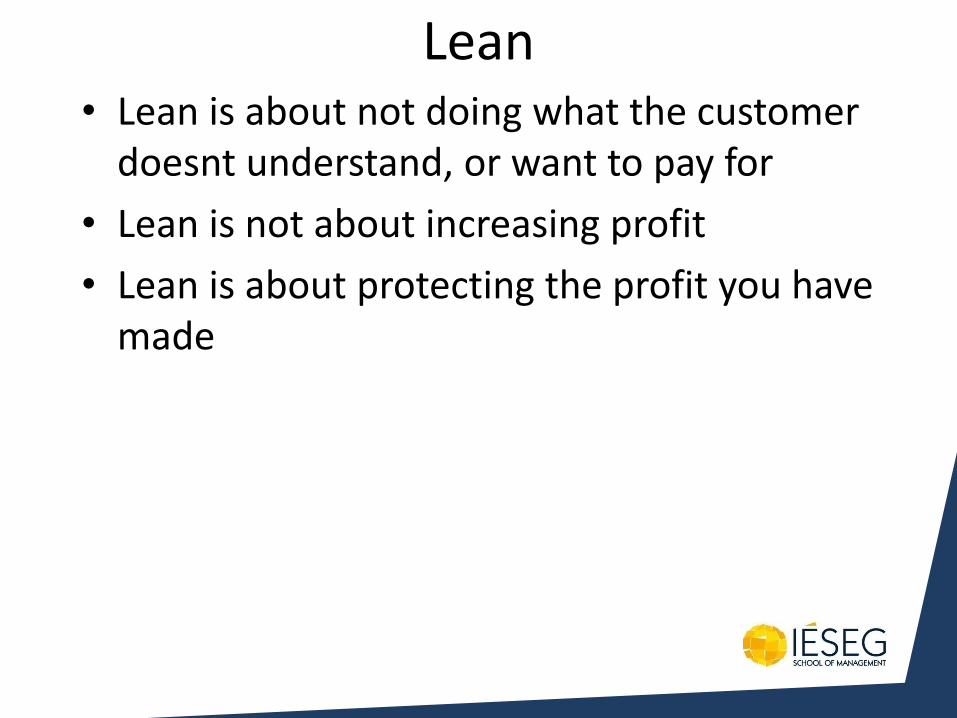
Lean • Lean is about not doing what the customer
doesnt understand, or want to pay for
• Lean is not about increasing profit
• Lean is about protecting the profit you have made
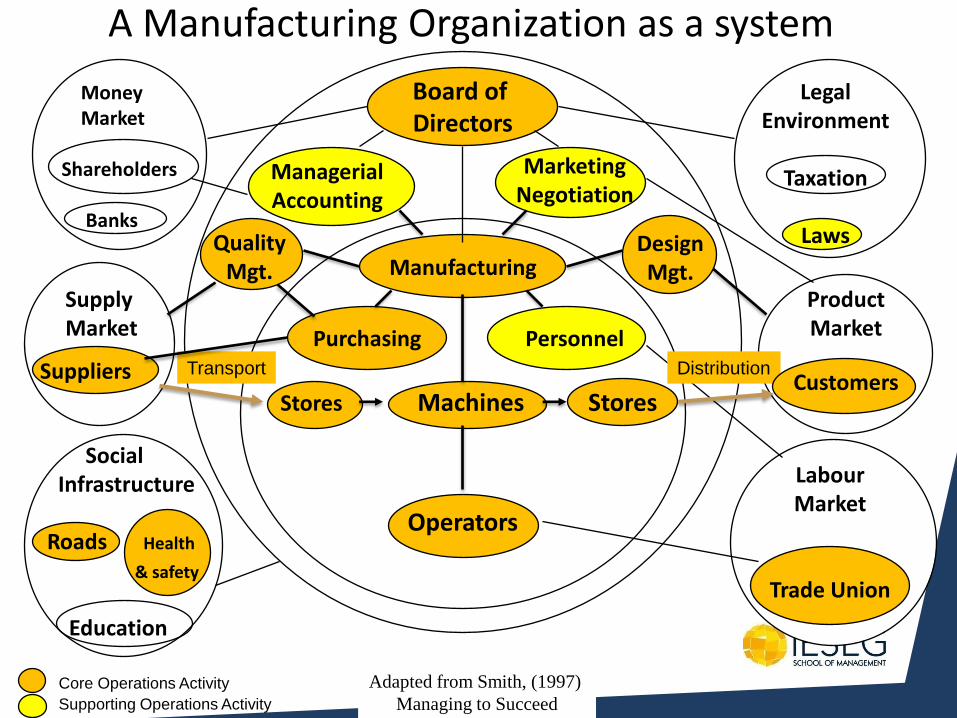
A Manufacturing Organization as a system
Money Market Shareholders Banks
Supply Market
Adapted from Smith, (1997)
Managing to Succeed
Design Mgt.
Quality Mgt.
Machines Stores
Operators
Stores
Purchasing
Manufacturing
Suppliers Transport Distribution
Product Market
Customers
Board of Directors
Managerial Accounting
Personnel
Marketing Negotiation
Social Infrastructure Roads Health
& safety
Education
Legal Environment
Taxation
Laws
Core Operations Activity
Supporting Operations Activity
Labour Market
Trade Union
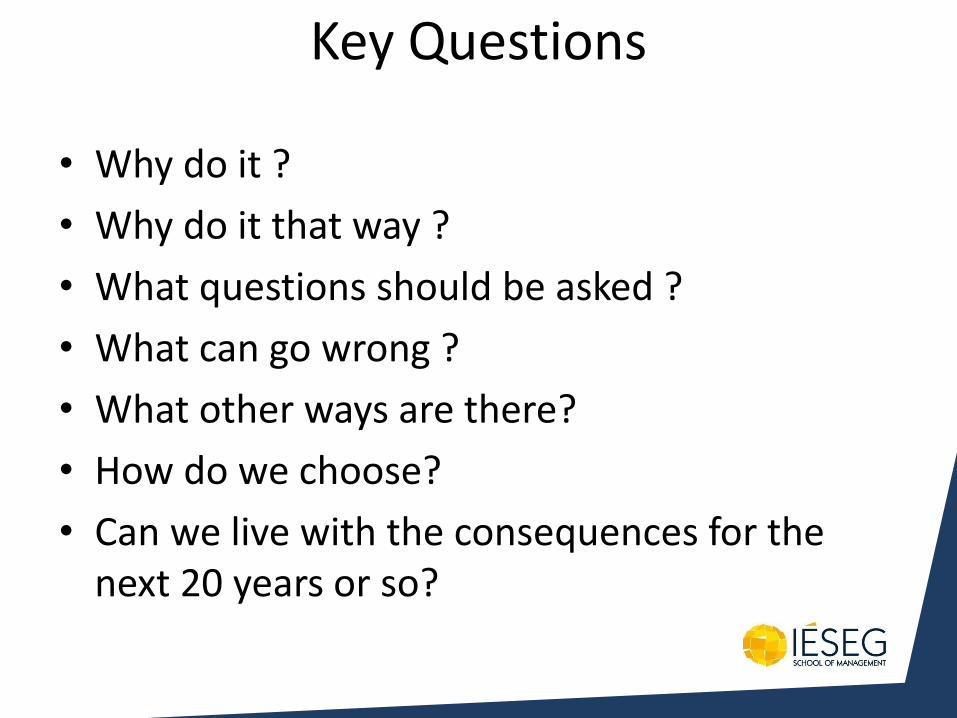
Key Questions
• Why do it ?
• Why do it that way ?
• What questions should be asked ?
• What can go wrong ?
• What other ways are there?
• How do we choose?
• Can we live with the consequences for the next 20 years or so?
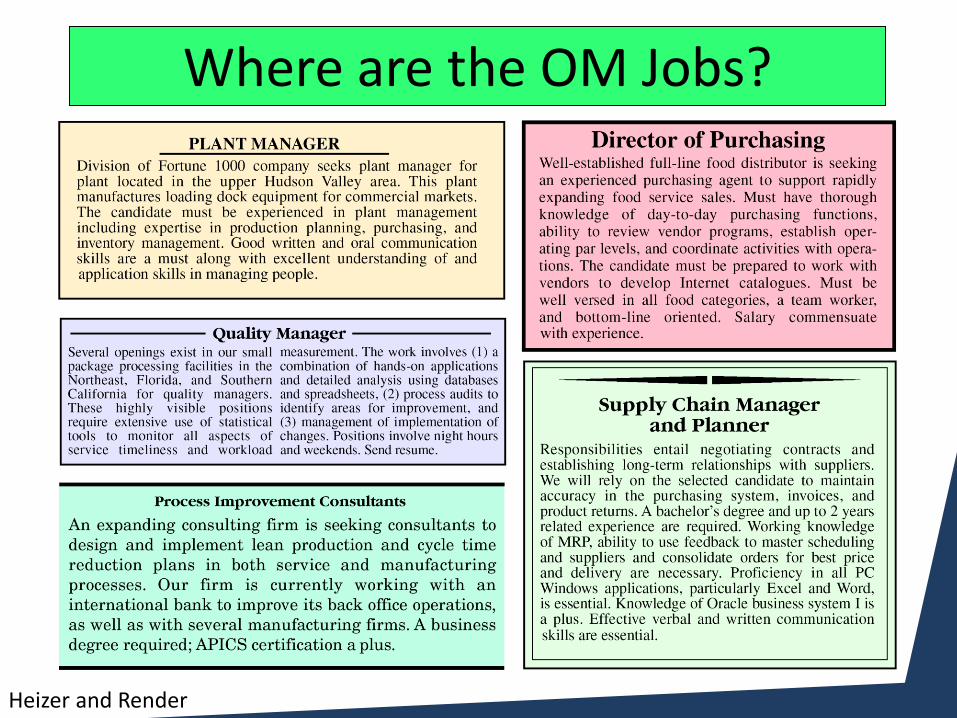
Where are the OM Jobs?
Heizer and Render
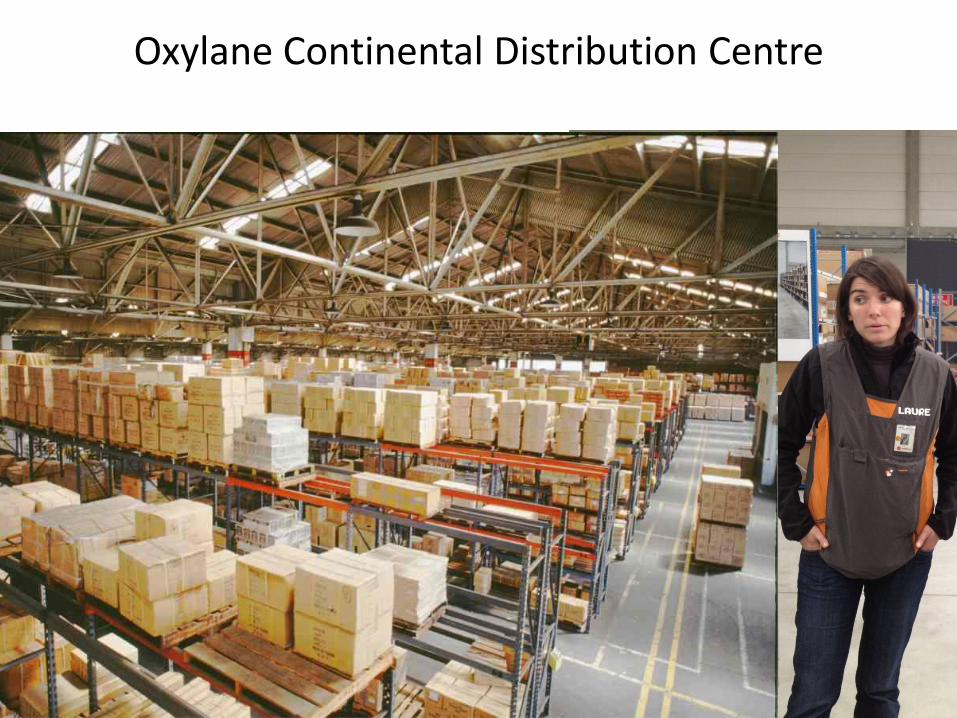
http://www.fhiplantservices.com/go2/warehouse-services.cfm
Oxylane Continental Distribution Centre
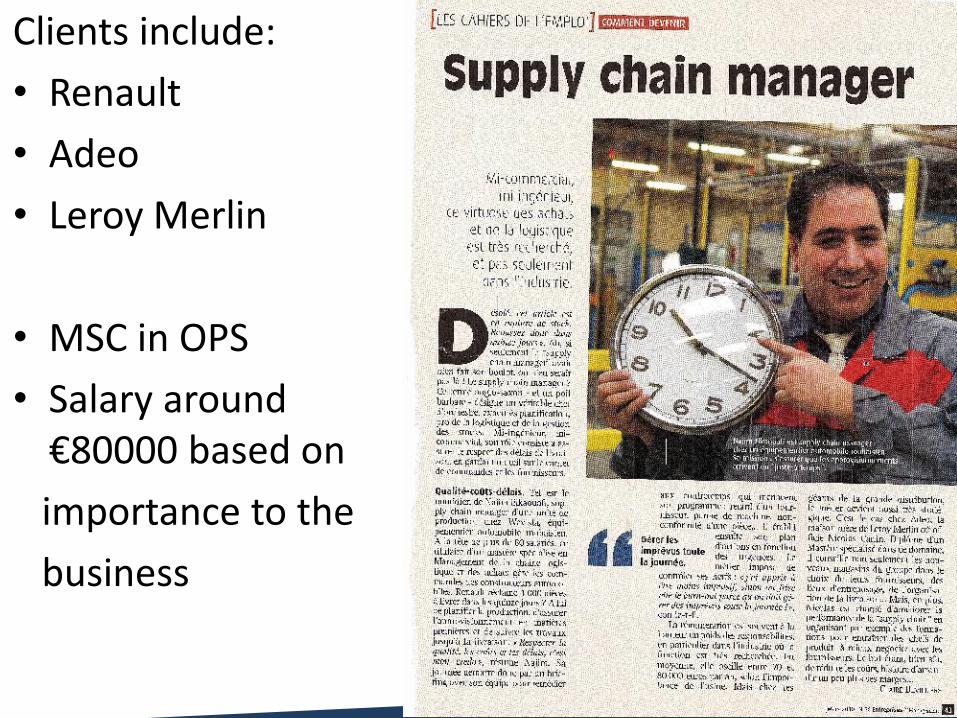
Clients include:
• Renault
• Adeo
• Leroy Merlin
• MSC in OPS
• Salary around €80000 based on
importance to the
business

Tryout these sites for All Concentrations/Types of Job
http://www.questsearch.co.uk/?
search=advanced
http://www.monster.fr/geo/siteselection
Try out these sites for Operations
jobs.supplymanagement.com
experteer.com
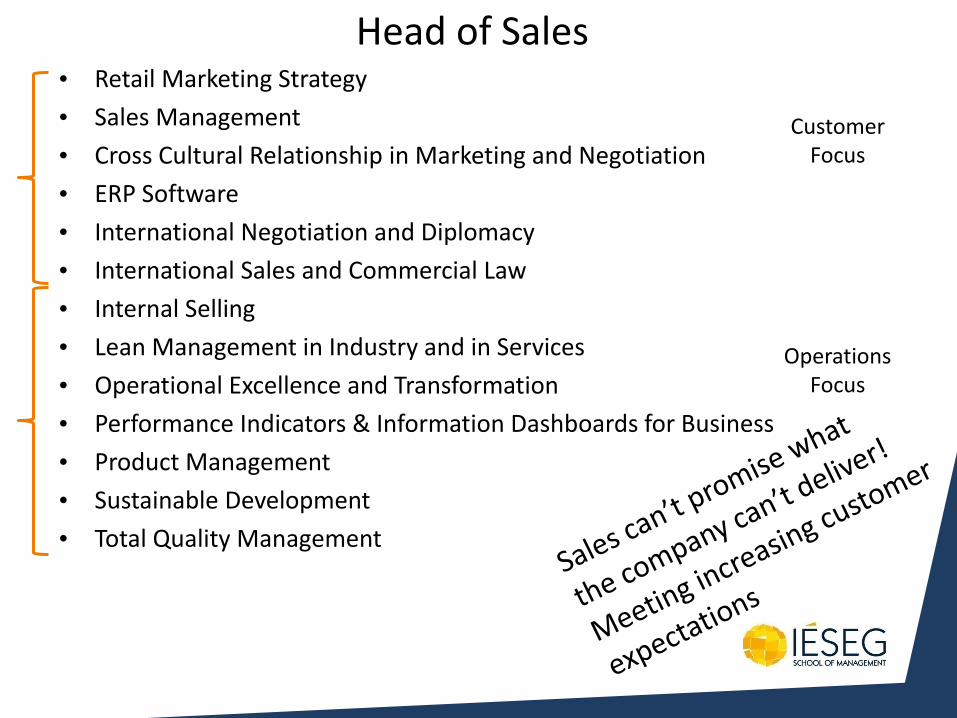
Head of Sales • Retail Marketing Strategy
• Sales Management
• Cross Cultural Relationship in Marketing and Negotiation
• ERP Software
• International Negotiation and Diplomacy
• International Sales and Commercial Law
• Internal Selling
• Lean Management in Industry and in Services
• Operational Excellence and Transformation
• Performance Indicators & Information Dashboards for Business
• Product Management
• Sustainable Development
• Total Quality Management
Customer Focus
Operations Focus
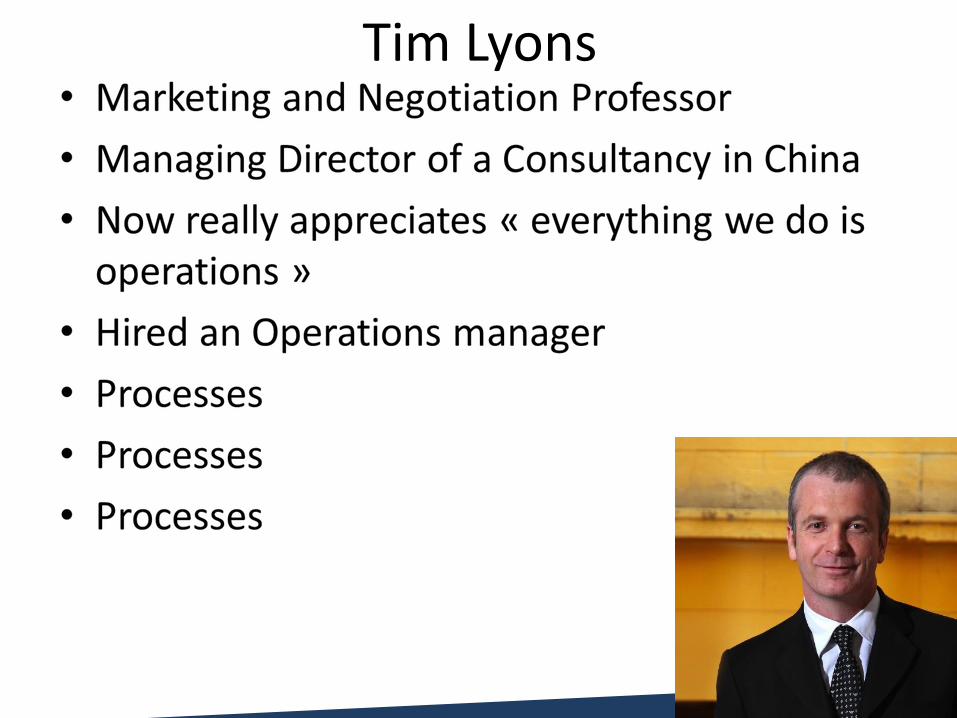
Tim Lyons
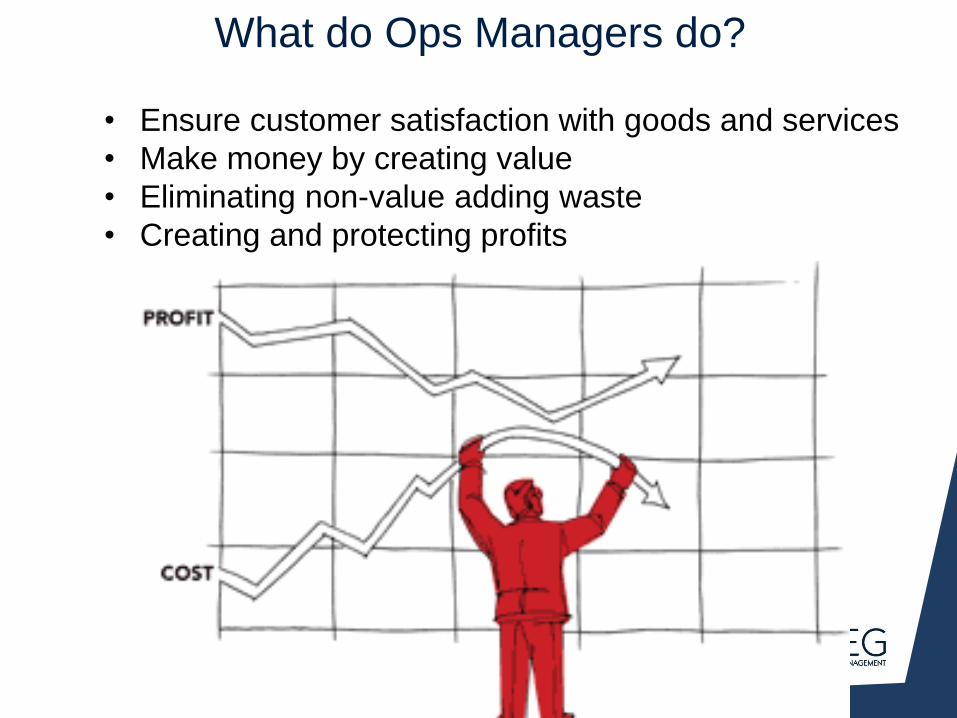
What do Ops Managers do?
• Ensure customer satisfaction with goods and services
• Make money by creating value
• Eliminating non-value adding waste
• Creating and protecting profits
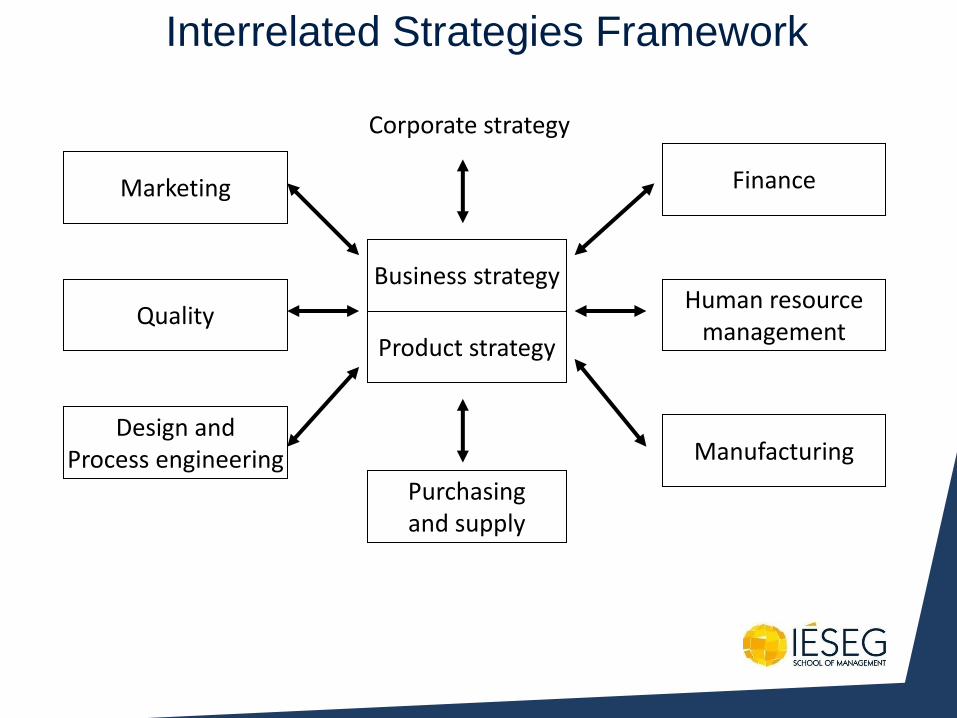
Interrelated Strategies Framework
Marketing
Quality
Design and Process engineering
Business strategy
Product strategy
Purchasing and supply
Finance
Human resource management
Manufacturing
Corporate strategy
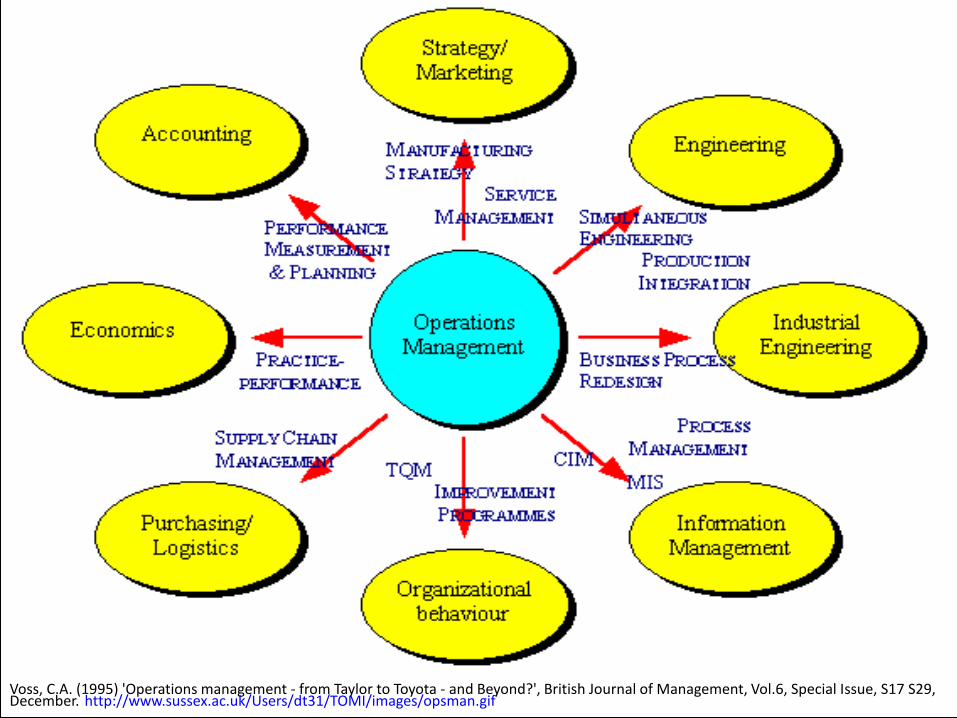
• http://www.sussex.ac.uk/Users/dt31/TOMI/images/opsman.gif
Voss, C.A. (1995) 'Operations management - from Taylor to Toyota - and Beyond?', British Journal of Management, Vol.6, Special Issue, S17 S29, December. http://www.sussex.ac.uk/Users/dt31/TOMI/images/opsman.gif
Continuous
Quality
Improvement
Human
Resource &
Conflict
Management
Component Quality Planning
& Supplier Management
QCDDM
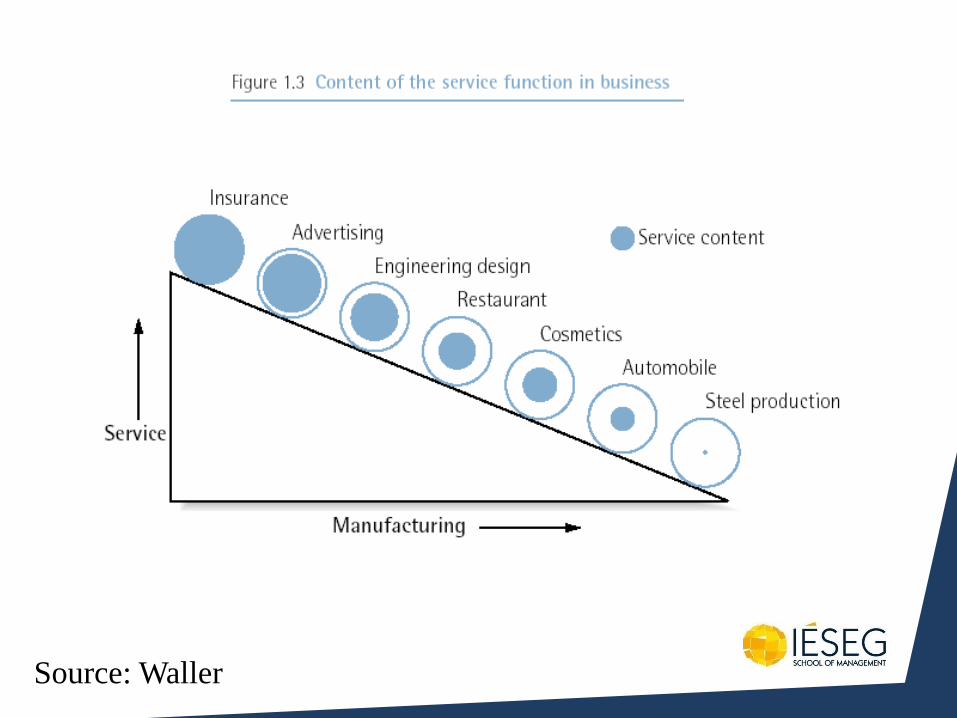
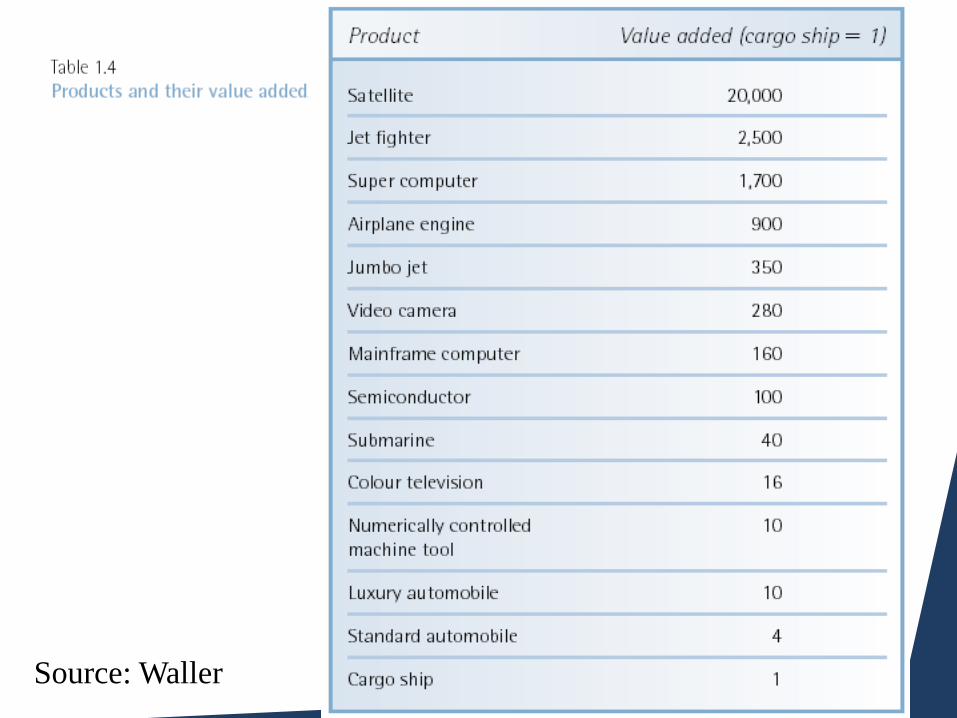
Source: Waller

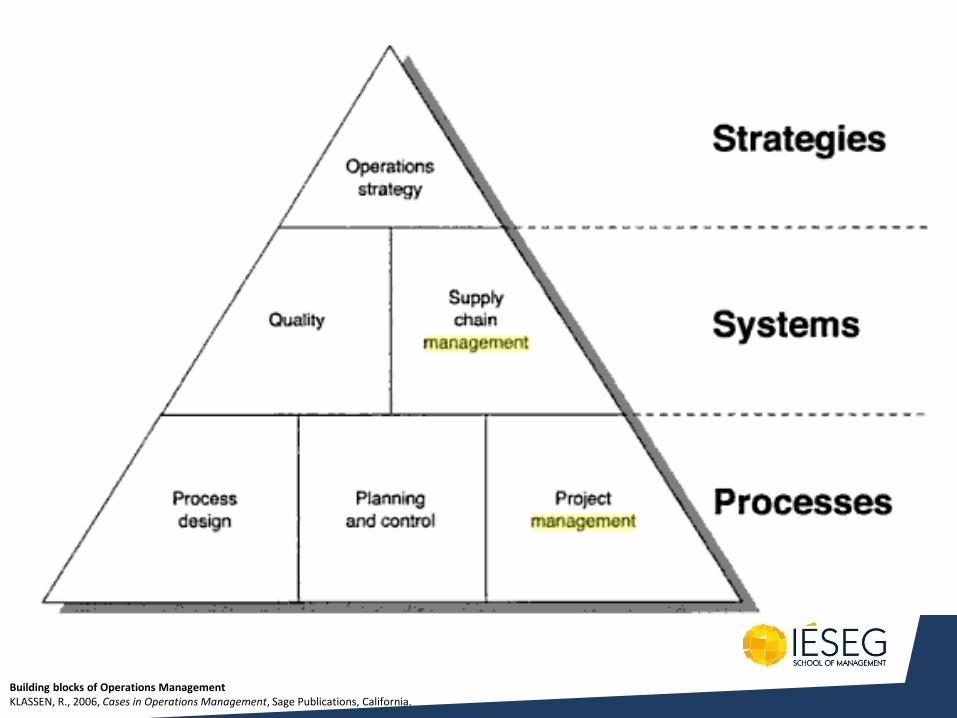
Building blocks of Operations Management KLASSEN, R., 2006, Cases in Operations Management, Sage Publications, California.
RULES OF THE OFFICE • A CLEAN DESK IS A SIGN OF A SICK MIND • TOMORROW WE ARE GOING TO GET ORGANISED • QUICK, LOOK BUSY, HERE COMES THE BOSS • THE BOSS IS ALWAYS RIGHT: MISSINFORMED, LAZY,
STUPID, BUT RIGHT • NOTHING IS IMPOSSIBLE, OUR BOSS SAYS SO • TO ERR IS HUMAN BUT TO FOUL THINGS UP COMPLETELY
REQUIRES A COMPUTER • NO-ONE IS FIRED HERE. SLAVES ARE ONLY SOLD • WORK FASCINATES US. WE CAN LOOK AT IT FOR HOURS • THE BOSS TREATS US LIKE MUSHROOMS. KEEPS US IN THE
DARK AND FEEDS US BULLSHIT • WE ARE THE WILLING, LED BY THE UNKNOWING, DOING
THE IMPOSSIBLE FOR THE UNGRATEFUL
©1999 Jack Dusty’s Earth 2000 Ltd, PO Box 37 Bognor Regis

WE ARE THE WILLING LED BY THE UNKNOWING DOING THE IMPOSSIBLE FOR THE UNGRATEFUL
WE HAVE NOW DONE SO MUCH FOR SO LONG – FOR SO MANY
WITH SO LITTLE WE CAN NOW DO ANYTHING
WITH NOTHING
©1999 Jack Dusty’s Earth 2000 Ltd, PO Box 37 Bognor Regis

• Operations strategy is the set of decisions and the processes used to make those decisions, that affect how the corporation delivered value to customers and other stakeholders
• Operations strategy aims to increase the fit between what customers want, competition, suppliers, alternatives, governments, lenders and other stakeholders want

Goods and Services
Characteristics of Goods
Tangible product
Consistent product definition
Production usually separate from consumption
Can be inventoried
Low customer interaction
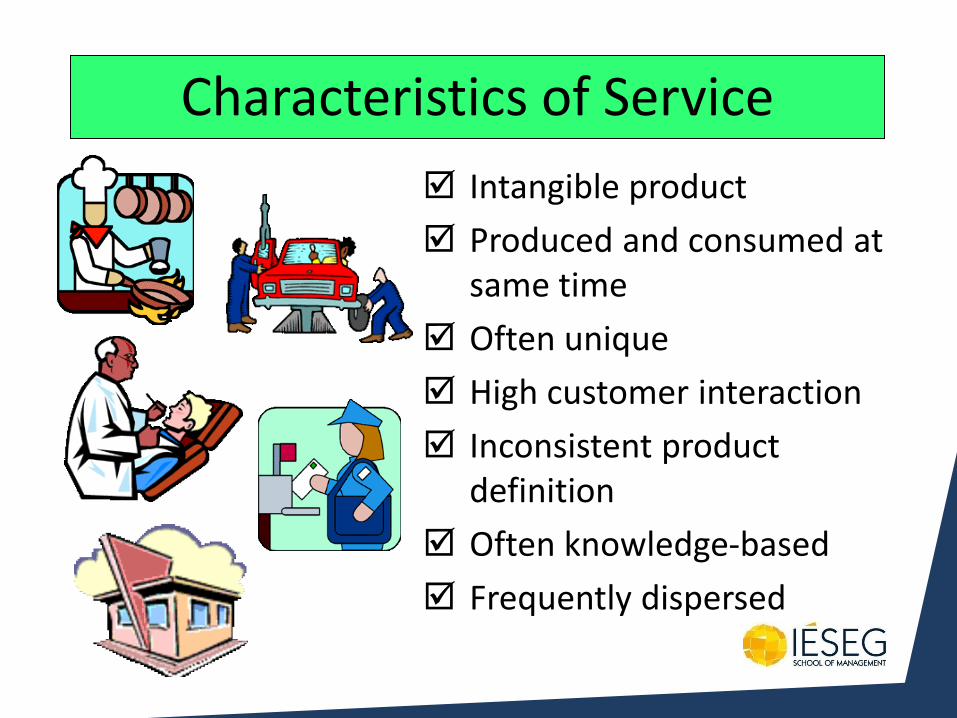
Characteristics of Service
Intangible product
Produced and consumed at same time
Often unique
High customer interaction
Inconsistent product definition
Often knowledge-based
Frequently dispersed
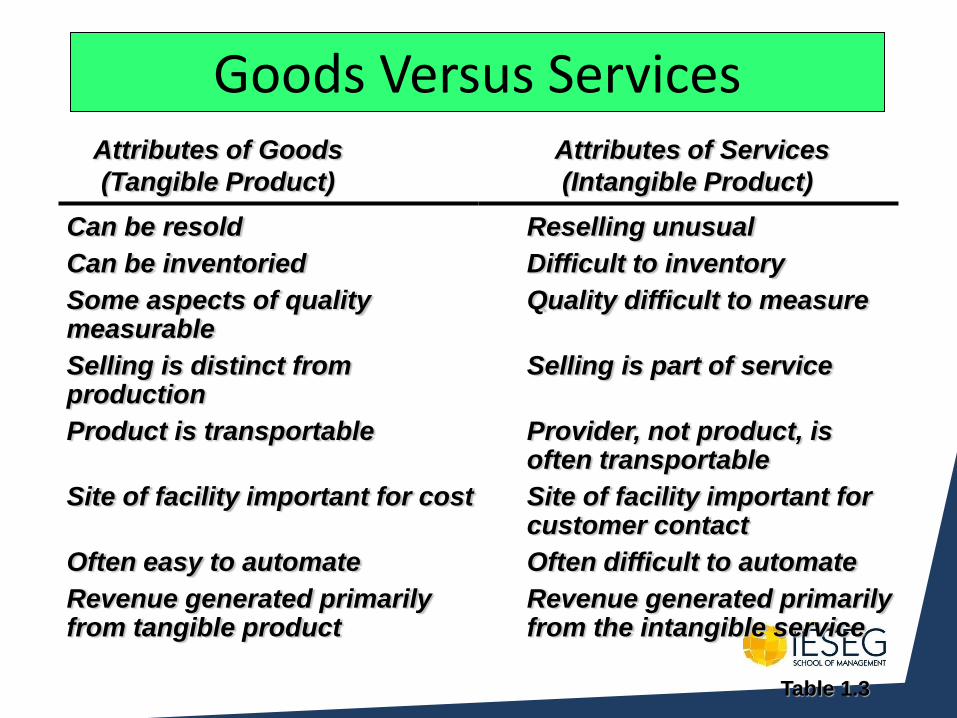
Goods Versus Services
Table 1.3
Can be resold
Can be inventoried
Some aspects of quality measurable
Selling is distinct from production
Product is transportable
Site of facility important for cost
Often easy to automate
Revenue generated primarily from tangible product
Attributes of Goods
(Tangible Product)
Attributes of Services
(Intangible Product)
Reselling unusual
Difficult to inventory
Quality difficult to measure
Selling is part of service
Provider, not product, is often transportable
Site of facility important for customer contact
Often difficult to automate
Revenue generated primarily from the intangible service
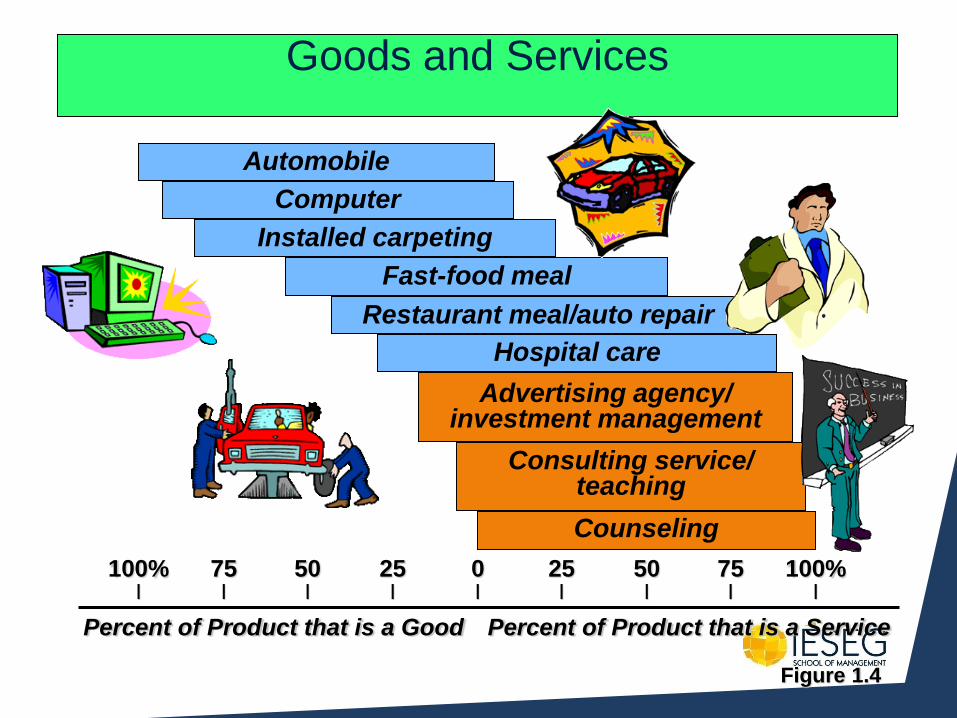
Goods and Services
Automobile
Computer
Installed carpeting
Fast-food meal
Restaurant meal/auto repair
Hospital care
Advertising agency/ investment management
Consulting service/ teaching
Counseling
Percent of Product that is a Good Percent of Product that is a Service
100% 75 50 25 0 25 50 75 100% | | | | | | | | |
Figure 1.4
Source: Waller
Source: Waller
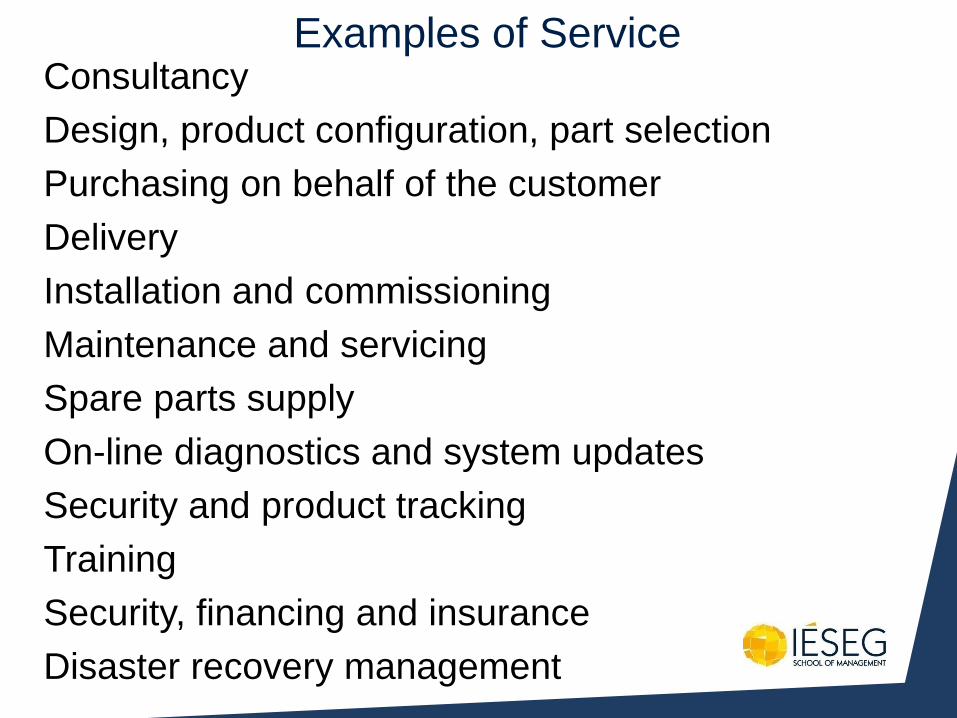
Examples of Service Consultancy
Design, product configuration, part selection
Purchasing on behalf of the customer
Delivery
Installation and commissioning
Maintenance and servicing
Spare parts supply
On-line diagnostics and system updates
Security and product tracking
Training
Security, financing and insurance
Disaster recovery management
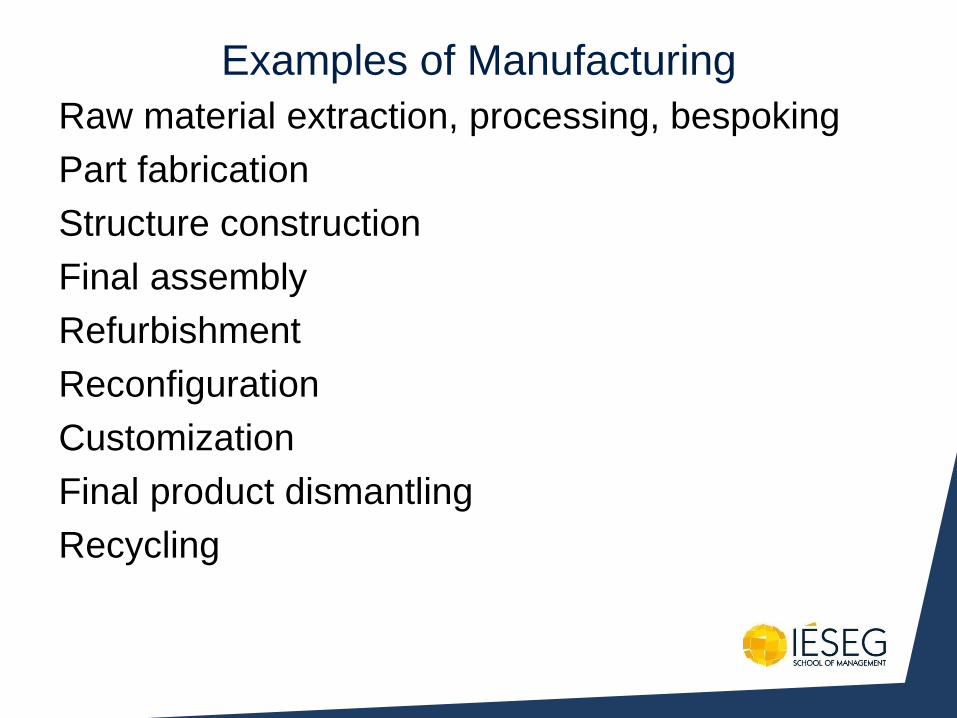
Examples of Manufacturing
Raw material extraction, processing, bespoking
Part fabrication
Structure construction
Final assembly
Refurbishment
Reconfiguration
Customization
Final product dismantling
Recycling
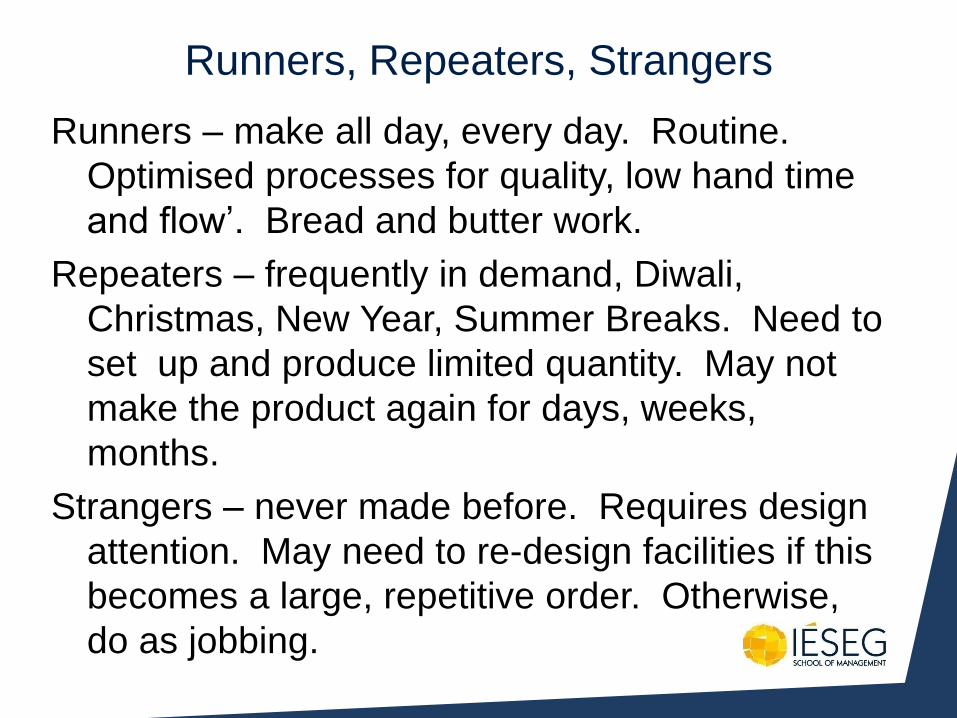
Runners, Repeaters, Strangers
Runners – make all day, every day. Routine.
Optimised processes for quality, low hand time
and flow’. Bread and butter work.
Repeaters – frequently in demand, Diwali,
Christmas, New Year, Summer Breaks. Need to
set up and produce limited quantity. May not
make the product again for days, weeks,
months.
Strangers – never made before. Requires design
attention. May need to re-design facilities if this
becomes a large, repetitive order. Otherwise,
do as jobbing.
http://fastlane.gmblogs.com/2012/10/25/new-small-block-corvette-lt1-engine-brings-big-gains-in-performance-and-fuel-economy/
Runner Examples
http://pitstopusa.com/i-5064704-auto-meter-12-volt-bulbs-replacement-bulb-3-watt.html
http://www.steeda.com/store/brisk-silver-racing-spark-plugs-for-ford-mustang.html
http://www.mobilemechanic212.com/car-batteriesstarting-charging-systems/
http://tonemain.en.made-in-china.com/product/eMSxXfDOyvWy/China-Car-Paint-Binder-System.html
http://www.conversionspecialists.com/seat_belts/
Repeater Examples
http://www.santabanta.com/photos/diwali/9000109.htm
http://www.onlygowns.com/blog/your-wedding-against-the-royal-wedding.asp
http://www.amazon.co.uk/Operations-Strategy-Slack-Nigel-Lewis/dp/B00DO8QXO2/ref=sr_1_3?s=books&ie=UTF8&qid=1383729879&sr=1-3&keywords=slack+and+lewis+operations+strategy
http://www.happybirthday11.com/birthday-cards/
http://www.whe.org/why-do-we-put-lights-on-christmas-trees.html

Stranger Examples
http://mystifyingindia.com/blog/wp-content/uploads/2010/09/taj_mahal.jpg
http://englishu2.blogspot.in/2012/07/happy-olympic-games.html
http://neilandheather.com/images/Will%20-%20Birth%20004.jpg
http://www.bhmpics.com/view-death_grim_reaper-1600x1200.html
http://ashaadi.blogspot.in/2011/09/indian-wedding-reception.html
• Operations strategy is the set of decisions and the processes used to make those decisions, that affect how the corporation delivered value to customers and other stakeholders
• Operations strategy aims to increase the fit between what customers want, competition, suppliers, alternatives, governments, lenders and other stakeholders want
Comparative Benchmarking
• Compare with the best – best practice benchmarking (Camp)
• Process of descovery – find out what is possible
• Understand why they are so good, so much better, faster, cheaper
• Learn – discover / identify – how to come up to the same level or exceed that level
Services
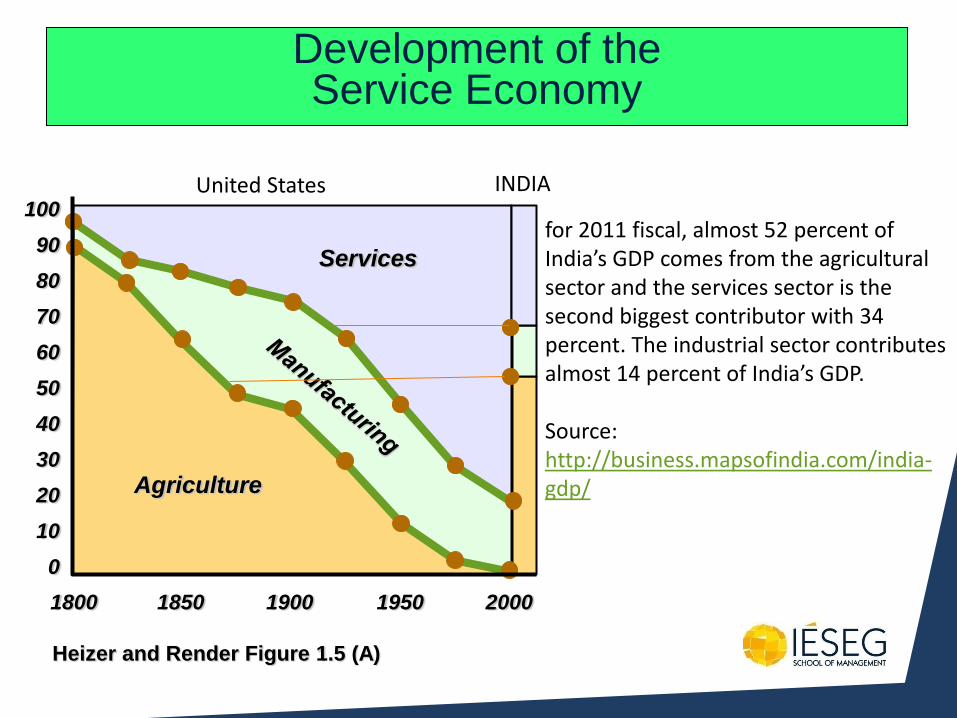
Development of the Service Economy
Heizer and Render Figure 1.5 (A)
Agriculture
100
90
80
70
60
50
40
30
20
10
0
1800 1850 1900 1950 2000
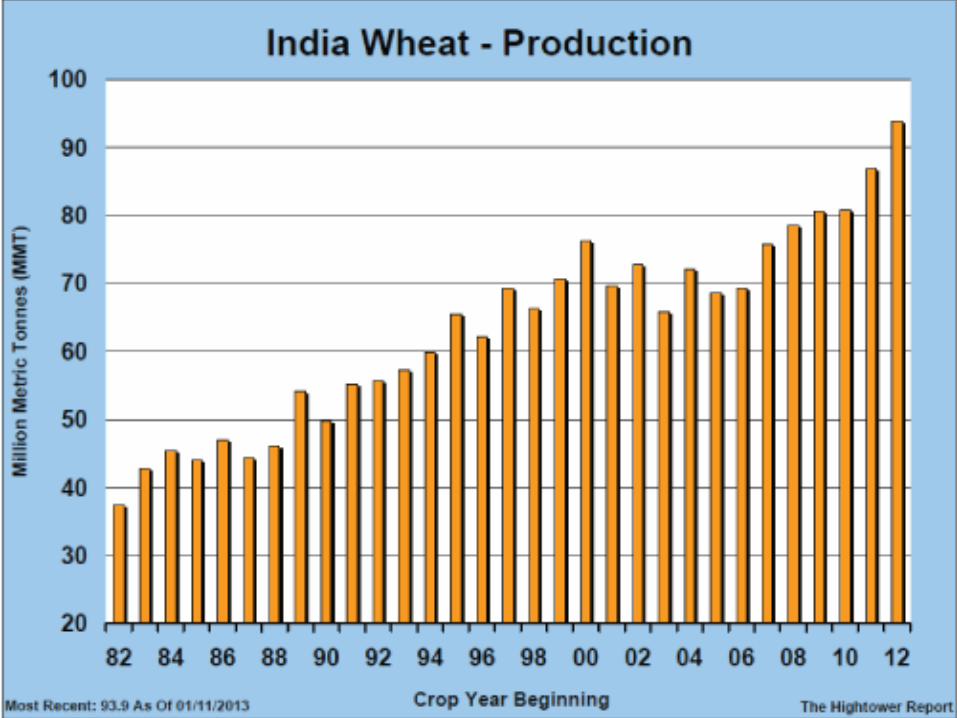
for 2011 fiscal, almost 52 percent of India’s GDP comes from the agricultural sector and the services sector is the second biggest contributor with 34 percent. The industrial sector contributes almost 14 percent of India’s GDP. Source: http://business.mapsofindia.com/india-gdp/
United States INDIA

http://thecalibre.in/in-depth-current-affairs/agriculture-sector-in-budget-2013-14/032013/?p=3101/
Typical Indian Farm?

http://indi.ca/2011/07/indias-food-supply-and-agriculture-in-crisis-infographic/
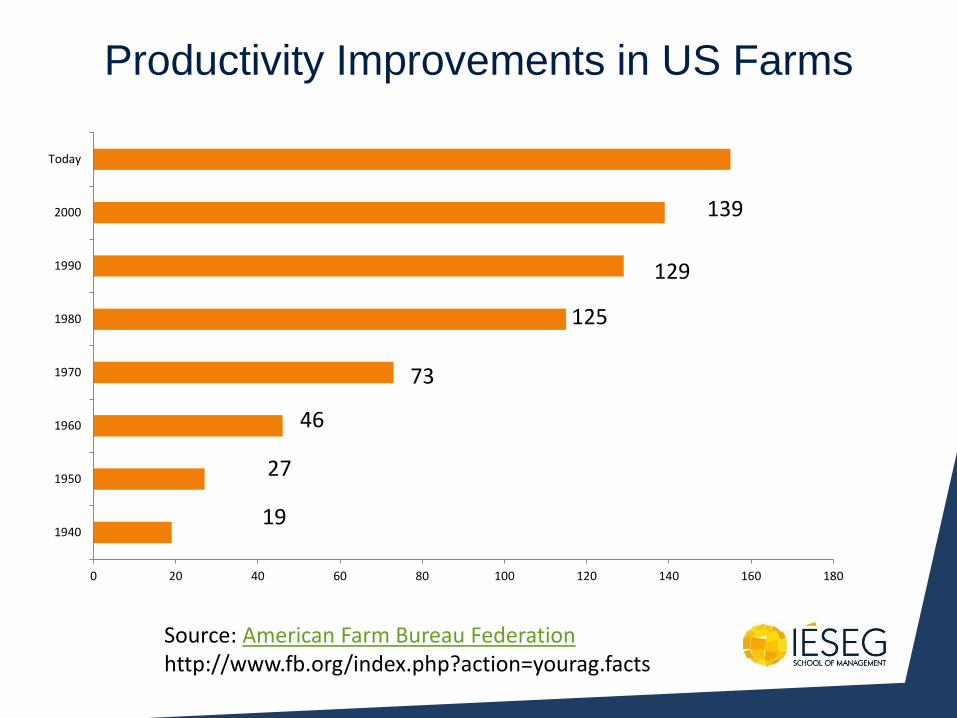
Productivity
in Indian
Farms

http://online.wsj.com/news/articles/SB122463109671256373
Typical US Farm
0 20 40 60 80 100 120 140 160 180
1940
1950
1960
1970
1980
1990
2000
Today
Productivity Improvements in US Farms
Source: American Farm Bureau Federation http://www.fb.org/index.php?action=yourag.facts
73
46
27
19
139
129
125
http://en.wikipedia.org/wiki/Norman_Borlaug
http://www.rba.gov.au/publications/bulletin/2011/jun/3.html
http://www.danielstrading.com/resources/newsletter/2013/02/05/
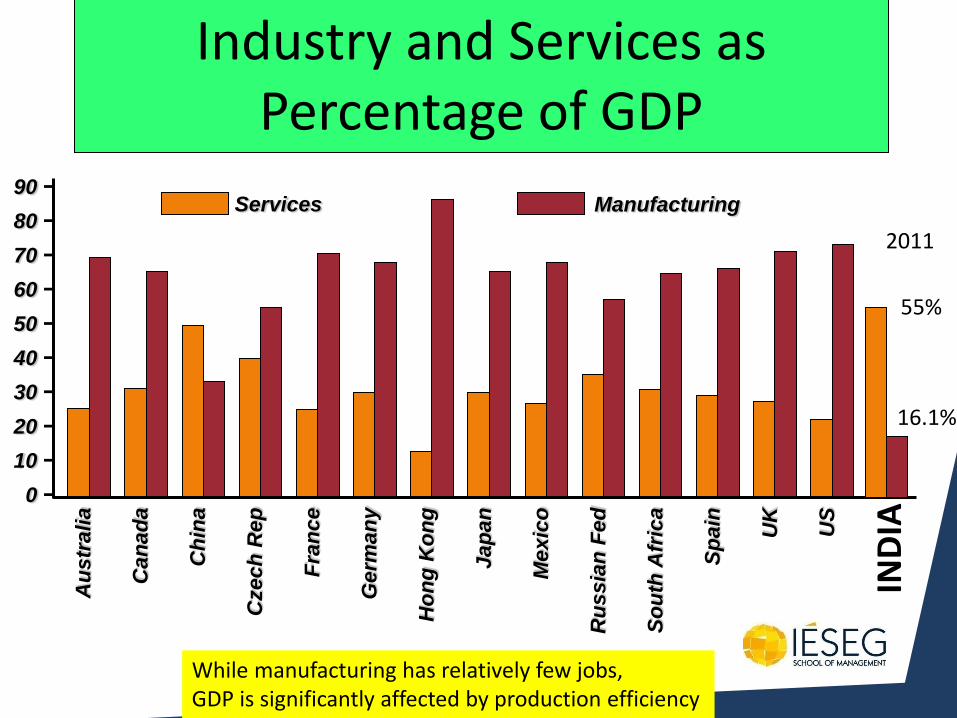
Industry and Services as Percentage of GDP
Services Manufacturing
Au
str
alia
Ca
na
da
Ch
ina
Czech
Rep
Fra
nce
Germ
an
y
Ho
ng
Ko
ng
Jap
an
Me
xic
o
Ru
ssia
n F
ed
So
uth
Afr
ica
Sp
ain
UK
US
90 −
80 −
70 −
60 −
50 −
40 −
30 −
20 −
10 −
0 −
IND
IA
55%
16.1%
While manufacturing has relatively few jobs, GDP is significantly affected by production efficiency
2011
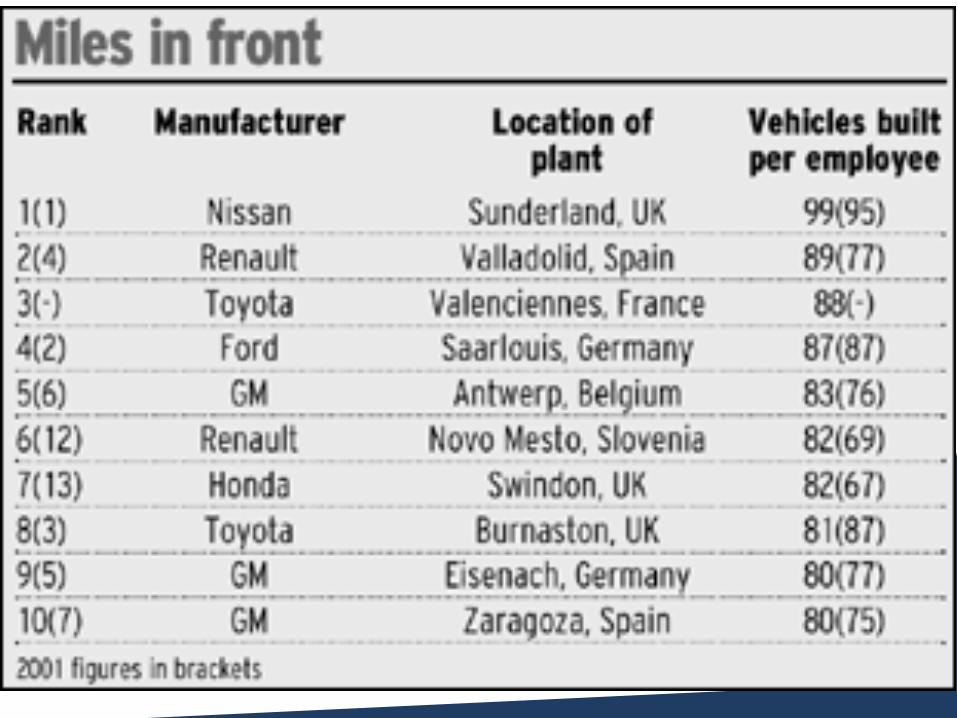
http://www.telegraph.co.uk/finance/2857193/Nissa
n-Sunderland-retains-top-spot-for-
productivity.html
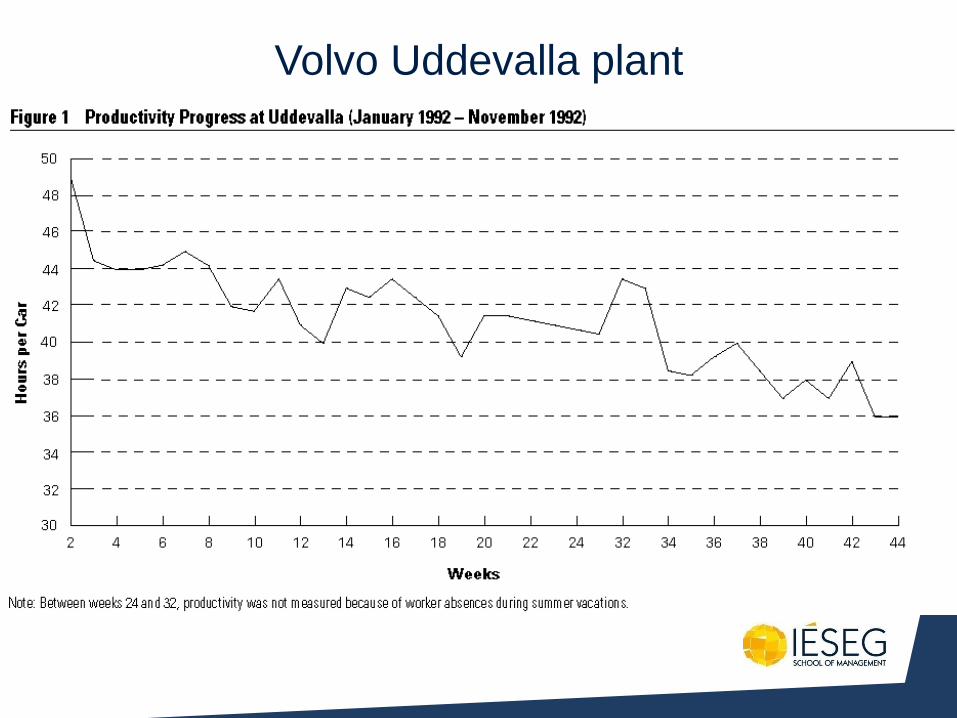
Volvo Uddevalla plant
http://sloanreview.mit.edu/article/pointcounterpoint
-nummi-vs-uddevalla/
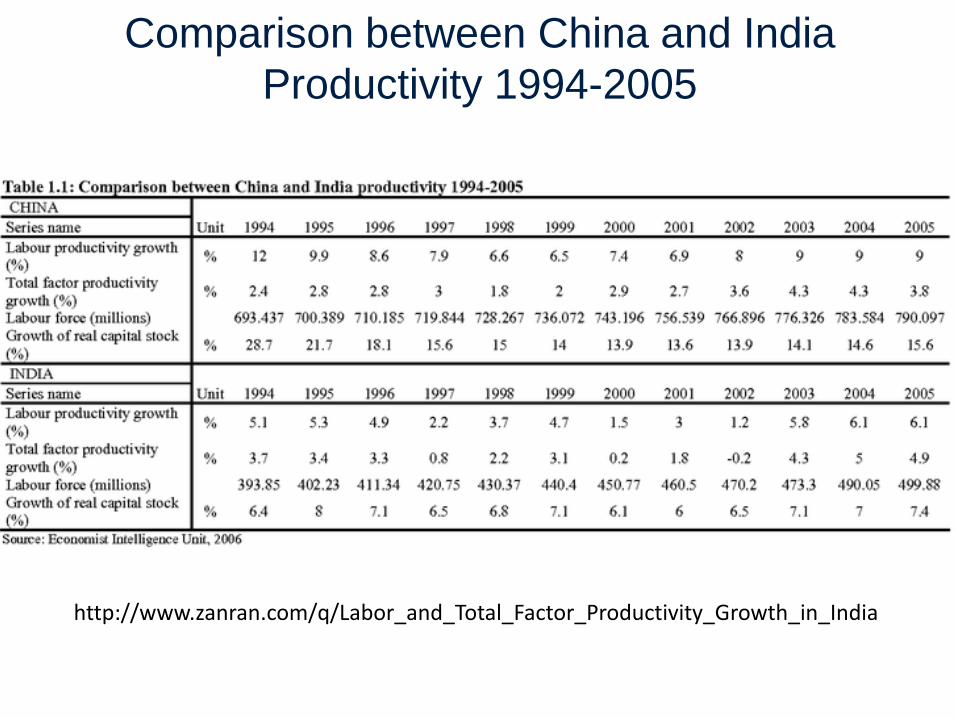
Comparison between China and India
Productivity 1994-2005
http://www.zanran.com/q/Labor_and_Total_Factor_Productivity_Growth_in_India
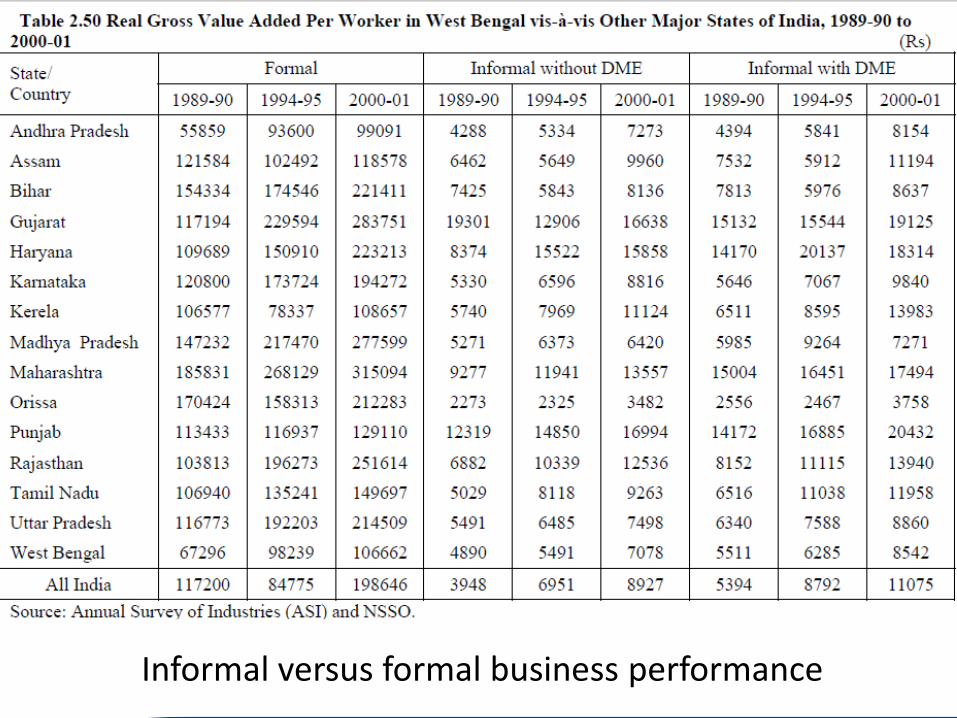
Informal versus formal business performance

Deflation in India? Need to ‘print money’ to
devalue the rupee?
Need to cut government spending in order to
balance the fiscal budget and repay debt?
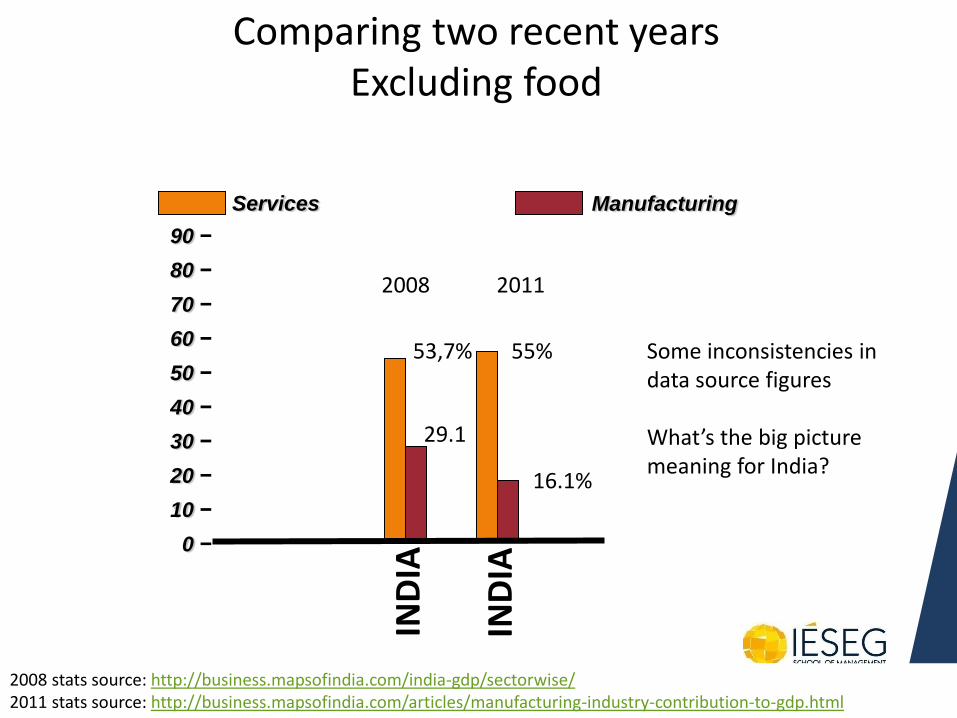
Comparing two recent years Excluding food
IND
IA
55%
2011
IND
IA
53,7%
2008
16.1%
29.1
90 −
80 −
70 −
60 −
50 −
40 −
30 −
20 −
10 −
0 −
2008 stats source: http://business.mapsofindia.com/india-gdp/sectorwise/ 2011 stats source: http://business.mapsofindia.com/articles/manufacturing-industry-contribution-to-gdp.html
Services Manufacturing
Some inconsistencies in data source figures What’s the big picture meaning for India?
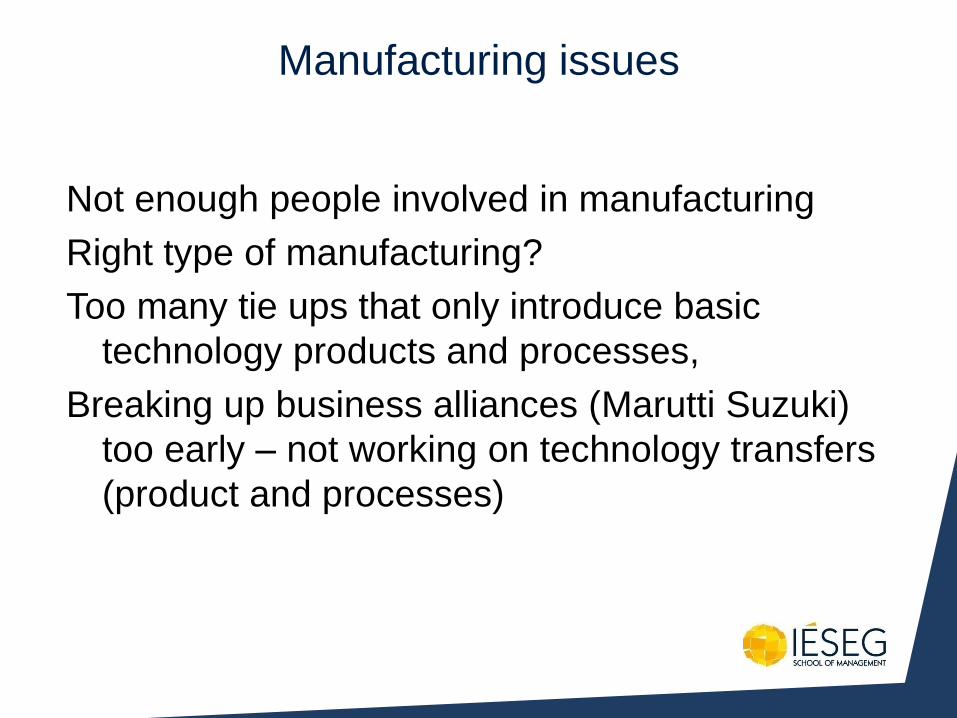
Manufacturing issues
Not enough people involved in manufacturing
Right type of manufacturing?
Too many tie ups that only introduce basic
technology products and processes,
Breaking up business alliances (Marutti Suzuki)
too early – not working on technology transfers
(product and processes)
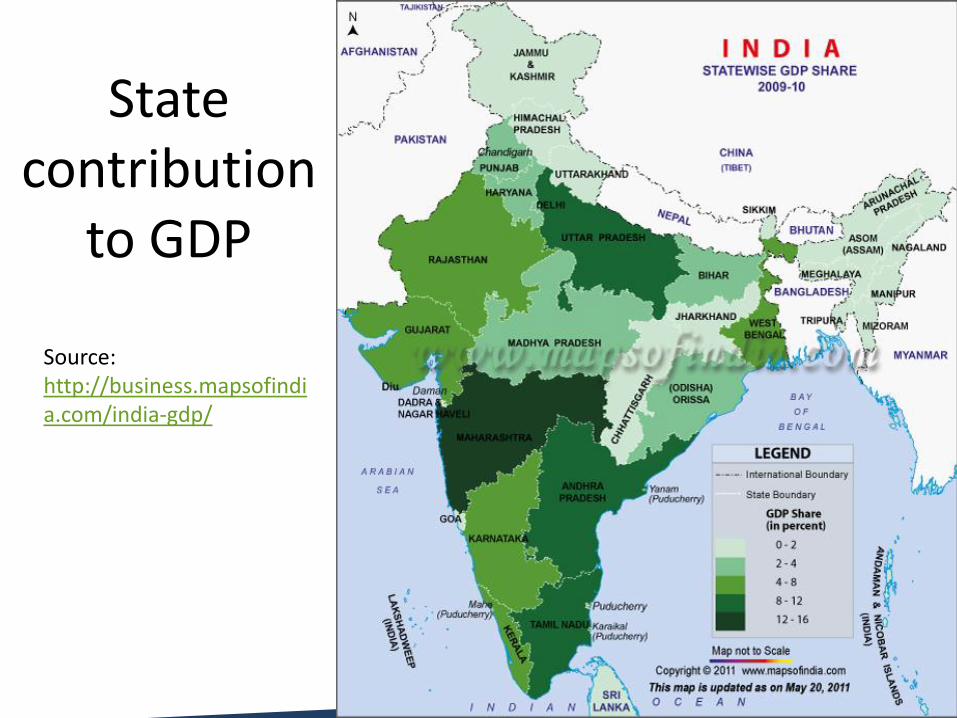
State contribution
to GDP
Source: http://business.mapsofindia.com/india-gdp/
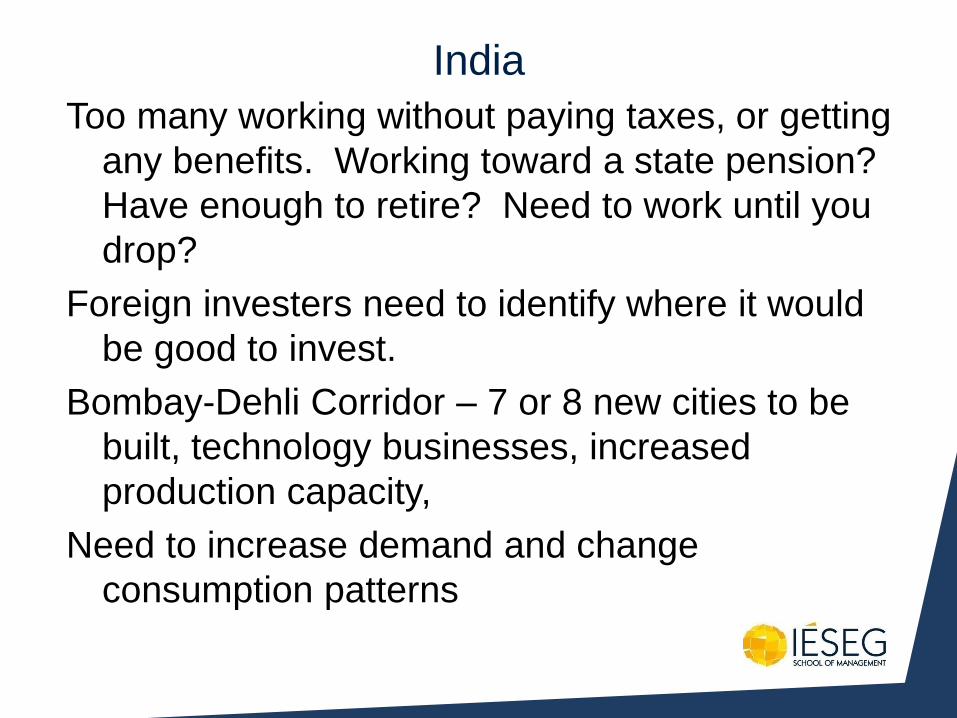
India
Too many working without paying taxes, or getting
any benefits. Working toward a state pension?
Have enough to retire? Need to work until you
drop?
Foreign investers need to identify where it would
be good to invest.
Bombay-Dehli Corridor – 7 or 8 new cities to be
built, technology businesses, increased
production capacity,
Need to increase demand and change
consumption patterns
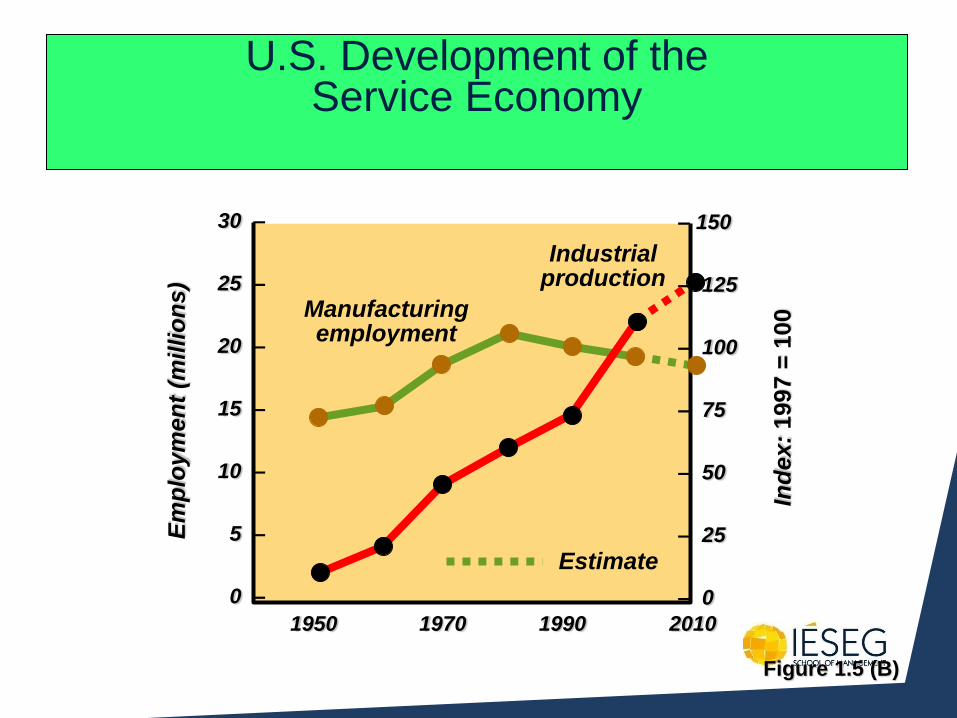
U.S. Development of the Service Economy
Figure 1.5 (B)
30 –
25 –
20 –
15 –
10 –
5 –
0 –
1950 1970 1990 2010
– 150
– 125
– 100
– 75
– 50
– 25
– 0
Em
plo
ym
en
t (m
illi
on
s)
In
dex:
1997 =
100 Manufacturing
employment
Industrial production
Estimate
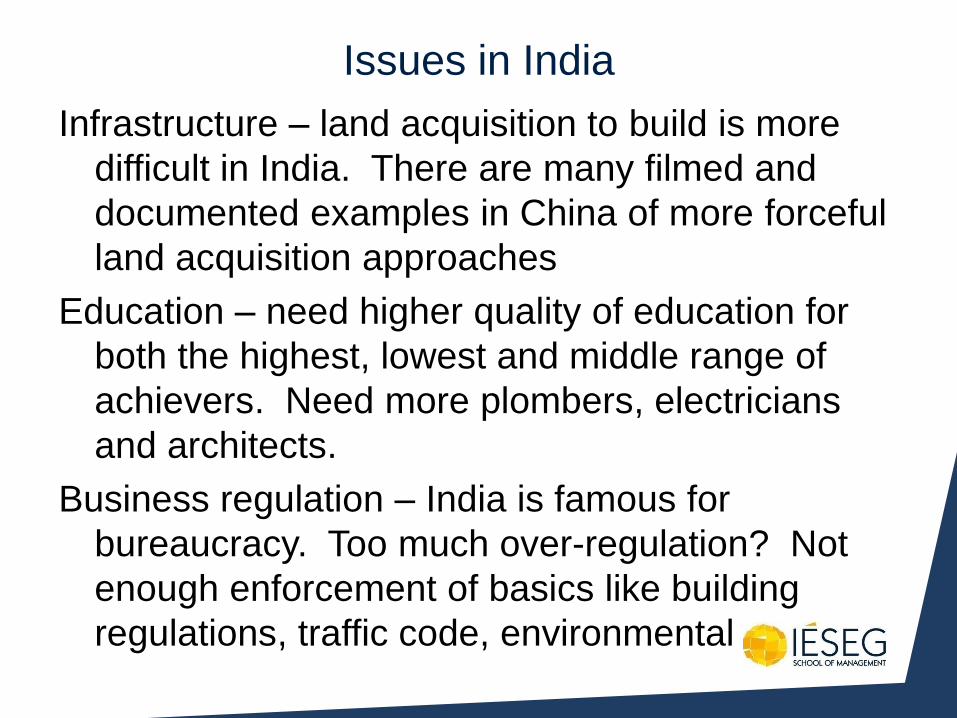
Issues in India
Infrastructure – land acquisition to build is more
difficult in India. There are many filmed and
documented examples in China of more forceful
land acquisition approaches
Education – need higher quality of education for
both the highest, lowest and middle range of
achievers. Need more plombers, electricians
and architects.
Business regulation – India is famous for
bureaucracy. Too much over-regulation? Not
enough enforcement of basics like building
regulations, traffic code, environmental
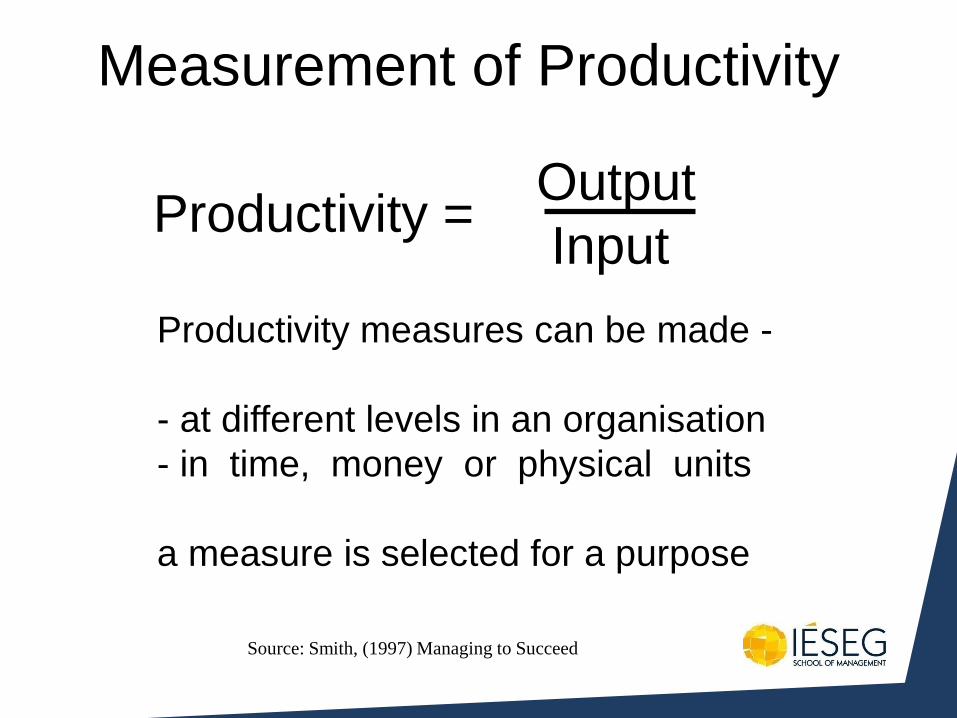
Measurement of Productivity
Productivity = Output
Input
Productivity measures can be made -
- at different levels in an organisation
- in time, money or physical units
a measure is selected for a purpose
Source: Smith, (1997) Managing to Succeed
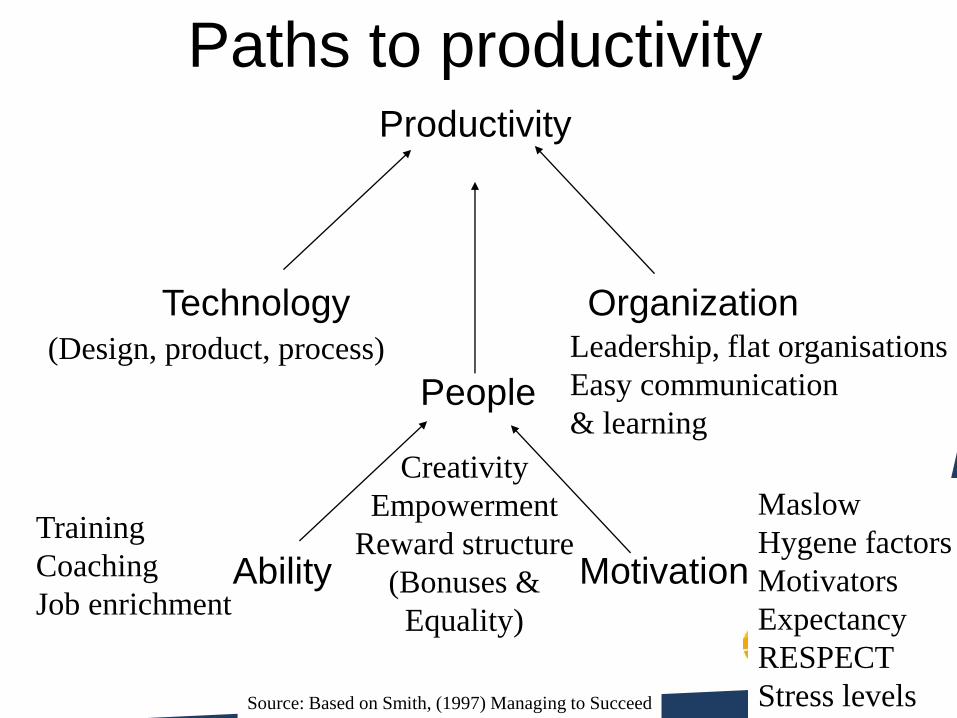
Paths to productivity Productivity
Technology Organization
People
Ability Motivation
Source: Based on Smith, (1997) Managing to Succeed
(Design, product, process)
Creativity
Empowerment
Reward structure
(Bonuses &
Equality)
Leadership, flat organisations
Easy communication
& learning
Training
Coaching
Job enrichment
Maslow
Hygene factors
Motivators
Expectancy
RESPECT
Stress levels
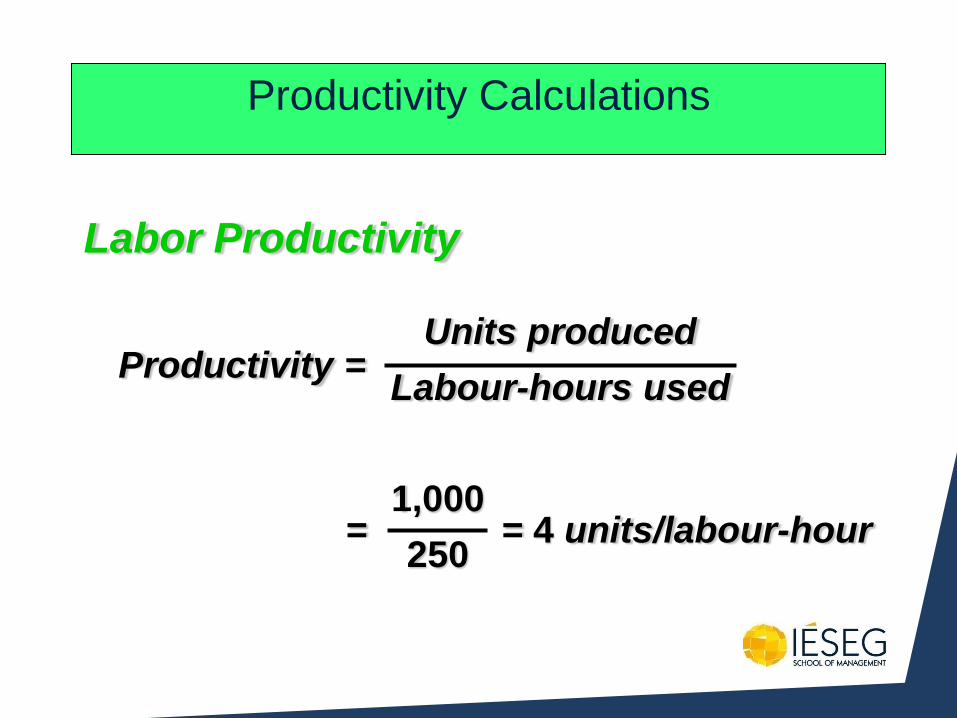
Productivity Calculations
Productivity = Units produced
Labour-hours used
= = 4 units/labour-hour 1,000
250
Labor Productivity

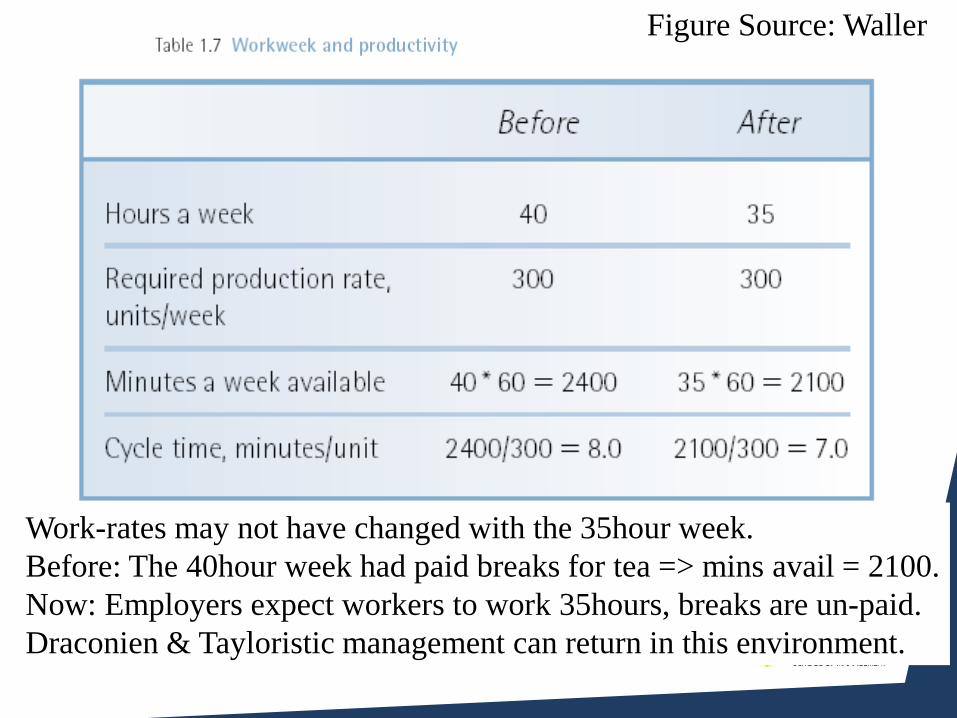
Work-rates may not have changed with the 35hour week.
Before: The 40hour week had paid breaks for tea => mins avail = 2100.
Now: Employers expect workers to work 35hours, breaks are un-paid.
Draconien & Tayloristic management can return in this environment.
Figure Source: Waller
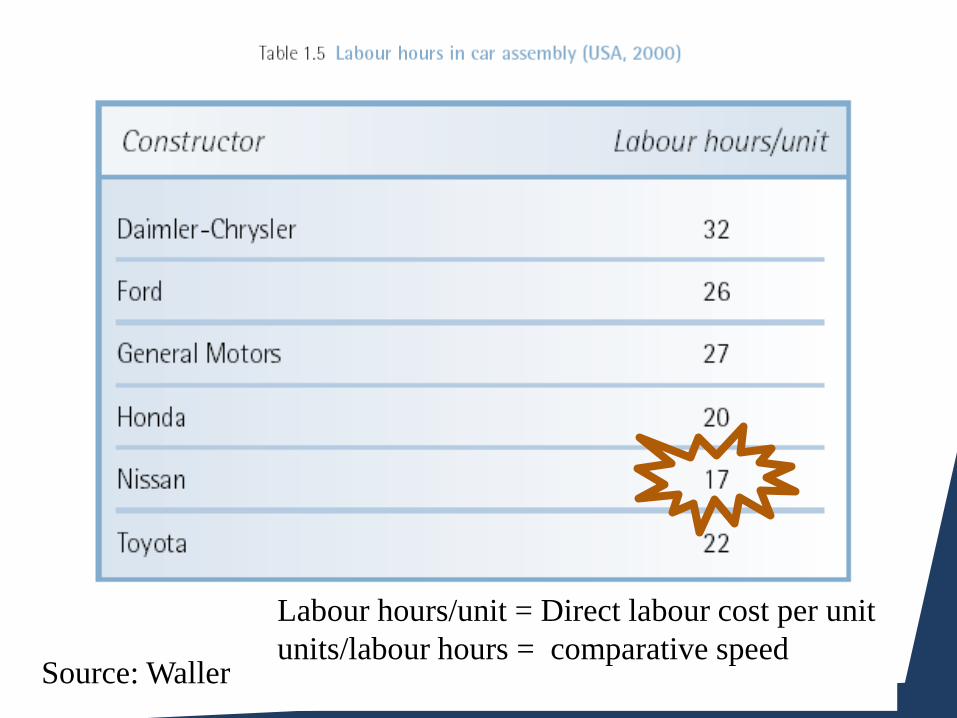
Source: Waller
Labour hours/unit = Direct labour cost per unit
units/labour hours = comparative speed
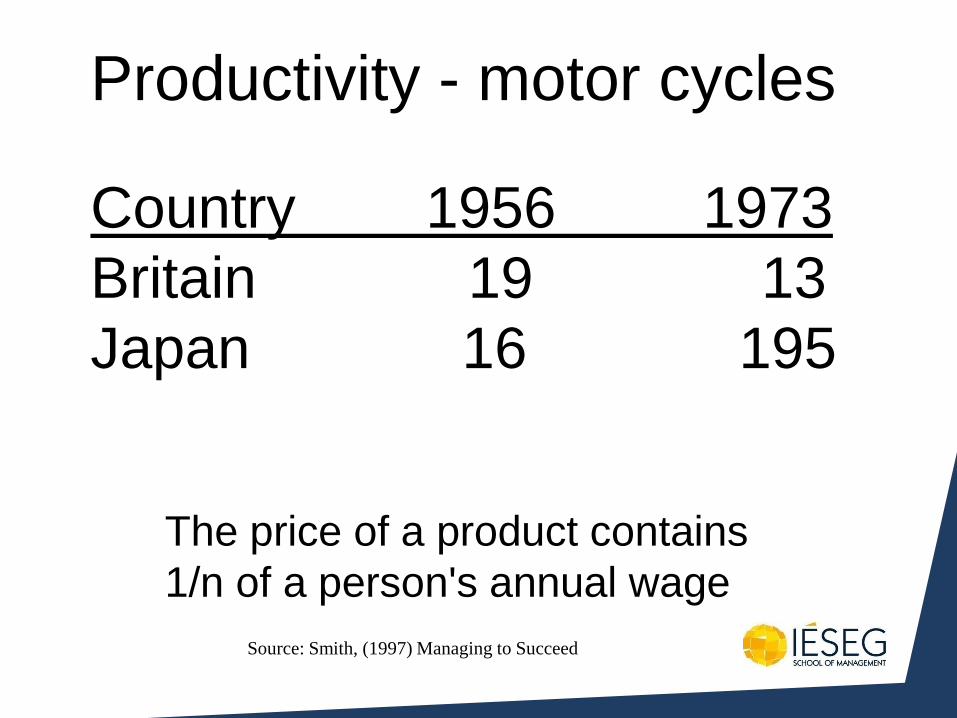
Productivity - motor cycles
Country 1956 1973
Britain 19 13
Japan 16 195
The price of a product contains
1/n of a person's annual wage
Source: Smith, (1997) Managing to Succeed
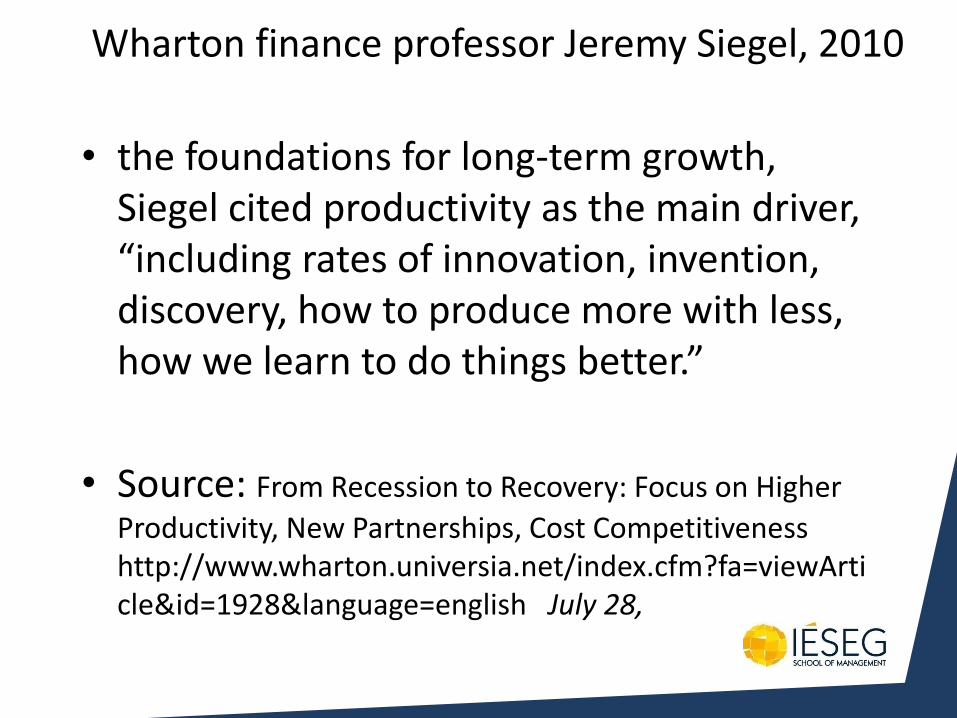
Wharton finance professor Jeremy Siegel, 2010
• the foundations for long-term growth, Siegel cited productivity as the main driver, “including rates of innovation, invention, discovery, how to produce more with less, how we learn to do things better.”
• Source: From Recession to Recovery: Focus on Higher
Productivity, New Partnerships, Cost Competitiveness http://www.wharton.universia.net/index.cfm?fa=viewArticle&id=1928&language=english July 28,

Work-rates may not have changed with the 35hour week.
Before: The 40hour week had paid breaks for tea => mins avail = 2100.
Now: Employers expect workers to work 35hours, breaks are un-paid.
Draconien & Tayloristic management can return in this environment.
Figure Source: Waller
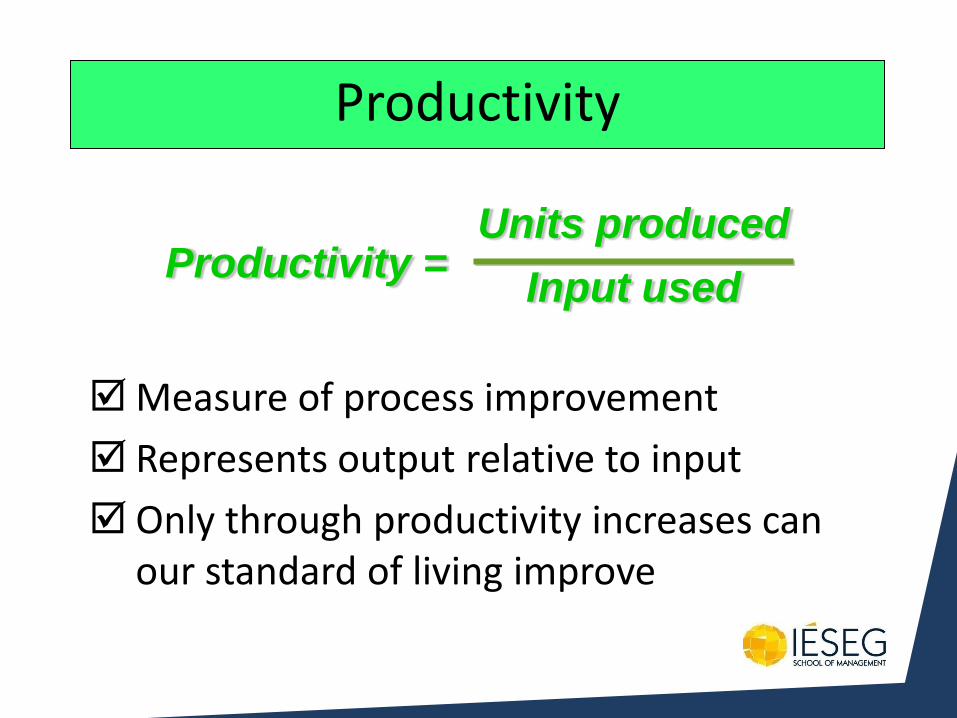
Measure of process improvement
Represents output relative to input
Only through productivity increases can our standard of living improve
Productivity
Productivity = Units produced
Input used
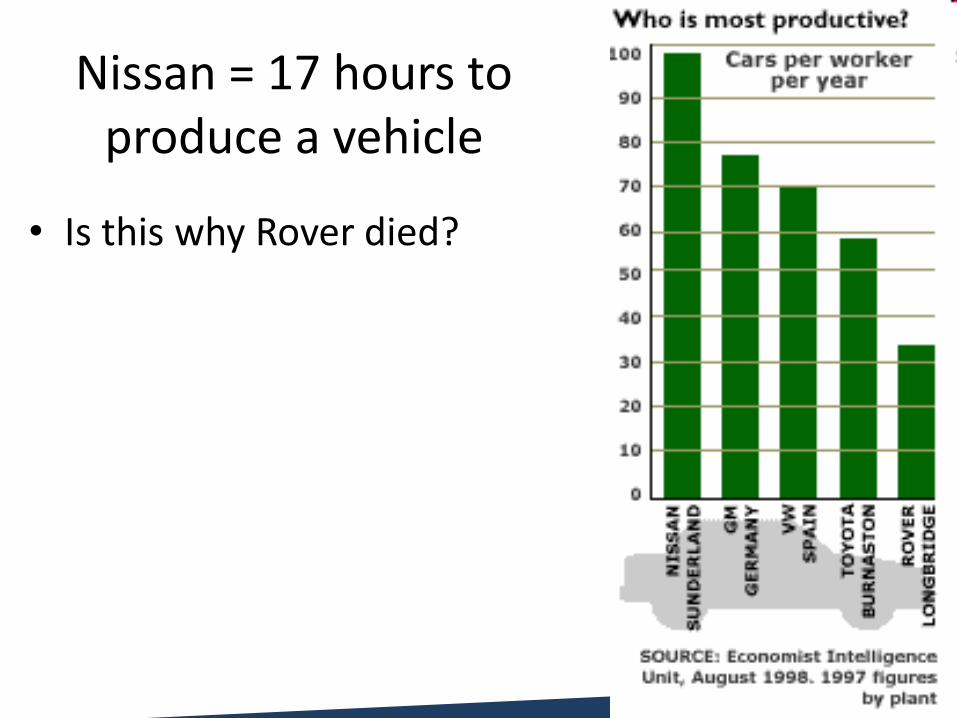
Nissan = 17 hours to produce a vehicle
• Is this why Rover died?

What you measure is what you
get
Original Source: Waller
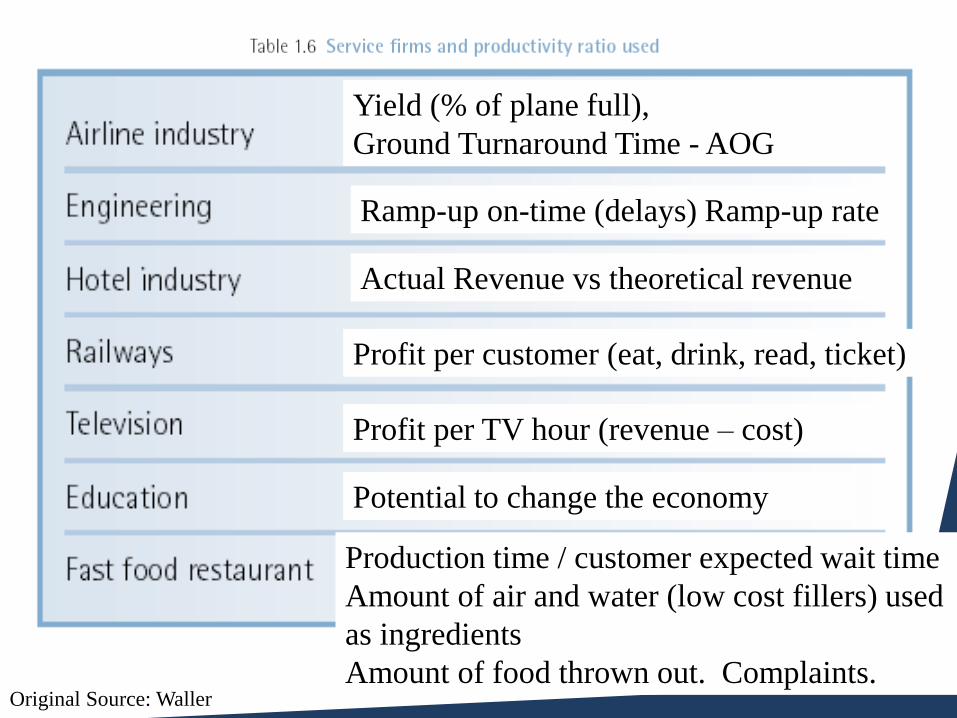
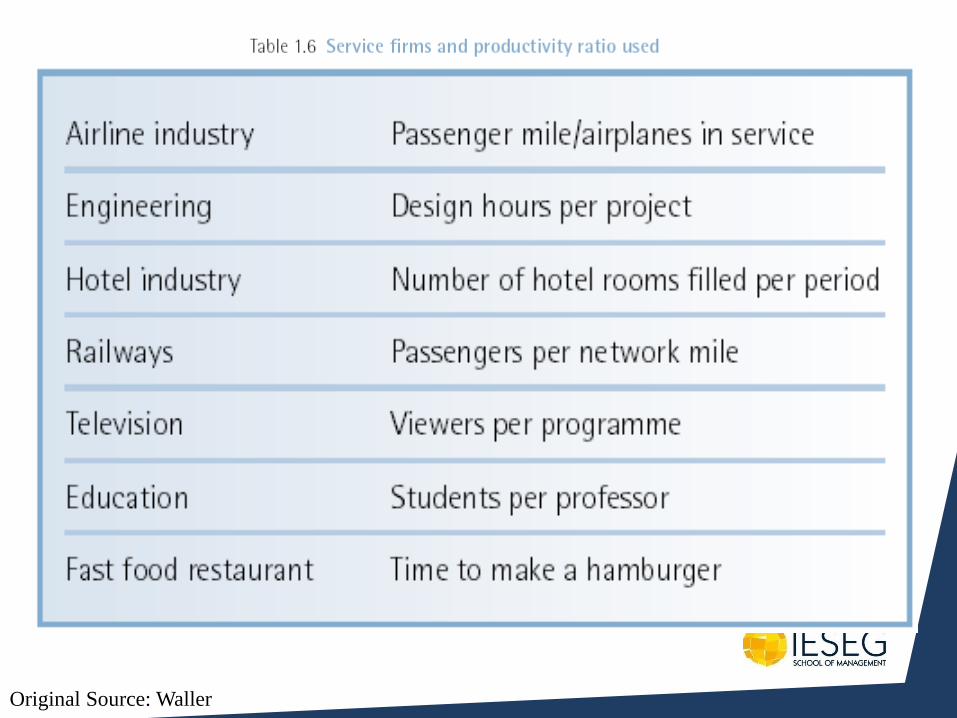
Profit per customer (eat, drink, read, ticket)
Profit per TV hour (revenue – cost)
Production time / customer expected wait time
Amount of air and water (low cost fillers) used
as ingredients
Amount of food thrown out. Complaints.
Potential to change the economy
Yield (% of plane full),
Ground Turnaround Time - AOG
Actual Revenue vs theoretical revenue
Ramp-up on-time (delays) Ramp-up rate
Original Source: Waller
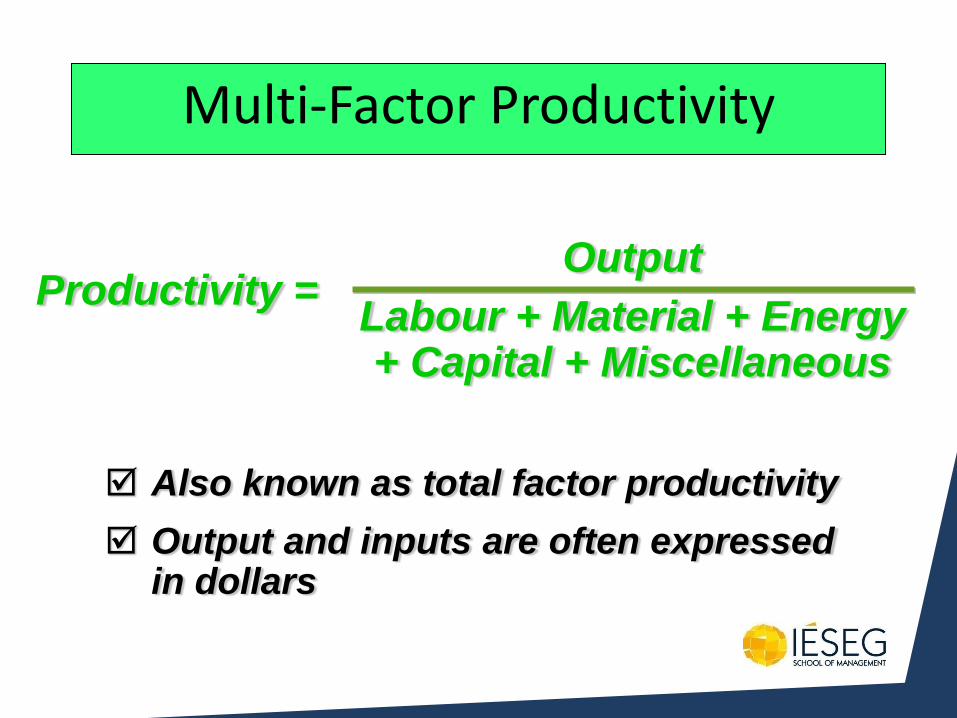
Multi-Factor Productivity
Output
Labour + Material + Energy + Capital + Miscellaneous
Productivity =
Also known as total factor productivity
Output and inputs are often expressed in dollars
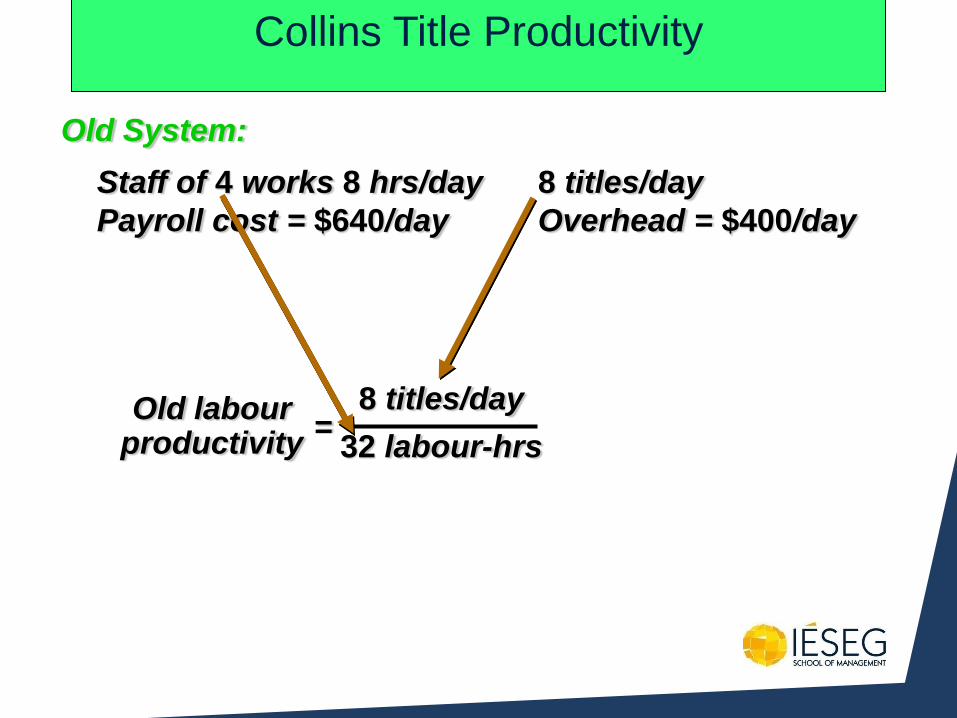
Collins Title Productivity
Staff of 4 works 8 hrs/day 8 titles/day
Payroll cost = $640/day Overhead = $400/day
Old System:
= Old labour
productivity
8 titles/day
32 labour-hrs
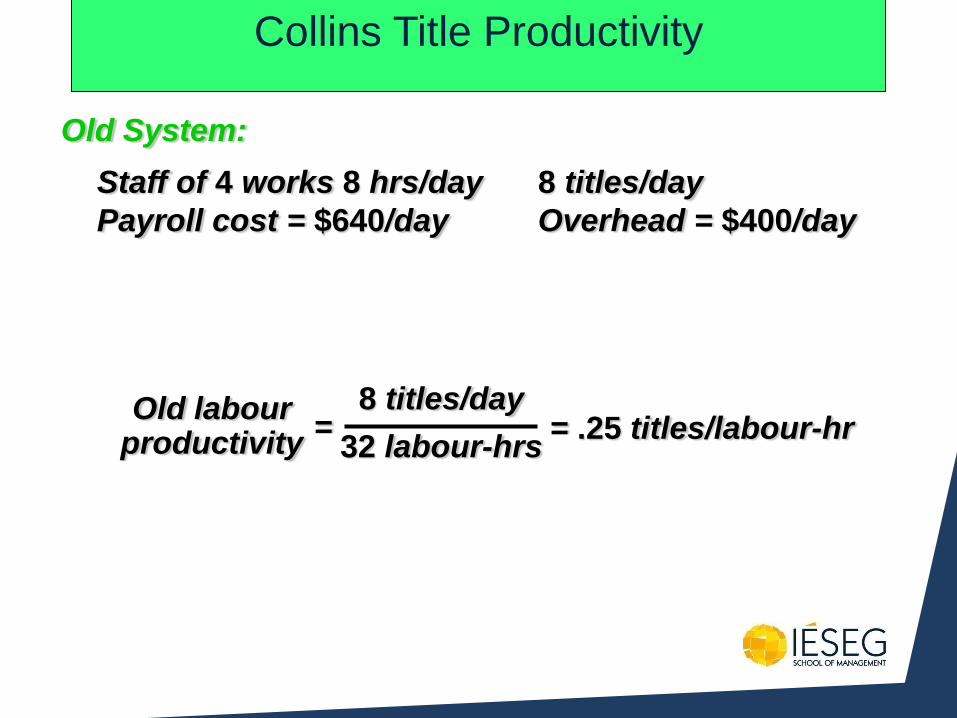
Collins Title Productivity
Staff of 4 works 8 hrs/day 8 titles/day
Payroll cost = $640/day Overhead = $400/day
Old System:
8 titles/day
32 labour-hrs =
Old labour productivity = .25 titles/labour-hr
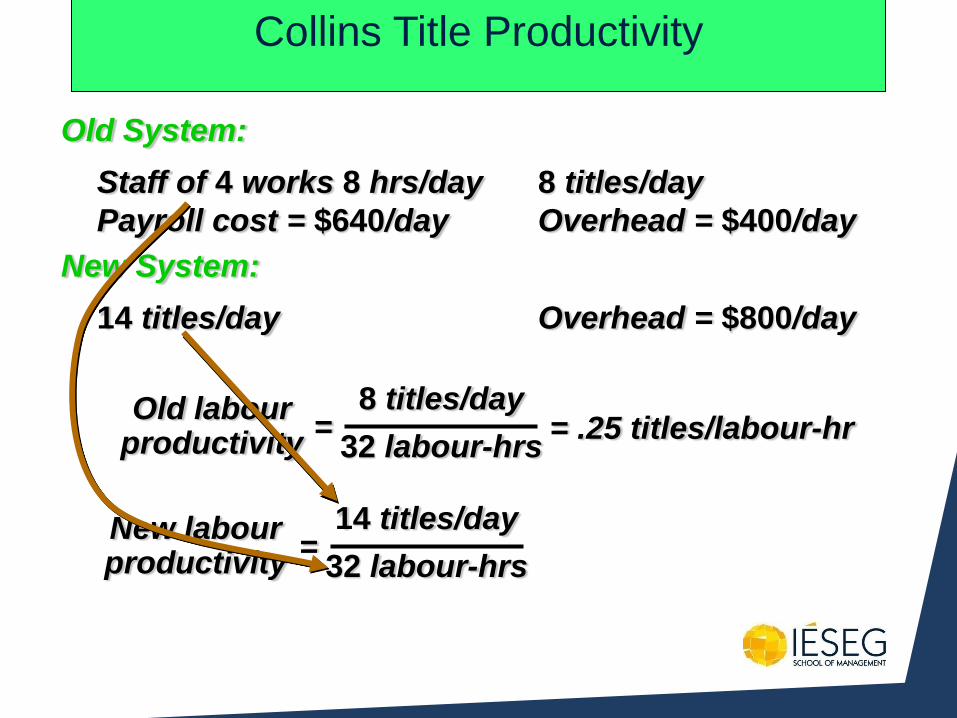
Collins Title Productivity
Staff of 4 works 8 hrs/day 8 titles/day
Payroll cost = $640/day Overhead = $400/day
Old System:
14 titles/day Overhead = $800/day
New System:
8 titles/day
32 labour-hrs =
Old labour productivity
= New labour productivity
= .25 titles/labour-hr
14 titles/day
32 labour-hrs
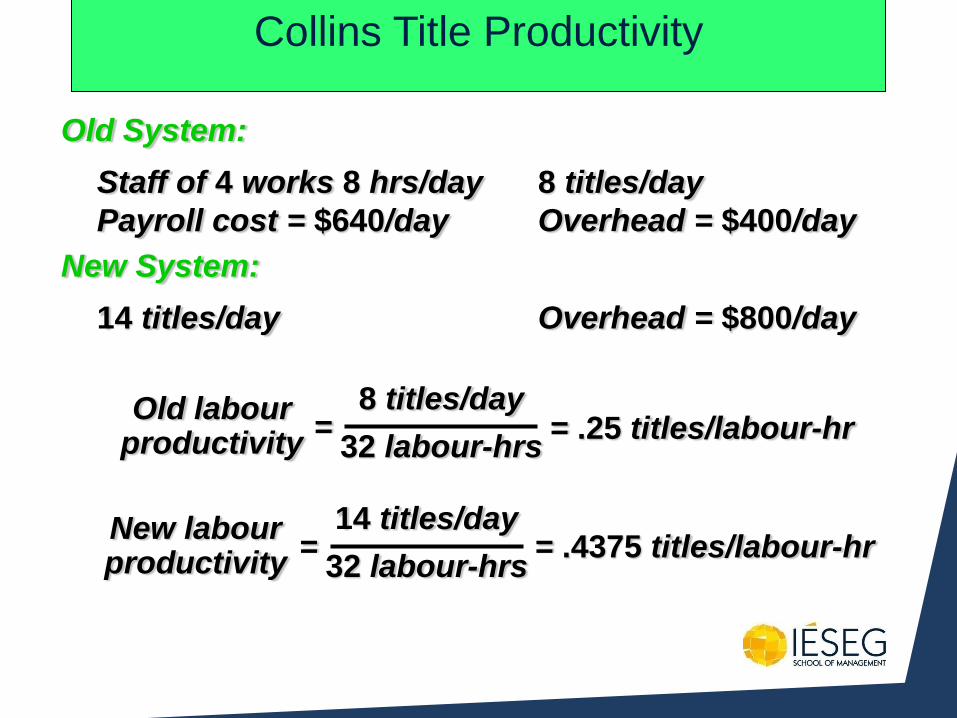
Collins Title Productivity
Staff of 4 works 8 hrs/day 8 titles/day
Payroll cost = $640/day Overhead = $400/day
Old System:
14 titles/day Overhead = $800/day
New System:
8 titles/day
32 labour-hrs =
Old labour productivity = .25 titles/labour-hr
14 titles/day
32 labour-hrs =
New labour productivity
= .4375 titles/labour-hr
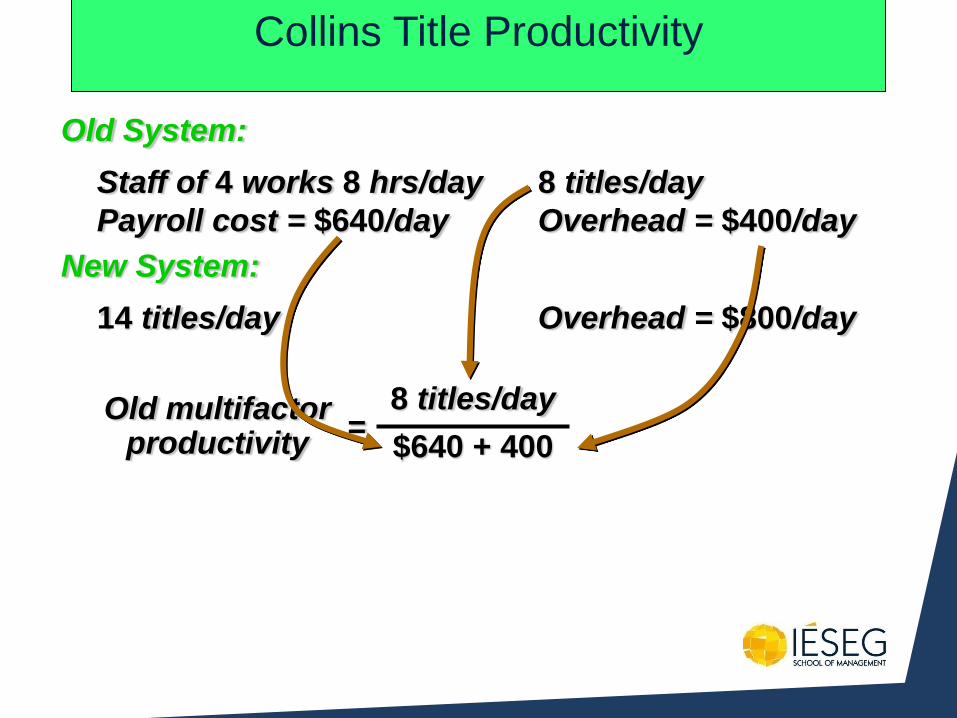
Collins Title Productivity
Staff of 4 works 8 hrs/day 8 titles/day
Payroll cost = $640/day Overhead = $400/day
Old System:
14 titles/day Overhead = $800/day
New System:
= Old multifactor
productivity
8 titles/day
$640 + 400
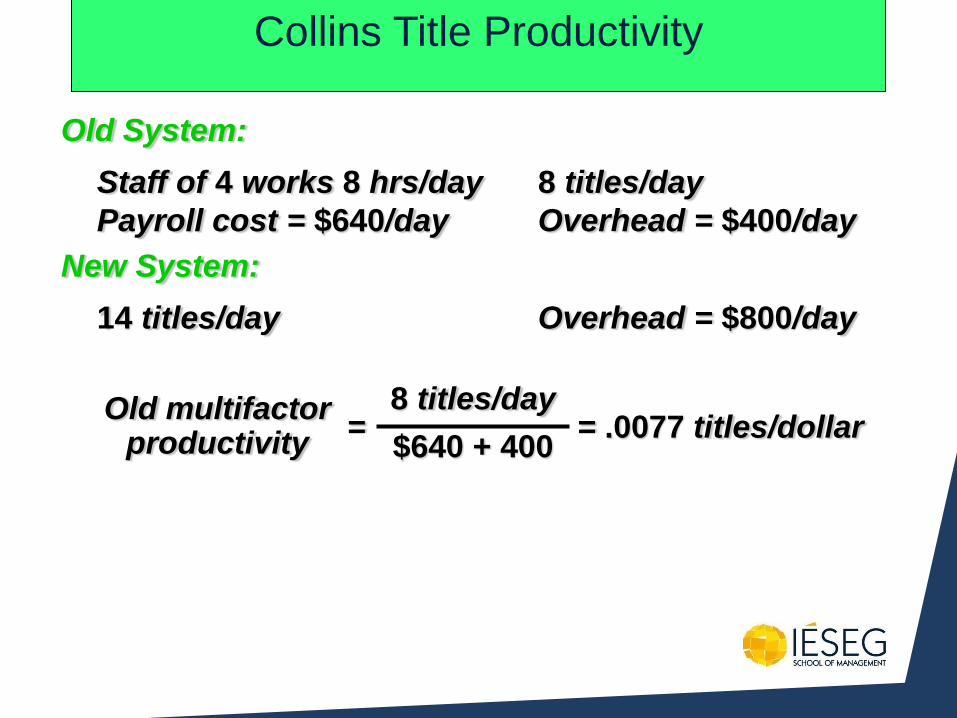
Collins Title Productivity
Staff of 4 works 8 hrs/day 8 titles/day
Payroll cost = $640/day Overhead = $400/day
Old System:
14 titles/day Overhead = $800/day
New System:
8 titles/day
$640 + 400 =
Old multifactor productivity
= .0077 titles/dollar
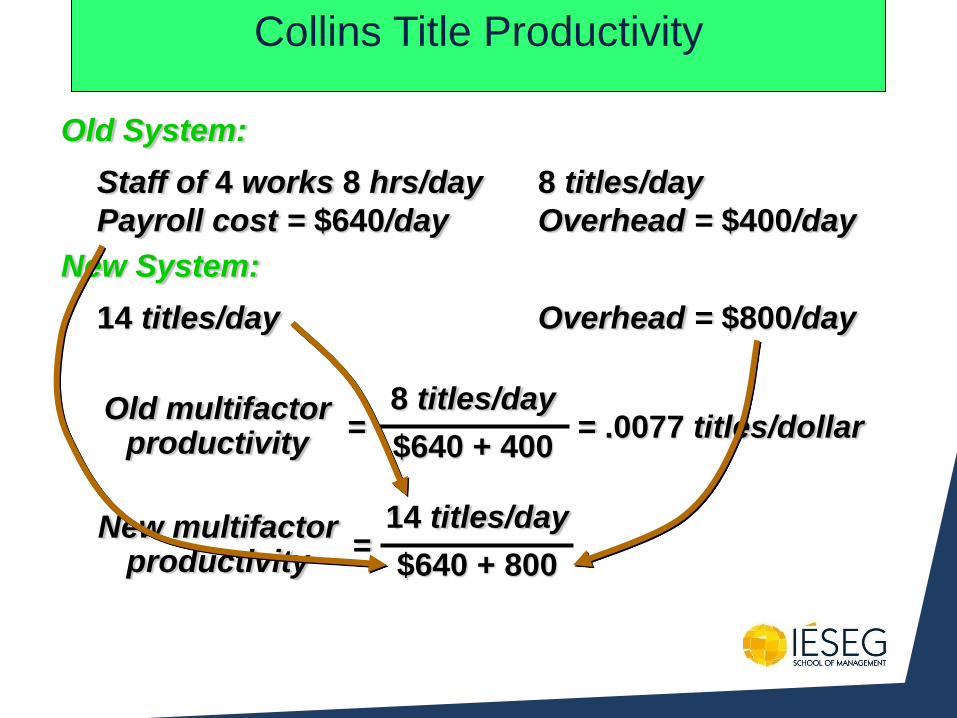
Collins Title Productivity
Staff of 4 works 8 hrs/day 8 titles/day
Payroll cost = $640/day Overhead = $400/day
Old System:
14 titles/day Overhead = $800/day
New System:
8 titles/day
$640 + 400 =
Old multifactor productivity
= New multifactor
productivity
= .0077 titles/dollar
14 titles/day
$640 + 800
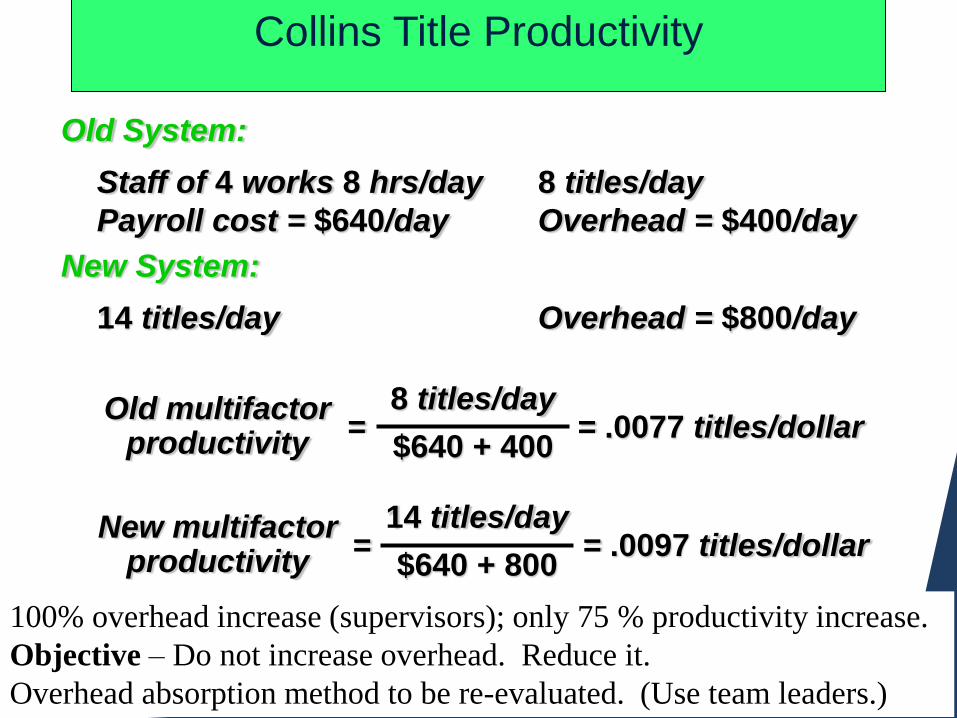
Collins Title Productivity
Staff of 4 works 8 hrs/day 8 titles/day
Payroll cost = $640/day Overhead = $400/day
Old System:
14 titles/day Overhead = $800/day
New System:
8 titles/day
$640 + 400
14 titles/day
$640 + 800
= Old multifactor
productivity
= New multifactor
productivity
= .0077 titles/dollar
= .0097 titles/dollar
100% overhead increase (supervisors); only 75 % productivity increase.
Objective – Do not increase overhead. Reduce it.
Overhead absorption method to be re-evaluated. (Use team leaders.)
Collins Title Productivity
Staff of 4 works 8 hrs/day 8 titles/day
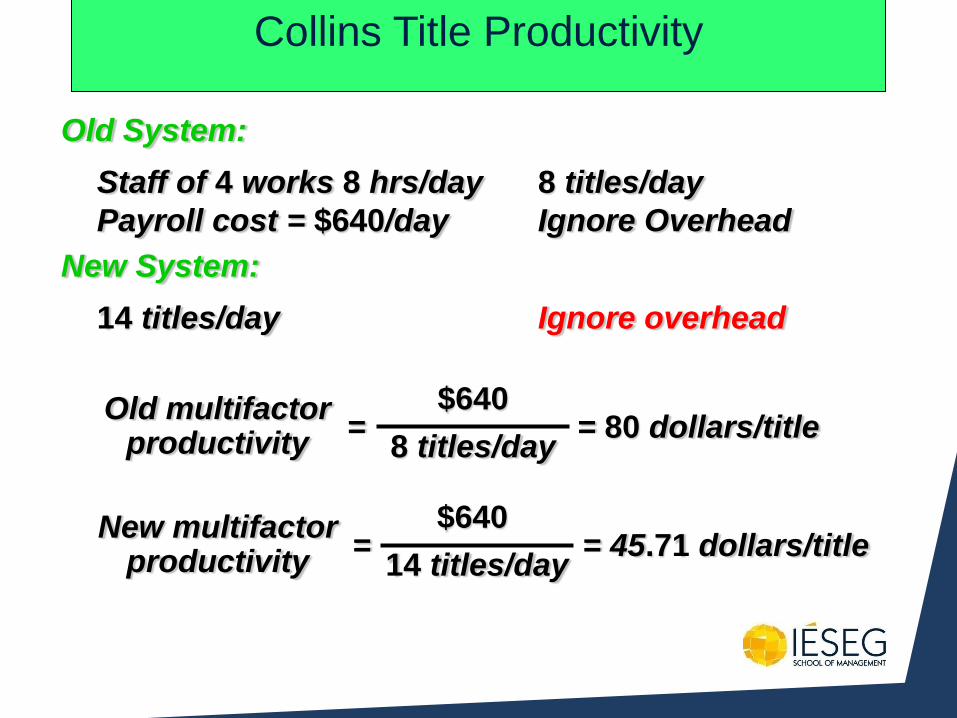
Payroll cost = $640/day Ignore Overhead
Old System:
14 titles/day Ignore overhead
New System:
$640
8 titles/day
$640
14 titles/day
= Old multifactor
productivity
= New multifactor
productivity
= 80 dollars/title
= 45.71 dollars/title
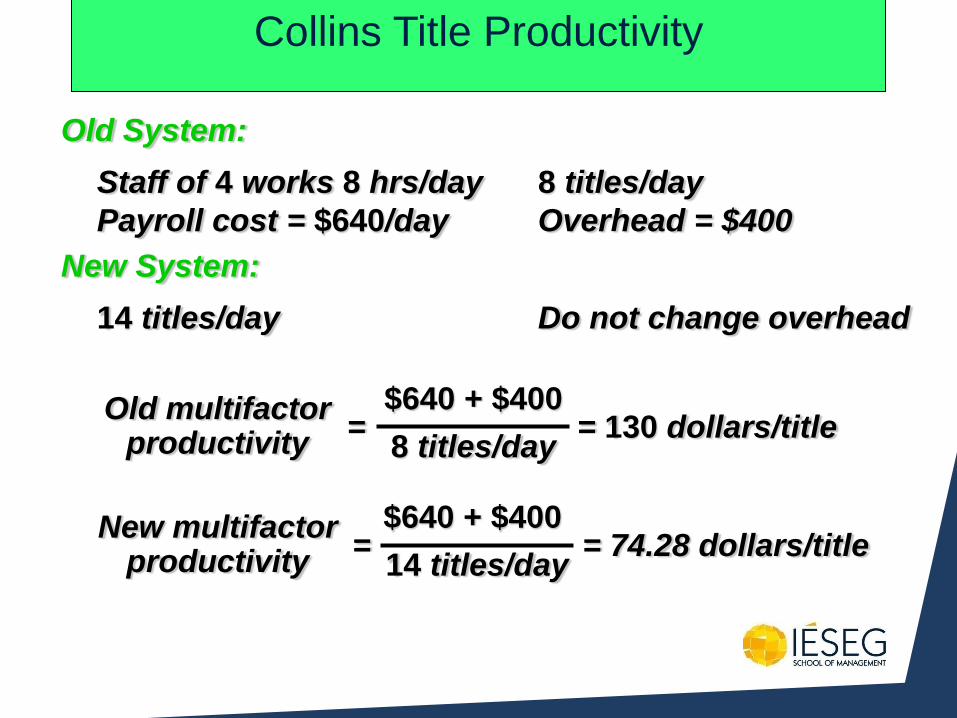
Collins Title Productivity
Staff of 4 works 8 hrs/day 8 titles/day
Payroll cost = $640/day Overhead = $400
Old System:
14 titles/day Do not change overhead
New System:
$640 + $400
8 titles/day
$640 + $400
14 titles/day
= Old multifactor
productivity
= New multifactor
productivity
= 130 dollars/title
= 74.28 dollars/title
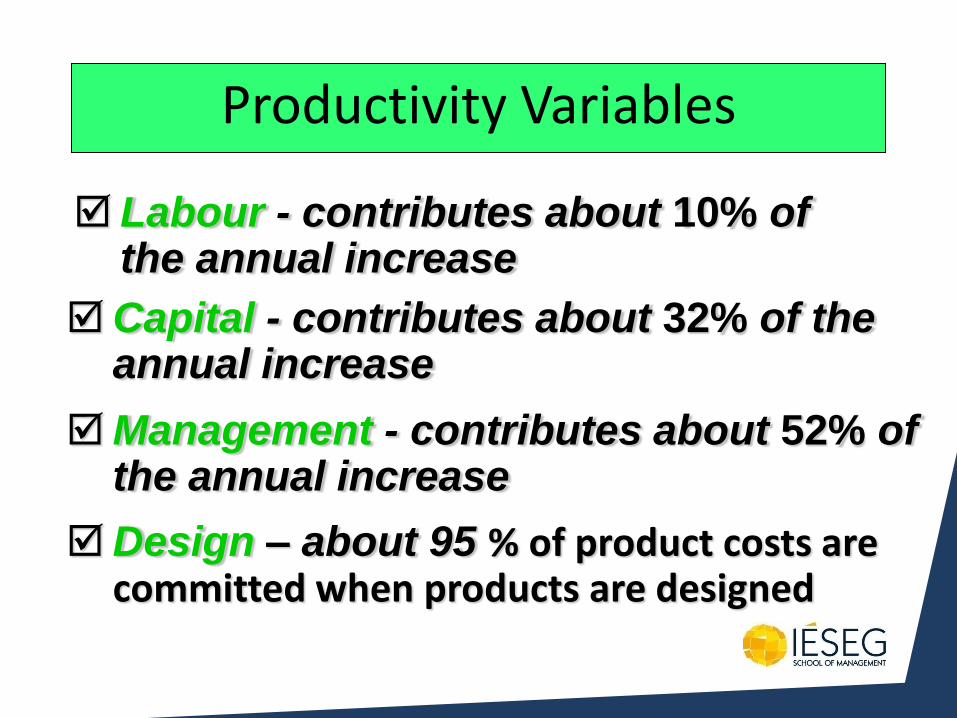
Productivity Variables
Labour - contributes about 10% of the annual increase
Capital - contributes about 32% of the annual increase
Management - contributes about 52% of the annual increase
Design – about 95 % of product costs are committed when products are designed
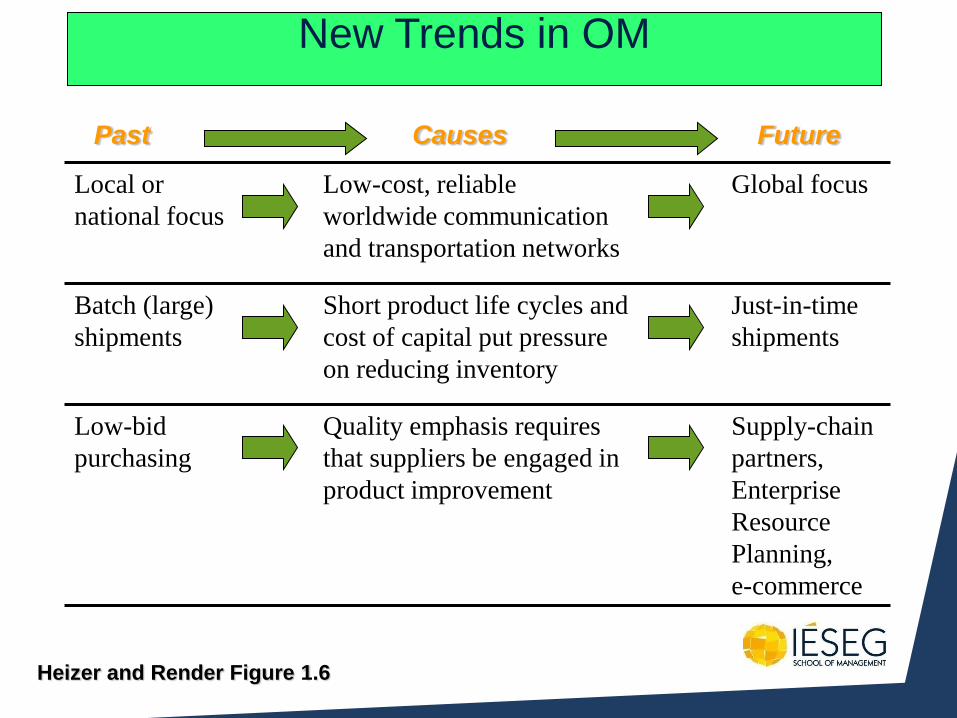
New Trends in OM
Local or
national focus
Low-cost, reliable
worldwide communication
and transportation networks
Global focus
Batch (large)
shipments
Short product life cycles and
cost of capital put pressure
on reducing inventory
Just-in-time
shipments
Low-bid
purchasing
Quality emphasis requires
that suppliers be engaged in
product improvement
Supply-chain
partners,
Enterprise
Resource
Planning,
e-commerce
Heizer and Render Figure 1.6
Past Causes Future
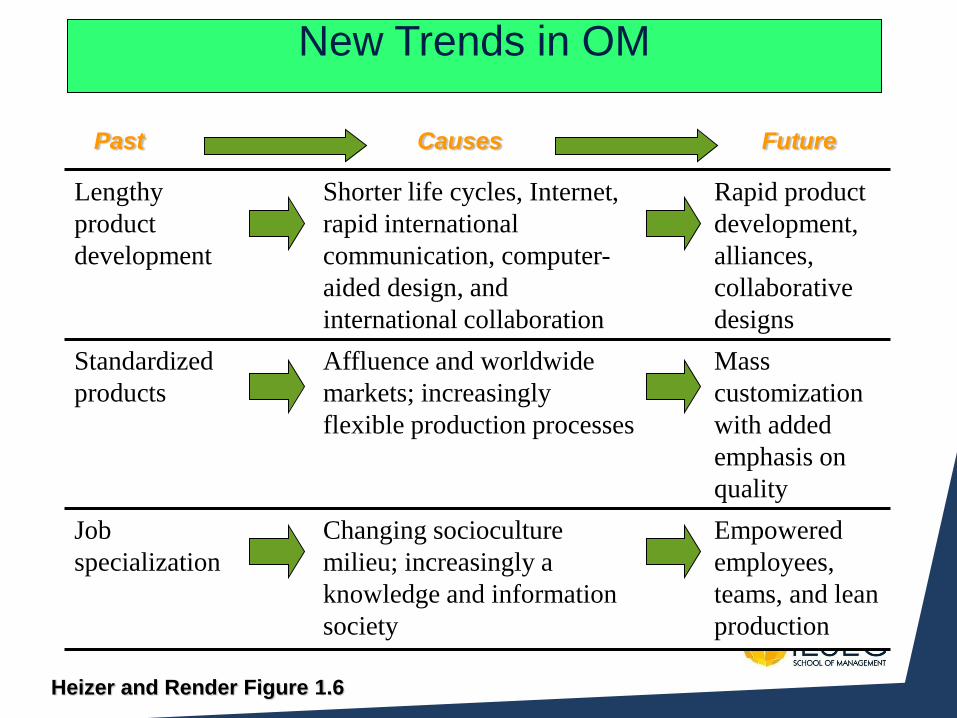
New Trends in OM
Lengthy
product
development
Shorter life cycles, Internet,
rapid international
communication, computer-
aided design, and
international collaboration
Rapid product
development,
alliances,
collaborative
designs
Standardized
products
Affluence and worldwide
markets; increasingly
flexible production processes
Mass
customization
with added
emphasis on
quality
Job
specialization
Changing socioculture
milieu; increasingly a
knowledge and information
society
Empowered
employees,
teams, and lean
production
Heizer and Render Figure 1.6
Past Causes Future
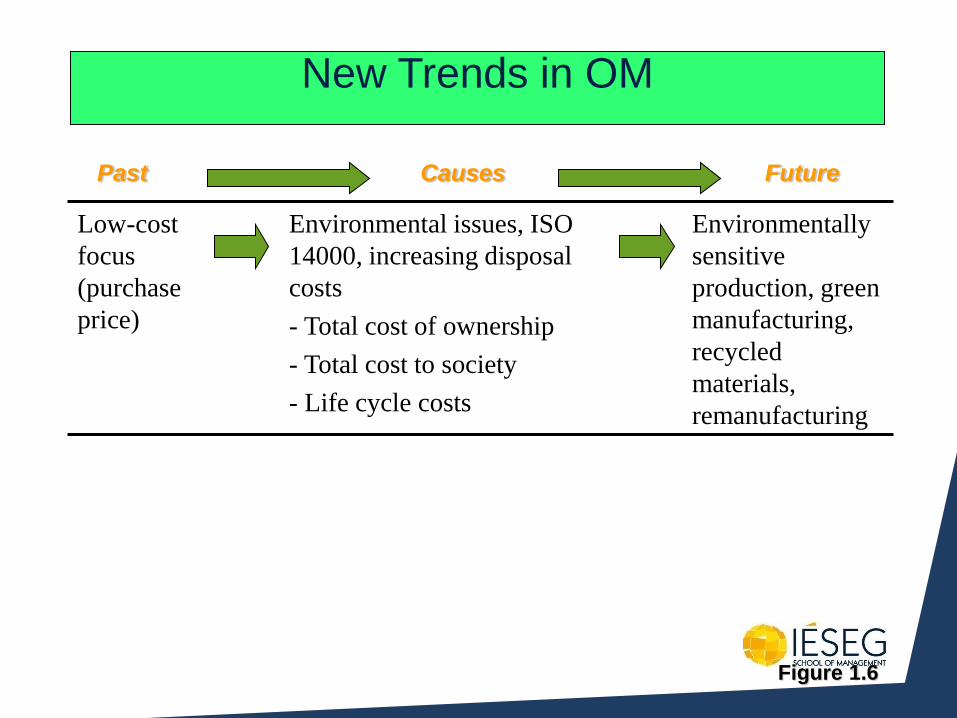
New Trends in OM
Low-cost
focus
(purchase
price)
Environmental issues, ISO
14000, increasing disposal
costs
- Total cost of ownership
- Total cost to society
- Life cycle costs
Environmentally
sensitive
production, green
manufacturing,
recycled
materials,
remanufacturing
Figure 1.6
Past Causes Future
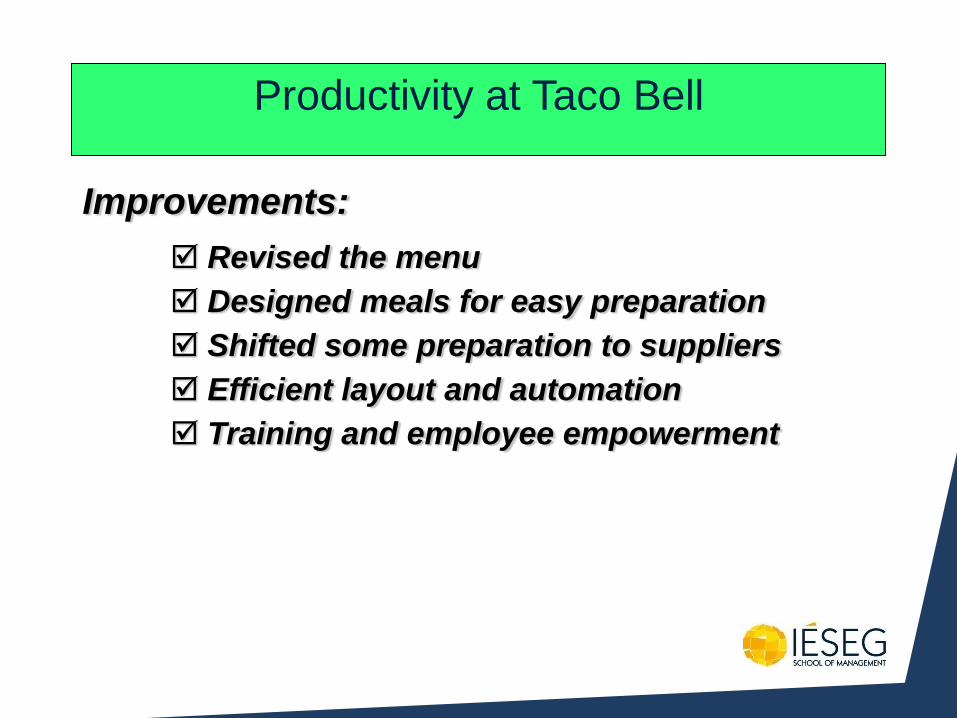
Productivity at Taco Bell
Improvements:
Revised the menu
Designed meals for easy preparation
Shifted some preparation to suppliers
Efficient layout and automation
Training and employee empowerment
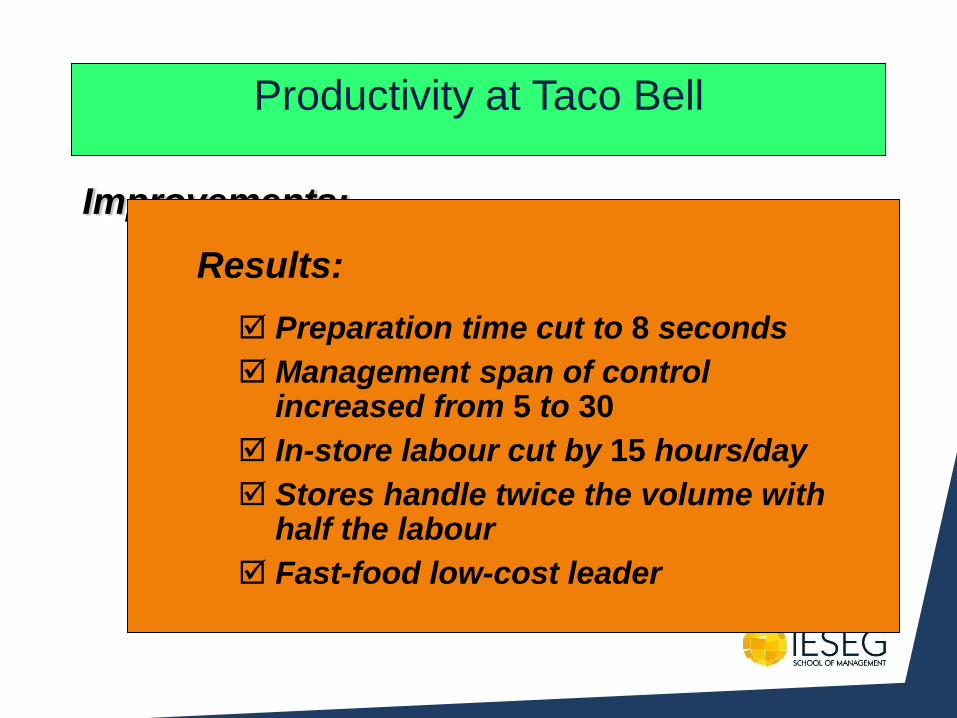
Productivity at Taco Bell
Improvements:
Revised the menu
Designed meals for easy preparation
Shifted some preparation to suppliers
Efficient layout and automation
Training and employee empowerment
Results:
Preparation time cut to 8 seconds
Management span of control increased from 5 to 30
In-store labour cut by 15 hours/day
Stores handle twice the volume with half the labour
Fast-food low-cost leader
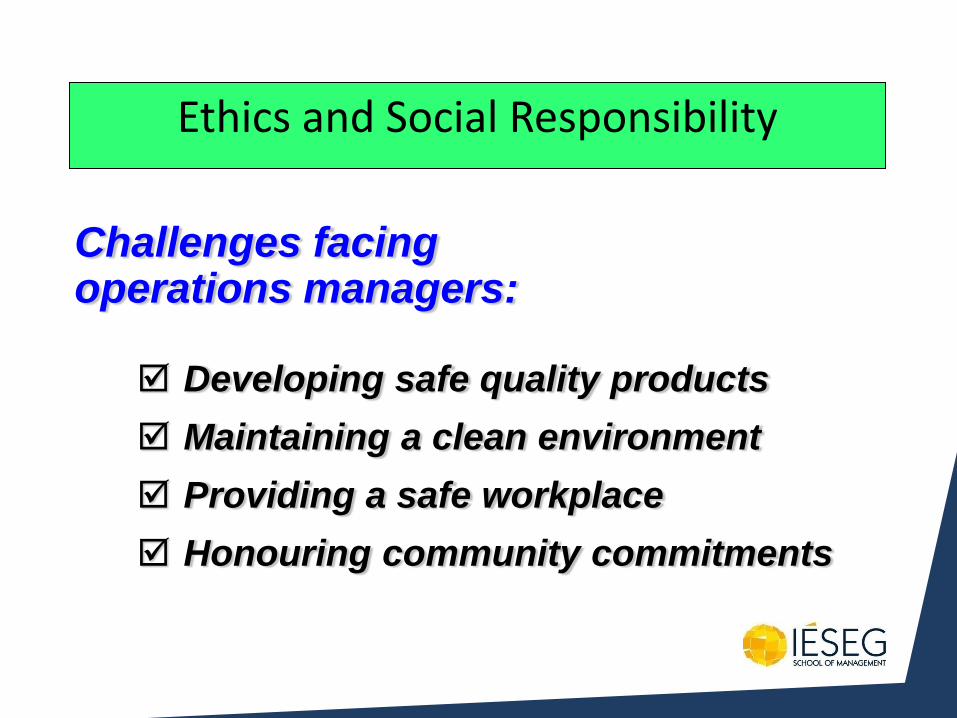
Ethics and Social Responsibility
Challenges facing operations managers:
Developing safe quality products
Maintaining a clean environment
Providing a safe workplace
Honouring community commitments

Chapter 7
Improvement strategy
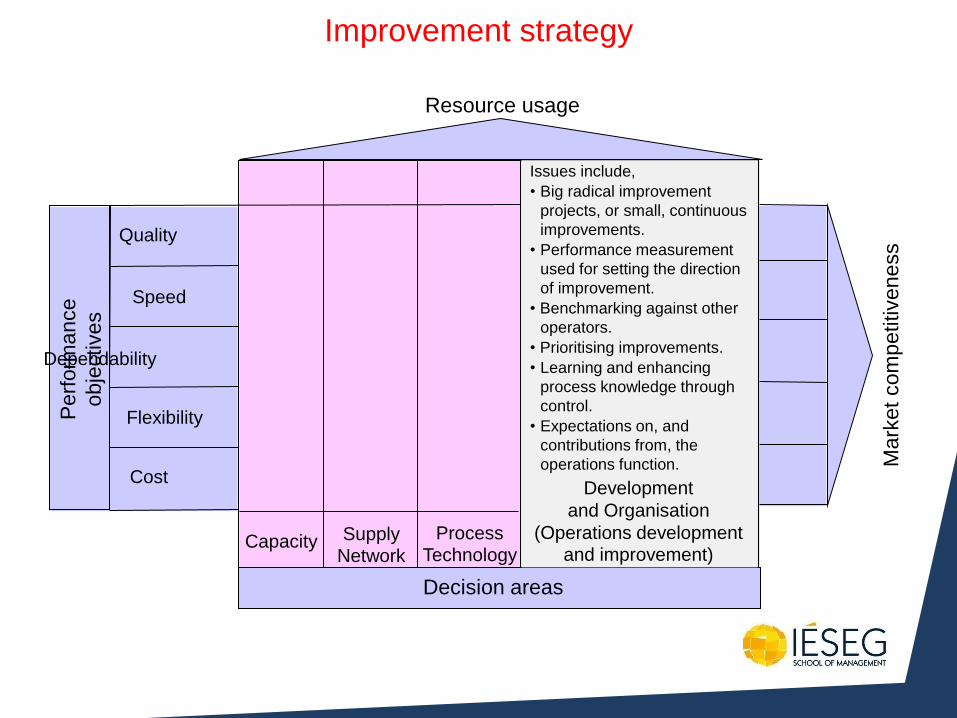
Decision areas
Capacity Supply Network
Mark
et
com
petitiveness
Process Technology
Resource usage
Development
and Organisation
(Operations development and improvement)
Issues include,
• Big radical improvement
projects, or small, continuous
improvements.
• Performance measurement
used for setting the direction
of improvement.
• Benchmarking against other
operators.
• Prioritising improvements.
• Learning and enhancing
process knowledge through
control.
• Expectations on, and
contributions from, the
operations function.
Quality
Perf
orm
ance
obje
ctives
Dependability
Speed
Flexibility
Cost
Improvement strategy
Customer
Satisfaction Resilience
Quality Dependability Speed Flexibility Cost
Agility
Market
strategic
objectives
Financial
strategic
objectives
Overall strategic
objectives
Detailed
performance
measures, e.g.
Operations
strategic
objectives
Broad strategic measures
Functional strategic
measures, e.g.
Composite performance
measures, e.g.
Generic operations
performance
measures, e.g.
• Defects per unit •Level of customer complaints • Scrap level
• Mean time between failures • Lateness complaints
• Customer query time • Order lead- time • Throughput time
• Time to market • Product range
• Transaction costs • Labour productivity • Machine efficiency
Performance targets can involve different levels of aggregation
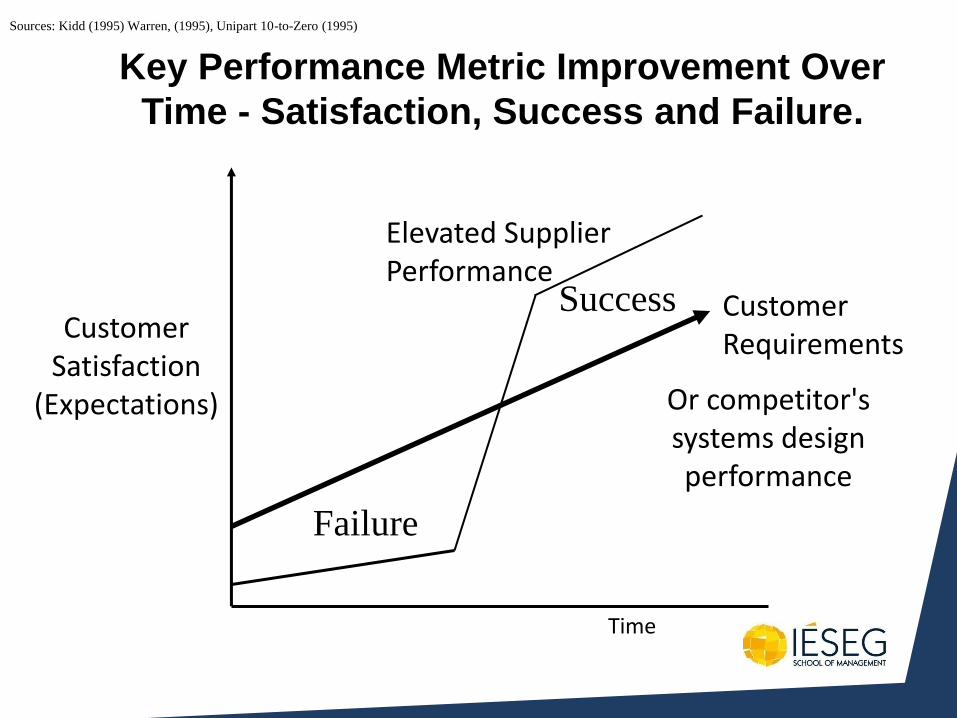
Key Performance Metric Improvement Over
Time - Satisfaction, Success and Failure.
Sources: Kidd (1995) Warren, (1995), Unipart 10-to-Zero (1995)
Elevated Supplier Performance
Or competitor's systems design performance
Customer Requirements
Customer Satisfaction
(Expectations)
Time
Failure
Success
40
X X X
X
X
X
Time
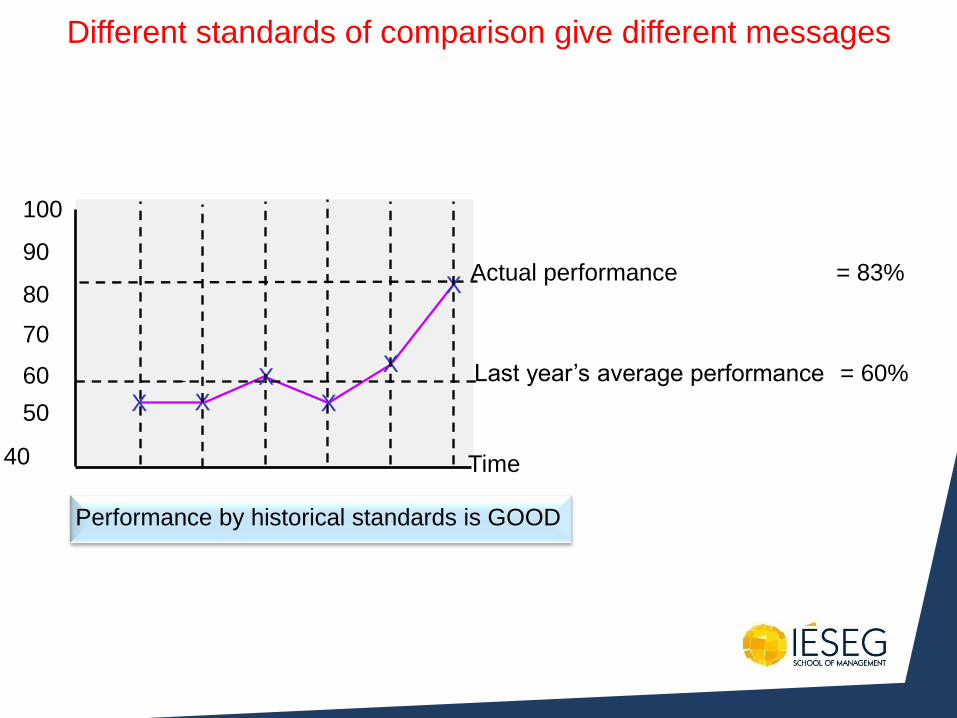
Last year’s average performance = 60%
Actual performance = 83%
Performance by historical standards is GOOD
50
60
70
80
90
100
Different standards of comparison give different messages
40
X X X
X
X
X
Time
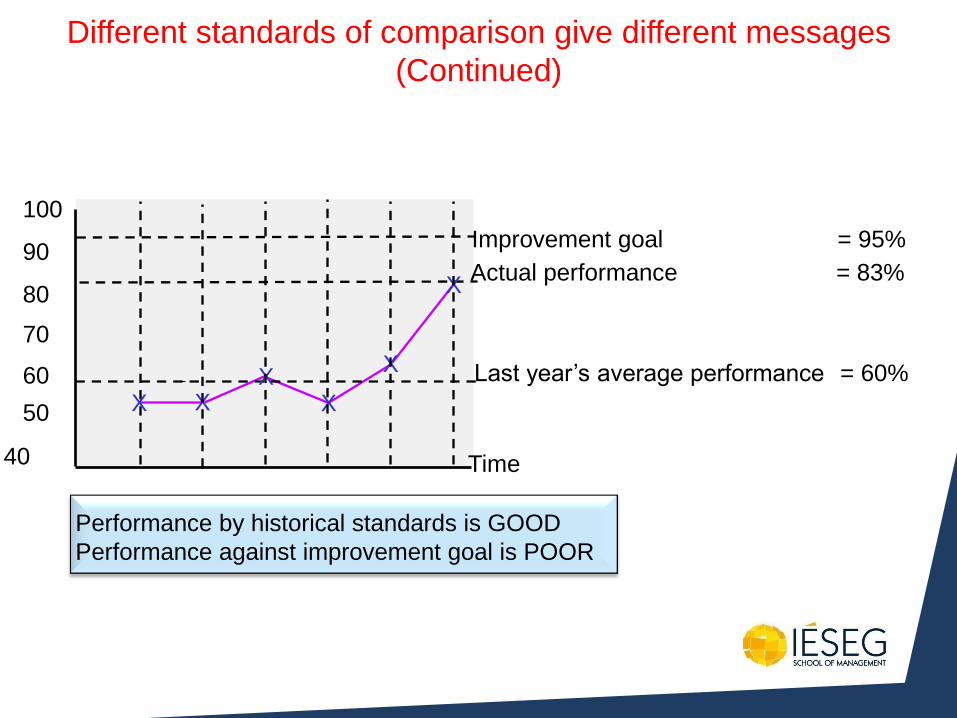
Last year’s average performance = 60%
Actual performance = 83%
Performance by historical standards is GOOD
Performance against improvement goal is POOR
50
60
70
80
90
100
Improvement goal = 95%
Different standards of comparison give different messages
(Continued)
40
X X X
X
X
X
Time
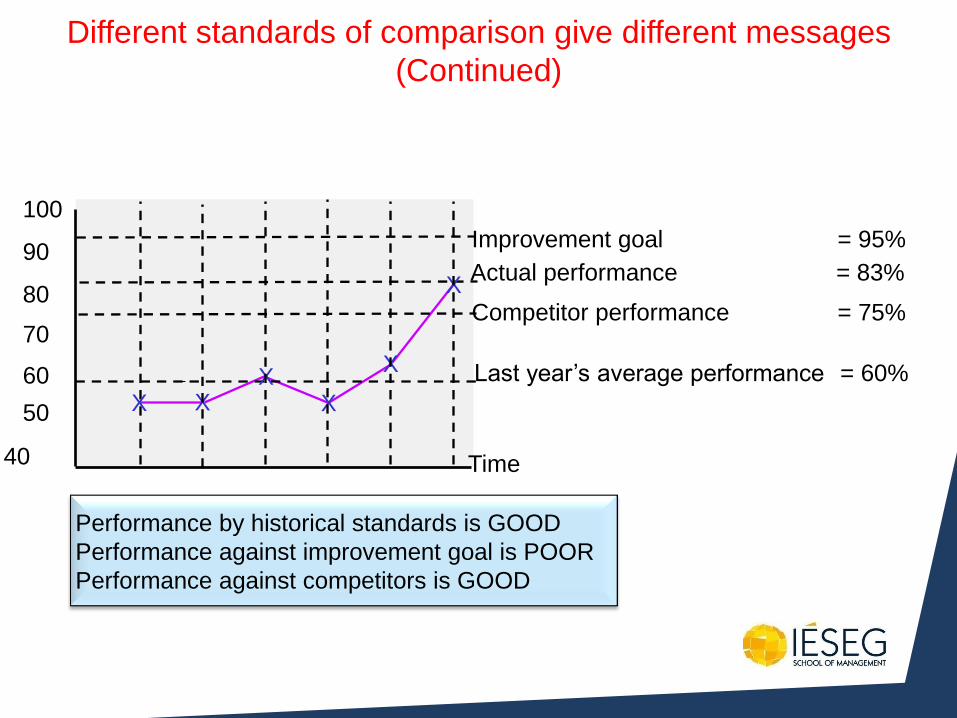
Last year’s average performance = 60%
Actual performance = 83%
Performance by historical standards is GOOD
Performance against improvement goal is POOR
Performance against competitors is GOOD
50
60
70
80
90
100
Improvement goal = 95%
Competitor performance = 75%
Different standards of comparison give different messages
(Continued)
40
X X X
X
X
X
Time
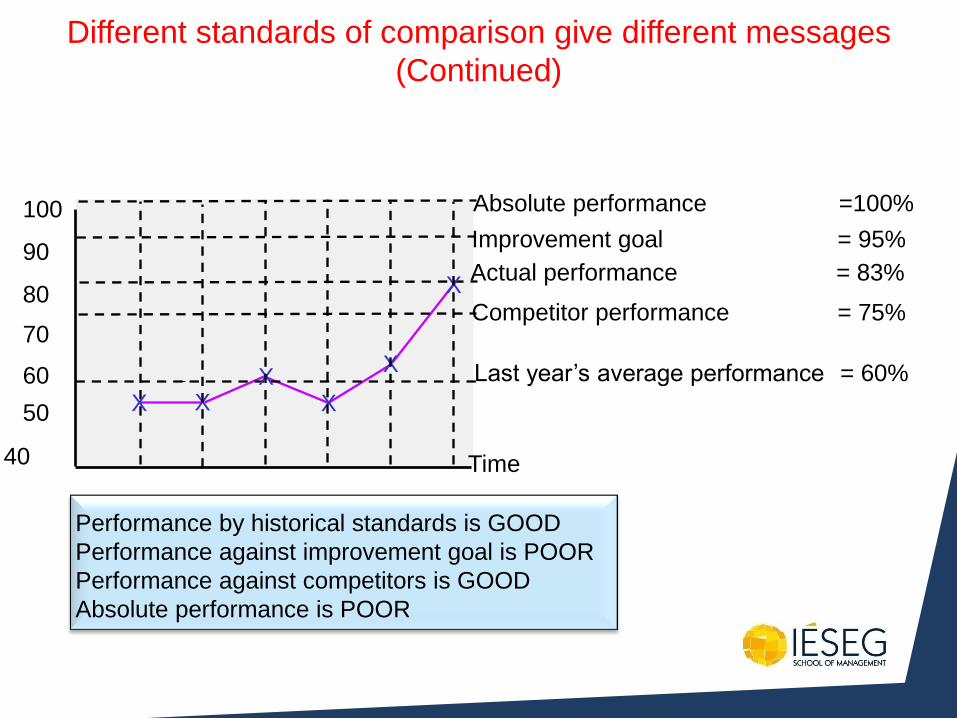
Last year’s average performance = 60%
Actual performance = 83%
Performance by historical standards is GOOD
Performance against improvement goal is POOR
Performance against competitors is GOOD
Absolute performance is POOR
50
60
70
80
90
100
Improvement goal = 95%
Competitor performance = 75%
Absolute performance =100%
Different standards of comparison give different messages
(Continued)
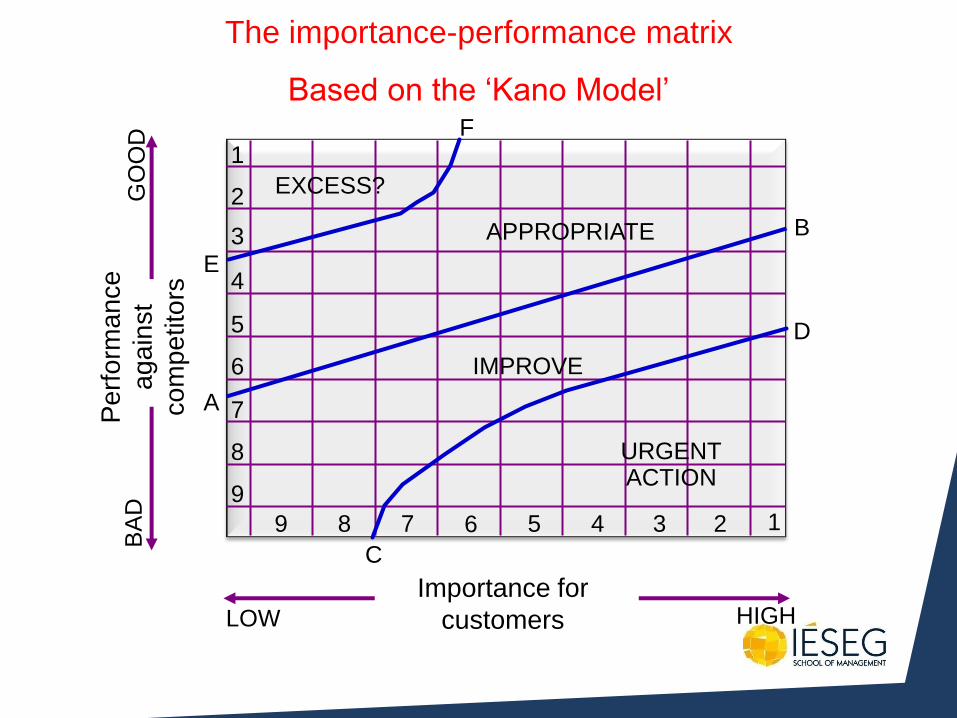
1
2
3
4
5
6
7
8
9
1 2 3 4 5 6 7 8 9
Importance for
customers LOW HIGH
Pe
rfo
rma
nce
ag
ain
st
co
mp
etito
rs
GO
OD
B
AD
URGENT ACTION
IMPROVE
APPROPRIATE
EXCESS?
F
E
A
C
D
B
The importance-performance matrix
Based on the ‘Kano Model’
1
2
3
4
5
6
7
8
9
1 2 3 4 5 6 7 8 9
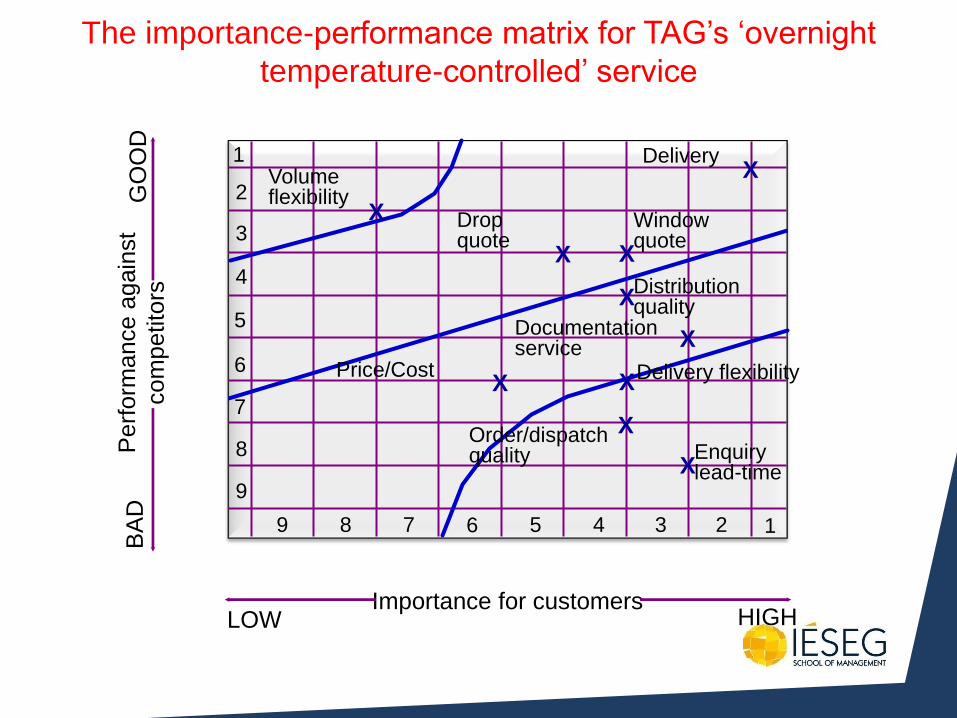
Importance for customers LOW HIGH
Perf
orm
ance a
gain
st
com
petito
rs
GO
OD
B
AD
The importance-performance matrix for TAG’s ‘overnight
temperature-controlled’ service
X
X X
X
X
X
X
X
X
X Volume flexibility
Delivery
Drop quote
Window quote
Distribution quality
Documentation service
Delivery flexibility
Enquiry lead-time
Order/dispatch quality
Price/Cost
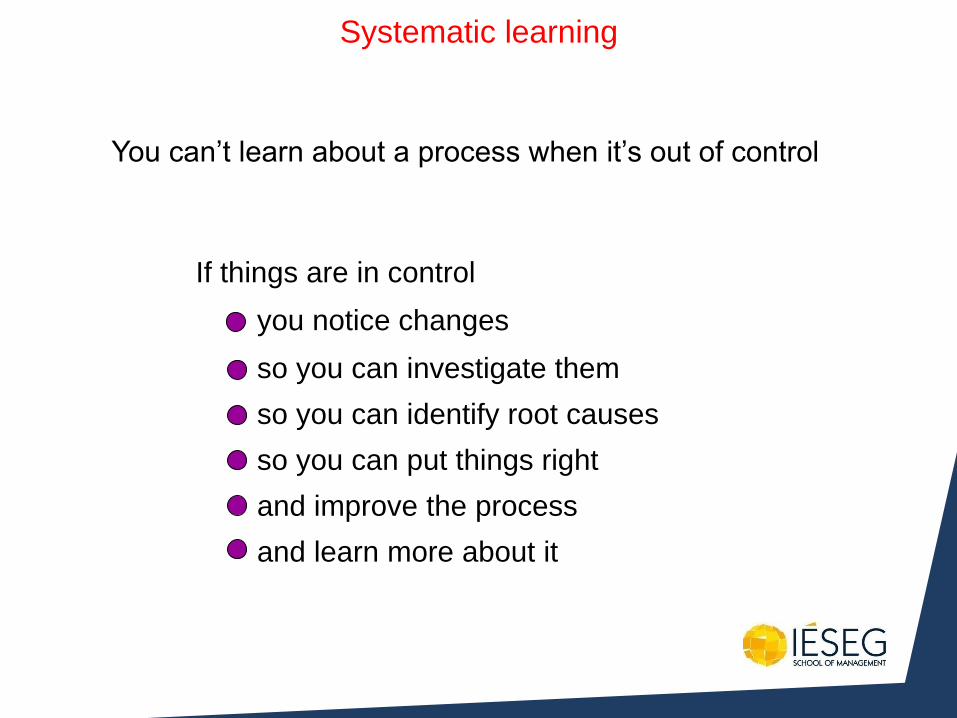
Systematic learning
You can’t learn about a process when it’s out of control
If things are in control
you notice changes
so you can investigate them
so you can identify root causes
so you can put things right
and improve the process
and learn more about it
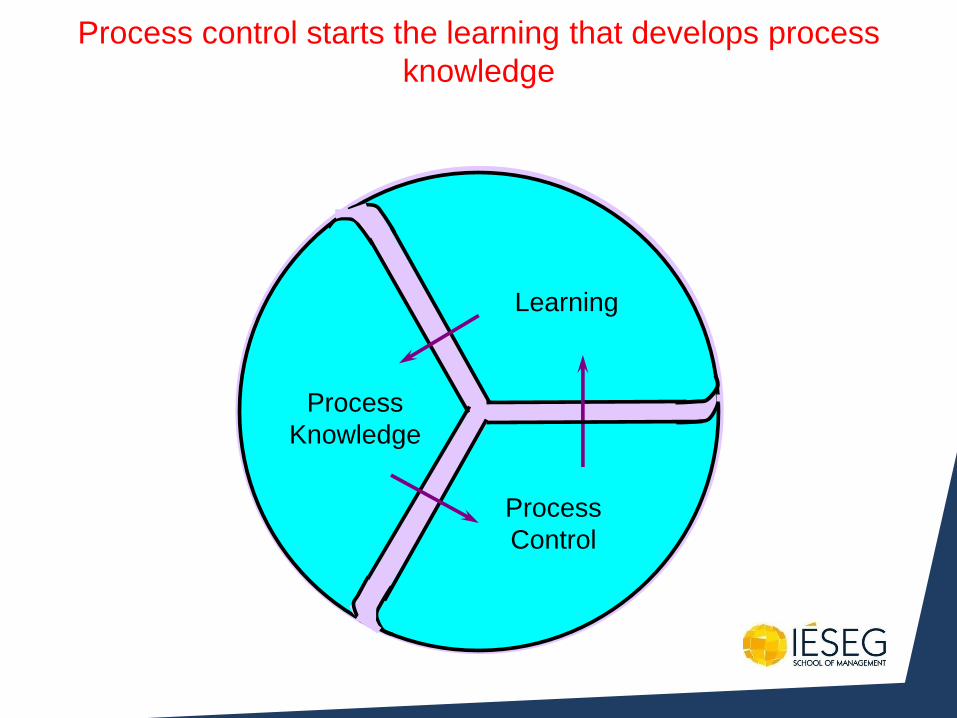
Process
Control
Learning
Process
Knowledge
Process control starts the learning that develops process
knowledge
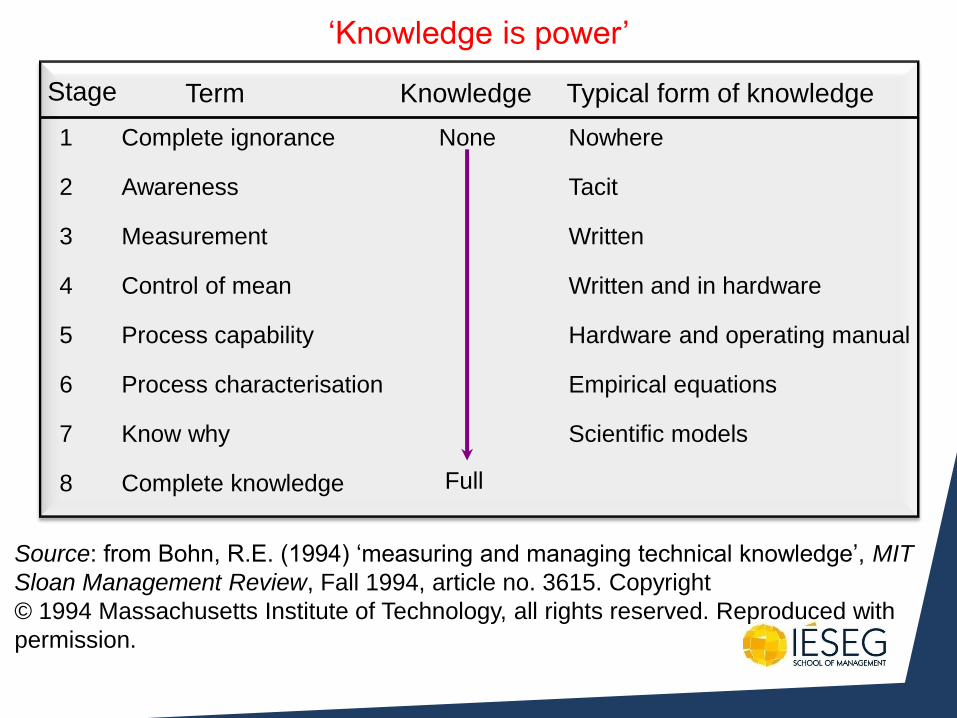
‘Knowledge is power’
1 Complete ignorance Nowhere
2 Awareness Tacit
3 Measurement Written
4 Control of mean Written and in hardware
5 Process capability Hardware and operating manual
6 Process characterisation Empirical equations
7 Know why Scientific models
8 Complete knowledge
None
Full
Stage Term Knowledge Typical form of knowledge
Source: from Bohn, R.E. (1994) ‘measuring and managing technical knowledge’, MIT
Sloan Management Review, Fall 1994, article no. 3615. Copyright
© 1994 Massachusetts Institute of Technology, all rights reserved. Reproduced with
permission.
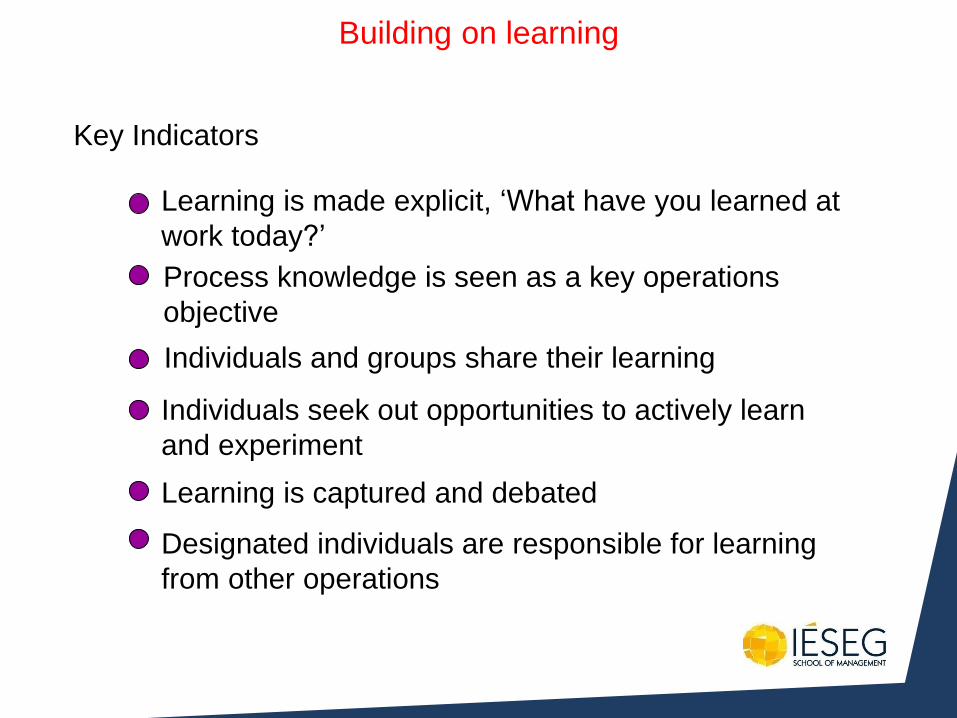
Building on learning
Key Indicators
Learning is made explicit, ‘What have you learned at
work today?’
Process knowledge is seen as a key operations
objective
Individuals and groups share their learning
Individuals seek out opportunities to actively learn
and experiment
Learning is captured and debated
Designated individuals are responsible for learning
from other operations

• People have had plenty of time to learn and practice undesirable behaviours.
• Change requires
– Stopping doing things not required,
– Starting to do things that are needed
– Learning to do these things faster, better and cheaper than anyone else
– Creating, maintaining and increasing the competitive gap.
– Being prepared to do all this over again.
Lean / Toyotism
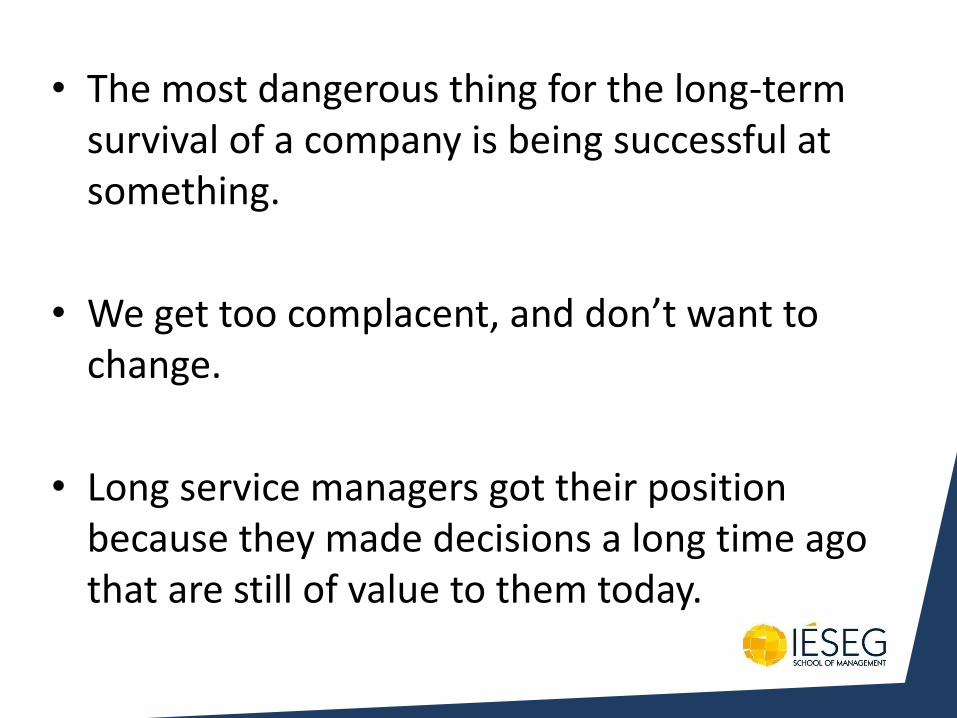
• The most dangerous thing for the long-term survival of a company is being successful at something.
• We get too complacent, and don’t want to change.
• Long service managers got their position because they made decisions a long time ago that are still of value to them today.
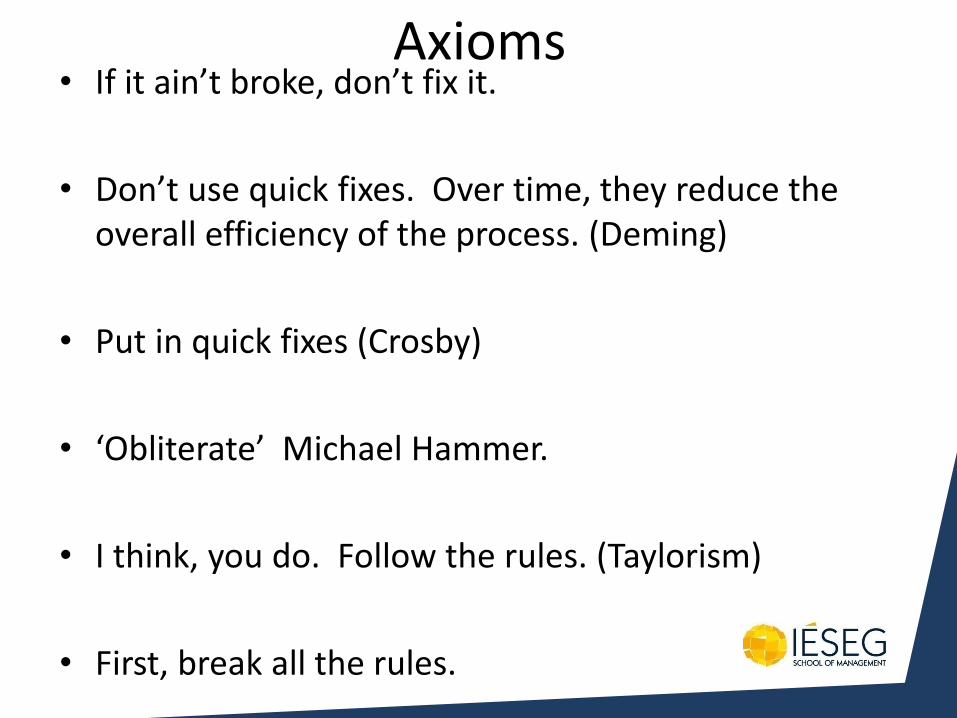
Axioms • If it ain’t broke, don’t fix it.
• Don’t use quick fixes. Over time, they reduce the overall efficiency of the process. (Deming)
• Put in quick fixes (Crosby)
• ‘Obliterate’ Michael Hammer.
• I think, you do. Follow the rules. (Taylorism)
• First, break all the rules.
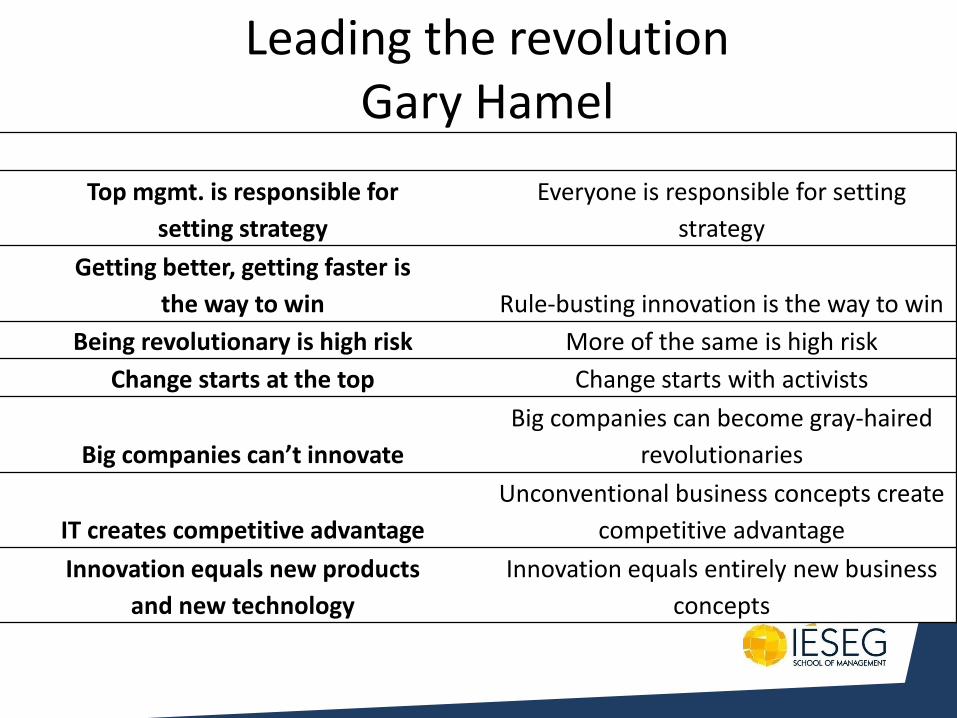
Leading the revolution Gary Hamel
Old Brick New Brick
Top mgmt. is responsible for
setting strategy
Everyone is responsible for setting
strategy
Getting better, getting faster is
the way to win Rule-busting innovation is the way to win
Being revolutionary is high risk More of the same is high risk
Change starts at the top Change starts with activists
Big companies can’t innovate
Big companies can become gray-haired
revolutionaries
IT creates competitive advantage
Unconventional business concepts create
competitive advantage
Innovation equals new products
and new technology
Innovation equals entirely new business
concepts
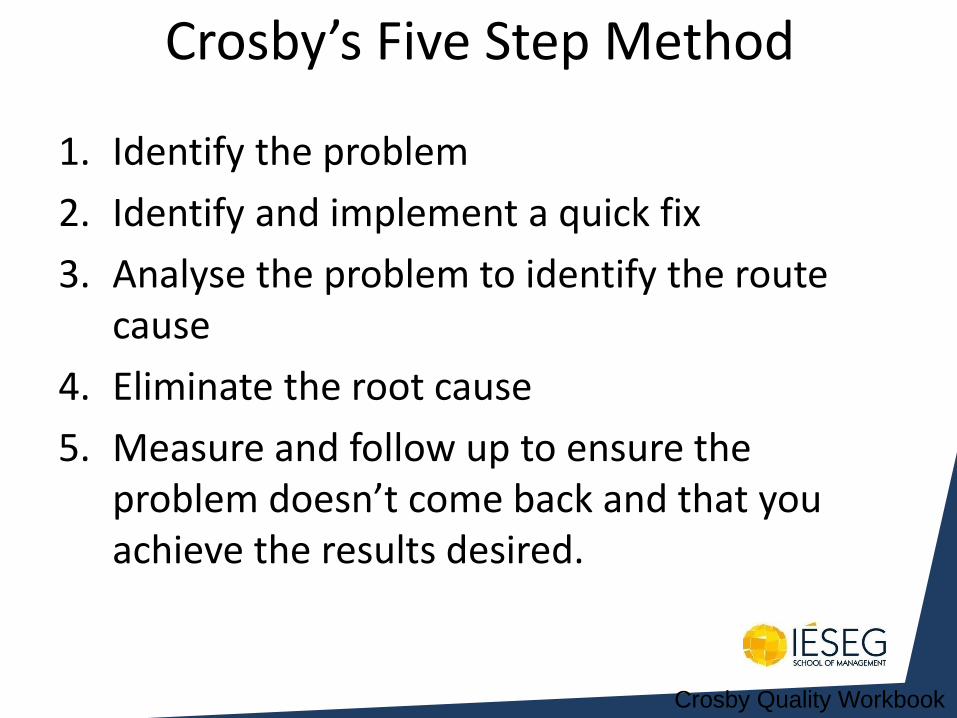
Crosby’s Five Step Method
1. Identify the problem
2. Identify and implement a quick fix
3. Analyse the problem to identify the route cause
4. Eliminate the root cause
5. Measure and follow up to ensure the problem doesn’t come back and that you achieve the results desired.
Crosby Quality Workbook

Creating the Future
How Creative are you?
• An object will appear. Your job is to identify as many uses for it as you can in two minutes.
http://www.sxc.hu/photo/205250
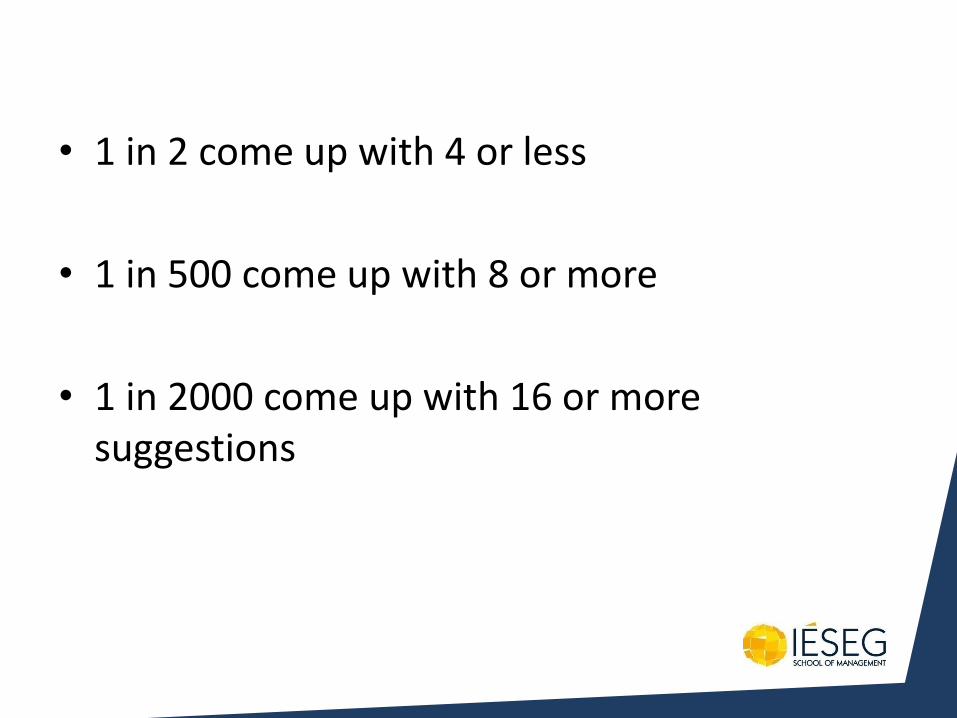
• 1 in 2 come up with 4 or less
• 1 in 500 come up with 8 or more
• 1 in 2000 come up with 16 or more suggestions
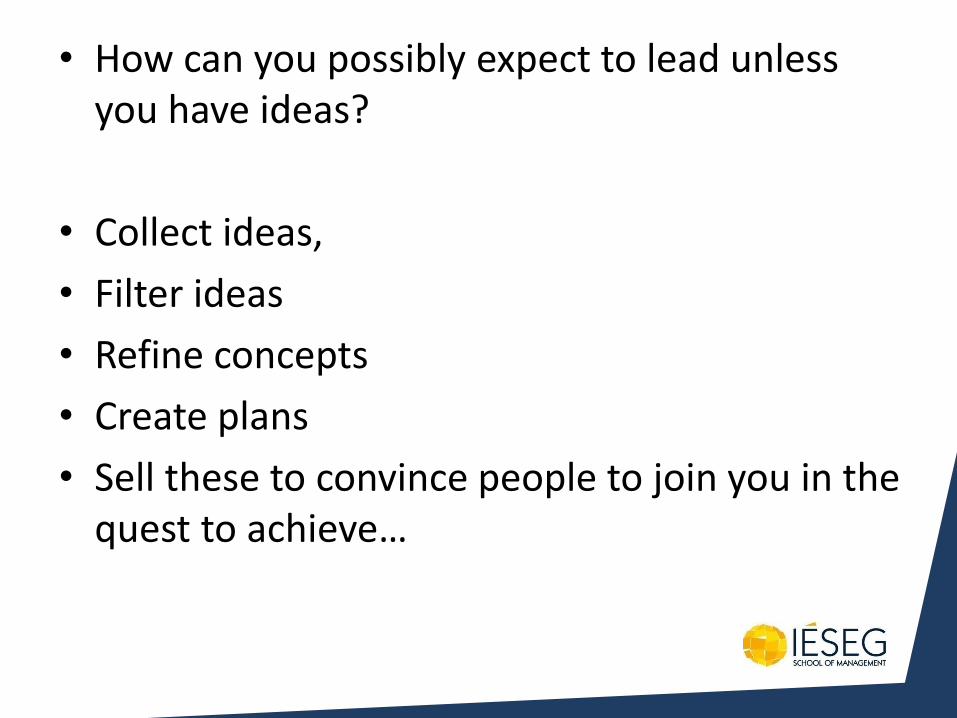
• How can you possibly expect to lead unless you have ideas?
• Collect ideas,
• Filter ideas
• Refine concepts
• Create plans
• Sell these to convince people to join you in the quest to achieve…

Lead or Facilitate Seminar

Exercise 1 Key Questions 10 minutes
• Why are you here?
• Why learn – go through years of training?
• What do you want to get out of your time in higher education?

Mission et Valeurs de l’IÉSEG IÉSEG’s Our Mission and Values
• Dans un contexte international, la mission de l’ IÉSEG est de préparer des managers acteurs du changement et de contribuer au renforcement d’organisations responsables, innovantes et humanistes. L’Ecole veut être reconnue comme une institution éducative très internationale et rigoureuse, avec des valeurs humaines fortes.
• In an international context, the mission of IÉSEG is to prepare managers who are able to initiate change and to contribute to the development of responsible, innovative and humanistic organizations. The School wants to be recognized as a very international and rigorous educational institution, with strong human values.

Mission et valeurs Our Mission and values
• Nos valeurs: Responsabilité, Tolérance, Respect des autres, Engagement, Esprit d’équipe, Force de travail, Modestie et Honnêteté.
• Our values: Responsibility, Tolerance, Respect of the people, Commitment, Team Spirit, Hard Work, Humility and Honesty.
Exercise 2 a 15 minutes • Individually, think of an occassion when you made a
change.
• What did you think off first?
• What did you do?
• How did you make sure the change stuck?
• Write down the sequence of events that made the change.
• E.G. Stop A, reduce B, start C, start D later
• Professors – do the same just in case odd person
Exercise 2 b 15 minutes
• With a colleague, compare notes.
• Try to identify common characteristics
• Session objective: Make a model that you both agree on that represents what you did, the sequence, how you did it,
• Include what you considered, who you considered, what you measured
Exercise 2 c 15 minutes
• Pairs work together with other pairs and compare notes
• Come up with an agreed model
• Present your model to the rest of the group using a laptop or the flip chart paper provided
The four-stage model of operations contribution
Internally
neutral
Holding the
organisation back
Externally
neutral
As good as
competitors
Internally
supportive
Clearly the best in
the industry
Externally
supportive
Redefining industry
expectations
STAGE 2
Adopt best
practice
STAGE 3 Link strategy
with operations
STAGE 4 Give an
operations Advantage
Increasing operations capabilities
Incre
asin
g s
trate
gic
im
pact
STAGE 1 Correct the
worst problems
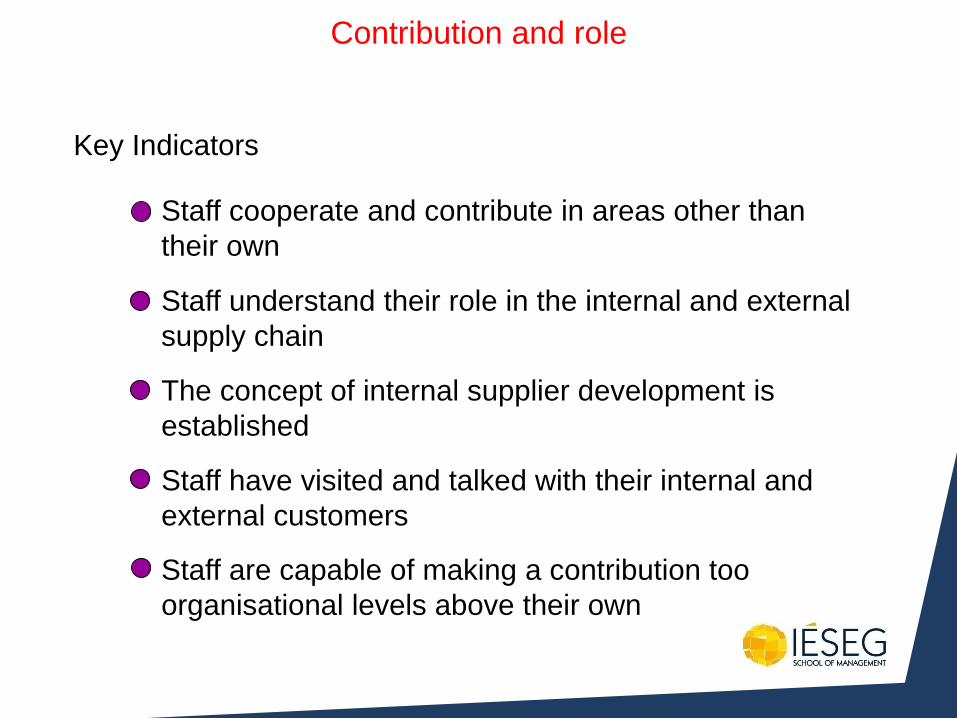
Contribution and role
Key Indicators
Staff cooperate and contribute in areas other than
their own
Staff understand their role in the internal and external
supply chain
The concept of internal supplier development is
established
Staff have visited and talked with their internal and
external customers
Staff are capable of making a contribution too
organisational levels above their own
Investment and Productivity in Selected Nations
US UK
Canada
Italy
Belgium
France
Netherlands
Japan
10
8
6
4
2
0 Perc
en
t in
cre
ase i
n m
fg p
rod
ucti
vit
y
Percentage investment
10 15 20 25 30 35
Classic concept of a supply chain
Necessary Capabilities
– qualifiers and winners
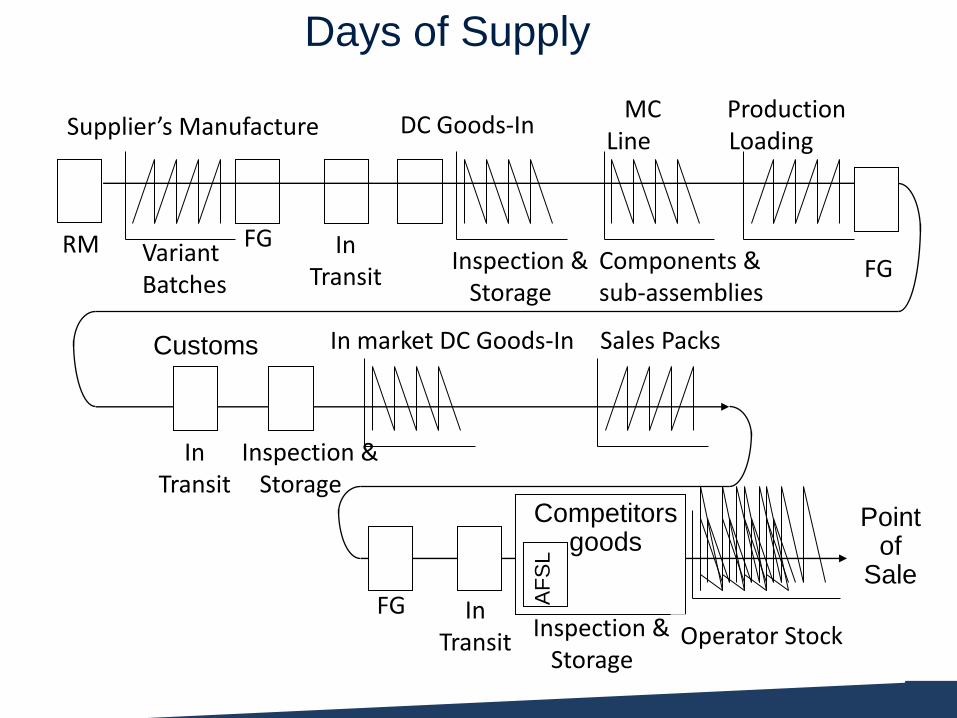
Days of Supply
Supplier’s Manufacture
FG Variant Batches
In Transit
DC Goods-In
Inspection & Storage
Sales Packs
MC Production Line Loading
Components & sub-assemblies
FG
In Transit
Inspection & Storage
In market DC Goods-In Customs
FG In Transit
Inspection & Storage
Competitors goods
AF
SL
Operator Stock
Point of
Sale
RM
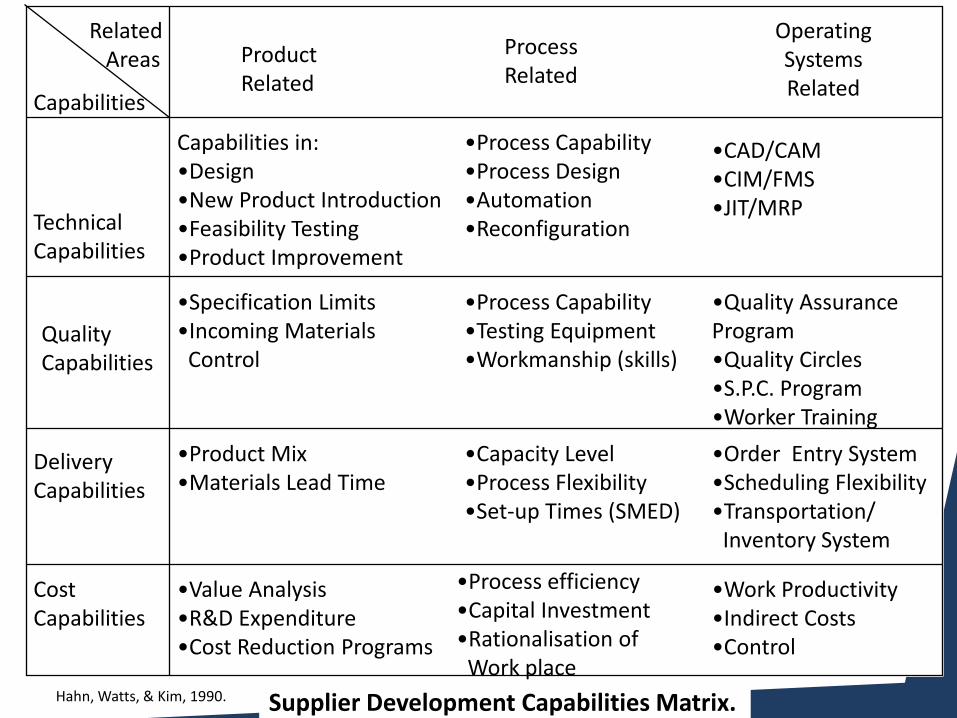
Related Areas
Capabilities
Technical Capabilities
Product Related
Quality Capabilities
Delivery Capabilities
Cost Capabilities
Process Related
Operating Systems Related
Capabilities in: •Design •New Product Introduction •Feasibility Testing •Product Improvement
•Process Capability •Process Design •Automation •Reconfiguration
•CAD/CAM •CIM/FMS •JIT/MRP
•Specification Limits •Incoming Materials Control
•Process Capability •Testing Equipment •Workmanship (skills)
•Quality Assurance Program •Quality Circles •S.P.C. Program •Worker Training
•Product Mix •Materials Lead Time
•Capacity Level •Process Flexibility •Set-up Times (SMED)
•Order Entry System •Scheduling Flexibility •Transportation/ Inventory System
•Value Analysis •R&D Expenditure •Cost Reduction Programs
•Process efficiency •Capital Investment •Rationalisation of Work place
•Work Productivity •Indirect Costs •Control
Hahn, Watts, & Kim, 1990. Supplier Development Capabilities Matrix.

Key Problems
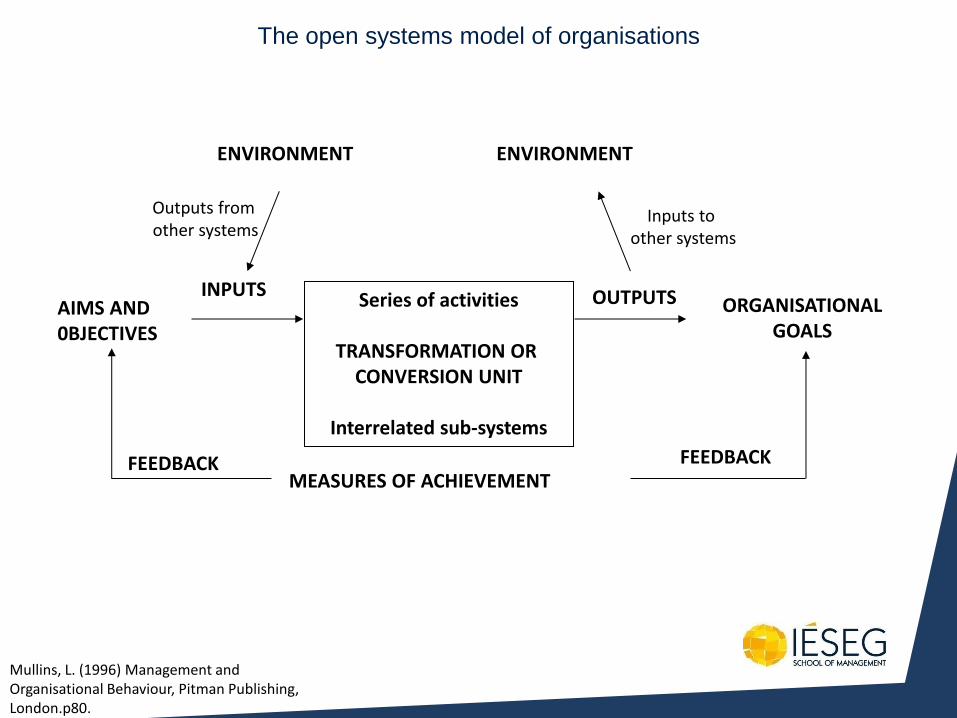
The open systems model of organisations
Mullins, L. (1996) Management and Organisational Behaviour, Pitman Publishing, London.p80.
ENVIRONMENT
INPUTS Series of activities
TRANSFORMATION OR
CONVERSION UNIT
Interrelated sub-systems
OUTPUTS ORGANISATIONAL GOALS
MEASURES OF ACHIEVEMENT
ENVIRONMENT
AIMS AND 0BJECTIVES
Outputs from other systems
Inputs to other systems
FEEDBACK FEEDBACK
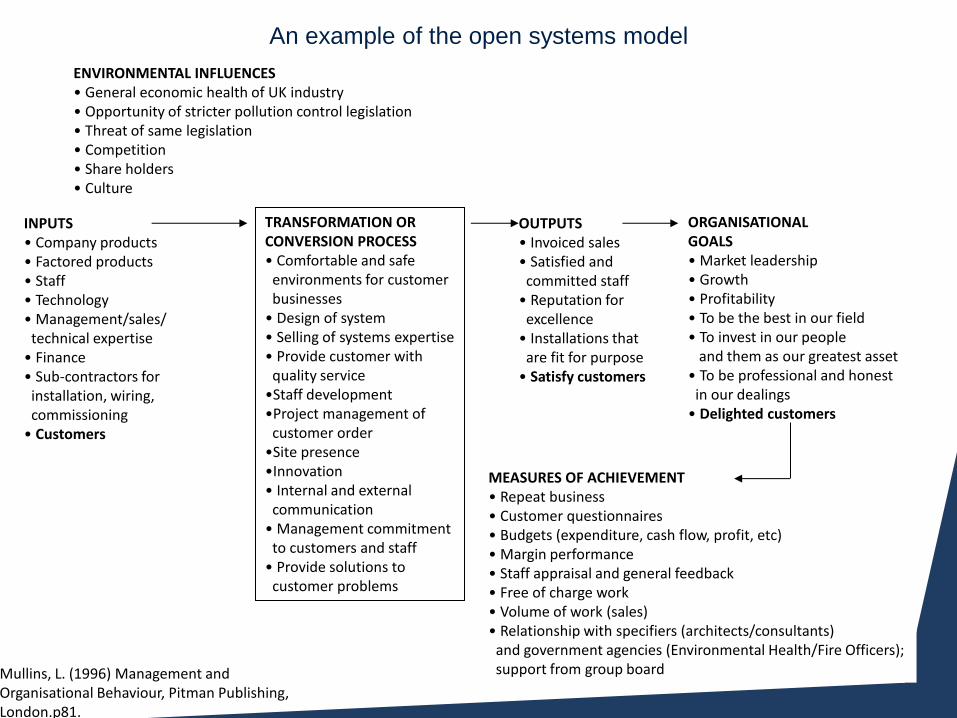
An example of the open systems model
Mullins, L. (1996) Management and Organisational Behaviour, Pitman Publishing, London.p81.
ENVIRONMENTAL INFLUENCES • General economic health of UK industry • Opportunity of stricter pollution control legislation • Threat of same legislation • Competition • Share holders • Culture
INPUTS • Company products • Factored products • Staff • Technology • Management/sales/ technical expertise • Finance • Sub-contractors for installation, wiring, commissioning • Customers
TRANSFORMATION OR CONVERSION PROCESS • Comfortable and safe environments for customer businesses • Design of system • Selling of systems expertise • Provide customer with quality service •Staff development •Project management of customer order •Site presence •Innovation • Internal and external communication • Management commitment to customers and staff • Provide solutions to customer problems
OUTPUTS • Invoiced sales • Satisfied and committed staff • Reputation for excellence • Installations that are fit for purpose • Satisfy customers
ORGANISATIONAL GOALS • Market leadership • Growth • Profitability • To be the best in our field • To invest in our people and them as our greatest asset • To be professional and honest in our dealings • Delighted customers
MEASURES OF ACHIEVEMENT • Repeat business • Customer questionnaires • Budgets (expenditure, cash flow, profit, etc) • Margin performance • Staff appraisal and general feedback • Free of charge work • Volume of work (sales) • Relationship with specifiers (architects/consultants) and government agencies (Environmental Health/Fire Officers); support from group board
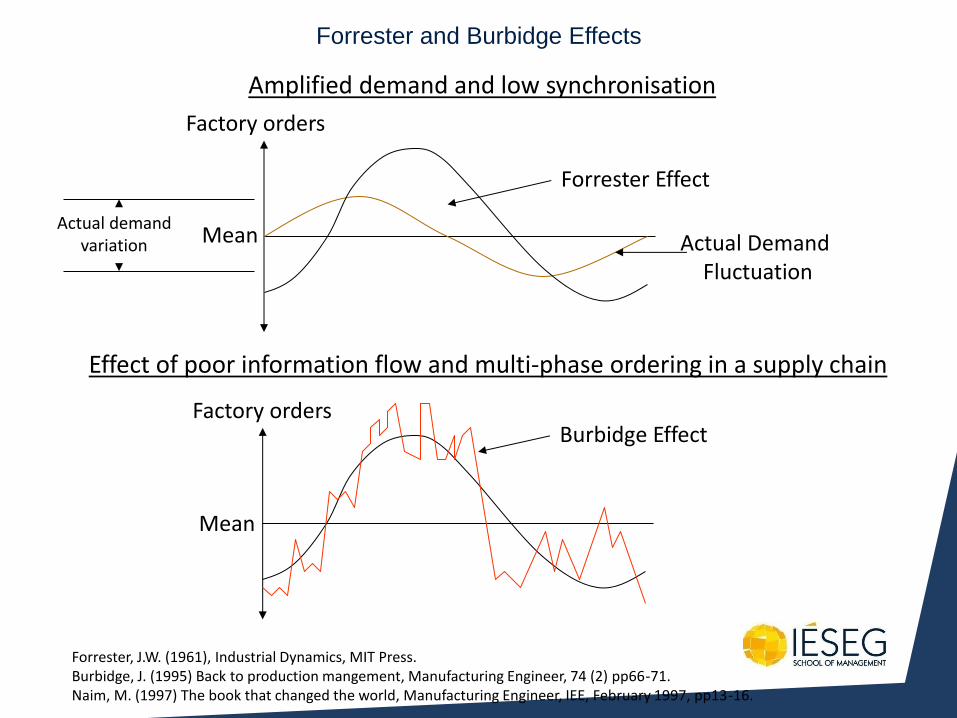
Forrester and Burbidge Effects
Forrester Effect
Burbidge Effect
Actual Demand Fluctuation
Mean
Mean
Factory orders
Factory orders
Amplified demand and low synchronisation
Effect of poor information flow and multi-phase ordering in a supply chain
Actual demand variation
Forrester, J.W. (1961), Industrial Dynamics, MIT Press. Burbidge, J. (1995) Back to production mangement, Manufacturing Engineer, 74 (2) pp66-71. Naim, M. (1997) The book that changed the world, Manufacturing Engineer, IEE, February 1997, pp13-16.
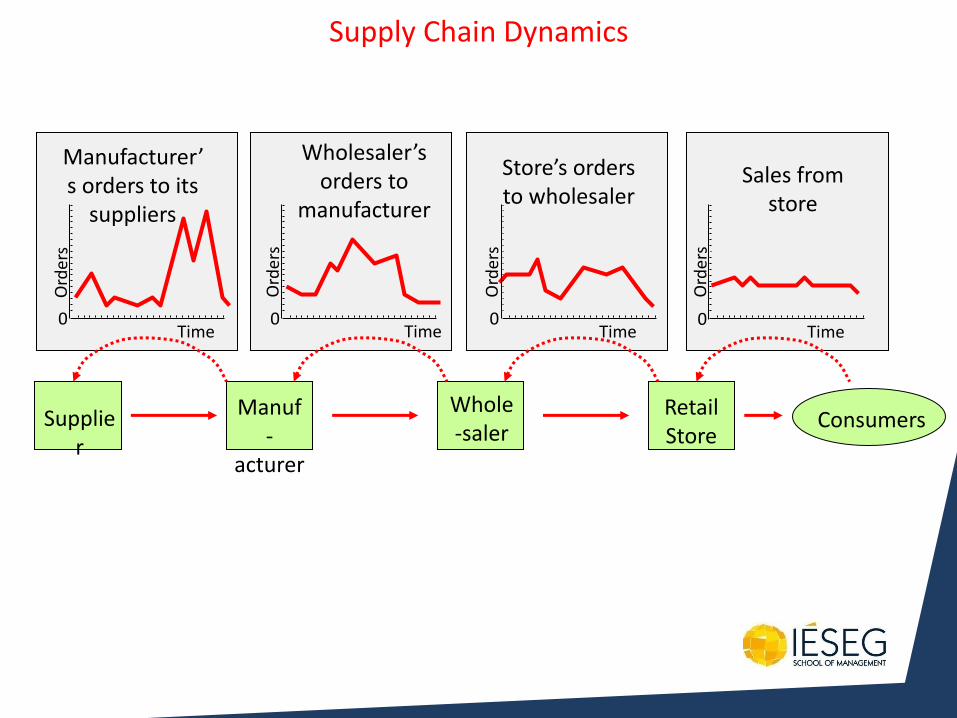
0 Time
Sales from store
Consumers
0 Time
Store’s orders to wholesaler
Manufacturer’s orders to its
suppliers
0 Time
Wholesaler’s orders to
manufacturer
0 Time
Retail Store
Whole -saler
Manuf-
acturer
Supplier
Supply Chain Dynamics
154
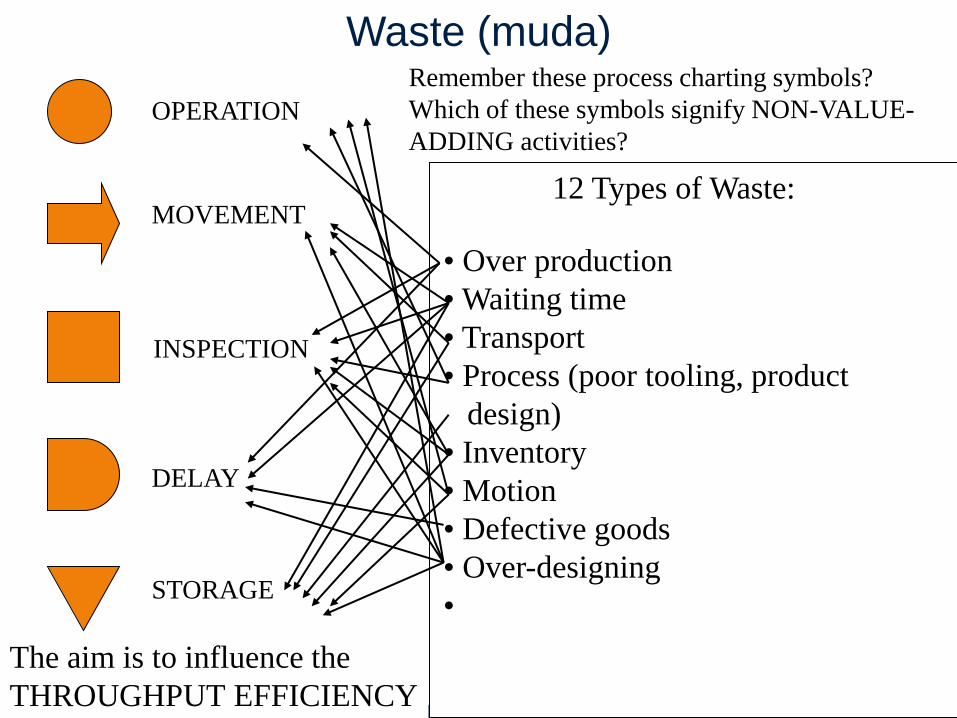
Waste (muda) Remember these process charting symbols?
Which of these symbols signify NON-VALUE-
ADDING activities?
OPERATION
MOVEMENT
INSPECTION
DELAY
STORAGE
12 Types of Waste:
• Over production
• Waiting time
• Transport
• Process (poor tooling, product
design)
• Inventory
• Motion
• Defective goods
• Over-designing
•
The aim is to influence the
THROUGHPUT EFFICIENCY
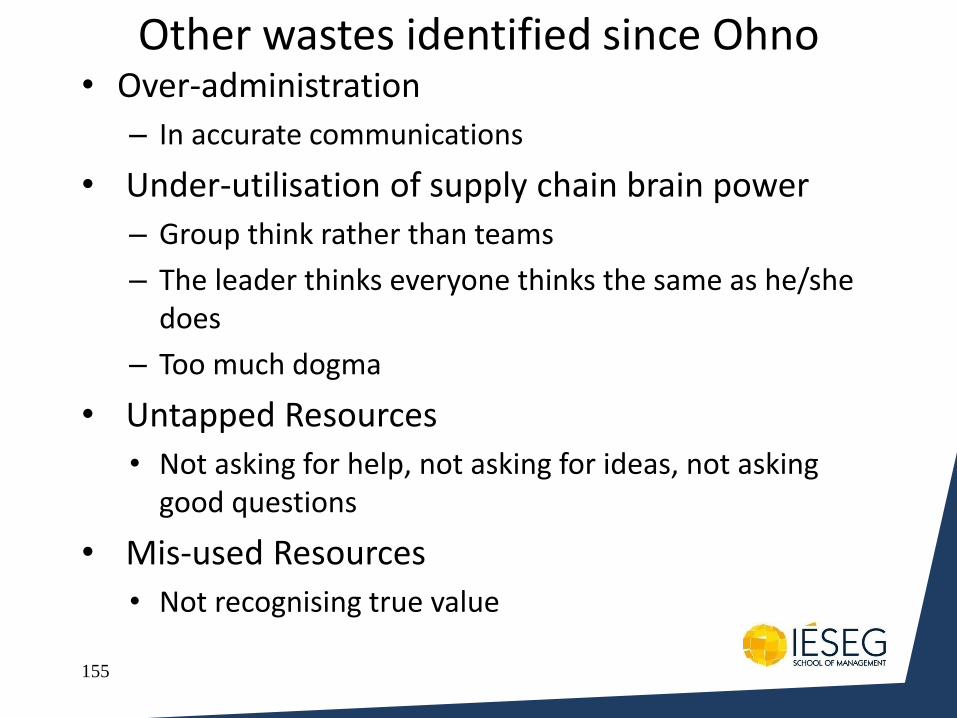
Other wastes identified since Ohno • Over-administration
– In accurate communications
• Under-utilisation of supply chain brain power
– Group think rather than teams
– The leader thinks everyone thinks the same as he/she does
– Too much dogma
• Untapped Resources
• Not asking for help, not asking for ideas, not asking good questions
• Mis-used Resources
• Not recognising true value
155
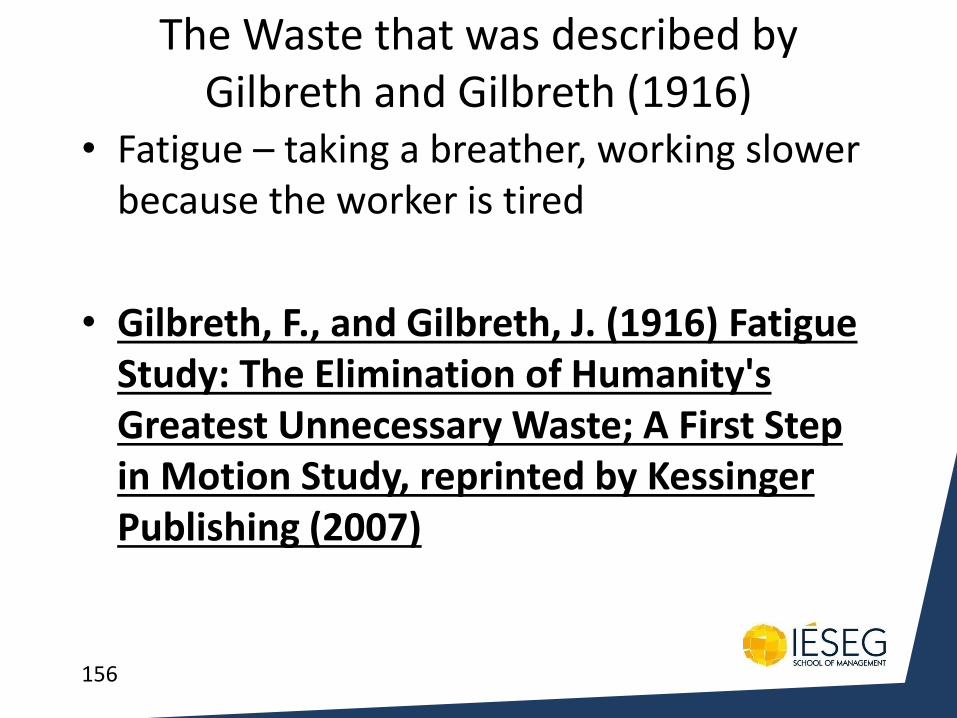
The Waste that was described by Gilbreth and Gilbreth (1916)
• Fatigue – taking a breather, working slower because the worker is tired
• Gilbreth, F., and Gilbreth, J. (1916) Fatigue Study: The Elimination of Humanity's Greatest Unnecessary Waste; A First Step in Motion Study, reprinted by Kessinger Publishing (2007)
156
157
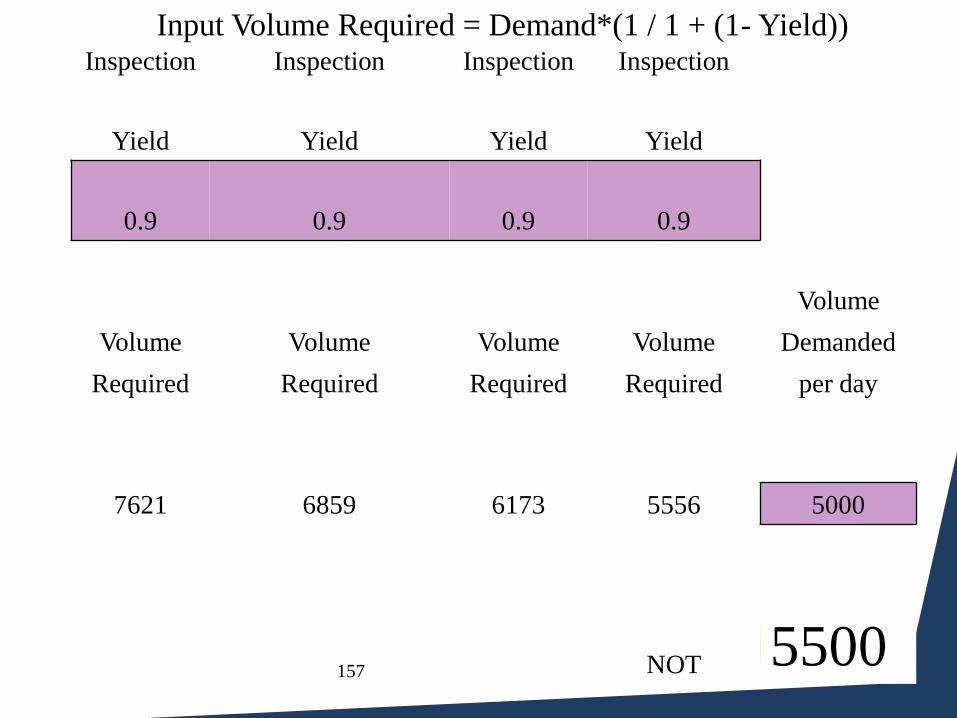
Input Volume Required = Demand*(1 / 1 + (1- Yield)) Inspection Inspection Inspection Inspection
Yield Yield Yield Yield
0.9 0.9 0.9 0.9
Volume
Volume Volume Volume Volume Demanded
Required Required Required Required per day
7621 6859 6173 5556 5000
NOT 5500
2621
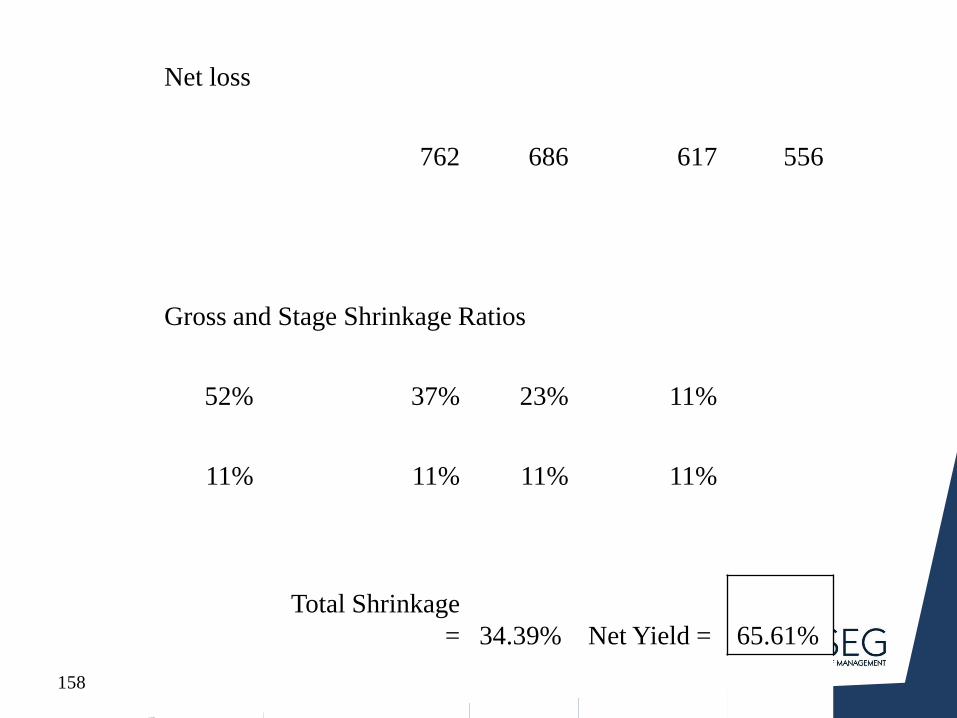
Net loss
762 686 617 556
Gross and Stage Shrinkage Ratios
52% 37% 23% 11%
11% 11% 11% 11%
Total Shrinkage = 34.39% Net Yield = 65.61%
158
Net loss
762 686 617 556
Gross and Stage Shrinkage Ratios
52% 37% 23% 11%
11% 11% 11% 11%
Total Shrinkage
= 34.39% Net Yield = 65.61%
159
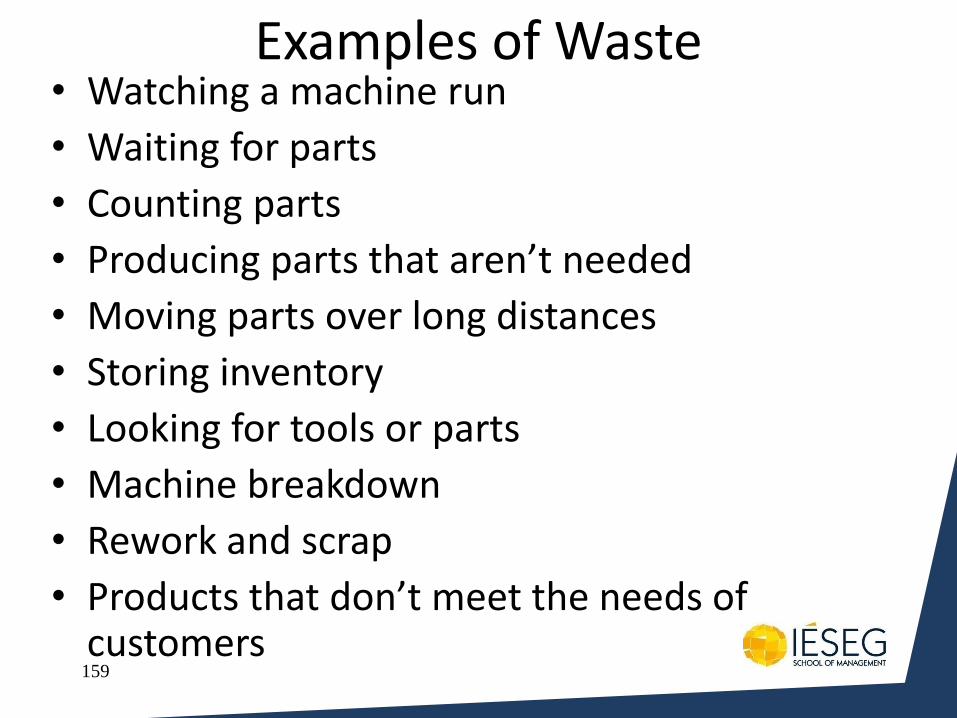
Examples of Waste • Watching a machine run
• Waiting for parts
• Counting parts
• Producing parts that aren’t needed
• Moving parts over long distances
• Storing inventory
• Looking for tools or parts
• Machine breakdown
• Rework and scrap
• Products that don’t meet the needs of customers
160
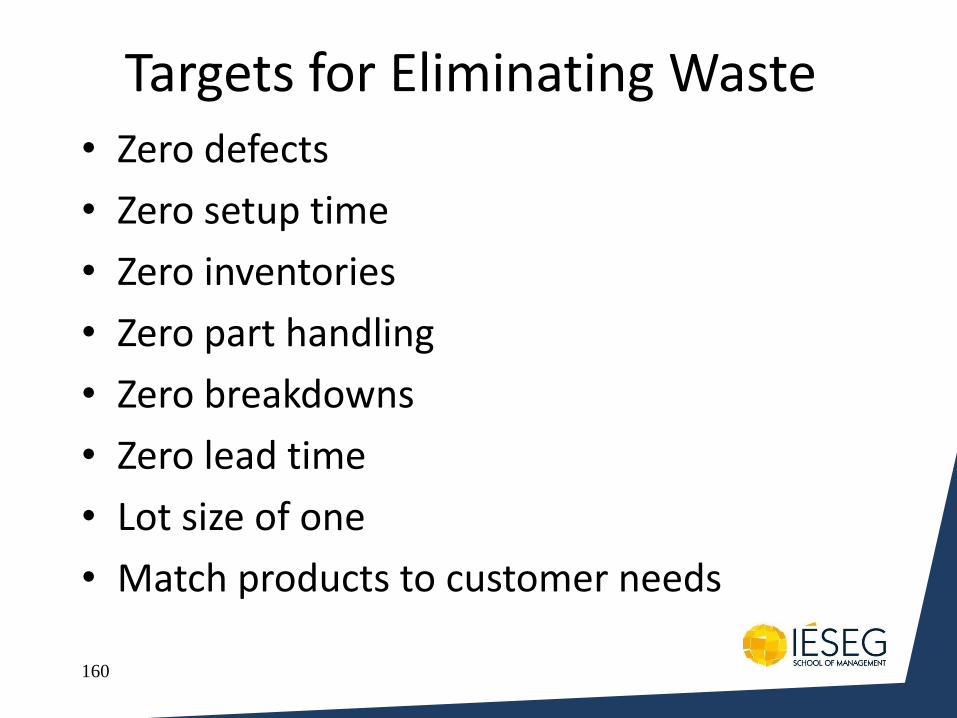
Targets for Eliminating Waste • Zero defects
• Zero setup time
• Zero inventories
• Zero part handling
• Zero breakdowns
• Zero lead time
• Lot size of one
• Match products to customer needs

Strategic Perspectives
Chapter 1
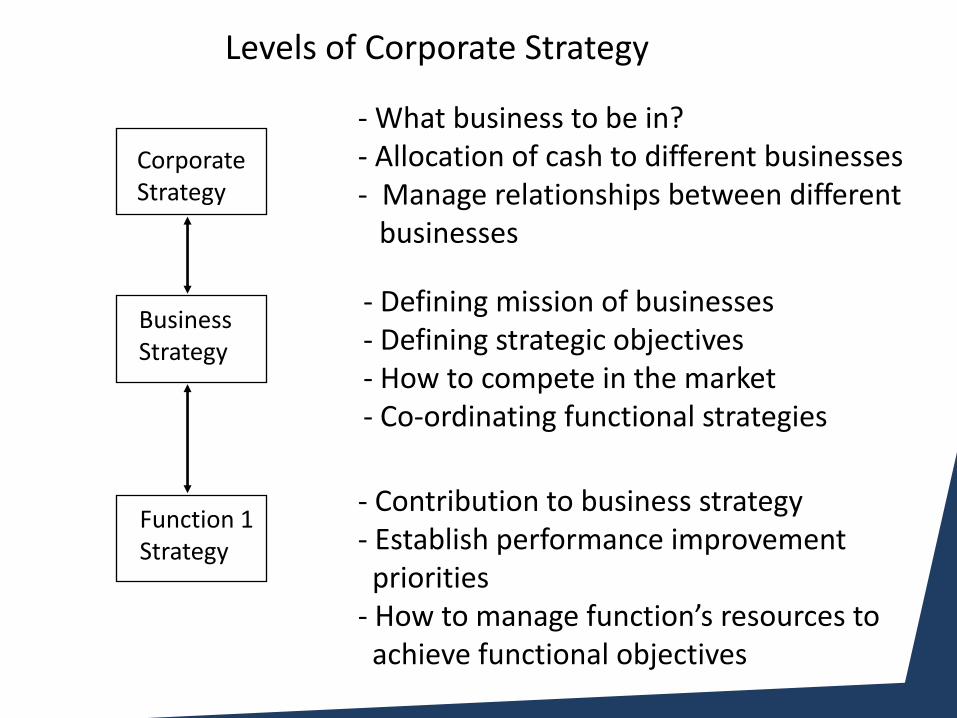
Levels of Corporate Strategy
Corporate Strategy
Function 1 Strategy
Business Strategy
- What business to be in? - Allocation of cash to different businesses - Manage relationships between different businesses
- Defining mission of businesses - Defining strategic objectives - How to compete in the market - Co-ordinating functional strategies
- Contribution to business strategy - Establish performance improvement priorities - How to manage function’s resources to achieve functional objectives
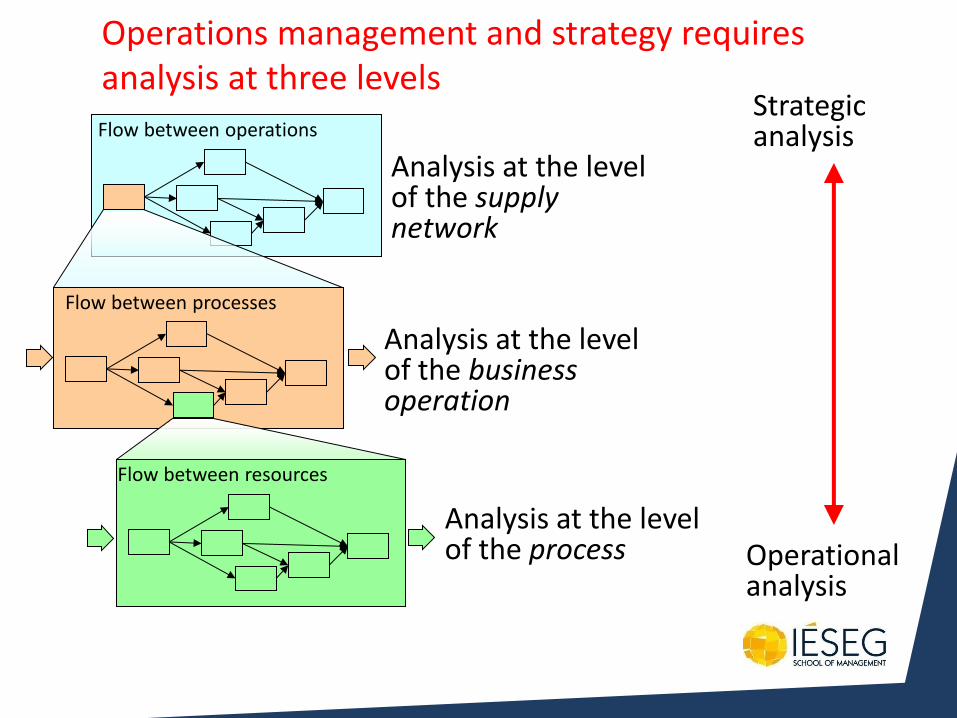
Operations management and strategy requires analysis at three levels
Flow between operations
Analysis at the level of the supply network
Analysis at the level of the business operation
Flow between processes
Analysis at the level of the process
Flow between resources
Strategic analysis
Operational analysis
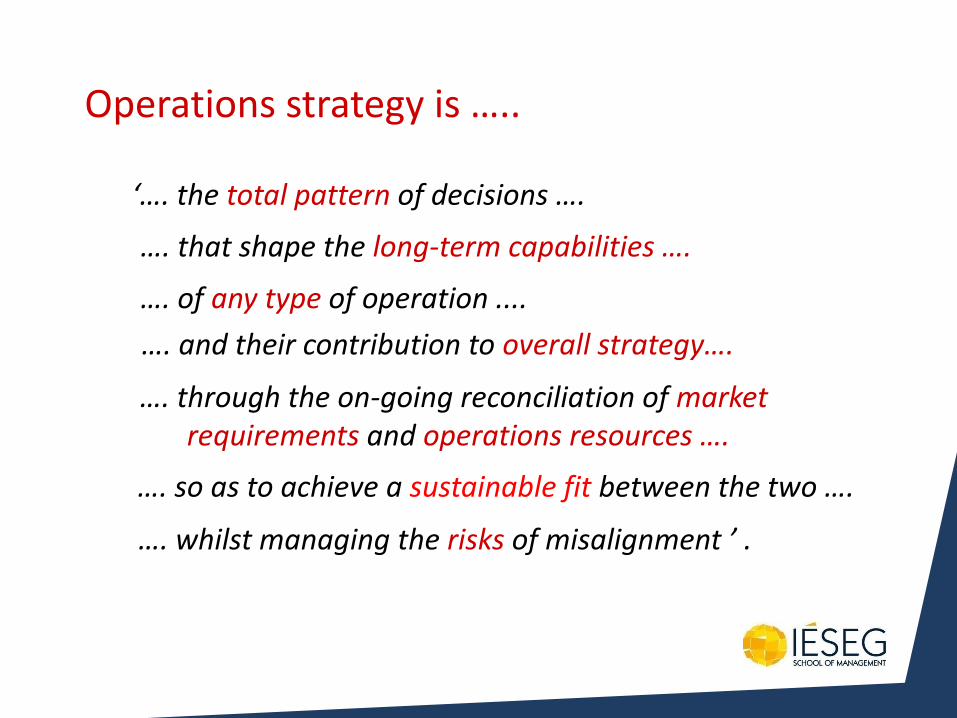
Operations strategy is …..
‘…. the total pattern of decisions ….
…. whilst managing the risks of misalignment ’ .
…. through the on-going reconciliation of market requirements and operations resources ….
…. and their contribution to overall strategy….
…. of any type of operation ....
…. that shape the long-term capabilities ….
…. so as to achieve a sustainable fit between the two ….
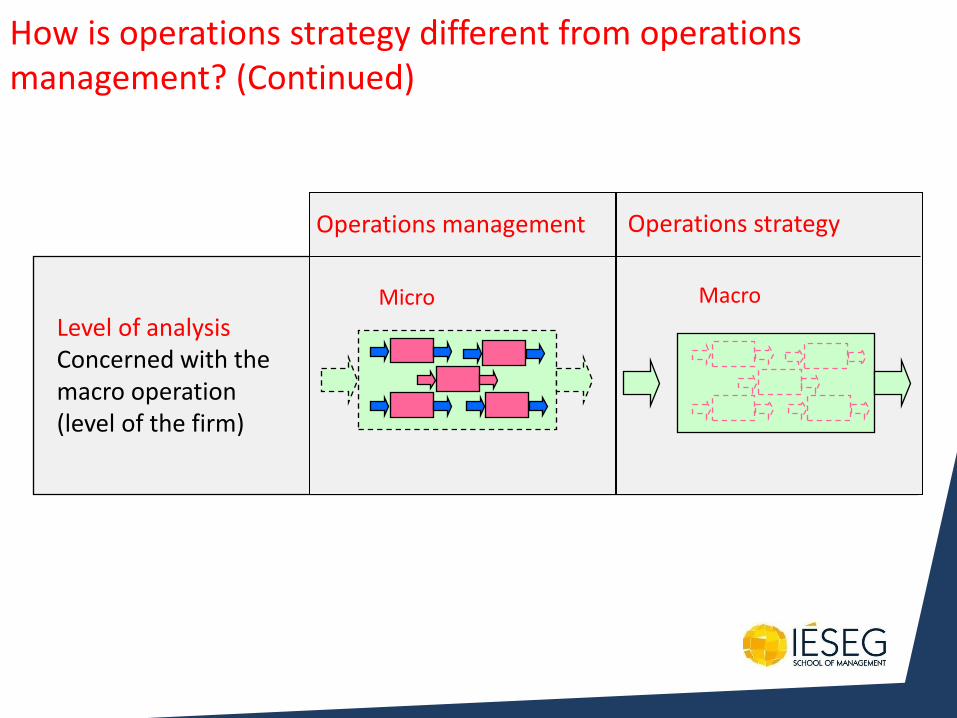
Level of analysis Concerned with the macro operation (level of the firm)
Micro
Operations management
Macro
Operations strategy
How is operations strategy different from operations management? (Continued)
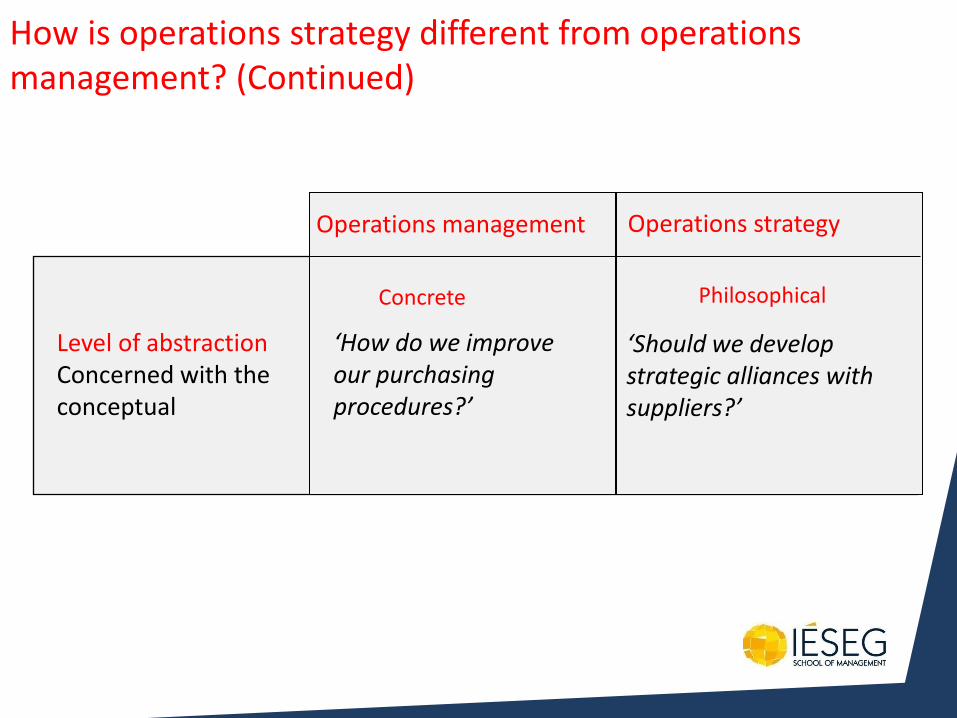
Level of abstraction Concerned with the conceptual
Concrete
Operations management
Philosophical
Operations strategy
‘How do we improve our purchasing procedures?’
‘Should we develop strategic alliances with suppliers?’
How is operations strategy different from operations management? (Continued)
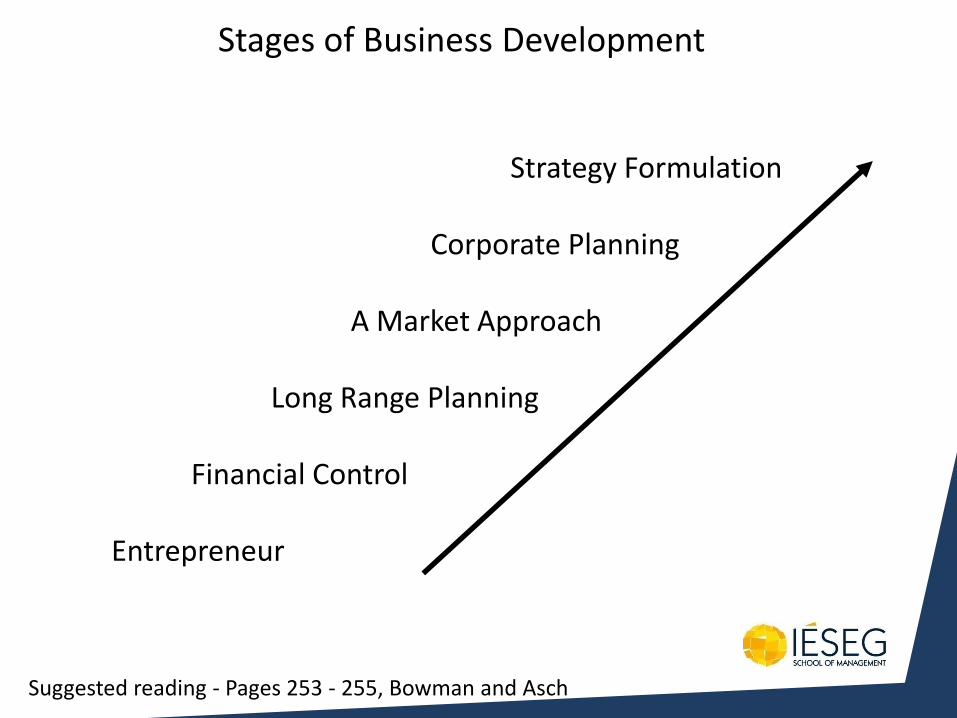
Stages of Business Development
Strategy Formulation Corporate Planning A Market Approach Long Range Planning Financial Control Entrepreneur
Suggested reading - Pages 253 - 255, Bowman and Asch
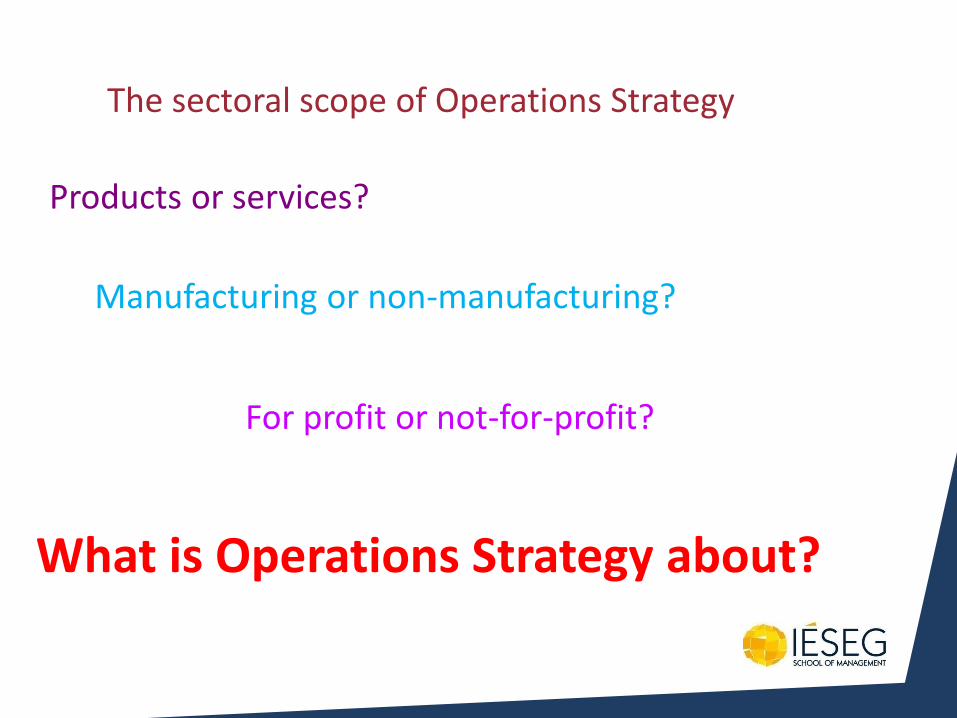
Products or services?
Manufacturing or non-manufacturing?
What is Operations Strategy about?
For profit or not-for-profit?
The sectoral scope of Operations Strategy
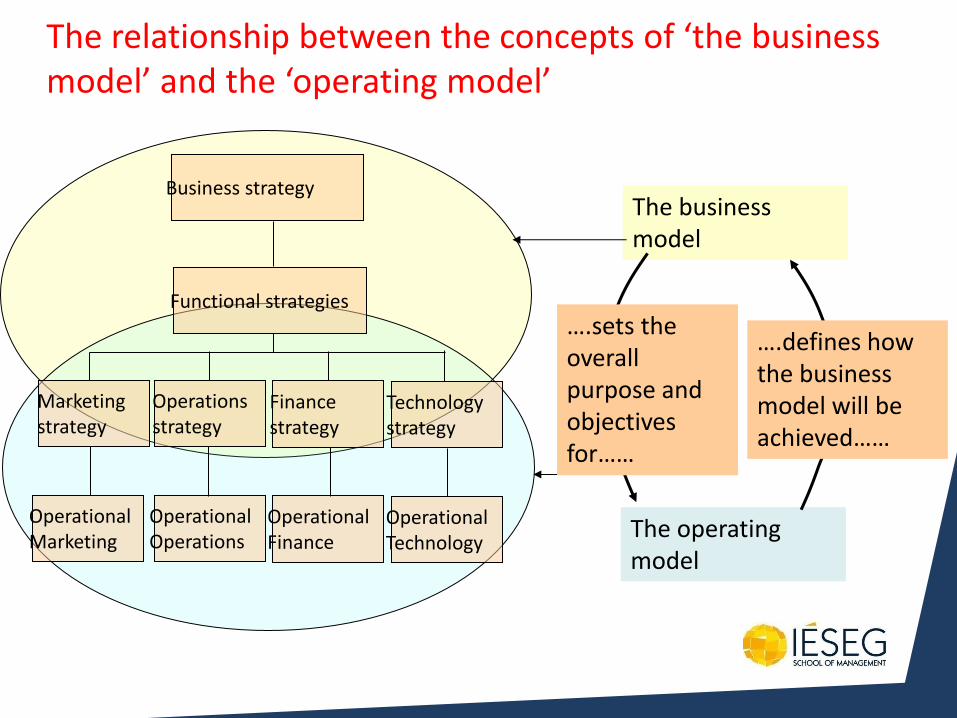
Operational Operations
Operational Finance
Marketing strategy
Operations strategy
Finance strategy
Technology strategy
The business model
The operating model
Business strategy
Functional strategies
Operational Marketing
Operational Technology
The relationship between the concepts of ‘the business model’ and the ‘operating model’
….sets the overall purpose and objectives for……
….defines how the business model will be achieved……
Contributing to the leadership team and aligning business and functional visions
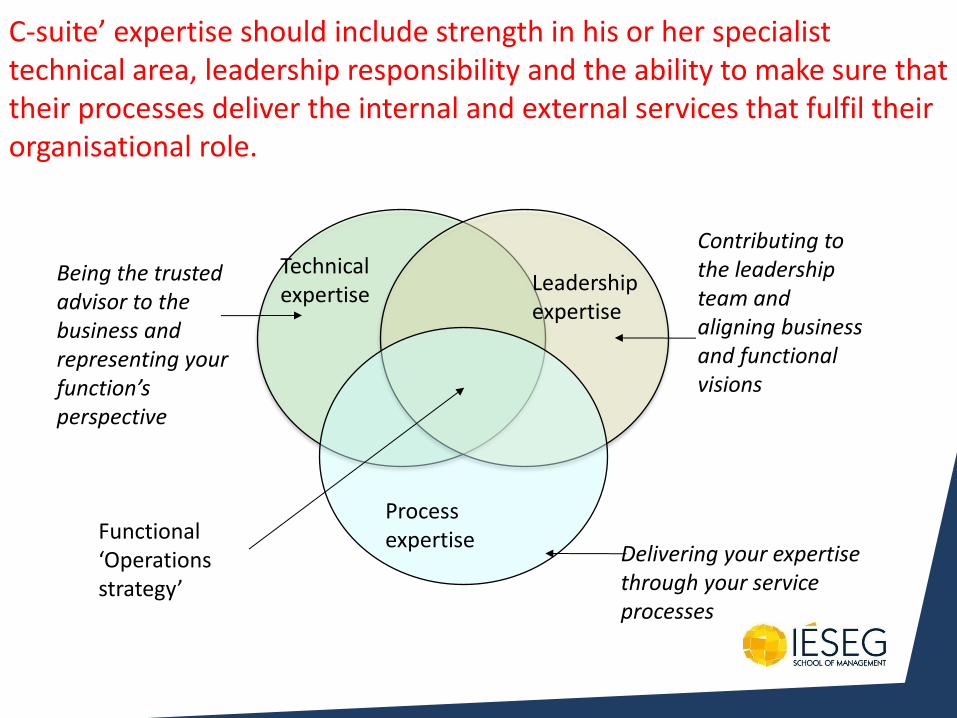
C-suite’ expertise should include strength in his or her specialist technical area, leadership responsibility and the ability to make sure that their processes deliver the internal and external services that fulfil their organisational role.
Technical expertise Leadership
expertise
Process expertise
Being the trusted advisor to the business and representing your function’s perspective
Delivering your expertise through your service processes
Functional ‘Operations strategy’
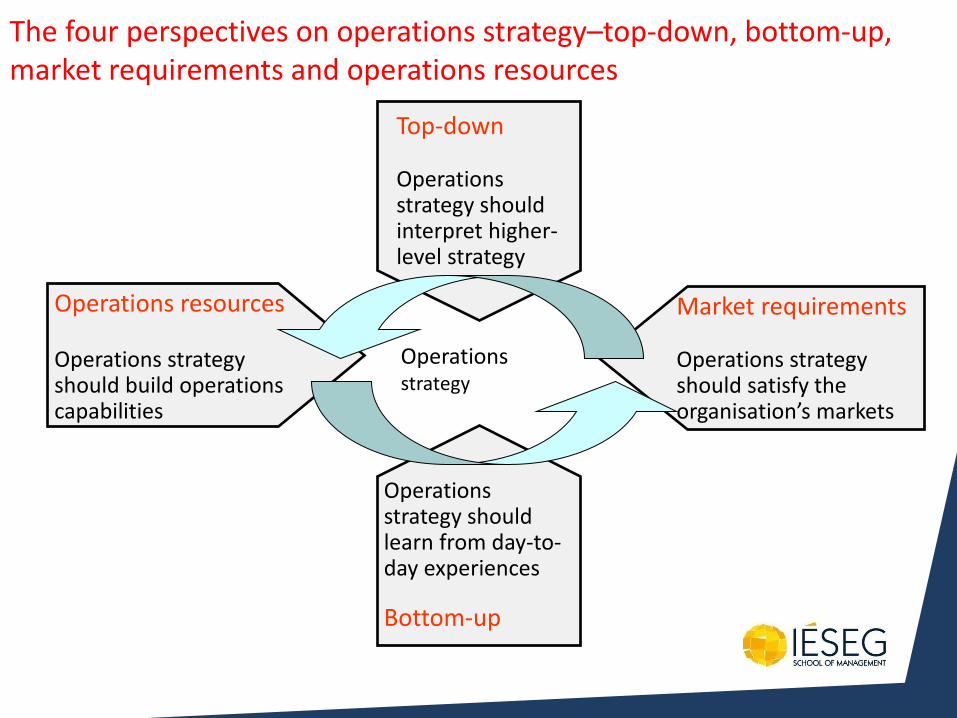
Top-down Operations strategy should interpret higher- level strategy
Operations resources Operations strategy should build operations capabilities
Operations strategy should learn from day-to-day experiences
Bottom-up
Market requirements Operations strategy should satisfy the organisation’s markets
The four perspectives on operations strategy–top-down, bottom-up, market requirements and operations resources
Operations strategy
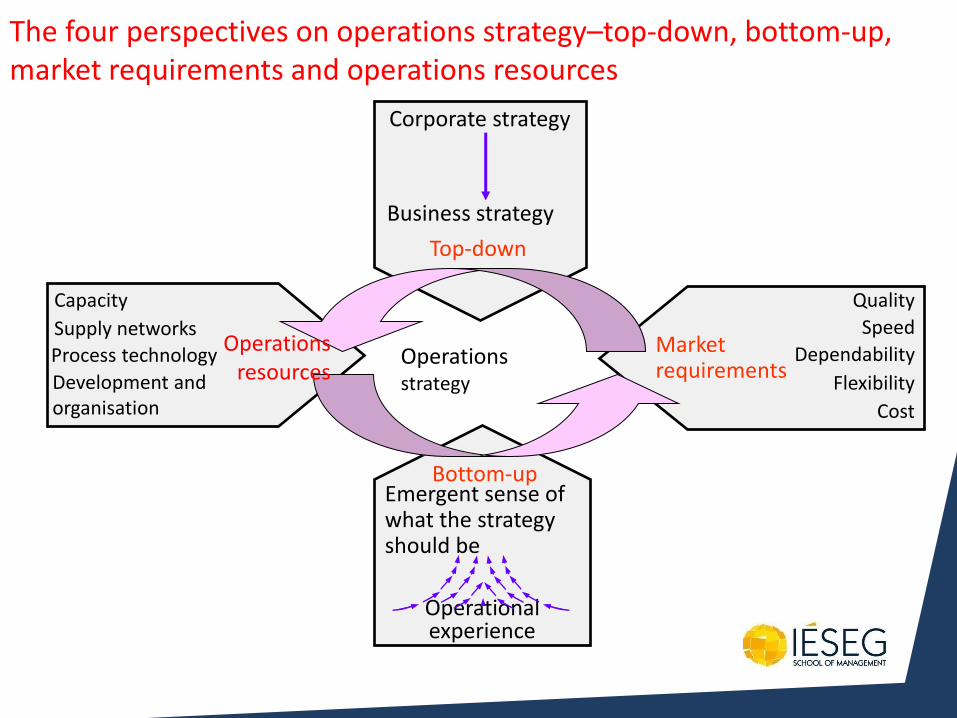
Top-down
Bottom-up
Corporate strategy
Business strategy
Emergent sense of what the strategy should be
Operational experience
Capacity
Supply networks
Process technology
Development and organisation
Market requirements
Quality
Speed
Dependability
Flexibility
Cost
The four perspectives on operations strategy–top-down, bottom-up, market requirements and operations resources
Operations strategy
Operations resources
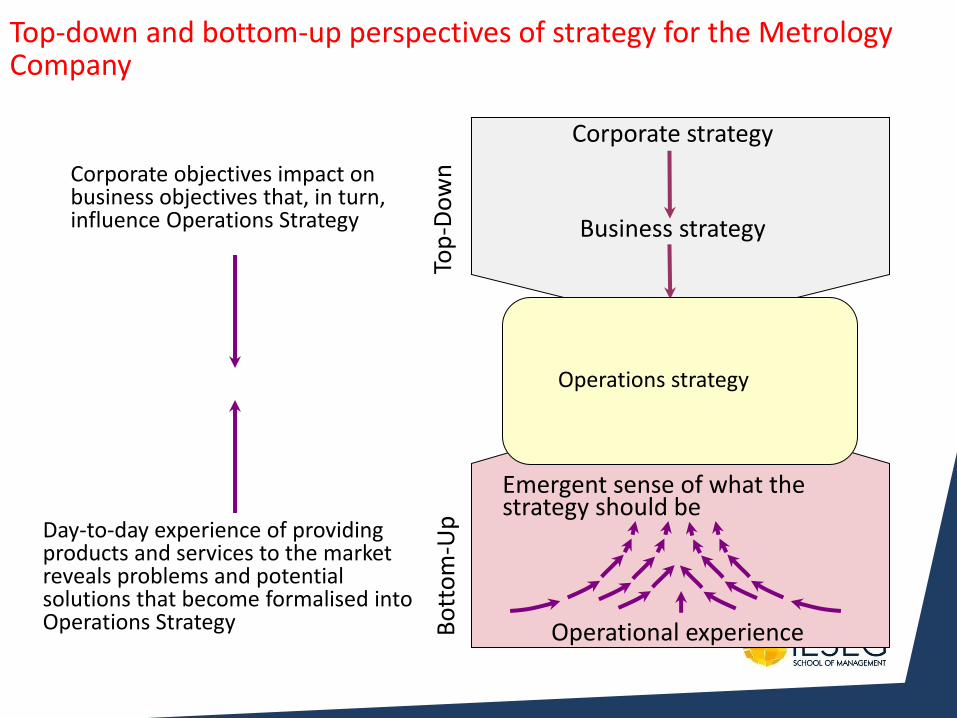
Top-down and bottom-up perspectives of strategy for the Metrology Company
Corporate objectives impact on business objectives that, in turn, influence Operations Strategy
Top
-Do
wn
Corporate strategy
Business strategy
Bo
tto
m-U
p
Day-to-day experience of providing products and services to the market reveals problems and potential solutions that become formalised into Operations Strategy
Emergent sense of what the strategy should be
Operational experience
Operations strategy
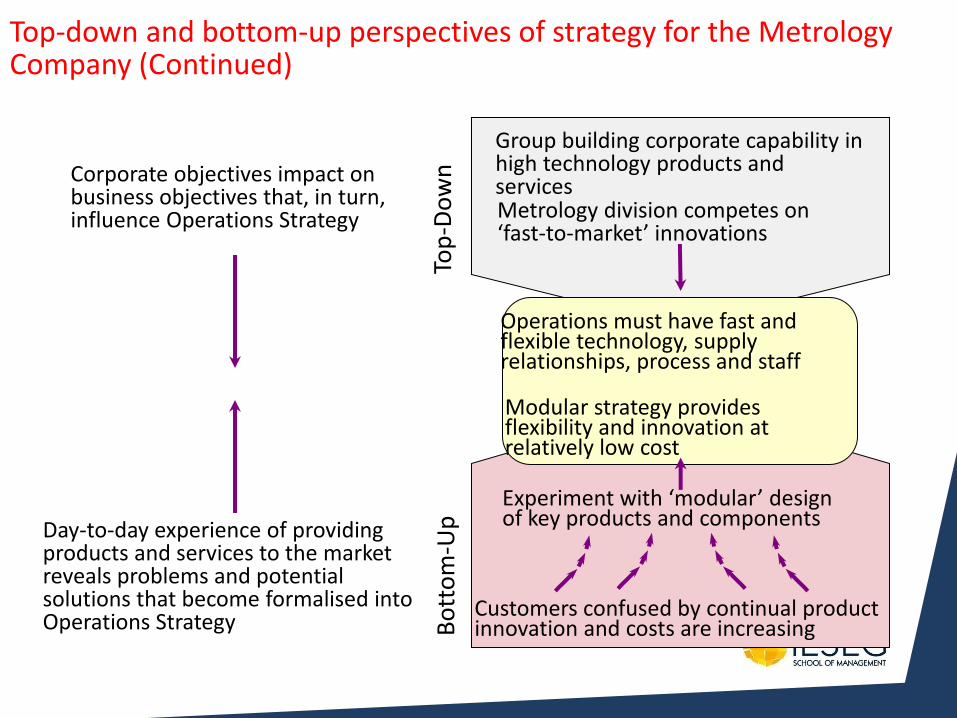
Top-down and bottom-up perspectives of strategy for the Metrology Company (Continued)
Corporate objectives impact on business objectives that, in turn, influence Operations Strategy
Top
-Do
wn
B
ott
om
-Up
Day-to-day experience of providing products and services to the market reveals problems and potential solutions that become formalised into Operations Strategy
Group building corporate capability in high technology products and services Metrology division competes on ‘fast-to-market’ innovations
Experiment with ‘modular’ design of key products and components
Customers confused by continual product innovation and costs are increasing
Operations must have fast and flexible technology, supply relationships, process and staff
Modular strategy provides flexibility and innovation at relatively low cost
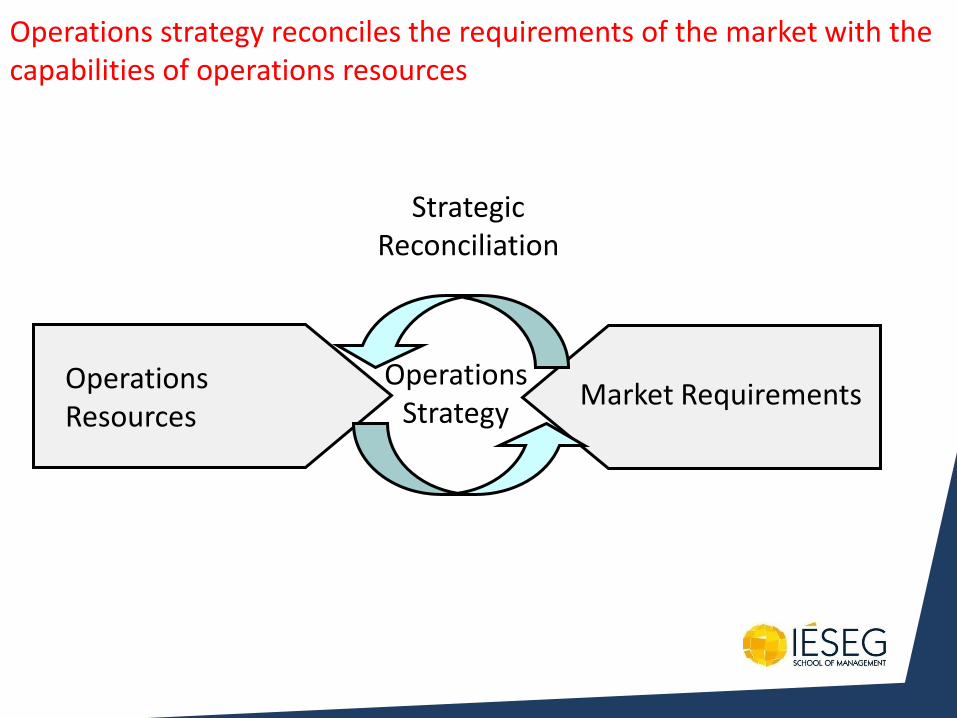
Operations Resources
Market Requirements
Operations strategy reconciles the requirements of the market with the capabilities of operations resources
Strategic Reconciliation
Operations Strategy
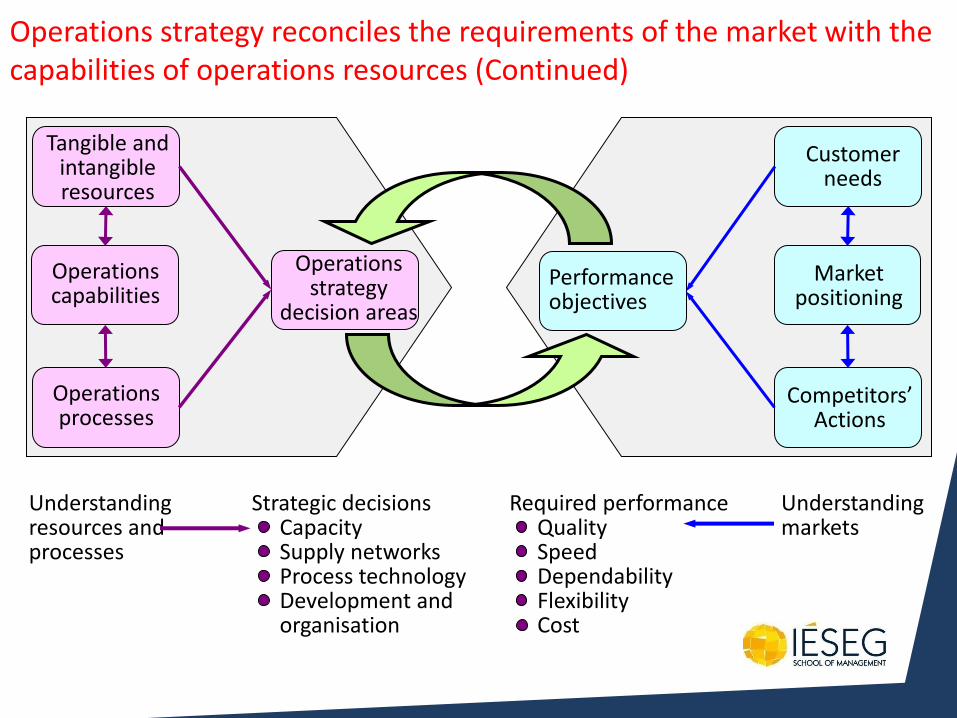
Tangible and intangible resources
Operations capabilities
Operations processes
Operations strategy
decision areas
Customer needs
Market positioning
Competitors’ Actions
Performance objectives
Understanding resources and processes
Strategic decisions Capacity Supply networks Process technology Development and organisation
Required performance Quality Speed Dependability Flexibility Cost
Understanding markets
Operations strategy reconciles the requirements of the market with the capabilities of operations resources (Continued)
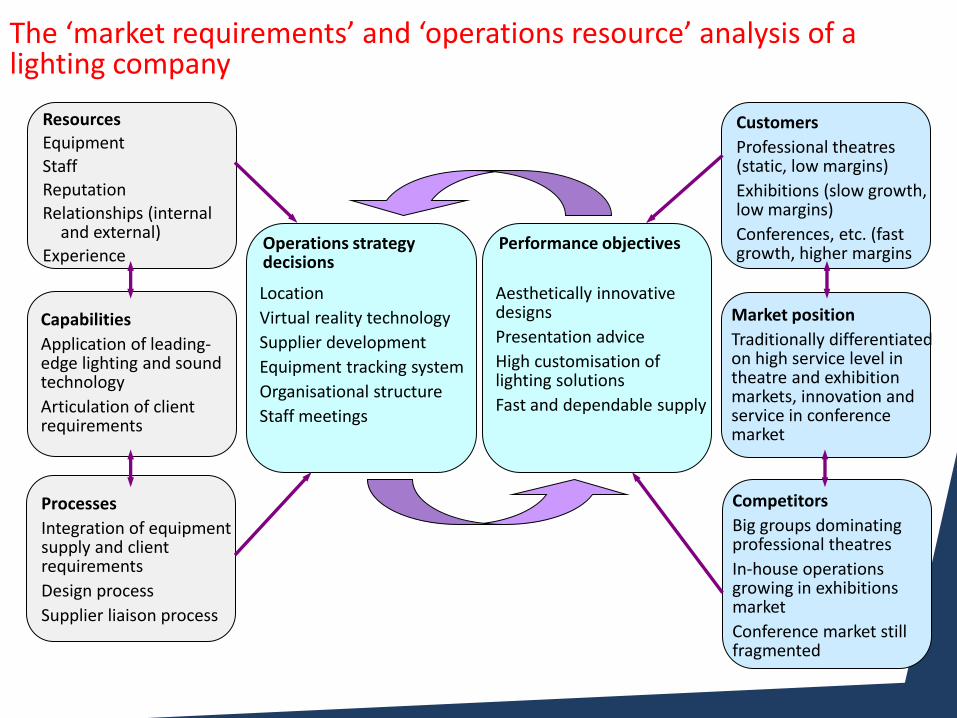
The ‘market requirements’ and ‘operations resource’ analysis of a lighting company
Resources
Equipment
Staff
Reputation
Relationships (internal and external)
Experience
Capabilities
Application of leading-edge lighting and sound technology
Articulation of client requirements
Processes
Integration of equipment supply and client requirements
Design process
Supplier liaison process
Operations strategy decisions
Location
Virtual reality technology
Supplier development
Equipment tracking system
Organisational structure
Staff meetings
Customers
Professional theatres (static, low margins)
Exhibitions (slow growth, low margins)
Conferences, etc. (fast growth, higher margins
Market position
Traditionally differentiated on high service level in theatre and exhibition markets, innovation and service in conference market
Competitors
Big groups dominating professional theatres
In-house operations growing in exhibitions market
Conference market still fragmented
Performance objectives
Aesthetically innovative designs
Presentation advice
High customisation of lighting solutions
Fast and dependable supply
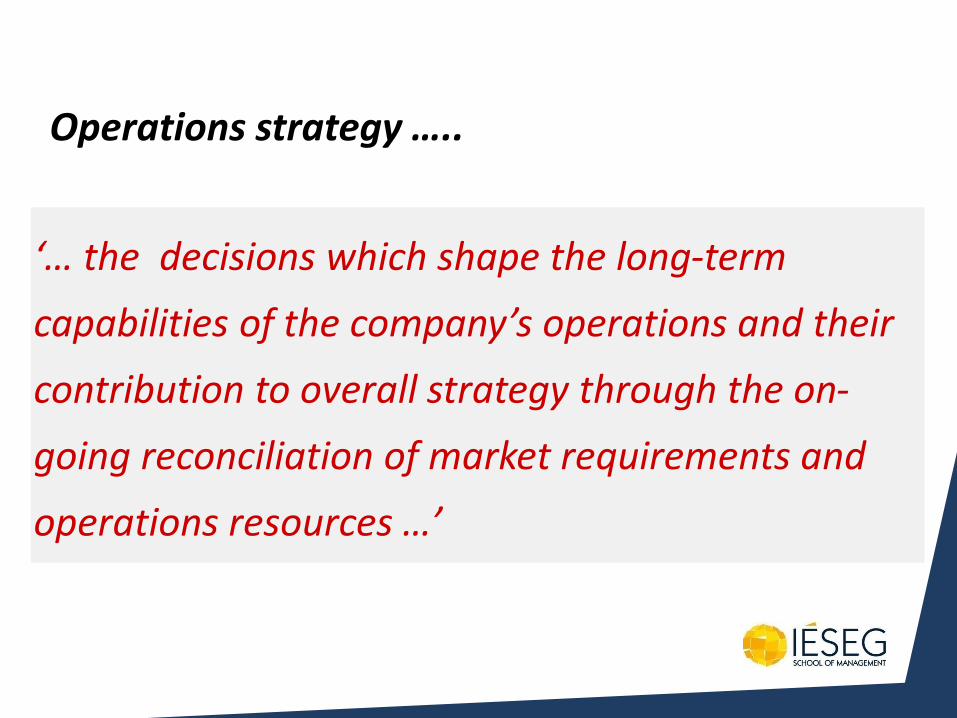
Operations strategy …..
‘… the decisions which shape the long-term
capabilities of the company’s operations and their
contribution to overall strategy through the on-
going reconciliation of market requirements and
operations resources …’
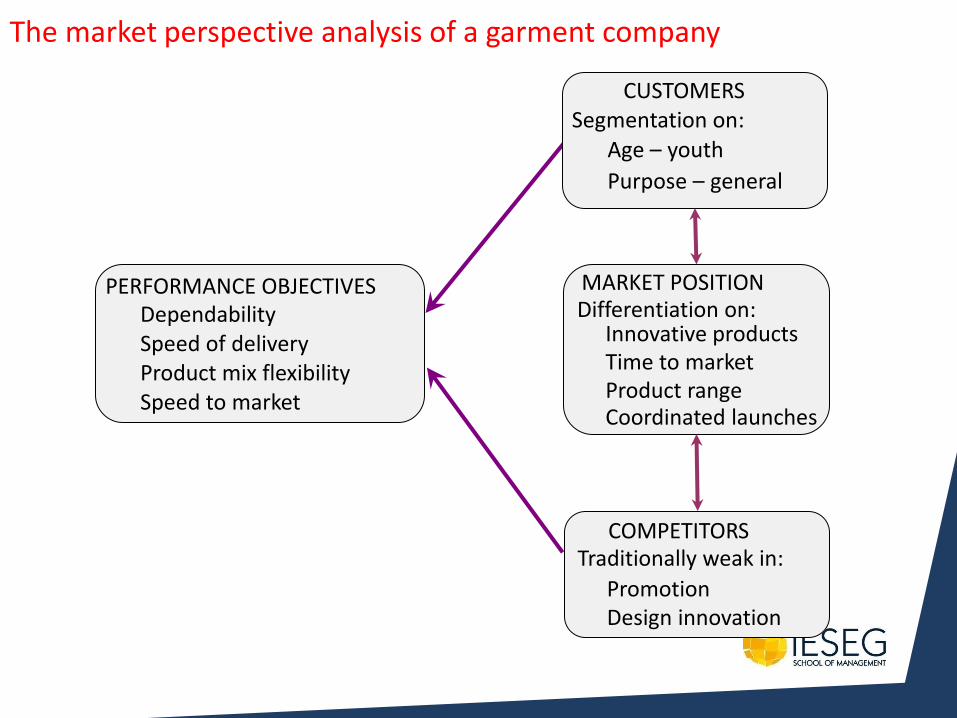
PERFORMANCE OBJECTIVES
The market perspective analysis of a garment company
MARKET POSITION Differentiation on:
CUSTOMERS Segmentation on:
Age – youth
Purpose – general
COMPETITORS Traditionally weak in:
Innovative products Time to market Product range Coordinated launches
Promotion Design innovation
Dependability Speed of delivery Product mix flexibility Speed to market
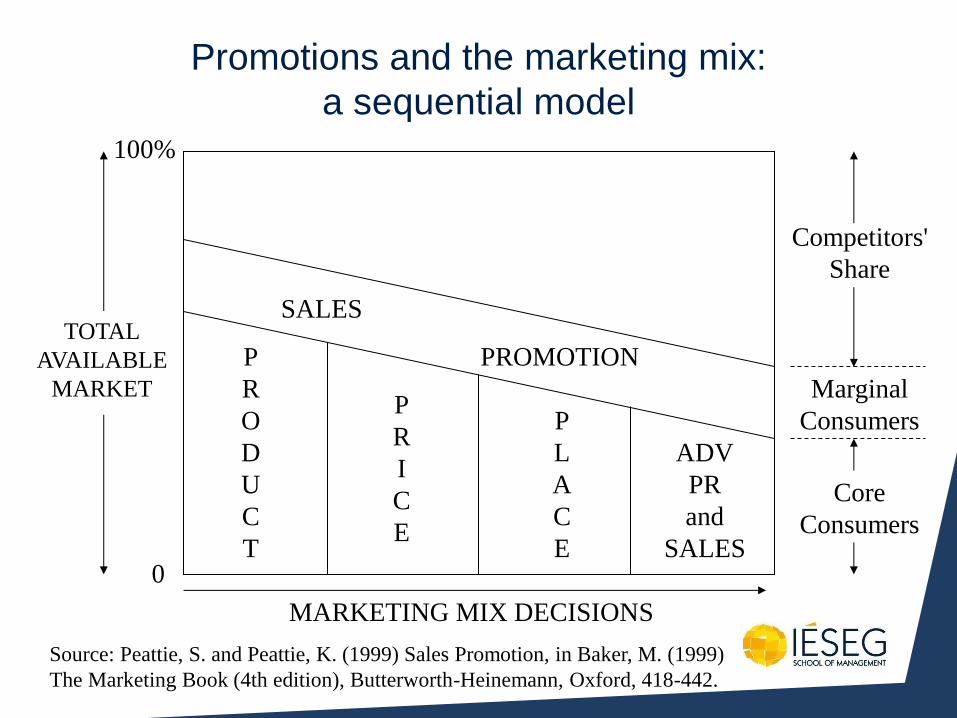
Promotions and the marketing mix:
a sequential model
TOTAL
AVAILABLE
MARKET
0
100%
MARKETING MIX DECISIONS
P
R
O
D
U
C
T
P
R
I
C
E
P
L
A
C
E
ADV
PR
and
SALES
SALES
PROMOTION
Core
Consumers
Marginal
Consumers
Competitors'
Share
Source: Peattie, S. and Peattie, K. (1999) Sales Promotion, in Baker, M. (1999)
The Marketing Book (4th edition), Butterworth-Heinemann, Oxford, 418-442.
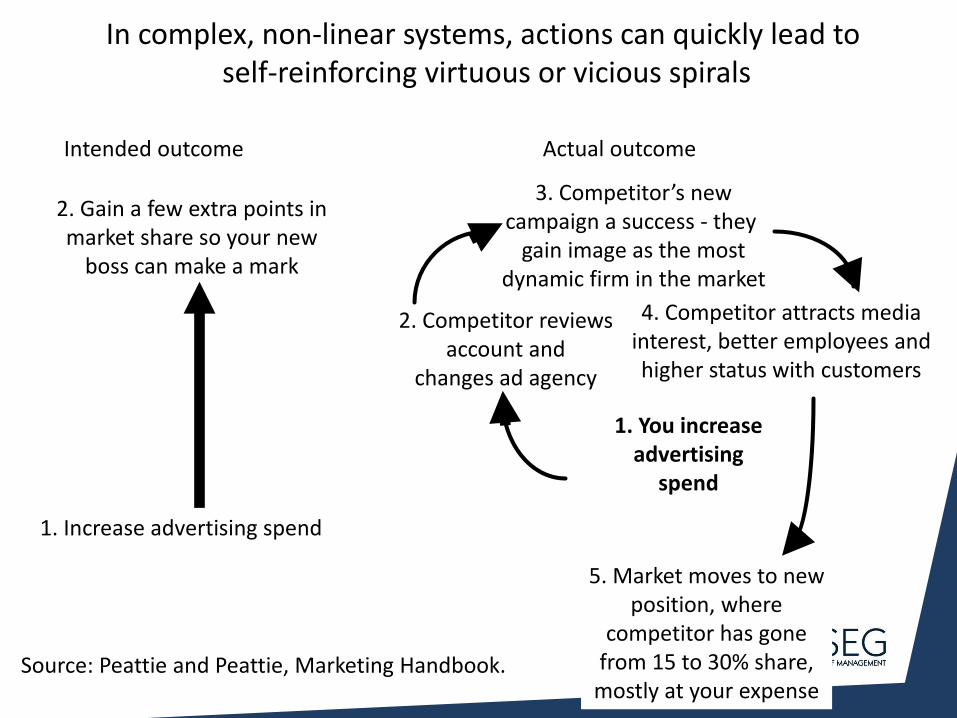
Intended outcome Actual outcome
1. Increase advertising spend
2. Gain a few extra points in market share so your new
boss can make a mark
1. You increase advertising
spend
2. Competitor reviews account and
changes ad agency
4. Competitor attracts media interest, better employees and higher status with customers
3. Competitor’s new campaign a success - they
gain image as the most dynamic firm in the market
5. Market moves to new position, where
competitor has gone from 15 to 30% share,
mostly at your expense
In complex, non-linear systems, actions can quickly lead to self-reinforcing virtuous or vicious spirals
Source: Peattie and Peattie, Marketing Handbook.
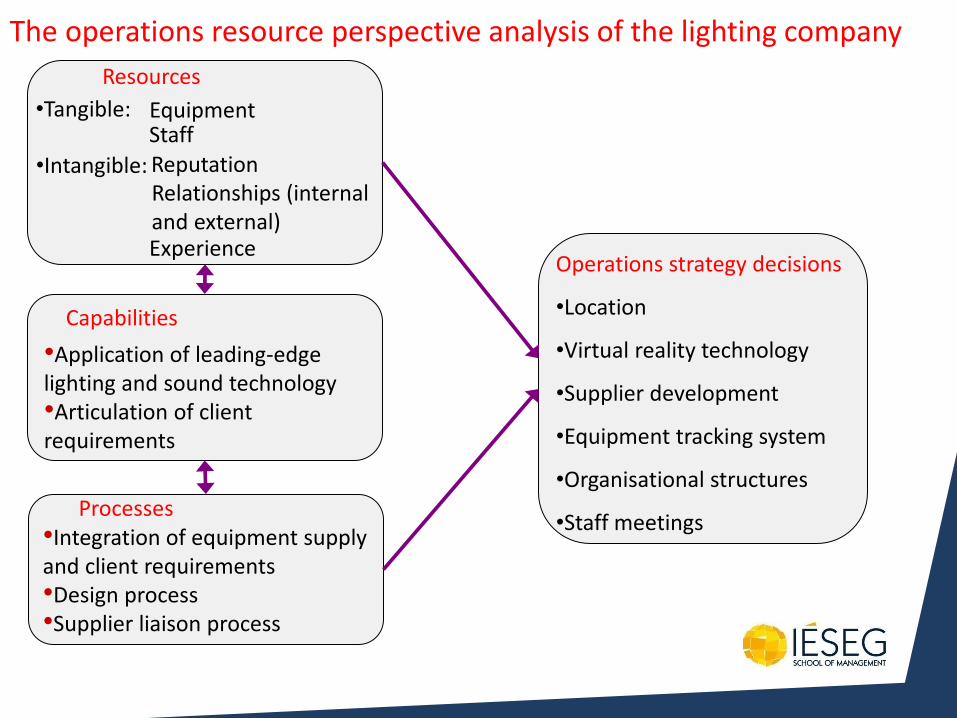
Capabilities
Resources
•Tangible: Equipment Staff
Processes
Reputation Relationships (internal and external) Experience
•Intangible:
•Application of leading-edge lighting and sound technology •Articulation of client requirements
•Integration of equipment supply and client requirements •Design process •Supplier liaison process
Operations strategy decisions
•Location
•Virtual reality technology
•Supplier development
•Equipment tracking system
•Organisational structures
•Staff meetings
The operations resource perspective analysis of the lighting company
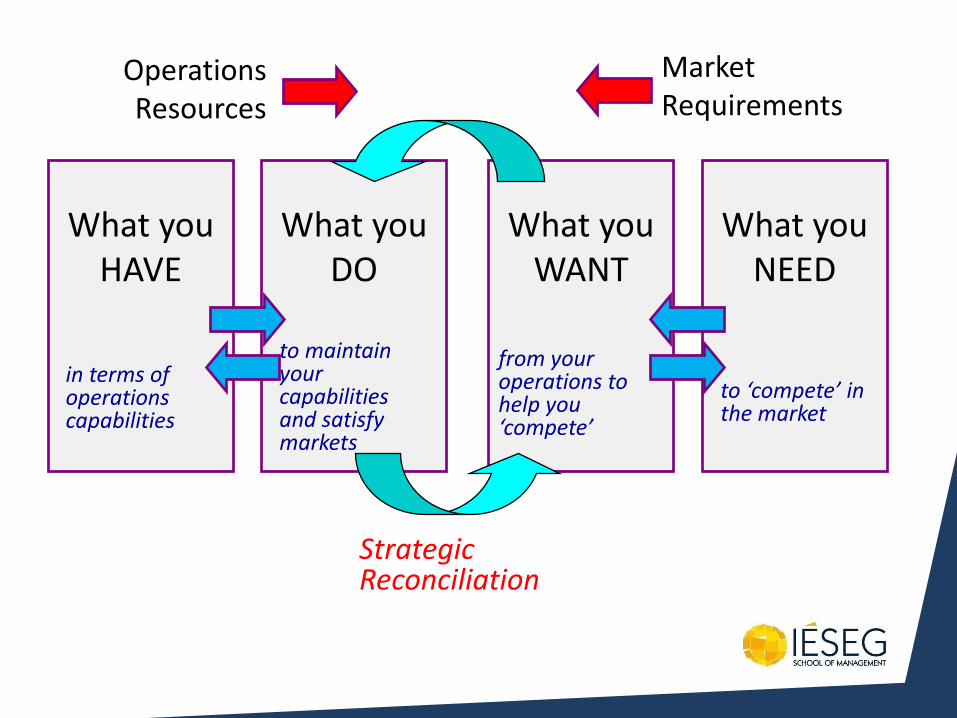
What you HAVE
in terms of operations capabilities
What you NEED
to ‘compete’ in the market
Operations Resources
Market Requirements
What you WANT
from your operations to help you ‘compete’
What you DO
to maintain your capabilities and satisfy markets
Strategic Reconciliation
Building blocks of Operations Management KLASSEN, R., 2006, Cases in Operations Management, Sage Publications, California.
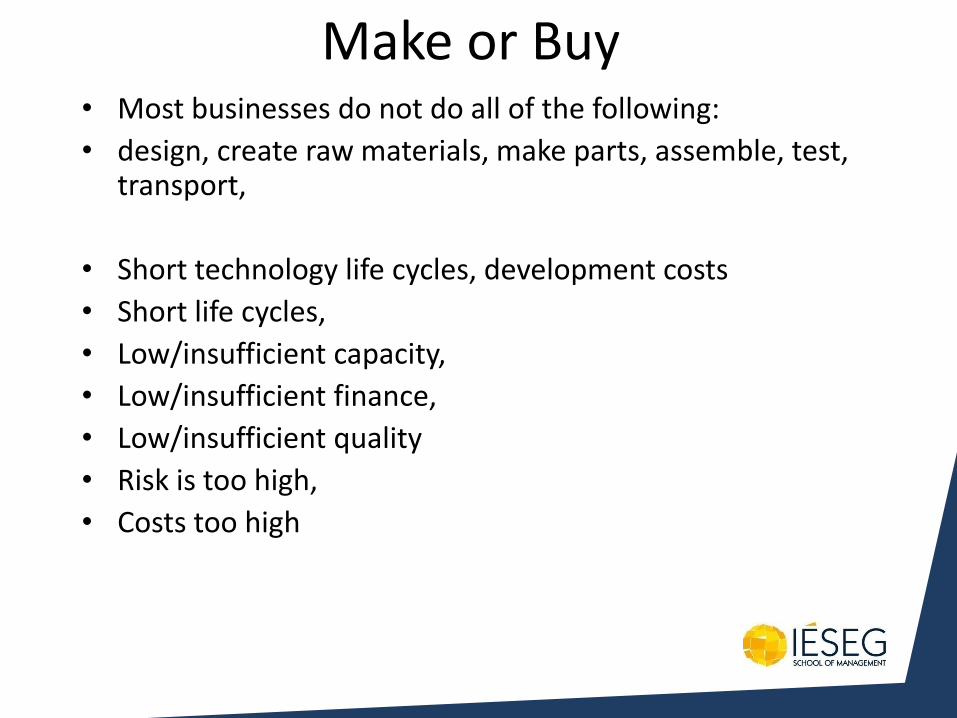
Make or Buy • Most businesses do not do all of the following:
• design, create raw materials, make parts, assemble, test, transport,
• Short technology life cycles, development costs
• Short life cycles,
• Low/insufficient capacity,
• Low/insufficient finance,
• Low/insufficient quality
• Risk is too high,
• Costs too high
Value Chain Fight Deconstruction & Value Migration in PC Industry
IBM – 1985
Microchip design and manufacturing
Computer assembly
Applications software
Marketing, sales, and
distribution
Operating systems
IBM
OS/2
PC industry - 2000
Reconstruction
Intel
Motorola
AMD Cyrix
Compaq
Dell
Apple
Packard Bell DOS and Windows
UNIX
Mac OS
Microsoft Office
WordPerfect
Others
CompUSA
Sam’s Club
PC-order.com
Mail order
NeXt Dell
Resellers
Resellers
Resellers
Source: The Boston Consulting Group
IBM
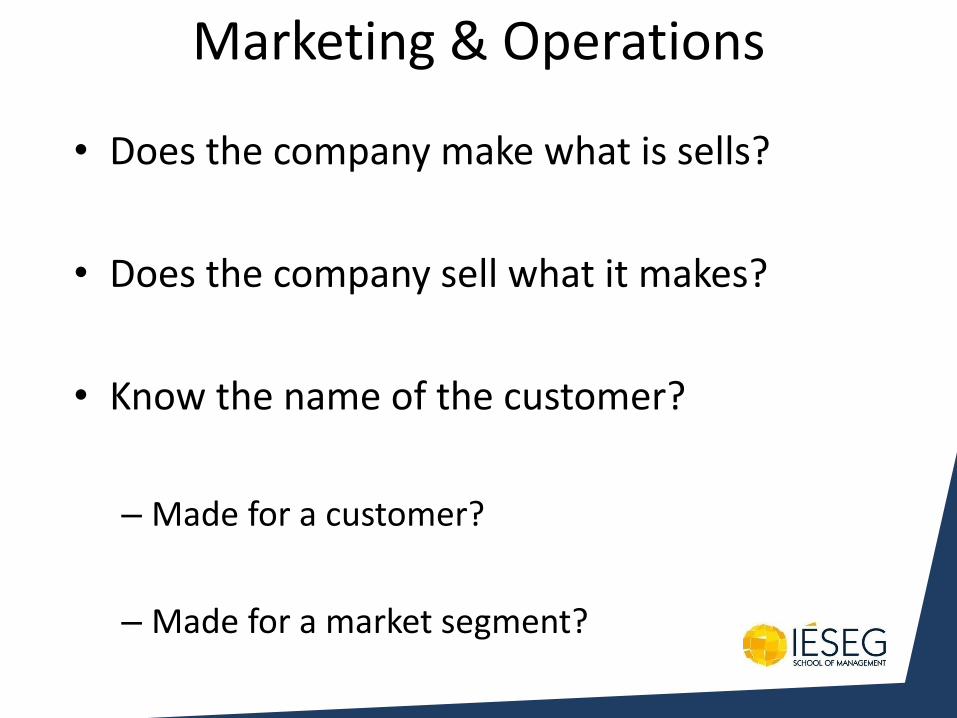
Marketing & Operations
• Does the company make what is sells?
• Does the company sell what it makes?
• Know the name of the customer?
– Made for a customer?
– Made for a market segment?

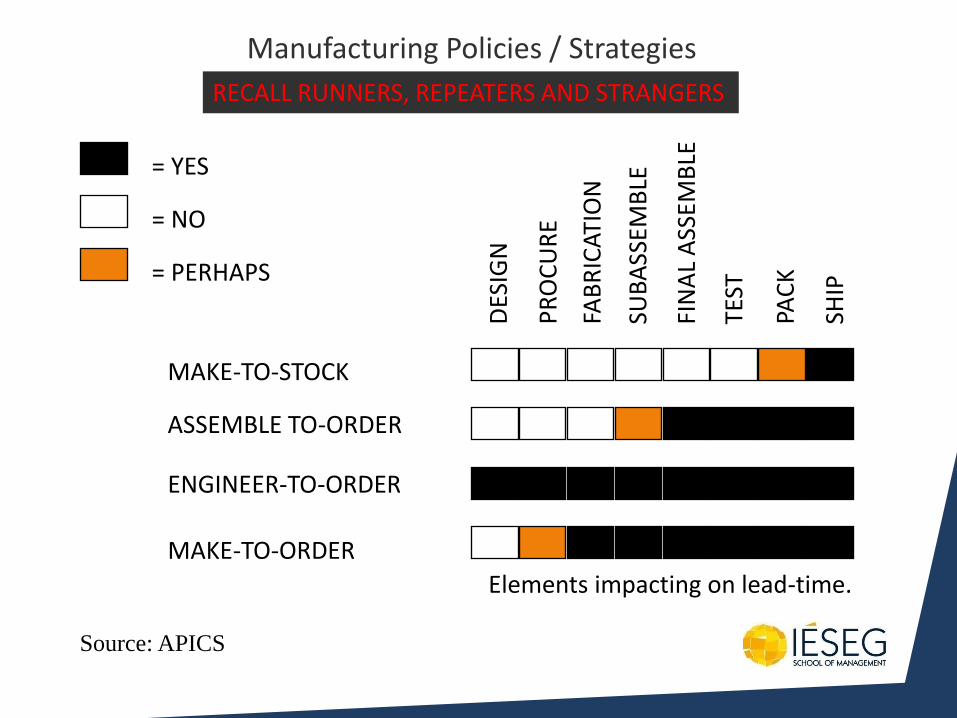
DES
IGN
PR
OC
UR
E
FAB
RIC
ATI
ON
SUB
ASS
EMB
LE
FIN
AL
ASS
EMB
LE
TEST
PAC
K
SHIP
= YES
= NO
= PERHAPS
MAKE-TO-STOCK
ASSEMBLE TO-ORDER
ENGINEER-TO-ORDER
MAKE-TO-ORDER
Elements impacting on lead-time.
Manufacturing Policies / Strategies
Source: APICS
RECALL RUNNERS, REPEATERS AND STRANGERS
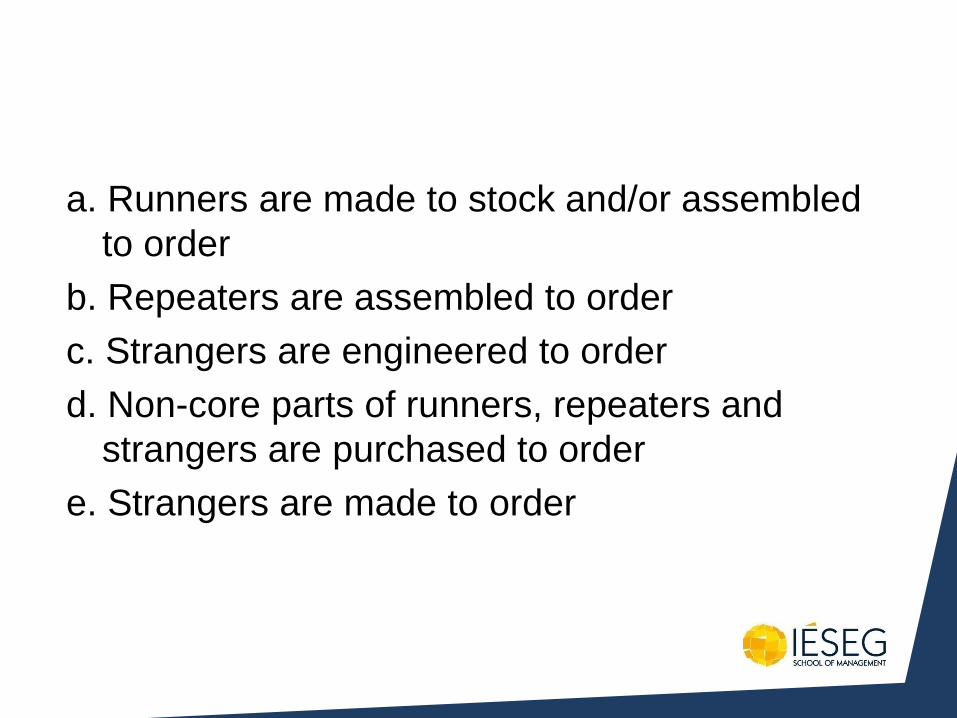
a. Runners are made to stock and/or assembled
to order
b. Repeaters are assembled to order
c. Strangers are engineered to order
d. Non-core parts of runners, repeaters and
strangers are purchased to order
e. Strangers are made to order
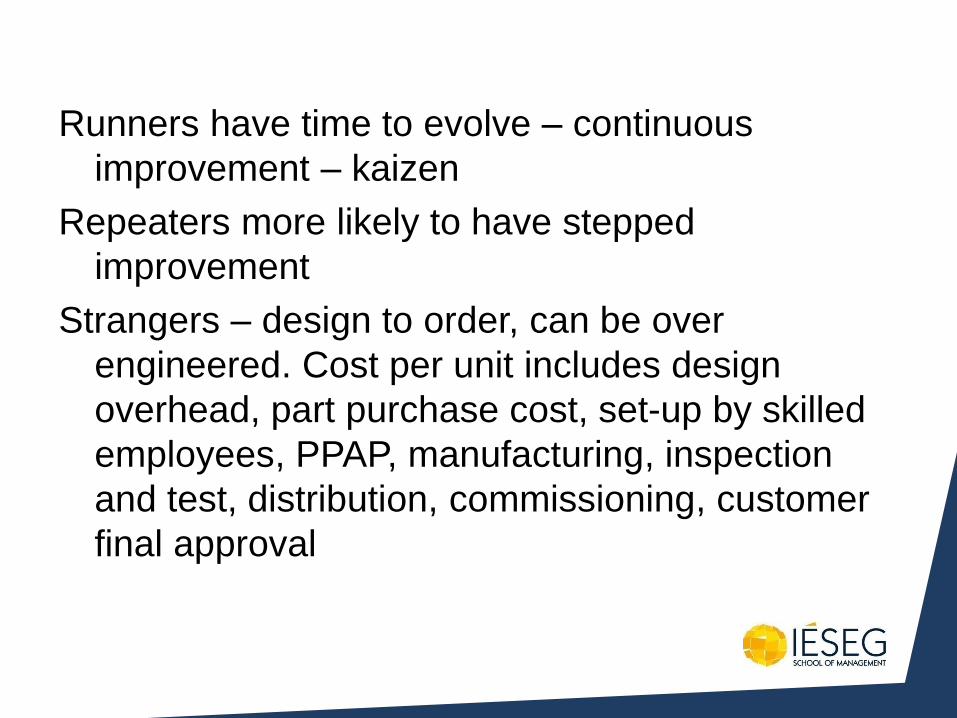
Runners have time to evolve – continuous
improvement – kaizen
Repeaters more likely to have stepped
improvement
Strangers – design to order, can be over
engineered. Cost per unit includes design
overhead, part purchase cost, set-up by skilled
employees, PPAP, manufacturing, inspection
and test, distribution, commissioning, customer
final approval
Manufacturing Policies / Strategies
Identify your own examples

http://www.instructables.com/id/Red-car-Yellow-car-Mini-The-reaction-sport/
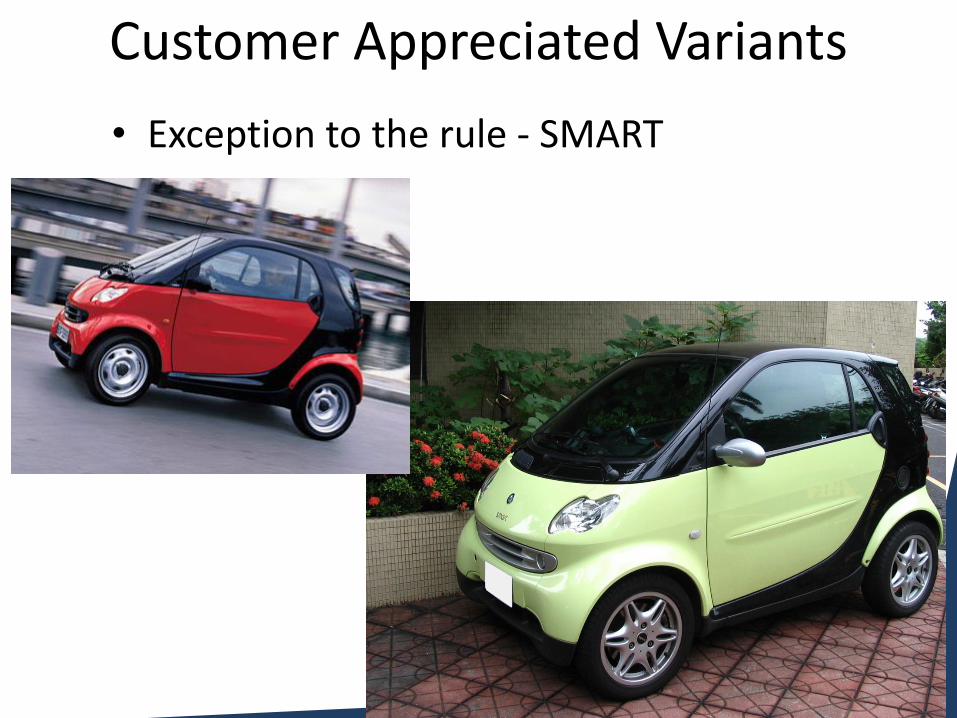
Customer Appreciated Variants
• As soon as you paint a car red, you can only sell it to someone that wants a red car.
http://auto.howstuffworks.com/smart-car.htm
Customer Appreciated Variants
• Exception to the rule - SMART
http://en.wikipedia.org/wiki/File:Smart_car.jpg
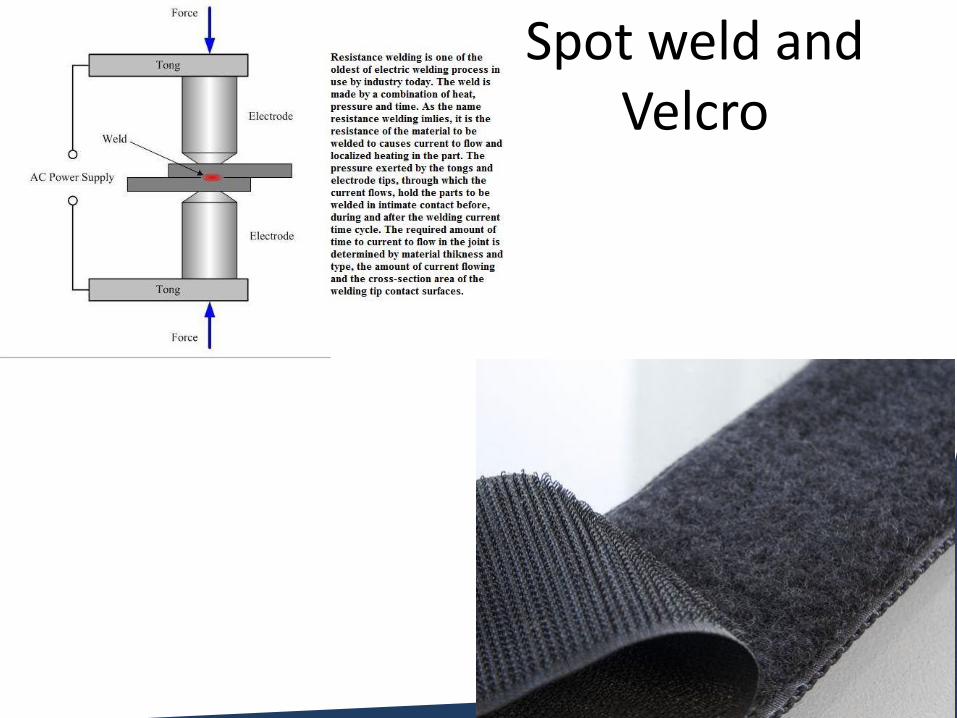
http://siliconcontrols.ca/system%20integration.htm
http://www.globaltextiles.com/tradeleads/detail/007/569202/Buy-Velcro-Tape.html
Spot weld and Velcro

• Smart velcro on variant parts – door skins. Other manufacturers glue them on so paint inside and outside together.
• After two years, a SMART owner may have a different colour, -takes 2 hours with appointment.
• Change colour of a conventional car – 1 month and many thousands of €
• SMART cars get stronger. Spot welded cars get weaker.
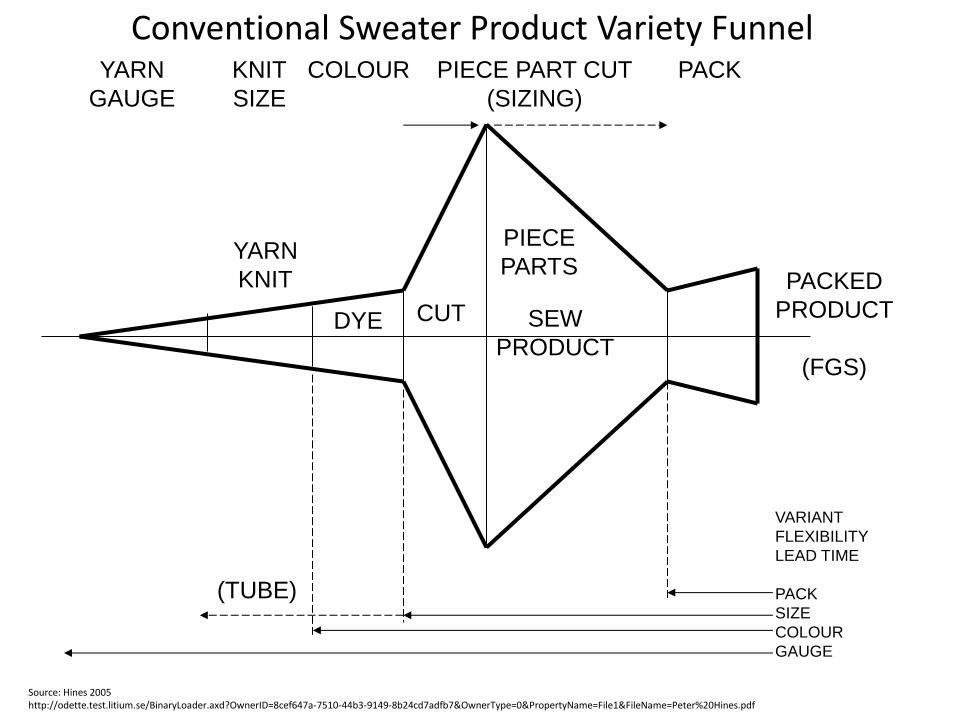
Conventional Sweater Product Variety Funnel YARN
GAUGE
YARN
KNIT
KNIT
SIZE
DYE
COLOUR
PACKED
PRODUCT
(FGS)
PACK
VARIANT
FLEXIBILITY
LEAD TIME
PACK
SIZE
COLOUR
GAUGE
(TUBE)
CUT
PIECE
PARTS
SEW
PRODUCT
PIECE PART CUT
(SIZING)
Source: Hines 2005 http://odette.test.litium.se/BinaryLoader.axd?OwnerID=8cef647a-7510-44b3-9149-8b24cd7adfb7&OwnerType=0&PropertyName=File1&FileName=Peter%20Hines.pdf
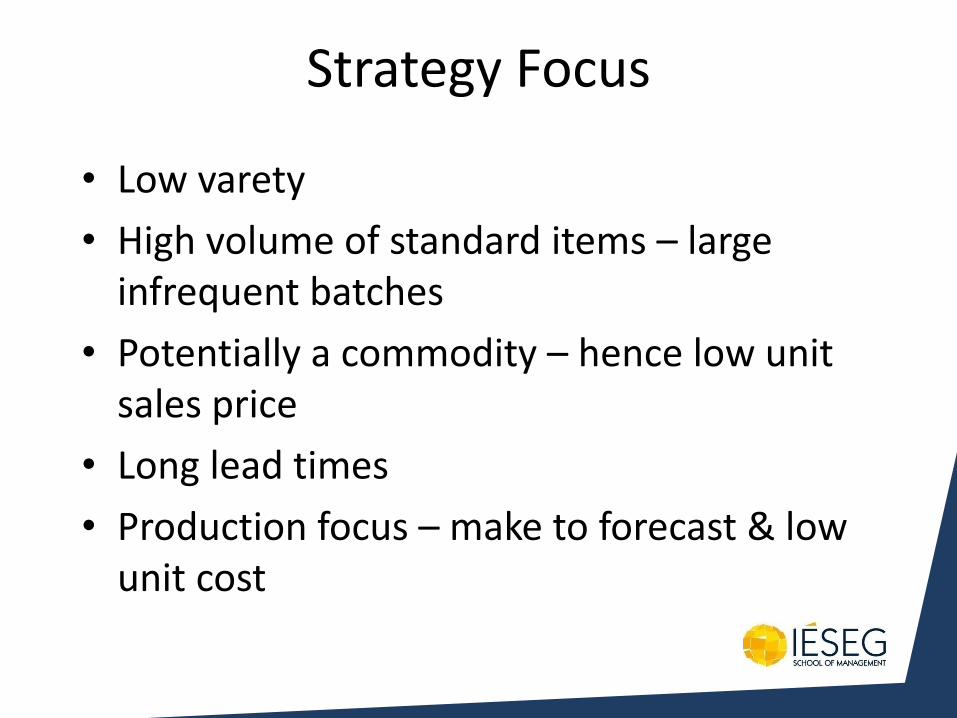
Strategy Focus
• Low varety
• High volume of standard items – large infrequent batches
• Potentially a commodity – hence low unit sales price
• Long lead times
• Production focus – make to forecast & low unit cost
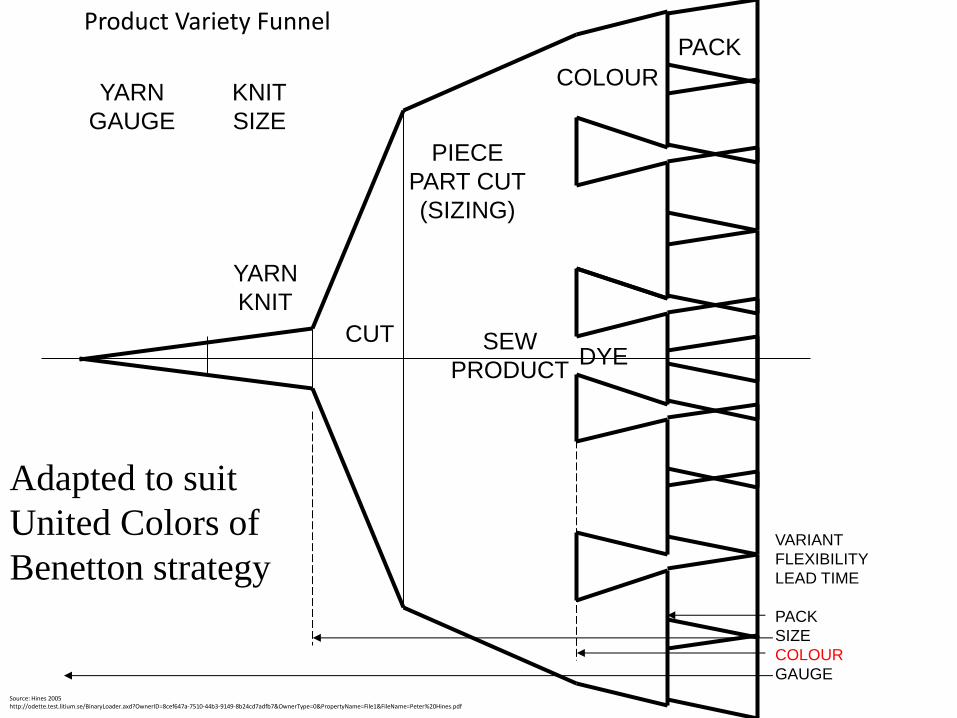
Product Variety Funnel
YARN
GAUGE
YARN
KNIT
KNIT
SIZE
DYE
COLOUR
PACK
VARIANT
FLEXIBILITY
LEAD TIME
PACK
SIZE
COLOUR
GAUGE
CUT SEW
PRODUCT
PIECE
PART CUT
(SIZING)
Adapted to suit
United Colors of
Benetton strategy
Source: Hines 2005 http://odette.test.litium.se/BinaryLoader.axd?OwnerID=8cef647a-7510-44b3-9149-8b24cd7adfb7&OwnerType=0&PropertyName=File1&FileName=Peter%20Hines.pdf
Check This Out
• http://bookboon.com/en/textbooks/management-organisation/fundamentals-of-supply-chain-management
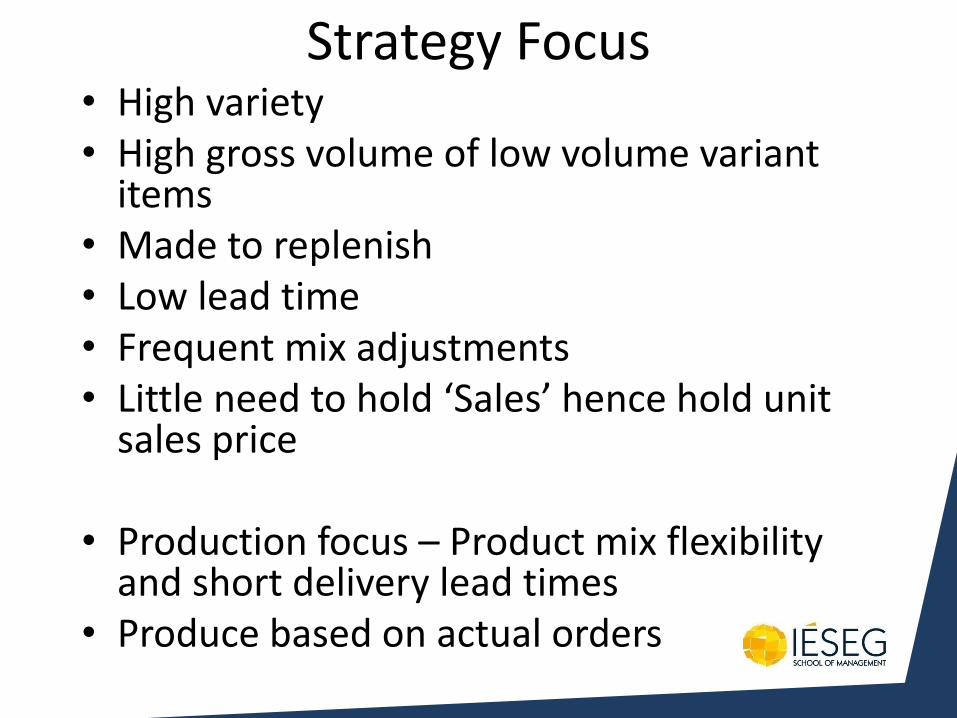
Strategy Focus • High variety • High gross volume of low volume variant
items • Made to replenish • Low lead time • Frequent mix adjustments • Little need to hold ‘Sales’ hence hold unit
sales price
• Production focus – Product mix flexibility and short delivery lead times
• Produce based on actual orders
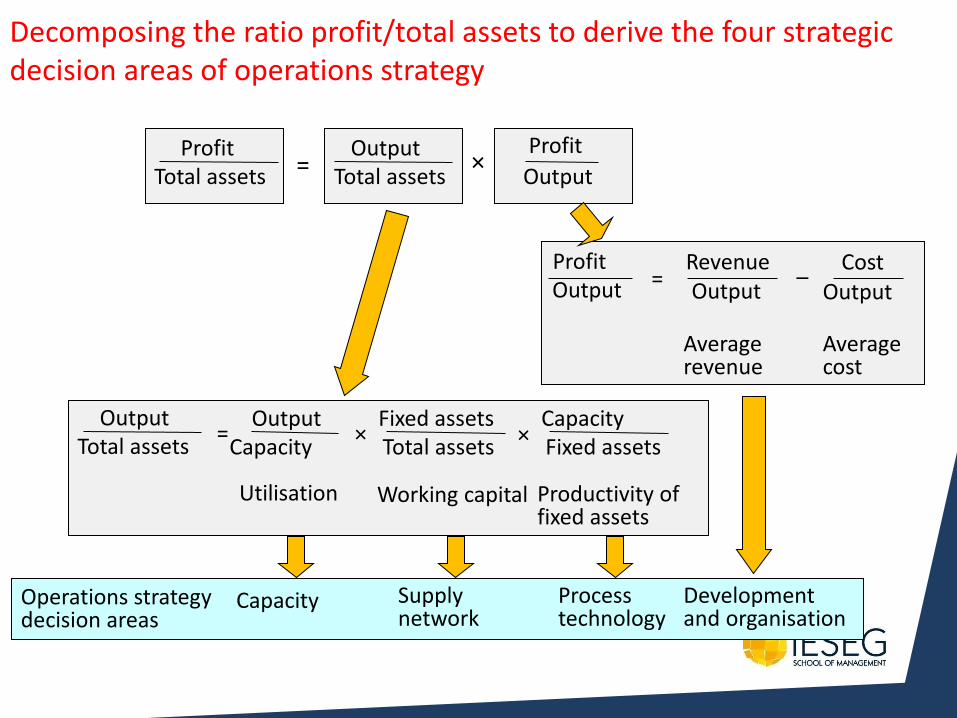
Profit Total assets
Output Total assets
Profit
Output =
×
Decomposing the ratio profit/total assets to derive the four strategic decision areas of operations strategy
Output Total assets
Output Capacity
Fixed assets Total assets
Capacity Fixed assets
Utilisation Working capital Productivity of fixed assets
= × ×
Operations strategy decision areas
Capacity Supply network
Process technology
Development and organisation
Profit Output
Revenue Output
Cost Output
Average revenue
Average cost
= –
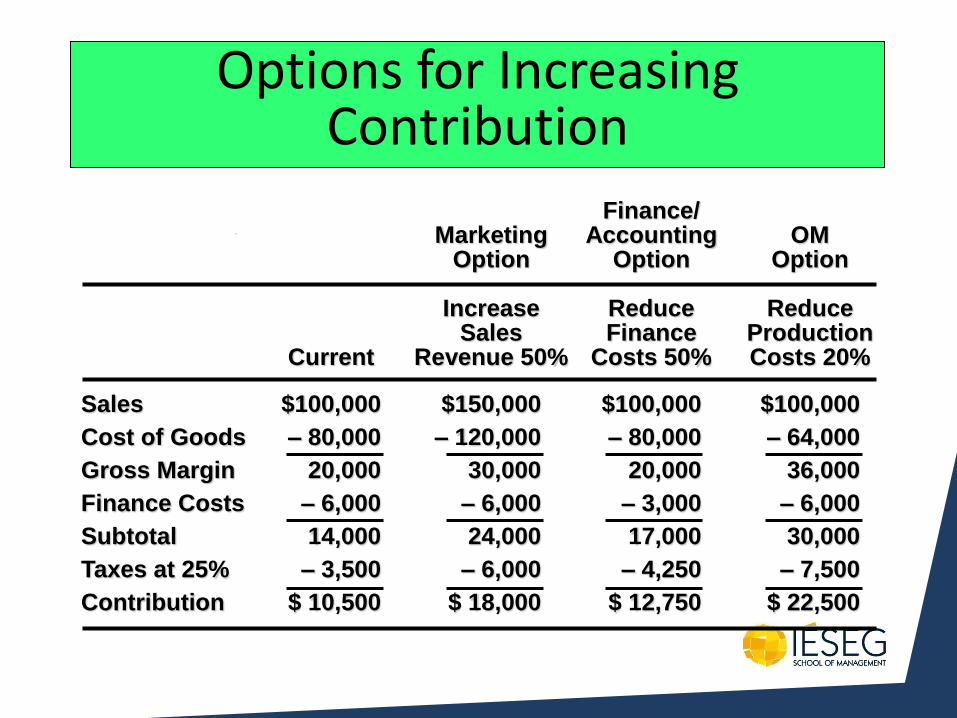
Options for Increasing Contribution
Sales $100,000 $150,000 $100,000 $100,000
Cost of Goods – 80,000 – 120,000 – 80,000 – 64,000
Gross Margin 20,000 30,000 20,000 36,000
Finance Costs – 6,000 – 6,000 – 3,000 – 6,000
Subtotal 14,000 24,000 17,000 30,000
Taxes at 25% – 3,500 – 6,000 – 4,250 – 7,500
Contribution $ 10,500 $ 18,000 $ 12,750 $ 22,500
Finance/ Marketing Accounting OM Option Option Option Increase Reduce Reduce Sales Finance Production Current Revenue 50% Costs 50% Costs 20%
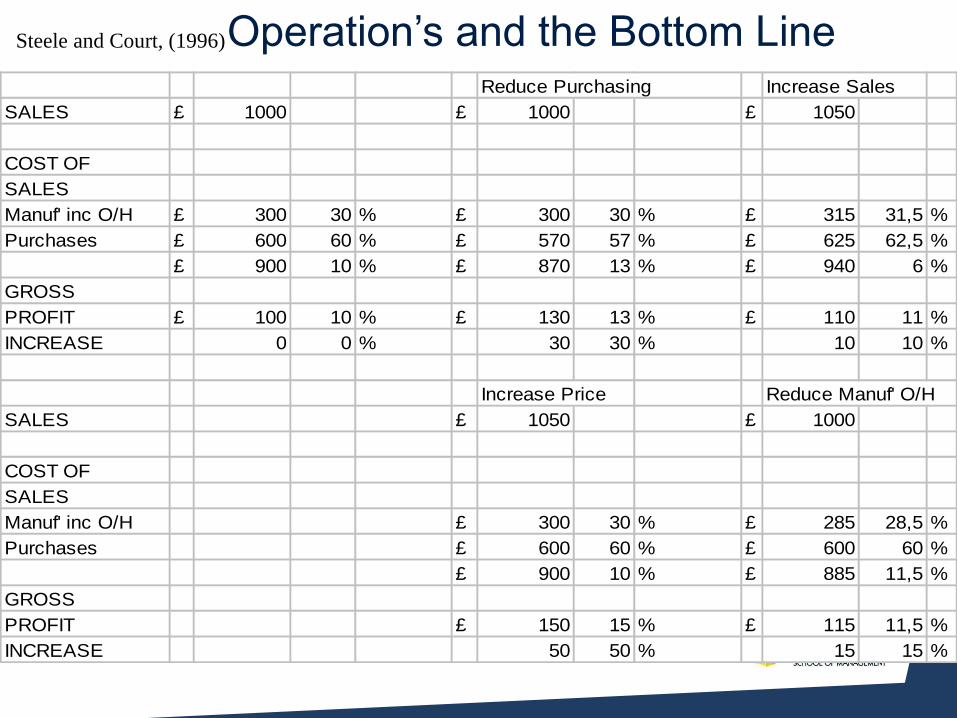
Operation’s and the Bottom Line Reduce Purchasing Increase Sales
SALES £ 1000 £ 1000 £ 1050
COST OF
SALES
Manuf' inc O/H £ 300 30 % £ 300 30 % £ 315 31,5 %
Purchases £ 600 60 % £ 570 57 % £ 625 62,5 %
£ 900 10 % £ 870 13 % £ 940 6 %
GROSS
PROFIT £ 100 10 % £ 130 13 % £ 110 11 %
INCREASE 0 0 % 30 30 % 10 10 %
Increase Price Reduce Manuf' O/H
SALES £ 1050 £ 1000
COST OF
SALES
Manuf' inc O/H £ 300 30 % £ 285 28,5 %
Purchases £ 600 60 % £ 600 60 %
£ 900 10 % £ 885 11,5 %
GROSS
PROFIT £ 150 15 % £ 115 11,5 %
INCREASE 50 50 % 15 15 %
Steele and Court, (1996)
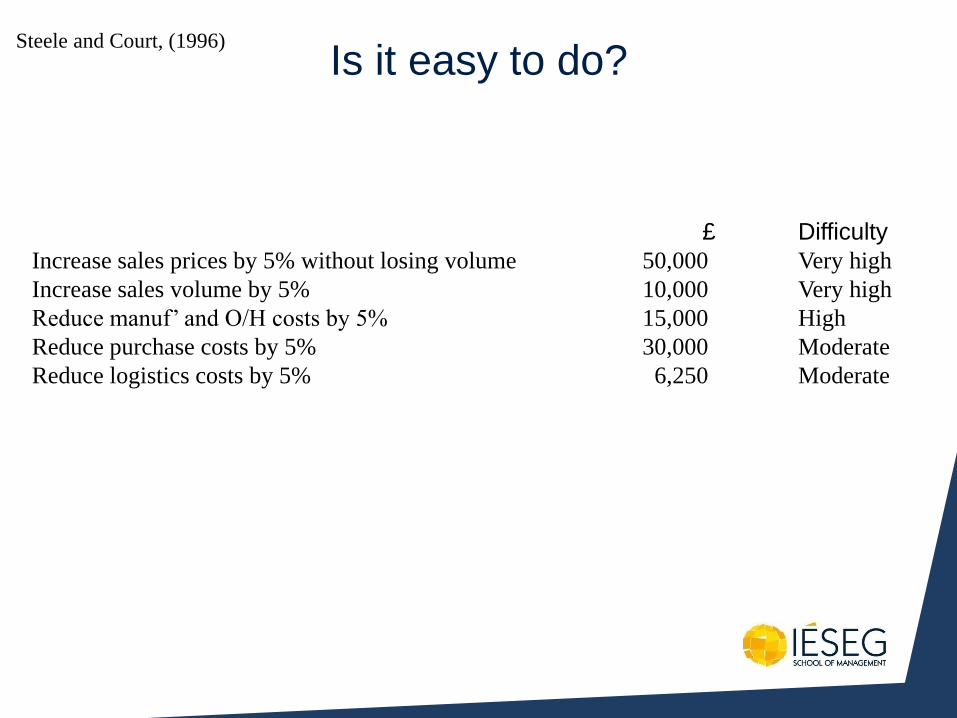
Is it easy to do?
£ Difficulty
Increase sales prices by 5% without losing volume 50,000 Very high
Increase sales volume by 5% 10,000 Very high
Reduce manuf’ and O/H costs by 5% 15,000 High
Reduce purchase costs by 5% 30,000 Moderate
Reduce logistics costs by 5% 6,250 Moderate
Steele and Court, (1996)
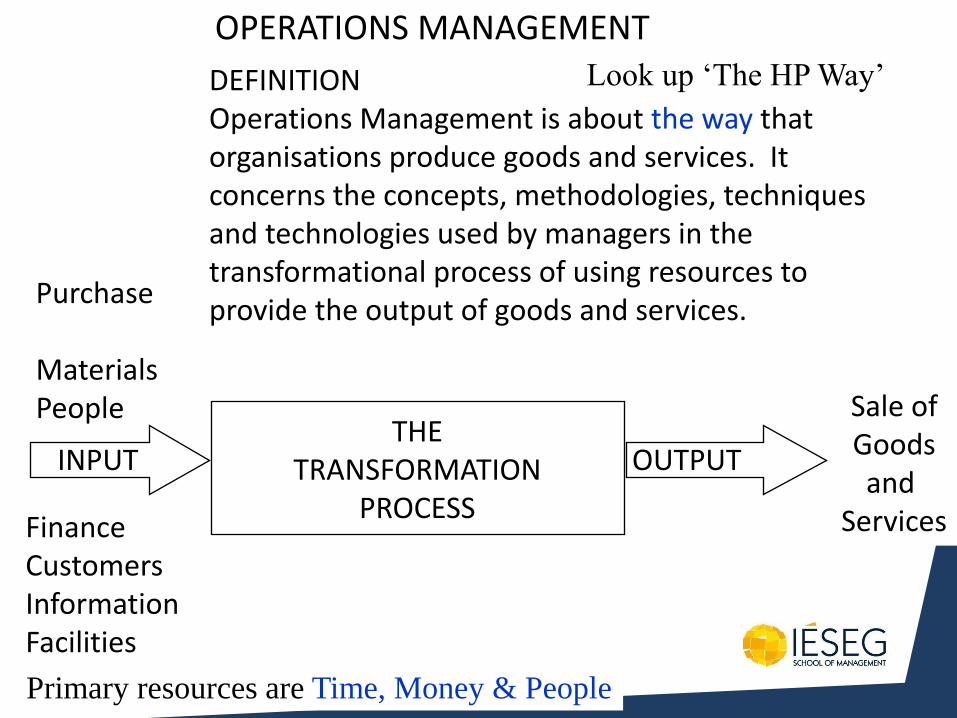
OPERATIONS MANAGEMENT
DEFINITION Operations Management is about the way that organisations produce goods and services. It concerns the concepts, methodologies, techniques and technologies used by managers in the transformational process of using resources to provide the output of goods and services.
Sale of Goods and
Services
OUTPUT INPUT
Purchase Materials People
Finance Customers Information Facilities
THE TRANSFORMATION
PROCESS
Primary resources are Time, Money & People
Look up ‘The HP Way’

Source: Waller
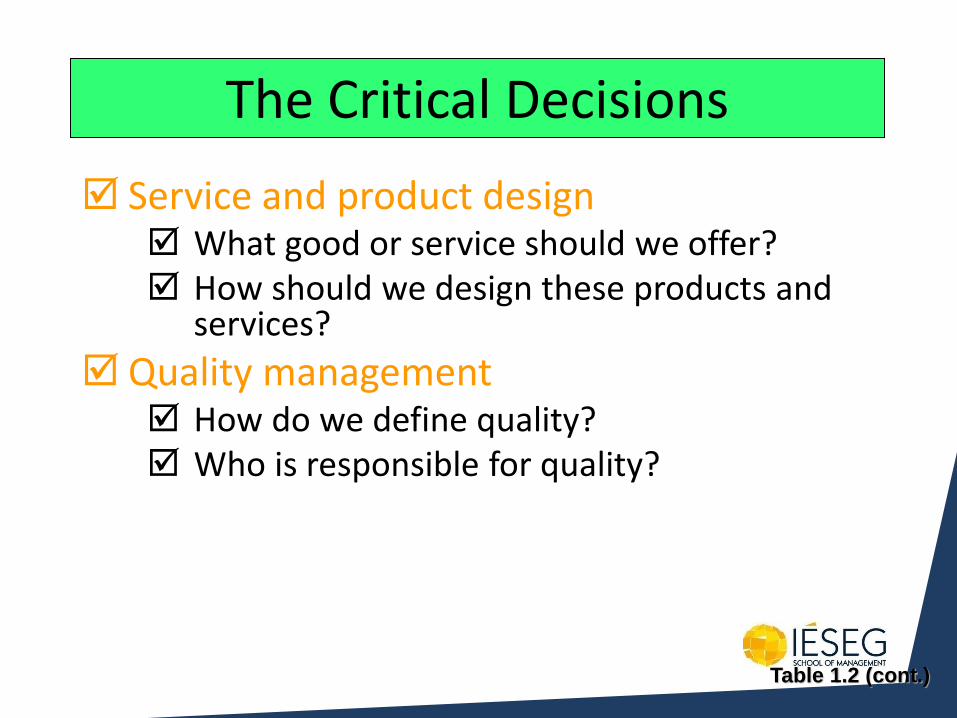
The Critical Decisions
Service and product design What good or service should we offer? How should we design these products and
services?
Quality management How do we define quality? Who is responsible for quality?
Table 1.2 (cont.)
The Critical Decisions
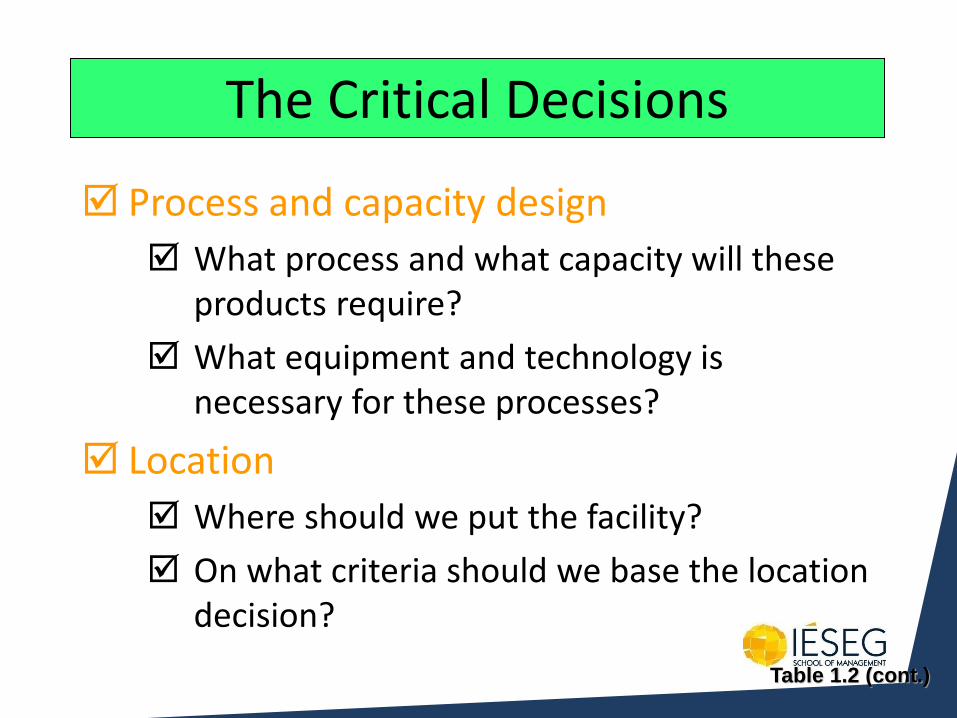
Process and capacity design
What process and what capacity will these products require?
What equipment and technology is necessary for these processes?
Location
Where should we put the facility?
On what criteria should we base the location decision?
Table 1.2 (cont.)
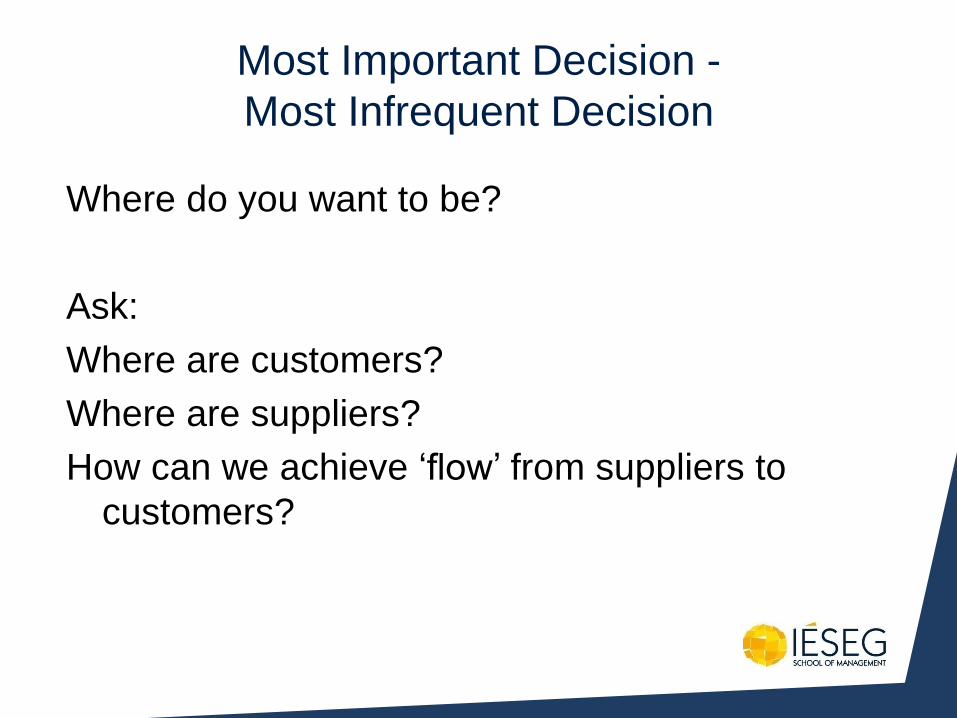
Most Important Decision -
Most Infrequent Decision
Where do you want to be?
Ask:
Where are customers?
Where are suppliers?
How can we achieve ‘flow’ from suppliers to
customers?
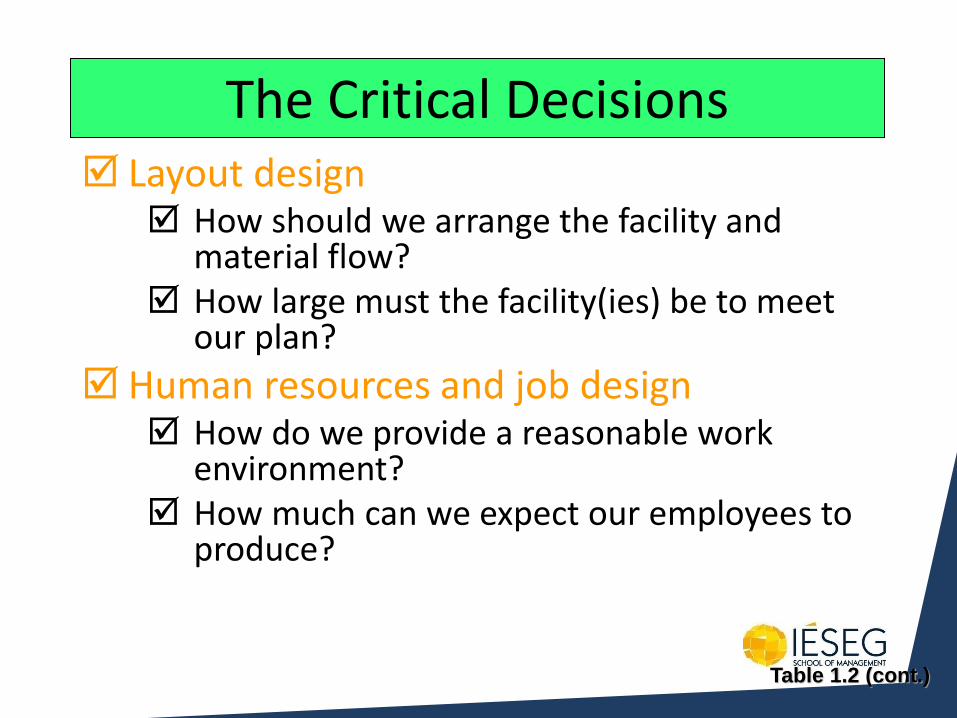
The Critical Decisions Layout design
How should we arrange the facility and material flow?
How large must the facility(ies) be to meet our plan?
Human resources and job design How do we provide a reasonable work
environment? How much can we expect our employees to
produce?
Table 1.2 (cont.)
The Critical Decisions
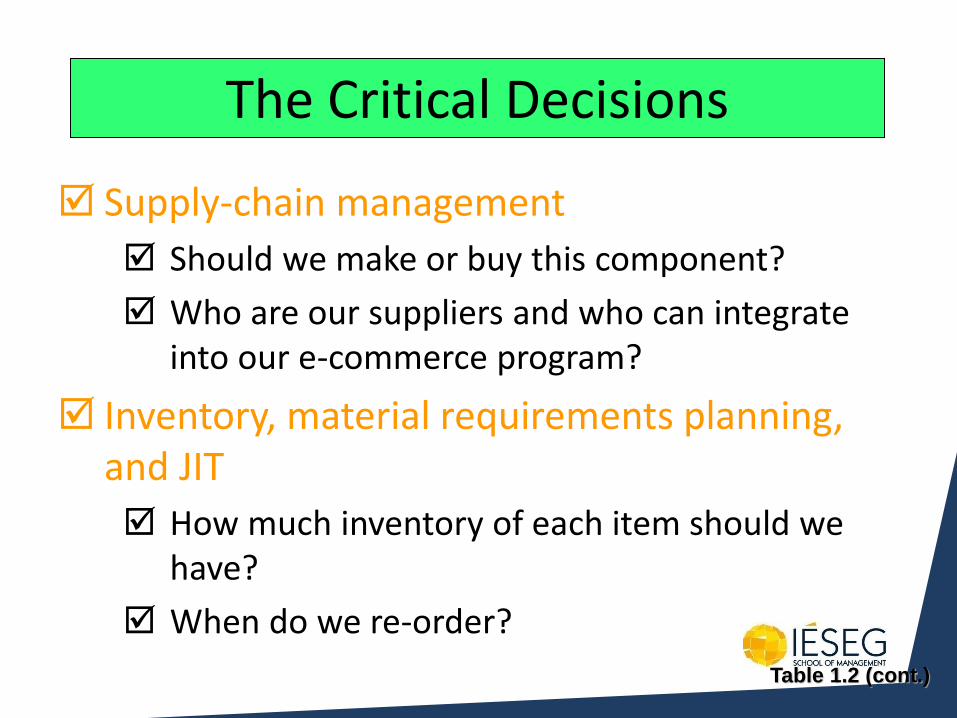
Supply-chain management
Should we make or buy this component?
Who are our suppliers and who can integrate into our e-commerce program?
Inventory, material requirements planning, and JIT
How much inventory of each item should we have?
When do we re-order?
Table 1.2 (cont.)
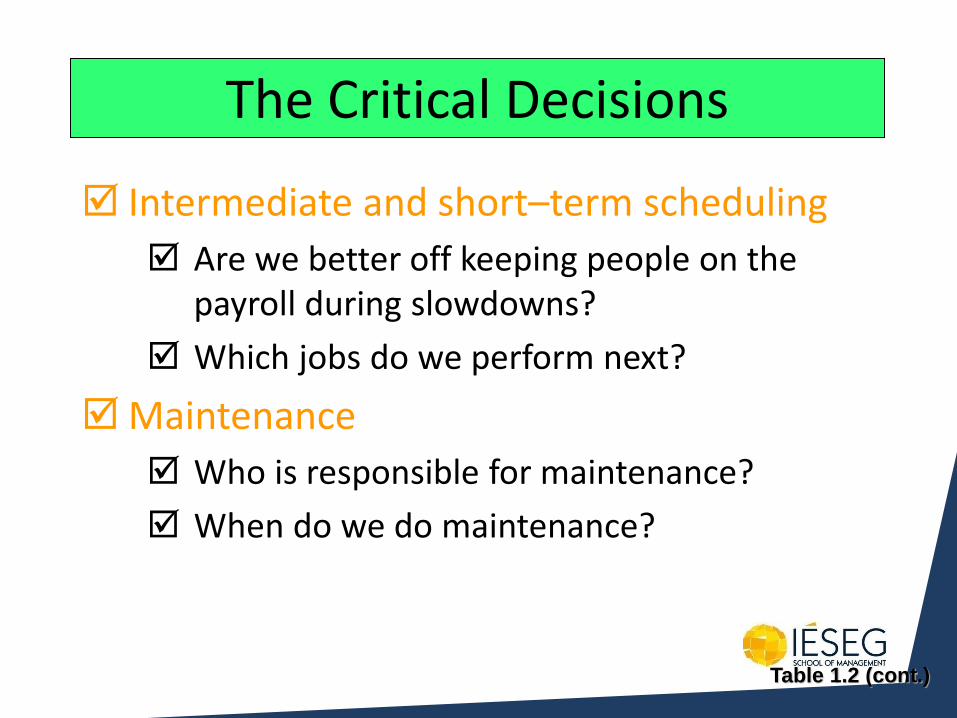
The Critical Decisions
Intermediate and short–term scheduling
Are we better off keeping people on the payroll during slowdowns?
Which jobs do we perform next?
Maintenance
Who is responsible for maintenance?
When do we do maintenance?
Table 1.2 (cont.)
New Challenges in OM
Global focus
Just-in-time
Supply chain
partnering
Rapid product
development,
alliances
Mass
customization
Empowered
employees, teams
To From
Local or national focus
Batch shipments
Low bid purchasing
Lengthy product development
Standard products
Job specialization
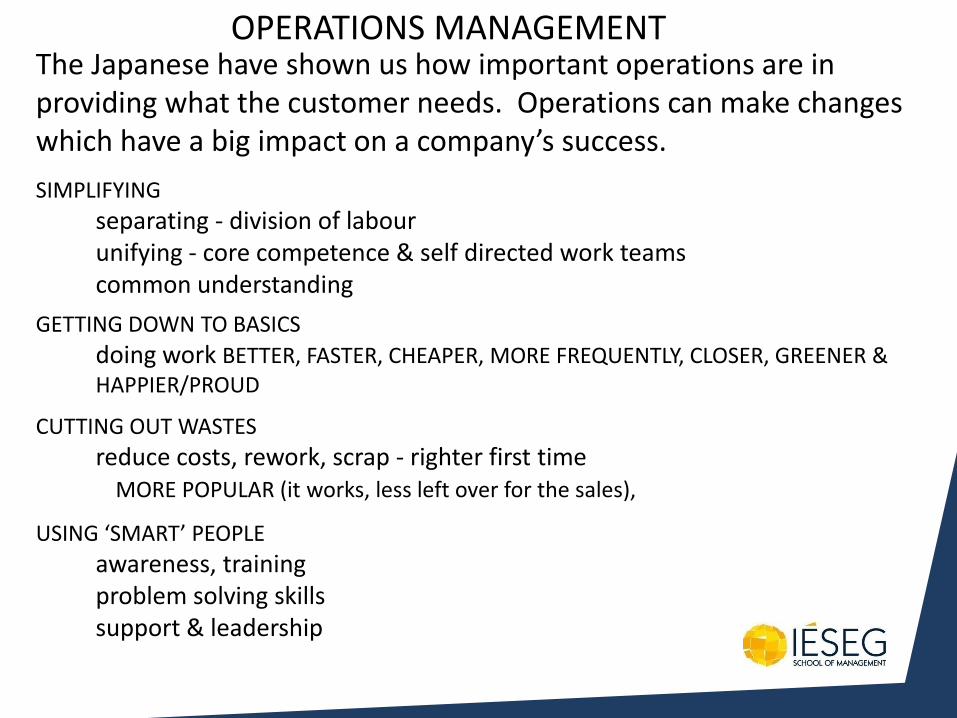
OPERATIONS MANAGEMENT The Japanese have shown us how important operations are in providing what the customer needs. Operations can make changes which have a big impact on a company’s success.
SIMPLIFYING
separating - division of labour unifying - core competence & self directed work teams common understanding
GETTING DOWN TO BASICS
doing work BETTER, FASTER, CHEAPER, MORE FREQUENTLY, CLOSER, GREENER & HAPPIER/PROUD
CUTTING OUT WASTES
reduce costs, rework, scrap - righter first time MORE POPULAR (it works, less left over for the sales),
USING ‘SMART’ PEOPLE
awareness, training problem solving skills support & leadership
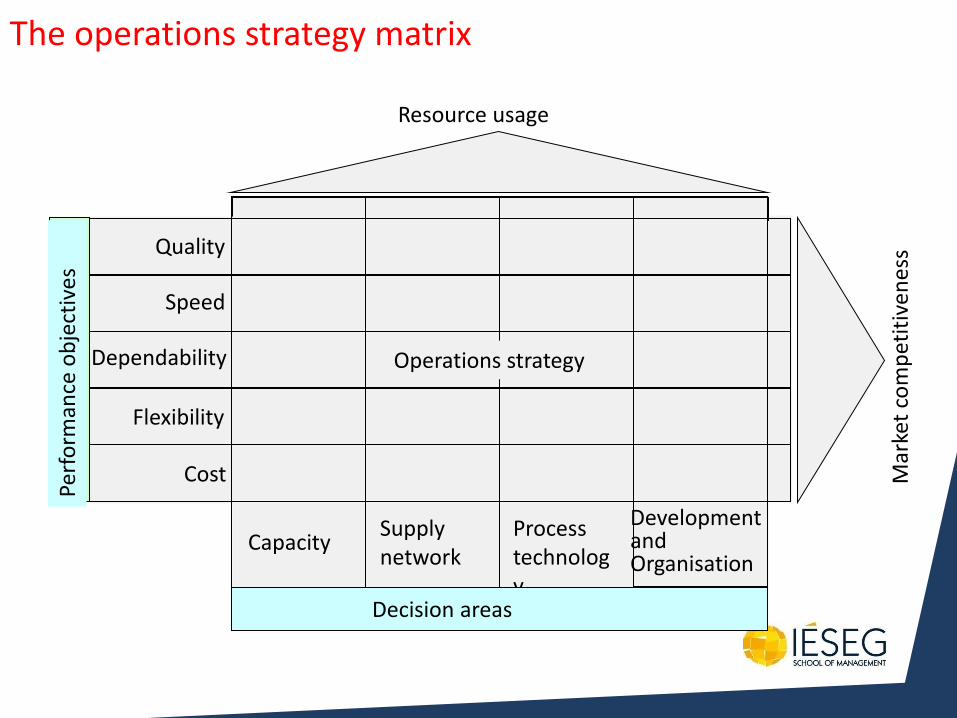
Operations strategy
Perf
orm
ance
ob
ject
ives
Quality
Speed
Dependability
Flexibility
Cost
Development and Organisation
Capacity Supply network
Process technology
Decision areas
Mar
ket
com
pet
itiv
enes
s
The operations strategy matrix
Resource usage
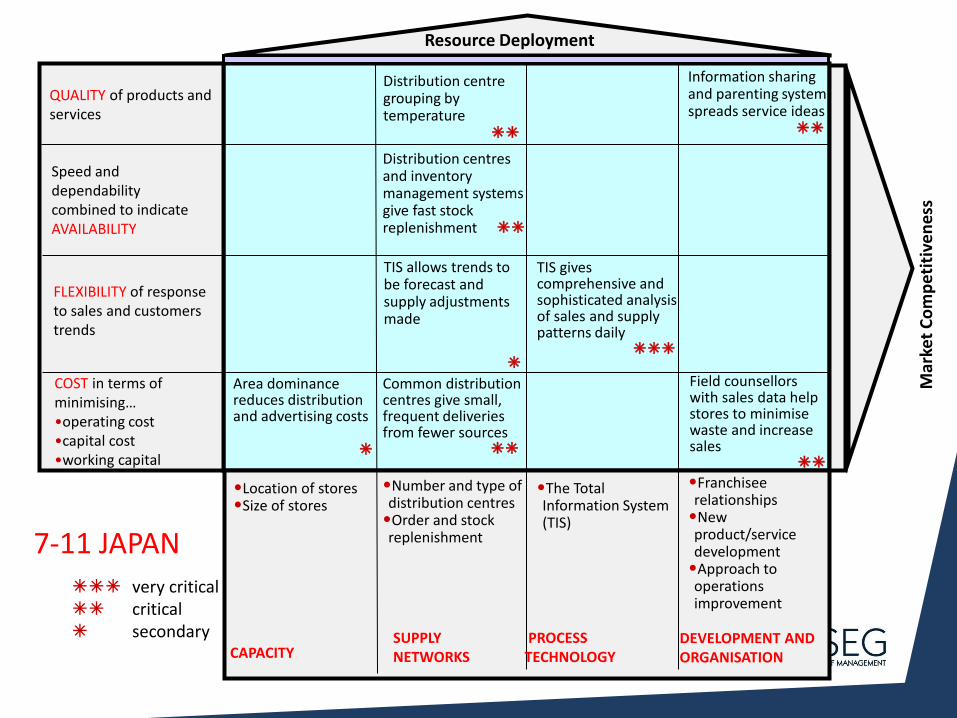
COST in terms of minimising… •operating cost •capital cost •working capital
QUALITY of products and services
Speed and dependability combined to indicate AVAILABILITY
FLEXIBILITY of response to sales and customers trends
Area dominance reduces distribution and advertising costs
•Location of stores •Size of stores
Distribution centre grouping by temperature
Distribution centres and inventory management systems give fast stock replenishment
TIS allows trends to be forecast and supply adjustments made
Common distribution centres give small, frequent deliveries from fewer sources
•Number and type of distribution centres •Order and stock replenishment
TIS gives comprehensive and sophisticated analysis of sales and supply patterns daily
•The Total Information System (TIS)
Information sharing and parenting system spreads service ideas
Field counsellors with sales data help stores to minimise waste and increase sales
•Franchisee relationships •New product/service development •Approach to operations improvement
DEVELOPMENT AND ORGANISATION
PROCESS TECHNOLOGY
SUPPLY NETWORKS CAPACITY
Resource Deployment
Mar
ket
Co
mp
etit
ive
nes
s
very critical critical secondary
7-11 JAPAN
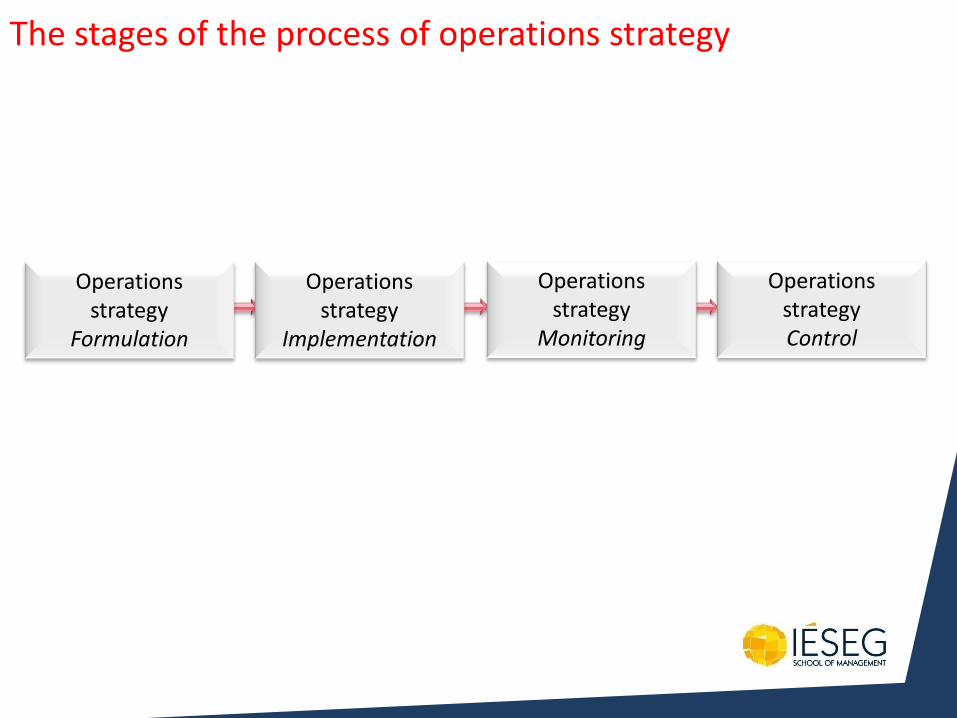
The stages of the process of operations strategy
Operations strategy
Formulation
Operations strategy
Implementation
Operations strategy
Monitoring
Operations strategy Control
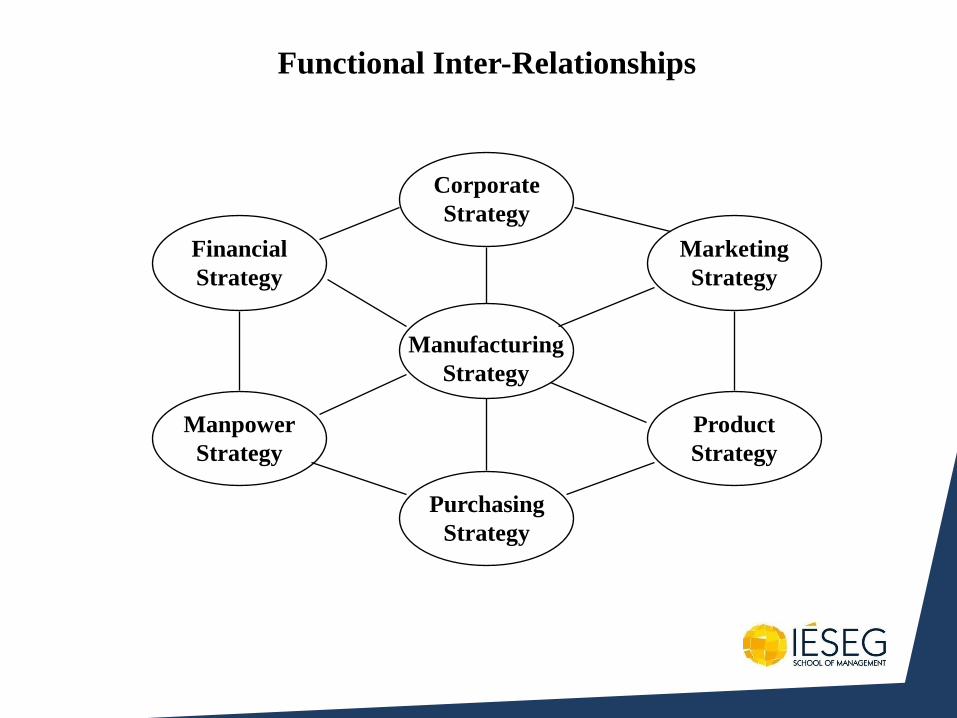
Manufacturing
Strategy
Corporate
Strategy
Purchasing
Strategy
Financial
Strategy
Manpower
Strategy
Marketing
Strategy
Product
Strategy
Functional Inter-Relationships
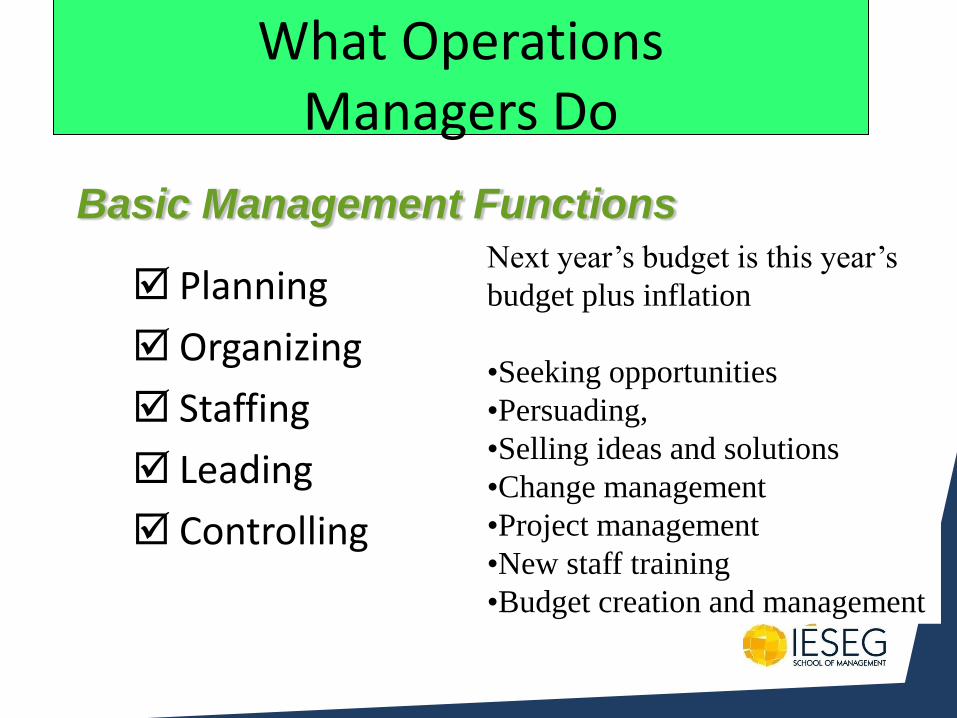
What Operations Managers Do
Planning
Organizing
Staffing
Leading
Controlling
Basic Management Functions Next year’s budget is this year’s
budget plus inflation
•Seeking opportunities
•Persuading,
•Selling ideas and solutions
•Change management
•Project management
•New staff training
•Budget creation and management
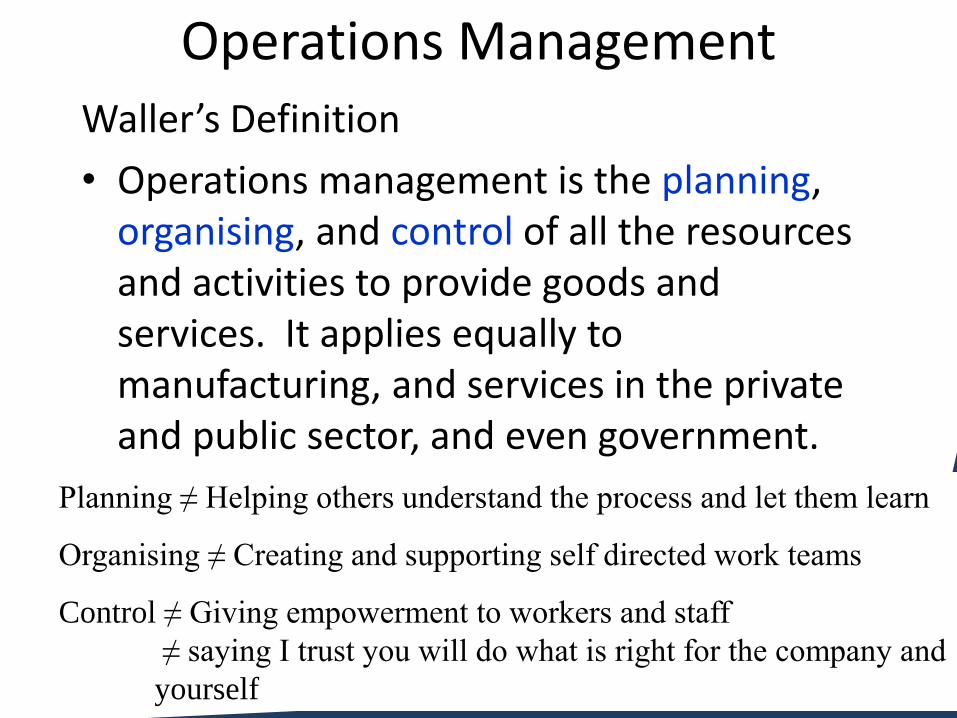
Operations Management Waller’s Definition
• Operations management is the planning, organising, and control of all the resources and activities to provide goods and services. It applies equally to manufacturing, and services in the private and public sector, and even government.
Planning ≠ Helping others understand the process and let them learn
Organising ≠ Creating and supporting self directed work teams
Control ≠ Giving empowerment to workers and staff
≠ saying I trust you will do what is right for the company and
yourself
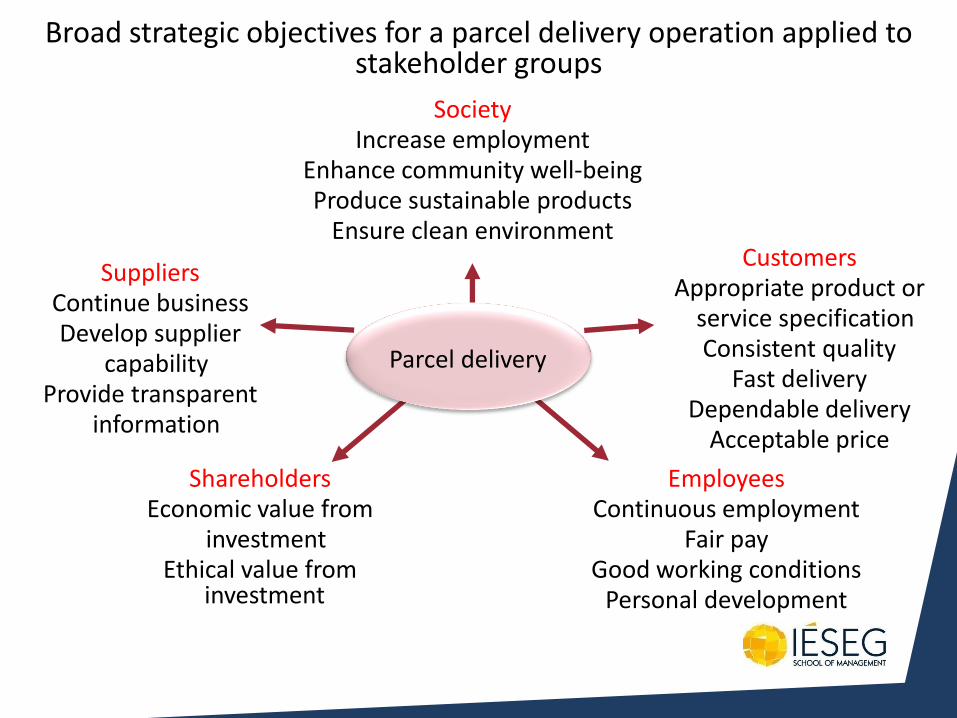
Broad strategic objectives for a parcel delivery operation applied to stakeholder groups
Society Increase employment
Enhance community well-being Produce sustainable products
Ensure clean environment Customers
Appropriate product or service specification
Consistent quality Fast delivery
Dependable delivery Acceptable price
Suppliers Continue business Develop supplier
capability Provide transparent
information
Shareholders Economic value from
investment Ethical value from
investment
Employees Continuous employment
Fair pay Good working conditions
Personal development
Parcel delivery
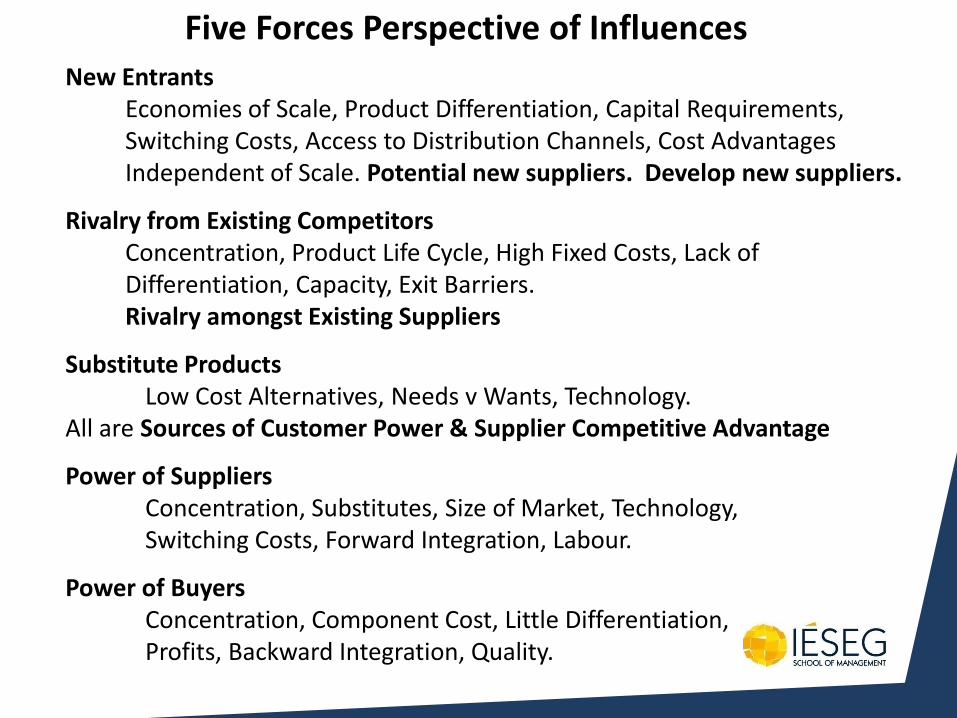
Five Forces Perspective of Influences New Entrants
Economies of Scale, Product Differentiation, Capital Requirements, Switching Costs, Access to Distribution Channels, Cost Advantages Independent of Scale. Potential new suppliers. Develop new suppliers.
Rivalry from Existing Competitors Concentration, Product Life Cycle, High Fixed Costs, Lack of Differentiation, Capacity, Exit Barriers. Rivalry amongst Existing Suppliers
Substitute Products Low Cost Alternatives, Needs v Wants, Technology. All are Sources of Customer Power & Supplier Competitive Advantage
Power of Suppliers Concentration, Substitutes, Size of Market, Technology, Switching Costs, Forward Integration, Labour.
Power of Buyers Concentration, Component Cost, Little Differentiation, Profits, Backward Integration, Quality.
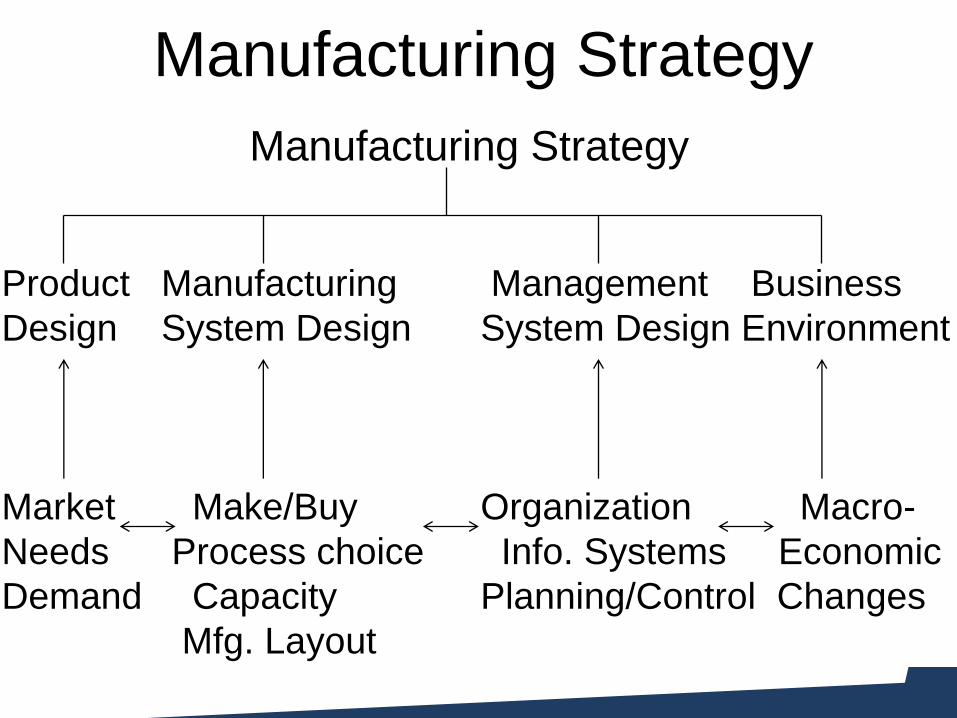
Manufacturing Strategy
Manufacturing Strategy
Product Manufacturing Management Business
Design System Design System Design Environment
Market Make/Buy Organization Macro-
Needs Process choice Info. Systems Economic
Demand Capacity Planning/Control Changes
Mfg. Layout
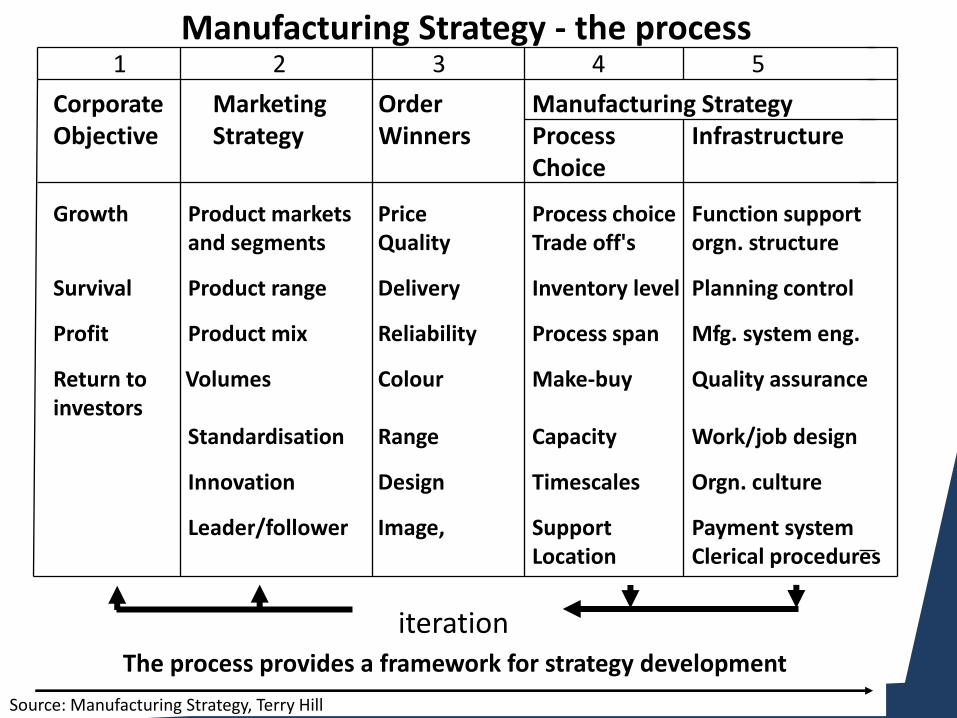
The process provides a framework for strategy development
Manufacturing Strategy - the process
Corporate Marketing Order Manufacturing Strategy Objective Strategy Winners Process Infrastructure Choice
Growth Product markets Price Process choice Function support and segments Quality Trade off's orgn. structure
Survival Product range Delivery Inventory level Planning control
Profit Product mix Reliability Process span Mfg. system eng.
Return to Volumes Colour Make-buy Quality assurance investors Standardisation Range Capacity Work/job design
Innovation Design Timescales Orgn. culture
Leader/follower Image, Support Payment system Location Clerical procedures
1 2 3 4 5
iteration
Source: Manufacturing Strategy, Terry Hill
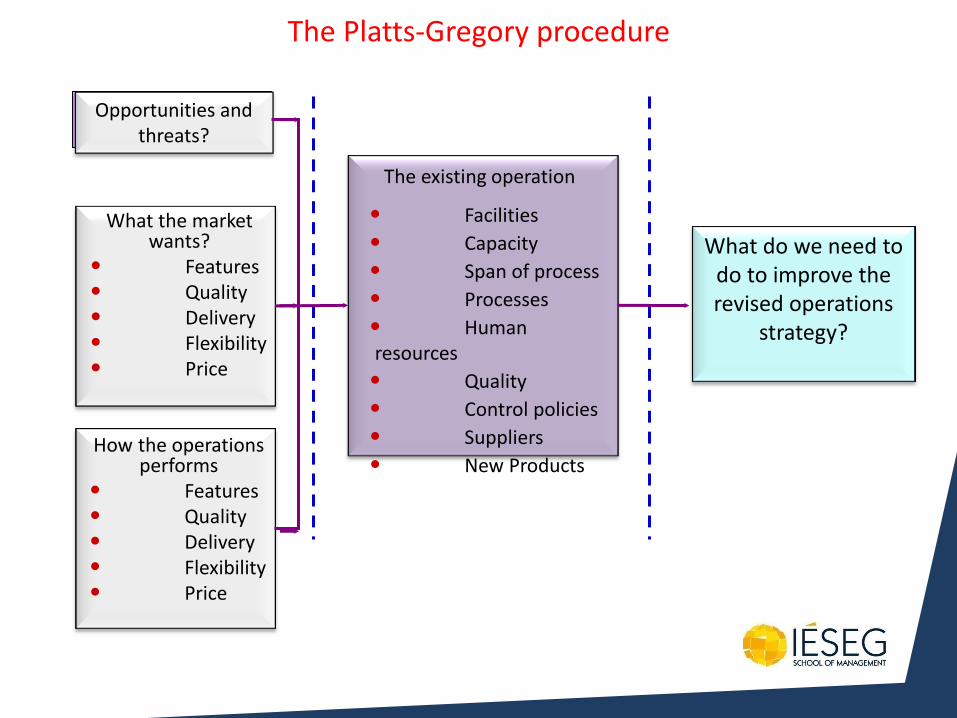
• Facilities
• Capacity
• Span of process
• Processes
• Human resources
• Quality
• Control policies
• Suppliers
• New Products
The existing operation
What do we need to do to improve the revised operations
strategy?
What the market wants?
• Features • Quality • Delivery • Flexibility • Price
Opportunities and threats?
The Platts-Gregory procedure
How the operations performs
• Features • Quality • Delivery • Flexibility • Price
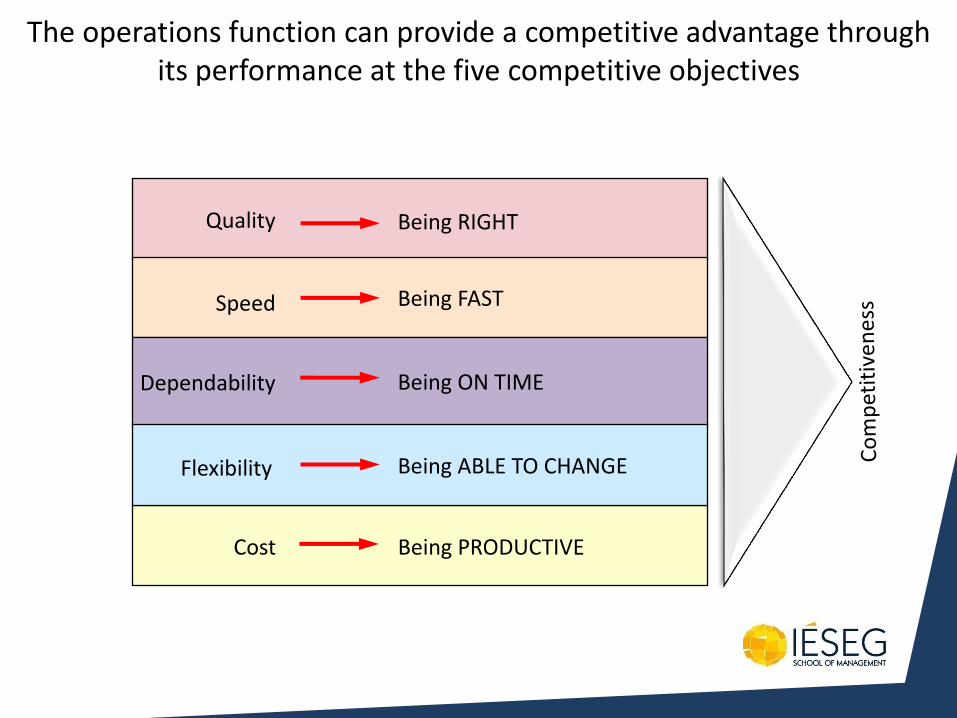
The operations function can provide a competitive advantage through its performance at the five competitive objectives
Quality Being RIGHT
Speed Being FAST
Dependability Being ON TIME
Cost Being PRODUCTIVE
Being ABLE TO CHANGE Flexibility
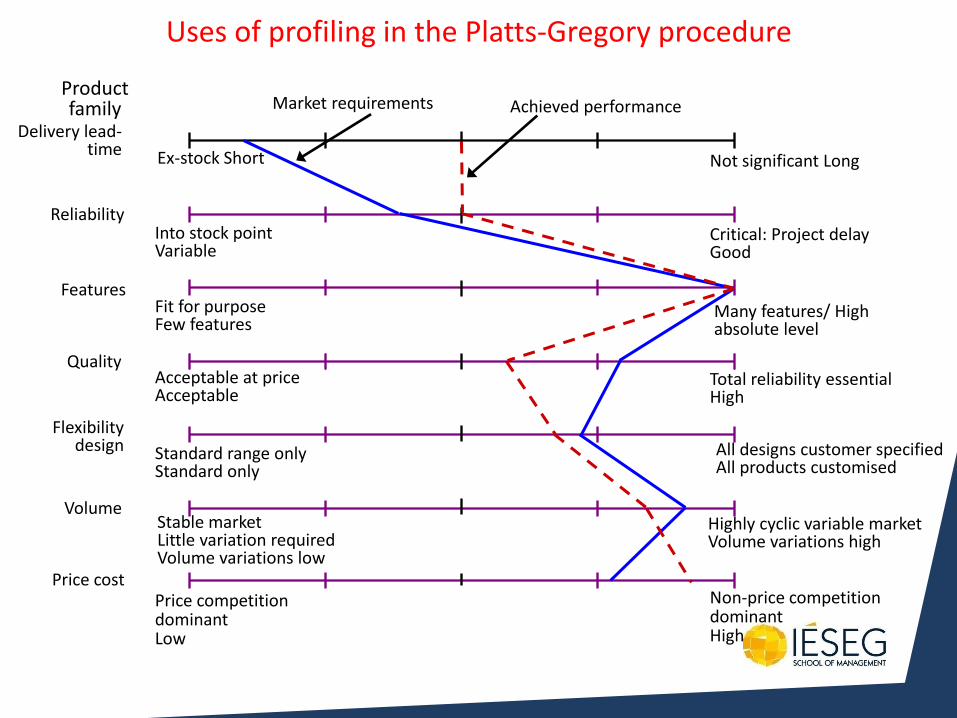
Product family
Reliability Into stock point Variable
Critical: Project delay Good
Features Fit for purpose Few features
Many features/ High absolute level
Total reliability essential High
Flexibility design Standard range only
Standard only
Quality Acceptable at price Acceptable
All designs customer specified All products customised
Stable market Little variation required Volume variations low
Highly cyclic variable market Volume variations high
Delivery lead-time Ex-stock Short Not significant Long
Volume
Price cost Price competition dominant Low
Non-price competition dominant High
Achieved performance Market requirements
Uses of profiling in the Platts-Gregory procedure
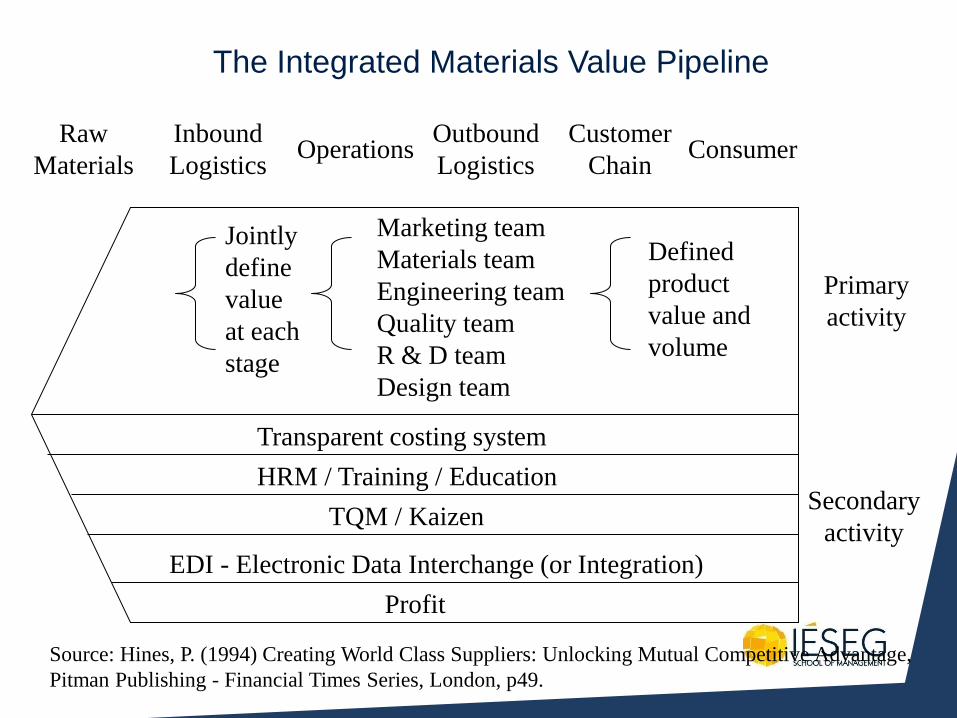
The Integrated Materials Value Pipeline
Source: Hines, P. (1994) Creating World Class Suppliers: Unlocking Mutual Competitive Advantage,
Pitman Publishing - Financial Times Series, London, p49.
Jointly
define
value
at each
stage
Marketing team
Materials team
Engineering team
Quality team
R & D team
Design team
Defined
product
value and
volume
Primary
activity
Secondary
activity
Transparent costing system
HRM / Training / Education
TQM / Kaizen
EDI - Electronic Data Interchange (or Integration)
Profit
Consumer Customer
Chain
Outbound
Logistics
Inbound
Logistics Operations
Raw
Materials
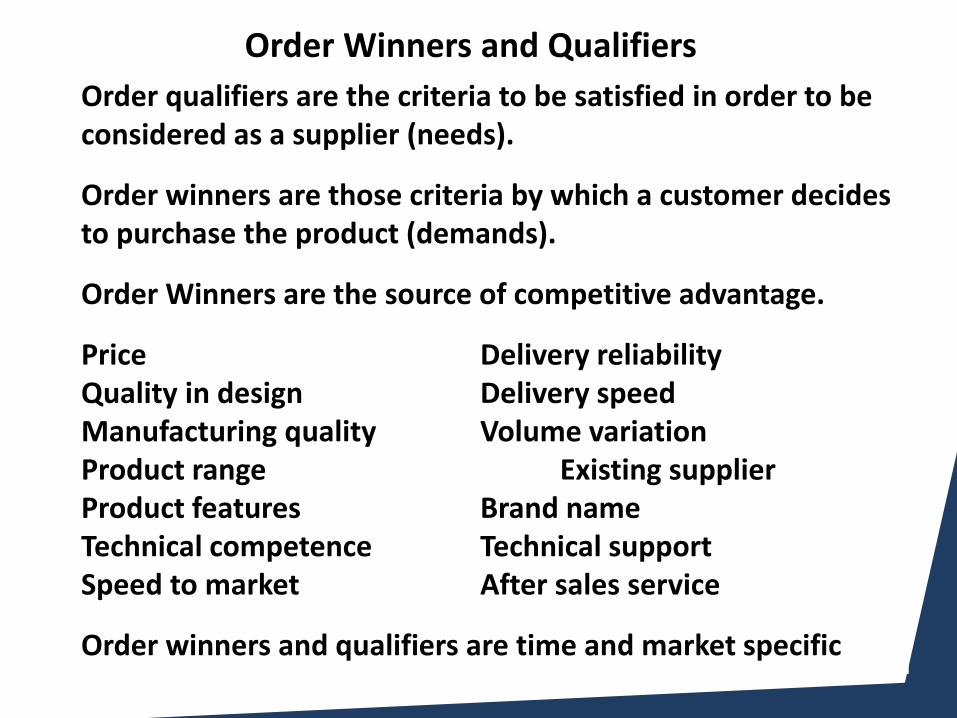
Order Winners and Qualifiers
Order qualifiers are the criteria to be satisfied in order to be considered as a supplier (needs).
Order winners are those criteria by which a customer decides to purchase the product (demands).
Order Winners are the source of competitive advantage.
Price Delivery reliability Quality in design Delivery speed Manufacturing quality Volume variation Product range Existing supplier Product features Brand name Technical competence Technical support Speed to market After sales service
Order winners and qualifiers are time and market specific
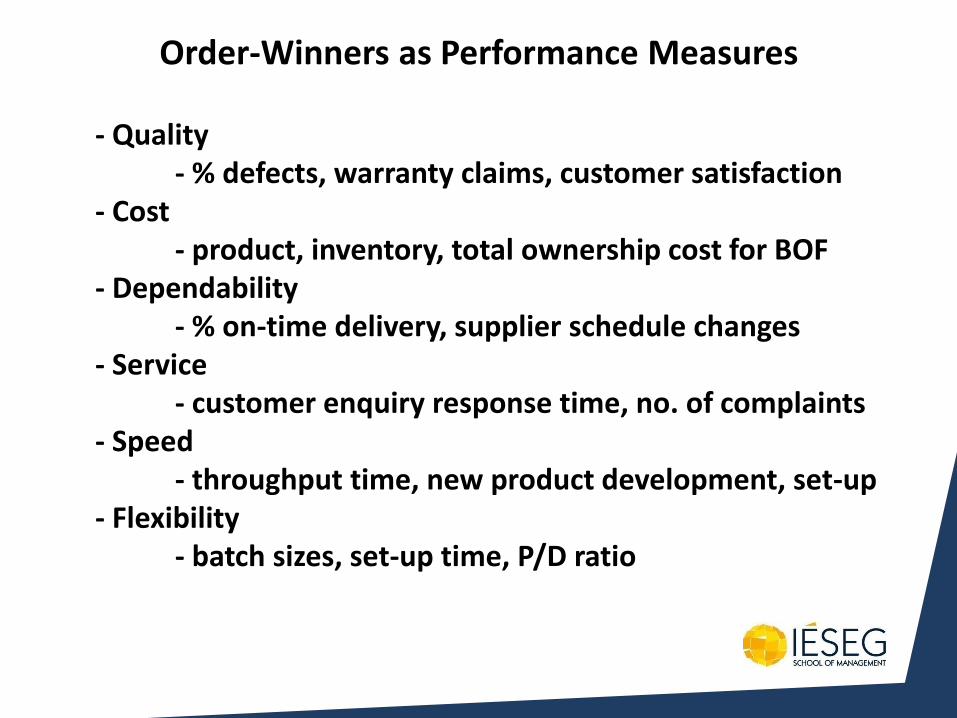
Order-Winners as Performance Measures
- Quality - % defects, warranty claims, customer satisfaction - Cost - product, inventory, total ownership cost for BOF - Dependability - % on-time delivery, supplier schedule changes - Service - customer enquiry response time, no. of complaints - Speed - throughput time, new product development, set-up - Flexibility - batch sizes, set-up time, P/D ratio

Chapter 2
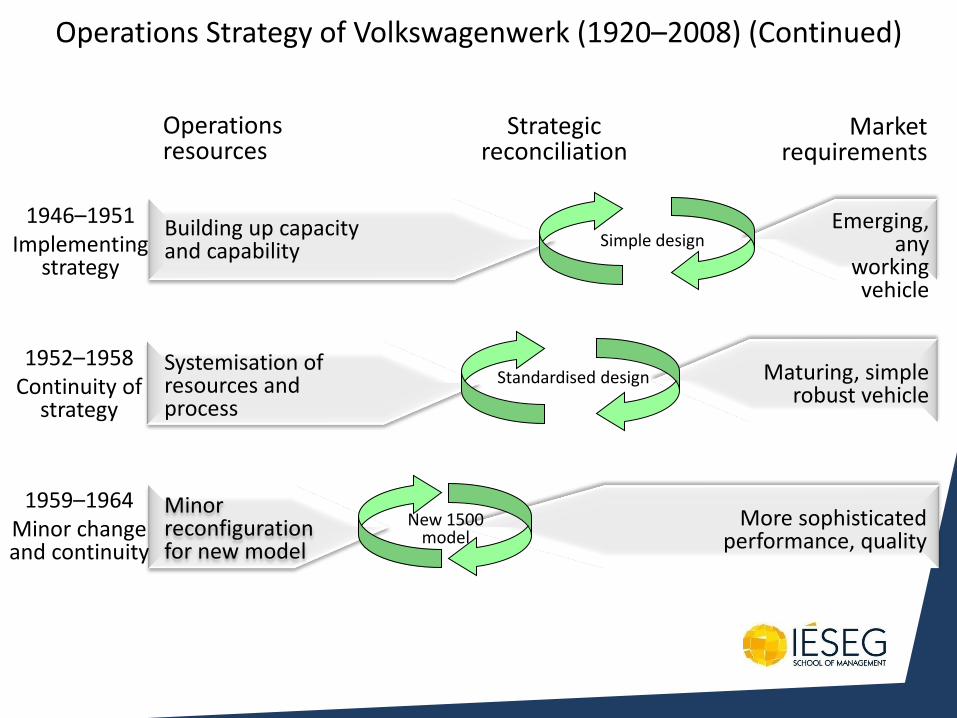
1946–1951 Implementing
strategy
Building up capacity and capability
Simple design
Standardised design Systemisation of resources and process
Emerging, any
working vehicle
Maturing, simple robust vehicle
Minor reconfiguration for new model
More sophisticated performance, quality
New 1500 model
Operations resources
Market requirements
1952–1958 Continuity of
strategy
1959–1964 Minor change and continuity
Strategic reconciliation
Operations Strategy of Volkswagenwerk (1920–2008) (Continued)
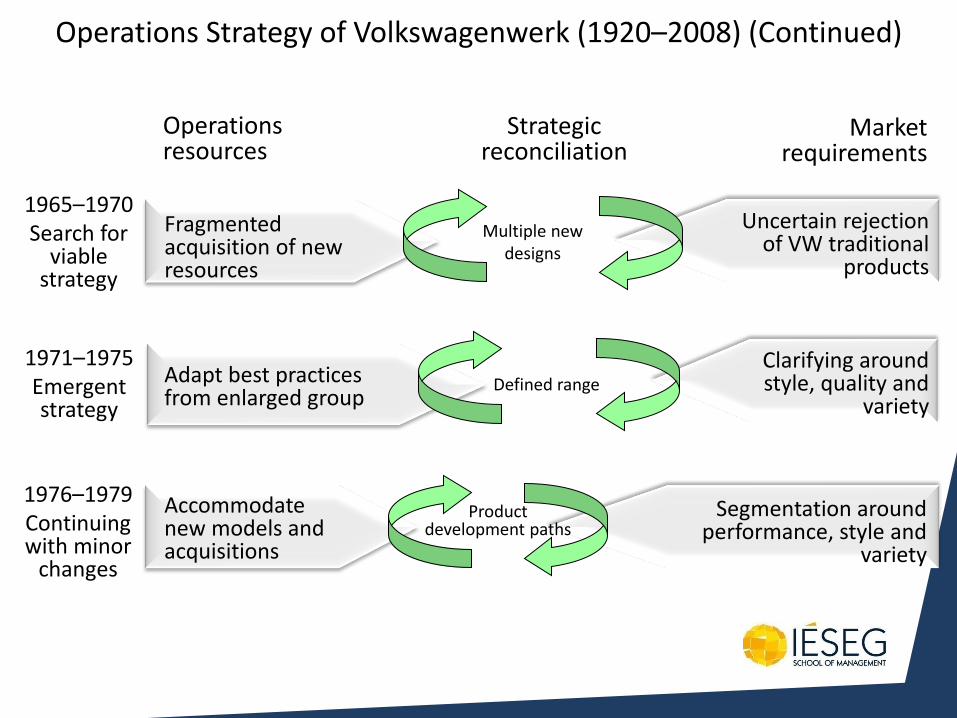
1965–1970 Search for
viable strategy
Fragmented acquisition of new resources
Multiple new designs
Defined range Adapt best practices from enlarged group
Uncertain rejection of VW traditional
products
Clarifying around style, quality and
variety
Accommodate new models and acquisitions
Segmentation around performance, style and
variety
Product development paths
Operations resources
Market requirements
1971–1975 Emergent strategy
1976–1979 Continuing with minor
changes
Operations Strategy of Volkswagenwerk (1920–2008) (Continued)
Strategic reconciliation
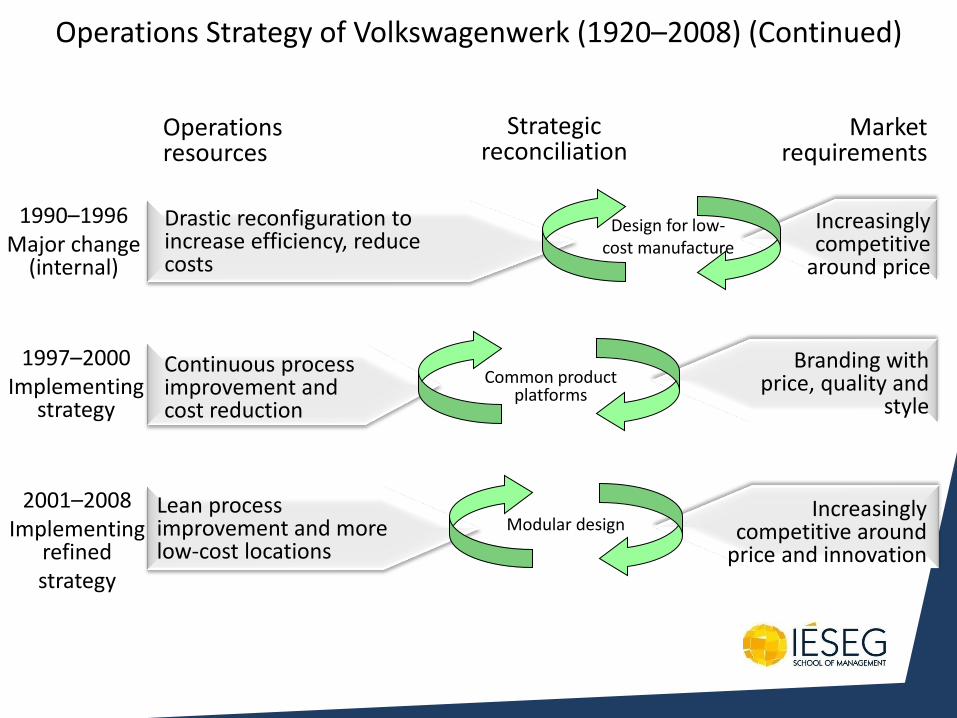
1990–1996 Major change
(internal)
Drastic reconfiguration to increase efficiency, reduce costs
Design for low- cost manufacture
Common product platforms
Continuous process improvement and cost reduction
Increasingly competitive
around price
Branding with price, quality and
style
Lean process improvement and more low-cost locations
Increasingly competitive around
price and innovation
Modular design
Operations resources
Market requirements
1997–2000 Implementing
strategy
2001–2008 Implementing
refined strategy
Operations Strategy of Volkswagenwerk (1920–2008) (Continued)
Strategic reconciliation
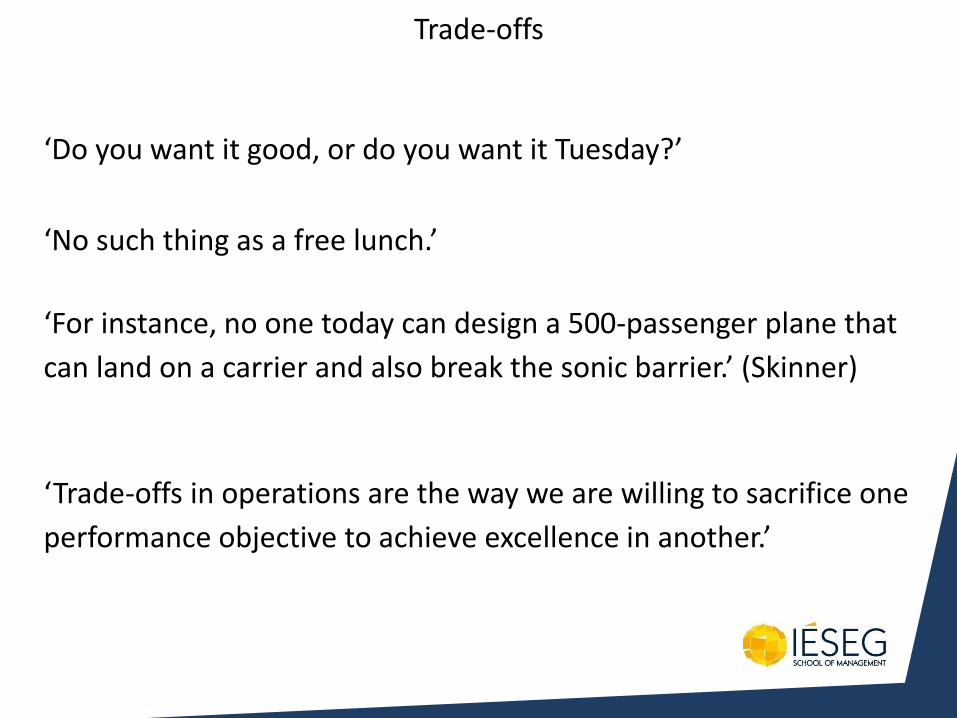
Trade-offs
‘Do you want it good, or do you want it Tuesday?’
‘No such thing as a free lunch.’
‘For instance, no one today can design a 500-passenger plane that
can land on a carrier and also break the sonic barrier.’ (Skinner)
‘Trade-offs in operations are the way we are willing to sacrifice one
performance objective to achieve excellence in another.’

X
Cost efficiency
Var
iety
A
C
D
B
The ‘efficient frontier’ A
X C
D
Cost efficiency V
arie
ty
B
The new ‘efficient frontier’
B1
The ‘efficient frontier’ view
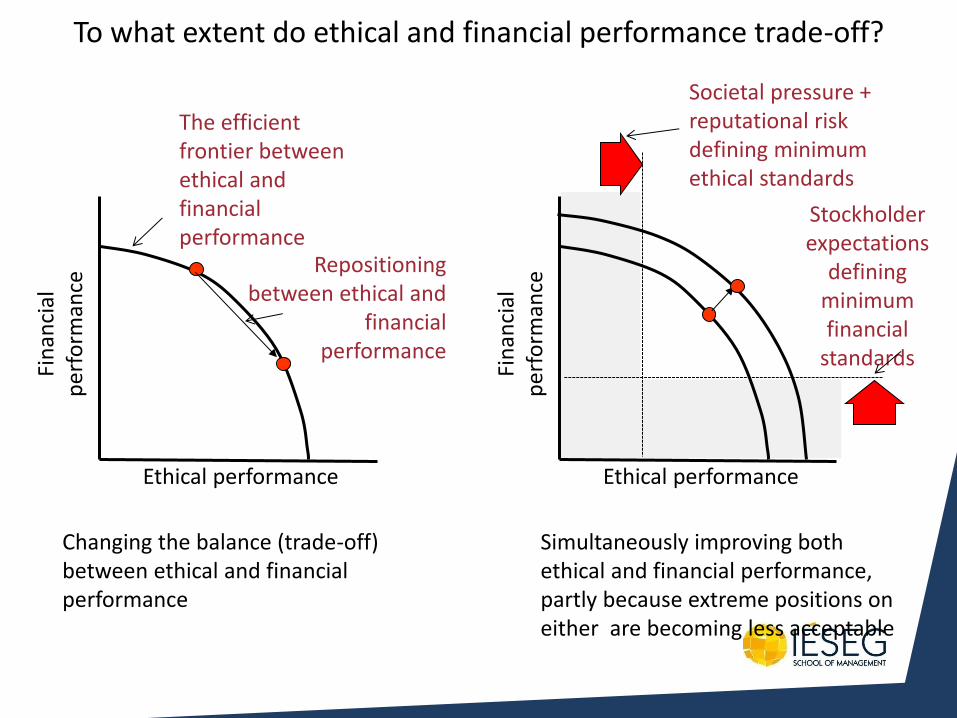
To what extent do ethical and financial performance trade-off?
Ethical performance Fi
nan
cial
p
erf
orm
ance
Societal pressure + reputational risk defining minimum ethical standards
Stockholder expectations
defining minimum financial
standards
Ethical performance
Fin
anci
al
pe
rfo
rman
ce Repositioning
between ethical and financial
performance
The efficient frontier between ethical and financial performance
Changing the balance (trade-off) between ethical and financial performance
Simultaneously improving both ethical and financial performance, partly because extreme positions on either are becoming less acceptable
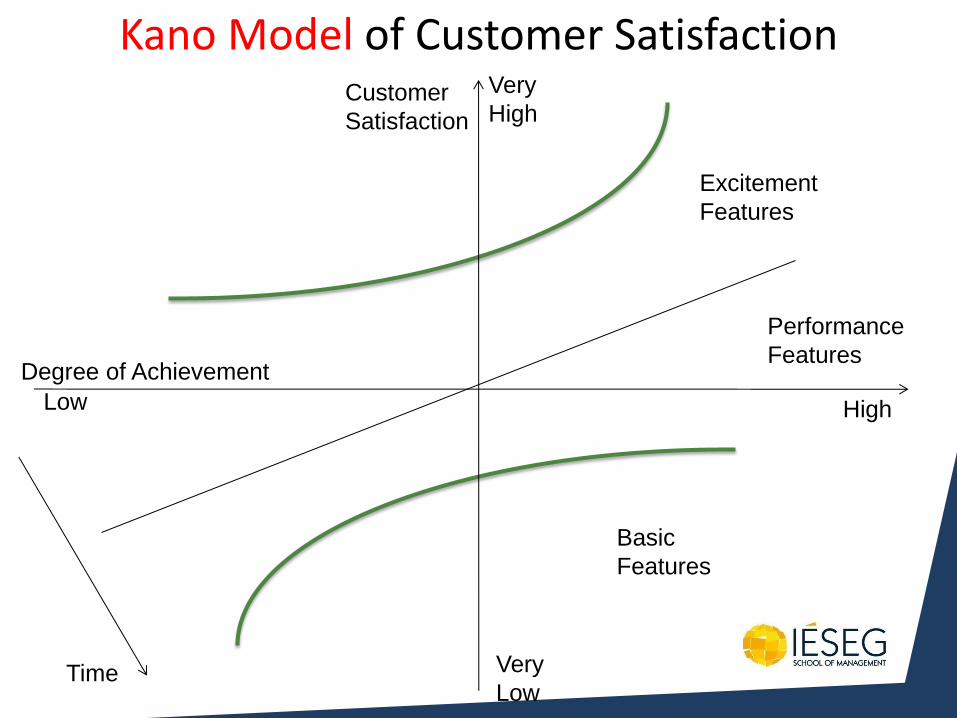
Kano Model of Customer Satisfaction Customer
Satisfaction
Very
High
Very
Low
Excitement
Features
Performance
Features
Basic
Features
Time
High Low
Degree of Achievement
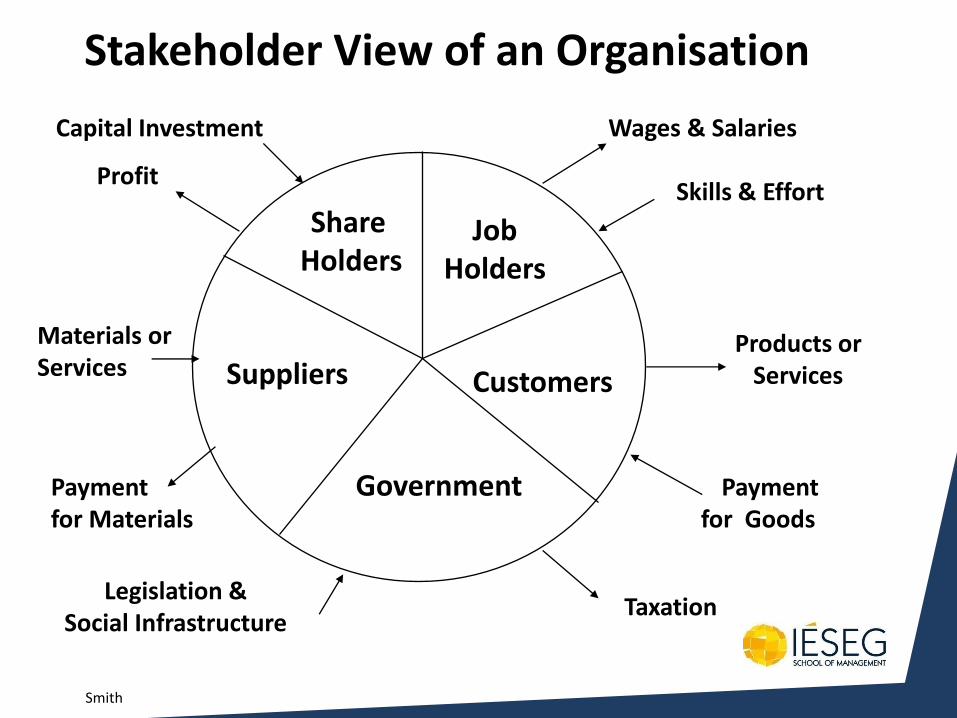
Smith
Stakeholder View of an Organisation
Capital Investment
Skills & Effort
Wages & Salaries
Products or Services
Payment for Goods
Taxation Legislation &
Social Infrastructure
Payment for Materials
Materials or Services
Profit
Share
Holders Job
Holders
Customers
Government
Suppliers
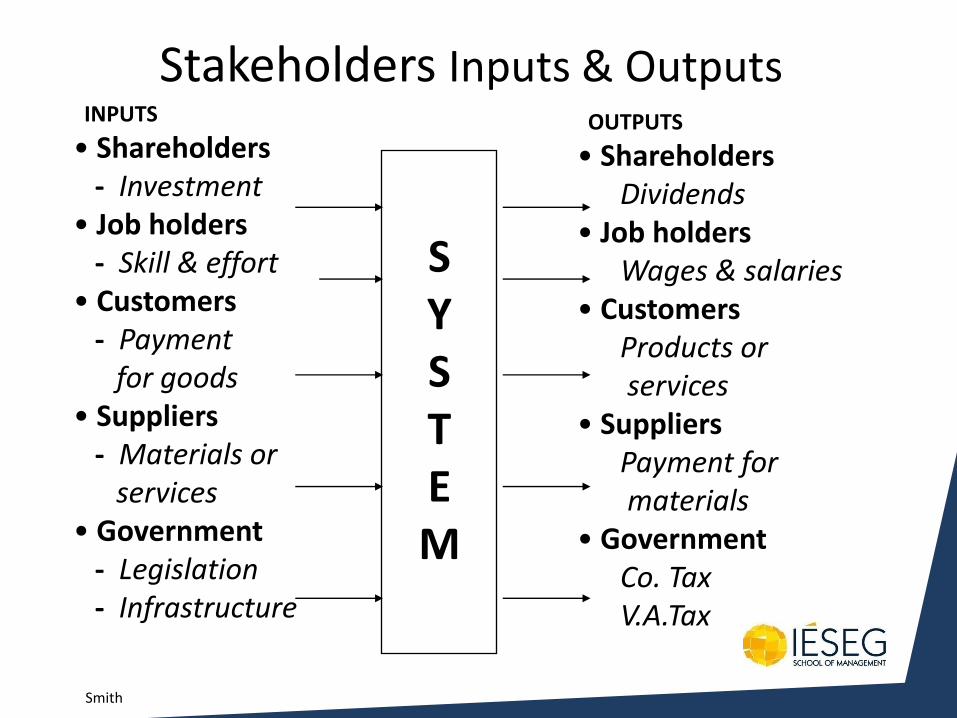
Smith
Stakeholders Inputs & Outputs INPUTS
• Shareholders - Investment • Job holders - Skill & effort • Customers - Payment for goods • Suppliers - Materials or services • Government - Legislation - Infrastructure
OUTPUTS
• Shareholders Dividends • Job holders Wages & salaries • Customers Products or services • Suppliers Payment for materials • Government Co. Tax V.A.Tax
S Y S T E M
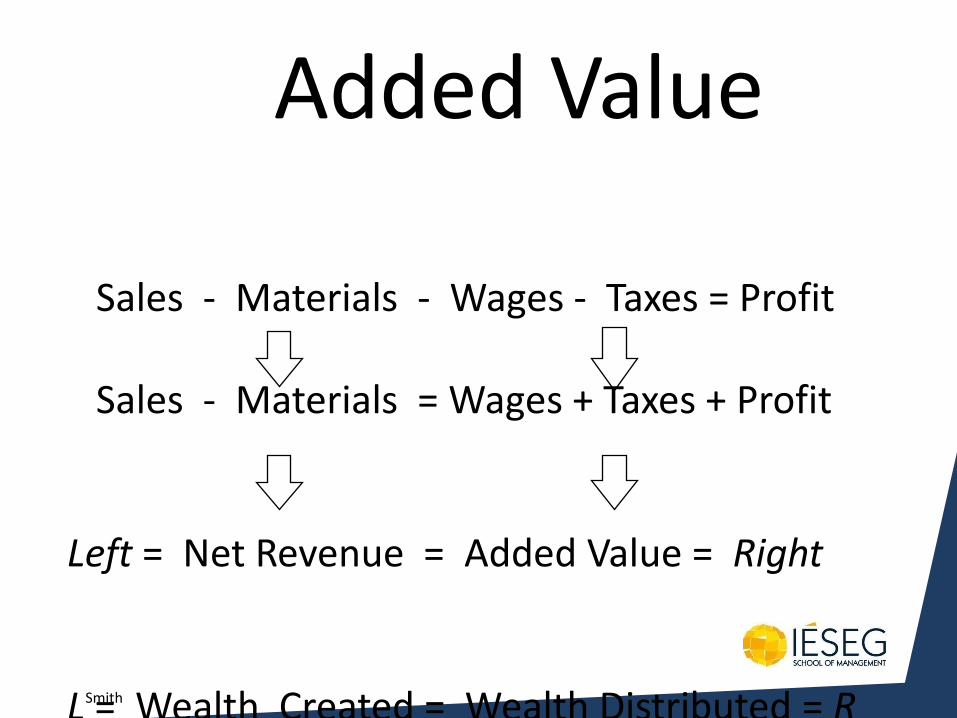
Smith
Added Value Sales - Materials - Wages - Taxes = Profit Sales - Materials = Wages + Taxes + Profit Left = Net Revenue = Added Value = Right L = Wealth Created = Wealth Distributed = R
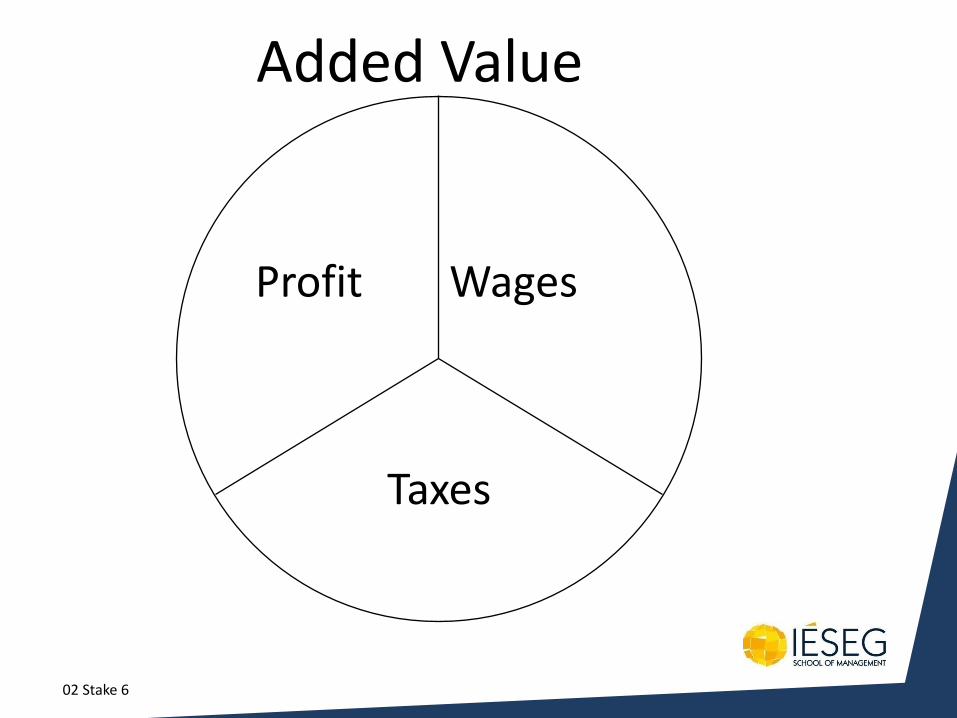
Added Value
Profit Wages
Taxes
02 Stake 6
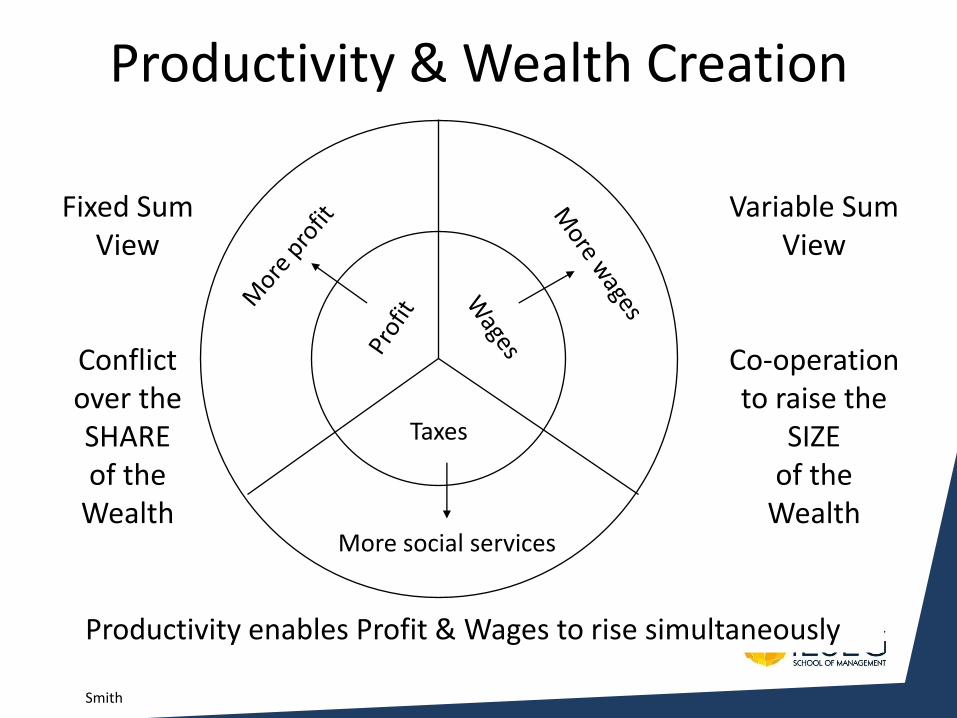
Smith
Productivity & Wealth Creation
Fixed Sum View
Conflict over the SHARE of the
Wealth
Productivity enables Profit & Wages to rise simultaneously
Variable Sum View
Co-operation to raise the
SIZE of the
Wealth
Taxes
More social services
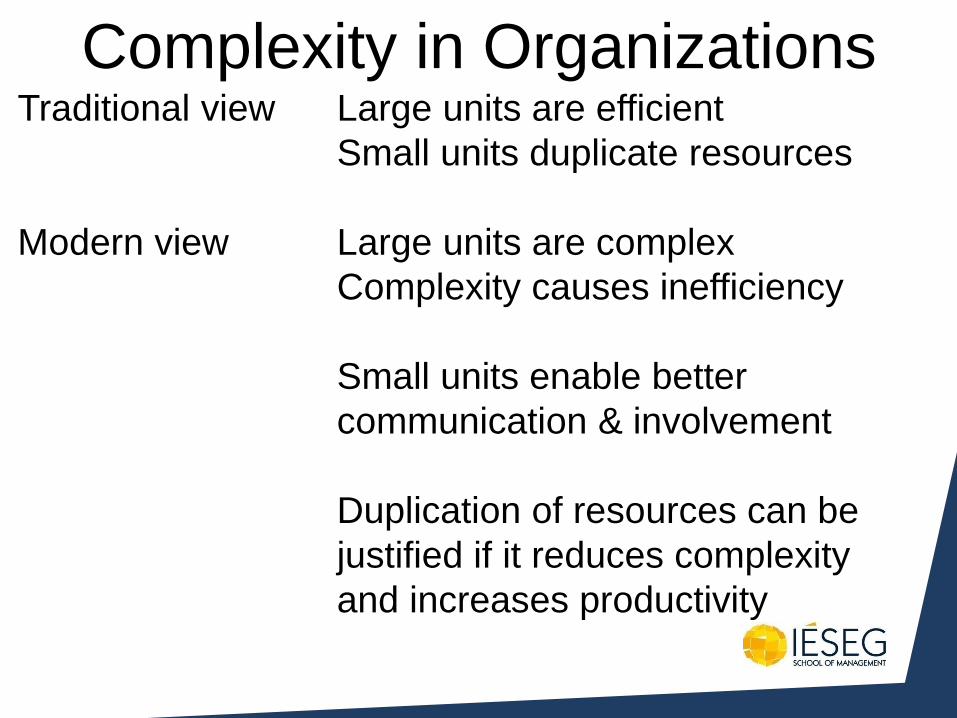
Complexity in Organizations Traditional view Large units are efficient
Small units duplicate resources
Modern view Large units are complex
Complexity causes inefficiency
Small units enable better
communication & involvement
Duplication of resources can be
justified if it reduces complexity
and increases productivity
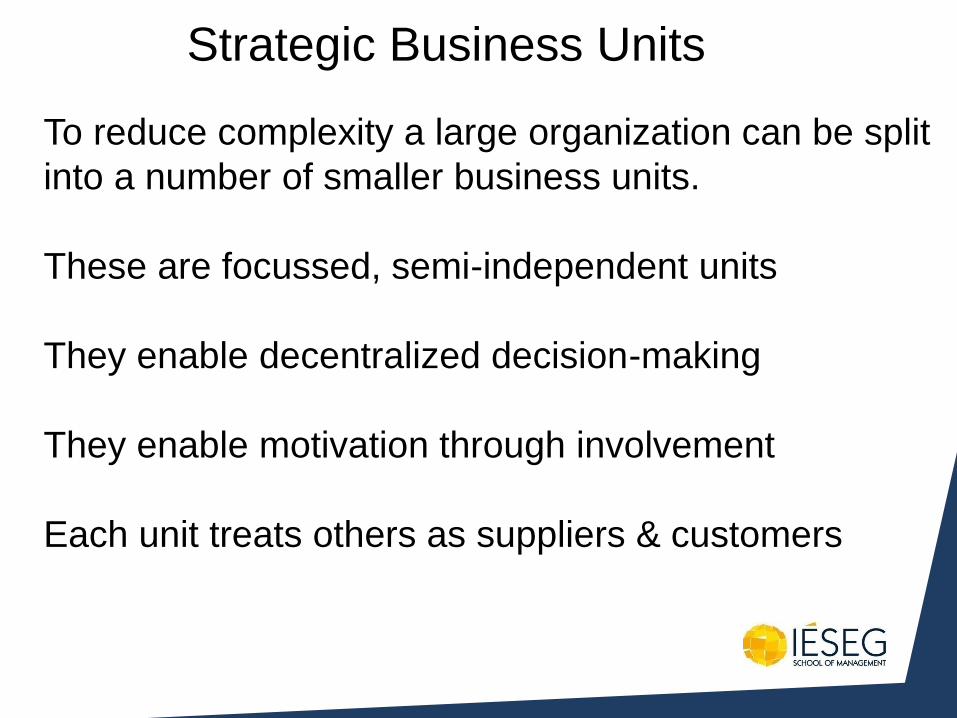
Strategic Business Units
To reduce complexity a large organization can be split
into a number of smaller business units.
These are focussed, semi-independent units
They enable decentralized decision-making
They enable motivation through involvement
Each unit treats others as suppliers & customers
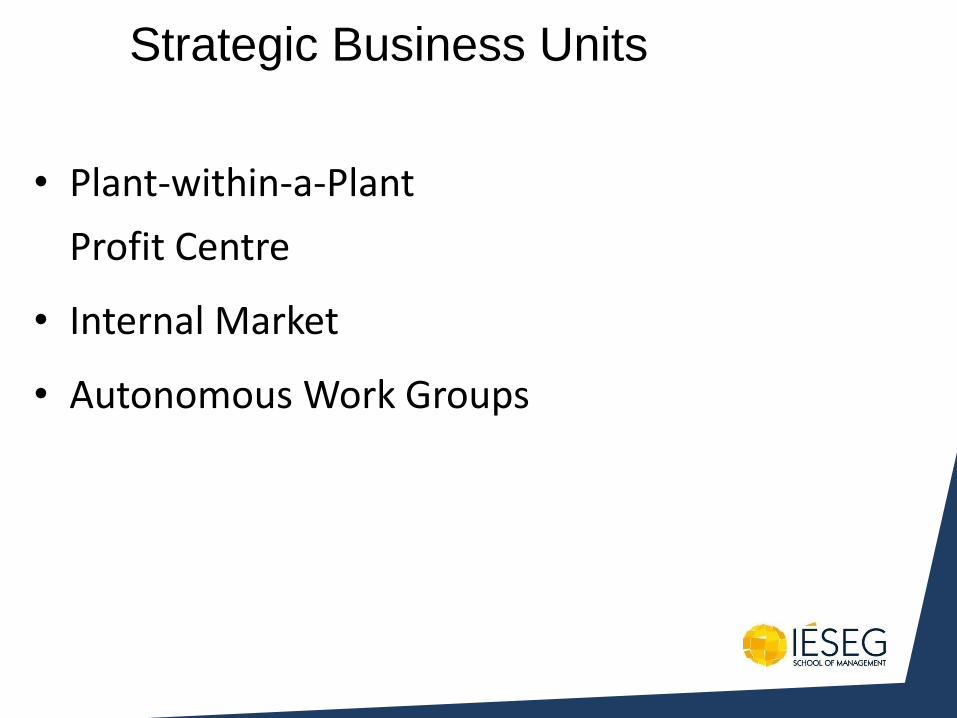
• Plant-within-a-Plant
Profit Centre
• Internal Market
• Autonomous Work Groups
Strategic Business Units
Chapter 3
Substitutes for strategy
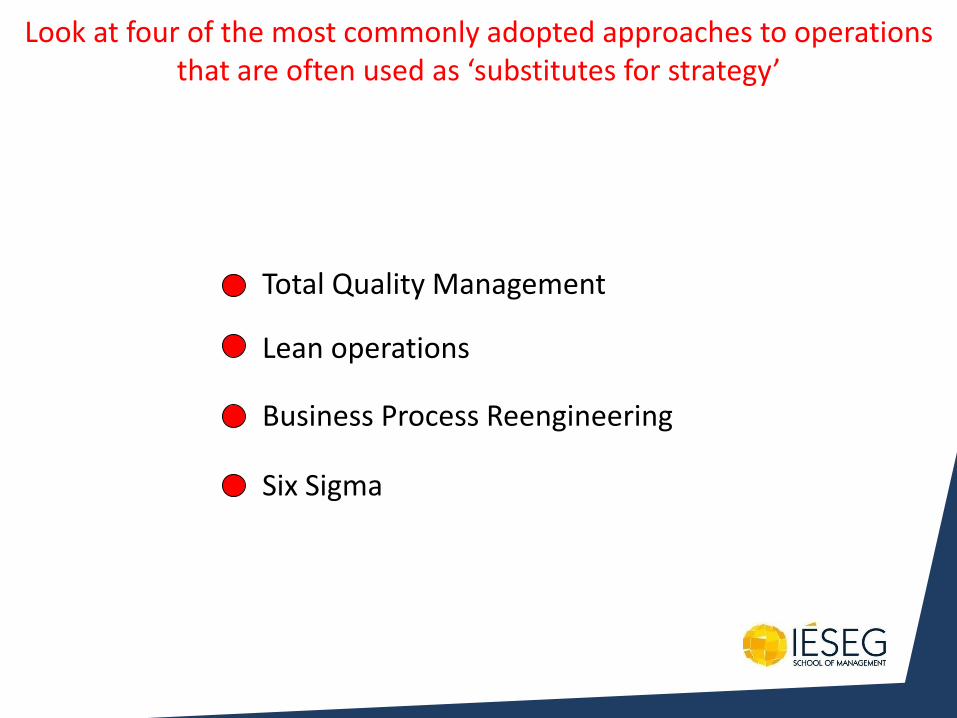
Look at four of the most commonly adopted approaches to operations that are often used as ‘substitutes for strategy’
Total Quality Management
Lean operations
Business Process Reengineering
Six Sigma
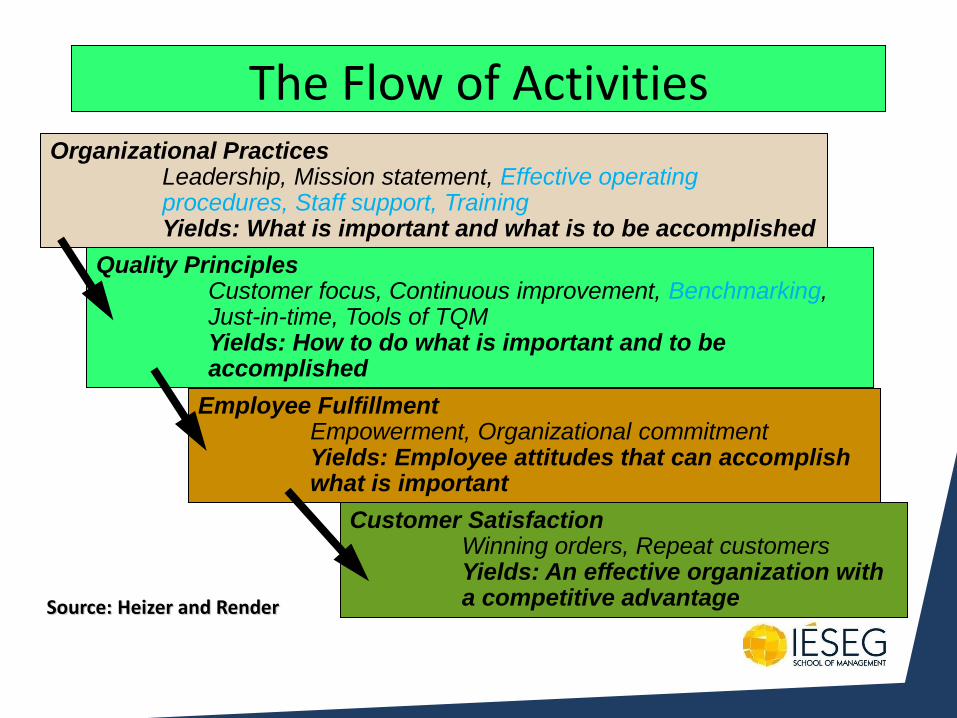
The Flow of Activities Organizational Practices Leadership, Mission statement, Effective operating
procedures, Staff support, Training Yields: What is important and what is to be accomplished
Quality Principles Customer focus, Continuous improvement, Benchmarking,
Just-in-time, Tools of TQM Yields: How to do what is important and to be
accomplished
Employee Fulfillment Empowerment, Organizational commitment Yields: Employee attitudes that can accomplish
what is important
Customer Satisfaction Winning orders, Repeat customers Yields: An effective organization with
a competitive advantage Source: Heizer and Render
‘an effective system for integrating the quality
development, quality maintenance and quality
improvement efforts of the various groups in an
organisation so as to enable production and service at
the most economical levels which allow for full customer
satisfaction’
Feigenbaum (generally held to be the originator of the term) defines TQM as………
The elements of TQM
Meeting the needs and expectations of customers
Covering all parts of the organisation
Including every person in the organisation
Examining all costs that are related to quality, especially failure costs
Getting things ‘right first time’
Developing the systems and procedures that support improvement
Leadership People
Policy and strategy
Partnership and resources
Processes People results
Customer results
Society results
Key performance results
EFQM excellence model
People
Policy and
strategy
Partnership and
resources
Processes People
results
Customer
results
Society
results
Key
performance
results
EFQM excellence model - Leadership
Leadership – how leaders
develop and facilitate the
achievement of the mission
and vision, develop values
required for long-term
success and implement these
through appropriate actions
and behaviour, and are
personally involved in
ensuring that the
organisation’s management
system is developed and
implemented
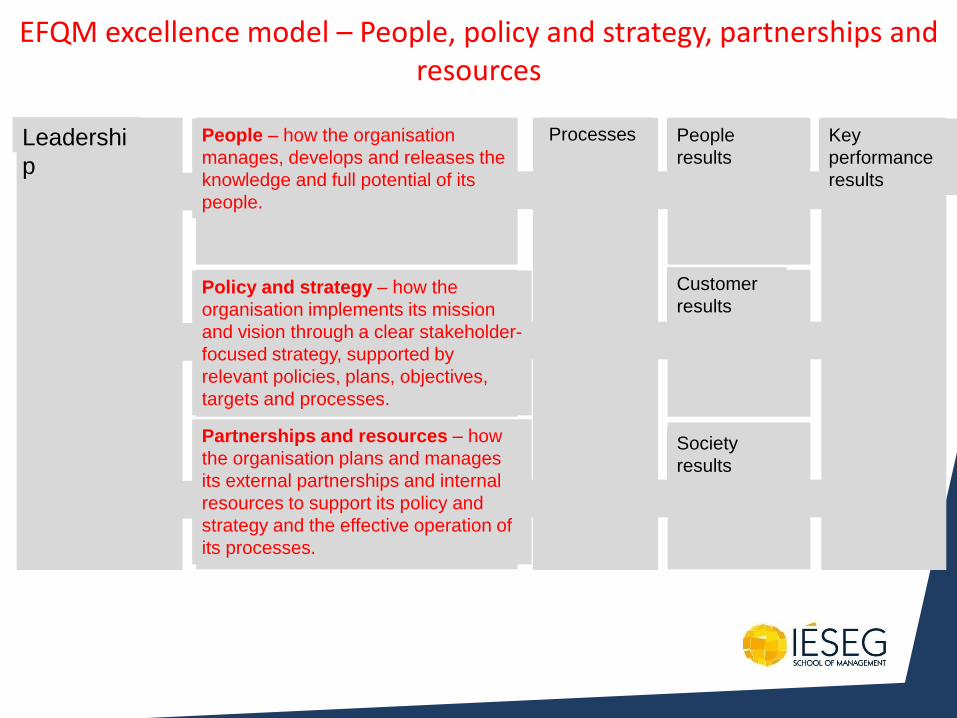
Policy and strategy – how the
organisation implements its mission
and vision through a clear stakeholder-
focused strategy, supported by
relevant policies, plans, objectives,
targets and processes.
Processes People
results
Customer
results
Society
results
Key
performance
results
EFQM excellence model – People, policy and strategy, partnerships and resources
People – how the organisation
manages, develops and releases the
knowledge and full potential of its
people.
Partnerships and resources – how
the organisation plans and manages
its external partnerships and internal
resources to support its policy and
strategy and the effective operation of
its processes.
Leadershi
p
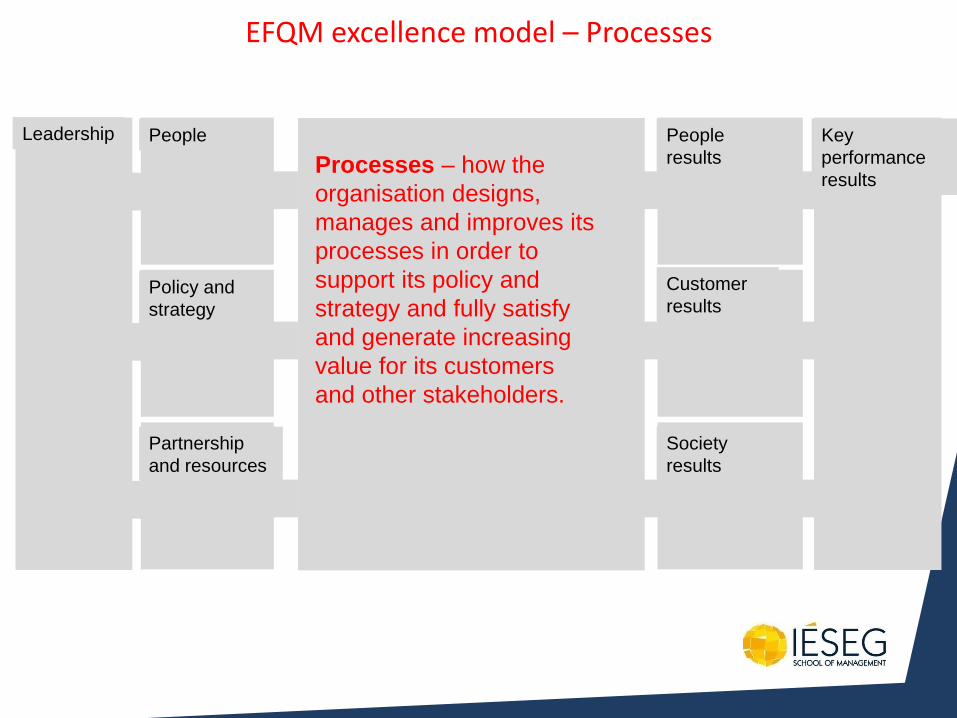
Leadership People
Policy and
strategy
Partnership
and resources
People
results
Customer
results
Society
results
Key
performance
results Processes – how the
organisation designs,
manages and improves its
processes in order to
support its policy and
strategy and fully satisfy
and generate increasing
value for its customers
and other stakeholders.
EFQM excellence model – Processes
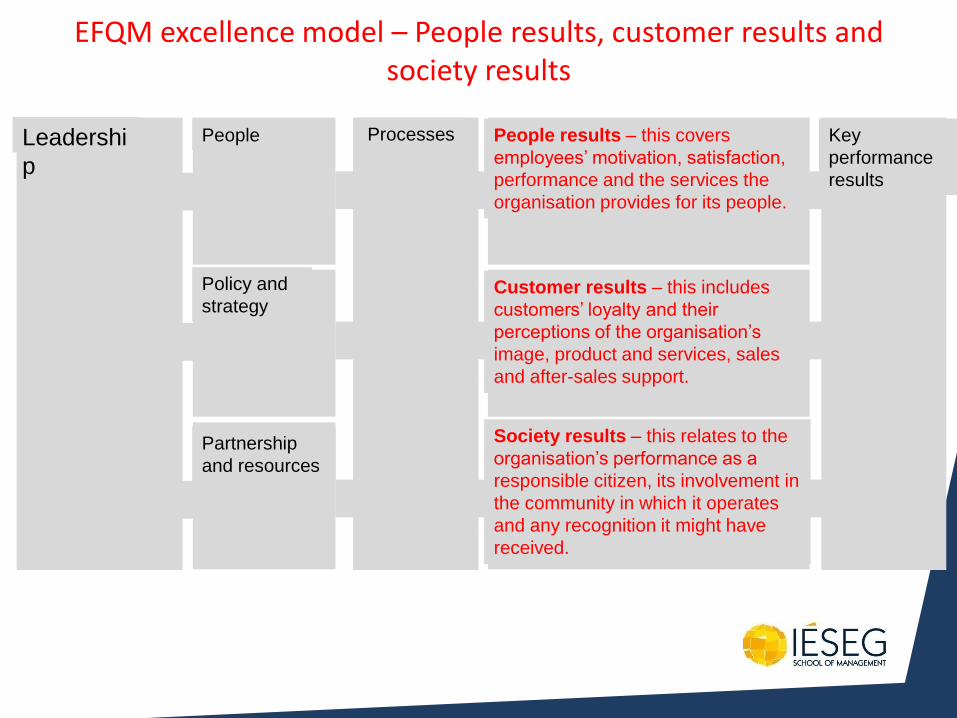
Processes People
Policy and
strategy
Partnership
and resources
Key
performance
results
EFQM excellence model – People results, customer results and society results
Customer results – this includes
customers’ loyalty and their
perceptions of the organisation’s
image, product and services, sales
and after-sales support.
People results – this covers
employees’ motivation, satisfaction,
performance and the services the
organisation provides for its people.
Society results – this relates to the
organisation’s performance as a
responsible citizen, its involvement in
the community in which it operates
and any recognition it might have
received.
Leadershi
p
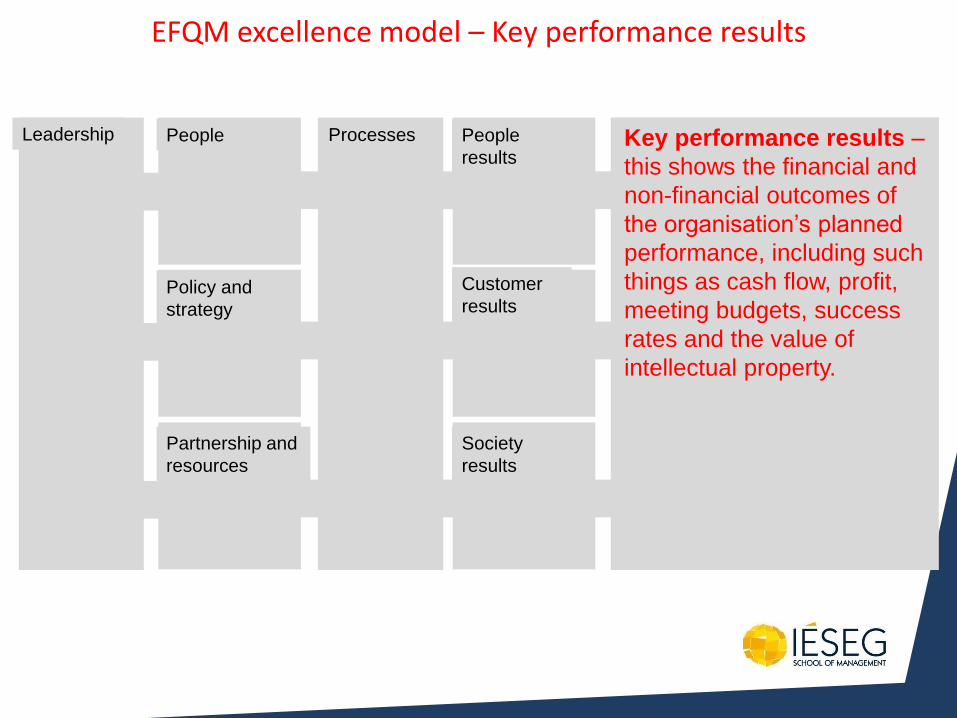
People
Policy and
strategy
Partnership and
resources
Processes People
results
Customer
results
Society
results
EFQM excellence model – Key performance results
Key performance results –
this shows the financial and
non-financial outcomes of
the organisation’s planned
performance, including such
things as cash flow, profit,
meeting budgets, success
rates and the value of
intellectual property.
Leadership

Decision areas
Mar
ket
com
pet
itiv
enes
s
Process Technology
Resource usage
TQM elements in the four operations strategy decision categories
Development and Organisation
• Provide resources to support quality
• Use quality as performance criterion
Quality
Perf
orm
ance
o
bje
ctiv
es
Dependability
Speed
Flexibility
Cost
Capacity
Supply Network
Capacity
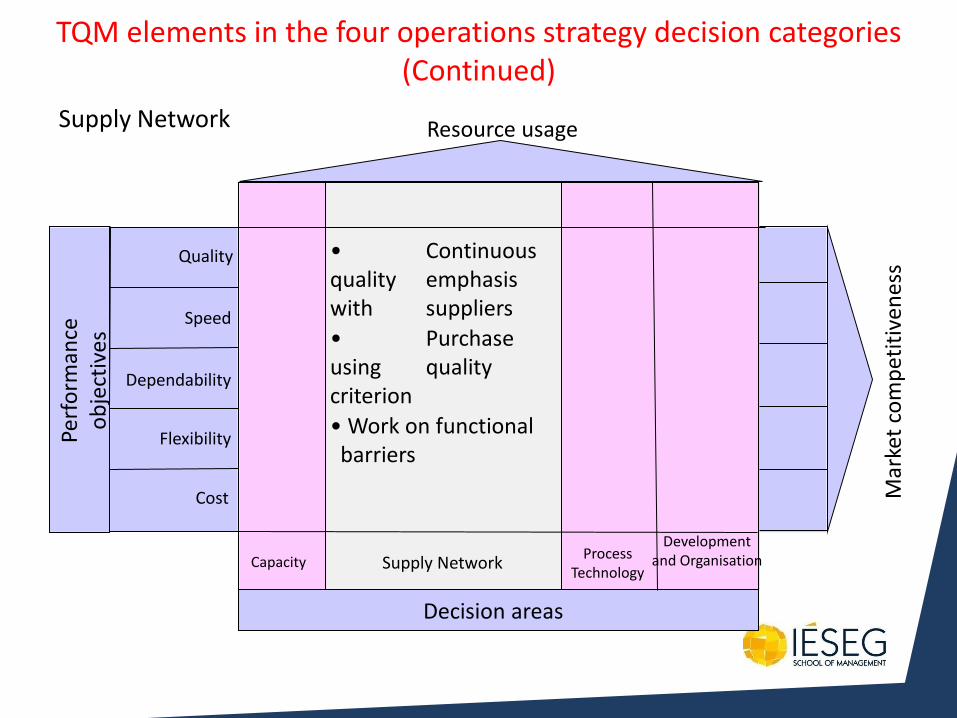
Decision areas
Capacity Process
Technology
Resource usage
Development and Organisation
• Continuous quality emphasis with suppliers
• Purchase using quality criterion
• Work on functional barriers
Quality
Perf
orm
ance
o
bje
ctiv
es
Dependability
Speed
Flexibility
Cost
Supply Network
Supply Network
TQM elements in the four operations strategy decision categories (Continued)
Mar
ket
com
pet
itiv
enes
s
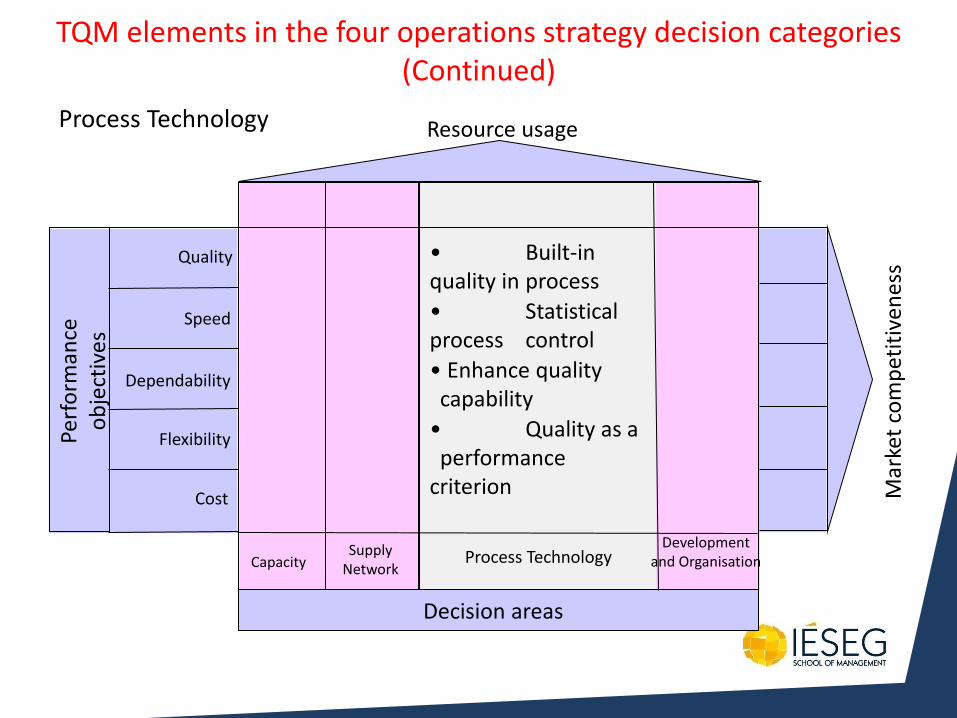
Decision areas
Capacity Supply
Network Process Technology
Resource usage
Development and Organisation
• Built-in quality in process
• Statistical process control
• Enhance quality capability
• Quality as a performance criterion
Quality
Perf
orm
ance
o
bje
ctiv
es
Dependability
Speed
Flexibility
Cost
Process Technology
TQM elements in the four operations strategy decision categories (Continued)
Mar
ket
com
pet
itiv
enes
s

Decision areas
Capacity Supply
Network
Mar
ket
com
pet
itiv
enes
s
Process Technology
Resource usage
Development and Organisation
• Long-term plans
• Quality culture
• Continuous improvement
• Quality performance measurement and control
• Training and education emphasis
• Operational supervision is important
• Communication
• Appropriate organisational structure
Quality
Perf
orm
ance
o
bje
ctiv
es
Dependability
Speed
Flexibility
Cost
Development and Organization
TQM elements in the four operations strategy decision categories (Continued)
MRP and Lean/JIT
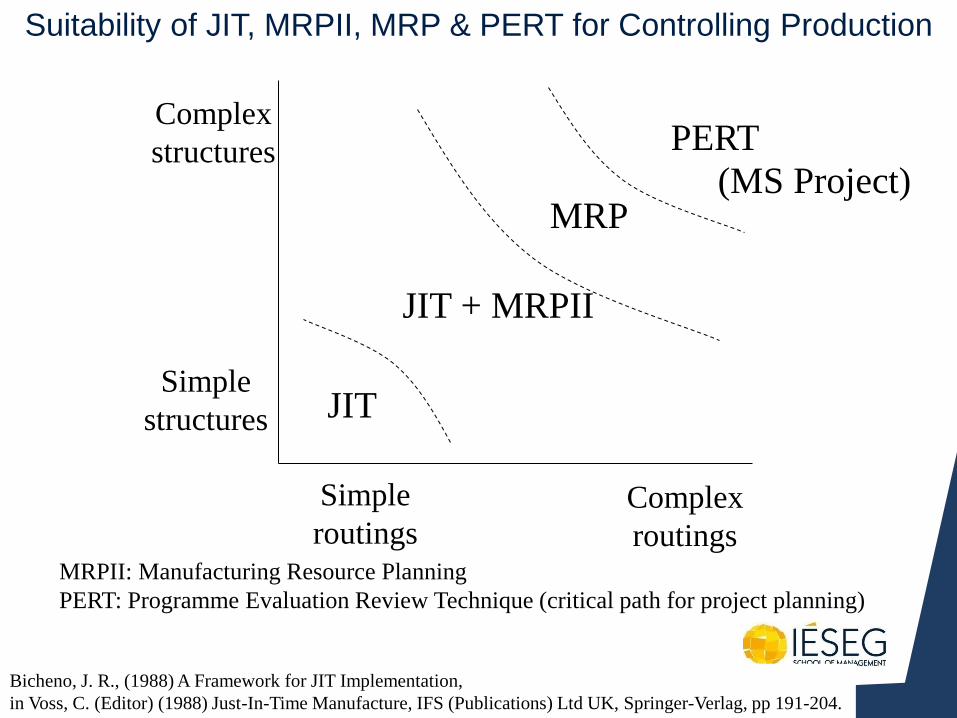
Suitability of JIT, MRPII, MRP & PERT for Controlling Production
JIT
JIT + MRPII
PERT
MRP
Simple
routings Complex
routings
Simple
structures
Complex
structures
Bicheno, J. R., (1988) A Framework for JIT Implementation,
in Voss, C. (Editor) (1988) Just-In-Time Manufacture, IFS (Publications) Ltd UK, Springer-Verlag, pp 191-204.
MRPII: Manufacturing Resource Planning
PERT: Programme Evaluation Review Technique (critical path for project planning)
(MS Project)
Questions
• What is the most expensive component on a computer?
• What is the most expensive component on an aeroplane?
• What is the most expensive component on a car?
Answer
• The one you don’t have.
• If you don’t have it, you can’t build the product. You then can’t get paid for it and hence your cash flow suffers.
Natural disasters – fire, earthquakes, tusnami etc,
Strikes
Raw material shortages
Late and erratic deliveries
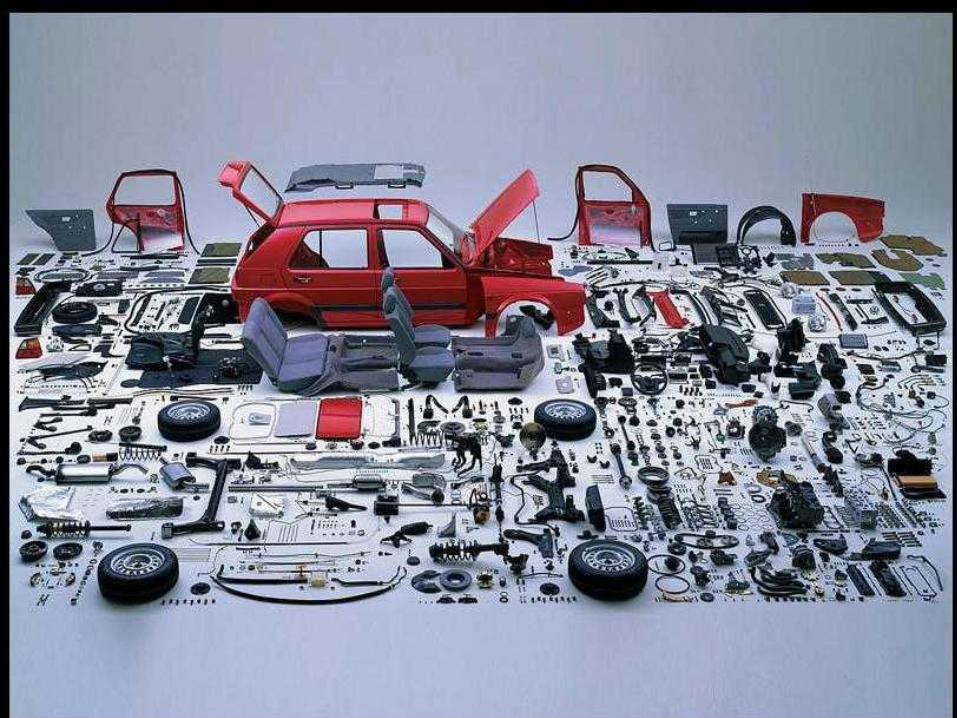
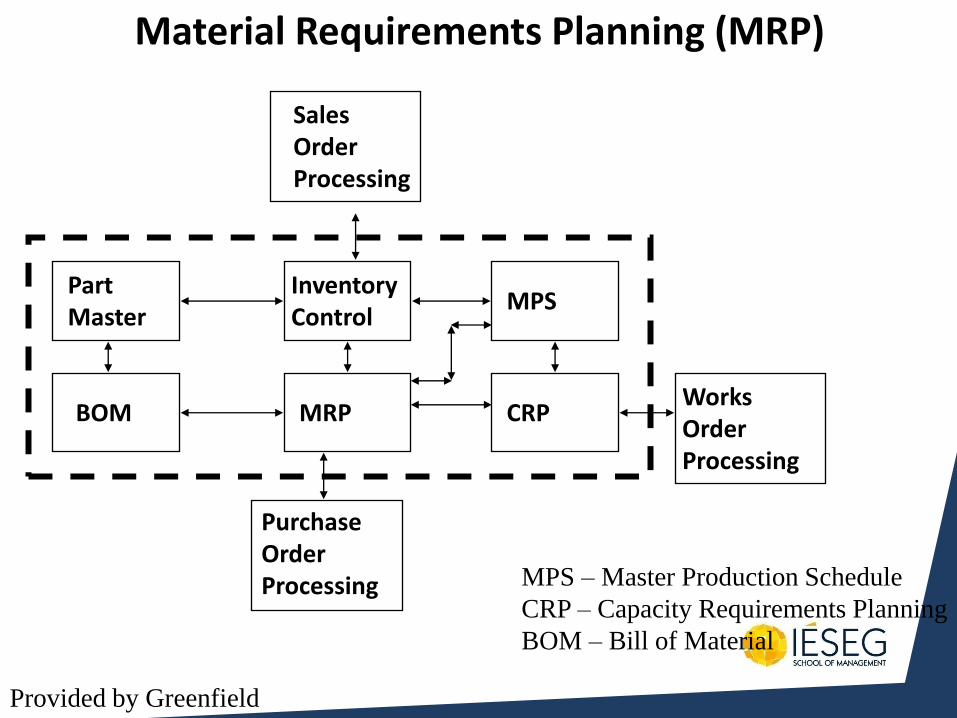
Material Requirements Planning (MRP)
Part Master
BOM
Inventory Control
Sales Order Processing
Purchase Order Processing
MPS
CRP MRP Works Order Processing
MPS – Master Production Schedule
CRP – Capacity Requirements Planning
BOM – Bill of Material
Provided by Greenfield
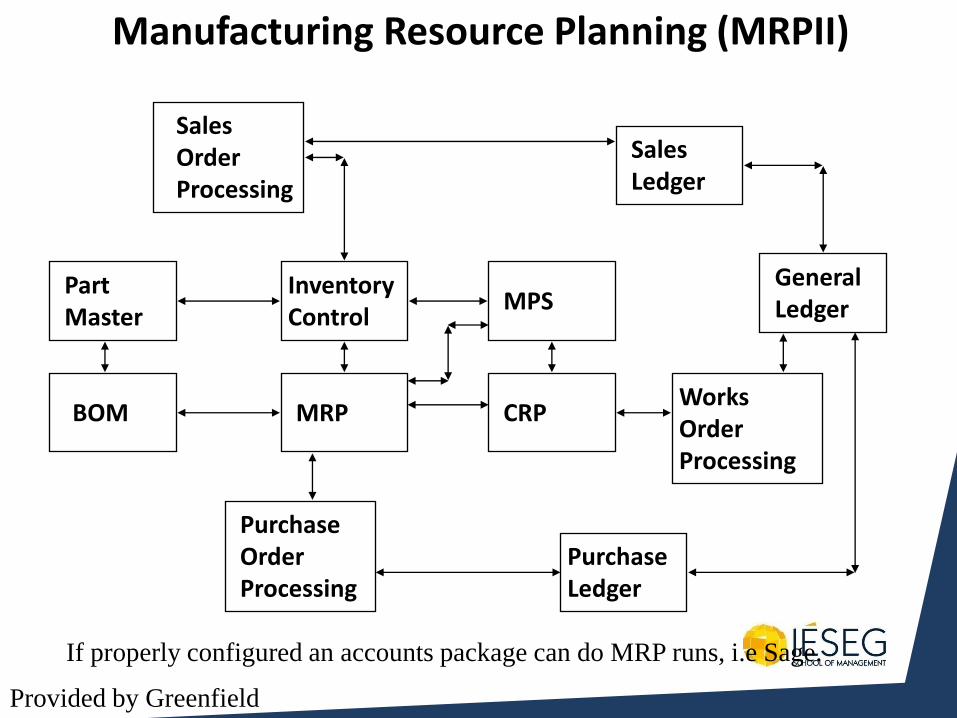
Manufacturing Resource Planning (MRPII)
Part Master
BOM
Inventory Control
Sales Order Processing
Purchase Order Processing
Sales Ledger
Purchase Ledger
MPS
CRP MRP Works Order Processing
General Ledger
If properly configured an accounts package can do MRP runs, i.e Sage.
Provided by Greenfield
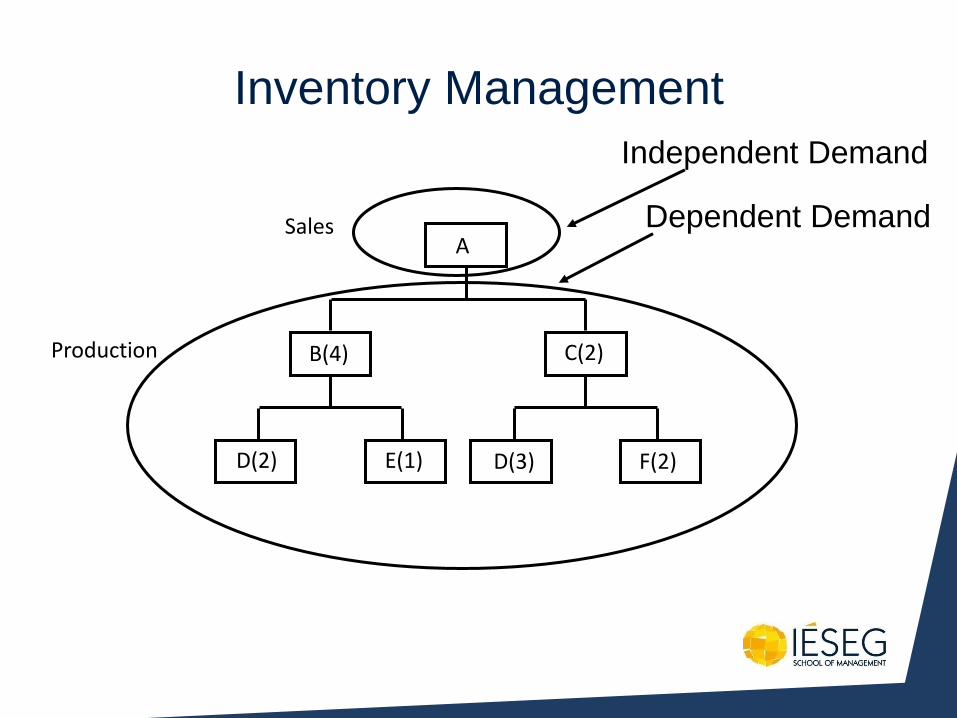
Inventory Management
A
B(4) C(2)
D(2) E(1) D(3) F(2)
Independent Demand
Dependent Demand Sales
Production
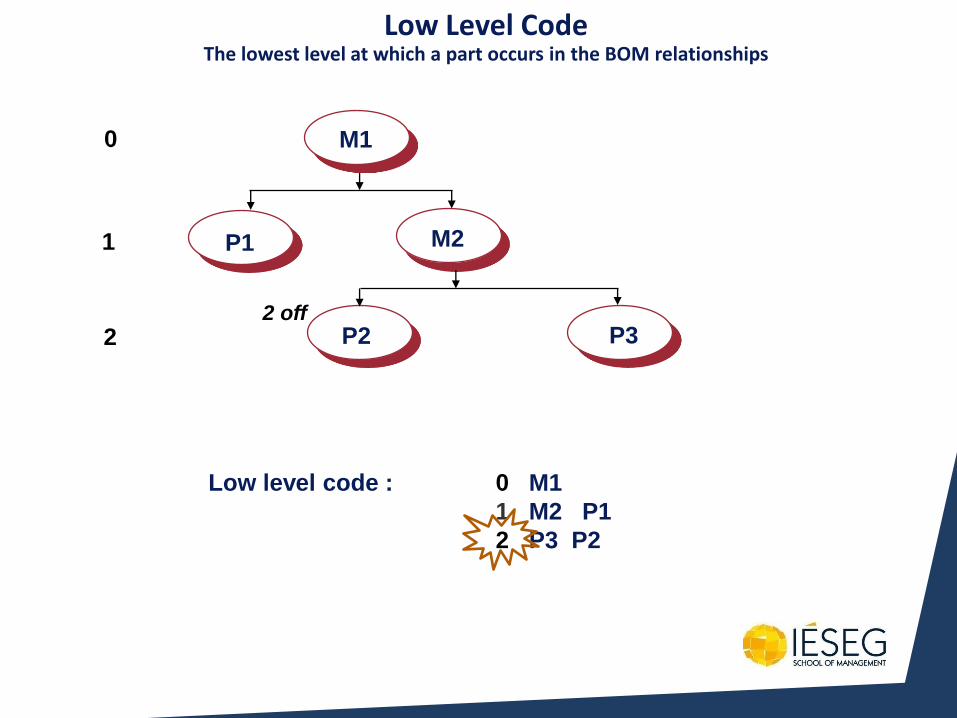
Low Level Code The lowest level at which a part occurs in the BOM relationships
M1
P1 M2
P2 P3 2
1
0
2 off
Low level code : 0 M1
1 M2 P1
2 P3 P2
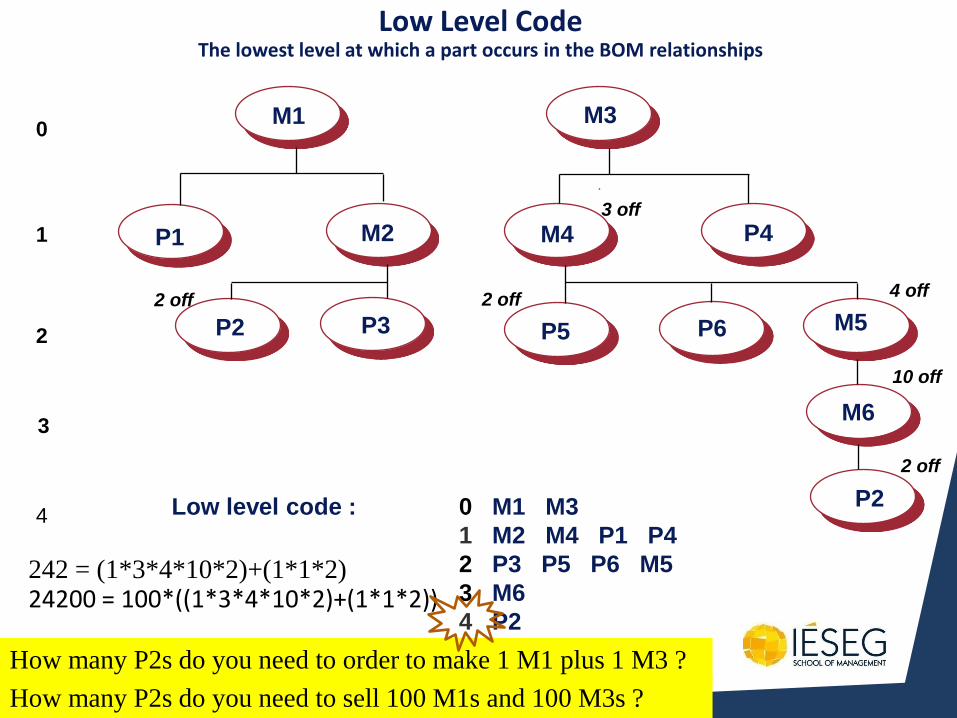
Low Level Code The lowest level at which a part occurs in the BOM relationships
M1 M3
P1 M2 M4 P4
P2 P3 P5 P6 M5
M6
P2 4
3
2
1
0
3 off
2 off 4 off
2 off
10 off
2 off
Low level code : 0 M1 M3
1 M2 M4 P1 P4
2 P3 P5 P6 M5
3 M6
4 P2
How many P2s do you need to order to make 1 M1 plus 1 M3 ?
242 = (1*3*4*10*2)+(1*1*2) 24200 = 100*((1*3*4*10*2)+(1*1*2))
How many P2s do you need to sell 100 M1s and 100 M3s ?
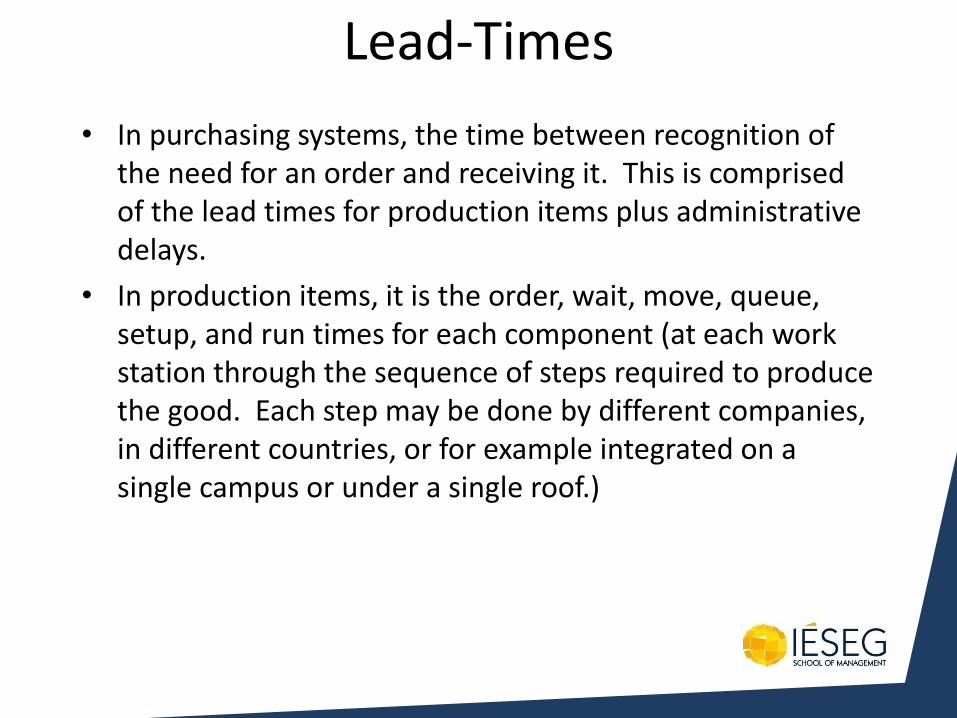
Lead-Times
• In purchasing systems, the time between recognition of the need for an order and receiving it. This is comprised of the lead times for production items plus administrative delays.
• In production items, it is the order, wait, move, queue, setup, and run times for each component (at each work station through the sequence of steps required to produce the good. Each step may be done by different companies, in different countries, or for example integrated on a single campus or under a single roof.)
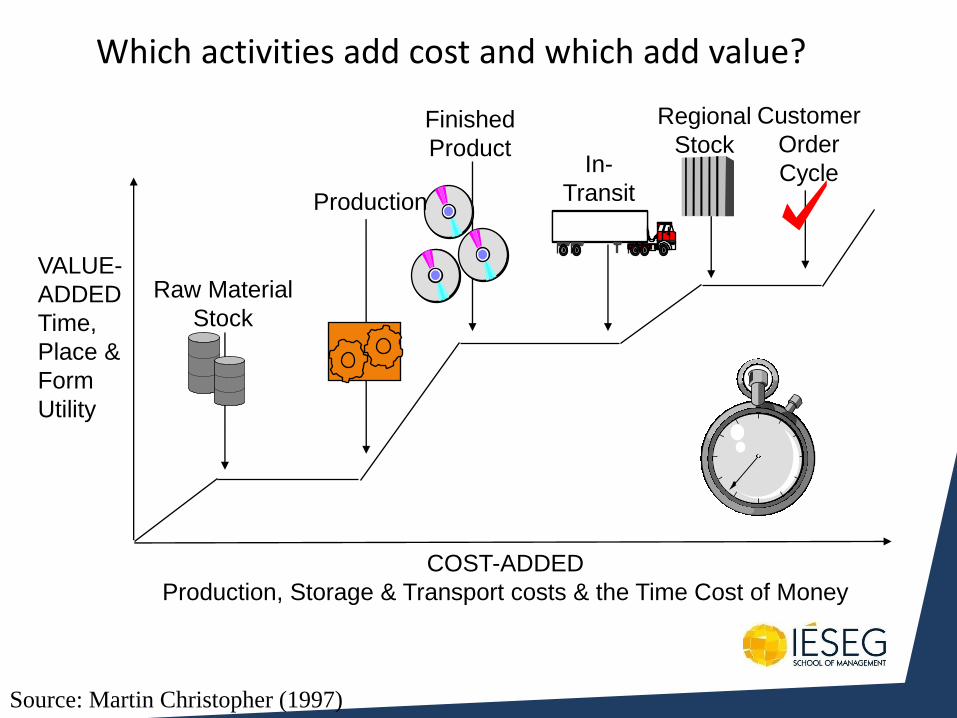
Which activities add cost and which add value?
COST-ADDED
Production, Storage & Transport costs & the Time Cost of Money
VALUE-
ADDED
Time,
Place &
Form
Utility
Raw Material
Stock
Production
Finished
Product In-
Transit
Regional
Stock
Customer
Order
Cycle
Source: Martin Christopher (1997)
Question
• How long does it take to make 10?
• 10 times longer than it takes to make 1
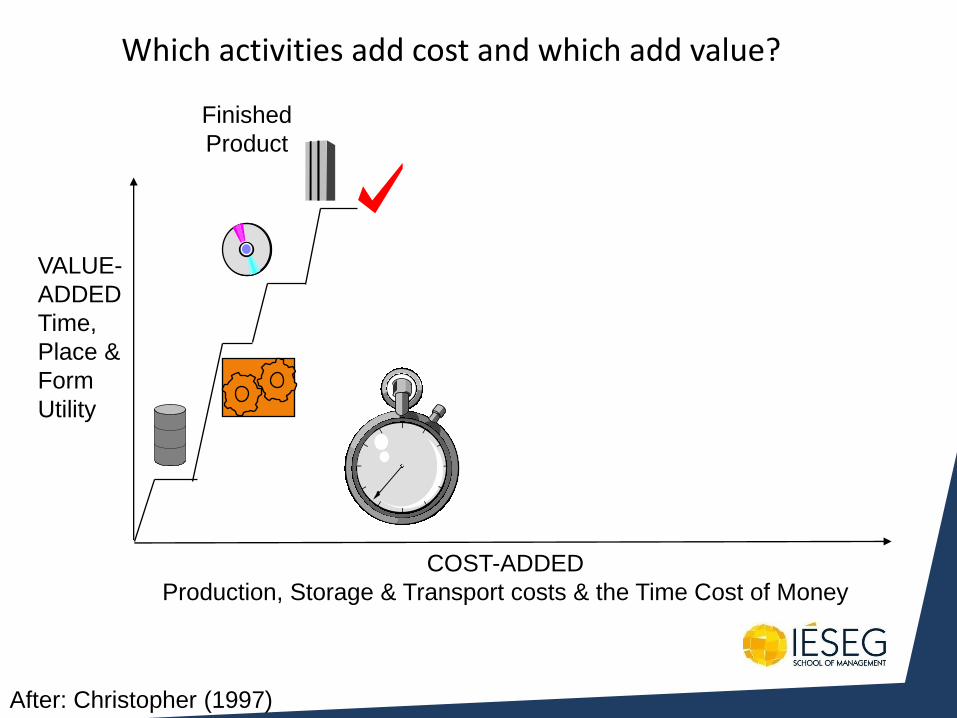
Which activities add cost and which add value?
COST-ADDED
Production, Storage & Transport costs & the Time Cost of Money
VALUE-
ADDED
Time,
Place &
Form
Utility
Finished
Product
After: Christopher (1997)
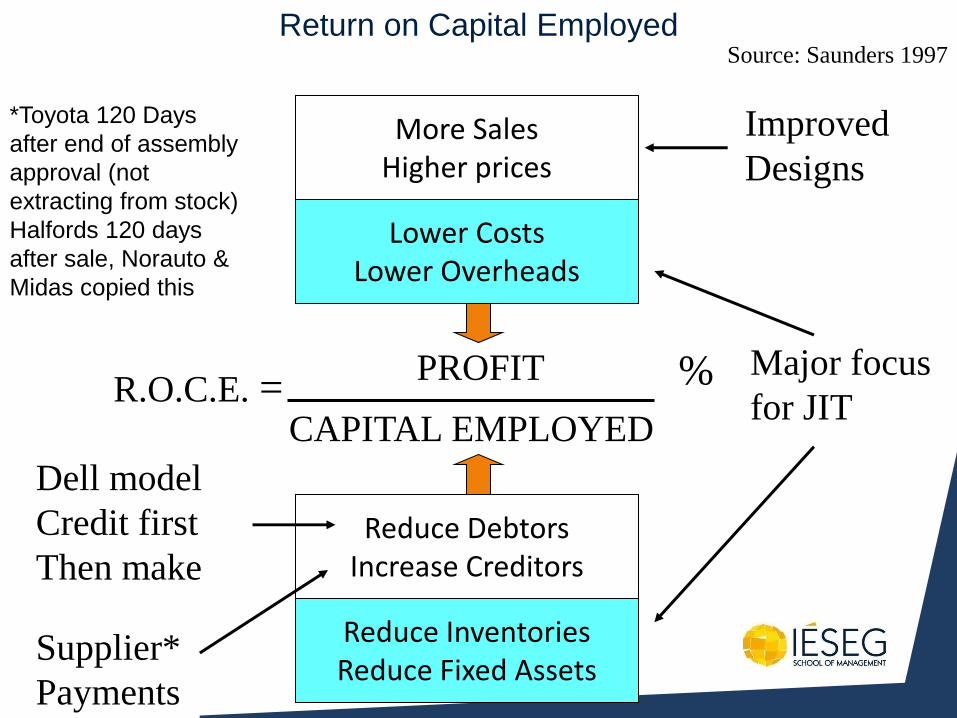
Return on Capital Employed
More Sales Higher prices
Lower Costs Lower Overheads
Reduce Inventories Reduce Fixed Assets
Reduce Debtors Increase Creditors
PROFIT
CAPITAL EMPLOYED R.O.C.E. = % Major focus
for JIT
Improved
Designs
Dell model
Credit first
Then make
Supplier*
Payments
*Toyota 120 Days
after end of assembly
approval (not
extracting from stock)
Halfords 120 days
after sale, Norauto &
Midas copied this
Source: Saunders 1997
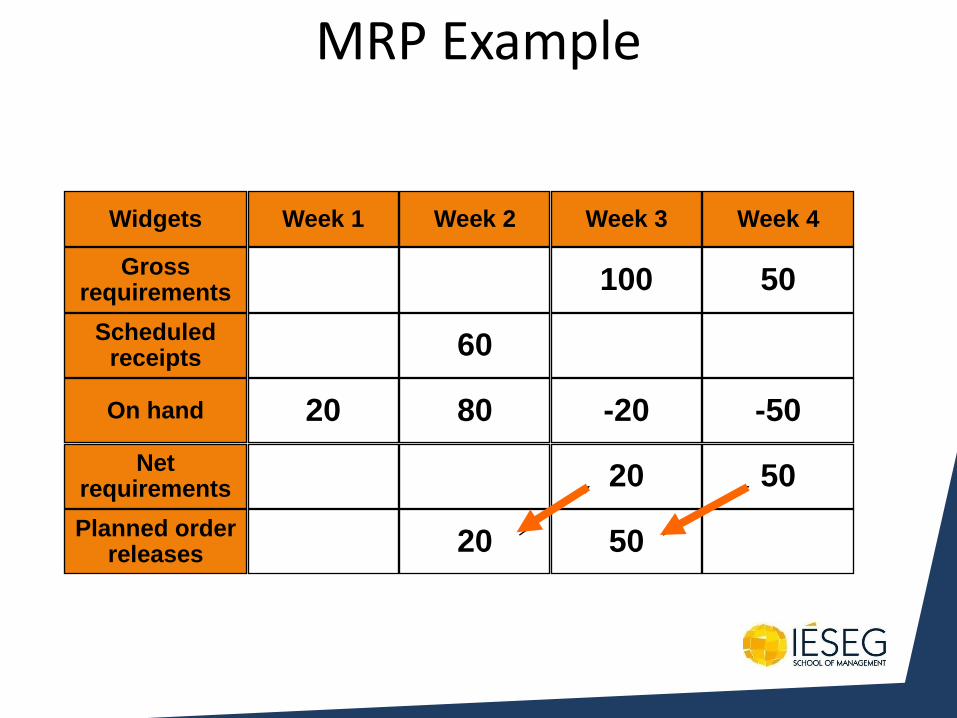
MRP Example
Week 1 Week 2 Week 3 Week 4 Widgets
100 50
60
20 80 -20 -50
20 50
20 50
Gross requirements
Scheduled receipts
On hand
Net requirements
Planned order releases
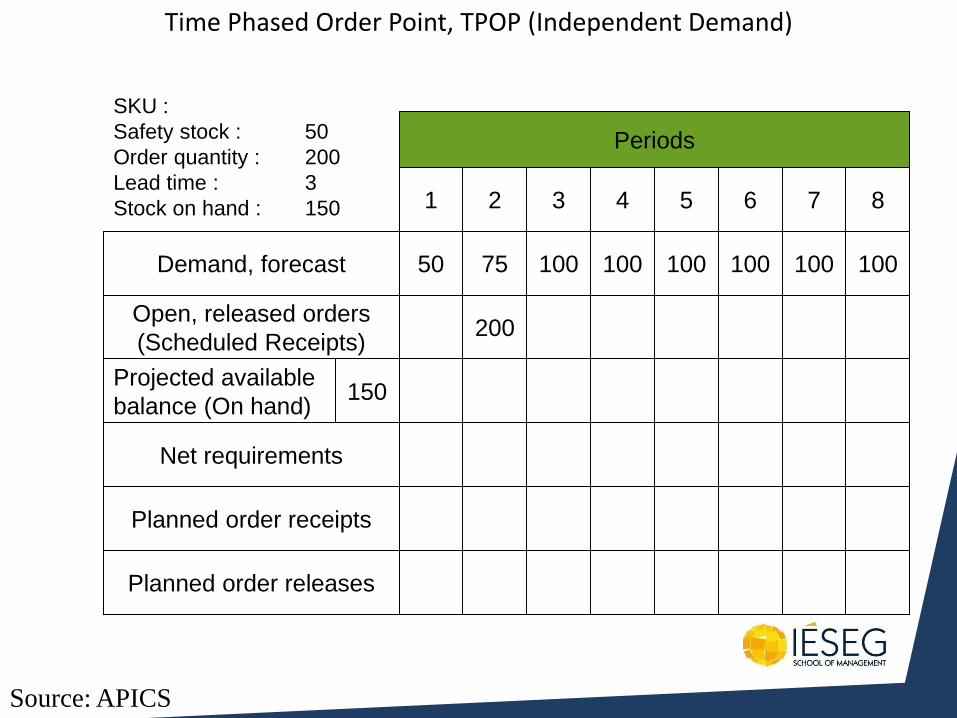
Time Phased Order Point, TPOP (Independent Demand)
Demand, forecast
Open, released orders
(Scheduled Receipts)
Projected available
balance (On hand)
Net requirements
Planned order receipts
Planned order releases
50 75 100 100 100 100 100 100
200
1 2 3 4 5 6 7 8
Periods
SKU :
Safety stock : 50
Order quantity : 200
Lead time : 3
Stock on hand : 150
150
Source: APICS
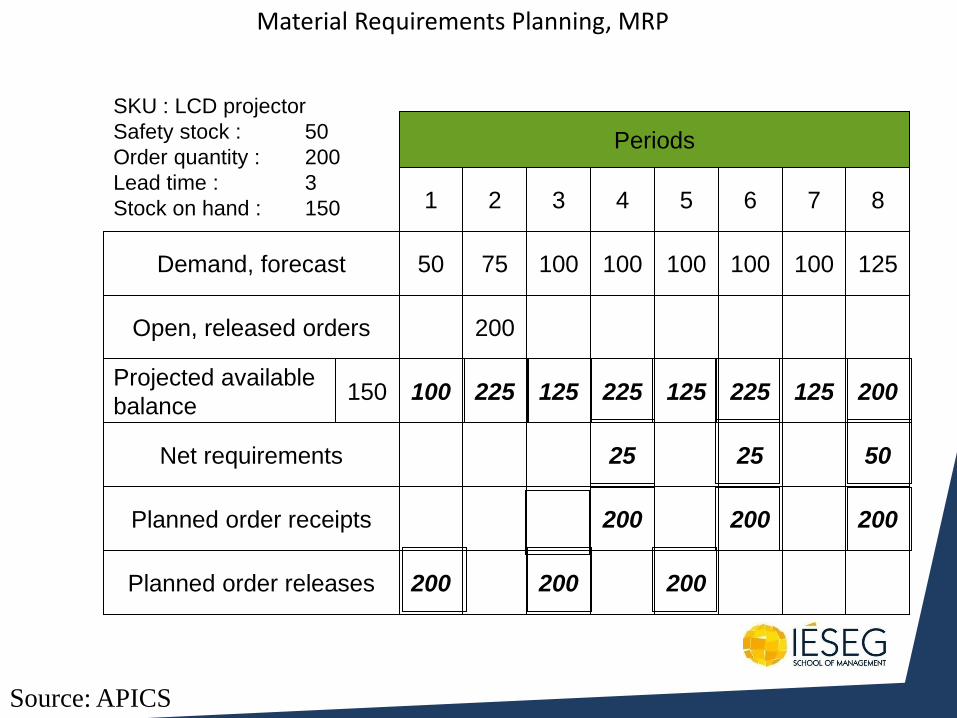
Material Requirements Planning, MRP
Demand, forecast
Open, released orders
Projected available
balance
Net requirements
Planned order receipts
Planned order releases
50 75 100 100 100 100 100 125
200
100 225 125 225 125 225 125 200
25 25 50
200 200 200
200 200 200
1 2 3 4 5 6 7 8
Periods
SKU : LCD projector
Safety stock : 50
Order quantity : 200
Lead time : 3
Stock on hand : 150
150
Source: APICS
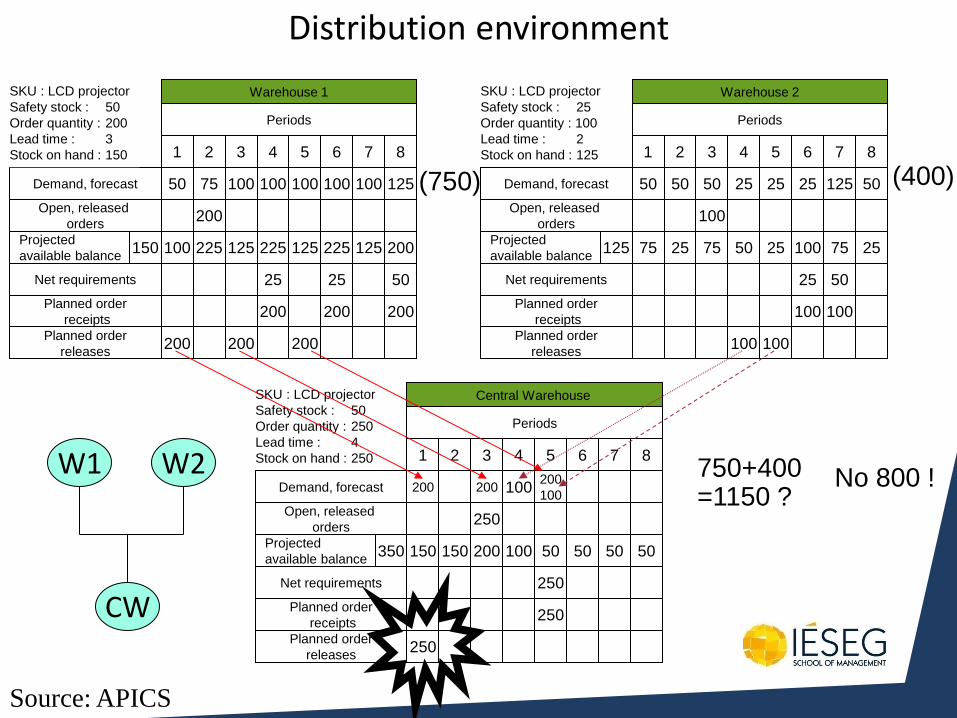
Distribution environment
Demand, forecast
Open, released
orders
Projected
available balance
Net requirements
Planned order
receipts
Planned order
releases
50 75 100 100 100 100 100 125
200
100 225 125 225 125 225 125 200
25 25 50
200 200 200
200 200 200
1 2 3 4 5 6 7 8
150
SKU : LCD projector
Safety stock : 50
Order quantity : 200
Lead time : 3
Stock on hand : 150
Demand, forecast
Open, released
orders
Projected
available balance
Net requirements
Planned order
receipts
Planned order
releases
50 50 50 25 25 25 125 50
100
75 25 75 50 25 100 75 25
25 50
100 100
100 100
1 2 3 4 5 6 7 8
125
SKU : LCD projector
Safety stock : 25
Order quantity : 100
Lead time : 2
Stock on hand : 125
Periods Periods
Warehouse 1 Warehouse 2
Demand, forecast
Open, released
orders
Projected
available balance
Net requirements
Planned order
receipts
Planned order
releases
200 200 100 200
100
250
150 150 200 100 50 50 50 50
250
250
250
1 2 3 4 5 6 7 8
350
SKU : LCD projector
Safety stock : 50
Order quantity : 250
Lead time : 4
Stock on hand : 250
Periods
Central Warehouse
W1 W2
CW
(400) (750)
750+400 =1150 ?
No 800 !
Source: APICS
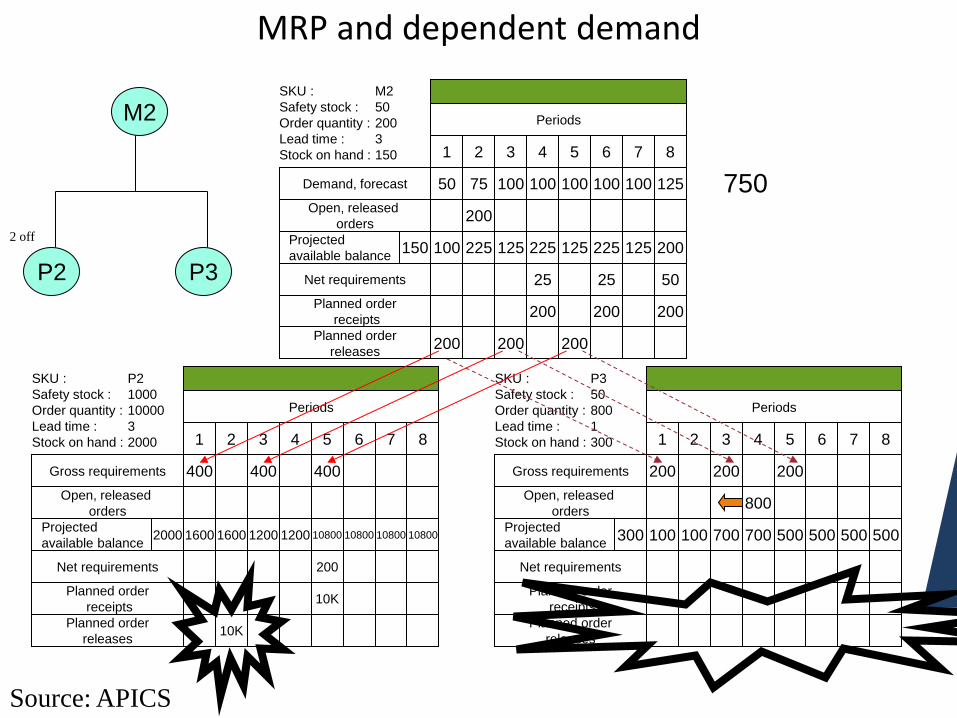
MRP and dependent demand
Demand, forecast
Open, released
orders
Projected
available balance
Net requirements
Planned order
receipts
Planned order
releases
50 75 100 100 100 100 100 125
200
100 225 125 225 125 225 125 200
25 25 50
200 200 200
200 200 200
1 2 3 4 5 6 7 8
150
SKU : M2
Safety stock : 50
Order quantity : 200
Lead time : 3
Stock on hand : 150
Gross requirements
Open, released
orders
Projected
available balance
Net requirements
Planned order
receipts
Planned order
releases
200 200 200
800
100 100 700 700 500 500 500 500
1 2 3 4 5 6 7 8
300
SKU : P3
Safety stock : 50
Order quantity : 800
Lead time : 1
Stock on hand : 300
Periods
Periods
Gross requirements
Open, released
orders
Projected
available balance
Net requirements
Planned order
receipts
Planned order
releases
400 400 400
1600 1600 1200 1200 10800 10800 10800 10800
200
10K
10K
1 2 3 4 5 6 7 8
2000
SKU : P2
Safety stock : 1000
Order quantity : 10000
Lead time : 3
Stock on hand : 2000
Periods
M2
P2 P3
2 off
750
Source: APICS
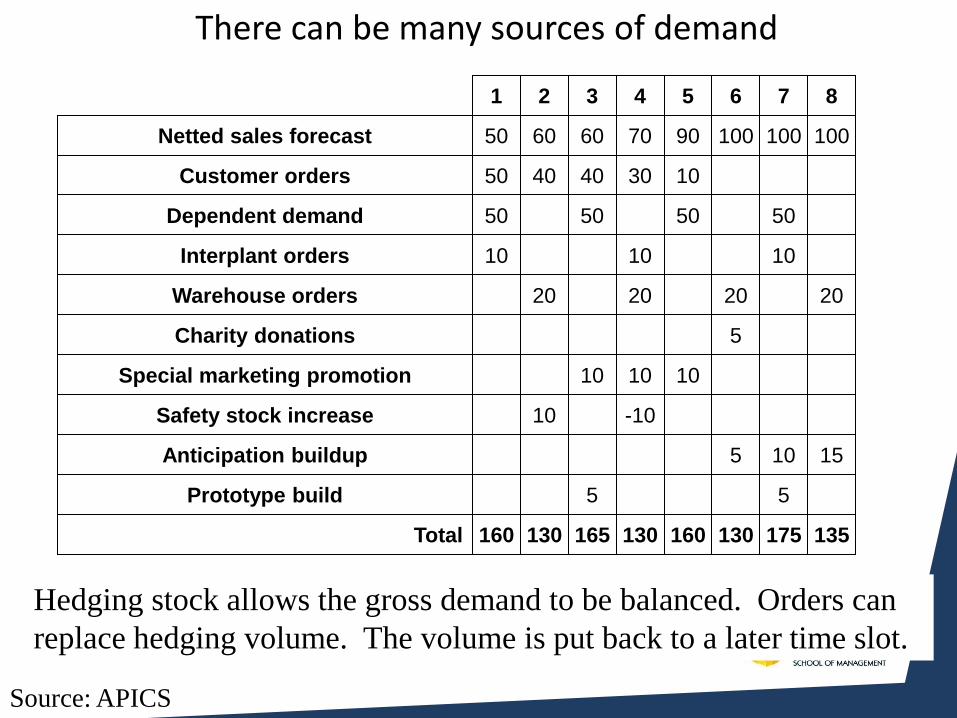
There can be many sources of demand
Netted sales forecast
Customer orders
Dependent demand
Interplant orders
Warehouse orders
Charity donations
Special marketing promotion
Safety stock increase
Anticipation buildup
Prototype build
Total
50 60 60 70 90 100 100 100
50 40 40 30 10
50 50 50 50
10 10 10
20 20 20 20
5
10 10 10
10 -10
5 10 15
5 5
160 130 165 130 160 130 175 135
1 2 3 4 5 6 7 8
Hedging stock allows the gross demand to be balanced. Orders can
replace hedging volume. The volume is put back to a later time slot.
Source: APICS
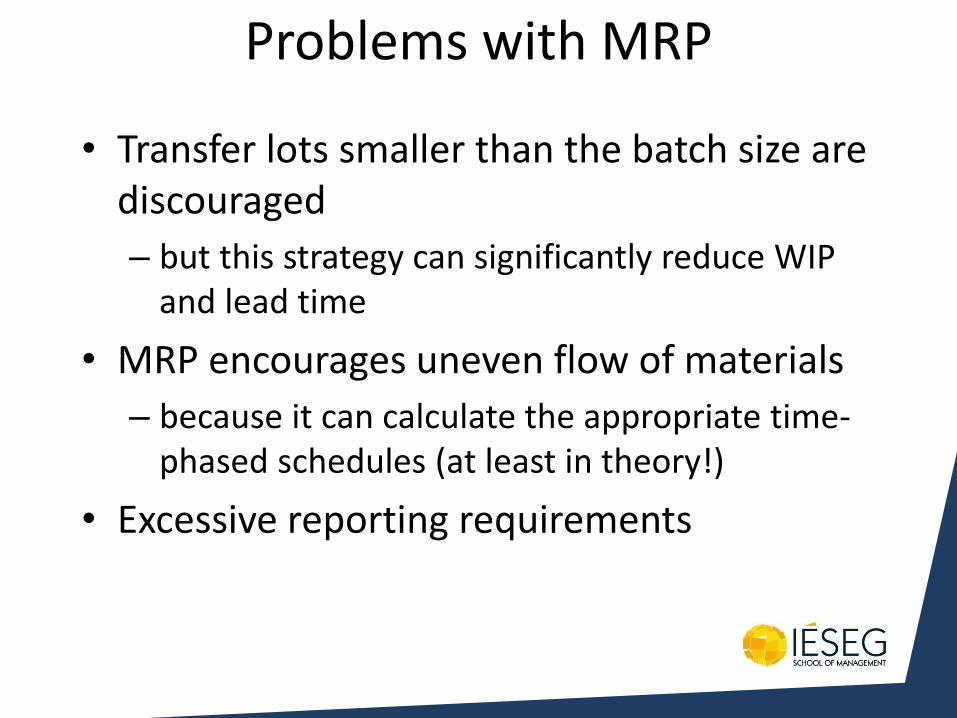
Problems with MRP
• Transfer lots smaller than the batch size are discouraged
– but this strategy can significantly reduce WIP and lead time
• MRP encourages uneven flow of materials
– because it can calculate the appropriate time-phased schedules (at least in theory!)
• Excessive reporting requirements
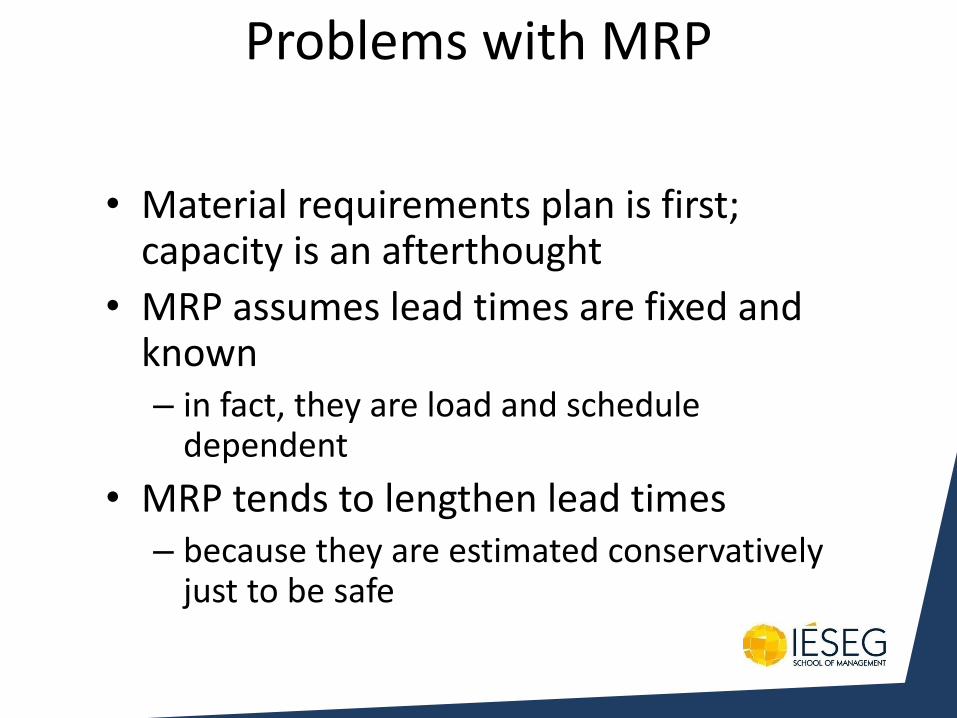
Problems with MRP
• Material requirements plan is first; capacity is an afterthought
• MRP assumes lead times are fixed and known – in fact, they are load and schedule
dependent
• MRP tends to lengthen lead times – because they are estimated conservatively
just to be safe
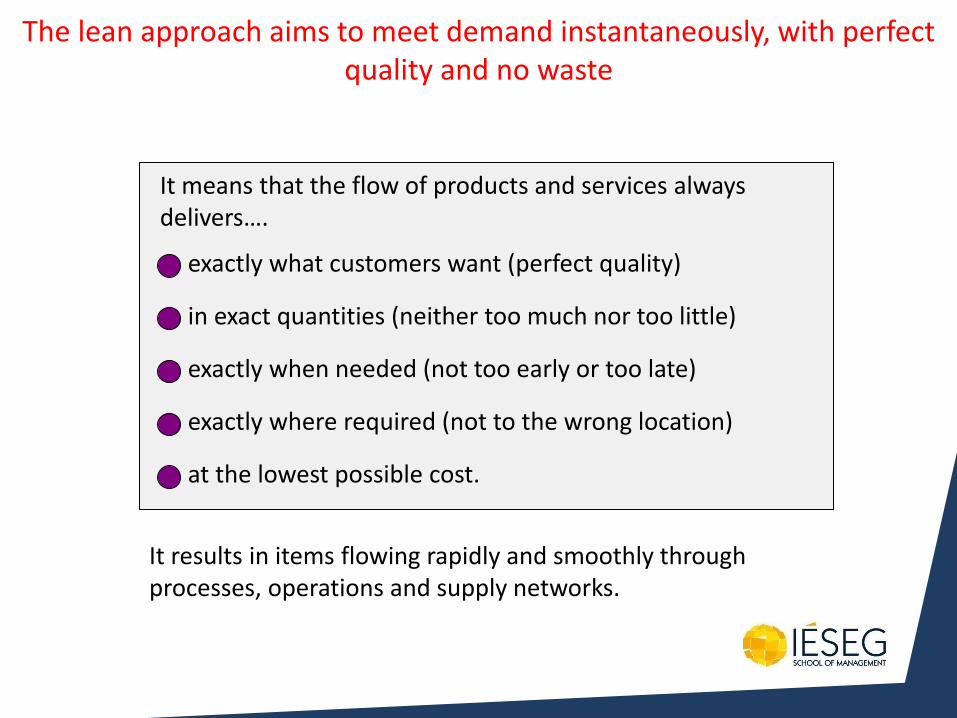
The lean approach aims to meet demand instantaneously, with perfect quality and no waste
It means that the flow of products and services always delivers….
exactly what customers want (perfect quality)
in exact quantities (neither too much nor too little)
exactly when needed (not too early or too late)
exactly where required (not to the wrong location)
at the lowest possible cost.
It results in items flowing rapidly and smoothly through processes, operations and supply networks.
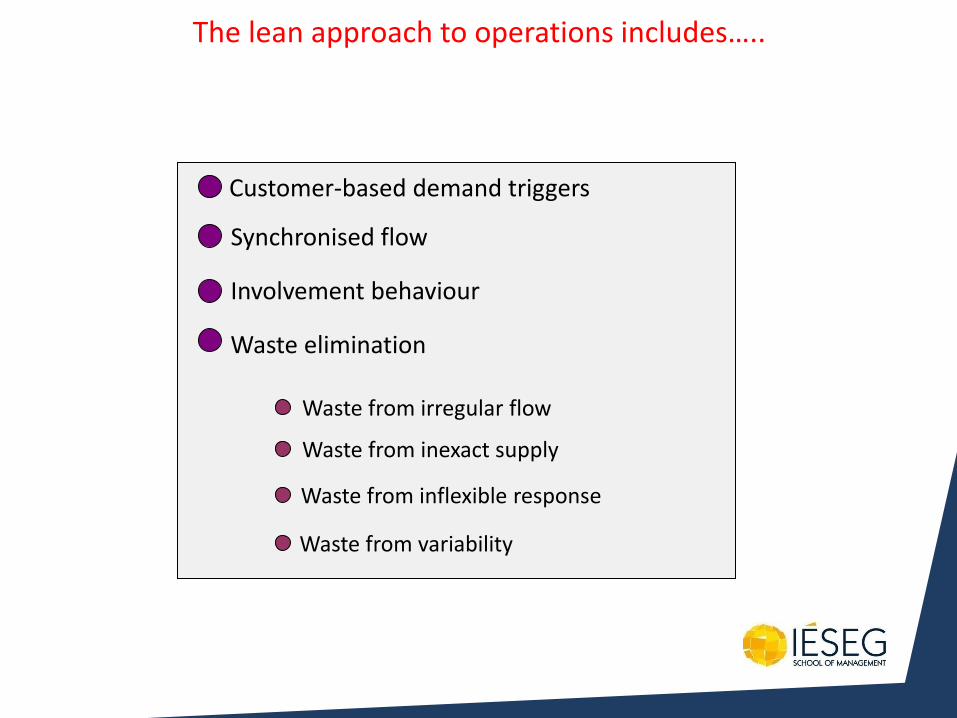
The lean approach to operations includes…..
Customer-based demand triggers
Synchronised flow
Involvement behaviour
Waste elimination
Waste from irregular flow
Waste from inexact supply
Waste from inflexible response
Waste from variability
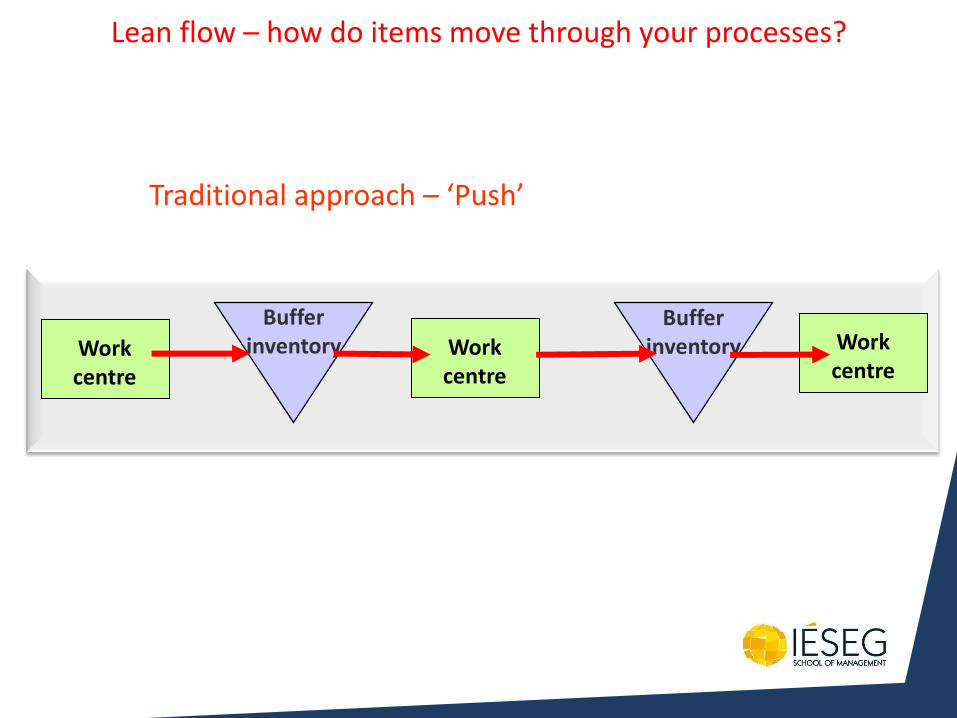
Work centre
Work centre
Work centre
Buffer inventory
Buffer inventory
Lean flow – how do items move through your processes?
Traditional approach – ‘Push’
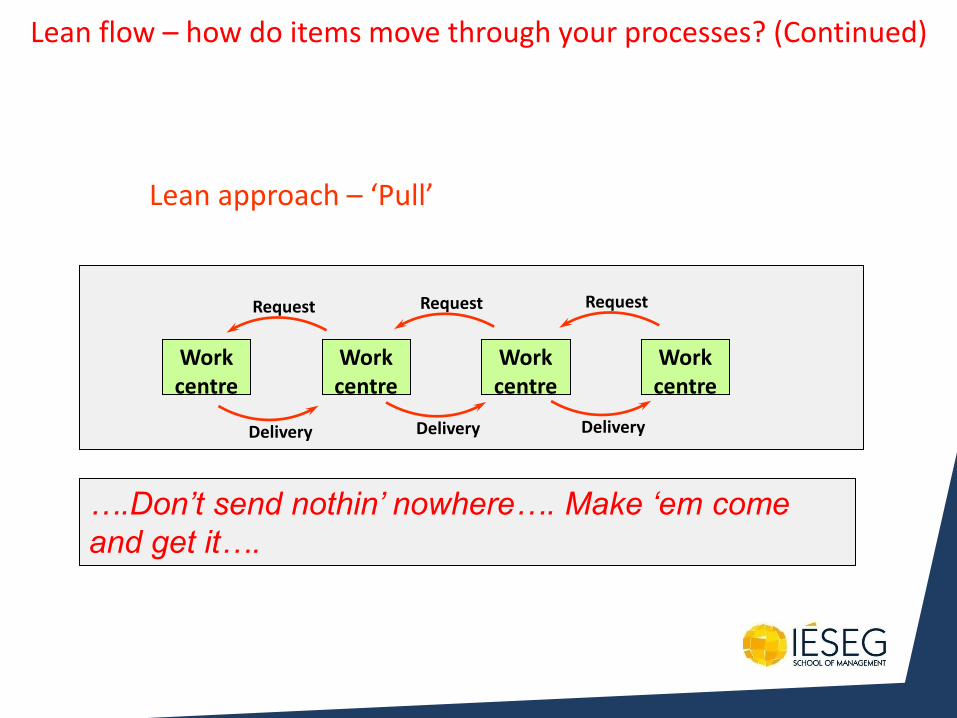
Work centre
Work centre
Work centre
Work centre
Request
Delivery
Request
Delivery
Request
Delivery
Lean approach – ‘Pull’
….Don’t send nothin’ nowhere…. Make ‘em come
and get it….
Lean flow – how do items move through your processes? (Continued)
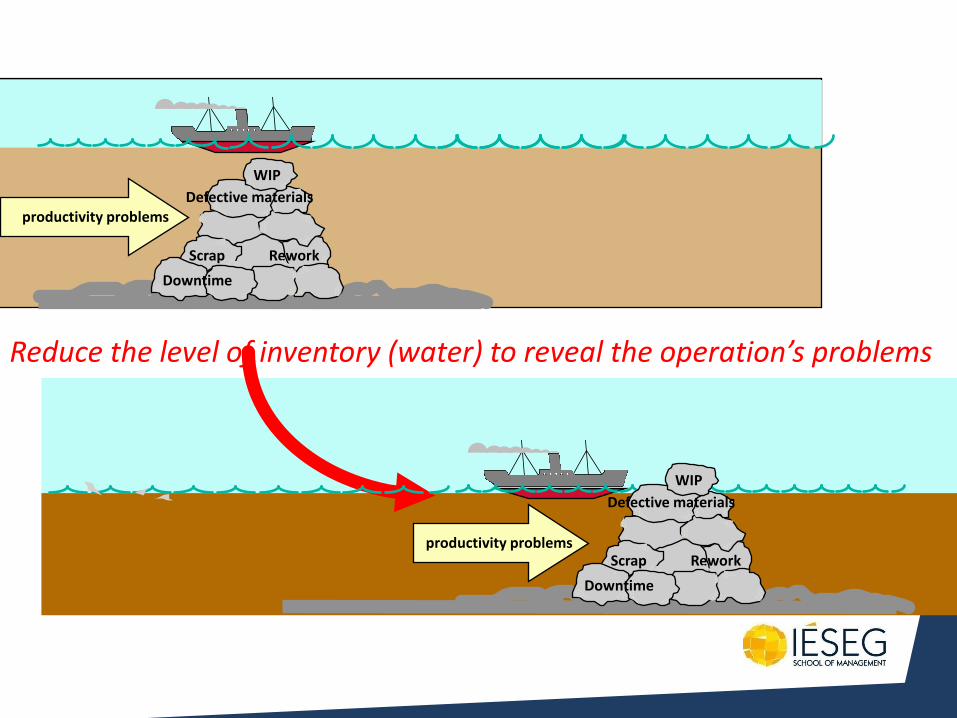
WIP
Defective materials
Rework Scrap
Downtime
productivity problems
productivity problems
Reduce the level of inventory (water) to reveal the operation’s problems
WIP
Defective materials
Rework Scrap
Downtime
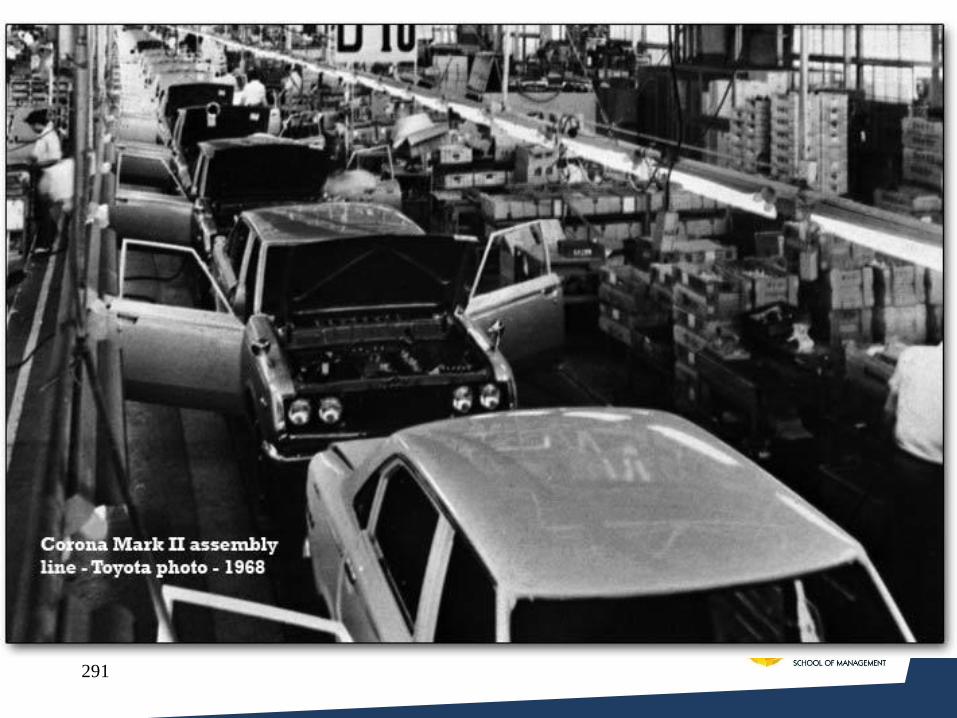
291
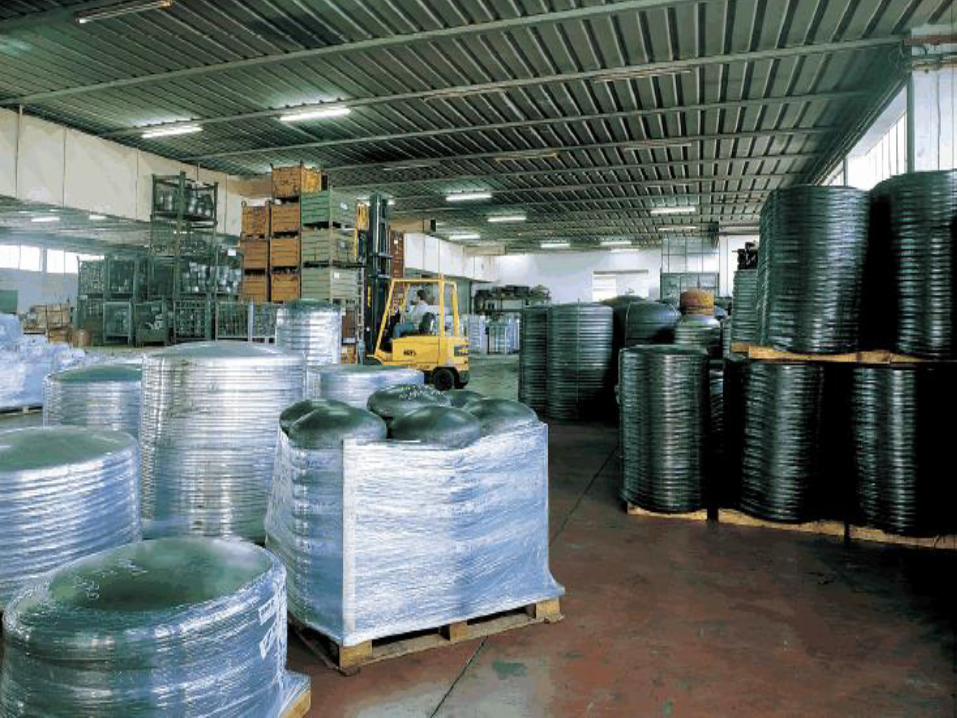
292
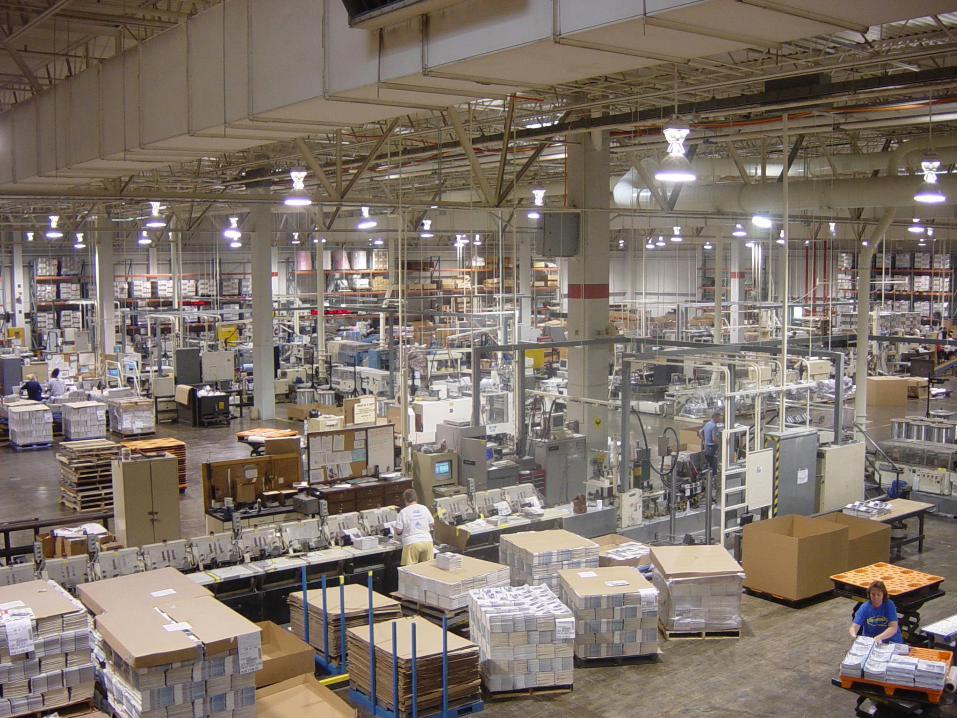
293

294
• httpwww.chezpilou.infopublicInclassables.girafe_obese_m.jpg
295
Underlying Philosophy
Productivity Problems WIP Queues
Late Deliveries
Design Changes
Poor Quality Parts
Rework
Poor Space Layout
Scrap
Demand Instability
Machine Down-Time
Cost of Production
Expose Problems
Eliminate Problems
Reduce Costs:
• Space
• Inventory
• Manpower
• Equipment
296
Product Transport Costs for Japan Market Products
Japan Region LogisticsOriginator: David Newlands
Product Datum Data and Possible Scenarios
Nominal Production Volume per day (24hrs) 5000
Number of days producing/week 6 Number of production days/year 288
NMP Internal operations Lead Time (days) 4
Customer lead time expectations (days) 6
Datum Current Scenario Scenario Scenario
Data Plan Possible 1 Possible 2 Possible 3
Product Nominal cost ex-works £80.00 £80.00 £80.00 £80.00 £80.00
Nominal Life Cycle Volume (Millions) 1.2 1.7 1.7 1.7 1.7
Mechanics Supplier (Plastics) Local Japan Japan Japan Japan
Supplier Location Europe Japan Japan Korea Japan
Mechanics Supplier (Metal) N/A Japan Japan Japan Japan
Supplier Location N/A Japan Japan Japan Japan
Product PCB SMD Country Europe Europe Europe Europe Japan
Product PCB SMD Site Coventry Coventry Coventry Coventry Japan
Product Fin Ass. Site Coventry Coventry Tokyo Tokyo Tokyo
Shipping Frequency (nominal per week) 2 2 2 2 18
Shipping Duration (Days) 1 3 1 4 1
Shipment Quantity 15000 15000 15000 15000 1667
Dispatch Safety Stock
(delivery LT x daily requirements) 5000 15000 5000 20000 5000
Receiving Buffer Stock 15000 15000 15000 15000 1667
Plant Line Loaded Raw Materials 5000 5000 5000 5000 5000
297
In-bound Transport Costs From Japan to Europe
Mechanics Inbound Costs Total Total £200.00 £1,320.00 £200.00 £1,120.00 £1,800.00
per unit £0.01 £0.09 £0.01 £0.07 £1.08
Electro-mech. Inbound Cost Total £1,467 £1,800 £556 £556 £5,000
per unit £0.10 £0.12 £0.04 £0.04 £3.00
Total Inbound Transport Cost Total £1,667 £3,120 £756 £1,676 £6,800
(Six days production) per unit £0.11 £0.21 £0.05 £0.11 £4.08
Outbound Transport Costs Europe to Japan
Mechanics Outbound Cost Total £1,274.00 £1,204.00 £0.00 £0.00 £0.00
per unit £0.08 £0.08 £0.00 £0.00 £0.00
Electronics Outbound Cost Total £160.00 £172.00 £142.00 £142.00 £1,800.00
per unit £0.01 £0.01 £0.01 £0.01 £1.08
Electro-mech Outbound Cost Total £263.00 £362.00 £0.00 £0.00 £0.00
per unit £0.02 £0.02 £0.00 £0.00 £0.00
Total Material Outbound Cost £1,697 £1,738 £142 £142 £1,800
Total Material Turning Cost per week
Total £3,364 £4,858 £898 £1,818 £8,600
per unit £0.22 £0.32 £0.06 £0.12 £5.16
Mean Cost from analysis Mean = £1.18
Lowest £0.06 -£1.12 Favourable
Highest £5.16 £3.98 Unfavourable
Life Time Cost Total £262,000 £544,000 £102,000 £204,000 £8,772,000
Mean Cost from analysis Mean = £1,976,800
Lowest £102,000 -£1,874,800 Favourable
Highest £8,772,000 £6,795,200 Unfavourable
Based on Total material stock cost (1 week)
Total Value All inbound & outbound stock
(Worst Case) £5,197,123 £5,213,848 £3,802,020 £4,618,615 £1,321,212
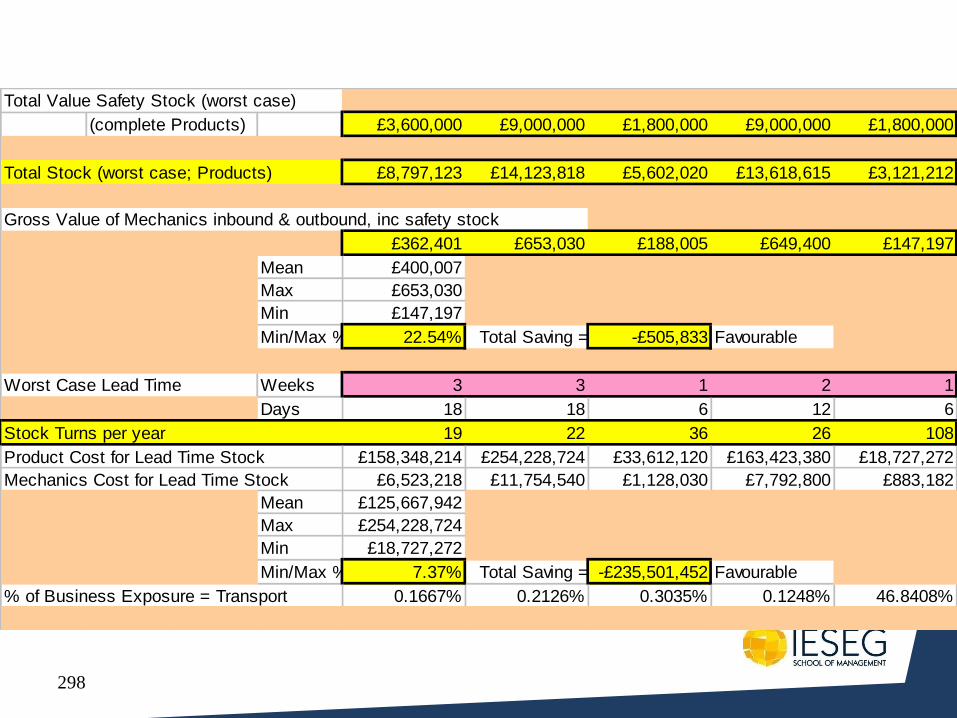
298
Total Value Safety Stock (worst case)
(complete Products) £3,600,000 £9,000,000 £1,800,000 £9,000,000 £1,800,000
Total Stock (worst case; Products) £8,797,123 £14,123,818 £5,602,020 £13,618,615 £3,121,212
Gross Value of Mechanics inbound & outbound, inc safety stock
£362,401 £653,030 £188,005 £649,400 £147,197
Mean £400,007
Max £653,030
Min £147,197
Min/Max % 22.54% Total Saving = -£505,833 Favourable
Worst Case Lead Time Weeks 3 3 1 2 1
Days 18 18 6 12 6
Stock Turns per year 19 22 36 26 108
Product Cost for Lead Time Stock £158,348,214 £254,228,724 £33,612,120 £163,423,380 £18,727,272
Mechanics Cost for Lead Time Stock £6,523,218 £11,754,540 £1,128,030 £7,792,800 £883,182
Mean £125,667,942
Max £254,228,724
Min £18,727,272
Min/Max % 7.37% Total Saving = -£235,501,452 Favourable
% of Business Exposure = Transport 0.1667% 0.2126% 0.3035% 0.1248% 46.8408%
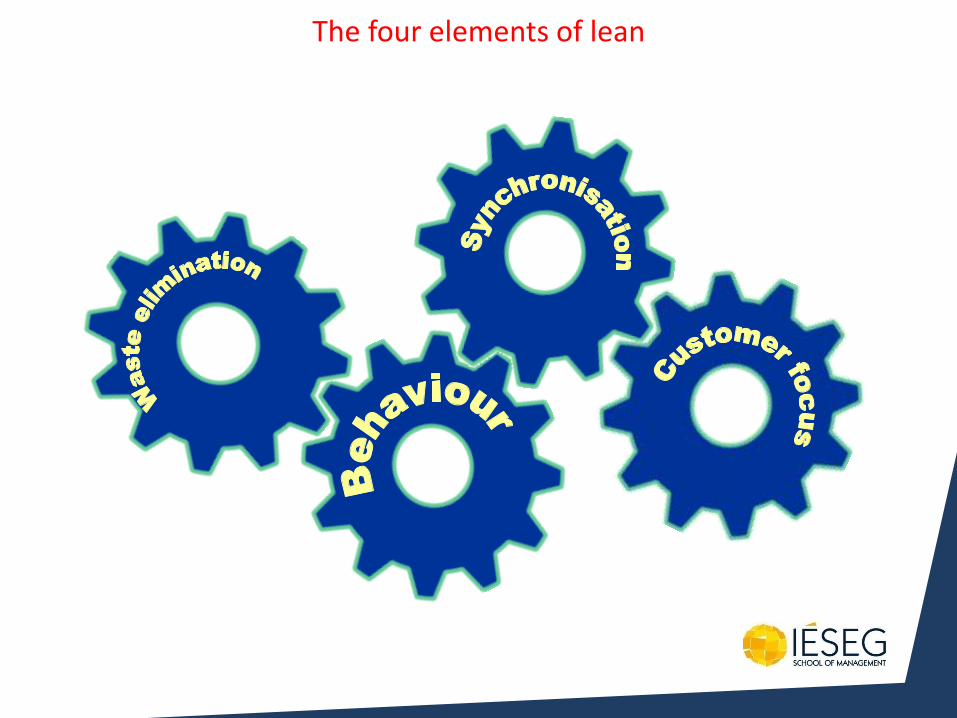
The four elements of lean
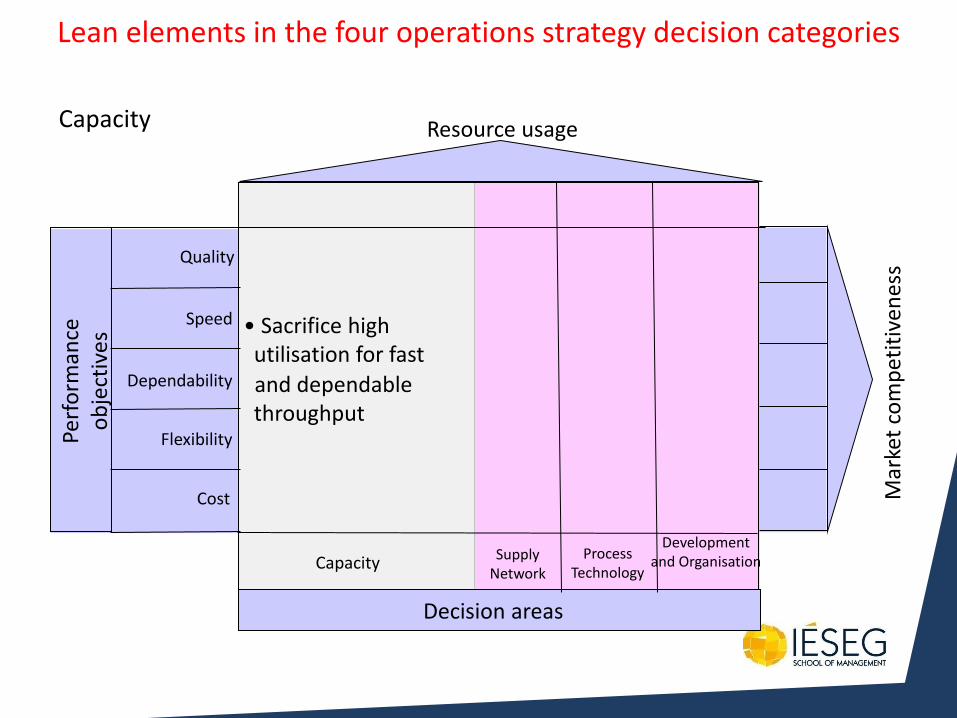
Decision areas
Mar
ket
com
pet
itiv
enes
s
Process Technology
Resource usage
Lean elements in the four operations strategy decision categories
Development and Organisation
• Sacrifice high utilisation for fast
and dependable throughput
Quality
Perf
orm
ance
o
bje
ctiv
es
Dependability
Speed
Flexibility
Cost
Capacity
Supply Network
Capacity
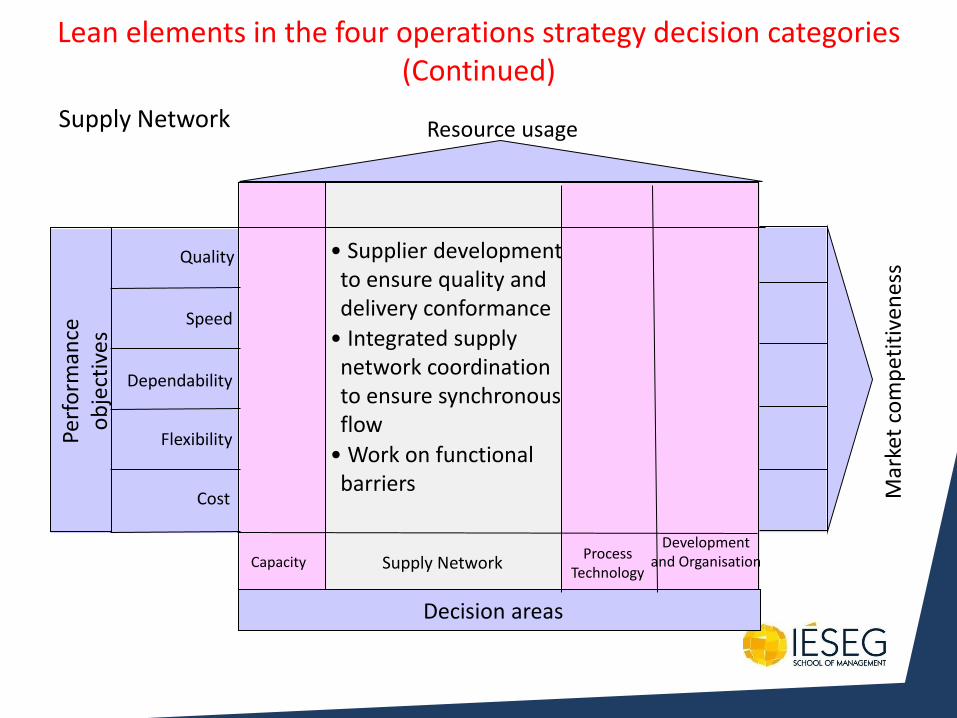
Decision areas
Capacity
Mar
ket
com
pet
itiv
enes
s
Process Technology
Resource usage
Development and Organisation
• Supplier development to ensure quality and delivery conformance
• Integrated supply network coordination to ensure synchronous flow
• Work on functional barriers
Quality
Perf
orm
ance
o
bje
ctiv
es
Dependability
Speed
Flexibility
Cost
Supply Network
Supply Network
Lean elements in the four operations strategy decision categories (Continued)
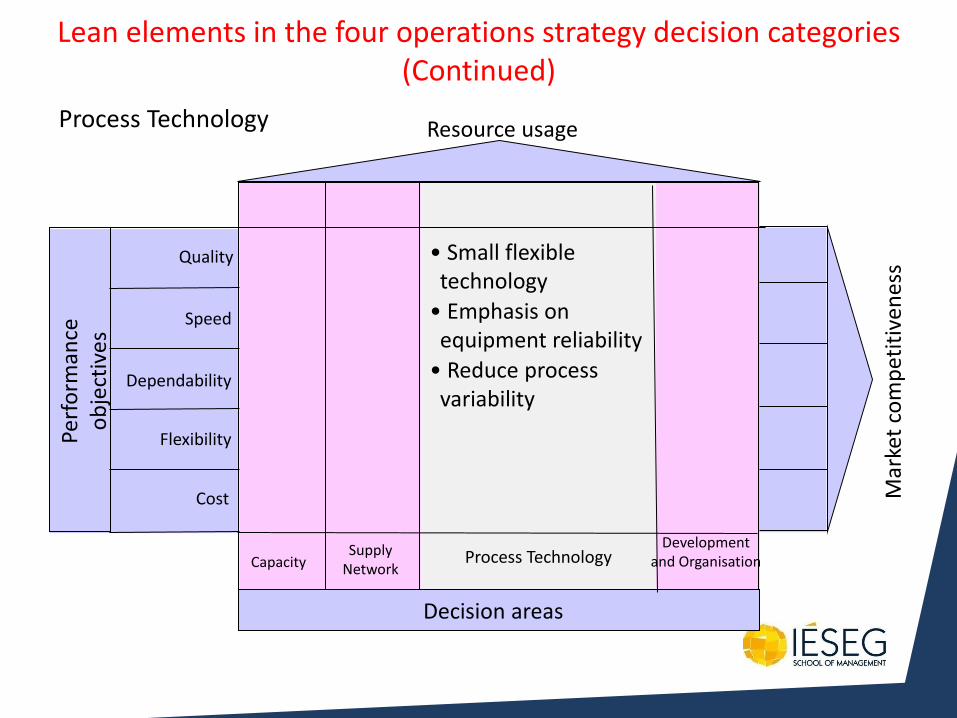
Decision areas
Capacity Supply
Network
Mar
ket
com
pet
itiv
enes
s
Process Technology
Resource usage
Development and Organisation
• Small flexible technology
• Emphasis on equipment reliability
• Reduce process variability
Quality
Perf
orm
ance
o
bje
ctiv
es
Dependability
Speed
Flexibility
Cost
Process Technology
Lean elements in the four operations strategy decision categories (Continued)
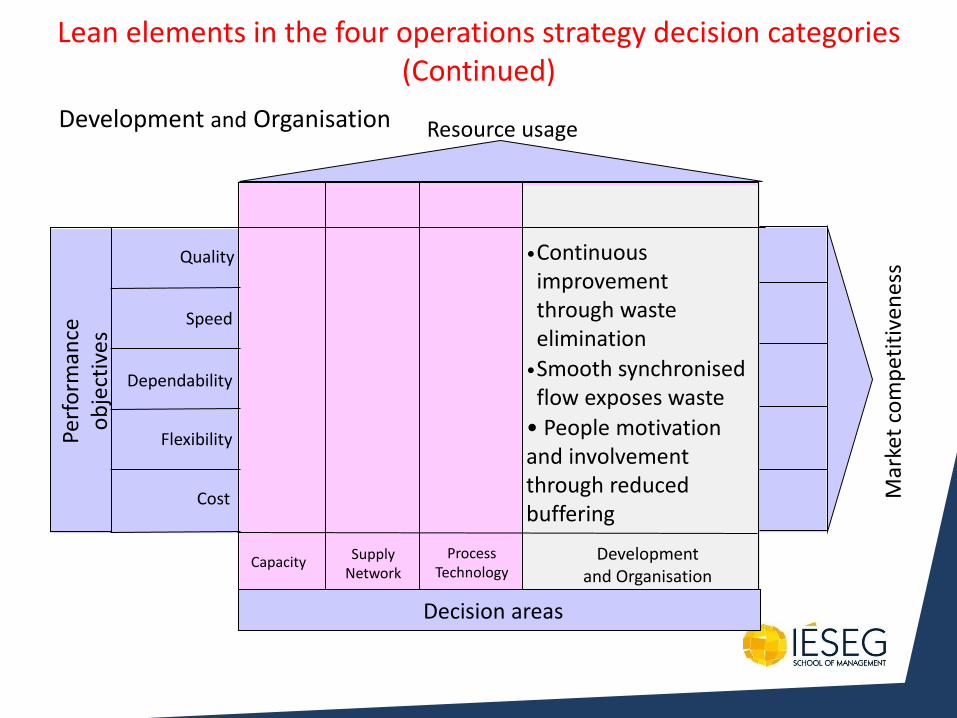
Decision areas
Capacity Supply
Network
Mar
ket
com
pet
itiv
enes
s
Process Technology
Resource usage
Development and Organisation
• Continuous improvement through waste elimination
• Smooth synchronised flow exposes waste
• People motivation and involvement through reduced buffering
Quality
Perf
orm
ance
o
bje
ctiv
es
Dependability
Speed
Flexibility
Cost
Development and Organisation
Lean elements in the four operations strategy decision categories (Continued)
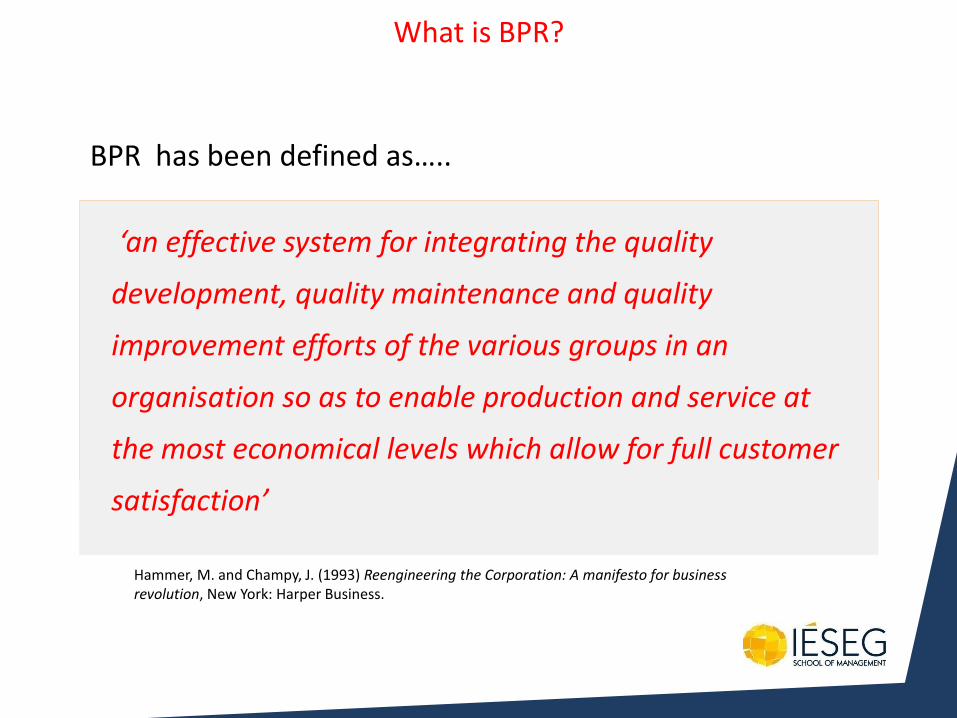
What is BPR?
BPR has been defined as…..
the fundamental rethinking and radical redesign of
business processes to achieve dramatic improvements in
critical, contemporary measures of performance such as
cost, quality, service and speed.
Hammer, M. and Champy, J. (1993) Reengineering the Corporation: A manifesto for business revolution, New York: Harper Business.
‘an effective system for integrating the quality
development, quality maintenance and quality
improvement efforts of the various groups in an
organisation so as to enable production and service at
the most economical levels which allow for full customer
satisfaction’
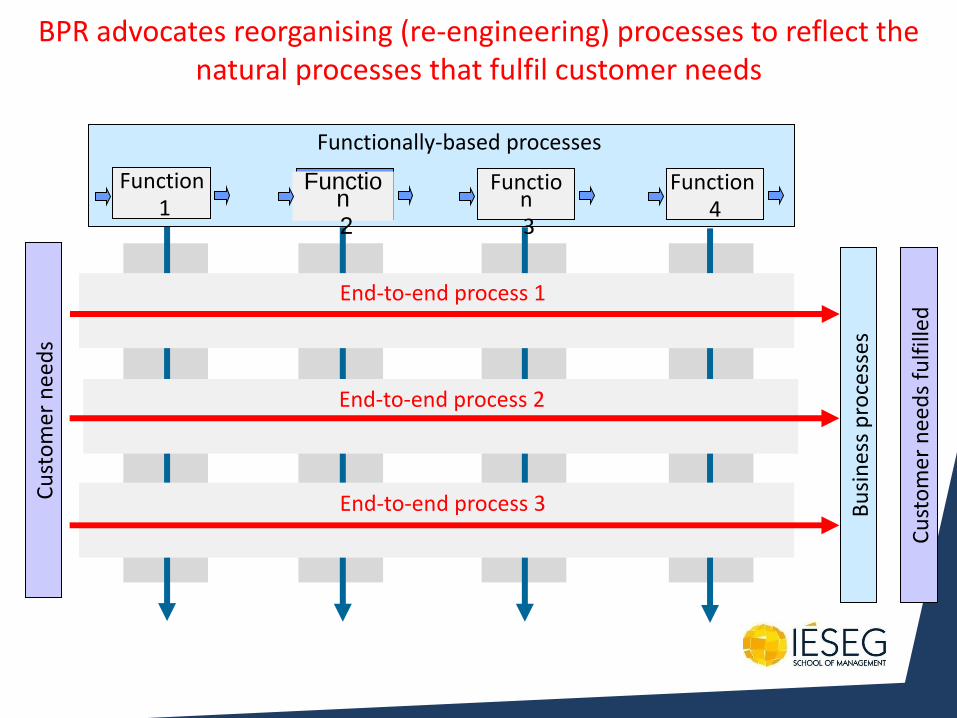
BPR advocates reorganising (re-engineering) processes to reflect the natural processes that fulfil customer needs
Function 1
Cu
sto
mer
ne
eds
Cu
sto
mer
nee
ds
fulf
illed
Functionally-based processes
Function 2
Function 3
Function 4
Bu
sin
ess
pro
cess
es
End-to-end process 1
End-to-end process 2
End-to-end process 3
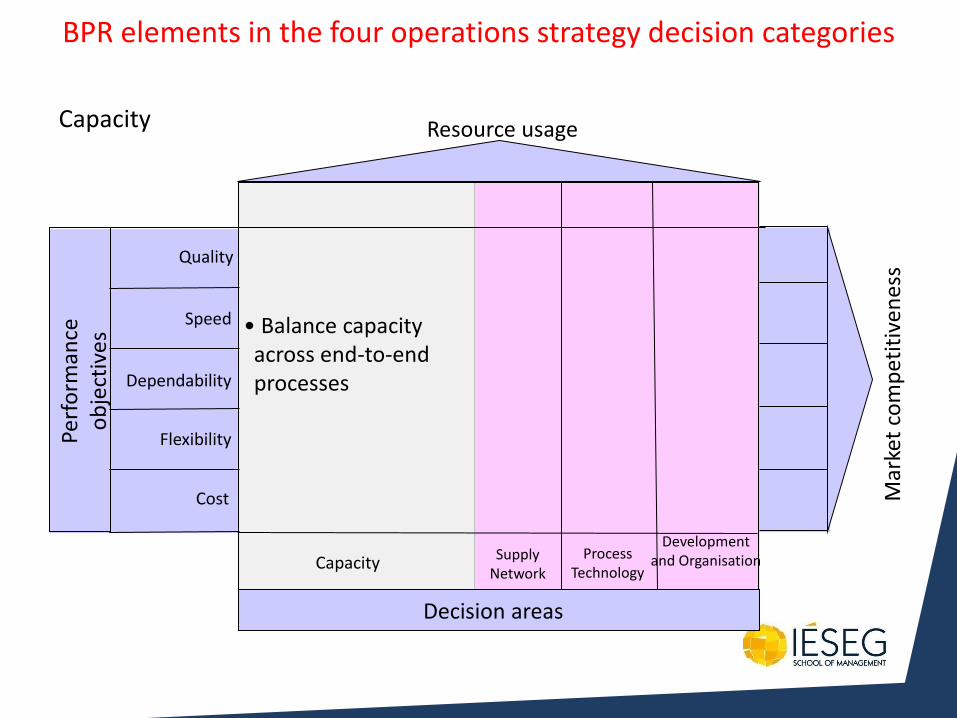
Decision areas
Mar
ket
com
pet
itiv
enes
s
Process Technology
Resource usage
BPR elements in the four operations strategy decision categories
Development and Organisation
• Balance capacity across end-to-end processes
Quality
Perf
orm
ance
o
bje
ctiv
es
Dependability
Speed
Flexibility
Cost
Capacity
Supply Network
Capacity
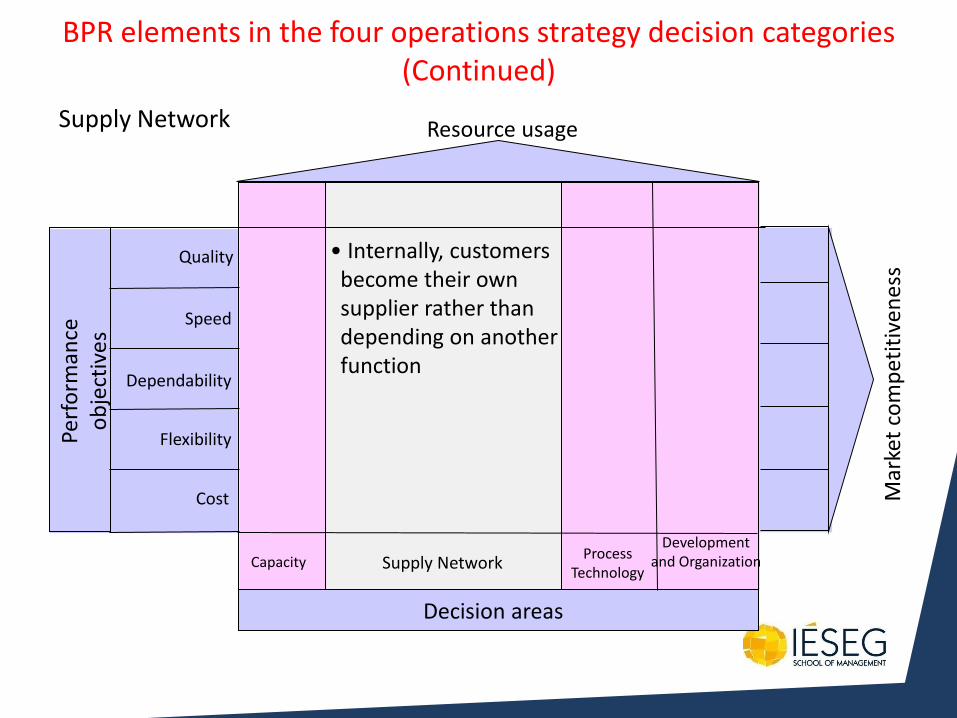
Decision areas
Capacity Process
Technology
Resource usage
Development and Organization
• Internally, customers become their own supplier rather than depending on another function
Quality
Perf
orm
ance
o
bje
ctiv
es
Dependability
Speed
Flexibility
Cost
Supply Network
Supply Network
BPR elements in the four operations strategy decision categories (Continued)
Mar
ket
com
pet
itiv
enes
s
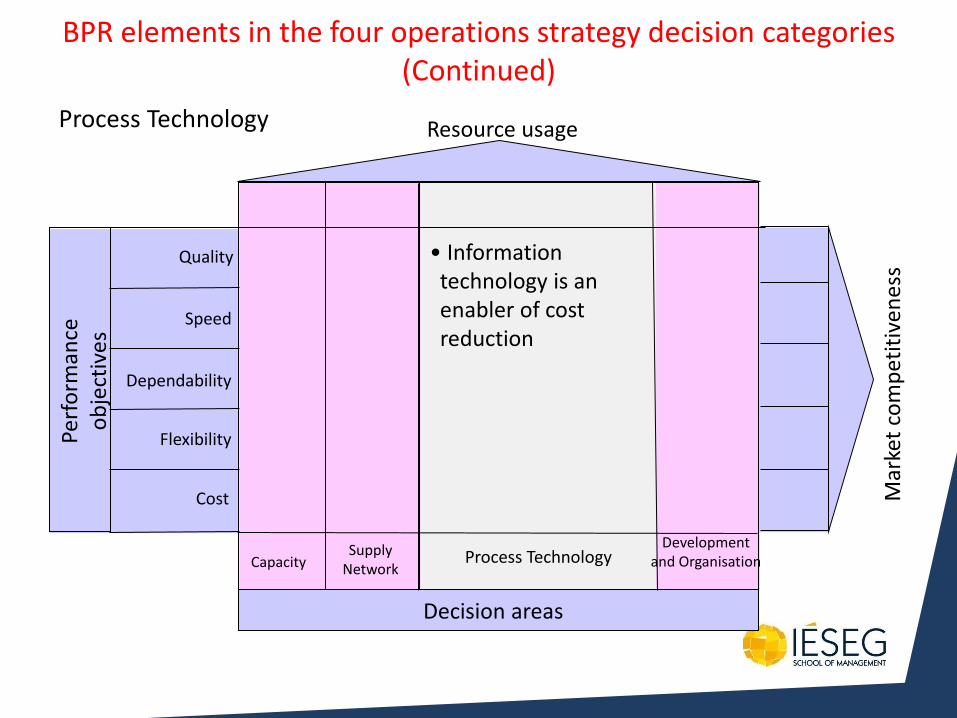
Decision areas
Capacity Supply
Network Process Technology
Resource usage
Development and Organisation
• Information technology is an enabler of cost reduction
Quality
Perf
orm
ance
o
bje
ctiv
es
Dependability
Speed
Flexibility
Cost
Process Technology
BPR elements in the four operations strategy decision categories (Continued)
Mar
ket
com
pet
itiv
enes
s
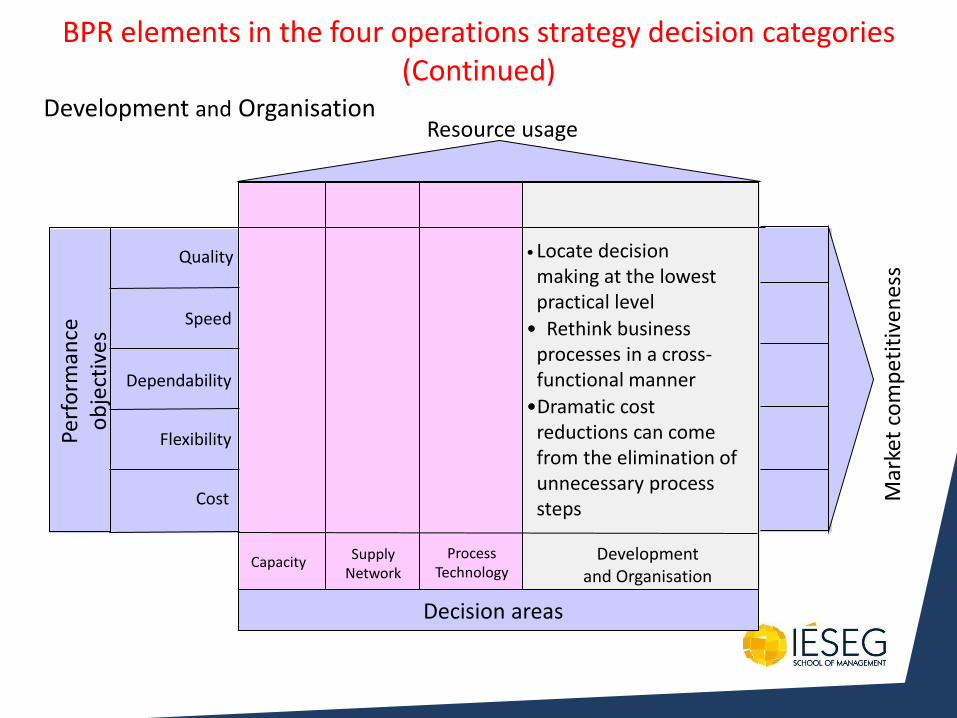
Decision areas
Capacity Supply
Network
Process Technology
Resource usage
Development and Organisation
• Locate decision making at the lowest practical level
• Rethink business processes in a cross- functional manner
•Dramatic cost reductions can come from the elimination of unnecessary process steps
Quality
Perf
orm
ance
o
bje
ctiv
es
Dependability
Speed
Flexibility
Cost
Development and Organisation
BPR elements in the four operations strategy decision categories (Continued)
Mar
ket
com
pet
itiv
enes
s
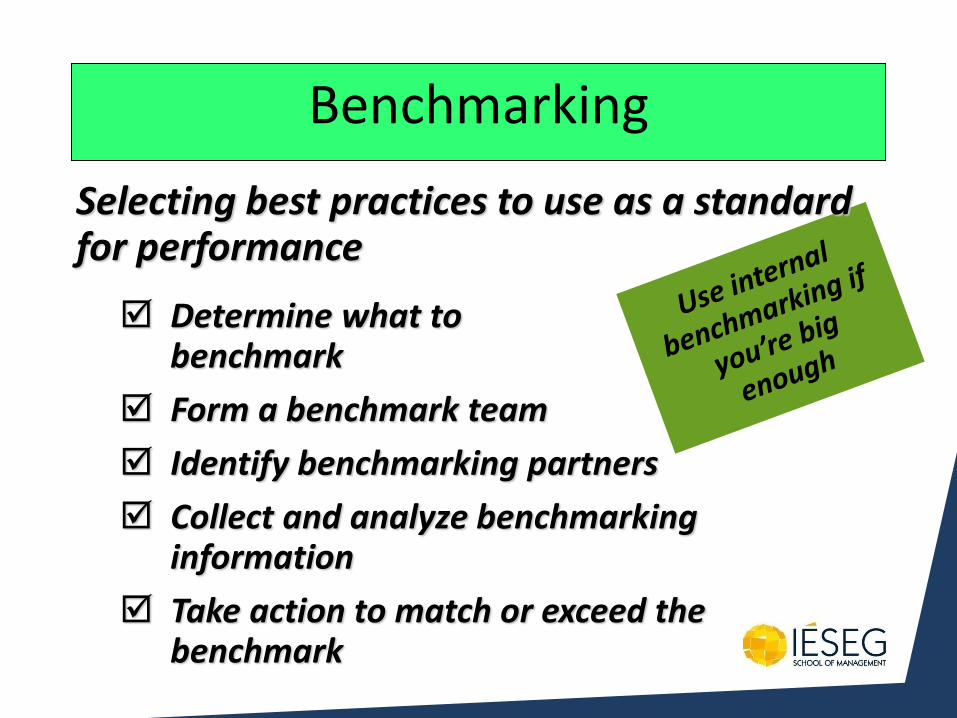
Benchmarking
Selecting best practices to use as a standard for performance
Determine what to benchmark
Form a benchmark team
Identify benchmarking partners
Collect and analyze benchmarking information
Take action to match or exceed the benchmark

EVERYONE GETS TWO SHEETS OF PAPER
Paper Aeroplane Exercise
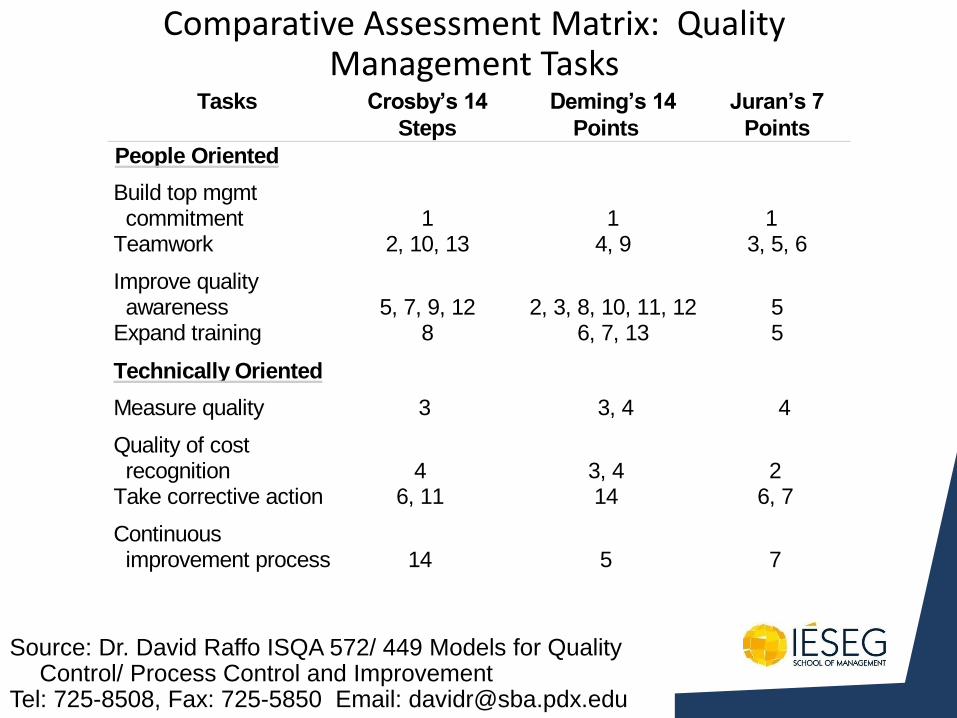
Comparative Assessment Matrix: Quality Management Tasks
Tasks Crosby’s 14
Steps
Deming’s 14
Points
Juran’s 7
Points
People Oriented
Build top mgmtcommitment 1 1 1
Teamwork 2, 10, 13 4, 9 3, 5, 6
Improve qualityawareness 5, 7, 9, 12 2, 3, 8, 10, 11, 12 5
Expand training 8 6, 7, 13 5
Technically Oriented
Measure quality 3 3, 4 4
Quality of costrecognition 4 3, 4 2
Take corrective action 6, 11 14 6, 7
Continuousimprovement process 14 5 7
Source: Dr. David Raffo ISQA 572/ 449 Models for Quality Control/ Process Control and Improvement
Tel: 725-8508, Fax: 725-5850 Email: [email protected]
Capability Maturity Model • Provides a framework for process
improvement
• Processes are assessed to determine their current level of process maturity
• Five levels of maturity
• 17 Key Process Areas (KPAs) related to essential core software development processes
• Actions to be taken based on current state of the process
Source: Raffo, ISQA 572/ 449
Models for Quality Control/ Process
Control and Improvement
The Five Levels of Software Process Maturity
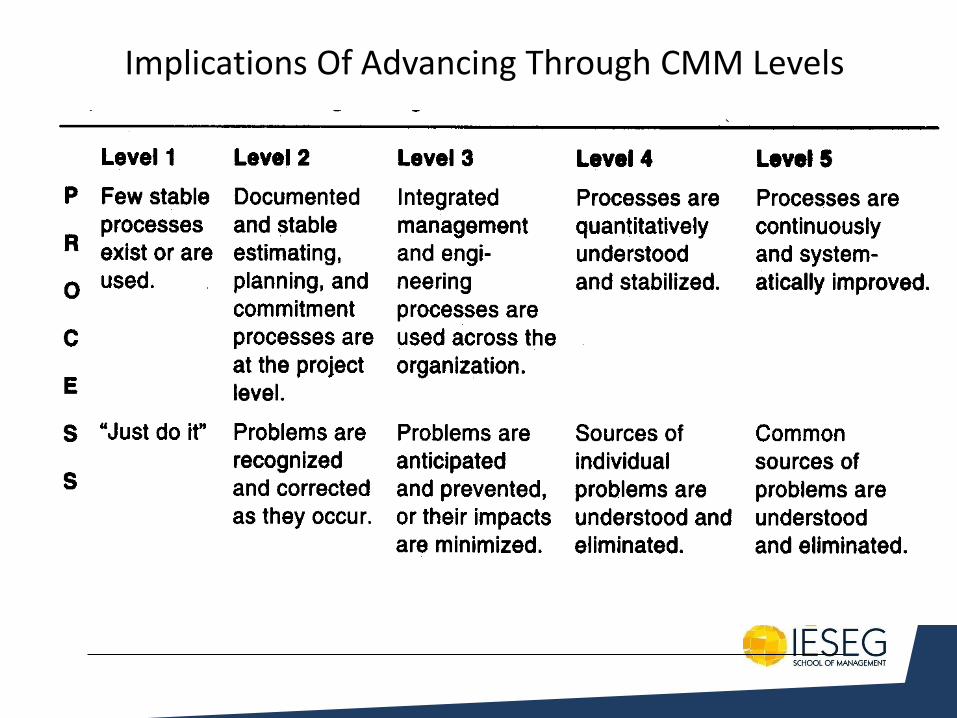
Implications Of Advancing Through CMM Levels
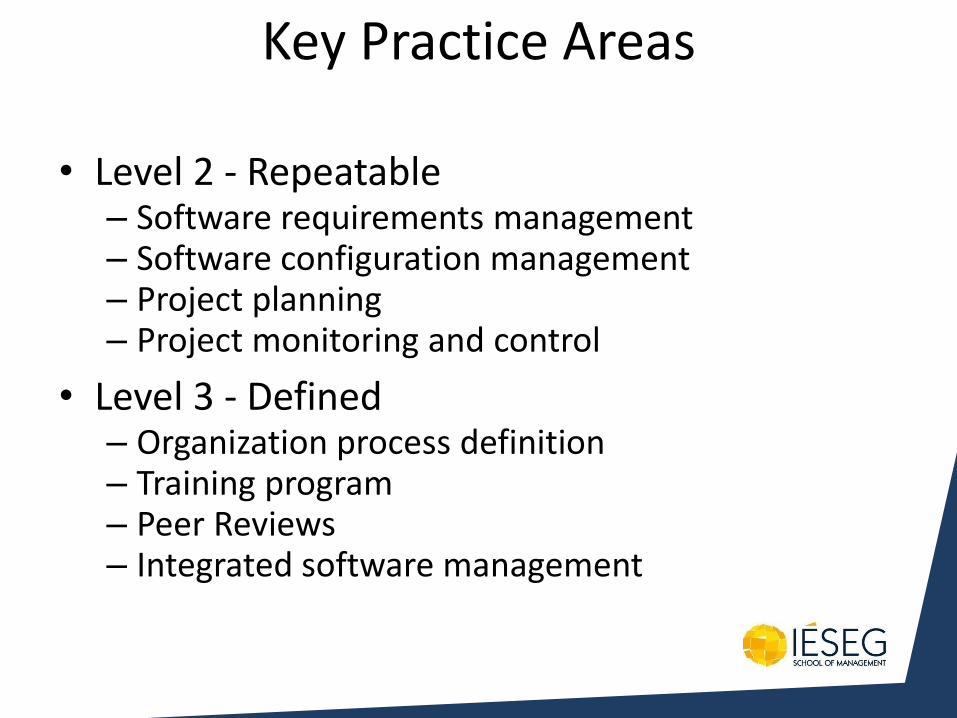
Key Practice Areas
• Level 2 - Repeatable – Software requirements management – Software configuration management – Project planning – Project monitoring and control
• Level 3 - Defined – Organization process definition – Training program – Peer Reviews – Integrated software management
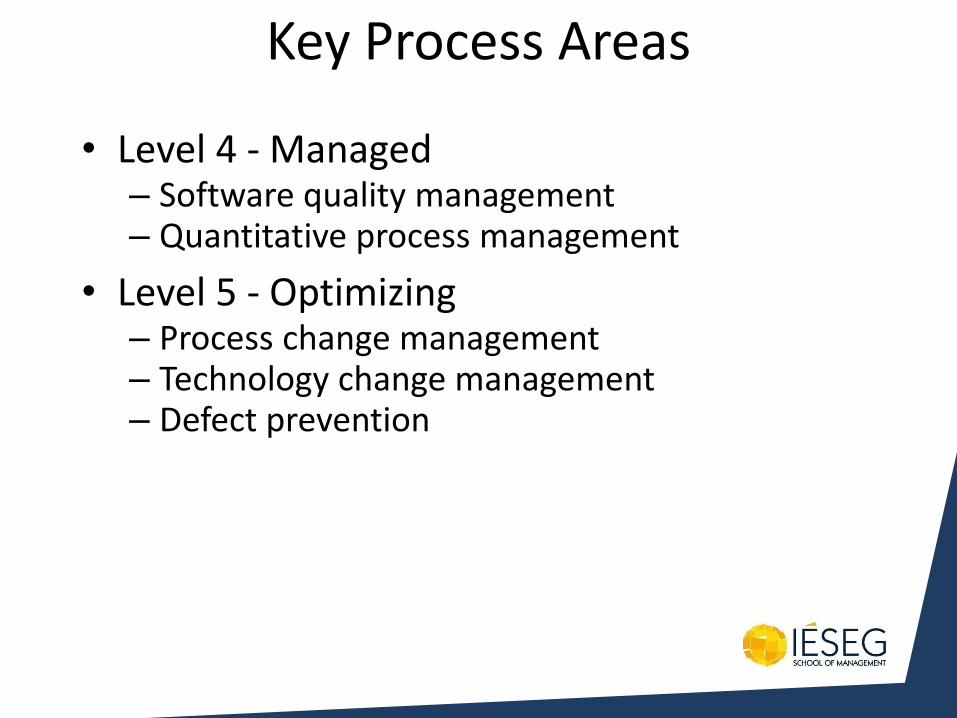
Key Process Areas
• Level 4 - Managed – Software quality management – Quantitative process management
• Level 5 - Optimizing – Process change management – Technology change management – Defect prevention
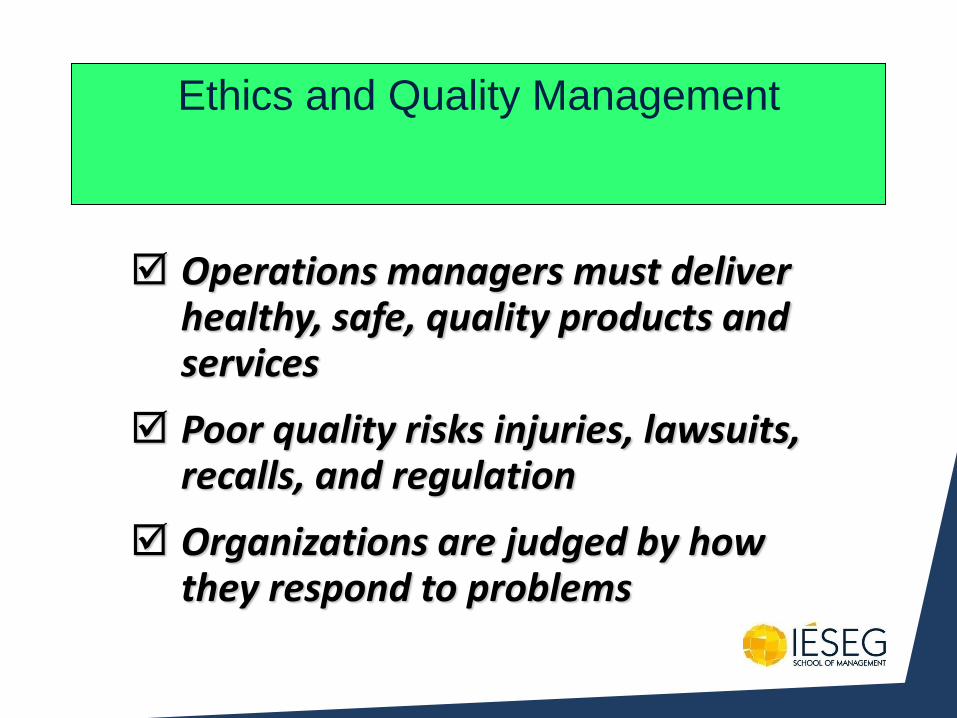
Ethics and Quality Management
Operations managers must deliver healthy, safe, quality products and services
Poor quality risks injuries, lawsuits, recalls, and regulation
Organizations are judged by how they respond to problems
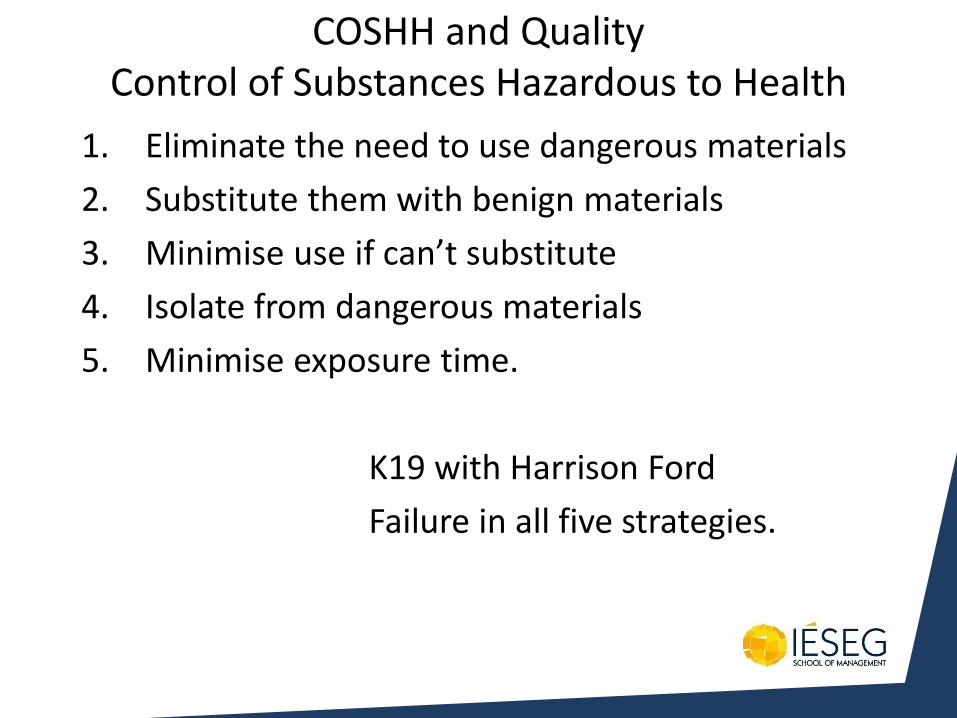
COSHH and Quality Control of Substances Hazardous to Health
1. Eliminate the need to use dangerous materials
2. Substitute them with benign materials
3. Minimise use if can’t substitute
4. Isolate from dangerous materials
5. Minimise exposure time.
K19 with Harrison Ford
Failure in all five strategies.
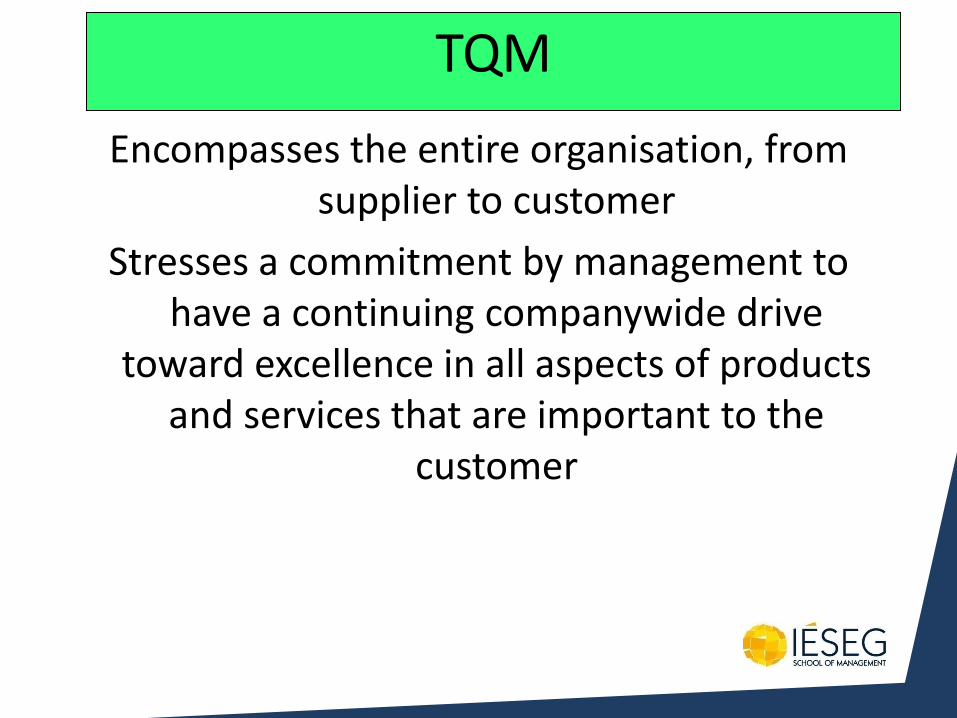
TQM
Encompasses the entire organisation, from supplier to customer
Stresses a commitment by management to have a continuing companywide drive
toward excellence in all aspects of products and services that are important to the
customer
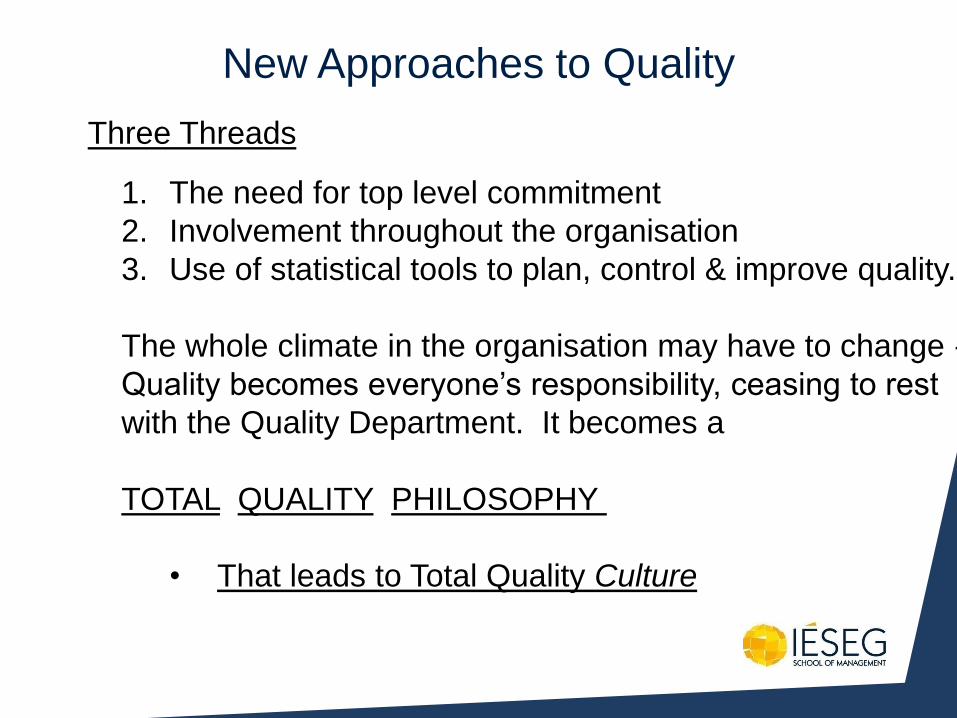
New Approaches to Quality
Three Threads
1. The need for top level commitment
2. Involvement throughout the organisation
3. Use of statistical tools to plan, control & improve quality.
The whole climate in the organisation may have to change -
Quality becomes everyone’s responsibility, ceasing to rest
with the Quality Department. It becomes a
TOTAL QUALITY PHILOSOPHY
• That leads to Total Quality Culture
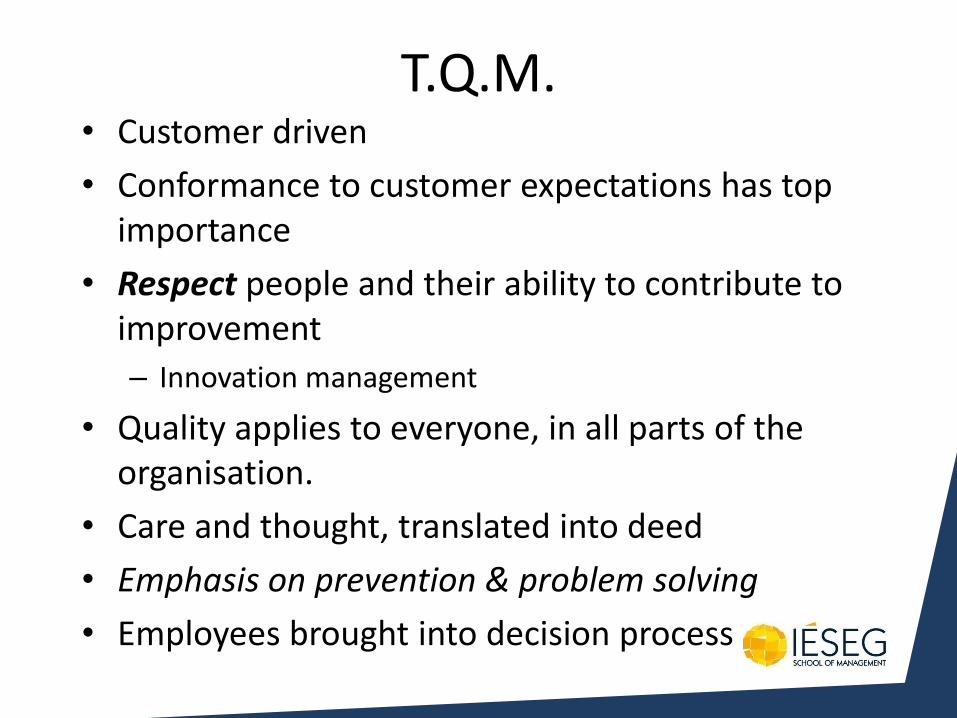
T.Q.M. • Customer driven
• Conformance to customer expectations has top importance
• Respect people and their ability to contribute to improvement
– Innovation management
• Quality applies to everyone, in all parts of the organisation.
• Care and thought, translated into deed
• Emphasis on prevention & problem solving
• Employees brought into decision process
Develop “Quattitude”
• Quality begins with personal attitudes
• Quality-focused individuals often exceed customer expectations (i.e., whomever you deal with)
• Attitudes can be changed through awareness and effort (e.g., personal quality checklists)
• Personal initiative has a positive impact on success (business, family, or friends)
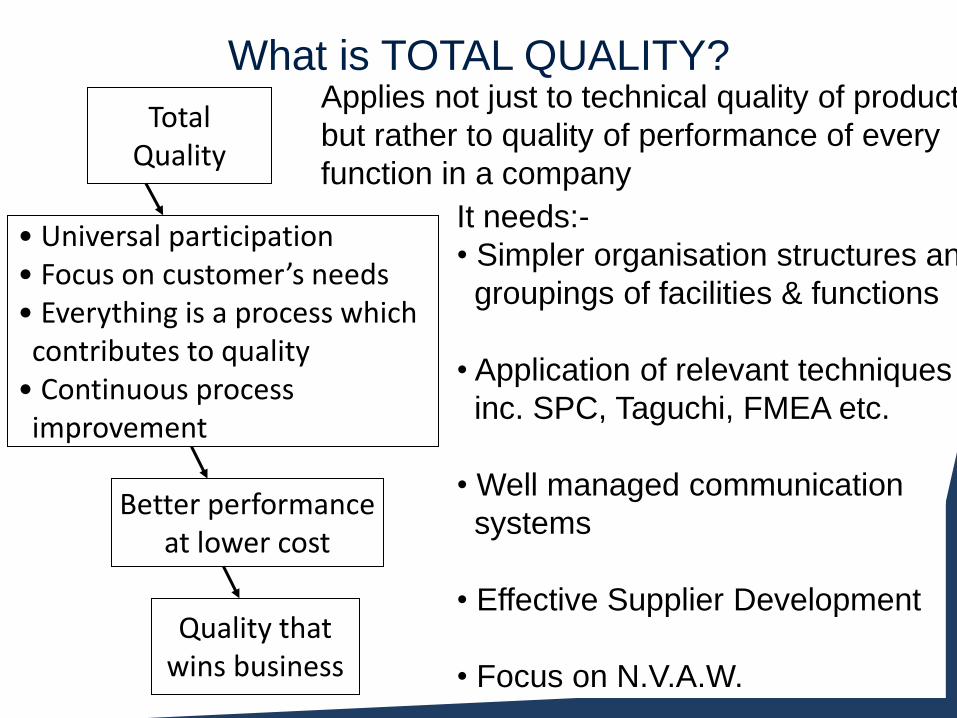
What is TOTAL QUALITY? Applies not just to technical quality of products
but rather to quality of performance of every
function in a company
It needs:-
• Simpler organisation structures and
groupings of facilities & functions
• Application of relevant techniques
inc. SPC, Taguchi, FMEA etc.
• Well managed communication
systems
• Effective Supplier Development
• Focus on N.V.A.W.
Total Quality
• Universal participation • Focus on customer’s needs • Everything is a process which contributes to quality • Continuous process improvement
Better performance at lower cost
Quality that wins business
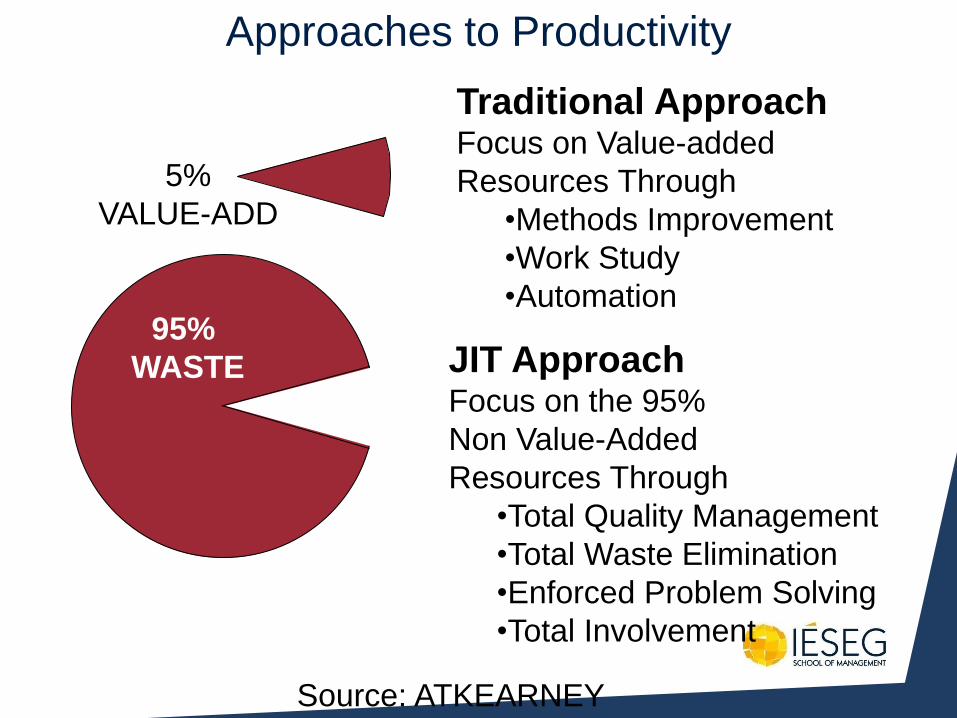
Approaches to Productivity
95%
WASTE
5%
VALUE-ADD
Traditional Approach Focus on Value-added
Resources Through
•Methods Improvement
•Work Study
•Automation
JIT Approach Focus on the 95%
Non Value-Added
Resources Through
•Total Quality Management
•Total Waste Elimination
•Enforced Problem Solving
•Total Involvement
Source: ATKEARNEY

Philip Crosby
Enforced Problem Solving Crosby’s Five Step Method
1. Identify the problem
2. Put in a quick fix
3. Analyse the problem to identify the route cause, use the process mapping tool
4. Create plan and implement the change
5. Monitor the situation, make the change habit

http://www.videobash.com/photo_show/Fail-Safe-7140
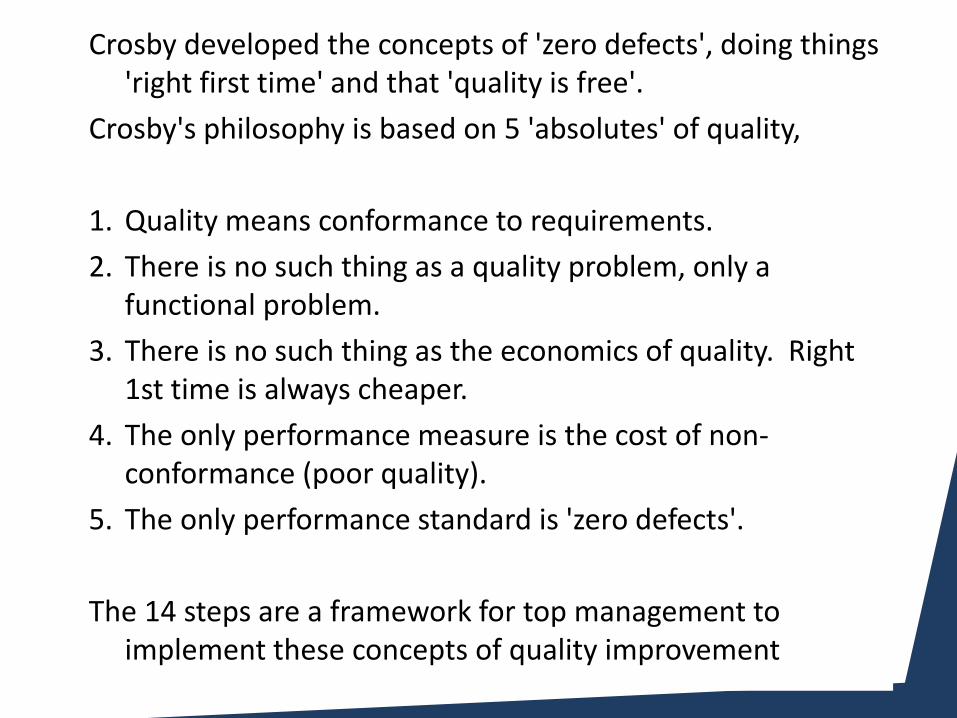
Crosby developed the concepts of 'zero defects', doing things 'right first time' and that 'quality is free'.
Crosby's philosophy is based on 5 'absolutes' of quality,
1. Quality means conformance to requirements.
2. There is no such thing as a quality problem, only a functional problem.
3. There is no such thing as the economics of quality. Right 1st time is always cheaper.
4. The only performance measure is the cost of non-conformance (poor quality).
5. The only performance standard is 'zero defects'.
The 14 steps are a framework for top management to implement these concepts of quality improvement
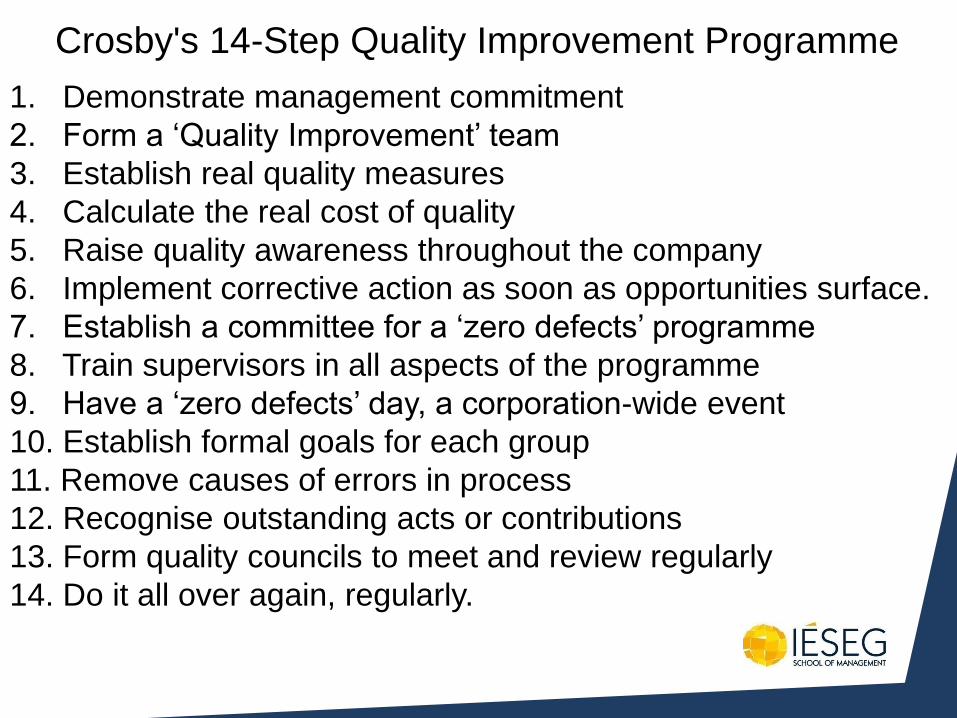
Crosby's 14-Step Quality Improvement Programme
1. Demonstrate management commitment
2. Form a ‘Quality Improvement’ team
3. Establish real quality measures
4. Calculate the real cost of quality
5. Raise quality awareness throughout the company
6. Implement corrective action as soon as opportunities surface.
7. Establish a committee for a ‘zero defects’ programme
8. Train supervisors in all aspects of the programme
9. Have a ‘zero defects’ day, a corporation-wide event
10. Establish formal goals for each group
11. Remove causes of errors in process
12. Recognise outstanding acts or contributions
13. Form quality councils to meet and review regularly
14. Do it all over again, regularly.
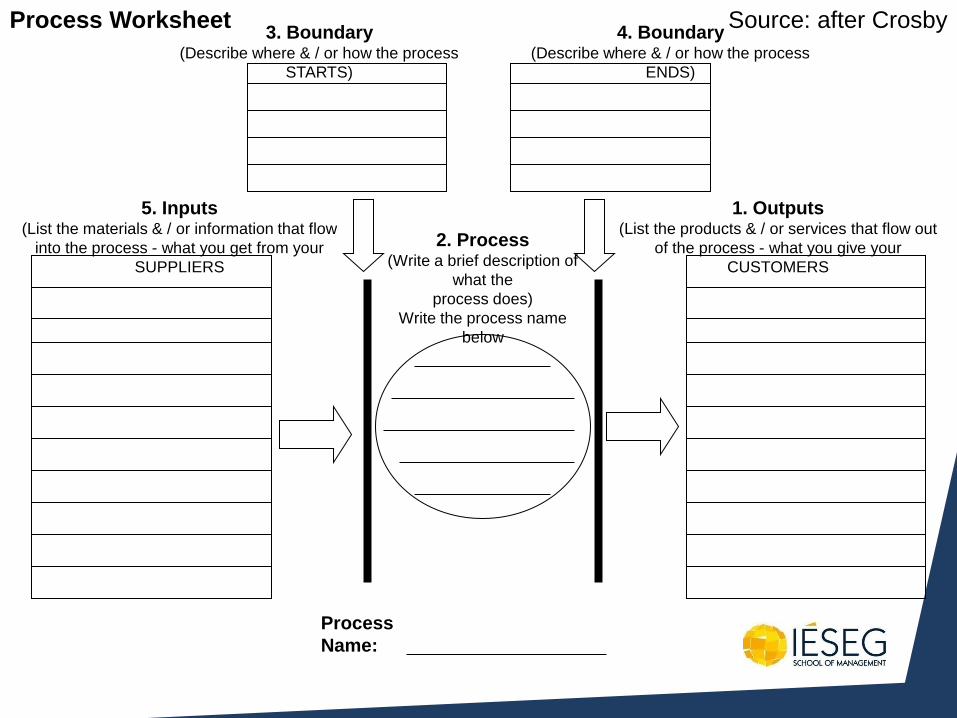
Process
Name:
1. Outputs (List the products & / or services that flow out
of the process - what you give your
CUSTOMERS
2. Process (Write a brief description of
what the
process does)
Write the process name
below
3. Boundary (Describe where & / or how the process
STARTS)
4. Boundary (Describe where & / or how the process
ENDS)
5. Inputs (List the materials & / or information that flow
into the process - what you get from your
SUPPLIERS
Process Worksheet Source: after Crosby
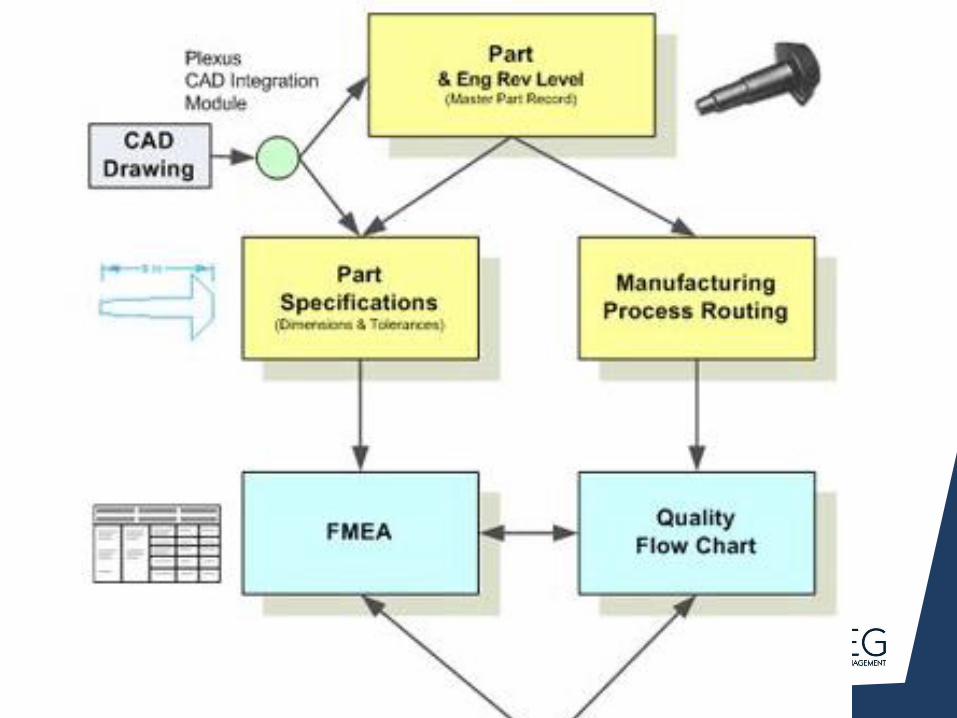
http://www.plex.com/modules/software-QMS.asp
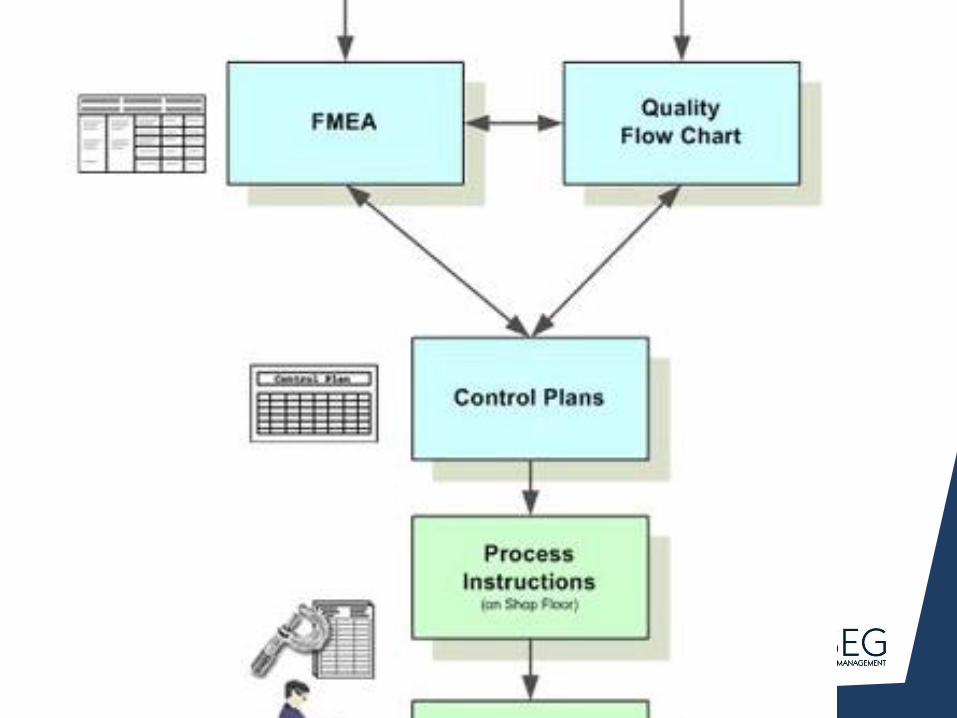
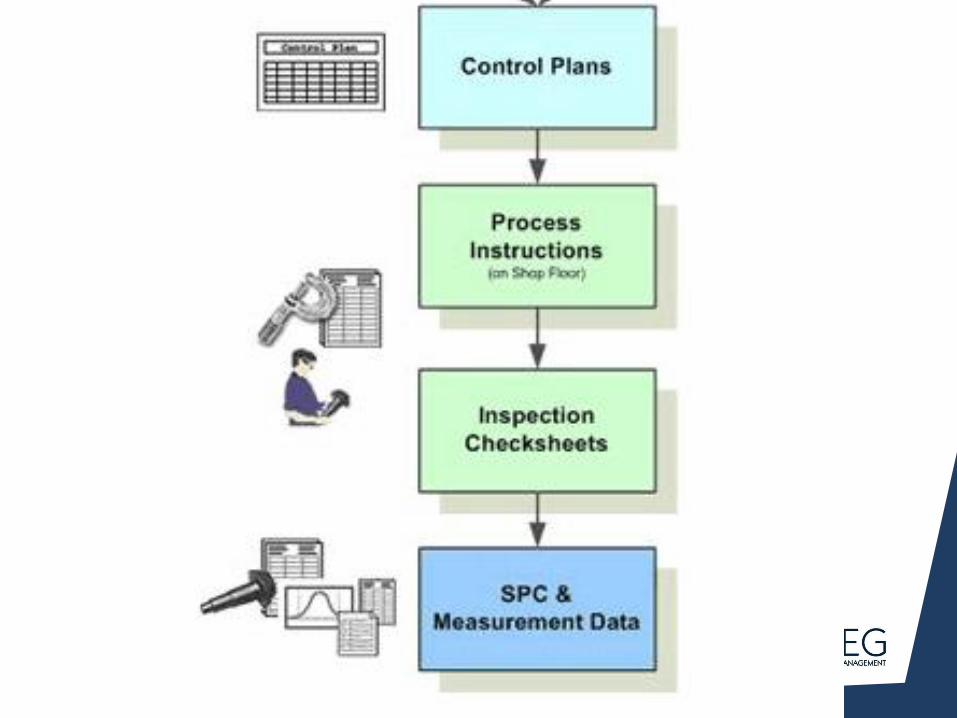
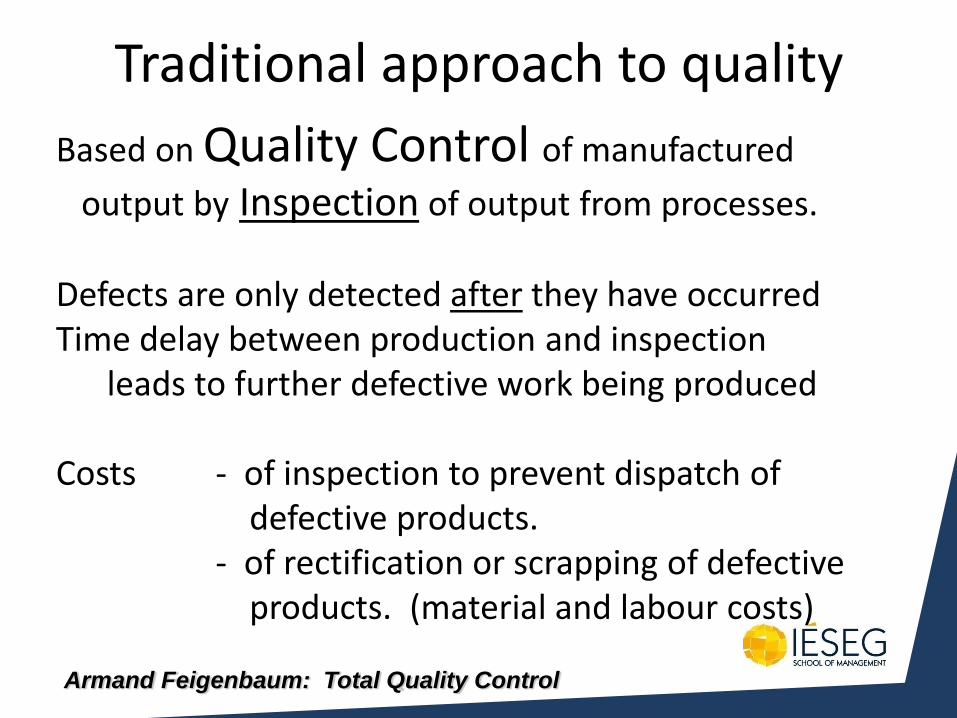
Traditional approach to quality
Based on Quality Control of manufactured
output by Inspection of output from processes. Defects are only detected after they have occurred Time delay between production and inspection leads to further defective work being produced Costs - of inspection to prevent dispatch of defective products. - of rectification or scrapping of defective products. (material and labour costs)
Armand Feigenbaum: Total Quality Control

http://news.bbc.co.uk/2/hi/in_pictures/6924104.stm
Bottles of kosher beer Simcha speed through the production process at a German brewery, under the watchful eye of master brewer Michael Huschens.
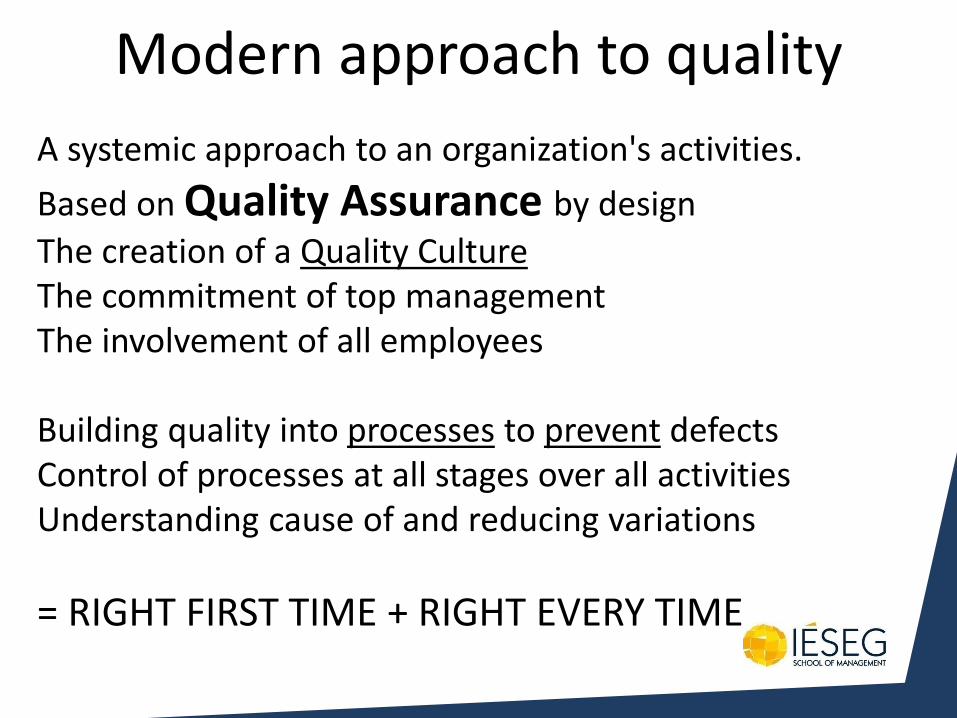
Modern approach to quality
A systemic approach to an organization's activities.
Based on Quality Assurance by design
The creation of a Quality Culture The commitment of top management The involvement of all employees Building quality into processes to prevent defects Control of processes at all stages over all activities Understanding cause of and reducing variations
= RIGHT FIRST TIME + RIGHT EVERY TIME
The ability, to trace back from a product in use to its manufacturer, the day, machine, operator and batch of material from which it was made. This requires keeping accurate quality records, From this to trace forward to other customers having products made the same day, machine, operator and batch of material. This is used when products fail prematurely. Used in the following industries - - Nuclear power - Aircraft parts - Military equipment - Motor industry
Traceability
Quality Audit • Monitoring and evaluation of an organisation's
quality systems to ensure that they are achieving quality.
• An 'audit trail' follows an item of information through the set of quality procedures to ensure that it is being transferred correctly.
• The audit may be carried out:
– internally within the organisation.
– by a purchaser or supplier
– by a 'third party' assessment body
Quality Circles • Quality Circles originated in Japan in the 1960s
• Quality Circles are groups of 4 or 5 employees, meeting to diagnose and solve problems.
• A participative style of management is needed quality must be established as a common objective
• Quality circles can also discuss safety and productivity
• Quality circles are an effective way of gaining commitment and enthusiasm of employees.
• They use employee skills to create quality and method improvements (= Kaizen, continuous improvement)
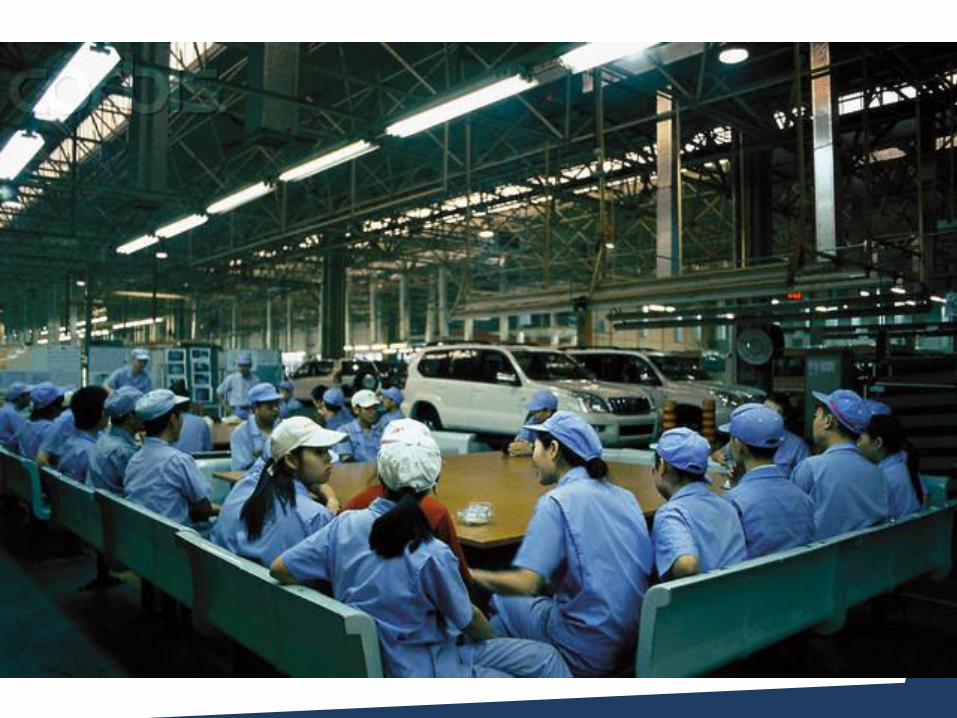
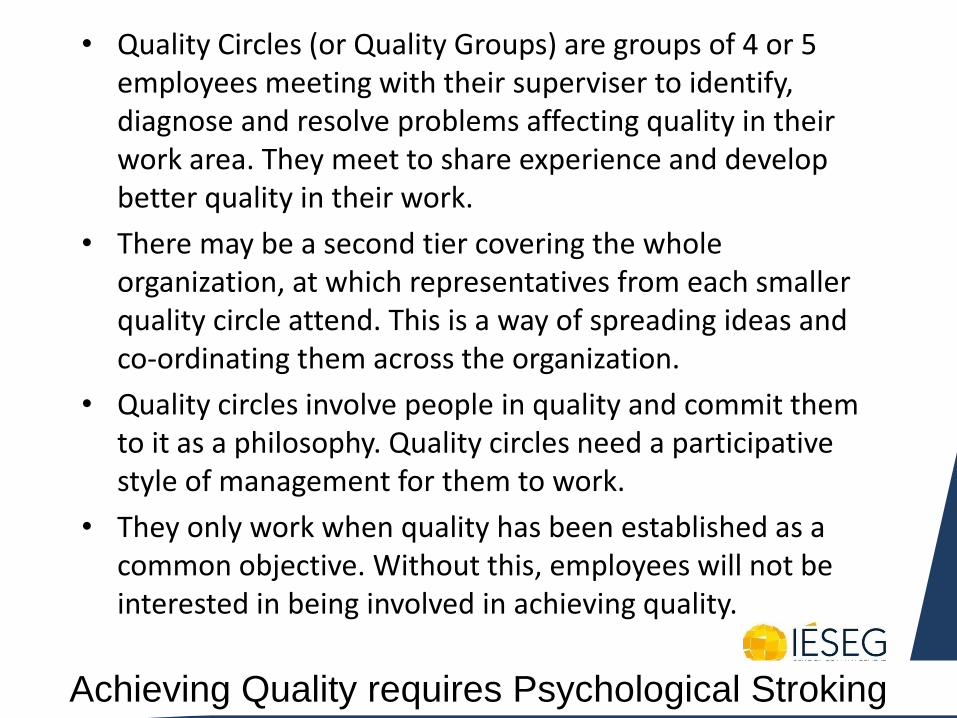
• Quality Circles (or Quality Groups) are groups of 4 or 5 employees meeting with their superviser to identify, diagnose and resolve problems affecting quality in their work area. They meet to share experience and develop better quality in their work.
• There may be a second tier covering the whole organization, at which representatives from each smaller quality circle attend. This is a way of spreading ideas and co-ordinating them across the organization.
• Quality circles involve people in quality and commit them to it as a philosophy. Quality circles need a participative style of management for them to work.
• They only work when quality has been established as a common objective. Without this, employees will not be interested in being involved in achieving quality.
Achieving Quality requires Psychological Stroking
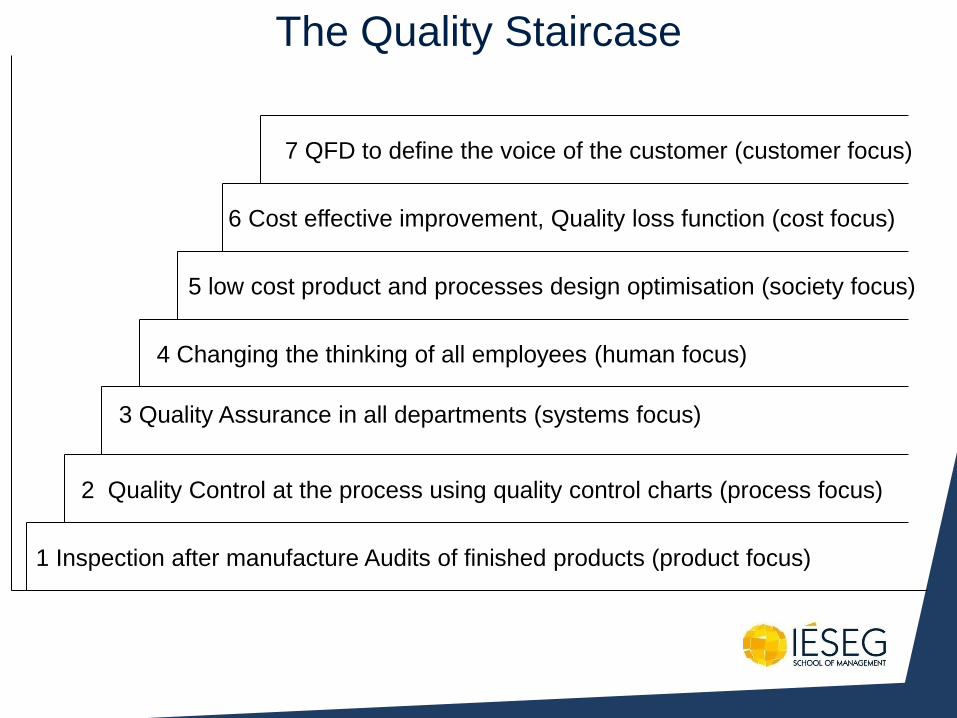
The Quality Staircase
1 Inspection after manufacture Audits of finished products (product focus)
2 Quality Control at the process using quality control charts (process focus)
3 Quality Assurance in all departments (systems focus)
4 Changing the thinking of all employees (human focus)
5 low cost product and processes design optimisation (society focus)
6 Cost effective improvement, Quality loss function (cost focus)
7 QFD to define the voice of the customer (customer focus)
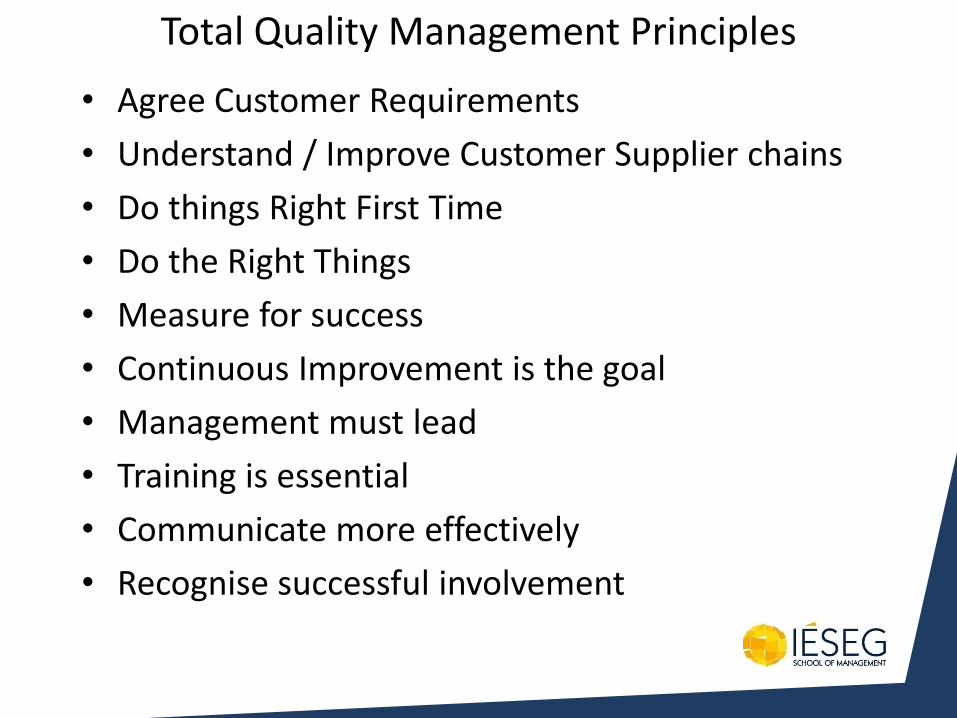
Total Quality Management Principles
• Agree Customer Requirements
• Understand / Improve Customer Supplier chains
• Do things Right First Time
• Do the Right Things
• Measure for success
• Continuous Improvement is the goal
• Management must lead
• Training is essential
• Communicate more effectively
• Recognise successful involvement
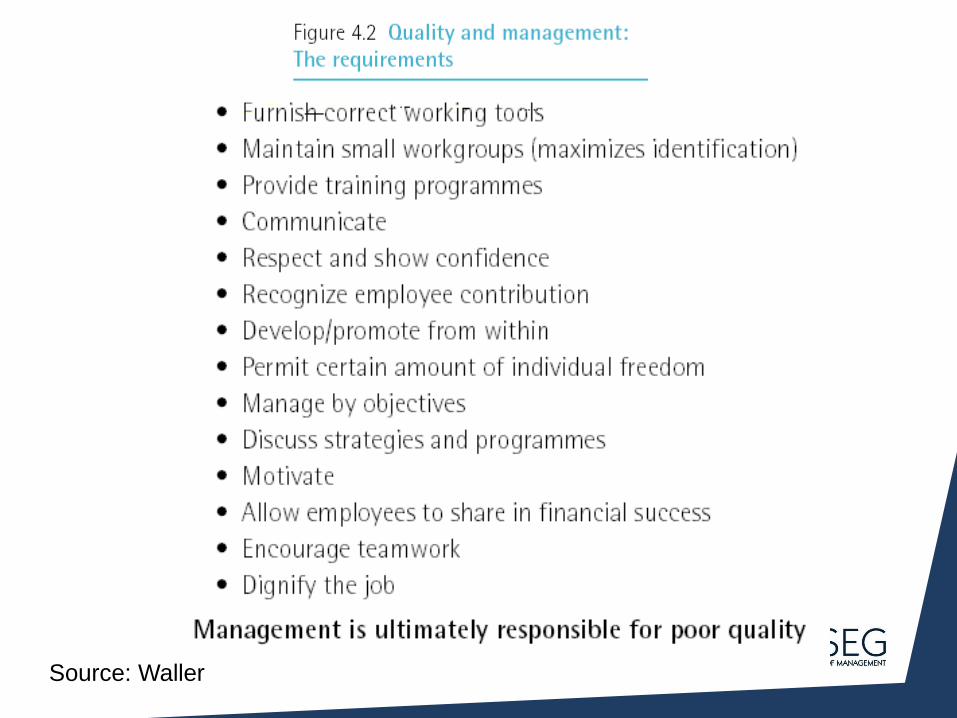
Source: Waller
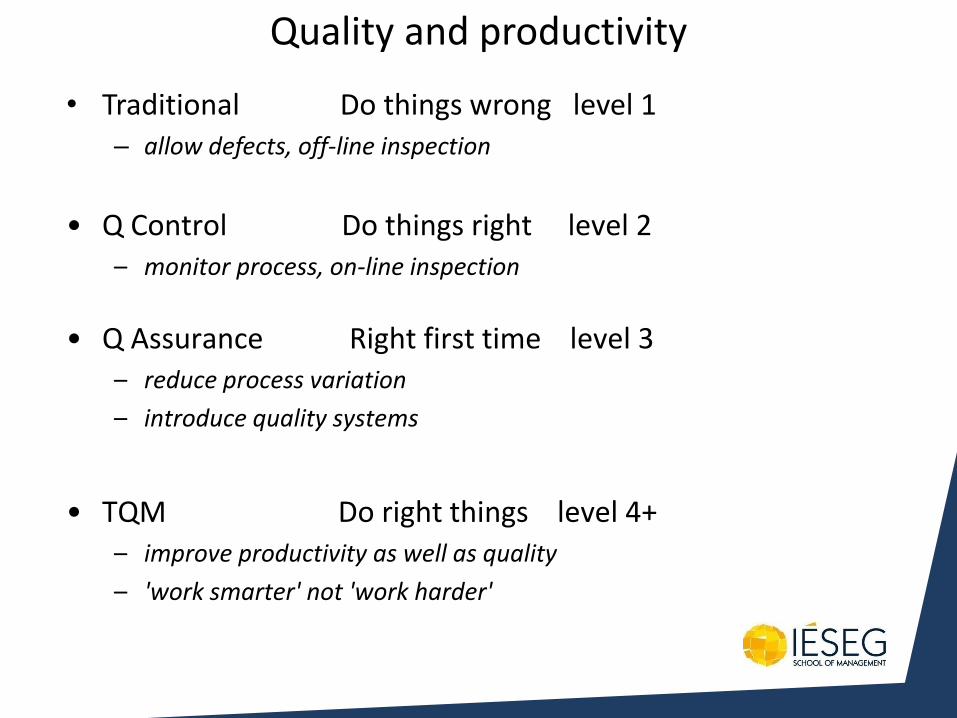
Quality and productivity
• Traditional Do things wrong level 1 – allow defects, off-line inspection
• Q Control Do things right level 2 – monitor process, on-line inspection
• Q Assurance Right first time level 3 – reduce process variation
– introduce quality systems
• TQM Do right things level 4+ – improve productivity as well as quality
– 'work smarter' not 'work harder'
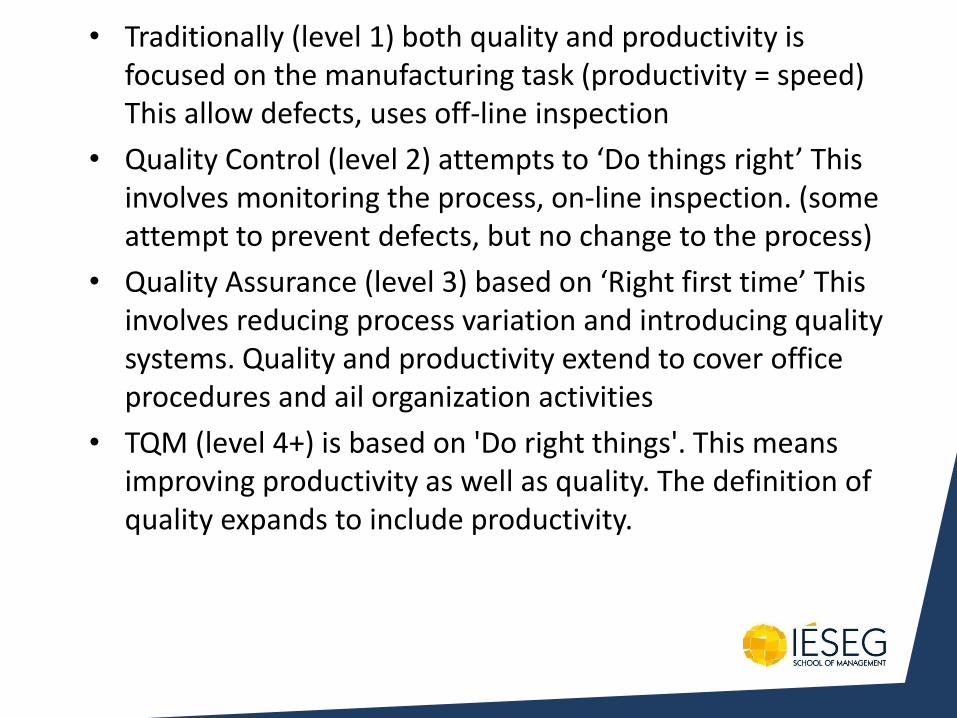
• Traditionally (level 1) both quality and productivity is focused on the manufacturing task (productivity = speed) This allow defects, uses off-line inspection
• Quality Control (level 2) attempts to ‘Do things right’ This involves monitoring the process, on-line inspection. (some attempt to prevent defects, but no change to the process)
• Quality Assurance (level 3) based on ‘Right first time’ This involves reducing process variation and introducing quality systems. Quality and productivity extend to cover office procedures and ail organization activities
• TQM (level 4+) is based on 'Do right things'. This means improving productivity as well as quality. The definition of quality expands to include productivity.
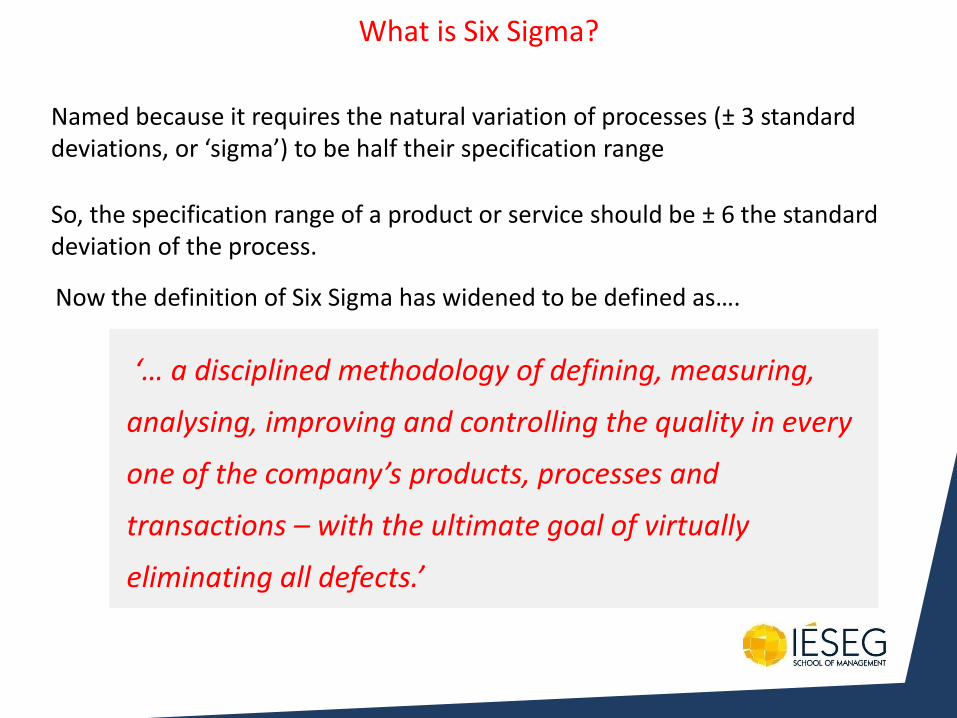
What is Six Sigma?
Named because it requires the natural variation of processes (± 3 standard deviations, or ‘sigma’) to be half their specification range
So, the specification range of a product or service should be ± 6 the standard deviation of the process.
Now the definition of Six Sigma has widened to be defined as….
‘… a disciplined methodology of defining, measuring,
analysing, improving and controlling the quality in every
one of the company’s products, processes and
transactions – with the ultimate goal of virtually
eliminating all defects.’
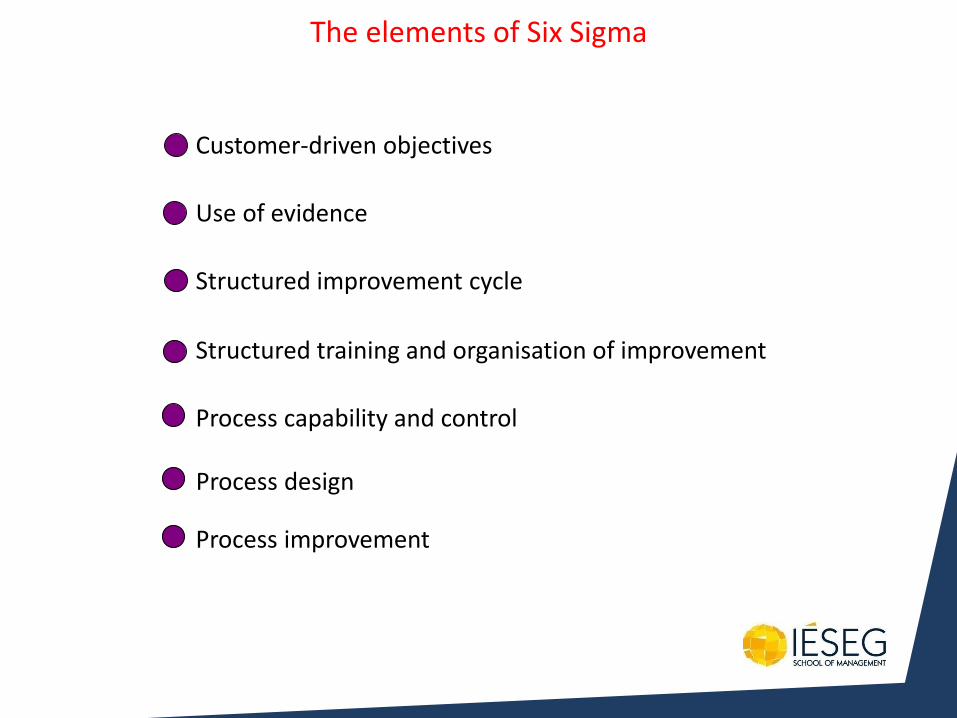
The elements of Six Sigma
Customer-driven objectives
Use of evidence
Structured improvement cycle
Structured training and organisation of improvement
Process capability and control
Process design
Process improvement
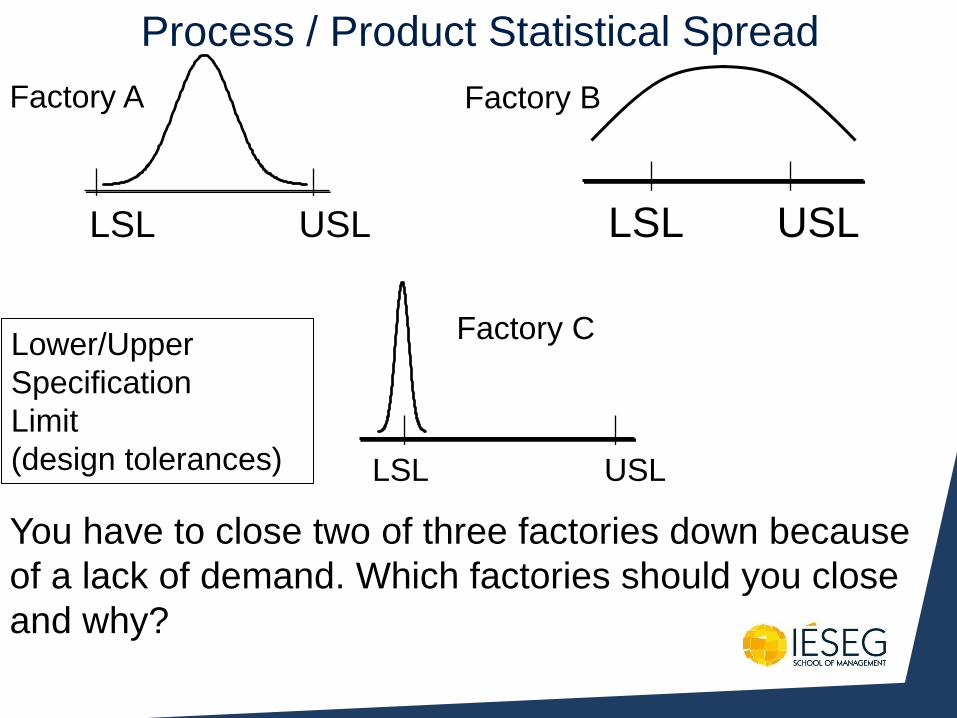
Process / Product Statistical Spread
LSL USL
LSL USL
LSL USL
You have to close two of three factories down because
of a lack of demand. Which factories should you close
and why?
Factory A
Factory C
Factory B
Lower/Upper
Specification
Limit
(design tolerances)
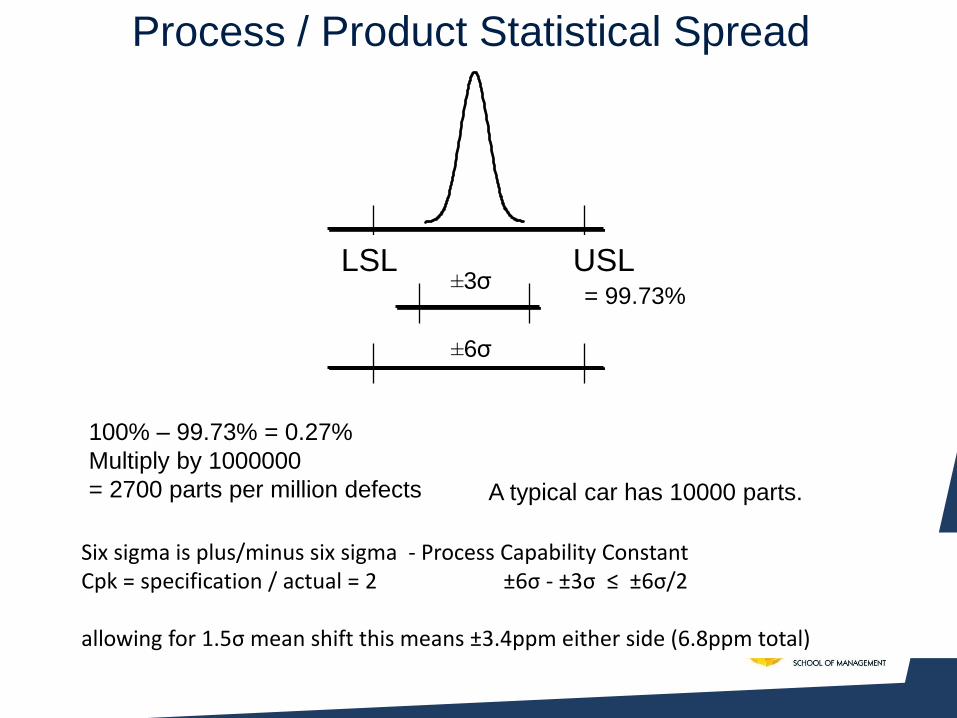
Process / Product Statistical Spread
LSL USL
±3σ
±6σ
= 99.73%
100% – 99.73% = 0.27%
Multiply by 1000000
= 2700 parts per million defects
Six sigma is plus/minus six sigma - Process Capability Constant Cpk = specification / actual = 2 ±6σ - ±3σ ≤ ±6σ/2 allowing for 1.5σ mean shift this means ±3.4ppm either side (6.8ppm total)
A typical car has 10000 parts.
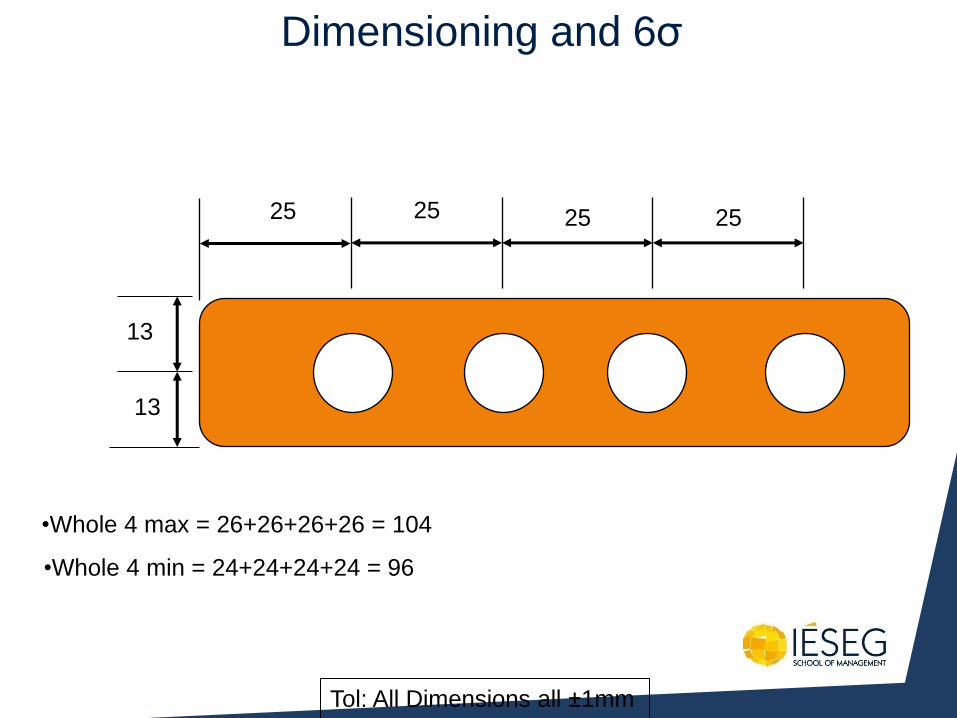
Dimensioning and 6σ
25 25 25 25
13
13
Tol: All Dimensions all ±1mm
•Whole 4 max = 26+26+26+26 = 104
•Whole 4 min = 24+24+24+24 = 96
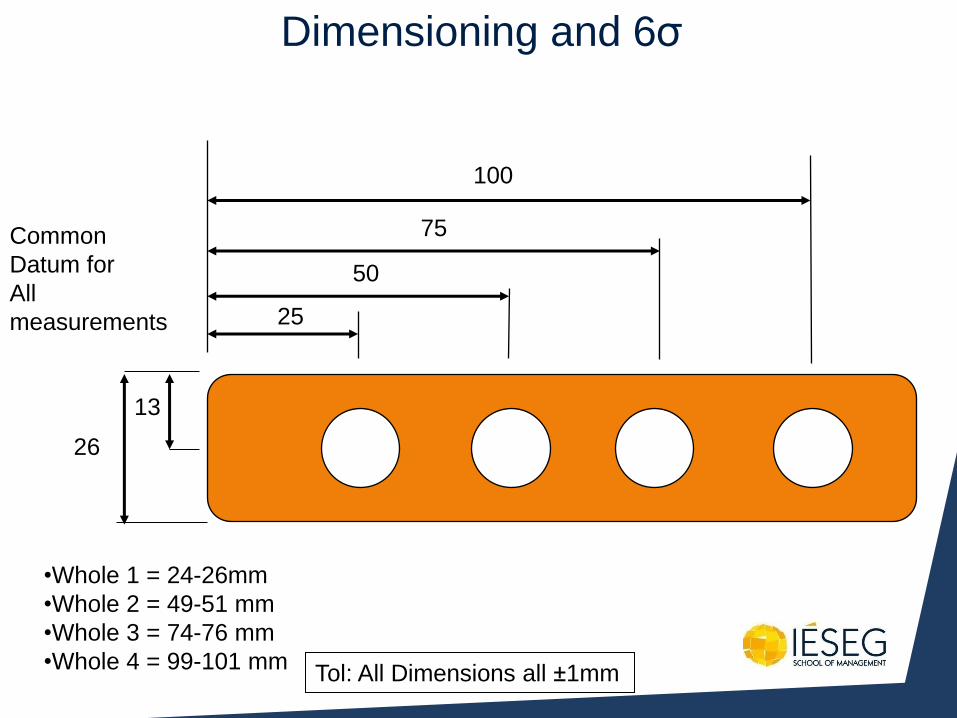
Dimensioning and 6σ
25
50
100
75
13
26
Common
Datum for
All
measurements
Tol: All Dimensions all ±1mm
•Whole 1 = 24-26mm
•Whole 2 = 49-51 mm
•Whole 3 = 74-76 mm
•Whole 4 = 99-101 mm
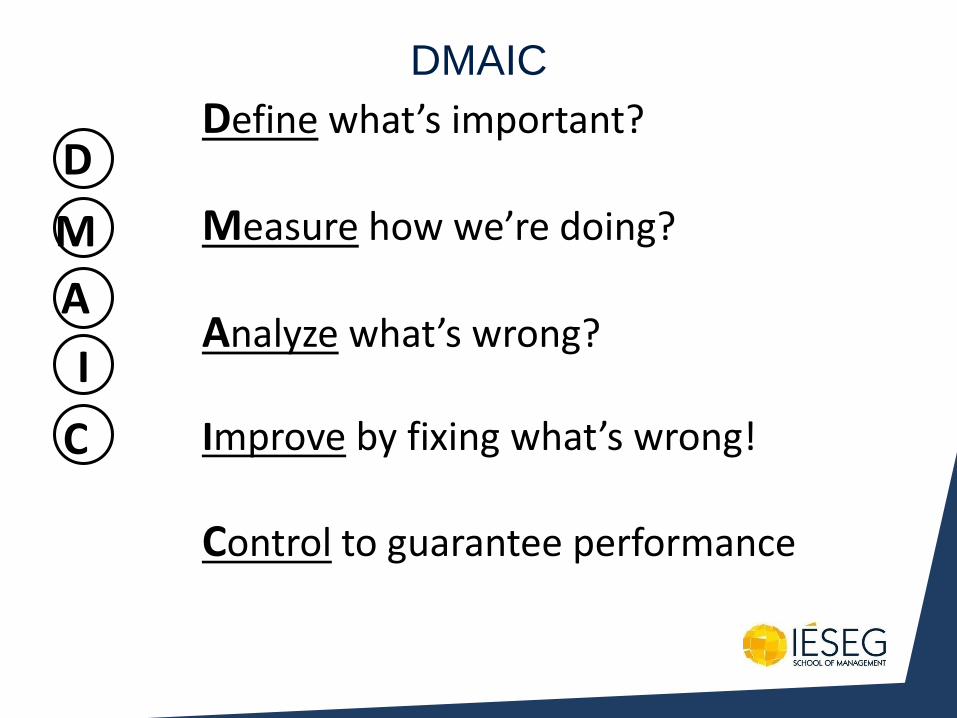
DMAIC
D
M
I
A
C
Define what’s important?
Measure how we’re doing?
Analyze what’s wrong? Improve by fixing what’s wrong!
Control to guarantee performance
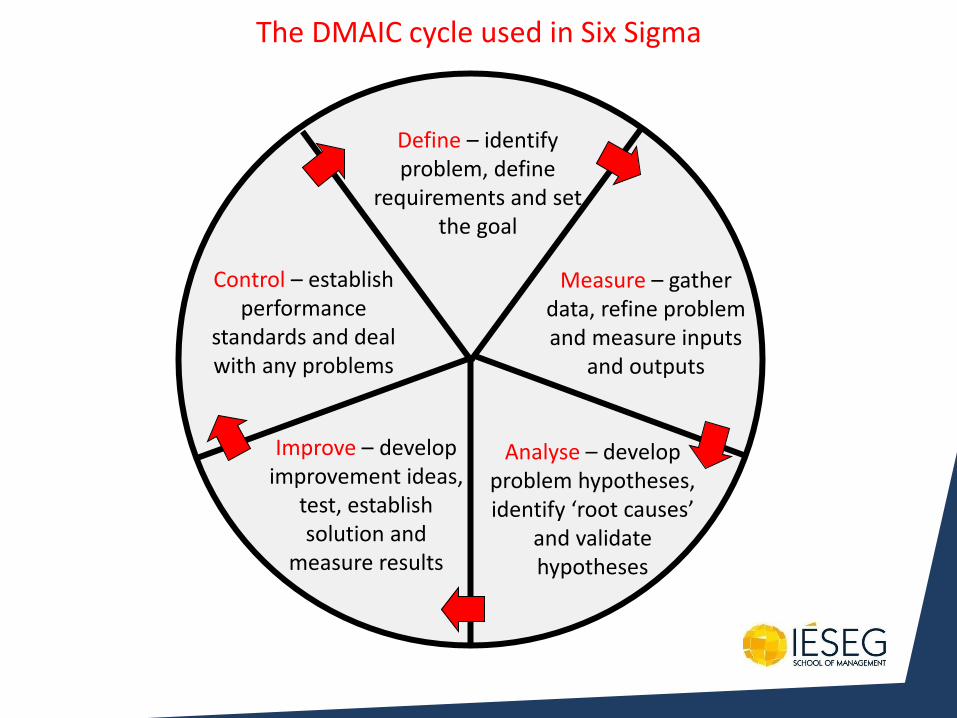
Define – identify problem, define
requirements and set the goal
Measure – gather data, refine problem and measure inputs
and outputs
Analyse – develop problem hypotheses, identify ‘root causes’
and validate hypotheses
Improve – develop improvement ideas,
test, establish solution and
measure results
Control – establish performance
standards and deal with any problems
The DMAIC cycle used in Six Sigma
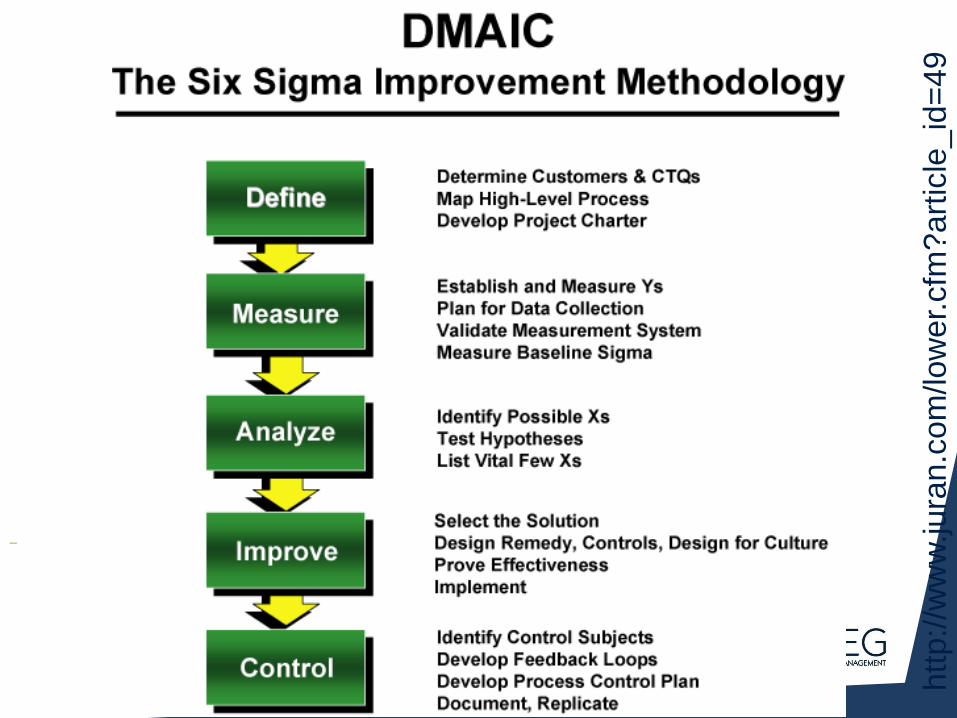
htt
p:/
/ww
w.jura
n.c
om
/low
er.
cfm
?art
icle
_id
=49
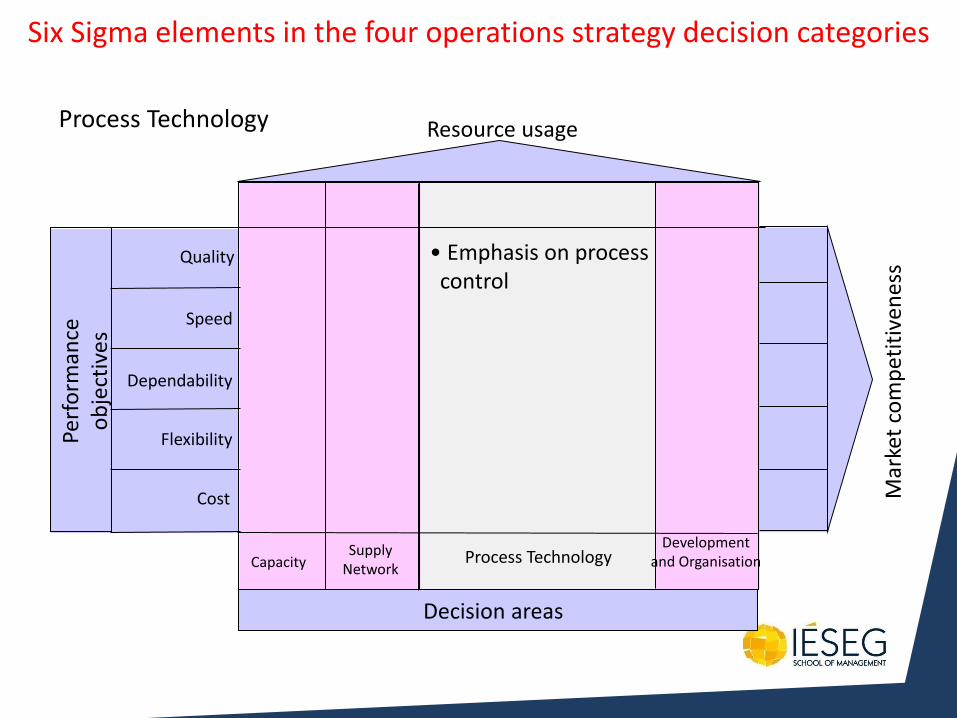
Decision areas
Capacity Supply
Network
Mar
ket
com
pet
itiv
enes
s
Process Technology
Resource usage
Six Sigma elements in the four operations strategy decision categories
Development and Organisation
• Emphasis on process control
Quality
Perf
orm
ance
o
bje
ctiv
es
Dependability
Speed
Flexibility
Cost
Process Technology
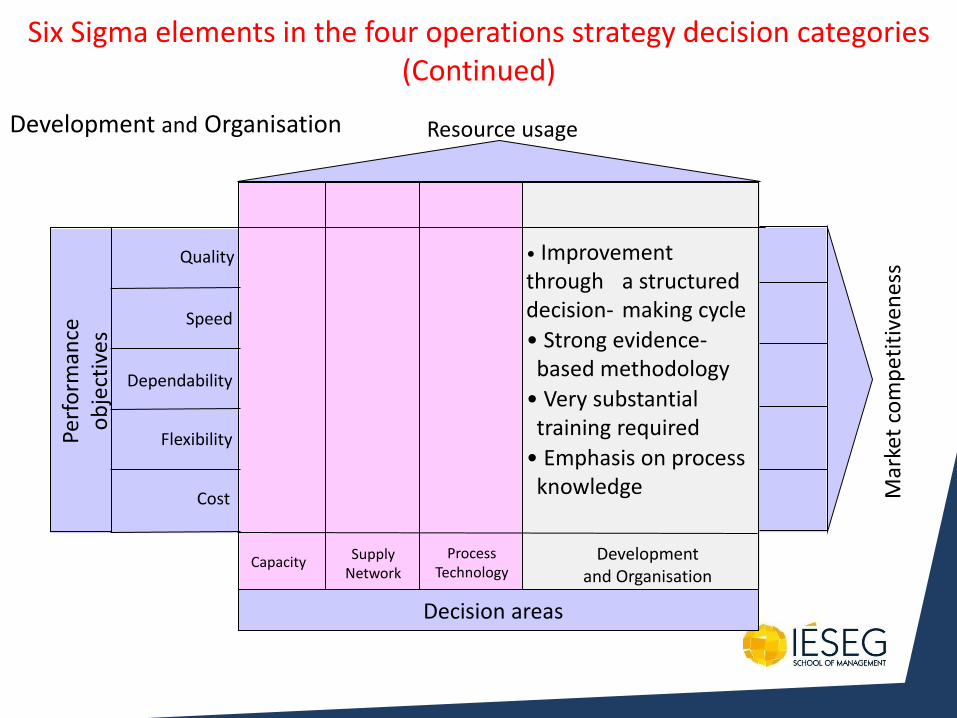
Decision areas
Capacity Supply
Network
Mar
ket
com
pet
itiv
enes
s
Process Technology
Resource usage
Development and Organisation
• Improvement through a structured decision- making cycle
• Strong evidence- based methodology
• Very substantial training required
• Emphasis on process knowledge
Quality
Perf
orm
ance
o
bje
ctiv
es
Dependability
Speed
Flexibility
Cost
Development and Organisation
Six Sigma elements in the four operations strategy decision categories (Continued)
Some points for discussion How much should one be influenced by the
experiences of other organisations?
Operations that rely on others to define what is
‘best practice’, are always limiting themselves to
currently accepted methods of operating or
currently accepted limits to performance.
Best practice is not ‘best’ in the sense that it
cannot be bettered, it is only ‘best’ in the sense
that it is the best one can currently find.
Some points for discussion (Continued) Senior managers sometimes use these new approaches
without fully understanding them.
If senior managers do not understand these
approaches, how can the rest of the organisation take
them seriously?
Not every approach fits every set of
circumstances. So, understanding in detail what
each approach means must be the first step in
deciding whether it is appropriate.
The details of these approaches are not simply
technical matters. They are fundamental to how
appropriate the approach could be in different
contexts.
All these approaches are different.
Does the approach emphasise a gradual,
continuous approach to change, or a more
radical ‘breakthrough’ change?
What is the balance between whether the
approach emphasises what changes should
be made or how changes should be made?
Some points for discussion (Continued)
Each of the ‘new approaches’ are positioned in terms of their emphasis on what changes to make or how to make the changes, and whether
they emphasise rapid or gradual change
Emphasis on rapid change
Emphasis on gradual change
Emphasis on what to do
Emphasis on how to do it
Six Sigma
BPR
Lean TQM
These approaches are not strategies, but they are strategic
decisions.
Operations strategy is the ‘reconciliation of market
requirements and operations resource capabilities’.
Operations strategy is individual and specific to one
organisation at one point in time, but these approaches are
generic.
An individual enterprise’s market requirements and operations
resource capabilities are unique.
They are an important part of a strategy, but not strategies in
themselves.
Some points for discussion (Continued)
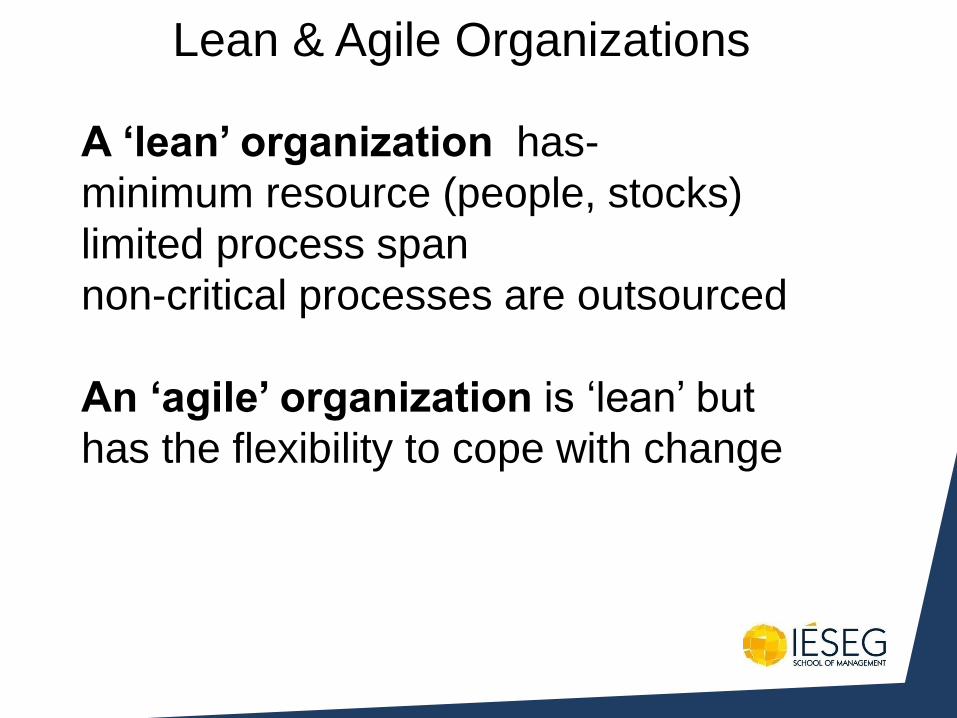
Lean & Agile Organizations
A ‘lean’ organization has-
minimum resource (people, stocks)
limited process span
non-critical processes are outsourced
An ‘agile’ organization is ‘lean’ but
has the flexibility to cope with change
Strategic Purchasing
• Differentiate the Supply Market
• Identify Critical Criteria
• Identify Key Suppliers
• Position Purchasing Process
• Focus on Relationships
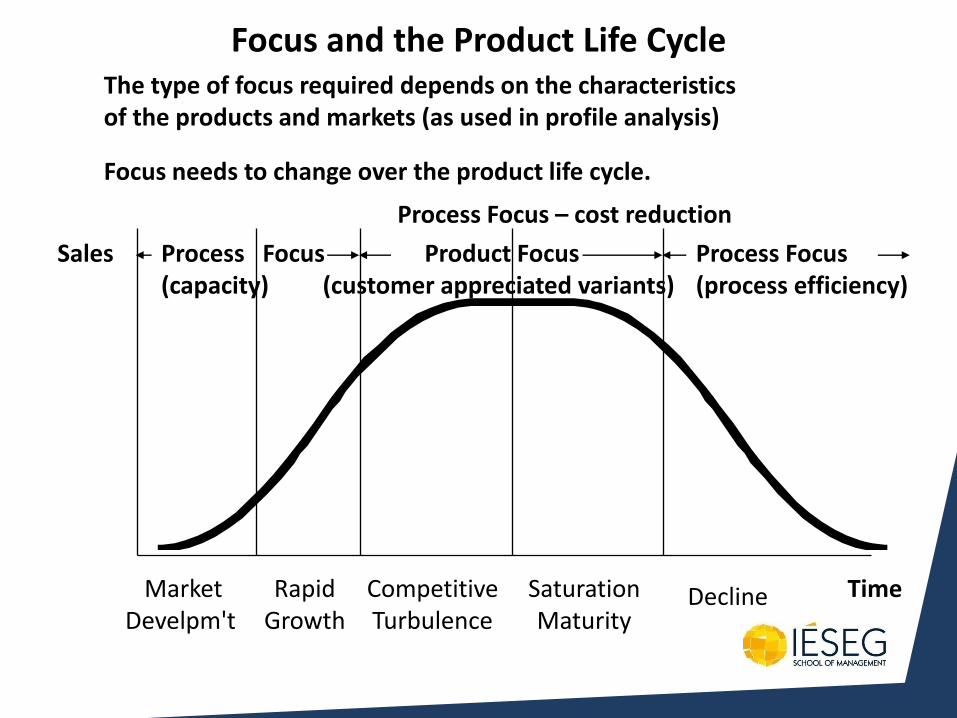
Focus and the Product Life Cycle The type of focus required depends on the characteristics of the products and markets (as used in profile analysis)
Focus needs to change over the product life cycle.
Sales Process Focus Product Focus Process Focus (capacity) (customer appreciated variants) (process efficiency)
Time
Market Develpm't
Rapid Growth
Competitive Turbulence
Saturation Maturity
Decline
Process Focus – cost reduction
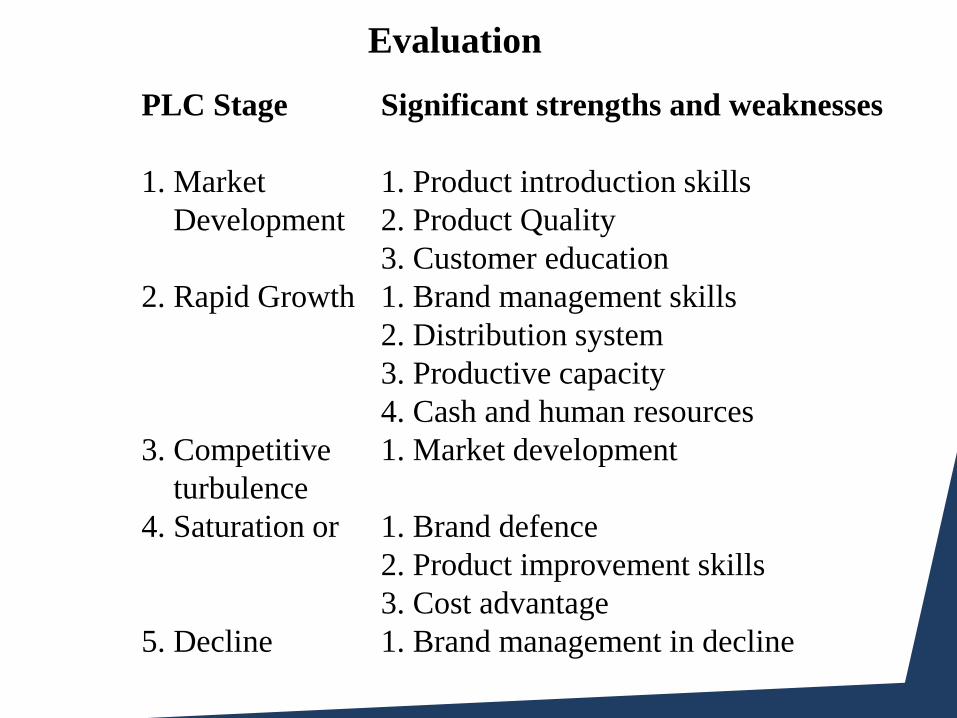
Evaluation
PLC Stage Significant strengths and weaknesses
1. Market 1. Product introduction skills
Development 2. Product Quality
3. Customer education
2. Rapid Growth 1. Brand management skills
2. Distribution system
3. Productive capacity
4. Cash and human resources
3. Competitive 1. Market development
turbulence
4. Saturation or 1. Brand defence
2. Product improvement skills
3. Cost advantage
5. Decline 1. Brand management in decline
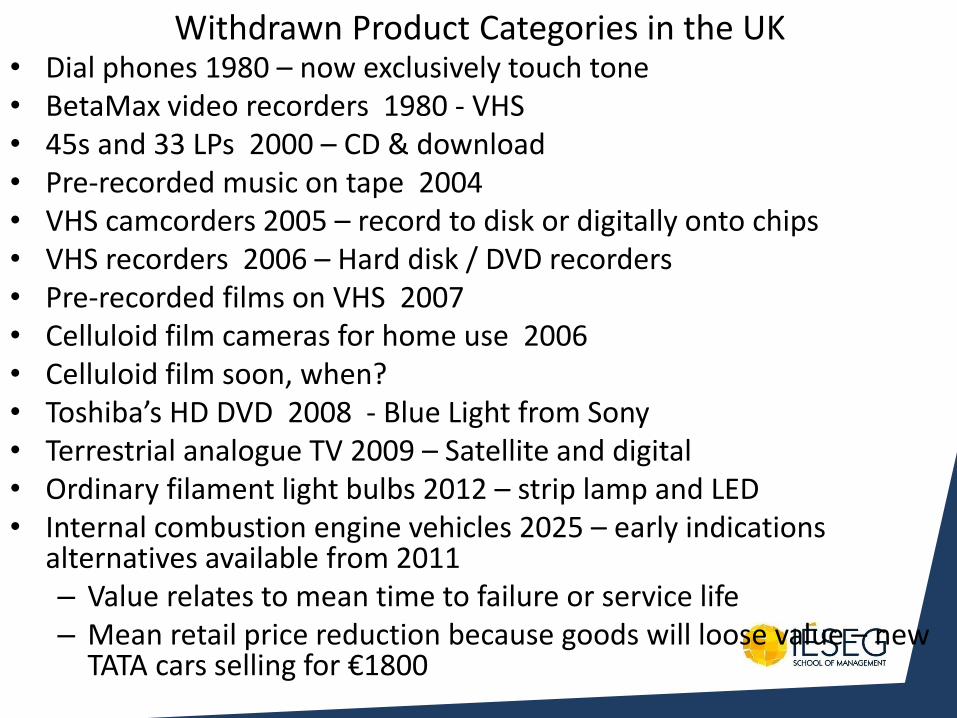
Withdrawn Product Categories in the UK • Dial phones 1980 – now exclusively touch tone • BetaMax video recorders 1980 - VHS • 45s and 33 LPs 2000 – CD & download • Pre-recorded music on tape 2004 • VHS camcorders 2005 – record to disk or digitally onto chips • VHS recorders 2006 – Hard disk / DVD recorders • Pre-recorded films on VHS 2007 • Celluloid film cameras for home use 2006 • Celluloid film soon, when? • Toshiba’s HD DVD 2008 - Blue Light from Sony • Terrestrial analogue TV 2009 – Satellite and digital • Ordinary filament light bulbs 2012 – strip lamp and LED • Internal combustion engine vehicles 2025 – early indications
alternatives available from 2011 – Value relates to mean time to failure or service life – Mean retail price reduction because goods will loose value – new
TATA cars selling for €1800
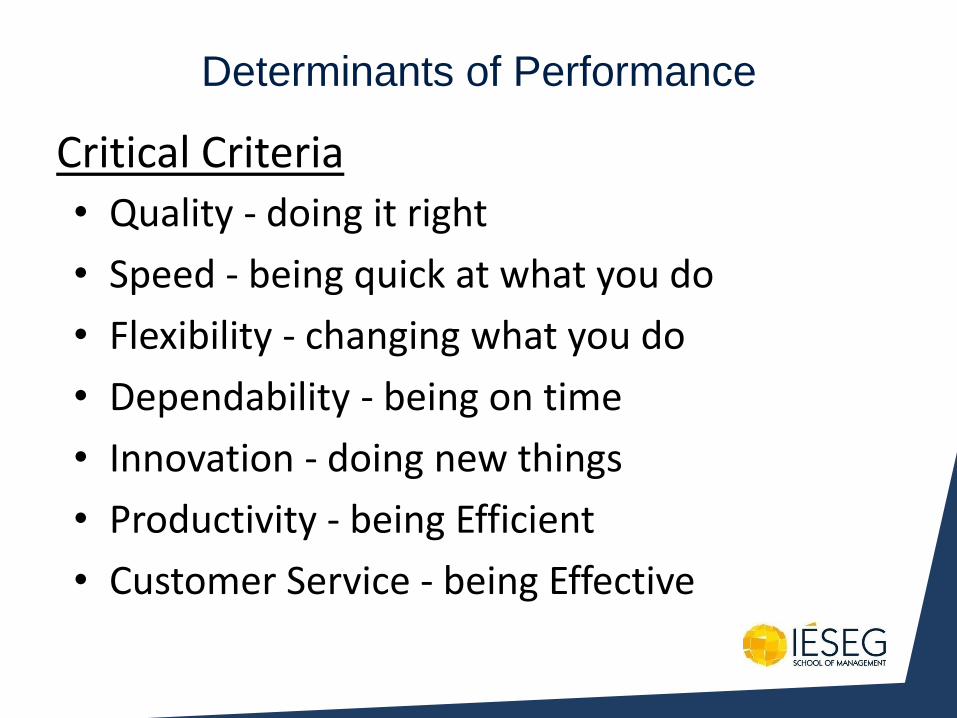
Determinants of Performance
• Quality - doing it right
• Speed - being quick at what you do
• Flexibility - changing what you do
• Dependability - being on time
• Innovation - doing new things
• Productivity - being Efficient
• Customer Service - being Effective
Critical Criteria
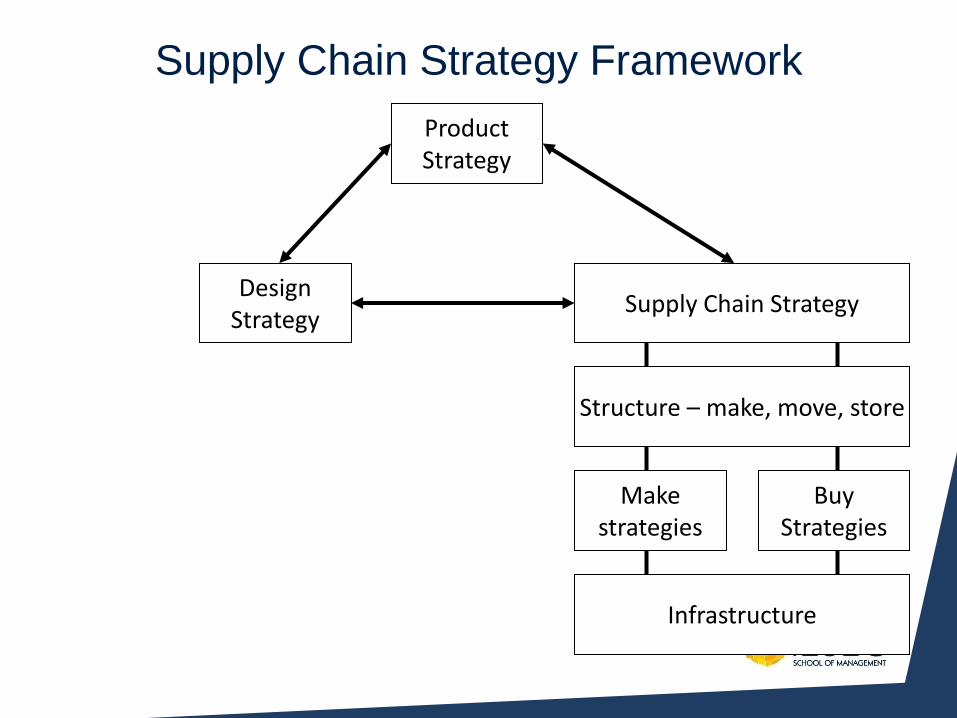
Supply Chain Strategy Framework
Product Strategy
Design Strategy
Supply Chain Strategy
Structure – make, move, store
Buy Strategies
Make strategies
Infrastructure
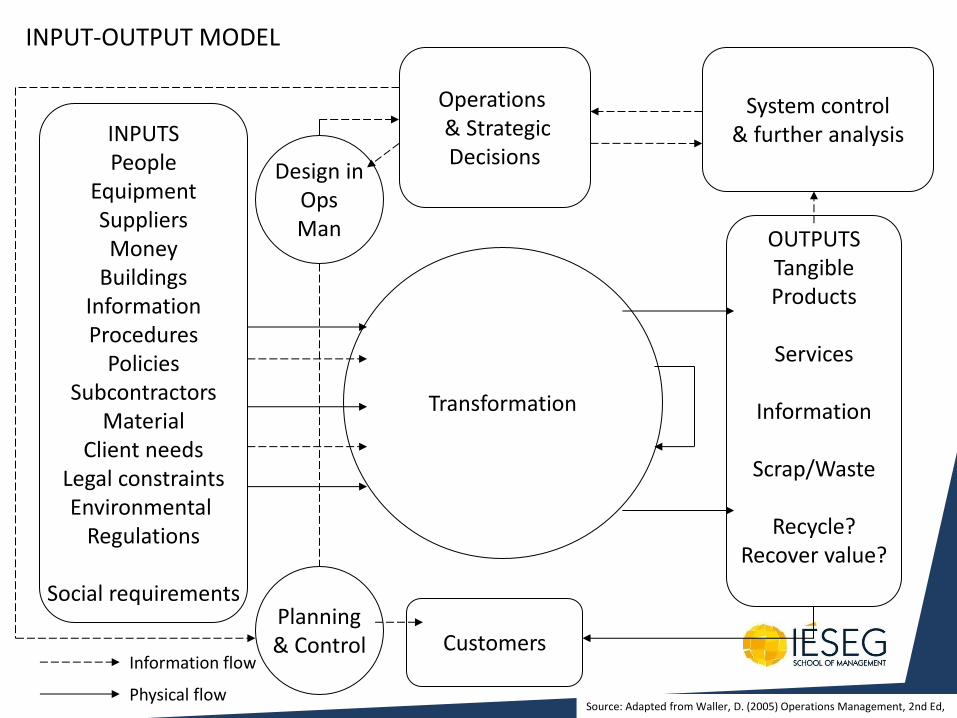
Operations & Strategic Decisions
System control & further analysis
OUTPUTS Tangible Products
Services
Information
Scrap/Waste
Recycle?
Recover value?
Customers
INPUTS People
Equipment Suppliers Money
Buildings Information Procedures
Policies Subcontractors
Material Client needs
Legal constraints Environmental
Regulations
Social requirements
Transformation
Planning & Control
Design in Ops Man
Information flow
Physical flow
INPUT-OUTPUT MODEL
Source: Adapted from Waller, D. (2005) Operations Management, 2nd Ed,
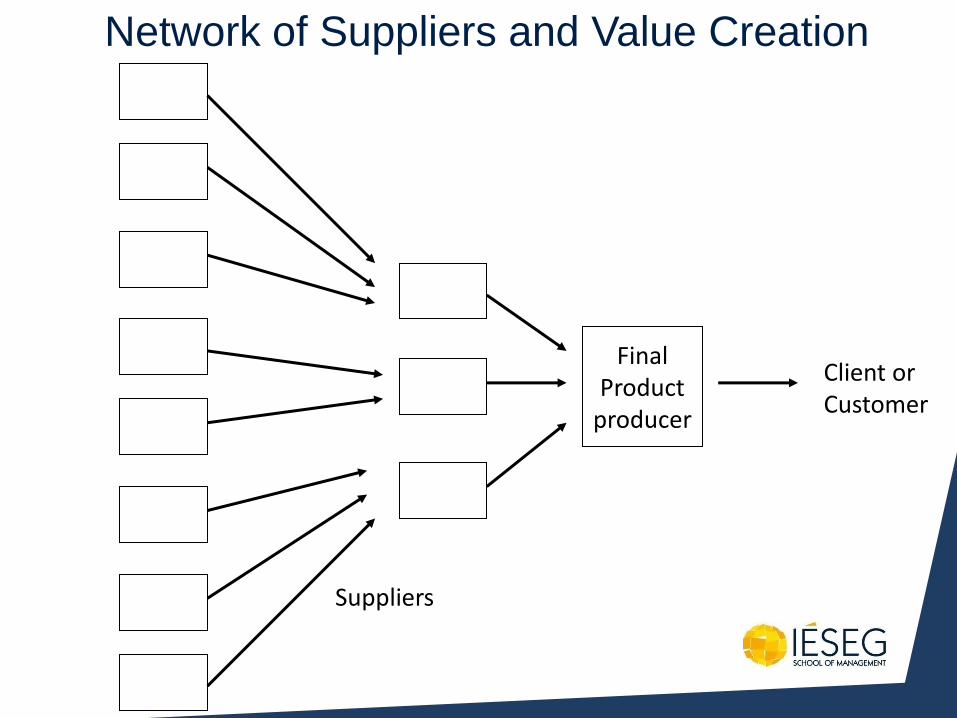
Network of Suppliers and Value Creation
Final Product
producer
Client or Customer
Suppliers
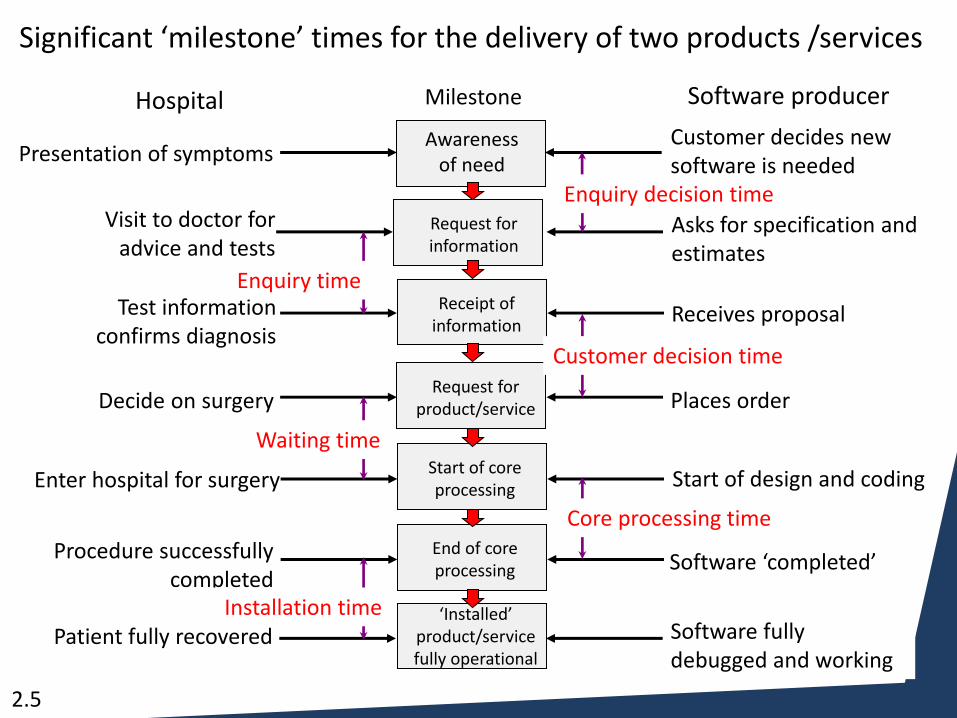
Awareness of need
Request for information
Milestone Hospital Software producer
Presentation of symptoms
Visit to doctor for advice and tests
Test information confirms diagnosis
Decide on surgery
Enter hospital for surgery
Procedure successfully completed
Patient fully recovered
Customer decides new software is needed
Asks for specification and estimates
Receives proposal
Places order
Start of design and coding
Software ‘completed’
Software fully debugged and working
Receipt of information
Request for product/service
Start of core processing
End of core processing
‘Installed’ product/service fully operational
Significant ‘milestone’ times for the delivery of two products /services
Installation time
Core processing time
Waiting time
Enquiry time
Customer decision time
Enquiry decision time
2.5
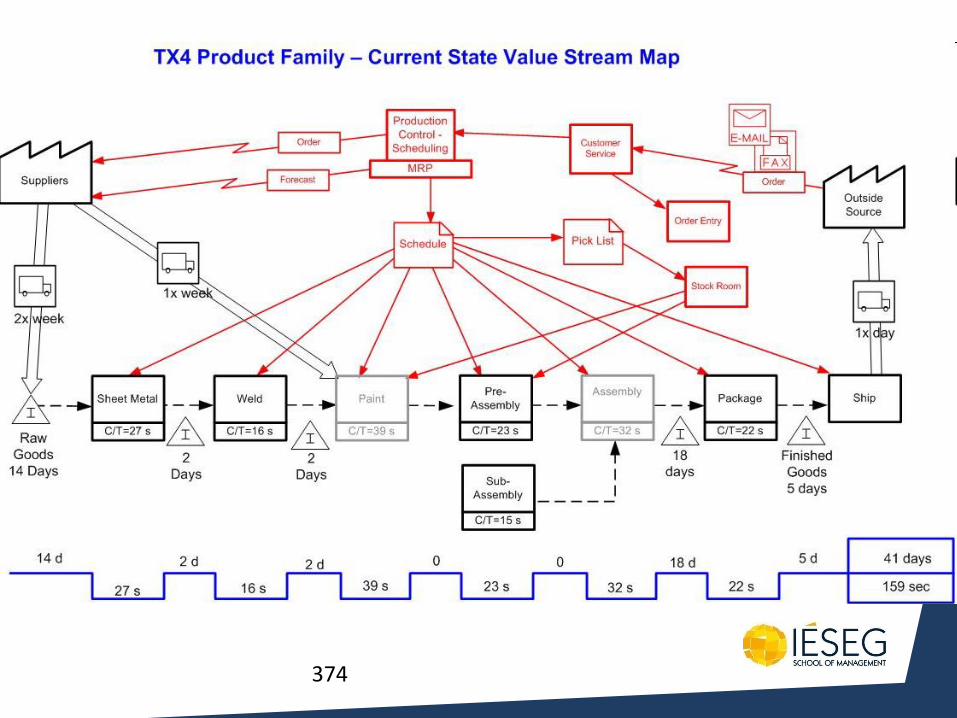
374
• https://jdsupply.deere.com/business_processes/supplier_development_process/sd_tools/docs/industry_standard_value_stream_map.JPG
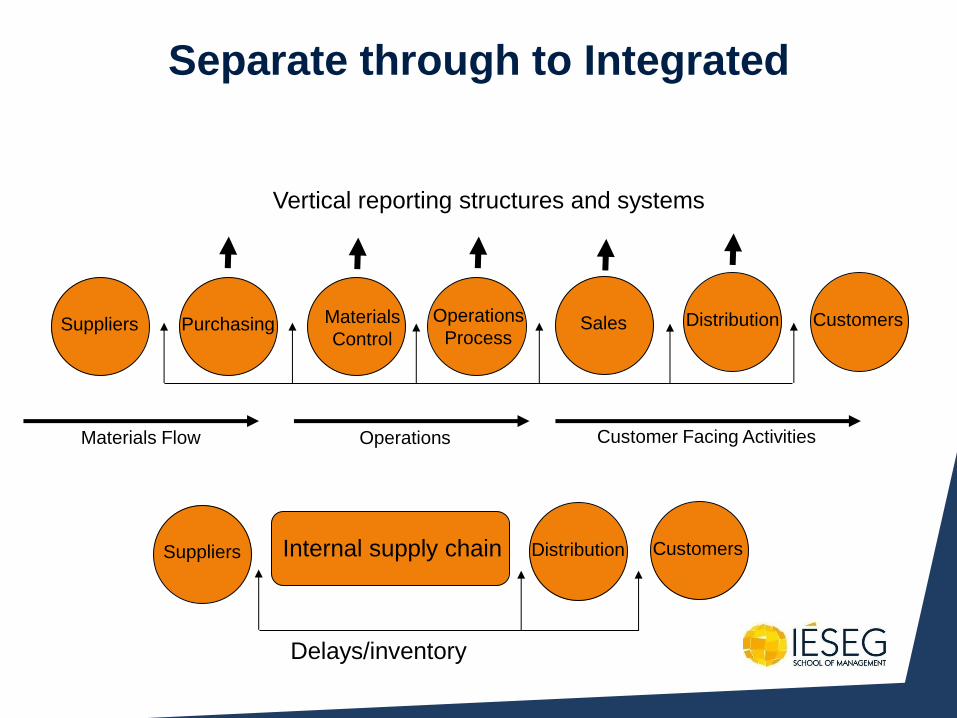
Separate through to Integrated
Suppliers Purchasing Materials
Control Sales Distribution Customers
Materials Flow Operations Customer Facing Activities
Operations
Process
Vertical reporting structures and systems
Internal supply chain Suppliers Distribution Customers
Delays/inventory
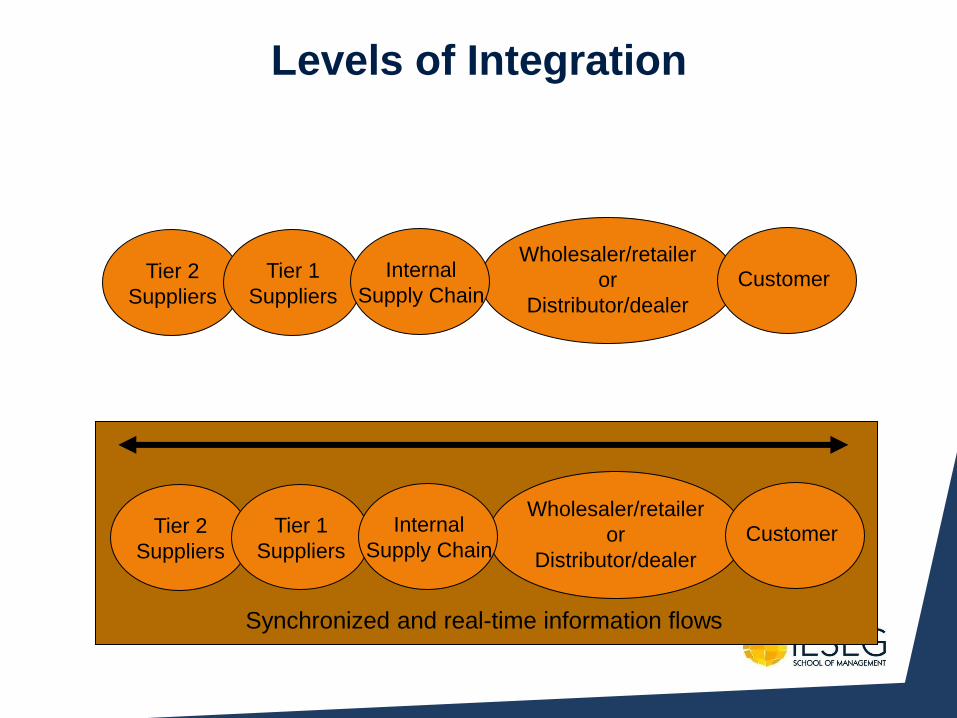
Levels of Integration
Tier 2
Suppliers
Tier 1
Suppliers
Wholesaler/retailer
or
Distributor/dealer
Customer Internal
Supply Chain
Tier 2
Suppliers
Tier 1
Suppliers
Wholesaler/retailer
or
Distributor/dealer
Customer Internal
Supply Chain
Synchronized and real-time information flows
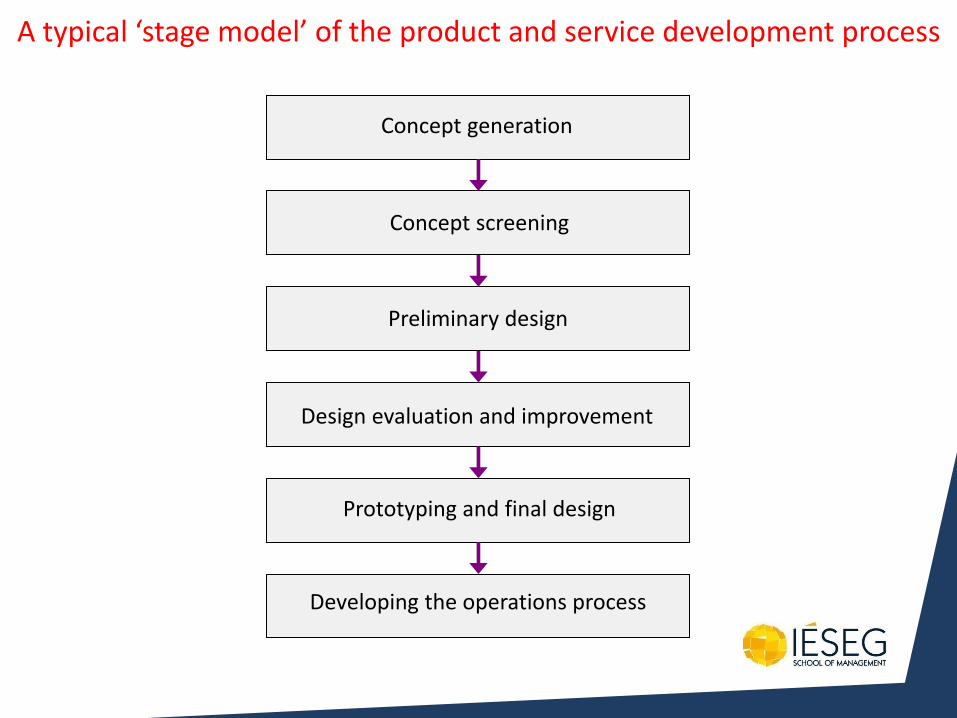
Concept generation
Concept screening
Preliminary design
Design evaluation and improvement
Prototyping and final design
Developing the operations process
A typical ‘stage model’ of the product and service development process
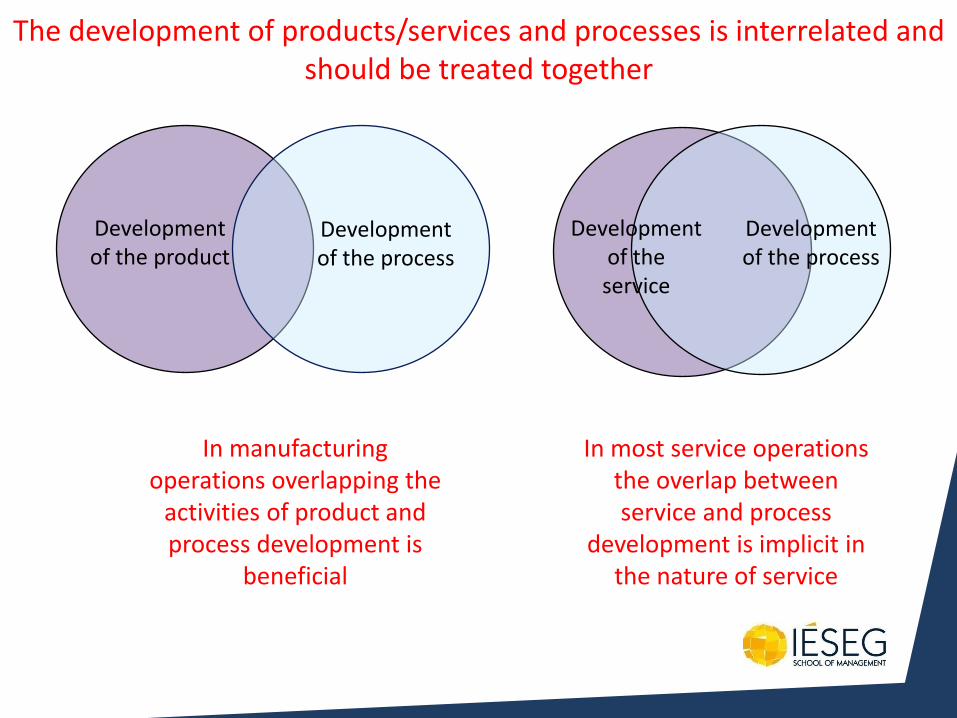
Development of the service
Development of the process
Development of the product
Development of the process
In most service operations the overlap between service and process
development is implicit in the nature of service
In manufacturing operations overlapping the
activities of product and process development is
beneficial
The development of products/services and processes is interrelated and should be treated together
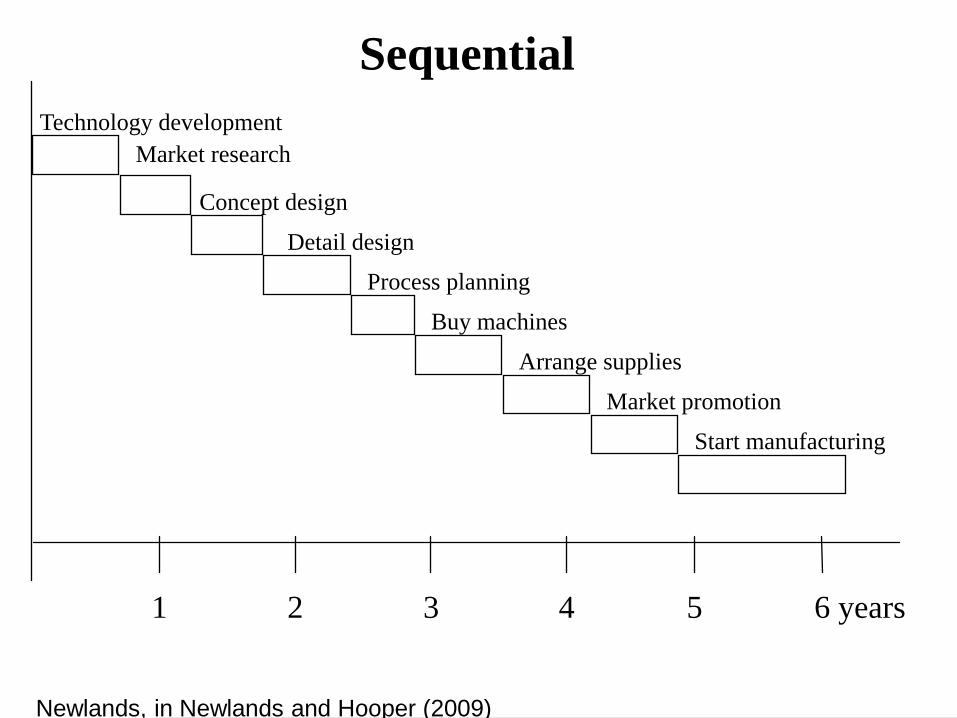
Sequential
Technology development
Market research
Concept design
Detail design
Process planning
Buy machines
Arrange supplies
Market promotion
Start manufacturing
1 2 3 4 5 6 years
Newlands, in Newlands and Hooper (2009)
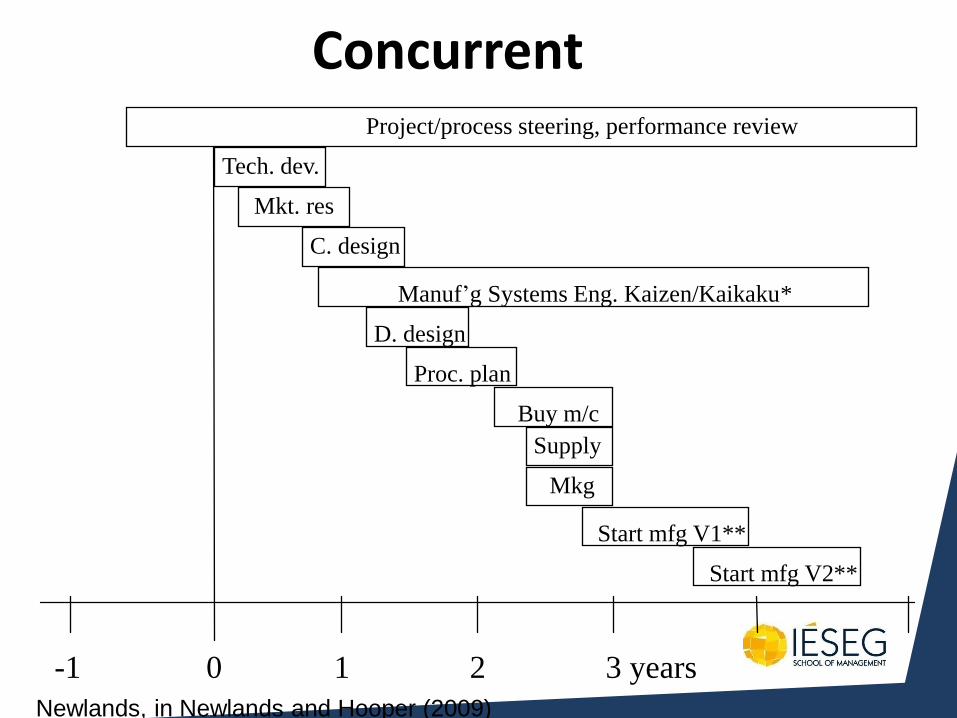
Concurrent
Tech. dev.
Mkt. res
C. design
D. design
Proc. plan
Buy m/c
Supply
Mkg
Start mfg V1**
1 2 3 years
Manuf ’ g Systems Eng. Kaizen/ Kaikaku *
Start mfg V2**
Project/process steering, performance review
- 1 0 Newlands, in Newlands and Hooper (2009)
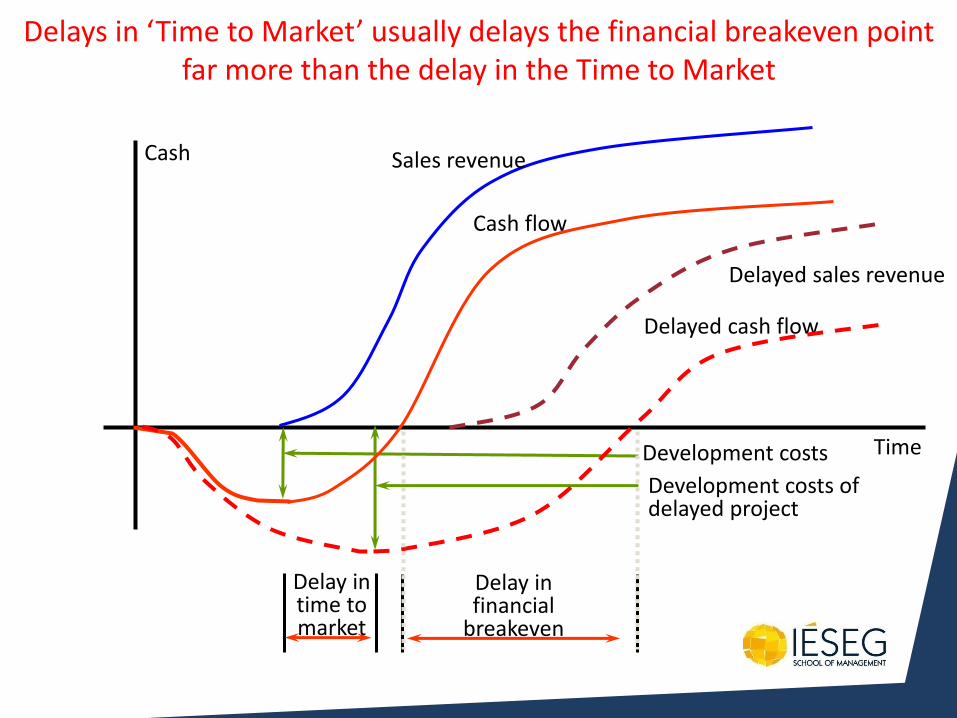
Delays in ‘Time to Market’ usually delays the financial breakeven point far more than the delay in the Time to Market
Delay in financial
breakeven
Delay in time to market
Development costs
Development costs of delayed project
Time
Cash Sales revenue
Delayed sales revenue
Cash flow
Delayed cash flow
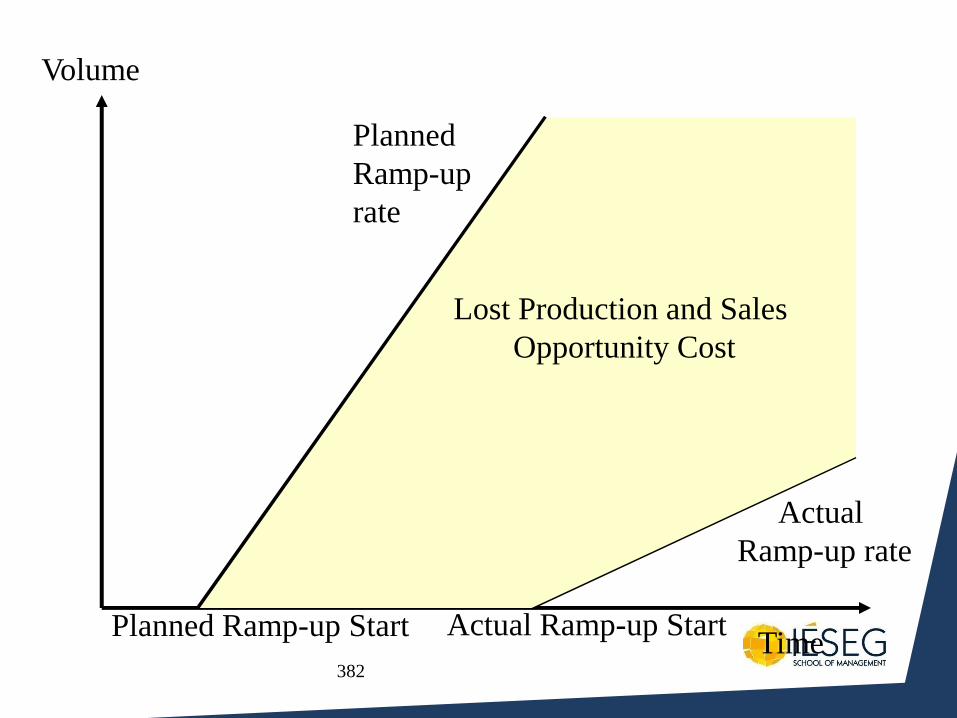
382
Time
Volume
Planned
Ramp-up
rate
Actual
Ramp-up rate
Planned Ramp-up Start Actual Ramp-up Start
Lost Production and Sales
Opportunity Cost
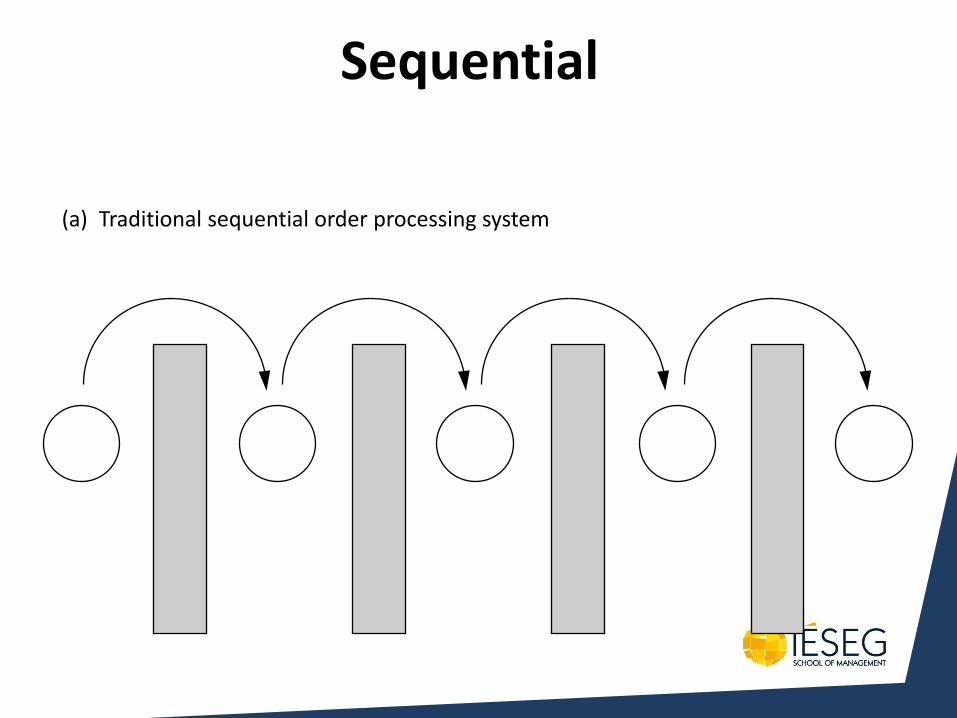
Sequential
(a) Traditional sequential order processing system
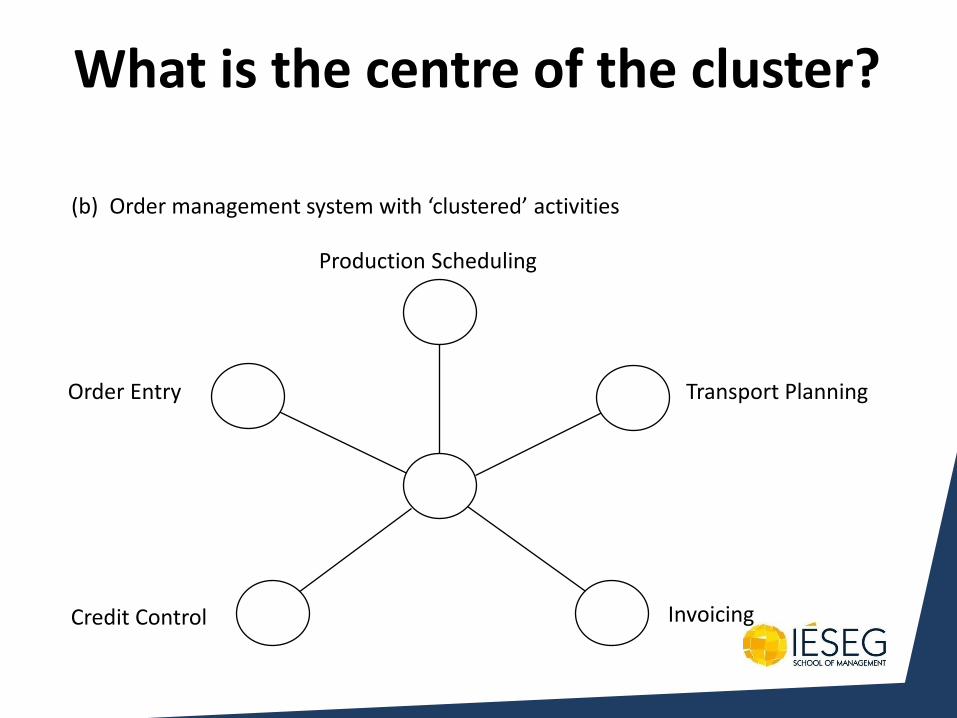
What is the centre of the cluster?
Production Scheduling
Order Entry Transport Planning
Credit Control Invoicing
(b) Order management system with ‘clustered’ activities
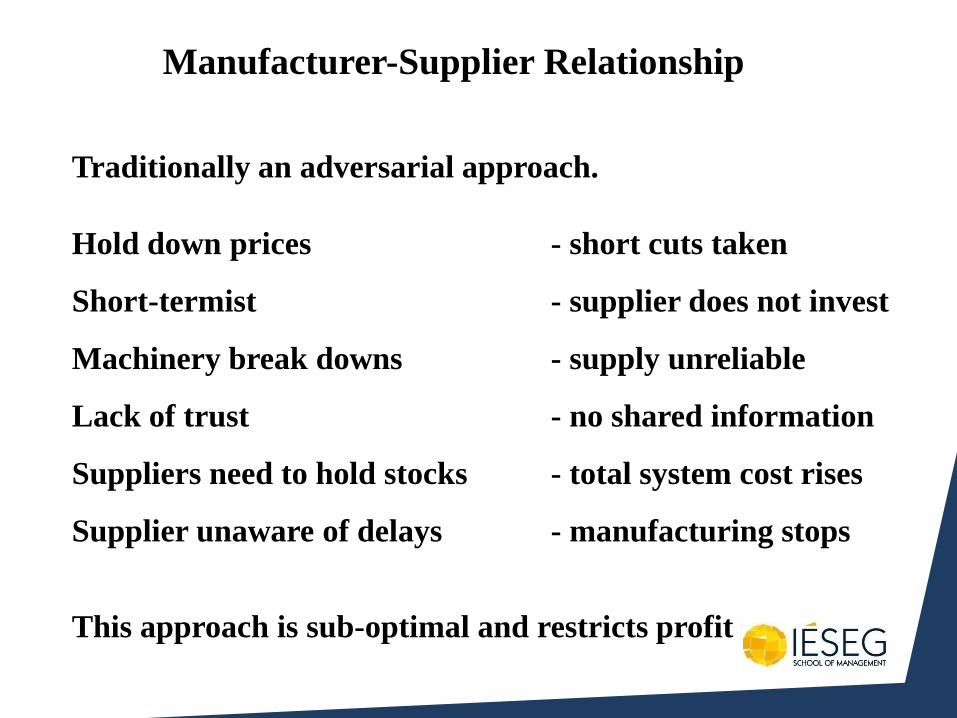
Manufacturer-Supplier Relationship
Traditionally an adversarial approach.
Hold down prices - short cuts taken
Short-termist - supplier does not invest
Machinery break downs - supply unreliable
Lack of trust - no shared information
Suppliers need to hold stocks - total system cost rises
Supplier unaware of delays - manufacturing stops
This approach is sub-optimal and restricts profit
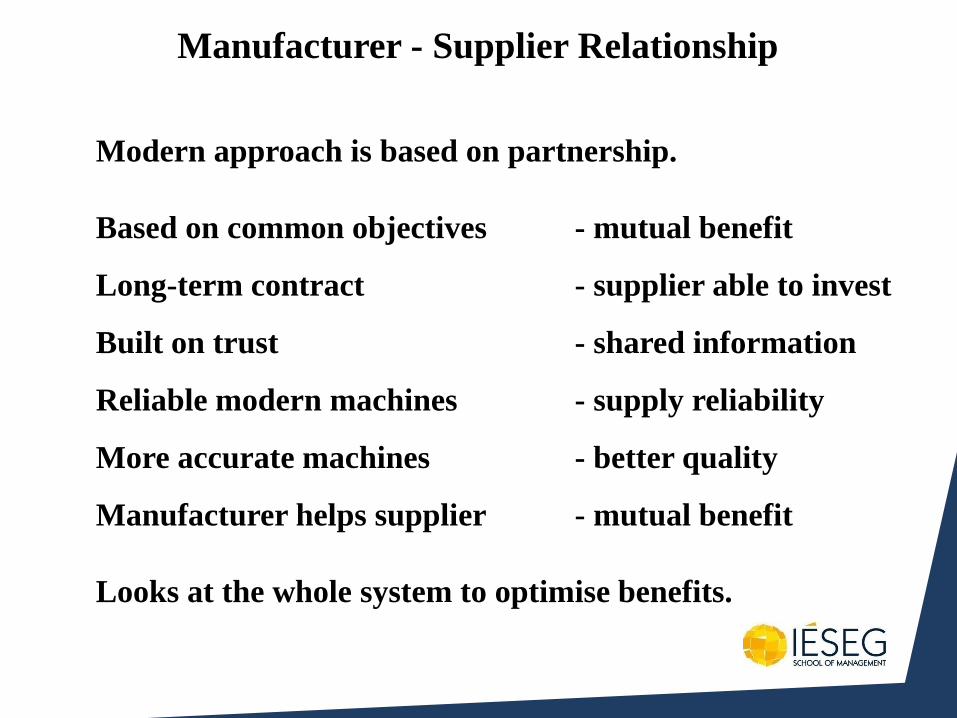
Manufacturer - Supplier Relationship
Modern approach is based on partnership.
Based on common objectives - mutual benefit
Long-term contract - supplier able to invest
Built on trust - shared information
Reliable modern machines - supply reliability
More accurate machines - better quality
Manufacturer helps supplier - mutual benefit
Looks at the whole system to optimise benefits.
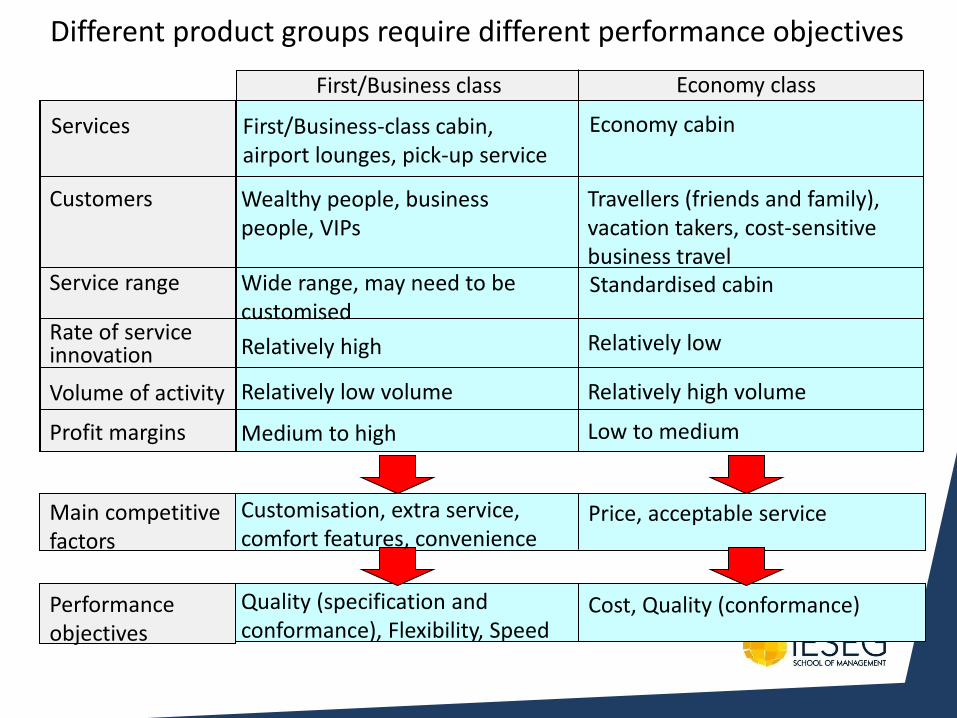
First/Business-class cabin, airport lounges, pick-up service
Economy cabin
Wealthy people, business people, VIPs
Travellers (friends and family), vacation takers, cost-sensitive business travel
Wide range, may need to be customised
Standardised cabin
Relatively high Relatively low
Relatively low volume Relatively high volume
Medium to high Low to medium
First/Business class Economy class
Customisation, extra service, comfort features, convenience
Quality (specification and conformance), Flexibility, Speed
Price, acceptable service
Cost, Quality (conformance)
Services
Customers
Service range
Rate of service innovation
Volume of activity
Profit margins
Main competitive factors
Performance objectives
Different product groups require different performance objectives
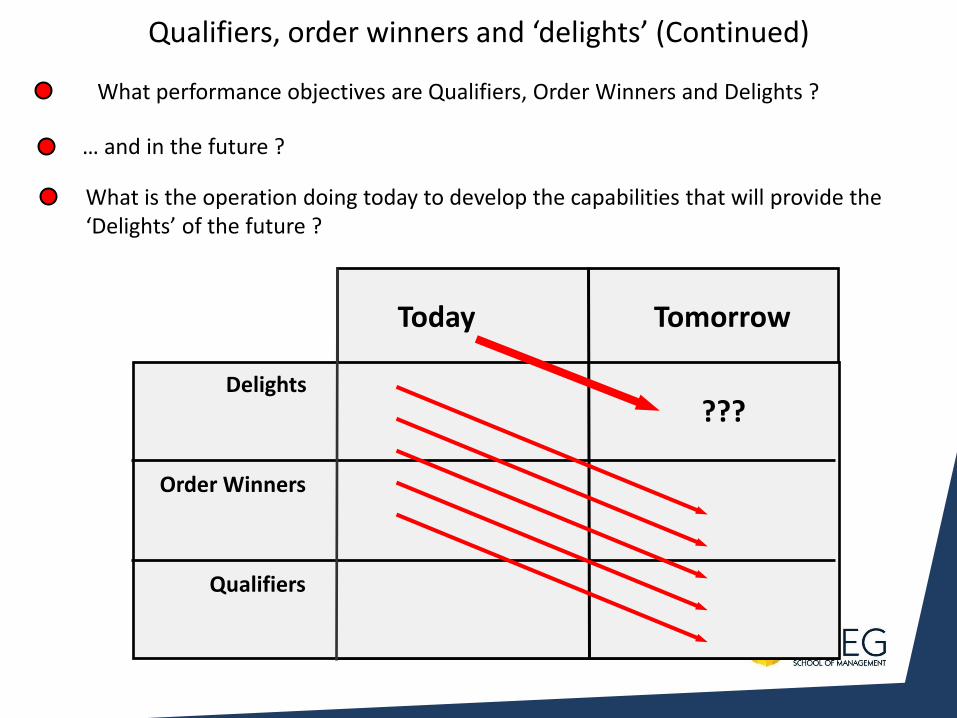
What performance objectives are Qualifiers, Order Winners and Delights ?
Delights
Order Winners
Qualifiers
Today Tomorrow
… and in the future ?
???
What is the operation doing today to develop the capabilities that will provide the ‘Delights’ of the future ?
Qualifiers, order winners and ‘delights’ (Continued)
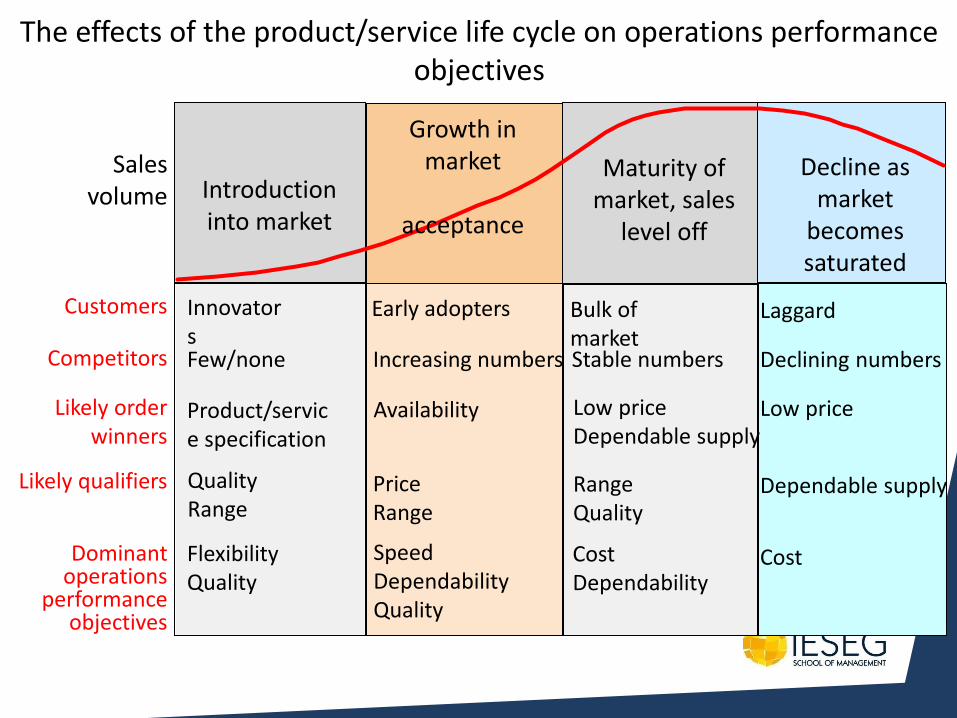
The effects of the product/service life cycle on operations performance objectives
Sales volume
Customers
Competitors
Dominant operations
performance objectives
Introduction into market
Growth in market
acceptance
Maturity of market, sales
level off
Decline as market
becomes saturated
Innovators
Early adopters Bulk of market
Laggard
Likely order winners
Few/none Increasing numbers Stable numbers Declining numbers
Product/service specification
Availability Low price Dependable supply
Low price
Likely qualifiers Quality Range
Price Range
Range Quality
Dependable supply
Flexibility Quality
Speed Dependability Quality
Cost Dependability
Cost

Delays in ‘Time to Market’ usually delays the financial breakeven point far more than the delay in the Time to Market
Delay in financial
breakeven
Delay in time to market
Development costs
Development costs of delayed project
Time
Cash Sales revenue
Delayed sales revenue
Cash flow
Delayed cash flow
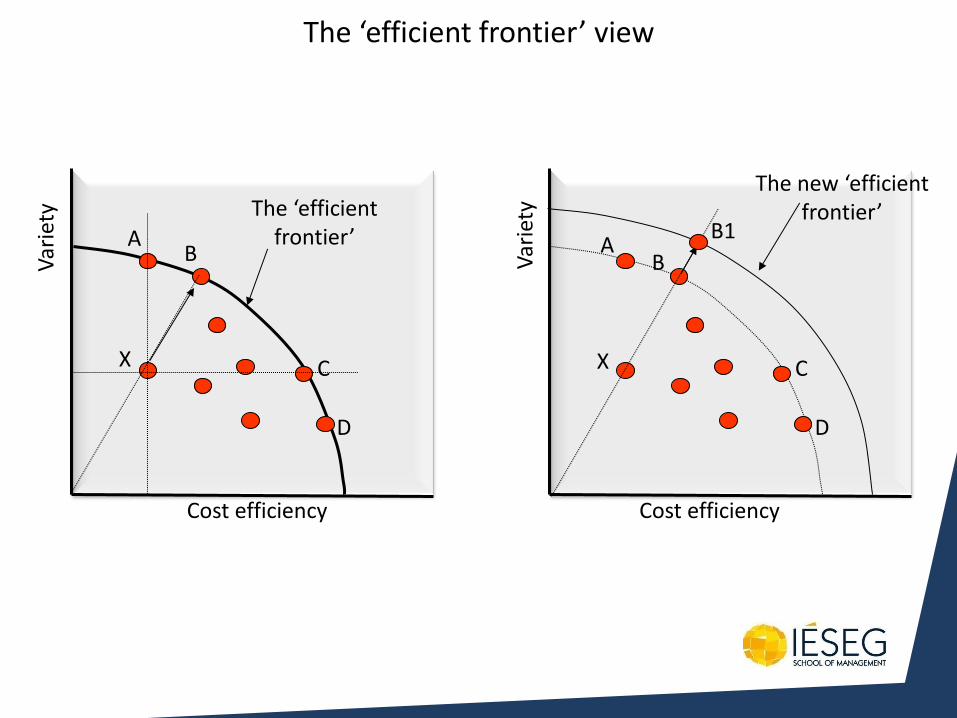
X
Cost efficiency
Var
iety
A
C
D
B
The ‘efficient frontier’ A
X C
D
Cost efficiency V
arie
ty
B
The new ‘efficient frontier’
B1
The ‘efficient frontier’ view

What stops us from achieving: 100% Increase in Sales
50% Increase in Productivity 100% Increase in Profits
This Year!
The Limits of Change
Identify Limiting Beliefs!
http://www.ictinteg.co.uk/serv01.htm
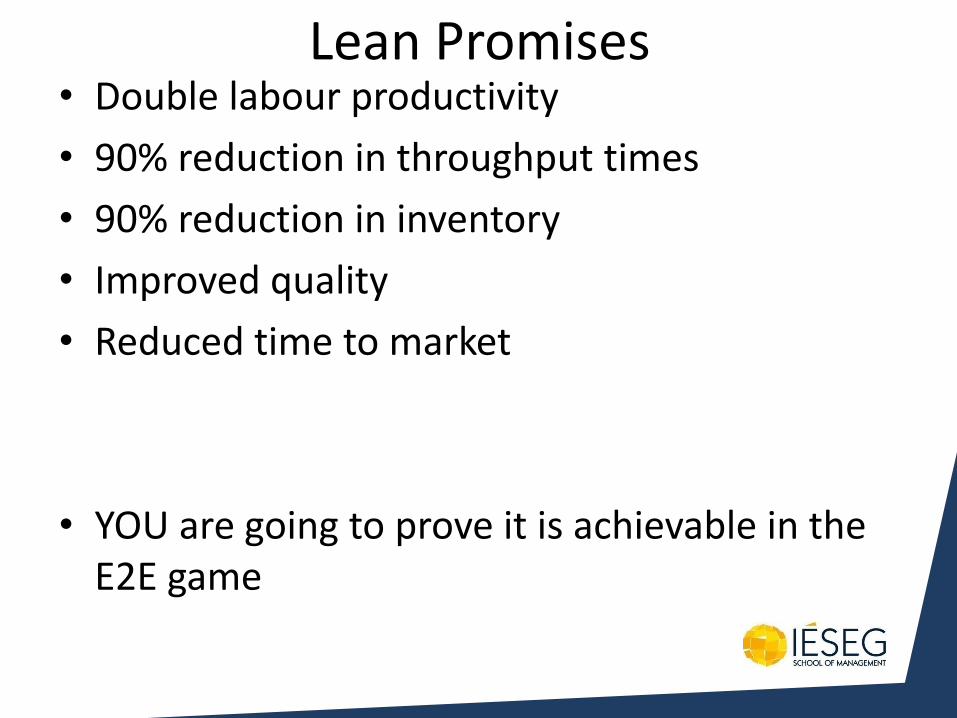
Lean Promises • Double labour productivity
• 90% reduction in throughput times
• 90% reduction in inventory
• Improved quality
• Reduced time to market
• YOU are going to prove it is achievable in the E2E game
Chapter 4
Capacity strategy
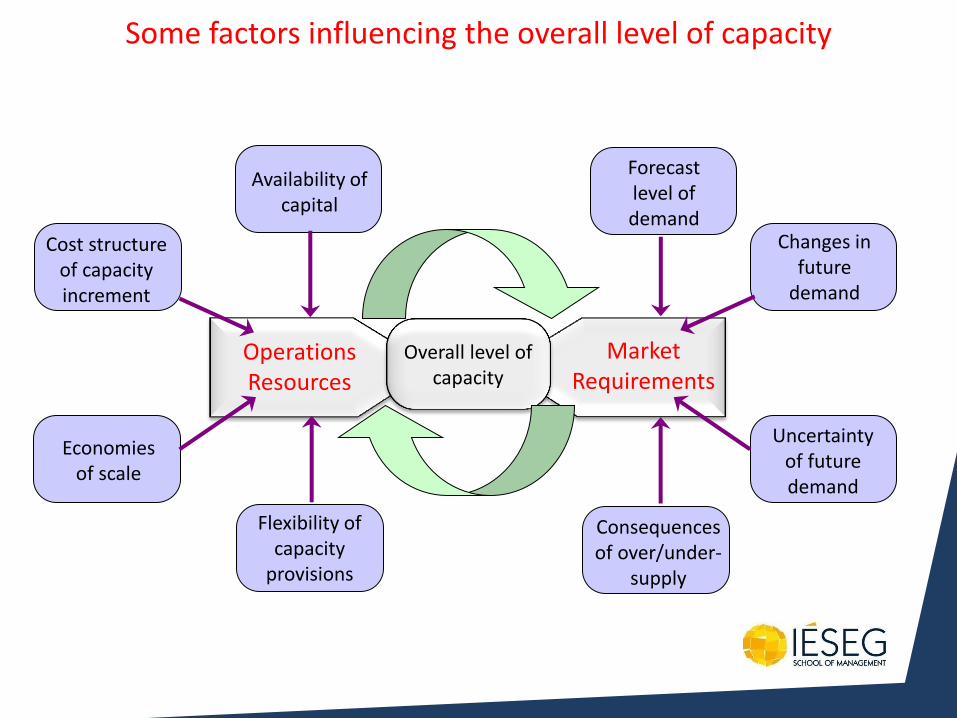
Forecast level of demand
Consequences of over/under-
supply
Availability of capital
Flexibility of capacity
provisions
Some factors influencing the overall level of capacity
Changes in future
demand
Uncertainty of future demand
Cost structure of capacity increment
Economies of scale
Operations Resources
Market Requirements
Overall level of capacity
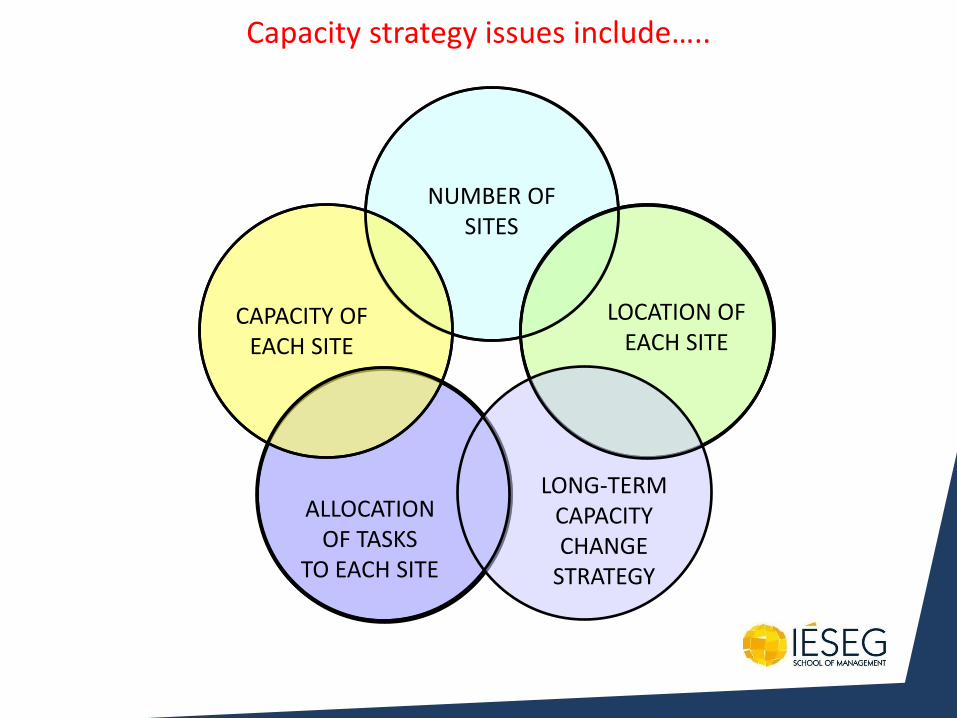
Capacity strategy issues include…..
NUMBER OF SITES
LOCATION OF EACH SITE
ALLOCATION OF TASKS
TO EACH SITE
CAPACITY OF EACH SITE
LONG-TERM CAPACITY CHANGE
STRATEGY
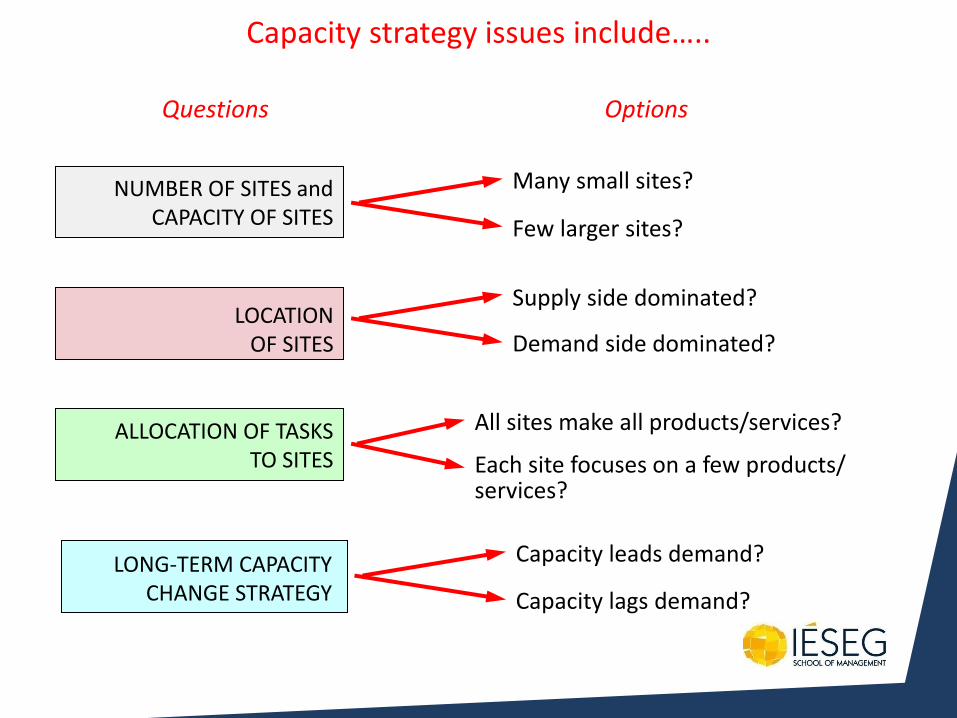
NUMBER OF SITES and CAPACITY OF SITES
LOCATION OF SITES
ALLOCATION OF TASKS TO SITES
LONG-TERM CAPACITY CHANGE STRATEGY
Many small sites?
Few larger sites?
Questions Options
Supply side dominated?
Demand side dominated?
All sites make all products/services?
Each site focuses on a few products/ services?
Capacity leads demand?
Capacity lags demand?
Capacity strategy issues include…..
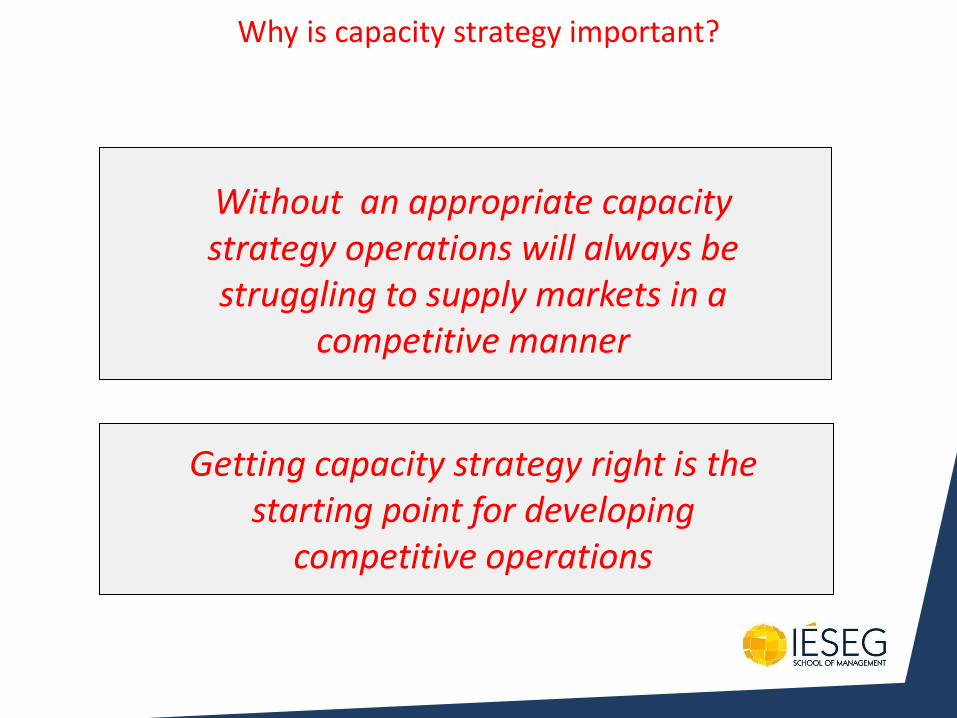
Why is capacity strategy important?
Without an appropriate capacity strategy operations will always be struggling to supply markets in a
competitive manner
Getting capacity strategy right is the starting point for developing
competitive operations
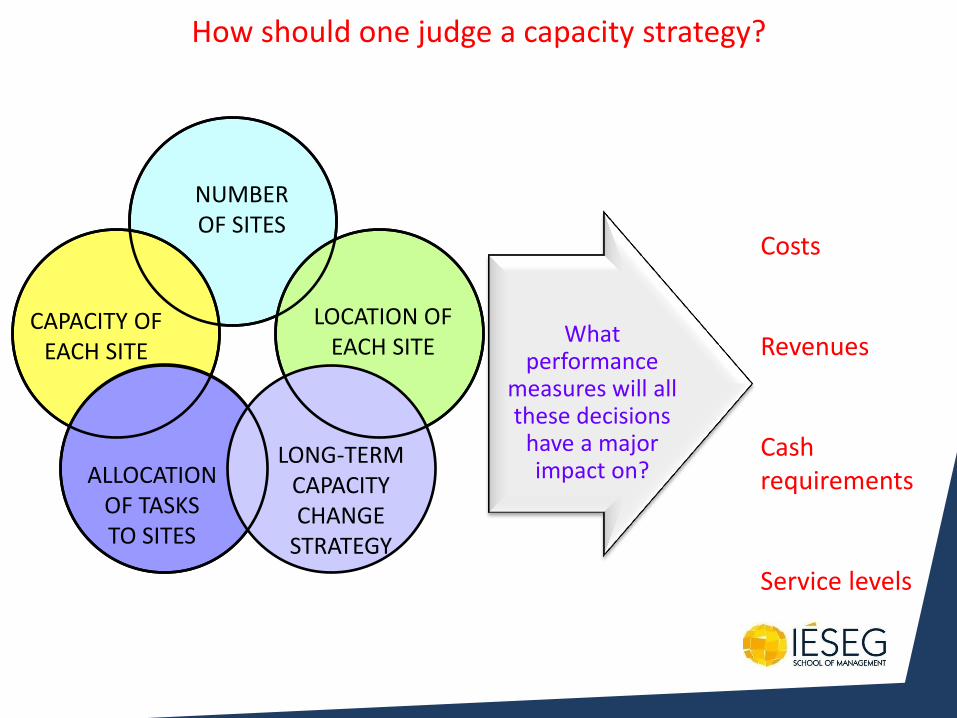
LONG-TERM CAPACITY CHANGE
STRATEGY
NUMBER OF SITES
LOCATION OF EACH SITE
CAPACITY OF EACH SITE
ALLOCATION OF TASKS TO SITES
What performance
measures will all these decisions
have a major impact on?
Costs
Revenues
Cash requirements
Service levels
How should one judge a capacity strategy?
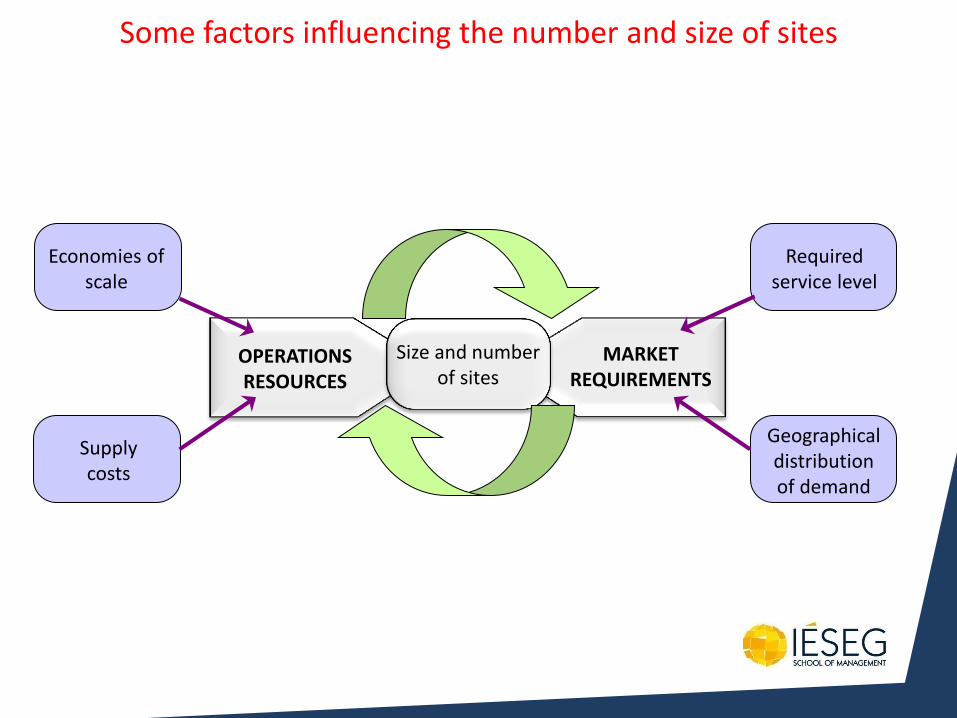
Required service level
Geographical distribution of demand
Economies of scale
Supply costs
OPERATIONS RESOURCES
MARKET REQUIREMENTS
Size and number of sites
Some factors influencing the number and size of sites
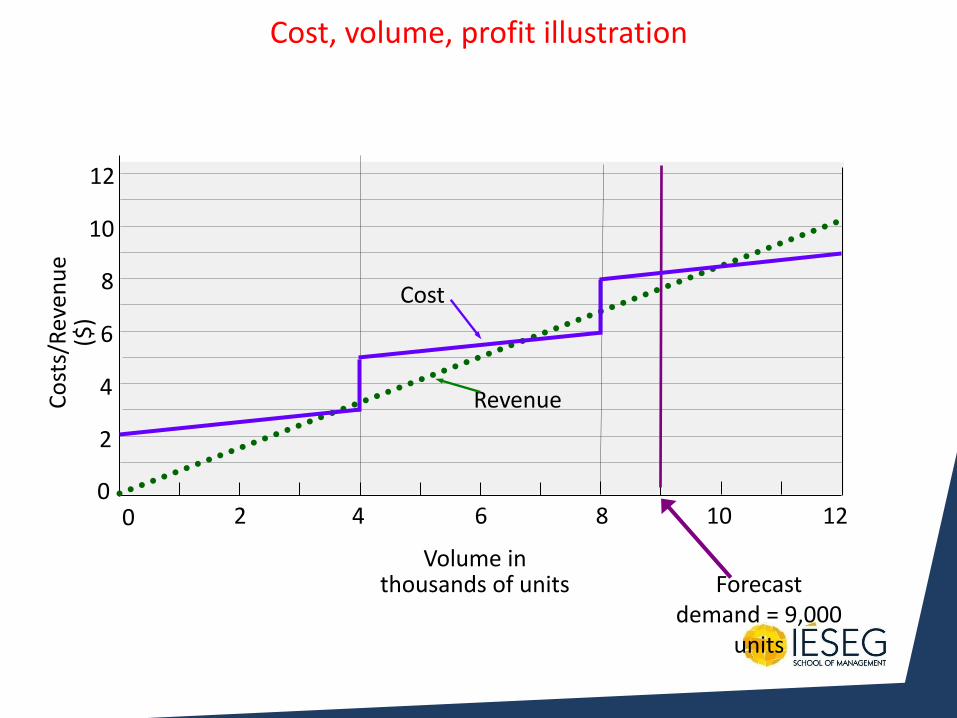
2
4
6
8
10
12
0 0 2 4 6 8 10 12
Co
sts/
Rev
enu
e
($)
Volume in thousands of units Forecast
demand = 9,000 units
Cost
Revenue
Cost, volume, profit illustration
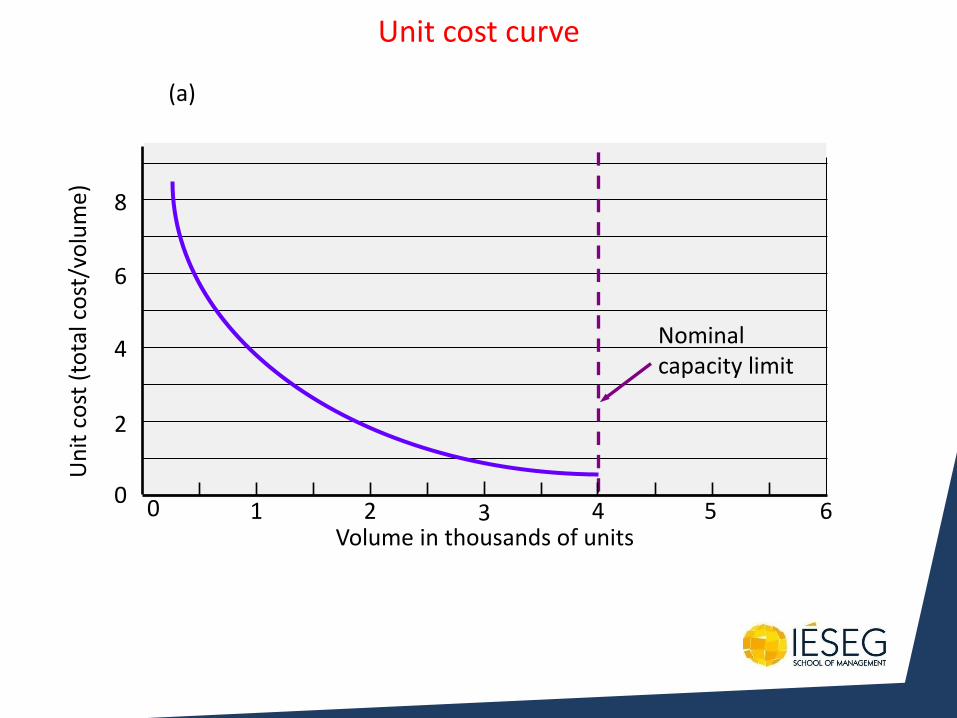
1 2 3 4 5 6 0 0
2
4
6
8
Un
it c
ost
(to
tal c
ost
/vo
lum
e)
Volume in thousands of units
(a)
Nominal capacity limit
Unit cost curve
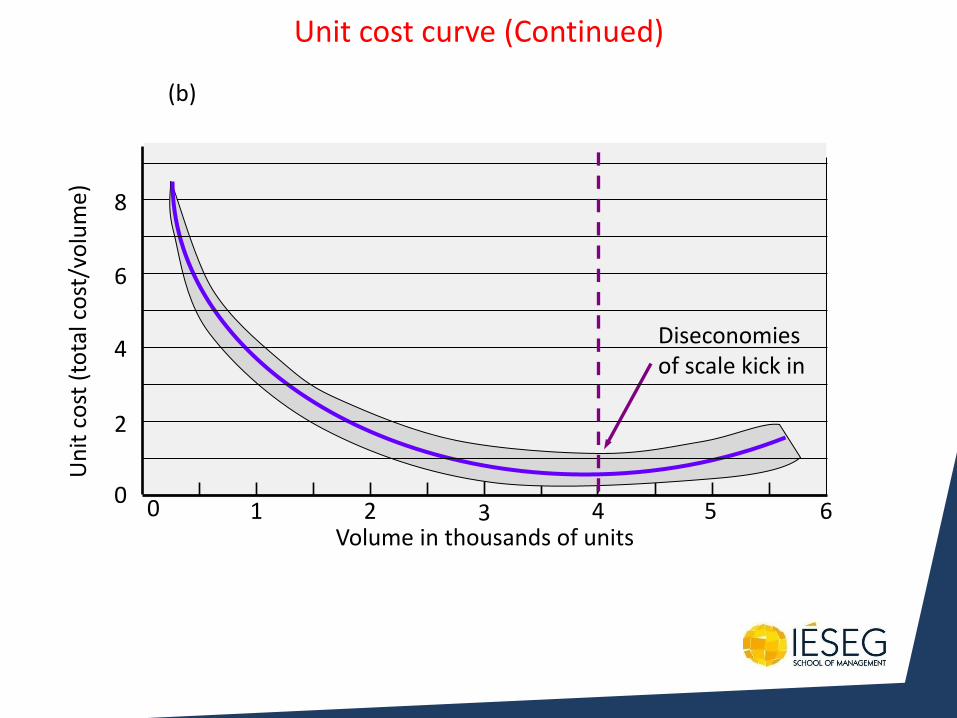
1 2 3 4 5 6 0 0
2
4
6
8
Un
it c
ost
(to
tal c
ost
/vo
lum
e)
Volume in thousands of units
(b)
Diseconomies of scale kick in
Unit cost curve (Continued)
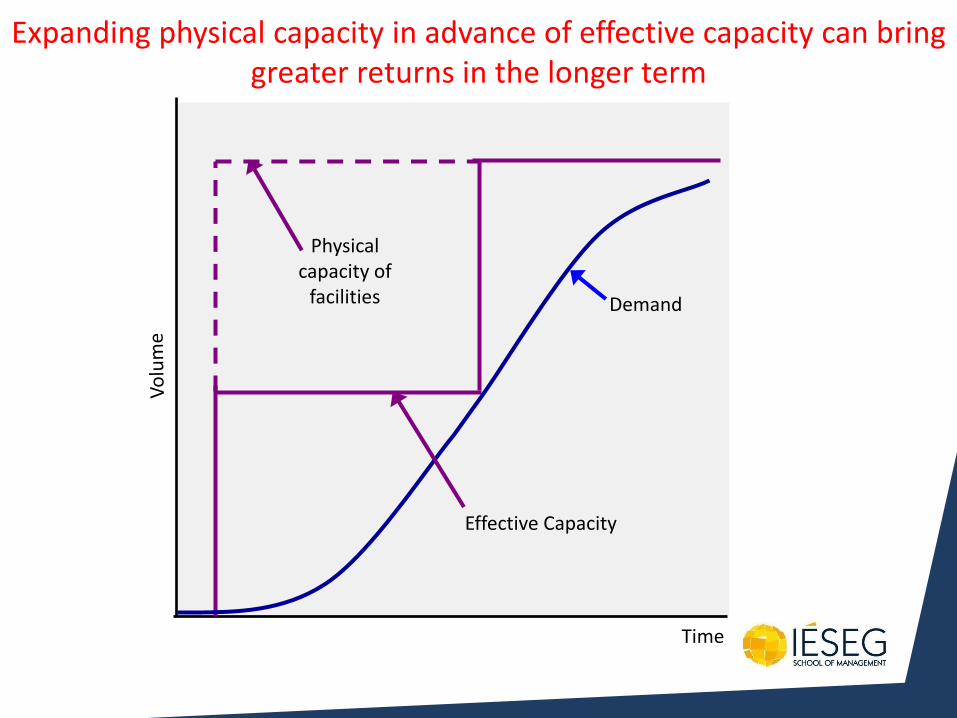
Physical capacity of
facilities
Effective Capacity
Demand
Time
Expanding physical capacity in advance of effective capacity can bring greater returns in the longer term
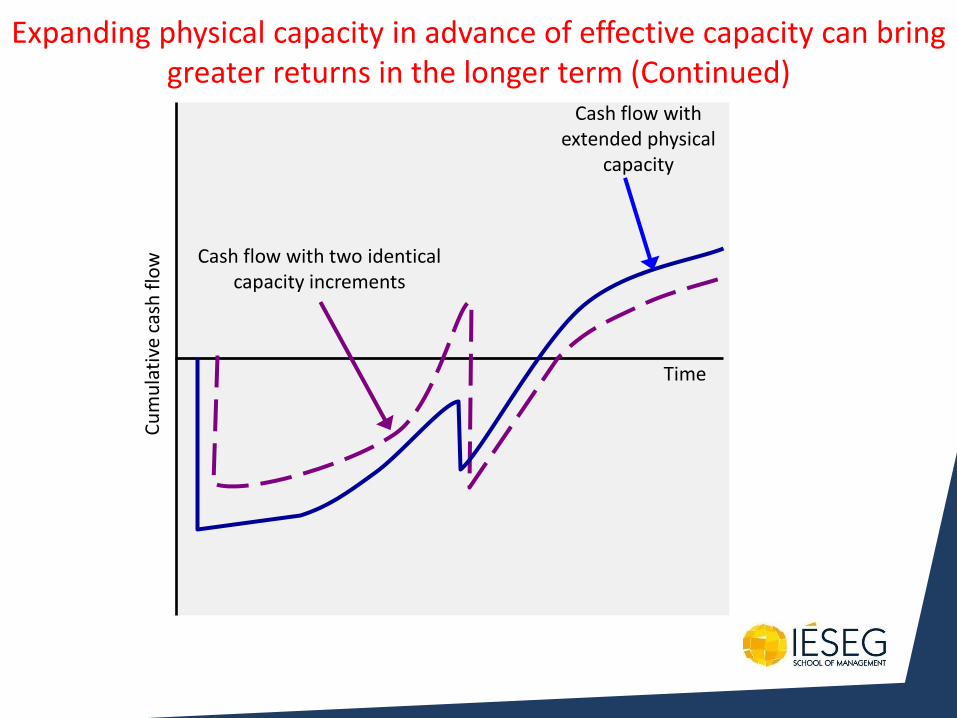
Cash flow with extended physical
capacity
Cash flow with two identical capacity increments
Time
Expanding physical capacity in advance of effective capacity can bring greater returns in the longer term (Continued)
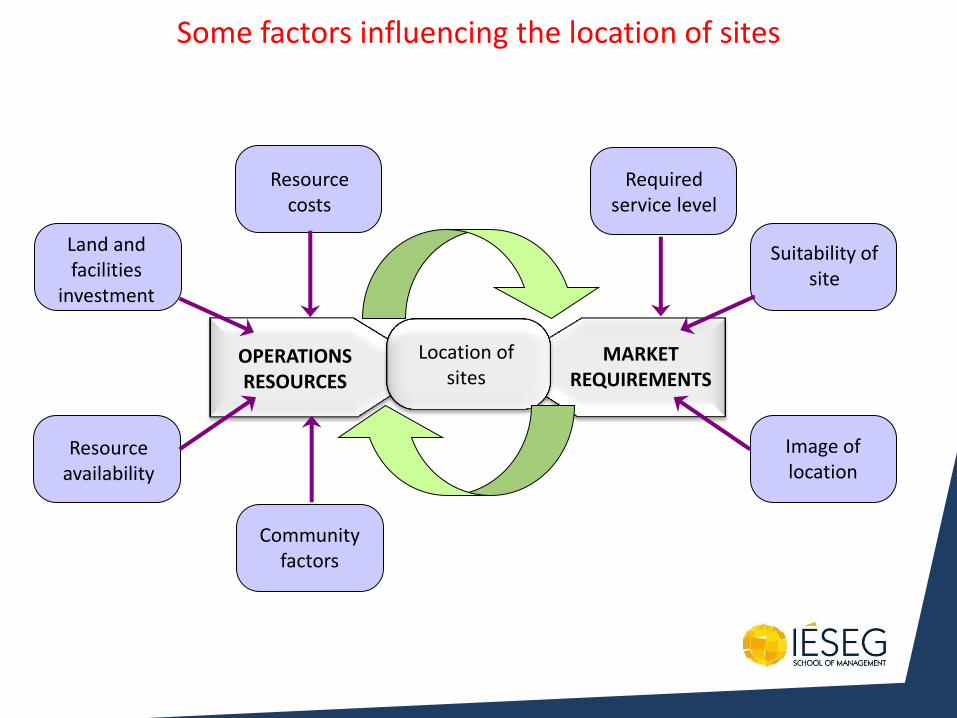
Required service level
Resource costs
Community factors
Some factors influencing the location of sites
Suitability of site
Image of location
Land and facilities
investment
Resource availability
OPERATIONS RESOURCES
MARKET REQUIREMENTS
Location of sites
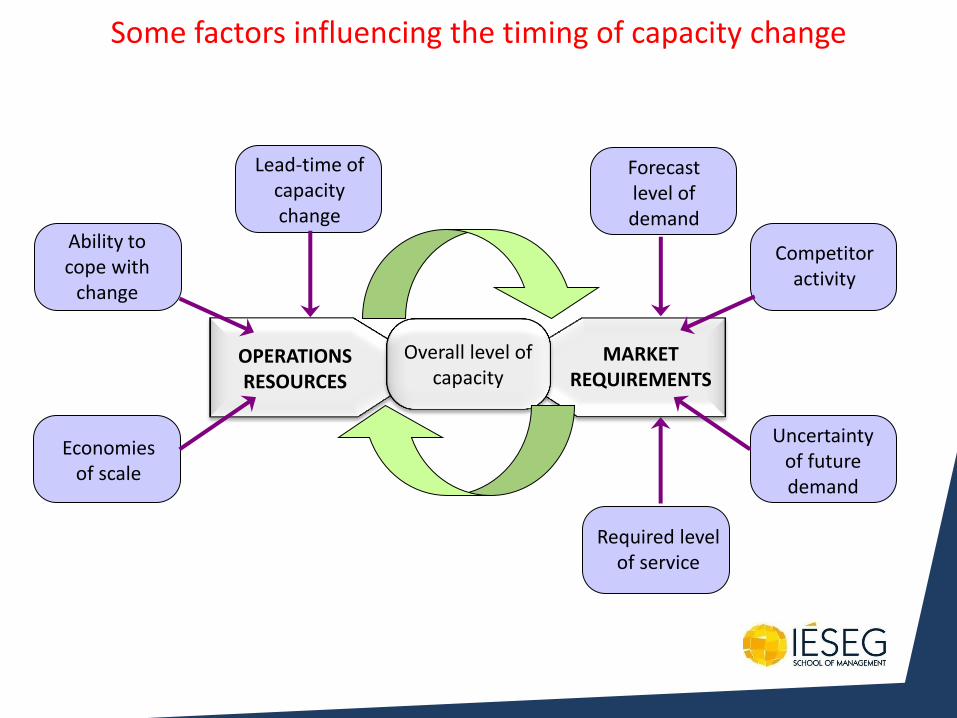
Forecast level of demand
Required level of service
Lead-time of capacity change
Some factors influencing the timing of capacity change
Competitor activity
Uncertainty of future demand
Ability to cope with
change
Economies of scale
OPERATIONS RESOURCES
MARKET REQUIREMENTS
Overall level of capacity
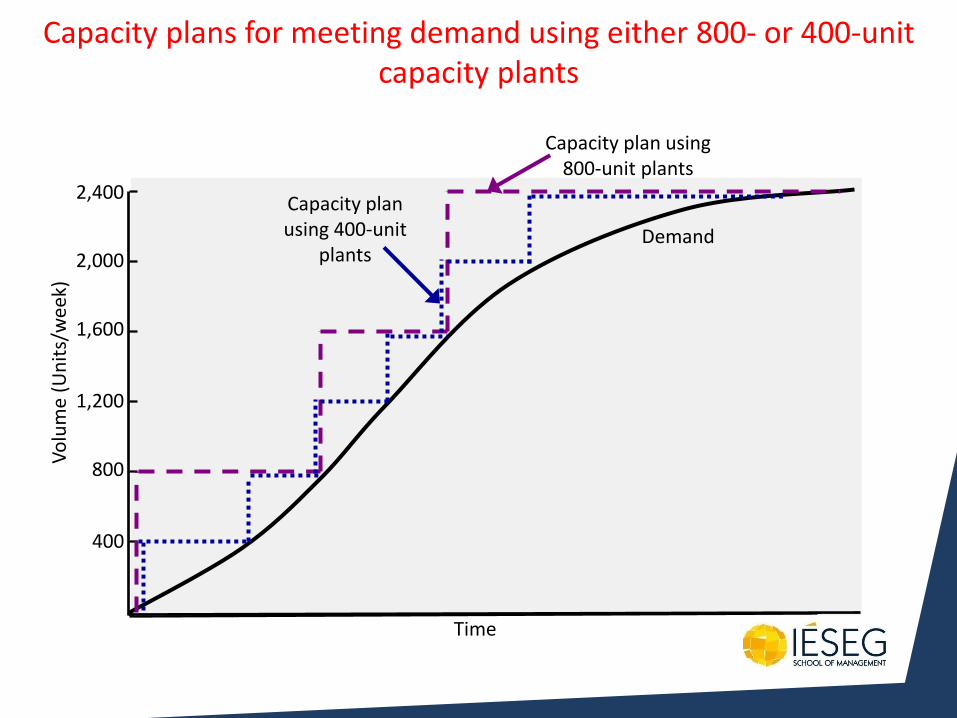
400
800
1,200
1,600
2,000
2,400
Vo
lum
e (U
nit
s/w
eek)
Time
Demand
Capacity plans for meeting demand using either 800- or 400-unit capacity plants
Capacity plan using 800-unit plants
Capacity plan using 400-unit
plants
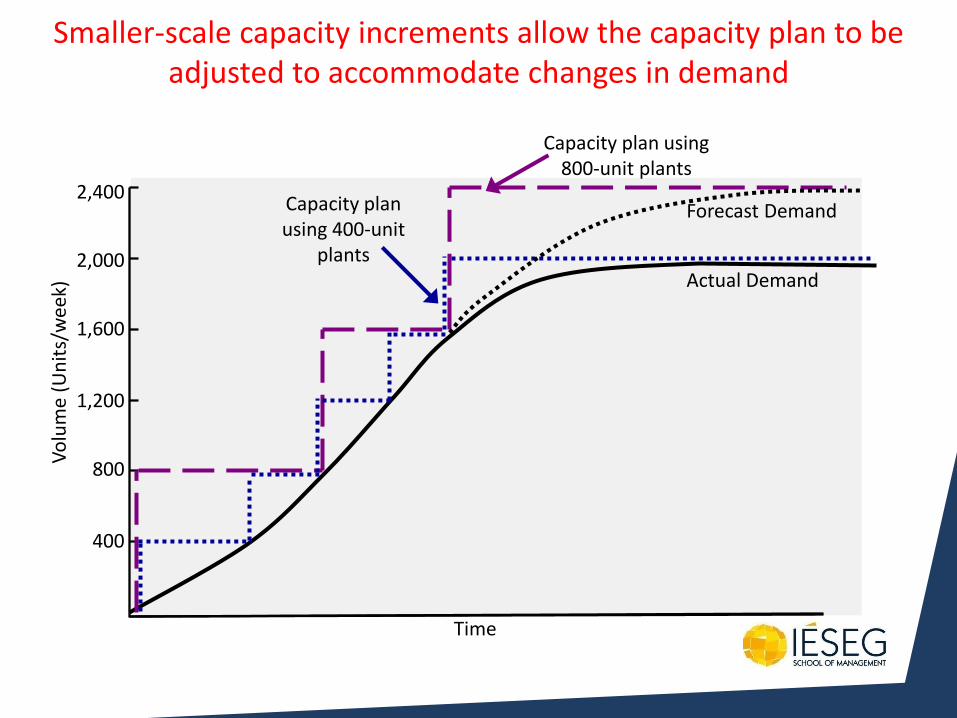
Forecast Demand
Smaller-scale capacity increments allow the capacity plan to be adjusted to accommodate changes in demand
Actual Demand
Capacity plan using 800-unit plants
Capacity plan using 400-unit
plants
400
800
1,200
1,600
2,000
2,400
Vo
lum
e (U
nit
s/w
eek)
Time
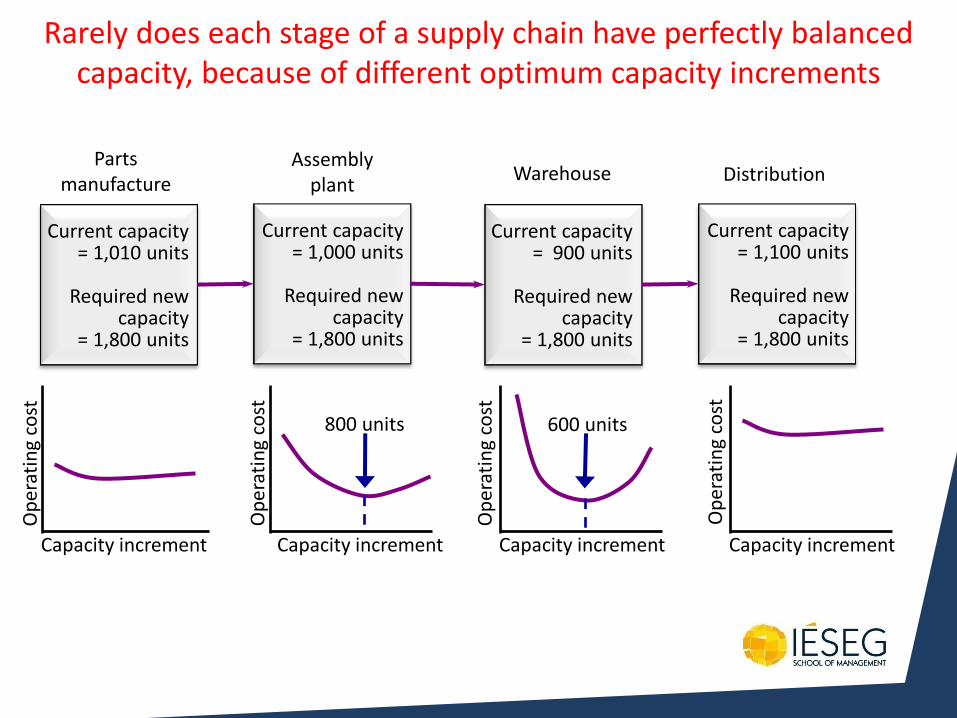
Current capacity = 1,010 units
Required new
capacity = 1,800 units
Current capacity = 1,000 units
Required new
capacity = 1,800 units
Current capacity = 900 units
Required new
capacity = 1,800 units
Current capacity = 1,100 units
Required new
capacity = 1,800 units
Capacity increment
Op
erat
ing
cost
Capacity increment
Op
erat
ing
cost
Capacity increment
Op
erat
ing
cost
Capacity increment
Op
erat
ing
cost
800 units 600 units
Parts manufacture
Assembly plant
Warehouse Distribution
Rarely does each stage of a supply chain have perfectly balanced capacity, because of different optimum capacity increments
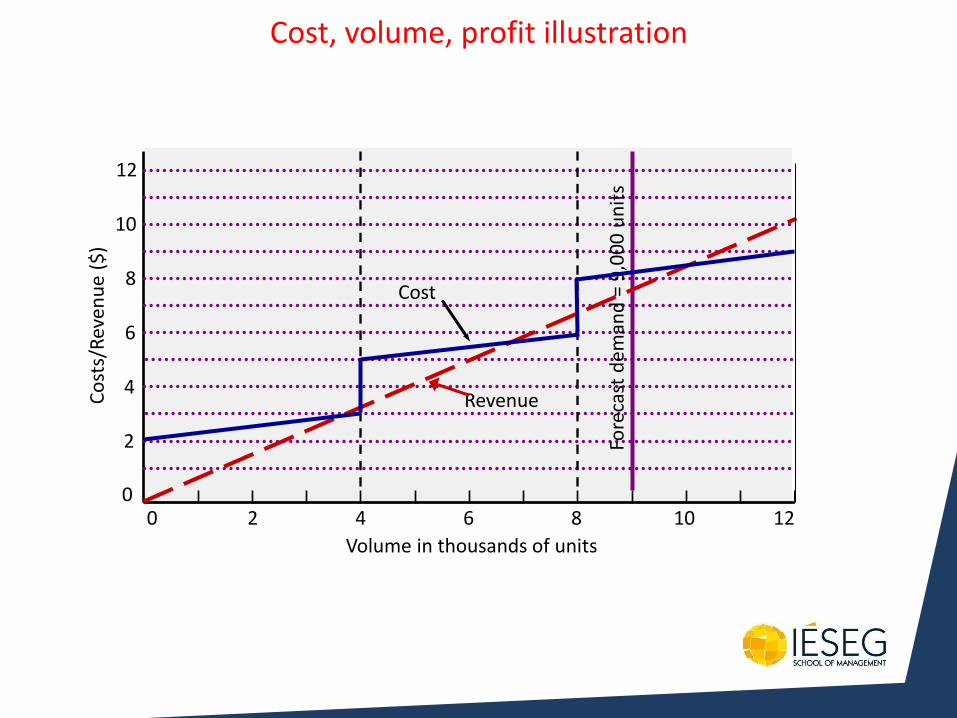
2
4
6
8
10
12
0 0 2 4 6 8 10 12
Co
sts/
Rev
enu
e ($
)
Volume in thousands of units
Fore
cast
dem
and
= 9
,00
0 u
nit
s
Cost
Revenue
Cost, volume, profit illustration
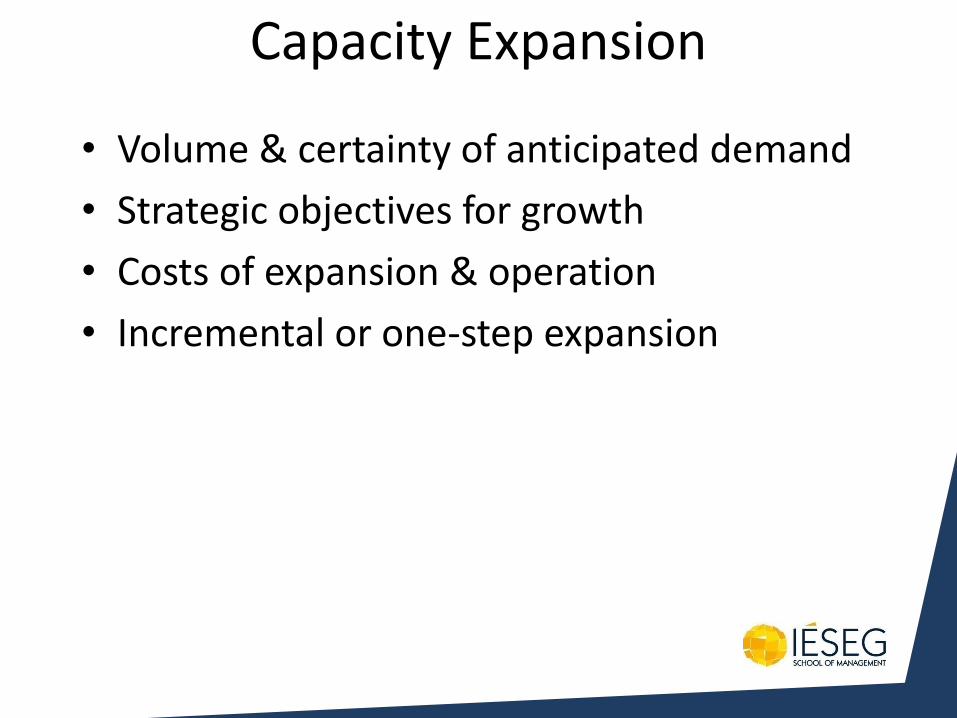
Capacity Expansion
• Volume & certainty of anticipated demand
• Strategic objectives for growth
• Costs of expansion & operation
• Incremental or one-step expansion
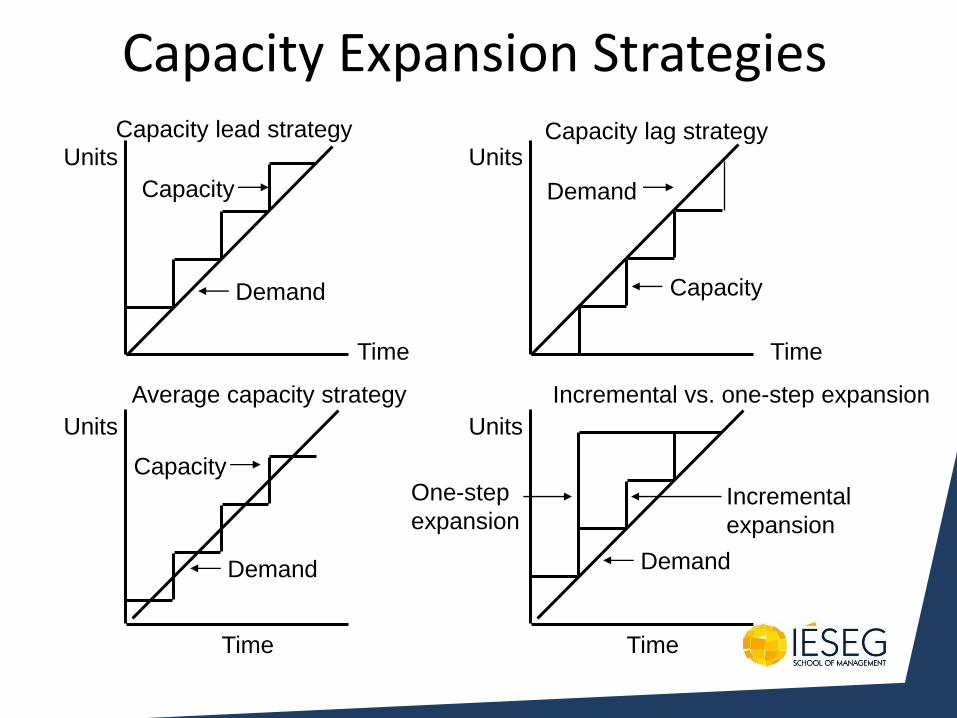
Capacity Expansion Strategies
Units
Capacity
Time
Demand
Capacity lead strategy Units
Capacity
Time
Demand
Capacity lag strategy
Units
Capacity
Time
Demand
Average capacity strategy Incremental vs. one-step expansion
Units
Incremental
expansion
Time
Demand
One-step
expansion
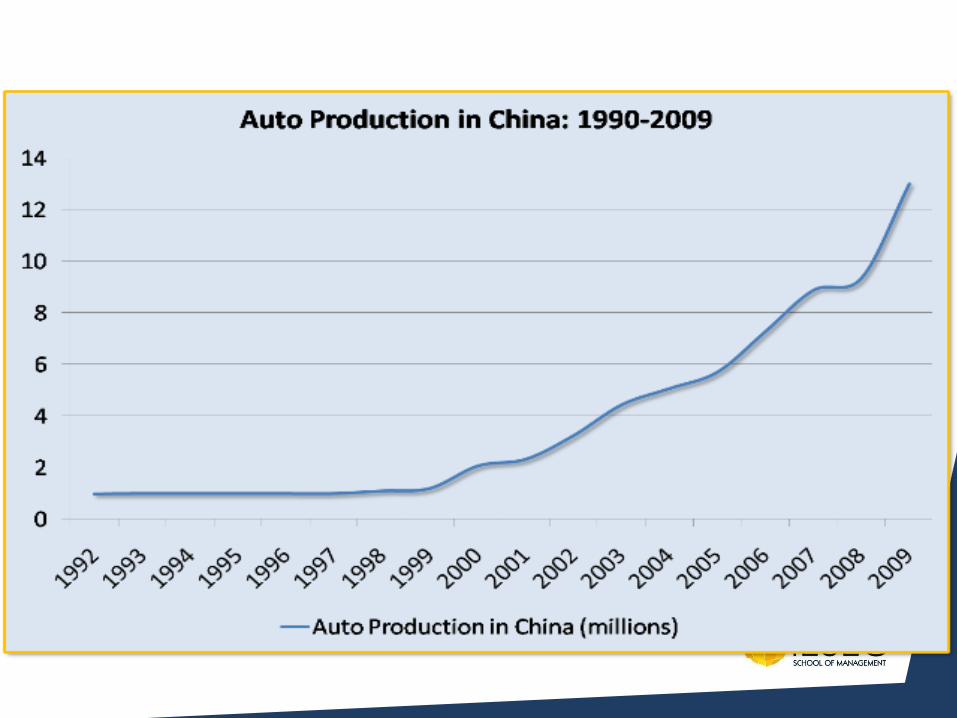
Strategies for Meeting Non-Uniform Demand
• Build up inventory
• Back-ordering
• Smooth demand through marketing
– Forecast data analysis – smoothing to eliminate seasonality
– increase price to reduce demand
– decrease price to increase demand
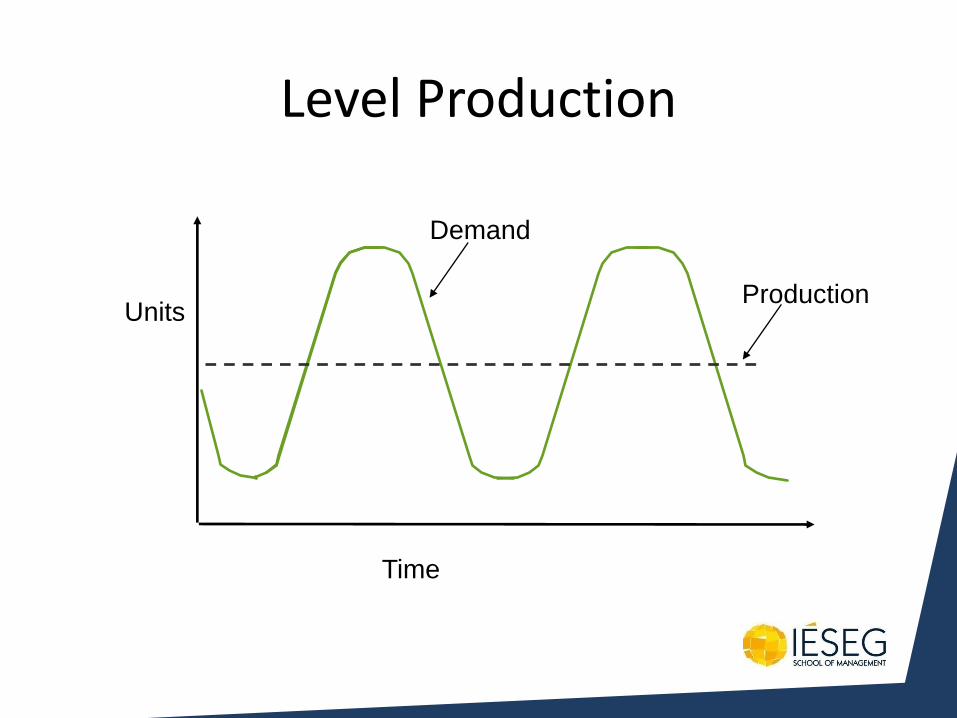
Level Production
Time
Demand
Production Units
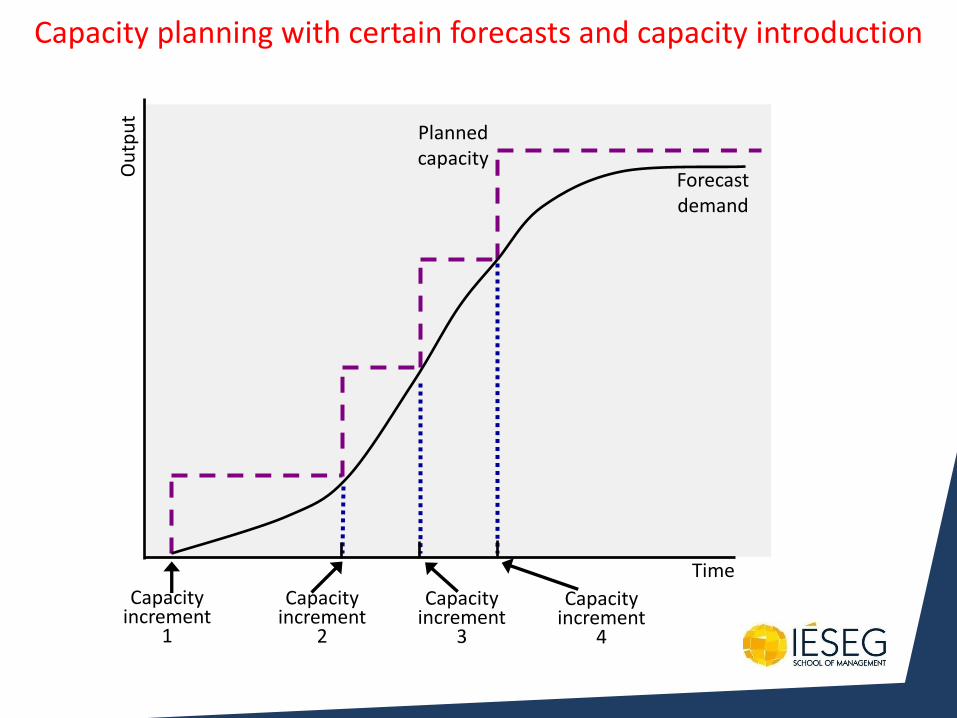
Ou
tpu
t Planned capacity
Forecast demand
Capacity increment
1
Capacity increment
2
Capacity increment
3
Capacity increment
4
Time
Capacity planning with certain forecasts and capacity introduction
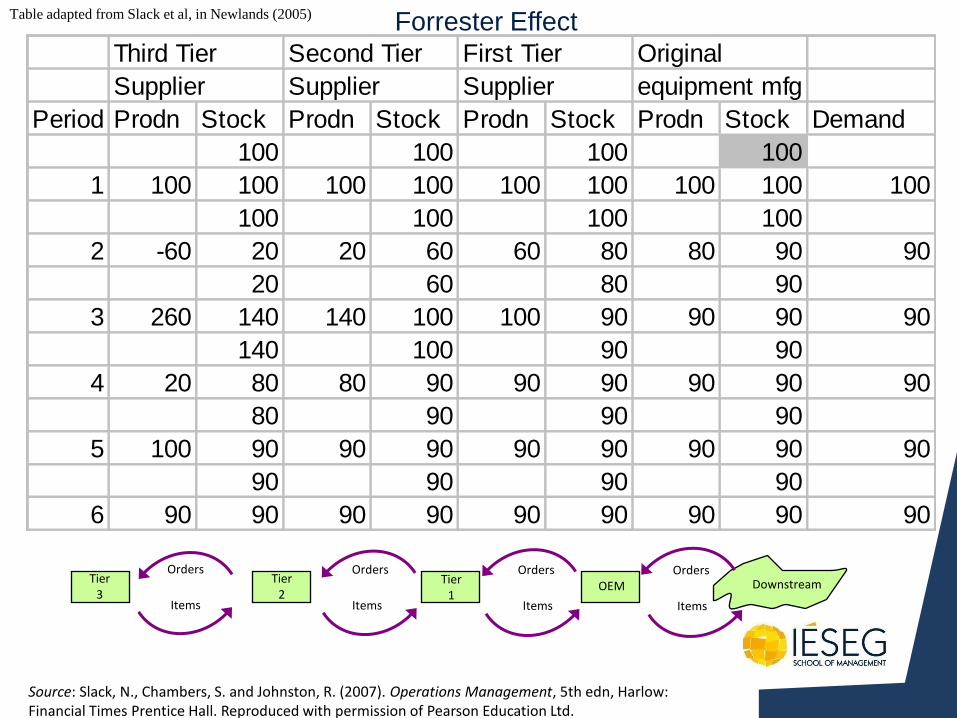
Forrester Effect
Third Tier Second Tier First Tier Original
Supplier Supplier Supplier equipment mfg
Period Prodn Stock Prodn Stock Prodn Stock Prodn Stock Demand
100 100 100 100
1 100 100 100 100 100 100 100 100 100
100 100 100 100
2 -60 20 20 60 60 80 80 90 90
20 60 80 90
3 260 140 140 100 100 90 90 90 90
140 100 90 90
4 20 80 80 90 90 90 90 90 90
80 90 90 90
5 100 90 90 90 90 90 90 90 90
90 90 90 90
6 90 90 90 90 90 90 90 90 90
Table adapted from Slack et al, in Newlands (2005)
Downstream Orders Orders Orders
Tier3
Tier2
Tier1
OEM
Orders
Items Items Items Items
Source: Slack, N., Chambers, S. and Johnston, R. (2007). Operations Management, 5th edn, Harlow: Financial Times Prentice Hall. Reproduced with permission of Pearson Education Ltd.
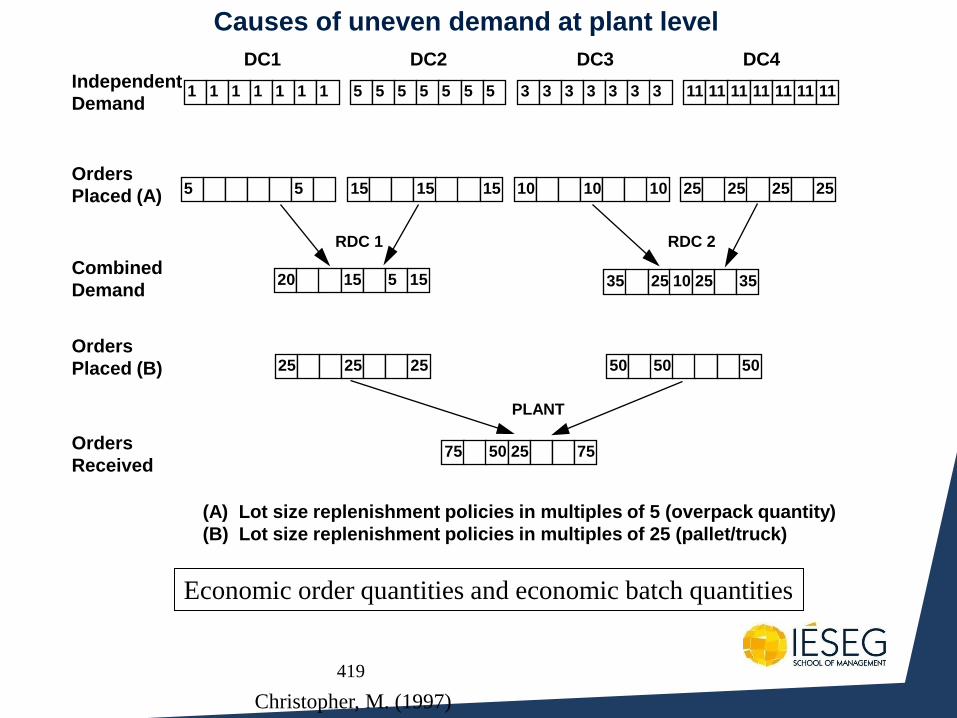
419
Causes of uneven demand at plant level
(A) Lot size replenishment policies in multiples of 5 (overpack quantity)
(B) Lot size replenishment policies in multiples of 25 (pallet/truck)
Independent
Demand 1 1 1 1 1 1 1 5 5 5 5 5 5 5 3 3 3 3 3 3 3 11 11 11 11 11 11 11
DC1 DC2 DC3 DC4
Orders
Received 75 50 25 75
PLANT
Orders
Placed (A)
Combined
Demand
Orders
Placed (B)
5 5 15 15 15 10 10 10 25 25 25 25
35 25 10 25 35
25 25 25 50 50 50
20 15 5 15
RDC 1 RDC 2
Economic order quantities and economic batch quantities
Christopher, M. (1997)
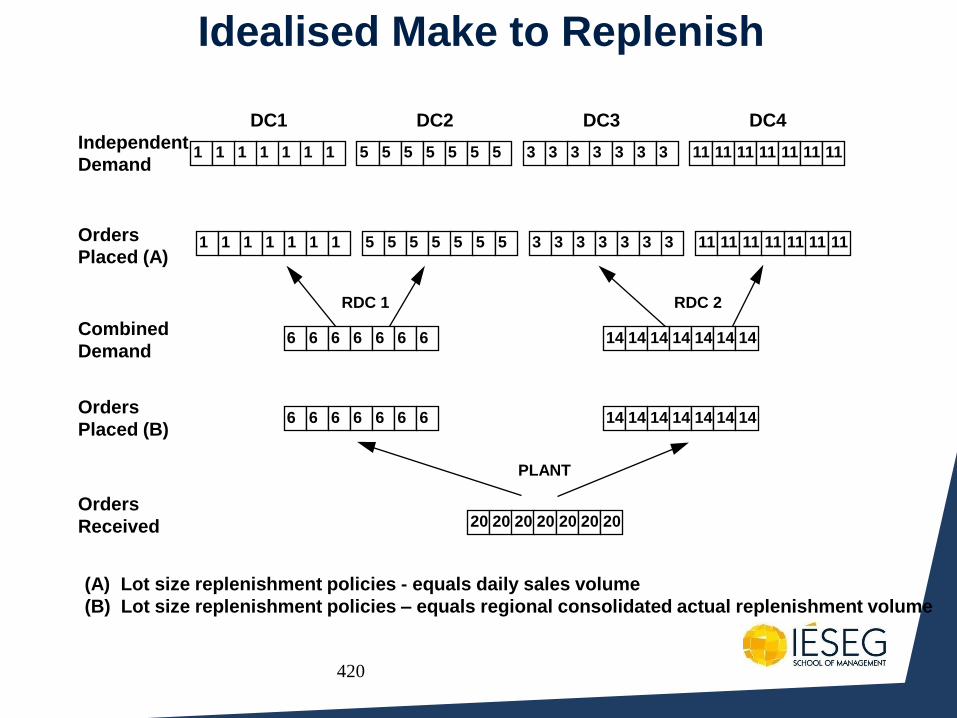
420
Idealised Make to Replenish
(A) Lot size replenishment policies - equals daily sales volume
(B) Lot size replenishment policies – equals regional consolidated actual replenishment volume
Independent
Demand 1 1 1 1 1 1 1 5 5 5 5 5 5 5 3 3 3 3 3 3 3 11 11 11 11 11 11 11
DC1 DC2 DC3 DC4
Orders
Received
PLANT
Orders
Placed (A)
Combined
Demand
Orders
Placed (B)
RDC 1 RDC 2
1 1 1 1 1 1 1 5 5 5 5 5 5 5 3 3 3 3 3 3 3 11 11 11 11 11 11 11
20 20 20 20 20 20 20
6 6 6 6 6 6 6 14 14 14 14 14 14 14
6 6 6 6 6 6 6 14 14 14 14 14 14 14
421
Forrester Effect
Third Tier Second Tier First Tier Original
Supplier Supplier Supplier equipment mfg
Period Prodn Stock Prodn Stock Prodn Stock Prodn Stock Demand
100 100 100 100
1 100 100 100 100 100 100 100 100 100
100 100 100 100
2 -60 20 20 60 60 80 80 90 90
20 60 80 90
3 260 140 140 100 100 90 90 90 90
140 100 90 90
4 20 80 80 90 90 90 90 90 90
80 90 90 90
5 100 90 90 90 90 90 90 90 90
90 90 90 90
6 90 90 90 90 90 90 90 90 90
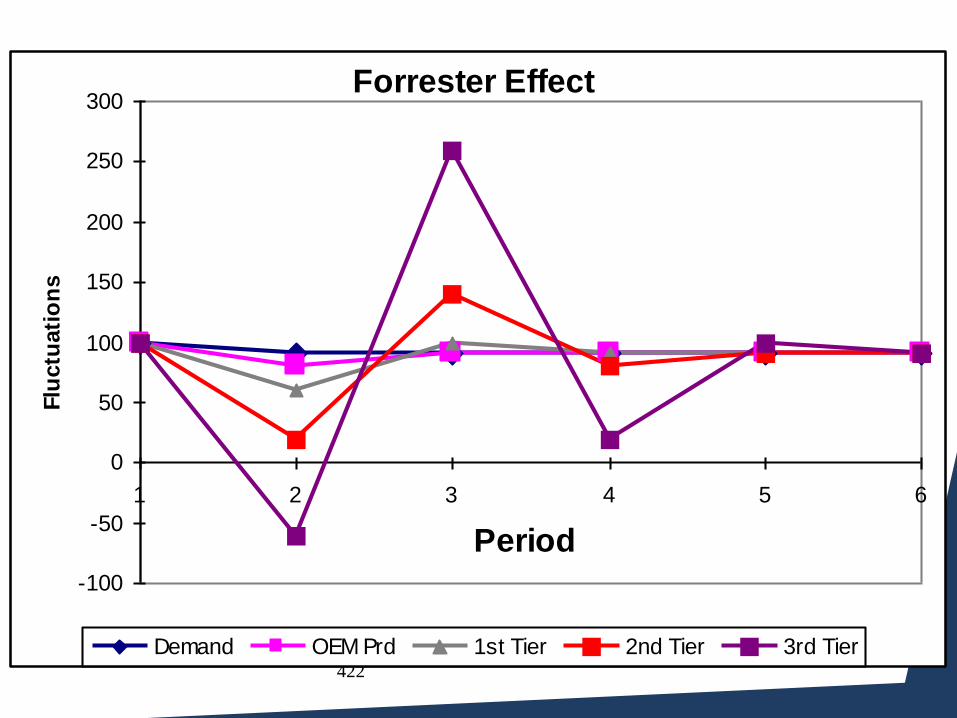
422
Forrester Effect
-100
-50
0
50
100
150
200
250
300
1 2 3 4 5 6
Period
Flu
ctu
ati
on
s
Demand OEM Prd 1st Tier 2nd Tier 3rd Tier
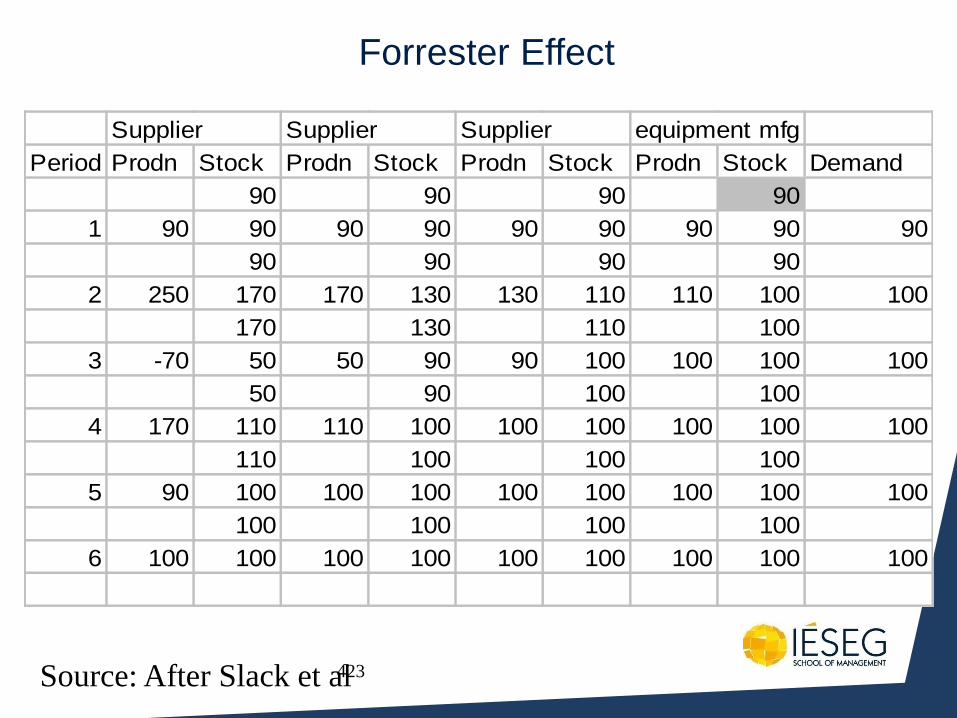
423
Forrester Effect
Supplier Supplier Supplier equipment mfg
Period Prodn Stock Prodn Stock Prodn Stock Prodn Stock Demand
90 90 90 90
1 90 90 90 90 90 90 90 90 90
90 90 90 90
2 250 170 170 130 130 110 110 100 100
170 130 110 100
3 -70 50 50 90 90 100 100 100 100
50 90 100 100
4 170 110 110 100 100 100 100 100 100
110 100 100 100
5 90 100 100 100 100 100 100 100 100
100 100 100 100
6 100 100 100 100 100 100 100 100 100
Source: After Slack et al
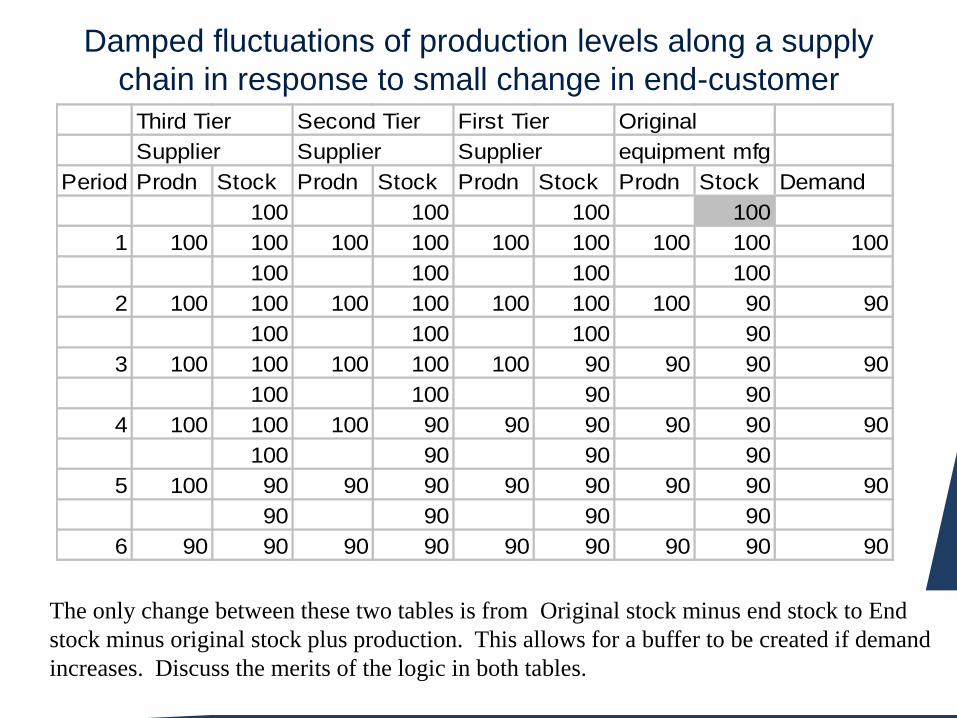
424
Damped fluctuations of production levels along a supply
chain in response to small change in end-customer
demand Third Tier Second Tier First Tier Original
Supplier Supplier Supplier equipment mfg
Period Prodn Stock Prodn Stock Prodn Stock Prodn Stock Demand
100 100 100 100
1 100 100 100 100 100 100 100 100 100
100 100 100 100
2 100 100 100 100 100 100 100 90 90
100 100 100 90
3 100 100 100 100 100 90 90 90 90
100 100 90 90
4 100 100 100 90 90 90 90 90 90
100 90 90 90
5 100 90 90 90 90 90 90 90 90
90 90 90 90
6 90 90 90 90 90 90 90 90 90
The only change between these two tables is from Original stock minus end stock to End
stock minus original stock plus production. This allows for a buffer to be created if demand
increases. Discuss the merits of the logic in both tables.
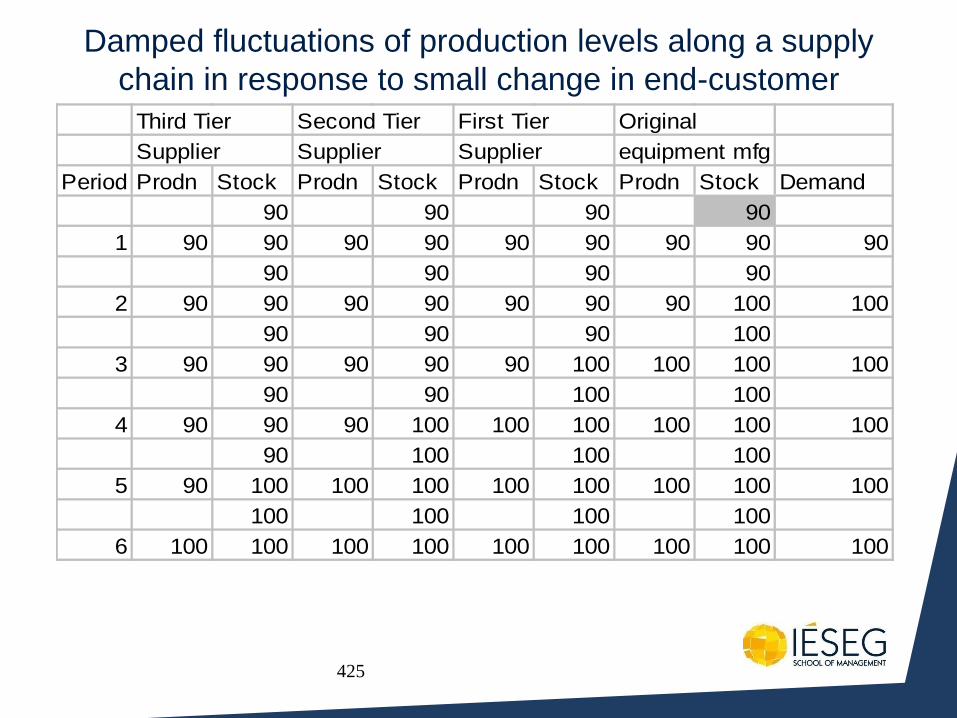
425
Damped fluctuations of production levels along a supply
chain in response to small change in end-customer
demand Third Tier Second Tier First Tier Original
Supplier Supplier Supplier equipment mfg
Period Prodn Stock Prodn Stock Prodn Stock Prodn Stock Demand
90 90 90 90
1 90 90 90 90 90 90 90 90 90
90 90 90 90
2 90 90 90 90 90 90 90 100 100
90 90 90 100
3 90 90 90 90 90 100 100 100 100
90 90 100 100
4 90 90 90 100 100 100 100 100 100
90 100 100 100
5 90 100 100 100 100 100 100 100 100
100 100 100 100
6 100 100 100 100 100 100 100 100 100
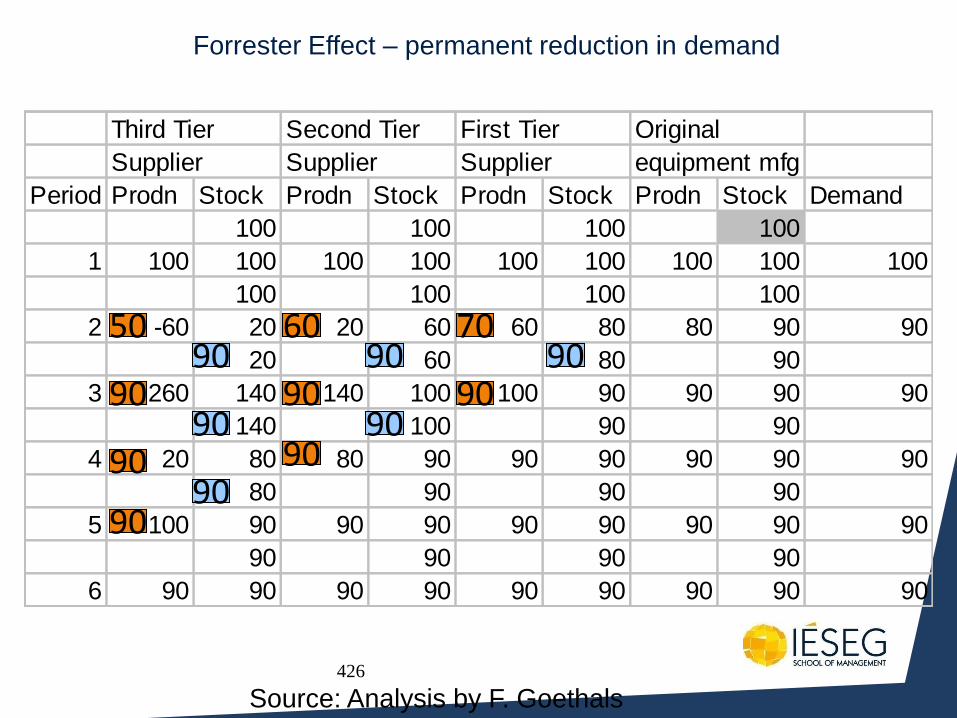
426
Forrester Effect – permanent reduction in demand
Third Tier Second Tier First Tier Original
Supplier Supplier Supplier equipment mfg
Period Prodn Stock Prodn Stock Prodn Stock Prodn Stock Demand
100 100 100 100
1 100 100 100 100 100 100 100 100 100
100 100 100 100
2 -60 20 20 60 60 80 80 90 90
20 60 80 90
3 260 140 140 100 100 90 90 90 90
140 100 90 90
4 20 80 80 90 90 90 90 90 90
80 90 90 90
5 100 90 90 90 90 90 90 90 90
90 90 90 90
6 90 90 90 90 90 90 90 90 90
90 70
90 90
60
90 90
90 50
90 90
90 90
90
90
Source: Analysis by F. Goethals
427
The Pull System
• This leads to a chain reaction, with each station pulling material from its preceding station
• JIT uses the “Kanban” system to control the flow of material with very little work-in-process inventory
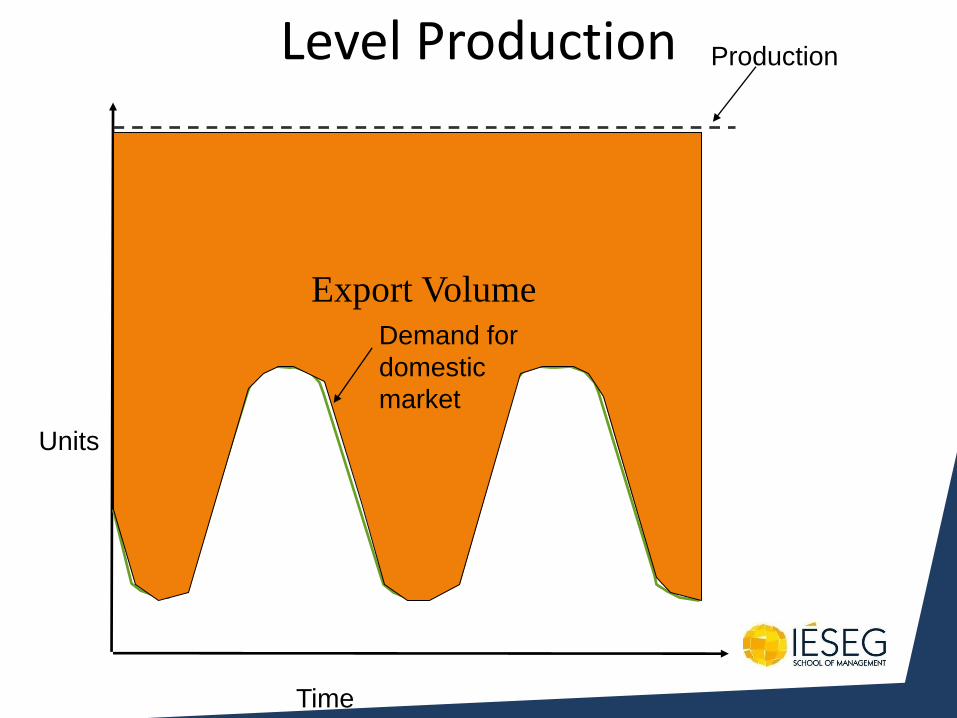
Level Production
Time
Production
Units
Demand in
the domestic
market
Export Volume
Demand for
domestic
market
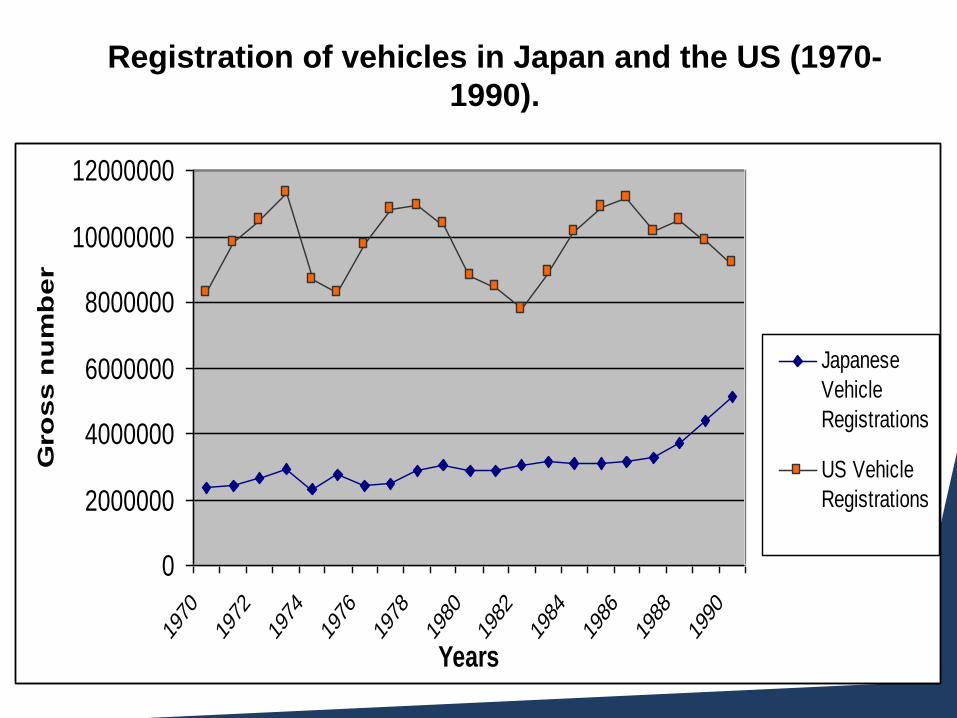
Registration of vehicles in Japan and the US (1970-
1990).
0
2000000
4000000
6000000
8000000
10000000
12000000
1970
1972
1974
1976
1978
1980
1982
1984
1986
1988
1990
Years
Gro
ss
nu
mb
er
Japanese
Vehicle
Registrations
US Vehicle
Registrations
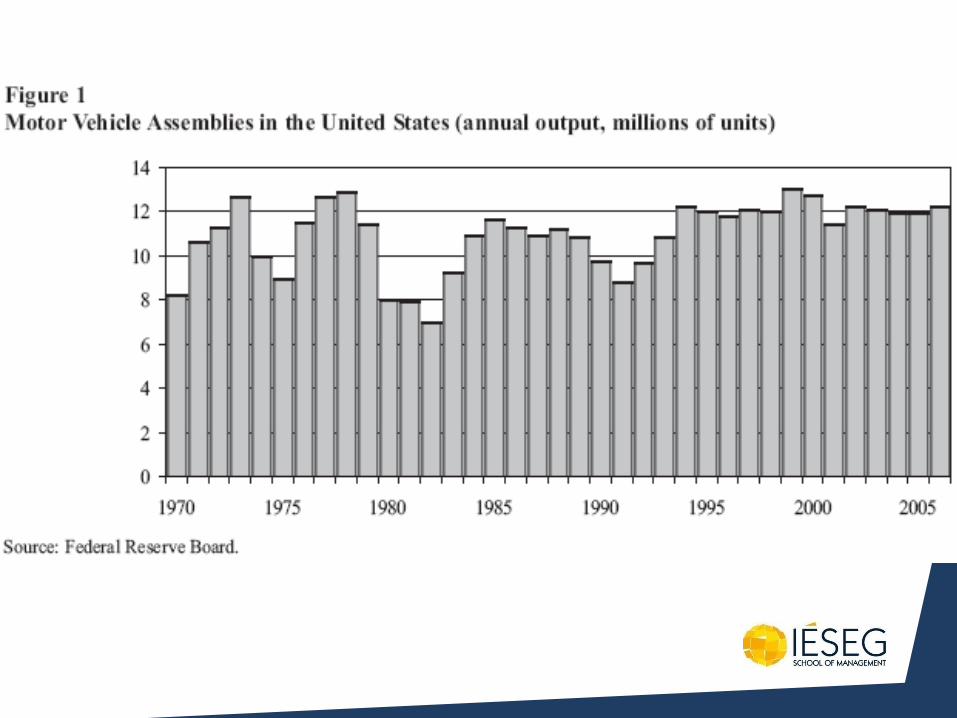
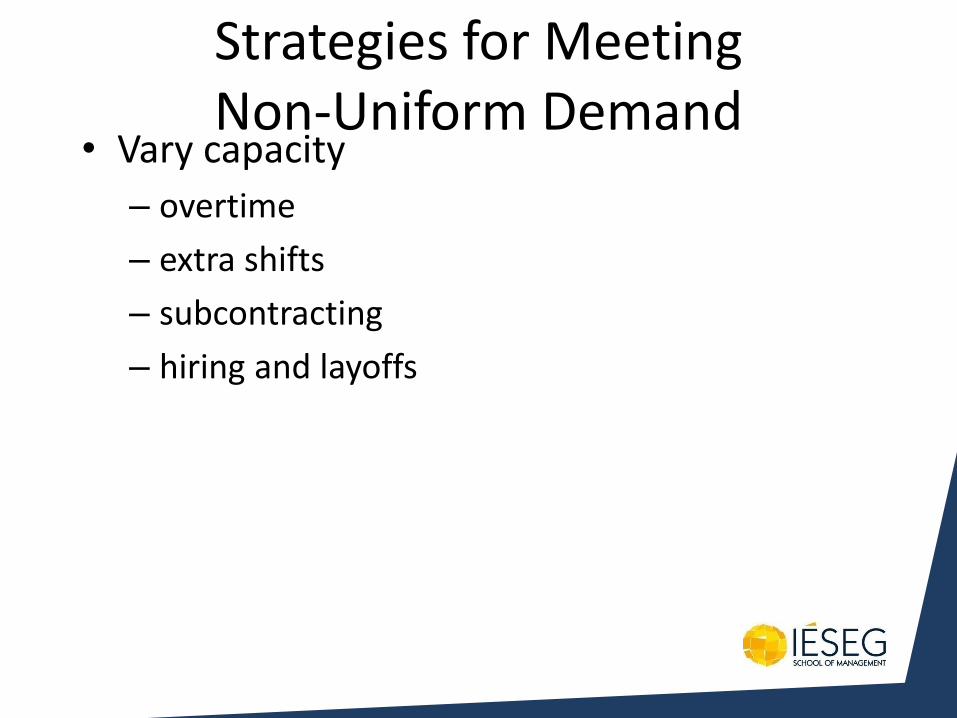
Strategies for Meeting Non-Uniform Demand
• Vary capacity
– overtime
– extra shifts
– subcontracting
– hiring and layoffs
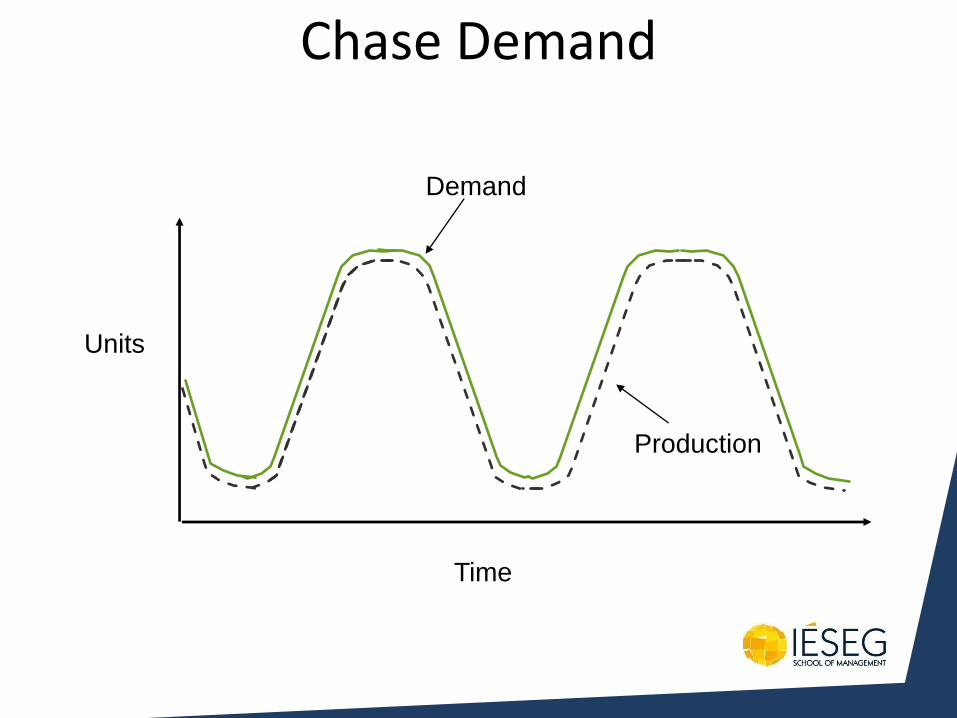
Chase Demand
Time
Units
Demand
Production
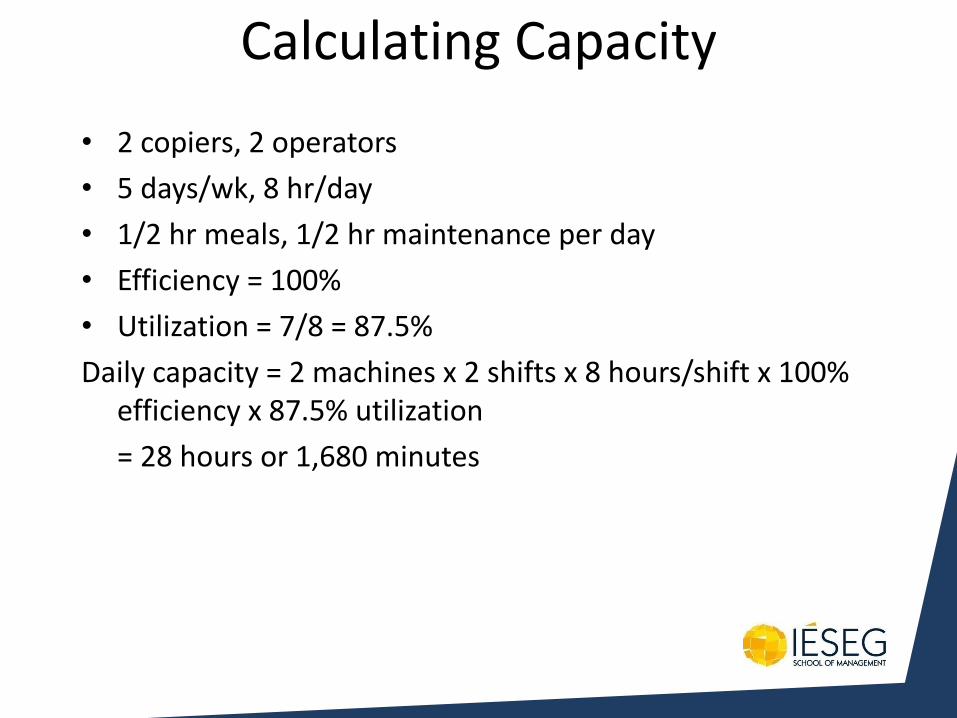
Calculating Capacity
• 2 copiers, 2 operators
• 5 days/wk, 8 hr/day
• 1/2 hr meals, 1/2 hr maintenance per day
• Efficiency = 100%
• Utilization = 7/8 = 87.5%
Daily capacity = 2 machines x 2 shifts x 8 hours/shift x 100% efficiency x 87.5% utilization
= 28 hours or 1,680 minutes
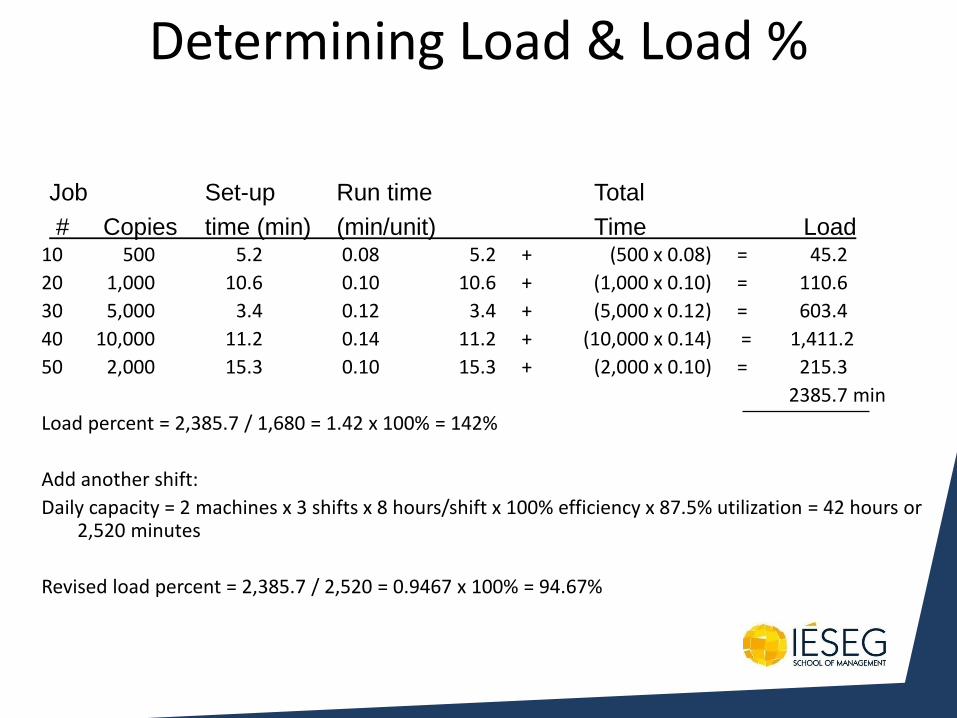
Determining Load & Load %
10 500 5.2 0.08 5.2 + (500 x 0.08) = 45.2
20 1,000 10.6 0.10 10.6 + (1,000 x 0.10) = 110.6
30 5,000 3.4 0.12 3.4 + (5,000 x 0.12) = 603.4
40 10,000 11.2 0.14 11.2 + (10,000 x 0.14) = 1,411.2
50 2,000 15.3 0.10 15.3 + (2,000 x 0.10) = 215.3
2385.7 min
Load percent = 2,385.7 / 1,680 = 1.42 x 100% = 142%
Add another shift:
Daily capacity = 2 machines x 3 shifts x 8 hours/shift x 100% efficiency x 87.5% utilization = 42 hours or 2,520 minutes
Revised load percent = 2,385.7 / 2,520 = 0.9467 x 100% = 94.67%
Job Set-up Run time Total
# Copies time (min) (min/unit) Time Load
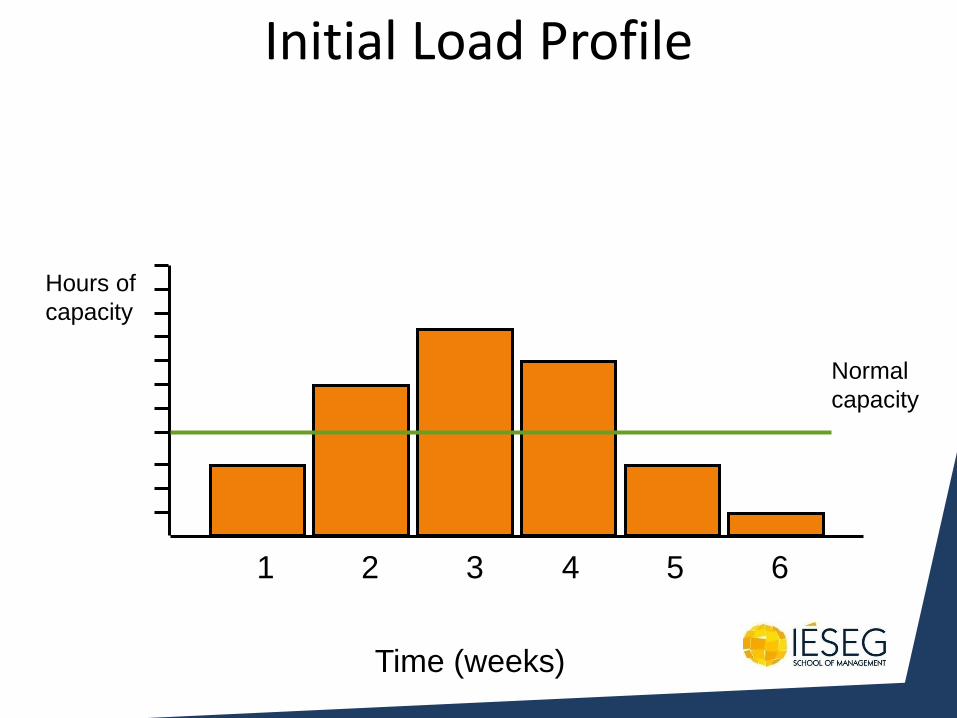
Initial Load Profile
1 2 3 4 5 6
Time (weeks)
Normal
capacity
Hours of
capacity
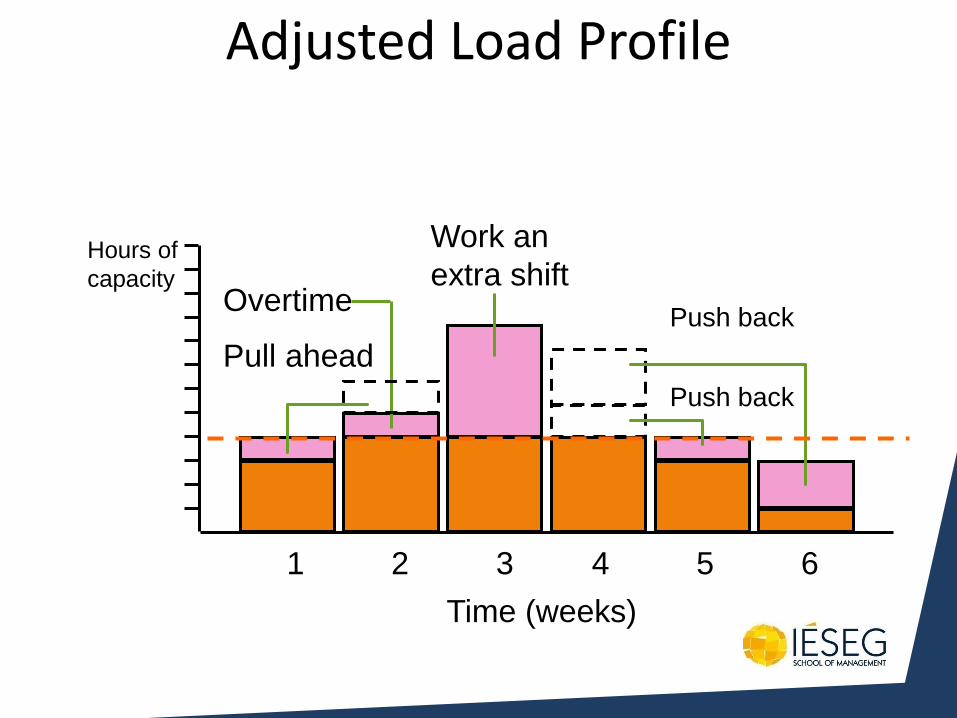
Adjusted Load Profile
1 2 3 4 5 6
Time (weeks)
Overtime Push back
Push back
Pull ahead
Work an
extra shift Hours of
capacity
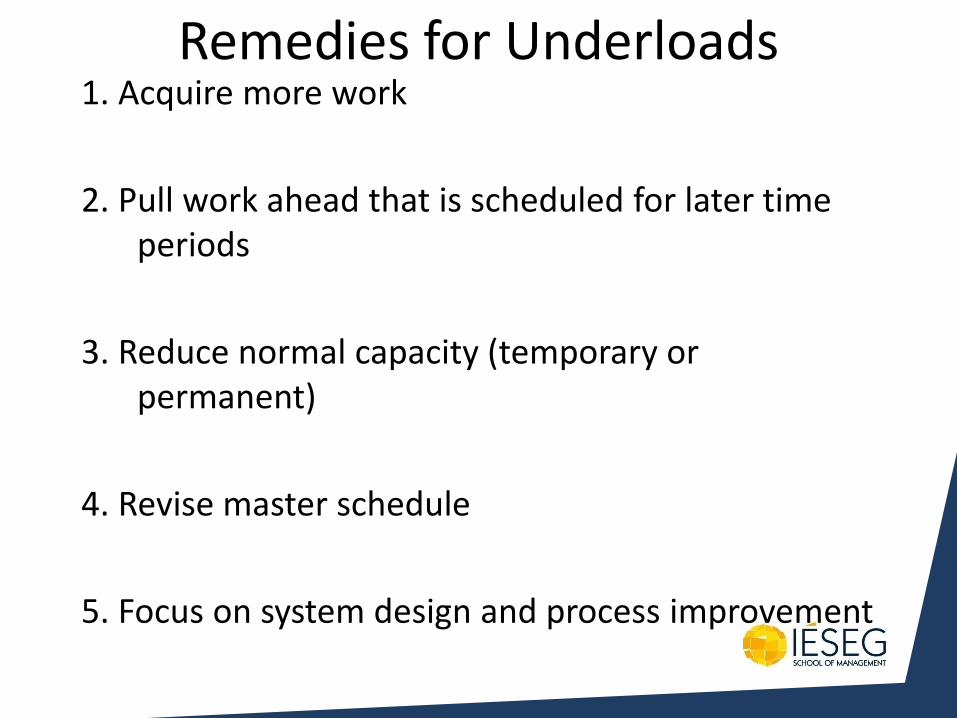
Remedies for Underloads 1. Acquire more work
2. Pull work ahead that is scheduled for later time periods
3. Reduce normal capacity (temporary or permanent)
4. Revise master schedule
5. Focus on system design and process improvement
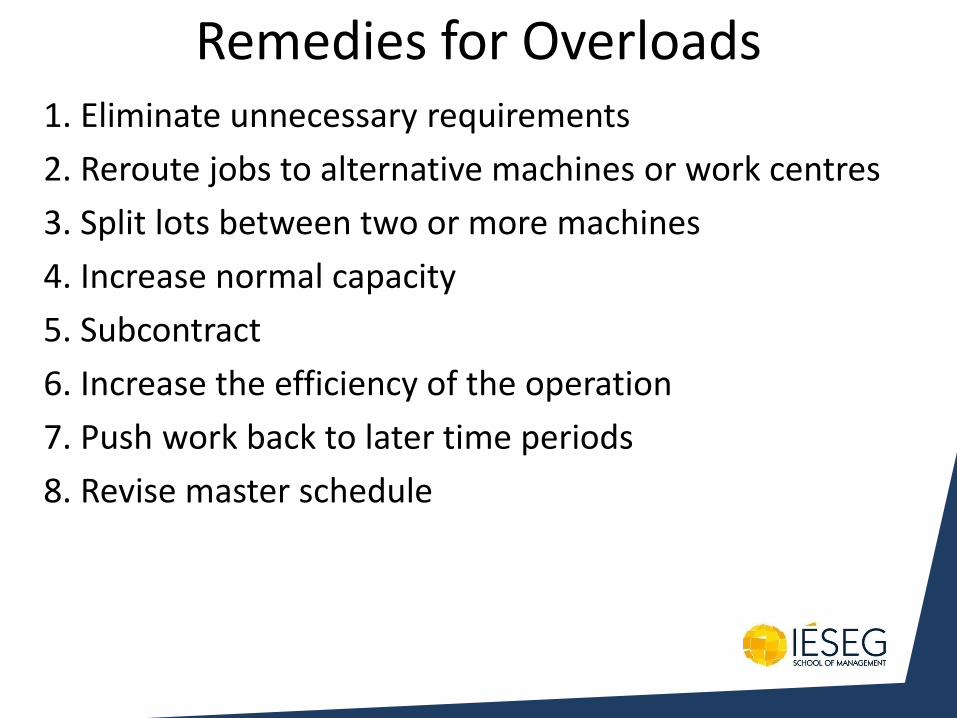
Remedies for Overloads 1. Eliminate unnecessary requirements
2. Reroute jobs to alternative machines or work centres
3. Split lots between two or more machines
4. Increase normal capacity
5. Subcontract
6. Increase the efficiency of the operation
7. Push work back to later time periods
8. Revise master schedule
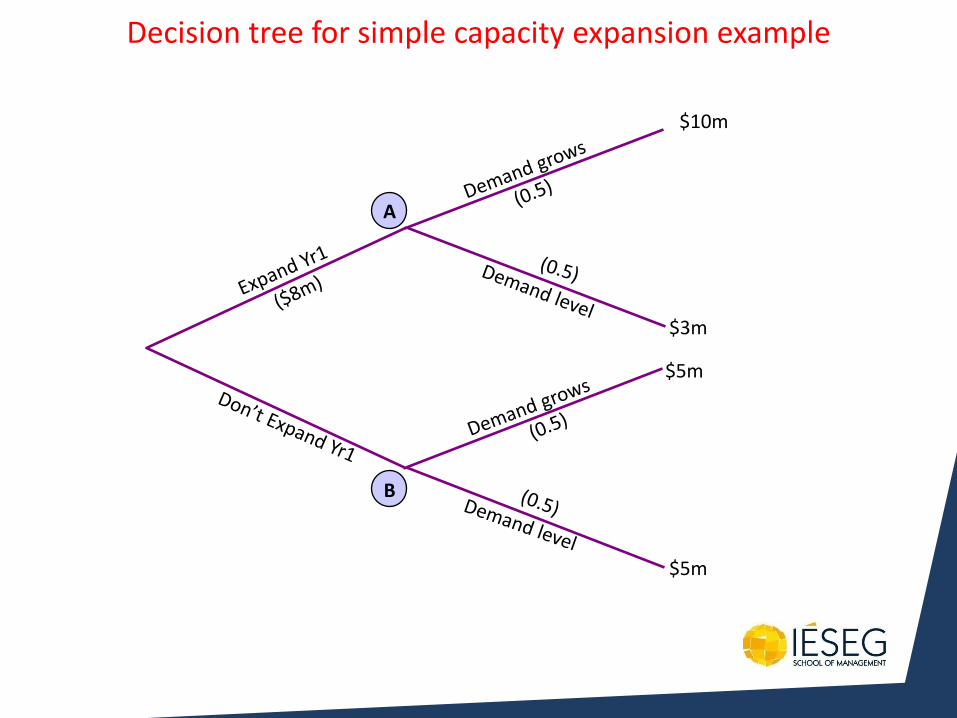
A
B
$10m
$3m
$5m
$5m
Decision tree for simple capacity expansion example
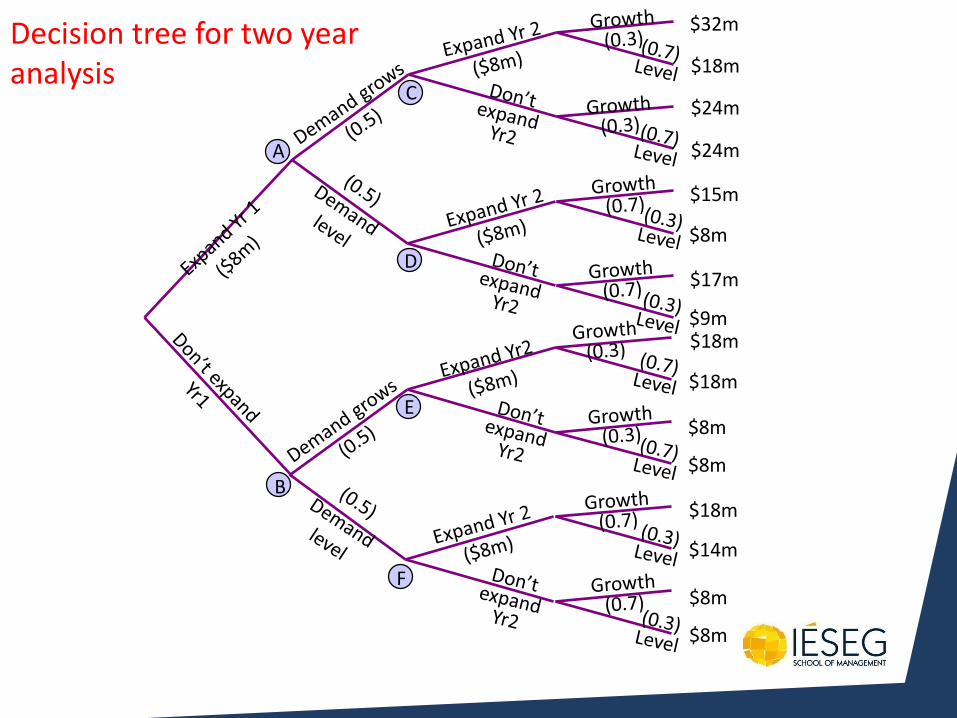
$32m
$18m
$24m
$24m
$15m
$8m
$17m
$9m $18m
$18m
$8m
$8m
$18m
$14m
$8m
$8m
B
Decision tree for two year analysis
F
E
D
C
A

Chapter 5
Purchasing and supply strategy
Quality
Dependabilit
y
Speed
Flexibilit
y
Cost
Resource usage
Mark
et
com
petitiveness
Decision areas
Perf
orm
ance
obje
ctives
Development and
organisation
Process
technology Supply networks Capacity strategy
Issues include:
• What is purchasing and supply
strategy?
•What should we do and what
should we buy?
•How do we buy; what is the role
of contracts and/or relationships?
•How do we manage supply
dynamics?
•How do we manage suppliers
over time?
•How do we manage supply
chain risks?
Purchasing and supply strategy
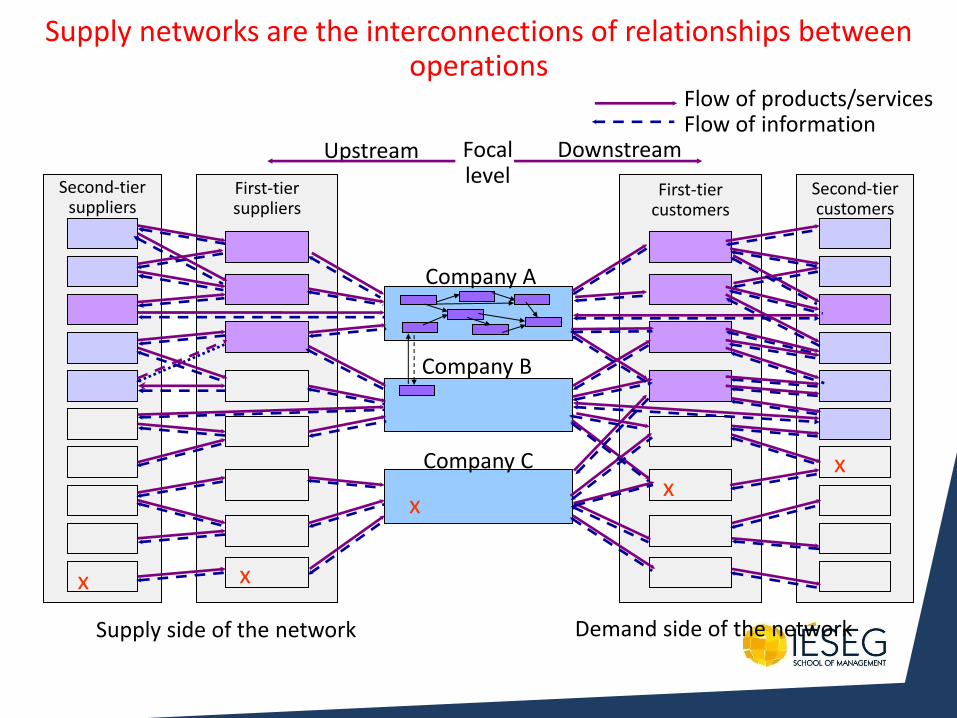
Second-tier suppliers
First-tier suppliers
Company A
Company B
Company C
x
Second-tier customers
First-tier customers
x
x x
x
Focal level
Upstream Downstream
Supply side of the network Demand side of the network
Flow of products/services Flow of information
Supply networks are the interconnections of relationships between operations
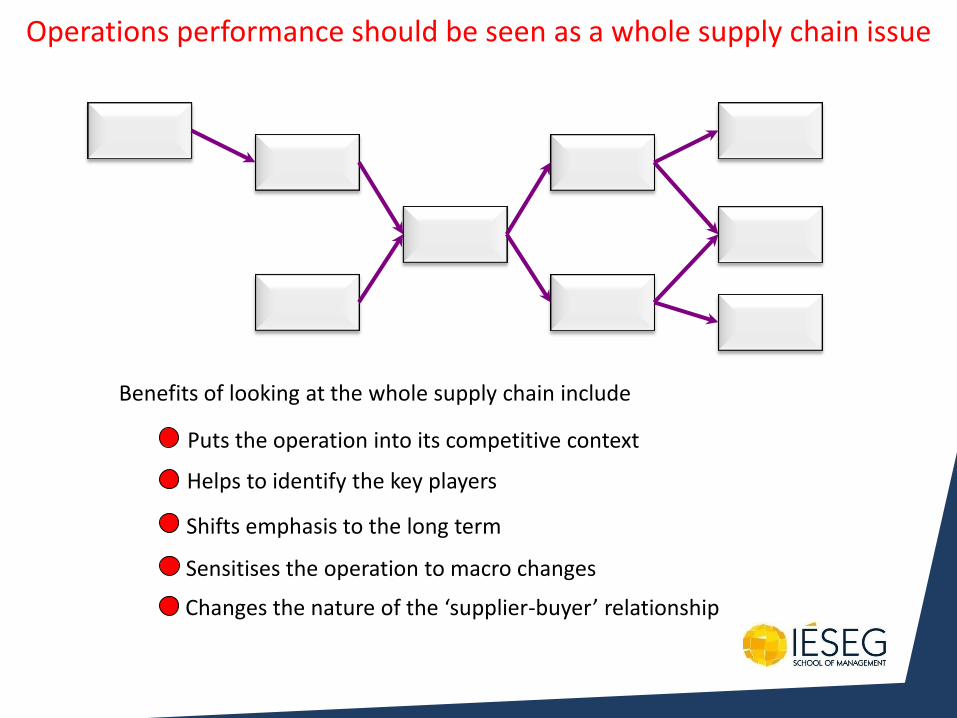
Operations performance should be seen as a whole supply chain issue
Benefits of looking at the whole supply chain include
Puts the operation into its competitive context
Helps to identify the key players
Shifts emphasis to the long term
Sensitises the operation to macro changes
Changes the nature of the ‘supplier-buyer’ relationship
Make- Buy Choices
Design Make Assemble Distribute
Deliver Deliver
Design Distribute
Supplier O.E.M.
Supplier Sub-Contractor
In House
External Source
Do nothing Do everything
The character of internal operations activity
Virtual spot
trading
Traditional market
supply (based on
contractual
arrangements)
Resource scope
Long-term virtual operation
‘Partnership’
supply
relationships
Vertical
integration
Type o
f in
ter-
firm
conta
ct
Tra
nsactional –
Many s
upplie
rs
Clo
se
– F
ew
supplie
rs
Types of supply arrangement
When to Make
Decisions can be affected by: - cheaper than buying
- control of quality
- protect security of design
- establish reputation as manufacturers
- volumes are high and stable
- expertise is available in-house
- spare capacity exists
- capital is available
- control of supply chain
When to Buy
Decisions can be affected by: - cheaper than making
- confident of supplier quality
- part needs special equipment
- confident of market image
- cope with volume variations
- expertise is not available
- space/machines not available
- avoid capital investment
- reduce process span and complexity
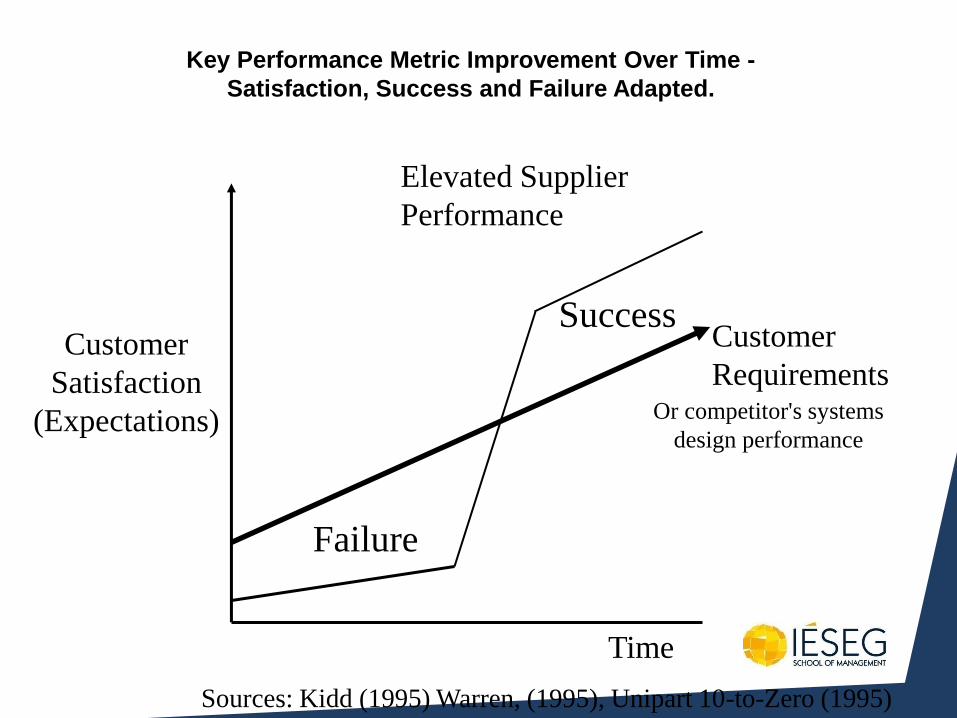
Key Performance Metric Improvement Over Time -
Satisfaction, Success and Failure Adapted.
Sources: Kidd (1995) Warren, (1995), Unipart 10-to-Zero (1995)
Elevated Supplier
Performance
Or competitor's systems
design performance
Customer
Requirements Customer
Satisfaction
(Expectations)
Time
Failure
Success
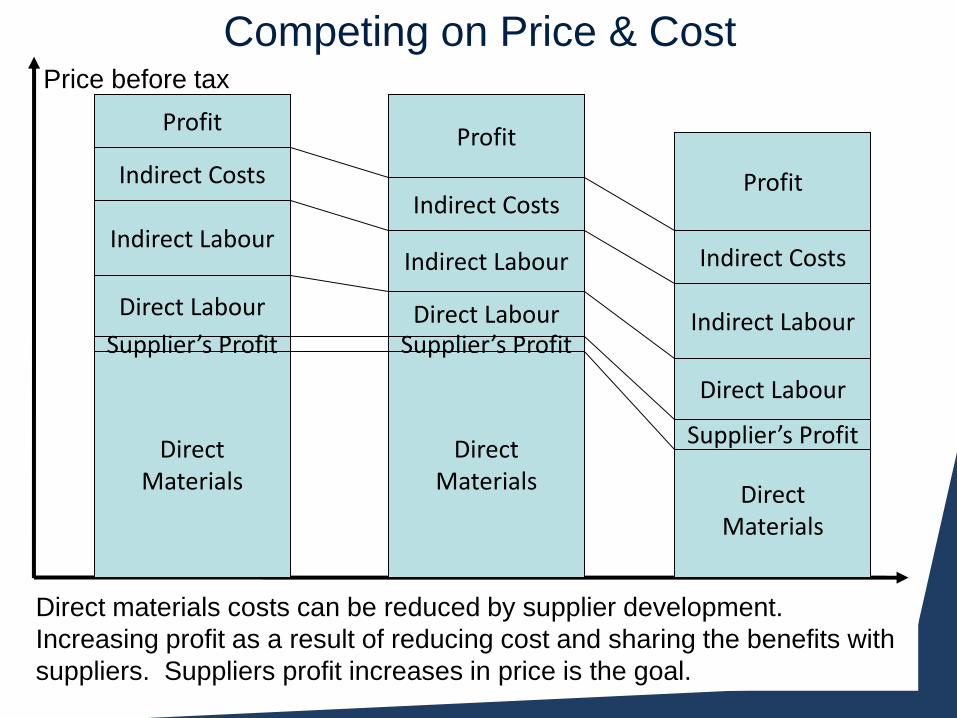
Competing on Price & Cost
Direct Materials
Direct Labour
Indirect Labour
Indirect Costs
Profit
Direct materials costs can be reduced by supplier development.
Increasing profit as a result of reducing cost and sharing the benefits with
suppliers. Suppliers profit increases in price is the goal.
Price before tax
Supplier’s Profit
Direct Materials
Direct Labour
Indirect Labour
Indirect Costs
Profit
Supplier’s Profit
Direct Materials
Direct Labour
Indirect Labour
Indirect Costs
Profit
Supplier’s Profit
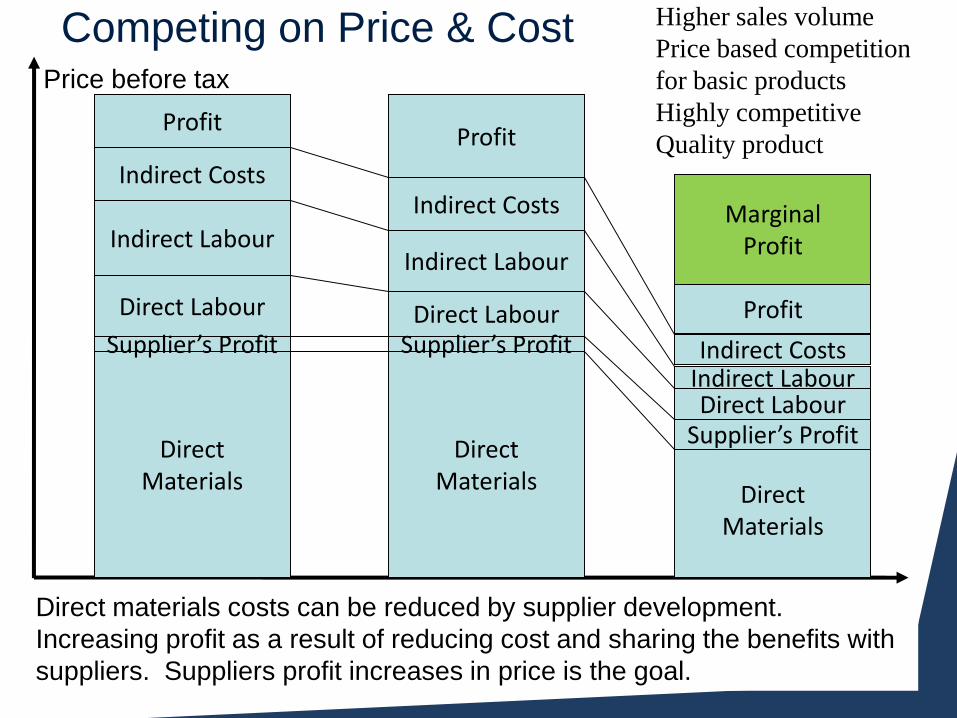
Competing on Price & Cost
Direct Materials
Direct Labour
Indirect Labour
Indirect Costs
Profit
Direct materials costs can be reduced by supplier development.
Increasing profit as a result of reducing cost and sharing the benefits with
suppliers. Suppliers profit increases in price is the goal.
Price before tax
Supplier’s Profit
Direct Materials
Direct Labour
Indirect Labour
Indirect Costs
Profit
Supplier’s Profit
Direct Materials
Direct Labour Indirect Labour Indirect Costs
Profit
Supplier’s Profit
Higher sales volume
Price based competition
for basic products
Highly competitive
Quality product
Marginal Profit
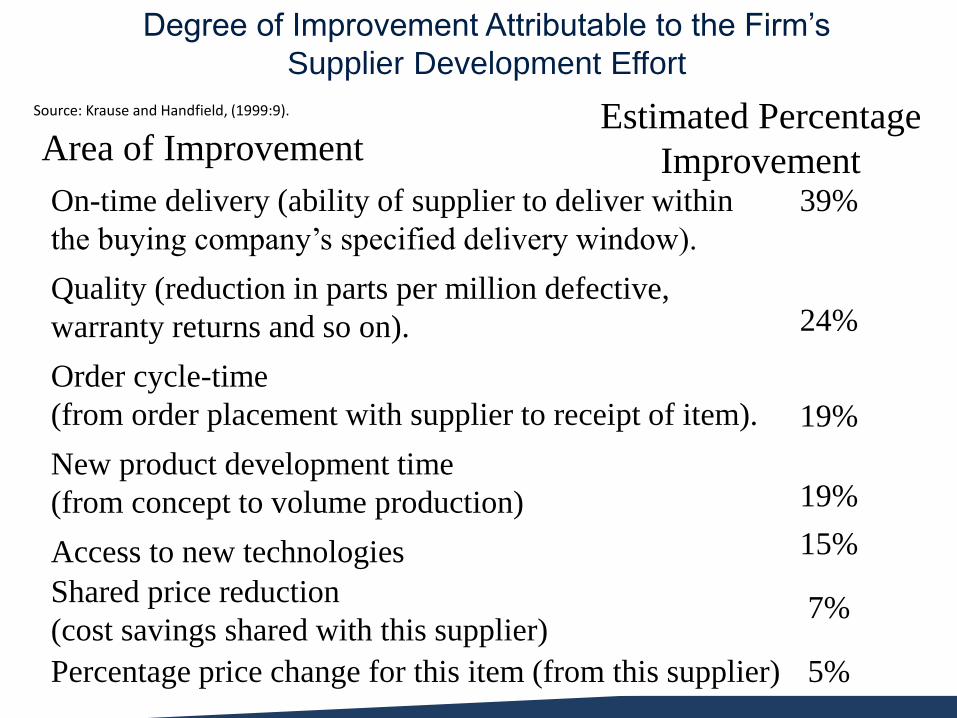
Degree of Improvement Attributable to the Firm’s
Supplier Development Effort
Area of Improvement Estimated Percentage
Improvement On-time delivery (ability of supplier to deliver within
the buying company’s specified delivery window).
39%
Order cycle-time
(from order placement with supplier to receipt of item). 19%
24% Quality (reduction in parts per million defective,
warranty returns and so on).
19% New product development time
(from concept to volume production)
15% Access to new technologies
7% Shared price reduction
(cost savings shared with this supplier)
5% Percentage price change for this item (from this supplier)
Source: Krause and Handfield, (1999:9).
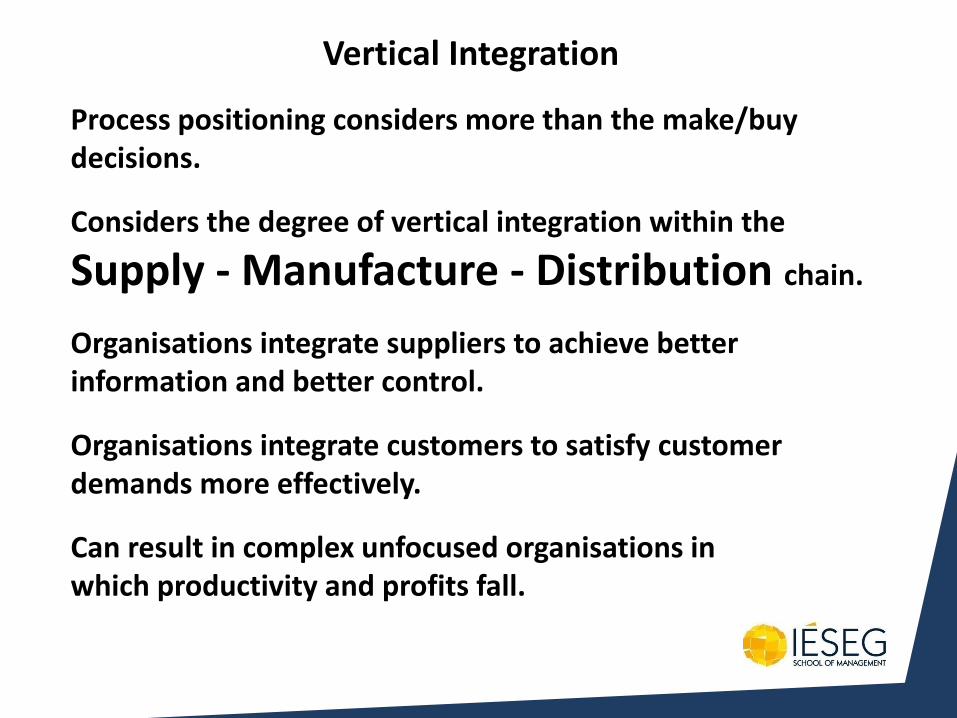
Vertical Integration
Process positioning considers more than the make/buy decisions.
Considers the degree of vertical integration within the
Supply - Manufacture - Distribution chain.
Organisations integrate suppliers to achieve better information and better control.
Organisations integrate customers to satisfy customer demands more effectively.
Can result in complex unfocused organisations in which productivity and profits fall.
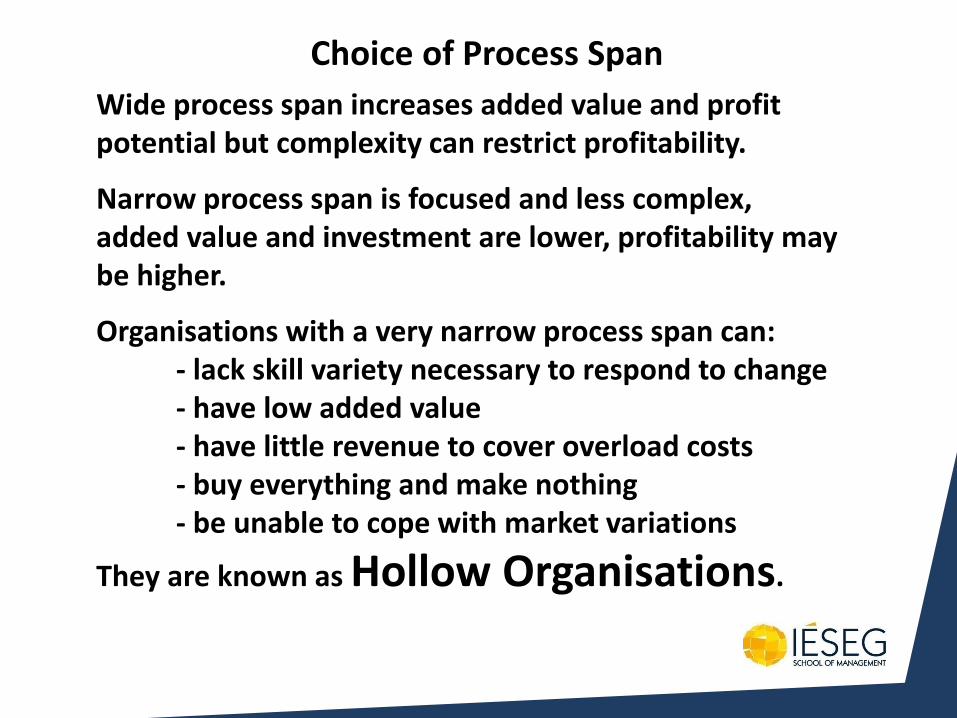
Choice of Process Span
Wide process span increases added value and profit potential but complexity can restrict profitability.
Narrow process span is focused and less complex, added value and investment are lower, profitability may be higher.
Organisations with a very narrow process span can: - lack skill variety necessary to respond to change - have low added value - have little revenue to cover overload costs - buy everything and make nothing - be unable to cope with market variations
They are known as Hollow Organisations.
Product Range Management and
Process Flexibility
Using Group Technology to group machines for a family of products and sequence these.
Layouts and their characteristics/limits
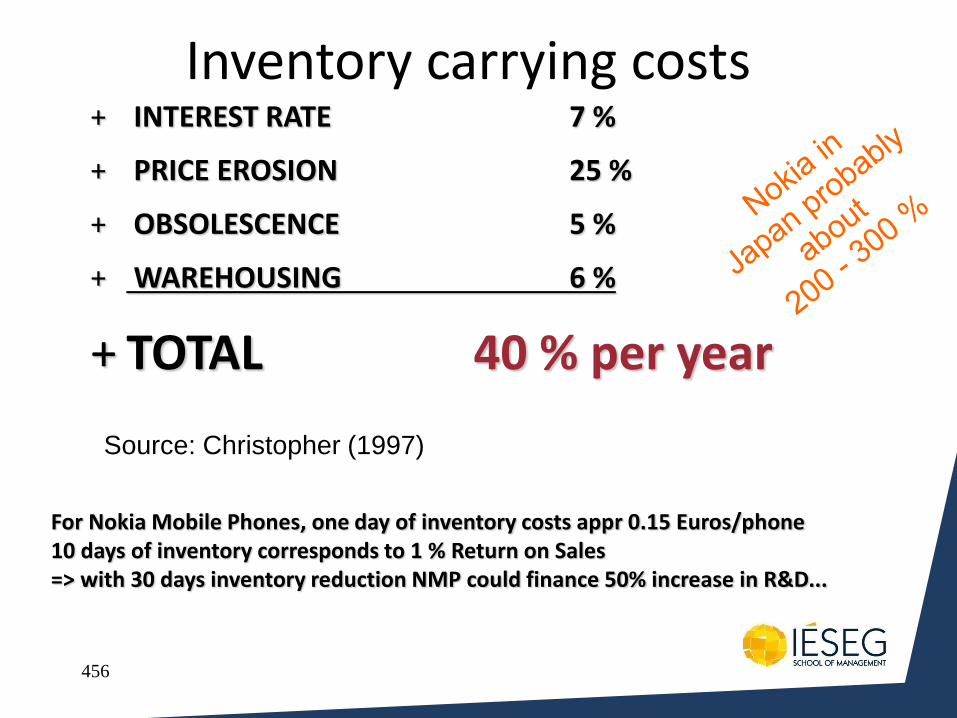
456
Inventory carrying costs + INTEREST RATE 7 %
+ PRICE EROSION 25 %
+ OBSOLESCENCE 5 %
+ WAREHOUSING 6 %
+ TOTAL 40 % per year
For Nokia Mobile Phones, one day of inventory costs appr 0.15 Euros/phone 10 days of inventory corresponds to 1 % Return on Sales => with 30 days inventory reduction NMP could finance 50% increase in R&D...
Source: Christopher (1997)
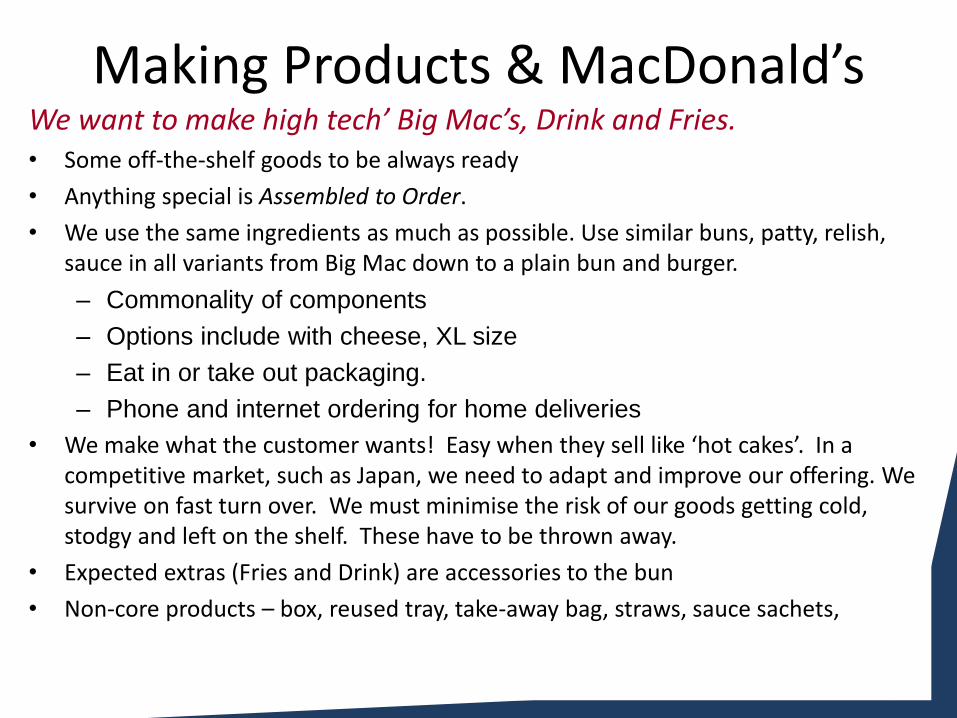
457
Making Products & MacDonald’s We want to make high tech’ Big Mac’s, Drink and Fries. • Some off-the-shelf goods to be always ready
• Anything special is Assembled to Order.
• We use the same ingredients as much as possible. Use similar buns, patty, relish, sauce in all variants from Big Mac down to a plain bun and burger.
– Commonality of components
– Options include with cheese, XL size
– Eat in or take out packaging.
– Phone and internet ordering for home deliveries
• We make what the customer wants! Easy when they sell like ‘hot cakes’. In a competitive market, such as Japan, we need to adapt and improve our offering. We survive on fast turn over. We must minimise the risk of our goods getting cold, stodgy and left on the shelf. These have to be thrown away.
• Expected extras (Fries and Drink) are accessories to the bun
• Non-core products – box, reused tray, take-away bag, straws, sauce sachets,
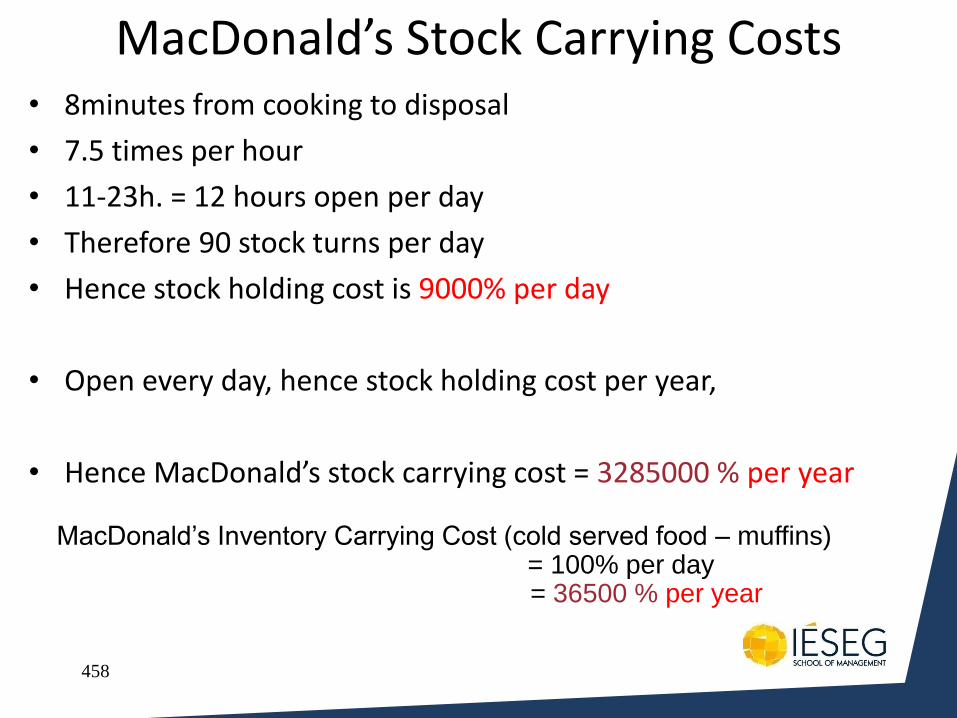
458
MacDonald’s Stock Carrying Costs • 8minutes from cooking to disposal
• 7.5 times per hour
• 11-23h. = 12 hours open per day
• Therefore 90 stock turns per day
• Hence stock holding cost is 9000% per day
• Open every day, hence stock holding cost per year,
• Hence MacDonald’s stock carrying cost = 3285000 % per year
MacDonald’s Inventory Carrying Cost (cold served food – muffins) = 100% per day
= 36500 % per year
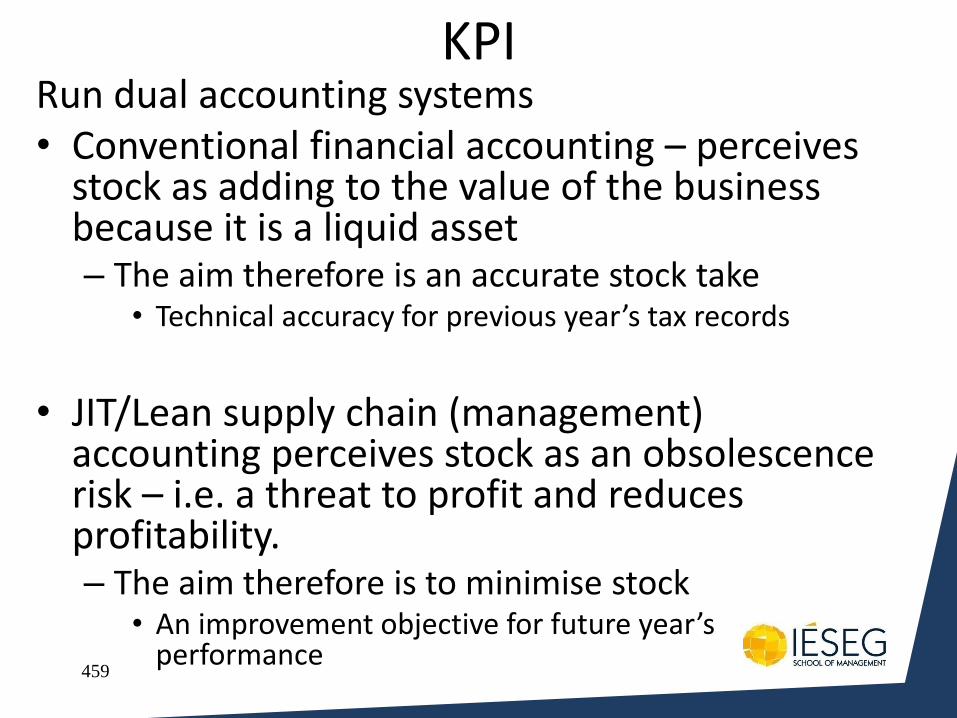
459
KPI Run dual accounting systems • Conventional financial accounting – perceives
stock as adding to the value of the business because it is a liquid asset – The aim therefore is an accurate stock take
• Technical accuracy for previous year’s tax records
• JIT/Lean supply chain (management)
accounting perceives stock as an obsolescence risk – i.e. a threat to profit and reduces profitability. – The aim therefore is to minimise stock
• An improvement objective for future year’s performance
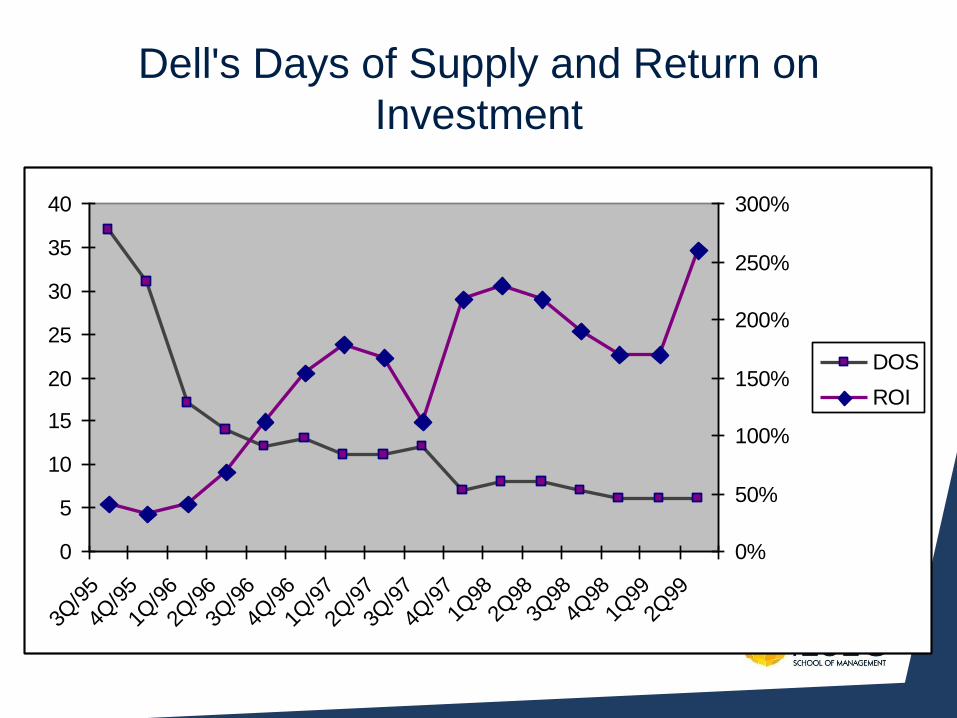
Dell's Days of Supply and Return on
Investment
0
5
10
15
20
25
30
35
40
3Q/9
5
4Q/9
5
1Q/9
6
2Q/9
6
3Q/9
6
4Q/9
6
1Q/9
7
2Q/9
7
3Q/9
7
4Q/9
7
1Q98
2Q98
3Q98
4Q98
1Q99
2Q99
0%
50%
100%
150%
200%
250%
300%
DOS
ROI
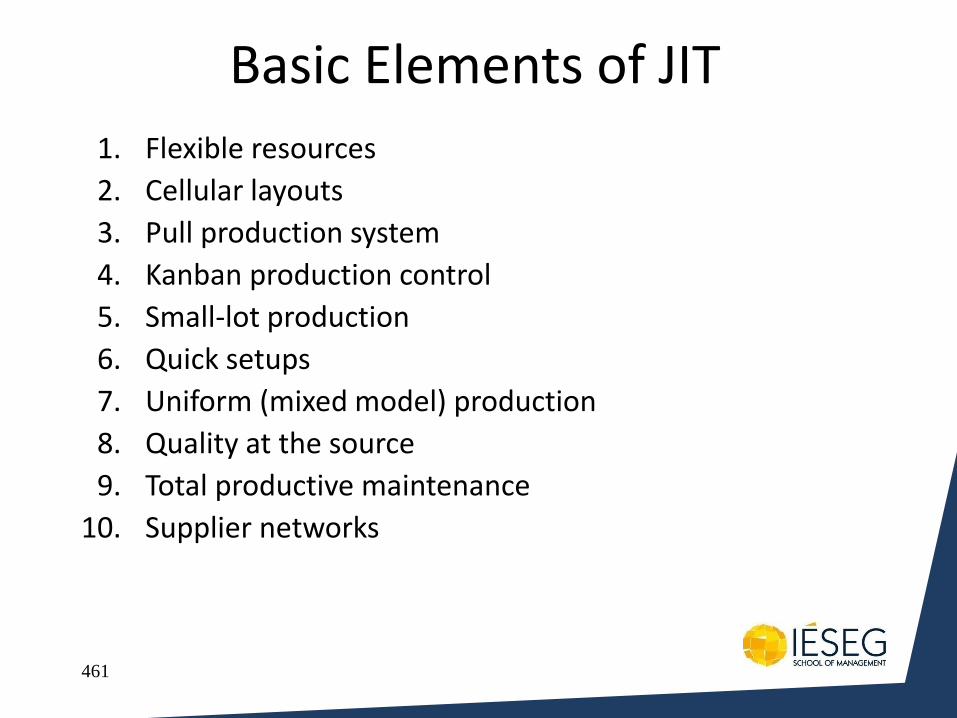
461
Basic Elements of JIT
1. Flexible resources
2. Cellular layouts
3. Pull production system
4. Kanban production control
5. Small-lot production
6. Quick setups
7. Uniform (mixed model) production
8. Quality at the source
9. Total productive maintenance
10. Supplier networks
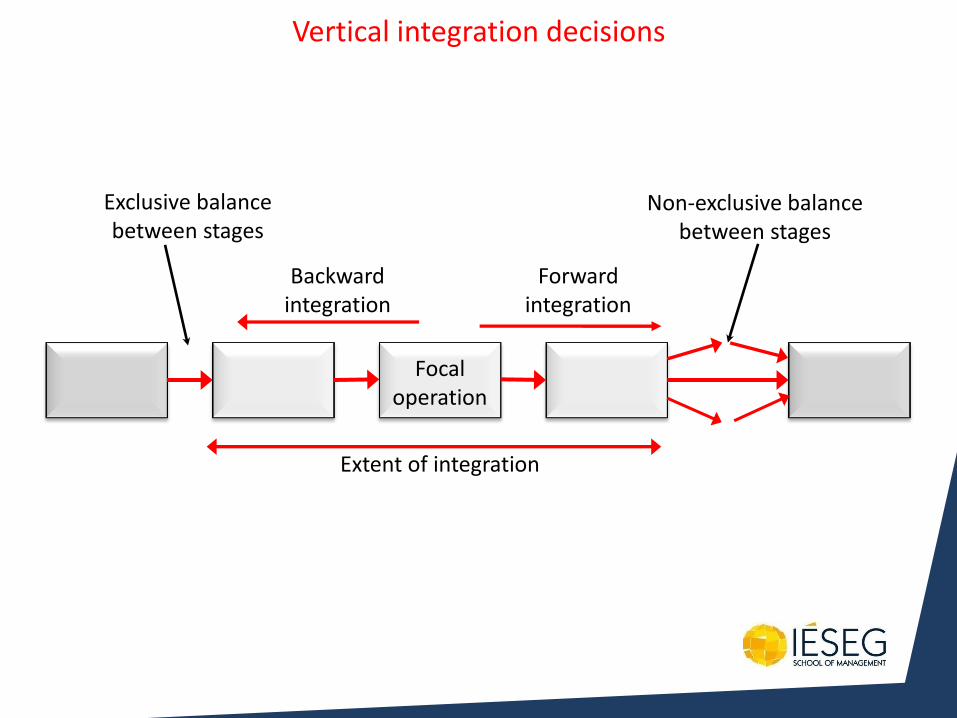
Focal operation
Extent of integration
Backward integration
Forward integration
Non-exclusive balance between stages
Exclusive balance between stages
Vertical integration decisions
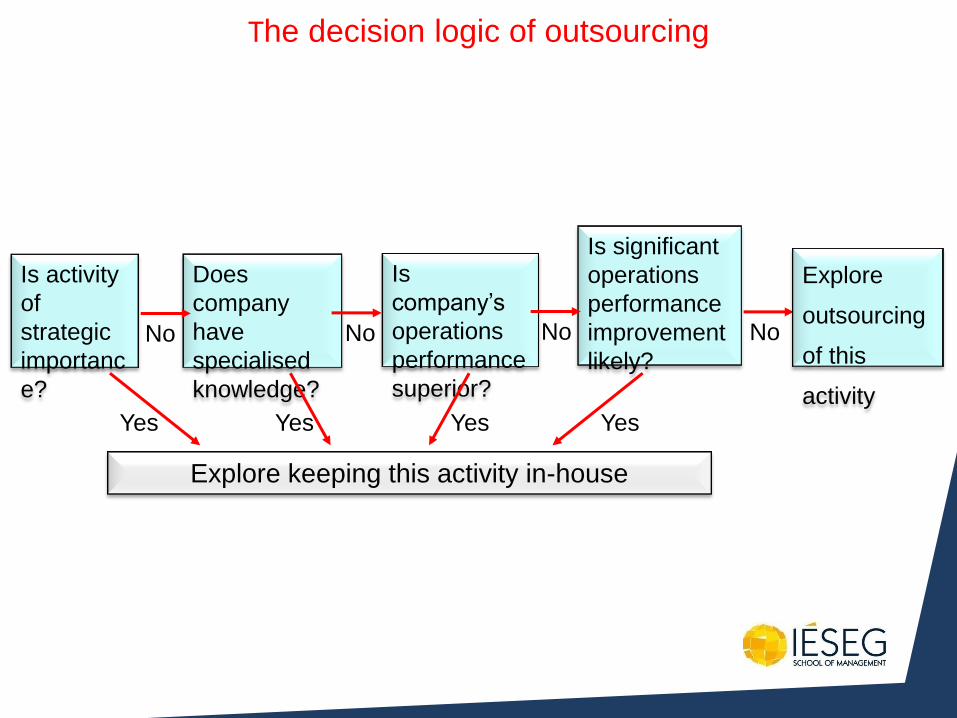
Is activity
of
strategic
importanc
e?
Does
company
have
specialised
knowledge?
Is
company’s
operations
performance
superior?
Is significant
operations
performance
improvement
likely? No No No No
Explore keeping this activity in-house
Yes Yes Yes Yes
The decision logic of outsourcing
Explore
outsourcing
of this
activity
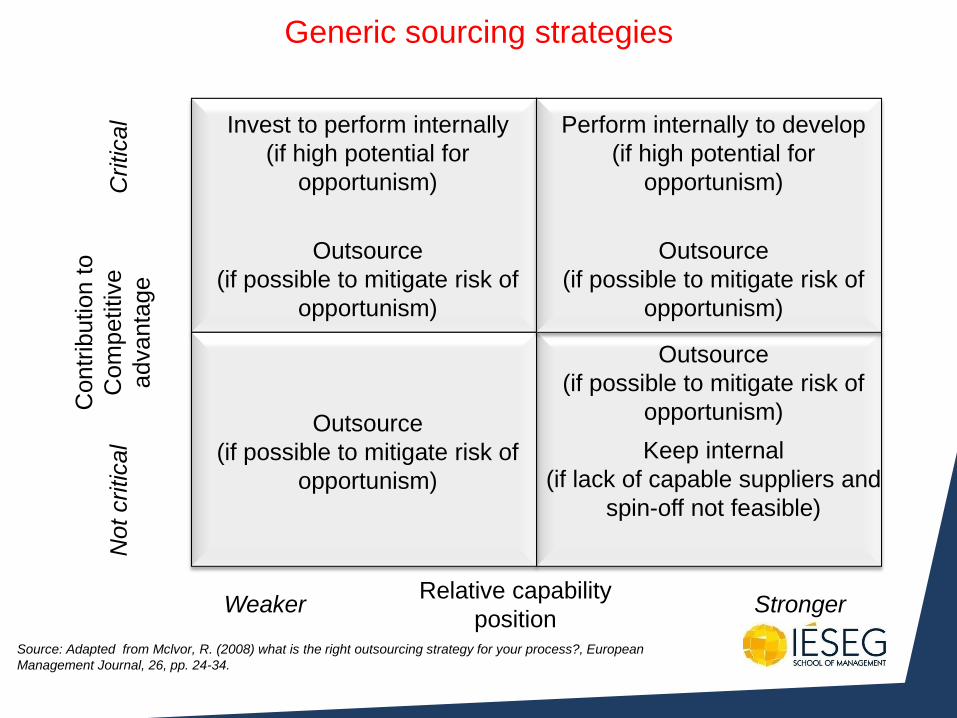
Invest to perform internally
(if high potential for
opportunism)
Contr
ibution t
o
Com
petitive
advanta
ge
Relative capability
position Stronger Weaker
Not
critical
Critical Perform internally to develop
(if high potential for
opportunism)
Outsource
(if possible to mitigate risk of
opportunism)
Outsource
(if possible to mitigate risk of
opportunism)
Keep internal
(if lack of capable suppliers and
spin-off not feasible)
Outsource
(if possible to mitigate risk of
opportunism)
Outsource
(if possible to mitigate risk of
opportunism)
Generic sourcing strategies
Source: Adapted from Mclvor, R. (2008) what is the right outsourcing strategy for your process?, European
Management Journal, 26, pp. 24-34.
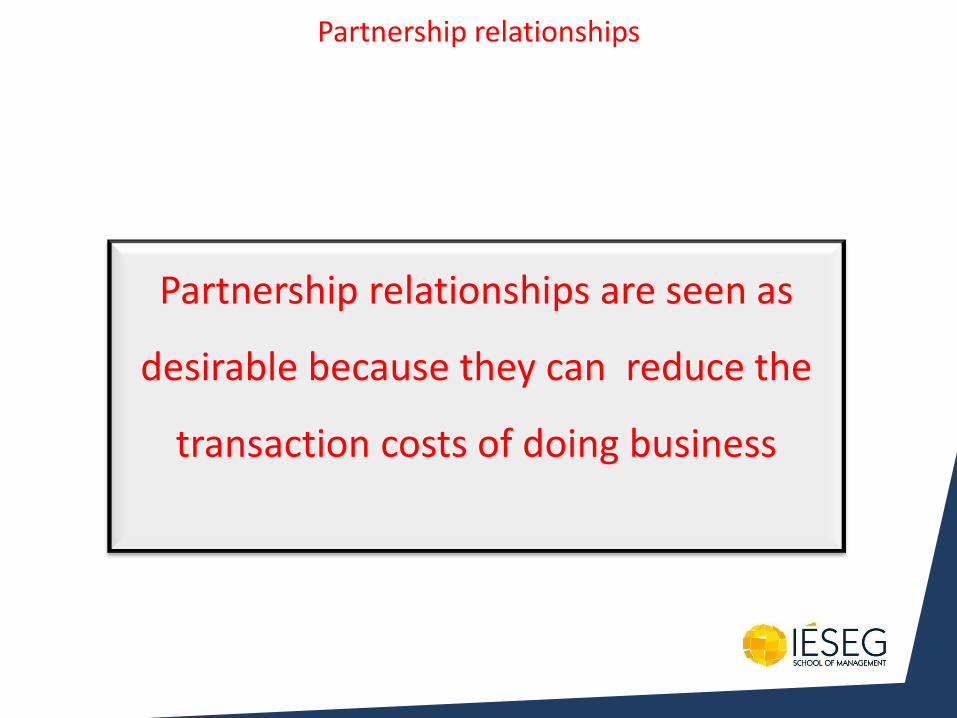
Partnership relationships are seen as
desirable because they can reduce the
transaction costs of doing business
Partnership relationships
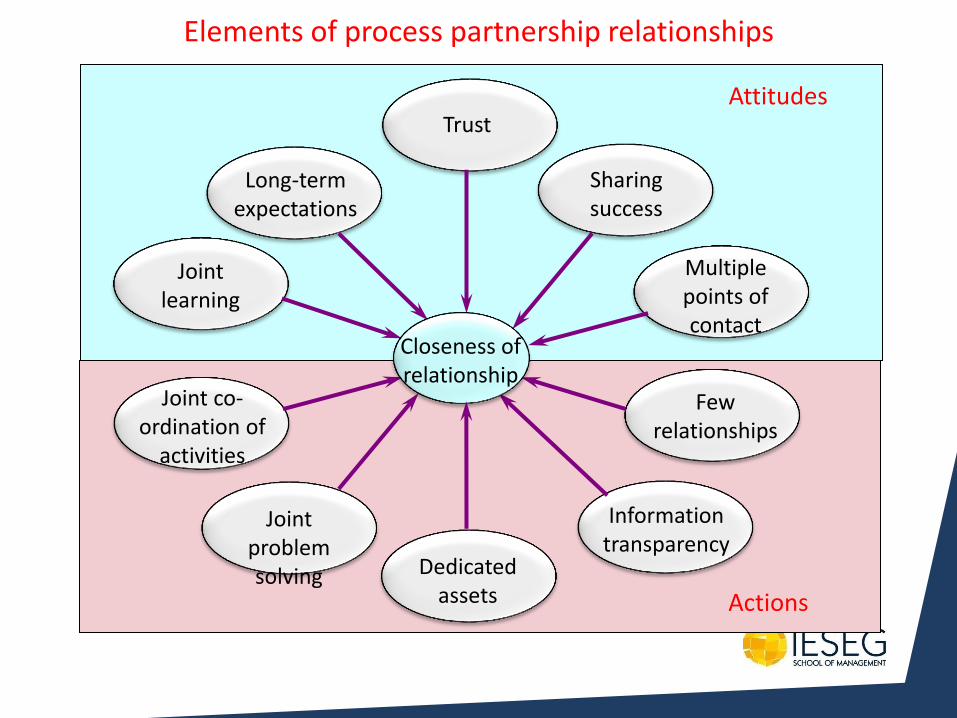
Attitudes
Actions
Trust
Elements of process partnership relationships
Joint problem solving
Joint co-ordination of
activities
Joint learning
Long-term expectations
Sharing success
Multiple points of contact
Few relationships
Information transparency
Dedicated assets
Closeness of relationship
There are strong forces acting against the
maintenance of trust
Partnership relationships
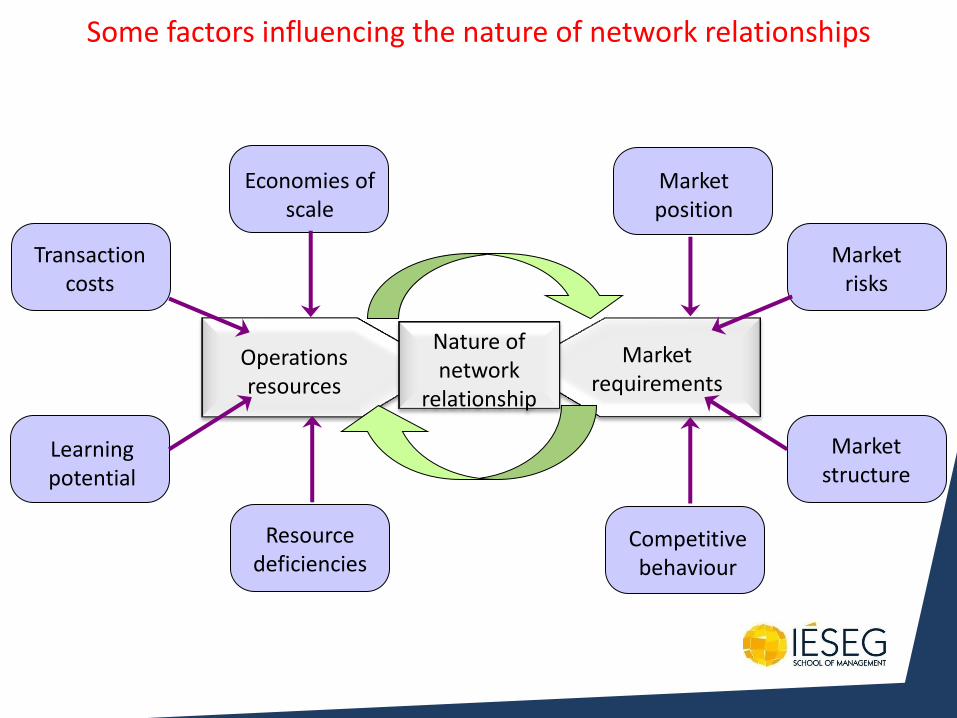
Market position
Competitive behaviour
Economies of scale
Resource deficiencies
Some factors influencing the nature of network relationships
Market risks
Market structure
Transaction costs
Learning potential
Operations resources
Market requirements
Nature of network
relationship
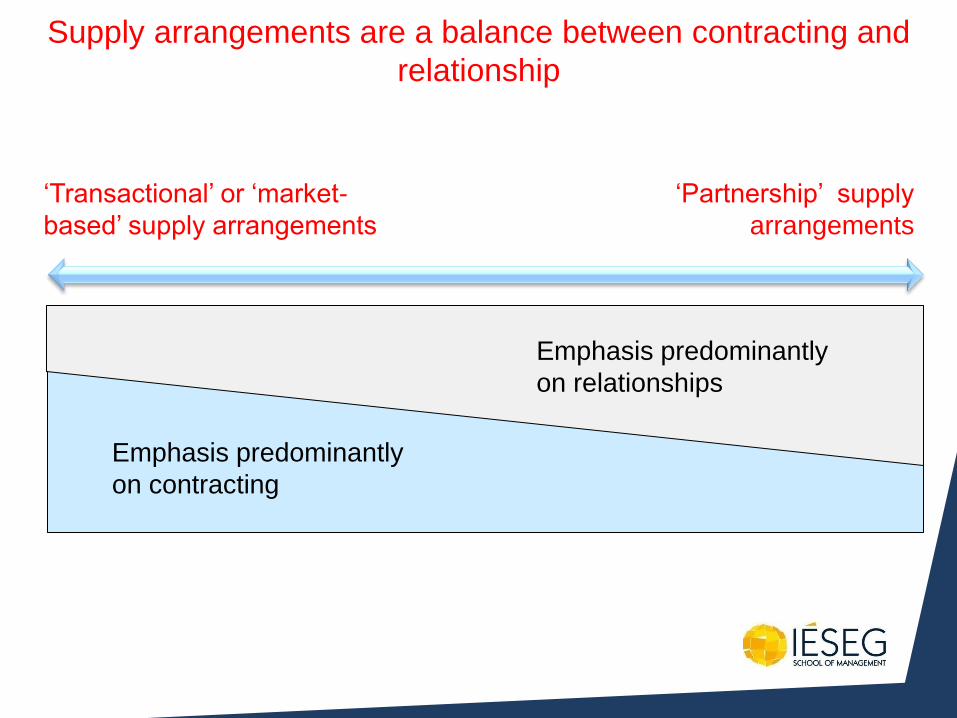
Emphasis predominantly
on contracting
Emphasis predominantly
on relationships
‘Transactional’ or ‘market-
based’ supply arrangements
‘Partnership’ supply
arrangements
Supply arrangements are a balance between contracting and
relationship
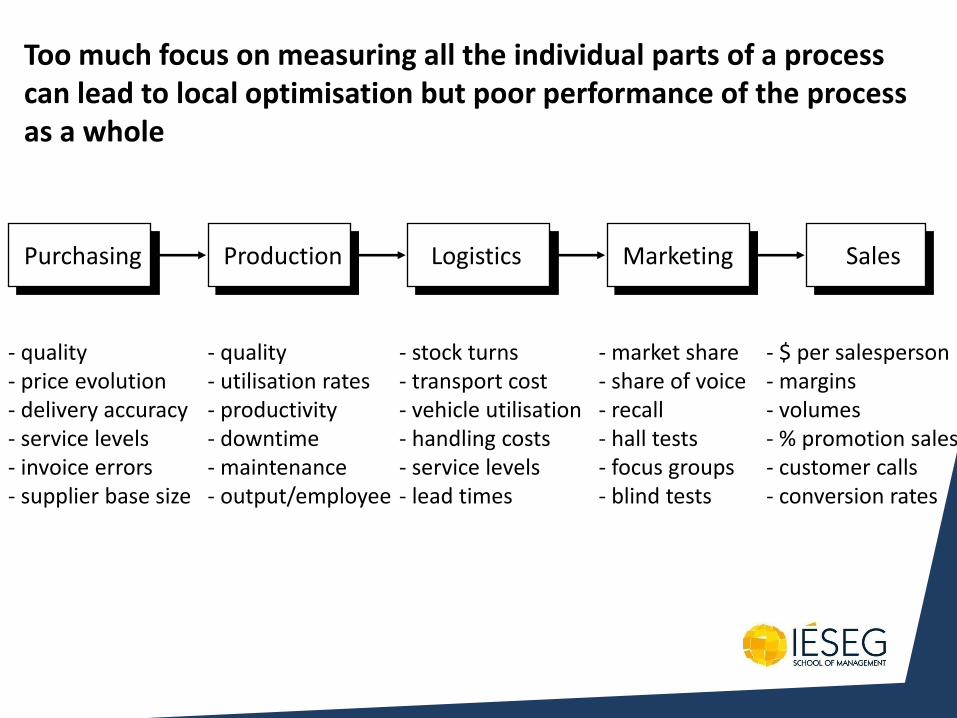
Purchasing Production Logistics Marketing Sales
- quality - price evolution - delivery accuracy - service levels - invoice errors - supplier base size
- quality - utilisation rates - productivity - downtime - maintenance - output/employee
- stock turns - transport cost - vehicle utilisation - handling costs - service levels - lead times
- market share - share of voice - recall - hall tests - focus groups - blind tests
- $ per salesperson - margins - volumes - % promotion sales - customer calls - conversion rates
Too much focus on measuring all the individual parts of a process can lead to local optimisation but poor performance of the process as a whole
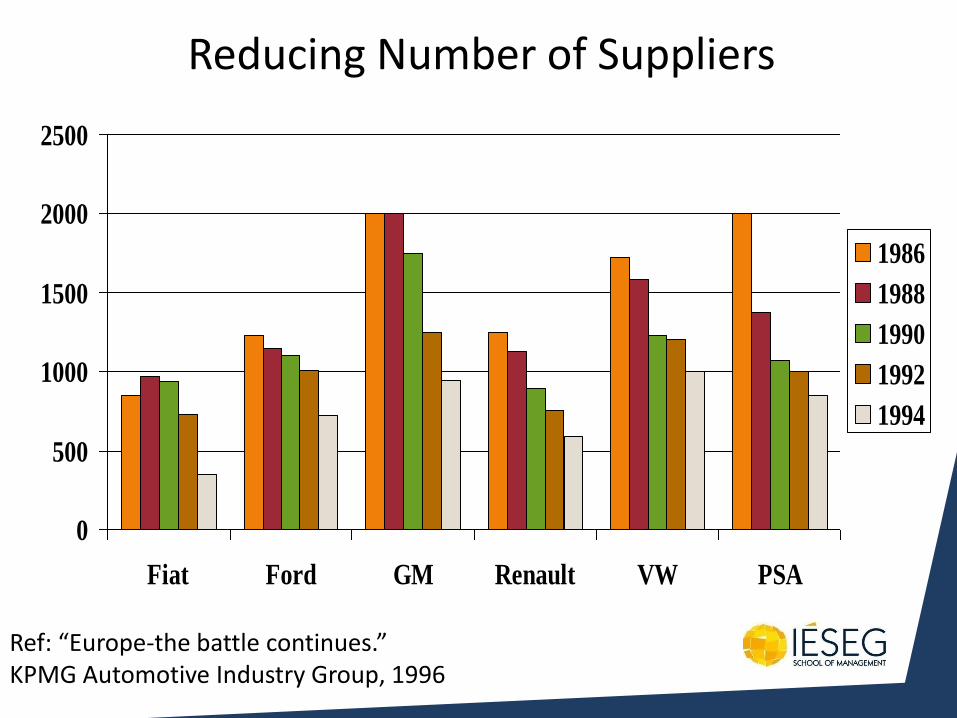
Reducing Number of Suppliers
Ref: “Europe-the battle continues.” KPMG Automotive Industry Group, 1996
0
500
1000
1500
2000
2500
Fiat Ford GM Renault VW PSA
1986
1988
1990
1992
1994
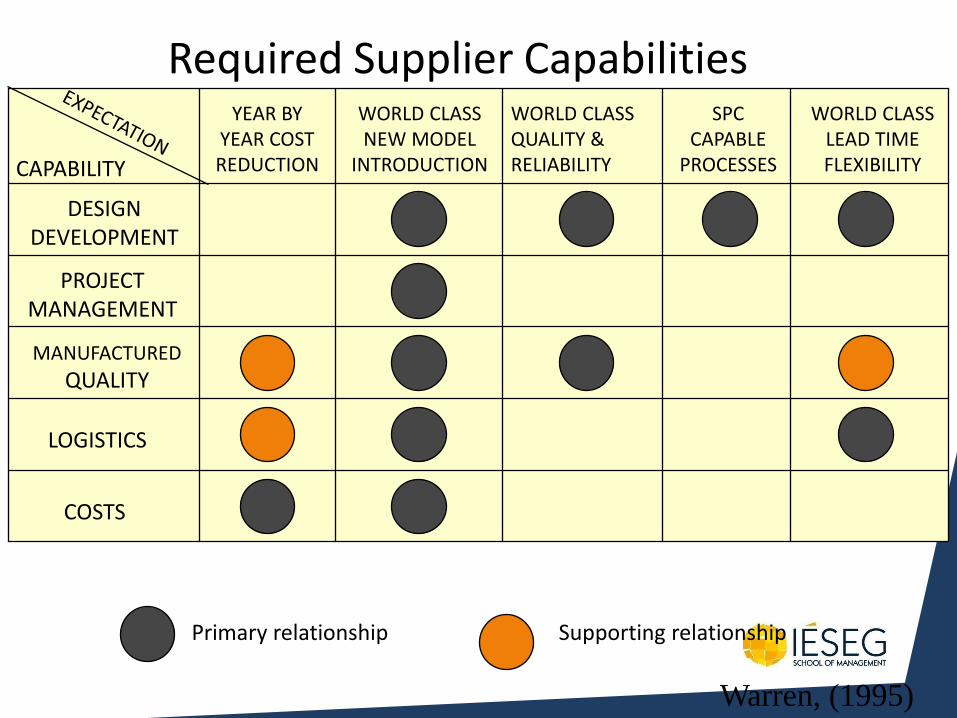
Required Supplier Capabilities
CAPABILITY
YEAR BY YEAR COST REDUCTION
DESIGN DEVELOPMENT
PROJECT MANAGEMENT
MANUFACTURED
QUALITY
LOGISTICS
COSTS
WORLD CLASS NEW MODEL
INTRODUCTION
WORLD CLASS QUALITY & RELIABILITY
SPC CAPABLE
PROCESSES
WORLD CLASS LEAD TIME FLEXIBILITY
Primary relationship Supporting relationship
Warren, (1995)
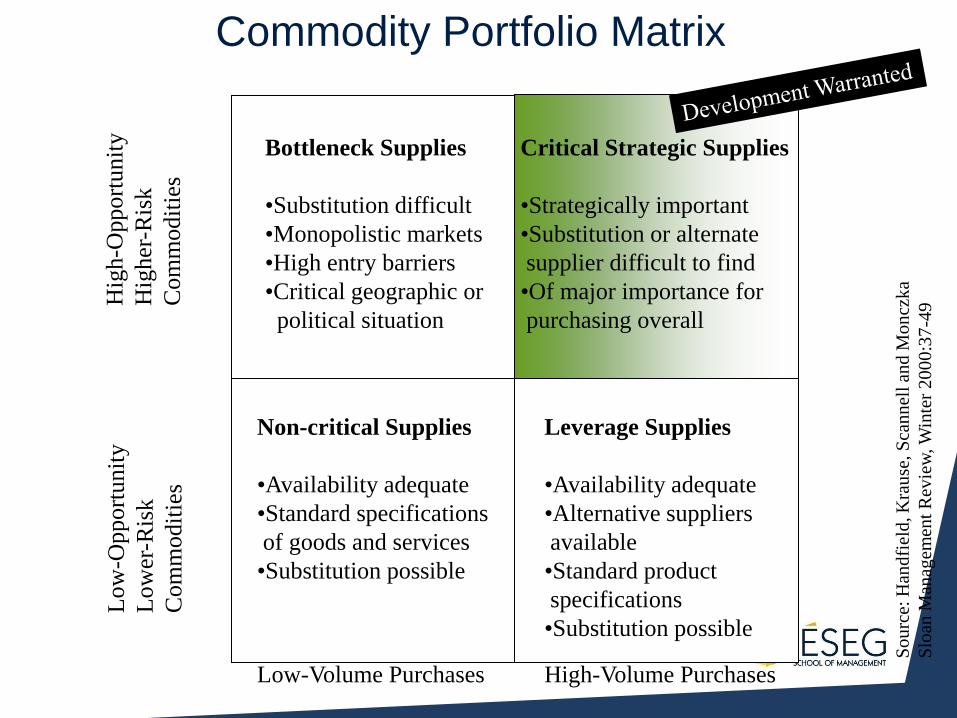
Commodity Portfolio Matrix
So
urc
e: H
and
fiel
d, K
rau
se, S
can
nel
l an
d M
on
czk
a
Slo
an M
anag
emen
t R
evie
w, W
inte
r 2
00
0:3
7-4
9
Bottleneck Supplies
•Substitution difficult
•Monopolistic markets
•High entry barriers
•Critical geographic or
political situation
Non-critical Supplies
•Availability adequate
•Standard specifications
of goods and services
•Substitution possible
Leverage Supplies
•Availability adequate
•Alternative suppliers
available
•Standard product
specifications
•Substitution possible
Low-Volume Purchases High-Volume Purchases
Hig
h-O
pport
unit
y
Hig
her
-Ris
k
Com
modit
ies
Low
-Opport
unit
y
Lo
wer
-Ris
k
Com
modit
ies
Critical Strategic Supplies
•Strategically important
•Substitution or alternate
supplier difficult to find
•Of major importance for
purchasing overall
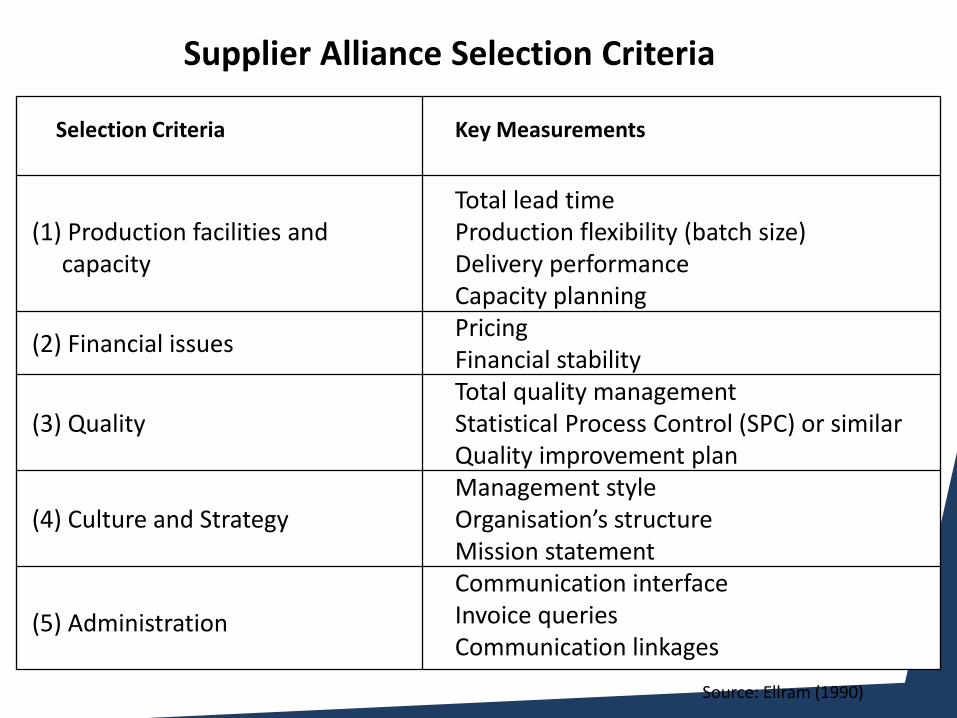
Selection Criteria
(1) Production facilities and capacity
(2) Financial issues
(3) Quality
(4) Culture and Strategy
(5) Administration
Key Measurements
Total lead time Production flexibility (batch size) Delivery performance Capacity planning Pricing Financial stability Total quality management Statistical Process Control (SPC) or similar Quality improvement plan Management style Organisation’s structure Mission statement Communication interface Invoice queries Communication linkages
Supplier Alliance Selection Criteria
Source: Ellram (1990)
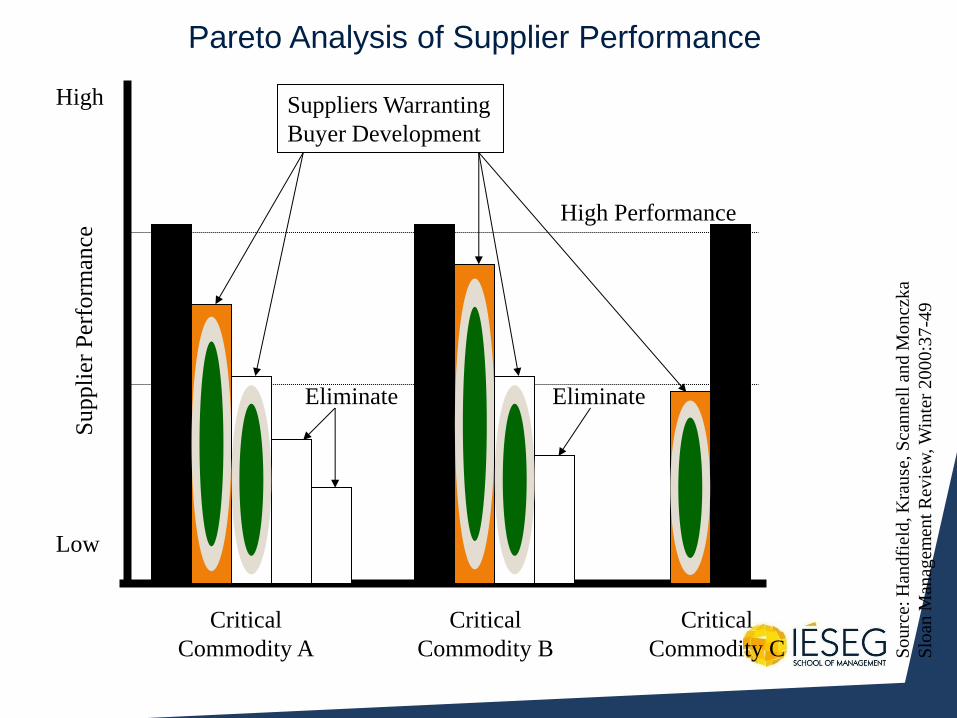
Pareto Analysis of Supplier Performance
Eliminate Eliminate
Suppliers Warranting
Buyer Development
Critical
Commodity A
Critical
Commodity B
Critical
Commodity C
Low
High S
uppli
er P
erfo
rman
ce High Performance
So
urc
e: H
and
fiel
d, K
rau
se, S
can
nel
l an
d M
on
czk
a
Slo
an M
anag
emen
t R
evie
w, W
inte
r 2
00
0:3
7-4
9
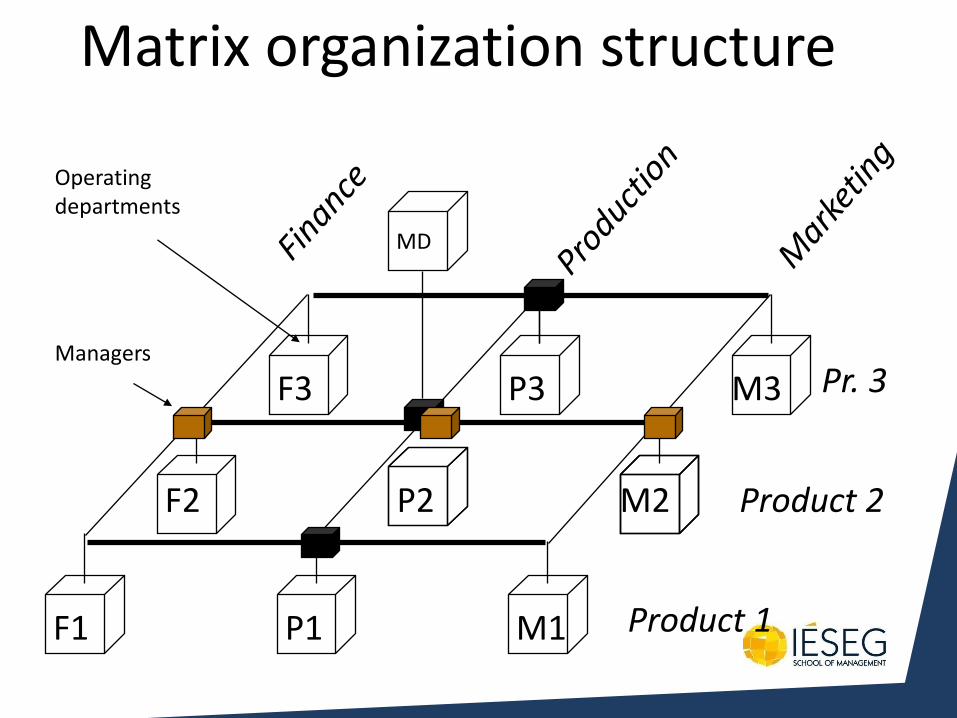
Matrix organization structure
F1 P1 M1
F2 P2 M2
F3 P3 M3
MD
Product 1
Product 2
Pr. 3
Operating departments
Managers
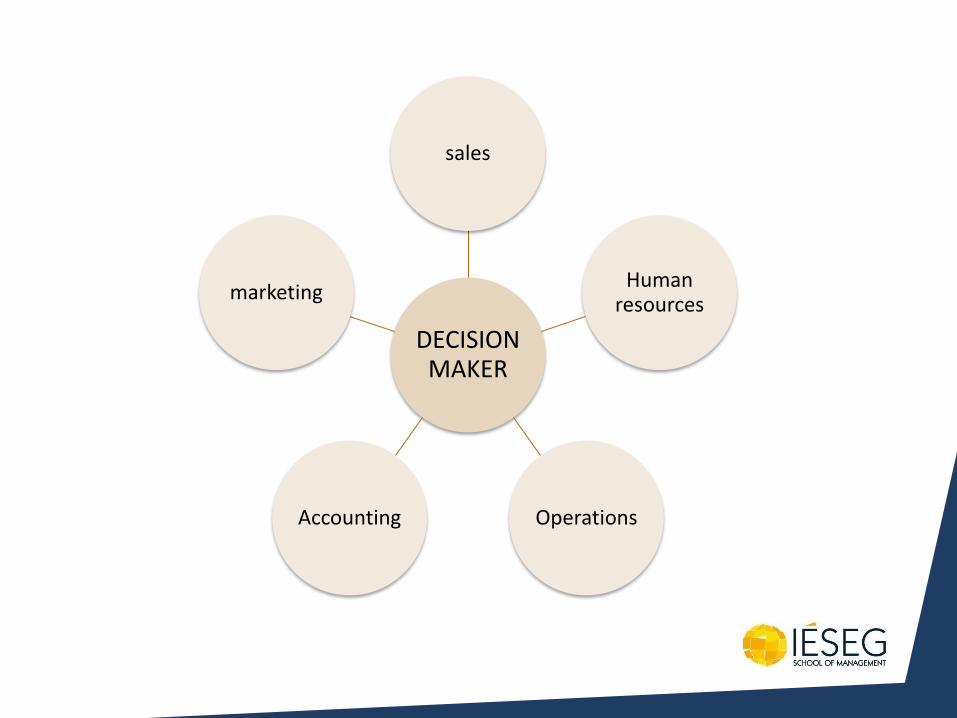
DECISION MAKER
sales
Human resources
Operations
Accounting
marketing
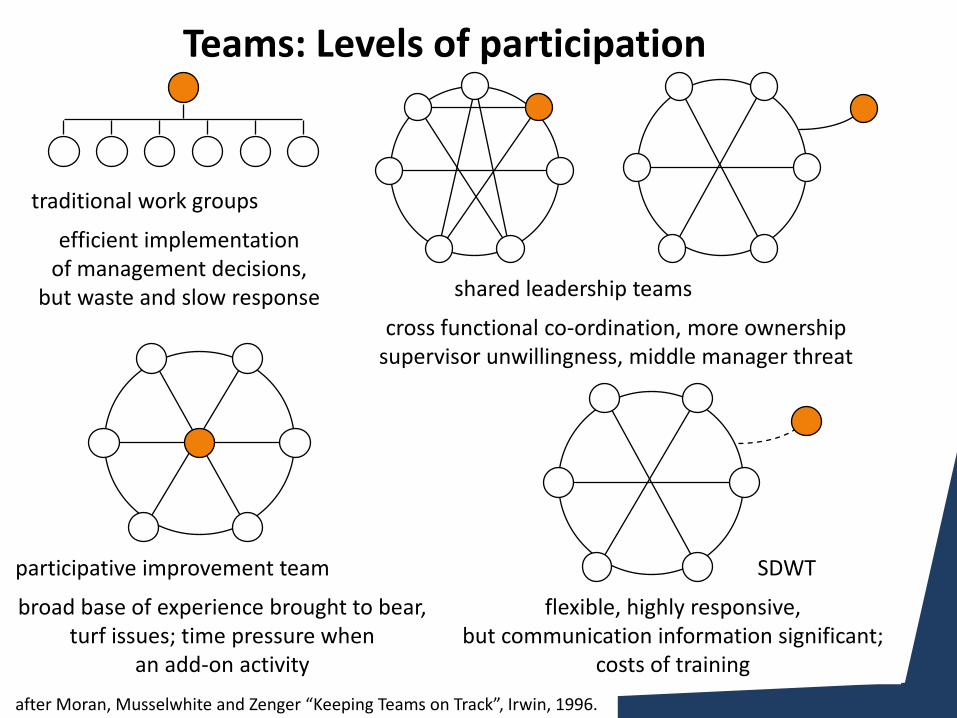
Teams: Levels of participation
traditional work groups
efficient implementation of management decisions,
but waste and slow response shared leadership teams
cross functional co-ordination, more ownership supervisor unwillingness, middle manager threat
participative improvement team
broad base of experience brought to bear, turf issues; time pressure when
an add-on activity
SDWT
flexible, highly responsive, but communication information significant;
costs of training
after Moran, Musselwhite and Zenger “Keeping Teams on Track”, Irwin, 1996.
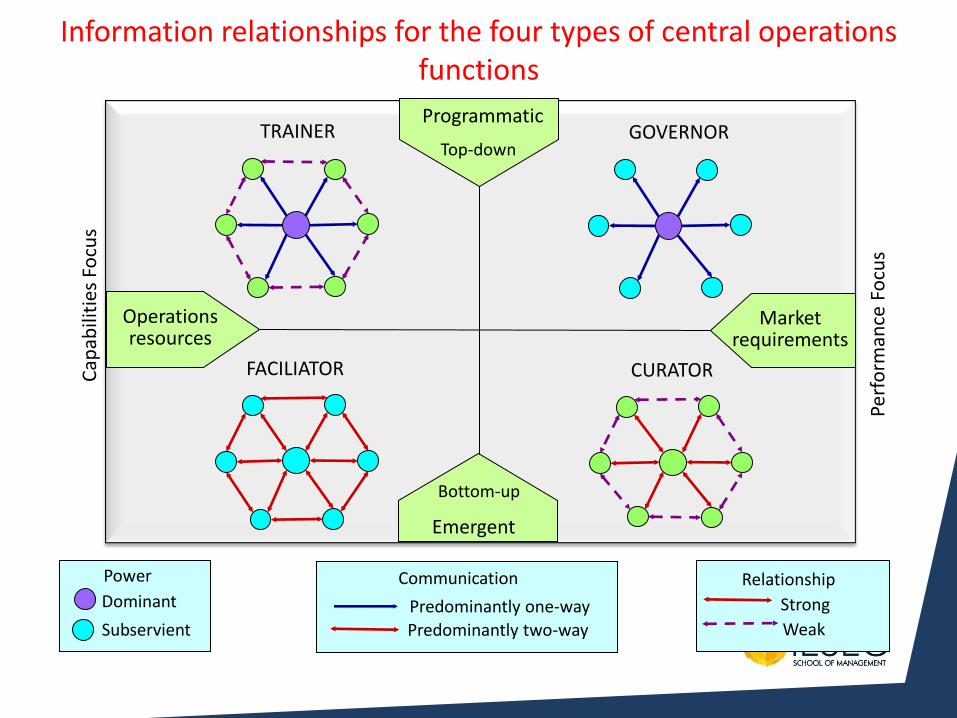
Information relationships for the four types of central operations functions
Dominant
Subservient Predominantly one-way
Predominantly two-way
Strong
Weak
Power Communication Relationship
Market requirements
Operations resources
Top down GOVERNOR TRAINER
FACILIATOR CURATOR Cap
abili
ties
Fo
cus
Perf
orm
ance
Fo
cus
Programmatic
Top-down
Emergent
Bottom-up
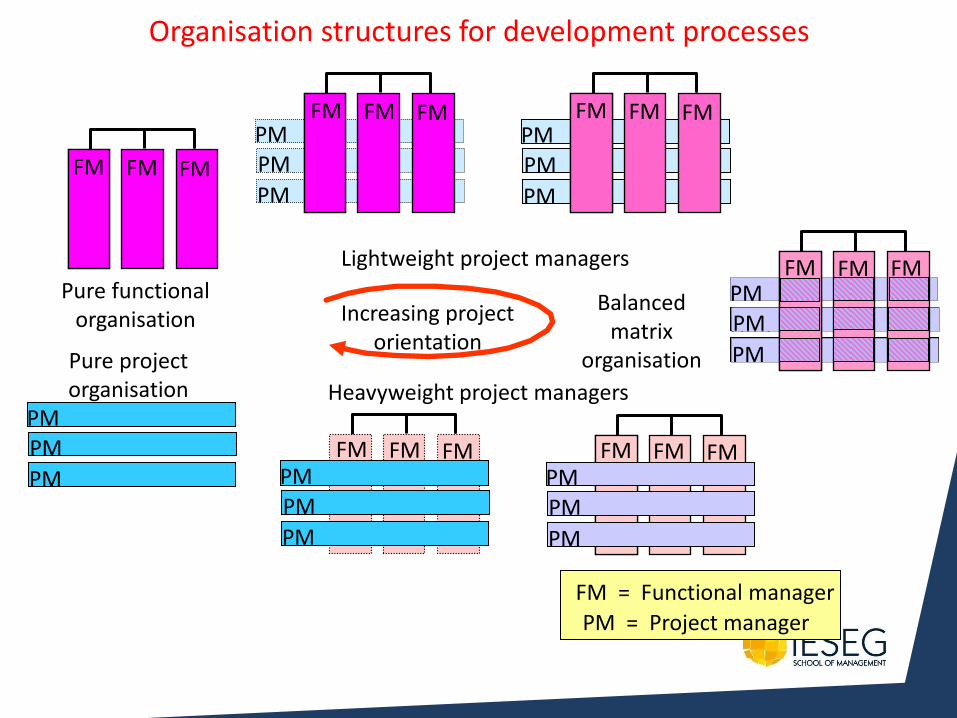
Increasing project orientation
Organisation structures for development processes
Pure functional organisation
FM FM FM P.M.
PM
PM
PM
FM FM FM
FM FM FM
P.M.
PM
PM
PM
Pure project organisation
P.M.
PM PM
PM
P.M.
PM
PM
PM
FM FM FM
Balanced matrix
organisation
FM = Functional manager
PM = Project manager
P.M.
PM PM
PM
FM FM FM
Lightweight project managers
FM FM FM
P.M.
PM
PM
PM
Heavyweight project managers
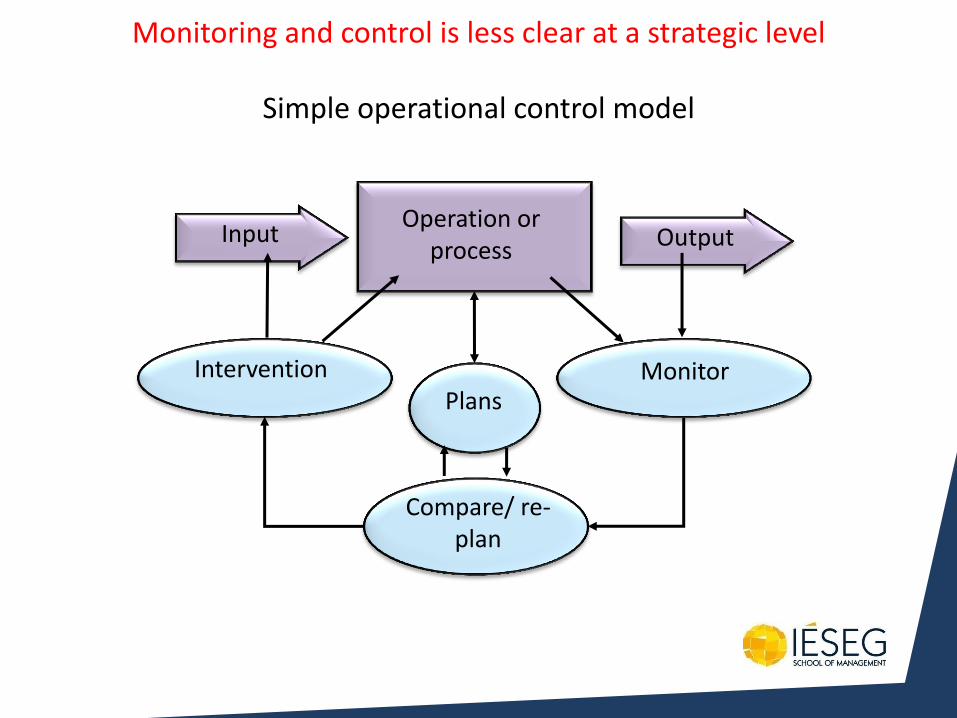
Monitoring and control is less clear at a strategic level
Operation or process
Input Output
Compare/ re-plan
Intervention Plans
Monitor
Simple operational control model
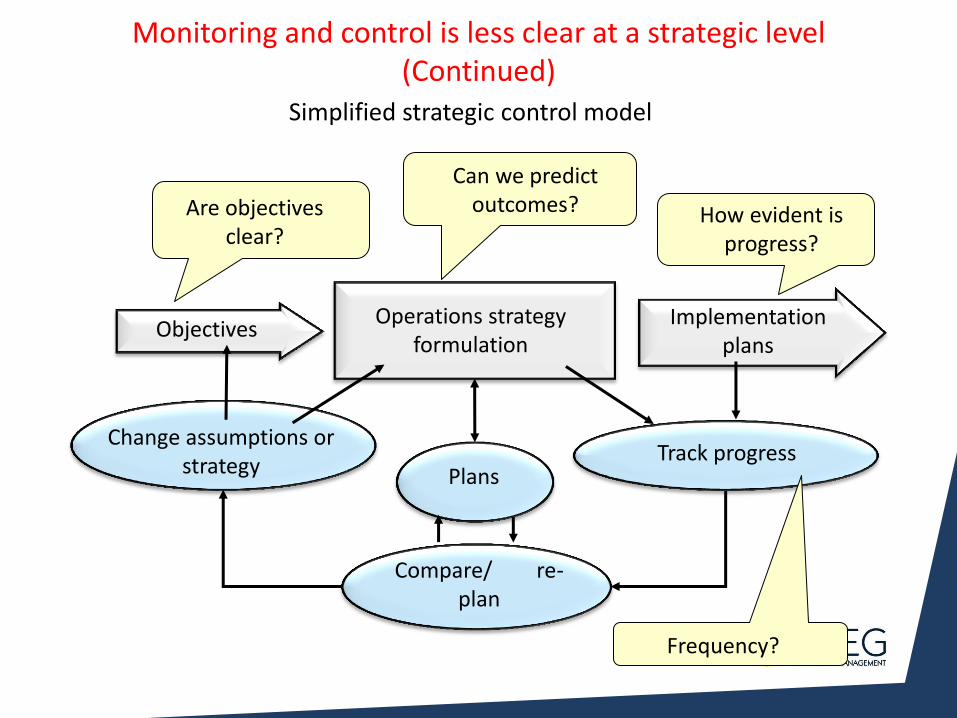
Monitoring and control is less clear at a strategic level (Continued)
Operations strategy formulation
Objectives Implementation
plans
Compare/ re-plan
Change assumptions or strategy Plans
Track progress
How evident is progress?
Are objectives clear?
Frequency?
Can we predict outcomes?
Simplified strategic control model
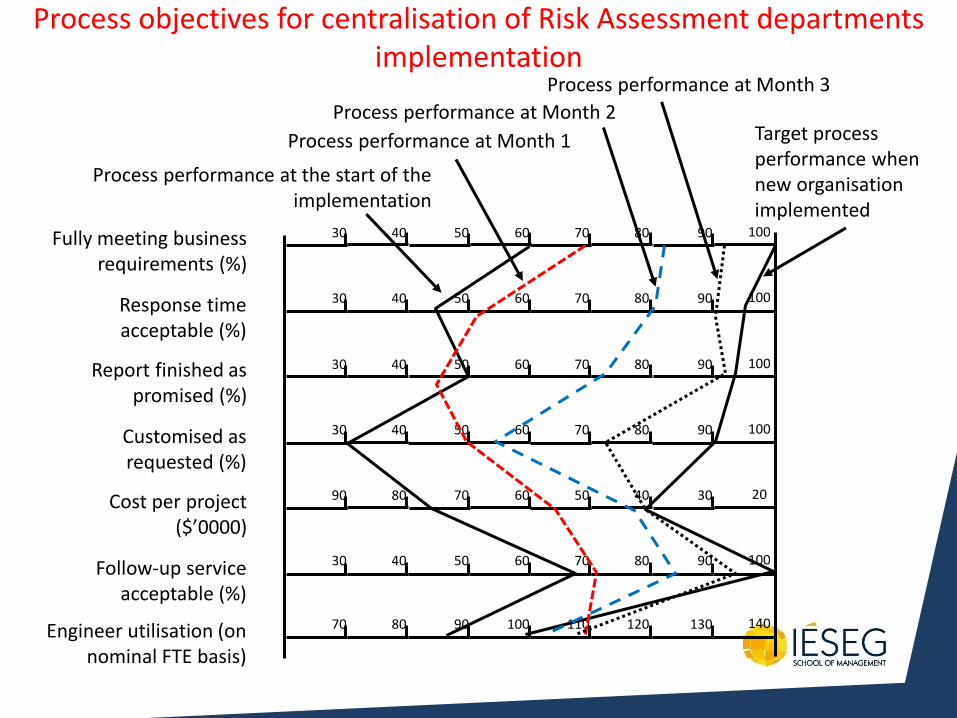
Fully meeting business requirements (%)
Response time acceptable (%)
Report finished as promised (%)
Customised as requested (%)
Cost per project ($’0000)
Follow-up service acceptable (%)
Engineer utilisation (on nominal FTE basis)
100 90 80 70 60 50 40 30
100 90 80 70 60 50 40 30
100 90 80 70 60 50 40 30
100 90 80 70 60 50 40 30
20 30 40 50 60 70 80 90
100 90 80 70 60 50 40 30
140 130 120 110 100 90 80 70
Process performance at the start of the implementation
Target process performance when new organisation implemented
Process performance at Month 1
Process performance at Month 2
Process performance at Month 3
Process objectives for centralisation of Risk Assessment departments implementation
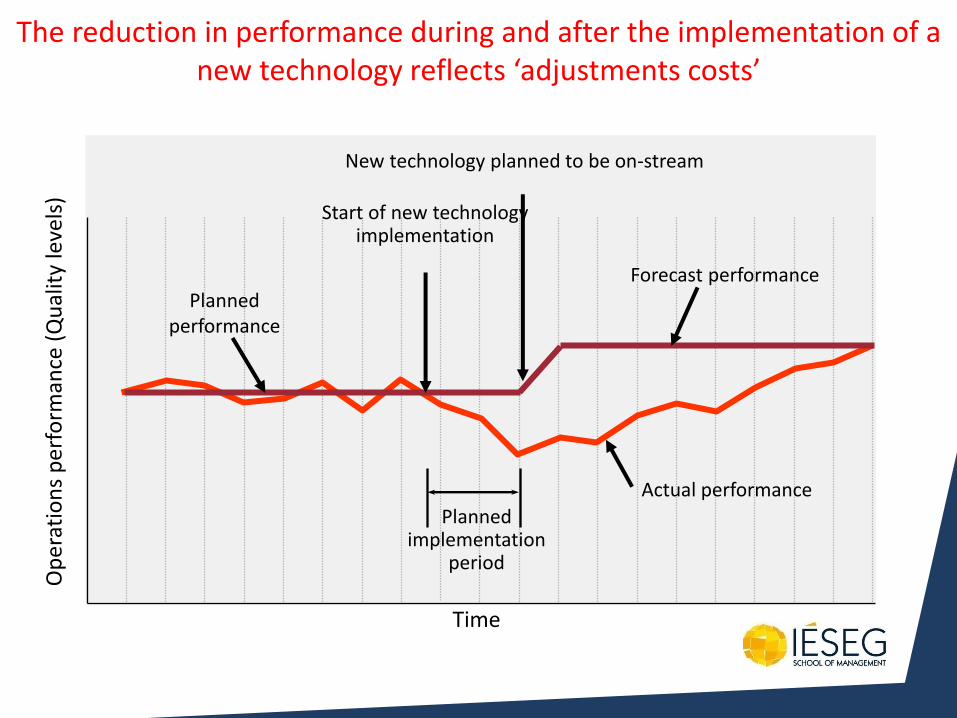
Actual performance
Planned implementation
period
Op
erat
ion
s p
erf
orm
ance
(Q
ual
ity
leve
ls)
Time
The reduction in performance during and after the implementation of a new technology reflects ‘adjustments costs’
Planned performance
Start of new technology implementation
New technology planned to be on-stream
Forecast performance
Chapter 6
Process technology strategy
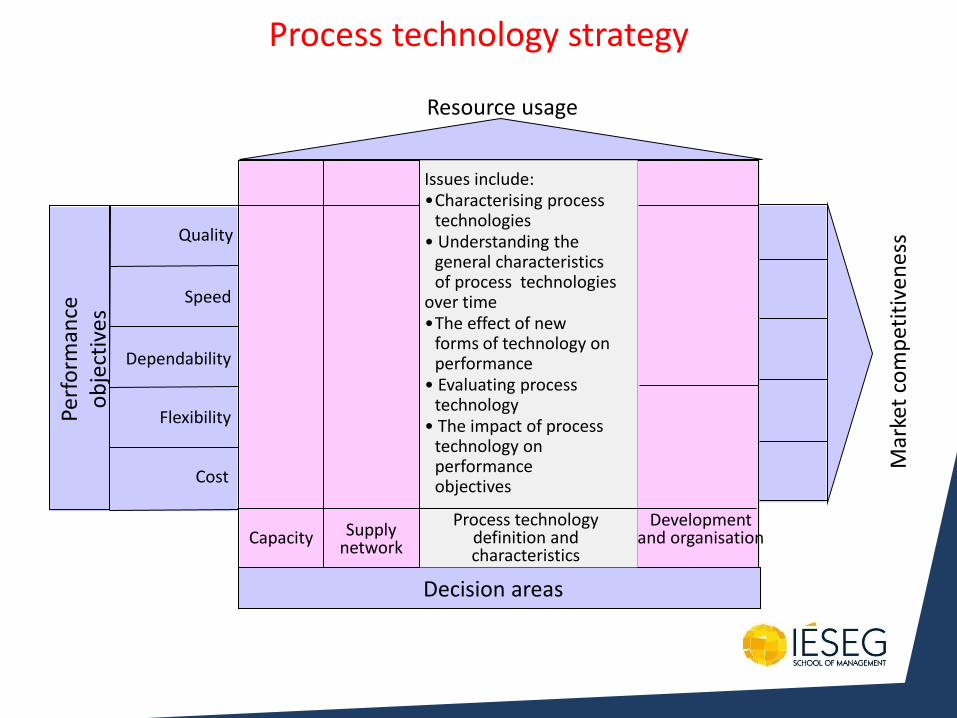
Development and organisation
Decision areas
Capacity Supply network
Mar
ket
com
pet
itiv
ene
ss
Issues include: • Characterising process technologies • Understanding the general characteristics of process technologies over time • The effect of new forms of technology on performance • Evaluating process technology • The impact of process technology on performance objectives
Process technology definition and characteristics
Resource usage
Quality
Perf
orm
ance
o
bje
ctiv
es
Dependability
Speed
Flexibility
Cost
Process technology strategy
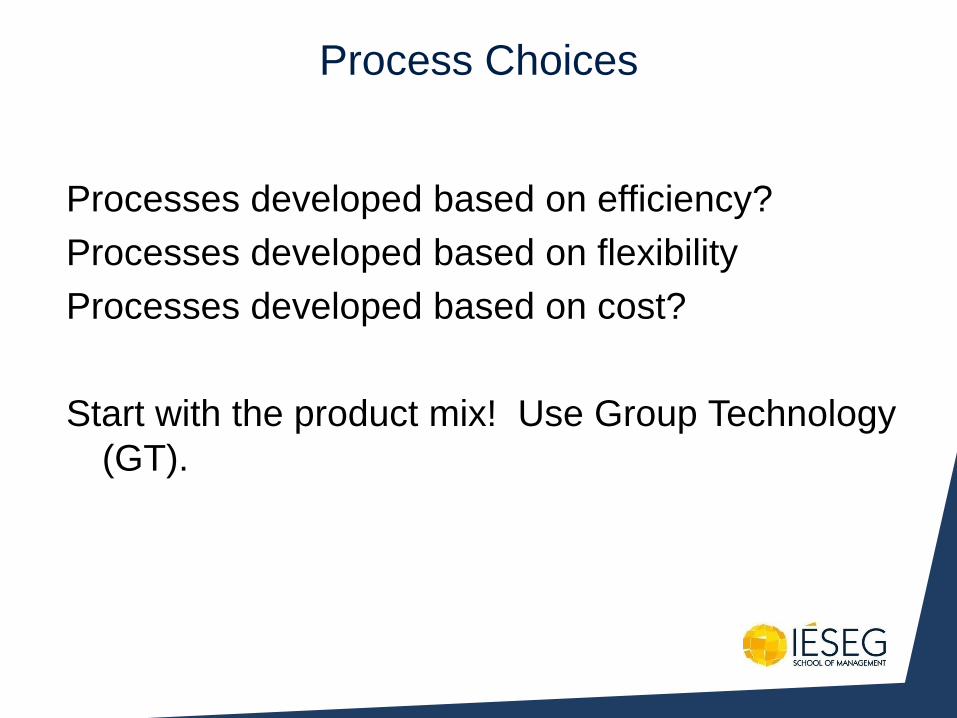
Process Choices
Processes developed based on efficiency?
Processes developed based on flexibility
Processes developed based on cost?
Start with the product mix! Use Group Technology
(GT).
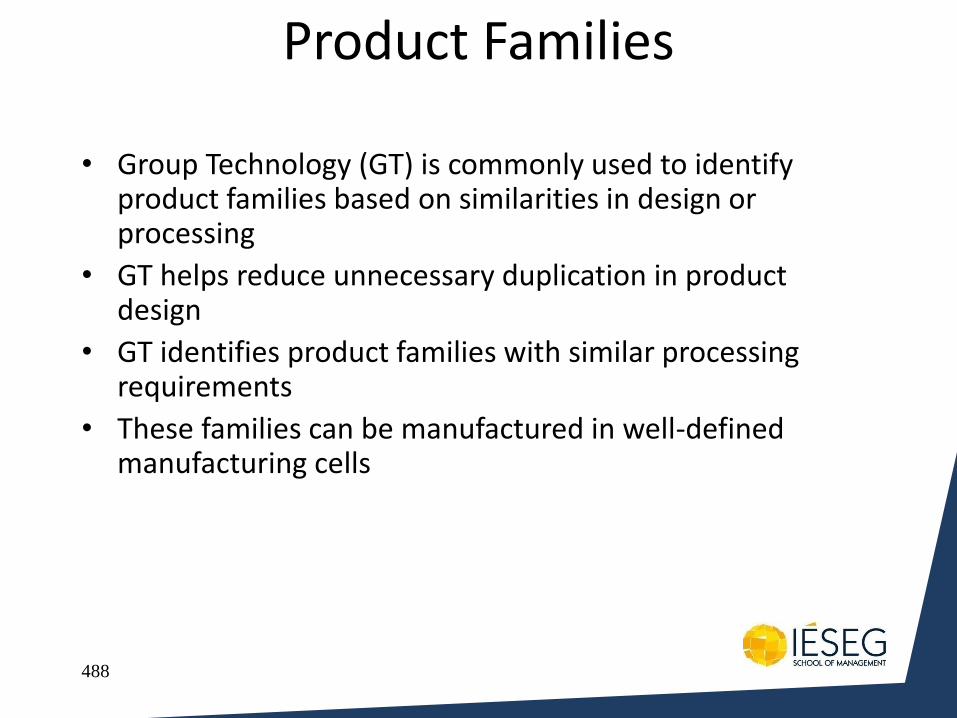
488
Product Families
• Group Technology (GT) is commonly used to identify product families based on similarities in design or processing
• GT helps reduce unnecessary duplication in product design
• GT identifies product families with similar processing requirements
• These families can be manufactured in well-defined manufacturing cells
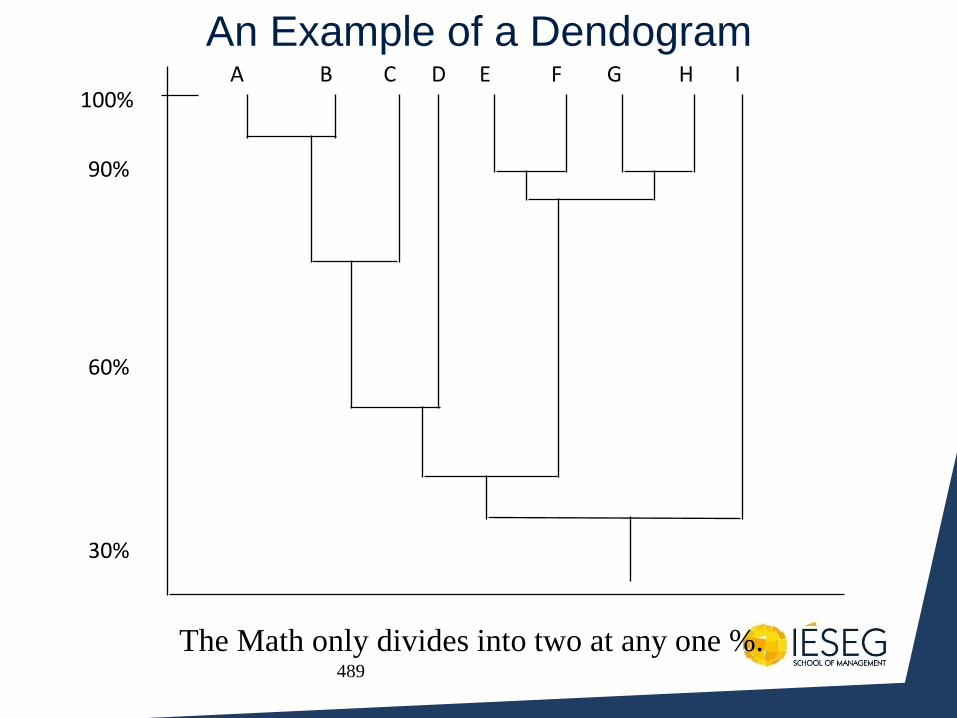
489
An Example of a Dendogram
100%
30%
60%
90%
A B E C D F G I H
The Math only divides into two at any one %.
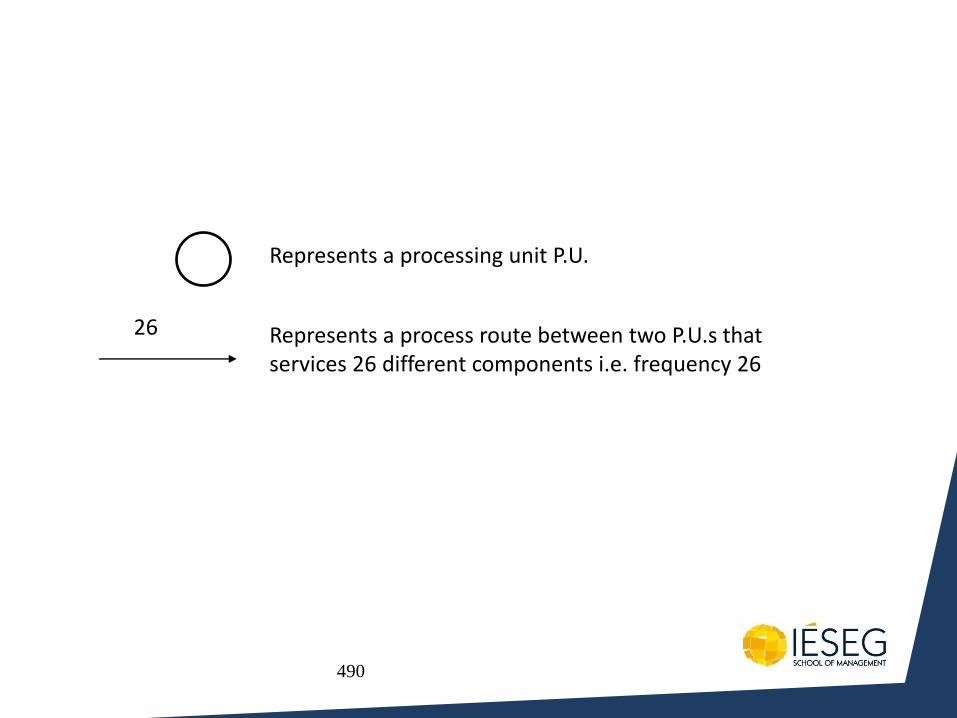
490
Represents a processing unit P.U.
Represents a process route between two P.U.s that services 26 different components i.e. frequency 26
26
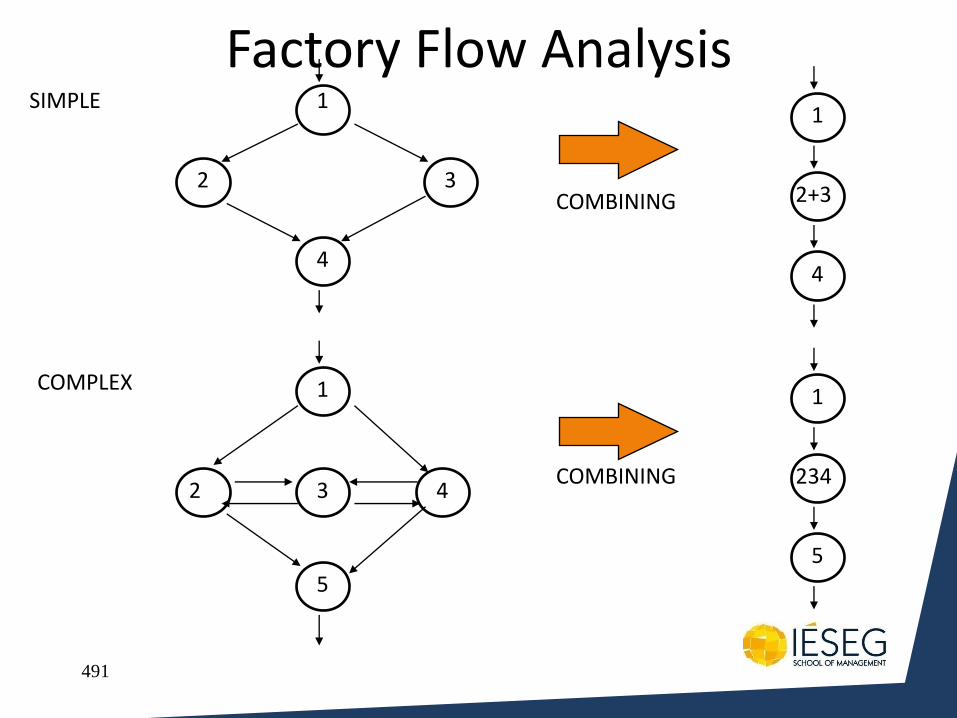
491
Factory Flow Analysis 1
1 1
1
2+3
234
2
2
4
5
3 4
3
5
4
SIMPLE
COMPLEX
COMBINING
COMBINING
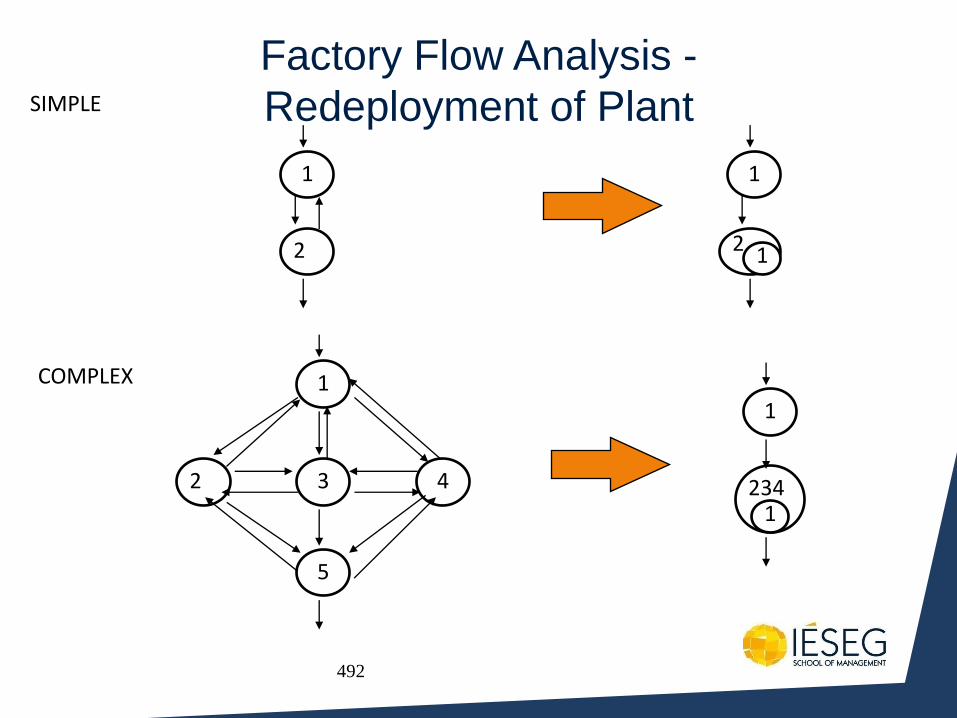
492
Factory Flow Analysis -
Redeployment of Plant
1
2
5
3 4
COMPLEX
1
2
SIMPLE
1
2 1
1
234 1
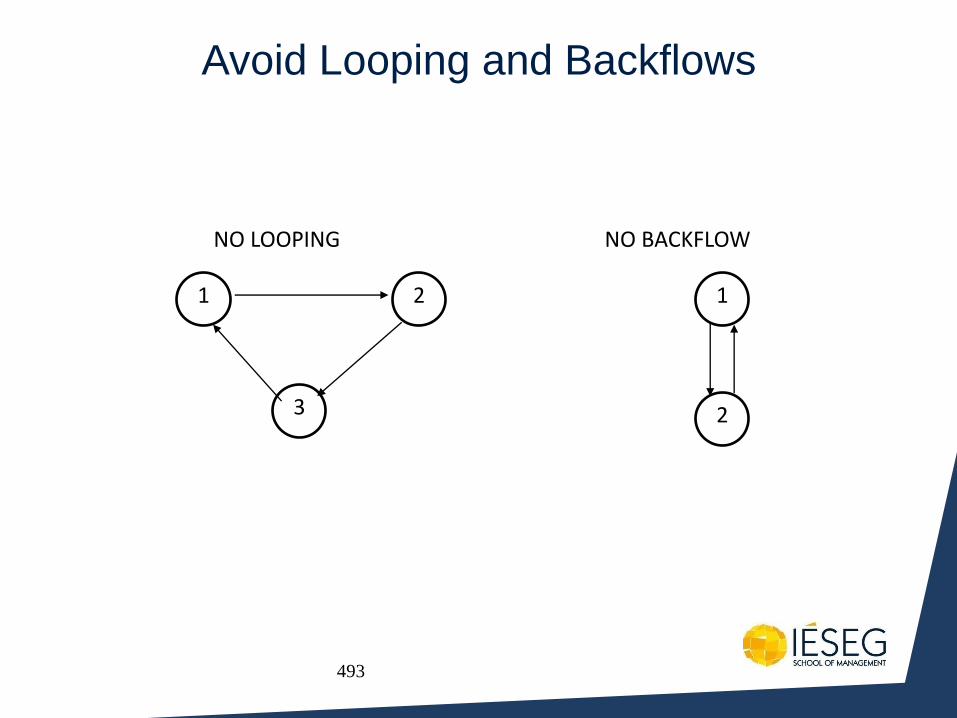
493
Avoid Looping and Backflows
1
2
NO BACKFLOW
1 2
3
NO LOOPING
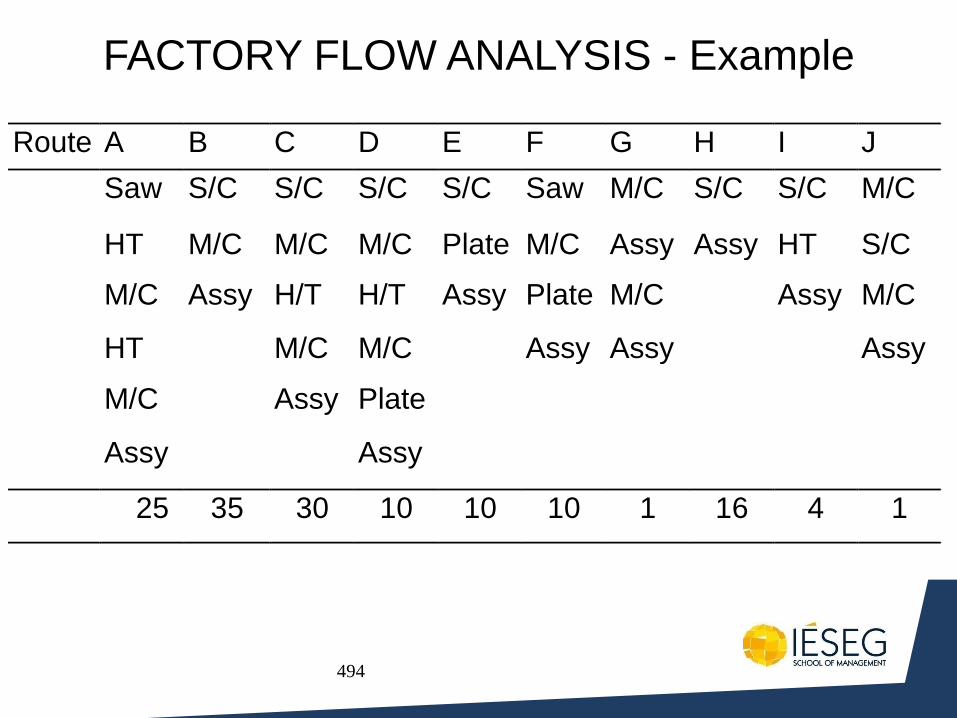
494
FACTORY FLOW ANALYSIS - Example
Route A B C D E F G H I J
Saw S/C S/C S/C S/C Saw M/C S/C S/C M/C
HT M/C M/C M/C Plate M/C Assy Assy HT S/C
M/C Assy H/T H/T Assy Plate M/C Assy M/C
HT M/C M/C Assy Assy Assy
M/C Assy Plate
Assy Assy
25 35 30 10 10 10 1 16 4 1
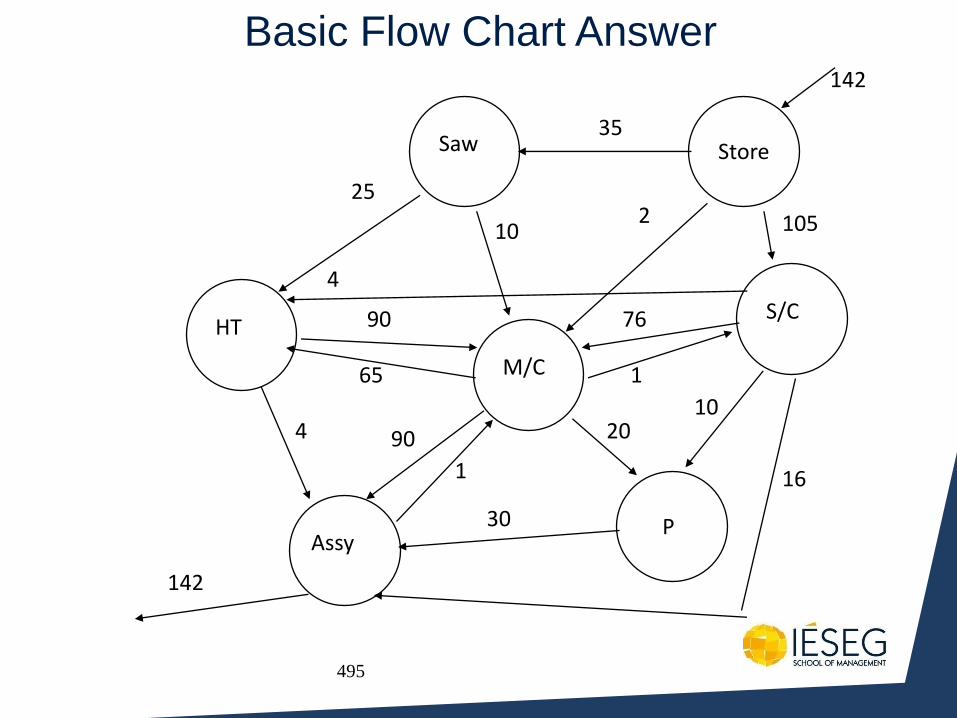
495
Basic Flow Chart Answer
Store Saw
HT
M/C
S/C
P Assy
142
142
4
90
65
25
4
35
10 2 105
16
10
76
1
20
30
1
90
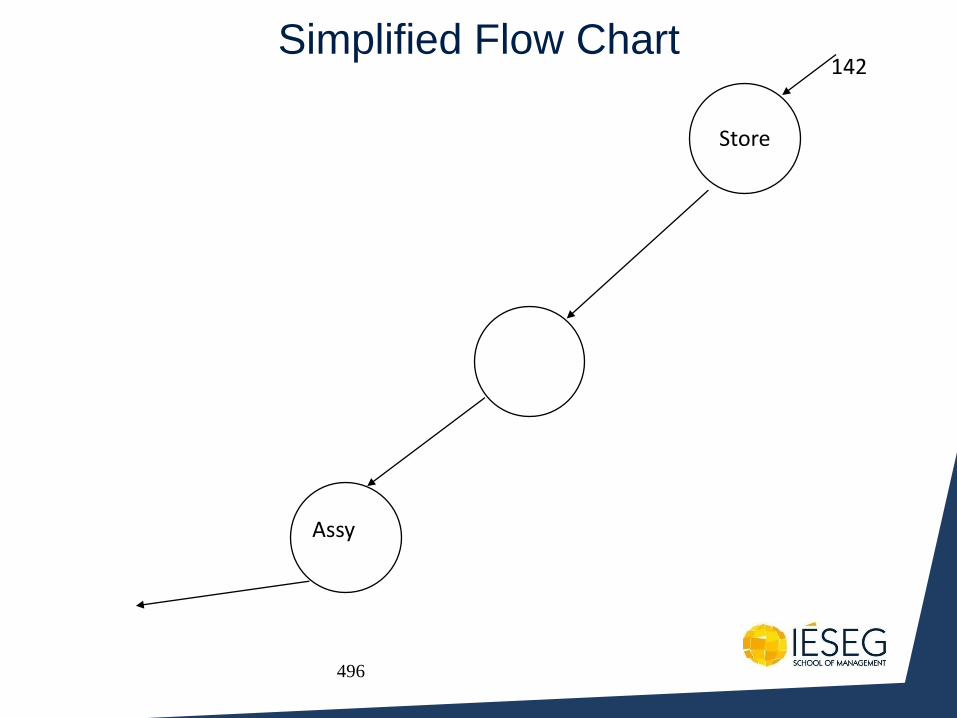
496
Simplified Flow Chart
Store
Assy
142
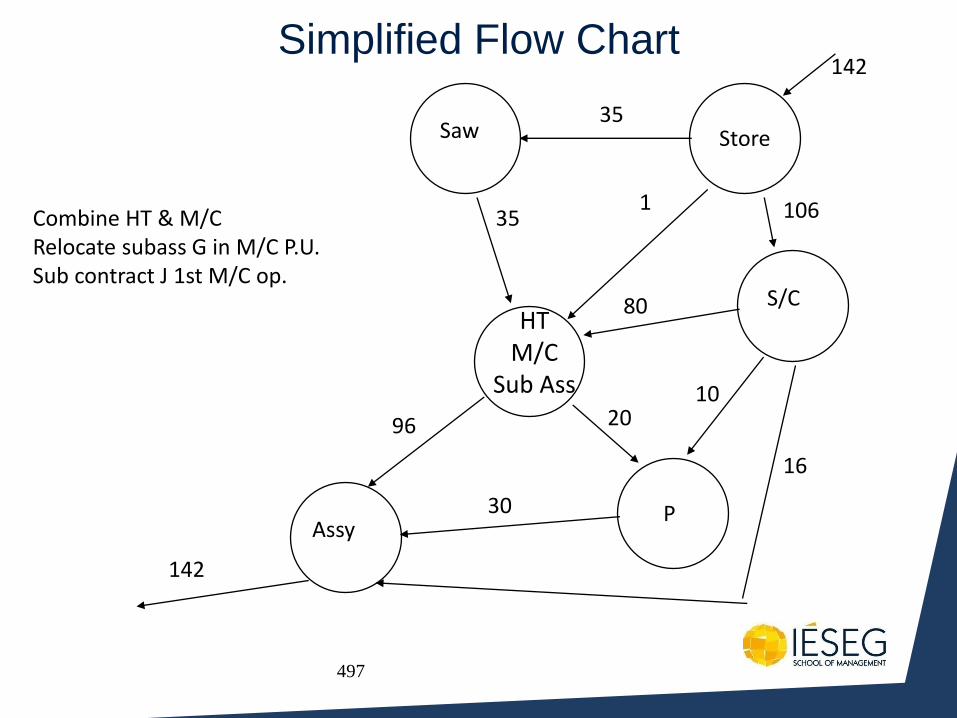
497
Simplified Flow Chart
Store Saw
HT M/C
Sub Ass
S/C
P Assy
142
142
35
35 1 106
16
10
80
20
30
96
Combine HT & M/C Relocate subass G in M/C P.U. Sub contract J 1st M/C op.
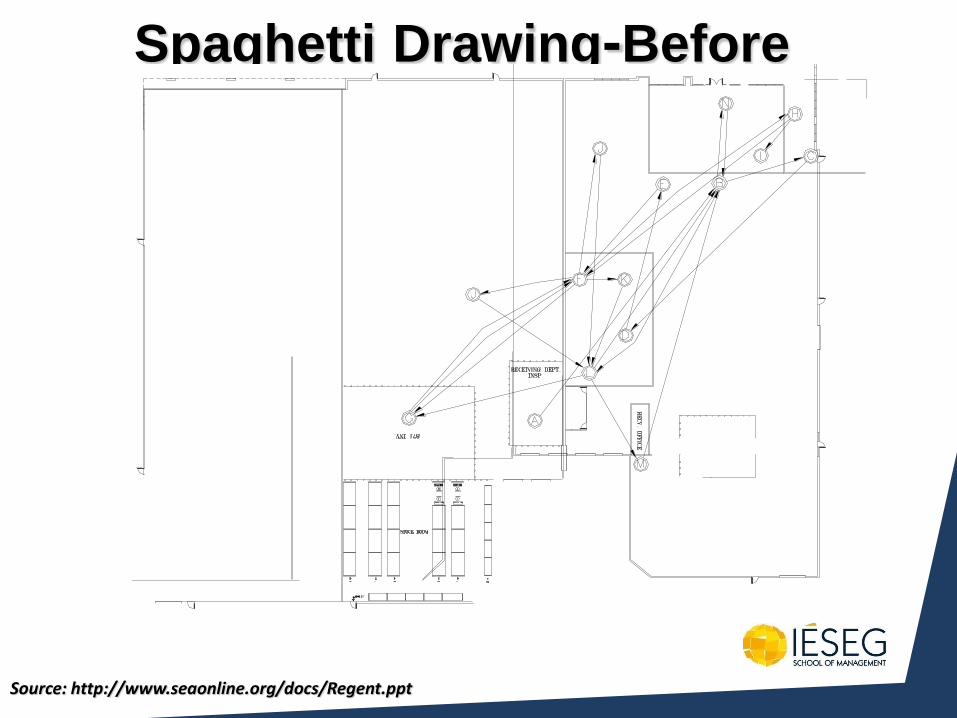
Spaghetti Drawing-Before
Source: http://www.seaonline.org/docs/Regent.ppt
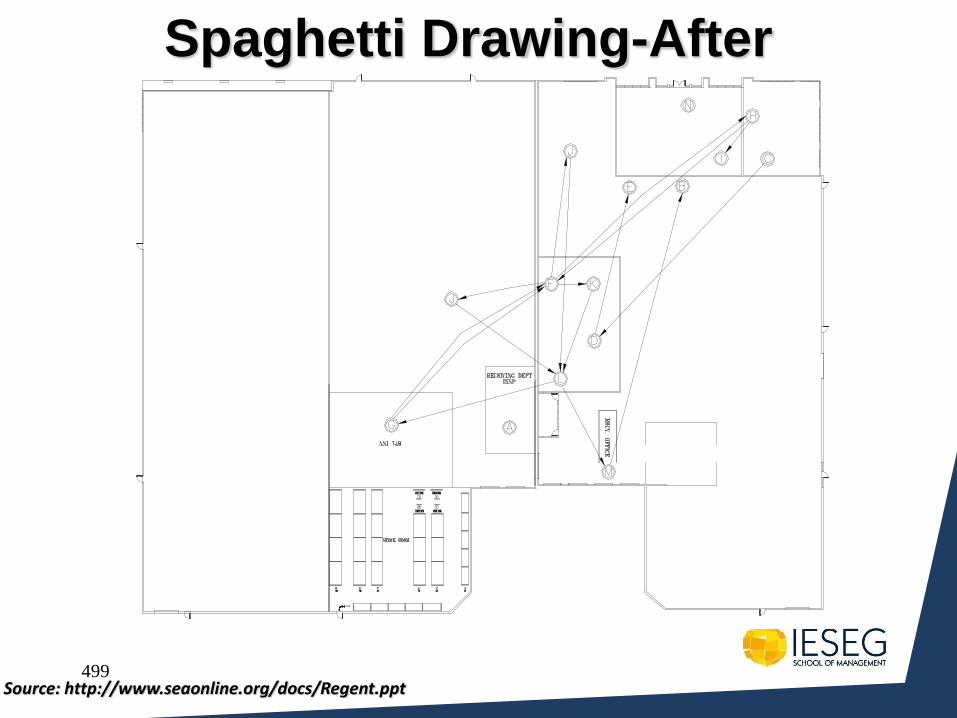
499
Spaghetti Drawing-After
Source: http://www.seaonline.org/docs/Regent.ppt
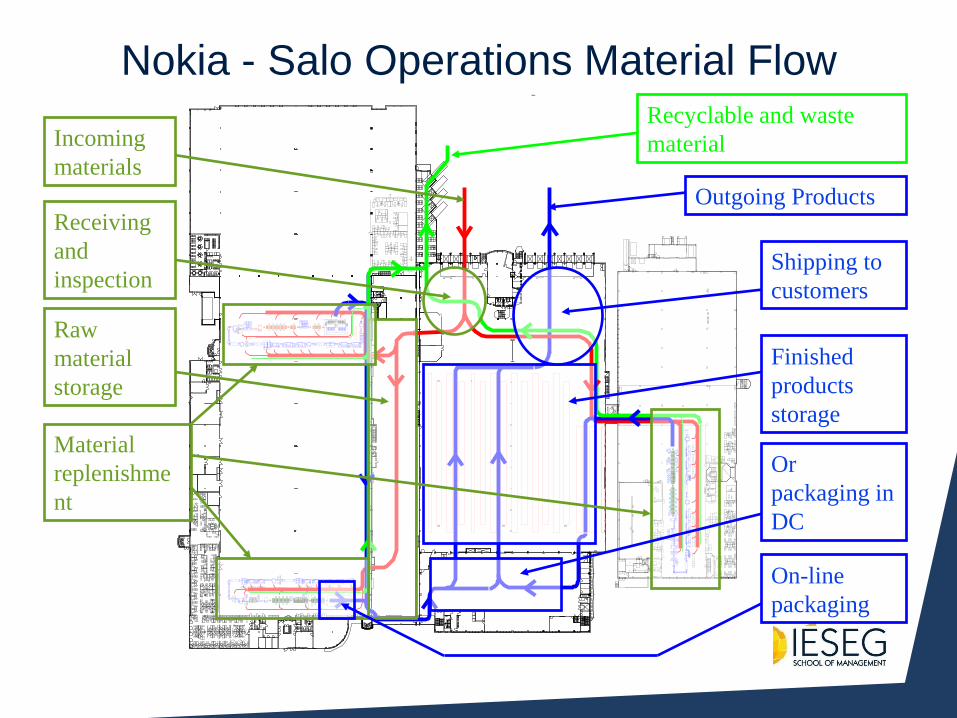
Nokia - Salo Operations Material Flow
Example
JKJK
JKJK
JKJK
.00 cm .00 cm
.00 cm
.00
cm
.00
cm
.00
cm
.00
cm
.00
cm
.00
cm
.00
cm
MPM
s
4.7 m
3.9 m
1.5
m
PP
P
PP P
PP
P
SÄ
HK
ÖK
.
MA
TE
R.
S
YÖ
TT
Ö
Nai
ste
n
puku
til
a
Mie
ste
n
puku
til
a
Vaatesäilytys
ilmastointi-
kanava
Sis
ään
käy
nti
Ulo
skä
ynt
i
DC
-CO
NN
EC
TIO
N
No
sti
n
post
ipa
ket
it
säh
kök
aap
pi
PE
SU
Käry
-
imuri
Tu
pa
kk
a
Välis
ein
ä
Type
nke
hit
in
PCMikrosk.
X - ra y
SAT
Puhdasvesiasema
PESUP.
ME
MM
ER
T
NE
UK
KA
RI
NE
UK
KA
RI
KA
TIS
KA
FA
X
CO
PY
PR
INT
ER
säh
kök
aap
pi
sähkökaappi
Incoming
materials
Receiving
and
inspection
Raw
material
storage
Material
replenishme
nt
Outgoing Products
On-line
packaging
Or
packaging in
DC
Finished
products
storage
Shipping to
customers
Recyclable and waste
material
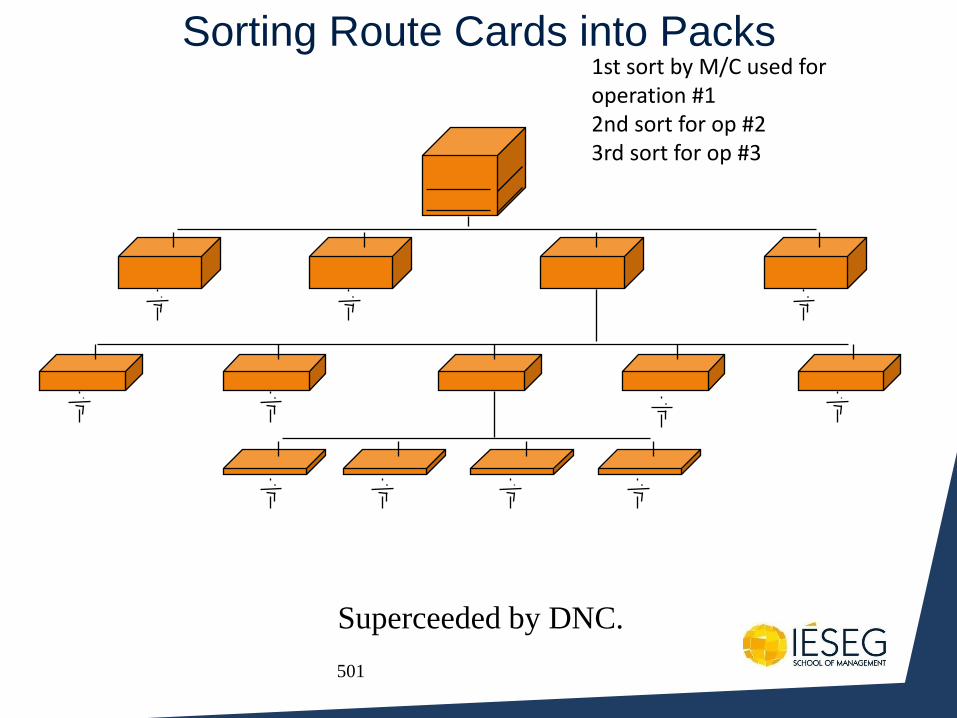
501
Sorting Route Cards into Packs 1st sort by M/C used for operation #1 2nd sort for op #2 3rd sort for op #3
Superceeded by DNC.
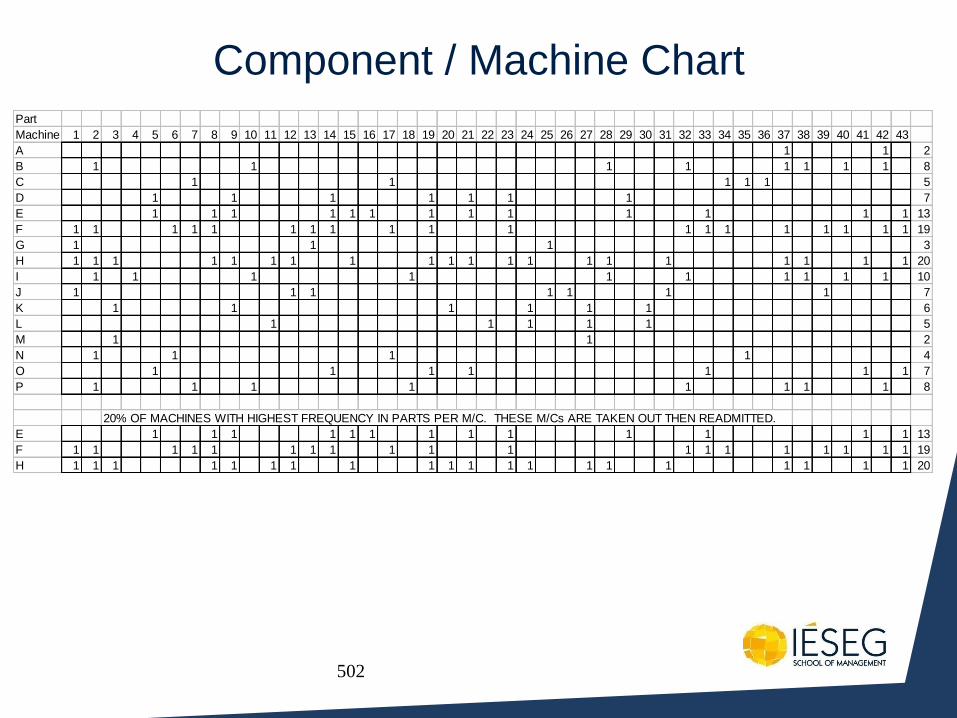
502
Component / Machine Chart Part
Machine 1 2 3 4 5 6 7 8 9 10 11 12 13 14 15 16 17 18 19 20 21 22 23 24 25 26 27 28 29 30 31 32 33 34 35 36 37 38 39 40 41 42 43
A 1 1 2
B 1 1 1 1 1 1 1 1 8
C 1 1 1 1 1 5
D 1 1 1 1 1 1 1 7
E 1 1 1 1 1 1 1 1 1 1 1 1 1 13
F 1 1 1 1 1 1 1 1 1 1 1 1 1 1 1 1 1 1 1 19
G 1 1 1 3
H 1 1 1 1 1 1 1 1 1 1 1 1 1 1 1 1 1 1 1 1 20
I 1 1 1 1 1 1 1 1 1 1 10
J 1 1 1 1 1 1 1 7
K 1 1 1 1 1 1 6
L 1 1 1 1 1 5
M 1 1 2
N 1 1 1 1 4
O 1 1 1 1 1 1 1 7
P 1 1 1 1 1 1 1 1 8
20% OF MACHINES WITH HIGHEST FREQUENCY IN PARTS PER M/C. THESE M/Cs ARE TAKEN OUT THEN READMITTED.
E 1 1 1 1 1 1 1 1 1 1 1 1 1 13
F 1 1 1 1 1 1 1 1 1 1 1 1 1 1 1 1 1 1 1 19
H 1 1 1 1 1 1 1 1 1 1 1 1 1 1 1 1 1 1 1 1 20
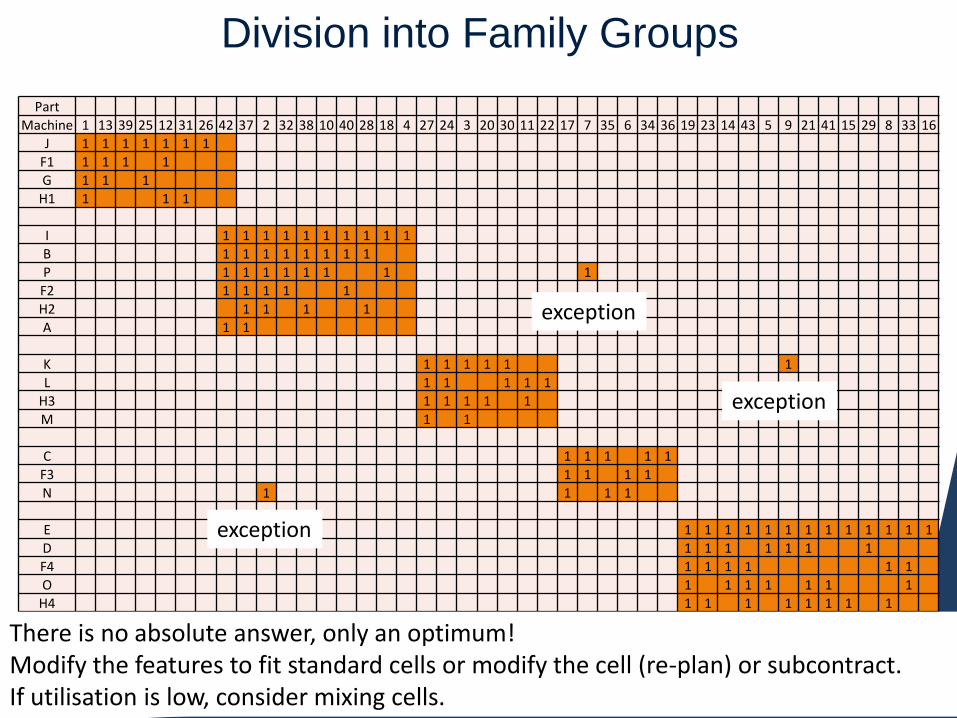
Division into Family Groups
Part Machine 1 13 39 25 12 31 26 42 37 2 32 38 10 40 28 18 4 27 24 3 20 30 11 22 17 7 35 6 34 36 19 23 14 43 5 9 21 41 15 29 8 33 16
J 1 1 1 1 1 1 1 F1 1 1 1 1 G 1 1 1
H1 1 1 1
I 1 1 1 1 1 1 1 1 1 1 B 1 1 1 1 1 1 1 1 P 1 1 1 1 1 1 1 1 F2 1 1 1 1 1 H2 1 1 1 1 A 1 1
K 1 1 1 1 1 1 L 1 1 1 1 1
H3 1 1 1 1 1 M 1 1
C 1 1 1 1 1 F3 1 1 1 1 N 1 1 1 1
E 1 1 1 1 1 1 1 1 1 1 1 1 1
D 1 1 1 1 1 1 1 F4 1 1 1 1 1 1 O 1 1 1 1 1 1 1
H4 1 1 1 1 1 1 1 1
There is no absolute answer, only an optimum! Modify the features to fit standard cells or modify the cell (re-plan) or subcontract. If utilisation is low, consider mixing cells.
exception
exception
exception
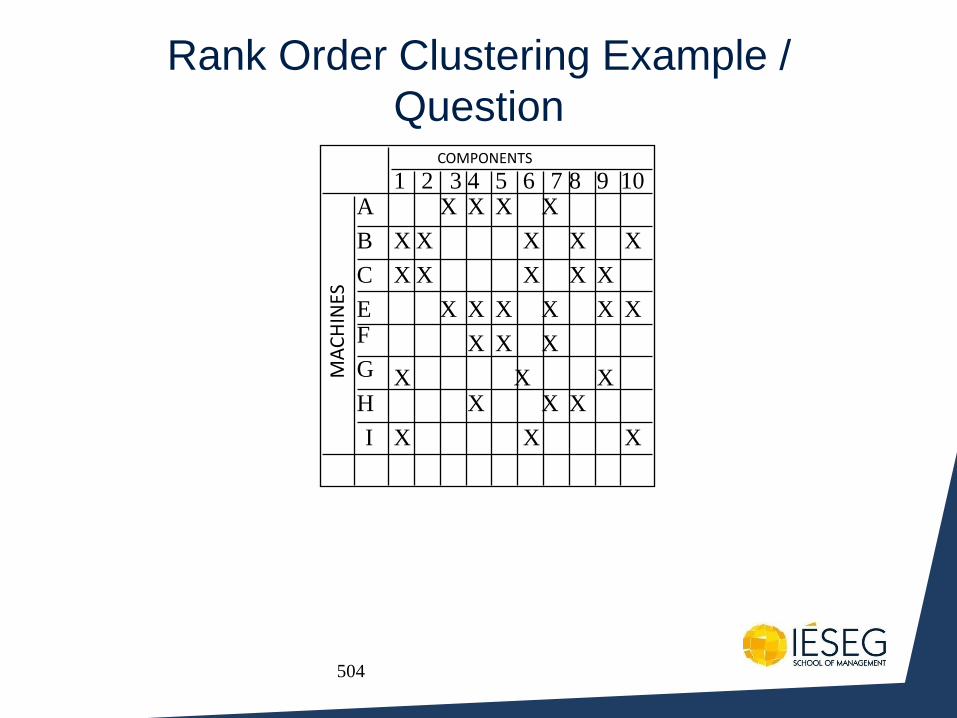
504
Rank Order Clustering Example /
Question COMPONENTS
MA
CH
INES
A
B
F
C
E
G
H
I
1 2 3 4 5 6 7 8 9 10 X X X X
X
X
X
X
X X X
X X X
X X X X X X
X X X
X X X X X X
X X X
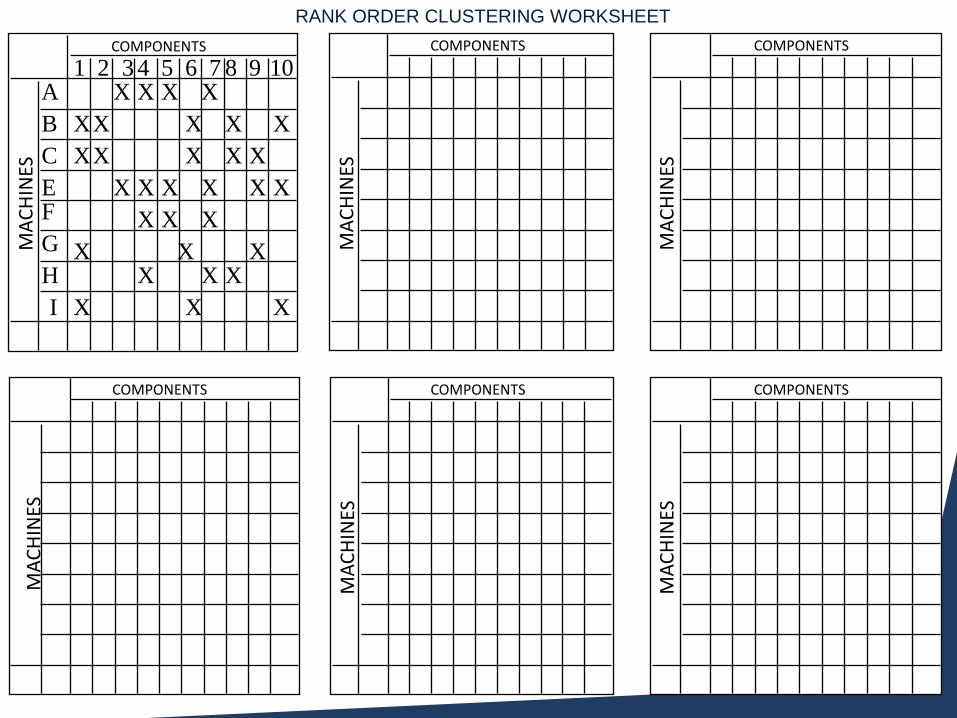
505
RANK ORDER CLUSTERING WORKSHEET
COMPONENTS
MA
CH
INES
COMPONENTS
MA
CH
INES
COMPONENTS
MA
CH
INES
COMPONENTS
MA
CH
INES
COMPONENTS
MA
CH
INES
COMPONENTS M
AC
HIN
ES
A
B
F
C
E
G
H
I
1 2 3 4 5 6 7 8 9 10 X X X X
X
X
X
X
X X X
X X X
X X X X X X
X X X
X X X X X X
X X X
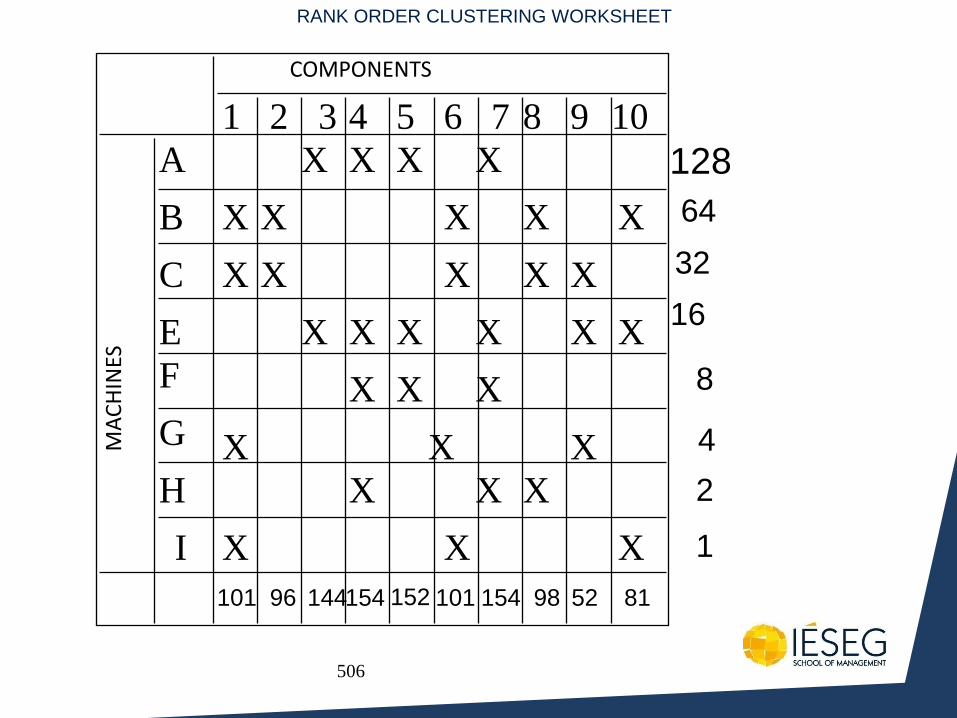
506
RANK ORDER CLUSTERING WORKSHEET
COMPONENTS
MA
CH
INES
A
B
F
C
E
G
H
I
1 2 3 4 5 6 7 8 9 10
X X X X
X
X
X
X
X X X
X X X
X X X X X X
X X X
X X X
X X X
X X X 1
2
4
8
16
32
64
128
81 52 98 154 101 154 152 144 96 101
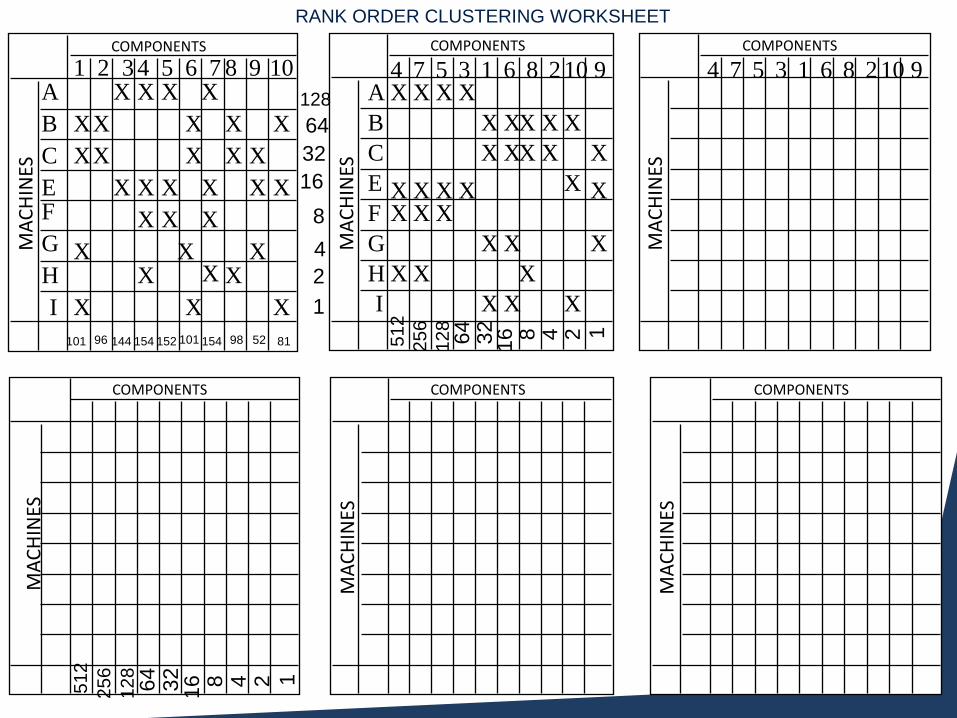
507
RANK ORDER CLUSTERING WORKSHEET
COMPONENTS
MA
CH
INES
COMPONENTS
MA
CH
INES
COMPONENTS
MA
CH
INES
COMPONENTS
MA
CH
INES
COMPONENTS
MA
CH
INES
COMPONENTS M
AC
HIN
ES
A
B
F
C
E
G
H
I
1 2 3 4 5 6 7 8 9 10 X X X X
X
X
X
X
X X X
X X X
X X X X X X
X X X
X X X X X X
X X X 1
2
4
8
16
32
64
128
16
128
256
1
2
4
8
32
6
4
512
16
128
256
1
2
4
8
32
6
4
512
81 52 98 154 101 152 154 144 96 101
A
B
F
C
E
G
H
I
1 2 3 4 5 6 7 8 9 10 X
X X
X
X
X
X
X
X
X
X
X
X X
X
X
X X
X
X
X
X
X
X
X
X
X
X
X
X
X
X
1 2 3 4 5 6 7 8 9 10
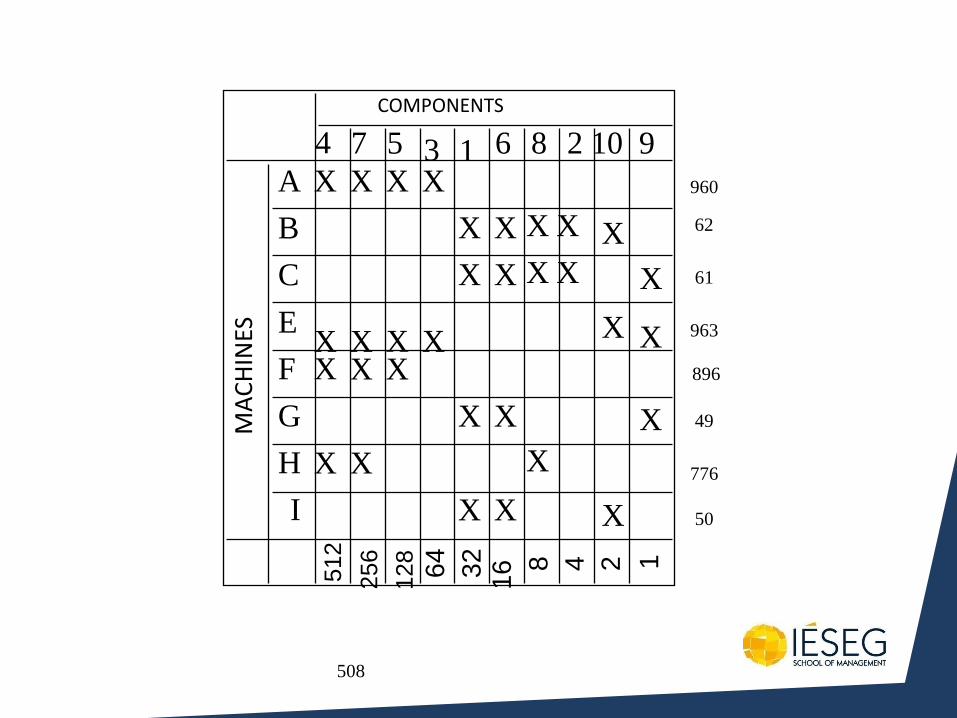
508
COMPONENTS
MA
CH
INES
16
128
256
1
2
4
8
32
64
512
A
B
F
C
E
G
H
I
1 2 3 4 5 6 7 8 9 10
X
X X
X
X
X
X
X
X
X
X
X
X X
X
X
X X
X
X
X
X
X
X
X
X
X
X
X
X
X
X
50
776
49
896
963
61
62
960
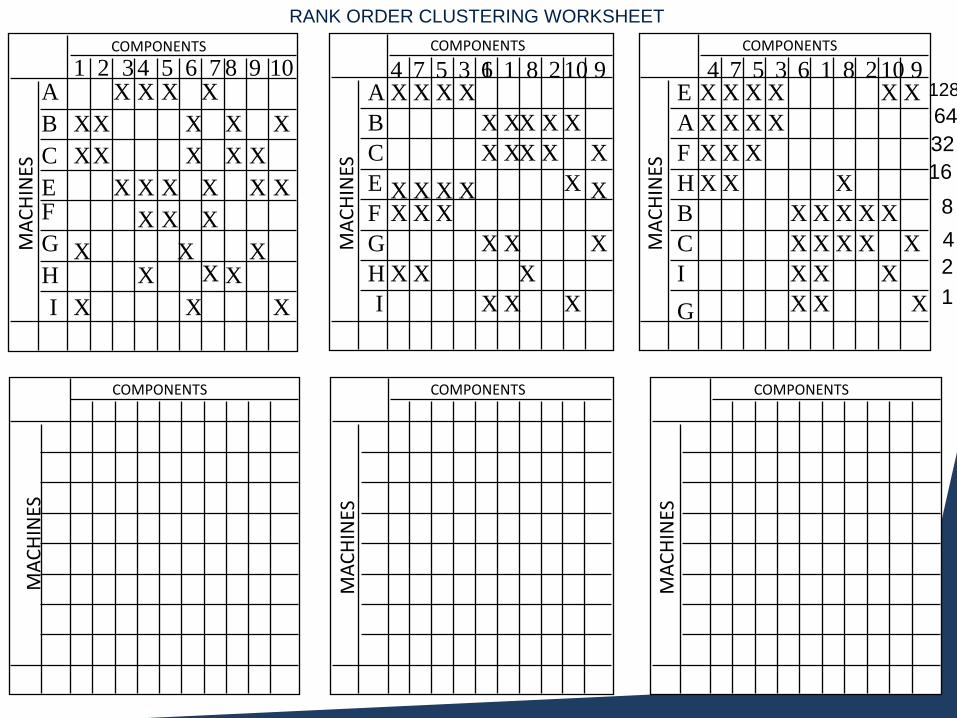
509
RANK ORDER CLUSTERING WORKSHEET
COMPONENTS
MA
CH
INES
COMPONENTS
MA
CH
INES
COMPONENTS
MA
CH
INES
COMPONENTS
MA
CH
INES
COMPONENTS M
AC
HIN
ES
A
B
F
C
E
G
H
I
1 2 3 4 5 6 7 8 9 10 X X X X
X
X
X
X
X X X
X X X
X X X X X X
X X X
X X X X X X
X X X
A
B
F
C
E
G
H
I
1 2 3 4 5 1 7 8 9 10 X
X X
X
X
X
X
X
X
X
X
X
X X
X
X
X X
X
X
X
X
X
X
X
X
X
X
X
X
X
X
6 COMPONENTS
MA
CH
INES
1
2
4
8
16
32
64
128 6 2 3 4 5 1 7 8 9 10
E
A
H
F
C
B
G
I
X X X X
X X X X
X
X
X
X
X
X
X
X
X
X X X
X X X X
X X
X
X
X
X
X
X

510
RANK ORDER CLUSTERING WORKSHEET
COMPONENTS
MA
CH
INES
COMPONENTS M
AC
HIN
ES
A
B
F
C
E
G
H
I
1 2 3 4 5 6 7 8 9 10 X X X X
X
X
X
X
X X X
X X X
X X X X X X
X X X
X X X X X X
X X X
A
B
F
C
E
G
H
I
1 2 3 4 5 1 7 8 9 10 X
X X
X
X
X
X
X
X
X
X
X
X X
X
X
X X
X
X
X
X
X
X
X
X
X
X
X
X
X
X
6
COMPONENTS
MA
CH
INES
10 6 3 4 5 8 7 9 2 1 E
A
H
F
C
B
G
I
X X X X
X X X X
X
X
X
X
X
X
X X
X
X X X
X
X X
X
X
X
X
X
X
X
X
X
COMPONENTS
MA
CH
INES
COMPONENTS
MA
CH
INES
COMPONENTS
MA
CH
INES
1
2
4
8
16
32
64
128 6 2 3 4 5 1 7 8 9 10
E
A
H
F
C
B
G
I
X X X X
X X X X
X
X
X
X
X
X
X
X
X
X X X
X X X X
X X
X
X
X
X
X
X
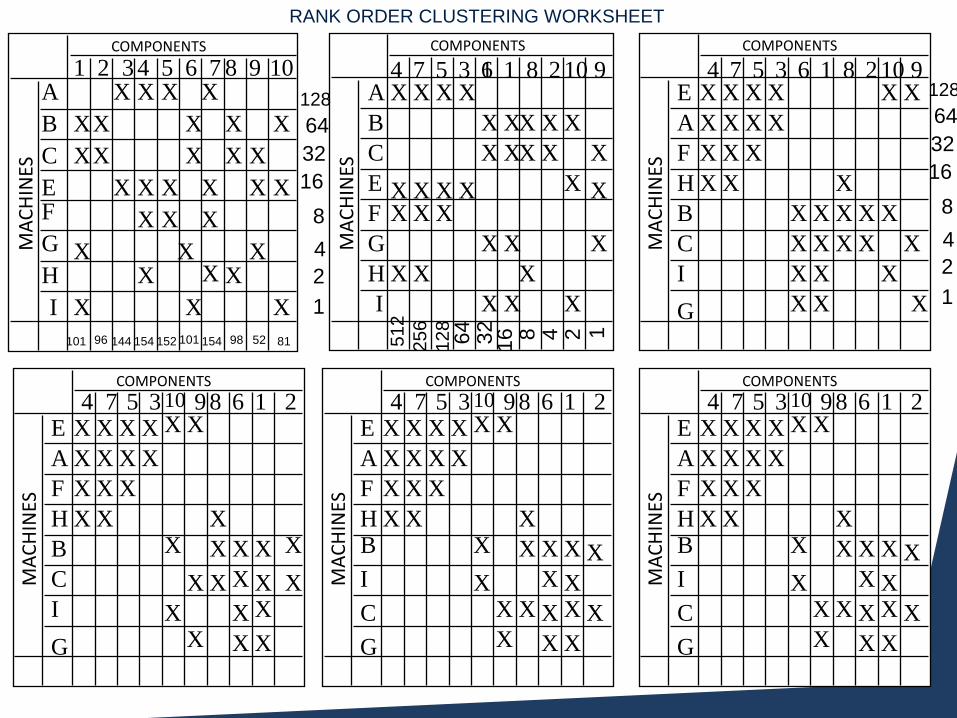
511
RANK ORDER CLUSTERING WORKSHEET
COMPONENTS
MA
CH
INES
COMPONENTS M
AC
HIN
ES
A
B
F
C
E
G
H
I
1 2 3 4 5 6 7 8 9 10 X X X X
X
X
X
X
X X X
X X X
X X X X X X
X X X
X X X X X X
X X X 1
2
4
8
16
32
64
128
16
128
256
1
2
4
8
32
6
4
512
81 52 98 154 101 152 154 144 96 101
A
B
F
C
E
G
H
I
1 2 3 4 5 1 7 8 9 10 X
X X
X
X
X
X
X
X
X
X
X
X X
X
X
X X
X
X
X
X
X
X
X
X
X
X
X
X
X
X
6
COMPONENTS
MA
CH
INES
10 6 3 4 5 8 7 9 2 1 E
A
H
F
C
B
G
I
X X X X
X X X X
X
X
X
X
X
X
X X
X
X X X
X
X X
X
X
X
X
X
X
X
X
X
COMPONENTS
MA
CH
INES
10 6 3 4 5 8 7 9 2 1 E
A
H
F
I
B
G
C
X X X X
X X X X
X
X
X
X
X
X
X X
X
X X X
X X X X
X
X
X
X
X
X
X X
COMPONENTS
MA
CH
INES
1
2
4
8
16
32
64
128 6 2 3 4 5 1 7 8 9 10
E
A
H
F
C
B
G
I
X X X X
X X X X
X
X
X
X
X
X
X
X
X
X X X
X X X X
X X
X
X
X
X
X
X
COMPONENTS
MA
CH
INES
10 6 3 4 5 8 7 9 2 1 E
A
H
F
I
B
G
C
X X X X
X X X X
X
X
X
X
X
X
X X
X
X X X
X X X X
X
X
X
X
X
X
X X
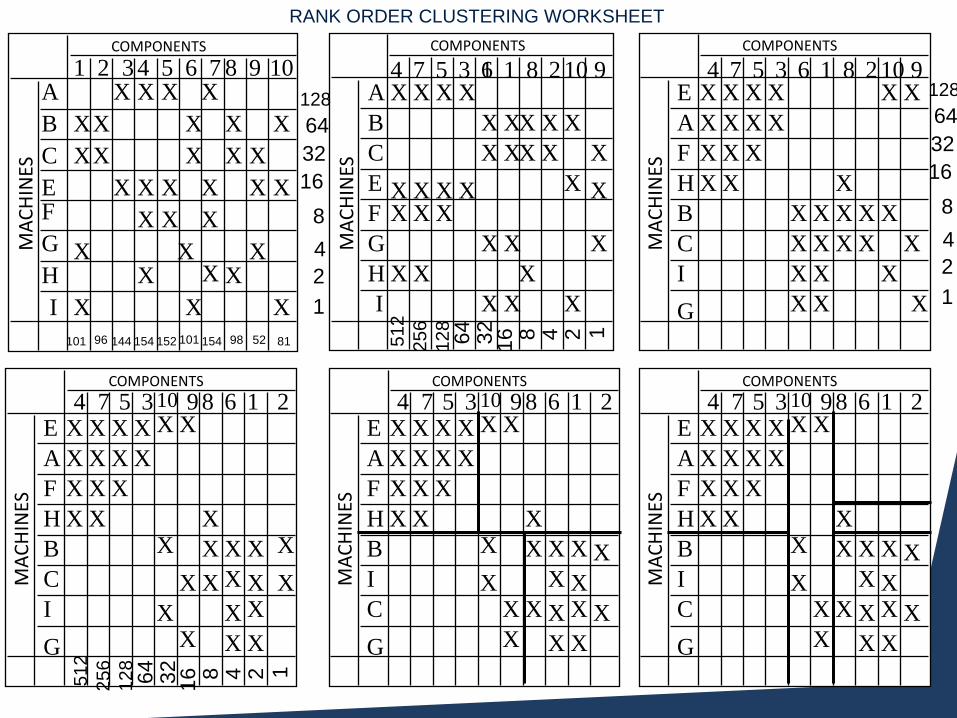
512
RANK ORDER CLUSTERING WORKSHEET
COMPONENTS
MA
CH
INES
COMPONENTS M
AC
HIN
ES
A
B
F
C
E
G
H
I
1 2 3 4 5 6 7 8 9 10 X X X X
X
X
X
X
X X X
X X X
X X X X X X
X X X
X X X X X X
X X X 1
2
4
8
16
32
64
128
16
128
256
1
2
4
8
32
6
4
512
81 52 98 154 101 152 154 144 96 101
A
B
F
C
E
G
H
I
1 2 3 4 5 1 7 8 9 10 X
X X
X
X
X
X
X
X
X
X
X
X X
X
X
X X
X
X
X
X
X
X
X
X
X
X
X
X
X
X
6
COMPONENTS
MA
CH
INES
10 6 3 4 5 8 7 9 2 1 E
A
H
F
C
B
G
I
X X X X
X X X X
X
X
X
X
X
X
X X
X
X X X
X
X X
X
X
X
X
X
X
X
X
X
COMPONENTS
MA
CH
INES
10 6 3 4 5 8 7 9 2 1 E
A
H
F
I
B
G
C
X X X X
X X X X
X
X
X
X
X
X
X X
X
X X X
X X X X
X
X
X
X
X
X
X X
COMPONENTS
MA
CH
INES
10 6 3 4 5 8 7 9 2 1 E
A
H
F
I
B
G
C
X X X X
X X X X
X
X
X
X
X
X
X X
X
X X X
X X X X
X
X
X
X
X
X
X X
COMPONENTS
MA
CH
INES
1
2
4
8
16
32
64
128 6 2 3 4 5 1 7 8 9 10
E
A
H
F
C
B
G
I
X X X X
X X X X
X
X
X
X
X
X
X
X
X
X X X
X X X X
X X
X
X
X
X
X
X
16
12
8
25
6
1
2
4
8
32
6
4
512
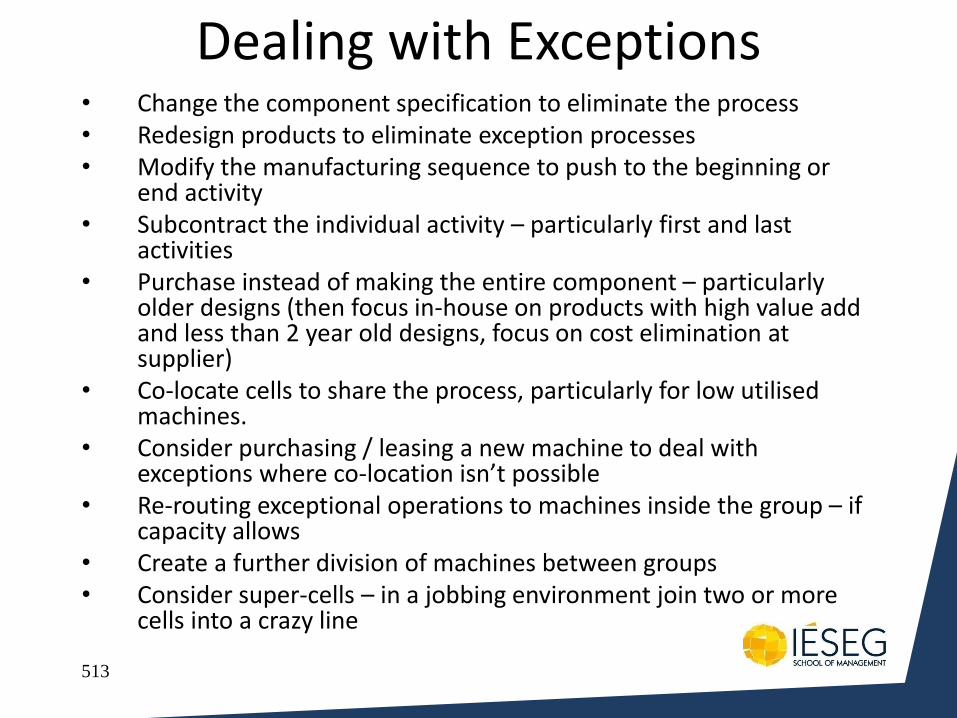
513
Dealing with Exceptions • Change the component specification to eliminate the process • Redesign products to eliminate exception processes • Modify the manufacturing sequence to push to the beginning or
end activity • Subcontract the individual activity – particularly first and last
activities • Purchase instead of making the entire component – particularly
older designs (then focus in-house on products with high value add and less than 2 year old designs, focus on cost elimination at supplier)
• Co-locate cells to share the process, particularly for low utilised machines.
• Consider purchasing / leasing a new machine to deal with exceptions where co-location isn’t possible
• Re-routing exceptional operations to machines inside the group – if capacity allows
• Create a further division of machines between groups • Consider super-cells – in a jobbing environment join two or more
cells into a crazy line
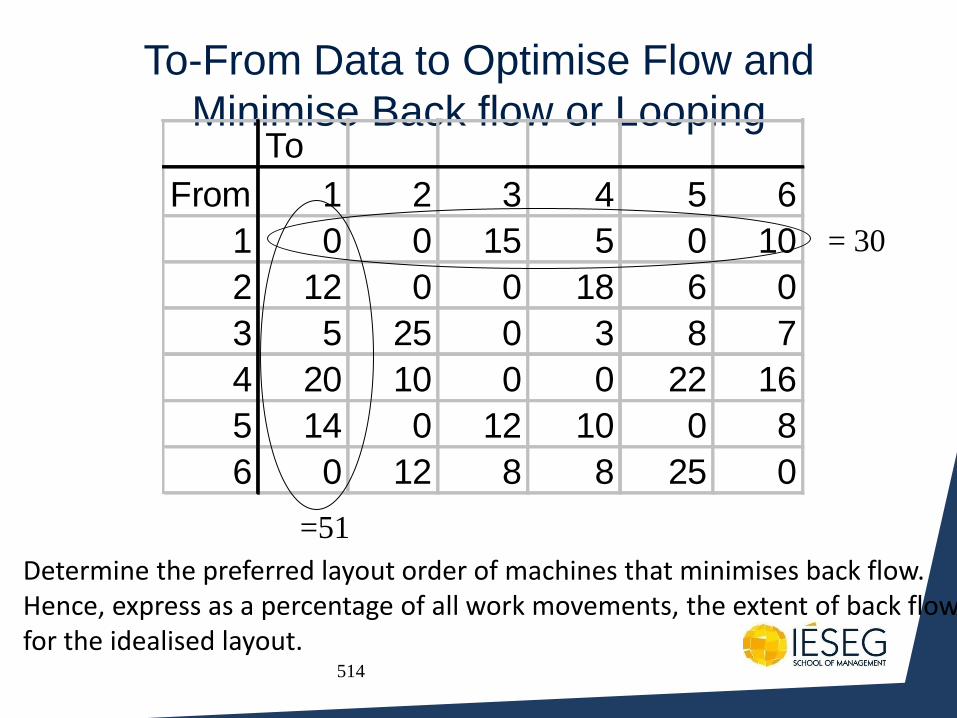
514
To-From Data to Optimise Flow and
Minimise Back flow or Looping
Determine the preferred layout order of machines that minimises back flow. Hence, express as a percentage of all work movements, the extent of back flow for the idealised layout.
To
From 1 2 3 4 5 6
1 0 0 15 5 0 10
2 12 0 0 18 6 0
3 5 25 0 3 8 7
4 20 10 0 0 22 16
5 14 0 12 10 0 8
6 0 12 8 8 25 0
= 30
=51
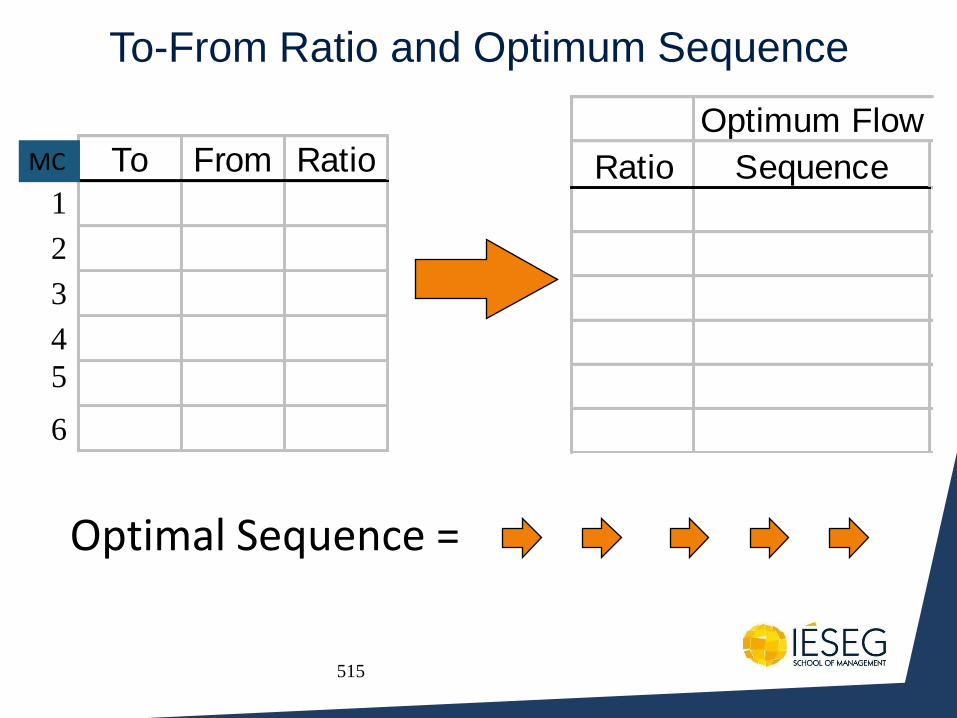
515
To-From Ratio and Optimum Sequence
To From RatioOptimum Flow
Ratio Sequence
Optimal Sequence =
1
2
3
4
5
6
MC
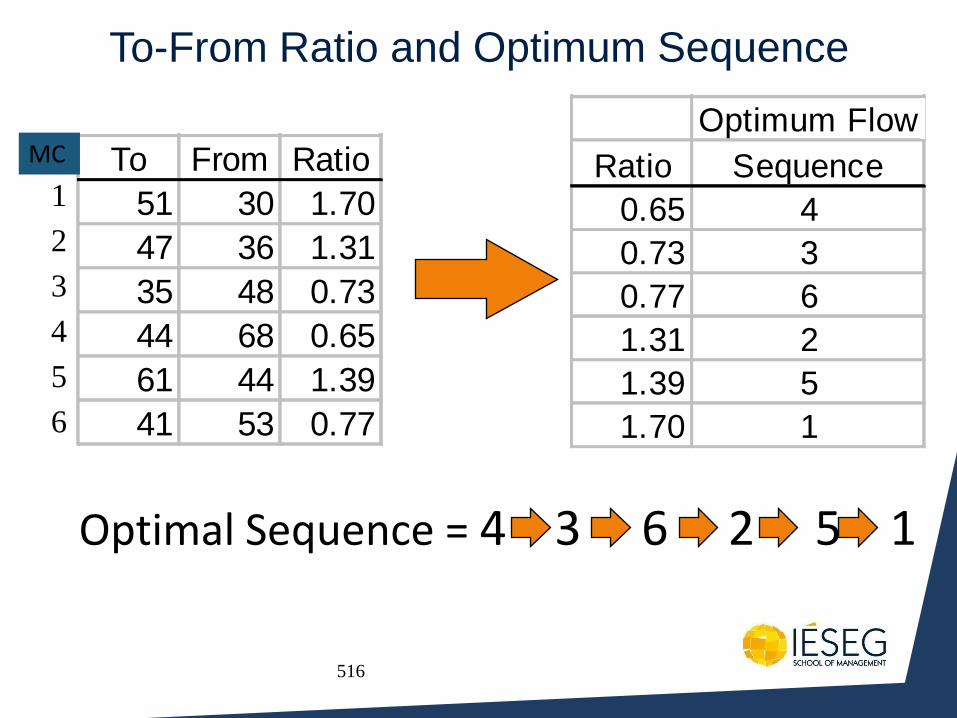
516
To-From Ratio and Optimum Sequence
To From Ratio
51 30 1.70
47 36 1.31
35 48 0.73
44 68 0.65
61 44 1.39
41 53 0.77
Optimum Flow
Ratio Sequence
0.65 4
0.73 3
0.77 6
1.31 2
1.39 5
1.70 1
Optimal Sequence = 4 3 6 2 5 1
1
2
3
4
5
6
MC
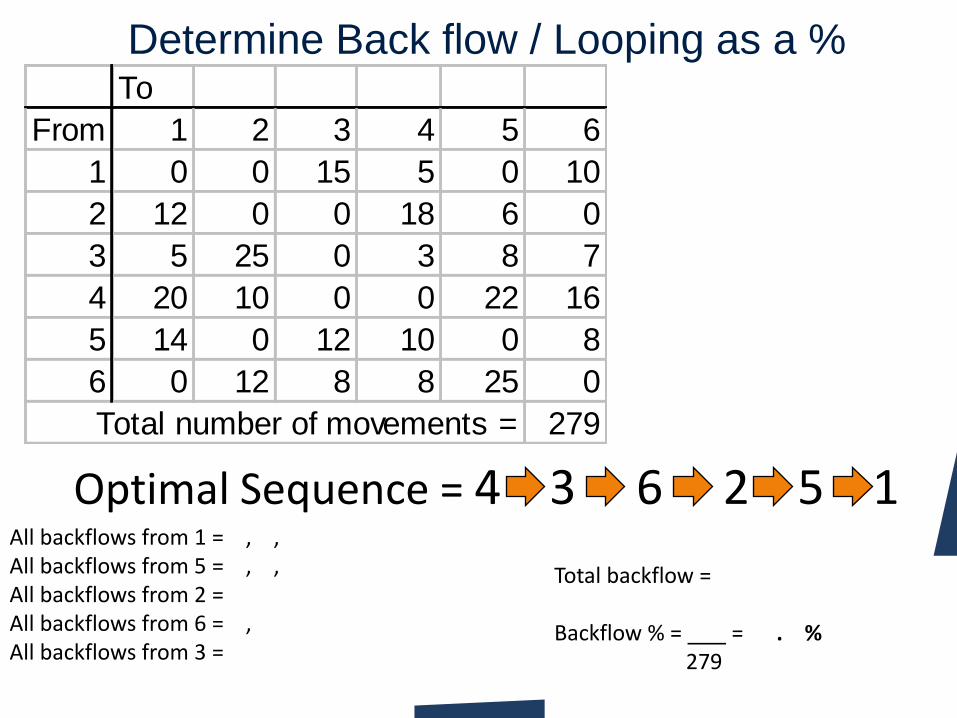
517
Determine Back flow / Looping as a % To
From 1 2 3 4 5 6
1 0 0 15 5 0 10
2 12 0 0 18 6 0
3 5 25 0 3 8 7
4 20 10 0 0 22 16
5 14 0 12 10 0 8
6 0 12 8 8 25 0
Total number of movements = 279
All backflows from 1 = , , All backflows from 5 = , , All backflows from 2 = All backflows from 6 = , All backflows from 3 =
Total backflow = Backflow % = = . % 279
Optimal Sequence = 4 3 6 2 5 1
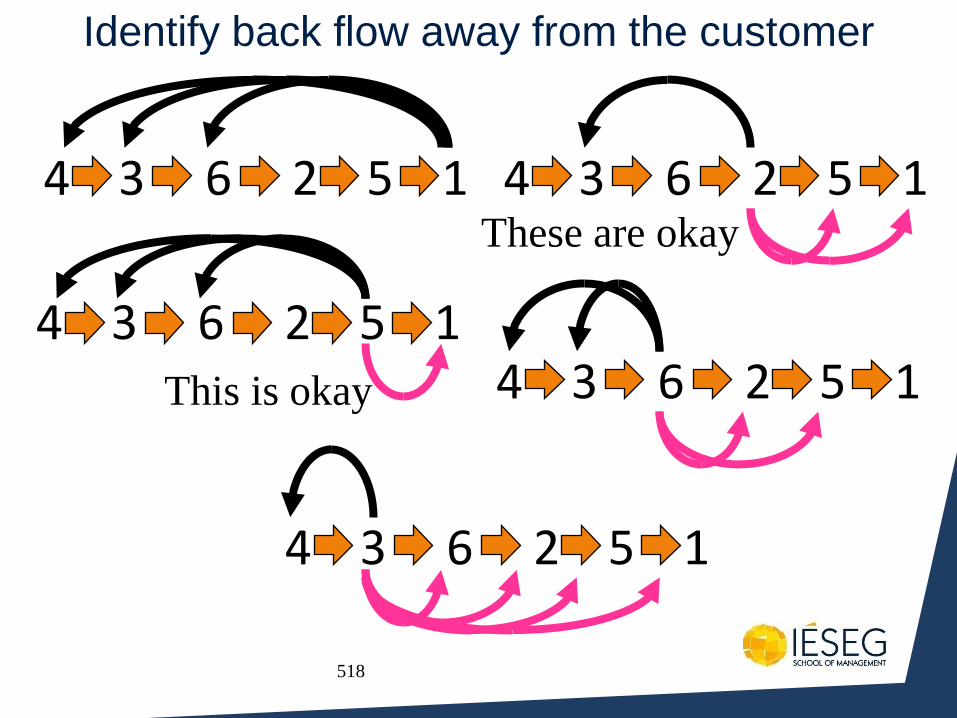
518
Identify back flow away from the customer
4 3 6 2 5 1
4 3 6 2 5 1 This is okay
4 3 6 2 5 1 These are okay
4 3 6 2 5 1
4 3 6 2 5 1
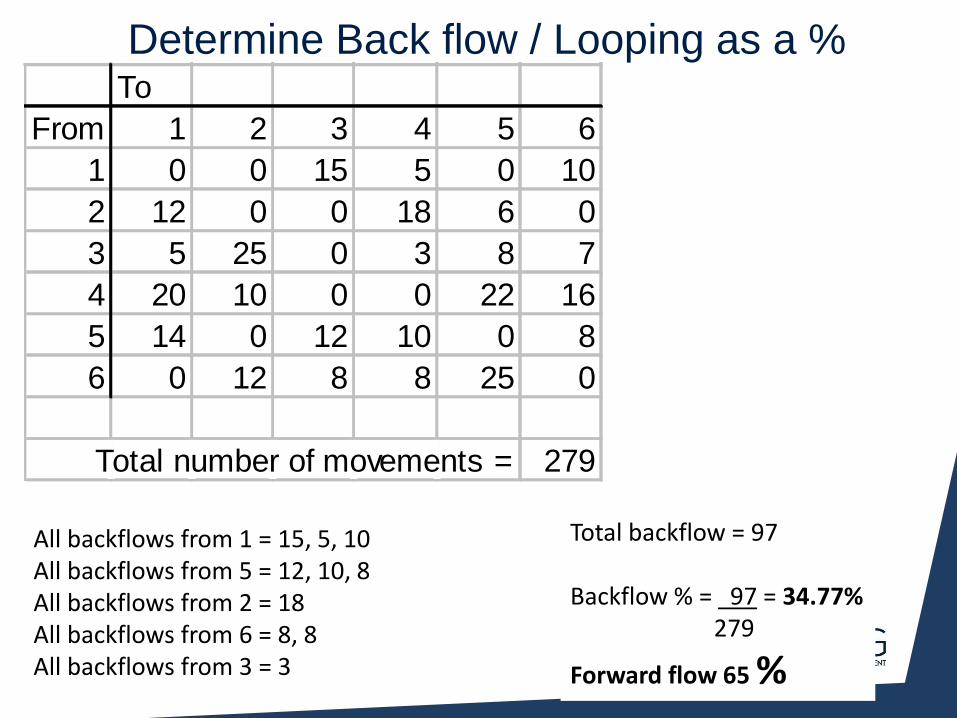
519
Determine Back flow / Looping as a % To
From 1 2 3 4 5 6
1 0 0 15 5 0 10
2 12 0 0 18 6 0
3 5 25 0 3 8 7
4 20 10 0 0 22 16
5 14 0 12 10 0 8
6 0 12 8 8 25 0
Total number of movements = 279
All backflows from 1 = 15, 5, 10 All backflows from 5 = 12, 10, 8 All backflows from 2 = 18 All backflows from 6 = 8, 8 All backflows from 3 = 3
Total backflow = 97 Backflow % = 97 = 34.77% 279
Forward flow 65 %
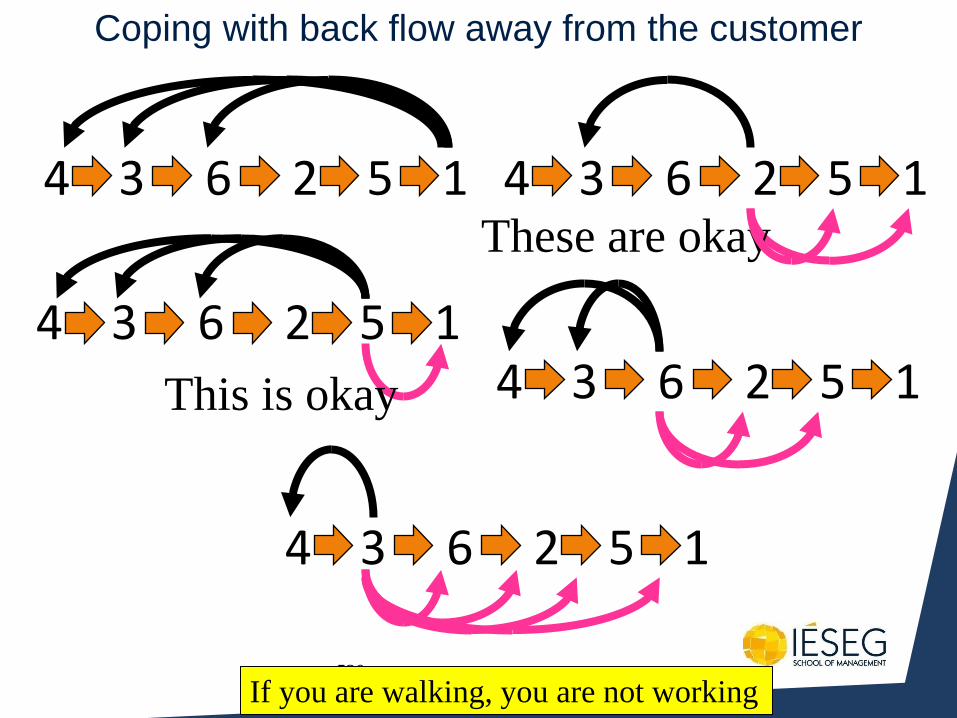
520
Coping with back flow away from the customer
4 3 6 2 5 1
4 3 6 2 5 1
This is okay
4 3 6 2 5 1 These are okay
4 3 6 2 5 1
4 3 6 2 5 1
If you are walking, you are not working
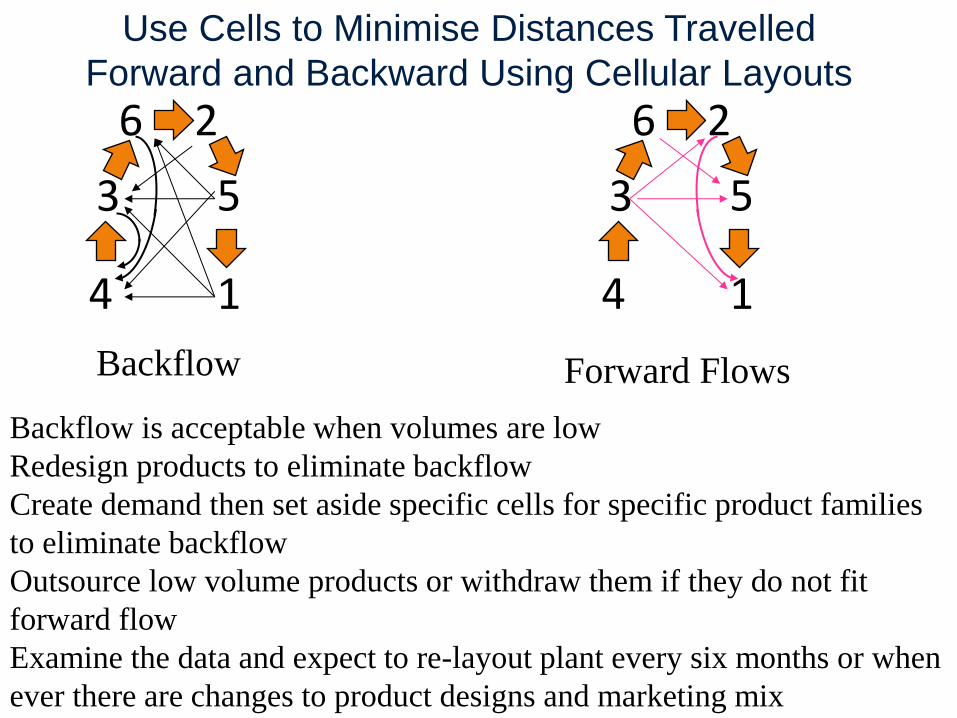
521
Use Cells to Minimise Distances Travelled
Forward and Backward Using Cellular Layouts
4
3
2 6
1
5
4
3
2 6
1
5
Backflow Forward Flows
Backflow is acceptable when volumes are low
Redesign products to eliminate backflow
Create demand then set aside specific cells for specific product families
to eliminate backflow
Outsource low volume products or withdraw them if they do not fit
forward flow
Examine the data and expect to re-layout plant every six months or when
ever there are changes to product designs and marketing mix

Profit Total assets
Output Total assets
Profit
Output =
×
Decomposing the ratio profit/total assets to derive the four strategic decision areas of operations strategy
Output Total assets
Output Capacity
Fixed assets Total assets
Capacity Fixed assets
Utilisation Working capital Productivity of fixed assets
= × ×
Operations strategy decision areas
Capacity Supply network
Process technology
Development and organisation
Profit Output
Revenue Output
Cost Output
Average revenue
Average cost
= –
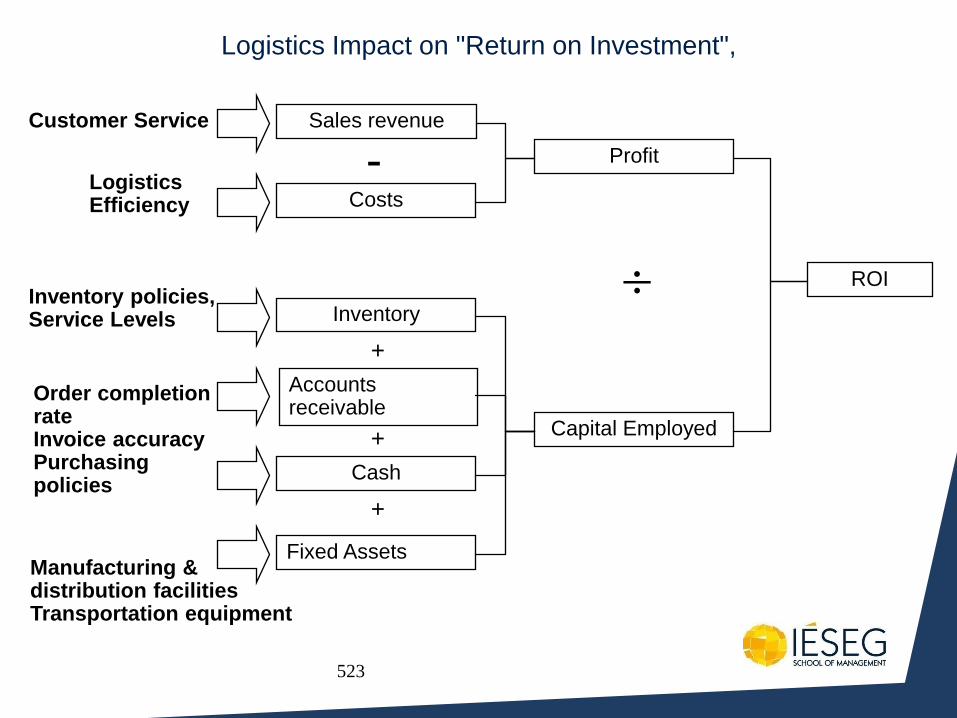
523
Logistics Impact on "Return on Investment",
Sales revenue
Costs
Inventory
Accounts receivable
Cash
Fixed Assets
-
+
+
+
Profit
Capital Employed
ROI
Customer Service
Logistics Efficiency
Inventory policies, Service Levels
Order completion rate Invoice accuracy Purchasing policies
Manufacturing & distribution facilities Transportation equipment
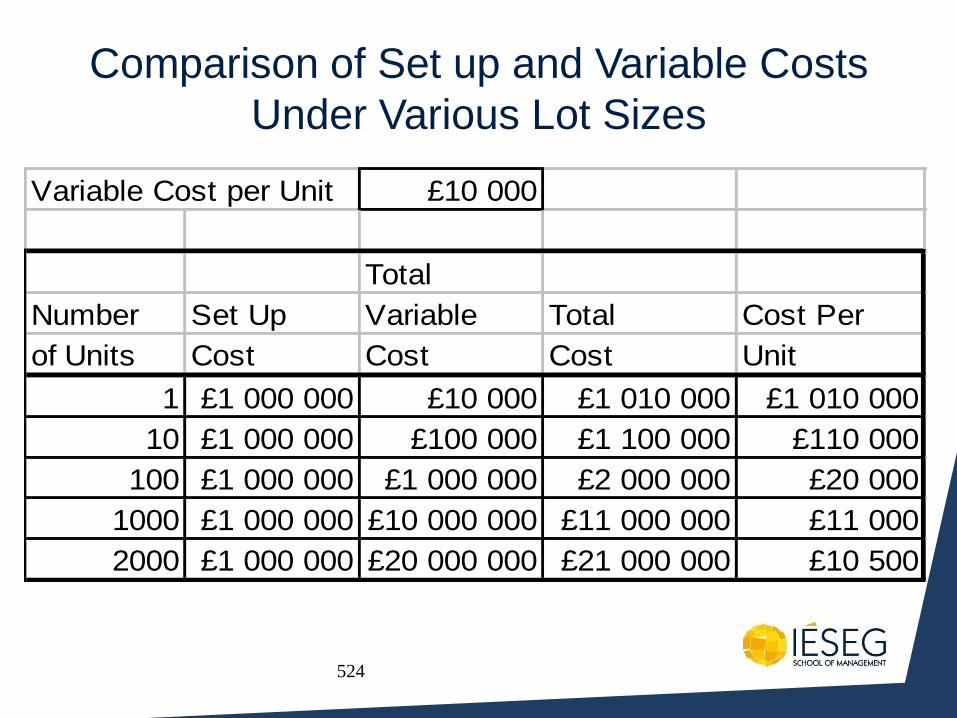
524
Comparison of Set up and Variable Costs
Under Various Lot Sizes
Variable Cost per Unit £10 000
Total
Number Set Up Variable Total Cost Per
of Units Cost Cost Cost Unit
1 £1 000 000 £10 000 £1 010 000 £1 010 000
10 £1 000 000 £100 000 £1 100 000 £110 000
100 £1 000 000 £1 000 000 £2 000 000 £20 000
1000 £1 000 000 £10 000 000 £11 000 000 £11 000
2000 £1 000 000 £20 000 000 £21 000 000 £10 500

525
• If you have 1€ million, and the machine you want costs 1€ million, what do you do?
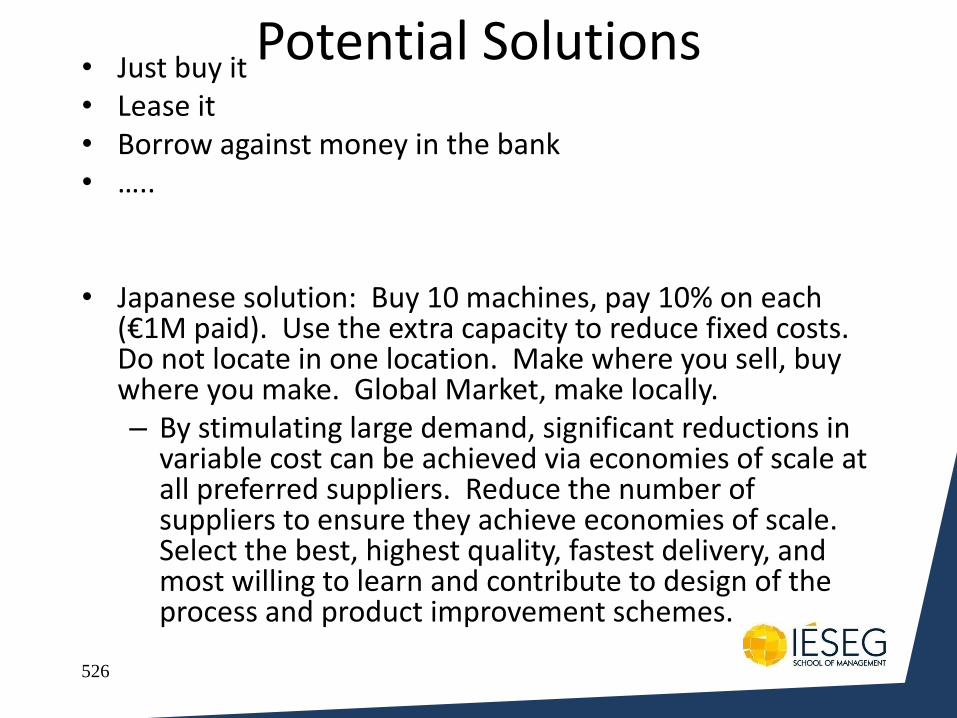
526
Potential Solutions • Just buy it • Lease it • Borrow against money in the bank • …..
• Japanese solution: Buy 10 machines, pay 10% on each (€1M paid). Use the extra capacity to reduce fixed costs. Do not locate in one location. Make where you sell, buy where you make. Global Market, make locally. – By stimulating large demand, significant reductions in
variable cost can be achieved via economies of scale at all preferred suppliers. Reduce the number of suppliers to ensure they achieve economies of scale. Select the best, highest quality, fastest delivery, and most willing to learn and contribute to design of the process and product improvement schemes.
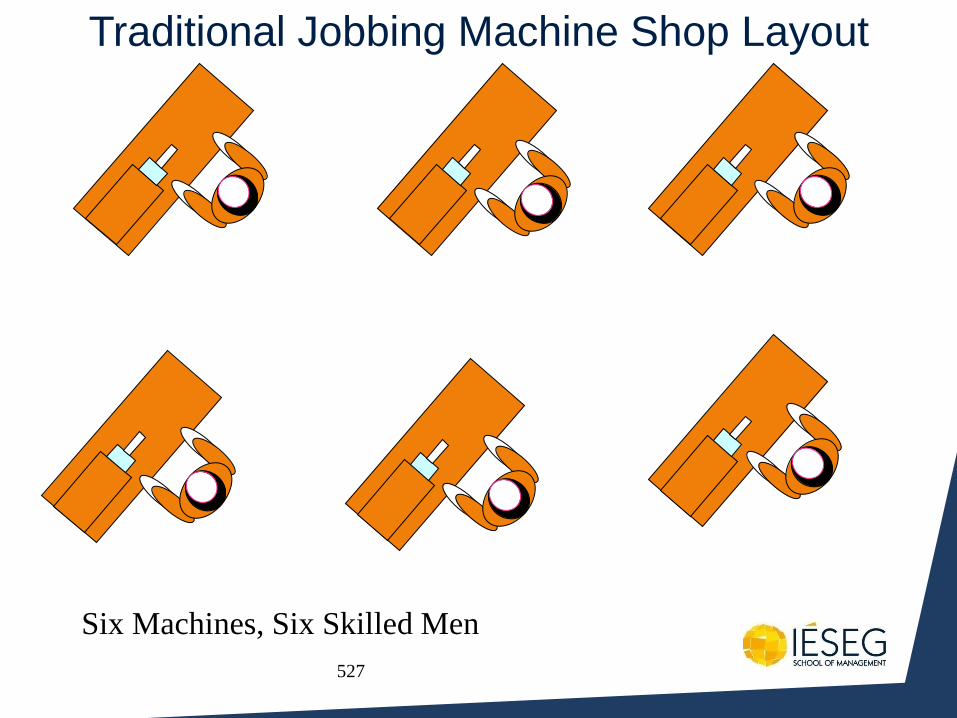
527
Traditional Jobbing Machine Shop Layout
Six Machines, Six Skilled Men

528
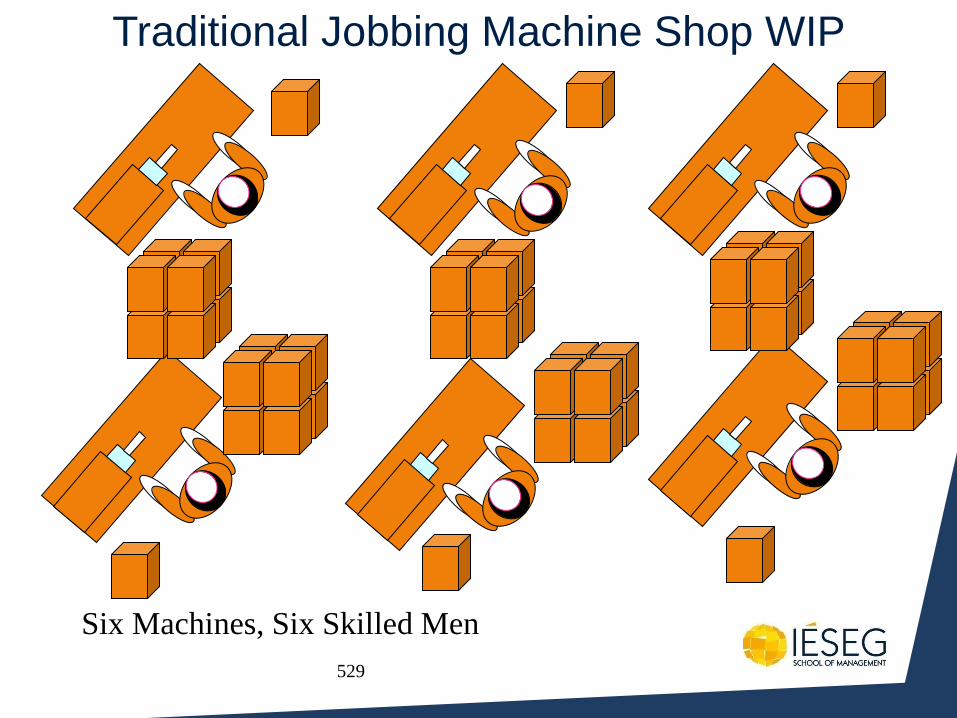
529
Traditional Jobbing Machine Shop WIP
Six Machines, Six Skilled Men
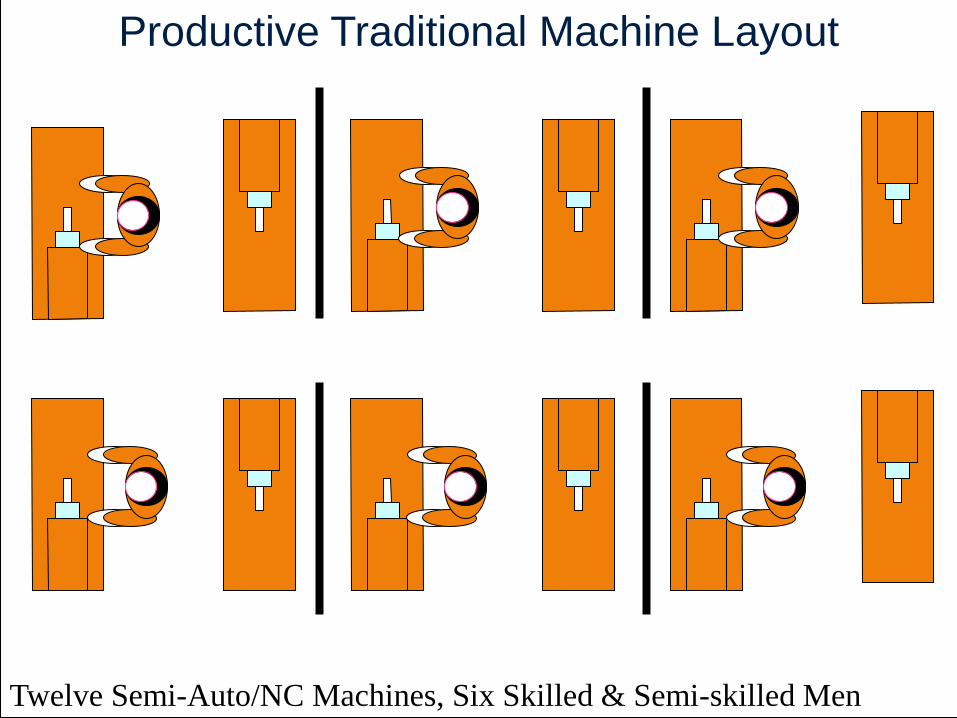
530
Productive Traditional Machine Layout
Twelve Semi-Auto/NC Machines, Six Skilled & Semi-skilled Men
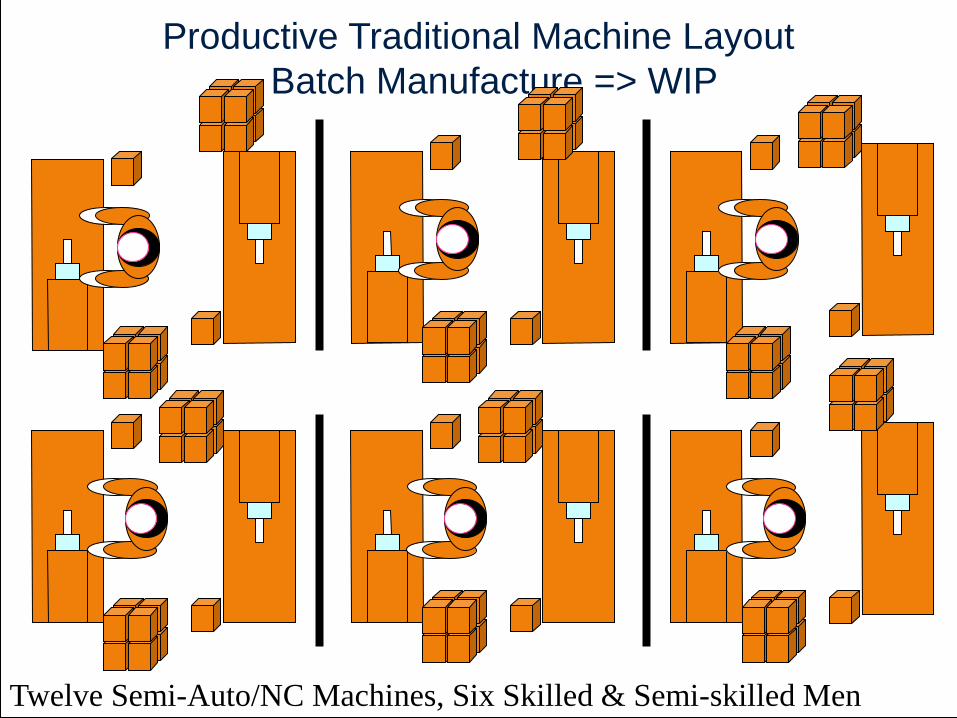
531
Productive Traditional Machine Layout
– Batch Manufacture => WIP
Twelve Semi-Auto/NC Machines, Six Skilled & Semi-skilled Men
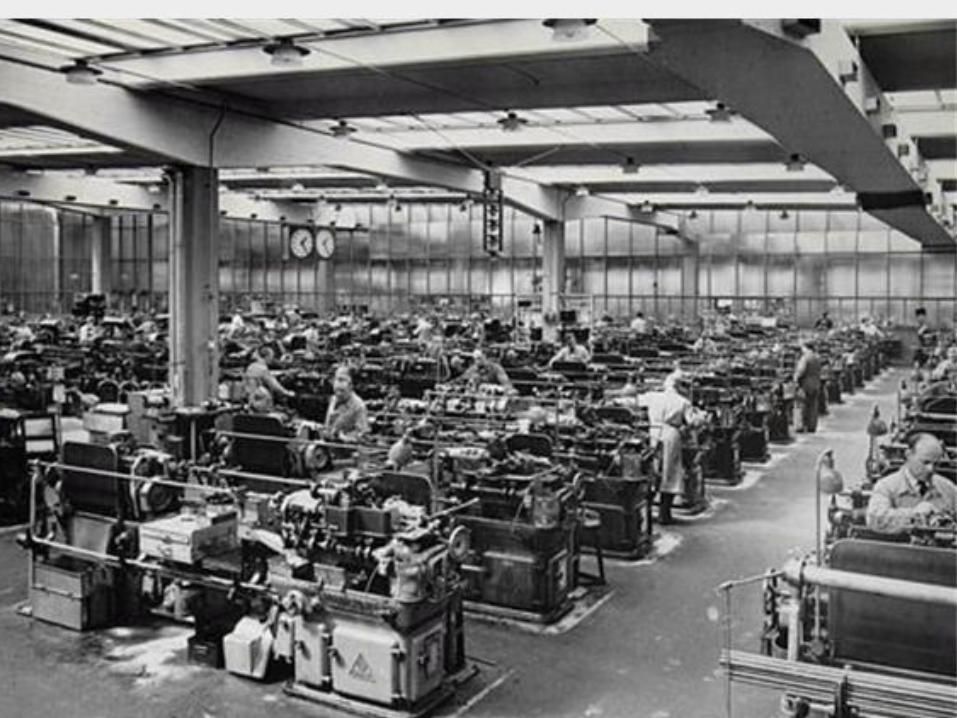
532
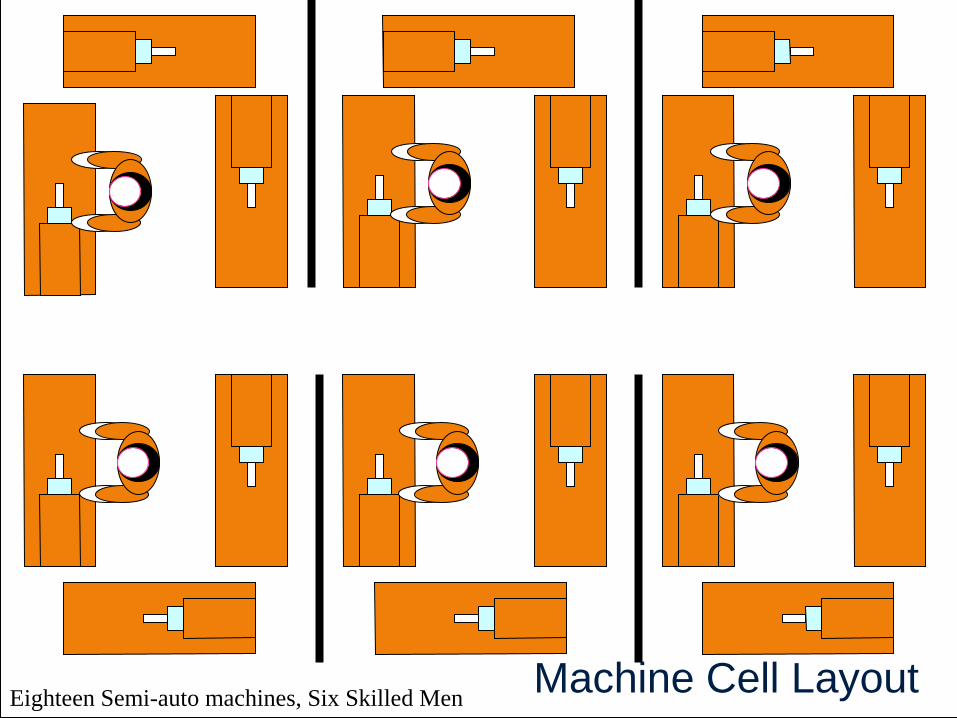
533 Machine Cell Layout Eighteen Semi-auto machines, Six Skilled Men
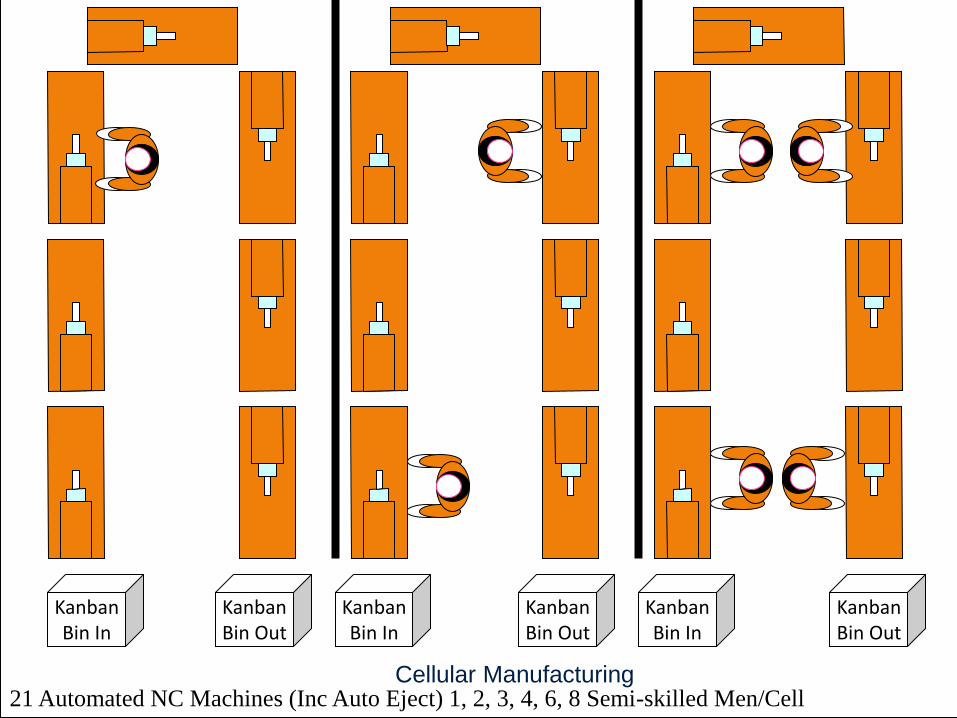
534 Cellular Manufacturing 21 Automated NC Machines (Inc Auto Eject) 1, 2, 3, 4, 6, 8 Semi-skilled Men/Cell
Kanban Bin In
Kanban Bin Out
Kanban Bin In
Kanban Bin Out
Kanban Bin In
Kanban Bin Out
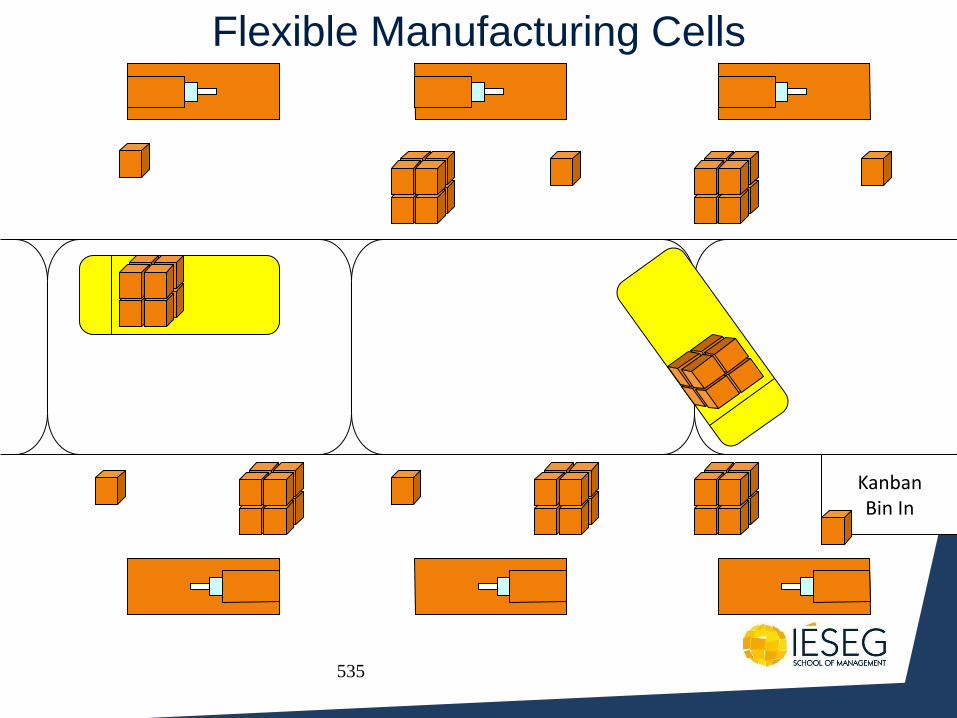
535
Kanban Bin In
Flexible Manufacturing Cells
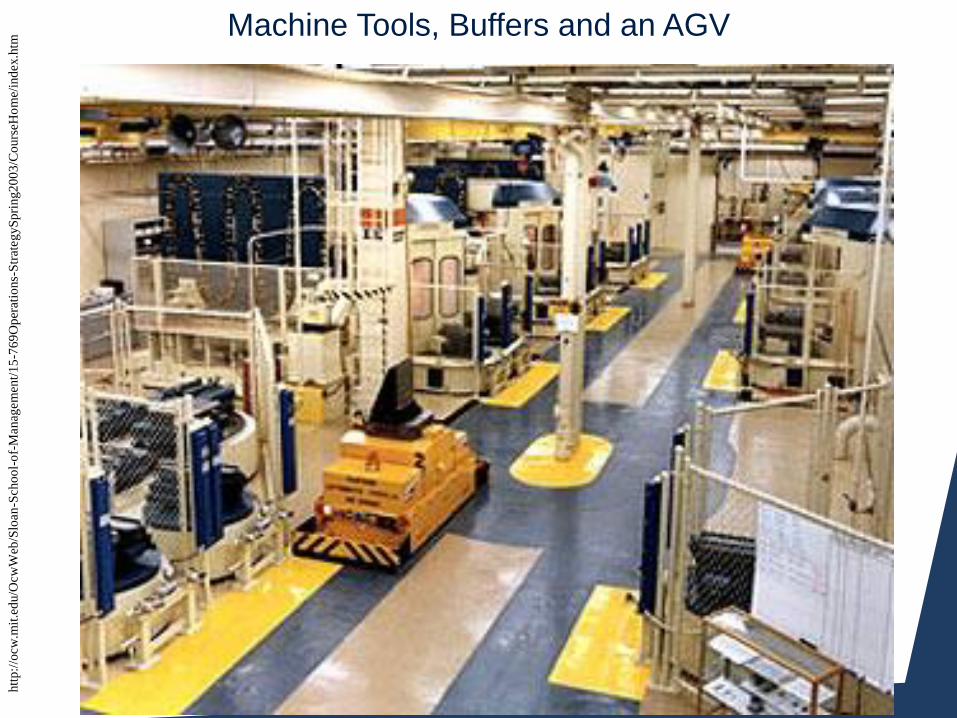
536
Machine Tools, Buffers and an AGV htt
p:/
/ocw
.mit
.ed
u/O
cw
Web
/Slo
an
-Scho
ol-
of-
Man
agem
ent/
15
-76
9O
per
atio
ns-
Str
ateg
yS
pri
ng2
00
3/C
ours
eHo
me/
ind
ex.h
tm
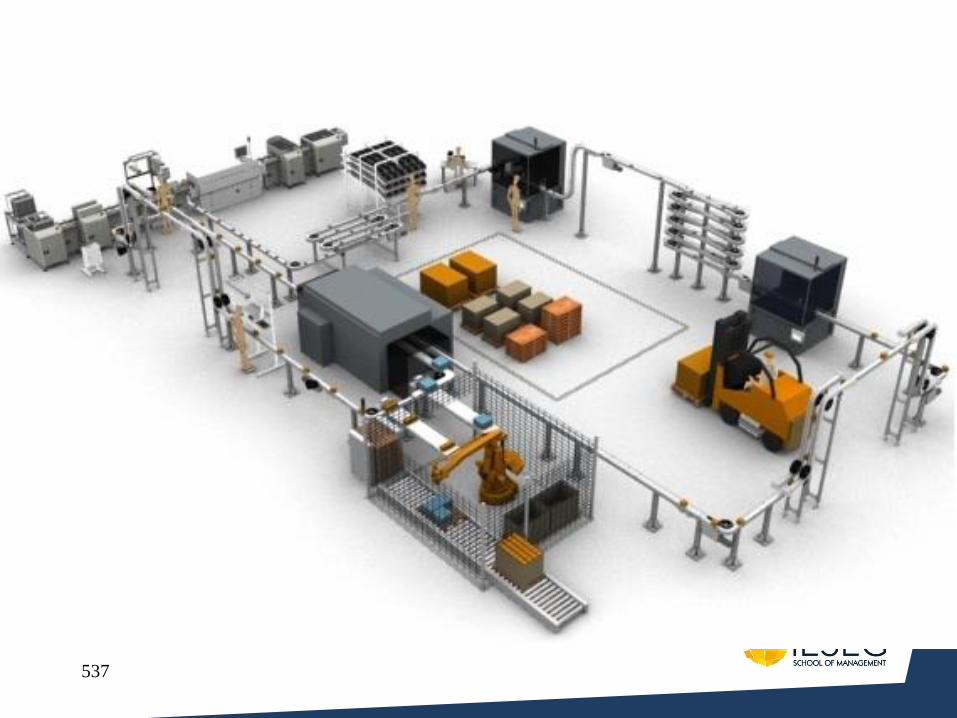
537
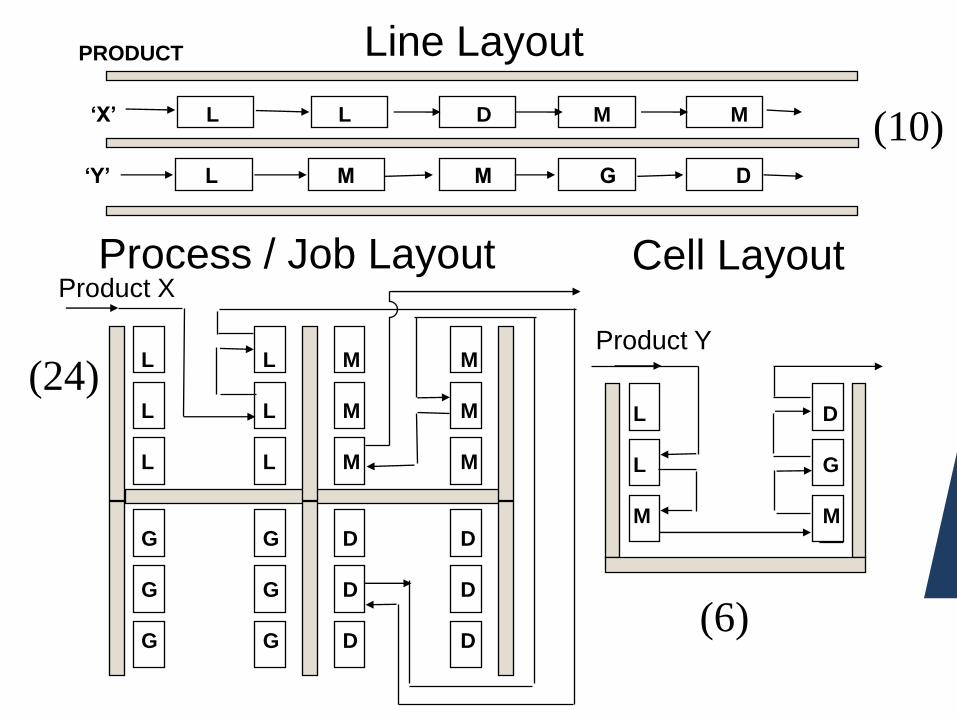
538
PRODUCT
‘X’ L L D M M
‘Y’ L M M G D
Line Layout
L L M M
L L M M
L L M M
G G D D
G G D D
G G D D
Process / Job Layout Product X
(10)
(6)
(24) L D
L G
M M
Product Y
Cell Layout
539
A Simulation of Cellular Manufacturing – Two Handed Operations, One Handed Operations,
and Loading Kanban Bins
©Dr David J. Newlands 2004
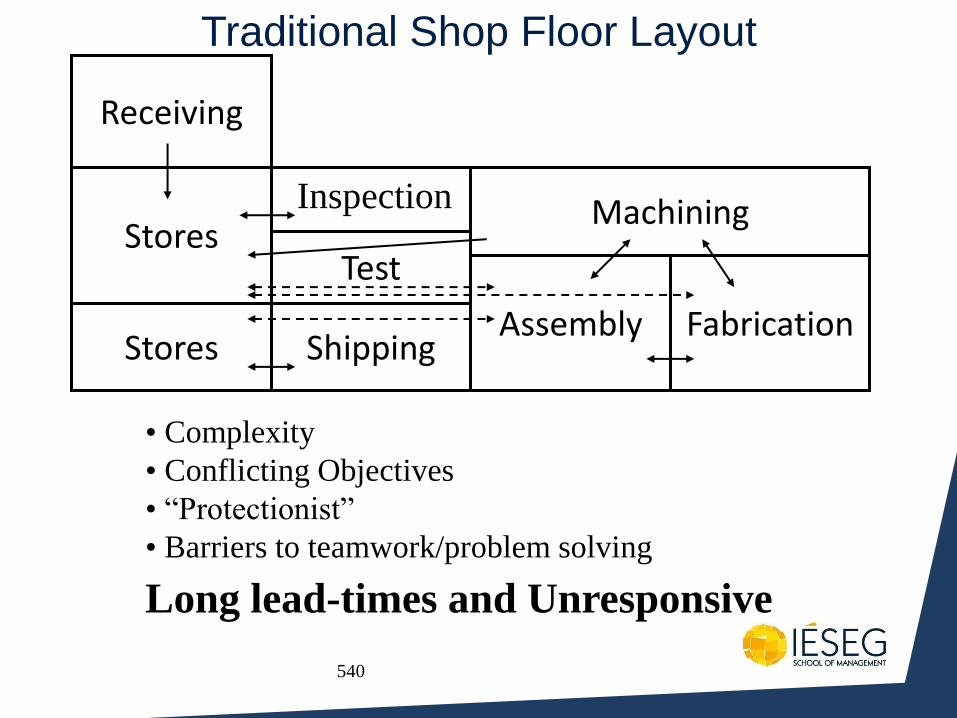
540
Traditional Shop Floor Layout
Receiving
Stores
Stores Shipping
Test
Assembly
Machining
Fabrication
Inspection
• Complexity
• Conflicting Objectives
• “Protectionist”
• Barriers to teamwork/problem solving
Long lead-times and Unresponsive
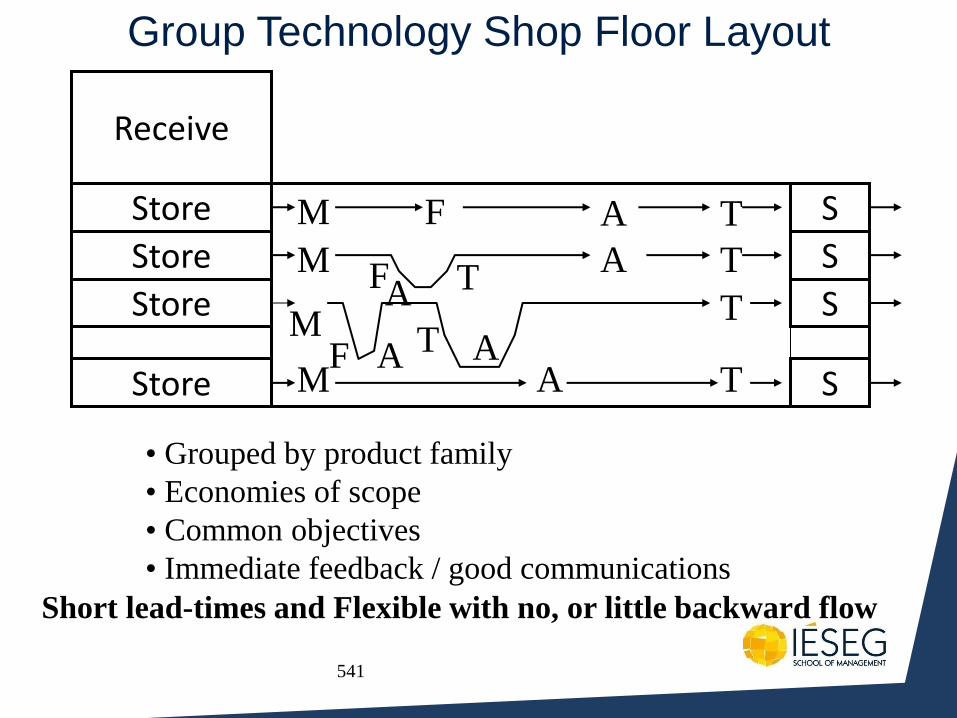
541
Group Technology Shop Floor Layout
S
Receive
Store
Store
Store
Store
S
S
S
• Grouped by product family
• Economies of scope
• Common objectives
• Immediate feedback / good communications
Short lead-times and Flexible with no, or little backward flow
M F A T
M A A F T
T
M F A A T
T
M A T
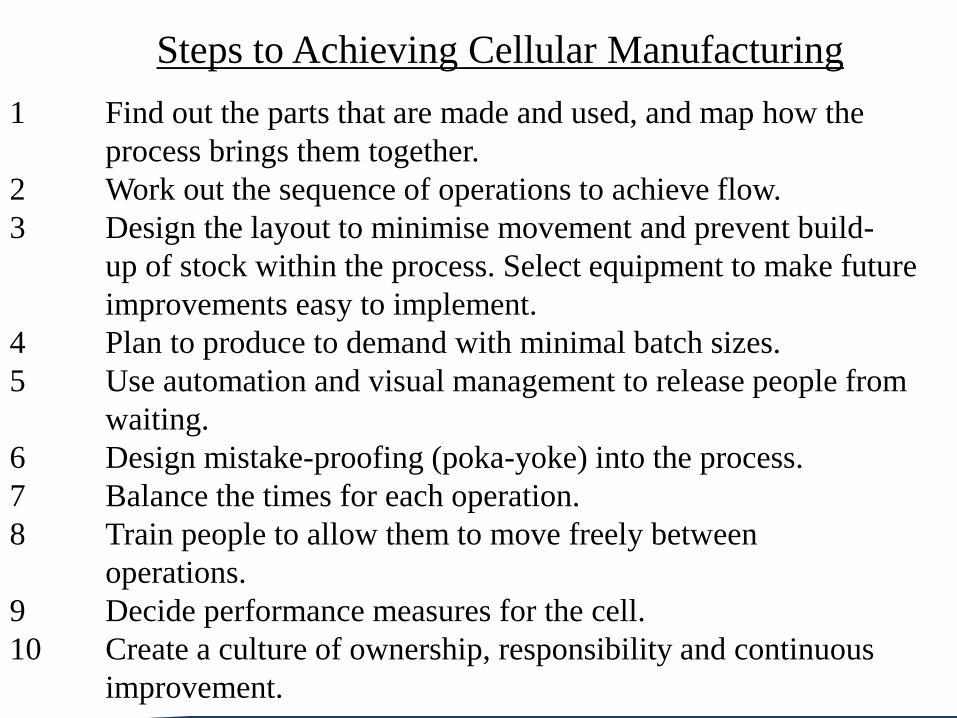
542
Steps to Achieving Cellular Manufacturing
1 Find out the parts that are made and used, and map how the
process brings them together.
2 Work out the sequence of operations to achieve flow.
3 Design the layout to minimise movement and prevent build-
up of stock within the process. Select equipment to make future
improvements easy to implement.
4 Plan to produce to demand with minimal batch sizes.
5 Use automation and visual management to release people from
waiting.
6 Design mistake-proofing (poka-yoke) into the process.
7 Balance the times for each operation.
8 Train people to allow them to move freely between
operations.
9 Decide performance measures for the cell.
10 Create a culture of ownership, responsibility and continuous
improvement.
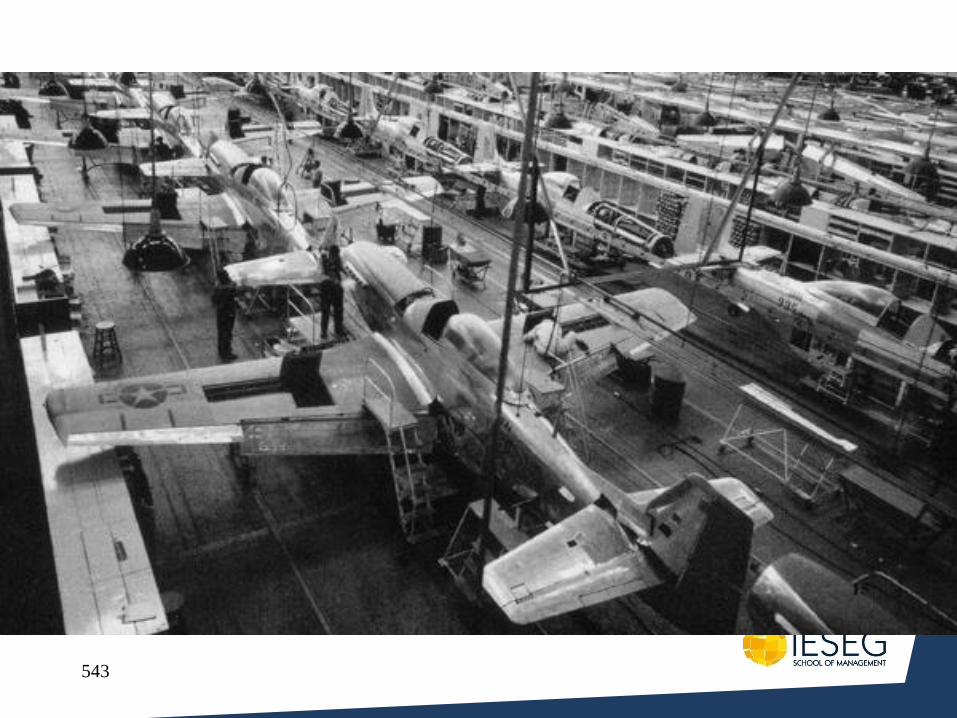
543
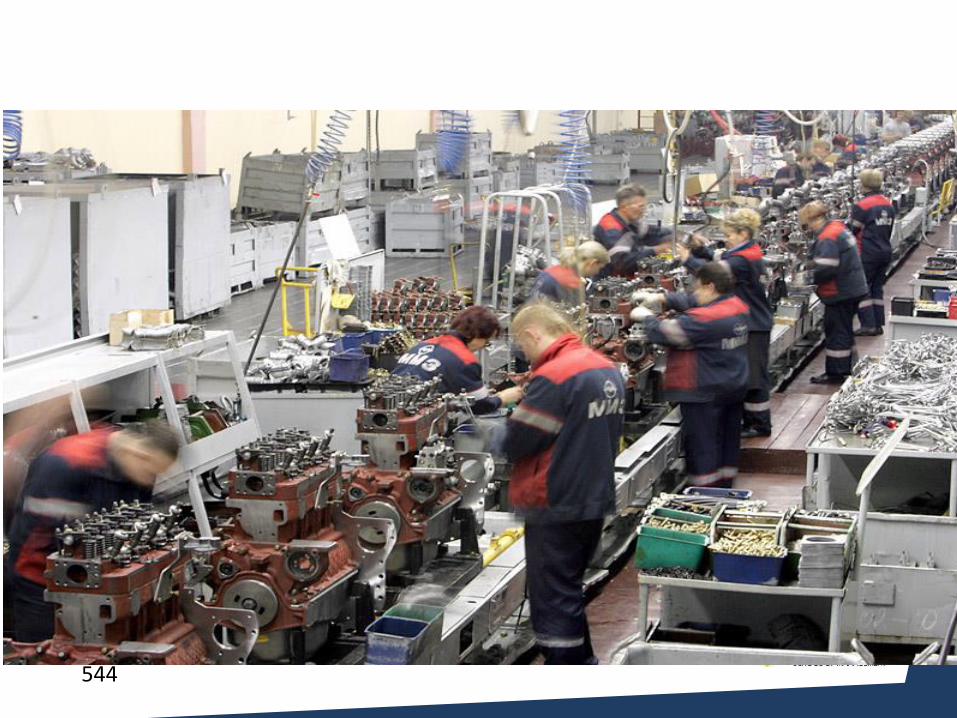
544
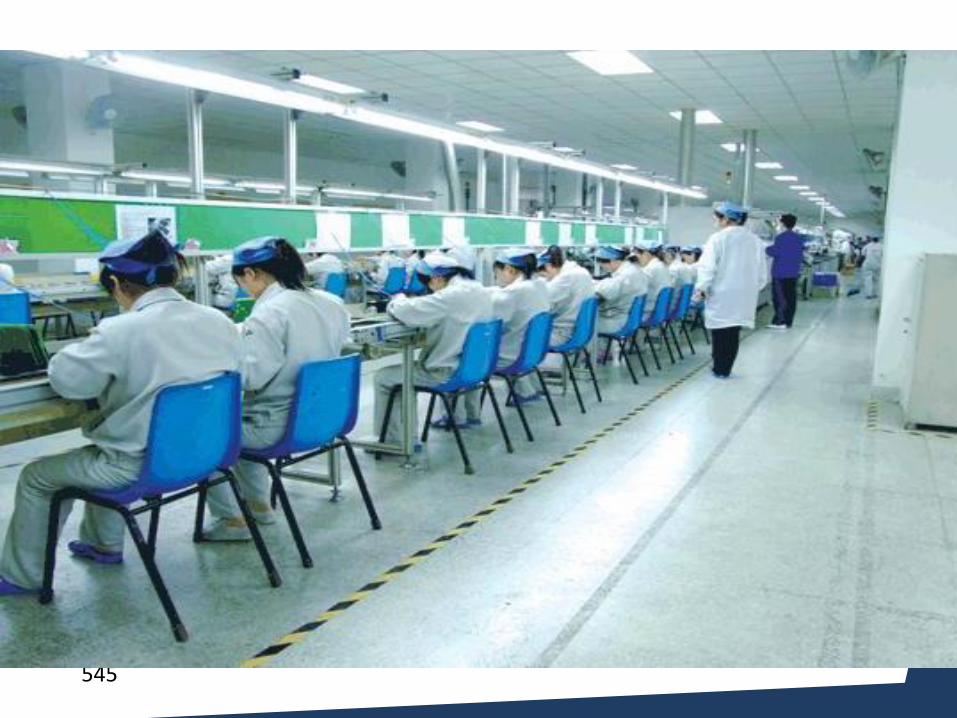
545
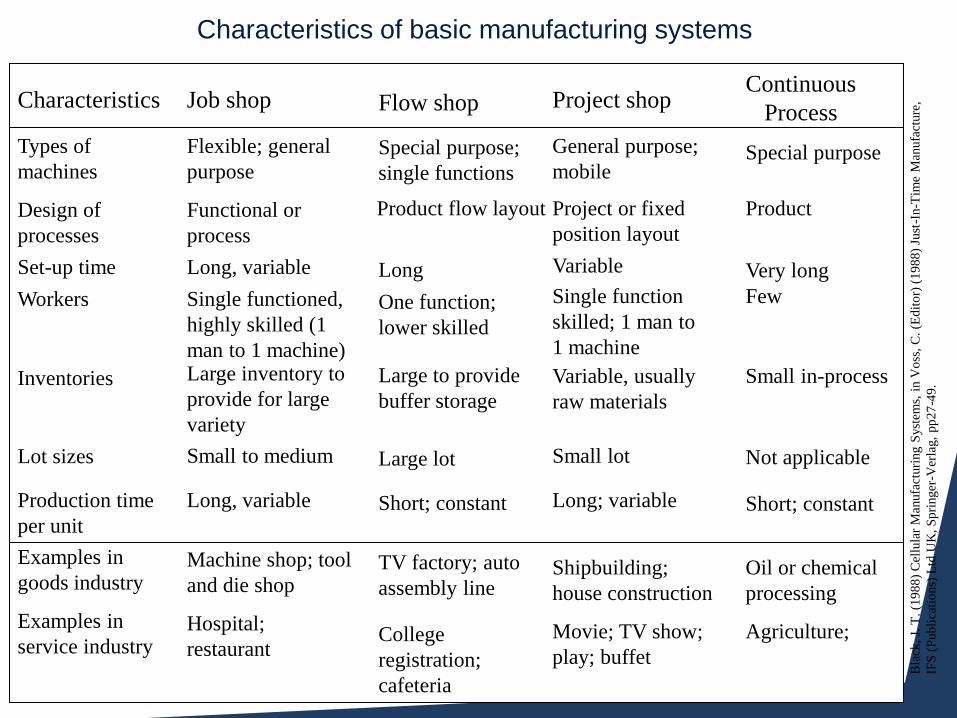
546
Characteristics of basic manufacturing systems
Characteristics Job shop Flow shop Project shop Continuous
Process
Types of
machines
Design of
processes
Set-up time
Workers
Inventories
Lot sizes
Production time
per unit
Examples in
goods industry
Examples in
service industry
Flexible; general
purpose
Functional or
process
Long, variable
Single functioned,
highly skilled (1
man to 1 machine) Large inventory to
provide for large
variety
Small to medium
Long, variable
Machine shop; tool
and die shop
Hospital;
restaurant
Special purpose;
single functions
Product flow layout
Long
One function;
lower skilled
Large to provide
buffer storage
Large lot
Short; constant
TV factory; auto
assembly line
College
registration;
cafeteria
General purpose;
mobile
Project or fixed
position layout
Variable
Single function
skilled; 1 man to
1 machine
Variable, usually
raw materials
Small lot
Long; variable
Special purpose
Product
Very long
Few
Small in-process
Not applicable
Short; constant
Shipbuilding;
house construction
Movie; TV show;
play; buffet
Oil or chemical
processing
Agriculture;
Bla
ck,
J. T
. (1
98
8)
Cel
lula
r M
anufa
cturi
ng S
yst
ems,
in V
oss
, C
. (E
dit
or)
(1
98
8)
Just
-In-T
ime
Man
ufa
cture
,
IFS
(P
ub
lica
tio
ns)
Ltd
UK
, S
pri
nger
-Ver
lag,
pp
27
-49
.
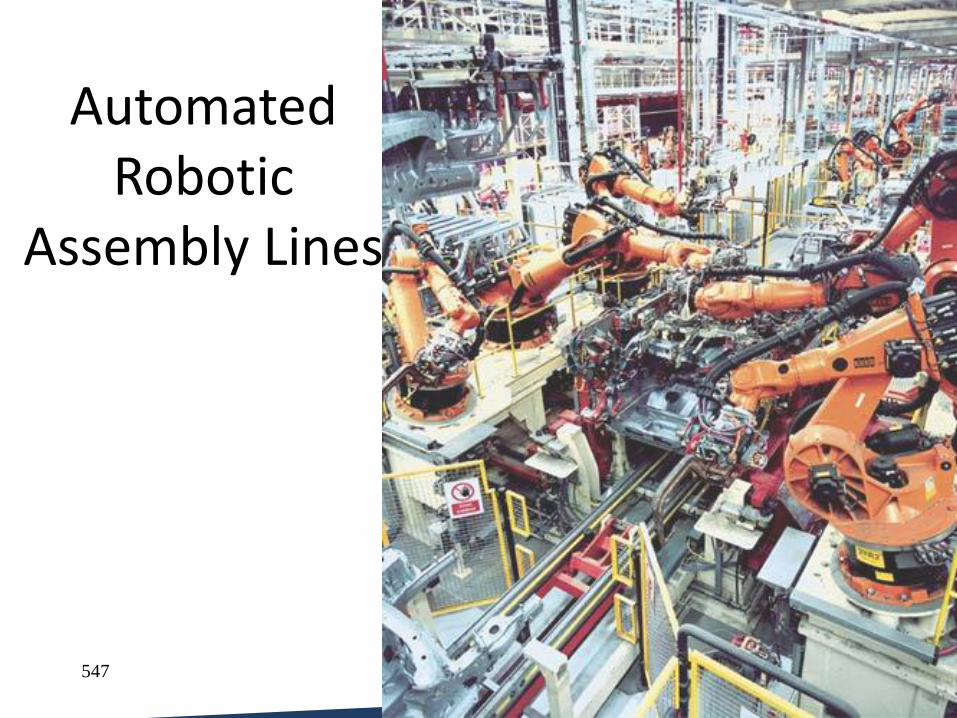
547
Automated Robotic
Assembly Lines
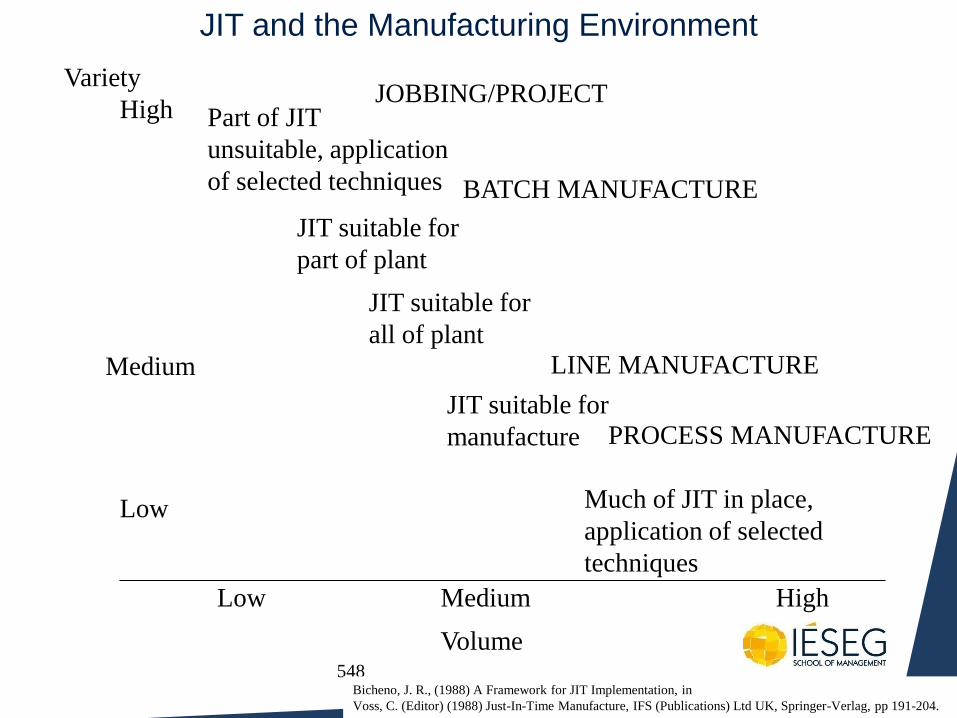
548
JIT and the Manufacturing Environment
Variety
High
Low
Medium
Part of JIT
unsuitable, application
of selected techniques
JIT suitable for
part of plant
JIT suitable for
all of plant
LINE MANUFACTURE
BATCH MANUFACTURE
JOBBING/PROJECT
PROCESS MANUFACTURE
JIT suitable for
manufacture
Much of JIT in place,
application of selected
techniques
Volume
High Low Medium
Bicheno, J. R., (1988) A Framework for JIT Implementation, in
Voss, C. (Editor) (1988) Just-In-Time Manufacture, IFS (Publications) Ltd UK, Springer-Verlag, pp 191-204.
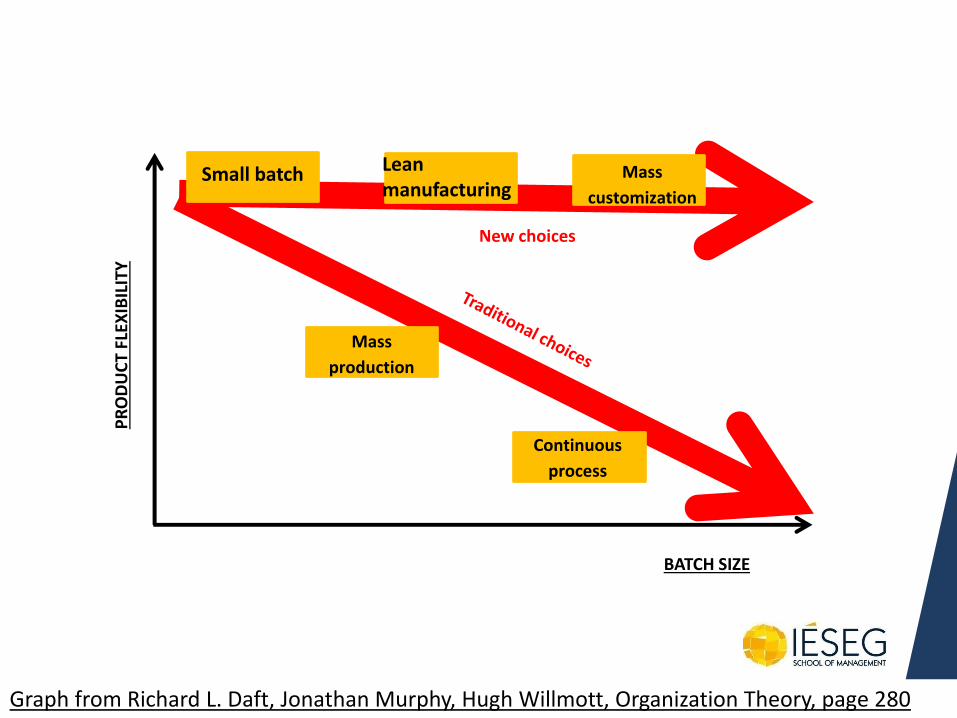
Small batch
Mass
production
Continuous
process
New choices
BATCH SIZE
PR
OD
UC
T FL
EXIB
ILIT
Y
Lean manufacturing
Mass
customization
Graph from Richard L. Daft, Jonathan Murphy, Hugh Willmott, Organization Theory, page 280
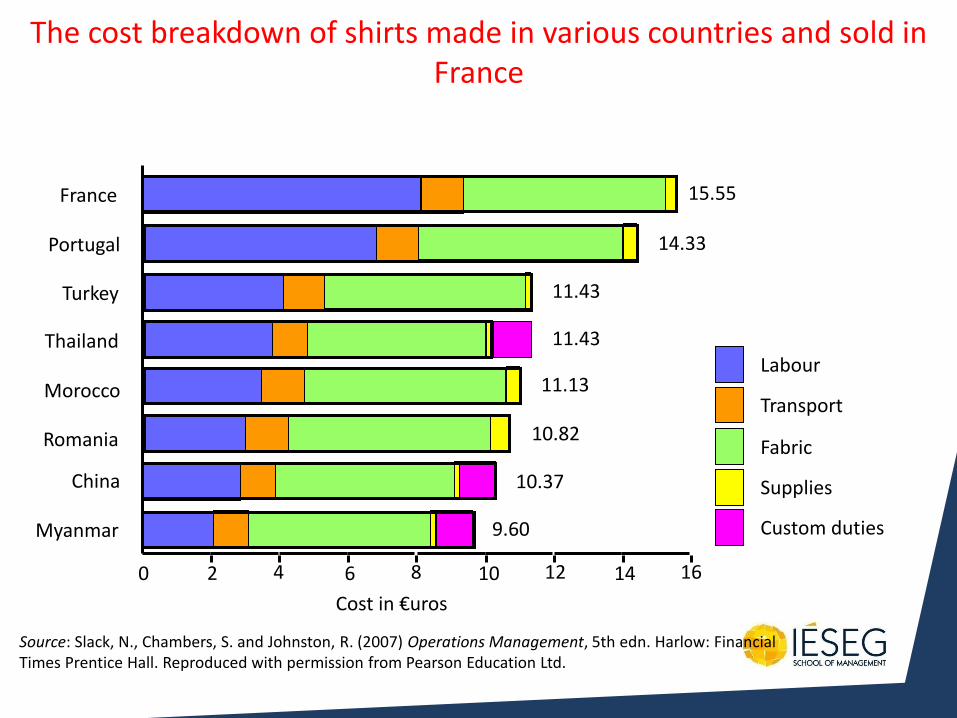
Labour
Transport
Fabric
Supplies
Custom duties
15.55 France
14.33 Portugal
11.43 Turkey
11.43 Thailand
11.13 Morocco
10.82 Romania
10.37 China
9.60 Myanmar
Cost in €uros
2 4 6 8 10 12 14 16 0
The cost breakdown of shirts made in various countries and sold in France
Source: Slack, N., Chambers, S. and Johnston, R. (2007) Operations Management, 5th edn. Harlow: Financial Times Prentice Hall. Reproduced with permission from Pearson Education Ltd.
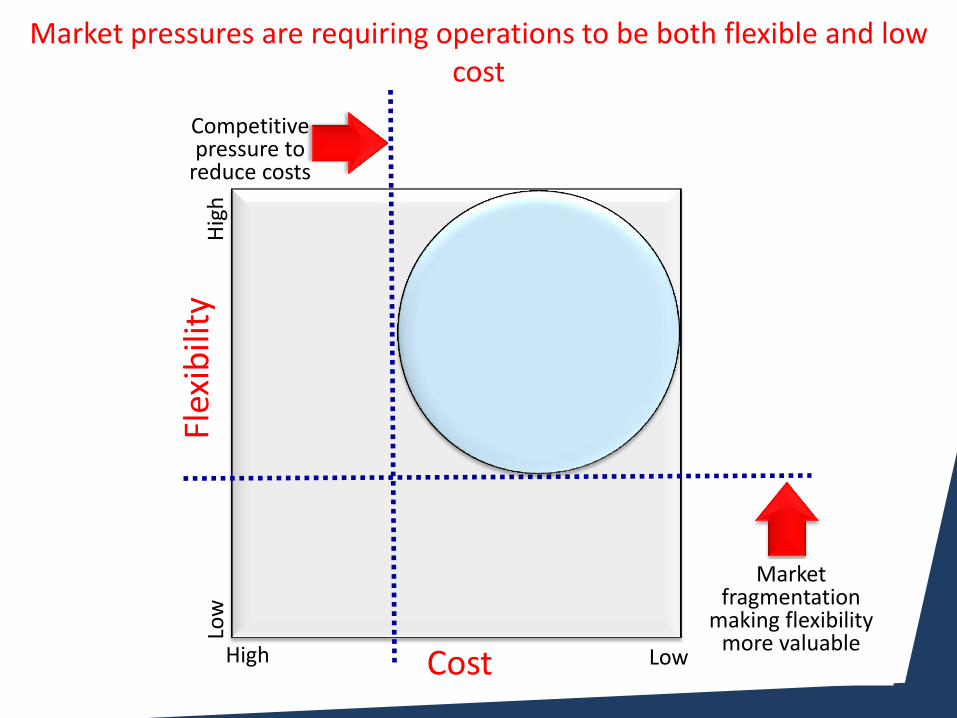
Low
Fl
exib
ility
H
igh
High Low Cost
Market fragmentation
making flexibility more valuable
Competitive pressure to
reduce costs
Market pressures are requiring operations to be both flexible and low cost
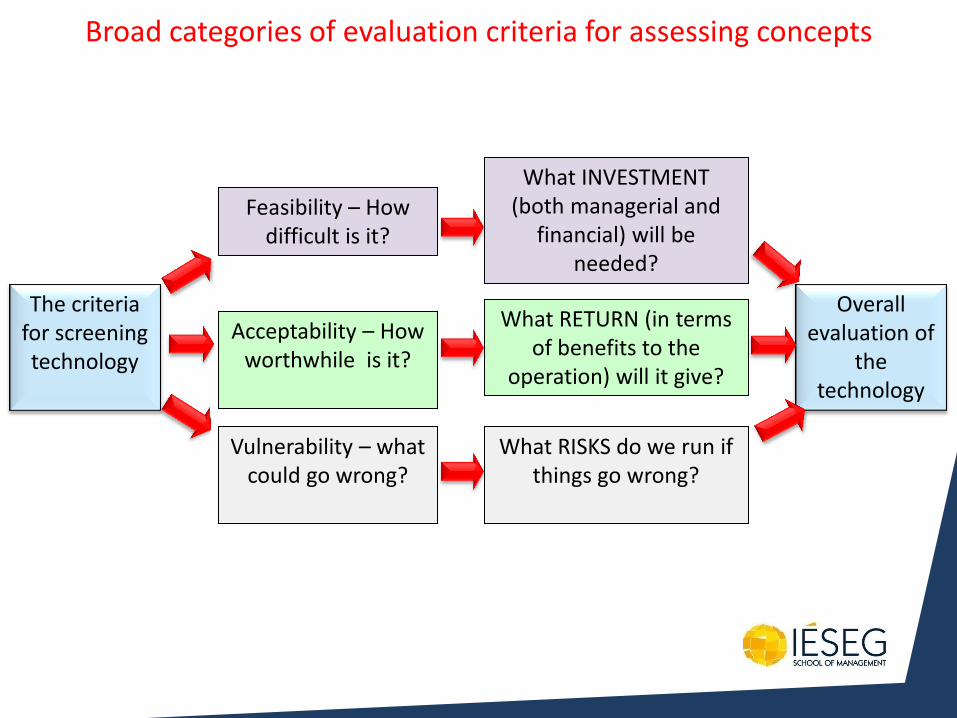
What INVESTMENT (both managerial and
financial) will be needed?
What RETURN (in terms of benefits to the
operation) will it give?
What RISKS do we run if things go wrong?
Feasibility – How difficult is it?
The criteria for screening technology
Overall evaluation of
the technology
Acceptability – How worthwhile is it?
Vulnerability – what could go wrong?
Broad categories of evaluation criteria for assessing concepts
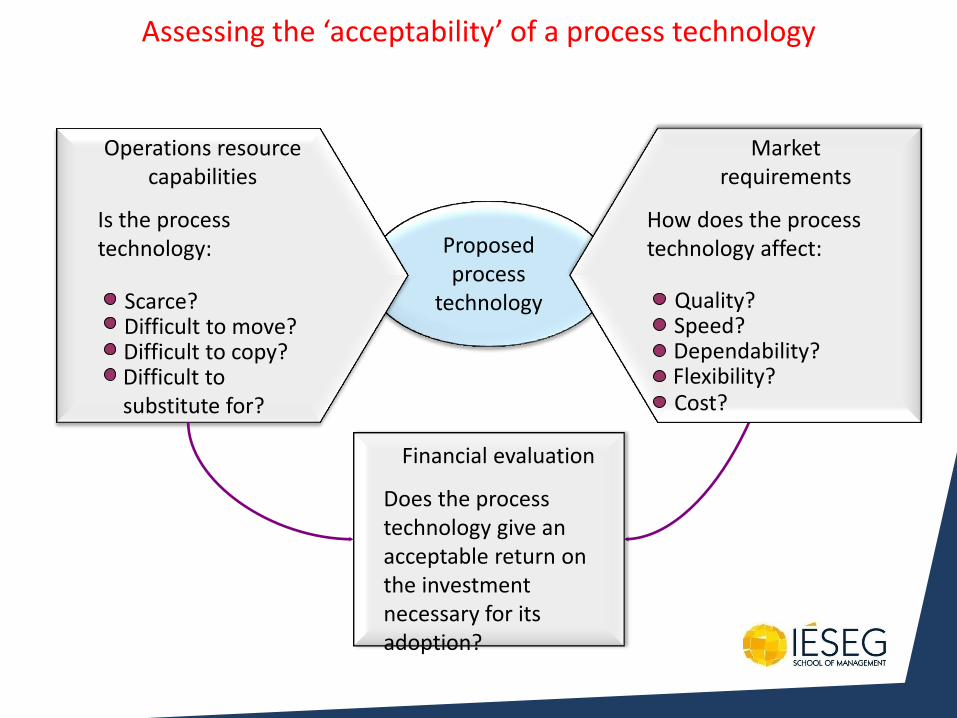
Operations resource capabilities
Is the process technology:
Market requirements
How does the process technology affect: Proposed
process technology
Financial evaluation
Does the process technology give an acceptable return on the investment necessary for its adoption?
Assessing the ‘acceptability’ of a process technology
Scarce? Difficult to move? Difficult to copy? Difficult to substitute for?
Quality? Speed? Dependability? Flexibility? Cost?
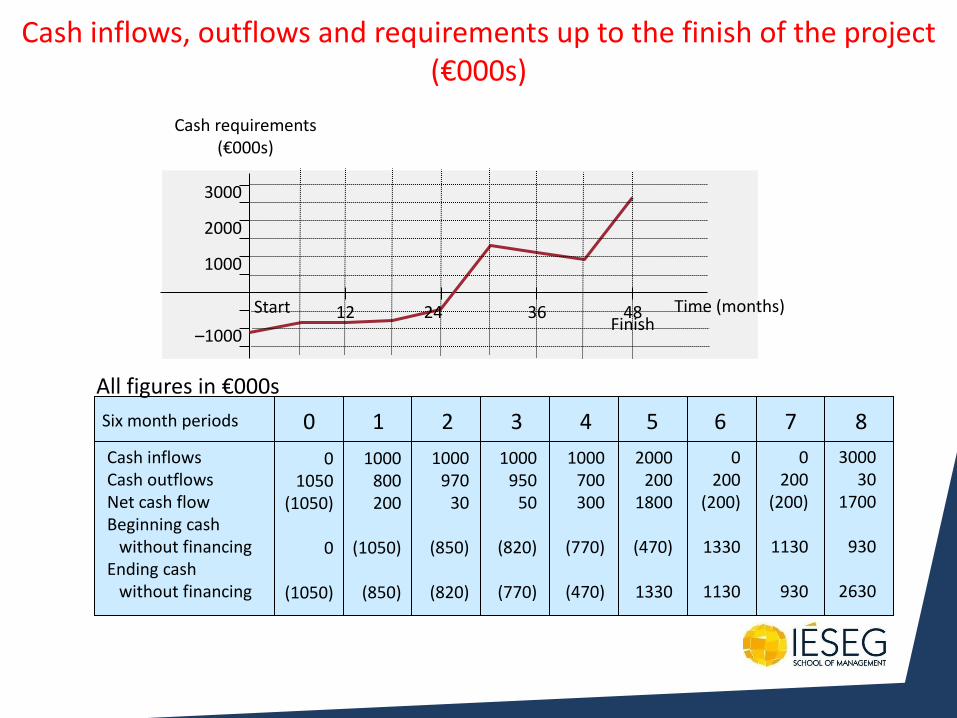
Cash inflows Cash outflows Net cash flow Beginning cash without financing Ending cash without financing
0 1050
(1050)
0
(1050)
1000 800 200
(1050)
(850)
1000 970
30
(850)
(820)
1000 950
50
(820)
(770)
1000 700 300
(770)
(470)
2000 200
1800
(470)
1330
0 200
(200)
1330
1130
0 200
(200)
1130
930
3000 30
1700
930
2630
Six month periods 0 1 2 3 4 5 6 7 8
All figures in €000s
3000
2000
1000
Cash requirements (€000s)
12 36 48 Start
–1000 Finish
Time (months) 24
Cash inflows, outflows and requirements up to the finish of the project (€000s)
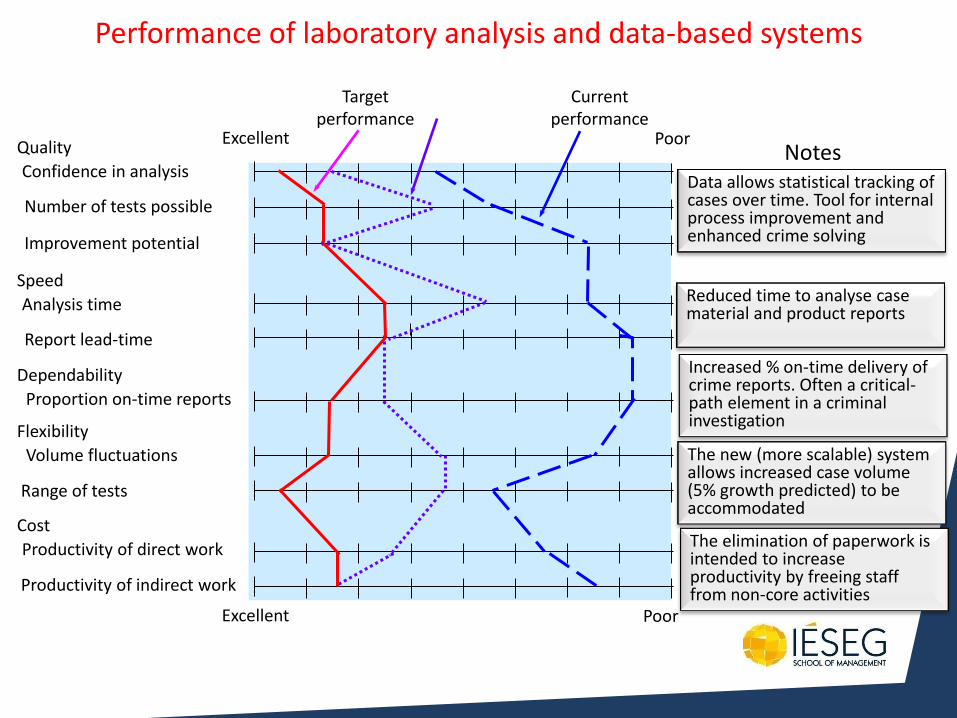
Excellent
Target performance
Current performance
Quality
Confidence in analysis
Number of tests possible
Improvement potential
Speed
Analysis time
Report lead-time
Dependability
Proportion on-time reports
Flexibility
Volume fluctuations
Range of tests
Cost
Productivity of direct work
Productivity of indirect work
Poor
Excellent Poor
Data allows statistical tracking of cases over time. Tool for internal process improvement and enhanced crime solving
Reduced time to analyse case material and product reports
Increased % on-time delivery of crime reports. Often a critical-path element in a criminal investigation
The new (more scalable) system allows increased case volume (5% growth predicted) to be accommodated
The elimination of paperwork is intended to increase productivity by freeing staff from non-core activities
Notes
Performance of laboratory analysis and data-based systems
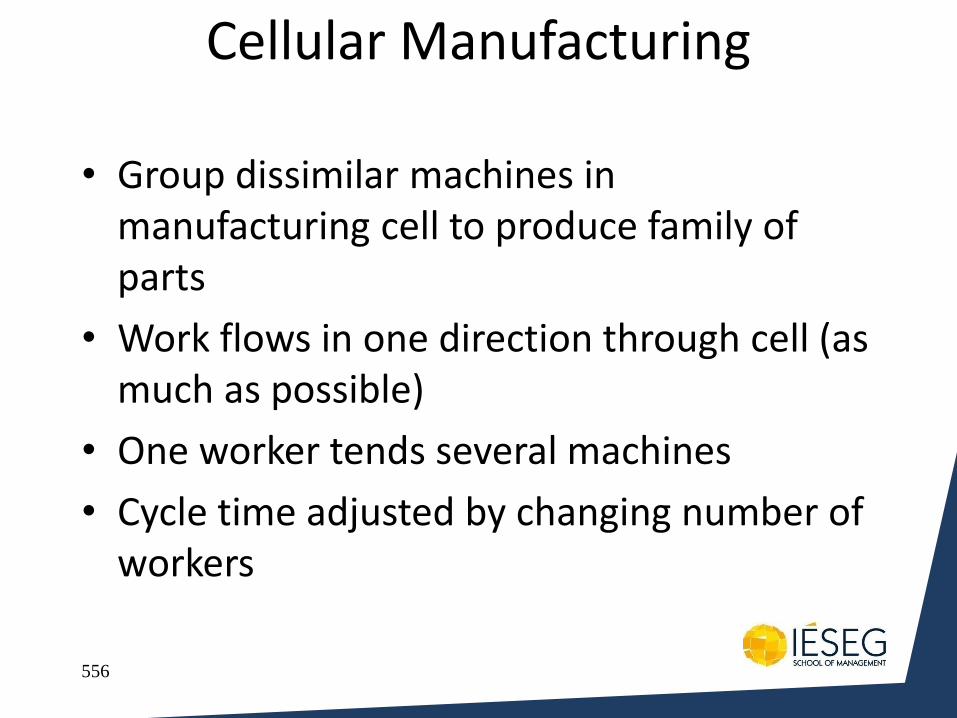
556
Cellular Manufacturing
• Group dissimilar machines in manufacturing cell to produce family of parts
• Work flows in one direction through cell (as much as possible)
• One worker tends several machines
• Cycle time adjusted by changing number of workers
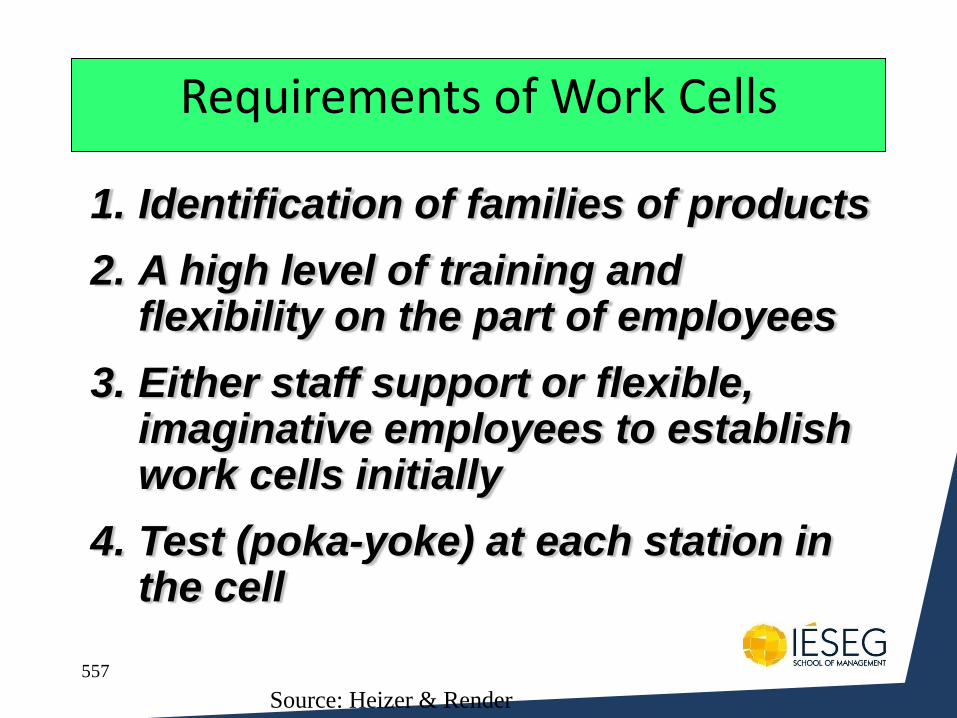
557
Requirements of Work Cells
1. Identification of families of products
2. A high level of training and flexibility on the part of employees
3. Either staff support or flexible, imaginative employees to establish work cells initially
4. Test (poka-yoke) at each station in the cell
Source: Heizer & Render
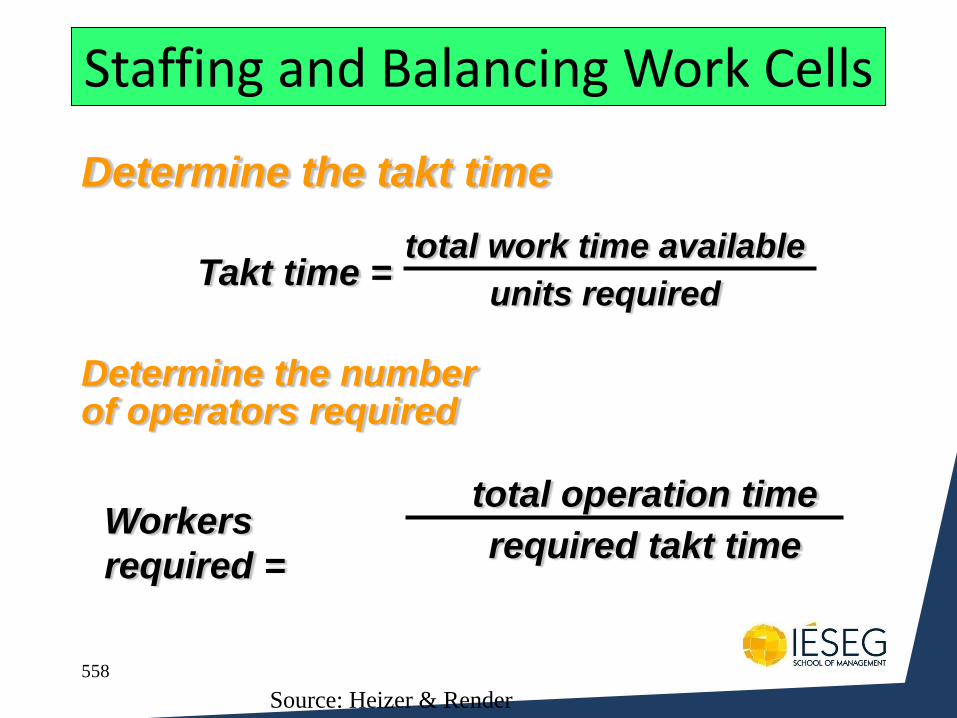
558
Staffing and Balancing Work Cells
Determine the takt time
Takt time = total work time available
units required
Determine the number of operators required
Workers
required =
total operation time
required takt time
Source: Heizer & Render
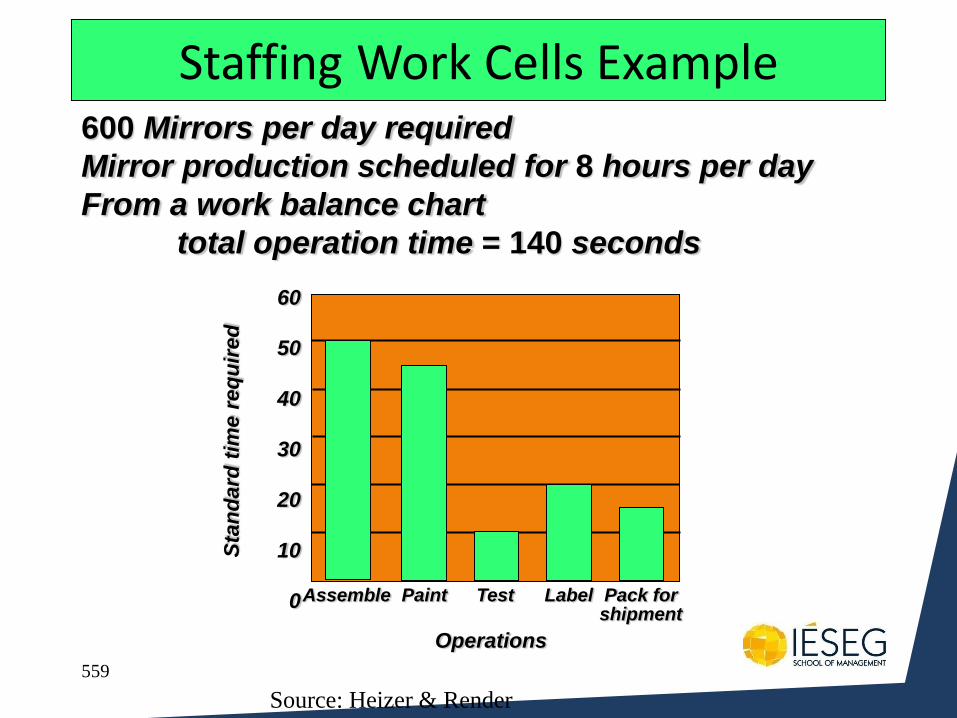
559
Staffing Work Cells Example 600 Mirrors per day required
Mirror production scheduled for 8 hours per day
From a work balance chart
total operation time = 140 seconds S
tan
dard
tim
e r
eq
uir
ed
Operations
Assemble Paint Test Label Pack for shipment
60
50
40
30
20
10
0
Source: Heizer & Render
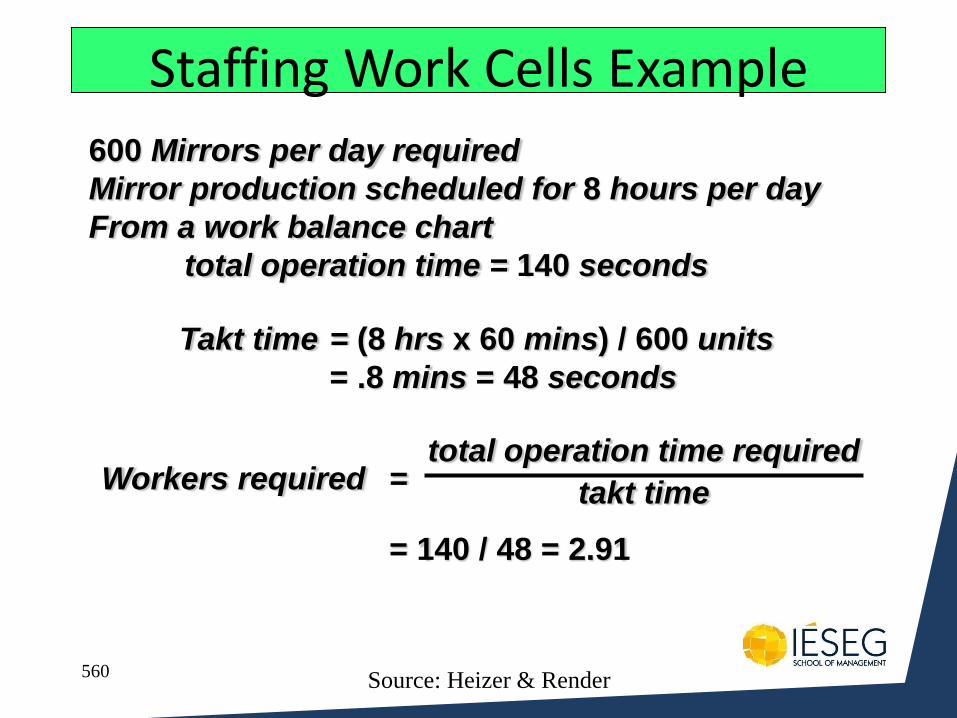
560
600 Mirrors per day required
Mirror production scheduled for 8 hours per day
From a work balance chart
total operation time = 140 seconds
Staffing Work Cells Example
Takt time = (8 hrs x 60 mins) / 600 units
= .8 mins = 48 seconds
Workers required = total operation time required
takt time
= 140 / 48 = 2.91
Source: Heizer & Render
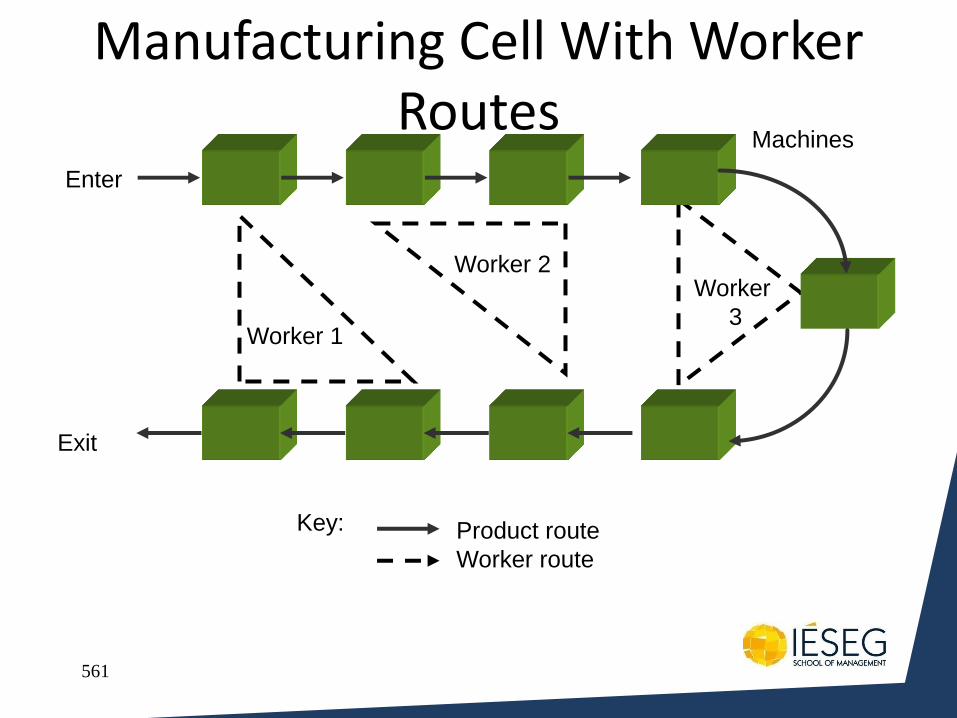
561
Manufacturing Cell With Worker Routes
Worker 1
Worker 2 Worker
3
Enter
Exit
Machines
Key: Product route
Worker route
562
TAKT Time Observations • Blindly following TAKT calculations will lead to one
solution. This may be only the obvious solution.
• Benchmark what competitors do.
• Benchmark against an absolute value – the absolute minimum or maximum conceivable.
• Volume may increase or drop. Employ flexible workforces able to take holidays and work when needed.
• Work backwards from number of employees available during holidays.
• Increase the process time flexibility – reduce time by identifying efficiencies and reducing component part count – reduces hand time required to pick up and assemble.
• Can the product be made slower with fewer resources?
• Outsource low value add work.
563
A Simulation of Lean Manufacturing
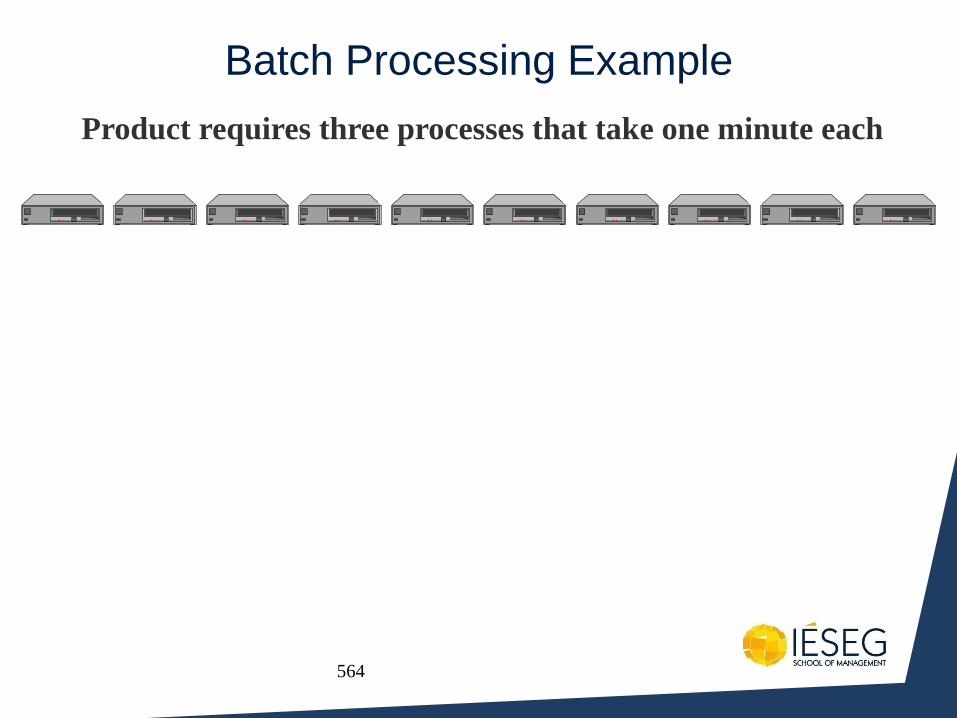
564
Batch Processing Example
Product requires three processes that take one minute each
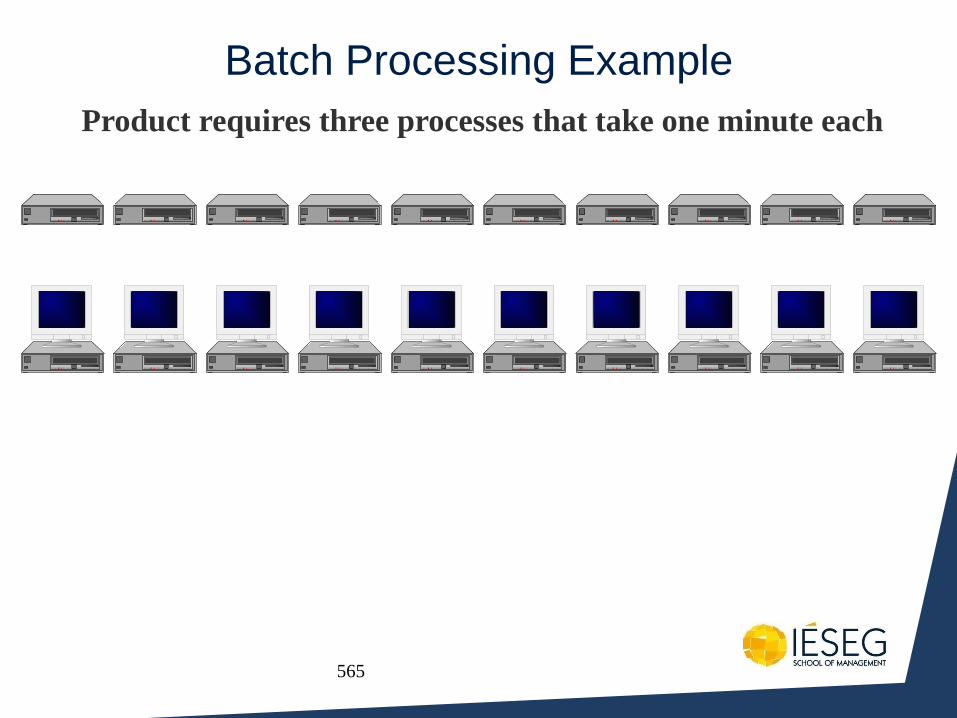
565
Batch Processing Example
Product requires three processes that take one minute each
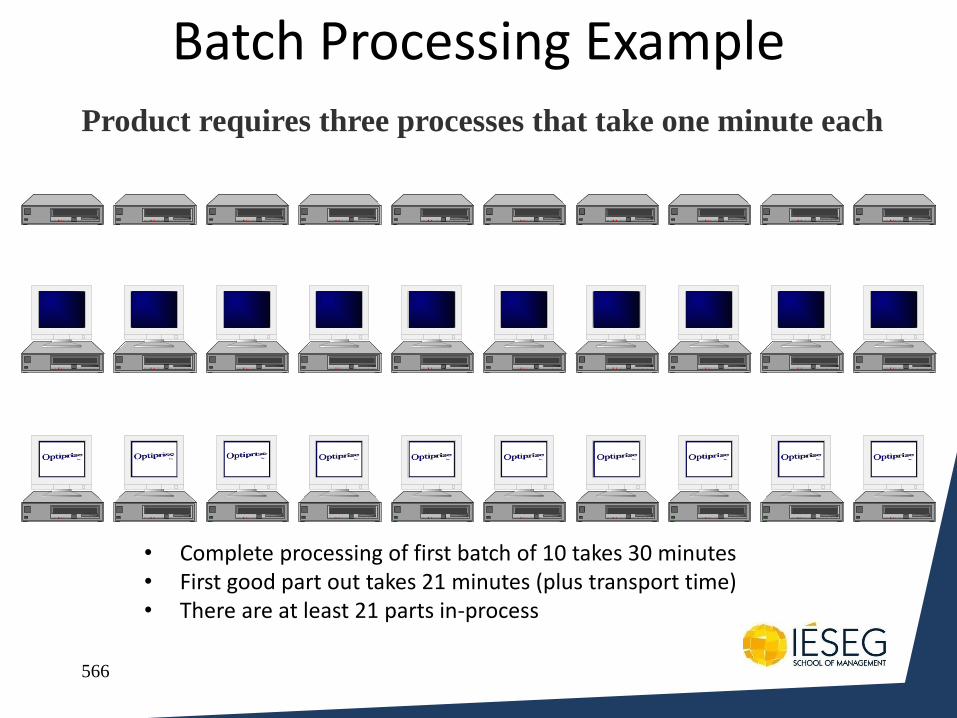
566
Batch Processing Example Product requires three processes that take one minute each
• Complete processing of first batch of 10 takes 30 minutes • First good part out takes 21 minutes (plus transport time) • There are at least 21 parts in-process
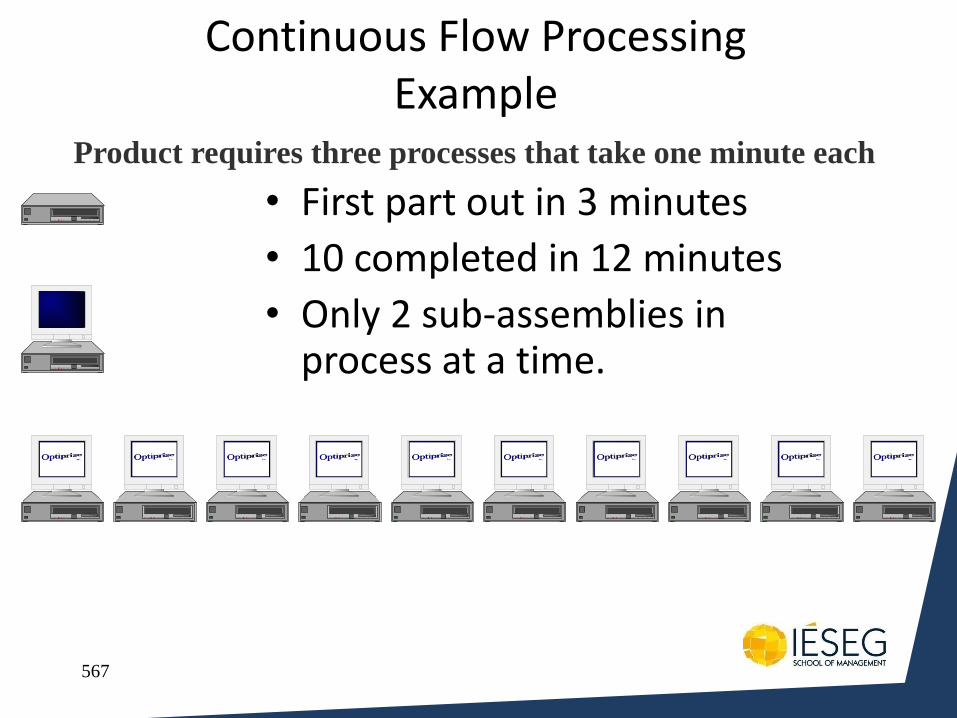
567
Continuous Flow Processing Example
• First part out in 3 minutes
• 10 completed in 12 minutes
• Only 2 sub-assemblies in process at a time.
Product requires three processes that take one minute each

Surveys of Activity
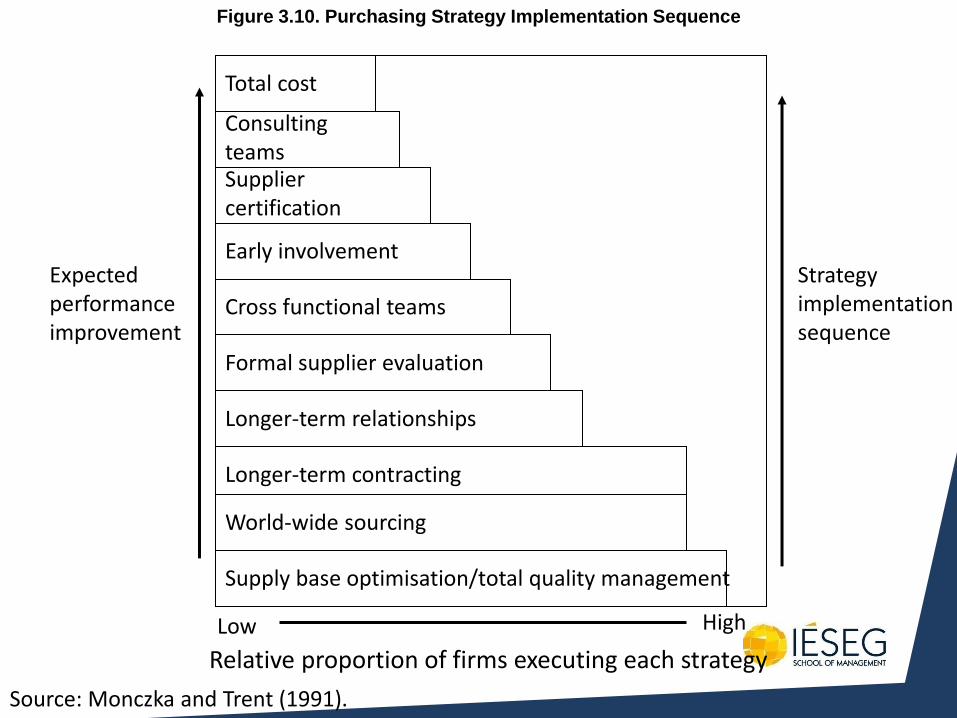
Figure 3.10. Purchasing Strategy Implementation Sequence
Source: Monczka and Trent (1991).
Supply base optimisation/total quality management
World-wide sourcing
Longer-term contracting
Formal supplier evaluation
Cross functional teams
Early involvement
Longer-term relationships
Supplier certification
Consulting teams
Total cost
Low High
Expected performance improvement
Strategy implementation sequence
Relative proportion of firms executing each strategy
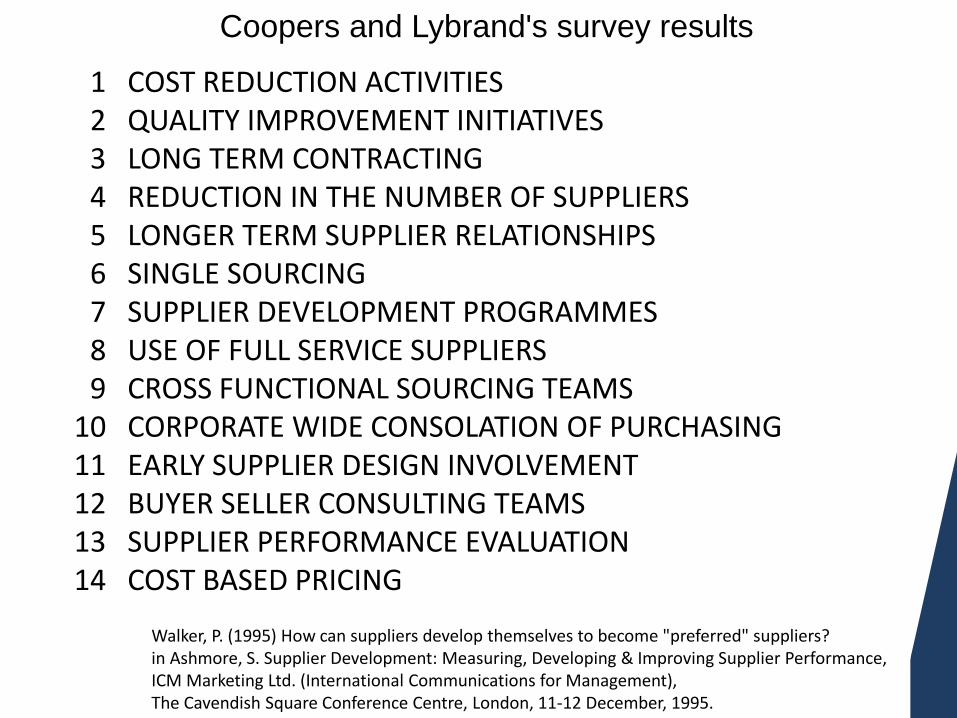
Coopers and Lybrand's survey results
Walker, P. (1995) How can suppliers develop themselves to become "preferred" suppliers? in Ashmore, S. Supplier Development: Measuring, Developing & Improving Supplier Performance, ICM Marketing Ltd. (International Communications for Management), The Cavendish Square Conference Centre, London, 11-12 December, 1995.
COST REDUCTION ACTIVITIES QUALITY IMPROVEMENT INITIATIVES LONG TERM CONTRACTING REDUCTION IN THE NUMBER OF SUPPLIERS LONGER TERM SUPPLIER RELATIONSHIPS SINGLE SOURCING SUPPLIER DEVELOPMENT PROGRAMMES USE OF FULL SERVICE SUPPLIERS CROSS FUNCTIONAL SOURCING TEAMS CORPORATE WIDE CONSOLATION OF PURCHASING EARLY SUPPLIER DESIGN INVOLVEMENT BUYER SELLER CONSULTING TEAMS SUPPLIER PERFORMANCE EVALUATION
COST BASED PRICING
1 2 3 4 5 6 7 8 9
10 11 12 13 14

Cost Analysis for World Class
Change
• Dr David J. Newlands
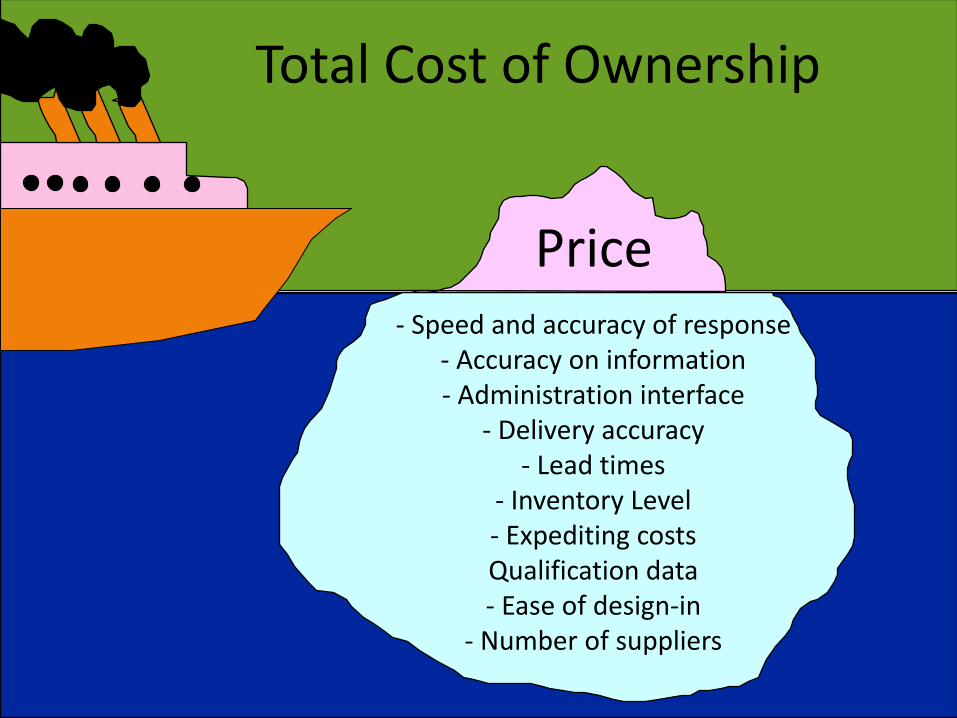
Price
Total Cost of Ownership
- Speed and accuracy of response - Accuracy on information - Administration interface
- Delivery accuracy - Lead times
- Inventory Level - Expediting costs Qualification data - Ease of design-in
- Number of suppliers
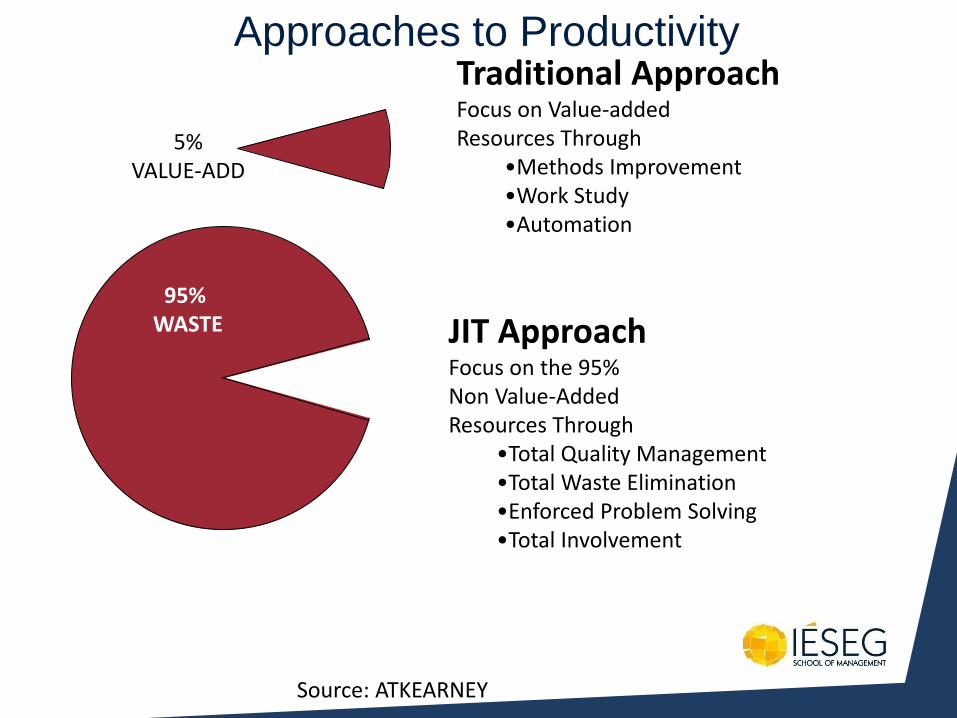
Approaches to Productivity
95% WASTE
5% VALUE-ADD
Traditional Approach Focus on Value-added Resources Through
•Methods Improvement •Work Study •Automation
JIT Approach Focus on the 95% Non Value-Added Resources Through
•Total Quality Management •Total Waste Elimination •Enforced Problem Solving •Total Involvement
Source: ATKEARNEY
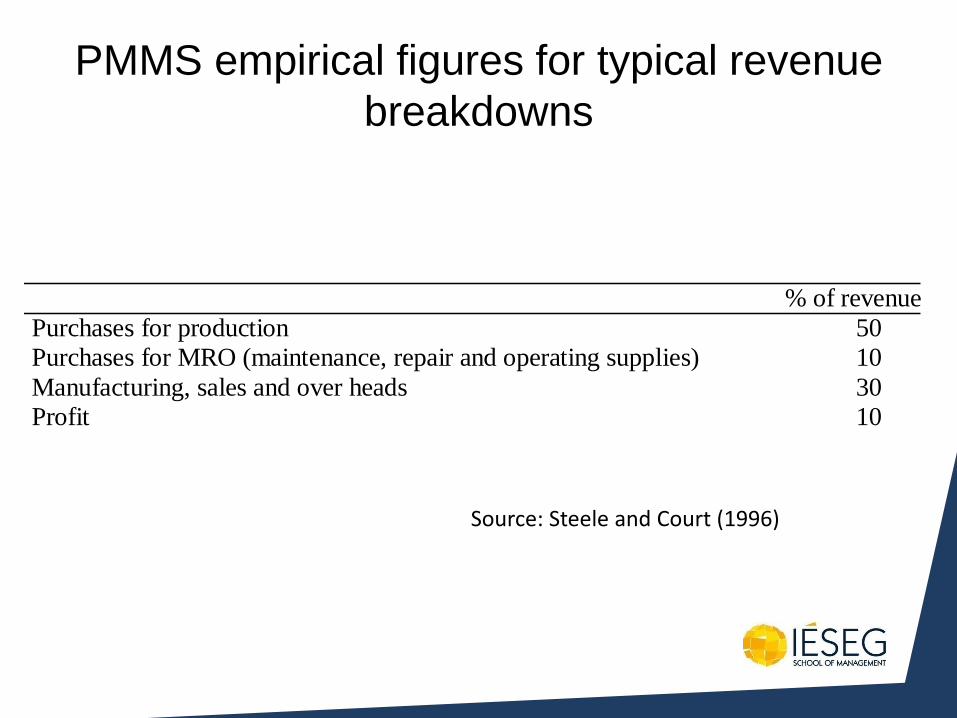
PMMS empirical figures for typical revenue
breakdowns
% of revenue
Purchases for production 50
Purchases for MRO (maintenance, repair and operating supplies) 10
Manufacturing, sales and over heads 30
Profit 10
Source: Steele and Court (1996)
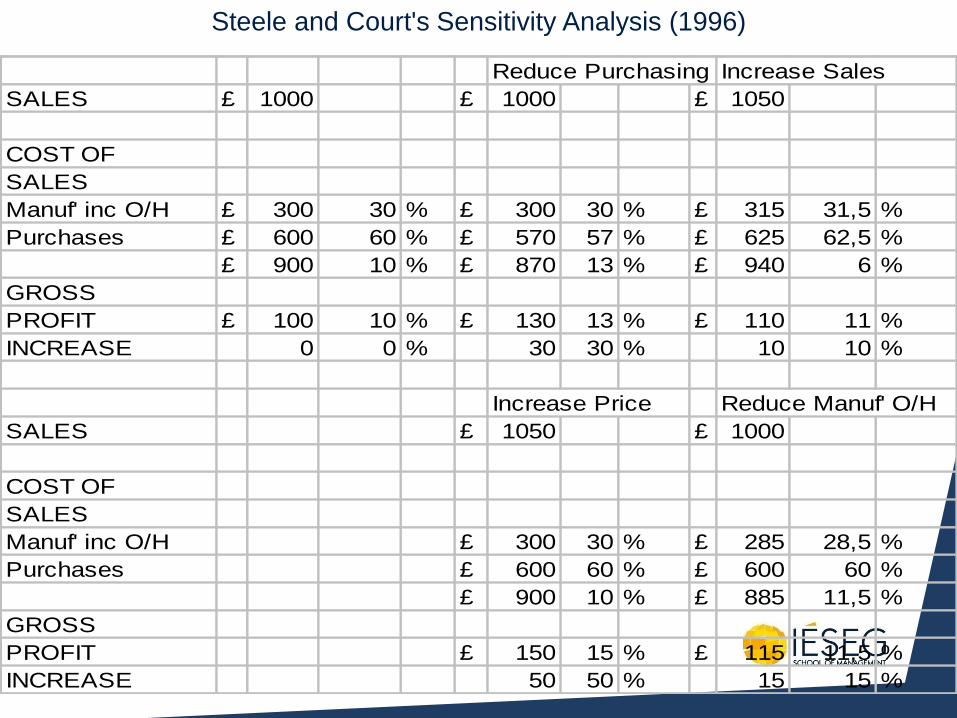
Steele and Court's Sensitivity Analysis (1996)
Reduce Purchasing Increase Sales
SALES £ 1000 £ 1000 £ 1050
COST OF
SALES
Manuf' inc O/H £ 300 30 % £ 300 30 % £ 315 31,5 %
Purchases £ 600 60 % £ 570 57 % £ 625 62,5 %
£ 900 10 % £ 870 13 % £ 940 6 %
GROSS
PROFIT £ 100 10 % £ 130 13 % £ 110 11 %
INCREASE 0 0 % 30 30 % 10 10 %
Increase Price Reduce Manuf' O/H
SALES £ 1050 £ 1000
COST OF
SALES
Manuf' inc O/H £ 300 30 % £ 285 28,5 %
Purchases £ 600 60 % £ 600 60 %
£ 900 10 % £ 885 11,5 %
GROSS
PROFIT £ 150 15 % £ 115 11,5 %
INCREASE 50 50 % 15 15 %
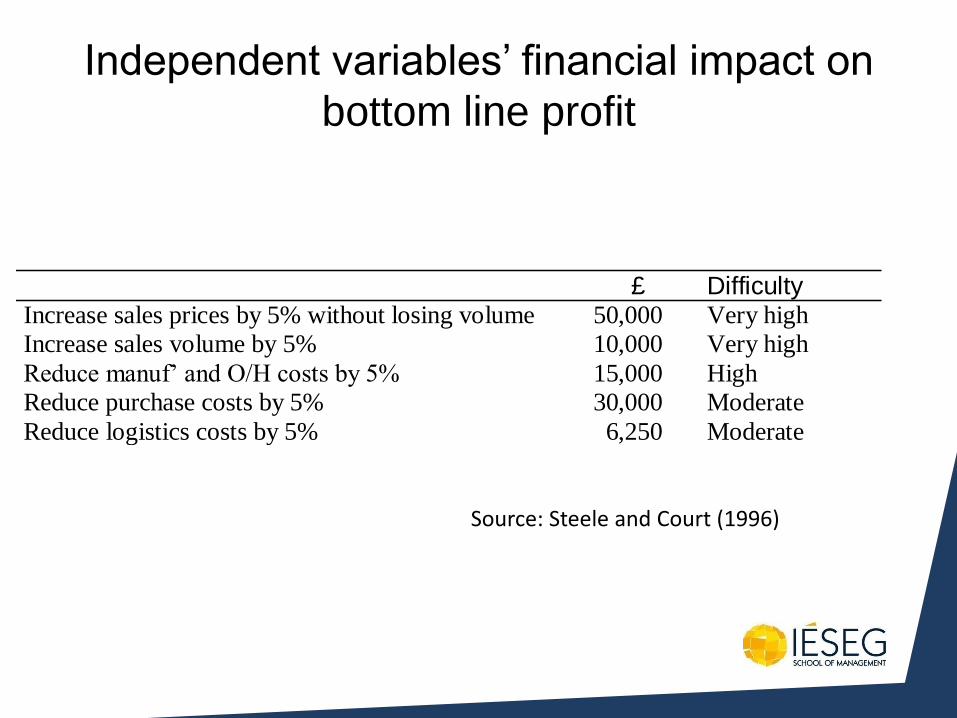
Independent variables’ financial impact on
bottom line profit
£ DifficultyIncrease sales prices by 5% without losing volume 50,000 Very high
Increase sales volume by 5% 10,000 Very high
Reduce manuf’ and O/H costs by 5% 15,000 High
Reduce purchase costs by 5% 30,000 Moderate
Reduce logistics costs by 5% 6,250 Moderate
Source: Steele and Court (1996)
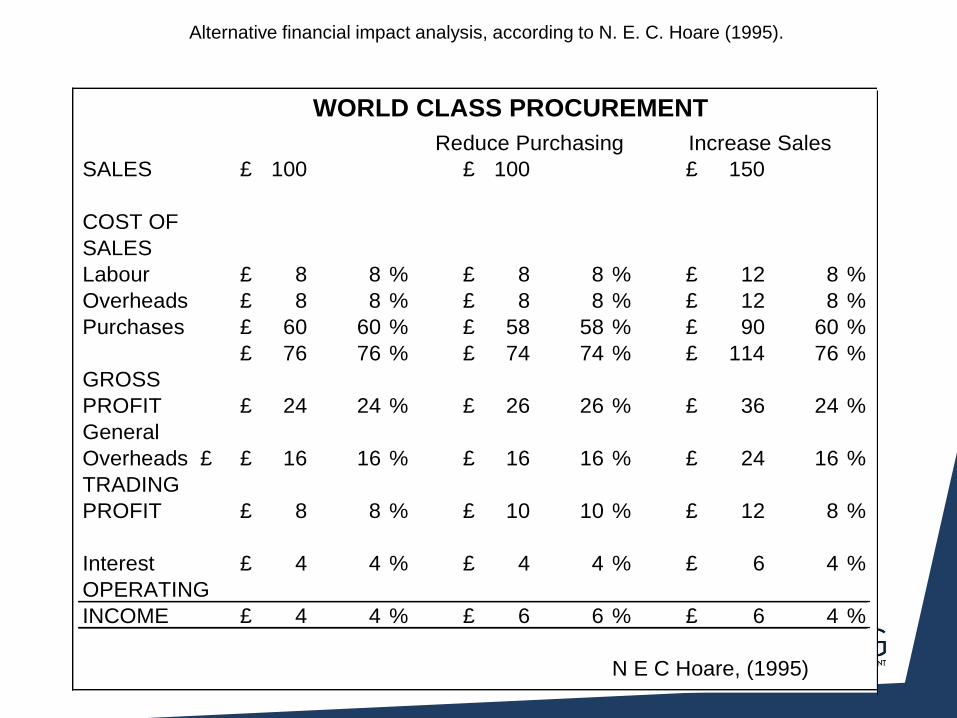
Alternative financial impact analysis, according to N. E. C. Hoare (1995).
WORLD CLASS PROCUREMENT
Reduce Purchasing Increase Sales
SALES £ 100 £ 100 £ 150
COST OF
SALES
Labour £ 8 8 % £ 8 8 % £ 12 8 %
Overheads £ 8 8 % £ 8 8 % £ 12 8 %
Purchases £ 60 60 % £ 58 58 % £ 90 60 %
£ 76 76 % £ 74 74 % £ 114 76 %
GROSS
PROFIT £ 24 24 % £ 26 26 % £ 36 24 %
General
Overheads £ £ 16 16 % £ 16 16 % £ 24 16 %
TRADING
PROFIT £ 8 8 % £ 10 10 % £ 12 8 %
Interest £ 4 4 % £ 4 4 % £ 6 4 %
OPERATING
INCOME £ 4 4 % £ 6 6 % £ 6 4 %
N E C Hoare, (1995)
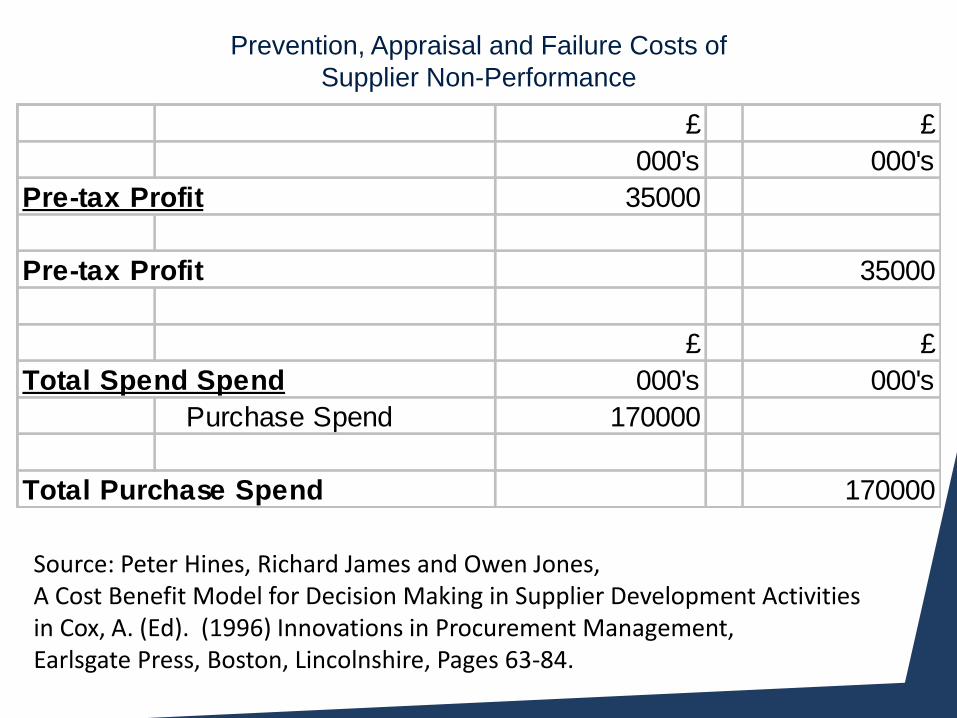
Prevention, Appraisal and Failure Costs of
Supplier Non-Performance
£ £
000's 000's
Pre-tax Profit 35000
Pre-tax Profit 35000
£ £
Total Spend Spend 000's 000's
Purchase Spend 170000
Total Purchase Spend 170000
Source: Peter Hines, Richard James and Owen Jones, A Cost Benefit Model for Decision Making in Supplier Development Activities in Cox, A. (Ed). (1996) Innovations in Procurement Management, Earlsgate Press, Boston, Lincolnshire, Pages 63-84.
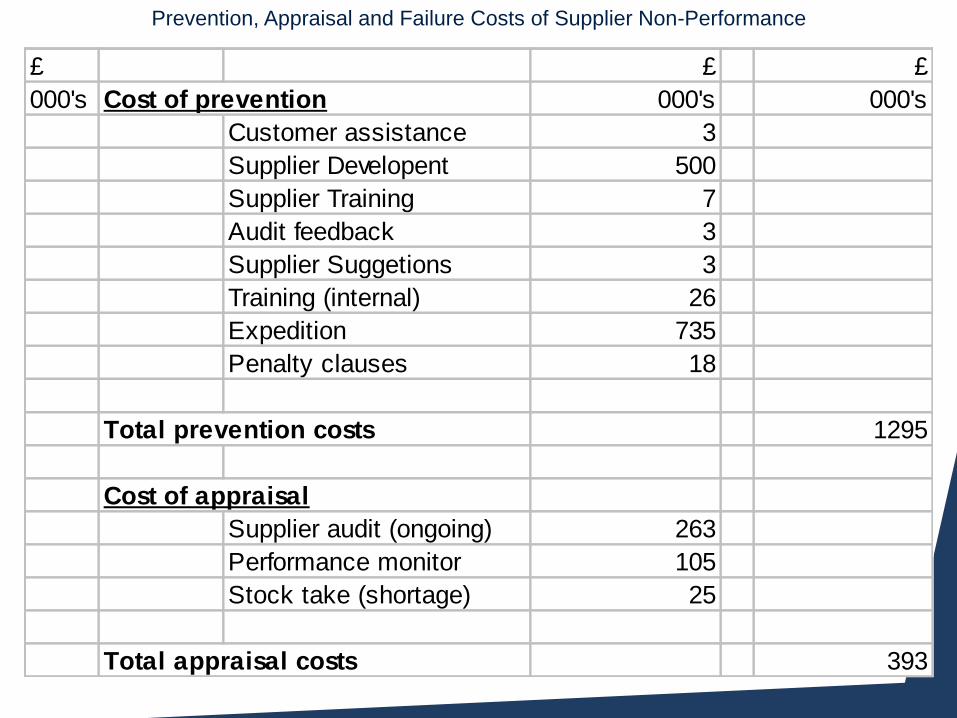
Prevention, Appraisal and Failure Costs of Supplier Non-Performance
£ £ £
000's Cost of prevention 000's 000's
Customer assistance 3
Supplier Developent 500
Supplier Training 7
Audit feedback 3
Supplier Suggetions 3
Training (internal) 26
Expedition 735
Penalty clauses 18
Total prevention costs 1295
Cost of appraisal
Supplier audit (ongoing) 263
Performance monitor 105
Stock take (shortage) 25
Total appraisal costs 393
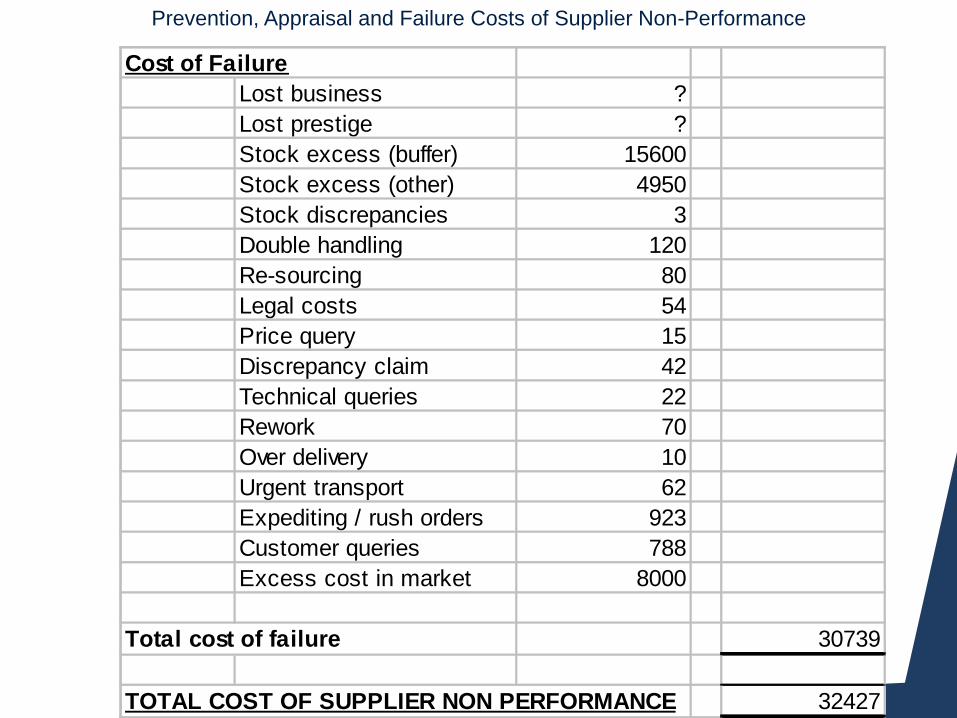
Prevention, Appraisal and Failure Costs of Supplier Non-Performance
Cost of Failure
Lost business ?
Lost prestige ?
Stock excess (buffer) 15600
Stock excess (other) 4950
Stock discrepancies 3
Double handling 120
Re-sourcing 80
Legal costs 54
Price query 15
Discrepancy claim 42
Technical queries 22
Rework 70
Over delivery 10
Urgent transport 62
Expediting / rush orders 923
Customer queries 788
Excess cost in market 8000
Total cost of failure 30739
TOTAL COST OF SUPPLIER NON PERFORMANCE 32427
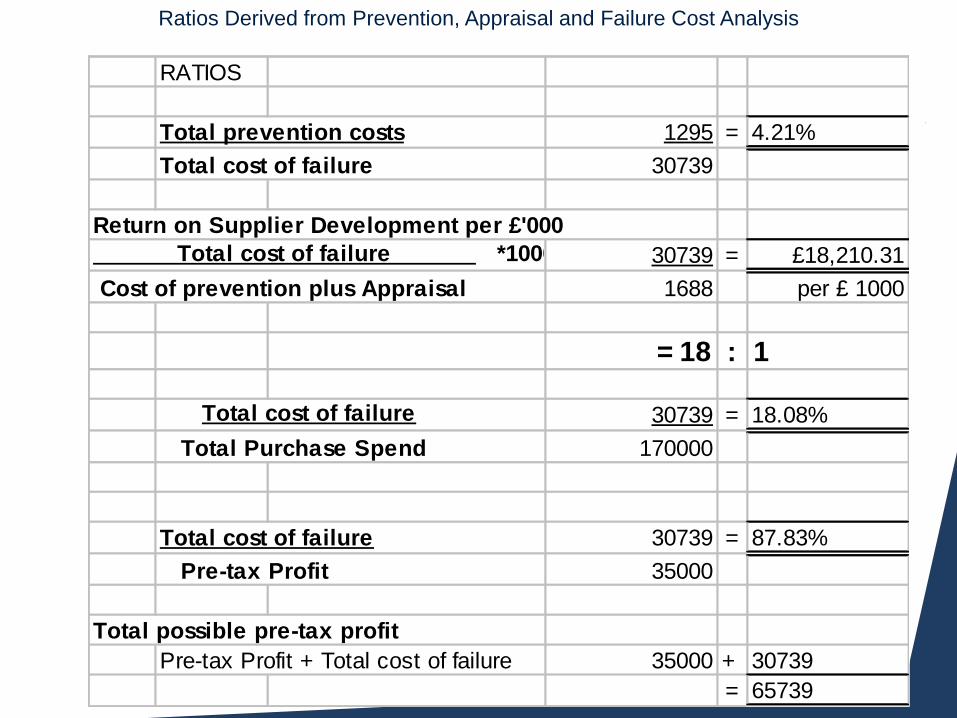
Ratios Derived from Prevention, Appraisal and Failure Cost Analysis
RATIOS
Total prevention costs 1295 = 4.21%
Total cost of failure 30739
Return on Supplier Development per £'000
Total cost of failure *1000 30739 = £18,210.31
Cost of prevention plus Appraisal 1688 per £ 1000
= 18 : 1
Total cost of failure 30739 = 18.08%
Total Purchase Spend 170000
Total cost of failure 30739 = 87.83%
Pre-tax Profit 35000
Total possible pre-tax profit
Pre-tax Profit + Total cost of failure 35000 + 30739
= 65739
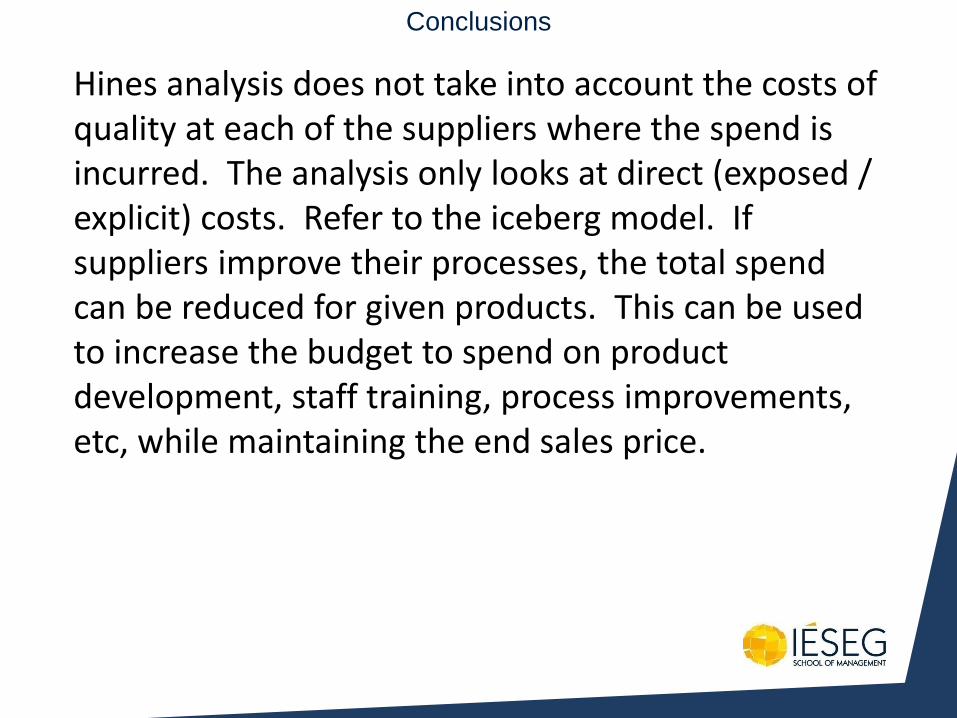
Conclusions
Hines analysis does not take into account the costs of quality at each of the suppliers where the spend is incurred. The analysis only looks at direct (exposed / explicit) costs. Refer to the iceberg model. If suppliers improve their processes, the total spend can be reduced for given products. This can be used to increase the budget to spend on product development, staff training, process improvements, etc, while maintaining the end sales price.
Product and Process Design
Cases

584
Typical Layout of Trim and Functional Elements
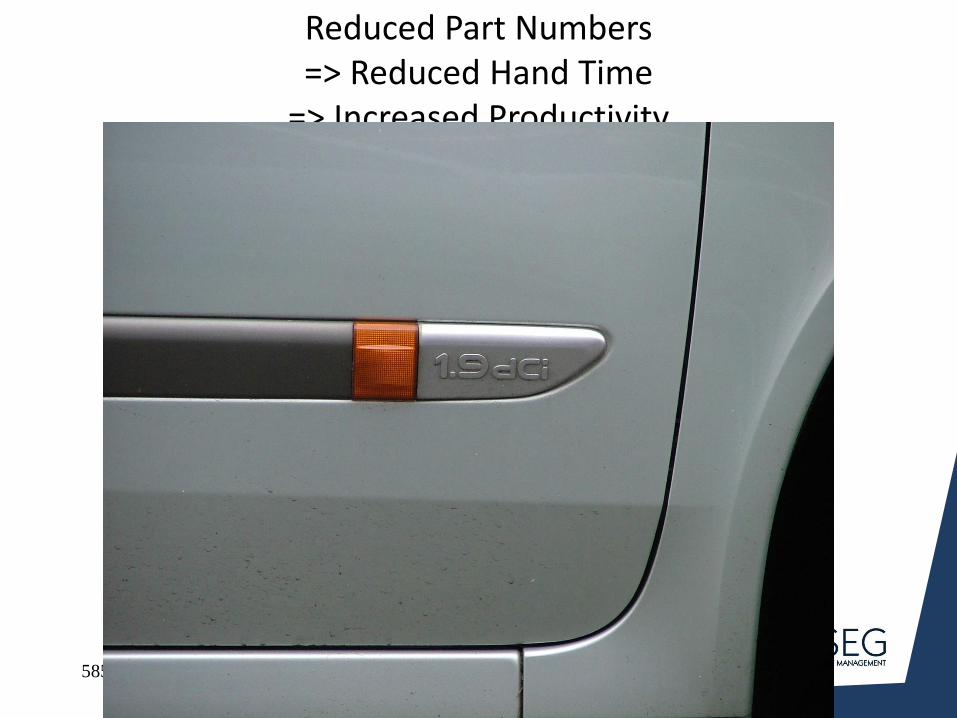
585
Reduced Part Numbers => Reduced Hand Time
=> Increased Productivity

586
Mercedes – Motors & Light Mounted in the Mirror

587
Renault Altenate Solution
588
Component Count
589
Component Count Reduction, Same Customer Value

590
Ability to Late Configure
No electronics fitted, motors or leavers within the door
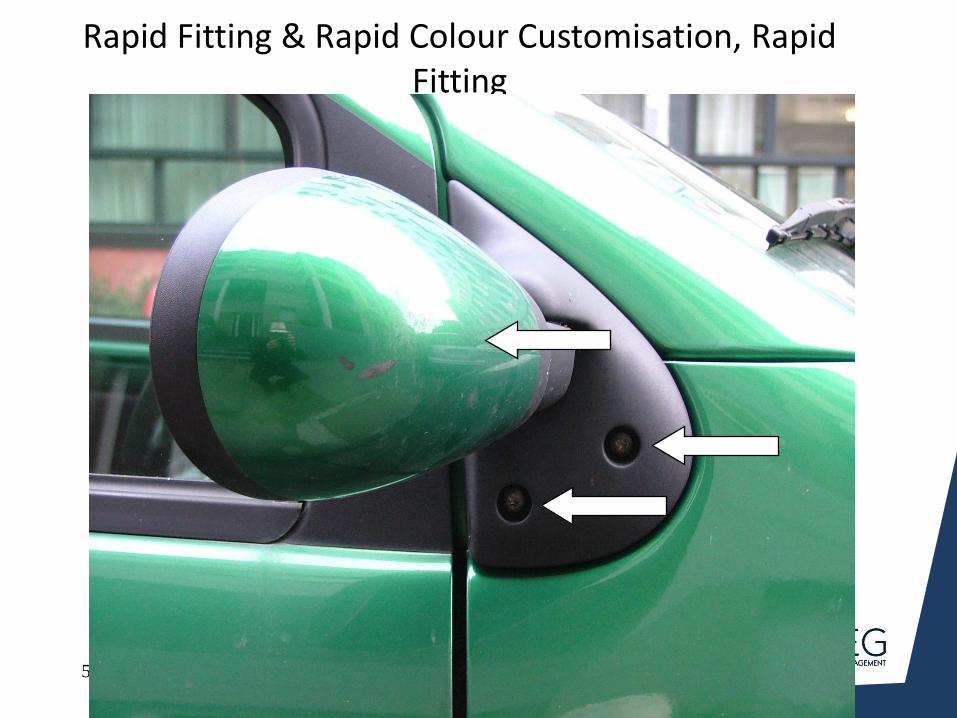
591
Rapid Fitting & Rapid Colour Customisation, Rapid Fitting
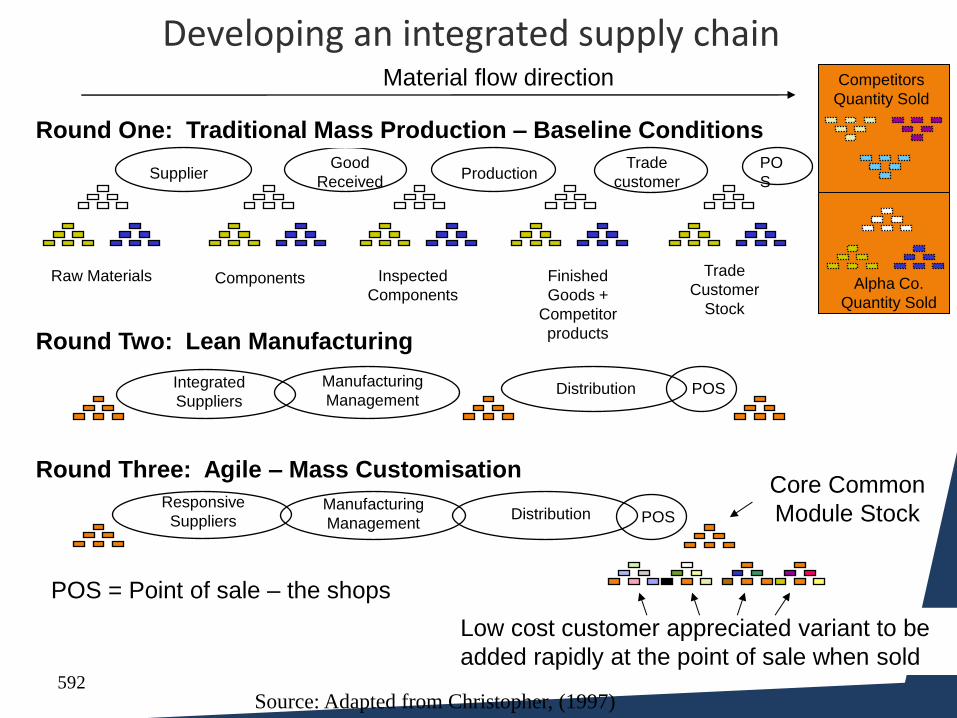
592
Developing an integrated supply chain
Round One: Traditional Mass Production – Baseline Conditions
Good
Received Supplier Production
Trade
customer
Source: Adapted from Christopher, (1997)
Material flow direction
PO
S
Round Two: Lean Manufacturing
Manufacturing
Management Integrated
Suppliers Distribution POS
Round Three: Agile – Mass Customisation
Manufacturing
Management
Responsive
Suppliers Distribution POS
Core Common
Module Stock
Low cost customer appreciated variant to be
added rapidly at the point of sale when sold
POS = Point of sale – the shops
Raw Materials Components Inspected
Components
Finished
Goods +
Competitor
products
Trade
Customer
Stock
Alpha Co.
Quantity Sold
Competitors
Quantity Sold
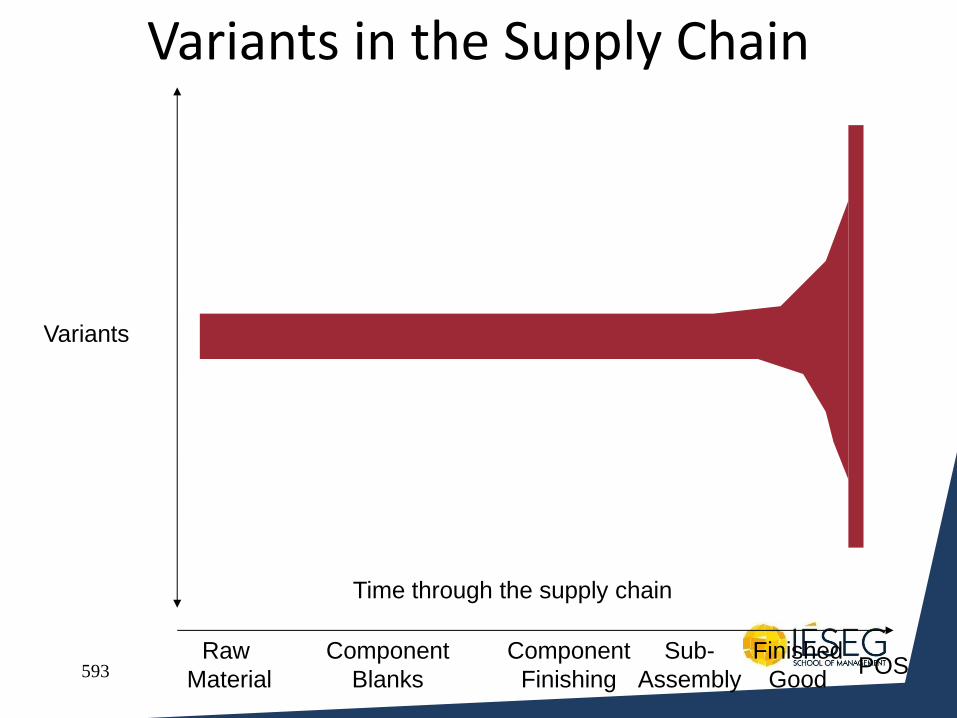
593
Variants in the Supply Chain
Variants
Time through the supply chain
Raw
Material POS
Finished
Good
Component
Blanks
Component
Finishing
Sub-
Assembly

594

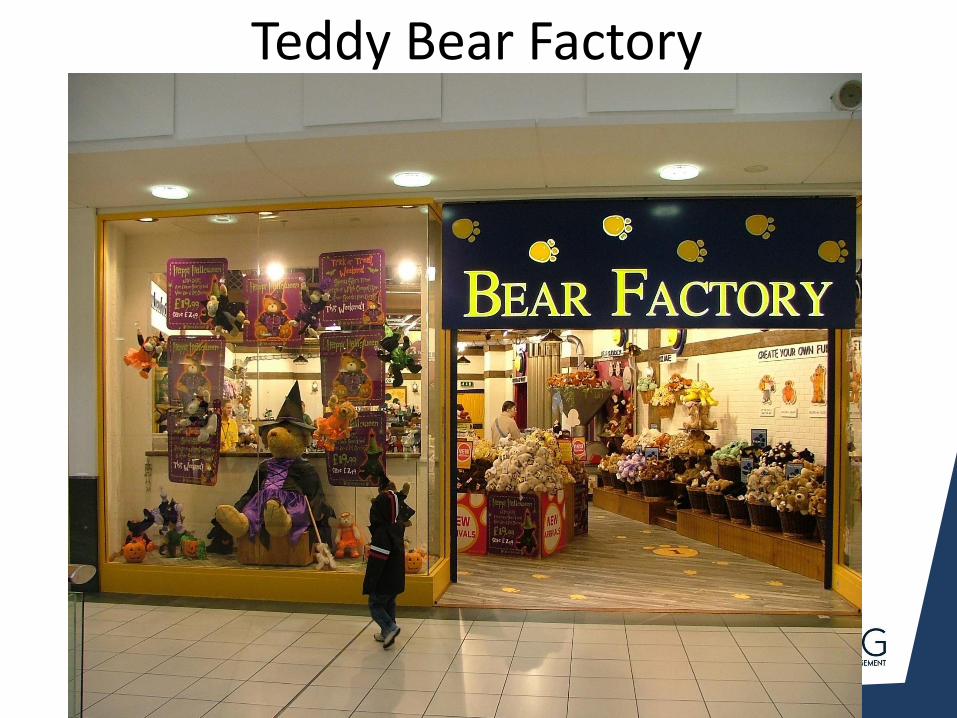
596
Teddy Bear Factory

597
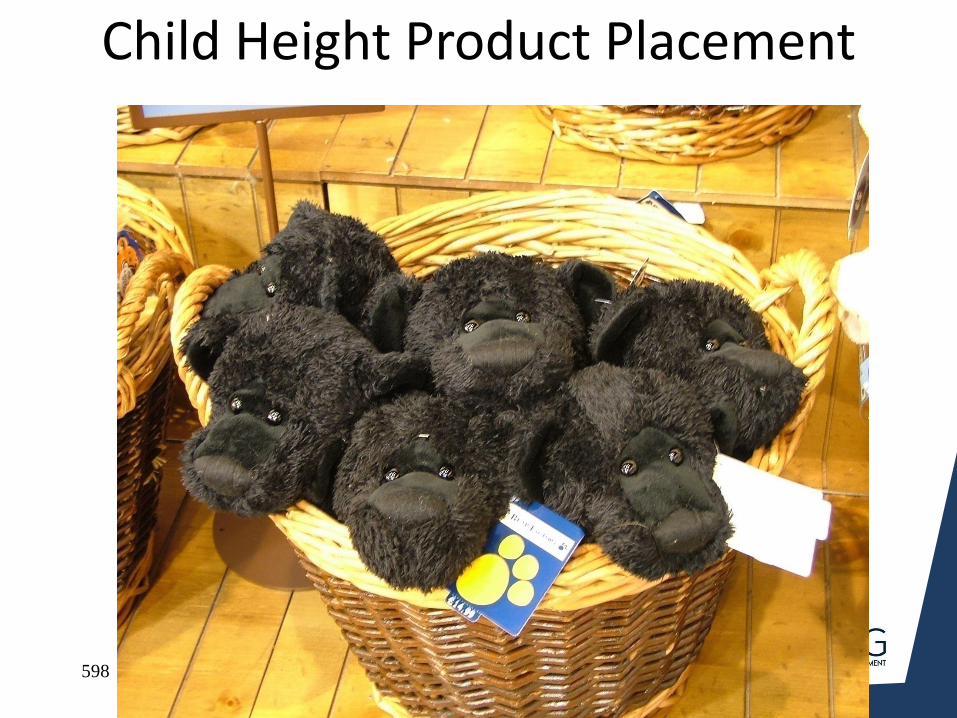
598
Child Height Product Placement

599
Baby Safe Products

600
All Products are empty of filling

601
Filling Added

602
Personal Stroking during the sale
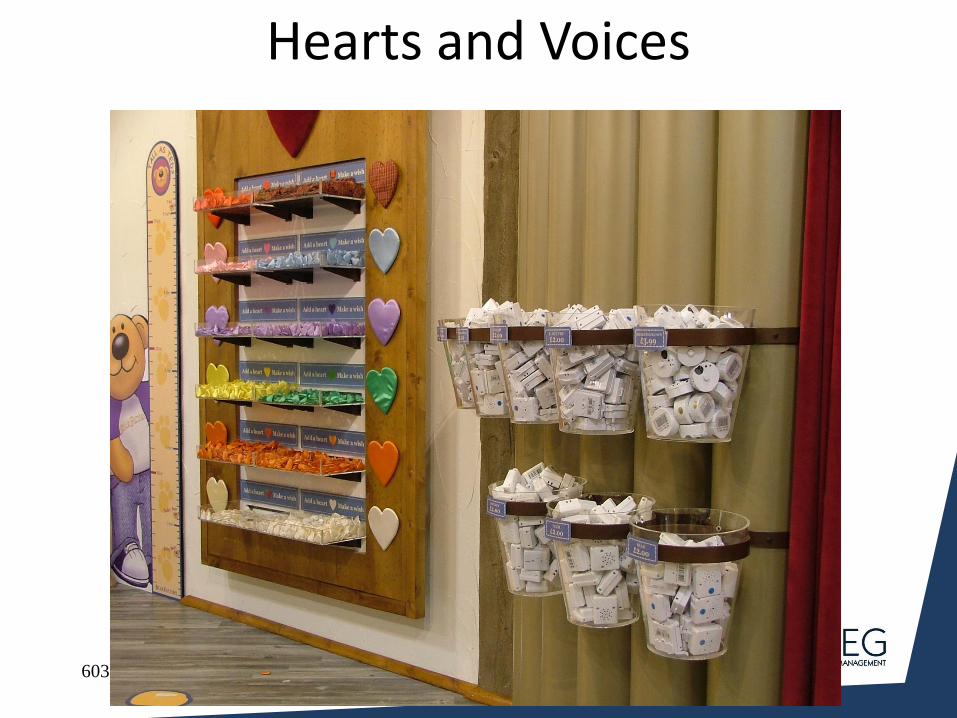
603
Hearts and Voices

604
Stitching Up

605
Clothes Variants

606
Theme and Special Occasion Clothes
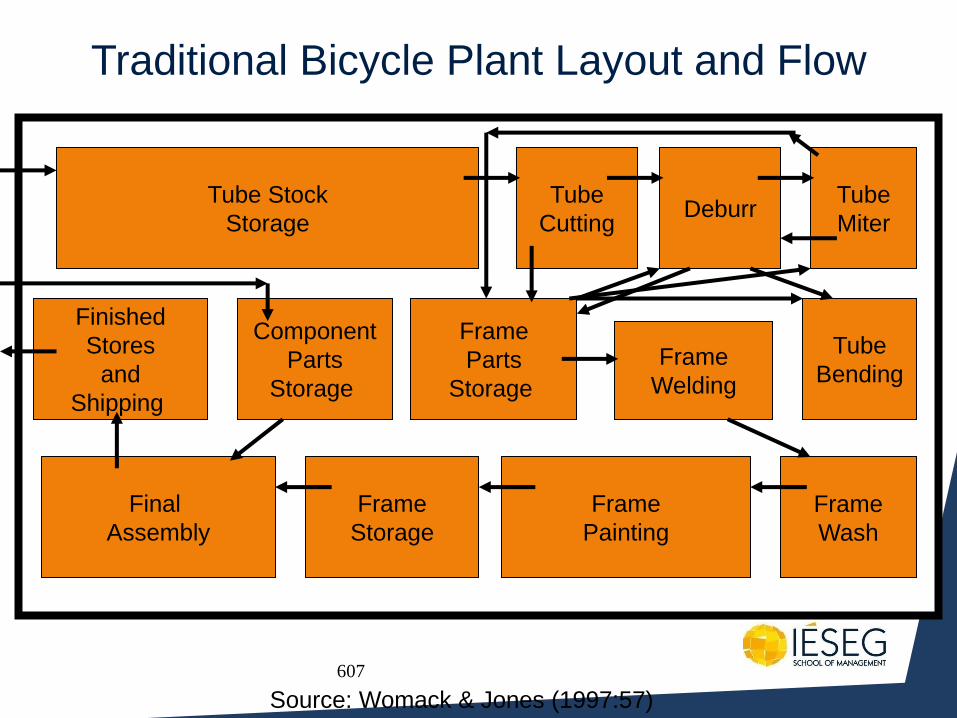
607
Traditional Bicycle Plant Layout and Flow
Tube Stock
Storage
Tube
Cutting Deburr
Tube
Miter
Finished
Stores
and
Shipping
Component
Parts
Storage
Frame
Parts
Storage
Frame
Welding
Tube
Bending
Final
Assembly
Frame
Storage
Frame
Painting
Frame
Wash
Source: Womack & Jones (1997:57)
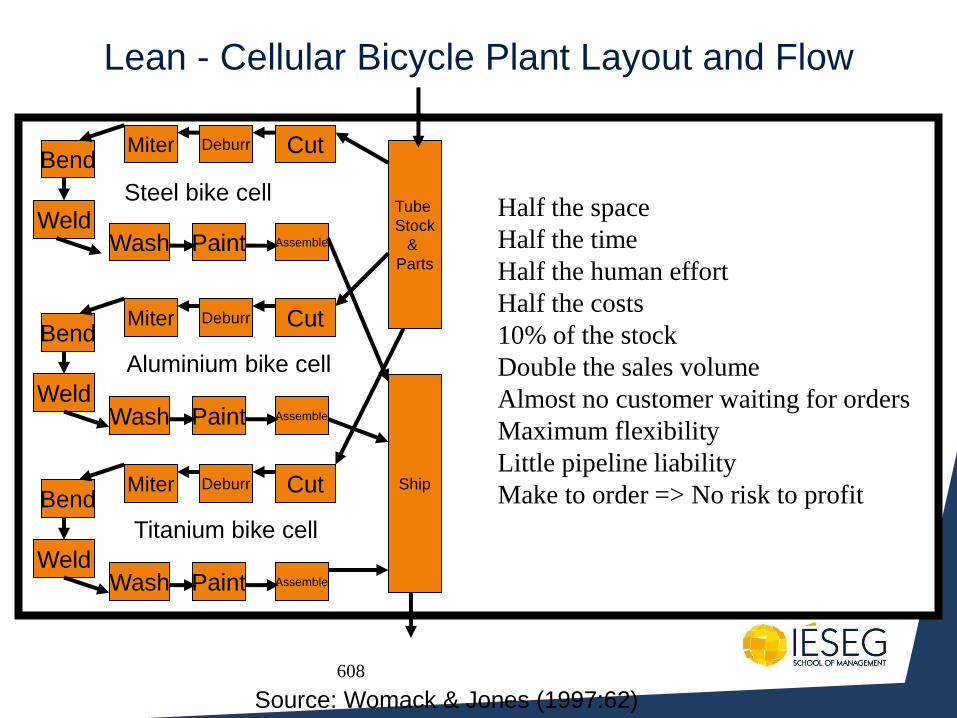
608
Lean - Cellular Bicycle Plant Layout and Flow
Tube
Stock
&
Parts
Cut Deburr Miter
Weld
Bend
Assemble Paint Wash
Source: Womack & Jones (1997:62)
Ship
Cut Deburr Miter
Weld
Bend
Assemble Paint Wash
Cut Deburr Miter
Weld
Bend
Assemble Paint Wash
Steel bike cell
Aluminium bike cell
Titanium bike cell
Half the space
Half the time
Half the human effort
Half the costs
10% of the stock
Double the sales volume
Almost no customer waiting for orders
Maximum flexibility
Little pipeline liability
Make to order => No risk to profit
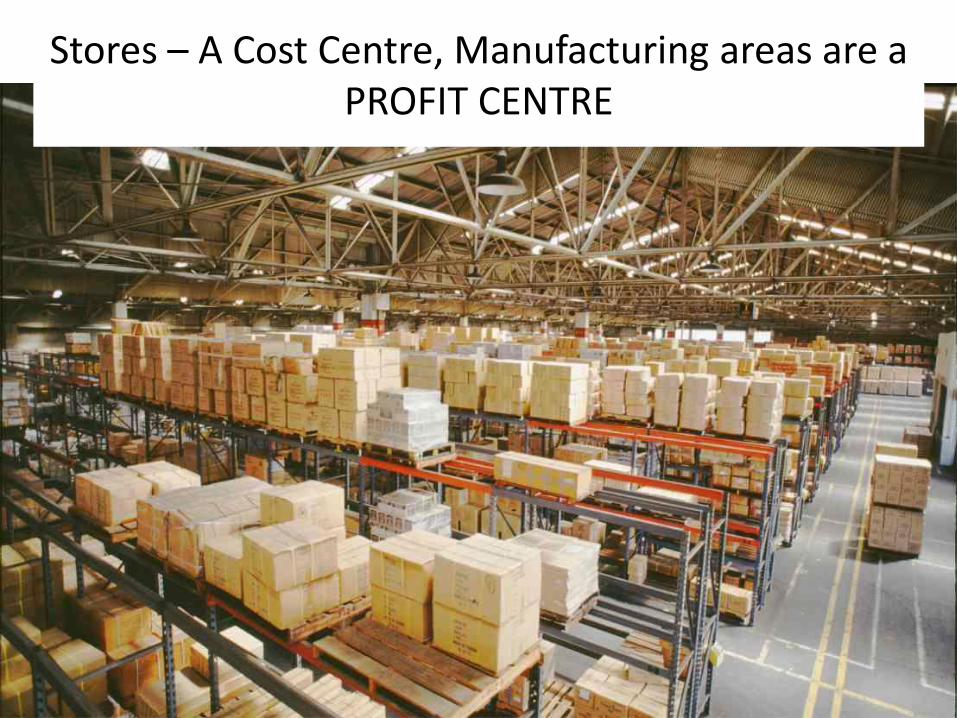
http://www.fhiplantservices.com/go2/warehouse-services.cfm
Stores – A Cost Centre, Manufacturing areas are a PROFIT CENTRE
Japan Supply Chain Case
© Dr David J. Newlands
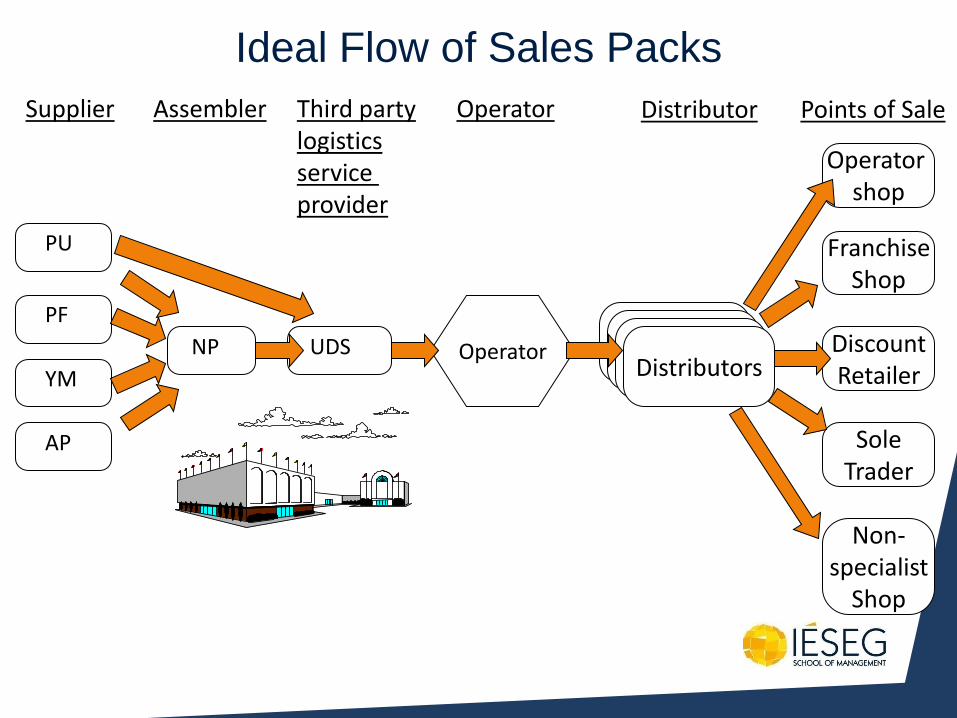
Ideal Flow of Sales Packs
Points of Sale
Operator shop
Franchise Shop
Discount Retailer
Sole Trader
Non- specialist
Shop
Operator
Operator
Distributor
Distributors UDS
Third party logistics service provider
Supplier
PF
YM
PU
AP
Assembler
NP
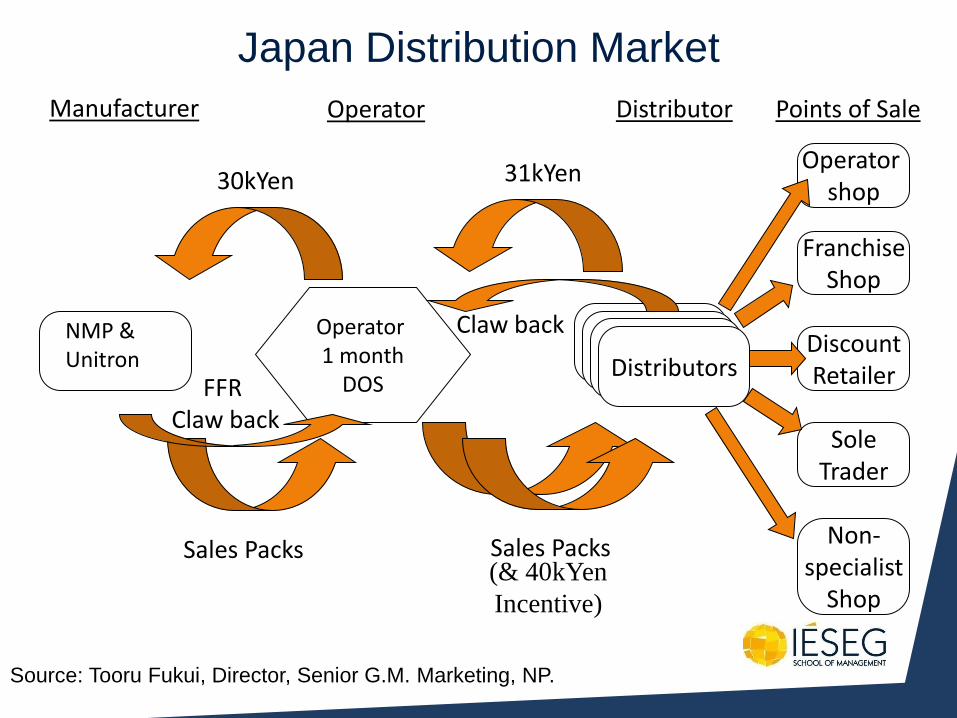
Japan Distribution Market
Operator 1 month
DOS
NMP & Unitron Distributors
30kYen
Sales Packs Sales Packs
31kYen
Claw back
Operator shop
Franchise Shop
Discount Retailer
Sole Trader
Non- specialist
Shop
Manufacturer Operator Points of Sale Distributor
(& 40kYen
Incentive)
FFR Claw back
Source: Tooru Fukui, Director, Senior G.M. Marketing, NP.
Case Study: HD928
• Based on recent experience in the toughest and fastest developing market
• Major challenges: quality-volume, capacity, delivery reliability, lead-time, communication
• First hand experience as the basis of lessons to learn
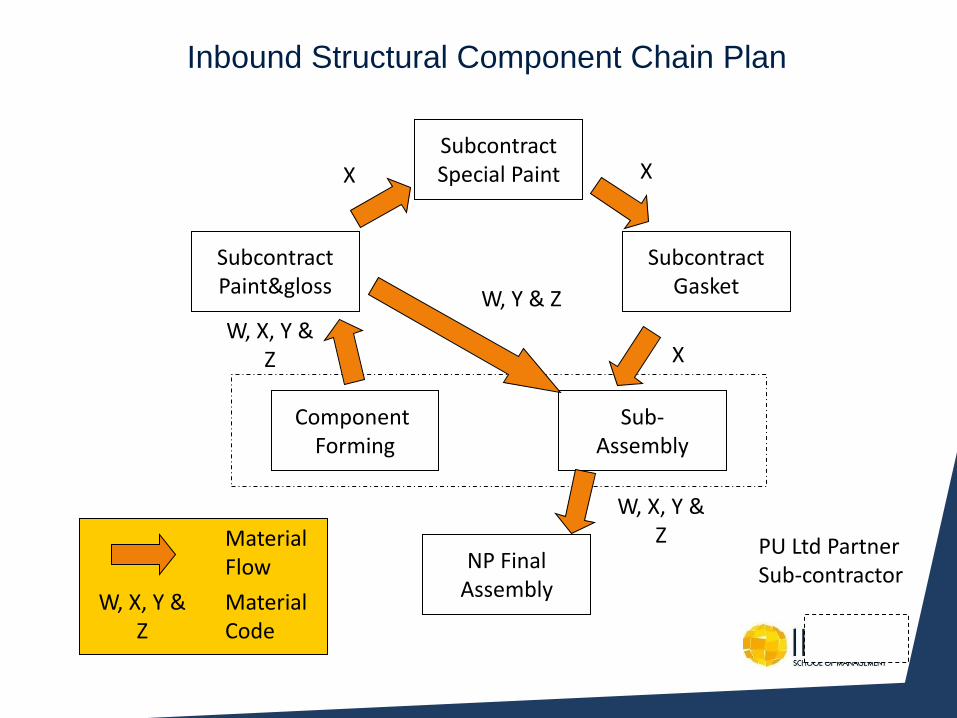
Inbound Structural Component Chain Plan
NP Final Assembly
Subcontract Gasket
Subcontract Special Paint
Subcontract Paint&gloss
Component Forming
Sub- Assembly
Material Flow
W, X, Y & Z
W, Y & Z
X X
X
W, X, Y & Z
W, X, Y & Z
Material Code
PU Ltd Partner Sub-contractor
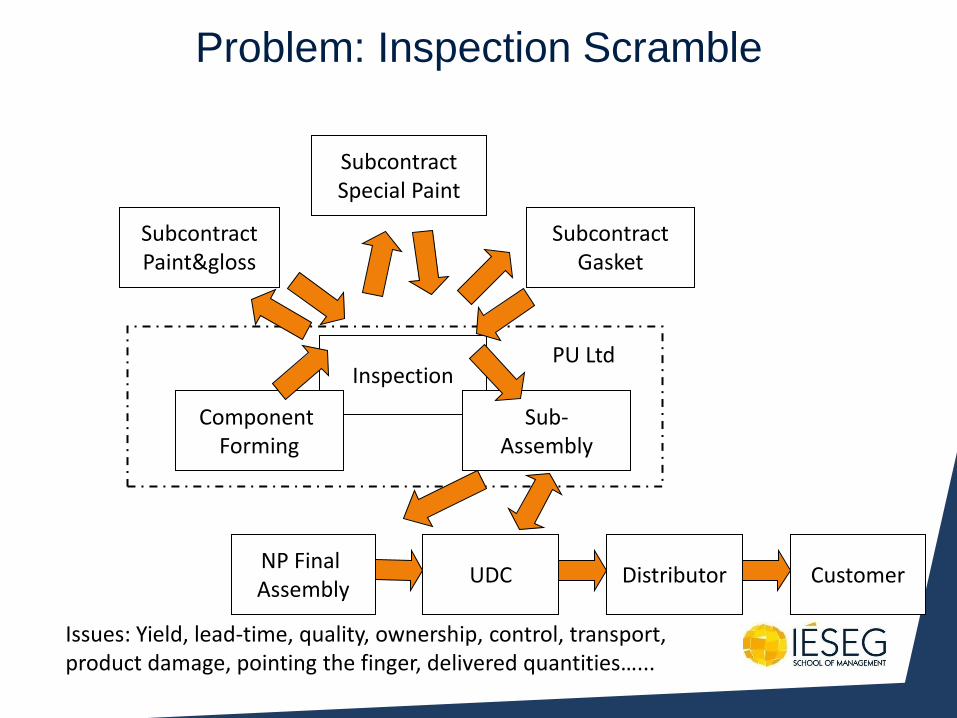
Problem: Inspection Scramble
Inspection
Subcontract Gasket
Subcontract Special Paint
Subcontract Paint&gloss
Component Forming
Sub- Assembly
Issues: Yield, lead-time, quality, ownership, control, transport, product damage, pointing the finger, delivered quantities…...
NP Final Assembly
UDC Distributor Customer
PU Ltd

http://www.suji2k.50megs.com/cell.htm

http://itzr.en.alibaba.com/product/336440847-210389654/PCB_A_for_MOBILE_PHONE_CELL_1200_1202_1203_1208_1209.html
http://www.hiwtc.com/photo/products/34/01/92/19234.jpg

http://gadgetstress.com/2011/08/alcatel-ot-606-stress-test/
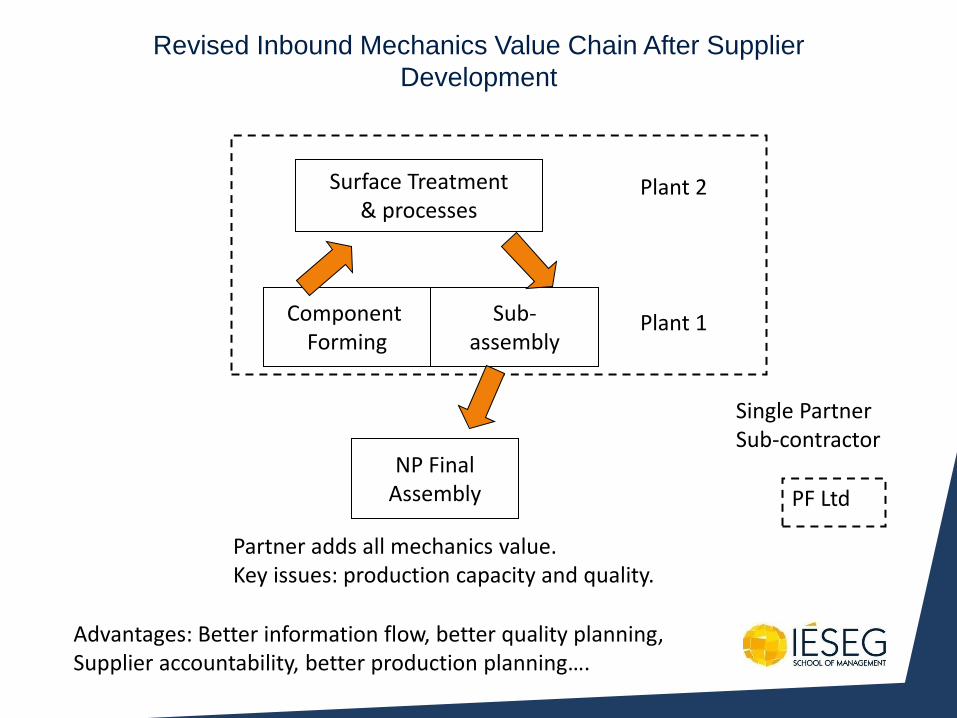
Revised Inbound Mechanics Value Chain After Supplier
Development
Partner adds all mechanics value. Key issues: production capacity and quality.
Single Partner Sub-contractor
NP Final Assembly
Component Forming
Sub- assembly
Surface Treatment & processes
Plant 1
Plant 2
Advantages: Better information flow, better quality planning, Supplier accountability, better production planning….
PF Ltd
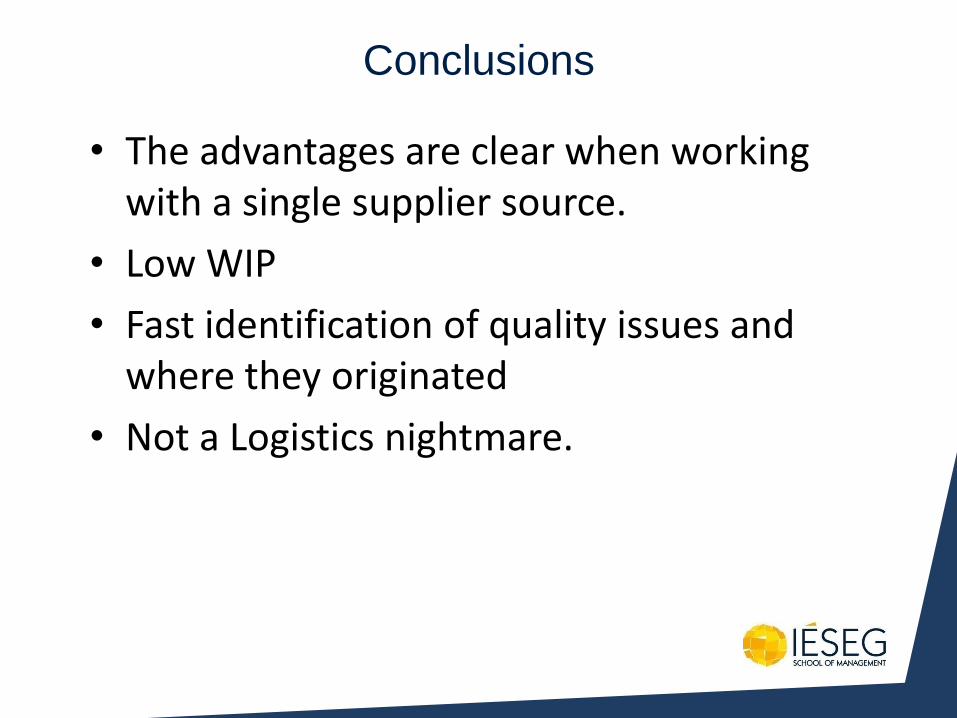
Conclusions
• The advantages are clear when working with a single supplier source.
• Low WIP
• Fast identification of quality issues and where they originated
• Not a Logistics nightmare.
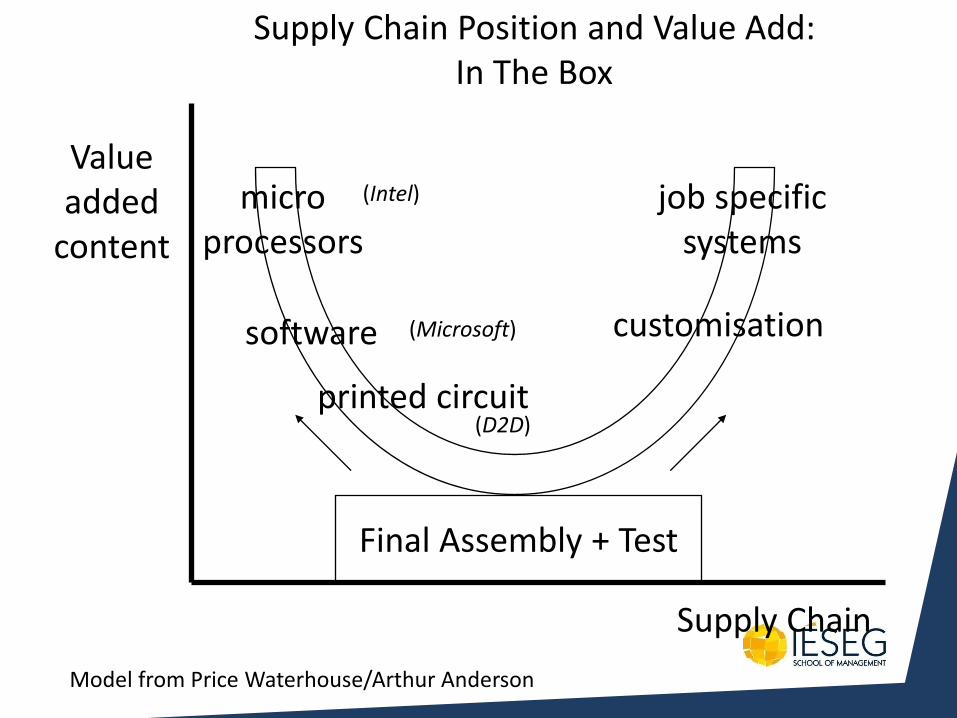
Supply Chain Position and Value Add: In The Box
Model from Price Waterhouse/Arthur Anderson
micro processors
job specific systems
software
printed circuit
customisation
Final Assembly + Test
(Intel)
(Microsoft)
(D2D)
Value added
content
Supply Chain
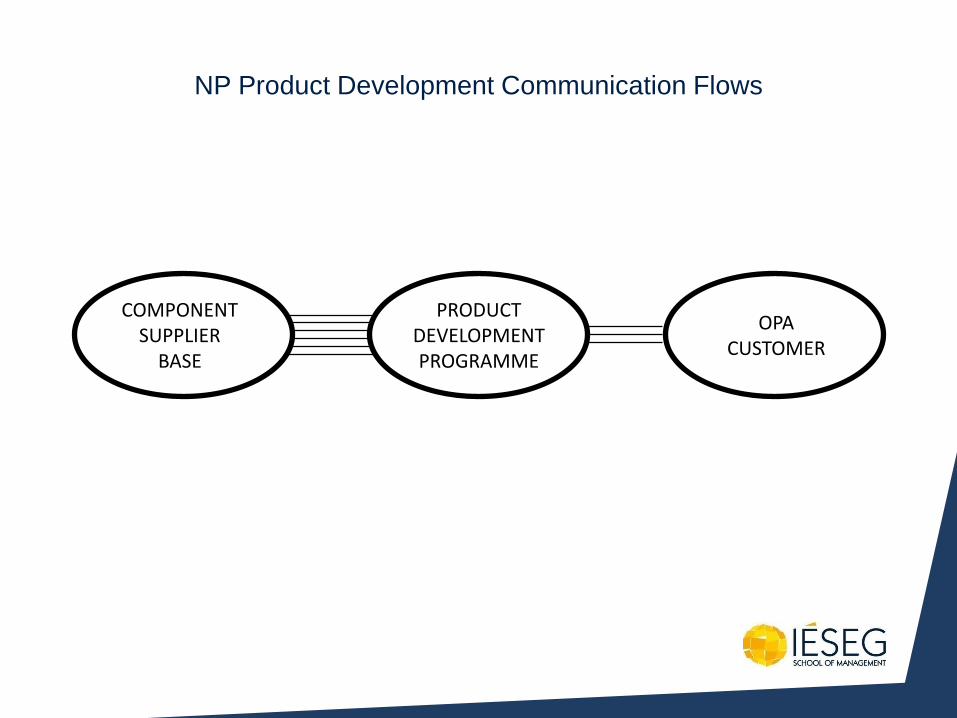
COMPONENT SUPPLIER
BASE
PRODUCT DEVELOPMENT PROGRAMME
OPA CUSTOMER
NP Product Development Communication Flows
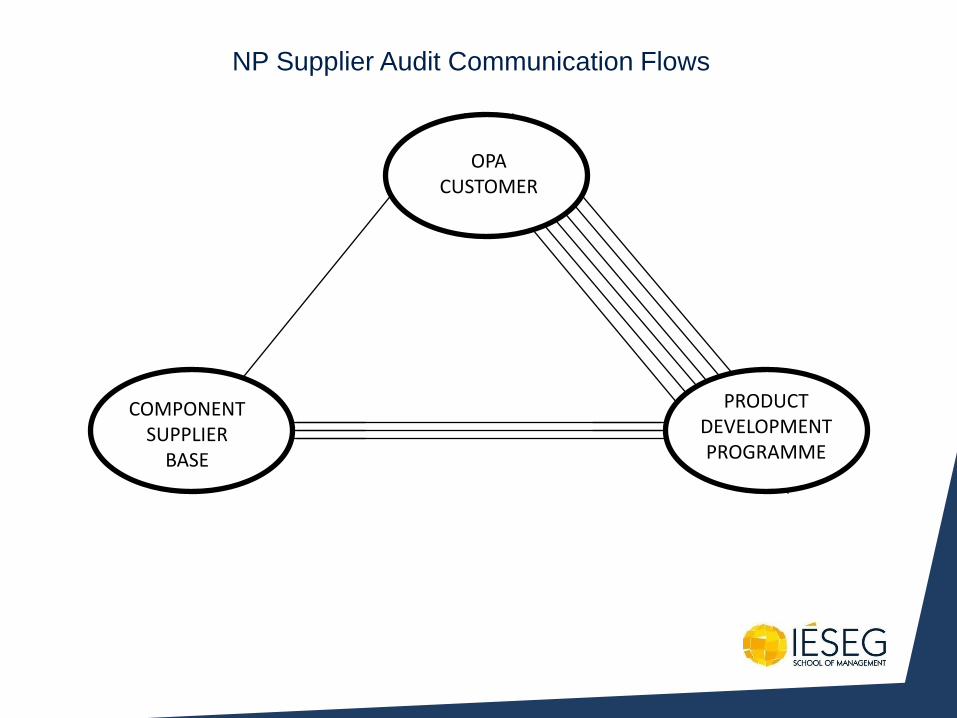
OPA CUSTOMER
COMPONENT SUPPLIER
BASE
PRODUCT DEVELOPMENT PROGRAMME
NP Supplier Audit Communication Flows
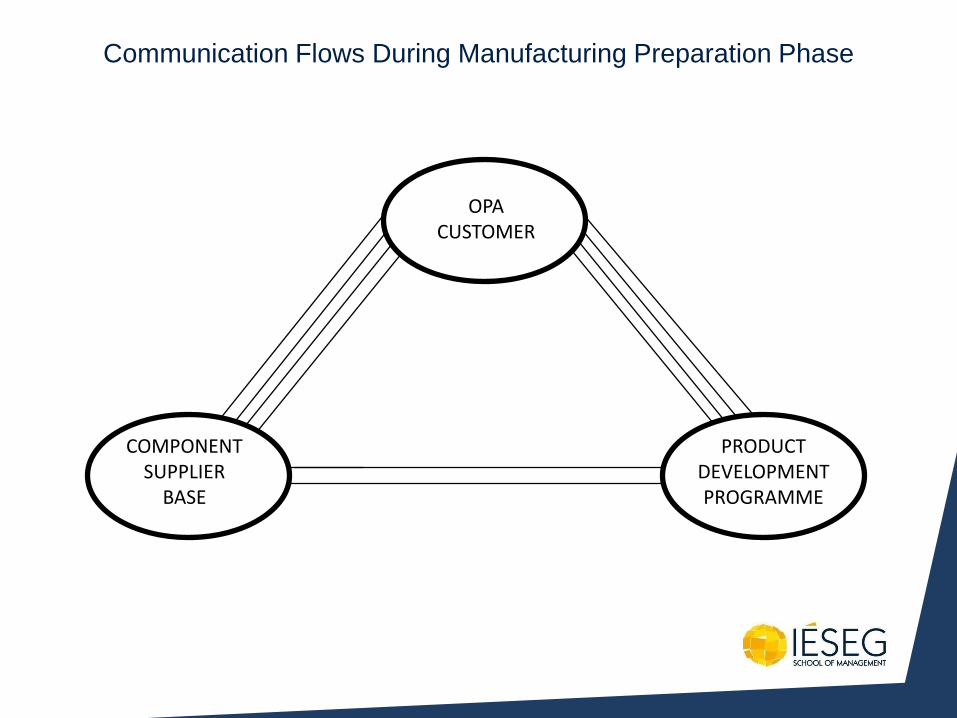
OPA CUSTOMER
COMPONENT SUPPLIER
BASE
PRODUCT DEVELOPMENT PROGRAMME
Communication Flows During Manufacturing Preparation Phase
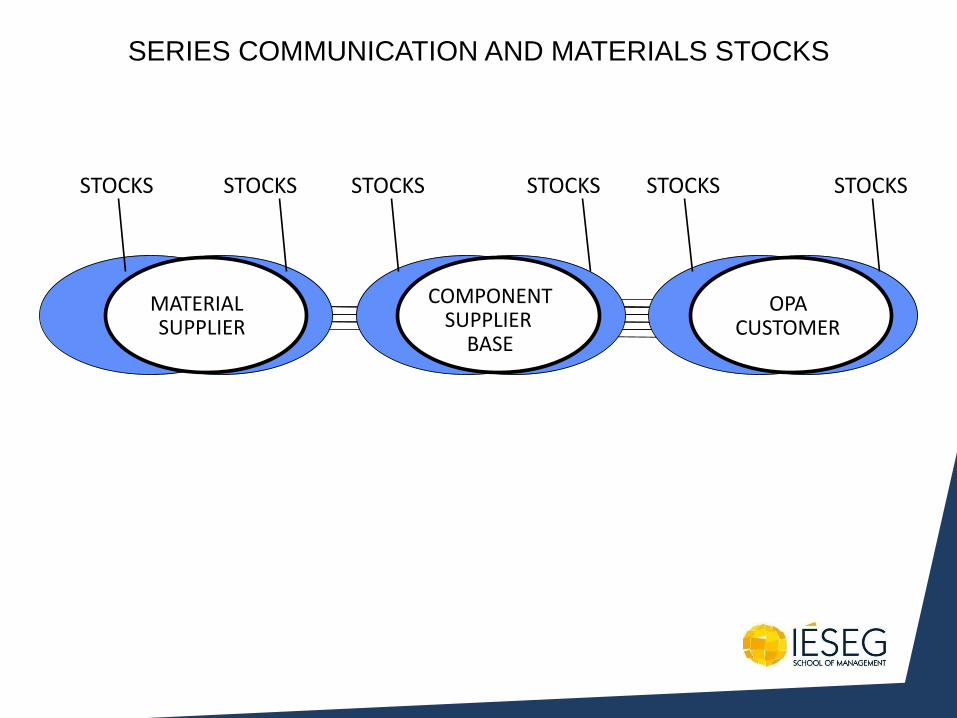
SERIES COMMUNICATION AND MATERIALS STOCKS
MATERIAL SUPPLIER
COMPONENT SUPPLIER
BASE
OPA CUSTOMER
STOCKS STOCKS STOCKS STOCKS STOCKS STOCKS
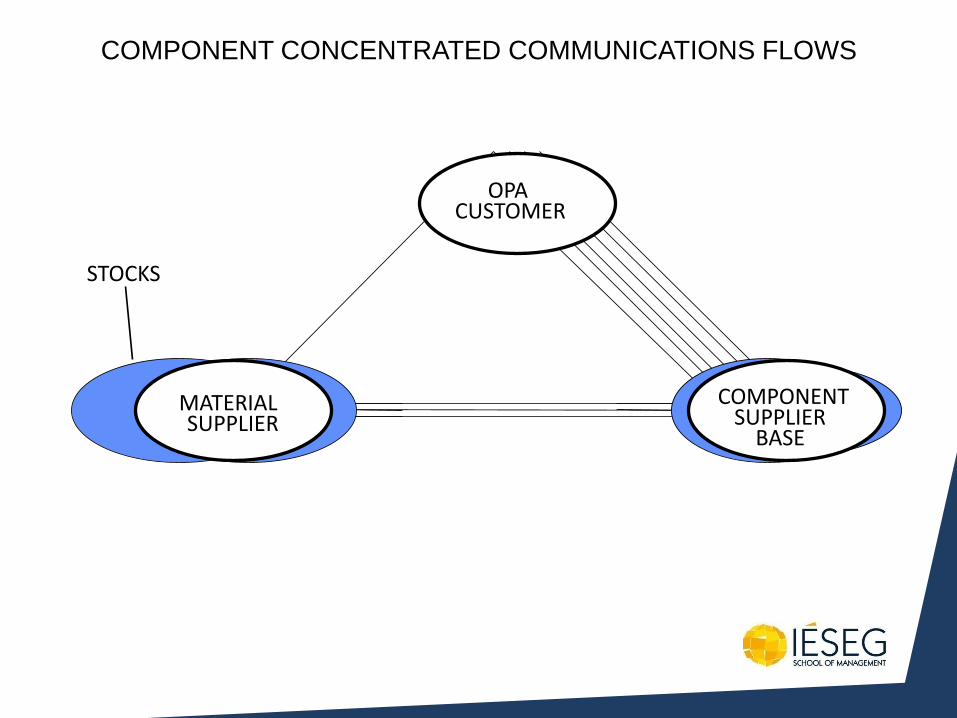
COMPONENT CONCENTRATED COMMUNICATIONS FLOWS
OPA CUSTOMER
MATERIAL SUPPLIER
COMPONENT SUPPLIER
BASE
STOCKS
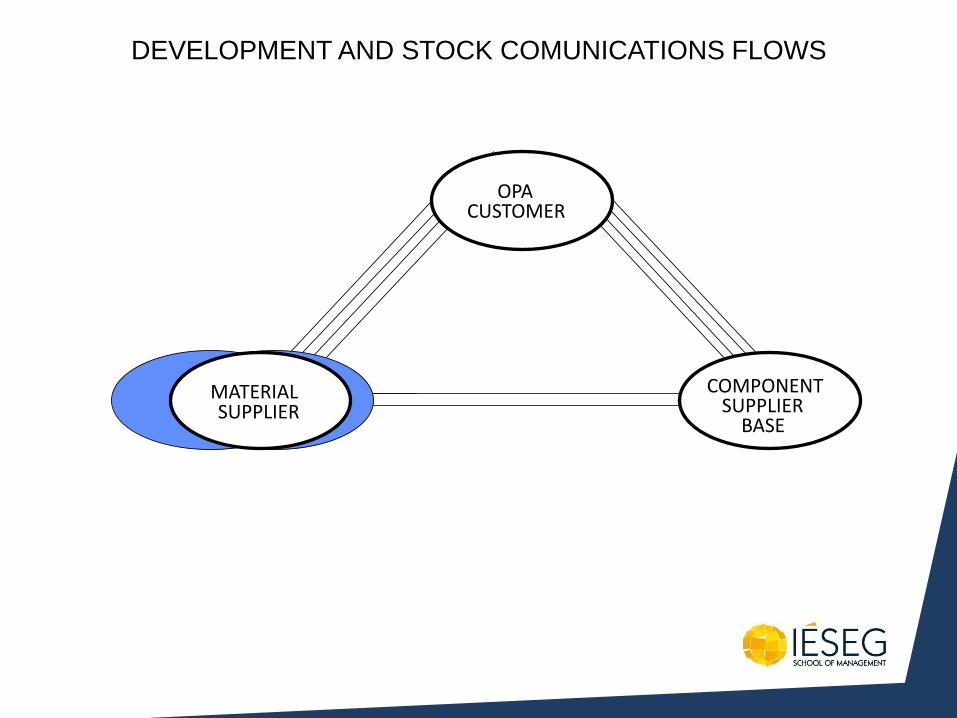
DEVELOPMENT AND STOCK COMUNICATIONS FLOWS
OPA CUSTOMER
MATERIAL SUPPLIER
COMPONENT SUPPLIER
BASE
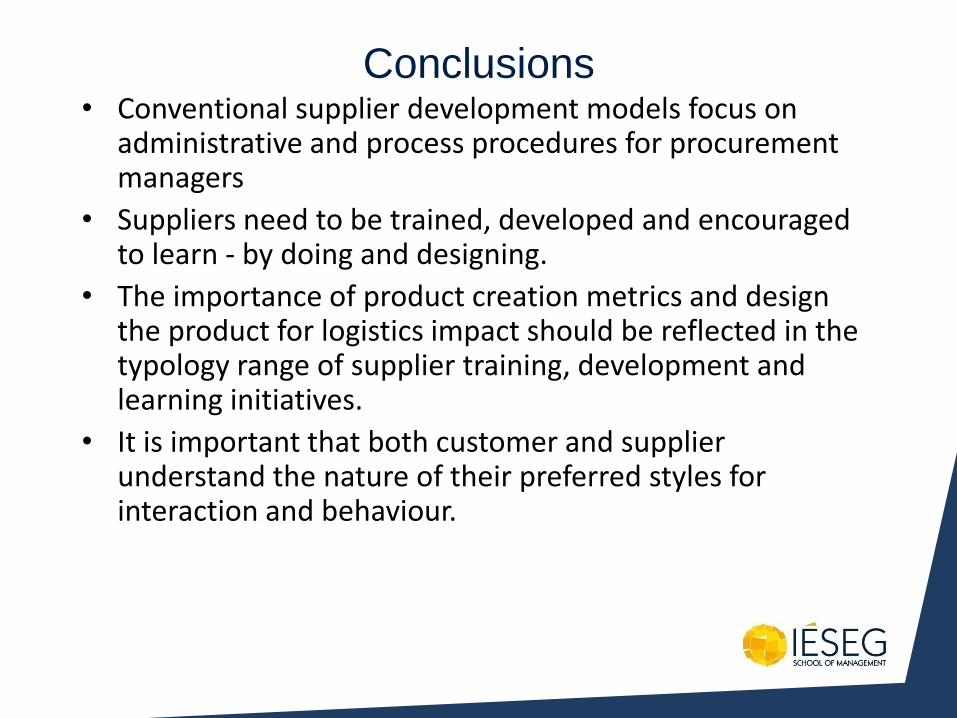
Conclusions • Conventional supplier development models focus on
administrative and process procedures for procurement managers
• Suppliers need to be trained, developed and encouraged to learn - by doing and designing.
• The importance of product creation metrics and design the product for logistics impact should be reflected in the typology range of supplier training, development and learning initiatives.
• It is important that both customer and supplier understand the nature of their preferred styles for interaction and behaviour.
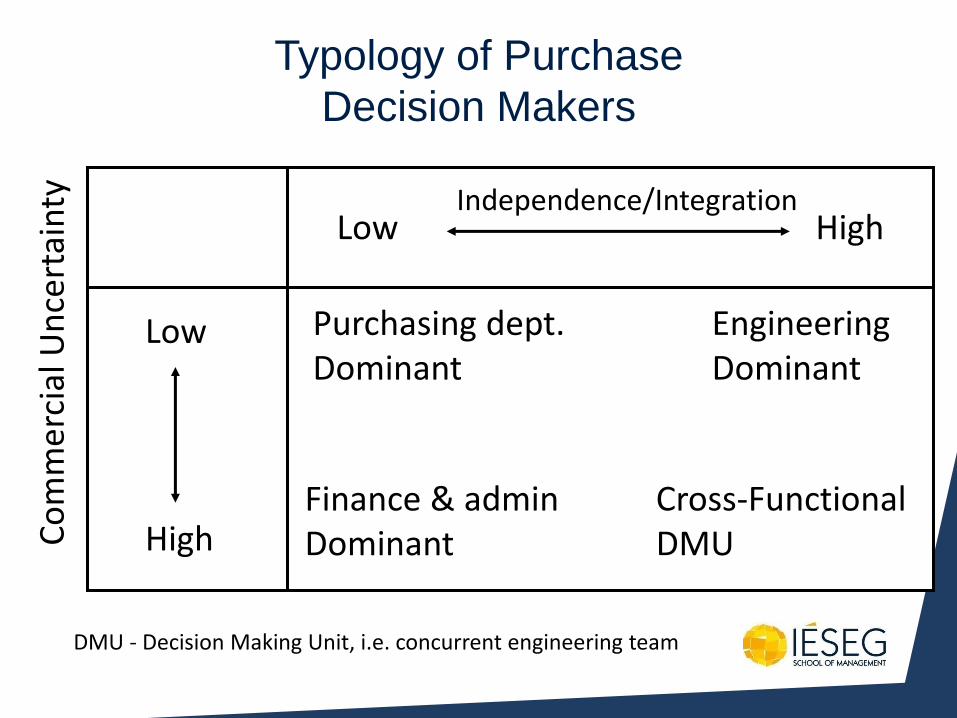
Typology of Purchase
Decision Makers
Co
mm
erci
al U
nce
rtai
nty
Low
Low
High
High
Purchasing dept. Dominant
Engineering Dominant
Finance & admin Dominant
Cross-Functional DMU
DMU - Decision Making Unit, i.e. concurrent engineering team
Independence/Integration
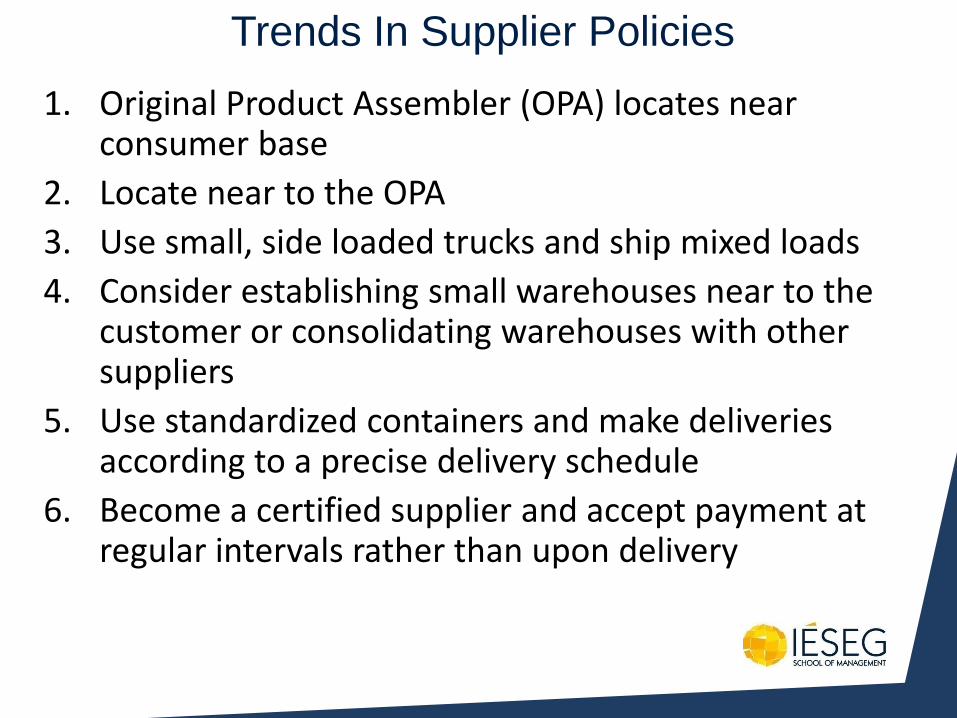
Trends In Supplier Policies
1. Original Product Assembler (OPA) locates near consumer base
2. Locate near to the OPA
3. Use small, side loaded trucks and ship mixed loads
4. Consider establishing small warehouses near to the customer or consolidating warehouses with other suppliers
5. Use standardized containers and make deliveries according to a precise delivery schedule
6. Become a certified supplier and accept payment at regular intervals rather than upon delivery
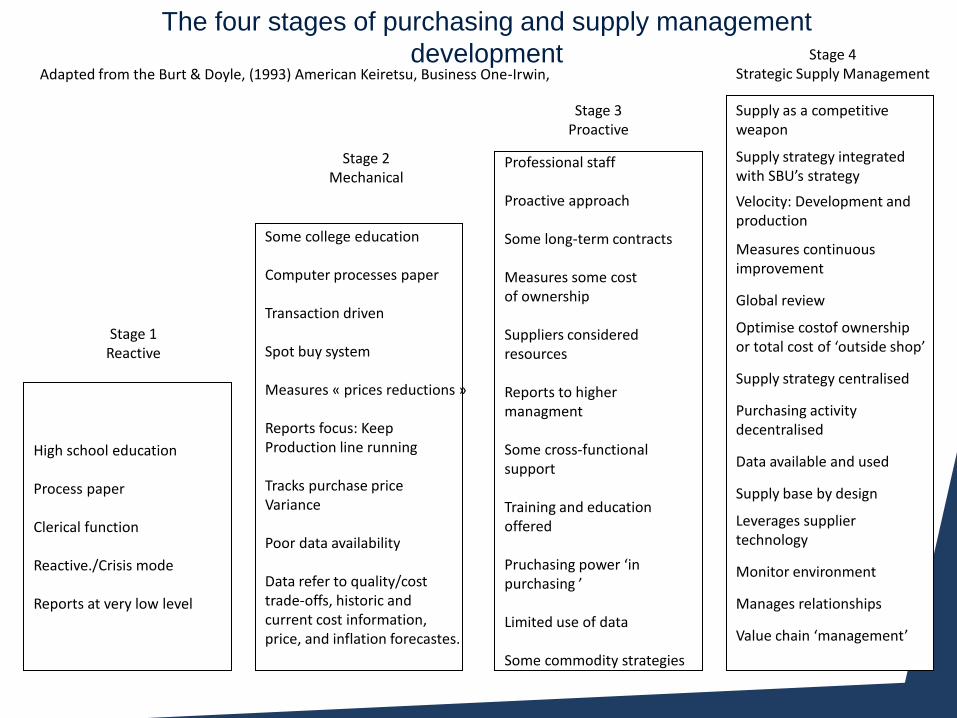
The four stages of purchasing and supply management
development
Professional staff Proactive approach Some long-term contracts Measures some cost of ownership Suppliers considered resources Reports to higher managment Some cross-functional support Training and education offered Pruchasing power ‘in purchasing ’ Limited use of data Some commodity strategies
Some college education Computer processes paper Transaction driven Spot buy system Measures « prices reductions » Reports focus: Keep Production line running Tracks purchase price Variance Poor data availability Data refer to quality/cost trade-offs, historic and current cost information, price, and inflation forecastes.
High school education Process paper Clerical function Reactive./Crisis mode Reports at very low level
Stage 4 Strategic Supply Management
Stage 3 Proactive
Stage 2 Mechanical
Stage 1 Reactive
Adapted from the Burt & Doyle, (1993) American Keiretsu, Business One-Irwin,
Supply as a competitive weapon
Supply strategy integrated with SBU’s strategy
Velocity: Development and production
Measures continuous improvement
Global review
Optimise costof ownership or total cost of ‘outside shop’
Supply strategy centralised
Purchasing activity decentralised
Data available and used
Supply base by design
Leverages supplier technology
Monitor environment
Manages relationships
Value chain ‘management’

Key Solutions
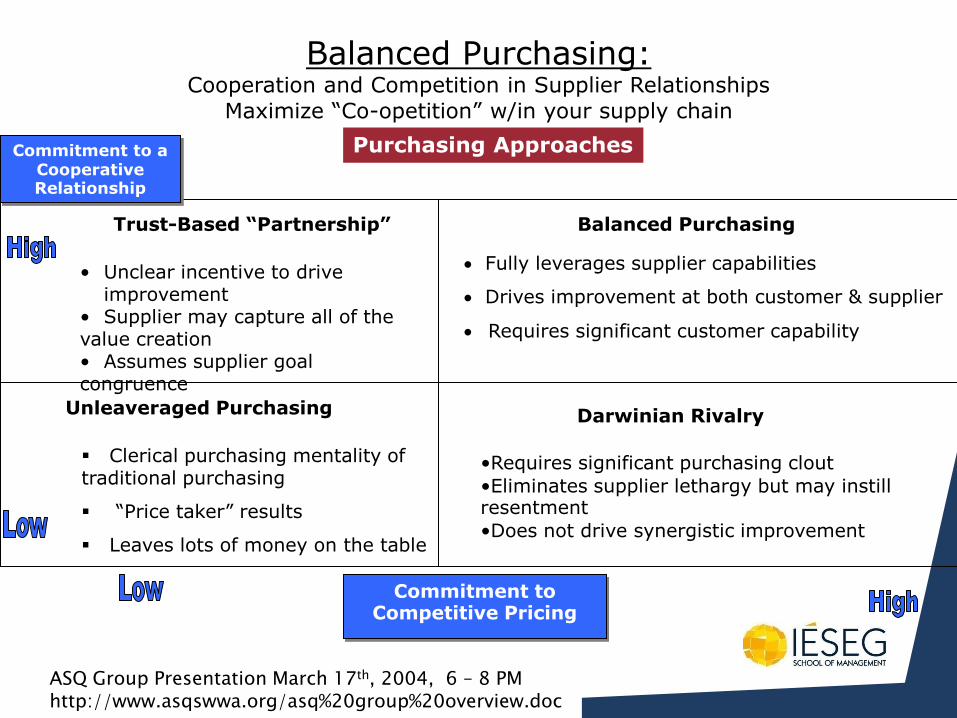
Balanced Purchasing: Cooperation and Competition in Supplier Relationships
Maximize “Co-opetition” w/in your supply chain
• Unclear incentive to drive improvement • Supplier may capture all of the value creation • Assumes supplier goal congruence
Fully leverages supplier capabilities
Drives improvement at both customer & supplier
Requires significant customer capability
Clerical purchasing mentality of traditional purchasing
“Price taker” results
Leaves lots of money on the table
•Requires significant purchasing clout •Eliminates supplier lethargy but may instill resentment •Does not drive synergistic improvement
Commitment to Competitive Pricing
Commitment to a Cooperative Relationship
Purchasing Approaches
ASQ Group Presentation March 17th, 2004, 6 – 8 PM http://www.asqswwa.org/asq%20group%20overview.doc
Trust-Based “Partnership” Balanced Purchasing
Unleaveraged Purchasing Darwinian Rivalry
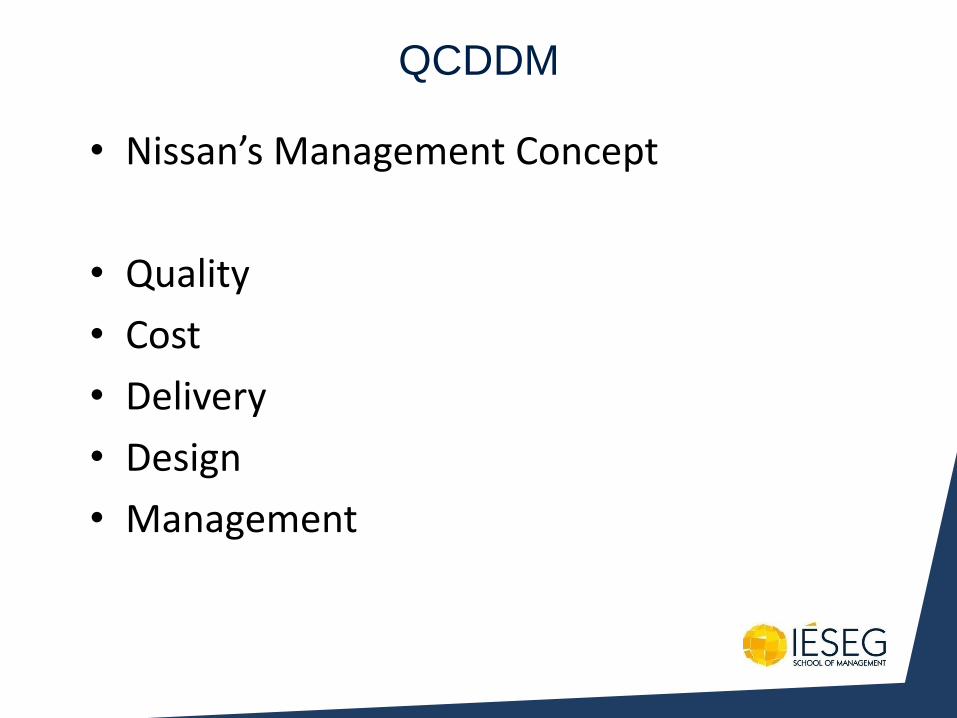
QCDDM
• Nissan’s Management Concept
• Quality
• Cost
• Delivery
• Design
• Management
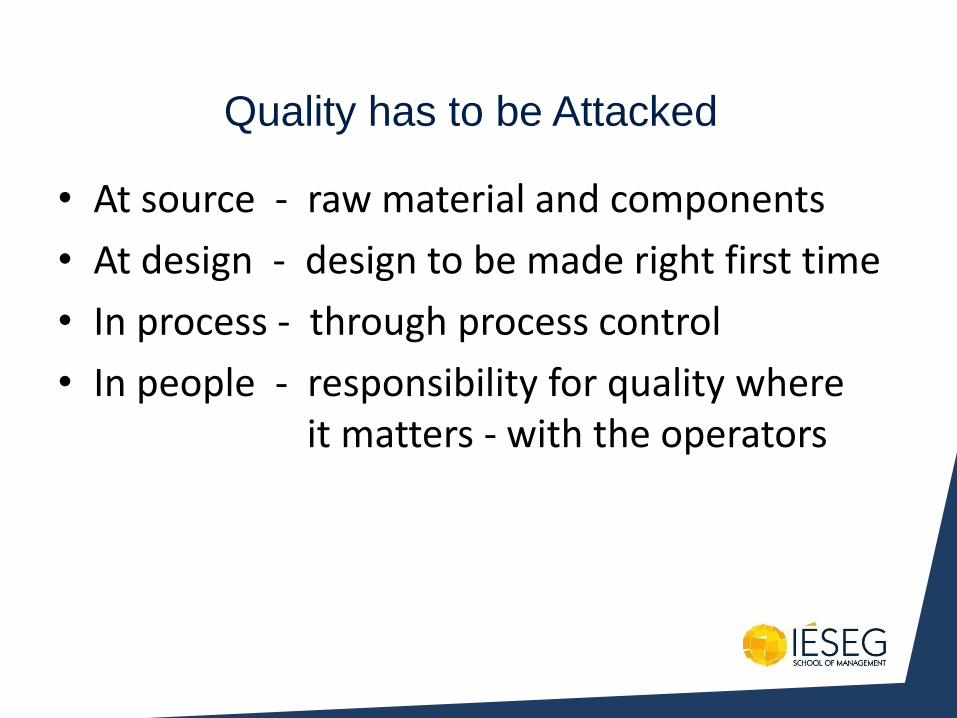
Quality has to be Attacked
• At source - raw material and components
• At design - design to be made right first time
• In process - through process control
• In people - responsibility for quality where it matters - with the operators
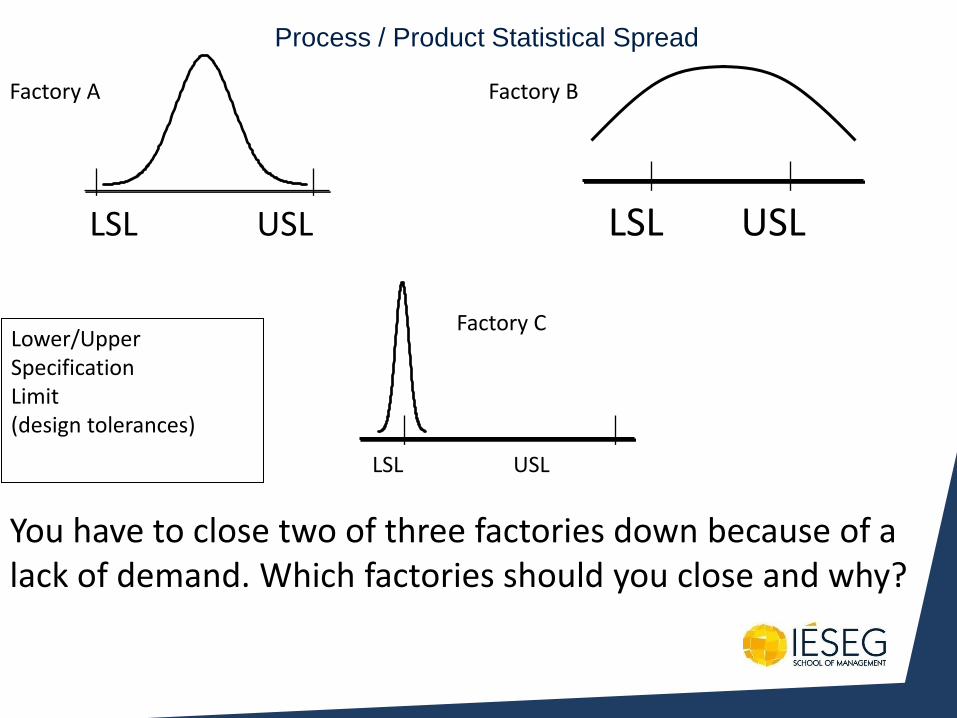
Process / Product Statistical Spread
LSL USL
LSL USL
LSL USL
You have to close two of three factories down because of a lack of demand. Which factories should you close and why?
Factory A
Factory C
Factory B
Lower/Upper Specification Limit (design tolerances)
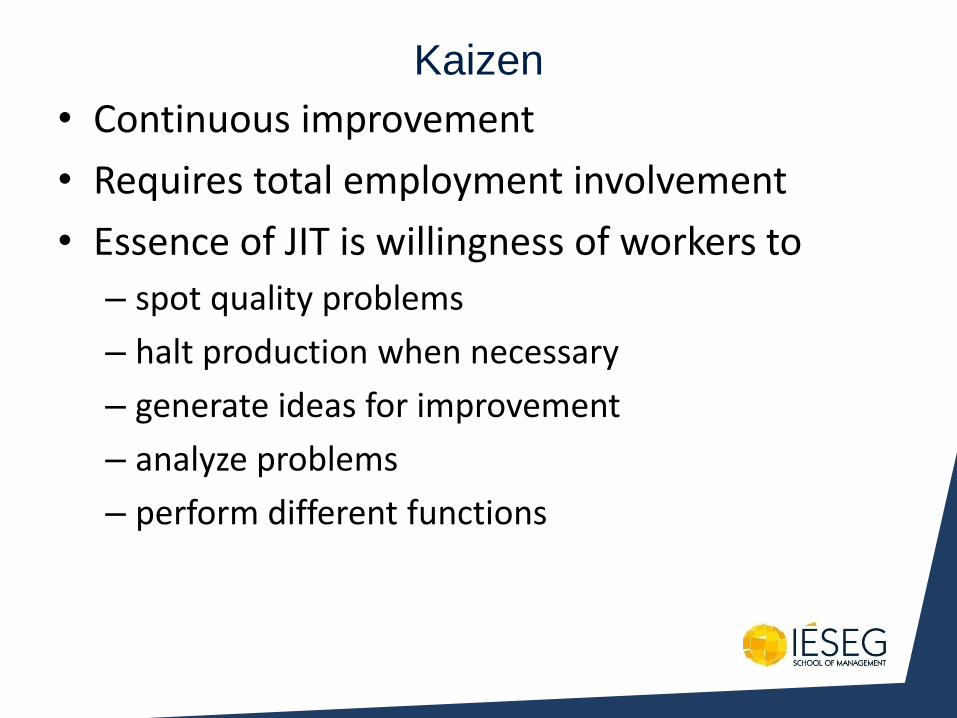
Kaizen
• Continuous improvement
• Requires total employment involvement
• Essence of JIT is willingness of workers to
– spot quality problems
– halt production when necessary
– generate ideas for improvement
– analyze problems
– perform different functions
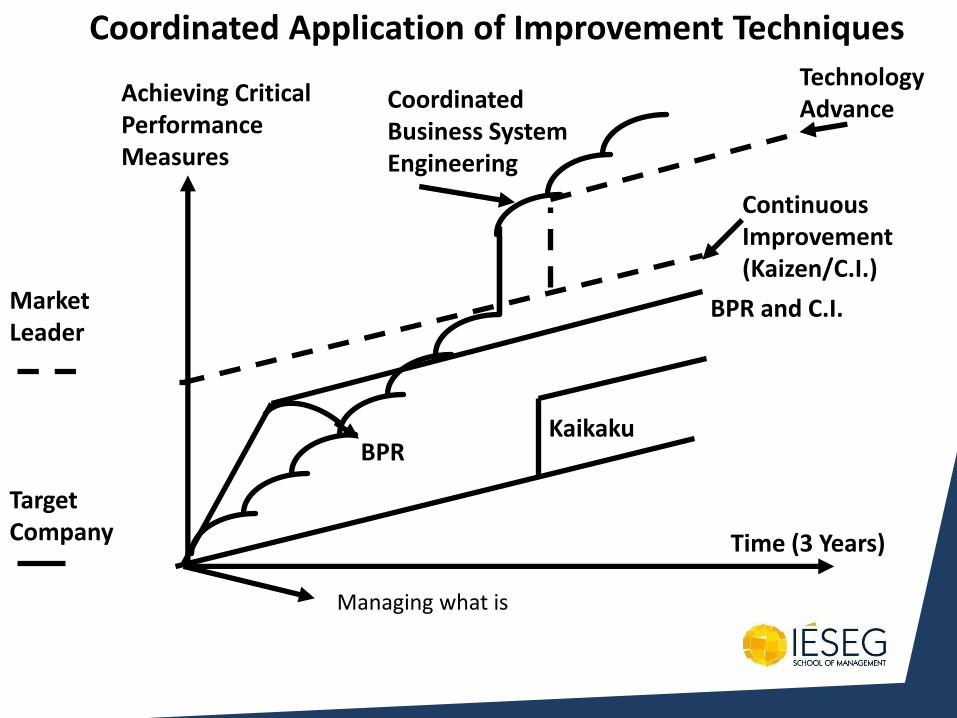
Coordinated Application of Improvement Techniques
Achieving Critical Performance Measures
Time (3 Years)
Market Leader
Target Company
BPR and C.I.
Managing what is
BPR
Continuous Improvement (Kaizen/C.I.)
Kaikaku
Technology Advance Coordinated
Business System Engineering
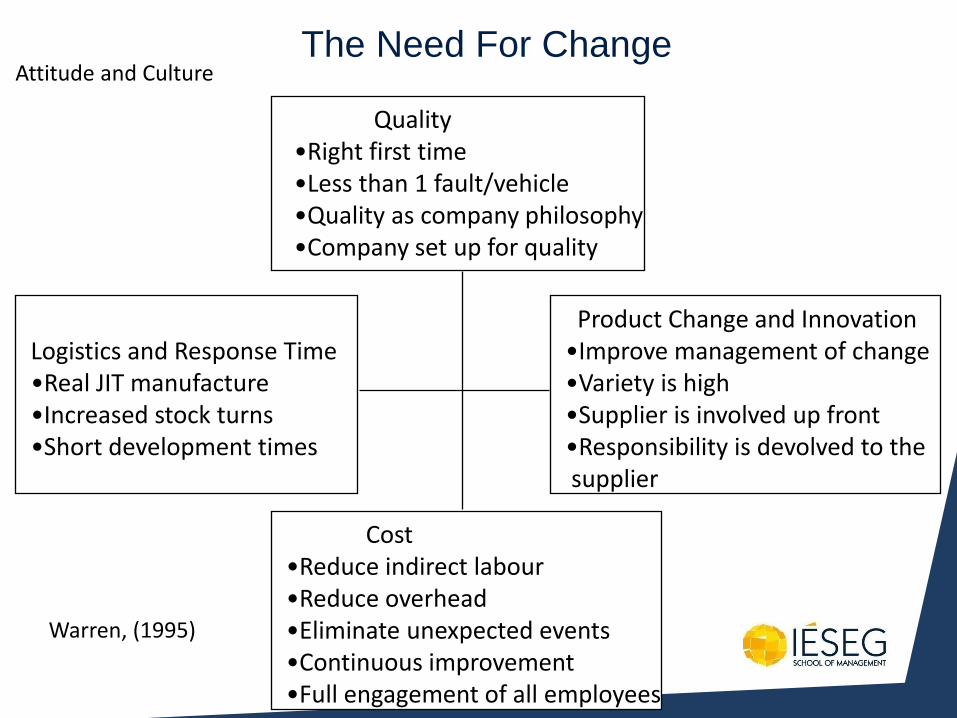
The Need For Change Attitude and Culture
Quality •Right first time •Less than 1 fault/vehicle •Quality as company philosophy •Company set up for quality
Logistics and Response Time •Real JIT manufacture •Increased stock turns •Short development times
Cost •Reduce indirect labour •Reduce overhead •Eliminate unexpected events •Continuous improvement •Full engagement of all employees
Product Change and Innovation •Improve management of change •Variety is high •Supplier is involved up front •Responsibility is devolved to the supplier
Warren, (1995)
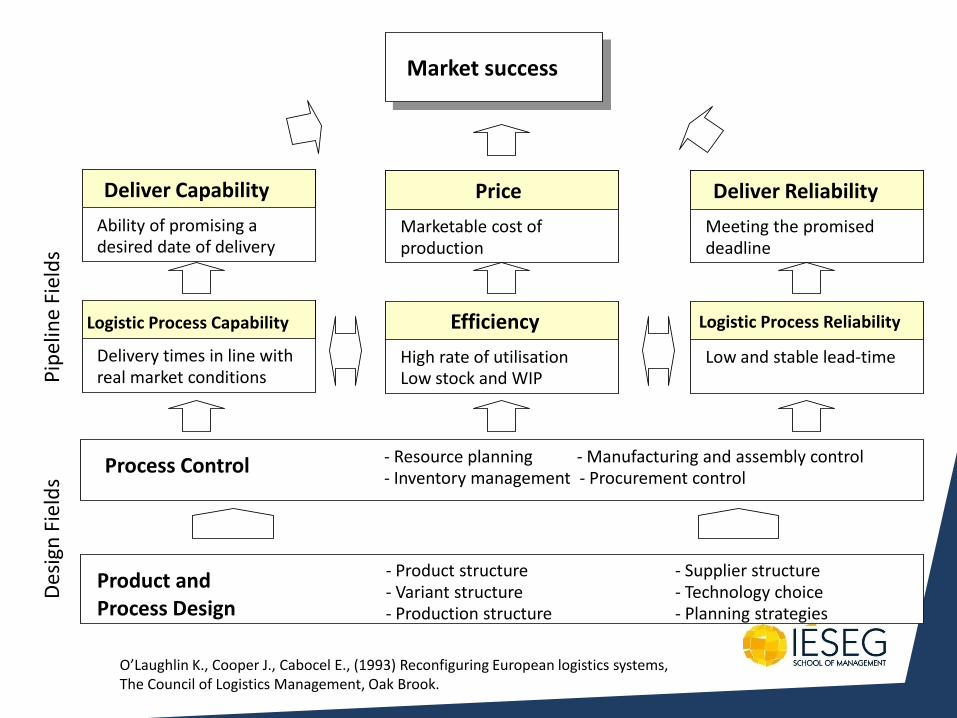
O’Laughlin K., Cooper J., Cabocel E., (1993) Reconfiguring European logistics systems, The Council of Logistics Management, Oak Brook.
Market success Market success
Logistic Process Capability
Delivery times in line with real market conditions
Efficiency
High rate of utilisation Low stock and WIP
Logistic Process Reliability
Low and stable lead-time
Deliver Reliability
Meeting the promised deadline
Price
Marketable cost of production
Deliver Capability
Ability of promising a desired date of delivery
Process Control
Product and Process Design
- Resource planning - Manufacturing and assembly control - Inventory management - Procurement control
- Product structure - Supplier structure - Variant structure - Technology choice - Production structure - Planning strategies
Des
ign
Fie
lds
Pip
elin
e Fi
eld
s
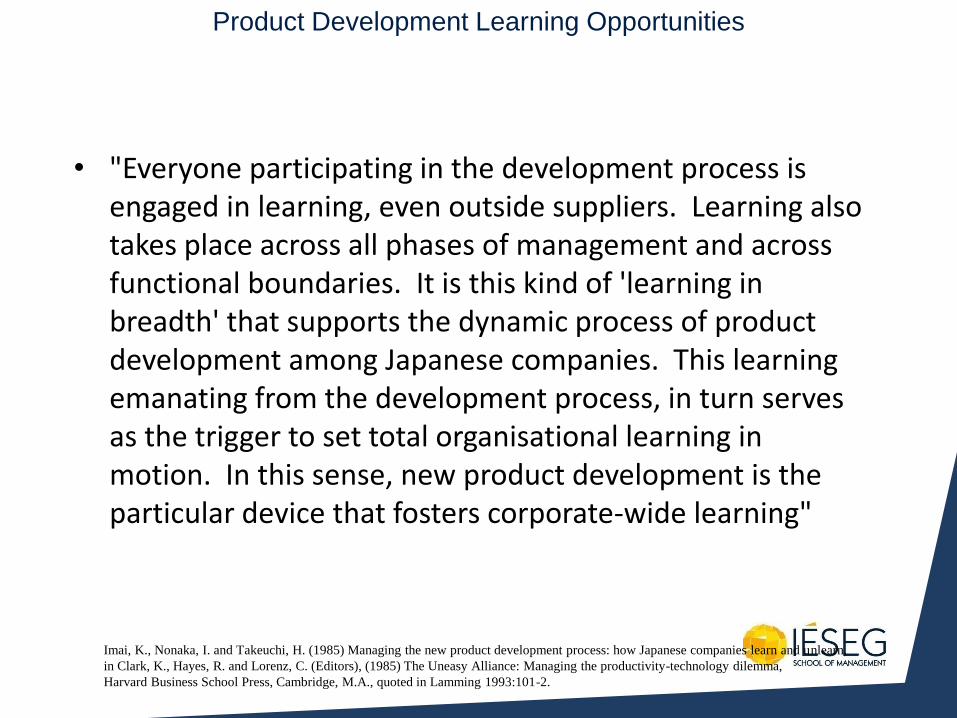
Product Development Learning Opportunities
• "Everyone participating in the development process is engaged in learning, even outside suppliers. Learning also takes place across all phases of management and across functional boundaries. It is this kind of 'learning in breadth' that supports the dynamic process of product development among Japanese companies. This learning emanating from the development process, in turn serves as the trigger to set total organisational learning in motion. In this sense, new product development is the particular device that fosters corporate-wide learning"
Imai, K., Nonaka, I. and Takeuchi, H. (1985) Managing the new product development process: how Japanese companies learn and unlearn,
in Clark, K., Hayes, R. and Lorenz, C. (Editors), (1985) The Uneasy Alliance: Managing the productivity-technology dilemma,
Harvard Business School Press, Cambridge, M.A., quoted in Lamming 1993:101-2.
What Is Expected Of Suppliers
And How Do They Fulfil Those
Expectations?
Dunlop Ltd. - Topy Wheels Ltd.
• Gerald Brooks
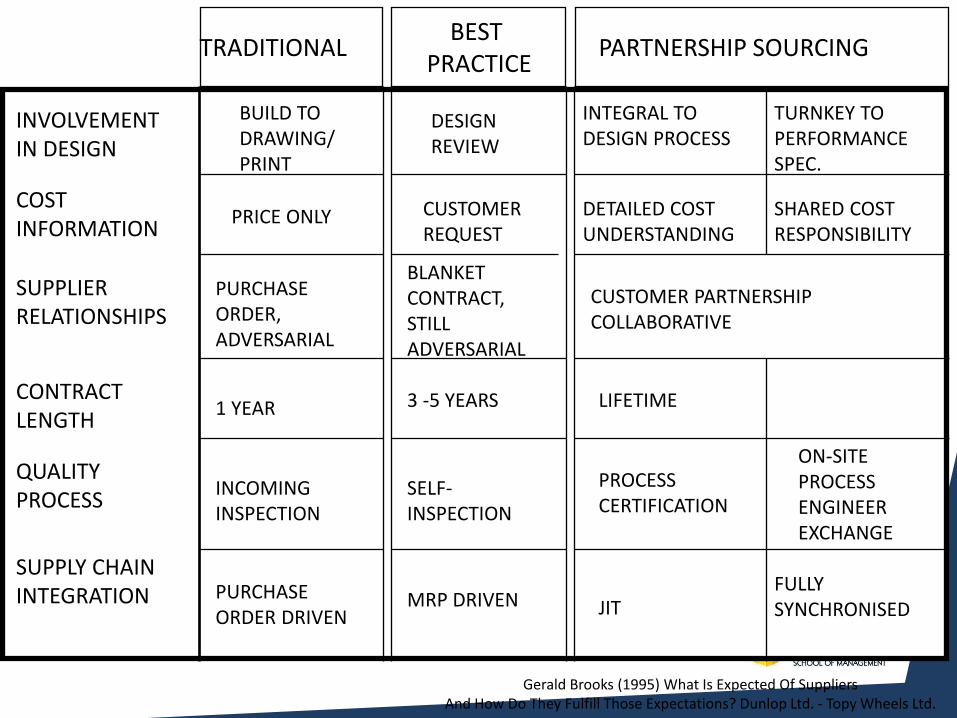
TRADITIONAL BEST
PRACTICE PARTNERSHIP SOURCING
INVOLVEMENT IN DESIGN
COST INFORMATION
SUPPLIER RELATIONSHIPS
CONTRACT LENGTH
QUALITY PROCESS
SUPPLY CHAIN INTEGRATION
BUILD TO DRAWING/ PRINT
PRICE ONLY
PURCHASE ORDER, ADVERSARIAL
1 YEAR
INCOMING INSPECTION
PURCHASE ORDER DRIVEN
DESIGN REVIEW
CUSTOMER REQUEST
BLANKET CONTRACT, STILL ADVERSARIAL
PROCESS CERTIFICATION
ON-SITE PROCESS ENGINEER EXCHANGE
SHARED COST RESPONSIBILITY
DETAILED COST UNDERSTANDING
LIFETIME
INTEGRAL TO DESIGN PROCESS
TURNKEY TO PERFORMANCE SPEC.
CUSTOMER PARTNERSHIP COLLABORATIVE
JIT FULLY SYNCHRONISED
3 -5 YEARS
SELF- INSPECTION
MRP DRIVEN
Gerald Brooks (1995) What Is Expected Of Suppliers And How Do They Fulfill Those Expectations? Dunlop Ltd. - Topy Wheels Ltd.
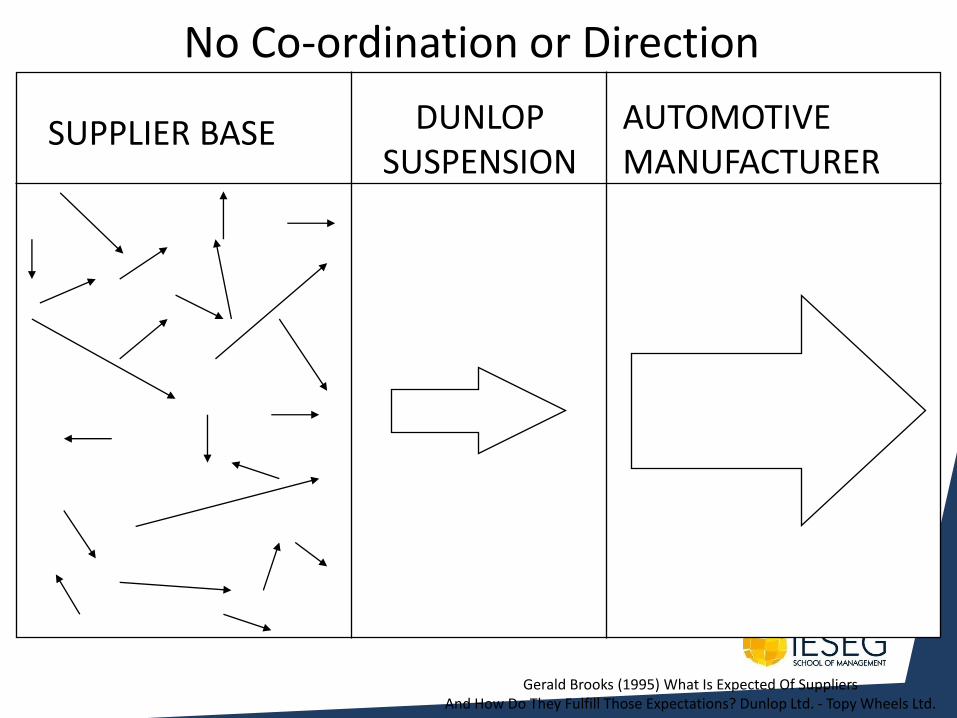
No Co-ordination or Direction
SUPPLIER BASE DUNLOP SUSPENSION
AUTOMOTIVE MANUFACTURER
Gerald Brooks (1995) What Is Expected Of Suppliers And How Do They Fulfill Those Expectations? Dunlop Ltd. - Topy Wheels Ltd.
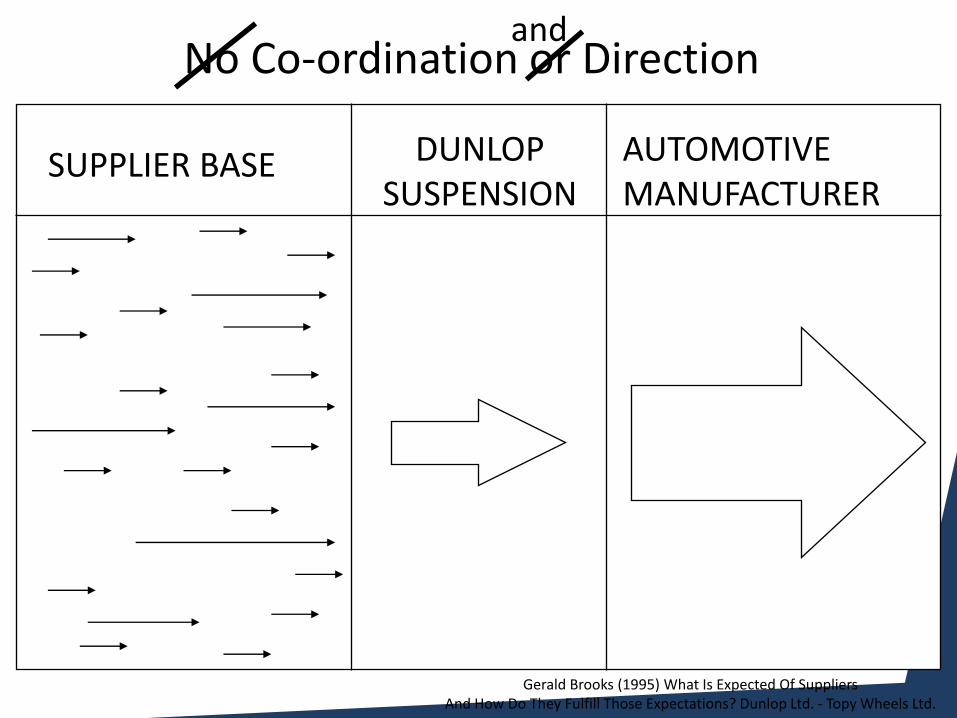
No Co-ordination or Direction
SUPPLIER BASE DUNLOP SUSPENSION
AUTOMOTIVE MANUFACTURER
and
Gerald Brooks (1995) What Is Expected Of Suppliers And How Do They Fulfill Those Expectations? Dunlop Ltd. - Topy Wheels Ltd.
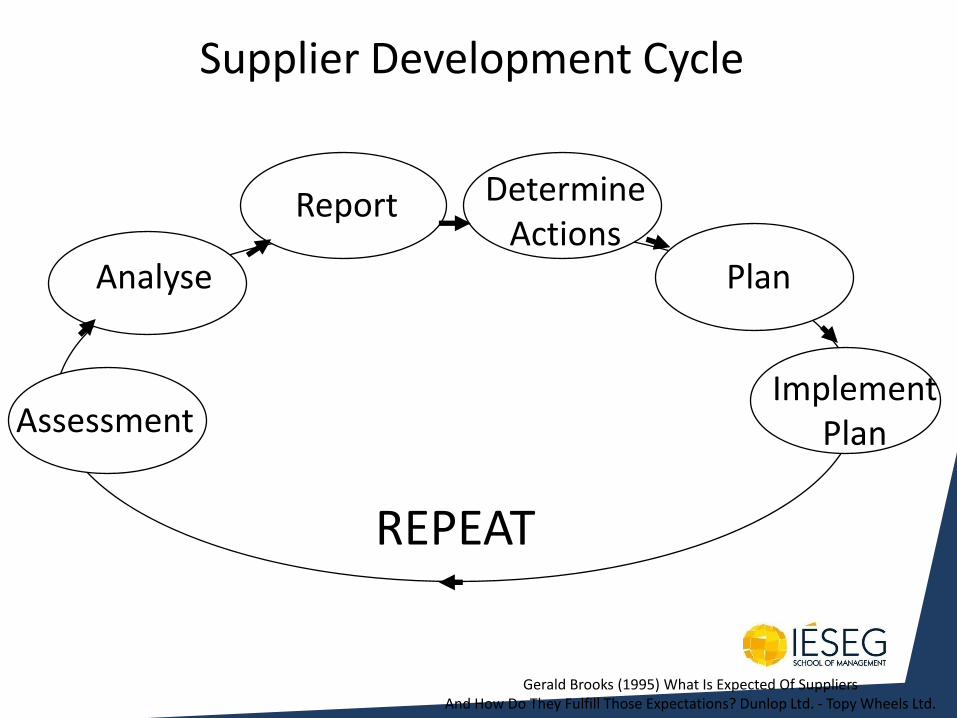
Assessment
Analyse
Report Determine Actions
Plan
Implement Plan
REPEAT
Supplier Development Cycle
Gerald Brooks (1995) What Is Expected Of Suppliers And How Do They Fulfill Those Expectations? Dunlop Ltd. - Topy Wheels Ltd.
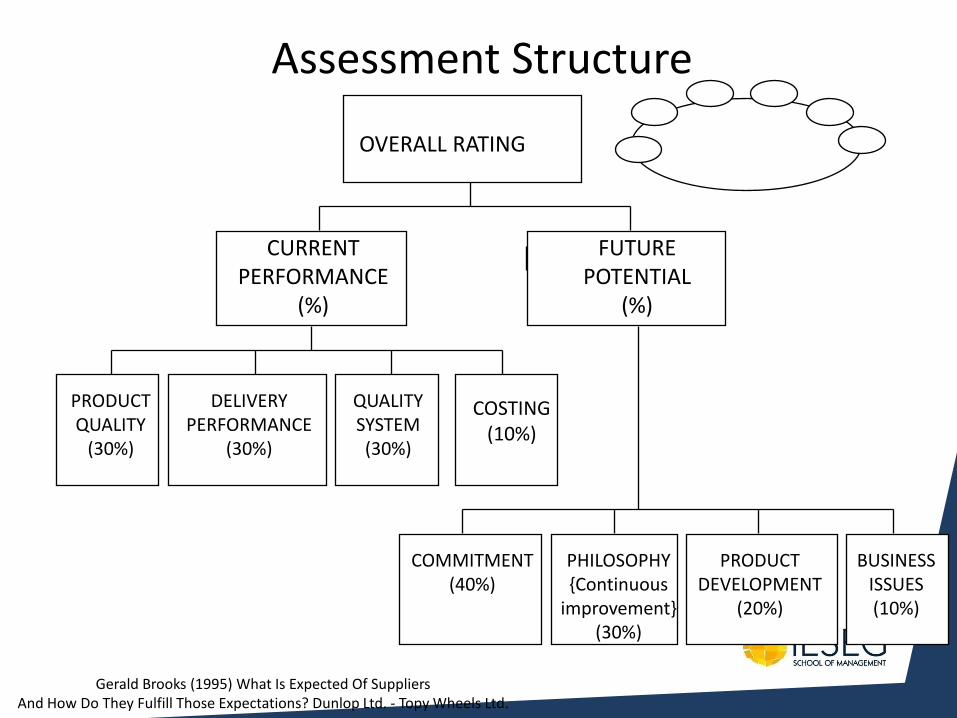
Assessment Structure
OVERALL RATING
CURRENT PERFORMANCE
(%)
FUTURE POTENTIAL
(%)
PRODUCT QUALITY
(30%)
DELIVERY PERFORMANCE
(30%)
QUALITY SYSTEM (30%)
COMMITMENT (40%)
PHILOSOPHY {Continuous
improvement} (30%)
BUSINESS ISSUES (10%)
COSTING (10%)
Gerald Brooks (1995) What Is Expected Of Suppliers And How Do They Fulfill Those Expectations? Dunlop Ltd. - Topy Wheels Ltd.
PRODUCT DEVELOPMENT
(20%)
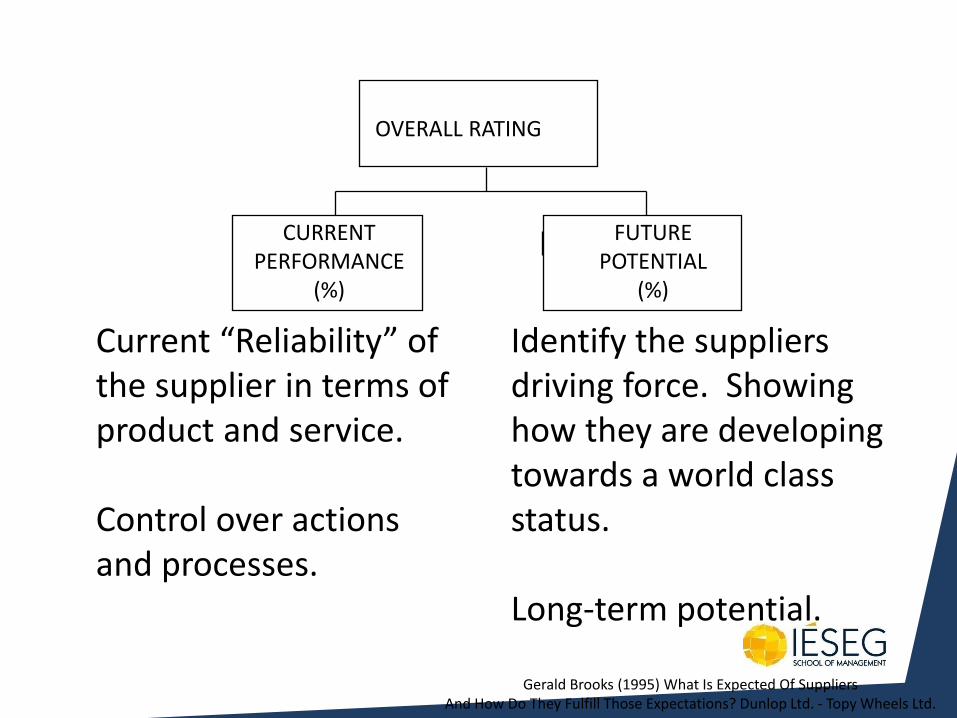
OVERALL RATING
CURRENT PERFORMANCE
(%)
FUTURE POTENTIAL
(%)
Current “Reliability” of the supplier in terms of product and service. Control over actions and processes.
Identify the suppliers driving force. Showing how they are developing towards a world class status. Long-term potential.
Gerald Brooks (1995) What Is Expected Of Suppliers And How Do They Fulfill Those Expectations? Dunlop Ltd. - Topy Wheels Ltd.
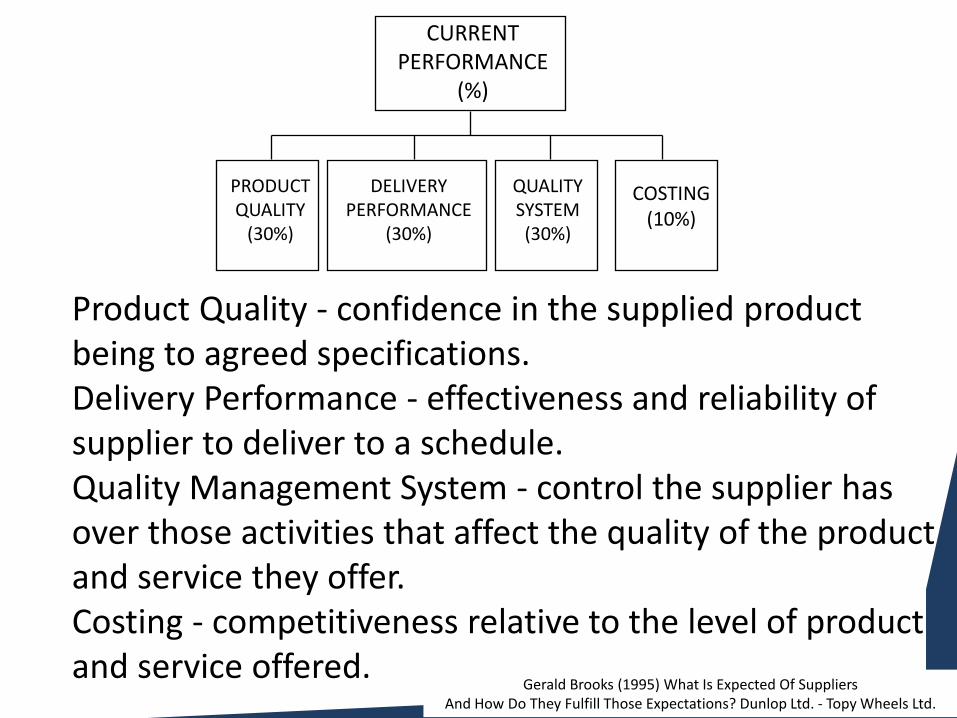
CURRENT PERFORMANCE
(%)
PRODUCT QUALITY
(30%)
DELIVERY PERFORMANCE
(30%)
QUALITY SYSTEM (30%)
COSTING (10%)
Product Quality - confidence in the supplied product being to agreed specifications. Delivery Performance - effectiveness and reliability of supplier to deliver to a schedule. Quality Management System - control the supplier has over those activities that affect the quality of the product and service they offer. Costing - competitiveness relative to the level of product and service offered.
Gerald Brooks (1995) What Is Expected Of Suppliers And How Do They Fulfill Those Expectations? Dunlop Ltd. - Topy Wheels Ltd.
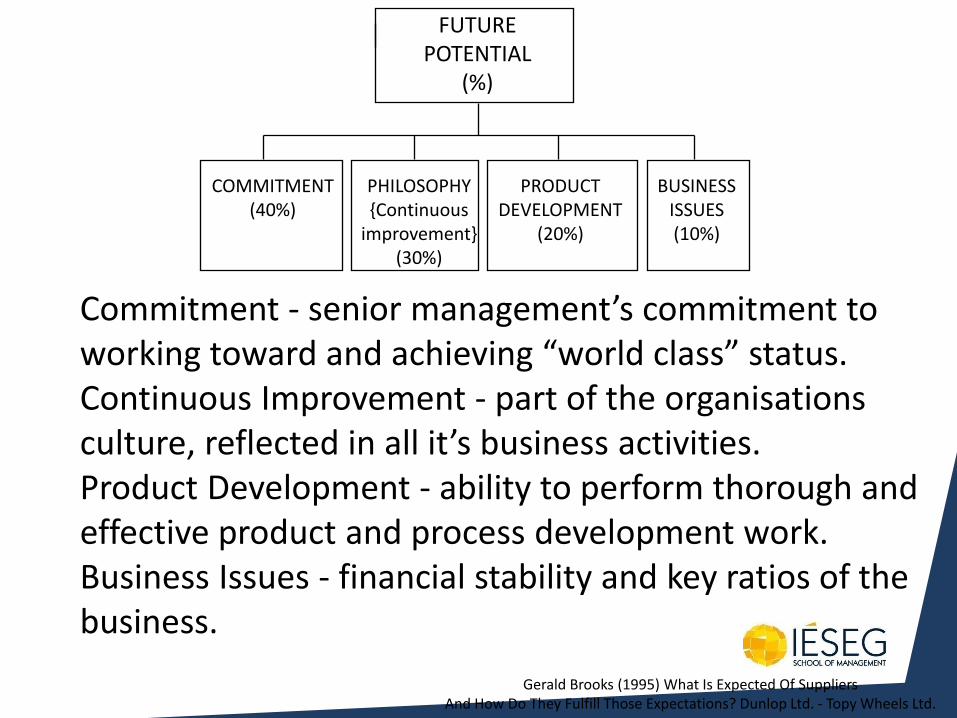
FUTURE POTENTIAL
(%)
PHILOSOPHY {Continuous
improvement} (30%)
PRODUCT DEVELOPMENT
(20%)
BUSINESS ISSUES (10%)
COMMITMENT (40%)
Commitment - senior management’s commitment to working toward and achieving “world class” status. Continuous Improvement - part of the organisations culture, reflected in all it’s business activities. Product Development - ability to perform thorough and effective product and process development work. Business Issues - financial stability and key ratios of the business.
Gerald Brooks (1995) What Is Expected Of Suppliers And How Do They Fulfill Those Expectations? Dunlop Ltd. - Topy Wheels Ltd.
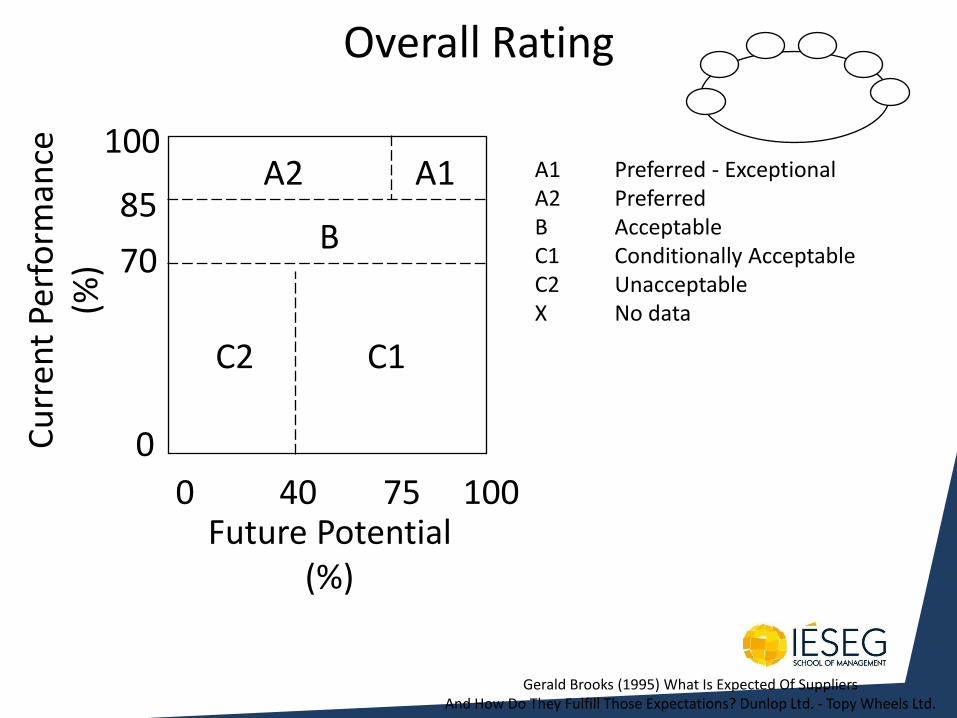
Overall Rating
A2 A1
B
C2 C1
A1 Preferred - Exceptional A2 Preferred B Acceptable C1 Conditionally Acceptable C2 Unacceptable X No data
Future Potential (%)
0
0 100 75 40
100
85
70
Cu
rren
t Pe
rfo
rman
ce
(%)
Gerald Brooks (1995) What Is Expected Of Suppliers And How Do They Fulfill Those Expectations? Dunlop Ltd. - Topy Wheels Ltd.
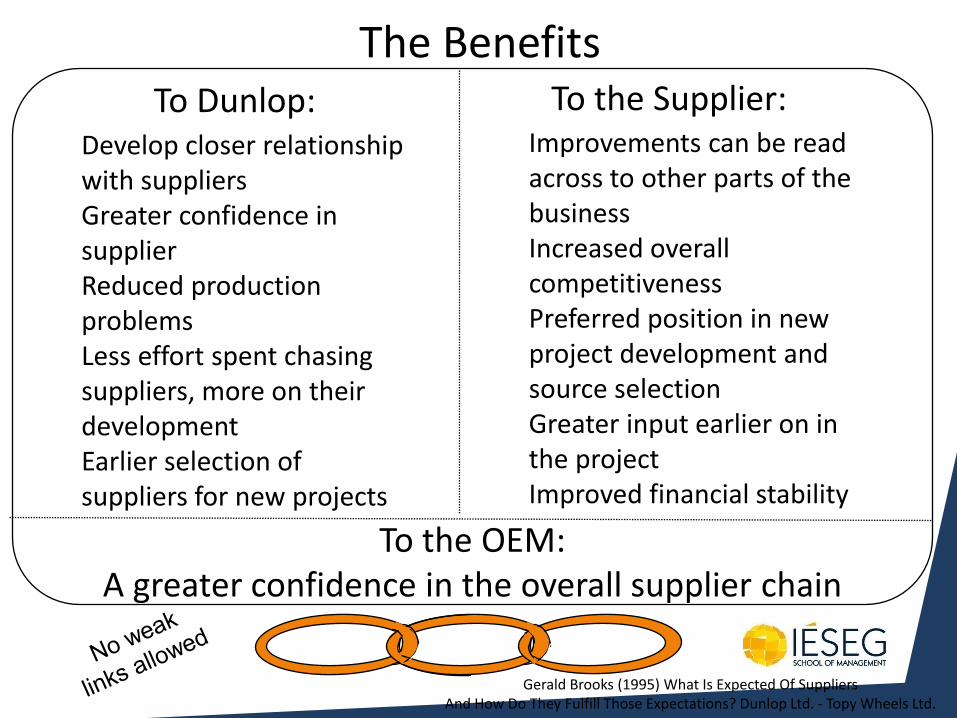
The Benefits To Dunlop: To the Supplier:
Develop closer relationship with suppliers Greater confidence in supplier Reduced production problems Less effort spent chasing suppliers, more on their development Earlier selection of suppliers for new projects
Improvements can be read across to other parts of the business Increased overall competitiveness Preferred position in new project development and source selection Greater input earlier on in the project Improved financial stability
To the OEM: A greater confidence in the overall supplier chain
Gerald Brooks (1995) What Is Expected Of Suppliers And How Do They Fulfill Those Expectations? Dunlop Ltd. - Topy Wheels Ltd.
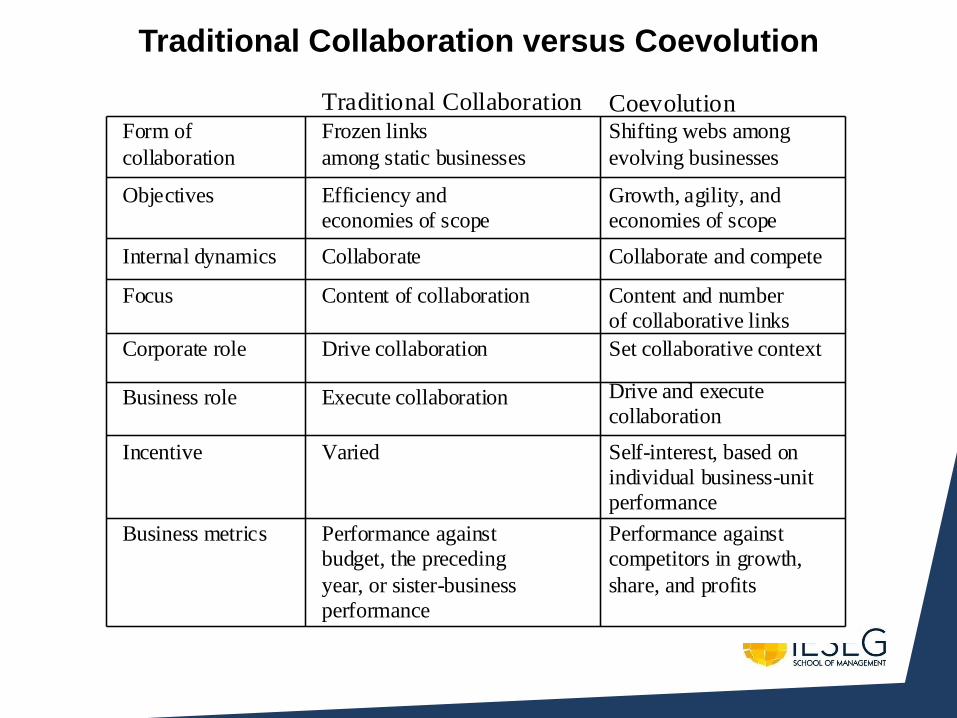
Traditional Collaboration versus Coevolution
Form of
collaboration
Objectives
Internal dynamics
Focus
Corporate role
Business role
Incentive
Business metrics
Frozen links
among static businesses
Efficiency and
economies of scope
Collaborate
Content of collaboration
Drive collaboration
Execute collaboration
Varied
Performance against
budget, the preceding
year, or sister-business
performance
Shifting webs among
evolving businesses
Growth, agility, and
economies of scope
Collaborate and compete
Set collaborative context
Drive and execute
collaboration
Self-interest, based on
individual business-unit
performance
Performance against
competitors in growth,
share, and profits
Content and number
of collaborative links
Traditional Collaboration Coevolution
Reverse Logistics
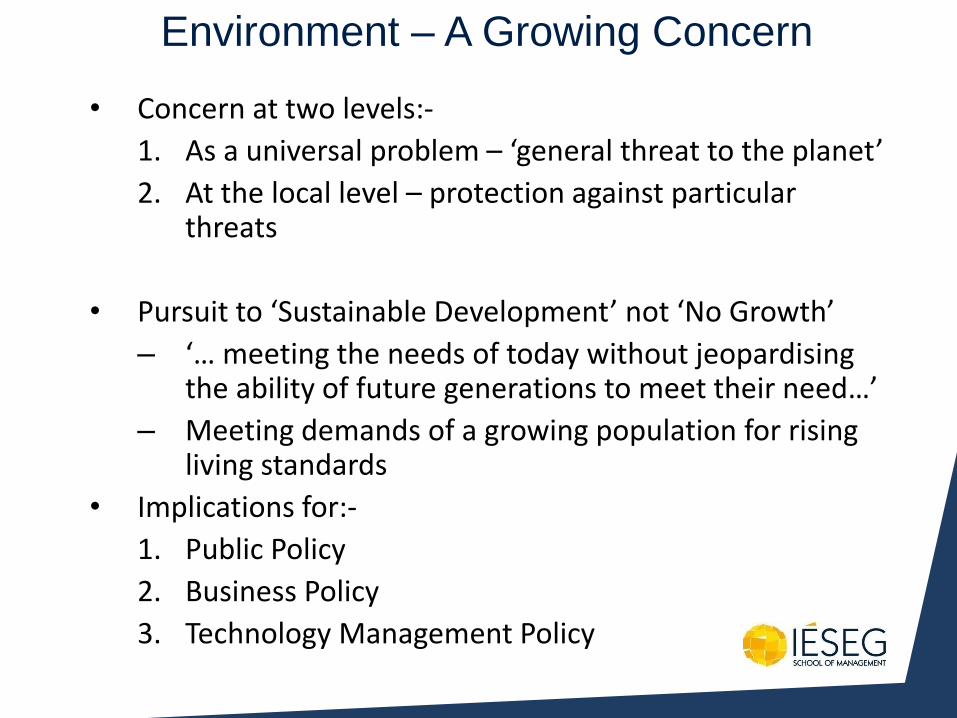
Environment – A Growing Concern
• Concern at two levels:-
1. As a universal problem – ‘general threat to the planet’
2. At the local level – protection against particular threats
• Pursuit to ‘Sustainable Development’ not ‘No Growth’
– ‘… meeting the needs of today without jeopardising the ability of future generations to meet their need…’
– Meeting demands of a growing population for rising living standards
• Implications for:-
1. Public Policy
2. Business Policy
3. Technology Management Policy
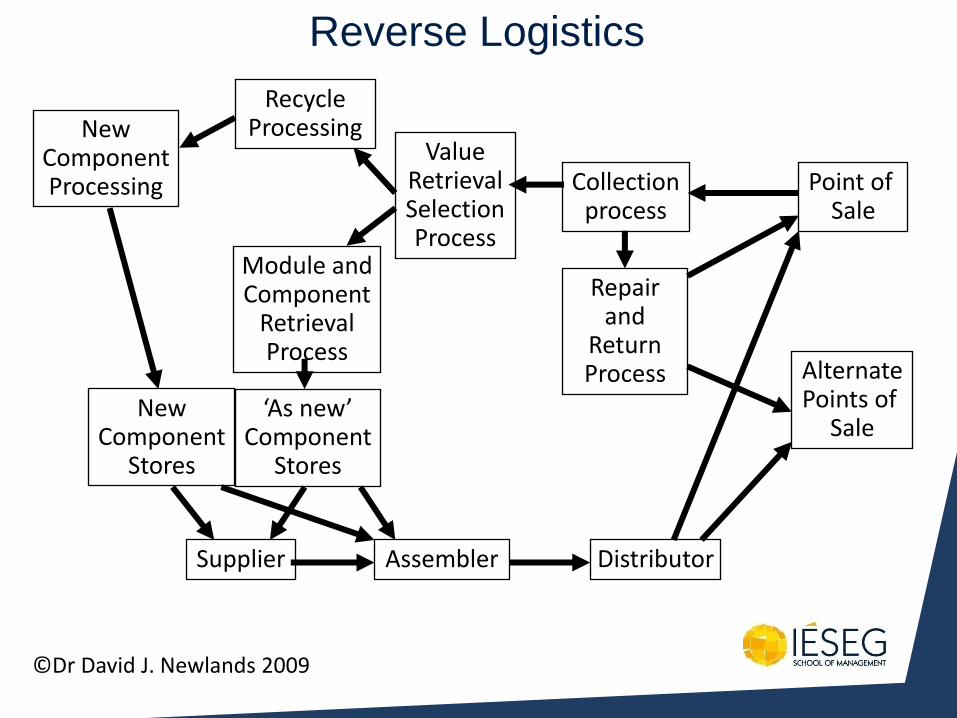
Reverse Logistics
Point of Sale
Collection process
Repair and
Return Process
Value Retrieval Selection Process
Alternate Points of
Sale
Recycle Processing
Module and Component
Retrieval Process
‘As new’ Component
Stores
New Component Processing
New Component
Stores
Supplier Distributor Assembler
©Dr David J. Newlands 2009
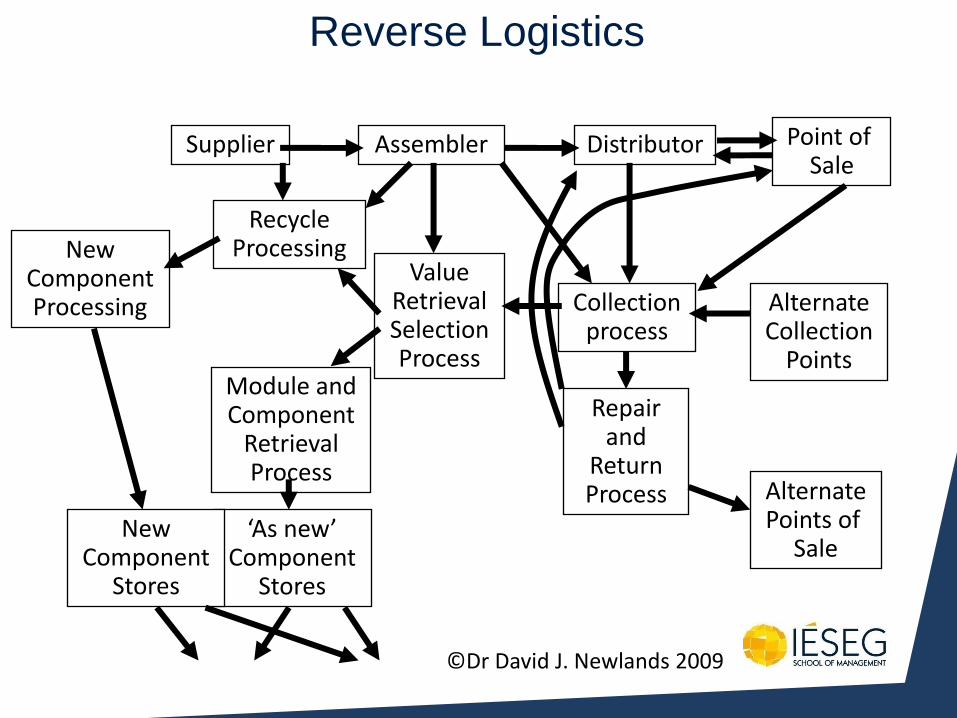
Reverse Logistics
Point of Sale
Collection process
Repair and
Return Process
Value Retrieval Selection Process
Alternate Points of
Sale
Recycle Processing
Module and Component
Retrieval Process
‘As new’ Component
Stores
New Component Processing
New Component
Stores
Supplier Distributor Assembler
Alternate Collection
Points
©Dr David J. Newlands 2009
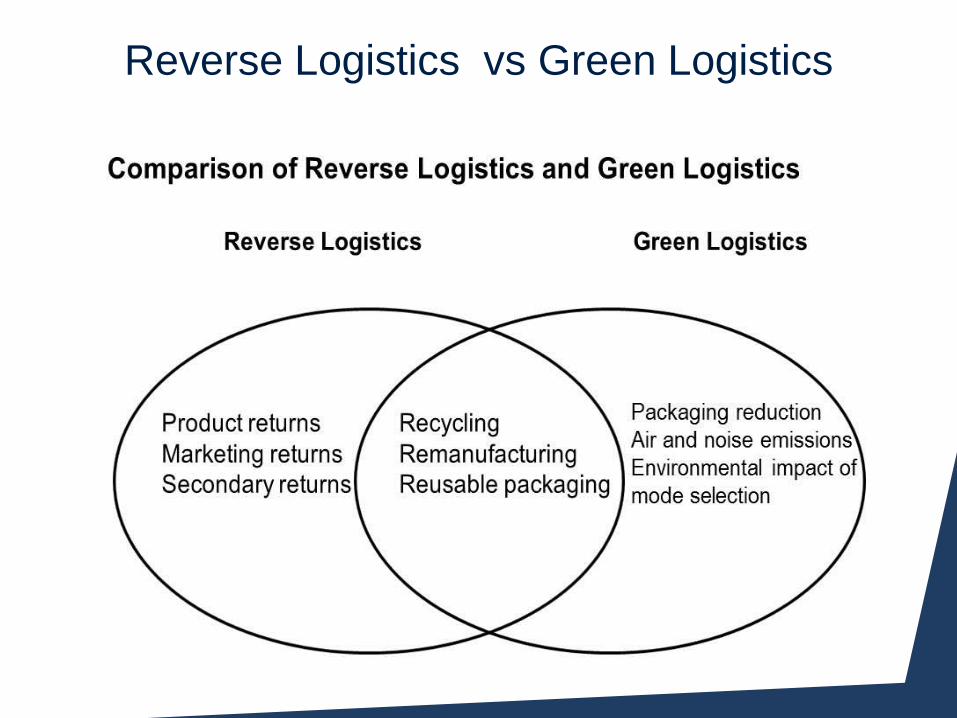
Reverse Logistics vs Green Logistics
http://reverselogisticstalk.wordpress.com/2013/05/
24/reverse-logistics-vs-green-logistics-is-there-
a-
difference/?goback=.gde_1933115_member_24
3949981.gmp_1933115.gde_1933115_member
_243949981#!
http://reverselogisticstalk.files.wordpress.com/201
3/05/rl-vs-gl1.jpg