1301.2802.pdf - arxiv
TRANSCRIPT
arX
iv:1
301.
2802
v1 [
hep-
ex]
13
Jan
2013
Proceedings of the PIC 2012, Strbske Pleso, Slovakia
HIGGS SEARCHES IN ATLAS
A. SCHAFFER
On behalf of the ATLAS Collaboration
LAL, Univ Paris-Sud, IN2P3/CNRSOrsay, France
E-mail: [email protected]
This talk covers the results of a search for the Standard Model Higgs boson inproton-proton collisions with the ATLAS detector at the LHC. The datasets usedcorrespond to integrated luminosities of approximately 4.8 fb−1 collected at
√s =
7TeV in 2011 and 5.8 fb−1 at√s = 8TeV in 2012. Individual searches in the chan-
nels H→ZZ(∗)→ 4ℓ, H→ γγ and H→WW (∗)→ eνµν in the 8TeV data are com-bined with previously published results of searches for H→ZZ(∗), WW (∗), bb andτ+τ− in the 7TeV data and results from improved analyses of the H→ZZ(∗)→ 4ℓand H→ γγ channels in the 7TeV data. Clear evidence for the production of a neu-tral boson with a measured mass of 126.0± 0.4 (stat)± 0.4 (sys)GeV is presented.This observation, which has a significance of 5.9 standard deviations, correspond-ing to a background fluctuation probability of 1.7 × 10⁻⁹, is compatible with theproduction and decay of the Standard Model Higgs boson. First measurements ofthe couplings of this particle are presented and are compatible with a SM Higgsboson hypothesis.
1 Introduction
The Standard Model (SM) of particle physics [1–4] has been tested by many ex-periments over the last four decades and has been shown to successfully describehigh energy particle interactions. However, the mechanism that breaks electroweaksymmetry in the SM has not been verified experimentally. This mechanism [5–10],which gives mass to massive elementary particles, implies the existence of a scalarparticle, the SM Higgs boson. The search for the Higgs boson is one of the highlightsof the Large Hadron Collider [11] (LHC) physics programme.
Indirect limits on the SM Higgs boson mass ofmH < 158GeV at 95% confidencelevel (CL) have been set using global fits to precision electroweak results [12]. Directsearches at LEP [13], the Tevatron [14–16] and the LHC [17, 18] have previouslyexcluded, at 95% CL, a SM Higgs boson with mass below 600GeV, apart fromsome mass regions between 116GeV and 127GeV.
Recently both the ATLAS and CMS Collaborations have reported the obser-vation of a new particle in the search for the Higgs boson [19, 20]. The CDF andDØ experiments at the Tevatron have also recently reported a broad excess in themass region 120–135GeV with an observed local significance for mH =125GeV of2.8σ for the combination of the two experiments [16]. This talk covers the resultsreported in [19], as well as new results on the couplings of the newly observed par-ticle reported in [21]. More complete discussion of these analyses is provided inthese references.
The data taken are affected by multiple pp collisions occurring in the same or
c© Institute of Experimental Physics SAS, Kosice, Slovakia 1
2 A. Schaffer on behalf of the ATLAS Collaboration
neighbouring bunch crossings (pile-up). In the 7TeV data, the average number ofinteractions per bunch crossing was∼ 10, increasing to ∼ 20 in the 8TeV data. Thereconstruction, identification and isolation criteria used for electrons and photonsin the 8TeV data are improved, making the H→ZZ(∗)→ 4ℓ and H→ γγ searchesmore robust against the increased pile-up. These analyses were re-optimised withsimulation and frozen before looking at the 8TeV data.
In the H→WW (∗)→ ℓνℓν channel, the increased pile-up deteriorates the eventmissing transverse momentum, Emiss
T , resolution, which results in significantlylarger Drell-Yan background in the same-flavour final states. Since the eµ channelprovides most of the sensitivity of the search, only this final state is used in theanalysis of the 8TeV data. The kinematic region in which a SM Higgs boson witha mass between 110GeV and 140GeV is searched for was kept blinded during theanalysis optimisation, until satisfactory agreement was found between the observedand predicted numbers of events in control samples dominated by the principalbackgrounds.
2 The ATLAS detector
The ATLAS detector [22] is a multi-purpose particle physics detector with ap-proximately forward-backward symmetric cylindrical geometry. The inner trackingdetector (ID) with a pseudo-rapidity coverage of |η| < 2.5 and consists of a siliconpixel detector, a silicon micro-strip detector, and a transition radiation tracker.The ID is surrounded by a thin superconducting solenoid providing a 2T axialmagnetic field. A high-granularity lead/liquid-argon (LAr) sampling calorimetermeasures the energy and the position of electromagnetic showers within |η| < 3.2.LAr sampling calorimeters are also used to measure hadronic showers in the end-cap(1.5 < |η| < 3.2) and forward (3.1 < |η| < 4.9) regions, while an iron/scintillatortile calorimeter measures hadronic showers in the central region (|η| < 1.7). Themuon spectrometer (MS) surrounds the calorimeters and consists of three largesuperconducting air-core toroid magnets, each with eight coils, a system of preci-sion tracking chambers (|η| < 2.7), and fast tracking chambers for triggering. Athree-level trigger system selects events to be recorded for offline analysis.
3 Signal and background simulation samples
The SM Higgs boson production processes considered in this analysis are the dom-inant gluon fusion (gg → H , denoted ggF), vector-boson fusion (qq′ → qq′H ,denoted VBF) and Higgs-strahlung (qq′ → WH,ZH , denoted WH/ZH). Thesmall contribution from the associated production with a tt pair (qq/gg → ttH ,denoted ttH) is taken into account only in the H→ γγ analysis. Full details on thesimulation samples is provided in [19].
4 H → ZZ(∗) → 4ℓ channel
The search for the SM Higgs boson through the decay H → ZZ(∗) → 4ℓ, whereℓ = e or µ, provides good sensitivity over a wide mass range (110-600GeV) due
Higgs Searches in ATLAS 3
to a fully reconstructed final state with excellent momentum resolution allowinga peak to be seen above the background. This analysis searches for Higgs bosoncandidates by selecting two pairs of isolated leptons, each of which is comprised oftwo leptons with the same flavour and opposite charge. The expected cross sectiontimes branching ratio for the process H → ZZ(∗) → 4ℓ with Higgs mass hypothesismH =125GeV is 2.2 fb for
√s = 7TeV and 2.8 fb for
√s = 8TeV.
The largest background comes from continuum (Z(∗)/γ∗)(Z(∗)/γ∗) production,referred to hereafter as ZZ(∗). For low masses there are also important backgroundcontributions from Z+jets and tt production, where charged lepton candidates ariseeither from decays of hadrons with b- or c-quark content or from mis-identificationof jets. The reducible backgrounds are suppressed with isolation and impact pa-rameter requirements.
The crucial experimental aspects of this channel are:
• high lepton acceptance, reconstruction and identification down to low pT,
• good lepton energy/momentum resolution,
• good control of reducible backgrounds (Z+jets and Z+ bb and tt) in low massregion below ∼ 170GeV.
The reducible background estimates cannot rely on Monte Carlo (MC) simu-lation alone due to theoretical uncertainties and b/jet → ℓ modeling. So theMC simulation is validated with data enriched control samples.
The 7TeV data have been re-analysed and combined with the 8TeV data. Theanalysis is improved in several aspects with respect to [23] to enhance the sensitivityto a low-mass Higgs boson. In particular, the kinematic selections are revised. The8TeV data analysis also benefits from improvements in the electron reconstructionand identification. The expected local signal significances for a Higgs boson withmH =125GeV are 1.6 σ for the 7TeV data (to be compared with 1.25 σ in [23])and 2.1 σ for the 8TeV data.
4.1 Event selection
The data are selected using single-lepton or di-lepton triggers. Muon candidatesare formed by matching reconstructed ID tracks with either a complete track ora track-segment reconstructed in the MS [24]. Electron candidates are formedfrom ID tracks pointing to electromagnetic calorimeter clusters, where the clustermust satisfy a set of identification criteria [25] that require the longitudinal andtransverse shower profiles to be consistent with those expected for electromagneticshowers. The electron tracks are fitted using a Gaussian-Sum Filter [26], allowingfor bremsstrahlung energy losses.
Quadruplets are formed from same-flavour opposite-charge (SFOC) lepton pairswith their transverse momentum, pT, at least 20,15,10GeV for the three lead-ing leptons, and at least 7(6)GeV for the final muon (electron). The leadingSFOC lepton pair has an invariant mass (m12) closest to the Z boson mass with50GeV< m12 < 106GeV. The sub-leading SFOC lepton pair, with its invariantmass (m34) required to be in the range mmin < m34 < 115GeV with mmin varying
4 A. Schaffer on behalf of the ATLAS Collaboration
from 17.5GeV at m4ℓ =120GeV to 50GeV at m4ℓ =190GeV [27]. There are fourdifferent analysis sub-channels: 4e, 2e2µ, 2µ2e and 4µ, with the cross-flavouredpairs ordered in pT.
Non-prompt leptons from heavy flavour decays, electrons from photon conver-sions and jets mis-identified as electrons have broader transverse impact parameterdistributions than prompt leptons from Z boson decays and/or are non-isolated.Thus, the Z+jets and tt background contributions are reduced by applying a cut onthe transverse impact parameter significance, d0/σd0
, required to be less than 3.5(6.5) for muons (electrons). In addition, leptons must satisfy isolation requirementsbased on tracking and calorimetric information. The normalised track isolation dis-criminant requires the sum of the transverse momenta of tracks inside a cone ofsize ∆R = 0.2 around the lepton direction divided by the lepton pT be smallerthan 0.15. The normalised calorimetric isolation for electrons, the sum of the ET
of topological clusters [28] within ∆R = 0.2 divided by the electron ET, is requiredto be less than 0.2. Finally, the normalised calorimetric isolation discriminant formuons, the ET sum of the calorimeter cells inside ∆R = 0.2 divided by the muonpT, is required to be less than 0.3.
The combined signal reconstruction and selection efficiencies for a SM Higgswith mH =125GeV for the 7TeV (8TeV) data are 37% (36%) for the 4µ channel,20% (22%) for the 2e2µ/2µ2e channels and 15% (20%) for the 4e channel.
The 4ℓ invariant mass resolution is improved by applying a Z-mass constrainedkinematic fit to the leading lepton pair for m4ℓ < 190GeV and to both lepton pairsfor higher masses. The expected width of the reconstructed mass distribution isdominated by the experimental resolution for mH < 350GeV, and by the naturalwidth of the Higgs boson for higher masses (30GeV atmH =400GeV). The typicalmass resolutions for mH =125GeV are 1.8GeV, 2.0GeV and 2.5GeV for the 4µ,2e2µ/2µ2e and 4e sub-channels, respectively.
4.2 Background estimation
The expected background yield and composition are estimated using the MC sim-ulation normalised to the theoretical cross section for ZZ(∗) production and bymethods using control regions from data for the Z + jets and tt processes. Sincethe background composition depends on the flavour of the sub-leading lepton pair,different approaches are taken for the ℓℓ + µµ and the ℓℓ + ee final states. Thetransfer factors needed to extrapolate the background yields from the control re-gions defined below to the signal region are obtained from the MC simulation. TheMC description of the selection efficiencies for the different background componentshas been verified with data.
The reducible ℓℓ+µµ background is dominated by tt and Z+jets (mostly Z+bb)events. A control region is defined by removing the isolation requirement on theleptons in the sub-leading pair, and by requiring that at least one of the sub-leadingmuons fails the transverse impact parameter significance selection. These modifica-tions remove ZZ(∗) contributions, and allow both the tt and Z + jets backgroundsto be estimated simultaneously using a fit to the m12 distribution (m12 peaks atmZ for Z + jets and tt is relatively flat in m12).
Higgs Searches in ATLAS 5
In order to estimate the reducible ℓℓ+ee background, a control region is formedby relaxing the selection criteria for the electrons of the sub-leading pair. Thedifferent sources of electron background are then separated into categories consistingof non-prompt leptons from heavy flavour decays, electrons from photon conversionsand jets mis-identified as electrons, using appropriate discriminating variables [29].This method allows the sum of the Z + jets and tt background contributions to beestimated. Two other methods have been used as cross-check and yield consistentresults.
Table 1. Summary of the estimated numbers of Z + jets and tt background events, for the 7TeVand 8TeV data in the entire phase-space of the analysis after the kinematic selections describedin the text. The backgrounds are combined for the 2µ2e and 4e channels, as discussed in the text.The first uncertainty is statistical, while the second is systematic. Ref. [19].
Background Estimatednumbers of events√
s = 7TeV√s = 8TeV
4µZ+jets 0.3± 0.1 ±0.1 0.5± 0.1 ±0.2tt 0.02±0.02±0.01 0.04±0.02±0.02
2e2µZ+jets 0.2± 0.1 ±0.1 0.4± 0.1 ±0.1tt 0.02±0.01±0.01 0.04±0.01±0.01
2µ2eZ+jets, tt 2.6± 0.4 ±0.4 4.9± 0.8 ±0.7
4eZ+jets, tt 3.1± 0.6 ±0.5 3.9± 0.7 ±0.8
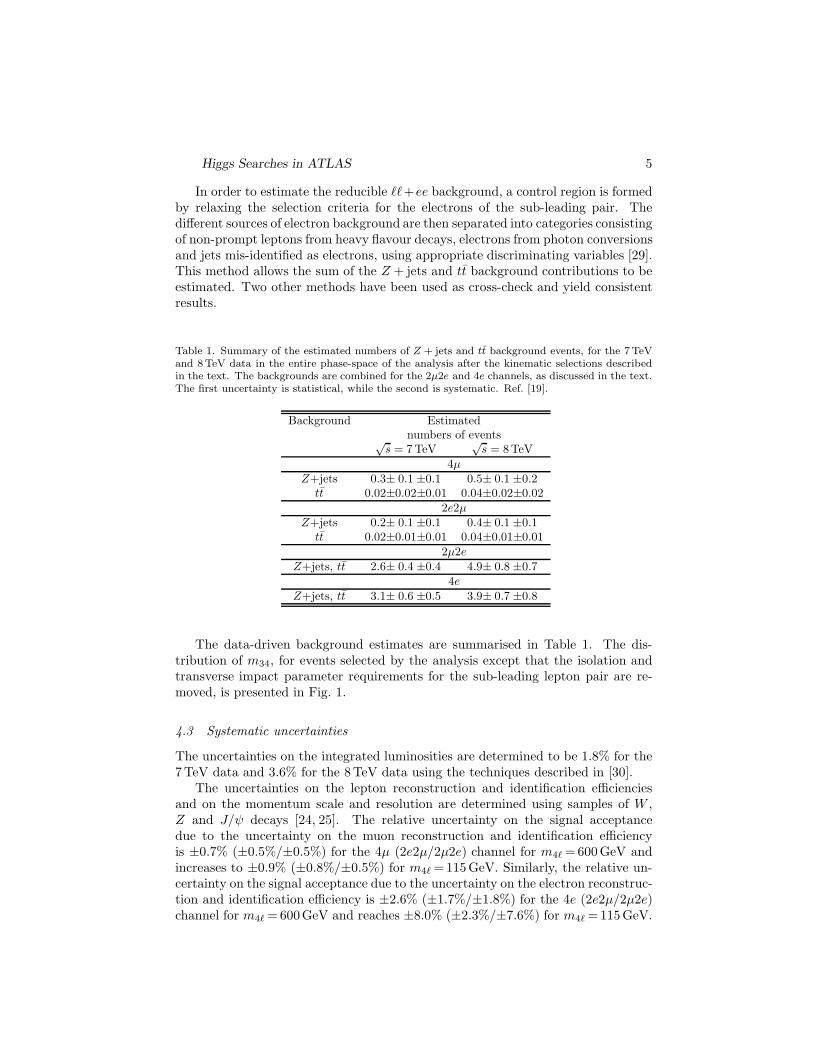
The data-driven background estimates are summarised in Table 1. The dis-tribution of m34, for events selected by the analysis except that the isolation andtransverse impact parameter requirements for the sub-leading lepton pair are re-moved, is presented in Fig. 1.
4.3 Systematic uncertainties
The uncertainties on the integrated luminosities are determined to be 1.8% for the7TeV data and 3.6% for the 8TeV data using the techniques described in [30].
The uncertainties on the lepton reconstruction and identification efficienciesand on the momentum scale and resolution are determined using samples of W ,Z and J/ψ decays [24, 25]. The relative uncertainty on the signal acceptancedue to the uncertainty on the muon reconstruction and identification efficiencyis ±0.7% (±0.5%/±0.5%) for the 4µ (2e2µ/2µ2e) channel for m4ℓ =600GeV andincreases to ±0.9% (±0.8%/±0.5%) for m4ℓ =115GeV. Similarly, the relative un-certainty on the signal acceptance due to the uncertainty on the electron reconstruc-tion and identification efficiency is ±2.6% (±1.7%/±1.8%) for the 4e (2e2µ/2µ2e)channel for m4ℓ =600GeV and reaches ±8.0% (±2.3%/±7.6%) for m4ℓ =115GeV.
6 A. Schaffer on behalf of the ATLAS Collaboration
[GeV]34m20 40 60 80 100
Eve
nts/
5 G
eV
0
20
40
60
80
100 Data(*)
ZZ
tZ+jets,t
H(125 GeV)
Syst.Unc.
ATLAS
-1Ldt = 4.8 fb∫ = 7 TeV: s-1Ldt = 5.8 fb∫ = 8 TeV: s
4l→(*)ZZ→H
Figure 1. Invariant mass distribution of the sub-leading lepton pair (m34) for a sample with of aZ boson candidate and an additional same-flavour electron or muon pair, for the combined 7TeVand 8TeV data after the kinematic selections described in the text. Isolation and transverseimpact parameter significance requirements are applied to the leading lepton pair only. The MCis normalised to the data-driven background estimations. The relatively small contribution of aSM Higgs with mH =125GeV in this sample is also shown. Ref. [19].
The uncertainty on the electron energy scale results in an uncertainty of ±0.7%(±0.5%/±0.2%) on the mass scale of the m4ℓ distribution for the 4e (2e2µ/2µ2e)channel. The impact of the uncertainties on the electron energy resolution and onthe muon momentum resolution and scale are found to be negligible.
The theoretical uncertainties associated with the signal are described in detailin [19].
4.4 Results
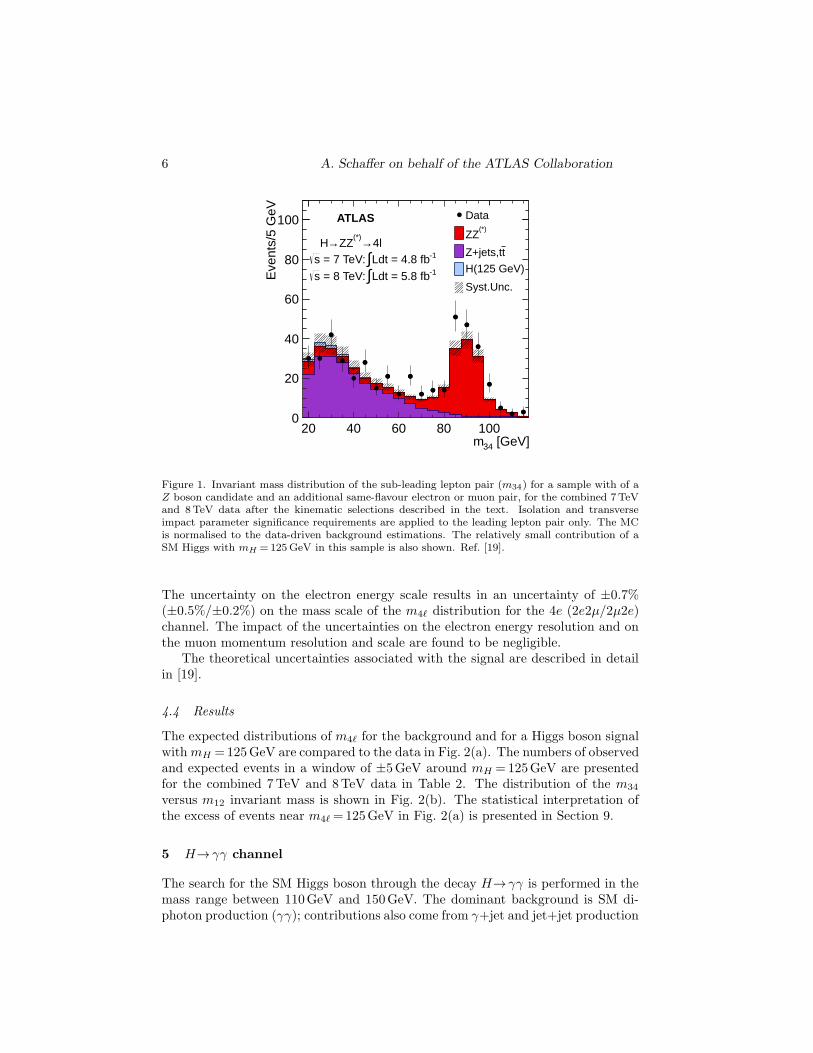
The expected distributions of m4ℓ for the background and for a Higgs boson signalwithmH =125GeV are compared to the data in Fig. 2(a). The numbers of observedand expected events in a window of ±5GeV around mH =125GeV are presentedfor the combined 7TeV and 8TeV data in Table 2. The distribution of the m34
versus m12 invariant mass is shown in Fig. 2(b). The statistical interpretation ofthe excess of events near m4ℓ =125GeV in Fig. 2(a) is presented in Section 9.
5 H→ γγ channel
The search for the SM Higgs boson through the decay H→ γγ is performed in themass range between 110GeV and 150GeV. The dominant background is SM di-photon production (γγ); contributions also come from γ+jet and jet+jet production
Higgs Searches in ATLAS 7
[GeV]4lm100 150 200 250
Eve
nts/
5 G
eV
0
5
10
15
20
25
-1Ldt = 4.8 fb∫ = 7 TeV: s
-1Ldt = 5.8 fb∫ = 8 TeV: s
4l→(*)ZZ→H
Data(*)Background ZZ
tBackground Z+jets, t
=125 GeV)H
Signal (m
Syst.Unc.
ATLAS
(a)
[GeV]12m50 60 70 80 90 100
[GeV
]34
m
20
30
40
50
60
70
80=125 GeVHm
<130 GeV)4l
Bkg (120<m<130 GeV)
4lData (120<m
ATLAS
4l→(*)ZZ→H
-1Ldt = 4.8 fb∫ = 7 TeV: s-1Ldt = 5.8 fb∫ = 8 TeV: s
(b)
Figure 2. (a) The distribution of the four-lepton invariant mass, m4ℓ, for the selected candidates,compared to the background expectation in the 80–250GeV mass range, for the combined 7TeVand 8TeV data. The signal expectation for a SM Higgs with mH =125GeV is also shown. (b)The distribution of the m34 versus the m12 invariant mass, before the application of the Z-mass constrained kinematic fit, for the selected candidates in the m4ℓ range 120–130GeV. Theexpected distributions for a SM Higgs with mH =125GeV (the sizes of the boxes indicate therelative density) and for the total background (the intensity of the shading indicates the relativedensity) are also shown. Ref. [19].
Table 2. The numbers of expected signal (mH =125GeV) and background events, together withthe numbers of observed events in the data, in a window of size ±5GeV around 125GeV, for thecombined 7TeV and 8TeV data. Ref. [19].
Signal ZZ(∗) Z + jets, tt Observed4µ 2.09±0.30 1.12±0.05 0.13±0.04 6
2e2µ/2µ2e 2.29± 0.33 0.80±0.05 1.27±0.19 54e 0.90±0.14 0.44±0.04 1.09±0.20 2
with one or two jets mis-identified as photons (γj and jj) and from the Drell-Yanprocess with the electrons mis-identified as photons. The 7TeV data have been re-analysed and the results combined with those from the 8TeV data. Among otherchanges to the analysis, a new category of events with two forward jets is introduced,which enhances the sensitivity to the VBF process. Overall, the sensitivity of theanalysis has been improved by about 20% with respect to that described in [31].
5.1 Event selection
The data used in this channel are selected using a di-photon trigger [32], with> 99% efficiency after the final event selection. Events are required to contain
8 A. Schaffer on behalf of the ATLAS Collaboration
at least one reconstructed vertex with at least two tracks, as well as two photoncandidates. Photon candidates must be in the fiducial region |η| < 2.37, excludingthe calorimeter transition region 1.37 ≤ |η| < 1.52. Converted photons have oneor two tracks matching the clusters in the calorimeter. The photon reconstructionefficiency is about 97% for ET > 30GeV.
MC simulation is used to calibrate for energy losses upstream of the calorimeterand leakage outside of the cluster of the photon candidates; this is done separatelyfor unconverted and converted candidates. The calibration is refined by applyingη-dependent correction factors (±1%) determined from measured Z→ e+e− events.The leading (sub-leading) photon candidate is required to have ET > 40GeV(30GeV).
Photon candidates must pass identification criteria based on shower shapes andhadronic energy leakage [33]. For the 7TeV data, the selection uses a neural net-work, and for the 8TeV data, cut-based criteria are used. This cut-based selectionhas been tuned to be robust against pile-up. The photon identification efficienciesrange from 85% to above 95%. To further suppress the jet background, an isolationselection is applied by requiring the transverse energy of topological clusters within∆R < 0.4 to be less than 4GeV.
5.2 Invariant mass reconstruction
The invariant mass of the two photons is evaluated using the photon energies mea-sured in the calorimeter, the azimuthal angle φ between the photons as determinedfrom the positions of the photons in the calorimeter, and the values of η calculatedfrom the position of the identified primary vertex and the impact points of thephotons in the calorimeter.
The primary vertex is identified by combining the following information in aglobal likelihood: the directions of flight of the photons as determined using thelongitudinal segmentation of the electromagnetic calorimeter (calorimeter point-ing), the parameters of the beam spot, and the
∑p2T of the tracks associated with
each reconstructed vertex. In addition, for the 7TeV data analysis, the photonconversion vertex is used in the likelihood. The calorimeter pointing is sufficientto ensure that the contribution of the opening angle between the photons to themass resolution is negligible. The tracking information from the ID improves theidentification of the primary vertex, which is needed for the jet selection in the 2-jetcategory.
The number of selected di-photon candidates with an invariant mass between100GeV and 160GeV is 23788 (35251) in the 7TeV (8TeV) data sample.
5.3 Event categorisation
To increase the sensitivity to a Higgs boson signal, the events are separated intoten mutually exclusive categories having different mass resolutions and signal-to-background ratios. An exclusive category of events containing two jets improvesthe sensitivity to VBF. The other nine categories are defined by the presence or
Higgs Searches in ATLAS 9
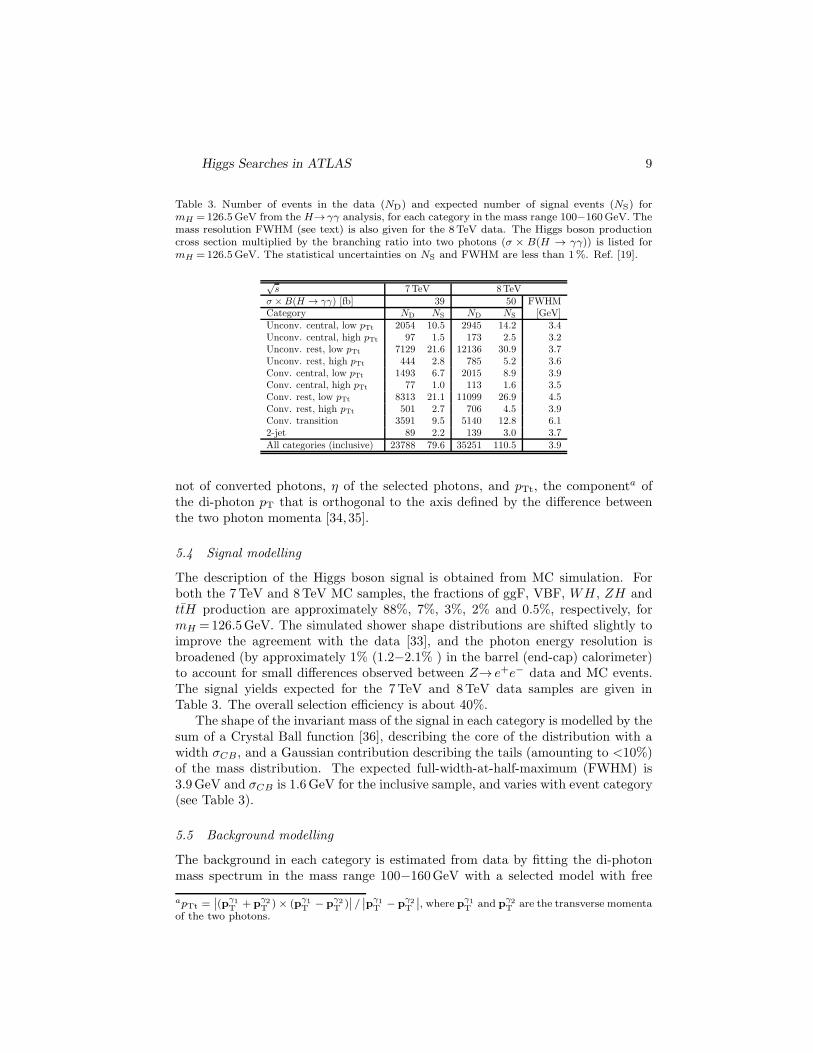
Table 3. Number of events in the data (ND) and expected number of signal events (NS) formH =126.5GeV from the H→ γγ analysis, for each category in the mass range 100−160GeV. Themass resolution FWHM (see text) is also given for the 8TeV data. The Higgs boson productioncross section multiplied by the branching ratio into two photons (σ × B(H → γγ)) is listed formH =126.5GeV. The statistical uncertainties on NS and FWHM are less than 1%. Ref. [19].
√s 7TeV 8TeV
σ ×B(H → γγ) [fb] 39 50 FWHMCategory ND NS ND NS [GeV]Unconv. central, low pTt 2054 10.5 2945 14.2 3.4Unconv. central, high pTt 97 1.5 173 2.5 3.2Unconv. rest, low pTt 7129 21.6 12136 30.9 3.7Unconv. rest, high pTt 444 2.8 785 5.2 3.6Conv. central, low pTt 1493 6.7 2015 8.9 3.9Conv. central, high pTt 77 1.0 113 1.6 3.5Conv. rest, low pTt 8313 21.1 11099 26.9 4.5Conv. rest, high pTt 501 2.7 706 4.5 3.9Conv. transition 3591 9.5 5140 12.8 6.12-jet 89 2.2 139 3.0 3.7All categories (inclusive) 23788 79.6 35251 110.5 3.9
not of converted photons, η of the selected photons, and pTt, the componenta ofthe di-photon pT that is orthogonal to the axis defined by the difference betweenthe two photon momenta [34, 35].
5.4 Signal modelling
The description of the Higgs boson signal is obtained from MC simulation. Forboth the 7TeV and 8TeV MC samples, the fractions of ggF, VBF, WH , ZH andttH production are approximately 88%, 7%, 3%, 2% and 0.5%, respectively, formH =126.5GeV. The simulated shower shape distributions are shifted slightly toimprove the agreement with the data [33], and the photon energy resolution isbroadened (by approximately 1% (1.2−2.1% ) in the barrel (end-cap) calorimeter)to account for small differences observed between Z→ e+e− data and MC events.The signal yields expected for the 7TeV and 8TeV data samples are given inTable 3. The overall selection efficiency is about 40%.
The shape of the invariant mass of the signal in each category is modelled by thesum of a Crystal Ball function [36], describing the core of the distribution with awidth σCB, and a Gaussian contribution describing the tails (amounting to <10%)of the mass distribution. The expected full-width-at-half-maximum (FWHM) is3.9GeV and σCB is 1.6GeV for the inclusive sample, and varies with event category(see Table 3).
5.5 Background modelling
The background in each category is estimated from data by fitting the di-photonmass spectrum in the mass range 100−160GeV with a selected model with free
apTt =∣
∣(pγ1T + p
γ2T )× (pγ1
T − pγ2T )
∣
∣ /∣
∣pγ1T − p
γ2T
∣
∣, where pγ1T and p
γ2T are the transverse momenta
of the two photons.
10 A. Schaffer on behalf of the ATLAS Collaboration
parameters of shape and normalisation. Different models are chosen for the differentcategories to achieve a good compromise between limiting the size of a potentialbias while retaining good statistical power. The models are a fourth-order Bernsteinpolynomial function [37], an exponential function of a second-order polynomial andan exponential function. Based on MC studies, the background model which hasthe best sensitivity formH =125GeV and a bias less of than a 20% of the statisticaluncertainty is chosen for each category. The largest absolute signal yield as definedabove is taken as the systematic uncertainty on the background model, amountingto ±(0.2−4.6) and ±(0.3−6.8) events, depending on the category for the 7TeV and8TeV data samples, respectively.
5.6 Systematic uncertainties
The dominant experimental uncertainty on the signal yield ±8% (±11%) for 7TeV(8TeV) data comes from the photon reconstruction and identification efficiency,which is estimated with data using electrons from Z decays and photons fromZ → ℓ+ℓ−γ events. The total uncertainty on the mass resolution is ±14%. Thedominant contribution (±12%) comes from the uncertainty on the energy resolutionof the calorimeter, which is determined from Z→ e+e− events.
100 110 120 130 140 150 160
Eve
nts
/ 2 G
eV
500
1000
1500
2000
2500
3000
3500
γγ→H
Data
Sig+Bkg Fit
Bkg (4th order polynomial)
-1Ldt=4.8fb∫=7 TeV, s
-1Ldt=5.9fb∫=8 TeV, s
ATLAS=126.5 GeV)
H(m
[GeV]γγm100 110 120 130 140 150 160
Eve
nts
- B
kg
-200-100
0100200
(a)
100 110 120 130 140 150 160
wei
ghts
/ 2
GeV
Σ
20
40
60
80
100
γγ→H
Data S/B Weighted
Sig+Bkg Fit
Bkg (4th order polynomial)
ATLAS
-1Ldt=4.8fb∫=7 TeV, s
-1Ldt=5.9fb∫=8 TeV, s
=126.5 GeV)H
(m
[GeV]γγm100 110 120 130 140 150 160
wei
ghts
- B
kgΣ
-8-4
04
8
(b)
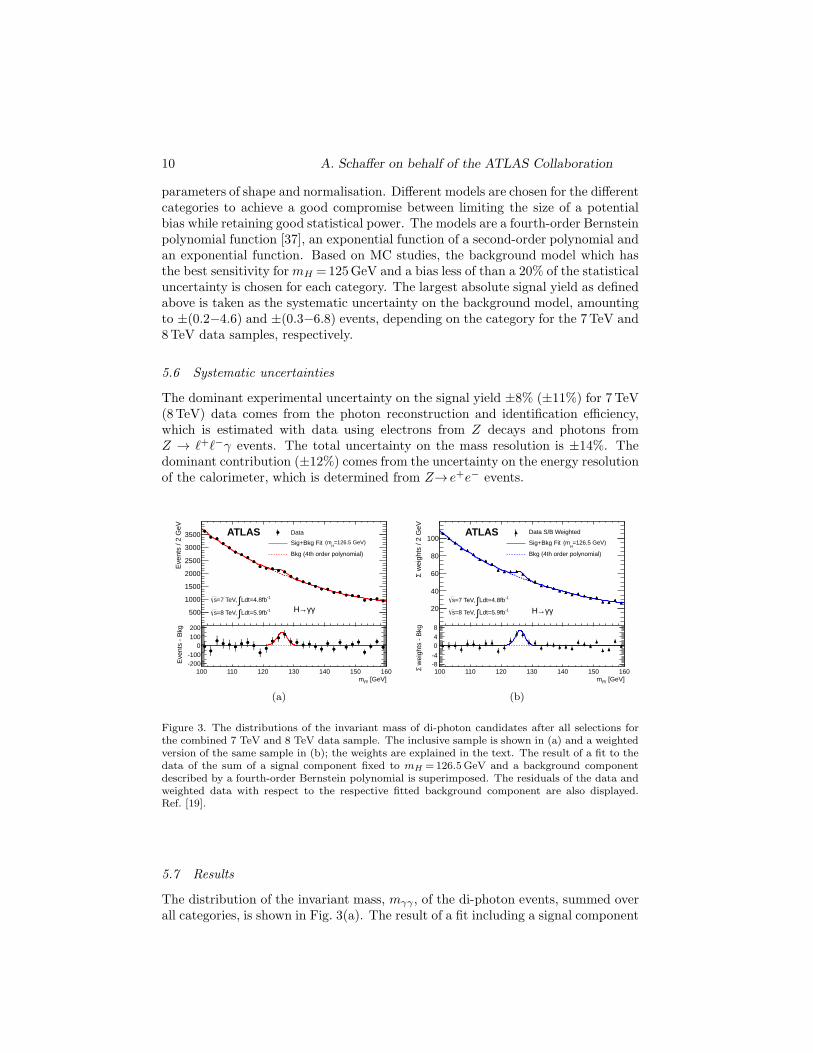
Figure 3. The distributions of the invariant mass of di-photon candidates after all selections forthe combined 7 TeV and 8 TeV data sample. The inclusive sample is shown in (a) and a weightedversion of the same sample in (b); the weights are explained in the text. The result of a fit to thedata of the sum of a signal component fixed to mH =126.5GeV and a background componentdescribed by a fourth-order Bernstein polynomial is superimposed. The residuals of the data andweighted data with respect to the respective fitted background component are also displayed.Ref. [19].
5.7 Results
The distribution of the invariant mass, mγγ , of the di-photon events, summed overall categories, is shown in Fig. 3(a). The result of a fit including a signal component
Higgs Searches in ATLAS 11
fixed to mH =126.5GeV and a background component described by a fourth-orderBernstein polynomial is superimposed.
The statistical analysis uses an unbinned likelihood function constructed fromthose of the ten categories of the 7TeV and 8TeV data samples. To demonstratethe sensitivity of this likelihood analysis, Fig. 3(b) also shows the mass spectrum ob-tained after weighting events with category-dependent factors reflecting the signal-to-background ratios. The statistical interpretation of the excess of events nearmγγ =126.5GeV in Fig. 3 is presented in Section 9.
6 H→WW (∗)→ eνµν channel
The signature for the H→WW (∗)→ ℓνℓν channel is two opposite-charge leptonswith large transverse momentum and a large momentum imbalance in the eventdue to the escaping neutrinos. This channel has a high rate, but limited massresolution. The dominant backgrounds are non-resonantWW and top production,both of which have real W pairs in the final state. Other important backgroundsinclude Drell-Yan events (Z/γ(∗)→ ℓℓ) with mis-measured Emiss
T , W+jets eventswith a fake second lepton, and Wγ events with an electron from a conversion.
The analysis of the 8 TeV data is restricted to the eµ final state, providing> 85% of the sensitivity of the search, due to the higher luminosity and increasednumber of interactions which worsens the Drell-Yan background. The Drell-Yanbackground to the eµ final state is from semi-lepton τ decays and thus significantlyreduced.
6.1 Event selection
For the 8 TeV H→WW (∗)→ eνµν search, the data are selected using inclusivesingle-muon and single-electron triggers. Candidates are selected with a leading(sub-leading) lepton ET> 25GeV (> 15GeV). The lepton selection and isolationhave more stringent requirements than those used for the H → ZZ(∗) → 4ℓ analysis(see Section 4), to reduce the larger background from non-prompt leptons in the
ℓνℓν final state. Events are separated into 0, 1 and 2-jet categories, with pjetT >25(30)GeV for |η| < 2.5 (2.5− 4.5).
With two neutrinos in the signal final state, events are required to have largeEmiss
T . The quantity EmissT,rel is required to be > 25GeV and is the projection of the
direction of EmissT perpendicular to the nearest lepton or jet. Compared to Emiss
T ,Emiss
T,rel has increased rejection power when the EmissT is generated by a neutrino in
a jet or the mis-measurement of an object.The data are subdivided into 0-jet, 1-jet and 2-jet search channels since the
background rate and composition depend significantly on the jet multiplicity. The0-jet background is dominated byWW events, and top is an important backgroundfor the other two channels. To reduce the WW background, the di-leptons arerequired to be close together (|∆φℓℓ| < 1.8), which arises from the spin-0 of a SMHiggs and the V-A nature of the W decay. Top backgrounds are reduced withb-tagging requirements. Further details on the event selection can be found in [19].For mH =125GeV, the combined acceptance times efficiency of the 8TeV 0-jet and
12 A. Schaffer on behalf of the ATLAS Collaboration
1-jet selection is about 7.4%.
6.2 Background normalisation and control samples
The leading backgrounds from SM processes producing two isolated high-pT lep-tons and Emiss
T are WW and top, both tt and single top. These are estimatedusing partially data-driven techniques based on normalising the MC predictionsto the data in control regions dominated by the relevant background source. TheW+jets background is estimated from data for all jet multiplicities. Only the smallbackgrounds from Drell-Yan and di-boson processes other than WW , as well as theWW background for the 2-jet analysis, are estimated using MC simulation.
The control regions are defined by selections similar to those used for the signalregion but with some criteria reversed or modified to obtain signal-depleted samplesenriched in a particular background. Some control regions have significant contribu-tions from backgrounds other than the targeted one, which introduces dependenciesamong the background estimates. These correlations are taken into account in theWW control region where the top and W+jets backgrounds are subtracted usingtheir respective measurements. See [19] for full details on the background controlsamples and estimates.
6.3 Systematic uncertainties
The systematic uncertainties that have the largest impact on the sensitivity of thesearch are the theoretical uncertainties associated with the signal, arising from theseparation into 0-,1-,and 2-jet channels. The main experimental uncertainties areassociated with the JES, the jet energy resolution (JER), pile-up, Emiss
T , the b-tagging efficiency, the W+jets transfer factor, and the integrated luminosity. Thelargest uncertainties on the backgrounds includeWW normalisation and modelling,top normalisation, andWγ(∗) normalisation. The 2-jet systematic uncertainties aredominated by the statistical uncertainties in the data and the MC simulation.
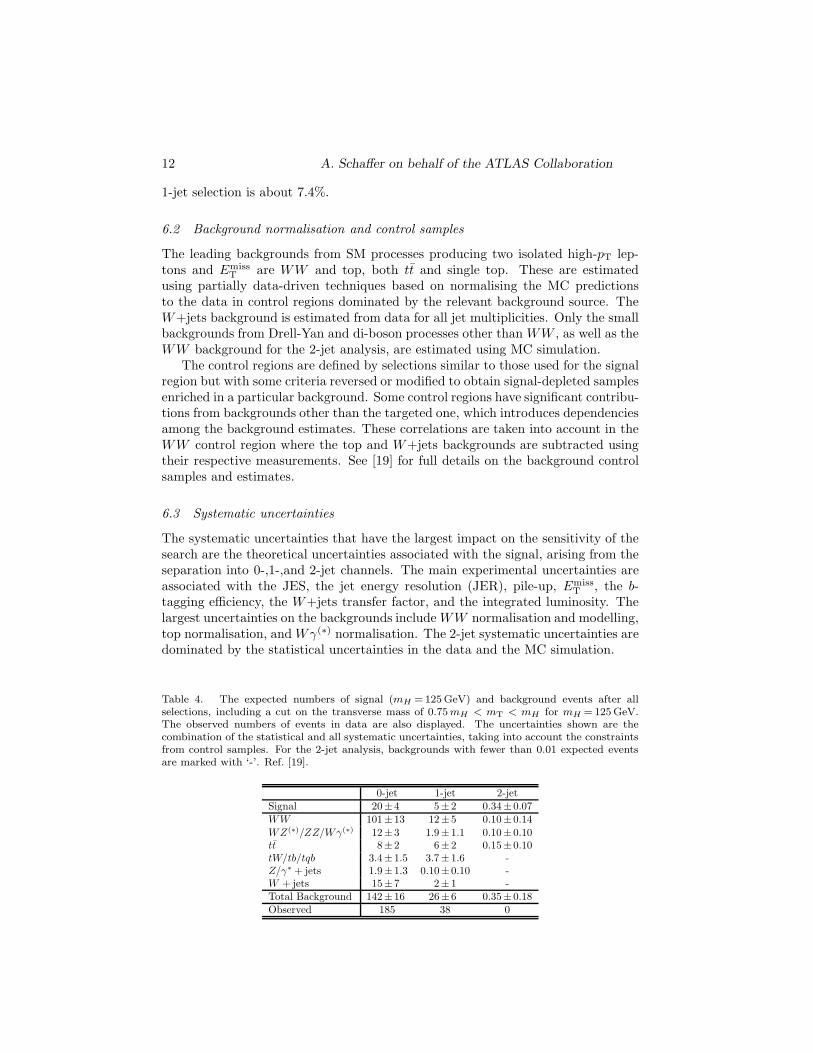
Table 4. The expected numbers of signal (mH =125GeV) and background events after allselections, including a cut on the transverse mass of 0.75mH < mT < mH for mH =125GeV.The observed numbers of events in data are also displayed. The uncertainties shown are thecombination of the statistical and all systematic uncertainties, taking into account the constraintsfrom control samples. For the 2-jet analysis, backgrounds with fewer than 0.01 expected eventsare marked with ‘-’. Ref. [19].
0-jet 1-jet 2-jetSignal 20± 4 5± 2 0.34± 0.07WW 101± 13 12± 5 0.10± 0.14
WZ(∗)/ZZ/Wγ(∗) 12± 3 1.9± 1.1 0.10± 0.10tt 8± 2 6± 2 0.15± 0.10tW/tb/tqb 3.4± 1.5 3.7± 1.6 -Z/γ∗ + jets 1.9± 1.3 0.10± 0.10 -W + jets 15± 7 2± 1 -Total Background 142± 16 26± 6 0.35± 0.18Observed 185 38 0
Higgs Searches in ATLAS 13
6.4 Results
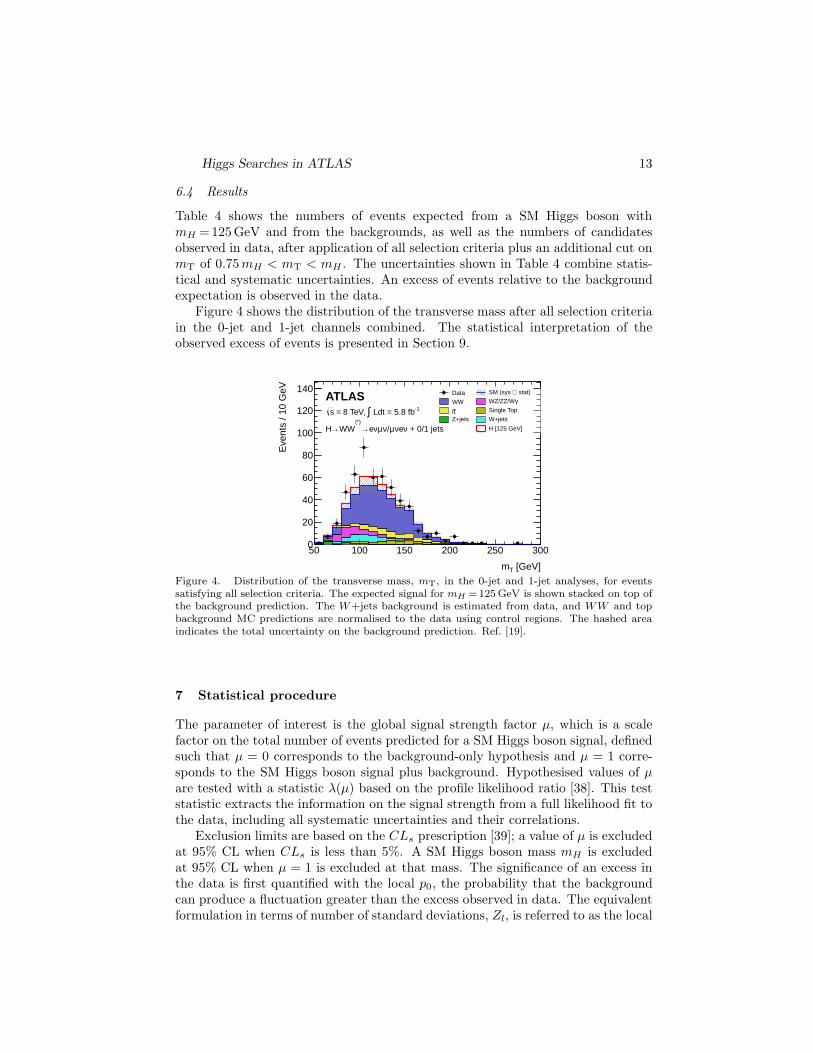
Table 4 shows the numbers of events expected from a SM Higgs boson withmH =125GeV and from the backgrounds, as well as the numbers of candidatesobserved in data, after application of all selection criteria plus an additional cut onmT of 0.75mH < mT < mH . The uncertainties shown in Table 4 combine statis-tical and systematic uncertainties. An excess of events relative to the backgroundexpectation is observed in the data.
Figure 4 shows the distribution of the transverse mass after all selection criteriain the 0-jet and 1-jet channels combined. The statistical interpretation of theobserved excess of events is presented in Section 9.
[GeV]Tm
50 100 150 200 250 300
Eve
nts
/ 10
GeV
0
20
40
60
80
100
120
140 Data stat)⊕ SM (sys
WW γ WZ/ZZ/W
t t Single Top
Z+jets W+jets H [125 GeV]
ATLAS -1 Ldt = 5.8 fb∫ = 8 TeV, s
+ 0/1 jetsνeνµ/νµνe→(*)
WW→H
Figure 4. Distribution of the transverse mass, mT, in the 0-jet and 1-jet analyses, for eventssatisfying all selection criteria. The expected signal for mH =125GeV is shown stacked on top ofthe background prediction. The W+jets background is estimated from data, and WW and topbackground MC predictions are normalised to the data using control regions. The hashed areaindicates the total uncertainty on the background prediction. Ref. [19].
7 Statistical procedure
The parameter of interest is the global signal strength factor µ, which is a scalefactor on the total number of events predicted for a SM Higgs boson signal, definedsuch that µ = 0 corresponds to the background-only hypothesis and µ = 1 corre-sponds to the SM Higgs boson signal plus background. Hypothesised values of µare tested with a statistic λ(µ) based on the profile likelihood ratio [38]. This teststatistic extracts the information on the signal strength from a full likelihood fit tothe data, including all systematic uncertainties and their correlations.
Exclusion limits are based on the CLs prescription [39]; a value of µ is excludedat 95% CL when CLs is less than 5%. A SM Higgs boson mass mH is excludedat 95% CL when µ = 1 is excluded at that mass. The significance of an excess inthe data is first quantified with the local p0, the probability that the backgroundcan produce a fluctuation greater than the excess observed in data. The equivalentformulation in terms of number of standard deviations, Zl, is referred to as the local
14 A. Schaffer on behalf of the ATLAS Collaboration
significance. The global probability for the most significant excess to be observedanywhere in a given search region includes a correction for the “look elsewhere”effect, reducing that given by local p0 .
8 Correlated systematic uncertainties
The full list of the individual search channels that enter the combination are pro-vided in [19]. The main uncorrelated systematic uncertainties correspond to theelements of the background estimates. The sources of correlated systematic un-certainties are: integrated luminosity, electron/photon energy scales, muon recon-struction, JES and Emiss
T , and theoretical uncertainties.
9 Results
The addition of the 8TeV data for the H→ZZ(∗)→ 4ℓ, H→ γγ andH→WW (∗)→ eνµν channels, as well as the improvements to the analyses of the7TeV data in the first two of these channels, bring a significant gain in sensitivityin the low-mass region with respect to the previous combined search [17].
9.1 Excluded mass regions
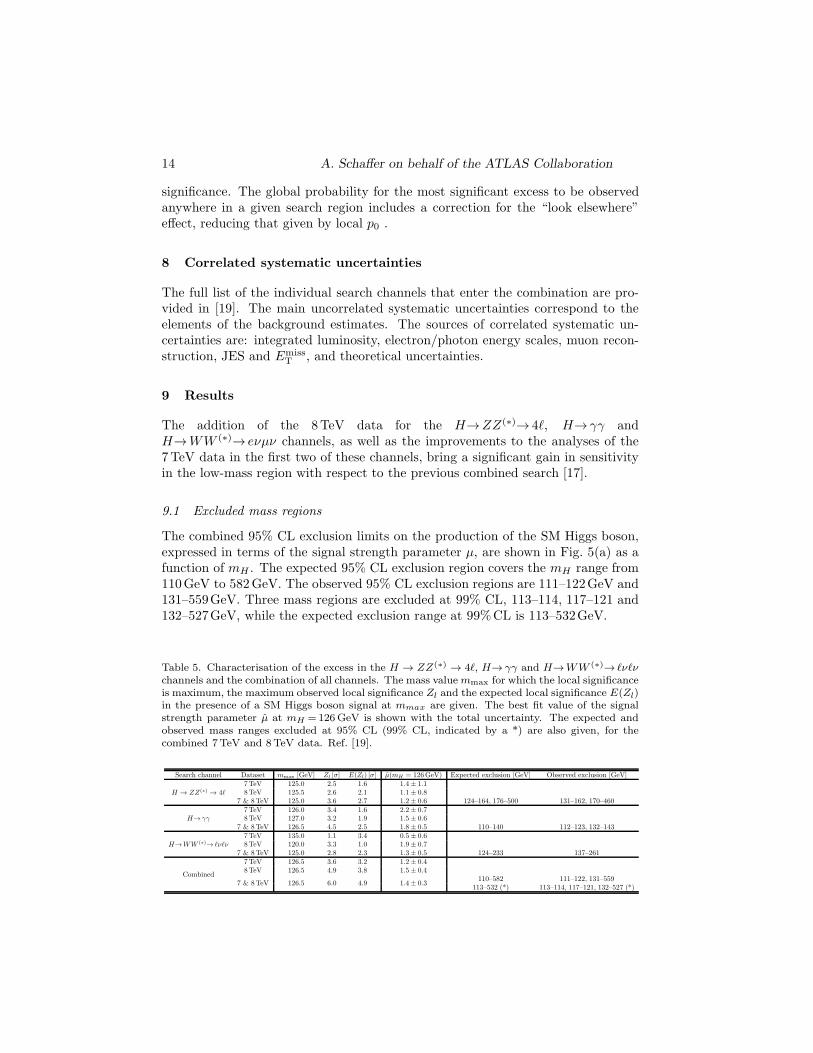
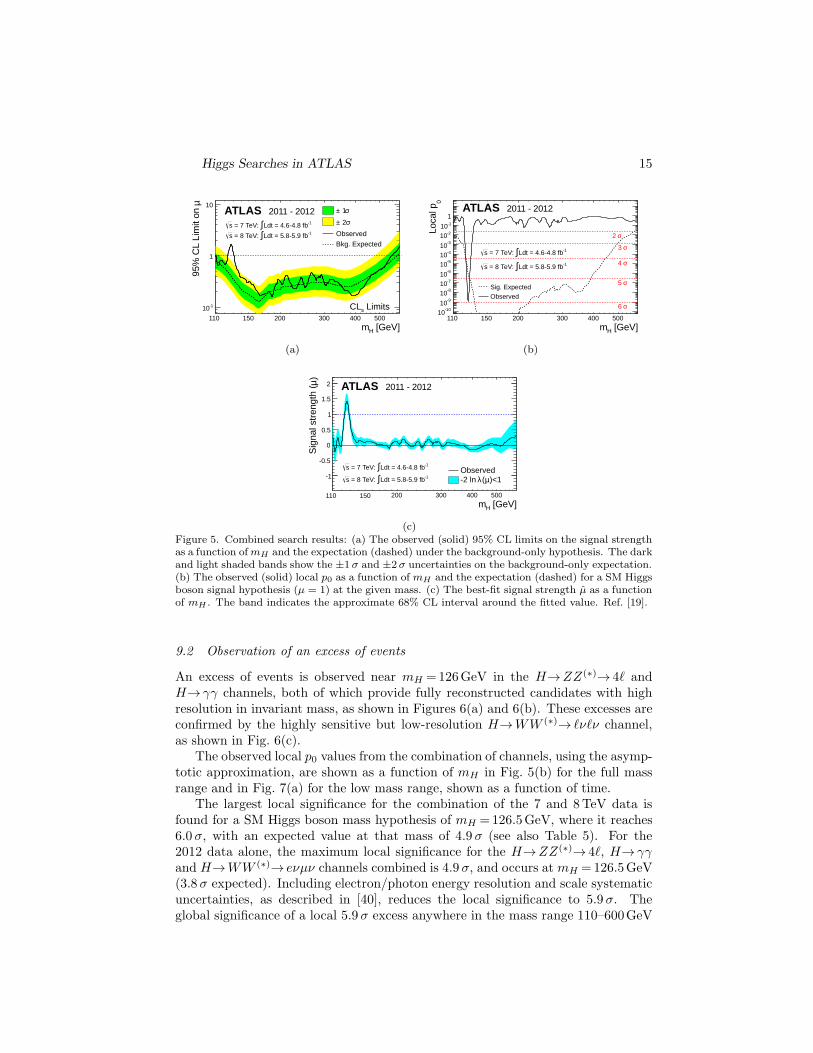
The combined 95% CL exclusion limits on the production of the SM Higgs boson,expressed in terms of the signal strength parameter µ, are shown in Fig. 5(a) as afunction of mH . The expected 95% CL exclusion region covers the mH range from110GeV to 582GeV. The observed 95% CL exclusion regions are 111–122GeV and131–559GeV. Three mass regions are excluded at 99% CL, 113–114, 117–121 and132–527GeV, while the expected exclusion range at 99%CL is 113–532GeV.
Table 5. Characterisation of the excess in the H → ZZ(∗) → 4ℓ, H→ γγ and H→WW (∗)→ ℓνℓνchannels and the combination of all channels. The mass value mmax for which the local significanceis maximum, the maximum observed local significance Zl and the expected local significance E(Zl)in the presence of a SM Higgs boson signal at mmax are given. The best fit value of the signalstrength parameter µ at mH =126GeV is shown with the total uncertainty. The expected andobserved mass ranges excluded at 95% CL (99% CL, indicated by a *) are also given, for thecombined 7TeV and 8TeV data. Ref. [19].
Search channel Dataset mmax [GeV] Zl [σ] E(Zl) [σ] µ(mH = 126GeV) Expected exclusion [GeV] Observed exclusion [GeV]
H → ZZ(∗) → 4ℓ7TeV 125.0 2.5 1.6 1.4± 1.18TeV 125.5 2.6 2.1 1.1± 0.8
7 & 8TeV 125.0 3.6 2.7 1.2± 0.6 124–164, 176–500 131–162, 170–460
H→ γγ7TeV 126.0 3.4 1.6 2.2± 0.78TeV 127.0 3.2 1.9 1.5± 0.6
7 & 8TeV 126.5 4.5 2.5 1.8± 0.5 110–140 112–123, 132–143
H→WW (∗)→ ℓνℓν7TeV 135.0 1.1 3.4 0.5± 0.68TeV 120.0 3.3 1.0 1.9± 0.7
7 & 8TeV 125.0 2.8 2.3 1.3± 0.5 124–233 137–261
Combined
7TeV 126.5 3.6 3.2 1.2± 0.48TeV 126.5 4.9 3.8 1.5± 0.4
7 & 8TeV 126.5 6.0 4.9 1.4± 0.3110–582 111–122, 131–559
113–532 (*) 113–114, 117–121, 132–527 (*)
Higgs Searches in ATLAS 15
[GeV]Hm200 300 400 500
µ95
% C
L Li
mit
on
-110
1
10σ 1±
σ 2±Observed
Bkg. Expected
ATLAS 2011 - 2012-1Ldt = 4.6-4.8 fb∫ = 7 TeV: s -1Ldt = 5.8-5.9 fb∫ = 8 TeV: s
LimitssCL110 150
(a)
[GeV]Hm200 300 400 500
0Lo
cal p
-1010
-910
-810
-710
-610
-510
-410
-310
-210
-110
1
ATLAS 2011 - 2012
Sig. ExpectedObserved
σ2
σ3
σ4
σ5
σ6
110 150
-1Ldt = 4.6-4.8 fb∫ = 7 TeV: s
-1Ldt = 5.8-5.9 fb∫ = 8 TeV: s
(b)
[GeV]Hm200 300 400 500
)µS
igna
l str
engt
h (
-1
-0.5
0
0.5
1
1.5
2
Observed)<1µ(λ-2 ln
ATLAS 2011 - 2012
110 150
-1Ldt = 4.6-4.8 fb∫ = 7 TeV: s -1Ldt = 5.8-5.9 fb∫ = 8 TeV: s
(c)Figure 5. Combined search results: (a) The observed (solid) 95% CL limits on the signal strengthas a function ofmH and the expectation (dashed) under the background-only hypothesis. The darkand light shaded bands show the ±1σ and ±2σ uncertainties on the background-only expectation.(b) The observed (solid) local p0 as a function of mH and the expectation (dashed) for a SM Higgsboson signal hypothesis (µ = 1) at the given mass. (c) The best-fit signal strength µ as a functionof mH . The band indicates the approximate 68% CL interval around the fitted value. Ref. [19].
9.2 Observation of an excess of events
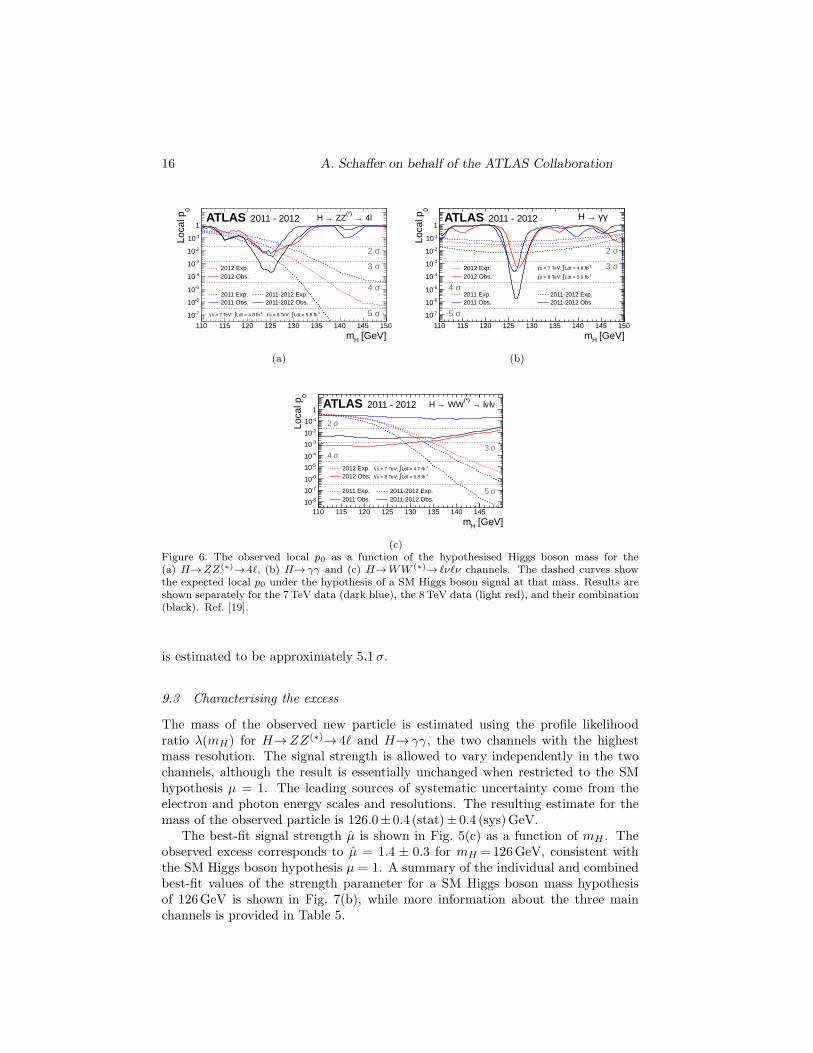
An excess of events is observed near mH =126GeV in the H→ZZ(∗)→ 4ℓ andH→ γγ channels, both of which provide fully reconstructed candidates with highresolution in invariant mass, as shown in Figures 6(a) and 6(b). These excesses areconfirmed by the highly sensitive but low-resolution H→WW (∗)→ ℓνℓν channel,as shown in Fig. 6(c).
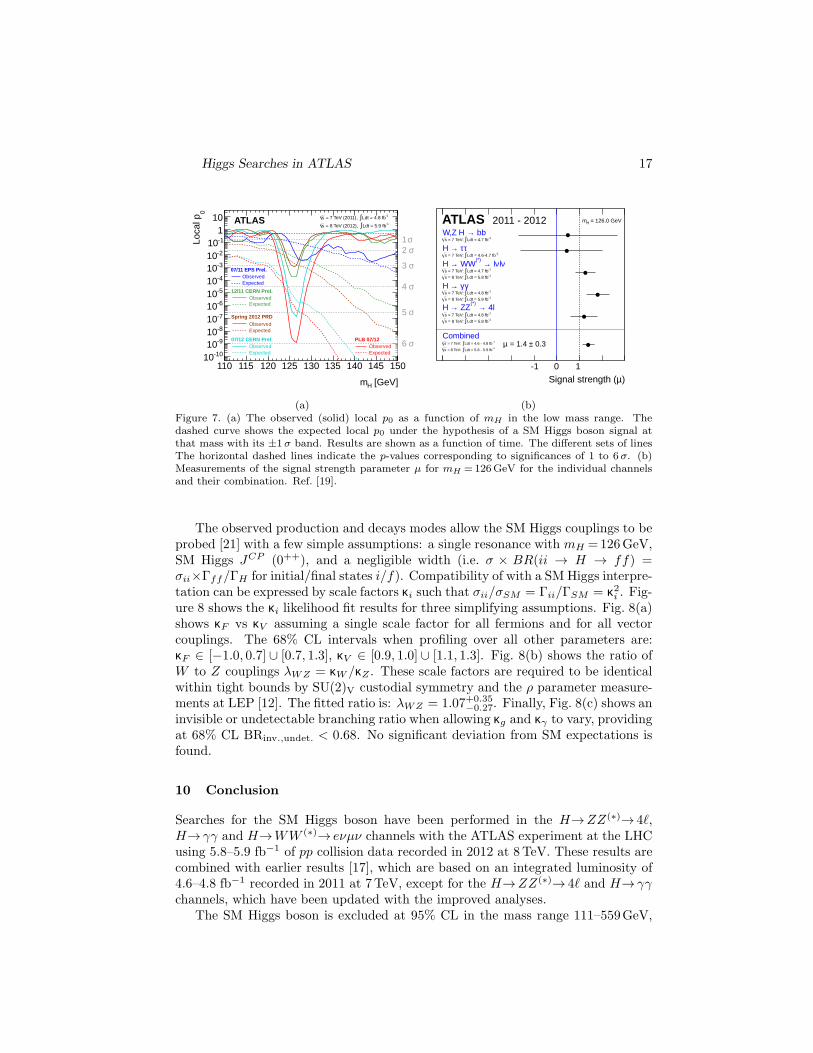
The observed local p0 values from the combination of channels, using the asymp-totic approximation, are shown as a function of mH in Fig. 5(b) for the full massrange and in Fig. 7(a) for the low mass range, shown as a function of time.
The largest local significance for the combination of the 7 and 8TeV data isfound for a SM Higgs boson mass hypothesis of mH =126.5GeV, where it reaches6.0 σ, with an expected value at that mass of 4.9 σ (see also Table 5). For the2012 data alone, the maximum local significance for the H→ZZ(∗)→ 4ℓ, H→ γγand H→WW (∗)→ eνµν channels combined is 4.9 σ, and occurs at mH =126.5GeV(3.8 σ expected). Including electron/photon energy resolution and scale systematicuncertainties, as described in [40], reduces the local significance to 5.9 σ. Theglobal significance of a local 5.9 σ excess anywhere in the mass range 110–600GeV
16 A. Schaffer on behalf of the ATLAS Collaboration
[GeV]Hm110 115 120 125 130 135 140 145 150
0Lo
cal p
-710
-610
-510
-410
-310
-210
-110
1
2011 Exp.2011 Obs.
2012 Exp.2012 Obs.
2011-2012 Exp.2011-2012 Obs.
ATLAS 2011 - 2012 4l→ (*) ZZ→H
σ2
σ3
σ4
σ5 -1Ldt = 4.8 fb∫ = 7 TeV: s -1Ldt = 5.8 fb∫ = 8 TeV: s
(a)
[GeV]Hm110 115 120 125 130 135 140 145 150
0Lo
cal p
-710
-610
-510
-410
-310
-210
-110
1
γγ →H
σ2
σ3
σ4
σ5
-1Ldt = 4.8 fb∫ = 7 TeV: s -1Ldt = 5.9 fb∫ = 8 TeV: s
2011 Exp.2011 Obs.
2012 Exp.2012 Obs.
2011-2012 Exp.2011-2012 Obs.
ATLAS 2011 - 2012
(b)
[GeV]Hm110 115 120 125 130 135 140 145
0Lo
cal p
-810
-710
-610
-510
-410
-310
-210
-110
1
ATLAS 2011 - 2012 νlν l→ (*) WW→H
σ2
σ3 σ4
σ5 2011 Exp.2011 Obs.
2012 Exp.2012 Obs.
2011-2012 Exp.2011-2012 Obs.
-1Ldt = 4.7 fb∫ = 7 TeV: s -1Ldt = 5.8 fb∫ = 8 TeV: s
(c)Figure 6. The observed local p0 as a function of the hypothesised Higgs boson mass for the(a) H→ZZ(∗)→ 4ℓ, (b) H→ γγ and (c) H→WW (∗)→ ℓνℓν channels. The dashed curves showthe expected local p0 under the hypothesis of a SM Higgs boson signal at that mass. Results areshown separately for the 7TeV data (dark blue), the 8TeV data (light red), and their combination(black). Ref. [19].
is estimated to be approximately 5.1 σ.
9.3 Characterising the excess
The mass of the observed new particle is estimated using the profile likelihoodratio λ(mH) for H→ZZ(∗)→ 4ℓ and H→ γγ, the two channels with the highestmass resolution. The signal strength is allowed to vary independently in the twochannels, although the result is essentially unchanged when restricted to the SMhypothesis µ = 1. The leading sources of systematic uncertainty come from theelectron and photon energy scales and resolutions. The resulting estimate for themass of the observed particle is 126.0± 0.4 (stat)± 0.4 (sys)GeV.
The best-fit signal strength µ is shown in Fig. 5(c) as a function of mH . Theobserved excess corresponds to µ = 1.4 ± 0.3 for mH =126GeV, consistent withthe SM Higgs boson hypothesis µ = 1. A summary of the individual and combinedbest-fit values of the strength parameter for a SM Higgs boson mass hypothesisof 126GeV is shown in Fig. 7(b), while more information about the three mainchannels is provided in Table 5.
Higgs Searches in ATLAS 17
[GeV]Hm
110 115 120 125 130 135 140 145 150
0Lo
cal p
-1010
-910
-810
-710
-610
-510
-410
-310
-210
-1101
10
07/11 EPS Prel.ObservedExpected
12/11 CERN Prel.ObservedExpected
Spring 2012 PRDObservedExpected
07/12 CERN Prel.ObservedExpected
PLB 07/12ObservedExpected
ATLAS
σ1 σ2
σ3
σ4
σ5
σ6
-1Ldt = 4.8 fb∫ = 7 TeV (2011), s-1Ldt = 5.9 fb∫ = 8 TeV (2012), s
(a)
)µSignal strength (
-1 0 1
Combined
4l→ (*) ZZ→H
γγ →H
νlν l→ (*) WW→H
ττ →H
bb→W,Z H
-1Ldt = 4.6 - 4.8 fb∫ = 7 TeV: s-1Ldt = 5.8 - 5.9 fb∫ = 8 TeV: s
-1Ldt = 4.8 fb∫ = 7 TeV: s-1Ldt = 5.8 fb∫ = 8 TeV: s
-1Ldt = 4.8 fb∫ = 7 TeV: s-1Ldt = 5.9 fb∫ = 8 TeV: s
-1Ldt = 4.7 fb∫ = 7 TeV: s-1Ldt = 5.8 fb∫ = 8 TeV: s
-1Ldt = 4.7 fb∫ = 7 TeV: s
-1Ldt = 4.6-4.7 fb∫ = 7 TeV: s
= 126.0 GeVHm
0.3± = 1.4 µ
ATLAS 2011 - 2012
(b)Figure 7. (a) The observed (solid) local p0 as a function of mH in the low mass range. Thedashed curve shows the expected local p0 under the hypothesis of a SM Higgs boson signal atthat mass with its ±1σ band. Results are shown as a function of time. The different sets of linesThe horizontal dashed lines indicate the p-values corresponding to significances of 1 to 6σ. (b)Measurements of the signal strength parameter µ for mH =126GeV for the individual channelsand their combination. Ref. [19].
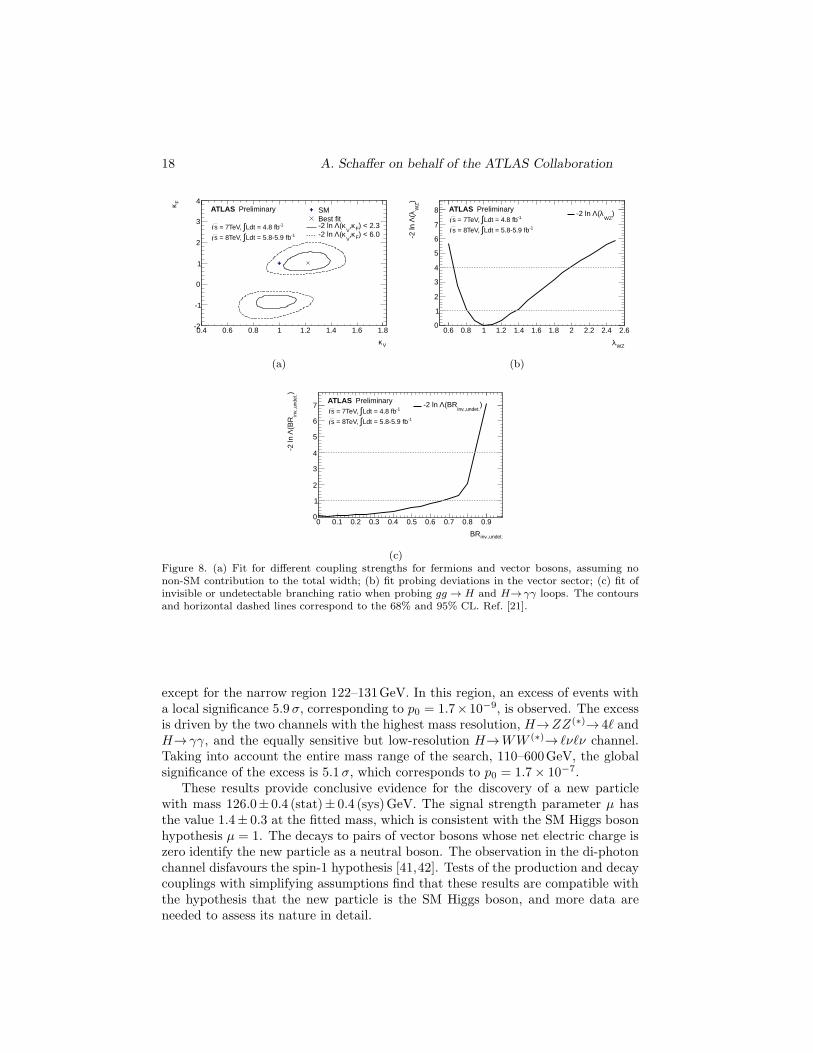
The observed production and decays modes allow the SM Higgs couplings to beprobed [21] with a few simple assumptions: a single resonance with mH =126GeV,SM Higgs JCP (0++), and a negligible width (i.e. σ × BR(ii → H → ff) =σii×Γff/ΓH for initial/final states i/f). Compatibility of with a SM Higgs interpre-tation can be expressed by scale factors κi such that σii/σSM = Γii/ΓSM = κ2
i . Fig-ure 8 shows the κi likelihood fit results for three simplifying assumptions. Fig. 8(a)shows κF vs κV assuming a single scale factor for all fermions and for all vectorcouplings. The 68% CL intervals when profiling over all other parameters are:κF ∈ [−1.0, 0.7] ∪ [0.7, 1.3], κV ∈ [0.9, 1.0] ∪ [1.1, 1.3]. Fig. 8(b) shows the ratio ofW to Z couplings λWZ = κW /κZ . These scale factors are required to be identicalwithin tight bounds by SU(2)V custodial symmetry and the ρ parameter measure-ments at LEP [12]. The fitted ratio is: λWZ = 1.07+0.35
−0.27. Finally, Fig. 8(c) shows aninvisible or undetectable branching ratio when allowing κg and κγ to vary, providingat 68% CL BRinv.,undet. < 0.68. No significant deviation from SM expectations isfound.
10 Conclusion
Searches for the SM Higgs boson have been performed in the H→ZZ(∗)→ 4ℓ,H→ γγ and H→WW (∗)→ eνµν channels with the ATLAS experiment at the LHCusing 5.8–5.9 fb−1 of pp collision data recorded in 2012 at 8TeV. These results arecombined with earlier results [17], which are based on an integrated luminosity of4.6–4.8 fb−1 recorded in 2011 at 7TeV, except for the H→ZZ(∗)→ 4ℓ and H→ γγchannels, which have been updated with the improved analyses.
The SM Higgs boson is excluded at 95% CL in the mass range 111–559GeV,
18 A. Schaffer on behalf of the ATLAS Collaboration
Vκ0.4 0.6 0.8 1 1.2 1.4 1.6 1.8
Fκ
-2
-1
0
1
2
3
4SMBest fit
) < 2.3Fκ,V
κ(Λ-2 ln ) < 6.0Fκ,
Vκ(Λ-2 ln -1Ldt = 5.8-5.9 fb∫ = 8TeV, s
-1Ldt = 4.8 fb∫ = 7TeV, s
ATLAS Preliminary
(a)
WZλ
0.6 0.8 1 1.2 1.4 1.6 1.8 2 2.2 2.4 2.6
)W
Zλ(
Λ-2
ln
0
1
2
3
4
5
6
7
8 )WZ
λ(Λ-2 ln
-1Ldt = 5.8-5.9 fb∫ = 8TeV, s
-1Ldt = 4.8 fb∫ = 7TeV, s
ATLAS Preliminary
(b)
inv.,undet.BR
0 0.1 0.2 0.3 0.4 0.5 0.6 0.7 0.8 0.9
)in
v.,u
ndet
.(B
RΛ
-2 ln
0
1
2
3
4
5
6
7 )inv.,undet.
(BRΛ-2 ln
-1Ldt = 5.8-5.9 fb∫ = 8TeV, s
-1Ldt = 4.8 fb∫ = 7TeV, s
ATLAS Preliminary
(c)Figure 8. (a) Fit for different coupling strengths for fermions and vector bosons, assuming nonon-SM contribution to the total width; (b) fit probing deviations in the vector sector; (c) fit ofinvisible or undetectable branching ratio when probing gg → H and H→ γγ loops. The contoursand horizontal dashed lines correspond to the 68% and 95% CL. Ref. [21].
except for the narrow region 122–131GeV. In this region, an excess of events witha local significance 5.9 σ, corresponding to p0 = 1.7× 10⁻⁹, is observed. The excessis driven by the two channels with the highest mass resolution, H→ZZ(∗)→ 4ℓ andH→ γγ, and the equally sensitive but low-resolution H→WW (∗)→ ℓνℓν channel.Taking into account the entire mass range of the search, 110–600GeV, the globalsignificance of the excess is 5.1 σ, which corresponds to p0 = 1.7× 10⁻⁷.
These results provide conclusive evidence for the discovery of a new particlewith mass 126.0± 0.4 (stat)± 0.4 (sys)GeV. The signal strength parameter µ hasthe value 1.4± 0.3 at the fitted mass, which is consistent with the SM Higgs bosonhypothesis µ = 1. The decays to pairs of vector bosons whose net electric charge iszero identify the new particle as a neutral boson. The observation in the di-photonchannel disfavours the spin-1 hypothesis [41,42]. Tests of the production and decaycouplings with simplifying assumptions find that these results are compatible withthe hypothesis that the new particle is the SM Higgs boson, and more data areneeded to assess its nature in detail.
Higgs Searches in ATLAS 19
References
1. S. L. Glashow, Nucl. Phys. 22 no. 4, (1961) 579.2. S. Weinberg, Phys. Rev. Lett. 19 (1967) 1264.3. A. Salam, Elementary particle theory: relativistic groups and analyticity, N.
Svartholm, ed., p. 367. Almqvist & Wiksell, 1968. Proceedings of the eighthNobel symposium.
4. G. ’t Hooft and M. Veltman, Nucl. Phys. B44 (1972) 189.5. F. Englert and R. Brout, Phys. Rev. Lett. 13 (1964) 321.6. P. W. Higgs, Phys. Lett. 12 (1964) 132.7. P. W. Higgs, Phys. Rev. Lett. 13 (1964) 508.8. G. S. Guralnik, C. R. Hagen, and T. W. B. Kibble, Phys. Rev. Lett. 13
(1964) 585.9. P. W. Higgs, Phys. Rev. 145 (1966) 1156.10. T. W. B. Kibble, Phys. Rev. 155 (1967) 1554.11. L. Evans and P. Bryant (Eds.), JINST 3 (2008) S08001.12. ALEPH, CDF, DØ, DELPHI, L3, OPAL, SLD Collaborations, the LEP
Electroweak Working Group, the Tevatron Electroweak Working Group, andthe SLD electroweak and heavy flavour groups, CERN-PH-EP-2010-095(2010), arXiv:1012.2367 [hep-ex].
13. ALEPH, DELPHI, L3 and OPAL Collaborations, The LEP Working Groupfor Higgs boson searches, Phys. Lett. B 565 (2003) 61.
14. CDF Collaboration, T. Aaltonen et al., Phys. Rev. Lett. 109 (2012) 111802,arXiv:1207.1707 [hep-ex].
15. DØ Collaboration, V. M. Abazov et al., Phys. Rev. Lett. 109 (2012) 121802,arXiv:1207.6631 [hep-ex].
16. CDF Collaboration, DØ Collaboration, Phys. Rev. Lett. 109 (2012) 71804,Lett. (2012), arXiv:1207.6436 [hep-ex].
17. ATLAS Collaboration, Phys. Rev. D86 (2012) 032003.18. CMS Collaboration, Phys. Lett. B 710 (2012) 26.19. ATLAS Collaboration, Phys. Lett. B716 (2012) 1–29, arXiv:1207.7214
[hep-ex]. Figures from ATLAS web.20. CMS Collaboration, Phys. Lett. B716 (2012) 30–61, arXiv:1207.7235
[hep-ex].21. ATLAS Collaboration, ATLAS-CONF-2012-127 (2012)
http://cdsweb.cern.ch/record/1476765.22. ATLAS Collaboration, JINST 3 (2008) S08003.23. ATLAS Collaboration, Phys. Lett. B 710 (2012) 383.24. ATLAS Collaboration, ATLAS-CONF-2011-063 (2011)
http://cdsweb.cern.ch/record/1345743.25. ATLAS Collaboration, Eur. Phys. J. C72 (2012) 1909.26. ATLAS Collaboration, ATLAS-CONF-2012-047 (2012)
http://cdsweb.cern.ch/record/1449796.27. ATLAS Collaboration, ATLAS-CONF-2012-092 (2012)
http://cdsweb.cern.ch/record/1460411.28. W. Lampl, S. Laplace, D. Lelas, P. Loch, H. Ma, S. Menke, S. Rajagopalan,
20 A. Schaffer on behalf of the ATLAS Collaboration
D. Rousseau, S. Snyder, and G. Unal, ATL-LARG-PUB-2008-002 (2008)http://cdsweb.cern.ch/record/1099735.
29. ATLAS Collaboration, Phys. Lett. B 707 (2012) 438.30. ATLAS Collaboration, ATLAS-CONF-2012-080 (2012)
http://cdsweb.cern.ch/record/1460392.31. ATLAS Collaboration, Phys. Rev. Lett. 108 (2012) 111803.32. ATLAS Collaboration, Eur. Phys. J. C72 (2012) 1849.33. ATLAS Collaboration, Phys. Rev. D83 (2011) 052005.34. OPAL Collaboration Collaboration, K. Ackerstaff et al., Eur. Phys. J. C4
(1998) 47, arXiv:hep-ex/9710010 [hep-ex].35. M. Vesterinen and T. R. Wyatt, Nucl. Instrum. Meth. A602 (2009) 432.36. J. Gaiser, Ph.D. Thesis No. SLAC-R-255, (1982) 178.37. S. N. Bernstein, Comm. Soc. Math. Kharkov 13 (1912) 1.38. G. Cowan, K. Cranmer, E. Gross, and O. Vitells, Eur. Phys. J. C71 (2011)
1554.39. A. L. Read, J. Phys. G28 (2002) 2693.40. ATLAS Collaboration, ATLAS-CONF-2012-093 (2012)
http://cdsweb.cern.ch/record/1460439.41. L. D. Landau, Dokl. Akad. Nawk. USSR 60 (1948) 207.42. C. N. Yang, Phys. Rev. 77 (1950) 242.