1,3-diketone fluids and their complexes with iron
TRANSCRIPT
1,3-Diketone Fluids and Their Complexes with IronMichael Walter,*,†,‡ Tobias Amann,‡ Ke Li,¶ Andreas Kailer,‡ Jurgen Ruhe,¶ and Michael Moseler‡
†FMF, Freiburg Materials Research Center, University of Freiburg, Stefan-Meier-Straße 21, 79104 Freiburg, Germany‡IWM, Fraunhofer Institute for Mechanics of Materials, Woehlerstraße 11, 79108 Freiburg, Germany¶IMTEK, Department of Microsystems Engineering, University of Freiburg, Georges-Kohler-Allee 103, D-79110 Freiburg, Germany
*S Supporting Information
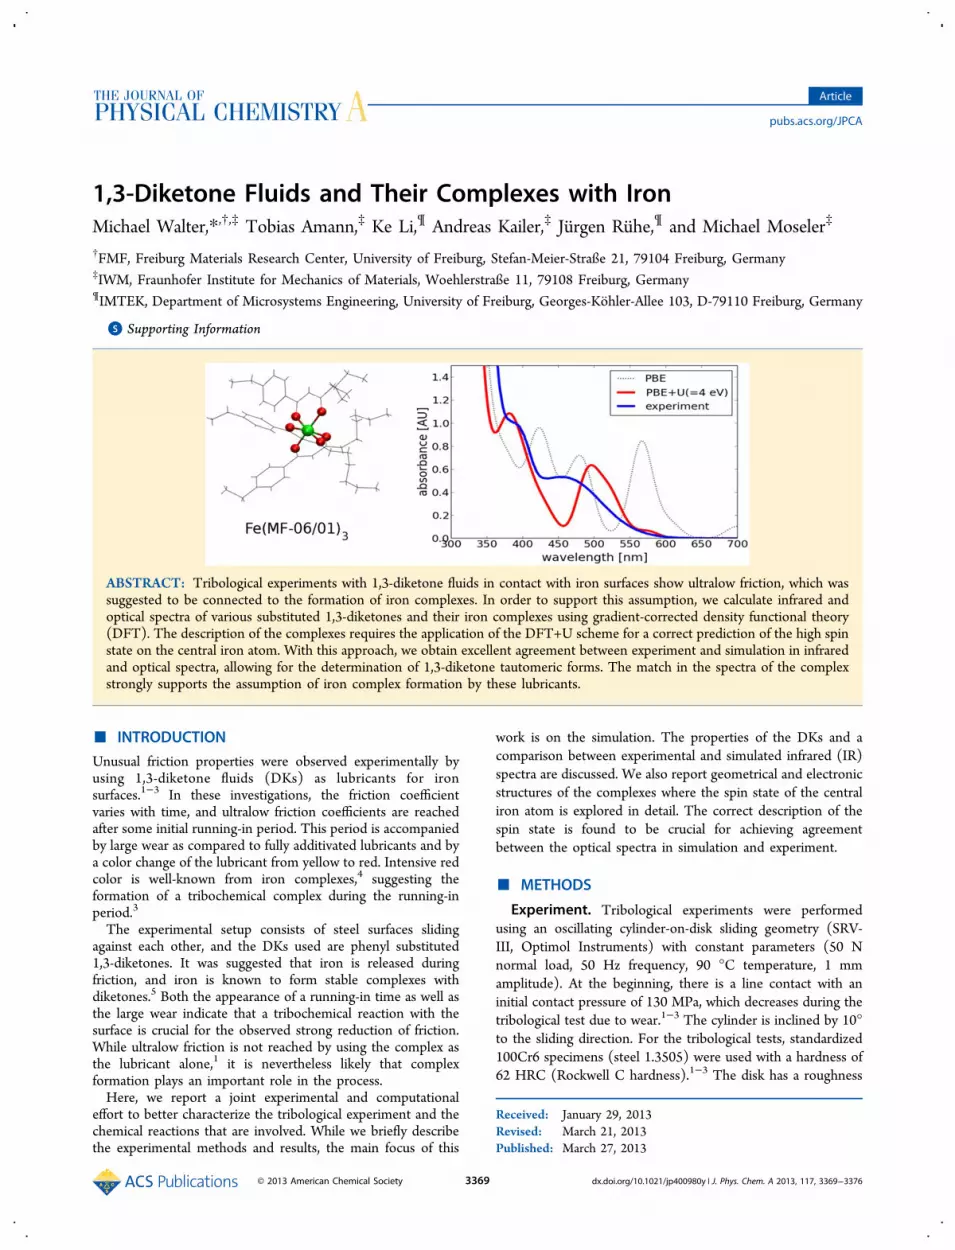
ABSTRACT: Tribological experiments with 1,3-diketone fluids in contact with iron surfaces show ultralow friction, which wassuggested to be connected to the formation of iron complexes. In order to support this assumption, we calculate infrared andoptical spectra of various substituted 1,3-diketones and their iron complexes using gradient-corrected density functional theory(DFT). The description of the complexes requires the application of the DFT+U scheme for a correct prediction of the high spinstate on the central iron atom. With this approach, we obtain excellent agreement between experiment and simulation in infraredand optical spectra, allowing for the determination of 1,3-diketone tautomeric forms. The match in the spectra of the complexstrongly supports the assumption of iron complex formation by these lubricants.
■ INTRODUCTION
Unusual friction properties were observed experimentally byusing 1,3-diketone fluids (DKs) as lubricants for ironsurfaces.1−3 In these investigations, the friction coefficientvaries with time, and ultralow friction coefficients are reachedafter some initial running-in period. This period is accompaniedby large wear as compared to fully additivated lubricants and bya color change of the lubricant from yellow to red. Intensive redcolor is well-known from iron complexes,4 suggesting theformation of a tribochemical complex during the running-inperiod.3
The experimental setup consists of steel surfaces slidingagainst each other, and the DKs used are phenyl substituted1,3-diketones. It was suggested that iron is released duringfriction, and iron is known to form stable complexes withdiketones.5 Both the appearance of a running-in time as well asthe large wear indicate that a tribochemical reaction with thesurface is crucial for the observed strong reduction of friction.While ultralow friction is not reached by using the complex asthe lubricant alone,1 it is nevertheless likely that complexformation plays an important role in the process.Here, we report a joint experimental and computational
effort to better characterize the tribological experiment and thechemical reactions that are involved. While we briefly describethe experimental methods and results, the main focus of this
work is on the simulation. The properties of the DKs and acomparison between experimental and simulated infrared (IR)spectra are discussed. We also report geometrical and electronicstructures of the complexes where the spin state of the centraliron atom is explored in detail. The correct description of thespin state is found to be crucial for achieving agreementbetween the optical spectra in simulation and experiment.
■ METHODS
Experiment. Tribological experiments were performedusing an oscillating cylinder-on-disk sliding geometry (SRV-III, Optimol Instruments) with constant parameters (50 Nnormal load, 50 Hz frequency, 90 °C temperature, 1 mmamplitude). At the beginning, there is a line contact with aninitial contact pressure of 130 MPa, which decreases during thetribological test due to wear.1−3 The cylinder is inclined by 10°to the sliding direction. For the tribological tests, standardized100Cr6 specimens (steel 1.3505) were used with a hardness of62 HRC (Rockwell C hardness).1−3 The disk has a roughness
Received: January 29, 2013Revised: March 21, 2013Published: March 27, 2013
Article
pubs.acs.org/JPCA
© 2013 American Chemical Society 3369 dx.doi.org/10.1021/jp400980y | J. Phys. Chem. A 2013, 117, 3369−3376
of Ra = 0.07 μm and Rz = 0.60 μm, and the cylinder has Ra =0.06 μm and Rz = 0.46 μm.1−3
For FT-IR measurements, a BioRad Excalibur FTS 3000spectrometer was used. The different fluids were measuredbetween two NaCl windows with a resolution of 4 cm−1. TheUV−vis spectra were measured between 800 and 300 nm usingquartz cuvettes with a Cary Bio 50 spectrometer (Co. Varian).Acetonitrile with a molar concentration of 10−4 mol/L was usedto dissolve the DKs for the UV−vis measurement.Simulation. The density functional theory (DFT) calcu-
lations were performed with the grid projector augmented wave(GPAW) method.6,7 A grid spacing of h = 0.2 Å was used forthe representation of the smooth wave functions and waschecked for convergence. The simulation box contained at least4.0 Å of vacuum around the molecules, and zero boundaryconditions were applied outside of the box. The exchange−correlation energy was approximated in the generalizedgradient approximation (GGA) as devised by Perdew, Burke,and Ernzerhof (PBE)8 and cross-checked with the meta-GGAfunctional of Tao et al. (TPSS)9 in a non-self-consistentcalculation using PBE densities. In order to obtain reliablevibrational spectra, the molecules were relaxed withoutsymmetry constraints until the forces were lower than 0.01eV/Å. The vibrational spectra were obtained from a finitedifference approximation of the dynamical matrix and the IRintensities via a finite difference approximation of the gradientof the dipole moment.10 The correct description of the ironcomplexes’ electronic structure and spin state made it necessaryto employ the PBE+U method,11 as detailed below.
■ RESULTS AND DISCUSSION1,3-Diketone Fluids. The DKs considered in this study are
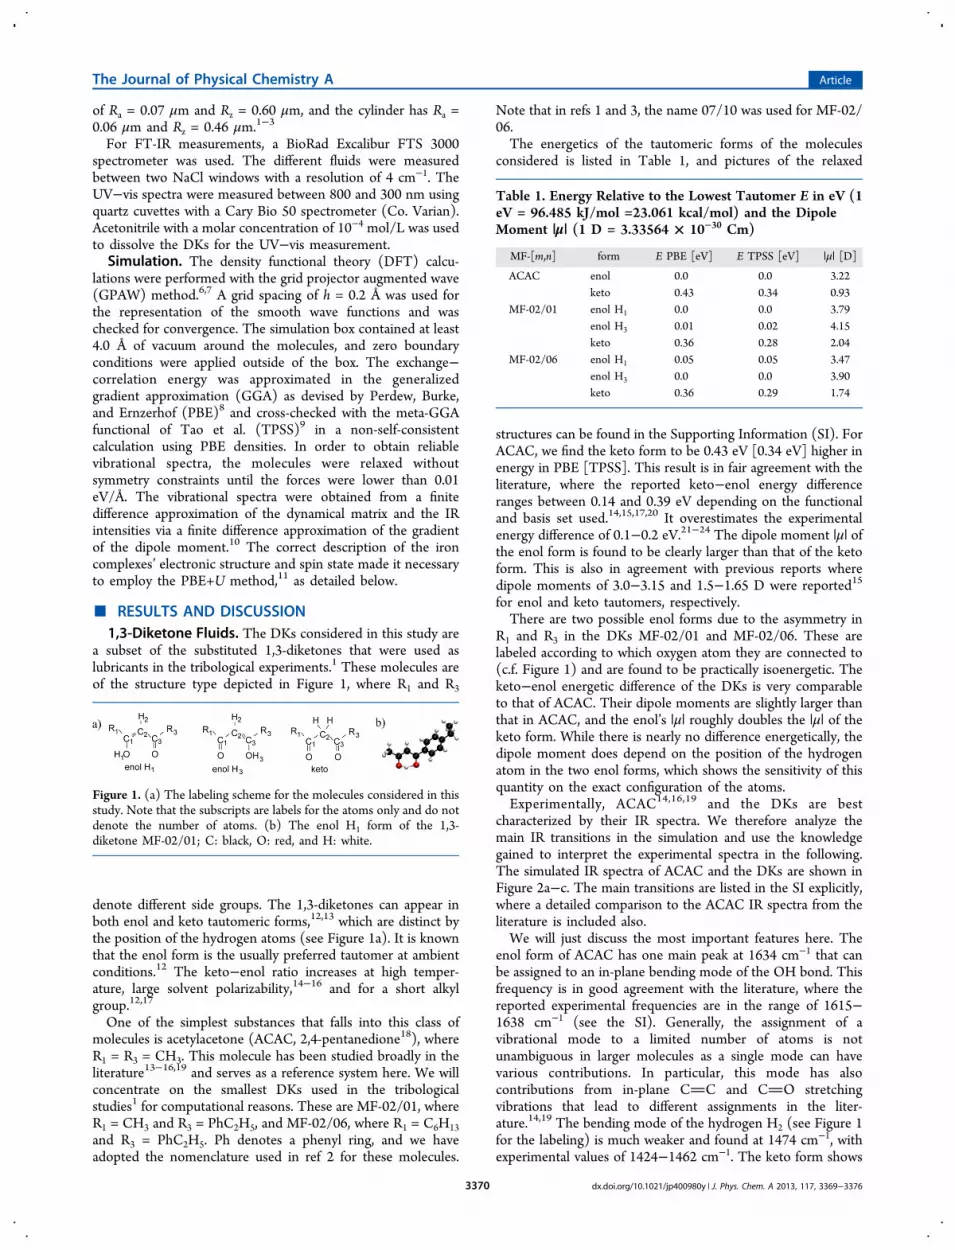
a subset of the substituted 1,3-diketones that were used aslubricants in the tribological experiments.1 These molecules areof the structure type depicted in Figure 1, where R1 and R3
denote different side groups. The 1,3-diketones can appear inboth enol and keto tautomeric forms,12,13 which are distinct bythe position of the hydrogen atoms (see Figure 1a). It is knownthat the enol form is the usually preferred tautomer at ambientconditions.12 The keto−enol ratio increases at high temper-ature, large solvent polarizability,14−16 and for a short alkylgroup.12,17
One of the simplest substances that falls into this class ofmolecules is acetylacetone (ACAC, 2,4-pentanedione18), whereR1 = R3 = CH3. This molecule has been studied broadly in theliterature13−16,19 and serves as a reference system here. We willconcentrate on the smallest DKs used in the tribologicalstudies1 for computational reasons. These are MF-02/01, whereR1 = CH3 and R3 = PhC2H5, and MF-02/06, where R1 = C6H13and R3 = PhC2H5. Ph denotes a phenyl ring, and we haveadopted the nomenclature used in ref 2 for these molecules.
Note that in refs 1 and 3, the name 07/10 was used for MF-02/06.The energetics of the tautomeric forms of the molecules
considered is listed in Table 1, and pictures of the relaxed
structures can be found in the Supporting Information (SI). ForACAC, we find the keto form to be 0.43 eV [0.34 eV] higher inenergy in PBE [TPSS]. This result is in fair agreement with theliterature, where the reported keto−enol energy differenceranges between 0.14 and 0.39 eV depending on the functionaland basis set used.14,15,17,20 It overestimates the experimentalenergy difference of 0.1−0.2 eV.21−24 The dipole moment |μ| ofthe enol form is found to be clearly larger than that of the ketoform. This is also in agreement with previous reports wheredipole moments of 3.0−3.15 and 1.5−1.65 D were reported15
for enol and keto tautomers, respectively.There are two possible enol forms due to the asymmetry in
R1 and R3 in the DKs MF-02/01 and MF-02/06. These arelabeled according to which oxygen atom they are connected to(c.f. Figure 1) and are found to be practically isoenergetic. Theketo−enol energetic difference of the DKs is very comparableto that of ACAC. Their dipole moments are slightly larger thanthat in ACAC, and the enol’s |μ| roughly doubles the |μ| of theketo form. While there is nearly no difference energetically, thedipole moment does depend on the position of the hydrogenatom in the two enol forms, which shows the sensitivity of thisquantity on the exact configuration of the atoms.Experimentally, ACAC14,16,19 and the DKs are best
characterized by their IR spectra. We therefore analyze themain IR transitions in the simulation and use the knowledgegained to interpret the experimental spectra in the following.The simulated IR spectra of ACAC and the DKs are shown inFigure 2a−c. The main transitions are listed in the SI explicitly,where a detailed comparison to the ACAC IR spectra from theliterature is included also.We will just discuss the most important features here. The
enol form of ACAC has one main peak at 1634 cm−1 that canbe assigned to an in-plane bending mode of the OH bond. Thisfrequency is in good agreement with the literature, where thereported experimental frequencies are in the range of 1615−1638 cm−1 (see the SI). Generally, the assignment of avibrational mode to a limited number of atoms is notunambiguous in larger molecules as a single mode can havevarious contributions. In particular, this mode has alsocontributions from in-plane CC and CO stretchingvibrations that lead to different assignments in the liter-ature.14,19 The bending mode of the hydrogen H2 (see Figure 1for the labeling) is much weaker and found at 1474 cm−1, withexperimental values of 1424−1462 cm−1. The keto form shows
Figure 1. (a) The labeling scheme for the molecules considered in thisstudy. Note that the subscripts are labels for the atoms only and do notdenote the number of atoms. (b) The enol H1 form of the 1,3-diketone MF-02/01; C: black, O: red, and H: white.
Table 1. Energy Relative to the Lowest Tautomer E in eV (1eV = 96.485 kJ/mol =23.061 kcal/mol) and the DipoleMoment |μ| (1 D = 3.33564 × 10⁻³⁰ Cm)
MF-[m,n] form E PBE [eV] E TPSS [eV] |μ| [D]
ACAC enol 0.0 0.0 3.22keto 0.43 0.34 0.93
MF-02/01 enol H1 0.0 0.0 3.79enol H3 0.01 0.02 4.15keto 0.36 0.28 2.04
MF-02/06 enol H1 0.05 0.05 3.47enol H3 0.0 0.0 3.90keto 0.36 0.29 1.74
The Journal of Physical Chemistry A Article
dx.doi.org/10.1021/jp400980y | J. Phys. Chem. A 2013, 117, 3369−33763370

a strong CO stretch peak at 1704 cm−1 (1705−1715 cm−1 inthe experiment) and a weaker in-plane stretch mode of the C1−C2−C3 backbone at 1148 cm−1 (1176−1179 cm−1 in theexperiment). In conclusion, we obtain good agreement with theexperiment and hence are able to clearly assign the strongest IRtransitions to the tautomeric forms of ACAC.The IR spectra of the DKs in Figure 2b,c have many
similarities to the spectrum of ACAC. The strongest peak of thetwo enol forms is still the OH bending mode at 1633 and 1622cm−1 for MF-02/01 and MF-02/06, respectively. This modeincreases in intensity with increasing molecular mass. The H2bending mode of the enol form is found at 1463 and 1476 cm−1
for MF-02/01 and MF-02/06, respectively. The keto formshows two peaks related to CO stretch vibrations, a strongerone at 1666 cm−1 for both DKs and a weaker one at 1163 and1140 cm−1 for MF-02/01 and MF-02/06, respectively.We now turn to the experimental IR spectrum of the DKs
shown in Figure 2d,e. A very strong transition at 1609 cm−1 canbe identified and is a clear signature of the presence of the enolform when compared to Figure 2b,c. The transitions at 1681,1268, and 1184 cm−1 indicate the substantial presence of theketo form in the experiment also. Using the relative heights ofenol and keto peaks suggests a larger proportion of the ketoform in the liquid of MF-02/01 than that in the liquid of MF-02/06.This dependence of the keto−enol ratio on the size of the
alkyl chain R1 cannot be explained by the gas-phase energeticsfrom Table 1, where the same energy difference is found forboth DKs. The keto form should be present only in very smallquantities at ambient temperature as the energetic gap is muchlarger than thermal energy (kBT = 0.026 eV at 298° K). It isknown from the experiment that the polarizability of a solventcan change the energetics and lower the keto energy relative to
the enol energy.15 We do not have a solvent here, but we aredealing with the pure DKs that have their own polarizability.Application of a simple estimate of the polarizability obtainedfor freely rotating permanent dipoles (see the SI) leads to ε =5.68 and 4.58 for MF-02/01 and MF-02/06 at 298° K,respectively. Although MF-02/01 has a slightly smaller dipolemoment than MF-02/06, it is of smaller size, and therefore,there are more dipoles present per unit volume. The larger ε ofMF-02/01 suggests that this effect could lead to a strongerpresence of the keto seen in the experiment.
Iron Complexes. We now discuss the properties of ironcomplexes with the DKs as some of us suggested in ref 1 thatthere is complex formation due to a tribochemical reaction withthe iron surface in the tribological experiments. This proposalwill be corroborated in the following by a comparison of thesimulated spectra of the iron complexes with experimentalresults.The simplest DK considered in this work, ACAC, is well-
known to build a chelate complex with FeIII.18,25 A similar(partial) complexation reaction is known as the salicylatedetection reaction with a characteristic absorbance maximum at535 nm = 2.32 eV, giving a strong color.4 The reaction can beimagined in a simple picture. Disregarding the ligand fieldeffect, the iron atom gives three electrons away to reachoxidation state III. It transforms from the neutral ground stateFe(3d64s2) to Fe(3d54s0), that is, to a half-filled 3d shell thatshould be exceptionally stable according to Hund’s rules. Dueto complexation, the three electrons are absorbed by three 1,3-diketone ligand radicals that are octahedrally coordinated to thecentral metal atom.5 Accordingly, an experimentally crystallizedFeIII 1,3-diketone complex was found to be neutral.26
It is well-known, however, that FeIII can complex into spin-crossover systems, where typically doublet and sextet spin states
Figure 2. Simulated vibrational spectra for the different tautomers of (a) ACAC, (b) MF-02/01, and (c) MF-02/06. The simulated spectra are foldedby Gaussians of 4 cm−1 width. Experimental IR spectra of the 1,3 diketone fluids (d) MF-02/01 and (e) MF-02/06. The simulated spectra areoverlaid for better comparison in (d) and (e).
Figure 3. Relaxed structures of (a) Fe(ACAC)3, Fe(MF-02/01)3 in the (b) xxx and (c) xx-x configurations, and Fe(MF-02/06)3 in the (d) xxx and(e) xx-x configurations (see the text). Iron (green) and oxygen atoms (red) are highlighted.
The Journal of Physical Chemistry A Article
dx.doi.org/10.1021/jp400980y | J. Phys. Chem. A 2013, 117, 3369−33763371

are near in energy and their occupation can depend ontemperature.27 As an example, it was found computationallythat a catecholato-FeIII system in the solid state undergoes adoublet to the sextet spin-crossover with increasing temper-ature.28 FeIII complexes with octahedral coordination, as we aredealing with here, are typically found in the high-spin (sextet)ground state. Examples are FeIII(cyclooctadiene)3, wherecyclooctadiene is a 1,2-diketone,29 and FeIII porphyrindifluoride.30
We consider the iron complexes in octahedral conformationas depicted in Figure 3. Spin-unpolarized relaxation of thestructures with the PBE functional did not lead to severestructural changes, that is, these structures represent stableminima in all cases. For the asymmetric ligand molecules likeMF-02/01 and MF-02/06, there are two possible conformers,one where all phenyl groups point into the same directionlabeled by xxx (Figure 3b and d) and another one where one ofthe phenyl groups points into the opposite direction, labeled byxx-x (Figure 3c and e). Due to the similar binding motif, thestructural properties do not depend on the ligand type. This isexemplified by the FeO distance, which is found to be RFeO =1.92 Å for all three ligands consistently. The xxx and xx-xconformations are within 0.02 eV (within 0.03 eV in TPSS) andtherefore practically isoenergetic. This is a consequence of thesteric hindrance of ligand−ligand interactions due to theiroctahedral conformation.Particularly optical properties, such as the UV−vis spectrum,
depend directly on the electronic structure of the complexes.We therefore address the electronic structure and in particularthe spin state of the complexes in the next step. We haveperformed spin-polarized calculations at the spin-unpolarizedgeometry obtained above. DFT does not allow one to restrictthe total spin but only the spin projection Sz,
31 which is definedby the difference in the occupation numbers of the majority andminority spin Kohn−Sham states resulting in different majorityand minority spin densities, that is Sz = 1 (in units of ℏ/2)denotes one more electron in the majority than in the minorityspin density. The Sz dependence of the PBE energy shown inFigure 4a is very similar to that for the three ligands (only thexxx conformers of MF-02/01 and MF-02/06 are shown as thexx-x conformers do not differ). We allow for partialoccupations, and therefore, also even Sz values appear. Theprojection Sz = 1[ℏ/2] (the doublet) leads to the minimum ofthe PBE energy. Although in a range of 1 eV, the energydependence is rather flat for Sz ≤ 5[ℏ/2], with a steep rise for
larger Sz. The flatness can be interpreted as the result ofdifferent possible projections of the total spin32,33 due to thetwo possible doublet and sextet states of FeIII. A very similarbehavior was observed for the octahedrally coordinateddifluoride iron porphine complex using the PBE functional.30
Relaxation of the Fe(ACAC)3 at fixed spin projection Szresults in practically no structure changes for the doublet state(Sz = 1[ℏ/2]). In contrast, it increases the Fe−O bond lengthof the high-spin sextet state (Sz = 5[ℏ/2]) considerably to 2.04± 0.02 Å.34 This structural change also results in an improvedenergy, as shown in Figure 4a. The relaxed sextet becomes thespin configuration with the second lowest energy andrepresents a real minimum now.Nevertheless, as discussed above, we expect the sextet to be
lower in energy than the doublet, which is not the case here.Difficulties of the local density approximation persisting inGGAs with strongly localized orbitals are well-known. Theseappear in particular in transition metals and are attributed tothe self-interaction errors present in these functionals.35 Theseproblems can be at least partially resolved by a DFT+Uapproach pioneered by Anisimov et al.,11 where a Hubbard-likeenergy term U is added to the metal d electrons.35 This termeffectively favors integer occupations of the d orbitals andtherefore prefers their localization.36 Both B3LYB+U and GGA+U were found to correctly describe the spin ordering in FeIII
complexes.30,37−39
We use a particular formulation, where only an effectiveHubbard U parameter appears,7,36 a method that was applied toiron complexes before.30,37 While most approaches use U as afree parameter, as we will also do in the following, it can also beobtained by a self-consistent approach using unrestrictedHartree−Fock theory.40 Mosey et al. reported a self-consistentvalue for iron oxide of U = 3.7−4.3 eV depending on theoxidation state.40 In agreement with this result, U = 4 eV wasproposed for iron oxides by Wang et al.41
Figure 4b shows the relative energy of the doublet and thesextet depending on U in the spin-paired relaxed geometries.The result is remarkably similar for all of the ligandsconsidered. The clear preference of the doublet by PBE ofnearly 1 eV diminishes with increasing U. At around U = 3 eV,the spin states are of equal energy, and the Sz = 5[ℏ/2] statebecomes the ground state for larger U. A very similar behaviorwas found for the heme FeII complex,37 where the value of U =4 eV was recommended.
Figure 4. (a) Spin projection Sz dependence of the PBE energy. (b) Energetics using PBE+U with varying U at Sz = 1[ℏ/2] and Sz = 5[ℏ/2]. Onlyxxx conformers are considered for MF-02/01 and MF-02/06.
The Journal of Physical Chemistry A Article
dx.doi.org/10.1021/jp400980y | J. Phys. Chem. A 2013, 117, 3369−33763372

Because of the clear preference of the sextet state for U > 3eV seen in Figure 4b and the recommendations from theliterature, we use U = 4 eV for the further analysis. As listed inTable 2, spin-polarized relaxation in the sextet ground state
leads to an increase of the Fe−O distance in the complexesrelative to that for the PBE spin-paired ground state.Independent of the ligand type, the bond length changes toRFeO = 2.04 Å at U = 4 eV in comparison to 1.92 Å at U = 0.This increase in bond length is mainly a consequence of thesextet ground state. A similar effect is seen in a spin-restrictedPBE relaxation in the sextet discussed above. The long bondlength is in excellent agreement with the experimentallydetermined RFeO = 2.04 Å in the FeIII 1,2-dimethoxyethanecomplex,29 giving a strong indication that we have found thecorrect structure and spin state. The comparison of IR andoptical spectra with experiment will further validate thesefindings in the following.Figure 5a−c shows the calculated vibrational spectra of the
iron complexes (the main vibrational lines are given in the SI).The IR spectrum of Fe(ACAC)3 consists of two strong lines at1513 and 1563 cm−1. The higher-energy vibration consists oftwo degenerate vibrations that can be assigned to CO stretchvibrations, while the lower one is an in-plane vibration of the
H2 atom. A similar concentration of the vibrational lines is seenin the IR spectra of the complexes with MF-02/01 and MF-02/06 also. The two degenerate CO stretch vibrations can befound at around 1540 cm−1 (see the SI for the explicitnumbers) but lose intensity when the ligand gets larger. The in-plane vibration of the H2 atom hybridizes more and more withother vibrations (e.g., gets mixed with contributions from thephenyl rings) with increasing ligand size and becomes thedominating feature in Fe(MF-02/06)3. There is nearly nodifference between the spectra of the xxx and the xx-xconfigurations.The splitting and shifting of the main vibrational intensity to
the region around 1550 cm−1 is also seen in the experimentalIR spectra shown in Figure 5c, where the spectra of MF-02/06and the complex Fe(MF-02/06)3 are overlaid to improve thedirect comparison (note that the similarity of the vibrationalspectra between MF-02/06 and the corresponding complex, inparticular for vibrations lower than 1300 cm−1, indicates thepresence of pure DK in the experimental Fe(MF-02/06)3complex). A similar effect of shifting and splitting in thevibrational lines has been found experimentally for the spectraof copper(II) diketonate complexes.42 The IR spectrum of MF-02/06 after 20 h of tribological experiment is depicted in Figure5d. It clearly shows the presence of the complex within the DK,strongly supporting the assumption of complex formation inthe tribological experiment.1
We now want to further discuss the electronic structure ofthe complexes. In contrast to the energy calculations, theelectronic structure is less sensitive to the grid spacing (see theSI for the similarity of optical spectra obtained with grids usingdifferent grid spacings). Therefore, we have used the computa-tionally cheaper grid spacing h = 0.25 Å for the representationof the smooth wave functions in analysis of the electronicstructure and the electronic excited-state properties. As listed inTable 2, the complexes at Sz = 5[ℏ/2] possess HOMO−LUMO gaps of more than 2 eV in both spin manifolds(HOMO = highest occupied molecular orbital; LUMO =lowest unoccupied molecular orbital). The gaps are alwayssmaller for the minority spin manifold and decrease withincreasing ligand size.In order to obtain a better understanding of the effect of U,
we compare the electronic structure for U = 0 and 4 eV in
Table 2. Structural and Electronic Properties of theComplexesa
RFeO [Å]U = 0 eV
RFeO [Å]U = 4 eV
gap [eV]U = 4 eV
Fe(ACAC)3 1.92 2.04 3.30 (2.35)Fe(MF-02/01)3xxx
1.92 2.04 2.97 (2.32)
Fe(MF-02/01)3xx-x
1.93 2.04 2.92 (2.30)
Fe(MF-02/06)3xxx
1.92 2.03 2.83 (2.14)
Fe(MF-02/06)3xx-x
1.92 2.03 2.83 (2.14)
aU = 0 values are for the spin-paired and U = 4 eV values for the Sz =5[ℏ/2] state. The mean value RFeO of the six iron−oxygen distances isgiven (the standard deviation is ≤0.01 Å). The gap is defined as theenergy difference between the HOMO and LUMO of each spinseparately, with the minority spin gap in parentheses.
Figure 5. Simulated (a−c) and measured (d,e) vibrational spectra for the iron complexes. The simulated vibrational spectra of (a) ACAC, (b) MF-02/01, and (c) MF-02/06 are folded by Gaussians of 4 cm−1 width. The experimental spectra were obtained from (c) the pure MF-02/06 and pureFe(MF-02/06)3 complex and (d) MF-02/06 after a 20 h tribological experiment. The simulated spectrum of MF-02/06 is overlaid for bettercomparison in (d).
The Journal of Physical Chemistry A Article
dx.doi.org/10.1021/jp400980y | J. Phys. Chem. A 2013, 117, 3369−33763373

Figure 6, which shows the density of states around the Fermienergy projected on the elements (PDOS). The PBE (U = 0)doublet PDOS of Fe(ACAC)3 in Figure 6a has a clearHOMO−LUMO gap for the majority spin, but the minorityspin has two half-filled, nearly degenerated Fe(d) orbitals at theFermi energy. The PBE (U = 0) sextet of Fe(ACAC)3 in Figure6b opens a gap also for the minority spin manifold and lets theLUMO orbitals be built of Fe(d) orbitals. The occupied Fe(d)orbitals are distributed over a large energy range including theHOMO. Applying U = 4 localizes the Fe(d) orbitals andtherefore reduces their energy splitting, as shown in Figure 6c.The LUMO orbitals are still purely Fe(d), but the occupiedFe(d) are very deep, around −9 eV relative to the Fermi level.The HOMO orbitals of both spin manifolds are now located onoxygen and carbon atoms. While the overall PDOS depends onthe ligand type, the Fe PDOS is rather independent, as can beseen in the comparison of Figure 6c−e.Finally, we report the optical spectra of the complexes
formed by the DKs in Figure 7. The spectra are also contrastedto the corresponding spectra using the PBE ground state (U =0) in the PBE relaxed geometry at Sz = 5. The spectra for U = 0and 4 eV are clearly different, both in position and number ofmaxima. The spectra at U = 4 eV of MF-02/01 and MF-02/06show two maxima at ∼490 and ∼370 nm. Although the
HOMO−LUMO gaps are different for MF-02/01 and MF-02/06 and the peaks consist of several transitions, the total spectraare very similar. The spectra are also in excellent agreementwith the experimental UV−vis spectra depicted in Figure 7d−f.Figure 7d shows the spectrum of the pure complex of MF-02/06 as obtained from Nematel GmbH. The spectrum shows twomaxima at nearly the same frequencies as those found in thesimulation. A controlled reaction of the MFs to produce thecomplex results in a similar optical spectrum as seen in Figure7e. Here, pure iron powder (diameter ≈ 150 μm) was mixedwith three times the molar quantity of MF-02/01 and MF-02/06. The mixture was heated to 90 °C for 30 h, and the UV−vismeasurement was performed after cooling to room temper-ature. The spectra obtained clearly reveal the differentreactivities of the two MFs. While the smaller MF-02/01shows the signatures of the complex, this is not the case forMF-02/06. The optical signal of the complex is clearly visible inthe spectra recorded after 2 and 30 h of tribological experimentfor MF-02/01 and MF-02/06, respectively, in Figure 7f. Inagreement with the reactivity study, the smaller MF-02/01needs a shorter tribological treatment to show the complex.
Figure 6. Projected density of states (PDOS) of the complexes in the relaxed configurations of each spin state and functional. Fe(ACAC)3 in (a) thedoublet with PBE, (b) the sextet with PBE, and (c) the sextet with PBE+U, U = 4 eV. (d) Fe(MF-02/01)3 and (e) Fe(MF-02/06)3 are in the xxxconfiguration with PBE+U, U = 4 eV. The majority and minority spin PDOS are plotted as positive and negative numbers respectively. The colorcodes are given in (d) and (e).
Figure 7. Simulated optical spectra for the iron complexes with (a) ACAC, (b) MF-02/01, and (c) MF-02/06. The folded oscillator strength (FOS)was obtained by folding with Gaussians of 15 nm width. Experimental UV−vis absorbance spectra (d) of the pure Fe(MF-02/06)3 complex, (e) ofMF-02/01 and MF-02/06 after 30 h of reaction (see text), and (f) of MF-02/01 and MF-02/06 after the tribological experiment. The simulatedspectrum for U = 4 eV of (c) is overlaid for better comparison in (d).
The Journal of Physical Chemistry A Article
dx.doi.org/10.1021/jp400980y | J. Phys. Chem. A 2013, 117, 3369−33763374

■ CONCLUSIONSIn conclusion, we have analyzed the energetics of the 1,3-diketone fluids used in the tribological experiments andsimulated the IR spectra of the different tautomers. Weobtained good agreement with the experimentally measuredspectra and can assign vibrational lines to the tautomers,proving their presence in the experimental samples. Thedependence of the keto−enol ratio on the ligand type can berationalized by a simple model for the polarizability of the 1,3-diketone fluids.In order to check the assumption of complex formation, we
also studied the geometric and electronic structure of Fe(III)complexes. We found that the use of PBE+U with an effectiveU = 4 eV provides the expected sextet spin state. The spin statewas shown to influence the structure of the complex in that thehigh spin state increases the iron−oxygen distance markedly.Within the PBE+U approach, the simulated IR as well as opticalspectra are in very good agreement with those from theexperiment. We therefore clearly can approve the formation ofFe(III) complexes during the tribological experiment.From the computational perspective, we have proved that the
inclusion of U is necessary but also sufficient to obtainmeaningful infrared and optical spectra that can be directlycompared to the experiment. In particular, the optical spectraare strongly influenced by U and change dramatically when U ischanged. We found a good match to the experimental UV−visspectra for U = 4 eV, while the correlation between the PBEoptical spectrum and the experiment is hardly possible.
■ ASSOCIATED CONTENT*S Supporting InformationPictures of the different tautomers of the 1,3-diketones, theirvibrational frequencies in comparison to the literature, and theestimate of the polarizability. The main vibrations of theFe(III)(1,3-diketone)3 complexes are listed, and the con-vergence of the optical spectrum with grid spacing is shown.This material is available free of charge via the Internet athttp://pubs.acs.org.
■ AUTHOR INFORMATIONCorresponding Author*E-mail: [email protected] authors declare no competing financial interest.
■ ACKNOWLEDGMENTSM.W. thanks Alexander Held for help with the estimate of thepolarizabilities using the rigid dipole model. M.W., T.A., andK.L. acknowledge funding from the Deutsche Forschungsge-meinschaft (Grant No. BA 60026). M.W. gratefully thanks FZJulich, RZ Karlsruhe, and the bwGRiD project43 for thecomputational resources.
■ REFERENCES(1) Amann, T.; Kailer, A. Analysis of the Ultralow Friction Behaviorof a Mesogenic Fluid in a Reciprocating Line Contact. Wear 2011,271, 1701−1706.(2) Amann, T.; Kailer, A. Relationship Between Ultralow Friction ofMesogenic-Like Fluids and Their Lateral Chain Length. Tribol. Lett.2011, 41, 121−129.(3) Amann, T.; Kailer, A. Ultralow Friction of Mesogenic FluidMixtures in Tribological Reciprocating Systems. Tribol. Lett. 2010, 37,343−352.
(4) Mitchell-Koch, J. T.; Reid, K. R.; Meyerhoff, M. E. SalicylateDetection by Complexation with Iron(III) and Optical AbsorbanceSpectroscopy. J. Chem. Educ. 2008, 85, 1658.(5) Giroud-Godquin, A. M. My 20 Years of Research in theChemistry of Metal Containing Liquid Crystals. Coord. Chem. Rev.1998, 178−180, 1485−1499.(6) Mortensen, J. J.; Hansen, L. B.; Jacobsen, K. W. Real-Space GridImplementation of the Projector Augmented Wave Method. Phys. Rev.B 2005, 71, 035109.(7) Enkovaara, J.; et al. Electronic Structure Calculations withGPAW: A Real-Space Implementation of the Projector Augmented-Wave Method. J. Phys.: Cond. Mat. 2010, 22, 253202.(8) Perdew, J. P.; Burke, K.; Ernzerhof, M. Generalized GradientApproximation Made Simple. Phys. Rev. Lett. 1996, 77, 3865−3868.(9) Tao, J.; Perdew, J. P.; Staroverov, V. N.; Scuseria, G. E. Climbingthe Density Functional Ladder: Nonempirical Meta-GeneralizedGradient Approximation Designed for Molecules and Solids. Phys.Rev. Lett. 2003, 91, 146401.(10) Porezag, D.; Pederson, M. R. Infrared Intensities and Raman-Scattering Activities within Density-Functional Theory. Phys. Rev. B1996, 54, 7830−7836.(11) Anisimov, V. I.; Solovyev, I. V.; Korotin, M. A.; Czyzyk, M. T.;Sawatzky, G. A. Density-functional Theory and NiO PhotoemissionSpectra. Phys. Rev. B 1993, 48, 16929−16934.(12) Bassetti, M.; Cerichelli, G.; Floris, B. Substituent Effects inKeto−Enol Tautomerism. Part 3.1 Influence of Substitution on theEquilibrium Composition of of β-Dicarbonyl Compounds. Tetrahedron1988, 44, 2997−3004.(13) Pocker, Y.; Spyridis, G. T. Modulation of Tautomeric Equilibriaby Ionic Clusters. Acetylacetone in Solutions of Lithium Perchlorate-Diethyl Ether. J. Am. Chem. Soc. 2002, 124, 10373−10380.(14) Nagashima, N.; Kudoh, S.; Takayanagi, M.; Nakata, M. UV-Induced Photoisomerization of Acetylacetone and Identification ofLess-Stable Isomers by Low-Temperature Matrix-Isolation InfraredSpectroscopy and Density Functional Theory Calculation. J. Phys.Chem. A 2001, 105, 10832−10838.(15) Schlund, S.; Janke, E. M. B.; Weisz, K.; Engels, B. Predicting theTautomeric Equilibrium of Acetylacetone in Solution. I. The RightAnswer for the Wrong Reason? J. Comput. Chem. 2010, 31, 665−670.(16) Karabulut, S.; Namli, H. An FT-IR and DFT Based NewApproach for the Detection of Tautomer Proportions in Solution. J.Mol. Struct. 2012, 1024, 151−155.(17) Cabral do Couto, P.; Costa Cabral, B. J.; Martinho Simoes, J.The Enthalpy of Formation of the Pentane-2,4-dionate Radical: AComplete Basis Set Approach. Chem. Phys. Lett. 2006, 419, 486−491.(18) Charles, R. G.; Barnartt, S. Reaction of Acetylacetone withMetallic Iron in the Presence of Oxygen. J. Phys. Chem. 1958, 62, 315−318.(19) Lozada-Garcia, R. R.; Ceponkus, J.; Chin, W.; Chevalier, M.;Crepin, C. Acetylacetone in Hydrogen Solids: IR Signatures of theEnol and Keto Tautomers and UV Induced Tautomerization. Chem.Phys. Lett. 2011, 504, 142−147.(20) Chen, X.-B.; Fang, W.-H.; Phillips, D. L. Theoretical Studies ofthe Photochemical Dynamics of Acetylacetone: Isomerzation,Dissociation, and Dehydration Reactions. J. Phys. Chem. A 2006,110, 4434−4441.(21) Nakanishi, H.; Morita, H.; Nagakura, S. Electronic Structuresand Spectra of the Keto and Enol Forms of Acetylacetone. Bull. Chem.Soc. Jpn. 1977, 50, 2255−2261.(22) Hacking, J.; Pilcher, G. Enthalpy of Combustion of Pentane-2,4-dione. J. Chem. Thermodyn. 1979, 11, 1015−1017.(23) Folkendt, M. M.; Weiss-Lopez, B. E.; Chauvel, J. P.; True, N. S.Gas-Phase Proton NMR Studies of Keto−Enol Tautomerism ofAcetylacetone, Methyl Acetoacetate, and Ethyl Acetoacetate. J. Phys.Chem. 1985, 89, 3347−3352.(24) Hush, N. S.; Livett, M. K.; Peel, J. B.; Willett, G. D. Variable-Temperature Ultraviolet Photoelectron-Spectroscopy of the Keto−Enol Tautomers of Pentane-2,4-dione. Aust. J. Chem. 1987, 40, 599−609.
The Journal of Physical Chemistry A Article
dx.doi.org/10.1021/jp400980y | J. Phys. Chem. A 2013, 117, 3369−33763375

(25) Brito, H.; Brito, V.; Springer, J. Chelatbildung von 5-Methyl-5-hexen-2,4-dion/Styrol- Copolymeren in Losung und an MetallischenOberflachen. Makromol. Chem. 1977, 178, 2507−2514.(26) Saalfrank, R. W.; Horner, B.; Stalke, D.; Salbeck, J. The FirstNeutral Adamantanoid Iron(III)-Chelate Complex: SpontaneousFormation, Structure, and Electrochemistry. Angew. Chem., Int. Ed.1993, 32, 1179−1182.(27) Nihei, M.; Shiga, T.; Maeda, Y.; Oshio, H. Spin CrossoverIron(III) Complexes. Coord. Chem. Rev. 2007, 251, 2606−2621.(28) Simaan, A. J.; Boillot, M.-L.; Carrasco, R.; Cano, J.; Girerd, J.-J.;Mattioli, T. A.; Ensling, J.; Spiering, H.; Gutlich, P. Electronic,Vibrational, and Structural Properties of a Spin-Crossover Catecho-lato-Iron System in the Solid State: Theoretical Study of the ElectronicNature of the Doublet and Sextet States. Chem.Eur. J. 2005, 11,1779−1793.(29) Spikes, G. H.; Bill, E.; Weyhermuller, T.; Wieghardt, K.Transition-Metal Complexes with Singly Reduced 1,2-DiketoneRadical Ligands. Angew. Chem., Int. Ed. 2008, 47, 2973−2977.(30) Panchmatia, P. M.; Ali, M. E.; Sanyal, B.; Oppeneer, P. M.Halide Ligated Iron Porphines: A DFT+U and UB3LYP Study. J. Phys.Chem. A 2010, 114, 13381−13387.(31) Wang, J.; Becke, A. D.; Vedene, H.; Smith, J. Evaluation of ⟨S2⟩in Restricted, Unrestricted Hartree−Fock, and Density FunctionalBased Theories. J. Chem. Phys. 1995, 102, 3477−3480.(32) Moseler, M.; Hakkinen, H.; Barnett, R. N.; Landman, U.Structure and Magnetism of Neutral and Anionic Palladium Clusters.Phys. Rev. Lett. 2001, 86, 2545−2548.(33) Borgh, M.; Toreblad, M.; Koskinen, M.; Manninen, M.; Åberg,S.; Reimann, S. M. Correlation and Spin Polarization in QuantumDots: Local Spin Density Functional Theory Revisited. Int. J. QuantumChem. 2005, 105, 817−825.(34) The “error” given is the standard deviation as obtained from thesix Fe−O bonds.(35) Cramer, C. J.; Truhlar, D. G. Density Functional Theory forTransition Metals and Transition Metal Chemistry. Phys. Chem. Chem.Phys. 2009, 11, 10757−10816.(36) Dudarev, S. L.; Botton, G. A.; Savrasov, S. Y.; Humphreys, C. J.;Sutton, A. P. Electron-Energy-Loss Spectra and the Structural Stabilityof Nickel Oxide: An LSDA+U Study. Phys. Rev. B 1998, 57, 1505−1509.(37) Scherlis, D. A.; Cococcioni, M.; Sit, P.; Marzari, N. Simulation ofHeme Using DFT + U: A Step toward Accurate Spin-State Energetics.J. Phys. Chem. B 2007, 111, 7384−7391.(38) Sarkar, S.; Tarafder, K.; Oppeneer, P. M.; Saha-Dasgupt, T.Spin-Crossover in Cyanide-Based Bimetallic Coordination Polymers Insight from First-Principles Calculations. J. Mater. Chem. 2011, 21,13832.(39) Ali, M. E.; Sanyal, B.; Oppeneer, P. M. Electronic Structure,Spin-States, and Spin-Crossover Reaction of Heme-Related Fe-Porphyrins: A Theoretical Perspective. J. Phys. Chem. B 2012, 116,5849−5859.(40) Mosey, N. J.; Liao, P.; Carter, E. A. Rotationally Invariant AbInitio Evaluation of Coulomb and Exchange Parameters for DFT+ UCalculations. J. Chem. Phys. 2008, 129, 014103.(41) Wang, L.; Maxisch, T.; Ceder, G. Oxidation Energies ofTransition Metal Oxides within the GGA+ U Framework. Phys. Rev. B2006, 73, 195107.(42) David, L.; Craciun, C.; Cozar, O.; Chis, V.; Agut, C.; Rusu, D.;Rusu, M. Spectroscopic Studies of Some Oxygen-Bonded Copper(II)β-Diketonate Complexes. J. Mol. Struct. 2001, 563−564, 573−578.(43) bwGRiD, member of the German D-Grid initiative, funded bythe Ministry for Education and Research and the Ministry for Science,Research and Arts Baden-Wuerttemberg. http://www.bw-grid.de(2013).
The Journal of Physical Chemistry A Article
dx.doi.org/10.1021/jp400980y | J. Phys. Chem. A 2013, 117, 3369−33763376