12 august 2021 - net
TRANSCRIPT
Title of the Report Highlights
12 August 2021
• Global oil demand surged by 3.8 mb/d month-on-month in June, led by increased mobility in North America and Europe. However, demand growth abruptly reversed course in July and the outlook for the remainder of 2021 has been downgraded due to the worsening progression of the pandemic and revisions to historical data. Global oil demand is now seen rising 5.3 mb/d on average, to 96.2 mb/d in 2021, and by further 3.2 mb/d in 2022.
• World oil supply rose by 1.7 mb/d in July to 96.7 mb/d after Saudi Arabia ended its extra voluntary production cut and the North Sea recovered strongly after maintenance. Global output is poised to rise further in the coming months after OPEC+ agreed a new deal to unwind its remaining curbs. Following gains of 600 kb/d this year, supply from producers outside the alliance is expected to rise by 1.7 mb/d in 2022 with the US accounting for 60% of the growth.
• The recovery in global refinery activity slowed in July as new waves of Covid-19 cut into fuel demand while margins remained under pressure. Throughputs are expected to rise marginally in August before seasonal maintenance starts. Runs in 3Q21 were reduced on demand downgrades, narrowing the increase over 2Q21 levels to 2.5 mb/d. Global refinery runs are now forecast to rise by 3.7 mb/d to 77.9 mb/d in 2021 over year ago, still 3.7 mb/d below 2019 levels.
• OECD total industry stocks fell by a large 50.3 mb in June and stood at 2 882 mb, 131.2 mb lower than the 2016 2020 average and 66 mb below the pre-Covid 2015-19 average. The Chinese implied crude balance fell for a third consecutive month, by 35.5 mb or 1.2 mb/d in June. Preliminary July data for the US, Europe and Japan show that industry stocks rose by a combined 4.2 mb. Crude oil held in short term floating storage increased by 4.5 mb to 103.6 mb in July.
• The 2Q21 crude price rally lost steam in July on fears that new Covid-19 Delta cases and weaker economic indicators could slow the oil demand recovery just as more supply hit the market. Despite big swings, North Sea Dated still rose $2.03/bbl to $74.99/bbl but fell to $70.73/bbl in early August. Backwardation only eased in August with the fall in prices.
.
Table of contents
Tipping the scale ......................................................................................................................................... 3
Demand ..................................................................................................................................................... 4 Overview .............................................................................................................................................. 4 Fundamentals ....................................................................................................................................... 5 OECD ................................................................................................................................................... 7 Non-OECD .......................................................................................................................................... 11
Supply ..................................................................................................................................................... 16 Overview ............................................................................................................................................ 16 Saudi ends extra cut, hikes OPEC+ supply ............................................................................................. 18 Easing maintenance boosts non-OPEC+ ................................................................................................ 21
Refining ................................................................................................................................................... 26 Overview ............................................................................................................................................ 26 Product cracks and refinery margins .................................................................................................................. 27 Regional refining developments ........................................................................................................... 31
Stocks ...................................................................................................................................................... 36 Overview ............................................................................................................................................ 36 Implied balance ................................................................................................................................................. 37 Recent OECD industry stock changes .................................................................................................... 38 OECD Americas ................................................................................................................................................. 38 OECD Europe .................................................................................................................................................... 39 OECD Asia Oceania ........................................................................................................................................... 40 Other stock developments ................................................................................................................... 41
Prices ....................................................................................................................................................... 44 Overview ............................................................................................................................................ 44 Futures markets .................................................................................................................................. 47 Spot crude oil prices............................................................................................................................. 49 Freight ............................................................................................................................................... 53 Table…………………… .......................................................................................................................... 55
List of boxes
Box 1. Benchmark maintenance – Platts to boost Brent basket trade volumes ............................................ 45
Oil Market Report Market Overview
Page | 3 12 August 2021
IEA
. All
right
s re
serv
ed.
Tipping the scale A new OPEC+ deal struck last month will go a long way to restore market balance. The immediate boost from OPEC+ is colliding with slower demand growth and higher output from outside the alliance, stamping out lingering suggestions of a near-term supply crunch or super cycle. Oil prices offer more evidence. A recent rally has lost steam on concerns that a surge in Covid-19 cases from the Delta variant could derail the recovery just as more barrels hit the market. Brent futures slumped from a high of $76.40/bbl in early July to around $70/bbl at the time of writing.
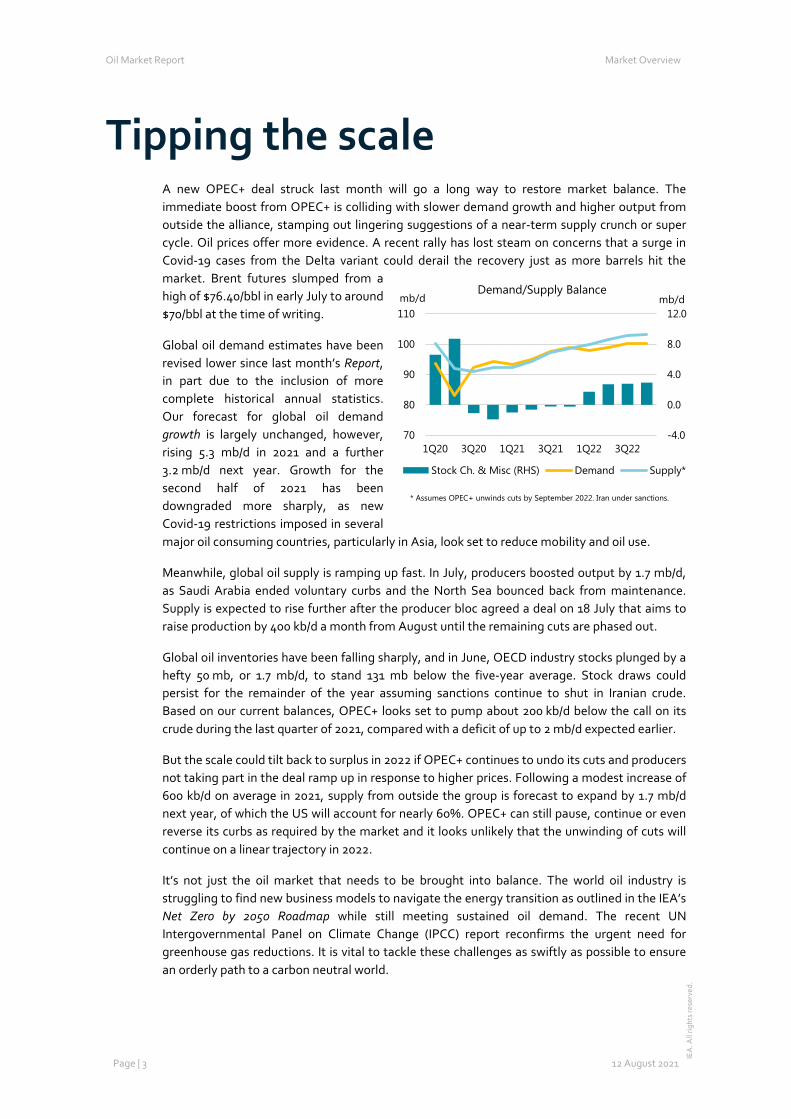
Global oil demand estimates have been revised lower since last month’s Report, in part due to the inclusion of more complete historical annual statistics. Our forecast for global oil demand growth is largely unchanged, however, rising 5.3 mb/d in 2021 and a further 3.2 mb/d next year. Growth for the second half of 2021 has been downgraded more sharply, as new Covid-19 restrictions imposed in several major oil consuming countries, particularly in Asia, look set to reduce mobility and oil use.
Meanwhile, global oil supply is ramping up fast. In July, producers boosted output by 1.7 mb/d, as Saudi Arabia ended voluntary curbs and the North Sea bounced back from maintenance. Supply is expected to rise further after the producer bloc agreed a deal on 18 July that aims to raise production by 400 kb/d a month from August until the remaining cuts are phased out.
Global oil inventories have been falling sharply, and in June, OECD industry stocks plunged by a hefty 50 mb, or 1.7 mb/d, to stand 131 mb below the five-year average. Stock draws could persist for the remainder of the year assuming sanctions continue to shut in Iranian crude. Based on our current balances, OPEC+ looks set to pump about 200 kb/d below the call on its crude during the last quarter of 2021, compared with a deficit of up to 2 mb/d expected earlier.
But the scale could tilt back to surplus in 2022 if OPEC+ continues to undo its cuts and producers not taking part in the deal ramp up in response to higher prices. Following a modest increase of 600 kb/d on average in 2021, supply from outside the group is forecast to expand by 1.7 mb/d next year, of which the US will account for nearly 60%. OPEC+ can still pause, continue or even reverse its curbs as required by the market and it looks unlikely that the unwinding of cuts will continue on a linear trajectory in 2022.
It’s not just the oil market that needs to be brought into balance. The world oil industry is struggling to find new business models to navigate the energy transition as outlined in the IEA’s Net Zero by 2050 Roadmap while still meeting sustained oil demand. The recent UN Intergovernmental Panel on Climate Change (IPCC) report reconfirms the urgent need for greenhouse gas reductions. It is vital to tackle these challenges as swiftly as possible to ensure an orderly path to a carbon neutral world.
-4.0
0.0
4.0
8.0
12.0
70
80
90
100
110
1Q20 3Q20 1Q21 3Q21 1Q22 3Q22
mb/dmb/dDemand/Supply Balance
Stock Ch. & Misc (RHS) Demand Supply*
* Assumes OPEC+ unwinds cuts by September 2022. Iran under sanctions.
Oil Market Report Demand
Page | 4 12 August 2021 IEA
. All
right
s re
serv
ed.
Demand Overview
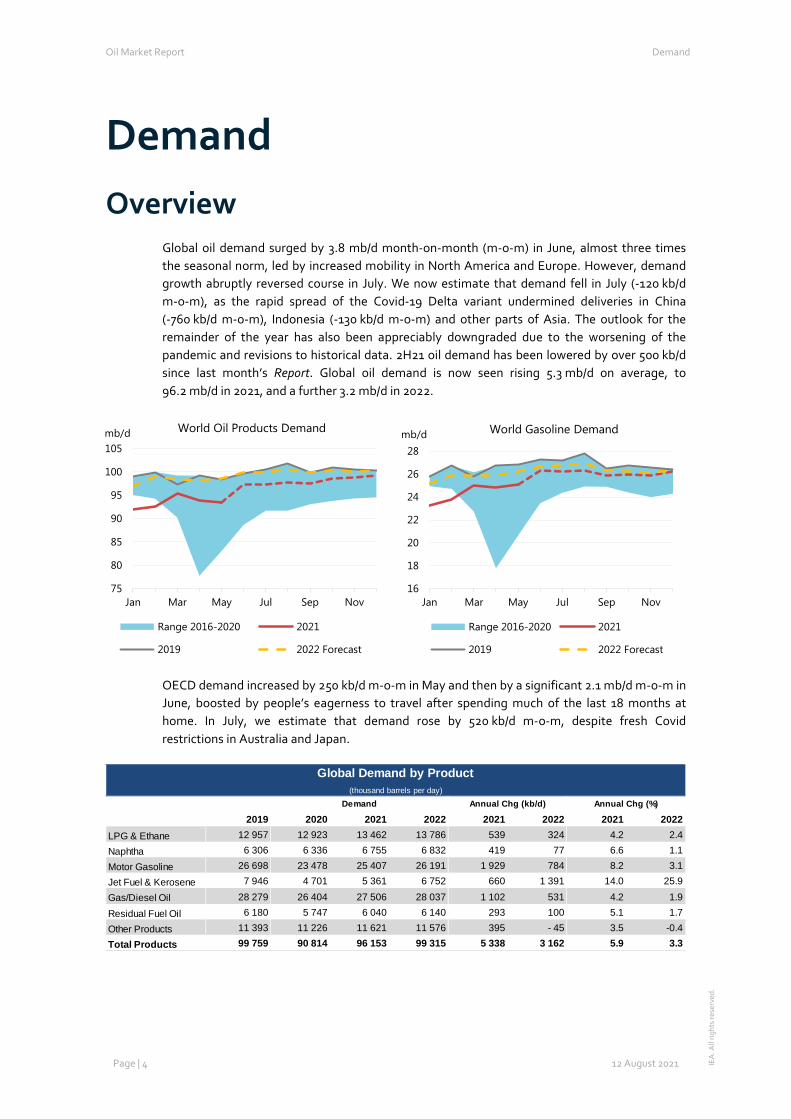
Global oil demand surged by 3.8 mb/d month-on-month (m-o-m) in June, almost three times the seasonal norm, led by increased mobility in North America and Europe. However, demand growth abruptly reversed course in July. We now estimate that demand fell in July (-120 kb/d m-o-m), as the rapid spread of the Covid-19 Delta variant undermined deliveries in China (-760 kb/d m-o-m), Indonesia (-130 kb/d m-o-m) and other parts of Asia. The outlook for the remainder of the year has also been appreciably downgraded due to the worsening of the pandemic and revisions to historical data. 2H21 oil demand has been lowered by over 500 kb/d since last month’s Report. Global oil demand is now seen rising 5.3 mb/d on average, to 96.2 mb/d in 2021, and a further 3.2 mb/d in 2022.
OECD demand increased by 250 kb/d m-o-m in May and then by a significant 2.1 mb/d m-o-m in June, boosted by people’s eagerness to travel after spending much of the last 18 months at home. In July, we estimate that demand rose by 520 kb/d m-o-m, despite fresh Covid restrictions in Australia and Japan.
75
80
85
90
95
100
105
Jan Mar May Jul Sep Nov
mb/d World Oil Products Demand
Range 2016-2020 2021
2019 2022 Forecast
16
18
20
22
24
26
28
Jan Mar May Jul Sep Nov
mb/d World Gasoline Demand
Range 2016-2020 2021
2019 2022 Forecast
Global Demand by Product(thousand barrels per day)
2019 2020 2021 2022 2021 2022 2021 2022LPG & Ethane 12 957 12 923 13 462 13 786 539 324 4.2 2.4
Naphtha 6 306 6 336 6 755 6 832 419 77 6.6 1.1
Motor Gasoline 26 698 23 478 25 407 26 191 1 929 784 8.2 3.1
Jet Fuel & Kerosene 7 946 4 701 5 361 6 752 660 1 391 14.0 25.9
Gas/Diesel Oil 28 279 26 404 27 506 28 037 1 102 531 4.2 1.9
Residual Fuel Oil 6 180 5 747 6 040 6 140 293 100 5.1 1.7
Other Products 11 393 11 226 11 621 11 576 395 - 45 3.5 -0.4
Total Products 99 759 90 814 96 153 99 315 5 338 3 162 5.9 3.3
Demand Annual Chg (kb/d) Annual Chg (%)
Oil Market Report Demand
Page | 5 12 August 2021 IEA
. All
right
s re
serv
ed.
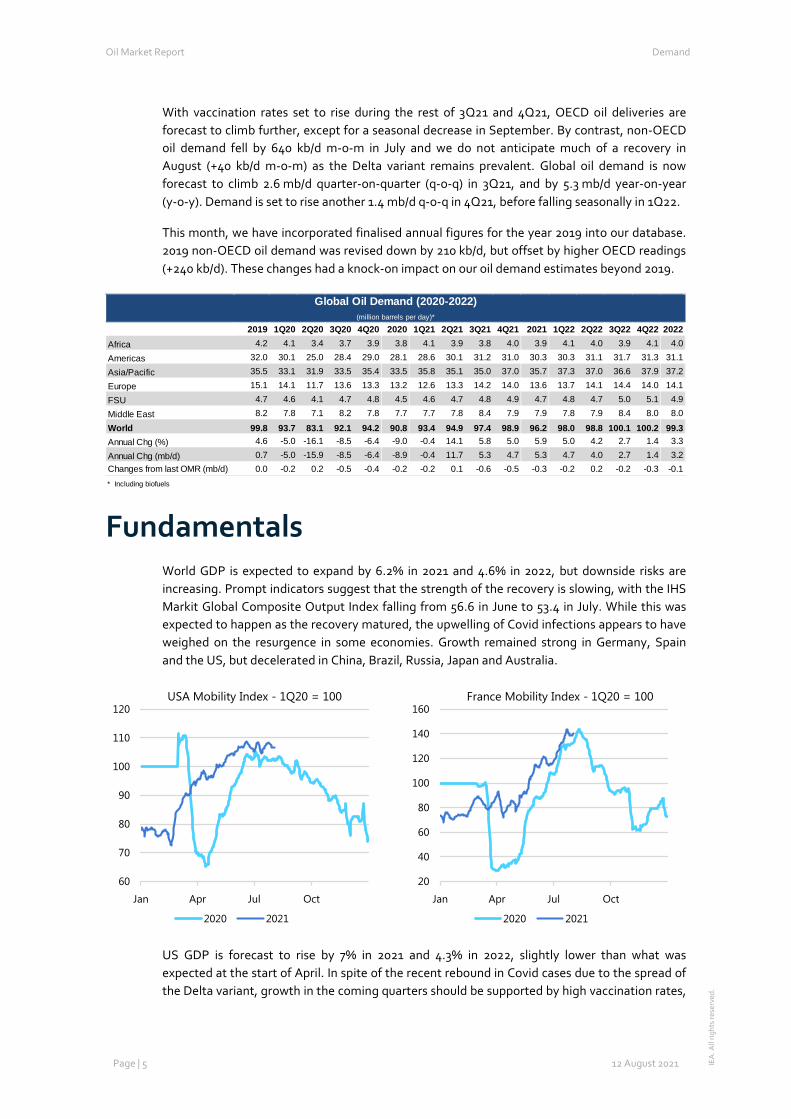
With vaccination rates set to rise during the rest of 3Q21 and 4Q21, OECD oil deliveries are forecast to climb further, except for a seasonal decrease in September. By contrast, non-OECD oil demand fell by 640 kb/d m-o-m in July and we do not anticipate much of a recovery in August (+40 kb/d m-o-m) as the Delta variant remains prevalent. Global oil demand is now forecast to climb 2.6 mb/d quarter-on-quarter (q-o-q) in 3Q21, and by 5.3 mb/d year-on-year (y-o-y). Demand is set to rise another 1.4 mb/d q-o-q in 4Q21, before falling seasonally in 1Q22.
This month, we have incorporated finalised annual figures for the year 2019 into our database. 2019 non-OECD oil demand was revised down by 210 kb/d, but offset by higher OECD readings (+240 kb/d). These changes had a knock-on impact on our oil demand estimates beyond 2019.
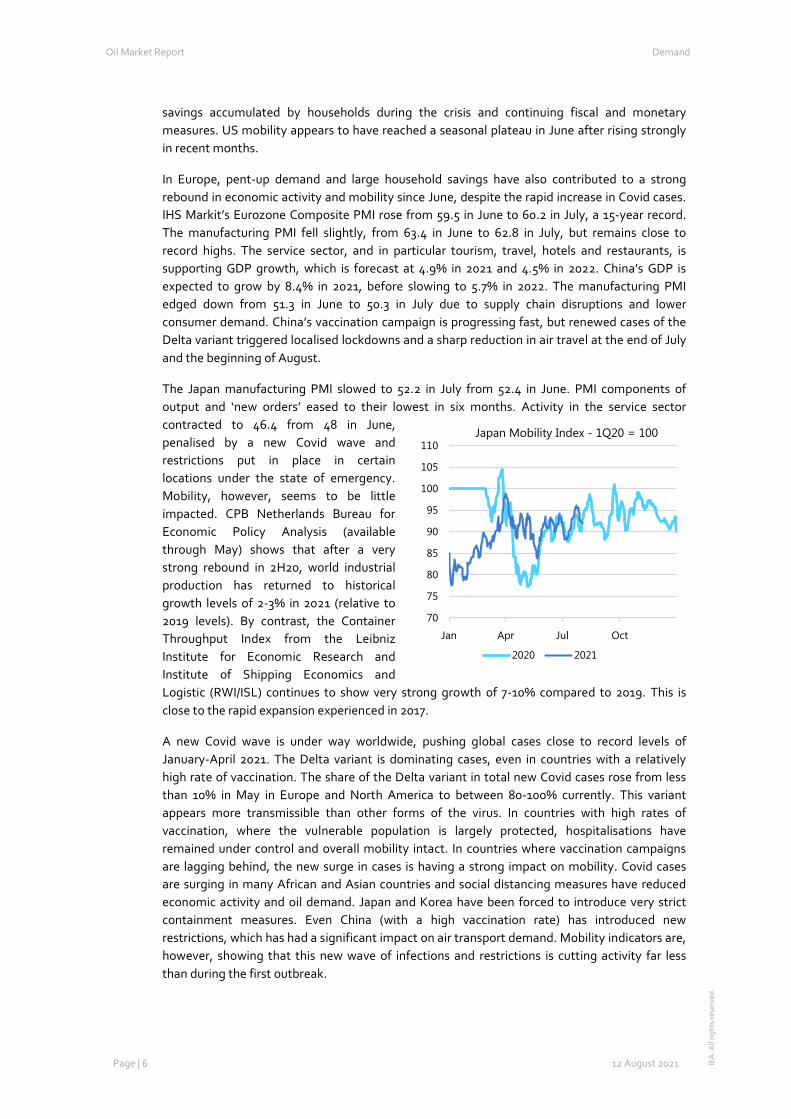
Fundamentals World GDP is expected to expand by 6.2% in 2021 and 4.6% in 2022, but downside risks are increasing. Prompt indicators suggest that the strength of the recovery is slowing, with the IHS Markit Global Composite Output Index falling from 56.6 in June to 53.4 in July. While this was expected to happen as the recovery matured, the upwelling of Covid infections appears to have weighed on the resurgence in some economies. Growth remained strong in Germany, Spain and the US, but decelerated in China, Brazil, Russia, Japan and Australia.
US GDP is forecast to rise by 7% in 2021 and 4.3% in 2022, slightly lower than what was expected at the start of April. In spite of the recent rebound in Covid cases due to the spread of the Delta variant, growth in the coming quarters should be supported by high vaccination rates,
Global Oil Demand (2020-2022) (million barrels per day)*
2019 1Q20 2Q20 3Q20 4Q20 2020 1Q21 2Q21 3Q21 4Q21 2021 1Q22 2Q22 3Q22 4Q22 2022Africa 4.2 4.1 3.4 3.7 3.9 3.8 4.1 3.9 3.8 4.0 3.9 4.1 4.0 3.9 4.1 4.0
Americas 32.0 30.1 25.0 28.4 29.0 28.1 28.6 30.1 31.2 31.0 30.3 30.3 31.1 31.7 31.3 31.1
Asia/Pacific 35.5 33.1 31.9 33.5 35.4 33.5 35.8 35.1 35.0 37.0 35.7 37.3 37.0 36.6 37.9 37.2
Europe 15.1 14.1 11.7 13.6 13.3 13.2 12.6 13.3 14.2 14.0 13.6 13.7 14.1 14.4 14.0 14.1
FSU 4.7 4.6 4.1 4.7 4.8 4.5 4.6 4.7 4.8 4.9 4.7 4.8 4.7 5.0 5.1 4.9
Middle East 8.2 7.8 7.1 8.2 7.8 7.7 7.7 7.8 8.4 7.9 7.9 7.8 7.9 8.4 8.0 8.0
World 99.8 93.7 83.1 92.1 94.2 90.8 93.4 94.9 97.4 98.9 96.2 98.0 98.8 100.1 100.2 99.3Annual Chg (%) 4.6 -5.0 -16.1 -8.5 -6.4 -9.0 -0.4 14.1 5.8 5.0 5.9 5.0 4.2 2.7 1.4 3.3
Annual Chg (mb/d) 0.7 -5.0 -15.9 -8.5 -6.4 -8.9 -0.4 11.7 5.3 4.7 5.3 4.7 4.0 2.7 1.4 3.2Changes from last OMR (mb/d) 0.0 -0.2 0.2 -0.5 -0.4 -0.2 -0.2 0.1 -0.6 -0.5 -0.3 -0.2 0.2 -0.2 -0.3 -0.1* Including biofuels
60
70
80
90
100
110
120
Jan Apr Jul Oct
USA Mobility Index - 1Q20 = 100
2020 2021
20
40
60
80
100
120
140
160
Jan Apr Jul Oct
France Mobility Index - 1Q20 = 100
2020 2021
Oil Market Report Demand
Page | 6 12 August 2021 IEA
. All
right
s re
serv
ed.
savings accumulated by households during the crisis and continuing fiscal and monetary measures. US mobility appears to have reached a seasonal plateau in June after rising strongly in recent months.
In Europe, pent-up demand and large household savings have also contributed to a strong rebound in economic activity and mobility since June, despite the rapid increase in Covid cases. IHS Markit’s Eurozone Composite PMI rose from 59.5 in June to 60.2 in July, a 15-year record. The manufacturing PMI fell slightly, from 63.4 in June to 62.8 in July, but remains close to record highs. The service sector, and in particular tourism, travel, hotels and restaurants, is supporting GDP growth, which is forecast at 4.9% in 2021 and 4.5% in 2022. China’s GDP is expected to grow by 8.4% in 2021, before slowing to 5.7% in 2022. The manufacturing PMI edged down from 51.3 in June to 50.3 in July due to supply chain disruptions and lower consumer demand. China’s vaccination campaign is progressing fast, but renewed cases of the Delta variant triggered localised lockdowns and a sharp reduction in air travel at the end of July and the beginning of August.
The Japan manufacturing PMI slowed to 52.2 in July from 52.4 in June. PMI components of output and ‘new orders’ eased to their lowest in six months. Activity in the service sector contracted to 46.4 from 48 in June, penalised by a new Covid wave and restrictions put in place in certain locations under the state of emergency. Mobility, however, seems to be little impacted. CPB Netherlands Bureau for Economic Policy Analysis (available through May) shows that after a very strong rebound in 2H20, world industrial production has returned to historical growth levels of 2-3% in 2021 (relative to 2019 levels). By contrast, the Container Throughput Index from the Leibniz Institute for Economic Research and Institute of Shipping Economics and Logistic (RWI/ISL) continues to show very strong growth of 7-10% compared to 2019. This is close to the rapid expansion experienced in 2017.
A new Covid wave is under way worldwide, pushing global cases close to record levels of January-April 2021. The Delta variant is dominating cases, even in countries with a relatively high rate of vaccination. The share of the Delta variant in total new Covid cases rose from less than 10% in May in Europe and North America to between 80-100% currently. This variant appears more transmissible than other forms of the virus. In countries with high rates of vaccination, where the vulnerable population is largely protected, hospitalisations have remained under control and overall mobility intact. In countries where vaccination campaigns are lagging behind, the new surge in cases is having a strong impact on mobility. Covid cases are surging in many African and Asian countries and social distancing measures have reduced economic activity and oil demand. Japan and Korea have been forced to introduce very strict containment measures. Even China (with a high vaccination rate) has introduced new restrictions, which has had a significant impact on air transport demand. Mobility indicators are, however, showing that this new wave of infections and restrictions is cutting activity far less than during the first outbreak.
70
75
80
85
90
95
100
105
110
Jan Apr Jul Oct
Japan Mobility Index - 1Q20 = 100
2020 2021
Oil Market Report Demand
Page | 7 12 August 2021 IEA
. All
right
s re
serv
ed.
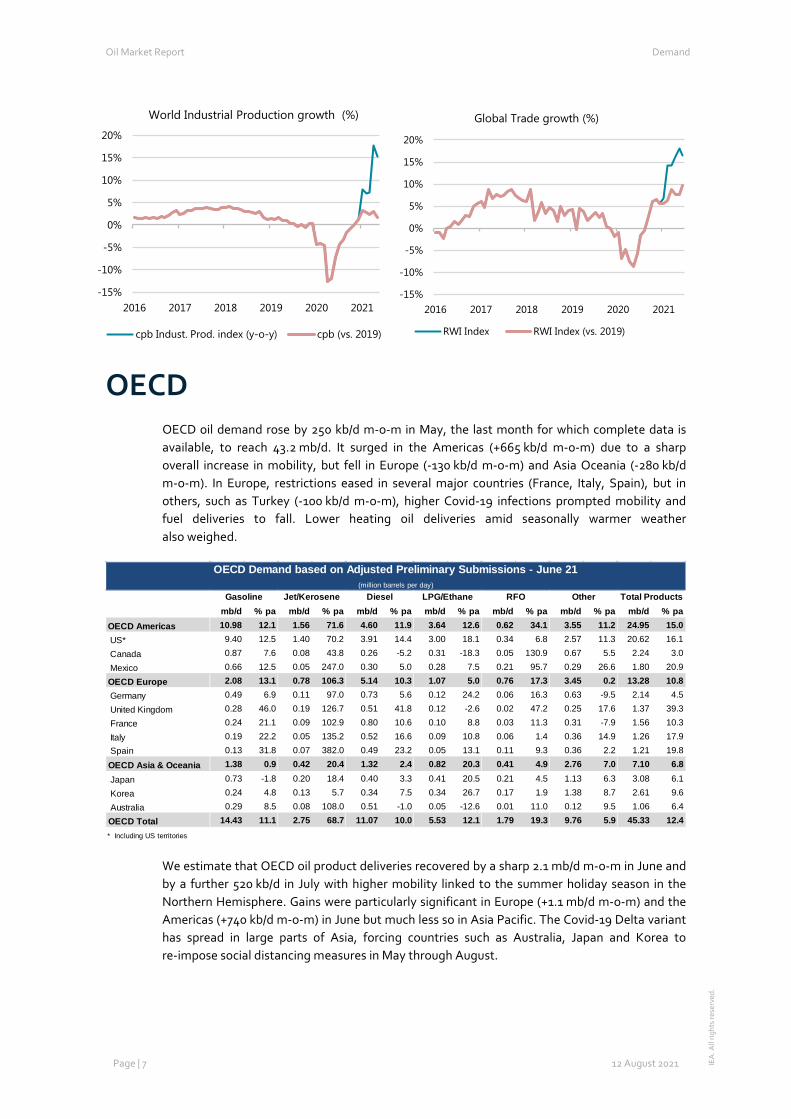
OECD OECD oil demand rose by 250 kb/d m-o-m in May, the last month for which complete data is available, to reach 43.2 mb/d. It surged in the Americas (+665 kb/d m-o-m) due to a sharp overall increase in mobility, but fell in Europe (-130 kb/d m-o-m) and Asia Oceania (-280 kb/d m-o-m). In Europe, restrictions eased in several major countries (France, Italy, Spain), but in others, such as Turkey (-100 kb/d m-o-m), higher Covid-19 infections prompted mobility and fuel deliveries to fall. Lower heating oil deliveries amid seasonally warmer weather also weighed.
We estimate that OECD oil product deliveries recovered by a sharp 2.1 mb/d m-o-m in June and by a further 520 kb/d in July with higher mobility linked to the summer holiday season in the Northern Hemisphere. Gains were particularly significant in Europe (+1.1 mb/d m-o-m) and the Americas (+740 kb/d m-o-m) in June but much less so in Asia Pacific. The Covid-19 Delta variant has spread in large parts of Asia, forcing countries such as Australia, Japan and Korea to re-impose social distancing measures in May through August.
-15%
-10%
-5%
0%
5%
10%
15%
20%
2016 2017 2018 2019 2020 2021
World Industrial Production growth (%)
cpb Indust. Prod. index (y-o-y) cpb (vs. 2019)
-15%
-10%
-5%
0%
5%
10%
15%
20%
2016 2017 2018 2019 2020 2021
Global Trade growth (%)
RWI Index RWI Index (vs. 2019)
OECD Demand based on Adjusted Preliminary Submissions - June 21 (million barrels per day)
mb/d % pa mb/d % pa mb/d % pa mb/d % pa mb/d % pa mb/d % pa mb/d % paOECD Americas 10.98 12.1 1.56 71.6 4.60 11.9 3.64 12.6 0.62 34.1 3.55 11.2 24.95 15.0 US* 9.40 12.5 1.40 70.2 3.91 14.4 3.00 18.1 0.34 6.8 2.57 11.3 20.62 16.1
Canada 0.87 7.6 0.08 43.8 0.26 -5.2 0.31 -18.3 0.05 130.9 0.67 5.5 2.24 3.0
Mexico 0.66 12.5 0.05 247.0 0.30 5.0 0.28 7.5 0.21 95.7 0.29 26.6 1.80 20.9
OECD Europe 2.08 13.1 0.78 106.3 5.14 10.3 1.07 5.0 0.76 17.3 3.45 0.2 13.28 10.8 Germany 0.49 6.9 0.11 97.0 0.73 5.6 0.12 24.2 0.06 16.3 0.63 -9.5 2.14 4.5
United Kingdom 0.28 46.0 0.19 126.7 0.51 41.8 0.12 -2.6 0.02 47.2 0.25 17.6 1.37 39.3
France 0.24 21.1 0.09 102.9 0.80 10.6 0.10 8.8 0.03 11.3 0.31 -7.9 1.56 10.3
Italy 0.19 22.2 0.05 135.2 0.52 16.6 0.09 10.8 0.06 1.4 0.36 14.9 1.26 17.9 Spain 0.13 31.8 0.07 382.0 0.49 23.2 0.05 13.1 0.11 9.3 0.36 2.2 1.21 19.8
OECD Asia & Oceania 1.38 0.9 0.42 20.4 1.32 2.4 0.82 20.3 0.41 4.9 2.76 7.0 7.10 6.8
Japan 0.73 -1.8 0.20 18.4 0.40 3.3 0.41 20.5 0.21 4.5 1.13 6.3 3.08 6.1
Korea 0.24 4.8 0.13 5.7 0.34 7.5 0.34 26.7 0.17 1.9 1.38 8.7 2.61 9.6
Australia 0.29 8.5 0.08 108.0 0.51 -1.0 0.05 -12.6 0.01 11.0 0.12 9.5 1.06 6.4
OECD Total 14.43 11.1 2.75 68.7 11.07 10.0 5.53 12.1 1.79 19.3 9.76 5.9 45.33 12.4* Including US territories
Other Total ProductsGasoline Jet/Kerosene Diesel LPG/Ethane RFO
Oil Market Report Demand
Page | 8 12 August 2021 IEA
. All
right
s re
serv
ed.
OECD Americas
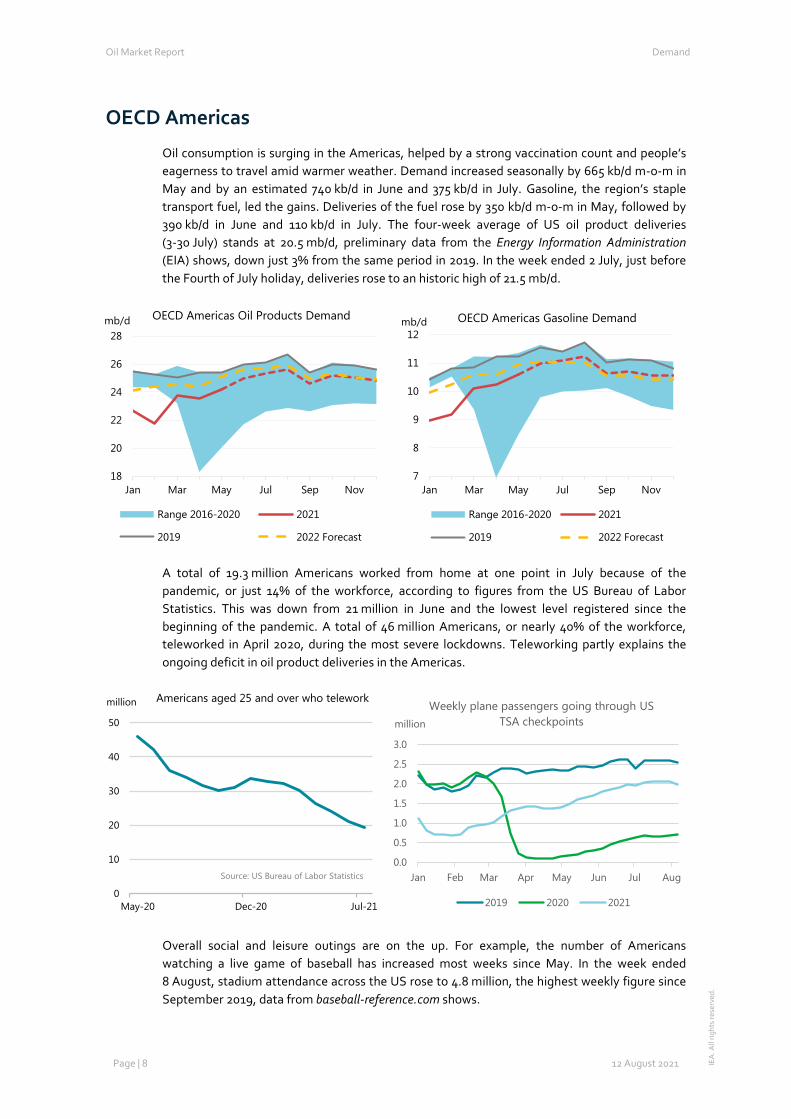
Oil consumption is surging in the Americas, helped by a strong vaccination count and people’s eagerness to travel amid warmer weather. Demand increased seasonally by 665 kb/d m-o-m in May and by an estimated 740 kb/d in June and 375 kb/d in July. Gasoline, the region’s staple transport fuel, led the gains. Deliveries of the fuel rose by 350 kb/d m-o-m in May, followed by 390 kb/d in June and 110 kb/d in July. The four-week average of US oil product deliveries (3-30 July) stands at 20.5 mb/d, preliminary data from the Energy Information Administration (EIA) shows, down just 3% from the same period in 2019. In the week ended 2 July, just before the Fourth of July holiday, deliveries rose to an historic high of 21.5 mb/d.
A total of 19.3 million Americans worked from home at one point in July because of the pandemic, or just 14% of the workforce, according to figures from the US Bureau of Labor Statistics. This was down from 21 million in June and the lowest level registered since the beginning of the pandemic. A total of 46 million Americans, or nearly 40% of the workforce, teleworked in April 2020, during the most severe lockdowns. Teleworking partly explains the ongoing deficit in oil product deliveries in the Americas.
Overall social and leisure outings are on the up. For example, the number of Americans watching a live game of baseball has increased most weeks since May. In the week ended 8 August, stadium attendance across the US rose to 4.8 million, the highest weekly figure since September 2019, data from baseball-reference.com shows.
18
20
22
24
26
28
Jan Mar May Jul Sep Nov
mb/d OECD Americas Oil Products Demand
Range 2016-2020 2021
2019 2022 Forecast
7
8
9
10
11
12
Jan Mar May Jul Sep Nov
mb/d OECD Americas Gasoline Demand
Range 2016-2020 2021
2019 2022 Forecast
0
10
20
30
40
50
May-20 Dec-20 Jul-21
million Americans aged 25 and over who telework
Source: US Bureau of Labor Statistics0.0
0.5
1.0
1.5
2.0
2.5
3.0
Jan Feb Mar Apr May Jun Jul Aug
million
Weekly plane passengers going through US TSA checkpoints
2019 2020 2021
Oil Market Report Demand
Page | 9 12 August 2021 IEA
. All
right
s re
serv
ed.
Jet/kerosene deliveries are also on the rise, helped by the fast recovery in domestic air travel across North America. Demand was up 60 kb/d m-o-m in May and we estimate that it rose by another 80 kb/d in June and by 170 kb/d in July. Our July estimate for the Americas is around 490 kb/d lower than July 2019, as international travel is still significantly impacted by the pandemic. Figures available from the Department of Transportation show the number of passengers going through US checkpoints averaged 2.038 million per day in July, up from 1.890 million in June but still well below the July 2019 level (2.559 million).
We forecast continued rapid overall demand growth in the Americas of 950 kb/d q-o-q in 3Q21 (+2.5 mb/d y-o-y), before a seasonal dip of 190 kb/d in 4Q21 (+1.9 mb/d y-o-y). Demand should grow by 1.8 mb/d in 2021, the most out of all OECD regions, and slow to 700 kb/d in 2022.
OECD Europe
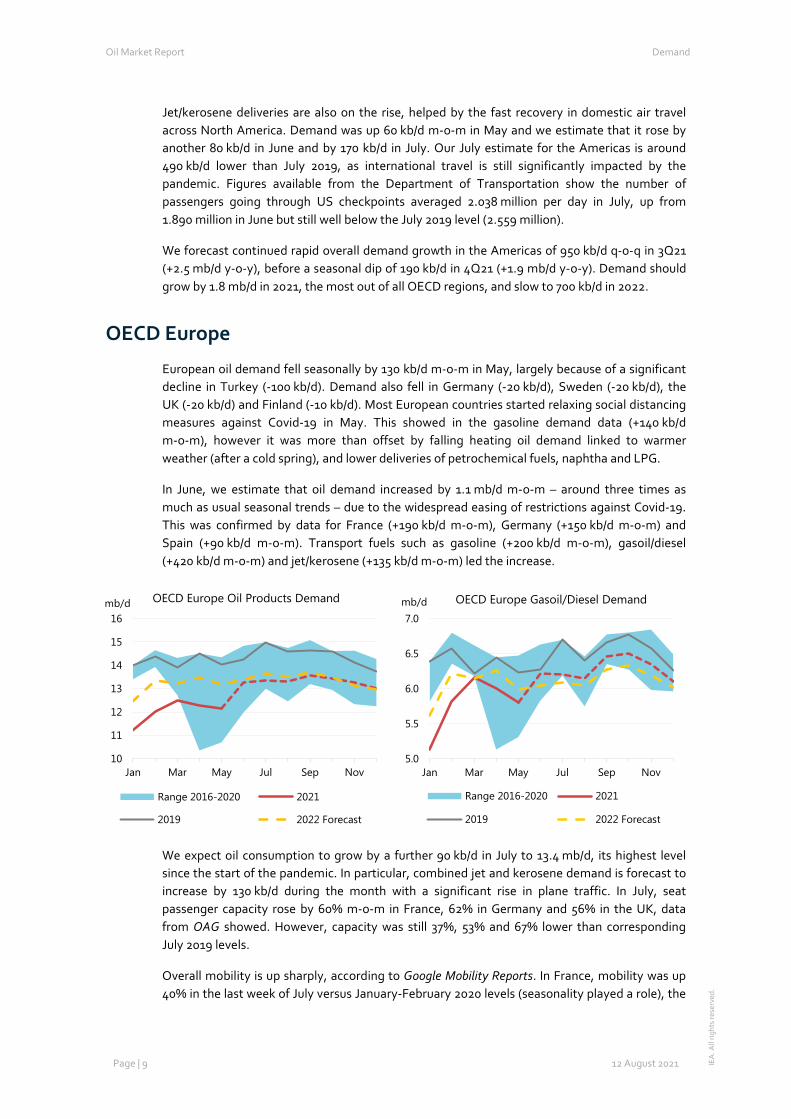
European oil demand fell seasonally by 130 kb/d m-o-m in May, largely because of a significant decline in Turkey (-100 kb/d). Demand also fell in Germany (-20 kb/d), Sweden (-20 kb/d), the UK (-20 kb/d) and Finland (-10 kb/d). Most European countries started relaxing social distancing measures against Covid-19 in May. This showed in the gasoline demand data (+140 kb/d m-o-m), however it was more than offset by falling heating oil demand linked to warmer weather (after a cold spring), and lower deliveries of petrochemical fuels, naphtha and LPG.
In June, we estimate that oil demand increased by 1.1 mb/d m-o-m – around three times as much as usual seasonal trends – due to the widespread easing of restrictions against Covid-19. This was confirmed by data for France (+190 kb/d m-o-m), Germany (+150 kb/d m-o-m) and Spain (+90 kb/d m-o-m). Transport fuels such as gasoline (+200 kb/d m-o-m), gasoil/diesel (+420 kb/d m-o-m) and jet/kerosene (+135 kb/d m-o-m) led the increase.
We expect oil consumption to grow by a further 90 kb/d in July to 13.4 mb/d, its highest level since the start of the pandemic. In particular, combined jet and kerosene demand is forecast to increase by 130 kb/d during the month with a significant rise in plane traffic. In July, seat passenger capacity rose by 60% m-o-m in France, 62% in Germany and 56% in the UK, data from OAG showed. However, capacity was still 37%, 53% and 67% lower than corresponding July 2019 levels.
Overall mobility is up sharply, according to Google Mobility Reports. In France, mobility was up 40% in the last week of July versus January-February 2020 levels (seasonality played a role), the
10
11
12
13
14
15
16
Jan Mar May Jul Sep Nov
mb/d OECD Europe Oil Products Demand
Range 2016-2020 2021
2019 2022 Forecast
5.0
5.5
6.0
6.5
7.0
Jan Mar May Jul Sep Nov
mb/d OECD Europe Gasoil/Diesel Demand
Range 2016-2020 2021
2019 2022 Forecast
Oil Market Report Demand
Page | 10 12 August 2021 IEA
. All
right
s re
serv
ed.
highest figure registered since August 2020. Mobility for the same period was up 14% in the UK and by 35% in Germany.
European oil demand is now projected to rise by 845 kb/d q-o-q in 3Q21 (+530 kb/d y-o-y), the fastest pace of growth since 3Q20 during the initial recovery from the Covid-19 lockdowns. Demand should then decline seasonally by 170 kb/d q-o-q in 4Q21. However, the gap with pre-pandemic consumption levels is likely to narrow below 1 mb/d with further recoveries expected in the major transport fuels. For 2021 as a whole, we forecast oil demand to increase by 350 kb/d. In 2022, consumption should rise by a further 505 kb/d.
OECD Asia Oceania
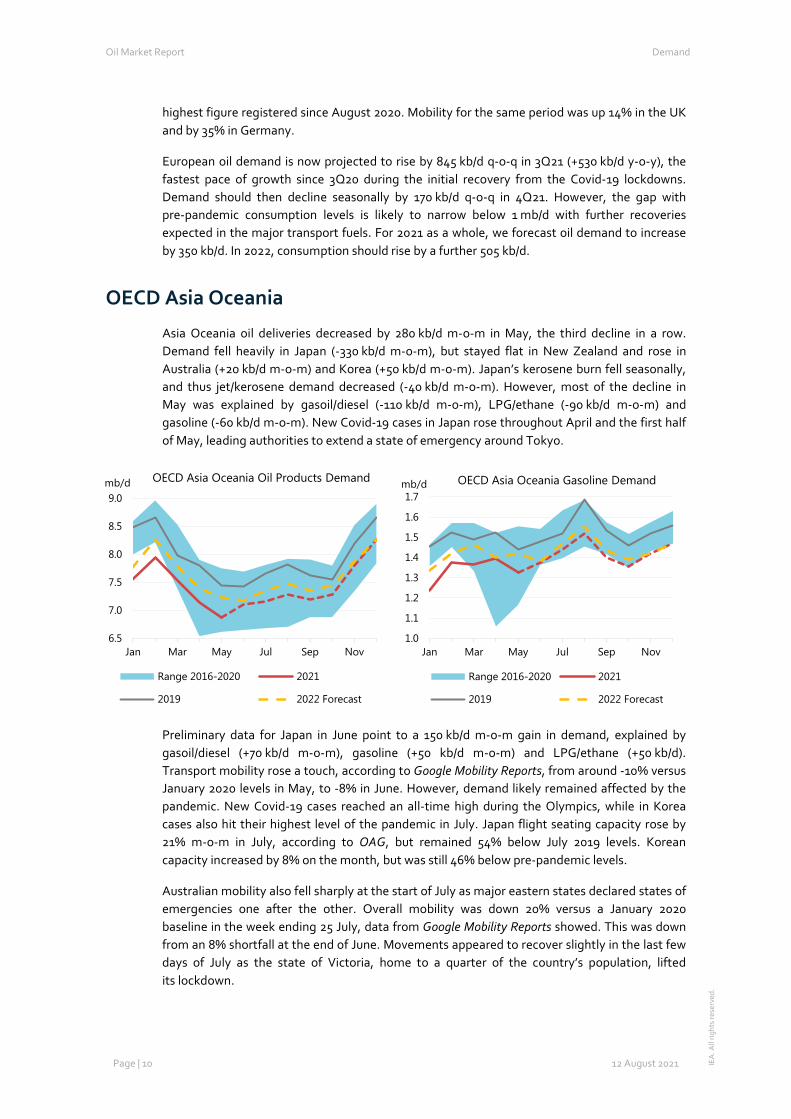
Asia Oceania oil deliveries decreased by 280 kb/d m-o-m in May, the third decline in a row. Demand fell heavily in Japan (-330 kb/d m-o-m), but stayed flat in New Zealand and rose in Australia (+20 kb/d m-o-m) and Korea (+50 kb/d m-o-m). Japan’s kerosene burn fell seasonally, and thus jet/kerosene demand decreased (-40 kb/d m-o-m). However, most of the decline in May was explained by gasoil/diesel (-110 kb/d m-o-m), LPG/ethane (-90 kb/d m-o-m) and gasoline (-60 kb/d m-o-m). New Covid-19 cases in Japan rose throughout April and the first half of May, leading authorities to extend a state of emergency around Tokyo.
Preliminary data for Japan in June point to a 150 kb/d m-o-m gain in demand, explained by gasoil/diesel (+70 kb/d m-o-m), gasoline (+50 kb/d m-o-m) and LPG/ethane (+50 kb/d). Transport mobility rose a touch, according to Google Mobility Reports, from around -10% versus January 2020 levels in May, to -8% in June. However, demand likely remained affected by the pandemic. New Covid-19 cases reached an all-time high during the Olympics, while in Korea cases also hit their highest level of the pandemic in July. Japan flight seating capacity rose by 21% m-o-m in July, according to OAG, but remained 54% below July 2019 levels. Korean capacity increased by 8% on the month, but was still 46% below pre-pandemic levels.
Australian mobility also fell sharply at the start of July as major eastern states declared states of emergencies one after the other. Overall mobility was down 20% versus a January 2020 baseline in the week ending 25 July, data from Google Mobility Reports showed. This was down from an 8% shortfall at the end of June. Movements appeared to recover slightly in the last few days of July as the state of Victoria, home to a quarter of the country’s population, lifted its lockdown.
6.5
7.0
7.5
8.0
8.5
9.0
Jan Mar May Jul Sep Nov
mb/d OECD Asia Oceania Oil Products Demand
Range 2016-2020 2021
2019 2022 Forecast
1.0
1.1
1.2
1.3
1.4
1.5
1.6
1.7
Jan Mar May Jul Sep Nov
mb/d OECD Asia Oceania Gasoline Demand
Range 2016-2020 2021
2019 2022 Forecast
Oil Market Report Demand
Page | 11 12 August 2021 IEA
. All
right
s re
serv
ed.
However, other metrics point to significantly worse fuel demand. Australia passenger flight capacity fell by 25% m-o-m in July, one of the only countries in the world to show a negative trend, and was 56% below July 2019 levels, data from OAG showed. In July, authorities halved the caps on the number of passengers allowed into the country, to 3 505 passengers per week, in response to the spread of Covid-19.
Stadium attendance at Australian rules football games fell in the week ending 1 August to the lowest attendance rate registered since the start of the season in March, data from afltables.com showed, with just two stadiums allowed to open.
On 28 July, the state of New South Wales extended a lockdown on Sydney's population of 5 million until the end of August. Meanwhile, on 31 July Queensland imposed a three-day lockdown on parts of the state, including on Australia's third-largest city Brisbane.
We expect the region’s demand to increase by 170 kb/d q-o-q (+460 kb/d y-o-y) in 3Q21, the smallest increase of all OECD regions. Demand should then climb by a sharp 570 kb/d q-o-q (+430 kb/d y-o-y) in 4Q21, assuming Covid comes under control. Demand is forecast to rise by 280 kb/d y-o-y in 2021 and 190 kb/d in 2022.
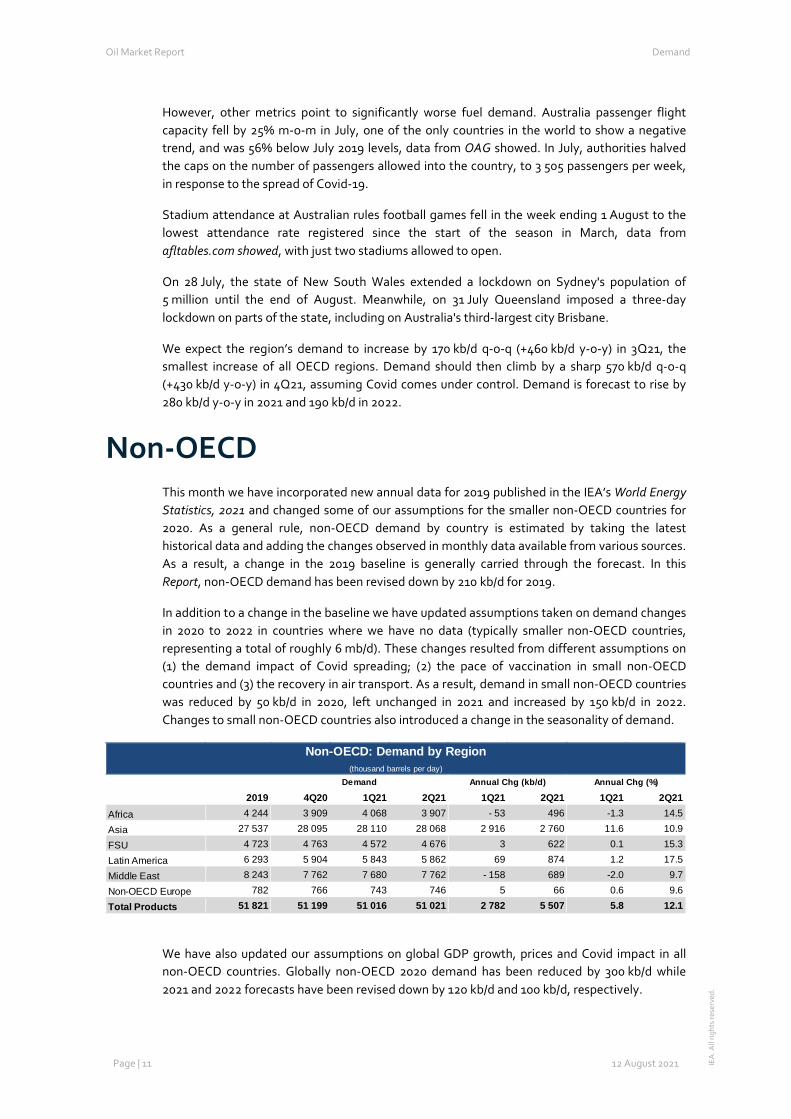
Non-OECD This month we have incorporated new annual data for 2019 published in the IEA’s World Energy Statistics, 2021 and changed some of our assumptions for the smaller non-OECD countries for 2020. As a general rule, non-OECD demand by country is estimated by taking the latest historical data and adding the changes observed in monthly data available from various sources. As a result, a change in the 2019 baseline is generally carried through the forecast. In this Report, non-OECD demand has been revised down by 210 kb/d for 2019.
In addition to a change in the baseline we have updated assumptions taken on demand changes in 2020 to 2022 in countries where we have no data (typically smaller non-OECD countries, representing a total of roughly 6 mb/d). These changes resulted from different assumptions on (1) the demand impact of Covid spreading; (2) the pace of vaccination in small non-OECD countries and (3) the recovery in air transport. As a result, demand in small non-OECD countries was reduced by 50 kb/d in 2020, left unchanged in 2021 and increased by 150 kb/d in 2022. Changes to small non-OECD countries also introduced a change in the seasonality of demand.
We have also updated our assumptions on global GDP growth, prices and Covid impact in all non-OECD countries. Globally non-OECD 2020 demand has been reduced by 300 kb/d while 2021 and 2022 forecasts have been revised down by 120 kb/d and 100 kb/d, respectively.
Non-OECD: Demand by Region(thousand barrels per day)
2019 4Q20 1Q21 2Q21 1Q21 2Q21 1Q21 2Q21Africa 4 244 3 909 4 068 3 907 - 53 496 -1.3 14.5
Asia 27 537 28 095 28 110 28 068 2 916 2 760 11.6 10.9
FSU 4 723 4 763 4 572 4 676 3 622 0.1 15.3
Latin America 6 293 5 904 5 843 5 862 69 874 1.2 17.5
Middle East 8 243 7 762 7 680 7 762 - 158 689 -2.0 9.7
Non-OECD Europe 782 766 743 746 5 66 0.6 9.6
Total Products 51 821 51 199 51 016 51 021 2 782 5 507 5.8 12.1
Demand Annual Chg (kb/d) Annual Chg (%)
Oil Market Report Demand
Page | 12 12 August 2021 IEA
. All
right
s re
serv
ed.
While the latest non-OECD data available are generally strong, a new Covid wave and the subsequent mobility restrictions in several countries are likely to slow the demand recovery in 2H21. Non-OECD demand is estimated to have increased by 1.7 mb/d m-o-m in June, more than offsetting counter-seasonal drops in April (-870 kb/d) and May (-540 kb/d). However, we estimate demand growth reversed in July (-640 kb/d m-o-m) and will remain subdued in August (+40 kb/d m-o-m) because of a new wave of Covid. While a drop in non-OECD demand in July in is line with seasonal patterns, the rebound usually observed in August is generally stronger.
We forecast an increase in non-OECD oil demand of 620 kb/d q-o-q in 3Q21 and 1.2 mb/d q-o-q in 4Q21, lifting demand 400 kb/d above pre-pandemic levels during 4Q21. Non-OECD demand is set to increase by 2.9 mb/d in 2021 and 1.8 mb/d in 2022.
China
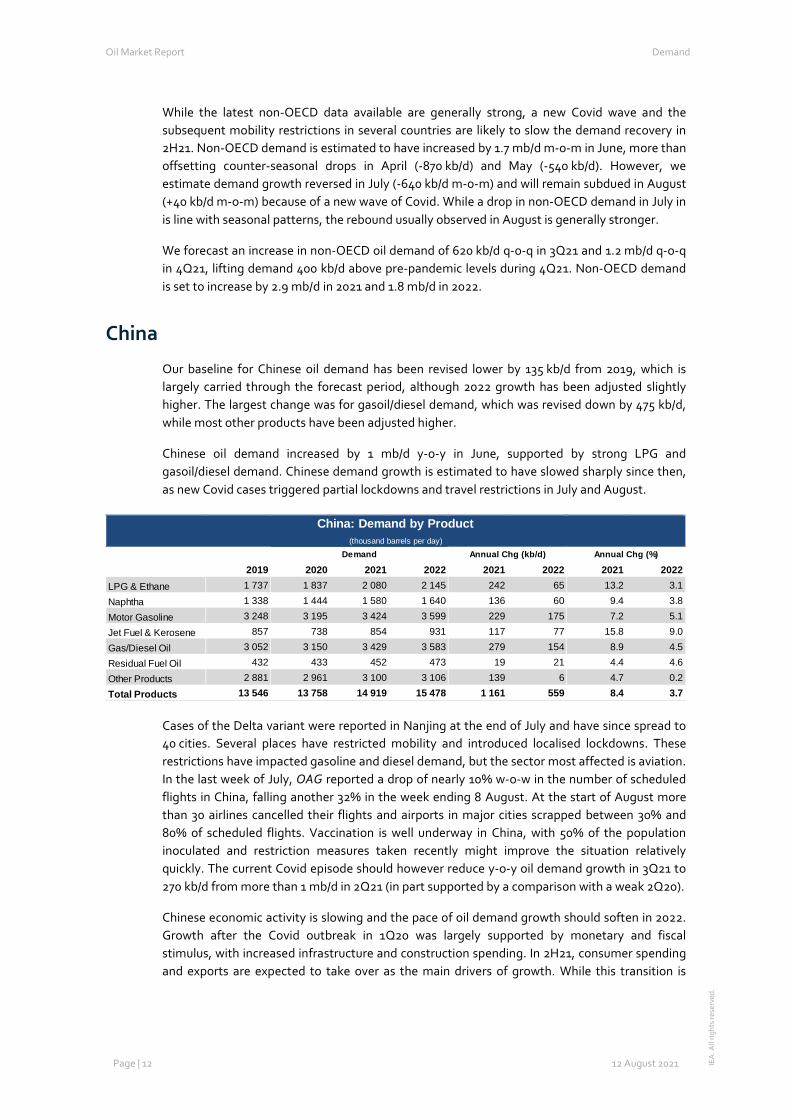
Our baseline for Chinese oil demand has been revised lower by 135 kb/d from 2019, which is largely carried through the forecast period, although 2022 growth has been adjusted slightly higher. The largest change was for gasoil/diesel demand, which was revised down by 475 kb/d, while most other products have been adjusted higher.
Chinese oil demand increased by 1 mb/d y-o-y in June, supported by strong LPG and gasoil/diesel demand. Chinese demand growth is estimated to have slowed sharply since then, as new Covid cases triggered partial lockdowns and travel restrictions in July and August.
Cases of the Delta variant were reported in Nanjing at the end of July and have since spread to 40 cities. Several places have restricted mobility and introduced localised lockdowns. These restrictions have impacted gasoline and diesel demand, but the sector most affected is aviation. In the last week of July, OAG reported a drop of nearly 10% w-o-w in the number of scheduled flights in China, falling another 32% in the week ending 8 August. At the start of August more than 30 airlines cancelled their flights and airports in major cities scrapped between 30% and 80% of scheduled flights. Vaccination is well underway in China, with 50% of the population inoculated and restriction measures taken recently might improve the situation relatively quickly. The current Covid episode should however reduce y-o-y oil demand growth in 3Q21 to 270 kb/d from more than 1 mb/d in 2Q21 (in part supported by a comparison with a weak 2Q20).
Chinese economic activity is slowing and the pace of oil demand growth should soften in 2022. Growth after the Covid outbreak in 1Q20 was largely supported by monetary and fiscal stimulus, with increased infrastructure and construction spending. In 2H21, consumer spending and exports are expected to take over as the main drivers of growth. While this transition is
China: Demand by Product(thousand barrels per day)
2019 2020 2021 2022 2021 2022 2021 2022LPG & Ethane 1 737 1 837 2 080 2 145 242 65 13.2 3.1
Naphtha 1 338 1 444 1 580 1 640 136 60 9.4 3.8
Motor Gasoline 3 248 3 195 3 424 3 599 229 175 7.2 5.1
Jet Fuel & Kerosene 857 738 854 931 117 77 15.8 9.0
Gas/Diesel Oil 3 052 3 150 3 429 3 583 279 154 8.9 4.5
Residual Fuel Oil 432 433 452 473 19 21 4.4 4.6
Other Products 2 881 2 961 3 100 3 106 139 6 4.7 0.2
Total Products 13 546 13 758 14 919 15 478 1 161 559 8.4 3.7
Demand Annual Chg (kb/d) Annual Chg (%)
Oil Market Report Demand
Page | 13 12 August 2021 IEA
. All
right
s re
serv
ed.
20
30
40
50
60
70
80
90
100
110
Jan Apr Jul Oct
India Mobility Index - 1Q20 = 100
2020 2021
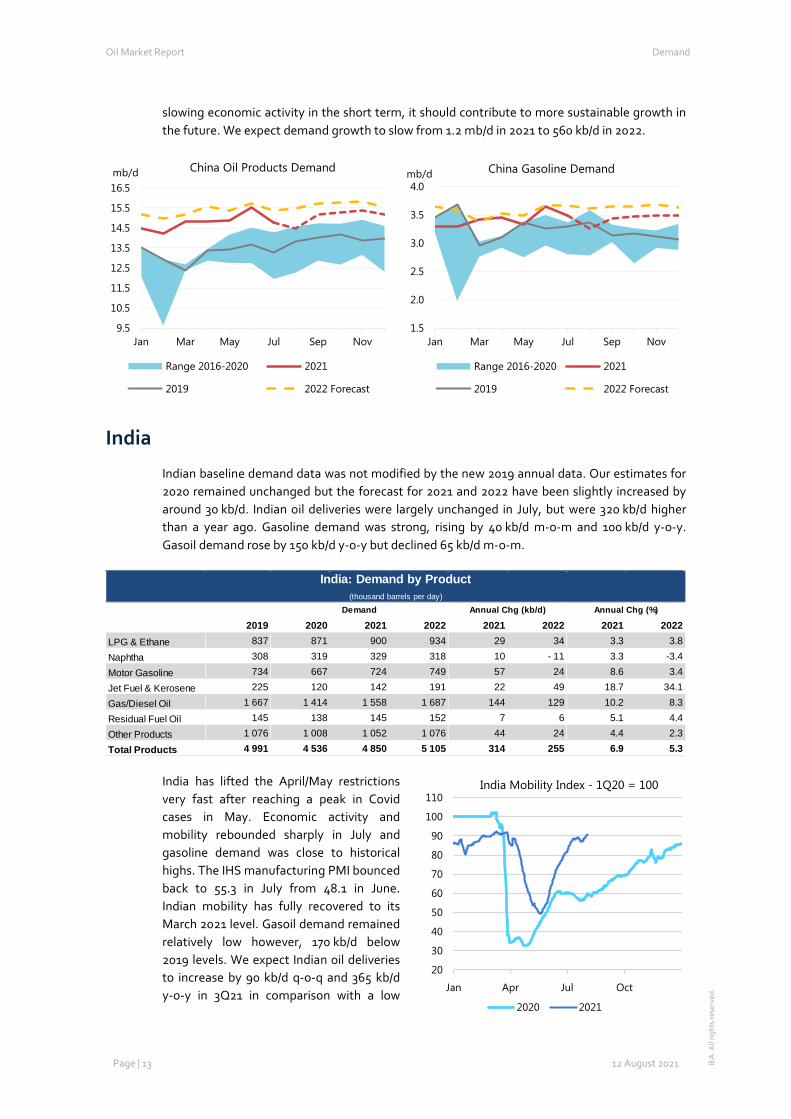
slowing economic activity in the short term, it should contribute to more sustainable growth in the future. We expect demand growth to slow from 1.2 mb/d in 2021 to 560 kb/d in 2022.
India
Indian baseline demand data was not modified by the new 2019 annual data. Our estimates for 2020 remained unchanged but the forecast for 2021 and 2022 have been slightly increased by around 30 kb/d. Indian oil deliveries were largely unchanged in July, but were 320 kb/d higher than a year ago. Gasoline demand was strong, rising by 40 kb/d m-o-m and 100 kb/d y-o-y. Gasoil demand rose by 150 kb/d y-o-y but declined 65 kb/d m-o-m.
India has lifted the April/May restrictions very fast after reaching a peak in Covid cases in May. Economic activity and mobility rebounded sharply in July and gasoline demand was close to historical highs. The IHS manufacturing PMI bounced back to 55.3 in July from 48.1 in June. Indian mobility has fully recovered to its March 2021 level. Gasoil demand remained relatively low however, 170 kb/d below 2019 levels. We expect Indian oil deliveries to increase by 90 kb/d q-o-q and 365 kb/d y-o-y in 3Q21 in comparison with a low
9.5
10.5
11.5
12.5
13.5
14.5
15.5
16.5
Jan Mar May Jul Sep Nov
mb/d China Oil Products Demand
Range 2016-2020 2021
2019 2022 Forecast
1.5
2.0
2.5
3.0
3.5
4.0
Jan Mar May Jul Sep Nov
mb/d China Gasoline Demand
Range 2016-2020 2021
2019 2022 Forecast
India: Demand by Product(thousand barrels per day)
2019 2020 2021 2022 2021 2022 2021 2022LPG & Ethane 837 871 900 934 29 34 3.3 3.8
Naphtha 308 319 329 318 10 - 11 3.3 -3.4
Motor Gasoline 734 667 724 749 57 24 8.6 3.4
Jet Fuel & Kerosene 225 120 142 191 22 49 18.7 34.1
Gas/Diesel Oil 1 667 1 414 1 558 1 687 144 129 10.2 8.3
Residual Fuel Oil 145 138 145 152 7 6 5.1 4.4
Other Products 1 076 1 008 1 052 1 076 44 24 4.4 2.3
Total Products 4 991 4 536 4 850 5 105 314 255 6.9 5.3
Demand Annual Chg (kb/d) Annual Chg (%)
Oil Market Report Demand
Page | 14 12 August 2021 IEA
. All
right
s re
serv
ed.
base. For 2021, we forecast overall growth of 310 kb/d y-o-y. Demand should gain 255 kb/d in 2022.
Other Non-OECD
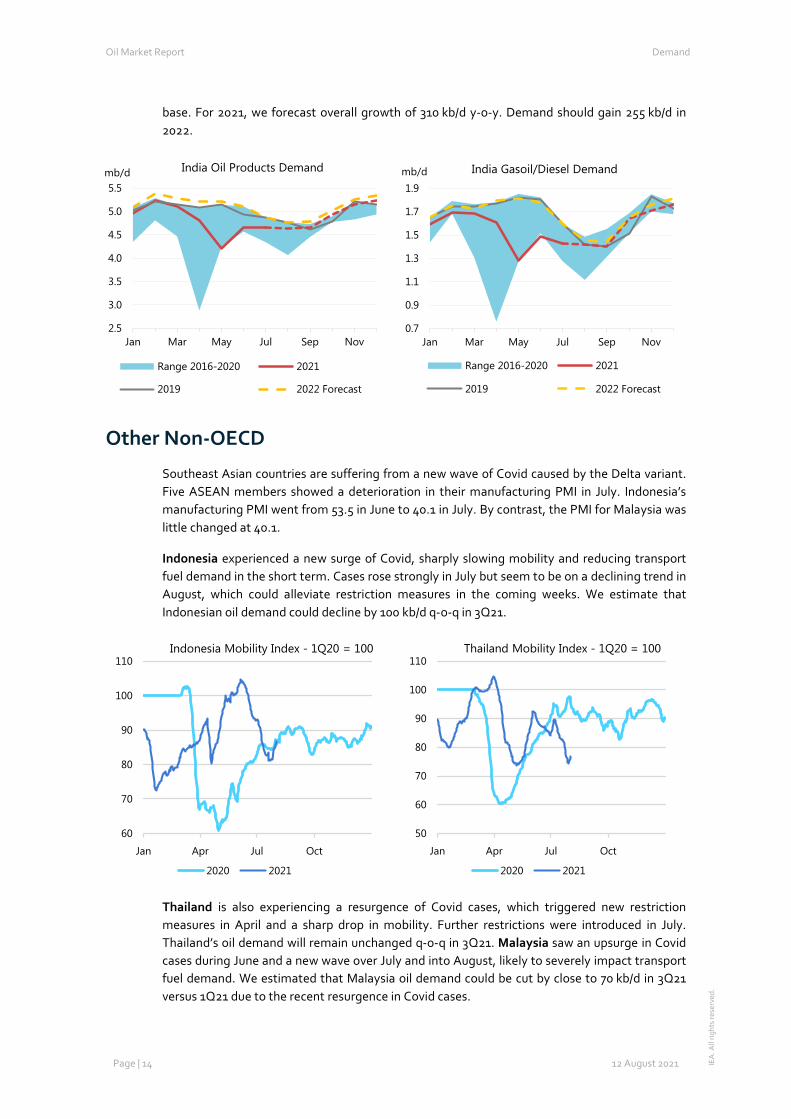
Southeast Asian countries are suffering from a new wave of Covid caused by the Delta variant. Five ASEAN members showed a deterioration in their manufacturing PMI in July. Indonesia’s manufacturing PMI went from 53.5 in June to 40.1 in July. By contrast, the PMI for Malaysia was little changed at 40.1.
Indonesia experienced a new surge of Covid, sharply slowing mobility and reducing transport fuel demand in the short term. Cases rose strongly in July but seem to be on a declining trend in August, which could alleviate restriction measures in the coming weeks. We estimate that Indonesian oil demand could decline by 100 kb/d q-o-q in 3Q21.
Thailand is also experiencing a resurgence of Covid cases, which triggered new restriction measures in April and a sharp drop in mobility. Further restrictions were introduced in July. Thailand’s oil demand will remain unchanged q-o-q in 3Q21. Malaysia saw an upsurge in Covid cases during June and a new wave over July and into August, likely to severely impact transport fuel demand. We estimated that Malaysia oil demand could be cut by close to 70 kb/d in 3Q21 versus 1Q21 due to the recent resurgence in Covid cases.
2.5
3.0
3.5
4.0
4.5
5.0
5.5
Jan Mar May Jul Sep Nov
mb/d India Oil Products Demand
Range 2016-2020 2021
2019 2022 Forecast
0.7
0.9
1.1
1.3
1.5
1.7
1.9
Jan Mar May Jul Sep Nov
mb/d India Gasoil/Diesel Demand
Range 2016-2020 2021
2019 2022 Forecast
60
70
80
90
100
110
Jan Apr Jul Oct
Indonesia Mobility Index - 1Q20 = 100
2020 2021
50
60
70
80
90
100
110
Jan Apr Jul Oct
Thailand Mobility Index - 1Q20 = 100
2020 2021
Oil Market Report Demand
Page | 15 12 August 2021 IEA
. All
right
s re
serv
ed.
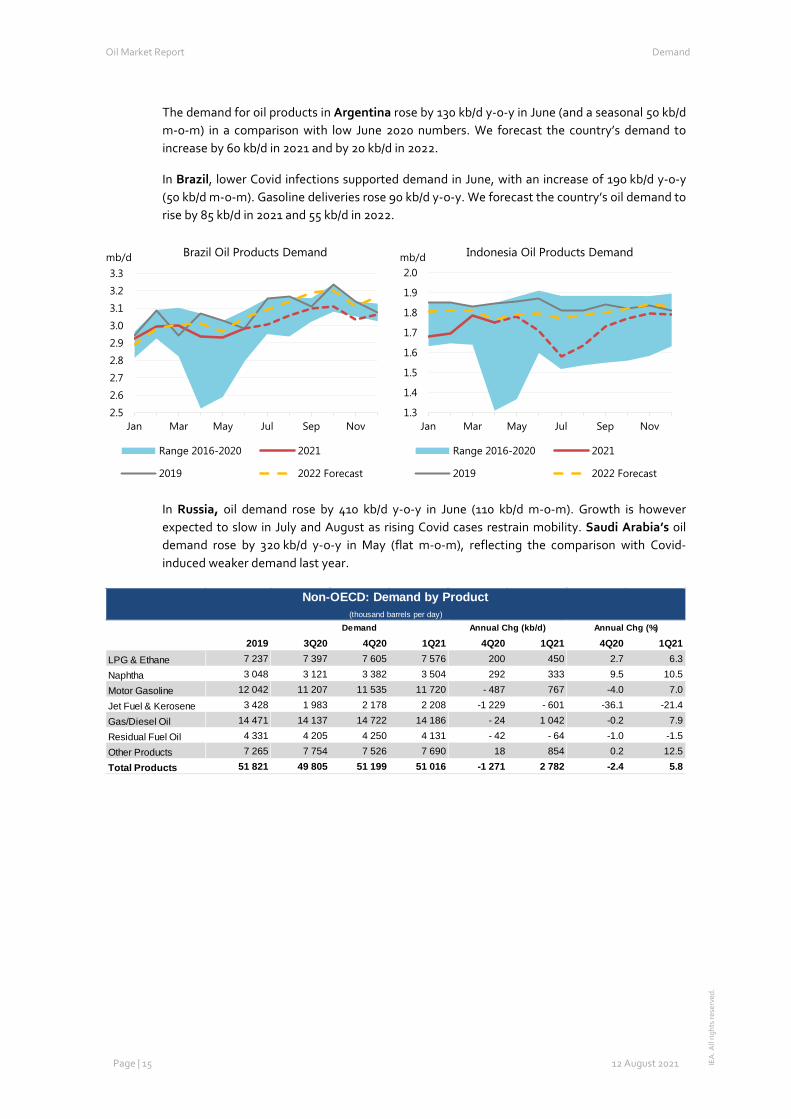
The demand for oil products in Argentina rose by 130 kb/d y-o-y in June (and a seasonal 50 kb/d m-o-m) in a comparison with low June 2020 numbers. We forecast the country’s demand to increase by 60 kb/d in 2021 and by 20 kb/d in 2022.
In Brazil, lower Covid infections supported demand in June, with an increase of 190 kb/d y-o-y (50 kb/d m-o-m). Gasoline deliveries rose 90 kb/d y-o-y. We forecast the country’s oil demand to rise by 85 kb/d in 2021 and 55 kb/d in 2022.
In Russia, oil demand rose by 410 kb/d y-o-y in June (110 kb/d m-o-m). Growth is however expected to slow in July and August as rising Covid cases restrain mobility. Saudi Arabia’s oil demand rose by 320 kb/d y-o-y in May (flat m-o-m), reflecting the comparison with Covid-induced weaker demand last year.
2.5
2.6
2.7
2.8
2.9
3.0
3.1
3.2
3.3
Jan Mar May Jul Sep Nov
mb/d Brazil Oil Products Demand
Range 2016-2020 2021
2019 2022 Forecast
1.3
1.4
1.5
1.6
1.7
1.8
1.9
2.0
Jan Mar May Jul Sep Nov
mb/d Indonesia Oil Products Demand
Range 2016-2020 2021
2019 2022 Forecast
Non-OECD: Demand by Product(thousand barrels per day)
2019 3Q20 4Q20 1Q21 4Q20 1Q21 4Q20 1Q21LPG & Ethane 7 237 7 397 7 605 7 576 200 450 2.7 6.3
Naphtha 3 048 3 121 3 382 3 504 292 333 9.5 10.5
Motor Gasoline 12 042 11 207 11 535 11 720 - 487 767 -4.0 7.0
Jet Fuel & Kerosene 3 428 1 983 2 178 2 208 -1 229 - 601 -36.1 -21.4
Gas/Diesel Oil 14 471 14 137 14 722 14 186 - 24 1 042 -0.2 7.9
Residual Fuel Oil 4 331 4 205 4 250 4 131 - 42 - 64 -1.0 -1.5
Other Products 7 265 7 754 7 526 7 690 18 854 0.2 12.5
Total Products 51 821 49 805 51 199 51 016 -1 271 2 782 -2.4 5.8
Demand Annual Chg (kb/d) Annual Chg (%)
Oil Market Report Supply
Page | 16 12 August 2021 IEA
. All
right
s re
serv
ed.
Supply Overview
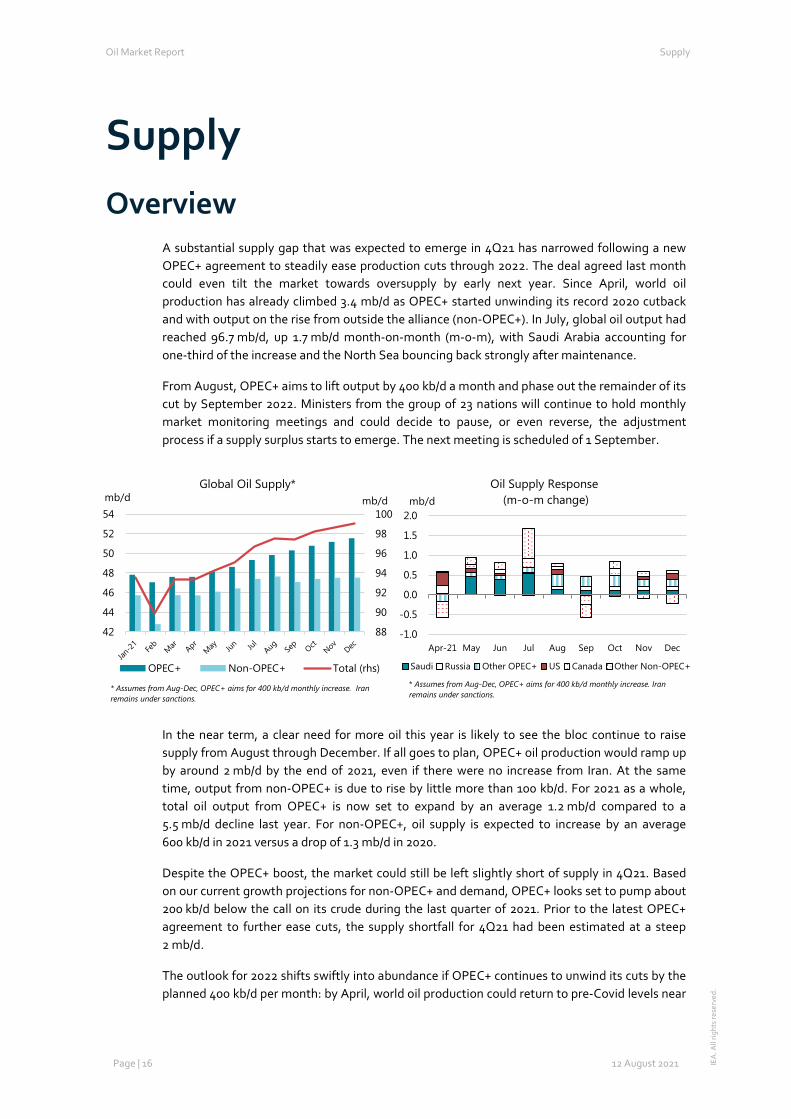
A substantial supply gap that was expected to emerge in 4Q21 has narrowed following a new OPEC+ agreement to steadily ease production cuts through 2022. The deal agreed last month could even tilt the market towards oversupply by early next year. Since April, world oil production has already climbed 3.4 mb/d as OPEC+ started unwinding its record 2020 cutback and with output on the rise from outside the alliance (non-OPEC+). In July, global oil output had reached 96.7 mb/d, up 1.7 mb/d month-on-month (m-o-m), with Saudi Arabia accounting for one-third of the increase and the North Sea bouncing back strongly after maintenance.
From August, OPEC+ aims to lift output by 400 kb/d a month and phase out the remainder of its cut by September 2022. Ministers from the group of 23 nations will continue to hold monthly market monitoring meetings and could decide to pause, or even reverse, the adjustment process if a supply surplus starts to emerge. The next meeting is scheduled of 1 September.
In the near term, a clear need for more oil this year is likely to see the bloc continue to raise supply from August through December. If all goes to plan, OPEC+ oil production would ramp up by around 2 mb/d by the end of 2021, even if there were no increase from Iran. At the same time, output from non-OPEC+ is due to rise by little more than 100 kb/d. For 2021 as a whole, total oil output from OPEC+ is now set to expand by an average 1.2 mb/d compared to a 5.5 mb/d decline last year. For non-OPEC+, oil supply is expected to increase by an average 600 kb/d in 2021 versus a drop of 1.3 mb/d in 2020.
Despite the OPEC+ boost, the market could still be left slightly short of supply in 4Q21. Based on our current growth projections for non-OPEC+ and demand, OPEC+ looks set to pump about 200 kb/d below the call on its crude during the last quarter of 2021. Prior to the latest OPEC+ agreement to further ease cuts, the supply shortfall for 4Q21 had been estimated at a steep 2 mb/d.
The outlook for 2022 shifts swiftly into abundance if OPEC+ continues to unwind its cuts by the planned 400 kb/d per month: by April, world oil production could return to pre-Covid levels near
88
90
92
94
96
98
100
42
44
46
48
50
52
54mb/dmb/d
Global Oil Supply*
OPEC+ Non-OPEC+ Total (rhs)
* Assumes from Aug-Dec, OPEC+ aims for 400 kb/d monthly increase. Iran remains under sanctions.
-1.0
-0.5
0.0
0.5
1.0
1.5
2.0
Apr-21 May Jun Jul Aug Sep Oct Nov Dec
mb/dOil Supply Response
(m-o-m change)
Saudi Russia Other OPEC+ US Canada Other Non-OPEC+
* Assumes from Aug-Dec, OPEC+ aims for 400 kb/d monthly increase. Iranremains under sanctions.
Oil Market Report Supply
Page | 17 12 August 2021 IEA
. All
right
s re
serv
ed.
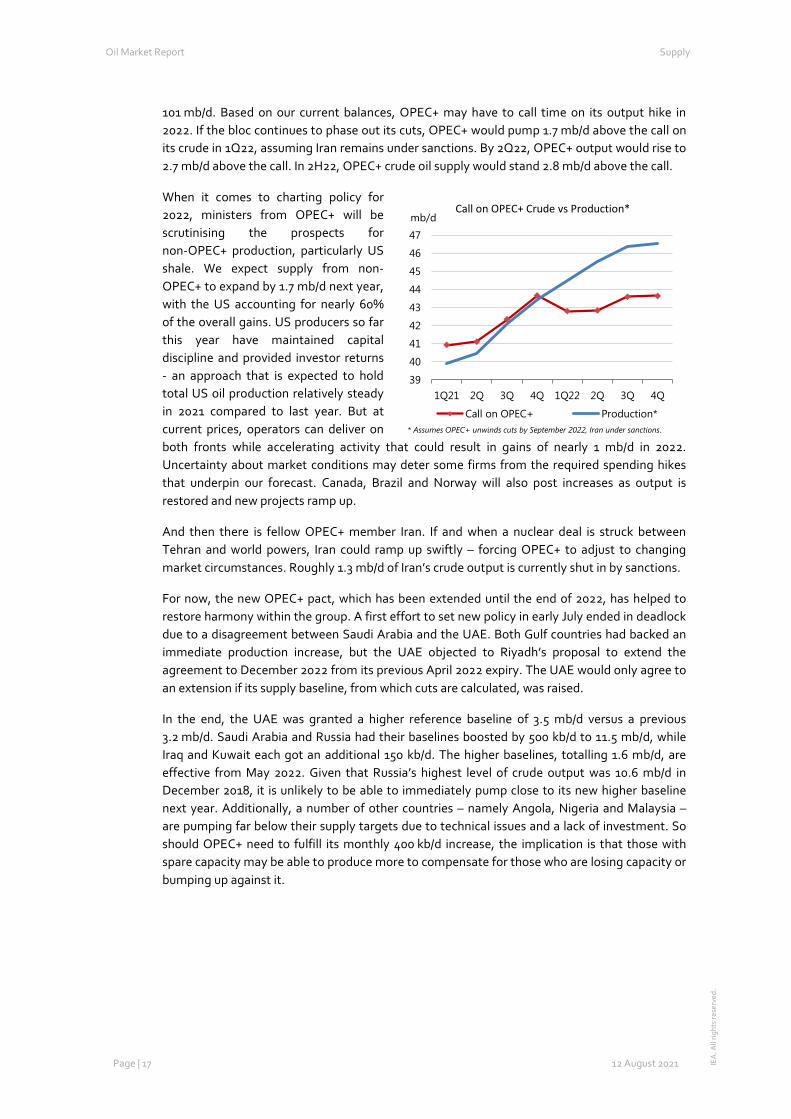
101 mb/d. Based on our current balances, OPEC+ may have to call time on its output hike in 2022. If the bloc continues to phase out its cuts, OPEC+ would pump 1.7 mb/d above the call on its crude in 1Q22, assuming Iran remains under sanctions. By 2Q22, OPEC+ output would rise to 2.7 mb/d above the call. In 2H22, OPEC+ crude oil supply would stand 2.8 mb/d above the call.
When it comes to charting policy for 2022, ministers from OPEC+ will be scrutinising the prospects for non-OPEC+ production, particularly US shale. We expect supply from non-OPEC+ to expand by 1.7 mb/d next year, with the US accounting for nearly 60% of the overall gains. US producers so far this year have maintained capital discipline and provided investor returns - an approach that is expected to hold total US oil production relatively steady in 2021 compared to last year. But at current prices, operators can deliver on both fronts while accelerating activity that could result in gains of nearly 1 mb/d in 2022. Uncertainty about market conditions may deter some firms from the required spending hikes that underpin our forecast. Canada, Brazil and Norway will also post increases as output is restored and new projects ramp up.
And then there is fellow OPEC+ member Iran. If and when a nuclear deal is struck between Tehran and world powers, Iran could ramp up swiftly – forcing OPEC+ to adjust to changing market circumstances. Roughly 1.3 mb/d of Iran’s crude output is currently shut in by sanctions.
For now, the new OPEC+ pact, which has been extended until the end of 2022, has helped to restore harmony within the group. A first effort to set new policy in early July ended in deadlock due to a disagreement between Saudi Arabia and the UAE. Both Gulf countries had backed an immediate production increase, but the UAE objected to Riyadh’s proposal to extend the agreement to December 2022 from its previous April 2022 expiry. The UAE would only agree to an extension if its supply baseline, from which cuts are calculated, was raised.
In the end, the UAE was granted a higher reference baseline of 3.5 mb/d versus a previous 3.2 mb/d. Saudi Arabia and Russia had their baselines boosted by 500 kb/d to 11.5 mb/d, while Iraq and Kuwait each got an additional 150 kb/d. The higher baselines, totalling 1.6 mb/d, are effective from May 2022. Given that Russia’s highest level of crude output was 10.6 mb/d in December 2018, it is unlikely to be able to immediately pump close to its new higher baseline next year. Additionally, a number of other countries – namely Angola, Nigeria and Malaysia – are pumping far below their supply targets due to technical issues and a lack of investment. So should OPEC+ need to fulfill its monthly 400 kb/d increase, the implication is that those with spare capacity may be able to produce more to compensate for those who are losing capacity or bumping up against it.
39
40
41
42
43
44
45
46
47
1Q21 2Q 3Q 4Q 1Q22 2Q 3Q 4Q
mb/dCall on OPEC+ Crude vs Production*
Call on OPEC+ Production** Assumes OPEC+ unwinds cuts by September 2022, Iran under sanctions.
Oil Market Report Supply
Page | 18 12 August 2021 IEA
. All
right
s re
serv
ed.
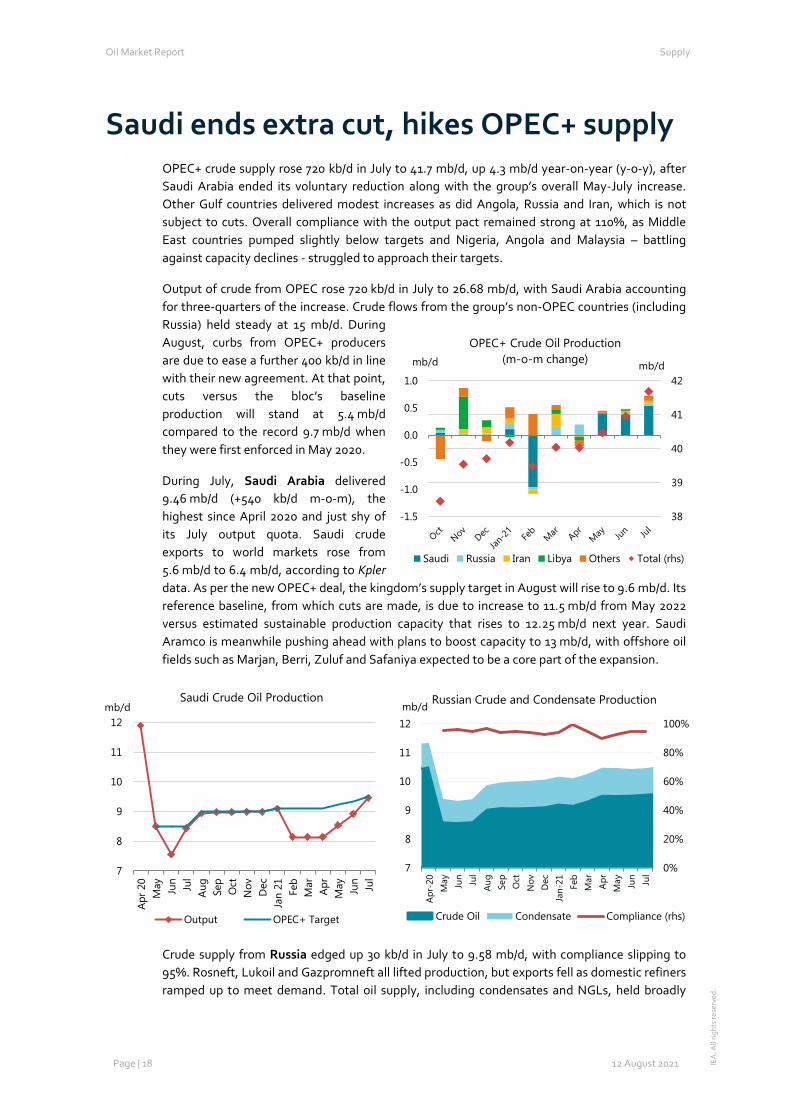
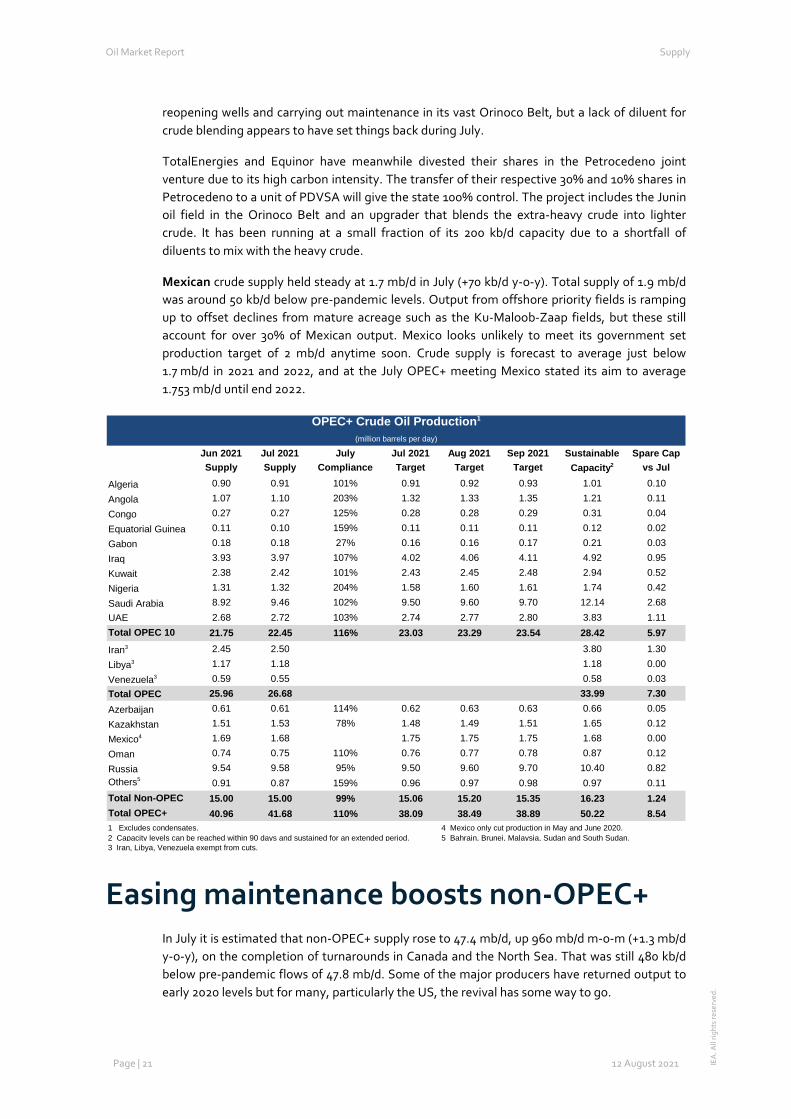
Saudi ends extra cut, hikes OPEC+ supply OPEC+ crude supply rose 720 kb/d in July to 41.7 mb/d, up 4.3 mb/d year-on-year (y-o-y), after Saudi Arabia ended its voluntary reduction along with the group’s overall May-July increase. Other Gulf countries delivered modest increases as did Angola, Russia and Iran, which is not subject to cuts. Overall compliance with the output pact remained strong at 110%, as Middle East countries pumped slightly below targets and Nigeria, Angola and Malaysia – battling against capacity declines - struggled to approach their targets.
Output of crude from OPEC rose 720 kb/d in July to 26.68 mb/d, with Saudi Arabia accounting for three-quarters of the increase. Crude flows from the group’s non-OPEC countries (including Russia) held steady at 15 mb/d. During August, curbs from OPEC+ producers are due to ease a further 400 kb/d in line with their new agreement. At that point, cuts versus the bloc’s baseline production will stand at 5.4 mb/d compared to the record 9.7 mb/d when they were first enforced in May 2020.
During July, Saudi Arabia delivered 9.46 mb/d (+540 kb/d m-o-m), the highest since April 2020 and just shy of its July output quota. Saudi crude exports to world markets rose from 5.6 mb/d to 6.4 mb/d, according to Kpler data. As per the new OPEC+ deal, the kingdom’s supply target in August will rise to 9.6 mb/d. Its reference baseline, from which cuts are made, is due to increase to 11.5 mb/d from May 2022 versus estimated sustainable production capacity that rises to 12.25 mb/d next year. Saudi Aramco is meanwhile pushing ahead with plans to boost capacity to 13 mb/d, with offshore oil fields such as Marjan, Berri, Zuluf and Safaniya expected to be a core part of the expansion.
Crude supply from Russia edged up 30 kb/d in July to 9.58 mb/d, with compliance slipping to 95%. Rosneft, Lukoil and Gazpromneft all lifted production, but exports fell as domestic refiners ramped up to meet demand. Total oil supply, including condensates and NGLs, held broadly
7
8
9
10
11
12
Apr 2
0M
ay Jun Jul
Aug
Sep
Oct
Nov Dec
Jan
21 Feb
Mar
Apr
May Jun Jul
mb/dSaudi Crude Oil Production
Output OPEC+ Target
0%
20%
40%
60%
80%
100%
7
8
9
10
11
12
Apr
-20
May Jun Jul
Aug Se
pO
ctN
ov Dec
Jan-
21 Feb
Mar
Apr
May Jun Jul
mb/d Russian Crude and Condensate Production
Crude Oil Condensate Compliance (rhs)
38
39
40
41
42
-1.5
-1.0
-0.5
0.0
0.5
1.0mb/dmb/d
OPEC+ Crude Oil Production(m-o-m change)
Saudi Russia Iran Libya Others Total (rhs)
Oil Market Report Supply
Page | 19 12 August 2021 IEA
. All
right
s re
serv
ed.
steady in July at 10.8 mb/d, 1.1 mb/d above July 2020. Under the new OPEC+ deal, the supply targets of Russia and Saudi Arabia are due to rise by roughly 100 kb/d per month. And, along with Saudi Arabia, Russia’s reference baseline is set to rise to 11.5 mb/d from May 2022. Our 2022 estimate for Russia’s sustainable crude production capacity is 10.5 mb/d, a level Deputy Prime Minister Alexander Novak says Russia intends to reach by next May and which is 1 mb/d below its new baseline target.
Kazakh output crept up to 1.53 mb/d in July, 50 kb/d above its slightly higher July OPEC+ quota. For August, however, production may fall sharply due to six weeks of major maintenance at the Tengiz oil field that started on 1 August. Shipments of light sweet Caspian CPC Blend are set to drop by 200 kb/d m-o-m in August compared with July. Meanwhile, the $45 billion expansion of the Tengiz oil field is expected to be completed by mid-2024, a delay of up to a year, due to setbacks linked to Covid. The expansion aims to boost capacity from 600 kb/d to 850 kb/d at the field that currently makes up more than a third of Kazakh output. Supply from Azerbaijan held steady at 610 kb/d, just below its OPEC+ quota.
Saudi Arabia’s Middle East neighbours (taking part in cuts) lifted supply by 130 kb/d between them during July. Kuwaiti output rose 40 kb/d to 2.42 mb/d, a gain of 240 kb/d y-o-y. Kuwait’s reference baseline is due to rise to 2.96 mb/d in May 2022, roughly in line with our capacity estimate at that time. Production in the UAE increased by a similar amount to reach 2.72 mb/d. Its reference baseline rises to 3.5 mb/d in 2022, some 400 kb/d below our higher capacity estimate for next year. The UAE has been actively building up capacity and has set an official target of 5 mb/d by 2030. To help reach its goal, the Abu Dhabi National Oil Co has awarded $764 million worth of drilling-related contracts to Schlumberger, ADNOC Drilling and Halliburton to boost production at the Upper Zakum and Satah al-Razboot fields.
Supply from Iraq, including the Kurdistan Regional Government, edged up to 3.97 mb/d (+220 kb/d y-o-y). Total Iraqi shipments of crude held steady at 3.3 mb/d due to operational hiccups at southern export terminals, with some barrels moving into storage. On the upstream front, Baghdad is hoping it can prevent international oil companies from leaving Iraq. ExxonMobil has filed an arbitration case against Iraq's Basrah Oil Co about the proposed sale of its 32.7% share in West Qurna-1. Other partners are PetroChina (32.7%), Itochu (19.6%), Pertamina (10%) and Iraq’s Oil Exploration Co (5%). Iraq reportedly has been trying to convince another US company to replace operator Exxon, which is divesting the share as it seeks to focus on more cost-effective assets. Baghdad plans to boost capacity at West Qurna-1 by 40% to more than 700 kb/d over the next five years. The southern field is now pumping just under 400 kb/d but has capacity of roughly 500 kb/d. Basrah Oil Co had signed a contract with Exxon and Schlumberger to boost capacity by 200 kb/d by drilling 96 wells. Exxon is not alone in seeking to quit the country. Iraq reportedly refused Lukoil’s request to sell part of its share in West Qurna-2.
Crude output in Oman rose marginally to 750 kb/d. Oman is hoping to attract investors via its latest upstream auction. Bids for onshore Blocks 38 and 66 and offshore Block 23 were due at the start of August. Supply from Bahrain inched up to roughly 180 kb/d.
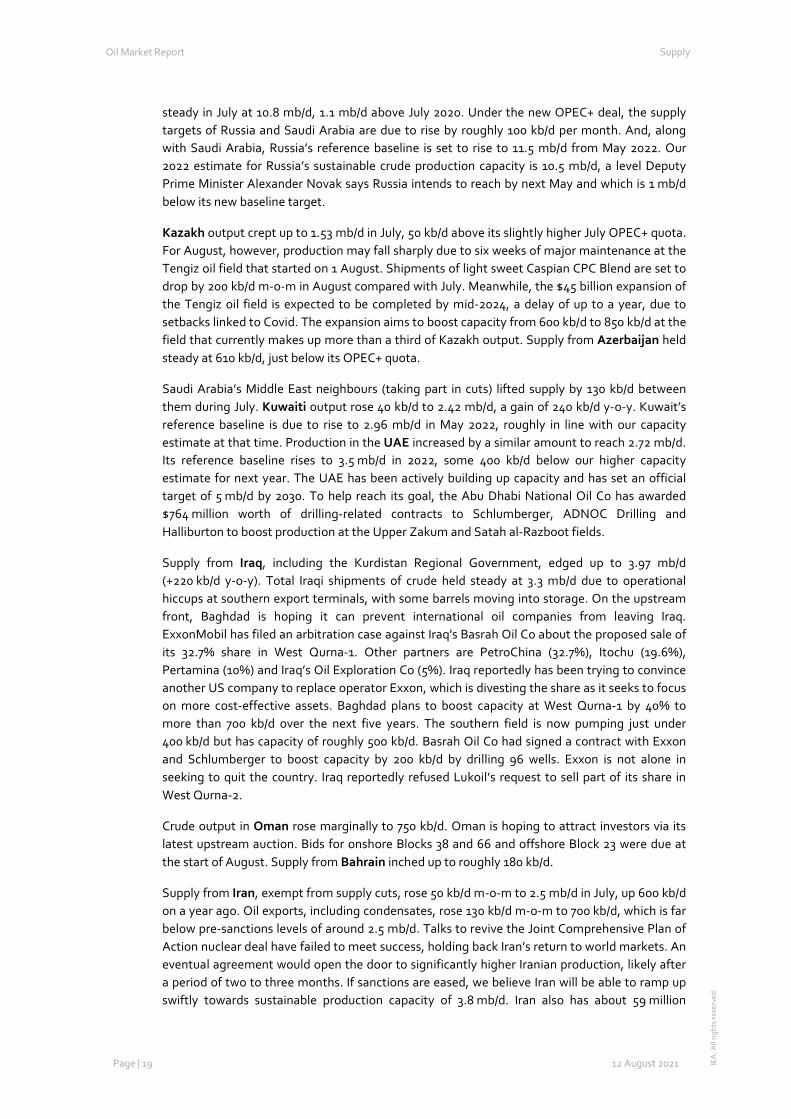
Supply from Iran, exempt from supply cuts, rose 50 kb/d m-o-m to 2.5 mb/d in July, up 600 kb/d on a year ago. Oil exports, including condensates, rose 130 kb/d m-o-m to 700 kb/d, which is far below pre-sanctions levels of around 2.5 mb/d. Talks to revive the Joint Comprehensive Plan of Action nuclear deal have failed to meet success, holding back Iran’s return to world markets. An eventual agreement would open the door to significantly higher Iranian production, likely after a period of two to three months. If sanctions are eased, we believe Iran will be able to ramp up swiftly towards sustainable production capacity of 3.8 mb/d. Iran also has about 59 million
Oil Market Report Supply
Page | 20 12 August 2021 IEA
. All
right
s re
serv
ed.
barrels of crude and condensate stored on tankers along with 67 million barrels stored on land and it will seek to shift that overhang as quickly as possible.
Iran has meanwhile launched its new $2 billion export terminal by loading a tanker off the Sea of Oman, allowing it to bypass the pivotal Strait of Hormuz. The Goureh-Jask pipeline, which connects the Goureh oil terminal in the southwestern province of Bushehr on the Gulf to the Jask port on the Sea of Oman, can now load 300 kb/d and, when completed, is due to reach 1 mb/d.
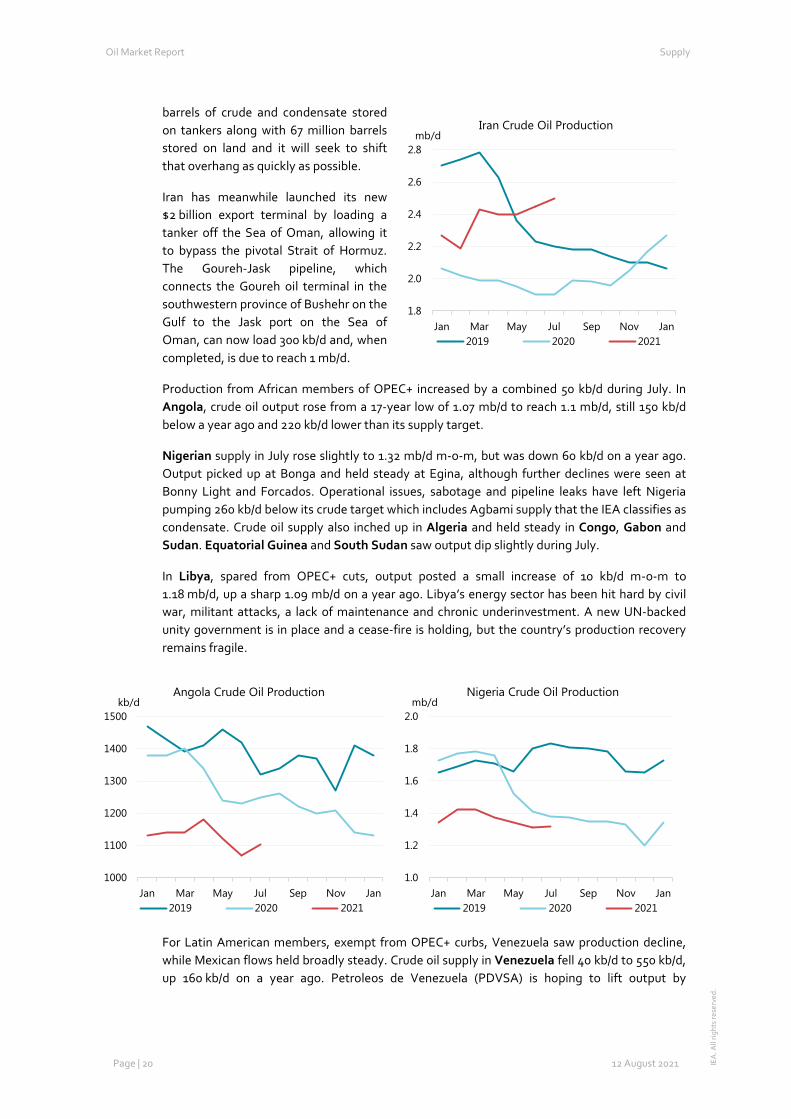
Production from African members of OPEC+ increased by a combined 50 kb/d during July. In Angola, crude oil output rose from a 17-year low of 1.07 mb/d to reach 1.1 mb/d, still 150 kb/d below a year ago and 220 kb/d lower than its supply target.
Nigerian supply in July rose slightly to 1.32 mb/d m-o-m, but was down 60 kb/d on a year ago. Output picked up at Bonga and held steady at Egina, although further declines were seen at Bonny Light and Forcados. Operational issues, sabotage and pipeline leaks have left Nigeria pumping 260 kb/d below its crude target which includes Agbami supply that the IEA classifies as condensate. Crude oil supply also inched up in Algeria and held steady in Congo, Gabon and Sudan. Equatorial Guinea and South Sudan saw output dip slightly during July.
In Libya, spared from OPEC+ cuts, output posted a small increase of 10 kb/d m-o-m to 1.18 mb/d, up a sharp 1.09 mb/d on a year ago. Libya’s energy sector has been hit hard by civil war, militant attacks, a lack of maintenance and chronic underinvestment. A new UN-backed unity government is in place and a cease-fire is holding, but the country’s production recovery remains fragile.
For Latin American members, exempt from OPEC+ curbs, Venezuela saw production decline, while Mexican flows held broadly steady. Crude oil supply in Venezuela fell 40 kb/d to 550 kb/d, up 160 kb/d on a year ago. Petroleos de Venezuela (PDVSA) is hoping to lift output by
1000
1100
1200
1300
1400
1500
Jan Mar May Jul Sep Nov Jan
kb/dAngola Crude Oil Production
2019 2020 2021
1.0
1.2
1.4
1.6
1.8
2.0
Jan Mar May Jul Sep Nov Jan
mb/dNigeria Crude Oil Production
2019 2020 2021
1.8
2.0
2.2
2.4
2.6
2.8
Jan Mar May Jul Sep Nov Jan
mb/dIran Crude Oil Production
2019 2020 2021
Oil Market Report Supply
Page | 21 12 August 2021 IEA
. All
right
s re
serv
ed.
reopening wells and carrying out maintenance in its vast Orinoco Belt, but a lack of diluent for crude blending appears to have set things back during July.
TotalEnergies and Equinor have meanwhile divested their shares in the Petrocedeno joint venture due to its high carbon intensity. The transfer of their respective 30% and 10% shares in Petrocedeno to a unit of PDVSA will give the state 100% control. The project includes the Junin oil field in the Orinoco Belt and an upgrader that blends the extra-heavy crude into lighter crude. It has been running at a small fraction of its 200 kb/d capacity due to a shortfall of diluents to mix with the heavy crude.
Mexican crude supply held steady at 1.7 mb/d in July (+70 kb/d y-o-y). Total supply of 1.9 mb/d was around 50 kb/d below pre-pandemic levels. Output from offshore priority fields is ramping up to offset declines from mature acreage such as the Ku-Maloob-Zaap fields, but these still account for over 30% of Mexican output. Mexico looks unlikely to meet its government set production target of 2 mb/d anytime soon. Crude supply is forecast to average just below 1.7 mb/d in 2021 and 2022, and at the July OPEC+ meeting Mexico stated its aim to average 1.753 mb/d until end 2022.
Easing maintenance boosts non-OPEC+ In July it is estimated that non-OPEC+ supply rose to 47.4 mb/d, up 960 mb/d m-o-m (+1.3 mb/d y-o-y), on the completion of turnarounds in Canada and the North Sea. That was still 480 kb/d below pre-pandemic flows of 47.8 mb/d. Some of the major producers have returned output to early 2020 levels but for many, particularly the US, the revival has some way to go.
OPEC+ Crude Oil Production1
(million barrels per day)
Jun 2021 Jul 2021 July Jul 2021 Aug 2021 Sep 2021 Sustainable Spare CapSupply Supply Compliance Target Target Target Capacity2 vs Jul
Algeria 0.90 0.91 101% 0.91 0.92 0.93 1.01 0.10Angola 1.07 1.10 203% 1.32 1.33 1.35 1.21 0.11Congo 0.27 0.27 125% 0.28 0.28 0.29 0.31 0.04Equatorial Guinea 0.11 0.10 159% 0.11 0.11 0.11 0.12 0.02Gabon 0.18 0.18 27% 0.16 0.16 0.17 0.21 0.03Iraq 3.93 3.97 107% 4.02 4.06 4.11 4.92 0.95Kuwait 2.38 2.42 101% 2.43 2.45 2.48 2.94 0.52Nigeria 1.31 1.32 204% 1.58 1.60 1.61 1.74 0.42Saudi Arabia 8.92 9.46 102% 9.50 9.60 9.70 12.14 2.68UAE 2.68 2.72 103% 2.74 2.77 2.80 3.83 1.11Total OPEC 10 21.75 22.45 116% 23.03 23.29 23.54 28.42 5.97
Iran3 2.45 2.50 3.80 1.30Libya3 1.17 1.18 1.18 0.00Venezuela3 0.59 0.55 0.58 0.03Total OPEC 25.96 26.68 33.99 7.30Azerbaijan 0.61 0.61 114% 0.62 0.63 0.63 0.66 0.05Kazakhstan 1.51 1.53 78% 1.48 1.49 1.51 1.65 0.12Mexico4 1.69 1.68 1.75 1.75 1.75 1.68 0.00Oman 0.74 0.75 110% 0.76 0.77 0.78 0.87 0.12Russia 9.54 9.58 95% 9.50 9.60 9.70 10.40 0.82Others5 0.91 0.87 159% 0.96 0.97 0.98 0.97 0.11Total Non-OPEC 15.00 15.00 99% 15.06 15.20 15.35 16.23 1.24Total OPEC+ 40.96 41.68 110% 38.09 38.49 38.89 50.22 8.541 Excludes condensates. 4 Mexico only cut production in May and June 2020.2 Capacity levels can be reached within 90 days and sustained for an extended period. 5 Bahrain, Brunei, Malaysia, Sudan and South Sudan.3 Iran, Libya, Venezuela exempt from cuts.
Oil Market Report Supply
Page | 22 12 August 2021 IEA
. All
right
s re
serv
ed.
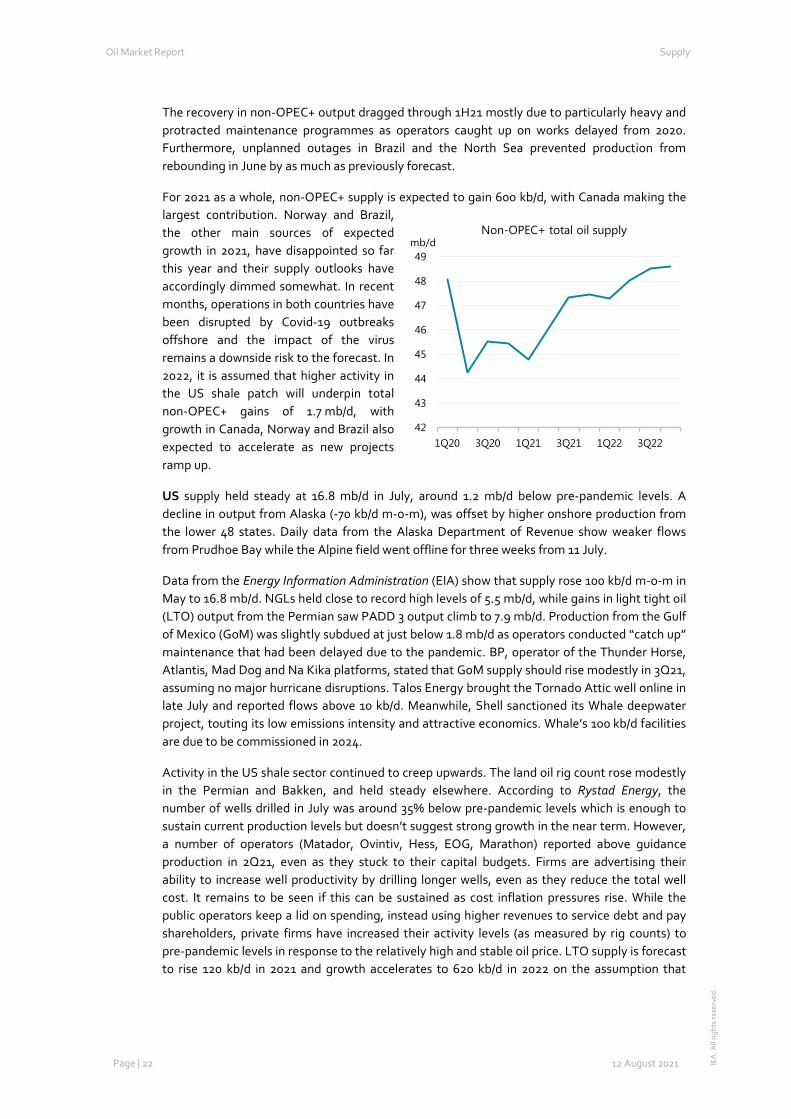
The recovery in non-OPEC+ output dragged through 1H21 mostly due to particularly heavy and protracted maintenance programmes as operators caught up on works delayed from 2020. Furthermore, unplanned outages in Brazil and the North Sea prevented production from rebounding in June by as much as previously forecast.
For 2021 as a whole, non-OPEC+ supply is expected to gain 600 kb/d, with Canada making the largest contribution. Norway and Brazil, the other main sources of expected growth in 2021, have disappointed so far this year and their supply outlooks have accordingly dimmed somewhat. In recent months, operations in both countries have been disrupted by Covid-19 outbreaks offshore and the impact of the virus remains a downside risk to the forecast. In 2022, it is assumed that higher activity in the US shale patch will underpin total non-OPEC+ gains of 1.7 mb/d, with growth in Canada, Norway and Brazil also expected to accelerate as new projects ramp up.
US supply held steady at 16.8 mb/d in July, around 1.2 mb/d below pre-pandemic levels. A decline in output from Alaska (-70 kb/d m-o-m), was offset by higher onshore production from the lower 48 states. Daily data from the Alaska Department of Revenue show weaker flows from Prudhoe Bay while the Alpine field went offline for three weeks from 11 July.
Data from the Energy Information Administration (EIA) show that supply rose 100 kb/d m-o-m in May to 16.8 mb/d. NGLs held close to record high levels of 5.5 mb/d, while gains in light tight oil (LTO) output from the Permian saw PADD 3 output climb to 7.9 mb/d. Production from the Gulf of Mexico (GoM) was slightly subdued at just below 1.8 mb/d as operators conducted “catch up” maintenance that had been delayed due to the pandemic. BP, operator of the Thunder Horse, Atlantis, Mad Dog and Na Kika platforms, stated that GoM supply should rise modestly in 3Q21, assuming no major hurricane disruptions. Talos Energy brought the Tornado Attic well online in late July and reported flows above 10 kb/d. Meanwhile, Shell sanctioned its Whale deepwater project, touting its low emissions intensity and attractive economics. Whale’s 100 kb/d facilities are due to be commissioned in 2024.
Activity in the US shale sector continued to creep upwards. The land oil rig count rose modestly in the Permian and Bakken, and held steady elsewhere. According to Rystad Energy, the number of wells drilled in July was around 35% below pre-pandemic levels which is enough to sustain current production levels but doesn’t suggest strong growth in the near term. However, a number of operators (Matador, Ovintiv, Hess, EOG, Marathon) reported above guidance production in 2Q21, even as they stuck to their capital budgets. Firms are advertising their ability to increase well productivity by drilling longer wells, even as they reduce the total well cost. It remains to be seen if this can be sustained as cost inflation pressures rise. While the public operators keep a lid on spending, instead using higher revenues to service debt and pay shareholders, private firms have increased their activity levels (as measured by rig counts) to pre-pandemic levels in response to the relatively high and stable oil price. LTO supply is forecast to rise 120 kb/d in 2021 and growth accelerates to 620 kb/d in 2022 on the assumption that
42
43
44
45
46
47
48
49
1Q20 3Q20 1Q21 3Q21 1Q22 3Q22
mb/dNon-OPEC+ total oil supply
Oil Market Report Supply
Page | 23 12 August 2021 IEA
. All
right
s re
serv
ed.
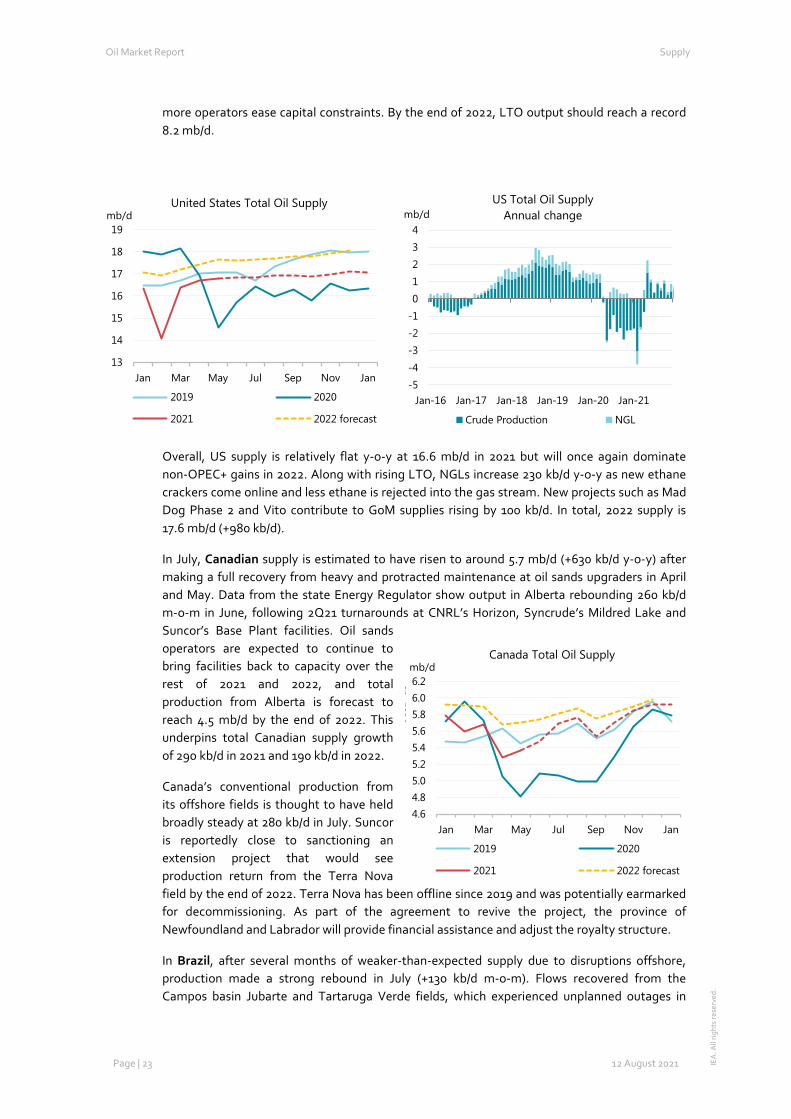
more operators ease capital constraints. By the end of 2022, LTO output should reach a record 8.2 mb/d.
Overall, US supply is relatively flat y-o-y at 16.6 mb/d in 2021 but will once again dominate non-OPEC+ gains in 2022. Along with rising LTO, NGLs increase 230 kb/d y-o-y as new ethane crackers come online and less ethane is rejected into the gas stream. New projects such as Mad Dog Phase 2 and Vito contribute to GoM supplies rising by 100 kb/d. In total, 2022 supply is 17.6 mb/d (+980 kb/d).
In July, Canadian supply is estimated to have risen to around 5.7 mb/d (+630 kb/d y-o-y) after making a full recovery from heavy and protracted maintenance at oil sands upgraders in April and May. Data from the state Energy Regulator show output in Alberta rebounding 260 kb/d m-o-m in June, following 2Q21 turnarounds at CNRL’s Horizon, Syncrude’s Mildred Lake and Suncor’s Base Plant facilities. Oil sands operators are expected to continue to bring facilities back to capacity over the rest of 2021 and 2022, and total production from Alberta is forecast to reach 4.5 mb/d by the end of 2022. This underpins total Canadian supply growth of 290 kb/d in 2021 and 190 kb/d in 2022.
Canada’s conventional production from its offshore fields is thought to have held broadly steady at 280 kb/d in July. Suncor is reportedly close to sanctioning an extension project that would see production return from the Terra Nova field by the end of 2022. Terra Nova has been offline since 2019 and was potentially earmarked for decommissioning. As part of the agreement to revive the project, the province of Newfoundland and Labrador will provide financial assistance and adjust the royalty structure.
In Brazil, after several months of weaker-than-expected supply due to disruptions offshore, production made a strong rebound in July (+130 kb/d m-o-m). Flows recovered from the Campos basin Jubarte and Tartaruga Verde fields, which experienced unplanned outages in
13
14
15
16
17
18
19
Jan Mar May Jul Sep Nov Jan
mb/dUnited States Total Oil Supply
2019 2020
2021 2022 forecast
-5-4-3-2-101234
Jan-16 Jan-17 Jan-18 Jan-19 Jan-20 Jan-21
mb/dUS Total Oil Supply
Annual change
Crude Production NGL
4.64.85.05.25.45.65.86.06.2
Jan Mar May Jul Sep Nov Jan
mb/d
ousa
ds
Canada Total Oil Supply
2019 2020
2021 2022 forecast
Oil Market Report Supply
Page | 24 12 August 2021 IEA
. All
right
s re
serv
ed.
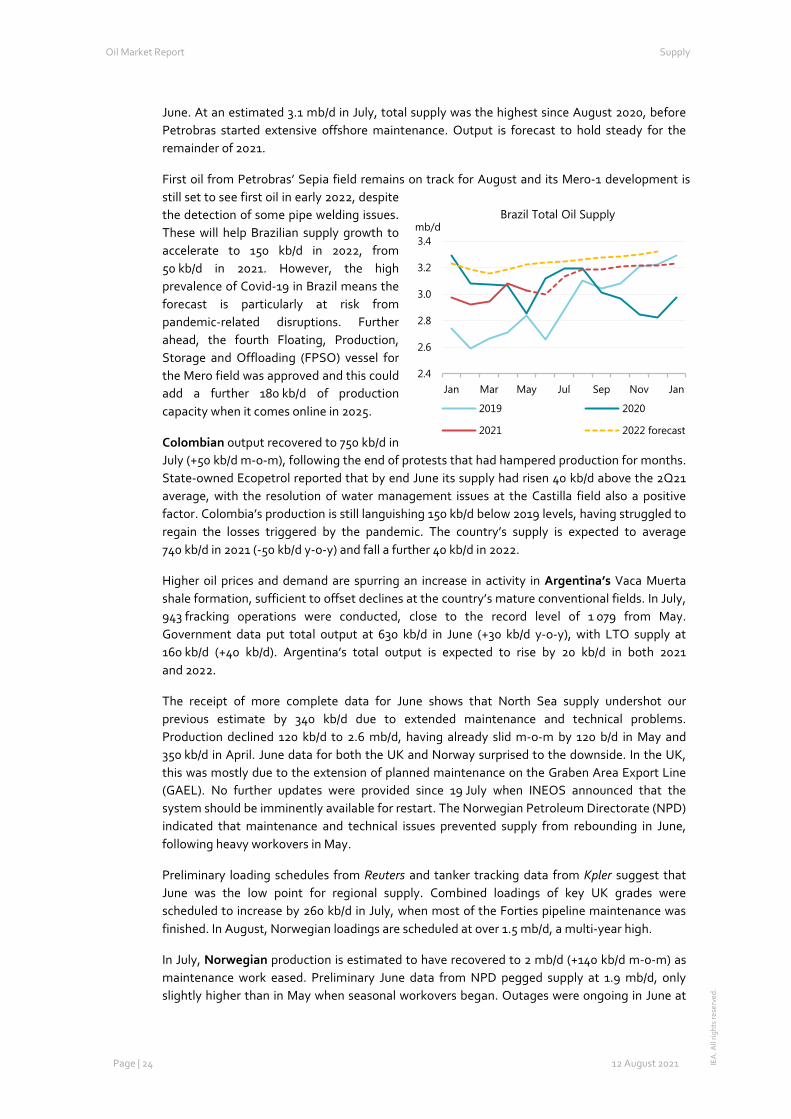
June. At an estimated 3.1 mb/d in July, total supply was the highest since August 2020, before Petrobras started extensive offshore maintenance. Output is forecast to hold steady for the remainder of 2021.
First oil from Petrobras’ Sepia field remains on track for August and its Mero-1 development is still set to see first oil in early 2022, despite the detection of some pipe welding issues. These will help Brazilian supply growth to accelerate to 150 kb/d in 2022, from 50 kb/d in 2021. However, the high prevalence of Covid-19 in Brazil means the forecast is particularly at risk from pandemic-related disruptions. Further ahead, the fourth Floating, Production, Storage and Offloading (FPSO) vessel for the Mero field was approved and this could add a further 180 kb/d of production capacity when it comes online in 2025.
Colombian output recovered to 750 kb/d in July (+50 kb/d m-o-m), following the end of protests that had hampered production for months. State-owned Ecopetrol reported that by end June its supply had risen 40 kb/d above the 2Q21 average, with the resolution of water management issues at the Castilla field also a positive factor. Colombia’s production is still languishing 150 kb/d below 2019 levels, having struggled to regain the losses triggered by the pandemic. The country’s supply is expected to average 740 kb/d in 2021 (-50 kb/d y-o-y) and fall a further 40 kb/d in 2022.
Higher oil prices and demand are spurring an increase in activity in Argentina’s Vaca Muerta shale formation, sufficient to offset declines at the country’s mature conventional fields. In July, 943 fracking operations were conducted, close to the record level of 1 079 from May. Government data put total output at 630 kb/d in June (+30 kb/d y-o-y), with LTO supply at 160 kb/d (+40 kb/d). Argentina’s total output is expected to rise by 20 kb/d in both 2021 and 2022.
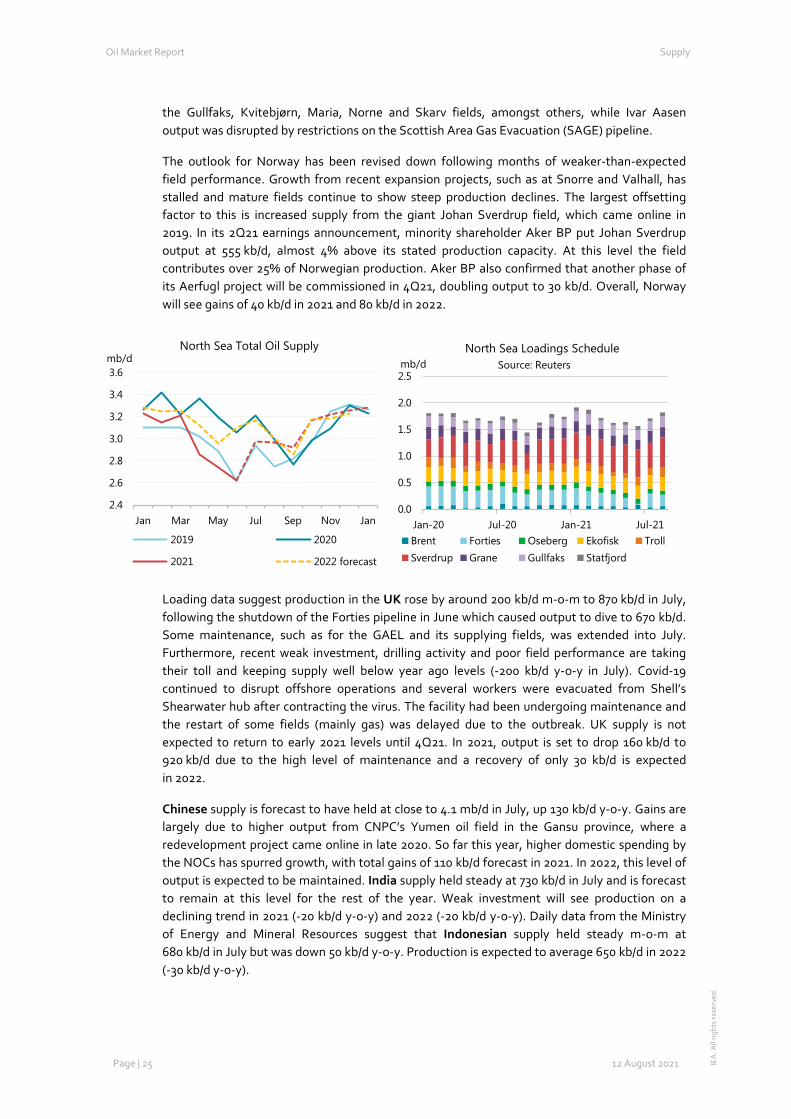
The receipt of more complete data for June shows that North Sea supply undershot our previous estimate by 340 kb/d due to extended maintenance and technical problems. Production declined 120 kb/d to 2.6 mb/d, having already slid m-o-m by 120 b/d in May and 350 kb/d in April. June data for both the UK and Norway surprised to the downside. In the UK, this was mostly due to the extension of planned maintenance on the Graben Area Export Line (GAEL). No further updates were provided since 19 July when INEOS announced that the system should be imminently available for restart. The Norwegian Petroleum Directorate (NPD) indicated that maintenance and technical issues prevented supply from rebounding in June, following heavy workovers in May.
Preliminary loading schedules from Reuters and tanker tracking data from Kpler suggest that June was the low point for regional supply. Combined loadings of key UK grades were scheduled to increase by 260 kb/d in July, when most of the Forties pipeline maintenance was finished. In August, Norwegian loadings are scheduled at over 1.5 mb/d, a multi-year high.
In July, Norwegian production is estimated to have recovered to 2 mb/d (+140 kb/d m-o-m) as maintenance work eased. Preliminary June data from NPD pegged supply at 1.9 mb/d, only slightly higher than in May when seasonal workovers began. Outages were ongoing in June at
2.4
2.6
2.8
3.0
3.2
3.4
Jan Mar May Jul Sep Nov Jan
mb/dBrazil Total Oil Supply
2019 2020
2021 2022 forecast
Oil Market Report Supply
Page | 25 12 August 2021 IEA
. All
right
s re
serv
ed.
the Gullfaks, Kvitebjørn, Maria, Norne and Skarv fields, amongst others, while Ivar Aasen output was disrupted by restrictions on the Scottish Area Gas Evacuation (SAGE) pipeline.
The outlook for Norway has been revised down following months of weaker-than-expected field performance. Growth from recent expansion projects, such as at Snorre and Valhall, has stalled and mature fields continue to show steep production declines. The largest offsetting factor to this is increased supply from the giant Johan Sverdrup field, which came online in 2019. In its 2Q21 earnings announcement, minority shareholder Aker BP put Johan Sverdrup output at 555 kb/d, almost 4% above its stated production capacity. At this level the field contributes over 25% of Norwegian production. Aker BP also confirmed that another phase of its Aerfugl project will be commissioned in 4Q21, doubling output to 30 kb/d. Overall, Norway will see gains of 40 kb/d in 2021 and 80 kb/d in 2022.
Loading data suggest production in the UK rose by around 200 kb/d m-o-m to 870 kb/d in July, following the shutdown of the Forties pipeline in June which caused output to dive to 670 kb/d. Some maintenance, such as for the GAEL and its supplying fields, was extended into July. Furthermore, recent weak investment, drilling activity and poor field performance are taking their toll and keeping supply well below year ago levels (-200 kb/d y-o-y in July). Covid-19 continued to disrupt offshore operations and several workers were evacuated from Shell’s Shearwater hub after contracting the virus. The facility had been undergoing maintenance and the restart of some fields (mainly gas) was delayed due to the outbreak. UK supply is not expected to return to early 2021 levels until 4Q21. In 2021, output is set to drop 160 kb/d to 920 kb/d due to the high level of maintenance and a recovery of only 30 kb/d is expected in 2022.
Chinese supply is forecast to have held at close to 4.1 mb/d in July, up 130 kb/d y-o-y. Gains are largely due to higher output from CNPC’s Yumen oil field in the Gansu province, where a redevelopment project came online in late 2020. So far this year, higher domestic spending by the NOCs has spurred growth, with total gains of 110 kb/d forecast in 2021. In 2022, this level of output is expected to be maintained. India supply held steady at 730 kb/d in July and is forecast to remain at this level for the rest of the year. Weak investment will see production on a declining trend in 2021 (-20 kb/d y-o-y) and 2022 (-20 kb/d y-o-y). Daily data from the Ministry of Energy and Mineral Resources suggest that Indonesian supply held steady m-o-m at 680 kb/d in July but was down 50 kb/d y-o-y. Production is expected to average 650 kb/d in 2022 (-30 kb/d y-o-y).
2.4
2.6
2.8
3.0
3.2
3.4
3.6
Jan Mar May Jul Sep Nov Jan
mb/dNorth Sea Total Oil Supply
2019 2020
2021 2022 forecast
0.0
0.5
1.0
1.5
2.0
2.5
Jan-20 Jul-20 Jan-21 Jul-21
mb/dNorth Sea Loadings Schedule
Brent Forties Oseberg Ekofisk TrollSverdrup Grane Gullfaks Statfjord
Source: Reuters
Oil Market Report Refining
Page | 26 12 August 2021 IEA
. All
right
s re
serv
ed.
Refining Overview
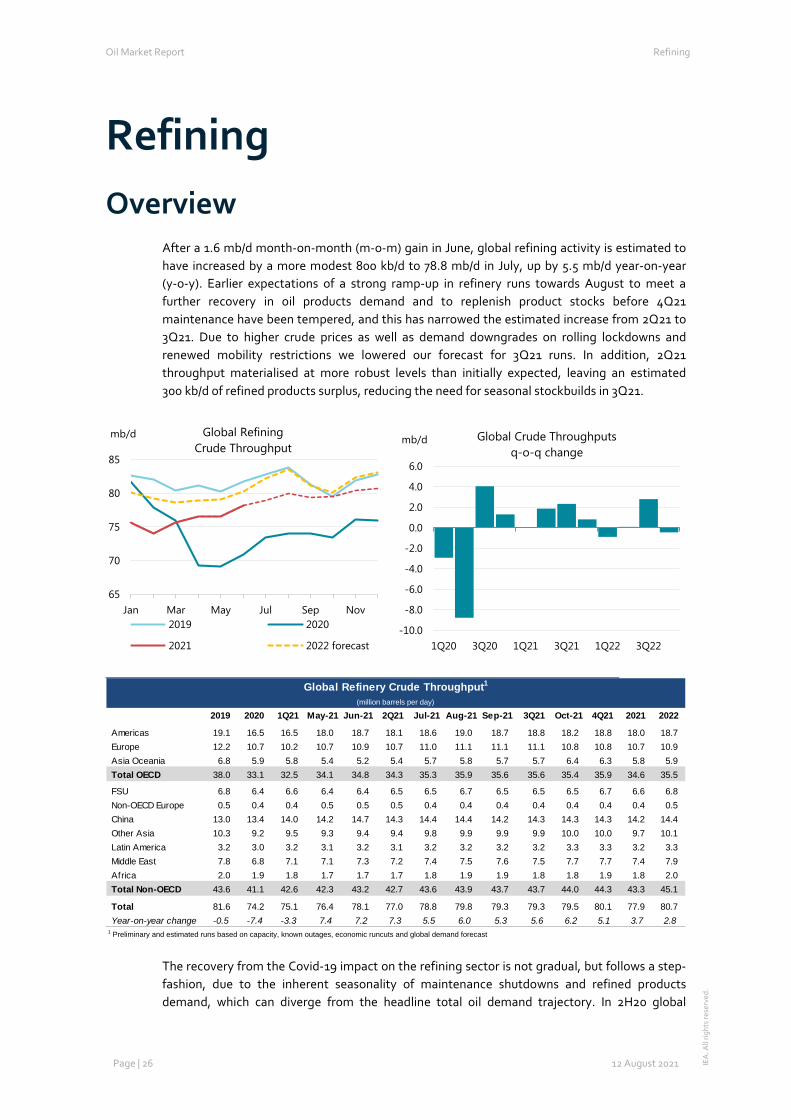
After a 1.6 mb/d month-on-month (m-o-m) gain in June, global refining activity is estimated to have increased by a more modest 800 kb/d to 78.8 mb/d in July, up by 5.5 mb/d year-on-year (y-o-y). Earlier expectations of a strong ramp-up in refinery runs towards August to meet a further recovery in oil products demand and to replenish product stocks before 4Q21 maintenance have been tempered, and this has narrowed the estimated increase from 2Q21 to 3Q21. Due to higher crude prices as well as demand downgrades on rolling lockdowns and renewed mobility restrictions we lowered our forecast for 3Q21 runs. In addition, 2Q21 throughput materialised at more robust levels than initially expected, leaving an estimated 300 kb/d of refined products surplus, reducing the need for seasonal stockbuilds in 3Q21.
The recovery from the Covid-19 impact on the refining sector is not gradual, but follows a step-fashion, due to the inherent seasonality of maintenance shutdowns and refined products demand, which can diverge from the headline total oil demand trajectory. In 2H20 global
65
70
75
80
85
Jan Mar May Jul Sep Nov
mb/d Global RefiningCrude Throughput
2019 2020
2021 2022 forecast-10.0
-8.0
-6.0
-4.0
-2.0
0.0
2.0
4.0
6.0
1Q20 3Q20 1Q21 3Q21 1Q22 3Q22
mb/d Global Crude Throughputsq-o-q change
Global Refinery Crude Throughput1
(million barrels per day)
2019 2020 1Q21 May-21 Jun-21 2Q21 Jul-21 Aug-21 Sep-21 3Q21 Oct-21 4Q21 2021 2022
Americas 19.1 16.5 16.5 18.0 18.7 18.1 18.6 19.0 18.7 18.8 18.2 18.8 18.0 18.7 Europe 12.2 10.7 10.2 10.7 10.9 10.7 11.0 11.1 11.1 11.1 10.8 10.8 10.7 10.9 Asia Oceania 6.8 5.9 5.8 5.4 5.2 5.4 5.7 5.8 5.7 5.7 6.4 6.3 5.8 5.9 Total OECD 38.0 33.1 32.5 34.1 34.8 34.3 35.3 35.9 35.6 35.6 35.4 35.9 34.6 35.5
FSU 6.8 6.4 6.6 6.4 6.4 6.5 6.5 6.7 6.5 6.5 6.5 6.7 6.6 6.8 Non-OECD Europe 0.5 0.4 0.4 0.5 0.5 0.5 0.4 0.4 0.4 0.4 0.4 0.4 0.4 0.5 China 13.0 13.4 14.0 14.2 14.7 14.3 14.4 14.4 14.2 14.3 14.3 14.3 14.2 14.4 Other Asia 10.3 9.2 9.5 9.3 9.4 9.4 9.8 9.9 9.9 9.9 10.0 10.0 9.7 10.1 Latin America 3.2 3.0 3.2 3.1 3.2 3.1 3.2 3.2 3.2 3.2 3.3 3.3 3.2 3.3 Middle East 7.8 6.8 7.1 7.1 7.3 7.2 7.4 7.5 7.6 7.5 7.7 7.7 7.4 7.9 Africa 2.0 1.9 1.8 1.7 1.7 1.7 1.8 1.9 1.9 1.8 1.8 1.9 1.8 2.0 Total Non-OECD 43.6 41.1 42.6 42.3 43.2 42.7 43.6 43.9 43.7 43.7 44.0 44.3 43.3 45.1
Total 81.6 74.2 75.1 76.4 78.1 77.0 78.8 79.8 79.3 79.3 79.5 80.1 77.9 80.7 Year-on-year change -0.5 -7.4 -3.3 7.4 7.2 7.3 5.5 6.0 5.3 5.6 6.2 5.1 3.7 2.8
1 Preliminary and estimated runs based on capacity, known outages, economic runcuts and global demand forecast
Oil Market Report Refining
Page | 27 12 August 2021 IEA
. All
right
s re
serv
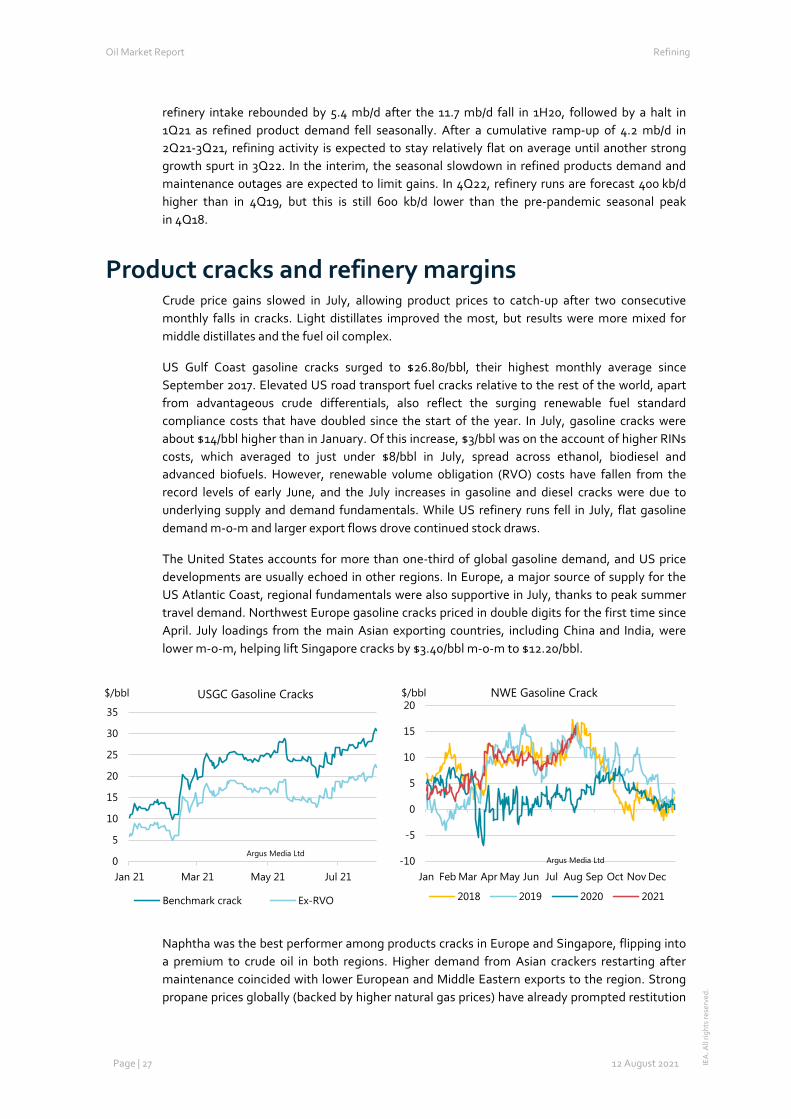
ed.
refinery intake rebounded by 5.4 mb/d after the 11.7 mb/d fall in 1H20, followed by a halt in 1Q21 as refined product demand fell seasonally. After a cumulative ramp-up of 4.2 mb/d in 2Q21-3Q21, refining activity is expected to stay relatively flat on average until another strong growth spurt in 3Q22. In the interim, the seasonal slowdown in refined products demand and maintenance outages are expected to limit gains. In 4Q22, refinery runs are forecast 400 kb/d higher than in 4Q19, but this is still 600 kb/d lower than the pre-pandemic seasonal peak in 4Q18.
Product cracks and refinery margins Crude price gains slowed in July, allowing product prices to catch-up after two consecutive monthly falls in cracks. Light distillates improved the most, but results were more mixed for middle distillates and the fuel oil complex.
US Gulf Coast gasoline cracks surged to $26.80/bbl, their highest monthly average since September 2017. Elevated US road transport fuel cracks relative to the rest of the world, apart from advantageous crude differentials, also reflect the surging renewable fuel standard compliance costs that have doubled since the start of the year. In July, gasoline cracks were about $14/bbl higher than in January. Of this increase, $3/bbl was on the account of higher RINs costs, which averaged to just under $8/bbl in July, spread across ethanol, biodiesel and advanced biofuels. However, renewable volume obligation (RVO) costs have fallen from the record levels of early June, and the July increases in gasoline and diesel cracks were due to underlying supply and demand fundamentals. While US refinery runs fell in July, flat gasoline demand m-o-m and larger export flows drove continued stock draws.
The United States accounts for more than one-third of global gasoline demand, and US price developments are usually echoed in other regions. In Europe, a major source of supply for the US Atlantic Coast, regional fundamentals were also supportive in July, thanks to peak summer travel demand. Northwest Europe gasoline cracks priced in double digits for the first time since April. July loadings from the main Asian exporting countries, including China and India, were lower m-o-m, helping lift Singapore cracks by $3.40/bbl m-o-m to $12.20/bbl.
Naphtha was the best performer among products cracks in Europe and Singapore, flipping into a premium to crude oil in both regions. Higher demand from Asian crackers restarting after maintenance coincided with lower European and Middle Eastern exports to the region. Strong propane prices globally (backed by higher natural gas prices) have already prompted restitution
0
5
10
15
20
25
30
35
Jan 21 Mar 21 May 21 Jul 21
$/bbl USGC Gasoline Cracks
Benchmark crack Ex-RVO
Argus Media Ltd-10
-5
0
5
10
15
20
Jan Feb Mar Apr May Jun Jul Aug Sep Oct Nov Dec
$/bbl NWE Gasoline Crack
2018 2019 2020 2021
Argus Media Ltd
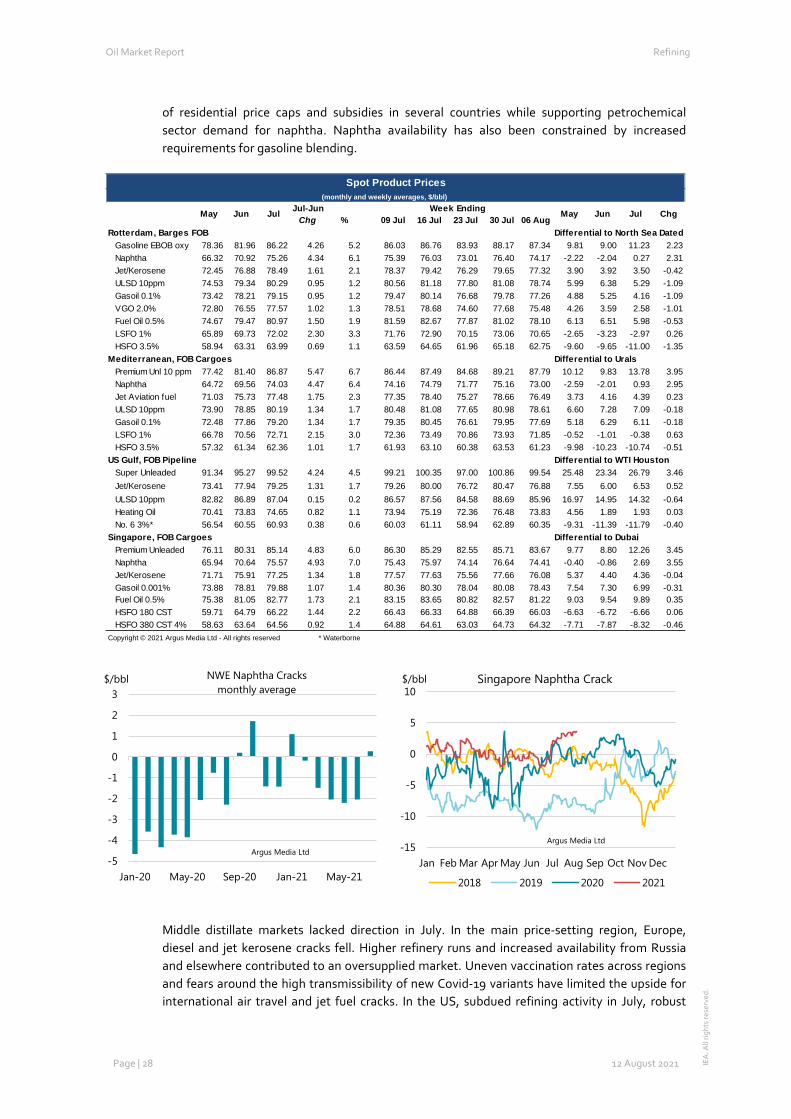
Oil Market Report Refining
Page | 28 12 August 2021 IEA
. All
right
s re
serv
ed.
of residential price caps and subsidies in several countries while supporting petrochemical sector demand for naphtha. Naphtha availability has also been constrained by increased requirements for gasoline blending.
Middle distillate markets lacked direction in July. In the main price-setting region, Europe, diesel and jet kerosene cracks fell. Higher refinery runs and increased availability from Russia and elsewhere contributed to an oversupplied market. Uneven vaccination rates across regions and fears around the high transmissibility of new Covid-19 variants have limited the upside for international air travel and jet fuel cracks. In the US, subdued refining activity in July, robust
Jul-Jun Week EndingChg % 09 Jul 16 Jul 23 Jul 30 Jul 06 Aug
Rotterdam, Barges FOB Differential to North Sea DatedGasoline EBOB oxy 78.36 81.96 86.22 4.26 5.2 86.03 86.76 83.93 88.17 87.34 9.81 9.00 11.23 2.23Naphtha 66.32 70.92 75.26 4.34 6.1 75.39 76.03 73.01 76.40 74.17 -2.22 -2.04 0.27 2.31Jet/Kerosene 72.45 76.88 78.49 1.61 2.1 78.37 79.42 76.29 79.65 77.32 3.90 3.92 3.50 -0.42ULSD 10ppm 74.53 79.34 80.29 0.95 1.2 80.56 81.18 77.80 81.08 78.74 5.99 6.38 5.29 -1.09Gasoil 0.1% 73.42 78.21 79.15 0.95 1.2 79.47 80.14 76.68 79.78 77.26 4.88 5.25 4.16 -1.09VGO 2.0% 72.80 76.55 77.57 1.02 1.3 78.51 78.68 74.60 77.68 75.48 4.26 3.59 2.58 -1.01Fuel Oil 0.5% 74.67 79.47 80.97 1.50 1.9 81.59 82.67 77.87 81.02 78.10 6.13 6.51 5.98 -0.53LSFO 1% 65.89 69.73 72.02 2.30 3.3 71.76 72.90 70.15 73.06 70.65 -2.65 -3.23 -2.97 0.26HSFO 3.5% 58.94 63.31 63.99 0.69 1.1 63.59 64.65 61.96 65.18 62.75 -9.60 -9.65 -11.00 -1.35
Mediterranean, FOB Cargoes Differential to UralsPremium Unl 10 ppm 77.42 81.40 86.87 5.47 6.7 86.44 87.49 84.68 89.21 87.79 10.12 9.83 13.78 3.95Naphtha 64.72 69.56 74.03 4.47 6.4 74.16 74.79 71.77 75.16 73.00 -2.59 -2.01 0.93 2.95Jet Aviation fuel 71.03 75.73 77.48 1.75 2.3 77.35 78.40 75.27 78.66 76.49 3.73 4.16 4.39 0.23ULSD 10ppm 73.90 78.85 80.19 1.34 1.7 80.48 81.08 77.65 80.98 78.61 6.60 7.28 7.09 -0.18Gasoil 0.1% 72.48 77.86 79.20 1.34 1.7 79.35 80.45 76.61 79.95 77.69 5.18 6.29 6.11 -0.18LSFO 1% 66.78 70.56 72.71 2.15 3.0 72.36 73.49 70.86 73.93 71.85 -0.52 -1.01 -0.38 0.63HSFO 3.5% 57.32 61.34 62.36 1.01 1.7 61.93 63.10 60.38 63.53 61.23 -9.98 -10.23 -10.74 -0.51
US Gulf, FOB Pipeline Differential to WTI HoustonSuper Unleaded 91.34 95.27 99.52 4.24 4.5 99.21 100.35 97.00 100.86 99.54 25.48 23.34 26.79 3.46Jet/Kerosene 73.41 77.94 79.25 1.31 1.7 79.26 80.00 76.72 80.47 76.88 7.55 6.00 6.53 0.52ULSD 10ppm 82.82 86.89 87.04 0.15 0.2 86.57 87.56 84.58 88.69 85.96 16.97 14.95 14.32 -0.64Heating Oil 70.41 73.83 74.65 0.82 1.1 73.94 75.19 72.36 76.48 73.83 4.56 1.89 1.93 0.03No. 6 3%* 56.54 60.55 60.93 0.38 0.6 60.03 61.11 58.94 62.89 60.35 -9.31 -11.39 -11.79 -0.40
Singapore, FOB Cargoes Differential to DubaiPremium Unleaded 76.11 80.31 85.14 4.83 6.0 86.30 85.29 82.55 85.71 83.67 9.77 8.80 12.26 3.45Naphtha 65.94 70.64 75.57 4.93 7.0 75.43 75.97 74.14 76.64 74.41 -0.40 -0.86 2.69 3.55Jet/Kerosene 71.71 75.91 77.25 1.34 1.8 77.57 77.63 75.56 77.66 76.08 5.37 4.40 4.36 -0.04Gasoil 0.001% 73.88 78.81 79.88 1.07 1.4 80.36 80.30 78.04 80.08 78.43 7.54 7.30 6.99 -0.31Fuel Oil 0.5% 75.38 81.05 82.77 1.73 2.1 83.15 83.65 80.82 82.57 81.22 9.03 9.54 9.89 0.35HSFO 180 CST 59.71 64.79 66.22 1.44 2.2 66.43 66.33 64.88 66.39 66.03 -6.63 -6.72 -6.66 0.06HSFO 380 CST 4% 58.63 63.64 64.56 0.92 1.4 64.88 64.61 63.03 64.73 64.32 -7.71 -7.87 -8.32 -0.46
Copyright © 2021 Argus Media Ltd - All rights reserved * Waterborne
Spot Product Prices(monthly and weekly averages, $/bbl)
JulMay Jun Jul May Jun Chg
-5
-4
-3
-2
-1
0
1
2
3
Jan-20 May-20 Sep-20 Jan-21 May-21
$/bbl NWE Naphtha Cracksmonthly average
Argus Media Ltd -15
-10
-5
0
5
10
Jan Feb Mar Apr May Jun Jul Aug Sep Oct Nov Dec
$/bbl Singapore Naphtha Crack
2018 2019 2020 2021
Argus Media Ltd
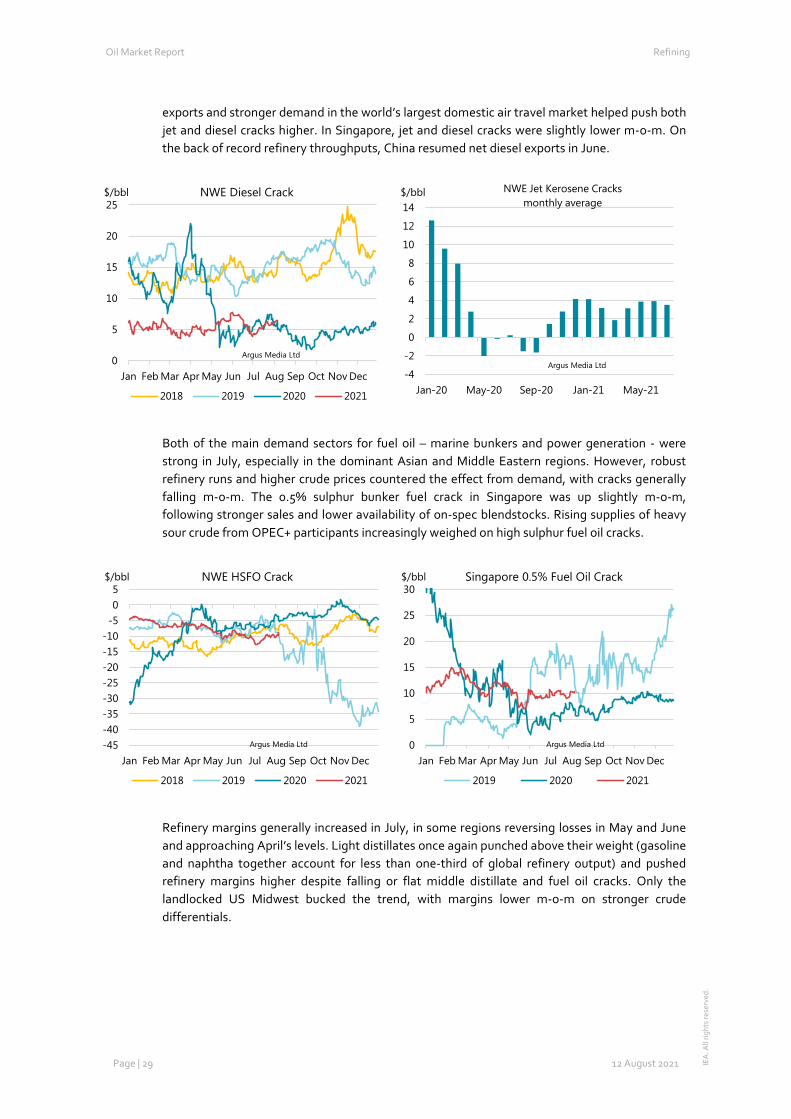
Oil Market Report Refining
Page | 29 12 August 2021 IEA
. All
right
s re
serv
ed.
exports and stronger demand in the world’s largest domestic air travel market helped push both jet and diesel cracks higher. In Singapore, jet and diesel cracks were slightly lower m-o-m. On the back of record refinery throughputs, China resumed net diesel exports in June.
Both of the main demand sectors for fuel oil – marine bunkers and power generation - were strong in July, especially in the dominant Asian and Middle Eastern regions. However, robust refinery runs and higher crude prices countered the effect from demand, with cracks generally falling m-o-m. The 0.5% sulphur bunker fuel crack in Singapore was up slightly m-o-m, following stronger sales and lower availability of on-spec blendstocks. Rising supplies of heavy sour crude from OPEC+ participants increasingly weighed on high sulphur fuel oil cracks.
Refinery margins generally increased in July, in some regions reversing losses in May and June and approaching April’s levels. Light distillates once again punched above their weight (gasoline and naphtha together account for less than one-third of global refinery output) and pushed refinery margins higher despite falling or flat middle distillate and fuel oil cracks. Only the landlocked US Midwest bucked the trend, with margins lower m-o-m on stronger crude differentials.
0
5
10
15
20
25
Jan Feb Mar Apr May Jun Jul Aug Sep Oct Nov Dec
$/bbl NWE Diesel Crack
2018 2019 2020 2021
Argus Media Ltd
-4
-2
0
2
4
6
8
10
12
14
Jan-20 May-20 Sep-20 Jan-21 May-21
$/bbl NWE Jet Kerosene Cracksmonthly average
Argus Media Ltd
-45-40-35-30-25-20-15-10-505
Jan Feb Mar Apr May Jun Jul Aug Sep Oct Nov Dec
$/bbl NWE HSFO Crack
2018 2019 2020 2021
Argus Media Ltd 0
5
10
15
20
25
30
Jan Feb Mar Apr May Jun Jul Aug Sep Oct Nov Dec
$/bbl Singapore 0.5% Fuel Oil Crack
2019 2020 2021
Argus Media Ltd
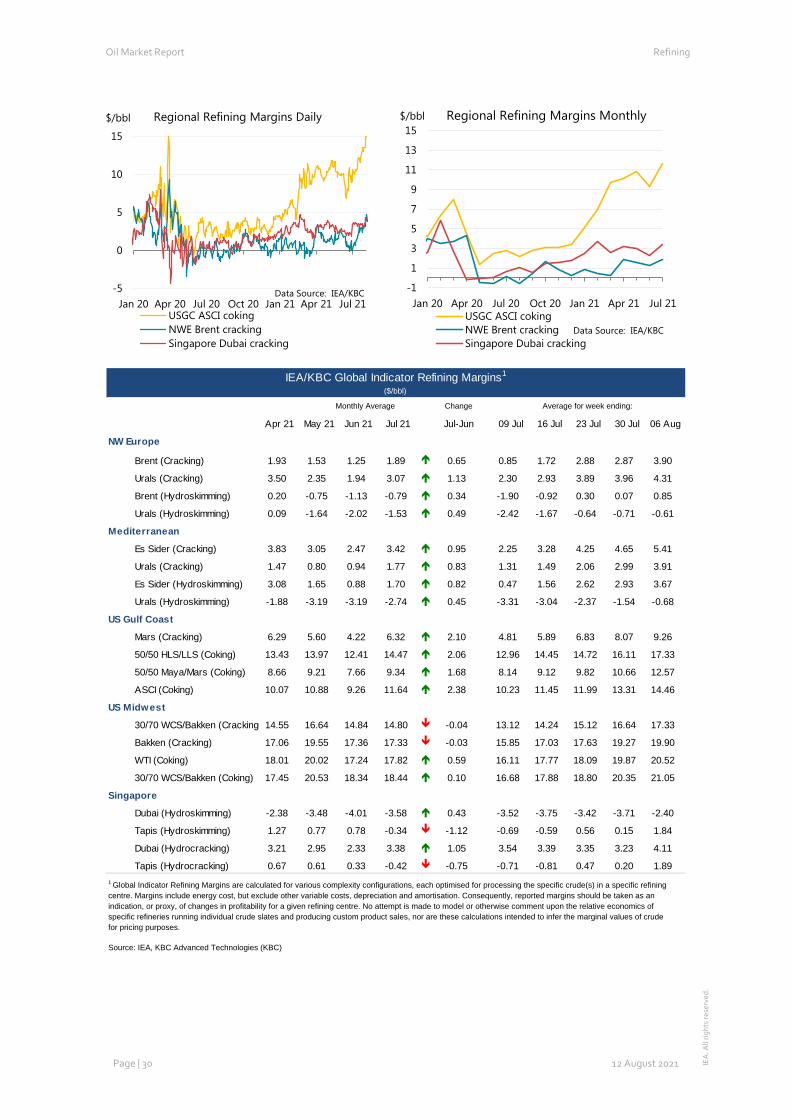
Oil Market Report Refining
Page | 30 12 August 2021 IEA
. All
right
s re
serv
ed.
-5
0
5
10
15
Jan 20 Apr 20 Jul 20 Oct 20 Jan 21 Apr 21 Jul 21
$/bbl Regional Refining Margins Daily
USGC ASCI cokingNWE Brent crackingSingapore Dubai cracking
Data Source: IEA/KBC -1
1
3
5
7
9
11
13
15
Jan 20 Apr 20 Jul 20 Oct 20 Jan 21 Apr 21 Jul 21
$/bbl Regional Refining Margins Monthly
USGC ASCI cokingNWE Brent crackingSingapore Dubai cracking
Data Source: IEA/KBC
IEA/KBC Global Indicator Refining Margins1
($/bbl)
Monthly Average Change Average for week ending:
Apr 21 May 21 Jun 21 Jul 21 Jul-Jun 09 Jul 16 Jul 23 Jul 30 Jul 06 Aug
NW Europe
Brent (Cracking) 1.93 1.53 1.25 1.89 0.65 0.85 1.72 2.88 2.87 3.90
Urals (Cracking) 3.50 2.35 1.94 3.07 1.13 2.30 2.93 3.89 3.96 4.31
Brent (Hydroskimming) 0.20 -0.75 -1.13 -0.79 0.34 -1.90 -0.92 0.30 0.07 0.85
Urals (Hydroskimming) 0.09 -1.64 -2.02 -1.53 0.49 -2.42 -1.67 -0.64 -0.71 -0.61
Mediterranean
Es Sider (Cracking) 3.83 3.05 2.47 3.42 0.95 2.25 3.28 4.25 4.65 5.41
Urals (Cracking) 1.47 0.80 0.94 1.77 0.83 1.31 1.49 2.06 2.99 3.91
Es Sider (Hydroskimming) 3.08 1.65 0.88 1.70 0.82 0.47 1.56 2.62 2.93 3.67
Urals (Hydroskimming) -1.88 -3.19 -3.19 -2.74 0.45 -3.31 -3.04 -2.37 -1.54 -0.68
US Gulf Coast
Mars (Cracking) 6.29 5.60 4.22 6.32 2.10 4.81 5.89 6.83 8.07 9.26
50/50 HLS/LLS (Coking) 13.43 13.97 12.41 14.47 2.06 12.96 14.45 14.72 16.11 17.33
50/50 Maya/Mars (Coking) 8.66 9.21 7.66 9.34 1.68 8.14 9.12 9.82 10.66 12.57
ASCI (Coking) 10.07 10.88 9.26 11.64 2.38 10.23 11.45 11.99 13.31 14.46
US Midwest
30/70 WCS/Bakken (Cracking) 14.55 16.64 14.84 14.80 -0.04 13.12 14.24 15.12 16.64 17.33
Bakken (Cracking) 17.06 19.55 17.36 17.33 -0.03 15.85 17.03 17.63 19.27 19.90
WTI (Coking) 18.01 20.02 17.24 17.82 0.59 16.11 17.77 18.09 19.87 20.52
30/70 WCS/Bakken (Coking) 17.45 20.53 18.34 18.44 0.10 16.68 17.88 18.80 20.35 21.05
Singapore
Dubai (Hydroskimming) -2.38 -3.48 -4.01 -3.58 0.43 -3.52 -3.75 -3.42 -3.71 -2.40
Tapis (Hydroskimming) 1.27 0.77 0.78 -0.34 -1.12 -0.69 -0.59 0.56 0.15 1.84
Dubai (Hydrocracking) 3.21 2.95 2.33 3.38 1.05 3.54 3.39 3.35 3.23 4.11
Tapis (Hydrocracking) 0.67 0.61 0.33 -0.42 -0.75 -0.71 -0.81 0.47 0.20 1.89 1 Global Indicator Refining Margins are calculated for various complexity configurations, each optimised for processing the specific crude(s) in a specific refining centre. Margins include energy cost, but exclude other variable costs, depreciation and amortisation. Consequently, reported margins should be taken as an indication, or proxy, of changes in profitability for a given refining centre. No attempt is made to model or otherwise comment upon the relative economics of specific refineries running individual crude slates and producing custom product sales, nor are these calculations intended to infer the marginal values of crude for pricing purposes.
Source: IEA, KBC Advanced Technologies (KBC)
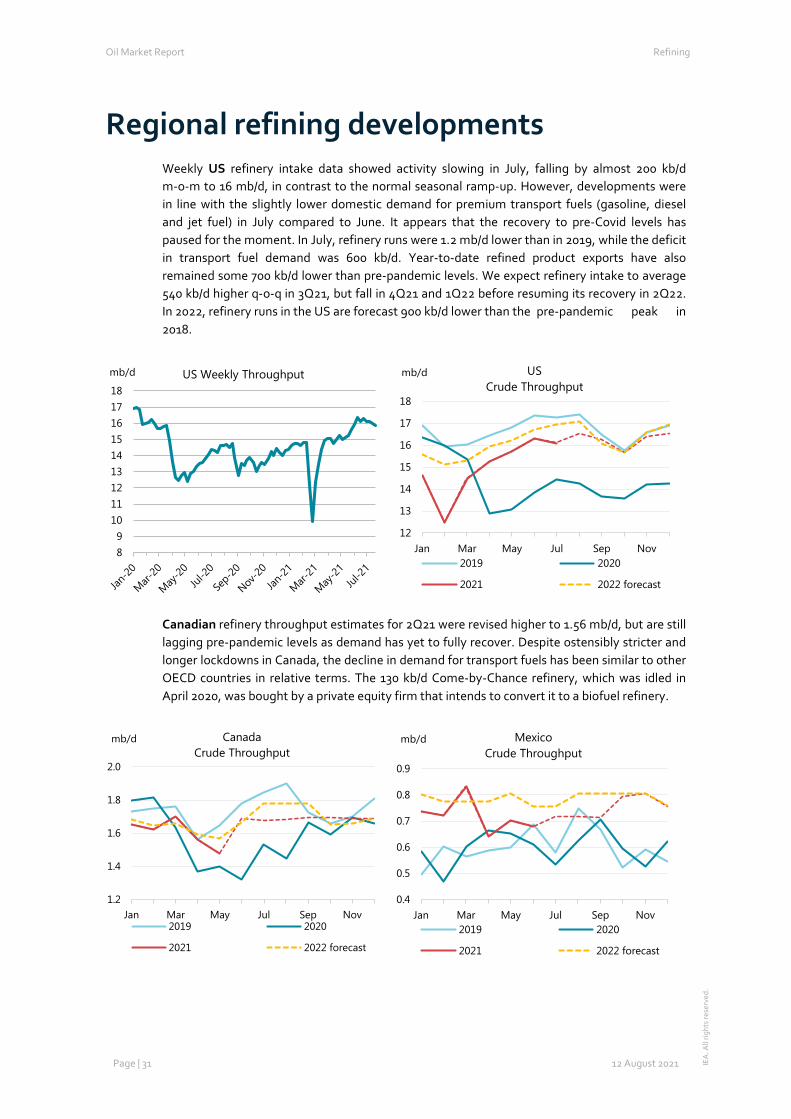
Oil Market Report Refining
Page | 31 12 August 2021 IEA
. All
right
s re
serv
ed.
Regional refining developments Weekly US refinery intake data showed activity slowing in July, falling by almost 200 kb/d m-o-m to 16 mb/d, in contrast to the normal seasonal ramp-up. However, developments were in line with the slightly lower domestic demand for premium transport fuels (gasoline, diesel and jet fuel) in July compared to June. It appears that the recovery to pre-Covid levels has paused for the moment. In July, refinery runs were 1.2 mb/d lower than in 2019, while the deficit in transport fuel demand was 600 kb/d. Year-to-date refined product exports have also remained some 700 kb/d lower than pre-pandemic levels. We expect refinery intake to average 540 kb/d higher q-o-q in 3Q21, but fall in 4Q21 and 1Q22 before resuming its recovery in 2Q22. In 2022, refinery runs in the US are forecast 900 kb/d lower than the pre-pandemic peak in 2018.
Canadian refinery throughput estimates for 2Q21 were revised higher to 1.56 mb/d, but are still lagging pre-pandemic levels as demand has yet to fully recover. Despite ostensibly stricter and longer lockdowns in Canada, the decline in demand for transport fuels has been similar to other OECD countries in relative terms. The 130 kb/d Come-by-Chance refinery, which was idled in April 2020, was bought by a private equity firm that intends to convert it to a biofuel refinery.
89
101112131415161718
mb/d US Weekly Throughput
12
13
14
15
16
17
18
Jan Mar May Jul Sep Nov
mb/d USCrude Throughput
2019 2020
2021 2022 forecast
1.2
1.4
1.6
1.8
2.0
Jan Mar May Jul Sep Nov
mb/d CanadaCrude Throughput
2019 2020
2021 2022 forecast
0.4
0.5
0.6
0.7
0.8
0.9
Jan Mar May Jul Sep Nov
mb/d MexicoCrude Throughput
2019 2020
2021 2022 forecast
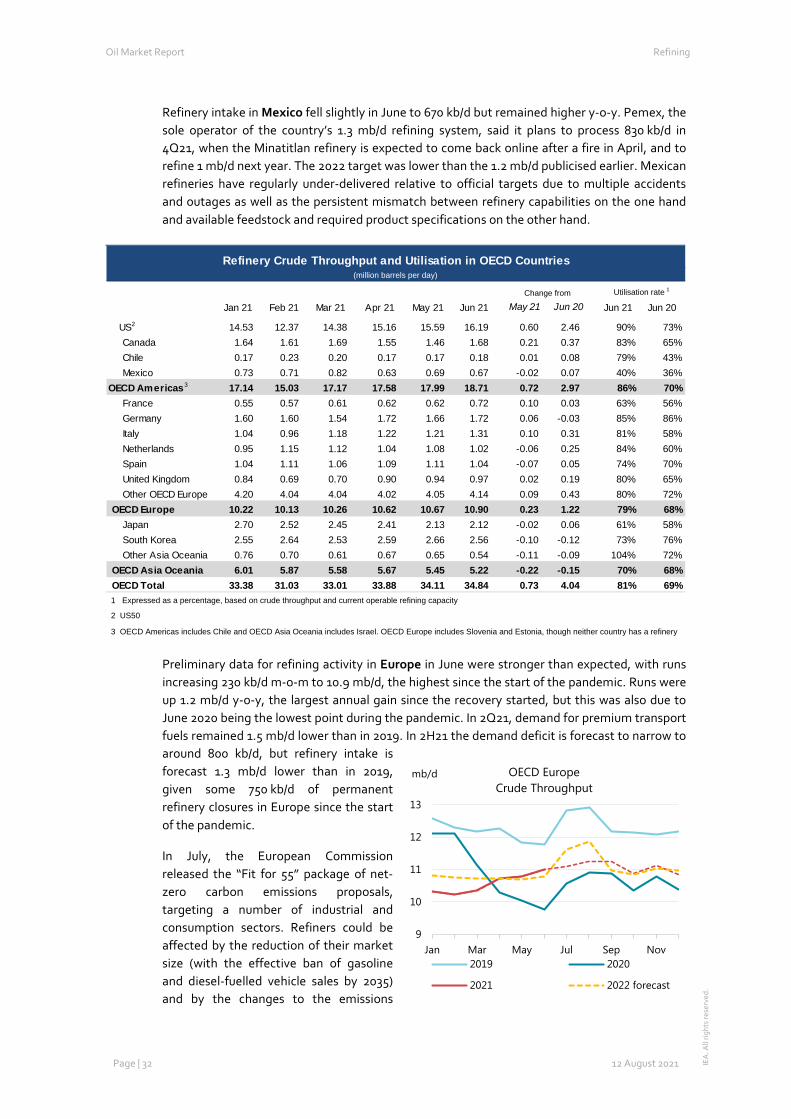
Oil Market Report Refining
Page | 32 12 August 2021 IEA
. All
right
s re
serv
ed.
Refinery intake in Mexico fell slightly in June to 670 kb/d but remained higher y-o-y. Pemex, the sole operator of the country’s 1.3 mb/d refining system, said it plans to process 830 kb/d in 4Q21, when the Minatitlan refinery is expected to come back online after a fire in April, and to refine 1 mb/d next year. The 2022 target was lower than the 1.2 mb/d publicised earlier. Mexican refineries have regularly under-delivered relative to official targets due to multiple accidents and outages as well as the persistent mismatch between refinery capabilities on the one hand and available feedstock and required product specifications on the other hand.
Preliminary data for refining activity in Europe in June were stronger than expected, with runs increasing 230 kb/d m-o-m to 10.9 mb/d, the highest since the start of the pandemic. Runs were up 1.2 mb/d y-o-y, the largest annual gain since the recovery started, but this was also due to June 2020 being the lowest point during the pandemic. In 2Q21, demand for premium transport fuels remained 1.5 mb/d lower than in 2019. In 2H21 the demand deficit is forecast to narrow to around 800 kb/d, but refinery intake is forecast 1.3 mb/d lower than in 2019, given some 750 kb/d of permanent refinery closures in Europe since the start of the pandemic.
In July, the European Commission released the “Fit for 55” package of net-zero carbon emissions proposals, targeting a number of industrial and consumption sectors. Refiners could be affected by the reduction of their market size (with the effective ban of gasoline and diesel-fuelled vehicle sales by 2035) and by the changes to the emissions
Refinery Crude Throughput and Utilisation in OECD Countries(million barrels per day)
Change from Utilisation rate 1
Jan 21 Feb 21 Mar 21 Apr 21 May 21 Jun 21 May 21 Jun 20 Jun 21 Jun 20
US2 14.53 12.37 14.38 15.16 15.59 16.19 0.60 2.46 90% 73%Canada 1.64 1.61 1.69 1.55 1.46 1.68 0.21 0.37 83% 65%Chile 0.17 0.23 0.20 0.17 0.17 0.18 0.01 0.08 79% 43%Mexico 0.73 0.71 0.82 0.63 0.69 0.67 -0.02 0.07 40% 36%
OECD Americas3 17.14 15.03 17.17 17.58 17.99 18.71 0.72 2.97 86% 70%France 0.55 0.57 0.61 0.62 0.62 0.72 0.10 0.03 63% 56%Germany 1.60 1.60 1.54 1.72 1.66 1.72 0.06 -0.03 85% 86%Italy 1.04 0.96 1.18 1.22 1.21 1.31 0.10 0.31 81% 58%Netherlands 0.95 1.15 1.12 1.04 1.08 1.02 -0.06 0.25 84% 60%Spain 1.04 1.11 1.06 1.09 1.11 1.04 -0.07 0.05 74% 70%United Kingdom 0.84 0.69 0.70 0.90 0.94 0.97 0.02 0.19 80% 65%Other OECD Europe 4.20 4.04 4.04 4.02 4.05 4.14 0.09 0.43 80% 72%
OECD Europe 10.22 10.13 10.26 10.62 10.67 10.90 0.23 1.22 79% 68%Japan 2.70 2.52 2.45 2.41 2.13 2.12 -0.02 0.06 61% 58%South Korea 2.55 2.64 2.53 2.59 2.66 2.56 -0.10 -0.12 73% 76%Other Asia Oceania 0.76 0.70 0.61 0.67 0.65 0.54 -0.11 -0.09 104% 72%
OECD Asia Oceania 6.01 5.87 5.58 5.67 5.45 5.22 -0.22 -0.15 70% 68%OECD Total 33.38 31.03 33.01 33.88 34.11 34.84 0.73 4.04 81% 69%1 Expressed as a percentage, based on crude throughput and current operable refining capacity
2 US50
3 OECD Americas includes Chile and OECD Asia Oceania includes Israel. OECD Europe includes Slovenia and Estonia, though neither country has a refinery
9
10
11
12
13
Jan Mar May Jul Sep Nov
mb/d OECD Europe Crude Throughput
2019 2020
2021 2022 forecast
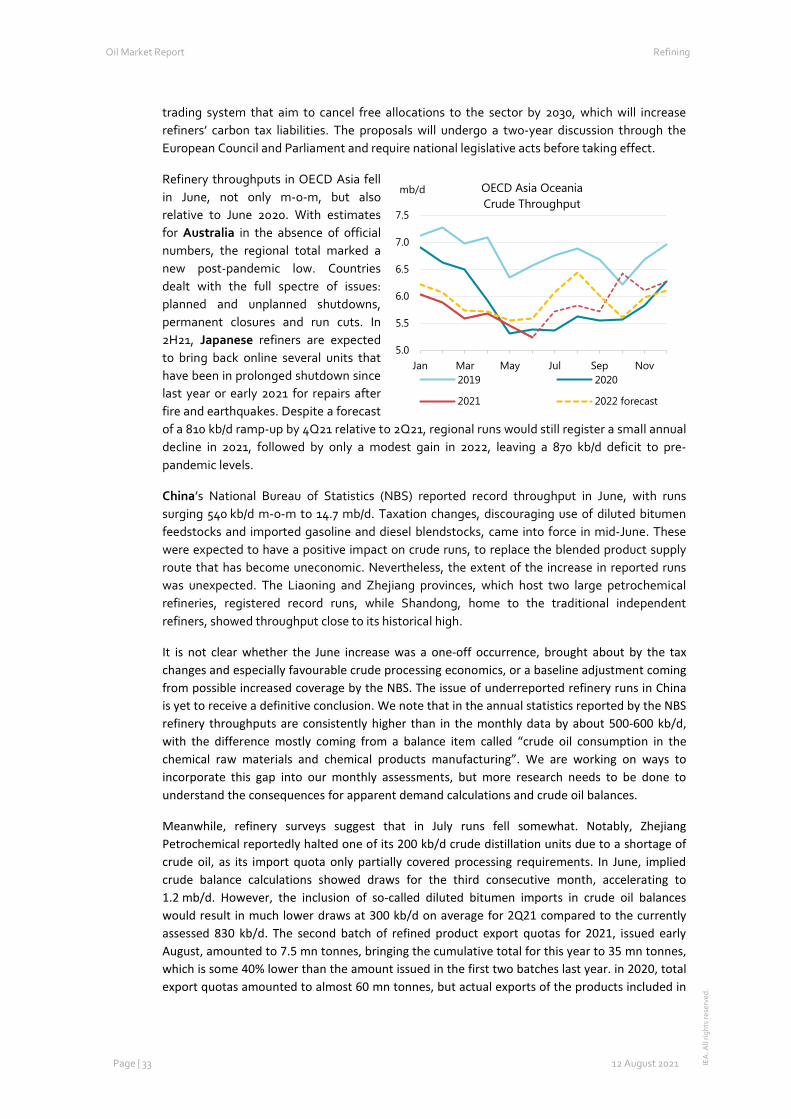
Oil Market Report Refining
Page | 33 12 August 2021 IEA
. All
right
s re
serv
ed.
trading system that aim to cancel free allocations to the sector by 2030, which will increase refiners’ carbon tax liabilities. The proposals will undergo a two-year discussion through the European Council and Parliament and require national legislative acts before taking effect.
Refinery throughputs in OECD Asia fell in June, not only m-o-m, but also relative to June 2020. With estimates for Australia in the absence of official numbers, the regional total marked a new post-pandemic low. Countries dealt with the full spectre of issues: planned and unplanned shutdowns, permanent closures and run cuts. In 2H21, Japanese refiners are expected to bring back online several units that have been in prolonged shutdown since last year or early 2021 for repairs after fire and earthquakes. Despite a forecast of a 810 kb/d ramp-up by 4Q21 relative to 2Q21, regional runs would still register a small annual decline in 2021, followed by only a modest gain in 2022, leaving a 870 kb/d deficit to pre-pandemic levels.
China’s National Bureau of Statistics (NBS) reported record throughput in June, with runs surging 540 kb/d m-o-m to 14.7 mb/d. Taxation changes, discouraging use of diluted bitumen feedstocks and imported gasoline and diesel blendstocks, came into force in mid-June. These were expected to have a positive impact on crude runs, to replace the blended product supply route that has become uneconomic. Nevertheless, the extent of the increase in reported runs was unexpected. The Liaoning and Zhejiang provinces, which host two large petrochemical refineries, registered record runs, while Shandong, home to the traditional independent refiners, showed throughput close to its historical high.
It is not clear whether the June increase was a one-off occurrence, brought about by the tax changes and especially favourable crude processing economics, or a baseline adjustment coming from possible increased coverage by the NBS. The issue of underreported refinery runs in China is yet to receive a definitive conclusion. We note that in the annual statistics reported by the NBS refinery throughputs are consistently higher than in the monthly data by about 500-600 kb/d, with the difference mostly coming from a balance item called “crude oil consumption in the chemical raw materials and chemical products manufacturing”. We are working on ways to incorporate this gap into our monthly assessments, but more research needs to be done to understand the consequences for apparent demand calculations and crude oil balances.
Meanwhile, refinery surveys suggest that in July runs fell somewhat. Notably, Zhejiang Petrochemical reportedly halted one of its 200 kb/d crude distillation units due to a shortage of crude oil, as its import quota only partially covered processing requirements. In June, implied crude balance calculations showed draws for the third consecutive month, accelerating to 1.2 mb/d. However, the inclusion of so-called diluted bitumen imports in crude oil balances would result in much lower draws at 300 kb/d on average for 2Q21 compared to the currently assessed 830 kb/d. The second batch of refined product export quotas for 2021, issued early August, amounted to 7.5 mn tonnes, bringing the cumulative total for this year to 35 mn tonnes, which is some 40% lower than the amount issued in the first two batches last year. in 2020, total export quotas amounted to almost 60 mn tonnes, but actual exports of the products included in
5.0
5.5
6.0
6.5
7.0
7.5
Jan Mar May Jul Sep Nov
mb/d OECD Asia OceaniaCrude Throughput
2019 2020
2021 2022 forecast
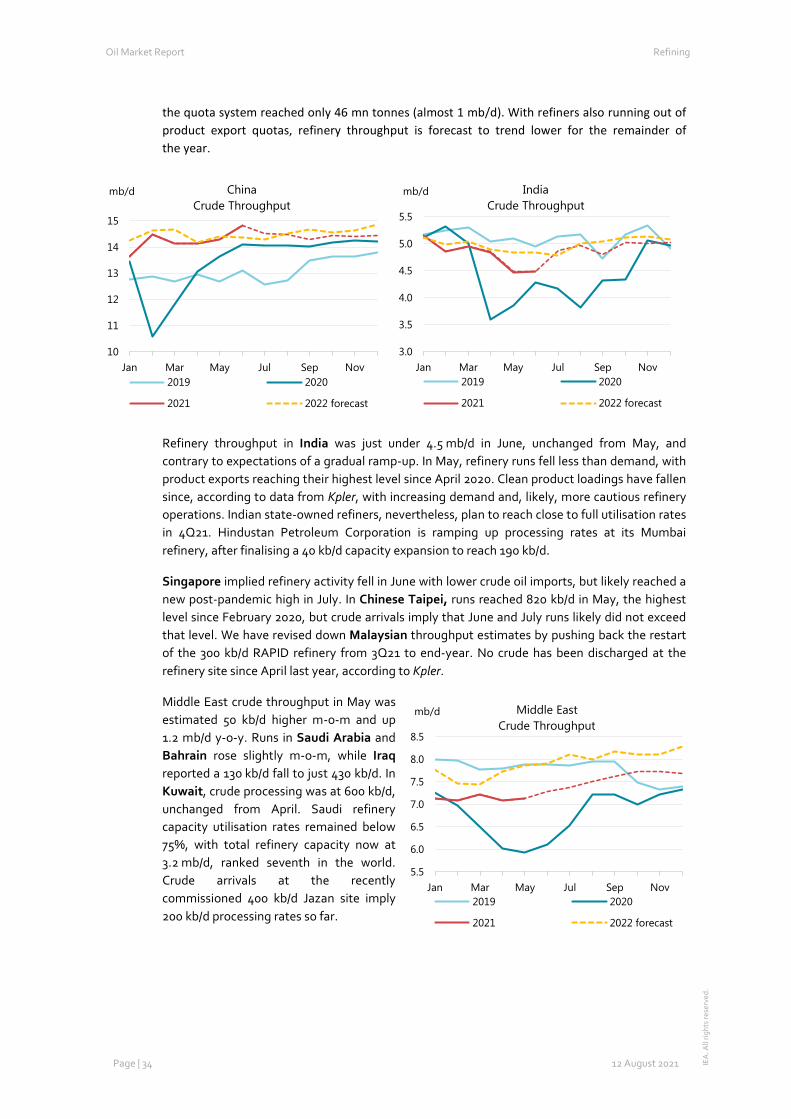
Oil Market Report Refining
Page | 34 12 August 2021 IEA
. All
right
s re
serv
ed.
the quota system reached only 46 mn tonnes (almost 1 mb/d). With refiners also running out of product export quotas, refinery throughput is forecast to trend lower for the remainder of the year.
Refinery throughput in India was just under 4.5 mb/d in June, unchanged from May, and contrary to expectations of a gradual ramp-up. In May, refinery runs fell less than demand, with product exports reaching their highest level since April 2020. Clean product loadings have fallen since, according to data from Kpler, with increasing demand and, likely, more cautious refinery operations. Indian state-owned refiners, nevertheless, plan to reach close to full utilisation rates in 4Q21. Hindustan Petroleum Corporation is ramping up processing rates at its Mumbai refinery, after finalising a 40 kb/d capacity expansion to reach 190 kb/d.
Singapore implied refinery activity fell in June with lower crude oil imports, but likely reached a new post-pandemic high in July. In Chinese Taipei, runs reached 820 kb/d in May, the highest level since February 2020, but crude arrivals imply that June and July runs likely did not exceed that level. We have revised down Malaysian throughput estimates by pushing back the restart of the 300 kb/d RAPID refinery from 3Q21 to end-year. No crude has been discharged at the refinery site since April last year, according to Kpler.
Middle East crude throughput in May was estimated 50 kb/d higher m-o-m and up 1.2 mb/d y-o-y. Runs in Saudi Arabia and Bahrain rose slightly m-o-m, while Iraq reported a 130 kb/d fall to just 430 kb/d. In Kuwait, crude processing was at 600 kb/d, unchanged from April. Saudi refinery capacity utilisation rates remained below 75%, with total refinery capacity now at 3.2 mb/d, ranked seventh in the world. Crude arrivals at the recently commissioned 400 kb/d Jazan site imply 200 kb/d processing rates so far.
10
11
12
13
14
15
Jan Mar May Jul Sep Nov
mb/d ChinaCrude Throughput
2019 2020
2021 2022 forecast
3.0
3.5
4.0
4.5
5.0
5.5
Jan Mar May Jul Sep Nov
mb/d IndiaCrude Throughput
2019 2020
2021 2022 forecast
5.5
6.0
6.5
7.0
7.5
8.0
8.5
Jan Mar May Jul Sep Nov
mb/d Middle EastCrude Throughput
2019 2020
2021 2022 forecast
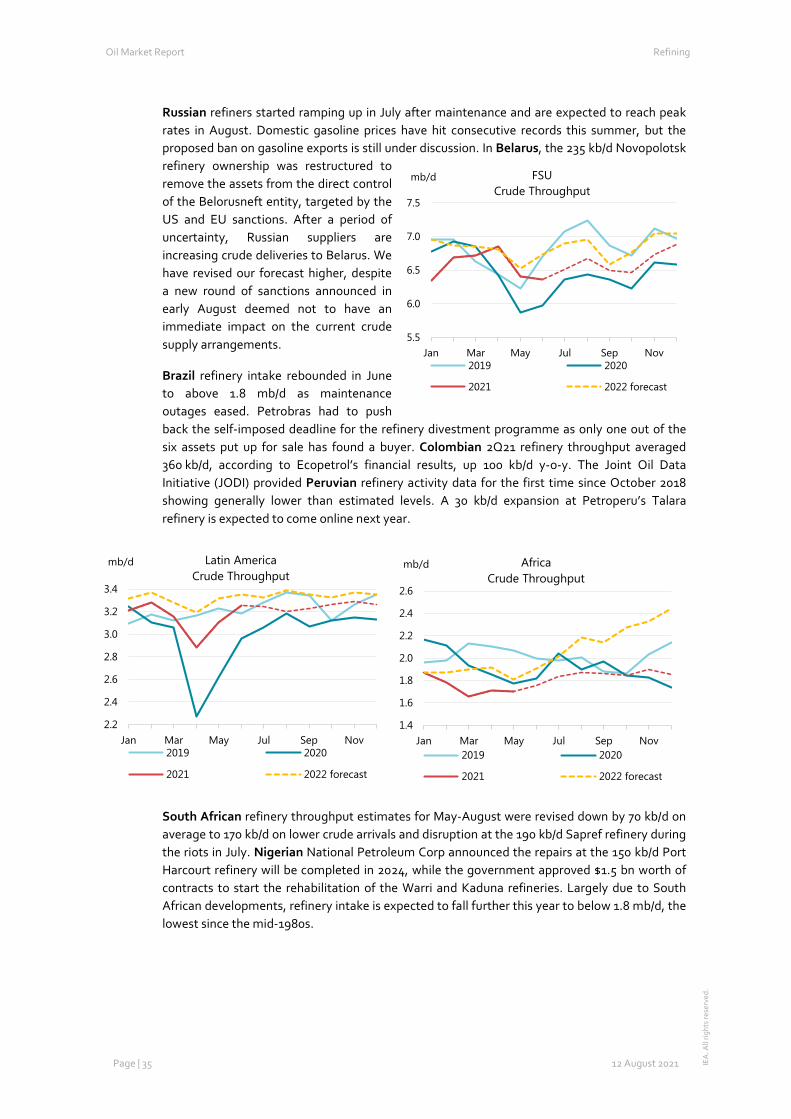
Oil Market Report Refining
Page | 35 12 August 2021 IEA
. All
right
s re
serv
ed.
Russian refiners started ramping up in July after maintenance and are expected to reach peak rates in August. Domestic gasoline prices have hit consecutive records this summer, but the proposed ban on gasoline exports is still under discussion. In Belarus, the 235 kb/d Novopolotsk refinery ownership was restructured to remove the assets from the direct control of the Belorusneft entity, targeted by the US and EU sanctions. After a period of uncertainty, Russian suppliers are increasing crude deliveries to Belarus. We have revised our forecast higher, despite a new round of sanctions announced in early August deemed not to have an immediate impact on the current crude supply arrangements.
Brazil refinery intake rebounded in June to above 1.8 mb/d as maintenance outages eased. Petrobras had to push back the self-imposed deadline for the refinery divestment programme as only one out of the six assets put up for sale has found a buyer. Colombian 2Q21 refinery throughput averaged 360 kb/d, according to Ecopetrol’s financial results, up 100 kb/d y-o-y. The Joint Oil Data Initiative (JODI) provided Peruvian refinery activity data for the first time since October 2018 showing generally lower than estimated levels. A 30 kb/d expansion at Petroperu’s Talara refinery is expected to come online next year.
South African refinery throughput estimates for May-August were revised down by 70 kb/d on average to 170 kb/d on lower crude arrivals and disruption at the 190 kb/d Sapref refinery during the riots in July. Nigerian National Petroleum Corp announced the repairs at the 150 kb/d Port Harcourt refinery will be completed in 2024, while the government approved $1.5 bn worth of contracts to start the rehabilitation of the Warri and Kaduna refineries. Largely due to South African developments, refinery intake is expected to fall further this year to below 1.8 mb/d, the lowest since the mid-1980s.
2.2
2.4
2.6
2.8
3.0
3.2
3.4
Jan Mar May Jul Sep Nov
mb/d Latin AmericaCrude Throughput
2019 2020
2021 2022 forecast
1.4
1.6
1.8
2.0
2.2
2.4
2.6
Jan Mar May Jul Sep Nov
mb/d AfricaCrude Throughput
2019 2020
2021 2022 forecast
5.5
6.0
6.5
7.0
7.5
Jan Mar May Jul Sep Nov
mb/d FSUCrude Throughput
2019 2020
2021 2022 forecast
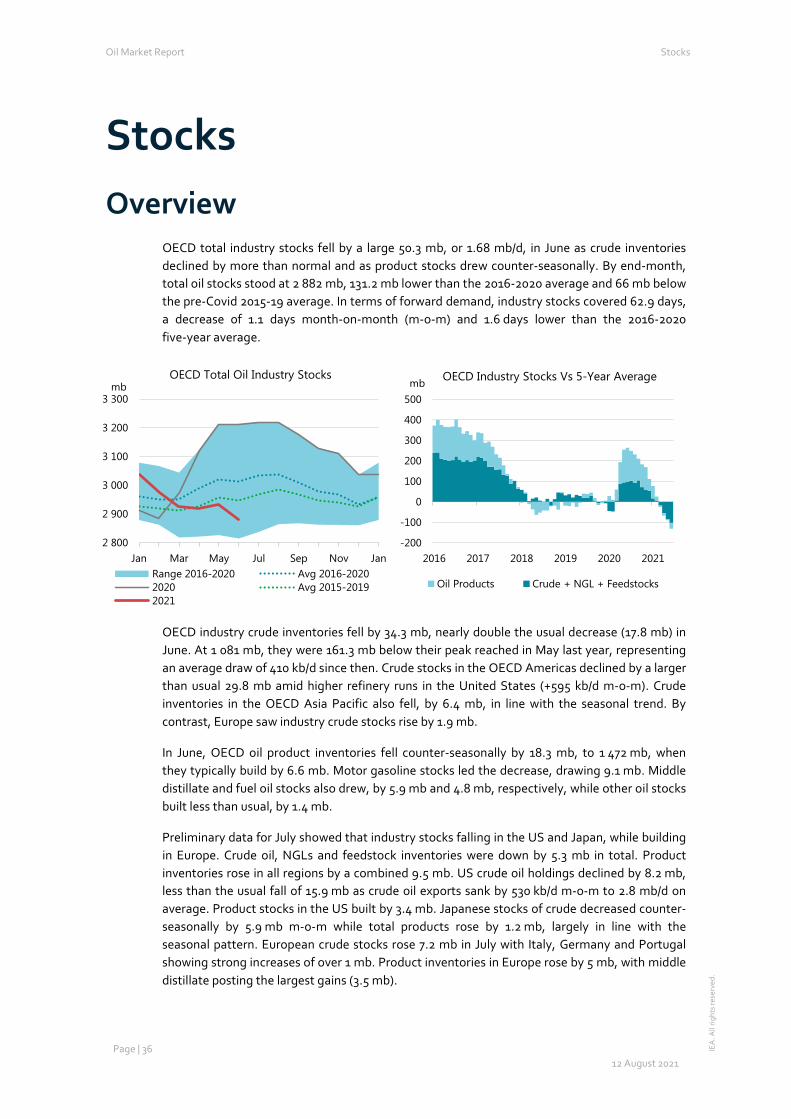
Oil Market Report Stocks
Page | 36 12 August 2021
IEA
. All
right
s re
serv
ed.
Stocks Overview
OECD total industry stocks fell by a large 50.3 mb, or 1.68 mb/d, in June as crude inventories declined by more than normal and as product stocks drew counter-seasonally. By end-month, total oil stocks stood at 2 882 mb, 131.2 mb lower than the 2016-2020 average and 66 mb below the pre-Covid 2015-19 average. In terms of forward demand, industry stocks covered 62.9 days, a decrease of 1.1 days month-on-month (m-o-m) and 1.6 days lower than the 2016-2020 five-year average.
OECD industry crude inventories fell by 34.3 mb, nearly double the usual decrease (17.8 mb) in June. At 1 081 mb, they were 161.3 mb below their peak reached in May last year, representing an average draw of 410 kb/d since then. Crude stocks in the OECD Americas declined by a larger than usual 29.8 mb amid higher refinery runs in the United States (+595 kb/d m-o-m). Crude inventories in the OECD Asia Pacific also fell, by 6.4 mb, in line with the seasonal trend. By contrast, Europe saw industry crude stocks rise by 1.9 mb.
In June, OECD oil product inventories fell counter-seasonally by 18.3 mb, to 1 472 mb, when they typically build by 6.6 mb. Motor gasoline stocks led the decrease, drawing 9.1 mb. Middle distillate and fuel oil stocks also drew, by 5.9 mb and 4.8 mb, respectively, while other oil stocks built less than usual, by 1.4 mb.
Preliminary data for July showed that industry stocks falling in the US and Japan, while building in Europe. Crude oil, NGLs and feedstock inventories were down by 5.3 mb in total. Product inventories rose in all regions by a combined 9.5 mb. US crude oil holdings declined by 8.2 mb, less than the usual fall of 15.9 mb as crude oil exports sank by 530 kb/d m-o-m to 2.8 mb/d on average. Product stocks in the US built by 3.4 mb. Japanese stocks of crude decreased counter-seasonally by 5.9 mb m-o-m while total products rose by 1.2 mb, largely in line with the seasonal pattern. European crude stocks rose 7.2 mb in July with Italy, Germany and Portugal showing strong increases of over 1 mb. Product inventories in Europe rose by 5 mb, with middle distillate posting the largest gains (3.5 mb).
2 800
2 900
3 000
3 100
3 200
3 300
Jan Mar May Jul Sep Nov Jan
mbOECD Total Oil Industry Stocks
Range 2016-2020 Avg 2016-20202020 Avg 2015-20192021
-200
-100
0
100
200
300
400
500
2016 2017 2018 2019 2020 2021
mb OECD Industry Stocks Vs 5-Year Average
Oil Products Crude + NGL + Feedstocks
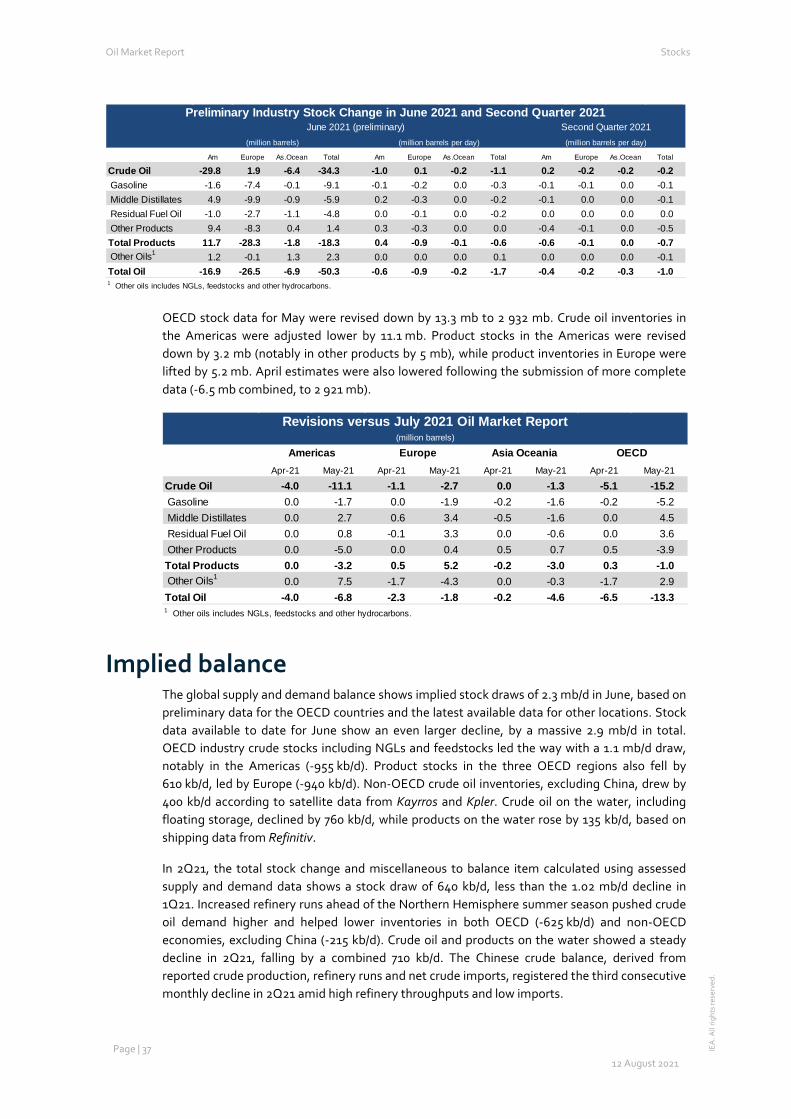
Oil Market Report Stocks
Page | 37 12 August 2021
IEA
. All
right
s re
serv
ed.
OECD stock data for May were revised down by 13.3 mb to 2 932 mb. Crude oil inventories in the Americas were adjusted lower by 11.1 mb. Product stocks in the Americas were revised down by 3.2 mb (notably in other products by 5 mb), while product inventories in Europe were lifted by 5.2 mb. April estimates were also lowered following the submission of more complete data (-6.5 mb combined, to 2 921 mb).
Implied balance The global supply and demand balance shows implied stock draws of 2.3 mb/d in June, based on preliminary data for the OECD countries and the latest available data for other locations. Stock data available to date for June show an even larger decline, by a massive 2.9 mb/d in total. OECD industry crude stocks including NGLs and feedstocks led the way with a 1.1 mb/d draw, notably in the Americas (-955 kb/d). Product stocks in the three OECD regions also fell by 610 kb/d, led by Europe (-940 kb/d). Non-OECD crude oil inventories, excluding China, drew by 400 kb/d according to satellite data from Kayrros and Kpler. Crude oil on the water, including floating storage, declined by 760 kb/d, while products on the water rose by 135 kb/d, based on shipping data from Refinitiv.
In 2Q21, the total stock change and miscellaneous to balance item calculated using assessed supply and demand data shows a stock draw of 640 kb/d, less than the 1.02 mb/d decline in 1Q21. Increased refinery runs ahead of the Northern Hemisphere summer season pushed crude oil demand higher and helped lower inventories in both OECD (-625 kb/d) and non-OECD economies, excluding China (-215 kb/d). Crude oil and products on the water showed a steady decline in 2Q21, falling by a combined 710 kb/d. The Chinese crude balance, derived from reported crude production, refinery runs and net crude imports, registered the third consecutive monthly decline in 2Q21 amid high refinery throughputs and low imports.
Am Europe As.Ocean Total Am Europe As.Ocean Total Am Europe As.Ocean Total
Crude Oil -29.8 1.9 -6.4 -34.3 -1.0 0.1 -0.2 -1.1 0.2 -0.2 -0.2 -0.2 Gasoline -1.6 -7.4 -0.1 -9.1 -0.1 -0.2 0.0 -0.3 -0.1 -0.1 0.0 -0.1 Middle Distillates 4.9 -9.9 -0.9 -5.9 0.2 -0.3 0.0 -0.2 -0.1 0.0 0.0 -0.1 Residual Fuel Oil -1.0 -2.7 -1.1 -4.8 0.0 -0.1 0.0 -0.2 0.0 0.0 0.0 0.0 Other Products 9.4 -8.3 0.4 1.4 0.3 -0.3 0.0 0.0 -0.4 -0.1 0.0 -0.5 Total Products 11.7 -28.3 -1.8 -18.3 0.4 -0.9 -0.1 -0.6 -0.6 -0.1 0.0 -0.7 Other Oils1 1.2 -0.1 1.3 2.3 0.0 0.0 0.0 0.1 0.0 0.0 0.0 -0.1 Total Oil -16.9 -26.5 -6.9 -50.3 -0.6 -0.9 -0.2 -1.7 -0.4 -0.2 -0.3 -1.0 1 Other oils includes NGLs, feedstocks and other hydrocarbons.
Preliminary Industry Stock Change in June 2021 and Second Quarter 2021June 2021 (preliminary) Second Quarter 2021
(million barrels) (million barrels per day) (million barrels per day)
(million barrels)
Apr-21 May-21 Apr-21 May-21 Apr-21 May-21 Apr-21 May-21
Crude Oil -4.0 -11.1 -1.1 -2.7 0.0 -1.3 -5.1 -15.2 Gasoline 0.0 -1.7 0.0 -1.9 -0.2 -1.6 -0.2 -5.2 Middle Distillates 0.0 2.7 0.6 3.4 -0.5 -1.6 0.0 4.5 Residual Fuel Oil 0.0 0.8 -0.1 3.3 0.0 -0.6 0.0 3.6 Other Products 0.0 -5.0 0.0 0.4 0.5 0.7 0.5 -3.9 Total Products 0.0 -3.2 0.5 5.2 -0.2 -3.0 0.3 -1.0 Other Oils1 0.0 7.5 -1.7 -4.3 0.0 -0.3 -1.7 2.9 Total Oil -4.0 -6.8 -2.3 -1.8 -0.2 -4.6 -6.5 -13.3 1 Other oils includes NGLs, feedstocks and other hydrocarbons.
Revisions versus July 2021 Oil Market Report
Americas Europe Asia Oceania OECD
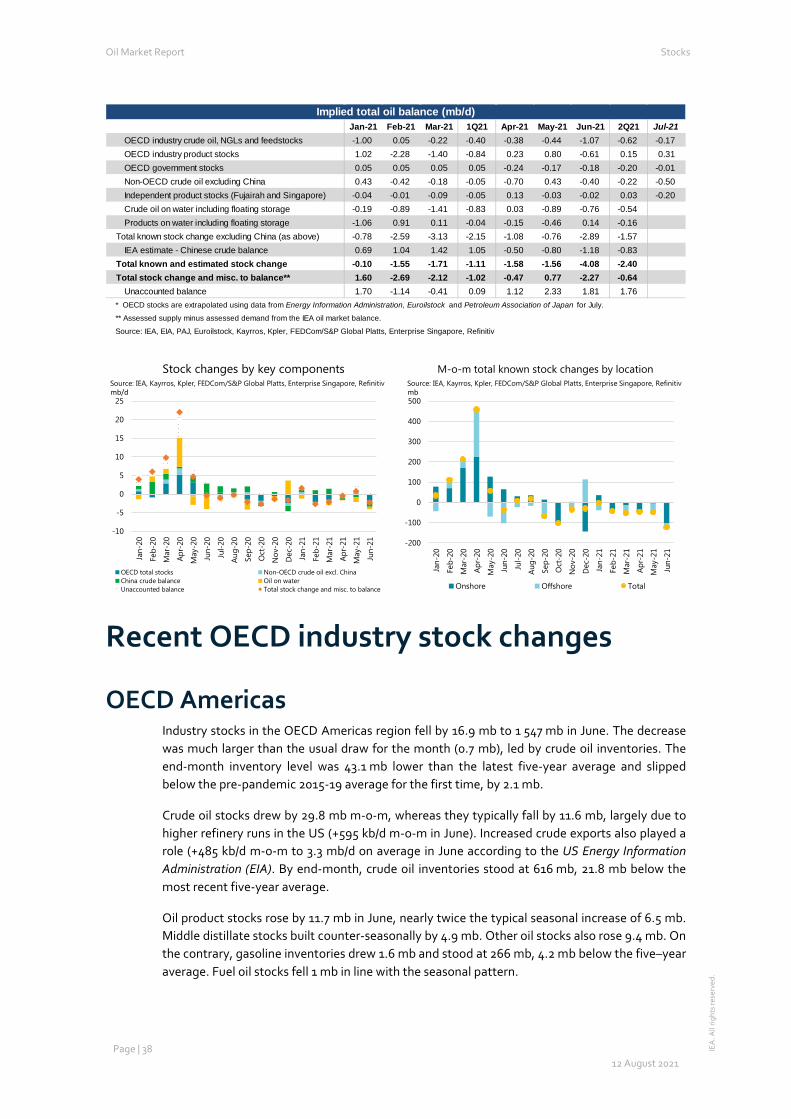
Oil Market Report Stocks
Page | 38 12 August 2021
IEA
. All
right
s re
serv
ed.
Recent OECD industry stock changes
OECD Americas Industry stocks in the OECD Americas region fell by 16.9 mb to 1 547 mb in June. The decrease was much larger than the usual draw for the month (0.7 mb), led by crude oil inventories. The end-month inventory level was 43.1 mb lower than the latest five-year average and slipped below the pre-pandemic 2015-19 average for the first time, by 2.1 mb.
Crude oil stocks drew by 29.8 mb m-o-m, whereas they typically fall by 11.6 mb, largely due to higher refinery runs in the US (+595 kb/d m-o-m in June). Increased crude exports also played a role (+485 kb/d m-o-m to 3.3 mb/d on average in June according to the US Energy Information Administration (EIA). By end-month, crude oil inventories stood at 616 mb, 21.8 mb below the most recent five-year average.
Oil product stocks rose by 11.7 mb in June, nearly twice the typical seasonal increase of 6.5 mb. Middle distillate stocks built counter-seasonally by 4.9 mb. Other oil stocks also rose 9.4 mb. On the contrary, gasoline inventories drew 1.6 mb and stood at 266 mb, 4.2 mb below the five–year average. Fuel oil stocks fell 1 mb in line with the seasonal pattern.
Jan-21 Feb-21 Mar-21 1Q21 Apr-21 May-21 Jun-21 2Q21 Jul-21OECD industry crude oil, NGLs and feedstocks -1.00 0.05 -0.22 -0.40 -0.38 -0.44 -1.07 -0.62 -0.17OECD industry product stocks 1.02 -2.28 -1.40 -0.84 0.23 0.80 -0.61 0.15 0.31OECD government stocks 0.05 0.05 0.05 0.05 -0.24 -0.17 -0.18 -0.20 -0.01Non-OECD crude oil excluding China 0.43 -0.42 -0.18 -0.05 -0.70 0.43 -0.40 -0.22 -0.50Independent product stocks (Fujairah and Singapore) -0.04 -0.01 -0.09 -0.05 0.13 -0.03 -0.02 0.03 -0.20Crude oil on water including floating storage -0.19 -0.89 -1.41 -0.83 0.03 -0.89 -0.76 -0.54Products on water including floating storage -1.06 0.91 0.11 -0.04 -0.15 -0.46 0.14 -0.16
Total known stock change excluding China (as above) -0.78 -2.59 -3.13 -2.15 -1.08 -0.76 -2.89 -1.57IEA estimate - Chinese crude balance 0.69 1.04 1.42 1.05 -0.50 -0.80 -1.18 -0.83
Total known and estimated stock change -0.10 -1.55 -1.71 -1.11 -1.58 -1.56 -4.08 -2.40Total stock change and misc. to balance** 1.60 -2.69 -2.12 -1.02 -0.47 0.77 -2.27 -0.64
Unaccounted balance 1.70 -1.14 -0.41 0.09 1.12 2.33 1.81 1.76* OECD stocks are extrapolated using data from Energy Information Administration, Euroilstock and Petroleum Association of Japan for July.
** Assessed supply minus assessed demand from the IEA oil market balance.
Source: IEA, EIA, PAJ, Euroilstock, Kayrros, Kpler, FEDCom/S&P Global Platts, Enterprise Singapore, Refinitiv
Implied total oil balance (mb/d)
-10
-5
0
5
10
15
20
25
Jan-
20
Feb-
20
Mar
-20
Apr-
20
May
-20
Jun-
20
Jul-2
0
Aug-
20
Sep-
20
Oct
-20
Nov
-20
Dec
-20
Jan-
21
Feb-
21
Mar
-21
Apr-
21
May
-21
Jun-
21Stock changes by key components
OECD total stocks Non-OECD crude oil excl. ChinaChina crude balance Oil on waterUnaccounted balance Total stock change and misc. to balance
Source: IEA, Kayrros, Kpler, FEDCom/S&P Global Platts, Enterprise Singapore, Refinitiv mb/d
-200
-100
0
100
200
300
400
500
Jan-
20
Feb-
20
Mar
-20
Apr-
20
May
-20
Jun-
20
Jul-2
0
Aug-
20
Sep-
20
Oct
-20
Nov
-20
Dec
-20
Jan-
21
Feb-
21
Mar
-21
Apr-
21
May
-21
Jun-
21
M-o-m total known stock changes by location
Onshore Offshore Total
Source: IEA, Kayrros, Kpler, FEDCom/S&P Global Platts, Enterprise Singapore, Refinitiv mb
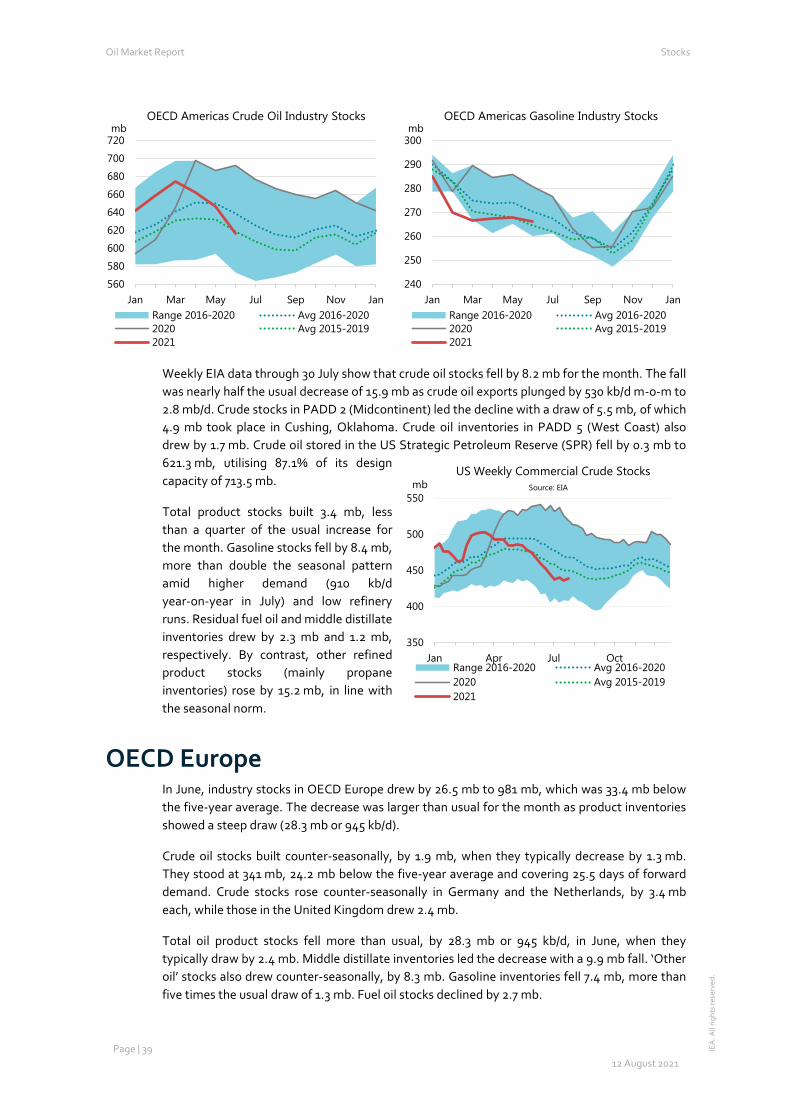
Oil Market Report Stocks
Page | 39 12 August 2021
IEA
. All
right
s re
serv
ed.
Weekly EIA data through 30 July show that crude oil stocks fell by 8.2 mb for the month. The fall was nearly half the usual decrease of 15.9 mb as crude oil exports plunged by 530 kb/d m-o-m to 2.8 mb/d. Crude stocks in PADD 2 (Midcontinent) led the decline with a draw of 5.5 mb, of which 4.9 mb took place in Cushing, Oklahoma. Crude oil inventories in PADD 5 (West Coast) also drew by 1.7 mb. Crude oil stored in the US Strategic Petroleum Reserve (SPR) fell by 0.3 mb to 621.3 mb, utilising 87.1% of its design capacity of 713.5 mb.
Total product stocks built 3.4 mb, less than a quarter of the usual increase for the month. Gasoline stocks fell by 8.4 mb, more than double the seasonal pattern amid higher demand (910 kb/d year-on-year in July) and low refinery runs. Residual fuel oil and middle distillate inventories drew by 2.3 mb and 1.2 mb, respectively. By contrast, other refined product stocks (mainly propane inventories) rose by 15.2 mb, in line with the seasonal norm.
OECD Europe In June, industry stocks in OECD Europe drew by 26.5 mb to 981 mb, which was 33.4 mb below the five-year average. The decrease was larger than usual for the month as product inventories showed a steep draw (28.3 mb or 945 kb/d).
Crude oil stocks built counter-seasonally, by 1.9 mb, when they typically decrease by 1.3 mb. They stood at 341 mb, 24.2 mb below the five-year average and covering 25.5 days of forward demand. Crude stocks rose counter-seasonally in Germany and the Netherlands, by 3.4 mb each, while those in the United Kingdom drew 2.4 mb.
Total oil product stocks fell more than usual, by 28.3 mb or 945 kb/d, in June, when they typically draw by 2.4 mb. Middle distillate inventories led the decrease with a 9.9 mb fall. ‘Other oil’ stocks also drew counter-seasonally, by 8.3 mb. Gasoline inventories fell 7.4 mb, more than five times the usual draw of 1.3 mb. Fuel oil stocks declined by 2.7 mb.
560
580
600
620
640
660
680
700
720
Jan Mar May Jul Sep Nov Jan
mbOECD Americas Crude Oil Industry Stocks
Range 2016-2020 Avg 2016-20202020 Avg 2015-20192021
240
250
260
270
280
290
300
Jan Mar May Jul Sep Nov Jan
mbOECD Americas Gasoline Industry Stocks
Range 2016-2020 Avg 2016-20202020 Avg 2015-20192021
350
400
450
500
550
Jan Apr Jul Oct
mbUS Weekly Commercial Crude Stocks
Range 2016-2020 Avg 2016-20202020 Avg 2015-20192021
Source: EIA
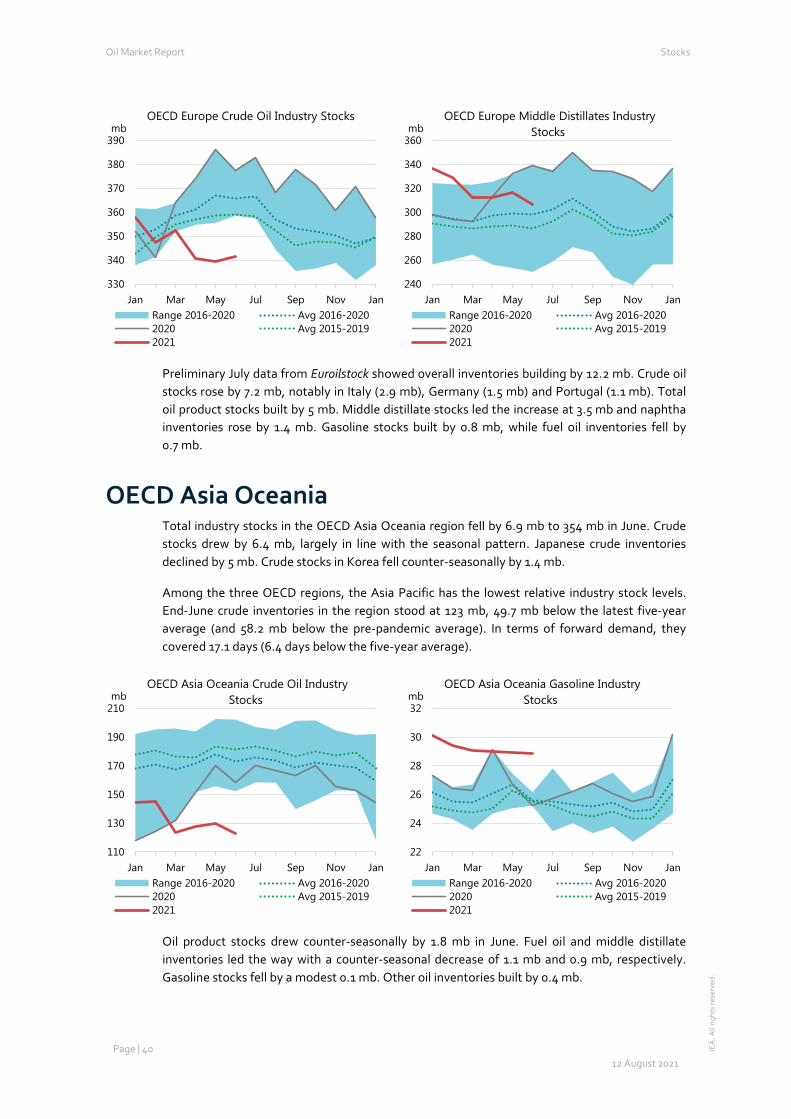
Oil Market Report Stocks
Page | 40 12 August 2021
IEA
. All
right
s re
serv
ed.
Preliminary July data from Euroilstock showed overall inventories building by 12.2 mb. Crude oil stocks rose by 7.2 mb, notably in Italy (2.9 mb), Germany (1.5 mb) and Portugal (1.1 mb). Total oil product stocks built by 5 mb. Middle distillate stocks led the increase at 3.5 mb and naphtha inventories rose by 1.4 mb. Gasoline stocks built by 0.8 mb, while fuel oil inventories fell by 0.7 mb.
OECD Asia Oceania Total industry stocks in the OECD Asia Oceania region fell by 6.9 mb to 354 mb in June. Crude stocks drew by 6.4 mb, largely in line with the seasonal pattern. Japanese crude inventories declined by 5 mb. Crude stocks in Korea fell counter-seasonally by 1.4 mb.
Among the three OECD regions, the Asia Pacific has the lowest relative industry stock levels. End-June crude inventories in the region stood at 123 mb, 49.7 mb below the latest five-year average (and 58.2 mb below the pre-pandemic average). In terms of forward demand, they covered 17.1 days (6.4 days below the five-year average).
Oil product stocks drew counter-seasonally by 1.8 mb in June. Fuel oil and middle distillate inventories led the way with a counter-seasonal decrease of 1.1 mb and 0.9 mb, respectively. Gasoline stocks fell by a modest 0.1 mb. Other oil inventories built by 0.4 mb.
330
340
350
360
370
380
390
Jan Mar May Jul Sep Nov Jan
mbOECD Europe Crude Oil Industry Stocks
Range 2016-2020 Avg 2016-20202020 Avg 2015-20192021
240
260
280
300
320
340
360
Jan Mar May Jul Sep Nov Jan
mbOECD Europe Middle Distillates Industry
Stocks
Range 2016-2020 Avg 2016-20202020 Avg 2015-20192021
110
130
150
170
190
210
Jan Mar May Jul Sep Nov Jan
mbOECD Asia Oceania Crude Oil Industry
Stocks
Range 2016-2020 Avg 2016-20202020 Avg 2015-20192021
22
24
26
28
30
32
Jan Mar May Jul Sep Nov Jan
mbOECD Asia Oceania Gasoline Industry
Stocks
Range 2016-2020 Avg 2016-20202020 Avg 2015-20192021
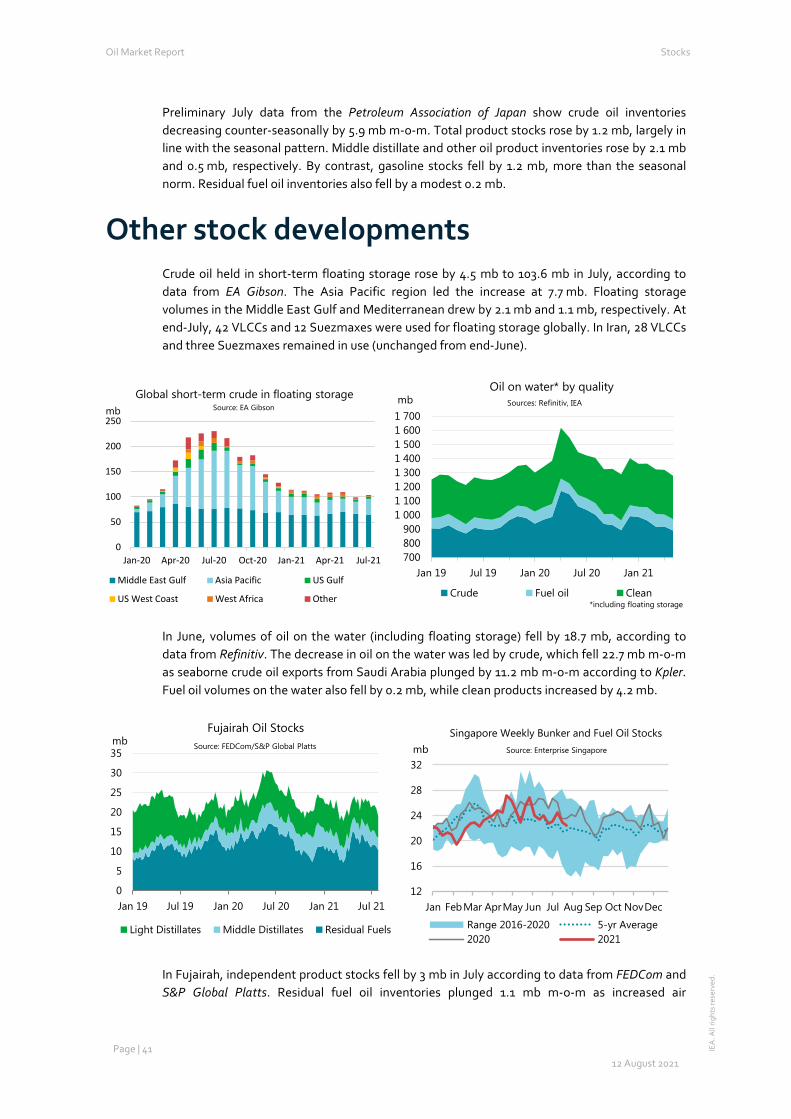
Oil Market Report Stocks
Page | 41 12 August 2021
IEA
. All
right
s re
serv
ed.
Preliminary July data from the Petroleum Association of Japan show crude oil inventories decreasing counter-seasonally by 5.9 mb m-o-m. Total product stocks rose by 1.2 mb, largely in line with the seasonal pattern. Middle distillate and other oil product inventories rose by 2.1 mb and 0.5 mb, respectively. By contrast, gasoline stocks fell by 1.2 mb, more than the seasonal norm. Residual fuel oil inventories also fell by a modest 0.2 mb.
Other stock developments Crude oil held in short-term floating storage rose by 4.5 mb to 103.6 mb in July, according to data from EA Gibson. The Asia Pacific region led the increase at 7.7 mb. Floating storage volumes in the Middle East Gulf and Mediterranean drew by 2.1 mb and 1.1 mb, respectively. At end-July, 42 VLCCs and 12 Suezmaxes were used for floating storage globally. In Iran, 28 VLCCs and three Suezmaxes remained in use (unchanged from end-June).
In June, volumes of oil on the water (including floating storage) fell by 18.7 mb, according to data from Refinitiv. The decrease in oil on the water was led by crude, which fell 22.7 mb m-o-m as seaborne crude oil exports from Saudi Arabia plunged by 11.2 mb m-o-m according to Kpler. Fuel oil volumes on the water also fell by 0.2 mb, while clean products increased by 4.2 mb.
In Fujairah, independent product stocks fell by 3 mb in July according to data from FEDCom and S&P Global Platts. Residual fuel oil inventories plunged 1.1 mb m-o-m as increased air
0
50
100
150
200
250
Jan-20 Apr-20 Jul-20 Oct-20 Jan-21 Apr-21 Jul-21
Global short-term crude in floating storage
Middle East Gulf Asia Pacific US Gulf
US West Coast West Africa Other
mb Source: EA Gibson
700 800 900
1 0001 1001 2001 3001 4001 5001 6001 700
Jan 19 Jul 19 Jan 20 Jul 20 Jan 21
mbOil on water* by quality
Crude Fuel oil Clean
Sources: Refinitiv, IEA
*including floating storage
0
5
10
15
20
25
30
35
Jan 19 Jul 19 Jan 20 Jul 20 Jan 21 Jul 21
mbFujairah Oil Stocks
Light Distillates Middle Distillates Residual Fuels
Source: FEDCom/S&P Global Platts
12
16
20
24
28
32
Jan FebMar AprMay Jun Jul Aug Sep Oct NovDec
mbSingapore Weekly Bunker and Fuel Oil Stocks
Range 2016-2020 5-yr Average2020 2021
Source: Enterprise Singapore
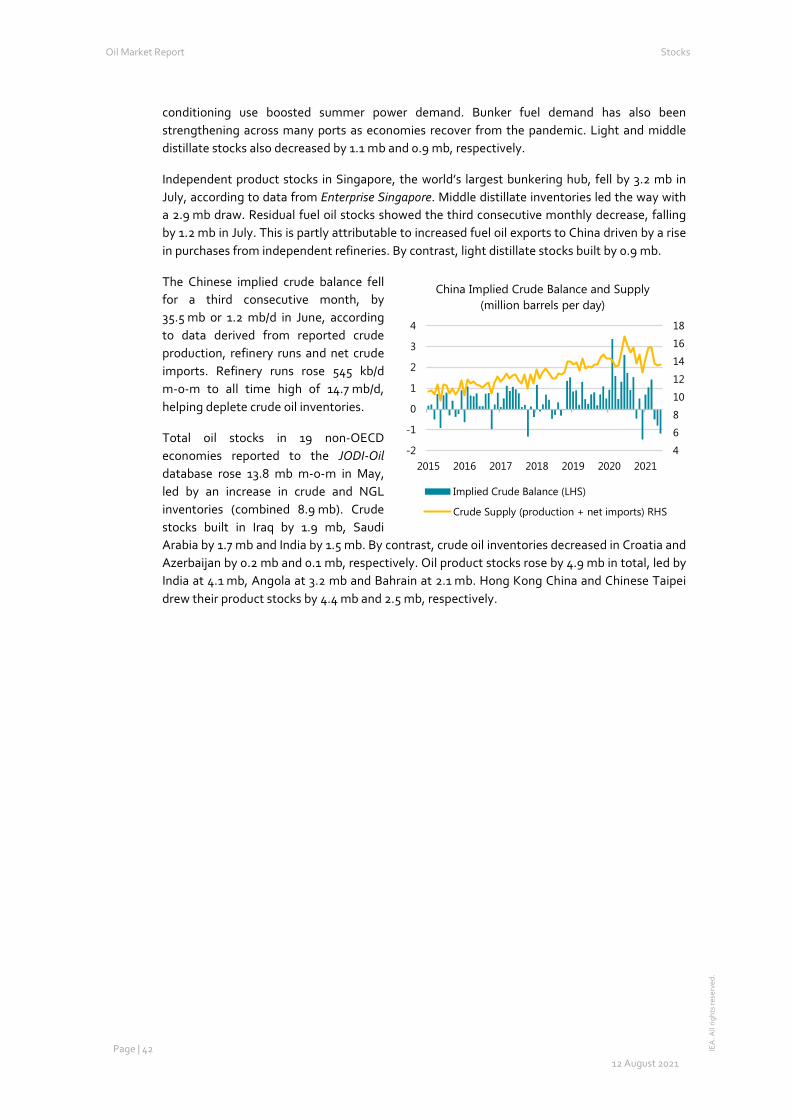
Oil Market Report Stocks
Page | 42 12 August 2021
IEA
. All
right
s re
serv
ed.
conditioning use boosted summer power demand. Bunker fuel demand has also been strengthening across many ports as economies recover from the pandemic. Light and middle distillate stocks also decreased by 1.1 mb and 0.9 mb, respectively.
Independent product stocks in Singapore, the world’s largest bunkering hub, fell by 3.2 mb in July, according to data from Enterprise Singapore. Middle distillate inventories led the way with a 2.9 mb draw. Residual fuel oil stocks showed the third consecutive monthly decrease, falling by 1.2 mb in July. This is partly attributable to increased fuel oil exports to China driven by a rise in purchases from independent refineries. By contrast, light distillate stocks built by 0.9 mb.
The Chinese implied crude balance fell for a third consecutive month, by 35.5 mb or 1.2 mb/d in June, according to data derived from reported crude production, refinery runs and net crude imports. Refinery runs rose 545 kb/d m-o-m to all time high of 14.7 mb/d, helping deplete crude oil inventories.
Total oil stocks in 19 non-OECD economies reported to the JODI-Oil database rose 13.8 mb m-o-m in May, led by an increase in crude and NGL inventories (combined 8.9 mb). Crude stocks built in Iraq by 1.9 mb, Saudi Arabia by 1.7 mb and India by 1.5 mb. By contrast, crude oil inventories decreased in Croatia and Azerbaijan by 0.2 mb and 0.1 mb, respectively. Oil product stocks rose by 4.9 mb in total, led by India at 4.1 mb, Angola at 3.2 mb and Bahrain at 2.1 mb. Hong Kong China and Chinese Taipei drew their product stocks by 4.4 mb and 2.5 mb, respectively.
4
6
8
10
12
14
16
18
-2
-1
0
1
2
3
4
2015 2016 2017 2018 2019 2020 2021
China Implied Crude Balance and Supply(million barrels per day)
Implied Crude Balance (LHS)
Crude Supply (production + net imports) RHS
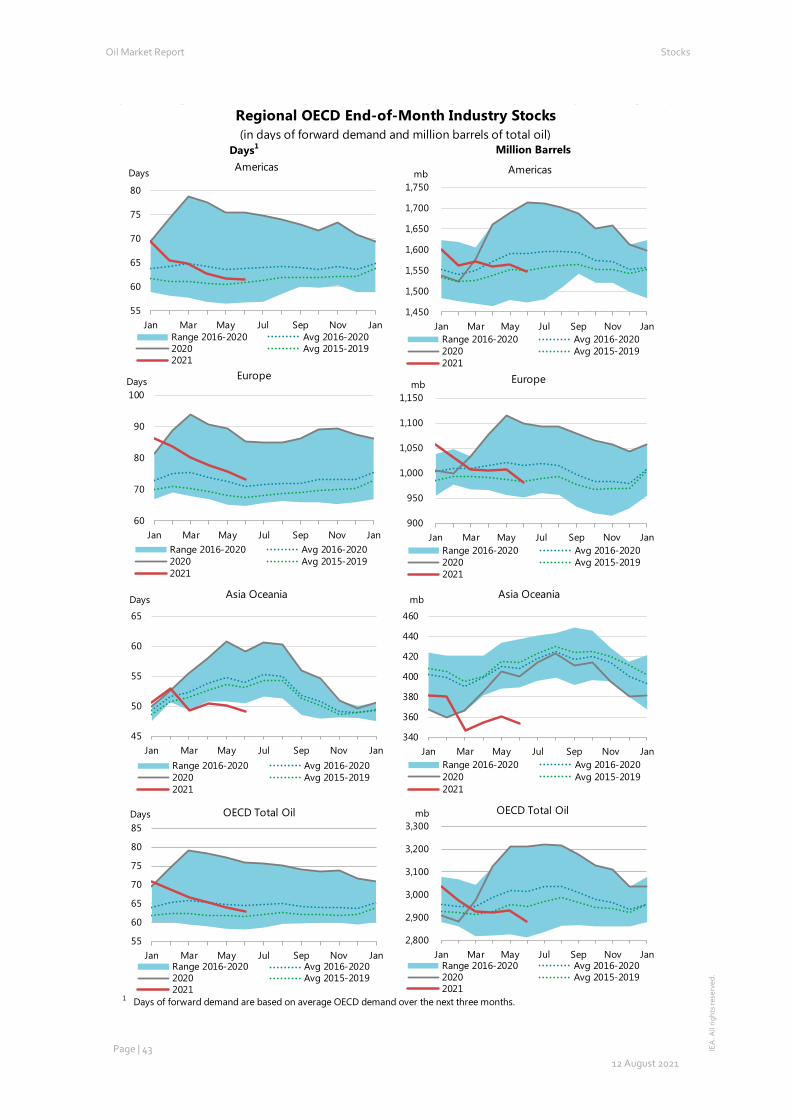
Oil Market Report Stocks
Page | 43 12 August 2021
IEA
. All
right
s re
serv
ed.
1 Days of forward demand are based on average OECD demand over the next three months.
Days1 Million Barrels
Regional OECD End-of-Month Industry Stocks(in days of forward demand and million barrels of total oil)
55
60
65
70
75
80
85
Jan Mar May Jul Sep Nov Jan
Days OECD Total Oil
Range 2016-2020 Avg 2016-20202020 Avg 2015-20192021
55
60
65
70
75
80
Jan Mar May Jul Sep Nov Jan
Days Americas
Range 2016-2020 Avg 2016-20202020 Avg 2015-20192021
60
70
80
90
100
Jan Mar May Jul Sep Nov Jan
Days Europe
Range 2016-2020 Avg 2016-20202020 Avg 2015-20192021
45
50
55
60
65
Jan Mar May Jul Sep Nov Jan
Days Asia Oceania
Range 2016-2020 Avg 2016-20202020 Avg 2015-20192021
1,450
1,500
1,550
1,600
1,650
1,700
1,750
Jan Mar May Jul Sep Nov Jan
mb Americas
Range 2016-2020 Avg 2016-20202020 Avg 2015-20192021
900
950
1,000
1,050
1,100
1,150
Jan Mar May Jul Sep Nov Jan
mb Europe
Range 2016-2020 Avg 2016-20202020 Avg 2015-20192021
340
360
380
400
420
440
460
Jan Mar May Jul Sep Nov Jan
mb Asia Oceania
Range 2016-2020 Avg 2016-20202020 Avg 2015-20192021
2,800
2,900
3,000
3,100
3,200
3,300
Jan Mar May Jul Sep Nov Jan
mb OECD Total Oil
Range 2016-2020 Avg 2016-20202020 Avg 2015-20192021
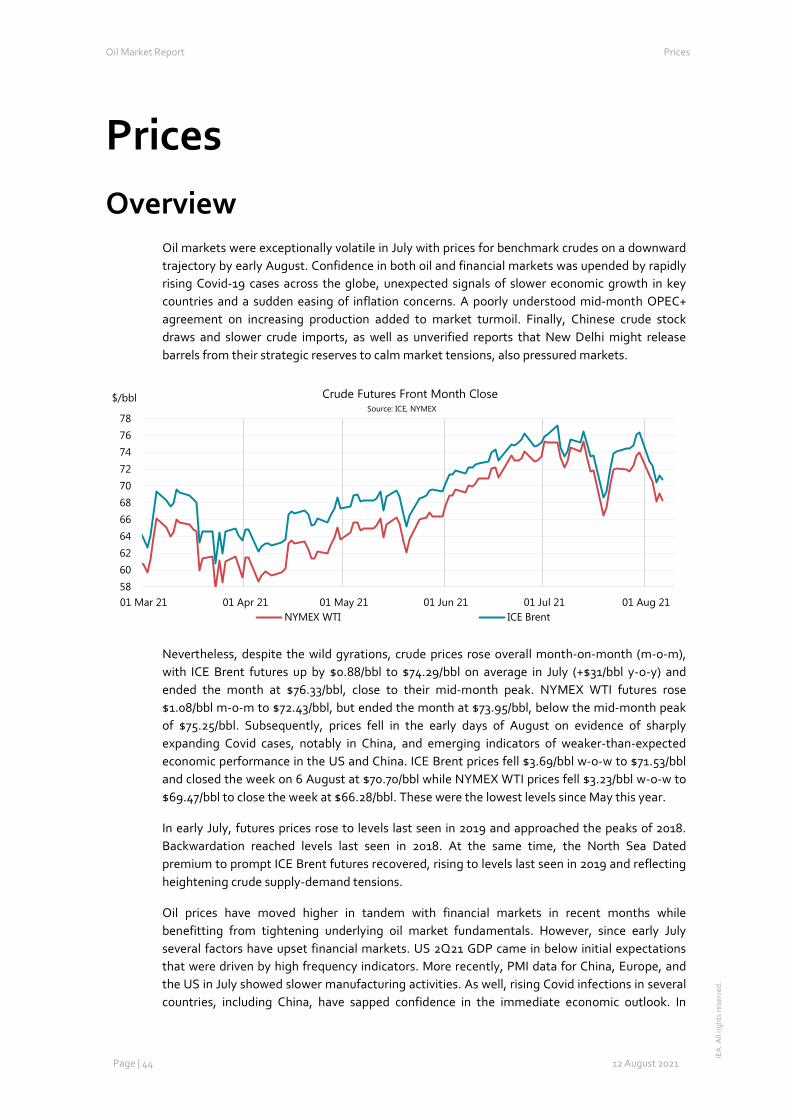
Oil Market Report Prices
Page | 44 12 August 2021
IEA
. All
right
s re
serv
ed.
Prices Overview
Oil markets were exceptionally volatile in July with prices for benchmark crudes on a downward trajectory by early August. Confidence in both oil and financial markets was upended by rapidly rising Covid-19 cases across the globe, unexpected signals of slower economic growth in key countries and a sudden easing of inflation concerns. A poorly understood mid-month OPEC+ agreement on increasing production added to market turmoil. Finally, Chinese crude stock draws and slower crude imports, as well as unverified reports that New Delhi might release barrels from their strategic reserves to calm market tensions, also pressured markets.
Nevertheless, despite the wild gyrations, crude prices rose overall month-on-month (m-o-m), with ICE Brent futures up by $0.88/bbl to $74.29/bbl on average in July (+$31/bbl y-o-y) and ended the month at $76.33/bbl, close to their mid-month peak. NYMEX WTI futures rose $1.08/bbl m-o-m to $72.43/bbl, but ended the month at $73.95/bbl, below the mid-month peak of $75.25/bbl. Subsequently, prices fell in the early days of August on evidence of sharply expanding Covid cases, notably in China, and emerging indicators of weaker-than-expected economic performance in the US and China. ICE Brent prices fell $3.69/bbl w-o-w to $71.53/bbl and closed the week on 6 August at $70.70/bbl while NYMEX WTI prices fell $3.23/bbl w-o-w to $69.47/bbl to close the week at $66.28/bbl. These were the lowest levels since May this year.
In early July, futures prices rose to levels last seen in 2019 and approached the peaks of 2018. Backwardation reached levels last seen in 2018. At the same time, the North Sea Dated premium to prompt ICE Brent futures recovered, rising to levels last seen in 2019 and reflecting heightening crude supply-demand tensions.
Oil prices have moved higher in tandem with financial markets in recent months while benefitting from tightening underlying oil market fundamentals. However, since early July several factors have upset financial markets. US 2Q21 GDP came in below initial expectations that were driven by high frequency indicators. More recently, PMI data for China, Europe, and the US in July showed slower manufacturing activities. As well, rising Covid infections in several countries, including China, have sapped confidence in the immediate economic outlook. In
5860626466687072747678
01 Mar 21 01 Apr 21 01 May 21 01 Jun 21 01 Jul 21 01 Aug 21
$/bbl Crude Futures Front Month Close
NYMEX WTI ICE Brent
Source: ICE, NYMEX
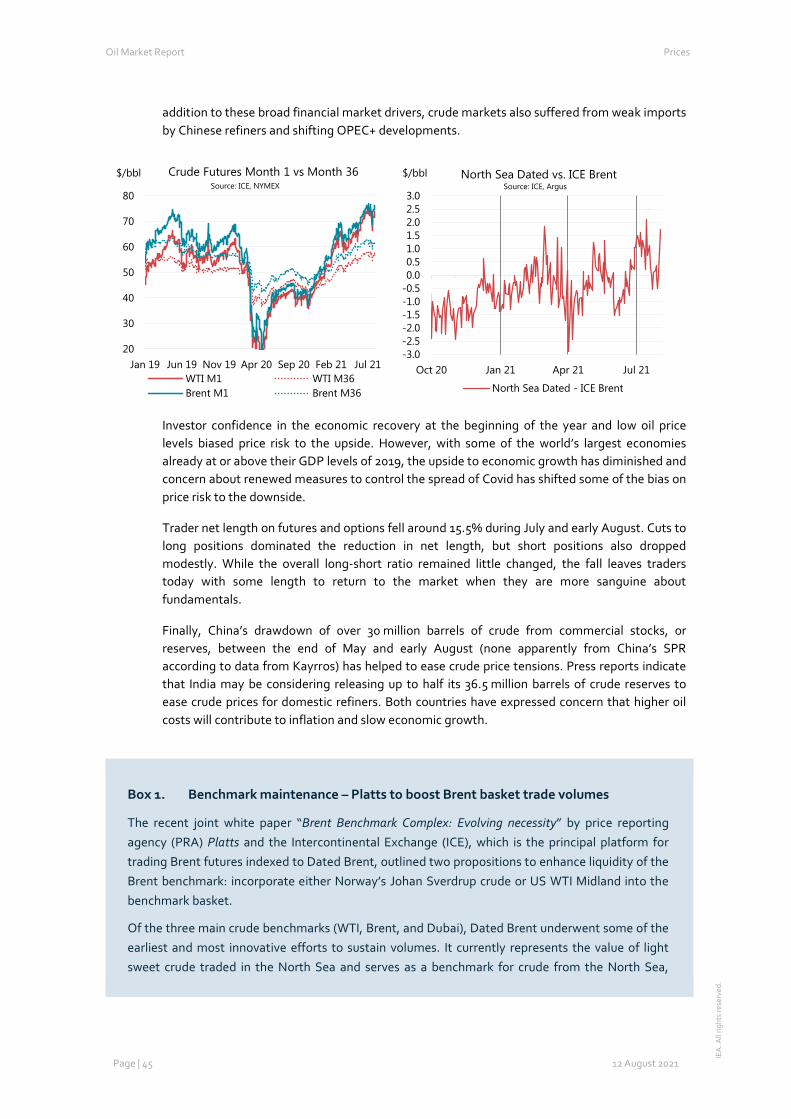
Oil Market Report Prices
Page | 45 12 August 2021
IEA
. All
right
s re
serv
ed.
addition to these broad financial market drivers, crude markets also suffered from weak imports by Chinese refiners and shifting OPEC+ developments.
Investor confidence in the economic recovery at the beginning of the year and low oil price levels biased price risk to the upside. However, with some of the world’s largest economies already at or above their GDP levels of 2019, the upside to economic growth has diminished and concern about renewed measures to control the spread of Covid has shifted some of the bias on price risk to the downside.
Trader net length on futures and options fell around 15.5% during July and early August. Cuts to long positions dominated the reduction in net length, but short positions also dropped modestly. While the overall long-short ratio remained little changed, the fall leaves traders today with some length to return to the market when they are more sanguine about fundamentals.
Finally, China’s drawdown of over 30 million barrels of crude from commercial stocks, or reserves, between the end of May and early August (none apparently from China’s SPR according to data from Kayrros) has helped to ease crude price tensions. Press reports indicate that India may be considering releasing up to half its 36.5 million barrels of crude reserves to ease crude prices for domestic refiners. Both countries have expressed concern that higher oil costs will contribute to inflation and slow economic growth.
Box 1. Benchmark maintenance – Platts to boost Brent basket trade volumes
The recent joint white paper “Brent Benchmark Complex: Evolving necessity” by price reporting agency (PRA) Platts and the Intercontinental Exchange (ICE), which is the principal platform for trading Brent futures indexed to Dated Brent, outlined two propositions to enhance liquidity of the Brent benchmark: incorporate either Norway’s Johan Sverdrup crude or US WTI Midland into the benchmark basket.
Of the three main crude benchmarks (WTI, Brent, and Dubai), Dated Brent underwent some of the earliest and most innovative efforts to sustain volumes. It currently represents the value of light sweet crude traded in the North Sea and serves as a benchmark for crude from the North Sea,
20
30
40
50
60
70
80
Jan 19 Jun 19 Nov 19 Apr 20 Sep 20 Feb 21 Jul 21
$/bbl Crude Futures Month 1 vs Month 36
WTI M1 WTI M36Brent M1 Brent M36
Source: ICE, NYMEX
-3.0-2.5-2.0-1.5-1.0-0.50.00.51.01.52.02.53.0
Oct 20 Jan 21 Apr 21 Jul 21
$/bbl North Sea Dated vs. ICE Brent
North Sea Dated - ICE Brent
Source: ICE, Argus
Oil Market Report Prices
Page | 46 12 August 2021
IEA
. All
right
s re
serv
ed.
continental Europe, Russia, the Mediterranean, the Caspian, Africa, the Middle East, and more recently light sweet grades in Asia.
In the mid-1980s, when oil majors created the first physical forward contract (the 15-day Brent market, now the BFOE cash market) that established the crude’s benchmark status, the UK’s Brent field produced some 800 kb/d. In 2002, as Brent output fell to 400 kb/d, Platts modified its benchmark assessment to create a basket of crudes including Brent, Forties, and Oseberg (BFO) where the lowest value crude set the benchmark price each day in order to boost the overall volume considered. Subsequently, the PRA added Ekofisk to the basket in 2007 and Troll in 2017. The five grades (BFOET) are all deliverable in the ‘Brent basket’. Platts generally refers to the basket as ‘BFOE’ for brevity. To make the multiple grades in the basket fungible, Platts implemented sulphur content de-escalators and quality premiums. Further innovations to enhance liquidity included trading partial cargos in the forward market, extending the physical forward trading window from 10-15 days to 12-25 days in 2012 and to 12 days to one month ahead in 2015; as well as including CIF cargos (versus only FOB).
Production of the five crudes making up the Dated Brent basket will soon fall below 600 kb/d. Since the basket already includes most of the North Sea’s large light sweet crude streams, a more radical solution is required.
As a medium sour crude (28° API, 0.8% sulphur), the quality of Johan Sverdrup differs markedly from the Brent basket. The existing sulphur de-escalator would suffice to accommodate that, but the much higher density (its specific gravity is 10° API lower than the BFOE average) requires a substantial quality de-escalator. While many industry participants back this proposal, Platts suggests that without effective de-escalators for sulphur and gravity, Johan Sverdrup crude could transform Brent from a light sweet to a medium sour benchmark. Platts also points out the potential risk from the dominant share of Equinor in the equity of Johan Sverdrup along with several other grades in the BFOET basket.
In December 2020, Platts proposed delivering light sweet WTI Midland CIF into the basket, which a large part of industry rejected. Platts’s new proposal involves an FOB Houston forward contract with FOB values based on CIF deliveries into Brent adjusted for freight (750 kb Aframax). This would ensure FOB compatibility with Brent complex. While large volumes of WTI Midland are already sold into Europe on a delivered basis (CIF), industry points to the complexity of deriving an FOB Houston value for North Sea delivery that would be compatible with the BFOE North Sea FOB grades.
Consultations on the proposals are just beginning. While Platts attempts to maintain coherence with existing contract specifications in the Brent complex (light, sweet crude delivered FOB with a one-month loading window), both proposals could lead to significant changes and increasing complexity in Brent benchmark price formation in the coming years.
Oil Market Report Prices
Page | 47 12 August 2021
IEA
. All
right
s re
serv
ed.
Futures markets Futures markets posted the highest volatility since March-April this year during the month of July, with benchmarks oscillating in a $6-9/bbl range. The steady rise in futures through June carried ICE Brent prices to $77.16/bbl on 5 July and NYMEX WTI to $75.23/bbl on 1 July, over $7/bbl higher than their level on 31 May (and a level not seen since October 2018). Brent futures then dipped to $73.43/bbl on 7 July and WTI futures to $72.20/bbl. Prices initially rose following the 5 July standoff in OPEC+ talks but subsequently collapsed on 7 July due to fears that UAE demands for a higher production baseline could provoke faster output increases, less quota discipline, or even a breakdown in the OPEC+ agreement. The fall in prices was also motivated by renewed Covid lockdowns in some Asian countries and slowing economic activity, notably in China. However, markets recovered rapidly with Brent reaching $76.49/bbl and WTI reaching $75.25/bbl on 13 July due to sustained Atlantic Basin crude demand and continued crude stock draws in the US.
Oil futures prices collapsed again after 13 July, overwhelmed by falling financial markets that suffered a cross-asset sell-off as easing inflation fears undermined treasury yields. In a sanguine testimony, the US Federal Reserve Bank (FED) chairman rejected heightened inflation risks, offsetting the impact of a third month of strong US CPI data and driving investors out of inflation hedges that included oil futures. Subsequently, a 14 July Saudi-UAE patch-up led to an OPEC+ agreement on 18 July to continue unwinding production cuts while raising baselines for five key members. This led markets to anticipate a supply surge that OPEC+ never intended. Brent futures fell to $68.62/bbl on 19 July and WTI futures fell to $66.42/bbl, $8-9/bbl below levels of 13 July.
In the last decade of the month, crude futures recovered from cross-asset turmoil and OPEC+ confusion to focus on strong underlying oil market fundamentals, good European economic data, and sustained fiscal and monetary support. The US FED Chairman, Jerome Powell, concluded the bank’s July meeting with more dovish inflation comments which helped boost financial markets. Nevertheless, the financial markets were discomfited by data showing US 2Q21 GDP growth fell well below market expectations, a rout in Chinese equities as the country’s authorities undertook a new crack-down on foreign investment in tech companies (notably in education), as well as heightened mobility restrictions across the globe to fight spreading Covid infections. Brent futures rose to $73.33/bbl on 30 July and WTI futures to $73.95/bbl. Subsequently, Brent futures collapsed to $68.28/bbl and WTI futures to $70.70/bbl on 6 August with continued pressure from the spread of Covid infections, global PMI data trends showing a plateauing of activity, and easing of inflation expectations.
The backwardation in crude futures remained very steep between end-June and end-July, reflecting the overall supply-demand pressures that have resulted in steady crude stock draws across OECD and non-OECD oil markets. Backwardation over the 12-month strip reached $7.30/bbl for NYMEX WTI and $5.62/bbl for ICE Brent on 30 July, but collapsed by 6 August to $4.35/bbl and $3.66/bbl. The ICE Brent versus NYMEX WTI price spread narrowed considerably from end-May to end-June as the US market tightened, lifting WTI prices faster than Brent due to tight stock cover in the US midcontinent at Cushing, OK. By end-June, prompt NYMEX WTI prices were less than $1.70/bbl below ICE Brent. However, rising export demand for crude boosted the prompt spread to nearly $2.40/bbl at end-July. The contango in the spread’s forward curve shows the markets expect a return to a looser US crude balance that would result from a stronger recovery in US crude production. However, between end-July and 6 August the spread’s forward curve fell, indicating that the perception shifted toward a tightening of the US
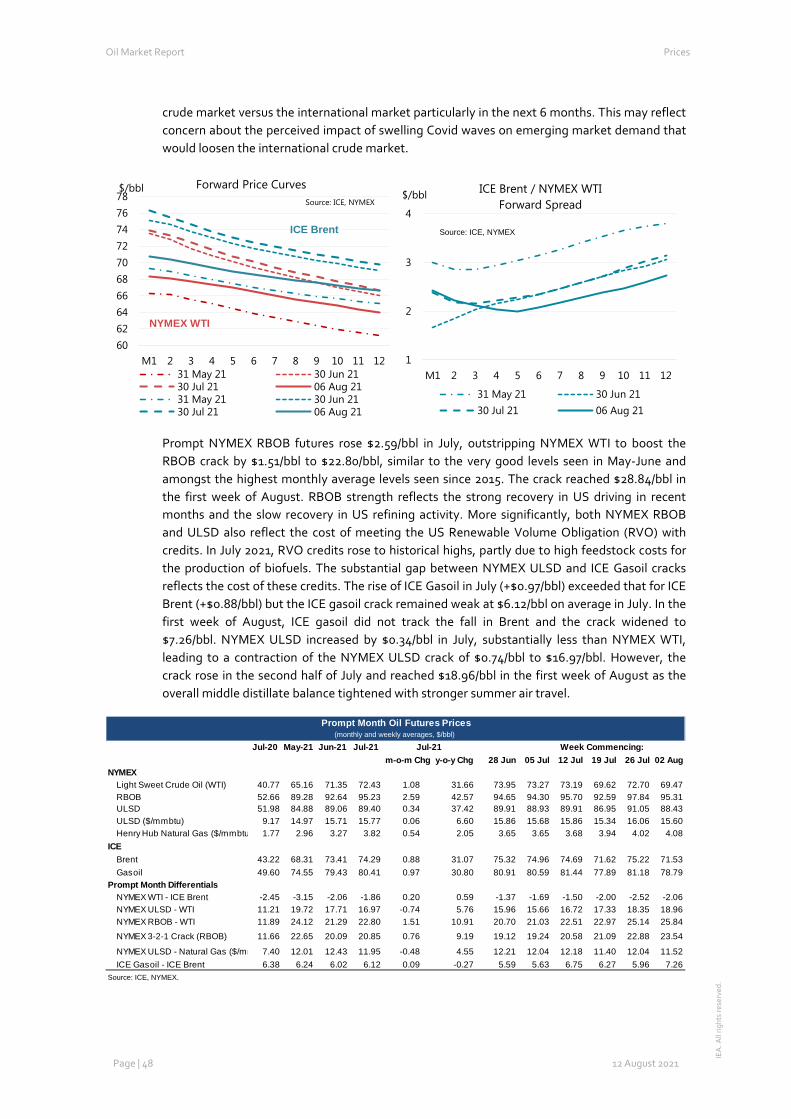
Oil Market Report Prices
Page | 48 12 August 2021
IEA
. All
right
s re
serv
ed.
crude market versus the international market particularly in the next 6 months. This may reflect concern about the perceived impact of swelling Covid waves on emerging market demand that would loosen the international crude market.
Prompt NYMEX RBOB futures rose $2.59/bbl in July, outstripping NYMEX WTI to boost the RBOB crack by $1.51/bbl to $22.80/bbl, similar to the very good levels seen in May-June and amongst the highest monthly average levels seen since 2015. The crack reached $28.84/bbl in the first week of August. RBOB strength reflects the strong recovery in US driving in recent months and the slow recovery in US refining activity. More significantly, both NYMEX RBOB and ULSD also reflect the cost of meeting the US Renewable Volume Obligation (RVO) with credits. In July 2021, RVO credits rose to historical highs, partly due to high feedstock costs for the production of biofuels. The substantial gap between NYMEX ULSD and ICE Gasoil cracks reflects the cost of these credits. The rise of ICE Gasoil in July (+$0.97/bbl) exceeded that for ICE Brent (+$0.88/bbl) but the ICE gasoil crack remained weak at $6.12/bbl on average in July. In the first week of August, ICE gasoil did not track the fall in Brent and the crack widened to $7.26/bbl. NYMEX ULSD increased by $0.34/bbl in July, substantially less than NYMEX WTI, leading to a contraction of the NYMEX ULSD crack of $0.74/bbl to $16.97/bbl. However, the crack rose in the second half of July and reached $18.96/bbl in the first week of August as the overall middle distillate balance tightened with stronger summer air travel.
60626466687072747678
M1 2 3 4 5 6 7 8 9 10 11 12
$/bbl Forward Price Curves
31 May 21 30 Jun 2130 Jul 21 06 Aug 2131 May 21 30 Jun 2130 Jul 21 06 Aug 21
Source: ICE, NYMEX
NYMEX WTI
ICE Brent
1
2
3
4
M1 2 3 4 5 6 7 8 9 10 11 12
$/bbl ICE Brent / NYMEX WTI Forward Spread
31 May 21 30 Jun 2130 Jul 21 06 Aug 21
Source: ICE, NYMEX
Jul-20 May-21 Jun-21 Jul-21m-o-m Chg y-o-y Chg 28 Jun 05 Jul 12 Jul 19 Jul 26 Jul 02 Aug
NYMEXLight Sweet Crude Oil (WTI) 40.77 65.16 71.35 72.43 1.08 31.66 73.95 73.27 73.19 69.62 72.70 69.47RBOB 52.66 89.28 92.64 95.23 2.59 42.57 94.65 94.30 95.70 92.59 97.84 95.31ULSD 51.98 84.88 89.06 89.40 0.34 37.42 89.91 88.93 89.91 86.95 91.05 88.43ULSD ($/mmbtu) 9.17 14.97 15.71 15.77 0.06 6.60 15.86 15.68 15.86 15.34 16.06 15.60Henry Hub Natural Gas ($/mmbtu 1.77 2.96 3.27 3.82 0.54 2.05 3.65 3.65 3.68 3.94 4.02 4.08
ICEBrent 43.22 68.31 73.41 74.29 0.88 31.07 75.32 74.96 74.69 71.62 75.22 71.53Gasoil 49.60 74.55 79.43 80.41 0.97 30.80 80.91 80.59 81.44 77.89 81.18 78.79
Prompt Month DifferentialsNYMEX WTI - ICE Brent -2.45 -3.15 -2.06 -1.86 0.20 0.59 -1.37 -1.69 -1.50 -2.00 -2.52 -2.06NYMEX ULSD - WTI 11.21 19.72 17.71 16.97 -0.74 5.76 15.96 15.66 16.72 17.33 18.35 18.96NYMEX RBOB - WTI 11.89 24.12 21.29 22.80 1.51 10.91 20.70 21.03 22.51 22.97 25.14 25.84
NYMEX 3-2-1 Crack (RBOB) 11.66 22.65 20.09 20.85 0.76 9.19 19.12 19.24 20.58 21.09 22.88 23.54
NYMEX ULSD - Natural Gas ($/mm 7.40 12.01 12.43 11.95 -0.48 4.55 12.21 12.04 12.18 11.40 12.04 11.52ICE Gasoil - ICE Brent 6.38 6.24 6.02 6.12 0.09 -0.27 5.59 5.63 6.75 6.27 5.96 7.26
Source: ICE, NYMEX.
Prompt Month Oil Futures Prices(monthly and weekly averages, $/bbl)
Week Commencing:Jul-21
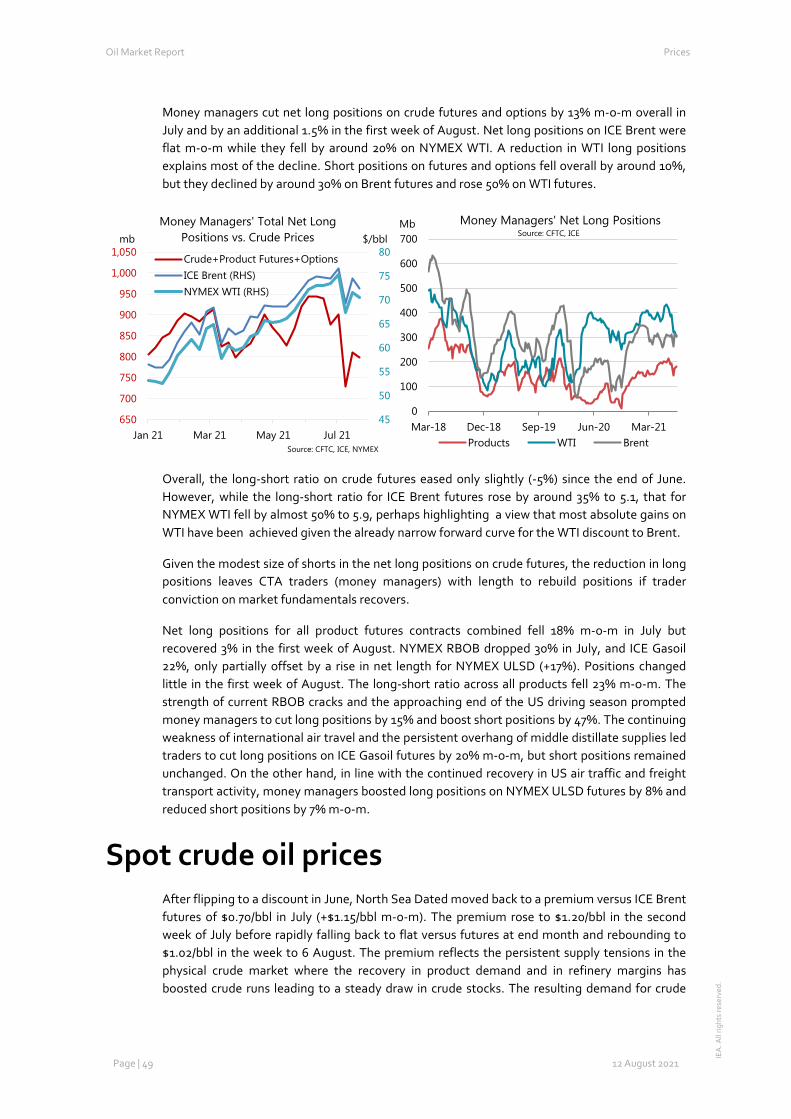
Oil Market Report Prices
Page | 49 12 August 2021
IEA
. All
right
s re
serv
ed.
Money managers cut net long positions on crude futures and options by 13% m-o-m overall in July and by an additional 1.5% in the first week of August. Net long positions on ICE Brent were flat m-o-m while they fell by around 20% on NYMEX WTI. A reduction in WTI long positions explains most of the decline. Short positions on futures and options fell overall by around 10%, but they declined by around 30% on Brent futures and rose 50% on WTI futures.
Overall, the long-short ratio on crude futures eased only slightly (-5%) since the end of June. However, while the long-short ratio for ICE Brent futures rose by around 35% to 5.1, that for NYMEX WTI fell by almost 50% to 5.9, perhaps highlighting a view that most absolute gains on WTI have been achieved given the already narrow forward curve for the WTI discount to Brent.
Given the modest size of shorts in the net long positions on crude futures, the reduction in long positions leaves CTA traders (money managers) with length to rebuild positions if trader conviction on market fundamentals recovers.
Net long positions for all product futures contracts combined fell 18% m-o-m in July but recovered 3% in the first week of August. NYMEX RBOB dropped 30% in July, and ICE Gasoil 22%, only partially offset by a rise in net length for NYMEX ULSD (+17%). Positions changed little in the first week of August. The long-short ratio across all products fell 23% m-o-m. The strength of current RBOB cracks and the approaching end of the US driving season prompted money managers to cut long positions by 15% and boost short positions by 47%. The continuing weakness of international air travel and the persistent overhang of middle distillate supplies led traders to cut long positions on ICE Gasoil futures by 20% m-o-m, but short positions remained unchanged. On the other hand, in line with the continued recovery in US air traffic and freight transport activity, money managers boosted long positions on NYMEX ULSD futures by 8% and reduced short positions by 7% m-o-m.
Spot crude oil prices After flipping to a discount in June, North Sea Dated moved back to a premium versus ICE Brent futures of $0.70/bbl in July (+$1.15/bbl m-o-m). The premium rose to $1.20/bbl in the second week of July before rapidly falling back to flat versus futures at end month and rebounding to $1.02/bbl in the week to 6 August. The premium reflects the persistent supply tensions in the physical crude market where the recovery in product demand and in refinery margins has boosted crude runs leading to a steady draw in crude stocks. The resulting demand for crude
45
50
55
60
65
70
75
80
650
700
750
800
850
900
950
1,000
1,050
Jan 21 Mar 21 May 21 Jul 21
$/bblmbMoney Managers' Total Net Long
Positions vs. Crude Prices
Crude+Product Futures+OptionsICE Brent (RHS)NYMEX WTI (RHS)
Source: CFTC, ICE, NYMEX
0
100
200
300
400
500
600
700
Mar-18 Dec-18 Sep-19 Jun-20 Mar-21
Mb Money Managers' Net Long Positions
Products WTI Brent
Source: CFTC, ICE
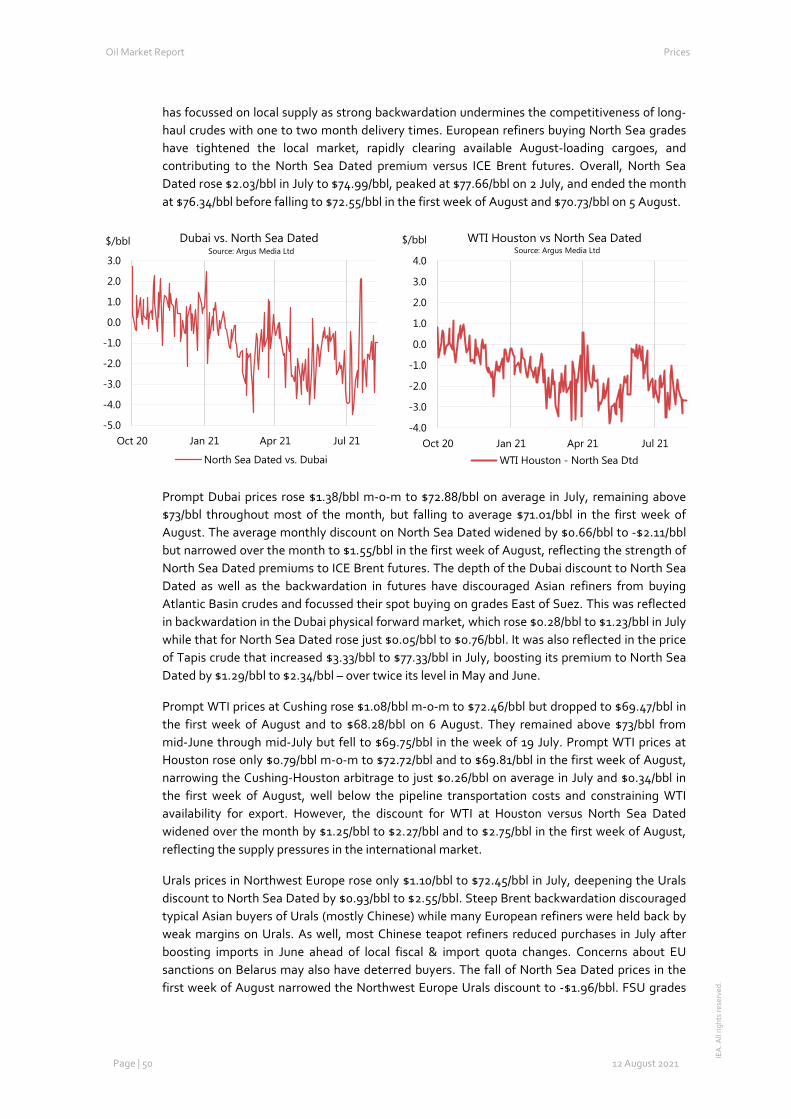
Oil Market Report Prices
Page | 50 12 August 2021
IEA
. All
right
s re
serv
ed.
has focussed on local supply as strong backwardation undermines the competitiveness of long-haul crudes with one to two month delivery times. European refiners buying North Sea grades have tightened the local market, rapidly clearing available August-loading cargoes, and contributing to the North Sea Dated premium versus ICE Brent futures. Overall, North Sea Dated rose $2.03/bbl in July to $74.99/bbl, peaked at $77.66/bbl on 2 July, and ended the month at $76.34/bbl before falling to $72.55/bbl in the first week of August and $70.73/bbl on 5 August.
Prompt Dubai prices rose $1.38/bbl m-o-m to $72.88/bbl on average in July, remaining above $73/bbl throughout most of the month, but falling to average $71.01/bbl in the first week of August. The average monthly discount on North Sea Dated widened by $0.66/bbl to -$2.11/bbl but narrowed over the month to $1.55/bbl in the first week of August, reflecting the strength of North Sea Dated premiums to ICE Brent futures. The depth of the Dubai discount to North Sea Dated as well as the backwardation in futures have discouraged Asian refiners from buying Atlantic Basin crudes and focussed their spot buying on grades East of Suez. This was reflected in backwardation in the Dubai physical forward market, which rose $0.28/bbl to $1.23/bbl in July while that for North Sea Dated rose just $0.05/bbl to $0.76/bbl. It was also reflected in the price of Tapis crude that increased $3.33/bbl to $77.33/bbl in July, boosting its premium to North Sea Dated by $1.29/bbl to $2.34/bbl – over twice its level in May and June.
Prompt WTI prices at Cushing rose $1.08/bbl m-o-m to $72.46/bbl but dropped to $69.47/bbl in the first week of August and to $68.28/bbl on 6 August. They remained above $73/bbl from mid-June through mid-July but fell to $69.75/bbl in the week of 19 July. Prompt WTI prices at Houston rose only $0.79/bbl m-o-m to $72.72/bbl and to $69.81/bbl in the first week of August, narrowing the Cushing-Houston arbitrage to just $0.26/bbl on average in July and $0.34/bbl in the first week of August, well below the pipeline transportation costs and constraining WTI availability for export. However, the discount for WTI at Houston versus North Sea Dated widened over the month by $1.25/bbl to $2.27/bbl and to $2.75/bbl in the first week of August, reflecting the supply pressures in the international market.
Urals prices in Northwest Europe rose only $1.10/bbl to $72.45/bbl in July, deepening the Urals discount to North Sea Dated by $0.93/bbl to $2.55/bbl. Steep Brent backwardation discouraged typical Asian buyers of Urals (mostly Chinese) while many European refiners were held back by weak margins on Urals. As well, most Chinese teapot refiners reduced purchases in July after boosting imports in June ahead of local fiscal & import quota changes. Concerns about EU sanctions on Belarus may also have deterred buyers. The fall of North Sea Dated prices in the first week of August narrowed the Northwest Europe Urals discount to -$1.96/bbl. FSU grades
-5.0
-4.0
-3.0
-2.0
-1.0
0.0
1.0
2.0
3.0
Oct 20 Jan 21 Apr 21 Jul 21
$/bbl Dubai vs. North Sea Dated
North Sea Dated vs. Dubai
Source: Argus Media Ltd
-4.0
-3.0
-2.0
-1.0
0.0
1.0
2.0
3.0
4.0
Oct 20 Jan 21 Apr 21 Jul 21
$/bbl WTI Houston vs North Sea Dated
WTI Houston - North Sea Dtd
Source: Argus Media Ltd
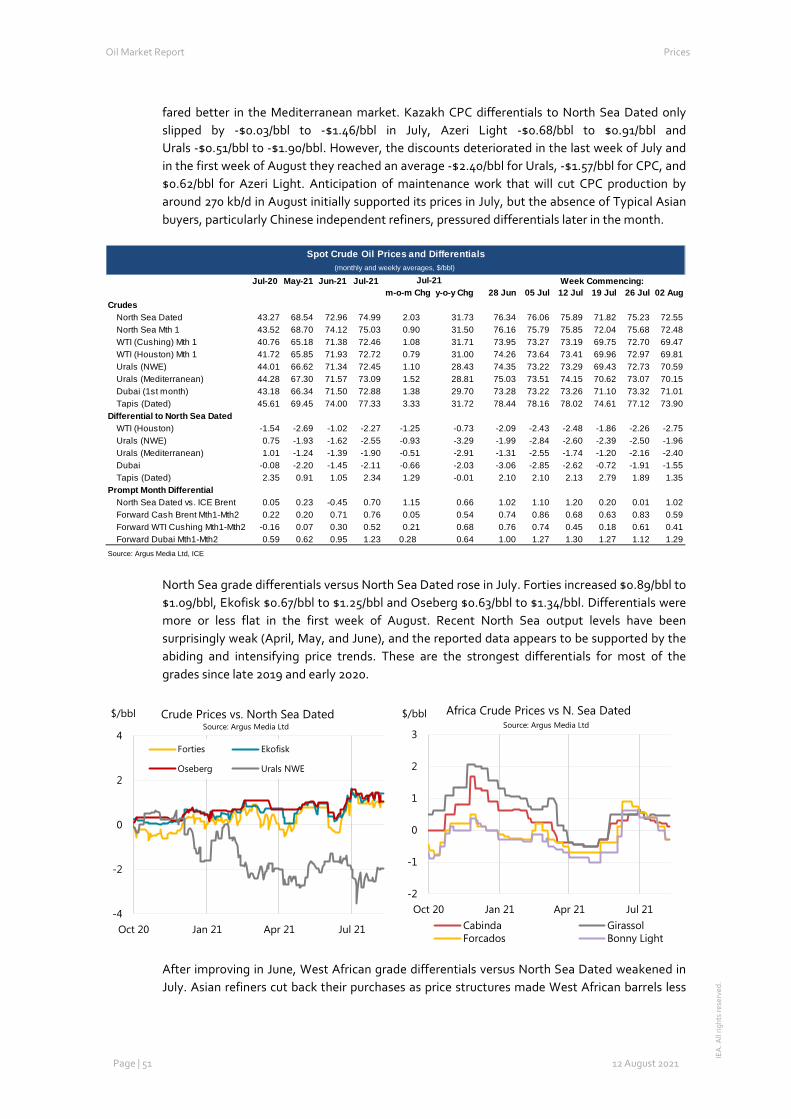
Oil Market Report Prices
Page | 51 12 August 2021
IEA
. All
right
s re
serv
ed.
fared better in the Mediterranean market. Kazakh CPC differentials to North Sea Dated only slipped by -$0.03/bbl to -$1.46/bbl in July, Azeri Light -$0.68/bbl to $0.91/bbl and Urals -$0.51/bbl to -$1.90/bbl. However, the discounts deteriorated in the last week of July and in the first week of August they reached an average -$2.40/bbl for Urals, -$1.57/bbl for CPC, and $0.62/bbl for Azeri Light. Anticipation of maintenance work that will cut CPC production by around 270 kb/d in August initially supported its prices in July, but the absence of Typical Asian buyers, particularly Chinese independent refiners, pressured differentials later in the month.
North Sea grade differentials versus North Sea Dated rose in July. Forties increased $0.89/bbl to $1.09/bbl, Ekofisk $0.67/bbl to $1.25/bbl and Oseberg $0.63/bbl to $1.34/bbl. Differentials were more or less flat in the first week of August. Recent North Sea output levels have been surprisingly weak (April, May, and June), and the reported data appears to be supported by the abiding and intensifying price trends. These are the strongest differentials for most of the grades since late 2019 and early 2020.
After improving in June, West African grade differentials versus North Sea Dated weakened in July. Asian refiners cut back their purchases as price structures made West African barrels less
Jul-20 May-21 Jun-21 Jul-21m-o-m Chg y-o-y Chg 28 Jun 05 Jul 12 Jul 19 Jul 26 Jul 02 Aug
CrudesNorth Sea Dated 43.27 68.54 72.96 74.99 2.03 31.73 76.34 76.06 75.89 71.82 75.23 72.55North Sea Mth 1 43.52 68.70 74.12 75.03 0.90 31.50 76.16 75.79 75.85 72.04 75.68 72.48WTI (Cushing) Mth 1 40.76 65.18 71.38 72.46 1.08 31.71 73.95 73.27 73.19 69.75 72.70 69.47WTI (Houston) Mth 1 41.72 65.85 71.93 72.72 0.79 31.00 74.26 73.64 73.41 69.96 72.97 69.81Urals (NWE) 44.01 66.62 71.34 72.45 1.10 28.43 74.35 73.22 73.29 69.43 72.73 70.59Urals (Mediterranean) 44.28 67.30 71.57 73.09 1.52 28.81 75.03 73.51 74.15 70.62 73.07 70.15Dubai (1st month) 43.18 66.34 71.50 72.88 1.38 29.70 73.28 73.22 73.26 71.10 73.32 71.01Tapis (Dated) 45.61 69.45 74.00 77.33 3.33 31.72 78.44 78.16 78.02 74.61 77.12 73.90
Differential to North Sea Dated WTI (Houston) -1.54 -2.69 -1.02 -2.27 -1.25 -0.73 -2.09 -2.43 -2.48 -1.86 -2.26 -2.75Urals (NWE) 0.75 -1.93 -1.62 -2.55 -0.93 -3.29 -1.99 -2.84 -2.60 -2.39 -2.50 -1.96Urals (Mediterranean) 1.01 -1.24 -1.39 -1.90 -0.51 -2.91 -1.31 -2.55 -1.74 -1.20 -2.16 -2.40Dubai -0.08 -2.20 -1.45 -2.11 -0.66 -2.03 -3.06 -2.85 -2.62 -0.72 -1.91 -1.55Tapis (Dated) 2.35 0.91 1.05 2.34 1.29 -0.01 2.10 2.10 2.13 2.79 1.89 1.35
Prompt Month DifferentialNorth Sea Dated vs. ICE Brent 0.05 0.23 -0.45 0.70 1.15 0.66 1.02 1.10 1.20 0.20 0.01 1.02Forward Cash Brent Mth1-Mth2 0.22 0.20 0.71 0.76 0.05 0.54 0.74 0.86 0.68 0.63 0.83 0.59Forward WTI Cushing Mth1-Mth2 -0.16 0.07 0.30 0.52 0.21 0.68 0.76 0.74 0.45 0.18 0.61 0.41Forward Dubai Mth1-Mth2 0.59 0.62 0.95 1.23 0.28 0.64 1.00 1.27 1.30 1.27 1.12 1.29
Source: Argus Media Ltd, ICE
Spot Crude Oil Prices and Differentials(monthly and weekly averages, $/bbl)
Week Commencing:Jul-21
-4
-2
0
2
4
Oct 20 Jan 21 Apr 21 Jul 21
$/bbl Crude Prices vs. North Sea Dated
Forties Ekofisk
Oseberg Urals NWE
Source: Argus Media Ltd
-2
-1
0
1
2
3
Oct 20 Jan 21 Apr 21 Jul 21
$/bbl Africa Crude Prices vs N. Sea Dated
Cabinda GirassolForcados Bonny Light
Source: Argus Media Ltd
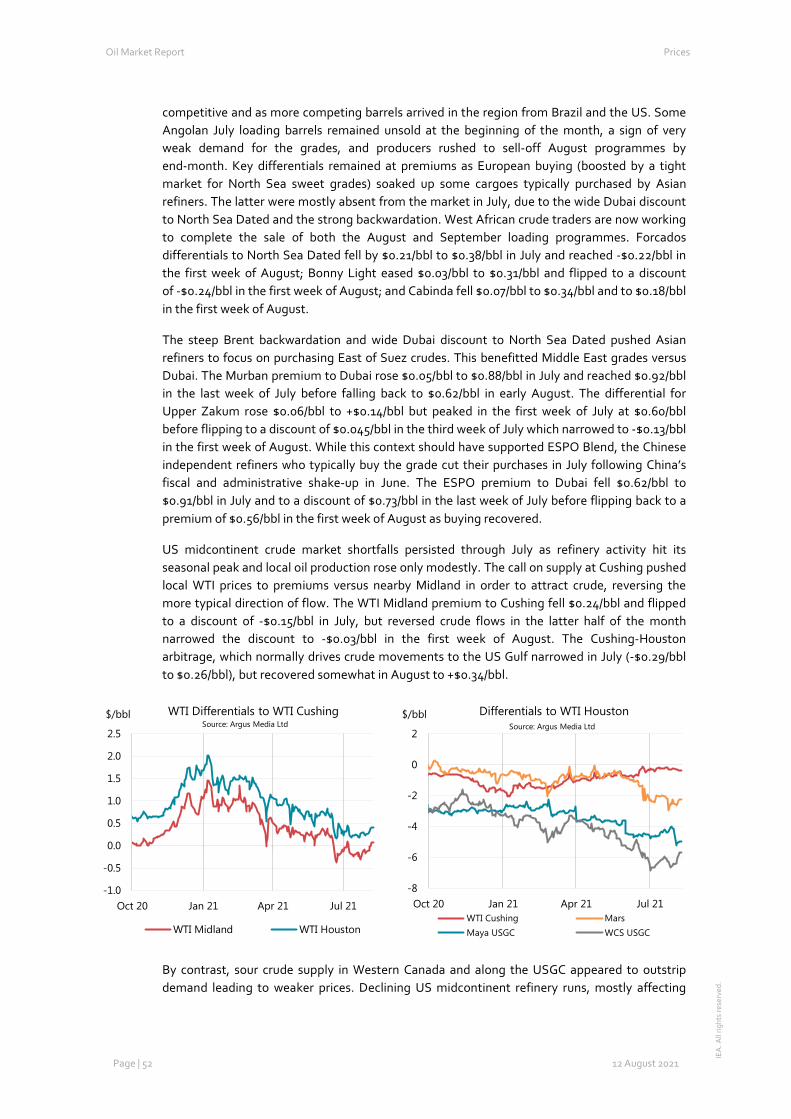
Oil Market Report Prices
Page | 52 12 August 2021
IEA
. All
right
s re
serv
ed.
competitive and as more competing barrels arrived in the region from Brazil and the US. Some Angolan July loading barrels remained unsold at the beginning of the month, a sign of very weak demand for the grades, and producers rushed to sell-off August programmes by end-month. Key differentials remained at premiums as European buying (boosted by a tight market for North Sea sweet grades) soaked up some cargoes typically purchased by Asian refiners. The latter were mostly absent from the market in July, due to the wide Dubai discount to North Sea Dated and the strong backwardation. West African crude traders are now working to complete the sale of both the August and September loading programmes. Forcados differentials to North Sea Dated fell by $0.21/bbl to $0.38/bbl in July and reached -$0.22/bbl in the first week of August; Bonny Light eased $0.03/bbl to $0.31/bbl and flipped to a discount of -$0.24/bbl in the first week of August; and Cabinda fell $0.07/bbl to $0.34/bbl and to $0.18/bbl in the first week of August.
The steep Brent backwardation and wide Dubai discount to North Sea Dated pushed Asian refiners to focus on purchasing East of Suez crudes. This benefitted Middle East grades versus Dubai. The Murban premium to Dubai rose $0.05/bbl to $0.88/bbl in July and reached $0.92/bbl in the last week of July before falling back to $0.62/bbl in early August. The differential for Upper Zakum rose $0.06/bbl to +$0.14/bbl but peaked in the first week of July at $0.60/bbl before flipping to a discount of $0.045/bbl in the third week of July which narrowed to -$0.13/bbl in the first week of August. While this context should have supported ESPO Blend, the Chinese independent refiners who typically buy the grade cut their purchases in July following China’s fiscal and administrative shake-up in June. The ESPO premium to Dubai fell $0.62/bbl to $0.91/bbl in July and to a discount of $0.73/bbl in the last week of July before flipping back to a premium of $0.56/bbl in the first week of August as buying recovered.
US midcontinent crude market shortfalls persisted through July as refinery activity hit its seasonal peak and local oil production rose only modestly. The call on supply at Cushing pushed local WTI prices to premiums versus nearby Midland in order to attract crude, reversing the more typical direction of flow. The WTI Midland premium to Cushing fell $0.24/bbl and flipped to a discount of -$0.15/bbl in July, but reversed crude flows in the latter half of the month narrowed the discount to -$0.03/bbl in the first week of August. The Cushing-Houston arbitrage, which normally drives crude movements to the US Gulf narrowed in July (-$0.29/bbl to $0.26/bbl), but recovered somewhat in August to +$0.34/bbl.
By contrast, sour crude supply in Western Canada and along the USGC appeared to outstrip demand leading to weaker prices. Declining US midcontinent refinery runs, mostly affecting
-1.0
-0.5
0.0
0.5
1.0
1.5
2.0
2.5
Oct 20 Jan 21 Apr 21 Jul 21
$/bbl WTI Differentials to WTI Cushing
WTI Midland WTI Houston
Source: Argus Media Ltd
-8
-6
-4
-2
0
2
Oct 20 Jan 21 Apr 21 Jul 21
$/bbl Differentials to WTI Houston
WTI Cushing MarsMaya USGC WCS USGC
Source: Argus Media Ltd
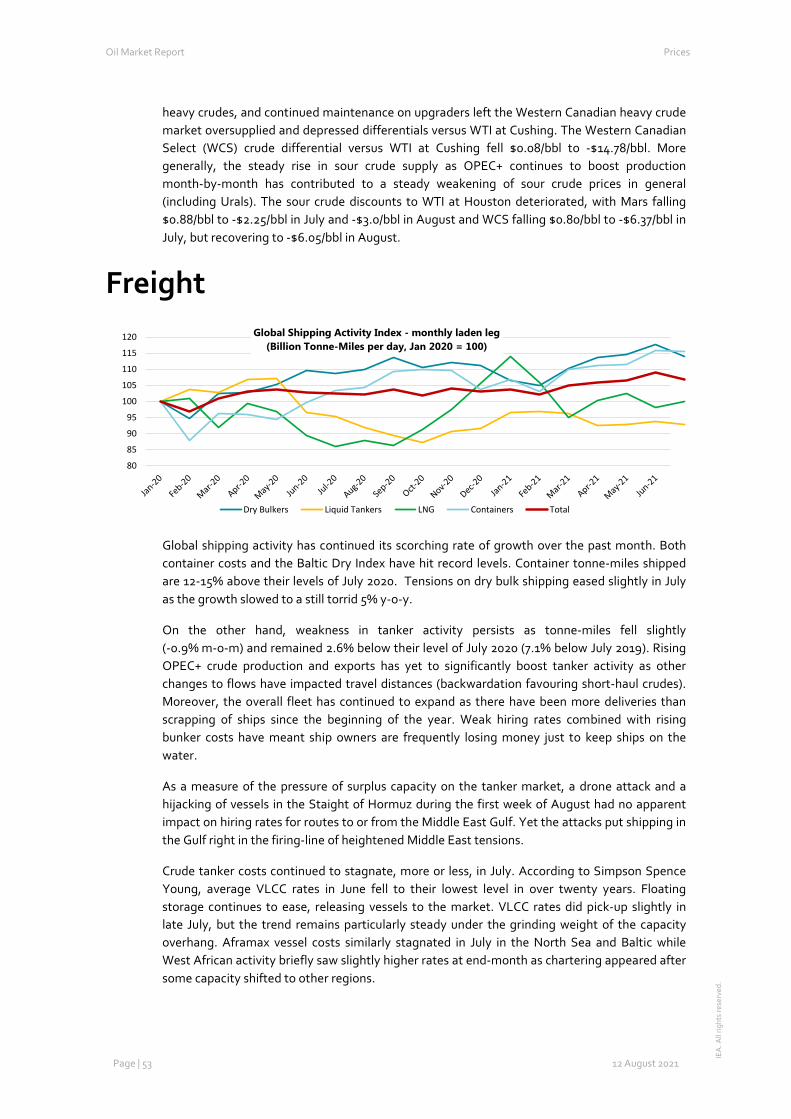
Oil Market Report Prices
Page | 53 12 August 2021
IEA
. All
right
s re
serv
ed.
heavy crudes, and continued maintenance on upgraders left the Western Canadian heavy crude market oversupplied and depressed differentials versus WTI at Cushing. The Western Canadian Select (WCS) crude differential versus WTI at Cushing fell $0.08/bbl to -$14.78/bbl. More generally, the steady rise in sour crude supply as OPEC+ continues to boost production month-by-month has contributed to a steady weakening of sour crude prices in general (including Urals). The sour crude discounts to WTI at Houston deteriorated, with Mars falling $0.88/bbl to -$2.25/bbl in July and -$3.0/bbl in August and WCS falling $0.80/bbl to -$6.37/bbl in July, but recovering to -$6.05/bbl in August.
Freight
Global shipping activity has continued its scorching rate of growth over the past month. Both container costs and the Baltic Dry Index have hit record levels. Container tonne-miles shipped are 12-15% above their levels of July 2020. Tensions on dry bulk shipping eased slightly in July as the growth slowed to a still torrid 5% y-o-y.
On the other hand, weakness in tanker activity persists as tonne-miles fell slightly (-0.9% m-o-m) and remained 2.6% below their level of July 2020 (7.1% below July 2019). Rising OPEC+ crude production and exports has yet to significantly boost tanker activity as other changes to flows have impacted travel distances (backwardation favouring short-haul crudes). Moreover, the overall fleet has continued to expand as there have been more deliveries than scrapping of ships since the beginning of the year. Weak hiring rates combined with rising bunker costs have meant ship owners are frequently losing money just to keep ships on the water.
As a measure of the pressure of surplus capacity on the tanker market, a drone attack and a hijacking of vessels in the Staight of Hormuz during the first week of August had no apparent impact on hiring rates for routes to or from the Middle East Gulf. Yet the attacks put shipping in the Gulf right in the firing-line of heightened Middle East tensions.
Crude tanker costs continued to stagnate, more or less, in July. According to Simpson Spence Young, average VLCC rates in June fell to their lowest level in over twenty years. Floating storage continues to ease, releasing vessels to the market. VLCC rates did pick-up slightly in late July, but the trend remains particularly steady under the grinding weight of the capacity overhang. Aframax vessel costs similarly stagnated in July in the North Sea and Baltic while West African activity briefly saw slightly higher rates at end-month as chartering appeared after some capacity shifted to other regions.
80
85
90
95
100
105
110
115
120 Global Shipping Activity Index - monthly laden leg(Billion Tonne-Miles per day, Jan 2020 = 100)
Dry Bulkers Liquid Tankers LNG Containers Total
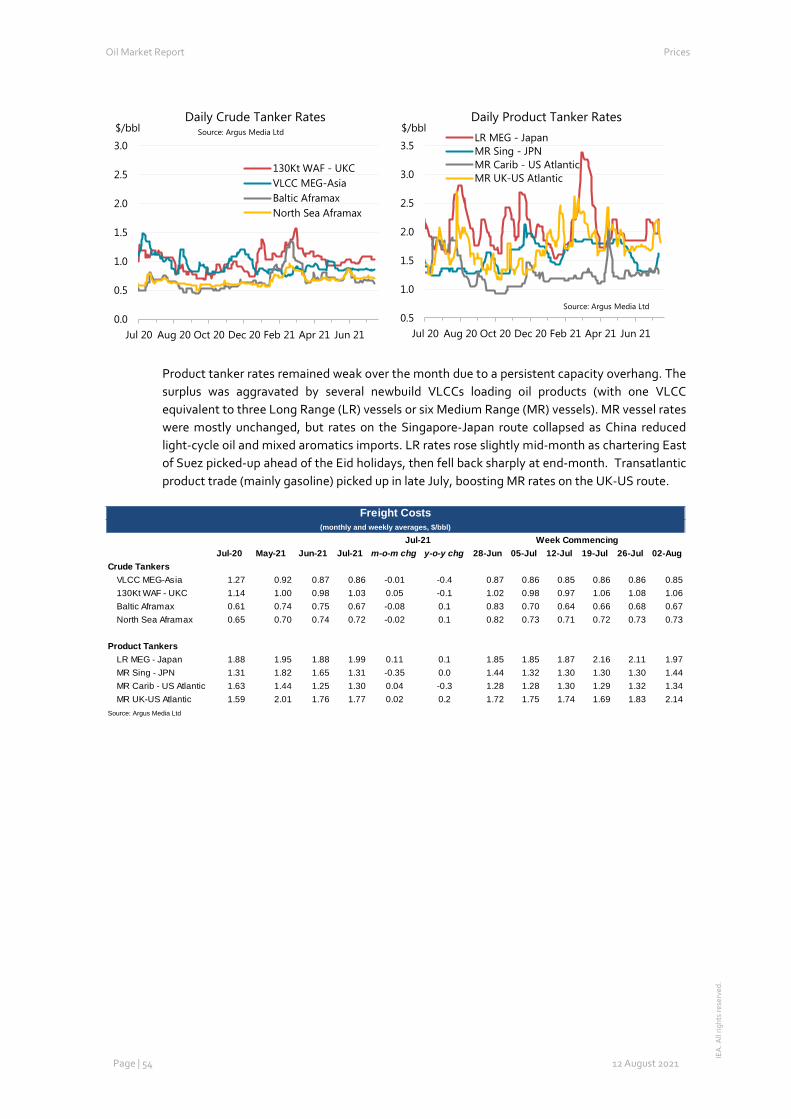
Oil Market Report Prices
Page | 54 12 August 2021
IEA
. All
right
s re
serv
ed.
Product tanker rates remained weak over the month due to a persistent capacity overhang. The surplus was aggravated by several newbuild VLCCs loading oil products (with one VLCC equivalent to three Long Range (LR) vessels or six Medium Range (MR) vessels). MR vessel rates were mostly unchanged, but rates on the Singapore-Japan route collapsed as China reduced light-cycle oil and mixed aromatics imports. LR rates rose slightly mid-month as chartering East of Suez picked-up ahead of the Eid holidays, then fell back sharply at end-month. Transatlantic product trade (mainly gasoline) picked up in late July, boosting MR rates on the UK-US route.
0.0
0.5
1.0
1.5
2.0
2.5
3.0
Jul 20 Aug 20 Oct 20 Dec 20 Feb 21 Apr 21 Jun 21
$/bblDaily Crude Tanker Rates
130Kt WAF - UKCVLCC MEG-AsiaBaltic AframaxNorth Sea Aframax
Source: Argus Media Ltd
0.5
1.0
1.5
2.0
2.5
3.0
3.5
Jul 20 Aug 20 Oct 20 Dec 20 Feb 21 Apr 21 Jun 21
$/bblDaily Product Tanker RatesLR MEG - JapanMR Sing - JPNMR Carib - US AtlanticMR UK-US Atlantic
Source: Argus Media Ltd
Jul-20 May-21 Jun-21 Jul-21 m-o-m chg y-o-y chg 28-Jun 05-Jul 12-Jul 19-Jul 26-Jul 02-AugCrude Tankers
VLCC MEG-Asia 1.27 0.92 0.87 0.86 -0.01 -0.4 0.87 0.86 0.85 0.86 0.86 0.85130Kt WAF - UKC 1.14 1.00 0.98 1.03 0.05 -0.1 1.02 0.98 0.97 1.06 1.08 1.06Baltic Aframax 0.61 0.74 0.75 0.67 -0.08 0.1 0.83 0.70 0.64 0.66 0.68 0.67North Sea Aframax 0.65 0.70 0.74 0.72 -0.02 0.1 0.82 0.73 0.71 0.72 0.73 0.73
Product TankersLR MEG - Japan 1.88 1.95 1.88 1.99 0.11 0.1 1.85 1.85 1.87 2.16 2.11 1.97MR Sing - JPN 1.31 1.82 1.65 1.31 -0.35 0.0 1.44 1.32 1.30 1.30 1.30 1.44MR Carib - US Atlantic 1.63 1.44 1.25 1.30 0.04 -0.3 1.28 1.28 1.30 1.29 1.32 1.34MR UK-US Atlantic 1.59 2.01 1.76 1.77 0.02 0.2 1.72 1.75 1.74 1.69 1.83 2.14
Source: Argus Media Ltd
Freight Costs(monthly and weekly averages, $/bbl)
Jul-21 Week Commencing
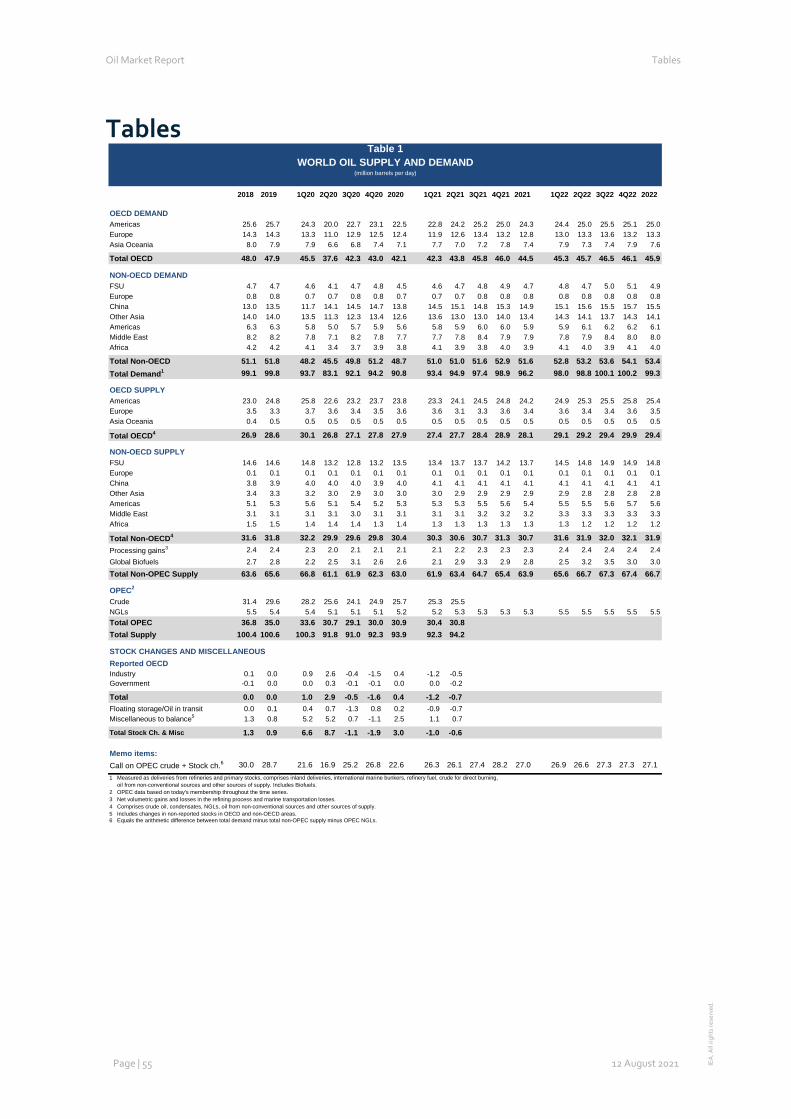
Oil Market Report Tables
Page | 55 12 August 2021 IEA
. All
right
s re
serv
ed.
Tables
Table 1: World Oil Supply And Demand 2018 2019 1Q20 2Q20 3Q20 4Q20 2020 1Q21 2Q21 3Q21 4Q21 2021 1Q22 2Q22 3Q22 4Q22 2022
OECD DEMANDAmericas 25.6 25.7 24.3 20.0 22.7 23.1 22.5 22.8 24.2 25.2 25.0 24.3 24.4 25.0 25.5 25.1 25.0Europe 14.3 14.3 13.3 11.0 12.9 12.5 12.4 11.9 12.6 13.4 13.2 12.8 13.0 13.3 13.6 13.2 13.3Asia Oceania 8.0 7.9 7.9 6.6 6.8 7.4 7.1 7.7 7.0 7.2 7.8 7.4 7.9 7.3 7.4 7.9 7.6
Total OECD 48.0 47.9 45.5 37.6 42.3 43.0 42.1 42.3 43.8 45.8 46.0 44.5 45.3 45.7 46.5 46.1 45.9
NON-OECD DEMANDFSU 4.7 4.7 4.6 4.1 4.7 4.8 4.5 4.6 4.7 4.8 4.9 4.7 4.8 4.7 5.0 5.1 4.9Europe 0.8 0.8 0.7 0.7 0.8 0.8 0.7 0.7 0.7 0.8 0.8 0.8 0.8 0.8 0.8 0.8 0.8China 13.0 13.5 11.7 14.1 14.5 14.7 13.8 14.5 15.1 14.8 15.3 14.9 15.1 15.6 15.5 15.7 15.5Other Asia 14.0 14.0 13.5 11.3 12.3 13.4 12.6 13.6 13.0 13.0 14.0 13.4 14.3 14.1 13.7 14.3 14.1Americas 6.3 6.3 5.8 5.0 5.7 5.9 5.6 5.8 5.9 6.0 6.0 5.9 5.9 6.1 6.2 6.2 6.1Middle East 8.2 8.2 7.8 7.1 8.2 7.8 7.7 7.7 7.8 8.4 7.9 7.9 7.8 7.9 8.4 8.0 8.0Africa 4.2 4.2 4.1 3.4 3.7 3.9 3.8 4.1 3.9 3.8 4.0 3.9 4.1 4.0 3.9 4.1 4.0
Total Non-OECD 51.1 51.8 48.2 45.5 49.8 51.2 48.7 51.0 51.0 51.6 52.9 51.6 52.8 53.2 53.6 54.1 53.4Total Demand1 99.1 99.8 93.7 83.1 92.1 94.2 90.8 93.4 94.9 97.4 98.9 96.2 98.0 98.8 100.1 100.2 99.3
OECD SUPPLYAmericas 23.0 24.8 25.8 22.6 23.2 23.7 23.8 23.3 24.1 24.5 24.8 24.2 24.9 25.3 25.5 25.8 25.4Europe 3.5 3.3 3.7 3.6 3.4 3.5 3.6 3.6 3.1 3.3 3.6 3.4 3.6 3.4 3.4 3.6 3.5Asia Oceania 0.4 0.5 0.5 0.5 0.5 0.5 0.5 0.5 0.5 0.5 0.5 0.5 0.5 0.5 0.5 0.5 0.5
Total OECD4 26.9 28.6 30.1 26.8 27.1 27.8 27.9 27.4 27.7 28.4 28.9 28.1 29.1 29.2 29.4 29.9 29.4
NON-OECD SUPPLYFSU 14.6 14.6 14.8 13.2 12.8 13.2 13.5 13.4 13.7 13.7 14.2 13.7 14.5 14.8 14.9 14.9 14.8Europe 0.1 0.1 0.1 0.1 0.1 0.1 0.1 0.1 0.1 0.1 0.1 0.1 0.1 0.1 0.1 0.1 0.1China 3.8 3.9 4.0 4.0 4.0 3.9 4.0 4.1 4.1 4.1 4.1 4.1 4.1 4.1 4.1 4.1 4.1Other Asia 3.4 3.3 3.2 3.0 2.9 3.0 3.0 3.0 2.9 2.9 2.9 2.9 2.9 2.8 2.8 2.8 2.8Americas 5.1 5.3 5.6 5.1 5.4 5.2 5.3 5.3 5.3 5.5 5.6 5.4 5.5 5.5 5.6 5.7 5.6Middle East 3.1 3.1 3.1 3.1 3.0 3.1 3.1 3.1 3.1 3.2 3.2 3.2 3.3 3.3 3.3 3.3 3.3Africa 1.5 1.5 1.4 1.4 1.4 1.3 1.4 1.3 1.3 1.3 1.3 1.3 1.3 1.2 1.2 1.2 1.2
Total Non-OECD4 31.6 31.8 32.2 29.9 29.6 29.8 30.4 30.3 30.6 30.7 31.3 30.7 31.6 31.9 32.0 32.1 31.9Processing gains3 2.4 2.4 2.3 2.0 2.1 2.1 2.1 2.1 2.2 2.3 2.3 2.3 2.4 2.4 2.4 2.4 2.4Global Biofuels 2.7 2.8 2.2 2.5 3.1 2.6 2.6 2.1 2.9 3.3 2.9 2.8 2.5 3.2 3.5 3.0 3.0
Total Non-OPEC Supply 63.6 65.6 66.8 61.1 61.9 62.3 63.0 61.9 63.4 64.7 65.4 63.9 65.6 66.7 67.3 67.4 66.7
OPEC2
Crude 31.4 29.6 28.2 25.6 24.1 24.9 25.7 25.3 25.5NGLs 5.5 5.4 5.4 5.1 5.1 5.1 5.2 5.2 5.3 5.3 5.3 5.3 5.5 5.5 5.5 5.5 5.5Total OPEC 36.8 35.0 33.6 30.7 29.1 30.0 30.9 30.4 30.8Total Supply 100.4 100.6 100.3 91.8 91.0 92.3 93.9 92.3 94.2
STOCK CHANGES AND MISCELLANEOUSReported OECDIndustry 0.1 0.0 0.9 2.6 -0.4 -1.5 0.4 -1.2 -0.5Government -0.1 0.0 0.0 0.3 -0.1 -0.1 0.0 0.0 -0.2
Total 0.0 0.0 1.0 2.9 -0.5 -1.6 0.4 -1.2 -0.7Floating storage/Oil in transit 0.0 0.1 0.4 0.7 -1.3 0.8 0.2 -0.9 -0.7Miscellaneous to balance5 1.3 0.8 5.2 5.2 0.7 -1.1 2.5 1.1 0.7
Total Stock Ch. & Misc 1.3 0.9 6.6 8.7 -1.1 -1.9 3.0 -1.0 -0.6
Memo items:Call on OPEC crude + Stock ch.6 30.0 28.7 21.6 16.9 25.2 26.8 22.6 26.3 26.1 27.4 28.2 27.0 26.9 26.6 27.3 27.3 27.11 Measured as deliveries from refineries and primary stocks, comprises inland deliveries, international marine bunkers, refinery fuel, crude for direct burning, oil from non-conventional sources and other sources of supply. Includes Biofuels.2 OPEC data based on today's membership throughout the time series. 3 Net volumetric gains and losses in the refining process and marine transportation losses.4 Comprises crude oil, condensates, NGLs, oil from non-conventional sources and other sources of supply.5 Includes changes in non-reported stocks in OECD and non-OECD areas.6 Equals the arithmetic difference between total demand minus total non-OPEC supply minus OPEC NGLs.
Table 1WORLD OIL SUPPLY AND DEMAND
(million barrels per day)
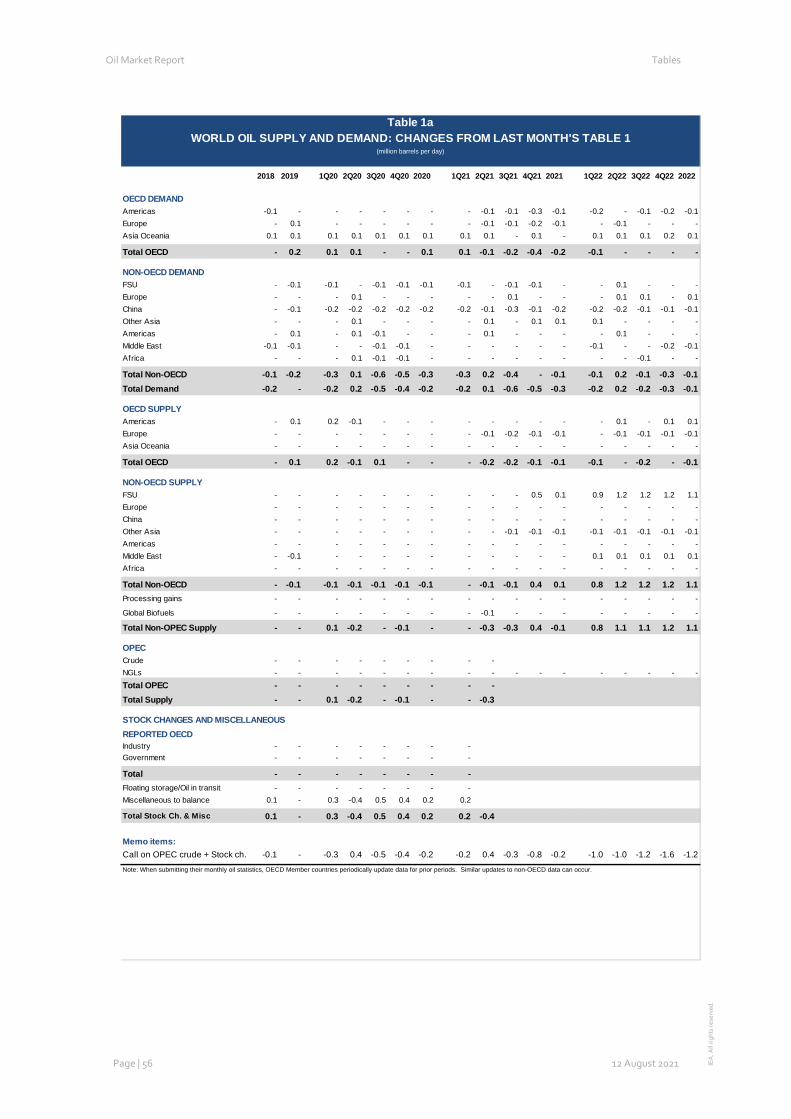
Oil Market Report Tables
Page | 56 12 August 2021 IEA
. All
right
s re
serv
ed.
Table 1a: World Oil Supply And Demand: Changes From Last Month’s Table 1
2018 2019 1Q20 2Q20 3Q20 4Q20 2020 1Q21 2Q21 3Q21 4Q21 2021 1Q22 2Q22 3Q22 4Q22 2022
OECD DEMANDAmericas -0.1 - - - - - - - -0.1 -0.1 -0.3 -0.1 -0.2 - -0.1 -0.2 -0.1Europe - 0.1 - - - - - - -0.1 -0.1 -0.2 -0.1 - -0.1 - - -Asia Oceania 0.1 0.1 0.1 0.1 0.1 0.1 0.1 0.1 0.1 - 0.1 - 0.1 0.1 0.1 0.2 0.1
Total OECD - 0.2 0.1 0.1 - - 0.1 0.1 -0.1 -0.2 -0.4 -0.2 -0.1 - - - -
NON-OECD DEMANDFSU - -0.1 -0.1 - -0.1 -0.1 -0.1 -0.1 - -0.1 -0.1 - - 0.1 - - -Europe - - - 0.1 - - - - - 0.1 - - - 0.1 0.1 - 0.1China - -0.1 -0.2 -0.2 -0.2 -0.2 -0.2 -0.2 -0.1 -0.3 -0.1 -0.2 -0.2 -0.2 -0.1 -0.1 -0.1Other Asia - - - 0.1 - - - - 0.1 - 0.1 0.1 0.1 - - - -Americas - 0.1 - 0.1 -0.1 - - - 0.1 - - - - 0.1 - - -Middle East -0.1 -0.1 - - -0.1 -0.1 - - - - - - -0.1 - - -0.2 -0.1Africa - - - 0.1 -0.1 -0.1 - - - - - - - - -0.1 - -
Total Non-OECD -0.1 -0.2 -0.3 0.1 -0.6 -0.5 -0.3 -0.3 0.2 -0.4 - -0.1 -0.1 0.2 -0.1 -0.3 -0.1Total Demand -0.2 - -0.2 0.2 -0.5 -0.4 -0.2 -0.2 0.1 -0.6 -0.5 -0.3 -0.2 0.2 -0.2 -0.3 -0.1
OECD SUPPLYAmericas - 0.1 0.2 -0.1 - - - - - - - - - 0.1 - 0.1 0.1Europe - - - - - - - - -0.1 -0.2 -0.1 -0.1 - -0.1 -0.1 -0.1 -0.1Asia Oceania - - - - - - - - - - - - - - - - -
Total OECD - 0.1 0.2 -0.1 0.1 - - - -0.2 -0.2 -0.1 -0.1 -0.1 - -0.2 - -0.1
NON-OECD SUPPLYFSU - - - - - - - - - - 0.5 0.1 0.9 1.2 1.2 1.2 1.1Europe - - - - - - - - - - - - - - - - -China - - - - - - - - - - - - - - - - -Other Asia - - - - - - - - - -0.1 -0.1 -0.1 -0.1 -0.1 -0.1 -0.1 -0.1Americas - - - - - - - - - - - - - - - - -Middle East - -0.1 - - - - - - - - - - 0.1 0.1 0.1 0.1 0.1Africa - - - - - - - - - - - - - - - - -
Total Non-OECD - -0.1 -0.1 -0.1 -0.1 -0.1 -0.1 - -0.1 -0.1 0.4 0.1 0.8 1.2 1.2 1.2 1.1Processing gains - - - - - - - - - - - - - - - - -
Global Biofuels - - - - - - - - -0.1 - - - - - - - -
Total Non-OPEC Supply - - 0.1 -0.2 - -0.1 - - -0.3 -0.3 0.4 -0.1 0.8 1.1 1.1 1.2 1.1
OPECCrude - - - - - - - - -NGLs - - - - - - - - - - - - - - - - -Total OPEC - - - - - - - - -Total Supply - - 0.1 -0.2 - -0.1 - - -0.3
STOCK CHANGES AND MISCELLANEOUSREPORTED OECDIndustry - - - - - - - -Government - - - - - - - -
Total - - - - - - - -Floating storage/Oil in transit - - - - - - - -Miscellaneous to balance 0.1 - 0.3 -0.4 0.5 0.4 0.2 0.2
Total Stock Ch. & Misc 0.1 - 0.3 -0.4 0.5 0.4 0.2 0.2 -0.4
Memo items:Call on OPEC crude + Stock ch. -0.1 - -0.3 0.4 -0.5 -0.4 -0.2 -0.2 0.4 -0.3 -0.8 -0.2 -1.0 -1.0 -1.2 -1.6 -1.2
Note: When submitting their monthly oil statistics, OECD Member countries periodically update data for prior periods. Similar updates to non-OECD data can occur.
Table 1aWORLD OIL SUPPLY AND DEMAND: CHANGES FROM LAST MONTH'S TABLE 1
(million barrels per day)
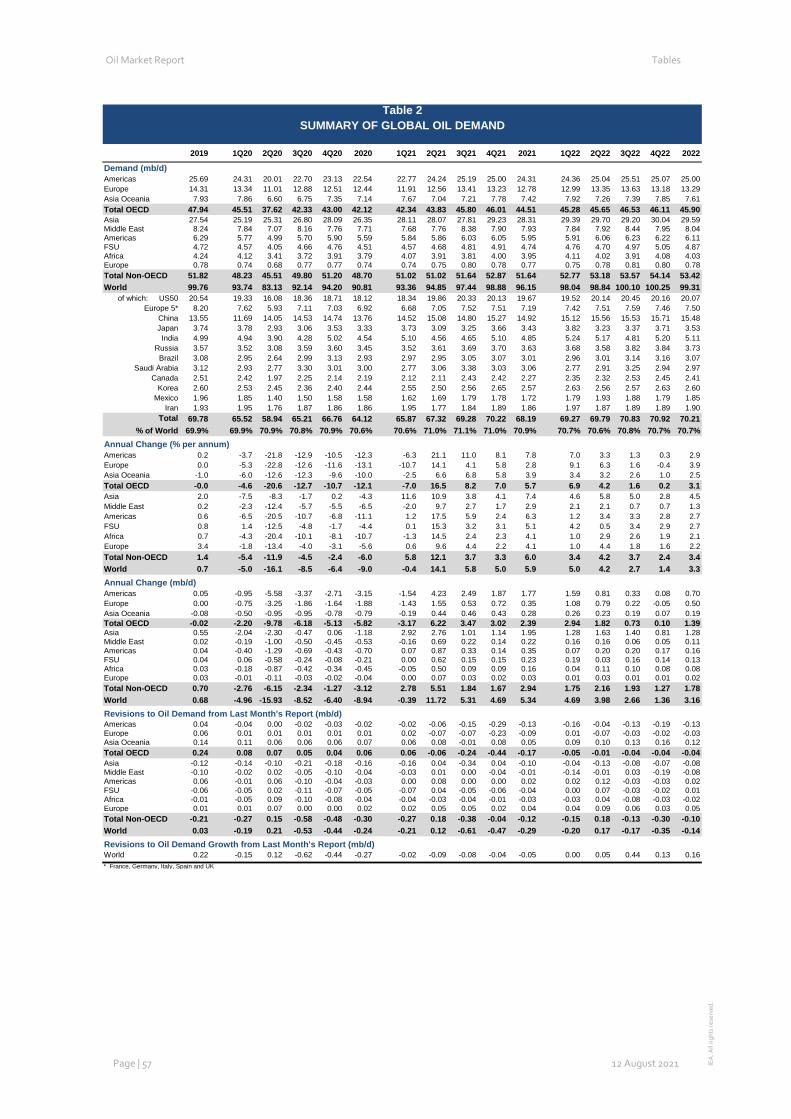
Oil Market Report Tables
Page | 57 12 August 2021 IEA
. All
right
s re
serv
ed.
Table 2: Summary of Global Oil Demand 2019 1Q20 2Q20 3Q20 4Q20 2020 1Q21 2Q21 3Q21 4Q21 2021 1Q22 2Q22 3Q22 4Q22 2022
Demand (mb/d)Americas 25.69 24.31 20.01 22.70 23.13 22.54 22.77 24.24 25.19 25.00 24.31 24.36 25.04 25.51 25.07 25.00Europe 14.31 13.34 11.01 12.88 12.51 12.44 11.91 12.56 13.41 13.23 12.78 12.99 13.35 13.63 13.18 13.29Asia Oceania 7.93 7.86 6.60 6.75 7.35 7.14 7.67 7.04 7.21 7.78 7.42 7.92 7.26 7.39 7.85 7.61Total OECD 47.94 45.51 37.62 42.33 43.00 42.12 42.34 43.83 45.80 46.01 44.51 45.28 45.65 46.53 46.11 45.90Asia 27.54 25.19 25.31 26.80 28.09 26.35 28.11 28.07 27.81 29.23 28.31 29.39 29.70 29.20 30.04 29.59Middle East 8.24 7.84 7.07 8.16 7.76 7.71 7.68 7.76 8.38 7.90 7.93 7.84 7.92 8.44 7.95 8.04Americas 6.29 5.77 4.99 5.70 5.90 5.59 5.84 5.86 6.03 6.05 5.95 5.91 6.06 6.23 6.22 6.11FSU 4.72 4.57 4.05 4.66 4.76 4.51 4.57 4.68 4.81 4.91 4.74 4.76 4.70 4.97 5.05 4.87Africa 4.24 4.12 3.41 3.72 3.91 3.79 4.07 3.91 3.81 4.00 3.95 4.11 4.02 3.91 4.08 4.03Europe 0.78 0.74 0.68 0.77 0.77 0.74 0.74 0.75 0.80 0.78 0.77 0.75 0.78 0.81 0.80 0.78Total Non-OECD 51.82 48.23 45.51 49.80 51.20 48.70 51.02 51.02 51.64 52.87 51.64 52.77 53.18 53.57 54.14 53.42World 99.76 93.74 83.13 92.14 94.20 90.81 93.36 94.85 97.44 98.88 96.15 98.04 98.84 100.10 100.25 99.31
of which: US50 20.54 19.33 16.08 18.36 18.71 18.12 18.34 19.86 20.33 20.13 19.67 19.52 20.14 20.45 20.16 20.07Europe 5* 8.20 7.62 5.93 7.11 7.03 6.92 6.68 7.05 7.52 7.51 7.19 7.42 7.51 7.59 7.46 7.50
China 13.55 11.69 14.05 14.53 14.74 13.76 14.52 15.08 14.80 15.27 14.92 15.12 15.56 15.53 15.71 15.48Japan 3.74 3.78 2.93 3.06 3.53 3.33 3.73 3.09 3.25 3.66 3.43 3.82 3.23 3.37 3.71 3.53India 4.99 4.94 3.90 4.28 5.02 4.54 5.10 4.56 4.65 5.10 4.85 5.24 5.17 4.81 5.20 5.11
Russia 3.57 3.52 3.08 3.59 3.60 3.45 3.52 3.61 3.69 3.70 3.63 3.68 3.58 3.82 3.84 3.73Brazil 3.08 2.95 2.64 2.99 3.13 2.93 2.97 2.95 3.05 3.07 3.01 2.96 3.01 3.14 3.16 3.07
Saudi Arabia 3.12 2.93 2.77 3.30 3.01 3.00 2.77 3.06 3.38 3.03 3.06 2.77 2.91 3.25 2.94 2.97Canada 2.51 2.42 1.97 2.25 2.14 2.19 2.12 2.11 2.43 2.42 2.27 2.35 2.32 2.53 2.45 2.41
Korea 2.60 2.53 2.45 2.36 2.40 2.44 2.55 2.50 2.56 2.65 2.57 2.63 2.56 2.57 2.63 2.60Mexico 1.96 1.85 1.40 1.50 1.58 1.58 1.62 1.69 1.79 1.78 1.72 1.79 1.93 1.88 1.79 1.85
Iran 1.93 1.95 1.76 1.87 1.86 1.86 1.95 1.77 1.84 1.89 1.86 1.97 1.87 1.89 1.89 1.90Total 69.78 65.52 58.94 65.21 66.76 64.12 65.87 67.32 69.28 70.22 68.19 69.27 69.79 70.83 70.92 70.21
% of World 69.9% 69.9% 70.9% 70.8% 70.9% 70.6% 70.6% 71.0% 71.1% 71.0% 70.9% 70.7% 70.6% 70.8% 70.7% 70.7%Annual Change (% per annum)Americas 0.2 -3.7 -21.8 -12.9 -10.5 -12.3 -6.3 21.1 11.0 8.1 7.8 7.0 3.3 1.3 0.3 2.9Europe 0.0 -5.3 -22.8 -12.6 -11.6 -13.1 -10.7 14.1 4.1 5.8 2.8 9.1 6.3 1.6 -0.4 3.9Asia Oceania -1.0 -6.0 -12.6 -12.3 -9.6 -10.0 -2.5 6.6 6.8 5.8 3.9 3.4 3.2 2.6 1.0 2.5Total OECD -0.0 -4.6 -20.6 -12.7 -10.7 -12.1 -7.0 16.5 8.2 7.0 5.7 6.9 4.2 1.6 0.2 3.1Asia 2.0 -7.5 -8.3 -1.7 0.2 -4.3 11.6 10.9 3.8 4.1 7.4 4.6 5.8 5.0 2.8 4.5Middle East 0.2 -2.3 -12.4 -5.7 -5.5 -6.5 -2.0 9.7 2.7 1.7 2.9 2.1 2.1 0.7 0.7 1.3Americas 0.6 -6.5 -20.5 -10.7 -6.8 -11.1 1.2 17.5 5.9 2.4 6.3 1.2 3.4 3.3 2.8 2.7FSU 0.8 1.4 -12.5 -4.8 -1.7 -4.4 0.1 15.3 3.2 3.1 5.1 4.2 0.5 3.4 2.9 2.7Africa 0.7 -4.3 -20.4 -10.1 -8.1 -10.7 -1.3 14.5 2.4 2.3 4.1 1.0 2.9 2.6 1.9 2.1Europe 3.4 -1.8 -13.4 -4.0 -3.1 -5.6 0.6 9.6 4.4 2.2 4.1 1.0 4.4 1.8 1.6 2.2Total Non-OECD 1.4 -5.4 -11.9 -4.5 -2.4 -6.0 5.8 12.1 3.7 3.3 6.0 3.4 4.2 3.7 2.4 3.4World 0.7 -5.0 -16.1 -8.5 -6.4 -9.0 -0.4 14.1 5.8 5.0 5.9 5.0 4.2 2.7 1.4 3.3Annual Change (mb/d)Americas 0.05 -0.95 -5.58 -3.37 -2.71 -3.15 -1.54 4.23 2.49 1.87 1.77 1.59 0.81 0.33 0.08 0.70Europe 0.00 -0.75 -3.25 -1.86 -1.64 -1.88 -1.43 1.55 0.53 0.72 0.35 1.08 0.79 0.22 -0.05 0.50Asia Oceania -0.08 -0.50 -0.95 -0.95 -0.78 -0.79 -0.19 0.44 0.46 0.43 0.28 0.26 0.23 0.19 0.07 0.19Total OECD -0.02 -2.20 -9.78 -6.18 -5.13 -5.82 -3.17 6.22 3.47 3.02 2.39 2.94 1.82 0.73 0.10 1.39Asia 0.55 -2.04 -2.30 -0.47 0.06 -1.18 2.92 2.76 1.01 1.14 1.95 1.28 1.63 1.40 0.81 1.28Middle East 0.02 -0.19 -1.00 -0.50 -0.45 -0.53 -0.16 0.69 0.22 0.14 0.22 0.16 0.16 0.06 0.05 0.11Americas 0.04 -0.40 -1.29 -0.69 -0.43 -0.70 0.07 0.87 0.33 0.14 0.35 0.07 0.20 0.20 0.17 0.16FSU 0.04 0.06 -0.58 -0.24 -0.08 -0.21 0.00 0.62 0.15 0.15 0.23 0.19 0.03 0.16 0.14 0.13Africa 0.03 -0.18 -0.87 -0.42 -0.34 -0.45 -0.05 0.50 0.09 0.09 0.16 0.04 0.11 0.10 0.08 0.08Europe 0.03 -0.01 -0.11 -0.03 -0.02 -0.04 0.00 0.07 0.03 0.02 0.03 0.01 0.03 0.01 0.01 0.02Total Non-OECD 0.70 -2.76 -6.15 -2.34 -1.27 -3.12 2.78 5.51 1.84 1.67 2.94 1.75 2.16 1.93 1.27 1.78World 0.68 -4.96 -15.93 -8.52 -6.40 -8.94 -0.39 11.72 5.31 4.69 5.34 4.69 3.98 2.66 1.36 3.16Revisions to Oil Demand from Last Month's Report (mb/d)Americas 0.04 -0.04 0.00 -0.02 -0.03 -0.02 -0.02 -0.06 -0.15 -0.29 -0.13 -0.16 -0.04 -0.13 -0.19 -0.13Europe 0.06 0.01 0.01 0.01 0.01 0.01 0.02 -0.07 -0.07 -0.23 -0.09 0.01 -0.07 -0.03 -0.02 -0.03Asia Oceania 0.14 0.11 0.06 0.06 0.06 0.07 0.06 0.08 -0.01 0.08 0.05 0.09 0.10 0.13 0.16 0.12Total OECD 0.24 0.08 0.07 0.05 0.04 0.06 0.06 -0.06 -0.24 -0.44 -0.17 -0.05 -0.01 -0.04 -0.04 -0.04Asia -0.12 -0.14 -0.10 -0.21 -0.18 -0.16 -0.16 0.04 -0.34 0.04 -0.10 -0.04 -0.13 -0.08 -0.07 -0.08Middle East -0.10 -0.02 0.02 -0.05 -0.10 -0.04 -0.03 0.01 0.00 -0.04 -0.01 -0.14 -0.01 0.03 -0.19 -0.08Americas 0.06 -0.01 0.06 -0.10 -0.04 -0.03 0.00 0.08 0.00 0.00 0.02 0.02 0.12 -0.03 -0.03 0.02FSU -0.06 -0.05 0.02 -0.11 -0.07 -0.05 -0.07 0.04 -0.05 -0.06 -0.04 0.00 0.07 -0.03 -0.02 0.01Africa -0.01 -0.05 0.09 -0.10 -0.08 -0.04 -0.04 -0.03 -0.04 -0.01 -0.03 -0.03 0.04 -0.08 -0.03 -0.02Europe 0.01 0.01 0.07 0.00 0.00 0.02 0.02 0.05 0.05 0.02 0.04 0.04 0.09 0.06 0.03 0.05Total Non-OECD -0.21 -0.27 0.15 -0.58 -0.48 -0.30 -0.27 0.18 -0.38 -0.04 -0.12 -0.15 0.18 -0.13 -0.30 -0.10World 0.03 -0.19 0.21 -0.53 -0.44 -0.24 -0.21 0.12 -0.61 -0.47 -0.29 -0.20 0.17 -0.17 -0.35 -0.14Revisions to Oil Demand Growth from Last Month's Report (mb/d)World 0.22 -0.15 0.12 -0.62 -0.44 -0.27 -0.02 -0.09 -0.08 -0.04 -0.05 0.00 0.05 0.44 0.13 0.16* France, Germany, Italy, Spain and UK
Table 2SUMMARY OF GLOBAL OIL DEMAND
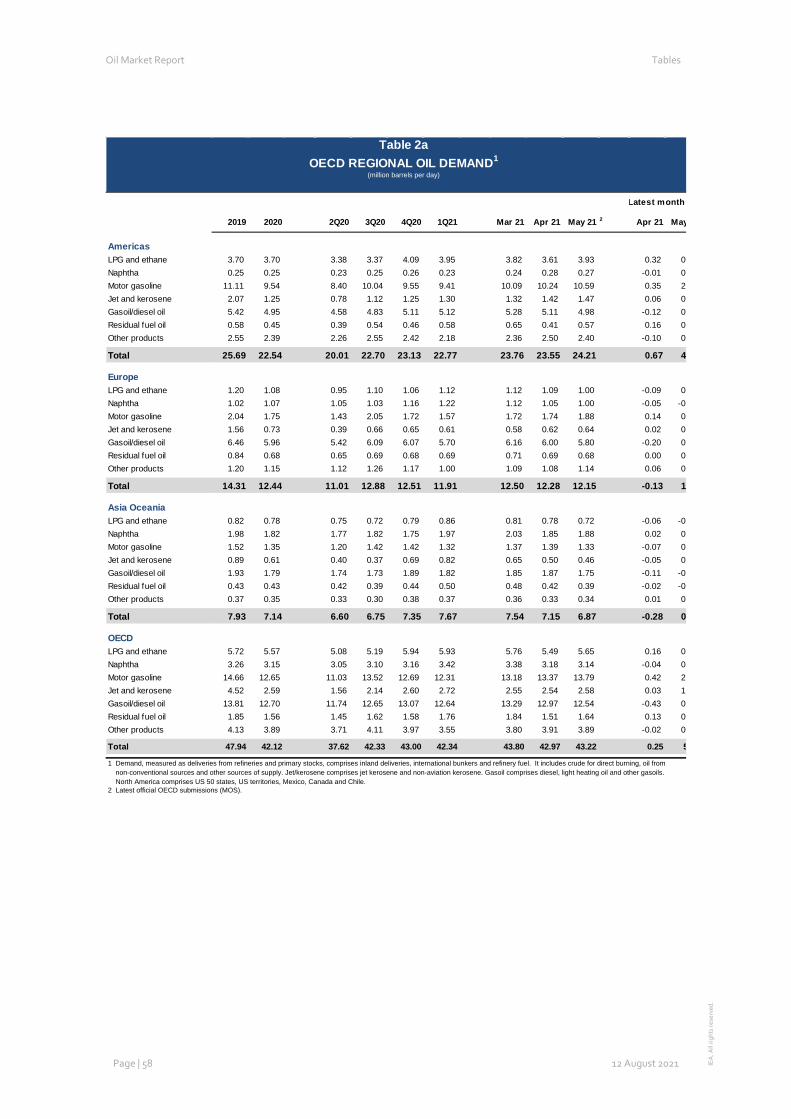
Oil Market Report Tables
Page | 58 12 August 2021 IEA
. All
right
s re
serv
ed.
Table 2a: OECD Regional Oil Demand
2019 2020 2Q20 3Q20 4Q20 1Q21 Mar 21 Apr 21 May 21 2 Apr 21 May
AmericasLPG and ethane 3.70 3.70 3.38 3.37 4.09 3.95 3.82 3.61 3.93 0.32 0 Naphtha 0.25 0.25 0.23 0.25 0.26 0.23 0.24 0.28 0.27 -0.01 0 Motor gasoline 11.11 9.54 8.40 10.04 9.55 9.41 10.09 10.24 10.59 0.35 2 Jet and kerosene 2.07 1.25 0.78 1.12 1.25 1.30 1.32 1.42 1.47 0.06 0 Gasoil/diesel oil 5.42 4.95 4.58 4.83 5.11 5.12 5.28 5.11 4.98 -0.12 0 Residual fuel oil 0.58 0.45 0.39 0.54 0.46 0.58 0.65 0.41 0.57 0.16 0 Other products 2.55 2.39 2.26 2.55 2.42 2.18 2.36 2.50 2.40 -0.10 0
Total 25.69 22.54 20.01 22.70 23.13 22.77 23.76 23.55 24.21 0.67 4
EuropeLPG and ethane 1.20 1.08 0.95 1.10 1.06 1.12 1.12 1.09 1.00 -0.09 0 Naphtha 1.02 1.07 1.05 1.03 1.16 1.22 1.12 1.05 1.00 -0.05 -0 Motor gasoline 2.04 1.75 1.43 2.05 1.72 1.57 1.72 1.74 1.88 0.14 0 Jet and kerosene 1.56 0.73 0.39 0.66 0.65 0.61 0.58 0.62 0.64 0.02 0 Gasoil/diesel oil 6.46 5.96 5.42 6.09 6.07 5.70 6.16 6.00 5.80 -0.20 0 Residual fuel oil 0.84 0.68 0.65 0.69 0.68 0.69 0.71 0.69 0.68 0.00 0 Other products 1.20 1.15 1.12 1.26 1.17 1.00 1.09 1.08 1.14 0.06 0
Total 14.31 12.44 11.01 12.88 12.51 11.91 12.50 12.28 12.15 -0.13 1
Asia OceaniaLPG and ethane 0.82 0.78 0.75 0.72 0.79 0.86 0.81 0.78 0.72 -0.06 -0 Naphtha 1.98 1.82 1.77 1.82 1.75 1.97 2.03 1.85 1.88 0.02 0 Motor gasoline 1.52 1.35 1.20 1.42 1.42 1.32 1.37 1.39 1.33 -0.07 0 Jet and kerosene 0.89 0.61 0.40 0.37 0.69 0.82 0.65 0.50 0.46 -0.05 0 Gasoil/diesel oil 1.93 1.79 1.74 1.73 1.89 1.82 1.85 1.87 1.75 -0.11 -0 Residual fuel oil 0.43 0.43 0.42 0.39 0.44 0.50 0.48 0.42 0.39 -0.02 -0 Other products 0.37 0.35 0.33 0.30 0.38 0.37 0.36 0.33 0.34 0.01 0
Total 7.93 7.14 6.60 6.75 7.35 7.67 7.54 7.15 6.87 -0.28 0
OECDLPG and ethane 5.72 5.57 5.08 5.19 5.94 5.93 5.76 5.49 5.65 0.16 0 Naphtha 3.26 3.15 3.05 3.10 3.16 3.42 3.38 3.18 3.14 -0.04 0 Motor gasoline 14.66 12.65 11.03 13.52 12.69 12.31 13.18 13.37 13.79 0.42 2 Jet and kerosene 4.52 2.59 1.56 2.14 2.60 2.72 2.55 2.54 2.58 0.03 1 Gasoil/diesel oil 13.81 12.70 11.74 12.65 13.07 12.64 13.29 12.97 12.54 -0.43 0 Residual fuel oil 1.85 1.56 1.45 1.62 1.58 1.76 1.84 1.51 1.64 0.13 0 Other products 4.13 3.89 3.71 4.11 3.97 3.55 3.80 3.91 3.89 -0.02 0
Total 47.94 42.12 37.62 42.33 43.00 42.34 43.80 42.97 43.22 0.25 5
1 Demand, measured as deliveries from refineries and primary stocks, comprises inland deliveries, international bunkers and refinery fuel. It includes crude for direct burning, oil from non-conventional sources and other sources of supply. Jet/kerosene comprises jet kerosene and non-aviation kerosene. Gasoil comprises diesel, light heating oil and other gasoils. North America comprises US 50 states, US territories, Mexico, Canada and Chile. 2 Latest official OECD submissions (MOS).
Latest month
Table 2aOECD REGIONAL OIL DEMAND1
(million barrels per day)
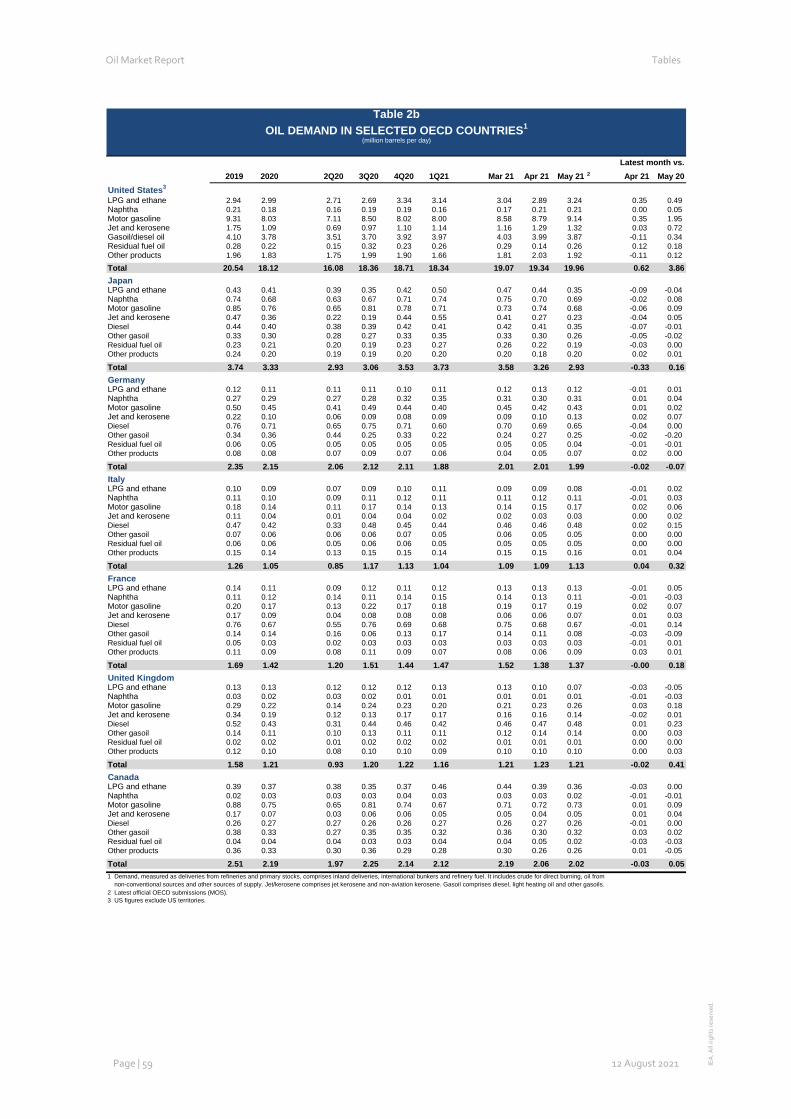
Oil Market Report Tables
Page | 59 12 August 2021 IEA
. All
right
s re
serv
ed.
Table 2b: Oil Demand in Selected OECD Countries
2019 2020 2Q20 3Q20 4Q20 1Q21 Mar 21 Apr 21 May 21 2 Apr 21 May 20United States3
LPG and ethane 2.94 2.99 2.71 2.69 3.34 3.14 3.04 2.89 3.24 0.35 0.49 Naphtha 0.21 0.18 0.16 0.19 0.19 0.16 0.17 0.21 0.21 0.00 0.05 Motor gasoline 9.31 8.03 7.11 8.50 8.02 8.00 8.58 8.79 9.14 0.35 1.95 Jet and kerosene 1.75 1.09 0.69 0.97 1.10 1.14 1.16 1.29 1.32 0.03 0.72 Gasoil/diesel oil 4.10 3.78 3.51 3.70 3.92 3.97 4.03 3.99 3.87 -0.11 0.34 Residual fuel oil 0.28 0.22 0.15 0.32 0.23 0.26 0.29 0.14 0.26 0.12 0.18 Other products 1.96 1.83 1.75 1.99 1.90 1.66 1.81 2.03 1.92 -0.11 0.12
Total 20.54 18.12 16.08 18.36 18.71 18.34 19.07 19.34 19.96 0.62 3.86JapanLPG and ethane 0.43 0.41 0.39 0.35 0.42 0.50 0.47 0.44 0.35 -0.09 -0.04 Naphtha 0.74 0.68 0.63 0.67 0.71 0.74 0.75 0.70 0.69 -0.02 0.08 Motor gasoline 0.85 0.76 0.65 0.81 0.78 0.71 0.73 0.74 0.68 -0.06 0.09 Jet and kerosene 0.47 0.36 0.22 0.19 0.44 0.55 0.41 0.27 0.23 -0.04 0.05 Diesel 0.44 0.40 0.38 0.39 0.42 0.41 0.42 0.41 0.35 -0.07 -0.01 Other gasoil 0.33 0.30 0.28 0.27 0.33 0.35 0.33 0.30 0.26 -0.05 -0.02 Residual fuel oil 0.23 0.21 0.20 0.19 0.23 0.27 0.26 0.22 0.19 -0.03 0.00 Other products 0.24 0.20 0.19 0.19 0.20 0.20 0.20 0.18 0.20 0.02 0.01
Total 3.74 3.33 2.93 3.06 3.53 3.73 3.58 3.26 2.93 -0.33 0.16GermanyLPG and ethane 0.12 0.11 0.11 0.11 0.10 0.11 0.12 0.13 0.12 -0.01 0.01 Naphtha 0.27 0.29 0.27 0.28 0.32 0.35 0.31 0.30 0.31 0.01 0.04 Motor gasoline 0.50 0.45 0.41 0.49 0.44 0.40 0.45 0.42 0.43 0.01 0.02 Jet and kerosene 0.22 0.10 0.06 0.09 0.08 0.09 0.09 0.10 0.13 0.02 0.07 Diesel 0.76 0.71 0.65 0.75 0.71 0.60 0.70 0.69 0.65 -0.04 0.00 Other gasoil 0.34 0.36 0.44 0.25 0.33 0.22 0.24 0.27 0.25 -0.02 -0.20 Residual fuel oil 0.06 0.05 0.05 0.05 0.05 0.05 0.05 0.05 0.04 -0.01 -0.01 Other products 0.08 0.08 0.07 0.09 0.07 0.06 0.04 0.05 0.07 0.02 0.00
Total 2.35 2.15 2.06 2.12 2.11 1.88 2.01 2.01 1.99 -0.02 -0.07ItalyLPG and ethane 0.10 0.09 0.07 0.09 0.10 0.11 0.09 0.09 0.08 -0.01 0.02 Naphtha 0.11 0.10 0.09 0.11 0.12 0.11 0.11 0.12 0.11 -0.01 0.03 Motor gasoline 0.18 0.14 0.11 0.17 0.14 0.13 0.14 0.15 0.17 0.02 0.06 Jet and kerosene 0.11 0.04 0.01 0.04 0.04 0.02 0.02 0.03 0.03 0.00 0.02 Diesel 0.47 0.42 0.33 0.48 0.45 0.44 0.46 0.46 0.48 0.02 0.15 Other gasoil 0.07 0.06 0.06 0.06 0.07 0.05 0.06 0.05 0.05 0.00 0.00 Residual fuel oil 0.06 0.06 0.05 0.06 0.06 0.05 0.05 0.05 0.05 0.00 0.00 Other products 0.15 0.14 0.13 0.15 0.15 0.14 0.15 0.15 0.16 0.01 0.04
Total 1.26 1.05 0.85 1.17 1.13 1.04 1.09 1.09 1.13 0.04 0.32FranceLPG and ethane 0.14 0.11 0.09 0.12 0.11 0.12 0.13 0.13 0.13 -0.01 0.05 Naphtha 0.11 0.12 0.14 0.11 0.14 0.15 0.14 0.13 0.11 -0.01 -0.03 Motor gasoline 0.20 0.17 0.13 0.22 0.17 0.18 0.19 0.17 0.19 0.02 0.07 Jet and kerosene 0.17 0.09 0.04 0.08 0.08 0.08 0.06 0.06 0.07 0.01 0.03 Diesel 0.76 0.67 0.55 0.76 0.69 0.68 0.75 0.68 0.67 -0.01 0.14 Other gasoil 0.14 0.14 0.16 0.06 0.13 0.17 0.14 0.11 0.08 -0.03 -0.09 Residual fuel oil 0.05 0.03 0.02 0.03 0.03 0.03 0.03 0.03 0.03 -0.01 0.01 Other products 0.11 0.09 0.08 0.11 0.09 0.07 0.08 0.06 0.09 0.03 0.01
Total 1.69 1.42 1.20 1.51 1.44 1.47 1.52 1.38 1.37 -0.00 0.18United KingdomLPG and ethane 0.13 0.13 0.12 0.12 0.12 0.13 0.13 0.10 0.07 -0.03 -0.05 Naphtha 0.03 0.02 0.03 0.02 0.01 0.01 0.01 0.01 0.01 -0.01 -0.03 Motor gasoline 0.29 0.22 0.14 0.24 0.23 0.20 0.21 0.23 0.26 0.03 0.18 Jet and kerosene 0.34 0.19 0.12 0.13 0.17 0.17 0.16 0.16 0.14 -0.02 0.01 Diesel 0.52 0.43 0.31 0.44 0.46 0.42 0.46 0.47 0.48 0.01 0.23 Other gasoil 0.14 0.11 0.10 0.13 0.11 0.11 0.12 0.14 0.14 0.00 0.03 Residual fuel oil 0.02 0.02 0.01 0.02 0.02 0.02 0.01 0.01 0.01 0.00 0.00 Other products 0.12 0.10 0.08 0.10 0.10 0.09 0.10 0.10 0.10 0.00 0.03
Total 1.58 1.21 0.93 1.20 1.22 1.16 1.21 1.23 1.21 -0.02 0.41CanadaLPG and ethane 0.39 0.37 0.38 0.35 0.37 0.46 0.44 0.39 0.36 -0.03 0.00 Naphtha 0.02 0.03 0.03 0.03 0.04 0.03 0.03 0.03 0.02 -0.01 -0.01 Motor gasoline 0.88 0.75 0.65 0.81 0.74 0.67 0.71 0.72 0.73 0.01 0.09 Jet and kerosene 0.17 0.07 0.03 0.06 0.06 0.05 0.05 0.04 0.05 0.01 0.04 Diesel 0.26 0.27 0.27 0.26 0.26 0.27 0.26 0.27 0.26 -0.01 0.00 Other gasoil 0.38 0.33 0.27 0.35 0.35 0.32 0.36 0.30 0.32 0.03 0.02 Residual fuel oil 0.04 0.04 0.04 0.03 0.03 0.04 0.04 0.05 0.02 -0.03 -0.03 Other products 0.36 0.33 0.30 0.36 0.29 0.28 0.30 0.26 0.26 0.01 -0.05
Total 2.51 2.19 1.97 2.25 2.14 2.12 2.19 2.06 2.02 -0.03 0.051 Demand, measured as deliveries from refineries and primary stocks, comprises inland deliveries, international bunkers and refinery fuel. It includes crude for direct burning, oil from non-conventional sources and other sources of supply. Jet/kerosene comprises jet kerosene and non-aviation kerosene. Gasoil comprises diesel, light heating oil and other gasoils. 2 Latest official OECD submissions (MOS).3 US figures exclude US territories.
Latest month vs.
Table 2bOIL DEMAND IN SELECTED OECD COUNTRIES1
(million barrels per day)
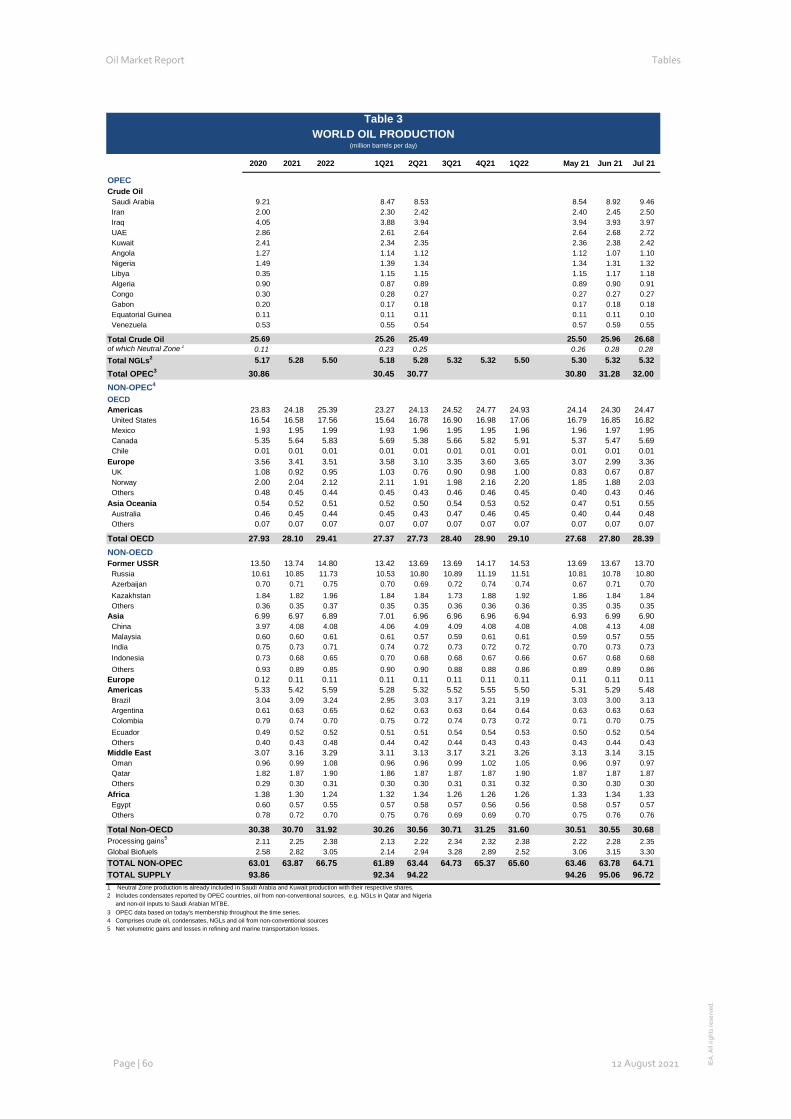
Oil Market Report Tables
Page | 60 12 August 2021 IEA
. All
right
s re
serv
ed.
Table 3: World Oil Production 2020 2021 2022 1Q21 2Q21 3Q21 4Q21 1Q22 May 21 Jun 21 Jul 21
OPECCrude Oil Saudi Arabia 9.21 8.47 8.53 8.54 8.92 9.46 Iran 2.00 2.30 2.42 2.40 2.45 2.50 Iraq 4.05 3.88 3.94 3.94 3.93 3.97 UAE 2.86 2.61 2.64 2.64 2.68 2.72 Kuwait 2.41 2.34 2.35 2.36 2.38 2.42 Angola 1.27 1.14 1.12 1.12 1.07 1.10 Nigeria 1.49 1.39 1.34 1.34 1.31 1.32 Libya 0.35 1.15 1.15 1.15 1.17 1.18 Algeria 0.90 0.87 0.89 0.89 0.90 0.91 Congo 0.30 0.28 0.27 0.27 0.27 0.27 Gabon 0.20 0.17 0.18 0.17 0.18 0.18 Equatorial Guinea 0.11 0.11 0.11 0.11 0.11 0.10 Venezuela 0.53 0.55 0.54 0.57 0.59 0.55
Total Crude Oil 25.69 25.26 25.49 25.50 25.96 26.68 of which Neutral Zone 1 0.11 0.23 0.25 0.26 0.28 0.28 Total NGLs2 5.17 5.28 5.50 5.18 5.28 5.32 5.32 5.50 5.30 5.32 5.32
Total OPEC3 30.86 30.45 30.77 30.80 31.28 32.00 NON-OPEC4
OECDAmericas 23.83 24.18 25.39 23.27 24.13 24.52 24.77 24.93 24.14 24.30 24.47 United States 16.54 16.58 17.56 15.64 16.78 16.90 16.98 17.06 16.79 16.85 16.82 Mexico 1.93 1.95 1.99 1.93 1.96 1.95 1.95 1.96 1.96 1.97 1.95 Canada 5.35 5.64 5.83 5.69 5.38 5.66 5.82 5.91 5.37 5.47 5.69 Chile 0.01 0.01 0.01 0.01 0.01 0.01 0.01 0.01 0.01 0.01 0.01 Europe 3.56 3.41 3.51 3.58 3.10 3.35 3.60 3.65 3.07 2.99 3.36 UK 1.08 0.92 0.95 1.03 0.76 0.90 0.98 1.00 0.83 0.67 0.87 Norway 2.00 2.04 2.12 2.11 1.91 1.98 2.16 2.20 1.85 1.88 2.03 Others 0.48 0.45 0.44 0.45 0.43 0.46 0.46 0.45 0.40 0.43 0.46 Asia Oceania 0.54 0.52 0.51 0.52 0.50 0.54 0.53 0.52 0.47 0.51 0.55 Australia 0.46 0.45 0.44 0.45 0.43 0.47 0.46 0.45 0.40 0.44 0.48 Others 0.07 0.07 0.07 0.07 0.07 0.07 0.07 0.07 0.07 0.07 0.07
Total OECD 27.93 28.10 29.41 27.37 27.73 28.40 28.90 29.10 27.68 27.80 28.39 NON-OECDFormer USSR 13.50 13.74 14.80 13.42 13.69 13.69 14.17 14.53 13.69 13.67 13.70 Russia 10.61 10.85 11.73 10.53 10.80 10.89 11.19 11.51 10.81 10.78 10.80 Azerbaijan 0.70 0.71 0.75 0.70 0.69 0.72 0.74 0.74 0.67 0.71 0.70 Kazakhstan 1.84 1.82 1.96 1.84 1.84 1.73 1.88 1.92 1.86 1.84 1.84 Others 0.36 0.35 0.37 0.35 0.35 0.36 0.36 0.36 0.35 0.35 0.35 Asia 6.99 6.97 6.89 7.01 6.96 6.96 6.96 6.94 6.93 6.99 6.90 China 3.97 4.08 4.08 4.06 4.09 4.09 4.08 4.08 4.08 4.13 4.08 Malaysia 0.60 0.60 0.61 0.61 0.57 0.59 0.61 0.61 0.59 0.57 0.55 India 0.75 0.73 0.71 0.74 0.72 0.73 0.72 0.72 0.70 0.73 0.73 Indonesia 0.73 0.68 0.65 0.70 0.68 0.68 0.67 0.66 0.67 0.68 0.68 Others 0.93 0.89 0.85 0.90 0.90 0.88 0.88 0.86 0.89 0.89 0.86 Europe 0.12 0.11 0.11 0.11 0.11 0.11 0.11 0.11 0.11 0.11 0.11 Americas 5.33 5.42 5.59 5.28 5.32 5.52 5.55 5.50 5.31 5.29 5.48 Brazil 3.04 3.09 3.24 2.95 3.03 3.17 3.21 3.19 3.03 3.00 3.13 Argentina 0.61 0.63 0.65 0.62 0.63 0.63 0.64 0.64 0.63 0.63 0.63 Colombia 0.79 0.74 0.70 0.75 0.72 0.74 0.73 0.72 0.71 0.70 0.75 Ecuador 0.49 0.52 0.52 0.51 0.51 0.54 0.54 0.53 0.50 0.52 0.54 Others 0.40 0.43 0.48 0.44 0.42 0.44 0.43 0.43 0.43 0.44 0.43 Middle East 3.07 3.16 3.29 3.11 3.13 3.17 3.21 3.26 3.13 3.14 3.15 Oman 0.96 0.99 1.08 0.96 0.96 0.99 1.02 1.05 0.96 0.97 0.97 Qatar 1.82 1.87 1.90 1.86 1.87 1.87 1.87 1.90 1.87 1.87 1.87 Others 0.29 0.30 0.31 0.30 0.30 0.31 0.31 0.32 0.30 0.30 0.30 Africa 1.38 1.30 1.24 1.32 1.34 1.26 1.26 1.26 1.33 1.34 1.33 Egypt 0.60 0.57 0.55 0.57 0.58 0.57 0.56 0.56 0.58 0.57 0.57 Others 0.78 0.72 0.70 0.75 0.76 0.69 0.69 0.70 0.75 0.76 0.76
Total Non-OECD 30.38 30.70 31.92 30.26 30.56 30.71 31.25 31.60 30.51 30.55 30.68 Processing gains5 2.11 2.25 2.38 2.13 2.22 2.34 2.32 2.38 2.22 2.28 2.35 Global Biofuels 2.58 2.82 3.05 2.14 2.94 3.28 2.89 2.52 3.06 3.15 3.30 TOTAL NON-OPEC 63.01 63.87 66.75 61.89 63.44 64.73 65.37 65.60 63.46 63.78 64.71 TOTAL SUPPLY 93.86 92.34 94.22 94.26 95.06 96.72 1 Neutral Zone production is already included in Saudi Arabia and Kuwait production with their respective shares.2 Includes condensates reported by OPEC countries, oil from non-conventional sources, e.g. NGLs in Qatar and Nigeria and non-oil inputs to Saudi Arabian MTBE.3 OPEC data based on today's membership throughout the time series. 4 Comprises crude oil, condensates, NGLs and oil from non-conventional sources5 Net volumetric gains and losses in refining and marine transportation losses.
Table 3WORLD OIL PRODUCTION
(million barrels per day)
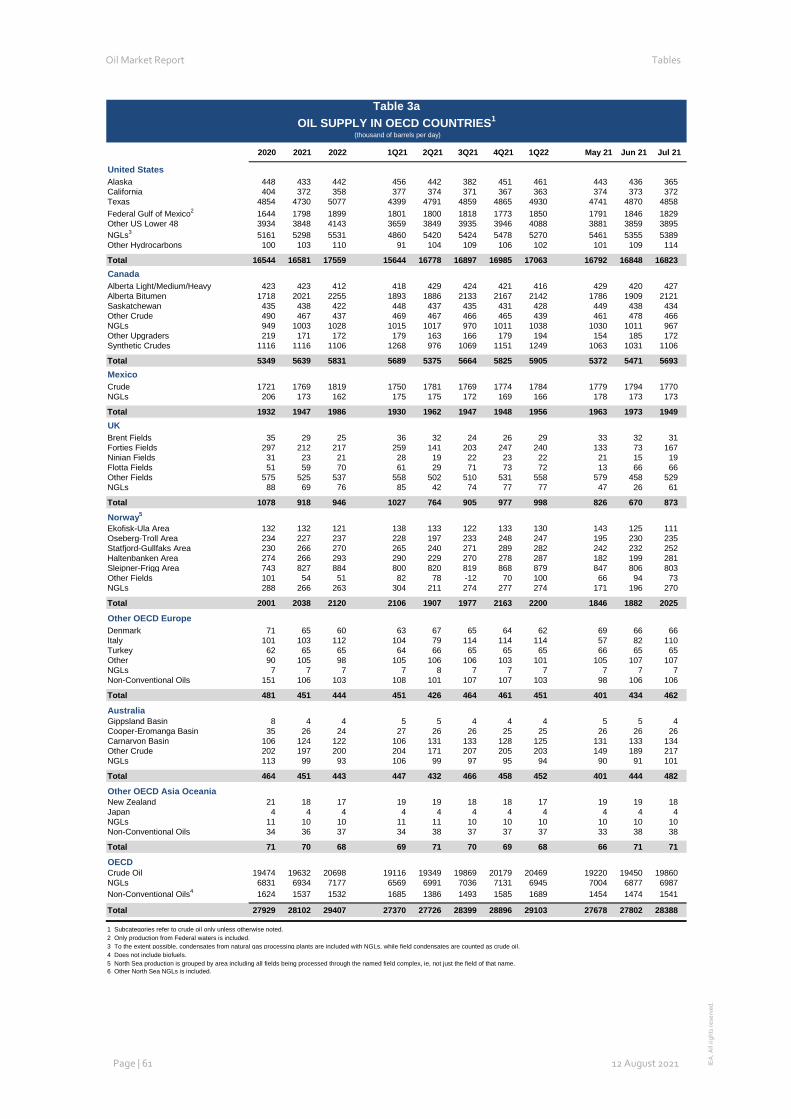
Oil Market Report Tables
Page | 61 12 August 2021 IEA
. All
right
s re
serv
ed.
Table 3a: Oil Supply in OECD Countries 2020 2021 2022 1Q21 2Q21 3Q21 4Q21 1Q22 May 21 Jun 21 Jul 21
United StatesAlaska 448 433 442 456 442 382 451 461 443 436 365 California 404 372 358 377 374 371 367 363 374 373 372 Texas 4854 4730 5077 4399 4791 4859 4865 4930 4741 4870 4858 Federal Gulf of Mexico2 1644 1798 1899 1801 1800 1818 1773 1850 1791 1846 1829 Other US Lower 48 3934 3848 4143 3659 3849 3935 3946 4088 3881 3859 3895 NGLs3 5161 5298 5531 4860 5420 5424 5478 5270 5461 5355 5389 Other Hydrocarbons 100 103 110 91 104 109 106 102 101 109 114
Total 16544 16581 17559 15644 16778 16897 16985 17063 16792 16848 16823 CanadaAlberta Light/Medium/Heavy 423 423 412 418 429 424 421 416 429 420 427 Alberta Bitumen 1718 2021 2255 1893 1886 2133 2167 2142 1786 1909 2121 Saskatchewan 435 438 422 448 437 435 431 428 449 438 434 Other Crude 490 467 437 469 467 466 465 439 461 478 466 NGLs 949 1003 1028 1015 1017 970 1011 1038 1030 1011 967 Other Upgraders 219 171 172 179 163 166 179 194 154 185 172 Synthetic Crudes 1116 1116 1106 1268 976 1069 1151 1249 1063 1031 1106
Total 5349 5639 5831 5689 5375 5664 5825 5905 5372 5471 5693 MexicoCrude 1721 1769 1819 1750 1781 1769 1774 1784 1779 1794 1770 NGLs 206 173 162 175 175 172 169 166 178 173 173
Total 1932 1947 1986 1930 1962 1947 1948 1956 1963 1973 1949 UKBrent Fields 35 29 25 36 32 24 26 29 33 32 31 Forties Fields 297 212 217 259 141 203 247 240 133 73 167 Ninian Fields 31 23 21 28 19 22 23 22 21 15 19 Flotta Fields 51 59 70 61 29 71 73 72 13 66 66 Other Fields 575 525 537 558 502 510 531 558 579 458 529 NGLs 88 69 76 85 42 74 77 77 47 26 61
Total 1078 918 946 1027 764 905 977 998 826 670 873
Norway5
Ekofisk-Ula Area 132 132 121 138 133 122 133 130 143 125 111 Oseberg-Troll Area 234 227 237 228 197 233 248 247 195 230 235 Statfjord-Gullfaks Area 230 266 270 265 240 271 289 282 242 232 252 Haltenbanken Area 274 266 293 290 229 270 278 287 182 199 281 Sleipner-Frigg Area 743 827 884 800 820 819 868 879 847 806 803 Other Fields 101 54 51 82 78 -12 70 100 66 94 73 NGLs 288 266 263 304 211 274 277 274 171 196 270
Total 2001 2038 2120 2106 1907 1977 2163 2200 1846 1882 2025
Other OECD EuropeDenmark 71 65 60 63 67 65 64 62 69 66 66 Italy 101 103 112 104 79 114 114 114 57 82 110 Turkey 62 65 65 64 66 65 65 65 66 65 65 Other 90 105 98 105 106 106 103 101 105 107 107 NGLs 7 7 7 7 8 7 7 7 7 7 7 Non-Conventional Oils 151 106 103 108 101 107 107 103 98 106 106
Total 481 451 444 451 426 464 461 451 401 434 462
AustraliaGippsland Basin 8 4 4 5 5 4 4 4 5 5 4 Cooper-Eromanga Basin 35 26 24 27 26 26 25 25 26 26 26 Carnarvon Basin 106 124 122 106 131 133 128 125 131 133 134 Other Crude 202 197 200 204 171 207 205 203 149 189 217 NGLs 113 99 93 106 99 97 95 94 90 91 101
Total 464 451 443 447 432 466 458 452 401 444 482
Other OECD Asia OceaniaNew Zealand 21 18 17 19 19 18 18 17 19 19 18 Japan 4 4 4 4 4 4 4 4 4 4 4 NGLs 11 10 10 11 11 10 10 10 10 10 10 Non-Conventional Oils 34 36 37 34 38 37 37 37 33 38 38
Total 71 70 68 69 71 70 69 68 66 71 71
OECDCrude Oil 19474 19632 20698 19116 19349 19869 20179 20469 19220 19450 19860 NGLs 6831 6934 7177 6569 6991 7036 7131 6945 7004 6877 6987 Non-Conventional Oils4 1624 1537 1532 1685 1386 1493 1585 1689 1454 1474 1541
Total 27929 28102 29407 27370 27726 28399 28896 29103 27678 27802 28388
1 Subcategories refer to crude oil only unless otherwise noted.2 Only production from Federal waters is included.3 To the extent possible, condensates from natural gas processing plants are included with NGLs, while field condensates are counted as crude oil.4 Does not include biofuels.5 North Sea production is grouped by area including all fields being processed through the named field complex, ie, not just the field of that name.6 Other North Sea NGLs is included.
Table 3aOIL SUPPLY IN OECD COUNTRIES1
(thousand of barrels per day)
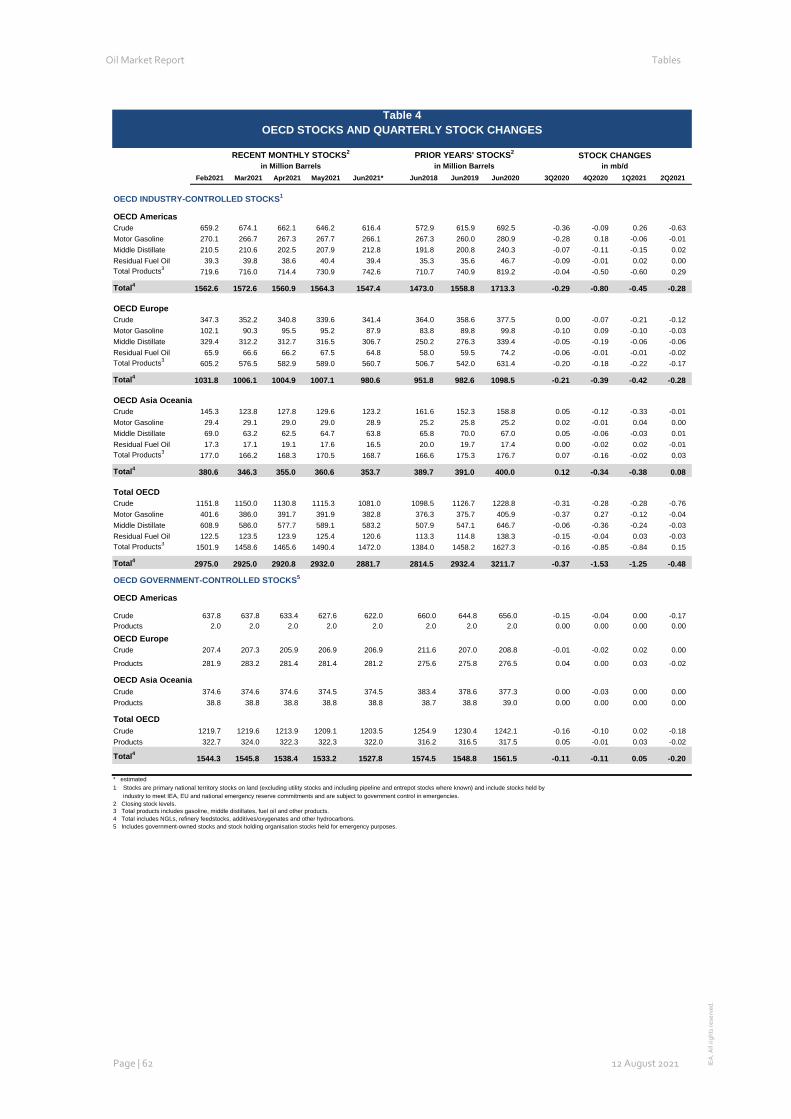
Oil Market Report Tables
Page | 62 12 August 2021 IEA
. All
right
s re
serv
ed.
Table 4: OECD Industry Stocks and Quarterly Stock Changes
RECENT MONTHLY STOCKS2 PRIOR YEARS' STOCKS2 STOCK CHANGESin Million Barrels in Million Barrels in mb/d
Feb2021 Mar2021 Apr2021 May2021 Jun2021* Jun2018 Jun2019 Jun2020 3Q2020 4Q2020 1Q2021 2Q2021
OECD INDUSTRY-CONTROLLED STOCKS1
OECD AmericasCrude 659.2 674.1 662.1 646.2 616.4 572.9 615.9 692.5 -0.36 -0.09 0.26 -0.63 Motor Gasoline 270.1 266.7 267.3 267.7 266.1 267.3 260.0 280.9 -0.28 0.18 -0.06 -0.01 Middle Distillate 210.5 210.6 202.5 207.9 212.8 191.8 200.8 240.3 -0.07 -0.11 -0.15 0.02 Residual Fuel Oil 39.3 39.8 38.6 40.4 39.4 35.3 35.6 46.7 -0.09 -0.01 0.02 0.00 Total Products3 719.6 716.0 714.4 730.9 742.6 710.7 740.9 819.2 -0.04 -0.50 -0.60 0.29
Total4 1562.6 1572.6 1560.9 1564.3 1547.4 1473.0 1558.8 1713.3 -0.29 -0.80 -0.45 -0.28
OECD EuropeCrude 347.3 352.2 340.8 339.6 341.4 364.0 358.6 377.5 0.00 -0.07 -0.21 -0.12 Motor Gasoline 102.1 90.3 95.5 95.2 87.9 83.8 89.8 99.8 -0.10 0.09 -0.10 -0.03 Middle Distillate 329.4 312.2 312.7 316.5 306.7 250.2 276.3 339.4 -0.05 -0.19 -0.06 -0.06 Residual Fuel Oil 65.9 66.6 66.2 67.5 64.8 58.0 59.5 74.2 -0.06 -0.01 -0.01 -0.02 Total Products3 605.2 576.5 582.9 589.0 560.7 506.7 542.0 631.4 -0.20 -0.18 -0.22 -0.17
Total4 1031.8 1006.1 1004.9 1007.1 980.6 951.8 982.6 1098.5 -0.21 -0.39 -0.42 -0.28
OECD Asia OceaniaCrude 145.3 123.8 127.8 129.6 123.2 161.6 152.3 158.8 0.05 -0.12 -0.33 -0.01 Motor Gasoline 29.4 29.1 29.0 29.0 28.9 25.2 25.8 25.2 0.02 -0.01 0.04 0.00 Middle Distillate 69.0 63.2 62.5 64.7 63.8 65.8 70.0 67.0 0.05 -0.06 -0.03 0.01 Residual Fuel Oil 17.3 17.1 19.1 17.6 16.5 20.0 19.7 17.4 0.00 -0.02 0.02 -0.01 Total Products3 177.0 166.2 168.3 170.5 168.7 166.6 175.3 176.7 0.07 -0.16 -0.02 0.03
Total4 380.6 346.3 355.0 360.6 353.7 389.7 391.0 400.0 0.12 -0.34 -0.38 0.08
Total OECDCrude 1151.8 1150.0 1130.8 1115.3 1081.0 1098.5 1126.7 1228.8 -0.31 -0.28 -0.28 -0.76 Motor Gasoline 401.6 386.0 391.7 391.9 382.8 376.3 375.7 405.9 -0.37 0.27 -0.12 -0.04 Middle Distillate 608.9 586.0 577.7 589.1 583.2 507.9 547.1 646.7 -0.06 -0.36 -0.24 -0.03 Residual Fuel Oil 122.5 123.5 123.9 125.4 120.6 113.3 114.8 138.3 -0.15 -0.04 0.03 -0.03 Total Products3 1501.9 1458.6 1465.6 1490.4 1472.0 1384.0 1458.2 1627.3 -0.16 -0.85 -0.84 0.15
Total4 2975.0 2925.0 2920.8 2932.0 2881.7 2814.5 2932.4 3211.7 -0.37 -1.53 -1.25 -0.48
OECD GOVERNMENT-CONTROLLED STOCKS5
OECD Americas
Crude 637.8 637.8 633.4 627.6 622.0 660.0 644.8 656.0 -0.15 -0.04 0.00 -0.17 Products 2.0 2.0 2.0 2.0 2.0 2.0 2.0 2.0 0.00 0.00 0.00 0.00
OECD EuropeCrude 207.4 207.3 205.9 206.9 206.9 211.6 207.0 208.8 -0.01 -0.02 0.02 0.00
Products 281.9 283.2 281.4 281.4 281.2 275.6 275.8 276.5 0.04 0.00 0.03 -0.02
OECD Asia OceaniaCrude 374.6 374.6 374.6 374.5 374.5 383.4 378.6 377.3 0.00 -0.03 0.00 0.00 Products 38.8 38.8 38.8 38.8 38.8 38.7 38.8 39.0 0.00 0.00 0.00 0.00
Total OECDCrude 1219.7 1219.6 1213.9 1209.1 1203.5 1254.9 1230.4 1242.1 -0.16 -0.10 0.02 -0.18 Products 322.7 324.0 322.3 322.3 322.0 316.2 316.5 317.5 0.05 -0.01 0.03 -0.02
Total4 1544.3 1545.8 1538.4 1533.2 1527.8 1574.5 1548.8 1561.5 -0.11 -0.11 0.05 -0.20
* estimated1 Stocks are primary national territory stocks on land (excluding utility stocks and including pipeline and entrepot stocks where known) and include stocks held by industry to meet IEA, EU and national emergency reserve commitments and are subject to government control in emergencies. 2 Closing stock levels.3 Total products includes gasoline, middle distillates, fuel oil and other products. 4 Total includes NGLs, refinery feedstocks, additives/oxygenates and other hydrocarbons. 5 Includes government-owned stocks and stock holding organisation stocks held for emergency purposes.
Table 4OECD STOCKS AND QUARTERLY STOCK CHANGES
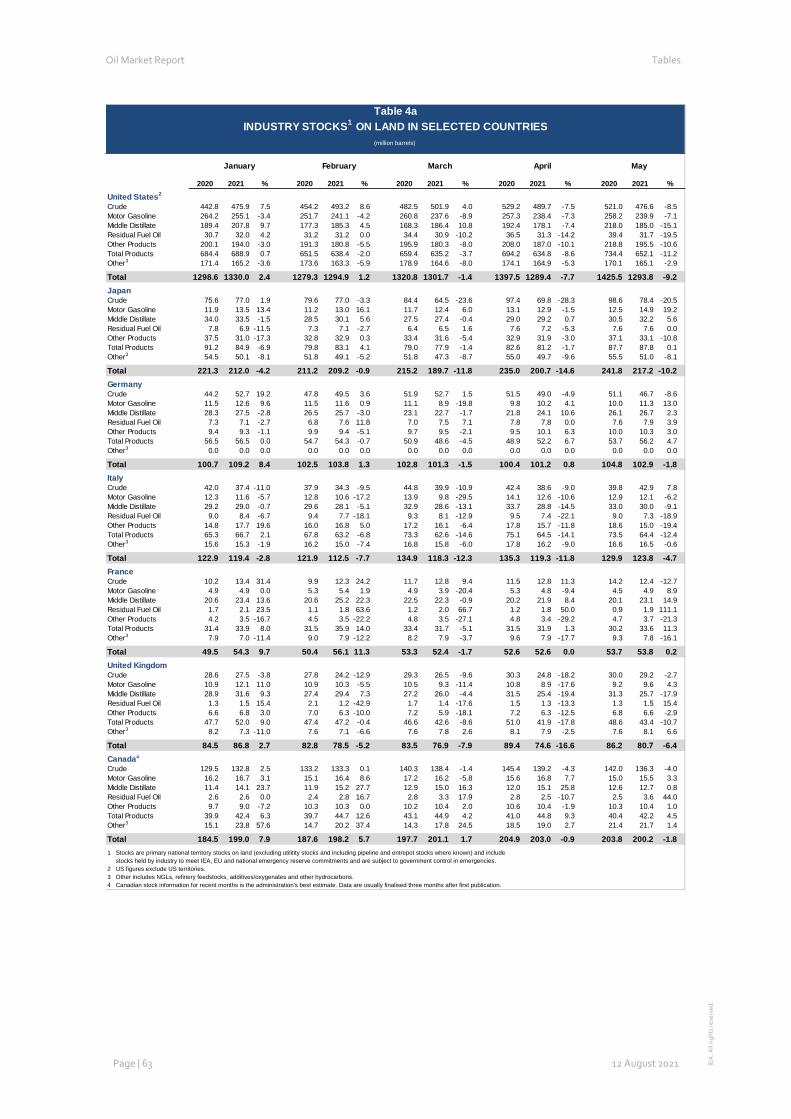
Oil Market Report Tables
Page | 63 12 August 2021 IEA
. All
right
s re
serv
ed.
Table 4a: Industry Stocks on Land in Selected Countries
January February March April May
2020 2021 % 2020 2021 % 2020 2021 % 2020 2021 % 2020 2021 %
United States2
Crude 442.8 475.9 7.5 454.2 493.2 8.6 482.5 501.9 4.0 529.2 489.7 -7.5 521.0 476.6 -8.5 Motor Gasoline 264.2 255.1 -3.4 251.7 241.1 -4.2 260.8 237.6 -8.9 257.3 238.4 -7.3 258.2 239.9 -7.1 Middle Distillate 189.4 207.8 9.7 177.3 185.3 4.5 168.3 186.4 10.8 192.4 178.1 -7.4 218.0 185.0 -15.1 Residual Fuel Oil 30.7 32.0 4.2 31.2 31.2 0.0 34.4 30.9 -10.2 36.5 31.3 -14.2 39.4 31.7 -19.5 Other Products 200.1 194.0 -3.0 191.3 180.8 -5.5 195.9 180.3 -8.0 208.0 187.0 -10.1 218.8 195.5 -10.6 Total Products 684.4 688.9 0.7 651.5 638.4 -2.0 659.4 635.2 -3.7 694.2 634.8 -8.6 734.4 652.1 -11.2 Other3 171.4 165.2 -3.6 173.6 163.3 -5.9 178.9 164.6 -8.0 174.1 164.9 -5.3 170.1 165.1 -2.9
Total 1298.6 1330.0 2.4 1279.3 1294.9 1.2 1320.8 1301.7 -1.4 1397.5 1289.4 -7.7 1425.5 1293.8 -9.2 JapanCrude 75.6 77.0 1.9 79.6 77.0 -3.3 84.4 64.5 -23.6 97.4 69.8 -28.3 98.6 78.4 -20.5 Motor Gasoline 11.9 13.5 13.4 11.2 13.0 16.1 11.7 12.4 6.0 13.1 12.9 -1.5 12.5 14.9 19.2 Middle Distillate 34.0 33.5 -1.5 28.5 30.1 5.6 27.5 27.4 -0.4 29.0 29.2 0.7 30.5 32.2 5.6 Residual Fuel Oil 7.8 6.9 -11.5 7.3 7.1 -2.7 6.4 6.5 1.6 7.6 7.2 -5.3 7.6 7.6 0.0 Other Products 37.5 31.0 -17.3 32.8 32.9 0.3 33.4 31.6 -5.4 32.9 31.9 -3.0 37.1 33.1 -10.8 Total Products 91.2 84.9 -6.9 79.8 83.1 4.1 79.0 77.9 -1.4 82.6 81.2 -1.7 87.7 87.8 0.1 Other3 54.5 50.1 -8.1 51.8 49.1 -5.2 51.8 47.3 -8.7 55.0 49.7 -9.6 55.5 51.0 -8.1
Total 221.3 212.0 -4.2 211.2 209.2 -0.9 215.2 189.7 -11.8 235.0 200.7 -14.6 241.8 217.2 -10.2 GermanyCrude 44.2 52.7 19.2 47.8 49.5 3.6 51.9 52.7 1.5 51.5 49.0 -4.9 51.1 46.7 -8.6 Motor Gasoline 11.5 12.6 9.6 11.5 11.6 0.9 11.1 8.9 -19.8 9.8 10.2 4.1 10.0 11.3 13.0 Middle Distillate 28.3 27.5 -2.8 26.5 25.7 -3.0 23.1 22.7 -1.7 21.8 24.1 10.6 26.1 26.7 2.3 Residual Fuel Oil 7.3 7.1 -2.7 6.8 7.6 11.8 7.0 7.5 7.1 7.8 7.8 0.0 7.6 7.9 3.9 Other Products 9.4 9.3 -1.1 9.9 9.4 -5.1 9.7 9.5 -2.1 9.5 10.1 6.3 10.0 10.3 3.0 Total Products 56.5 56.5 0.0 54.7 54.3 -0.7 50.9 48.6 -4.5 48.9 52.2 6.7 53.7 56.2 4.7 Other3 0.0 0.0 0.0 0.0 0.0 0.0 0.0 0.0 0.0 0.0 0.0 0.0 0.0 0.0 0.0
Total 100.7 109.2 8.4 102.5 103.8 1.3 102.8 101.3 -1.5 100.4 101.2 0.8 104.8 102.9 -1.8 ItalyCrude 42.0 37.4 -11.0 37.9 34.3 -9.5 44.8 39.9 -10.9 42.4 38.6 -9.0 39.8 42.9 7.8 Motor Gasoline 12.3 11.6 -5.7 12.8 10.6 -17.2 13.9 9.8 -29.5 14.1 12.6 -10.6 12.9 12.1 -6.2 Middle Distillate 29.2 29.0 -0.7 29.6 28.1 -5.1 32.9 28.6 -13.1 33.7 28.8 -14.5 33.0 30.0 -9.1 Residual Fuel Oil 9.0 8.4 -6.7 9.4 7.7 -18.1 9.3 8.1 -12.9 9.5 7.4 -22.1 9.0 7.3 -18.9 Other Products 14.8 17.7 19.6 16.0 16.8 5.0 17.2 16.1 -6.4 17.8 15.7 -11.8 18.6 15.0 -19.4 Total Products 65.3 66.7 2.1 67.8 63.2 -6.8 73.3 62.6 -14.6 75.1 64.5 -14.1 73.5 64.4 -12.4 Other3 15.6 15.3 -1.9 16.2 15.0 -7.4 16.8 15.8 -6.0 17.8 16.2 -9.0 16.6 16.5 -0.6
Total 122.9 119.4 -2.8 121.9 112.5 -7.7 134.9 118.3 -12.3 135.3 119.3 -11.8 129.9 123.8 -4.7 FranceCrude 10.2 13.4 31.4 9.9 12.3 24.2 11.7 12.8 9.4 11.5 12.8 11.3 14.2 12.4 -12.7 Motor Gasoline 4.9 4.9 0.0 5.3 5.4 1.9 4.9 3.9 -20.4 5.3 4.8 -9.4 4.5 4.9 8.9 Middle Distillate 20.6 23.4 13.6 20.6 25.2 22.3 22.5 22.3 -0.9 20.2 21.9 8.4 20.1 23.1 14.9 Residual Fuel Oil 1.7 2.1 23.5 1.1 1.8 63.6 1.2 2.0 66.7 1.2 1.8 50.0 0.9 1.9 111.1 Other Products 4.2 3.5 -16.7 4.5 3.5 -22.2 4.8 3.5 -27.1 4.8 3.4 -29.2 4.7 3.7 -21.3 Total Products 31.4 33.9 8.0 31.5 35.9 14.0 33.4 31.7 -5.1 31.5 31.9 1.3 30.2 33.6 11.3 Other3 7.9 7.0 -11.4 9.0 7.9 -12.2 8.2 7.9 -3.7 9.6 7.9 -17.7 9.3 7.8 -16.1
Total 49.5 54.3 9.7 50.4 56.1 11.3 53.3 52.4 -1.7 52.6 52.6 0.0 53.7 53.8 0.2 United KingdomCrude 28.6 27.5 -3.8 27.8 24.2 -12.9 29.3 26.5 -9.6 30.3 24.8 -18.2 30.0 29.2 -2.7 Motor Gasoline 10.9 12.1 11.0 10.9 10.3 -5.5 10.5 9.3 -11.4 10.8 8.9 -17.6 9.2 9.6 4.3 Middle Distillate 28.9 31.6 9.3 27.4 29.4 7.3 27.2 26.0 -4.4 31.5 25.4 -19.4 31.3 25.7 -17.9 Residual Fuel Oil 1.3 1.5 15.4 2.1 1.2 -42.9 1.7 1.4 -17.6 1.5 1.3 -13.3 1.3 1.5 15.4 Other Products 6.6 6.8 3.0 7.0 6.3 -10.0 7.2 5.9 -18.1 7.2 6.3 -12.5 6.8 6.6 -2.9 Total Products 47.7 52.0 9.0 47.4 47.2 -0.4 46.6 42.6 -8.6 51.0 41.9 -17.8 48.6 43.4 -10.7 Other3 8.2 7.3 -11.0 7.6 7.1 -6.6 7.6 7.8 2.6 8.1 7.9 -2.5 7.6 8.1 6.6
Total 84.5 86.8 2.7 82.8 78.5 -5.2 83.5 76.9 -7.9 89.4 74.6 -16.6 86.2 80.7 -6.4 Canada4
Crude 129.5 132.8 2.5 133.2 133.3 0.1 140.3 138.4 -1.4 145.4 139.2 -4.3 142.0 136.3 -4.0 Motor Gasoline 16.2 16.7 3.1 15.1 16.4 8.6 17.2 16.2 -5.8 15.6 16.8 7.7 15.0 15.5 3.3 Middle Distillate 11.4 14.1 23.7 11.9 15.2 27.7 12.9 15.0 16.3 12.0 15.1 25.8 12.6 12.7 0.8 Residual Fuel Oil 2.6 2.6 0.0 2.4 2.8 16.7 2.8 3.3 17.9 2.8 2.5 -10.7 2.5 3.6 44.0 Other Products 9.7 9.0 -7.2 10.3 10.3 0.0 10.2 10.4 2.0 10.6 10.4 -1.9 10.3 10.4 1.0 Total Products 39.9 42.4 6.3 39.7 44.7 12.6 43.1 44.9 4.2 41.0 44.8 9.3 40.4 42.2 4.5 Other3 15.1 23.8 57.6 14.7 20.2 37.4 14.3 17.8 24.5 18.5 19.0 2.7 21.4 21.7 1.4
Total 184.5 199.0 7.9 187.6 198.2 5.7 197.7 201.1 1.7 204.9 203.0 -0.9 203.8 200.2 -1.8 1 Stocks are primary national territory stocks on land (excluding utilitity stocks and including pipeline and entrepot stocks where known) and include stocks held by industry to meet IEA, EU and national emergency reserve commitments and are subject to government control in emergencies.2 US figures exclude US territories.3 Other includes NGLs, refinery feedstocks, additives/oxygenates and other hydrocarbons.4 Canadian stock information for recent months is the administration's best estimate. Data are usually finalised three months after first publication.
Table 4aINDUSTRY STOCKS1
ON LAND IN SELECTED COUNTRIES(million barrels)
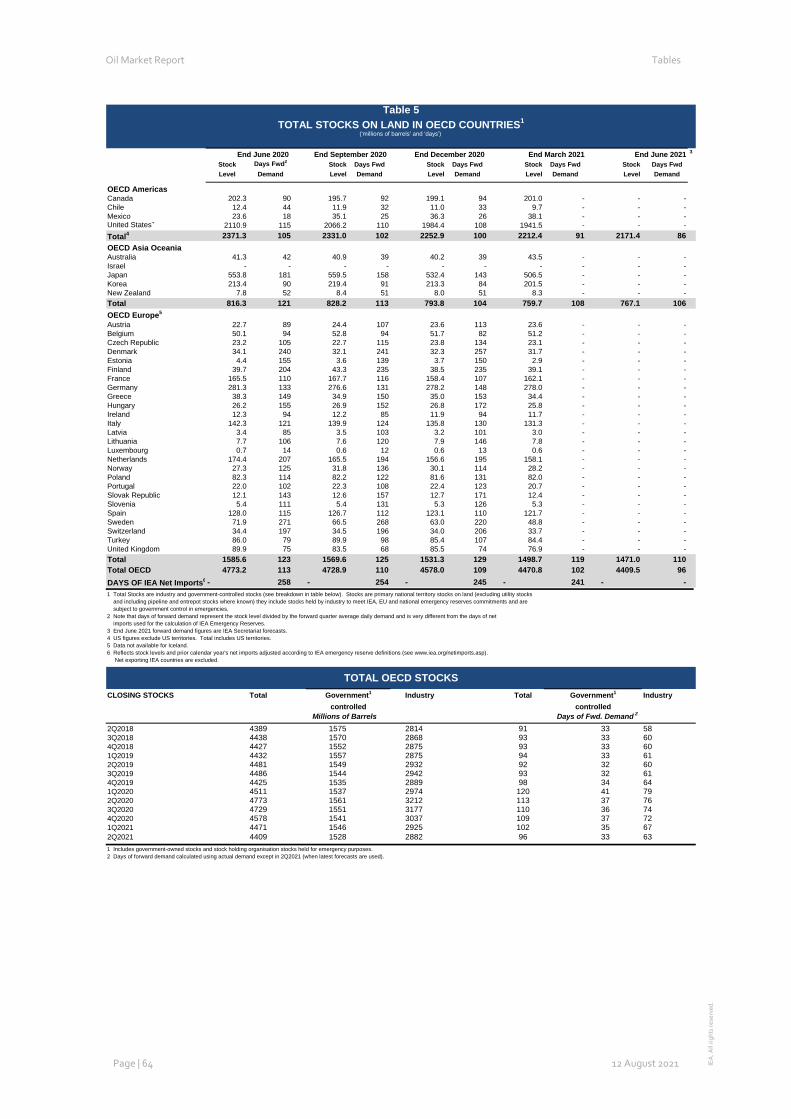
Oil Market Report Tables
Page | 64 12 August 2021 IEA
. All
right
s re
serv
ed.
Table 5: Total Stocks on Land in OECD Countries
3
Stock Days Fwd2 Stock Days Fwd Stock Days Fwd Stock Days Fwd Stock Days FwdLevel Demand Level Demand Level Demand Level Demand Level Demand
OECD AmericasCanada 202.3 90 195.7 92 199.1 94 201.0 - - -Chile 12.4 44 11.9 32 11.0 33 9.7 - - -Mexico 23.6 18 35.1 25 36.3 26 38.1 - - -United States4 2110.9 115 2066.2 110 1984.4 108 1941.5 - - -Total4 2371.3 105 2331.0 102 2252.9 100 2212.4 91 2171.4 86OECD Asia OceaniaAustralia 41.3 42 40.9 39 40.2 39 43.5 - - -Israel - - - - - - - - - -Japan 553.8 181 559.5 158 532.4 143 506.5 - - -Korea 213.4 90 219.4 91 213.3 84 201.5 - - -New Zealand 7.8 52 8.4 51 8.0 51 8.3 - - -Total 816.3 121 828.2 113 793.8 104 759.7 108 767.1 106OECD Europe5
Austria 22.7 89 24.4 107 23.6 113 23.6 - - -Belgium 50.1 94 52.8 94 51.7 82 51.2 - - -Czech Republic 23.2 105 22.7 115 23.8 134 23.1 - - -Denmark 34.1 240 32.1 241 32.3 257 31.7 - - -Estonia 4.4 155 3.6 139 3.7 150 2.9 - - -Finland 39.7 204 43.3 235 38.5 235 39.1 - - -France 165.5 110 167.7 116 158.4 107 162.1 - - -Germany 281.3 133 276.6 131 278.2 148 278.0 - - -Greece 38.3 149 34.9 150 35.0 153 34.4 - - -Hungary 26.2 155 26.9 152 26.8 172 25.8 - - -Ireland 12.3 94 12.2 85 11.9 94 11.7 - - -Italy 142.3 121 139.9 124 135.8 130 131.3 - - -Latvia 3.4 85 3.5 103 3.2 101 3.0 - - -Lithuania 7.7 106 7.6 120 7.9 146 7.8 - - -Luxembourg 0.7 14 0.6 12 0.6 13 0.6 - - -Netherlands 174.4 207 165.5 194 156.6 195 158.1 - - -Norway 27.3 125 31.8 136 30.1 114 28.2 - - -Poland 82.3 114 82.2 122 81.6 131 82.0 - - -Portugal 22.0 102 22.3 108 22.4 123 20.7 - - -Slovak Republic 12.1 143 12.6 157 12.7 171 12.4 - - -Slovenia 5.4 111 5.4 131 5.3 126 5.3 - - -Spain 128.0 115 126.7 112 123.1 110 121.7 - - -Sweden 71.9 271 66.5 268 63.0 220 48.8 - - -Switzerland 34.4 197 34.5 196 34.0 206 33.7 - - -Turkey 86.0 79 89.9 98 85.4 107 84.4 - - -United Kingdom 89.9 75 83.5 68 85.5 74 76.9 - - -Total 1585.6 123 1569.6 125 1531.3 129 1498.7 119 1471.0 110Total OECD 4773.2 113 4728.9 110 4578.0 109 4470.8 102 4409.5 96DAYS OF IEA Net Imports6 - 258 - 254 - 245 - 241 - -1 Total Stocks are industry and government-controlled stocks (see breakdown in table below). Stocks are primary national territory stocks on land (excluding utility stocks and including pipeline and entrepot stocks where known) they include stocks held by industry to meet IEA, EU and national emergency reserves commitments and are subject to government control in emergencies.2 Note that days of forward demand represent the stock level divided by the forward quarter average daily demand and is very different from the days of net imports used for the calculation of IEA Emergency Reserves.3 End June 2021 forward demand figures are IEA Secretariat forecasts. 4 US figures exclude US territories. Total includes US territories.5 Data not available for Iceland.6 Reflects stock levels and prior calendar year's net imports adjusted according to IEA emergency reserve definitions (see www.iea.org/netimports.asp). Net exporting IEA countries are excluded.
CLOSING STOCKS Total Industry Total Industry
2Q2018 4389 1575 2814 91 33 583Q2018 4438 1570 2868 93 33 604Q2018 4427 1552 2875 93 33 601Q2019 4432 1557 2875 94 33 612Q2019 4481 1549 2932 92 32 603Q2019 4486 1544 2942 93 32 614Q2019 4425 1535 2889 98 34 641Q2020 4511 1537 2974 120 41 792Q2020 4773 1561 3212 113 37 763Q2020 4729 1551 3177 110 36 744Q2020 4578 1541 3037 109 37 721Q2021 4471 1546 2925 102 35 672Q2021 4409 1528 2882 96 33 631 Includes government-owned stocks and stock holding organisation stocks held for emergency purposes.2 Days of forward demand calculated using actual demand except in 2Q2021 (when latest forecasts are used).
Table 5TOTAL STOCKS ON LAND IN OECD COUNTRIES1
controlledDays of Fwd. Demand 2
End June 2021End September 2020 End June 2020 End December 2020 End March 2021
Millions of Barrels
Government1
controlledGovernment1
('millions of barrels' and 'days')
TOTAL OECD STOCKS
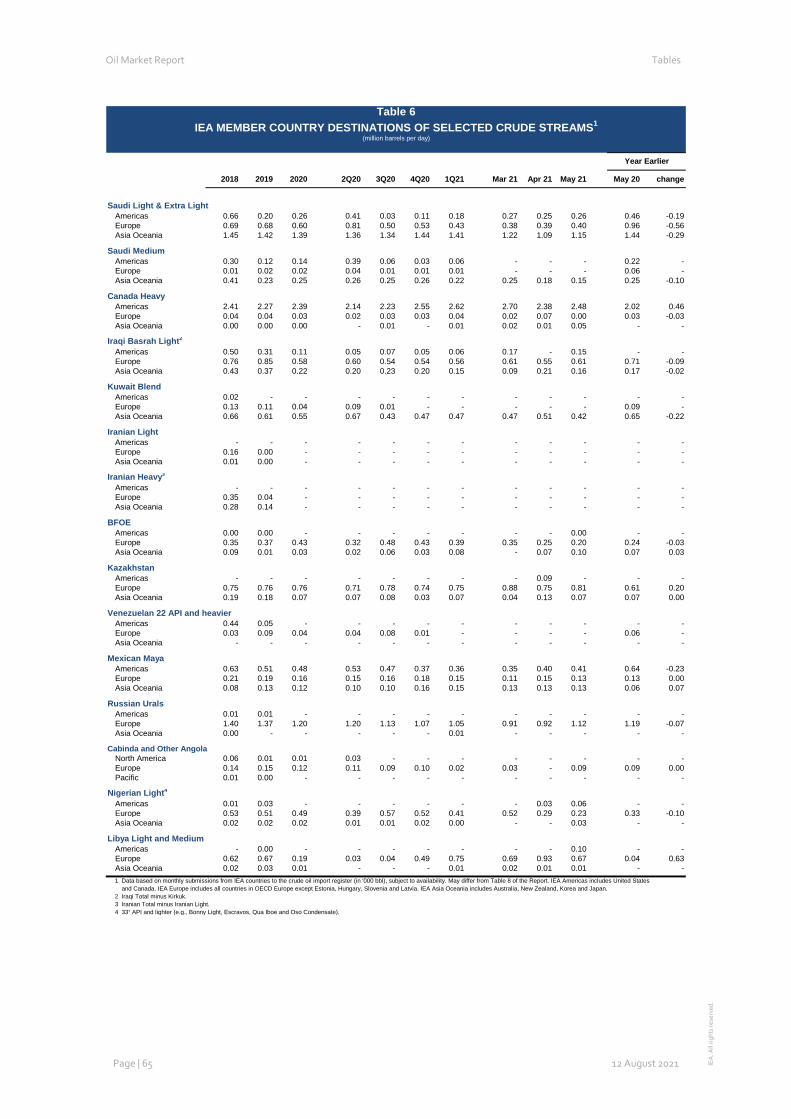
Oil Market Report Tables
Page | 65 12 August 2021 IEA
. All
right
s re
serv
ed.
Table 6: IEA Member Country Destinations of Selected Crude Streams
2018 2019 2020 2Q20 3Q20 4Q20 1Q21 Mar 21 Apr 21 May 21 May 20 change
Saudi Light & Extra LightAmericas 0.66 0.20 0.26 0.41 0.03 0.11 0.18 0.27 0.25 0.26 0.46 -0.19Europe 0.69 0.68 0.60 0.81 0.50 0.53 0.43 0.38 0.39 0.40 0.96 -0.56Asia Oceania 1.45 1.42 1.39 1.36 1.34 1.44 1.41 1.22 1.09 1.15 1.44 -0.29
Saudi MediumAmericas 0.30 0.12 0.14 0.39 0.06 0.03 0.06 - - - 0.22 -Europe 0.01 0.02 0.02 0.04 0.01 0.01 0.01 - - - 0.06 -Asia Oceania 0.41 0.23 0.25 0.26 0.25 0.26 0.22 0.25 0.18 0.15 0.25 -0.10
Canada HeavyAmericas 2.41 2.27 2.39 2.14 2.23 2.55 2.62 2.70 2.38 2.48 2.02 0.46Europe 0.04 0.04 0.03 0.02 0.03 0.03 0.04 0.02 0.07 0.00 0.03 -0.03Asia Oceania 0.00 0.00 0.00 - 0.01 - 0.01 0.02 0.01 0.05 - -
Iraqi Basrah Light2
Americas 0.50 0.31 0.11 0.05 0.07 0.05 0.06 0.17 - 0.15 - -Europe 0.76 0.85 0.58 0.60 0.54 0.54 0.56 0.61 0.55 0.61 0.71 -0.09Asia Oceania 0.43 0.37 0.22 0.20 0.23 0.20 0.15 0.09 0.21 0.16 0.17 -0.02
Kuwait BlendAmericas 0.02 - - - - - - - - - - -Europe 0.13 0.11 0.04 0.09 0.01 - - - - - 0.09 -Asia Oceania 0.66 0.61 0.55 0.67 0.43 0.47 0.47 0.47 0.51 0.42 0.65 -0.22
Iranian LightAmericas - - - - - - - - - - - -Europe 0.16 0.00 - - - - - - - - - -Asia Oceania 0.01 0.00 - - - - - - - - - -
Iranian Heavy3
Americas - - - - - - - - - - - -Europe 0.35 0.04 - - - - - - - - - -Asia Oceania 0.28 0.14 - - - - - - - - - -
BFOEAmericas 0.00 0.00 - - - - - - - 0.00 - -Europe 0.35 0.37 0.43 0.32 0.48 0.43 0.39 0.35 0.25 0.20 0.24 -0.03Asia Oceania 0.09 0.01 0.03 0.02 0.06 0.03 0.08 - 0.07 0.10 0.07 0.03
KazakhstanAmericas - - - - - - - - 0.09 - - -Europe 0.75 0.76 0.76 0.71 0.78 0.74 0.75 0.88 0.75 0.81 0.61 0.20Asia Oceania 0.19 0.18 0.07 0.07 0.08 0.03 0.07 0.04 0.13 0.07 0.07 0.00
Venezuelan 22 API and heavierAmericas 0.44 0.05 - - - - - - - - - -Europe 0.03 0.09 0.04 0.04 0.08 0.01 - - - - 0.06 -Asia Oceania - - - - - - - - - - - -
Mexican MayaAmericas 0.63 0.51 0.48 0.53 0.47 0.37 0.36 0.35 0.40 0.41 0.64 -0.23Europe 0.21 0.19 0.16 0.15 0.16 0.18 0.15 0.11 0.15 0.13 0.13 0.00Asia Oceania 0.08 0.13 0.12 0.10 0.10 0.16 0.15 0.13 0.13 0.13 0.06 0.07
Russian UralsAmericas 0.01 0.01 - - - - - - - - - -Europe 1.40 1.37 1.20 1.20 1.13 1.07 1.05 0.91 0.92 1.12 1.19 -0.07Asia Oceania 0.00 - - - - - 0.01 - - - - -
Cabinda and Other AngolaNorth America 0.06 0.01 0.01 0.03 - - - - - - - -Europe 0.14 0.15 0.12 0.11 0.09 0.10 0.02 0.03 - 0.09 0.09 0.00Pacific 0.01 0.00 - - - - - - - - - -
Nigerian Light4
Americas 0.01 0.03 - - - - - - 0.03 0.06 - -Europe 0.53 0.51 0.49 0.39 0.57 0.52 0.41 0.52 0.29 0.23 0.33 -0.10Asia Oceania 0.02 0.02 0.02 0.01 0.01 0.02 0.00 - - 0.03 - -
Libya Light and MediumAmericas - 0.00 - - - - - - - 0.10 - -Europe 0.62 0.67 0.19 0.03 0.04 0.49 0.75 0.69 0.93 0.67 0.04 0.63Asia Oceania 0.02 0.03 0.01 - - - 0.01 0.02 0.01 0.01 - -1 Data based on monthly submissions from IEA countries to the crude oil import register (in '000 bbl), subject to availability. May differ from Table 8 of the Report. IEA Americas includes United States and Canada. IEA Europe includes all countries in OECD Europe except Estonia, Hungary, Slovenia and Latvia. IEA Asia Oceania includes Australia, New Zealand, Korea and Japan.2 Iraqi Total minus Kirkuk.3 Iranian Total minus Iranian Light.4 33° API and lighter (e.g., Bonny Light, Escravos, Qua Iboe and Oso Condensate).
Year Earlier
Table 6IEA MEMBER COUNTRY DESTINATIONS OF SELECTED CRUDE STREAMS1
(million barrels per day)
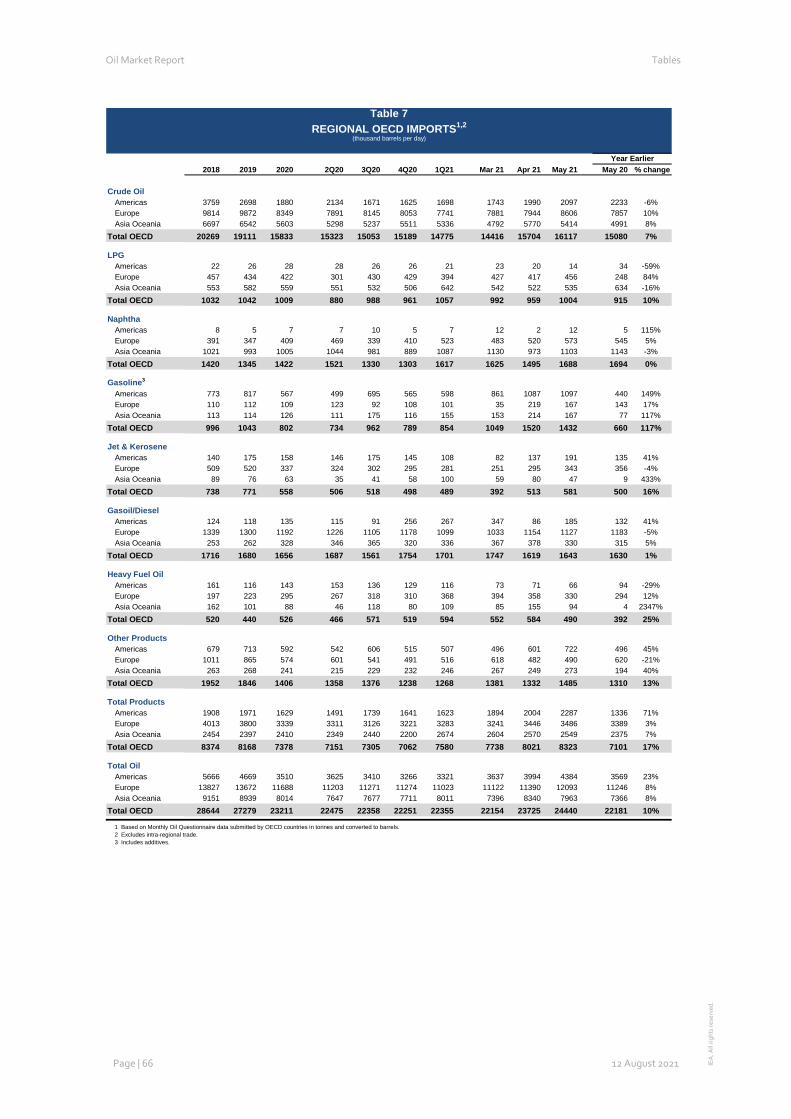
Oil Market Report Tables
Page | 66 12 August 2021 IEA
. All
right
s re
serv
ed.
Table 7: Regional OECD Imports 2018 2019 2020 2Q20 3Q20 4Q20 1Q21 Mar 21 Apr 21 May 21 May 20 % change
Crude Oil Americas 3759 2698 1880 2134 1671 1625 1698 1743 1990 2097 2233 -6%Europe 9814 9872 8349 7891 8145 8053 7741 7881 7944 8606 7857 10%Asia Oceania 6697 6542 5603 5298 5237 5511 5336 4792 5770 5414 4991 8%
Total OECD 20269 19111 15833 15323 15053 15189 14775 14416 15704 16117 15080 7%
LPGAmericas 22 26 28 28 26 26 21 23 20 14 34 -59%Europe 457 434 422 301 430 429 394 427 417 456 248 84%Asia Oceania 553 582 559 551 532 506 642 542 522 535 634 -16%
Total OECD 1032 1042 1009 880 988 961 1057 992 959 1004 915 10%
NaphthaAmericas 8 5 7 7 10 5 7 12 2 12 5 115%Europe 391 347 409 469 339 410 523 483 520 573 545 5%Asia Oceania 1021 993 1005 1044 981 889 1087 1130 973 1103 1143 -3%
Total OECD 1420 1345 1422 1521 1330 1303 1617 1625 1495 1688 1694 0%
Gasoline3
Americas 773 817 567 499 695 565 598 861 1087 1097 440 149%Europe 110 112 109 123 92 108 101 35 219 167 143 17%Asia Oceania 113 114 126 111 175 116 155 153 214 167 77 117%
Total OECD 996 1043 802 734 962 789 854 1049 1520 1432 660 117%
Jet & KeroseneAmericas 140 175 158 146 175 145 108 82 137 191 135 41%Europe 509 520 337 324 302 295 281 251 295 343 356 -4%Asia Oceania 89 76 63 35 41 58 100 59 80 47 9 433%
Total OECD 738 771 558 506 518 498 489 392 513 581 500 16%
Gasoil/DieselAmericas 124 118 135 115 91 256 267 347 86 185 132 41%Europe 1339 1300 1192 1226 1105 1178 1099 1033 1154 1127 1183 -5%Asia Oceania 253 262 328 346 365 320 336 367 378 330 315 5%
Total OECD 1716 1680 1656 1687 1561 1754 1701 1747 1619 1643 1630 1%
Heavy Fuel OilAmericas 161 116 143 153 136 129 116 73 71 66 94 -29%Europe 197 223 295 267 318 310 368 394 358 330 294 12%Asia Oceania 162 101 88 46 118 80 109 85 155 94 4 2347%
Total OECD 520 440 526 466 571 519 594 552 584 490 392 25%
Other ProductsAmericas 679 713 592 542 606 515 507 496 601 722 496 45%Europe 1011 865 574 601 541 491 516 618 482 490 620 -21%Asia Oceania 263 268 241 215 229 232 246 267 249 273 194 40%
Total OECD 1952 1846 1406 1358 1376 1238 1268 1381 1332 1485 1310 13%
Total ProductsAmericas 1908 1971 1629 1491 1739 1641 1623 1894 2004 2287 1336 71%Europe 4013 3800 3339 3311 3126 3221 3283 3241 3446 3486 3389 3%Asia Oceania 2454 2397 2410 2349 2440 2200 2674 2604 2570 2549 2375 7%
Total OECD 8374 8168 7378 7151 7305 7062 7580 7738 8021 8323 7101 17%
Total OilAmericas 5666 4669 3510 3625 3410 3266 3321 3637 3994 4384 3569 23%Europe 13827 13672 11688 11203 11271 11274 11023 11122 11390 12093 11246 8%Asia Oceania 9151 8939 8014 7647 7677 7711 8011 7396 8340 7963 7366 8%
Total OECD 28644 27279 23211 22475 22358 22251 22355 22154 23725 24440 22181 10%
1 Based on Monthly Oil Questionnaire data submitted by OECD countries in tonnes and converted to barrels. 2 Excludes intra-regional trade.3 Includes additives.
Year Earlier
Table 7REGIONAL OECD IMPORTS1,2
(thousand barrels per day)
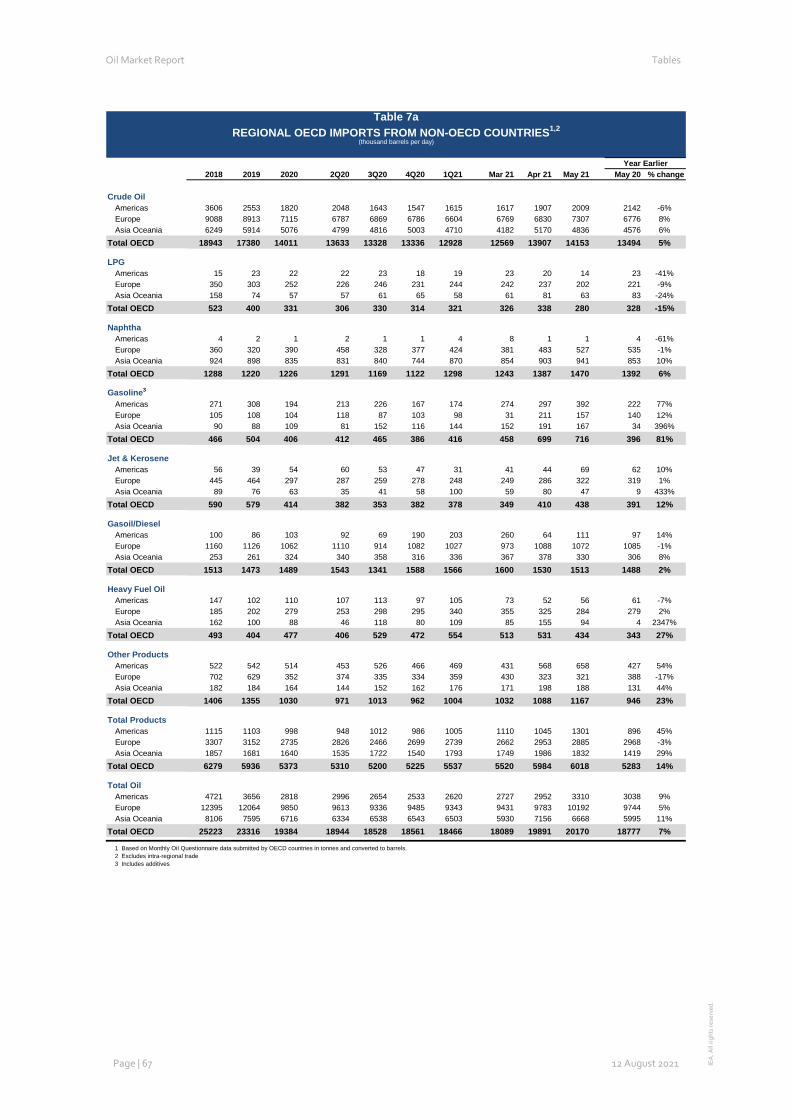
Oil Market Report Tables
Page | 67 12 August 2021 IEA
. All
right
s re
serv
ed.
Table 7a: Regional OECD Imports From Non- OECD Countries
Year Earlier2018 2019 2020 2Q20 3Q20 4Q20 1Q21 Mar 21 Apr 21 May 21 May 20 % change
Crude Oil Americas 3606 2553 1820 2048 1643 1547 1615 1617 1907 2009 2142 -6%Europe 9088 8913 7115 6787 6869 6786 6604 6769 6830 7307 6776 8%Asia Oceania 6249 5914 5076 4799 4816 5003 4710 4182 5170 4836 4576 6%
Total OECD 18943 17380 14011 13633 13328 13336 12928 12569 13907 14153 13494 5%
LPGAmericas 15 23 22 22 23 18 19 23 20 14 23 -41%Europe 350 303 252 226 246 231 244 242 237 202 221 -9%Asia Oceania 158 74 57 57 61 65 58 61 81 63 83 -24%
Total OECD 523 400 331 306 330 314 321 326 338 280 328 -15%
NaphthaAmericas 4 2 1 2 1 1 4 8 1 1 4 -61%Europe 360 320 390 458 328 377 424 381 483 527 535 -1%Asia Oceania 924 898 835 831 840 744 870 854 903 941 853 10%
Total OECD 1288 1220 1226 1291 1169 1122 1298 1243 1387 1470 1392 6%
Gasoline3
Americas 271 308 194 213 226 167 174 274 297 392 222 77%Europe 105 108 104 118 87 103 98 31 211 157 140 12%Asia Oceania 90 88 109 81 152 116 144 152 191 167 34 396%
Total OECD 466 504 406 412 465 386 416 458 699 716 396 81%
Jet & KeroseneAmericas 56 39 54 60 53 47 31 41 44 69 62 10%Europe 445 464 297 287 259 278 248 249 286 322 319 1%Asia Oceania 89 76 63 35 41 58 100 59 80 47 9 433%
Total OECD 590 579 414 382 353 382 378 349 410 438 391 12%
Gasoil/DieselAmericas 100 86 103 92 69 190 203 260 64 111 97 14%Europe 1160 1126 1062 1110 914 1082 1027 973 1088 1072 1085 -1%Asia Oceania 253 261 324 340 358 316 336 367 378 330 306 8%
Total OECD 1513 1473 1489 1543 1341 1588 1566 1600 1530 1513 1488 2%
Heavy Fuel OilAmericas 147 102 110 107 113 97 105 73 52 56 61 -7%Europe 185 202 279 253 298 295 340 355 325 284 279 2%Asia Oceania 162 100 88 46 118 80 109 85 155 94 4 2347%
Total OECD 493 404 477 406 529 472 554 513 531 434 343 27%
Other ProductsAmericas 522 542 514 453 526 466 469 431 568 658 427 54%Europe 702 629 352 374 335 334 359 430 323 321 388 -17%Asia Oceania 182 184 164 144 152 162 176 171 198 188 131 44%
Total OECD 1406 1355 1030 971 1013 962 1004 1032 1088 1167 946 23%
Total ProductsAmericas 1115 1103 998 948 1012 986 1005 1110 1045 1301 896 45%Europe 3307 3152 2735 2826 2466 2699 2739 2662 2953 2885 2968 -3%Asia Oceania 1857 1681 1640 1535 1722 1540 1793 1749 1986 1832 1419 29%
Total OECD 6279 5936 5373 5310 5200 5225 5537 5520 5984 6018 5283 14%
Total OilAmericas 4721 3656 2818 2996 2654 2533 2620 2727 2952 3310 3038 9%Europe 12395 12064 9850 9613 9336 9485 9343 9431 9783 10192 9744 5%Asia Oceania 8106 7595 6716 6334 6538 6543 6503 5930 7156 6668 5995 11%
Total OECD 25223 23316 19384 18944 18528 18561 18466 18089 19891 20170 18777 7%
1 Based on Monthly Oil Questionnaire data submitted by OECD countries in tonnes and converted to barrels. 2 Excludes intra-regional trade3 Includes additives
Table 7aREGIONAL OECD IMPORTS FROM NON-OECD COUNTRIES1,2
(thousand barrels per day)
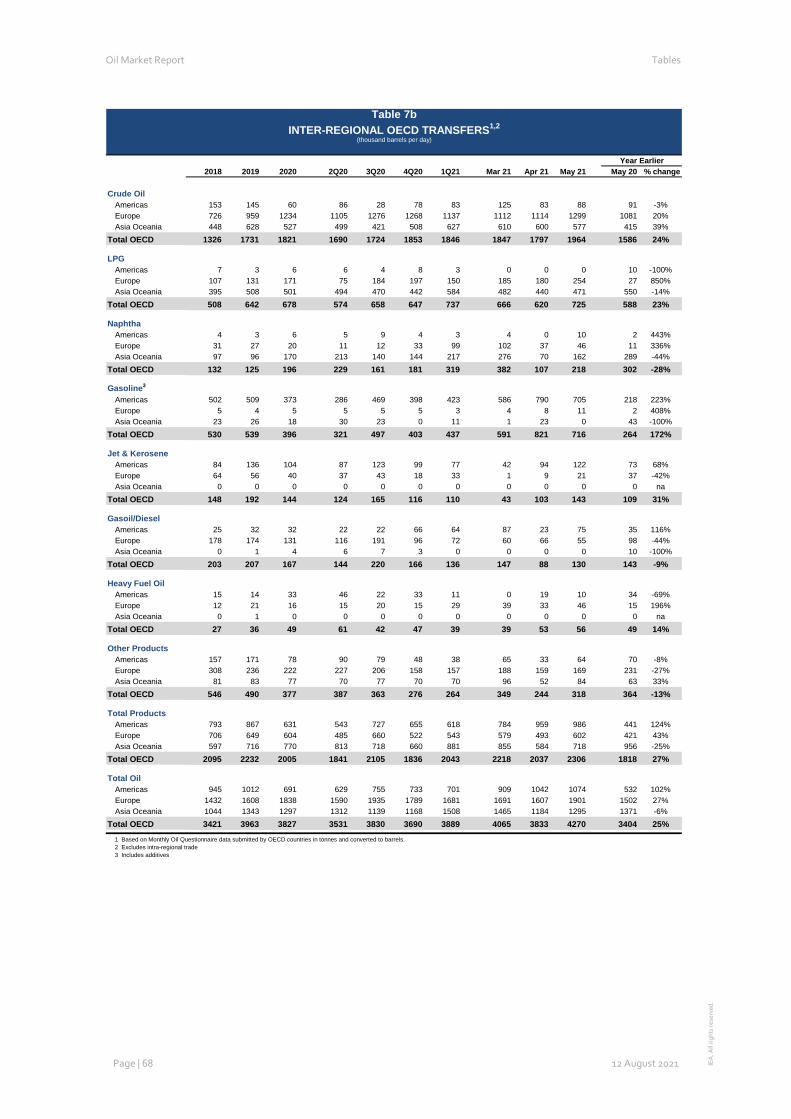
Oil Market Report Tables
Page | 68 12 August 2021 IEA
. All
right
s re
serv
ed.
Table 7b: Inter-Regional OECD Transfers Year Earlier2018 2019 2020 2Q20 3Q20 4Q20 1Q21 Mar 21 Apr 21 May 21 May 20 % change
Crude Oil Americas 153 145 60 86 28 78 83 125 83 88 91 -3%Europe 726 959 1234 1105 1276 1268 1137 1112 1114 1299 1081 20%Asia Oceania 448 628 527 499 421 508 627 610 600 577 415 39%
Total OECD 1326 1731 1821 1690 1724 1853 1846 1847 1797 1964 1586 24%
LPGAmericas 7 3 6 6 4 8 3 0 0 0 10 -100%Europe 107 131 171 75 184 197 150 185 180 254 27 850%Asia Oceania 395 508 501 494 470 442 584 482 440 471 550 -14%
Total OECD 508 642 678 574 658 647 737 666 620 725 588 23%
NaphthaAmericas 4 3 6 5 9 4 3 4 0 10 2 443%Europe 31 27 20 11 12 33 99 102 37 46 11 336%Asia Oceania 97 96 170 213 140 144 217 276 70 162 289 -44%
Total OECD 132 125 196 229 161 181 319 382 107 218 302 -28%
Gasoline3
Americas 502 509 373 286 469 398 423 586 790 705 218 223%Europe 5 4 5 5 5 5 3 4 8 11 2 408%Asia Oceania 23 26 18 30 23 0 11 1 23 0 43 -100%
Total OECD 530 539 396 321 497 403 437 591 821 716 264 172%
Jet & KeroseneAmericas 84 136 104 87 123 99 77 42 94 122 73 68%Europe 64 56 40 37 43 18 33 1 9 21 37 -42%Asia Oceania 0 0 0 0 0 0 0 0 0 0 0 na
Total OECD 148 192 144 124 165 116 110 43 103 143 109 31%
Gasoil/DieselAmericas 25 32 32 22 22 66 64 87 23 75 35 116%Europe 178 174 131 116 191 96 72 60 66 55 98 -44%Asia Oceania 0 1 4 6 7 3 0 0 0 0 10 -100%
Total OECD 203 207 167 144 220 166 136 147 88 130 143 -9%
Heavy Fuel OilAmericas 15 14 33 46 22 33 11 0 19 10 34 -69%Europe 12 21 16 15 20 15 29 39 33 46 15 196%Asia Oceania 0 1 0 0 0 0 0 0 0 0 0 na
Total OECD 27 36 49 61 42 47 39 39 53 56 49 14%
Other ProductsAmericas 157 171 78 90 79 48 38 65 33 64 70 -8%Europe 308 236 222 227 206 158 157 188 159 169 231 -27%Asia Oceania 81 83 77 70 77 70 70 96 52 84 63 33%
Total OECD 546 490 377 387 363 276 264 349 244 318 364 -13%
Total ProductsAmericas 793 867 631 543 727 655 618 784 959 986 441 124%Europe 706 649 604 485 660 522 543 579 493 602 421 43%Asia Oceania 597 716 770 813 718 660 881 855 584 718 956 -25%
Total OECD 2095 2232 2005 1841 2105 1836 2043 2218 2037 2306 1818 27%
Total OilAmericas 945 1012 691 629 755 733 701 909 1042 1074 532 102%Europe 1432 1608 1838 1590 1935 1789 1681 1691 1607 1901 1502 27%Asia Oceania 1044 1343 1297 1312 1139 1168 1508 1465 1184 1295 1371 -6%
Total OECD 3421 3963 3827 3531 3830 3690 3889 4065 3833 4270 3404 25%
1 Based on Monthly Oil Questionnaire data submitted by OECD countries in tonnes and converted to barrels. 2 Excludes intra-regional trade3 Includes additives
Table 7bINTER-REGIONAL OECD TRANSFERS1,2
(thousand barrels per day)
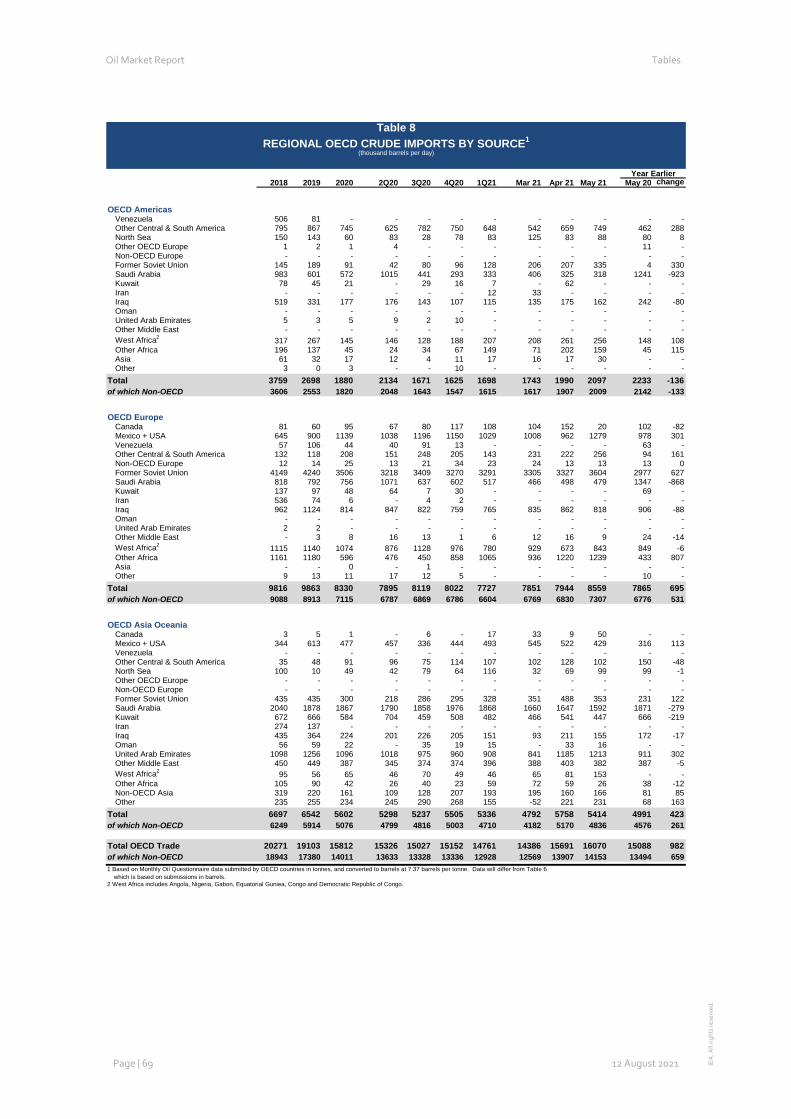
Oil Market Report Tables
Page | 69 12 August 2021 IEA
. All
right
s re
serv
ed.
Table 8: Regional OECD Crude Imports by Source
Year Earlier2018 2019 2020 2Q20 3Q20 4Q20 1Q21 Mar 21 Apr 21 May 21 May 20 change
OECD AmericasVenezuela 506 81 - - - - - - - - - -Other Central & South America 795 867 745 625 782 750 648 542 659 749 462 288North Sea 150 143 60 83 28 78 83 125 83 88 80 8Other OECD Europe 1 2 1 4 - - - - - - 11 -Non-OECD Europe - - - - - - - - - - - -Former Soviet Union 145 189 91 42 80 96 128 206 207 335 4 330Saudi Arabia 983 601 572 1015 441 293 333 406 325 318 1241 -923Kuwait 78 45 21 - 29 16 7 - 62 - - -Iran - - - - - - 12 33 - - - -Iraq 519 331 177 176 143 107 115 135 175 162 242 -80Oman - - - - - - - - - - - -United Arab Emirates 5 3 5 9 2 10 - - - - - -Other Middle East - - - - - - - - - - - -West Africa2 317 267 145 146 128 188 207 208 261 256 148 108Other Africa 196 137 45 24 34 67 149 71 202 159 45 115Asia 61 32 17 12 4 11 17 16 17 30 - -Other 3 0 3 - - 10 - - - - - -
Total 3759 2698 1880 2134 1671 1625 1698 1743 1990 2097 2233 -136of which Non-OECD 3606 2553 1820 2048 1643 1547 1615 1617 1907 2009 2142 -133
OECD EuropeCanada 81 60 95 67 80 117 108 104 152 20 102 -82Mexico + USA 645 900 1139 1038 1196 1150 1029 1008 962 1279 978 301Venezuela 57 106 44 40 91 13 - - - - 63 -Other Central & South America 132 118 208 151 248 205 143 231 222 256 94 161Non-OECD Europe 12 14 25 13 21 34 23 24 13 13 13 0Former Soviet Union 4149 4240 3506 3218 3409 3270 3291 3305 3327 3604 2977 627Saudi Arabia 818 792 756 1071 637 602 517 466 498 479 1347 -868Kuwait 137 97 48 64 7 30 - - - - 69 -Iran 536 74 6 - 4 2 - - - - - -Iraq 962 1124 814 847 822 759 765 835 862 818 906 -88Oman - - - - - - - - - - - -United Arab Emirates 2 2 - - - - - - - - - -Other Middle East - 3 8 16 13 1 6 12 16 9 24 -14West Africa2 1115 1140 1074 876 1128 976 780 929 673 843 849 -6Other Africa 1161 1180 596 476 450 858 1065 936 1220 1239 433 807Asia - - 0 - 1 - - - - - - -Other 9 13 11 17 12 5 - - - - 10 -
Total 9816 9863 8330 7895 8119 8022 7727 7851 7944 8559 7865 695of which Non-OECD 9088 8913 7115 6787 6869 6786 6604 6769 6830 7307 6776 531
OECD Asia OceaniaCanada 3 5 1 - 6 - 17 33 9 50 - -Mexico + USA 344 613 477 457 336 444 493 545 522 429 316 113Venezuela - - - - - - - - - - - -Other Central & South America 35 48 91 96 75 114 107 102 128 102 150 -48North Sea 100 10 49 42 79 64 116 32 69 99 99 -1Other OECD Europe - - - - - - - - - - - -Non-OECD Europe - - - - - - - - - - - -Former Soviet Union 435 435 300 218 286 295 328 351 488 353 231 122Saudi Arabia 2040 1878 1867 1790 1858 1976 1868 1660 1647 1592 1871 -279Kuwait 672 666 584 704 459 508 482 466 541 447 666 -219Iran 274 137 - - - - - - - - - -Iraq 435 364 224 201 226 205 151 93 211 155 172 -17Oman 56 59 22 - 35 19 15 - 33 16 - -United Arab Emirates 1098 1256 1096 1018 975 960 908 841 1185 1213 911 302Other Middle East 450 449 387 345 374 374 396 388 403 382 387 -5West Africa2 95 56 65 46 70 49 46 65 81 153 - -Other Africa 105 90 42 26 40 23 59 72 59 26 38 -12Non-OECD Asia 319 220 161 109 128 207 193 195 160 166 81 85Other 235 255 234 245 290 268 155 -52 221 231 68 163
Total 6697 6542 5602 5298 5237 5505 5336 4792 5758 5414 4991 423of which Non-OECD 6249 5914 5076 4799 4816 5003 4710 4182 5170 4836 4576 261
Total OECD Trade 20271 19103 15812 15326 15027 15152 14761 14386 15691 16070 15088 982of which Non-OECD 18943 17380 14011 13633 13328 13336 12928 12569 13907 14153 13494 6591 Based on Monthly Oil Questionnaire data submitted by OECD countries in tonnes, and converted to barrels at 7.37 barrels per tonne. Data will differ from Table 6 which is based on submissions in barrels.2 West Africa includes Angola, Nigeria, Gabon, Equatorial Guniea, Congo and Democratic Republic of Congo.
Table 8REGIONAL OECD CRUDE IMPORTS BY SOURCE1
(thousand barrels per day)
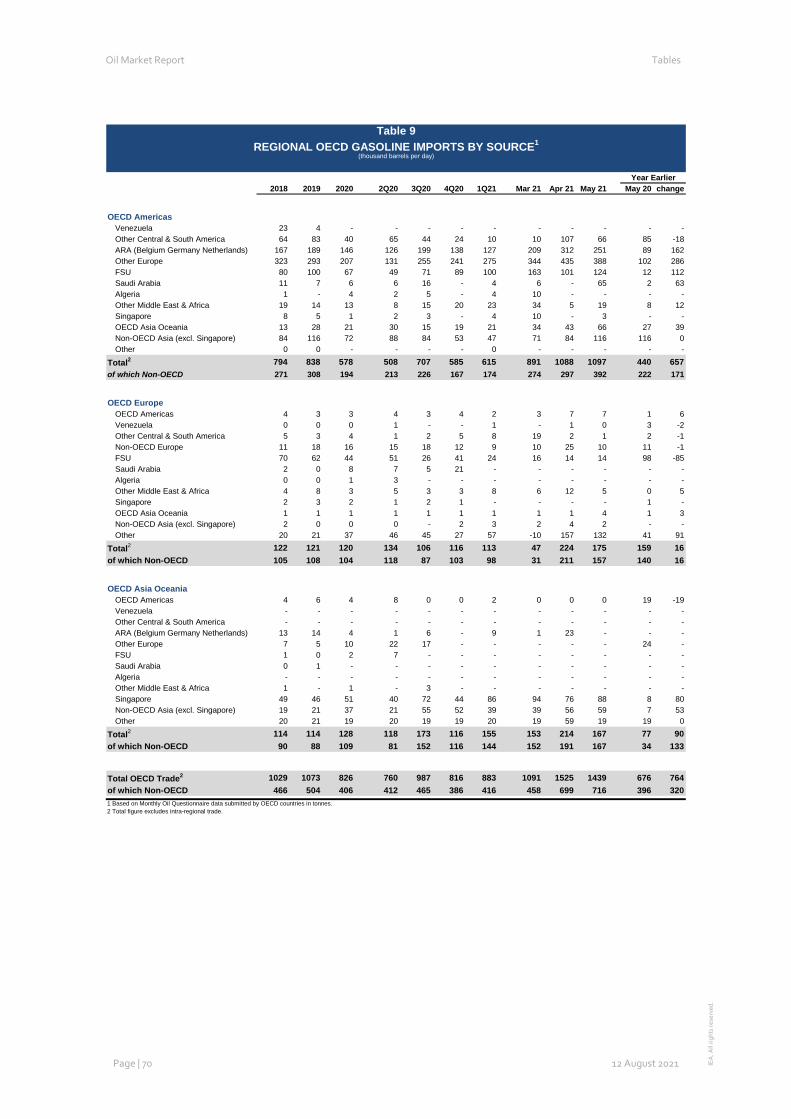
Oil Market Report Tables
Page | 70 12 August 2021 IEA
. All
right
s re
serv
ed.
Table 9: Regional OECD Gasoline Imports by Source
Year Earlier2018 2019 2020 2Q20 3Q20 4Q20 1Q21 Mar 21 Apr 21 May 21 May 20 change
OECD AmericasVenezuela 23 4 - - - - - - - - - -Other Central & South America 64 83 40 65 44 24 10 10 107 66 85 -18ARA (Belgium Germany Netherlands) 167 189 146 126 199 138 127 209 312 251 89 162Other Europe 323 293 207 131 255 241 275 344 435 388 102 286FSU 80 100 67 49 71 89 100 163 101 124 12 112Saudi Arabia 11 7 6 6 16 - 4 6 - 65 2 63Algeria 1 - 4 2 5 - 4 10 - - - -Other Middle East & Africa 19 14 13 8 15 20 23 34 5 19 8 12Singapore 8 5 1 2 3 - 4 10 - 3 - -OECD Asia Oceania 13 28 21 30 15 19 21 34 43 66 27 39Non-OECD Asia (excl. Singapore) 84 116 72 88 84 53 47 71 84 116 116 0Other 0 0 - - - - 0 - - - - -
Total2 794 838 578 508 707 585 615 891 1088 1097 440 657of which Non-OECD 271 308 194 213 226 167 174 274 297 392 222 171
OECD EuropeOECD Americas 4 3 3 4 3 4 2 3 7 7 1 6Venezuela 0 0 0 1 - - 1 - 1 0 3 -2Other Central & South America 5 3 4 1 2 5 8 19 2 1 2 -1Non-OECD Europe 11 18 16 15 18 12 9 10 25 10 11 -1FSU 70 62 44 51 26 41 24 16 14 14 98 -85Saudi Arabia 2 0 8 7 5 21 - - - - - -Algeria 0 0 1 3 - - - - - - - -Other Middle East & Africa 4 8 3 5 3 3 8 6 12 5 0 5Singapore 2 3 2 1 2 1 - - - - 1 -OECD Asia Oceania 1 1 1 1 1 1 1 1 1 4 1 3Non-OECD Asia (excl. Singapore) 2 0 0 0 - 2 3 2 4 2 - -Other 20 21 37 46 45 27 57 -10 157 132 41 91
Total2 122 121 120 134 106 116 113 47 224 175 159 16of which Non-OECD 105 108 104 118 87 103 98 31 211 157 140 16
OECD Asia OceaniaOECD Americas 4 6 4 8 0 0 2 0 0 0 19 -19Venezuela - - - - - - - - - - - -Other Central & South America - - - - - - - - - - - -ARA (Belgium Germany Netherlands) 13 14 4 1 6 - 9 1 23 - - -Other Europe 7 5 10 22 17 - - - - - 24 -FSU 1 0 2 7 - - - - - - - -Saudi Arabia 0 1 - - - - - - - - - -Algeria - - - - - - - - - - - -Other Middle East & Africa 1 - 1 - 3 - - - - - - -Singapore 49 46 51 40 72 44 86 94 76 88 8 80Non-OECD Asia (excl. Singapore) 19 21 37 21 55 52 39 39 56 59 7 53Other 20 21 19 20 19 19 20 19 59 19 19 0
Total2 114 114 128 118 173 116 155 153 214 167 77 90of which Non-OECD 90 88 109 81 152 116 144 152 191 167 34 133
Total OECD Trade2 1029 1073 826 760 987 816 883 1091 1525 1439 676 764of which Non-OECD 466 504 406 412 465 386 416 458 699 716 396 3201 Based on Monthly Oil Questionnaire data submitted by OECD countries in tonnes.2 Total figure excludes intra-regional trade.
Table 9REGIONAL OECD GASOLINE IMPORTS BY SOURCE1
(thousand barrels per day)
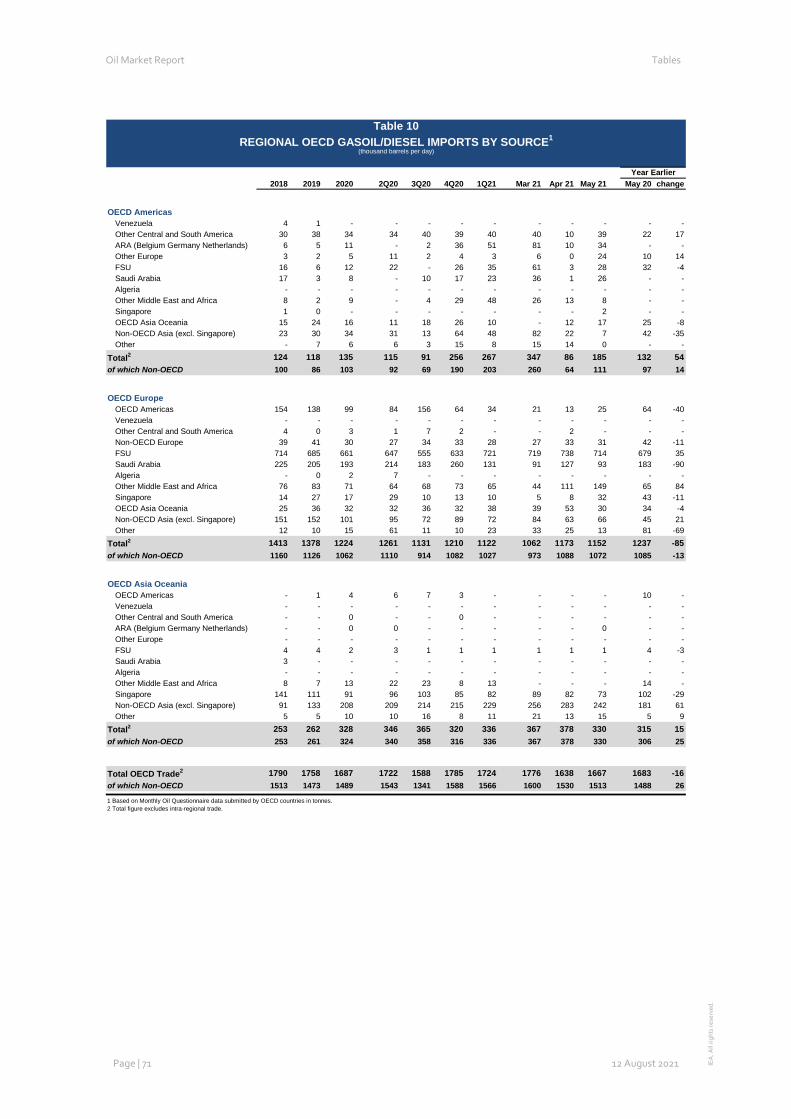
Oil Market Report Tables
Page | 71 12 August 2021 IEA
. All
right
s re
serv
ed.
Table 10: Regional OECD Gasoil/Diesel Imports by Source
2018 2019 2020 2Q20 3Q20 4Q20 1Q21 Mar 21 Apr 21 May 21 May 20 change
OECD AmericasVenezuela 4 1 - - - - - - - - - -Other Central and South America 30 38 34 34 40 39 40 40 10 39 22 17ARA (Belgium Germany Netherlands) 6 5 11 - 2 36 51 81 10 34 - -Other Europe 3 2 5 11 2 4 3 6 0 24 10 14FSU 16 6 12 22 - 26 35 61 3 28 32 -4Saudi Arabia 17 3 8 - 10 17 23 36 1 26 - -Algeria - - - - - - - - - - - -Other Middle East and Africa 8 2 9 - 4 29 48 26 13 8 - -Singapore 1 0 - - - - - - - 2 - -OECD Asia Oceania 15 24 16 11 18 26 10 - 12 17 25 -8Non-OECD Asia (excl. Singapore) 23 30 34 31 13 64 48 82 22 7 42 -35Other - 7 6 6 3 15 8 15 14 0 - -
Total2 124 118 135 115 91 256 267 347 86 185 132 54of which Non-OECD 100 86 103 92 69 190 203 260 64 111 97 14
OECD EuropeOECD Americas 154 138 99 84 156 64 34 21 13 25 64 -40Venezuela - - - - - - - - - - - -Other Central and South America 4 0 3 1 7 2 - - 2 - - -Non-OECD Europe 39 41 30 27 34 33 28 27 33 31 42 -11FSU 714 685 661 647 555 633 721 719 738 714 679 35Saudi Arabia 225 205 193 214 183 260 131 91 127 93 183 -90Algeria - 0 2 7 - - - - - - - -Other Middle East and Africa 76 83 71 64 68 73 65 44 111 149 65 84Singapore 14 27 17 29 10 13 10 5 8 32 43 -11OECD Asia Oceania 25 36 32 32 36 32 38 39 53 30 34 -4Non-OECD Asia (excl. Singapore) 151 152 101 95 72 89 72 84 63 66 45 21Other 12 10 15 61 11 10 23 33 25 13 81 -69
Total2 1413 1378 1224 1261 1131 1210 1122 1062 1173 1152 1237 -85of which Non-OECD 1160 1126 1062 1110 914 1082 1027 973 1088 1072 1085 -13
OECD Asia OceaniaOECD Americas - 1 4 6 7 3 - - - - 10 -Venezuela - - - - - - - - - - - -Other Central and South America - - 0 - - 0 - - - - - -ARA (Belgium Germany Netherlands) - - 0 0 - - - - - 0 - -Other Europe - - - - - - - - - - - -FSU 4 4 2 3 1 1 1 1 1 1 4 -3Saudi Arabia 3 - - - - - - - - - - -Algeria - - - - - - - - - - - -Other Middle East and Africa 8 7 13 22 23 8 13 - - - 14 -Singapore 141 111 91 96 103 85 82 89 82 73 102 -29Non-OECD Asia (excl. Singapore) 91 133 208 209 214 215 229 256 283 242 181 61Other 5 5 10 10 16 8 11 21 13 15 5 9
Total2 253 262 328 346 365 320 336 367 378 330 315 15of which Non-OECD 253 261 324 340 358 316 336 367 378 330 306 25
Total OECD Trade2 1790 1758 1687 1722 1588 1785 1724 1776 1638 1667 1683 -16of which Non-OECD 1513 1473 1489 1543 1341 1588 1566 1600 1530 1513 1488 26
1 Based on Monthly Oil Questionnaire data submitted by OECD countries in tonnes.2 Total figure excludes intra-regional trade.
Year Earlier
Table 10REGIONAL OECD GASOIL/DIESEL IMPORTS BY SOURCE1
(thousand barrels per day)
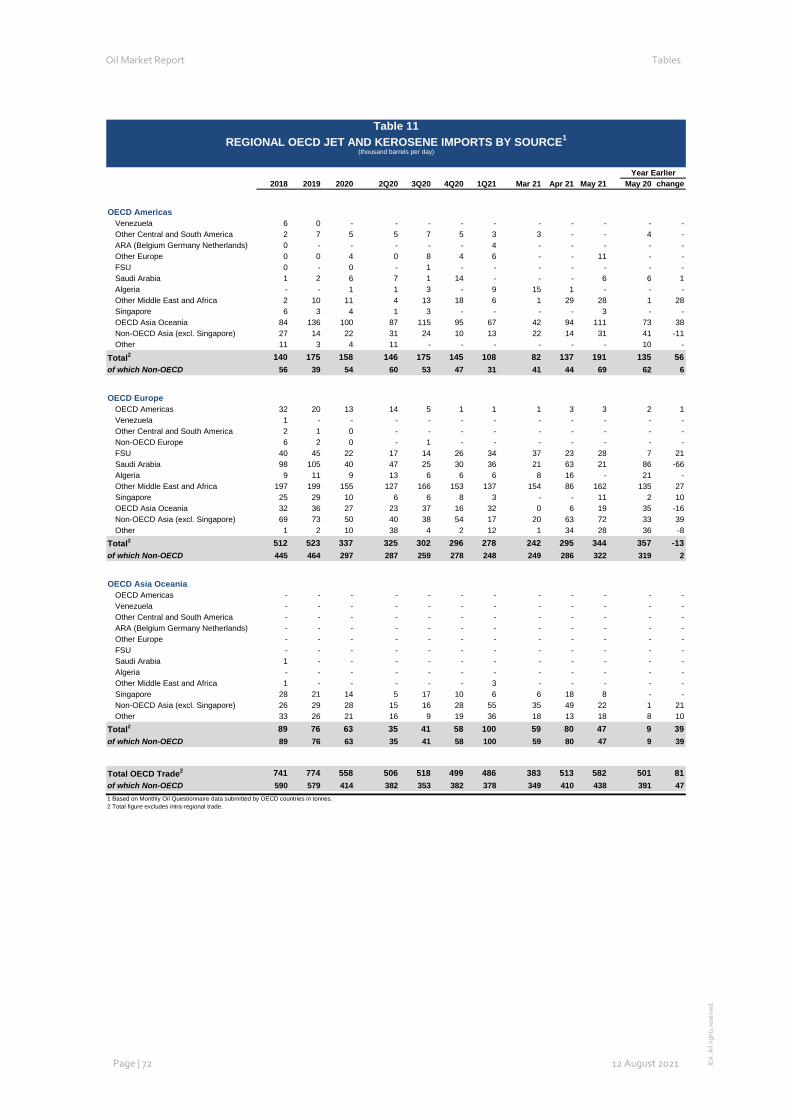
Oil Market Report Tables
Page | 72 12 August 2021 IEA
. All
right
s re
serv
ed.
Table 11: Regional OECD Jet and Kerosene Imports by Source
Table 11: Regional OECD Jet and Kerosene Imports by Source
Year Earlier2018 2019 2020 2Q20 3Q20 4Q20 1Q21 Mar 21 Apr 21 May 21 May 20 change
OECD AmericasVenezuela 6 0 - - - - - - - - - -Other Central and South America 2 7 5 5 7 5 3 3 - - 4 -ARA (Belgium Germany Netherlands) 0 - - - - - 4 - - - - -Other Europe 0 0 4 0 8 4 6 - - 11 - -FSU 0 - 0 - 1 - - - - - - -Saudi Arabia 1 2 6 7 1 14 - - - 6 6 1Algeria - - 1 1 3 - 9 15 1 - - -Other Middle East and Africa 2 10 11 4 13 18 6 1 29 28 1 28Singapore 6 3 4 1 3 - - - - 3 - -OECD Asia Oceania 84 136 100 87 115 95 67 42 94 111 73 38Non-OECD Asia (excl. Singapore) 27 14 22 31 24 10 13 22 14 31 41 -11Other 11 3 4 11 - - - - - - 10 -
Total2 140 175 158 146 175 145 108 82 137 191 135 56of which Non-OECD 56 39 54 60 53 47 31 41 44 69 62 6
OECD EuropeOECD Americas 32 20 13 14 5 1 1 1 3 3 2 1Venezuela 1 - - - - - - - - - - -Other Central and South America 2 1 0 - - - - - - - - -Non-OECD Europe 6 2 0 - 1 - - - - - - -FSU 40 45 22 17 14 26 34 37 23 28 7 21Saudi Arabia 98 105 40 47 25 30 36 21 63 21 86 -66Algeria 9 11 9 13 6 6 6 8 16 - 21 -Other Middle East and Africa 197 199 155 127 166 153 137 154 86 162 135 27Singapore 25 29 10 6 6 8 3 - - 11 2 10OECD Asia Oceania 32 36 27 23 37 16 32 0 6 19 35 -16Non-OECD Asia (excl. Singapore) 69 73 50 40 38 54 17 20 63 72 33 39Other 1 2 10 38 4 2 12 1 34 28 36 -8
Total2 512 523 337 325 302 296 278 242 295 344 357 -13of which Non-OECD 445 464 297 287 259 278 248 249 286 322 319 2
OECD Asia OceaniaOECD Americas - - - - - - - - - - - -Venezuela - - - - - - - - - - - -Other Central and South America - - - - - - - - - - - -ARA (Belgium Germany Netherlands) - - - - - - - - - - - -Other Europe - - - - - - - - - - - -FSU - - - - - - - - - - - -Saudi Arabia 1 - - - - - - - - - - -Algeria - - - - - - - - - - - -Other Middle East and Africa 1 - - - - - 3 - - - - -Singapore 28 21 14 5 17 10 6 6 18 8 - -Non-OECD Asia (excl. Singapore) 26 29 28 15 16 28 55 35 49 22 1 21Other 33 26 21 16 9 19 36 18 13 18 8 10
Total2 89 76 63 35 41 58 100 59 80 47 9 39of which Non-OECD 89 76 63 35 41 58 100 59 80 47 9 39
Total OECD Trade2 741 774 558 506 518 499 486 383 513 582 501 81of which Non-OECD 590 579 414 382 353 382 378 349 410 438 391 471 Based on Monthly Oil Questionnaire data submitted by OECD countries in tonnes.2 Total figure excludes intra-regional trade.
Table 11REGIONAL OECD JET AND KEROSENE IMPORTS BY SOURCE1
(thousand barrels per day)
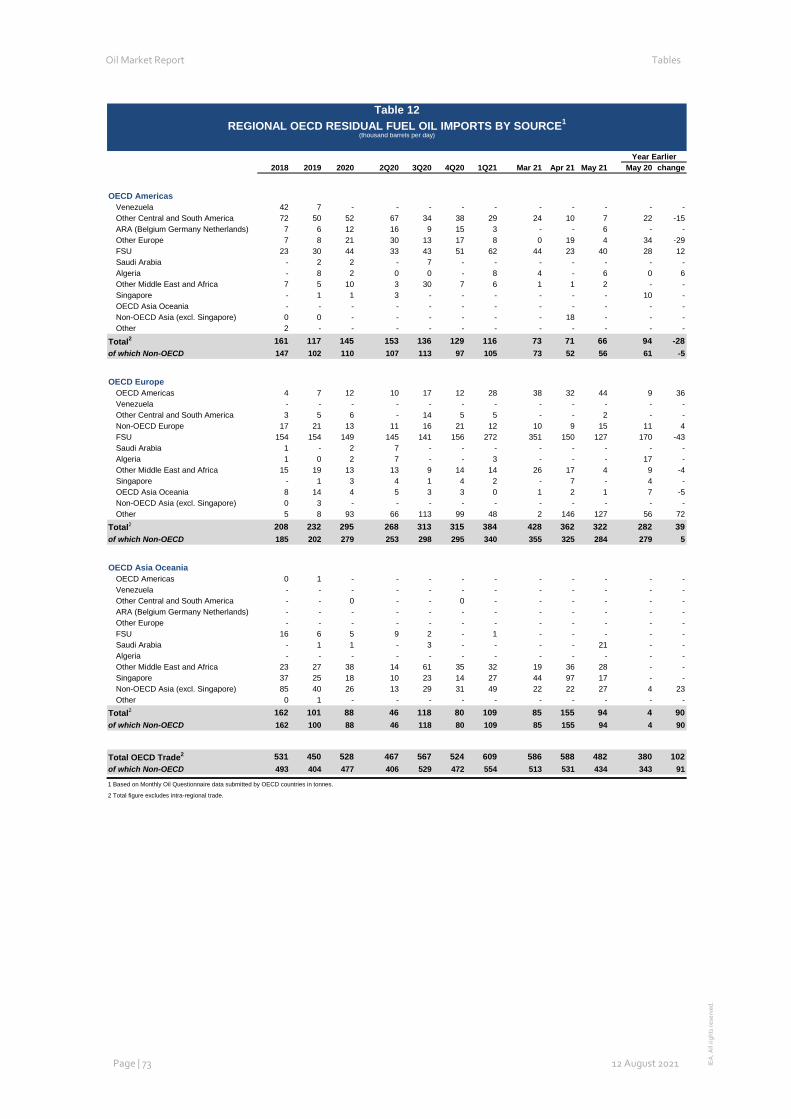
Oil Market Report Tables
Page | 73 12 August 2021 IEA
. All
right
s re
serv
ed.
Table 12: Regional OECD Residual Fuel Oil Imports by Source
Year Earlier2018 2019 2020 2Q20 3Q20 4Q20 1Q21 Mar 21 Apr 21 May 21 May 20 change
OECD AmericasVenezuela 42 7 - - - - - - - - - -Other Central and South America 72 50 52 67 34 38 29 24 10 7 22 -15ARA (Belgium Germany Netherlands) 7 6 12 16 9 15 3 - - 6 - -Other Europe 7 8 21 30 13 17 8 0 19 4 34 -29FSU 23 30 44 33 43 51 62 44 23 40 28 12Saudi Arabia - 2 2 - 7 - - - - - - -Algeria - 8 2 0 0 - 8 4 - 6 0 6Other Middle East and Africa 7 5 10 3 30 7 6 1 1 2 - -Singapore - 1 1 3 - - - - - - 10 -OECD Asia Oceania - - - - - - - - - - - -Non-OECD Asia (excl. Singapore) 0 0 - - - - - - 18 - - -Other 2 - - - - - - - - - - -
Total2 161 117 145 153 136 129 116 73 71 66 94 -28of which Non-OECD 147 102 110 107 113 97 105 73 52 56 61 -5
OECD EuropeOECD Americas 4 7 12 10 17 12 28 38 32 44 9 36Venezuela - - - - - - - - - - - -Other Central and South America 3 5 6 - 14 5 5 - - 2 - -Non-OECD Europe 17 21 13 11 16 21 12 10 9 15 11 4FSU 154 154 149 145 141 156 272 351 150 127 170 -43Saudi Arabia 1 - 2 7 - - - - - - - -Algeria 1 0 2 7 - - 3 - - - 17 -Other Middle East and Africa 15 19 13 13 9 14 14 26 17 4 9 -4Singapore - 1 3 4 1 4 2 - 7 - 4 -OECD Asia Oceania 8 14 4 5 3 3 0 1 2 1 7 -5Non-OECD Asia (excl. Singapore) 0 3 - - - - - - - - - -Other 5 8 93 66 113 99 48 2 146 127 56 72
Total2 208 232 295 268 313 315 384 428 362 322 282 39of which Non-OECD 185 202 279 253 298 295 340 355 325 284 279 5
OECD Asia OceaniaOECD Americas 0 1 - - - - - - - - - -Venezuela - - - - - - - - - - - -Other Central and South America - - 0 - - 0 - - - - - -ARA (Belgium Germany Netherlands) - - - - - - - - - - - -Other Europe - - - - - - - - - - - -FSU 16 6 5 9 2 - 1 - - - - -Saudi Arabia - 1 1 - 3 - - - - 21 - -Algeria - - - - - - - - - - - -Other Middle East and Africa 23 27 38 14 61 35 32 19 36 28 - -Singapore 37 25 18 10 23 14 27 44 97 17 - -Non-OECD Asia (excl. Singapore) 85 40 26 13 29 31 49 22 22 27 4 23Other 0 1 - - - - - - - - - -
Total2 162 101 88 46 118 80 109 85 155 94 4 90of which Non-OECD 162 100 88 46 118 80 109 85 155 94 4 90
Total OECD Trade2 531 450 528 467 567 524 609 586 588 482 380 102of which Non-OECD 493 404 477 406 529 472 554 513 531 434 343 91
1 Based on Monthly Oil Questionnaire data submitted by OECD countries in tonnes.
2 Total figure excludes intra-regional trade.
Table 12REGIONAL OECD RESIDUAL FUEL OIL IMPORTS BY SOURCE1
(thousand barrels per day)
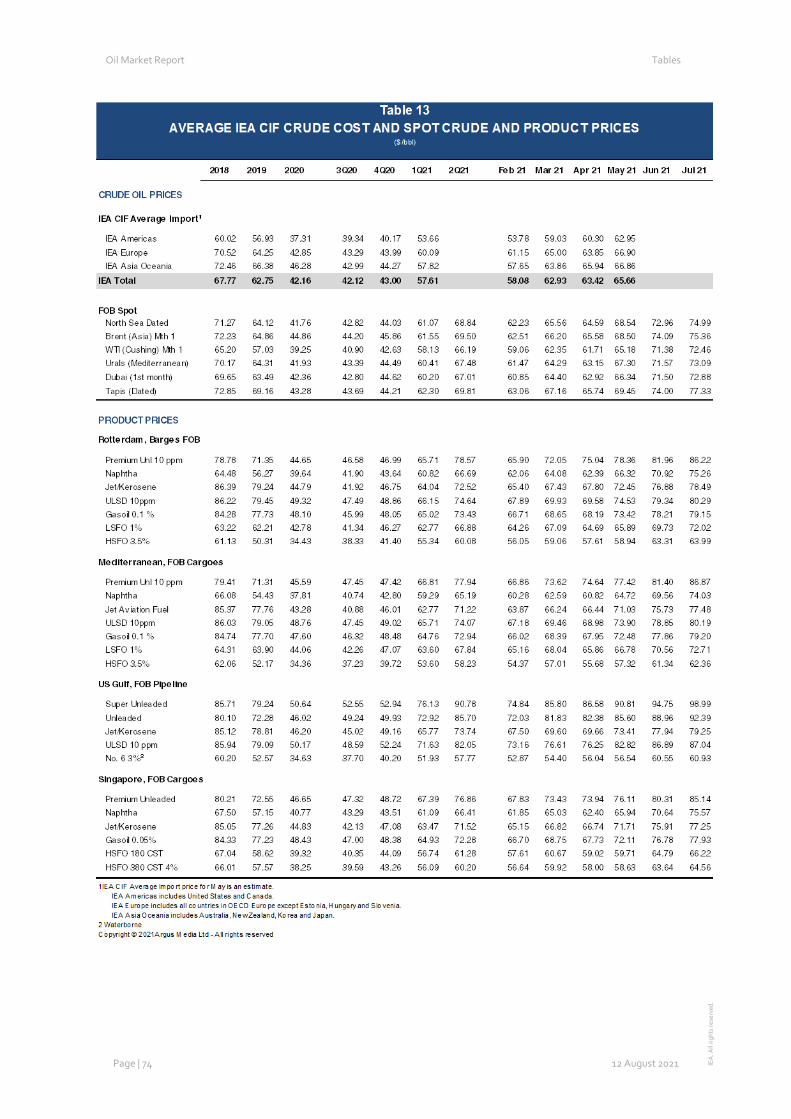
Oil Market Report Tables
Page | 74 12 August 2021 IEA
. All
right
s re
serv
ed.
Table 13: Average IEA CIF Crude Cost and Spot Crude and Production Prices
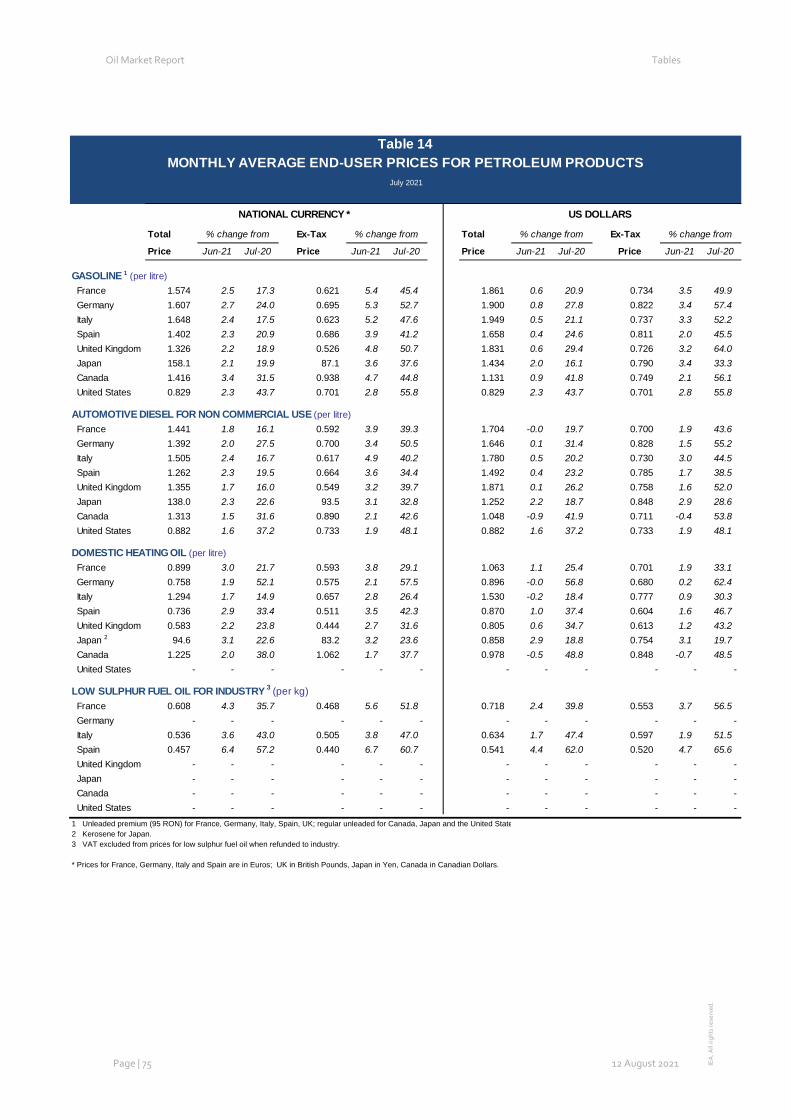
Oil Market Report Tables
Page | 75 12 August 2021 IEA
. All
right
s re
serv
ed.
Table 14: Monthly Average End-User Prices for Petroleum Products
Total Ex-Tax Total Ex-Tax
Price Jun-21 Jul-20 Price Jun-21 Jul-20 Price Jun-21 Jul-20 Price Jun-21 Jul-20
GASOLINE 1 (per litre) France 1.574 2.5 17.3 0.621 5.4 45.4 1.861 0.6 20.9 0.734 3.5 49.9 Germany 1.607 2.7 24.0 0.695 5.3 52.7 1.900 0.8 27.8 0.822 3.4 57.4 Italy 1.648 2.4 17.5 0.623 5.2 47.6 1.949 0.5 21.1 0.737 3.3 52.2 Spain 1.402 2.3 20.9 0.686 3.9 41.2 1.658 0.4 24.6 0.811 2.0 45.5 United Kingdom 1.326 2.2 18.9 0.526 4.8 50.7 1.831 0.6 29.4 0.726 3.2 64.0 Japan 158.1 2.1 19.9 87.1 3.6 37.6 1.434 2.0 16.1 0.790 3.4 33.3 Canada 1.416 3.4 31.5 0.938 4.7 44.8 1.131 0.9 41.8 0.749 2.1 56.1 United States 0.829 2.3 43.7 0.701 2.8 55.8 0.829 2.3 43.7 0.701 2.8 55.8
AUTOMOTIVE DIESEL FOR NON COMMERCIAL USE (per litre) France 1.441 1.8 16.1 0.592 3.9 39.3 1.704 -0.0 19.7 0.700 1.9 43.6 Germany 1.392 2.0 27.5 0.700 3.4 50.5 1.646 0.1 31.4 0.828 1.5 55.2 Italy 1.505 2.4 16.7 0.617 4.9 40.2 1.780 0.5 20.2 0.730 3.0 44.5 Spain 1.262 2.3 19.5 0.664 3.6 34.4 1.492 0.4 23.2 0.785 1.7 38.5 United Kingdom 1.355 1.7 16.0 0.549 3.2 39.7 1.871 0.1 26.2 0.758 1.6 52.0 Japan 138.0 2.3 22.6 93.5 3.1 32.8 1.252 2.2 18.7 0.848 2.9 28.6 Canada 1.313 1.5 31.6 0.890 2.1 42.6 1.048 -0.9 41.9 0.711 -0.4 53.8 United States 0.882 1.6 37.2 0.733 1.9 48.1 0.882 1.6 37.2 0.733 1.9 48.1
DOMESTIC HEATING OIL (per litre) France 0.899 3.0 21.7 0.593 3.8 29.1 1.063 1.1 25.4 0.701 1.9 33.1 Germany 0.758 1.9 52.1 0.575 2.1 57.5 0.896 -0.0 56.8 0.680 0.2 62.4 Italy 1.294 1.7 14.9 0.657 2.8 26.4 1.530 -0.2 18.4 0.777 0.9 30.3 Spain 0.736 2.9 33.4 0.511 3.5 42.3 0.870 1.0 37.4 0.604 1.6 46.7 United Kingdom 0.583 2.2 23.8 0.444 2.7 31.6 0.805 0.6 34.7 0.613 1.2 43.2 Japan 2 94.6 3.1 22.6 83.2 3.2 23.6 0.858 2.9 18.8 0.754 3.1 19.7 Canada 1.225 2.0 38.0 1.062 1.7 37.7 0.978 -0.5 48.8 0.848 -0.7 48.5 United States - - - - - - - - - - - -
LOW SULPHUR FUEL OIL FOR INDUSTRY 3 (per kg) France 0.608 4.3 35.7 0.468 5.6 51.8 0.718 2.4 39.8 0.553 3.7 56.5 Germany - - - - - - - - - - - - Italy 0.536 3.6 43.0 0.505 3.8 47.0 0.634 1.7 47.4 0.597 1.9 51.5 Spain 0.457 6.4 57.2 0.440 6.7 60.7 0.541 4.4 62.0 0.520 4.7 65.6 United Kingdom - - - - - - - - - - - - Japan - - - - - - - - - - - - Canada - - - - - - - - - - - - United States - - - - - - - - - - - -1 Unleaded premium (95 RON) for France, Germany, Italy, Spain, UK; regular unleaded for Canada, Japan and the United State2 Kerosene for Japan.3 VAT excluded from prices for low sulphur fuel oil when refunded to industry.
* Prices for France, Germany, Italy and Spain are in Euros; UK in British Pounds, Japan in Yen, Canada in Canadian Dollars.
% change from% change from
Table 14MONTHLY AVERAGE END-USER PRICES FOR PETROLEUM PRODUCTS
July 2021
NATIONAL CURRENCY * US DOLLARS
% change from % change from
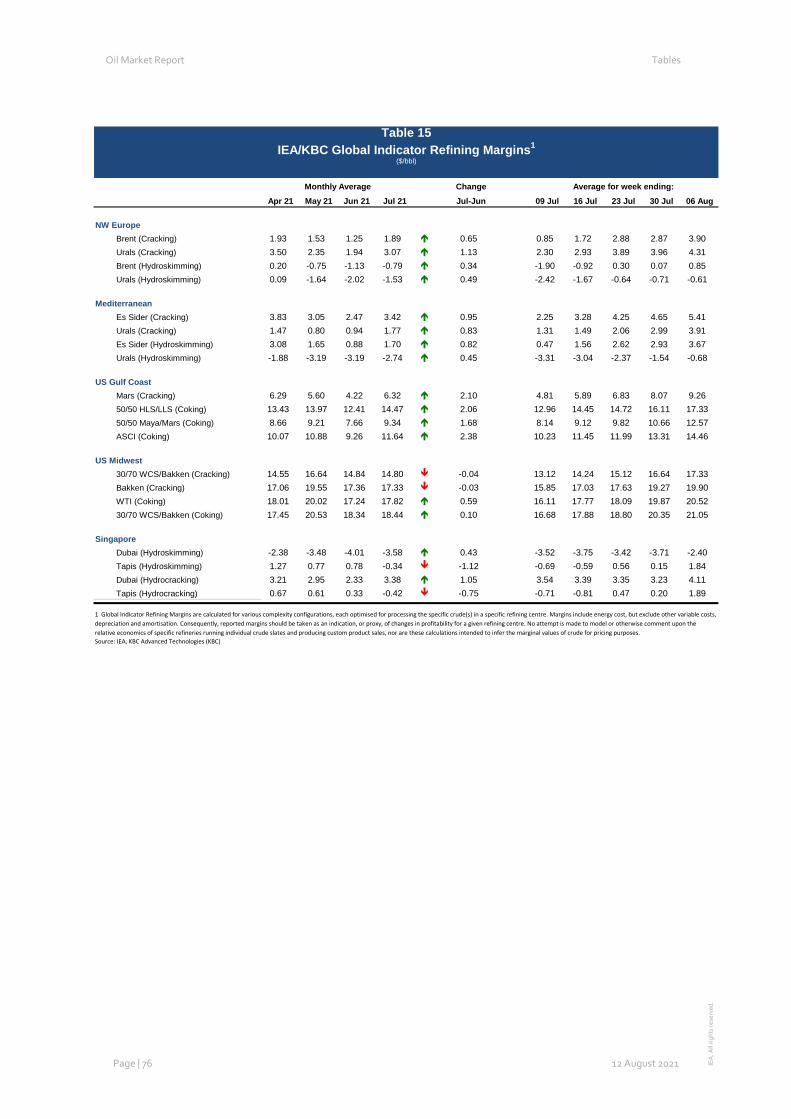
Oil Market Report Tables
Page | 76 12 August 2021 IEA
. All
right
s re
serv
ed.
Table 15: IEA/KBC Global Indicator Refining Margins
Change
Apr 21 May 21 Jun 21 Jul 21 Jul-Jun 09 Jul 16 Jul 23 Jul 30 Jul 06 Aug
NW EuropeBrent (Cracking) 1.93 1.53 1.25 1.89 0.65 0.85 1.72 2.88 2.87 3.90 Urals (Cracking) 3.50 2.35 1.94 3.07 1.13 2.30 2.93 3.89 3.96 4.31 Brent (Hydroskimming) 0.20 -0.75 -1.13 -0.79 0.34 -1.90 -0.92 0.30 0.07 0.85 Urals (Hydroskimming) 0.09 -1.64 -2.02 -1.53 0.49 -2.42 -1.67 -0.64 -0.71 -0.61
MediterraneanEs Sider (Cracking) 3.83 3.05 2.47 3.42 0.95 2.25 3.28 4.25 4.65 5.41 Urals (Cracking) 1.47 0.80 0.94 1.77 0.83 1.31 1.49 2.06 2.99 3.91 Es Sider (Hydroskimming) 3.08 1.65 0.88 1.70 0.82 0.47 1.56 2.62 2.93 3.67 Urals (Hydroskimming) -1.88 -3.19 -3.19 -2.74 0.45 -3.31 -3.04 -2.37 -1.54 -0.68
US Gulf CoastMars (Cracking) 6.29 5.60 4.22 6.32 2.10 4.81 5.89 6.83 8.07 9.26 50/50 HLS/LLS (Coking) 13.43 13.97 12.41 14.47 2.06 12.96 14.45 14.72 16.11 17.33 50/50 Maya/Mars (Coking) 8.66 9.21 7.66 9.34 1.68 8.14 9.12 9.82 10.66 12.57 ASCI (Coking) 10.07 10.88 9.26 11.64 2.38 10.23 11.45 11.99 13.31 14.46
US Midwest30/70 WCS/Bakken (Cracking) 14.55 16.64 14.84 14.80 -0.04 13.12 14.24 15.12 16.64 17.33 Bakken (Cracking) 17.06 19.55 17.36 17.33 -0.03 15.85 17.03 17.63 19.27 19.90 WTI (Coking) 18.01 20.02 17.24 17.82 0.59 16.11 17.77 18.09 19.87 20.52 30/70 WCS/Bakken (Coking) 17.45 20.53 18.34 18.44 0.10 16.68 17.88 18.80 20.35 21.05
SingaporeDubai (Hydroskimming) -2.38 -3.48 -4.01 -3.58 0.43 -3.52 -3.75 -3.42 -3.71 -2.40 Tapis (Hydroskimming) 1.27 0.77 0.78 -0.34 -1.12 -0.69 -0.59 0.56 0.15 1.84 Dubai (Hydrocracking) 3.21 2.95 2.33 3.38 1.05 3.54 3.39 3.35 3.23 4.11 Tapis (Hydrocracking) 0.67 0.61 0.33 -0.42 -0.75 -0.71 -0.81 0.47 0.20 1.89
1 Global Indicator Refining Margins are calculated for various complexity configurations, each optimised for processing the specific crude(s) in a specific refining centre. Margins include energy cost, but exclude other variable costs, depreciation and amortisation. Consequently, reported margins should be taken as an indication, or proxy, of changes in profitability for a given refining centre. No attempt is made to model or otherwise comment upon the relative economics of specific refineries running individual crude slates and producing custom product sales, nor are these calculations intended to infer the marginal values of crude for pricing purposes. Source: IEA, KBC Advanced Technologies (KBC)
Table 15IEA/KBC Global Indicator Refining Margins1
($/bbl)
Monthly Average Average for week ending:
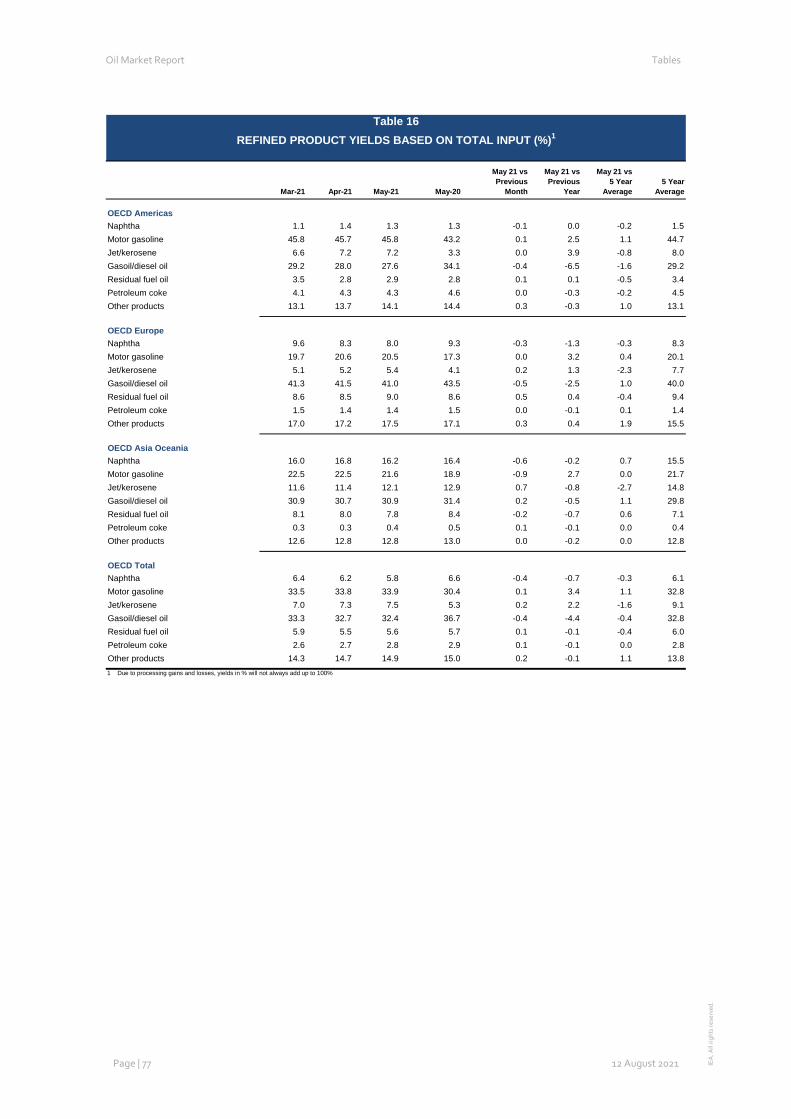
Oil Market Report Tables
Page | 77 12 August 2021 IEA
. All
right
s re
serv
ed.
Table 16: Refined Product Yields Based On Total Input (%) Mar-21 Apr-21 May-21 May-20
May 21 vs Previous
Month
May 21 vs Previous
Year
May 21 vs 5 Year
Average 5 Year
Average
OECD AmericasNaphtha 1.1 1.4 1.3 1.3 -0.1 0.0 -0.2 1.5Motor gasoline 45.8 45.7 45.8 43.2 0.1 2.5 1.1 44.7Jet/kerosene 6.6 7.2 7.2 3.3 0.0 3.9 -0.8 8.0Gasoil/diesel oil 29.2 28.0 27.6 34.1 -0.4 -6.5 -1.6 29.2Residual fuel oil 3.5 2.8 2.9 2.8 0.1 0.1 -0.5 3.4Petroleum coke 4.1 4.3 4.3 4.6 0.0 -0.3 -0.2 4.5Other products 13.1 13.7 14.1 14.4 0.3 -0.3 1.0 13.1
OECD EuropeNaphtha 9.6 8.3 8.0 9.3 -0.3 -1.3 -0.3 8.3Motor gasoline 19.7 20.6 20.5 17.3 0.0 3.2 0.4 20.1Jet/kerosene 5.1 5.2 5.4 4.1 0.2 1.3 -2.3 7.7Gasoil/diesel oil 41.3 41.5 41.0 43.5 -0.5 -2.5 1.0 40.0Residual fuel oil 8.6 8.5 9.0 8.6 0.5 0.4 -0.4 9.4Petroleum coke 1.5 1.4 1.4 1.5 0.0 -0.1 0.1 1.4Other products 17.0 17.2 17.5 17.1 0.3 0.4 1.9 15.5
OECD Asia OceaniaNaphtha 16.0 16.8 16.2 16.4 -0.6 -0.2 0.7 15.5Motor gasoline 22.5 22.5 21.6 18.9 -0.9 2.7 0.0 21.7Jet/kerosene 11.6 11.4 12.1 12.9 0.7 -0.8 -2.7 14.8Gasoil/diesel oil 30.9 30.7 30.9 31.4 0.2 -0.5 1.1 29.8Residual fuel oil 8.1 8.0 7.8 8.4 -0.2 -0.7 0.6 7.1Petroleum coke 0.3 0.3 0.4 0.5 0.1 -0.1 0.0 0.4Other products 12.6 12.8 12.8 13.0 0.0 -0.2 0.0 12.8
OECD TotalNaphtha 6.4 6.2 5.8 6.6 -0.4 -0.7 -0.3 6.1Motor gasoline 33.5 33.8 33.9 30.4 0.1 3.4 1.1 32.8Jet/kerosene 7.0 7.3 7.5 5.3 0.2 2.2 -1.6 9.1Gasoil/diesel oil 33.3 32.7 32.4 36.7 -0.4 -4.4 -0.4 32.8Residual fuel oil 5.9 5.5 5.6 5.7 0.1 -0.1 -0.4 6.0Petroleum coke 2.6 2.7 2.8 2.9 0.1 -0.1 0.0 2.8Other products 14.3 14.7 14.9 15.0 0.2 -0.1 1.1 13.81 Due to processing gains and losses, yields in % will not always add up to 100%
Table 16REFINED PRODUCT YIELDS BASED ON TOTAL INPUT (%)1
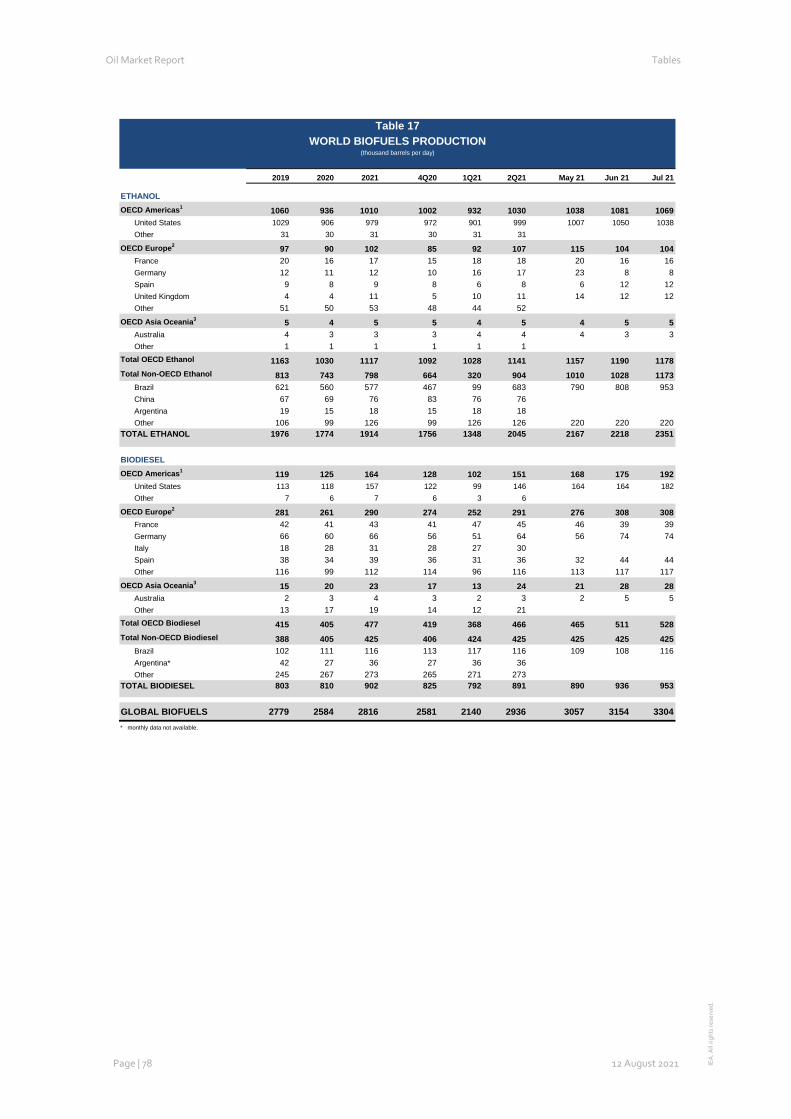
Oil Market Report Tables
Page | 78 12 August 2021 IEA
. All
right
s re
serv
ed.
Table 17: World Biofuels Production 2019 2020 2021 4Q20 1Q21 2Q21 May 21 Jun 21 Jul 21
ETHANOLOECD Americas1 1060 936 1010 1002 932 1030 1038 1081 1069
United States 1029 906 979 972 901 999 1007 1050 1038Other 31 30 31 30 31 31 31 32 32
OECD Europe2 97 90 102 85 92 107 115 104 104France 20 16 17 15 18 18 20 16 16Germany 12 11 12 10 16 17 23 8 8Spain 9 8 9 8 6 8 6 12 12United Kingdom 4 4 11 5 10 11 14 12 12Other 51 50 53 48 44 52
OECD Asia Oceania3 5 4 5 5 4 5 4 5 5Australia 4 3 3 3 4 4 4 3 3Other 1 1 1 1 1 1 1 1 1
Total OECD Ethanol 1163 1030 1117 1092 1028 1141 1157 1190 1178Total Non-OECD Ethanol 813 743 798 664 320 904 1010 1028 1173
Brazil 621 560 577 467 99 683 790 808 953China 67 69 76 83 76 76Argentina 19 15 18 15 18 18Other 106 99 126 99 126 126 220 220 220
TOTAL ETHANOL 1976 1774 1914 1756 1348 2045 2167 2218 2351
BIODIESELOECD Americas1 119 125 164 128 102 151 168 175 192
United States 113 118 157 122 99 146 164 164 182Other 7 6 7 6 3 6 3 11 11
OECD Europe2 281 261 290 274 252 291 276 308 308France 42 41 43 41 47 45 46 39 39Germany 66 60 66 56 51 64 56 74 74Italy 18 28 31 28 27 30 29 34 34Spain 38 34 39 36 31 36 32 44 44Other 116 99 112 114 96 116 113 117 117
OECD Asia Oceania3 15 20 23 17 13 24 21 28 28Australia 2 3 4 3 2 3 2 5 5Other 13 17 19 14 12 21 20 22 22
Total OECD Biodiesel 415 405 477 419 368 466 465 511 528Total Non-OECD Biodiesel 388 405 425 406 424 425 425 425 425
Brazil 102 111 116 113 117 116 109 108 116Argentina* 42 27 36 27 36 36Other 245 267 273 265 271 273
TOTAL BIODIESEL 803 810 902 825 792 891 890 936 953
GLOBAL BIOFUELS 2779 2584 2816 2581 2140 2936 3057 3154 3304* monthly data not available.
Table 17WORLD BIOFUELS PRODUCTION
(thousand barrels per day)
Source: IEA 2021. All Rights Reserved
Without prejudice to the terms and conditions on the IEA website at www.iea.org/t&c/termsandconditions/ (the Terms), which also apply to this Oil Market Report (OMR) and its related publications, the Executive Director and the Secretariat of the IEA are responsible for the publication of the OMR. Although some of the data are supplied by IEA Member-country governments, largely on the basis of information they in turn receive from oil companies, neither these governments nor these oil companies necessarily share the Secretariat’s views or conclusions as expressed in the OMR. The OMR is prepared for general circulation and is distributed for general information only. Neither the information nor any opinion expressed in the OMR constitutes an offer, or an invitation to make an offer, to buy or sell any securities or any options, futures or other derivatives related to such securities.
As set out in the Terms, the IEA owns the copyright in this OMR. However, in relation to the edition of OMR made available to Subscribers (as defined in the Terms), all Argus information is sourced as Copyright © 2021 Argus Media Limited and is published here with the permission of Argus. The spot crude and product price assessments are based on daily Argus prices, converted when appropriate to USD per barrel according to the Argus specification of products. Argus Media Limited reserves all rights in relation to all Argus information. Any reproduction of Argus information requires the express prior written permission of Argus. Argus shall not be liable to any party for any inaccuracy, error or omission contained or provided in Argus information contained in this OMR or for any loss, or damage, whether or not due to reliance placed by that party on information in this OMR.
Oil Market Team
Editor
Toril Bosoni +33 (0)1 40 57 67 18
Statistics Luis Fernando Rosa +33 (0)1 40 57 65 56
Demand Christophe Barret +33 (0)1 40 57 65 16
Statistics Dionysia Lyngopoulou +33 (0) 40 57 66 92
Dionysia.Lyngopoulou @iea.org
Demand Olivier Lejeune +33 (0)1 40 57 67 58
OPEC Supply Peg Mackey +33 (0)1 40 57 65 81
Non-OPEC Supply
Anne Kloss +33 (0)1 40 57 67 28
Editorial Assistant Deven Mooneesawmy +33 (0)1 40 57 65 03
Refining Kristine Petrosyan +33 (0)1 40 57 66 05
Data Enquiries to Oil Market Report: [email protected]
Stocks Masataka Yarita +33 (0)1 40 57 67 64
Subscription & Delivery Enquiries
+33 (0)1 40 57 66 90 [email protected]
Prices Joel R. Couse +33 (0)1 40 57 67 22
Media Enquiries IEA Press Office
+33 (0)1 40 57 66 94 [email protected]
Next Issue: 14 September 2021
For information on the data sources, definitions, technical terms and general approach used in preparing the Oil Market Report (OMR), Market Report Series_Oil and Annual Statistical Supplement (current issue of the Statistical Supplement dated 12 August 2021), readers are referred to the Users’ Guide at https://www.iea.org/articles/oil-market-report-glossary. It should be noted that the spot crude and product price assessments are based on daily Argus prices, converted when appropriate to US$ per barrel according to the Argus specification of products (Copyright © 2021 Argus Media Limited - all rights reserved)