111 iiiii ll~i - dtic
TRANSCRIPT
AFHRL-TR-90-67
AD-A243 225111 II III ll~I ~IIIIh ~I~FACTOR ANALYTIC EXAMINATION OF THE
ARMED SERVICES VOCATIONAL APTITUDEBATTERY (ASVA3) AND THE KIT OF
FACTOR-REFERENCED TESTS
H Werner Wothke
R. Darrell Bock
U Scientific Software, Incorporated
Technical Operations Division1525 E. 53rd Street, Suite 830
A Chicago, Illinois 60615
N Linda T. Curran
MANPOWER AND PERSONNEL DIVISIONBrooks Air Force Base, Texas 78235-5601
Benjamin A. Falrbank
Operational Technologies Corporation-R 5825 Callaghan Road, Suite 225
E San Antonio, Texas 78228-1110
James W. AugustinS Alexander H. Gillet0 Carlos Guerrero, Jr.
0 Universal Energy Systems, incorporatedU 4401 Dayton-Xenia Road
Dayton, Ohio 45432-1894
RC April 1991
E Final Technical Report for Period September 1986 - August 1990
mom'S Approved for pub.lic release; distribution is unlimited.
•,,4jLABORATORY
AIR FORCE SYSTEMS COMMAND
BROOKS AIR FORCE BASE,, TEXAS 78235-5601
91 11 27 062
IL
NOTICE
When Sovemment drawings, specifications, or other data are used for any purposeother than in connection with a definitely Government-related procurement, theUnited States Government incurs no responsibility or any obligation whatsoever.The fact that the Government may have formulated or in any way supplied the saiddrawings, specifications, or other data, is not to be regarded by implication, orotherwise in any manner construed, as licensing the holder, or any other personor corporation; or as conveying any rights or permission to manufacture, use, orsell any patented invention that may in any way be related thereto.
The Public Affairs Office has reviewed this report, and it is releasable to the NationalTechnical Information Service, where it will be available to the general public,including foreign nationals.
This report has been reviewed and is approved for publication.
THOMAS W. WATSONContract Monitor
WILLIAM E. ALLEY, Technical DirectorManpower and Personnel Division
HAROLD G. JENSEN, Colonel, USAFCommander
Form ApprovedREPORT DOCUMENTATION PAGE OMB No. 0704-0188
Public reporng burden for this collectin' of info;ration is estinmti:l to average 1 hour r response, including the time for reviewing Instructions, searching existing data sources, gathering
end maintaining tle data ndednd dand rMeng the collection of ian. Send comments regerdin. this burden estimate of any other aspect of this collection orinformation, inctuding suggestions for reducing this burden, to Washington Headquarters Services, Directorate for Information Operations and Repors, 1215 Jefferson Davis Highway, Sute
1204, Arlington, VA 2fl02-4302, and to the Office of Management and Budgat Paperwork Reduction Project (0704-0188), Washington, and 20503.
1. AGENCY USE ONLY (Leave blank) 2. REPORT DATE .. REPORT TYPE AND DATES COVEREDApril 1991 Final Report - September 1986 - August 19904. TITLlE AND SUBTITLE S. FUNDING NUMBERS /
Factor Analytic Examination of the Armed Services Vocational Aptitude C - F41689-87-D-001 2Battery (ASVAB) and the Kit of Factor-Referenced Tests F41689-84-D-0002 0
PE - 63227F
6. AUTHOR(S) PR - 2922,7719
Werner Wothke R. Darrell Bock TA - 02,18
Linda T. Curran Benjamin A- Fairbank WU - 02, 04
James W. Augustin Alexandar H. GilletCarlos Guerrero, Jr.
7. PERFORMING ORGANIZATION NAME(S) AND ADDRESS(ES) S. PERFORMING ORGANIZATION
Operational Technologies Corporation V REPORT NUMBER
5825 Callaghan Road, Suite 225San Antonio, Texas 78228-1110
9. SPONSORING/MONITORING AGENCY NAMES(S) A0ND ADDRESS(ES) 10. SPONSORING/MONITORING AGENCY
Manpower and Personnel Division REPORT NUMBER
Air Force Human Resources Laboratory AFHRL-TR-90-67Brooks Air Force Base, Texas 78235-5601
11. SUPPLEMENTARY NOTES
12a. DISTRIBUTION/AVAILABILITY STATEMENT 12b. DISTRIBUTION CODE
Approved for public release; distribution is unlimited.
13. ABSTRACT (Maximum 200 words)
The Armed Services Vocational Aptitude Battery (ASVAB) is used to select and classify enlisted personnel.Although the factor structure of the ASVAB has been assessed and compared to similar aptitude tests, nothorough factor reference study has been done with the current ASVAB configuration. To examine the factorstructure of the ASVAB, 46 tests from the Kit of Factor Referenced Cognitive Tests (the Kit) and the 10 ASVABsubtests were administered to a sample of airmen. Because 56 tests were investigated, it was impossible tohave every examinee receive every test. Matrix sampling was used to pair each test with each of the othertests. After consideration of descriptive statistics and after editing, the data were assembled into a correlationmatrix for exploratory and confirmatory factor analysis. Matrix sampling requires special factor analytic methods.The factor analyses indicated that the correlation structure among the ASVAB scores required three factors toexplain, whereas that in the Kit scores required six. The factors used to explain the ASVAB can largely beplaced within the factor space of the Kit factors, indicating that the abilities measured by the ASVAB are a subsetof the abilities measured by the Kit. Future research to enhance selection and classification should focus onabilities not currently measured by the ASVAB.
14. SUBJECT TERMS 15. NUMBER OF PAGES
ASVAB factor analysis test construction 76Xconfirmatory factor analysis -LISREL 16. PRICE CODE
construct validity selection
17, SECURITY CLASSIFICATION 18. SECURITY CLASSIFICATION 19. SECURITY CLASSIFICATION 20. LIMITATION OF ABSTRACTOF REPORT uF THIS PAGE OF ABSTRCTTUnclassified Unclassified a sified UL
NSN 754-01 -21)-5500 Standard Form 290 iRev 2-89)
Prescribed by ANSI Std. Z39-18298-102
SUMMARY
The Armed Services Vocational Aptitude Battery (ASVAB) is used for selection and job
classification of enlisted personnel by the Armed Services. The factor structure of the
ASVAB, in its current composition, has never been examined in reference to a known
cognitive battery. To determine the factor structure of the ASVAB, tests from the Kit of
Factor-Referenced Cognitive Tests (the Kit) were administered along with the 10 subtests on
the ASVAB. The Kit was developed by the Educational Testing Service and consists of 72
tests that measure 23 aptitude factors. Two tests per aptitude factor were selected based
upon the test administration time, ease of administration, and ease of scoring. A set of 56
cognitive ability tests, 46 of which were chosen from the Kit and 10 of which were the
ASVAB subtests, was administered to a sample of Air Force reservists and basic trainees.
Because of the large number of tests involved, a matrix sampling scheme was used in order
that each test might be paired with each other test. The resulting data were edited and
assembled into a correlation matrix which presented the intercorrelations of ail 56 tests. The
data were factor analyzed to determine the joint factor structure of the two test batteries.
Three factors accounted for the correlation structure in the ASVAB. Six factors accounted
for the correlations among the factor-referenced tests. The simultaneous analysis of the two
batteries showed that most of the factor space for the ASVAB fits within the factor space of
the Factor-Referenced Cognitive Tests.
NiOr it,
PREFACE
This report documents the efforts conducted under two projects. One project was
completed as part of the Armed Services Vocational Aptitude Battery (ASVAB) Factor
Reference Study-Data Collection (Task 47 under Contract F41689-84-D-0002). The other
project was completed as part of the Factor Reference Study-Data Analysis (Task 05 under
Contract F41689-87-D-0012). These contracts are documented under Air Force Human
Resources Laboratory (AFHRL) Work Units 77191840 and 29220202, respectively. These
projects represent the continuing effort of the AFHRL to fulfill its research and development
(R&D) responsibilities by examining the factor structure of the ASVAB in comparison to a
known factor-referenced aptitude battery, the kit of Factor-Referenced Cognitive Tests
developed by the Educational Testing Service.
Special appreciation is expressed to Dr. Malcolm James Ree, Air Force Human
Resources Laboratory, for originating and designing this research and for providing technical
guidance once the project was under way.
TABLE OF CONTENTS
Page
INTRODUCTION .......................................................................................... 1
II. METHODOLOGY ........................................................................................ 2
Phase 1: Development of Methodology ............................................................ 2
Measures .................................................................................................. 2
Armed Services Vocational Aptitude Battery (ASVAB) ....................... 2
The Kit ................................................................................................. 3
Test Booklet Construction ........................................................................... 3
Test Administration Configuration ................................................................ 8
Testing Sessions and Examinees ..................................................................... 8
Manuals for Test Administration ...................................... ....................... 9
Test Scoring Plans .................................................................................. 10
Phase II: Data Collection and Scoring .......................................................... 11
Selection of Test Administrators .................................................................. 11
Training of Test Administrators ..................................................................... 12
Pilot Administration of Factor-Referenced Test Booklets ................................ 13
Data Collection ........................................................................................ 13
Selection and Training of Test Scorers ........................................................ 1 5
Distribution of Booklets to Scorers ............................................................. 16
Quality Control ................................................. 16
Interrater Agreement ................................................................................... 16
Supplemental Procedures ......................................................................... 1 7
Data Entry .............................................................................................. 17
Phase IIl: Data Analysis ................................................................................ 18
Data Editing and Descriptive Analyses .................................................... 18
Estimation of Correlation Matrix ............................................................. 18
Asymptotic Sampling Variance of Correlation Coefficients .......................... 1 9
Modeling of Correlation Coefficients for AFQT-1, AFQT-2,
and VE Scales ...................................................................................... 20
Factor Analysis ........................................................................................ 21
Loss Functions ......................................................................................... 21
Identification and Rotation .......................................... . ..................... 22
iii
TABLE OF CONTENTS (Continued)Page
Confirmatory Factor Analysis ...................................................................... 22
Restricted Factor Structure for the Kit Reference Tests ................................... 22
Regression of the ASVAB Subtests onto the Major Kit Factors ...................... 23
Hierarchical Factor Model for the ASVAB Regressed onto
the Major Kit Factors ................................................................................. 23
Major ASVAB Factors Regressed onto the Major Kit Factors ....................... 24
II1. RESULTS AND DISCUSSION ..................................................................... 24
Editing and Description ............................................................................... 24
Data Editing .............................................................................................. 24
Descriptive Analysis ................................................................................. 24
Estimation of Correlation Matrix ................................................................. 26
Modeling of Correlation Coefficients for AFQT-1, AFQT-2, and VE Scales .......... 26
Factor Analyses ........................................................................................... 27
Exploratory Factor Analyses ........................................................................ 27
ASVAB Subtests, Using Pairwise Complete Correlations ............................. 27
ASVAB Subtests, Using Listwise Complete Data ....................................... 29
Relation to the ASVAB Factors in "Profile of the American Youth" ............... 30
Kit Reference Tests ................................................................................. 31
Joint Analysis of ASVAB and Kit Subtests ................................................. 34
Kit Reference Tests and the Two AFQT Scales ........................................... 37
Confirmatory Factor Analyses ...................................................................... 38
Restricted Factor Structure for the Kit Reference Tests ................................... 38
Ten ASVAB Subtests Regressed on the Major Kit Factors ............................ 42
Hierarchical Factor Model for the ASVAB Regressed onto
the Major Kit Factors .............................................................................. 45
Major ASVAB Factors Regressed onto Major Kit Factors ............................. 45
IV. CONCLUSIONS ......................................................................................... 50
REFERENCES .................................................................................................... 52
iv
TABLE OF CONTENTS (Concluded)
Page
APPENDIX A: FACTOR-REFERENCED TEST SCORING CATEGORIES ................ 55
APPENDIX B: UNIVARIATE STATISTICS AND
PAIRW ISE CORRELATIONS ........................................................ 56
APPENDIX C: UNIVARIATE AND BIVARIATE SAMPLE SIZE ............................. 66
APPENDIX D: MODELED STANDARD DEVIATIONS AND CORRELATION
STRUCTURE FOR THE AFQT-1, AFQT-2,
A ND V E SCA LES ....................................................................... 67
LIST OF FEGURES
Figure Page
1 Linear Structural Relations ............................................................................. 25
V
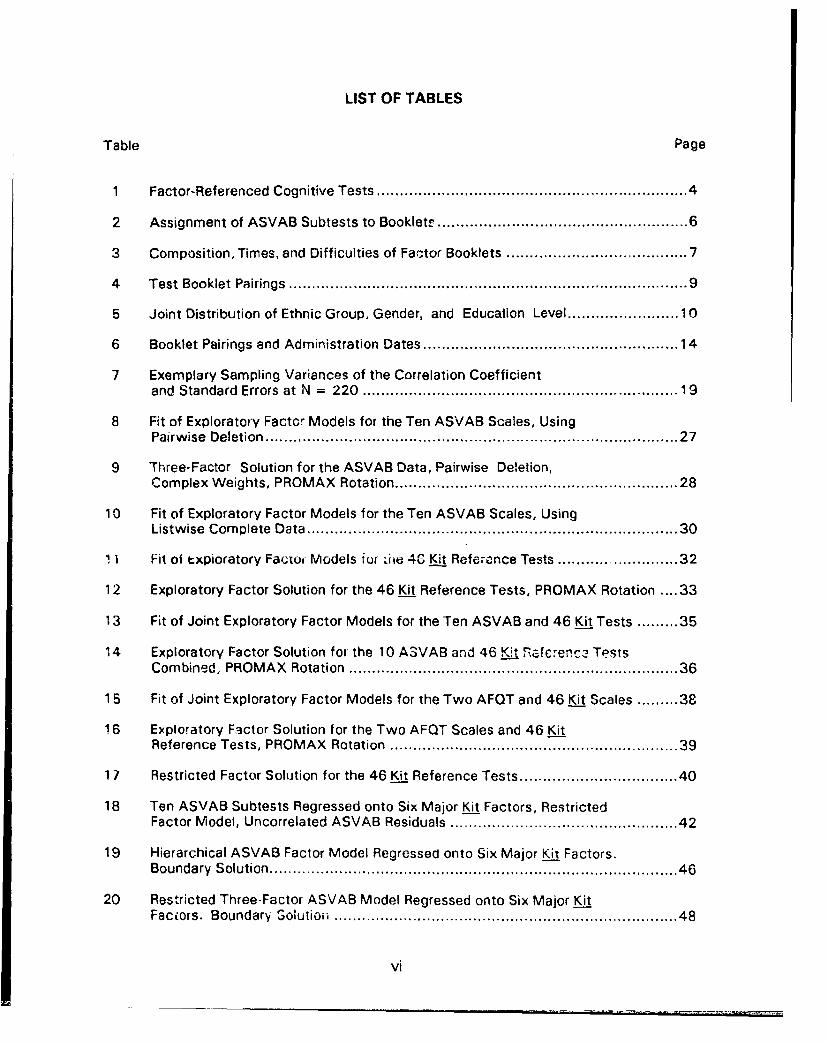
LIST OF TABLES
Table Page
1 Factor-Referenced Cognitive Tests .............................................................. 4
2 Assignment of ASVAB Subtests to Booklett ...................................................... 6
3 Composition, Times, and Difficulties of Factor Booklets .................................... 7
4 Test Booklet Pairings .................................................................................. 9
5 Joint Distribution of Ethnic Group, Gender, and Education Level .................... 10
6 Booklet Pairings and Administration Dates .................................................. 14
7 Exemplary Sampling Variances of the Correlation Coefficientand Standard Errors at N = 220 ................................................................ 19
8 Fit of Exploratory Factor Models for the Ten ASVAB Scales, UsingPairw ise Deletion ...................................................................................... 27
9 Three-Factor Solution for the ASVAB Data, Pairwise Deletion,Complex Weights, PROMAX Rotation ......................................................... 28
10 Fit of Exploratory Factor Models for the Ten ASVAB Scales, UsingListw ise Com plete Data ............................................................................ 30
1 1 Fit of t.xpioratory Facto, Models fur Liie 40 Kit Reference Tests ....................... 32
12 Exploratory Factor Solution for the 46 Kit Reference Tests, PROMAX Rotation .... 33
13 Fit of Joint Exploratory Factor Models for the Ten ASVAB and 46 Kit Tests ......... 35
14 Exploratory Factor Solution for the 10 ASVAB and 46 Kit Sfcrenc2 TestsCom bined, PROM AX Rotation .................................................................... 36
15 Fit of Joint Exploratory Factor Models for the Two AFQT and 46 Kit Scales ......... 38
16 Exploratory Factor Solution for the Two AFQT Scales and 46 KitReference Tests, PROM AX Rotation .......................................................... 39
17 Restricted Factor Solution for the 46 Kit Reference Tests .............................. 40
18 Ten ASVAB Subtests Regressed onto Six Major Kit Factors, RestrictedFactor Model, Uncorrelated ASVAB Residuals ............................................ 42
19 Hierarchical ASVAB Factor Model Regressed onto Six Major Ki_. Factors.Boundary Solution .................................................................................... 46
20 Restricted Three-Factor ASVAB Model Regressed onto Six Major KitFactors. Boundary Solution ......................................... ............... 48
vi
FACTOR ANALYTIC EXAMINATION OF THE
ARMED SERVICES VOCATIONAL APTITUDE BATTERY (ASVAB)
AND THE FACTOR REFERENCE TEST
I. INTRODUCTION
The present study addresses the construct validity of the ASVAB. The construct
validity of a test battery denotes the extent to which the battery measures the traits,
abilities, or theoretical constructs which it was designed to measure. Construct validity is
thus the most general or inclusive term for validity, but general usage restricts construct
validity to exclude face validity and predictive validity. The construct validity of a test can
be measured in various ways, most obviously by determining whether scores obtained by
examinees taking the test battery correlate well with other measures of the same abilities or
constructs. It is also possir'Ie to investigate construct validity through other, more
statistically intensive techniques. The most frequently used of these techniques is factor
analysis, which allows one to determine the factor structure underlying the various
components or tests which comprise a test battery. One can also examine the relationship
of the obtained factors to the factor structure of other test batteries which are known to
measure the constructs. This study assesses the construct validity of the ASVAB through a
joint factor analysis of the ASVAO subtests and a subset of the tests which make up the Kit
of Factor-Referenced Cognitive Ttsts (Ekstrom, French, Harman, with Derman, 1 976a).
Past studies of the factor strurture of the ASVAB, such as that performed by Ree,
Mullins, Mathews, and Massey (1982), are summarized by Curran, Kucinkas, and Welsh
(1990). These studies have shown that four moderately intercorrelated factors generally
emerge from factor analyses of the 10 subtests: a verbal factor, a quantitative factor, a
speeded factor, and a factor wnich corresponds to technical knowledge. These factors have
tended to emerge across all forms of the ASVAB since its present subtest structure was
established with Forms 8, 9, and 10. The intercorrelations of the factors have been
attributed to the influence of a general cognitive ability (GCA) factor in the various subtests
(Welsh et al., 1990).
Comparisons of the ASVAB with other cognitive batteries have included an investigation
by Hunter, Crosson, and Friedman (1985) which studied the ASVAB in relation to the
General Aptitude Test Battery (GATB). Among other finding:,, Hunter et al., (1985)
1
concluded that the ASVAB is a better measuire of GCA than is the GATB, but that the two
batteries measure much of the same ability structure. A later, smaller scale investigation
(Palmer, Haywood, Fairbank, & Earles, 1990) showed that the GATB and the ASVAB share
considerable variance, probably attributable to GCA, but that the ASVAB has subtests which
measure a technical knowledge domain that the GATB does not measure, and the GATB
measures spatial abilities not measured by the ASVAB. Welsh et al. (1990) report other
comparisons of the ASVAB with tests of reading ability, but aside from the work of Hunter et
al. (1985), there has been no recent extensive comparison of the ASVAB with another test
battery.
The present research is intended to address the need for a construct vlidation of the
ASVAB by means of comparing it with another complex test battery. A 3mparison with
such a battery migl ý yield insights on questions of theoretical import and contribute to the
resolution of practical issues regarding the actual and ideal composition of the ASVAB. For
this purpose, subtests from the Kit of Factor-Referenced Cognitive Tests (Ekstrom et al.,
1976a), hereafter called the Kit, published by the Educational Testing Serv;ce (ETS) were
analyzed with the ASVAB.
II. METHODOLOGY
Phase I: Development of Methodology_
Measures
Armed Services Vocatiui-al Apjtitue Battery (ASVAB). The ASVAB is the test battery
which the United States Military Services have used since 1976 to determine the cognitive
qualification of applicants for service. The battery serves both to dctermine whether
applicants meet minimum enlistment standards and to aid in determining the specialty area
in which an applicant might most benefit from advanced training. The ASVAB contains ten
subtests, two of which, Coding Speed and Numerical Operations, are speeded tests, and
eight of which are power tests. The power subtests are Word Knowledge, Paragraph
Cormrprehension, General Science, Mathematics Knowledge, Arithmetic Reasoning,
Electronics Information, Auto and Shop Information, and Mechanical Comprehension. The
total battery, which includes 344 questions, requires 144 minutes 0f testing time; however,
the administration time, which includes not only testing time but also time between tests
and time for the reading of instructions, is somewhat longer.
2
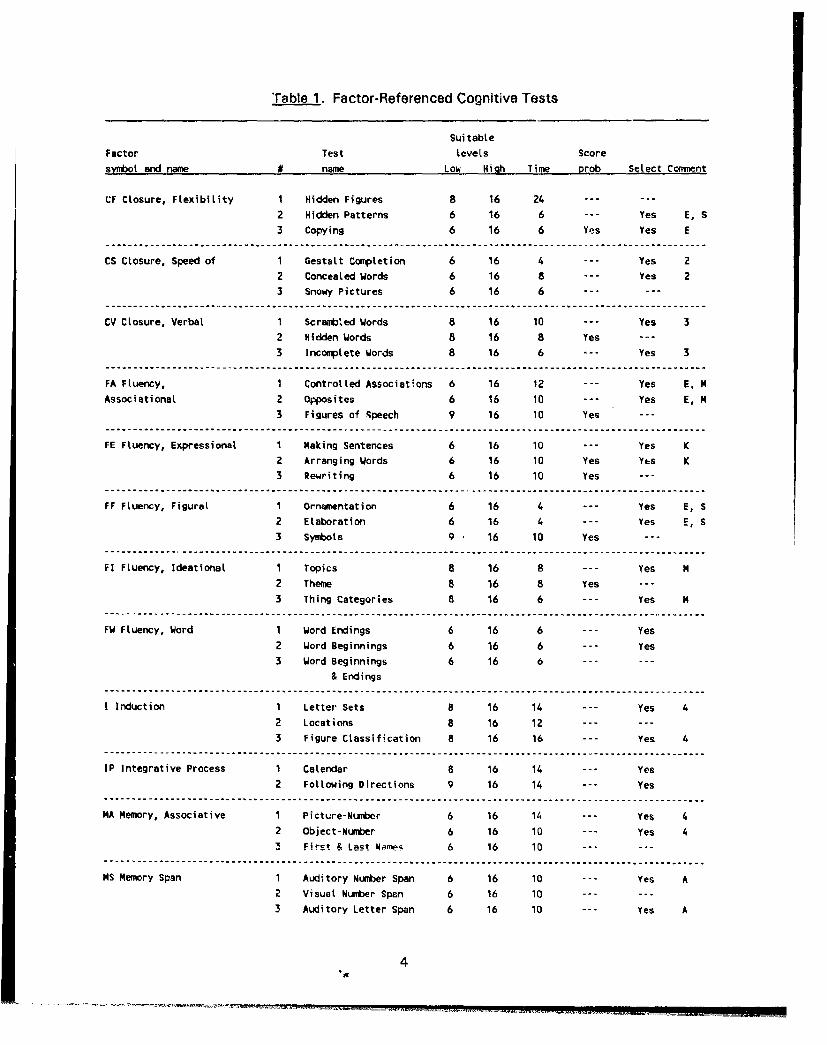
The Kit. The Kit is based upon the scientific literature concerning cognitive aptitude
factors. The Kit contains 72 cognitive tests designed to measure 23 different aptitude
factors. Three or more tests are provided for each of 21 factors, and two tests are provided
for each of the remaining two factors. The authors of the Kit recommend that more than one
test be used to identify a particular factor.
Two tests for each factor represented in the Kit were selected for study, for a total of 46
tests from the group of 72. For this study, the most desirable tests were those which were
shorter in required administration time, easier to answer correctly, easier to administer, and
easier to score, and which had an answer key. Because of testing time constraints (a
maximum of 3.5 hours was available for testing), required administration time was a heavily
weighted criterion for test selection. The information presented in Table I was compiled for
use in selecting the tests. The table also notes the 46 factor.referenced tests that were
selected.
Test Booklet Construction
Eight test booklets were constructed for the study. Two of these booklets contained the
10 ASVAB subtests. Table 2 presents the assignment of ASVAB subtests to
Factor-Referenced Test Booklets 1 and 2. Tne order of the subtests was the same as their
order in the operational ASVAB. Form 13c of the ASVAB was used in the study, but all
information identifying the tests as ASVAB subtests was removed prior to reproducing the
booklets. Form 13c is identical to Form 8a, the normative standard, and has the same
subtest composition and factor structure as those found in current operational fcrrnms.
Booklets 3 through 8 consisted of tests which were selected from the Kit. The tests
were assigned to booklets to distribute the time requirements evenly. No tests representing
the same factor were allowed in the same booklet. Time requirements for the booklets
ranged from 66 to 68 minutes.
Difficulty scores assigned to each test were obtained by summing the estimates of
the low educational grade level and high educational grade level for which the test is
suitable. Low and high grade estimates reported in the Kit were used. The difficulty scores
for individual tests ranged from 18 to 27. Based on the preliminary assignment of tests to
booklets, average difficulty measures were determined for each booklet. This measure was
obtained by summing the difficulty estimates for the individual tests assigned to a booklet
and dividing the. total by the number of tests assigned to the booklet. The range Of Calve-a
difficulty levels among the six booklets was 1.89. To reduce this range and to better
balance the average difficuities, tests within the same time limits were exchanged among
3
"Table 1. Factor-Referenced Cognitive Tests
SuitableFactor Test Levels Score
symbol and name # name Low High Time prob Select Comment
CF Closure, Flexibility 1 Hidden Figures 8 16 24 ......
2 Hidden Patterns 6 16 6 --- Yes E, S
3 Copying 6 16 6 Yes Yes ES............................................................................................................CS Closure, Speed of I GestaLt Completion 6 16 4 --- Yes 2
2 Concealed Words 6 16 8 --- Yes 2
3 Snowy Pictures 6 16 6 ---...
CV Closure, Verbal 1 Scrambued Words 8 16 10 --- Yes 32 Hidden Words 8 16 8 Yes
3 Incomplete Words 8 16 6 --- Yes 3
FA Fluency, 1 Controlled Associations 6 16 12 --- Yes E, N
Associational 2 Opposites 6 16 10 --- Yes E, N3 Figures of Speech 9 16 10 Yes ---
FE Fluency, Expressional 1 Making Sentences 6 16 10 --- Yes K
2 Arranging Words 6 16 10 Yes Yes K
3 Rewriting 6 16 10 Yes
FF Fluency, Figural 1 Ornamentation 6 16 4 --- Yes E, S
2 Elaboration 6 16 4 --- Yes E, S3 Symbols 9 16 10 Yes -.-
F! Fluency, Ideational 1 Topics 8 16 8 --- Yes N
2 Theme 8 16 8 Yes ---
3 Thing Categories 8 16 6 --- Yes N
FW FLuency, Word 1 Word Endings 6 16 6 --- Yes
2 Word Beginnings 6 16 6 -- .Yes
3 Word Beginnings 6 16 6 ---
& Endings-------......................................................................................................
I Induction 1 Letter Sets 8 16 14 --- Yes 4
2 Locations 8 16 12 ---
3 Figure CLassification 8 16 16 --- Yes 4
IP Integrative Process 1 Calendar 8 16 14 --- Yes
2 Following Directions 9 16 14 --- Yes
MA Memory, Associative I Picture-Number 6 16 1U --- Yes 4
2 Object-Number 6 16 10 --- Yes 4
3 First & Last Name. 6 16 10--------------------------------------------------------------------------- .................
MS Memory Span 1 Auditory Number Span 6 16 10 --- Yes A
2 Visual Number Span 6 16 10 ... ...
3 Auditory Letter Span 6 16 10 --- Yes A
4aS
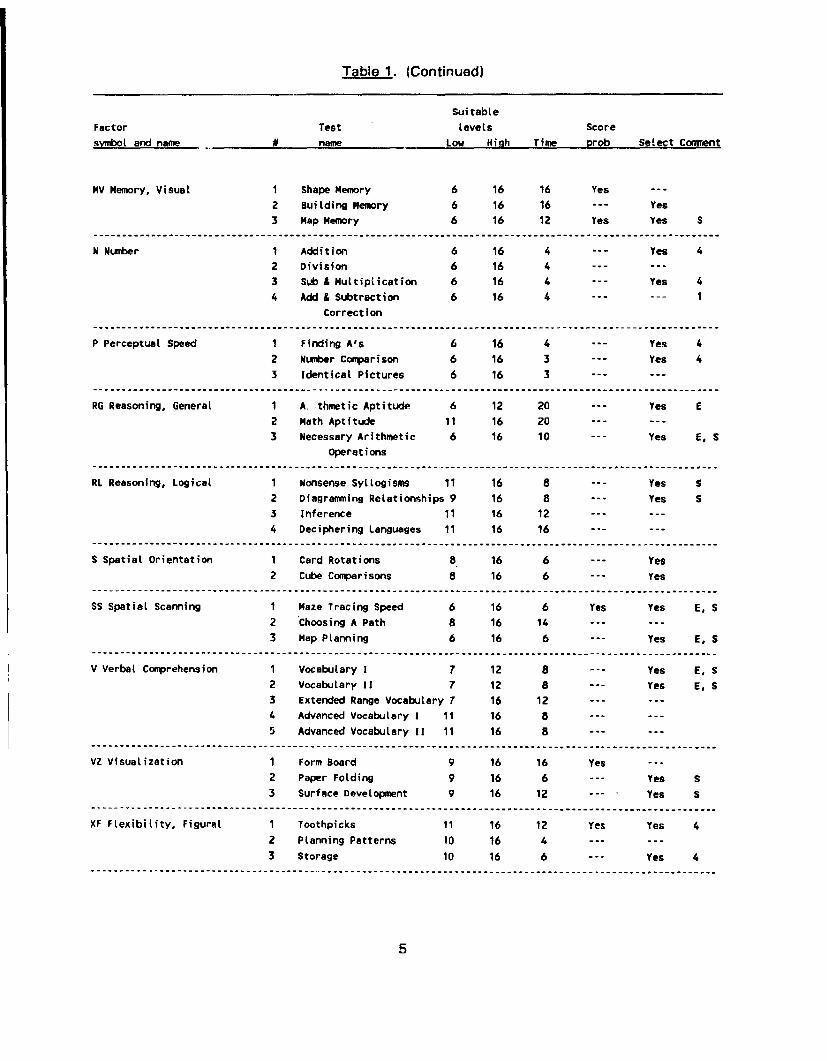
Table 1. (Continued)
SuitableFactor Test levels Scoresvnbol and name # name Low High Time prob Select Comment
MV Memory, Visual 1 Shape Memory 6 16 16 Yes ---
2 Building Memory 6 16 16 --- Yes
3 Map Memory 6 16 12 Yes Yes S
N Number 1 Addition 6 16 4 --- Yes 42 Division 6 16 43 Sub & Muttiplication 6 16 4 --- Yes 4
4 Add & Subtraction 6 16 4 ... ... 1Correction
P Perceptual Speed 1 Finding A's 6 16 4 --- Yes 4
2 Number Comparison 6 16 3 --- Yes 43 Identical Pictures 6 16 3 ......
RU Reasoning, General 1 A. thmetic Aptitude 6 12 20 --- Yes E2 Math Aptitude 11 16 20 ......3 Necessary Arithmetic 6 16 10 --- Yes E, S
Operations
RL Reasoning, Logical 1 Nonsense Syllogisms 11 16 8 --- Yes S2 Diagramming Relationships 9 16 8 --- Yes S
3 Inference 11 16 124 Deciphering Languages 11 16 16
S Spatial Orientation 1 Card Rotations 8 16 6 --- Yes2 Cube Comparisons 8 16 6 --- Yes
SS Spatial Scanning 1 Maze Tracing Speed 6 16 6 Yes Yes E, S2 Choosing A Path 8 16 14 ... ...3 Map Planning 6 16 6 --- Yes E, S
V Verbal Comprehension 1 Vocabulary 1 7 12 8 --- Yes E, S2 Vocabulary 11 7 12 8 --- Yes E, S
3 Extended Range Vocabulary 7 16 12 ... ...4 Advanced Vocabulary 1 11 16 85 Advanced Vocabulary II 11 16 8 ... ...
------------ ------------------------------------------------------------------------------------............
VZ visualization 1 Form Board 9 16 16 Yes ---2 Paper Folding 9 16 6 --- Yes S3 Surface Development 9 16 12 --- Yes S
S-----------------------------------------------------------------------------------------XF Flexibility, Figural 1 Toothpicks 11 16 12 Yes Yes 4
2 Planning Patterns 10 16 4
3 Storage 10 16 6 --- Yes 4
5
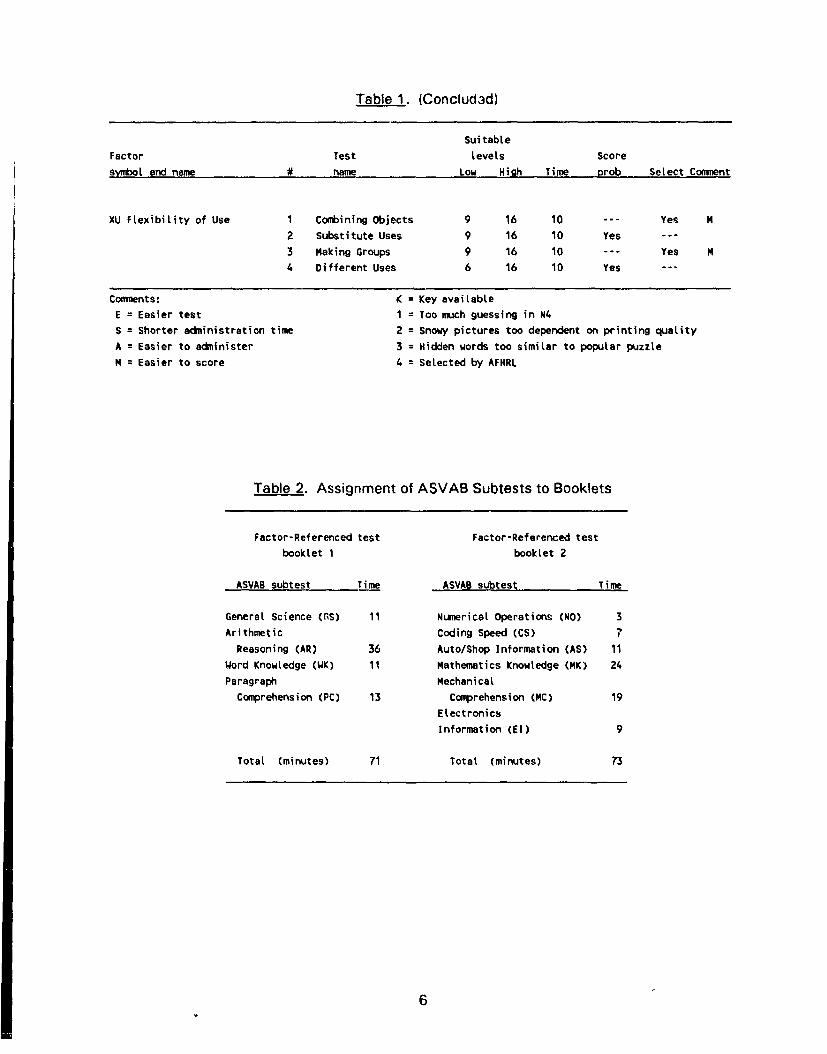
Table 1. (Concludad)
SuitableFactor Test levels Scoresymbol and name name Low High Time prob Select Comment
XU FlexibiLity of Use 1 Combining Objects 9 16 10 --- Yes N
2 substitute Uses 9 16 10 Yes ...
3 Making Groups 9 16 10 --- Yes N4 Different Uses 6 16 10 Yes ---
Comments: K = Key availableE = Easier test 1 = Too much guessing in N4S = Shorter administration time 2 = Snowy pictures too dependent on printing qualityA = Easier to administer 3 = Hidden words too similar to popular puzzleN = Easier to score 4 = Selected by AFHRL
Table 2. Assignment of ASVAB Subtests to Booklets
Factor-Referenced test Factor-Referenced testbooklet 1 booklet 2
ASVAB subtest Time ASVAB subtest Time
General Science (GS) 11 Numerical Operations (NO) 3Arithmetic Coding Speed (CS) 7
Reasoning (AR) 36 Auto/Shop Information (AS) 11Word Knowledge (WK) 11 Mathematics Knowledge (MK) 24Paragraph Mechanical
Comoprehension (PC) 13 Comprehension (MC) 19
ElectronicsInformation (El) 9
Total (minutes) 71 Total (minutes) 73
6
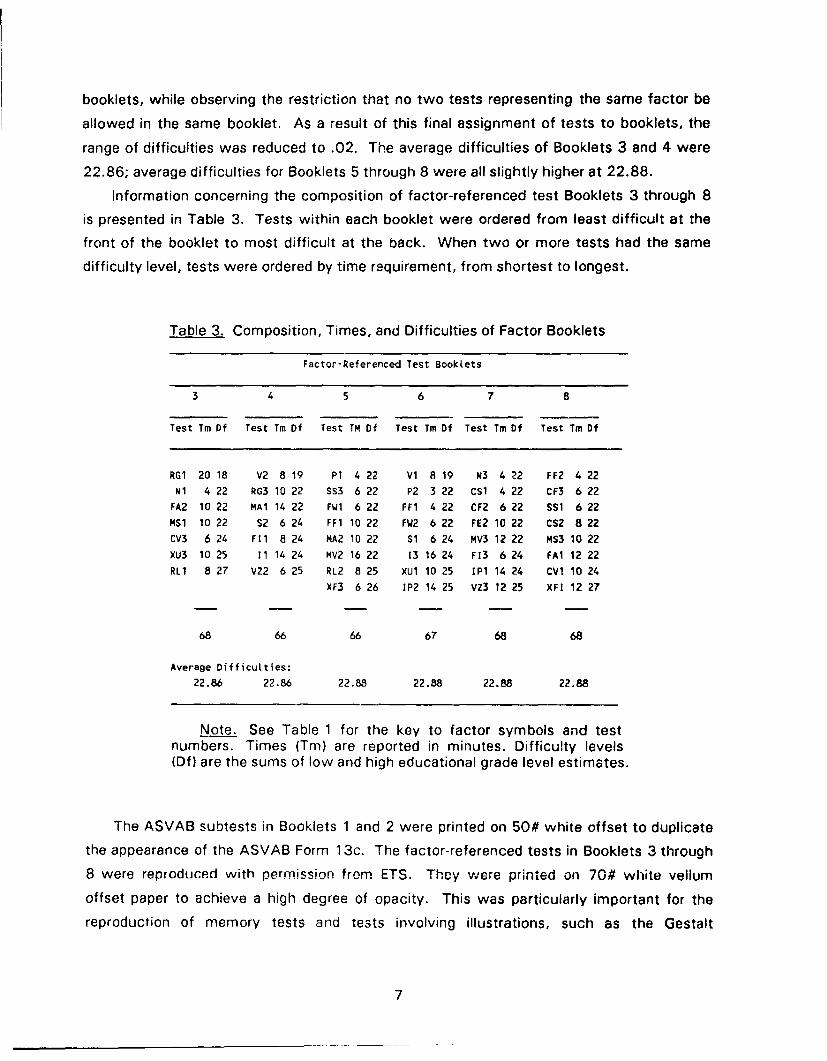
booklets, while observing the restriction that no two tests representing the same factor be
allowed in the same booklet. As a result of this final assignment of tests to booklets, the
range of difficulties was reduced to .02. The average difficulties of Booklets 3 and 4 were
22.86; average difficulties for Booklets 5 through 8 were all slightly higher at 22.88.
Information concerning the composition of factor-referenced test Booklets 3 through 8
is presented in Table 3. Tests within each booklet were ordered from least difficult at the
front of the booklet to most difficult at the back. When two or more tests had the same
difficulty level, tests were ordered by time requirement, from shortest to longest.
Table 3. Composition, Times, and Difficulties of Factor Booklets
Factor-Referenced Test BookLets
3 4 5 6 7 8
Test Tm Df Test Tm Df Test TM Df Test Tm Df Test Tm Df Test Tm Df
RG1 20 18 V2 8 19 P1 4 22 VI 8 19 N3 4 22 FF2 4 22NI 4 22 RG3 10 22 SS3 6 22 P2 3 22 CSI 4 22 CF3 6 22
FA2 10 22 MAI 14 22 FW1 6 22 FF1 4 22 CF2 6 22 SS1 6 22MS1 10 22 S2 6 24 FF1 10 22 FW2 6 22 FE2 10 22 CS2 8 22
CV3 6 24 F1I 8 24 MA2 10 22 S1 6 24 MV3 12 22 MS3 10 22
XU3 10 25 11 14 24 MV2 16 22 13 16 24 F13 6 24 FAt 12 22
RL1 8 27 VZ2 6 25 RL2 8 25 XU1 10 25 IN 14 24 CVi 10 24
XF3 6 26 IP2 14 25 VZ3 12 25 XFI 12 27
68 66 66 67 68 68
Average Difficulties:
22.86 22.86 22.88 22.88 22.88 22.88
Note. See Table 1 for the key to factor symbols and testnumbers. Times (Tm) are reported in minutes. Difficulty levels(Df) are the sums of low and high educational grade level estimates.
The ASVAB subtests in Booklets 1 and 2 were printed on 50# white offset to duplicate
the appearance of the ASVAB Form 1 3c. The factor-referenced tests in Booklets 3 through
8 were reproduced with permission from ETS. They were printed on 70# white vellum
offset paper to achieve a high degree of opacity. This was particularly important for the
reproduction of memory tests and tests involving illustrations, such as the Gestalt
7
Completion Test and the Concealed Words Test. Each of the eight booklets was stamped
with a unique control number for use in monitoring the location and status of booklets duing
the study.
Prior to reproduction, small changes were made to the example test items in the
instructions of two factor-referenced tests. The changes were made after personal
communication with Dr. Ruth Ekstrom, Senior Research Scientist at ETS and an author of
the Kit. In the example items given for the Making Groups Test (XU-3), items to be grouped
were changed to single spacing to resemble item lists for the actual test questions. The
double spacing of the example list on the test copy originally received from ETS was
regarded as confusing and inconsistent with the format in which items were listed in Part 1
and Part 2 of the test. On the instruction page for the Storage Test (XF-3), dashed lines
were added to the faces of the three containers presented as examples, to make their
appearance consistent with the appearance of the containers in the test.
On the front cover of each copy of Booklets 3 through 8 was space for the examinee's
name, social security number, date of birth, and testing date. Gender, service, education
level, and population group were also indicated by each recruit. The back covers of Booklets
3 through 8 contained a series of spaces where test scorers could record scores for the tests
within each booklet. Consequently, Booklets 3 through 8 could be used only once. Booklets
1 and 2 were reusable in that each recruit recorded descriptive information and test
responses on a separate standard ASVAB answer sheet:
Test Administration Configuration
Plans were developed to administer two booklets to each examinee in a matrix sampling
plan. Booklets were paired in all possible combinations so that each booklet was
administered with each other booklet. It was desired to have on administration of the
ASVAB both at the beginning and end of data collection so that the effect of time of year
upon test performance could be examined. Consequently, two additional pairings were
made. An administration of the complete ASVAB Form 1 3c was planned for the first and
last testing sessions. This resulted in 30 pairings, as shown in Table 4.
Testing Sessions and Examinees
Each pair of booklets was to be administered to at least 200 examinees, with 15%
oversampling. That is, each of 30 pairs was to be administered to 230 examinees, for a
total of 6,900 examinees. As explained below, data from some of the examinees were
8
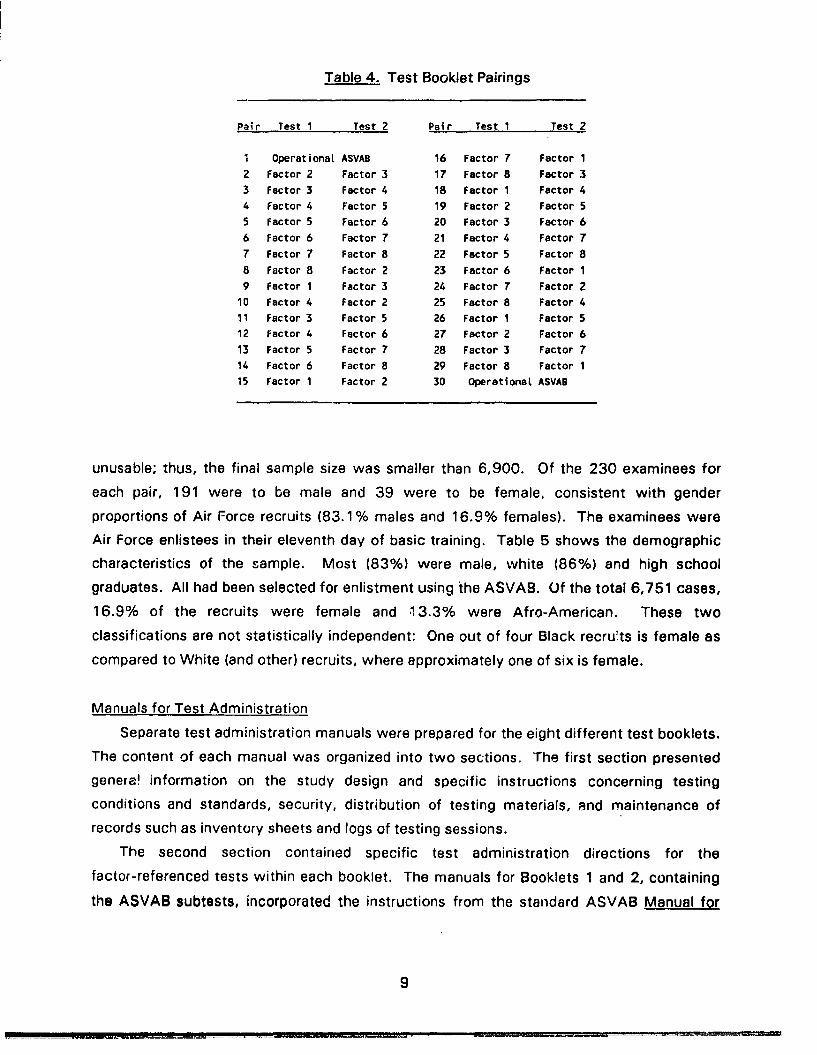
Table 4. Test Booklet Pairings
Pair Test 1 Test 2 Pair Test 1 Test 2
1 Operational ASVAB 16 Factor 7 Factor 1
2 Factor 2 Factor 3 17 Factor 8 Factor 3
3 Factor 3 Factor 4 18 Factor 1 Factor 4
4 Factor 4 Factor 5 19 Factor 2 Factor 5
5 Factor 5 Factor 6 20 Factor 3 Factor 6
6 Factor 6 Factor 7 21 Factor 4 Factor 7
7 Factor 7 Factor 8 22 Factor 5 Factor 8
8 Factor 8 Factor 2 23 Factor 6 Factor 1
9 Factor 1 Factor 3 24 Factor 7 Factor 210 Factor 4 Factor 2 25 Factor 8 Factor 4
11 Factor 3 Factor 5 26 Factor 1 Factor 512 Factor 4 Factor 6 27 Factor 2 Factor 6
13 Factor 5 Factor 7 28 Factor 3 Factor 7
14 Factor 6 Factor 8 29 Factor 8 Factor 1
15 Factor 1 Factor 2 30 Operational ASVAB
unusable; thus, the final sample size was smaller than 6,900. Of the 230 examinees for
each pair, 191 were to be male and 39 were to be female, consistent with gender
proportions of Air Force recruits (83.1% males and 16.9% females). The examinees were
Air Force enlistees in their eleventh day of basic training. Table 5 shows the demographic
characteristics of the sample. Most (83%) were male, white (86%) and high school
graduates. All had been selected for enlistment using the ASVAB. Of the total 6,751 cases,
16.9% of the recruits were female and 13.3% were Afro-American. These two
classifications are not statistically independent: One out of four Black recru'ts is female as
compared to White (and other) recruits, where approximately one of six is female.
Manuals for Test Administration
Separate test administration manuals were prepared for the eight different test booklets.
The content of each manual was organized into two sections. The first section presented
genera! information on the study design and specific instructions concerning testing
conditions and standards, security, distribution of testing materials, and maintenance of
records such as inventory sheets and logs of testing sessions.
The second section contained specific test administration directions for the
factor-referenced tests within each booklet. The manuals for Booklets 1 and 2, containing
the ASVAB subtests, incorporated the instructions from the standard ASVAB Manual for
9
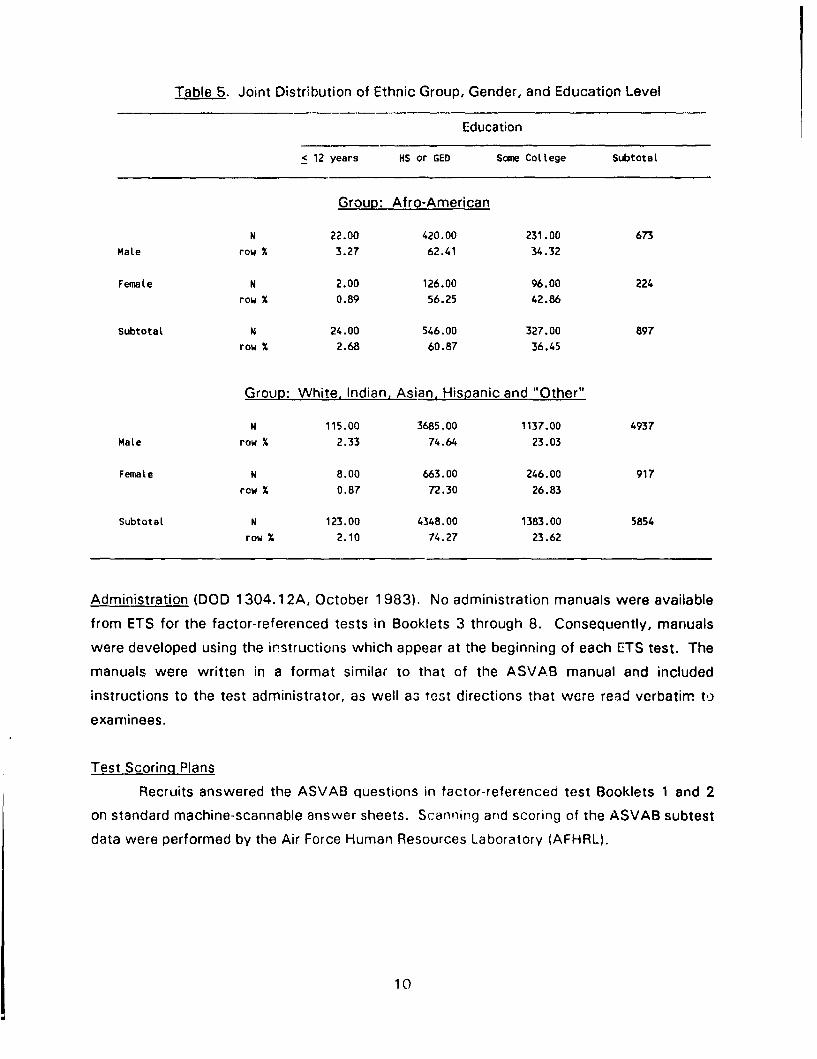
Table 5. Joint Distribution of Ethnic Group, Gender, and Education Level
Education
< 12 years HS or GED Some Cotllege Subtotal
Group: Afro-American
N 22.00 420.00 231.00 673
Male row % 3.27 62.41 34.32
Female N 2.00 126.00 96.00 224
row X 0.89 56.25 42.86
Subtotal N 24.00 546.00 327.00 897row % 2.68 60.87 36.45
Group: White, Indian, Asian, Hispanic and "Other"
N 115.00 3685.00 1137.00 4937Mate row % 2.33 74.64 23.03
Female N 8.00 663.00 246.00 917
row % 0.87 72.30 26.83
Subtotal N 123.00 4348.00 1383.00 5854
row % 2.10 74.27 23.62
Administration (DOD 1304.12A, October 1983). No administration manuals were available
from ETS for the factor-referenced tests in Booklets 3 through 8. Consequently, manuals
were developed using the instructions which appear at the beginning of each ETS test. The
manuals were written in a format similar to that of the ASVAB manual and included
instructions to the test administrator, as well a3 test directions that were read verbatim to
examinees.
Test Scoring Plans
Recruits answered the ASVAB questions in factor-referenced test Booklets 1 and 2
on standard machine-scannable answer sheets. Scanning and scoring of the ASVAB subtest
data were performed by the Air Force Human Resources Laboratory (AFHRL).
10
The 46 factor-referenced tests were diverse in their formats and ranged from
objective multiple-choice vocabulary tests to pattern copying and sentence writing tests
which required careful inspection and considerable judgment by raters during scoring. The
Manual for Kit of Factor-Referenced Cognitive Tests (Ekstrom et al., 1976b) provides
information on scoring many of the tests. For some tests, answer keys are provided; for
others, preparation of an answer key or set of scoring procedures is left entirely to the test
user. Instructions and keys in the Kit Manual were fully incorporated into a more detailed
and extensive set of procedures and examples prepared for this study.
Special scoring manuals were developed for factor-referenced test Booklets 3 through
8. The manuals were required because all the tests in these booklets would be hand-scored.
This was due to the fact that recruits answered both objective and open-ended test
questions by writing directly in the consumable booklets.
The scoring manuals for the factor-referenced test booklets all contained two sections.
Section one was the same in each manual and presented general guidelines for scoring.
Among the topics addressed were rater independence, scoring m3rks and notations, use of
templates, spelling, and corrections for guessing.
The second section was unique to each manual, as it contained step-by-step
instructions for scoring each of the seven or eight tests within a specific booklet. For many
objective tests, answer keys were provided with the instructions. For other objective tests,
particularly those with unnumbered items, templates which could be placed over the test
pages were constructed for scoring. The step-by-step scoring instructions for tests that
called for open-ended responses were the most detailed and were accompanied by example
pages of simulated responses with comments on how the responses should be scored.
Tables to be used in arriving at corrected scores when the score was the number of correct
answers minus a fraction of incorrectly attempted items were also contained in the manuals.
Although instructions on the Surface Development Test (VZ-3) and the Figure
Classification Test (1-3) indicate a correction for guessing, these tests were scored by simply
counting the number of correctly answered items. In a personal communication, Dr. Ruth
Ekstrom recommended that a "number correct" score be used due to the varying number of
response alternatives for items within each of the two tests.
Phase I1: Data Collection and Scoring
Selection of Test Administrators
Data collection required four test administrators at Lackland AFB, Texas, to ensure
that standard testing procedures were followed, the testing schedule was met, and the
11
project could efficiently test all recruits available for testing at any point in time. The staff of
four test administrators was required to monitor large testing sessions (up to 100
examinees) and ensure completion of the specified tests within the narrow time limits (3-1/2
hours maximum) set aside for each test session. Another justification for additional test
administrators was that it would allow the simultaneous testing, in different locations, of
two or three groups with different pairs of booklets. Candidates for the test administrator
position were required to have good verbal skills, including a clear voice and a high level of
text reading accuracy and fluency. Some experience in public speaking, psychology, and
testing was preferred.
Training of Test Administrators
Due to the complexity of the study design and the diversity of the factor-referenced
tests, all four test administrators were required to attend a 2-day training session. The test
administration team practiced with each of the test administration manuals in order to gain
proficiency with the unique instructions for each test. Special emphasis was placed on
mastering the administration of the Memory Span (MS-1 and MS-3) tests. These particular
tests require the test administrator to read strings of digits or letters at 1 -second intervals.The administrators also staged mock question-and-answer sessions to anticipate queries
that might arise during the actual testing session.
The testing team was also briefed on procedures for assuming responsibility for the test
subjects from their Training Instructor (T.I.). These procedures included asking the T.I. if any
recruit had previously taken the tests, if there were any medical appointments, or if there
were any other appointments that would interfere with completion of the testing session.
The T.I. must then be told what time to return for his flight.
The temporal aspects of test administration were also addressed during training. This
included a discussion of the tentative schedule for administering booklet pairs, and steps
that needed to be taken to ensure each testing session was completed within the allotted
time. Of particular concern were the narrow time constraints involved in actual test
administration. The administration time required for most pairs of booklets, together with a
short break between booklets, approached the maximum time available for any one session.Because of these time limits, efficient administration and careful proctoring during the
testing sessions were required.
Instructions concerning the secure storage of the completed test booklets were provided
during training. Finally, procedures concerning distribution and collection of the testing
materials were discussed.
12
Pilot Administration of Factor-Referenced Test Bocklets
Two pilot sessions were conducted at Lackland AFB: (a) to provide administrators the
opportunity to practice reading the test directions, (b) to identify potential procedural
problems, and (c) to check on the clarity of the instructions.
In the first session, 41 male recruits were assembled to read through the directions of all
tests in Booklets 3, 4, and 5, and to complete the descriptive and demographic items on a
booklet cover. The recruits studied actuai test items. Then they were asked about problems
with understanding the directions, about suggestions to improve the directions, and if they
understood how to record answers. The procedure was repeated for all the tests.
The success of the pilot administration of the Auditory Number Span Test (MS-i)
confirmed a decision to have test administrators read the items in the Auditory Number Span
Test and the Auditory Letter Span Test (MS-3) instead of having the items recorded on audio
tape for playback during test administration.
Two of the tests, Map Planning (SS-3) from Booklet 5 and Making Groups (XU-3) from
Booklet 3, required more detailed instructions because the test subjects indicated some
difficulty in understanding them. Additional paragraphs explaining the examples were
written for Tests SS-3 and XU-3 and added to the instructions in the administration manuals.
During the second session, 13 females were read the directions for all tests in Booklets
6, 7, and 8. The same review procedures used in the first pilot session were followed.
Recruits completed a booklet cover and Part I of six tests with complex directions: Figure
Classification (1-3), Arranging Words (FE-2), Auditory Letter Span (MS-3), Surface
Development (VZ-3), Combining Objects (XU-1), and Storage (XF-3). These six tests were
viewed to be a potential source of problems; however, no problems occurred with them.
The recruits also completed Part I of Tests SS-3 (Booklet 5) and XU-3 (Booklet 3) as part of
the pilot testing of the new directions. The elaboration of directions was effective enough to
compensate for earlier misunderstandings.
Data Collection
Data collection began with the administration of ASVAB Form 13c and then the first pair
of factor-referenced test Booklets 2 and 3. A complete list of factor booklet pairings and
their administration dates appear in Table 6. Some pairings took longer to complete than
others. To take full advantage of the flow of individuals passing through the testing facility,
both recruits and reservists were tested.
13
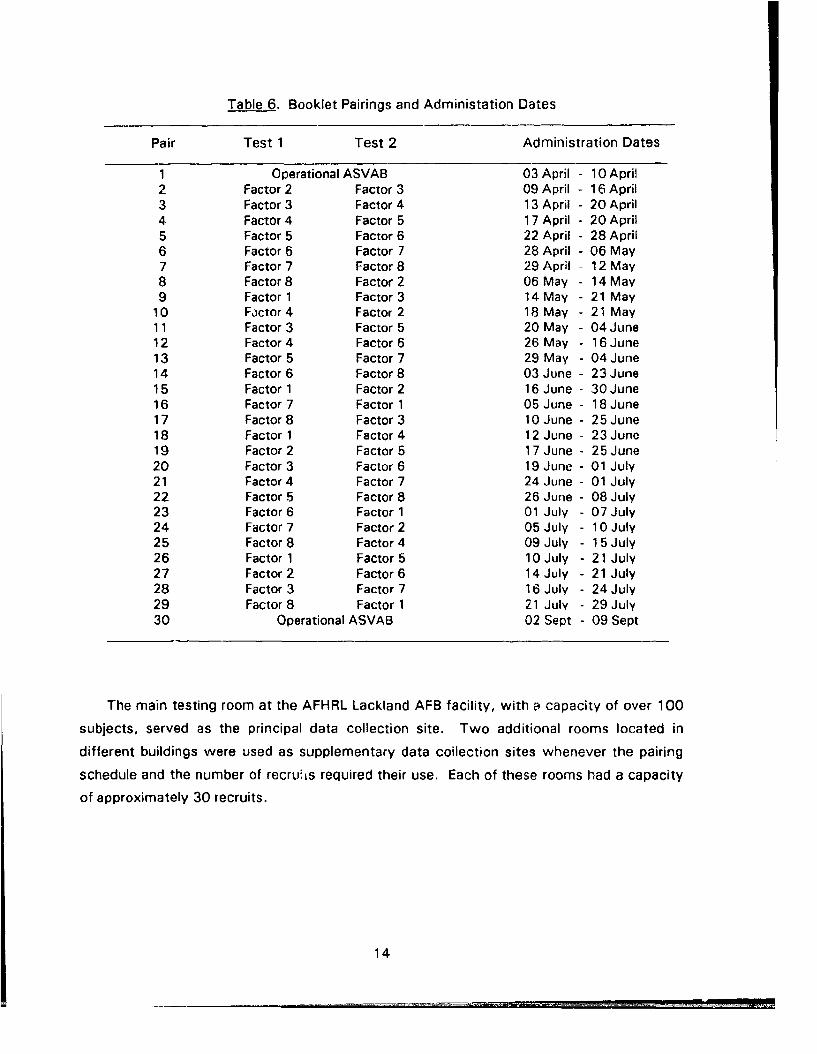
Table 6. Booklet Pairings and Administation Dates
Pair Test 1 Test 2 Administration Dates
1 Operational ASVAB 03 April - 10 April2 Factor 2 Factor 3 09 April - 16 April3 Factor 3 Factor 4 13 April - 20 April4 Factor 4 Factor 5 17 April - 20 April5 Factor 5 Factor 6 22 April - 28 April6 Factor 6 Factor 7 28 April - 06 May7 Factor 7 Factor 8 29 April - 12 May8 Factor 8 Factor 2 06 May - 14 May9 Factor 1 Factor 3 14 May - 21 May
10 Factor 4 Factor 2 18 May - 21 May11 Factor 3 Factor 5 20 May - 04 June12 Factor 4 Factor 6 26 May 16 June13 Factor 5 Factor 7 29 May - 04 June14 Factor 6 Factor 8 03 June - 23 June15 Factor 1 Factor 2 16 June - 30 June16 Factor 7 Factor 1 05 June - 18 June17 Factor 8 Factor 3 10 June - 25 June18 Factor 1 Factor 4 12 June - 23 June19 Factor 2 Factor 5 17 June - 25 June20 Factor 3 Factor 6 19 June - 01 July21 Factor 4 Factor 7 24 June - 01 July22 Factor 5 Factor 8 26 June - 08 July23 Factor 6 Factor 1 01 July - 07 July24 Factor 7 Factor 2 05 July - 10 July25 Factor 8 Factor 4 09 July - 15 July26 Factor 1 Factor 5 10 July - 21 July27 Factor 2 Factor 6 14 July - 21 July28 Factor 3 Factor 7 16 July - 24 July29 Factor 8 Factor 1 21 July - 29 July30 Operational ASVAB 02 Sept - 09 Sept
The main testing room at the AFHRL Lackland AFB facility, with a capacity of over 100
subjects, served as the principal data collection site. Two additional rooms located in
different buildings were used as supplementary data coilection sites whenever the pairing
schedule and the number of recruiks required their use. Each of these rooms had a capacity
of approximately 30 recruits.
14
At each test session, one administrator read all directions for all tests in the designated
booklets. Unless occupied with simultaneous administration to another group in a
supplemental room, the other test administrators served as proctors during the session.
Makeup test sessions were held to obtain replacemencs for incomplete factor booklets
which were attributable to group administration problems or individual illness. In one pair 13
session, 60 recruits were evacuated from the main testing room when a faulty fire alarm
went off. Upon return to the room, inadequate time remained,- to complete Booklets 5 and 7.
On three separate occasions, Booklet 4 was not completely administered. On two of these
occasions, Booklet 4 was paired with Booklet 3; it was paired with Booklet 5 on the third.
During several test sessions, some recruits became too ill to continue and were
replaced. One administration problem that spanned several test sessions involved the
Finding A's Test (P-i) in Booklet 5. Each of the two test parts in P-1 has four pages ot items
"which are very similar in appearance. The numbered test parts are poorly marked. During
several initial test sessions, some recruits mistook the third and fourth pages of Part 1 for the
first two pages of Part 2 when they were instructed to pro•.eod to Part 2. Consequently,
they spent twice the designated time on Part 1 and left Part 2 unattempted. The
combination of an announcement during test administration of the correct page numbers for
each part and very close monitoring by the proctors virtually eliminated this problem from
subsequent sessions. Booklets from pairings 4 and 5 with no response to Part 2 of the
Finding A's Test were replaced as were the appropriate paired book!ets.
Selection and Training of Test Scorers
Test scorers were chosen using the folowing selection criteria: (a) completion of at
least 2 years of college, including course work in English/Composition; (b) possession of
excellent reading and grammatical skills; (c) good attention to detail; and (d) some
background in education, psychology, or testing (preferred, but not required).
Each individual was assigned to score two booklets; one booklet would become too
tedious, whereas mnore than two would reduce accuracy, expertise, and speed. At least 16
booklets could be accurately scored during an 8-hour day after a period of training.
Accuracy and good judgment were always stressed as being of greater importance than
speed.
Fifteen individuals were initially hired, but five scorers left. They were replaced and
supplemented with two additional scorers. Of the 22 scorers who worked on the project.. six
were enrolled in undergraduate programs, eight had recently earned bachelor's degrees, and
eight were enrolled in graduate school.
15
Each initial team of five scorers was trained to an acceptable level of proficiency on one
booklet. Repeating the training process, the team was then trained to score the second
booklet. Test scorers worked independently while scoring valid test booklets. Scorers used
plastic overlays and grease pencils so that no scoring marks would be made directly on the
booklet pages, thereby ensuring that the ratings and scores given by each scorer would be
independent of the ratings and scores given by other scorers.
Distribution of Booklets to Scorers
The 75 numerically sequenced factor-referenced booklets were sorted into five sets of
15 booklets. Each set was randomly assigned such that all raters served as first, second,
and third scorer for approximately 1/3 of the booklets. The booklets were assigned to avoid
having onc scorer follow another on a regular basis, but some adjustments were required for
individual differences in scoring speed, illnesses, and turnover of personnel.
Quality Control
To ensure the quality of the scorers' ratings, test booklets were examined for two types
of scorer problems: (a) differences among scorer ratings on tests considered to have only
one correct score (i.e., tests which possessed a complete answer key), and (b) large
differences among the scorer ratings on tests with open-ended questions that required
substantial scorer judgment. Scored test booklets with either of these two problems were
returned to their scorers for further inspection and possible rescoring.
!nterrater Arreement
The factor-referenced tests can be placed in three general categories of ease/difficulty
of obtaining interrater agreement. Category 1 includes tests for which a very high level of
scorer agreement is easily attained. Tests in this category have a comprehensive answer
key for scoring objective test items. Responses to test items are usually in the form of
circles around or X's on the responses chosen as correct. A few of these tests involve
writing letters or words. Only occasional interpretation of trainees' answer marks or
handwriting is required.
Category 2 encompasses tests which pn.cess noncomprehensive answer keys for
test items. Some items have more than one correct answer, and new solutions or
acceptable answers, beyond those provided by ETS, were found during scoring. These tests
often require handwriting which must be deciphered by the scorer. Agreement among
scorers can be slightly more difficult to attain for tests in this category; however, the
interrater reliabilities are still quite high.
16
No answer keys are available for tests in Category 3, due to the open-ended nature of
the test items. Only a set of guidelines and examples were provided to scorers. Substantial
scorer judgment is required and deciphering of handwriting is often necessary.
Consequently, differences among the three scorers can be more frequent and of greater
magnitude for tests in Category 3 than for Category 1. Nevertheless, interrater reliabilities
for these tests are also very high. All of the factor-referenced tests used in this study are
listed by category in Appendix A.
Suppylemental Procedures
As the scoring process advanced, supplemental procedures and answer key aaditions
were incorporated into the scoring manuals. Changes were also recorded on the master
copy of that manual, to ensure that new copies of the manual would reflect the additions.
Procedures of a general nature which emerged during scoring included the following: (a)
Items with multiple answers marked were scored as incorrect; (b) ambiguous numbers or
letters were compared with other writing in that individual's test to assist in deciphering
whether the response was correct; (c) when answers were superimposed, the clearly darker
or larker one was accepted aad scored; and (d) when the trainee's answer was to be
indicated by filling a box, any mark within, through, or around that box was accepted.
Data Ent•y
Booklets which revealed problems attributable to illness or administration errors were
not scored or entered in the data file. All hand-entered test data were verified using one of
two methods. Data for about half of the booklets were verified using a double-entry method.
Each of two clerks entered data from the same booklets. Their sets of entries were
compared by a computer program, and a list of discrepancies generated. Staff personnel
referred back to the original test book!ets when necessary to resolve differences.
The remaining half of the booklets were verified by comparing complete printouts of the
entered data with the booklets themselves. Discrepancies were noted on the printouts and
corrections were then made. This second method was as effective as the double-entry
method, but more efficient because of the way personnel were used.
17
Phase i1!: Data Analysis
Data Editing and Descriptive Analyses
The data set was screened further for clerical or programming errors that would be
easily detectable with simple statisticP! ,nethorv3. Specifically, the data records were tested
for non-numeric characters in numr-ric data fields, apparently shifted data fields, and data
values outside their permitted range. Furthermore, the 57 univariate distributions and 1,596
bivariate scatterplots of the continuous variables in the study were examined for indications
of outliers due to non-response or guessing and for distribution mixtures, all of which could
have affected the correlational structure among the, variables. These latter examinations
were performed by visual inspection rather than analytical method, because no "true"
distributional forms for the Kit reference tests were known.
The dem.,graphic variables for Ethnicity and Education Level were recoded so as to
avoid problems of small sampie sizes and to simplify further data analyses. Ethnic Group
was coded (1) for Afro-American (as the most populous minority) and (0) for all other groups;
Education level was coded (-1) for up to 1 2 years of schooling, (0) f or High School diplonma or
General Equivalency Diploma (GEDI, and (1Mi for some college The variable Gender was
recoded into (1) female and (0) male.
A series of descriptive statistical analyses were performed on cleaned data files ot
ASVAB and factor-referenced test scores. Frequency distributions and percentages were
computed for demographic varicbAes, including Education level, Gender, and Ethnic group.
Univariate histograms, univariate summary statistics and bivariate scatterplots were
computed for all continuous variables including Age, the 10 ASVAB subscales and the 46 Kit
reference tests. These tabulations were completed for the entire group of recruits who
participated in the study. Interrater reliabilities based on intraclass correlations were
calculated for all the hand-scored ETS tests.
Estimation of Correlation Matrix
Sample correlations based on pairwise complete data are more efficient estimates of the
population corre!ations than are those based on listwise complete data. Pairwise
correlations use the entire information, of the observed measures and, if the missing data
process is independent of the values of the missing and observed data, provide unbiased
estimates of the population correlations.
18
Pairwise complete correlations are also the only methods available to estimate the entire
56 by 56 correlation matrix of the ASVAB and the Kt reference tests. It proved to be
technically infeasible to estimate so large a matrix by the statistically more attractive method
of maximum likelihood along the lines proposed by Allison (1987).
The pairwise sample sizes should vary considerably due to the blockwise matrix sample
design. Sample sizes for correlation between tests on the same booklet are considerably
larger than for pairs of tests from different booklets. Also, due to the fact that two entire
presentations of the operational ASVAB were administered to separate groups of 230
examinees before and after the collection of the entire 28-group measurement design, the
pairing of Booklets 1 and 2 was effectively oversampled by a factor of three. The
demographic variables Age and Education were assessed from nearly all recruits, and all
correlations involving these two variables are therefore based on large pairwise sample sizes.
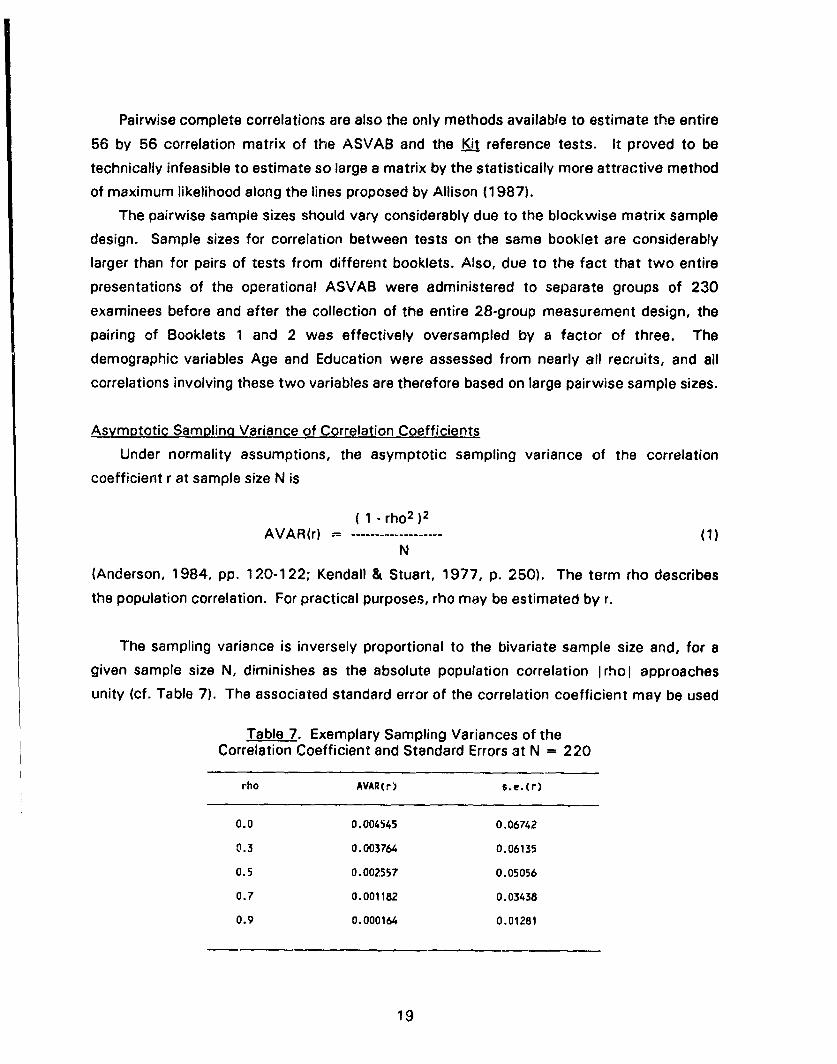
Asymptotic Sampling Variance of Correlation Coefficients
Under normality assumptions, the asymptotic sampling variance of the correlation
coefficient r at sample size N is
( 1 - rho 2 )2AVA R(r) = ------------------ (1)
N
(Anderson, 1984, pp. 120-122; Kendall & Stuart, 1977, p. 250). The term rho describes
the population correlation. For practical purposes, rho may be estimated by r.
The sampling variance is inversely proportional to the bivariate sample size and, for a
given sample size N, diminishes as the absolute population correlation I rhol approaches
unity (cf. Table 7). The associated standard error of the correlation coefficient may be used
Table 7. Exemplary Sampling Variances of theCorrelation Coefficient and Standard Errors at N = 220
rho AVAR(r) s.e.(r)
0.0 0.004545 0,06742
0.3 0.003764 0.06135
0.5 0.002557 0.05056
0.7 0.001182 0.03438
0.9 0.000164 0.01281
19
to construct approximate confidence intervals: The typical correlation listed in Appendix B is
0.5 or less. At an assumed average sample size of 220, the associated 95% confidence
intervals are in the vicinity of plus or minus 0.10.
The standard error of sample correlations also serves as a useful test criterion for the
Root-Mean-Square-Residual (RMSR) fit statistic used by LISREL and other multivariate
programs. in cases with fairly homogeneous correlation coefficients, a well-fitting factor
model should yield an RMSR statistic close to the typical standard error of estimation. With
the present sample, good RMSR values would range between 0.050 and 0.067 for Kit
models and between 0.030 and 0.037 for ASVAB models. Larger RMSR statistics indicate
some degree of model misfit; RMSR values closer to zero indicate model overfit.
Modeling of Correlation Coefficients for AFQT-1, AFQT-2, and VE Scales
The Armed Forces Qualification Test (AFQT) and Verbal (VE) composite scales are linear
combinations of the ASVAB subtests, defined as
AFQT-1 = AR + WK + PC + NO/2 (2)
AFQT-2 = AR + WK + PC +'MK (3)
VE = WK + PC. (4)
Correlation coefficients between the AFQT scales and the Kit reference tests involve
subtests from three different booklets. They cannot be computed directly because each
examinee answered only two booklets. Assuming that the correlation structure of the
ASVAB was not greatly affected by the matrix sampling design, the correlation structure of
the derived AFQT and VE scales can be modeled as a bilinear form of the pairwise complete
correlation matrix, pre- and post-multiplied by the diagonal matrix of univariate standard
deviations. If the goal is to model the correlation matrix of 59 variables (the 56 individual
tests, AFQT-1, AFQT-2, and VE), given a 56 x 56 matrix M of subtest variances and
covariances, and T is a 59 x 56 matrix, the bilinear form is T x M x T'.
20
Factor Analysis
Loss Functions. Exploratory factor analyses are computed with four different loss
functions (if the data permit):
1. Complex weights: Diagonally weighted least squares (DWLS) using the
reciprocal of the sampling variances for correlations. The asymptotic sampling
variance of a correlation coefficient is given in equation (1). This weight
formula is simultaneously sensitive to the finite range of correlation coefficients
and variation in bivariate sample size due to pairwise deletion. If the analyzed
correlation matrix is positive definite, the parameter estimates are
asymptotically equivalent to a multiple-group maximum likelihood solution
adapted for a missing-data design (as outlined by Allison, 1987).
2. Simple weigqhts: DWLS using the inverse of the bivariate sample size, (1/nij).
Trivially, these simple weights are sensitive only to variation in sample size, not
to the size of the correlation coefficient. A simply weighted DWLS solution for
pairwise complete data is therefore equivalent to a multiple-group unweighted
least squares solution adapted to an incomplete data structure,
3. Unweighted Least Sauares (ULS): This is the simplest fit function. Every
element of the correlation matrix contributes equally to the solution. ULS is
certainly less efficient than maximum likelihood, and is often less efficient than
DWLS. However, in many cases ULS solutions are found to be rather close to
those obtained by the maximum likelihood method.
An advantage of ULS is, aside from its simplicity, that the function minimizes
the root-mean-square-residuel (RMSR) statistic, defined asRMSR { SUM (sij- Aij )2 } o.'
Si (5)i <
where sij is the sample covariance for variables i and j and sij is the covariance
for i and j reproduced by the factor model. Other advantages of ULS are that it
produces a slightly conservative G2 fit statistic (defined below), and does not
require the sample correlation matrix to be positive definite.
21
4. Maximum Likelihood ML. Advantageous properties of the well-known
maximum likelihood method are its consistency and efficiency. It minimizes the
fit function
G2 = log I (Sigma)I + trace[S (Sigma)"'1 - log ISI - p, (6)
where S is the sample covariance matrix of order p, Sigma is the corresponding
model covariance matrix, and the notations I SI and I (Sigma')1 symbolize the
determinants of the corresponding matrices.
Under normality, ML produces consistent parameter estimates and asymptotic
standard errors, as well as a G2 fit statistic that follows the chi-square
distribution. Recent work in several statistical laboratoies has found the ML
estimator to be robust against deviations from normality.
A critical requirement for ML is that the sample moment matrix has to be strictly
positive definite. In case the sample moment matrix is indefinite, a ridge may
be added to its diagonal in order to obtain some "ridged-ML" parameter
estimates (Joreskog & Sorbom, 1989). However, because sampling
characteristics of such estimates are largely unknown, neither the G2 statistic
nor the standard errors for parameter estimates have established
interpretations.
Identification and Rotation. The unrotated factor solutions are computed with the
LISREL 7 program (Joreskog & Sorbom, 1989). Rotational identification is assured by (a)
restricting the k factors to be uncorrelated and (b) fixing a triangular pattern of k(k-!)/2
factor loadings at zero values (Anderson & Rubin, 1956). These initial unrotated factor
solutions are rotated by Promax (Hendrickson & White, 1964) into an oblique simple
structure solution. A power coefficient of 4.00 is used. The advantages of the use of
Promax are that it produces stable results for simple structure, it does not constrain the
solution to be orthogonal, and it is computationally efficient.
Confirmatory Factor Analysis
Restricted Factor Structure for the Kit Reference Tests. Any attempt to relate ASVAB
subtests to the Kit factors must deal with the conceptual problem that the orientation of the
22
indeterminacy is generally resolved by first extracting any one of the many equivalent factor
solutions. One may then conveniently rotate this solution so as to satisfy simple structure,
to approximate another known or hypothesized solution. In the preceding section,
Identification and Rotation, for example, the Promax algorithm was applied to obtain
simple-structured oblique factors. When using confirmatory analysis, on the other hand,
factors are typically directly estimated to fit a specified pattern of loadings or to coincide
with some other, well-established solution. As a fundamental principle in confirmatory
analysis, the structure and orientation of the factors must be known beforehand.
Apart from the exploratory solutions obtained from the same data, this study cannot
claim prior knowledge sufficient for strict confirmatory analyses. Yet, by modeling some
fairly basic aspects of the measurement design, it was possible to further rafine the Promax
rotated solution. Due to the fact that only one sample was used for all analyses, the
solutions in t'-is section should more accurately be labeled as restricted, rather than as
confirmatory, factor analyses.
Repression of the ASVAB Subtests onto the Maior Kit Factors. A simple way of
comparing the ASVAB subtests to the major Kit factors is to compute a multiple regression
equation for each subtest. Depending on how the residual values of the ASVAB are treated,
the entire model can either take the form of a restricted regression analysis with fallible
predictors, or be a joint restricted factor analysis of the ASVAB and Kit tests. If the residual
covariance matrix of the ASVAB subtests is diagonal, we have the case of restricted factor
analysis; if the matrix is generally symmetric, the regression model applies.
Hierarchical Factor Model for the ASVAB Repressed onto the Major Kit Factors.
Hierarchical factor analysis is understood here in the modern sense of higher-order or
second-order factor analytic models (cf., Bollen, 1989; Joreskog & Sorbom, 1989). In the
LISREL model, first- and second-order factor structures are specified in perfectly analogous
ways, the only difference being that the factors defined by the first-order structure become
indicators at the second-order level. The function of the higher-order factors is to describe
the correlation structure of several oblique first-order factors.
Identification conditions for the second-order structure are also equivalcnt to those in
first-order multiple factor analysis. Specifically, a second-order model with exactly three
first-order factors and one second-order factor is only just-identified. In the presence of
exogenous predictor variables, however, even such a small hierarchical model tends to be
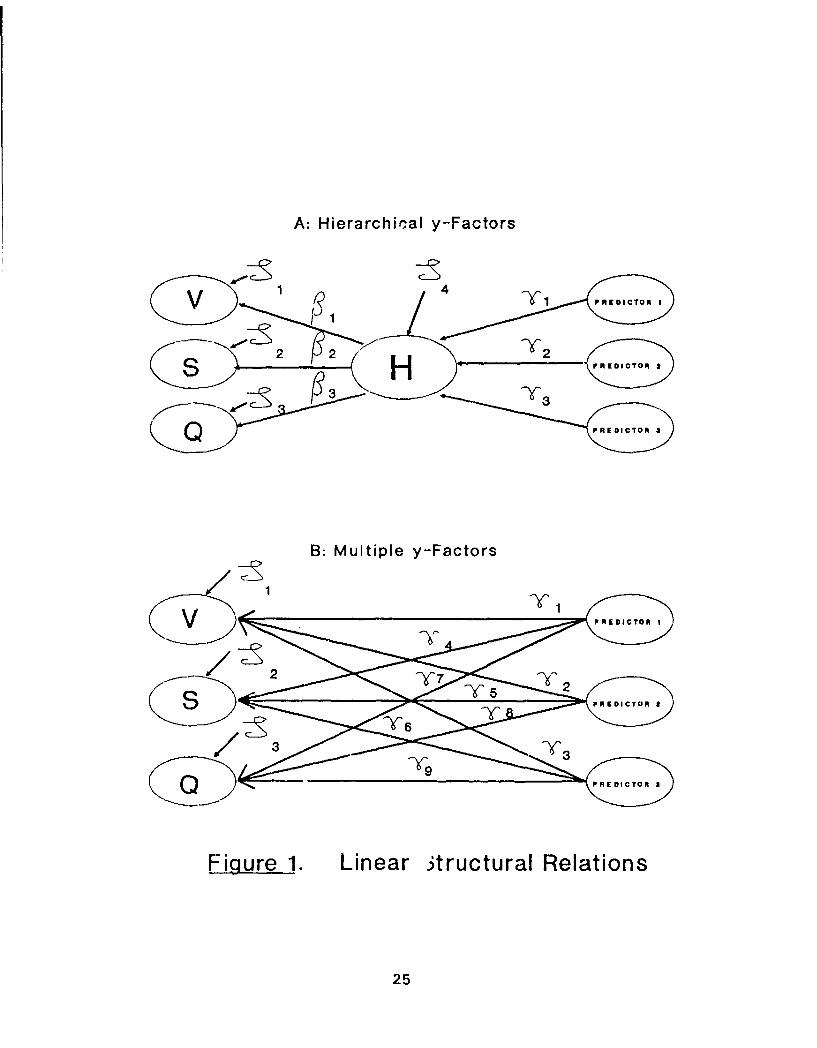
more restricted than the multiple factor model. This is demonstrated in Figure 1. In panel A
of the figure, the correlation structure of three dependent factors, generically labeled as "V,""S," and "Ci," is described by the higher-order factor "H" which, in turn, is dependent on
three predictors. After fixing one beta parameter (shown in Panel A of Figure 1) at a
23
non-zero value to ensure scale identification, a total of nine estimated parameters describe
the structural equation system. In Panel B, however, where each of the three dependent
factors is regressed onto each of the three predictors, a total of 12 parameters have to be
estimated. By routing the regression through the single second-order factor, as shown in
Panel A of Figure 1, proportionality constraints are introduced into the prediction equations,
with the effect that the relative impact of the various predictors remains constant for each
dependent variable. This aspect of the hierarchical factor model is closely related to the
MIMIC (multiple indicator, multiple causes) model proposed by Hauser and Goldberger
(1971).
Maior ASVAB Factors Repressed onto the Major Kit Factors. The final model is similar to
the one sketched in Panel B of Figure 1. The three major ASVAB factors are regressed
directly onto the six major Kit factors.
I1l. RESULTS AND DISCUSSION
Editina and Descriotion
Data Editing
Cases with errors were either corrected or removed from the data set.
Descrigtive Analysis
Care would be appropriate in generalizing the results of this research outside of the
population from which the examinees were sampled (i.e., an Air Force population). The
education level of the sample is below the national average figures reported by the Bureau of
Census (1988). Whereas nationwide approximately 36% of the 25- to 29-year-old men and
women in either ethnic group have attended at least some college, only 25% of the sample
of recruits have done so. In the current sample, gender differences in education appear
rather small and inconsequential for the White (and other) mainstream group, but there are
striking differences in the Black subsample. Although, first of all, the college attendance
figure for Black males (34.3%) is close to the national average, a larger proportion of Black
females (42.9%) has obtained some college education. The higher educational mobility of
young Black females has been previously documented (cf., Bock & Moore, 1986), yet we are
not aware of specific aspects of the recruiting process that would selectively draw more
24
A: Hierarchinal y-Faotors
S PREDICTOR I
Q PREDICTOR 3
B: Multiple y-Factors
VRD O
y 7Y
SP
Figure 1. Linear 3truotural Relations
25
educated Black recruits into the Air Force and, at the same time, fail to attract the higher
educated segments of the White (and otrier) mainstream. These stochastic dependencies in
the demographic distribution pattern, taken together with the traditionally skewed
distribution of the Genders in the Armed Services, do indicate a considerable degree of
clumping in the total sample, which may disturb correlation structures and almost certainly
adversely affect the tests of model fit.
Means, standard deviations, and skewness and kurtosis coefficients for the 57
continuous variables are given in Appendix B.
Interrater reliabilities for the hand-scored Kit tests ranged from .95 to .99. Though the
reliabilities seem high, it should be noted that two-thirds of the hand-scored tests were
objective tests with comprehensive answer keys and one accurate "correct" score.
Estimation of Correlation Matrix
Appendix B displays the pairwise complete correlation coefficients for Age, Education,
Population Group, Gender, the 10 ASVAB subscales, and the 46 Kit reference tests.
Most correlation coefficients range between -0.2 and 0.5; the largest correlation in the
matrix is 0.815 between AR (Arithmetic Reasoning, ASVAB) and RG1 (Arithmetic Aptitude
Test, Kit). Due to the matrix sampling design, the bivariate sample size for individual
correlations varies widely. For the Kit reference tests which were presented in Booklets 3 to
8, test scores located on different booklets were jointly observed on between 207 and 233
cases, while bivariate sample sizes for tests on the same booklet ranged between 1,533 and
1,594 (cf., Appendix C). The ASVAB subtests are presented in Booklets 1 and 2;
corresponding bivariate sample sizes are 701 for subtests on different booklets, 2,055 and
2,057 for subtests located in the same booklet. Finally, identifying information on
Education, Population Group, and Gender is available from all 6,751 respondents, and Age
information from 6,015 cases. The bivariate sample sizes involving these four variables are
similarly large.
Modeling of Correlation Coefficients for AFQT-1, AFQT-2, and VE Scales
The modeled correlation coefficients for the AFQT and VE scales appear in Appendix D.
All three scales are highly correlated with each other, due to the sizable common vocabulary
comp4,,lent defined by ASVAB subtests WK + PC. Those ASVAB and Kit subtests which
involve reasoning, numeric, or spatial tasks correlate higher with the AFQT scales than with
the VE scale. Both AFQT scales have correlation structures which are virtually identical to
those of the Kit reference tests.
26
Factor Analyses
Exploratory Factor Analyses
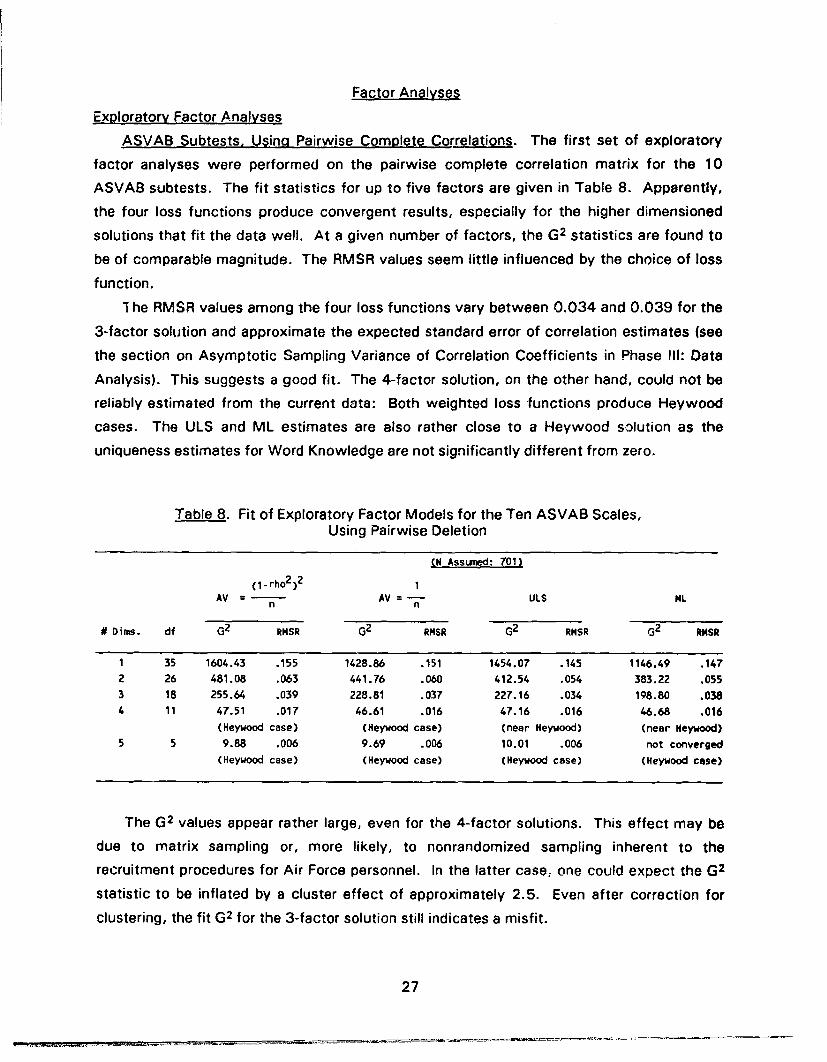
ASVAB Subtests, Using Pairwise Complete Correlations. The first set of exploratory
factor analyses were performed on the pairwise complete correlation matrix for the 10
ASVAB subtests. The fit statistics for up to five factors are given in Table 8. Apparently,
the four loss functions produce convergent results, especially for the higher dimensioned
solutions that fit the data well. At a given number of factors, the G2 statistics are found to
be of comparable magnitude. The RMSR values seem little influenced by the choice of loss
function.
I he RMSR values among the four loss functions vary between 0.034 and 0.039 for the
3-factor solution and approximate the expected standard error of correlation estimates (see
the section on Asymptotic Sampling Variance of Correlation Coefficients in Phase II: Data
Analysis). This suggests a good fit. The 4-factor solution, on the other hand, could not be
reliably estimated from the current data: Both weighted loss functions produce Heywood
cases. The ULS and ML estimates are also rather close to a Heywood solution as the
uniqueness estimates for Word Knowledge are not significantly different from zero.
Table 8. Fit of Exploratory Factor Models for the Ten ASVAB Scales,Using Pairwise Deletion
(N Assumed: 701)
(1-rho 2 )2 1
nn
9 Dims. df G2 RNSR G2 RMSR G2 RMSR G2 RMSR
1 35 1604.43 .155 1428.86 .151 1454.07 .145 1146.49 .1472 26 481.08 .063 441.76 .060 412.54 .054 383.22 .0553 18 255.64 .039 228.81 .037 227.16 .034 198.80 .0384 11 47.51 .017 46.61 .016 47.16 .016 46.68 .016
(Heywood case) (Heywood case) (near Heywood) (near Heywood)5 5 9.88 .006 9.69 .006 10.01 .006 not converged
(Heywood case) (Heywood case) (Heywood case) (Heywood case)
The G2 values appear rather large, even for the 4-factor solutions. This effect may be
due to matrix sampling or, more likely, to nonrandomized sampling inherent to the
recruitment procedures for Air Force personnel. In the latter case, one could expect the G2
statistic to be inflated by a cluster effect of approximately 2.5. Even after correction for
clustering, the fit G2 for the 3-factor solution still indicates a misfit.
27
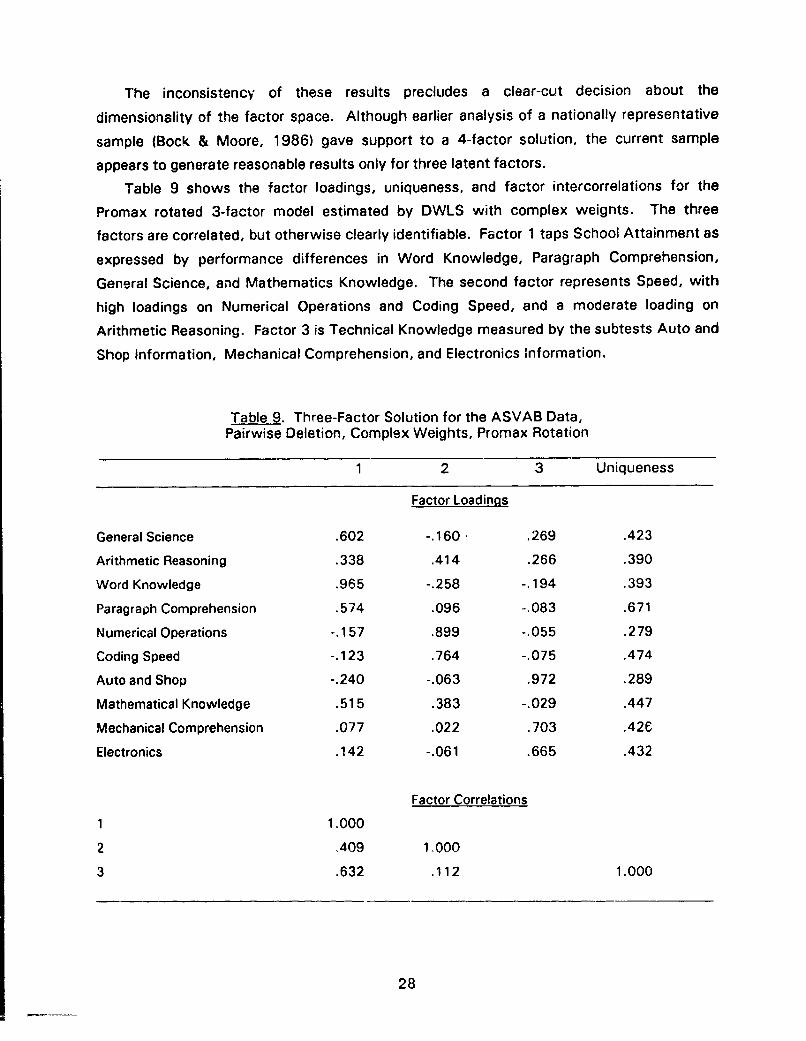
The inconsistency of these results precludes a clear-cut decision about the
dimensionality of the factor space. Although earlier analysis of a nationally representative
sample (Bock & Moore, 1986) gave support to a 4-factor solution, the current sample
appears to generate reasonable results only for three latent factors.
Table 9 shows the factor loadings, uniqueness, and factor intercorrelations for the
Promax rotated 3-factor model estimated by DWLS with complex weignts. The three
factors are correlated, but otherwise clearly identifiable. Factor 1 taps School Attainment as
expressed by performance differences in Word Knowledge, Paragraph Comprehension,
General Science, and Mathematics Knowledge. The second factor represents Speed, with
high loadings on Numerical Operations and Coding Speed, and a moderate loading on
Arithmetic Reasoning. Factor 3 is Technical Knowledge measured by the subtests Auto and
Shop Information, Mechanical Comprehension, and Electronics Information.
Table 9. Three-Factor Solution for the ASVAB Data,Pairwise Deletion, Complex Weights, Promax Rotation
1 2 3 Uniqueness
Factor Loadings
General Science .602 -. 160. .269 .423
Arithmetic Reasoning .338 .414 .266 .390
Word Knowledge .965 -.258 -. 194 .393
Paragraph Comprehension .574 .096 -.083 .671
Numerical Operations -. 157 .899 -.055 .279
Coding Speed -. 123 .764 -.075 .474
Auto and Shop -.240 -.063 .972 .289
Mathematical Knowledge .515 .383 -.029 .447
Mechanical Comprehension .077 .022 .703 .42e
Electronics .142 -.061 .665 .432
Factor Correlations
1 1.000
2 ,409 1,000
3 .632 .112 1.000
28
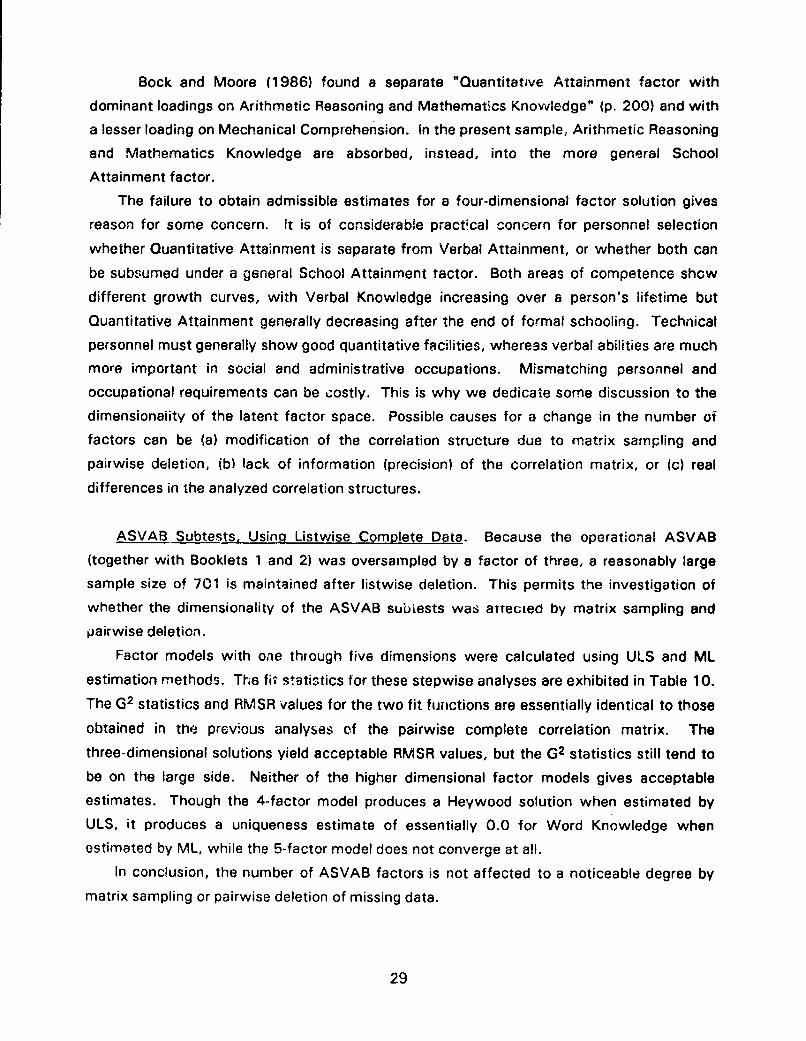
Bock and Moore (1986) found a separate "Quantitative Attainment factor with
dominant loadings on Arithmetic Reasoning and Mathematics Knowledge" (p. 200) and with
a lesser loading on Mechanical Comprehension. In the present sample, Arithmetic Reasoning
and Mathematics Knowledge are absorbed, instead, into the more general School
Attainment factor.
The failure to obtain admissible estimates for a four-dimensional factor solution gives
reason for some concern. It is of considerable practtcal concern for personnel selection
whether Quantitative Attainment is separate from Verbal Attainment, or whether both can
be subsumed under a general School Attainment tactor. Both areas of competence show
different growth curves, with Verbal Knowledge increasing over a person's lifetime but
Quantitative Attainment generally decreasing after the end of formal schooling. Technical
personnel must generally show good quantitative facilities, whereas verbal abilities are much
more important in social and administrative occupations. Mismatching personnel and
occupational requirements can be costly. This is why we dedicate some discussion to the
dimensionality of the latent factor space. Possible causes for a change in the number of
factors can be (a) modification of the correlation structure due to matrix sampling and
pairwise deletion, (b) lack of information (precision) of the correlation matrix, or (c) real
differences in the analyzed correlation structures.
ASVAB Subtests, Using Listwise Complete Data. Because the operational ASVAB
(together with Booklets 1 and 2) was oversampled by a factor of three, a reasonably large
sample size of 701 is maintained after listwise deletion. This permits the investigation of
whether the dimensionality of the ASVAB subtests was arTecLed by matrix sampling and
pairwise deletion.
Factor models with one through five dimensions were calculated using ULS and ML
estimation methods. The fit statistics for these stepwise analyses are exhibited in Table 10.
The G2 statistics and RMSR values for the two fit functions are essentially identical to those
obtained in the previous analyses of the pairwise complete correlation matrix. The
three-dimensional solutions yield acceptable RMSR values, but the G2 statistics still tend to
be on the large side. Neither of the higher dimensional factor models gives acceptable
estimates. Though the 4-factor model produces a Heywood solution when estimated by
ULS, it produces a uniqueness estimate of essentially 0.0 for Word Knowledge when
estimated by ML, while the 5-factor model does not converge at all.
In conclusion, the number of ASVAB factors is not affected to a noticeable degree by
matrix sampling or pairwise deletion of missing data.
29
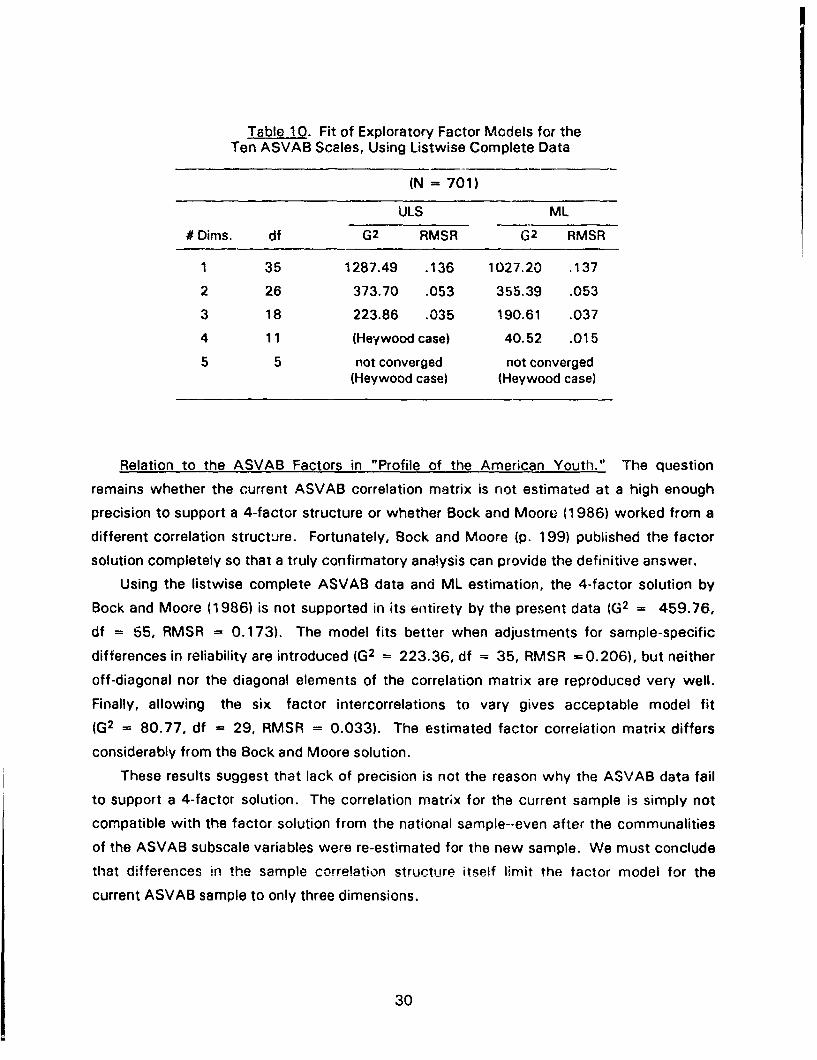
Table 10. Fit of Exploratory Factor Models for theTen ASVAB Scales, Using Listwise Complete Data
(N = 701)
ULS ML
# Dims. df G2 RMSR G2 RMSR
1 35 1287.49 .136 1027.20 .137
2 26 373.70 .053 355.39 .053
3 18 223.86 .035 190.61 .037
4 11 (Heywood case) 40.52 .015
5 5 not converged not converged(Heywood case) (Heywood case)
Relation to the ASVAB Factors in "Profile of the American Youth." The question
remains whether the current ASVAB correlation matrix is not estimated at a high enough
precision to support a 4-factor structure or whether Bock and Moore (1986) worked from a
different correlation structure. Fortunately, Bock and Moore (p. 199) published the factor
solution completely so that a truly confirmatory analysis can provide the definitive answer.
Using the listwise complete ASVAB data and ML estimation, the 4-factor solution by
Bock and Moore (1986) is not supported in its entirety by the present data (G2 = 459.76,
df = 65, RMSR - 0.173). The model fits better when adjustments for sample-specific
differences in reliability are introduced (G2 = 223.36, df = 35, RMSR =0.206), but neither
off-diagonal nor the diagonal elements of the correlation matrix are reproduced very well.
Finally, allowing the six factor intercorrelations to vary gives acceptable model fit
(G2 = 80.77, df = 29, RMSR = 0.033). The estimated factor correlation matrix differs
considerably from the Bock and Moore solution.
These results suggest that lack of precision is not the reason why the ASVAB data fail
to support a 4-factor solution. The correlation matrix for the current sample is simply not
compatible with the factor solution from the national sample--even after the communalities
of the ASVAB subscale variables were re-estimated for the new sample. We must conclude
that differences in the sample correlation structure itself limit the factor model for the
current ASVAB sample to only three dimensions.
30
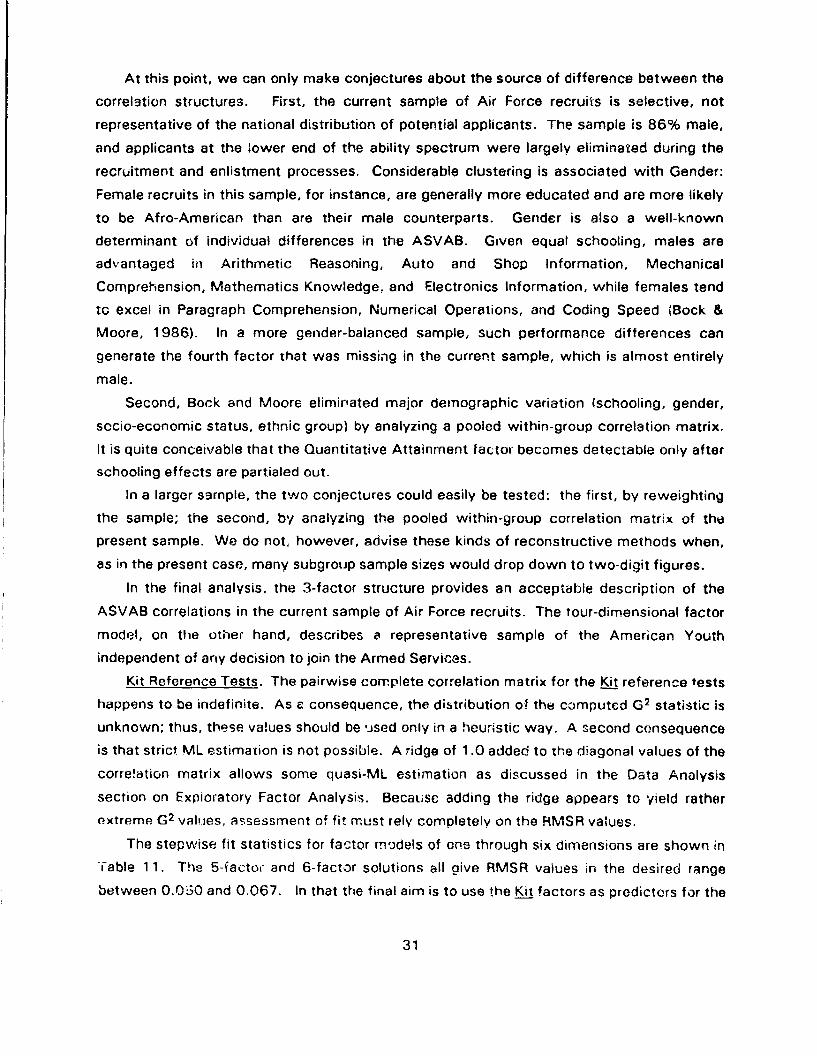
At this point, we can only make conjectures about the source of difference between the
correlation structures. First, the current sample of Air Force recruits is selective, not
representative of the national distribution of potential applicants. The sample is 86% male,
and applicants at the lower end of the ability spectrum were largely eliminated during the
recruitment and enlistment processes. Considerable clustering is associated with Gender:
Female recruits in this sample, for instance, are generally more educated and are more likely
to be Afro-American than are their male counterparts. Gender is also a well-known
determinant of individual differences in the ASVAB. Given equal schooling, males are
advantaged in Arithmetic Reasoning, Auto and Shop Information, Mechanical
Comprehension, Mathematics Knowledge. and Electronics Information, while females tend
to excel in Paragraph Comprehension, Numerical Operations, and Coding Speed (Bock &
Moore, 1986). In a more gender-balanced sample, such performance differences can
generate the fourth factor that was missing in the current sample, which is almost entirely
male.
Second, Bock and Moore eliminated major demographic variation (schooling, gender,
socio-economic status, ethnic group) by analyzing a pooled within-group correlation matrix.
It is quite conceivable that the Quantitative Attainment factor becomes detectable only after
schooling effects are partialed out.
In a larger sample, the two conjectures could easily be tested: the first, by reweighting
the sample; the second, by analyzing the pooled within-group correlation matrix of thepresent sample. We do not, however, advise these kinds of reconstructive methods when,
as in the present case, many subgroup sample sizes would drop down to two-digit figures.
In the final analysis, the 3-factor structure provides an acceptable description of the
ASVAB correlations in the current sample of Air Force recruits. The tour-dimensional factor
model, on the other hand, describes a representative sample of the American Youth
independent of any decision to join the Armed Services.
Kit Reference Tests. The pairwise complete correlation matrix for the Kit reference tests
happens to be indefinite. As a consequence, the distribution of the computed G 2 statistic is
unknown; thus, these values should be used only in a heuristic way. A second consequence
is that strict ML estimation is not possible. A ridge of 1.0 added to the diagonal values of the
corre!ation matrix allows some quasi-ML estimation as discussed in the Data Analysis
section on Exploratory Factor Analysis. Because adding the ridge appears to yield rather
extreme G 2 valjes, assessment of fit must rely completely on the RMSR values.
The stepwise fit statistics for factor models of one through six dimensions are shown in
Table 11. The 5-factor and 6-factor solutions all give RMSR values in the desired range
between 0.060 and 0,067. In that the final aim is to use the Kit factors as predictors for the
31
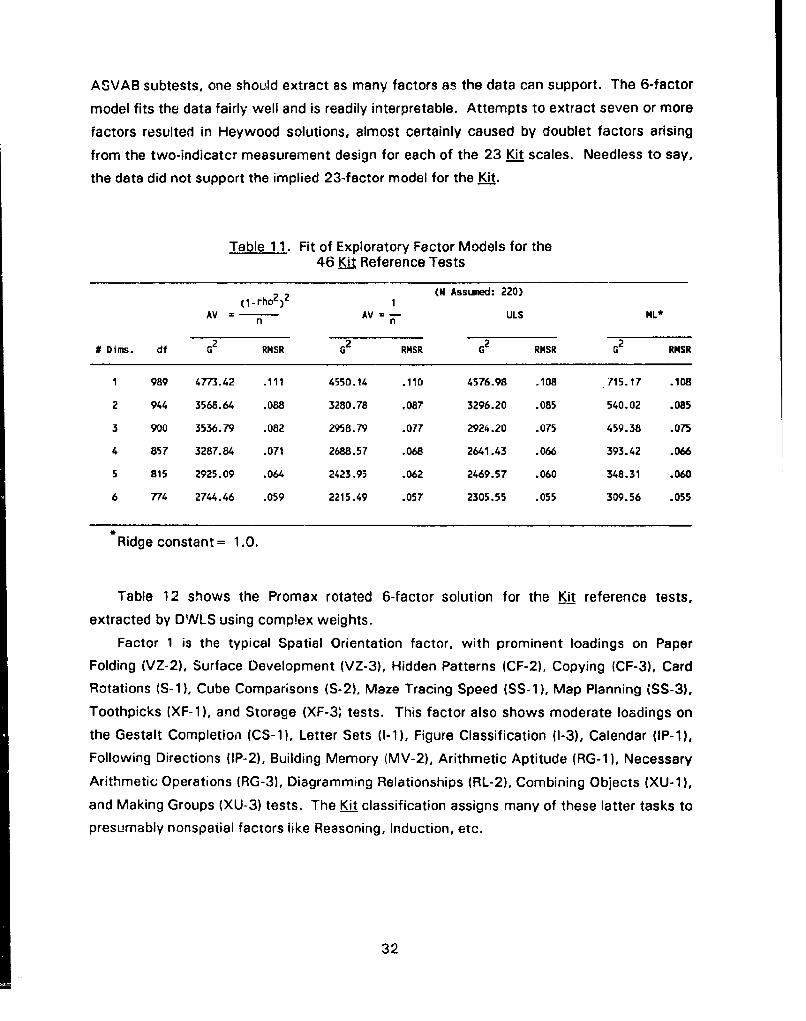
ASVAB subtests, one should extract as many factors as the data can support. The 6-factor
model fits the data fairly well and is readily interpretable. Attempts to extract seven or more
factors resulted in Heywood solutions, almost certainly caused by doublet factors arising
from the two-indicatcr measurement design for each of the 23 Kit scales. Needless to say,
the data did not support the implied 23-factor model for the Kit.
Table 11. Fit of Exploratory Factor Models for the46 Kit Reference Tests
(1-rho2 ) 2 1 (N Assumed: 220)
AV = AV=w ULS ML*
# Dims. df G2 RMSR G2 RMSR G2 RMSR G2 RMSR
1 989 4773.42 .111 4550.14 .110 4576.98 .108 715.17 .108
2 944 3568.64 .088 3280.78 .087 3296.20 .085 540.02 .085
3 900 3536.79 .082 2958.79 .077 2924.20 .075 459.38 .075
4 857 3287.84 .071 2683.57 .068 2641.43 .066 393.42 .066
5 815 2925.09 .064 2423.95 .062 2469.57 .060 348.31 .060
6 774 2744.46 .059 2215.49 .057 2305.55 .055 309.56 .055
Ridge constant-= 1.0.
Table 12 shows the Promax rotated 6-factor solution for the Kit reference tests,
extracted by DWLS using complex weights.
Factor 1 is the typical Spatial Orientation factor, with prominent loadings on Paper
Folding (VZ-2), Surface Development (VZ-3), Hidden Patterns (CF-2), Copying (CF-3), Card
Rotations (S-i), Cube Comparisons (S-2), Maze Tracing Speed (SS-1), Map Planning (SS-3),
Toothpicks (XF-1), and Storage (XF-3$ tests. This factor also shows moderate loadings on
the Gestalt Completion (CS-1), Letter Sets (I-1), Figure Classification (1-3), Calendar (IP-1),
Following Directions (IP-2), Building Memory (MV-2), Arithmetic Aptitude (RG-1), Necessary
Arithmetic Operations (RG-3), Diagramming Relationships (RL-2), Combining Objects (XU-1),
and Making Groups (XU-3) tests. The Kit classification assigns many of these latter tasks to
presumably nonspatial factors like Reasoning, Induction, etc.
32
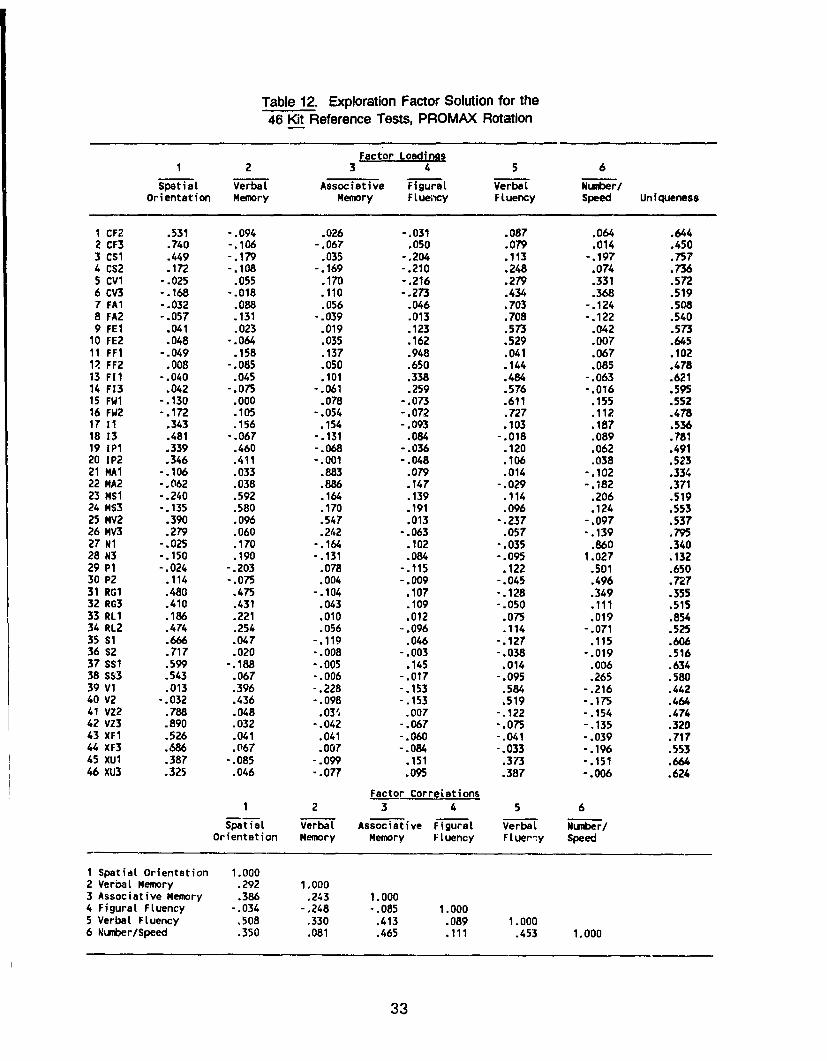
Table 12. Exploration Factor Solution for the46 Kit Reference Tests, PROMAX Rotation
Factor Loadinrs1 2 3 4 5 6
SpatiaL Verbal Associative Figural Verbal Number/Orientation Memory Memory FLuency Fluency Speed Uniqueness
1 CF2 .531 -. 094 .026 - 031 .087 .064 .6442 CF3 .740 -. 106 -. 067 .050 .079 .014 .4503 CS1 .449 -. 179 .035 -. 204 .113 -. 197 .7574 CS2 .172 -. 108 -. 169 -. 210 .248 .074 .7365 CV1 -. 025 .055 .170 -. 216 .279 .331 .5726 CV3 -. 168 -. 018 .110 -. 273 .434 .368 .5197 FA1 -. 032 .088 .056 .046 .703 -. 124 .5088 FA2 -. 057 .131 -. 039 .013 .708 -. 122 .5409 FE1 .041 .023 .019 .123 .573 .042 .573
10 FE2 .048 -. 064 .035 .162 .529 .007 .64511 FF1 -. 049 .158 .137 .948 .041 .067 .10212 FF2 .008 -. 085 .050 .650 .144 .085 .47813 FI1 -. 040 .045 .101 .338 .484 -. 063 .62114 F13 .042 -. 075 -. 061 .259 .576 -. 016 .59515 FW1 -. 130 .000 .078 -. 073 .611 .155 .55216 FW2 -. 172 .105 -. 054 -. 072 .727 .112 .47817 11 .343 .156 .154 -. 093 .103 .187 .53618 13 .481 -. 067 -. 131 .084 -. 018 .089 .78119 IPI .339 .460 -. 068 -. 036 .120 .062 .49120 1P2 .346 .411 -. 001 -. 048 .106 .038 .52321 MA1 -. 106 .033 .883 .079 .014 -. 102 .33422 MA2 -. 062 .038 .886 .147 -. 029 -. 182 .37123 MS1 -.240 .592 .164 .139 .114 .206 .51924 MS3 -. 135 .580 .170 .191 .096 .124 .55325 V2 .390 .096 .547 .013 -. 237 -. 097 .53726 MV3 .279 .060 .242 -. 063 .057 -. 139 .79527 N1 -. 025 .170 -. 164 .102 -. 035 .860 .34028 N3 -. 150 .190 -. 131 .084 -. 095 1.027 .13229 P1 -. 024 -. 203 .078 -. 115 .122 .501 .65030 P2 .114 -. 075 .004 -. 009 -. 045 .496 .72731 RG1 .480 .475 -. 104 .107 -. 128 .349 .35532 RG3 .410 .431 .043 .109 -. 050 .111 .51533 RL1 .186 .221 .010 .012 .075 .019 .85434 RL2 .474 .254 .056 -. 096 .114 -. 071 .52535 S1 .666 .047 -. 119 .046 -. 127 .115 .60636 S2 .717 .020 -. 008 -. 003 -. 038 -. 019 .51637 ss1 .599 -. 188 -. 005 .145 .014 .006 .63438 Ss3 .543 .067 -. 006 -. 017 -. 095 .265 .58039 Vi .013 .396 -. 228 -. 153 .584 -. 216 .44240 V2 -. 032 .436 -. 098 -. 153 .519 -. 175 .46441 VZ2 .788 .048 .03M .007 -. 122 -. 154 .47442 VZ3 .890 .032 -. 042 -. 067 -. 075 -. 135 .32043 XF1 .526 .041 .041 -. 060 -. 041 -. 039 .71744 XF3 .686 .067 .007 -. 084 -. 033 -. 196 .55345 XUl .387 -. 085 -. 099 .151 .373 -. 151 .66446 XU3 .325 .046 -. 077 .095 .387 -. 006 .624
Factor Correjations1 2 3 4 5 6
Spatial Verbal Associative Figural Verbal Number/Orientation Memory Memory Fluency FLuerny Speed
1 Spatial Orientation 1.0002 Verbat Memory .292 1.0003 Associative Memory .386 .243 1.0004 Figurat Fluency -. 034 -. 248 -. 085 1.0005 Verbal Fluency .508 .330 .413 .089 1.0006 Number/Speed .350 .081 .465 .111 .453 1.000
33
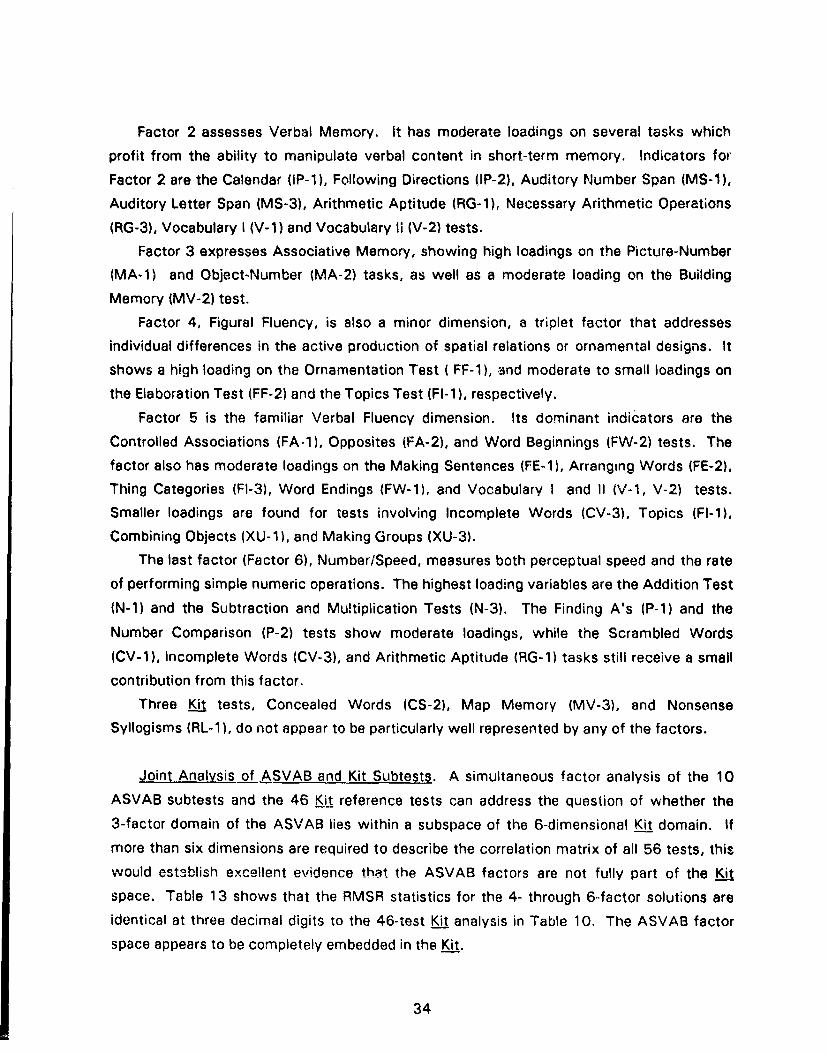
Factor 2 assesses Verbal Memory. It has moderate loadings on several tasks which
profit from the ability to manipulate verbal content in short-term memory. Indicators for
Factor 2 are the Calendar (IP-1), Following Directions (IP-2), Auditory Number Span (MS-i),
Auditory Letter Span (MS-3), Arithmetic Aptitude (RG-1), Necessary Arithmetic Operations
(RG-3), Vocabulary I (V-1) and Vocabulary Ii (V-2) tests.
Factor 3 expresses Associative Memory, showing high loadings on the Picture-Number
(MA-1) and Object-Number (MA-2) tasks, as well as a moderate loading on the Building
Memory (MV-2) test.
Factor 4, Figural Fluency, is also a minor dimension, a triplet factor that addresses
individual differences in the active production of spatial relations or ornamental designs. It
shows a high loading on the Ornamentation Test ( FF-1), and moderate to small loadings on
the Elaboration Test (FF-2) and the Topics Test (FI-1), respectively.
Factor 5 is the familiar Verbal Fluency dimension. Its dominant indicators are the
Controlled Associations (FA.1), Opposites (FA-2), and Word Beginnings (FW-2) tests. The
factor also has moderate loadings on the Making Sentences (FE-1), Arranging Words (FE-2),
Thing Categories (FI-3), Word Endings (FW-1), and Vocabulary I and II (V-i, V-2) tests.
Smaller loadings are found for tests involving Incomplete Words (CV-3), Topics (FI-1),
Combining Objects (XU-1), and Making Groups (XU-3).
The last factor (Factor 6), Number/Speed, measures both perceptual speed and the rate
of performing simple numeric operations. The highest loading variables are the Addition Test
(N-i) and the Subtraction and Multiplication Tests (N-3). The Finding A's (P-i) and the
Number Comparison (P-2) tests show moderate loadings, while the Scrambled Words
(CV-1), Incomplete Words (CV-3), and Arithmetic Aptitude (RG-1) tasks still receive a small
contribution from this factor.
Three Kit tests, Concealed Words (CS-2), Map Memory (MV-3), and Nonsense
Syllogisms (RL-1), do not appear to be particularly well represented by any of the factors.
Joint Analysis of ASVAB and Kit Subtests. A simultaneous factor analysis of the 10
ASVAB subtests and the 46 Kit reference tests can address the question of whether the
3-factor domain of the ASVAB lies within a subspace of the 6-dimensional Kit domain. If
more than six dimensions are required to describe the correlation matrix of all 56 tests, this
would establish excellent evidence that the ASVAB factors are not fully part of the Kit
space. Table 13 shows that the RMSR statistics for the 4- through 6-factor solutions are
identical at three decimal digits to the 46-test Kit analysis in Table 10. The ASVAB factor
space appears to be completely embedded in the Kit.
34
Table 13. Fit of Joint Exploratory Factor Modelsfor the Ten ASVAB and 46 Kit Tests
(1-rho2)2 1 (N Atsumed: 220)
AV a n AV t- ULS ML*
U Dims. df G2 RMSR 62 RMSR G2 RMSR G2 RNSR
1 1484 8748.86 .125 8059.90 .120 4822.03 .117 1131.70 .118
2 1429 6468.67 .093 5859W68 .091 5755.92 .088 849.09 .088
3 1375 5561.41 .080 4864.02 .077 4716.68 .074 699.21 .074
4 1322 5497.56 .072 4578.73 .069 4365.44 .066 617.57 .066
5 1270 4915.23 .065 4111.91 .063 4073.89 .061 553.38 .061
6 1219 4669.71 .060 3934.04 .058 3987.67 .057 507.28 .057
Ridge constant - 1.0.
Table 14 displays the factor loadings, uniqueness coefficients, and factorintercorrelations of the Prornax rotated 6-factor DWLS solution using complex weights.
Although all of the four 6-factor solutions have about equally good fit, the DWLS solutionwith complex weights is Cyven here, mainly because its fit function is most comparable tothe 46-test Kit factor solution in Table 11.
The solution comprises an essentially unchanged factor structure for the 46 Kireference tests, almost exactly as described in the previous section. Therefore, the loadingstructure of the Kit reference tests need not be discussed again. The factors appear stable
enough to describe the ASVAB subtest in terms of the six known factors.Factor 6, Verbal Memory, makes the most general contribution to the ASVAB subtests.
It shows appreciably large weights on General Science, Arithmetic Reasoning, WordKnowledge, and Electronics Information. Further minor loadings are found for Paragraph
Comprehension, Auto and Shop Information, Mathematics Knowledge, and MechanicalComprehension. The factor appears to be strongly related to the concept of School
Attainment.
Factor 1, Spatial Orientation, has the expected large contribution for MechanicalComprehension, and moderate contributions for Arithmetic Reasoning, Auto and ShopInformation, and Electronics Information. The Kit Number/Speed factor (Factor 6) affectsexclusively Numerical Operations and Coding Speed, while the Verbal Fluency factor exhibitsa minor secondary component on the Word Knowledge test. Finally, the ASVAB subtests do
not share any communality with the Kit factors Figural Fluency and Associative Memory.
35
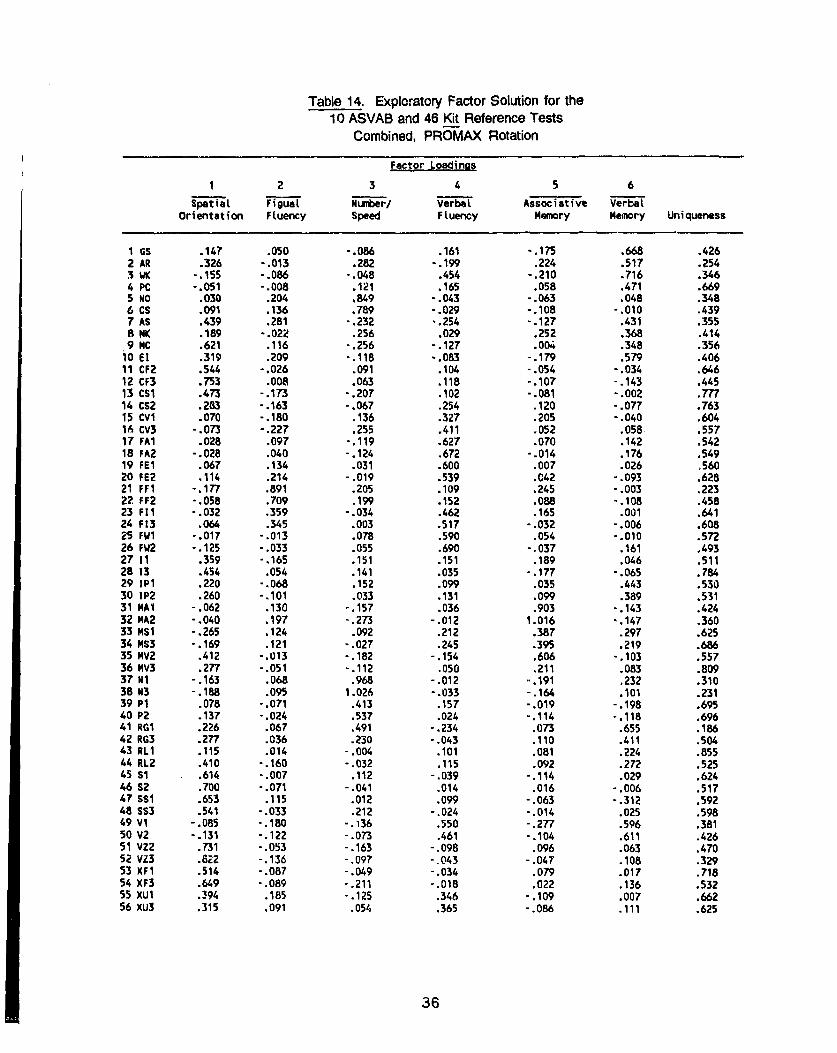
Table 14. Exploratory Factor Solution for the10 ASVAB and 46 Kit Reference Tests
Combined, PROMAX Rotation
Factor Loadirgs
1 2 3 4 5 6
Spatial Figual Number/ Verbal Associative VerbalOrientation Fluency Speed Fluency Memory Memory Uniqueness
1 6S .147 .050 -. 086 .161 -. 175 .668 .4262 AR .326 -. 013 .282 -. 199 .224 .517 .2543 WK -. 155 -. 086 -. 048 .454 -. 210 .716 .3464 PC -. 051 -. 008 .121 .165 .058 .471 .6695 NO .030 .204 .849 -. 043 -. 063 .048 .3486 CS .091 .136 .789 -. 029 -. 108 -. 010 .4397 AS .439 .281 -. 232 -. 254 -. 127 .431 .3558 HK .189 -. 022 .256 .029 .252 .368 .4149 MC .621 .116 -. 256 -. 127 .004 .348 .356
10 El .319 .209 -. 118 -. 083 -. 179 .579 .40611 CF2 .544 -. 026 .091 .104 -. 054 -. 034 .64612 CF3 .753 .008 .063 .118 -. 107 .143 .44513 CS1 .473 -. 173 -. 207 .102 -. 081 -. 002 .77714 CS2 .283 -. 163 -. 067 .254 .120 -. 077 .76315 CV1 .070 -. 180 .136 .327 .205 -. 040 .60416 CV3 -. 073 -. 227 .255 .411 .052 .058 .55717 FA1 .028 .097 -. 119 .627 .070 .142 .54218 FA2 -. 028 .040 -. 124 .672 -. 014 .176 .54919 FE1 .067 .134 .031 .600 .007 .026 .56020 FE2 .114 .214 -. 019 .539 .042 -. 093 .62621 FF1 -. 177 .891 .EO5 .109 .245 -. 003 .22322 FF2 -. 058 .709 .199 .152 .088 -. 108 .45823 FIl -. 032 .359 -. 034 .462 .165 .001 .64124 F13 .064 .345 .003 .517 -. 032 -. 006 .60825 FW1 -. 017 -. 013 .078 .590 .054 -. 010 .57226 FW2 -. 125 -. 033 .055 .690 -. 037 .161 .49327 11 .359 -. 165 .151 .151 .189 .046 .51128 13 .454 .054 .141 .035 -. 177 -. 065 .78429 IPl .220 -. 068 .152 .099 .035 .443 .53030 1P2 .260 -. 101 .033 .131 .099 .389 .53131 MAI -. 062 .130 -. 157 .036 .903 -. 143 .42432 MA2 -. 040 .197 -. 273 -. 012 1.016 -. 147 .36033 MS1 -. 265 .124 .092 .212 .387 .297 .62534 MS3 -. 169 .121 -. 027 .245 .395 .219 .68635 MV2 .412 -. 013 -. 182 -. 154 .606 -. 103 .55736 MV3 .277 -. 051 -. 112 .050 .211 .083 .80937 M1 -. 163 .068 .968 -. 012 -. 191 .232 .31038 N3 -. 188 .095 1.026 -. 033 -. 164 .101 .23139 P1 .078 -. 071 .413 .157 -. 019 -. 198 .69540 P2 .137 -. 024 .537 .024 -. 114 -. 118 .69641 ROt .226 .067 .491 -. 234 .073 .655 .18642 RG3 .277 .036 .230 -. 043 .110 .411 .50443 RL1 .115 .014 -. 004 .101 .081 .224 .85544 RL2 .410 -. 160 -. 032 .115 .092 .272 .52545 Sl .614 -. 007 .112 -. 039 -. 114 .029 .62446 S2 .700 -. 071 -. 041 .014 .016 -. 006 .51747 SS1 .653 .115 .012 .099 -. 063 -. 312 .59248 SS3 .541 -. 033 .212 -. 024 -. 014 .025 .59849 V1 -. 085 -. 180 -. 136 .550 -. 277 .596 .38150 V2 -. 131 -. 122 -. 073 .461 -. 104 .611 .42651 VZ2 .731 -. 053 -. 163 -. 098 .096 .063 .47052 VZ3 .822 -. 136 -. 097 -. 043 -. 047 .108 .32953 XF1 .514 -. 087 -. 049 -. 034 .079 .017 .71854 XF3 .649 -. 089 -. 211 -. 018 .022 .136 .53255 XUl .394 .185 -. 125 .346 -. 109 .007 .66256 xu3 .315 .091 .054 .365 -. 086 .111 .625
36
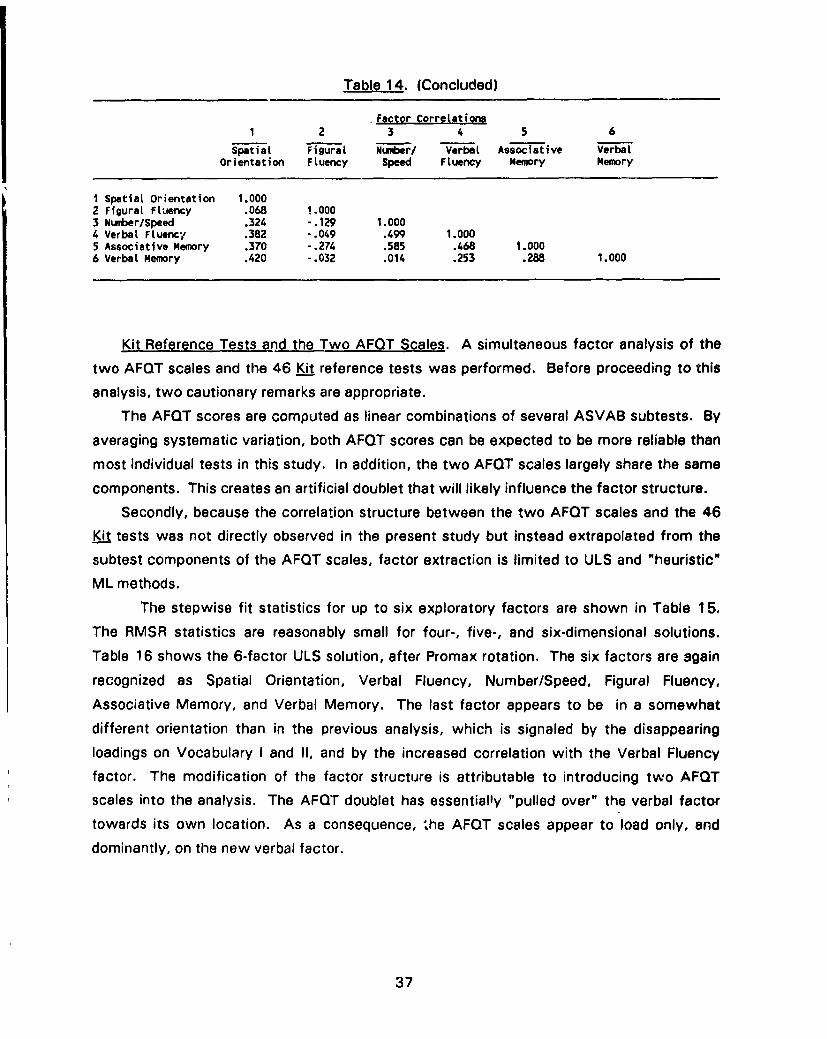
Table 14. (Concluded)
Factor Correlatlons
1 2 3 4 5 6
Spat ita l F i gural Nutber/ Verbat Associative VerbalOrientation Fluency Speed Fluency Memory Memory
1 Spatial Orientation 1.0002 Figural Fluency .068 i.0003 Number/Speed .324 -. 129 1.0004 Verbal Fluency .382 -. 049 .499 1.0005 Associative Memory .370 -. 274 .585 .468 1.0006 Verbal Memory .420 -. 032 .014 .253 .288 1.000
Kit Reference Tests and_ the Two AFQT Scales. A simultaneous factor analysis of the
two AFQT scales and the 46 Kit reference tests was performed. Before proceeding to this
analysis, two cautionary remarks are appropriate.
The AFQT scores are computed as linear combinations of several ASVAB subtests. By
averaging systematic variation, both AFQT scores can be expected to be more reliable than
most individual tests in this study. In addition, the two AFQT scales largely share the same
components. This creates an artificial doublet that will likely influence the factor structure.
Secondly, because the correlation structure between the two AFQT scales and the 46
Kit tests was not directly observed in the present study but instead extrapolated from the
subtest components of the AFQT scales, factor extraction is limited to ULS and "heuristic"
ML methods.
The stepwise fit statistics for up to six exploratory factors are shown in Table 15.
The RMSR statistics are reasonably small for four-, five-, and six-dimensional solutions.
Table 16 shows the 6-factor ULS solution, after Promax rotation. The six factors are again
recognized as Spatial Orientation, Verbal Fluency, Number/Speed, Figural Fluency,
Associative Memory, and Verbal Memory. The last factor appears to be in a somewhat
different orientation than in the previous analysis, which is signaled by the disappearing
loadings on Vocabulary I and II, and by the increased correlation with the Verbal Fluency
factor. The modification of the factor structure is attributable to introducing two AFQT
scales into the analysis. The AFQT doublet has essentially "pulled over" the verbal factor
towards its own location. As a consequence, the AFQT scales appear to load only, and
dominantly, on the new verbal factor.
37
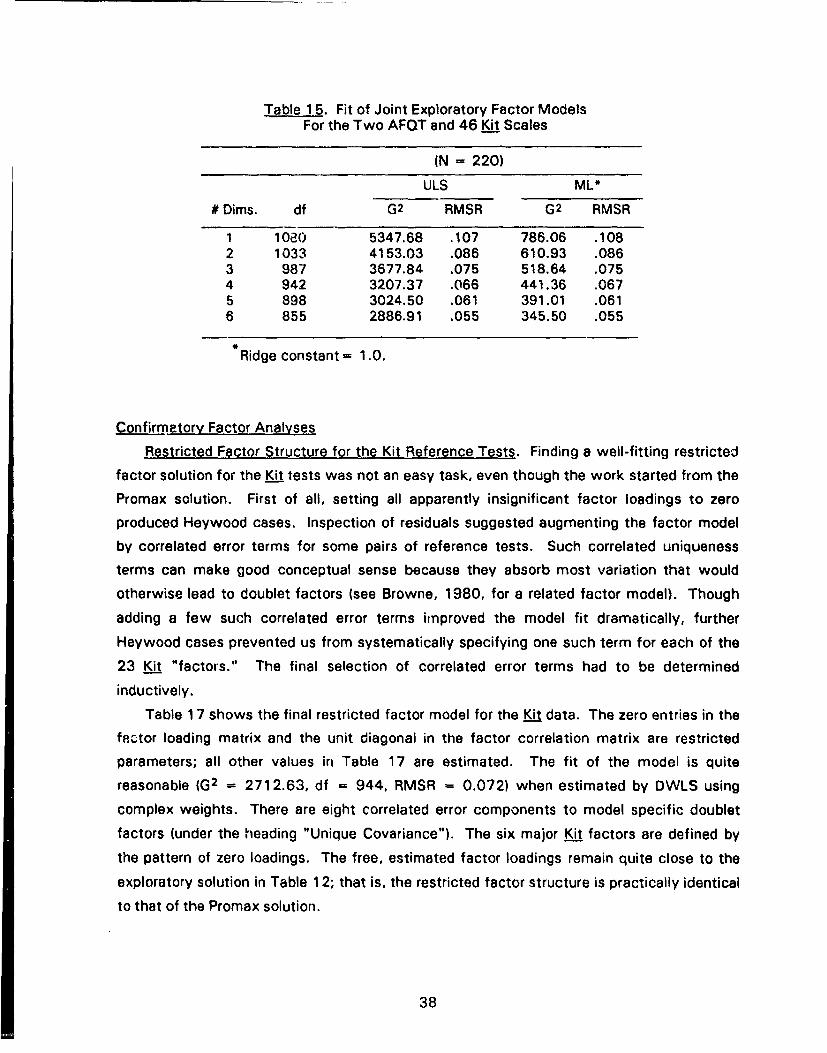
Table 1 5. Fit of Joint Exploratory Factor Models
For the Two AFQT and 46 Kit Scales
(N = 220)
ULS ML*
# Dims. df G2 RMSR G2 RMSR
1 1020 5347.68 .107 786.06 .1082 1033 4153.03 .086 610.93 .0863 987 3677.84 .075 518.64 .0754 942 3207.37 .066 441.36 .0675 898 3024.50 .061 391.01 .0616 855 2886.91 .055 345.50 .055
Ridge constant= 1.0.
Confirmetory Factor Analyses
Restricted Factor Structure for the Kit Reference Tests. Finding a well-fitting restricted
factor solution for the Kit tests was not an easy task, even though the work started from the
Promax solution. First of all, setting all apparently insignificant factor loadings to zero
produced Heywood cases. Inspection of residuals suggested augmenting the factor model
by correlated error terms for some pairs of reference tests. Such correlated uniqueness
terms can make good conceptual sense because they absorb most variation that would
otherwise lead to doublet factors (see Browne, 1980, for a related factor model). Though
adding a few such correlated error terms improved the model fit dramatically, further
Heywood cases prevented us from systematically specifying one such term for each of the
23 Kit "factors." The final selection of correlated error terms had to be determined
inductively.
Table 1 7 shows the final restricted factor model for the Kit data. The zero entries in the
fector loading matrix and the unit diagonal in the factor correlation matrix are restricted
parameters; all other values in Table 17 are estimated. The fit of the model is quite
reasonable (G2 - 2712.63, df = 944, RMSR = 0.072) when estimated by DWLS using
complex weights. There are eight correlated error components to model specific doublet
factors (under the heading "Uniaue Covariance"). The six major Kit factors are defined by
the pattern of zero loadings. The free, estimated factor loadings remain quite close to the
exploratory solution in Table 1 2; that is, the restricted factor structure is practically identical
to that of the Promax solution.
38
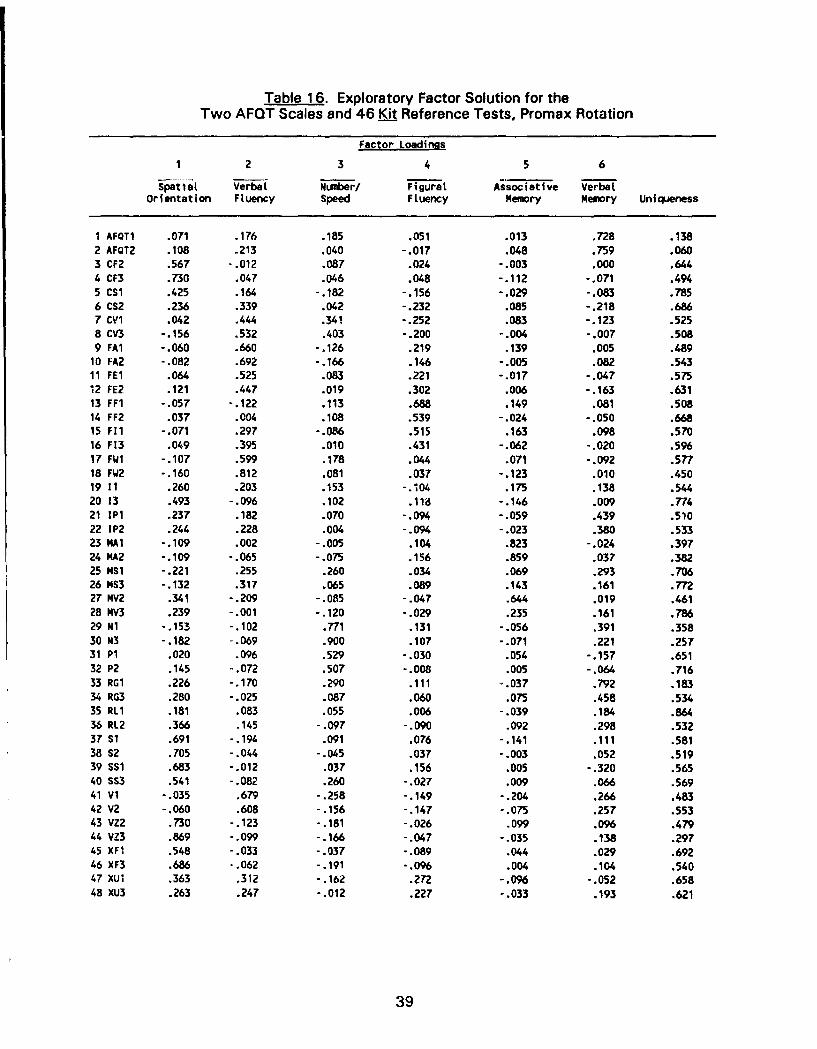
Table 16. Exploratory Factor Solution for theTwo AFQT Scales and 46 Kit Reference Tests, Promax Rotation
Factor Loadings
1 2 3 4 5 6
S-atiat VerbaLt Number/ Figurat Associative Verbalorientation Fluency Speed Fluency Memory Memory Uniqueness
1 AFQT1 .071 .176 .185 .051 .013 .728 .1382 AFQT2 .108 .213 .040 -. 017 .048 .759 .0603 CF2 .567 -. 012 .087 .024 -. 003 .000 .6444 CF3 .730 .047 .046 .048 -. 112 -. 071 .4945 CSI .425 .164 -. 182 -. 156 -. 029 -. 083 .7856 CS2 .236 .339 .042 -. 232 .085 -. 218 .6867 CV1 .042 .444 .341 -. 252 .083 -. 123 .5258 CV3 -. 156 .532 .403 -. 200 -. 004 -. 007 .5089 FA1 -. 060 .660 -. 126 .219 .139 .005 .489
10 FA2 -. 082 .692 -. 166 .146 -. 005 .082 .54311 FE1 .064 .525 .083 .221 -. 017 -. 047 .57512 FE2 .121 .447 .019 .302 .006 -. 163 .63113 FF1 -. 057 -. 122 .113 .688 .149 .081 .50814 FF2 .037 .004 .108 .539 -. 024 -. 050 .66815 FI1 -. 071 .297 -. 086 .515 .163 .098 .57016 F13 .049 .395 .010 .431 -. 062 -. 020 .59617 FWl -. 107 .599 .178 .044 .071 -. 092 .57718 FW2 -. 160 .812 .081 .037 -. 123 .010 .45019 11 .260 .203 .153 -. 104 .175 .138 .5420 13 .493 -. 096 .102 .118 -. 146 .009 .77421 IPI .237 .182 .070 -. 094 -. 059 .439 .51022 1P2 .244 .228 .004 -. 094 -. 023 .380 .53323 MA1 -. 109 .002 -. 005 .104 .823 -. 024 .39724 MA2 -. 109 -. 065 -. 075 .156 .859 .037 .38225 MS1 -. 221 .255 .260 .034 .069 .293 .70626 MS3 -. 132 .317 .065 .089 .143 .161 .77227 MV2 .341 -. 209 -. 085 -. 047 .644 .019 .46128 MV3 .239 -. 001 -. 120 -. 029 .235 .161 .78629 N1 -. 153 -. 102 .771 .131 -. 056 .391 .35830 N3 -. 182 -. 069 .900 .107 -. 071 .221 .25731 P1 .020 .096 .529 -. 030 .054 -. 157 .65132 P2 .145 -. 072 .507 -. 008 .005 -. 064 .71633 RG1 .226 -. 170 .290 .111 -. 037 .792 .18334 RG3 .280 -. 025 .087 .060 .075 .458 .53435 RL .181 .083 .055 .006 -. 039 .184 .86436 RL2 .366 .145 -. 097 -. 090 .092 .298 .53237 Si .691 -. 194 .091 .076 -. 141 .111 .58138 S2 .705 -. 044 -. 045 .037 -. 003 .052 .51939 SS1 .683 -. 012 .037 .156 .005 -. 320 .56540 SS3 .541 -. 082 .260 -. 027 .009 .066 .56941V1 -. 035 .679 -. 258 -. 149 -. 204 .266 .48342 V2 -. 060 .608 -. 156 -. 147 -. 075 .257 .55343 VZ2 .730 -. 123 -. 181 -. 026 .099 .096 .47944 VZ3 .869 -. 099 -. 166 -. 047 -. 035 .138 .29745 XFI .548 -. 033 -. 037 -. 089 .044 .029 .69246 XF3 .686 -. 062 -. 191 -. 096 .004 .104 .54047 XU1 .363 .312 -. 162 .272 -. 096 -. 052 .65848 XU3 .263 .247 -. 012 .227 -. 033 .193 .621
39
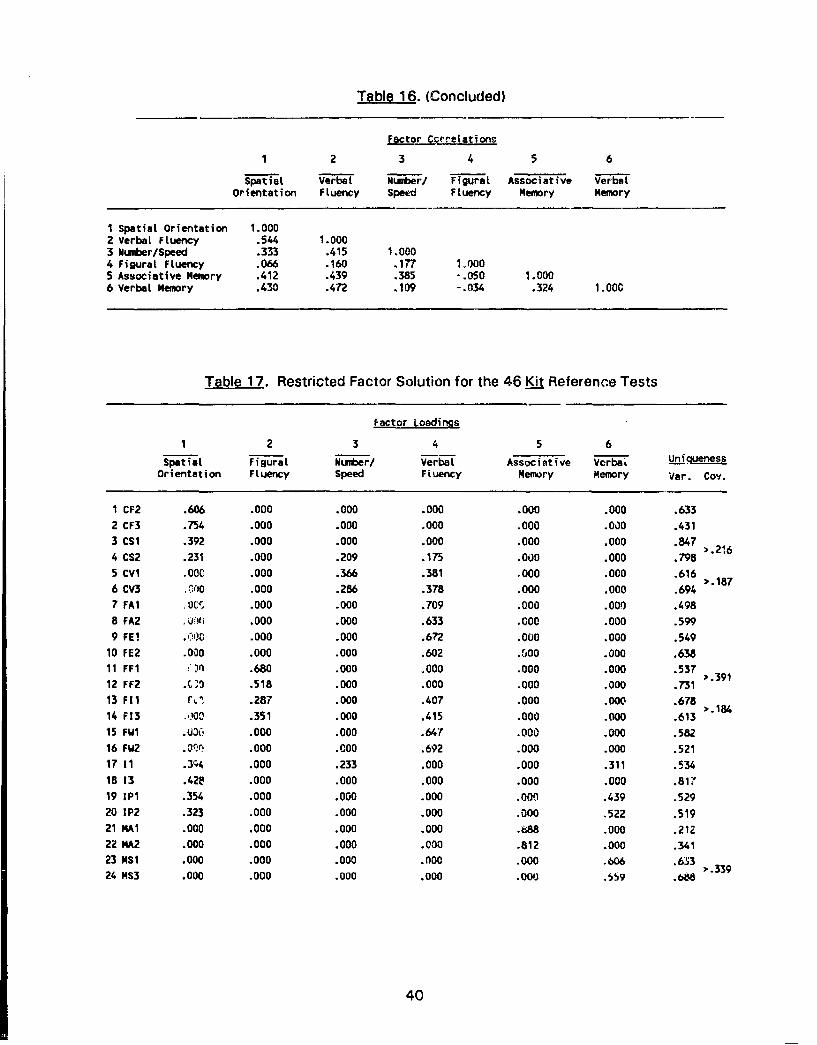
Table 16. (Concluded)
Factor Cqrretations
1 2 3 4 5 6
Spatial Verbal Number/ Figural Associative VerbalOrientation Fluency Speed Fluency Memory Memory
1 Spatial Orientation 1.0002 Verbal Fluency .544 1.0003 Number/Speed .333 .415 1.0004 Figural Fluency .066 .160 .177 1'0005 Associative memory .412 .439 .385 -. 050 1.0006 Verbal Memory .430 .472 .109 -. 034 .324 1.000
Table 17. Restricted Factor Solution for the 46 Kit Reference Tests
Factor Loadings
1 2 3 4 5 6
Spatial Figural Number/ VerbaL Associative Verba,. Uniggeness
Orientation Fluency Speed Fluency Memory Memory Var. Coy.
1 CF2 .606 .000 .000 .000 .000 .000 .6332 CF3 .754 .000 .000 .000 .000 .000 .431
3 CSI .392 .000 .000 .000 .000 .000 .847
4 CS2 .231 .000 .209 .175 .000 .000 .798
5 CVl .OOC. .000 .366 .381 .000 .000 .616 ' .1876 CV3 ,G.10 .000 .286 .378 .000 .000 .694
7 FA1 OCJ .000 .000 .709 .000 .000 .4988 FA2 .000 .000 .633 .000 .000 .599
9 FEl .) .000 .000 .672 .000 .000 .549
10 FEZ .000 .000 .000 .602 .500 .000 .638
11 FF1 .680 .000 .000 .000 .000 .53712 FF2 .C33 .518 .000 .000 .000 .000 .731
13 FI11 '. .287 .000 .407 .000 .000 .678 '.18414 F13 .300 .351 .000 .415 .000 .000 .613
15 FW1 .036 .000 .000 .647 .000 .000 .582
16 FW2 .Oory .000 .000 .692 .000 .000 .521
17 11 .3q4 .000 .233 .000 .000 .311 .534
18 13 .426 .000 .000 .000 .000 .000 .81719 IPI .354 .000 .000 .000 .00n .439 .529
20 IP2 .323 .000 .000 .000 .000 .522 .519
21 MAl .000 .000 .000 .000 .888 .000 .212
22 MA2 .000 .000 .000 .000 .812 .000 .34123 MS1 .000 .000 .000 .000 .000 .606 .63324 MS3 .000 .000 .000 .000 .000 .f59 .688
40
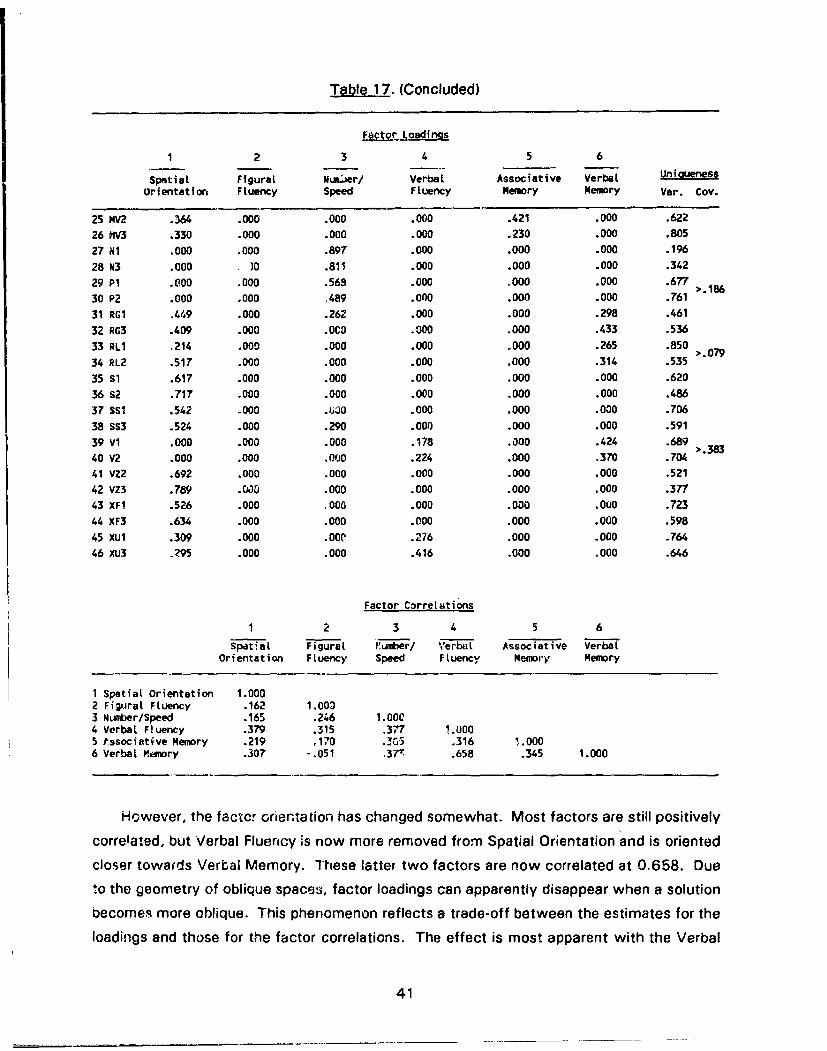
Table 17. (Concluded)
Factor Loadings
1 2 3 4 5 6
spatial Figural MLa..*r/ Verbal Associative Verbal Uniqueness
Orientation Fluency Speed Fluency Memory Memory Var. Coy.
25 MV2 .364 .000 .000 .000 .421 .000 .62226 MfV3 .330 .000 .000 .000 .230 .000 .805
27 N1 .000 .000 .897 .000 .000 .000 .196
28 N3 .000 )0 .811 .000 .000 .000 .342
29 P1 .000 .000 .568 .000 .000 .000 .677 186
30 P2 .000 .000 .489 .000 .000 .000 .76131 RG1 .449 .000 .262 .000 .000 .298 .46132 RG3 .409 .000 .000 .000 .000 .433 .53633 RL1 .214 .000 .000 .000 .000 .265 .850 >.07934 RL2 .517 .000 .000 .000 .000 .314 .53535 S1 .617 .000 .000 .000 .000 .000 .620
36 S2 .717 .000 .000 .000 .000 .000 .48637 srI .542 .000 .6o0 .000 .000 .000 .70638 SS3 .524 .000 .290 .000 .000 .000 .59139 VI .000 .000 .000 .178 .000 .424 .68940 V2 .000 .000 ,000 .224 .000 .370 .70441 VZ2 .692 .000 .000 .000 .000 .000 .52142 VZ3 .789 . WO .000 .000 .000 .000 .37743 XF1 .526 .000 ,000 .000 .000 .000 .72344 XF3 .634 .000 .000 .000 .000 .000 .598
45 XU1 .309 .000 .00e .276 .000 .000 .76446 XU3 .M .000 .000 .416 .000 .000 .646
Factor Correlations
1 2 3 4 5 6
Spatial Figural rutber/ Verbal Associative VerbalOrientation Fluency Speed Fluency Memory Memory
1 Spatial Orientation 1.0002 Figurat Fluency .162 1.00o3 Number/Speed .165 .246 1.0004 Verbal Fluency .379 .315 .377 1.0005 t.ssociative Memory .219 .170 .!3"5 .316 1.0006 Verbal Memory .307 -. 051 i373, .658 .345 1.000
However, the factor orientation has changed somewhat. Most factors are still positively
corre!ated, but Verbal Fluency is now more removed from Spatial Orientation and is oriented
closer towards Verbal Memory. These latter two factors are now correlated at 0.658. Due
to the geometry of oblique spaces, factor loadings can apparently disappear when a solution
oecomes more oblique. This phenomenon reflects a trade-off between the estimates for the
loadings and those for the factor correlations. The effect is most apparent with the Verbal
41
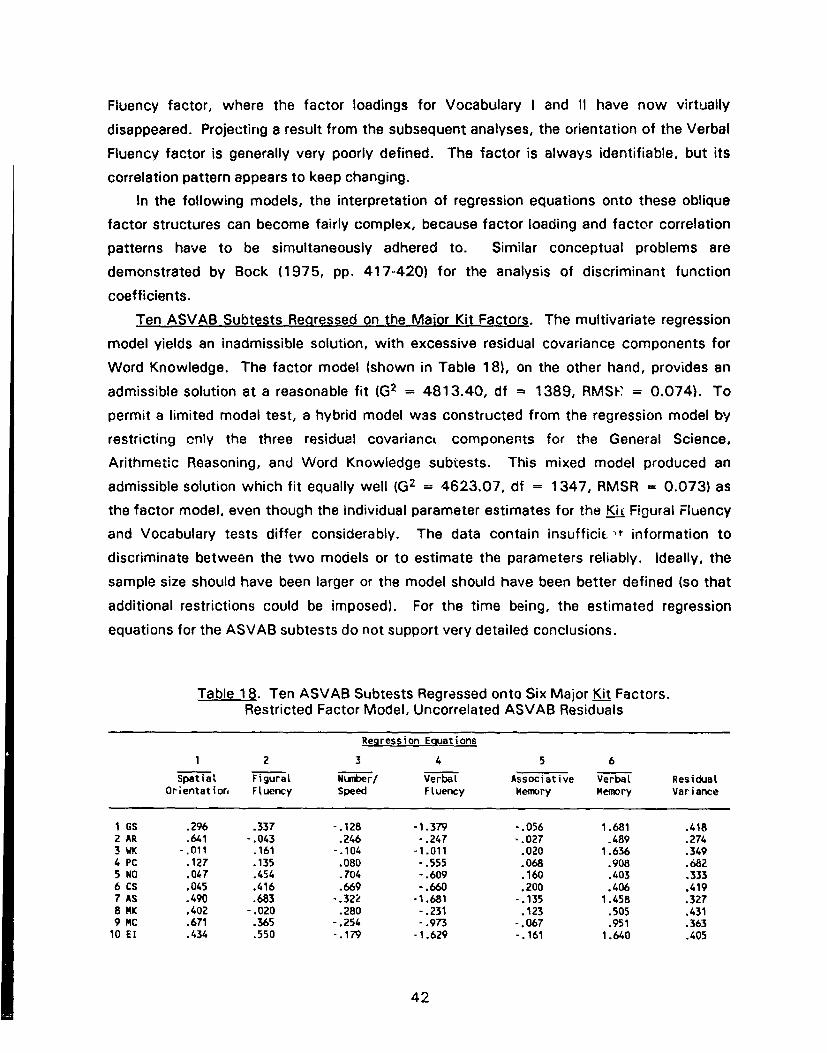
Fluency factor, where the factor loadings for Vocabulary I and II have now virtually
disappeared. Projecting a result from the subsequent analyses, the orientation of the Verbal
Fluency factor is generally very poorly defined. The factor is always identifiable, but its
correlation pattern appears to keep changing.
In the following models, the interpretation of regression equations onto these oblique
factor structures can become fairly complex, because factor loading and factor correlation
patterns have to be simultaneously adhered to. Similar conceptual problems are
demonstrated by Bock (1975, pp. 417-420) for the analysis of discriminant function
coefficients.
Ten ASVAB Subtests Regressed on the Maior Kit Factors. The multivariate regression
model yields an inadmissible solution, with excessive residual covariance components for
Word Knowledge. The factor model (shown in Table 18), on the other hand, provides an
admissible solution at a reasonable fit (G2 = 4813.40, df = 1389, RMS, = 0.074). To
permit a limited model test, a hybrid model was constructed from the regression model by
restricting only the three residual covarianct components for the General Science,
Arithmetic Reasoning, and Word Knowledge subtests. This mixed model produced an
admissible solution which fit equally well (G2 = 4623.07, df = 1347, RMSR - 0.073) as
the factor model, even though the individual parameter estimates for the Ki_ Figural Fluency
and Vocabulary tests differ considerably. The data contain insufficik it information to
discriminate between the two models or to estimate the parameters reliably. Ideally, the
sample size should have been larger or the model should have been better defined (so that
additional restrictions could be imposed). For the time being, the estimated regression
equations for the ASVAB subtests do not support very detailed conclusions.
Table 18. Ten ASVAB Subtests Regressed onto Six Major Kit Factors.Restricted Factor Model, Uncorrelated ASVAB Residuals
Regression Equations
1 2 3 4 5 6
Spatial, Figurat Number/ VerbaL Associative VerbaL ResiduaLOrientation FLuency Speed Fluency Memory Memory Variance
1 GS .296 .337 -. 128 -1.379 -. 056 1.681 .4182 AR .641 -. 043 .246 -. 247 -. 027 .489 .2743 WK -.011 -161 -. 104 -1.011 .020 1.636 .3494 PC .127 .135 .080 -. 555 .068 .908 .6825 NO .047 .454 .704 -. 609 .160 .403 .3336 CS .045 .416 .669 -. 660 .200 .406 .4197 AS .490 .683 -. 322 -1.681 -. 135 1.458 .3278 MK .402 -. 020 .280 -. 231 .123 .505 .4319 MC .671 .365 -. 254 -. 973 -. 067 .951 .363
10 El .434 .550 -.179 -1.629 -. 161 1.640 .405
42
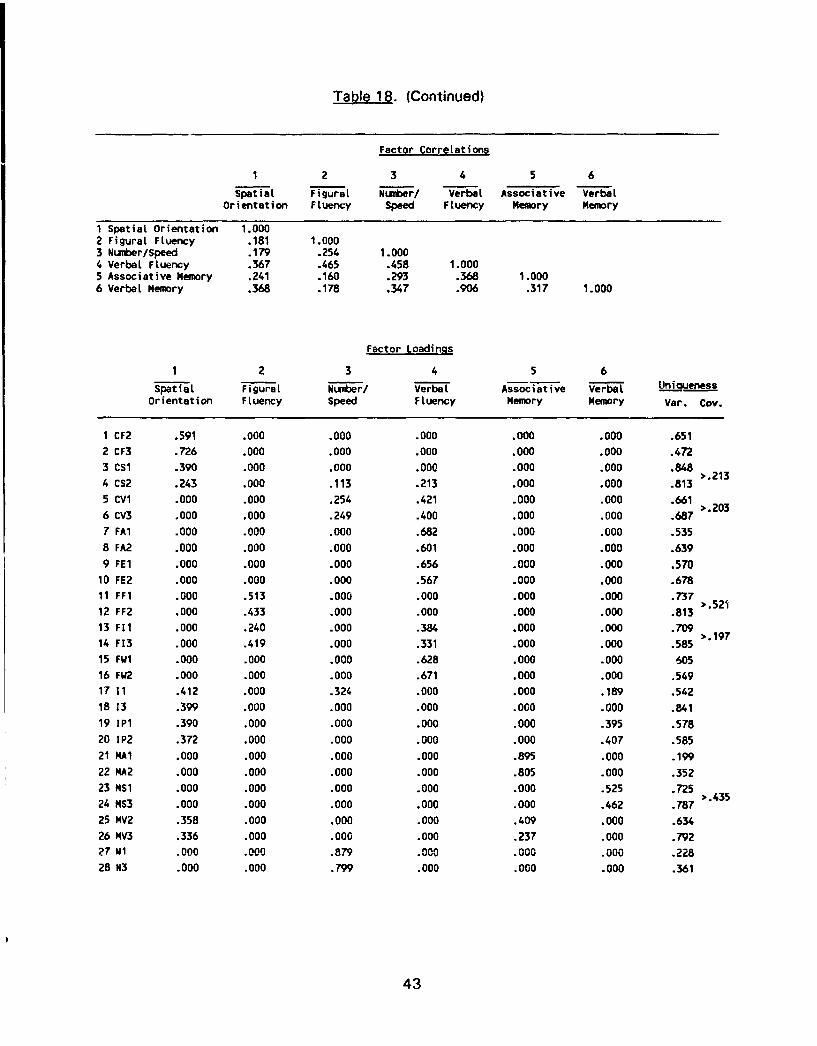
Table 18. (Continued)
Factor correlations
1 2 3 4 5 6
Spati a l F i gural Nutber/ Verba A issociative VerbaLOrientation Fluency Speed Fluency Memory Memory
1 Spatial Orientation 1.0002 Figural Fluency .181 1.0003 Number/Speed .179 .254 1.0004 Verbal Fluency .367 .465 .458 1.0005 Associative Memory .241 .160 .293 .368 1.0006 Verbal Memory .368 .178 .347 .906 .317 1.000
Factor Loadings
1 2 3 4 5 6
Spatial Figural Number/ Verbal Associative VerbalOrientation Fluency Speed Fluency Memory Memory Var. Cov.
1 CF2 .591 .000 .000 .000 .000 .000 .651
2 CF3 .726 .000 .000 .000 .000 .000 .472
3 CSI .390 .000 .000 .000 .000 .000 .848 213
4 CS2 .243 .000 .113 .213 .000 .000 .813
5 CV1 .000 .000 .254 .421 .000 .000 .661 >.2036 CV3 .000 .000 .249 .400 .000 .000 .6877 FA1 .000 .000 .000 .682 .000 .000 .535
8 FA2 .000 .000 .000 .601 .000 .000 .6399 FE1 .000 .000 .000 .656 .000 .000 .570
10 FE2 .000 .000 .000 .567 .000 .000 .67811 FF1 .000 .513 .000 .000 .000 .000 .737
12 FF2 .000 .433 .000 .000 .000 .000 .81313 F11 .000 .240 .000 .384 .000 .000 .709 >.19714 F13 .000 .419 .000 .331 .000 .000 .585
15 FWi .000 .000 .000 .628 .000 .000 60516 FW2 .000 .000 .000 .671 .000 .000 .549
17 11 .412 .000 .324 .000 .000 .189 .54218 13 .399 .000 .000 .000 .000 .000 .841
19 IP1 .390 .000 .000 .000 .000 .395 .578
20 IP2 .372 .000 .000 .000 .000 .407 .585
21 MAI .000 .000 .000 .000 .895 .000 .199
22 MA2 .000 .000 .000 .000 .805 .000 .352
23 MS1 .000 .000 .000 .000 .000 .525 .72524 MS3 .000 .000 .000 .000 .000 .462 .787
25 MV2 .358 .000 .000 .000 .409 .000 .634
26 MV3 .336 .000 .000 .000 .237 .000 .79227 NI .000 .000 .879 .000 .000 .000 .228
28 N3 .000 .000 .799 .000 .000 .000 .361
43
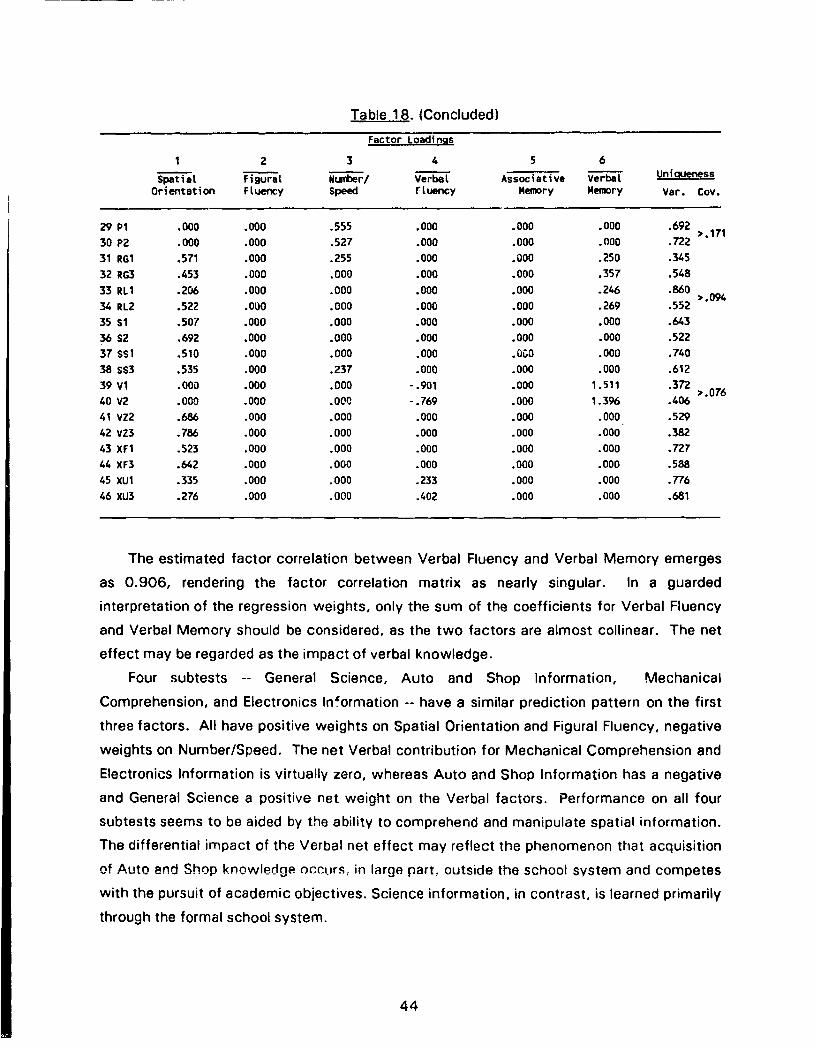
Table 18. (Concluded)
Factor Loadings
1 2 3 4 5 6
Spatial Figural Number/ Verbal Associative Verbal UniquenessOrientation Fluency Speed rluency Memory Memory Var. Cov.
29 P1 .000 .000 .555 .000 .000 .000 .692 >.17130 P2 .000 .000 .527 .000 .000 .000 .722
31 RG1 .571 .000 .255 .000 .000 .250 .345
32 RG3 .453 .000 .000 .000 .000 .357 .548
33 RLl .206 .000 .000 .000 .000 .246 .860 ">.09434 RL2 .522 .000 .000 .000 .000 .269 .552
35 S1 .507 .000 .000 .000 .000 .000 .64336 S2 .692 .000 .000 .000 .000 .000 .522
37 SS1 .510 .000 .000 .000 .000 .000 .74038 SS3 .535 .000 .237 .000 .000 .000 .612
39 Vi .000 .000 .000 -. 901 .000 1.511 .372 >.07640 V2 .000 .000 .000 -. 769 .000 1.396 .406
41 VZ2 .686 .000 .000 .000 .000 .000 .52942 VZ3 .786 .000 .000 .000 .000 .000 .38243 XF1 .523 .000 .000 .000 .000 .000 .727
44 XF3 .642 .000 .000 .000 .000 .000 .588
45 XUl .335 .000 .000 .233 .000 .000 .776
46 xU3 .276 .000 .000 .402 .000 .000 .681
The estimated factor correlation between Verbal Fluency and Verbal Memory emerges
as 0.906, rendering the factor correlation matrix as nearly singular. In a guarded
interpretation of the regression weights, only the sum of the coefficients for Verbal Fluency
and Verbal Memory should be considered, as the two factors are almost collinear. The net
effect may be regarded as the impact of verbal knowledge.
Four subtests -- General Science, Auto and Shop Information, Mechanical
Comprehension, and Electronics Information -- have a similar prediction pattern on the first
three factors. All have positive weights on Spatial Orientation and Figural Fluency, negative
weights on Number/Speed. The net Verbal contribution for Mechanical Comprehension and
Electronics Information is virtually zero, whereas Auto and Shop Information has a negative
and General Science a positive net weight on the Verbal factors. Performance on all four
subtests seems to be aided by the ability to comprehend and manipulate spatial information.
The differential impact of the Verbal net effect may reflect the phenomenon that acquisition
of Auto and Shop knowledge occurs, in large part, outside the school system and competes
with the pursuit of academic objectives. Science information, in contrast, is learned primarily
through the formal school system.
44
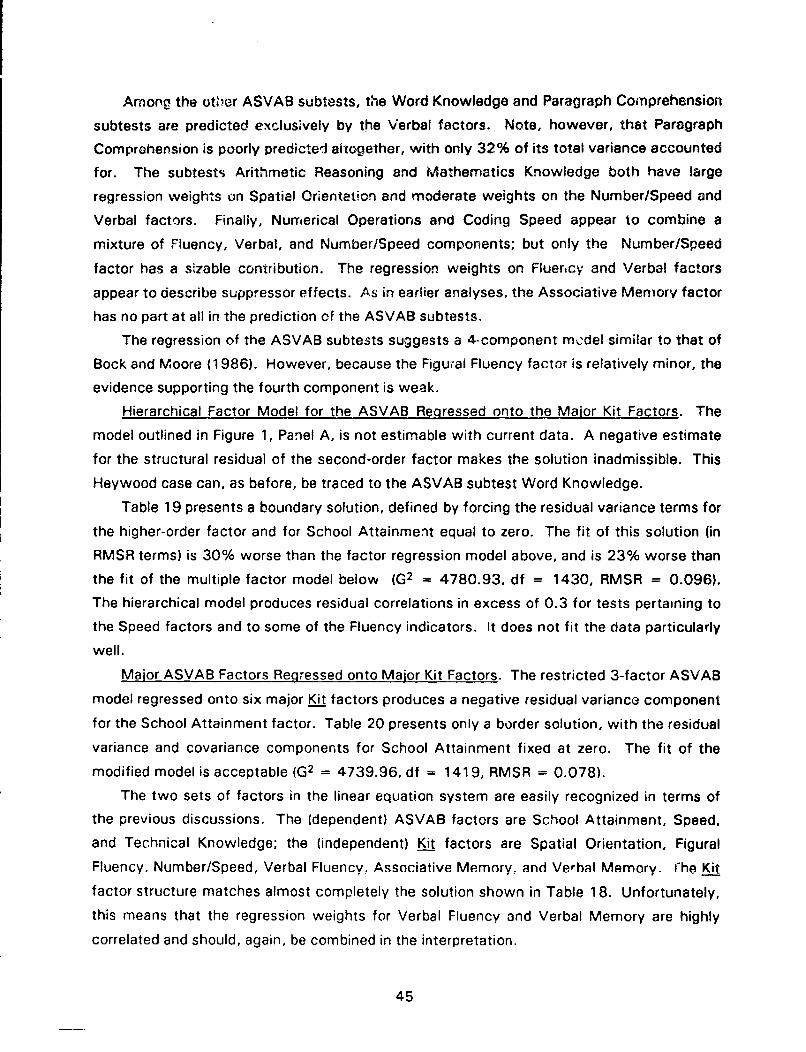
Among the other ASVAB subtests, the Word Knowledge and Paragraph Comprehension
subtests are predicted exclusively by the Verbal factors. Note, however, that Paragraph
Comprehension is poorly predicted altogether, with only 32% of its total variance accounted
for. The subtests Arithmetic Reasoning and iathematics Knowledge both have large
regression weights on Spatial Orientation and moderate weights on the Number/Speed and
Verbal factors. Finally, Numerical Operations and Coding Speed appear to combine a
mixture of Fluency, Verbal, and Number/Speed components; but only the Number/Speed
factor has a sizable contribution. The regression weights on Fluency and Verbal factors
appear to describe suppressor effects. As in earlier analyses, the Associative Memory factor
has no part at all in the prediction of the ASVAB subtests.
The regression of the ASVAB subtests suggests a 4-component model similar to that of
Bock and Moore (1986). However, because the Figural Fluency factor is relatively minor, the
evidence supporting the fourth component is weak.
Hierarchical Factor Model for the ASVAB Regressed onto the Major Kit Factors. The
model outlined in Figure 1, Panel A, is not estimable with current data. A negative estimate
for the structural residual of the second-order factor makes the solution inadmissible. This
Heywood case can, as before, be traced to the ASVAB subtest Word Knowledge.
Table 19 presents a boundary solution, defined by forcing the residual variance terms for
the higher-order factor and for School Attainment equal to zero. The fit of this solution (in
RMSR terms) is 30% worse than the factor regression model above, and is 23% worse than
the fit of the multiple factor model below (G2 = 4780.93, df = 1430, RMSR = 0.096).
The hierarchical model produces residual correlations in excess of 0.3 for tests pertaining to
the Speed factors and to some of the Fluency indicators. It does not fit the data particularly
well.
Major ASVAB Factors Repressed onto Major Kit Factors. The restricted 3-factor ASVAB
model regressed onto six major Kit factors produces a negative residual variance component
for the School Attainment factor. Table 20 presents only a border solution, with the residual
variance and covariance components for School Attainment fixed at zero. The fit of the
modified model is acceptable (G2 = 4739.96, df = 1419, RMSR = 0.078).
The two sets of factors in the linear equation system are easily recognized in terms of
the previous discussions. The (dependent) ASVAB factors are School Attainment, Speed,
and Technical Knowledge; the (independent) Kit factors are Spatial Orientation, Figural
Fluency. Number/Speed, Verbal Fluency, Associative Memory, and Verbal Memory. I'he Kit
factor structure matches almost completely the solution shown in Table 18. Unfortunately,
this means that the regression weights for Verbal Fluency and Verbal Memory are highly
correlated and should, again, be combined in the interpretation.
45
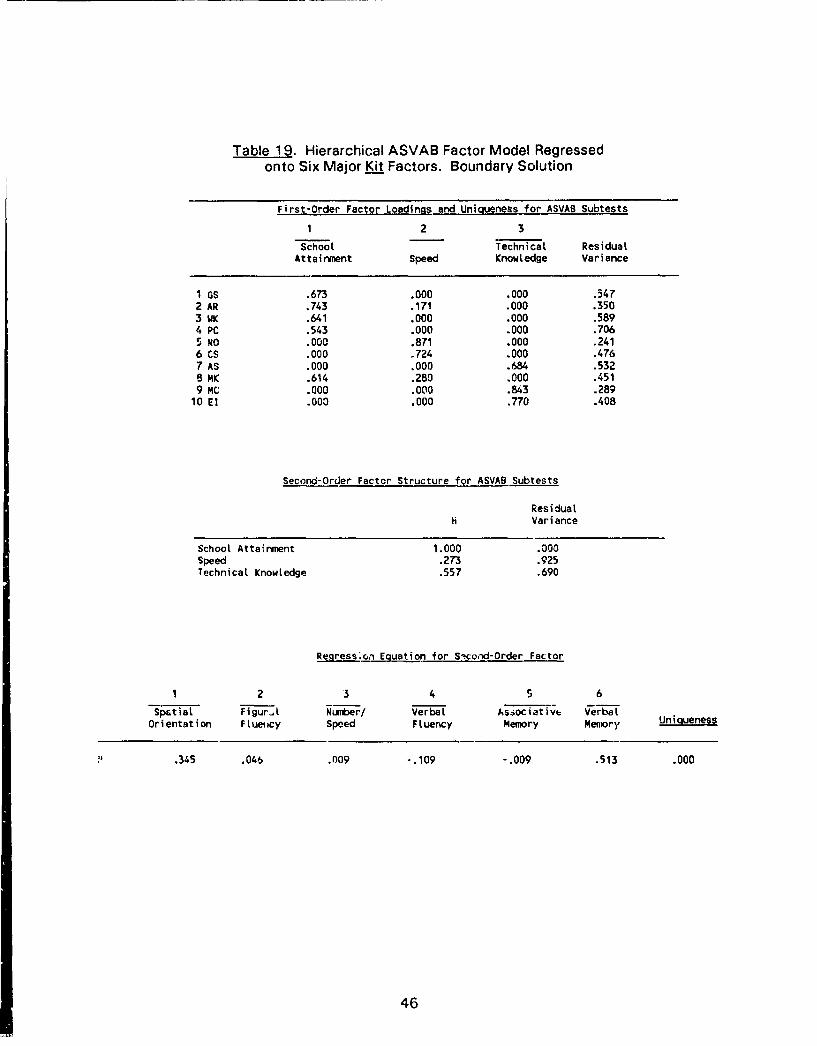
Table 19. Hierarchical ASVAB Factor Model Regressedonto Six Major Kit Factors. Boundary Solution
First-Order Factor Loadings and Uniqueness for ASVAS Subtests
1 2 3
School Technical ResidualAttainment Speed Knowledge Variance
1 GS .673 .000 .000 .5472 AR .743 .171 .000 .3503 WK .641 .000 .000 .5894 PC .543 .000 .000 .706S NO .000 .871 .000 .2416 CS .000 J724 .000 .4767 AS .000 .000 .684 .532B MK .614 .280 .000 .4519 MC .000 .000 .843 .289
10 El .000 .000 .770 .408
Second-Order Factor Structure for ASVAB Subtests
ResidualVariance
School Attainment 1.000 .000Speed .273 .925Technical Knowledge .557 .690
Regresson Equation for Sicond-Order Factor
1 2 3 4 5 6
Spatial Figural Number/ Verbal Associativt VerbalOrientation Fluency Speed Fluency Memory Memory Uniqueness
.345 .046 .o09 -. 109 -. 009 .513 .000
46
Table 19. (Continued)
Factor Loadings for the Kit
1 2 3 4 5 6
Spatial Figural. Number/ VerbaL Associative Verbal Uni oness
Orientation Fluency Speed Fluency Memory Memory Var. Coy.
1 CF2 .600 .000 .000 .000 .000 .000 .6402 CF3 .739 .000 .000 .000 .000 .000 .454
3 CS1 .397 .000 .000 .000 .000 .000 .8434 CS2 .236 .000 .225 .158 .000 .000 .794
5 CV1 .000 .000 .369 .359 .000 .000 .628
6 CV3 .000 .000 .258 .397 .000 .000 .6947 FA1 .000 .000 .000 .720 .000 .000 .481
8 FA2 .000 .000 .000 .625 .000 .000 .610
9 FEI .000 .000 .000 .671 .000 .000 .55010 FEZ .000 .000 .000 .589 .000 .000 .65411 FF1 .000 .672 .000 .000 .000 .000 .:48 '.39912 FF2 .000 .513 .000 .000 .000 .000 .737
13 F11 .000 .269 .000 .414 .000 .000 .67914 F13 .000 .367 .000 .406 .000 .000 .59715 FW1 .000 .000 .000 .638 .000 .000 .593
16 FW2 .000 .000 .000 .691 .000 .000 .523
17 11 .416 .000 .311 .000 .000 .196 .55118 13 .409 .000 .000 .000 .000 .000 .833
19 IP1 .344 .000 .000 .000 .000 .483 .53720 IP2 .343 .000 .000 .000 .000 .467 .557
21 MA1 .000 .000 .000 .000 .889 .000 .210
22 MA2 .000 .000 .000 .000 .813 .000 .34023 MS1 .000 .000 .000 .000 .000 .545 .70324 MS3 .000 .000 .000 .000 .000 .495 .755
25 MV2 .358 .000 .000 .000 .417 .000 .63026 MV3 .342 .000 .000 .000 .231 .000 .794
27 N1 .000 .000 .929 .000 .000 .000 .137
28 N3 .000 .000 .785 .000 .000 .000 .384
29 P1 .000 .000 .548 .000 .000 .000 .69930 P2 .000 .000 .482 .000 .000 .000 .767
31 RG1 .472 .000 .188 .000 .000 .424 .34232 RG3 .429 .000 .000 .000 .000 .406 .534
33 RL1 .193 .000 .000 .000 .000 .269 .855 '.08734 RL2 .513 .000 .000 .000 .000 .309 .53635 S1 .612 .000 .000 .000 .000 .000 .625
36 S2 .704 .000 .000 .000 .000 .000 .50537 SS1 .515 .000 .000 .000 .000 .000 .734
38 SS3 .514 .000 .294 .000 .000 .000 .59839 V1 .000 .000 .000 -. 052 .000 .706 .550 '.22640 V2 .000 .000 .000 -. 074 .000 .736 .53041 VZ2 .698 .000 .000 .000 .000 .000 .513
42 VZ3 .804 .000 .000 .000 .000 .000 .35443 XF1 .528 .000 .000 .000 .000 .000 .72144 XF3 .653 .000 .000 .000 .000 .000 .573
45 XU1 .311 .000 .000 .275 .000 .000 .766
46 XU3 .290 .000 .000 .414 .000 .000 .657
47
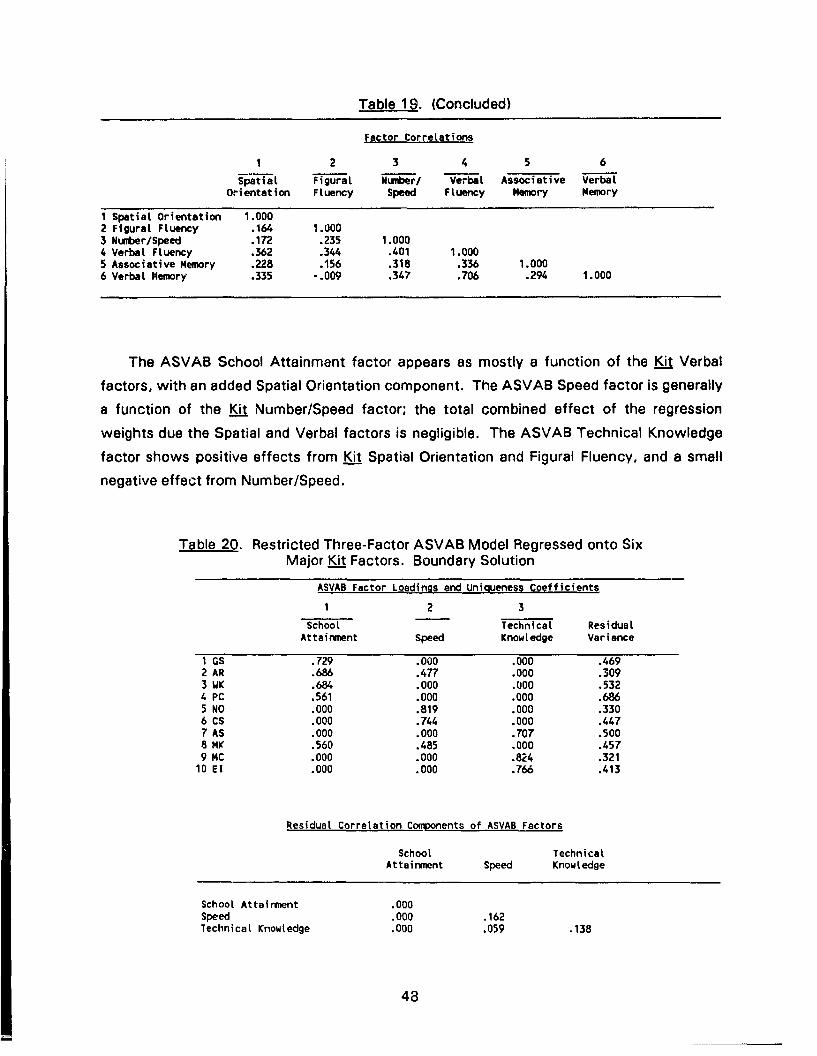
Table 19. (Concluded)
Factor Correlations
1 2 3 4 5 6
Spatial Figural Nuwmer/ Verbal- Associative VerbalOrientation Fluency Speed Fluency Memory Memory
1 Spatial Orientation 1.0002 Figural Fluency .164 1.0003 Number/Speed .172 .235 1.0004 Verbal Fluency .362 .344 .401 1.0005 Associative Memory .228 .156 .318 .336 1.0006 VerbaL Memory .335 -. 009 .347 .706 .294 1.000
The ASVAB School Attainment factor appears as mostly a function of the Kit Verbal
factors, with an added Spatial Orientation component. The ASVAB Speed factor is generally
a function of the Kit Number/Speed factor; the total combined effect of the regressionweights due the Spatial and Verbal factors is negligible. The ASVAB Technical Knowledge
factor shows positive effects from Kit Spatial Orientation and Figural Fluency, and a small
negative effect from Number/Speed.
Table 20. Restricted Three-Factor ASVAB Model Regressed onto SixMajor Kit Factors. Boundary Solution
ASVAB Factor Loadings and Uniqueness Coefficients
1 2 3
School Technical ResidualAttainment Speed Knowledge Variance
I GS .729 .000 .000 .4692 AR .686 .477 .000 .3093 WK .684 .000 .000 .5324 PC .561 .000 .000 .6865 NO .000 .819 .000 .3306 CS .000 .744 .000 .4477 AS .000 .000 .707 .5008 MK .560 .485 .000 .4579 MC .000 .000 .824 .321
10 El .000 .000 .766 .413
Residual Correlation Components of ASVAS Factors
School TechnicalAttainment Speed Knowledge
School Attainment .000Speed .000 .162Technical Knowledge .000 .059 .138
48
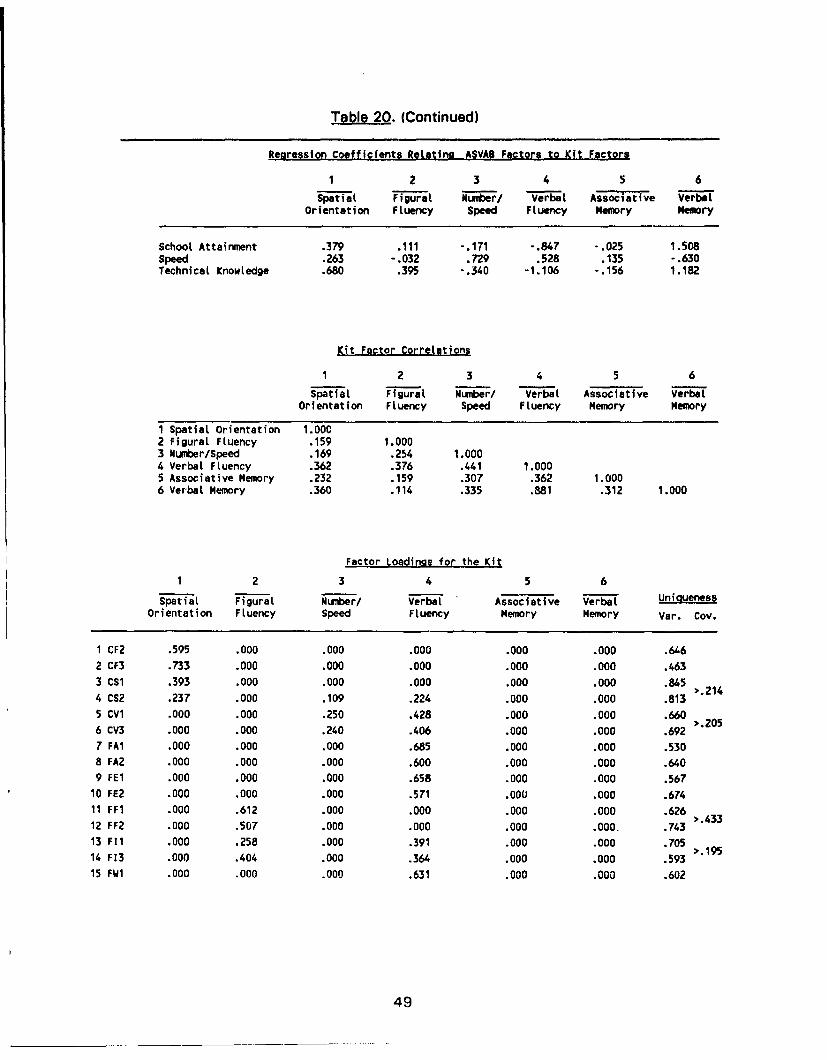
Table 20. (Continued)
Regression Coefficients Relating 6SVAB Factors to Kit Factors
1 2 3 4 5 6
Spatiat Fig[ur NuLber/ Verbal Associative VerbalOrientation Fluency Speed Fluency Memory Memory
School Attainment .379 .111 -. 171 -.847 -. 025 1.508Speed .263 -. 032 .729 .528 .135 -. 630Technical Knowledge .680 .395 -. 340 -1.106 -. 156 1.182
Kit Factor Corretations
1 2 3 4 5 6
SpatiaL Figurea NuWber/ Verbal Associative VerbalOrientation Fluency Speed Fluency Memory Memory
I Spatial Orientation 1.0002 Figural Fluency .159 1.0003 Number/Speed .169 .254 1.0004 Verbal Fluency .362 .376 .441 1.0005 Associative Memory .232 .159 .307 .362 1.0006 Verbal Memory .360 .114 .335 .881 .312 1.000
Factor Loadings for the Kit
1 2 3 4 5 6
SpatiaL Figural Number/ Verbal Associative Verbal UniquenessOrientation FLuency Speed Fluency Memory Memory Var. Coy.
1 CF2 .595 .000 .000 .000 .000 .000 .6462 CF3 .733 .000 .000 .000 .000 .000 .4633 CS1 .393 .000 .000 .000 .000 .000 .845 '.2144 C52 .237 .000 .109 .224 .000 .000 .8135 CVI .000 .000 .250 .428 .000 .000 .660 '.2056 CV3 .000 .000 .240 .406 .000 .000 .6927 FAI .000 .000 .000 .685 .000 .000 .5308 FA2 .000 .000 .000 .600 .000 .000 .6409 FEI .000 .000 .000 .658 .000 .000 .567
10 FE2 .000 .000 .000 .571 .000 .000 .67411 FF1 .000 .612 .000 .000 .000 .000 .62612 FF2 .000 .507 .000 .000 .000 .000. .74313 FI1 .000 .258 .000 .391 .000 .000 .70514 F13 .000 .404 .000 .364 .000 .000 .59315 FW1 .000 .000 .000 .631 .000 .000 .602
49
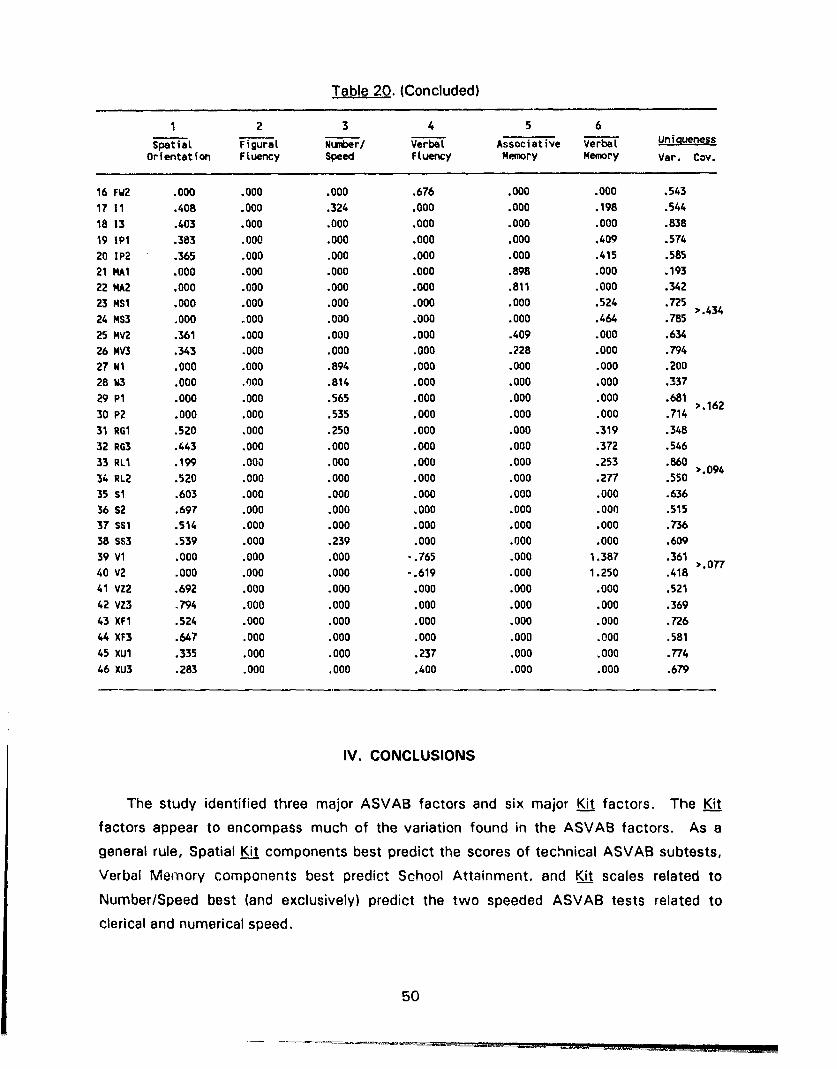
Table 20. (Concluded)
1 2 3 4 5 6
SpatiaL FiguraL Number/ Verbal Associative VerbaL UniquenessOrientation FLuency Speed Ftuency Nemory Memory Var. Coy.
16 FW2 .000 .000 .000 .676 .000 .000 .54317 1i .408 .000 .324 .000 .000 .198 .544
18 13 .403 .000 .000 .000 .000 .000 .83819 WI .383 .000 .000 .000 .000 .409 .57420 IP2 .365 .000 .000 .000 .000 .415 .58521 MA1 .000 .000 .000 .000 .898 .000 .19322 MA2 .000 .000 .000 .000 .811 .000 .34223 MSI .000 .000 .000 .000 .000 .524 .72524 MS3 .000 .000 .000 .000 .000 .464 .78525 MV2 .361 .000 .000 .000 .409 .000 .63426 MV3 .343 .000 .000 .000 .228 .000 .79427 Ni .000 .000 .894 .000 .000 .000 .20028 W3 .000 .000 .814 .000 .000 .000 .33729 P1 .000 .000 .565 .000 .000 .000 .681 >.16230 P2 .000 .000 .535 .000 .000 .000 .714
31 RG1 .520 .000 .250 .000 .000 .319 .34832 RG3 .443 .000 .000 .000 .000 .372 .54633 RLI .199 .000 .000 .000 .000 .253 .860 >.09434 RL2 .520 .000 .000 .000 .000 .277 .55035 Si .603 .000 .000 .000 .000 .000 .63636 S2 .697 .000 .000 .000 .000 .000 .51537 SSI .514 .000 .000 .000 .000 .000 .73638 WS3 .539 .000 .239 .000 .000 .000 .60939 V1 .000 .000 .000 -. 765 .000 1.387 .361 >.07740 V2 .000 .000 .000 -. 619 .000 1.250 .41841 VZ2 .692 .000 .000 .000 .000 .000 .52142 VZ3 .794 .000 .000 .000 .000 .000 .36943 XF1 .524 .000 .000 .000 .000 .000 .726
44 XF3 .647 .000 .000 .000 .000 .000 .58145 XUl .335 .000 .000 .237 .000 .000 .77446 XU3 .283 .000 .000 .400 .000 .000 .679
IV. CONCLUSIONS
The study identified three major ASVAB factors and six major Kit factors. The Kit
factors appear to encompass much of the variation found in the ASVAB factors. As a
general rule, Spatial Kit components best predict the scores of technical ASVAB subtests,
Verbal Memory components best predict School Attainment, and Kit scales related to
Number/Speed best (and exclusively) predict the two speeded ASVAB tests related to
clerical and numerical speed.
50
The KiA factor analyses consistently produced a Verbal Fluency component, in addition
to the Verbal Memory factor. Though the results clearly show the need for a
two-dimensional construct of verbal ability, the correlation between the two factors
appeared to be rather unstable in the present study. Some future effort should be made to
map the factor structure of the verbal domain more clearly. Verbal fluency appears to be a
necessary aptitude for all successful writers, whereas the ability to retain verbal content in
memory would affect performance in nearly all occupational fields.
It may be noted that the indicators of the Kit Spatial Orientation factor are all rather
exclusively comprised of older spatial tasks that tend to permit solutions by non-analog (i.e.,
non-visualizing or non-image-manipulating) strategies (cf., Zimowski & Wothke, 1986). It is
therefore not surprising that a number of clearly nonspatial reasoning tasks showed
substantial loadings on this so-called Spatial Orientation factor. The spatial domain should,
in future studies, be studied with analog spatial tests like the Vandenberg-Shepard Mental
Rotations test.
Apart from these cautionary remarks, the study clearly identified Figural Fluency and
Associative Memory as specific, but stable ability factors that are not at all addressed by the
ASVAB. At the time of this writing we can only speculate what possible predictive validity
the two new dimensions might have; but, judging from itsz io,;tel', one could easily imagine
that Figural Fluency may be a rather important component in the production and
understanding of technical and/or spatial information. A literature search would produce
some prior validity studies of the pertinent tests. This information may give rise to further
validity studies. Technical illustrators and electronic circuit board designers, for instance,
would be important target groups.
It is a little harder to conjecture where Associative Memory may play an important role in
job performance. Air controllers and a limited number of intelligence and communications
tasks might currently be affected. Again, a literature search would provide a good amount of
useful information. However, further validity testing for the mentioned occupations should
proceed with care, for the occupational demands are currently in a process of rapid change
due to the introduction of advanced technology into these areas.
51
REFERENCES
Allison, P. 0. (1987). Estimation of linear models with incomplete data. In C. Clogg [Ed.jSociological methodology, 1987. Washington, DC: American Sociological Association.
Anderson, J. C., & Gerbing, D. W. (1984). The effect of sampling error on convergence,improper solutions and goodness-of-fit indices for maximum likelihood confirmatoryfactor analysis. Psychometrika, 49(2), 155-173.
Anderson, T. W. (1984). An Introduction to multivariate statistical analysis (2nd ed.). NewYork; Wiley.
Anderson, T. W., & Rubin, H. (1956). Statistical inference in factor analysis. In J. Neyman[Ed.], Proceedings of the Third Berkeley Symposium on Mathematical Statistics andProbability. Berkeley: University of California Press.
Bock, R. D. (1975). Multivariate statistical methods for behavioral research. New York:McGraw-Hill.
Bock, R. D., & Moore, E. G. J. (1986). Advantage and disadvantage: A profile of theAmerican youth. Hillsdale, NJ: Lawrence Earlbaum.
Bollen, K. A. (1989). Structural equations with latent variables. New York: Wiley.
Browne, M. W. (1980). Factor analysis of multiple batteries by maximum likelihood. BritishJournal of Mathematical and Statistical Psychology, 30, 113-124.
Bureau of Census. (1988). Statistical abstract of the United States. Washington, DC: U.S.Government Printing Office.
Department of Defense, (1983). Manual for administration, Armed Services VocationalAptitude Battery. (DoD 1304.1 2A) Washington, DC: Author.
Ekstrom, R. B., French, J. W., Harman, H. H., with Derman, D. (1976a). ETS Kit offactor-referenced cognitive tests. Princeton, NJ: Educational Testing Service.
Ekstrom, R. B., French, J. W., Harman, H. H., with Derman, D. (1976b). Manual for Kit offactor-referenced cognitive tests. Princeton, NJ: Educational Testing Service.
Hauser, R. M., & Goldberger, A. S. (1971). The treatment of unobservable variables in pathanalysis. In H. L. Costner (Ed.), Sociological Methodology, (pp. 81-117) San Francisco,C. A. Jossey-Bass.
Hendrickson, A. E., & White, P. 0. (1964). Promax: a quick method for rotation to obliquesimple structure. British Journal of Mathematical and Statistical Psychology, 17, 65-70.
Hunter, J. E., Crosson, J. J., & Friedman, D. H. (1985). The validity of the Armed ServicesVocational Aptitude Battery (ASVAB) for civilian and military job performance(Contract No. F41689-83-C-0025). Washington, DC: HQ USAF/MPXOA,Department of Defense.
52
Joreskog, K. G., & Sorbom, D. (1989). LISREL 7 User's reference guide. Mooresville, IN:Scientific Software, Inc.
Kendall, M., & Stuart, A. (1977). The advanceu ýheorv of statistics: Vol. 1. Distributiontheory. London, GB: Charles Griffin.
Palmer, P., Haywood, C. S., Fairbank, B. A., & Earles, J. A. (1990). Comparison of theArmed Services Vocational Aptitude Battery to the General Aptitude Test Battery(AFHRL-TP-90-8, AD-A221 551). Brooks AFB, TX: Manpower and PersonnelDivision, Air Force Human Resources Laboratory.
Ree, M. J., Mullins, C. J., Mathews, J. J., & Massey, R. H. (1982). Armed ServicesVocational Aptitude Battery: Item and factor analyses of Forms 8, 9. and 10(AFHRL-TR-81-55, AD-A113 465). Brooks AFB, TX: Manpower and PersonnelDivision, Air Force Human Resources Laboratory.
Welsh, J. R., Jr., Kucinkas, S. K., & Curran, L. (1990). Armed Service Vocational AptitudeBattery (ASVAB): Integrative review of validity studies (AFHRL-TR-90-22,AD-A225 074). Brooks AFB, TX: Manpower and Personnel Division, Air ForceHuman Resources Laboratory.
Zimowski, M. F., & Wothke, W. (1986). The Measurement of human variation in spatialvisualizing ability: A Process-oriented perspective Chicago, IL: Johnson O'ConnorResearch Foundation. (Also: Washington, DC: U.S. Dept. of Ed., Educational ResourcesInformation Center, TM 012 916).
53

APPENDIX A: FACTOR-REFERENCED TEST SCORING CATEGORIES
Category 1: Tests with objective test items and comprehensive answer keys. Letters or numbers mfustoccasionally be deciphered.
CF-2 -- Hidden Patterns TestCS-2 -- Concealed Words Test1-i -- Letter Sets TestI- -- Figure Classification Test
IP-1 ,- Calendar TestIP-2 -- Following Directions TestMA-1 -- Picture-Number TestMA-2 -- Object-NuTber TestMS-1 -- Auditory Number Span TestMS-3 -- Auditory Letter Span TestMV-2 -- Building Memory TestMV-3 -- Map Memory Test
N-1 -- Addition TestN-3 -- Subtraction & Multiplication TestP-1 -- Finding A's TestP-2 -- Numuer Comparison Test
RG-1 -- Arithmetic Aptitude TestRG-3 -- Necessary Arithmetic Operations TestRL-1 -- Nonsense SyLLogisms TestRL-2 -- Diagraiming Relationships Test
S-1 -- Card Rotations TestS-2 -- Cube Comparisons Test
SS-i -- Maze Tracing Speed TestSS-3 - Map Planning Test
V-1 -- Vocabulary I TestV-2 -- Vocabulary i1 Test
VZ-2 -- Paper Folding TestVZ-3 -- Surface Development lestXF-3 -- Storage Test
Category 2: Tests with noncorrprehensive answer keys. Items may have several acceptable solutions oranswers. Marks or handwriting mast often be deciphered.
CF-3 -- Copying TeatCS-i -- Gestalt Completion TestCV-1 -- Scrambted Words TestCV-3 -- Inzomplete Words TestFA-1 -- ControLled Associations TestFA-2 -- Opposites TestFW-1 -- Word Endings TestFW-2 -- Word Beginnings TestXF-1 -- Toothpicks TestXU-1 -- Comrbining Objects Test
Category 3: Open-ended test items without answer keys. Substantial scorer judgment is required anddeciphering of handwriting is often recessary.
FE-1 -- Making Sontences TestFE-2 -- Arranging Words TestFF-1 -- Ornamentation TestFF-2 -- Elaboration TestFl-i -- Topics TestFI-3 -- Thing Categories TestXU-3 -- Making Groups Test
55
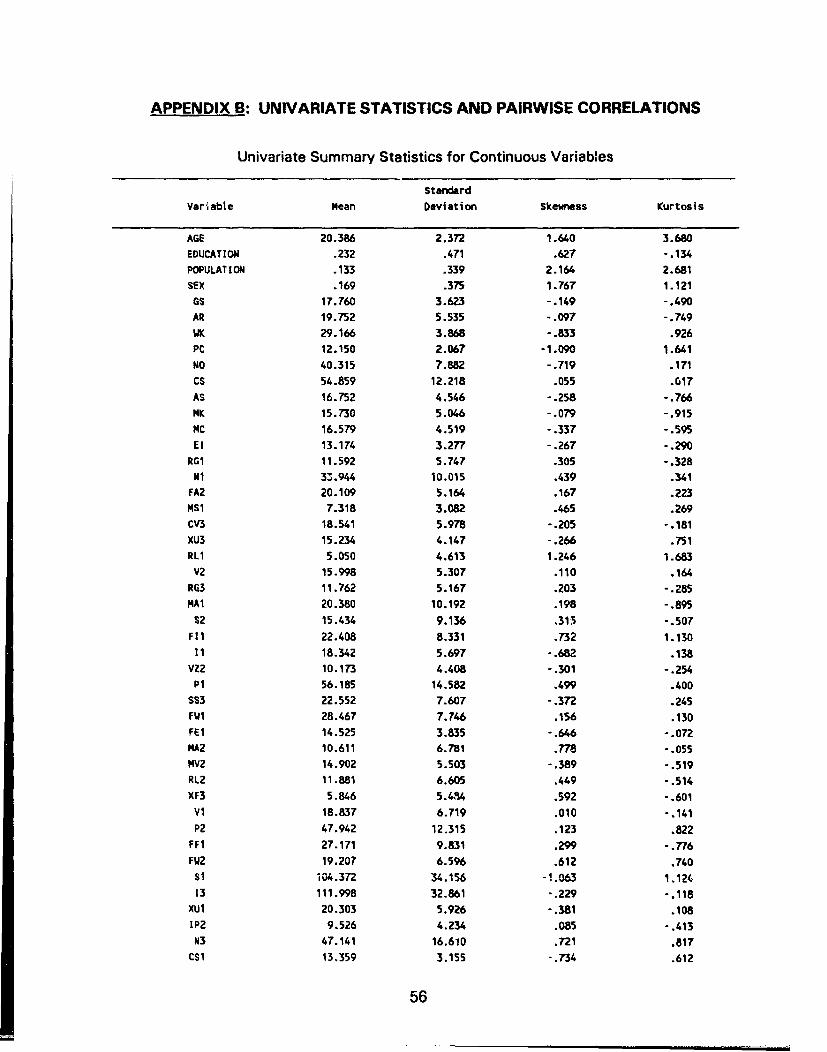
APPENDIX B: UNIVARIATE STATISTICS AND PAIRWISE CORRELATIONS
Univariate Summary Statistics for Continuous Variables
StandardVariabte Mean Deviation Skewness Kurtosis
AGE 20.386 2.372 1.640 3.680EDUCATION .232 .471 .627 -. 134POPULATION .133 .339 2.164 2.681SEX .169 .375 1.767 1.121
GS 17.760 3.623 - .149 - .490AR 19.752 5.535 -. 097 -. 749WK 29.166 3.868 -. 833 .926PC 12.150 2.067 -1.090 1.641NO 40.315 7.882 -. 719 .171CS 54.859 12.218 .055 .017AS 16.752 4.546 -. 258 -. 766MK 15.730 5.046 - .079 -. 915MC 16.579 4.519 -. 337 - .595El 13.174 3.277 -. 267 -. 290
RG1 11.592 5.747 .305 -. 328Nl 33.944 10.015 .439 .341
FA2 20.109 5.164 .167 .223MS1 7.318 3.082 .465 .269CV3 18.541 5.978 -. 205 -. 181XU3 15.234 4.147 - .266 .751RL1 5.050 4.613 1.246 1.683
V2 15.998 5.307 .110 .164RG3 11.762 5.167 .203 -. 285MAl 20.380 10.192 .198 -. 895
S2 15.434 9.136 .315 -. 507FIl 22.408 8.331 .732 1.130
11 18.342 5.697 -.682 .138VZ2 10.173 4.408 -. 301 -. 254P1 56.185 14.582 .499 .400
SS3 22.552 7.607 - .372 .245Mi 28.467 7.746 .156 .130
FE1 14.525 3.835 -. 646 -. 072MhA2 10.611 6.781 .778 -. 055MV2 14.902 5.503 -. 389 - .519RL2 11.881 6.605 .449 -. 514XF3 5.846 5.4,4 .592 -. 601Vi 18.837 6.719 .010 - .141P2 47.942 12.315 .123 .822
FF1 27.171 9.831 .299 -. 776FW2 19.207 6.596 .612 .740Si iG4.372 34.156 -1.063 1.12413 111.998 32.861 -. 229 -. 118
XU1 20.303 5.926 - .381 .108IP2 9.526 4.234 .085 -. 413W3 47.141 16.610 .721 .817
CS1 13.359 3.155 -. 734 .612
56
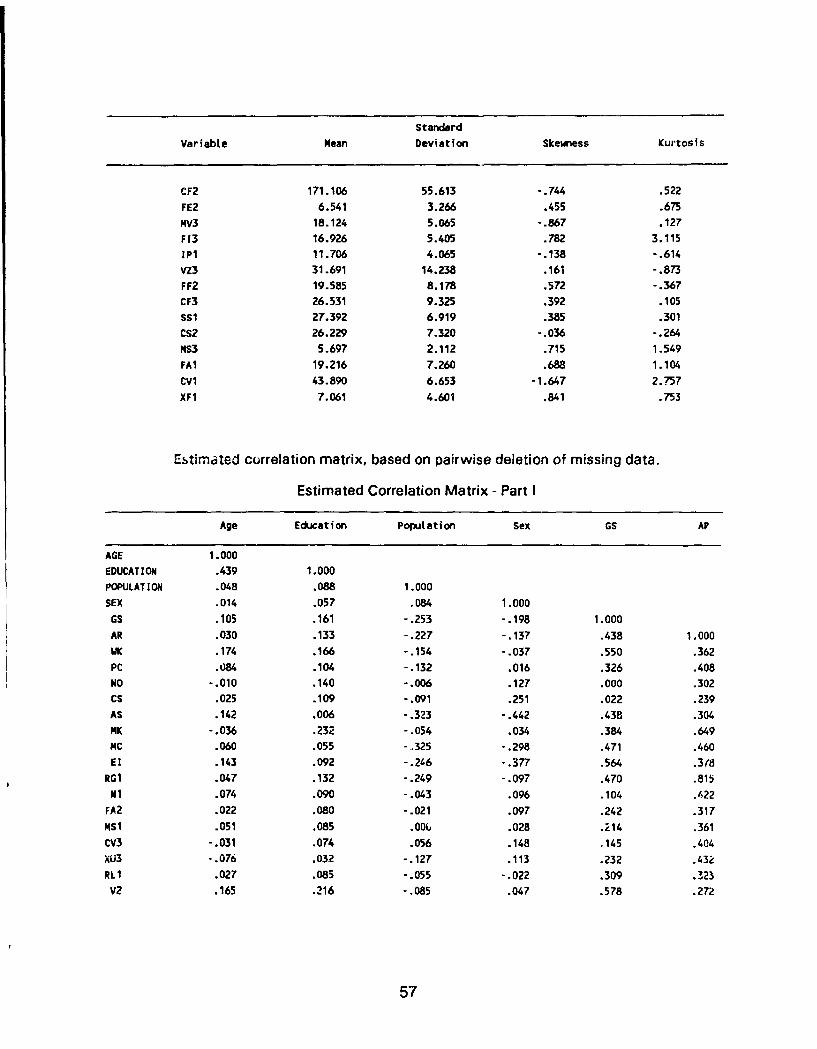
StandardVariable Mean Deviation Skewness Kurtosis
CF2 171.106 55.613 -. 744 .522FE2 6.541 3.266 .455 .675MV3 18.124 5.065 -. 867 .127F13 16.926 5.405 .782 3.115IP1 11.706 4.065 -. 138 -. 614VZ3 31.691 14.238 .161 -. 873FF2 19.585 8.178 .572 -. 367CF3 26.531 9.325 .392 .105SS1 27.392 6.919 .385 .301CS2 26.229 7.320 -. 036 -. 264
M53 5.697 2.112 .715 1.549FAl 19.216 7.260 .688 1.104CVl 43.890 6.653 -1.647 2.757XF1 7.061 4.601 .841 .753
Estimated correlation matrix, based on pairwise deletion of missing data.
Estimated Correlation Matrix - Part I
Age Education Population Sex GS AP
AGE 1.000EDUCATION .439 1.000POPULATION .048 .088 1.000SEX .014 .057 .084 1.000GS .105 .161 -. 253 -. 198 1.000AR .030 .133 -. 227 -. 137 .438 1.000WK .174 .166 -. 154 -. 037 .550 .362PC .084 .104 -. 132 .016 .326 .408NO -. 010 .140 -. 006 .127 .000 .302CS .025 .109 -. 091 .251 .022 .239AS .142 .006 -. 323 -. 442 .438 .304MK - .036 .232 - .054 .034 .384 .649
MC .060 .055 - 325 -. 298 .471 .460El .143 .092 -. 246 -. 377 .564 .3/8
RG1 .047 .132 -. 249 - .097 .470 .815N1 .074 .090 -. 043 .096 .104 .422
FA2 .022 .080 -. 021 .097 .242 .317NS1 .051 .085 .OO i .028 .Z14 .361CV3 -. 031 .074 .056 .148 .145 .404XU3 -. 076 .032 - .127 .113 .232 .432
RL1 .027 .085 -. 055 - .022 .309 .323V2 .165 .216 -. 085 .047 .578 .272
57
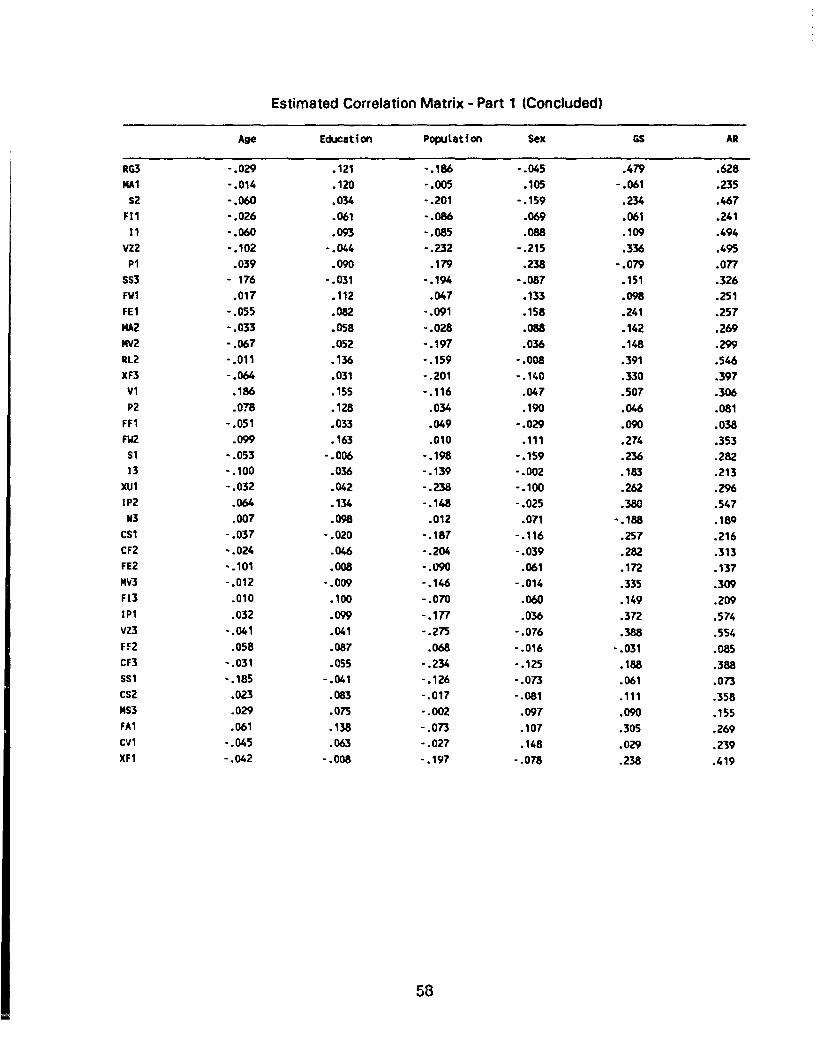
Estimated Correlation Matrix - Part 1 (Concluded)
Age Educat i on Poputation Sex GS AR
RG3 -. 029 .121 -. 186 -. 045 .479 .628KA1 -. 014 .120 -. 005 .105 -. 061 .235
S2 - .060 .034 -. 201 - .159 .234 .467F11 -. 026 .061 -. 086 .069 .061 .24111 -. 060 .093 -. 085 .088 .109 .494
VZ2 -. 102 -. 044 -.232 -. 215 .336 .495P1 .039 .090 .179 .238 -. 079 .077
SS3 - 176 -. 031 -. 194 -. 087 .151 .326WI .017 .112 .047 .133 .098 .251
FE1 -. 055 .082 -. 091 .158 .241 .257MA2 -. 033 .058 -. 028 .088 .142 .269MV2 -. 067 .052 -. 197 .036 .148 .299RL2 -. 011 .136 -. 159 -. 008 .391 .546XF3 - .064 .031 -. 201 -. 140 .330 .397Vi .186 .155 -. 116 .047 .507 .306P2 .078 .128 .034 .190 .046 .081
FF1 - .051 .033 .049 -. 029 .090 .038
FW2 .099 .163 .010 .111 .274 .353Sl -. 053 -. 006 -. 198 -. 159 .236 .28213 -. 100 .036 -. 139 -. 002 .183 .213
XUl -. 032 .042 -. 238 -. 100 .262 .296IP2 .064 .134 -. 148 -. 025 .380 .547W3 .007 .098 .012 .071 -. 188 .189
cS1 -. 037 -. 020 -. 187 -. 116 .257 .216CF2 - .024 .046 -. 204 - .039 .282 .313FE2 -. 101 .008 -. 090 .061 .172 .137MV3 -. 012 -. 009 -. 146 -. 014 .335 .309F13 .010 .100 -. 070 .060 .149 .209
IPN .032 .099 -. 177 .036 .372 .574VZ3 -. 041 .041 -. 275 -. 076 .388 .554FF2 .058 .087 .068 - .016 - .031 .085
CF3 -. 031 .055 -. 234 -. 125 .188 .388SS1 -. 185 -. 041 -. 126 -. 073 .061 .073CS2 .023 .083 -. 017 -. 081 .111 .3589S3 .029 .075 -. 002 .097 .090 .155FAl .061 .138 -. 073 .107 .305 .269cvl -. 045 .063 -. 027 .148 .029 .239
XF1 -. 042 -. 008 -. 197 -. 078 .238 .419
58
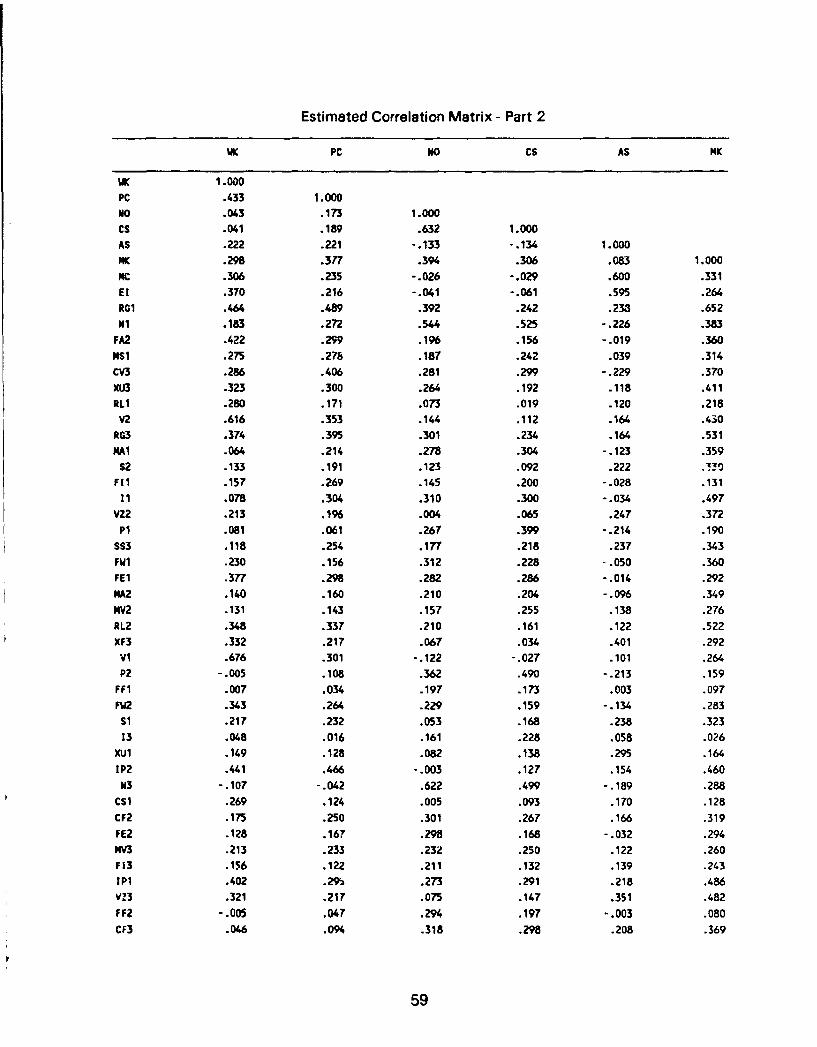
Estimated Correlation Matrix - Part 2
wK PC NO CS AS HK
WK 1.000
PC .433 1.000NO .043 .173 1.000CS .041 .189 .632 1.000AS .222 .221 -. 133 -. 134 1.000MC .298 .3'7 .394 .306 .083 1.000NC .306 .235 -. 026 -. 029 .600 .331El .370 .216 -. 041 -. 061 .595 .264RG1 .464 .489 .392 .242 .233 .652w1 .183 .272 .544 .525 -. 226 .383
FA2 .422 .299 .196 .156 -. 019 .360NS1 .275 .278 .187 .242 .039 .314CV3 .286 .406 .281 .299 -. 229 .370XU3 .323 .300 .264 .192 .118 .411RL1 .280 .171 .073 .019 .120 .218
V2 .616 .353 .144 .112 .164 .430RG3 .374 .395 .301 .234 .164 .5311A1 .064 .214 .278 .304 - .123 .359
52 .133 .191 .123 .092 .222 .330FI1 .157 .269 .145 .200 -. 028 .131
11 .078 .304 .310 .300 -. 034 .497VZ2 .213 .196 .004 .065 .247 .372
P1 .081 .061 .267 .399 -. 214 .190SS3 .118 .254 .177 .218 .237 .343FWl .230 .156 .312 .228 -.050 .360FE1 .3T7 .298 .282 .286 -. 014 .292KA2 .140 .160 .210 .204 -. 096 .349MV2 .131 .143 .157 .255 .138 .276RL2 .348 .337 .210 .161 .122 .522XF3 .332 .217 .067 .034 .401 .292VI .676 .301 -. 122 -. 027 .101 .264P2 -. 005 .108 .362 .490 -. 213 .159
FF1 .007 .034 .197 .173 .003 .097FW2 .343 .264 .229 .159 -. 134 .283
S1 .217 .232 .053 .168 .238 .32313 .048 .016 .161 .228 .058 .026
XU1 .149 .128 .082 .138 .295 .164IP2 .441 .466 -. 003 .127 .154 .460W3 - .107 - .042 .622 .499 -. 189 .288
CS1 .269 .124 .005 .093 .170 .128CF2 .175 .250 .301 .267 .166 .319FE2 .128 .167 .298 .168 -. 032 .294NV3 .213 .233 .23Z .250 .122 .260F13 .156 .122 .211 .132 .139 .243IPI .402 .2% .273 .291 .218 .486VZ3 .321 .217 .075 .147 .351 .482FF2 -. 005 .047 .294 .197 - .003 .080CF3 .046 .094 .318 .298 .208 .369
59
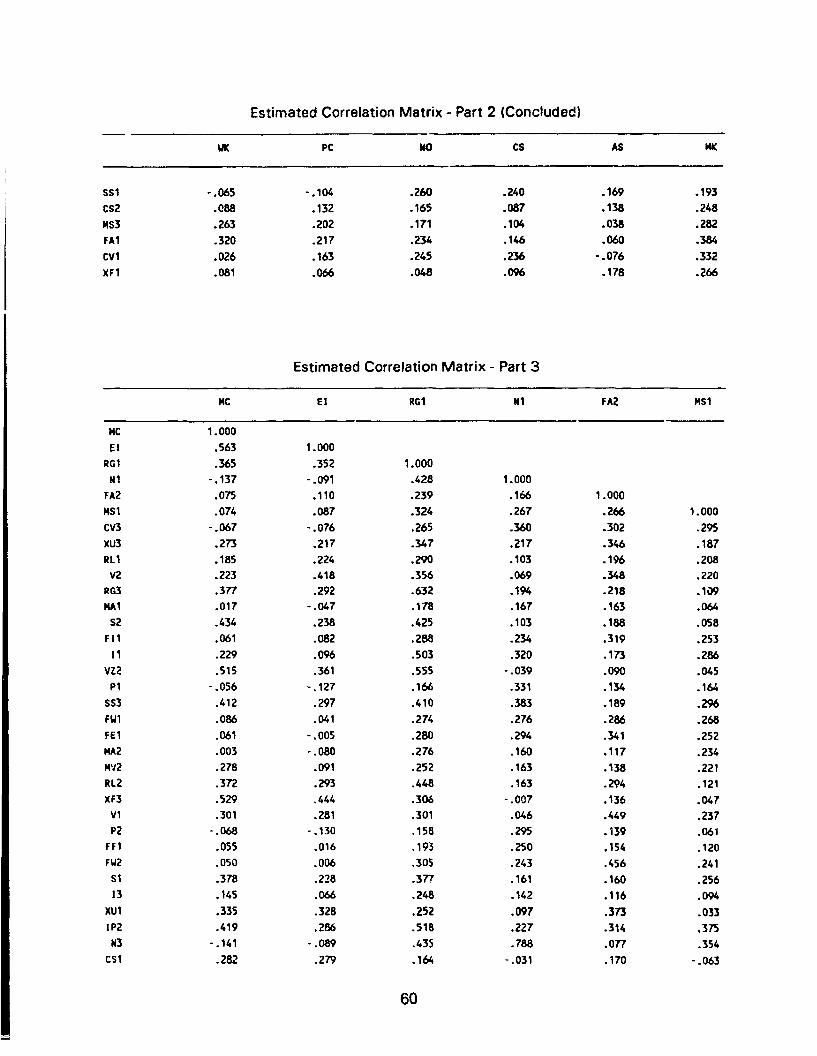
Estimated Correlation Matrix - Part 2 (Concluded)
WK PC NO CS AS I4K
SSl -. 065 -. 104 .260 .240 .169 .193
CS2 .088 .132 .165 .087 .138 .248
MS3 .263 .202 .171 .104 .038 .282
FAl .320 .217 .234 .146 .060 .384
CVl .026 .163 .245 .236 -. 076 .332
XF1 .081 .066 .048 .096 .178 .266
Estimated Correlation Matrix - Part 3
MC El RG1 NI FA2 NSi
MC 1.000
El .563 1.000
RG1 .365 .352 1.000
Ni -. 137 -. 091 .428 1.000
FA2 .075 .110 .239 .166 1.000
NSi .074 .087 .324 .267 .266 1.000
CV3 -. 067 -. 076 .265 .360 .302 .295
XU3 .273 .217 .347 .217 .346 .187
RL1 .185 .224 .290 .103 .196 .208
V2 .223 .418 .356 .069 .348 .220RG3 .377 .292 .632 .194 .218 .109KAI .017 -. 047 .178 .167 .163 .064
S2 .434 .238 .425 .103 .188 .058
F11 .061 .082 .288 .234 .319 .253
11 .229 .096 .503 .320 .173 .286
VZ2 .515 .361 .555 -. 039 .090 .045
P1 -. 056 -. 127 .166 .331 .134 .164
SS3 .412 .297 .410 .383 .189 .296
FW1 .086 .041 .274 .276 .286 .268
FE1 .061 -. 005 .280 .294 .341 .252
MA2 .003 -. 080 .276 .160 .117 .234MV2 .278 .091 .252 .163 .138 .221
RL2 .372 .293 .448 .163 .294 .121
XF3 .529 .444 .306 -. 007 .136 .047
Vi .301 .281 .301 .046 .449 .237P2 -. 068 -. 130 .158 .295 .139 .061
FF1 .055 .016 .193 .250 .154 .120
FW2 .050 .006 .305 .243 .456 .241
Si .378 .228 .377 .161 .160 .256
13 .145 .066 .248 .142 .116 .094
XU1 .335 .328 .252 .097 .373 .033
IP2 .419 .286 .518 .227 .314 .375
N3 -. 141 -. 089 .435 .788 .077 .354
CS1 .282 .279 .164 -. 031 .170 -. 063
60
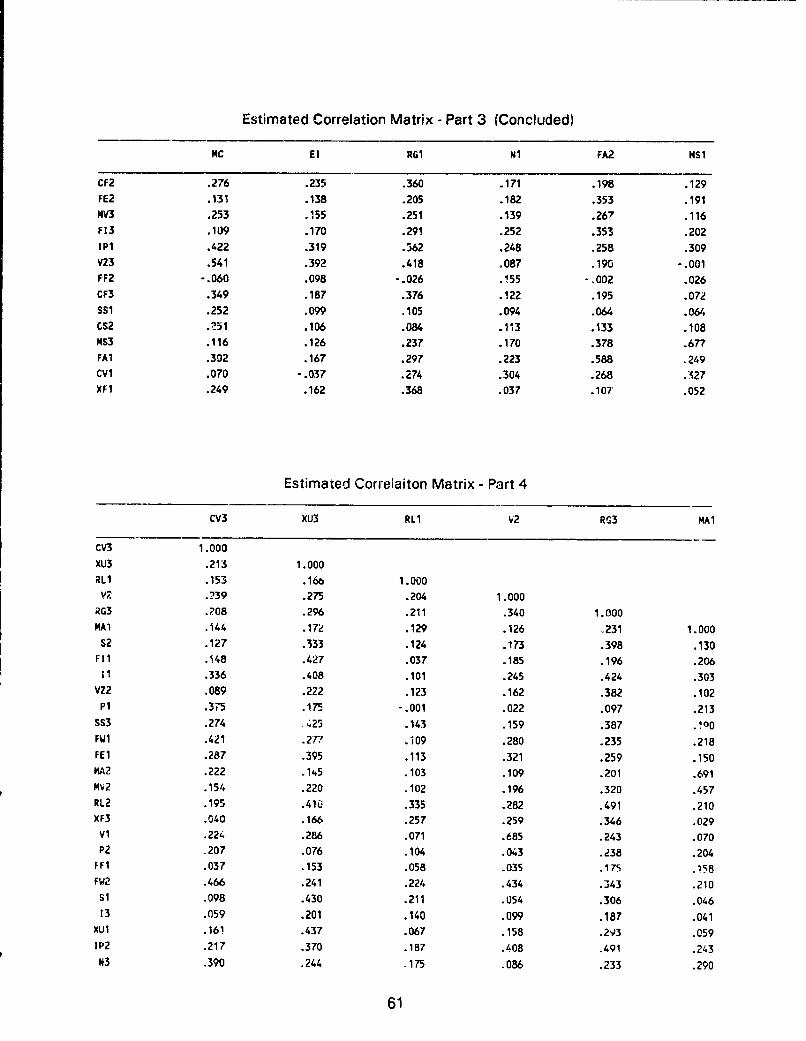
Estimated Correlation Matrix - Part 3 (Concluded)
MC El R61 N1 FA2 MS1
CF2 .276 .235 .360 .171 .198 .129FE2 .131 .138 .205 .182 .353 .191MV3 .253 .155 .251 .139 .267 .116F13 .109 .170 .291 .252 .353 .202I•P .422 .319 .562 .248 .258 .309VZ3 .541 .392 .418 .087 .190 -. 001FF2 -. 060 .098 -. 026 .S55 -. 002 .026CF3 .349 .187 .376 .122 .195 .072SS1 .252 .099 .10 .094 .064 .064CS2 .251 .106 .084 .113 .133 .108MS3 .116 .126 .237 .170 .378 .677FAl .302 .167 .297 .223 .588 .249CV1 .070 -. 037 .274 .304 .268 .127XF1 .249 .162 .368 .037 .107 .052
Estimated Correlaiton Matrix - Part 4
CV3 XU3 RL1 V2 RG3 MA1
CV3 1.000
XU3 .213 1.000RLl .153 .16b 1.000Ve .239 .275 .204 1.000
RG3 .208 .296 .211 .340 1.000MAI .144 .172 .129 .126 ,231 1.000S2 .127 .333 .124 .173 .398 .130
F11 .148 .427 .037 .185 .196 .20611 .336 .408 .101 .245 .424 .303
VZ2 .089 .222 .123 .162 .382 .102PI .375 .175 -. 001 .022 .097 .213
Ss3 .274 .425 .143 .159 .387 .100FWI .421 .277 .109 .280 .235 .218FE1 .287 .395 .113 .321 .259 .150MA2 .222 J145 .103 .109 .201 .691Mv2 .154 .220 .102 .196 .320 .457RL2 .195 .410 .335 .282 .491 .210XF3 .040 .166 .257 .259 .346 .029Vi .224 .286 .071 .685 .243 .070P2 ,207 .076 .104 .043 .238 .204
FF1 .037 .153 .058 .035 .175 .158FW2 .466 .241 .224 .434 .343 .210S1 .098 .430 .211 .054 .306 .04613 .059 .201 .140 .099 .187 .041
XUlI .161 .437 .067 .158 .293 .0591P2 .217 .370 .187 .408 .491 .243
N3 .390 .244 .175 .086 .233 .290
61
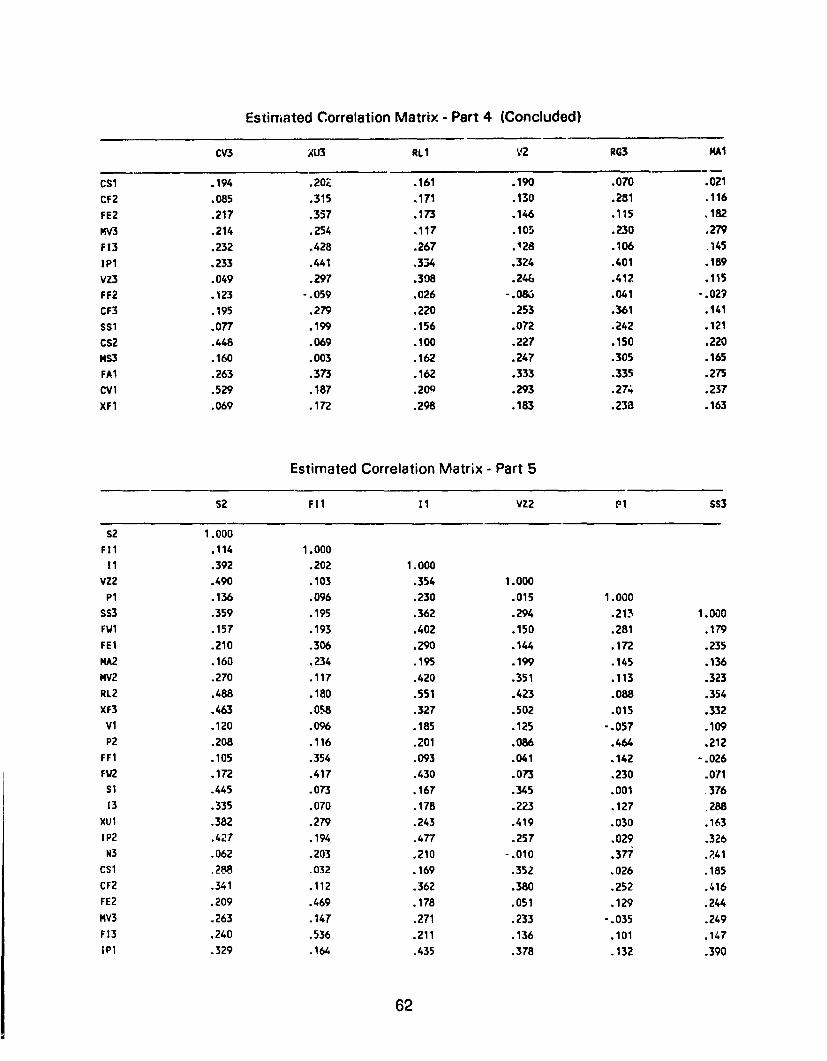
Estimated Correlation Matrix - Part 4 (Concluded)
CV3 XU3 RL1 V2 RG3 MAI
CSl .194 .202 .161 .190 .070 .021
CF2 .085 .315 .171 .130 .281 .116
FE2 .217 .357 .173 .146 .115 .182
MV3 .214 .254 .117 .105 .230 .279
F13 .232 .428 .267 .128 .106 145
IN .233 .441 .334 .324 .401 .189
VZ3 .049 .297 .308 .246 .412 .115
FF2 .123 -. 059 .026 -. 086 .041 -. 029
CF3 .195 .279 .220 .253 .361 .141
SS1 .077 .199 .156 .072 .242 .121
CS2 .448 .069 .100 .227 .150 .220
MS3 .160 .003 .162 .247 .305 .165
FA¶ .263 .373 .162 .333 .335 .275
CVi .529 .187 .20Q .293 .274 .237
XF1 .069 .172 .298 .183 .238 .163
Estimated Correlation Matrix - Part 5
S2 Fi1 11 VZ2 P1 SS3
S2 1.000
F1i .114 1.000
11 .392 .202 1.000
VZ2 .490 .103 .354 1.000
P1 .136 .096 .230 .015 1.000
SS3 .359 .195 .362 .294 .213 1.000
FW1 .157 .193 .402 .150 .281 .179
FE1 .210 .306 .290 .144 .172 .235MA2 .160 .234 .195 .199 .145 .136
MV2 .270 .117 .420 .351 .113 .323
RL2 .488 .180 .551 .423 .088 .354
XF3 .463 .058 .327 .502 .015 .332
Vi .120 .096 .185 .125 -. 057 .109
P2 .208 .116 .201 .086 .464 .212
FF1 .105 .354 .093 .041 .142 -. 026
FW2 .172 .417 .430 .073 .230 .071
Si .445 .073 .167 .345 .001 .376
13 .335 .070 .178 .223 .127 288
XU1 .382 .279 .243 .419 .030 .163
IP2 .427 .194 .477 .257 .029 .326
N3 .062 .203 .210 -. 010 .377 .741
CS1 .288 .032 .169 .352 .026 .185
CF2 .341 .112 .362 .380 .252 .416FE2 .209 .469 .178 .051 .129 .244
MV3 .263 .147 .271 .233 -. 035 .249
F13 .240 .536 .211 .136 .101 .147
IN .329 .164 .435 .378 .132 .390
62
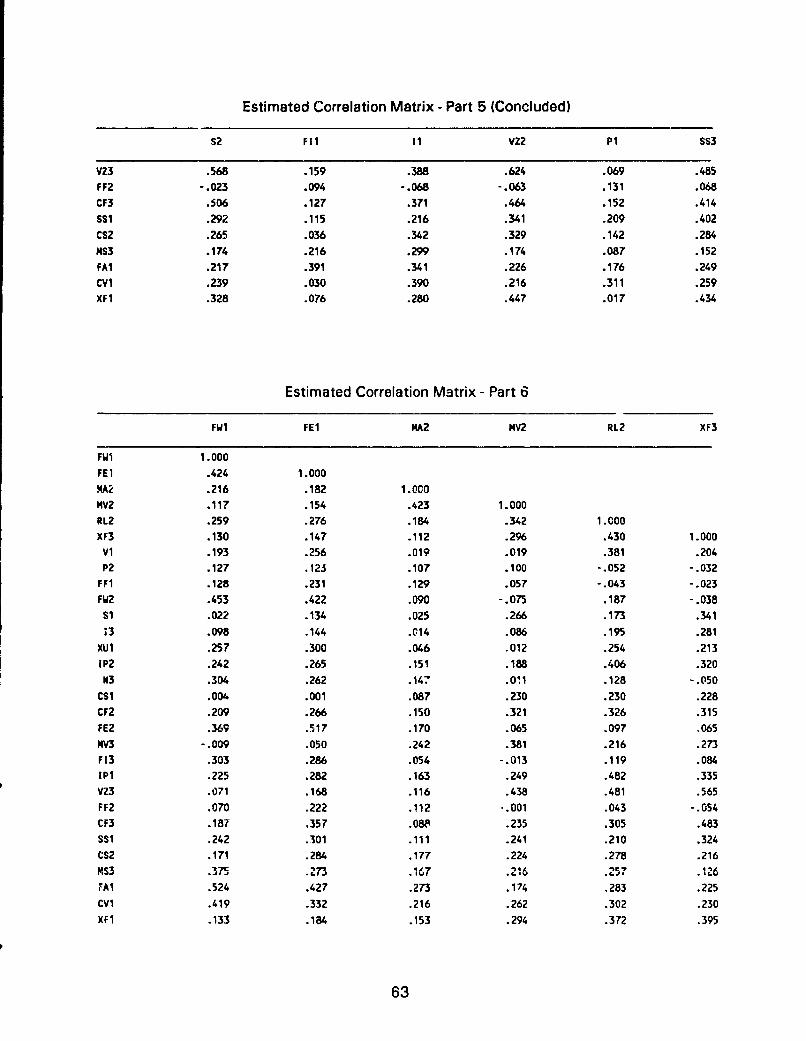
Estimated Correlation Matrix - Part 5 (Concluded)
S2 F11 11 VZ2 P1 SS3
VZ3 .568 .159 .388 .624 .069 .485
FF2 -. 023 .094 -. 068 -. 063 .131 .068
CF3 .506 .127 .371 .464 .152 .414
SS1 .292 .115 .216 .341 .209 .402
CS2 .265 .036 .342 .329 .142 .284
MS3 .174 .216 .299 .174 .087 .152
FAl .217 .391 .341 .226 .176 .249
CVl .239 .030 .390 .216 .311 .259
XF1 .328 .076 .280 .447 .017 .434
Estimated Correlation Matrix - Part 6
FW1 FE1 MA2 MV2 RL2 XF3
FWI 1.000
FEI .424 1.000
MA2 .216 .182 1.000
MV2 .117 .154 .423 1.000
RL2 .259 .276 .184 .342 1.000
XF3 .130 .147 .112 .296 .430 1.000
Vi .193 .256 .019 .019 .381 .204P2 .127 .123 .107 .100 -. 052 -. 032
FF1 .128 .231 .129 .057 -. 043 -. 023FW2 .453 .422 .090 -. 075 .187 -. 038
S1 .022 .134 .025 .266 .173 .341
13 .098 .144 .X14 .086 .195 .281
XUl .257 .300 .046 .012 .254 .213
IP2 .242 .265 .151 .188 .406 .320
W3 .304 .262 .147 .011 .128 -. 050
CS1 .004 .001 .087 .230 .230 .228CF2 .209 .266 .150 .321 .326 .315
FE2 .369 .517 .170 .065 .097 .065
HV3 -. 009 .050 .242 .381 .216 .273
F13 .303 .286 .054 -. 013 .119 .084
lP1 .225 .282 .163 .249 .482 .335
VZ3 .071 .168 .116 .438 .481 .565FF2 .070 .222 .112 ".001 .043 -. 054
CF3 .187 .357 .08f .235 .305 .483SS1 .242 .301 .111 .241 .210 .324
CS2 .171 .284 .177 .224 .278 .216
MS3 .375 .273 .167 .216 .257 .126
FAt .524 .427 .273 .174 .283 .225
CVI .419 .332 .216 .262 .302 .230
XFI .133 .184 .153 .294 .372 .395
63
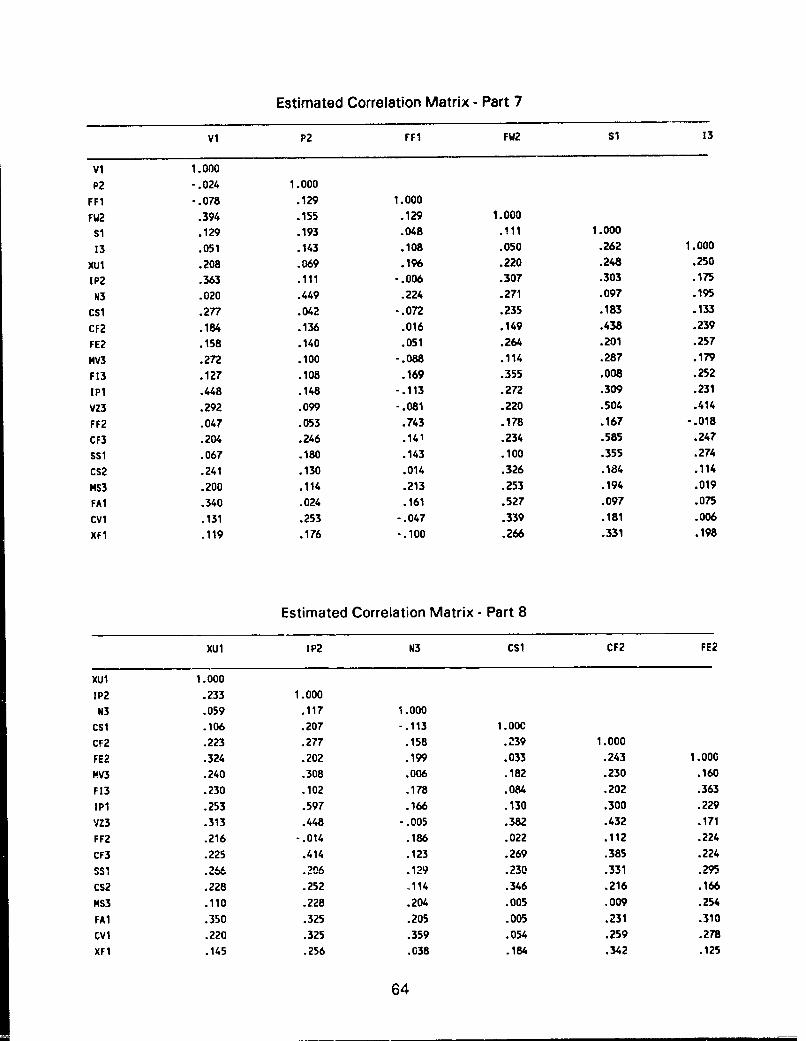
Estimated Correlation Matrix - Part 7
Vi P2 FF1 FW2 Sl 13
vi 1.000
P2 -. 024 1.000
FF1 -. 078 .129 1.000
FW2 .394 .155 .129 1.000
Si .129 .193 .048 .111 1.000
13 .051 .143 .108 .050 .262 1.000
XU1 .208 .069 .196 .220 .248 .250
IP2 .363 .111 -. 006 .307 .303 .175
N3 .020 .449 .224 .271 .097 .195
CS1 .277 .042 -. 072 .235 .183 .133
CF2 .184 .136 .016 .149 .438 .239
FE2 .158 .140 .051 .264 .201 .257
MV3 .272 .100 -. 088 .114 .287 .179
F13 .127 .108 .169 .355 .008 .252
IPi .448 .148 -. 113 .272 .309 .231
VZ3 .292 .099 -. 081 .220 .504 .414
FF2 .047 .053 .743 .178 .167 -. 018
CF3 .204 .246 .141 .234 .585 .247
SSl .067 .180 .143 .100 .355 .274
CS2 .241 .130 .014 .326 .184 .114
MS3 .200 .114 .213 .253 .194 .019
FA1 .340 .024 .161 .527 .097 .075
CVl .131 .253 -. 047 .339 .181 .006
XF1 .119 .176 -. 100 .266 .331 .198
Estimated Correlation Matrix - Part 8
XU1 IP2 N3 CS1 CF2 FE2
Xu1 1.000
1P2 .233 1.000
N3 .059 .117 1.000
CS1 .106 .207 -. 113 1.00C
CF2 .223 .277 .158 .239 1.000
FE2 .324 .202 .199 .033 .243 1.000
MV3 .240 .308 .006 .182 .230 .160
F13 .230 .102 .178 .084 .202 .363
IPI .253 .597 .166 .130 .300 .229
VZ3 .313 .448 -. 005 .382 .432 .171
FF2 .216 -. 014 .186 .022 .112 .224
CF3 .225 .414 .123 .269 .385 .224
SS1 .266 .206 .129 .230 .331 .295
CS2 .228 .252 .114 .346 .216 .166
MS3 .110 .228 .204 .005 .009 .254
FA1 .350 .325 .205 .005 .231 .310
cvi .220 .325 .359 .054 .259 .278
XF1 .145 .256 .038 .184 .342 .125
64
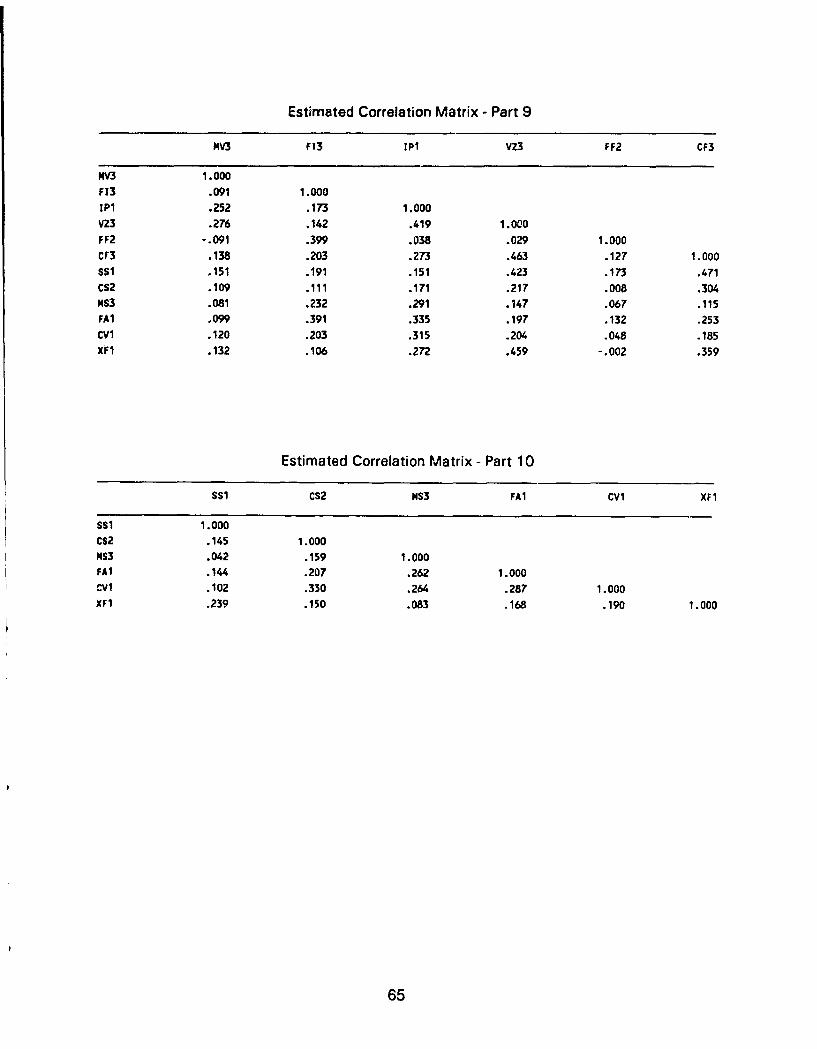
Estimated Correlation Matrix - Part 9
w F13 ipi vz3 FF2 CF3
S 1.000F13 .091 1.000
IPN .252 .173 1.000
VZ3 .276 .142 .419 1.000FF2 -. 091 .399 .038 .029 1.000
CF3 .138 .203 .273 .463 .127 1.000SSl .151 .191 .151 .423 .173 .471
CS2 .109 .111 .171 .217 .008 .304NS3 .081 .232 .291 .147 .067 .115FA1 .099 .391 .335 .197 .132 .253CV1 .120 .203 .315 .204 .048 .185x1 .132 .106 .272 .459 -. 002 .359
Estimated Correlation Matrix - Part 10
SS1 CS2 NS3 FA1 CvI XF1
SS1 1.000CS2 .145 1.000
MS3 .042 .159 1.000FAl .144 .207 .262 1.000
cv1 .102 .330 .264 .287 1.000XFI .239 .150 .083 .168 .190 1.000
65
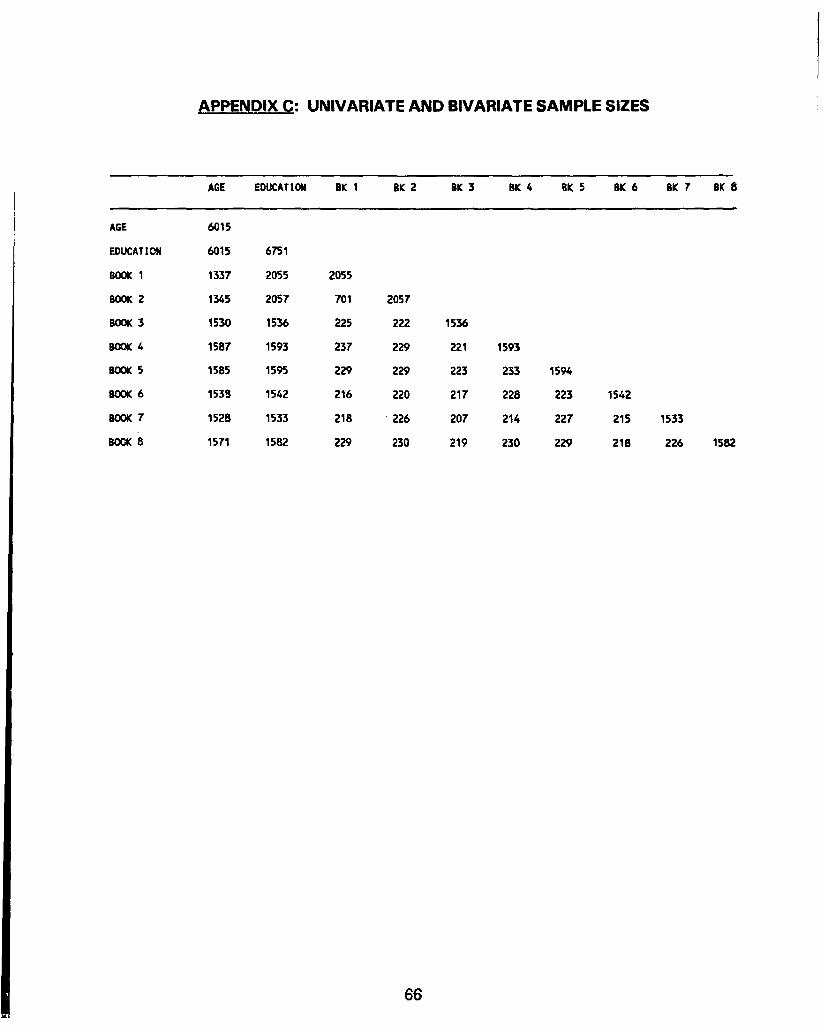
APPENDIX C: UNIVARIATE AND BIVARIATE SAMPLE SIZES
AGE EDUCATION BK 1 BK 2 BK 3 RK 4 SK 5 BK 6 BK 7 SK 8
AGE 6015
EDUCATION 6015 6751
BOOK 1 1337 2055 2055
BOOK 2 1345 2057 701 2057
BOOK 3 1530 1536 225 222 1536
BOOK 4 1587 1593 237 229 221 1593
BOOK 5 1585 1595 229 229 223 233 1594
BOOK 6 1538 1542 216 220 217 228 223 1542
BOOK 7 1528 1533 218 226 207 214 227 215 1533
BOOK 8 1571 1582 229 230 219 230 229 218 226 1582
66
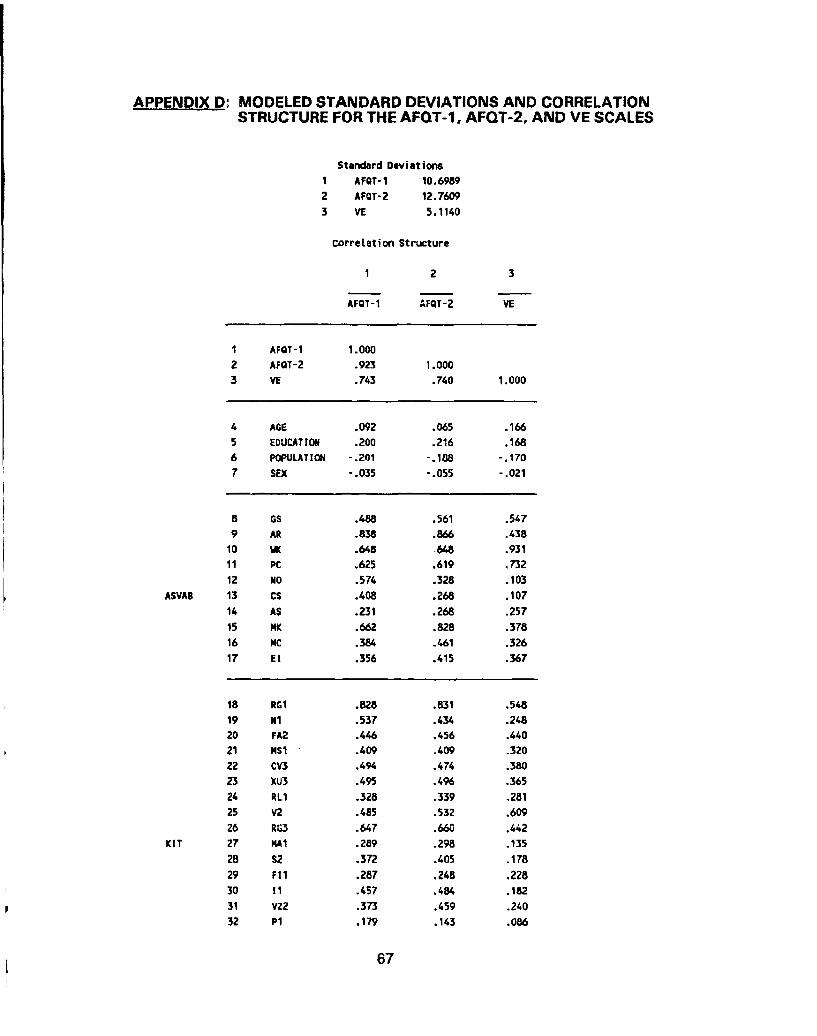
APPENDIX D: MODELED STANDARD DEVIATIONS AND CORRELATIONSTRUCTURE FOR THE AFQT-1, AFQT-2, AND VE SCALES
Standard Deviations
1 AFQT-1 10.6989
2 AFQT-2 12.76093 VE 5.1140
corretation Structure
1 2 3
AFQT-1 AFQT-2 VE
I AFQT-1 1.000
2 AFOT-2 .923 1.0003 VE .743 .740 1.000
4 AGE .092 .065 .1665 EDUCATION .200 .216 .1686 POPULATION -. 201 -.188 -. 170
7 SEX -. 035 -. 055 -. 021
5 OS .488 .561 .5479 AR .838 .866 .438
10 UK .648 .648 .931
11 PC .625 .619 .73212 NO .574 .328 .103
ASVAB 13 CS .408 .268 .107
14 AS .231 .268 .257
15 NK .662 .828 .378
16 MC .384 .461 .32617 El .356 .415 .367
18 RG1 .828 .831 .548
19 NI .537 .434 .248
20 FA2 .446 .456 .44021 NS¶ .409 .409 .320
22 CV3 .494 .474 .380
23 XU3 .495 .496 .36524 RL1 .328 .339 .281
25 V2 .485 .532 .609
26 RU3 .647 .660 .442
KIT 27 KIM .289 .298 .13528 S2 .372 .405 .17829 Fi1 .287 .248 .228
30 11 .457 .484 .182
31 VZ2 .373 .459 .240
32 P1 .179 .143 .086
67
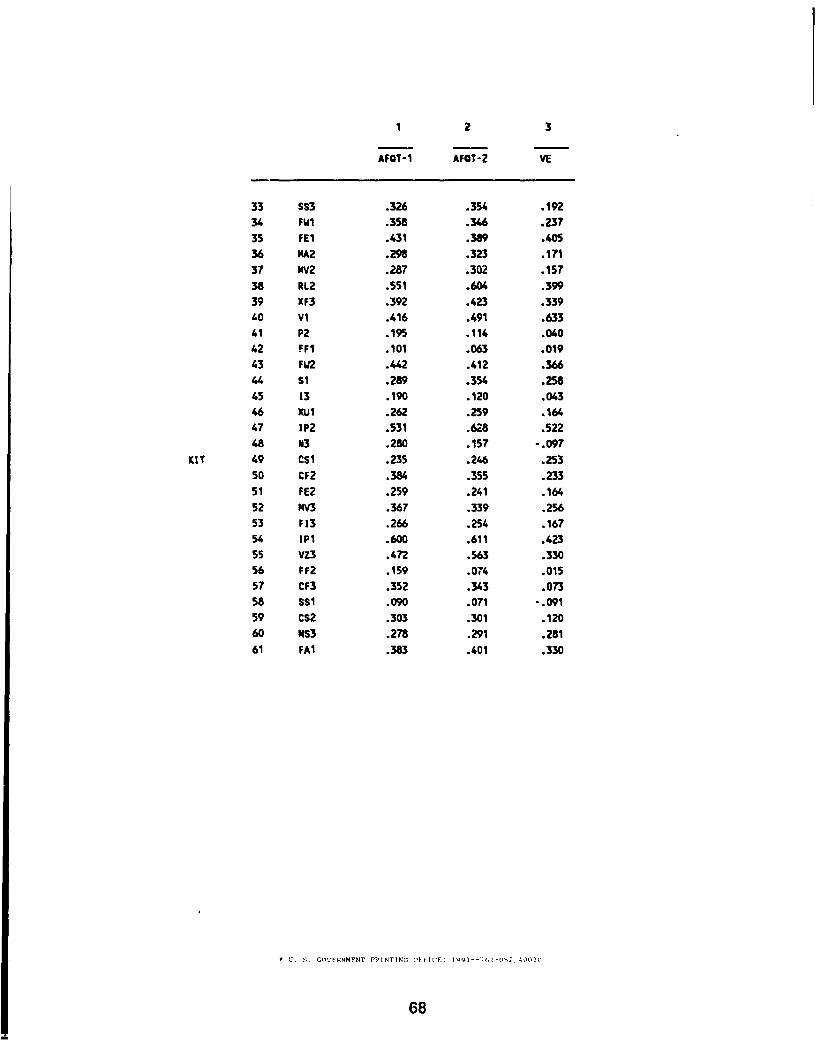
1 2 3
AFQT-1 AFQT-2 VE
33 SS3 .326 .354 .19234 FW1 .358 .346 .23735 FE1 .431 .389 .40536 MA2 .298 .323 .17137 NV2 .287 .302 .15738 RL2 .551 .604 .39939 XF3 .392 .423 .33940 Vi .416 .491 .63341 P2 .195 .114 .04042 FF1 .101 .063 .01943 FU2 ."2 .412 .36644 51 .289 .354 .25845 13 .190 .120 .04346 XU1 .262 .259 .16447 1P2 .531 .628 .52248 N3 .280 .157 -. 097
KIT 49 CS1 .235 .246 .25350 CF2 .384 .355 .23351 FE2 .259 .241 .16452 NV3 .367 .339 .25653 F13 .266 .254 .16754 IPI .600 .611 .42355 VZ3 .472 .563 .33056 FF2 .159 .074 .01557 CF3 .352 .343 .073
58 SSl .090 .071 -. 09159 CS2 .303 .301 .12060 NS3 .278 .291 .28161 FAl .383 .401 .330
* U. S. GOVErNMFNT PpENTING OlFFICF 1n9I--:61-o52. 410:0
68