04a_quezon.pdf - philippine statistics authority
TRANSCRIPT

CITATION: Philippine Statistics Authority, 2015 Census of Population, Report No. 2 – Demographic and Socioeconomic Characteristics Quezon, June 2017 ISSN 0117-1453
ISSN 0117-1453
REPORT NO. 2
Republic of the Philippines
Philippine Statistics Authority SOLID • RESPONSIVE • WORLD-CLASS
22001155 CCeennssuu ss ooff PPooppuullaattiioonn
DDeemmooggrraapphhiicc aanndd SSoocciiooeeccoonnoommiicc CChhaarraacctteerriissttiiccss
QQUUEEZZOONN
REPUBLIC OF THE PHILIPPINES
PRESIDENT RODRIGO ROA DUTERTE
REPUBLIC OF THE PHILIPPINES
PHILIPPINE STATISTICS AUTHORITY
LISA GRACE S. BERSALES, Ph.D. Undersecretary
National Statistician and Civil Registrar General
Copyright © 2016 by Philippine Statistics Authority (PSA) PSA Complex, East Avenue, Diliman
Quezon City, Philippines

Philippine Statistics Authority v
TABLE OF CONTENTS
Foreword iii List of Abbreviations and Acronyms vii Explanatory Text Introduction ix Content and Coverage of this Publication ix Authority to Conduct the POPCEN 2015 x Coordination for the POPCEN 2015 x The POPCEN 2015 Field Organization xi Method of Enumeration xii Definition of Census Terms and Concepts xii Demographic Characteristics xvii Socioeconomic Characteristics xviii Dissemination of the POPCEN 2015 Results xx Population Map of Quezon: 2015 xxi Quezon at a Glance xxii Quezon: Highlights on Demographic and Socioeconomic Characteristics xxiii List of Tables Statistical Tables 1 Population Enumerated in Various Censuses by City/Municipality: 1960 – 2015 3 2 Total Population by Single-Year Age and Sex: 2015 5 3 Household Population by Single-Year Age and Sex: 2015 7 4 Total Population by Age Group, Sex, and City/Municipality: 2015 9 5 Household Population by Age Group, Sex, and City/Municipality: 2015 30 6 Total Population 10 Years Old and Over by Age Group, Marital Status, Sex,
and City/Municipality: 2015 51 7 Household Population 10 Years Old and Over by Age Group, Marital Status,
Sex, and City/Municipality: 2015 92
Table of Contents
Philippine Statistics Authority vi
8 Total Population by Religious Affiliation and Sex: 2015 133 9 Household Population 5 to 24 Years Old Who Were Currently Attending School
by Age Group, Sex, and City/Municipality: 2015 134 10 Literacy of the Household Population 10 Years Old and Over by Age Group,
Sex, and City/Municipality: 2015 140 11 Total Population 5 Years Old and Over by Highest Grade/Year Completed, Sex,
Age, and City/Municipality: 2015 154 12 Overseas Workers 15 Years Old and Over by Highest Grade/Year Completed,
Sex, and Age Group: 2015 277 13 Gainful Workers 15 Years Old and Over by Major Occupation Group,
Age Group, Sex, and City/Municipality: 2015 278 14 Household Population by Relationship to the Household Head
and Household Size: 2015 360 15 Number of Households by Age Group, Sex of the Household Head,
Household Size, and City/Municipality: 2015 362 Appendices A. Excerpts from Republic Act No. 10625 Relevant to the Conduct
of the 2015 Census of Population A-1 B. Executive Order No. 352 – Designation of Statistical Activities That Will Generate
Critical Data for Decision-Making of the Government and the Private Sector B-1 C. CP Form 1 – Listing Booklet C-1 D. CP Form 2 – Household Questionnaire D-1 E. CP Form 4 – Institutional Population Questionnaire E-1 F. 2015 Census of Population – List of Report No. 2 F-1
Philippine Statistics Authority vii
LIST OF ABBREVIATIONS AND ACRONYMS
AHS Average Household Size ANS Assistant National Statistician C/MCCB City/Municipal Census Coordinating Board CAS Census Area Supervisor CO Central Office CP Census of Population CPS Census Project Staff CRCSO Civil Registration and Central Support Office CSC Census Steering Committee CTCO Census and Technical Coordination Office DILG Department of the Interior and Local Government DNS Deputy National Statistician DPC Data Processing Center EA Enumeration Area EN Enumerator EO No. 352 Executive Order No. 352 E-QN Electronic Questionnaire FAO Food and Agriculture Organization FAS Finance and Administrative Service FO Field Office GAA General Appropriations Act HUC Highly Urbanized City ILQ Institutional Living Quarter ITDS Information Technology and Dissemination Service LGU Local Government Unit NCCB National Census Coordinating Board NCR National Capital Region NCS National Censuses Service NEDA National Economic and Development Authority NS National Statistician NSCB National Statistical Coordination Board PCCB Provincial Census Coordinating Board PCPS Provincial Census Project Staff PHCD Population and Housing Census Division PGR Population growth rate PO Provincial Statistical Office POPCEN 2015 2015 Census of Population PSA Philippine Statistics Authority PSGC Philippine Standard Geographic Code PSO Provincial Statistics Officer PSOC Philippine Standard Occupational Classification PSS Philippine Statistical System RA 10625 Republic Act No. 10625 RCCB Regional Census Coordinating Board RCPS Regional Census Project Staff RD Regional Director RSSO Regional Statistical Services Office SAQ Self-Administered Questionnaire SPED Special Education SOCD Statistical Operations and Coordination Division SDD Systems Development Division SOID Systems Operations and Infrastructure Division SS Scan Station TNT Tago ng Tago TOR Terms of Reference TS Team Supervisor VHU Vacant Housing Unit

Philippine Statistics Authority ix
EXPLANATORY TEXT
Introduction
The Philippine Statistics Authority (PSA) conducted the census-taking for the 2015 Census of Population (POPCEN 2015) in August to September 2015. This was the third census of population that was undertaken in between two decennial censuses. Mid-decade censuses were previously conducted in 1995 and 2007. POPCEN 2015 was the 14
th census of population in the
country since the first census in 1903.
POPCEN 2015 was designed primarily to take an inventory of the total population in the Philippines and collect basic information about its characteristics. It aimed to provide government executives, policy makers, and planners with population data, especially updated population counts of all barangays in the country, for use as bases in their social and economic development plans, policies, and programs.
The census of population is the source of information on the size and distribution of the population, as well as its demographic and socioeconomic characteristics. These information are vital for making rational plans and programs for local and national development.
The population sizes and their geographic distribution were presented in the regional volumes of POPCEN 2015 Report No. 1 (Population Count by Province, City/Municipality, and Barangay). The population counts down to barangay level were declared official for all purposes by former President Benigno S. Aquino III under Presidential Proclamation No. 1269 dated 13 May 2016. Report No. 1 also presents the household population size, number of households, and average household size (AHS) by city/municipality.
Content and Coverage of this Publication
This publication, POPCEN 2015 Report No. 2 (Demographic and Socioeconomic Characteristics) presents the demographic and socioeconomic characteristics of the population, which were collected using the CP Form 2 (Household Questionnaire) and CP Form 4 (Institutional Population Questionnaire).
Below are the data presented using total population:
• Age and sex distribution,
• Age and sex indicators,
• Marital status,
• Religious affiliation, and
• Highest grade/year completed. This report also presents the characteristics of the household population in terms of the
following:
• Relationship to the household head,
• School attendance,
• Literacy,
• Overseas worker, and
• Usual activity/occupation.
The POPCEN 2015 Report No. 2 is published by province and highly urbanized city (HUC), for a total of 105 publications, including the national volume.
Explanatory Text
Philippine Statistics Authority x
Authority to Conduct the POPCEN 2015
The authority and mandate of PSA to conduct the POPCEN 2015 emanates from Republic Act (RA) No. 10625 and Executive Order (EO) No. 352.
RA No. 10625, also known as the Philippine Statistical Act of 2013, which was approved on
September 12, 2013, states that “PSA shall be primarily responsible for all national censuses and surveys, sectoral statistics, consolidation of administrative recording system, and compilation of national accounts”. Specifically, Section 6(b) of this Act mandates PSA “to prepare and conduct periodic censuses on population, housing, agriculture, fisheries, business, industry, and other sectors of the economy”.
EO No. 352 – Designation of Statistical Activities That Will Generate Critical Data for Decision-Making of the Government and the Private Sector, stipulates the conduct of a mid-decade census primarily to update the population count in all barangays nationwide. Moreover, Presidential Proclamation No. 1031, Declaring August 2015 as National Census Month, enjoined all departments and other government agencies, including government-owned and -controlled corporations, as well as local government units (LGUs) to implement and execute the operational plans, directives, and orders of the PSA Board through PSA, relative to this proclamation. Coordination for the POPCEN 2015
At the national level, a National Census Coordinating Board (NCCB), composed primarily of the members of the PSA Board was created for POPCEN 2015. The National Statistician (NS) acted as the Executive Officer of the NCCB, with the Secretary for Socioeconomic Planning of the National Economic and Development Authority (NEDA) as Chairperson. PSA Board Resolution No. 07, Series of 2014 - Designating the PSA Board as the NCCB for the POPCEN 2015, and Approving its Terms of Reference (TOR) and Assistance to be Rendered to the PSA also enjoined all agencies and instrumentalities of the national government, particularly the member-agencies of the NCCB to provide assistance to PSA in connection with POPCEN 2015.
As part of the PSA Board’s function of establishing mechanisms for statistical coordination at
the regional and LGU levels, the PSA Board has approved PSA Board Resolution No. 09, Series of 2014 - Approving the Composition and TOR of the Regional, Provincial, City, and Municipal Census Coordinating Boards for the POPCEN 2015.
The Regional Statistical Services Office (RSSO) was responsible for the entire census
operation in the region. Specifically, it was responsible for the coordination, monitoring, and supervision of the conduct of enumeration in the areas under its jurisdiction. As stipulated in the PSA Board Resolution No. 09, Series of 2014, the PSA Regional Director (RD) acted as the Executive Officer of the Regional Census Coordinating Board (RCCB), with the NEDA RD as Chairperson. In the Autonomous Region in Muslim Mindanao (ARMM), the RD coordinated with the ARMM regional government regarding the conduct of the POPCEN 2015, including the organization and convening of the R/P/C/MCCBs, with TORs and membership in accordance with PSA Board Resolution No. 09, whenever appropriate and practicable. In the case of the National Capital Region (NCR) where there is no NEDA regional office, an official of the Department of the Interior and Local Government (DILG) was designated as chairperson of the RCCB.
The Provincial Statistics Officer (PSO) of the PSA Provincial Statistical Office (PO) acted as
the Executive Officer of the Provincial Census Coordinating Board (PCCB), with the Provincial Governor as Chairperson. Due to the absence of provinces in NCR, no PCCBs were established in the region.
Explanatory Text
Philippine Statistics Authority xi
At the city/municipality level, the statistician/permanent staff of the PO acted as the Executive Officer of the City/Municipal Census Coordinating Board (C/MCCB), with the City/Municipal Mayor as Chairperson. The POPCEN 2015 Field Organization
PSA, headed by the NS, was the agency mandated to formulate and execute plans for POPCEN 2015. All directives pertaining to the census emanated from the Office of the NS. The NS was the Chairperson of the Census Steering Committee (CSC) for POPCEN 2015. The CSC was responsible for the overall guidance of the conduct of the census. The NS was assisted by the Deputy National Statistician (DNS) of the Census and Technical Coordination Office (CTCO). Specific instructions and orders were delegated to the field supervisors through a chain of command.
For the entire duration of the census, the DNS of CTCO, together with the Assistant National
Statistician (ANS) of the CTCO-National Censuses Service (NCS) supervised the entire operations of the census. Under the supervision of the ANS of NCS was the Population and Housing Census Division (PHCD), which was responsible for the planning, implementation, and technical supervision of the census operations. The ANS of the CTCO-Information Technology and Dissemination Service (ITDS), on the other hand, supervised the Systems Development Division (SDD), the unit responsible for the development of the entire machine processing system of the census in the Field Offices (FOs) and Central Office (CO); as well as the Systems Operations and Infrastructure Division (SOID), which spearheaded all census mapping activities. The ANS of the Finance and Administrative Service (FAS), under the Civil Registration and Central Support Office (CRCSO), meanwhile, was responsible for transferring funds to FOs and the procurement and other logistics requirements at the national level. Both ITDS and FAS closely coordinated with NCS on all POPCEN 2015 concerns to ensure the smooth flow of operation. The POPCEN 2015 Census Project Staff (CPS 2015) which was created at NCS, served as the monitoring hub and communications and action center for the nationwide undertaking. All communications to and from CO and FOs were sent to CPS 2015.
At the regional level, RSSO was responsible for the entire census operation in the region. Specifically, it was responsible for the coordination, monitoring, and supervision of the conduct of enumeration in the areas under its jurisdiction. Further, RSSO managed the POPCEN 2015 Data Processing Center (DPC 2015) in the provinces under its jurisdiction, as well as the POPCEN 2015 Scan Station (SS 2015) in RSSO, if any. DPC 2015 was responsible for the manual and machine processing of the Census of Population (CP) forms and maps. SS 2015, on the other hand, took charge of the scanning/interpretation and archiving of the forms and maps. Selected DPC 2015 had their own SS 2015.
A Regional Census Project Staff (RCPS) was formed in RSSO. It was headed by the Chief of
the Statistical Operations and Coordination Division (SOCD) in RSSO and included concerned statistical and other permanent staff, and hired census staff. The RCPS was in charge of all aspects of the census in the region, including data processing and evaluation.
At the provincial level, PO was directly responsible for the coordination, monitoring, and
supervision of the field operations in the areas under its jurisdiction. PO supervised the operations in DPC 2015. Further, all provinces designated to host the
entire machine processing had direct supervision over the scanning/interpretation and archiving of the CP forms and maps in DPC 2015.
A Provincial Census Project Staff (PCPS) was established in PO. It was headed by a
permanent statistician of the PO. The PCPS was in charge of all aspects of the census in the province, including data processing and evaluation.
Explanatory Text
Philippine Statistics Authority xii
The Head Census Area Supervisor (CAS), who was a statistician/permanent staff of PO was responsible, on a fulltime basis, for the coordination, supervision, and monitoring of the conduct of enumeration in the cities/municipalities under his/her jurisdiction. He/She supervised all the hired CASs assigned in his/her areas. The number of hired CASs supervised by a Head CAS depended on the number of PO statisticians/staff available and the number of hired CASs in PO.
The hired CAS was responsible for a group of five teams, with each team consisting of one
team supervisor (TS) and four enumerators (ENs). Generally, his/her teams covered a city/municipality. However, in big cities or municipalities, two or more hired CASs were assigned.
The TS was in charge of supervising around four ENs. He/She was responsible to report to
his/her CAS the progress of enumeration in the areas assigned to him/her. The EN, on the other hand, was responsible for the complete enumeration in the area/s
assigned to him/her. Method of Enumeration The gathering of population and housing data was performed by the census ENs through house-to-house visits and interview of a responsible member of each household. Self-Administered Questionnaires (SAQs) and/or Electronic Questionnaires (E-QNs) were provided to households living in special areas, such as high-rise buildings/condominiums, exclusive subdivisions/villages and townhouses, and institutional living quarters (ILQs) where personal interview was not possible. A complete listing of buildings which contain living quarters, including the vacant ones, as well as housing units and ILQs was also done. A complete enumeration was conducted in all barangays nationwide to obtain the population count and data on selected demographic and socioeconomic characteristics of the household population. Also asked were selected housing characteristics. For institutional population, selected demographic and socioeconomic characteristics were likewise gathered.
Information about households of Filipinos working in Philippine embassies, consulates, and missions in foreign countries, as well as those of the homeless population were also gathered and included in the total population of the country. Definition of Census Terms and Concepts Most of the operational definitions and concepts adopted in POPCEN 2015 have also been used in past censuses of population. The use of the same operational definitions of terms and concepts and adherence to national and international standards in population censuses aimed at ensuring the comparability of census results across different census years and census data of other countries. The POPCEN 2015 ENs were instructed to adhere strictly to these operational definitions. Barangay A barangay is the smallest political unit in the country. Generally, one EN was assigned to enumerate one barangay. To facilitate enumeration, large barangays were divided into parts, and each part was called an enumeration area (EA). The official list of barangays of DILG based on the Philippine Standard Geographic Code (PSGC) as of December 2015 was used for POPCEN 2015.
Explanatory Text
Philippine Statistics Authority xiii
Usual place of residence All persons were enumerated in their usual place of residence, which refers to the geographic place (street, sitio/purok, barangay, city/municipality or province) where the person usually resides. As a rule, a person’s usual place of residence is the place where he/she sleeps most of the time. Hence, it may be the same as or different from the place where he/she was found at the time of the census. Building
A building is defined as any structure built, designed or intended for the enclosure, shelter or protection of any person, animal or property. It consists of one or more rooms and/or other spaces, covered by a roof, and usually enclosed within external walls or with common dividing walls with adjacent buildings, which usually extend from the foundation to the roof.
For purposes of the census, only those buildings which contained living quarters, whether
occupied or vacant, were listed. Living quarters are structurally separate and independent places of abode. They may: 1. have been constructed, built, converted or arranged for human habitation, provided that
they were not, at the time of the census, used wholly for other purposes, or 2. have been constructed for purposes other than human habitation but were actually used
as living quarters at the time of the census. Housing unit
A housing unit is a structurally separate and independent place of abode which, by the way it has been constructed, converted or arranged, is intended for habitation by one or more households. Structures or parts of structures which were not intended for habitation, such as commercial, industrial, and agricultural buildings, or natural and man-made shelters such as boats, abandoned trucks, culverts, and others, but which were used as living quarters by households, were also considered as housing units. Housing Units Identified in a Building
A housing unit is generally intended for habitation by one household. However, in some cases, two or more households may share the same building or the same housing unit as their place of habitation. The building may have more than one housing unit but from its physical layout, the different housing units may not be discernible.
A portion of a building (a room or a group of rooms) qualified as a separate housing unit if it
met both the following requirements:
1. Separateness – the portion of a building had facilities for sleeping, preparing and taking meals, and its occupants were isolated from other households in the building by means of walls or permanent partitions, and
2. Direct access – the portion of the building had direct access from the outside of the building, that is, the occupants can come in to the portion of the building without passing through anybody else’s premises from the street, pathway, alley, road, yard, catwalk, public or communal staircase, passage, gallery, ground or through a common hall.
Explanatory Text
Philippine Statistics Authority xiv
Housing Units Listed
Only the following housing units were listed:
1. Occupied or vacant housing units (VHUs) in single residential houses, 2. Occupied or VHUs in multi-unit residential buildings such as duplex, accessoria or row
houses, condominiums, tenement houses, townhouses, and others, 3. Occupied barong-barong or shanties, 4. VHUs in residential buildings with one or more housing units presently not occupied by
households but used for purposes other than residential, 5. Housing units which were still under construction, but the roof and walls were already in
place, 6. Occupied housing units in ILQs such as hotels, motels, dormitories, lodging houses,
seminaries, mental hospitals, and others, 7. Occupied housing units in nonresidential buildings such as offices, rice mills, barns,
churches, and others, 8. VHUs with complete facilities for cooking, dining, and sleeping in ILQs and nonresidential
buildings, 9. Occupied mobile housing units such as boats, trailers, and others, and 10. Occupied improvised housing units in structures such as culverts, abandoned trucks,
caves, container vans, tents, and railroad cars. Institutional living quarter
The place of abode of an institutional population is not called a housing unit; it is referred to as an ILQ. An ILQ is a structurally separate and independent place of abode intended for habitation by large groups of individuals (10 or more). Such quarter usually has certain common facilities such as kitchen and dining room, toilet and bath, and lounging area, which are shared by the occupants. Household
A household is a social unit consisting of a person living alone or a group of persons who
sleep in the same housing unit and have a common arrangement in the preparation and consumption of food. In most cases, a household consists of persons who are related by kinship ties, such as parents and their children. In some instances, however, several generations of familial ties are represented in one household while, still in others, even more distant relatives are considered as members of the household. Household helpers, boarders, and nonrelatives were considered members of the household, provided that they slept in the same housing unit and had common arrangement in the preparation and consumption of food and did not usually go home to their family at least once a week. A person who shared a housing unit with a household but separately cooked his/her meals or consumed his/her food elsewhere was not considered a member of the household he/she shared the housing unit with. This person was listed as a separate household. Household population Household population comprises persons who belong to a household. The basic criterion in determining household membership is the usual place of residence or the place where the person usually resides. This may be the same or different from the place where he/she is found at the time of the census. It is the place where he/she usually sleeps.
Explanatory Text
Philippine Statistics Authority xv
Institutional population Institutional population comprises persons who are found living in ILQs. They may have their own families or households elsewhere but at the time of the census, they are committed or confined in institutions, or they live in ILQs and are usually subject to a common authority or management, or are bound by either a common public objective or a common personal interest. Who Were Enumerated As in past censuses, ENs of POPCEN 2015 were provided with guidelines on whom to list as members of a household and ILQ. This helped ensure uniformity in determining household membership, institutional population, and in identifying persons to be included in the enumeration or excluded from it. Further, this prevented omission or duplication in the enumeration of persons and households during the census-taking. The following guidelines were used in determining the household membership and institutional population:
Persons enumerated as members of the household
1. Those who were present at the time of the visit and whose usual place of residence was the housing unit where the household lived,
2. Family members who were overseas workers and who were away at the time of the census and were expected to be back within five years from the date of their last departure,
3. Those whose usual place of residence was the place where the household lived but were temporarily away at the time of the census for any of the following reasons: a. on vacation, business/pleasure trip, or training somewhere in the Philippines and
were expected to be back within six months from the date of their departure, b. on vacation, business/pleasure trip, or studying/training abroad and were expected to
be back within a year from the date of their departure, c. working or attending school outside their usual place of residence but usually came
home at least once a week, d. confined in hospitals for a period of not more than six months as of the time of
enumeration, except when they were confined as patients in mental hospitals, leprosaria/leper colonies or drug rehabilitation centers, regardless of the duration of their confinement,
e. detained in national/provincial/city/municipal jails or in military camps for a period of not more than six months at the time of enumeration, except when their sentence or detention was expected to exceed six months,
f. on board coastal, interisland, or fishing vessels within Philippine territories, and g. on board oceangoing vessels but were expected to be back within five years from the
date of their departure, 4. Boarders/lodgers of a household or employees of household-operated businesses who
did not usually return/go to their respective homes weekly, 5. Citizens of foreign countries who had resided or were expected to reside in the
Philippines for at least a year from their arrival, except members of diplomatic missions and non-Filipino members of international organizations,
6. Filipino balikbayans with usual place of residence in a foreign country but had resided or were expected to reside in the Philippines for at least a year from their arrival, and
7. Those temporarily staying with the household who had no usual place of residence or who were not certain to be enumerated elsewhere.
Explanatory Text
Philippine Statistics Authority xvi
Persons enumerated as members of the institutional population 1. Permanent lodgers in boarding houses, 2. Dormitory residents who did not usually go home to their respective homes at least once
a week, 3. Hotel residents who had stayed in the hotel for more than six months at the time of the
census, 4. Boarders in residential houses provided that their number was 10 or more; otherwise,
they were considered as members of regular households, 5. Patients in hospitals who were confined for more than six months, 6. Patients confined in mental hospitals, leprosaria or leper colonies, and drug rehabilitation
centers, regardless of the length of their confinement, 7. Wards in orphanages and other welfare institutions, 8. Prisoners of corrective and penal institutions, 9. Seminarians, nuns in convents, monks, and postulants, 10. Soldiers residing in military camps, and 11. Workers residing in mining and similar camps.
The following persons were not considered members of the institutional population and were included in the households to which they belonged: 1. Military officials/enlisted men or draftees (and members of their households) who had
housing units within military installations or camps, 2. Managers (and members of their households) of refugee camps, dormitories, hotels,
hospitals, and others, who occupied and regularly used as their place of abode a living quarter in the institution that they managed, and
3. Priests, who together with their relatives and/or household help, occupied and regularly used as their place of abode a living quarter in the church or seminary.
Persons Included in the Census Enumeration
Included in the enumeration were those who were alive as of the census reference date, that is, 12:01 a.m. of 1 August 2015. Specifically, these were the following:
1. Filipino nationals permanently residing in the Philippines, 2. Filipino nationals, who as of 1 August 2015, were temporarily at Philippine sea, or were
temporarily on vacation, business/pleasure trip or studying/ training abroad and were expected to be back within a year from the date of their departure,
3. Filipino overseas workers, including those on board oceangoing vessels, who were away as of 1 August 2015 but were expected to be back within five years from the date of their departure,
4. Philippine government officials, both military and civilian, including Philippine diplomatic personnel and their families, assigned abroad, and
5. Civilian citizens of foreign countries who had their usual residence in the Philippines, or foreign visitors who had stayed or were expected to stay for at least a year from the date of their arrival in the country.
Explanatory Text
Philippine Statistics Authority xvii
Persons Excluded from the Census Enumeration
Excluded from the enumeration were the following persons, although they happened to be within the territorial jurisdiction of the Philippines at the time of the census enumeration:
1. Foreign ambassadors, ministers, consuls or other diplomatic representatives, and
members of their families, 2. Citizens of foreign countries living within the premises of an embassy, legation,
chancellery or consulate, 3. Citizens of foreign countries who were chiefs or officials of international organizations,
who were subject to reassignment to other countries after their tour of duty in the Philippines, and members of their families. Examples of these international organizations are United Nations, International Labor Organization, Asian Development Bank, Food and Agriculture Organization, World Health Organization or the United States Agency for International Development,
4. Citizens of foreign countries, together with non-Filipino members of their families, who were students or who were employed or had business in the Philippines, but who had stayed or were expected to stay in the country for less than a year from their arrival,
5. Citizens of foreign countries and Filipinos with usual place of residence in a foreign country, who visited the Philippines and who had stayed or were expected to stay in the country for less than a year from their arrival,
6. Citizens of foreign countries in refugee camps/vessels, and 7. Residents of the Philippines on vacation, pleasure or business trip, study or training
abroad who had been away or were expected to be away from the Philippines for more than one year from their departure.
Respondent A respondent was any responsible member of the household who furnished the information or answered the questions during the interview. Demographic Characteristics Head of the household The head of the household is an adult person, male or female, who is responsible for the organization and care of the household, or who is regarded as such by the members of the household.
The census questions for this item, which were asked from the respondent were: Who is the head of this household? Who are the persons residing here as of August 1, 2015? Relationship to the household head
The members of the household were classified in terms of their relationship to the head of the household:
• Head • Grandson • Nephew
• Spouse • Granddaughter • Niece
• Son • Father • Other relative
• Daughter • Mother • Nonrelative
• Stepson • Brother • Boarder
• Stepdaughter • Sister • Domestic helper
• Son-in-law • Uncle
• Daughter-in-law • Aunt
Explanatory Text
Philippine Statistics Authority xviii
The census question for this item, which was asked for all members of the household, other than the household head was: What is ____’s relationship to the head of the household? Sex
Sex of a household member is classified as either male or female. The census question for this item, which was asked for all household members was: Is ____
male or female?
Age as of last birthday
Age as of last birthday referred to the interval of time between the person’s date of birth and 1 August 2015. It was expressed in completed years, thus, recorded in whole number.
The census question for this item, which was asked for all members of the household was:
What is ______’s age as of his/her last birthday? Marital status
Marital status refers to the personal status of each individual with reference to the marriage laws or customs of the country. It is the same as civil status, the term usually used in official and private records, documents, transactions, and others, in the country. For the POPCEN 2015, the person’s marital status was as of the date of the visit.
The following were the categories used for marital status:
• Single – person who has never been married.
• Married – person married in a religious, civil ceremony or tribal rite, either living with his/her spouse at the time of visit or temporarily living apart because his/her spouse is employed elsewhere (as in the case of a person whose spouse is an overseas worker or one who works with the Armed Forces and residing somewhere else).
• Widowed – married person whose spouse died and who has not married up to the time of visit.
• Divorced/separated – person who is permanently separated from his/her spouse, legally or through mutual consent. This is also applicable to a person whose marriage with another person has been annulled or dissolved and can, therefore, remarry.
• Common-law/live-in – person cohabiting or living consensually with another person as husband and wife without the benefit of a legal marriage.
• Unknown – person whose marital status is unknown to the respondent, or whose marital status is being concealed by the respondent/person himself/herself.
The census question for this item, which was asked for all persons 10 years old and over
was: Is ____ single, married, widowed, divorced/separated, or in a common-law/live-in arrangement? Socioeconomic Characteristics
Religious affiliation
Religious affiliation refers to a particular system of beliefs, attitudes, emotions, and behaviors constituting man’s relationship with the powers and principalities of the universe.
The census question for this item, which was asked for all persons was: What is _____’s
religious affiliation?
Explanatory Text
Philippine Statistics Authority xix
School attendance School attendance referred to the attendance in any educational institution, public or private to obtain formal education for School Year 2015-2016. The census question for this item, which was asked for household members 5 to 24 years old was: Is ______ currently attending school? Literacy
Simple literacy is the ability of a person to read and write a simple message. As such, a person is said to be literate if he/she can both read and write a simple message in any language or dialect. A person who could not read and write a simple message, such as “I CAN READ” was considered illiterate. Moreover, a person was still considered illiterate if he/she was capable of reading and writing only his/her own name or numbers. Similarly, a person was illiterate if he/she could read but not write, vice versa. A person who knew how to read and write but at the time of the census could no longer read and/or write due to a physical defect or illness was still considered literate.
The census question for this item, which was asked for household members 5 years old and
over was: Can _____ read and write a simple message in any language or dialect?” Highest grade/year completed
Highest grade/year completed referred to the highest grade or year completed in school, college or university as of August 1, 2015. This may be any one of the specific grades or years in elementary, high school, post secondary school, college, and post baccalaureate levels of schooling. It also included preschool education and grade levels in K-12 Program.
A person’s highest grade/year completed was categorized as follows:
• No grade completed (did not undergo formal schooling)
• Preschool
• Special Education (SPED), undergraduate
• Special Education (SPED), graduate
• Elementary from Grade 1 to Grade 7
• Elementary graduate
• High school from 1st Year to 4
th Year, including Grade 7 to Grade 11 in K-12 Program
• High school graduate, including Grade 12 inK-12 Program
• Post secondary from 1st Year to 2
nd Year
• Post secondary graduate
• College undergraduate from 1st Year to 6
th Year
• Baccalaureate/College graduate
• Post baccalaureate (a graduate or a post baccalaureate course referred to any course for which an undergraduate degree is required). Master’s and doctoral degree students and graduates both fell under this category. Also included here were students in law or medical school, as well as students who were still working on their master’s degree, taking doctoral studies, and those who had already completed their master’s or doctoral degree.
The census question for this item, which was asked for all persons 5 years old and over was:
What is the highest grade/year completed by _____?
Explanatory Text
Philippine Statistics Authority xx
Overseas worker
An overseas worker was a household member who was at the time out of the country due to overseas employment. He/she may or may not have had a specific work contract or may have been presently at home on vacation during the census but had an existing overseas employment to return to. Undocumented overseas workers, or “TNT” (Tago Nang Tago), were considered overseas workers for as long as they were still considered members of the household and that they had been away for less than five years. However, immigrants were excluded from the census.
The census question for this item, which was asked for household members 15 years old and
over was: Is _____ an overseas worker? Usual activity/occupation
The term usual activity/occupation referred to the kind of job or business, which a person was engaged in most of the time during the 12 months preceding the interview. In other words, it was the person’s principal means of earning a living during the past 12 months, such as being a rice farmer, primary school teacher, police inspector, accounting clerk, medical doctor, building architect or lawyer.
For persons who did not work during the past 12 months, their usual activity/occupation referred to the non-gainful activities that they usually did during the past 12 months, such as being a housekeeper in own home, student, pensioner, retired or person with disability or dependent.
The 2008 Philippine Standard Occupational Classification (PSOC) was used in classifying the
usual activity/occupation of household members 15 years old and over.
The census question for this item, which was asked for household members 15 years old and over was: During the past 12 months, what was ______’s usual activity/occupation? Dissemination of the POPCEN 2015 Results The results of the POPCEN 2015 will be disseminated to data users in various forms, such as reports, press releases, factsheets, and statistical tables posted in the PSA website, and published and/or disseminated in various fora. Licensed microdata files will also be made available to data users. The following are the reports or publications on the POPCEN 2015:
Report No. 1 - Population by Province, City/Municipality, and Barangay
(in regional volumes)
Report No. 2 - Demographic and Socioeconomic Characteristics of the Population (in provincial and HUC volumes)
Report No. 3 - Population, Land Area, and Population Density (in national volume)
Report No. 4 - Urban Population (in national volume)
Report No. 5 - Institutional Population (in national volume)
Report No. 6 - Barangay Characteristics (in national volume)
Report on Housing Characteristics (in regional volumes)
Population Counts by Legislative District (in national volume)
Census Facts and Figures (in national volume)
Special Report on Birth and Death Registration (in national volume)
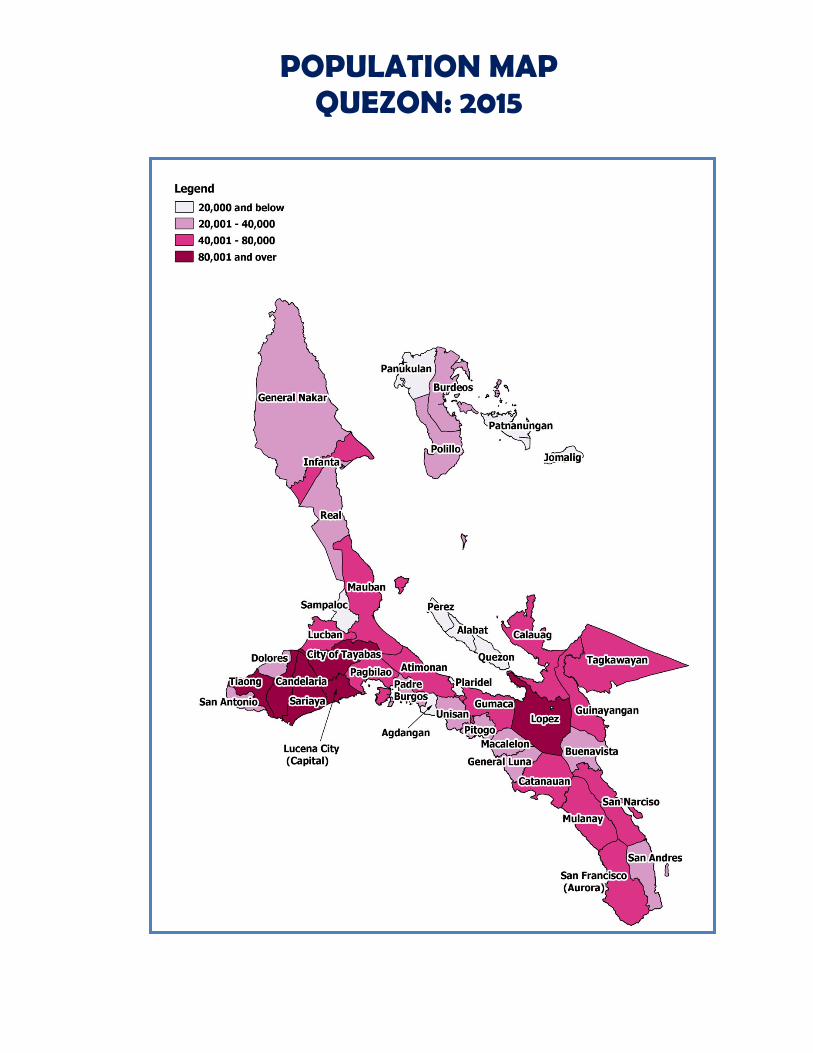
POPULATION MAP QUEZON: 2015
Philippine Statistics Authority
xxii
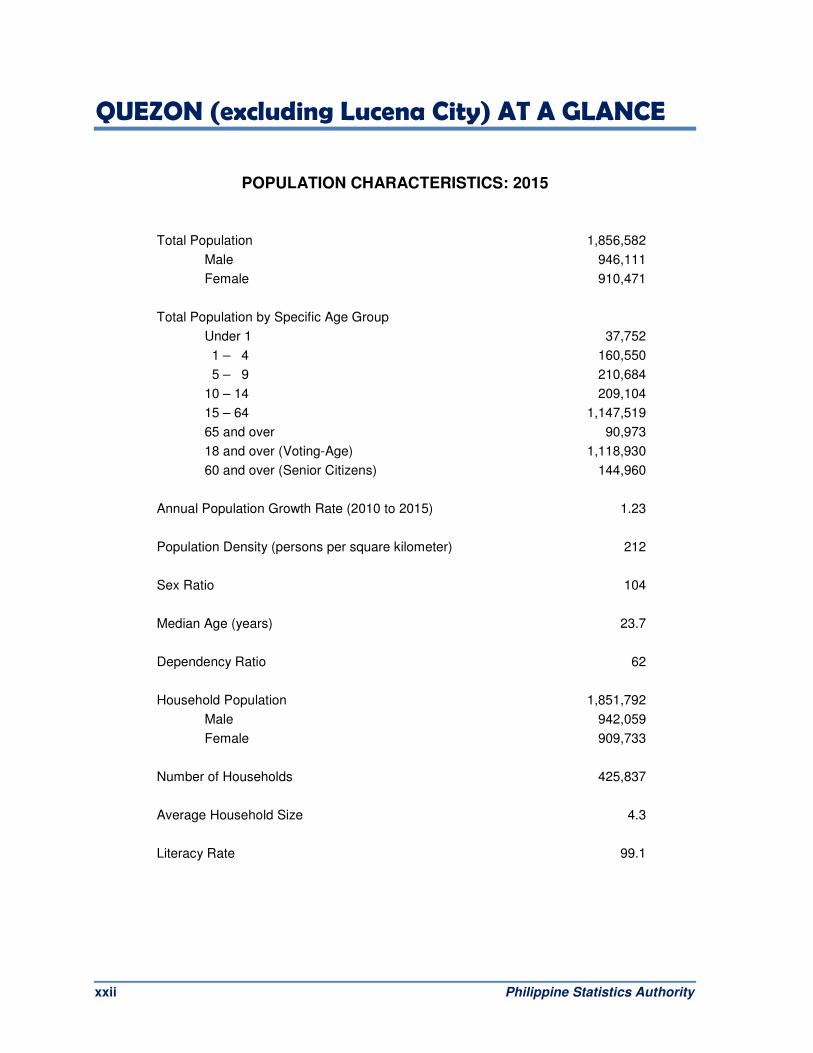
QUEZON (excluding Lucena City) AT A GLANCE
POPULATION CHARACTERISTICS: 2015
Total Population 1,856,582
Male 946,111
Female 910,471
Total Population by Specific Age Group
Under 1 37,752
1 – 4 160,550
5 – 9 210,684
10 – 14 209,104
15 – 64 1,147,519
65 and over 90,973
18 and over (Voting-Age) 1,118,930
60 and over (Senior Citizens) 144,960
Annual Population Growth Rate (2010 to 2015) 1.23
Population Density (persons per square kilometer) 212
Sex Ratio 104
Median Age (years) 23.7
Dependency Ratio 62
Household Population 1,851,792
Male 942,059
Female 909,733
Number of Households 425,837
Average Household Size 4.3
Literacy Rate 99.1
Philippine Statistics Authority xxiii
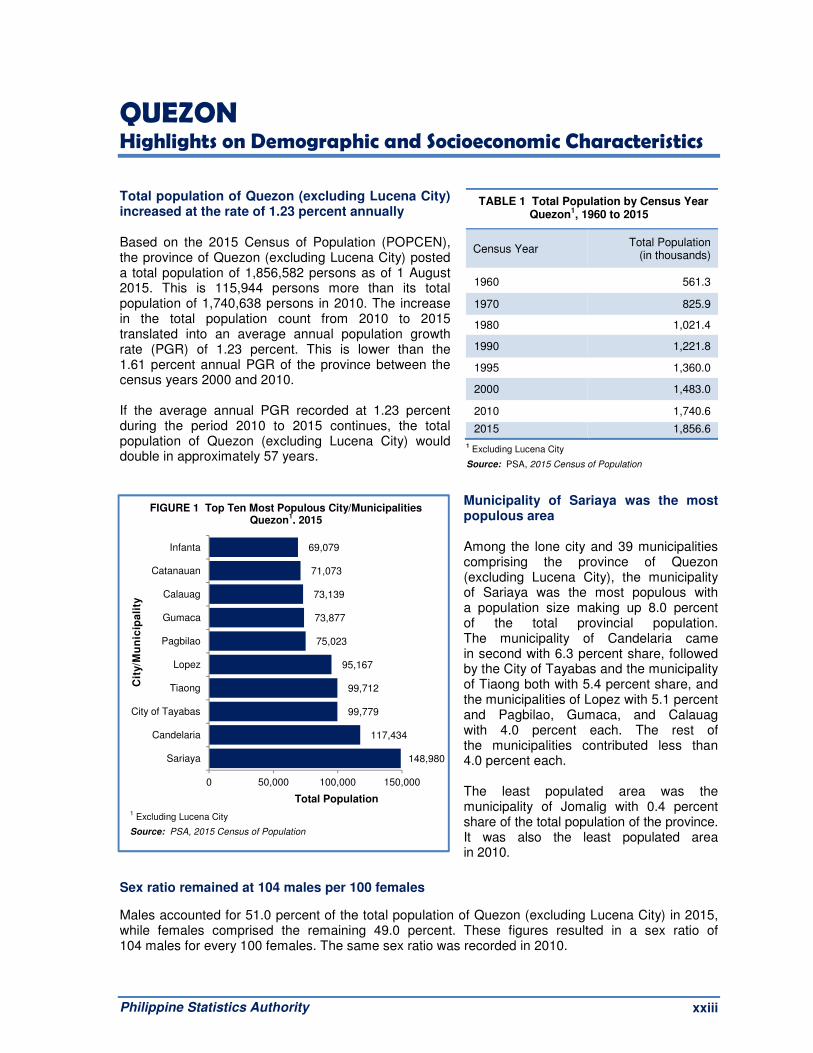
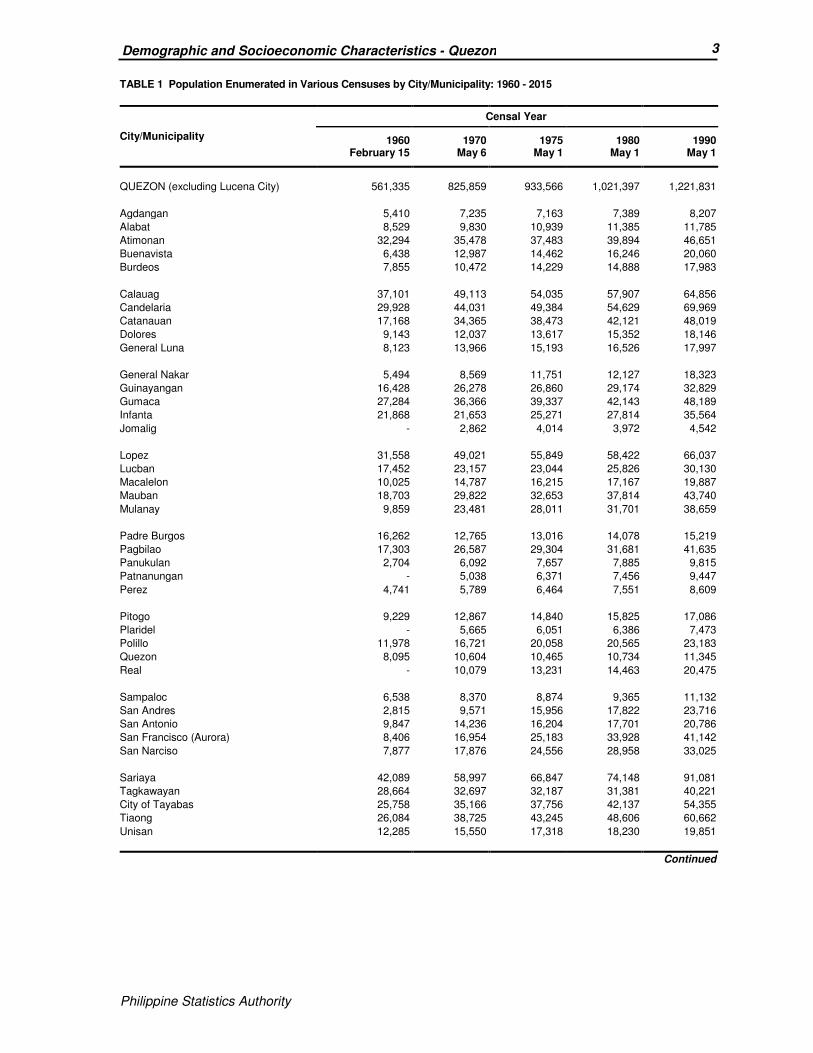
TABLE 1 Total Population by Census Year Quezon1, 1960 to 2015
Census Year Total Population (in thousands)
1960 561.3
1970 825.9
1980 1,021.4
1990 1,221.8
1995 1,360.0
2000 1,483.0
2010 1,740.6
2015 1,856.6
1 Excluding Lucena City
Source: PSA, 2015 Census of Population
QUEZON Highlights on Demographic and Socioeconomic Characteristics Total population of Quezon (excluding Lucena City) increased at the rate of 1.23 percent annually Based on the 2015 Census of Population (POPCEN), the province of Quezon (excluding Lucena City) posted a total population of 1,856,582 persons as of 1 August 2015. This is 115,944 persons more than its total population of 1,740,638 persons in 2010. The increase in the total population count from 2010 to 2015 translated into an average annual population growth rate (PGR) of 1.23 percent. This is lower than the 1.61 percent annual PGR of the province between the census years 2000 and 2010. If the average annual PGR recorded at 1.23 percent during the period 2010 to 2015 continues, the total population of Quezon (excluding Lucena City) would double in approximately 57 years.
Municipality of Sariaya was the most populous area Among the lone city and 39 municipalities comprising the province of Quezon (excluding Lucena City), the municipality of Sariaya was the most populous with a population size making up 8.0 percent of the total provincial population. The municipality of Candelaria came in second with 6.3 percent share, followed by the City of Tayabas and the municipality of Tiaong both with 5.4 percent share, and the municipalities of Lopez with 5.1 percent and Pagbilao, Gumaca, and Calauag with 4.0 percent each. The rest of the municipalities contributed less than 4.0 percent each. The least populated area was the municipality of Jomalig with 0.4 percent share of the total population of the province. It was also the least populated area in 2010.
Sex ratio remained at 104 males per 100 females
Males accounted for 51.0 percent of the total population of Quezon (excluding Lucena City) in 2015, while females comprised the remaining 49.0 percent. These figures resulted in a sex ratio of 104 males for every 100 females. The same sex ratio was recorded in 2010.
148,980
117,434
99,779
99,712
95,167
75,023
73,877
73,139
71,073
69,079
0 50,000 100,000 150,000
Sariaya
Candelaria
City of Tayabas
Tiaong
Lopez
Pagbilao
Gumaca
Calauag
Catanauan
Infanta
Total Population
Cit
y/M
un
icip
ali
ty
1 Excluding Lucena City
Source: PSA, 2015 Census of Population
FIGURE 1 Top Ten Most Populous City/Municipalities Quezon
1, 2015
Highlights
Philippine Statistics Authority xxiv
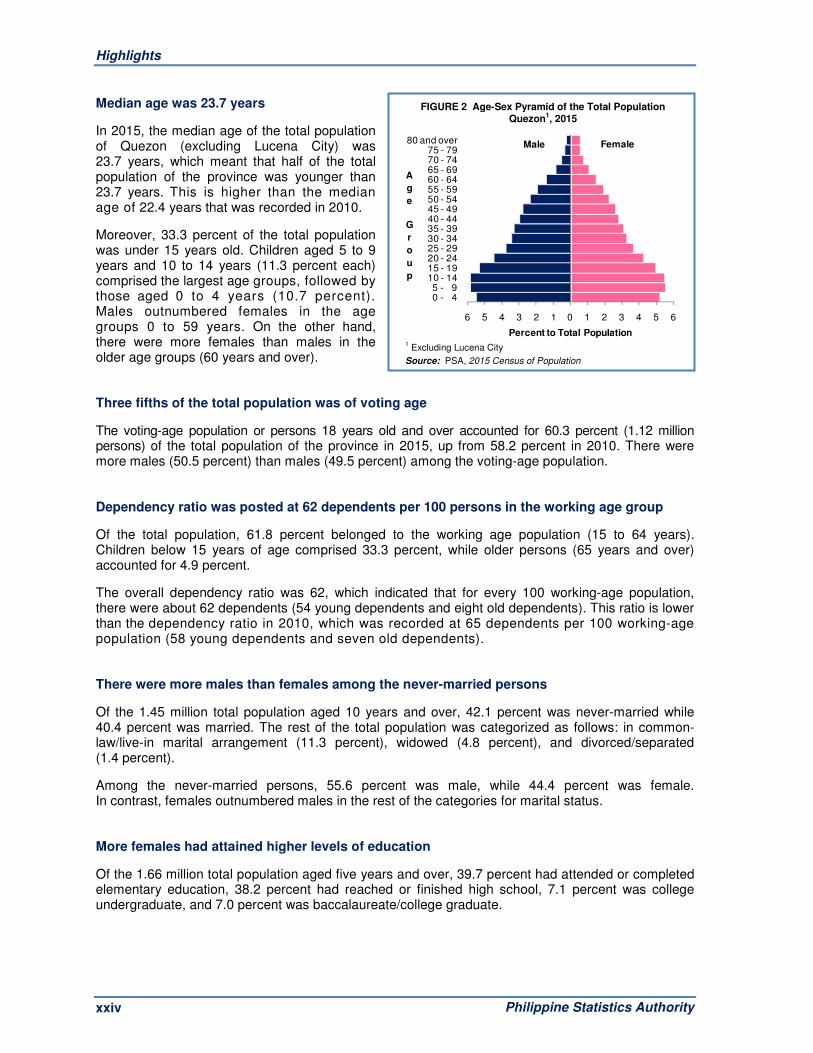
Median age was 23.7 years
In 2015, the median age of the total population of Quezon (excluding Lucena City) was 23.7 years, which meant that half of the total population of the province was younger than 23.7 years. This is higher than the median age of 22.4 years that was recorded in 2010.
Moreover, 33.3 percent of the total population was under 15 years old. Children aged 5 to 9 years and 10 to 14 years (11.3 percent each) comprised the largest age groups, followed by those aged 0 to 4 years (10.7 percent). Males outnumbered females in the age groups 0 to 59 years. On the other hand, there were more females than males in the older age groups (60 years and over). Three fifths of the total population was of voting age
The voting-age population or persons 18 years old and over accounted for 60.3 percent (1.12 million persons) of the total population of the province in 2015, up from 58.2 percent in 2010. There were more males (50.5 percent) than males (49.5 percent) among the voting-age population. Dependency ratio was posted at 62 dependents per 100 persons in the working age group
Of the total population, 61.8 percent belonged to the working age population (15 to 64 years). Children below 15 years of age comprised 33.3 percent, while older persons (65 years and over) accounted for 4.9 percent.
The overall dependency ratio was 62, which indicated that for every 100 working-age population, there were about 62 dependents (54 young dependents and eight old dependents). This ratio is lower than the dependency ratio in 2010, which was recorded at 65 dependents per 100 working-age population (58 young dependents and seven old dependents). There were more males than females among the never-married persons
Of the 1.45 million total population aged 10 years and over, 42.1 percent was never-married while 40.4 percent was married. The rest of the total population was categorized as follows: in common-law/live-in marital arrangement (11.3 percent), widowed (4.8 percent), and divorced/separated (1.4 percent).
Among the never-married persons, 55.6 percent was male, while 44.4 percent was female. In contrast, females outnumbered males in the rest of the categories for marital status. More females had attained higher levels of education
Of the 1.66 million total population aged five years and over, 39.7 percent had attended or completed elementary education, 38.2 percent had reached or finished high school, 7.1 percent was college undergraduate, and 7.0 percent was baccalaureate/college graduate.
6 5 4 3 2 1 0 1 2 3 4 5 6
0 - 45 - 9
10 - 1415 - 1920 - 2425 - 2930 - 3435 - 3940 - 4445 - 4950 - 5455 - 5960 - 6465 - 6970 - 7475 - 79
80 and over
Percent to Total Population
A
g
e
G
r
o
u
p
Male Female
1 Excluding Lucena City
Source: PSA, 2015 Census of Population
FIGURE 2 Age-Sex Pyramid of the Total Population Quezon1, 2015
Highlights
Philippine Statistics Authority xxv
TABLE 2 Household Population, Number of Households, and Average Household Size Quezon1, 2015 and 2010
Census Year Household Population Number of Households Average Household Size
2015 1,851,792 425,837 4.3 2010 1,738,015 384,455 4.5
1 Excluding Lucena City
Source: PSA, 2015 Census of Population
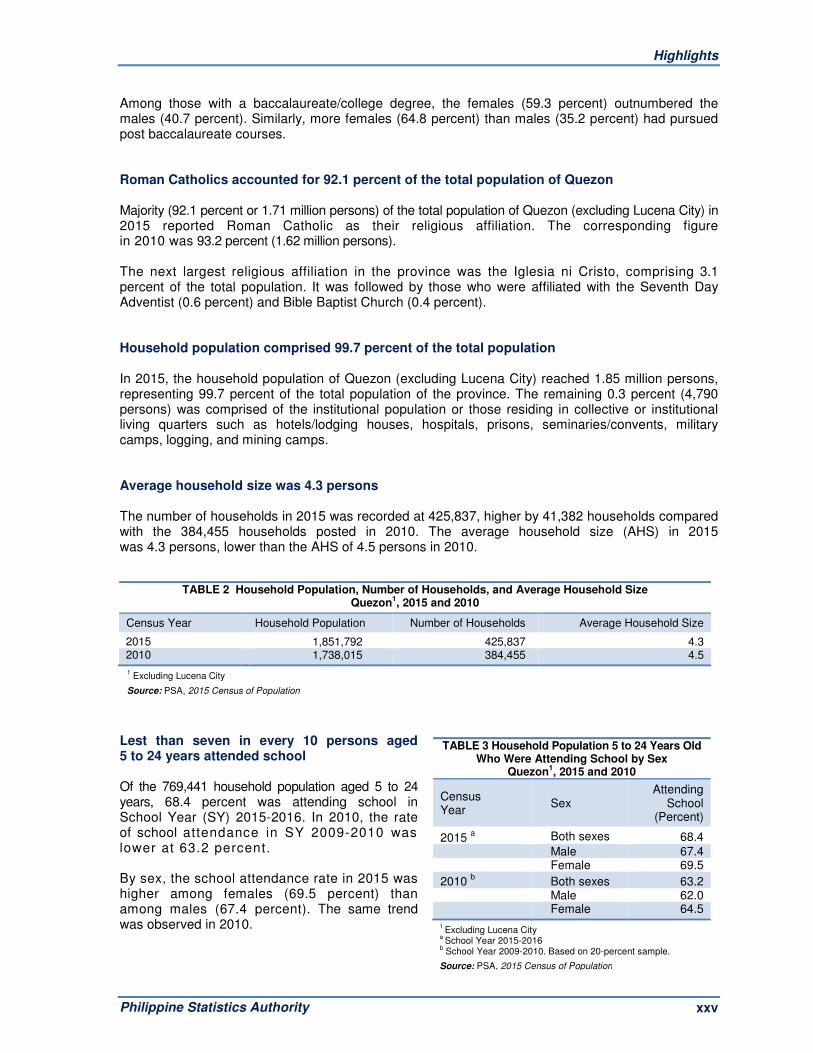
TABLE 3 Household Population 5 to 24 Years Old Who Were Attending School by Sex
Quezon1, 2015 and 2010
Census Year
Sex Attending
School (Percent)
2015 a Both sexes 68.4
Male 67.4 Female 69.5
2010 b Both sexes 63.2
Male 62.0 Female 64.5
1 Excluding Lucena City
a School Year 2015-2016
b School Year 2009-2010. Based on 20-percent sample.
Source: PSA, 2015 Census of Population
Among those with a baccalaureate/college degree, the females (59.3 percent) outnumbered the males (40.7 percent). Similarly, more females (64.8 percent) than males (35.2 percent) had pursued post baccalaureate courses. Roman Catholics accounted for 92.1 percent of the total population of Quezon Majority (92.1 percent or 1.71 million persons) of the total population of Quezon (excluding Lucena City) in 2015 reported Roman Catholic as their religious affiliation. The corresponding figure in 2010 was 93.2 percent (1.62 million persons). The next largest religious affiliation in the province was the Iglesia ni Cristo, comprising 3.1 percent of the total population. It was followed by those who were affiliated with the Seventh Day Adventist (0.6 percent) and Bible Baptist Church (0.4 percent). Household population comprised 99.7 percent of the total population In 2015, the household population of Quezon (excluding Lucena City) reached 1.85 million persons, representing 99.7 percent of the total population of the province. The remaining 0.3 percent (4,790 persons) was comprised of the institutional population or those residing in collective or institutional living quarters such as hotels/lodging houses, hospitals, prisons, seminaries/convents, military camps, logging, and mining camps. Average household size was 4.3 persons The number of households in 2015 was recorded at 425,837, higher by 41,382 households compared with the 384,455 households posted in 2010. The average household size (AHS) in 2015 was 4.3 persons, lower than the AHS of 4.5 persons in 2010.
Lest than seven in every 10 persons aged 5 to 24 years attended school Of the 769,441 household population aged 5 to 24 years, 68.4 percent was attending school in School Year (SY) 2015-2016. In 2010, the rate of school attendance in SY 2009-2010 was lower at 63.2 percent. By sex, the school attendance rate in 2015 was higher among females (69.5 percent) than among males (67.4 percent). The same trend was observed in 2010.
Highlights
Philippine Statistics Authority xxvi
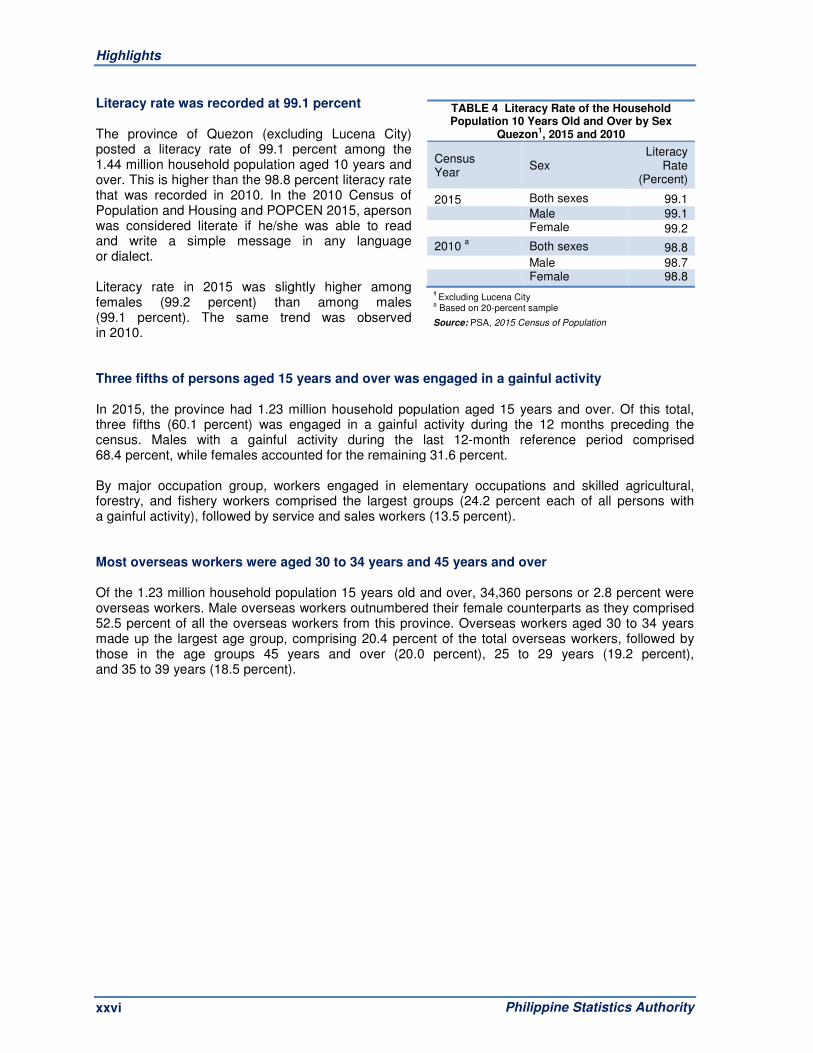
TABLE 4 Literacy Rate of the Household Population 10 Years Old and Over by Sex
Quezon1, 2015 and 2010
Census Year
Sex Literacy
Rate (Percent)
2015 Both sexes 99.1
Male 99.1 Female 99.2
2010 a Both sexes 98.8
Male 98.7 Female 98.8
1 Excluding Lucena City
a Based on 20-percent sample
Source: PSA, 2015 Census of Population
Literacy rate was recorded at 99.1 percent The province of Quezon (excluding Lucena City) posted a literacy rate of 99.1 percent among the 1.44 million household population aged 10 years and over. This is higher than the 98.8 percent literacy rate that was recorded in 2010. In the 2010 Census of Population and Housing and POPCEN 2015, aperson was considered literate if he/she was able to read and write a simple message in any language or dialect. Literacy rate in 2015 was slightly higher among females (99.2 percent) than among males (99.1 percent). The same trend was observed in 2010. Three fifths of persons aged 15 years and over was engaged in a gainful activity In 2015, the province had 1.23 million household population aged 15 years and over. Of this total, three fifths (60.1 percent) was engaged in a gainful activity during the 12 months preceding the census. Males with a gainful activity during the last 12-month reference period comprised 68.4 percent, while females accounted for the remaining 31.6 percent. By major occupation group, workers engaged in elementary occupations and skilled agricultural, forestry, and fishery workers comprised the largest groups (24.2 percent each of all persons with a gainful activity), followed by service and sales workers (13.5 percent). Most overseas workers were aged 30 to 34 years and 45 years and over Of the 1.23 million household population 15 years old and over, 34,360 persons or 2.8 percent were overseas workers. Male overseas workers outnumbered their female counterparts as they comprised 52.5 percent of all the overseas workers from this province. Overseas workers aged 30 to 34 years made up the largest age group, comprising 20.4 percent of the total overseas workers, followed by those in the age groups 45 years and over (20.0 percent), 25 to 29 years (19.2 percent), and 35 to 39 years (18.5 percent).
STATISTICAL
TABLES

Philippine Statistics Authority
3 Demographic and Socioeconomic Characteristics - Quezon
Philippine Statistics Authority
TABLE 1 Population Enumerated in Various Censuses by City/Municipality: 1960 - 2015
City/Municipality
Censal Year
1960 1970 1975 1980 1990 February 15 May 6 May 1 May 1 May 1
QUEZON (excluding Lucena City) 561,335 825,859 933,566 1,021,397 1,221,831
Agdangan 5,410 7,235 7,163 7,389 8,207
Alabat 8,529 9,830 10,939 11,385 11,785
Atimonan 32,294 35,478 37,483 39,894 46,651
Buenavista 6,438 12,987 14,462 16,246 20,060
Burdeos 7,855 10,472 14,229 14,888 17,983
Calauag 37,101 49,113 54,035 57,907 64,856
Candelaria 29,928 44,031 49,384 54,629 69,969
Catanauan 17,168 34,365 38,473 42,121 48,019
Dolores 9,143 12,037 13,617 15,352 18,146
General Luna 8,123 13,966 15,193 16,526 17,997
General Nakar 5,494 8,569 11,751 12,127 18,323
Guinayangan 16,428 26,278 26,860 29,174 32,829
Gumaca 27,284 36,366 39,337 42,143 48,189
Infanta 21,868 21,653 25,271 27,814 35,564
Jomalig - 2,862 4,014 3,972 4,542
Lopez 31,558 49,021 55,849 58,422 66,037
Lucban 17,452 23,157 23,044 25,826 30,130
Macalelon 10,025 14,787 16,215 17,167 19,887
Mauban 18,703 29,822 32,653 37,814 43,740
Mulanay 9,859 23,481 28,011 31,701 38,659
Padre Burgos 16,262 12,765 13,016 14,078 15,219
Pagbilao 17,303 26,587 29,304 31,681 41,635
Panukulan 2,704 6,092 7,657 7,885 9,815
Patnanungan - 5,038 6,371 7,456 9,447
Perez 4,741 5,789 6,464 7,551 8,609
Pitogo 9,229 12,867 14,840 15,825 17,086
Plaridel - 5,665 6,051 6,386 7,473
Polillo 11,978 16,721 20,058 20,565 23,183
Quezon 8,095 10,604 10,465 10,734 11,345
Real - 10,079 13,231 14,463 20,475
Sampaloc 6,538 8,370 8,874 9,365 11,132
San Andres 2,815 9,571 15,956 17,822 23,716
San Antonio 9,847 14,236 16,204 17,701 20,786
San Francisco (Aurora) 8,406 16,954 25,183 33,928 41,142
San Narciso 7,877 17,876 24,556 28,958 33,025
Sariaya 42,089 58,997 66,847 74,148 91,081
Tagkawayan 28,664 32,697 32,187 31,381 40,221
City of Tayabas 25,758 35,166 37,756 42,137 54,355
Tiaong 26,084 38,725 43,245 48,606 60,662
Unisan 12,285 15,550 17,318 18,230 19,851
Continued
Philippine Statistics Authority
4 Demographic and Socioeconomic Characteristics - Quezon
Philippine Statistics Authority
Table 1--Concluded
City/Municipality
Censal Year
1995 2000 2010 2015 September 1 May 1 May 1 August 1
QUEZON (excluding Lucena City) 1,359,992 1,482,955 1,740,638 1,856,582
Agdangan 9,025 9,946 11,567 12,851
Alabat 13,787 14,204 16,120 15,630
Atimonan 54,283 56,716 61,587 63,432
Buenavista 21,376 22,840 29,053 30,047
Burdeos 20,246 19,635 24,166 26,760
Calauag 60,941 65,907 69,223 73,139
Candelaria 80,733 92,429 110,570 117,434
Catanauan 52,420 57,736 65,832 71,073
Dolores 20,749 23,649 27,702 28,891
General Luna 20,956 21,068 25,373 26,494
General Nakar 21,121 23,678 25,973 29,705
Guinayangan 36,775 37,164 41,669 45,155
Gumaca 53,568 60,191 69,618 73,877
Infanta 39,772 50,992 64,818 69,079
Jomalig 4,371 5,817 6,884 7,417
Lopez 75,344 78,694 91,074 95,167
Lucban 35,128 38,834 46,698 51,475
Macalelon 23,094 22,935 26,419 28,188
Mauban 47,442 50,134 61,141 63,819
Mulanay 43,617 45,903 50,826 53,123
Padre Burgos 17,635 18,962 20,161 22,460
Pagbilao 49,605 53,442 65,996 75,023
Panukulan 10,351 11,311 12,511 13,546
Patnanungan 9,638 11,034 13,865 14,606
Perez 10,264 10,454 12,039 12,173
Pitogo 18,832 20,558 21,380 23,019
Plaridel 8,666 9,501 10,238 10,935
Polillo 24,626 24,105 28,125 30,582
Quezon 13,200 14,594 15,142 15,228
Real 27,641 30,684 35,189 35,979
Sampaloc 10,977 12,858 13,107 13,907
San Andres 25,948 27,184 33,586 35,780
San Antonio 22,933 26,419 31,681 33,467
San Francisco (Aurora) 43,457 48,310 57,979 61,473
San Narciso 36,535 38,474 45,386 48,461
Sariaya 100,709 114,568 138,894 148,980
Tagkawayan 40,866 44,290 50,833 51,832
City of Tayabas 64,449 70,985 91,428 99,779
Tiaong 67,403 75,498 91,599 99,712
Unisan 21,509 21,252 25,186 26,884
Source: Philippine Statistics Authority, Various Census Reports

Philippine Statistics Authority
5 Demographic and Socioeconomic Characteristics - Quezon
Philippine Statistics Authority
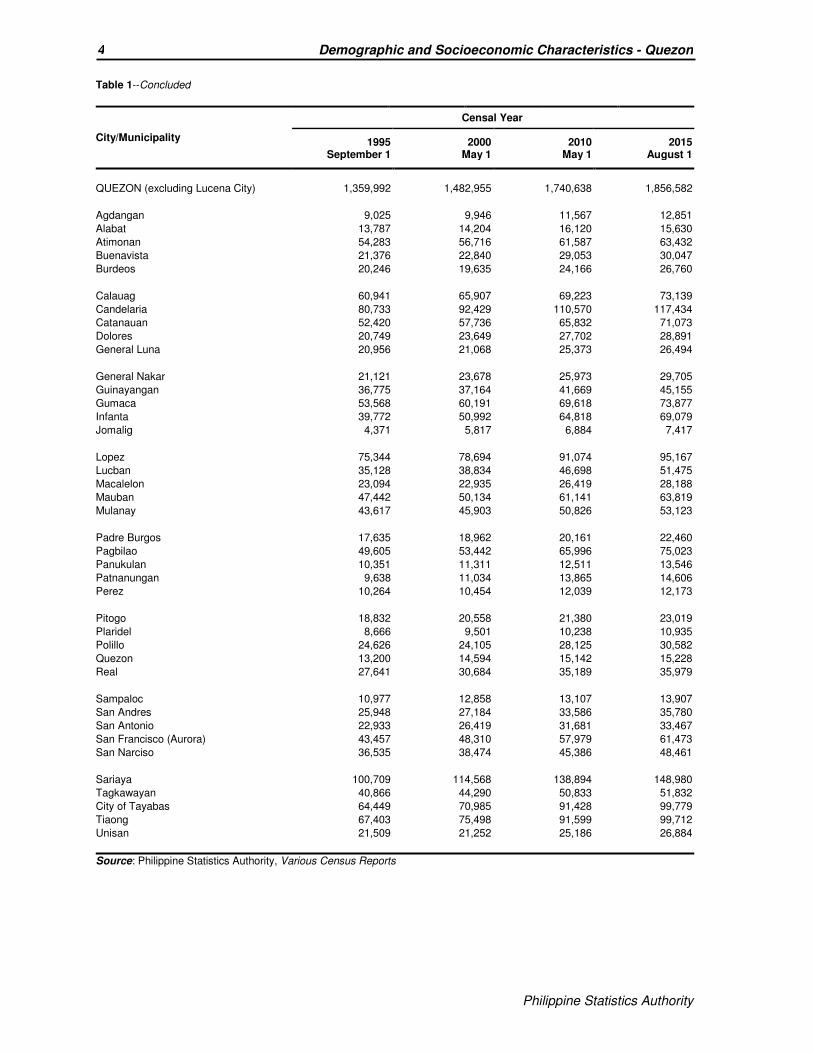
TABLE 2 Total Population by Single-Year Age and Sex: 2015
Single-Year Age Both Sexes Male Female
QUEZON (excluding Lucena City)
All ages 1,856,582 946,111 910,471
Under 1 37,752 19,452 18,300
1 38,409 19,930 18,479
2 39,702 20,485 19,217
3 41,095 21,185 19,910
4 41,344 21,405 19,939
5 41,972 21,690 20,282
6 42,902 22,091 20,811
7 42,800 21,921 20,879
8 41,845 21,512 20,333
9 41,165 21,027 20,138
10 42,747 22,350 20,397
11 42,159 21,707 20,452
12 41,437 21,374 20,063
13 40,483 20,816 19,667
14 42,278 22,121 20,157
15 42,556 22,124 20,432
16 38,158 19,804 18,354
17 38,848 20,217 18,631
18 35,725 18,476 17,249
19 34,839 17,939 16,900
20 33,650 17,441 16,209
21 33,169 17,108 16,061
22 32,764 16,741 16,023
23 31,368 16,120 15,248
24 30,084 15,455 14,629
25 29,601 15,234 14,367
26 26,758 13,532 13,226
27 28,151 14,325 13,826
28 27,303 13,984 13,319
29 25,687 13,204 12,483
30 25,513 13,170 12,343
31 24,388 12,556 11,832
32 24,802 12,809 11,993
33 24,644 12,624 12,020
34 24,914 12,805 12,109
35 25,593 13,151 12,442
36 24,325 12,598 11,727
37 23,069 12,086 10,983
38 23,266 12,052 11,214
39 22,190 11,408 10,782
40 22,898 11,803 11,095
41 20,637 10,649 9,988
42 21,451 11,102 10,349
43 21,020 10,870 10,150
44 20,090 10,399 9,691
Continued
Philippine Statistics Authority
6 Demographic and Socioeconomic Characteristics - Quezon
Philippine Statistics Authority
Table 2--Concluded
Single-Year Age Both Sexes Male Female
45 21,880 11,254 10,626
46 20,393 10,533 9,860
47 19,708 10,268 9,440
48 19,216 9,898 9,318
49 18,676 9,595 9,081
50 18,530 9,704 8,826
51 17,560 9,089 8,471
52 17,270 8,898 8,372
53 16,558 8,511 8,047
54 15,133 7,637 7,496
55 16,325 8,420 7,905
56 14,576 7,483 7,093
57 13,953 7,044 6,909
58 13,224 6,696 6,528
59 13,069 6,532 6,537
60 12,720 6,350 6,370
61 11,177 5,472 5,705
62 11,133 5,416 5,717
63 9,874 4,839 5,035
64 9,083 4,341 4,742
65 9,248 4,316 4,932
66 7,467 3,469 3,998
67 7,329 3,341 3,988
68 6,539 2,912 3,627
69 5,524 2,386 3,138
70 5,324 2,258 3,066
71 4,491 1,946 2,545
72 4,844 1,974 2,870
73 4,903 2,007 2,896
74 4,234 1,743 2,491
75 4,231 1,707 2,524
76 3,483 1,324 2,159
77 3,274 1,317 1,957
78 3,141 1,213 1,928
79 2,664 1,001 1,663
80 years and over 14,277 4,365 9,912
Source: Philippine Statistics Authority, 2015 Census of Population
Philippine Statistics Authority
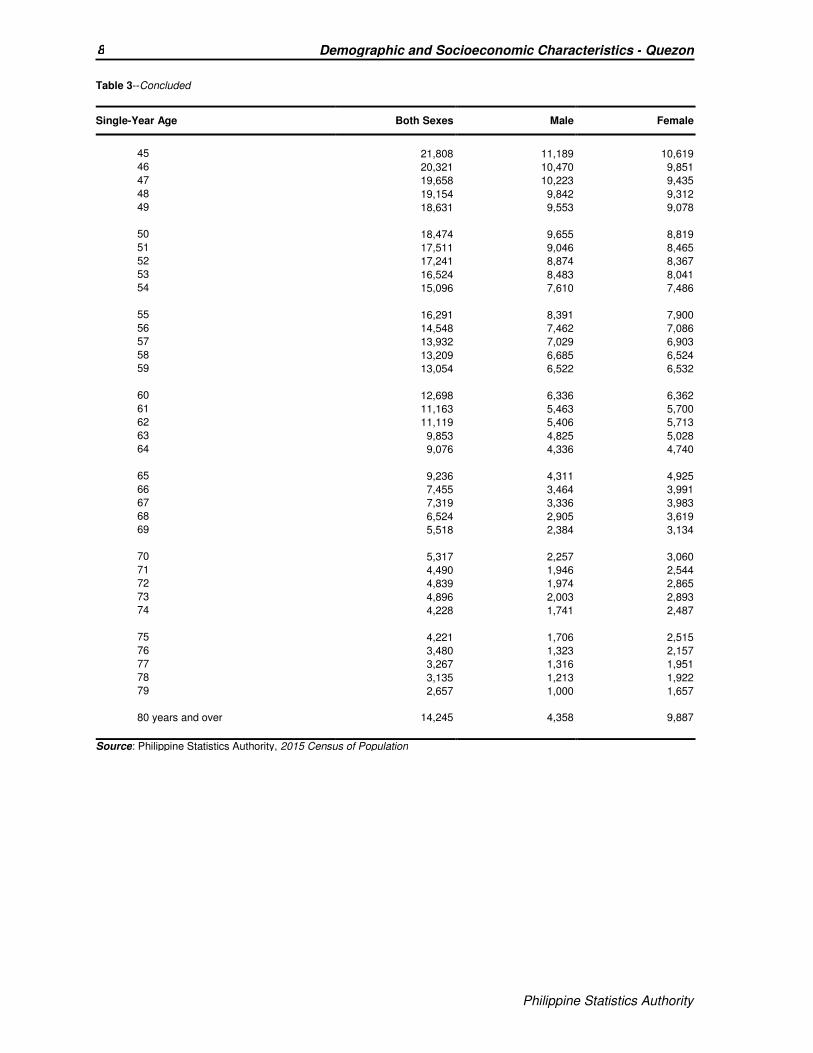
7 Demographic and Socioeconomic Characteristics - Quezon
Philippine Statistics Authority
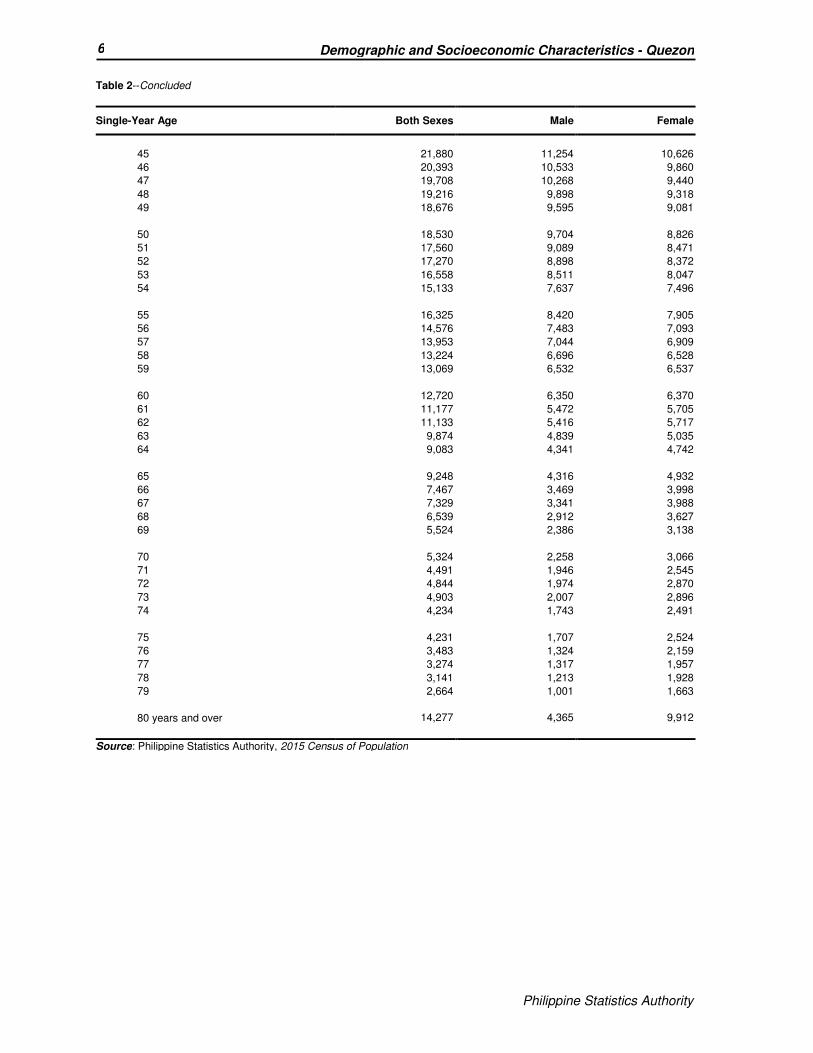
TABLE 3 Household Population by Single-Year Age and Sex: 2015
Single-Year Age Both Sexes Male Female
QUEZON (excluding Lucena City)
All ages 1,851,792 942,059 909,733
Under 1 37,750 19,450 18,300
1 38,407 19,928 18,479
2 39,698 20,482 19,216
3 41,093 21,183 19,910
4 41,344 21,405 19,939
5 41,972 21,690 20,282
6 42,899 22,089 20,810
7 42,796 21,917 20,879
8 41,840 21,511 20,329
9 41,162 21,026 20,136
10 42,744 22,347 20,397
11 42,145 21,698 20,447
12 41,424 21,365 20,059
13 40,466 20,805 19,661
14 42,242 22,089 20,153
15 42,523 22,099 20,424
16 38,086 19,750 18,336
17 38,720 20,117 18,603
18 35,560 18,341 17,219
19 34,663 17,795 16,868
20 33,467 17,288 16,179
21 33,020 16,984 16,036
22 32,606 16,612 15,994
23 31,203 15,987 15,216
24 29,903 15,309 14,594
25 29,425 15,083 14,342
26 26,593 13,387 13,206
27 27,981 14,172 13,809
28 27,134 13,831 13,303
29 25,541 13,074 12,467
30 25,341 13,012 12,329
31 24,259 12,435 11,824
32 24,669 12,683 11,986
33 24,501 12,490 12,011
34 24,797 12,700 12,097
35 25,446 13,014 12,432
36 24,219 12,499 11,720
37 22,967 11,991 10,976
38 23,156 11,949 11,207
39 22,081 11,307 10,774
40 22,805 11,725 11,080
41 20,569 10,589 9,980
42 21,390 11,045 10,345
43 20,964 10,822 10,142
44 20,033 10,347 9,686
Continued
Philippine Statistics Authority
8 Demographic and Socioeconomic Characteristics - Quezon
Philippine Statistics Authority
Table 3--Concluded
Single-Year Age Both Sexes Male Female
45 21,808 11,189 10,619
46 20,321 10,470 9,851
47 19,658 10,223 9,435
48 19,154 9,842 9,312
49 18,631 9,553 9,078
50 18,474 9,655 8,819
51 17,511 9,046 8,465
52 17,241 8,874 8,367
53 16,524 8,483 8,041
54 15,096 7,610 7,486
55 16,291 8,391 7,900
56 14,548 7,462 7,086
57 13,932 7,029 6,903
58 13,209 6,685 6,524
59 13,054 6,522 6,532
60 12,698 6,336 6,362
61 11,163 5,463 5,700
62 11,119 5,406 5,713
63 9,853 4,825 5,028
64 9,076 4,336 4,740
65 9,236 4,311 4,925
66 7,455 3,464 3,991
67 7,319 3,336 3,983
68 6,524 2,905 3,619
69 5,518 2,384 3,134
70 5,317 2,257 3,060
71 4,490 1,946 2,544
72 4,839 1,974 2,865
73 4,896 2,003 2,893
74 4,228 1,741 2,487
75 4,221 1,706 2,515
76 3,480 1,323 2,157
77 3,267 1,316 1,951
78 3,135 1,213 1,922
79 2,657 1,000 1,657
80 years and over 14,245 4,358 9,887
Source: Philippine Statistics Authority, 2015 Census of Population
Philippine Statistics Authority
9 Demographic and Socioeconomic Characteristics - Quezon
Philippine Statistics Authority
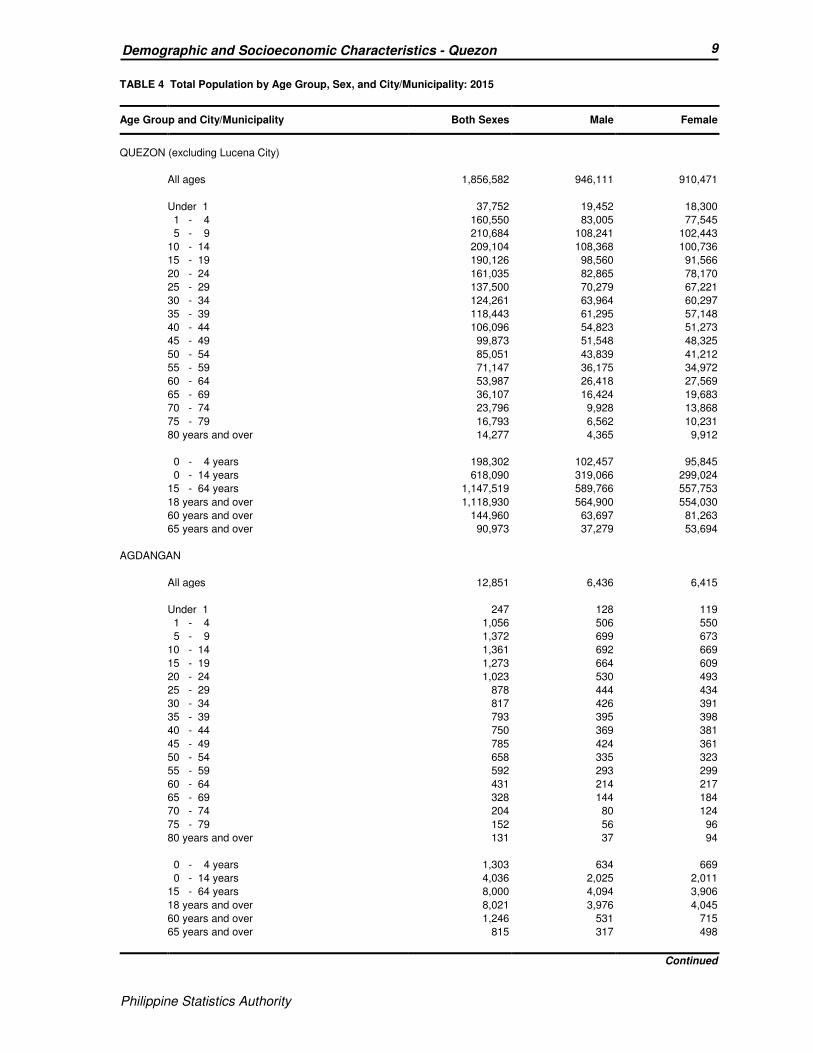
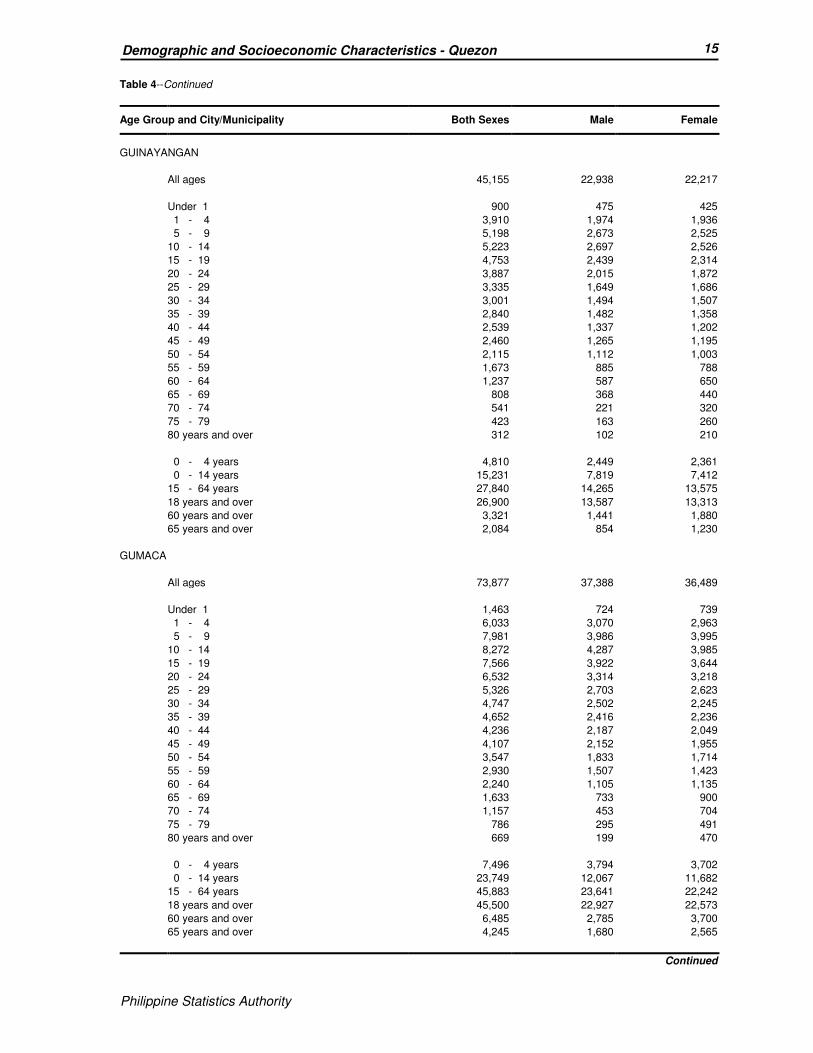
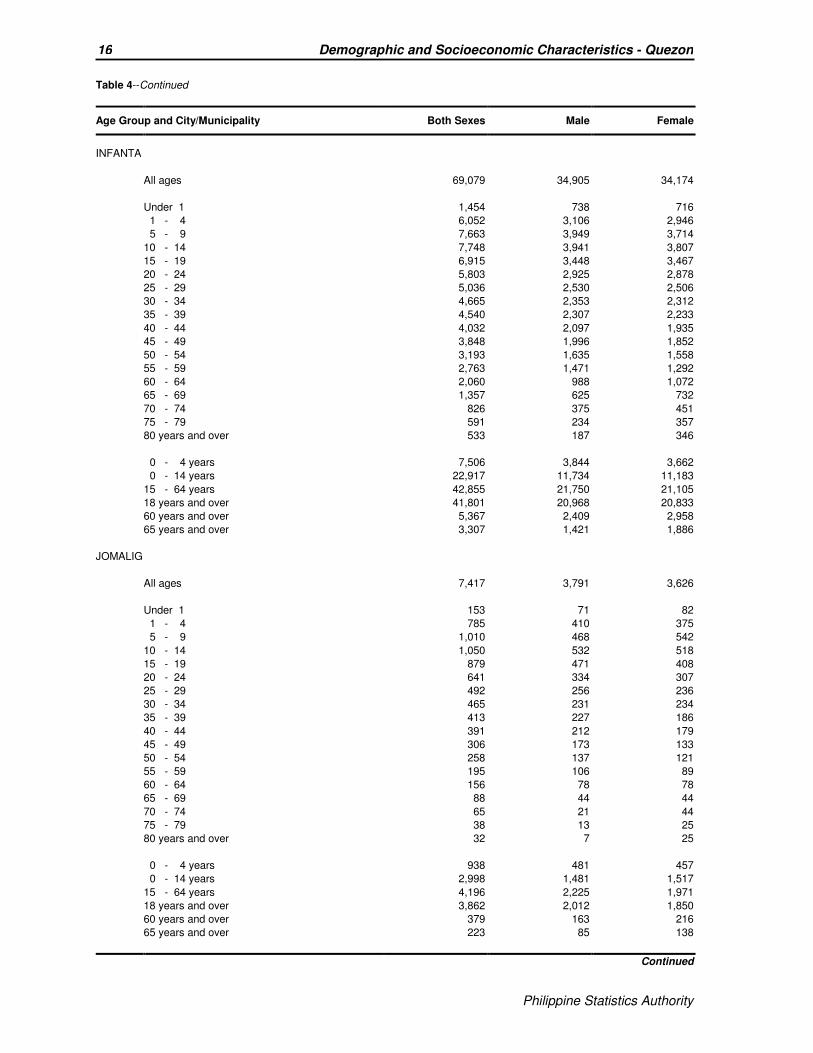
TABLE 4 Total Population by Age Group, Sex, and City/Municipality: 2015
Age Group and City/Municipality Both Sexes Male Female
QUEZON (excluding Lucena City)
All ages 1,856,582 946,111 910,471
Under 1 37,752 19,452 18,300
1 - 4 160,550 83,005 77,545
5 - 9 210,684 108,241 102,443
10 - 14 209,104 108,368 100,736
15 - 19 190,126 98,560 91,566
20 - 24 161,035 82,865 78,170
25 - 29 137,500 70,279 67,221
30 - 34 124,261 63,964 60,297
35 - 39 118,443 61,295 57,148
40 - 44 106,096 54,823 51,273
45 - 49 99,873 51,548 48,325
50 - 54 85,051 43,839 41,212
55 - 59 71,147 36,175 34,972
60 - 64 53,987 26,418 27,569
65 - 69 36,107 16,424 19,683
70 - 74 23,796 9,928 13,868
75 - 79 16,793 6,562 10,231
80 years and over 14,277 4,365 9,912
0 - 4 years 198,302 102,457 95,845
0 - 14 years 618,090 319,066 299,024
15 - 64 years 1,147,519 589,766 557,753
18 years and over 1,118,930 564,900 554,030
60 years and over 144,960 63,697 81,263
65 years and over 90,973 37,279 53,694
AGDANGAN
All ages 12,851 6,436 6,415
Under 1 247 128 119
1 - 4 1,056 506 550
5 - 9 1,372 699 673
10 - 14 1,361 692 669
15 - 19 1,273 664 609
20 - 24 1,023 530 493
25 - 29 878 444 434
30 - 34 817 426 391
35 - 39 793 395 398
40 - 44 750 369 381
45 - 49 785 424 361
50 - 54 658 335 323
55 - 59 592 293 299
60 - 64 431 214 217
65 - 69 328 144 184
70 - 74 204 80 124
75 - 79 152 56 96
80 years and over 131 37 94
0 - 4 years 1,303 634 669
0 - 14 years 4,036 2,025 2,011
15 - 64 years 8,000 4,094 3,906
18 years and over 8,021 3,976 4,045
60 years and over 1,246 531 715
65 years and over 815 317 498
Continued

Philippine Statistics Authority
10 Demographic and Socioeconomic Characteristics - Quezon
Philippine Statistics Authority
Table 4--Continued
Age Group and City/Municipality Both Sexes Male Female
ALABAT
All ages 15,630 7,935 7,695
Under 1 287 149 138
1 - 4 1,297 664 633
5 - 9 1,781 917 864
10 - 14 1,796 906 890
15 - 19 1,515 786 729
20 - 24 1,117 565 552
25 - 29 965 501 464
30 - 34 929 474 455
35 - 39 873 472 401
40 - 44 887 433 454
45 - 49 860 442 418
50 - 54 850 453 397
55 - 59 720 398 322
60 - 64 594 296 298
65 - 69 448 208 240
70 - 74 350 148 202
75 - 79 189 70 119
80 years and over 172 53 119
0 - 4 years 1,584 813 771
0 - 14 years 5,161 2,636 2,525
15 - 64 years 9,310 4,820 4,490
18 years and over 9,489 4,797 4,692
60 years and over 1,753 775 978
65 years and over 1,159 479 680
ATIMONAN
All ages 63,432 32,217 31,215
Under 1 1,151 584 567
1 - 4 5,071 2,655 2,416
5 - 9 6,382 3,324 3,058
10 - 14 6,312 3,292 3,020
15 - 19 6,090 3,160 2,930
20 - 24 5,311 2,670 2,641
25 - 29 4,845 2,484 2,361
30 - 34 4,361 2,250 2,111
35 - 39 3,917 1,968 1,949
40 - 44 3,700 1,959 1,741
45 - 49 3,727 1,903 1,824
50 - 54 3,415 1,798 1,617
55 - 59 2,871 1,421 1,450
60 - 64 2,208 1,128 1,080
65 - 69 1,534 711 823
70 - 74 1,067 430 637
75 - 79 789 298 491
80 years and over 681 182 499
0 - 4 years 6,222 3,239 2,983
0 - 14 years 18,916 9,855 9,061
15 - 64 years 40,445 20,741 19,704
18 years and over 40,802 20,431 20,371
60 years and over 6,279 2,749 3,530
65 years and over 4,071 1,621 2,450
Continued
Philippine Statistics Authority
11 Demographic and Socioeconomic Characteristics - Quezon
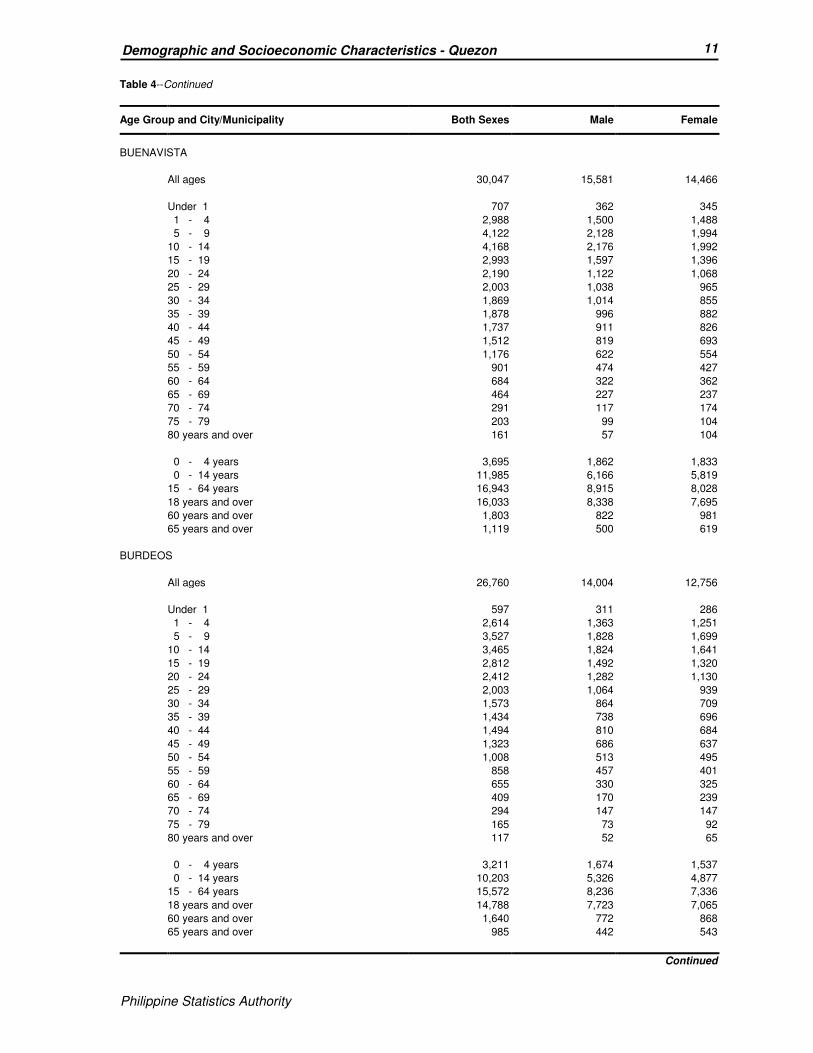
Philippine Statistics Authority
Table 4--Continued
Age Group and City/Municipality Both Sexes Male Female
BUENAVISTA
All ages 30,047 15,581 14,466
Under 1 707 362 345
1 - 4 2,988 1,500 1,488
5 - 9 4,122 2,128 1,994
10 - 14 4,168 2,176 1,992
15 - 19 2,993 1,597 1,396
20 - 24 2,190 1,122 1,068
25 - 29 2,003 1,038 965
30 - 34 1,869 1,014 855
35 - 39 1,878 996 882
40 - 44 1,737 911 826
45 - 49 1,512 819 693
50 - 54 1,176 622 554
55 - 59 901 474 427
60 - 64 684 322 362
65 - 69 464 227 237
70 - 74 291 117 174
75 - 79 203 99 104
80 years and over 161 57 104
0 - 4 years 3,695 1,862 1,833
0 - 14 years 11,985 6,166 5,819
15 - 64 years 16,943 8,915 8,028
18 years and over 16,033 8,338 7,695
60 years and over 1,803 822 981
65 years and over 1,119 500 619
BURDEOS
All ages 26,760 14,004 12,756
Under 1 597 311 286
1 - 4 2,614 1,363 1,251
5 - 9 3,527 1,828 1,699
10 - 14 3,465 1,824 1,641
15 - 19 2,812 1,492 1,320
20 - 24 2,412 1,282 1,130
25 - 29 2,003 1,064 939
30 - 34 1,573 864 709
35 - 39 1,434 738 696
40 - 44 1,494 810 684
45 - 49 1,323 686 637
50 - 54 1,008 513 495
55 - 59 858 457 401
60 - 64 655 330 325
65 - 69 409 170 239
70 - 74 294 147 147
75 - 79 165 73 92
80 years and over 117 52 65
0 - 4 years 3,211 1,674 1,537
0 - 14 years 10,203 5,326 4,877
15 - 64 years 15,572 8,236 7,336
18 years and over 14,788 7,723 7,065
60 years and over 1,640 772 868
65 years and over 985 442 543
Continued

Philippine Statistics Authority
12 Demographic and Socioeconomic Characteristics - Quezon
Philippine Statistics Authority
Table 4--Continued
Age Group and City/Municipality Both Sexes Male Female
CALAUAG
All ages 73,139 37,322 35,817
Under 1 1,578 803 775
1 - 4 6,462 3,400 3,062
5 - 9 8,607 4,458 4,149
10 - 14 8,290 4,270 4,020
15 - 19 7,872 4,109 3,763
20 - 24 6,162 3,131 3,031
25 - 29 5,282 2,657 2,625
30 - 34 4,464 2,321 2,143
35 - 39 4,386 2,294 2,092
40 - 44 4,206 2,182 2,024
45 - 49 4,010 2,038 1,972
50 - 54 3,377 1,789 1,588
55 - 59 2,800 1,430 1,370
60 - 64 1,983 962 1,021
65 - 69 1,490 663 827
70 - 74 953 389 564
75 - 79 686 270 416
80 years and over 531 156 375
0 - 4 years 8,040 4,203 3,837
0 - 14 years 24,937 12,931 12,006
15 - 64 years 44,542 22,913 21,629
18 years and over 43,099 21,734 21,365
60 years and over 5,643 2,440 3,203
65 years and over 3,660 1,478 2,182
CANDELARIA
All ages 117,434 58,987 58,447
Under 1 2,427 1,274 1,153
1 - 4 9,411 4,889 4,522
5 - 9 12,374 6,384 5,990
10 - 14 12,604 6,499 6,105
15 - 19 11,453 5,901 5,552
20 - 24 10,732 5,356 5,376
25 - 29 9,453 4,777 4,676
30 - 34 8,679 4,441 4,238
35 - 39 8,330 4,262 4,068
40 - 44 7,141 3,686 3,455
45 - 49 6,250 3,102 3,148
50 - 54 5,420 2,695 2,725
55 - 59 4,591 2,246 2,345
60 - 64 3,506 1,628 1,878
65 - 69 1,964 820 1,144
70 - 74 1,272 471 801
75 - 79 900 311 589
80 years and over 927 245 682
0 - 4 years 11,838 6,163 5,675
0 - 14 years 36,816 19,046 17,770
15 - 64 years 75,555 38,094 37,461
18 years and over 73,521 36,257 37,264
60 years and over 8,569 3,475 5,094
65 years and over 5,063 1,847 3,216
Continued
Philippine Statistics Authority
13 Demographic and Socioeconomic Characteristics - Quezon
Philippine Statistics Authority
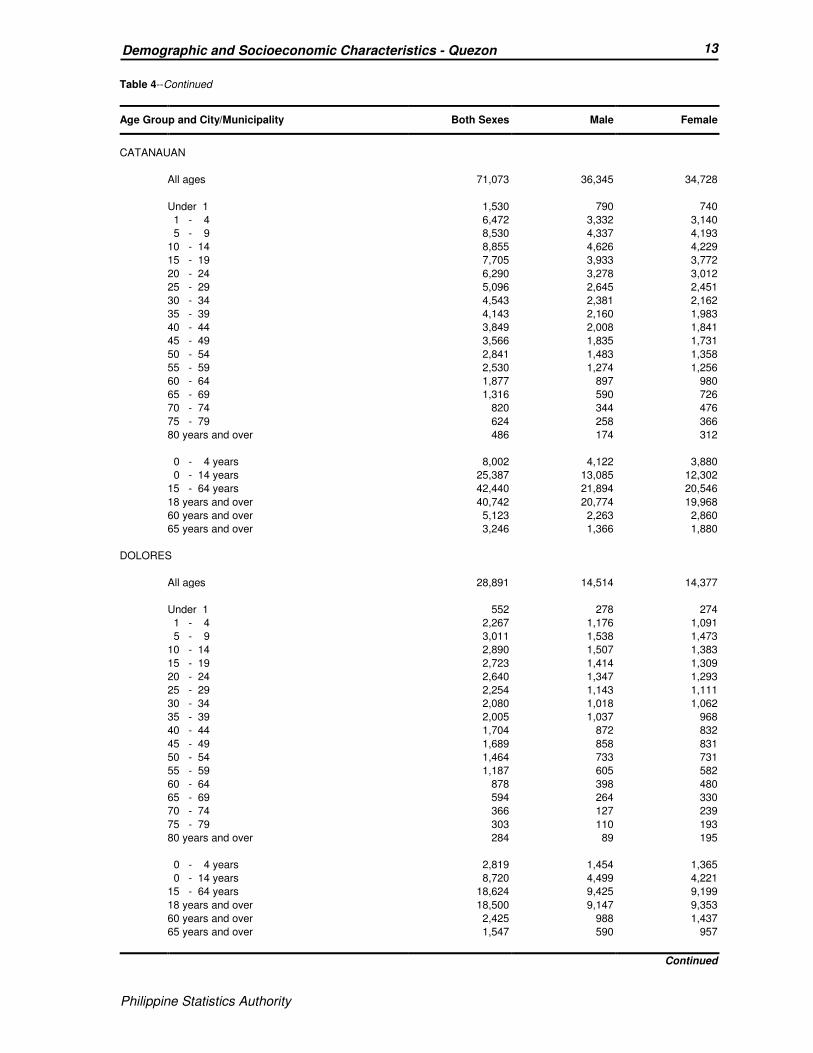
Table 4--Continued
Age Group and City/Municipality Both Sexes Male Female
CATANAUAN
All ages 71,073 36,345 34,728
Under 1 1,530 790 740
1 - 4 6,472 3,332 3,140
5 - 9 8,530 4,337 4,193
10 - 14 8,855 4,626 4,229
15 - 19 7,705 3,933 3,772
20 - 24 6,290 3,278 3,012
25 - 29 5,096 2,645 2,451
30 - 34 4,543 2,381 2,162
35 - 39 4,143 2,160 1,983
40 - 44 3,849 2,008 1,841
45 - 49 3,566 1,835 1,731
50 - 54 2,841 1,483 1,358
55 - 59 2,530 1,274 1,256
60 - 64 1,877 897 980
65 - 69 1,316 590 726
70 - 74 820 344 476
75 - 79 624 258 366
80 years and over 486 174 312
0 - 4 years 8,002 4,122 3,880
0 - 14 years 25,387 13,085 12,302
15 - 64 years 42,440 21,894 20,546
18 years and over 40,742 20,774 19,968
60 years and over 5,123 2,263 2,860
65 years and over 3,246 1,366 1,880
DOLORES
All ages 28,891 14,514 14,377
Under 1 552 278 274
1 - 4 2,267 1,176 1,091
5 - 9 3,011 1,538 1,473
10 - 14 2,890 1,507 1,383
15 - 19 2,723 1,414 1,309
20 - 24 2,640 1,347 1,293
25 - 29 2,254 1,143 1,111
30 - 34 2,080 1,018 1,062
35 - 39 2,005 1,037 968
40 - 44 1,704 872 832
45 - 49 1,689 858 831
50 - 54 1,464 733 731
55 - 59 1,187 605 582
60 - 64 878 398 480
65 - 69 594 264 330
70 - 74 366 127 239
75 - 79 303 110 193
80 years and over 284 89 195
0 - 4 years 2,819 1,454 1,365
0 - 14 years 8,720 4,499 4,221
15 - 64 years 18,624 9,425 9,199
18 years and over 18,500 9,147 9,353
60 years and over 2,425 988 1,437
65 years and over 1,547 590 957
Continued

Philippine Statistics Authority
14 Demographic and Socioeconomic Characteristics - Quezon
Philippine Statistics Authority
Table 4--Continued
Age Group and City/Municipality Both Sexes Male Female
GENERAL LUNA
All ages 26,494 13,576 12,918
Under 1 485 261 224
1 - 4 2,235 1,126 1,109
5 - 9 2,967 1,524 1,443
10 - 14 3,183 1,659 1,524
15 - 19 2,981 1,570 1,411
20 - 24 2,435 1,248 1,187
25 - 29 1,979 1,031 948
30 - 34 1,733 906 827
35 - 39 1,610 820 790
40 - 44 1,422 771 651
45 - 49 1,358 685 673
50 - 54 1,138 594 544
55 - 59 922 463 459
60 - 64 762 377 385
65 - 69 544 258 286
70 - 74 340 148 192
75 - 79 215 80 135
80 years and over 185 55 130
0 - 4 years 2,720 1,387 1,333
0 - 14 years 8,870 4,570 4,300
15 - 64 years 16,340 8,465 7,875
18 years and over 15,723 7,995 7,728
60 years and over 2,046 918 1,128
65 years and over 1,284 541 743
GENERAL NAKAR
All ages 29,705 15,593 14,112
Under 1 728 375 353
1 - 4 2,944 1,572 1,372
5 - 9 3,580 1,843 1,737
10 - 14 3,401 1,782 1,619
15 - 19 3,280 1,679 1,601
20 - 24 2,936 1,528 1,408
25 - 29 2,336 1,233 1,103
30 - 34 1,905 1,030 875
35 - 39 1,750 952 798
40 - 44 1,509 815 694
45 - 49 1,400 744 656
50 - 54 1,195 647 548
55 - 59 1,037 543 494
60 - 64 739 410 329
65 - 69 398 191 207
70 - 74 244 114 130
75 - 79 160 79 81
80 years and over 163 56 107
0 - 4 years 3,672 1,947 1,725
0 - 14 years 10,653 5,572 5,081
15 - 64 years 18,087 9,581 8,506
18 years and over 17,083 8,999 8,084
60 years and over 1,704 850 854
65 years and over 965 440 525
Continued
Philippine Statistics Authority
15 Demographic and Socioeconomic Characteristics - Quezon
Philippine Statistics Authority
Table 4--Continued
Age Group and City/Municipality Both Sexes Male Female
GUINAYANGAN
All ages 45,155 22,938 22,217
Under 1 900 475 425
1 - 4 3,910 1,974 1,936
5 - 9 5,198 2,673 2,525
10 - 14 5,223 2,697 2,526
15 - 19 4,753 2,439 2,314
20 - 24 3,887 2,015 1,872
25 - 29 3,335 1,649 1,686
30 - 34 3,001 1,494 1,507
35 - 39 2,840 1,482 1,358
40 - 44 2,539 1,337 1,202
45 - 49 2,460 1,265 1,195
50 - 54 2,115 1,112 1,003
55 - 59 1,673 885 788
60 - 64 1,237 587 650
65 - 69 808 368 440
70 - 74 541 221 320
75 - 79 423 163 260
80 years and over 312 102 210
0 - 4 years 4,810 2,449 2,361
0 - 14 years 15,231 7,819 7,412
15 - 64 years 27,840 14,265 13,575
18 years and over 26,900 13,587 13,313
60 years and over 3,321 1,441 1,880
65 years and over 2,084 854 1,230
GUMACA
All ages 73,877 37,388 36,489
Under 1 1,463 724 739
1 - 4 6,033 3,070 2,963
5 - 9 7,981 3,986 3,995
10 - 14 8,272 4,287 3,985
15 - 19 7,566 3,922 3,644
20 - 24 6,532 3,314 3,218
25 - 29 5,326 2,703 2,623
30 - 34 4,747 2,502 2,245
35 - 39 4,652 2,416 2,236
40 - 44 4,236 2,187 2,049
45 - 49 4,107 2,152 1,955
50 - 54 3,547 1,833 1,714
55 - 59 2,930 1,507 1,423
60 - 64 2,240 1,105 1,135
65 - 69 1,633 733 900
70 - 74 1,157 453 704
75 - 79 786 295 491
80 years and over 669 199 470
0 - 4 years 7,496 3,794 3,702
0 - 14 years 23,749 12,067 11,682
15 - 64 years 45,883 23,641 22,242
18 years and over 45,500 22,927 22,573
60 years and over 6,485 2,785 3,700
65 years and over 4,245 1,680 2,565
Continued
Philippine Statistics Authority
16 Demographic and Socioeconomic Characteristics - Quezon
Philippine Statistics Authority
Table 4--Continued
Age Group and City/Municipality Both Sexes Male Female
INFANTA
All ages 69,079 34,905 34,174
Under 1 1,454 738 716
1 - 4 6,052 3,106 2,946
5 - 9 7,663 3,949 3,714
10 - 14 7,748 3,941 3,807
15 - 19 6,915 3,448 3,467
20 - 24 5,803 2,925 2,878
25 - 29 5,036 2,530 2,506
30 - 34 4,665 2,353 2,312
35 - 39 4,540 2,307 2,233
40 - 44 4,032 2,097 1,935
45 - 49 3,848 1,996 1,852
50 - 54 3,193 1,635 1,558
55 - 59 2,763 1,471 1,292
60 - 64 2,060 988 1,072
65 - 69 1,357 625 732
70 - 74 826 375 451
75 - 79 591 234 357
80 years and over 533 187 346
0 - 4 years 7,506 3,844 3,662
0 - 14 years 22,917 11,734 11,183
15 - 64 years 42,855 21,750 21,105
18 years and over 41,801 20,968 20,833
60 years and over 5,367 2,409 2,958
65 years and over 3,307 1,421 1,886
JOMALIG
All ages 7,417 3,791 3,626
Under 1 153 71 82
1 - 4 785 410 375
5 - 9 1,010 468 542
10 - 14 1,050 532 518
15 - 19 879 471 408
20 - 24 641 334 307
25 - 29 492 256 236
30 - 34 465 231 234
35 - 39 413 227 186
40 - 44 391 212 179
45 - 49 306 173 133
50 - 54 258 137 121
55 - 59 195 106 89
60 - 64 156 78 78
65 - 69 88 44 44
70 - 74 65 21 44
75 - 79 38 13 25
80 years and over 32 7 25
0 - 4 years 938 481 457
0 - 14 years 2,998 1,481 1,517
15 - 64 years 4,196 2,225 1,971
18 years and over 3,862 2,012 1,850
60 years and over 379 163 216
65 years and over 223 85 138
Continued
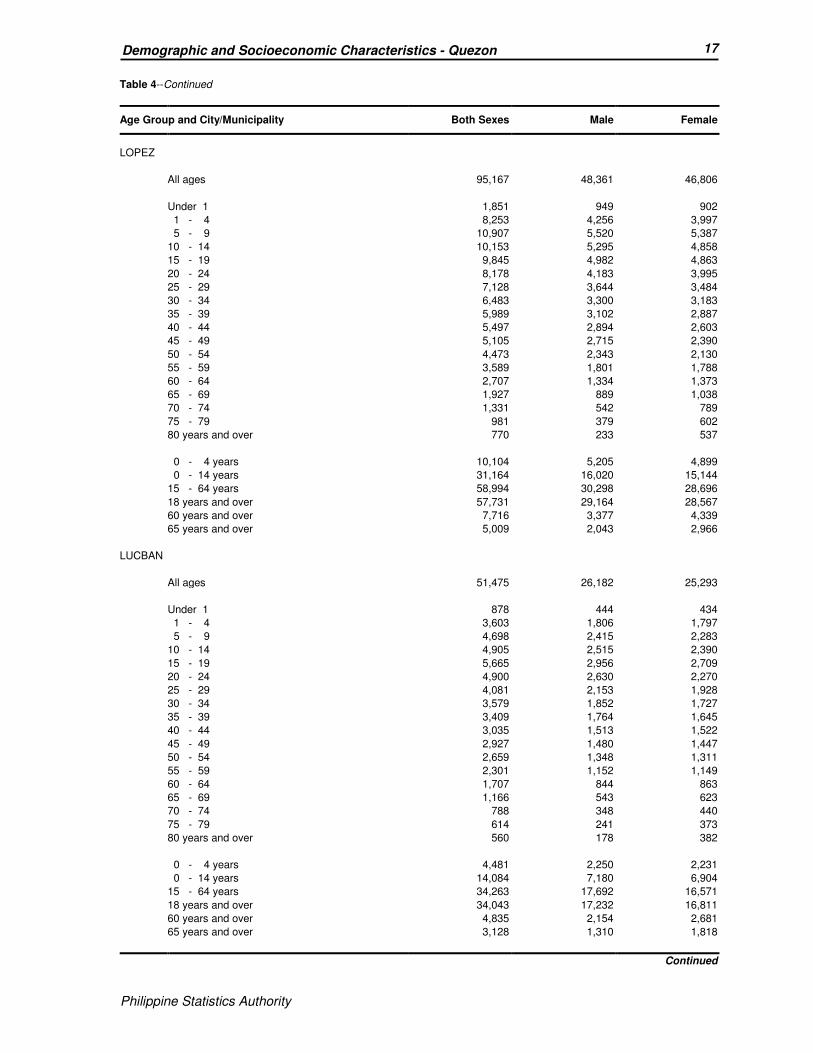
Philippine Statistics Authority
17 Demographic and Socioeconomic Characteristics - Quezon
Philippine Statistics Authority
Table 4--Continued
Age Group and City/Municipality Both Sexes Male Female
LOPEZ
All ages 95,167 48,361 46,806
Under 1 1,851 949 902
1 - 4 8,253 4,256 3,997
5 - 9 10,907 5,520 5,387
10 - 14 10,153 5,295 4,858
15 - 19 9,845 4,982 4,863
20 - 24 8,178 4,183 3,995
25 - 29 7,128 3,644 3,484
30 - 34 6,483 3,300 3,183
35 - 39 5,989 3,102 2,887
40 - 44 5,497 2,894 2,603
45 - 49 5,105 2,715 2,390
50 - 54 4,473 2,343 2,130
55 - 59 3,589 1,801 1,788
60 - 64 2,707 1,334 1,373
65 - 69 1,927 889 1,038
70 - 74 1,331 542 789
75 - 79 981 379 602
80 years and over 770 233 537
0 - 4 years 10,104 5,205 4,899
0 - 14 years 31,164 16,020 15,144
15 - 64 years 58,994 30,298 28,696
18 years and over 57,731 29,164 28,567
60 years and over 7,716 3,377 4,339
65 years and over 5,009 2,043 2,966
LUCBAN
All ages 51,475 26,182 25,293
Under 1 878 444 434
1 - 4 3,603 1,806 1,797
5 - 9 4,698 2,415 2,283
10 - 14 4,905 2,515 2,390
15 - 19 5,665 2,956 2,709
20 - 24 4,900 2,630 2,270
25 - 29 4,081 2,153 1,928
30 - 34 3,579 1,852 1,727
35 - 39 3,409 1,764 1,645
40 - 44 3,035 1,513 1,522
45 - 49 2,927 1,480 1,447
50 - 54 2,659 1,348 1,311
55 - 59 2,301 1,152 1,149
60 - 64 1,707 844 863
65 - 69 1,166 543 623
70 - 74 788 348 440
75 - 79 614 241 373
80 years and over 560 178 382
0 - 4 years 4,481 2,250 2,231
0 - 14 years 14,084 7,180 6,904
15 - 64 years 34,263 17,692 16,571
18 years and over 34,043 17,232 16,811
60 years and over 4,835 2,154 2,681
65 years and over 3,128 1,310 1,818
Continued
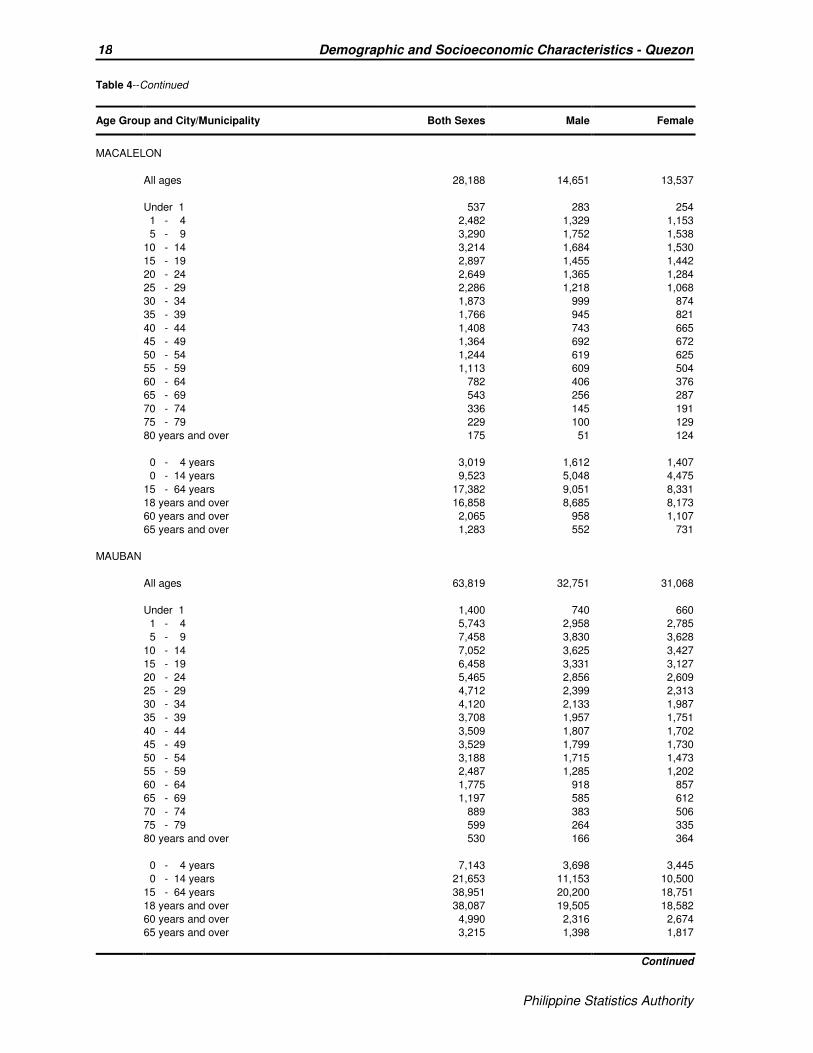
Philippine Statistics Authority
18 Demographic and Socioeconomic Characteristics - Quezon
Philippine Statistics Authority
Table 4--Continued
Age Group and City/Municipality Both Sexes Male Female
MACALELON
All ages 28,188 14,651 13,537
Under 1 537 283 254
1 - 4 2,482 1,329 1,153
5 - 9 3,290 1,752 1,538
10 - 14 3,214 1,684 1,530
15 - 19 2,897 1,455 1,442
20 - 24 2,649 1,365 1,284
25 - 29 2,286 1,218 1,068
30 - 34 1,873 999 874
35 - 39 1,766 945 821
40 - 44 1,408 743 665
45 - 49 1,364 692 672
50 - 54 1,244 619 625
55 - 59 1,113 609 504
60 - 64 782 406 376
65 - 69 543 256 287
70 - 74 336 145 191
75 - 79 229 100 129
80 years and over 175 51 124
0 - 4 years 3,019 1,612 1,407
0 - 14 years 9,523 5,048 4,475
15 - 64 years 17,382 9,051 8,331
18 years and over 16,858 8,685 8,173
60 years and over 2,065 958 1,107
65 years and over 1,283 552 731
MAUBAN
All ages 63,819 32,751 31,068
Under 1 1,400 740 660
1 - 4 5,743 2,958 2,785
5 - 9 7,458 3,830 3,628
10 - 14 7,052 3,625 3,427
15 - 19 6,458 3,331 3,127
20 - 24 5,465 2,856 2,609
25 - 29 4,712 2,399 2,313
30 - 34 4,120 2,133 1,987
35 - 39 3,708 1,957 1,751
40 - 44 3,509 1,807 1,702
45 - 49 3,529 1,799 1,730
50 - 54 3,188 1,715 1,473
55 - 59 2,487 1,285 1,202
60 - 64 1,775 918 857
65 - 69 1,197 585 612
70 - 74 889 383 506
75 - 79 599 264 335
80 years and over 530 166 364
0 - 4 years 7,143 3,698 3,445
0 - 14 years 21,653 11,153 10,500
15 - 64 years 38,951 20,200 18,751
18 years and over 38,087 19,505 18,582
60 years and over 4,990 2,316 2,674
65 years and over 3,215 1,398 1,817
Continued
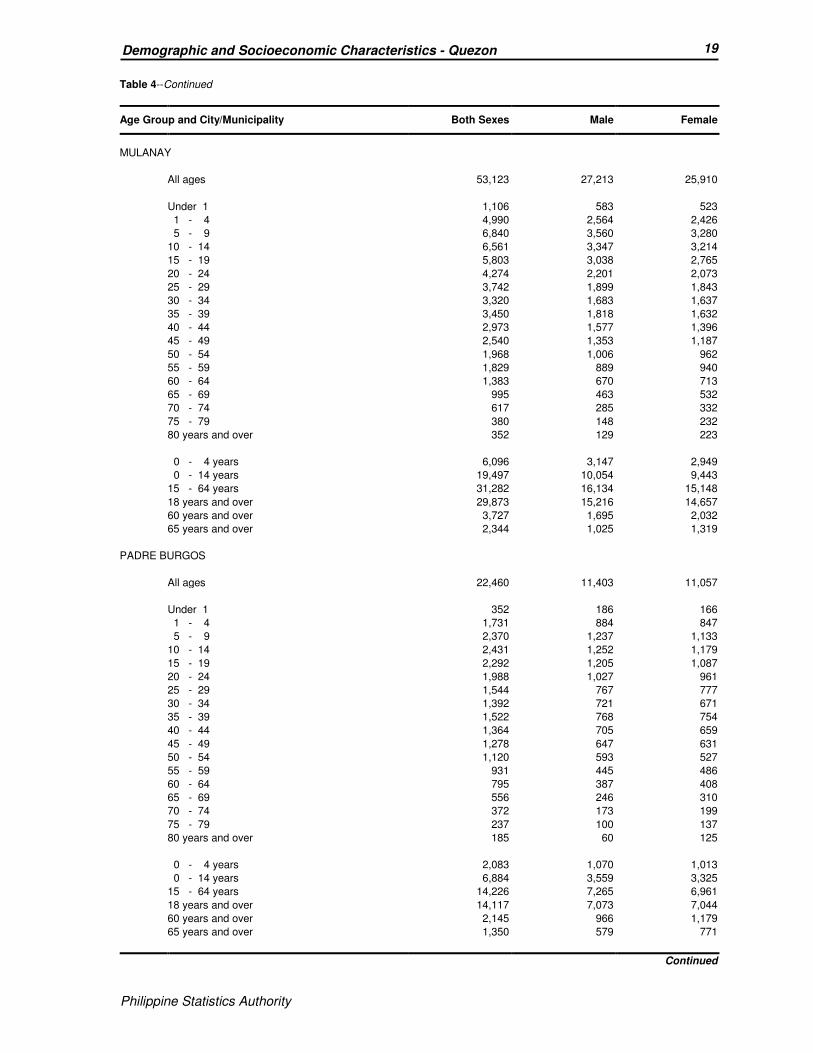
Philippine Statistics Authority
19 Demographic and Socioeconomic Characteristics - Quezon
Philippine Statistics Authority
Table 4--Continued
Age Group and City/Municipality Both Sexes Male Female
MULANAY
All ages 53,123 27,213 25,910
Under 1 1,106 583 523
1 - 4 4,990 2,564 2,426
5 - 9 6,840 3,560 3,280
10 - 14 6,561 3,347 3,214
15 - 19 5,803 3,038 2,765
20 - 24 4,274 2,201 2,073
25 - 29 3,742 1,899 1,843
30 - 34 3,320 1,683 1,637
35 - 39 3,450 1,818 1,632
40 - 44 2,973 1,577 1,396
45 - 49 2,540 1,353 1,187
50 - 54 1,968 1,006 962
55 - 59 1,829 889 940
60 - 64 1,383 670 713
65 - 69 995 463 532
70 - 74 617 285 332
75 - 79 380 148 232
80 years and over 352 129 223
0 - 4 years 6,096 3,147 2,949
0 - 14 years 19,497 10,054 9,443
15 - 64 years 31,282 16,134 15,148
18 years and over 29,873 15,216 14,657
60 years and over 3,727 1,695 2,032
65 years and over 2,344 1,025 1,319
PADRE BURGOS
All ages 22,460 11,403 11,057
Under 1 352 186 166
1 - 4 1,731 884 847
5 - 9 2,370 1,237 1,133
10 - 14 2,431 1,252 1,179
15 - 19 2,292 1,205 1,087
20 - 24 1,988 1,027 961
25 - 29 1,544 767 777
30 - 34 1,392 721 671
35 - 39 1,522 768 754
40 - 44 1,364 705 659
45 - 49 1,278 647 631
50 - 54 1,120 593 527
55 - 59 931 445 486
60 - 64 795 387 408
65 - 69 556 246 310
70 - 74 372 173 199
75 - 79 237 100 137
80 years and over 185 60 125
0 - 4 years 2,083 1,070 1,013
0 - 14 years 6,884 3,559 3,325
15 - 64 years 14,226 7,265 6,961
18 years and over 14,117 7,073 7,044
60 years and over 2,145 966 1,179
65 years and over 1,350 579 771
Continued

Philippine Statistics Authority
20 Demographic and Socioeconomic Characteristics - Quezon
Philippine Statistics Authority
Table 4--Continued
Age Group and City/Municipality Both Sexes Male Female
PAGBILAO
All ages 75,023 38,406 36,617
Under 1 1,471 777 694
1 - 4 5,932 3,127 2,805
5 - 9 7,932 4,122 3,810
10 - 14 7,515 3,861 3,654
15 - 19 7,710 3,982 3,728
20 - 24 7,039 3,646 3,393
25 - 29 6,002 3,092 2,910
30 - 34 5,250 2,746 2,504
35 - 39 5,255 2,722 2,533
40 - 44 4,327 2,244 2,083
45 - 49 4,255 2,185 2,070
50 - 54 3,687 1,874 1,813
55 - 59 2,954 1,500 1,454
60 - 64 2,226 1,132 1,094
65 - 69 1,423 632 791
70 - 74 904 390 514
75 - 79 612 220 392
80 years and over 529 154 375
0 - 4 years 7,403 3,904 3,499
0 - 14 years 22,850 11,887 10,963
15 - 64 years 48,705 25,123 23,582
18 years and over 47,469 24,135 23,334
60 years and over 5,694 2,528 3,166
65 years and over 3,468 1,396 2,072
PANUKULAN
All ages 13,546 7,091 6,455
Under 1 276 142 134
1 - 4 1,246 640 606
5 - 9 1,714 890 824
10 - 14 1,627 831 796
15 - 19 1,276 712 564
20 - 24 1,117 596 521
25 - 29 1,036 563 473
30 - 34 996 482 514
35 - 39 784 433 351
40 - 44 779 417 362
45 - 49 673 357 316
50 - 54 615 329 286
55 - 59 475 246 229
60 - 64 334 170 164
65 - 69 207 117 90
70 - 74 171 72 99
75 - 79 134 65 69
80 years and over 86 29 57
0 - 4 years 1,522 782 740
0 - 14 years 4,863 2,503 2,360
15 - 64 years 8,085 4,305 3,780
18 years and over 7,843 4,114 3,729
60 years and over 932 453 479
65 years and over 598 283 315
Continued
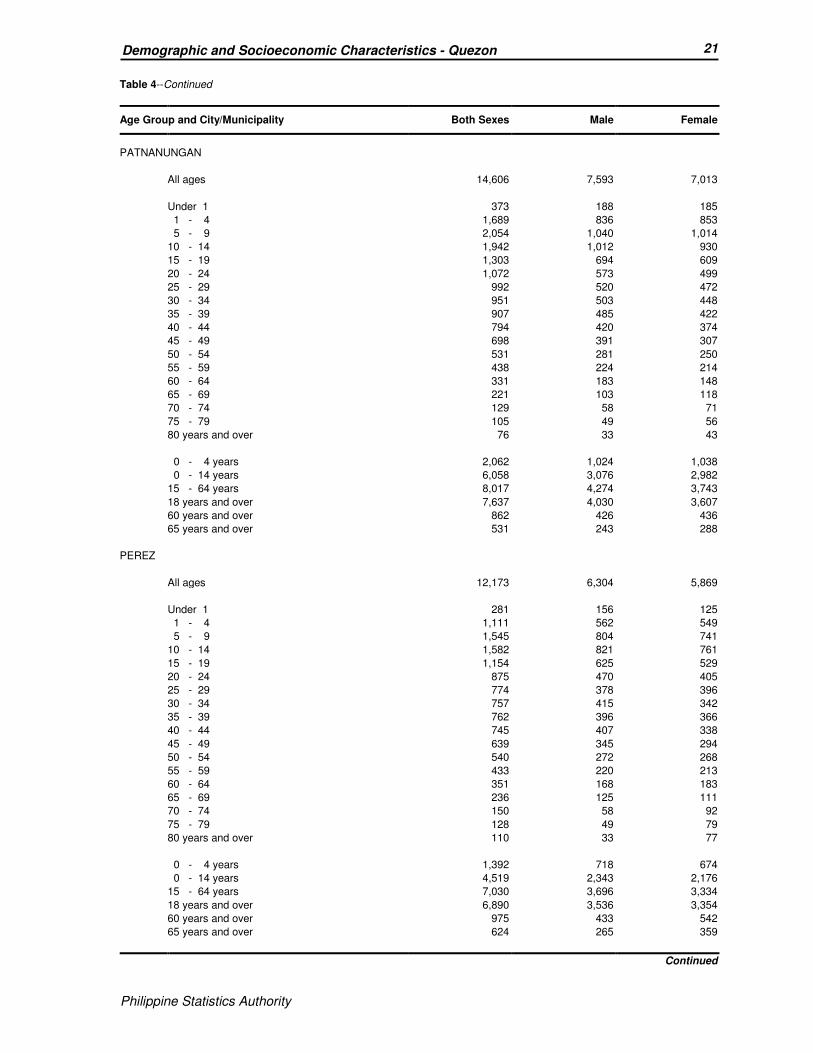
Philippine Statistics Authority
21 Demographic and Socioeconomic Characteristics - Quezon
Philippine Statistics Authority
Table 4--Continued
Age Group and City/Municipality Both Sexes Male Female
PATNANUNGAN
All ages 14,606 7,593 7,013
Under 1 373 188 185
1 - 4 1,689 836 853
5 - 9 2,054 1,040 1,014
10 - 14 1,942 1,012 930
15 - 19 1,303 694 609
20 - 24 1,072 573 499
25 - 29 992 520 472
30 - 34 951 503 448
35 - 39 907 485 422
40 - 44 794 420 374
45 - 49 698 391 307
50 - 54 531 281 250
55 - 59 438 224 214
60 - 64 331 183 148
65 - 69 221 103 118
70 - 74 129 58 71
75 - 79 105 49 56
80 years and over 76 33 43
0 - 4 years 2,062 1,024 1,038
0 - 14 years 6,058 3,076 2,982
15 - 64 years 8,017 4,274 3,743
18 years and over 7,637 4,030 3,607
60 years and over 862 426 436
65 years and over 531 243 288
PEREZ
All ages 12,173 6,304 5,869
Under 1 281 156 125
1 - 4 1,111 562 549
5 - 9 1,545 804 741
10 - 14 1,582 821 761
15 - 19 1,154 625 529
20 - 24 875 470 405
25 - 29 774 378 396
30 - 34 757 415 342
35 - 39 762 396 366
40 - 44 745 407 338
45 - 49 639 345 294
50 - 54 540 272 268
55 - 59 433 220 213
60 - 64 351 168 183
65 - 69 236 125 111
70 - 74 150 58 92
75 - 79 128 49 79
80 years and over 110 33 77
0 - 4 years 1,392 718 674
0 - 14 years 4,519 2,343 2,176
15 - 64 years 7,030 3,696 3,334
18 years and over 6,890 3,536 3,354
60 years and over 975 433 542
65 years and over 624 265 359
Continued

Philippine Statistics Authority
22 Demographic and Socioeconomic Characteristics - Quezon
Philippine Statistics Authority
Table 4--Continued
Age Group and City/Municipality Both Sexes Male Female
PITOGO
All ages 23,019 11,820 11,199
Under 1 393 205 188
1 - 4 1,928 1,002 926
5 - 9 2,558 1,348 1,210
10 - 14 2,616 1,344 1,272
15 - 19 2,464 1,276 1,188
20 - 24 1,977 1,033 944
25 - 29 1,557 826 731
30 - 34 1,369 692 677
35 - 39 1,418 729 689
40 - 44 1,242 651 591
45 - 49 1,371 714 657
50 - 54 1,025 553 472
55 - 59 922 459 463
60 - 64 792 411 381
65 - 69 540 248 292
70 - 74 367 161 206
75 - 79 267 102 165
80 years and over 213 66 147
0 - 4 years 2,321 1,207 1,114
0 - 14 years 7,495 3,899 3,596
15 - 64 years 14,137 7,344 6,793
18 years and over 13,966 7,100 6,866
60 years and over 2,179 988 1,191
65 years and over 1,387 577 810
PLARIDEL
All ages 10,935 5,561 5,374
Under 1 210 106 104
1 - 4 858 462 396
5 - 9 1,134 584 550
10 - 14 1,129 590 539
15 - 19 1,066 560 506
20 - 24 907 462 445
25 - 29 838 413 425
30 - 34 722 393 329
35 - 39 672 332 340
40 - 44 624 308 316
45 - 49 620 321 299
50 - 54 561 282 279
55 - 59 519 284 235
60 - 64 370 172 198
65 - 69 282 125 157
70 - 74 172 81 91
75 - 79 146 53 93
80 years and over 105 33 72
0 - 4 years 1,068 568 500
0 - 14 years 3,331 1,742 1,589
15 - 64 years 6,899 3,527 3,372
18 years and over 6,927 3,467 3,460
60 years and over 1,075 464 611
65 years and over 705 292 413
Continued
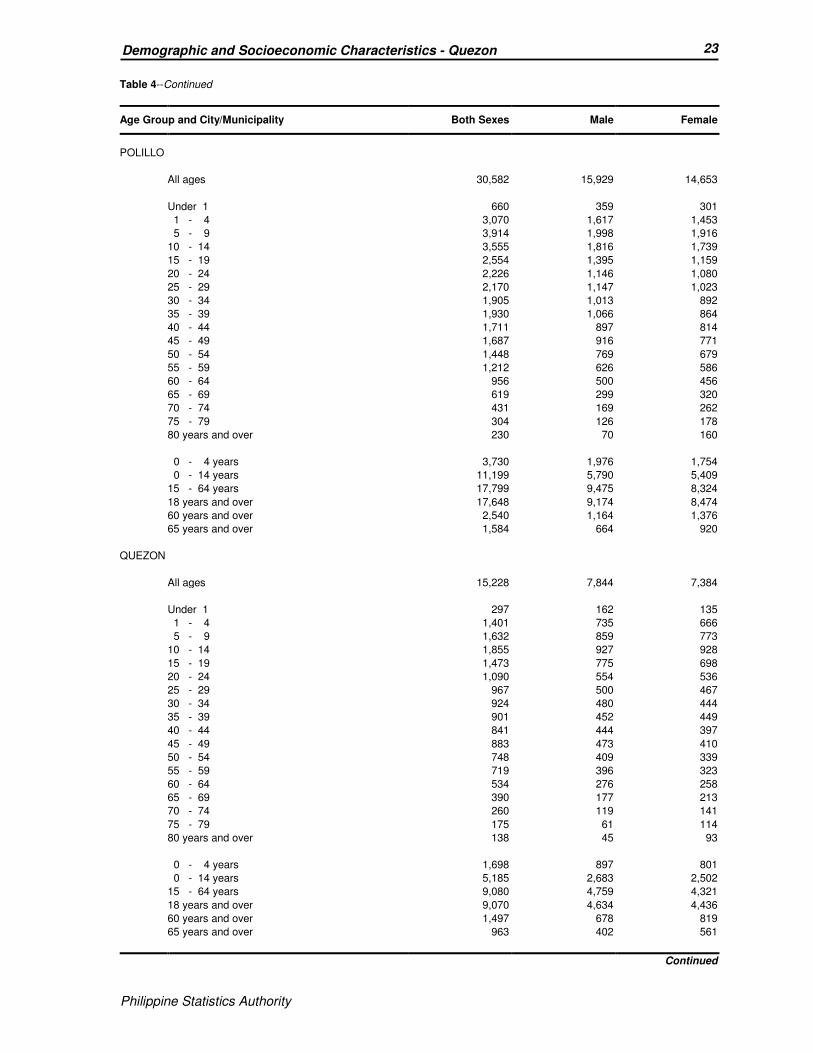
Philippine Statistics Authority
23 Demographic and Socioeconomic Characteristics - Quezon
Philippine Statistics Authority
Table 4--Continued
Age Group and City/Municipality Both Sexes Male Female
POLILLO
All ages 30,582 15,929 14,653
Under 1 660 359 301
1 - 4 3,070 1,617 1,453
5 - 9 3,914 1,998 1,916
10 - 14 3,555 1,816 1,739
15 - 19 2,554 1,395 1,159
20 - 24 2,226 1,146 1,080
25 - 29 2,170 1,147 1,023
30 - 34 1,905 1,013 892
35 - 39 1,930 1,066 864
40 - 44 1,711 897 814
45 - 49 1,687 916 771
50 - 54 1,448 769 679
55 - 59 1,212 626 586
60 - 64 956 500 456
65 - 69 619 299 320
70 - 74 431 169 262
75 - 79 304 126 178
80 years and over 230 70 160
0 - 4 years 3,730 1,976 1,754
0 - 14 years 11,199 5,790 5,409
15 - 64 years 17,799 9,475 8,324
18 years and over 17,648 9,174 8,474
60 years and over 2,540 1,164 1,376
65 years and over 1,584 664 920
QUEZON
All ages 15,228 7,844 7,384
Under 1 297 162 135
1 - 4 1,401 735 666
5 - 9 1,632 859 773
10 - 14 1,855 927 928
15 - 19 1,473 775 698
20 - 24 1,090 554 536
25 - 29 967 500 467
30 - 34 924 480 444
35 - 39 901 452 449
40 - 44 841 444 397
45 - 49 883 473 410
50 - 54 748 409 339
55 - 59 719 396 323
60 - 64 534 276 258
65 - 69 390 177 213
70 - 74 260 119 141
75 - 79 175 61 114
80 years and over 138 45 93
0 - 4 years 1,698 897 801
0 - 14 years 5,185 2,683 2,502
15 - 64 years 9,080 4,759 4,321
18 years and over 9,070 4,634 4,436
60 years and over 1,497 678 819
65 years and over 963 402 561
Continued
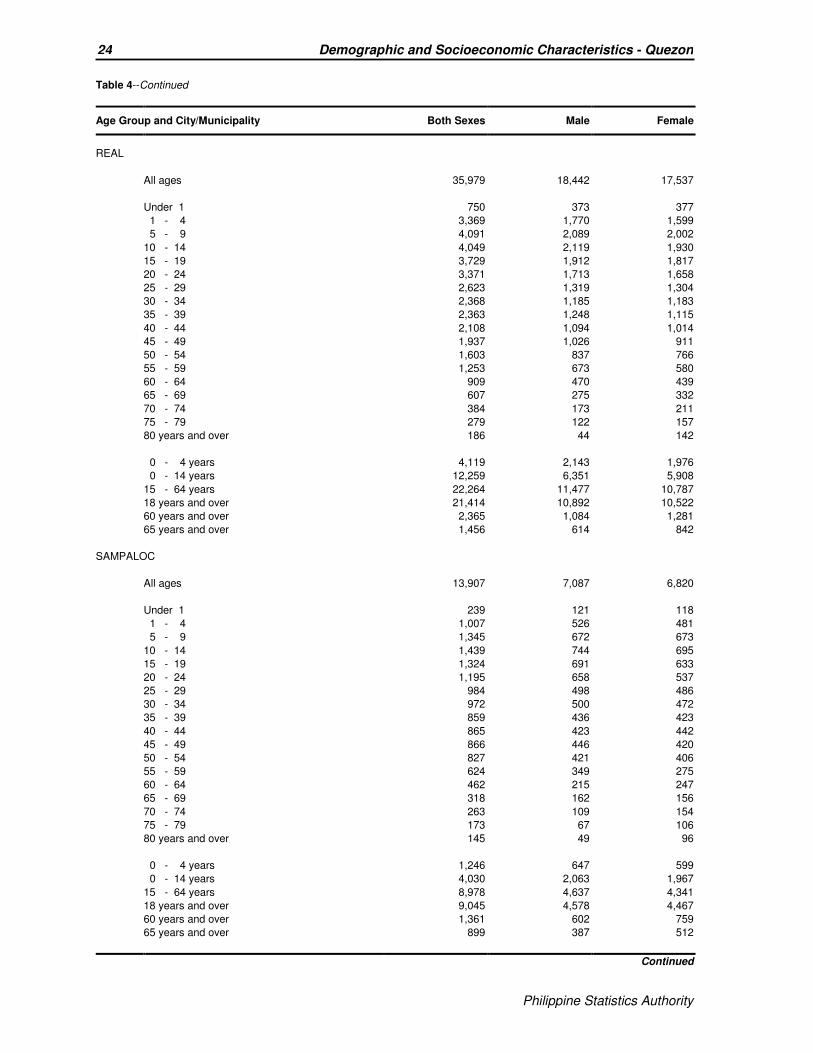
Philippine Statistics Authority
24 Demographic and Socioeconomic Characteristics - Quezon
Philippine Statistics Authority
Table 4--Continued
Age Group and City/Municipality Both Sexes Male Female
REAL
All ages 35,979 18,442 17,537
Under 1 750 373 377
1 - 4 3,369 1,770 1,599
5 - 9 4,091 2,089 2,002
10 - 14 4,049 2,119 1,930
15 - 19 3,729 1,912 1,817
20 - 24 3,371 1,713 1,658
25 - 29 2,623 1,319 1,304
30 - 34 2,368 1,185 1,183
35 - 39 2,363 1,248 1,115
40 - 44 2,108 1,094 1,014
45 - 49 1,937 1,026 911
50 - 54 1,603 837 766
55 - 59 1,253 673 580
60 - 64 909 470 439
65 - 69 607 275 332
70 - 74 384 173 211
75 - 79 279 122 157
80 years and over 186 44 142
0 - 4 years 4,119 2,143 1,976
0 - 14 years 12,259 6,351 5,908
15 - 64 years 22,264 11,477 10,787
18 years and over 21,414 10,892 10,522
60 years and over 2,365 1,084 1,281
65 years and over 1,456 614 842
SAMPALOC
All ages 13,907 7,087 6,820
Under 1 239 121 118
1 - 4 1,007 526 481
5 - 9 1,345 672 673
10 - 14 1,439 744 695
15 - 19 1,324 691 633
20 - 24 1,195 658 537
25 - 29 984 498 486
30 - 34 972 500 472
35 - 39 859 436 423
40 - 44 865 423 442
45 - 49 866 446 420
50 - 54 827 421 406
55 - 59 624 349 275
60 - 64 462 215 247
65 - 69 318 162 156
70 - 74 263 109 154
75 - 79 173 67 106
80 years and over 145 49 96
0 - 4 years 1,246 647 599
0 - 14 years 4,030 2,063 1,967
15 - 64 years 8,978 4,637 4,341
18 years and over 9,045 4,578 4,467
60 years and over 1,361 602 759
65 years and over 899 387 512
Continued

Philippine Statistics Authority
25 Demographic and Socioeconomic Characteristics - Quezon
Philippine Statistics Authority
Table 4--Continued
Age Group and City/Municipality Both Sexes Male Female
SAN ANDRES
All ages 35,780 18,239 17,541
Under 1 870 460 410
1 - 4 3,666 1,865 1,801
5 - 9 4,667 2,359 2,308
10 - 14 4,700 2,433 2,267
15 - 19 4,068 2,077 1,991
20 - 24 3,091 1,561 1,530
25 - 29 2,499 1,291 1,208
30 - 34 2,184 1,144 1,040
35 - 39 2,053 1,071 982
40 - 44 1,789 963 826
45 - 49 1,485 764 721
50 - 54 1,252 597 655
55 - 59 1,084 550 534
60 - 64 893 436 457
65 - 69 621 293 328
70 - 74 373 168 205
75 - 79 279 124 155
80 years and over 206 83 123
0 - 4 years 4,536 2,325 2,211
0 - 14 years 13,903 7,117 6,786
15 - 64 years 20,398 10,454 9,944
18 years and over 19,329 9,834 9,495
60 years and over 2,372 1,104 1,268
65 years and over 1,479 668 811
SAN ANTONIO
All ages 33,467 16,961 16,506
Under 1 654 340 314
1 - 4 2,721 1,420 1,301
5 - 9 3,732 1,930 1,802
10 - 14 3,798 2,036 1,762
15 - 19 3,415 1,745 1,670
20 - 24 3,030 1,523 1,507
25 - 29 2,574 1,286 1,288
30 - 34 2,397 1,209 1,188
35 - 39 2,214 1,158 1,056
40 - 44 1,808 918 890
45 - 49 1,689 847 842
50 - 54 1,450 751 699
55 - 59 1,331 671 660
60 - 64 957 454 503
65 - 69 621 288 333
70 - 74 431 168 263
75 - 79 312 116 196
80 years and over 333 101 232
0 - 4 years 3,375 1,760 1,615
0 - 14 years 10,905 5,726 5,179
15 - 64 years 20,865 10,562 10,303
18 years and over 20,464 10,150 10,314
60 years and over 2,654 1,127 1,527
65 years and over 1,697 673 1,024
Continued

Philippine Statistics Authority
26 Demographic and Socioeconomic Characteristics - Quezon
Philippine Statistics Authority
Table 4--Continued
Age Group and City/Municipality Both Sexes Male Female
SAN FRANCISCO (AURORA)
All ages 61,473 31,691 29,782
Under 1 1,307 689 618
1 - 4 6,237 3,258 2,979
5 - 9 8,289 4,274 4,015
10 - 14 8,280 4,261 4,019
15 - 19 6,816 3,605 3,211
20 - 24 5,300 2,768 2,532
25 - 29 4,214 2,155 2,059
30 - 34 3,651 1,902 1,749
35 - 39 3,429 1,802 1,627
40 - 44 3,147 1,607 1,540
45 - 49 2,860 1,465 1,395
50 - 54 2,295 1,145 1,150
55 - 59 1,914 1,003 911
60 - 64 1,447 719 728
65 - 69 924 446 478
70 - 74 667 298 369
75 - 79 418 195 223
80 years and over 278 99 179
0 - 4 years 7,544 3,947 3,597
0 - 14 years 24,113 12,482 11,631
15 - 64 years 35,073 18,171 16,902
18 years and over 32,976 16,853 16,123
60 years and over 3,734 1,757 1,977
65 years and over 2,287 1,038 1,249
SAN NARCISO
All ages 48,461 24,836 23,625
Under 1 1,054 532 522
1 - 4 4,548 2,332 2,216
5 - 9 6,197 3,140 3,057
10 - 14 6,246 3,187 3,059
15 - 19 5,525 2,895 2,630
20 - 24 4,039 2,117 1,922
25 - 29 3,243 1,702 1,541
30 - 34 3,023 1,606 1,417
35 - 39 2,885 1,518 1,367
40 - 44 2,643 1,374 1,269
45 - 49 2,351 1,212 1,139
50 - 54 1,876 943 933
55 - 59 1,640 832 808
60 - 64 1,225 607 618
65 - 69 835 370 465
70 - 74 533 237 296
75 - 79 333 137 196
80 years and over 265 95 170
0 - 4 years 5,602 2,864 2,738
0 - 14 years 18,045 9,191 8,854
15 - 64 years 28,450 14,806 13,644
18 years and over 26,795 13,750 13,045
60 years and over 3,191 1,446 1,745
65 years and over 1,966 839 1,127
Continued

Philippine Statistics Authority
27 Demographic and Socioeconomic Characteristics - Quezon
Philippine Statistics Authority
Table 4--Continued
Age Group and City/Municipality Both Sexes Male Female
SARIAYA
All ages 148,980 75,423 73,557
Under 1 3,029 1,549 1,480
1 - 4 12,119 6,281 5,838
5 - 9 16,140 8,291 7,849
10 - 14 15,825 8,374 7,451
15 - 19 14,750 7,751 6,999
20 - 24 12,881 6,631 6,250
25 - 29 11,307 5,713 5,594
30 - 34 10,834 5,454 5,380
35 - 39 10,315 5,272 5,043
40 - 44 9,187 4,643 4,544
45 - 49 8,291 4,245 4,046
50 - 54 7,082 3,622 3,460
55 - 59 5,658 2,834 2,824
60 - 64 4,423 2,057 2,366
65 - 69 2,905 1,270 1,635
70 - 74 1,823 704 1,119
75 - 79 1,250 432 818
80 years and over 1,161 300 861
0 - 4 years 15,148 7,830 7,318
0 - 14 years 47,113 24,495 22,618
15 - 64 years 94,728 48,222 46,506
18 years and over 92,762 46,127 46,635
60 years and over 11,562 4,763 6,799
65 years and over 7,139 2,706 4,433
TAGKAWAYAN
All ages 51,832 26,418 25,414
Under 1 1,097 566 531
1 - 4 4,933 2,534 2,399
5 - 9 6,680 3,442 3,238
10 - 14 6,259 3,278 2,981
15 - 19 5,065 2,654 2,411
20 - 24 3,777 1,926 1,851
25 - 29 3,371 1,695 1,676
30 - 34 3,281 1,657 1,624
35 - 39 3,045 1,568 1,477
40 - 44 2,752 1,432 1,320
45 - 49 2,884 1,447 1,437
50 - 54 2,472 1,306 1,166
55 - 59 2,018 1,024 994
60 - 64 1,573 794 779
65 - 69 1,015 465 550
70 - 74 708 289 419
75 - 79 506 206 300
80 years and over 396 135 261
0 - 4 years 6,030 3,100 2,930
0 - 14 years 18,969 9,820 9,149
15 - 64 years 30,238 15,503 14,735
18 years and over 29,509 14,829 14,680
60 years and over 4,198 1,889 2,309
65 years and over 2,625 1,095 1,530
Continued

Philippine Statistics Authority
28 Demographic and Socioeconomic Characteristics - Quezon
Philippine Statistics Authority
Table 4--Continued
Age Group and City/Municipality Both Sexes Male Female
CITY OF TAYABAS
All ages 99,779 50,609 49,170
Under 1 1,861 970 891
1 - 4 7,915 4,106 3,809
5 - 9 9,974 5,102 4,872
10 - 14 10,513 5,550 4,963
15 - 19 10,220 5,237 4,983
20 - 24 9,067 4,715 4,352
25 - 29 7,603 3,903 3,700
30 - 34 6,896 3,518 3,378
35 - 39 6,606 3,338 3,268
40 - 44 5,879 2,913 2,966
45 - 49 5,779 2,946 2,833
50 - 54 5,023 2,590 2,433
55 - 59 4,171 2,069 2,102
60 - 64 3,213 1,579 1,634
65 - 69 2,051 914 1,137
70 - 74 1,334 596 738
75 - 79 900 340 560
80 years and over 774 223 551
0 - 4 years 9,776 5,076 4,700
0 - 14 years 30,263 15,728 14,535
15 - 64 years 64,457 32,808 31,649
18 years and over 63,235 31,654 31,581
60 years and over 8,272 3,652 4,620
65 years and over 5,059 2,073 2,986
TIAONG
All ages 99,712 50,102 49,610
Under 1 2,012 985 1,027
1 - 4 8,209 4,287 3,922
5 - 9 10,571 5,428 5,143
10 - 14 10,584 5,396 5,188
15 - 19 9,795 5,089 4,706
20 - 24 9,044 4,658 4,386
25 - 29 7,918 3,999 3,919
30 - 34 7,398 3,763 3,635
35 - 39 6,936 3,495 3,441
40 - 44 5,872 2,947 2,925
45 - 49 5,440 2,812 2,628
50 - 54 4,406 2,187 2,219
55 - 59 3,784 1,849 1,935
60 - 64 2,942 1,364 1,578
65 - 69 1,890 834 1,056
70 - 74 1,186 465 721
75 - 79 888 321 567
80 years and over 837 223 614
0 - 4 years 10,221 5,272 4,949
0 - 14 years 31,376 16,096 15,280
15 - 64 years 63,535 32,163 31,372
18 years and over 62,325 30,895 31,430
60 years and over 7,743 3,207 4,536
65 years and over 4,801 1,843 2,958
Continued
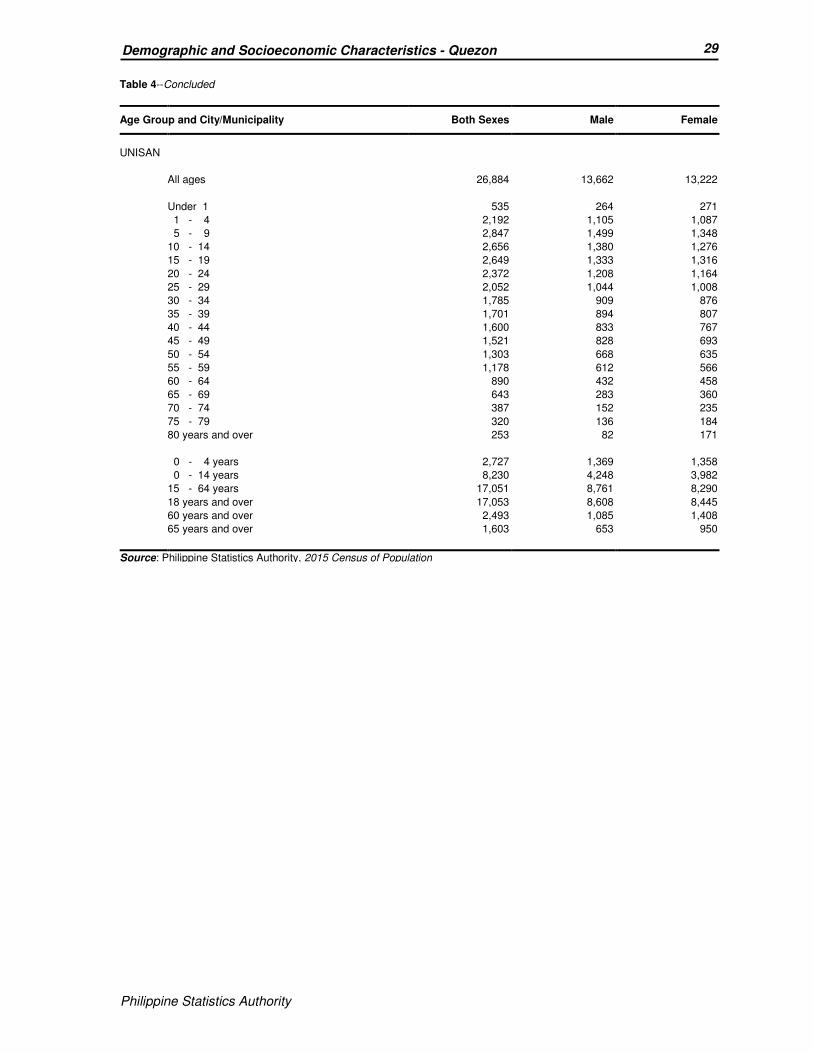
Philippine Statistics Authority
29 Demographic and Socioeconomic Characteristics - Quezon
Philippine Statistics Authority
Table 4--Concluded
Age Group and City/Municipality Both Sexes Male Female
UNISAN
All ages 26,884 13,662 13,222
Under 1 535 264 271
1 - 4 2,192 1,105 1,087
5 - 9 2,847 1,499 1,348
10 - 14 2,656 1,380 1,276
15 - 19 2,649 1,333 1,316
20 - 24 2,372 1,208 1,164
25 - 29 2,052 1,044 1,008
30 - 34 1,785 909 876
35 - 39 1,701 894 807
40 - 44 1,600 833 767
45 - 49 1,521 828 693
50 - 54 1,303 668 635
55 - 59 1,178 612 566
60 - 64 890 432 458
65 - 69 643 283 360
70 - 74 387 152 235
75 - 79 320 136 184
80 years and over 253 82 171
0 - 4 years 2,727 1,369 1,358
0 - 14 years 8,230 4,248 3,982
15 - 64 years 17,051 8,761 8,290
18 years and over 17,053 8,608 8,445
60 years and over 2,493 1,085 1,408
65 years and over 1,603 653 950
Source: Philippine Statistics Authority, 2015 Census of Population
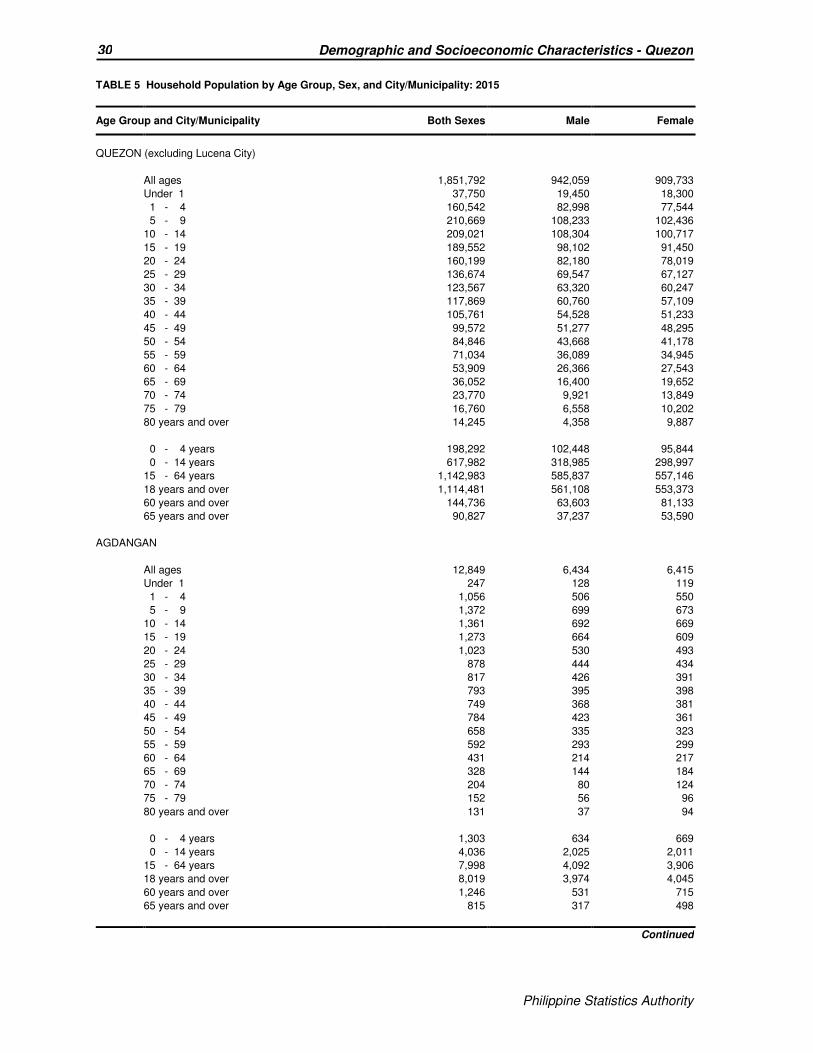
Philippine Statistics Authority
30 Demographic and Socioeconomic Characteristics - Quezon
Philippine Statistics Authority
TABLE 5 Household Population by Age Group, Sex, and City/Municipality: 2015
Age Group and City/Municipality Both Sexes Male Female
QUEZON (excluding Lucena City)
All ages 1,851,792 942,059 909,733
Under 1 37,750 19,450 18,300
1 - 4 160,542 82,998 77,544
5 - 9 210,669 108,233 102,436
10 - 14 209,021 108,304 100,717
15 - 19 189,552 98,102 91,450
20 - 24 160,199 82,180 78,019
25 - 29 136,674 69,547 67,127
30 - 34 123,567 63,320 60,247
35 - 39 117,869 60,760 57,109
40 - 44 105,761 54,528 51,233
45 - 49 99,572 51,277 48,295
50 - 54 84,846 43,668 41,178
55 - 59 71,034 36,089 34,945
60 - 64 53,909 26,366 27,543
65 - 69 36,052 16,400 19,652
70 - 74 23,770 9,921 13,849
75 - 79 16,760 6,558 10,202
80 years and over 14,245 4,358 9,887
0 - 4 years 198,292 102,448 95,844
0 - 14 years 617,982 318,985 298,997
15 - 64 years 1,142,983 585,837 557,146
18 years and over 1,114,481 561,108 553,373
60 years and over 144,736 63,603 81,133
65 years and over 90,827 37,237 53,590
AGDANGAN
All ages 12,849 6,434 6,415
Under 1 247 128 119
1 - 4 1,056 506 550
5 - 9 1,372 699 673
10 - 14 1,361 692 669
15 - 19 1,273 664 609
20 - 24 1,023 530 493
25 - 29 878 444 434
30 - 34 817 426 391
35 - 39 793 395 398
40 - 44 749 368 381
45 - 49 784 423 361
50 - 54 658 335 323
55 - 59 592 293 299
60 - 64 431 214 217
65 - 69 328 144 184
70 - 74 204 80 124
75 - 79 152 56 96
80 years and over 131 37 94
0 - 4 years 1,303 634 669
0 - 14 years 4,036 2,025 2,011
15 - 64 years 7,998 4,092 3,906
18 years and over 8,019 3,974 4,045
60 years and over 1,246 531 715
65 years and over 815 317 498
Continued
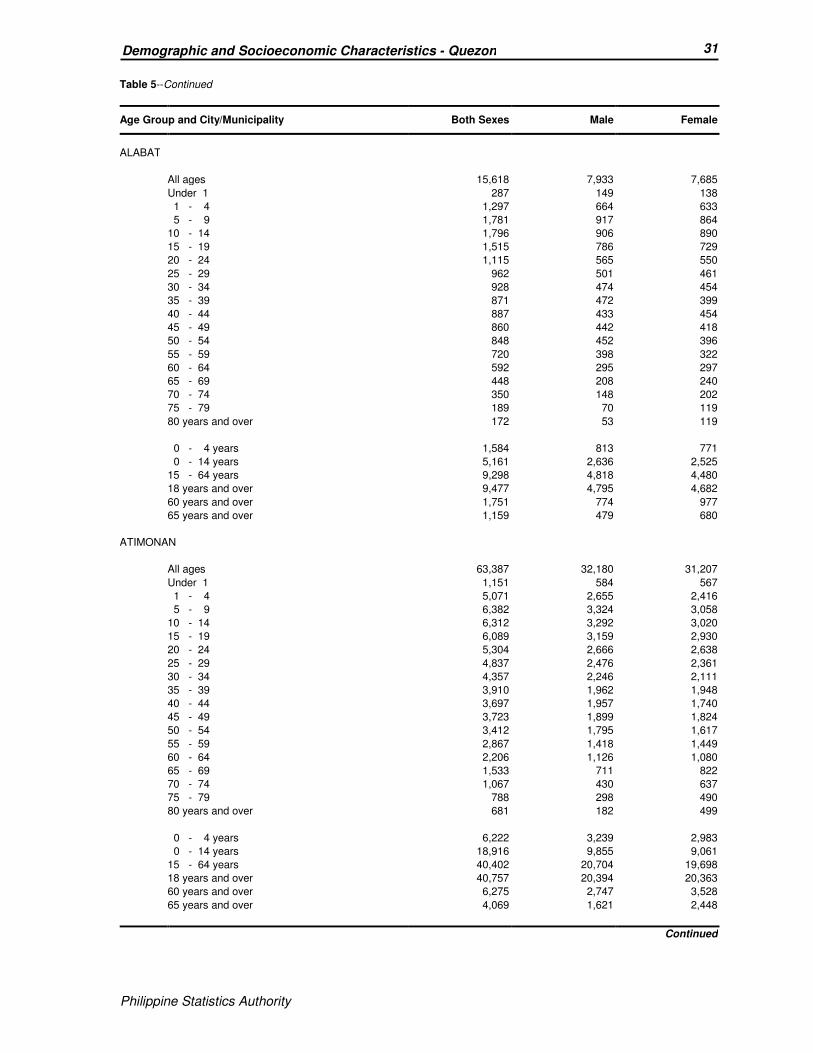
Philippine Statistics Authority
31 Demographic and Socioeconomic Characteristics - Quezon
Philippine Statistics Authority
Table 5--Continued
Age Group and City/Municipality Both Sexes Male Female
ALABAT
All ages 15,618 7,933 7,685
Under 1 287 149 138
1 - 4 1,297 664 633
5 - 9 1,781 917 864
10 - 14 1,796 906 890
15 - 19 1,515 786 729
20 - 24 1,115 565 550
25 - 29 962 501 461
30 - 34 928 474 454
35 - 39 871 472 399
40 - 44 887 433 454
45 - 49 860 442 418
50 - 54 848 452 396
55 - 59 720 398 322
60 - 64 592 295 297
65 - 69 448 208 240
70 - 74 350 148 202
75 - 79 189 70 119
80 years and over 172 53 119
0 - 4 years 1,584 813 771
0 - 14 years 5,161 2,636 2,525
15 - 64 years 9,298 4,818 4,480
18 years and over 9,477 4,795 4,682
60 years and over 1,751 774 977
65 years and over 1,159 479 680
ATIMONAN
All ages 63,387 32,180 31,207
Under 1 1,151 584 567
1 - 4 5,071 2,655 2,416
5 - 9 6,382 3,324 3,058
10 - 14 6,312 3,292 3,020
15 - 19 6,089 3,159 2,930
20 - 24 5,304 2,666 2,638
25 - 29 4,837 2,476 2,361
30 - 34 4,357 2,246 2,111
35 - 39 3,910 1,962 1,948
40 - 44 3,697 1,957 1,740
45 - 49 3,723 1,899 1,824
50 - 54 3,412 1,795 1,617
55 - 59 2,867 1,418 1,449
60 - 64 2,206 1,126 1,080
65 - 69 1,533 711 822
70 - 74 1,067 430 637
75 - 79 788 298 490
80 years and over 681 182 499
0 - 4 years 6,222 3,239 2,983
0 - 14 years 18,916 9,855 9,061
15 - 64 years 40,402 20,704 19,698
18 years and over 40,757 20,394 20,363
60 years and over 6,275 2,747 3,528
65 years and over 4,069 1,621 2,448
Continued

Philippine Statistics Authority
32 Demographic and Socioeconomic Characteristics - Quezon
Philippine Statistics Authority
Table 5--Continued
Age Group and City/Municipality Both Sexes Male Female
BUENAVISTA
All ages 29,963 15,500 14,463
Under 1 707 362 345
1 - 4 2,988 1,500 1,488
5 - 9 4,122 2,128 1,994
10 - 14 4,168 2,176 1,992
15 - 19 2,984 1,589 1,395
20 - 24 2,166 1,098 1,068
25 - 29 1,991 1,026 965
30 - 34 1,857 1,002 855
35 - 39 1,869 988 881
40 - 44 1,730 905 825
45 - 49 1,506 813 693
50 - 54 1,174 620 554
55 - 59 901 474 427
60 - 64 683 321 362
65 - 69 462 225 237
70 - 74 291 117 174
75 - 79 203 99 104
80 years and over 161 57 104
0 - 4 years 3,695 1,862 1,833
0 - 14 years 11,985 6,166 5,819
15 - 64 years 16,861 8,836 8,025
18 years and over 15,953 8,260 7,693
60 years and over 1,800 819 981
65 years and over 1,117 498 619
BURDEOS
All ages 26,760 14,004 12,756
Under 1 597 311 286
1 - 4 2,614 1,363 1,251
5 - 9 3,527 1,828 1,699
10 - 14 3,465 1,824 1,641
15 - 19 2,812 1,492 1,320
20 - 24 2,412 1,282 1,130
25 - 29 2,003 1,064 939
30 - 34 1,573 864 709
35 - 39 1,434 738 696
40 - 44 1,494 810 684
45 - 49 1,323 686 637
50 - 54 1,008 513 495
55 - 59 858 457 401
60 - 64 655 330 325
65 - 69 409 170 239
70 - 74 294 147 147
75 - 79 165 73 92
80 years and over 117 52 65
0 - 4 years 3,211 1,674 1,537
0 - 14 years 10,203 5,326 4,877
15 - 64 years 15,572 8,236 7,336
18 years and over 14,788 7,723 7,065
60 years and over 1,640 772 868
65 years and over 985 442 543
Continued
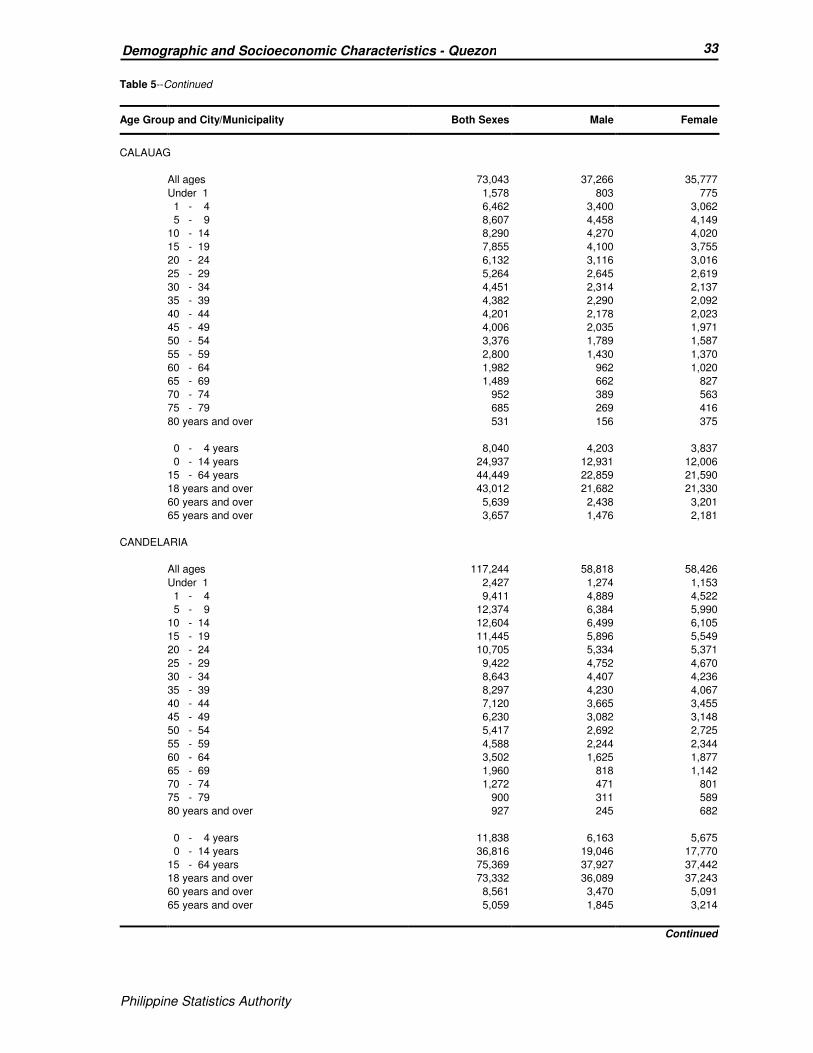
Philippine Statistics Authority
33 Demographic and Socioeconomic Characteristics - Quezon
Philippine Statistics Authority
Table 5--Continued
Age Group and City/Municipality Both Sexes Male Female
CALAUAG
All ages 73,043 37,266 35,777
Under 1 1,578 803 775
1 - 4 6,462 3,400 3,062
5 - 9 8,607 4,458 4,149
10 - 14 8,290 4,270 4,020
15 - 19 7,855 4,100 3,755
20 - 24 6,132 3,116 3,016
25 - 29 5,264 2,645 2,619
30 - 34 4,451 2,314 2,137
35 - 39 4,382 2,290 2,092
40 - 44 4,201 2,178 2,023
45 - 49 4,006 2,035 1,971
50 - 54 3,376 1,789 1,587
55 - 59 2,800 1,430 1,370
60 - 64 1,982 962 1,020
65 - 69 1,489 662 827
70 - 74 952 389 563
75 - 79 685 269 416
80 years and over 531 156 375
0 - 4 years 8,040 4,203 3,837
0 - 14 years 24,937 12,931 12,006
15 - 64 years 44,449 22,859 21,590
18 years and over 43,012 21,682 21,330
60 years and over 5,639 2,438 3,201
65 years and over 3,657 1,476 2,181
CANDELARIA
All ages 117,244 58,818 58,426
Under 1 2,427 1,274 1,153
1 - 4 9,411 4,889 4,522
5 - 9 12,374 6,384 5,990
10 - 14 12,604 6,499 6,105
15 - 19 11,445 5,896 5,549
20 - 24 10,705 5,334 5,371
25 - 29 9,422 4,752 4,670
30 - 34 8,643 4,407 4,236
35 - 39 8,297 4,230 4,067
40 - 44 7,120 3,665 3,455
45 - 49 6,230 3,082 3,148
50 - 54 5,417 2,692 2,725
55 - 59 4,588 2,244 2,344
60 - 64 3,502 1,625 1,877
65 - 69 1,960 818 1,142
70 - 74 1,272 471 801
75 - 79 900 311 589
80 years and over 927 245 682
0 - 4 years 11,838 6,163 5,675
0 - 14 years 36,816 19,046 17,770
15 - 64 years 75,369 37,927 37,442
18 years and over 73,332 36,089 37,243
60 years and over 8,561 3,470 5,091
65 years and over 5,059 1,845 3,214
Continued

Philippine Statistics Authority
34 Demographic and Socioeconomic Characteristics - Quezon
Philippine Statistics Authority
Table 5--Continued
Age Group and City/Municipality Both Sexes Male Female
CATANAUAN
All ages 71,038 36,314 34,724
Under 1 1,530 790 740
1 - 4 6,472 3,332 3,140
5 - 9 8,529 4,337 4,192
10 - 14 8,855 4,626 4,229
15 - 19 7,702 3,931 3,771
20 - 24 6,285 3,274 3,011
25 - 29 5,088 2,637 2,451
30 - 34 4,537 2,375 2,162
35 - 39 4,141 2,158 1,983
40 - 44 3,849 2,008 1,841
45 - 49 3,565 1,834 1,731
50 - 54 2,834 1,477 1,357
55 - 59 2,528 1,272 1,256
60 - 64 1,877 897 980
65 - 69 1,316 590 726
70 - 74 820 344 476
75 - 79 624 258 366
80 years and over 486 174 312
0 - 4 years 8,002 4,122 3,880
0 - 14 years 25,386 13,085 12,301
15 - 64 years 42,406 21,863 20,543
18 years and over 40,709 20,743 19,966
60 years and over 5,123 2,263 2,860
65 years and over 3,246 1,366 1,880
DOLORES
All ages 28,832 14,499 14,333
Under 1 552 278 274
1 - 4 2,267 1,176 1,091
5 - 9 3,011 1,538 1,473
10 - 14 2,889 1,507 1,382
15 - 19 2,718 1,412 1,306
20 - 24 2,638 1,347 1,291
25 - 29 2,253 1,142 1,111
30 - 34 2,077 1,018 1,059
35 - 39 2,002 1,036 966
40 - 44 1,699 869 830
45 - 49 1,687 858 829
50 - 54 1,457 730 727
55 - 59 1,180 604 576
60 - 64 871 396 475
65 - 69 587 262 325
70 - 74 363 127 236
75 - 79 300 110 190
80 years and over 281 89 192
0 - 4 years 2,819 1,454 1,365
0 - 14 years 8,719 4,499 4,220
15 - 64 years 18,582 9,412 9,170
18 years and over 18,443 9,132 9,311
60 years and over 2,402 984 1,418
65 years and over 1,531 588 943
Continued
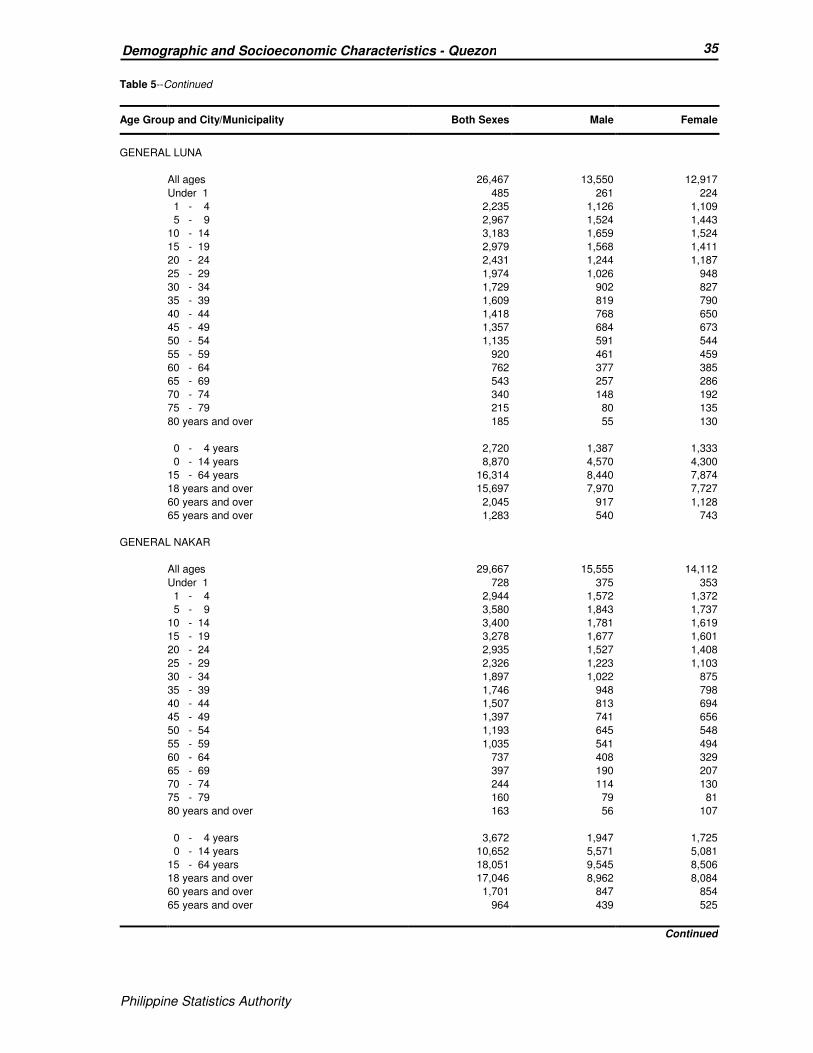
Philippine Statistics Authority
35 Demographic and Socioeconomic Characteristics - Quezon
Philippine Statistics Authority
Table 5--Continued
Age Group and City/Municipality Both Sexes Male Female
GENERAL LUNA
All ages 26,467 13,550 12,917
Under 1 485 261 224
1 - 4 2,235 1,126 1,109
5 - 9 2,967 1,524 1,443
10 - 14 3,183 1,659 1,524
15 - 19 2,979 1,568 1,411
20 - 24 2,431 1,244 1,187
25 - 29 1,974 1,026 948
30 - 34 1,729 902 827
35 - 39 1,609 819 790
40 - 44 1,418 768 650
45 - 49 1,357 684 673
50 - 54 1,135 591 544
55 - 59 920 461 459
60 - 64 762 377 385
65 - 69 543 257 286
70 - 74 340 148 192
75 - 79 215 80 135
80 years and over 185 55 130
0 - 4 years 2,720 1,387 1,333
0 - 14 years 8,870 4,570 4,300
15 - 64 years 16,314 8,440 7,874
18 years and over 15,697 7,970 7,727
60 years and over 2,045 917 1,128
65 years and over 1,283 540 743
GENERAL NAKAR
All ages 29,667 15,555 14,112
Under 1 728 375 353
1 - 4 2,944 1,572 1,372
5 - 9 3,580 1,843 1,737
10 - 14 3,400 1,781 1,619
15 - 19 3,278 1,677 1,601
20 - 24 2,935 1,527 1,408
25 - 29 2,326 1,223 1,103
30 - 34 1,897 1,022 875
35 - 39 1,746 948 798
40 - 44 1,507 813 694
45 - 49 1,397 741 656
50 - 54 1,193 645 548
55 - 59 1,035 541 494
60 - 64 737 408 329
65 - 69 397 190 207
70 - 74 244 114 130
75 - 79 160 79 81
80 years and over 163 56 107
0 - 4 years 3,672 1,947 1,725
0 - 14 years 10,652 5,571 5,081
15 - 64 years 18,051 9,545 8,506
18 years and over 17,046 8,962 8,084
60 years and over 1,701 847 854
65 years and over 964 439 525
Continued
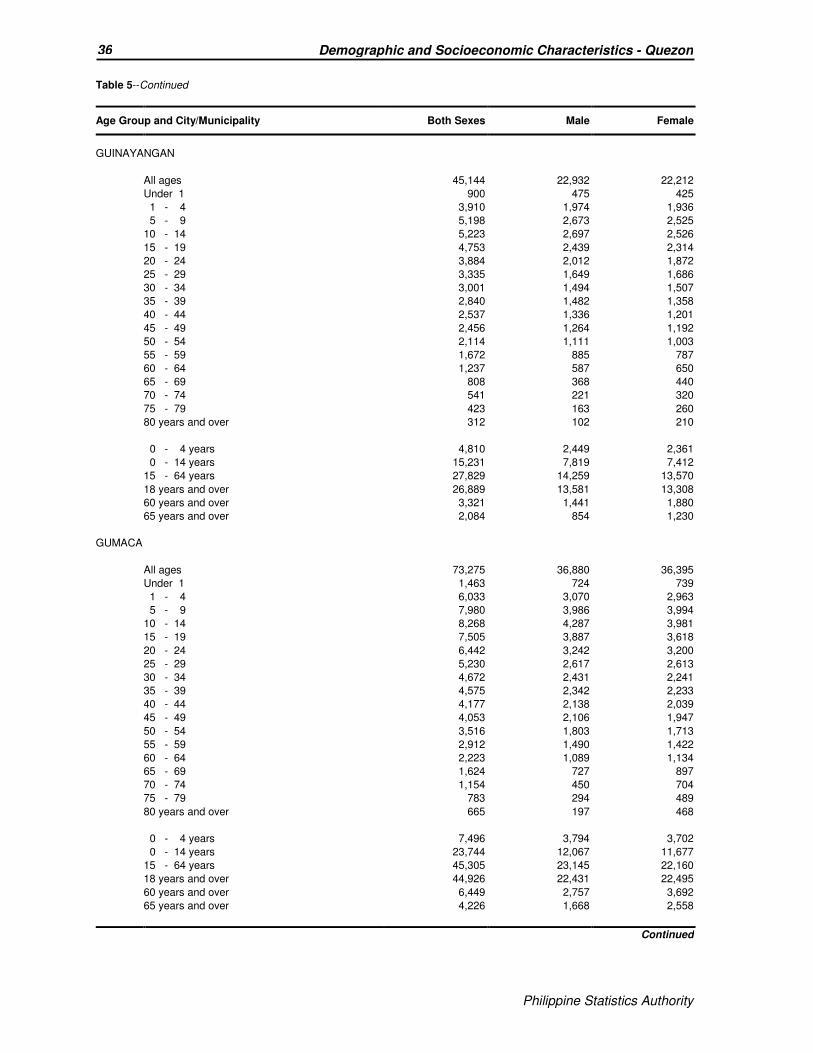
Philippine Statistics Authority
36 Demographic and Socioeconomic Characteristics - Quezon
Philippine Statistics Authority
Table 5--Continued
Age Group and City/Municipality Both Sexes Male Female
GUINAYANGAN
All ages 45,144 22,932 22,212
Under 1 900 475 425
1 - 4 3,910 1,974 1,936
5 - 9 5,198 2,673 2,525
10 - 14 5,223 2,697 2,526
15 - 19 4,753 2,439 2,314
20 - 24 3,884 2,012 1,872
25 - 29 3,335 1,649 1,686
30 - 34 3,001 1,494 1,507
35 - 39 2,840 1,482 1,358
40 - 44 2,537 1,336 1,201
45 - 49 2,456 1,264 1,192
50 - 54 2,114 1,111 1,003
55 - 59 1,672 885 787
60 - 64 1,237 587 650
65 - 69 808 368 440
70 - 74 541 221 320
75 - 79 423 163 260
80 years and over 312 102 210
0 - 4 years 4,810 2,449 2,361
0 - 14 years 15,231 7,819 7,412
15 - 64 years 27,829 14,259 13,570
18 years and over 26,889 13,581 13,308
60 years and over 3,321 1,441 1,880
65 years and over 2,084 854 1,230
GUMACA
All ages 73,275 36,880 36,395
Under 1 1,463 724 739
1 - 4 6,033 3,070 2,963
5 - 9 7,980 3,986 3,994
10 - 14 8,268 4,287 3,981
15 - 19 7,505 3,887 3,618
20 - 24 6,442 3,242 3,200
25 - 29 5,230 2,617 2,613
30 - 34 4,672 2,431 2,241
35 - 39 4,575 2,342 2,233
40 - 44 4,177 2,138 2,039
45 - 49 4,053 2,106 1,947
50 - 54 3,516 1,803 1,713
55 - 59 2,912 1,490 1,422
60 - 64 2,223 1,089 1,134
65 - 69 1,624 727 897
70 - 74 1,154 450 704
75 - 79 783 294 489
80 years and over 665 197 468
0 - 4 years 7,496 3,794 3,702
0 - 14 years 23,744 12,067 11,677
15 - 64 years 45,305 23,145 22,160
18 years and over 44,926 22,431 22,495
60 years and over 6,449 2,757 3,692
65 years and over 4,226 1,668 2,558
Continued
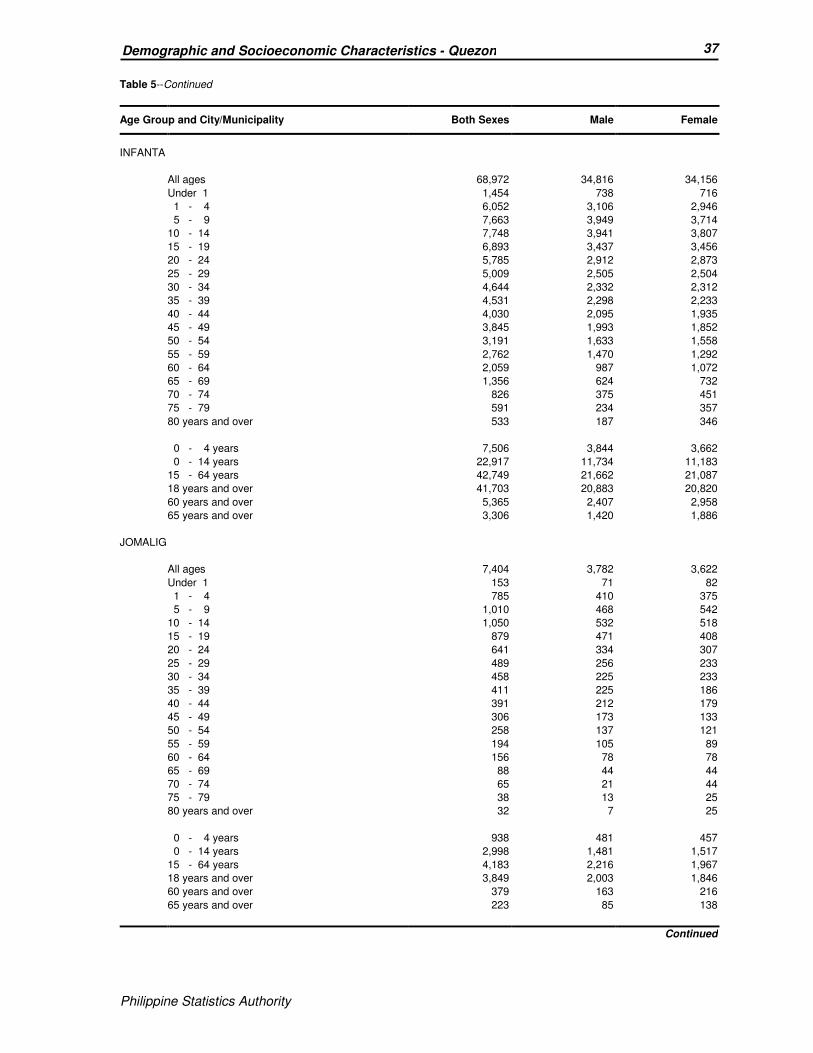
Philippine Statistics Authority
37 Demographic and Socioeconomic Characteristics - Quezon
Philippine Statistics Authority
Table 5--Continued
Age Group and City/Municipality Both Sexes Male Female
INFANTA
All ages 68,972 34,816 34,156
Under 1 1,454 738 716
1 - 4 6,052 3,106 2,946
5 - 9 7,663 3,949 3,714
10 - 14 7,748 3,941 3,807
15 - 19 6,893 3,437 3,456
20 - 24 5,785 2,912 2,873
25 - 29 5,009 2,505 2,504
30 - 34 4,644 2,332 2,312
35 - 39 4,531 2,298 2,233
40 - 44 4,030 2,095 1,935
45 - 49 3,845 1,993 1,852
50 - 54 3,191 1,633 1,558
55 - 59 2,762 1,470 1,292
60 - 64 2,059 987 1,072
65 - 69 1,356 624 732
70 - 74 826 375 451
75 - 79 591 234 357
80 years and over 533 187 346
0 - 4 years 7,506 3,844 3,662
0 - 14 years 22,917 11,734 11,183
15 - 64 years 42,749 21,662 21,087
18 years and over 41,703 20,883 20,820
60 years and over 5,365 2,407 2,958
65 years and over 3,306 1,420 1,886
JOMALIG
All ages 7,404 3,782 3,622
Under 1 153 71 82
1 - 4 785 410 375
5 - 9 1,010 468 542
10 - 14 1,050 532 518
15 - 19 879 471 408
20 - 24 641 334 307
25 - 29 489 256 233
30 - 34 458 225 233
35 - 39 411 225 186
40 - 44 391 212 179
45 - 49 306 173 133
50 - 54 258 137 121
55 - 59 194 105 89
60 - 64 156 78 78
65 - 69 88 44 44
70 - 74 65 21 44
75 - 79 38 13 25
80 years and over 32 7 25
0 - 4 years 938 481 457
0 - 14 years 2,998 1,481 1,517
15 - 64 years 4,183 2,216 1,967
18 years and over 3,849 2,003 1,846
60 years and over 379 163 216
65 years and over 223 85 138
Continued

Philippine Statistics Authority
38 Demographic and Socioeconomic Characteristics - Quezon
Philippine Statistics Authority
Table 5--Continued
Age Group and City/Municipality Both Sexes Male Female
LOPEZ
All ages 95,052 48,287 46,765
Under 1 1,850 948 902
1 - 4 8,252 4,255 3,997
5 - 9 10,907 5,520 5,387
10 - 14 10,152 5,295 4,857
15 - 19 9,818 4,974 4,844
20 - 24 8,159 4,175 3,984
25 - 29 7,112 3,632 3,480
30 - 34 6,469 3,287 3,182
35 - 39 5,978 3,091 2,887
40 - 44 5,495 2,892 2,603
45 - 49 5,097 2,707 2,390
50 - 54 4,461 2,334 2,127
55 - 59 3,588 1,800 1,788
60 - 64 2,705 1,334 1,371
65 - 69 1,927 889 1,038
70 - 74 1,331 542 789
75 - 79 981 379 602
80 years and over 770 233 537
0 - 4 years 10,102 5,203 4,899
0 - 14 years 31,161 16,018 15,143
15 - 64 years 58,882 30,226 28,656
18 years and over 57,630 29,093 28,537
60 years and over 7,714 3,377 4,337
65 years and over 5,009 2,043 2,966
LUCBAN
All ages 50,796 25,555 25,241
Under 1 878 444 434
1 - 4 3,603 1,806 1,797
5 - 9 4,698 2,415 2,283
10 - 14 4,903 2,513 2,390
15 - 19 5,431 2,740 2,691
20 - 24 4,688 2,421 2,267
25 - 29 3,983 2,058 1,925
30 - 34 3,541 1,816 1,725
35 - 39 3,386 1,744 1,642
40 - 44 3,014 1,496 1,518
45 - 49 2,917 1,471 1,446
50 - 54 2,652 1,342 1,310
55 - 59 2,298 1,150 1,148
60 - 64 1,702 841 861
65 - 69 1,161 539 622
70 - 74 785 345 440
75 - 79 608 240 368
80 years and over 548 174 374
0 - 4 years 4,481 2,250 2,231
0 - 14 years 14,082 7,178 6,904
15 - 64 years 33,612 17,079 16,533
18 years and over 33,452 16,686 16,766
60 years and over 4,804 2,139 2,665
65 years and over 3,102 1,298 1,804
Continued
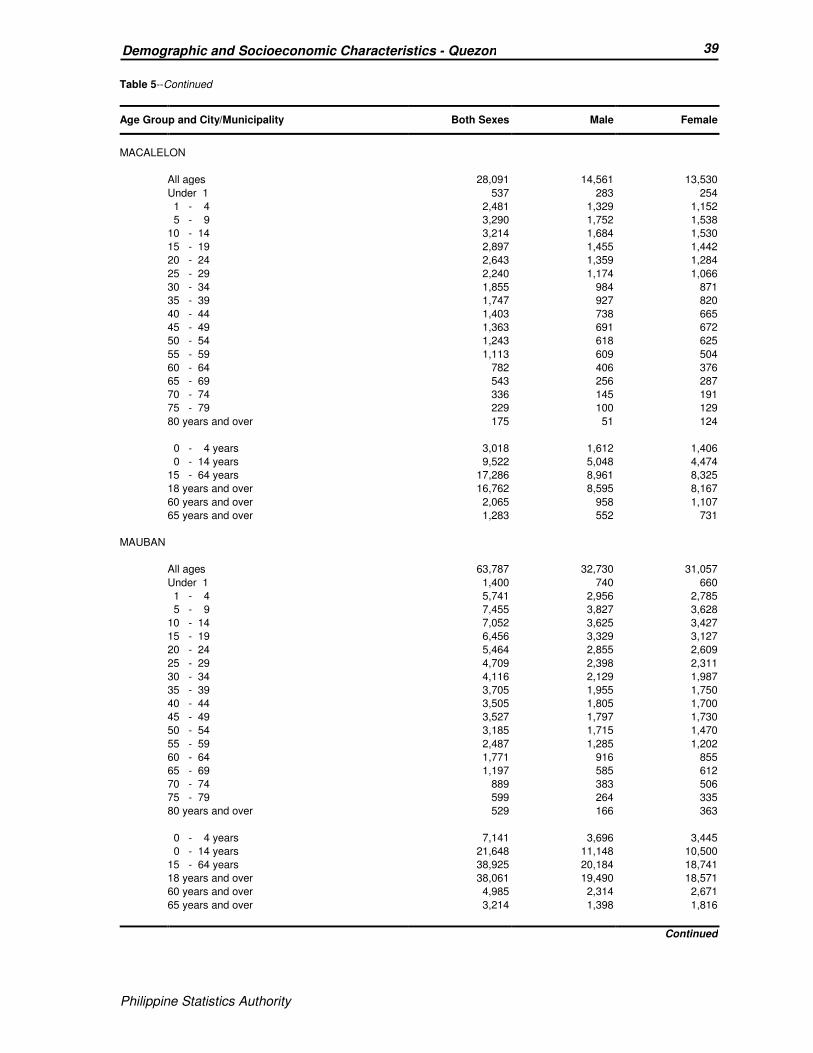
Philippine Statistics Authority
39 Demographic and Socioeconomic Characteristics - Quezon
Philippine Statistics Authority
Table 5--Continued
Age Group and City/Municipality Both Sexes Male Female
MACALELON
All ages 28,091 14,561 13,530
Under 1 537 283 254
1 - 4 2,481 1,329 1,152
5 - 9 3,290 1,752 1,538
10 - 14 3,214 1,684 1,530
15 - 19 2,897 1,455 1,442
20 - 24 2,643 1,359 1,284
25 - 29 2,240 1,174 1,066
30 - 34 1,855 984 871
35 - 39 1,747 927 820
40 - 44 1,403 738 665
45 - 49 1,363 691 672
50 - 54 1,243 618 625
55 - 59 1,113 609 504
60 - 64 782 406 376
65 - 69 543 256 287
70 - 74 336 145 191
75 - 79 229 100 129
80 years and over 175 51 124
0 - 4 years 3,018 1,612 1,406
0 - 14 years 9,522 5,048 4,474
15 - 64 years 17,286 8,961 8,325
18 years and over 16,762 8,595 8,167
60 years and over 2,065 958 1,107
65 years and over 1,283 552 731
MAUBAN
All ages 63,787 32,730 31,057
Under 1 1,400 740 660
1 - 4 5,741 2,956 2,785
5 - 9 7,455 3,827 3,628
10 - 14 7,052 3,625 3,427
15 - 19 6,456 3,329 3,127
20 - 24 5,464 2,855 2,609
25 - 29 4,709 2,398 2,311
30 - 34 4,116 2,129 1,987
35 - 39 3,705 1,955 1,750
40 - 44 3,505 1,805 1,700
45 - 49 3,527 1,797 1,730
50 - 54 3,185 1,715 1,470
55 - 59 2,487 1,285 1,202
60 - 64 1,771 916 855
65 - 69 1,197 585 612
70 - 74 889 383 506
75 - 79 599 264 335
80 years and over 529 166 363
0 - 4 years 7,141 3,696 3,445
0 - 14 years 21,648 11,148 10,500
15 - 64 years 38,925 20,184 18,741
18 years and over 38,061 19,490 18,571
60 years and over 4,985 2,314 2,671
65 years and over 3,214 1,398 1,816
Continued

Philippine Statistics Authority
40 Demographic and Socioeconomic Characteristics - Quezon
Philippine Statistics Authority
Table 5--Continued
Age Group and City/Municipality Both Sexes Male Female
MULANAY
All ages 53,047 27,142 25,905
Under 1 1,106 583 523
1 - 4 4,990 2,564 2,426
5 - 9 6,840 3,560 3,280
10 - 14 6,561 3,347 3,214
15 - 19 5,801 3,036 2,765
20 - 24 4,262 2,190 2,072
25 - 29 3,720 1,880 1,840
30 - 34 3,302 1,665 1,637
35 - 39 3,434 1,803 1,631
40 - 44 2,969 1,573 1,396
45 - 49 2,539 1,352 1,187
50 - 54 1,968 1,006 962
55 - 59 1,828 888 940
60 - 64 1,383 670 713
65 - 69 995 463 532
70 - 74 617 285 332
75 - 79 380 148 232
80 years and over 352 129 223
0 - 4 years 6,096 3,147 2,949
0 - 14 years 19,497 10,054 9,443
15 - 64 years 31,206 16,063 15,143
18 years and over 29,797 15,145 14,652
60 years and over 3,727 1,695 2,032
65 years and over 2,344 1,025 1,319
PADRE BURGOS
All ages 22,459 11,402 11,057
Under 1 352 186 166
1 - 4 1,731 884 847
5 - 9 2,370 1,237 1,133
10 - 14 2,431 1,252 1,179
15 - 19 2,292 1,205 1,087
20 - 24 1,988 1,027 961
25 - 29 1,544 767 777
30 - 34 1,392 721 671
35 - 39 1,522 768 754
40 - 44 1,364 705 659
45 - 49 1,277 646 631
50 - 54 1,120 593 527
55 - 59 931 445 486
60 - 64 795 387 408
65 - 69 556 246 310
70 - 74 372 173 199
75 - 79 237 100 137
80 years and over 185 60 125
0 - 4 years 2,083 1,070 1,013
0 - 14 years 6,884 3,559 3,325
15 - 64 years 14,225 7,264 6,961
18 years and over 14,116 7,072 7,044
60 years and over 2,145 966 1,179
65 years and over 1,350 579 771
Continued
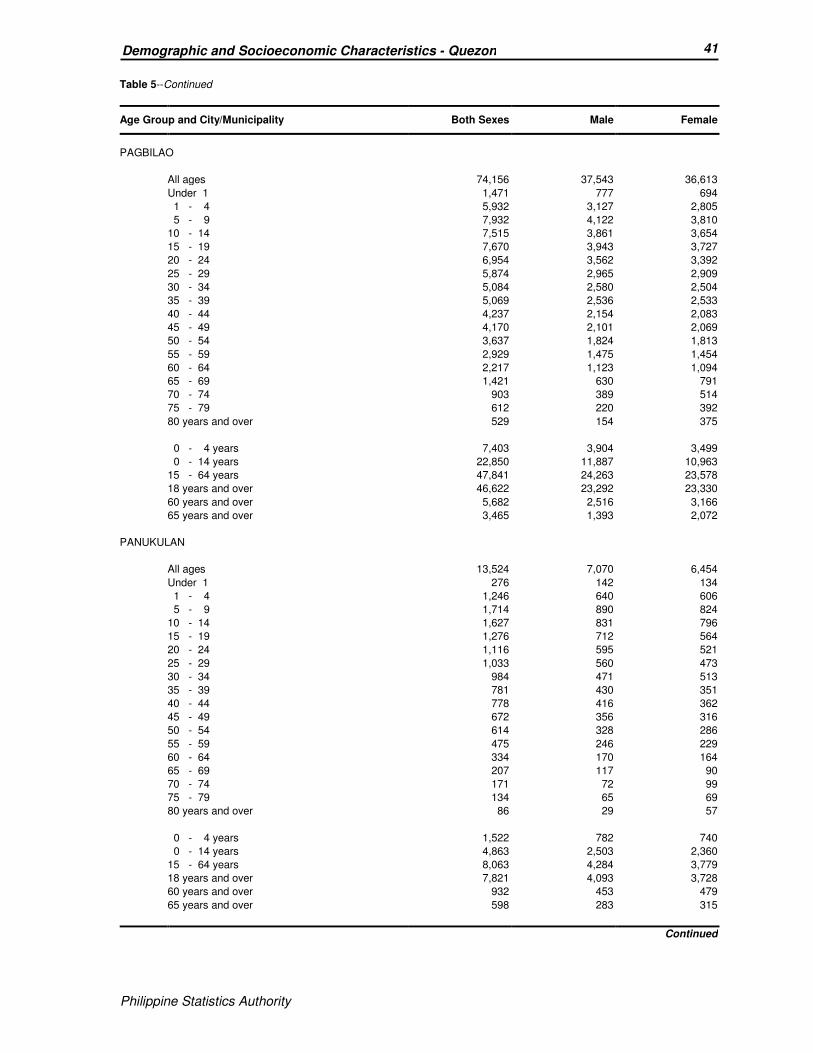
Philippine Statistics Authority
41 Demographic and Socioeconomic Characteristics - Quezon
Philippine Statistics Authority
Table 5--Continued
Age Group and City/Municipality Both Sexes Male Female
PAGBILAO
All ages 74,156 37,543 36,613
Under 1 1,471 777 694
1 - 4 5,932 3,127 2,805
5 - 9 7,932 4,122 3,810
10 - 14 7,515 3,861 3,654
15 - 19 7,670 3,943 3,727
20 - 24 6,954 3,562 3,392
25 - 29 5,874 2,965 2,909
30 - 34 5,084 2,580 2,504
35 - 39 5,069 2,536 2,533
40 - 44 4,237 2,154 2,083
45 - 49 4,170 2,101 2,069
50 - 54 3,637 1,824 1,813
55 - 59 2,929 1,475 1,454
60 - 64 2,217 1,123 1,094
65 - 69 1,421 630 791
70 - 74 903 389 514
75 - 79 612 220 392
80 years and over 529 154 375
0 - 4 years 7,403 3,904 3,499
0 - 14 years 22,850 11,887 10,963
15 - 64 years 47,841 24,263 23,578
18 years and over 46,622 23,292 23,330
60 years and over 5,682 2,516 3,166
65 years and over 3,465 1,393 2,072
PANUKULAN
All ages 13,524 7,070 6,454
Under 1 276 142 134
1 - 4 1,246 640 606
5 - 9 1,714 890 824
10 - 14 1,627 831 796
15 - 19 1,276 712 564
20 - 24 1,116 595 521
25 - 29 1,033 560 473
30 - 34 984 471 513
35 - 39 781 430 351
40 - 44 778 416 362
45 - 49 672 356 316
50 - 54 614 328 286
55 - 59 475 246 229
60 - 64 334 170 164
65 - 69 207 117 90
70 - 74 171 72 99
75 - 79 134 65 69
80 years and over 86 29 57
0 - 4 years 1,522 782 740
0 - 14 years 4,863 2,503 2,360
15 - 64 years 8,063 4,284 3,779
18 years and over 7,821 4,093 3,728
60 years and over 932 453 479
65 years and over 598 283 315
Continued
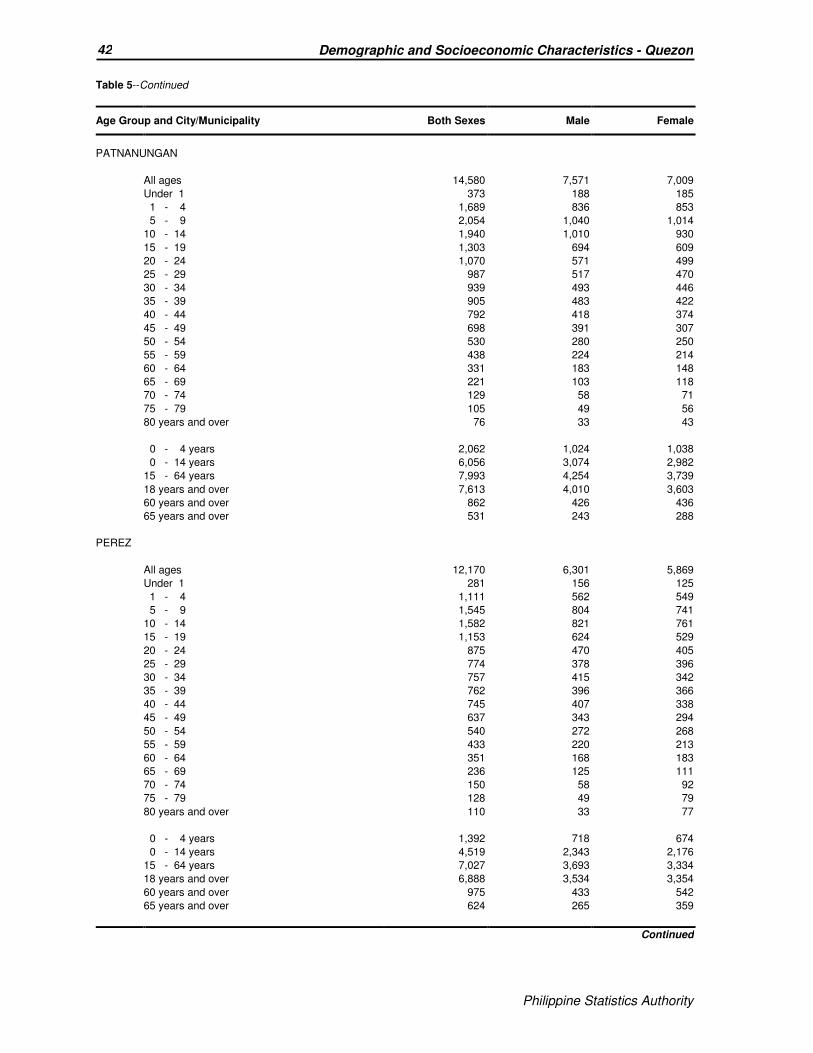
Philippine Statistics Authority
42 Demographic and Socioeconomic Characteristics - Quezon
Philippine Statistics Authority
Table 5--Continued
Age Group and City/Municipality Both Sexes Male Female
PATNANUNGAN
All ages 14,580 7,571 7,009
Under 1 373 188 185
1 - 4 1,689 836 853
5 - 9 2,054 1,040 1,014
10 - 14 1,940 1,010 930
15 - 19 1,303 694 609
20 - 24 1,070 571 499
25 - 29 987 517 470
30 - 34 939 493 446
35 - 39 905 483 422
40 - 44 792 418 374
45 - 49 698 391 307
50 - 54 530 280 250
55 - 59 438 224 214
60 - 64 331 183 148
65 - 69 221 103 118
70 - 74 129 58 71
75 - 79 105 49 56
80 years and over 76 33 43
0 - 4 years 2,062 1,024 1,038
0 - 14 years 6,056 3,074 2,982
15 - 64 years 7,993 4,254 3,739
18 years and over 7,613 4,010 3,603
60 years and over 862 426 436
65 years and over 531 243 288
PEREZ
All ages 12,170 6,301 5,869
Under 1 281 156 125
1 - 4 1,111 562 549
5 - 9 1,545 804 741
10 - 14 1,582 821 761
15 - 19 1,153 624 529
20 - 24 875 470 405
25 - 29 774 378 396
30 - 34 757 415 342
35 - 39 762 396 366
40 - 44 745 407 338
45 - 49 637 343 294
50 - 54 540 272 268
55 - 59 433 220 213
60 - 64 351 168 183
65 - 69 236 125 111
70 - 74 150 58 92
75 - 79 128 49 79
80 years and over 110 33 77
0 - 4 years 1,392 718 674
0 - 14 years 4,519 2,343 2,176
15 - 64 years 7,027 3,693 3,334
18 years and over 6,888 3,534 3,354
60 years and over 975 433 542
65 years and over 624 265 359
Continued
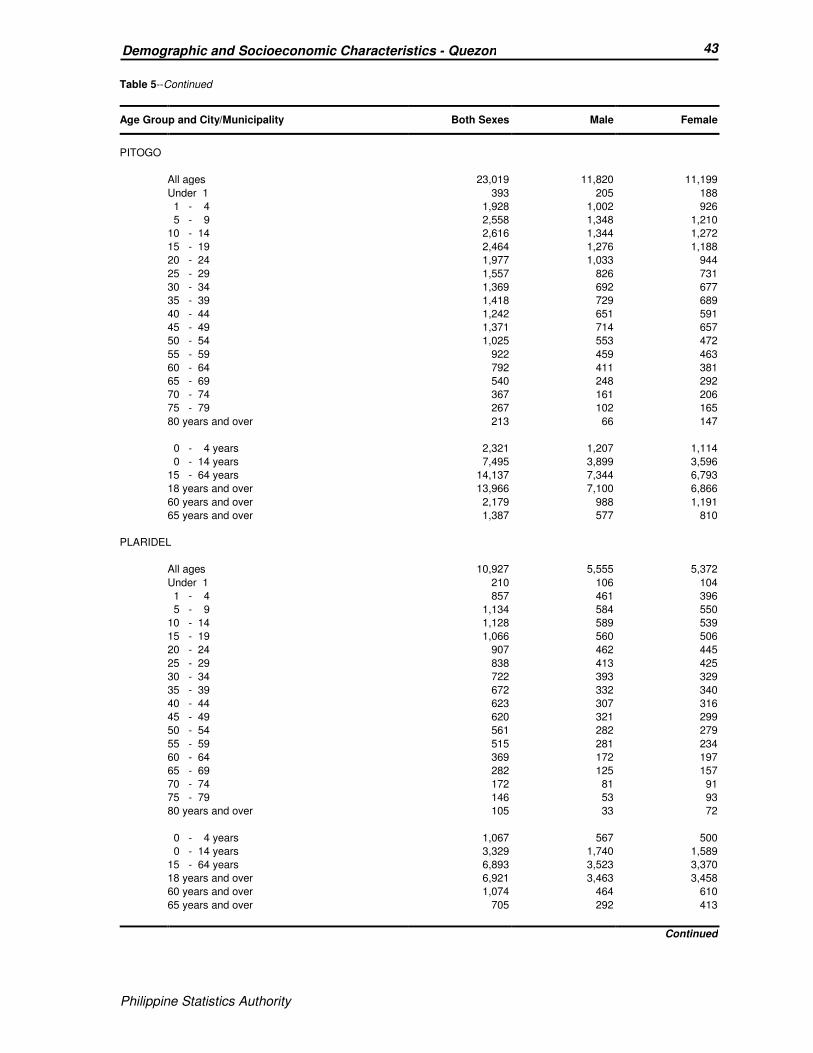
Philippine Statistics Authority
43 Demographic and Socioeconomic Characteristics - Quezon
Philippine Statistics Authority
Table 5--Continued
Age Group and City/Municipality Both Sexes Male Female
PITOGO
All ages 23,019 11,820 11,199
Under 1 393 205 188
1 - 4 1,928 1,002 926
5 - 9 2,558 1,348 1,210
10 - 14 2,616 1,344 1,272
15 - 19 2,464 1,276 1,188
20 - 24 1,977 1,033 944
25 - 29 1,557 826 731
30 - 34 1,369 692 677
35 - 39 1,418 729 689
40 - 44 1,242 651 591
45 - 49 1,371 714 657
50 - 54 1,025 553 472
55 - 59 922 459 463
60 - 64 792 411 381
65 - 69 540 248 292
70 - 74 367 161 206
75 - 79 267 102 165
80 years and over 213 66 147
0 - 4 years 2,321 1,207 1,114
0 - 14 years 7,495 3,899 3,596
15 - 64 years 14,137 7,344 6,793
18 years and over 13,966 7,100 6,866
60 years and over 2,179 988 1,191
65 years and over 1,387 577 810
PLARIDEL
All ages 10,927 5,555 5,372
Under 1 210 106 104
1 - 4 857 461 396
5 - 9 1,134 584 550
10 - 14 1,128 589 539
15 - 19 1,066 560 506
20 - 24 907 462 445
25 - 29 838 413 425
30 - 34 722 393 329
35 - 39 672 332 340
40 - 44 623 307 316
45 - 49 620 321 299
50 - 54 561 282 279
55 - 59 515 281 234
60 - 64 369 172 197
65 - 69 282 125 157
70 - 74 172 81 91
75 - 79 146 53 93
80 years and over 105 33 72
0 - 4 years 1,067 567 500
0 - 14 years 3,329 1,740 1,589
15 - 64 years 6,893 3,523 3,370
18 years and over 6,921 3,463 3,458
60 years and over 1,074 464 610
65 years and over 705 292 413
Continued
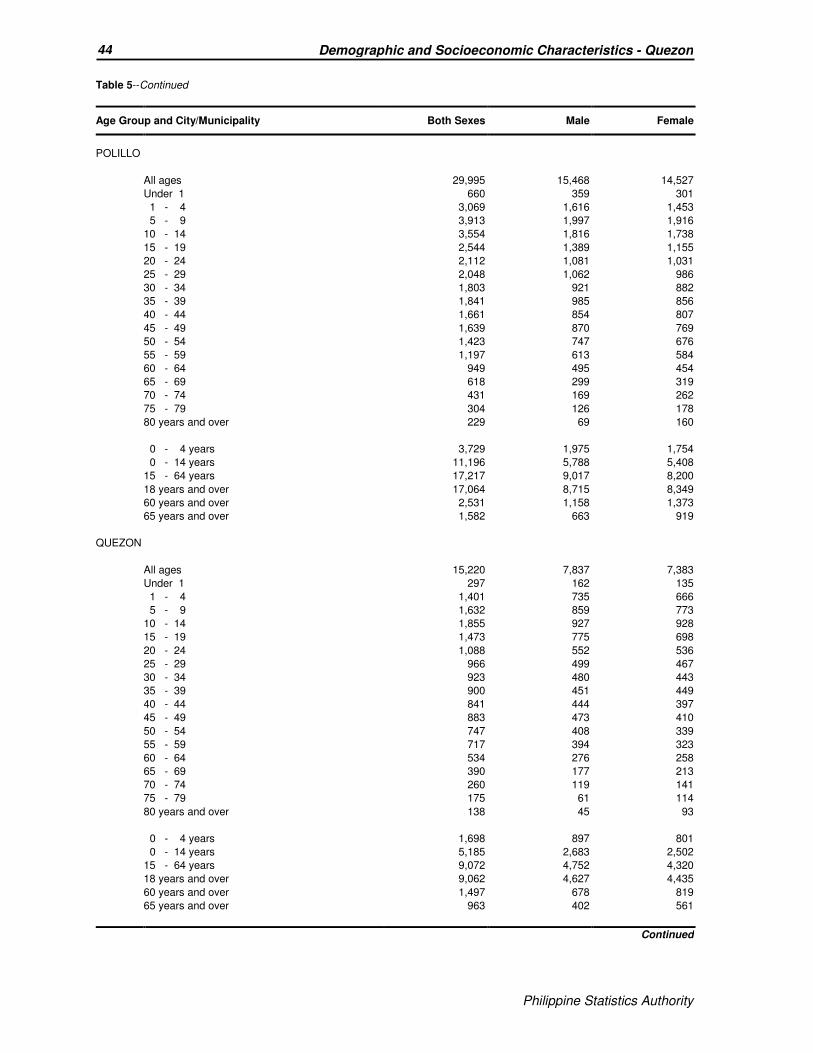
Philippine Statistics Authority
44 Demographic and Socioeconomic Characteristics - Quezon
Philippine Statistics Authority
Table 5--Continued
Age Group and City/Municipality Both Sexes Male Female
POLILLO
All ages 29,995 15,468 14,527
Under 1 660 359 301
1 - 4 3,069 1,616 1,453
5 - 9 3,913 1,997 1,916
10 - 14 3,554 1,816 1,738
15 - 19 2,544 1,389 1,155
20 - 24 2,112 1,081 1,031
25 - 29 2,048 1,062 986
30 - 34 1,803 921 882
35 - 39 1,841 985 856
40 - 44 1,661 854 807
45 - 49 1,639 870 769
50 - 54 1,423 747 676
55 - 59 1,197 613 584
60 - 64 949 495 454
65 - 69 618 299 319
70 - 74 431 169 262
75 - 79 304 126 178
80 years and over 229 69 160
0 - 4 years 3,729 1,975 1,754
0 - 14 years 11,196 5,788 5,408
15 - 64 years 17,217 9,017 8,200
18 years and over 17,064 8,715 8,349
60 years and over 2,531 1,158 1,373
65 years and over 1,582 663 919
QUEZON
All ages 15,220 7,837 7,383
Under 1 297 162 135
1 - 4 1,401 735 666
5 - 9 1,632 859 773
10 - 14 1,855 927 928
15 - 19 1,473 775 698
20 - 24 1,088 552 536
25 - 29 966 499 467
30 - 34 923 480 443
35 - 39 900 451 449
40 - 44 841 444 397
45 - 49 883 473 410
50 - 54 747 408 339
55 - 59 717 394 323
60 - 64 534 276 258
65 - 69 390 177 213
70 - 74 260 119 141
75 - 79 175 61 114
80 years and over 138 45 93
0 - 4 years 1,698 897 801
0 - 14 years 5,185 2,683 2,502
15 - 64 years 9,072 4,752 4,320
18 years and over 9,062 4,627 4,435
60 years and over 1,497 678 819
65 years and over 963 402 561
Continued
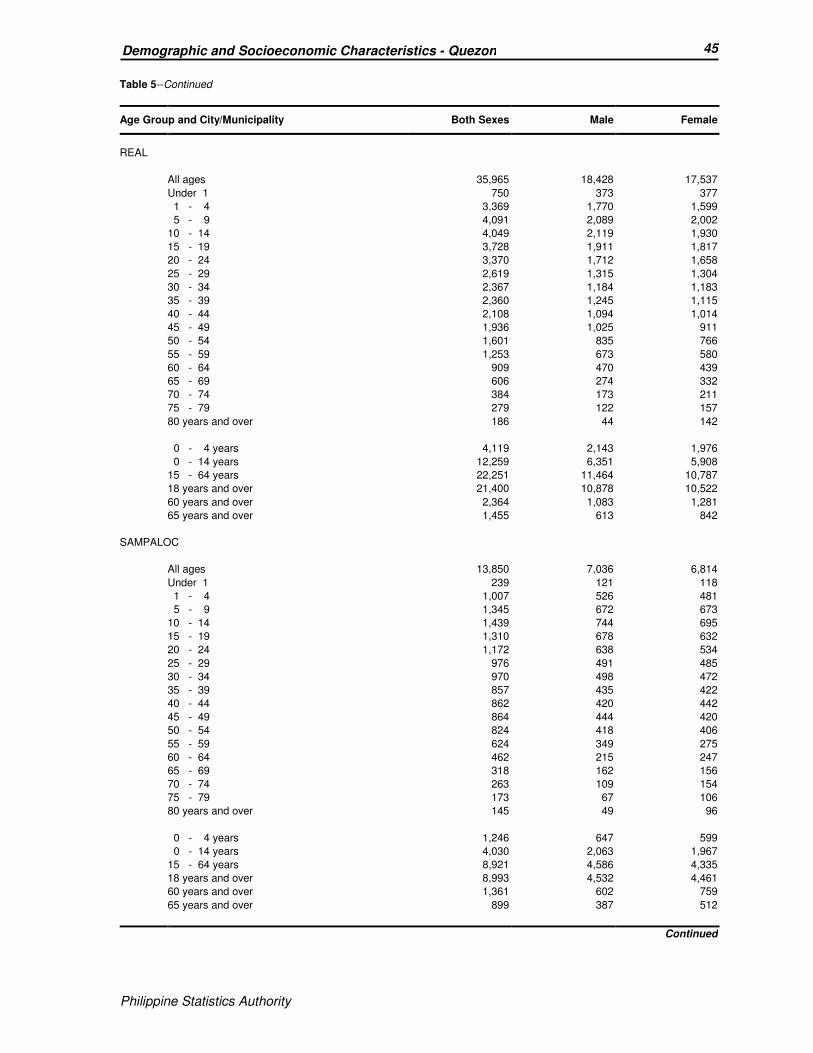
Philippine Statistics Authority
45 Demographic and Socioeconomic Characteristics - Quezon
Philippine Statistics Authority
Table 5--Continued
Age Group and City/Municipality Both Sexes Male Female
REAL
All ages 35,965 18,428 17,537
Under 1 750 373 377
1 - 4 3,369 1,770 1,599
5 - 9 4,091 2,089 2,002
10 - 14 4,049 2,119 1,930
15 - 19 3,728 1,911 1,817
20 - 24 3,370 1,712 1,658
25 - 29 2,619 1,315 1,304
30 - 34 2,367 1,184 1,183
35 - 39 2,360 1,245 1,115
40 - 44 2,108 1,094 1,014
45 - 49 1,936 1,025 911
50 - 54 1,601 835 766
55 - 59 1,253 673 580
60 - 64 909 470 439
65 - 69 606 274 332
70 - 74 384 173 211
75 - 79 279 122 157
80 years and over 186 44 142
0 - 4 years 4,119 2,143 1,976
0 - 14 years 12,259 6,351 5,908
15 - 64 years 22,251 11,464 10,787
18 years and over 21,400 10,878 10,522
60 years and over 2,364 1,083 1,281
65 years and over 1,455 613 842
SAMPALOC
All ages 13,850 7,036 6,814
Under 1 239 121 118
1 - 4 1,007 526 481
5 - 9 1,345 672 673
10 - 14 1,439 744 695
15 - 19 1,310 678 632
20 - 24 1,172 638 534
25 - 29 976 491 485
30 - 34 970 498 472
35 - 39 857 435 422
40 - 44 862 420 442
45 - 49 864 444 420
50 - 54 824 418 406
55 - 59 624 349 275
60 - 64 462 215 247
65 - 69 318 162 156
70 - 74 263 109 154
75 - 79 173 67 106
80 years and over 145 49 96
0 - 4 years 1,246 647 599
0 - 14 years 4,030 2,063 1,967
15 - 64 years 8,921 4,586 4,335
18 years and over 8,993 4,532 4,461
60 years and over 1,361 602 759
65 years and over 899 387 512
Continued
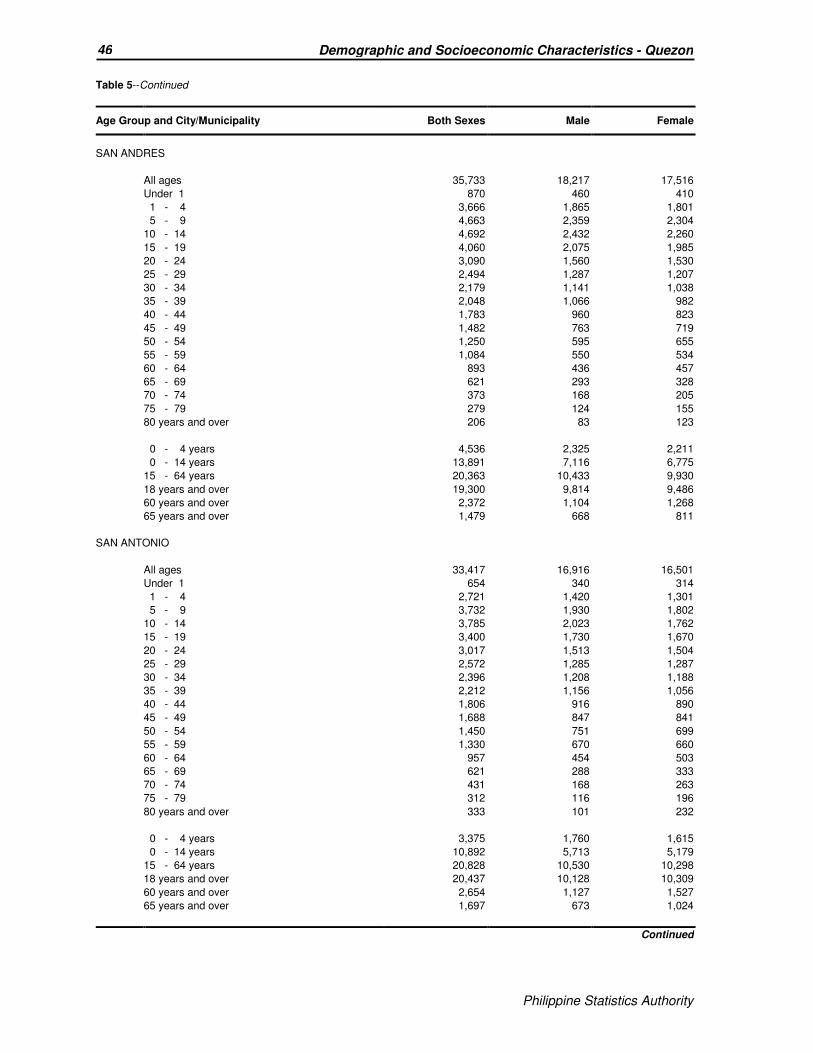
Philippine Statistics Authority
46 Demographic and Socioeconomic Characteristics - Quezon
Philippine Statistics Authority
Table 5--Continued
Age Group and City/Municipality Both Sexes Male Female
SAN ANDRES
All ages 35,733 18,217 17,516
Under 1 870 460 410
1 - 4 3,666 1,865 1,801
5 - 9 4,663 2,359 2,304
10 - 14 4,692 2,432 2,260
15 - 19 4,060 2,075 1,985
20 - 24 3,090 1,560 1,530
25 - 29 2,494 1,287 1,207
30 - 34 2,179 1,141 1,038
35 - 39 2,048 1,066 982
40 - 44 1,783 960 823
45 - 49 1,482 763 719
50 - 54 1,250 595 655
55 - 59 1,084 550 534
60 - 64 893 436 457
65 - 69 621 293 328
70 - 74 373 168 205
75 - 79 279 124 155
80 years and over 206 83 123
0 - 4 years 4,536 2,325 2,211
0 - 14 years 13,891 7,116 6,775
15 - 64 years 20,363 10,433 9,930
18 years and over 19,300 9,814 9,486
60 years and over 2,372 1,104 1,268
65 years and over 1,479 668 811
SAN ANTONIO
All ages 33,417 16,916 16,501
Under 1 654 340 314
1 - 4 2,721 1,420 1,301
5 - 9 3,732 1,930 1,802
10 - 14 3,785 2,023 1,762
15 - 19 3,400 1,730 1,670
20 - 24 3,017 1,513 1,504
25 - 29 2,572 1,285 1,287
30 - 34 2,396 1,208 1,188
35 - 39 2,212 1,156 1,056
40 - 44 1,806 916 890
45 - 49 1,688 847 841
50 - 54 1,450 751 699
55 - 59 1,330 670 660
60 - 64 957 454 503
65 - 69 621 288 333
70 - 74 431 168 263
75 - 79 312 116 196
80 years and over 333 101 232
0 - 4 years 3,375 1,760 1,615
0 - 14 years 10,892 5,713 5,179
15 - 64 years 20,828 10,530 10,298
18 years and over 20,437 10,128 10,309
60 years and over 2,654 1,127 1,527
65 years and over 1,697 673 1,024
Continued
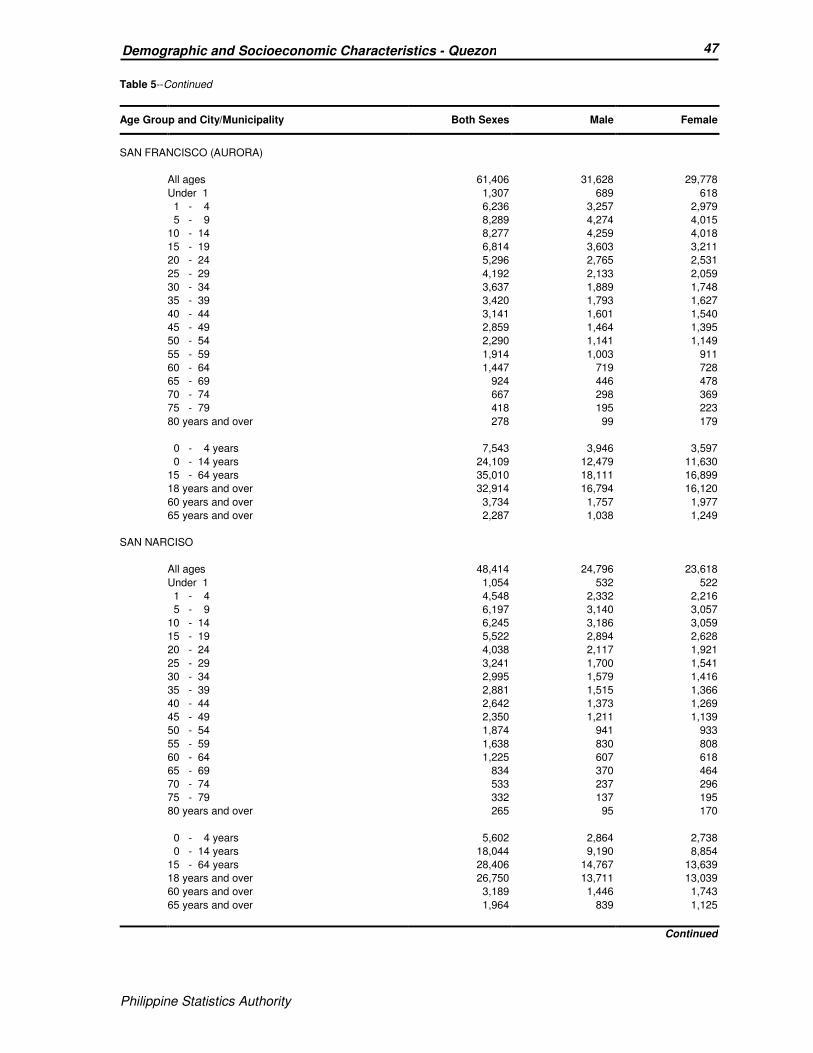
Philippine Statistics Authority
47 Demographic and Socioeconomic Characteristics - Quezon
Philippine Statistics Authority
Table 5--Continued
Age Group and City/Municipality Both Sexes Male Female
SAN FRANCISCO (AURORA)
All ages 61,406 31,628 29,778
Under 1 1,307 689 618
1 - 4 6,236 3,257 2,979
5 - 9 8,289 4,274 4,015
10 - 14 8,277 4,259 4,018
15 - 19 6,814 3,603 3,211
20 - 24 5,296 2,765 2,531
25 - 29 4,192 2,133 2,059
30 - 34 3,637 1,889 1,748
35 - 39 3,420 1,793 1,627
40 - 44 3,141 1,601 1,540
45 - 49 2,859 1,464 1,395
50 - 54 2,290 1,141 1,149
55 - 59 1,914 1,003 911
60 - 64 1,447 719 728
65 - 69 924 446 478
70 - 74 667 298 369
75 - 79 418 195 223
80 years and over 278 99 179
0 - 4 years 7,543 3,946 3,597
0 - 14 years 24,109 12,479 11,630
15 - 64 years 35,010 18,111 16,899
18 years and over 32,914 16,794 16,120
60 years and over 3,734 1,757 1,977
65 years and over 2,287 1,038 1,249
SAN NARCISO
All ages 48,414 24,796 23,618
Under 1 1,054 532 522
1 - 4 4,548 2,332 2,216
5 - 9 6,197 3,140 3,057
10 - 14 6,245 3,186 3,059
15 - 19 5,522 2,894 2,628
20 - 24 4,038 2,117 1,921
25 - 29 3,241 1,700 1,541
30 - 34 2,995 1,579 1,416
35 - 39 2,881 1,515 1,366
40 - 44 2,642 1,373 1,269
45 - 49 2,350 1,211 1,139
50 - 54 1,874 941 933
55 - 59 1,638 830 808
60 - 64 1,225 607 618
65 - 69 834 370 464
70 - 74 533 237 296
75 - 79 332 137 195
80 years and over 265 95 170
0 - 4 years 5,602 2,864 2,738
0 - 14 years 18,044 9,190 8,854
15 - 64 years 28,406 14,767 13,639
18 years and over 26,750 13,711 13,039
60 years and over 3,189 1,446 1,743
65 years and over 1,964 839 1,125
Continued
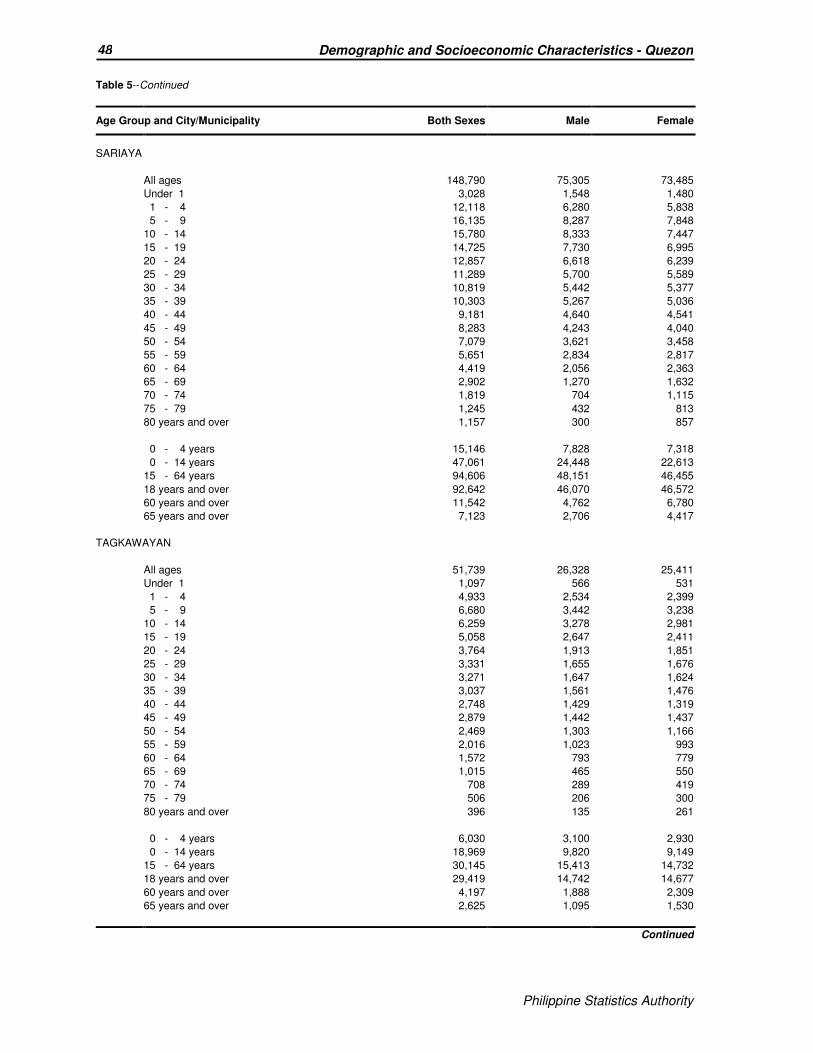
Philippine Statistics Authority
48 Demographic and Socioeconomic Characteristics - Quezon
Philippine Statistics Authority
Table 5--Continued
Age Group and City/Municipality Both Sexes Male Female
SARIAYA
All ages 148,790 75,305 73,485
Under 1 3,028 1,548 1,480
1 - 4 12,118 6,280 5,838
5 - 9 16,135 8,287 7,848
10 - 14 15,780 8,333 7,447
15 - 19 14,725 7,730 6,995
20 - 24 12,857 6,618 6,239
25 - 29 11,289 5,700 5,589
30 - 34 10,819 5,442 5,377
35 - 39 10,303 5,267 5,036
40 - 44 9,181 4,640 4,541
45 - 49 8,283 4,243 4,040
50 - 54 7,079 3,621 3,458
55 - 59 5,651 2,834 2,817
60 - 64 4,419 2,056 2,363
65 - 69 2,902 1,270 1,632
70 - 74 1,819 704 1,115
75 - 79 1,245 432 813
80 years and over 1,157 300 857
0 - 4 years 15,146 7,828 7,318
0 - 14 years 47,061 24,448 22,613
15 - 64 years 94,606 48,151 46,455
18 years and over 92,642 46,070 46,572
60 years and over 11,542 4,762 6,780
65 years and over 7,123 2,706 4,417
TAGKAWAYAN
All ages 51,739 26,328 25,411
Under 1 1,097 566 531
1 - 4 4,933 2,534 2,399
5 - 9 6,680 3,442 3,238
10 - 14 6,259 3,278 2,981
15 - 19 5,058 2,647 2,411
20 - 24 3,764 1,913 1,851
25 - 29 3,331 1,655 1,676
30 - 34 3,271 1,647 1,624
35 - 39 3,037 1,561 1,476
40 - 44 2,748 1,429 1,319
45 - 49 2,879 1,442 1,437
50 - 54 2,469 1,303 1,166
55 - 59 2,016 1,023 993
60 - 64 1,572 793 779
65 - 69 1,015 465 550
70 - 74 708 289 419
75 - 79 506 206 300
80 years and over 396 135 261
0 - 4 years 6,030 3,100 2,930
0 - 14 years 18,969 9,820 9,149
15 - 64 years 30,145 15,413 14,732
18 years and over 29,419 14,742 14,677
60 years and over 4,197 1,888 2,309
65 years and over 2,625 1,095 1,530
Continued
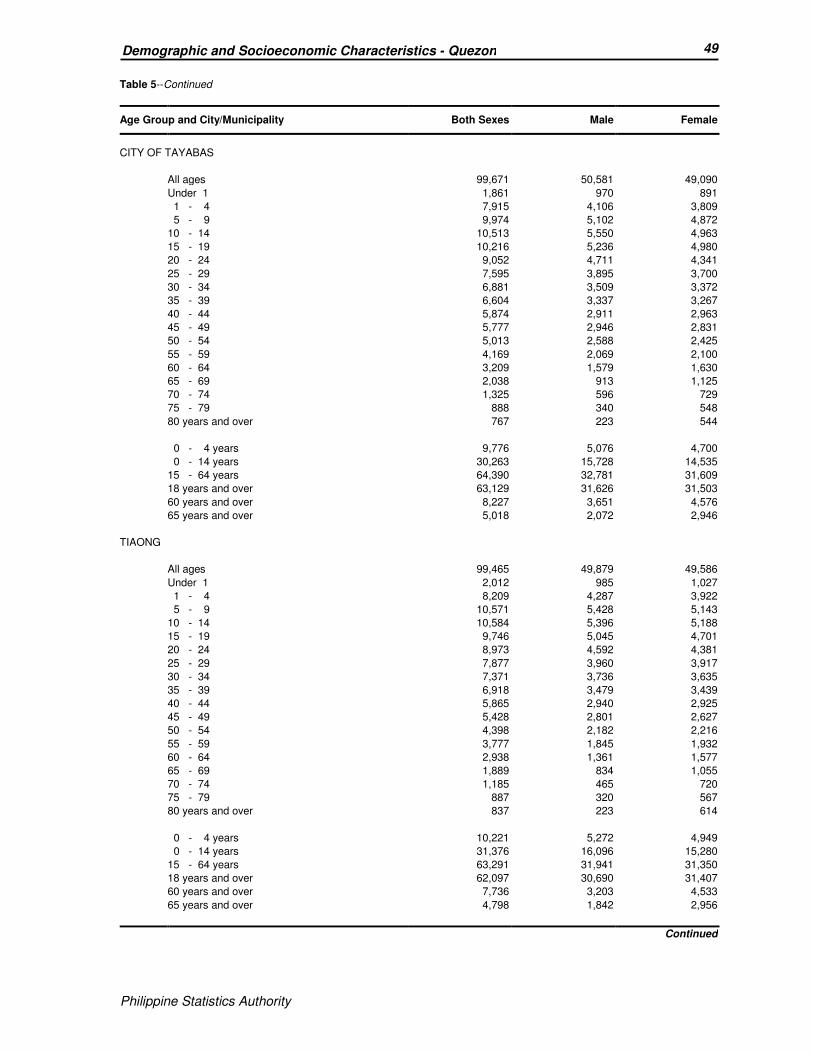
Philippine Statistics Authority
49 Demographic and Socioeconomic Characteristics - Quezon
Philippine Statistics Authority
Table 5--Continued
Age Group and City/Municipality Both Sexes Male Female
CITY OF TAYABAS
All ages 99,671 50,581 49,090
Under 1 1,861 970 891
1 - 4 7,915 4,106 3,809
5 - 9 9,974 5,102 4,872
10 - 14 10,513 5,550 4,963
15 - 19 10,216 5,236 4,980
20 - 24 9,052 4,711 4,341
25 - 29 7,595 3,895 3,700
30 - 34 6,881 3,509 3,372
35 - 39 6,604 3,337 3,267
40 - 44 5,874 2,911 2,963
45 - 49 5,777 2,946 2,831
50 - 54 5,013 2,588 2,425
55 - 59 4,169 2,069 2,100
60 - 64 3,209 1,579 1,630
65 - 69 2,038 913 1,125
70 - 74 1,325 596 729
75 - 79 888 340 548
80 years and over 767 223 544
0 - 4 years 9,776 5,076 4,700
0 - 14 years 30,263 15,728 14,535
15 - 64 years 64,390 32,781 31,609
18 years and over 63,129 31,626 31,503
60 years and over 8,227 3,651 4,576
65 years and over 5,018 2,072 2,946
TIAONG
All ages 99,465 49,879 49,586
Under 1 2,012 985 1,027
1 - 4 8,209 4,287 3,922
5 - 9 10,571 5,428 5,143
10 - 14 10,584 5,396 5,188
15 - 19 9,746 5,045 4,701
20 - 24 8,973 4,592 4,381
25 - 29 7,877 3,960 3,917
30 - 34 7,371 3,736 3,635
35 - 39 6,918 3,479 3,439
40 - 44 5,865 2,940 2,925
45 - 49 5,428 2,801 2,627
50 - 54 4,398 2,182 2,216
55 - 59 3,777 1,845 1,932
60 - 64 2,938 1,361 1,577
65 - 69 1,889 834 1,055
70 - 74 1,185 465 720
75 - 79 887 320 567
80 years and over 837 223 614
0 - 4 years 10,221 5,272 4,949
0 - 14 years 31,376 16,096 15,280
15 - 64 years 63,291 31,941 31,350
18 years and over 62,097 30,690 31,407
60 years and over 7,736 3,203 4,533
65 years and over 4,798 1,842 2,956
Continued
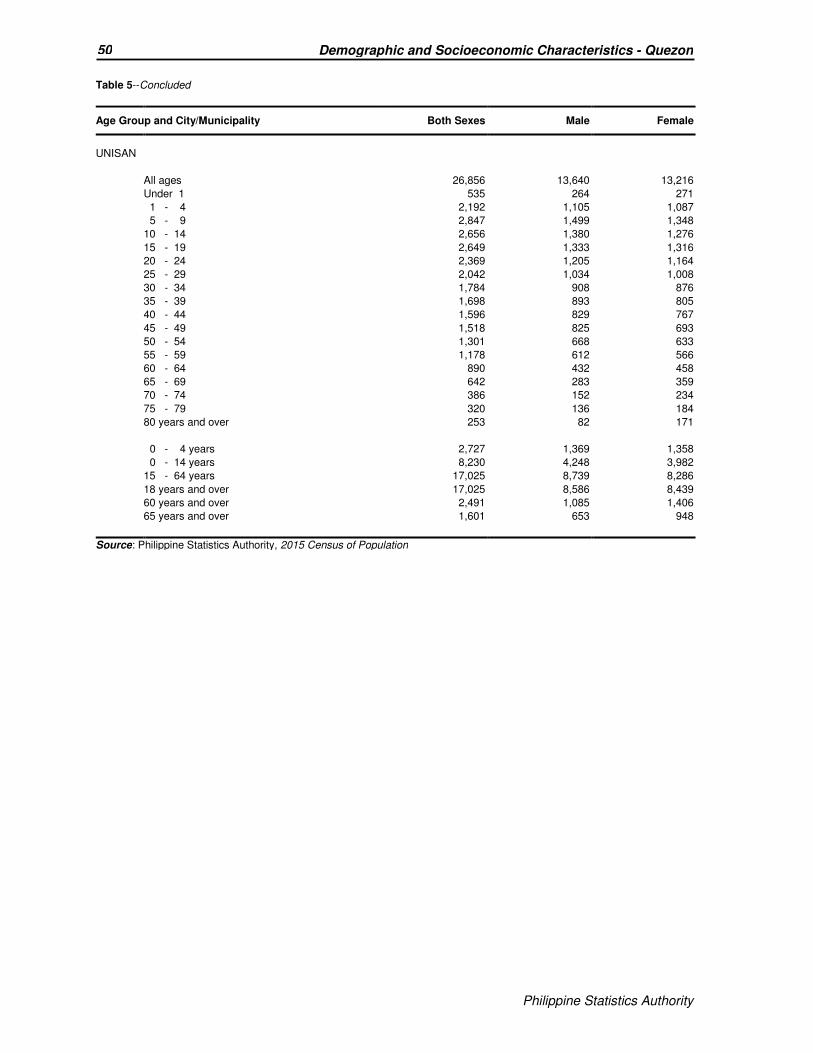
Philippine Statistics Authority
50 Demographic and Socioeconomic Characteristics - Quezon
Philippine Statistics Authority
Table 5--Concluded
Age Group and City/Municipality Both Sexes Male Female
UNISAN
All ages 26,856 13,640 13,216
Under 1 535 264 271
1 - 4 2,192 1,105 1,087
5 - 9 2,847 1,499 1,348
10 - 14 2,656 1,380 1,276
15 - 19 2,649 1,333 1,316
20 - 24 2,369 1,205 1,164
25 - 29 2,042 1,034 1,008
30 - 34 1,784 908 876
35 - 39 1,698 893 805
40 - 44 1,596 829 767
45 - 49 1,518 825 693
50 - 54 1,301 668 633
55 - 59 1,178 612 566
60 - 64 890 432 458
65 - 69 642 283 359
70 - 74 386 152 234
75 - 79 320 136 184
80 years and over 253 82 171
0 - 4 years 2,727 1,369 1,358
0 - 14 years 8,230 4,248 3,982
15 - 64 years 17,025 8,739 8,286
18 years and over 17,025 8,586 8,439
60 years and over 2,491 1,085 1,406
65 years and over 1,601 653 948
Source: Philippine Statistics Authority, 2015 Census of Population
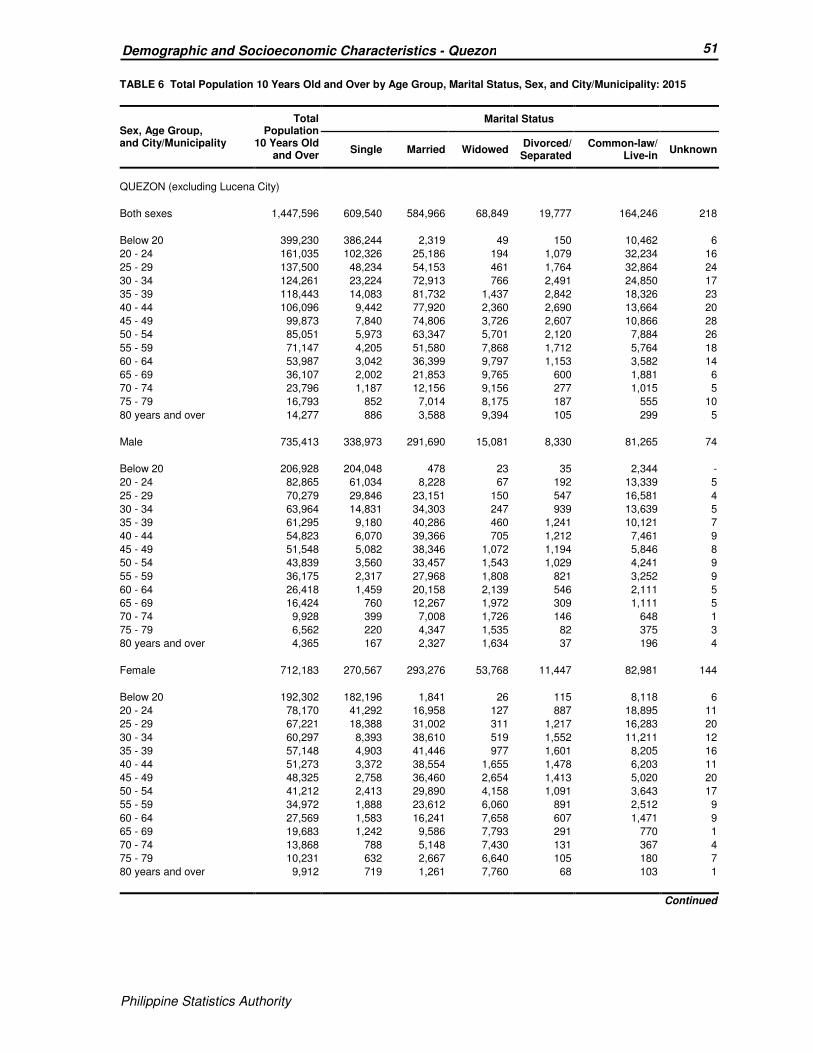
Philippine Statistics Authority
51 Demographic and Socioeconomic Characteristics - Quezon
Philippine Statistics Authority
TABLE 6 Total Population 10 Years Old and Over by Age Group, Marital Status, Sex, and City/Municipality: 2015
Sex, Age Group, and City/Municipality
Total Population
10 Years Old and Over
Marital Status
Single Married Widowed Divorced/ Separated
Common-law/ Live-in
Unknown
QUEZON (excluding Lucena City)
Both sexes 1,447,596 609,540 584,966 68,849 19,777 164,246 218
Below 20 399,230 386,244 2,319 49 150 10,462 6
20 - 24 161,035 102,326 25,186 194 1,079 32,234 16
25 - 29 137,500 48,234 54,153 461 1,764 32,864 24
30 - 34 124,261 23,224 72,913 766 2,491 24,850 17
35 - 39 118,443 14,083 81,732 1,437 2,842 18,326 23
40 - 44 106,096 9,442 77,920 2,360 2,690 13,664 20
45 - 49 99,873 7,840 74,806 3,726 2,607 10,866 28
50 - 54 85,051 5,973 63,347 5,701 2,120 7,884 26
55 - 59 71,147 4,205 51,580 7,868 1,712 5,764 18
60 - 64 53,987 3,042 36,399 9,797 1,153 3,582 14
65 - 69 36,107 2,002 21,853 9,765 600 1,881 6
70 - 74 23,796 1,187 12,156 9,156 277 1,015 5
75 - 79 16,793 852 7,014 8,175 187 555 10
80 years and over 14,277 886 3,588 9,394 105 299 5
Male 735,413 338,973 291,690 15,081 8,330 81,265 74
Below 20 206,928 204,048 478 23 35 2,344 -
20 - 24 82,865 61,034 8,228 67 192 13,339 5
25 - 29 70,279 29,846 23,151 150 547 16,581 4
30 - 34 63,964 14,831 34,303 247 939 13,639 5
35 - 39 61,295 9,180 40,286 460 1,241 10,121 7
40 - 44 54,823 6,070 39,366 705 1,212 7,461 9
45 - 49 51,548 5,082 38,346 1,072 1,194 5,846 8
50 - 54 43,839 3,560 33,457 1,543 1,029 4,241 9
55 - 59 36,175 2,317 27,968 1,808 821 3,252 9
60 - 64 26,418 1,459 20,158 2,139 546 2,111 5
65 - 69 16,424 760 12,267 1,972 309 1,111 5
70 - 74 9,928 399 7,008 1,726 146 648 1
75 - 79 6,562 220 4,347 1,535 82 375 3
80 years and over 4,365 167 2,327 1,634 37 196 4
Female 712,183 270,567 293,276 53,768 11,447 82,981 144
Below 20 192,302 182,196 1,841 26 115 8,118 6
20 - 24 78,170 41,292 16,958 127 887 18,895 11
25 - 29 67,221 18,388 31,002 311 1,217 16,283 20
30 - 34 60,297 8,393 38,610 519 1,552 11,211 12
35 - 39 57,148 4,903 41,446 977 1,601 8,205 16
40 - 44 51,273 3,372 38,554 1,655 1,478 6,203 11
45 - 49 48,325 2,758 36,460 2,654 1,413 5,020 20
50 - 54 41,212 2,413 29,890 4,158 1,091 3,643 17
55 - 59 34,972 1,888 23,612 6,060 891 2,512 9
60 - 64 27,569 1,583 16,241 7,658 607 1,471 9
65 - 69 19,683 1,242 9,586 7,793 291 770 1
70 - 74 13,868 788 5,148 7,430 131 367 4
75 - 79 10,231 632 2,667 6,640 105 180 7
80 years and over 9,912 719 1,261 7,760 68 103 1
Continued

Philippine Statistics Authority
52 Demographic and Socioeconomic Characteristics - Quezon
Philippine Statistics Authority
Table 6--Continued
Sex, Age Group, and City/Municipality
Total Population
10 Years Old and Over
Marital Status
Single Married Widowed Divorced/ Separated
Common-law/ Live-in
Unknown
AGDANGAN
Both sexes 10,176 4,042 4,148 630 9 1,347 -
Below 20 2,634 2,537 4 - - 93 -
20 - 24 1,023 638 129 3 1 252 -
25 - 29 878 283 345 1 - 249 -
30 - 34 817 157 468 5 1 186 -
35 - 39 793 94 547 12 1 139 -
40 - 44 750 85 527 14 2 122 -
45 - 49 785 73 578 30 2 102 -
50 - 54 658 58 488 44 - 68 -
55 - 59 592 46 408 70 1 67 -
60 - 64 431 22 276 93 1 39 -
65 - 69 328 20 205 93 - 10 -
70 - 74 204 17 85 90 - 12 -
75 - 79 152 8 56 80 - 8 -
80 years and over 131 4 32 95 - - -
Male 5,103 2,255 2,063 124 4 657 -
Below 20 1,356 1,331 - - - 25 -
20 - 24 530 393 39 - - 98 -
25 - 29 444 184 139 - - 121 -
30 - 34 426 97 223 - 1 105 -
35 - 39 395 63 254 5 - 73 -
40 - 44 369 51 254 5 2 57 -
45 - 49 424 54 304 4 - 62 -
50 - 54 335 29 257 9 - 40 -
55 - 59 293 27 215 14 - 37 -
60 - 64 214 11 158 23 1 21 -
65 - 69 144 9 117 15 - 3 -
70 - 74 80 5 45 21 - 9 -
75 - 79 56 - 37 13 - 6 -
80 years and over 37 1 21 15 - - -
Female 5,073 1,787 2,085 506 5 690 -
Below 20 1,278 1,206 4 - - 68 -
20 - 24 493 245 90 3 1 154 -
25 - 29 434 99 206 1 - 128 -
30 - 34 391 60 245 5 - 81 -
35 - 39 398 31 293 7 1 66 -
40 - 44 381 34 273 9 - 65 -
45 - 49 361 19 274 26 2 40 -
50 - 54 323 29 231 35 - 28 -
55 - 59 299 19 193 56 1 30 -
60 - 64 217 11 118 70 - 18 -
65 - 69 184 11 88 78 - 7 -
70 - 74 124 12 40 69 - 3 -
75 - 79 96 8 19 67 - 2 -
80 years and over 94 3 11 80 - - -
Continued
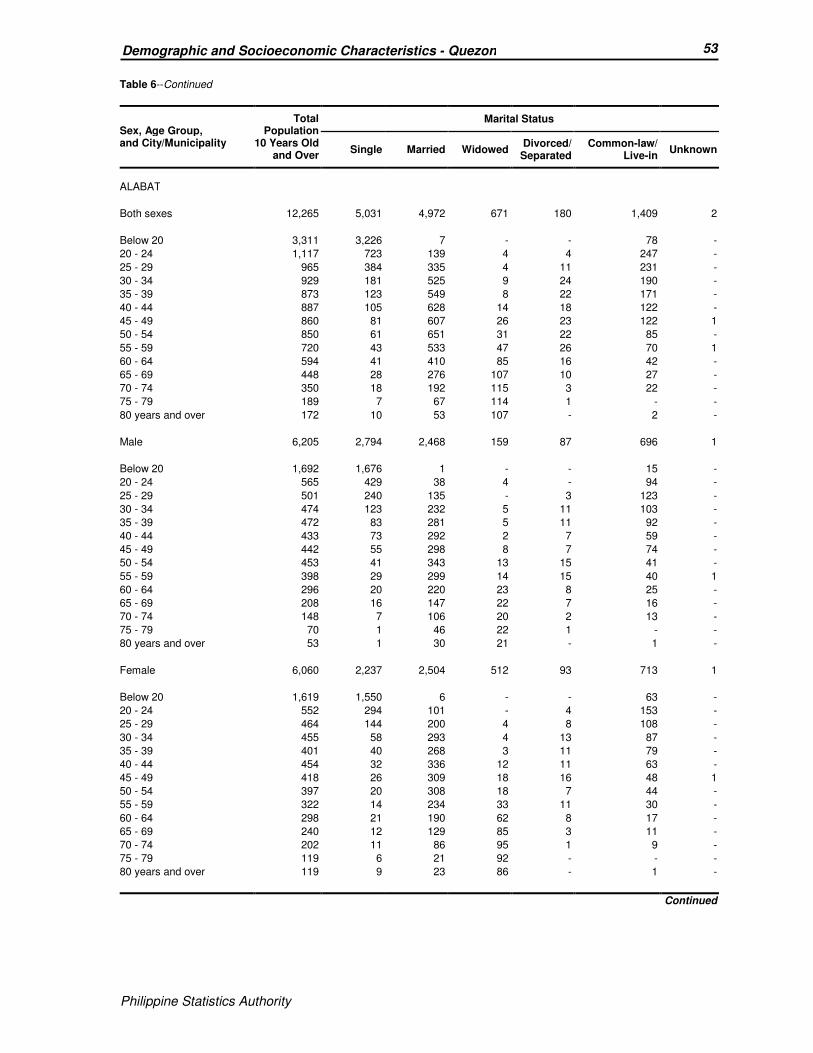
Philippine Statistics Authority
53 Demographic and Socioeconomic Characteristics - Quezon
Philippine Statistics Authority
Table 6--Continued
Sex, Age Group, and City/Municipality
Total Population
10 Years Old and Over
Marital Status
Single Married Widowed Divorced/ Separated
Common-law/ Live-in
Unknown
ALABAT
Both sexes 12,265 5,031 4,972 671 180 1,409 2
Below 20 3,311 3,226 7 - - 78 -
20 - 24 1,117 723 139 4 4 247 -
25 - 29 965 384 335 4 11 231 -
30 - 34 929 181 525 9 24 190 -
35 - 39 873 123 549 8 22 171 -
40 - 44 887 105 628 14 18 122 -
45 - 49 860 81 607 26 23 122 1
50 - 54 850 61 651 31 22 85 -
55 - 59 720 43 533 47 26 70 1
60 - 64 594 41 410 85 16 42 -
65 - 69 448 28 276 107 10 27 -
70 - 74 350 18 192 115 3 22 -
75 - 79 189 7 67 114 1 - -
80 years and over 172 10 53 107 - 2 -
Male 6,205 2,794 2,468 159 87 696 1
Below 20 1,692 1,676 1 - - 15 -
20 - 24 565 429 38 4 - 94 -
25 - 29 501 240 135 - 3 123 -
30 - 34 474 123 232 5 11 103 -
35 - 39 472 83 281 5 11 92 -
40 - 44 433 73 292 2 7 59 -
45 - 49 442 55 298 8 7 74 -
50 - 54 453 41 343 13 15 41 -
55 - 59 398 29 299 14 15 40 1
60 - 64 296 20 220 23 8 25 -
65 - 69 208 16 147 22 7 16 -
70 - 74 148 7 106 20 2 13 -
75 - 79 70 1 46 22 1 - -
80 years and over 53 1 30 21 - 1 -
Female 6,060 2,237 2,504 512 93 713 1
Below 20 1,619 1,550 6 - - 63 -
20 - 24 552 294 101 - 4 153 -
25 - 29 464 144 200 4 8 108 -
30 - 34 455 58 293 4 13 87 -
35 - 39 401 40 268 3 11 79 -
40 - 44 454 32 336 12 11 63 -
45 - 49 418 26 309 18 16 48 1
50 - 54 397 20 308 18 7 44 -
55 - 59 322 14 234 33 11 30 -
60 - 64 298 21 190 62 8 17 -
65 - 69 240 12 129 85 3 11 -
70 - 74 202 11 86 95 1 9 -
75 - 79 119 6 21 92 - - -
80 years and over 119 9 23 86 - 1 -
Continued

Philippine Statistics Authority
54 Demographic and Socioeconomic Characteristics - Quezon
Philippine Statistics Authority
Table 6--Continued
Sex, Age Group, and City/Municipality
Total Population
10 Years Old and Over
Marital Status
Single Married Widowed Divorced/ Separated
Common-law/ Live-in
Unknown
ATIMONAN
Both sexes 50,828 20,725 18,628 2,962 893 7,606 14
Below 20 12,402 11,874 56 1 4 467 -
20 - 24 5,311 3,421 486 8 33 1,363 -
25 - 29 4,845 1,900 1,400 17 62 1,463 3
30 - 34 4,361 965 2,082 29 92 1,193 -
35 - 39 3,917 630 2,329 45 115 797 1
40 - 44 3,700 493 2,315 71 123 696 2
45 - 49 3,727 419 2,534 118 134 519 3
50 - 54 3,415 340 2,337 196 116 426 -
55 - 59 2,871 232 1,929 315 85 309 1
60 - 64 2,208 172 1,344 421 63 207 1
65 - 69 1,534 115 893 408 35 82 1
70 - 74 1,067 64 499 439 14 50 1
75 - 79 789 56 288 408 11 25 1
80 years and over 681 44 136 486 6 9 -
Male 25,654 11,639 9,260 613 390 3,748 4
Below 20 6,452 6,332 16 - - 104 -
20 - 24 2,670 1,979 140 1 7 543 -
25 - 29 2,484 1,177 570 7 15 714 1
30 - 34 2,250 617 935 9 30 659 -
35 - 39 1,968 391 1,089 21 48 419 -
40 - 44 1,959 343 1,158 11 59 387 1
45 - 49 1,903 258 1,266 27 67 285 -
50 - 54 1,798 209 1,231 56 62 240 -
55 - 59 1,421 130 1,021 59 38 172 1
60 - 64 1,128 98 777 94 32 127 -
65 - 69 711 52 503 89 16 50 1
70 - 74 430 29 289 76 6 30 -
75 - 79 298 18 174 82 10 14 -
80 years and over 182 6 91 81 - 4 -
Female 25,174 9,086 9,368 2,349 503 3,858 10
Below 20 5,950 5,542 40 1 4 363 -
20 - 24 2,641 1,442 346 7 26 820 -
25 - 29 2,361 723 830 10 47 749 2
30 - 34 2,111 348 1,147 20 62 534 -
35 - 39 1,949 239 1,240 24 67 378 1
40 - 44 1,741 150 1,157 60 64 309 1
45 - 49 1,824 161 1,268 91 67 234 3
50 - 54 1,617 131 1,106 140 54 186 -
55 - 59 1,450 102 908 256 47 137 -
60 - 64 1,080 74 567 327 31 80 1
65 - 69 823 63 390 319 19 32 -
70 - 74 637 35 210 363 8 20 1
75 - 79 491 38 114 326 1 11 1
80 years and over 499 38 45 405 6 5 -
Continued
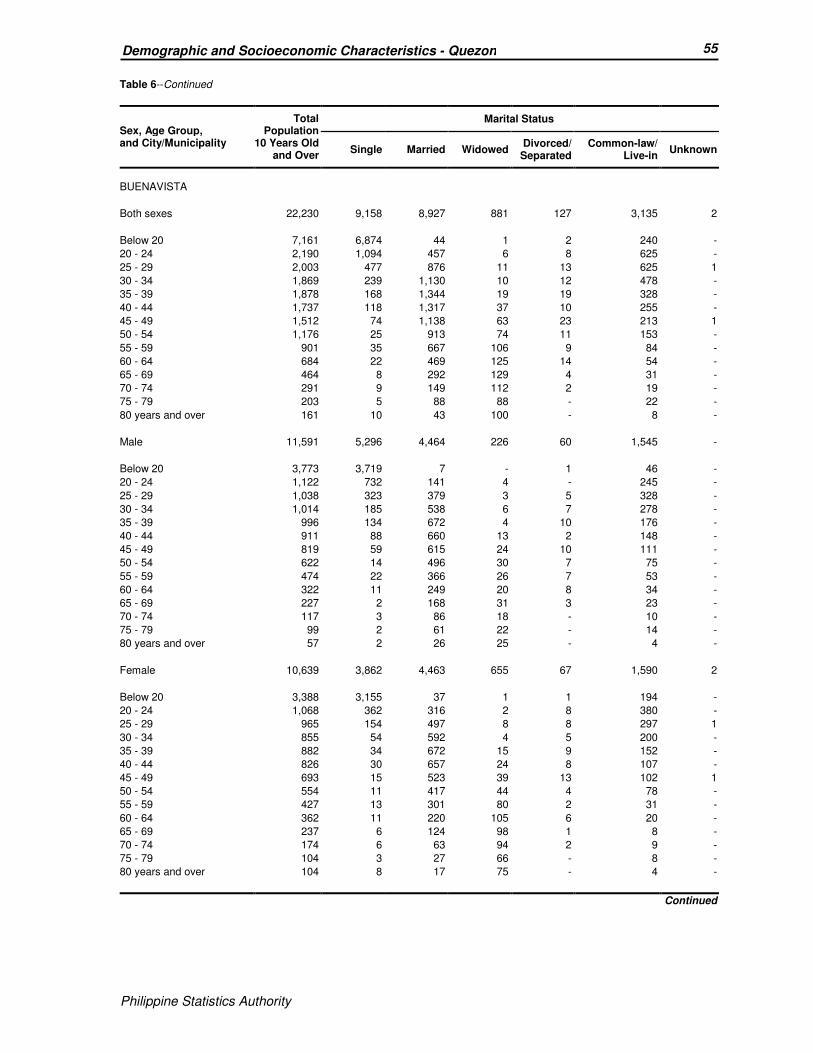
Philippine Statistics Authority
55 Demographic and Socioeconomic Characteristics - Quezon
Philippine Statistics Authority
Table 6--Continued
Sex, Age Group, and City/Municipality
Total Population
10 Years Old and Over
Marital Status
Single Married Widowed Divorced/ Separated
Common-law/ Live-in
Unknown
BUENAVISTA
Both sexes 22,230 9,158 8,927 881 127 3,135 2
Below 20 7,161 6,874 44 1 2 240 -
20 - 24 2,190 1,094 457 6 8 625 -
25 - 29 2,003 477 876 11 13 625 1
30 - 34 1,869 239 1,130 10 12 478 -
35 - 39 1,878 168 1,344 19 19 328 -
40 - 44 1,737 118 1,317 37 10 255 -
45 - 49 1,512 74 1,138 63 23 213 1
50 - 54 1,176 25 913 74 11 153 -
55 - 59 901 35 667 106 9 84 -
60 - 64 684 22 469 125 14 54 -
65 - 69 464 8 292 129 4 31 -
70 - 74 291 9 149 112 2 19 -
75 - 79 203 5 88 88 - 22 -
80 years and over 161 10 43 100 - 8 -
Male 11,591 5,296 4,464 226 60 1,545 -
Below 20 3,773 3,719 7 - 1 46 -
20 - 24 1,122 732 141 4 - 245 -
25 - 29 1,038 323 379 3 5 328 -
30 - 34 1,014 185 538 6 7 278 -
35 - 39 996 134 672 4 10 176 -
40 - 44 911 88 660 13 2 148 -
45 - 49 819 59 615 24 10 111 -
50 - 54 622 14 496 30 7 75 -
55 - 59 474 22 366 26 7 53 -
60 - 64 322 11 249 20 8 34 -
65 - 69 227 2 168 31 3 23 -
70 - 74 117 3 86 18 - 10 -
75 - 79 99 2 61 22 - 14 -
80 years and over 57 2 26 25 - 4 -
Female 10,639 3,862 4,463 655 67 1,590 2
Below 20 3,388 3,155 37 1 1 194 -
20 - 24 1,068 362 316 2 8 380 -
25 - 29 965 154 497 8 8 297 1
30 - 34 855 54 592 4 5 200 -
35 - 39 882 34 672 15 9 152 -
40 - 44 826 30 657 24 8 107 -
45 - 49 693 15 523 39 13 102 1
50 - 54 554 11 417 44 4 78 -
55 - 59 427 13 301 80 2 31 -
60 - 64 362 11 220 105 6 20 -
65 - 69 237 6 124 98 1 8 -
70 - 74 174 6 63 94 2 9 -
75 - 79 104 3 27 66 - 8 -
80 years and over 104 8 17 75 - 4 -
Continued

Philippine Statistics Authority
56 Demographic and Socioeconomic Characteristics - Quezon
Philippine Statistics Authority
Table 6--Continued
Sex, Age Group, and City/Municipality
Total Population
10 Years Old and Over
Marital Status
Single Married Widowed Divorced/ Separated
Common-law/ Live-in
Unknown
BURDEOS
Both sexes 20,022 8,670 7,395 760 163 3,033 1
Below 20 6,277 6,051 28 1 2 195 -
20 - 24 2,412 1,496 296 6 12 602 -
25 - 29 2,003 605 738 10 20 630 -
30 - 34 1,573 199 938 10 25 401 -
35 - 39 1,434 96 1,000 14 20 304 -
40 - 44 1,494 68 1,079 40 23 283 1
45 - 49 1,323 49 1,014 47 13 200 -
50 - 54 1,008 31 759 59 15 144 -
55 - 59 858 22 632 92 11 101 -
60 - 64 655 12 436 116 14 77 -
65 - 69 409 19 225 113 4 48 -
70 - 74 294 12 143 106 - 33 -
75 - 79 165 5 71 77 3 9 -
80 years and over 117 5 36 69 1 6 -
Male 10,502 4,992 3,699 209 87 1,514 1
Below 20 3,316 3,267 2 1 2 44 -
20 - 24 1,282 947 78 3 4 250 -
25 - 29 1,064 420 308 1 9 326 -
30 - 34 864 139 462 4 15 244 -
35 - 39 738 67 491 11 11 158 -
40 - 44 810 59 549 21 9 171 1
45 - 49 686 39 528 22 7 90 -
50 - 54 513 22 384 21 10 76 -
55 - 59 457 9 361 20 9 58 -
60 - 64 330 5 254 28 7 36 -
65 - 69 170 5 118 18 3 26 -
70 - 74 147 7 92 26 - 22 -
75 - 79 73 5 43 18 - 7 -
80 years and over 52 1 29 15 1 6 -
Female 9,520 3,678 3,696 551 76 1,519 -
Below 20 2,961 2,784 26 - - 151 -
20 - 24 1,130 549 218 3 8 352 -
25 - 29 939 185 430 9 11 304 -
30 - 34 709 60 476 6 10 157 -
35 - 39 696 29 509 3 9 146 -
40 - 44 684 9 530 19 14 112 -
45 - 49 637 10 486 25 6 110 -
50 - 54 495 9 375 38 5 68 -
55 - 59 401 13 271 72 2 43 -
60 - 64 325 7 182 88 7 41 -
65 - 69 239 14 107 95 1 22 -
70 - 74 147 5 51 80 - 11 -
75 - 79 92 - 28 59 3 2 -
80 years and over 65 4 7 54 - - -
Continued

Philippine Statistics Authority
57 Demographic and Socioeconomic Characteristics - Quezon
Philippine Statistics Authority
Table 6--Continued
Sex, Age Group, and City/Municipality
Total Population
10 Years Old and Over
Marital Status
Single Married Widowed Divorced/ Separated
Common-law/ Live-in
Unknown
CALAUAG
Both sexes 56,492 24,143 22,222 2,778 827 6,516 6
Below 20 16,162 15,633 84 3 9 433 -
20 - 24 6,162 3,918 872 4 54 1,314 -
25 - 29 5,282 1,753 2,066 18 75 1,370 -
30 - 34 4,464 788 2,553 28 97 996 2
35 - 39 4,386 542 2,983 62 115 684 -
40 - 44 4,206 450 3,066 80 115 495 -
45 - 49 4,010 346 2,975 167 111 410 1
50 - 54 3,377 255 2,509 220 90 302 1
55 - 59 2,800 163 2,003 335 79 219 1
60 - 64 1,983 111 1,318 373 48 133 -
65 - 69 1,490 80 897 412 18 83 -
70 - 74 953 39 491 374 9 40 -
75 - 79 686 35 271 353 5 21 1
80 years and over 531 30 134 349 2 16 -
Male 28,661 13,418 11,020 637 361 3,224 1
Below 20 8,379 8,274 20 2 1 82 -
20 - 24 3,131 2,316 267 1 8 539 -
25 - 29 2,657 1,096 828 6 21 706 -
30 - 34 2,321 498 1,208 12 44 559 -
35 - 39 2,294 360 1,479 27 53 375 -
40 - 44 2,182 294 1,524 31 51 282 -
45 - 49 2,038 226 1,487 51 58 216 -
50 - 54 1,789 165 1,348 70 47 158 1
55 - 59 1,430 90 1,087 80 38 135 -
60 - 64 962 48 738 84 21 71 -
65 - 69 663 27 496 83 9 48 -
70 - 74 389 7 286 62 6 28 -
75 - 79 270 10 172 69 4 15 -
80 years and over 156 7 80 59 - 10 -
Female 27,831 10,725 11,202 2,141 466 3,292 5
Below 20 7,783 7,359 64 1 8 351 -
20 - 24 3,031 1,602 605 3 46 775 -
25 - 29 2,625 657 1,238 12 54 664 -
30 - 34 2,143 290 1,345 16 53 437 2
35 - 39 2,092 182 1,504 35 62 309 -
40 - 44 2,024 156 1,542 49 64 213 -
45 - 49 1,972 120 1,488 116 53 194 1
50 - 54 1,588 90 1,161 150 43 144 -
55 - 59 1,370 73 916 255 41 84 1
60 - 64 1,021 63 580 289 27 62 -
65 - 69 827 53 401 329 9 35 -
70 - 74 564 32 205 312 3 12 -
75 - 79 416 25 99 284 1 6 1
80 years and over 375 23 54 290 2 6 -
Continued
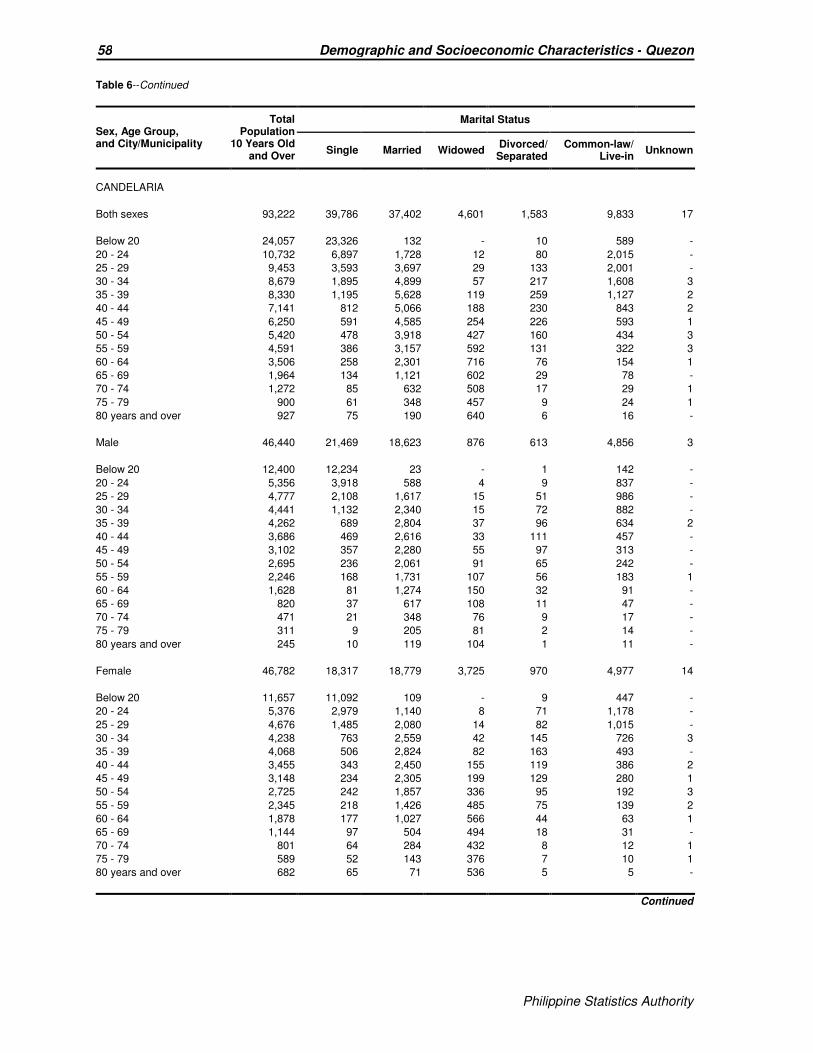
Philippine Statistics Authority
58 Demographic and Socioeconomic Characteristics - Quezon
Philippine Statistics Authority
Table 6--Continued
Sex, Age Group, and City/Municipality
Total Population
10 Years Old and Over
Marital Status
Single Married Widowed Divorced/ Separated
Common-law/ Live-in
Unknown
CANDELARIA
Both sexes 93,222 39,786 37,402 4,601 1,583 9,833 17
Below 20 24,057 23,326 132 - 10 589 -
20 - 24 10,732 6,897 1,728 12 80 2,015 -
25 - 29 9,453 3,593 3,697 29 133 2,001 -
30 - 34 8,679 1,895 4,899 57 217 1,608 3
35 - 39 8,330 1,195 5,628 119 259 1,127 2
40 - 44 7,141 812 5,066 188 230 843 2
45 - 49 6,250 591 4,585 254 226 593 1
50 - 54 5,420 478 3,918 427 160 434 3
55 - 59 4,591 386 3,157 592 131 322 3
60 - 64 3,506 258 2,301 716 76 154 1
65 - 69 1,964 134 1,121 602 29 78 -
70 - 74 1,272 85 632 508 17 29 1
75 - 79 900 61 348 457 9 24 1
80 years and over 927 75 190 640 6 16 -
Male 46,440 21,469 18,623 876 613 4,856 3
Below 20 12,400 12,234 23 - 1 142 -
20 - 24 5,356 3,918 588 4 9 837 -
25 - 29 4,777 2,108 1,617 15 51 986 -
30 - 34 4,441 1,132 2,340 15 72 882 -
35 - 39 4,262 689 2,804 37 96 634 2
40 - 44 3,686 469 2,616 33 111 457 -
45 - 49 3,102 357 2,280 55 97 313 -
50 - 54 2,695 236 2,061 91 65 242 -
55 - 59 2,246 168 1,731 107 56 183 1
60 - 64 1,628 81 1,274 150 32 91 -
65 - 69 820 37 617 108 11 47 -
70 - 74 471 21 348 76 9 17 -
75 - 79 311 9 205 81 2 14 -
80 years and over 245 10 119 104 1 11 -
Female 46,782 18,317 18,779 3,725 970 4,977 14
Below 20 11,657 11,092 109 - 9 447 -
20 - 24 5,376 2,979 1,140 8 71 1,178 -
25 - 29 4,676 1,485 2,080 14 82 1,015 -
30 - 34 4,238 763 2,559 42 145 726 3
35 - 39 4,068 506 2,824 82 163 493 -
40 - 44 3,455 343 2,450 155 119 386 2
45 - 49 3,148 234 2,305 199 129 280 1
50 - 54 2,725 242 1,857 336 95 192 3
55 - 59 2,345 218 1,426 485 75 139 2
60 - 64 1,878 177 1,027 566 44 63 1
65 - 69 1,144 97 504 494 18 31 -
70 - 74 801 64 284 432 8 12 1
75 - 79 589 52 143 376 7 10 1
80 years and over 682 65 71 536 5 5 -
Continued
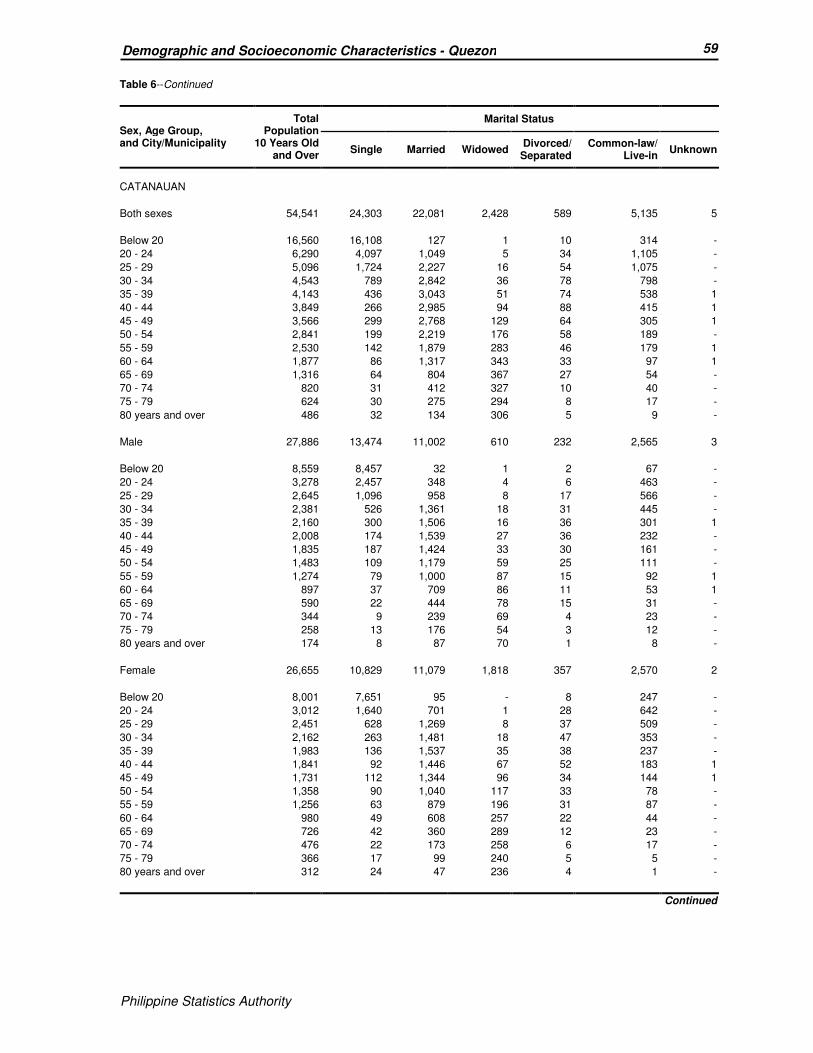
Philippine Statistics Authority
59 Demographic and Socioeconomic Characteristics - Quezon
Philippine Statistics Authority
Table 6--Continued
Sex, Age Group, and City/Municipality
Total Population
10 Years Old and Over
Marital Status
Single Married Widowed Divorced/ Separated
Common-law/ Live-in
Unknown
CATANAUAN
Both sexes 54,541 24,303 22,081 2,428 589 5,135 5
Below 20 16,560 16,108 127 1 10 314 -
20 - 24 6,290 4,097 1,049 5 34 1,105 -
25 - 29 5,096 1,724 2,227 16 54 1,075 -
30 - 34 4,543 789 2,842 36 78 798 -
35 - 39 4,143 436 3,043 51 74 538 1
40 - 44 3,849 266 2,985 94 88 415 1
45 - 49 3,566 299 2,768 129 64 305 1
50 - 54 2,841 199 2,219 176 58 189 -
55 - 59 2,530 142 1,879 283 46 179 1
60 - 64 1,877 86 1,317 343 33 97 1
65 - 69 1,316 64 804 367 27 54 -
70 - 74 820 31 412 327 10 40 -
75 - 79 624 30 275 294 8 17 -
80 years and over 486 32 134 306 5 9 -
Male 27,886 13,474 11,002 610 232 2,565 3
Below 20 8,559 8,457 32 1 2 67 -
20 - 24 3,278 2,457 348 4 6 463 -
25 - 29 2,645 1,096 958 8 17 566 -
30 - 34 2,381 526 1,361 18 31 445 -
35 - 39 2,160 300 1,506 16 36 301 1
40 - 44 2,008 174 1,539 27 36 232 -
45 - 49 1,835 187 1,424 33 30 161 -
50 - 54 1,483 109 1,179 59 25 111 -
55 - 59 1,274 79 1,000 87 15 92 1
60 - 64 897 37 709 86 11 53 1
65 - 69 590 22 444 78 15 31 -
70 - 74 344 9 239 69 4 23 -
75 - 79 258 13 176 54 3 12 -
80 years and over 174 8 87 70 1 8 -
Female 26,655 10,829 11,079 1,818 357 2,570 2
Below 20 8,001 7,651 95 - 8 247 -
20 - 24 3,012 1,640 701 1 28 642 -
25 - 29 2,451 628 1,269 8 37 509 -
30 - 34 2,162 263 1,481 18 47 353 -
35 - 39 1,983 136 1,537 35 38 237 -
40 - 44 1,841 92 1,446 67 52 183 1
45 - 49 1,731 112 1,344 96 34 144 1
50 - 54 1,358 90 1,040 117 33 78 -
55 - 59 1,256 63 879 196 31 87 -
60 - 64 980 49 608 257 22 44 -
65 - 69 726 42 360 289 12 23 -
70 - 74 476 22 173 258 6 17 -
75 - 79 366 17 99 240 5 5 -
80 years and over 312 24 47 236 4 1 -
Continued

Philippine Statistics Authority
60 Demographic and Socioeconomic Characteristics - Quezon
Philippine Statistics Authority
Table 6--Continued
Sex, Age Group, and City/Municipality
Total Population
10 Years Old and Over
Marital Status
Single Married Widowed Divorced/ Separated
Common-law/ Live-in
Unknown
DOLORES
Both sexes 23,061 9,469 10,077 1,241 374 1,900 -
Below 20 5,613 5,453 47 3 1 109 -
20 - 24 2,640 1,808 441 3 14 374 -
25 - 29 2,254 849 941 8 42 414 -
30 - 34 2,080 390 1,344 15 44 287 -
35 - 39 2,005 250 1,443 28 43 241 -
40 - 44 1,704 155 1,305 39 62 143 -
45 - 49 1,689 142 1,285 72 49 141 -
50 - 54 1,464 112 1,113 114 37 88 -
55 - 59 1,187 80 870 141 44 52 -
60 - 64 878 85 587 165 17 24 -
65 - 69 594 58 349 161 8 18 -
70 - 74 366 33 155 165 9 4 -
75 - 79 303 22 134 141 2 4 -
80 years and over 284 32 63 186 2 1 -
Male 11,522 5,163 5,009 231 167 952 -
Below 20 2,921 2,880 12 1 - 28 -
20 - 24 1,347 1,031 151 1 6 158 -
25 - 29 1,143 505 410 1 14 213 -
30 - 34 1,018 231 604 3 25 155 -
35 - 39 1,037 162 727 4 16 128 -
40 - 44 872 99 656 11 27 79 -
45 - 49 858 93 651 14 18 82 -
50 - 54 733 58 579 27 22 47 -
55 - 59 605 35 493 27 23 27 -
60 - 64 398 30 323 21 6 18 -
65 - 69 264 20 201 27 4 12 -
70 - 74 127 9 82 29 5 2 -
75 - 79 110 3 79 26 - 2 -
80 years and over 89 7 41 39 1 1 -
Female 11,539 4,306 5,068 1,010 207 948 -
Below 20 2,692 2,573 35 2 1 81 -
20 - 24 1,293 777 290 2 8 216 -
25 - 29 1,111 344 531 7 28 201 -
30 - 34 1,062 159 740 12 19 132 -
35 - 39 968 88 716 24 27 113 -
40 - 44 832 56 649 28 35 64 -
45 - 49 831 49 634 58 31 59 -
50 - 54 731 54 534 87 15 41 -
55 - 59 582 45 377 114 21 25 -
60 - 64 480 55 264 144 11 6 -
65 - 69 330 38 148 134 4 6 -
70 - 74 239 24 73 136 4 2 -
75 - 79 193 19 55 115 2 2 -
80 years and over 195 25 22 147 1 - -
Continued
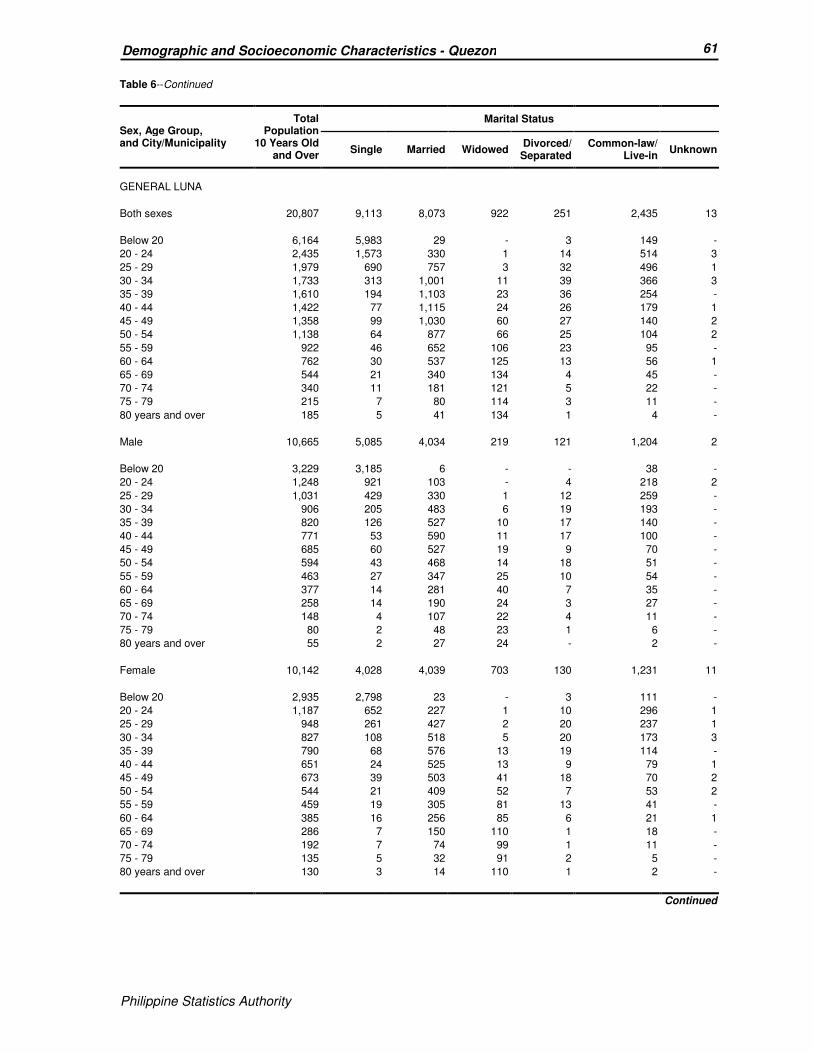
Philippine Statistics Authority
61 Demographic and Socioeconomic Characteristics - Quezon
Philippine Statistics Authority
Table 6--Continued
Sex, Age Group, and City/Municipality
Total Population
10 Years Old and Over
Marital Status
Single Married Widowed Divorced/ Separated
Common-law/ Live-in
Unknown
GENERAL LUNA
Both sexes 20,807 9,113 8,073 922 251 2,435 13
Below 20 6,164 5,983 29 - 3 149 -
20 - 24 2,435 1,573 330 1 14 514 3
25 - 29 1,979 690 757 3 32 496 1
30 - 34 1,733 313 1,001 11 39 366 3
35 - 39 1,610 194 1,103 23 36 254 -
40 - 44 1,422 77 1,115 24 26 179 1
45 - 49 1,358 99 1,030 60 27 140 2
50 - 54 1,138 64 877 66 25 104 2
55 - 59 922 46 652 106 23 95 -
60 - 64 762 30 537 125 13 56 1
65 - 69 544 21 340 134 4 45 -
70 - 74 340 11 181 121 5 22 -
75 - 79 215 7 80 114 3 11 -
80 years and over 185 5 41 134 1 4 -
Male 10,665 5,085 4,034 219 121 1,204 2
Below 20 3,229 3,185 6 - - 38 -
20 - 24 1,248 921 103 - 4 218 2
25 - 29 1,031 429 330 1 12 259 -
30 - 34 906 205 483 6 19 193 -
35 - 39 820 126 527 10 17 140 -
40 - 44 771 53 590 11 17 100 -
45 - 49 685 60 527 19 9 70 -
50 - 54 594 43 468 14 18 51 -
55 - 59 463 27 347 25 10 54 -
60 - 64 377 14 281 40 7 35 -
65 - 69 258 14 190 24 3 27 -
70 - 74 148 4 107 22 4 11 -
75 - 79 80 2 48 23 1 6 -
80 years and over 55 2 27 24 - 2 -
Female 10,142 4,028 4,039 703 130 1,231 11
Below 20 2,935 2,798 23 - 3 111 -
20 - 24 1,187 652 227 1 10 296 1
25 - 29 948 261 427 2 20 237 1
30 - 34 827 108 518 5 20 173 3
35 - 39 790 68 576 13 19 114 -
40 - 44 651 24 525 13 9 79 1
45 - 49 673 39 503 41 18 70 2
50 - 54 544 21 409 52 7 53 2
55 - 59 459 19 305 81 13 41 -
60 - 64 385 16 256 85 6 21 1
65 - 69 286 7 150 110 1 18 -
70 - 74 192 7 74 99 1 11 -
75 - 79 135 5 32 91 2 5 -
80 years and over 130 3 14 110 1 2 -
Continued

Philippine Statistics Authority
62 Demographic and Socioeconomic Characteristics - Quezon
Philippine Statistics Authority
Table 6--Continued
Sex, Age Group, and City/Municipality
Total Population
10 Years Old and Over
Marital Status
Single Married Widowed Divorced/ Separated
Common-law/ Live-in
Unknown
GENERAL NAKAR
Both sexes 22,453 9,530 9,380 802 261 2,479 1
Below 20 6,681 6,383 88 - 1 209 -
20 - 24 2,936 1,698 648 7 20 563 -
25 - 29 2,336 715 1,115 10 30 466 -
30 - 34 1,905 286 1,262 16 32 309 -
35 - 39 1,750 144 1,299 21 30 256 -
40 - 44 1,509 94 1,176 25 28 186 -
45 - 49 1,400 76 1,089 63 34 138 -
50 - 54 1,195 50 889 79 44 133 -
55 - 59 1,037 36 785 101 19 96 -
60 - 64 739 23 514 120 11 70 1
65 - 69 398 9 246 106 4 33 -
70 - 74 244 6 144 80 4 10 -
75 - 79 160 2 78 71 4 5 -
80 years and over 163 8 47 103 - 5 -
Male 11,803 5,498 4,723 219 131 1,232 -
Below 20 3,461 3,404 14 - - 43 -
20 - 24 1,528 1,058 220 3 6 241 -
25 - 29 1,233 504 471 4 9 245 -
30 - 34 1,030 201 634 3 9 183 -
35 - 39 952 107 670 9 15 151 -
40 - 44 815 75 607 10 20 103 -
45 - 49 744 56 576 24 16 72 -
50 - 54 647 43 478 32 29 65 -
55 - 59 543 25 431 24 13 50 -
60 - 64 410 14 308 32 6 50 -
65 - 69 191 4 145 24 3 15 -
70 - 74 114 3 88 15 2 6 -
75 - 79 79 1 49 22 3 4 -
80 years and over 56 3 32 17 - 4 -
Female 10,650 4,032 4,657 583 130 1,247 1
Below 20 3,220 2,979 74 - 1 166 -
20 - 24 1,408 640 428 4 14 322 -
25 - 29 1,103 211 644 6 21 221 -
30 - 34 875 85 628 13 23 126 -
35 - 39 798 37 629 12 15 105 -
40 - 44 694 19 569 15 8 83 -
45 - 49 656 20 513 39 18 66 -
50 - 54 548 7 411 47 15 68 -
55 - 59 494 11 354 77 6 46 -
60 - 64 329 9 206 88 5 20 1
65 - 69 207 5 101 82 1 18 -
70 - 74 130 3 56 65 2 4 -
75 - 79 81 1 29 49 1 1 -
80 years and over 107 5 15 86 - 1 -
Continued
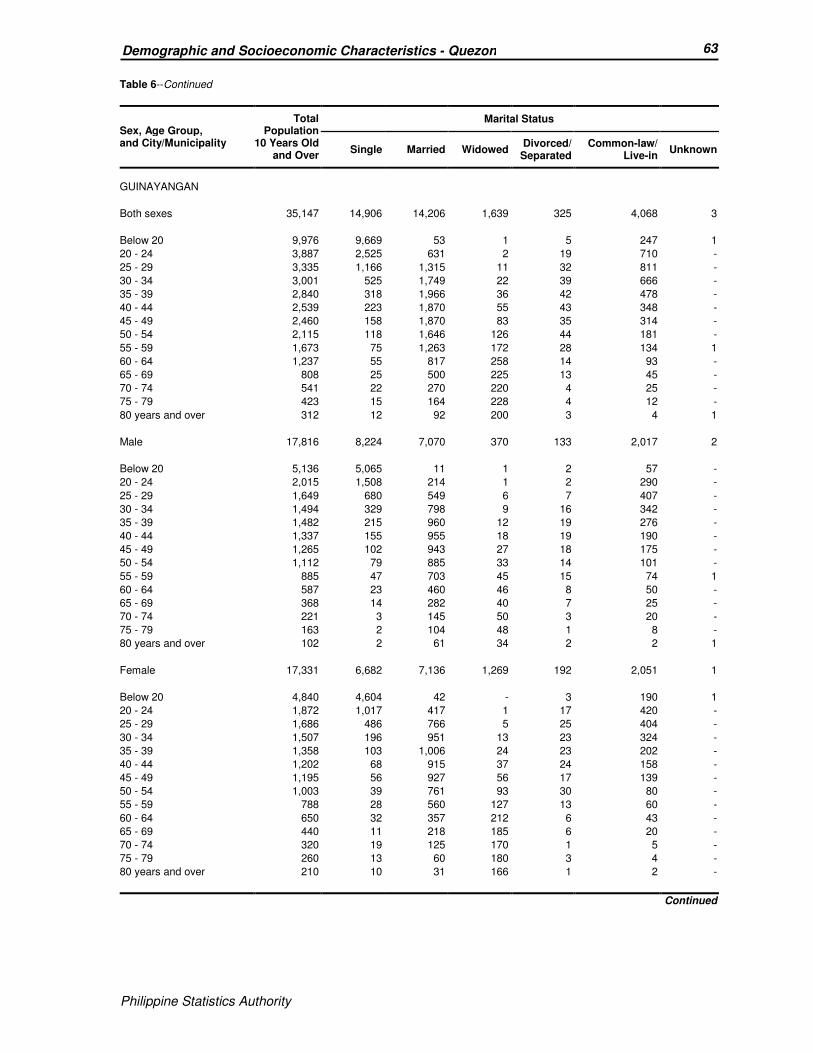
Philippine Statistics Authority
63 Demographic and Socioeconomic Characteristics - Quezon
Philippine Statistics Authority
Table 6--Continued
Sex, Age Group, and City/Municipality
Total Population
10 Years Old and Over
Marital Status
Single Married Widowed Divorced/ Separated
Common-law/ Live-in
Unknown
GUINAYANGAN
Both sexes 35,147 14,906 14,206 1,639 325 4,068 3
Below 20 9,976 9,669 53 1 5 247 1
20 - 24 3,887 2,525 631 2 19 710 -
25 - 29 3,335 1,166 1,315 11 32 811 -
30 - 34 3,001 525 1,749 22 39 666 -
35 - 39 2,840 318 1,966 36 42 478 -
40 - 44 2,539 223 1,870 55 43 348 -
45 - 49 2,460 158 1,870 83 35 314 -
50 - 54 2,115 118 1,646 126 44 181 -
55 - 59 1,673 75 1,263 172 28 134 1
60 - 64 1,237 55 817 258 14 93 -
65 - 69 808 25 500 225 13 45 -
70 - 74 541 22 270 220 4 25 -
75 - 79 423 15 164 228 4 12 -
80 years and over 312 12 92 200 3 4 1
Male 17,816 8,224 7,070 370 133 2,017 2
Below 20 5,136 5,065 11 1 2 57 -
20 - 24 2,015 1,508 214 1 2 290 -
25 - 29 1,649 680 549 6 7 407 -
30 - 34 1,494 329 798 9 16 342 -
35 - 39 1,482 215 960 12 19 276 -
40 - 44 1,337 155 955 18 19 190 -
45 - 49 1,265 102 943 27 18 175 -
50 - 54 1,112 79 885 33 14 101 -
55 - 59 885 47 703 45 15 74 1
60 - 64 587 23 460 46 8 50 -
65 - 69 368 14 282 40 7 25 -
70 - 74 221 3 145 50 3 20 -
75 - 79 163 2 104 48 1 8 -
80 years and over 102 2 61 34 2 2 1
Female 17,331 6,682 7,136 1,269 192 2,051 1
Below 20 4,840 4,604 42 - 3 190 1
20 - 24 1,872 1,017 417 1 17 420 -
25 - 29 1,686 486 766 5 25 404 -
30 - 34 1,507 196 951 13 23 324 -
35 - 39 1,358 103 1,006 24 23 202 -
40 - 44 1,202 68 915 37 24 158 -
45 - 49 1,195 56 927 56 17 139 -
50 - 54 1,003 39 761 93 30 80 -
55 - 59 788 28 560 127 13 60 -
60 - 64 650 32 357 212 6 43 -
65 - 69 440 11 218 185 6 20 -
70 - 74 320 19 125 170 1 5 -
75 - 79 260 13 60 180 3 4 -
80 years and over 210 10 31 166 1 2 -
Continued
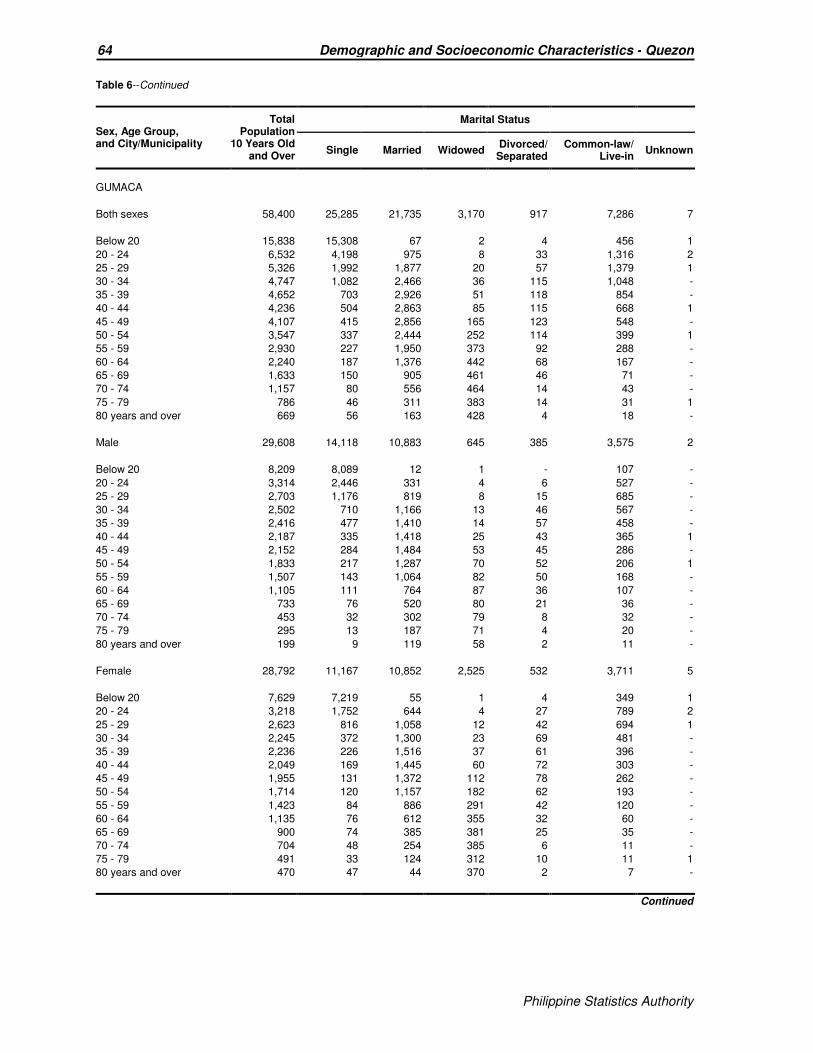
Philippine Statistics Authority
64 Demographic and Socioeconomic Characteristics - Quezon
Philippine Statistics Authority
Table 6--Continued
Sex, Age Group, and City/Municipality
Total Population
10 Years Old and Over
Marital Status
Single Married Widowed Divorced/ Separated
Common-law/ Live-in
Unknown
GUMACA
Both sexes 58,400 25,285 21,735 3,170 917 7,286 7
Below 20 15,838 15,308 67 2 4 456 1
20 - 24 6,532 4,198 975 8 33 1,316 2
25 - 29 5,326 1,992 1,877 20 57 1,379 1
30 - 34 4,747 1,082 2,466 36 115 1,048 -
35 - 39 4,652 703 2,926 51 118 854 -
40 - 44 4,236 504 2,863 85 115 668 1
45 - 49 4,107 415 2,856 165 123 548 -
50 - 54 3,547 337 2,444 252 114 399 1
55 - 59 2,930 227 1,950 373 92 288 -
60 - 64 2,240 187 1,376 442 68 167 -
65 - 69 1,633 150 905 461 46 71 -
70 - 74 1,157 80 556 464 14 43 -
75 - 79 786 46 311 383 14 31 1
80 years and over 669 56 163 428 4 18 -
Male 29,608 14,118 10,883 645 385 3,575 2
Below 20 8,209 8,089 12 1 - 107 -
20 - 24 3,314 2,446 331 4 6 527 -
25 - 29 2,703 1,176 819 8 15 685 -
30 - 34 2,502 710 1,166 13 46 567 -
35 - 39 2,416 477 1,410 14 57 458 -
40 - 44 2,187 335 1,418 25 43 365 1
45 - 49 2,152 284 1,484 53 45 286 -
50 - 54 1,833 217 1,287 70 52 206 1
55 - 59 1,507 143 1,064 82 50 168 -
60 - 64 1,105 111 764 87 36 107 -
65 - 69 733 76 520 80 21 36 -
70 - 74 453 32 302 79 8 32 -
75 - 79 295 13 187 71 4 20 -
80 years and over 199 9 119 58 2 11 -
Female 28,792 11,167 10,852 2,525 532 3,711 5
Below 20 7,629 7,219 55 1 4 349 1
20 - 24 3,218 1,752 644 4 27 789 2
25 - 29 2,623 816 1,058 12 42 694 1
30 - 34 2,245 372 1,300 23 69 481 -
35 - 39 2,236 226 1,516 37 61 396 -
40 - 44 2,049 169 1,445 60 72 303 -
45 - 49 1,955 131 1,372 112 78 262 -
50 - 54 1,714 120 1,157 182 62 193 -
55 - 59 1,423 84 886 291 42 120 -
60 - 64 1,135 76 612 355 32 60 -
65 - 69 900 74 385 381 25 35 -
70 - 74 704 48 254 385 6 11 -
75 - 79 491 33 124 312 10 11 1
80 years and over 470 47 44 370 2 7 -
Continued
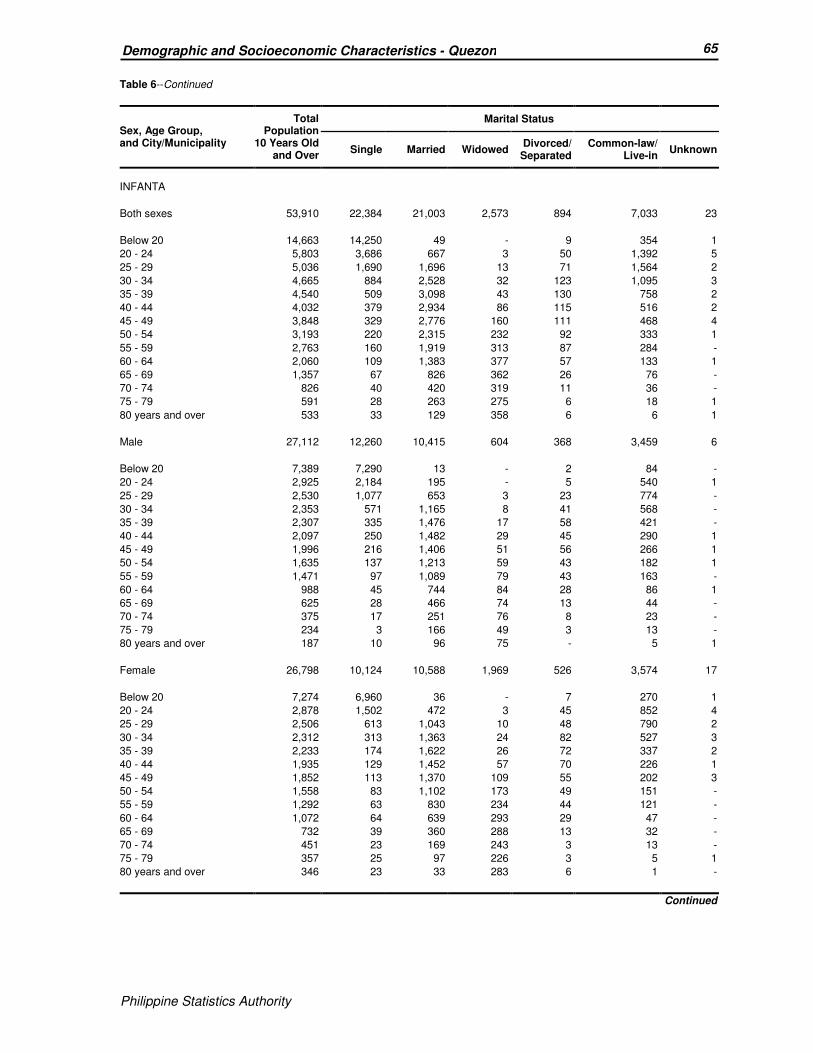
Philippine Statistics Authority
65 Demographic and Socioeconomic Characteristics - Quezon
Philippine Statistics Authority
Table 6--Continued
Sex, Age Group, and City/Municipality
Total Population
10 Years Old and Over
Marital Status
Single Married Widowed Divorced/ Separated
Common-law/ Live-in
Unknown
INFANTA
Both sexes 53,910 22,384 21,003 2,573 894 7,033 23
Below 20 14,663 14,250 49 - 9 354 1
20 - 24 5,803 3,686 667 3 50 1,392 5
25 - 29 5,036 1,690 1,696 13 71 1,564 2
30 - 34 4,665 884 2,528 32 123 1,095 3
35 - 39 4,540 509 3,098 43 130 758 2
40 - 44 4,032 379 2,934 86 115 516 2
45 - 49 3,848 329 2,776 160 111 468 4
50 - 54 3,193 220 2,315 232 92 333 1
55 - 59 2,763 160 1,919 313 87 284 -
60 - 64 2,060 109 1,383 377 57 133 1
65 - 69 1,357 67 826 362 26 76 -
70 - 74 826 40 420 319 11 36 -
75 - 79 591 28 263 275 6 18 1
80 years and over 533 33 129 358 6 6 1
Male 27,112 12,260 10,415 604 368 3,459 6
Below 20 7,389 7,290 13 - 2 84 -
20 - 24 2,925 2,184 195 - 5 540 1
25 - 29 2,530 1,077 653 3 23 774 -
30 - 34 2,353 571 1,165 8 41 568 -
35 - 39 2,307 335 1,476 17 58 421 -
40 - 44 2,097 250 1,482 29 45 290 1
45 - 49 1,996 216 1,406 51 56 266 1
50 - 54 1,635 137 1,213 59 43 182 1
55 - 59 1,471 97 1,089 79 43 163 -
60 - 64 988 45 744 84 28 86 1
65 - 69 625 28 466 74 13 44 -
70 - 74 375 17 251 76 8 23 -
75 - 79 234 3 166 49 3 13 -
80 years and over 187 10 96 75 - 5 1
Female 26,798 10,124 10,588 1,969 526 3,574 17
Below 20 7,274 6,960 36 - 7 270 1
20 - 24 2,878 1,502 472 3 45 852 4
25 - 29 2,506 613 1,043 10 48 790 2
30 - 34 2,312 313 1,363 24 82 527 3
35 - 39 2,233 174 1,622 26 72 337 2
40 - 44 1,935 129 1,452 57 70 226 1
45 - 49 1,852 113 1,370 109 55 202 3
50 - 54 1,558 83 1,102 173 49 151 -
55 - 59 1,292 63 830 234 44 121 -
60 - 64 1,072 64 639 293 29 47 -
65 - 69 732 39 360 288 13 32 -
70 - 74 451 23 169 243 3 13 -
75 - 79 357 25 97 226 3 5 1
80 years and over 346 23 33 283 6 1 -
Continued

Philippine Statistics Authority
66 Demographic and Socioeconomic Characteristics - Quezon
Philippine Statistics Authority
Table 6--Continued
Sex, Age Group, and City/Municipality
Total Population
10 Years Old and Over
Marital Status
Single Married Widowed Divorced/ Separated
Common-law/ Live-in
Unknown
JOMALIG
Both sexes 5,469 2,448 2,009 164 60 786 2
Below 20 1,929 1,836 9 - 3 81 -
20 - 24 641 341 113 1 6 180 -
25 - 29 492 117 215 1 7 152 -
30 - 34 465 58 300 3 4 100 -
35 - 39 413 32 293 5 2 80 1
40 - 44 391 9 299 6 10 66 1
45 - 49 306 21 228 9 6 42 -
50 - 54 258 9 194 16 11 28 -
55 - 59 195 8 143 19 2 23 -
60 - 64 156 4 105 28 3 16 -
65 - 69 88 4 55 17 3 9 -
70 - 74 65 3 30 27 - 5 -
75 - 79 38 3 19 13 2 1 -
80 years and over 32 3 6 19 1 3 -
Male 2,842 1,377 1,009 37 29 390 -
Below 20 1,003 985 1 - - 17 -
20 - 24 334 218 35 1 1 79 -
25 - 29 256 78 90 1 2 85 -
30 - 34 231 30 141 3 2 55 -
35 - 39 227 22 155 - 2 48 -
40 - 44 212 6 158 2 4 42 -
45 - 49 173 18 121 5 5 24 -
50 - 54 137 8 108 3 7 11 -
55 - 59 106 6 83 4 2 11 -
60 - 64 78 - 59 11 1 7 -
65 - 69 44 3 27 6 2 6 -
70 - 74 21 3 16 - - 2 -
75 - 79 13 - 12 - 1 - -
80 years and over 7 - 3 1 - 3 -
Female 2,627 1,071 1,000 127 31 396 2
Below 20 926 851 8 - 3 64 -
20 - 24 307 123 78 - 5 101 -
25 - 29 236 39 125 - 5 67 -
30 - 34 234 28 159 - 2 45 -
35 - 39 186 10 138 5 - 32 1
40 - 44 179 3 141 4 6 24 1
45 - 49 133 3 107 4 1 18 -
50 - 54 121 1 86 13 4 17 -
55 - 59 89 2 60 15 - 12 -
60 - 64 78 4 46 17 2 9 -
65 - 69 44 1 28 11 1 3 -
70 - 74 44 - 14 27 - 3 -
75 - 79 25 3 7 13 1 1 -
80 years and over 25 3 3 18 1 - -
Continued
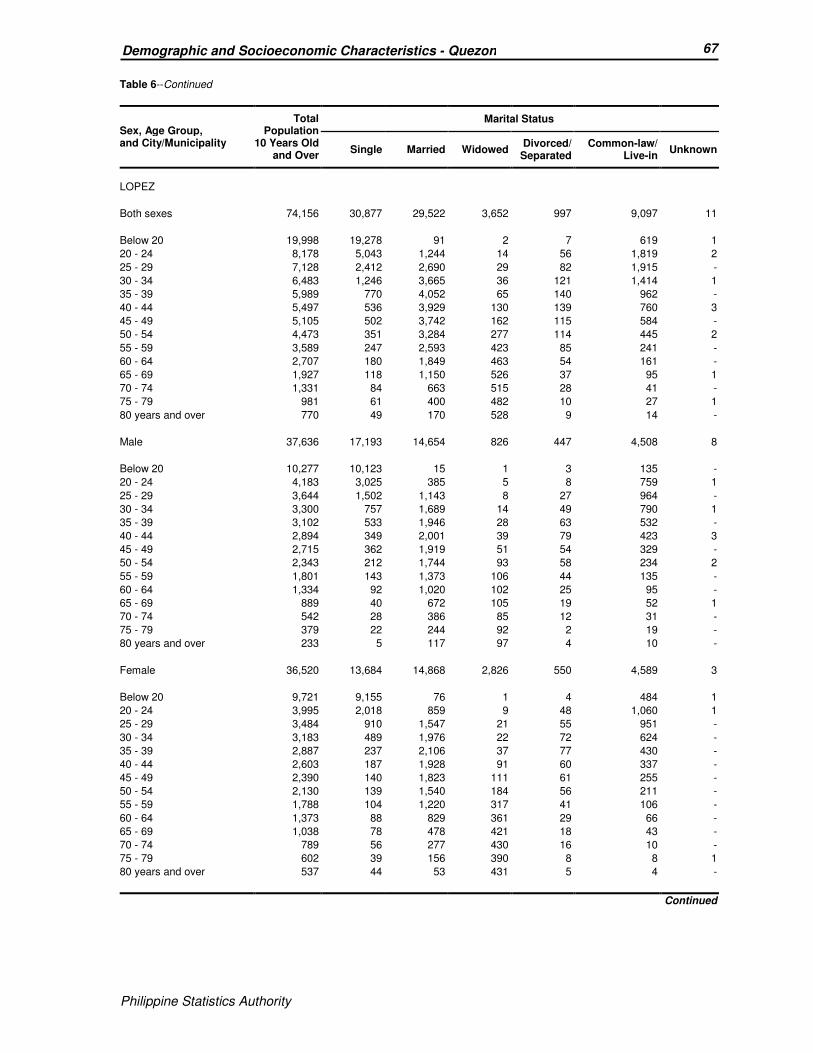
Philippine Statistics Authority
67 Demographic and Socioeconomic Characteristics - Quezon
Philippine Statistics Authority
Table 6--Continued
Sex, Age Group, and City/Municipality
Total Population
10 Years Old and Over
Marital Status
Single Married Widowed Divorced/ Separated
Common-law/ Live-in
Unknown
LOPEZ
Both sexes 74,156 30,877 29,522 3,652 997 9,097 11
Below 20 19,998 19,278 91 2 7 619 1
20 - 24 8,178 5,043 1,244 14 56 1,819 2
25 - 29 7,128 2,412 2,690 29 82 1,915 -
30 - 34 6,483 1,246 3,665 36 121 1,414 1
35 - 39 5,989 770 4,052 65 140 962 -
40 - 44 5,497 536 3,929 130 139 760 3
45 - 49 5,105 502 3,742 162 115 584 -
50 - 54 4,473 351 3,284 277 114 445 2
55 - 59 3,589 247 2,593 423 85 241 -
60 - 64 2,707 180 1,849 463 54 161 -
65 - 69 1,927 118 1,150 526 37 95 1
70 - 74 1,331 84 663 515 28 41 -
75 - 79 981 61 400 482 10 27 1
80 years and over 770 49 170 528 9 14 -
Male 37,636 17,193 14,654 826 447 4,508 8
Below 20 10,277 10,123 15 1 3 135 -
20 - 24 4,183 3,025 385 5 8 759 1
25 - 29 3,644 1,502 1,143 8 27 964 -
30 - 34 3,300 757 1,689 14 49 790 1
35 - 39 3,102 533 1,946 28 63 532 -
40 - 44 2,894 349 2,001 39 79 423 3
45 - 49 2,715 362 1,919 51 54 329 -
50 - 54 2,343 212 1,744 93 58 234 2
55 - 59 1,801 143 1,373 106 44 135 -
60 - 64 1,334 92 1,020 102 25 95 -
65 - 69 889 40 672 105 19 52 1
70 - 74 542 28 386 85 12 31 -
75 - 79 379 22 244 92 2 19 -
80 years and over 233 5 117 97 4 10 -
Female 36,520 13,684 14,868 2,826 550 4,589 3
Below 20 9,721 9,155 76 1 4 484 1
20 - 24 3,995 2,018 859 9 48 1,060 1
25 - 29 3,484 910 1,547 21 55 951 -
30 - 34 3,183 489 1,976 22 72 624 -
35 - 39 2,887 237 2,106 37 77 430 -
40 - 44 2,603 187 1,928 91 60 337 -
45 - 49 2,390 140 1,823 111 61 255 -
50 - 54 2,130 139 1,540 184 56 211 -
55 - 59 1,788 104 1,220 317 41 106 -
60 - 64 1,373 88 829 361 29 66 -
65 - 69 1,038 78 478 421 18 43 -
70 - 74 789 56 277 430 16 10 -
75 - 79 602 39 156 390 8 8 1
80 years and over 537 44 53 431 5 4 -
Continued
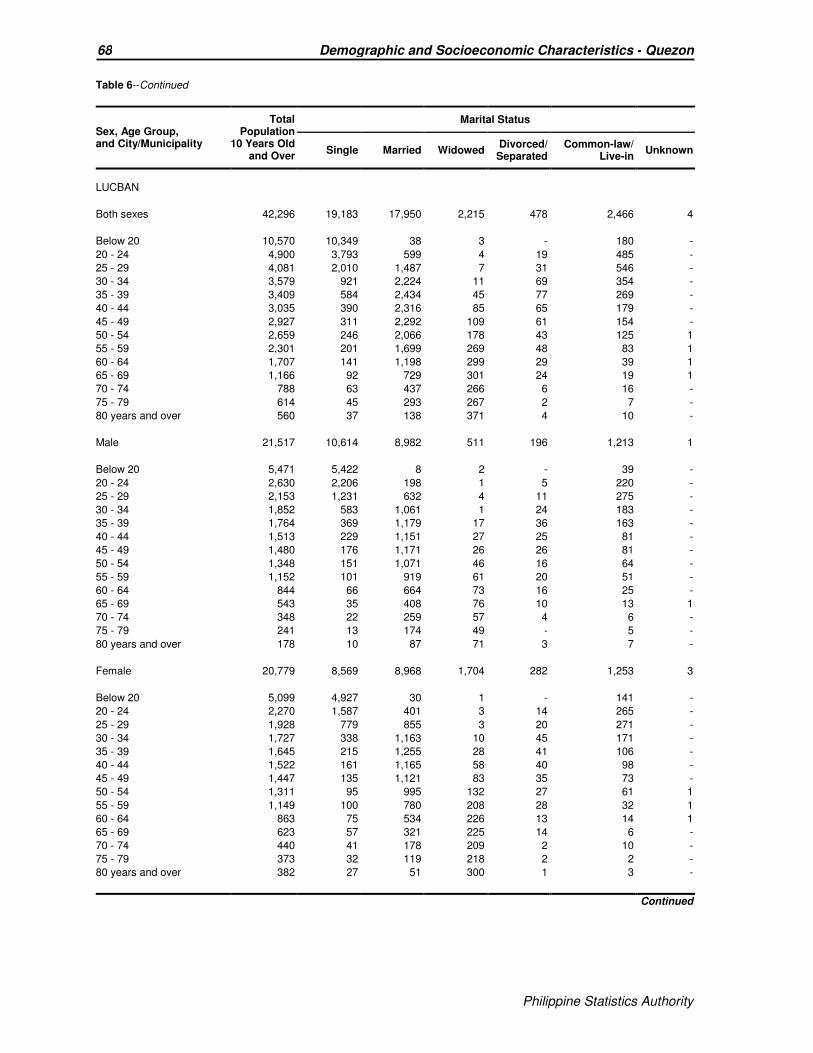
Philippine Statistics Authority
68 Demographic and Socioeconomic Characteristics - Quezon
Philippine Statistics Authority
Table 6--Continued
Sex, Age Group, and City/Municipality
Total Population
10 Years Old and Over
Marital Status
Single Married Widowed Divorced/ Separated
Common-law/ Live-in
Unknown
LUCBAN
Both sexes 42,296 19,183 17,950 2,215 478 2,466 4
Below 20 10,570 10,349 38 3 - 180 -
20 - 24 4,900 3,793 599 4 19 485 -
25 - 29 4,081 2,010 1,487 7 31 546 -
30 - 34 3,579 921 2,224 11 69 354 -
35 - 39 3,409 584 2,434 45 77 269 -
40 - 44 3,035 390 2,316 85 65 179 -
45 - 49 2,927 311 2,292 109 61 154 -
50 - 54 2,659 246 2,066 178 43 125 1
55 - 59 2,301 201 1,699 269 48 83 1
60 - 64 1,707 141 1,198 299 29 39 1
65 - 69 1,166 92 729 301 24 19 1
70 - 74 788 63 437 266 6 16 -
75 - 79 614 45 293 267 2 7 -
80 years and over 560 37 138 371 4 10 -
Male 21,517 10,614 8,982 511 196 1,213 1
Below 20 5,471 5,422 8 2 - 39 -
20 - 24 2,630 2,206 198 1 5 220 -
25 - 29 2,153 1,231 632 4 11 275 -
30 - 34 1,852 583 1,061 1 24 183 -
35 - 39 1,764 369 1,179 17 36 163 -
40 - 44 1,513 229 1,151 27 25 81 -
45 - 49 1,480 176 1,171 26 26 81 -
50 - 54 1,348 151 1,071 46 16 64 -
55 - 59 1,152 101 919 61 20 51 -
60 - 64 844 66 664 73 16 25 -
65 - 69 543 35 408 76 10 13 1
70 - 74 348 22 259 57 4 6 -
75 - 79 241 13 174 49 - 5 -
80 years and over 178 10 87 71 3 7 -
Female 20,779 8,569 8,968 1,704 282 1,253 3
Below 20 5,099 4,927 30 1 - 141 -
20 - 24 2,270 1,587 401 3 14 265 -
25 - 29 1,928 779 855 3 20 271 -
30 - 34 1,727 338 1,163 10 45 171 -
35 - 39 1,645 215 1,255 28 41 106 -
40 - 44 1,522 161 1,165 58 40 98 -
45 - 49 1,447 135 1,121 83 35 73 -
50 - 54 1,311 95 995 132 27 61 1
55 - 59 1,149 100 780 208 28 32 1
60 - 64 863 75 534 226 13 14 1
65 - 69 623 57 321 225 14 6 -
70 - 74 440 41 178 209 2 10 -
75 - 79 373 32 119 218 2 2 -
80 years and over 382 27 51 300 1 3 -
Continued
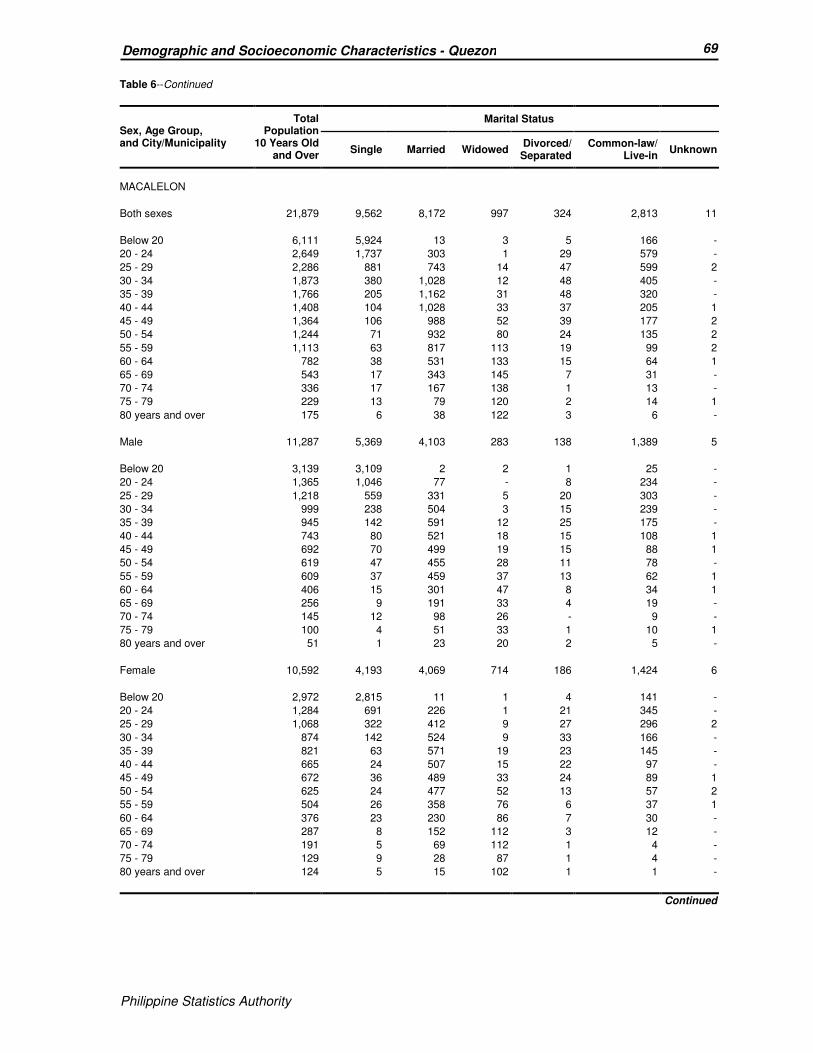
Philippine Statistics Authority
69 Demographic and Socioeconomic Characteristics - Quezon
Philippine Statistics Authority
Table 6--Continued
Sex, Age Group, and City/Municipality
Total Population
10 Years Old and Over
Marital Status
Single Married Widowed Divorced/ Separated
Common-law/ Live-in
Unknown
MACALELON
Both sexes 21,879 9,562 8,172 997 324 2,813 11
Below 20 6,111 5,924 13 3 5 166 -
20 - 24 2,649 1,737 303 1 29 579 -
25 - 29 2,286 881 743 14 47 599 2
30 - 34 1,873 380 1,028 12 48 405 -
35 - 39 1,766 205 1,162 31 48 320 -
40 - 44 1,408 104 1,028 33 37 205 1
45 - 49 1,364 106 988 52 39 177 2
50 - 54 1,244 71 932 80 24 135 2
55 - 59 1,113 63 817 113 19 99 2
60 - 64 782 38 531 133 15 64 1
65 - 69 543 17 343 145 7 31 -
70 - 74 336 17 167 138 1 13 -
75 - 79 229 13 79 120 2 14 1
80 years and over 175 6 38 122 3 6 -
Male 11,287 5,369 4,103 283 138 1,389 5
Below 20 3,139 3,109 2 2 1 25 -
20 - 24 1,365 1,046 77 - 8 234 -
25 - 29 1,218 559 331 5 20 303 -
30 - 34 999 238 504 3 15 239 -
35 - 39 945 142 591 12 25 175 -
40 - 44 743 80 521 18 15 108 1
45 - 49 692 70 499 19 15 88 1
50 - 54 619 47 455 28 11 78 -
55 - 59 609 37 459 37 13 62 1
60 - 64 406 15 301 47 8 34 1
65 - 69 256 9 191 33 4 19 -
70 - 74 145 12 98 26 - 9 -
75 - 79 100 4 51 33 1 10 1
80 years and over 51 1 23 20 2 5 -
Female 10,592 4,193 4,069 714 186 1,424 6
Below 20 2,972 2,815 11 1 4 141 -
20 - 24 1,284 691 226 1 21 345 -
25 - 29 1,068 322 412 9 27 296 2
30 - 34 874 142 524 9 33 166 -
35 - 39 821 63 571 19 23 145 -
40 - 44 665 24 507 15 22 97 -
45 - 49 672 36 489 33 24 89 1
50 - 54 625 24 477 52 13 57 2
55 - 59 504 26 358 76 6 37 1
60 - 64 376 23 230 86 7 30 -
65 - 69 287 8 152 112 3 12 -
70 - 74 191 5 69 112 1 4 -
75 - 79 129 9 28 87 1 4 -
80 years and over 124 5 15 102 1 1 -
Continued

Philippine Statistics Authority
70 Demographic and Socioeconomic Characteristics - Quezon
Philippine Statistics Authority
Table 6--Continued
Sex, Age Group, and City/Municipality
Total Population
10 Years Old and Over
Marital Status
Single Married Widowed Divorced/ Separated
Common-law/ Live-in
Unknown
MAUBAN
Both sexes 49,218 20,098 19,549 2,092 341 7,133 5
Below 20 13,510 12,976 63 5 4 462 -
20 - 24 5,465 3,396 628 4 15 1,422 -
25 - 29 4,712 1,563 1,623 10 40 1,476 -
30 - 34 4,120 639 2,358 21 44 1,058 -
35 - 39 3,708 424 2,492 33 39 719 1
40 - 44 3,509 270 2,546 66 48 579 -
45 - 49 3,529 242 2,667 104 45 471 -
50 - 54 3,188 223 2,394 177 39 354 1
55 - 59 2,487 117 1,860 225 25 259 1
60 - 64 1,775 87 1,231 282 24 151 -
65 - 69 1,197 54 744 293 9 97 -
70 - 74 889 50 497 286 7 48 1
75 - 79 599 23 290 264 - 21 1
80 years and over 530 34 156 322 2 16 -
Male 25,223 11,312 9,690 530 151 3,540 -
Below 20 6,956 6,835 16 2 3 100 -
20 - 24 2,856 2,064 190 2 6 594 -
25 - 29 2,399 1,005 642 5 15 732 -
30 - 34 2,133 424 1,097 2 17 593 -
35 - 39 1,957 307 1,226 8 13 403 -
40 - 44 1,807 186 1,271 19 20 311 -
45 - 49 1,799 167 1,309 33 29 261 -
50 - 54 1,715 146 1,294 56 20 199 -
55 - 59 1,285 70 993 58 11 153 -
60 - 64 918 54 698 75 9 82 -
65 - 69 585 25 413 86 4 57 -
70 - 74 383 14 270 64 4 31 -
75 - 79 264 9 182 59 - 14 -
80 years and over 166 6 89 61 - 10 -
Female 23,995 8,786 9,859 1,562 190 3,593 5
Below 20 6,554 6,141 47 3 1 362 -
20 - 24 2,609 1,332 438 2 9 828 -
25 - 29 2,313 558 981 5 25 744 -
30 - 34 1,987 215 1,261 19 27 465 -
35 - 39 1,751 117 1,266 25 26 316 1
40 - 44 1,702 84 1,275 47 28 268 -
45 - 49 1,730 75 1,358 71 16 210 -
50 - 54 1,473 77 1,100 121 19 155 1
55 - 59 1,202 47 867 167 14 106 1
60 - 64 857 33 533 207 15 69 -
65 - 69 612 29 331 207 5 40 -
70 - 74 506 36 227 222 3 17 1
75 - 79 335 14 108 205 - 7 1
80 years and over 364 28 67 261 2 6 -
Continued
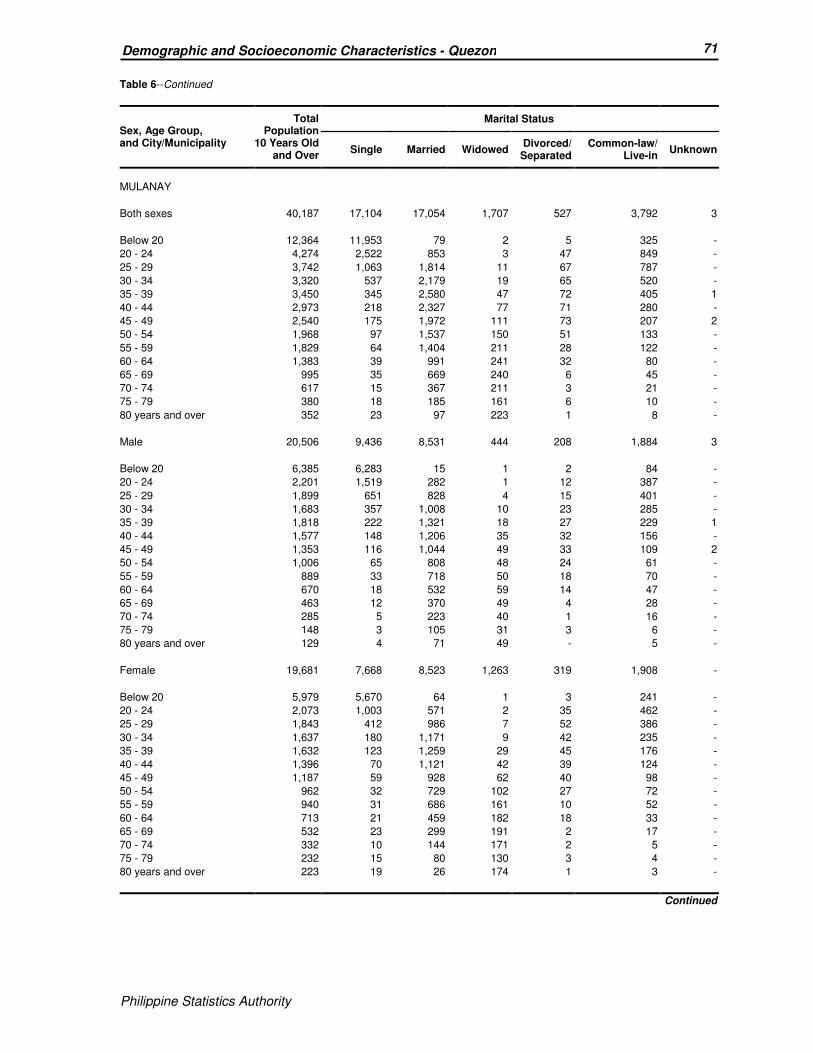
Philippine Statistics Authority
71 Demographic and Socioeconomic Characteristics - Quezon
Philippine Statistics Authority
Table 6--Continued
Sex, Age Group, and City/Municipality
Total Population
10 Years Old and Over
Marital Status
Single Married Widowed Divorced/ Separated
Common-law/ Live-in
Unknown
MULANAY
Both sexes 40,187 17,104 17,054 1,707 527 3,792 3
Below 20 12,364 11,953 79 2 5 325 -
20 - 24 4,274 2,522 853 3 47 849 -
25 - 29 3,742 1,063 1,814 11 67 787 -
30 - 34 3,320 537 2,179 19 65 520 -
35 - 39 3,450 345 2,580 47 72 405 1
40 - 44 2,973 218 2,327 77 71 280 -
45 - 49 2,540 175 1,972 111 73 207 2
50 - 54 1,968 97 1,537 150 51 133 -
55 - 59 1,829 64 1,404 211 28 122 -
60 - 64 1,383 39 991 241 32 80 -
65 - 69 995 35 669 240 6 45 -
70 - 74 617 15 367 211 3 21 -
75 - 79 380 18 185 161 6 10 -
80 years and over 352 23 97 223 1 8 -
Male 20,506 9,436 8,531 444 208 1,884 3
Below 20 6,385 6,283 15 1 2 84 -
20 - 24 2,201 1,519 282 1 12 387 -
25 - 29 1,899 651 828 4 15 401 -
30 - 34 1,683 357 1,008 10 23 285 -
35 - 39 1,818 222 1,321 18 27 229 1
40 - 44 1,577 148 1,206 35 32 156 -
45 - 49 1,353 116 1,044 49 33 109 2
50 - 54 1,006 65 808 48 24 61 -
55 - 59 889 33 718 50 18 70 -
60 - 64 670 18 532 59 14 47 -
65 - 69 463 12 370 49 4 28 -
70 - 74 285 5 223 40 1 16 -
75 - 79 148 3 105 31 3 6 -
80 years and over 129 4 71 49 - 5 -
Female 19,681 7,668 8,523 1,263 319 1,908 -
Below 20 5,979 5,670 64 1 3 241 -
20 - 24 2,073 1,003 571 2 35 462 -
25 - 29 1,843 412 986 7 52 386 -
30 - 34 1,637 180 1,171 9 42 235 -
35 - 39 1,632 123 1,259 29 45 176 -
40 - 44 1,396 70 1,121 42 39 124 -
45 - 49 1,187 59 928 62 40 98 -
50 - 54 962 32 729 102 27 72 -
55 - 59 940 31 686 161 10 52 -
60 - 64 713 21 459 182 18 33 -
65 - 69 532 23 299 191 2 17 -
70 - 74 332 10 144 171 2 5 -
75 - 79 232 15 80 130 3 4 -
80 years and over 223 19 26 174 1 3 -
Continued

Philippine Statistics Authority
72 Demographic and Socioeconomic Characteristics - Quezon
Philippine Statistics Authority
Table 6--Continued
Sex, Age Group, and City/Municipality
Total Population
10 Years Old and Over
Marital Status
Single Married Widowed Divorced/ Separated
Common-law/ Live-in
Unknown
PADRE BURGOS
Both sexes 18,007 7,390 7,065 963 366 2,222 1
Below 20 4,723 4,571 12 1 5 134 -
20 - 24 1,988 1,361 227 2 24 374 -
25 - 29 1,544 570 532 3 35 404 -
30 - 34 1,392 296 724 12 50 310 -
35 - 39 1,522 176 991 22 52 280 1
40 - 44 1,364 120 969 24 36 215 -
45 - 49 1,278 83 942 52 29 172 -
50 - 54 1,120 69 794 78 51 128 -
55 - 59 931 57 661 99 26 88 -
60 - 64 795 33 533 150 23 56 -
65 - 69 556 28 324 154 17 33 -
70 - 74 372 17 200 135 6 14 -
75 - 79 237 3 109 106 10 9 -
80 years and over 185 6 47 125 2 5 -
Male 9,096 4,124 3,529 210 137 1,095 1
Below 20 2,457 2,423 1 1 - 32 -
20 - 24 1,027 791 78 - 3 155 -
25 - 29 767 350 214 1 4 198 -
30 - 34 721 185 338 2 14 182 -
35 - 39 768 109 485 8 19 146 1
40 - 44 705 86 486 9 16 108 -
45 - 49 647 57 470 12 15 93 -
50 - 54 593 47 431 29 26 60 -
55 - 59 445 40 334 14 11 46 -
60 - 64 387 18 304 22 11 32 -
65 - 69 246 7 171 36 8 24 -
70 - 74 173 9 124 28 3 9 -
75 - 79 100 1 58 27 7 7 -
80 years and over 60 1 35 21 - 3 -
Female 8,911 3,266 3,536 753 229 1,127 -
Below 20 2,266 2,148 11 - 5 102 -
20 - 24 961 570 149 2 21 219 -
25 - 29 777 220 318 2 31 206 -
30 - 34 671 111 386 10 36 128 -
35 - 39 754 67 506 14 33 134 -
40 - 44 659 34 483 15 20 107 -
45 - 49 631 26 472 40 14 79 -
50 - 54 527 22 363 49 25 68 -
55 - 59 486 17 327 85 15 42 -
60 - 64 408 15 229 128 12 24 -
65 - 69 310 21 153 118 9 9 -
70 - 74 199 8 76 107 3 5 -
75 - 79 137 2 51 79 3 2 -
80 years and over 125 5 12 104 2 2 -
Continued

Philippine Statistics Authority
73 Demographic and Socioeconomic Characteristics - Quezon
Philippine Statistics Authority
Table 6--Continued
Sex, Age Group, and City/Municipality
Total Population
10 Years Old and Over
Marital Status
Single Married Widowed Divorced/ Separated
Common-law/ Live-in
Unknown
PAGBILAO
Both sexes 59,688 25,493 23,076 2,882 1,021 7,212 4
Below 20 15,225 14,799 61 2 3 360 -
20 - 24 7,039 4,876 816 6 60 1,281 -
25 - 29 6,002 2,430 2,029 15 97 1,430 1
30 - 34 5,250 1,167 2,833 41 120 1,088 1
35 - 39 5,255 735 3,374 71 171 904 -
40 - 44 4,327 433 3,000 113 124 657 -
45 - 49 4,255 330 3,113 166 162 484 -
50 - 54 3,687 236 2,697 262 102 390 -
55 - 59 2,954 164 2,124 335 76 255 -
60 - 64 2,226 136 1,434 409 55 192 -
65 - 69 1,423 76 795 445 34 72 1
70 - 74 904 40 443 346 14 61 -
75 - 79 612 36 241 306 3 26 -
80 years and over 529 35 116 365 - 12 1
Male 30,380 14,044 11,650 646 410 3,627 3
Below 20 7,843 7,724 21 - - 98 -
20 - 24 3,646 2,840 271 1 8 526 -
25 - 29 3,092 1,460 886 1 31 713 1
30 - 34 2,746 729 1,362 11 46 597 1
35 - 39 2,722 468 1,677 18 62 497 -
40 - 44 2,244 278 1,525 35 48 358 -
45 - 49 2,185 201 1,601 55 78 250 -
50 - 54 1,874 136 1,417 66 43 212 -
55 - 59 1,500 86 1,163 74 38 139 -
60 - 64 1,132 67 810 97 24 134 -
65 - 69 632 31 432 104 23 41 1
70 - 74 390 10 256 83 7 34 -
75 - 79 220 6 148 46 2 18 -
80 years and over 154 8 81 55 - 10 -
Female 29,308 11,449 11,426 2,236 611 3,585 1
Below 20 7,382 7,075 40 2 3 262 -
20 - 24 3,393 2,036 545 5 52 755 -
25 - 29 2,910 970 1,143 14 66 717 -
30 - 34 2,504 438 1,471 30 74 491 -
35 - 39 2,533 267 1,697 53 109 407 -
40 - 44 2,083 155 1,475 78 76 299 -
45 - 49 2,070 129 1,512 111 84 234 -
50 - 54 1,813 100 1,280 196 59 178 -
55 - 59 1,454 78 961 261 38 116 -
60 - 64 1,094 69 624 312 31 58 -
65 - 69 791 45 363 341 11 31 -
70 - 74 514 30 187 263 7 27 -
75 - 79 392 30 93 260 1 8 -
80 years and over 375 27 35 310 - 2 1
Continued
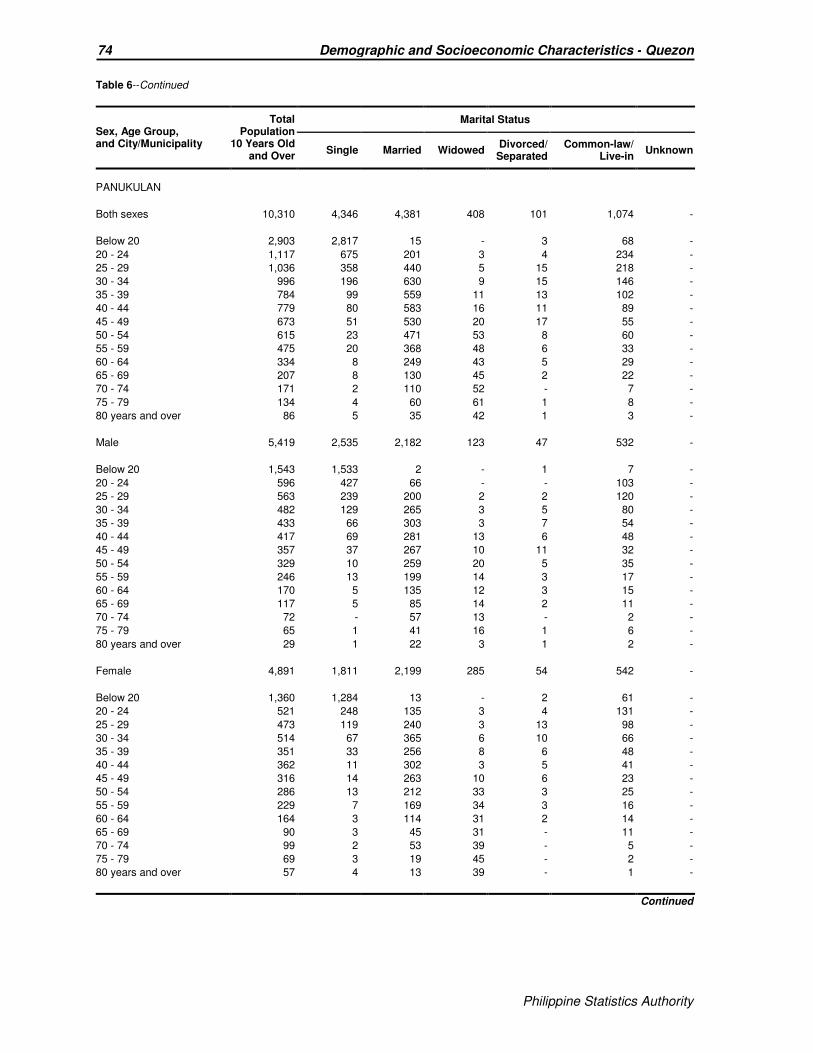
Philippine Statistics Authority
74 Demographic and Socioeconomic Characteristics - Quezon
Philippine Statistics Authority
Table 6--Continued
Sex, Age Group, and City/Municipality
Total Population
10 Years Old and Over
Marital Status
Single Married Widowed Divorced/ Separated
Common-law/ Live-in
Unknown
PANUKULAN
Both sexes 10,310 4,346 4,381 408 101 1,074 -
Below 20 2,903 2,817 15 - 3 68 -
20 - 24 1,117 675 201 3 4 234 -
25 - 29 1,036 358 440 5 15 218 -
30 - 34 996 196 630 9 15 146 -
35 - 39 784 99 559 11 13 102 -
40 - 44 779 80 583 16 11 89 -
45 - 49 673 51 530 20 17 55 -
50 - 54 615 23 471 53 8 60 -
55 - 59 475 20 368 48 6 33 -
60 - 64 334 8 249 43 5 29 -
65 - 69 207 8 130 45 2 22 -
70 - 74 171 2 110 52 - 7 -
75 - 79 134 4 60 61 1 8 -
80 years and over 86 5 35 42 1 3 -
Male 5,419 2,535 2,182 123 47 532 -
Below 20 1,543 1,533 2 - 1 7 -
20 - 24 596 427 66 - - 103 -
25 - 29 563 239 200 2 2 120 -
30 - 34 482 129 265 3 5 80 -
35 - 39 433 66 303 3 7 54 -
40 - 44 417 69 281 13 6 48 -
45 - 49 357 37 267 10 11 32 -
50 - 54 329 10 259 20 5 35 -
55 - 59 246 13 199 14 3 17 -
60 - 64 170 5 135 12 3 15 -
65 - 69 117 5 85 14 2 11 -
70 - 74 72 - 57 13 - 2 -
75 - 79 65 1 41 16 1 6 -
80 years and over 29 1 22 3 1 2 -
Female 4,891 1,811 2,199 285 54 542 -
Below 20 1,360 1,284 13 - 2 61 -
20 - 24 521 248 135 3 4 131 -
25 - 29 473 119 240 3 13 98 -
30 - 34 514 67 365 6 10 66 -
35 - 39 351 33 256 8 6 48 -
40 - 44 362 11 302 3 5 41 -
45 - 49 316 14 263 10 6 23 -
50 - 54 286 13 212 33 3 25 -
55 - 59 229 7 169 34 3 16 -
60 - 64 164 3 114 31 2 14 -
65 - 69 90 3 45 31 - 11 -
70 - 74 99 2 53 39 - 5 -
75 - 79 69 3 19 45 - 2 -
80 years and over 57 4 13 39 - 1 -
Continued
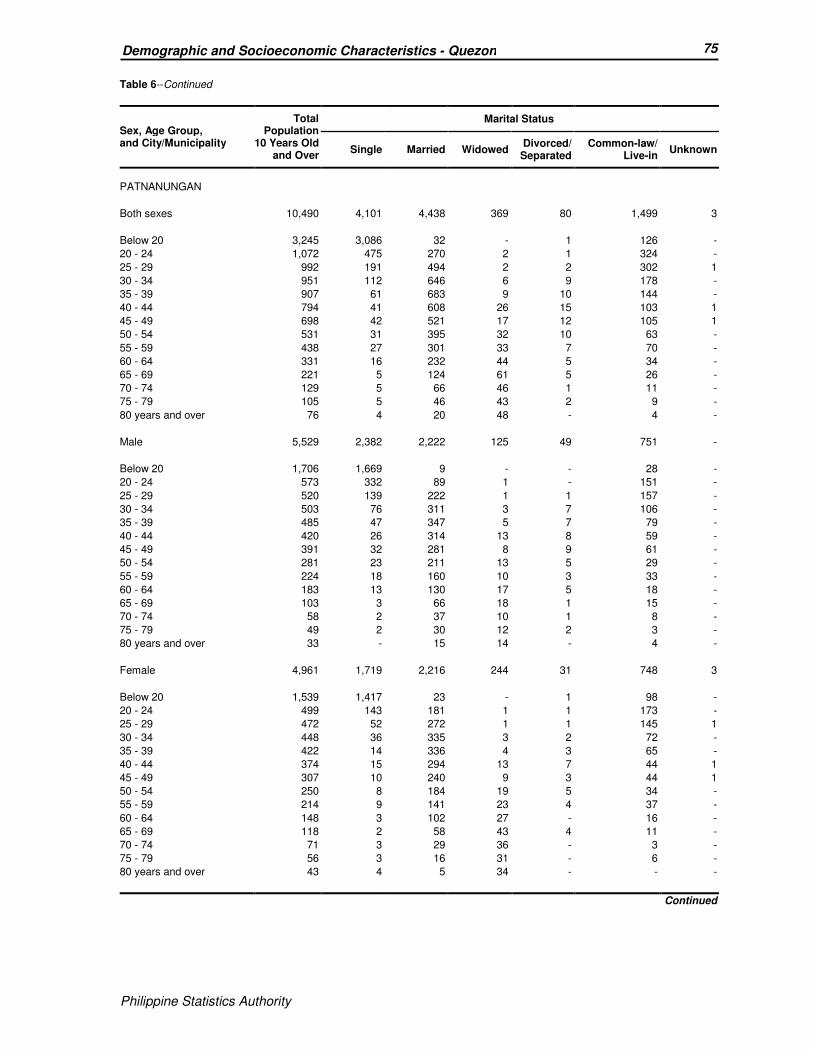
Philippine Statistics Authority
75 Demographic and Socioeconomic Characteristics - Quezon
Philippine Statistics Authority
Table 6--Continued
Sex, Age Group, and City/Municipality
Total Population
10 Years Old and Over
Marital Status
Single Married Widowed Divorced/ Separated
Common-law/ Live-in
Unknown
PATNANUNGAN
Both sexes 10,490 4,101 4,438 369 80 1,499 3
Below 20 3,245 3,086 32 - 1 126 -
20 - 24 1,072 475 270 2 1 324 -
25 - 29 992 191 494 2 2 302 1
30 - 34 951 112 646 6 9 178 -
35 - 39 907 61 683 9 10 144 -
40 - 44 794 41 608 26 15 103 1
45 - 49 698 42 521 17 12 105 1
50 - 54 531 31 395 32 10 63 -
55 - 59 438 27 301 33 7 70 -
60 - 64 331 16 232 44 5 34 -
65 - 69 221 5 124 61 5 26 -
70 - 74 129 5 66 46 1 11 -
75 - 79 105 5 46 43 2 9 -
80 years and over 76 4 20 48 - 4 -
Male 5,529 2,382 2,222 125 49 751 -
Below 20 1,706 1,669 9 - - 28 -
20 - 24 573 332 89 1 - 151 -
25 - 29 520 139 222 1 1 157 -
30 - 34 503 76 311 3 7 106 -
35 - 39 485 47 347 5 7 79 -
40 - 44 420 26 314 13 8 59 -
45 - 49 391 32 281 8 9 61 -
50 - 54 281 23 211 13 5 29 -
55 - 59 224 18 160 10 3 33 -
60 - 64 183 13 130 17 5 18 -
65 - 69 103 3 66 18 1 15 -
70 - 74 58 2 37 10 1 8 -
75 - 79 49 2 30 12 2 3 -
80 years and over 33 - 15 14 - 4 -
Female 4,961 1,719 2,216 244 31 748 3
Below 20 1,539 1,417 23 - 1 98 -
20 - 24 499 143 181 1 1 173 -
25 - 29 472 52 272 1 1 145 1
30 - 34 448 36 335 3 2 72 -
35 - 39 422 14 336 4 3 65 -
40 - 44 374 15 294 13 7 44 1
45 - 49 307 10 240 9 3 44 1
50 - 54 250 8 184 19 5 34 -
55 - 59 214 9 141 23 4 37 -
60 - 64 148 3 102 27 - 16 -
65 - 69 118 2 58 43 4 11 -
70 - 74 71 3 29 36 - 3 -
75 - 79 56 3 16 31 - 6 -
80 years and over 43 4 5 34 - - -
Continued

Philippine Statistics Authority
76 Demographic and Socioeconomic Characteristics - Quezon
Philippine Statistics Authority
Table 6--Continued
Sex, Age Group, and City/Municipality
Total Population
10 Years Old and Over
Marital Status
Single Married Widowed Divorced/ Separated
Common-law/ Live-in
Unknown
PEREZ
Both sexes 9,236 3,809 3,435 446 99 1,447 -
Below 20 2,736 2,647 10 - 1 78 -
20 - 24 875 510 92 1 14 258 -
25 - 29 774 197 256 3 12 306 -
30 - 34 757 132 384 4 18 219 -
35 - 39 762 99 464 4 13 182 -
40 - 44 745 68 529 11 11 126 -
45 - 49 639 46 486 21 9 77 -
50 - 54 540 34 374 47 4 81 -
55 - 59 433 18 306 54 3 52 -
60 - 64 351 30 238 59 3 21 -
65 - 69 236 8 146 52 7 23 -
70 - 74 150 8 70 56 2 14 -
75 - 79 128 7 54 58 2 7 -
80 years and over 110 5 26 76 - 3 -
Male 4,782 2,186 1,723 97 57 719 -
Below 20 1,446 1,425 3 - - 18 -
20 - 24 470 328 29 1 8 104 -
25 - 29 378 131 94 - 7 146 -
30 - 34 415 94 189 3 11 118 -
35 - 39 396 66 217 1 7 105 -
40 - 44 407 54 277 4 8 64 -
45 - 49 345 35 253 7 4 46 -
50 - 54 272 15 193 16 3 45 -
55 - 59 220 13 165 8 2 32 -
60 - 64 168 17 124 15 1 11 -
65 - 69 125 2 91 14 4 14 -
70 - 74 58 4 41 3 1 9 -
75 - 79 49 2 31 11 1 4 -
80 years and over 33 - 16 14 - 3 -
Female 4,454 1,623 1,712 349 42 728 -
Below 20 1,290 1,222 7 - 1 60 -
20 - 24 405 182 63 - 6 154 -
25 - 29 396 66 162 3 5 160 -
30 - 34 342 38 195 1 7 101 -
35 - 39 366 33 247 3 6 77 -
40 - 44 338 14 252 7 3 62 -
45 - 49 294 11 233 14 5 31 -
50 - 54 268 19 181 31 1 36 -
55 - 59 213 5 141 46 1 20 -
60 - 64 183 13 114 44 2 10 -
65 - 69 111 6 55 38 3 9 -
70 - 74 92 4 29 53 1 5 -
75 - 79 79 5 23 47 1 3 -
80 years and over 77 5 10 62 - - -
Continued
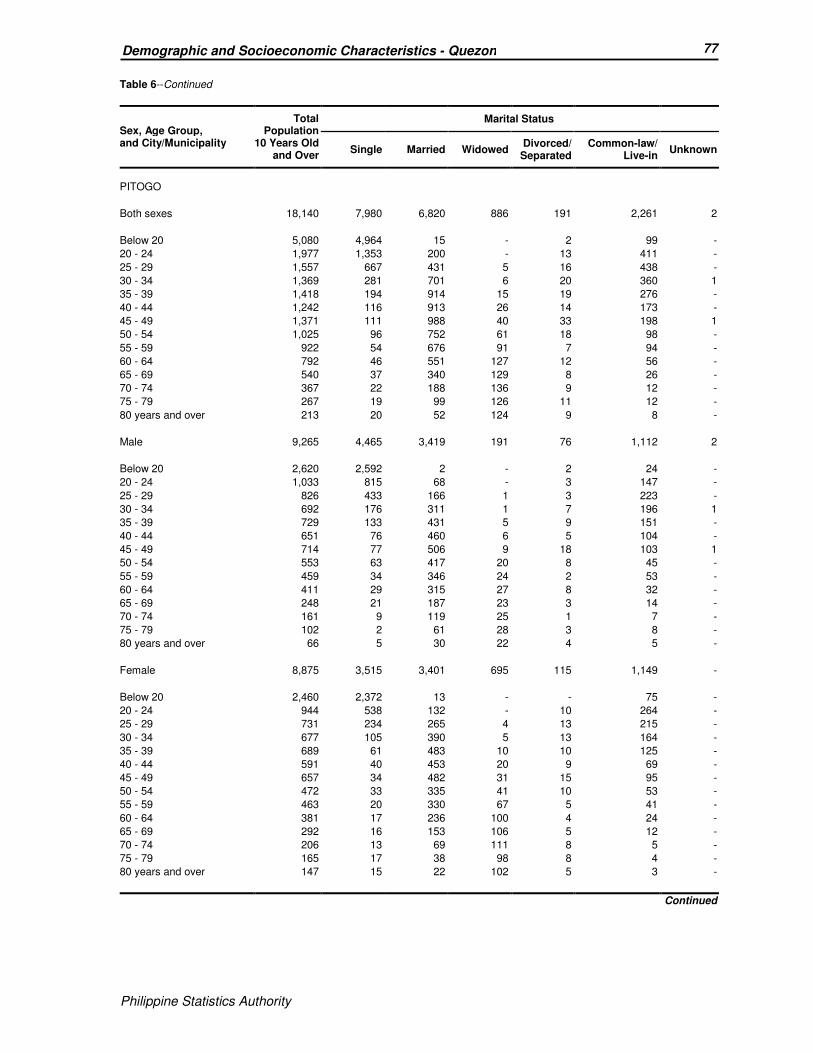
Philippine Statistics Authority
77 Demographic and Socioeconomic Characteristics - Quezon
Philippine Statistics Authority
Table 6--Continued
Sex, Age Group, and City/Municipality
Total Population
10 Years Old and Over
Marital Status
Single Married Widowed Divorced/ Separated
Common-law/ Live-in
Unknown
PITOGO
Both sexes 18,140 7,980 6,820 886 191 2,261 2
Below 20 5,080 4,964 15 - 2 99 -
20 - 24 1,977 1,353 200 - 13 411 -
25 - 29 1,557 667 431 5 16 438 -
30 - 34 1,369 281 701 6 20 360 1
35 - 39 1,418 194 914 15 19 276 -
40 - 44 1,242 116 913 26 14 173 -
45 - 49 1,371 111 988 40 33 198 1
50 - 54 1,025 96 752 61 18 98 -
55 - 59 922 54 676 91 7 94 -
60 - 64 792 46 551 127 12 56 -
65 - 69 540 37 340 129 8 26 -
70 - 74 367 22 188 136 9 12 -
75 - 79 267 19 99 126 11 12 -
80 years and over 213 20 52 124 9 8 -
Male 9,265 4,465 3,419 191 76 1,112 2
Below 20 2,620 2,592 2 - 2 24 -
20 - 24 1,033 815 68 - 3 147 -
25 - 29 826 433 166 1 3 223 -
30 - 34 692 176 311 1 7 196 1
35 - 39 729 133 431 5 9 151 -
40 - 44 651 76 460 6 5 104 -
45 - 49 714 77 506 9 18 103 1
50 - 54 553 63 417 20 8 45 -
55 - 59 459 34 346 24 2 53 -
60 - 64 411 29 315 27 8 32 -
65 - 69 248 21 187 23 3 14 -
70 - 74 161 9 119 25 1 7 -
75 - 79 102 2 61 28 3 8 -
80 years and over 66 5 30 22 4 5 -
Female 8,875 3,515 3,401 695 115 1,149 -
Below 20 2,460 2,372 13 - - 75 -
20 - 24 944 538 132 - 10 264 -
25 - 29 731 234 265 4 13 215 -
30 - 34 677 105 390 5 13 164 -
35 - 39 689 61 483 10 10 125 -
40 - 44 591 40 453 20 9 69 -
45 - 49 657 34 482 31 15 95 -
50 - 54 472 33 335 41 10 53 -
55 - 59 463 20 330 67 5 41 -
60 - 64 381 17 236 100 4 24 -
65 - 69 292 16 153 106 5 12 -
70 - 74 206 13 69 111 8 5 -
75 - 79 165 17 38 98 8 4 -
80 years and over 147 15 22 102 5 3 -
Continued

Philippine Statistics Authority
78 Demographic and Socioeconomic Characteristics - Quezon
Philippine Statistics Authority
Table 6--Continued
Sex, Age Group, and City/Municipality
Total Population
10 Years Old and Over
Marital Status
Single Married Widowed Divorced/ Separated
Common-law/ Live-in
Unknown
PLARIDEL
Both sexes 8,733 3,741 3,273 481 164 1,074 -
Below 20 2,195 2,147 3 1 - 44 -
20 - 24 907 654 86 - 6 161 -
25 - 29 838 346 260 - 11 221 -
30 - 34 722 168 382 2 15 155 -
35 - 39 672 106 440 7 18 101 -
40 - 44 624 65 411 12 22 114 -
45 - 49 620 71 414 18 24 93 -
50 - 54 561 57 372 30 22 80 -
55 - 59 519 50 355 52 14 48 -
60 - 64 370 30 226 72 15 27 -
65 - 69 282 22 161 74 9 16 -
70 - 74 172 13 82 64 3 10 -
75 - 79 146 6 57 76 3 4 -
80 years and over 105 6 24 73 2 - -
Male 4,409 2,066 1,637 104 64 538 -
Below 20 1,150 1,138 1 - - 11 -
20 - 24 462 381 22 - - 59 -
25 - 29 413 202 104 - 1 106 -
30 - 34 393 114 175 - 5 99 -
35 - 39 332 54 222 1 5 50 -
40 - 44 308 36 200 2 13 57 -
45 - 49 321 48 205 7 9 52 -
50 - 54 282 27 198 4 11 42 -
55 - 59 284 30 201 14 7 32 -
60 - 64 172 17 121 15 5 14 -
65 - 69 125 8 89 18 5 5 -
70 - 74 81 9 45 19 1 7 -
75 - 79 53 1 36 12 - 4 -
80 years and over 33 1 18 12 2 - -
Female 4,324 1,675 1,636 377 100 536 -
Below 20 1,045 1,009 2 1 - 33 -
20 - 24 445 273 64 - 6 102 -
25 - 29 425 144 156 - 10 115 -
30 - 34 329 54 207 2 10 56 -
35 - 39 340 52 218 6 13 51 -
40 - 44 316 29 211 10 9 57 -
45 - 49 299 23 209 11 15 41 -
50 - 54 279 30 174 26 11 38 -
55 - 59 235 20 154 38 7 16 -
60 - 64 198 13 105 57 10 13 -
65 - 69 157 14 72 56 4 11 -
70 - 74 91 4 37 45 2 3 -
75 - 79 93 5 21 64 3 - -
80 years and over 72 5 6 61 - - -
Continued

Philippine Statistics Authority
79 Demographic and Socioeconomic Characteristics - Quezon
Philippine Statistics Authority
Table 6--Continued
Sex, Age Group, and City/Municipality
Total Population
10 Years Old and Over
Marital Status
Single Married Widowed Divorced/ Separated
Common-law/ Live-in
Unknown
POLILLO
Both sexes 22,938 8,859 9,577 1,017 310 3,171 4
Below 20 6,109 5,915 40 1 1 152 -
20 - 24 2,226 1,221 444 4 12 545 -
25 - 29 2,170 701 837 10 17 605 -
30 - 34 1,905 360 1,071 5 26 442 1
35 - 39 1,930 234 1,245 23 46 380 2
40 - 44 1,711 122 1,220 22 53 294 -
45 - 49 1,687 113 1,253 42 40 238 1
50 - 54 1,448 72 1,081 79 44 172 -
55 - 59 1,212 43 889 96 35 149 -
60 - 64 956 30 696 139 14 77 -
65 - 69 619 21 379 146 12 61 -
70 - 74 431 10 217 166 6 32 -
75 - 79 304 6 136 139 4 19 -
80 years and over 230 11 69 145 - 5 -
Male 11,955 5,123 4,882 219 157 1,571 3
Below 20 3,211 3,174 7 1 - 29 -
20 - 24 1,146 774 149 1 2 220 -
25 - 29 1,147 485 351 4 7 300 -
30 - 34 1,013 252 517 1 7 235 1
35 - 39 1,066 169 645 12 18 220 2
40 - 44 897 77 628 8 30 154 -
45 - 49 916 80 669 15 24 128 -
50 - 54 769 45 585 18 24 97 -
55 - 59 626 28 475 23 20 80 -
60 - 64 500 17 403 29 11 40 -
65 - 69 299 10 213 32 8 36 -
70 - 74 169 7 117 22 4 19 -
75 - 79 126 3 78 31 2 12 -
80 years and over 70 2 45 22 - 1 -
Female 10,983 3,736 4,695 798 153 1,600 1
Below 20 2,898 2,741 33 - 1 123 -
20 - 24 1,080 447 295 3 10 325 -
25 - 29 1,023 216 486 6 10 305 -
30 - 34 892 108 554 4 19 207 -
35 - 39 864 65 600 11 28 160 -
40 - 44 814 45 592 14 23 140 -
45 - 49 771 33 584 27 16 110 1
50 - 54 679 27 496 61 20 75 -
55 - 59 586 15 414 73 15 69 -
60 - 64 456 13 293 110 3 37 -
65 - 69 320 11 166 114 4 25 -
70 - 74 262 3 100 144 2 13 -
75 - 79 178 3 58 108 2 7 -
80 years and over 160 9 24 123 - 4 -
Continued
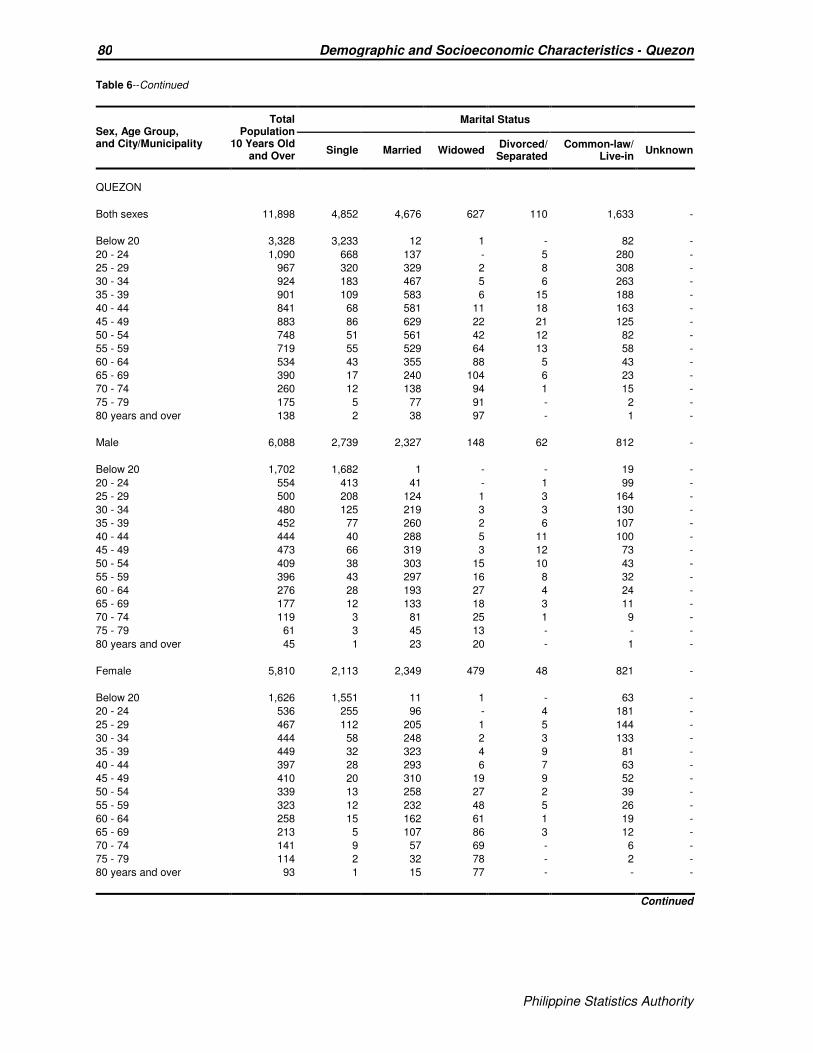
Philippine Statistics Authority
80 Demographic and Socioeconomic Characteristics - Quezon
Philippine Statistics Authority
Table 6--Continued
Sex, Age Group, and City/Municipality
Total Population
10 Years Old and Over
Marital Status
Single Married Widowed Divorced/ Separated
Common-law/ Live-in
Unknown
QUEZON
Both sexes 11,898 4,852 4,676 627 110 1,633 -
Below 20 3,328 3,233 12 1 - 82 -
20 - 24 1,090 668 137 - 5 280 -
25 - 29 967 320 329 2 8 308 -
30 - 34 924 183 467 5 6 263 -
35 - 39 901 109 583 6 15 188 -
40 - 44 841 68 581 11 18 163 -
45 - 49 883 86 629 22 21 125 -
50 - 54 748 51 561 42 12 82 -
55 - 59 719 55 529 64 13 58 -
60 - 64 534 43 355 88 5 43 -
65 - 69 390 17 240 104 6 23 -
70 - 74 260 12 138 94 1 15 -
75 - 79 175 5 77 91 - 2 -
80 years and over 138 2 38 97 - 1 -
Male 6,088 2,739 2,327 148 62 812 -
Below 20 1,702 1,682 1 - - 19 -
20 - 24 554 413 41 - 1 99 -
25 - 29 500 208 124 1 3 164 -
30 - 34 480 125 219 3 3 130 -
35 - 39 452 77 260 2 6 107 -
40 - 44 444 40 288 5 11 100 -
45 - 49 473 66 319 3 12 73 -
50 - 54 409 38 303 15 10 43 -
55 - 59 396 43 297 16 8 32 -
60 - 64 276 28 193 27 4 24 -
65 - 69 177 12 133 18 3 11 -
70 - 74 119 3 81 25 1 9 -
75 - 79 61 3 45 13 - - -
80 years and over 45 1 23 20 - 1 -
Female 5,810 2,113 2,349 479 48 821 -
Below 20 1,626 1,551 11 1 - 63 -
20 - 24 536 255 96 - 4 181 -
25 - 29 467 112 205 1 5 144 -
30 - 34 444 58 248 2 3 133 -
35 - 39 449 32 323 4 9 81 -
40 - 44 397 28 293 6 7 63 -
45 - 49 410 20 310 19 9 52 -
50 - 54 339 13 258 27 2 39 -
55 - 59 323 12 232 48 5 26 -
60 - 64 258 15 162 61 1 19 -
65 - 69 213 5 107 86 3 12 -
70 - 74 141 9 57 69 - 6 -
75 - 79 114 2 32 78 - 2 -
80 years and over 93 1 15 77 - - -
Continued
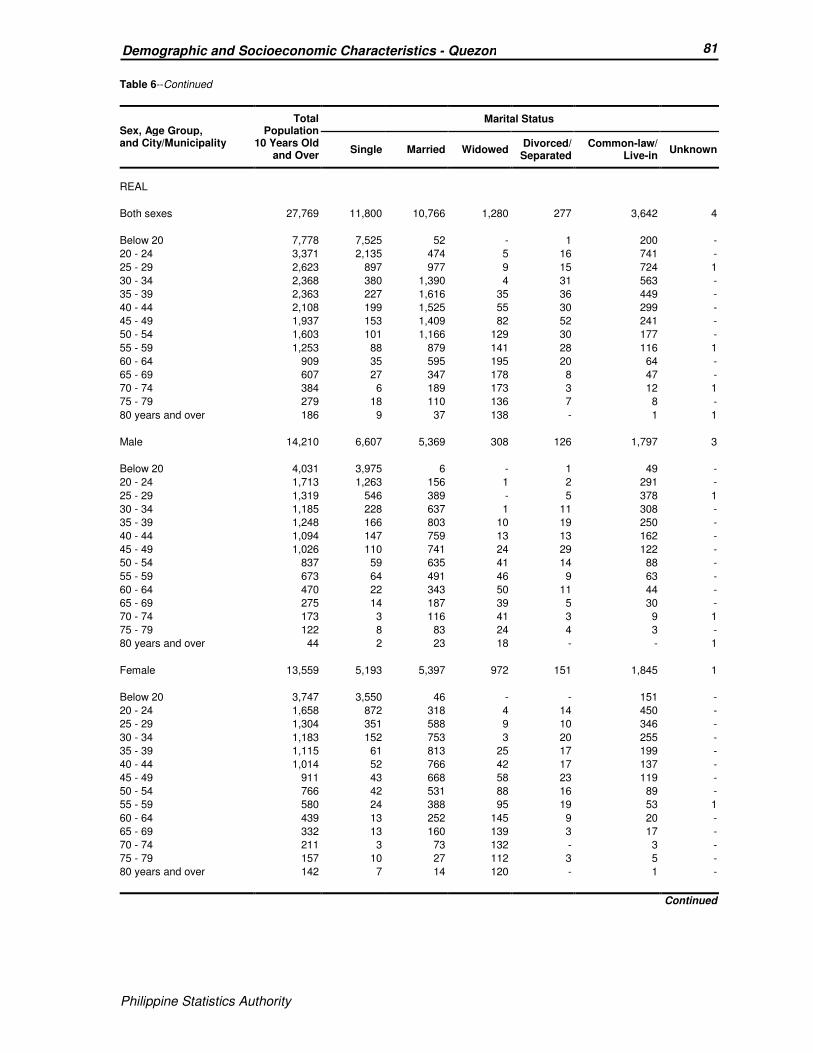
Philippine Statistics Authority
81 Demographic and Socioeconomic Characteristics - Quezon
Philippine Statistics Authority
Table 6--Continued
Sex, Age Group, and City/Municipality
Total Population
10 Years Old and Over
Marital Status
Single Married Widowed Divorced/ Separated
Common-law/ Live-in
Unknown
REAL
Both sexes 27,769 11,800 10,766 1,280 277 3,642 4
Below 20 7,778 7,525 52 - 1 200 -
20 - 24 3,371 2,135 474 5 16 741 -
25 - 29 2,623 897 977 9 15 724 1
30 - 34 2,368 380 1,390 4 31 563 -
35 - 39 2,363 227 1,616 35 36 449 -
40 - 44 2,108 199 1,525 55 30 299 -
45 - 49 1,937 153 1,409 82 52 241 -
50 - 54 1,603 101 1,166 129 30 177 -
55 - 59 1,253 88 879 141 28 116 1
60 - 64 909 35 595 195 20 64 -
65 - 69 607 27 347 178 8 47 -
70 - 74 384 6 189 173 3 12 1
75 - 79 279 18 110 136 7 8 -
80 years and over 186 9 37 138 - 1 1
Male 14,210 6,607 5,369 308 126 1,797 3
Below 20 4,031 3,975 6 - 1 49 -
20 - 24 1,713 1,263 156 1 2 291 -
25 - 29 1,319 546 389 - 5 378 1
30 - 34 1,185 228 637 1 11 308 -
35 - 39 1,248 166 803 10 19 250 -
40 - 44 1,094 147 759 13 13 162 -
45 - 49 1,026 110 741 24 29 122 -
50 - 54 837 59 635 41 14 88 -
55 - 59 673 64 491 46 9 63 -
60 - 64 470 22 343 50 11 44 -
65 - 69 275 14 187 39 5 30 -
70 - 74 173 3 116 41 3 9 1
75 - 79 122 8 83 24 4 3 -
80 years and over 44 2 23 18 - - 1
Female 13,559 5,193 5,397 972 151 1,845 1
Below 20 3,747 3,550 46 - - 151 -
20 - 24 1,658 872 318 4 14 450 -
25 - 29 1,304 351 588 9 10 346 -
30 - 34 1,183 152 753 3 20 255 -
35 - 39 1,115 61 813 25 17 199 -
40 - 44 1,014 52 766 42 17 137 -
45 - 49 911 43 668 58 23 119 -
50 - 54 766 42 531 88 16 89 -
55 - 59 580 24 388 95 19 53 1
60 - 64 439 13 252 145 9 20 -
65 - 69 332 13 160 139 3 17 -
70 - 74 211 3 73 132 - 3 -
75 - 79 157 10 27 112 3 5 -
80 years and over 142 7 14 120 - 1 -
Continued

Philippine Statistics Authority
82 Demographic and Socioeconomic Characteristics - Quezon
Philippine Statistics Authority
Table 6--Continued
Sex, Age Group, and City/Municipality
Total Population
10 Years Old and Over
Marital Status
Single Married Widowed Divorced/ Separated
Common-law/ Live-in
Unknown
SAMPALOC
Both sexes 11,316 4,773 4,918 579 65 981 -
Below 20 2,763 2,705 10 1 - 47 -
20 - 24 1,195 871 130 2 1 191 -
25 - 29 984 438 353 2 2 189 -
30 - 34 972 260 540 6 7 159 -
35 - 39 859 130 598 5 10 116 -
40 - 44 865 108 664 9 5 79 -
45 - 49 866 81 688 29 12 56 -
50 - 54 827 68 652 46 11 50 -
55 - 59 624 40 483 53 7 41 -
60 - 64 462 34 319 85 5 19 -
65 - 69 318 16 215 71 1 15 -
70 - 74 263 9 142 96 3 13 -
75 - 79 173 3 81 84 1 4 -
80 years and over 145 10 43 90 - 2 -
Male 5,768 2,684 2,439 128 32 485 -
Below 20 1,435 1,421 4 - - 10 -
20 - 24 658 547 40 2 - 69 -
25 - 29 498 269 136 1 1 91 -
30 - 34 500 156 249 - 3 92 -
35 - 39 436 82 290 1 4 59 -
40 - 44 423 60 306 2 2 53 -
45 - 49 446 58 346 8 5 29 -
50 - 54 421 32 342 11 6 30 -
55 - 59 349 27 282 14 5 21 -
60 - 64 215 16 167 18 4 10 -
65 - 69 162 9 121 21 1 10 -
70 - 74 109 5 81 16 1 6 -
75 - 79 67 1 49 14 - 3 -
80 years and over 49 1 26 20 - 2 -
Female 5,548 2,089 2,479 451 33 496 -
Below 20 1,328 1,284 6 1 - 37 -
20 - 24 537 324 90 - 1 122 -
25 - 29 486 169 217 1 1 98 -
30 - 34 472 104 291 6 4 67 -
35 - 39 423 48 308 4 6 57 -
40 - 44 442 48 358 7 3 26 -
45 - 49 420 23 342 21 7 27 -
50 - 54 406 36 310 35 5 20 -
55 - 59 275 13 201 39 2 20 -
60 - 64 247 18 152 67 1 9 -
65 - 69 156 7 94 50 - 5 -
70 - 74 154 4 61 80 2 7 -
75 - 79 106 2 32 70 1 1 -
80 years and over 96 9 17 70 - - -
Continued
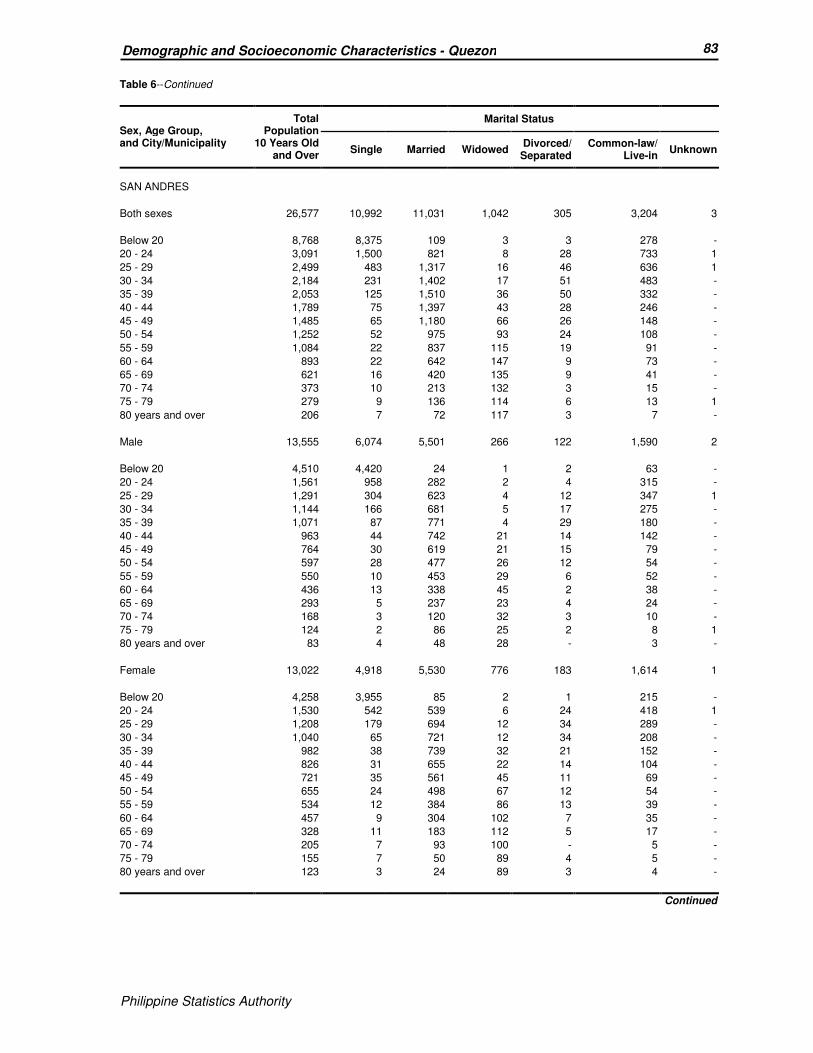
Philippine Statistics Authority
83 Demographic and Socioeconomic Characteristics - Quezon
Philippine Statistics Authority
Table 6--Continued
Sex, Age Group, and City/Municipality
Total Population
10 Years Old and Over
Marital Status
Single Married Widowed Divorced/ Separated
Common-law/ Live-in
Unknown
SAN ANDRES
Both sexes 26,577 10,992 11,031 1,042 305 3,204 3
Below 20 8,768 8,375 109 3 3 278 -
20 - 24 3,091 1,500 821 8 28 733 1
25 - 29 2,499 483 1,317 16 46 636 1
30 - 34 2,184 231 1,402 17 51 483 -
35 - 39 2,053 125 1,510 36 50 332 -
40 - 44 1,789 75 1,397 43 28 246 -
45 - 49 1,485 65 1,180 66 26 148 -
50 - 54 1,252 52 975 93 24 108 -
55 - 59 1,084 22 837 115 19 91 -
60 - 64 893 22 642 147 9 73 -
65 - 69 621 16 420 135 9 41 -
70 - 74 373 10 213 132 3 15 -
75 - 79 279 9 136 114 6 13 1
80 years and over 206 7 72 117 3 7 -
Male 13,555 6,074 5,501 266 122 1,590 2
Below 20 4,510 4,420 24 1 2 63 -
20 - 24 1,561 958 282 2 4 315 -
25 - 29 1,291 304 623 4 12 347 1
30 - 34 1,144 166 681 5 17 275 -
35 - 39 1,071 87 771 4 29 180 -
40 - 44 963 44 742 21 14 142 -
45 - 49 764 30 619 21 15 79 -
50 - 54 597 28 477 26 12 54 -
55 - 59 550 10 453 29 6 52 -
60 - 64 436 13 338 45 2 38 -
65 - 69 293 5 237 23 4 24 -
70 - 74 168 3 120 32 3 10 -
75 - 79 124 2 86 25 2 8 1
80 years and over 83 4 48 28 - 3 -
Female 13,022 4,918 5,530 776 183 1,614 1
Below 20 4,258 3,955 85 2 1 215 -
20 - 24 1,530 542 539 6 24 418 1
25 - 29 1,208 179 694 12 34 289 -
30 - 34 1,040 65 721 12 34 208 -
35 - 39 982 38 739 32 21 152 -
40 - 44 826 31 655 22 14 104 -
45 - 49 721 35 561 45 11 69 -
50 - 54 655 24 498 67 12 54 -
55 - 59 534 12 384 86 13 39 -
60 - 64 457 9 304 102 7 35 -
65 - 69 328 11 183 112 5 17 -
70 - 74 205 7 93 100 - 5 -
75 - 79 155 7 50 89 4 5 -
80 years and over 123 3 24 89 3 4 -
Continued

Philippine Statistics Authority
84 Demographic and Socioeconomic Characteristics - Quezon
Philippine Statistics Authority
Table 6--Continued
Sex, Age Group, and City/Municipality
Total Population
10 Years Old and Over
Marital Status
Single Married Widowed Divorced/ Separated
Common-law/ Live-in
Unknown
SAN ANTONIO
Both sexes 26,360 11,617 11,519 1,308 310 1,605 1
Below 20 7,213 7,078 43 - 1 91 -
20 - 24 3,030 2,111 587 2 22 307 1
25 - 29 2,574 1,029 1,192 7 38 308 -
30 - 34 2,397 486 1,610 13 40 248 -
35 - 39 2,214 244 1,686 27 55 202 -
40 - 44 1,808 152 1,420 44 45 147 -
45 - 49 1,689 134 1,345 71 32 107 -
50 - 54 1,450 114 1,124 117 26 69 -
55 - 59 1,331 97 989 164 29 52 -
60 - 64 957 65 660 182 13 37 -
65 - 69 621 40 385 171 5 20 -
70 - 74 431 26 250 144 3 8 -
75 - 79 312 15 141 151 - 5 -
80 years and over 333 26 87 215 1 4 -
Male 13,271 6,364 5,747 248 122 790 -
Below 20 3,781 3,755 10 - - 16 -
20 - 24 1,523 1,196 195 - 3 129 -
25 - 29 1,286 607 512 2 4 161 -
30 - 34 1,209 313 756 2 12 126 -
35 - 39 1,158 150 861 4 29 114 -
40 - 44 918 97 716 11 20 74 -
45 - 49 847 77 680 15 17 58 -
50 - 54 751 66 607 32 10 36 -
55 - 59 671 52 541 33 17 28 -
60 - 64 454 28 368 32 5 21 -
65 - 69 288 12 225 32 4 15 -
70 - 74 168 5 136 23 - 4 -
75 - 79 116 2 84 25 - 5 -
80 years and over 101 4 56 37 1 3 -
Female 13,089 5,253 5,772 1,060 188 815 1
Below 20 3,432 3,323 33 - 1 75 -
20 - 24 1,507 915 392 2 19 178 1
25 - 29 1,288 422 680 5 34 147 -
30 - 34 1,188 173 854 11 28 122 -
35 - 39 1,056 94 825 23 26 88 -
40 - 44 890 55 704 33 25 73 -
45 - 49 842 57 665 56 15 49 -
50 - 54 699 48 517 85 16 33 -
55 - 59 660 45 448 131 12 24 -
60 - 64 503 37 292 150 8 16 -
65 - 69 333 28 160 139 1 5 -
70 - 74 263 21 114 121 3 4 -
75 - 79 196 13 57 126 - - -
80 years and over 232 22 31 178 - 1 -
Continued
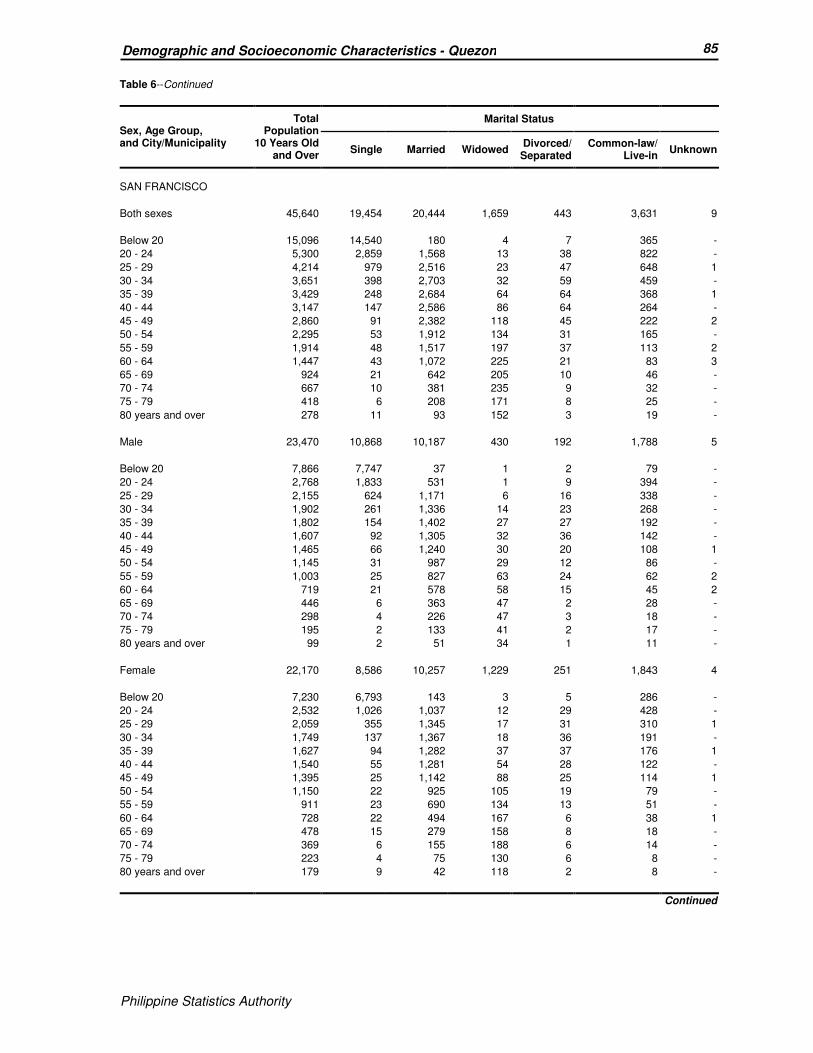
Philippine Statistics Authority
85 Demographic and Socioeconomic Characteristics - Quezon
Philippine Statistics Authority
Table 6--Continued
Sex, Age Group, and City/Municipality
Total Population
10 Years Old and Over
Marital Status
Single Married Widowed Divorced/ Separated
Common-law/ Live-in
Unknown
SAN FRANCISCO
Both sexes 45,640 19,454 20,444 1,659 443 3,631 9
Below 20 15,096 14,540 180 4 7 365 -
20 - 24 5,300 2,859 1,568 13 38 822 -
25 - 29 4,214 979 2,516 23 47 648 1
30 - 34 3,651 398 2,703 32 59 459 -
35 - 39 3,429 248 2,684 64 64 368 1
40 - 44 3,147 147 2,586 86 64 264 -
45 - 49 2,860 91 2,382 118 45 222 2
50 - 54 2,295 53 1,912 134 31 165 -
55 - 59 1,914 48 1,517 197 37 113 2
60 - 64 1,447 43 1,072 225 21 83 3
65 - 69 924 21 642 205 10 46 -
70 - 74 667 10 381 235 9 32 -
75 - 79 418 6 208 171 8 25 -
80 years and over 278 11 93 152 3 19 -
Male 23,470 10,868 10,187 430 192 1,788 5
Below 20 7,866 7,747 37 1 2 79 -
20 - 24 2,768 1,833 531 1 9 394 -
25 - 29 2,155 624 1,171 6 16 338 -
30 - 34 1,902 261 1,336 14 23 268 -
35 - 39 1,802 154 1,402 27 27 192 -
40 - 44 1,607 92 1,305 32 36 142 -
45 - 49 1,465 66 1,240 30 20 108 1
50 - 54 1,145 31 987 29 12 86 -
55 - 59 1,003 25 827 63 24 62 2
60 - 64 719 21 578 58 15 45 2
65 - 69 446 6 363 47 2 28 -
70 - 74 298 4 226 47 3 18 -
75 - 79 195 2 133 41 2 17 -
80 years and over 99 2 51 34 1 11 -
Female 22,170 8,586 10,257 1,229 251 1,843 4
Below 20 7,230 6,793 143 3 5 286 -
20 - 24 2,532 1,026 1,037 12 29 428 -
25 - 29 2,059 355 1,345 17 31 310 1
30 - 34 1,749 137 1,367 18 36 191 -
35 - 39 1,627 94 1,282 37 37 176 1
40 - 44 1,540 55 1,281 54 28 122 -
45 - 49 1,395 25 1,142 88 25 114 1
50 - 54 1,150 22 925 105 19 79 -
55 - 59 911 23 690 134 13 51 -
60 - 64 728 22 494 167 6 38 1
65 - 69 478 15 279 158 8 18 -
70 - 74 369 6 155 188 6 14 -
75 - 79 223 4 75 130 6 8 -
80 years and over 179 9 42 118 2 8 -
Continued
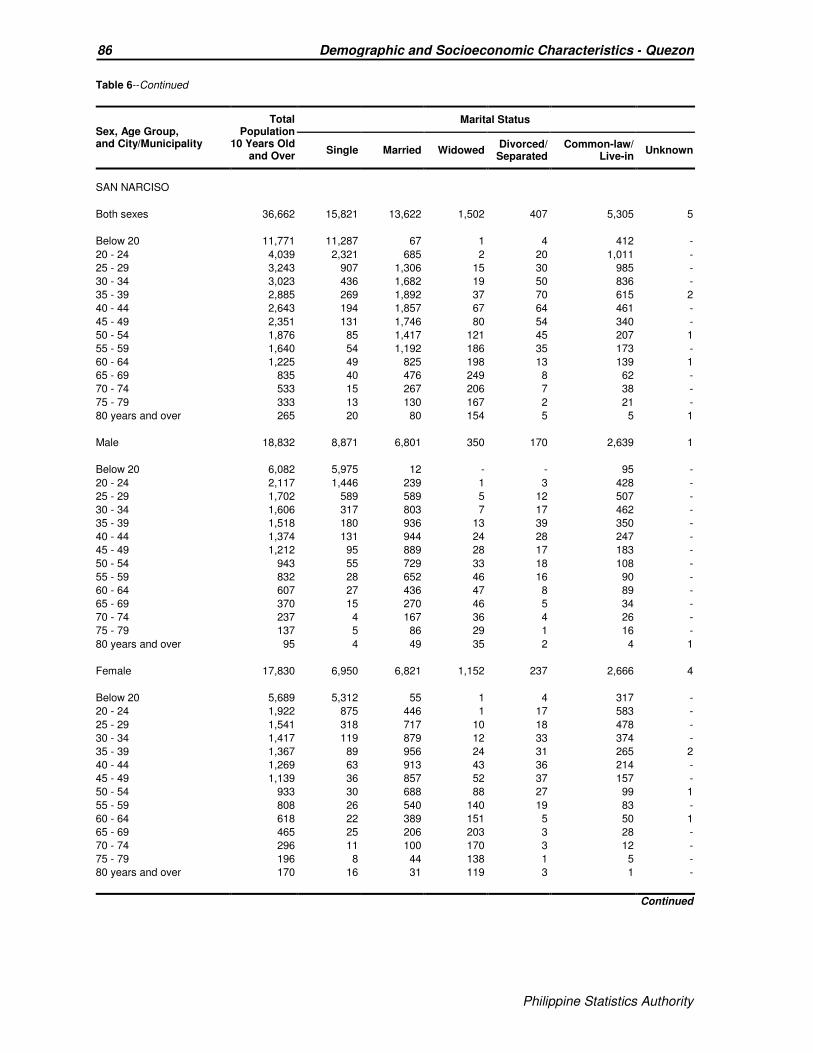
Philippine Statistics Authority
86 Demographic and Socioeconomic Characteristics - Quezon
Philippine Statistics Authority
Table 6--Continued
Sex, Age Group, and City/Municipality
Total Population
10 Years Old and Over
Marital Status
Single Married Widowed Divorced/ Separated
Common-law/ Live-in
Unknown
SAN NARCISO
Both sexes 36,662 15,821 13,622 1,502 407 5,305 5
Below 20 11,771 11,287 67 1 4 412 -
20 - 24 4,039 2,321 685 2 20 1,011 -
25 - 29 3,243 907 1,306 15 30 985 -
30 - 34 3,023 436 1,682 19 50 836 -
35 - 39 2,885 269 1,892 37 70 615 2
40 - 44 2,643 194 1,857 67 64 461 -
45 - 49 2,351 131 1,746 80 54 340 -
50 - 54 1,876 85 1,417 121 45 207 1
55 - 59 1,640 54 1,192 186 35 173 -
60 - 64 1,225 49 825 198 13 139 1
65 - 69 835 40 476 249 8 62 -
70 - 74 533 15 267 206 7 38 -
75 - 79 333 13 130 167 2 21 -
80 years and over 265 20 80 154 5 5 1
Male 18,832 8,871 6,801 350 170 2,639 1
Below 20 6,082 5,975 12 - - 95 -
20 - 24 2,117 1,446 239 1 3 428 -
25 - 29 1,702 589 589 5 12 507 -
30 - 34 1,606 317 803 7 17 462 -
35 - 39 1,518 180 936 13 39 350 -
40 - 44 1,374 131 944 24 28 247 -
45 - 49 1,212 95 889 28 17 183 -
50 - 54 943 55 729 33 18 108 -
55 - 59 832 28 652 46 16 90 -
60 - 64 607 27 436 47 8 89 -
65 - 69 370 15 270 46 5 34 -
70 - 74 237 4 167 36 4 26 -
75 - 79 137 5 86 29 1 16 -
80 years and over 95 4 49 35 2 4 1
Female 17,830 6,950 6,821 1,152 237 2,666 4
Below 20 5,689 5,312 55 1 4 317 -
20 - 24 1,922 875 446 1 17 583 -
25 - 29 1,541 318 717 10 18 478 -
30 - 34 1,417 119 879 12 33 374 -
35 - 39 1,367 89 956 24 31 265 2
40 - 44 1,269 63 913 43 36 214 -
45 - 49 1,139 36 857 52 37 157 -
50 - 54 933 30 688 88 27 99 1
55 - 59 808 26 540 140 19 83 -
60 - 64 618 22 389 151 5 50 1
65 - 69 465 25 206 203 3 28 -
70 - 74 296 11 100 170 3 12 -
75 - 79 196 8 44 138 1 5 -
80 years and over 170 16 31 119 3 1 -
Continued

Philippine Statistics Authority
87 Demographic and Socioeconomic Characteristics - Quezon
Philippine Statistics Authority
Table 6--Continued
Sex, Age Group, and City/Municipality
Total Population
10 Years Old and Over
Marital Status
Single Married Widowed Divorced/ Separated
Common-law/ Live-in
Unknown
SARIAYA
Both sexes 117,692 47,327 50,339 5,763 1,977 12,277 9
Below 20 30,575 29,563 210 - 10 792 -
20 - 24 12,881 8,186 2,197 20 93 2,385 -
25 - 29 11,307 3,929 4,765 39 177 2,396 1
30 - 34 10,834 1,855 6,735 69 244 1,931 -
35 - 39 10,315 1,091 7,355 106 310 1,453 -
40 - 44 9,187 702 6,997 184 272 1,031 1
45 - 49 8,291 547 6,338 323 255 826 2
50 - 54 7,082 503 5,284 492 216 585 2
55 - 59 5,658 326 4,151 609 168 403 1
60 - 64 4,423 221 2,954 868 129 250 1
65 - 69 2,905 171 1,711 848 58 117 -
70 - 74 1,823 102 879 765 23 54 -
75 - 79 1,250 65 485 651 15 33 1
80 years and over 1,161 66 278 789 7 21 -
Male 59,302 26,302 25,079 1,038 824 6,056 3
Below 20 16,125 15,893 45 - 2 185 -
20 - 24 6,631 4,865 742 7 23 994 -
25 - 29 5,713 2,414 2,040 14 52 1,193 -
30 - 34 5,454 1,129 3,155 19 101 1,050 -
35 - 39 5,272 688 3,640 28 128 788 -
40 - 44 4,643 375 3,536 44 129 559 -
45 - 49 4,245 307 3,295 90 112 440 1
50 - 54 3,622 296 2,791 104 105 325 1
55 - 59 2,834 150 2,270 124 68 222 -
60 - 64 2,057 96 1,614 140 53 154 -
65 - 69 1,270 47 973 145 31 74 -
70 - 74 704 26 505 120 15 38 -
75 - 79 432 9 295 98 3 26 1
80 years and over 300 7 178 105 2 8 -
Female 58,390 21,025 25,260 4,725 1,153 6,221 6
Below 20 14,450 13,670 165 - 8 607 -
20 - 24 6,250 3,321 1,455 13 70 1,391 -
25 - 29 5,594 1,515 2,725 25 125 1,203 1
30 - 34 5,380 726 3,580 50 143 881 -
35 - 39 5,043 403 3,715 78 182 665 -
40 - 44 4,544 327 3,461 140 143 472 1
45 - 49 4,046 240 3,043 233 143 386 1
50 - 54 3,460 207 2,493 388 111 260 1
55 - 59 2,824 176 1,881 485 100 181 1
60 - 64 2,366 125 1,340 728 76 96 1
65 - 69 1,635 124 738 703 27 43 -
70 - 74 1,119 76 374 645 8 16 -
75 - 79 818 56 190 553 12 7 -
80 years and over 861 59 100 684 5 13 -
Continued

Philippine Statistics Authority
88 Demographic and Socioeconomic Characteristics - Quezon
Philippine Statistics Authority
Table 6--Continued
Sex, Age Group, and City/Municipality
Total Population
10 Years Old and Over
Marital Status
Single Married Widowed Divorced/ Separated
Common-law/ Live-in
Unknown
TAGKAWAYAN
Both sexes 39,122 16,338 15,431 1,892 553 4,896 12
Below 20 11,324 10,978 70 2 3 271 -
20 - 24 3,777 2,226 592 3 34 922 -
25 - 29 3,371 1,038 1,304 10 43 973 3
30 - 34 3,281 576 1,853 17 67 767 1
35 - 39 3,045 410 1,982 31 66 555 1
40 - 44 2,752 283 1,923 62 71 412 1
45 - 49 2,884 253 2,111 115 86 316 3
50 - 54 2,472 208 1,791 148 63 259 3
55 - 59 2,018 147 1,434 222 46 169 -
60 - 64 1,573 102 1,055 261 38 117 -
65 - 69 1,015 55 629 248 15 68 -
70 - 74 708 26 349 277 9 47 -
75 - 79 506 20 226 247 6 7 -
80 years and over 396 16 112 249 6 13 -
Male 19,876 9,273 7,597 385 232 2,386 3
Below 20 5,932 5,865 15 2 1 49 -
20 - 24 1,926 1,378 185 - 1 362 -
25 - 29 1,695 679 544 1 16 455 -
30 - 34 1,657 399 825 2 24 407 -
35 - 39 1,568 285 931 7 33 312 -
40 - 44 1,432 187 985 14 23 222 1
45 - 49 1,447 167 1,025 34 44 176 1
50 - 54 1,306 138 937 38 34 158 1
55 - 59 1,024 74 779 54 23 94 -
60 - 64 794 55 601 57 16 65 -
65 - 69 465 23 353 42 6 41 -
70 - 74 289 7 189 56 6 31 -
75 - 79 206 11 151 34 4 6 -
80 years and over 135 5 77 44 1 8 -
Female 19,246 7,065 7,834 1,507 321 2,510 9
Below 20 5,392 5,113 55 - 2 222 -
20 - 24 1,851 848 407 3 33 560 -
25 - 29 1,676 359 760 9 27 518 3
30 - 34 1,624 177 1,028 15 43 360 1
35 - 39 1,477 125 1,051 24 33 243 1
40 - 44 1,320 96 938 48 48 190 -
45 - 49 1,437 86 1,086 81 42 140 2
50 - 54 1,166 70 854 110 29 101 2
55 - 59 994 73 655 168 23 75 -
60 - 64 779 47 454 204 22 52 -
65 - 69 550 32 276 206 9 27 -
70 - 74 419 19 160 221 3 16 -
75 - 79 300 9 75 213 2 1 -
80 years and over 261 11 35 205 5 5 -
Continued
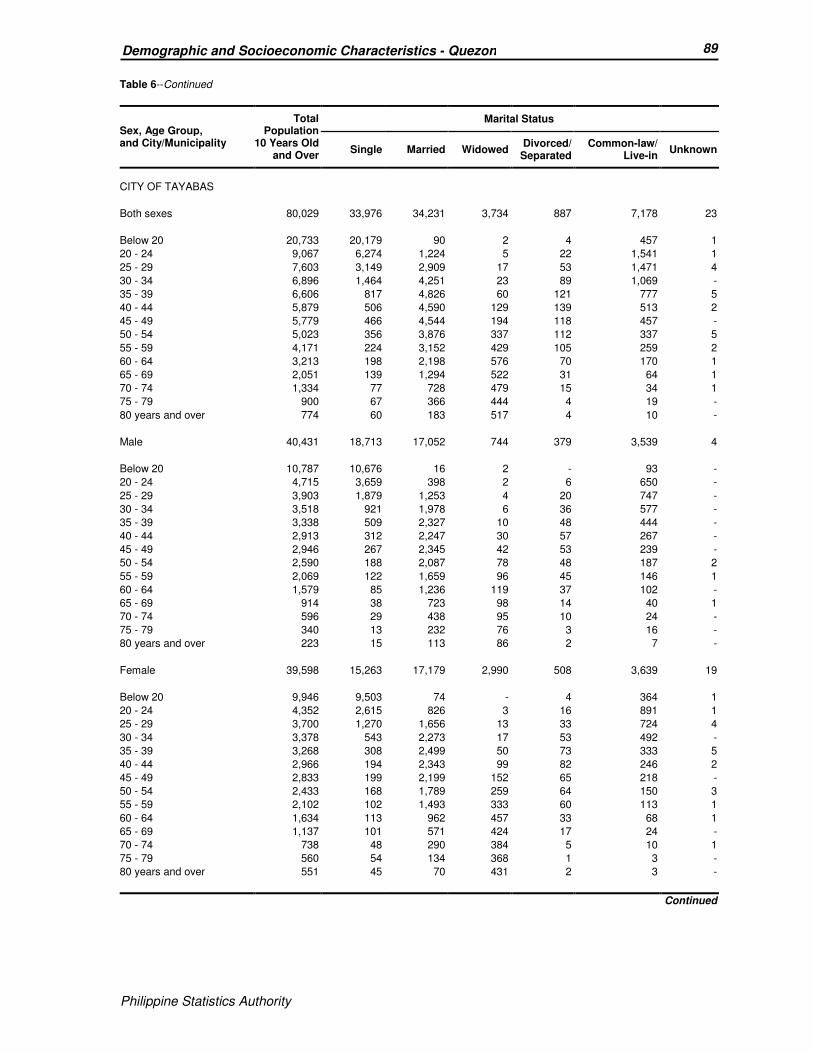
Philippine Statistics Authority
89 Demographic and Socioeconomic Characteristics - Quezon
Philippine Statistics Authority
Table 6--Continued
Sex, Age Group, and City/Municipality
Total Population
10 Years Old and Over
Marital Status
Single Married Widowed Divorced/ Separated
Common-law/ Live-in
Unknown
CITY OF TAYABAS
Both sexes 80,029 33,976 34,231 3,734 887 7,178 23
Below 20 20,733 20,179 90 2 4 457 1
20 - 24 9,067 6,274 1,224 5 22 1,541 1
25 - 29 7,603 3,149 2,909 17 53 1,471 4
30 - 34 6,896 1,464 4,251 23 89 1,069 -
35 - 39 6,606 817 4,826 60 121 777 5
40 - 44 5,879 506 4,590 129 139 513 2
45 - 49 5,779 466 4,544 194 118 457 -
50 - 54 5,023 356 3,876 337 112 337 5
55 - 59 4,171 224 3,152 429 105 259 2
60 - 64 3,213 198 2,198 576 70 170 1
65 - 69 2,051 139 1,294 522 31 64 1
70 - 74 1,334 77 728 479 15 34 1
75 - 79 900 67 366 444 4 19 -
80 years and over 774 60 183 517 4 10 -
Male 40,431 18,713 17,052 744 379 3,539 4
Below 20 10,787 10,676 16 2 - 93 -
20 - 24 4,715 3,659 398 2 6 650 -
25 - 29 3,903 1,879 1,253 4 20 747 -
30 - 34 3,518 921 1,978 6 36 577 -
35 - 39 3,338 509 2,327 10 48 444 -
40 - 44 2,913 312 2,247 30 57 267 -
45 - 49 2,946 267 2,345 42 53 239 -
50 - 54 2,590 188 2,087 78 48 187 2
55 - 59 2,069 122 1,659 96 45 146 1
60 - 64 1,579 85 1,236 119 37 102 -
65 - 69 914 38 723 98 14 40 1
70 - 74 596 29 438 95 10 24 -
75 - 79 340 13 232 76 3 16 -
80 years and over 223 15 113 86 2 7 -
Female 39,598 15,263 17,179 2,990 508 3,639 19
Below 20 9,946 9,503 74 - 4 364 1
20 - 24 4,352 2,615 826 3 16 891 1
25 - 29 3,700 1,270 1,656 13 33 724 4
30 - 34 3,378 543 2,273 17 53 492 -
35 - 39 3,268 308 2,499 50 73 333 5
40 - 44 2,966 194 2,343 99 82 246 2
45 - 49 2,833 199 2,199 152 65 218 -
50 - 54 2,433 168 1,789 259 64 150 3
55 - 59 2,102 102 1,493 333 60 113 1
60 - 64 1,634 113 962 457 33 68 1
65 - 69 1,137 101 571 424 17 24 -
70 - 74 738 48 290 384 5 10 1
75 - 79 560 54 134 368 1 3 -
80 years and over 551 45 70 431 2 3 -
Continued
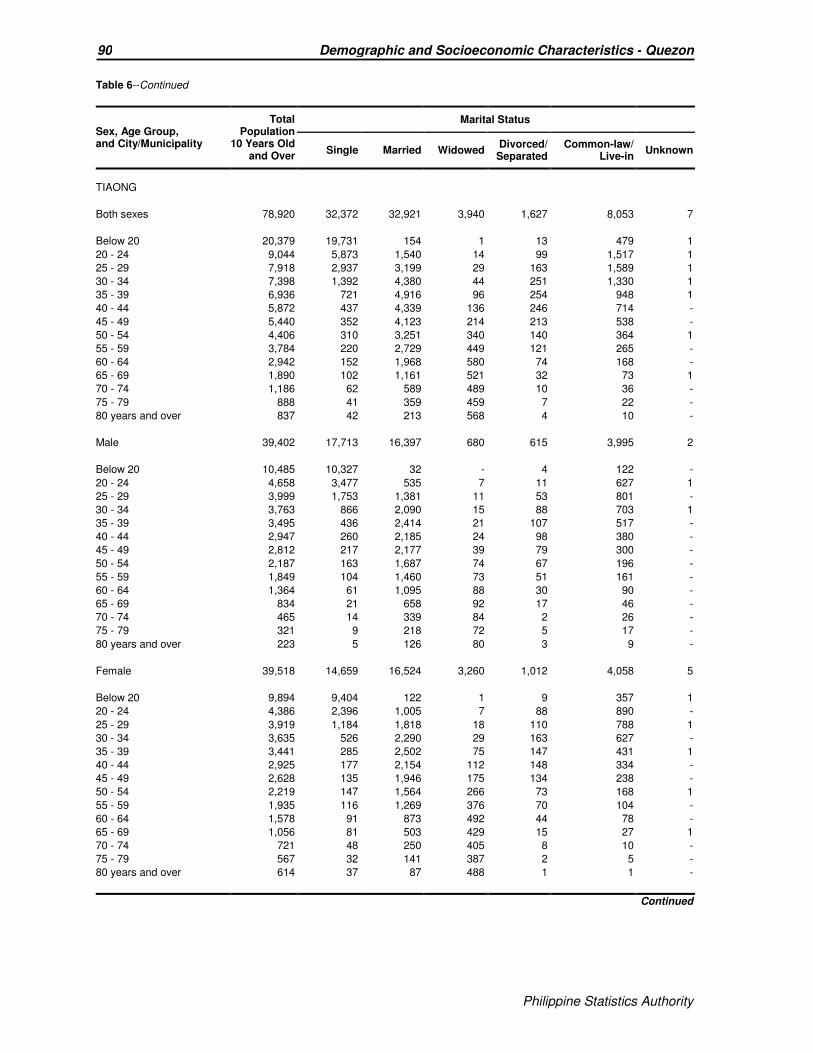
Philippine Statistics Authority
90 Demographic and Socioeconomic Characteristics - Quezon
Philippine Statistics Authority
Table 6--Continued
Sex, Age Group, and City/Municipality
Total Population
10 Years Old and Over
Marital Status
Single Married Widowed Divorced/ Separated
Common-law/ Live-in
Unknown
TIAONG
Both sexes 78,920 32,372 32,921 3,940 1,627 8,053 7
Below 20 20,379 19,731 154 1 13 479 1
20 - 24 9,044 5,873 1,540 14 99 1,517 1
25 - 29 7,918 2,937 3,199 29 163 1,589 1
30 - 34 7,398 1,392 4,380 44 251 1,330 1
35 - 39 6,936 721 4,916 96 254 948 1
40 - 44 5,872 437 4,339 136 246 714 -
45 - 49 5,440 352 4,123 214 213 538 -
50 - 54 4,406 310 3,251 340 140 364 1
55 - 59 3,784 220 2,729 449 121 265 -
60 - 64 2,942 152 1,968 580 74 168 -
65 - 69 1,890 102 1,161 521 32 73 1
70 - 74 1,186 62 589 489 10 36 -
75 - 79 888 41 359 459 7 22 -
80 years and over 837 42 213 568 4 10 -
Male 39,402 17,713 16,397 680 615 3,995 2
Below 20 10,485 10,327 32 - 4 122 -
20 - 24 4,658 3,477 535 7 11 627 1
25 - 29 3,999 1,753 1,381 11 53 801 -
30 - 34 3,763 866 2,090 15 88 703 1
35 - 39 3,495 436 2,414 21 107 517 -
40 - 44 2,947 260 2,185 24 98 380 -
45 - 49 2,812 217 2,177 39 79 300 -
50 - 54 2,187 163 1,687 74 67 196 -
55 - 59 1,849 104 1,460 73 51 161 -
60 - 64 1,364 61 1,095 88 30 90 -
65 - 69 834 21 658 92 17 46 -
70 - 74 465 14 339 84 2 26 -
75 - 79 321 9 218 72 5 17 -
80 years and over 223 5 126 80 3 9 -
Female 39,518 14,659 16,524 3,260 1,012 4,058 5
Below 20 9,894 9,404 122 1 9 357 1
20 - 24 4,386 2,396 1,005 7 88 890 -
25 - 29 3,919 1,184 1,818 18 110 788 1
30 - 34 3,635 526 2,290 29 163 627 -
35 - 39 3,441 285 2,502 75 147 431 1
40 - 44 2,925 177 2,154 112 148 334 -
45 - 49 2,628 135 1,946 175 134 238 -
50 - 54 2,219 147 1,564 266 73 168 1
55 - 59 1,935 116 1,269 376 70 104 -
60 - 64 1,578 91 873 492 44 78 -
65 - 69 1,056 81 503 429 15 27 1
70 - 74 721 48 250 405 8 10 -
75 - 79 567 32 141 387 2 5 -
80 years and over 614 37 87 488 1 1 -
Continued
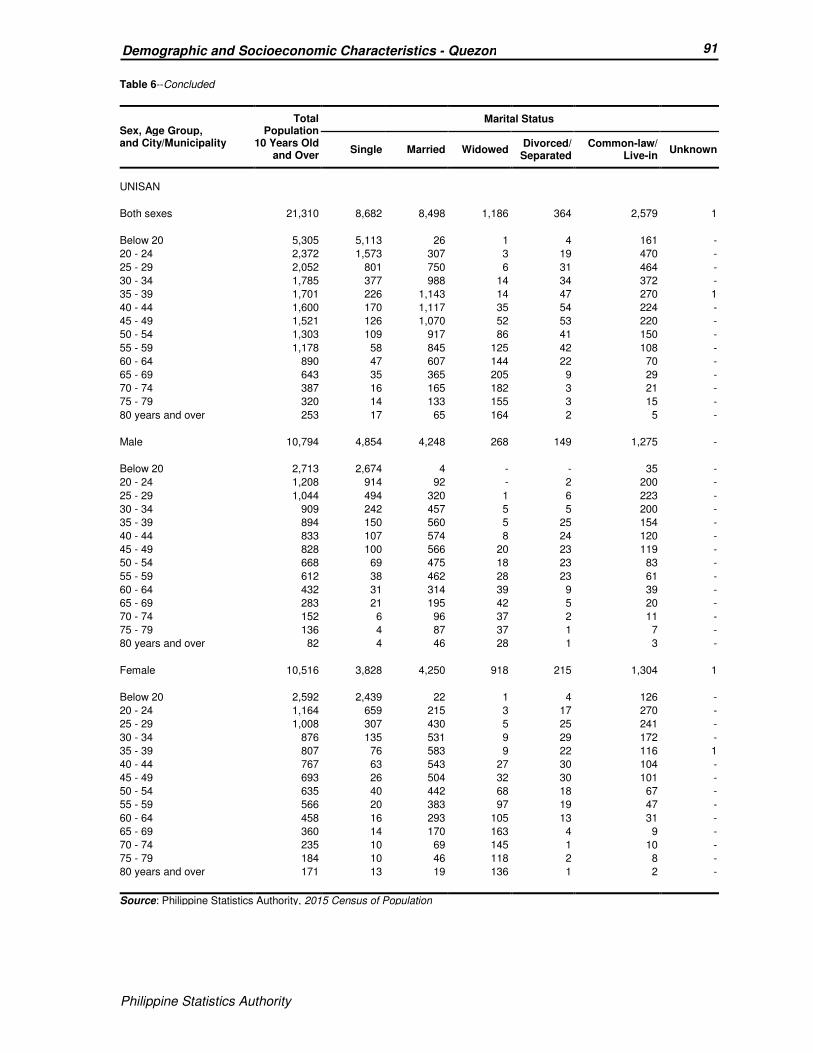
Philippine Statistics Authority
91 Demographic and Socioeconomic Characteristics - Quezon
Philippine Statistics Authority
Table 6--Concluded
Sex, Age Group, and City/Municipality
Total Population
10 Years Old and Over
Marital Status
Single Married Widowed Divorced/ Separated
Common-law/ Live-in
Unknown
UNISAN
Both sexes 21,310 8,682 8,498 1,186 364 2,579 1
Below 20 5,305 5,113 26 1 4 161 -
20 - 24 2,372 1,573 307 3 19 470 -
25 - 29 2,052 801 750 6 31 464 -
30 - 34 1,785 377 988 14 34 372 -
35 - 39 1,701 226 1,143 14 47 270 1
40 - 44 1,600 170 1,117 35 54 224 -
45 - 49 1,521 126 1,070 52 53 220 -
50 - 54 1,303 109 917 86 41 150 -
55 - 59 1,178 58 845 125 42 108 -
60 - 64 890 47 607 144 22 70 -
65 - 69 643 35 365 205 9 29 -
70 - 74 387 16 165 182 3 21 -
75 - 79 320 14 133 155 3 15 -
80 years and over 253 17 65 164 2 5 -
Male 10,794 4,854 4,248 268 149 1,275 -
Below 20 2,713 2,674 4 - - 35 -
20 - 24 1,208 914 92 - 2 200 -
25 - 29 1,044 494 320 1 6 223 -
30 - 34 909 242 457 5 5 200 -
35 - 39 894 150 560 5 25 154 -
40 - 44 833 107 574 8 24 120 -
45 - 49 828 100 566 20 23 119 -
50 - 54 668 69 475 18 23 83 -
55 - 59 612 38 462 28 23 61 -
60 - 64 432 31 314 39 9 39 -
65 - 69 283 21 195 42 5 20 -
70 - 74 152 6 96 37 2 11 -
75 - 79 136 4 87 37 1 7 -
80 years and over 82 4 46 28 1 3 -
Female 10,516 3,828 4,250 918 215 1,304 1
Below 20 2,592 2,439 22 1 4 126 -
20 - 24 1,164 659 215 3 17 270 -
25 - 29 1,008 307 430 5 25 241 -
30 - 34 876 135 531 9 29 172 -
35 - 39 807 76 583 9 22 116 1
40 - 44 767 63 543 27 30 104 -
45 - 49 693 26 504 32 30 101 -
50 - 54 635 40 442 68 18 67 -
55 - 59 566 20 383 97 19 47 -
60 - 64 458 16 293 105 13 31 -
65 - 69 360 14 170 163 4 9 -
70 - 74 235 10 69 145 1 10 -
75 - 79 184 10 46 118 2 8 -
80 years and over 171 13 19 136 1 2 -
Source: Philippine Statistics Authority, 2015 Census of Population
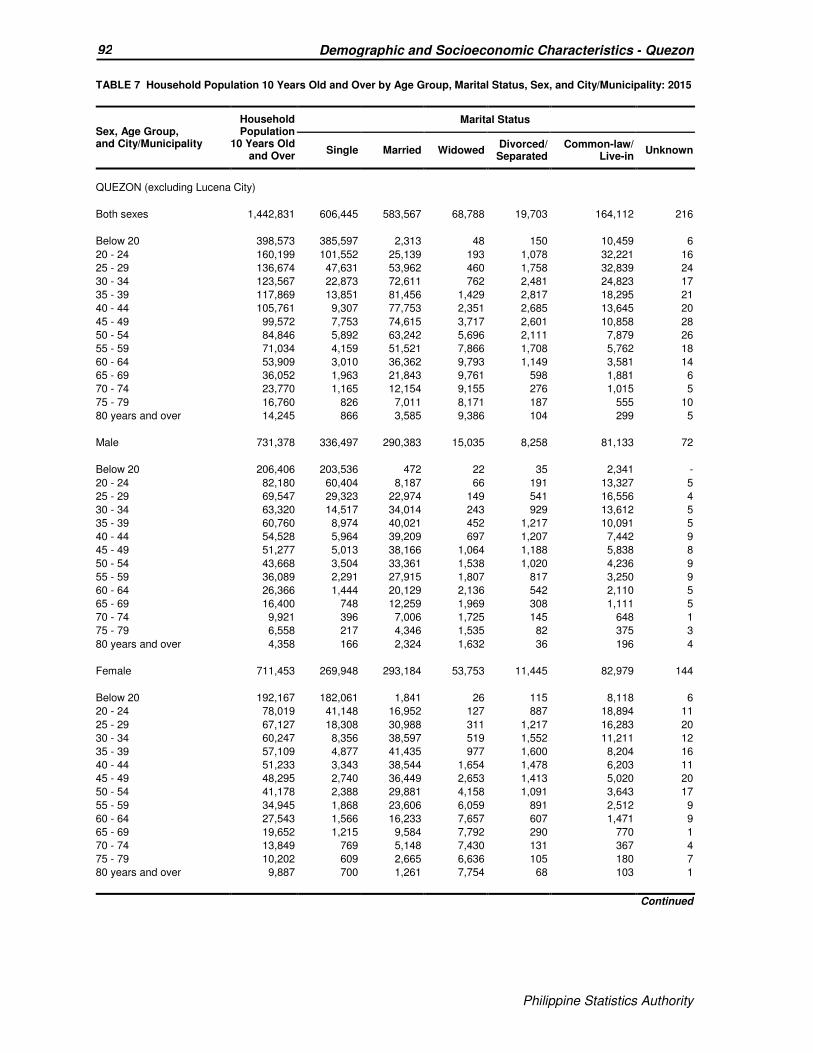
Philippine Statistics Authority
92 Demographic and Socioeconomic Characteristics - Quezon
Philippine Statistics Authority
TABLE 7 Household Population 10 Years Old and Over by Age Group, Marital Status, Sex, and City/Municipality: 2015
Sex, Age Group, and City/Municipality
Household Population
10 Years Old and Over
Marital Status
Single Married Widowed Divorced/ Separated
Common-law/ Live-in
Unknown
QUEZON (excluding Lucena City)
Both sexes 1,442,831 606,445 583,567 68,788 19,703 164,112 216
Below 20 398,573 385,597 2,313 48 150 10,459 6
20 - 24 160,199 101,552 25,139 193 1,078 32,221 16
25 - 29 136,674 47,631 53,962 460 1,758 32,839 24
30 - 34 123,567 22,873 72,611 762 2,481 24,823 17
35 - 39 117,869 13,851 81,456 1,429 2,817 18,295 21
40 - 44 105,761 9,307 77,753 2,351 2,685 13,645 20
45 - 49 99,572 7,753 74,615 3,717 2,601 10,858 28
50 - 54 84,846 5,892 63,242 5,696 2,111 7,879 26
55 - 59 71,034 4,159 51,521 7,866 1,708 5,762 18
60 - 64 53,909 3,010 36,362 9,793 1,149 3,581 14
65 - 69 36,052 1,963 21,843 9,761 598 1,881 6
70 - 74 23,770 1,165 12,154 9,155 276 1,015 5
75 - 79 16,760 826 7,011 8,171 187 555 10
80 years and over 14,245 866 3,585 9,386 104 299 5
Male 731,378 336,497 290,383 15,035 8,258 81,133 72
Below 20 206,406 203,536 472 22 35 2,341 -
20 - 24 82,180 60,404 8,187 66 191 13,327 5
25 - 29 69,547 29,323 22,974 149 541 16,556 4
30 - 34 63,320 14,517 34,014 243 929 13,612 5
35 - 39 60,760 8,974 40,021 452 1,217 10,091 5
40 - 44 54,528 5,964 39,209 697 1,207 7,442 9
45 - 49 51,277 5,013 38,166 1,064 1,188 5,838 8
50 - 54 43,668 3,504 33,361 1,538 1,020 4,236 9
55 - 59 36,089 2,291 27,915 1,807 817 3,250 9
60 - 64 26,366 1,444 20,129 2,136 542 2,110 5
65 - 69 16,400 748 12,259 1,969 308 1,111 5
70 - 74 9,921 396 7,006 1,725 145 648 1
75 - 79 6,558 217 4,346 1,535 82 375 3
80 years and over 4,358 166 2,324 1,632 36 196 4
Female 711,453 269,948 293,184 53,753 11,445 82,979 144
Below 20 192,167 182,061 1,841 26 115 8,118 6
20 - 24 78,019 41,148 16,952 127 887 18,894 11
25 - 29 67,127 18,308 30,988 311 1,217 16,283 20
30 - 34 60,247 8,356 38,597 519 1,552 11,211 12
35 - 39 57,109 4,877 41,435 977 1,600 8,204 16
40 - 44 51,233 3,343 38,544 1,654 1,478 6,203 11
45 - 49 48,295 2,740 36,449 2,653 1,413 5,020 20
50 - 54 41,178 2,388 29,881 4,158 1,091 3,643 17
55 - 59 34,945 1,868 23,606 6,059 891 2,512 9
60 - 64 27,543 1,566 16,233 7,657 607 1,471 9
65 - 69 19,652 1,215 9,584 7,792 290 770 1
70 - 74 13,849 769 5,148 7,430 131 367 4
75 - 79 10,202 609 2,665 6,636 105 180 7
80 years and over 9,887 700 1,261 7,754 68 103 1
Continued

Philippine Statistics Authority
93 Demographic and Socioeconomic Characteristics - Quezon
Philippine Statistics Authority
Table 7--Continued
Sex, Age Group, and City/Municipality
Household Population
10 Years Old and Over
Marital Status
Single Married Widowed Divorced/ Separated
Common-law/ Live-in
Unknown
AGDANGAN
Both sexes 10,174 4,040 4,148 630 9 1,347 -
Below 20 2,634 2,537 4 - - 93 -
20 - 24 1,023 638 129 3 1 252 -
25 - 29 878 283 345 1 - 249 -
30 - 34 817 157 468 5 1 186 -
35 - 39 793 94 547 12 1 139 -
40 - 44 749 84 527 14 2 122 -
45 - 49 784 72 578 30 2 102 -
50 - 54 658 58 488 44 - 68 -
55 - 59 592 46 408 70 1 67 -
60 - 64 431 22 276 93 1 39 -
65 - 69 328 20 205 93 - 10 -
70 - 74 204 17 85 90 - 12 -
75 - 79 152 8 56 80 - 8 -
80 years and over 131 4 32 95 - - -
Male 5,101 2,253 2,063 124 4 657 -
Below 20 1,356 1,331 - - - 25 -
20 - 24 530 393 39 - - 98 -
25 - 29 444 184 139 - - 121 -
30 - 34 426 97 223 - 1 105 -
35 - 39 395 63 254 5 - 73 -
40 - 44 368 50 254 5 2 57 -
45 - 49 423 53 304 4 - 62 -
50 - 54 335 29 257 9 - 40 -
55 - 59 293 27 215 14 - 37 -
60 - 64 214 11 158 23 1 21 -
65 - 69 144 9 117 15 - 3 -
70 - 74 80 5 45 21 - 9 -
75 - 79 56 - 37 13 - 6 -
80 years and over 37 1 21 15 - - -
Female 5,073 1,787 2,085 506 5 690 -
Below 20 1,278 1,206 4 - - 68 -
20 - 24 493 245 90 3 1 154 -
25 - 29 434 99 206 1 - 128 -
30 - 34 391 60 245 5 - 81 -
35 - 39 398 31 293 7 1 66 -
40 - 44 381 34 273 9 - 65 -
45 - 49 361 19 274 26 2 40 -
50 - 54 323 29 231 35 - 28 -
55 - 59 299 19 193 56 1 30 -
60 - 64 217 11 118 70 - 18 -
65 - 69 184 11 88 78 - 7 -
70 - 74 124 12 40 69 - 3 -
75 - 79 96 8 19 67 - 2 -
80 years and over 94 3 11 80 - - -
Continued
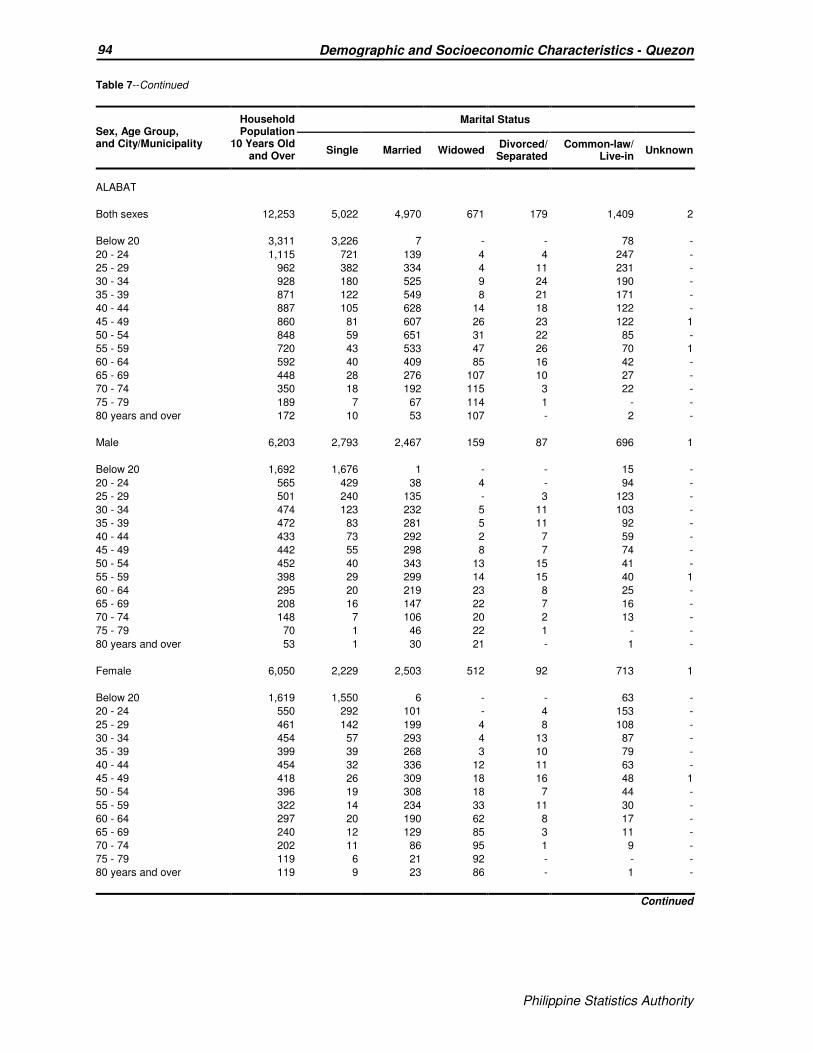
Philippine Statistics Authority
94 Demographic and Socioeconomic Characteristics - Quezon
Philippine Statistics Authority
Table 7--Continued
Sex, Age Group, and City/Municipality
Household Population
10 Years Old and Over
Marital Status
Single Married Widowed Divorced/ Separated
Common-law/ Live-in
Unknown
ALABAT
Both sexes 12,253 5,022 4,970 671 179 1,409 2
Below 20 3,311 3,226 7 - - 78 -
20 - 24 1,115 721 139 4 4 247 -
25 - 29 962 382 334 4 11 231 -
30 - 34 928 180 525 9 24 190 -
35 - 39 871 122 549 8 21 171 -
40 - 44 887 105 628 14 18 122 -
45 - 49 860 81 607 26 23 122 1
50 - 54 848 59 651 31 22 85 -
55 - 59 720 43 533 47 26 70 1
60 - 64 592 40 409 85 16 42 -
65 - 69 448 28 276 107 10 27 -
70 - 74 350 18 192 115 3 22 -
75 - 79 189 7 67 114 1 - -
80 years and over 172 10 53 107 - 2 -
Male 6,203 2,793 2,467 159 87 696 1
Below 20 1,692 1,676 1 - - 15 -
20 - 24 565 429 38 4 - 94 -
25 - 29 501 240 135 - 3 123 -
30 - 34 474 123 232 5 11 103 -
35 - 39 472 83 281 5 11 92 -
40 - 44 433 73 292 2 7 59 -
45 - 49 442 55 298 8 7 74 -
50 - 54 452 40 343 13 15 41 -
55 - 59 398 29 299 14 15 40 1
60 - 64 295 20 219 23 8 25 -
65 - 69 208 16 147 22 7 16 -
70 - 74 148 7 106 20 2 13 -
75 - 79 70 1 46 22 1 - -
80 years and over 53 1 30 21 - 1 -
Female 6,050 2,229 2,503 512 92 713 1
Below 20 1,619 1,550 6 - - 63 -
20 - 24 550 292 101 - 4 153 -
25 - 29 461 142 199 4 8 108 -
30 - 34 454 57 293 4 13 87 -
35 - 39 399 39 268 3 10 79 -
40 - 44 454 32 336 12 11 63 -
45 - 49 418 26 309 18 16 48 1
50 - 54 396 19 308 18 7 44 -
55 - 59 322 14 234 33 11 30 -
60 - 64 297 20 190 62 8 17 -
65 - 69 240 12 129 85 3 11 -
70 - 74 202 11 86 95 1 9 -
75 - 79 119 6 21 92 - - -
80 years and over 119 9 23 86 - 1 -
Continued
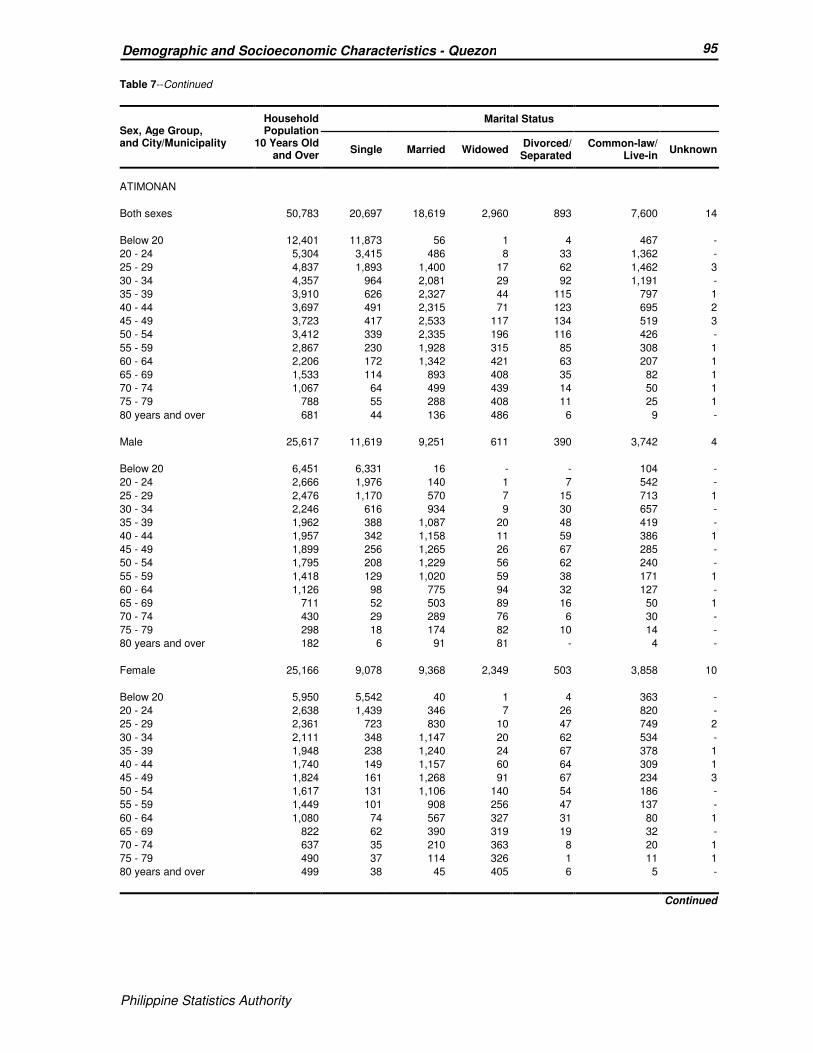
Philippine Statistics Authority
95 Demographic and Socioeconomic Characteristics - Quezon
Philippine Statistics Authority
Table 7--Continued
Sex, Age Group, and City/Municipality
Household Population
10 Years Old and Over
Marital Status
Single Married Widowed Divorced/ Separated
Common-law/ Live-in
Unknown
ATIMONAN
Both sexes 50,783 20,697 18,619 2,960 893 7,600 14
Below 20 12,401 11,873 56 1 4 467 -
20 - 24 5,304 3,415 486 8 33 1,362 -
25 - 29 4,837 1,893 1,400 17 62 1,462 3
30 - 34 4,357 964 2,081 29 92 1,191 -
35 - 39 3,910 626 2,327 44 115 797 1
40 - 44 3,697 491 2,315 71 123 695 2
45 - 49 3,723 417 2,533 117 134 519 3
50 - 54 3,412 339 2,335 196 116 426 -
55 - 59 2,867 230 1,928 315 85 308 1
60 - 64 2,206 172 1,342 421 63 207 1
65 - 69 1,533 114 893 408 35 82 1
70 - 74 1,067 64 499 439 14 50 1
75 - 79 788 55 288 408 11 25 1
80 years and over 681 44 136 486 6 9 -
Male 25,617 11,619 9,251 611 390 3,742 4
Below 20 6,451 6,331 16 - - 104 -
20 - 24 2,666 1,976 140 1 7 542 -
25 - 29 2,476 1,170 570 7 15 713 1
30 - 34 2,246 616 934 9 30 657 -
35 - 39 1,962 388 1,087 20 48 419 -
40 - 44 1,957 342 1,158 11 59 386 1
45 - 49 1,899 256 1,265 26 67 285 -
50 - 54 1,795 208 1,229 56 62 240 -
55 - 59 1,418 129 1,020 59 38 171 1
60 - 64 1,126 98 775 94 32 127 -
65 - 69 711 52 503 89 16 50 1
70 - 74 430 29 289 76 6 30 -
75 - 79 298 18 174 82 10 14 -
80 years and over 182 6 91 81 - 4 -
Female 25,166 9,078 9,368 2,349 503 3,858 10
Below 20 5,950 5,542 40 1 4 363 -
20 - 24 2,638 1,439 346 7 26 820 -
25 - 29 2,361 723 830 10 47 749 2
30 - 34 2,111 348 1,147 20 62 534 -
35 - 39 1,948 238 1,240 24 67 378 1
40 - 44 1,740 149 1,157 60 64 309 1
45 - 49 1,824 161 1,268 91 67 234 3
50 - 54 1,617 131 1,106 140 54 186 -
55 - 59 1,449 101 908 256 47 137 -
60 - 64 1,080 74 567 327 31 80 1
65 - 69 822 62 390 319 19 32 -
70 - 74 637 35 210 363 8 20 1
75 - 79 490 37 114 326 1 11 1
80 years and over 499 38 45 405 6 5 -
Continued

Philippine Statistics Authority
96 Demographic and Socioeconomic Characteristics - Quezon
Philippine Statistics Authority
Table 7--Continued
Sex, Age Group, and City/Municipality
Household Population
10 Years Old and Over
Marital Status
Single Married Widowed Divorced/ Separated
Common-law/ Live-in
Unknown
BUENAVISTA
Both sexes 22,146 9,103 8,907 879 126 3,129 2
Below 20 7,152 6,865 44 1 2 240 -
20 - 24 2,166 1,073 456 5 8 624 -
25 - 29 1,991 468 874 11 13 624 1
30 - 34 1,857 233 1,127 10 11 476 -
35 - 39 1,869 165 1,340 18 19 327 -
40 - 44 1,730 114 1,315 37 10 254 -
45 - 49 1,506 71 1,135 63 23 213 1
50 - 54 1,174 25 911 74 11 153 -
55 - 59 901 35 667 106 9 84 -
60 - 64 683 22 468 125 14 54 -
65 - 69 462 8 290 129 4 31 -
70 - 74 291 9 149 112 2 19 -
75 - 79 203 5 88 88 - 22 -
80 years and over 161 10 43 100 - 8 -
Male 11,510 5,242 4,446 224 59 1,539 -
Below 20 3,765 3,711 7 - 1 46 -
20 - 24 1,098 711 140 3 - 244 -
25 - 29 1,026 314 377 3 5 327 -
30 - 34 1,002 179 535 6 6 276 -
35 - 39 988 131 669 3 10 175 -
40 - 44 905 84 659 13 2 147 -
45 - 49 813 56 612 24 10 111 -
50 - 54 620 14 494 30 7 75 -
55 - 59 474 22 366 26 7 53 -
60 - 64 321 11 248 20 8 34 -
65 - 69 225 2 166 31 3 23 -
70 - 74 117 3 86 18 - 10 -
75 - 79 99 2 61 22 - 14 -
80 years and over 57 2 26 25 - 4 -
Female 10,636 3,861 4,461 655 67 1,590 2
Below 20 3,387 3,154 37 1 1 194 -
20 - 24 1,068 362 316 2 8 380 -
25 - 29 965 154 497 8 8 297 1
30 - 34 855 54 592 4 5 200 -
35 - 39 881 34 671 15 9 152 -
40 - 44 825 30 656 24 8 107 -
45 - 49 693 15 523 39 13 102 1
50 - 54 554 11 417 44 4 78 -
55 - 59 427 13 301 80 2 31 -
60 - 64 362 11 220 105 6 20 -
65 - 69 237 6 124 98 1 8 -
70 - 74 174 6 63 94 2 9 -
75 - 79 104 3 27 66 - 8 -
80 years and over 104 8 17 75 - 4 -
Continued

Philippine Statistics Authority
97 Demographic and Socioeconomic Characteristics - Quezon
Philippine Statistics Authority
Table 7--Continued
Sex, Age Group, and City/Municipality
Household Population
10 Years Old and Over
Marital Status
Single Married Widowed Divorced/ Separated
Common-law/ Live-in
Unknown
BURDEOS
Both sexes 20,022 8,670 7,395 760 163 3,033 1
Below 20 6,277 6,051 28 1 2 195 -
20 - 24 2,412 1,496 296 6 12 602 -
25 - 29 2,003 605 738 10 20 630 -
30 - 34 1,573 199 938 10 25 401 -
35 - 39 1,434 96 1,000 14 20 304 -
40 - 44 1,494 68 1,079 40 23 283 1
45 - 49 1,323 49 1,014 47 13 200 -
50 - 54 1,008 31 759 59 15 144 -
55 - 59 858 22 632 92 11 101 -
60 - 64 655 12 436 116 14 77 -
65 - 69 409 19 225 113 4 48 -
70 - 74 294 12 143 106 - 33 -
75 - 79 165 5 71 77 3 9 -
80 years and over 117 5 36 69 1 6 -
Male 10,502 4,992 3,699 209 87 1,514 1
Below 20 3,316 3,267 2 1 2 44 -
20 - 24 1,282 947 78 3 4 250 -
25 - 29 1,064 420 308 1 9 326 -
30 - 34 864 139 462 4 15 244 -
35 - 39 738 67 491 11 11 158 -
40 - 44 810 59 549 21 9 171 1
45 - 49 686 39 528 22 7 90 -
50 - 54 513 22 384 21 10 76 -
55 - 59 457 9 361 20 9 58 -
60 - 64 330 5 254 28 7 36 -
65 - 69 170 5 118 18 3 26 -
70 - 74 147 7 92 26 - 22 -
75 - 79 73 5 43 18 - 7 -
80 years and over 52 1 29 15 1 6 -
Female 9,520 3,678 3,696 551 76 1,519 -
Below 20 2,961 2,784 26 - - 151 -
20 - 24 1,130 549 218 3 8 352 -
25 - 29 939 185 430 9 11 304 -
30 - 34 709 60 476 6 10 157 -
35 - 39 696 29 509 3 9 146 -
40 - 44 684 9 530 19 14 112 -
45 - 49 637 10 486 25 6 110 -
50 - 54 495 9 375 38 5 68 -
55 - 59 401 13 271 72 2 43 -
60 - 64 325 7 182 88 7 41 -
65 - 69 239 14 107 95 1 22 -
70 - 74 147 5 51 80 - 11 -
75 - 79 92 - 28 59 3 2 -
80 years and over 65 4 7 54 - - -
Continued

Philippine Statistics Authority
98 Demographic and Socioeconomic Characteristics - Quezon
Philippine Statistics Authority
Table 7--Continued
Sex, Age Group, and City/Municipality
Household Population
10 Years Old and Over
Marital Status
Single Married Widowed Divorced/ Separated
Common-law/ Live-in
Unknown
CALAUAG
Both sexes 56,396 24,064 22,206 2,778 827 6,515 6
Below 20 16,145 15,617 83 3 9 433 -
20 - 24 6,132 3,889 871 4 54 1,314 -
25 - 29 5,264 1,736 2,065 18 75 1,370 -
30 - 34 4,451 780 2,548 28 97 996 2
35 - 39 4,382 541 2,981 62 115 683 -
40 - 44 4,201 447 3,064 80 115 495 -
45 - 49 4,006 343 2,974 167 111 410 1
50 - 54 3,376 255 2,508 220 90 302 1
55 - 59 2,800 163 2,003 335 79 219 1
60 - 64 1,982 111 1,317 373 48 133 -
65 - 69 1,489 80 896 412 18 83 -
70 - 74 952 38 491 374 9 40 -
75 - 79 685 34 271 353 5 21 1
80 years and over 531 30 134 349 2 16 -
Male 28,605 13,374 11,009 637 361 3,223 1
Below 20 8,370 8,266 19 2 1 82 -
20 - 24 3,116 2,302 266 1 8 539 -
25 - 29 2,645 1,084 828 6 21 706 -
30 - 34 2,314 495 1,204 12 44 559 -
35 - 39 2,290 359 1,477 27 53 374 -
40 - 44 2,178 292 1,522 31 51 282 -
45 - 49 2,035 223 1,487 51 58 216 -
50 - 54 1,789 165 1,348 70 47 158 1
55 - 59 1,430 90 1,087 80 38 135 -
60 - 64 962 48 738 84 21 71 -
65 - 69 662 27 495 83 9 48 -
70 - 74 389 7 286 62 6 28 -
75 - 79 269 9 172 69 4 15 -
80 years and over 156 7 80 59 - 10 -
Female 27,791 10,690 11,197 2,141 466 3,292 5
Below 20 7,775 7,351 64 1 8 351 -
20 - 24 3,016 1,587 605 3 46 775 -
25 - 29 2,619 652 1,237 12 54 664 -
30 - 34 2,137 285 1,344 16 53 437 2
35 - 39 2,092 182 1,504 35 62 309 -
40 - 44 2,023 155 1,542 49 64 213 -
45 - 49 1,971 120 1,487 116 53 194 1
50 - 54 1,587 90 1,160 150 43 144 -
55 - 59 1,370 73 916 255 41 84 1
60 - 64 1,020 63 579 289 27 62 -
65 - 69 827 53 401 329 9 35 -
70 - 74 563 31 205 312 3 12 -
75 - 79 416 25 99 284 1 6 1
80 years and over 375 23 54 290 2 6 -
Continued

Philippine Statistics Authority
99 Demographic and Socioeconomic Characteristics - Quezon
Philippine Statistics Authority
Table 7--Continued
Sex, Age Group, and City/Municipality
Household Population
10 Years Old and Over
Marital Status
Single Married Widowed Divorced/ Separated
Common-law/ Live-in
Unknown
CANDELARIA
Both sexes 93,032 39,684 37,317 4,598 1,583 9,833 17
Below 20 24,049 23,318 132 - 10 589 -
20 - 24 10,705 6,872 1,726 12 80 2,015 -
25 - 29 9,422 3,573 3,686 29 133 2,001 -
30 - 34 8,643 1,875 4,883 57 217 1,608 3
35 - 39 8,297 1,179 5,614 116 259 1,127 2
40 - 44 7,120 807 5,050 188 230 843 2
45 - 49 6,230 587 4,569 254 226 593 1
50 - 54 5,417 477 3,916 427 160 434 3
55 - 59 4,588 385 3,155 592 131 322 3
60 - 64 3,502 257 2,298 716 76 154 1
65 - 69 1,960 133 1,118 602 29 78 -
70 - 74 1,272 85 632 508 17 29 1
75 - 79 900 61 348 457 9 24 1
80 years and over 927 75 190 640 6 16 -
Male 46,271 21,382 18,544 873 613 4,856 3
Below 20 12,395 12,229 23 - 1 142 -
20 - 24 5,334 3,898 586 4 9 837 -
25 - 29 4,752 2,094 1,606 15 51 986 -
30 - 34 4,407 1,113 2,325 15 72 882 -
35 - 39 4,230 673 2,791 34 96 634 2
40 - 44 3,665 464 2,600 33 111 457 -
45 - 49 3,082 353 2,264 55 97 313 -
50 - 54 2,692 235 2,059 91 65 242 -
55 - 59 2,244 167 1,730 107 56 183 1
60 - 64 1,625 80 1,272 150 32 91 -
65 - 69 818 36 616 108 11 47 -
70 - 74 471 21 348 76 9 17 -
75 - 79 311 9 205 81 2 14 -
80 years and over 245 10 119 104 1 11 -
Female 46,761 18,302 18,773 3,725 970 4,977 14
Below 20 11,654 11,089 109 - 9 447 -
20 - 24 5,371 2,974 1,140 8 71 1,178 -
25 - 29 4,670 1,479 2,080 14 82 1,015 -
30 - 34 4,236 762 2,558 42 145 726 3
35 - 39 4,067 506 2,823 82 163 493 -
40 - 44 3,455 343 2,450 155 119 386 2
45 - 49 3,148 234 2,305 199 129 280 1
50 - 54 2,725 242 1,857 336 95 192 3
55 - 59 2,344 218 1,425 485 75 139 2
60 - 64 1,877 177 1,026 566 44 63 1
65 - 69 1,142 97 502 494 18 31 -
70 - 74 801 64 284 432 8 12 1
75 - 79 589 52 143 376 7 10 1
80 years and over 682 65 71 536 5 5 -
Continued

Philippine Statistics Authority
100 Demographic and Socioeconomic Characteristics - Quezon
Philippine Statistics Authority
Table 7--Continued
Sex, Age Group, and City/Municipality
Household Population
10 Years Old and Over
Marital Status
Single Married Widowed Divorced/ Separated
Common-law/ Live-in
Unknown
CATANAUAN
Both sexes 54,507 24,283 22,067 2,428 589 5,135 5
Below 20 16,557 16,106 126 1 10 314 -
20 - 24 6,285 4,093 1,048 5 34 1,105 -
25 - 29 5,088 1,719 2,224 16 54 1,075 -
30 - 34 4,537 787 2,838 36 78 798 -
35 - 39 4,141 435 3,042 51 74 538 1
40 - 44 3,849 266 2,985 94 88 415 1
45 - 49 3,565 299 2,767 129 64 305 1
50 - 54 2,834 194 2,217 176 58 189 -
55 - 59 2,528 141 1,878 283 46 179 1
60 - 64 1,877 86 1,317 343 33 97 1
65 - 69 1,316 64 804 367 27 54 -
70 - 74 820 31 412 327 10 40 -
75 - 79 624 30 275 294 8 17 -
80 years and over 486 32 134 306 5 9 -
Male 27,855 13,457 10,988 610 232 2,565 3
Below 20 8,557 8,456 31 1 2 67 -
20 - 24 3,274 2,454 347 4 6 463 -
25 - 29 2,637 1,091 955 8 17 566 -
30 - 34 2,375 524 1,357 18 31 445 -
35 - 39 2,158 299 1,505 16 36 301 1
40 - 44 2,008 174 1,539 27 36 232 -
45 - 49 1,834 187 1,423 33 30 161 -
50 - 54 1,477 105 1,177 59 25 111 -
55 - 59 1,272 78 999 87 15 92 1
60 - 64 897 37 709 86 11 53 1
65 - 69 590 22 444 78 15 31 -
70 - 74 344 9 239 69 4 23 -
75 - 79 258 13 176 54 3 12 -
80 years and over 174 8 87 70 1 8 -
Female 26,652 10,826 11,079 1,818 357 2,570 2
Below 20 8,000 7,650 95 - 8 247 -
20 - 24 3,011 1,639 701 1 28 642 -
25 - 29 2,451 628 1,269 8 37 509 -
30 - 34 2,162 263 1,481 18 47 353 -
35 - 39 1,983 136 1,537 35 38 237 -
40 - 44 1,841 92 1,446 67 52 183 1
45 - 49 1,731 112 1,344 96 34 144 1
50 - 54 1,357 89 1,040 117 33 78 -
55 - 59 1,256 63 879 196 31 87 -
60 - 64 980 49 608 257 22 44 -
65 - 69 726 42 360 289 12 23 -
70 - 74 476 22 173 258 6 17 -
75 - 79 366 17 99 240 5 5 -
80 years and over 312 24 47 236 4 1 -
Continued

Philippine Statistics Authority
101 Demographic and Socioeconomic Characteristics - Quezon
Philippine Statistics Authority
Table 7--Continued
Sex, Age Group, and City/Municipality
Household Population
10 Years Old and Over
Marital Status
Single Married Widowed Divorced/ Separated
Common-law/ Live-in
Unknown
DOLORES
Both sexes 23,002 9,411 10,077 1,240 374 1,900 -
Below 20 5,607 5,448 47 2 1 109 -
20 - 24 2,638 1,806 441 3 14 374 -
25 - 29 2,253 848 941 8 42 414 -
30 - 34 2,077 387 1,344 15 44 287 -
35 - 39 2,002 247 1,443 28 43 241 -
40 - 44 1,699 150 1,305 39 62 143 -
45 - 49 1,687 140 1,285 72 49 141 -
50 - 54 1,457 105 1,113 114 37 88 -
55 - 59 1,180 73 870 141 44 52 -
60 - 64 871 78 587 165 17 24 -
65 - 69 587 51 349 161 8 18 -
70 - 74 363 30 155 165 9 4 -
75 - 79 300 19 134 141 2 4 -
80 years and over 281 29 63 186 2 1 -
Male 11,507 5,149 5,009 230 167 952 -
Below 20 2,919 2,879 12 - - 28 -
20 - 24 1,347 1,031 151 1 6 158 -
25 - 29 1,142 504 410 1 14 213 -
30 - 34 1,018 231 604 3 25 155 -
35 - 39 1,036 161 727 4 16 128 -
40 - 44 869 96 656 11 27 79 -
45 - 49 858 93 651 14 18 82 -
50 - 54 730 55 579 27 22 47 -
55 - 59 604 34 493 27 23 27 -
60 - 64 396 28 323 21 6 18 -
65 - 69 262 18 201 27 4 12 -
70 - 74 127 9 82 29 5 2 -
75 - 79 110 3 79 26 - 2 -
80 years and over 89 7 41 39 1 1 -
Female 11,495 4,262 5,068 1,010 207 948 -
Below 20 2,688 2,569 35 2 1 81 -
20 - 24 1,291 775 290 2 8 216 -
25 - 29 1,111 344 531 7 28 201 -
30 - 34 1,059 156 740 12 19 132 -
35 - 39 966 86 716 24 27 113 -
40 - 44 830 54 649 28 35 64 -
45 - 49 829 47 634 58 31 59 -
50 - 54 727 50 534 87 15 41 -
55 - 59 576 39 377 114 21 25 -
60 - 64 475 50 264 144 11 6 -
65 - 69 325 33 148 134 4 6 -
70 - 74 236 21 73 136 4 2 -
75 - 79 190 16 55 115 2 2 -
80 years and over 192 22 22 147 1 - -
Continued

Philippine Statistics Authority
102 Demographic and Socioeconomic Characteristics - Quezon
Philippine Statistics Authority
Table 7--Continued
Sex, Age Group, and City/Municipality
Household Population
10 Years Old and Over
Marital Status
Single Married Widowed Divorced/ Separated
Common-law/ Live-in
Unknown
GENERAL LUNA
Both sexes 20,780 9,090 8,069 922 251 2,435 13
Below 20 6,162 5,981 29 - 3 149 -
20 - 24 2,431 1,569 330 1 14 514 3
25 - 29 1,974 686 756 3 32 496 1
30 - 34 1,729 311 999 11 39 366 3
35 - 39 1,609 193 1,103 23 36 254 -
40 - 44 1,418 73 1,115 24 26 179 1
45 - 49 1,357 98 1,030 60 27 140 2
50 - 54 1,135 62 876 66 25 104 2
55 - 59 920 44 652 106 23 95 -
60 - 64 762 30 537 125 13 56 1
65 - 69 543 20 340 134 4 45 -
70 - 74 340 11 181 121 5 22 -
75 - 79 215 7 80 114 3 11 -
80 years and over 185 5 41 134 1 4 -
Male 10,639 5,063 4,030 219 121 1,204 2
Below 20 3,227 3,183 6 - - 38 -
20 - 24 1,244 917 103 - 4 218 2
25 - 29 1,026 425 329 1 12 259 -
30 - 34 902 203 481 6 19 193 -
35 - 39 819 125 527 10 17 140 -
40 - 44 768 50 590 11 17 100 -
45 - 49 684 59 527 19 9 70 -
50 - 54 591 41 467 14 18 51 -
55 - 59 461 25 347 25 10 54 -
60 - 64 377 14 281 40 7 35 -
65 - 69 257 13 190 24 3 27 -
70 - 74 148 4 107 22 4 11 -
75 - 79 80 2 48 23 1 6 -
80 years and over 55 2 27 24 - 2 -
Female 10,141 4,027 4,039 703 130 1,231 11
Below 20 2,935 2,798 23 - 3 111 -
20 - 24 1,187 652 227 1 10 296 1
25 - 29 948 261 427 2 20 237 1
30 - 34 827 108 518 5 20 173 3
35 - 39 790 68 576 13 19 114 -
40 - 44 650 23 525 13 9 79 1
45 - 49 673 39 503 41 18 70 2
50 - 54 544 21 409 52 7 53 2
55 - 59 459 19 305 81 13 41 -
60 - 64 385 16 256 85 6 21 1
65 - 69 286 7 150 110 1 18 -
70 - 74 192 7 74 99 1 11 -
75 - 79 135 5 32 91 2 5 -
80 years and over 130 3 14 110 1 2 -
Continued
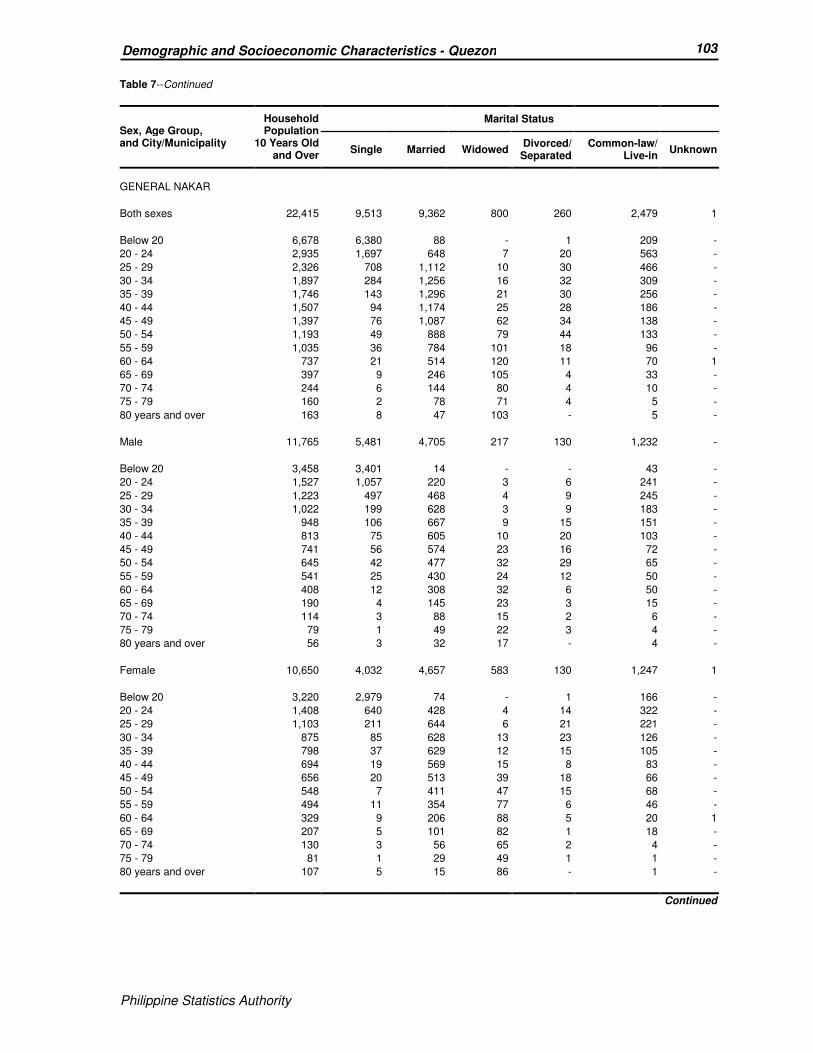
Philippine Statistics Authority
103 Demographic and Socioeconomic Characteristics - Quezon
Philippine Statistics Authority
Table 7--Continued
Sex, Age Group, and City/Municipality
Household Population
10 Years Old and Over
Marital Status
Single Married Widowed Divorced/ Separated
Common-law/ Live-in
Unknown
GENERAL NAKAR
Both sexes 22,415 9,513 9,362 800 260 2,479 1
Below 20 6,678 6,380 88 - 1 209 -
20 - 24 2,935 1,697 648 7 20 563 -
25 - 29 2,326 708 1,112 10 30 466 -
30 - 34 1,897 284 1,256 16 32 309 -
35 - 39 1,746 143 1,296 21 30 256 -
40 - 44 1,507 94 1,174 25 28 186 -
45 - 49 1,397 76 1,087 62 34 138 -
50 - 54 1,193 49 888 79 44 133 -
55 - 59 1,035 36 784 101 18 96 -
60 - 64 737 21 514 120 11 70 1
65 - 69 397 9 246 105 4 33 -
70 - 74 244 6 144 80 4 10 -
75 - 79 160 2 78 71 4 5 -
80 years and over 163 8 47 103 - 5 -
Male 11,765 5,481 4,705 217 130 1,232 -
Below 20 3,458 3,401 14 - - 43 -
20 - 24 1,527 1,057 220 3 6 241 -
25 - 29 1,223 497 468 4 9 245 -
30 - 34 1,022 199 628 3 9 183 -
35 - 39 948 106 667 9 15 151 -
40 - 44 813 75 605 10 20 103 -
45 - 49 741 56 574 23 16 72 -
50 - 54 645 42 477 32 29 65 -
55 - 59 541 25 430 24 12 50 -
60 - 64 408 12 308 32 6 50 -
65 - 69 190 4 145 23 3 15 -
70 - 74 114 3 88 15 2 6 -
75 - 79 79 1 49 22 3 4 -
80 years and over 56 3 32 17 - 4 -
Female 10,650 4,032 4,657 583 130 1,247 1
Below 20 3,220 2,979 74 - 1 166 -
20 - 24 1,408 640 428 4 14 322 -
25 - 29 1,103 211 644 6 21 221 -
30 - 34 875 85 628 13 23 126 -
35 - 39 798 37 629 12 15 105 -
40 - 44 694 19 569 15 8 83 -
45 - 49 656 20 513 39 18 66 -
50 - 54 548 7 411 47 15 68 -
55 - 59 494 11 354 77 6 46 -
60 - 64 329 9 206 88 5 20 1
65 - 69 207 5 101 82 1 18 -
70 - 74 130 3 56 65 2 4 -
75 - 79 81 1 29 49 1 1 -
80 years and over 107 5 15 86 - 1 -
Continued

Philippine Statistics Authority
104 Demographic and Socioeconomic Characteristics - Quezon
Philippine Statistics Authority
Table 7--Continued
Sex, Age Group, and City/Municipality
Household Population
10 Years Old and Over
Marital Status
Single Married Widowed Divorced/ Separated
Common-law/ Live-in
Unknown
GUINAYANGAN
Both sexes 35,136 14,895 14,206 1,639 325 4,068 3
Below 20 9,976 9,669 53 1 5 247 1
20 - 24 3,884 2,522 631 2 19 710 -
25 - 29 3,335 1,166 1,315 11 32 811 -
30 - 34 3,001 525 1,749 22 39 666 -
35 - 39 2,840 318 1,966 36 42 478 -
40 - 44 2,537 221 1,870 55 43 348 -
45 - 49 2,456 154 1,870 83 35 314 -
50 - 54 2,114 117 1,646 126 44 181 -
55 - 59 1,672 74 1,263 172 28 134 1
60 - 64 1,237 55 817 258 14 93 -
65 - 69 808 25 500 225 13 45 -
70 - 74 541 22 270 220 4 25 -
75 - 79 423 15 164 228 4 12 -
80 years and over 312 12 92 200 3 4 1
Male 17,810 8,218 7,070 370 133 2,017 2
Below 20 5,136 5,065 11 1 2 57 -
20 - 24 2,012 1,505 214 1 2 290 -
25 - 29 1,649 680 549 6 7 407 -
30 - 34 1,494 329 798 9 16 342 -
35 - 39 1,482 215 960 12 19 276 -
40 - 44 1,336 154 955 18 19 190 -
45 - 49 1,264 101 943 27 18 175 -
50 - 54 1,111 78 885 33 14 101 -
55 - 59 885 47 703 45 15 74 1
60 - 64 587 23 460 46 8 50 -
65 - 69 368 14 282 40 7 25 -
70 - 74 221 3 145 50 3 20 -
75 - 79 163 2 104 48 1 8 -
80 years and over 102 2 61 34 2 2 1
Female 17,326 6,677 7,136 1,269 192 2,051 1
Below 20 4,840 4,604 42 - 3 190 1
20 - 24 1,872 1,017 417 1 17 420 -
25 - 29 1,686 486 766 5 25 404 -
30 - 34 1,507 196 951 13 23 324 -
35 - 39 1,358 103 1,006 24 23 202 -
40 - 44 1,201 67 915 37 24 158 -
45 - 49 1,192 53 927 56 17 139 -
50 - 54 1,003 39 761 93 30 80 -
55 - 59 787 27 560 127 13 60 -
60 - 64 650 32 357 212 6 43 -
65 - 69 440 11 218 185 6 20 -
70 - 74 320 19 125 170 1 5 -
75 - 79 260 13 60 180 3 4 -
80 years and over 210 10 31 166 1 2 -
Continued

Philippine Statistics Authority
105 Demographic and Socioeconomic Characteristics - Quezon
Philippine Statistics Authority
Table 7--Continued
Sex, Age Group, and City/Municipality
Household Population
10 Years Old and Over
Marital Status
Single Married Widowed Divorced/ Separated
Common-law/ Live-in
Unknown
GUMACA
Both sexes 57,799 24,909 21,531 3,157 914 7,281 7
Below 20 15,773 15,243 67 2 4 456 1
20 - 24 6,442 4,116 968 8 33 1,315 2
25 - 29 5,230 1,929 1,848 19 57 1,376 1
30 - 34 4,672 1,039 2,437 35 114 1,047 -
35 - 39 4,575 660 2,892 51 118 854 -
40 - 44 4,177 472 2,840 81 115 668 1
45 - 49 4,053 398 2,822 163 122 548 -
50 - 54 3,516 326 2,427 249 114 399 1
55 - 59 2,912 221 1,938 373 92 288 -
60 - 64 2,223 182 1,365 442 67 167 -
65 - 69 1,624 144 903 460 46 71 -
70 - 74 1,154 79 554 464 14 43 -
75 - 79 783 46 309 382 14 31 1
80 years and over 665 54 161 428 4 18 -
Male 29,100 13,819 10,693 633 382 3,571 2
Below 20 8,174 8,054 12 1 - 107 -
20 - 24 3,242 2,381 324 4 6 527 -
25 - 29 2,617 1,122 791 7 15 682 -
30 - 34 2,431 669 1,139 12 45 566 -
35 - 39 2,342 435 1,378 14 57 458 -
40 - 44 2,138 311 1,397 21 43 365 1
45 - 49 2,106 271 1,454 51 44 286 -
50 - 54 1,803 207 1,270 67 52 206 1
55 - 59 1,490 137 1,053 82 50 168 -
60 - 64 1,089 106 754 87 35 107 -
65 - 69 727 73 518 79 21 36 -
70 - 74 450 31 300 79 8 32 -
75 - 79 294 13 186 71 4 20 -
80 years and over 197 9 117 58 2 11 -
Female 28,699 11,090 10,838 2,524 532 3,710 5
Below 20 7,599 7,189 55 1 4 349 1
20 - 24 3,200 1,735 644 4 27 788 2
25 - 29 2,613 807 1,057 12 42 694 1
30 - 34 2,241 370 1,298 23 69 481 -
35 - 39 2,233 225 1,514 37 61 396 -
40 - 44 2,039 161 1,443 60 72 303 -
45 - 49 1,947 127 1,368 112 78 262 -
50 - 54 1,713 119 1,157 182 62 193 -
55 - 59 1,422 84 885 291 42 120 -
60 - 64 1,134 76 611 355 32 60 -
65 - 69 897 71 385 381 25 35 -
70 - 74 704 48 254 385 6 11 -
75 - 79 489 33 123 311 10 11 1
80 years and over 468 45 44 370 2 7 -
Continued
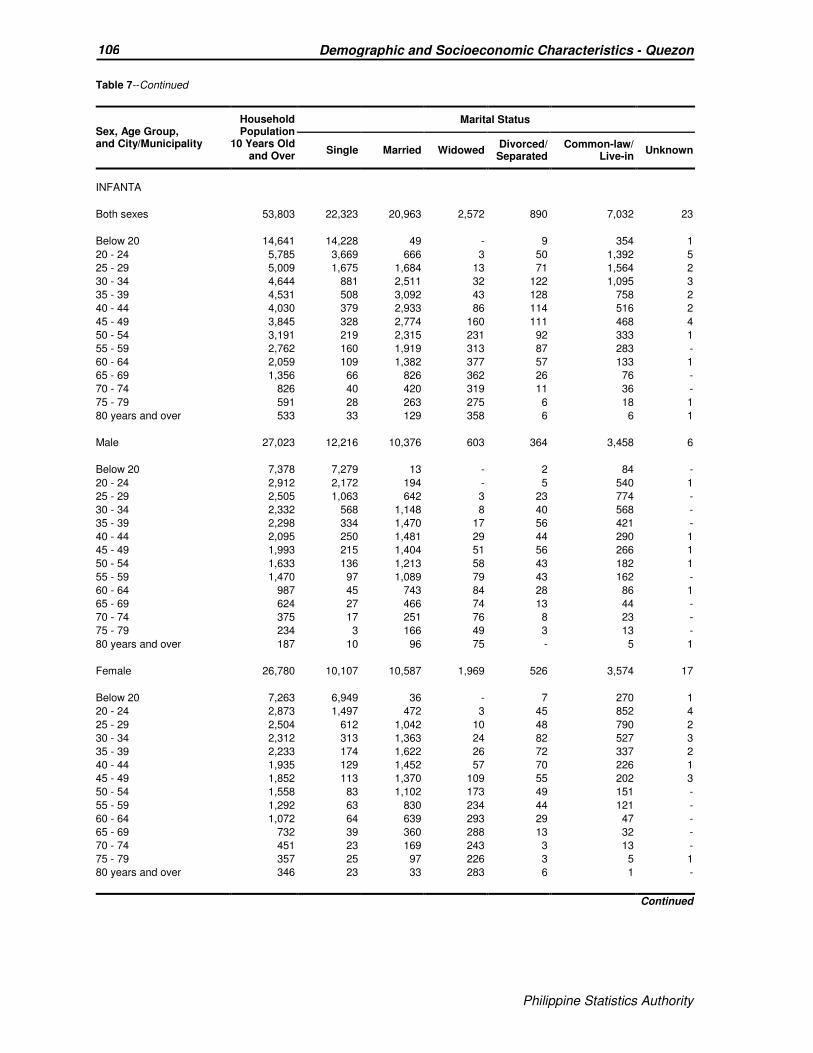
Philippine Statistics Authority
106 Demographic and Socioeconomic Characteristics - Quezon
Philippine Statistics Authority
Table 7--Continued
Sex, Age Group, and City/Municipality
Household Population
10 Years Old and Over
Marital Status
Single Married Widowed Divorced/ Separated
Common-law/ Live-in
Unknown
INFANTA
Both sexes 53,803 22,323 20,963 2,572 890 7,032 23
Below 20 14,641 14,228 49 - 9 354 1
20 - 24 5,785 3,669 666 3 50 1,392 5
25 - 29 5,009 1,675 1,684 13 71 1,564 2
30 - 34 4,644 881 2,511 32 122 1,095 3
35 - 39 4,531 508 3,092 43 128 758 2
40 - 44 4,030 379 2,933 86 114 516 2
45 - 49 3,845 328 2,774 160 111 468 4
50 - 54 3,191 219 2,315 231 92 333 1
55 - 59 2,762 160 1,919 313 87 283 -
60 - 64 2,059 109 1,382 377 57 133 1
65 - 69 1,356 66 826 362 26 76 -
70 - 74 826 40 420 319 11 36 -
75 - 79 591 28 263 275 6 18 1
80 years and over 533 33 129 358 6 6 1
Male 27,023 12,216 10,376 603 364 3,458 6
Below 20 7,378 7,279 13 - 2 84 -
20 - 24 2,912 2,172 194 - 5 540 1
25 - 29 2,505 1,063 642 3 23 774 -
30 - 34 2,332 568 1,148 8 40 568 -
35 - 39 2,298 334 1,470 17 56 421 -
40 - 44 2,095 250 1,481 29 44 290 1
45 - 49 1,993 215 1,404 51 56 266 1
50 - 54 1,633 136 1,213 58 43 182 1
55 - 59 1,470 97 1,089 79 43 162 -
60 - 64 987 45 743 84 28 86 1
65 - 69 624 27 466 74 13 44 -
70 - 74 375 17 251 76 8 23 -
75 - 79 234 3 166 49 3 13 -
80 years and over 187 10 96 75 - 5 1
Female 26,780 10,107 10,587 1,969 526 3,574 17
Below 20 7,263 6,949 36 - 7 270 1
20 - 24 2,873 1,497 472 3 45 852 4
25 - 29 2,504 612 1,042 10 48 790 2
30 - 34 2,312 313 1,363 24 82 527 3
35 - 39 2,233 174 1,622 26 72 337 2
40 - 44 1,935 129 1,452 57 70 226 1
45 - 49 1,852 113 1,370 109 55 202 3
50 - 54 1,558 83 1,102 173 49 151 -
55 - 59 1,292 63 830 234 44 121 -
60 - 64 1,072 64 639 293 29 47 -
65 - 69 732 39 360 288 13 32 -
70 - 74 451 23 169 243 3 13 -
75 - 79 357 25 97 226 3 5 1
80 years and over 346 23 33 283 6 1 -
Continued
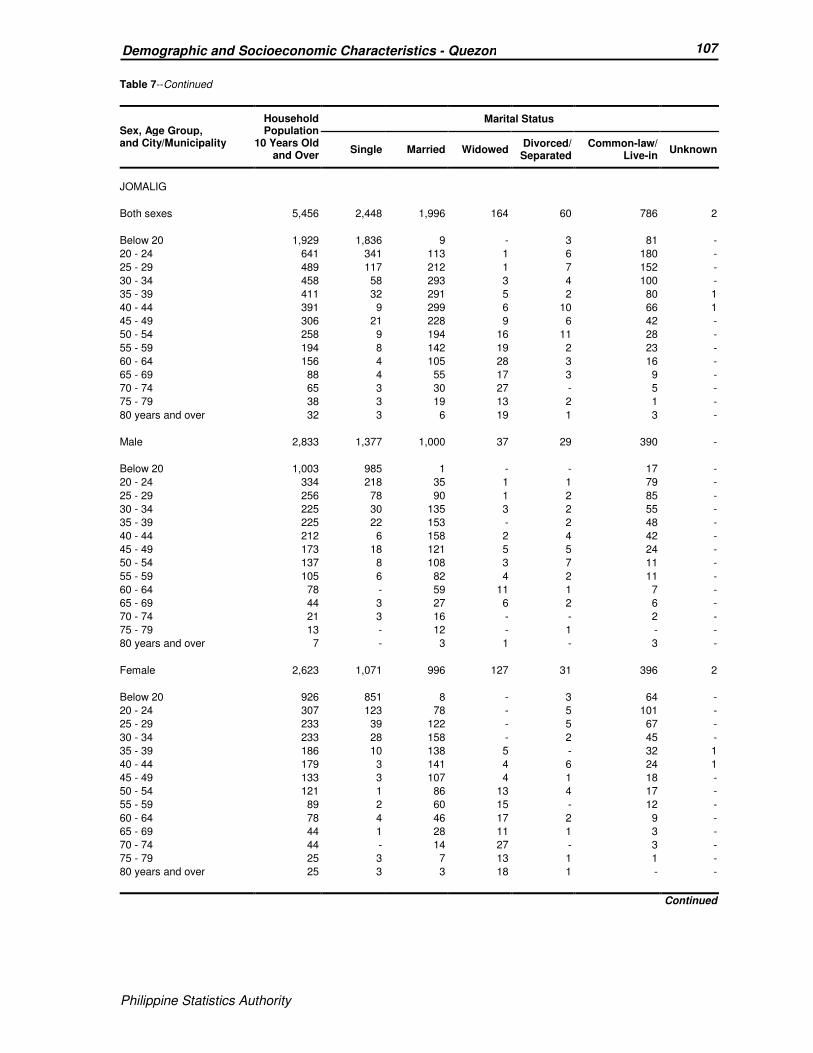
Philippine Statistics Authority
107 Demographic and Socioeconomic Characteristics - Quezon
Philippine Statistics Authority
Table 7--Continued
Sex, Age Group, and City/Municipality
Household Population
10 Years Old and Over
Marital Status
Single Married Widowed Divorced/ Separated
Common-law/ Live-in
Unknown
JOMALIG
Both sexes 5,456 2,448 1,996 164 60 786 2
Below 20 1,929 1,836 9 - 3 81 -
20 - 24 641 341 113 1 6 180 -
25 - 29 489 117 212 1 7 152 -
30 - 34 458 58 293 3 4 100 -
35 - 39 411 32 291 5 2 80 1
40 - 44 391 9 299 6 10 66 1
45 - 49 306 21 228 9 6 42 -
50 - 54 258 9 194 16 11 28 -
55 - 59 194 8 142 19 2 23 -
60 - 64 156 4 105 28 3 16 -
65 - 69 88 4 55 17 3 9 -
70 - 74 65 3 30 27 - 5 -
75 - 79 38 3 19 13 2 1 -
80 years and over 32 3 6 19 1 3 -
Male 2,833 1,377 1,000 37 29 390 -
Below 20 1,003 985 1 - - 17 -
20 - 24 334 218 35 1 1 79 -
25 - 29 256 78 90 1 2 85 -
30 - 34 225 30 135 3 2 55 -
35 - 39 225 22 153 - 2 48 -
40 - 44 212 6 158 2 4 42 -
45 - 49 173 18 121 5 5 24 -
50 - 54 137 8 108 3 7 11 -
55 - 59 105 6 82 4 2 11 -
60 - 64 78 - 59 11 1 7 -
65 - 69 44 3 27 6 2 6 -
70 - 74 21 3 16 - - 2 -
75 - 79 13 - 12 - 1 - -
80 years and over 7 - 3 1 - 3 -
Female 2,623 1,071 996 127 31 396 2
Below 20 926 851 8 - 3 64 -
20 - 24 307 123 78 - 5 101 -
25 - 29 233 39 122 - 5 67 -
30 - 34 233 28 158 - 2 45 -
35 - 39 186 10 138 5 - 32 1
40 - 44 179 3 141 4 6 24 1
45 - 49 133 3 107 4 1 18 -
50 - 54 121 1 86 13 4 17 -
55 - 59 89 2 60 15 - 12 -
60 - 64 78 4 46 17 2 9 -
65 - 69 44 1 28 11 1 3 -
70 - 74 44 - 14 27 - 3 -
75 - 79 25 3 7 13 1 1 -
80 years and over 25 3 3 18 1 - -
Continued

Philippine Statistics Authority
108 Demographic and Socioeconomic Characteristics - Quezon
Philippine Statistics Authority
Table 7--Continued
Sex, Age Group, and City/Municipality
Household Population
10 Years Old and Over
Marital Status
Single Married Widowed Divorced/ Separated
Common-law/ Live-in
Unknown
LOPEZ
Both sexes 74,043 30,798 29,493 3,651 997 9,093 11
Below 20 19,970 19,250 91 2 7 619 1
20 - 24 8,159 5,025 1,243 14 56 1,819 2
25 - 29 7,112 2,400 2,687 29 82 1,914 -
30 - 34 6,469 1,241 3,658 36 121 1,412 1
35 - 39 5,978 763 4,049 65 140 961 -
40 - 44 5,495 535 3,928 130 139 760 3
45 - 49 5,097 498 3,738 162 115 584 -
50 - 54 4,461 348 3,275 277 114 445 2
55 - 59 3,588 247 2,592 423 85 241 -
60 - 64 2,705 179 1,849 462 54 161 -
65 - 69 1,927 118 1,150 526 37 95 1
70 - 74 1,331 84 663 515 28 41 -
75 - 79 981 61 400 482 10 27 1
80 years and over 770 49 170 528 9 14 -
Male 37,564 17,152 14,627 826 447 4,504 8
Below 20 10,269 10,115 15 1 3 135 -
20 - 24 4,175 3,018 384 5 8 759 1
25 - 29 3,632 1,494 1,140 8 27 963 -
30 - 34 3,287 753 1,682 14 49 788 1
35 - 39 3,091 526 1,943 28 63 531 -
40 - 44 2,892 348 2,000 39 79 423 3
45 - 49 2,707 358 1,915 51 54 329 -
50 - 54 2,334 210 1,737 93 58 234 2
55 - 59 1,800 143 1,372 106 44 135 -
60 - 64 1,334 92 1,020 102 25 95 -
65 - 69 889 40 672 105 19 52 1
70 - 74 542 28 386 85 12 31 -
75 - 79 379 22 244 92 2 19 -
80 years and over 233 5 117 97 4 10 -
Female 36,479 13,646 14,866 2,825 550 4,589 3
Below 20 9,701 9,135 76 1 4 484 1
20 - 24 3,984 2,007 859 9 48 1,060 1
25 - 29 3,480 906 1,547 21 55 951 -
30 - 34 3,182 488 1,976 22 72 624 -
35 - 39 2,887 237 2,106 37 77 430 -
40 - 44 2,603 187 1,928 91 60 337 -
45 - 49 2,390 140 1,823 111 61 255 -
50 - 54 2,127 138 1,538 184 56 211 -
55 - 59 1,788 104 1,220 317 41 106 -
60 - 64 1,371 87 829 360 29 66 -
65 - 69 1,038 78 478 421 18 43 -
70 - 74 789 56 277 430 16 10 -
75 - 79 602 39 156 390 8 8 1
80 years and over 537 44 53 431 5 4 -
Continued

Philippine Statistics Authority
109 Demographic and Socioeconomic Characteristics - Quezon
Philippine Statistics Authority
Table 7--Continued
Sex, Age Group, and City/Municipality
Household Population
10 Years Old and Over
Marital Status
Single Married Widowed Divorced/ Separated
Common-law/ Live-in
Unknown
LUCBAN
Both sexes 41,617 18,580 17,901 2,199 472 2,461 4
Below 20 10,334 10,116 36 3 - 179 -
20 - 24 4,688 3,587 594 4 19 484 -
25 - 29 3,983 1,920 1,481 7 31 544 -
30 - 34 3,541 890 2,217 11 69 354 -
35 - 39 3,386 573 2,423 45 77 268 -
40 - 44 3,014 378 2,307 85 65 179 -
45 - 49 2,917 306 2,288 108 61 154 -
50 - 54 2,652 245 2,061 177 43 125 1
55 - 59 2,298 199 1,699 268 48 83 1
60 - 64 1,702 139 1,198 298 27 39 1
65 - 69 1,161 89 729 301 22 19 1
70 - 74 785 62 437 265 5 16 -
75 - 79 608 42 293 264 2 7 -
80 years and over 548 34 138 363 3 10 -
Male 20,890 10,047 8,938 505 191 1,208 1
Below 20 5,253 5,207 6 2 - 38 -
20 - 24 2,421 2,002 194 1 5 219 -
25 - 29 2,058 1,144 626 4 11 273 -
30 - 34 1,816 554 1,054 1 24 183 -
35 - 39 1,744 359 1,170 17 36 162 -
40 - 44 1,496 221 1,142 27 25 81 -
45 - 49 1,471 171 1,168 25 26 81 -
50 - 54 1,342 150 1,067 45 16 64 -
55 - 59 1,150 99 919 61 20 51 -
60 - 64 841 66 664 72 14 25 -
65 - 69 539 32 408 76 9 13 1
70 - 74 345 21 259 56 3 6 -
75 - 79 240 12 174 49 - 5 -
80 years and over 174 9 87 69 2 7 -
Female 20,727 8,533 8,963 1,694 281 1,253 3
Below 20 5,081 4,909 30 1 - 141 -
20 - 24 2,267 1,585 400 3 14 265 -
25 - 29 1,925 776 855 3 20 271 -
30 - 34 1,725 336 1,163 10 45 171 -
35 - 39 1,642 214 1,253 28 41 106 -
40 - 44 1,518 157 1,165 58 40 98 -
45 - 49 1,446 135 1,120 83 35 73 -
50 - 54 1,310 95 994 132 27 61 1
55 - 59 1,148 100 780 207 28 32 1
60 - 64 861 73 534 226 13 14 1
65 - 69 622 57 321 225 13 6 -
70 - 74 440 41 178 209 2 10 -
75 - 79 368 30 119 215 2 2 -
80 years and over 374 25 51 294 1 3 -
Continued

Philippine Statistics Authority
110 Demographic and Socioeconomic Characteristics - Quezon
Philippine Statistics Authority
Table 7--Continued
Sex, Age Group, and City/Municipality
Household Population
10 Years Old and Over
Marital Status
Single Married Widowed Divorced/ Separated
Common-law/ Live-in
Unknown
MACALELON
Both sexes 21,783 9,512 8,126 997 324 2,813 11
Below 20 6,111 5,924 13 3 5 166 -
20 - 24 2,643 1,731 303 1 29 579 -
25 - 29 2,240 848 730 14 47 599 2
30 - 34 1,855 373 1,017 12 48 405 -
35 - 39 1,747 203 1,145 31 48 320 -
40 - 44 1,403 103 1,024 33 37 205 1
45 - 49 1,363 106 987 52 39 177 2
50 - 54 1,243 70 932 80 24 135 2
55 - 59 1,113 63 817 113 19 99 2
60 - 64 782 38 531 133 15 64 1
65 - 69 543 17 343 145 7 31 -
70 - 74 336 17 167 138 1 13 -
75 - 79 229 13 79 120 2 14 1
80 years and over 175 6 38 122 3 6 -
Male 11,197 5,324 4,058 283 138 1,389 5
Below 20 3,139 3,109 2 2 1 25 -
20 - 24 1,359 1,040 77 - 8 234 -
25 - 29 1,174 528 318 5 20 303 -
30 - 34 984 234 493 3 15 239 -
35 - 39 927 140 575 12 25 175 -
40 - 44 738 79 517 18 15 108 1
45 - 49 691 70 498 19 15 88 1
50 - 54 618 46 455 28 11 78 -
55 - 59 609 37 459 37 13 62 1
60 - 64 406 15 301 47 8 34 1
65 - 69 256 9 191 33 4 19 -
70 - 74 145 12 98 26 - 9 -
75 - 79 100 4 51 33 1 10 1
80 years and over 51 1 23 20 2 5 -
Female 10,586 4,188 4,068 714 186 1,424 6
Below 20 2,972 2,815 11 1 4 141 -
20 - 24 1,284 691 226 1 21 345 -
25 - 29 1,066 320 412 9 27 296 2
30 - 34 871 139 524 9 33 166 -
35 - 39 820 63 570 19 23 145 -
40 - 44 665 24 507 15 22 97 -
45 - 49 672 36 489 33 24 89 1
50 - 54 625 24 477 52 13 57 2
55 - 59 504 26 358 76 6 37 1
60 - 64 376 23 230 86 7 30 -
65 - 69 287 8 152 112 3 12 -
70 - 74 191 5 69 112 1 4 -
75 - 79 129 9 28 87 1 4 -
80 years and over 124 5 15 102 1 1 -
Continued

Philippine Statistics Authority
111 Demographic and Socioeconomic Characteristics - Quezon
Philippine Statistics Authority
Table 7--Continued
Sex, Age Group, and City/Municipality
Household Population
10 Years Old and Over
Marital Status
Single Married Widowed Divorced/ Separated
Common-law/ Live-in
Unknown
MAUBAN
Both sexes 49,191 20,076 19,544 2,092 341 7,133 5
Below 20 13,508 12,974 63 5 4 462 -
20 - 24 5,464 3,395 628 4 15 1,422 -
25 - 29 4,709 1,562 1,621 10 40 1,476 -
30 - 34 4,116 635 2,358 21 44 1,058 -
35 - 39 3,705 421 2,492 33 39 719 1
40 - 44 3,505 267 2,545 66 48 579 -
45 - 49 3,527 240 2,667 104 45 471 -
50 - 54 3,185 220 2,394 177 39 354 1
55 - 59 2,487 117 1,860 225 25 259 1
60 - 64 1,771 85 1,229 282 24 151 -
65 - 69 1,197 54 744 293 9 97 -
70 - 74 889 50 497 286 7 48 1
75 - 79 599 23 290 264 - 21 1
80 years and over 529 33 156 322 2 16 -
Male 25,207 11,299 9,687 530 151 3,540 -
Below 20 6,954 6,833 16 2 3 100 -
20 - 24 2,855 2,063 190 2 6 594 -
25 - 29 2,398 1,005 641 5 15 732 -
30 - 34 2,129 420 1,097 2 17 593 -
35 - 39 1,955 305 1,226 8 13 403 -
40 - 44 1,805 185 1,270 19 20 311 -
45 - 49 1,797 165 1,309 33 29 261 -
50 - 54 1,715 146 1,294 56 20 199 -
55 - 59 1,285 70 993 58 11 153 -
60 - 64 916 53 697 75 9 82 -
65 - 69 585 25 413 86 4 57 -
70 - 74 383 14 270 64 4 31 -
75 - 79 264 9 182 59 - 14 -
80 years and over 166 6 89 61 - 10 -
Female 23,984 8,777 9,857 1,562 190 3,593 5
Below 20 6,554 6,141 47 3 1 362 -
20 - 24 2,609 1,332 438 2 9 828 -
25 - 29 2,311 557 980 5 25 744 -
30 - 34 1,987 215 1,261 19 27 465 -
35 - 39 1,750 116 1,266 25 26 316 1
40 - 44 1,700 82 1,275 47 28 268 -
45 - 49 1,730 75 1,358 71 16 210 -
50 - 54 1,470 74 1,100 121 19 155 1
55 - 59 1,202 47 867 167 14 106 1
60 - 64 855 32 532 207 15 69 -
65 - 69 612 29 331 207 5 40 -
70 - 74 506 36 227 222 3 17 1
75 - 79 335 14 108 205 - 7 1
80 years and over 363 27 67 261 2 6 -
Continued

Philippine Statistics Authority
112 Demographic and Socioeconomic Characteristics - Quezon
Philippine Statistics Authority
Table 7--Continued
Sex, Age Group, and City/Municipality
Household Population
10 Years Old and Over
Marital Status
Single Married Widowed Divorced/ Separated
Common-law/ Live-in
Unknown
MULANAY
Both sexes 40,111 17,066 17,018 1,706 527 3,791 3
Below 20 12,362 11,952 78 2 5 325 -
20 - 24 4,262 2,511 852 3 47 849 -
25 - 29 3,720 1,045 1,810 11 67 787 -
30 - 34 3,302 533 2,165 19 65 520 -
35 - 39 3,434 341 2,569 47 72 404 1
40 - 44 2,969 218 2,323 77 71 280 -
45 - 49 2,539 175 1,971 111 73 207 2
50 - 54 1,968 97 1,537 150 51 133 -
55 - 59 1,828 64 1,404 210 28 122 -
60 - 64 1,383 39 991 241 32 80 -
65 - 69 995 35 669 240 6 45 -
70 - 74 617 15 367 211 3 21 -
75 - 79 380 18 185 161 6 10 -
80 years and over 352 23 97 223 1 8 -
Male 20,435 9,403 8,495 443 208 1,883 3
Below 20 6,383 6,282 14 1 2 84 -
20 - 24 2,190 1,509 281 1 12 387 -
25 - 29 1,880 636 824 4 15 401 -
30 - 34 1,665 353 994 10 23 285 -
35 - 39 1,803 219 1,310 18 27 228 1
40 - 44 1,573 148 1,202 35 32 156 -
45 - 49 1,352 116 1,043 49 33 109 2
50 - 54 1,006 65 808 48 24 61 -
55 - 59 888 33 718 49 18 70 -
60 - 64 670 18 532 59 14 47 -
65 - 69 463 12 370 49 4 28 -
70 - 74 285 5 223 40 1 16 -
75 - 79 148 3 105 31 3 6 -
80 years and over 129 4 71 49 - 5 -
Female 19,676 7,663 8,523 1,263 319 1,908 -
Below 20 5,979 5,670 64 1 3 241 -
20 - 24 2,072 1,002 571 2 35 462 -
25 - 29 1,840 409 986 7 52 386 -
30 - 34 1,637 180 1,171 9 42 235 -
35 - 39 1,631 122 1,259 29 45 176 -
40 - 44 1,396 70 1,121 42 39 124 -
45 - 49 1,187 59 928 62 40 98 -
50 - 54 962 32 729 102 27 72 -
55 - 59 940 31 686 161 10 52 -
60 - 64 713 21 459 182 18 33 -
65 - 69 532 23 299 191 2 17 -
70 - 74 332 10 144 171 2 5 -
75 - 79 232 15 80 130 3 4 -
80 years and over 223 19 26 174 1 3 -
Continued
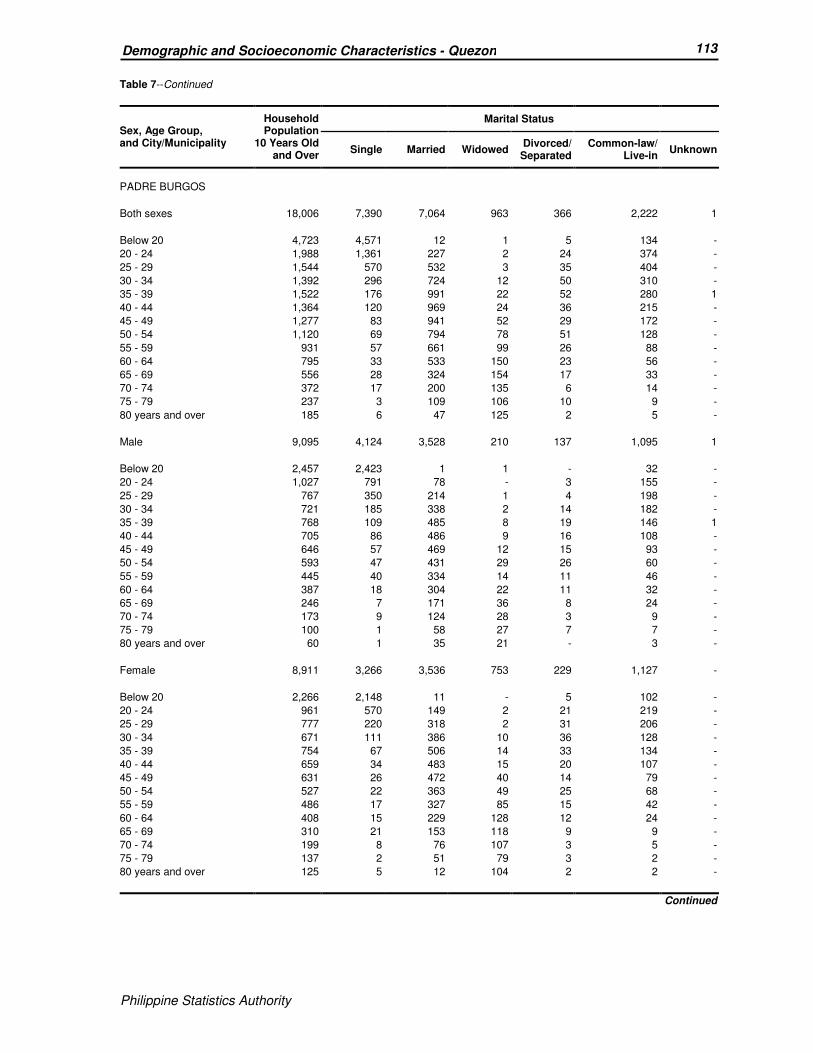
Philippine Statistics Authority
113 Demographic and Socioeconomic Characteristics - Quezon
Philippine Statistics Authority
Table 7--Continued
Sex, Age Group, and City/Municipality
Household Population
10 Years Old and Over
Marital Status
Single Married Widowed Divorced/ Separated
Common-law/ Live-in
Unknown
PADRE BURGOS
Both sexes 18,006 7,390 7,064 963 366 2,222 1
Below 20 4,723 4,571 12 1 5 134 -
20 - 24 1,988 1,361 227 2 24 374 -
25 - 29 1,544 570 532 3 35 404 -
30 - 34 1,392 296 724 12 50 310 -
35 - 39 1,522 176 991 22 52 280 1
40 - 44 1,364 120 969 24 36 215 -
45 - 49 1,277 83 941 52 29 172 -
50 - 54 1,120 69 794 78 51 128 -
55 - 59 931 57 661 99 26 88 -
60 - 64 795 33 533 150 23 56 -
65 - 69 556 28 324 154 17 33 -
70 - 74 372 17 200 135 6 14 -
75 - 79 237 3 109 106 10 9 -
80 years and over 185 6 47 125 2 5 -
Male 9,095 4,124 3,528 210 137 1,095 1
Below 20 2,457 2,423 1 1 - 32 -
20 - 24 1,027 791 78 - 3 155 -
25 - 29 767 350 214 1 4 198 -
30 - 34 721 185 338 2 14 182 -
35 - 39 768 109 485 8 19 146 1
40 - 44 705 86 486 9 16 108 -
45 - 49 646 57 469 12 15 93 -
50 - 54 593 47 431 29 26 60 -
55 - 59 445 40 334 14 11 46 -
60 - 64 387 18 304 22 11 32 -
65 - 69 246 7 171 36 8 24 -
70 - 74 173 9 124 28 3 9 -
75 - 79 100 1 58 27 7 7 -
80 years and over 60 1 35 21 - 3 -
Female 8,911 3,266 3,536 753 229 1,127 -
Below 20 2,266 2,148 11 - 5 102 -
20 - 24 961 570 149 2 21 219 -
25 - 29 777 220 318 2 31 206 -
30 - 34 671 111 386 10 36 128 -
35 - 39 754 67 506 14 33 134 -
40 - 44 659 34 483 15 20 107 -
45 - 49 631 26 472 40 14 79 -
50 - 54 527 22 363 49 25 68 -
55 - 59 486 17 327 85 15 42 -
60 - 64 408 15 229 128 12 24 -
65 - 69 310 21 153 118 9 9 -
70 - 74 199 8 76 107 3 5 -
75 - 79 137 2 51 79 3 2 -
80 years and over 125 5 12 104 2 2 -
Continued

Philippine Statistics Authority
114 Demographic and Socioeconomic Characteristics - Quezon
Philippine Statistics Authority
Table 7--Continued
Sex, Age Group, and City/Municipality
Household Population
10 Years Old and Over
Marital Status
Single Married Widowed Divorced/ Separated
Common-law/ Live-in
Unknown
PAGBILAO
Both sexes 58,821 25,044 22,805 2,868 974 7,126 4
Below 20 15,185 14,761 60 2 3 359 -
20 - 24 6,954 4,804 812 6 59 1,273 -
25 - 29 5,874 2,339 2,007 15 95 1,417 1
30 - 34 5,084 1,070 2,788 38 113 1,074 1
35 - 39 5,069 664 3,304 69 152 880 -
40 - 44 4,237 398 2,965 110 121 643 -
45 - 49 4,170 312 3,060 163 158 477 -
50 - 54 3,637 218 2,677 262 94 386 -
55 - 59 2,929 159 2,106 335 74 255 -
60 - 64 2,217 133 1,432 407 54 191 -
65 - 69 1,421 76 794 444 34 72 1
70 - 74 903 39 443 346 14 61 -
75 - 79 612 36 241 306 3 26 -
80 years and over 529 35 116 365 - 12 1
Male 29,517 13,598 11,380 632 363 3,541 3
Below 20 7,804 7,687 20 - - 97 -
20 - 24 3,562 2,769 267 1 7 518 -
25 - 29 2,965 1,370 864 1 29 700 1
30 - 34 2,580 632 1,317 8 39 583 1
35 - 39 2,536 397 1,607 16 43 473 -
40 - 44 2,154 243 1,490 32 45 344 -
45 - 49 2,101 183 1,549 52 74 243 -
50 - 54 1,824 118 1,397 66 35 208 -
55 - 59 1,475 81 1,145 74 36 139 -
60 - 64 1,123 64 808 95 23 133 -
65 - 69 630 31 431 103 23 41 1
70 - 74 389 9 256 83 7 34 -
75 - 79 220 6 148 46 2 18 -
80 years and over 154 8 81 55 - 10 -
Female 29,304 11,446 11,425 2,236 611 3,585 1
Below 20 7,381 7,074 40 2 3 262 -
20 - 24 3,392 2,035 545 5 52 755 -
25 - 29 2,909 969 1,143 14 66 717 -
30 - 34 2,504 438 1,471 30 74 491 -
35 - 39 2,533 267 1,697 53 109 407 -
40 - 44 2,083 155 1,475 78 76 299 -
45 - 49 2,069 129 1,511 111 84 234 -
50 - 54 1,813 100 1,280 196 59 178 -
55 - 59 1,454 78 961 261 38 116 -
60 - 64 1,094 69 624 312 31 58 -
65 - 69 791 45 363 341 11 31 -
70 - 74 514 30 187 263 7 27 -
75 - 79 392 30 93 260 1 8 -
80 years and over 375 27 35 310 - 2 1
Continued
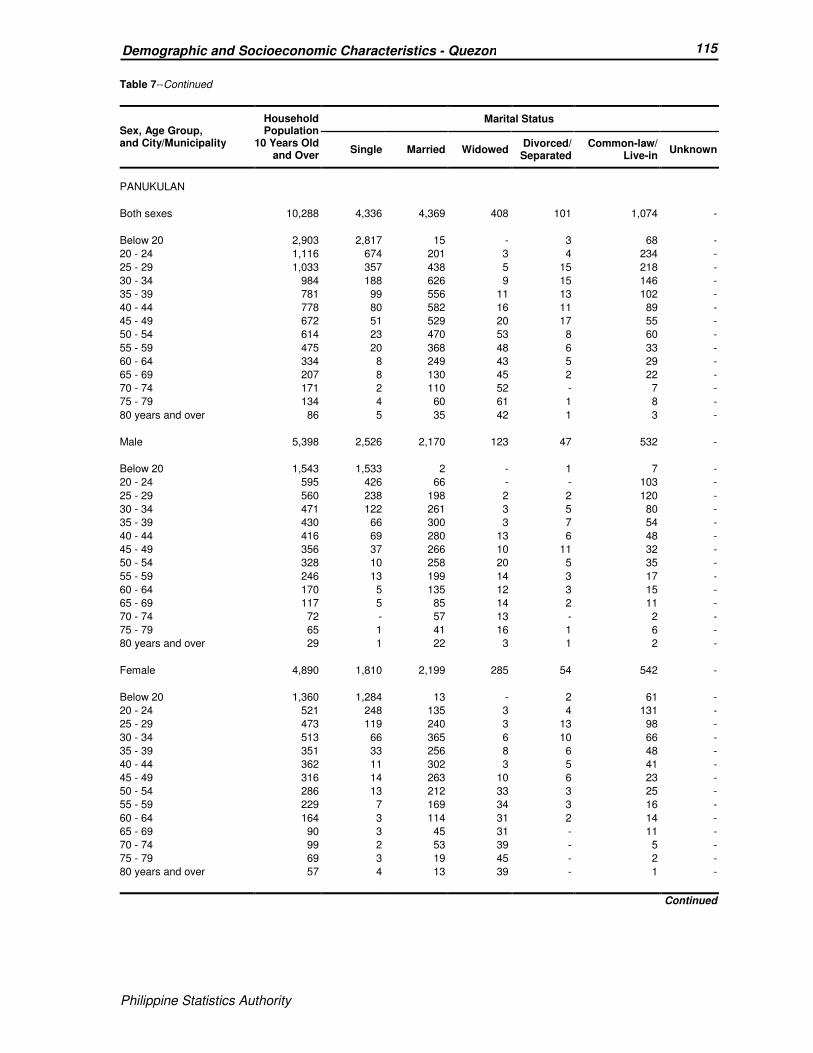
Philippine Statistics Authority
115 Demographic and Socioeconomic Characteristics - Quezon
Philippine Statistics Authority
Table 7--Continued
Sex, Age Group, and City/Municipality
Household Population
10 Years Old and Over
Marital Status
Single Married Widowed Divorced/ Separated
Common-law/ Live-in
Unknown
PANUKULAN
Both sexes 10,288 4,336 4,369 408 101 1,074 -
Below 20 2,903 2,817 15 - 3 68 -
20 - 24 1,116 674 201 3 4 234 -
25 - 29 1,033 357 438 5 15 218 -
30 - 34 984 188 626 9 15 146 -
35 - 39 781 99 556 11 13 102 -
40 - 44 778 80 582 16 11 89 -
45 - 49 672 51 529 20 17 55 -
50 - 54 614 23 470 53 8 60 -
55 - 59 475 20 368 48 6 33 -
60 - 64 334 8 249 43 5 29 -
65 - 69 207 8 130 45 2 22 -
70 - 74 171 2 110 52 - 7 -
75 - 79 134 4 60 61 1 8 -
80 years and over 86 5 35 42 1 3 -
Male 5,398 2,526 2,170 123 47 532 -
Below 20 1,543 1,533 2 - 1 7 -
20 - 24 595 426 66 - - 103 -
25 - 29 560 238 198 2 2 120 -
30 - 34 471 122 261 3 5 80 -
35 - 39 430 66 300 3 7 54 -
40 - 44 416 69 280 13 6 48 -
45 - 49 356 37 266 10 11 32 -
50 - 54 328 10 258 20 5 35 -
55 - 59 246 13 199 14 3 17 -
60 - 64 170 5 135 12 3 15 -
65 - 69 117 5 85 14 2 11 -
70 - 74 72 - 57 13 - 2 -
75 - 79 65 1 41 16 1 6 -
80 years and over 29 1 22 3 1 2 -
Female 4,890 1,810 2,199 285 54 542 -
Below 20 1,360 1,284 13 - 2 61 -
20 - 24 521 248 135 3 4 131 -
25 - 29 473 119 240 3 13 98 -
30 - 34 513 66 365 6 10 66 -
35 - 39 351 33 256 8 6 48 -
40 - 44 362 11 302 3 5 41 -
45 - 49 316 14 263 10 6 23 -
50 - 54 286 13 212 33 3 25 -
55 - 59 229 7 169 34 3 16 -
60 - 64 164 3 114 31 2 14 -
65 - 69 90 3 45 31 - 11 -
70 - 74 99 2 53 39 - 5 -
75 - 79 69 3 19 45 - 2 -
80 years and over 57 4 13 39 - 1 -
Continued

Philippine Statistics Authority
116 Demographic and Socioeconomic Characteristics - Quezon
Philippine Statistics Authority
Table 7--Continued
Sex, Age Group, and City/Municipality
Household Population
10 Years Old and Over
Marital Status
Single Married Widowed Divorced/ Separated
Common-law/ Live-in
Unknown
PATNANUNGAN
Both sexes 10,464 4,090 4,423 369 80 1,499 3
Below 20 3,243 3,084 32 - 1 126 -
20 - 24 1,070 473 270 2 1 324 -
25 - 29 987 188 492 2 2 302 1
30 - 34 939 108 638 6 9 178 -
35 - 39 905 61 681 9 10 144 -
40 - 44 792 41 606 26 15 103 1
45 - 49 698 42 521 17 12 105 1
50 - 54 530 31 394 32 10 63 -
55 - 59 438 27 301 33 7 70 -
60 - 64 331 16 232 44 5 34 -
65 - 69 221 5 124 61 5 26 -
70 - 74 129 5 66 46 1 11 -
75 - 79 105 5 46 43 2 9 -
80 years and over 76 4 20 48 - 4 -
Male 5,507 2,372 2,210 125 49 751 -
Below 20 1,704 1,667 9 - - 28 -
20 - 24 571 330 89 1 - 151 -
25 - 29 517 137 221 1 1 157 -
30 - 34 493 72 305 3 7 106 -
35 - 39 483 47 345 5 7 79 -
40 - 44 418 26 312 13 8 59 -
45 - 49 391 32 281 8 9 61 -
50 - 54 280 23 210 13 5 29 -
55 - 59 224 18 160 10 3 33 -
60 - 64 183 13 130 17 5 18 -
65 - 69 103 3 66 18 1 15 -
70 - 74 58 2 37 10 1 8 -
75 - 79 49 2 30 12 2 3 -
80 years and over 33 - 15 14 - 4 -
Female 4,957 1,718 2,213 244 31 748 3
Below 20 1,539 1,417 23 - 1 98 -
20 - 24 499 143 181 1 1 173 -
25 - 29 470 51 271 1 1 145 1
30 - 34 446 36 333 3 2 72 -
35 - 39 422 14 336 4 3 65 -
40 - 44 374 15 294 13 7 44 1
45 - 49 307 10 240 9 3 44 1
50 - 54 250 8 184 19 5 34 -
55 - 59 214 9 141 23 4 37 -
60 - 64 148 3 102 27 - 16 -
65 - 69 118 2 58 43 4 11 -
70 - 74 71 3 29 36 - 3 -
75 - 79 56 3 16 31 - 6 -
80 years and over 43 4 5 34 - - -
Continued
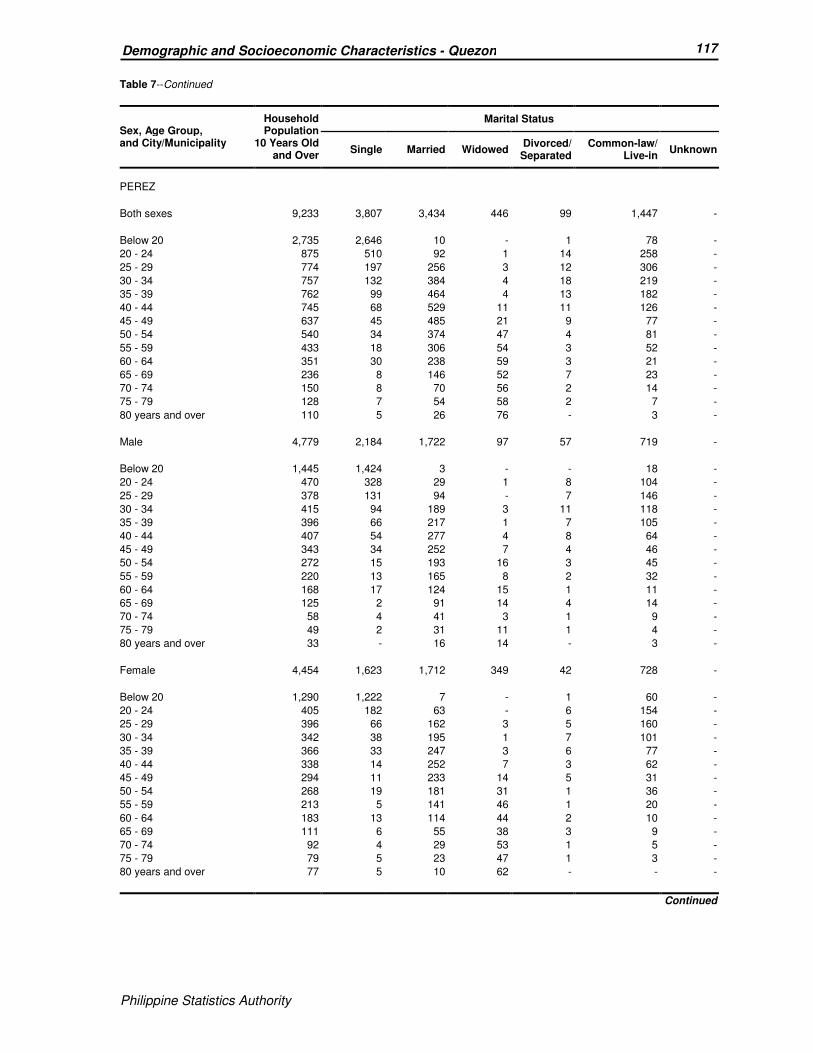
Philippine Statistics Authority
117 Demographic and Socioeconomic Characteristics - Quezon
Philippine Statistics Authority
Table 7--Continued
Sex, Age Group, and City/Municipality
Household Population
10 Years Old and Over
Marital Status
Single Married Widowed Divorced/ Separated
Common-law/ Live-in
Unknown
PEREZ
Both sexes 9,233 3,807 3,434 446 99 1,447 -
Below 20 2,735 2,646 10 - 1 78 -
20 - 24 875 510 92 1 14 258 -
25 - 29 774 197 256 3 12 306 -
30 - 34 757 132 384 4 18 219 -
35 - 39 762 99 464 4 13 182 -
40 - 44 745 68 529 11 11 126 -
45 - 49 637 45 485 21 9 77 -
50 - 54 540 34 374 47 4 81 -
55 - 59 433 18 306 54 3 52 -
60 - 64 351 30 238 59 3 21 -
65 - 69 236 8 146 52 7 23 -
70 - 74 150 8 70 56 2 14 -
75 - 79 128 7 54 58 2 7 -
80 years and over 110 5 26 76 - 3 -
Male 4,779 2,184 1,722 97 57 719 -
Below 20 1,445 1,424 3 - - 18 -
20 - 24 470 328 29 1 8 104 -
25 - 29 378 131 94 - 7 146 -
30 - 34 415 94 189 3 11 118 -
35 - 39 396 66 217 1 7 105 -
40 - 44 407 54 277 4 8 64 -
45 - 49 343 34 252 7 4 46 -
50 - 54 272 15 193 16 3 45 -
55 - 59 220 13 165 8 2 32 -
60 - 64 168 17 124 15 1 11 -
65 - 69 125 2 91 14 4 14 -
70 - 74 58 4 41 3 1 9 -
75 - 79 49 2 31 11 1 4 -
80 years and over 33 - 16 14 - 3 -
Female 4,454 1,623 1,712 349 42 728 -
Below 20 1,290 1,222 7 - 1 60 -
20 - 24 405 182 63 - 6 154 -
25 - 29 396 66 162 3 5 160 -
30 - 34 342 38 195 1 7 101 -
35 - 39 366 33 247 3 6 77 -
40 - 44 338 14 252 7 3 62 -
45 - 49 294 11 233 14 5 31 -
50 - 54 268 19 181 31 1 36 -
55 - 59 213 5 141 46 1 20 -
60 - 64 183 13 114 44 2 10 -
65 - 69 111 6 55 38 3 9 -
70 - 74 92 4 29 53 1 5 -
75 - 79 79 5 23 47 1 3 -
80 years and over 77 5 10 62 - - -
Continued

Philippine Statistics Authority
118 Demographic and Socioeconomic Characteristics - Quezon
Philippine Statistics Authority
Table 7--Continued
Sex, Age Group, and City/Municipality
Household Population
10 Years Old and Over
Marital Status
Single Married Widowed Divorced/ Separated
Common-law/ Live-in
Unknown
PITOGO
Both sexes 18,140 7,980 6,820 886 191 2,261 2
Below 20 5,080 4,964 15 - 2 99 -
20 - 24 1,977 1,353 200 - 13 411 -
25 - 29 1,557 667 431 5 16 438 -
30 - 34 1,369 281 701 6 20 360 1
35 - 39 1,418 194 914 15 19 276 -
40 - 44 1,242 116 913 26 14 173 -
45 - 49 1,371 111 988 40 33 198 1
50 - 54 1,025 96 752 61 18 98 -
55 - 59 922 54 676 91 7 94 -
60 - 64 792 46 551 127 12 56 -
65 - 69 540 37 340 129 8 26 -
70 - 74 367 22 188 136 9 12 -
75 - 79 267 19 99 126 11 12 -
80 years and over 213 20 52 124 9 8 -
Male 9,265 4,465 3,419 191 76 1,112 2
Below 20 2,620 2,592 2 - 2 24 -
20 - 24 1,033 815 68 - 3 147 -
25 - 29 826 433 166 1 3 223 -
30 - 34 692 176 311 1 7 196 1
35 - 39 729 133 431 5 9 151 -
40 - 44 651 76 460 6 5 104 -
45 - 49 714 77 506 9 18 103 1
50 - 54 553 63 417 20 8 45 -
55 - 59 459 34 346 24 2 53 -
60 - 64 411 29 315 27 8 32 -
65 - 69 248 21 187 23 3 14 -
70 - 74 161 9 119 25 1 7 -
75 - 79 102 2 61 28 3 8 -
80 years and over 66 5 30 22 4 5 -
Female 8,875 3,515 3,401 695 115 1,149 -
Below 20 2,460 2,372 13 - - 75 -
20 - 24 944 538 132 - 10 264 -
25 - 29 731 234 265 4 13 215 -
30 - 34 677 105 390 5 13 164 -
35 - 39 689 61 483 10 10 125 -
40 - 44 591 40 453 20 9 69 -
45 - 49 657 34 482 31 15 95 -
50 - 54 472 33 335 41 10 53 -
55 - 59 463 20 330 67 5 41 -
60 - 64 381 17 236 100 4 24 -
65 - 69 292 16 153 106 5 12 -
70 - 74 206 13 69 111 8 5 -
75 - 79 165 17 38 98 8 4 -
80 years and over 147 15 22 102 5 3 -
Continued
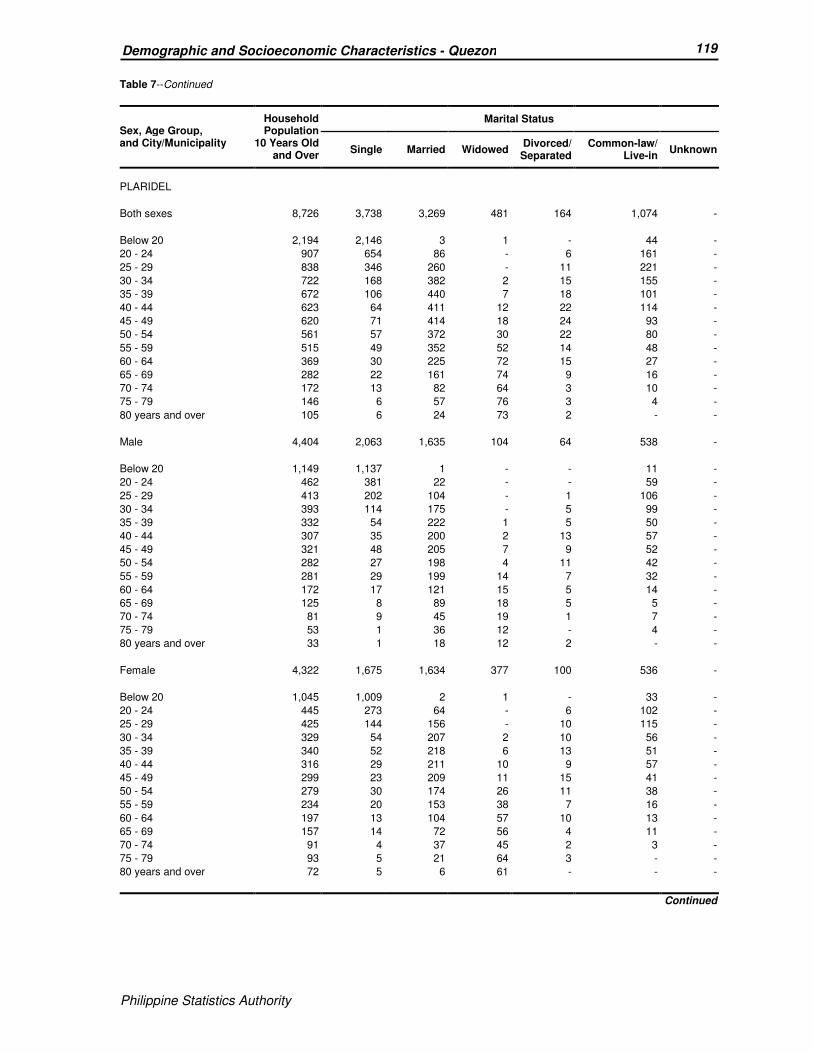
Philippine Statistics Authority
119 Demographic and Socioeconomic Characteristics - Quezon
Philippine Statistics Authority
Table 7--Continued
Sex, Age Group, and City/Municipality
Household Population
10 Years Old and Over
Marital Status
Single Married Widowed Divorced/ Separated
Common-law/ Live-in
Unknown
PLARIDEL
Both sexes 8,726 3,738 3,269 481 164 1,074 -
Below 20 2,194 2,146 3 1 - 44 -
20 - 24 907 654 86 - 6 161 -
25 - 29 838 346 260 - 11 221 -
30 - 34 722 168 382 2 15 155 -
35 - 39 672 106 440 7 18 101 -
40 - 44 623 64 411 12 22 114 -
45 - 49 620 71 414 18 24 93 -
50 - 54 561 57 372 30 22 80 -
55 - 59 515 49 352 52 14 48 -
60 - 64 369 30 225 72 15 27 -
65 - 69 282 22 161 74 9 16 -
70 - 74 172 13 82 64 3 10 -
75 - 79 146 6 57 76 3 4 -
80 years and over 105 6 24 73 2 - -
Male 4,404 2,063 1,635 104 64 538 -
Below 20 1,149 1,137 1 - - 11 -
20 - 24 462 381 22 - - 59 -
25 - 29 413 202 104 - 1 106 -
30 - 34 393 114 175 - 5 99 -
35 - 39 332 54 222 1 5 50 -
40 - 44 307 35 200 2 13 57 -
45 - 49 321 48 205 7 9 52 -
50 - 54 282 27 198 4 11 42 -
55 - 59 281 29 199 14 7 32 -
60 - 64 172 17 121 15 5 14 -
65 - 69 125 8 89 18 5 5 -
70 - 74 81 9 45 19 1 7 -
75 - 79 53 1 36 12 - 4 -
80 years and over 33 1 18 12 2 - -
Female 4,322 1,675 1,634 377 100 536 -
Below 20 1,045 1,009 2 1 - 33 -
20 - 24 445 273 64 - 6 102 -
25 - 29 425 144 156 - 10 115 -
30 - 34 329 54 207 2 10 56 -
35 - 39 340 52 218 6 13 51 -
40 - 44 316 29 211 10 9 57 -
45 - 49 299 23 209 11 15 41 -
50 - 54 279 30 174 26 11 38 -
55 - 59 234 20 153 38 7 16 -
60 - 64 197 13 104 57 10 13 -
65 - 69 157 14 72 56 4 11 -
70 - 74 91 4 37 45 2 3 -
75 - 79 93 5 21 64 3 - -
80 years and over 72 5 6 61 - - -
Continued

Philippine Statistics Authority
120 Demographic and Socioeconomic Characteristics - Quezon
Philippine Statistics Authority
Table 7--Continued
Sex, Age Group, and City/Municipality
Household Population
10 Years Old and Over
Marital Status
Single Married Widowed Divorced/ Separated
Common-law/ Live-in
Unknown
POLILLO
Both sexes 22,353 8,539 9,319 1,016 308 3,169 2
Below 20 6,098 5,904 40 1 1 152 -
20 - 24 2,112 1,114 437 4 12 545 -
25 - 29 2,048 595 822 10 16 605 -
30 - 34 1,803 316 1,015 5 26 440 1
35 - 39 1,841 206 1,187 23 45 380 -
40 - 44 1,661 109 1,184 21 53 294 -
45 - 49 1,639 109 1,209 42 40 238 1
50 - 54 1,423 71 1,057 79 44 172 -
55 - 59 1,197 40 877 96 35 149 -
60 - 64 949 28 691 139 14 77 -
65 - 69 618 20 379 146 12 61 -
70 - 74 431 10 217 166 6 32 -
75 - 79 304 6 136 139 4 19 -
80 years and over 229 11 68 145 - 5 -
Male 11,496 4,909 4,643 219 155 1,569 1
Below 20 3,205 3,168 7 1 - 29 -
20 - 24 1,081 713 145 1 2 220 -
25 - 29 1,062 413 339 4 6 300 -
30 - 34 921 215 464 1 7 233 1
35 - 39 985 147 589 12 17 220 -
40 - 44 854 68 594 8 30 154 -
45 - 49 870 76 627 15 24 128 -
50 - 54 747 44 564 18 24 97 -
55 - 59 613 26 464 23 20 80 -
60 - 64 495 17 398 29 11 40 -
65 - 69 299 10 213 32 8 36 -
70 - 74 169 7 117 22 4 19 -
75 - 79 126 3 78 31 2 12 -
80 years and over 69 2 44 22 - 1 -
Female 10,857 3,630 4,676 797 153 1,600 1
Below 20 2,893 2,736 33 - 1 123 -
20 - 24 1,031 401 292 3 10 325 -
25 - 29 986 182 483 6 10 305 -
30 - 34 882 101 551 4 19 207 -
35 - 39 856 59 598 11 28 160 -
40 - 44 807 41 590 13 23 140 -
45 - 49 769 33 582 27 16 110 1
50 - 54 676 27 493 61 20 75 -
55 - 59 584 14 413 73 15 69 -
60 - 64 454 11 293 110 3 37 -
65 - 69 319 10 166 114 4 25 -
70 - 74 262 3 100 144 2 13 -
75 - 79 178 3 58 108 2 7 -
80 years and over 160 9 24 123 - 4 -
Continued
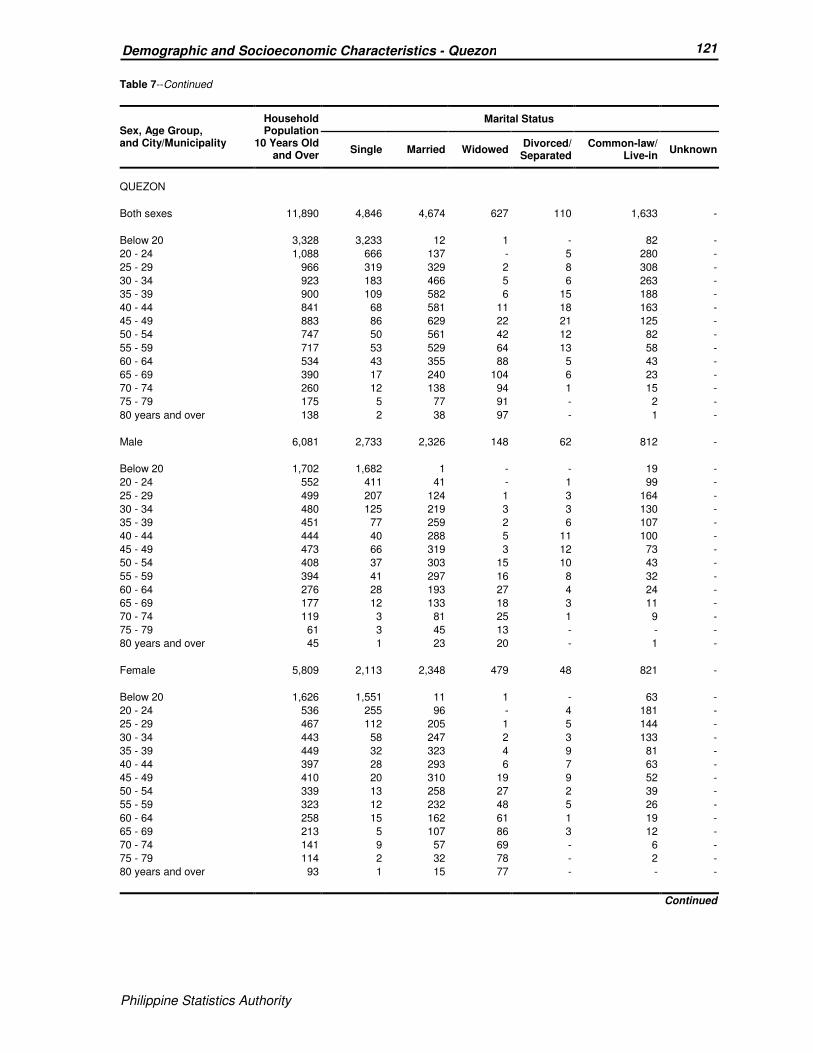
Philippine Statistics Authority
121 Demographic and Socioeconomic Characteristics - Quezon
Philippine Statistics Authority
Table 7--Continued
Sex, Age Group, and City/Municipality
Household Population
10 Years Old and Over
Marital Status
Single Married Widowed Divorced/ Separated
Common-law/ Live-in
Unknown
QUEZON
Both sexes 11,890 4,846 4,674 627 110 1,633 -
Below 20 3,328 3,233 12 1 - 82 -
20 - 24 1,088 666 137 - 5 280 -
25 - 29 966 319 329 2 8 308 -
30 - 34 923 183 466 5 6 263 -
35 - 39 900 109 582 6 15 188 -
40 - 44 841 68 581 11 18 163 -
45 - 49 883 86 629 22 21 125 -
50 - 54 747 50 561 42 12 82 -
55 - 59 717 53 529 64 13 58 -
60 - 64 534 43 355 88 5 43 -
65 - 69 390 17 240 104 6 23 -
70 - 74 260 12 138 94 1 15 -
75 - 79 175 5 77 91 - 2 -
80 years and over 138 2 38 97 - 1 -
Male 6,081 2,733 2,326 148 62 812 -
Below 20 1,702 1,682 1 - - 19 -
20 - 24 552 411 41 - 1 99 -
25 - 29 499 207 124 1 3 164 -
30 - 34 480 125 219 3 3 130 -
35 - 39 451 77 259 2 6 107 -
40 - 44 444 40 288 5 11 100 -
45 - 49 473 66 319 3 12 73 -
50 - 54 408 37 303 15 10 43 -
55 - 59 394 41 297 16 8 32 -
60 - 64 276 28 193 27 4 24 -
65 - 69 177 12 133 18 3 11 -
70 - 74 119 3 81 25 1 9 -
75 - 79 61 3 45 13 - - -
80 years and over 45 1 23 20 - 1 -
Female 5,809 2,113 2,348 479 48 821 -
Below 20 1,626 1,551 11 1 - 63 -
20 - 24 536 255 96 - 4 181 -
25 - 29 467 112 205 1 5 144 -
30 - 34 443 58 247 2 3 133 -
35 - 39 449 32 323 4 9 81 -
40 - 44 397 28 293 6 7 63 -
45 - 49 410 20 310 19 9 52 -
50 - 54 339 13 258 27 2 39 -
55 - 59 323 12 232 48 5 26 -
60 - 64 258 15 162 61 1 19 -
65 - 69 213 5 107 86 3 12 -
70 - 74 141 9 57 69 - 6 -
75 - 79 114 2 32 78 - 2 -
80 years and over 93 1 15 77 - - -
Continued

Philippine Statistics Authority
122 Demographic and Socioeconomic Characteristics - Quezon
Philippine Statistics Authority
Table 7--Continued
Sex, Age Group, and City/Municipality
Household Population
10 Years Old and Over
Marital Status
Single Married Widowed Divorced/ Separated
Common-law/ Live-in
Unknown
REAL
Both sexes 27,755 11,794 10,759 1,280 277 3,641 4
Below 20 7,777 7,524 52 - 1 200 -
20 - 24 3,370 2,134 474 5 16 741 -
25 - 29 2,619 895 976 9 15 723 1
30 - 34 2,367 380 1,389 4 31 563 -
35 - 39 2,360 226 1,614 35 36 449 -
40 - 44 2,108 199 1,525 55 30 299 -
45 - 49 1,936 153 1,408 82 52 241 -
50 - 54 1,601 100 1,165 129 30 177 -
55 - 59 1,253 88 879 141 28 116 1
60 - 64 909 35 595 195 20 64 -
65 - 69 606 27 346 178 8 47 -
70 - 74 384 6 189 173 3 12 1
75 - 79 279 18 110 136 7 8 -
80 years and over 186 9 37 138 - 1 1
Male 14,196 6,601 5,362 308 126 1,796 3
Below 20 4,030 3,974 6 - 1 49 -
20 - 24 1,712 1,262 156 1 2 291 -
25 - 29 1,315 544 388 - 5 377 1
30 - 34 1,184 228 636 1 11 308 -
35 - 39 1,245 165 801 10 19 250 -
40 - 44 1,094 147 759 13 13 162 -
45 - 49 1,025 110 740 24 29 122 -
50 - 54 835 58 634 41 14 88 -
55 - 59 673 64 491 46 9 63 -
60 - 64 470 22 343 50 11 44 -
65 - 69 274 14 186 39 5 30 -
70 - 74 173 3 116 41 3 9 1
75 - 79 122 8 83 24 4 3 -
80 years and over 44 2 23 18 - - 1
Female 13,559 5,193 5,397 972 151 1,845 1
Below 20 3,747 3,550 46 - - 151 -
20 - 24 1,658 872 318 4 14 450 -
25 - 29 1,304 351 588 9 10 346 -
30 - 34 1,183 152 753 3 20 255 -
35 - 39 1,115 61 813 25 17 199 -
40 - 44 1,014 52 766 42 17 137 -
45 - 49 911 43 668 58 23 119 -
50 - 54 766 42 531 88 16 89 -
55 - 59 580 24 388 95 19 53 1
60 - 64 439 13 252 145 9 20 -
65 - 69 332 13 160 139 3 17 -
70 - 74 211 3 73 132 - 3 -
75 - 79 157 10 27 112 3 5 -
80 years and over 142 7 14 120 - 1 -
Continued
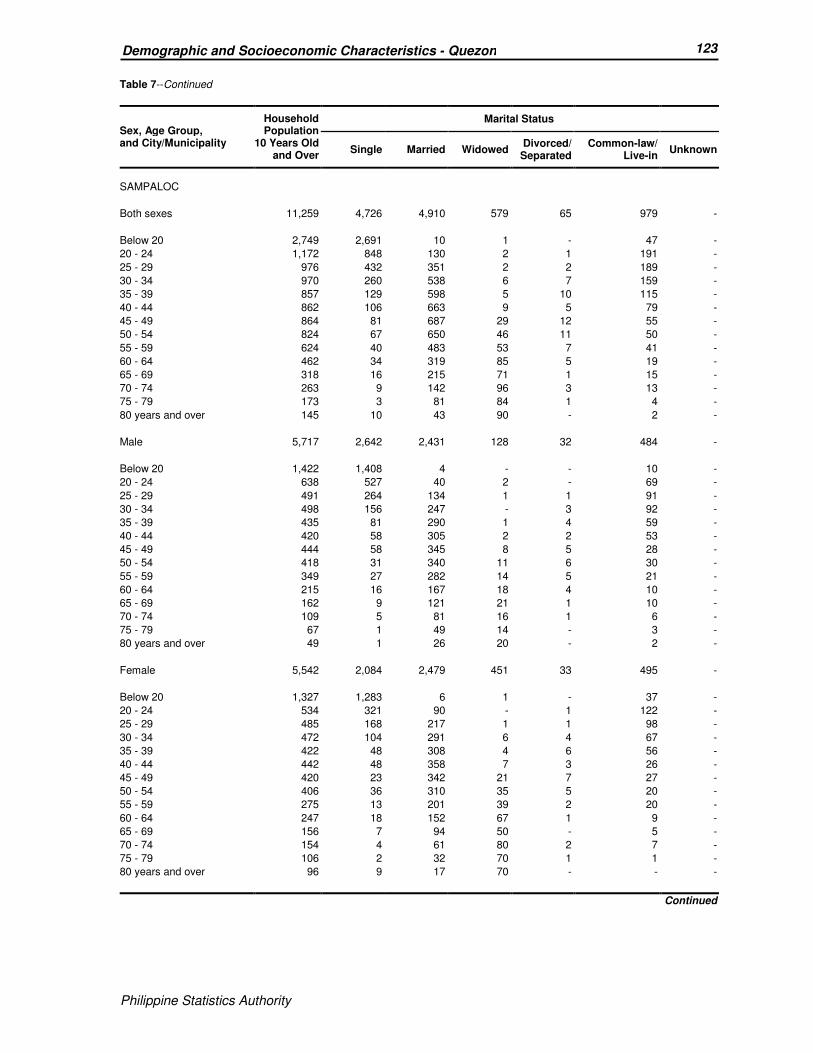
Philippine Statistics Authority
123 Demographic and Socioeconomic Characteristics - Quezon
Philippine Statistics Authority
Table 7--Continued
Sex, Age Group, and City/Municipality
Household Population
10 Years Old and Over
Marital Status
Single Married Widowed Divorced/ Separated
Common-law/ Live-in
Unknown
SAMPALOC
Both sexes 11,259 4,726 4,910 579 65 979 -
Below 20 2,749 2,691 10 1 - 47 -
20 - 24 1,172 848 130 2 1 191 -
25 - 29 976 432 351 2 2 189 -
30 - 34 970 260 538 6 7 159 -
35 - 39 857 129 598 5 10 115 -
40 - 44 862 106 663 9 5 79 -
45 - 49 864 81 687 29 12 55 -
50 - 54 824 67 650 46 11 50 -
55 - 59 624 40 483 53 7 41 -
60 - 64 462 34 319 85 5 19 -
65 - 69 318 16 215 71 1 15 -
70 - 74 263 9 142 96 3 13 -
75 - 79 173 3 81 84 1 4 -
80 years and over 145 10 43 90 - 2 -
Male 5,717 2,642 2,431 128 32 484 -
Below 20 1,422 1,408 4 - - 10 -
20 - 24 638 527 40 2 - 69 -
25 - 29 491 264 134 1 1 91 -
30 - 34 498 156 247 - 3 92 -
35 - 39 435 81 290 1 4 59 -
40 - 44 420 58 305 2 2 53 -
45 - 49 444 58 345 8 5 28 -
50 - 54 418 31 340 11 6 30 -
55 - 59 349 27 282 14 5 21 -
60 - 64 215 16 167 18 4 10 -
65 - 69 162 9 121 21 1 10 -
70 - 74 109 5 81 16 1 6 -
75 - 79 67 1 49 14 - 3 -
80 years and over 49 1 26 20 - 2 -
Female 5,542 2,084 2,479 451 33 495 -
Below 20 1,327 1,283 6 1 - 37 -
20 - 24 534 321 90 - 1 122 -
25 - 29 485 168 217 1 1 98 -
30 - 34 472 104 291 6 4 67 -
35 - 39 422 48 308 4 6 56 -
40 - 44 442 48 358 7 3 26 -
45 - 49 420 23 342 21 7 27 -
50 - 54 406 36 310 35 5 20 -
55 - 59 275 13 201 39 2 20 -
60 - 64 247 18 152 67 1 9 -
65 - 69 156 7 94 50 - 5 -
70 - 74 154 4 61 80 2 7 -
75 - 79 106 2 32 70 1 1 -
80 years and over 96 9 17 70 - - -
Continued

Philippine Statistics Authority
124 Demographic and Socioeconomic Characteristics - Quezon
Philippine Statistics Authority
Table 7--Continued
Sex, Age Group, and City/Municipality
Household Population
10 Years Old and Over
Marital Status
Single Married Widowed Divorced/ Separated
Common-law/ Live-in
Unknown
SAN ANDRES
Both sexes 26,534 10,970 11,012 1,042 305 3,202 3
Below 20 8,752 8,359 109 3 3 278 -
20 - 24 3,090 1,499 821 8 28 733 1
25 - 29 2,494 482 1,314 16 46 635 1
30 - 34 2,179 229 1,399 17 51 483 -
35 - 39 2,048 124 1,506 36 50 332 -
40 - 44 1,783 75 1,391 43 28 246 -
45 - 49 1,482 64 1,178 66 26 148 -
50 - 54 1,250 52 974 93 24 107 -
55 - 59 1,084 22 837 115 19 91 -
60 - 64 893 22 642 147 9 73 -
65 - 69 621 16 420 135 9 41 -
70 - 74 373 10 213 132 3 15 -
75 - 79 279 9 136 114 6 13 1
80 years and over 206 7 72 117 3 7 -
Male 13,533 6,067 5,488 266 122 1,588 2
Below 20 4,507 4,417 24 1 2 63 -
20 - 24 1,560 957 282 2 4 315 -
25 - 29 1,287 303 621 4 12 346 1
30 - 34 1,141 165 679 5 17 275 -
35 - 39 1,066 86 767 4 29 180 -
40 - 44 960 44 739 21 14 142 -
45 - 49 763 30 618 21 15 79 -
50 - 54 595 28 476 26 12 53 -
55 - 59 550 10 453 29 6 52 -
60 - 64 436 13 338 45 2 38 -
65 - 69 293 5 237 23 4 24 -
70 - 74 168 3 120 32 3 10 -
75 - 79 124 2 86 25 2 8 1
80 years and over 83 4 48 28 - 3 -
Female 13,001 4,903 5,524 776 183 1,614 1
Below 20 4,245 3,942 85 2 1 215 -
20 - 24 1,530 542 539 6 24 418 1
25 - 29 1,207 179 693 12 34 289 -
30 - 34 1,038 64 720 12 34 208 -
35 - 39 982 38 739 32 21 152 -
40 - 44 823 31 652 22 14 104 -
45 - 49 719 34 560 45 11 69 -
50 - 54 655 24 498 67 12 54 -
55 - 59 534 12 384 86 13 39 -
60 - 64 457 9 304 102 7 35 -
65 - 69 328 11 183 112 5 17 -
70 - 74 205 7 93 100 - 5 -
75 - 79 155 7 50 89 4 5 -
80 years and over 123 3 24 89 3 4 -
Continued

Philippine Statistics Authority
125 Demographic and Socioeconomic Characteristics - Quezon
Philippine Statistics Authority
Table 7--Continued
Sex, Age Group, and City/Municipality
Household Population
10 Years Old and Over
Marital Status
Single Married Widowed Divorced/ Separated
Common-law/ Live-in
Unknown
SAN ANTONIO
Both sexes 26,310 11,574 11,513 1,307 310 1,605 1
Below 20 7,185 7,050 43 - 1 91 -
20 - 24 3,017 2,099 586 2 22 307 1
25 - 29 2,572 1,029 1,190 7 38 308 -
30 - 34 2,396 485 1,610 13 40 248 -
35 - 39 2,212 243 1,685 27 55 202 -
40 - 44 1,806 152 1,418 44 45 147 -
45 - 49 1,688 134 1,345 70 32 107 -
50 - 54 1,450 114 1,124 117 26 69 -
55 - 59 1,330 96 989 164 29 52 -
60 - 64 957 65 660 182 13 37 -
65 - 69 621 40 385 171 5 20 -
70 - 74 431 26 250 144 3 8 -
75 - 79 312 15 141 151 - 5 -
80 years and over 333 26 87 215 1 4 -
Male 13,226 6,324 5,742 248 122 790 -
Below 20 3,753 3,727 10 - - 16 -
20 - 24 1,513 1,187 194 - 3 129 -
25 - 29 1,285 607 511 2 4 161 -
30 - 34 1,208 312 756 2 12 126 -
35 - 39 1,156 149 860 4 29 114 -
40 - 44 916 97 714 11 20 74 -
45 - 49 847 77 680 15 17 58 -
50 - 54 751 66 607 32 10 36 -
55 - 59 670 51 541 33 17 28 -
60 - 64 454 28 368 32 5 21 -
65 - 69 288 12 225 32 4 15 -
70 - 74 168 5 136 23 - 4 -
75 - 79 116 2 84 25 - 5 -
80 years and over 101 4 56 37 1 3 -
Female 13,084 5,250 5,771 1,059 188 815 1
Below 20 3,432 3,323 33 - 1 75 -
20 - 24 1,504 912 392 2 19 178 1
25 - 29 1,287 422 679 5 34 147 -
30 - 34 1,188 173 854 11 28 122 -
35 - 39 1,056 94 825 23 26 88 -
40 - 44 890 55 704 33 25 73 -
45 - 49 841 57 665 55 15 49 -
50 - 54 699 48 517 85 16 33 -
55 - 59 660 45 448 131 12 24 -
60 - 64 503 37 292 150 8 16 -
65 - 69 333 28 160 139 1 5 -
70 - 74 263 21 114 121 3 4 -
75 - 79 196 13 57 126 - - -
80 years and over 232 22 31 178 - 1 -
Continued

Philippine Statistics Authority
126 Demographic and Socioeconomic Characteristics - Quezon
Philippine Statistics Authority
Table 7--Continued
Sex, Age Group, and City/Municipality
Household Population
10 Years Old and Over
Marital Status
Single Married Widowed Divorced/ Separated
Common-law/ Live-in
Unknown
SAN FRANCISCO
Both sexes 45,574 19,437 20,395 1,659 443 3,631 9
Below 20 15,091 14,535 180 4 7 365 -
20 - 24 5,296 2,856 1,567 13 38 822 -
25 - 29 4,192 973 2,500 23 47 648 1
30 - 34 3,637 398 2,689 32 59 459 -
35 - 39 3,420 246 2,677 64 64 368 1
40 - 44 3,141 147 2,580 86 64 264 -
45 - 49 2,859 91 2,381 118 45 222 2
50 - 54 2,290 52 1,908 134 31 165 -
55 - 59 1,914 48 1,517 197 37 113 2
60 - 64 1,447 43 1,072 225 21 83 3
65 - 69 924 21 642 205 10 46 -
70 - 74 667 10 381 235 9 32 -
75 - 79 418 6 208 171 8 25 -
80 years and over 278 11 93 152 3 19 -
Male 23,408 10,853 10,140 430 192 1,788 5
Below 20 7,862 7,743 37 1 2 79 -
20 - 24 2,765 1,831 530 1 9 394 -
25 - 29 2,133 618 1,155 6 16 338 -
30 - 34 1,889 261 1,323 14 23 268 -
35 - 39 1,793 152 1,395 27 27 192 -
40 - 44 1,601 92 1,299 32 36 142 -
45 - 49 1,464 66 1,239 30 20 108 1
50 - 54 1,141 30 984 29 12 86 -
55 - 59 1,003 25 827 63 24 62 2
60 - 64 719 21 578 58 15 45 2
65 - 69 446 6 363 47 2 28 -
70 - 74 298 4 226 47 3 18 -
75 - 79 195 2 133 41 2 17 -
80 years and over 99 2 51 34 1 11 -
Female 22,166 8,584 10,255 1,229 251 1,843 4
Below 20 7,229 6,792 143 3 5 286 -
20 - 24 2,531 1,025 1,037 12 29 428 -
25 - 29 2,059 355 1,345 17 31 310 1
30 - 34 1,748 137 1,366 18 36 191 -
35 - 39 1,627 94 1,282 37 37 176 1
40 - 44 1,540 55 1,281 54 28 122 -
45 - 49 1,395 25 1,142 88 25 114 1
50 - 54 1,149 22 924 105 19 79 -
55 - 59 911 23 690 134 13 51 -
60 - 64 728 22 494 167 6 38 1
65 - 69 478 15 279 158 8 18 -
70 - 74 369 6 155 188 6 14 -
75 - 79 223 4 75 130 6 8 -
80 years and over 179 9 42 118 2 8 -
Continued

Philippine Statistics Authority
127 Demographic and Socioeconomic Characteristics - Quezon
Philippine Statistics Authority
Table 7--Continued
Sex, Age Group, and City/Municipality
Household Population
10 Years Old and Over
Marital Status
Single Married Widowed Divorced/ Separated
Common-law/ Live-in
Unknown
SAN NARCISO
Both sexes 36,615 15,799 13,597 1,502 407 5,305 5
Below 20 11,767 11,283 67 1 4 412 -
20 - 24 4,038 2,320 685 2 20 1,011 -
25 - 29 3,241 906 1,305 15 30 985 -
30 - 34 2,995 423 1,667 19 50 836 -
35 - 39 2,881 268 1,889 37 70 615 2
40 - 44 2,642 194 1,856 67 64 461 -
45 - 49 2,350 131 1,745 80 54 340 -
50 - 54 1,874 85 1,415 121 45 207 1
55 - 59 1,638 54 1,190 186 35 173 -
60 - 64 1,225 49 825 198 13 139 1
65 - 69 834 39 476 249 8 62 -
70 - 74 533 15 267 206 7 38 -
75 - 79 332 12 130 167 2 21 -
80 years and over 265 20 80 154 5 5 1
Male 18,792 8,855 6,777 350 170 2,639 1
Below 20 6,080 5,973 12 - - 95 -
20 - 24 2,117 1,446 239 1 3 428 -
25 - 29 1,700 588 588 5 12 507 -
30 - 34 1,579 305 788 7 17 462 -
35 - 39 1,515 179 934 13 39 350 -
40 - 44 1,373 131 943 24 28 247 -
45 - 49 1,211 95 888 28 17 183 -
50 - 54 941 55 727 33 18 108 -
55 - 59 830 28 650 46 16 90 -
60 - 64 607 27 436 47 8 89 -
65 - 69 370 15 270 46 5 34 -
70 - 74 237 4 167 36 4 26 -
75 - 79 137 5 86 29 1 16 -
80 years and over 95 4 49 35 2 4 1
Female 17,823 6,944 6,820 1,152 237 2,666 4
Below 20 5,687 5,310 55 1 4 317 -
20 - 24 1,921 874 446 1 17 583 -
25 - 29 1,541 318 717 10 18 478 -
30 - 34 1,416 118 879 12 33 374 -
35 - 39 1,366 89 955 24 31 265 2
40 - 44 1,269 63 913 43 36 214 -
45 - 49 1,139 36 857 52 37 157 -
50 - 54 933 30 688 88 27 99 1
55 - 59 808 26 540 140 19 83 -
60 - 64 618 22 389 151 5 50 1
65 - 69 464 24 206 203 3 28 -
70 - 74 296 11 100 170 3 12 -
75 - 79 195 7 44 138 1 5 -
80 years and over 170 16 31 119 3 1 -
Continued

Philippine Statistics Authority
128 Demographic and Socioeconomic Characteristics - Quezon
Philippine Statistics Authority
Table 7--Continued
Sex, Age Group, and City/Municipality
Household Population
10 Years Old and Over
Marital Status
Single Married Widowed Divorced/ Separated
Common-law/ Live-in
Unknown
SARIAYA
Both sexes 117,509 47,156 50,328 5,763 1,976 12,277 9
Below 20 30,505 29,493 210 - 10 792 -
20 - 24 12,857 8,162 2,197 20 93 2,385 -
25 - 29 11,289 3,914 4,762 39 177 2,396 1
30 - 34 10,819 1,841 6,734 69 244 1,931 -
35 - 39 10,303 1,081 7,354 106 309 1,453 -
40 - 44 9,181 699 6,994 184 272 1,031 1
45 - 49 8,283 540 6,337 323 255 826 2
50 - 54 7,079 500 5,284 492 216 585 2
55 - 59 5,651 319 4,151 609 168 403 1
60 - 64 4,419 218 2,953 868 129 250 1
65 - 69 2,902 168 1,711 848 58 117 -
70 - 74 1,819 98 879 765 23 54 -
75 - 79 1,245 61 484 651 15 33 1
80 years and over 1,157 62 278 789 7 21 -
Male 59,190 26,199 25,071 1,038 823 6,056 3
Below 20 16,063 15,831 45 - 2 185 -
20 - 24 6,618 4,852 742 7 23 994 -
25 - 29 5,700 2,404 2,037 14 52 1,193 -
30 - 34 5,442 1,118 3,154 19 101 1,050 -
35 - 39 5,267 685 3,639 28 127 788 -
40 - 44 4,640 374 3,534 44 129 559 -
45 - 49 4,243 306 3,294 90 112 440 1
50 - 54 3,621 295 2,791 104 105 325 1
55 - 59 2,834 150 2,270 124 68 222 -
60 - 64 2,056 95 1,614 140 53 154 -
65 - 69 1,270 47 973 145 31 74 -
70 - 74 704 26 505 120 15 38 -
75 - 79 432 9 295 98 3 26 1
80 years and over 300 7 178 105 2 8 -
Female 58,319 20,957 25,257 4,725 1,153 6,221 6
Below 20 14,442 13,662 165 - 8 607 -
20 - 24 6,239 3,310 1,455 13 70 1,391 -
25 - 29 5,589 1,510 2,725 25 125 1,203 1
30 - 34 5,377 723 3,580 50 143 881 -
35 - 39 5,036 396 3,715 78 182 665 -
40 - 44 4,541 325 3,460 140 143 472 1
45 - 49 4,040 234 3,043 233 143 386 1
50 - 54 3,458 205 2,493 388 111 260 1
55 - 59 2,817 169 1,881 485 100 181 1
60 - 64 2,363 123 1,339 728 76 96 1
65 - 69 1,632 121 738 703 27 43 -
70 - 74 1,115 72 374 645 8 16 -
75 - 79 813 52 189 553 12 7 -
80 years and over 857 55 100 684 5 13 -
Continued

Philippine Statistics Authority
129 Demographic and Socioeconomic Characteristics - Quezon
Philippine Statistics Authority
Table 7--Continued
Sex, Age Group, and City/Municipality
Household Population
10 Years Old and Over
Marital Status
Single Married Widowed Divorced/ Separated
Common-law/ Live-in
Unknown
TAGKAWAYAN
Both sexes 39,029 16,290 15,390 1,892 552 4,893 12
Below 20 11,317 10,971 70 2 3 271 -
20 - 24 3,764 2,216 589 3 34 922 -
25 - 29 3,331 1,015 1,288 10 43 972 3
30 - 34 3,271 573 1,847 17 67 766 1
35 - 39 3,037 409 1,975 31 66 555 1
40 - 44 2,748 283 1,920 62 71 411 1
45 - 49 2,879 251 2,108 115 86 316 3
50 - 54 2,469 207 1,789 148 63 259 3
55 - 59 2,016 146 1,434 222 45 169 -
60 - 64 1,572 102 1,054 261 38 117 -
65 - 69 1,015 55 629 248 15 68 -
70 - 74 708 26 349 277 9 47 -
75 - 79 506 20 226 247 6 7 -
80 years and over 396 16 112 249 6 13 -
Male 19,786 9,226 7,558 385 231 2,383 3
Below 20 5,925 5,858 15 2 1 49 -
20 - 24 1,913 1,368 182 - 1 362 -
25 - 29 1,655 656 528 1 16 454 -
30 - 34 1,647 396 819 2 24 406 -
35 - 39 1,561 284 925 7 33 312 -
40 - 44 1,429 187 983 14 23 221 1
45 - 49 1,442 165 1,022 34 44 176 1
50 - 54 1,303 137 935 38 34 158 1
55 - 59 1,023 74 779 54 22 94 -
60 - 64 793 55 600 57 16 65 -
65 - 69 465 23 353 42 6 41 -
70 - 74 289 7 189 56 6 31 -
75 - 79 206 11 151 34 4 6 -
80 years and over 135 5 77 44 1 8 -
Female 19,243 7,064 7,832 1,507 321 2,510 9
Below 20 5,392 5,113 55 - 2 222 -
20 - 24 1,851 848 407 3 33 560 -
25 - 29 1,676 359 760 9 27 518 3
30 - 34 1,624 177 1,028 15 43 360 1
35 - 39 1,476 125 1,050 24 33 243 1
40 - 44 1,319 96 937 48 48 190 -
45 - 49 1,437 86 1,086 81 42 140 2
50 - 54 1,166 70 854 110 29 101 2
55 - 59 993 72 655 168 23 75 -
60 - 64 779 47 454 204 22 52 -
65 - 69 550 32 276 206 9 27 -
70 - 74 419 19 160 221 3 16 -
75 - 79 300 9 75 213 2 1 -
80 years and over 261 11 35 205 5 5 -
Continued

Philippine Statistics Authority
130 Demographic and Socioeconomic Characteristics - Quezon
Philippine Statistics Authority
Table 7--Continued
Sex, Age Group, and City/Municipality
Household Population
10 Years Old and Over
Marital Status
Single Married Widowed Divorced/ Separated
Common-law/ Live-in
Unknown
CITY OF TAYABAS
Both sexes 79,921 33,887 34,212 3,734 887 7,178 23
Below 20 20,729 20,175 90 2 4 457 1
20 - 24 9,052 6,260 1,223 5 22 1,541 1
25 - 29 7,595 3,145 2,905 17 53 1,471 4
30 - 34 6,881 1,457 4,243 23 89 1,069 -
35 - 39 6,604 816 4,825 60 121 777 5
40 - 44 5,874 503 4,588 129 139 513 2
45 - 49 5,777 464 4,544 194 118 457 -
50 - 54 5,013 348 3,874 337 112 337 5
55 - 59 4,169 222 3,152 429 105 259 2
60 - 64 3,209 195 2,197 576 70 170 1
65 - 69 2,038 126 1,294 522 31 64 1
70 - 74 1,325 68 728 479 15 34 1
75 - 79 888 55 366 444 4 19 -
80 years and over 767 53 183 517 4 10 -
Male 40,403 18,703 17,034 744 379 3,539 4
Below 20 10,786 10,675 16 2 - 93 -
20 - 24 4,711 3,656 397 2 6 650 -
25 - 29 3,895 1,875 1,249 4 20 747 -
30 - 34 3,509 920 1,970 6 36 577 -
35 - 39 3,337 509 2,326 10 48 444 -
40 - 44 2,911 312 2,245 30 57 267 -
45 - 49 2,946 267 2,345 42 53 239 -
50 - 54 2,588 188 2,085 78 48 187 2
55 - 59 2,069 122 1,659 96 45 146 1
60 - 64 1,579 85 1,236 119 37 102 -
65 - 69 913 37 723 98 14 40 1
70 - 74 596 29 438 95 10 24 -
75 - 79 340 13 232 76 3 16 -
80 years and over 223 15 113 86 2 7 -
Female 39,518 15,184 17,178 2,990 508 3,639 19
Below 20 9,943 9,500 74 - 4 364 1
20 - 24 4,341 2,604 826 3 16 891 1
25 - 29 3,700 1,270 1,656 13 33 724 4
30 - 34 3,372 537 2,273 17 53 492 -
35 - 39 3,267 307 2,499 50 73 333 5
40 - 44 2,963 191 2,343 99 82 246 2
45 - 49 2,831 197 2,199 152 65 218 -
50 - 54 2,425 160 1,789 259 64 150 3
55 - 59 2,100 100 1,493 333 60 113 1
60 - 64 1,630 110 961 457 33 68 1
65 - 69 1,125 89 571 424 17 24 -
70 - 74 729 39 290 384 5 10 1
75 - 79 548 42 134 368 1 3 -
80 years and over 544 38 70 431 2 3 -
Continued

Philippine Statistics Authority
131 Demographic and Socioeconomic Characteristics - Quezon
Philippine Statistics Authority
Table 7--Continued
Sex, Age Group, and City/Municipality
Household Population
10 Years Old and Over
Marital Status
Single Married Widowed Divorced/ Separated
Common-law/ Live-in
Unknown
TIAONG
Both sexes 78,673 32,195 32,869 3,937 1,621 8,044 7
Below 20 20,330 19,683 154 1 13 478 1
20 - 24 8,973 5,812 1,531 14 99 1,516 1
25 - 29 7,877 2,906 3,193 29 160 1,588 1
30 - 34 7,371 1,376 4,372 44 251 1,327 1
35 - 39 6,918 712 4,910 95 253 947 1
40 - 44 5,865 436 4,337 135 245 712 -
45 - 49 5,428 349 4,114 214 213 538 -
50 - 54 4,398 306 3,248 340 139 364 1
55 - 59 3,777 218 2,724 449 121 265 -
60 - 64 2,938 152 1,964 580 74 168 -
65 - 69 1,889 102 1,161 520 32 73 1
70 - 74 1,185 61 589 489 10 36 -
75 - 79 887 40 359 459 7 22 -
80 years and over 837 42 213 568 4 10 -
Male 39,179 17,552 16,352 678 609 3,986 2
Below 20 10,441 10,284 32 - 4 121 -
20 - 24 4,592 3,419 528 7 11 626 1
25 - 29 3,960 1,724 1,375 11 50 800 -
30 - 34 3,736 850 2,082 15 88 700 1
35 - 39 3,479 429 2,408 20 106 516 -
40 - 44 2,940 259 2,183 23 97 378 -
45 - 49 2,801 214 2,169 39 79 300 -
50 - 54 2,182 161 1,685 74 66 196 -
55 - 59 1,845 103 1,457 73 51 161 -
60 - 64 1,361 61 1,092 88 30 90 -
65 - 69 834 21 658 92 17 46 -
70 - 74 465 14 339 84 2 26 -
75 - 79 320 8 218 72 5 17 -
80 years and over 223 5 126 80 3 9 -
Female 39,494 14,643 16,517 3,259 1,012 4,058 5
Below 20 9,889 9,399 122 1 9 357 1
20 - 24 4,381 2,393 1,003 7 88 890 -
25 - 29 3,917 1,182 1,818 18 110 788 1
30 - 34 3,635 526 2,290 29 163 627 -
35 - 39 3,439 283 2,502 75 147 431 1
40 - 44 2,925 177 2,154 112 148 334 -
45 - 49 2,627 135 1,945 175 134 238 -
50 - 54 2,216 145 1,563 266 73 168 1
55 - 59 1,932 115 1,267 376 70 104 -
60 - 64 1,577 91 872 492 44 78 -
65 - 69 1,055 81 503 428 15 27 1
70 - 74 720 47 250 405 8 10 -
75 - 79 567 32 141 387 2 5 -
80 years and over 614 37 87 488 1 1 -
Continued
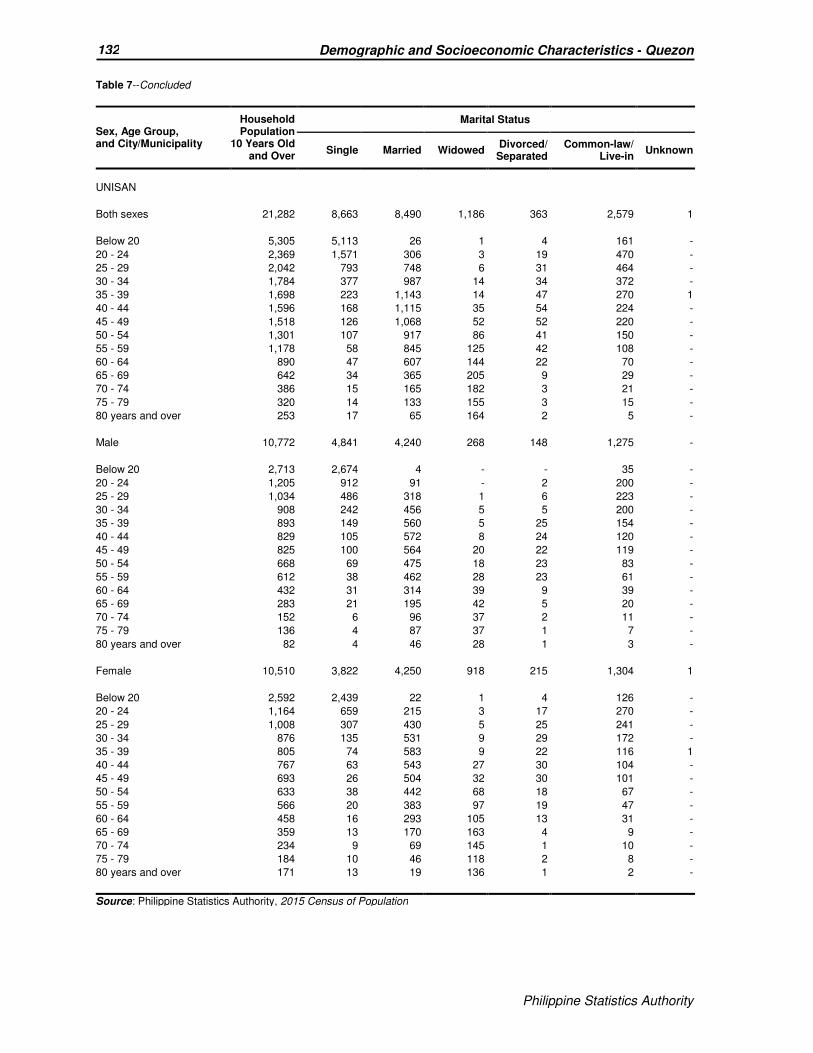
Philippine Statistics Authority
132 Demographic and Socioeconomic Characteristics - Quezon
Philippine Statistics Authority
Table 7--Concluded
Sex, Age Group, and City/Municipality
Household Population
10 Years Old and Over
Marital Status
Single Married Widowed Divorced/ Separated
Common-law/ Live-in
Unknown
UNISAN
Both sexes 21,282 8,663 8,490 1,186 363 2,579 1
Below 20 5,305 5,113 26 1 4 161 -
20 - 24 2,369 1,571 306 3 19 470 -
25 - 29 2,042 793 748 6 31 464 -
30 - 34 1,784 377 987 14 34 372 -
35 - 39 1,698 223 1,143 14 47 270 1
40 - 44 1,596 168 1,115 35 54 224 -
45 - 49 1,518 126 1,068 52 52 220 -
50 - 54 1,301 107 917 86 41 150 -
55 - 59 1,178 58 845 125 42 108 -
60 - 64 890 47 607 144 22 70 -
65 - 69 642 34 365 205 9 29 -
70 - 74 386 15 165 182 3 21 -
75 - 79 320 14 133 155 3 15 -
80 years and over 253 17 65 164 2 5 -
Male 10,772 4,841 4,240 268 148 1,275 -
Below 20 2,713 2,674 4 - - 35 -
20 - 24 1,205 912 91 - 2 200 -
25 - 29 1,034 486 318 1 6 223 -
30 - 34 908 242 456 5 5 200 -
35 - 39 893 149 560 5 25 154 -
40 - 44 829 105 572 8 24 120 -
45 - 49 825 100 564 20 22 119 -
50 - 54 668 69 475 18 23 83 -
55 - 59 612 38 462 28 23 61 -
60 - 64 432 31 314 39 9 39 -
65 - 69 283 21 195 42 5 20 -
70 - 74 152 6 96 37 2 11 -
75 - 79 136 4 87 37 1 7 -
80 years and over 82 4 46 28 1 3 -
Female 10,510 3,822 4,250 918 215 1,304 1
Below 20 2,592 2,439 22 1 4 126 -
20 - 24 1,164 659 215 3 17 270 -
25 - 29 1,008 307 430 5 25 241 -
30 - 34 876 135 531 9 29 172 -
35 - 39 805 74 583 9 22 116 1
40 - 44 767 63 543 27 30 104 -
45 - 49 693 26 504 32 30 101 -
50 - 54 633 38 442 68 18 67 -
55 - 59 566 20 383 97 19 47 -
60 - 64 458 16 293 105 13 31 -
65 - 69 359 13 170 163 4 9 -
70 - 74 234 9 69 145 1 10 -
75 - 79 184 10 46 118 2 8 -
80 years and over 171 13 19 136 1 2 -
Source: Philippine Statistics Authority, 2015 Census of Population
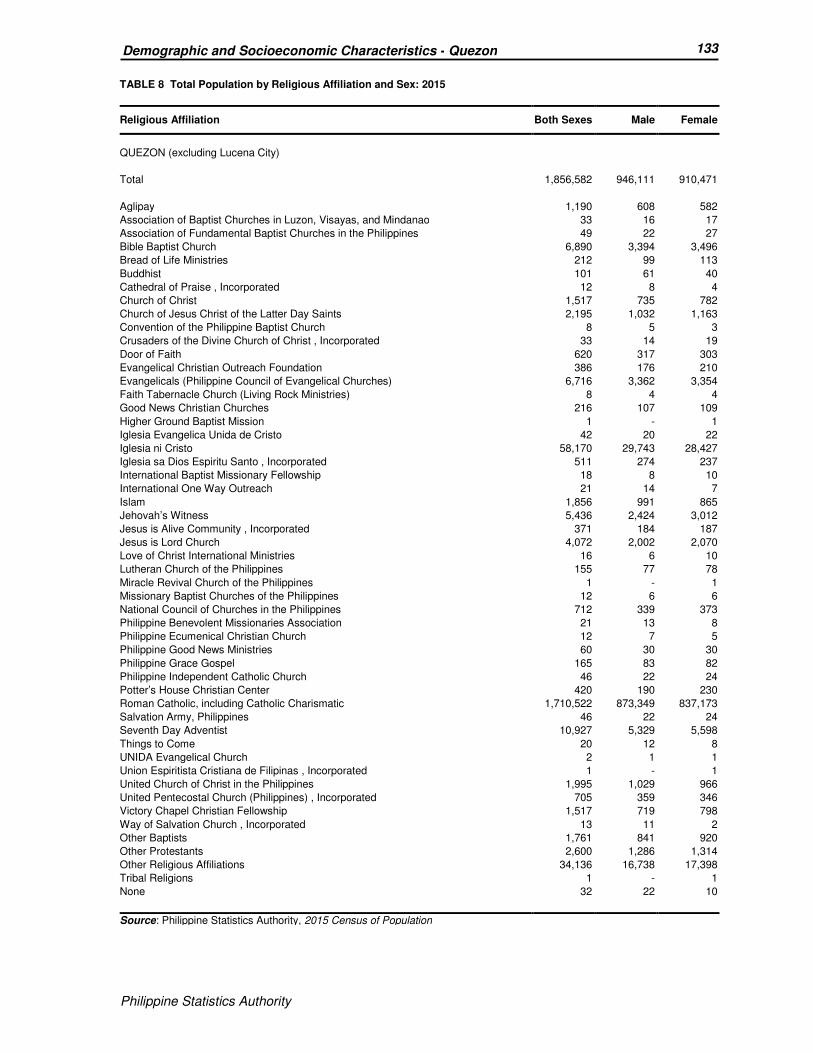
Philippine Statistics Authority
133 Demographic and Socioeconomic Characteristics - Quezon
Philippine Statistics Authority
TABLE 8 Total Population by Religious Affiliation and Sex: 2015
Religious Affiliation Both Sexes Male Female
QUEZON (excluding Lucena City)
Total 1,856,582 946,111 910,471
Aglipay 1,190 608 582
Association of Baptist Churches in Luzon, Visayas, and Mindanao 33 16 17
Association of Fundamental Baptist Churches in the Philippines 49 22 27
Bible Baptist Church 6,890 3,394 3,496
Bread of Life Ministries 212 99 113
Buddhist 101 61 40
Cathedral of Praise , Incorporated 12 8 4
Church of Christ 1,517 735 782
Church of Jesus Christ of the Latter Day Saints 2,195 1,032 1,163
Convention of the Philippine Baptist Church 8 5 3
Crusaders of the Divine Church of Christ , Incorporated 33 14 19
Door of Faith 620 317 303
Evangelical Christian Outreach Foundation 386 176 210
Evangelicals (Philippine Council of Evangelical Churches) 6,716 3,362 3,354
Faith Tabernacle Church (Living Rock Ministries) 8 4 4
Good News Christian Churches 216 107 109
Higher Ground Baptist Mission 1 - 1
Iglesia Evangelica Unida de Cristo 42 20 22
Iglesia ni Cristo 58,170 29,743 28,427
Iglesia sa Dios Espiritu Santo , Incorporated 511 274 237
International Baptist Missionary Fellowship 18 8 10
International One Way Outreach 21 14 7
Islam 1,856 991 865
Jehovah’s Witness 5,436 2,424 3,012
Jesus is Alive Community , Incorporated 371 184 187
Jesus is Lord Church 4,072 2,002 2,070
Love of Christ International Ministries 16 6 10
Lutheran Church of the Philippines 155 77 78
Miracle Revival Church of the Philippines 1 - 1
Missionary Baptist Churches of the Philippines 12 6 6
National Council of Churches in the Philippines 712 339 373
Philippine Benevolent Missionaries Association 21 13 8
Philippine Ecumenical Christian Church 12 7 5
Philippine Good News Ministries 60 30 30
Philippine Grace Gospel 165 83 82
Philippine Independent Catholic Church 46 22 24
Potter’s House Christian Center 420 190 230
Roman Catholic, including Catholic Charismatic 1,710,522 873,349 837,173
Salvation Army, Philippines 46 22 24
Seventh Day Adventist 10,927 5,329 5,598
Things to Come 20 12 8
UNIDA Evangelical Church 2 1 1
Union Espiritista Cristiana de Filipinas , Incorporated 1 - 1
United Church of Christ in the Philippines 1,995 1,029 966
United Pentecostal Church (Philippines) , Incorporated 705 359 346
Victory Chapel Christian Fellowship 1,517 719 798
Way of Salvation Church , Incorporated 13 11 2
Other Baptists 1,761 841 920
Other Protestants 2,600 1,286 1,314
Other Religious Affiliations 34,136 16,738 17,398
Tribal Religions 1 - 1
None 32 22 10
Source: Philippine Statistics Authority, 2015 Census of Population
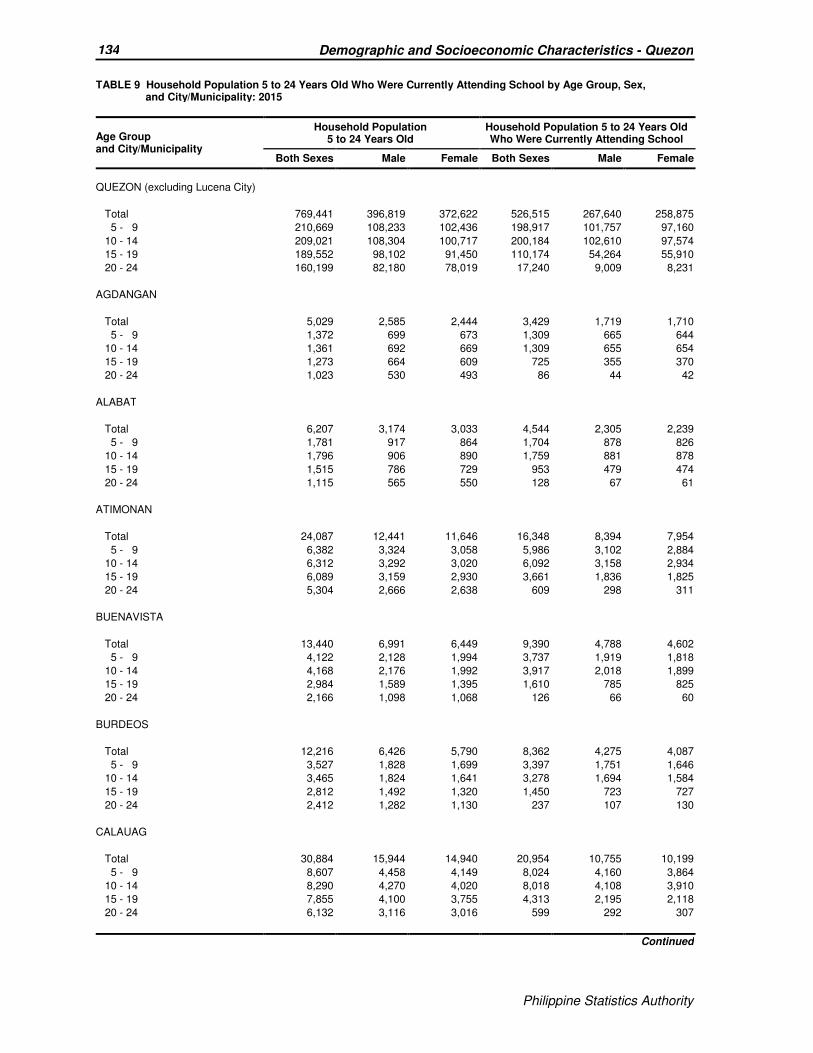
Philippine Statistics Authority
134 Demographic and Socioeconomic Characteristics - Quezon
Philippine Statistics Authority
TABLE 9 Household Population 5 to 24 Years Old Who Were Currently Attending School by Age Group, Sex, and City/Municipality: 2015
Age Group and City/Municipality
Household Population 5 to 24 Years Old
Household Population 5 to 24 Years Old Who Were Currently Attending School
Both Sexes Male Female Both Sexes Male Female
QUEZON (excluding Lucena City)
Total 769,441 396,819 372,622 526,515 267,640 258,875
5 - 9 210,669 108,233 102,436 198,917 101,757 97,160
10 - 14 209,021 108,304 100,717 200,184 102,610 97,574
15 - 19 189,552 98,102 91,450 110,174 54,264 55,910
20 - 24 160,199 82,180 78,019 17,240 9,009 8,231
AGDANGAN
Total 5,029 2,585 2,444 3,429 1,719 1,710
5 - 9 1,372 699 673 1,309 665 644
10 - 14 1,361 692 669 1,309 655 654
15 - 19 1,273 664 609 725 355 370
20 - 24 1,023 530 493 86 44 42
ALABAT
Total 6,207 3,174 3,033 4,544 2,305 2,239
5 - 9 1,781 917 864 1,704 878 826
10 - 14 1,796 906 890 1,759 881 878
15 - 19 1,515 786 729 953 479 474
20 - 24 1,115 565 550 128 67 61
ATIMONAN
Total 24,087 12,441 11,646 16,348 8,394 7,954
5 - 9 6,382 3,324 3,058 5,986 3,102 2,884
10 - 14 6,312 3,292 3,020 6,092 3,158 2,934
15 - 19 6,089 3,159 2,930 3,661 1,836 1,825
20 - 24 5,304 2,666 2,638 609 298 311
BUENAVISTA
Total 13,440 6,991 6,449 9,390 4,788 4,602
5 - 9 4,122 2,128 1,994 3,737 1,919 1,818
10 - 14 4,168 2,176 1,992 3,917 2,018 1,899
15 - 19 2,984 1,589 1,395 1,610 785 825
20 - 24 2,166 1,098 1,068 126 66 60
BURDEOS
Total 12,216 6,426 5,790 8,362 4,275 4,087
5 - 9 3,527 1,828 1,699 3,397 1,751 1,646
10 - 14 3,465 1,824 1,641 3,278 1,694 1,584
15 - 19 2,812 1,492 1,320 1,450 723 727
20 - 24 2,412 1,282 1,130 237 107 130
CALAUAG
Total 30,884 15,944 14,940 20,954 10,755 10,199
5 - 9 8,607 4,458 4,149 8,024 4,160 3,864
10 - 14 8,290 4,270 4,020 8,018 4,108 3,910
15 - 19 7,855 4,100 3,755 4,313 2,195 2,118
20 - 24 6,132 3,116 3,016 599 292 307
Continued
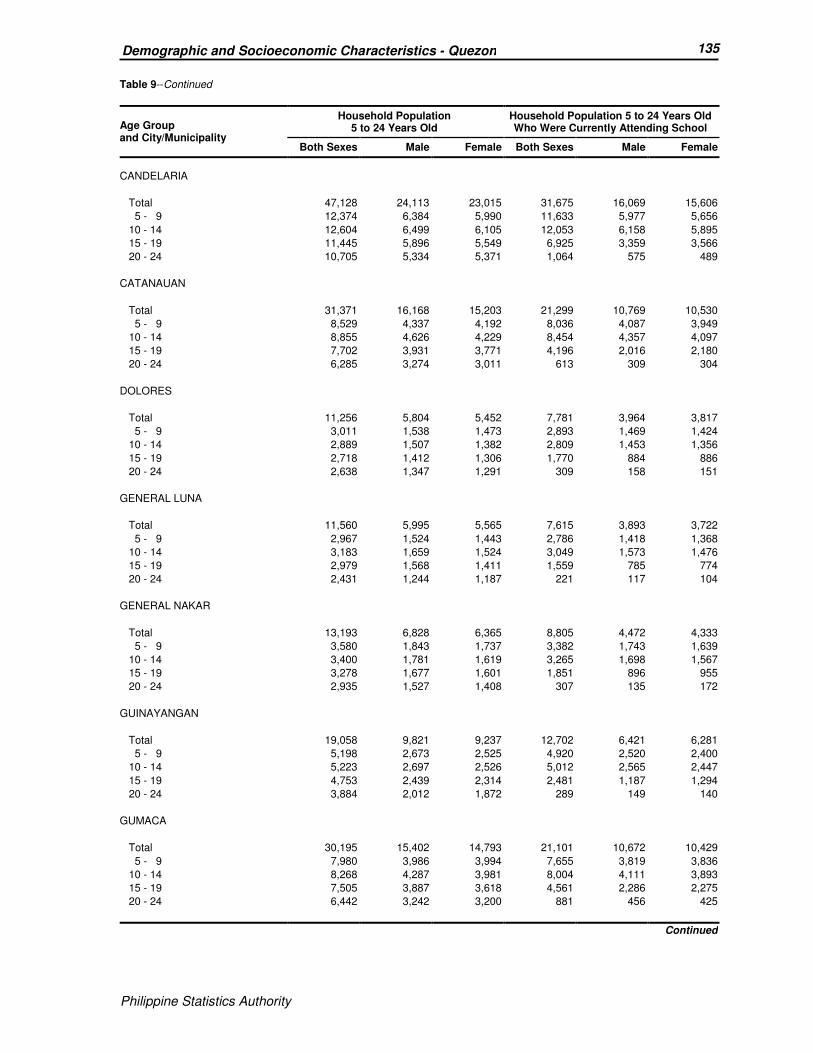
Philippine Statistics Authority
135 Demographic and Socioeconomic Characteristics - Quezon
Philippine Statistics Authority
Table 9--Continued
Age Group and City/Municipality
Household Population 5 to 24 Years Old
Household Population 5 to 24 Years Old Who Were Currently Attending School
Both Sexes Male Female Both Sexes Male Female
CANDELARIA
Total 47,128 24,113 23,015 31,675 16,069 15,606
5 - 9 12,374 6,384 5,990 11,633 5,977 5,656
10 - 14 12,604 6,499 6,105 12,053 6,158 5,895
15 - 19 11,445 5,896 5,549 6,925 3,359 3,566
20 - 24 10,705 5,334 5,371 1,064 575 489
CATANAUAN
Total 31,371 16,168 15,203 21,299 10,769 10,530
5 - 9 8,529 4,337 4,192 8,036 4,087 3,949
10 - 14 8,855 4,626 4,229 8,454 4,357 4,097
15 - 19 7,702 3,931 3,771 4,196 2,016 2,180
20 - 24 6,285 3,274 3,011 613 309 304
DOLORES
Total 11,256 5,804 5,452 7,781 3,964 3,817
5 - 9 3,011 1,538 1,473 2,893 1,469 1,424
10 - 14 2,889 1,507 1,382 2,809 1,453 1,356
15 - 19 2,718 1,412 1,306 1,770 884 886
20 - 24 2,638 1,347 1,291 309 158 151
GENERAL LUNA
Total 11,560 5,995 5,565 7,615 3,893 3,722
5 - 9 2,967 1,524 1,443 2,786 1,418 1,368
10 - 14 3,183 1,659 1,524 3,049 1,573 1,476
15 - 19 2,979 1,568 1,411 1,559 785 774
20 - 24 2,431 1,244 1,187 221 117 104
GENERAL NAKAR
Total 13,193 6,828 6,365 8,805 4,472 4,333
5 - 9 3,580 1,843 1,737 3,382 1,743 1,639
10 - 14 3,400 1,781 1,619 3,265 1,698 1,567
15 - 19 3,278 1,677 1,601 1,851 896 955
20 - 24 2,935 1,527 1,408 307 135 172
GUINAYANGAN
Total 19,058 9,821 9,237 12,702 6,421 6,281
5 - 9 5,198 2,673 2,525 4,920 2,520 2,400
10 - 14 5,223 2,697 2,526 5,012 2,565 2,447
15 - 19 4,753 2,439 2,314 2,481 1,187 1,294
20 - 24 3,884 2,012 1,872 289 149 140
GUMACA
Total 30,195 15,402 14,793 21,101 10,672 10,429
5 - 9 7,980 3,986 3,994 7,655 3,819 3,836
10 - 14 8,268 4,287 3,981 8,004 4,111 3,893
15 - 19 7,505 3,887 3,618 4,561 2,286 2,275
20 - 24 6,442 3,242 3,200 881 456 425
Continued
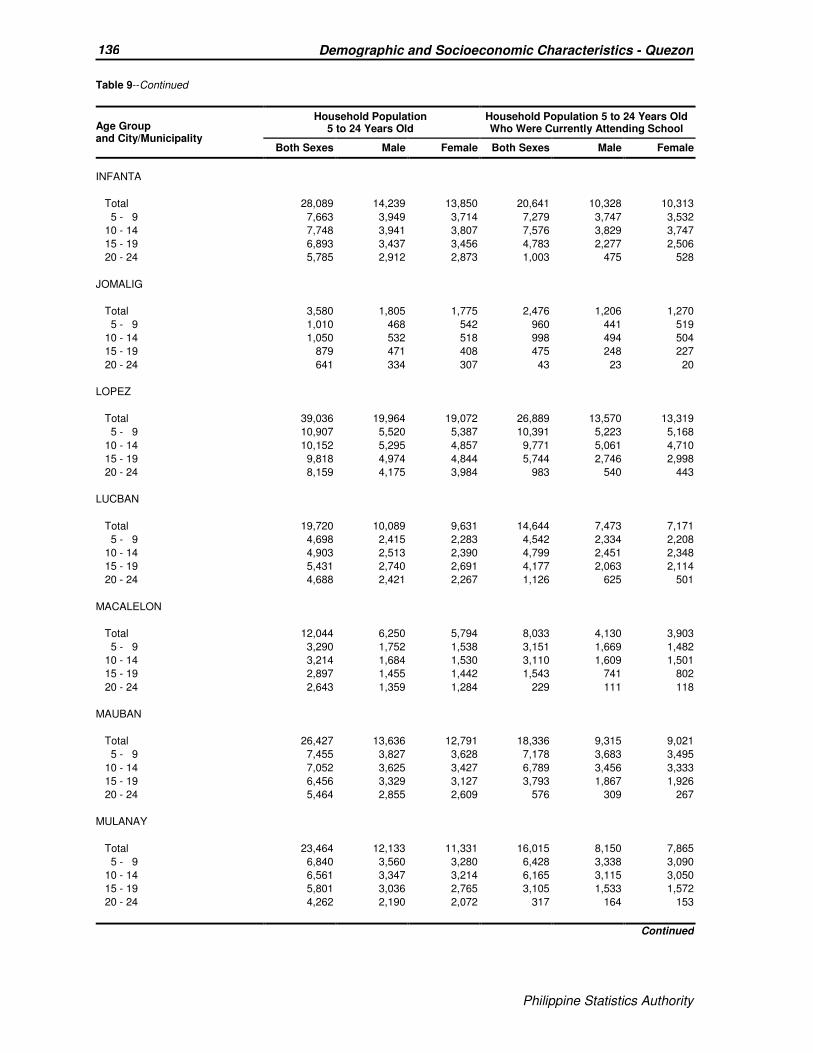
Philippine Statistics Authority
136 Demographic and Socioeconomic Characteristics - Quezon
Philippine Statistics Authority
Table 9--Continued
Age Group and City/Municipality
Household Population 5 to 24 Years Old
Household Population 5 to 24 Years Old Who Were Currently Attending School
Both Sexes Male Female Both Sexes Male Female
INFANTA
Total 28,089 14,239 13,850 20,641 10,328 10,313
5 - 9 7,663 3,949 3,714 7,279 3,747 3,532
10 - 14 7,748 3,941 3,807 7,576 3,829 3,747
15 - 19 6,893 3,437 3,456 4,783 2,277 2,506
20 - 24 5,785 2,912 2,873 1,003 475 528
JOMALIG
Total 3,580 1,805 1,775 2,476 1,206 1,270
5 - 9 1,010 468 542 960 441 519
10 - 14 1,050 532 518 998 494 504
15 - 19 879 471 408 475 248 227
20 - 24 641 334 307 43 23 20
LOPEZ
Total 39,036 19,964 19,072 26,889 13,570 13,319
5 - 9 10,907 5,520 5,387 10,391 5,223 5,168
10 - 14 10,152 5,295 4,857 9,771 5,061 4,710
15 - 19 9,818 4,974 4,844 5,744 2,746 2,998
20 - 24 8,159 4,175 3,984 983 540 443
LUCBAN
Total 19,720 10,089 9,631 14,644 7,473 7,171
5 - 9 4,698 2,415 2,283 4,542 2,334 2,208
10 - 14 4,903 2,513 2,390 4,799 2,451 2,348
15 - 19 5,431 2,740 2,691 4,177 2,063 2,114
20 - 24 4,688 2,421 2,267 1,126 625 501
MACALELON
Total 12,044 6,250 5,794 8,033 4,130 3,903
5 - 9 3,290 1,752 1,538 3,151 1,669 1,482
10 - 14 3,214 1,684 1,530 3,110 1,609 1,501
15 - 19 2,897 1,455 1,442 1,543 741 802
20 - 24 2,643 1,359 1,284 229 111 118
MAUBAN
Total 26,427 13,636 12,791 18,336 9,315 9,021
5 - 9 7,455 3,827 3,628 7,178 3,683 3,495
10 - 14 7,052 3,625 3,427 6,789 3,456 3,333
15 - 19 6,456 3,329 3,127 3,793 1,867 1,926
20 - 24 5,464 2,855 2,609 576 309 267
MULANAY
Total 23,464 12,133 11,331 16,015 8,150 7,865
5 - 9 6,840 3,560 3,280 6,428 3,338 3,090
10 - 14 6,561 3,347 3,214 6,165 3,115 3,050
15 - 19 5,801 3,036 2,765 3,105 1,533 1,572
20 - 24 4,262 2,190 2,072 317 164 153
Continued
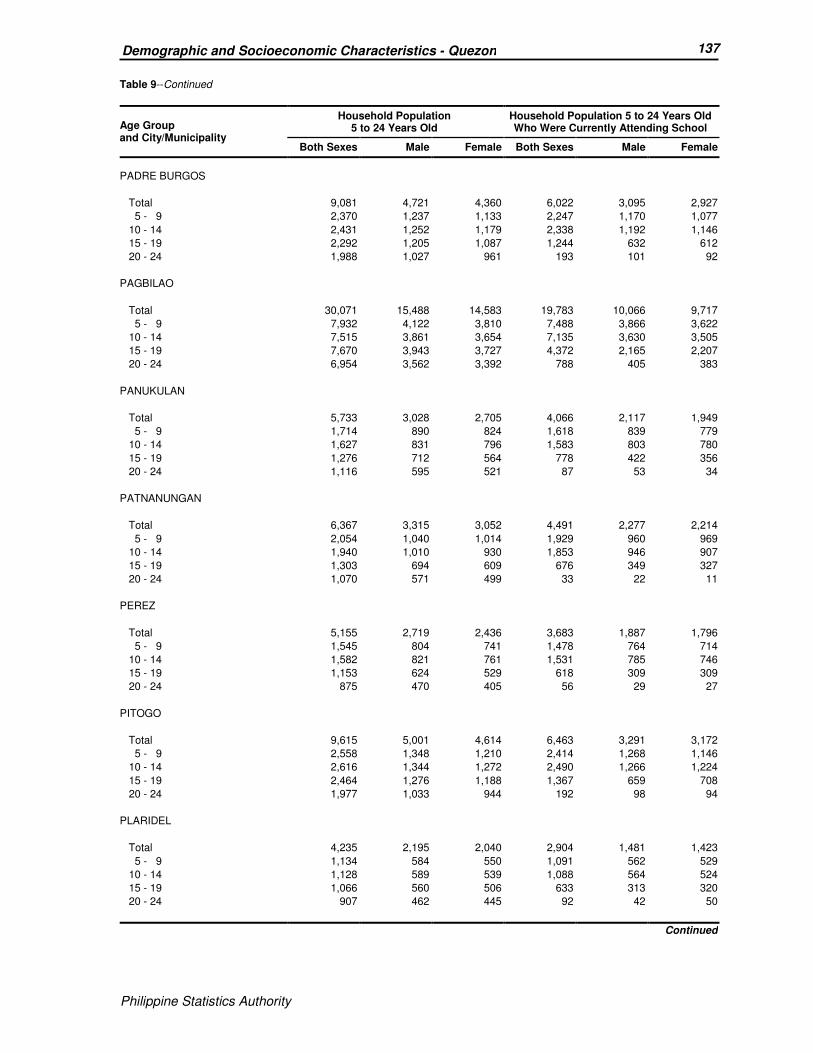
Philippine Statistics Authority
137 Demographic and Socioeconomic Characteristics - Quezon
Philippine Statistics Authority
Table 9--Continued
Age Group and City/Municipality
Household Population 5 to 24 Years Old
Household Population 5 to 24 Years Old Who Were Currently Attending School
Both Sexes Male Female Both Sexes Male Female
PADRE BURGOS
Total 9,081 4,721 4,360 6,022 3,095 2,927
5 - 9 2,370 1,237 1,133 2,247 1,170 1,077
10 - 14 2,431 1,252 1,179 2,338 1,192 1,146
15 - 19 2,292 1,205 1,087 1,244 632 612
20 - 24 1,988 1,027 961 193 101 92
PAGBILAO
Total 30,071 15,488 14,583 19,783 10,066 9,717
5 - 9 7,932 4,122 3,810 7,488 3,866 3,622
10 - 14 7,515 3,861 3,654 7,135 3,630 3,505
15 - 19 7,670 3,943 3,727 4,372 2,165 2,207
20 - 24 6,954 3,562 3,392 788 405 383
PANUKULAN
Total 5,733 3,028 2,705 4,066 2,117 1,949
5 - 9 1,714 890 824 1,618 839 779
10 - 14 1,627 831 796 1,583 803 780
15 - 19 1,276 712 564 778 422 356
20 - 24 1,116 595 521 87 53 34
PATNANUNGAN
Total 6,367 3,315 3,052 4,491 2,277 2,214
5 - 9 2,054 1,040 1,014 1,929 960 969
10 - 14 1,940 1,010 930 1,853 946 907
15 - 19 1,303 694 609 676 349 327
20 - 24 1,070 571 499 33 22 11
PEREZ
Total 5,155 2,719 2,436 3,683 1,887 1,796
5 - 9 1,545 804 741 1,478 764 714
10 - 14 1,582 821 761 1,531 785 746
15 - 19 1,153 624 529 618 309 309
20 - 24 875 470 405 56 29 27
PITOGO
Total 9,615 5,001 4,614 6,463 3,291 3,172
5 - 9 2,558 1,348 1,210 2,414 1,268 1,146
10 - 14 2,616 1,344 1,272 2,490 1,266 1,224
15 - 19 2,464 1,276 1,188 1,367 659 708
20 - 24 1,977 1,033 944 192 98 94
PLARIDEL
Total 4,235 2,195 2,040 2,904 1,481 1,423
5 - 9 1,134 584 550 1,091 562 529
10 - 14 1,128 589 539 1,088 564 524
15 - 19 1,066 560 506 633 313 320
20 - 24 907 462 445 92 42 50
Continued
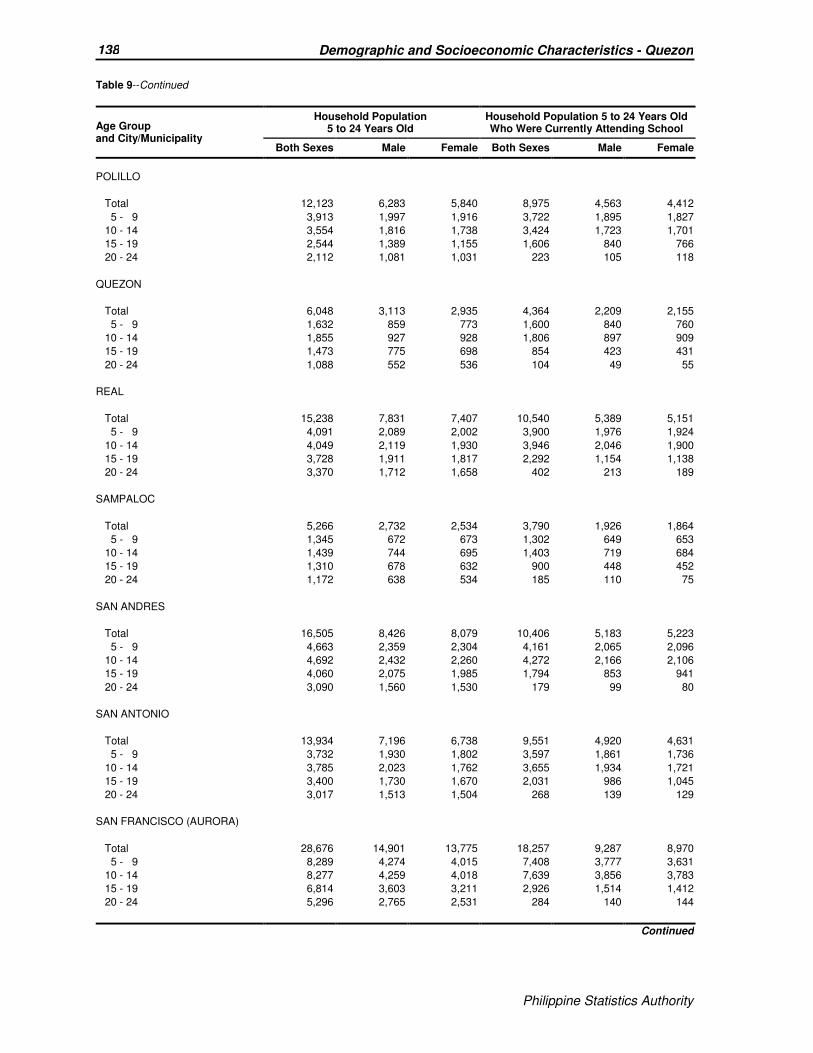
Philippine Statistics Authority
138 Demographic and Socioeconomic Characteristics - Quezon
Philippine Statistics Authority
Table 9--Continued
Age Group and City/Municipality
Household Population 5 to 24 Years Old
Household Population 5 to 24 Years Old Who Were Currently Attending School
Both Sexes Male Female Both Sexes Male Female
POLILLO
Total 12,123 6,283 5,840 8,975 4,563 4,412
5 - 9 3,913 1,997 1,916 3,722 1,895 1,827
10 - 14 3,554 1,816 1,738 3,424 1,723 1,701
15 - 19 2,544 1,389 1,155 1,606 840 766
20 - 24 2,112 1,081 1,031 223 105 118
QUEZON
Total 6,048 3,113 2,935 4,364 2,209 2,155
5 - 9 1,632 859 773 1,600 840 760
10 - 14 1,855 927 928 1,806 897 909
15 - 19 1,473 775 698 854 423 431
20 - 24 1,088 552 536 104 49 55
REAL
Total 15,238 7,831 7,407 10,540 5,389 5,151
5 - 9 4,091 2,089 2,002 3,900 1,976 1,924
10 - 14 4,049 2,119 1,930 3,946 2,046 1,900
15 - 19 3,728 1,911 1,817 2,292 1,154 1,138
20 - 24 3,370 1,712 1,658 402 213 189
SAMPALOC
Total 5,266 2,732 2,534 3,790 1,926 1,864
5 - 9 1,345 672 673 1,302 649 653
10 - 14 1,439 744 695 1,403 719 684
15 - 19 1,310 678 632 900 448 452
20 - 24 1,172 638 534 185 110 75
SAN ANDRES
Total 16,505 8,426 8,079 10,406 5,183 5,223
5 - 9 4,663 2,359 2,304 4,161 2,065 2,096
10 - 14 4,692 2,432 2,260 4,272 2,166 2,106
15 - 19 4,060 2,075 1,985 1,794 853 941
20 - 24 3,090 1,560 1,530 179 99 80
SAN ANTONIO
Total 13,934 7,196 6,738 9,551 4,920 4,631
5 - 9 3,732 1,930 1,802 3,597 1,861 1,736
10 - 14 3,785 2,023 1,762 3,655 1,934 1,721
15 - 19 3,400 1,730 1,670 2,031 986 1,045
20 - 24 3,017 1,513 1,504 268 139 129
SAN FRANCISCO (AURORA)
Total 28,676 14,901 13,775 18,257 9,287 8,970
5 - 9 8,289 4,274 4,015 7,408 3,777 3,631
10 - 14 8,277 4,259 4,018 7,639 3,856 3,783
15 - 19 6,814 3,603 3,211 2,926 1,514 1,412
20 - 24 5,296 2,765 2,531 284 140 144
Continued
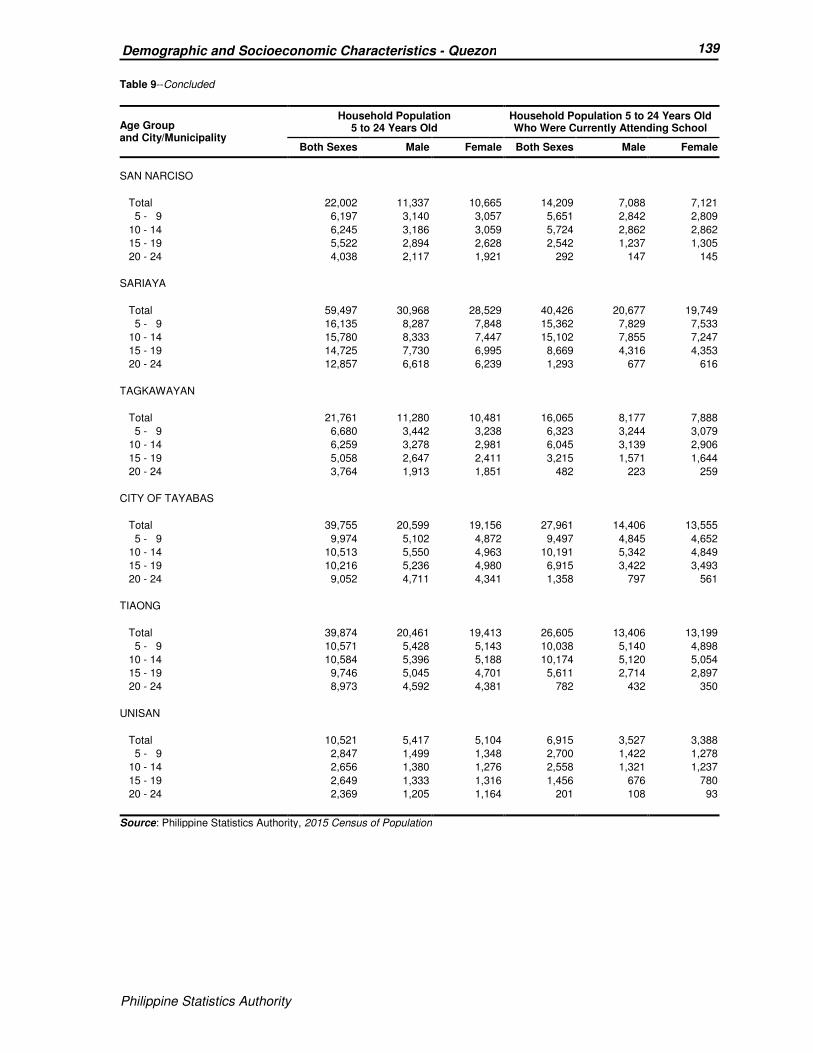
Philippine Statistics Authority
139 Demographic and Socioeconomic Characteristics - Quezon
Philippine Statistics Authority
Table 9--Concluded
Age Group and City/Municipality
Household Population 5 to 24 Years Old
Household Population 5 to 24 Years Old Who Were Currently Attending School
Both Sexes Male Female Both Sexes Male Female
SAN NARCISO
Total 22,002 11,337 10,665 14,209 7,088 7,121
5 - 9 6,197 3,140 3,057 5,651 2,842 2,809
10 - 14 6,245 3,186 3,059 5,724 2,862 2,862
15 - 19 5,522 2,894 2,628 2,542 1,237 1,305
20 - 24 4,038 2,117 1,921 292 147 145
SARIAYA
Total 59,497 30,968 28,529 40,426 20,677 19,749
5 - 9 16,135 8,287 7,848 15,362 7,829 7,533
10 - 14 15,780 8,333 7,447 15,102 7,855 7,247
15 - 19 14,725 7,730 6,995 8,669 4,316 4,353
20 - 24 12,857 6,618 6,239 1,293 677 616
TAGKAWAYAN
Total 21,761 11,280 10,481 16,065 8,177 7,888
5 - 9 6,680 3,442 3,238 6,323 3,244 3,079
10 - 14 6,259 3,278 2,981 6,045 3,139 2,906
15 - 19 5,058 2,647 2,411 3,215 1,571 1,644
20 - 24 3,764 1,913 1,851 482 223 259
CITY OF TAYABAS
Total 39,755 20,599 19,156 27,961 14,406 13,555
5 - 9 9,974 5,102 4,872 9,497 4,845 4,652
10 - 14 10,513 5,550 4,963 10,191 5,342 4,849
15 - 19 10,216 5,236 4,980 6,915 3,422 3,493
20 - 24 9,052 4,711 4,341 1,358 797 561
TIAONG
Total 39,874 20,461 19,413 26,605 13,406 13,199
5 - 9 10,571 5,428 5,143 10,038 5,140 4,898
10 - 14 10,584 5,396 5,188 10,174 5,120 5,054
15 - 19 9,746 5,045 4,701 5,611 2,714 2,897
20 - 24 8,973 4,592 4,381 782 432 350
UNISAN
Total 10,521 5,417 5,104 6,915 3,527 3,388
5 - 9 2,847 1,499 1,348 2,700 1,422 1,278
10 - 14 2,656 1,380 1,276 2,558 1,321 1,237
15 - 19 2,649 1,333 1,316 1,456 676 780
20 - 24 2,369 1,205 1,164 201 108 93
Source: Philippine Statistics Authority, 2015 Census of Population
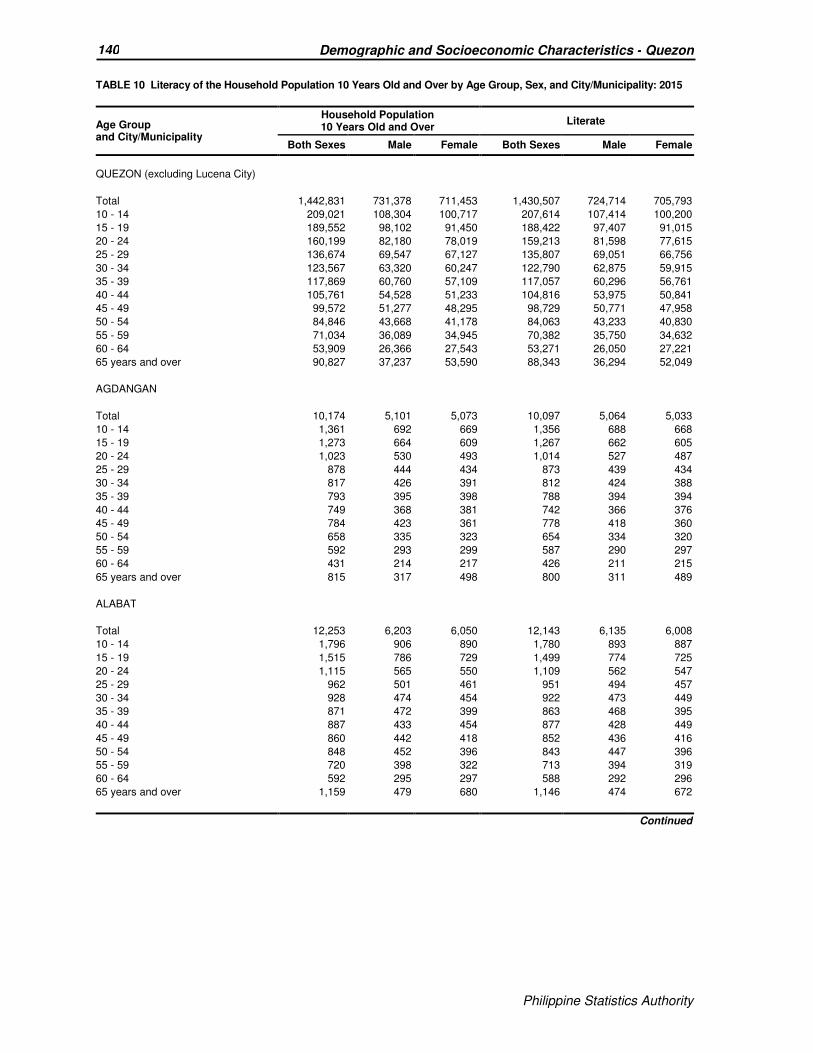
Philippine Statistics Authority
140 Demographic and Socioeconomic Characteristics - Quezon
Philippine Statistics Authority
TABLE 10 Literacy of the Household Population 10 Years Old and Over by Age Group, Sex, and City/Municipality: 2015
Age Group and City/Municipality
Household Population 10 Years Old and Over
Literate
Both Sexes Male Female Both Sexes Male Female
QUEZON (excluding Lucena City)
Total 1,442,831 731,378 711,453 1,430,507 724,714 705,793
10 - 14 209,021 108,304 100,717 207,614 107,414 100,200
15 - 19 189,552 98,102 91,450 188,422 97,407 91,015
20 - 24 160,199 82,180 78,019 159,213 81,598 77,615
25 - 29 136,674 69,547 67,127 135,807 69,051 66,756
30 - 34 123,567 63,320 60,247 122,790 62,875 59,915
35 - 39 117,869 60,760 57,109 117,057 60,296 56,761
40 - 44 105,761 54,528 51,233 104,816 53,975 50,841
45 - 49 99,572 51,277 48,295 98,729 50,771 47,958
50 - 54 84,846 43,668 41,178 84,063 43,233 40,830
55 - 59 71,034 36,089 34,945 70,382 35,750 34,632
60 - 64 53,909 26,366 27,543 53,271 26,050 27,221
65 years and over 90,827 37,237 53,590 88,343 36,294 52,049
AGDANGAN
Total 10,174 5,101 5,073 10,097 5,064 5,033
10 - 14 1,361 692 669 1,356 688 668
15 - 19 1,273 664 609 1,267 662 605
20 - 24 1,023 530 493 1,014 527 487
25 - 29 878 444 434 873 439 434
30 - 34 817 426 391 812 424 388
35 - 39 793 395 398 788 394 394
40 - 44 749 368 381 742 366 376
45 - 49 784 423 361 778 418 360
50 - 54 658 335 323 654 334 320
55 - 59 592 293 299 587 290 297
60 - 64 431 214 217 426 211 215
65 years and over 815 317 498 800 311 489
ALABAT
Total 12,253 6,203 6,050 12,143 6,135 6,008
10 - 14 1,796 906 890 1,780 893 887
15 - 19 1,515 786 729 1,499 774 725
20 - 24 1,115 565 550 1,109 562 547
25 - 29 962 501 461 951 494 457
30 - 34 928 474 454 922 473 449
35 - 39 871 472 399 863 468 395
40 - 44 887 433 454 877 428 449
45 - 49 860 442 418 852 436 416
50 - 54 848 452 396 843 447 396
55 - 59 720 398 322 713 394 319
60 - 64 592 295 297 588 292 296
65 years and over 1,159 479 680 1,146 474 672
Continued
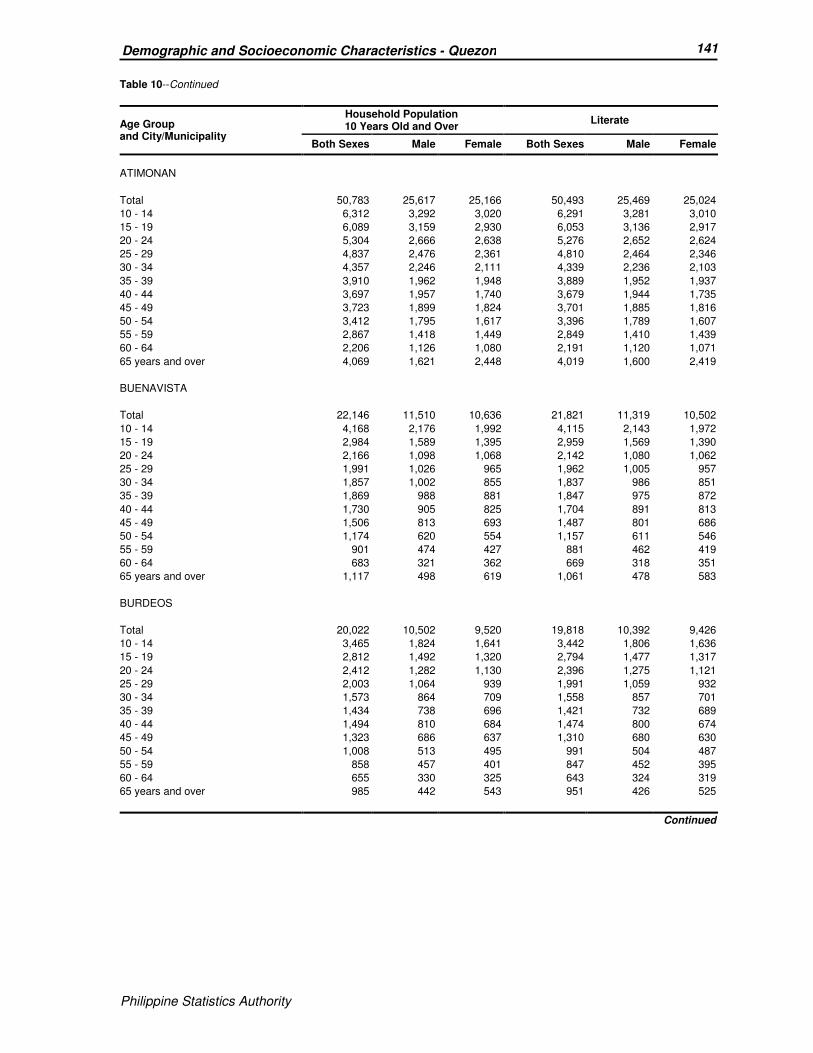
Philippine Statistics Authority
141 Demographic and Socioeconomic Characteristics - Quezon
Philippine Statistics Authority
Table 10--Continued
Age Group and City/Municipality
Household Population 10 Years Old and Over
Literate
Both Sexes Male Female Both Sexes Male Female
ATIMONAN
Total 50,783 25,617 25,166 50,493 25,469 25,024
10 - 14 6,312 3,292 3,020 6,291 3,281 3,010
15 - 19 6,089 3,159 2,930 6,053 3,136 2,917
20 - 24 5,304 2,666 2,638 5,276 2,652 2,624
25 - 29 4,837 2,476 2,361 4,810 2,464 2,346
30 - 34 4,357 2,246 2,111 4,339 2,236 2,103
35 - 39 3,910 1,962 1,948 3,889 1,952 1,937
40 - 44 3,697 1,957 1,740 3,679 1,944 1,735
45 - 49 3,723 1,899 1,824 3,701 1,885 1,816
50 - 54 3,412 1,795 1,617 3,396 1,789 1,607
55 - 59 2,867 1,418 1,449 2,849 1,410 1,439
60 - 64 2,206 1,126 1,080 2,191 1,120 1,071
65 years and over 4,069 1,621 2,448 4,019 1,600 2,419
BUENAVISTA
Total 22,146 11,510 10,636 21,821 11,319 10,502
10 - 14 4,168 2,176 1,992 4,115 2,143 1,972
15 - 19 2,984 1,589 1,395 2,959 1,569 1,390
20 - 24 2,166 1,098 1,068 2,142 1,080 1,062
25 - 29 1,991 1,026 965 1,962 1,005 957
30 - 34 1,857 1,002 855 1,837 986 851
35 - 39 1,869 988 881 1,847 975 872
40 - 44 1,730 905 825 1,704 891 813
45 - 49 1,506 813 693 1,487 801 686
50 - 54 1,174 620 554 1,157 611 546
55 - 59 901 474 427 881 462 419
60 - 64 683 321 362 669 318 351
65 years and over 1,117 498 619 1,061 478 583
BURDEOS
Total 20,022 10,502 9,520 19,818 10,392 9,426
10 - 14 3,465 1,824 1,641 3,442 1,806 1,636
15 - 19 2,812 1,492 1,320 2,794 1,477 1,317
20 - 24 2,412 1,282 1,130 2,396 1,275 1,121
25 - 29 2,003 1,064 939 1,991 1,059 932
30 - 34 1,573 864 709 1,558 857 701
35 - 39 1,434 738 696 1,421 732 689
40 - 44 1,494 810 684 1,474 800 674
45 - 49 1,323 686 637 1,310 680 630
50 - 54 1,008 513 495 991 504 487
55 - 59 858 457 401 847 452 395
60 - 64 655 330 325 643 324 319
65 years and over 985 442 543 951 426 525
Continued
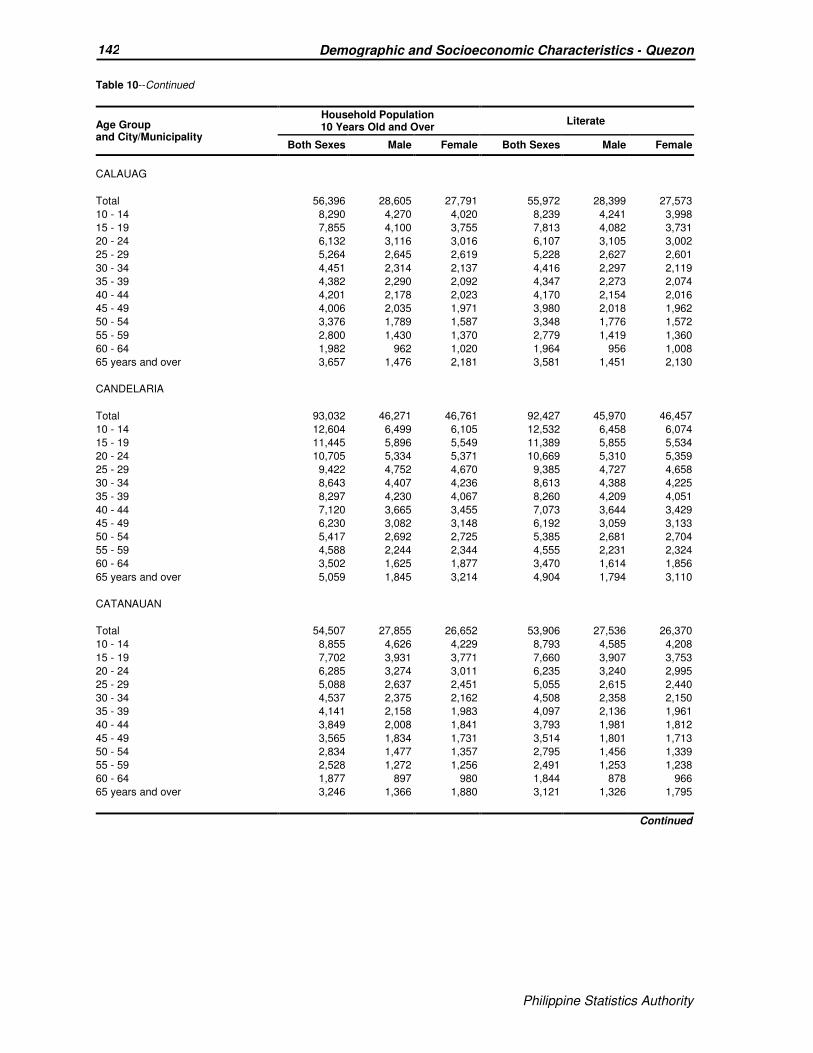
Philippine Statistics Authority
142 Demographic and Socioeconomic Characteristics - Quezon
Philippine Statistics Authority
Table 10--Continued
Age Group and City/Municipality
Household Population 10 Years Old and Over
Literate
Both Sexes Male Female Both Sexes Male Female
CALAUAG
Total 56,396 28,605 27,791 55,972 28,399 27,573
10 - 14 8,290 4,270 4,020 8,239 4,241 3,998
15 - 19 7,855 4,100 3,755 7,813 4,082 3,731
20 - 24 6,132 3,116 3,016 6,107 3,105 3,002
25 - 29 5,264 2,645 2,619 5,228 2,627 2,601
30 - 34 4,451 2,314 2,137 4,416 2,297 2,119
35 - 39 4,382 2,290 2,092 4,347 2,273 2,074
40 - 44 4,201 2,178 2,023 4,170 2,154 2,016
45 - 49 4,006 2,035 1,971 3,980 2,018 1,962
50 - 54 3,376 1,789 1,587 3,348 1,776 1,572
55 - 59 2,800 1,430 1,370 2,779 1,419 1,360
60 - 64 1,982 962 1,020 1,964 956 1,008
65 years and over 3,657 1,476 2,181 3,581 1,451 2,130
CANDELARIA
Total 93,032 46,271 46,761 92,427 45,970 46,457
10 - 14 12,604 6,499 6,105 12,532 6,458 6,074
15 - 19 11,445 5,896 5,549 11,389 5,855 5,534
20 - 24 10,705 5,334 5,371 10,669 5,310 5,359
25 - 29 9,422 4,752 4,670 9,385 4,727 4,658
30 - 34 8,643 4,407 4,236 8,613 4,388 4,225
35 - 39 8,297 4,230 4,067 8,260 4,209 4,051
40 - 44 7,120 3,665 3,455 7,073 3,644 3,429
45 - 49 6,230 3,082 3,148 6,192 3,059 3,133
50 - 54 5,417 2,692 2,725 5,385 2,681 2,704
55 - 59 4,588 2,244 2,344 4,555 2,231 2,324
60 - 64 3,502 1,625 1,877 3,470 1,614 1,856
65 years and over 5,059 1,845 3,214 4,904 1,794 3,110
CATANAUAN
Total 54,507 27,855 26,652 53,906 27,536 26,370
10 - 14 8,855 4,626 4,229 8,793 4,585 4,208
15 - 19 7,702 3,931 3,771 7,660 3,907 3,753
20 - 24 6,285 3,274 3,011 6,235 3,240 2,995
25 - 29 5,088 2,637 2,451 5,055 2,615 2,440
30 - 34 4,537 2,375 2,162 4,508 2,358 2,150
35 - 39 4,141 2,158 1,983 4,097 2,136 1,961
40 - 44 3,849 2,008 1,841 3,793 1,981 1,812
45 - 49 3,565 1,834 1,731 3,514 1,801 1,713
50 - 54 2,834 1,477 1,357 2,795 1,456 1,339
55 - 59 2,528 1,272 1,256 2,491 1,253 1,238
60 - 64 1,877 897 980 1,844 878 966
65 years and over 3,246 1,366 1,880 3,121 1,326 1,795
Continued
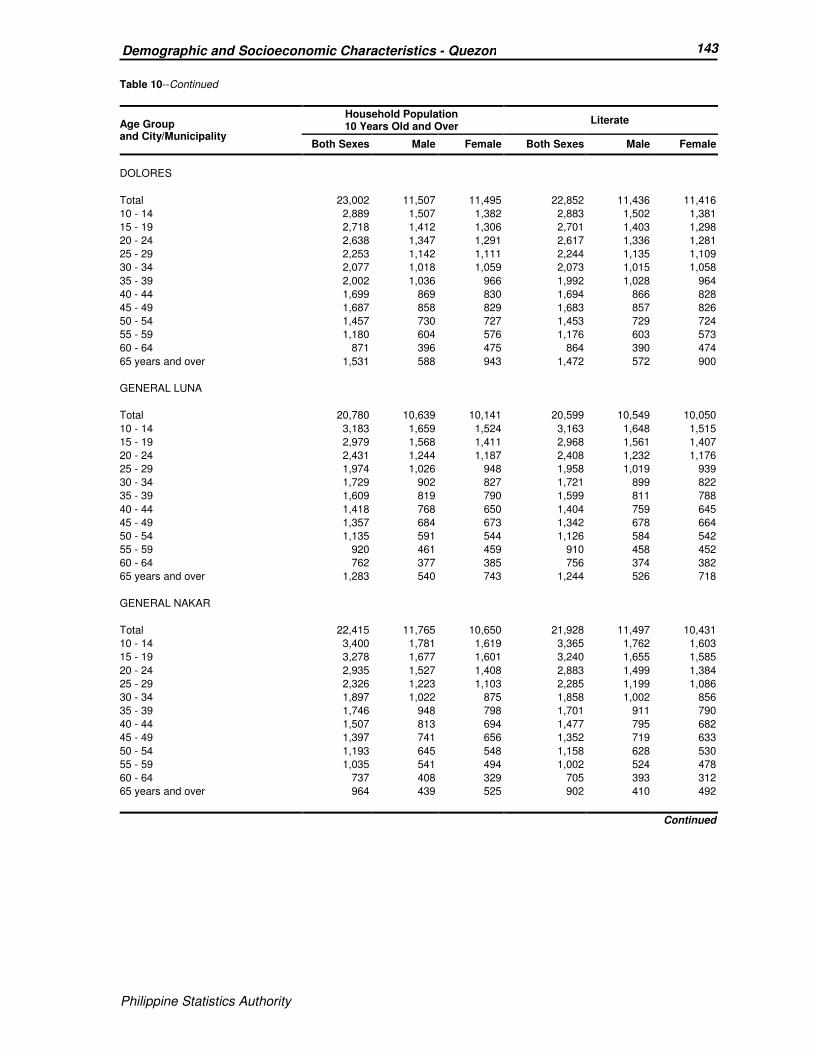
Philippine Statistics Authority
143 Demographic and Socioeconomic Characteristics - Quezon
Philippine Statistics Authority
Table 10--Continued
Age Group and City/Municipality
Household Population 10 Years Old and Over
Literate
Both Sexes Male Female Both Sexes Male Female
DOLORES
Total 23,002 11,507 11,495 22,852 11,436 11,416
10 - 14 2,889 1,507 1,382 2,883 1,502 1,381
15 - 19 2,718 1,412 1,306 2,701 1,403 1,298
20 - 24 2,638 1,347 1,291 2,617 1,336 1,281
25 - 29 2,253 1,142 1,111 2,244 1,135 1,109
30 - 34 2,077 1,018 1,059 2,073 1,015 1,058
35 - 39 2,002 1,036 966 1,992 1,028 964
40 - 44 1,699 869 830 1,694 866 828
45 - 49 1,687 858 829 1,683 857 826
50 - 54 1,457 730 727 1,453 729 724
55 - 59 1,180 604 576 1,176 603 573
60 - 64 871 396 475 864 390 474
65 years and over 1,531 588 943 1,472 572 900
GENERAL LUNA
Total 20,780 10,639 10,141 20,599 10,549 10,050
10 - 14 3,183 1,659 1,524 3,163 1,648 1,515
15 - 19 2,979 1,568 1,411 2,968 1,561 1,407
20 - 24 2,431 1,244 1,187 2,408 1,232 1,176
25 - 29 1,974 1,026 948 1,958 1,019 939
30 - 34 1,729 902 827 1,721 899 822
35 - 39 1,609 819 790 1,599 811 788
40 - 44 1,418 768 650 1,404 759 645
45 - 49 1,357 684 673 1,342 678 664
50 - 54 1,135 591 544 1,126 584 542
55 - 59 920 461 459 910 458 452
60 - 64 762 377 385 756 374 382
65 years and over 1,283 540 743 1,244 526 718
GENERAL NAKAR
Total 22,415 11,765 10,650 21,928 11,497 10,431
10 - 14 3,400 1,781 1,619 3,365 1,762 1,603
15 - 19 3,278 1,677 1,601 3,240 1,655 1,585
20 - 24 2,935 1,527 1,408 2,883 1,499 1,384
25 - 29 2,326 1,223 1,103 2,285 1,199 1,086
30 - 34 1,897 1,022 875 1,858 1,002 856
35 - 39 1,746 948 798 1,701 911 790
40 - 44 1,507 813 694 1,477 795 682
45 - 49 1,397 741 656 1,352 719 633
50 - 54 1,193 645 548 1,158 628 530
55 - 59 1,035 541 494 1,002 524 478
60 - 64 737 408 329 705 393 312
65 years and over 964 439 525 902 410 492
Continued
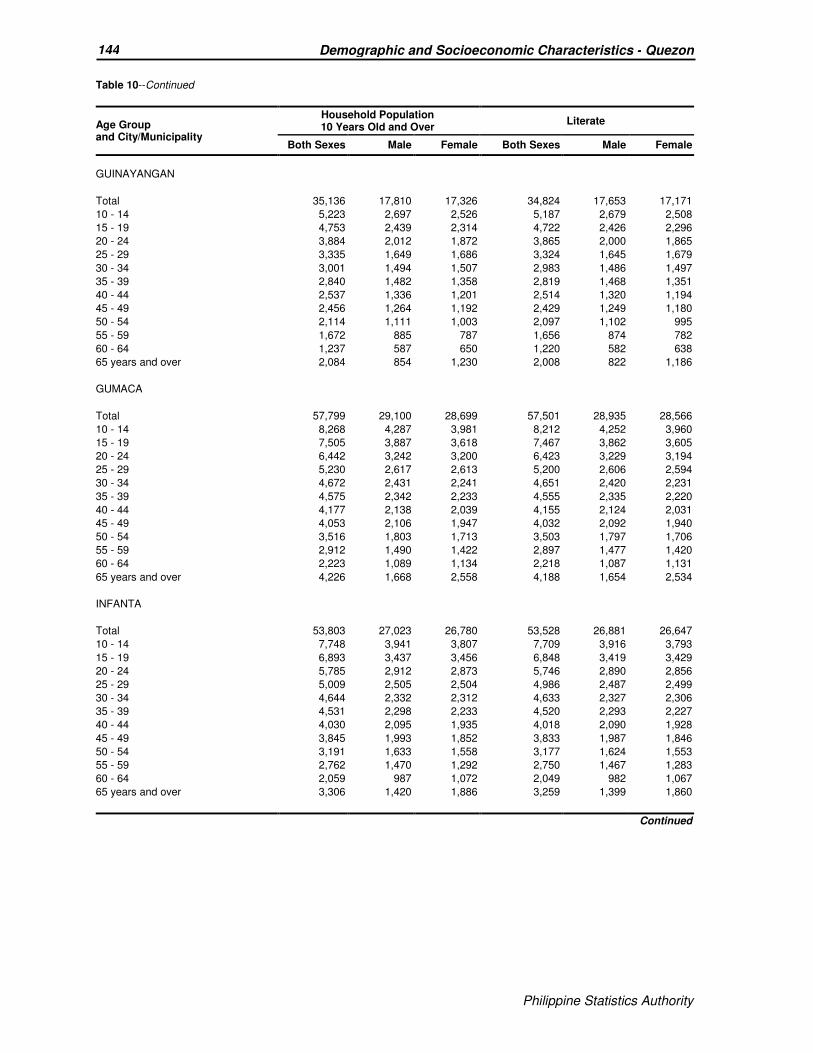
Philippine Statistics Authority
144 Demographic and Socioeconomic Characteristics - Quezon
Philippine Statistics Authority
Table 10--Continued
Age Group and City/Municipality
Household Population 10 Years Old and Over
Literate
Both Sexes Male Female Both Sexes Male Female
GUINAYANGAN
Total 35,136 17,810 17,326 34,824 17,653 17,171
10 - 14 5,223 2,697 2,526 5,187 2,679 2,508
15 - 19 4,753 2,439 2,314 4,722 2,426 2,296
20 - 24 3,884 2,012 1,872 3,865 2,000 1,865
25 - 29 3,335 1,649 1,686 3,324 1,645 1,679
30 - 34 3,001 1,494 1,507 2,983 1,486 1,497
35 - 39 2,840 1,482 1,358 2,819 1,468 1,351
40 - 44 2,537 1,336 1,201 2,514 1,320 1,194
45 - 49 2,456 1,264 1,192 2,429 1,249 1,180
50 - 54 2,114 1,111 1,003 2,097 1,102 995
55 - 59 1,672 885 787 1,656 874 782
60 - 64 1,237 587 650 1,220 582 638
65 years and over 2,084 854 1,230 2,008 822 1,186
GUMACA
Total 57,799 29,100 28,699 57,501 28,935 28,566
10 - 14 8,268 4,287 3,981 8,212 4,252 3,960
15 - 19 7,505 3,887 3,618 7,467 3,862 3,605
20 - 24 6,442 3,242 3,200 6,423 3,229 3,194
25 - 29 5,230 2,617 2,613 5,200 2,606 2,594
30 - 34 4,672 2,431 2,241 4,651 2,420 2,231
35 - 39 4,575 2,342 2,233 4,555 2,335 2,220
40 - 44 4,177 2,138 2,039 4,155 2,124 2,031
45 - 49 4,053 2,106 1,947 4,032 2,092 1,940
50 - 54 3,516 1,803 1,713 3,503 1,797 1,706
55 - 59 2,912 1,490 1,422 2,897 1,477 1,420
60 - 64 2,223 1,089 1,134 2,218 1,087 1,131
65 years and over 4,226 1,668 2,558 4,188 1,654 2,534
INFANTA
Total 53,803 27,023 26,780 53,528 26,881 26,647
10 - 14 7,748 3,941 3,807 7,709 3,916 3,793
15 - 19 6,893 3,437 3,456 6,848 3,419 3,429
20 - 24 5,785 2,912 2,873 5,746 2,890 2,856
25 - 29 5,009 2,505 2,504 4,986 2,487 2,499
30 - 34 4,644 2,332 2,312 4,633 2,327 2,306
35 - 39 4,531 2,298 2,233 4,520 2,293 2,227
40 - 44 4,030 2,095 1,935 4,018 2,090 1,928
45 - 49 3,845 1,993 1,852 3,833 1,987 1,846
50 - 54 3,191 1,633 1,558 3,177 1,624 1,553
55 - 59 2,762 1,470 1,292 2,750 1,467 1,283
60 - 64 2,059 987 1,072 2,049 982 1,067
65 years and over 3,306 1,420 1,886 3,259 1,399 1,860
Continued
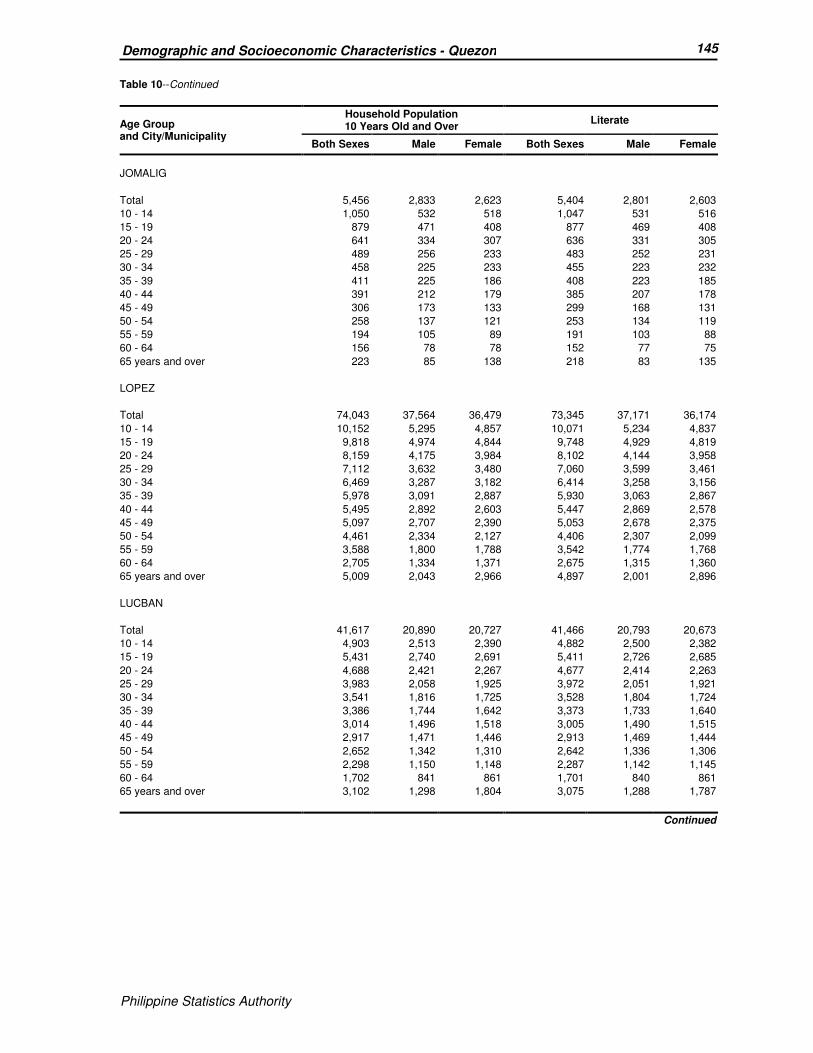
Philippine Statistics Authority
145 Demographic and Socioeconomic Characteristics - Quezon
Philippine Statistics Authority
Table 10--Continued
Age Group and City/Municipality
Household Population 10 Years Old and Over
Literate
Both Sexes Male Female Both Sexes Male Female
JOMALIG
Total 5,456 2,833 2,623 5,404 2,801 2,603
10 - 14 1,050 532 518 1,047 531 516
15 - 19 879 471 408 877 469 408
20 - 24 641 334 307 636 331 305
25 - 29 489 256 233 483 252 231
30 - 34 458 225 233 455 223 232
35 - 39 411 225 186 408 223 185
40 - 44 391 212 179 385 207 178
45 - 49 306 173 133 299 168 131
50 - 54 258 137 121 253 134 119
55 - 59 194 105 89 191 103 88
60 - 64 156 78 78 152 77 75
65 years and over 223 85 138 218 83 135
LOPEZ
Total 74,043 37,564 36,479 73,345 37,171 36,174
10 - 14 10,152 5,295 4,857 10,071 5,234 4,837
15 - 19 9,818 4,974 4,844 9,748 4,929 4,819
20 - 24 8,159 4,175 3,984 8,102 4,144 3,958
25 - 29 7,112 3,632 3,480 7,060 3,599 3,461
30 - 34 6,469 3,287 3,182 6,414 3,258 3,156
35 - 39 5,978 3,091 2,887 5,930 3,063 2,867
40 - 44 5,495 2,892 2,603 5,447 2,869 2,578
45 - 49 5,097 2,707 2,390 5,053 2,678 2,375
50 - 54 4,461 2,334 2,127 4,406 2,307 2,099
55 - 59 3,588 1,800 1,788 3,542 1,774 1,768
60 - 64 2,705 1,334 1,371 2,675 1,315 1,360
65 years and over 5,009 2,043 2,966 4,897 2,001 2,896
LUCBAN
Total 41,617 20,890 20,727 41,466 20,793 20,673
10 - 14 4,903 2,513 2,390 4,882 2,500 2,382
15 - 19 5,431 2,740 2,691 5,411 2,726 2,685
20 - 24 4,688 2,421 2,267 4,677 2,414 2,263
25 - 29 3,983 2,058 1,925 3,972 2,051 1,921
30 - 34 3,541 1,816 1,725 3,528 1,804 1,724
35 - 39 3,386 1,744 1,642 3,373 1,733 1,640
40 - 44 3,014 1,496 1,518 3,005 1,490 1,515
45 - 49 2,917 1,471 1,446 2,913 1,469 1,444
50 - 54 2,652 1,342 1,310 2,642 1,336 1,306
55 - 59 2,298 1,150 1,148 2,287 1,142 1,145
60 - 64 1,702 841 861 1,701 840 861
65 years and over 3,102 1,298 1,804 3,075 1,288 1,787
Continued
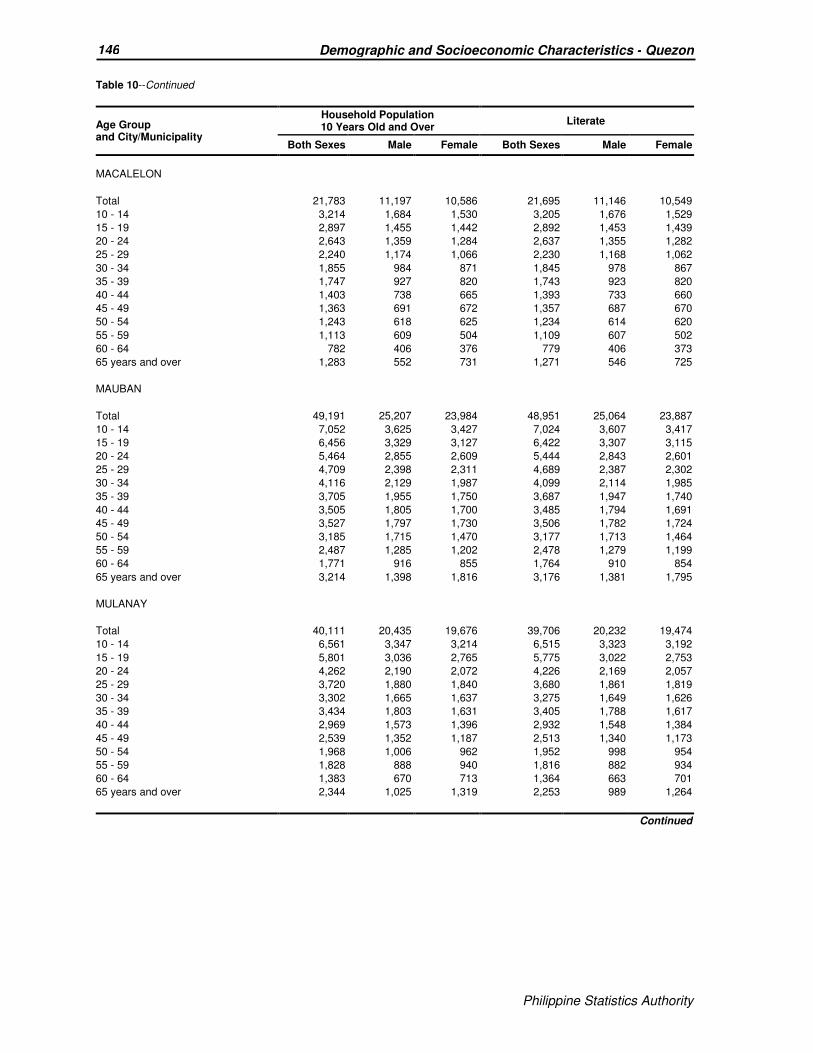
Philippine Statistics Authority
146 Demographic and Socioeconomic Characteristics - Quezon
Philippine Statistics Authority
Table 10--Continued
Age Group and City/Municipality
Household Population 10 Years Old and Over
Literate
Both Sexes Male Female Both Sexes Male Female
MACALELON
Total 21,783 11,197 10,586 21,695 11,146 10,549
10 - 14 3,214 1,684 1,530 3,205 1,676 1,529
15 - 19 2,897 1,455 1,442 2,892 1,453 1,439
20 - 24 2,643 1,359 1,284 2,637 1,355 1,282
25 - 29 2,240 1,174 1,066 2,230 1,168 1,062
30 - 34 1,855 984 871 1,845 978 867
35 - 39 1,747 927 820 1,743 923 820
40 - 44 1,403 738 665 1,393 733 660
45 - 49 1,363 691 672 1,357 687 670
50 - 54 1,243 618 625 1,234 614 620
55 - 59 1,113 609 504 1,109 607 502
60 - 64 782 406 376 779 406 373
65 years and over 1,283 552 731 1,271 546 725
MAUBAN
Total 49,191 25,207 23,984 48,951 25,064 23,887
10 - 14 7,052 3,625 3,427 7,024 3,607 3,417
15 - 19 6,456 3,329 3,127 6,422 3,307 3,115
20 - 24 5,464 2,855 2,609 5,444 2,843 2,601
25 - 29 4,709 2,398 2,311 4,689 2,387 2,302
30 - 34 4,116 2,129 1,987 4,099 2,114 1,985
35 - 39 3,705 1,955 1,750 3,687 1,947 1,740
40 - 44 3,505 1,805 1,700 3,485 1,794 1,691
45 - 49 3,527 1,797 1,730 3,506 1,782 1,724
50 - 54 3,185 1,715 1,470 3,177 1,713 1,464
55 - 59 2,487 1,285 1,202 2,478 1,279 1,199
60 - 64 1,771 916 855 1,764 910 854
65 years and over 3,214 1,398 1,816 3,176 1,381 1,795
MULANAY
Total 40,111 20,435 19,676 39,706 20,232 19,474
10 - 14 6,561 3,347 3,214 6,515 3,323 3,192
15 - 19 5,801 3,036 2,765 5,775 3,022 2,753
20 - 24 4,262 2,190 2,072 4,226 2,169 2,057
25 - 29 3,720 1,880 1,840 3,680 1,861 1,819
30 - 34 3,302 1,665 1,637 3,275 1,649 1,626
35 - 39 3,434 1,803 1,631 3,405 1,788 1,617
40 - 44 2,969 1,573 1,396 2,932 1,548 1,384
45 - 49 2,539 1,352 1,187 2,513 1,340 1,173
50 - 54 1,968 1,006 962 1,952 998 954
55 - 59 1,828 888 940 1,816 882 934
60 - 64 1,383 670 713 1,364 663 701
65 years and over 2,344 1,025 1,319 2,253 989 1,264
Continued

Philippine Statistics Authority
147 Demographic and Socioeconomic Characteristics - Quezon
Philippine Statistics Authority
Table 10--Continued
Age Group and City/Municipality
Household Population 10 Years Old and Over
Literate
Both Sexes Male Female Both Sexes Male Female
PADRE BURGOS
Total 18,006 9,095 8,911 17,847 9,011 8,836
10 - 14 2,431 1,252 1,179 2,414 1,240 1,174
15 - 19 2,292 1,205 1,087 2,280 1,197 1,083
20 - 24 1,988 1,027 961 1,972 1,017 955
25 - 29 1,544 767 777 1,535 765 770
30 - 34 1,392 721 671 1,382 714 668
35 - 39 1,522 768 754 1,514 763 751
40 - 44 1,364 705 659 1,349 695 654
45 - 49 1,277 646 631 1,266 641 625
50 - 54 1,120 593 527 1,106 585 521
55 - 59 931 445 486 927 444 483
60 - 64 795 387 408 787 383 404
65 years and over 1,350 579 771 1,315 567 748
PAGBILAO
Total 58,821 29,517 29,304 58,367 29,253 29,114
10 - 14 7,515 3,861 3,654 7,451 3,825 3,626
15 - 19 7,670 3,943 3,727 7,616 3,913 3,703
20 - 24 6,954 3,562 3,392 6,907 3,528 3,379
25 - 29 5,874 2,965 2,909 5,844 2,948 2,896
30 - 34 5,084 2,580 2,504 5,054 2,567 2,487
35 - 39 5,069 2,536 2,533 5,047 2,520 2,527
40 - 44 4,237 2,154 2,083 4,204 2,133 2,071
45 - 49 4,170 2,101 2,069 4,139 2,078 2,061
50 - 54 3,637 1,824 1,813 3,612 1,810 1,802
55 - 59 2,929 1,475 1,454 2,910 1,468 1,442
60 - 64 2,217 1,123 1,094 2,189 1,107 1,082
65 years and over 3,465 1,393 2,072 3,394 1,356 2,038
PANUKULAN
Total 10,288 5,398 4,890 10,161 5,324 4,837
10 - 14 1,627 831 796 1,622 828 794
15 - 19 1,276 712 564 1,266 704 562
20 - 24 1,116 595 521 1,103 587 516
25 - 29 1,033 560 473 1,022 556 466
30 - 34 984 471 513 974 467 507
35 - 39 781 430 351 763 420 343
40 - 44 778 416 362 760 402 358
45 - 49 672 356 316 665 351 314
50 - 54 614 328 286 605 325 280
55 - 59 475 246 229 471 243 228
60 - 64 334 170 164 329 168 161
65 years and over 598 283 315 581 273 308
Continued
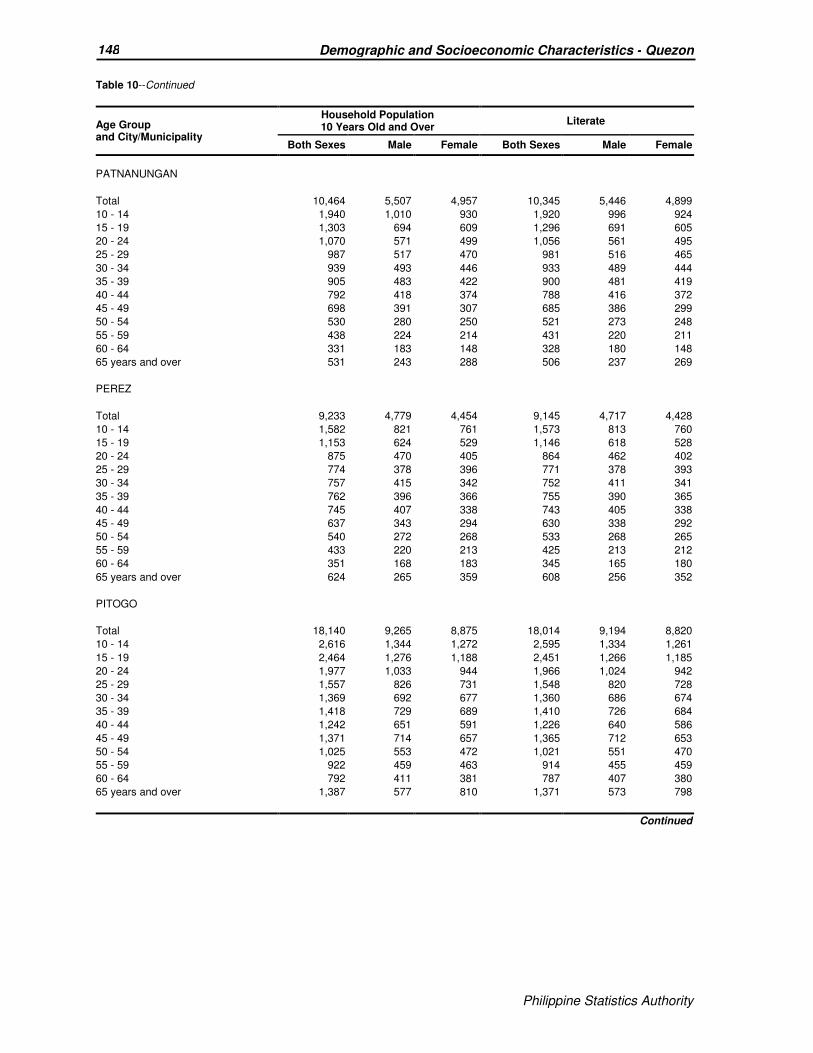
Philippine Statistics Authority
148 Demographic and Socioeconomic Characteristics - Quezon
Philippine Statistics Authority
Table 10--Continued
Age Group and City/Municipality
Household Population 10 Years Old and Over
Literate
Both Sexes Male Female Both Sexes Male Female
PATNANUNGAN
Total 10,464 5,507 4,957 10,345 5,446 4,899
10 - 14 1,940 1,010 930 1,920 996 924
15 - 19 1,303 694 609 1,296 691 605
20 - 24 1,070 571 499 1,056 561 495
25 - 29 987 517 470 981 516 465
30 - 34 939 493 446 933 489 444
35 - 39 905 483 422 900 481 419
40 - 44 792 418 374 788 416 372
45 - 49 698 391 307 685 386 299
50 - 54 530 280 250 521 273 248
55 - 59 438 224 214 431 220 211
60 - 64 331 183 148 328 180 148
65 years and over 531 243 288 506 237 269
PEREZ
Total 9,233 4,779 4,454 9,145 4,717 4,428
10 - 14 1,582 821 761 1,573 813 760
15 - 19 1,153 624 529 1,146 618 528
20 - 24 875 470 405 864 462 402
25 - 29 774 378 396 771 378 393
30 - 34 757 415 342 752 411 341
35 - 39 762 396 366 755 390 365
40 - 44 745 407 338 743 405 338
45 - 49 637 343 294 630 338 292
50 - 54 540 272 268 533 268 265
55 - 59 433 220 213 425 213 212
60 - 64 351 168 183 345 165 180
65 years and over 624 265 359 608 256 352
PITOGO
Total 18,140 9,265 8,875 18,014 9,194 8,820
10 - 14 2,616 1,344 1,272 2,595 1,334 1,261
15 - 19 2,464 1,276 1,188 2,451 1,266 1,185
20 - 24 1,977 1,033 944 1,966 1,024 942
25 - 29 1,557 826 731 1,548 820 728
30 - 34 1,369 692 677 1,360 686 674
35 - 39 1,418 729 689 1,410 726 684
40 - 44 1,242 651 591 1,226 640 586
45 - 49 1,371 714 657 1,365 712 653
50 - 54 1,025 553 472 1,021 551 470
55 - 59 922 459 463 914 455 459
60 - 64 792 411 381 787 407 380
65 years and over 1,387 577 810 1,371 573 798
Continued
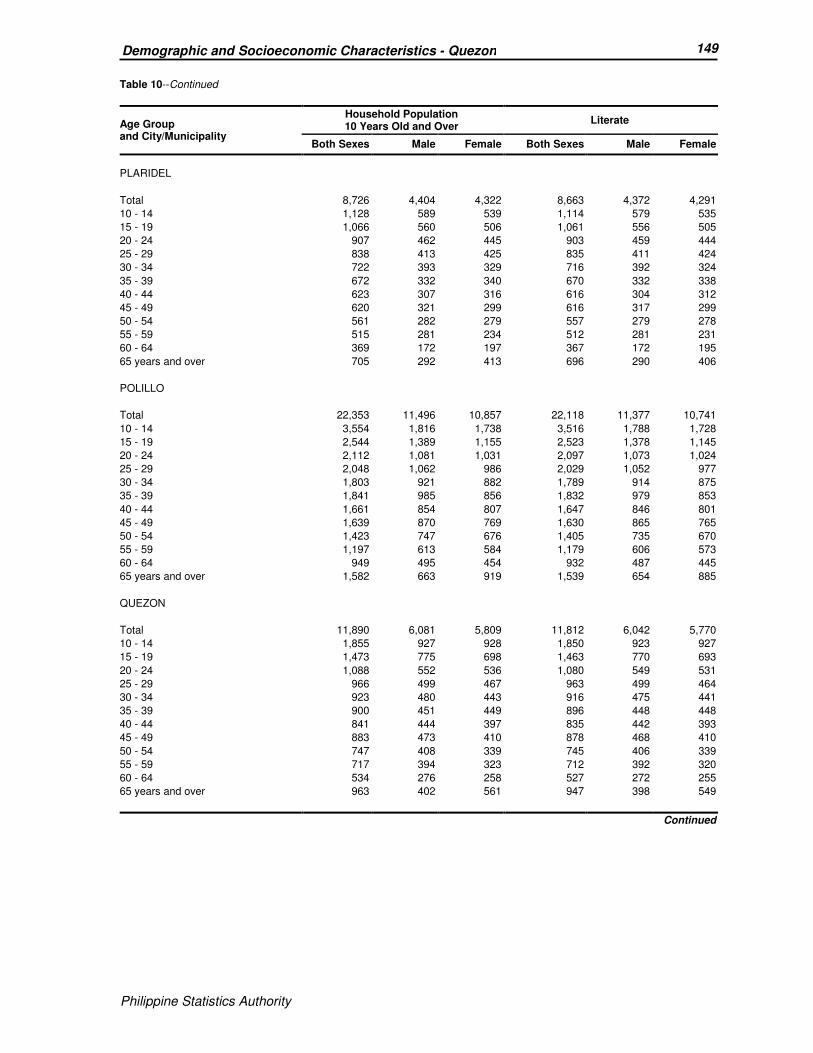
Philippine Statistics Authority
149 Demographic and Socioeconomic Characteristics - Quezon
Philippine Statistics Authority
Table 10--Continued
Age Group and City/Municipality
Household Population 10 Years Old and Over
Literate
Both Sexes Male Female Both Sexes Male Female
PLARIDEL
Total 8,726 4,404 4,322 8,663 4,372 4,291
10 - 14 1,128 589 539 1,114 579 535
15 - 19 1,066 560 506 1,061 556 505
20 - 24 907 462 445 903 459 444
25 - 29 838 413 425 835 411 424
30 - 34 722 393 329 716 392 324
35 - 39 672 332 340 670 332 338
40 - 44 623 307 316 616 304 312
45 - 49 620 321 299 616 317 299
50 - 54 561 282 279 557 279 278
55 - 59 515 281 234 512 281 231
60 - 64 369 172 197 367 172 195
65 years and over 705 292 413 696 290 406
POLILLO
Total 22,353 11,496 10,857 22,118 11,377 10,741
10 - 14 3,554 1,816 1,738 3,516 1,788 1,728
15 - 19 2,544 1,389 1,155 2,523 1,378 1,145
20 - 24 2,112 1,081 1,031 2,097 1,073 1,024
25 - 29 2,048 1,062 986 2,029 1,052 977
30 - 34 1,803 921 882 1,789 914 875
35 - 39 1,841 985 856 1,832 979 853
40 - 44 1,661 854 807 1,647 846 801
45 - 49 1,639 870 769 1,630 865 765
50 - 54 1,423 747 676 1,405 735 670
55 - 59 1,197 613 584 1,179 606 573
60 - 64 949 495 454 932 487 445
65 years and over 1,582 663 919 1,539 654 885
QUEZON
Total 11,890 6,081 5,809 11,812 6,042 5,770
10 - 14 1,855 927 928 1,850 923 927
15 - 19 1,473 775 698 1,463 770 693
20 - 24 1,088 552 536 1,080 549 531
25 - 29 966 499 467 963 499 464
30 - 34 923 480 443 916 475 441
35 - 39 900 451 449 896 448 448
40 - 44 841 444 397 835 442 393
45 - 49 883 473 410 878 468 410
50 - 54 747 408 339 745 406 339
55 - 59 717 394 323 712 392 320
60 - 64 534 276 258 527 272 255
65 years and over 963 402 561 947 398 549
Continued
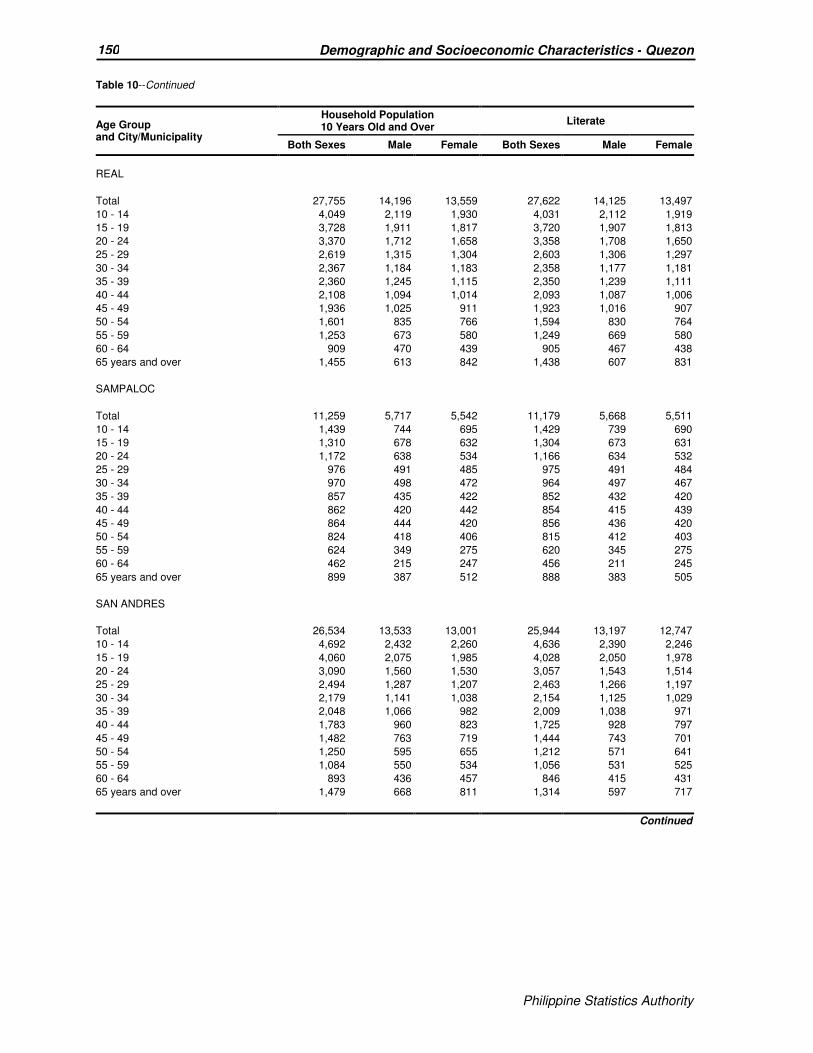
Philippine Statistics Authority
150 Demographic and Socioeconomic Characteristics - Quezon
Philippine Statistics Authority
Table 10--Continued
Age Group and City/Municipality
Household Population 10 Years Old and Over
Literate
Both Sexes Male Female Both Sexes Male Female
REAL
Total 27,755 14,196 13,559 27,622 14,125 13,497
10 - 14 4,049 2,119 1,930 4,031 2,112 1,919
15 - 19 3,728 1,911 1,817 3,720 1,907 1,813
20 - 24 3,370 1,712 1,658 3,358 1,708 1,650
25 - 29 2,619 1,315 1,304 2,603 1,306 1,297
30 - 34 2,367 1,184 1,183 2,358 1,177 1,181
35 - 39 2,360 1,245 1,115 2,350 1,239 1,111
40 - 44 2,108 1,094 1,014 2,093 1,087 1,006
45 - 49 1,936 1,025 911 1,923 1,016 907
50 - 54 1,601 835 766 1,594 830 764
55 - 59 1,253 673 580 1,249 669 580
60 - 64 909 470 439 905 467 438
65 years and over 1,455 613 842 1,438 607 831
SAMPALOC
Total 11,259 5,717 5,542 11,179 5,668 5,511
10 - 14 1,439 744 695 1,429 739 690
15 - 19 1,310 678 632 1,304 673 631
20 - 24 1,172 638 534 1,166 634 532
25 - 29 976 491 485 975 491 484
30 - 34 970 498 472 964 497 467
35 - 39 857 435 422 852 432 420
40 - 44 862 420 442 854 415 439
45 - 49 864 444 420 856 436 420
50 - 54 824 418 406 815 412 403
55 - 59 624 349 275 620 345 275
60 - 64 462 215 247 456 211 245
65 years and over 899 387 512 888 383 505
SAN ANDRES
Total 26,534 13,533 13,001 25,944 13,197 12,747
10 - 14 4,692 2,432 2,260 4,636 2,390 2,246
15 - 19 4,060 2,075 1,985 4,028 2,050 1,978
20 - 24 3,090 1,560 1,530 3,057 1,543 1,514
25 - 29 2,494 1,287 1,207 2,463 1,266 1,197
30 - 34 2,179 1,141 1,038 2,154 1,125 1,029
35 - 39 2,048 1,066 982 2,009 1,038 971
40 - 44 1,783 960 823 1,725 928 797
45 - 49 1,482 763 719 1,444 743 701
50 - 54 1,250 595 655 1,212 571 641
55 - 59 1,084 550 534 1,056 531 525
60 - 64 893 436 457 846 415 431
65 years and over 1,479 668 811 1,314 597 717
Continued
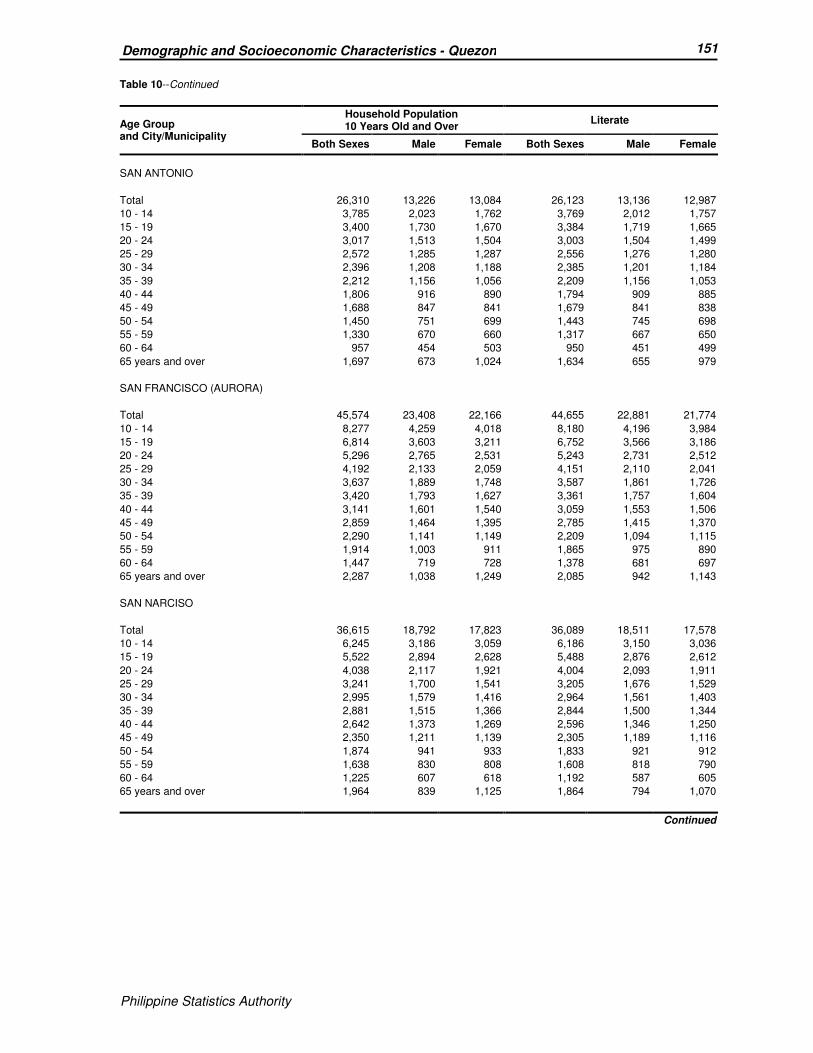
Philippine Statistics Authority
151 Demographic and Socioeconomic Characteristics - Quezon
Philippine Statistics Authority
Table 10--Continued
Age Group and City/Municipality
Household Population 10 Years Old and Over
Literate
Both Sexes Male Female Both Sexes Male Female
SAN ANTONIO
Total 26,310 13,226 13,084 26,123 13,136 12,987
10 - 14 3,785 2,023 1,762 3,769 2,012 1,757
15 - 19 3,400 1,730 1,670 3,384 1,719 1,665
20 - 24 3,017 1,513 1,504 3,003 1,504 1,499
25 - 29 2,572 1,285 1,287 2,556 1,276 1,280
30 - 34 2,396 1,208 1,188 2,385 1,201 1,184
35 - 39 2,212 1,156 1,056 2,209 1,156 1,053
40 - 44 1,806 916 890 1,794 909 885
45 - 49 1,688 847 841 1,679 841 838
50 - 54 1,450 751 699 1,443 745 698
55 - 59 1,330 670 660 1,317 667 650
60 - 64 957 454 503 950 451 499
65 years and over 1,697 673 1,024 1,634 655 979
SAN FRANCISCO (AURORA)
Total 45,574 23,408 22,166 44,655 22,881 21,774
10 - 14 8,277 4,259 4,018 8,180 4,196 3,984
15 - 19 6,814 3,603 3,211 6,752 3,566 3,186
20 - 24 5,296 2,765 2,531 5,243 2,731 2,512
25 - 29 4,192 2,133 2,059 4,151 2,110 2,041
30 - 34 3,637 1,889 1,748 3,587 1,861 1,726
35 - 39 3,420 1,793 1,627 3,361 1,757 1,604
40 - 44 3,141 1,601 1,540 3,059 1,553 1,506
45 - 49 2,859 1,464 1,395 2,785 1,415 1,370
50 - 54 2,290 1,141 1,149 2,209 1,094 1,115
55 - 59 1,914 1,003 911 1,865 975 890
60 - 64 1,447 719 728 1,378 681 697
65 years and over 2,287 1,038 1,249 2,085 942 1,143
SAN NARCISO
Total 36,615 18,792 17,823 36,089 18,511 17,578
10 - 14 6,245 3,186 3,059 6,186 3,150 3,036
15 - 19 5,522 2,894 2,628 5,488 2,876 2,612
20 - 24 4,038 2,117 1,921 4,004 2,093 1,911
25 - 29 3,241 1,700 1,541 3,205 1,676 1,529
30 - 34 2,995 1,579 1,416 2,964 1,561 1,403
35 - 39 2,881 1,515 1,366 2,844 1,500 1,344
40 - 44 2,642 1,373 1,269 2,596 1,346 1,250
45 - 49 2,350 1,211 1,139 2,305 1,189 1,116
50 - 54 1,874 941 933 1,833 921 912
55 - 59 1,638 830 808 1,608 818 790
60 - 64 1,225 607 618 1,192 587 605
65 years and over 1,964 839 1,125 1,864 794 1,070
Continued
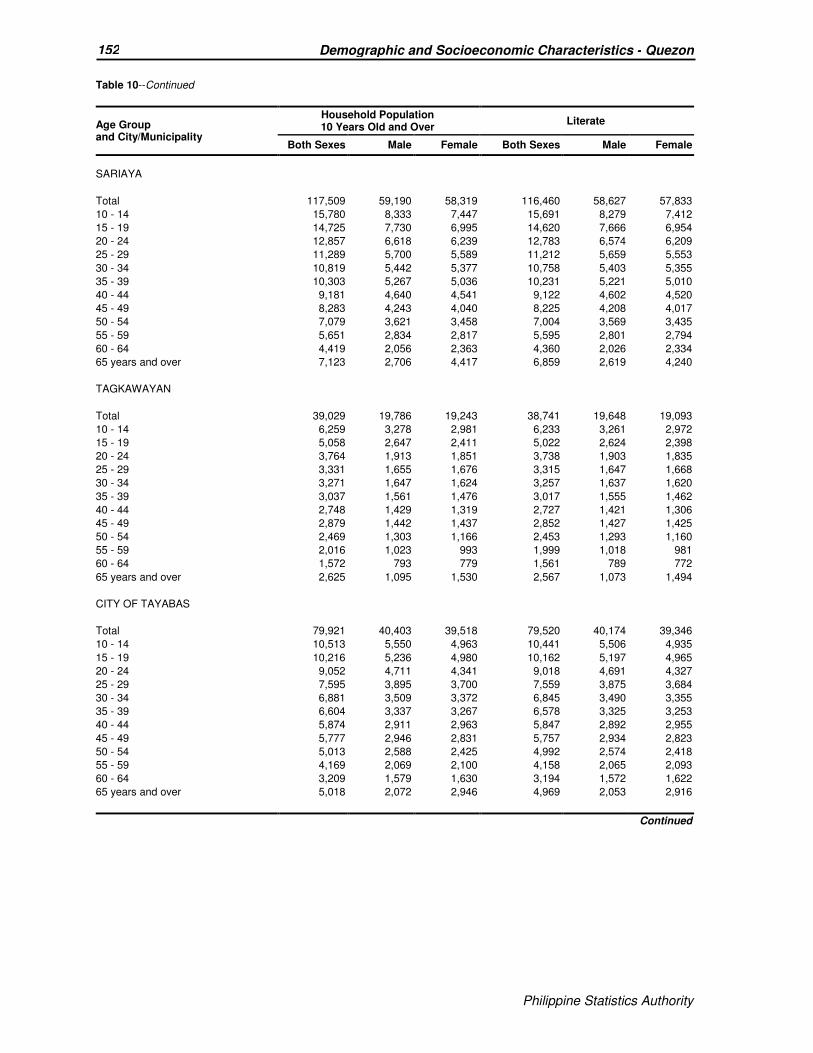
Philippine Statistics Authority
152 Demographic and Socioeconomic Characteristics - Quezon
Philippine Statistics Authority
Table 10--Continued
Age Group and City/Municipality
Household Population 10 Years Old and Over
Literate
Both Sexes Male Female Both Sexes Male Female
SARIAYA
Total 117,509 59,190 58,319 116,460 58,627 57,833
10 - 14 15,780 8,333 7,447 15,691 8,279 7,412
15 - 19 14,725 7,730 6,995 14,620 7,666 6,954
20 - 24 12,857 6,618 6,239 12,783 6,574 6,209
25 - 29 11,289 5,700 5,589 11,212 5,659 5,553
30 - 34 10,819 5,442 5,377 10,758 5,403 5,355
35 - 39 10,303 5,267 5,036 10,231 5,221 5,010
40 - 44 9,181 4,640 4,541 9,122 4,602 4,520
45 - 49 8,283 4,243 4,040 8,225 4,208 4,017
50 - 54 7,079 3,621 3,458 7,004 3,569 3,435
55 - 59 5,651 2,834 2,817 5,595 2,801 2,794
60 - 64 4,419 2,056 2,363 4,360 2,026 2,334
65 years and over 7,123 2,706 4,417 6,859 2,619 4,240
TAGKAWAYAN
Total 39,029 19,786 19,243 38,741 19,648 19,093
10 - 14 6,259 3,278 2,981 6,233 3,261 2,972
15 - 19 5,058 2,647 2,411 5,022 2,624 2,398
20 - 24 3,764 1,913 1,851 3,738 1,903 1,835
25 - 29 3,331 1,655 1,676 3,315 1,647 1,668
30 - 34 3,271 1,647 1,624 3,257 1,637 1,620
35 - 39 3,037 1,561 1,476 3,017 1,555 1,462
40 - 44 2,748 1,429 1,319 2,727 1,421 1,306
45 - 49 2,879 1,442 1,437 2,852 1,427 1,425
50 - 54 2,469 1,303 1,166 2,453 1,293 1,160
55 - 59 2,016 1,023 993 1,999 1,018 981
60 - 64 1,572 793 779 1,561 789 772
65 years and over 2,625 1,095 1,530 2,567 1,073 1,494
CITY OF TAYABAS
Total 79,921 40,403 39,518 79,520 40,174 39,346
10 - 14 10,513 5,550 4,963 10,441 5,506 4,935
15 - 19 10,216 5,236 4,980 10,162 5,197 4,965
20 - 24 9,052 4,711 4,341 9,018 4,691 4,327
25 - 29 7,595 3,895 3,700 7,559 3,875 3,684
30 - 34 6,881 3,509 3,372 6,845 3,490 3,355
35 - 39 6,604 3,337 3,267 6,578 3,325 3,253
40 - 44 5,874 2,911 2,963 5,847 2,892 2,955
45 - 49 5,777 2,946 2,831 5,757 2,934 2,823
50 - 54 5,013 2,588 2,425 4,992 2,574 2,418
55 - 59 4,169 2,069 2,100 4,158 2,065 2,093
60 - 64 3,209 1,579 1,630 3,194 1,572 1,622
65 years and over 5,018 2,072 2,946 4,969 2,053 2,916
Continued
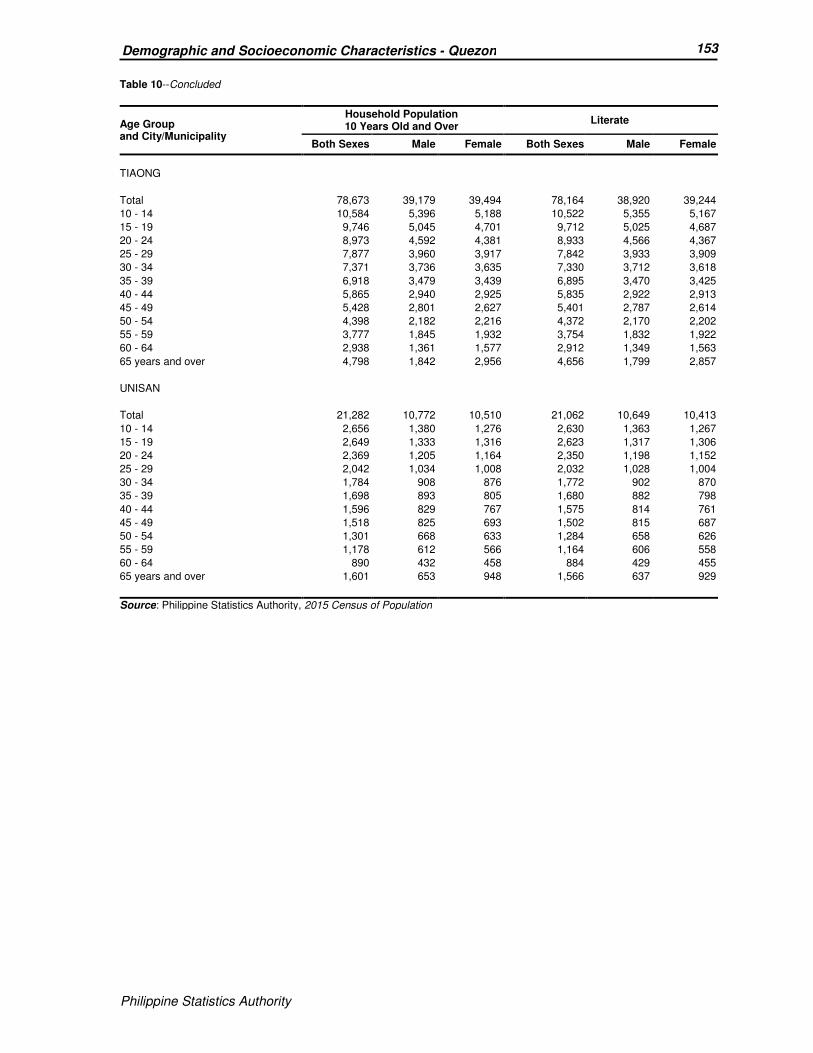
Philippine Statistics Authority
153 Demographic and Socioeconomic Characteristics - Quezon
Philippine Statistics Authority
Table 10--Concluded
Age Group and City/Municipality
Household Population 10 Years Old and Over
Literate
Both Sexes Male Female Both Sexes Male Female
TIAONG
Total 78,673 39,179 39,494 78,164 38,920 39,244
10 - 14 10,584 5,396 5,188 10,522 5,355 5,167
15 - 19 9,746 5,045 4,701 9,712 5,025 4,687
20 - 24 8,973 4,592 4,381 8,933 4,566 4,367
25 - 29 7,877 3,960 3,917 7,842 3,933 3,909
30 - 34 7,371 3,736 3,635 7,330 3,712 3,618
35 - 39 6,918 3,479 3,439 6,895 3,470 3,425
40 - 44 5,865 2,940 2,925 5,835 2,922 2,913
45 - 49 5,428 2,801 2,627 5,401 2,787 2,614
50 - 54 4,398 2,182 2,216 4,372 2,170 2,202
55 - 59 3,777 1,845 1,932 3,754 1,832 1,922
60 - 64 2,938 1,361 1,577 2,912 1,349 1,563
65 years and over 4,798 1,842 2,956 4,656 1,799 2,857
UNISAN
Total 21,282 10,772 10,510 21,062 10,649 10,413
10 - 14 2,656 1,380 1,276 2,630 1,363 1,267
15 - 19 2,649 1,333 1,316 2,623 1,317 1,306
20 - 24 2,369 1,205 1,164 2,350 1,198 1,152
25 - 29 2,042 1,034 1,008 2,032 1,028 1,004
30 - 34 1,784 908 876 1,772 902 870
35 - 39 1,698 893 805 1,680 882 798
40 - 44 1,596 829 767 1,575 814 761
45 - 49 1,518 825 693 1,502 815 687
50 - 54 1,301 668 633 1,284 658 626
55 - 59 1,178 612 566 1,164 606 558
60 - 64 890 432 458 884 429 455
65 years and over 1,601 653 948 1,566 637 929
Source: Philippine Statistics Authority, 2015 Census of Population
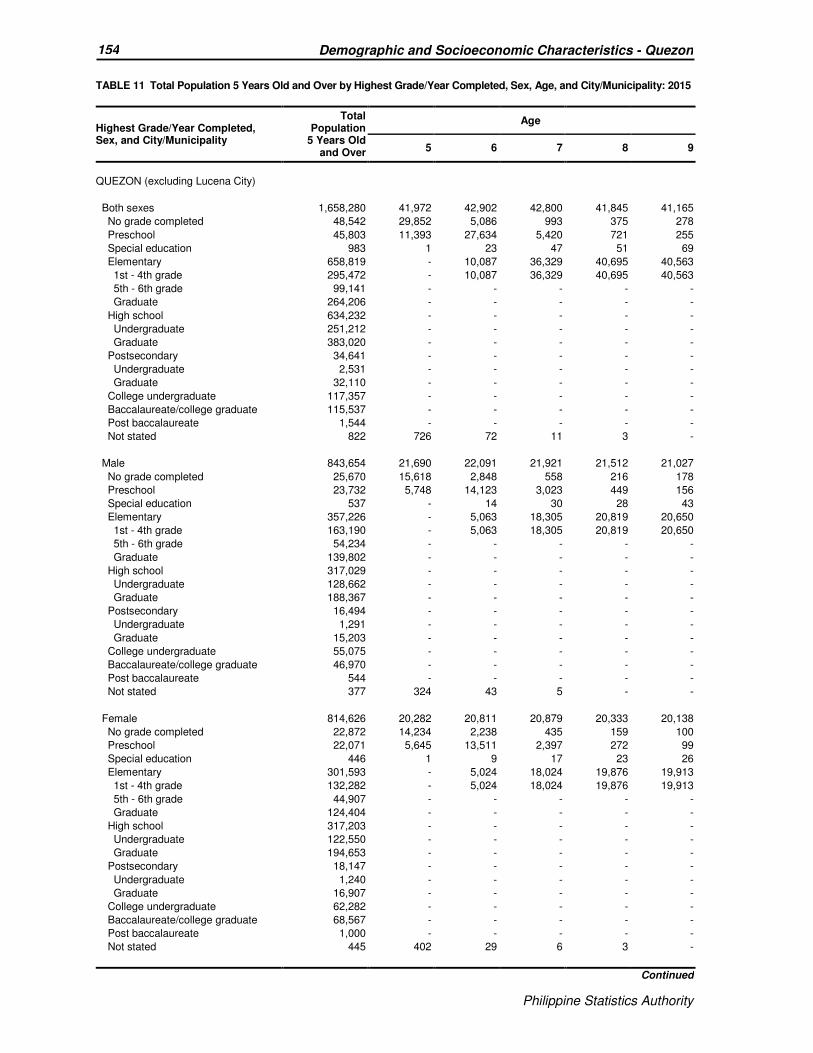
Philippine Statistics Authority
154 Demographic and Socioeconomic Characteristics - Quezon
Philippine Statistics Authority
TABLE 11 Total Population 5 Years Old and Over by Highest Grade/Year Completed, Sex, Age, and City/Municipality: 2015
Highest Grade/Year Completed, Sex, and City/Municipality
Total Population
5 Years Old and Over
Age
5 6 7 8 9
QUEZON (excluding Lucena City)
Both sexes 1,658,280 41,972 42,902 42,800 41,845 41,165
No grade completed 48,542 29,852 5,086 993 375 278
Preschool 45,803 11,393 27,634 5,420 721 255
Special education 983 1 23 47 51 69
Elementary 658,819 - 10,087 36,329 40,695 40,563
1st - 4th grade 295,472 - 10,087 36,329 40,695 40,563
5th - 6th grade 99,141 - - - - -
Graduate 264,206 - - - - -
High school 634,232 - - - - -
Undergraduate 251,212 - - - - -
Graduate 383,020 - - - - -
Postsecondary 34,641 - - - - -
Undergraduate 2,531 - - - - -
Graduate 32,110 - - - - -
College undergraduate 117,357 - - - - -
Baccalaureate/college graduate 115,537 - - - - -
Post baccalaureate 1,544 - - - - -
Not stated 822 726 72 11 3 -
Male 843,654 21,690 22,091 21,921 21,512 21,027
No grade completed 25,670 15,618 2,848 558 216 178
Preschool 23,732 5,748 14,123 3,023 449 156
Special education 537 - 14 30 28 43
Elementary 357,226 - 5,063 18,305 20,819 20,650
1st - 4th grade 163,190 - 5,063 18,305 20,819 20,650
5th - 6th grade 54,234 - - - - -
Graduate 139,802 - - - - -
High school 317,029 - - - - -
Undergraduate 128,662 - - - - -
Graduate 188,367 - - - - -
Postsecondary 16,494 - - - - -
Undergraduate 1,291 - - - - -
Graduate 15,203 - - - - -
College undergraduate 55,075 - - - - -
Baccalaureate/college graduate 46,970 - - - - -
Post baccalaureate 544 - - - - -
Not stated 377 324 43 5 - -
Female 814,626 20,282 20,811 20,879 20,333 20,138
No grade completed 22,872 14,234 2,238 435 159 100
Preschool 22,071 5,645 13,511 2,397 272 99
Special education 446 1 9 17 23 26
Elementary 301,593 - 5,024 18,024 19,876 19,913
1st - 4th grade 132,282 - 5,024 18,024 19,876 19,913
5th - 6th grade 44,907 - - - - -
Graduate 124,404 - - - - -
High school 317,203 - - - - -
Undergraduate 122,550 - - - - -
Graduate 194,653 - - - - -
Postsecondary 18,147 - - - - -
Undergraduate 1,240 - - - - -
Graduate 16,907 - - - - -
College undergraduate 62,282 - - - - -
Baccalaureate/college graduate 68,567 - - - - -
Post baccalaureate 1,000 - - - - -
Not stated 445 402 29 6 3 -
Continued

Philippine Statistics Authority
155 Demographic and Socioeconomic Characteristics - Quezon
Philippine Statistics Authority
Table 11--Continued
Highest Grade/Year Completed, Sex, and City/Municipality
Total Population
5 Years Old and Over
Age
5 6 7 8 9
AGDANGAN
Both sexes 11,548 271 273 256 301 271
No grade completed 360 242 34 4 1 1
Preschool 266 25 193 39 7 1
Special education 15 - 1 - - -
Elementary 4,280 - 45 213 293 269
1st - 4th grade 1,904 - 45 213 293 269
5th - 6th grade 613 - - - - -
Graduate 1,763 - - - - -
High school 4,544 - - - - -
Undergraduate 1,694 - - - - -
Graduate 2,850 - - - - -
Postsecondary 302 - - - - -
Undergraduate 57 - - - - -
Graduate 245 - - - - -
College undergraduate 838 - - - - -
Baccalaureate/college graduate 926 - - - - -
Post baccalaureate 13 - - - - -
Not stated 4 4 - - - -
Male 5,802 141 139 137 157 125
No grade completed 186 124 17 4 1 1
Preschool 139 15 95 22 5 1
Special education 8 - 1 - - -
Elementary 2,273 - 26 111 151 123
1st - 4th grade 1,031 - 26 111 151 123
5th - 6th grade 328 - - - - -
Graduate 914 - - - - -
High school 2,279 - - - - -
Undergraduate 859 - - - - -
Graduate 1,420 - - - - -
Postsecondary 164 - - - - -
Undergraduate 28 - - - - -
Graduate 136 - - - - -
College undergraduate 382 - - - - -
Baccalaureate/college graduate 366 - - - - -
Post baccalaureate 3 - - - - -
Not stated 2 2 - - - -
Female 5,746 130 134 119 144 146
No grade completed 174 118 17 - - -
Preschool 127 10 98 17 2 -
Special education 7 - - - - -
Elementary 2,007 - 19 102 142 146
1st - 4th grade 873 - 19 102 142 146
5th - 6th grade 285 - - - - -
Graduate 849 - - - - -
High school 2,265 - - - - -
Undergraduate 835 - - - - -
Graduate 1,430 - - - - -
Postsecondary 138 - - - - -
Undergraduate 29 - - - - -
Graduate 109 - - - - -
College undergraduate 456 - - - - -
Baccalaureate/college graduate 560 - - - - -
Post baccalaureate 10 - - - - -
Not stated 2 2 - - - -
Continued
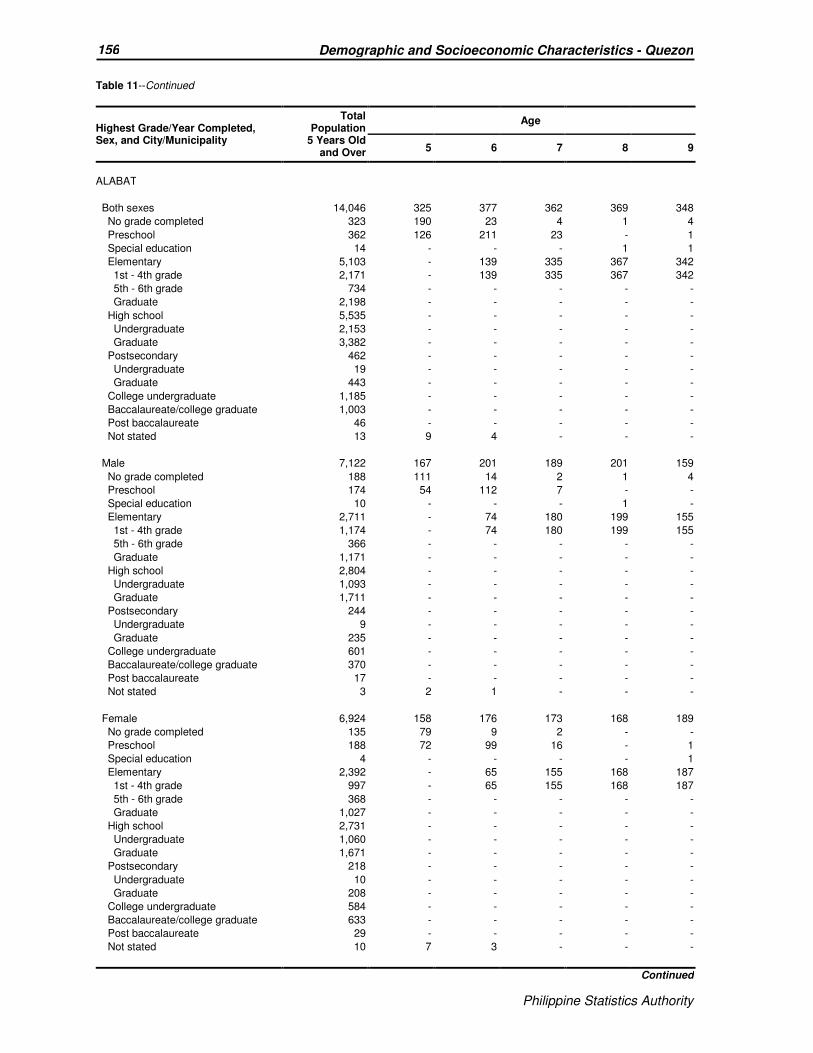
Philippine Statistics Authority
156 Demographic and Socioeconomic Characteristics - Quezon
Philippine Statistics Authority
Table 11--Continued
Highest Grade/Year Completed, Sex, and City/Municipality
Total Population
5 Years Old and Over
Age
5 6 7 8 9
ALABAT
Both sexes 14,046 325 377 362 369 348
No grade completed 323 190 23 4 1 4
Preschool 362 126 211 23 - 1
Special education 14 - - - 1 1
Elementary 5,103 - 139 335 367 342
1st - 4th grade 2,171 - 139 335 367 342
5th - 6th grade 734 - - - - -
Graduate 2,198 - - - - -
High school 5,535 - - - - -
Undergraduate 2,153 - - - - -
Graduate 3,382 - - - - -
Postsecondary 462 - - - - -
Undergraduate 19 - - - - -
Graduate 443 - - - - -
College undergraduate 1,185 - - - - -
Baccalaureate/college graduate 1,003 - - - - -
Post baccalaureate 46 - - - - -
Not stated 13 9 4 - - -
Male 7,122 167 201 189 201 159
No grade completed 188 111 14 2 1 4
Preschool 174 54 112 7 - -
Special education 10 - - - 1 -
Elementary 2,711 - 74 180 199 155
1st - 4th grade 1,174 - 74 180 199 155
5th - 6th grade 366 - - - - -
Graduate 1,171 - - - - -
High school 2,804 - - - - -
Undergraduate 1,093 - - - - -
Graduate 1,711 - - - - -
Postsecondary 244 - - - - -
Undergraduate 9 - - - - -
Graduate 235 - - - - -
College undergraduate 601 - - - - -
Baccalaureate/college graduate 370 - - - - -
Post baccalaureate 17 - - - - -
Not stated 3 2 1 - - -
Female 6,924 158 176 173 168 189
No grade completed 135 79 9 2 - -
Preschool 188 72 99 16 - 1
Special education 4 - - - - 1
Elementary 2,392 - 65 155 168 187
1st - 4th grade 997 - 65 155 168 187
5th - 6th grade 368 - - - - -
Graduate 1,027 - - - - -
High school 2,731 - - - - -
Undergraduate 1,060 - - - - -
Graduate 1,671 - - - - -
Postsecondary 218 - - - - -
Undergraduate 10 - - - - -
Graduate 208 - - - - -
College undergraduate 584 - - - - -
Baccalaureate/college graduate 633 - - - - -
Post baccalaureate 29 - - - - -
Not stated 10 7 3 - - -
Continued
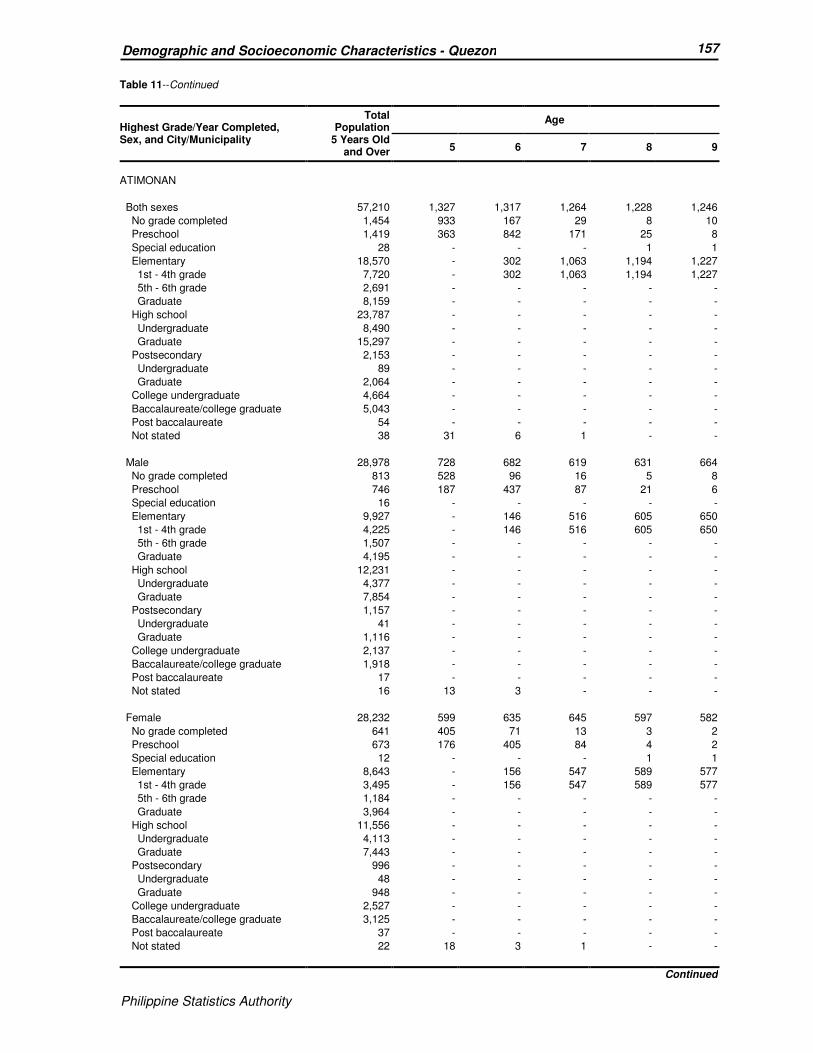
Philippine Statistics Authority
157 Demographic and Socioeconomic Characteristics - Quezon
Philippine Statistics Authority
Table 11--Continued
Highest Grade/Year Completed, Sex, and City/Municipality
Total Population
5 Years Old and Over
Age
5 6 7 8 9
ATIMONAN
Both sexes 57,210 1,327 1,317 1,264 1,228 1,246
No grade completed 1,454 933 167 29 8 10
Preschool 1,419 363 842 171 25 8
Special education 28 - - - 1 1
Elementary 18,570 - 302 1,063 1,194 1,227
1st - 4th grade 7,720 - 302 1,063 1,194 1,227
5th - 6th grade 2,691 - - - - -
Graduate 8,159 - - - - -
High school 23,787 - - - - -
Undergraduate 8,490 - - - - -
Graduate 15,297 - - - - -
Postsecondary 2,153 - - - - -
Undergraduate 89 - - - - -
Graduate 2,064 - - - - -
College undergraduate 4,664 - - - - -
Baccalaureate/college graduate 5,043 - - - - -
Post baccalaureate 54 - - - - -
Not stated 38 31 6 1 - -
Male 28,978 728 682 619 631 664
No grade completed 813 528 96 16 5 8
Preschool 746 187 437 87 21 6
Special education 16 - - - - -
Elementary 9,927 - 146 516 605 650
1st - 4th grade 4,225 - 146 516 605 650
5th - 6th grade 1,507 - - - - -
Graduate 4,195 - - - - -
High school 12,231 - - - - -
Undergraduate 4,377 - - - - -
Graduate 7,854 - - - - -
Postsecondary 1,157 - - - - -
Undergraduate 41 - - - - -
Graduate 1,116 - - - - -
College undergraduate 2,137 - - - - -
Baccalaureate/college graduate 1,918 - - - - -
Post baccalaureate 17 - - - - -
Not stated 16 13 3 - - -
Female 28,232 599 635 645 597 582
No grade completed 641 405 71 13 3 2
Preschool 673 176 405 84 4 2
Special education 12 - - - 1 1
Elementary 8,643 - 156 547 589 577
1st - 4th grade 3,495 - 156 547 589 577
5th - 6th grade 1,184 - - - - -
Graduate 3,964 - - - - -
High school 11,556 - - - - -
Undergraduate 4,113 - - - - -
Graduate 7,443 - - - - -
Postsecondary 996 - - - - -
Undergraduate 48 - - - - -
Graduate 948 - - - - -
College undergraduate 2,527 - - - - -
Baccalaureate/college graduate 3,125 - - - - -
Post baccalaureate 37 - - - - -
Not stated 22 18 3 1 - -
Continued

Philippine Statistics Authority
158 Demographic and Socioeconomic Characteristics - Quezon
Philippine Statistics Authority
Table 11--Continued
Highest Grade/Year Completed, Sex, and City/Municipality
Total Population
5 Years Old and Over
Age
5 6 7 8 9
BUENAVISTA
Both sexes 26,352 816 814 838 824 830
No grade completed 1,149 617 150 39 16 18
Preschool 818 180 481 120 21 7
Special education 2 - - - - 1
Elementary 13,589 - 180 678 787 804
1st - 4th grade 6,240 - 180 678 787 804
5th - 6th grade 2,196 - - - - -
Graduate 5,153 - - - - -
High school 8,958 - - - - -
Undergraduate 4,441 - - - - -
Graduate 4,517 - - - - -
Postsecondary 234 - - - - -
Undergraduate 28 - - - - -
Graduate 206 - - - - -
College undergraduate 842 - - - - -
Baccalaureate/college graduate 732 - - - - -
Post baccalaureate 5 - - - - -
Not stated 23 19 3 1 - -
Male 13,719 427 422 419 444 416
No grade completed 626 326 79 20 9 10
Preschool 429 95 251 60 12 5
Special education 1 - - - - -
Elementary 7,513 - 90 338 423 401
1st - 4th grade 3,528 - 90 338 423 401
5th - 6th grade 1,258 - - - - -
Graduate 2,727 - - - - -
High school 4,362 - - - - -
Undergraduate 2,171 - - - - -
Graduate 2,191 - - - - -
Postsecondary 114 - - - - -
Undergraduate 17 - - - - -
Graduate 97 - - - - -
College undergraduate 390 - - - - -
Baccalaureate/college graduate 273 - - - - -
Post baccalaureate 2 - - - - -
Not stated 9 6 2 1 - -
Female 12,633 389 392 419 380 414
No grade completed 523 291 71 19 7 8
Preschool 389 85 230 60 9 2
Special education 1 - - - - 1
Elementary 6,076 - 90 340 364 403
1st - 4th grade 2,712 - 90 340 364 403
5th - 6th grade 938 - - - - -
Graduate 2,426 - - - - -
High school 4,596 - - - - -
Undergraduate 2,270 - - - - -
Graduate 2,326 - - - - -
Postsecondary 120 - - - - -
Undergraduate 11 - - - - -
Graduate 109 - - - - -
College undergraduate 452 - - - - -
Baccalaureate/college graduate 459 - - - - -
Post baccalaureate 3 - - - - -
Not stated 14 13 1 - - -
Continued

Philippine Statistics Authority
159 Demographic and Socioeconomic Characteristics - Quezon
Philippine Statistics Authority
Table 11--Continued
Highest Grade/Year Completed, Sex, and City/Municipality
Total Population
5 Years Old and Over
Age
5 6 7 8 9
BURDEOS
Both sexes 23,549 718 701 741 702 665
No grade completed 759 431 98 17 10 5
Preschool 876 283 414 149 19 7
Special education 2 - - - - -
Elementary 11,372 - 189 575 673 653
1st - 4th grade 5,735 - 189 575 673 653
5th - 6th grade 2,031 - - - - -
Graduate 3,606 - - - - -
High school 8,385 - - - - -
Undergraduate 4,099 - - - - -
Graduate 4,286 - - - - -
Postsecondary 228 - - - - -
Undergraduate 51 - - - - -
Graduate 177 - - - - -
College undergraduate 1,167 - - - - -
Baccalaureate/college graduate 742 - - - - -
Post baccalaureate 14 - - - - -
Not stated 4 4 - - - -
Male 12,330 410 367 360 353 338
No grade completed 416 242 53 6 6 5
Preschool 471 167 204 81 12 6
Special education 1 - - - - -
Elementary 6,388 - 110 273 335 327
1st - 4th grade 3,267 - 110 273 335 327
5th - 6th grade 1,173 - - - - -
Graduate 1,948 - - - - -
High school 4,129 - - - - -
Undergraduate 2,042 - - - - -
Graduate 2,087 - - - - -
Postsecondary 123 - - - - -
Undergraduate 32 - - - - -
Graduate 91 - - - - -
College undergraduate 523 - - - - -
Baccalaureate/college graduate 272 - - - - -
Post baccalaureate 6 - - - - -
Not stated 1 1 - - - -
Female 11,219 308 334 381 349 327
No grade completed 343 189 45 11 4 -
Preschool 405 116 210 68 7 1
Special education 1 - - - - -
Elementary 4,984 - 79 302 338 326
1st - 4th grade 2,468 - 79 302 338 326
5th - 6th grade 858 - - - - -
Graduate 1,658 - - - - -
High school 4,256 - - - - -
Undergraduate 2,057 - - - - -
Graduate 2,199 - - - - -
Postsecondary 105 - - - - -
Undergraduate 19 - - - - -
Graduate 86 - - - - -
College undergraduate 644 - - - - -
Baccalaureate/college graduate 470 - - - - -
Post baccalaureate 8 - - - - -
Not stated 3 3 - - - -
Continued

Philippine Statistics Authority
160 Demographic and Socioeconomic Characteristics - Quezon
Philippine Statistics Authority
Table 11--Continued
Highest Grade/Year Completed, Sex, and City/Municipality
Total Population
5 Years Old and Over
Age
5 6 7 8 9
CALAUAG
Both sexes 65,099 1,735 1,765 1,754 1,672 1,681
No grade completed 1,866 1,247 195 29 9 7
Preschool 1,791 466 1,059 219 29 7
Special education 13 - - - - 2
Elementary 26,978 - 506 1,505 1,634 1,665
1st - 4th grade 10,741 - 506 1,505 1,634 1,665
5th - 6th grade 3,558 - - - - -
Graduate 12,679 - - - - -
High school 26,071 - - - - -
Undergraduate 10,646 - - - - -
Graduate 15,425 - - - - -
Postsecondary 1,175 - - - - -
Undergraduate 98 - - - - -
Graduate 1,077 - - - - -
College undergraduate 3,778 - - - - -
Baccalaureate/college graduate 3,352 - - - - -
Post baccalaureate 47 - - - - -
Not stated 28 22 5 1 - -
Male 33,119 892 902 926 867 871
No grade completed 932 640 99 16 4 4
Preschool 950 244 550 129 18 5
Special education 9 - - - - 1
Elementary 14,789 - 250 781 845 861
1st - 4th grade 5,990 - 250 781 845 861
5th - 6th grade 1,965 - - - - -
Graduate 6,834 - - - - -
High school 12,843 - - - - -
Undergraduate 5,303 - - - - -
Graduate 7,540 - - - - -
Postsecondary 566 - - - - -
Undergraduate 47 - - - - -
Graduate 519 - - - - -
College undergraduate 1,694 - - - - -
Baccalaureate/college graduate 1,305 - - - - -
Post baccalaureate 20 - - - - -
Not stated 11 8 3 - - -
Female 31,980 843 863 828 805 810
No grade completed 934 607 96 13 5 3
Preschool 841 222 509 90 11 2
Special education 4 - - - - 1
Elementary 12,189 - 256 724 789 804
1st - 4th grade 4,751 - 256 724 789 804
5th - 6th grade 1,593 - - - - -
Graduate 5,845 - - - - -
High school 13,228 - - - - -
Undergraduate 5,343 - - - - -
Graduate 7,885 - - - - -
Postsecondary 609 - - - - -
Undergraduate 51 - - - - -
Graduate 558 - - - - -
College undergraduate 2,084 - - - - -
Baccalaureate/college graduate 2,047 - - - - -
Post baccalaureate 27 - - - - -
Not stated 17 14 2 1 - -
Continued

Philippine Statistics Authority
161 Demographic and Socioeconomic Characteristics - Quezon
Philippine Statistics Authority
Table 11--Continued
Highest Grade/Year Completed, Sex, and City/Municipality
Total Population
5 Years Old and Over
Age
5 6 7 8 9
CANDELARIA
Both sexes 105,596 2,435 2,551 2,576 2,478 2,334
No grade completed 2,658 1,594 276 60 20 12
Preschool 2,660 749 1,566 256 43 21
Special education 85 1 2 2 1 5
Elementary 38,570 - 695 2,257 2,414 2,296
1st - 4th grade 15,686 - 695 2,257 2,414 2,296
5th - 6th grade 5,412 - - - - -
Graduate 17,472 - - - - -
High school 41,289 - - - - -
Undergraduate 14,872 - - - - -
Graduate 26,417 - - - - -
Postsecondary 2,747 - - - - -
Undergraduate 424 - - - - -
Graduate 2,323 - - - - -
College undergraduate 8,769 - - - - -
Baccalaureate/college graduate 8,655 - - - - -
Post baccalaureate 58 - - - - -
Not stated 105 91 12 1 - -
Male 52,824 1,300 1,302 1,296 1,291 1,195
No grade completed 1,401 860 155 35 8 8
Preschool 1,391 401 789 151 27 8
Special education 42 - 1 2 - 4
Elementary 20,437 - 351 1,108 1,256 1,175
1st - 4th grade 8,412 - 351 1,108 1,256 1,175
5th - 6th grade 2,854 - - - - -
Graduate 9,171 - - - - -
High school 20,585 - - - - -
Undergraduate 7,822 - - - - -
Graduate 12,763 - - - - -
Postsecondary 1,269 - - - - -
Undergraduate 211 - - - - -
Graduate 1,058 - - - - -
College undergraduate 4,184 - - - - -
Baccalaureate/college graduate 3,445 - - - - -
Post baccalaureate 25 - - - - -
Not stated 45 39 6 - - -
Female 52,772 1,135 1,249 1,280 1,187 1,139
No grade completed 1,257 734 121 25 12 4
Preschool 1,269 348 777 105 16 13
Special education 43 1 1 - 1 1
Elementary 18,133 - 344 1,149 1,158 1,121
1st - 4th grade 7,274 - 344 1,149 1,158 1,121
5th - 6th grade 2,558 - - - - -
Graduate 8,301 - - - - -
High school 20,704 - - - - -
Undergraduate 7,050 - - - - -
Graduate 13,654 - - - - -
Postsecondary 1,478 - - - - -
Undergraduate 213 - - - - -
Graduate 1,265 - - - - -
College undergraduate 4,585 - - - - -
Baccalaureate/college graduate 5,210 - - - - -
Post baccalaureate 33 - - - - -
Not stated 60 52 6 1 - -
Continued

Philippine Statistics Authority
162 Demographic and Socioeconomic Characteristics - Quezon
Philippine Statistics Authority
Table 11--Continued
Highest Grade/Year Completed, Sex, and City/Municipality
Total Population
5 Years Old and Over
Age
5 6 7 8 9
CATANAUAN
Both sexes 63,071 1,689 1,685 1,695 1,702 1,759
No grade completed 2,144 1,211 266 53 16 14
Preschool 1,642 460 970 155 20 10
Special education 39 - - 2 3 2
Elementary 27,554 - 449 1,485 1,663 1,733
1st - 4th grade 13,717 - 449 1,485 1,663 1,733
5th - 6th grade 4,657 - - - - -
Graduate 9,180 - - - - -
High school 24,096 - - - - -
Undergraduate 10,135 - - - - -
Graduate 13,961 - - - - -
Postsecondary 911 - - - - -
Undergraduate 46 - - - - -
Graduate 865 - - - - -
College undergraduate 3,541 - - - - -
Baccalaureate/college graduate 3,102 - - - - -
Post baccalaureate 23 - - - - -
Not stated 19 18 - - - -
Male 32,223 868 834 845 901 889
No grade completed 1,130 631 140 30 7 9
Preschool 833 232 485 78 15 7
Special education 23 - - 1 3 2
Elementary 15,054 - 209 736 876 871
1st - 4th grade 7,656 - 209 736 876 871
5th - 6th grade 2,577 - - - - -
Graduate 4,821 - - - - -
High school 11,857 - - - - -
Undergraduate 5,154 - - - - -
Graduate 6,703 - - - - -
Postsecondary 458 - - - - -
Undergraduate 26 - - - - -
Graduate 432 - - - - -
College undergraduate 1,628 - - - - -
Baccalaureate/college graduate 1,225 - - - - -
Post baccalaureate 10 - - - - -
Not stated 5 5 - - - -
Female 30,848 821 851 850 801 870
No grade completed 1,014 580 126 23 9 5
Preschool 809 228 485 77 5 3
Special education 16 - - 1 - -
Elementary 12,500 - 240 749 787 862
1st - 4th grade 6,061 - 240 749 787 862
5th - 6th grade 2,080 - - - - -
Graduate 4,359 - - - - -
High school 12,239 - - - - -
Undergraduate 4,981 - - - - -
Graduate 7,258 - - - - -
Postsecondary 453 - - - - -
Undergraduate 20 - - - - -
Graduate 433 - - - - -
College undergraduate 1,913 - - - - -
Baccalaureate/college graduate 1,877 - - - - -
Post baccalaureate 13 - - - - -
Not stated 14 13 - - - -
Continued
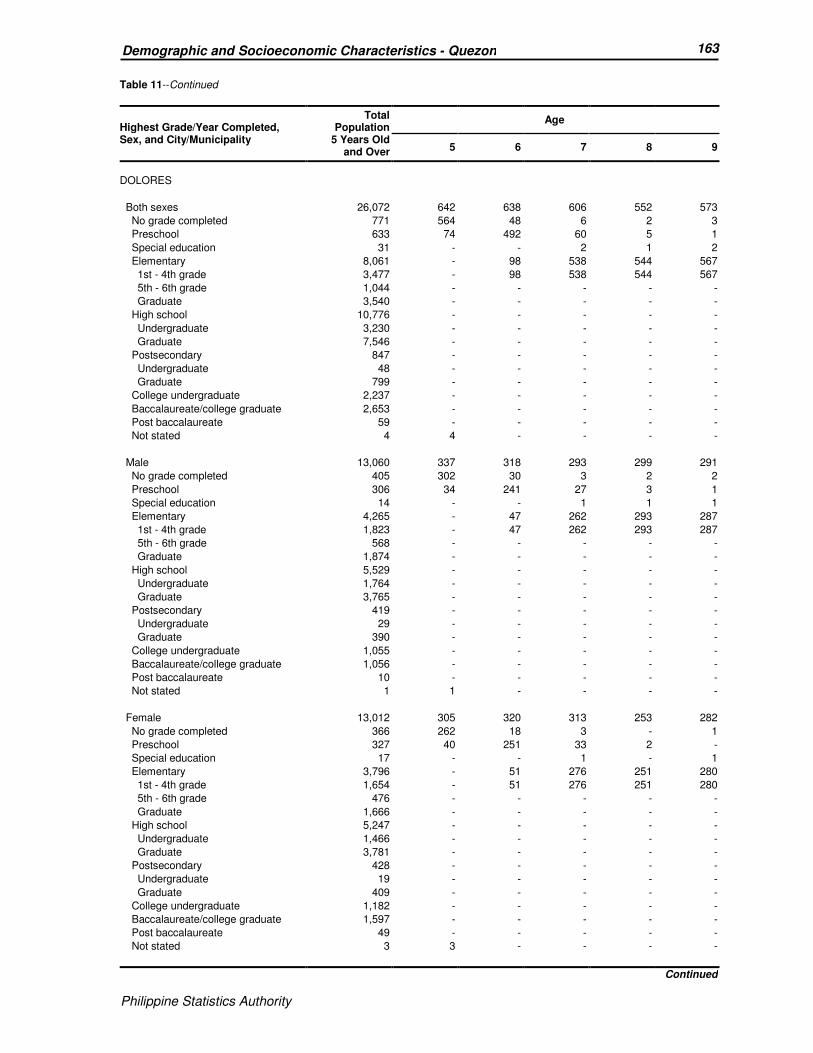
Philippine Statistics Authority
163 Demographic and Socioeconomic Characteristics - Quezon
Philippine Statistics Authority
Table 11--Continued
Highest Grade/Year Completed, Sex, and City/Municipality
Total Population
5 Years Old and Over
Age
5 6 7 8 9
DOLORES
Both sexes 26,072 642 638 606 552 573
No grade completed 771 564 48 6 2 3
Preschool 633 74 492 60 5 1
Special education 31 - - 2 1 2
Elementary 8,061 - 98 538 544 567
1st - 4th grade 3,477 - 98 538 544 567
5th - 6th grade 1,044 - - - - -
Graduate 3,540 - - - - -
High school 10,776 - - - - -
Undergraduate 3,230 - - - - -
Graduate 7,546 - - - - -
Postsecondary 847 - - - - -
Undergraduate 48 - - - - -
Graduate 799 - - - - -
College undergraduate 2,237 - - - - -
Baccalaureate/college graduate 2,653 - - - - -
Post baccalaureate 59 - - - - -
Not stated 4 4 - - - -
Male 13,060 337 318 293 299 291
No grade completed 405 302 30 3 2 2
Preschool 306 34 241 27 3 1
Special education 14 - - 1 1 1
Elementary 4,265 - 47 262 293 287
1st - 4th grade 1,823 - 47 262 293 287
5th - 6th grade 568 - - - - -
Graduate 1,874 - - - - -
High school 5,529 - - - - -
Undergraduate 1,764 - - - - -
Graduate 3,765 - - - - -
Postsecondary 419 - - - - -
Undergraduate 29 - - - - -
Graduate 390 - - - - -
College undergraduate 1,055 - - - - -
Baccalaureate/college graduate 1,056 - - - - -
Post baccalaureate 10 - - - - -
Not stated 1 1 - - - -
Female 13,012 305 320 313 253 282
No grade completed 366 262 18 3 - 1
Preschool 327 40 251 33 2 -
Special education 17 - - 1 - 1
Elementary 3,796 - 51 276 251 280
1st - 4th grade 1,654 - 51 276 251 280
5th - 6th grade 476 - - - - -
Graduate 1,666 - - - - -
High school 5,247 - - - - -
Undergraduate 1,466 - - - - -
Graduate 3,781 - - - - -
Postsecondary 428 - - - - -
Undergraduate 19 - - - - -
Graduate 409 - - - - -
College undergraduate 1,182 - - - - -
Baccalaureate/college graduate 1,597 - - - - -
Post baccalaureate 49 - - - - -
Not stated 3 3 - - - -
Continued

Philippine Statistics Authority
164 Demographic and Socioeconomic Characteristics - Quezon
Philippine Statistics Authority
Table 11--Continued
Highest Grade/Year Completed, Sex, and City/Municipality
Total Population
5 Years Old and Over
Age
5 6 7 8 9
GENERAL LUNA
Both sexes 23,774 599 607 606 567 588
No grade completed 832 450 92 17 2 5
Preschool 640 146 387 90 5 1
Special education 16 - - 1 1 -
Elementary 10,293 - 128 498 559 582
1st - 4th grade 4,543 - 128 498 559 582
5th - 6th grade 1,613 - - - - -
Graduate 4,137 - - - - -
High school 9,114 - - - - -
Undergraduate 3,689 - - - - -
Graduate 5,425 - - - - -
Postsecondary 378 - - - - -
Undergraduate 18 - - - - -
Graduate 360 - - - - -
College undergraduate 1,329 - - - - -
Baccalaureate/college graduate 1,155 - - - - -
Post baccalaureate 14 - - - - -
Not stated 3 3 - - - -
Male 12,189 311 316 296 307 294
No grade completed 437 236 54 12 1 5
Preschool 332 74 193 55 5 1
Special education 8 - - 1 1 -
Elementary 5,592 - 69 228 300 288
1st - 4th grade 2,477 - 69 228 300 288
5th - 6th grade 907 - - - - -
Graduate 2,208 - - - - -
High school 4,552 - - - - -
Undergraduate 1,885 - - - - -
Graduate 2,667 - - - - -
Postsecondary 176 - - - - -
Undergraduate 11 - - - - -
Graduate 165 - - - - -
College undergraduate 605 - - - - -
Baccalaureate/college graduate 478 - - - - -
Post baccalaureate 8 - - - - -
Not stated 1 1 - - - -
Female 11,585 288 291 310 260 294
No grade completed 395 214 38 5 1 -
Preschool 308 72 194 35 - -
Special education 8 - - - - -
Elementary 4,701 - 59 270 259 294
1st - 4th grade 2,066 - 59 270 259 294
5th - 6th grade 706 - - - - -
Graduate 1,929 - - - - -
High school 4,562 - - - - -
Undergraduate 1,804 - - - - -
Graduate 2,758 - - - - -
Postsecondary 202 - - - - -
Undergraduate 7 - - - - -
Graduate 195 - - - - -
College undergraduate 724 - - - - -
Baccalaureate/college graduate 677 - - - - -
Post baccalaureate 6 - - - - -
Not stated 2 2 - - - -
Continued

Philippine Statistics Authority
165 Demographic and Socioeconomic Characteristics - Quezon
Philippine Statistics Authority
Table 11--Continued
Highest Grade/Year Completed, Sex, and City/Municipality
Total Population
5 Years Old and Over
Age
5 6 7 8 9
GENERAL NAKAR
Both sexes 26,033 721 721 737 715 686
No grade completed 1,109 527 95 21 9 5
Preschool 836 186 466 143 20 8
Special education 2 - - - - -
Elementary 11,167 - 160 573 686 673
1st - 4th grade 5,321 - 160 573 686 673
5th - 6th grade 1,755 - - - - -
Graduate 4,091 - - - - -
High school 9,461 - - - - -
Undergraduate 3,922 - - - - -
Graduate 5,539 - - - - -
Postsecondary 474 - - - - -
Undergraduate 12 - - - - -
Graduate 462 - - - - -
College undergraduate 1,655 - - - - -
Baccalaureate/college graduate 1,298 - - - - -
Post baccalaureate 23 - - - - -
Not stated 8 8 - - - -
Male 13,646 374 364 385 385 335
No grade completed 565 263 48 13 5 3
Preschool 454 107 242 82 11 4
Special education 1 - - - - -
Elementary 6,286 - 74 290 369 328
1st - 4th grade 2,966 - 74 290 369 328
5th - 6th grade 1,041 - - - - -
Graduate 2,279 - - - - -
High school 4,899 - - - - -
Undergraduate 2,007 - - - - -
Graduate 2,892 - - - - -
Postsecondary 228 - - - - -
Undergraduate 5 - - - - -
Graduate 223 - - - - -
College undergraduate 708 - - - - -
Baccalaureate/college graduate 491 - - - - -
Post baccalaureate 10 - - - - -
Not stated 4 4 - - - -
Female 12,387 347 357 352 330 351
No grade completed 544 264 47 8 4 2
Preschool 382 79 224 61 9 4
Special education 1 - - - - -
Elementary 4,881 - 86 283 317 345
1st - 4th grade 2,355 - 86 283 317 345
5th - 6th grade 714 - - - - -
Graduate 1,812 - - - - -
High school 4,562 - - - - -
Undergraduate 1,915 - - - - -
Graduate 2,647 - - - - -
Postsecondary 246 - - - - -
Undergraduate 7 - - - - -
Graduate 239 - - - - -
College undergraduate 947 - - - - -
Baccalaureate/college graduate 807 - - - - -
Post baccalaureate 13 - - - - -
Not stated 4 4 - - - -
Continued

Philippine Statistics Authority
166 Demographic and Socioeconomic Characteristics - Quezon
Philippine Statistics Authority
Table 11--Continued
Highest Grade/Year Completed, Sex, and City/Municipality
Total Population
5 Years Old and Over
Age
5 6 7 8 9
GUINAYANGAN
Both sexes 40,345 1,009 1,082 1,045 1,050 1,012
No grade completed 1,227 765 128 23 8 7
Preschool 1,143 234 727 157 14 3
Special education 12 - 1 - - 1
Elementary 16,794 - 225 865 1,028 1,001
1st - 4th grade 7,282 - 225 865 1,028 1,001
5th - 6th grade 2,358 - - - - -
Graduate 7,154 - - - - -
High school 16,603 - - - - -
Undergraduate 6,251 - - - - -
Graduate 10,352 - - - - -
Postsecondary 568 - - - - -
Undergraduate 28 - - - - -
Graduate 540 - - - - -
College undergraduate 2,149 - - - - -
Baccalaureate/college graduate 1,825 - - - - -
Post baccalaureate 13 - - - - -
Not stated 11 10 1 - - -
Male 20,489 520 554 550 527 522
No grade completed 646 409 70 16 2 3
Preschool 566 107 362 82 7 1
Special education 6 - - - - -
Elementary 9,163 - 122 452 518 518
1st - 4th grade 4,047 - 122 452 518 518
5th - 6th grade 1,290 - - - - -
Graduate 3,826 - - - - -
High school 8,205 - - - - -
Undergraduate 3,173 - - - - -
Graduate 5,032 - - - - -
Postsecondary 259 - - - - -
Undergraduate 15 - - - - -
Graduate 244 - - - - -
College undergraduate 958 - - - - -
Baccalaureate/college graduate 677 - - - - -
Post baccalaureate 5 - - - - -
Not stated 4 4 - - - -
Female 19,856 489 528 495 523 490
No grade completed 581 356 58 7 6 4
Preschool 577 127 365 75 7 2
Special education 6 - 1 - - 1
Elementary 7,631 - 103 413 510 483
1st - 4th grade 3,235 - 103 413 510 483
5th - 6th grade 1,068 - - - - -
Graduate 3,328 - - - - -
High school 8,398 - - - - -
Undergraduate 3,078 - - - - -
Graduate 5,320 - - - - -
Postsecondary 309 - - - - -
Undergraduate 13 - - - - -
Graduate 296 - - - - -
College undergraduate 1,191 - - - - -
Baccalaureate/college graduate 1,148 - - - - -
Post baccalaureate 8 - - - - -
Not stated 7 6 1 - - -
Continued
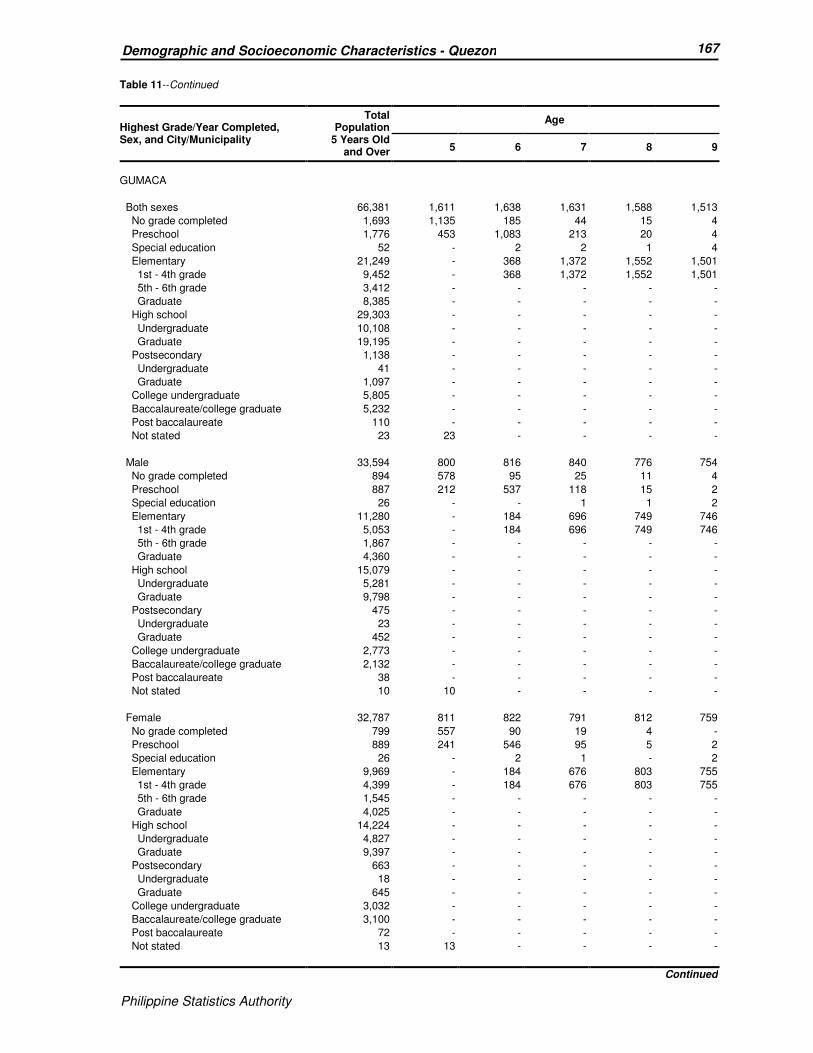
Philippine Statistics Authority
167 Demographic and Socioeconomic Characteristics - Quezon
Philippine Statistics Authority
Table 11--Continued
Highest Grade/Year Completed, Sex, and City/Municipality
Total Population
5 Years Old and Over
Age
5 6 7 8 9
GUMACA
Both sexes 66,381 1,611 1,638 1,631 1,588 1,513
No grade completed 1,693 1,135 185 44 15 4
Preschool 1,776 453 1,083 213 20 4
Special education 52 - 2 2 1 4
Elementary 21,249 - 368 1,372 1,552 1,501
1st - 4th grade 9,452 - 368 1,372 1,552 1,501
5th - 6th grade 3,412 - - - - -
Graduate 8,385 - - - - -
High school 29,303 - - - - -
Undergraduate 10,108 - - - - -
Graduate 19,195 - - - - -
Postsecondary 1,138 - - - - -
Undergraduate 41 - - - - -
Graduate 1,097 - - - - -
College undergraduate 5,805 - - - - -
Baccalaureate/college graduate 5,232 - - - - -
Post baccalaureate 110 - - - - -
Not stated 23 23 - - - -
Male 33,594 800 816 840 776 754
No grade completed 894 578 95 25 11 4
Preschool 887 212 537 118 15 2
Special education 26 - - 1 1 2
Elementary 11,280 - 184 696 749 746
1st - 4th grade 5,053 - 184 696 749 746
5th - 6th grade 1,867 - - - - -
Graduate 4,360 - - - - -
High school 15,079 - - - - -
Undergraduate 5,281 - - - - -
Graduate 9,798 - - - - -
Postsecondary 475 - - - - -
Undergraduate 23 - - - - -
Graduate 452 - - - - -
College undergraduate 2,773 - - - - -
Baccalaureate/college graduate 2,132 - - - - -
Post baccalaureate 38 - - - - -
Not stated 10 10 - - - -
Female 32,787 811 822 791 812 759
No grade completed 799 557 90 19 4 -
Preschool 889 241 546 95 5 2
Special education 26 - 2 1 - 2
Elementary 9,969 - 184 676 803 755
1st - 4th grade 4,399 - 184 676 803 755
5th - 6th grade 1,545 - - - - -
Graduate 4,025 - - - - -
High school 14,224 - - - - -
Undergraduate 4,827 - - - - -
Graduate 9,397 - - - - -
Postsecondary 663 - - - - -
Undergraduate 18 - - - - -
Graduate 645 - - - - -
College undergraduate 3,032 - - - - -
Baccalaureate/college graduate 3,100 - - - - -
Post baccalaureate 72 - - - - -
Not stated 13 13 - - - -
Continued

Philippine Statistics Authority
168 Demographic and Socioeconomic Characteristics - Quezon
Philippine Statistics Authority
Table 11--Continued
Highest Grade/Year Completed, Sex, and City/Municipality
Total Population
5 Years Old and Over
Age
5 6 7 8 9
INFANTA
Both sexes 61,573 1,568 1,500 1,494 1,571 1,530
No grade completed 1,577 1,069 191 27 10 5
Preschool 1,728 452 1,001 224 31 8
Special education 26 - - 1 1 2
Elementary 19,117 - 307 1,242 1,529 1,515
1st - 4th grade 9,249 - 307 1,242 1,529 1,515
5th - 6th grade 3,087 - - - - -
Graduate 6,781 - - - - -
High school 25,703 - - - - -
Undergraduate 9,599 - - - - -
Graduate 16,104 - - - - -
Postsecondary 1,844 - - - - -
Undergraduate 92 - - - - -
Graduate 1,752 - - - - -
College undergraduate 6,118 - - - - -
Baccalaureate/college graduate 5,370 - - - - -
Post baccalaureate 42 - - - - -
Not stated 48 47 1 - - -
Male 31,061 826 752 758 804 809
No grade completed 818 556 91 15 4 4
Preschool 892 248 501 118 15 6
Special education 12 - - 1 - 1
Elementary 10,299 - 160 624 785 798
1st - 4th grade 5,064 - 160 624 785 798
5th - 6th grade 1,650 - - - - -
Graduate 3,585 - - - - -
High school 13,183 - - - - -
Undergraduate 4,895 - - - - -
Graduate 8,288 - - - - -
Postsecondary 847 - - - - -
Undergraduate 39 - - - - -
Graduate 808 - - - - -
College undergraduate 2,718 - - - - -
Baccalaureate/college graduate 2,253 - - - - -
Post baccalaureate 17 - - - - -
Not stated 22 22 - - - -
Female 30,512 742 748 736 767 721
No grade completed 759 513 100 12 6 1
Preschool 836 204 500 106 16 2
Special education 14 - - - 1 1
Elementary 8,818 - 147 618 744 717
1st - 4th grade 4,185 - 147 618 744 717
5th - 6th grade 1,437 - - - - -
Graduate 3,196 - - - - -
High school 12,520 - - - - -
Undergraduate 4,704 - - - - -
Graduate 7,816 - - - - -
Postsecondary 997 - - - - -
Undergraduate 53 - - - - -
Graduate 944 - - - - -
College undergraduate 3,400 - - - - -
Baccalaureate/college graduate 3,117 - - - - -
Post baccalaureate 25 - - - - -
Not stated 26 25 1 - - -
Continued
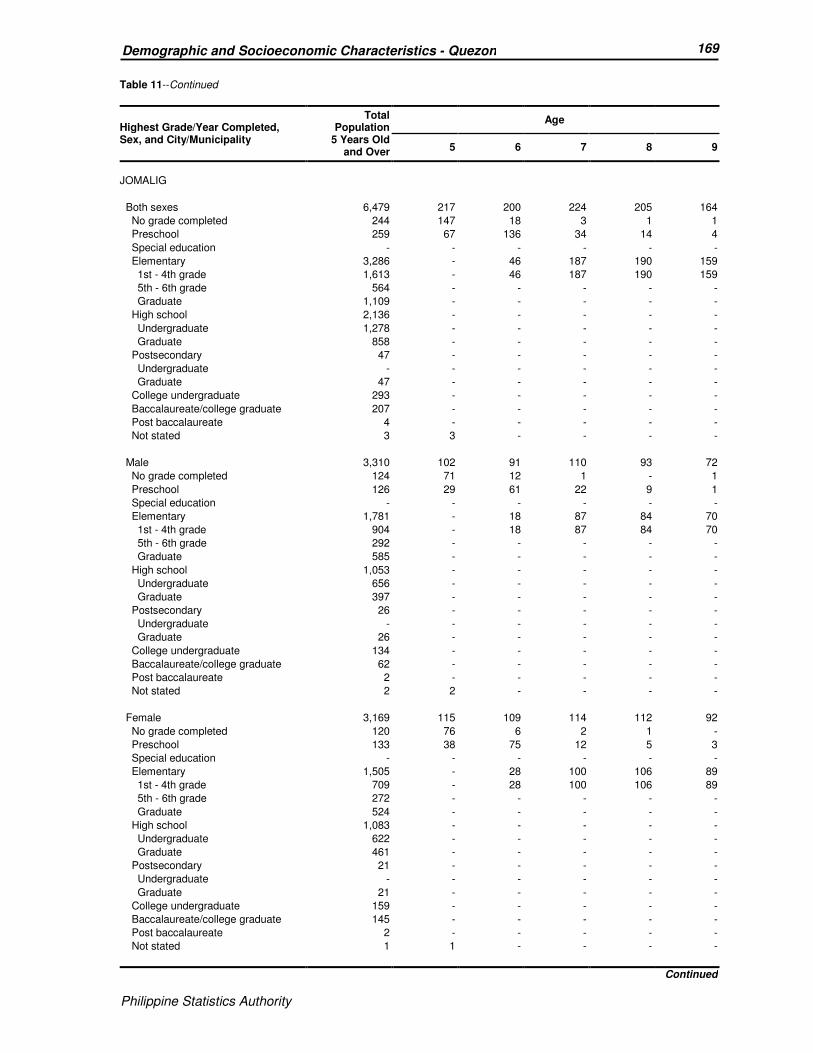
Philippine Statistics Authority
169 Demographic and Socioeconomic Characteristics - Quezon
Philippine Statistics Authority
Table 11--Continued
Highest Grade/Year Completed, Sex, and City/Municipality
Total Population
5 Years Old and Over
Age
5 6 7 8 9
JOMALIG
Both sexes 6,479 217 200 224 205 164
No grade completed 244 147 18 3 1 1
Preschool 259 67 136 34 14 4
Special education - - - - - -
Elementary 3,286 - 46 187 190 159
1st - 4th grade 1,613 - 46 187 190 159
5th - 6th grade 564 - - - - -
Graduate 1,109 - - - - -
High school 2,136 - - - - -
Undergraduate 1,278 - - - - -
Graduate 858 - - - - -
Postsecondary 47 - - - - -
Undergraduate - - - - - -
Graduate 47 - - - - -
College undergraduate 293 - - - - -
Baccalaureate/college graduate 207 - - - - -
Post baccalaureate 4 - - - - -
Not stated 3 3 - - - -
Male 3,310 102 91 110 93 72
No grade completed 124 71 12 1 - 1
Preschool 126 29 61 22 9 1
Special education - - - - - -
Elementary 1,781 - 18 87 84 70
1st - 4th grade 904 - 18 87 84 70
5th - 6th grade 292 - - - - -
Graduate 585 - - - - -
High school 1,053 - - - - -
Undergraduate 656 - - - - -
Graduate 397 - - - - -
Postsecondary 26 - - - - -
Undergraduate - - - - - -
Graduate 26 - - - - -
College undergraduate 134 - - - - -
Baccalaureate/college graduate 62 - - - - -
Post baccalaureate 2 - - - - -
Not stated 2 2 - - - -
Female 3,169 115 109 114 112 92
No grade completed 120 76 6 2 1 -
Preschool 133 38 75 12 5 3
Special education - - - - - -
Elementary 1,505 - 28 100 106 89
1st - 4th grade 709 - 28 100 106 89
5th - 6th grade 272 - - - - -
Graduate 524 - - - - -
High school 1,083 - - - - -
Undergraduate 622 - - - - -
Graduate 461 - - - - -
Postsecondary 21 - - - - -
Undergraduate - - - - - -
Graduate 21 - - - - -
College undergraduate 159 - - - - -
Baccalaureate/college graduate 145 - - - - -
Post baccalaureate 2 - - - - -
Not stated 1 1 - - - -
Continued

Philippine Statistics Authority
170 Demographic and Socioeconomic Characteristics - Quezon
Philippine Statistics Authority
Table 11--Continued
Highest Grade/Year Completed, Sex, and City/Municipality
Total Population
5 Years Old and Over
Age
5 6 7 8 9
LOPEZ
Both sexes 85,063 2,133 2,159 2,227 2,201 2,187
No grade completed 2,525 1,536 276 47 19 14
Preschool 2,278 573 1,355 293 38 6
Special education 24 - 3 1 3 1
Elementary 32,437 - 522 1,886 2,141 2,166
1st - 4th grade 13,446 - 522 1,886 2,141 2,166
5th - 6th grade 4,287 - - - - -
Graduate 14,704 - - - - -
High school 34,211 - - - - -
Undergraduate 12,996 - - - - -
Graduate 21,215 - - - - -
Postsecondary 1,767 - - - - -
Undergraduate 43 - - - - -
Graduate 1,724 - - - - -
College undergraduate 5,369 - - - - -
Baccalaureate/college graduate 6,330 - - - - -
Post baccalaureate 93 - - - - -
Not stated 29 24 3 - - -
Male 43,156 1,064 1,068 1,127 1,156 1,105
No grade completed 1,292 778 139 22 9 8
Preschool 1,117 274 655 154 24 5
Special education 16 - 3 1 3 1
Elementary 17,823 - 269 950 1,120 1,091
1st - 4th grade 7,496 - 269 950 1,120 1,091
5th - 6th grade 2,364 - - - - -
Graduate 7,963 - - - - -
High school 17,317 - - - - -
Undergraduate 6,646 - - - - -
Graduate 10,671 - - - - -
Postsecondary 737 - - - - -
Undergraduate 15 - - - - -
Graduate 722 - - - - -
College undergraduate 2,425 - - - - -
Baccalaureate/college graduate 2,375 - - - - -
Post baccalaureate 38 - - - - -
Not stated 16 12 2 - - -
Female 41,907 1,069 1,091 1,100 1,045 1,082
No grade completed 1,233 758 137 25 10 6
Preschool 1,161 299 700 139 14 1
Special education 8 - - - - -
Elementary 14,614 - 253 936 1,021 1,075
1st - 4th grade 5,950 - 253 936 1,021 1,075
5th - 6th grade 1,923 - - - - -
Graduate 6,741 - - - - -
High school 16,894 - - - - -
Undergraduate 6,350 - - - - -
Graduate 10,544 - - - - -
Postsecondary 1,030 - - - - -
Undergraduate 28 - - - - -
Graduate 1,002 - - - - -
College undergraduate 2,944 - - - - -
Baccalaureate/college graduate 3,955 - - - - -
Post baccalaureate 55 - - - - -
Not stated 13 12 1 - - -
Continued
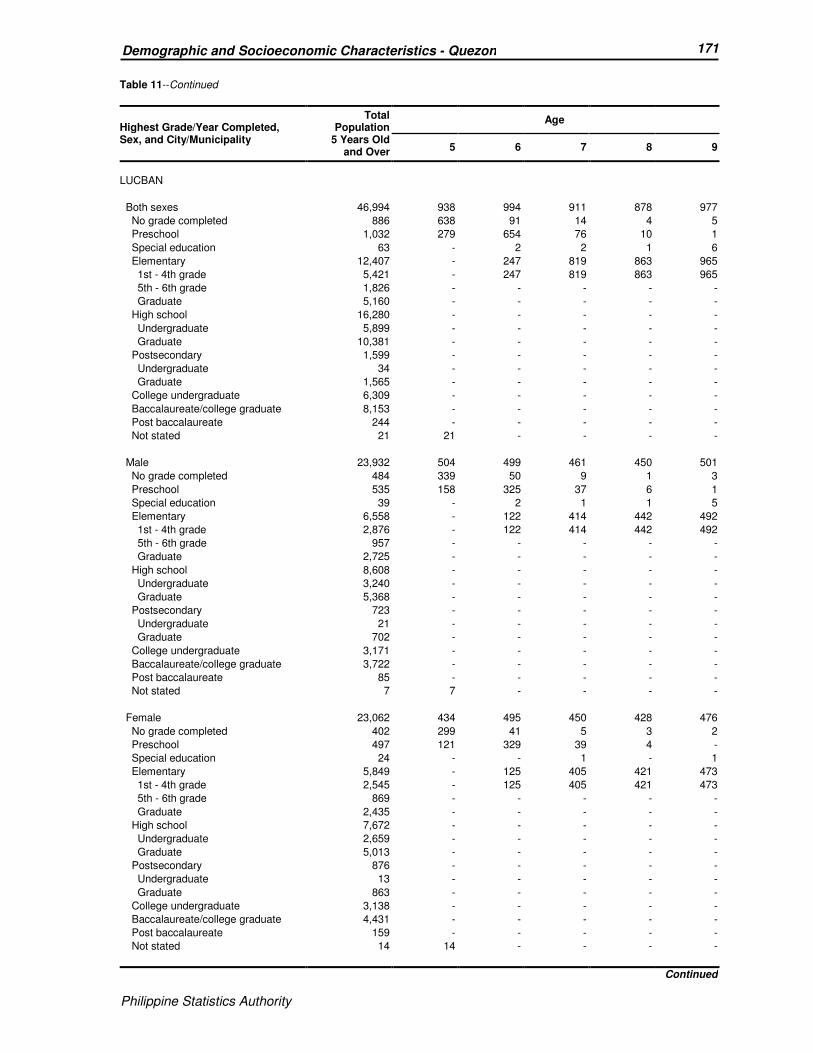
Philippine Statistics Authority
171 Demographic and Socioeconomic Characteristics - Quezon
Philippine Statistics Authority
Table 11--Continued
Highest Grade/Year Completed, Sex, and City/Municipality
Total Population
5 Years Old and Over
Age
5 6 7 8 9
LUCBAN
Both sexes 46,994 938 994 911 878 977
No grade completed 886 638 91 14 4 5
Preschool 1,032 279 654 76 10 1
Special education 63 - 2 2 1 6
Elementary 12,407 - 247 819 863 965
1st - 4th grade 5,421 - 247 819 863 965
5th - 6th grade 1,826 - - - - -
Graduate 5,160 - - - - -
High school 16,280 - - - - -
Undergraduate 5,899 - - - - -
Graduate 10,381 - - - - -
Postsecondary 1,599 - - - - -
Undergraduate 34 - - - - -
Graduate 1,565 - - - - -
College undergraduate 6,309 - - - - -
Baccalaureate/college graduate 8,153 - - - - -
Post baccalaureate 244 - - - - -
Not stated 21 21 - - - -
Male 23,932 504 499 461 450 501
No grade completed 484 339 50 9 1 3
Preschool 535 158 325 37 6 1
Special education 39 - 2 1 1 5
Elementary 6,558 - 122 414 442 492
1st - 4th grade 2,876 - 122 414 442 492
5th - 6th grade 957 - - - - -
Graduate 2,725 - - - - -
High school 8,608 - - - - -
Undergraduate 3,240 - - - - -
Graduate 5,368 - - - - -
Postsecondary 723 - - - - -
Undergraduate 21 - - - - -
Graduate 702 - - - - -
College undergraduate 3,171 - - - - -
Baccalaureate/college graduate 3,722 - - - - -
Post baccalaureate 85 - - - - -
Not stated 7 7 - - - -
Female 23,062 434 495 450 428 476
No grade completed 402 299 41 5 3 2
Preschool 497 121 329 39 4 -
Special education 24 - - 1 - 1
Elementary 5,849 - 125 405 421 473
1st - 4th grade 2,545 - 125 405 421 473
5th - 6th grade 869 - - - - -
Graduate 2,435 - - - - -
High school 7,672 - - - - -
Undergraduate 2,659 - - - - -
Graduate 5,013 - - - - -
Postsecondary 876 - - - - -
Undergraduate 13 - - - - -
Graduate 863 - - - - -
College undergraduate 3,138 - - - - -
Baccalaureate/college graduate 4,431 - - - - -
Post baccalaureate 159 - - - - -
Not stated 14 14 - - - -
Continued

Philippine Statistics Authority
172 Demographic and Socioeconomic Characteristics - Quezon
Philippine Statistics Authority
Table 11--Continued
Highest Grade/Year Completed, Sex, and City/Municipality
Total Population
5 Years Old and Over
Age
5 6 7 8 9
MACALELON
Both sexes 25,169 644 700 655 636 655
No grade completed 615 437 70 8 1 5
Preschool 684 203 402 60 10 3
Special education 36 - - 1 2 3
Elementary 10,577 - 228 586 623 644
1st - 4th grade 4,509 - 228 586 623 644
5th - 6th grade 1,591 - - - - -
Graduate 4,477 - - - - -
High school 10,059 - - - - -
Undergraduate 4,109 - - - - -
Graduate 5,950 - - - - -
Postsecondary 341 - - - - -
Undergraduate 32 - - - - -
Graduate 309 - - - - -
College undergraduate 1,585 - - - - -
Baccalaureate/college graduate 1,254 - - - - -
Post baccalaureate 14 - - - - -
Not stated 4 4 - - - -
Male 13,039 349 381 348 322 352
No grade completed 345 238 42 5 1 3
Preschool 375 108 222 36 3 2
Special education 25 - - - 1 3
Elementary 5,869 - 117 307 317 344
1st - 4th grade 2,540 - 117 307 317 344
5th - 6th grade 914 - - - - -
Graduate 2,415 - - - - -
High school 4,958 - - - - -
Undergraduate 2,095 - - - - -
Graduate 2,863 - - - - -
Postsecondary 171 - - - - -
Undergraduate 14 - - - - -
Graduate 157 - - - - -
College undergraduate 774 - - - - -
Baccalaureate/college graduate 518 - - - - -
Post baccalaureate 1 - - - - -
Not stated 3 3 - - - -
Female 12,130 295 319 307 314 303
No grade completed 270 199 28 3 - 2
Preschool 309 95 180 24 7 1
Special education 11 - - 1 1 -
Elementary 4,708 - 111 279 306 300
1st - 4th grade 1,969 - 111 279 306 300
5th - 6th grade 677 - - - - -
Graduate 2,062 - - - - -
High school 5,101 - - - - -
Undergraduate 2,014 - - - - -
Graduate 3,087 - - - - -
Postsecondary 170 - - - - -
Undergraduate 18 - - - - -
Graduate 152 - - - - -
College undergraduate 811 - - - - -
Baccalaureate/college graduate 736 - - - - -
Post baccalaureate 13 - - - - -
Not stated 1 1 - - - -
Continued
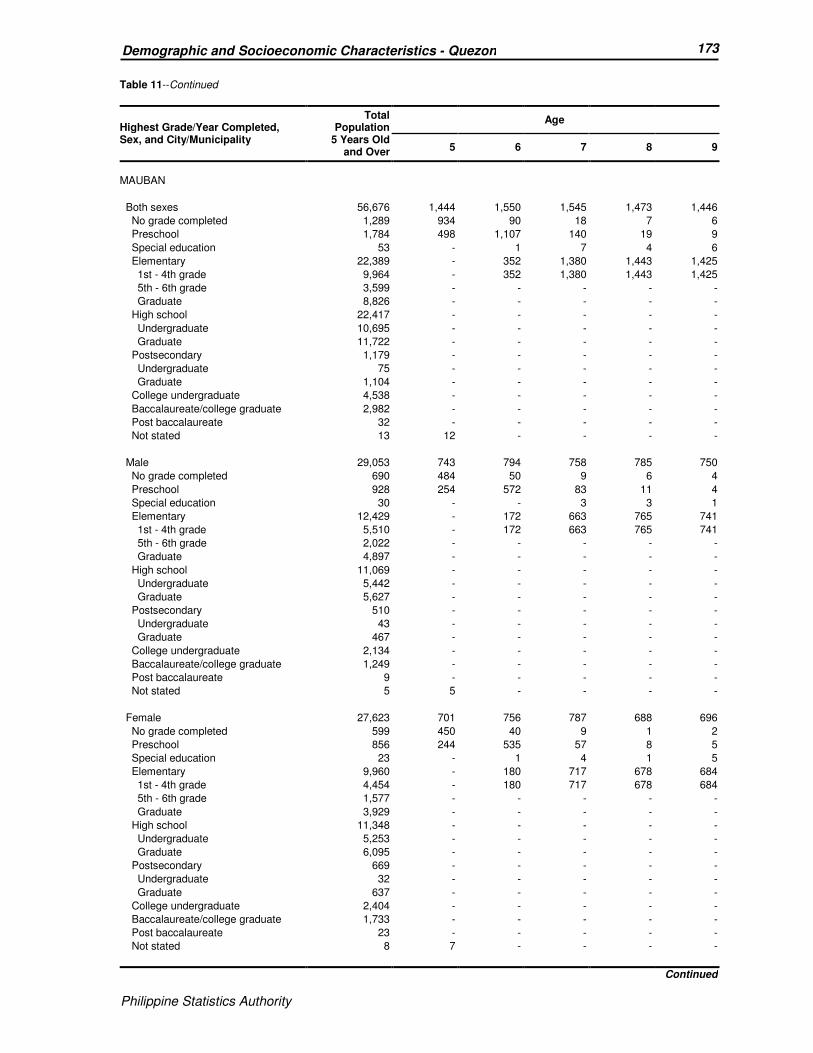
Philippine Statistics Authority
173 Demographic and Socioeconomic Characteristics - Quezon
Philippine Statistics Authority
Table 11--Continued
Highest Grade/Year Completed, Sex, and City/Municipality
Total Population
5 Years Old and Over
Age
5 6 7 8 9
MAUBAN
Both sexes 56,676 1,444 1,550 1,545 1,473 1,446
No grade completed 1,289 934 90 18 7 6
Preschool 1,784 498 1,107 140 19 9
Special education 53 - 1 7 4 6
Elementary 22,389 - 352 1,380 1,443 1,425
1st - 4th grade 9,964 - 352 1,380 1,443 1,425
5th - 6th grade 3,599 - - - - -
Graduate 8,826 - - - - -
High school 22,417 - - - - -
Undergraduate 10,695 - - - - -
Graduate 11,722 - - - - -
Postsecondary 1,179 - - - - -
Undergraduate 75 - - - - -
Graduate 1,104 - - - - -
College undergraduate 4,538 - - - - -
Baccalaureate/college graduate 2,982 - - - - -
Post baccalaureate 32 - - - - -
Not stated 13 12 - - - -
Male 29,053 743 794 758 785 750
No grade completed 690 484 50 9 6 4
Preschool 928 254 572 83 11 4
Special education 30 - - 3 3 1
Elementary 12,429 - 172 663 765 741
1st - 4th grade 5,510 - 172 663 765 741
5th - 6th grade 2,022 - - - - -
Graduate 4,897 - - - - -
High school 11,069 - - - - -
Undergraduate 5,442 - - - - -
Graduate 5,627 - - - - -
Postsecondary 510 - - - - -
Undergraduate 43 - - - - -
Graduate 467 - - - - -
College undergraduate 2,134 - - - - -
Baccalaureate/college graduate 1,249 - - - - -
Post baccalaureate 9 - - - - -
Not stated 5 5 - - - -
Female 27,623 701 756 787 688 696
No grade completed 599 450 40 9 1 2
Preschool 856 244 535 57 8 5
Special education 23 - 1 4 1 5
Elementary 9,960 - 180 717 678 684
1st - 4th grade 4,454 - 180 717 678 684
5th - 6th grade 1,577 - - - - -
Graduate 3,929 - - - - -
High school 11,348 - - - - -
Undergraduate 5,253 - - - - -
Graduate 6,095 - - - - -
Postsecondary 669 - - - - -
Undergraduate 32 - - - - -
Graduate 637 - - - - -
College undergraduate 2,404 - - - - -
Baccalaureate/college graduate 1,733 - - - - -
Post baccalaureate 23 - - - - -
Not stated 8 7 - - - -
Continued
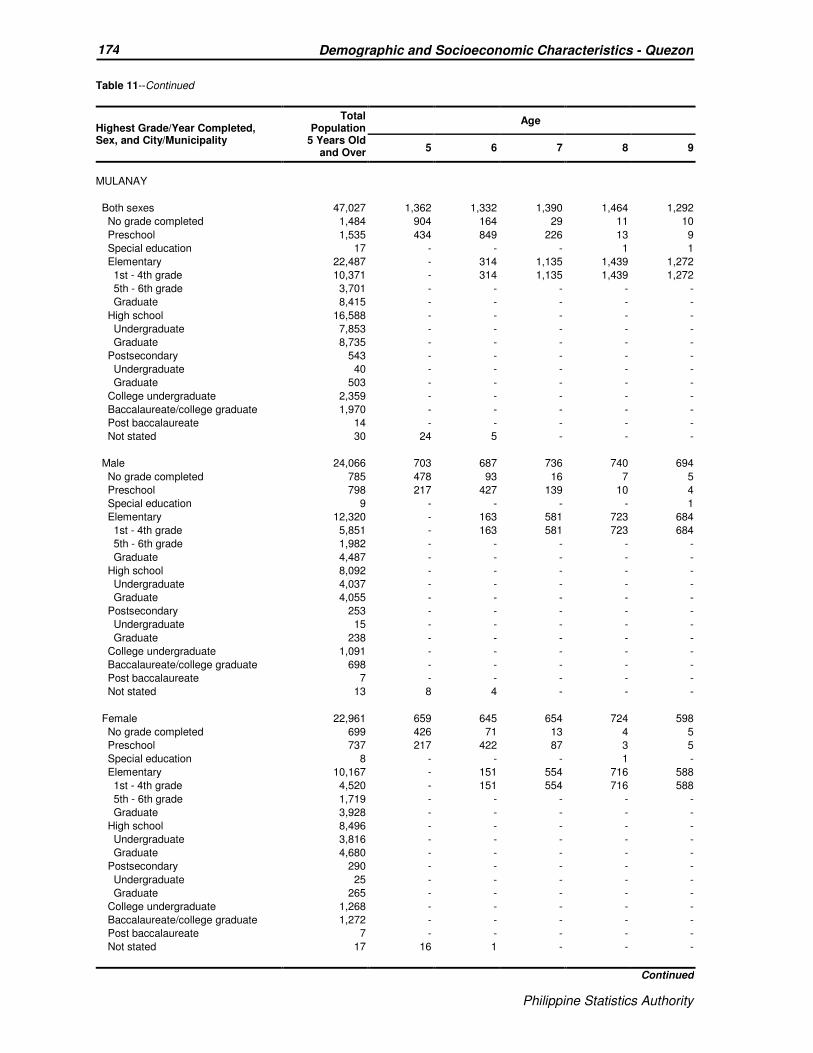
Philippine Statistics Authority
174 Demographic and Socioeconomic Characteristics - Quezon
Philippine Statistics Authority
Table 11--Continued
Highest Grade/Year Completed, Sex, and City/Municipality
Total Population
5 Years Old and Over
Age
5 6 7 8 9
MULANAY
Both sexes 47,027 1,362 1,332 1,390 1,464 1,292
No grade completed 1,484 904 164 29 11 10
Preschool 1,535 434 849 226 13 9
Special education 17 - - - 1 1
Elementary 22,487 - 314 1,135 1,439 1,272
1st - 4th grade 10,371 - 314 1,135 1,439 1,272
5th - 6th grade 3,701 - - - - -
Graduate 8,415 - - - - -
High school 16,588 - - - - -
Undergraduate 7,853 - - - - -
Graduate 8,735 - - - - -
Postsecondary 543 - - - - -
Undergraduate 40 - - - - -
Graduate 503 - - - - -
College undergraduate 2,359 - - - - -
Baccalaureate/college graduate 1,970 - - - - -
Post baccalaureate 14 - - - - -
Not stated 30 24 5 - - -
Male 24,066 703 687 736 740 694
No grade completed 785 478 93 16 7 5
Preschool 798 217 427 139 10 4
Special education 9 - - - - 1
Elementary 12,320 - 163 581 723 684
1st - 4th grade 5,851 - 163 581 723 684
5th - 6th grade 1,982 - - - - -
Graduate 4,487 - - - - -
High school 8,092 - - - - -
Undergraduate 4,037 - - - - -
Graduate 4,055 - - - - -
Postsecondary 253 - - - - -
Undergraduate 15 - - - - -
Graduate 238 - - - - -
College undergraduate 1,091 - - - - -
Baccalaureate/college graduate 698 - - - - -
Post baccalaureate 7 - - - - -
Not stated 13 8 4 - - -
Female 22,961 659 645 654 724 598
No grade completed 699 426 71 13 4 5
Preschool 737 217 422 87 3 5
Special education 8 - - - 1 -
Elementary 10,167 - 151 554 716 588
1st - 4th grade 4,520 - 151 554 716 588
5th - 6th grade 1,719 - - - - -
Graduate 3,928 - - - - -
High school 8,496 - - - - -
Undergraduate 3,816 - - - - -
Graduate 4,680 - - - - -
Postsecondary 290 - - - - -
Undergraduate 25 - - - - -
Graduate 265 - - - - -
College undergraduate 1,268 - - - - -
Baccalaureate/college graduate 1,272 - - - - -
Post baccalaureate 7 - - - - -
Not stated 17 16 1 - - -
Continued

Philippine Statistics Authority
175 Demographic and Socioeconomic Characteristics - Quezon
Philippine Statistics Authority
Table 11--Continued
Highest Grade/Year Completed, Sex, and City/Municipality
Total Population
5 Years Old and Over
Age
5 6 7 8 9
PADRE BURGOS
Both sexes 20,377 433 506 527 445 459
No grade completed 610 352 69 22 5 6
Preschool 470 77 330 49 7 -
Special education 22 - 1 2 3 -
Elementary 8,123 - 106 454 430 453
1st - 4th grade 3,537 - 106 454 430 453
5th - 6th grade 1,313 - - - - -
Graduate 3,273 - - - - -
High school 8,420 - - - - -
Undergraduate 3,092 - - - - -
Graduate 5,328 - - - - -
Postsecondary 448 - - - - -
Undergraduate 28 - - - - -
Graduate 420 - - - - -
College undergraduate 1,146 - - - - -
Baccalaureate/college graduate 1,123 - - - - -
Post baccalaureate 11 - - - - -
Not stated 4 4 - - - -
Male 10,333 222 262 274 239 240
No grade completed 310 180 33 11 3 4
Preschool 257 39 178 31 6 -
Special education 13 - - 1 1 -
Elementary 4,386 - 51 231 229 236
1st - 4th grade 1,979 - 51 231 229 236
5th - 6th grade 716 - - - - -
Graduate 1,691 - - - - -
High school 4,202 - - - - -
Undergraduate 1,589 - - - - -
Graduate 2,613 - - - - -
Postsecondary 221 - - - - -
Undergraduate 14 - - - - -
Graduate 207 - - - - -
College undergraduate 511 - - - - -
Baccalaureate/college graduate 427 - - - - -
Post baccalaureate 3 - - - - -
Not stated 3 3 - - - -
Female 10,044 211 244 253 206 219
No grade completed 300 172 36 11 2 2
Preschool 213 38 152 18 1 -
Special education 9 - 1 1 2 -
Elementary 3,737 - 55 223 201 217
1st - 4th grade 1,558 - 55 223 201 217
5th - 6th grade 597 - - - - -
Graduate 1,582 - - - - -
High school 4,218 - - - - -
Undergraduate 1,503 - - - - -
Graduate 2,715 - - - - -
Postsecondary 227 - - - - -
Undergraduate 14 - - - - -
Graduate 213 - - - - -
College undergraduate 635 - - - - -
Baccalaureate/college graduate 696 - - - - -
Post baccalaureate 8 - - - - -
Not stated 1 1 - - - -
Continued

Philippine Statistics Authority
176 Demographic and Socioeconomic Characteristics - Quezon
Philippine Statistics Authority
Table 11--Continued
Highest Grade/Year Completed, Sex, and City/Municipality
Total Population
5 Years Old and Over
Age
5 6 7 8 9
PAGBILAO
Both sexes 67,620 1,588 1,607 1,666 1,524 1,547
No grade completed 1,965 1,200 234 52 24 14
Preschool 1,701 364 1,072 216 22 9
Special education 39 - - 2 2 3
Elementary 24,865 - 298 1,395 1,476 1,521
1st - 4th grade 11,245 - 298 1,395 1,476 1,521
5th - 6th grade 3,673 - - - - -
Graduate 9,947 - - - - -
High school 25,192 - - - - -
Undergraduate 8,956 - - - - -
Graduate 16,236 - - - - -
Postsecondary 1,435 - - - - -
Undergraduate 61 - - - - -
Graduate 1,374 - - - - -
College undergraduate 5,628 - - - - -
Baccalaureate/college graduate 6,723 - - - - -
Post baccalaureate 44 - - - - -
Not stated 28 24 3 1 - -
Male 34,502 803 840 873 780 826
No grade completed 1,036 610 138 29 17 8
Preschool 893 182 553 127 14 4
Special education 22 - - 2 1 3
Elementary 13,302 - 147 714 748 811
1st - 4th grade 6,207 - 147 714 748 811
5th - 6th grade 2,000 - - - - -
Graduate 5,095 - - - - -
High school 12,854 - - - - -
Undergraduate 4,636 - - - - -
Graduate 8,218 - - - - -
Postsecondary 664 - - - - -
Undergraduate 31 - - - - -
Graduate 633 - - - - -
College undergraduate 2,804 - - - - -
Baccalaureate/college graduate 2,894 - - - - -
Post baccalaureate 19 - - - - -
Not stated 14 11 2 1 - -
Female 33,118 785 767 793 744 721
No grade completed 929 590 96 23 7 6
Preschool 808 182 519 89 8 5
Special education 17 - - - 1 -
Elementary 11,563 - 151 681 728 710
1st - 4th grade 5,038 - 151 681 728 710
5th - 6th grade 1,673 - - - - -
Graduate 4,852 - - - - -
High school 12,338 - - - - -
Undergraduate 4,320 - - - - -
Graduate 8,018 - - - - -
Postsecondary 771 - - - - -
Undergraduate 30 - - - - -
Graduate 741 - - - - -
College undergraduate 2,824 - - - - -
Baccalaureate/college graduate 3,829 - - - - -
Post baccalaureate 25 - - - - -
Not stated 14 13 1 - - -
Continued
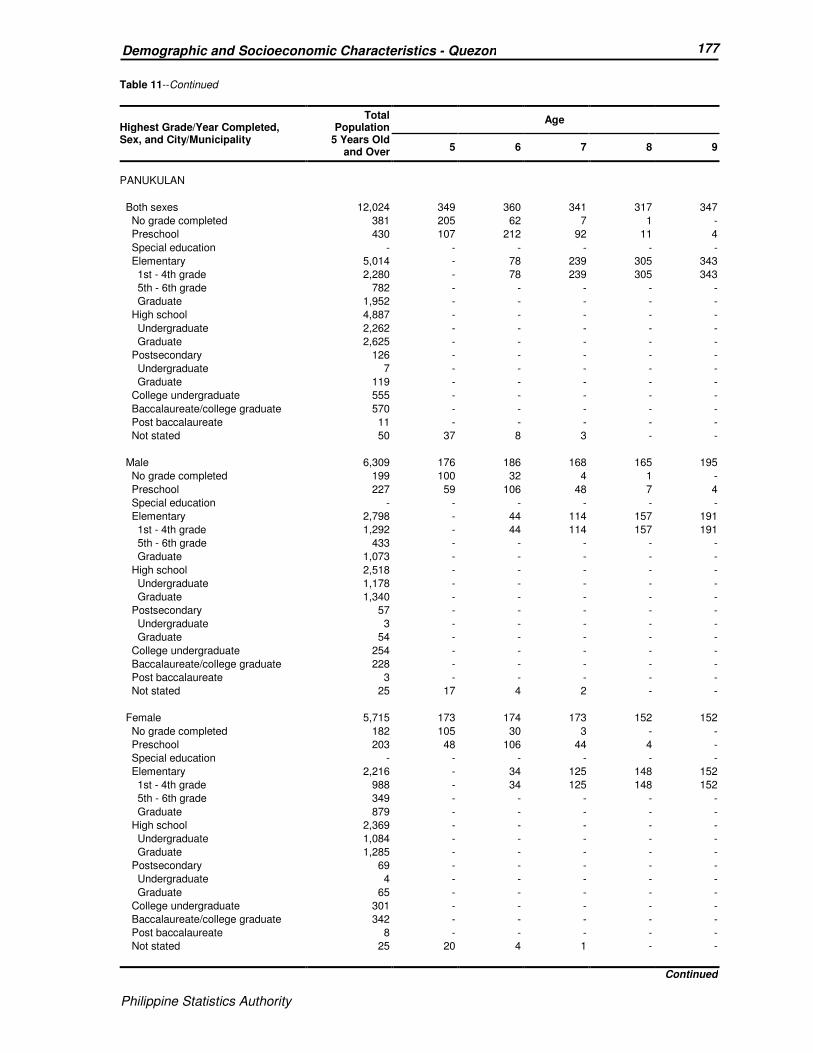
Philippine Statistics Authority
177 Demographic and Socioeconomic Characteristics - Quezon
Philippine Statistics Authority
Table 11--Continued
Highest Grade/Year Completed, Sex, and City/Municipality
Total Population
5 Years Old and Over
Age
5 6 7 8 9
PANUKULAN
Both sexes 12,024 349 360 341 317 347
No grade completed 381 205 62 7 1 -
Preschool 430 107 212 92 11 4
Special education - - - - - -
Elementary 5,014 - 78 239 305 343
1st - 4th grade 2,280 - 78 239 305 343
5th - 6th grade 782 - - - - -
Graduate 1,952 - - - - -
High school 4,887 - - - - -
Undergraduate 2,262 - - - - -
Graduate 2,625 - - - - -
Postsecondary 126 - - - - -
Undergraduate 7 - - - - -
Graduate 119 - - - - -
College undergraduate 555 - - - - -
Baccalaureate/college graduate 570 - - - - -
Post baccalaureate 11 - - - - -
Not stated 50 37 8 3 - -
Male 6,309 176 186 168 165 195
No grade completed 199 100 32 4 1 -
Preschool 227 59 106 48 7 4
Special education - - - - - -
Elementary 2,798 - 44 114 157 191
1st - 4th grade 1,292 - 44 114 157 191
5th - 6th grade 433 - - - - -
Graduate 1,073 - - - - -
High school 2,518 - - - - -
Undergraduate 1,178 - - - - -
Graduate 1,340 - - - - -
Postsecondary 57 - - - - -
Undergraduate 3 - - - - -
Graduate 54 - - - - -
College undergraduate 254 - - - - -
Baccalaureate/college graduate 228 - - - - -
Post baccalaureate 3 - - - - -
Not stated 25 17 4 2 - -
Female 5,715 173 174 173 152 152
No grade completed 182 105 30 3 - -
Preschool 203 48 106 44 4 -
Special education - - - - - -
Elementary 2,216 - 34 125 148 152
1st - 4th grade 988 - 34 125 148 152
5th - 6th grade 349 - - - - -
Graduate 879 - - - - -
High school 2,369 - - - - -
Undergraduate 1,084 - - - - -
Graduate 1,285 - - - - -
Postsecondary 69 - - - - -
Undergraduate 4 - - - - -
Graduate 65 - - - - -
College undergraduate 301 - - - - -
Baccalaureate/college graduate 342 - - - - -
Post baccalaureate 8 - - - - -
Not stated 25 20 4 1 - -
Continued
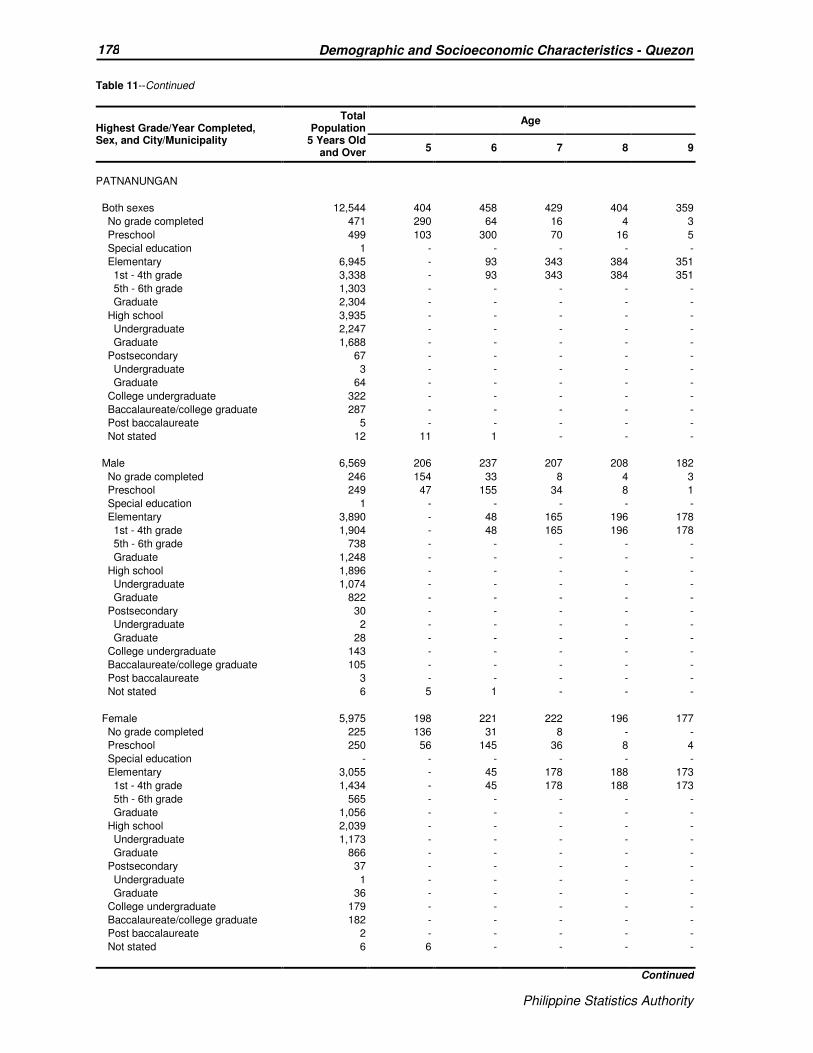
Philippine Statistics Authority
178 Demographic and Socioeconomic Characteristics - Quezon
Philippine Statistics Authority
Table 11--Continued
Highest Grade/Year Completed, Sex, and City/Municipality
Total Population
5 Years Old and Over
Age
5 6 7 8 9
PATNANUNGAN
Both sexes 12,544 404 458 429 404 359
No grade completed 471 290 64 16 4 3
Preschool 499 103 300 70 16 5
Special education 1 - - - - -
Elementary 6,945 - 93 343 384 351
1st - 4th grade 3,338 - 93 343 384 351
5th - 6th grade 1,303 - - - - -
Graduate 2,304 - - - - -
High school 3,935 - - - - -
Undergraduate 2,247 - - - - -
Graduate 1,688 - - - - -
Postsecondary 67 - - - - -
Undergraduate 3 - - - - -
Graduate 64 - - - - -
College undergraduate 322 - - - - -
Baccalaureate/college graduate 287 - - - - -
Post baccalaureate 5 - - - - -
Not stated 12 11 1 - - -
Male 6,569 206 237 207 208 182
No grade completed 246 154 33 8 4 3
Preschool 249 47 155 34 8 1
Special education 1 - - - - -
Elementary 3,890 - 48 165 196 178
1st - 4th grade 1,904 - 48 165 196 178
5th - 6th grade 738 - - - - -
Graduate 1,248 - - - - -
High school 1,896 - - - - -
Undergraduate 1,074 - - - - -
Graduate 822 - - - - -
Postsecondary 30 - - - - -
Undergraduate 2 - - - - -
Graduate 28 - - - - -
College undergraduate 143 - - - - -
Baccalaureate/college graduate 105 - - - - -
Post baccalaureate 3 - - - - -
Not stated 6 5 1 - - -
Female 5,975 198 221 222 196 177
No grade completed 225 136 31 8 - -
Preschool 250 56 145 36 8 4
Special education - - - - - -
Elementary 3,055 - 45 178 188 173
1st - 4th grade 1,434 - 45 178 188 173
5th - 6th grade 565 - - - - -
Graduate 1,056 - - - - -
High school 2,039 - - - - -
Undergraduate 1,173 - - - - -
Graduate 866 - - - - -
Postsecondary 37 - - - - -
Undergraduate 1 - - - - -
Graduate 36 - - - - -
College undergraduate 179 - - - - -
Baccalaureate/college graduate 182 - - - - -
Post baccalaureate 2 - - - - -
Not stated 6 6 - - - -
Continued
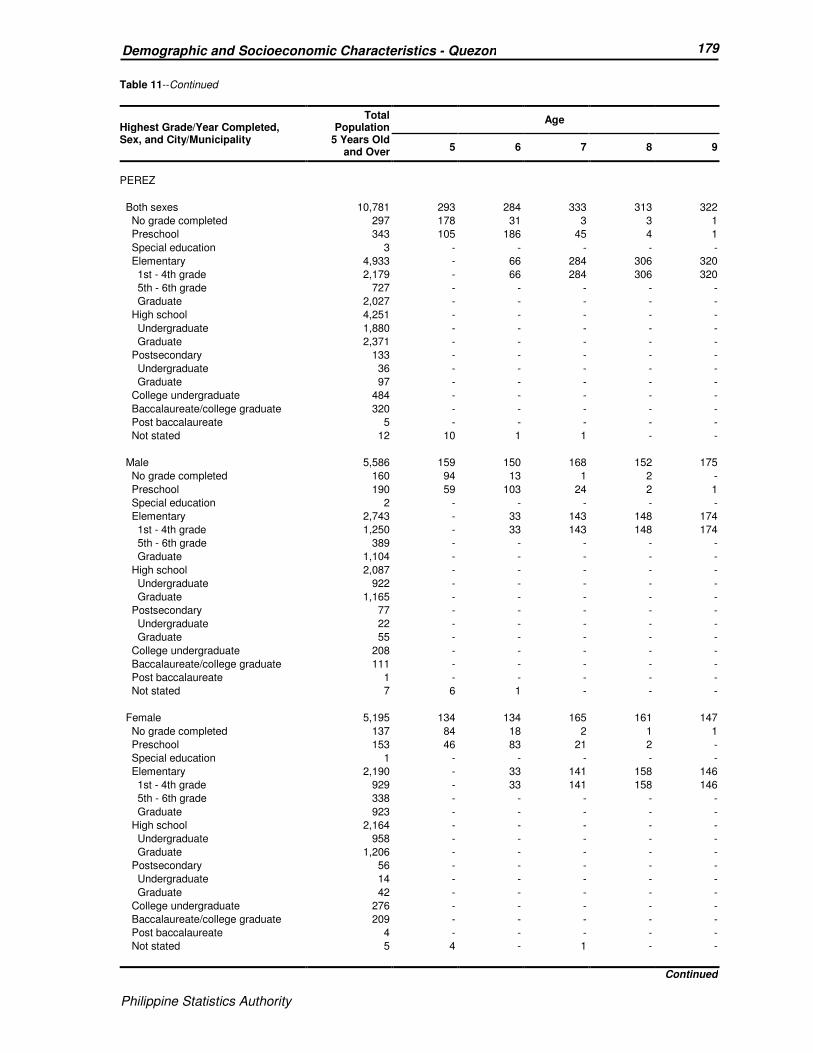
Philippine Statistics Authority
179 Demographic and Socioeconomic Characteristics - Quezon
Philippine Statistics Authority
Table 11--Continued
Highest Grade/Year Completed, Sex, and City/Municipality
Total Population
5 Years Old and Over
Age
5 6 7 8 9
PEREZ
Both sexes 10,781 293 284 333 313 322
No grade completed 297 178 31 3 3 1
Preschool 343 105 186 45 4 1
Special education 3 - - - - -
Elementary 4,933 - 66 284 306 320
1st - 4th grade 2,179 - 66 284 306 320
5th - 6th grade 727 - - - - -
Graduate 2,027 - - - - -
High school 4,251 - - - - -
Undergraduate 1,880 - - - - -
Graduate 2,371 - - - - -
Postsecondary 133 - - - - -
Undergraduate 36 - - - - -
Graduate 97 - - - - -
College undergraduate 484 - - - - -
Baccalaureate/college graduate 320 - - - - -
Post baccalaureate 5 - - - - -
Not stated 12 10 1 1 - -
Male 5,586 159 150 168 152 175
No grade completed 160 94 13 1 2 -
Preschool 190 59 103 24 2 1
Special education 2 - - - - -
Elementary 2,743 - 33 143 148 174
1st - 4th grade 1,250 - 33 143 148 174
5th - 6th grade 389 - - - - -
Graduate 1,104 - - - - -
High school 2,087 - - - - -
Undergraduate 922 - - - - -
Graduate 1,165 - - - - -
Postsecondary 77 - - - - -
Undergraduate 22 - - - - -
Graduate 55 - - - - -
College undergraduate 208 - - - - -
Baccalaureate/college graduate 111 - - - - -
Post baccalaureate 1 - - - - -
Not stated 7 6 1 - - -
Female 5,195 134 134 165 161 147
No grade completed 137 84 18 2 1 1
Preschool 153 46 83 21 2 -
Special education 1 - - - - -
Elementary 2,190 - 33 141 158 146
1st - 4th grade 929 - 33 141 158 146
5th - 6th grade 338 - - - - -
Graduate 923 - - - - -
High school 2,164 - - - - -
Undergraduate 958 - - - - -
Graduate 1,206 - - - - -
Postsecondary 56 - - - - -
Undergraduate 14 - - - - -
Graduate 42 - - - - -
College undergraduate 276 - - - - -
Baccalaureate/college graduate 209 - - - - -
Post baccalaureate 4 - - - - -
Not stated 5 4 - 1 - -
Continued
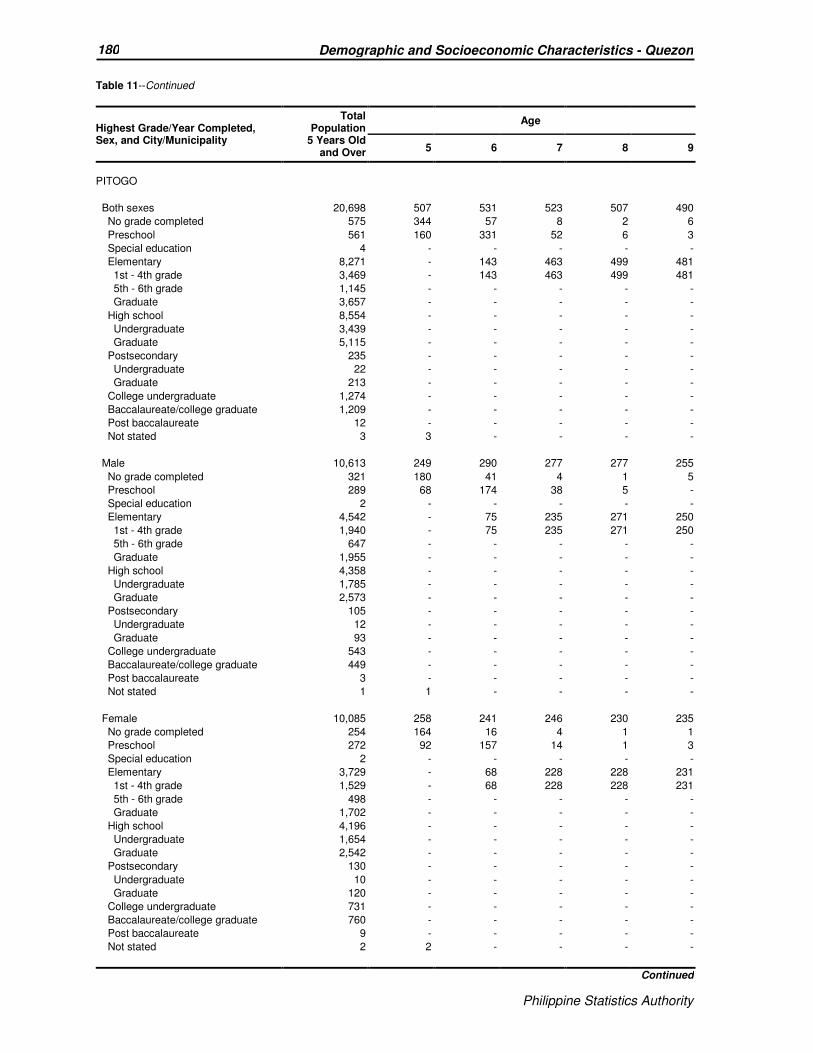
Philippine Statistics Authority
180 Demographic and Socioeconomic Characteristics - Quezon
Philippine Statistics Authority
Table 11--Continued
Highest Grade/Year Completed, Sex, and City/Municipality
Total Population
5 Years Old and Over
Age
5 6 7 8 9
PITOGO
Both sexes 20,698 507 531 523 507 490
No grade completed 575 344 57 8 2 6
Preschool 561 160 331 52 6 3
Special education 4 - - - - -
Elementary 8,271 - 143 463 499 481
1st - 4th grade 3,469 - 143 463 499 481
5th - 6th grade 1,145 - - - - -
Graduate 3,657 - - - - -
High school 8,554 - - - - -
Undergraduate 3,439 - - - - -
Graduate 5,115 - - - - -
Postsecondary 235 - - - - -
Undergraduate 22 - - - - -
Graduate 213 - - - - -
College undergraduate 1,274 - - - - -
Baccalaureate/college graduate 1,209 - - - - -
Post baccalaureate 12 - - - - -
Not stated 3 3 - - - -
Male 10,613 249 290 277 277 255
No grade completed 321 180 41 4 1 5
Preschool 289 68 174 38 5 -
Special education 2 - - - - -
Elementary 4,542 - 75 235 271 250
1st - 4th grade 1,940 - 75 235 271 250
5th - 6th grade 647 - - - - -
Graduate 1,955 - - - - -
High school 4,358 - - - - -
Undergraduate 1,785 - - - - -
Graduate 2,573 - - - - -
Postsecondary 105 - - - - -
Undergraduate 12 - - - - -
Graduate 93 - - - - -
College undergraduate 543 - - - - -
Baccalaureate/college graduate 449 - - - - -
Post baccalaureate 3 - - - - -
Not stated 1 1 - - - -
Female 10,085 258 241 246 230 235
No grade completed 254 164 16 4 1 1
Preschool 272 92 157 14 1 3
Special education 2 - - - - -
Elementary 3,729 - 68 228 228 231
1st - 4th grade 1,529 - 68 228 228 231
5th - 6th grade 498 - - - - -
Graduate 1,702 - - - - -
High school 4,196 - - - - -
Undergraduate 1,654 - - - - -
Graduate 2,542 - - - - -
Postsecondary 130 - - - - -
Undergraduate 10 - - - - -
Graduate 120 - - - - -
College undergraduate 731 - - - - -
Baccalaureate/college graduate 760 - - - - -
Post baccalaureate 9 - - - - -
Not stated 2 2 - - - -
Continued

Philippine Statistics Authority
181 Demographic and Socioeconomic Characteristics - Quezon
Philippine Statistics Authority
Table 11--Continued
Highest Grade/Year Completed, Sex, and City/Municipality
Total Population
5 Years Old and Over
Age
5 6 7 8 9
PLARIDEL
Both sexes 9,867 199 242 242 223 228
No grade completed 259 147 37 6 3 1
Preschool 231 48 147 29 5 2
Special education 1 - - - - -
Elementary 2,898 - 58 207 215 225
1st - 4th grade 1,310 - 58 207 215 225
5th - 6th grade 422 - - - - -
Graduate 1,166 - - - - -
High school 4,411 - - - - -
Undergraduate 1,502 - - - - -
Graduate 2,909 - - - - -
Postsecondary 362 - - - - -
Undergraduate 25 - - - - -
Graduate 337 - - - - -
College undergraduate 833 - - - - -
Baccalaureate/college graduate 865 - - - - -
Post baccalaureate 3 - - - - -
Not stated 4 4 - - - -
Male 4,993 103 122 121 121 117
No grade completed 137 77 27 1 1 -
Preschool 116 25 71 17 3 -
Special education 1 - - - - -
Elementary 1,556 - 24 103 117 117
1st - 4th grade 723 - 24 103 117 117
5th - 6th grade 219 - - - - -
Graduate 614 - - - - -
High school 2,281 - - - - -
Undergraduate 782 - - - - -
Graduate 1,499 - - - - -
Postsecondary 172 - - - - -
Undergraduate 7 - - - - -
Graduate 165 - - - - -
College undergraduate 386 - - - - -
Baccalaureate/college graduate 341 - - - - -
Post baccalaureate 2 - - - - -
Not stated 1 1 - - - -
Female 4,874 96 120 121 102 111
No grade completed 122 70 10 5 2 1
Preschool 115 23 76 12 2 2
Special education - - - - - -
Elementary 1,342 - 34 104 98 108
1st - 4th grade 587 - 34 104 98 108
5th - 6th grade 203 - - - - -
Graduate 552 - - - - -
High school 2,130 - - - - -
Undergraduate 720 - - - - -
Graduate 1,410 - - - - -
Postsecondary 190 - - - - -
Undergraduate 18 - - - - -
Graduate 172 - - - - -
College undergraduate 447 - - - - -
Baccalaureate/college graduate 524 - - - - -
Post baccalaureate 1 - - - - -
Not stated 3 3 - - - -
Continued

Philippine Statistics Authority
182 Demographic and Socioeconomic Characteristics - Quezon
Philippine Statistics Authority
Table 11--Continued
Highest Grade/Year Completed, Sex, and City/Municipality
Total Population
5 Years Old and Over
Age
5 6 7 8 9
POLILLO
Both sexes 26,852 801 780 769 779 785
No grade completed 925 593 68 17 7 8
Preschool 909 197 574 105 16 7
Special education 7 - - - - -
Elementary 11,100 - 138 645 756 770
1st - 4th grade 5,301 - 138 645 756 770
5th - 6th grade 1,685 - - - - -
Graduate 4,114 - - - - -
High school 10,211 - - - - -
Undergraduate 4,725 - - - - -
Graduate 5,486 - - - - -
Postsecondary 529 - - - - -
Undergraduate 42 - - - - -
Graduate 487 - - - - -
College undergraduate 1,750 - - - - -
Baccalaureate/college graduate 1,394 - - - - -
Post baccalaureate 14 - - - - -
Not stated 13 11 - 2 - -
Male 13,953 415 422 387 376 398
No grade completed 478 310 41 11 3 5
Preschool 494 100 318 58 6 5
Special education 3 - - - - -
Elementary 5,989 - 63 317 367 388
1st - 4th grade 2,936 - 63 317 367 388
5th - 6th grade 912 - - - - -
Graduate 2,141 - - - - -
High school 5,290 - - - - -
Undergraduate 2,392 - - - - -
Graduate 2,898 - - - - -
Postsecondary 308 - - - - -
Undergraduate 24 - - - - -
Graduate 284 - - - - -
College undergraduate 804 - - - - -
Baccalaureate/college graduate 576 - - - - -
Post baccalaureate 5 - - - - -
Not stated 6 5 - 1 - -
Female 12,899 386 358 382 403 387
No grade completed 447 283 27 6 4 3
Preschool 415 97 256 47 10 2
Special education 4 - - - - -
Elementary 5,111 - 75 328 389 382
1st - 4th grade 2,365 - 75 328 389 382
5th - 6th grade 773 - - - - -
Graduate 1,973 - - - - -
High school 4,921 - - - - -
Undergraduate 2,333 - - - - -
Graduate 2,588 - - - - -
Postsecondary 221 - - - - -
Undergraduate 18 - - - - -
Graduate 203 - - - - -
College undergraduate 946 - - - - -
Baccalaureate/college graduate 818 - - - - -
Post baccalaureate 9 - - - - -
Not stated 7 6 - 1 - -
Continued

Philippine Statistics Authority
183 Demographic and Socioeconomic Characteristics - Quezon
Philippine Statistics Authority
Table 11--Continued
Highest Grade/Year Completed, Sex, and City/Municipality
Total Population
5 Years Old and Over
Age
5 6 7 8 9
QUEZON
Both sexes 13,530 318 323 323 345 323
No grade completed 372 281 22 6 1 1
Preschool 311 34 244 30 2 1
Special education 8 - 1 - - -
Elementary 5,268 - 56 287 342 321
1st - 4th grade 2,116 - 56 287 342 321
5th - 6th grade 717 - - - - -
Graduate 2,435 - - - - -
High school 5,814 - - - - -
Undergraduate 2,286 - - - - -
Graduate 3,528 - - - - -
Postsecondary 152 - - - - -
Undergraduate 11 - - - - -
Graduate 141 - - - - -
College undergraduate 976 - - - - -
Baccalaureate/college graduate 623 - - - - -
Post baccalaureate 3 - - - - -
Not stated 3 3 - - - -
Male 6,947 161 171 179 172 176
No grade completed 196 147 12 4 1 -
Preschool 157 13 127 17 - -
Special education 4 - 1 - - -
Elementary 2,895 - 31 158 171 176
1st - 4th grade 1,160 - 31 158 171 176
5th - 6th grade 367 - - - - -
Graduate 1,368 - - - - -
High school 2,986 - - - - -
Undergraduate 1,231 - - - - -
Graduate 1,755 - - - - -
Postsecondary 58 - - - - -
Undergraduate 5 - - - - -
Graduate 53 - - - - -
College undergraduate 433 - - - - -
Baccalaureate/college graduate 216 - - - - -
Post baccalaureate 1 - - - - -
Not stated 1 1 - - - -
Female 6,583 157 152 144 173 147
No grade completed 176 134 10 2 - 1
Preschool 154 21 117 13 2 1
Special education 4 - - - - -
Elementary 2,373 - 25 129 171 145
1st - 4th grade 956 - 25 129 171 145
5th - 6th grade 350 - - - - -
Graduate 1,067 - - - - -
High school 2,828 - - - - -
Undergraduate 1,055 - - - - -
Graduate 1,773 - - - - -
Postsecondary 94 - - - - -
Undergraduate 6 - - - - -
Graduate 88 - - - - -
College undergraduate 543 - - - - -
Baccalaureate/college graduate 407 - - - - -
Post baccalaureate 2 - - - - -
Not stated 2 2 - - - -
Continued

Philippine Statistics Authority
184 Demographic and Socioeconomic Characteristics - Quezon
Philippine Statistics Authority
Table 11--Continued
Highest Grade/Year Completed, Sex, and City/Municipality
Total Population
5 Years Old and Over
Age
5 6 7 8 9
REAL
Both sexes 31,860 829 831 802 823 806
No grade completed 785 544 73 9 7 4
Preschool 1,028 278 605 121 14 2
Special education 13 - - - - -
Elementary 11,310 - 153 672 802 800
1st - 4th grade 5,471 - 153 672 802 800
5th - 6th grade 1,769 - - - - -
Graduate 4,070 - - - - -
High school 13,271 - - - - -
Undergraduate 5,232 - - - - -
Graduate 8,039 - - - - -
Postsecondary 726 - - - - -
Undergraduate 56 - - - - -
Graduate 670 - - - - -
College undergraduate 2,806 - - - - -
Baccalaureate/college graduate 1,891 - - - - -
Post baccalaureate 23 - - - - -
Not stated 7 7 - - - -
Male 16,299 410 437 417 432 393
No grade completed 400 260 49 7 4 2
Preschool 547 144 312 72 12 2
Special education 12 - - - - -
Elementary 6,136 - 76 338 416 389
1st - 4th grade 3,007 - 76 338 416 389
5th - 6th grade 975 - - - - -
Graduate 2,154 - - - - -
High school 6,725 - - - - -
Undergraduate 2,633 - - - - -
Graduate 4,092 - - - - -
Postsecondary 370 - - - - -
Undergraduate 27 - - - - -
Graduate 343 - - - - -
College undergraduate 1,331 - - - - -
Baccalaureate/college graduate 764 - - - - -
Post baccalaureate 8 - - - - -
Not stated 6 6 - - - -
Female 15,561 419 394 385 391 413
No grade completed 385 284 24 2 3 2
Preschool 481 134 293 49 2 -
Special education 1 - - - - -
Elementary 5,174 - 77 334 386 411
1st - 4th grade 2,464 - 77 334 386 411
5th - 6th grade 794 - - - - -
Graduate 1,916 - - - - -
High school 6,546 - - - - -
Undergraduate 2,599 - - - - -
Graduate 3,947 - - - - -
Postsecondary 356 - - - - -
Undergraduate 29 - - - - -
Graduate 327 - - - - -
College undergraduate 1,475 - - - - -
Baccalaureate/college graduate 1,127 - - - - -
Post baccalaureate 15 - - - - -
Not stated 1 1 - - - -
Continued

Philippine Statistics Authority
185 Demographic and Socioeconomic Characteristics - Quezon
Philippine Statistics Authority
Table 11--Continued
Highest Grade/Year Completed, Sex, and City/Municipality
Total Population
5 Years Old and Over
Age
5 6 7 8 9
SAMPALOC
Both sexes 12,661 262 302 281 244 256
No grade completed 173 96 9 2 - 1
Preschool 437 146 233 37 4 5
Special education 16 - 1 2 2 2
Elementary 3,680 - 55 240 237 248
1st - 4th grade 1,551 - 55 240 237 248
5th - 6th grade 582 - - - - -
Graduate 1,547 - - - - -
High school 5,133 - - - - -
Undergraduate 1,853 - - - - -
Graduate 3,280 - - - - -
Postsecondary 461 - - - - -
Undergraduate 16 - - - - -
Graduate 445 - - - - -
College undergraduate 1,172 - - - - -
Baccalaureate/college graduate 1,554 - - - - -
Post baccalaureate 10 - - - - -
Not stated 25 20 4 - 1 -
Male 6,440 138 149 133 118 134
No grade completed 96 50 3 1 - -
Preschool 223 75 119 18 2 3
Special education 9 - 1 2 - 1
Elementary 1,950 - 23 112 116 130
1st - 4th grade 830 - 23 112 116 130
5th - 6th grade 303 - - - - -
Graduate 817 - - - - -
High school 2,630 - - - - -
Undergraduate 952 - - - - -
Graduate 1,678 - - - - -
Postsecondary 219 - - - - -
Undergraduate 10 - - - - -
Graduate 209 - - - - -
College undergraduate 543 - - - - -
Baccalaureate/college graduate 751 - - - - -
Post baccalaureate 3 - - - - -
Not stated 16 13 3 - - -
Female 6,221 124 153 148 126 122
No grade completed 77 46 6 1 - 1
Preschool 214 71 114 19 2 2
Special education 7 - - - 2 1
Elementary 1,730 - 32 128 121 118
1st - 4th grade 721 - 32 128 121 118
5th - 6th grade 279 - - - - -
Graduate 730 - - - - -
High school 2,503 - - - - -
Undergraduate 901 - - - - -
Graduate 1,602 - - - - -
Postsecondary 242 - - - - -
Undergraduate 6 - - - - -
Graduate 236 - - - - -
College undergraduate 629 - - - - -
Baccalaureate/college graduate 803 - - - - -
Post baccalaureate 7 - - - - -
Not stated 9 7 1 - 1 -
Continued

Philippine Statistics Authority
186 Demographic and Socioeconomic Characteristics - Quezon
Philippine Statistics Authority
Table 11--Continued
Highest Grade/Year Completed, Sex, and City/Municipality
Total Population
5 Years Old and Over
Age
5 6 7 8 9
SAN ANDRES
Both sexes 31,244 959 926 931 970 881
No grade completed 1,472 719 185 37 20 16
Preschool 981 232 547 155 26 10
Special education 9 - - - - -
Elementary 18,568 - 194 739 923 855
1st - 4th grade 9,944 - 194 739 923 855
5th - 6th grade 3,306 - - - - -
Graduate 5,318 - - - - -
High school 8,314 - - - - -
Undergraduate 4,501 - - - - -
Graduate 3,813 - - - - -
Postsecondary 176 - - - - -
Undergraduate 22 - - - - -
Graduate 154 - - - - -
College undergraduate 992 - - - - -
Baccalaureate/college graduate 708 - - - - -
Post baccalaureate 15 - - - - -
Not stated 9 8 - - 1 -
Male 15,914 494 458 462 505 440
No grade completed 797 373 104 24 14 11
Preschool 500 118 265 86 17 7
Special education 6 - - - - -
Elementary 9,882 - 89 352 474 422
1st - 4th grade 5,527 - 89 352 474 422
5th - 6th grade 1,746 - - - - -
Graduate 2,609 - - - - -
High school 3,902 - - - - -
Undergraduate 2,136 - - - - -
Graduate 1,766 - - - - -
Postsecondary 90 - - - - -
Undergraduate 13 - - - - -
Graduate 77 - - - - -
College undergraduate 444 - - - - -
Baccalaureate/college graduate 286 - - - - -
Post baccalaureate 4 - - - - -
Not stated 3 3 - - - -
Female 15,330 465 468 469 465 441
No grade completed 675 346 81 13 6 5
Preschool 481 114 282 69 9 3
Special education 3 - - - - -
Elementary 8,686 - 105 387 449 433
1st - 4th grade 4,417 - 105 387 449 433
5th - 6th grade 1,560 - - - - -
Graduate 2,709 - - - - -
High school 4,412 - - - - -
Undergraduate 2,365 - - - - -
Graduate 2,047 - - - - -
Postsecondary 86 - - - - -
Undergraduate 9 - - - - -
Graduate 77 - - - - -
College undergraduate 548 - - - - -
Baccalaureate/college graduate 422 - - - - -
Post baccalaureate 11 - - - - -
Not stated 6 5 - - 1 -
Continued

Philippine Statistics Authority
187 Demographic and Socioeconomic Characteristics - Quezon
Philippine Statistics Authority
Table 11--Continued
Highest Grade/Year Completed, Sex, and City/Municipality
Total Population
5 Years Old and Over
Age
5 6 7 8 9
SAN ANTONIO
Both sexes 30,092 732 747 803 781 669
No grade completed 702 469 31 5 4 1
Preschool 772 253 444 63 8 2
Special education 33 - - 3 2 2
Elementary 12,007 - 272 732 767 664
1st - 4th grade 4,972 - 272 732 767 664
5th - 6th grade 1,417 - - - - -
Graduate 5,618 - - - - -
High school 11,663 - - - - -
Undergraduate 3,702 - - - - -
Graduate 7,961 - - - - -
Postsecondary 590 - - - - -
Undergraduate 24 - - - - -
Graduate 566 - - - - -
College undergraduate 2,214 - - - - -
Baccalaureate/college graduate 2,078 - - - - -
Post baccalaureate 23 - - - - -
Not stated 10 10 - - - -
Male 15,201 380 401 426 373 350
No grade completed 355 247 15 3 3 1
Preschool 420 128 247 36 6 1
Special education 16 - - 2 2 -
Elementary 6,544 - 139 385 362 348
1st - 4th grade 2,679 - 139 385 362 348
5th - 6th grade 783 - - - - -
Graduate 3,082 - - - - -
High school 5,712 - - - - -
Undergraduate 1,927 - - - - -
Graduate 3,785 - - - - -
Postsecondary 274 - - - - -
Undergraduate 15 - - - - -
Graduate 259 - - - - -
College undergraduate 1,053 - - - - -
Baccalaureate/college graduate 817 - - - - -
Post baccalaureate 5 - - - - -
Not stated 5 5 - - - -
Female 14,891 352 346 377 408 319
No grade completed 347 222 16 2 1 -
Preschool 352 125 197 27 2 1
Special education 17 - - 1 - 2
Elementary 5,463 - 133 347 405 316
1st - 4th grade 2,293 - 133 347 405 316
5th - 6th grade 634 - - - - -
Graduate 2,536 - - - - -
High school 5,951 - - - - -
Undergraduate 1,775 - - - - -
Graduate 4,176 - - - - -
Postsecondary 316 - - - - -
Undergraduate 9 - - - - -
Graduate 307 - - - - -
College undergraduate 1,161 - - - - -
Baccalaureate/college graduate 1,261 - - - - -
Post baccalaureate 18 - - - - -
Not stated 5 5 - - - -
Continued
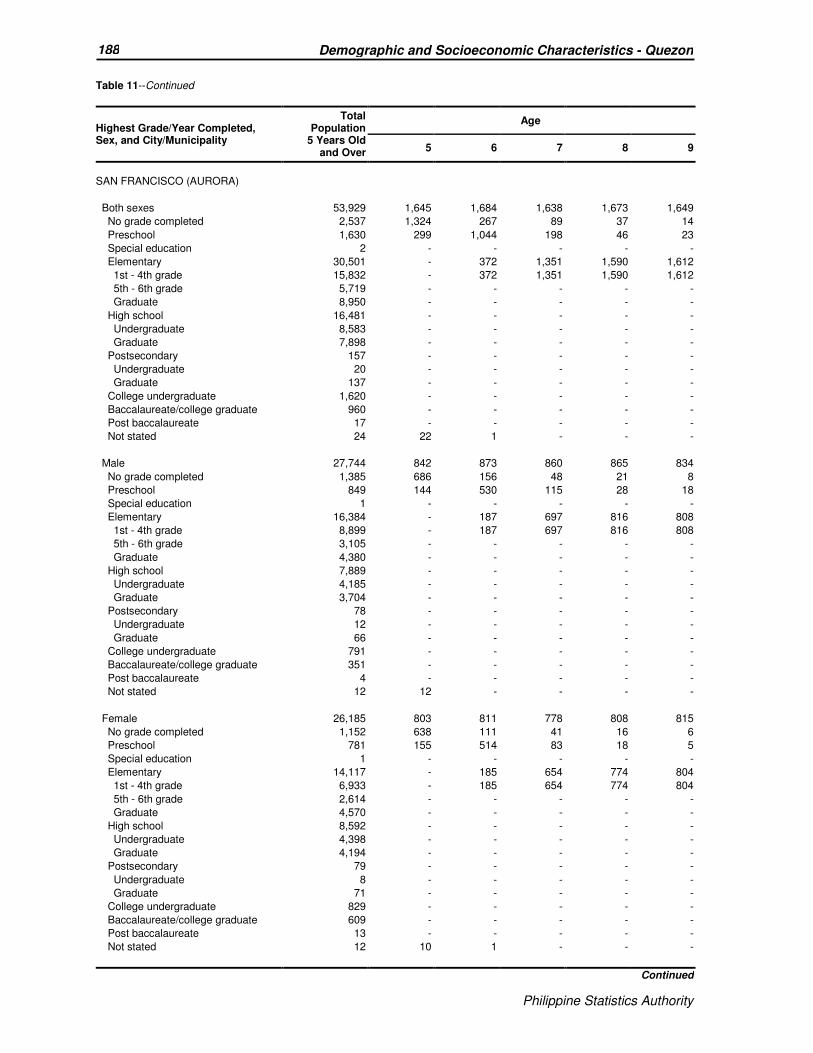
Philippine Statistics Authority
188 Demographic and Socioeconomic Characteristics - Quezon
Philippine Statistics Authority
Table 11--Continued
Highest Grade/Year Completed, Sex, and City/Municipality
Total Population
5 Years Old and Over
Age
5 6 7 8 9
SAN FRANCISCO (AURORA)
Both sexes 53,929 1,645 1,684 1,638 1,673 1,649
No grade completed 2,537 1,324 267 89 37 14
Preschool 1,630 299 1,044 198 46 23
Special education 2 - - - - -
Elementary 30,501 - 372 1,351 1,590 1,612
1st - 4th grade 15,832 - 372 1,351 1,590 1,612
5th - 6th grade 5,719 - - - - -
Graduate 8,950 - - - - -
High school 16,481 - - - - -
Undergraduate 8,583 - - - - -
Graduate 7,898 - - - - -
Postsecondary 157 - - - - -
Undergraduate 20 - - - - -
Graduate 137 - - - - -
College undergraduate 1,620 - - - - -
Baccalaureate/college graduate 960 - - - - -
Post baccalaureate 17 - - - - -
Not stated 24 22 1 - - -
Male 27,744 842 873 860 865 834
No grade completed 1,385 686 156 48 21 8
Preschool 849 144 530 115 28 18
Special education 1 - - - - -
Elementary 16,384 - 187 697 816 808
1st - 4th grade 8,899 - 187 697 816 808
5th - 6th grade 3,105 - - - - -
Graduate 4,380 - - - - -
High school 7,889 - - - - -
Undergraduate 4,185 - - - - -
Graduate 3,704 - - - - -
Postsecondary 78 - - - - -
Undergraduate 12 - - - - -
Graduate 66 - - - - -
College undergraduate 791 - - - - -
Baccalaureate/college graduate 351 - - - - -
Post baccalaureate 4 - - - - -
Not stated 12 12 - - - -
Female 26,185 803 811 778 808 815
No grade completed 1,152 638 111 41 16 6
Preschool 781 155 514 83 18 5
Special education 1 - - - - -
Elementary 14,117 - 185 654 774 804
1st - 4th grade 6,933 - 185 654 774 804
5th - 6th grade 2,614 - - - - -
Graduate 4,570 - - - - -
High school 8,592 - - - - -
Undergraduate 4,398 - - - - -
Graduate 4,194 - - - - -
Postsecondary 79 - - - - -
Undergraduate 8 - - - - -
Graduate 71 - - - - -
College undergraduate 829 - - - - -
Baccalaureate/college graduate 609 - - - - -
Post baccalaureate 13 - - - - -
Not stated 12 10 1 - - -
Continued
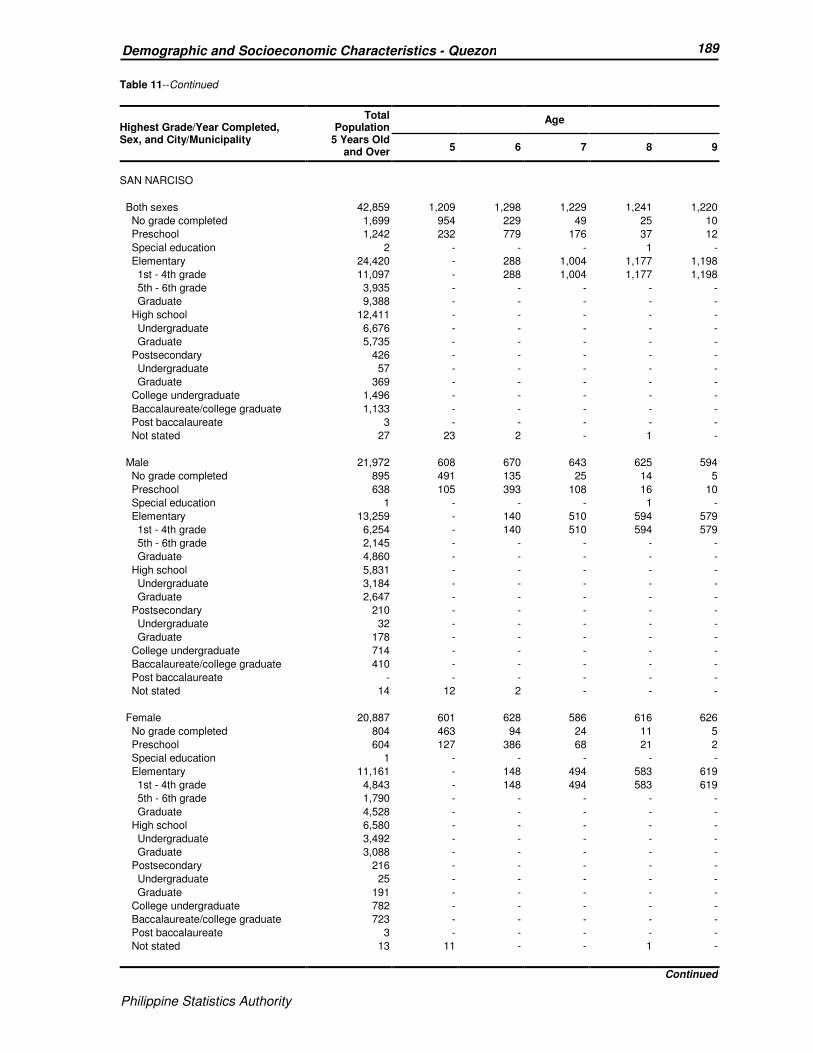
Philippine Statistics Authority
189 Demographic and Socioeconomic Characteristics - Quezon
Philippine Statistics Authority
Table 11--Continued
Highest Grade/Year Completed, Sex, and City/Municipality
Total Population
5 Years Old and Over
Age
5 6 7 8 9
SAN NARCISO
Both sexes 42,859 1,209 1,298 1,229 1,241 1,220
No grade completed 1,699 954 229 49 25 10
Preschool 1,242 232 779 176 37 12
Special education 2 - - - 1 -
Elementary 24,420 - 288 1,004 1,177 1,198
1st - 4th grade 11,097 - 288 1,004 1,177 1,198
5th - 6th grade 3,935 - - - - -
Graduate 9,388 - - - - -
High school 12,411 - - - - -
Undergraduate 6,676 - - - - -
Graduate 5,735 - - - - -
Postsecondary 426 - - - - -
Undergraduate 57 - - - - -
Graduate 369 - - - - -
College undergraduate 1,496 - - - - -
Baccalaureate/college graduate 1,133 - - - - -
Post baccalaureate 3 - - - - -
Not stated 27 23 2 - 1 -
Male 21,972 608 670 643 625 594
No grade completed 895 491 135 25 14 5
Preschool 638 105 393 108 16 10
Special education 1 - - - 1 -
Elementary 13,259 - 140 510 594 579
1st - 4th grade 6,254 - 140 510 594 579
5th - 6th grade 2,145 - - - - -
Graduate 4,860 - - - - -
High school 5,831 - - - - -
Undergraduate 3,184 - - - - -
Graduate 2,647 - - - - -
Postsecondary 210 - - - - -
Undergraduate 32 - - - - -
Graduate 178 - - - - -
College undergraduate 714 - - - - -
Baccalaureate/college graduate 410 - - - - -
Post baccalaureate - - - - - -
Not stated 14 12 2 - - -
Female 20,887 601 628 586 616 626
No grade completed 804 463 94 24 11 5
Preschool 604 127 386 68 21 2
Special education 1 - - - - -
Elementary 11,161 - 148 494 583 619
1st - 4th grade 4,843 - 148 494 583 619
5th - 6th grade 1,790 - - - - -
Graduate 4,528 - - - - -
High school 6,580 - - - - -
Undergraduate 3,492 - - - - -
Graduate 3,088 - - - - -
Postsecondary 216 - - - - -
Undergraduate 25 - - - - -
Graduate 191 - - - - -
College undergraduate 782 - - - - -
Baccalaureate/college graduate 723 - - - - -
Post baccalaureate 3 - - - - -
Not stated 13 11 - - 1 -
Continued

Philippine Statistics Authority
190 Demographic and Socioeconomic Characteristics - Quezon
Philippine Statistics Authority
Table 11--Continued
Highest Grade/Year Completed, Sex, and City/Municipality
Total Population
5 Years Old and Over
Age
5 6 7 8 9
SARIAYA
Both sexes 133,832 3,214 3,255 3,324 3,169 3,178
No grade completed 4,048 2,472 394 79 24 16
Preschool 3,451 693 2,195 447 53 14
Special education 109 - 1 8 10 8
Elementary 53,923 - 663 2,790 3,082 3,140
1st - 4th grade 22,748 - 663 2,790 3,082 3,140
5th - 6th grade 7,034 - - - - -
Graduate 24,141 - - - - -
High school 49,805 - - - - -
Undergraduate 18,501 - - - - -
Graduate 31,304 - - - - -
Postsecondary 3,809 - - - - -
Undergraduate 542 - - - - -
Graduate 3,267 - - - - -
College undergraduate 8,898 - - - - -
Baccalaureate/college graduate 9,601 - - - - -
Post baccalaureate 137 - - - - -
Not stated 51 49 2 - - -
Male 67,593 1,670 1,678 1,693 1,635 1,615
No grade completed 2,152 1,298 231 46 16 13
Preschool 1,776 345 1,113 239 36 8
Special education 51 - 1 4 2 6
Elementary 29,207 - 331 1,404 1,581 1,588
1st - 4th grade 12,548 - 331 1,404 1,581 1,588
5th - 6th grade 3,902 - - - - -
Graduate 12,757 - - - - -
High school 24,303 - - - - -
Undergraduate 9,778 - - - - -
Graduate 14,525 - - - - -
Postsecondary 1,885 - - - - -
Undergraduate 266 - - - - -
Graduate 1,619 - - - - -
College undergraduate 4,155 - - - - -
Baccalaureate/college graduate 3,999 - - - - -
Post baccalaureate 36 - - - - -
Not stated 29 27 2 - - -
Female 66,239 1,544 1,577 1,631 1,534 1,563
No grade completed 1,896 1,174 163 33 8 3
Preschool 1,675 348 1,082 208 17 6
Special education 58 - - 4 8 2
Elementary 24,716 - 332 1,386 1,501 1,552
1st - 4th grade 10,200 - 332 1,386 1,501 1,552
5th - 6th grade 3,132 - - - - -
Graduate 11,384 - - - - -
High school 25,502 - - - - -
Undergraduate 8,723 - - - - -
Graduate 16,779 - - - - -
Postsecondary 1,924 - - - - -
Undergraduate 276 - - - - -
Graduate 1,648 - - - - -
College undergraduate 4,743 - - - - -
Baccalaureate/college graduate 5,602 - - - - -
Post baccalaureate 101 - - - - -
Not stated 22 22 - - - -
Continued

Philippine Statistics Authority
191 Demographic and Socioeconomic Characteristics - Quezon
Philippine Statistics Authority
Table 11--Continued
Highest Grade/Year Completed, Sex, and City/Municipality
Total Population
5 Years Old and Over
Age
5 6 7 8 9
TAGKAWAYAN
Both sexes 45,802 1,290 1,315 1,304 1,364 1,407
No grade completed 1,388 874 157 31 11 11
Preschool 1,414 377 797 201 29 7
Special education 3 - - - - -
Elementary 19,507 - 352 1,072 1,324 1,389
1st - 4th grade 8,884 - 352 1,072 1,324 1,389
5th - 6th grade 2,669 - - - - -
Graduate 7,954 - - - - -
High school 17,830 - - - - -
Undergraduate 7,810 - - - - -
Graduate 10,020 - - - - -
Postsecondary 478 - - - - -
Undergraduate 11 - - - - -
Graduate 467 - - - - -
College undergraduate 2,765 - - - - -
Baccalaureate/college graduate 2,318 - - - - -
Post baccalaureate 51 - - - - -
Not stated 48 39 9 - - -
Male 23,318 673 712 708 671 678
No grade completed 753 487 106 16 4 7
Preschool 730 168 415 118 21 5
Special education 1 - - - - -
Elementary 10,630 - 184 574 646 666
1st - 4th grade 4,866 - 184 574 646 666
5th - 6th grade 1,494 - - - - -
Graduate 4,270 - - - - -
High school 8,827 - - - - -
Undergraduate 3,916 - - - - -
Graduate 4,911 - - - - -
Postsecondary 170 - - - - -
Undergraduate 6 - - - - -
Graduate 164 - - - - -
College undergraduate 1,261 - - - - -
Baccalaureate/college graduate 900 - - - - -
Post baccalaureate 21 - - - - -
Not stated 25 18 7 - - -
Female 22,484 617 603 596 693 729
No grade completed 635 387 51 15 7 4
Preschool 684 209 382 83 8 2
Special education 2 - - - - -
Elementary 8,877 - 168 498 678 723
1st - 4th grade 4,018 - 168 498 678 723
5th - 6th grade 1,175 - - - - -
Graduate 3,684 - - - - -
High school 9,003 - - - - -
Undergraduate 3,894 - - - - -
Graduate 5,109 - - - - -
Postsecondary 308 - - - - -
Undergraduate 5 - - - - -
Graduate 303 - - - - -
College undergraduate 1,504 - - - - -
Baccalaureate/college graduate 1,418 - - - - -
Post baccalaureate 30 - - - - -
Not stated 23 21 2 - - -
Continued

Philippine Statistics Authority
192 Demographic and Socioeconomic Characteristics - Quezon
Philippine Statistics Authority
Table 11--Continued
Highest Grade/Year Completed, Sex, and City/Municipality
Total Population
5 Years Old and Over
Age
5 6 7 8 9
CITY OF TAYABAS
Both sexes 90,003 1,964 2,017 2,061 1,967 1,965
No grade completed 1,837 1,252 171 28 9 8
Preschool 2,213 678 1,281 199 31 14
Special education 116 - 6 6 4 11
Elementary 29,081 - 559 1,828 1,923 1,932
1st - 4th grade 13,236 - 559 1,828 1,923 1,932
5th - 6th grade 4,329 - - - - -
Graduate 11,516 - - - - -
High school 33,813 - - - - -
Undergraduate 12,655 - - - - -
Graduate 21,158 - - - - -
Postsecondary 2,734 - - - - -
Undergraduate 120 - - - - -
Graduate 2,614 - - - - -
College undergraduate 9,281 - - - - -
Baccalaureate/college graduate 10,739 - - - - -
Post baccalaureate 155 - - - - -
Not stated 34 34 - - - -
Male 45,533 1,000 1,060 1,083 985 974
No grade completed 944 635 90 16 7 3
Preschool 1,180 351 685 109 19 9
Special education 61 - 4 4 1 7
Elementary 15,721 - 281 954 958 955
1st - 4th grade 7,227 - 281 954 958 955
5th - 6th grade 2,303 - - - - -
Graduate 6,191 - - - - -
High school 17,144 - - - - -
Undergraduate 6,655 - - - - -
Graduate 10,489 - - - - -
Postsecondary 1,262 - - - - -
Undergraduate 71 - - - - -
Graduate 1,191 - - - - -
College undergraduate 4,535 - - - - -
Baccalaureate/college graduate 4,616 - - - - -
Post baccalaureate 56 - - - - -
Not stated 14 14 - - - -
Female 44,470 964 957 978 982 991
No grade completed 893 617 81 12 2 5
Preschool 1,033 327 596 90 12 5
Special education 55 - 2 2 3 4
Elementary 13,360 - 278 874 965 977
1st - 4th grade 6,009 - 278 874 965 977
5th - 6th grade 2,026 - - - - -
Graduate 5,325 - - - - -
High school 16,669 - - - - -
Undergraduate 6,000 - - - - -
Graduate 10,669 - - - - -
Postsecondary 1,472 - - - - -
Undergraduate 49 - - - - -
Graduate 1,423 - - - - -
College undergraduate 4,746 - - - - -
Baccalaureate/college graduate 6,123 - - - - -
Post baccalaureate 99 - - - - -
Not stated 20 20 - - - -
Continued
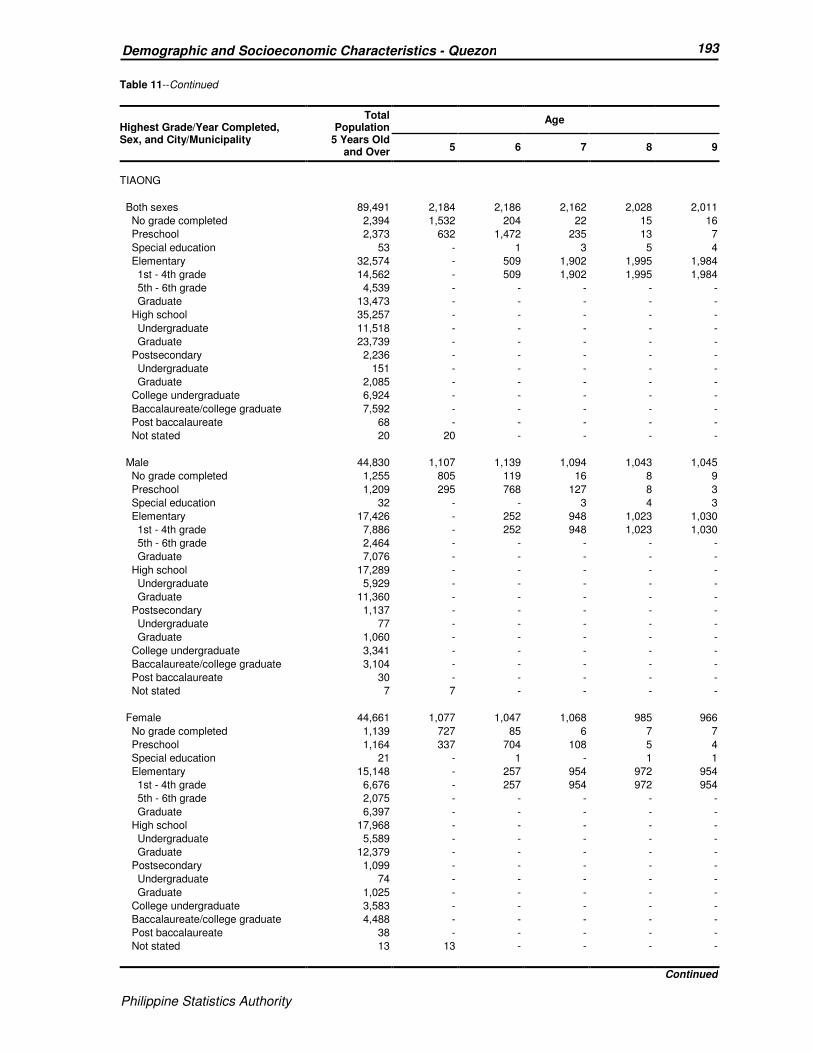
Philippine Statistics Authority
193 Demographic and Socioeconomic Characteristics - Quezon
Philippine Statistics Authority
Table 11--Continued
Highest Grade/Year Completed, Sex, and City/Municipality
Total Population
5 Years Old and Over
Age
5 6 7 8 9
TIAONG
Both sexes 89,491 2,184 2,186 2,162 2,028 2,011
No grade completed 2,394 1,532 204 22 15 16
Preschool 2,373 632 1,472 235 13 7
Special education 53 - 1 3 5 4
Elementary 32,574 - 509 1,902 1,995 1,984
1st - 4th grade 14,562 - 509 1,902 1,995 1,984
5th - 6th grade 4,539 - - - - -
Graduate 13,473 - - - - -
High school 35,257 - - - - -
Undergraduate 11,518 - - - - -
Graduate 23,739 - - - - -
Postsecondary 2,236 - - - - -
Undergraduate 151 - - - - -
Graduate 2,085 - - - - -
College undergraduate 6,924 - - - - -
Baccalaureate/college graduate 7,592 - - - - -
Post baccalaureate 68 - - - - -
Not stated 20 20 - - - -
Male 44,830 1,107 1,139 1,094 1,043 1,045
No grade completed 1,255 805 119 16 8 9
Preschool 1,209 295 768 127 8 3
Special education 32 - - 3 4 3
Elementary 17,426 - 252 948 1,023 1,030
1st - 4th grade 7,886 - 252 948 1,023 1,030
5th - 6th grade 2,464 - - - - -
Graduate 7,076 - - - - -
High school 17,289 - - - - -
Undergraduate 5,929 - - - - -
Graduate 11,360 - - - - -
Postsecondary 1,137 - - - - -
Undergraduate 77 - - - - -
Graduate 1,060 - - - - -
College undergraduate 3,341 - - - - -
Baccalaureate/college graduate 3,104 - - - - -
Post baccalaureate 30 - - - - -
Not stated 7 7 - - - -
Female 44,661 1,077 1,047 1,068 985 966
No grade completed 1,139 727 85 6 7 7
Preschool 1,164 337 704 108 5 4
Special education 21 - 1 - 1 1
Elementary 15,148 - 257 954 972 954
1st - 4th grade 6,676 - 257 954 972 954
5th - 6th grade 2,075 - - - - -
Graduate 6,397 - - - - -
High school 17,968 - - - - -
Undergraduate 5,589 - - - - -
Graduate 12,379 - - - - -
Postsecondary 1,099 - - - - -
Undergraduate 74 - - - - -
Graduate 1,025 - - - - -
College undergraduate 3,583 - - - - -
Baccalaureate/college graduate 4,488 - - - - -
Post baccalaureate 38 - - - - -
Not stated 13 13 - - - -
Continued

Philippine Statistics Authority
194 Demographic and Socioeconomic Characteristics - Quezon
Philippine Statistics Authority
Table 11--Continued
Highest Grade/Year Completed, Sex, and City/Municipality
Total Population
5 Years Old and Over
Age
5 6 7 8 9
UNISAN
Both sexes 24,157 588 646 555 552 506
No grade completed 687 455 65 13 3 -
Preschool 645 127 446 52 8 8
Special education 12 - - - 1 1
Elementary 9,551 - 134 490 540 497
1st - 4th grade 3,838 - 134 490 540 497
5th - 6th grade 1,346 - - - - -
Graduate 4,367 - - - - -
High school 9,263 - - - - -
Undergraduate 3,633 - - - - -
Graduate 5,630 - - - - -
Postsecondary 424 - - - - -
Undergraduate 2 - - - - -
Graduate 422 - - - - -
College undergraduate 1,691 - - - - -
Baccalaureate/college graduate 1,865 - - - - -
Post baccalaureate 12 - - - - -
Not stated 7 6 1 - - -
Male 12,293 308 345 295 281 270
No grade completed 378 240 43 8 2 -
Preschool 339 66 230 33 4 5
Special education 3 - - - 1 1
Elementary 5,229 - 72 254 274 264
1st - 4th grade 2,186 - 72 254 274 264
5th - 6th grade 711 - - - - -
Graduate 2,332 - - - - -
High school 4,671 - - - - -
Undergraduate 1,836 - - - - -
Graduate 2,835 - - - - -
Postsecondary 188 - - - - -
Undergraduate 1 - - - - -
Graduate 187 - - - - -
College undergraduate 736 - - - - -
Baccalaureate/college graduate 740 - - - - -
Post baccalaureate 7 - - - - -
Not stated 2 2 - - - -
Female 11,864 280 301 260 271 236
No grade completed 309 215 22 5 1 -
Preschool 306 61 216 19 4 3
Special education 9 - - - - -
Elementary 4,322 - 62 236 266 233
1st - 4th grade 1,652 - 62 236 266 233
5th - 6th grade 635 - - - - -
Graduate 2,035 - - - - -
High school 4,592 - - - - -
Undergraduate 1,797 - - - - -
Graduate 2,795 - - - - -
Postsecondary 236 - - - - -
Undergraduate 1 - - - - -
Graduate 235 - - - - - College undergraduate 955 - - - - - Baccalaureate/college graduate 1,125 - - - - - Post baccalaureate 5 - - - - - Not stated 5 4 1 - - -
Continued
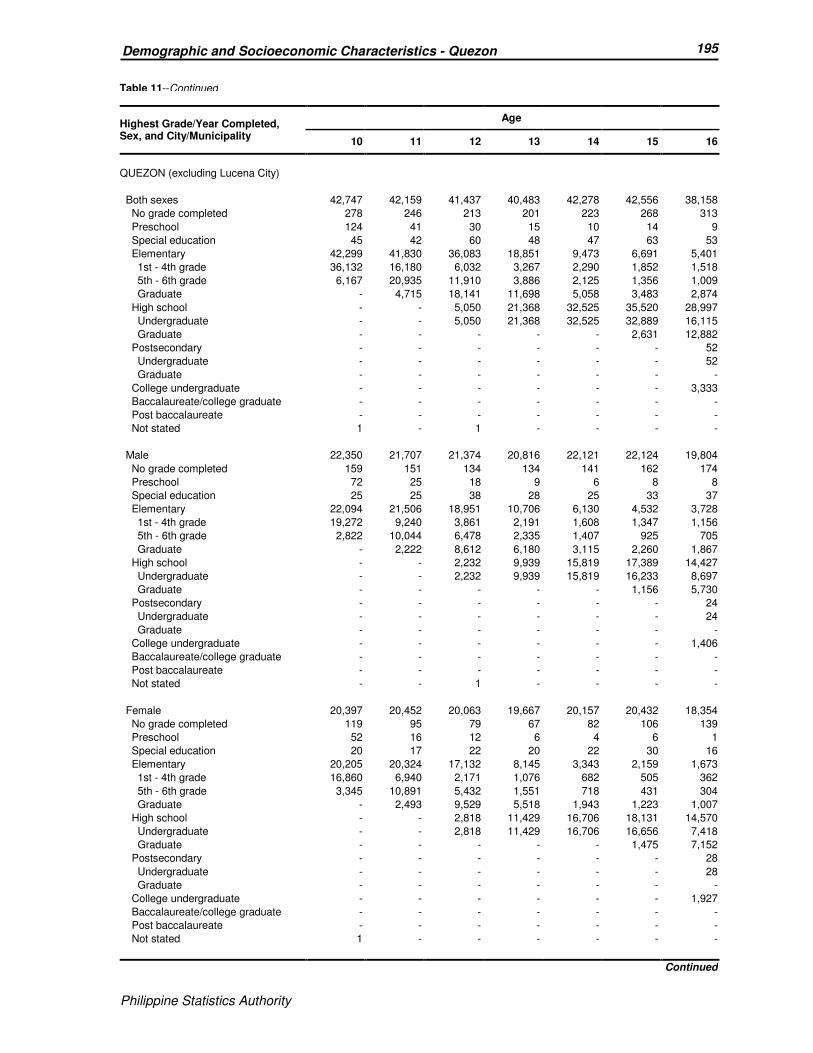
Philippine Statistics Authority
195 Demographic and Socioeconomic Characteristics - Quezon
Philippine Statistics Authority
Table 11--Continued
Highest Grade/Year Completed, Sex, and City/Municipality
Age
10 11 12 13 14 15 16
QUEZON (excluding Lucena City)
Both sexes 42,747 42,159 41,437 40,483 42,278 42,556 38,158
No grade completed 278 246 213 201 223 268 313
Preschool 124 41 30 15 10 14 9
Special education 45 42 60 48 47 63 53
Elementary 42,299 41,830 36,083 18,851 9,473 6,691 5,401
1st - 4th grade 36,132 16,180 6,032 3,267 2,290 1,852 1,518
5th - 6th grade 6,167 20,935 11,910 3,886 2,125 1,356 1,009
Graduate - 4,715 18,141 11,698 5,058 3,483 2,874
High school - - 5,050 21,368 32,525 35,520 28,997
Undergraduate - - 5,050 21,368 32,525 32,889 16,115
Graduate - - - - - 2,631 12,882
Postsecondary - - - - - - 52
Undergraduate - - - - - - 52
Graduate - - - - - - -
College undergraduate - - - - - - 3,333
Baccalaureate/college graduate - - - - - - -
Post baccalaureate - - - - - - -
Not stated 1 - 1 - - - -
Male 22,350 21,707 21,374 20,816 22,121 22,124 19,804
No grade completed 159 151 134 134 141 162 174
Preschool 72 25 18 9 6 8 8
Special education 25 25 38 28 25 33 37
Elementary 22,094 21,506 18,951 10,706 6,130 4,532 3,728
1st - 4th grade 19,272 9,240 3,861 2,191 1,608 1,347 1,156
5th - 6th grade 2,822 10,044 6,478 2,335 1,407 925 705
Graduate - 2,222 8,612 6,180 3,115 2,260 1,867
High school - - 2,232 9,939 15,819 17,389 14,427
Undergraduate - - 2,232 9,939 15,819 16,233 8,697
Graduate - - - - - 1,156 5,730
Postsecondary - - - - - - 24
Undergraduate - - - - - - 24
Graduate - - - - - - -
College undergraduate - - - - - - 1,406
Baccalaureate/college graduate - - - - - - -
Post baccalaureate - - - - - - -
Not stated - - 1 - - - -
Female 20,397 20,452 20,063 19,667 20,157 20,432 18,354
No grade completed 119 95 79 67 82 106 139
Preschool 52 16 12 6 4 6 1
Special education 20 17 22 20 22 30 16
Elementary 20,205 20,324 17,132 8,145 3,343 2,159 1,673
1st - 4th grade 16,860 6,940 2,171 1,076 682 505 362
5th - 6th grade 3,345 10,891 5,432 1,551 718 431 304
Graduate - 2,493 9,529 5,518 1,943 1,223 1,007
High school - - 2,818 11,429 16,706 18,131 14,570
Undergraduate - - 2,818 11,429 16,706 16,656 7,418
Graduate - - - - - 1,475 7,152
Postsecondary - - - - - - 28
Undergraduate - - - - - - 28
Graduate - - - - - - -
College undergraduate - - - - - - 1,927
Baccalaureate/college graduate - - - - - - -
Post baccalaureate - - - - - - -
Not stated 1 - - - - - -
Continued

Philippine Statistics Authority
196 Demographic and Socioeconomic Characteristics - Quezon
Philippine Statistics Authority
Table 11--Continued
Highest Grade/Year Completed, Sex, and City/Municipality
Age
10 11 12 13 14 15 16
AGDANGAN
Both sexes 241 288 260 289 283 279 265
No grade completed - 1 1 1 1 3 1
Preschool 1 - - - - - -
Special education - 1 - 1 - 3 1
Elementary 240 286 243 134 60 34 33
1st - 4th grade 208 107 47 24 14 14 6
5th - 6th grade 32 149 51 30 15 4 2
Graduate - 30 145 80 31 16 25
High school - - 16 153 222 239 216
Undergraduate - - 16 153 222 229 107
Graduate - - - - - 10 109
Postsecondary - - - - - - -
Undergraduate - - - - - - -
Graduate - - - - - - -
College undergraduate - - - - - - 14
Baccalaureate/college graduate - - - - - - -
Post baccalaureate - - - - - - -
Not stated - - - - - - -
Male 127 147 134 143 141 157 135
No grade completed - 1 1 - 1 2 1
Preschool 1 - - - - - -
Special education - - - - - 2 1
Elementary 126 146 123 72 38 20 22
1st - 4th grade 108 64 30 14 11 7 4
5th - 6th grade 18 69 25 19 8 3 2
Graduate - 13 68 39 19 10 16
High school - - 10 71 102 133 107
Undergraduate - - 10 71 102 127 58
Graduate - - - - - 6 49
Postsecondary - - - - - - -
Undergraduate - - - - - - -
Graduate - - - - - - -
College undergraduate - - - - - - 4
Baccalaureate/college graduate - - - - - - -
Post baccalaureate - - - - - - -
Not stated - - - - - - -
Female 114 141 126 146 142 122 130
No grade completed - - - 1 - 1 -
Preschool - - - - - - -
Special education - 1 - 1 - 1 -
Elementary 114 140 120 62 22 14 11
1st - 4th grade 100 43 17 10 3 7 2
5th - 6th grade 14 80 26 11 7 1 -
Graduate - 17 77 41 12 6 9
High school - - 6 82 120 106 109
Undergraduate - - 6 82 120 102 49
Graduate - - - - - 4 60
Postsecondary - - - - - - -
Undergraduate - - - - - - -
Graduate - - - - - - -
College undergraduate - - - - - - 10
Baccalaureate/college graduate - - - - - - -
Post baccalaureate - - - - - - -
Not stated - - - - - - -
Continued
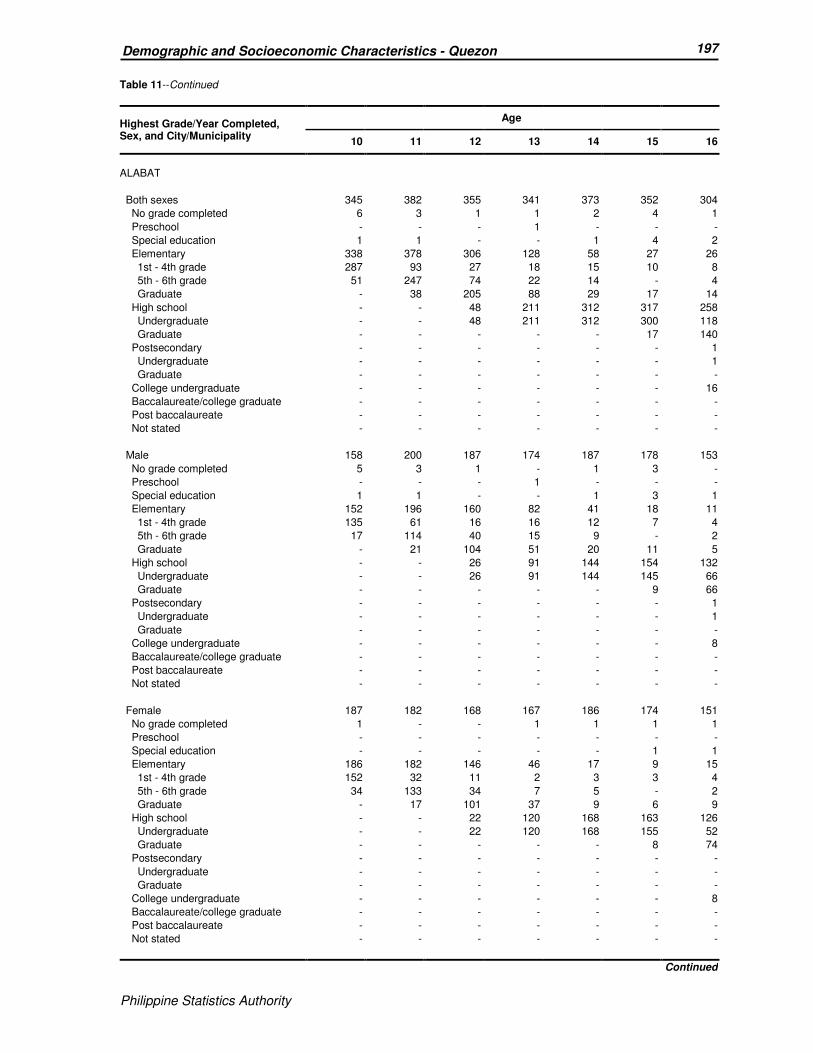
Philippine Statistics Authority
197 Demographic and Socioeconomic Characteristics - Quezon
Philippine Statistics Authority
Table 11--Continued
Highest Grade/Year Completed, Sex, and City/Municipality
Age
10 11 12 13 14 15 16
ALABAT
Both sexes 345 382 355 341 373 352 304
No grade completed 6 3 1 1 2 4 1
Preschool - - - 1 - - -
Special education 1 1 - - 1 4 2
Elementary 338 378 306 128 58 27 26
1st - 4th grade 287 93 27 18 15 10 8
5th - 6th grade 51 247 74 22 14 - 4
Graduate - 38 205 88 29 17 14
High school - - 48 211 312 317 258
Undergraduate - - 48 211 312 300 118
Graduate - - - - - 17 140
Postsecondary - - - - - - 1
Undergraduate - - - - - - 1
Graduate - - - - - - -
College undergraduate - - - - - - 16
Baccalaureate/college graduate - - - - - - -
Post baccalaureate - - - - - - -
Not stated - - - - - - -
Male 158 200 187 174 187 178 153
No grade completed 5 3 1 - 1 3 -
Preschool - - - 1 - - -
Special education 1 1 - - 1 3 1
Elementary 152 196 160 82 41 18 11
1st - 4th grade 135 61 16 16 12 7 4
5th - 6th grade 17 114 40 15 9 - 2
Graduate - 21 104 51 20 11 5
High school - - 26 91 144 154 132
Undergraduate - - 26 91 144 145 66
Graduate - - - - - 9 66
Postsecondary - - - - - - 1
Undergraduate - - - - - - 1
Graduate - - - - - - -
College undergraduate - - - - - - 8
Baccalaureate/college graduate - - - - - - -
Post baccalaureate - - - - - - -
Not stated - - - - - - -
Female 187 182 168 167 186 174 151
No grade completed 1 - - 1 1 1 1
Preschool - - - - - - -
Special education - - - - - 1 1
Elementary 186 182 146 46 17 9 15
1st - 4th grade 152 32 11 2 3 3 4
5th - 6th grade 34 133 34 7 5 - 2
Graduate - 17 101 37 9 6 9
High school - - 22 120 168 163 126
Undergraduate - - 22 120 168 155 52
Graduate - - - - - 8 74
Postsecondary - - - - - - -
Undergraduate - - - - - - -
Graduate - - - - - - -
College undergraduate - - - - - - 8
Baccalaureate/college graduate - - - - - - -
Post baccalaureate - - - - - - -
Not stated - - - - - - -
Continued

Philippine Statistics Authority
198 Demographic and Socioeconomic Characteristics - Quezon
Philippine Statistics Authority
Table 11--Continued
Highest Grade/Year Completed, Sex, and City/Municipality
Age
10 11 12 13 14 15 16
ATIMONAN
Both sexes 1,291 1,309 1,250 1,188 1,274 1,259 1,208
No grade completed 5 4 5 3 5 10 7
Preschool 5 1 1 1 1 - -
Special education 2 2 5 - 2 1 1
Elementary 1,279 1,302 1,086 477 272 160 155
1st - 4th grade 1,091 453 177 69 62 42 28
5th - 6th grade 188 725 334 117 67 30 36
Graduate - 124 575 291 143 88 91
High school - - 153 707 994 1,088 970
Undergraduate - - 153 707 994 1,013 494
Graduate - - - - - 75 476
Postsecondary - - - - - - -
Undergraduate - - - - - - -
Graduate - - - - - - -
College undergraduate - - - - - - 75
Baccalaureate/college graduate - - - - - - -
Post baccalaureate - - - - - - -
Not stated - - - - - - -
Male 680 674 656 640 642 638 646
No grade completed 4 2 3 2 2 6 2
Preschool 4 - 1 1 1 - -
Special education 1 1 4 - 1 1 -
Elementary 671 671 573 277 178 108 106
1st - 4th grade 571 257 113 52 48 29 21
5th - 6th grade 100 354 188 74 47 25 22
Graduate - 60 272 151 83 54 63
High school - - 75 360 460 523 503
Undergraduate - - 75 360 460 491 271
Graduate - - - - - 32 232
Postsecondary - - - - - - -
Undergraduate - - - - - - -
Graduate - - - - - - -
College undergraduate - - - - - - 35
Baccalaureate/college graduate - - - - - - -
Post baccalaureate - - - - - - -
Not stated - - - - - - -
Female 611 635 594 548 632 621 562
No grade completed 1 2 2 1 3 4 5
Preschool 1 1 - - - - -
Special education 1 1 1 - 1 - 1
Elementary 608 631 513 200 94 52 49
1st - 4th grade 520 196 64 17 14 13 7
5th - 6th grade 88 371 146 43 20 5 14
Graduate - 64 303 140 60 34 28
High school - - 78 347 534 565 467
Undergraduate - - 78 347 534 522 223
Graduate - - - - - 43 244
Postsecondary - - - - - - -
Undergraduate - - - - - - -
Graduate - - - - - - -
College undergraduate - - - - - - 40
Baccalaureate/college graduate - - - - - - -
Post baccalaureate - - - - - - -
Not stated - - - - - - -
Continued
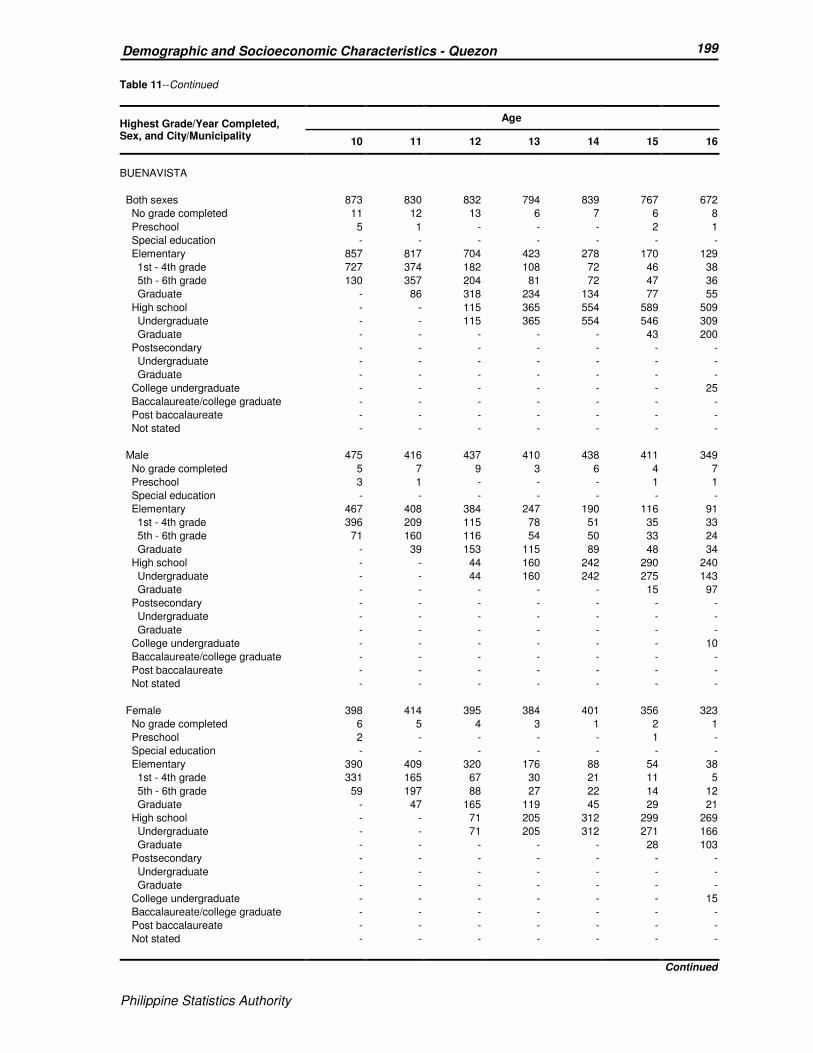
Philippine Statistics Authority
199 Demographic and Socioeconomic Characteristics - Quezon
Philippine Statistics Authority
Table 11--Continued
Highest Grade/Year Completed, Sex, and City/Municipality
Age
10 11 12 13 14 15 16
BUENAVISTA
Both sexes 873 830 832 794 839 767 672
No grade completed 11 12 13 6 7 6 8
Preschool 5 1 - - - 2 1
Special education - - - - - - -
Elementary 857 817 704 423 278 170 129
1st - 4th grade 727 374 182 108 72 46 38
5th - 6th grade 130 357 204 81 72 47 36
Graduate - 86 318 234 134 77 55
High school - - 115 365 554 589 509
Undergraduate - - 115 365 554 546 309
Graduate - - - - - 43 200
Postsecondary - - - - - - -
Undergraduate - - - - - - -
Graduate - - - - - - -
College undergraduate - - - - - - 25
Baccalaureate/college graduate - - - - - - -
Post baccalaureate - - - - - - -
Not stated - - - - - - -
Male 475 416 437 410 438 411 349
No grade completed 5 7 9 3 6 4 7
Preschool 3 1 - - - 1 1
Special education - - - - - - -
Elementary 467 408 384 247 190 116 91
1st - 4th grade 396 209 115 78 51 35 33
5th - 6th grade 71 160 116 54 50 33 24
Graduate - 39 153 115 89 48 34
High school - - 44 160 242 290 240
Undergraduate - - 44 160 242 275 143
Graduate - - - - - 15 97
Postsecondary - - - - - - -
Undergraduate - - - - - - -
Graduate - - - - - - -
College undergraduate - - - - - - 10
Baccalaureate/college graduate - - - - - - -
Post baccalaureate - - - - - - -
Not stated - - - - - - -
Female 398 414 395 384 401 356 323
No grade completed 6 5 4 3 1 2 1
Preschool 2 - - - - 1 -
Special education - - - - - - -
Elementary 390 409 320 176 88 54 38
1st - 4th grade 331 165 67 30 21 11 5
5th - 6th grade 59 197 88 27 22 14 12
Graduate - 47 165 119 45 29 21
High school - - 71 205 312 299 269
Undergraduate - - 71 205 312 271 166
Graduate - - - - - 28 103
Postsecondary - - - - - - -
Undergraduate - - - - - - -
Graduate - - - - - - -
College undergraduate - - - - - - 15
Baccalaureate/college graduate - - - - - - -
Post baccalaureate - - - - - - -
Not stated - - - - - - -
Continued
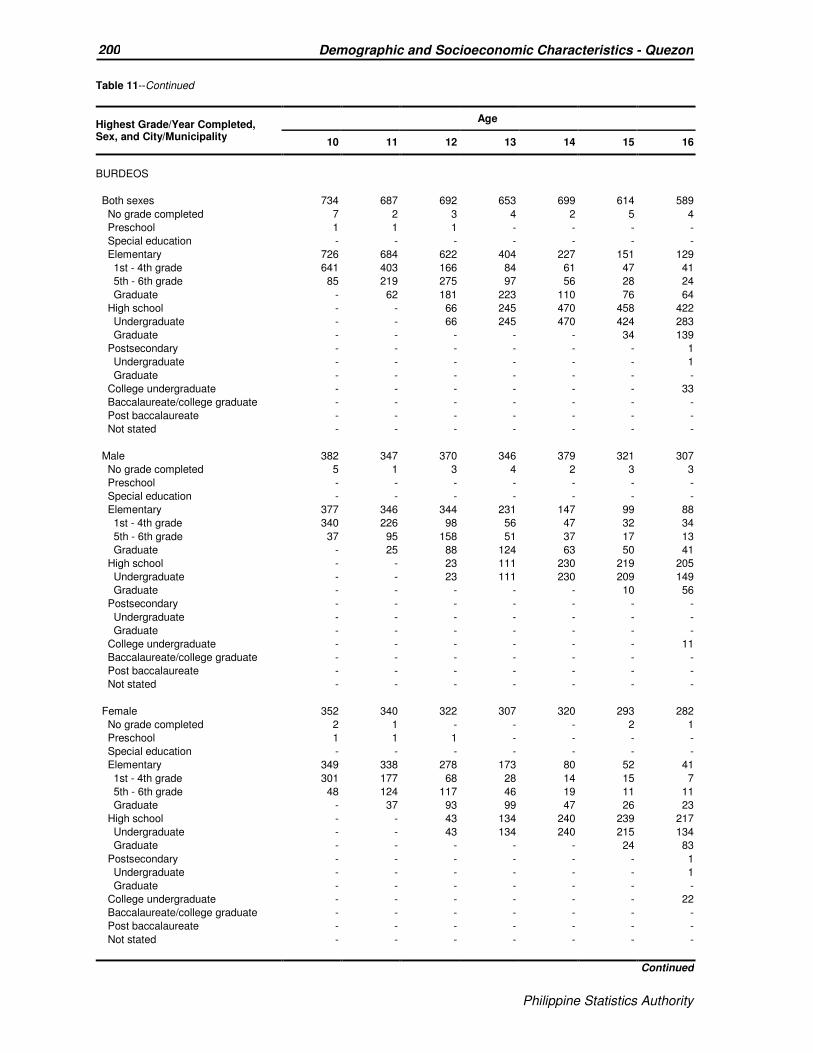
Philippine Statistics Authority
200 Demographic and Socioeconomic Characteristics - Quezon
Philippine Statistics Authority
Table 11--Continued
Highest Grade/Year Completed, Sex, and City/Municipality
Age
10 11 12 13 14 15 16
BURDEOS
Both sexes 734 687 692 653 699 614 589
No grade completed 7 2 3 4 2 5 4
Preschool 1 1 1 - - - -
Special education - - - - - - -
Elementary 726 684 622 404 227 151 129
1st - 4th grade 641 403 166 84 61 47 41
5th - 6th grade 85 219 275 97 56 28 24
Graduate - 62 181 223 110 76 64
High school - - 66 245 470 458 422
Undergraduate - - 66 245 470 424 283
Graduate - - - - - 34 139
Postsecondary - - - - - - 1
Undergraduate - - - - - - 1
Graduate - - - - - - -
College undergraduate - - - - - - 33
Baccalaureate/college graduate - - - - - - -
Post baccalaureate - - - - - - -
Not stated - - - - - - -
Male 382 347 370 346 379 321 307
No grade completed 5 1 3 4 2 3 3
Preschool - - - - - - -
Special education - - - - - - -
Elementary 377 346 344 231 147 99 88
1st - 4th grade 340 226 98 56 47 32 34
5th - 6th grade 37 95 158 51 37 17 13
Graduate - 25 88 124 63 50 41
High school - - 23 111 230 219 205
Undergraduate - - 23 111 230 209 149
Graduate - - - - - 10 56
Postsecondary - - - - - - -
Undergraduate - - - - - - -
Graduate - - - - - - -
College undergraduate - - - - - - 11
Baccalaureate/college graduate - - - - - - -
Post baccalaureate - - - - - - -
Not stated - - - - - - -
Female 352 340 322 307 320 293 282
No grade completed 2 1 - - - 2 1
Preschool 1 1 1 - - - -
Special education - - - - - - -
Elementary 349 338 278 173 80 52 41
1st - 4th grade 301 177 68 28 14 15 7
5th - 6th grade 48 124 117 46 19 11 11
Graduate - 37 93 99 47 26 23
High school - - 43 134 240 239 217
Undergraduate - - 43 134 240 215 134
Graduate - - - - - 24 83
Postsecondary - - - - - - 1
Undergraduate - - - - - - 1
Graduate - - - - - - -
College undergraduate - - - - - - 22
Baccalaureate/college graduate - - - - - - -
Post baccalaureate - - - - - - -
Not stated - - - - - - -
Continued
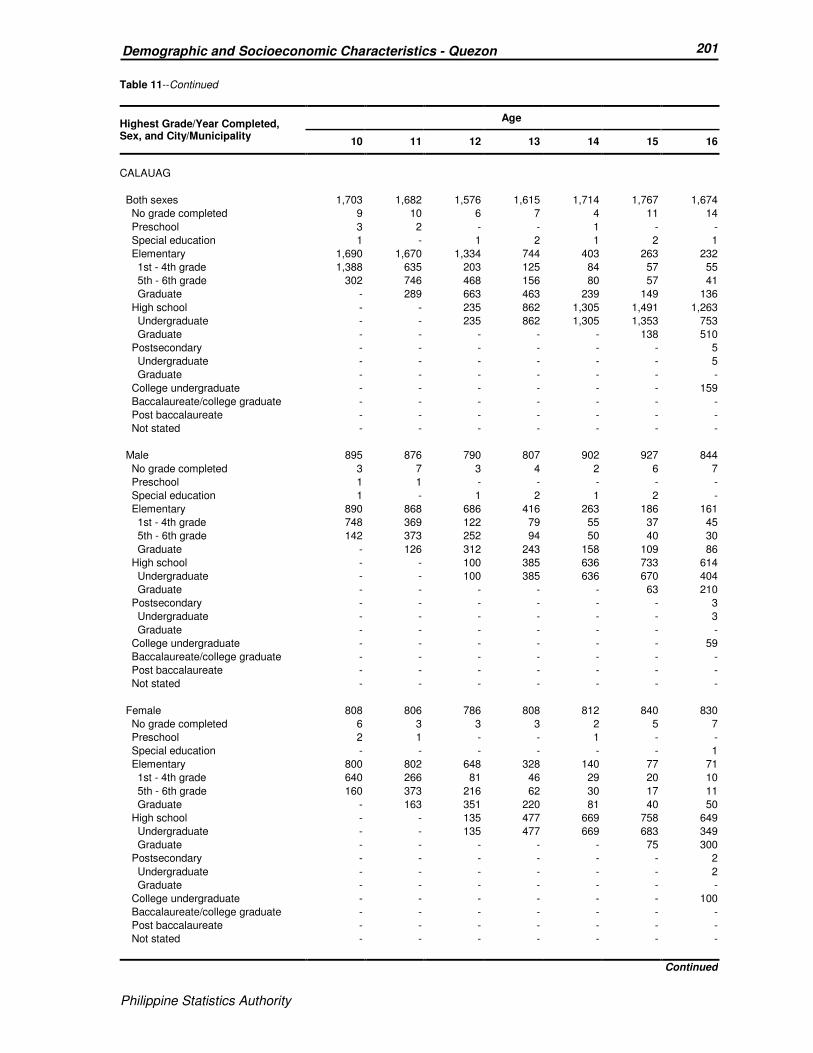
Philippine Statistics Authority
201 Demographic and Socioeconomic Characteristics - Quezon
Philippine Statistics Authority
Table 11--Continued
Highest Grade/Year Completed, Sex, and City/Municipality
Age
10 11 12 13 14 15 16
CALAUAG
Both sexes 1,703 1,682 1,576 1,615 1,714 1,767 1,674
No grade completed 9 10 6 7 4 11 14
Preschool 3 2 - - 1 - -
Special education 1 - 1 2 1 2 1
Elementary 1,690 1,670 1,334 744 403 263 232
1st - 4th grade 1,388 635 203 125 84 57 55
5th - 6th grade 302 746 468 156 80 57 41
Graduate - 289 663 463 239 149 136
High school - - 235 862 1,305 1,491 1,263
Undergraduate - - 235 862 1,305 1,353 753
Graduate - - - - - 138 510
Postsecondary - - - - - - 5
Undergraduate - - - - - - 5
Graduate - - - - - - -
College undergraduate - - - - - - 159
Baccalaureate/college graduate - - - - - - -
Post baccalaureate - - - - - - -
Not stated - - - - - - -
Male 895 876 790 807 902 927 844
No grade completed 3 7 3 4 2 6 7
Preschool 1 1 - - - - -
Special education 1 - 1 2 1 2 -
Elementary 890 868 686 416 263 186 161
1st - 4th grade 748 369 122 79 55 37 45
5th - 6th grade 142 373 252 94 50 40 30
Graduate - 126 312 243 158 109 86
High school - - 100 385 636 733 614
Undergraduate - - 100 385 636 670 404
Graduate - - - - - 63 210
Postsecondary - - - - - - 3
Undergraduate - - - - - - 3
Graduate - - - - - - -
College undergraduate - - - - - - 59
Baccalaureate/college graduate - - - - - - -
Post baccalaureate - - - - - - -
Not stated - - - - - - -
Female 808 806 786 808 812 840 830
No grade completed 6 3 3 3 2 5 7
Preschool 2 1 - - 1 - -
Special education - - - - - - 1
Elementary 800 802 648 328 140 77 71
1st - 4th grade 640 266 81 46 29 20 10
5th - 6th grade 160 373 216 62 30 17 11
Graduate - 163 351 220 81 40 50
High school - - 135 477 669 758 649
Undergraduate - - 135 477 669 683 349
Graduate - - - - - 75 300
Postsecondary - - - - - - 2
Undergraduate - - - - - - 2
Graduate - - - - - - -
College undergraduate - - - - - - 100
Baccalaureate/college graduate - - - - - - -
Post baccalaureate - - - - - - -
Not stated - - - - - - -
Continued

Philippine Statistics Authority
202 Demographic and Socioeconomic Characteristics - Quezon
Philippine Statistics Authority
Table 11--Continued
Highest Grade/Year Completed, Sex, and City/Municipality
Age
10 11 12 13 14 15 16
CANDELARIA
Both sexes 2,528 2,529 2,522 2,501 2,524 2,482 2,243
No grade completed 23 18 9 12 12 13 18
Preschool 7 4 3 3 2 2 -
Special education 1 4 3 5 2 6 7
Elementary 2,497 2,503 2,132 942 440 320 256
1st - 4th grade 2,022 776 276 143 112 74 56
5th - 6th grade 475 1,339 566 164 87 60 51
Graduate - 388 1,290 635 241 186 149
High school - - 375 1,539 2,068 2,141 1,598
Undergraduate - - 375 1,539 2,068 1,957 847
Graduate - - - - - 184 751
Postsecondary - - - - - - 9
Undergraduate - - - - - - 9
Graduate - - - - - - -
College undergraduate - - - - - - 355
Baccalaureate/college graduate - - - - - - -
Post baccalaureate - - - - - - -
Not stated - - - - - - -
Male 1,328 1,317 1,288 1,270 1,296 1,284 1,169
No grade completed 11 10 5 6 8 11 9
Preschool 4 2 2 3 1 1 -
Special education - 3 2 4 - 4 3
Elementary 1,313 1,302 1,125 527 293 219 185
1st - 4th grade 1,107 456 182 101 78 55 45
5th - 6th grade 206 664 341 95 62 39 35
Graduate - 182 602 331 153 125 105
High school - - 154 730 994 1,049 825
Undergraduate - - 154 730 994 965 461
Graduate - - - - - 84 364
Postsecondary - - - - - - 3
Undergraduate - - - - - - 3
Graduate - - - - - - -
College undergraduate - - - - - - 144
Baccalaureate/college graduate - - - - - - -
Post baccalaureate - - - - - - -
Not stated - - - - - - -
Female 1,200 1,212 1,234 1,231 1,228 1,198 1,074
No grade completed 12 8 4 6 4 2 9
Preschool 3 2 1 - 1 1 -
Special education 1 1 1 1 2 2 4
Elementary 1,184 1,201 1,007 415 147 101 71
1st - 4th grade 915 320 94 42 34 19 11
5th - 6th grade 269 675 225 69 25 21 16
Graduate - 206 688 304 88 61 44
High school - - 221 809 1,074 1,092 773
Undergraduate - - 221 809 1,074 992 386
Graduate - - - - - 100 387
Postsecondary - - - - - - 6
Undergraduate - - - - - - 6
Graduate - - - - - - -
College undergraduate - - - - - - 211
Baccalaureate/college graduate - - - - - - -
Post baccalaureate - - - - - - -
Not stated - - - - - - -
Continued

Philippine Statistics Authority
203 Demographic and Socioeconomic Characteristics - Quezon
Philippine Statistics Authority
Table 11--Continued
Highest Grade/Year Completed, Sex, and City/Municipality
Age
10 11 12 13 14 15 16
CATANAUAN
Both sexes 1,810 1,758 1,792 1,679 1,816 1,688 1,630
No grade completed 10 13 5 5 21 8 8
Preschool 5 4 1 2 - 1 2
Special education 2 1 2 1 3 3 1
Elementary 1,793 1,740 1,512 804 427 313 254
1st - 4th grade 1,511 661 282 179 117 87 106
5th - 6th grade 282 846 429 180 95 77 40
Graduate - 233 801 445 215 149 108
High school - - 272 867 1,365 1,363 1,236
Undergraduate - - 272 867 1,365 1,242 687
Graduate - - - - - 121 549
Postsecondary - - - - - - 2
Undergraduate - - - - - - 2
Graduate - - - - - - -
College undergraduate - - - - - - 127
Baccalaureate/college graduate - - - - - - -
Post baccalaureate - - - - - - -
Not stated - - - - - - -
Male 929 903 933 896 965 863 804
No grade completed 6 8 4 3 15 4 6
Preschool 3 4 - - - - 2
Special education 1 1 1 - 2 1 -
Elementary 919 890 816 472 293 209 175
1st - 4th grade 791 396 182 125 86 62 77
5th - 6th grade 128 379 244 111 61 52 25
Graduate - 115 390 236 146 95 73
High school - - 112 421 655 649 569
Undergraduate - - 112 421 655 612 352
Graduate - - - - - 37 217
Postsecondary - - - - - - 2
Undergraduate - - - - - - 2
Graduate - - - - - - -
College undergraduate - - - - - - 50
Baccalaureate/college graduate - - - - - - -
Post baccalaureate - - - - - - -
Not stated - - - - - - -
Female 881 855 859 783 851 825 826
No grade completed 4 5 1 2 6 4 2
Preschool 2 - 1 2 - 1 -
Special education 1 - 1 1 1 2 1
Elementary 874 850 696 332 134 104 79
1st - 4th grade 720 265 100 54 31 25 29
5th - 6th grade 154 467 185 69 34 25 15
Graduate - 118 411 209 69 54 35
High school - - 160 446 710 714 667
Undergraduate - - 160 446 710 630 335
Graduate - - - - - 84 332
Postsecondary - - - - - - -
Undergraduate - - - - - - -
Graduate - - - - - - -
College undergraduate - - - - - - 77
Baccalaureate/college graduate - - - - - - -
Post baccalaureate - - - - - - -
Not stated - - - - - - -
Continued

Philippine Statistics Authority
204 Demographic and Socioeconomic Characteristics - Quezon
Philippine Statistics Authority
Table 11--Continued
Highest Grade/Year Completed, Sex, and City/Municipality
Age
10 11 12 13 14 15 16
DOLORES
Both sexes 577 603 579 566 565 607 507
No grade completed 2 1 1 - 1 2 10
Preschool 1 - - - - - -
Special education - - 2 2 1 3 1
Elementary 574 602 504 194 75 57 36
1st - 4th grade 487 165 43 21 16 18 9
5th - 6th grade 87 374 146 33 15 8 5
Graduate - 63 315 140 44 31 22
High school - - 72 370 488 545 413
Undergraduate - - 72 370 488 507 174
Graduate - - - - - 38 239
Postsecondary - - - - - - 2
Undergraduate - - - - - - 2
Graduate - - - - - - -
College undergraduate - - - - - - 45
Baccalaureate/college graduate - - - - - - -
Post baccalaureate - - - - - - -
Not stated - - - - - - -
Male 283 312 310 297 305 327 252
No grade completed 1 1 - - 1 - 4
Preschool - - - - - - -
Special education - - - 2 - - 1
Elementary 282 311 277 107 48 42 27
1st - 4th grade 247 93 33 13 10 14 7
5th - 6th grade 35 189 86 22 10 6 4
Graduate - 29 158 72 28 22 16
High school - - 33 188 256 285 196
Undergraduate - - 33 188 256 270 94
Graduate - - - - - 15 102
Postsecondary - - - - - - 1
Undergraduate - - - - - - 1
Graduate - - - - - - -
College undergraduate - - - - - - 23
Baccalaureate/college graduate - - - - - - -
Post baccalaureate - - - - - - -
Not stated - - - - - - -
Female 294 291 269 269 260 280 255
No grade completed 1 - 1 - - 2 6
Preschool 1 - - - - - -
Special education - - 2 - 1 3 -
Elementary 292 291 227 87 27 15 9
1st - 4th grade 240 72 10 8 6 4 2
5th - 6th grade 52 185 60 11 5 2 1
Graduate - 34 157 68 16 9 6
High school - - 39 182 232 260 217
Undergraduate - - 39 182 232 237 80
Graduate - - - - - 23 137
Postsecondary - - - - - - 1
Undergraduate - - - - - - 1
Graduate - - - - - - -
College undergraduate - - - - - - 22
Baccalaureate/college graduate - - - - - - -
Post baccalaureate - - - - - - -
Not stated - - - - - - -
Continued

Philippine Statistics Authority
205 Demographic and Socioeconomic Characteristics - Quezon
Philippine Statistics Authority
Table 11--Continued
Highest Grade/Year Completed, Sex, and City/Municipality
Age
10 11 12 13 14 15 16
GENERAL LUNA
Both sexes 655 610 653 639 626 650 611
No grade completed 5 4 5 2 4 4 18
Preschool 3 2 3 - - - -
Special education 1 - 2 2 - 1 -
Elementary 646 604 574 310 159 114 75
1st - 4th grade 584 262 82 46 40 41 23
5th - 6th grade 62 300 212 65 30 14 15
Graduate - 42 280 199 89 59 37
High school - - 69 325 463 531 481
Undergraduate - - 69 325 463 498 277
Graduate - - - - - 33 204
Postsecondary - - - - - - 1
Undergraduate - - - - - - 1
Graduate - - - - - - -
College undergraduate - - - - - - 36
Baccalaureate/college graduate - - - - - - -
Post baccalaureate - - - - - - -
Not stated - - - - - - -
Male 344 313 348 324 330 351 322
No grade completed 2 3 3 1 2 3 10
Preschool 2 1 1 - - - -
Special education - - 1 1 - - -
Elementary 340 309 313 179 108 83 58
1st - 4th grade 310 141 54 28 25 33 23
5th - 6th grade 30 148 122 43 23 7 11
Graduate - 20 137 108 60 43 24
High school - - 30 143 220 265 241
Undergraduate - - 30 143 220 254 150
Graduate - - - - - 11 91
Postsecondary - - - - - - 1
Undergraduate - - - - - - 1
Graduate - - - - - - -
College undergraduate - - - - - - 12
Baccalaureate/college graduate - - - - - - -
Post baccalaureate - - - - - - -
Not stated - - - - - - -
Female 311 297 305 315 296 299 289
No grade completed 3 1 2 1 2 1 8
Preschool 1 1 2 - - - -
Special education 1 - 1 1 - 1 -
Elementary 306 295 261 131 51 31 17
1st - 4th grade 274 121 28 18 15 8 -
5th - 6th grade 32 152 90 22 7 7 4
Graduate - 22 143 91 29 16 13
High school - - 39 182 243 266 240
Undergraduate - - 39 182 243 244 127
Graduate - - - - - 22 113
Postsecondary - - - - - - -
Undergraduate - - - - - - -
Graduate - - - - - - -
College undergraduate - - - - - - 24
Baccalaureate/college graduate - - - - - - -
Post baccalaureate - - - - - - -
Not stated - - - - - - -
Continued

Philippine Statistics Authority
206 Demographic and Socioeconomic Characteristics - Quezon
Philippine Statistics Authority
Table 11--Continued
Highest Grade/Year Completed, Sex, and City/Municipality
Age
10 11 12 13 14 15 16
GENERAL NAKAR
Both sexes 777 669 698 581 676 682 655
No grade completed 11 1 5 2 3 9 14
Preschool 5 2 - - - 1 1
Special education - - - - - - 1
Elementary 761 666 630 355 221 168 132
1st - 4th grade 678 359 145 80 49 53 44
5th - 6th grade 83 251 242 73 60 27 26
Graduate - 56 243 202 112 88 62
High school - - 63 224 452 504 477
Undergraduate - - 63 224 452 480 321
Graduate - - - - - 24 156
Postsecondary - - - - - - -
Undergraduate - - - - - - -
Graduate - - - - - - -
College undergraduate - - - - - - 30
Baccalaureate/college graduate - - - - - - -
Post baccalaureate - - - - - - -
Not stated - - - - - - -
Male 386 369 364 304 359 353 347
No grade completed 6 1 2 1 1 2 6
Preschool 2 2 - - - 1 1
Special education - - - - - - 1
Elementary 378 366 330 199 138 100 83
1st - 4th grade 347 204 79 40 30 30 34
5th - 6th grade 31 132 133 45 39 17 15
Graduate - 30 118 114 69 53 34
High school - - 32 104 220 250 245
Undergraduate - - 32 104 220 239 169
Graduate - - - - - 11 76
Postsecondary - - - - - - -
Undergraduate - - - - - - -
Graduate - - - - - - -
College undergraduate - - - - - - 11
Baccalaureate/college graduate - - - - - - -
Post baccalaureate - - - - - - -
Not stated - - - - - - -
Female 391 300 334 277 317 329 308
No grade completed 5 - 3 1 2 7 8
Preschool 3 - - - - - -
Special education - - - - - - -
Elementary 383 300 300 156 83 68 49
1st - 4th grade 331 155 66 40 19 23 10
5th - 6th grade 52 119 109 28 21 10 11
Graduate - 26 125 88 43 35 28
High school - - 31 120 232 254 232
Undergraduate - - 31 120 232 241 152
Graduate - - - - - 13 80
Postsecondary - - - - - - -
Undergraduate - - - - - - -
Graduate - - - - - - -
College undergraduate - - - - - - 19
Baccalaureate/college graduate - - - - - - -
Post baccalaureate - - - - - - -
Not stated - - - - - - -
Continued

Philippine Statistics Authority
207 Demographic and Socioeconomic Characteristics - Quezon
Philippine Statistics Authority
Table 11--Continued
Highest Grade/Year Completed, Sex, and City/Municipality
Age
10 11 12 13 14 15 16
GUINAYANGAN
Both sexes 1,017 1,045 1,026 1,066 1,069 1,066 1,022
No grade completed 8 6 4 6 6 6 8
Preschool - 2 1 1 - - -
Special education 1 1 - - 1 1 1
Elementary 1,008 1,036 881 503 224 155 139
1st - 4th grade 866 436 160 86 59 39 34
5th - 6th grade 142 459 293 109 49 28 17
Graduate - 141 428 308 116 88 88
High school - - 140 556 838 904 768
Undergraduate - - 140 556 838 806 399
Graduate - - - - - 98 369
Postsecondary - - - - - - -
Undergraduate - - - - - - -
Graduate - - - - - - -
College undergraduate - - - - - - 106
Baccalaureate/college graduate - - - - - - -
Post baccalaureate - - - - - - -
Not stated - - - - - - -
Male 539 527 506 548 577 548 519
No grade completed 3 4 3 2 2 4 2
Preschool - 2 1 1 - - -
Special education 1 1 - - - - 1
Elementary 535 520 435 287 158 116 99
1st - 4th grade 474 254 87 63 46 32 29
5th - 6th grade 61 210 145 71 35 19 14
Graduate - 56 203 153 77 65 56
High school - - 67 258 417 428 371
Undergraduate - - 67 258 417 387 220
Graduate - - - - - 41 151
Postsecondary - - - - - - -
Undergraduate - - - - - - -
Graduate - - - - - - -
College undergraduate - - - - - - 46
Baccalaureate/college graduate - - - - - - -
Post baccalaureate - - - - - - -
Not stated - - - - - - -
Female 478 518 520 518 492 518 503
No grade completed 5 2 1 4 4 2 6
Preschool - - - - - - -
Special education - - - - 1 1 -
Elementary 473 516 446 216 66 39 40
1st - 4th grade 392 182 73 23 13 7 5
5th - 6th grade 81 249 148 38 14 9 3
Graduate - 85 225 155 39 23 32
High school - - 73 298 421 476 397
Undergraduate - - 73 298 421 419 179
Graduate - - - - - 57 218
Postsecondary - - - - - - -
Undergraduate - - - - - - -
Graduate - - - - - - -
College undergraduate - - - - - - 60
Baccalaureate/college graduate - - - - - - -
Post baccalaureate - - - - - - -
Not stated - - - - - - -
Continued
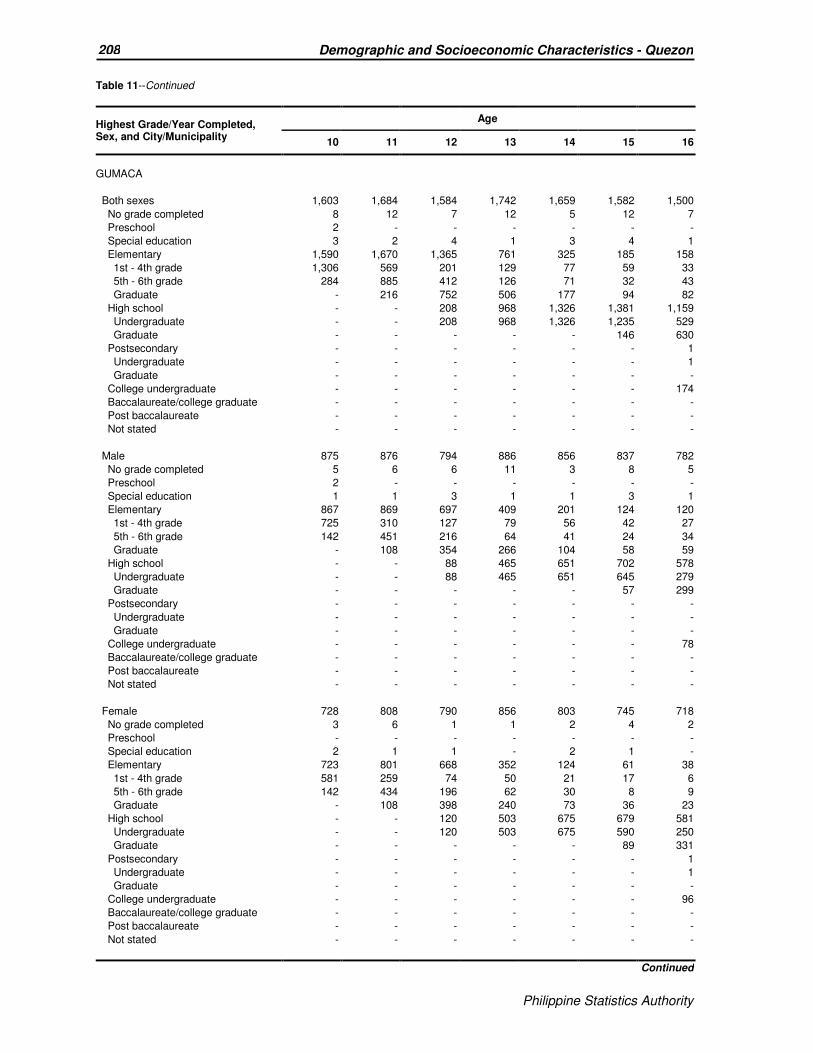
Philippine Statistics Authority
208 Demographic and Socioeconomic Characteristics - Quezon
Philippine Statistics Authority
Table 11--Continued
Highest Grade/Year Completed, Sex, and City/Municipality
Age
10 11 12 13 14 15 16
GUMACA
Both sexes 1,603 1,684 1,584 1,742 1,659 1,582 1,500
No grade completed 8 12 7 12 5 12 7
Preschool 2 - - - - - -
Special education 3 2 4 1 3 4 1
Elementary 1,590 1,670 1,365 761 325 185 158
1st - 4th grade 1,306 569 201 129 77 59 33
5th - 6th grade 284 885 412 126 71 32 43
Graduate - 216 752 506 177 94 82
High school - - 208 968 1,326 1,381 1,159
Undergraduate - - 208 968 1,326 1,235 529
Graduate - - - - - 146 630
Postsecondary - - - - - - 1
Undergraduate - - - - - - 1
Graduate - - - - - - -
College undergraduate - - - - - - 174
Baccalaureate/college graduate - - - - - - -
Post baccalaureate - - - - - - -
Not stated - - - - - - -
Male 875 876 794 886 856 837 782
No grade completed 5 6 6 11 3 8 5
Preschool 2 - - - - - -
Special education 1 1 3 1 1 3 1
Elementary 867 869 697 409 201 124 120
1st - 4th grade 725 310 127 79 56 42 27
5th - 6th grade 142 451 216 64 41 24 34
Graduate - 108 354 266 104 58 59
High school - - 88 465 651 702 578
Undergraduate - - 88 465 651 645 279
Graduate - - - - - 57 299
Postsecondary - - - - - - -
Undergraduate - - - - - - -
Graduate - - - - - - -
College undergraduate - - - - - - 78
Baccalaureate/college graduate - - - - - - -
Post baccalaureate - - - - - - -
Not stated - - - - - - -
Female 728 808 790 856 803 745 718
No grade completed 3 6 1 1 2 4 2
Preschool - - - - - - -
Special education 2 1 1 - 2 1 -
Elementary 723 801 668 352 124 61 38
1st - 4th grade 581 259 74 50 21 17 6
5th - 6th grade 142 434 196 62 30 8 9
Graduate - 108 398 240 73 36 23
High school - - 120 503 675 679 581
Undergraduate - - 120 503 675 590 250
Graduate - - - - - 89 331
Postsecondary - - - - - - 1
Undergraduate - - - - - - 1
Graduate - - - - - - -
College undergraduate - - - - - - 96
Baccalaureate/college graduate - - - - - - -
Post baccalaureate - - - - - - -
Not stated - - - - - - -
Continued

Philippine Statistics Authority
209 Demographic and Socioeconomic Characteristics - Quezon
Philippine Statistics Authority
Table 11--Continued
Highest Grade/Year Completed, Sex, and City/Municipality
Age
10 11 12 13 14 15 16
INFANTA
Both sexes 1,637 1,577 1,501 1,511 1,522 1,595 1,403
No grade completed 10 10 9 3 6 11 9
Preschool 9 1 1 - - - -
Special education 1 1 1 1 3 2 2
Elementary 1,617 1,565 1,344 764 288 180 107
1st - 4th grade 1,424 702 198 95 55 43 35
5th - 6th grade 193 716 512 156 61 46 24
Graduate - 147 634 513 172 91 48
High school - - 146 743 1,225 1,402 1,159
Undergraduate - - 146 743 1,225 1,321 712
Graduate - - - - - 81 447
Postsecondary - - - - - - -
Undergraduate - - - - - - -
Graduate - - - - - - -
College undergraduate - - - - - - 126
Baccalaureate/college graduate - - - - - - -
Post baccalaureate - - - - - - -
Not stated - - - - - - -
Male 874 773 753 758 783 803 722
No grade completed 7 6 6 2 4 7 4
Preschool 3 - 1 - - - -
Special education 1 1 1 - 1 1 2
Elementary 863 766 689 422 184 121 75
1st - 4th grade 781 380 117 54 39 30 26
5th - 6th grade 82 321 260 99 43 32 14
Graduate - 65 312 269 102 59 35
High school - - 56 334 594 674 591
Undergraduate - - 56 334 594 639 390
Graduate - - - - - 35 201
Postsecondary - - - - - - -
Undergraduate - - - - - - -
Graduate - - - - - - -
College undergraduate - - - - - - 50
Baccalaureate/college graduate - - - - - - -
Post baccalaureate - - - - - - -
Not stated - - - - - - -
Female 763 804 748 753 739 792 681
No grade completed 3 4 3 1 2 4 5
Preschool 6 1 - - - - -
Special education - - - 1 2 1 -
Elementary 754 799 655 342 104 59 32
1st - 4th grade 643 322 81 41 16 13 9
5th - 6th grade 111 395 252 57 18 14 10
Graduate - 82 322 244 70 32 13
High school - - 90 409 631 728 568
Undergraduate - - 90 409 631 682 322
Graduate - - - - - 46 246
Postsecondary - - - - - - -
Undergraduate - - - - - - -
Graduate - - - - - - -
College undergraduate - - - - - - 76
Baccalaureate/college graduate - - - - - - -
Post baccalaureate - - - - - - -
Not stated - - - - - - -
Continued

Philippine Statistics Authority
210 Demographic and Socioeconomic Characteristics - Quezon
Philippine Statistics Authority
Table 11--Continued
Highest Grade/Year Completed, Sex, and City/Municipality
Age
10 11 12 13 14 15 16
JOMALIG
Both sexes 205 210 209 210 216 198 187
No grade completed 3 1 1 1 1 1 1
Preschool 2 1 1 - - - -
Special education - - - - - - -
Elementary 200 208 191 125 88 58 45
1st - 4th grade 181 117 63 41 29 19 15
5th - 6th grade 19 77 62 24 19 13 10
Graduate - 14 66 60 40 26 20
High school - - 16 84 127 139 134
Undergraduate - - 16 84 127 136 106
Graduate - - - - - 3 28
Postsecondary - - - - - - -
Undergraduate - - - - - - -
Graduate - - - - - - -
College undergraduate - - - - - - 7
Baccalaureate/college graduate - - - - - - -
Post baccalaureate - - - - - - -
Not stated - - - - - - -
Male 109 112 93 109 109 114 106
No grade completed 1 1 - 1 - 1 1
Preschool 2 1 1 - - - -
Special education - - - - - - -
Elementary 106 110 86 71 53 38 31
1st - 4th grade 101 75 32 27 21 14 11
5th - 6th grade 5 27 33 17 10 7 6
Graduate - 8 21 27 22 17 14
High school - - 6 37 56 75 71
Undergraduate - - 6 37 56 73 64
Graduate - - - - - 2 7
Postsecondary - - - - - - -
Undergraduate - - - - - - -
Graduate - - - - - - -
College undergraduate - - - - - - 3
Baccalaureate/college graduate - - - - - - -
Post baccalaureate - - - - - - -
Not stated - - - - - - -
Female 96 98 116 101 107 84 81
No grade completed 2 - 1 - 1 - -
Preschool - - - - - - -
Special education - - - - - - -
Elementary 94 98 105 54 35 20 14
1st - 4th grade 80 42 31 14 8 5 4
5th - 6th grade 14 50 29 7 9 6 4
Graduate - 6 45 33 18 9 6
High school - - 10 47 71 64 63
Undergraduate - - 10 47 71 63 42
Graduate - - - - - 1 21
Postsecondary - - - - - - -
Undergraduate - - - - - - -
Graduate - - - - - - -
College undergraduate - - - - - - 4
Baccalaureate/college graduate - - - - - - -
Post baccalaureate - - - - - - -
Not stated - - - - - - -
Continued

Philippine Statistics Authority
211 Demographic and Socioeconomic Characteristics - Quezon
Philippine Statistics Authority
Table 11--Continued
Highest Grade/Year Completed, Sex, and City/Municipality
Age
10 11 12 13 14 15 16
LOPEZ
Both sexes 2,040 2,072 2,019 1,961 2,061 2,183 1,970
No grade completed 12 11 14 16 8 19 15
Preschool 4 3 2 - 1 1 -
Special education 1 1 1 - 4 - 2
Elementary 2,023 2,057 1,752 818 381 286 231
1st - 4th grade 1,732 699 246 132 84 72 53
5th - 6th grade 291 1,152 601 150 92 48 48
Graduate - 206 905 536 205 166 130
High school - - 249 1,127 1,667 1,877 1,504
Undergraduate - - 249 1,127 1,667 1,719 725
Graduate - - - - - 158 779
Postsecondary - - - - - - 3
Undergraduate - - - - - - 3
Graduate - - - - - - -
College undergraduate - - - - - - 215
Baccalaureate/college graduate - - - - - - -
Post baccalaureate - - - - - - -
Not stated - - 1 - - - -
Male 1,101 1,079 1,057 1,014 1,044 1,130 972
No grade completed 7 6 9 13 6 8 9
Preschool 1 2 1 - - - -
Special education 1 - 1 - 1 - 2
Elementary 1,092 1,071 943 469 243 211 150
1st - 4th grade 956 412 170 92 56 62 36
5th - 6th grade 136 554 323 92 66 36 29
Graduate - 105 450 285 121 113 85
High school - - 102 532 794 911 714
Undergraduate - - 102 532 794 838 396
Graduate - - - - - 73 318
Postsecondary - - - - - - 1
Undergraduate - - - - - - 1
Graduate - - - - - - -
College undergraduate - - - - - - 96
Baccalaureate/college graduate - - - - - - -
Post baccalaureate - - - - - - -
Not stated - - 1 - - - -
Female 939 993 962 947 1,017 1,053 998
No grade completed 5 5 5 3 2 11 6
Preschool 3 1 1 - 1 1 -
Special education - 1 - - 3 - -
Elementary 931 986 809 349 138 75 81
1st - 4th grade 776 287 76 40 28 10 17
5th - 6th grade 155 598 278 58 26 12 19
Graduate - 101 455 251 84 53 45
High school - - 147 595 873 966 790
Undergraduate - - 147 595 873 881 329
Graduate - - - - - 85 461
Postsecondary - - - - - - 2
Undergraduate - - - - - - 2
Graduate - - - - - - -
College undergraduate - - - - - - 119
Baccalaureate/college graduate - - - - - - -
Post baccalaureate - - - - - - -
Not stated - - - - - - -
Continued

Philippine Statistics Authority
212 Demographic and Socioeconomic Characteristics - Quezon
Philippine Statistics Authority
Table 11--Continued
Highest Grade/Year Completed, Sex, and City/Municipality
Age
10 11 12 13 14 15 16
LUCBAN
Both sexes 971 923 995 998 1,018 1,126 1,056
No grade completed 2 2 3 4 - 4 3
Preschool - 1 1 1 - - -
Special education 2 3 4 7 3 3 6
Elementary 967 917 902 523 145 91 87
1st - 4th grade 852 354 89 45 28 28 22
5th - 6th grade 115 471 396 79 34 12 13
Graduate - 92 417 399 83 51 52
High school - - 85 463 870 1,028 838
Undergraduate - - 85 463 870 973 482
Graduate - - - - - 55 356
Postsecondary - - - - - - -
Undergraduate - - - - - - -
Graduate - - - - - - -
College undergraduate - - - - - - 122
Baccalaureate/college graduate - - - - - - -
Post baccalaureate - - - - - - -
Not stated - - - - - - -
Male 498 455 502 506 554 574 574
No grade completed 2 2 - 4 - 3 3
Preschool - - - - - - -
Special education 1 2 2 4 2 1 6
Elementary 495 451 460 280 94 66 65
1st - 4th grade 449 182 59 31 17 22 16
5th - 6th grade 46 226 204 47 26 11 11
Graduate - 43 197 202 51 33 38
High school - - 40 218 458 504 438
Undergraduate - - 40 218 458 479 271
Graduate - - - - - 25 167
Postsecondary - - - - - - -
Undergraduate - - - - - - -
Graduate - - - - - - -
College undergraduate - - - - - - 62
Baccalaureate/college graduate - - - - - - -
Post baccalaureate - - - - - - -
Not stated - - - - - - -
Female 473 468 493 492 464 552 482
No grade completed - - 3 - - 1 -
Preschool - 1 1 1 - - -
Special education 1 1 2 3 1 2 -
Elementary 472 466 442 243 51 25 22
1st - 4th grade 403 172 30 14 11 6 6
5th - 6th grade 69 245 192 32 8 1 2
Graduate - 49 220 197 32 18 14
High school - - 45 245 412 524 400
Undergraduate - - 45 245 412 494 211
Graduate - - - - - 30 189
Postsecondary - - - - - - -
Undergraduate - - - - - - -
Graduate - - - - - - -
College undergraduate - - - - - - 60
Baccalaureate/college graduate - - - - - - -
Post baccalaureate - - - - - - -
Not stated - - - - - - -
Continued
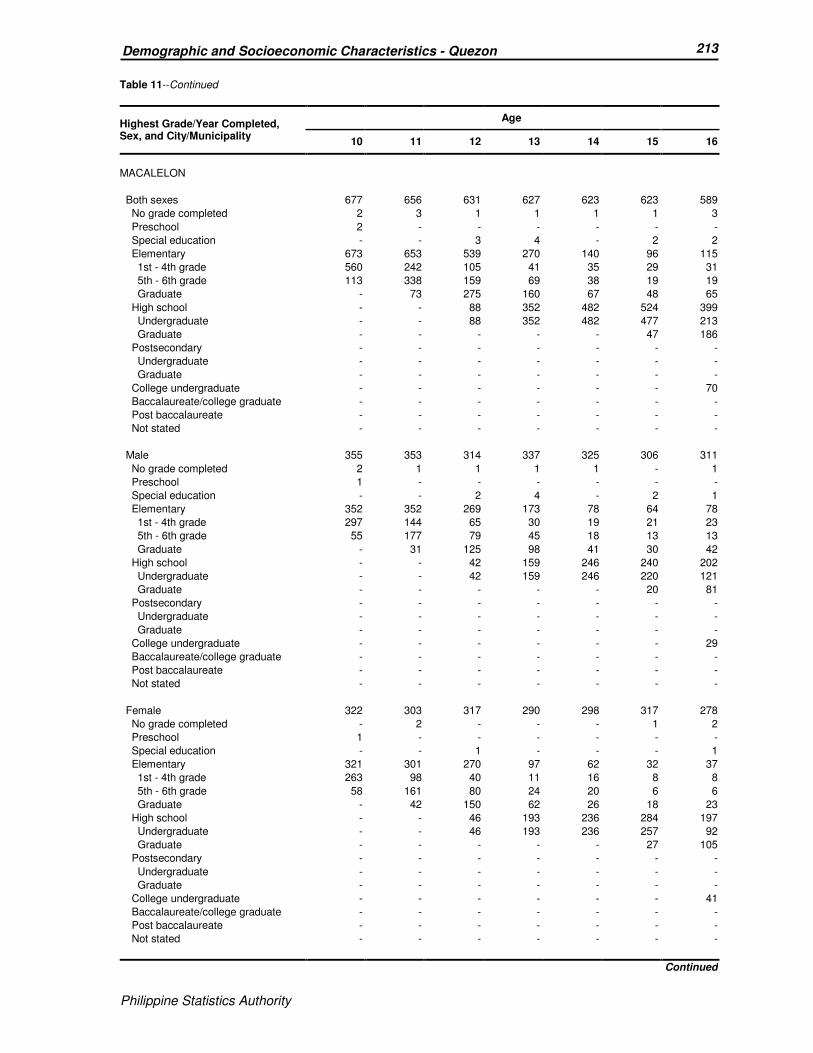
Philippine Statistics Authority
213 Demographic and Socioeconomic Characteristics - Quezon
Philippine Statistics Authority
Table 11--Continued
Highest Grade/Year Completed, Sex, and City/Municipality
Age
10 11 12 13 14 15 16
MACALELON
Both sexes 677 656 631 627 623 623 589
No grade completed 2 3 1 1 1 1 3
Preschool 2 - - - - - -
Special education - - 3 4 - 2 2
Elementary 673 653 539 270 140 96 115
1st - 4th grade 560 242 105 41 35 29 31
5th - 6th grade 113 338 159 69 38 19 19
Graduate - 73 275 160 67 48 65
High school - - 88 352 482 524 399
Undergraduate - - 88 352 482 477 213
Graduate - - - - - 47 186
Postsecondary - - - - - - -
Undergraduate - - - - - - -
Graduate - - - - - - -
College undergraduate - - - - - - 70
Baccalaureate/college graduate - - - - - - -
Post baccalaureate - - - - - - -
Not stated - - - - - - -
Male 355 353 314 337 325 306 311
No grade completed 2 1 1 1 1 - 1
Preschool 1 - - - - - -
Special education - - 2 4 - 2 1
Elementary 352 352 269 173 78 64 78
1st - 4th grade 297 144 65 30 19 21 23
5th - 6th grade 55 177 79 45 18 13 13
Graduate - 31 125 98 41 30 42
High school - - 42 159 246 240 202
Undergraduate - - 42 159 246 220 121
Graduate - - - - - 20 81
Postsecondary - - - - - - -
Undergraduate - - - - - - -
Graduate - - - - - - -
College undergraduate - - - - - - 29
Baccalaureate/college graduate - - - - - - -
Post baccalaureate - - - - - - -
Not stated - - - - - - -
Female 322 303 317 290 298 317 278
No grade completed - 2 - - - 1 2
Preschool 1 - - - - - -
Special education - - 1 - - - 1
Elementary 321 301 270 97 62 32 37
1st - 4th grade 263 98 40 11 16 8 8
5th - 6th grade 58 161 80 24 20 6 6
Graduate - 42 150 62 26 18 23
High school - - 46 193 236 284 197
Undergraduate - - 46 193 236 257 92
Graduate - - - - - 27 105
Postsecondary - - - - - - -
Undergraduate - - - - - - -
Graduate - - - - - - -
College undergraduate - - - - - - 41
Baccalaureate/college graduate - - - - - - -
Post baccalaureate - - - - - - -
Not stated - - - - - - -
Continued

Philippine Statistics Authority
214 Demographic and Socioeconomic Characteristics - Quezon
Philippine Statistics Authority
Table 11--Continued
Highest Grade/Year Completed, Sex, and City/Municipality
Age
10 11 12 13 14 15 16
MAUBAN
Both sexes 1,592 1,402 1,343 1,369 1,346 1,496 1,302
No grade completed 3 5 4 5 4 7 12
Preschool 2 - - - - - 1
Special education 1 1 2 4 4 3 2
Elementary 1,585 1,396 1,170 606 294 209 168
1st - 4th grade 1,349 542 178 98 68 52 47
5th - 6th grade 236 712 401 127 57 46 41
Graduate - 142 591 381 169 111 80
High school - - 167 754 1,044 1,277 988
Undergraduate - - 167 754 1,044 1,188 608
Graduate - - - - - 89 380
Postsecondary - - - - - - 3
Undergraduate - - - - - - 3
Graduate - - - - - - -
College undergraduate - - - - - - 128
Baccalaureate/college graduate - - - - - - -
Post baccalaureate - - - - - - -
Not stated 1 - - - - - -
Male 831 709 700 669 716 766 685
No grade completed 3 3 1 3 3 3 9
Preschool 1 - - - - - 1
Special education 1 - 2 2 3 2 2
Elementary 826 706 627 344 211 146 118
1st - 4th grade 712 292 113 64 50 38 40
5th - 6th grade 114 337 233 79 39 31 23
Graduate - 77 281 201 122 77 55
High school - - 70 320 499 615 499
Undergraduate - - 70 320 499 581 330
Graduate - - - - - 34 169
Postsecondary - - - - - - 1
Undergraduate - - - - - - 1
Graduate - - - - - - -
College undergraduate - - - - - - 55
Baccalaureate/college graduate - - - - - - -
Post baccalaureate - - - - - - -
Not stated - - - - - - -
Female 761 693 643 700 630 730 617
No grade completed - 2 3 2 1 4 3
Preschool 1 - - - - - -
Special education - 1 - 2 1 1 -
Elementary 759 690 543 262 83 63 50
1st - 4th grade 637 250 65 34 18 14 7
5th - 6th grade 122 375 168 48 18 15 18
Graduate - 65 310 180 47 34 25
High school - - 97 434 545 662 489
Undergraduate - - 97 434 545 607 278
Graduate - - - - - 55 211
Postsecondary - - - - - - 2
Undergraduate - - - - - - 2
Graduate - - - - - - -
College undergraduate - - - - - - 73
Baccalaureate/college graduate - - - - - - -
Post baccalaureate - - - - - - -
Not stated 1 - - - - - -
Continued
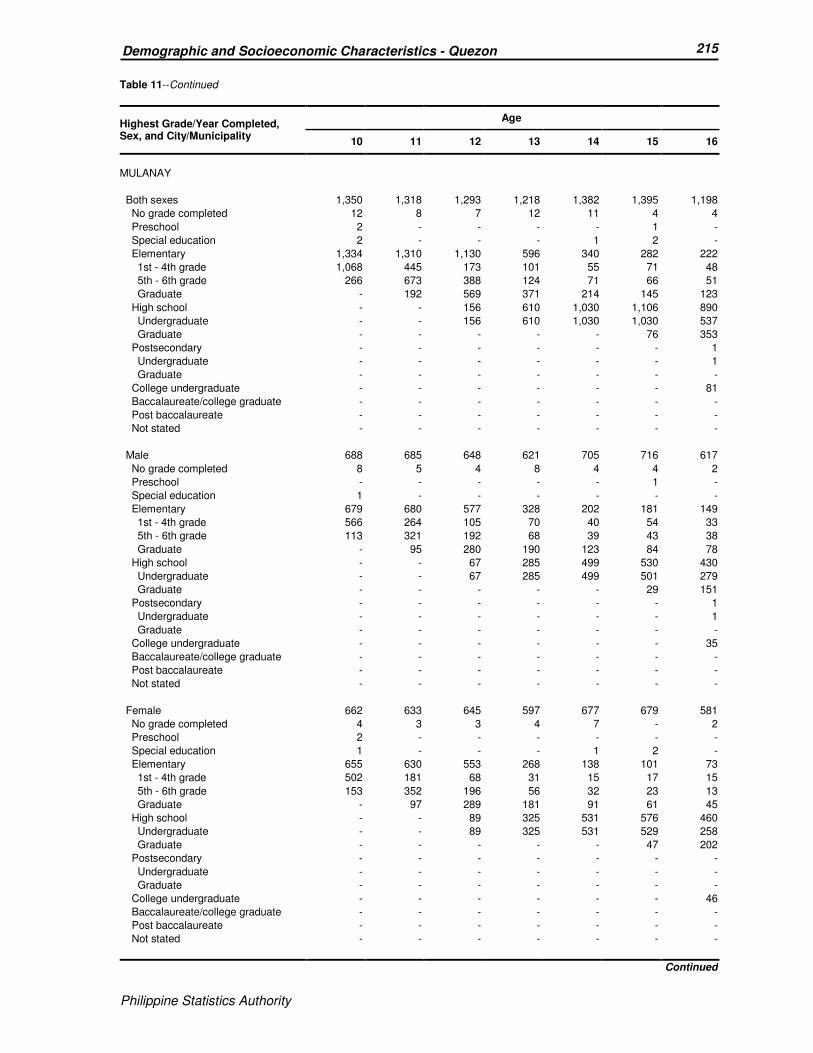
Philippine Statistics Authority
215 Demographic and Socioeconomic Characteristics - Quezon
Philippine Statistics Authority
Table 11--Continued
Highest Grade/Year Completed, Sex, and City/Municipality
Age
10 11 12 13 14 15 16
MULANAY
Both sexes 1,350 1,318 1,293 1,218 1,382 1,395 1,198
No grade completed 12 8 7 12 11 4 4
Preschool 2 - - - - 1 -
Special education 2 - - - 1 2 -
Elementary 1,334 1,310 1,130 596 340 282 222
1st - 4th grade 1,068 445 173 101 55 71 48
5th - 6th grade 266 673 388 124 71 66 51
Graduate - 192 569 371 214 145 123
High school - - 156 610 1,030 1,106 890
Undergraduate - - 156 610 1,030 1,030 537
Graduate - - - - - 76 353
Postsecondary - - - - - - 1
Undergraduate - - - - - - 1
Graduate - - - - - - -
College undergraduate - - - - - - 81
Baccalaureate/college graduate - - - - - - -
Post baccalaureate - - - - - - -
Not stated - - - - - - -
Male 688 685 648 621 705 716 617
No grade completed 8 5 4 8 4 4 2
Preschool - - - - - 1 -
Special education 1 - - - - - -
Elementary 679 680 577 328 202 181 149
1st - 4th grade 566 264 105 70 40 54 33
5th - 6th grade 113 321 192 68 39 43 38
Graduate - 95 280 190 123 84 78
High school - - 67 285 499 530 430
Undergraduate - - 67 285 499 501 279
Graduate - - - - - 29 151
Postsecondary - - - - - - 1
Undergraduate - - - - - - 1
Graduate - - - - - - -
College undergraduate - - - - - - 35
Baccalaureate/college graduate - - - - - - -
Post baccalaureate - - - - - - -
Not stated - - - - - - -
Female 662 633 645 597 677 679 581
No grade completed 4 3 3 4 7 - 2
Preschool 2 - - - - - -
Special education 1 - - - 1 2 -
Elementary 655 630 553 268 138 101 73
1st - 4th grade 502 181 68 31 15 17 15
5th - 6th grade 153 352 196 56 32 23 13
Graduate - 97 289 181 91 61 45
High school - - 89 325 531 576 460
Undergraduate - - 89 325 531 529 258
Graduate - - - - - 47 202
Postsecondary - - - - - - -
Undergraduate - - - - - - -
Graduate - - - - - - -
College undergraduate - - - - - - 46
Baccalaureate/college graduate - - - - - - -
Post baccalaureate - - - - - - -
Not stated - - - - - - -
Continued

Philippine Statistics Authority
216 Demographic and Socioeconomic Characteristics - Quezon
Philippine Statistics Authority
Table 11--Continued
Highest Grade/Year Completed, Sex, and City/Municipality
Age
10 11 12 13 14 15 16
PADRE BURGOS
Both sexes 479 504 500 455 493 537 412
No grade completed 4 4 3 2 1 1 2
Preschool 2 - 1 - - 2 1
Special education 2 - 1 - 2 2 1
Elementary 471 500 435 204 93 87 57
1st - 4th grade 393 202 66 35 33 24 22
5th - 6th grade 78 235 130 47 20 21 9
Graduate - 63 239 122 40 42 26
High school - - 60 249 397 445 327
Undergraduate - - 60 249 397 424 177
Graduate - - - - - 21 150
Postsecondary - - - - - - 1
Undergraduate - - - - - - 1
Graduate - - - - - - -
College undergraduate - - - - - - 23
Baccalaureate/college graduate - - - - - - -
Post baccalaureate - - - - - - -
Not stated - - - - - - -
Male 253 268 252 230 249 290 220
No grade completed 3 3 2 1 - 1 1
Preschool 2 - 1 - - - -
Special education 1 - 1 - 2 2 1
Elementary 247 265 222 120 64 61 35
1st - 4th grade 217 118 42 24 28 15 14
5th - 6th grade 30 120 70 30 17 17 6
Graduate - 27 110 66 19 29 15
High school - - 26 109 183 226 169
Undergraduate - - 26 109 183 213 105
Graduate - - - - - 13 64
Postsecondary - - - - - - -
Undergraduate - - - - - - -
Graduate - - - - - - -
College undergraduate - - - - - - 14
Baccalaureate/college graduate - - - - - - -
Post baccalaureate - - - - - - -
Not stated - - - - - - -
Female 226 236 248 225 244 247 192
No grade completed 1 1 1 1 1 - 1
Preschool - - - - - 2 1
Special education 1 - - - - - -
Elementary 224 235 213 84 29 26 22
1st - 4th grade 176 84 24 11 5 9 8
5th - 6th grade 48 115 60 17 3 4 3
Graduate - 36 129 56 21 13 11
High school - - 34 140 214 219 158
Undergraduate - - 34 140 214 211 72
Graduate - - - - - 8 86
Postsecondary - - - - - - 1
Undergraduate - - - - - - 1
Graduate - - - - - - -
College undergraduate - - - - - - 9
Baccalaureate/college graduate - - - - - - -
Post baccalaureate - - - - - - -
Not stated - - - - - - -
Continued
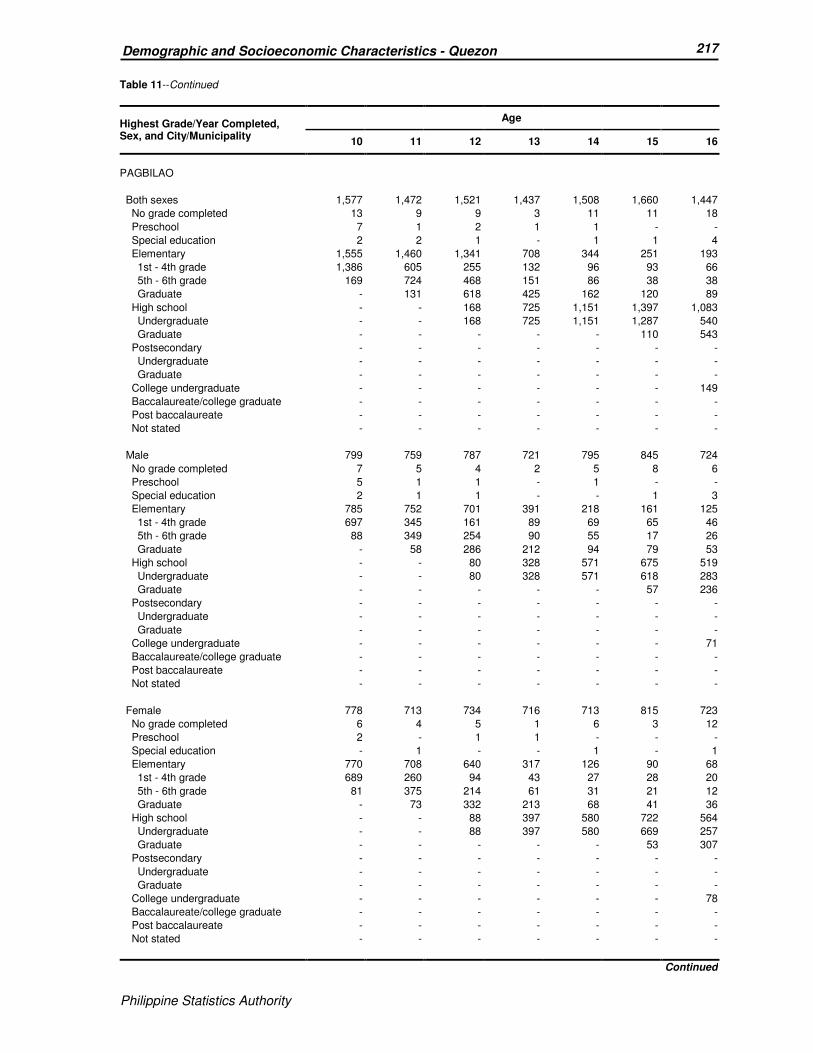
Philippine Statistics Authority
217 Demographic and Socioeconomic Characteristics - Quezon
Philippine Statistics Authority
Table 11--Continued
Highest Grade/Year Completed, Sex, and City/Municipality
Age
10 11 12 13 14 15 16
PAGBILAO
Both sexes 1,577 1,472 1,521 1,437 1,508 1,660 1,447
No grade completed 13 9 9 3 11 11 18
Preschool 7 1 2 1 1 - -
Special education 2 2 1 - 1 1 4
Elementary 1,555 1,460 1,341 708 344 251 193
1st - 4th grade 1,386 605 255 132 96 93 66
5th - 6th grade 169 724 468 151 86 38 38
Graduate - 131 618 425 162 120 89
High school - - 168 725 1,151 1,397 1,083
Undergraduate - - 168 725 1,151 1,287 540
Graduate - - - - - 110 543
Postsecondary - - - - - - -
Undergraduate - - - - - - -
Graduate - - - - - - -
College undergraduate - - - - - - 149
Baccalaureate/college graduate - - - - - - -
Post baccalaureate - - - - - - -
Not stated - - - - - - -
Male 799 759 787 721 795 845 724
No grade completed 7 5 4 2 5 8 6
Preschool 5 1 1 - 1 - -
Special education 2 1 1 - - 1 3
Elementary 785 752 701 391 218 161 125
1st - 4th grade 697 345 161 89 69 65 46
5th - 6th grade 88 349 254 90 55 17 26
Graduate - 58 286 212 94 79 53
High school - - 80 328 571 675 519
Undergraduate - - 80 328 571 618 283
Graduate - - - - - 57 236
Postsecondary - - - - - - -
Undergraduate - - - - - - -
Graduate - - - - - - -
College undergraduate - - - - - - 71
Baccalaureate/college graduate - - - - - - -
Post baccalaureate - - - - - - -
Not stated - - - - - - -
Female 778 713 734 716 713 815 723
No grade completed 6 4 5 1 6 3 12
Preschool 2 - 1 1 - - -
Special education - 1 - - 1 - 1
Elementary 770 708 640 317 126 90 68
1st - 4th grade 689 260 94 43 27 28 20
5th - 6th grade 81 375 214 61 31 21 12
Graduate - 73 332 213 68 41 36
High school - - 88 397 580 722 564
Undergraduate - - 88 397 580 669 257
Graduate - - - - - 53 307
Postsecondary - - - - - - -
Undergraduate - - - - - - -
Graduate - - - - - - -
College undergraduate - - - - - - 78
Baccalaureate/college graduate - - - - - - -
Post baccalaureate - - - - - - -
Not stated - - - - - - -
Continued

Philippine Statistics Authority
218 Demographic and Socioeconomic Characteristics - Quezon
Philippine Statistics Authority
Table 11--Continued
Highest Grade/Year Completed, Sex, and City/Municipality
Age
10 11 12 13 14 15 16
PANUKULAN
Both sexes 354 339 316 317 301 296 283
No grade completed - - 2 - - - 3
Preschool 1 1 1 - - - -
Special education - - - - - - -
Elementary 353 338 281 181 79 52 31
1st - 4th grade 318 183 57 35 14 14 10
5th - 6th grade 35 123 128 37 24 8 5
Graduate - 32 96 109 41 30 16
High school - - 32 136 222 244 240
Undergraduate - - 32 136 222 226 191
Graduate - - - - - 18 49
Postsecondary - - - - - - -
Undergraduate - - - - - - -
Graduate - - - - - - -
College undergraduate - - - - - - 9
Baccalaureate/college graduate - - - - - - -
Post baccalaureate - - - - - - -
Not stated - - - - - - -
Male 186 173 160 156 156 158 167
No grade completed - - 2 - - - 3
Preschool 1 1 - - - - -
Special education - - - - - - -
Elementary 185 172 146 100 37 36 19
1st - 4th grade 172 108 39 25 6 8 6
5th - 6th grade 13 56 63 21 13 6 3
Graduate - 8 44 54 18 22 10
High school - - 12 56 119 122 142
Undergraduate - - 12 56 119 115 110
Graduate - - - - - 7 32
Postsecondary - - - - - - -
Undergraduate - - - - - - -
Graduate - - - - - - -
College undergraduate - - - - - - 3
Baccalaureate/college graduate - - - - - - -
Post baccalaureate - - - - - - -
Not stated - - - - - - -
Female 168 166 156 161 145 138 116
No grade completed - - - - - - -
Preschool - - 1 - - - -
Special education - - - - - - -
Elementary 168 166 135 81 42 16 12
1st - 4th grade 146 75 18 10 8 6 4
5th - 6th grade 22 67 65 16 11 2 2
Graduate - 24 52 55 23 8 6
High school - - 20 80 103 122 98
Undergraduate - - 20 80 103 111 81
Graduate - - - - - 11 17
Postsecondary - - - - - - -
Undergraduate - - - - - - -
Graduate - - - - - - -
College undergraduate - - - - - - 6
Baccalaureate/college graduate - - - - - - -
Post baccalaureate - - - - - - -
Not stated - - - - - - -
Continued
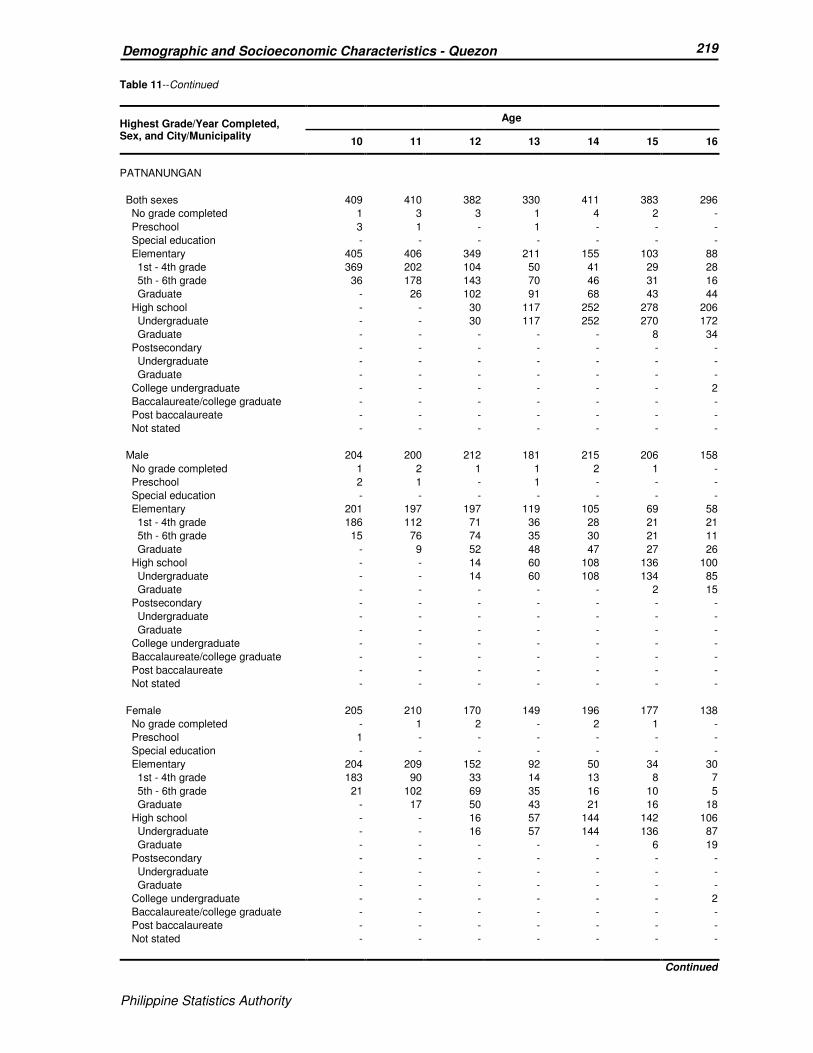
Philippine Statistics Authority
219 Demographic and Socioeconomic Characteristics - Quezon
Philippine Statistics Authority
Table 11--Continued
Highest Grade/Year Completed, Sex, and City/Municipality
Age
10 11 12 13 14 15 16
PATNANUNGAN
Both sexes 409 410 382 330 411 383 296
No grade completed 1 3 3 1 4 2 -
Preschool 3 1 - 1 - - -
Special education - - - - - - -
Elementary 405 406 349 211 155 103 88
1st - 4th grade 369 202 104 50 41 29 28
5th - 6th grade 36 178 143 70 46 31 16
Graduate - 26 102 91 68 43 44
High school - - 30 117 252 278 206
Undergraduate - - 30 117 252 270 172
Graduate - - - - - 8 34
Postsecondary - - - - - - -
Undergraduate - - - - - - -
Graduate - - - - - - -
College undergraduate - - - - - - 2
Baccalaureate/college graduate - - - - - - -
Post baccalaureate - - - - - - -
Not stated - - - - - - -
Male 204 200 212 181 215 206 158
No grade completed 1 2 1 1 2 1 -
Preschool 2 1 - 1 - - -
Special education - - - - - - -
Elementary 201 197 197 119 105 69 58
1st - 4th grade 186 112 71 36 28 21 21
5th - 6th grade 15 76 74 35 30 21 11
Graduate - 9 52 48 47 27 26
High school - - 14 60 108 136 100
Undergraduate - - 14 60 108 134 85
Graduate - - - - - 2 15
Postsecondary - - - - - - -
Undergraduate - - - - - - -
Graduate - - - - - - -
College undergraduate - - - - - - -
Baccalaureate/college graduate - - - - - - -
Post baccalaureate - - - - - - -
Not stated - - - - - - -
Female 205 210 170 149 196 177 138
No grade completed - 1 2 - 2 1 -
Preschool 1 - - - - - -
Special education - - - - - - -
Elementary 204 209 152 92 50 34 30
1st - 4th grade 183 90 33 14 13 8 7
5th - 6th grade 21 102 69 35 16 10 5
Graduate - 17 50 43 21 16 18
High school - - 16 57 144 142 106
Undergraduate - - 16 57 144 136 87
Graduate - - - - - 6 19
Postsecondary - - - - - - -
Undergraduate - - - - - - -
Graduate - - - - - - -
College undergraduate - - - - - - 2
Baccalaureate/college graduate - - - - - - -
Post baccalaureate - - - - - - -
Not stated - - - - - - -
Continued

Philippine Statistics Authority
220 Demographic and Socioeconomic Characteristics - Quezon
Philippine Statistics Authority
Table 11--Continued
Highest Grade/Year Completed, Sex, and City/Municipality
Age
10 11 12 13 14 15 16
PEREZ
Both sexes 359 300 327 277 319 312 223
No grade completed 1 1 - - 1 2 1
Preschool 1 - - 1 - - -
Special education - - 1 - - - 1
Elementary 357 299 307 154 69 42 35
1st - 4th grade 316 152 57 37 15 10 11
5th - 6th grade 41 125 114 38 15 11 7
Graduate - 22 136 79 39 21 17
High school - - 19 122 249 268 181
Undergraduate - - 19 122 249 256 112
Graduate - - - - - 12 69
Postsecondary - - - - - - 1
Undergraduate - - - - - - 1
Graduate - - - - - - -
College undergraduate - - - - - - 4
Baccalaureate/college graduate - - - - - - -
Post baccalaureate - - - - - - -
Not stated - - - - - - -
Male 195 141 158 145 182 172 129
No grade completed 1 1 - - 1 1 1
Preschool 1 - - - - - -
Special education - - 1 - - - -
Elementary 193 140 144 84 51 35 25
1st - 4th grade 176 79 34 28 13 7 11
5th - 6th grade 17 50 51 20 11 10 6
Graduate - 11 59 36 27 18 8
High school - - 13 61 130 136 102
Undergraduate - - 13 61 130 131 66
Graduate - - - - - 5 36
Postsecondary - - - - - - -
Undergraduate - - - - - - -
Graduate - - - - - - -
College undergraduate - - - - - - 1
Baccalaureate/college graduate - - - - - - -
Post baccalaureate - - - - - - -
Not stated - - - - - - -
Female 164 159 169 132 137 140 94
No grade completed - - - - - 1 -
Preschool - - - 1 - - -
Special education - - - - - - 1
Elementary 164 159 163 70 18 7 10
1st - 4th grade 140 73 23 9 2 3 -
5th - 6th grade 24 75 63 18 4 1 1
Graduate - 11 77 43 12 3 9
High school - - 6 61 119 132 79
Undergraduate - - 6 61 119 125 46
Graduate - - - - - 7 33
Postsecondary - - - - - - 1
Undergraduate - - - - - - 1
Graduate - - - - - - -
College undergraduate - - - - - - 3
Baccalaureate/college graduate - - - - - - -
Post baccalaureate - - - - - - -
Not stated - - - - - - -
Continued
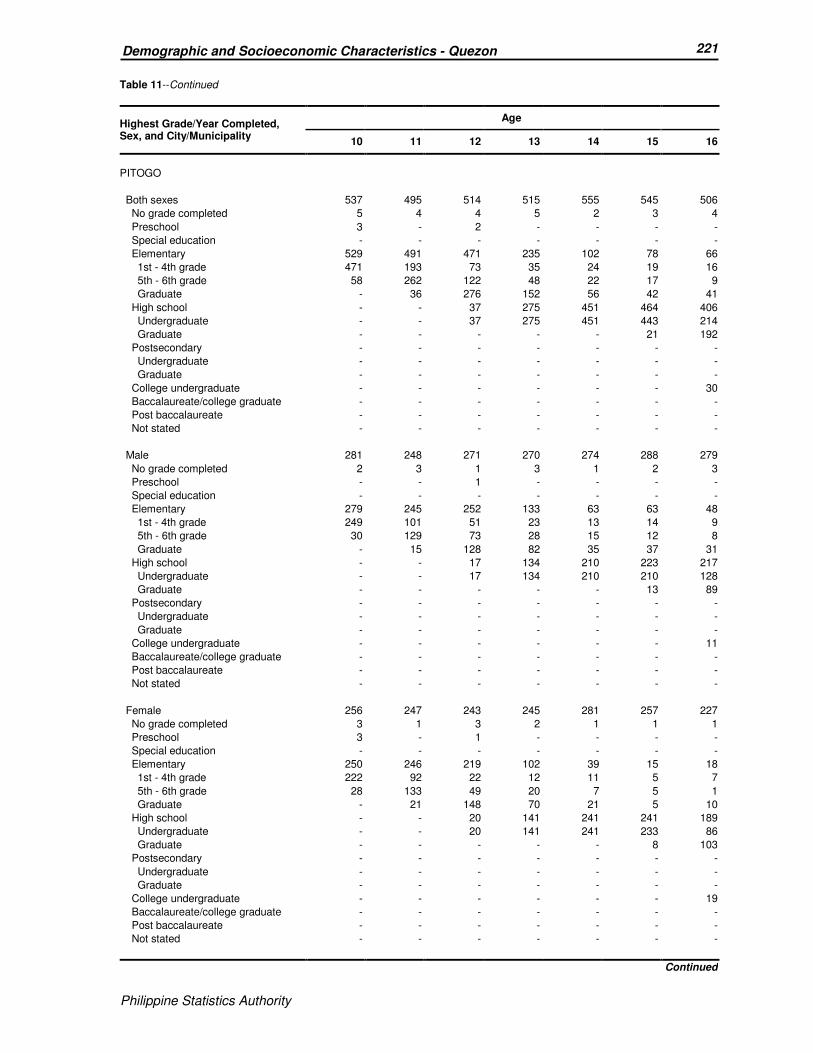
Philippine Statistics Authority
221 Demographic and Socioeconomic Characteristics - Quezon
Philippine Statistics Authority
Table 11--Continued
Highest Grade/Year Completed, Sex, and City/Municipality
Age
10 11 12 13 14 15 16
PITOGO
Both sexes 537 495 514 515 555 545 506
No grade completed 5 4 4 5 2 3 4
Preschool 3 - 2 - - - -
Special education - - - - - - -
Elementary 529 491 471 235 102 78 66
1st - 4th grade 471 193 73 35 24 19 16
5th - 6th grade 58 262 122 48 22 17 9
Graduate - 36 276 152 56 42 41
High school - - 37 275 451 464 406
Undergraduate - - 37 275 451 443 214
Graduate - - - - - 21 192
Postsecondary - - - - - - -
Undergraduate - - - - - - -
Graduate - - - - - - -
College undergraduate - - - - - - 30
Baccalaureate/college graduate - - - - - - -
Post baccalaureate - - - - - - -
Not stated - - - - - - -
Male 281 248 271 270 274 288 279
No grade completed 2 3 1 3 1 2 3
Preschool - - 1 - - - -
Special education - - - - - - -
Elementary 279 245 252 133 63 63 48
1st - 4th grade 249 101 51 23 13 14 9
5th - 6th grade 30 129 73 28 15 12 8
Graduate - 15 128 82 35 37 31
High school - - 17 134 210 223 217
Undergraduate - - 17 134 210 210 128
Graduate - - - - - 13 89
Postsecondary - - - - - - -
Undergraduate - - - - - - -
Graduate - - - - - - -
College undergraduate - - - - - - 11
Baccalaureate/college graduate - - - - - - -
Post baccalaureate - - - - - - -
Not stated - - - - - - -
Female 256 247 243 245 281 257 227
No grade completed 3 1 3 2 1 1 1
Preschool 3 - 1 - - - -
Special education - - - - - - -
Elementary 250 246 219 102 39 15 18
1st - 4th grade 222 92 22 12 11 5 7
5th - 6th grade 28 133 49 20 7 5 1
Graduate - 21 148 70 21 5 10
High school - - 20 141 241 241 189
Undergraduate - - 20 141 241 233 86
Graduate - - - - - 8 103
Postsecondary - - - - - - -
Undergraduate - - - - - - -
Graduate - - - - - - -
College undergraduate - - - - - - 19
Baccalaureate/college graduate - - - - - - -
Post baccalaureate - - - - - - -
Not stated - - - - - - -
Continued

Philippine Statistics Authority
222 Demographic and Socioeconomic Characteristics - Quezon
Philippine Statistics Authority
Table 11--Continued
Highest Grade/Year Completed, Sex, and City/Municipality
Age
10 11 12 13 14 15 16
PLARIDEL
Both sexes 237 204 233 225 230 246 207
No grade completed 1 2 1 - 4 3 15
Preschool - - - - - - -
Special education 1 - - - - - -
Elementary 235 202 203 78 36 30 15
1st - 4th grade 212 59 34 16 9 5 3
5th - 6th grade 23 125 76 27 8 8 7
Graduate - 18 93 35 19 17 5
High school - - 29 147 190 213 164
Undergraduate - - 29 147 190 201 76
Graduate - - - - - 12 88
Postsecondary - - - - - - -
Undergraduate - - - - - - -
Graduate - - - - - - -
College undergraduate - - - - - - 13
Baccalaureate/college graduate - - - - - - -
Post baccalaureate - - - - - - -
Not stated - - - - - - -
Male 124 105 111 126 124 124 100
No grade completed 1 - 1 - 2 3 6
Preschool - - - - - - -
Special education 1 - - - - - -
Elementary 122 105 97 53 26 19 10
1st - 4th grade 116 36 20 15 6 2 2
5th - 6th grade 6 55 40 16 6 6 6
Graduate - 14 37 22 14 11 2
High school - - 13 73 96 102 81
Undergraduate - - 13 73 96 97 44
Graduate - - - - - 5 37
Postsecondary - - - - - - -
Undergraduate - - - - - - -
Graduate - - - - - - -
College undergraduate - - - - - - 3
Baccalaureate/college graduate - - - - - - -
Post baccalaureate - - - - - - -
Not stated - - - - - - -
Female 113 99 122 99 106 122 107
No grade completed - 2 - - 2 - 9
Preschool - - - - - - -
Special education - - - - - - -
Elementary 113 97 106 25 10 11 5
1st - 4th grade 96 23 14 1 3 3 1
5th - 6th grade 17 70 36 11 2 2 1
Graduate - 4 56 13 5 6 3
High school - - 16 74 94 111 83
Undergraduate - - 16 74 94 104 32
Graduate - - - - - 7 51
Postsecondary - - - - - - -
Undergraduate - - - - - - -
Graduate - - - - - - -
College undergraduate - - - - - - 10
Baccalaureate/college graduate - - - - - - -
Post baccalaureate - - - - - - -
Not stated - - - - - - -
Continued

Philippine Statistics Authority
223 Demographic and Socioeconomic Characteristics - Quezon
Philippine Statistics Authority
Table 11--Continued
Highest Grade/Year Completed, Sex, and City/Municipality
Age
10 11 12 13 14 15 16
POLILLO
Both sexes 755 814 716 591 679 673 555
No grade completed 9 8 5 5 6 5 6
Preschool 2 1 - 1 1 - -
Special education 1 1 - - - 1 1
Elementary 743 804 637 287 135 117 80
1st - 4th grade 660 328 111 61 38 35 26
5th - 6th grade 83 403 195 57 26 21 8
Graduate - 73 331 169 71 61 46
High school - - 74 298 537 550 433
Undergraduate - - 74 298 537 523 294
Graduate - - - - - 27 139
Postsecondary - - - - - - 3
Undergraduate - - - - - - 3
Graduate - - - - - - -
College undergraduate - - - - - - 32
Baccalaureate/college graduate - - - - - - -
Post baccalaureate - - - - - - -
Not stated - - - - - - -
Male 383 420 364 298 351 371 321
No grade completed 6 7 4 2 4 2 4
Preschool 2 - - 1 1 - -
Special education - - - - - 1 1
Elementary 375 413 339 166 86 76 55
1st - 4th grade 349 194 66 42 25 26 19
5th - 6th grade 26 190 111 34 15 14 6
Graduate - 29 162 90 46 36 30
High school - - 21 129 260 292 244
Undergraduate - - 21 129 260 277 171
Graduate - - - - - 15 73
Postsecondary - - - - - - 1
Undergraduate - - - - - - 1
Graduate - - - - - - -
College undergraduate - - - - - - 16
Baccalaureate/college graduate - - - - - - -
Post baccalaureate - - - - - - -
Not stated - - - - - - -
Female 372 394 352 293 328 302 234
No grade completed 3 1 1 3 2 3 2
Preschool - 1 - - - - -
Special education 1 1 - - - - -
Elementary 368 391 298 121 49 41 25
1st - 4th grade 311 134 45 19 13 9 7
5th - 6th grade 57 213 84 23 11 7 2
Graduate - 44 169 79 25 25 16
High school - - 53 169 277 258 189
Undergraduate - - 53 169 277 246 123
Graduate - - - - - 12 66
Postsecondary - - - - - - 2
Undergraduate - - - - - - 2
Graduate - - - - - - -
College undergraduate - - - - - - 16
Baccalaureate/college graduate - - - - - - -
Post baccalaureate - - - - - - -
Not stated - - - - - - -
Continued

Philippine Statistics Authority
224 Demographic and Socioeconomic Characteristics - Quezon
Philippine Statistics Authority
Table 11--Continued
Highest Grade/Year Completed, Sex, and City/Municipality
Age
10 11 12 13 14 15 16
QUEZON
Both sexes 363 358 369 396 369 356 319
No grade completed - - 2 1 - 2 3
Preschool - - - - - - -
Special education - - 2 - 1 1 -
Elementary 363 358 324 183 63 39 34
1st - 4th grade 315 148 60 25 10 4 11
5th - 6th grade 48 181 123 43 16 10 7
Graduate - 29 141 115 37 25 16
High school - - 41 212 305 314 266
Undergraduate - - 41 212 305 299 155
Graduate - - - - - 15 111
Postsecondary - - - - - - -
Undergraduate - - - - - - -
Graduate - - - - - - -
College undergraduate - - - - - - 16
Baccalaureate/college graduate - - - - - - -
Post baccalaureate - - - - - - -
Not stated - - - - - - -
Male 167 175 188 206 191 184 179
No grade completed - - 2 1 - 1 2
Preschool - - - - - - -
Special education - - 1 - 1 - -
Elementary 167 175 165 103 41 26 27
1st - 4th grade 149 76 40 16 2 3 8
5th - 6th grade 18 83 62 21 13 6 7
Graduate - 16 63 66 26 17 12
High school - - 20 102 149 157 143
Undergraduate - - 20 102 149 152 88
Graduate - - - - - 5 55
Postsecondary - - - - - - -
Undergraduate - - - - - - -
Graduate - - - - - - -
College undergraduate - - - - - - 7
Baccalaureate/college graduate - - - - - - -
Post baccalaureate - - - - - - -
Not stated - - - - - - -
Female 196 183 181 190 178 172 140
No grade completed - - - - - 1 1
Preschool - - - - - - -
Special education - - 1 - - 1 -
Elementary 196 183 159 80 22 13 7
1st - 4th grade 166 72 20 9 8 1 3
5th - 6th grade 30 98 61 22 3 4 -
Graduate - 13 78 49 11 8 4
High school - - 21 110 156 157 123
Undergraduate - - 21 110 156 147 67
Graduate - - - - - 10 56
Postsecondary - - - - - - -
Undergraduate - - - - - - -
Graduate - - - - - - -
College undergraduate - - - - - - 9
Baccalaureate/college graduate - - - - - - -
Post baccalaureate - - - - - - -
Not stated - - - - - - -
Continued

Philippine Statistics Authority
225 Demographic and Socioeconomic Characteristics - Quezon
Philippine Statistics Authority
Table 11--Continued
Highest Grade/Year Completed, Sex, and City/Municipality
Age
10 11 12 13 14 15 16
REAL
Both sexes 844 795 792 808 810 847 764
No grade completed 3 1 3 2 5 3 4
Preschool 1 1 2 - - - -
Special education 1 - - 1 - - -
Elementary 839 793 728 405 185 103 87
1st - 4th grade 776 395 138 65 48 28 25
5th - 6th grade 63 355 295 91 40 26 25
Graduate - 43 295 249 97 49 37
High school - - 59 400 620 741 615
Undergraduate - - 59 400 620 697 371
Graduate - - - - - 44 244
Postsecondary - - - - - - -
Undergraduate - - - - - - -
Graduate - - - - - - -
College undergraduate - - - - - - 58
Baccalaureate/college graduate - - - - - - -
Post baccalaureate - - - - - - -
Not stated - - - - - - -
Male 456 416 422 424 401 440 414
No grade completed 1 - 1 1 2 2 3
Preschool - 1 1 - - - -
Special education 1 - - 1 - - -
Elementary 454 415 395 233 122 63 56
1st - 4th grade 419 228 86 44 31 20 17
5th - 6th grade 35 175 161 52 31 14 18
Graduate - 12 148 137 60 29 21
High school - - 25 189 277 375 329
Undergraduate - - 25 189 277 350 206
Graduate - - - - - 25 123
Postsecondary - - - - - - -
Undergraduate - - - - - - -
Graduate - - - - - - -
College undergraduate - - - - - - 26
Baccalaureate/college graduate - - - - - - -
Post baccalaureate - - - - - - -
Not stated - - - - - - -
Female 388 379 370 384 409 407 350
No grade completed 2 1 2 1 3 1 1
Preschool 1 - 1 - - - -
Special education - - - - - - -
Elementary 385 378 333 172 63 40 31
1st - 4th grade 357 167 52 21 17 8 8
5th - 6th grade 28 180 134 39 9 12 7
Graduate - 31 147 112 37 20 16
High school - - 34 211 343 366 286
Undergraduate - - 34 211 343 347 165
Graduate - - - - - 19 121
Postsecondary - - - - - - -
Undergraduate - - - - - - -
Graduate - - - - - - -
College undergraduate - - - - - - 32
Baccalaureate/college graduate - - - - - - -
Post baccalaureate - - - - - - -
Not stated - - - - - - -
Continued

Philippine Statistics Authority
226 Demographic and Socioeconomic Characteristics - Quezon
Philippine Statistics Authority
Table 11--Continued
Highest Grade/Year Completed, Sex, and City/Municipality
Age
10 11 12 13 14 15 16
SAMPALOC
Both sexes 275 303 286 299 276 315 261
No grade completed 2 1 2 - 2 1 -
Preschool 1 - - - 1 - 1
Special education 1 2 2 1 - - -
Elementary 271 300 268 150 39 24 14
1st - 4th grade 250 92 28 13 11 12 4
5th - 6th grade 21 190 101 25 8 4 3
Graduate - 18 139 112 20 8 7
High school - - 14 148 234 290 234
Undergraduate - - 14 148 234 279 131
Graduate - - - - - 11 103
Postsecondary - - - - - - -
Undergraduate - - - - - - -
Graduate - - - - - - -
College undergraduate - - - - - - 12
Baccalaureate/college graduate - - - - - - -
Post baccalaureate - - - - - - -
Not stated - - - - - - -
Male 159 144 140 145 156 177 137
No grade completed 2 1 2 - - - -
Preschool - - - - - - 1
Special education 1 1 - - - - -
Elementary 156 142 133 80 29 19 8
1st - 4th grade 144 48 18 9 9 9 3
5th - 6th grade 12 87 45 15 6 3 2
Graduate - 7 70 56 14 7 3
High school - - 5 65 127 158 121
Undergraduate - - 5 65 127 150 74
Graduate - - - - - 8 47
Postsecondary - - - - - - -
Undergraduate - - - - - - -
Graduate - - - - - - -
College undergraduate - - - - - - 7
Baccalaureate/college graduate - - - - - - -
Post baccalaureate - - - - - - -
Not stated - - - - - - -
Female 116 159 146 154 120 138 124
No grade completed - - - - 2 1 -
Preschool 1 - - - 1 - -
Special education - 1 2 1 - - -
Elementary 115 158 135 70 10 5 6
1st - 4th grade 106 44 10 4 2 3 1
5th - 6th grade 9 103 56 10 2 1 1
Graduate - 11 69 56 6 1 4
High school - - 9 83 107 132 113
Undergraduate - - 9 83 107 129 57
Graduate - - - - - 3 56
Postsecondary - - - - - - -
Undergraduate - - - - - - -
Graduate - - - - - - -
College undergraduate - - - - - - 5
Baccalaureate/college graduate - - - - - - -
Post baccalaureate - - - - - - -
Not stated - - - - - - -
Continued

Philippine Statistics Authority
227 Demographic and Socioeconomic Characteristics - Quezon
Philippine Statistics Authority
Table 11--Continued
Highest Grade/Year Completed, Sex, and City/Municipality
Age
10 11 12 13 14 15 16
SAN ANDRES
Both sexes 943 985 945 860 967 941 816
No grade completed 10 12 3 5 11 8 5
Preschool 5 3 2 - - - -
Special education - - - 1 - - -
Elementary 928 970 832 523 400 312 265
1st - 4th grade 795 475 247 143 112 90 85
5th - 6th grade 133 414 257 130 97 66 36
Graduate - 81 328 250 191 156 144
High school - - 108 331 556 621 518
Undergraduate - - 108 331 556 583 360
Graduate - - - - - 38 158
Postsecondary - - - - - - -
Undergraduate - - - - - - -
Graduate - - - - - - -
College undergraduate - - - - - - 28
Baccalaureate/college graduate - - - - - - -
Post baccalaureate - - - - - - -
Not stated - - - - - - -
Male 483 494 489 426 541 469 406
No grade completed 3 8 3 4 10 6 4
Preschool 3 1 2 - - - -
Special education - - - - - - -
Elementary 477 485 442 281 253 183 164
1st - 4th grade 428 272 154 92 78 60 62
5th - 6th grade 49 176 142 73 59 42 22
Graduate - 37 146 116 116 81 80
High school - - 42 141 278 280 231
Undergraduate - - 42 141 278 268 176
Graduate - - - - - 12 55
Postsecondary - - - - - - -
Undergraduate - - - - - - -
Graduate - - - - - - -
College undergraduate - - - - - - 7
Baccalaureate/college graduate - - - - - - -
Post baccalaureate - - - - - - -
Not stated - - - - - - -
Female 460 491 456 434 426 472 410
No grade completed 7 4 - 1 1 2 1
Preschool 2 2 - - - - -
Special education - - - 1 - - -
Elementary 451 485 390 242 147 129 101
1st - 4th grade 367 203 93 51 34 30 23
5th - 6th grade 84 238 115 57 38 24 14
Graduate - 44 182 134 75 75 64
High school - - 66 190 278 341 287
Undergraduate - - 66 190 278 315 184
Graduate - - - - - 26 103
Postsecondary - - - - - - -
Undergraduate - - - - - - -
Graduate - - - - - - -
College undergraduate - - - - - - 21
Baccalaureate/college graduate - - - - - - -
Post baccalaureate - - - - - - -
Not stated - - - - - - -
Continued

Philippine Statistics Authority
228 Demographic and Socioeconomic Characteristics - Quezon
Philippine Statistics Authority
Table 11--Continued
Highest Grade/Year Completed, Sex, and City/Municipality
Age
10 11 12 13 14 15 16
SAN ANTONIO
Both sexes 736 749 820 722 771 731 658
No grade completed 3 - 6 3 5 6 2
Preschool 1 - - - - 1 -
Special education 2 3 2 2 4 - -
Elementary 730 746 617 231 114 72 65
1st - 4th grade 561 183 72 33 25 16 19
5th - 6th grade 169 418 162 49 24 15 5
Graduate - 145 383 149 65 41 41
High school - - 195 486 648 652 482
Undergraduate - - 195 486 648 584 224
Graduate - - - - - 68 258
Postsecondary - - - - - - 1
Undergraduate - - - - - - 1
Graduate - - - - - - -
College undergraduate - - - - - - 108
Baccalaureate/college graduate - - - - - - -
Post baccalaureate - - - - - - -
Not stated - - - - - - -
Male 394 422 437 370 413 374 343
No grade completed 2 - 4 2 4 4 2
Preschool 1 - - - - 1 -
Special education 1 1 - 1 2 - -
Elementary 390 421 346 130 75 58 50
1st - 4th grade 312 117 50 18 20 12 17
5th - 6th grade 78 227 106 31 16 10 3
Graduate - 77 190 81 39 36 30
High school - - 87 237 332 311 252
Undergraduate - - 87 237 332 286 117
Graduate - - - - - 25 135
Postsecondary - - - - - - -
Undergraduate - - - - - - -
Graduate - - - - - - -
College undergraduate - - - - - - 39
Baccalaureate/college graduate - - - - - - -
Post baccalaureate - - - - - - -
Not stated - - - - - - -
Female 342 327 383 352 358 357 315
No grade completed 1 - 2 1 1 2 -
Preschool - - - - - - -
Special education 1 2 2 1 2 - -
Elementary 340 325 271 101 39 14 15
1st - 4th grade 249 66 22 15 5 4 2
5th - 6th grade 91 191 56 18 8 5 2
Graduate - 68 193 68 26 5 11
High school - - 108 249 316 341 230
Undergraduate - - 108 249 316 298 107
Graduate - - - - - 43 123
Postsecondary - - - - - - 1
Undergraduate - - - - - - 1
Graduate - - - - - - -
College undergraduate - - - - - - 69
Baccalaureate/college graduate - - - - - - -
Post baccalaureate - - - - - - -
Not stated - - - - - - -
Continued
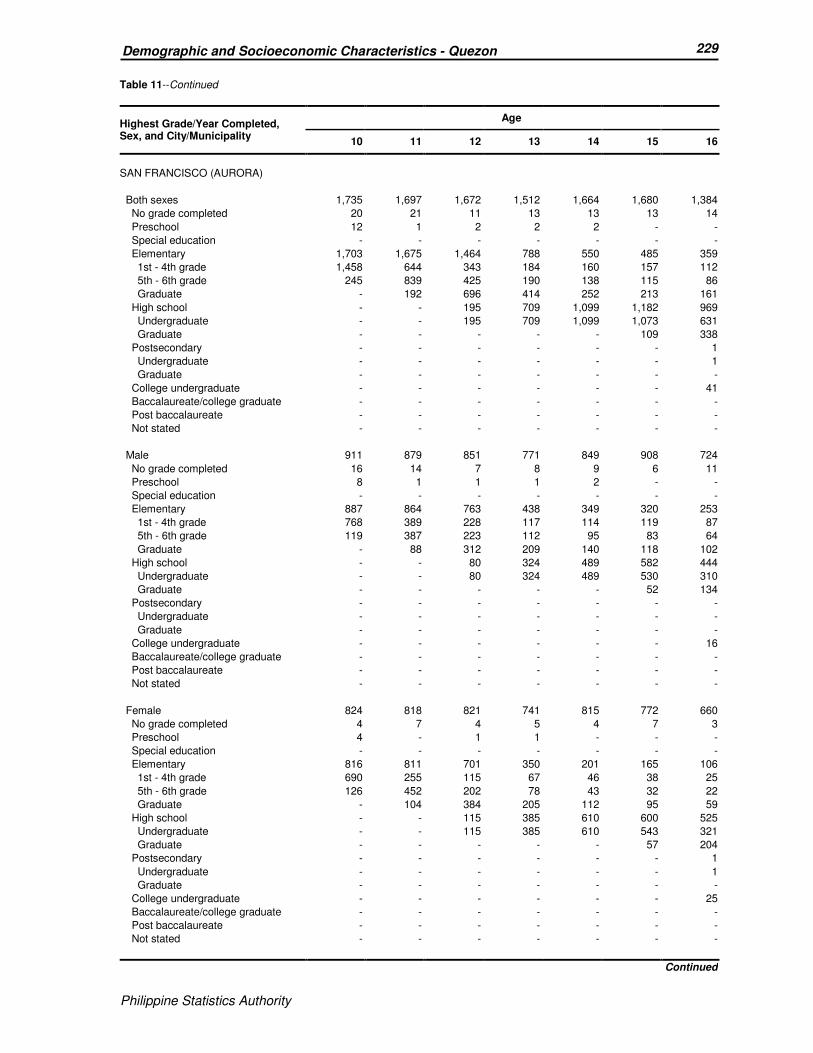
Philippine Statistics Authority
229 Demographic and Socioeconomic Characteristics - Quezon
Philippine Statistics Authority
Table 11--Continued
Highest Grade/Year Completed, Sex, and City/Municipality
Age
10 11 12 13 14 15 16
SAN FRANCISCO (AURORA)
Both sexes 1,735 1,697 1,672 1,512 1,664 1,680 1,384
No grade completed 20 21 11 13 13 13 14
Preschool 12 1 2 2 2 - -
Special education - - - - - - -
Elementary 1,703 1,675 1,464 788 550 485 359
1st - 4th grade 1,458 644 343 184 160 157 112
5th - 6th grade 245 839 425 190 138 115 86
Graduate - 192 696 414 252 213 161
High school - - 195 709 1,099 1,182 969
Undergraduate - - 195 709 1,099 1,073 631
Graduate - - - - - 109 338
Postsecondary - - - - - - 1
Undergraduate - - - - - - 1
Graduate - - - - - - -
College undergraduate - - - - - - 41
Baccalaureate/college graduate - - - - - - -
Post baccalaureate - - - - - - -
Not stated - - - - - - -
Male 911 879 851 771 849 908 724
No grade completed 16 14 7 8 9 6 11
Preschool 8 1 1 1 2 - -
Special education - - - - - - -
Elementary 887 864 763 438 349 320 253
1st - 4th grade 768 389 228 117 114 119 87
5th - 6th grade 119 387 223 112 95 83 64
Graduate - 88 312 209 140 118 102
High school - - 80 324 489 582 444
Undergraduate - - 80 324 489 530 310
Graduate - - - - - 52 134
Postsecondary - - - - - - -
Undergraduate - - - - - - -
Graduate - - - - - - -
College undergraduate - - - - - - 16
Baccalaureate/college graduate - - - - - - -
Post baccalaureate - - - - - - -
Not stated - - - - - - -
Female 824 818 821 741 815 772 660
No grade completed 4 7 4 5 4 7 3
Preschool 4 - 1 1 - - -
Special education - - - - - - -
Elementary 816 811 701 350 201 165 106
1st - 4th grade 690 255 115 67 46 38 25
5th - 6th grade 126 452 202 78 43 32 22
Graduate - 104 384 205 112 95 59
High school - - 115 385 610 600 525
Undergraduate - - 115 385 610 543 321
Graduate - - - - - 57 204
Postsecondary - - - - - - 1
Undergraduate - - - - - - 1
Graduate - - - - - - -
College undergraduate - - - - - - 25
Baccalaureate/college graduate - - - - - - -
Post baccalaureate - - - - - - -
Not stated - - - - - - -
Continued
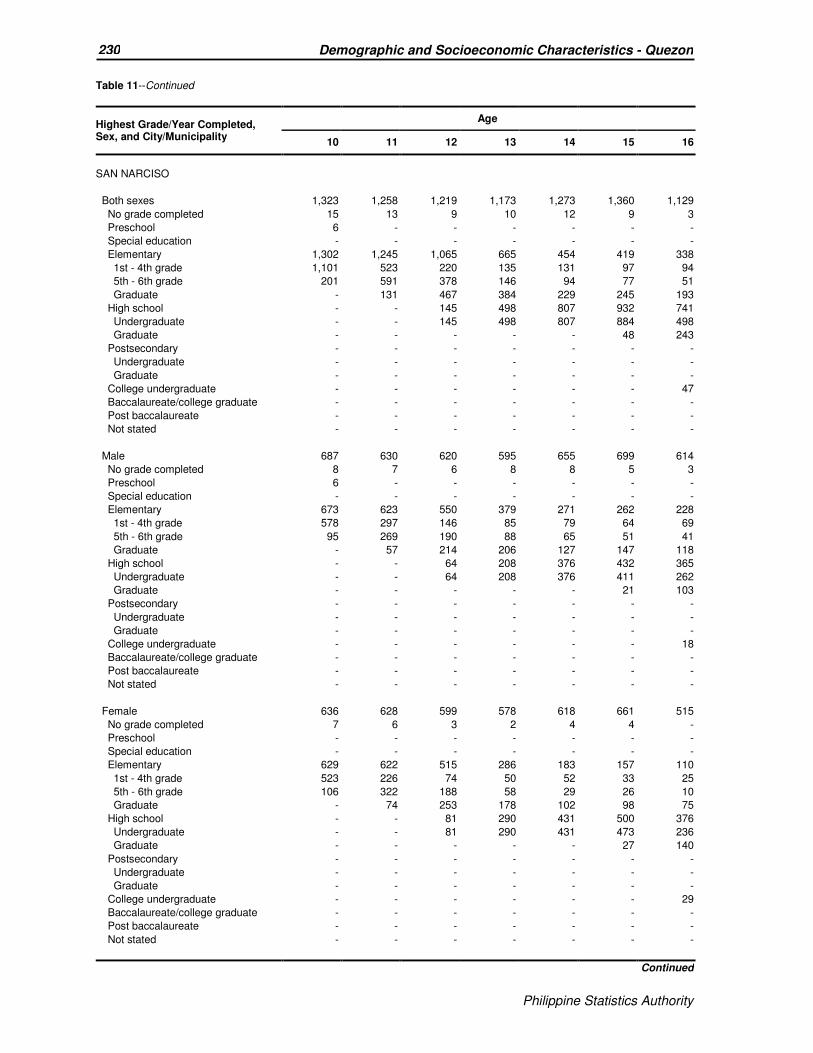
Philippine Statistics Authority
230 Demographic and Socioeconomic Characteristics - Quezon
Philippine Statistics Authority
Table 11--Continued
Highest Grade/Year Completed, Sex, and City/Municipality
Age
10 11 12 13 14 15 16
SAN NARCISO
Both sexes 1,323 1,258 1,219 1,173 1,273 1,360 1,129
No grade completed 15 13 9 10 12 9 3
Preschool 6 - - - - - -
Special education - - - - - - -
Elementary 1,302 1,245 1,065 665 454 419 338
1st - 4th grade 1,101 523 220 135 131 97 94
5th - 6th grade 201 591 378 146 94 77 51
Graduate - 131 467 384 229 245 193
High school - - 145 498 807 932 741
Undergraduate - - 145 498 807 884 498
Graduate - - - - - 48 243
Postsecondary - - - - - - -
Undergraduate - - - - - - -
Graduate - - - - - - -
College undergraduate - - - - - - 47
Baccalaureate/college graduate - - - - - - -
Post baccalaureate - - - - - - -
Not stated - - - - - - -
Male 687 630 620 595 655 699 614
No grade completed 8 7 6 8 8 5 3
Preschool 6 - - - - - -
Special education - - - - - - -
Elementary 673 623 550 379 271 262 228
1st - 4th grade 578 297 146 85 79 64 69
5th - 6th grade 95 269 190 88 65 51 41
Graduate - 57 214 206 127 147 118
High school - - 64 208 376 432 365
Undergraduate - - 64 208 376 411 262
Graduate - - - - - 21 103
Postsecondary - - - - - - -
Undergraduate - - - - - - -
Graduate - - - - - - -
College undergraduate - - - - - - 18
Baccalaureate/college graduate - - - - - - -
Post baccalaureate - - - - - - -
Not stated - - - - - - -
Female 636 628 599 578 618 661 515
No grade completed 7 6 3 2 4 4 -
Preschool - - - - - - -
Special education - - - - - - -
Elementary 629 622 515 286 183 157 110
1st - 4th grade 523 226 74 50 52 33 25
5th - 6th grade 106 322 188 58 29 26 10
Graduate - 74 253 178 102 98 75
High school - - 81 290 431 500 376
Undergraduate - - 81 290 431 473 236
Graduate - - - - - 27 140
Postsecondary - - - - - - -
Undergraduate - - - - - - -
Graduate - - - - - - -
College undergraduate - - - - - - 29
Baccalaureate/college graduate - - - - - - -
Post baccalaureate - - - - - - -
Not stated - - - - - - -
Continued
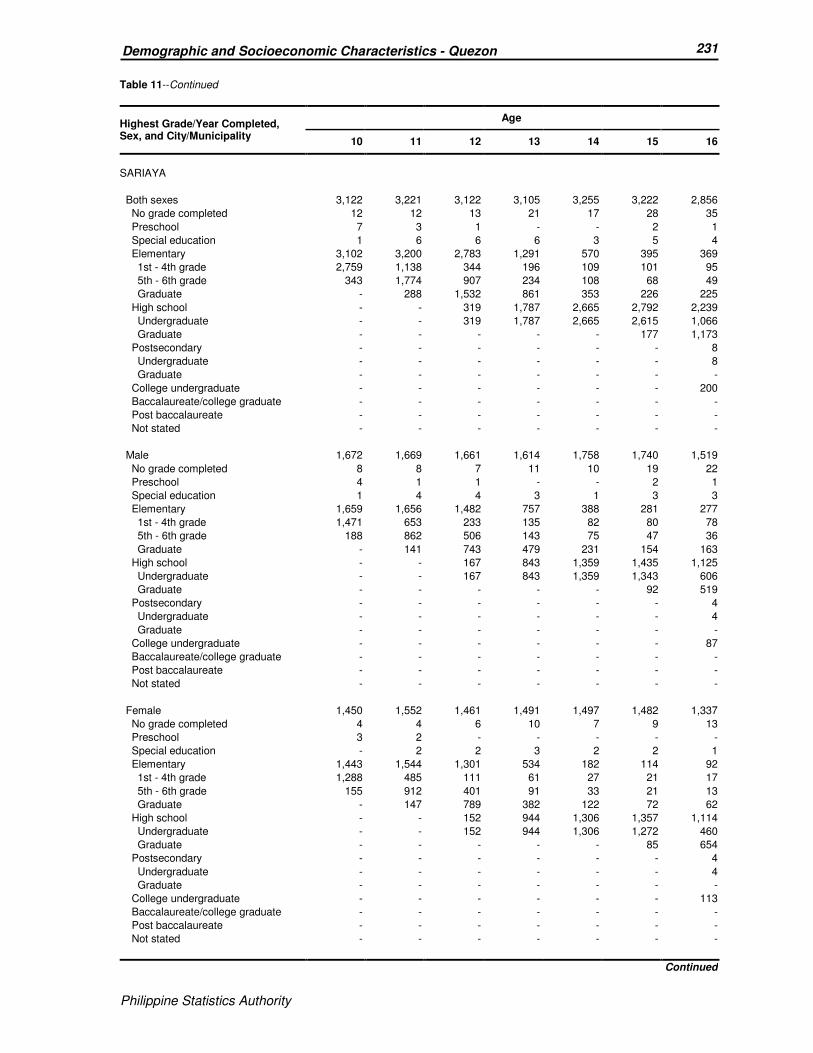
Philippine Statistics Authority
231 Demographic and Socioeconomic Characteristics - Quezon
Philippine Statistics Authority
Table 11--Continued
Highest Grade/Year Completed, Sex, and City/Municipality
Age
10 11 12 13 14 15 16
SARIAYA
Both sexes 3,122 3,221 3,122 3,105 3,255 3,222 2,856
No grade completed 12 12 13 21 17 28 35
Preschool 7 3 1 - - 2 1
Special education 1 6 6 6 3 5 4
Elementary 3,102 3,200 2,783 1,291 570 395 369
1st - 4th grade 2,759 1,138 344 196 109 101 95
5th - 6th grade 343 1,774 907 234 108 68 49
Graduate - 288 1,532 861 353 226 225
High school - - 319 1,787 2,665 2,792 2,239
Undergraduate - - 319 1,787 2,665 2,615 1,066
Graduate - - - - - 177 1,173
Postsecondary - - - - - - 8
Undergraduate - - - - - - 8
Graduate - - - - - - -
College undergraduate - - - - - - 200
Baccalaureate/college graduate - - - - - - -
Post baccalaureate - - - - - - -
Not stated - - - - - - -
Male 1,672 1,669 1,661 1,614 1,758 1,740 1,519
No grade completed 8 8 7 11 10 19 22
Preschool 4 1 1 - - 2 1
Special education 1 4 4 3 1 3 3
Elementary 1,659 1,656 1,482 757 388 281 277
1st - 4th grade 1,471 653 233 135 82 80 78
5th - 6th grade 188 862 506 143 75 47 36
Graduate - 141 743 479 231 154 163
High school - - 167 843 1,359 1,435 1,125
Undergraduate - - 167 843 1,359 1,343 606
Graduate - - - - - 92 519
Postsecondary - - - - - - 4
Undergraduate - - - - - - 4
Graduate - - - - - - -
College undergraduate - - - - - - 87
Baccalaureate/college graduate - - - - - - -
Post baccalaureate - - - - - - -
Not stated - - - - - - -
Female 1,450 1,552 1,461 1,491 1,497 1,482 1,337
No grade completed 4 4 6 10 7 9 13
Preschool 3 2 - - - - -
Special education - 2 2 3 2 2 1
Elementary 1,443 1,544 1,301 534 182 114 92
1st - 4th grade 1,288 485 111 61 27 21 17
5th - 6th grade 155 912 401 91 33 21 13
Graduate - 147 789 382 122 72 62
High school - - 152 944 1,306 1,357 1,114
Undergraduate - - 152 944 1,306 1,272 460
Graduate - - - - - 85 654
Postsecondary - - - - - - 4
Undergraduate - - - - - - 4
Graduate - - - - - - -
College undergraduate - - - - - - 113
Baccalaureate/college graduate - - - - - - -
Post baccalaureate - - - - - - -
Not stated - - - - - - -
Continued

Philippine Statistics Authority
232 Demographic and Socioeconomic Characteristics - Quezon
Philippine Statistics Authority
Table 11--Continued
Highest Grade/Year Completed, Sex, and City/Municipality
Age
10 11 12 13 14 15 16
TAGKAWAYAN
Both sexes 1,390 1,254 1,191 1,144 1,280 1,240 1,057
No grade completed 7 3 2 4 3 6 11
Preschool 2 1 - - - - -
Special education 1 - - - - 1 -
Elementary 1,380 1,250 1,012 561 268 192 103
1st - 4th grade 1,152 523 183 94 58 43 25
5th - 6th grade 228 571 348 141 60 50 23
Graduate - 156 481 326 150 99 55
High school - - 177 579 1,009 1,041 850
Undergraduate - - 177 579 1,009 935 507
Graduate - - - - - 106 343
Postsecondary - - - - - - -
Undergraduate - - - - - - -
Graduate - - - - - - -
College undergraduate - - - - - - 93
Baccalaureate/college graduate - - - - - - -
Post baccalaureate - - - - - - -
Not stated - - - - - - -
Male 727 689 624 607 631 658 530
No grade completed 6 2 - 2 1 4 5
Preschool 2 1 - - - - -
Special education - - - - - - -
Elementary 719 686 549 331 162 141 69
1st - 4th grade 624 316 127 68 46 33 15
5th - 6th grade 95 289 191 93 38 35 17
Graduate - 81 231 170 78 73 37
High school - - 75 274 468 513 424
Undergraduate - - 75 274 468 475 267
Graduate - - - - - 38 157
Postsecondary - - - - - - -
Undergraduate - - - - - - -
Graduate - - - - - - -
College undergraduate - - - - - - 32
Baccalaureate/college graduate - - - - - - -
Post baccalaureate - - - - - - -
Not stated - - - - - - -
Female 663 565 567 537 649 582 527
No grade completed 1 1 2 2 2 2 6
Preschool - - - - - - -
Special education 1 - - - - 1 -
Elementary 661 564 463 230 106 51 34
1st - 4th grade 528 207 56 26 12 10 10
5th - 6th grade 133 282 157 48 22 15 6
Graduate - 75 250 156 72 26 18
High school - - 102 305 541 528 426
Undergraduate - - 102 305 541 460 240
Graduate - - - - - 68 186
Postsecondary - - - - - - -
Undergraduate - - - - - - -
Graduate - - - - - - -
College undergraduate - - - - - - 61
Baccalaureate/college graduate - - - - - - -
Post baccalaureate - - - - - - -
Not stated - - - - - - -
Continued
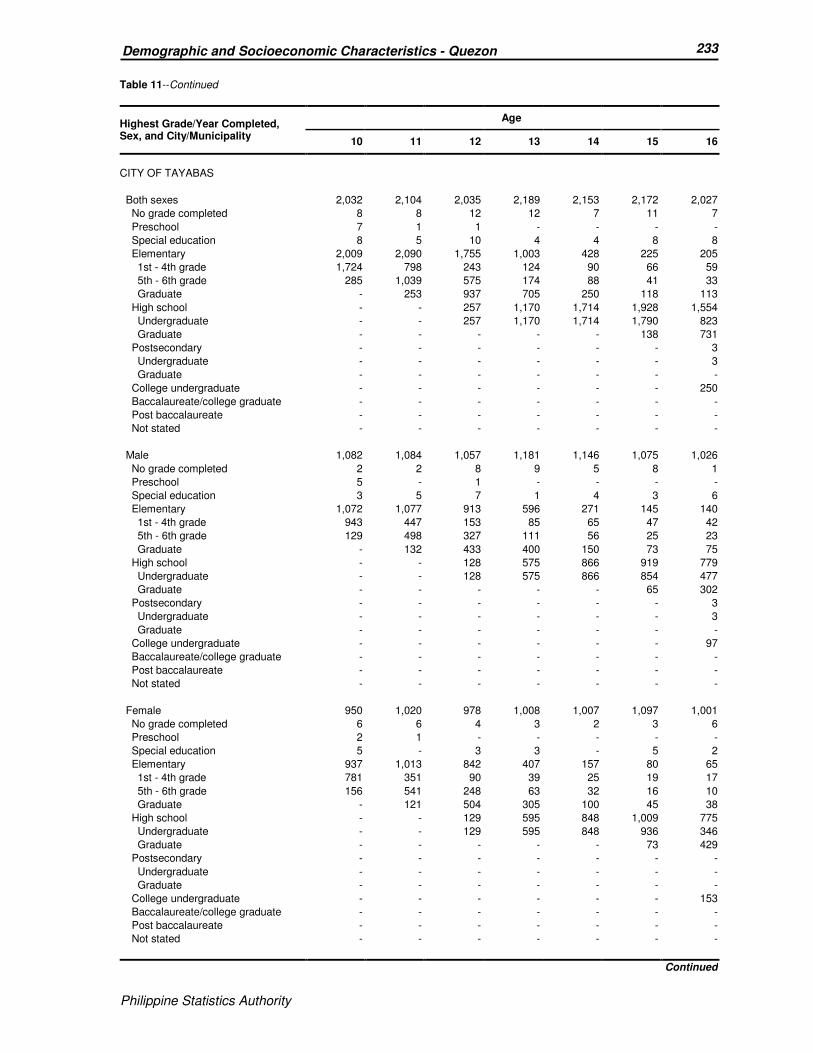
Philippine Statistics Authority
233 Demographic and Socioeconomic Characteristics - Quezon
Philippine Statistics Authority
Table 11--Continued
Highest Grade/Year Completed, Sex, and City/Municipality
Age
10 11 12 13 14 15 16
CITY OF TAYABAS
Both sexes 2,032 2,104 2,035 2,189 2,153 2,172 2,027
No grade completed 8 8 12 12 7 11 7
Preschool 7 1 1 - - - -
Special education 8 5 10 4 4 8 8
Elementary 2,009 2,090 1,755 1,003 428 225 205
1st - 4th grade 1,724 798 243 124 90 66 59
5th - 6th grade 285 1,039 575 174 88 41 33
Graduate - 253 937 705 250 118 113
High school - - 257 1,170 1,714 1,928 1,554
Undergraduate - - 257 1,170 1,714 1,790 823
Graduate - - - - - 138 731
Postsecondary - - - - - - 3
Undergraduate - - - - - - 3
Graduate - - - - - - -
College undergraduate - - - - - - 250
Baccalaureate/college graduate - - - - - - -
Post baccalaureate - - - - - - -
Not stated - - - - - - -
Male 1,082 1,084 1,057 1,181 1,146 1,075 1,026
No grade completed 2 2 8 9 5 8 1
Preschool 5 - 1 - - - -
Special education 3 5 7 1 4 3 6
Elementary 1,072 1,077 913 596 271 145 140
1st - 4th grade 943 447 153 85 65 47 42
5th - 6th grade 129 498 327 111 56 25 23
Graduate - 132 433 400 150 73 75
High school - - 128 575 866 919 779
Undergraduate - - 128 575 866 854 477
Graduate - - - - - 65 302
Postsecondary - - - - - - 3
Undergraduate - - - - - - 3
Graduate - - - - - - -
College undergraduate - - - - - - 97
Baccalaureate/college graduate - - - - - - -
Post baccalaureate - - - - - - -
Not stated - - - - - - -
Female 950 1,020 978 1,008 1,007 1,097 1,001
No grade completed 6 6 4 3 2 3 6
Preschool 2 1 - - - - -
Special education 5 - 3 3 - 5 2
Elementary 937 1,013 842 407 157 80 65
1st - 4th grade 781 351 90 39 25 19 17
5th - 6th grade 156 541 248 63 32 16 10
Graduate - 121 504 305 100 45 38
High school - - 129 595 848 1,009 775
Undergraduate - - 129 595 848 936 346
Graduate - - - - - 73 429
Postsecondary - - - - - - -
Undergraduate - - - - - - -
Graduate - - - - - - -
College undergraduate - - - - - - 153
Baccalaureate/college graduate - - - - - - -
Post baccalaureate - - - - - - -
Not stated - - - - - - -
Continued
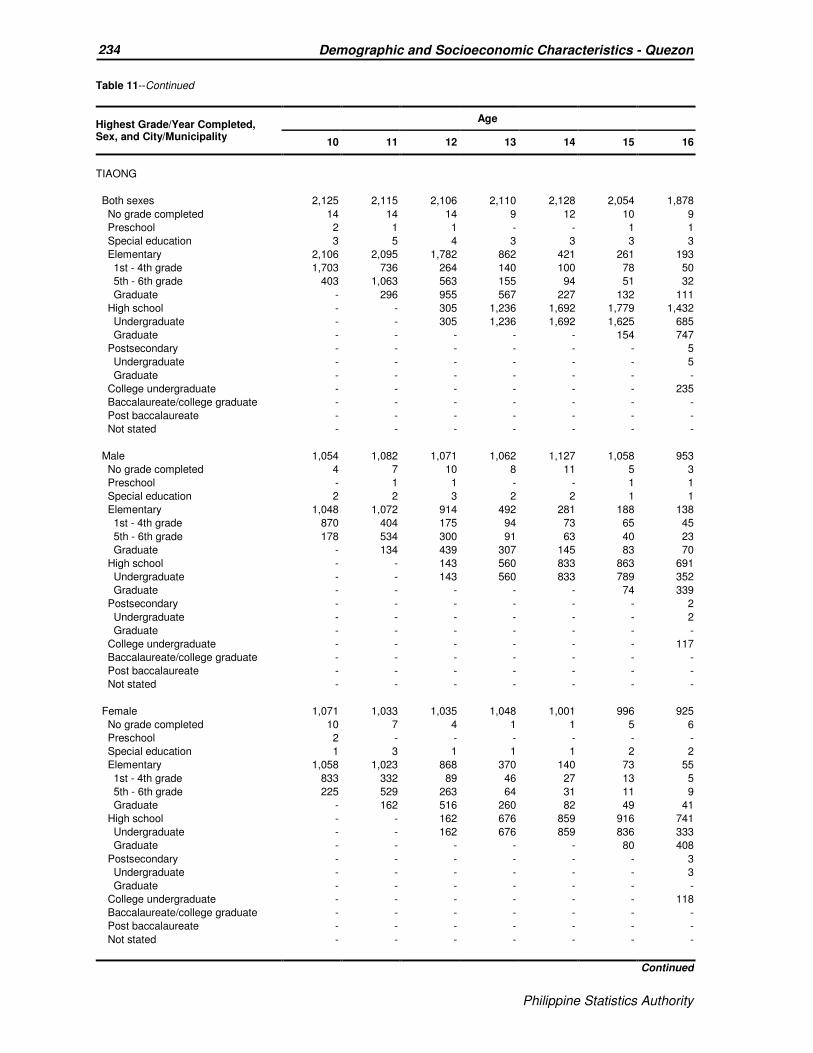
Philippine Statistics Authority
234 Demographic and Socioeconomic Characteristics - Quezon
Philippine Statistics Authority
Table 11--Continued
Highest Grade/Year Completed, Sex, and City/Municipality
Age
10 11 12 13 14 15 16
TIAONG
Both sexes 2,125 2,115 2,106 2,110 2,128 2,054 1,878
No grade completed 14 14 14 9 12 10 9
Preschool 2 1 1 - - 1 1
Special education 3 5 4 3 3 3 3
Elementary 2,106 2,095 1,782 862 421 261 193
1st - 4th grade 1,703 736 264 140 100 78 50
5th - 6th grade 403 1,063 563 155 94 51 32
Graduate - 296 955 567 227 132 111
High school - - 305 1,236 1,692 1,779 1,432
Undergraduate - - 305 1,236 1,692 1,625 685
Graduate - - - - - 154 747
Postsecondary - - - - - - 5
Undergraduate - - - - - - 5
Graduate - - - - - - -
College undergraduate - - - - - - 235
Baccalaureate/college graduate - - - - - - -
Post baccalaureate - - - - - - -
Not stated - - - - - - -
Male 1,054 1,082 1,071 1,062 1,127 1,058 953
No grade completed 4 7 10 8 11 5 3
Preschool - 1 1 - - 1 1
Special education 2 2 3 2 2 1 1
Elementary 1,048 1,072 914 492 281 188 138
1st - 4th grade 870 404 175 94 73 65 45
5th - 6th grade 178 534 300 91 63 40 23
Graduate - 134 439 307 145 83 70
High school - - 143 560 833 863 691
Undergraduate - - 143 560 833 789 352
Graduate - - - - - 74 339
Postsecondary - - - - - - 2
Undergraduate - - - - - - 2
Graduate - - - - - - -
College undergraduate - - - - - - 117
Baccalaureate/college graduate - - - - - - -
Post baccalaureate - - - - - - -
Not stated - - - - - - -
Female 1,071 1,033 1,035 1,048 1,001 996 925
No grade completed 10 7 4 1 1 5 6
Preschool 2 - - - - - -
Special education 1 3 1 1 1 2 2
Elementary 1,058 1,023 868 370 140 73 55
1st - 4th grade 833 332 89 46 27 13 5
5th - 6th grade 225 529 263 64 31 11 9
Graduate - 162 516 260 82 49 41
High school - - 162 676 859 916 741
Undergraduate - - 162 676 859 836 333
Graduate - - - - - 80 408
Postsecondary - - - - - - 3
Undergraduate - - - - - - 3
Graduate - - - - - - -
College undergraduate - - - - - - 118
Baccalaureate/college graduate - - - - - - -
Post baccalaureate - - - - - - -
Not stated - - - - - - -
Continued

Philippine Statistics Authority
235 Demographic and Socioeconomic Characteristics - Quezon
Philippine Statistics Authority
Table 11--Continued
Highest Grade/Year Completed, Sex, and City/Municipality
Age
10 11 12 13 14 15 16
UNISAN
Both sexes 526 548 561 470 551 575 495
No grade completed 1 3 5 2 3 4 6
Preschool 2 1 - - - - -
Special education 3 - 1 - - 1 -
Elementary 520 544 508 250 123 85 75
1st - 4th grade 451 207 90 49 34 30 25
5th - 6th grade 69 289 175 51 28 16 14
Graduate - 48 243 150 61 39 36
High school - - 47 218 425 485 375
Undergraduate - - 47 218 425 461 207
Graduate - - - - - 24 168
Postsecondary - - - - - - -
Undergraduate - - - - - - -
Graduate - - - - - - -
College undergraduate - - - - - - 39
Baccalaureate/college graduate - - - - - - -
Post baccalaureate - - - - - - -
Not stated - - - - - - -
Male 276 266 315 229 294 284 245
No grade completed - 3 5 2 2 2 3
Preschool - - - - - - -
Special education 1 - - - - - -
Elementary 275 263 287 128 77 59 51
1st - 4th grade 243 111 68 34 24 21 17
5th - 6th grade 32 131 99 26 15 11 12
Graduate - 21 120 68 38 27 22
High school - - 23 99 215 223 178
Undergraduate - - 23 99 215 210 103
Graduate - - - - - 13 75
Postsecondary - - - - - - -
Undergraduate - - - - - - -
Graduate - - - - - - -
College undergraduate - - - - - - 13
Baccalaureate/college graduate - - - - - - -
Post baccalaureate - - - - - - -
Not stated - - - - - - -
Female 250 282 246 241 257 291 250
No grade completed 1 - - - 1 2 3
Preschool 2 1 - - - - -
Special education 2 - 1 - - 1 -
Elementary 245 281 221 122 46 26 24
1st - 4th grade 208 96 22 15 10 9 8
5th - 6th grade 37 158 76 25 13 5 2
Graduate - 27 123 82 23 12 14
High school - - 24 119 210 262 197
Undergraduate - - 24 119 210 251 104
Graduate - - - - - 11 93
Postsecondary - - - - - - -
Undergraduate - - - - - - -
Graduate - - - - - - -
College undergraduate - - - - - - 26
Baccalaureate/college graduate - - - - - - -
Post baccalaureate - - - - - - -
Not stated - - - - - - -
Continued
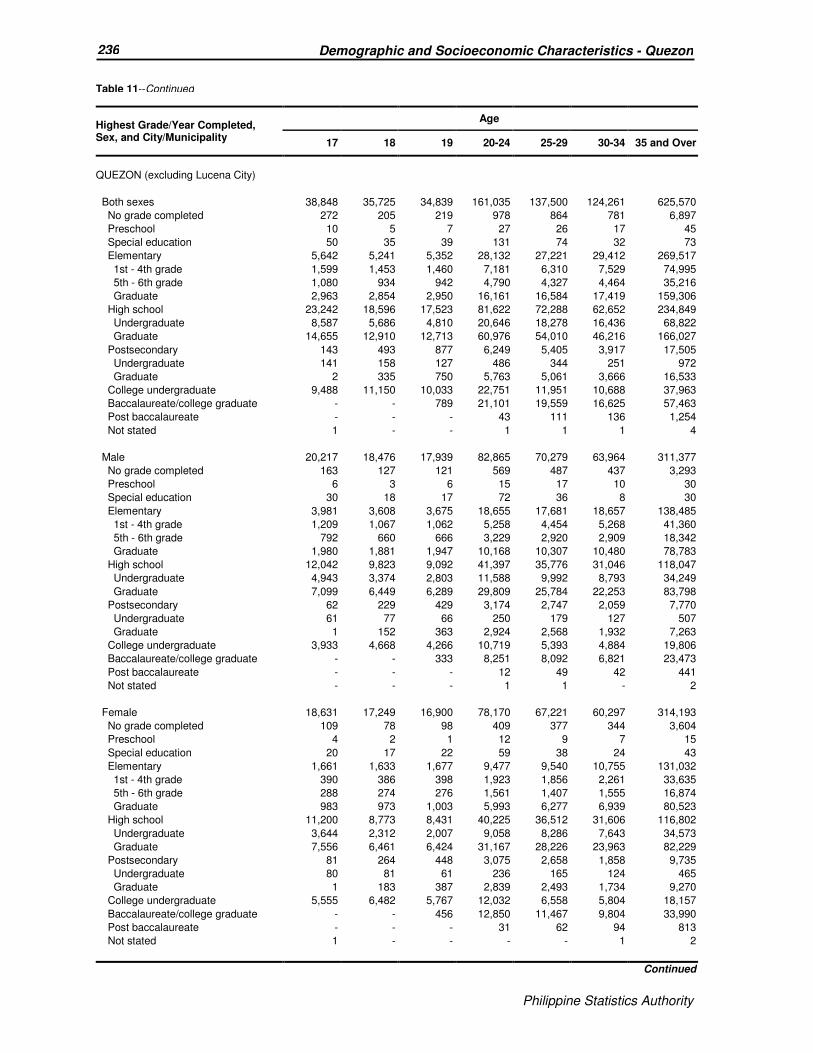
Philippine Statistics Authority
236 Demographic and Socioeconomic Characteristics - Quezon
Philippine Statistics Authority
Table 11--Continued
Highest Grade/Year Completed, Sex, and City/Municipality
Age
17 18 19 20-24 25-29 30-34 35 and Over
QUEZON (excluding Lucena City)
Both sexes 38,848 35,725 34,839 161,035 137,500 124,261 625,570
No grade completed 272 205 219 978 864 781 6,897
Preschool 10 5 7 27 26 17 45
Special education 50 35 39 131 74 32 73
Elementary 5,642 5,241 5,352 28,132 27,221 29,412 269,517
1st - 4th grade 1,599 1,453 1,460 7,181 6,310 7,529 74,995
5th - 6th grade 1,080 934 942 4,790 4,327 4,464 35,216
Graduate 2,963 2,854 2,950 16,161 16,584 17,419 159,306
High school 23,242 18,596 17,523 81,622 72,288 62,652 234,849
Undergraduate 8,587 5,686 4,810 20,646 18,278 16,436 68,822
Graduate 14,655 12,910 12,713 60,976 54,010 46,216 166,027
Postsecondary 143 493 877 6,249 5,405 3,917 17,505
Undergraduate 141 158 127 486 344 251 972
Graduate 2 335 750 5,763 5,061 3,666 16,533
College undergraduate 9,488 11,150 10,033 22,751 11,951 10,688 37,963
Baccalaureate/college graduate - - 789 21,101 19,559 16,625 57,463
Post baccalaureate - - - 43 111 136 1,254
Not stated 1 - - 1 1 1 4
Male 20,217 18,476 17,939 82,865 70,279 63,964 311,377
No grade completed 163 127 121 569 487 437 3,293
Preschool 6 3 6 15 17 10 30
Special education 30 18 17 72 36 8 30
Elementary 3,981 3,608 3,675 18,655 17,681 18,657 138,485
1st - 4th grade 1,209 1,067 1,062 5,258 4,454 5,268 41,360
5th - 6th grade 792 660 666 3,229 2,920 2,909 18,342
Graduate 1,980 1,881 1,947 10,168 10,307 10,480 78,783
High school 12,042 9,823 9,092 41,397 35,776 31,046 118,047
Undergraduate 4,943 3,374 2,803 11,588 9,992 8,793 34,249
Graduate 7,099 6,449 6,289 29,809 25,784 22,253 83,798
Postsecondary 62 229 429 3,174 2,747 2,059 7,770
Undergraduate 61 77 66 250 179 127 507
Graduate 1 152 363 2,924 2,568 1,932 7,263
College undergraduate 3,933 4,668 4,266 10,719 5,393 4,884 19,806
Baccalaureate/college graduate - - 333 8,251 8,092 6,821 23,473
Post baccalaureate - - - 12 49 42 441
Not stated - - - 1 1 - 2
Female 18,631 17,249 16,900 78,170 67,221 60,297 314,193
No grade completed 109 78 98 409 377 344 3,604
Preschool 4 2 1 12 9 7 15
Special education 20 17 22 59 38 24 43
Elementary 1,661 1,633 1,677 9,477 9,540 10,755 131,032
1st - 4th grade 390 386 398 1,923 1,856 2,261 33,635
5th - 6th grade 288 274 276 1,561 1,407 1,555 16,874
Graduate 983 973 1,003 5,993 6,277 6,939 80,523
High school 11,200 8,773 8,431 40,225 36,512 31,606 116,802
Undergraduate 3,644 2,312 2,007 9,058 8,286 7,643 34,573
Graduate 7,556 6,461 6,424 31,167 28,226 23,963 82,229
Postsecondary 81 264 448 3,075 2,658 1,858 9,735
Undergraduate 80 81 61 236 165 124 465
Graduate 1 183 387 2,839 2,493 1,734 9,270
College undergraduate 5,555 6,482 5,767 12,032 6,558 5,804 18,157
Baccalaureate/college graduate - - 456 12,850 11,467 9,804 33,990
Post baccalaureate - - - 31 62 94 813
Not stated 1 - - - - 1 2
Continued
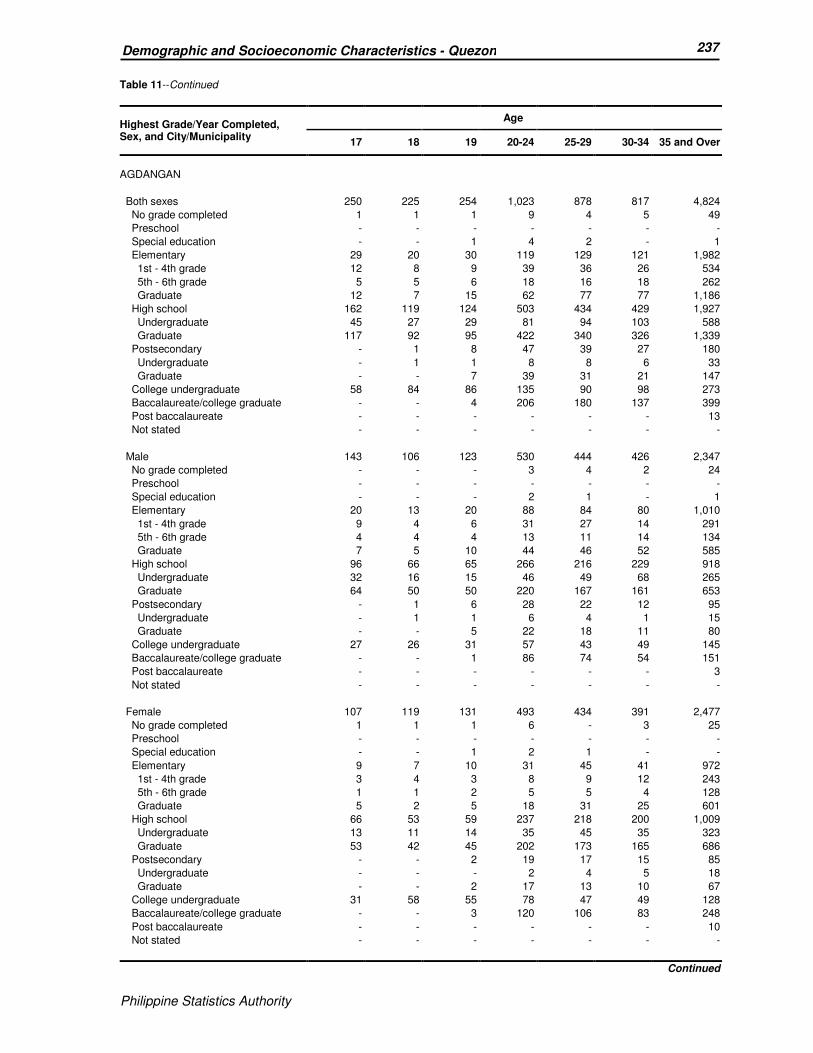
Philippine Statistics Authority
237 Demographic and Socioeconomic Characteristics - Quezon
Philippine Statistics Authority
Table 11--Continued
Highest Grade/Year Completed, Sex, and City/Municipality
Age
17 18 19 20-24 25-29 30-34 35 and Over
AGDANGAN
Both sexes 250 225 254 1,023 878 817 4,824
No grade completed 1 1 1 9 4 5 49
Preschool - - - - - - -
Special education - - 1 4 2 - 1
Elementary 29 20 30 119 129 121 1,982
1st - 4th grade 12 8 9 39 36 26 534
5th - 6th grade 5 5 6 18 16 18 262
Graduate 12 7 15 62 77 77 1,186
High school 162 119 124 503 434 429 1,927
Undergraduate 45 27 29 81 94 103 588
Graduate 117 92 95 422 340 326 1,339
Postsecondary - 1 8 47 39 27 180
Undergraduate - 1 1 8 8 6 33
Graduate - - 7 39 31 21 147
College undergraduate 58 84 86 135 90 98 273
Baccalaureate/college graduate - - 4 206 180 137 399
Post baccalaureate - - - - - - 13
Not stated - - - - - - -
Male 143 106 123 530 444 426 2,347
No grade completed - - - 3 4 2 24
Preschool - - - - - - -
Special education - - - 2 1 - 1
Elementary 20 13 20 88 84 80 1,010
1st - 4th grade 9 4 6 31 27 14 291
5th - 6th grade 4 4 4 13 11 14 134
Graduate 7 5 10 44 46 52 585
High school 96 66 65 266 216 229 918
Undergraduate 32 16 15 46 49 68 265
Graduate 64 50 50 220 167 161 653
Postsecondary - 1 6 28 22 12 95
Undergraduate - 1 1 6 4 1 15
Graduate - - 5 22 18 11 80
College undergraduate 27 26 31 57 43 49 145
Baccalaureate/college graduate - - 1 86 74 54 151
Post baccalaureate - - - - - - 3
Not stated - - - - - - -
Female 107 119 131 493 434 391 2,477
No grade completed 1 1 1 6 - 3 25
Preschool - - - - - - -
Special education - - 1 2 1 - -
Elementary 9 7 10 31 45 41 972
1st - 4th grade 3 4 3 8 9 12 243
5th - 6th grade 1 1 2 5 5 4 128
Graduate 5 2 5 18 31 25 601
High school 66 53 59 237 218 200 1,009
Undergraduate 13 11 14 35 45 35 323
Graduate 53 42 45 202 173 165 686
Postsecondary - - 2 19 17 15 85
Undergraduate - - - 2 4 5 18
Graduate - - 2 17 13 10 67
College undergraduate 31 58 55 78 47 49 128
Baccalaureate/college graduate - - 3 120 106 83 248
Post baccalaureate - - - - - - 10
Not stated - - - - - - -
Continued
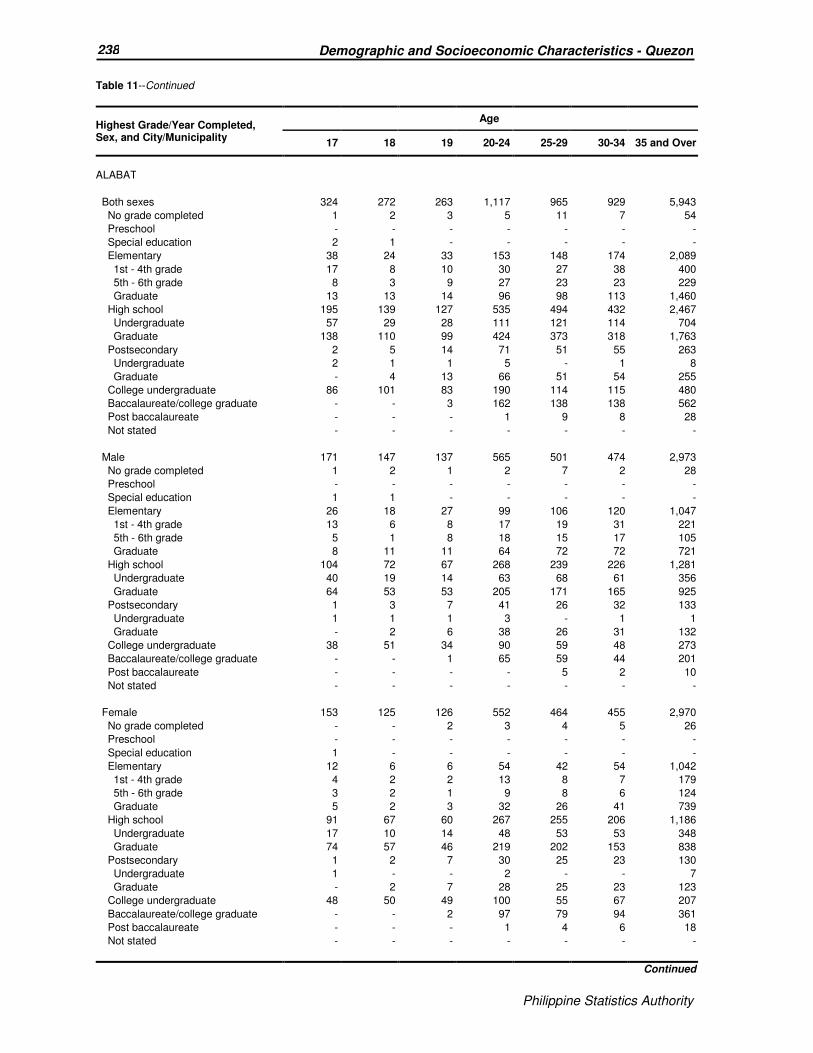
Philippine Statistics Authority
238 Demographic and Socioeconomic Characteristics - Quezon
Philippine Statistics Authority
Table 11--Continued
Highest Grade/Year Completed, Sex, and City/Municipality
Age
17 18 19 20-24 25-29 30-34 35 and Over
ALABAT
Both sexes 324 272 263 1,117 965 929 5,943
No grade completed 1 2 3 5 11 7 54
Preschool - - - - - - -
Special education 2 1 - - - - -
Elementary 38 24 33 153 148 174 2,089
1st - 4th grade 17 8 10 30 27 38 400
5th - 6th grade 8 3 9 27 23 23 229
Graduate 13 13 14 96 98 113 1,460
High school 195 139 127 535 494 432 2,467
Undergraduate 57 29 28 111 121 114 704
Graduate 138 110 99 424 373 318 1,763
Postsecondary 2 5 14 71 51 55 263
Undergraduate 2 1 1 5 - 1 8
Graduate - 4 13 66 51 54 255
College undergraduate 86 101 83 190 114 115 480
Baccalaureate/college graduate - - 3 162 138 138 562
Post baccalaureate - - - 1 9 8 28
Not stated - - - - - - -
Male 171 147 137 565 501 474 2,973
No grade completed 1 2 1 2 7 2 28
Preschool - - - - - - -
Special education 1 1 - - - - -
Elementary 26 18 27 99 106 120 1,047
1st - 4th grade 13 6 8 17 19 31 221
5th - 6th grade 5 1 8 18 15 17 105
Graduate 8 11 11 64 72 72 721
High school 104 72 67 268 239 226 1,281
Undergraduate 40 19 14 63 68 61 356
Graduate 64 53 53 205 171 165 925
Postsecondary 1 3 7 41 26 32 133
Undergraduate 1 1 1 3 - 1 1
Graduate - 2 6 38 26 31 132
College undergraduate 38 51 34 90 59 48 273
Baccalaureate/college graduate - - 1 65 59 44 201
Post baccalaureate - - - - 5 2 10
Not stated - - - - - - -
Female 153 125 126 552 464 455 2,970
No grade completed - - 2 3 4 5 26
Preschool - - - - - - -
Special education 1 - - - - - -
Elementary 12 6 6 54 42 54 1,042
1st - 4th grade 4 2 2 13 8 7 179
5th - 6th grade 3 2 1 9 8 6 124
Graduate 5 2 3 32 26 41 739
High school 91 67 60 267 255 206 1,186
Undergraduate 17 10 14 48 53 53 348
Graduate 74 57 46 219 202 153 838
Postsecondary 1 2 7 30 25 23 130
Undergraduate 1 - - 2 - - 7
Graduate - 2 7 28 25 23 123
College undergraduate 48 50 49 100 55 67 207
Baccalaureate/college graduate - - 2 97 79 94 361
Post baccalaureate - - - 1 4 6 18
Not stated - - - - - - -
Continued

Philippine Statistics Authority
239 Demographic and Socioeconomic Characteristics - Quezon
Philippine Statistics Authority
Table 11--Continued
Highest Grade/Year Completed, Sex, and City/Municipality
Age
17 18 19 20-24 25-29 30-34 35 and Over
ATIMONAN
Both sexes 1,247 1,185 1,191 5,311 4,845 4,361 23,909
No grade completed 7 6 4 32 26 19 174
Preschool - - - - - - 1
Special education - 2 1 4 4 1 1
Elementary 163 133 143 657 693 709 7,555
1st - 4th grade 52 31 39 164 137 150 1,439
5th - 6th grade 33 19 25 87 84 114 832
Graduate 78 83 79 406 472 445 5,284
High school 729 648 565 2,730 2,460 2,182 10,561
Undergraduate 268 199 138 634 588 509 2,793
Graduate 461 449 427 2,096 1,872 1,673 7,768
Postsecondary 8 16 64 320 328 234 1,183
Undergraduate 8 7 8 16 11 6 33
Graduate - 9 56 304 317 228 1,150
College undergraduate 340 380 379 797 525 458 1,710
Baccalaureate/college graduate - - 35 770 808 746 2,684
Post baccalaureate - - - 1 1 12 40
Not stated - - - - - - -
Male 647 627 602 2,670 2,484 2,250 11,798
No grade completed 6 4 3 16 11 11 88
Preschool - - - - - - 1
Special education - 2 1 2 2 - 1
Elementary 117 88 99 431 463 464 3,764
1st - 4th grade 36 20 28 118 101 109 805
5th - 6th grade 28 12 18 61 53 81 444
Graduate 53 56 53 252 309 274 2,515
High school 395 367 298 1,393 1,263 1,152 5,442
Undergraduate 151 118 81 354 339 297 1,380
Graduate 244 249 217 1,039 924 855 4,062
Postsecondary 4 5 21 183 178 135 631
Undergraduate 4 2 3 8 2 3 19
Graduate - 3 18 175 176 132 612
College undergraduate 125 161 164 353 230 191 878
Baccalaureate/college graduate - - 16 291 337 293 981
Post baccalaureate - - - 1 - 4 12
Not stated - - - - - - -
Female 600 558 589 2,641 2,361 2,111 12,111
No grade completed 1 2 1 16 15 8 86
Preschool - - - - - - -
Special education - - - 2 2 1 -
Elementary 46 45 44 226 230 245 3,791
1st - 4th grade 16 11 11 46 36 41 634
5th - 6th grade 5 7 7 26 31 33 388
Graduate 25 27 26 154 163 171 2,769
High school 334 281 267 1,337 1,197 1,030 5,119
Undergraduate 117 81 57 280 249 212 1,413
Graduate 217 200 210 1,057 948 818 3,706
Postsecondary 4 11 43 137 150 99 552
Undergraduate 4 5 5 8 9 3 14
Graduate - 6 38 129 141 96 538
College undergraduate 215 219 215 444 295 267 832
Baccalaureate/college graduate - - 19 479 471 453 1,703
Post baccalaureate - - - - 1 8 28
Not stated - - - - - - -
Continued
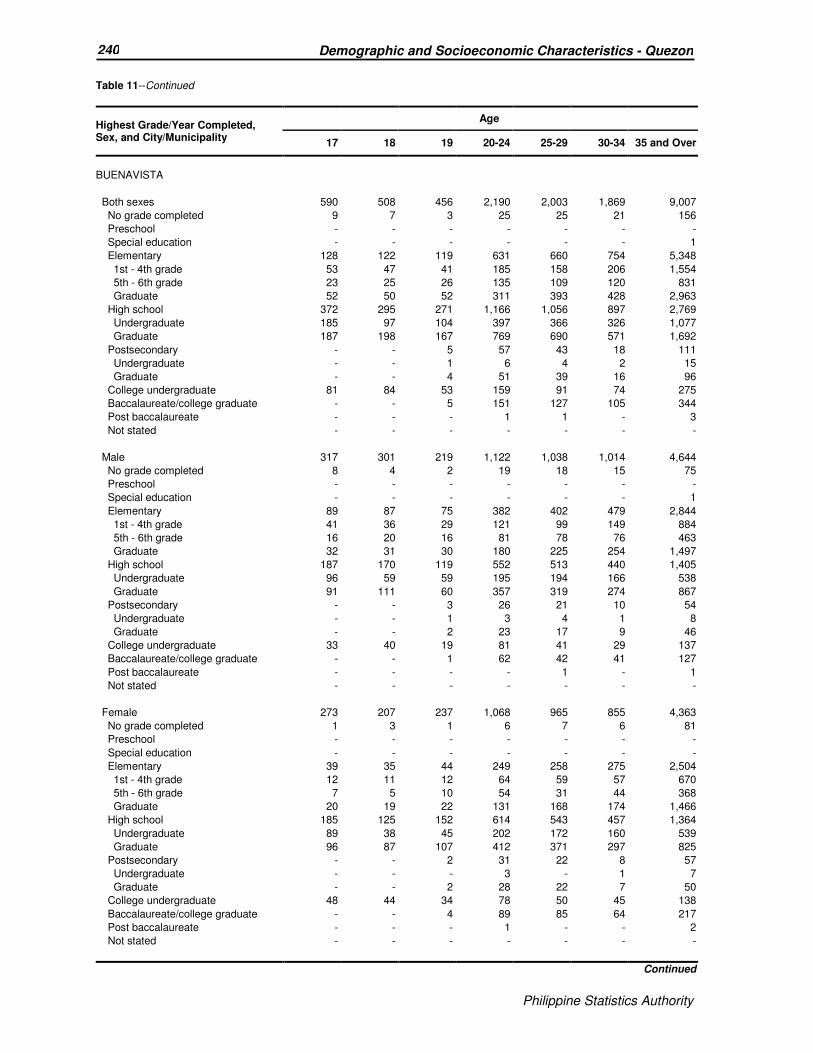
Philippine Statistics Authority
240 Demographic and Socioeconomic Characteristics - Quezon
Philippine Statistics Authority
Table 11--Continued
Highest Grade/Year Completed, Sex, and City/Municipality
Age
17 18 19 20-24 25-29 30-34 35 and Over
BUENAVISTA
Both sexes 590 508 456 2,190 2,003 1,869 9,007
No grade completed 9 7 3 25 25 21 156
Preschool - - - - - - -
Special education - - - - - - 1
Elementary 128 122 119 631 660 754 5,348
1st - 4th grade 53 47 41 185 158 206 1,554
5th - 6th grade 23 25 26 135 109 120 831
Graduate 52 50 52 311 393 428 2,963
High school 372 295 271 1,166 1,056 897 2,769
Undergraduate 185 97 104 397 366 326 1,077
Graduate 187 198 167 769 690 571 1,692
Postsecondary - - 5 57 43 18 111
Undergraduate - - 1 6 4 2 15
Graduate - - 4 51 39 16 96
College undergraduate 81 84 53 159 91 74 275
Baccalaureate/college graduate - - 5 151 127 105 344
Post baccalaureate - - - 1 1 - 3
Not stated - - - - - - -
Male 317 301 219 1,122 1,038 1,014 4,644
No grade completed 8 4 2 19 18 15 75
Preschool - - - - - - -
Special education - - - - - - 1
Elementary 89 87 75 382 402 479 2,844
1st - 4th grade 41 36 29 121 99 149 884
5th - 6th grade 16 20 16 81 78 76 463
Graduate 32 31 30 180 225 254 1,497
High school 187 170 119 552 513 440 1,405
Undergraduate 96 59 59 195 194 166 538
Graduate 91 111 60 357 319 274 867
Postsecondary - - 3 26 21 10 54
Undergraduate - - 1 3 4 1 8
Graduate - - 2 23 17 9 46
College undergraduate 33 40 19 81 41 29 137
Baccalaureate/college graduate - - 1 62 42 41 127
Post baccalaureate - - - - 1 - 1
Not stated - - - - - - -
Female 273 207 237 1,068 965 855 4,363
No grade completed 1 3 1 6 7 6 81
Preschool - - - - - - -
Special education - - - - - - -
Elementary 39 35 44 249 258 275 2,504
1st - 4th grade 12 11 12 64 59 57 670
5th - 6th grade 7 5 10 54 31 44 368
Graduate 20 19 22 131 168 174 1,466
High school 185 125 152 614 543 457 1,364
Undergraduate 89 38 45 202 172 160 539
Graduate 96 87 107 412 371 297 825
Postsecondary - - 2 31 22 8 57
Undergraduate - - - 3 - 1 7
Graduate - - 2 28 22 7 50
College undergraduate 48 44 34 78 50 45 138
Baccalaureate/college graduate - - 4 89 85 64 217
Post baccalaureate - - - 1 - - 2
Not stated - - - - - - -
Continued
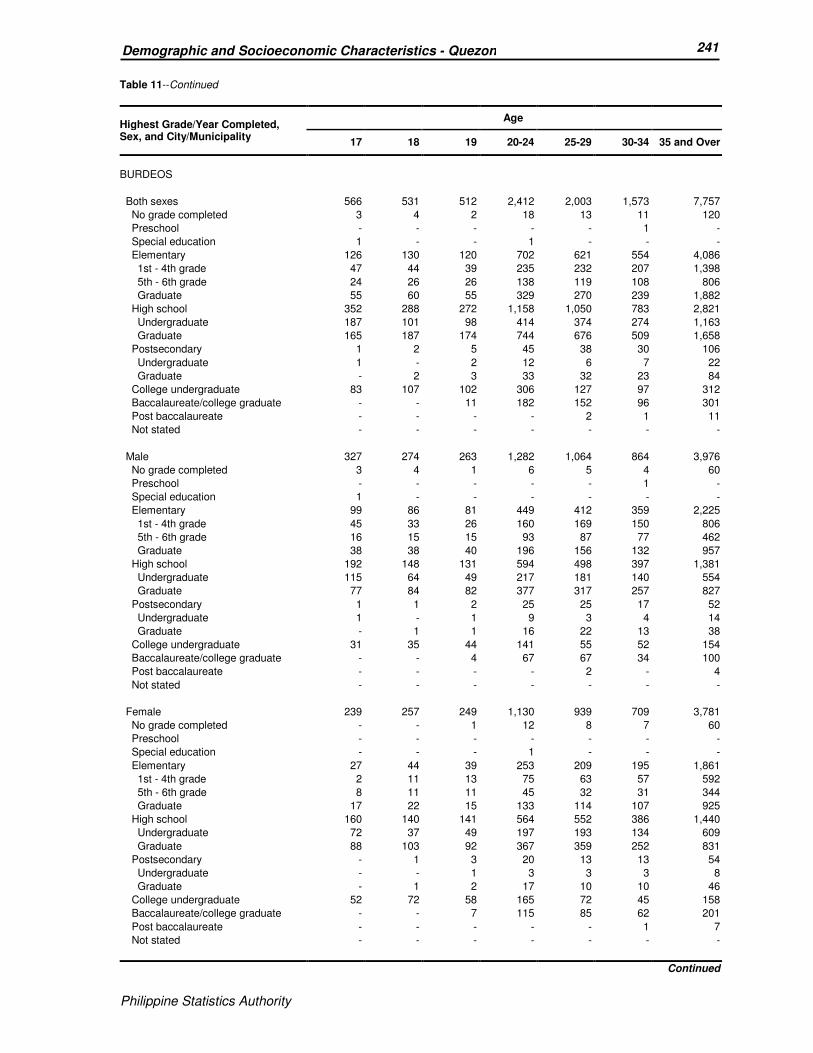
Philippine Statistics Authority
241 Demographic and Socioeconomic Characteristics - Quezon
Philippine Statistics Authority
Table 11--Continued
Highest Grade/Year Completed, Sex, and City/Municipality
Age
17 18 19 20-24 25-29 30-34 35 and Over
BURDEOS
Both sexes 566 531 512 2,412 2,003 1,573 7,757
No grade completed 3 4 2 18 13 11 120
Preschool - - - - - 1 -
Special education 1 - - 1 - - -
Elementary 126 130 120 702 621 554 4,086
1st - 4th grade 47 44 39 235 232 207 1,398
5th - 6th grade 24 26 26 138 119 108 806
Graduate 55 60 55 329 270 239 1,882
High school 352 288 272 1,158 1,050 783 2,821
Undergraduate 187 101 98 414 374 274 1,163
Graduate 165 187 174 744 676 509 1,658
Postsecondary 1 2 5 45 38 30 106
Undergraduate 1 - 2 12 6 7 22
Graduate - 2 3 33 32 23 84
College undergraduate 83 107 102 306 127 97 312
Baccalaureate/college graduate - - 11 182 152 96 301
Post baccalaureate - - - - 2 1 11
Not stated - - - - - - -
Male 327 274 263 1,282 1,064 864 3,976
No grade completed 3 4 1 6 5 4 60
Preschool - - - - - 1 -
Special education 1 - - - - - -
Elementary 99 86 81 449 412 359 2,225
1st - 4th grade 45 33 26 160 169 150 806
5th - 6th grade 16 15 15 93 87 77 462
Graduate 38 38 40 196 156 132 957
High school 192 148 131 594 498 397 1,381
Undergraduate 115 64 49 217 181 140 554
Graduate 77 84 82 377 317 257 827
Postsecondary 1 1 2 25 25 17 52
Undergraduate 1 - 1 9 3 4 14
Graduate - 1 1 16 22 13 38
College undergraduate 31 35 44 141 55 52 154
Baccalaureate/college graduate - - 4 67 67 34 100
Post baccalaureate - - - - 2 - 4
Not stated - - - - - - -
Female 239 257 249 1,130 939 709 3,781
No grade completed - - 1 12 8 7 60
Preschool - - - - - - -
Special education - - - 1 - - -
Elementary 27 44 39 253 209 195 1,861
1st - 4th grade 2 11 13 75 63 57 592
5th - 6th grade 8 11 11 45 32 31 344
Graduate 17 22 15 133 114 107 925
High school 160 140 141 564 552 386 1,440
Undergraduate 72 37 49 197 193 134 609
Graduate 88 103 92 367 359 252 831
Postsecondary - 1 3 20 13 13 54
Undergraduate - - 1 3 3 3 8
Graduate - 1 2 17 10 10 46
College undergraduate 52 72 58 165 72 45 158
Baccalaureate/college graduate - - 7 115 85 62 201
Post baccalaureate - - - - - 1 7
Not stated - - - - - - -
Continued

Philippine Statistics Authority
242 Demographic and Socioeconomic Characteristics - Quezon
Philippine Statistics Authority
Table 11--Continued
Highest Grade/Year Completed, Sex, and City/Municipality
Age
17 18 19 20-24 25-29 30-34 35 and Over
CALAUAG
Both sexes 1,662 1,371 1,398 6,162 5,282 4,464 24,422
No grade completed 9 13 6 21 36 31 202
Preschool - - - 4 1 - -
Special education - - - 2 1 - -
Elementary 225 188 227 1,081 1,091 1,211 11,309
1st - 4th grade 63 37 50 217 164 225 2,128
5th - 6th grade 42 35 43 177 155 128 1,128
Graduate 120 116 134 687 772 858 8,053
High school 1,075 783 779 3,547 3,041 2,357 9,333
Undergraduate 416 243 200 872 823 662 2,922
Graduate 659 540 579 2,675 2,218 1,695 6,411
Postsecondary 11 21 48 232 220 101 537
Undergraduate 11 7 7 23 10 7 28
Graduate - 14 41 209 210 94 509
College undergraduate 342 366 318 697 395 313 1,188
Baccalaureate/college graduate - - 20 578 496 449 1,809
Post baccalaureate - - - - 1 2 44
Not stated - - - - - - -
Male 886 732 720 3,131 2,657 2,321 12,173
No grade completed 4 8 - 10 12 16 87
Preschool - - - 1 1 - -
Special education - - - - 1 - -
Elementary 154 128 163 735 709 782 5,911
1st - 4th grade 47 31 36 164 127 175 1,218
5th - 6th grade 29 24 35 122 98 88 588
Graduate 78 73 92 449 484 519 4,105
High school 565 432 400 1,761 1,462 1,151 4,604
Undergraduate 255 135 109 476 422 328 1,383
Graduate 310 297 291 1,285 1,040 823 3,221
Postsecondary 4 8 27 116 114 63 231
Undergraduate 4 2 4 10 6 4 14
Graduate - 6 23 106 108 59 217
College undergraduate 159 156 122 298 168 127 605
Baccalaureate/college graduate - - 8 210 190 181 716
Post baccalaureate - - - - - 1 19
Not stated - - - - - - -
Female 776 639 678 3,031 2,625 2,143 12,249
No grade completed 5 5 6 11 24 15 115
Preschool - - - 3 - - -
Special education - - - 2 - - -
Elementary 71 60 64 346 382 429 5,398
1st - 4th grade 16 6 14 53 37 50 910
5th - 6th grade 13 11 8 55 57 40 540
Graduate 42 43 42 238 288 339 3,948
High school 510 351 379 1,786 1,579 1,206 4,729
Undergraduate 161 108 91 396 401 334 1,539
Graduate 349 243 288 1,390 1,178 872 3,190
Postsecondary 7 13 21 116 106 38 306
Undergraduate 7 5 3 13 4 3 14
Graduate - 8 18 103 102 35 292
College undergraduate 183 210 196 399 227 186 583
Baccalaureate/college graduate - - 12 368 306 268 1,093
Post baccalaureate - - - - 1 1 25
Not stated - - - - - - -
Continued
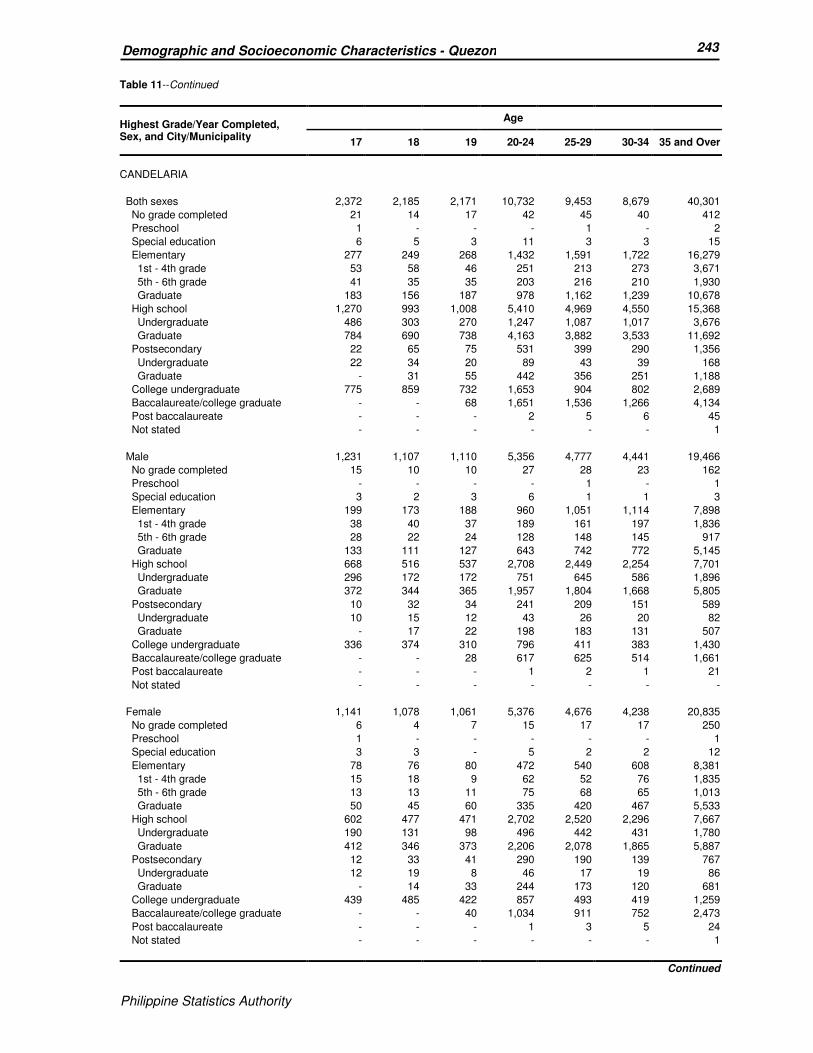
Philippine Statistics Authority
243 Demographic and Socioeconomic Characteristics - Quezon
Philippine Statistics Authority
Table 11--Continued
Highest Grade/Year Completed, Sex, and City/Municipality
Age
17 18 19 20-24 25-29 30-34 35 and Over
CANDELARIA
Both sexes 2,372 2,185 2,171 10,732 9,453 8,679 40,301
No grade completed 21 14 17 42 45 40 412
Preschool 1 - - - 1 - 2
Special education 6 5 3 11 3 3 15
Elementary 277 249 268 1,432 1,591 1,722 16,279
1st - 4th grade 53 58 46 251 213 273 3,671
5th - 6th grade 41 35 35 203 216 210 1,930
Graduate 183 156 187 978 1,162 1,239 10,678
High school 1,270 993 1,008 5,410 4,969 4,550 15,368
Undergraduate 486 303 270 1,247 1,087 1,017 3,676
Graduate 784 690 738 4,163 3,882 3,533 11,692
Postsecondary 22 65 75 531 399 290 1,356
Undergraduate 22 34 20 89 43 39 168
Graduate - 31 55 442 356 251 1,188
College undergraduate 775 859 732 1,653 904 802 2,689
Baccalaureate/college graduate - - 68 1,651 1,536 1,266 4,134
Post baccalaureate - - - 2 5 6 45
Not stated - - - - - - 1
Male 1,231 1,107 1,110 5,356 4,777 4,441 19,466
No grade completed 15 10 10 27 28 23 162
Preschool - - - - 1 - 1
Special education 3 2 3 6 1 1 3
Elementary 199 173 188 960 1,051 1,114 7,898
1st - 4th grade 38 40 37 189 161 197 1,836
5th - 6th grade 28 22 24 128 148 145 917
Graduate 133 111 127 643 742 772 5,145
High school 668 516 537 2,708 2,449 2,254 7,701
Undergraduate 296 172 172 751 645 586 1,896
Graduate 372 344 365 1,957 1,804 1,668 5,805
Postsecondary 10 32 34 241 209 151 589
Undergraduate 10 15 12 43 26 20 82
Graduate - 17 22 198 183 131 507
College undergraduate 336 374 310 796 411 383 1,430
Baccalaureate/college graduate - - 28 617 625 514 1,661
Post baccalaureate - - - 1 2 1 21
Not stated - - - - - - -
Female 1,141 1,078 1,061 5,376 4,676 4,238 20,835
No grade completed 6 4 7 15 17 17 250
Preschool 1 - - - - - 1
Special education 3 3 - 5 2 2 12
Elementary 78 76 80 472 540 608 8,381
1st - 4th grade 15 18 9 62 52 76 1,835
5th - 6th grade 13 13 11 75 68 65 1,013
Graduate 50 45 60 335 420 467 5,533
High school 602 477 471 2,702 2,520 2,296 7,667
Undergraduate 190 131 98 496 442 431 1,780
Graduate 412 346 373 2,206 2,078 1,865 5,887
Postsecondary 12 33 41 290 190 139 767
Undergraduate 12 19 8 46 17 19 86
Graduate - 14 33 244 173 120 681
College undergraduate 439 485 422 857 493 419 1,259
Baccalaureate/college graduate - - 40 1,034 911 752 2,473
Post baccalaureate - - - 1 3 5 24
Not stated - - - - - - 1
Continued
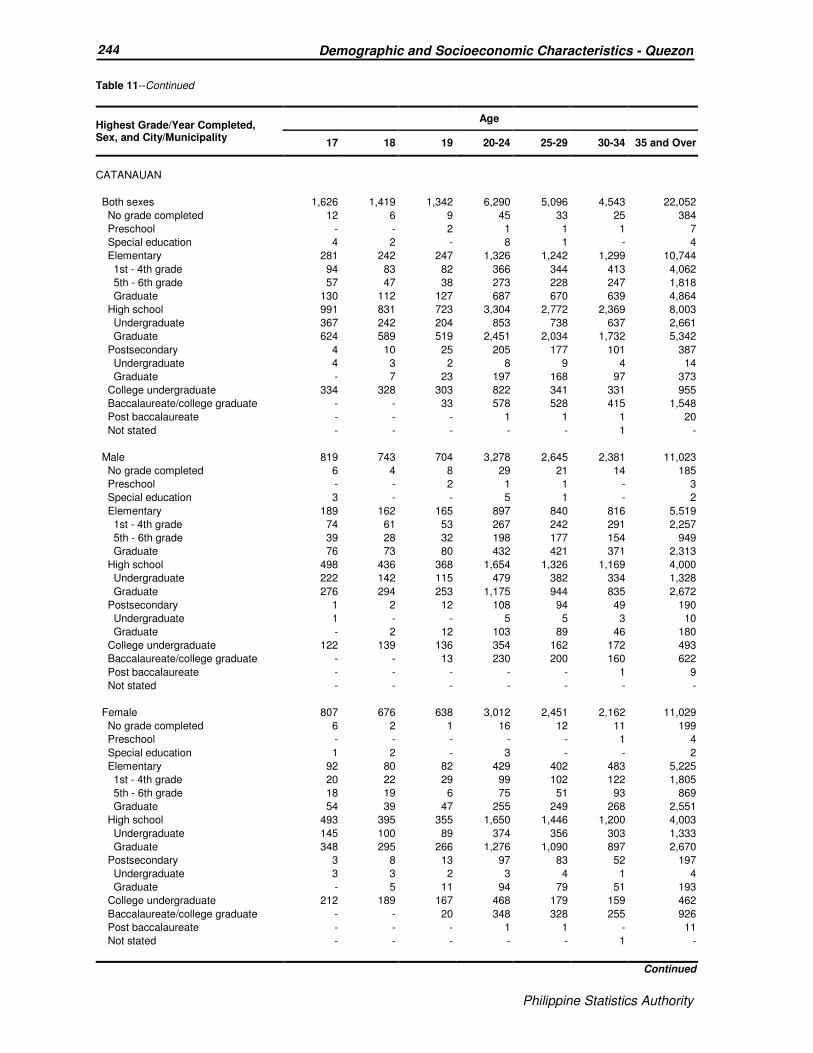
Philippine Statistics Authority
244 Demographic and Socioeconomic Characteristics - Quezon
Philippine Statistics Authority
Table 11--Continued
Highest Grade/Year Completed, Sex, and City/Municipality
Age
17 18 19 20-24 25-29 30-34 35 and Over
CATANAUAN
Both sexes 1,626 1,419 1,342 6,290 5,096 4,543 22,052
No grade completed 12 6 9 45 33 25 384
Preschool - - 2 1 1 1 7
Special education 4 2 - 8 1 - 4
Elementary 281 242 247 1,326 1,242 1,299 10,744
1st - 4th grade 94 83 82 366 344 413 4,062
5th - 6th grade 57 47 38 273 228 247 1,818
Graduate 130 112 127 687 670 639 4,864
High school 991 831 723 3,304 2,772 2,369 8,003
Undergraduate 367 242 204 853 738 637 2,661
Graduate 624 589 519 2,451 2,034 1,732 5,342
Postsecondary 4 10 25 205 177 101 387
Undergraduate 4 3 2 8 9 4 14
Graduate - 7 23 197 168 97 373
College undergraduate 334 328 303 822 341 331 955
Baccalaureate/college graduate - - 33 578 528 415 1,548
Post baccalaureate - - - 1 1 1 20
Not stated - - - - - 1 -
Male 819 743 704 3,278 2,645 2,381 11,023
No grade completed 6 4 8 29 21 14 185
Preschool - - 2 1 1 - 3
Special education 3 - - 5 1 - 2
Elementary 189 162 165 897 840 816 5,519
1st - 4th grade 74 61 53 267 242 291 2,257
5th - 6th grade 39 28 32 198 177 154 949
Graduate 76 73 80 432 421 371 2,313
High school 498 436 368 1,654 1,326 1,169 4,000
Undergraduate 222 142 115 479 382 334 1,328
Graduate 276 294 253 1,175 944 835 2,672
Postsecondary 1 2 12 108 94 49 190
Undergraduate 1 - - 5 5 3 10
Graduate - 2 12 103 89 46 180
College undergraduate 122 139 136 354 162 172 493
Baccalaureate/college graduate - - 13 230 200 160 622
Post baccalaureate - - - - - 1 9
Not stated - - - - - - -
Female 807 676 638 3,012 2,451 2,162 11,029
No grade completed 6 2 1 16 12 11 199
Preschool - - - - - 1 4
Special education 1 2 - 3 - - 2
Elementary 92 80 82 429 402 483 5,225
1st - 4th grade 20 22 29 99 102 122 1,805
5th - 6th grade 18 19 6 75 51 93 869
Graduate 54 39 47 255 249 268 2,551
High school 493 395 355 1,650 1,446 1,200 4,003
Undergraduate 145 100 89 374 356 303 1,333
Graduate 348 295 266 1,276 1,090 897 2,670
Postsecondary 3 8 13 97 83 52 197
Undergraduate 3 3 2 3 4 1 4
Graduate - 5 11 94 79 51 193
College undergraduate 212 189 167 468 179 159 462
Baccalaureate/college graduate - - 20 348 328 255 926
Post baccalaureate - - - 1 1 - 11
Not stated - - - - - 1 -
Continued
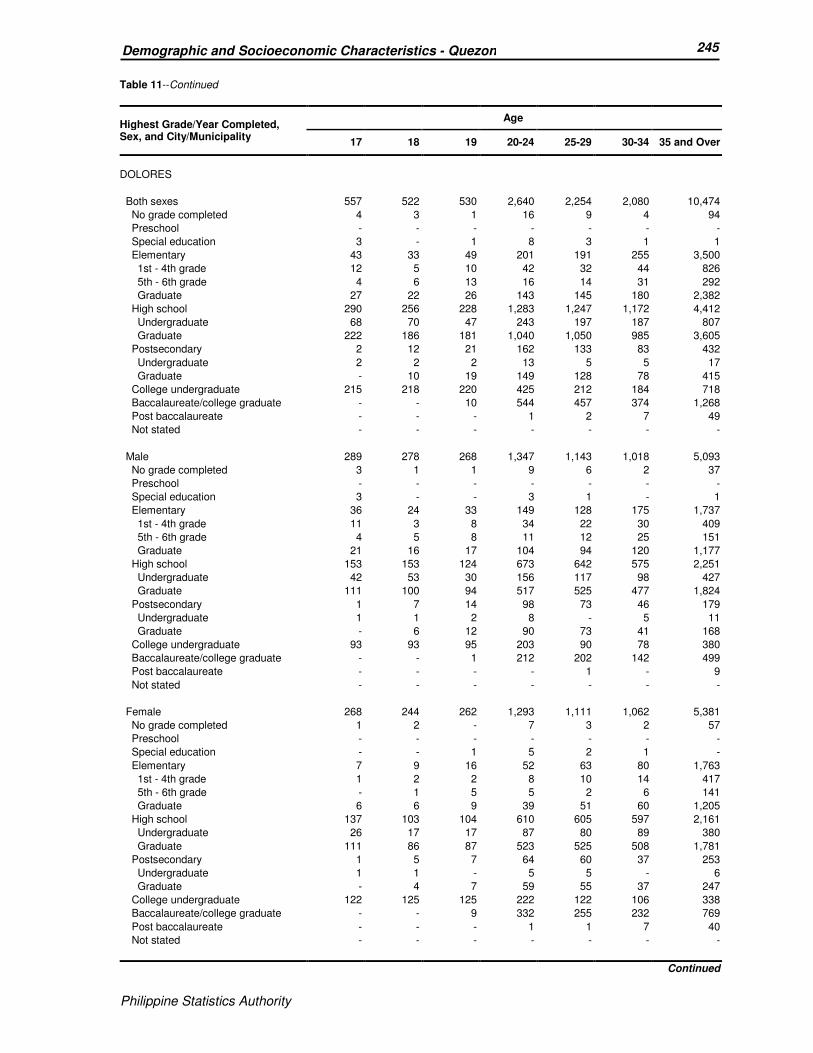
Philippine Statistics Authority
245 Demographic and Socioeconomic Characteristics - Quezon
Philippine Statistics Authority
Table 11--Continued
Highest Grade/Year Completed, Sex, and City/Municipality
Age
17 18 19 20-24 25-29 30-34 35 and Over
DOLORES
Both sexes 557 522 530 2,640 2,254 2,080 10,474
No grade completed 4 3 1 16 9 4 94
Preschool - - - - - - -
Special education 3 - 1 8 3 1 1
Elementary 43 33 49 201 191 255 3,500
1st - 4th grade 12 5 10 42 32 44 826
5th - 6th grade 4 6 13 16 14 31 292
Graduate 27 22 26 143 145 180 2,382
High school 290 256 228 1,283 1,247 1,172 4,412
Undergraduate 68 70 47 243 197 187 807
Graduate 222 186 181 1,040 1,050 985 3,605
Postsecondary 2 12 21 162 133 83 432
Undergraduate 2 2 2 13 5 5 17
Graduate - 10 19 149 128 78 415
College undergraduate 215 218 220 425 212 184 718
Baccalaureate/college graduate - - 10 544 457 374 1,268
Post baccalaureate - - - 1 2 7 49
Not stated - - - - - - -
Male 289 278 268 1,347 1,143 1,018 5,093
No grade completed 3 1 1 9 6 2 37
Preschool - - - - - - -
Special education 3 - - 3 1 - 1
Elementary 36 24 33 149 128 175 1,737
1st - 4th grade 11 3 8 34 22 30 409
5th - 6th grade 4 5 8 11 12 25 151
Graduate 21 16 17 104 94 120 1,177
High school 153 153 124 673 642 575 2,251
Undergraduate 42 53 30 156 117 98 427
Graduate 111 100 94 517 525 477 1,824
Postsecondary 1 7 14 98 73 46 179
Undergraduate 1 1 2 8 - 5 11
Graduate - 6 12 90 73 41 168
College undergraduate 93 93 95 203 90 78 380
Baccalaureate/college graduate - - 1 212 202 142 499
Post baccalaureate - - - - 1 - 9
Not stated - - - - - - -
Female 268 244 262 1,293 1,111 1,062 5,381
No grade completed 1 2 - 7 3 2 57
Preschool - - - - - - -
Special education - - 1 5 2 1 -
Elementary 7 9 16 52 63 80 1,763
1st - 4th grade 1 2 2 8 10 14 417
5th - 6th grade - 1 5 5 2 6 141
Graduate 6 6 9 39 51 60 1,205
High school 137 103 104 610 605 597 2,161
Undergraduate 26 17 17 87 80 89 380
Graduate 111 86 87 523 525 508 1,781
Postsecondary 1 5 7 64 60 37 253
Undergraduate 1 1 - 5 5 - 6
Graduate - 4 7 59 55 37 247
College undergraduate 122 125 125 222 122 106 338
Baccalaureate/college graduate - - 9 332 255 232 769
Post baccalaureate - - - 1 1 7 40
Not stated - - - - - - -
Continued

Philippine Statistics Authority
246 Demographic and Socioeconomic Characteristics - Quezon
Philippine Statistics Authority
Table 11--Continued
Highest Grade/Year Completed, Sex, and City/Municipality
Age
17 18 19 20-24 25-29 30-34 35 and Over
GENERAL LUNA
Both sexes 640 532 548 2,435 1,979 1,733 8,496
No grade completed 8 1 5 25 18 15 152
Preschool - - - 2 - - 1
Special education 1 - 1 4 2 - -
Elementary 109 86 97 520 480 472 4,280
1st - 4th grade 19 28 21 143 129 121 1,237
5th - 6th grade 29 13 22 93 91 66 601
Graduate 61 45 54 284 260 285 2,442
High school 382 306 301 1,289 1,062 882 3,023
Undergraduate 125 79 72 327 308 231 915
Graduate 257 227 229 962 754 651 2,108
Postsecondary 1 3 11 61 63 52 186
Undergraduate 1 1 3 - 2 2 8
Graduate - 2 8 61 61 50 178
College undergraduate 139 136 119 290 145 133 331
Baccalaureate/college graduate - - 14 243 208 176 514
Post baccalaureate - - - 1 1 3 9
Not stated - - - - - - -
Male 338 275 284 1,248 1,031 906 4,251
No grade completed 4 - 2 12 9 6 72
Preschool - - - - - - -
Special education 1 - - 2 1 - -
Elementary 82 69 66 333 317 298 2,152
1st - 4th grade 17 23 15 103 85 86 649
5th - 6th grade 20 12 15 65 64 42 305
Graduate 45 34 36 165 168 170 1,198
High school 190 152 153 653 525 431 1,549
Undergraduate 64 38 34 180 175 117 480
Graduate 126 114 119 473 350 314 1,069
Postsecondary 1 2 5 29 23 27 88
Undergraduate 1 1 1 - 1 2 4
Graduate - 1 4 29 22 25 84
College undergraduate 60 52 49 132 69 65 166
Baccalaureate/college graduate - - 9 87 86 77 219
Post baccalaureate - - - - 1 2 5
Not stated - - - - - - -
Female 302 257 264 1,187 948 827 4,245
No grade completed 4 1 3 13 9 9 80
Preschool - - - 2 - - 1
Special education - - 1 2 1 - -
Elementary 27 17 31 187 163 174 2,128
1st - 4th grade 2 5 6 40 44 35 588
5th - 6th grade 9 1 7 28 27 24 296
Graduate 16 11 18 119 92 115 1,244
High school 192 154 148 636 537 451 1,474
Undergraduate 61 41 38 147 133 114 435
Graduate 131 113 110 489 404 337 1,039
Postsecondary - 1 6 32 40 25 98
Undergraduate - - 2 - 1 - 4
Graduate - 1 4 32 39 25 94
College undergraduate 79 84 70 158 76 68 165
Baccalaureate/college graduate - - 5 156 122 99 295
Post baccalaureate - - - 1 - 1 4
Not stated - - - - - - -
Continued
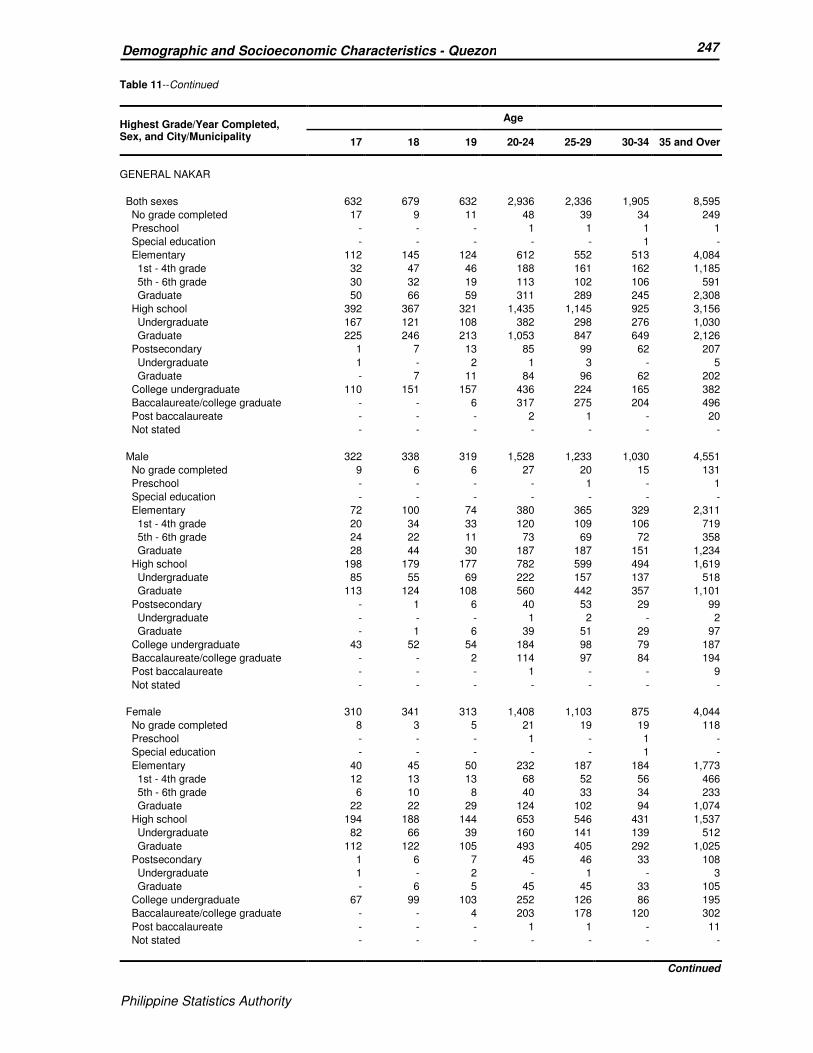
Philippine Statistics Authority
247 Demographic and Socioeconomic Characteristics - Quezon
Philippine Statistics Authority
Table 11--Continued
Highest Grade/Year Completed, Sex, and City/Municipality
Age
17 18 19 20-24 25-29 30-34 35 and Over
GENERAL NAKAR
Both sexes 632 679 632 2,936 2,336 1,905 8,595
No grade completed 17 9 11 48 39 34 249
Preschool - - - 1 1 1 1
Special education - - - - - 1 -
Elementary 112 145 124 612 552 513 4,084
1st - 4th grade 32 47 46 188 161 162 1,185
5th - 6th grade 30 32 19 113 102 106 591
Graduate 50 66 59 311 289 245 2,308
High school 392 367 321 1,435 1,145 925 3,156
Undergraduate 167 121 108 382 298 276 1,030
Graduate 225 246 213 1,053 847 649 2,126
Postsecondary 1 7 13 85 99 62 207
Undergraduate 1 - 2 1 3 - 5
Graduate - 7 11 84 96 62 202
College undergraduate 110 151 157 436 224 165 382
Baccalaureate/college graduate - - 6 317 275 204 496
Post baccalaureate - - - 2 1 - 20
Not stated - - - - - - -
Male 322 338 319 1,528 1,233 1,030 4,551
No grade completed 9 6 6 27 20 15 131
Preschool - - - - 1 - 1
Special education - - - - - - -
Elementary 72 100 74 380 365 329 2,311
1st - 4th grade 20 34 33 120 109 106 719
5th - 6th grade 24 22 11 73 69 72 358
Graduate 28 44 30 187 187 151 1,234
High school 198 179 177 782 599 494 1,619
Undergraduate 85 55 69 222 157 137 518
Graduate 113 124 108 560 442 357 1,101
Postsecondary - 1 6 40 53 29 99
Undergraduate - - - 1 2 - 2
Graduate - 1 6 39 51 29 97
College undergraduate 43 52 54 184 98 79 187
Baccalaureate/college graduate - - 2 114 97 84 194
Post baccalaureate - - - 1 - - 9
Not stated - - - - - - -
Female 310 341 313 1,408 1,103 875 4,044
No grade completed 8 3 5 21 19 19 118
Preschool - - - 1 - 1 -
Special education - - - - - 1 -
Elementary 40 45 50 232 187 184 1,773
1st - 4th grade 12 13 13 68 52 56 466
5th - 6th grade 6 10 8 40 33 34 233
Graduate 22 22 29 124 102 94 1,074
High school 194 188 144 653 546 431 1,537
Undergraduate 82 66 39 160 141 139 512
Graduate 112 122 105 493 405 292 1,025
Postsecondary 1 6 7 45 46 33 108
Undergraduate 1 - 2 - 1 - 3
Graduate - 6 5 45 45 33 105
College undergraduate 67 99 103 252 126 86 195
Baccalaureate/college graduate - - 4 203 178 120 302
Post baccalaureate - - - 1 1 - 11
Not stated - - - - - - -
Continued

Philippine Statistics Authority
248 Demographic and Socioeconomic Characteristics - Quezon
Philippine Statistics Authority
Table 11--Continued
Highest Grade/Year Completed, Sex, and City/Municipality
Age
17 18 19 20-24 25-29 30-34 35 and Over
GUINAYANGAN
Both sexes 936 869 860 3,887 3,335 3,001 14,948
No grade completed 4 7 8 18 13 23 179
Preschool - - 1 1 1 1 -
Special education - - - 1 1 2 1
Elementary 129 127 131 654 677 716 7,295
1st - 4th grade 40 40 30 153 141 153 1,926
5th - 6th grade 28 17 18 110 88 98 902
Graduate 61 70 83 391 448 465 4,467
High school 606 533 492 2,278 1,973 1,771 5,744
Undergraduate 204 159 96 548 461 437 1,607
Graduate 402 374 396 1,730 1,512 1,334 4,137
Postsecondary - 9 11 117 129 64 238
Undergraduate - 1 - 4 5 6 12
Graduate - 8 11 113 124 58 226
College undergraduate 197 193 205 430 208 178 632
Baccalaureate/college graduate - - 12 388 333 244 848
Post baccalaureate - - - - - 2 11
Not stated - - - - - - -
Male 465 472 435 2,015 1,649 1,494 7,522
No grade completed 2 3 2 11 6 10 92
Preschool - - 1 1 - 1 -
Special education - - - 1 - 2 -
Elementary 94 83 96 428 444 460 3,798
1st - 4th grade 31 23 27 119 96 110 1,046
5th - 6th grade 21 11 14 76 64 60 489
Graduate 42 49 55 233 284 290 2,263
High school 296 302 242 1,172 933 836 2,883
Undergraduate 115 103 52 310 244 229 771
Graduate 181 199 190 862 689 607 2,112
Postsecondary - 5 6 55 64 32 97
Undergraduate - 1 - 1 4 2 7
Graduate - 4 6 54 60 30 90
College undergraduate 73 79 82 194 84 69 331
Baccalaureate/college graduate - - 6 153 118 84 316
Post baccalaureate - - - - - - 5
Not stated - - - - - - -
Female 471 397 425 1,872 1,686 1,507 7,426
No grade completed 2 4 6 7 7 13 87
Preschool - - - - 1 - -
Special education - - - - 1 - 1
Elementary 35 44 35 226 233 256 3,497
1st - 4th grade 9 17 3 34 45 43 880
5th - 6th grade 7 6 4 34 24 38 413
Graduate 19 21 28 158 164 175 2,204
High school 310 231 250 1,106 1,040 935 2,861
Undergraduate 89 56 44 238 217 208 836
Graduate 221 175 206 868 823 727 2,025
Postsecondary - 4 5 62 65 32 141
Undergraduate - - - 3 1 4 5
Graduate - 4 5 59 64 28 136
College undergraduate 124 114 123 236 124 109 301
Baccalaureate/college graduate - - 6 235 215 160 532
Post baccalaureate - - - - - 2 6
Not stated - - - - - - -
Continued
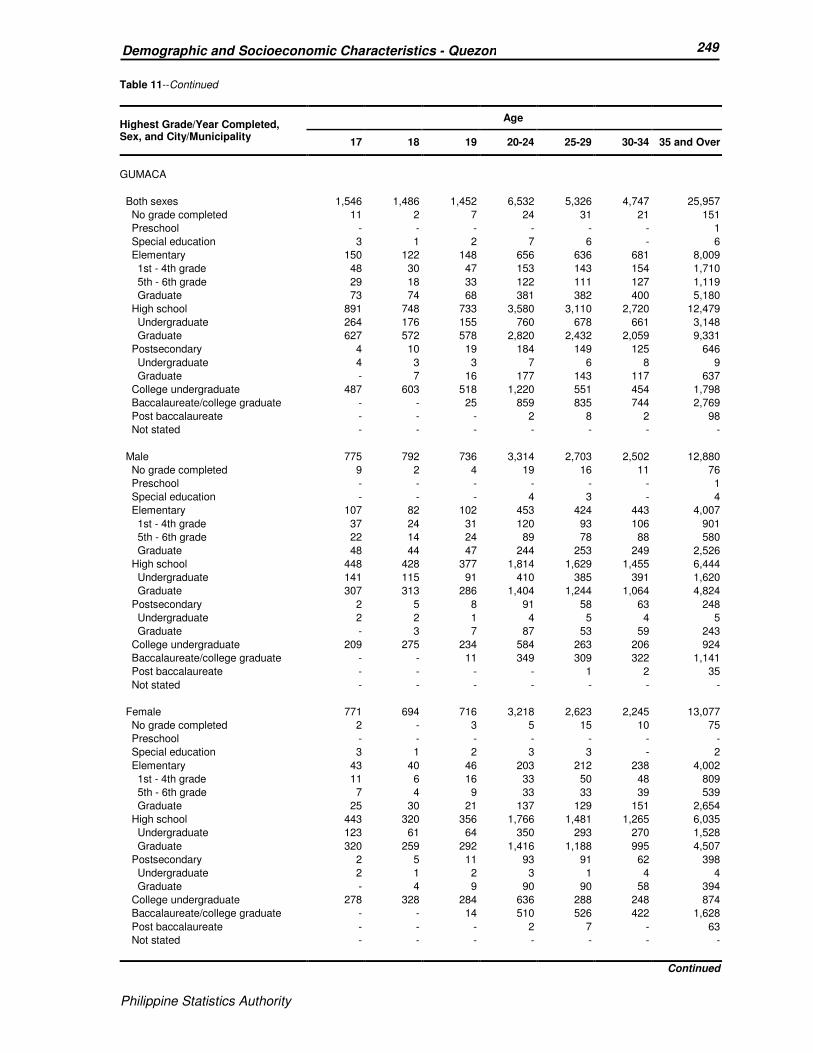
Philippine Statistics Authority
249 Demographic and Socioeconomic Characteristics - Quezon
Philippine Statistics Authority
Table 11--Continued
Highest Grade/Year Completed, Sex, and City/Municipality
Age
17 18 19 20-24 25-29 30-34 35 and Over
GUMACA
Both sexes 1,546 1,486 1,452 6,532 5,326 4,747 25,957
No grade completed 11 2 7 24 31 21 151
Preschool - - - - - - 1
Special education 3 1 2 7 6 - 6
Elementary 150 122 148 656 636 681 8,009
1st - 4th grade 48 30 47 153 143 154 1,710
5th - 6th grade 29 18 33 122 111 127 1,119
Graduate 73 74 68 381 382 400 5,180
High school 891 748 733 3,580 3,110 2,720 12,479
Undergraduate 264 176 155 760 678 661 3,148
Graduate 627 572 578 2,820 2,432 2,059 9,331
Postsecondary 4 10 19 184 149 125 646
Undergraduate 4 3 3 7 6 8 9
Graduate - 7 16 177 143 117 637
College undergraduate 487 603 518 1,220 551 454 1,798
Baccalaureate/college graduate - - 25 859 835 744 2,769
Post baccalaureate - - - 2 8 2 98
Not stated - - - - - - -
Male 775 792 736 3,314 2,703 2,502 12,880
No grade completed 9 2 4 19 16 11 76
Preschool - - - - - - 1
Special education - - - 4 3 - 4
Elementary 107 82 102 453 424 443 4,007
1st - 4th grade 37 24 31 120 93 106 901
5th - 6th grade 22 14 24 89 78 88 580
Graduate 48 44 47 244 253 249 2,526
High school 448 428 377 1,814 1,629 1,455 6,444
Undergraduate 141 115 91 410 385 391 1,620
Graduate 307 313 286 1,404 1,244 1,064 4,824
Postsecondary 2 5 8 91 58 63 248
Undergraduate 2 2 1 4 5 4 5
Graduate - 3 7 87 53 59 243
College undergraduate 209 275 234 584 263 206 924
Baccalaureate/college graduate - - 11 349 309 322 1,141
Post baccalaureate - - - - 1 2 35
Not stated - - - - - - -
Female 771 694 716 3,218 2,623 2,245 13,077
No grade completed 2 - 3 5 15 10 75
Preschool - - - - - - -
Special education 3 1 2 3 3 - 2
Elementary 43 40 46 203 212 238 4,002
1st - 4th grade 11 6 16 33 50 48 809
5th - 6th grade 7 4 9 33 33 39 539
Graduate 25 30 21 137 129 151 2,654
High school 443 320 356 1,766 1,481 1,265 6,035
Undergraduate 123 61 64 350 293 270 1,528
Graduate 320 259 292 1,416 1,188 995 4,507
Postsecondary 2 5 11 93 91 62 398
Undergraduate 2 1 2 3 1 4 4
Graduate - 4 9 90 90 58 394
College undergraduate 278 328 284 636 288 248 874
Baccalaureate/college graduate - - 14 510 526 422 1,628
Post baccalaureate - - - 2 7 - 63
Not stated - - - - - - -
Continued

Philippine Statistics Authority
250 Demographic and Socioeconomic Characteristics - Quezon
Philippine Statistics Authority
Table 11--Continued
Highest Grade/Year Completed, Sex, and City/Municipality
Age
17 18 19 20-24 25-29 30-34 35 and Over
INFANTA
Both sexes 1,363 1,334 1,220 5,803 5,036 4,665 23,743
No grade completed 17 13 6 37 26 11 107
Preschool - - - 1 - - -
Special education 3 1 2 - 1 3 1
Elementary 112 114 106 587 557 608 6,575
1st - 4th grade 39 39 23 141 113 163 1,586
5th - 6th grade 18 19 22 102 113 120 985
Graduate 55 56 61 344 331 325 4,004
High school 853 669 573 2,821 2,701 2,370 11,041
Undergraduate 328 218 186 750 650 583 2,737
Graduate 525 451 387 2,071 2,051 1,787 8,304
Postsecondary - 7 30 282 325 274 926
Undergraduate - 1 1 9 16 17 48
Graduate - 6 29 273 309 257 878
College undergraduate 378 530 468 1,267 627 559 2,163
Baccalaureate/college graduate - - 35 807 797 838 2,893
Post baccalaureate - - - 1 2 2 37
Not stated - - - - - - -
Male 678 644 601 2,925 2,530 2,353 11,915
No grade completed 5 3 5 22 19 6 52
Preschool - - - - - - -
Special education - 1 - - - 1 1
Elementary 83 78 67 386 362 400 3,436
1st - 4th grade 32 28 13 102 85 117 893
5th - 6th grade 15 12 17 67 76 79 533
Graduate 36 38 37 217 201 204 2,010
High school 454 368 314 1,527 1,378 1,213 5,680
Undergraduate 184 128 112 420 331 322 1,385
Graduate 270 240 202 1,107 1,047 891 4,295
Postsecondary - 3 12 131 167 152 382
Undergraduate - 1 - 3 4 9 22
Graduate - 2 12 128 163 143 360
College undergraduate 136 191 184 548 267 250 1,092
Baccalaureate/college graduate - - 19 311 336 330 1,257
Post baccalaureate - - - - 1 1 15
Not stated - - - - - - -
Female 685 690 619 2,878 2,506 2,312 11,828
No grade completed 12 10 1 15 7 5 55
Preschool - - - 1 - - -
Special education 3 - 2 - 1 2 -
Elementary 29 36 39 201 195 208 3,139
1st - 4th grade 7 11 10 39 28 46 693
5th - 6th grade 3 7 5 35 37 41 452
Graduate 19 18 24 127 130 121 1,994
High school 399 301 259 1,294 1,323 1,157 5,361
Undergraduate 144 90 74 330 319 261 1,352
Graduate 255 211 185 964 1,004 896 4,009
Postsecondary - 4 18 151 158 122 544
Undergraduate - - 1 6 12 8 26
Graduate - 4 17 145 146 114 518
College undergraduate 242 339 284 719 360 309 1,071
Baccalaureate/college graduate - - 16 496 461 508 1,636
Post baccalaureate - - - 1 1 1 22
Not stated - - - - - - -
Continued
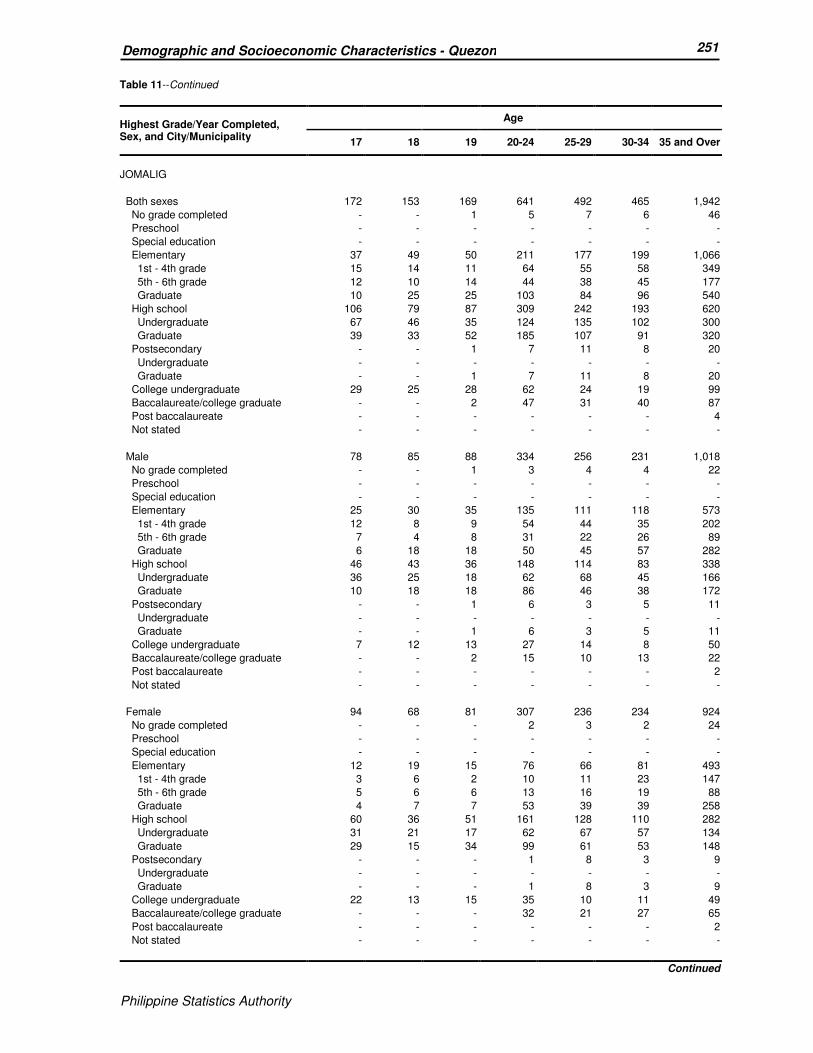
Philippine Statistics Authority
251 Demographic and Socioeconomic Characteristics - Quezon
Philippine Statistics Authority
Table 11--Continued
Highest Grade/Year Completed, Sex, and City/Municipality
Age
17 18 19 20-24 25-29 30-34 35 and Over
JOMALIG
Both sexes 172 153 169 641 492 465 1,942
No grade completed - - 1 5 7 6 46
Preschool - - - - - - -
Special education - - - - - - -
Elementary 37 49 50 211 177 199 1,066
1st - 4th grade 15 14 11 64 55 58 349
5th - 6th grade 12 10 14 44 38 45 177
Graduate 10 25 25 103 84 96 540
High school 106 79 87 309 242 193 620
Undergraduate 67 46 35 124 135 102 300
Graduate 39 33 52 185 107 91 320
Postsecondary - - 1 7 11 8 20
Undergraduate - - - - - - -
Graduate - - 1 7 11 8 20
College undergraduate 29 25 28 62 24 19 99
Baccalaureate/college graduate - - 2 47 31 40 87
Post baccalaureate - - - - - - 4
Not stated - - - - - - -
Male 78 85 88 334 256 231 1,018
No grade completed - - 1 3 4 4 22
Preschool - - - - - - -
Special education - - - - - - -
Elementary 25 30 35 135 111 118 573
1st - 4th grade 12 8 9 54 44 35 202
5th - 6th grade 7 4 8 31 22 26 89
Graduate 6 18 18 50 45 57 282
High school 46 43 36 148 114 83 338
Undergraduate 36 25 18 62 68 45 166
Graduate 10 18 18 86 46 38 172
Postsecondary - - 1 6 3 5 11
Undergraduate - - - - - - -
Graduate - - 1 6 3 5 11
College undergraduate 7 12 13 27 14 8 50
Baccalaureate/college graduate - - 2 15 10 13 22
Post baccalaureate - - - - - - 2
Not stated - - - - - - -
Female 94 68 81 307 236 234 924
No grade completed - - - 2 3 2 24
Preschool - - - - - - -
Special education - - - - - - -
Elementary 12 19 15 76 66 81 493
1st - 4th grade 3 6 2 10 11 23 147
5th - 6th grade 5 6 6 13 16 19 88
Graduate 4 7 7 53 39 39 258
High school 60 36 51 161 128 110 282
Undergraduate 31 21 17 62 67 57 134
Graduate 29 15 34 99 61 53 148
Postsecondary - - - 1 8 3 9
Undergraduate - - - - - - -
Graduate - - - 1 8 3 9
College undergraduate 22 13 15 35 10 11 49
Baccalaureate/college graduate - - - 32 21 27 65
Post baccalaureate - - - - - - 2
Not stated - - - - - - -
Continued

Philippine Statistics Authority
252 Demographic and Socioeconomic Characteristics - Quezon
Philippine Statistics Authority
Table 11--Continued
Highest Grade/Year Completed, Sex, and City/Municipality
Age
17 18 19 20-24 25-29 30-34 35 and Over
LOPEZ
Both sexes 2,119 1,768 1,805 8,178 7,128 6,483 32,369
No grade completed 15 8 11 57 54 54 339
Preschool - - - - 1 1 -
Special education 2 - - 3 1 - 1
Elementary 254 214 245 1,364 1,347 1,611 13,139
1st - 4th grade 51 39 59 252 211 328 2,773
5th - 6th grade 38 32 33 175 181 188 1,258
Graduate 165 143 153 937 955 1,095 9,108
High school 1,286 962 960 4,337 3,912 3,391 12,939
Undergraduate 393 246 211 922 943 921 3,873
Graduate 893 716 749 3,415 2,969 2,470 9,066
Postsecondary 9 19 48 279 259 176 974
Undergraduate 9 - 2 5 6 2 16
Graduate - 19 46 274 253 174 958
College undergraduate 553 565 490 1,002 446 355 1,743
Baccalaureate/college graduate - - 51 1,134 1,102 885 3,158
Post baccalaureate - - - 2 6 10 75
Not stated - - - - - - 1
Male 1,075 877 928 4,183 3,644 3,300 16,232
No grade completed 11 7 7 29 37 28 159
Preschool - - - - 1 - -
Special education 2 - - 1 - - -
Elementary 200 141 169 898 853 1,029 6,924
1st - 4th grade 40 26 41 186 154 235 1,600
5th - 6th grade 32 23 25 122 119 129 678
Graduate 128 92 103 590 580 665 4,646
High school 652 495 508 2,260 1,986 1,699 6,664
Undergraduate 249 147 133 498 511 480 1,966
Graduate 403 348 375 1,762 1,475 1,219 4,698
Postsecondary 3 6 20 136 110 70 391
Undergraduate 3 - 1 3 1 1 5
Graduate - 6 19 133 109 69 386
College undergraduate 207 228 204 478 191 136 885
Baccalaureate/college graduate - - 20 381 463 332 1,179
Post baccalaureate - - - - 3 6 29
Not stated - - - - - - 1
Female 1,044 891 877 3,995 3,484 3,183 16,137
No grade completed 4 1 4 28 17 26 180
Preschool - - - - - 1 -
Special education - - - 2 1 - 1
Elementary 54 73 76 466 494 582 6,215
1st - 4th grade 11 13 18 66 57 93 1,173
5th - 6th grade 6 9 8 53 62 59 580
Graduate 37 51 50 347 375 430 4,462
High school 634 467 452 2,077 1,926 1,692 6,275
Undergraduate 144 99 78 424 432 441 1,907
Graduate 490 368 374 1,653 1,494 1,251 4,368
Postsecondary 6 13 28 143 149 106 583
Undergraduate 6 - 1 2 5 1 11
Graduate - 13 27 141 144 105 572
College undergraduate 346 337 286 524 255 219 858
Baccalaureate/college graduate - - 31 753 639 553 1,979
Post baccalaureate - - - 2 3 4 46
Not stated - - - - - - -
Continued
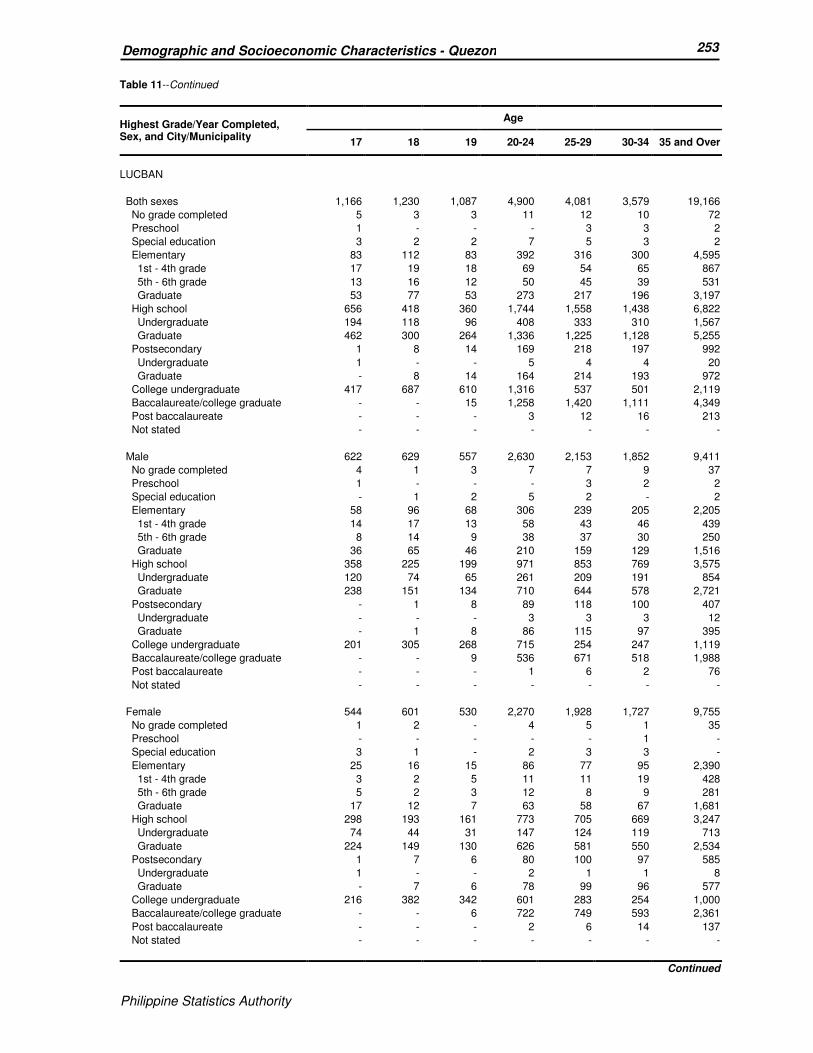
Philippine Statistics Authority
253 Demographic and Socioeconomic Characteristics - Quezon
Philippine Statistics Authority
Table 11--Continued
Highest Grade/Year Completed, Sex, and City/Municipality
Age
17 18 19 20-24 25-29 30-34 35 and Over
LUCBAN
Both sexes 1,166 1,230 1,087 4,900 4,081 3,579 19,166
No grade completed 5 3 3 11 12 10 72
Preschool 1 - - - 3 3 2
Special education 3 2 2 7 5 3 2
Elementary 83 112 83 392 316 300 4,595
1st - 4th grade 17 19 18 69 54 65 867
5th - 6th grade 13 16 12 50 45 39 531
Graduate 53 77 53 273 217 196 3,197
High school 656 418 360 1,744 1,558 1,438 6,822
Undergraduate 194 118 96 408 333 310 1,567
Graduate 462 300 264 1,336 1,225 1,128 5,255
Postsecondary 1 8 14 169 218 197 992
Undergraduate 1 - - 5 4 4 20
Graduate - 8 14 164 214 193 972
College undergraduate 417 687 610 1,316 537 501 2,119
Baccalaureate/college graduate - - 15 1,258 1,420 1,111 4,349
Post baccalaureate - - - 3 12 16 213
Not stated - - - - - - -
Male 622 629 557 2,630 2,153 1,852 9,411
No grade completed 4 1 3 7 7 9 37
Preschool 1 - - - 3 2 2
Special education - 1 2 5 2 - 2
Elementary 58 96 68 306 239 205 2,205
1st - 4th grade 14 17 13 58 43 46 439
5th - 6th grade 8 14 9 38 37 30 250
Graduate 36 65 46 210 159 129 1,516
High school 358 225 199 971 853 769 3,575
Undergraduate 120 74 65 261 209 191 854
Graduate 238 151 134 710 644 578 2,721
Postsecondary - 1 8 89 118 100 407
Undergraduate - - - 3 3 3 12
Graduate - 1 8 86 115 97 395
College undergraduate 201 305 268 715 254 247 1,119
Baccalaureate/college graduate - - 9 536 671 518 1,988
Post baccalaureate - - - 1 6 2 76
Not stated - - - - - - -
Female 544 601 530 2,270 1,928 1,727 9,755
No grade completed 1 2 - 4 5 1 35
Preschool - - - - - 1 -
Special education 3 1 - 2 3 3 -
Elementary 25 16 15 86 77 95 2,390
1st - 4th grade 3 2 5 11 11 19 428
5th - 6th grade 5 2 3 12 8 9 281
Graduate 17 12 7 63 58 67 1,681
High school 298 193 161 773 705 669 3,247
Undergraduate 74 44 31 147 124 119 713
Graduate 224 149 130 626 581 550 2,534
Postsecondary 1 7 6 80 100 97 585
Undergraduate 1 - - 2 1 1 8
Graduate - 7 6 78 99 96 577
College undergraduate 216 382 342 601 283 254 1,000
Baccalaureate/college graduate - - 6 722 749 593 2,361
Post baccalaureate - - - 2 6 14 137
Not stated - - - - - - -
Continued
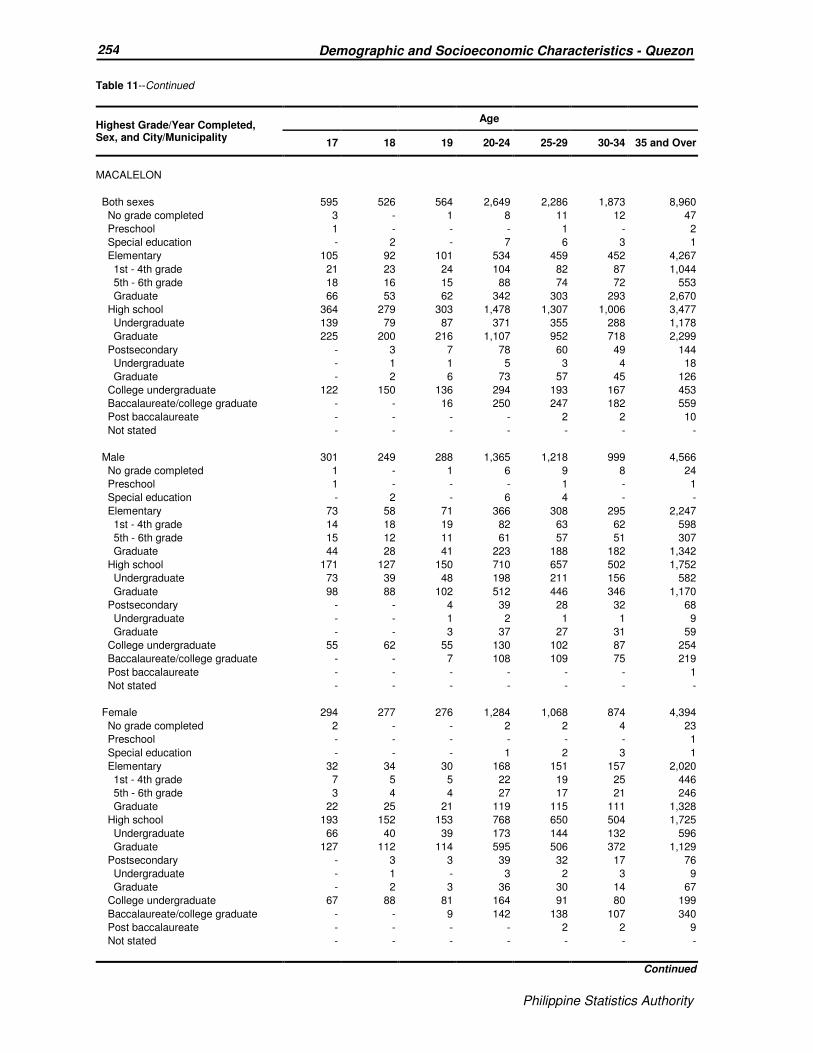
Philippine Statistics Authority
254 Demographic and Socioeconomic Characteristics - Quezon
Philippine Statistics Authority
Table 11--Continued
Highest Grade/Year Completed, Sex, and City/Municipality
Age
17 18 19 20-24 25-29 30-34 35 and Over
MACALELON
Both sexes 595 526 564 2,649 2,286 1,873 8,960
No grade completed 3 - 1 8 11 12 47
Preschool 1 - - - 1 - 2
Special education - 2 - 7 6 3 1
Elementary 105 92 101 534 459 452 4,267
1st - 4th grade 21 23 24 104 82 87 1,044
5th - 6th grade 18 16 15 88 74 72 553
Graduate 66 53 62 342 303 293 2,670
High school 364 279 303 1,478 1,307 1,006 3,477
Undergraduate 139 79 87 371 355 288 1,178
Graduate 225 200 216 1,107 952 718 2,299
Postsecondary - 3 7 78 60 49 144
Undergraduate - 1 1 5 3 4 18
Graduate - 2 6 73 57 45 126
College undergraduate 122 150 136 294 193 167 453
Baccalaureate/college graduate - - 16 250 247 182 559
Post baccalaureate - - - - 2 2 10
Not stated - - - - - - -
Male 301 249 288 1,365 1,218 999 4,566
No grade completed 1 - 1 6 9 8 24
Preschool 1 - - - 1 - 1
Special education - 2 - 6 4 - -
Elementary 73 58 71 366 308 295 2,247
1st - 4th grade 14 18 19 82 63 62 598
5th - 6th grade 15 12 11 61 57 51 307
Graduate 44 28 41 223 188 182 1,342
High school 171 127 150 710 657 502 1,752
Undergraduate 73 39 48 198 211 156 582
Graduate 98 88 102 512 446 346 1,170
Postsecondary - - 4 39 28 32 68
Undergraduate - - 1 2 1 1 9
Graduate - - 3 37 27 31 59
College undergraduate 55 62 55 130 102 87 254
Baccalaureate/college graduate - - 7 108 109 75 219
Post baccalaureate - - - - - - 1
Not stated - - - - - - -
Female 294 277 276 1,284 1,068 874 4,394
No grade completed 2 - - 2 2 4 23
Preschool - - - - - - 1
Special education - - - 1 2 3 1
Elementary 32 34 30 168 151 157 2,020
1st - 4th grade 7 5 5 22 19 25 446
5th - 6th grade 3 4 4 27 17 21 246
Graduate 22 25 21 119 115 111 1,328
High school 193 152 153 768 650 504 1,725
Undergraduate 66 40 39 173 144 132 596
Graduate 127 112 114 595 506 372 1,129
Postsecondary - 3 3 39 32 17 76
Undergraduate - 1 - 3 2 3 9
Graduate - 2 3 36 30 14 67
College undergraduate 67 88 81 164 91 80 199
Baccalaureate/college graduate - - 9 142 138 107 340
Post baccalaureate - - - - 2 2 9
Not stated - - - - - - -
Continued
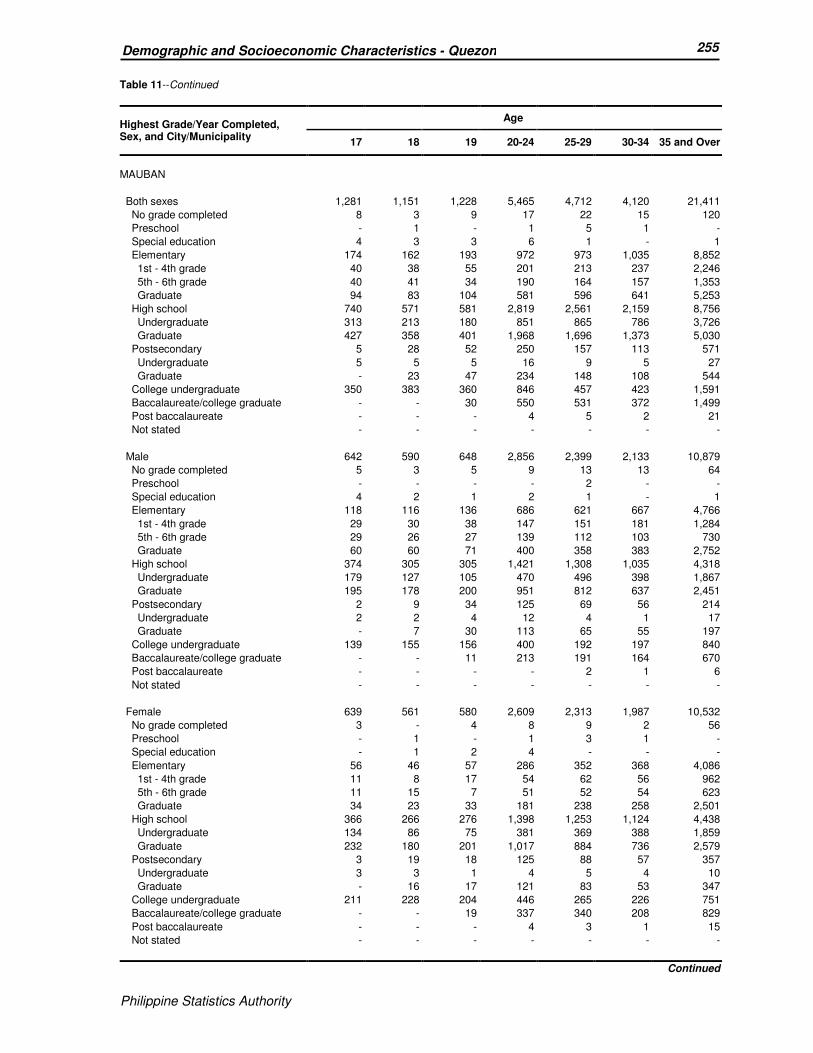
Philippine Statistics Authority
255 Demographic and Socioeconomic Characteristics - Quezon
Philippine Statistics Authority
Table 11--Continued
Highest Grade/Year Completed, Sex, and City/Municipality
Age
17 18 19 20-24 25-29 30-34 35 and Over
MAUBAN
Both sexes 1,281 1,151 1,228 5,465 4,712 4,120 21,411
No grade completed 8 3 9 17 22 15 120
Preschool - 1 - 1 5 1 -
Special education 4 3 3 6 1 - 1
Elementary 174 162 193 972 973 1,035 8,852
1st - 4th grade 40 38 55 201 213 237 2,246
5th - 6th grade 40 41 34 190 164 157 1,353
Graduate 94 83 104 581 596 641 5,253
High school 740 571 581 2,819 2,561 2,159 8,756
Undergraduate 313 213 180 851 865 786 3,726
Graduate 427 358 401 1,968 1,696 1,373 5,030
Postsecondary 5 28 52 250 157 113 571
Undergraduate 5 5 5 16 9 5 27
Graduate - 23 47 234 148 108 544
College undergraduate 350 383 360 846 457 423 1,591
Baccalaureate/college graduate - - 30 550 531 372 1,499
Post baccalaureate - - - 4 5 2 21
Not stated - - - - - - -
Male 642 590 648 2,856 2,399 2,133 10,879
No grade completed 5 3 5 9 13 13 64
Preschool - - - - 2 - -
Special education 4 2 1 2 1 - 1
Elementary 118 116 136 686 621 667 4,766
1st - 4th grade 29 30 38 147 151 181 1,284
5th - 6th grade 29 26 27 139 112 103 730
Graduate 60 60 71 400 358 383 2,752
High school 374 305 305 1,421 1,308 1,035 4,318
Undergraduate 179 127 105 470 496 398 1,867
Graduate 195 178 200 951 812 637 2,451
Postsecondary 2 9 34 125 69 56 214
Undergraduate 2 2 4 12 4 1 17
Graduate - 7 30 113 65 55 197
College undergraduate 139 155 156 400 192 197 840
Baccalaureate/college graduate - - 11 213 191 164 670
Post baccalaureate - - - - 2 1 6
Not stated - - - - - - -
Female 639 561 580 2,609 2,313 1,987 10,532
No grade completed 3 - 4 8 9 2 56
Preschool - 1 - 1 3 1 -
Special education - 1 2 4 - - -
Elementary 56 46 57 286 352 368 4,086
1st - 4th grade 11 8 17 54 62 56 962
5th - 6th grade 11 15 7 51 52 54 623
Graduate 34 23 33 181 238 258 2,501
High school 366 266 276 1,398 1,253 1,124 4,438
Undergraduate 134 86 75 381 369 388 1,859
Graduate 232 180 201 1,017 884 736 2,579
Postsecondary 3 19 18 125 88 57 357
Undergraduate 3 3 1 4 5 4 10
Graduate - 16 17 121 83 53 347
College undergraduate 211 228 204 446 265 226 751
Baccalaureate/college graduate - - 19 337 340 208 829
Post baccalaureate - - - 4 3 1 15
Not stated - - - - - - -
Continued
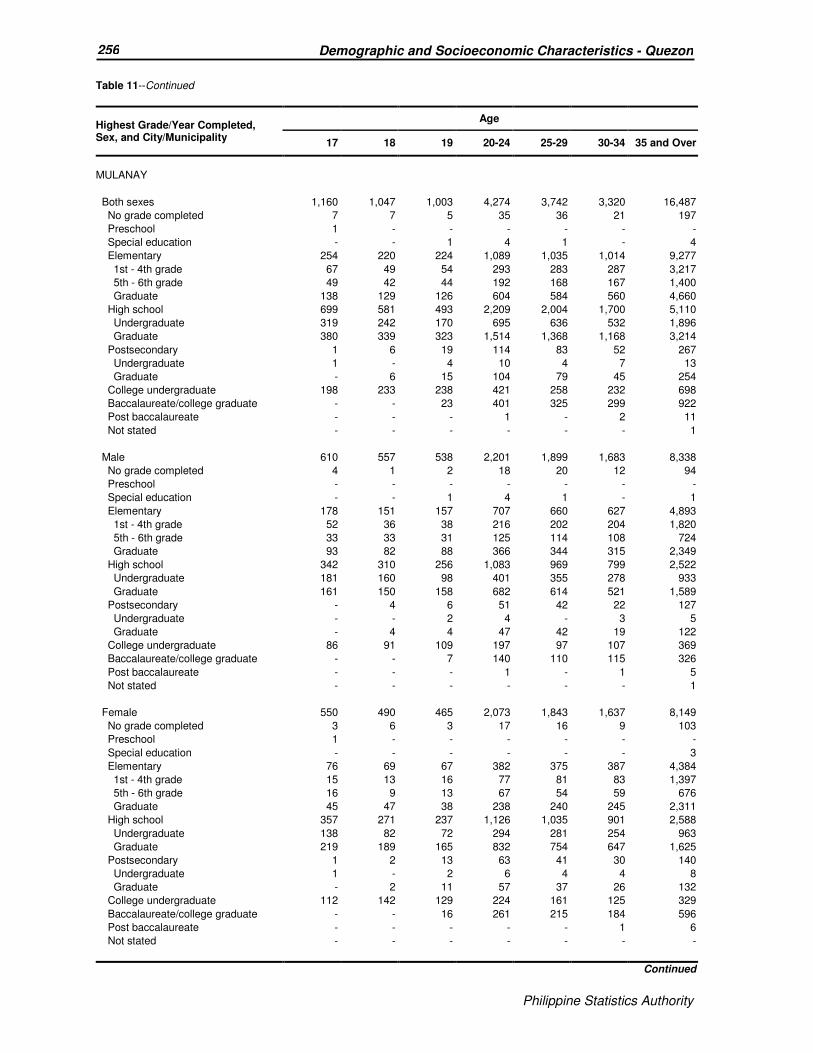
Philippine Statistics Authority
256 Demographic and Socioeconomic Characteristics - Quezon
Philippine Statistics Authority
Table 11--Continued
Highest Grade/Year Completed, Sex, and City/Municipality
Age
17 18 19 20-24 25-29 30-34 35 and Over
MULANAY
Both sexes 1,160 1,047 1,003 4,274 3,742 3,320 16,487
No grade completed 7 7 5 35 36 21 197
Preschool 1 - - - - - -
Special education - - 1 4 1 - 4
Elementary 254 220 224 1,089 1,035 1,014 9,277
1st - 4th grade 67 49 54 293 283 287 3,217
5th - 6th grade 49 42 44 192 168 167 1,400
Graduate 138 129 126 604 584 560 4,660
High school 699 581 493 2,209 2,004 1,700 5,110
Undergraduate 319 242 170 695 636 532 1,896
Graduate 380 339 323 1,514 1,368 1,168 3,214
Postsecondary 1 6 19 114 83 52 267
Undergraduate 1 - 4 10 4 7 13
Graduate - 6 15 104 79 45 254
College undergraduate 198 233 238 421 258 232 698
Baccalaureate/college graduate - - 23 401 325 299 922
Post baccalaureate - - - 1 - 2 11
Not stated - - - - - - 1
Male 610 557 538 2,201 1,899 1,683 8,338
No grade completed 4 1 2 18 20 12 94
Preschool - - - - - - -
Special education - - 1 4 1 - 1
Elementary 178 151 157 707 660 627 4,893
1st - 4th grade 52 36 38 216 202 204 1,820
5th - 6th grade 33 33 31 125 114 108 724
Graduate 93 82 88 366 344 315 2,349
High school 342 310 256 1,083 969 799 2,522
Undergraduate 181 160 98 401 355 278 933
Graduate 161 150 158 682 614 521 1,589
Postsecondary - 4 6 51 42 22 127
Undergraduate - - 2 4 - 3 5
Graduate - 4 4 47 42 19 122
College undergraduate 86 91 109 197 97 107 369
Baccalaureate/college graduate - - 7 140 110 115 326
Post baccalaureate - - - 1 - 1 5
Not stated - - - - - - 1
Female 550 490 465 2,073 1,843 1,637 8,149
No grade completed 3 6 3 17 16 9 103
Preschool 1 - - - - - -
Special education - - - - - - 3
Elementary 76 69 67 382 375 387 4,384
1st - 4th grade 15 13 16 77 81 83 1,397
5th - 6th grade 16 9 13 67 54 59 676
Graduate 45 47 38 238 240 245 2,311
High school 357 271 237 1,126 1,035 901 2,588
Undergraduate 138 82 72 294 281 254 963
Graduate 219 189 165 832 754 647 1,625
Postsecondary 1 2 13 63 41 30 140
Undergraduate 1 - 2 6 4 4 8
Graduate - 2 11 57 37 26 132
College undergraduate 112 142 129 224 161 125 329
Baccalaureate/college graduate - - 16 261 215 184 596
Post baccalaureate - - - - - 1 6
Not stated - - - - - - -
Continued
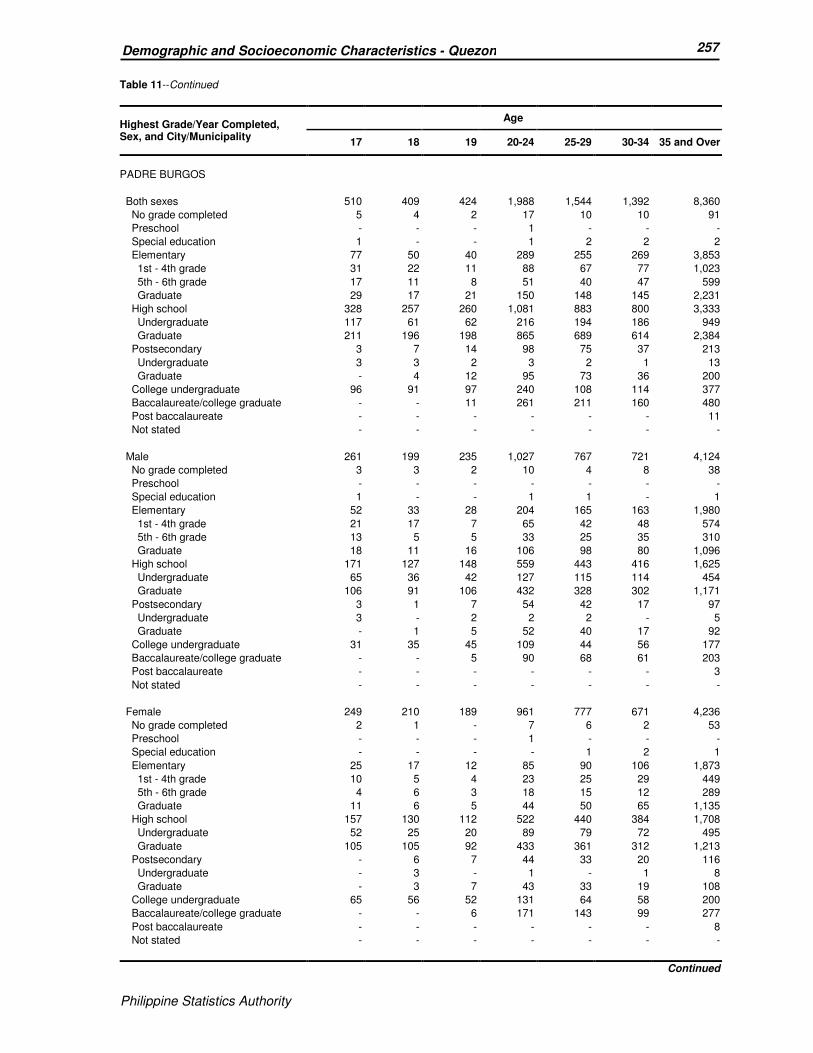
Philippine Statistics Authority
257 Demographic and Socioeconomic Characteristics - Quezon
Philippine Statistics Authority
Table 11--Continued
Highest Grade/Year Completed, Sex, and City/Municipality
Age
17 18 19 20-24 25-29 30-34 35 and Over
PADRE BURGOS
Both sexes 510 409 424 1,988 1,544 1,392 8,360
No grade completed 5 4 2 17 10 10 91
Preschool - - - 1 - - -
Special education 1 - - 1 2 2 2
Elementary 77 50 40 289 255 269 3,853
1st - 4th grade 31 22 11 88 67 77 1,023
5th - 6th grade 17 11 8 51 40 47 599
Graduate 29 17 21 150 148 145 2,231
High school 328 257 260 1,081 883 800 3,333
Undergraduate 117 61 62 216 194 186 949
Graduate 211 196 198 865 689 614 2,384
Postsecondary 3 7 14 98 75 37 213
Undergraduate 3 3 2 3 2 1 13
Graduate - 4 12 95 73 36 200
College undergraduate 96 91 97 240 108 114 377
Baccalaureate/college graduate - - 11 261 211 160 480
Post baccalaureate - - - - - - 11
Not stated - - - - - - -
Male 261 199 235 1,027 767 721 4,124
No grade completed 3 3 2 10 4 8 38
Preschool - - - - - - -
Special education 1 - - 1 1 - 1
Elementary 52 33 28 204 165 163 1,980
1st - 4th grade 21 17 7 65 42 48 574
5th - 6th grade 13 5 5 33 25 35 310
Graduate 18 11 16 106 98 80 1,096
High school 171 127 148 559 443 416 1,625
Undergraduate 65 36 42 127 115 114 454
Graduate 106 91 106 432 328 302 1,171
Postsecondary 3 1 7 54 42 17 97
Undergraduate 3 - 2 2 2 - 5
Graduate - 1 5 52 40 17 92
College undergraduate 31 35 45 109 44 56 177
Baccalaureate/college graduate - - 5 90 68 61 203
Post baccalaureate - - - - - - 3
Not stated - - - - - - -
Female 249 210 189 961 777 671 4,236
No grade completed 2 1 - 7 6 2 53
Preschool - - - 1 - - -
Special education - - - - 1 2 1
Elementary 25 17 12 85 90 106 1,873
1st - 4th grade 10 5 4 23 25 29 449
5th - 6th grade 4 6 3 18 15 12 289
Graduate 11 6 5 44 50 65 1,135
High school 157 130 112 522 440 384 1,708
Undergraduate 52 25 20 89 79 72 495
Graduate 105 105 92 433 361 312 1,213
Postsecondary - 6 7 44 33 20 116
Undergraduate - 3 - 1 - 1 8
Graduate - 3 7 43 33 19 108
College undergraduate 65 56 52 131 64 58 200
Baccalaureate/college graduate - - 6 171 143 99 277
Post baccalaureate - - - - - - 8
Not stated - - - - - - -
Continued
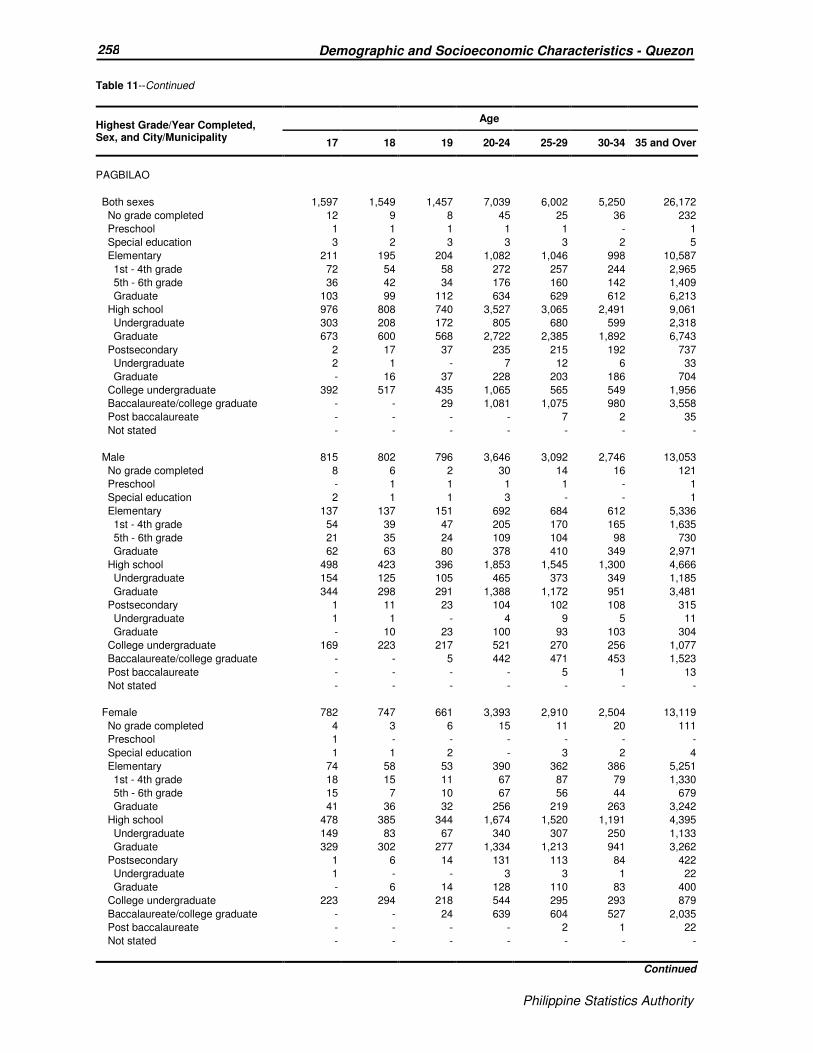
Philippine Statistics Authority
258 Demographic and Socioeconomic Characteristics - Quezon
Philippine Statistics Authority
Table 11--Continued
Highest Grade/Year Completed, Sex, and City/Municipality
Age
17 18 19 20-24 25-29 30-34 35 and Over
PAGBILAO
Both sexes 1,597 1,549 1,457 7,039 6,002 5,250 26,172
No grade completed 12 9 8 45 25 36 232
Preschool 1 1 1 1 1 - 1
Special education 3 2 3 3 3 2 5
Elementary 211 195 204 1,082 1,046 998 10,587
1st - 4th grade 72 54 58 272 257 244 2,965
5th - 6th grade 36 42 34 176 160 142 1,409
Graduate 103 99 112 634 629 612 6,213
High school 976 808 740 3,527 3,065 2,491 9,061
Undergraduate 303 208 172 805 680 599 2,318
Graduate 673 600 568 2,722 2,385 1,892 6,743
Postsecondary 2 17 37 235 215 192 737
Undergraduate 2 1 - 7 12 6 33
Graduate - 16 37 228 203 186 704
College undergraduate 392 517 435 1,065 565 549 1,956
Baccalaureate/college graduate - - 29 1,081 1,075 980 3,558
Post baccalaureate - - - - 7 2 35
Not stated - - - - - - -
Male 815 802 796 3,646 3,092 2,746 13,053
No grade completed 8 6 2 30 14 16 121
Preschool - 1 1 1 1 - 1
Special education 2 1 1 3 - - 1
Elementary 137 137 151 692 684 612 5,336
1st - 4th grade 54 39 47 205 170 165 1,635
5th - 6th grade 21 35 24 109 104 98 730
Graduate 62 63 80 378 410 349 2,971
High school 498 423 396 1,853 1,545 1,300 4,666
Undergraduate 154 125 105 465 373 349 1,185
Graduate 344 298 291 1,388 1,172 951 3,481
Postsecondary 1 11 23 104 102 108 315
Undergraduate 1 1 - 4 9 5 11
Graduate - 10 23 100 93 103 304
College undergraduate 169 223 217 521 270 256 1,077
Baccalaureate/college graduate - - 5 442 471 453 1,523
Post baccalaureate - - - - 5 1 13
Not stated - - - - - - -
Female 782 747 661 3,393 2,910 2,504 13,119
No grade completed 4 3 6 15 11 20 111
Preschool 1 - - - - - -
Special education 1 1 2 - 3 2 4
Elementary 74 58 53 390 362 386 5,251
1st - 4th grade 18 15 11 67 87 79 1,330
5th - 6th grade 15 7 10 67 56 44 679
Graduate 41 36 32 256 219 263 3,242
High school 478 385 344 1,674 1,520 1,191 4,395
Undergraduate 149 83 67 340 307 250 1,133
Graduate 329 302 277 1,334 1,213 941 3,262
Postsecondary 1 6 14 131 113 84 422
Undergraduate 1 - - 3 3 1 22
Graduate - 6 14 128 110 83 400
College undergraduate 223 294 218 544 295 293 879
Baccalaureate/college graduate - - 24 639 604 527 2,035
Post baccalaureate - - - - 2 1 22
Not stated - - - - - - -
Continued
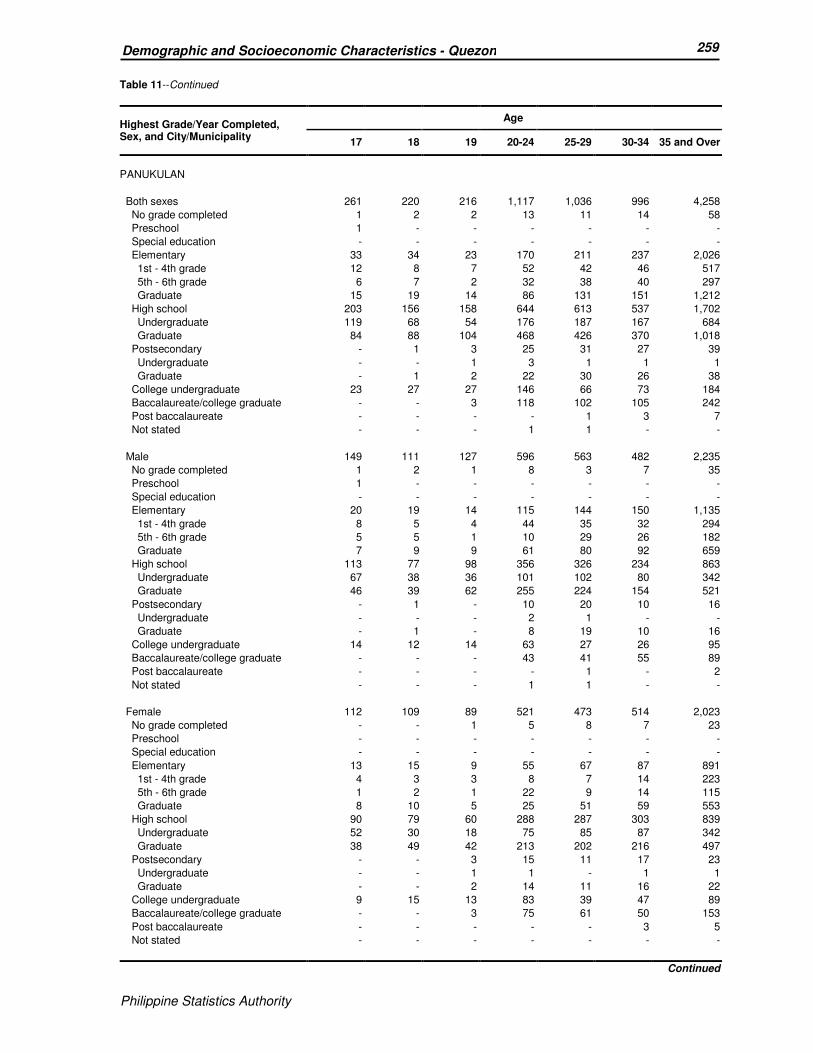
Philippine Statistics Authority
259 Demographic and Socioeconomic Characteristics - Quezon
Philippine Statistics Authority
Table 11--Continued
Highest Grade/Year Completed, Sex, and City/Municipality
Age
17 18 19 20-24 25-29 30-34 35 and Over
PANUKULAN
Both sexes 261 220 216 1,117 1,036 996 4,258
No grade completed 1 2 2 13 11 14 58
Preschool 1 - - - - - -
Special education - - - - - - -
Elementary 33 34 23 170 211 237 2,026
1st - 4th grade 12 8 7 52 42 46 517
5th - 6th grade 6 7 2 32 38 40 297
Graduate 15 19 14 86 131 151 1,212
High school 203 156 158 644 613 537 1,702
Undergraduate 119 68 54 176 187 167 684
Graduate 84 88 104 468 426 370 1,018
Postsecondary - 1 3 25 31 27 39
Undergraduate - - 1 3 1 1 1
Graduate - 1 2 22 30 26 38
College undergraduate 23 27 27 146 66 73 184
Baccalaureate/college graduate - - 3 118 102 105 242
Post baccalaureate - - - - 1 3 7
Not stated - - - 1 1 - -
Male 149 111 127 596 563 482 2,235
No grade completed 1 2 1 8 3 7 35
Preschool 1 - - - - - -
Special education - - - - - - -
Elementary 20 19 14 115 144 150 1,135
1st - 4th grade 8 5 4 44 35 32 294
5th - 6th grade 5 5 1 10 29 26 182
Graduate 7 9 9 61 80 92 659
High school 113 77 98 356 326 234 863
Undergraduate 67 38 36 101 102 80 342
Graduate 46 39 62 255 224 154 521
Postsecondary - 1 - 10 20 10 16
Undergraduate - - - 2 1 - -
Graduate - 1 - 8 19 10 16
College undergraduate 14 12 14 63 27 26 95
Baccalaureate/college graduate - - - 43 41 55 89
Post baccalaureate - - - - 1 - 2
Not stated - - - 1 1 - -
Female 112 109 89 521 473 514 2,023
No grade completed - - 1 5 8 7 23
Preschool - - - - - - -
Special education - - - - - - -
Elementary 13 15 9 55 67 87 891
1st - 4th grade 4 3 3 8 7 14 223
5th - 6th grade 1 2 1 22 9 14 115
Graduate 8 10 5 25 51 59 553
High school 90 79 60 288 287 303 839
Undergraduate 52 30 18 75 85 87 342
Graduate 38 49 42 213 202 216 497
Postsecondary - - 3 15 11 17 23
Undergraduate - - 1 1 - 1 1
Graduate - - 2 14 11 16 22
College undergraduate 9 15 13 83 39 47 89
Baccalaureate/college graduate - - 3 75 61 50 153
Post baccalaureate - - - - - 3 5
Not stated - - - - - - -
Continued
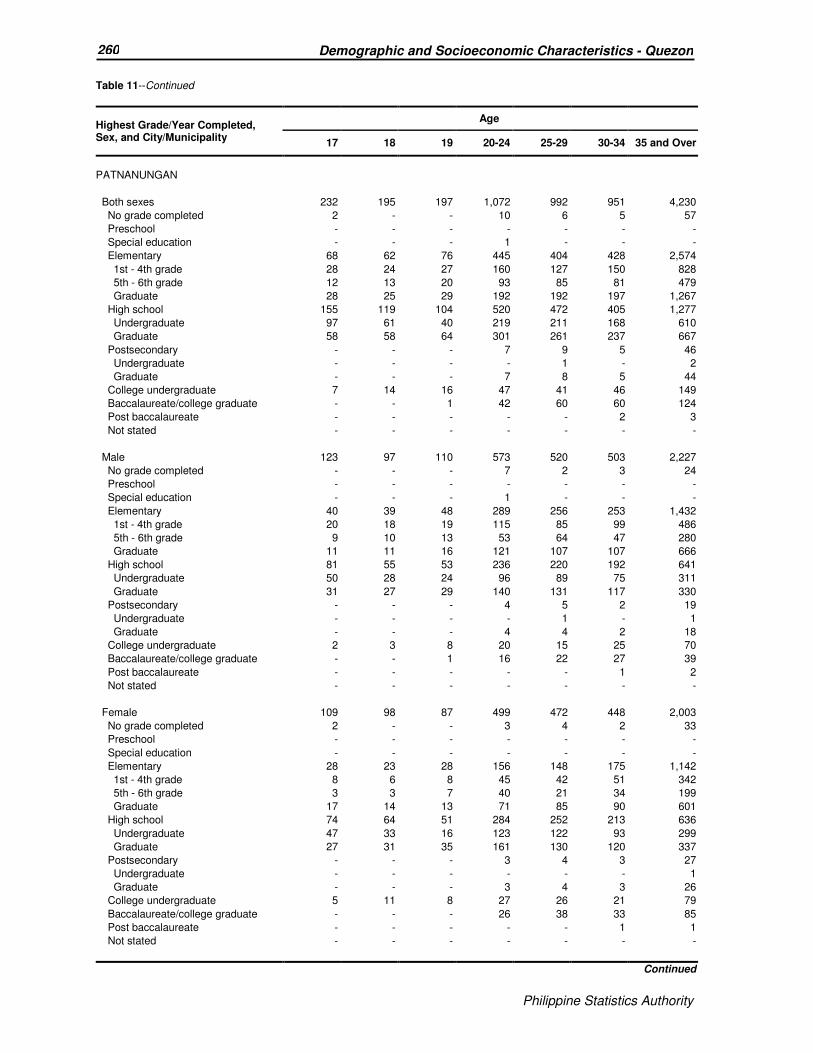
Philippine Statistics Authority
260 Demographic and Socioeconomic Characteristics - Quezon
Philippine Statistics Authority
Table 11--Continued
Highest Grade/Year Completed, Sex, and City/Municipality
Age
17 18 19 20-24 25-29 30-34 35 and Over
PATNANUNGAN
Both sexes 232 195 197 1,072 992 951 4,230
No grade completed 2 - - 10 6 5 57
Preschool - - - - - - -
Special education - - - 1 - - -
Elementary 68 62 76 445 404 428 2,574
1st - 4th grade 28 24 27 160 127 150 828
5th - 6th grade 12 13 20 93 85 81 479
Graduate 28 25 29 192 192 197 1,267
High school 155 119 104 520 472 405 1,277
Undergraduate 97 61 40 219 211 168 610
Graduate 58 58 64 301 261 237 667
Postsecondary - - - 7 9 5 46
Undergraduate - - - - 1 - 2
Graduate - - - 7 8 5 44
College undergraduate 7 14 16 47 41 46 149
Baccalaureate/college graduate - - 1 42 60 60 124
Post baccalaureate - - - - - 2 3
Not stated - - - - - - -
Male 123 97 110 573 520 503 2,227
No grade completed - - - 7 2 3 24
Preschool - - - - - - -
Special education - - - 1 - - -
Elementary 40 39 48 289 256 253 1,432
1st - 4th grade 20 18 19 115 85 99 486
5th - 6th grade 9 10 13 53 64 47 280
Graduate 11 11 16 121 107 107 666
High school 81 55 53 236 220 192 641
Undergraduate 50 28 24 96 89 75 311
Graduate 31 27 29 140 131 117 330
Postsecondary - - - 4 5 2 19
Undergraduate - - - - 1 - 1
Graduate - - - 4 4 2 18
College undergraduate 2 3 8 20 15 25 70
Baccalaureate/college graduate - - 1 16 22 27 39
Post baccalaureate - - - - - 1 2
Not stated - - - - - - -
Female 109 98 87 499 472 448 2,003
No grade completed 2 - - 3 4 2 33
Preschool - - - - - - -
Special education - - - - - - -
Elementary 28 23 28 156 148 175 1,142
1st - 4th grade 8 6 8 45 42 51 342
5th - 6th grade 3 3 7 40 21 34 199
Graduate 17 14 13 71 85 90 601
High school 74 64 51 284 252 213 636
Undergraduate 47 33 16 123 122 93 299
Graduate 27 31 35 161 130 120 337
Postsecondary - - - 3 4 3 27
Undergraduate - - - - - - 1
Graduate - - - 3 4 3 26
College undergraduate 5 11 8 27 26 21 79
Baccalaureate/college graduate - - - 26 38 33 85
Post baccalaureate - - - - - 1 1
Not stated - - - - - - -
Continued
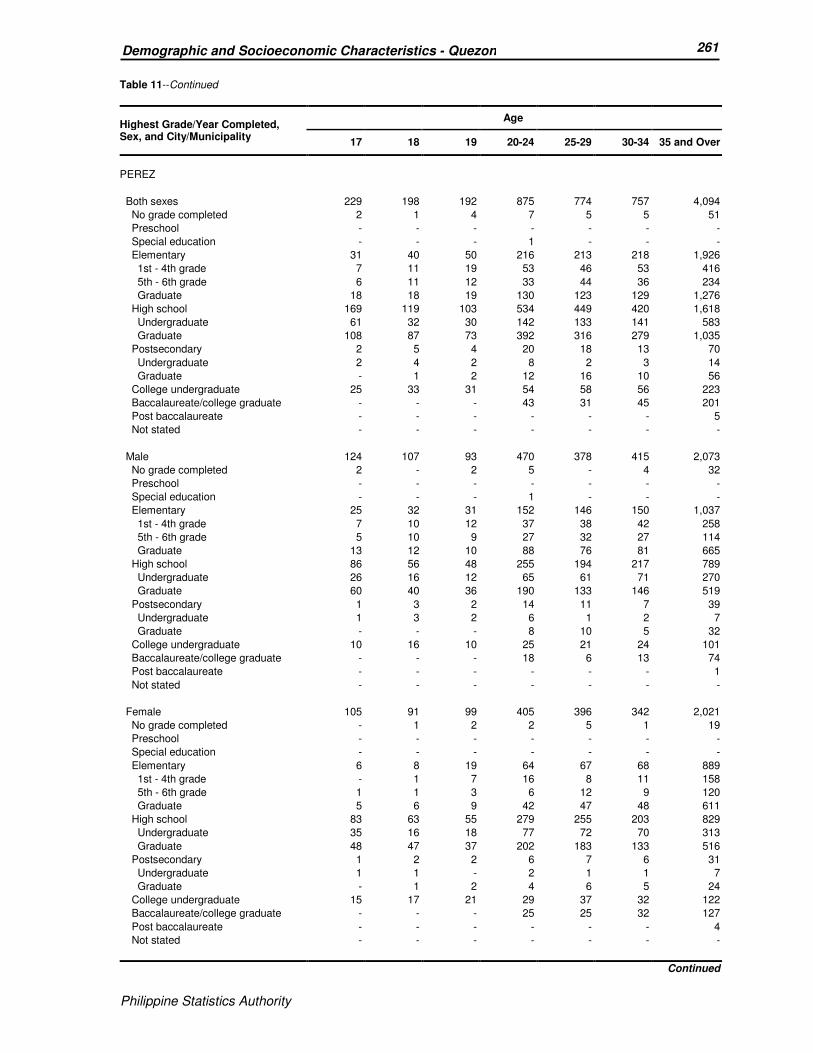
Philippine Statistics Authority
261 Demographic and Socioeconomic Characteristics - Quezon
Philippine Statistics Authority
Table 11--Continued
Highest Grade/Year Completed, Sex, and City/Municipality
Age
17 18 19 20-24 25-29 30-34 35 and Over
PEREZ
Both sexes 229 198 192 875 774 757 4,094
No grade completed 2 1 4 7 5 5 51
Preschool - - - - - - -
Special education - - - 1 - - -
Elementary 31 40 50 216 213 218 1,926
1st - 4th grade 7 11 19 53 46 53 416
5th - 6th grade 6 11 12 33 44 36 234
Graduate 18 18 19 130 123 129 1,276
High school 169 119 103 534 449 420 1,618
Undergraduate 61 32 30 142 133 141 583
Graduate 108 87 73 392 316 279 1,035
Postsecondary 2 5 4 20 18 13 70
Undergraduate 2 4 2 8 2 3 14
Graduate - 1 2 12 16 10 56
College undergraduate 25 33 31 54 58 56 223
Baccalaureate/college graduate - - - 43 31 45 201
Post baccalaureate - - - - - - 5
Not stated - - - - - - -
Male 124 107 93 470 378 415 2,073
No grade completed 2 - 2 5 - 4 32
Preschool - - - - - - -
Special education - - - 1 - - -
Elementary 25 32 31 152 146 150 1,037
1st - 4th grade 7 10 12 37 38 42 258
5th - 6th grade 5 10 9 27 32 27 114
Graduate 13 12 10 88 76 81 665
High school 86 56 48 255 194 217 789
Undergraduate 26 16 12 65 61 71 270
Graduate 60 40 36 190 133 146 519
Postsecondary 1 3 2 14 11 7 39
Undergraduate 1 3 2 6 1 2 7
Graduate - - - 8 10 5 32
College undergraduate 10 16 10 25 21 24 101
Baccalaureate/college graduate - - - 18 6 13 74
Post baccalaureate - - - - - - 1
Not stated - - - - - - -
Female 105 91 99 405 396 342 2,021
No grade completed - 1 2 2 5 1 19
Preschool - - - - - - -
Special education - - - - - - -
Elementary 6 8 19 64 67 68 889
1st - 4th grade - 1 7 16 8 11 158
5th - 6th grade 1 1 3 6 12 9 120
Graduate 5 6 9 42 47 48 611
High school 83 63 55 279 255 203 829
Undergraduate 35 16 18 77 72 70 313
Graduate 48 47 37 202 183 133 516
Postsecondary 1 2 2 6 7 6 31
Undergraduate 1 1 - 2 1 1 7
Graduate - 1 2 4 6 5 24
College undergraduate 15 17 21 29 37 32 122
Baccalaureate/college graduate - - - 25 25 32 127
Post baccalaureate - - - - - - 4
Not stated - - - - - - -
Continued
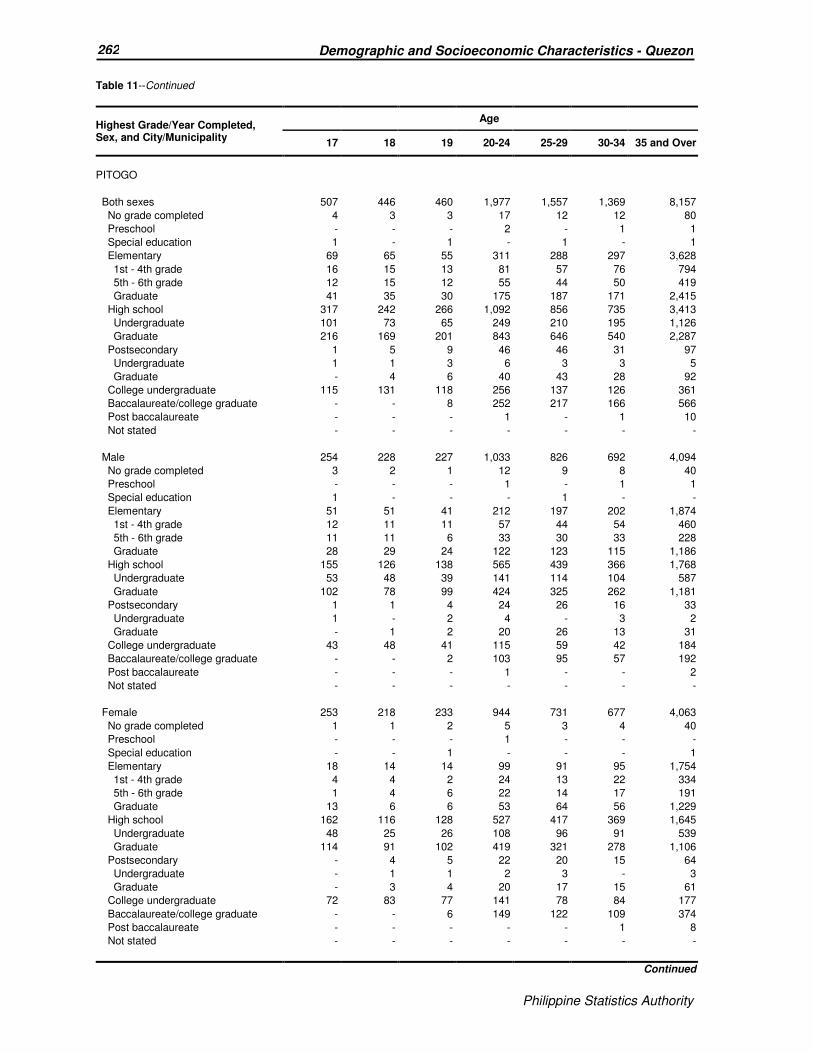
Philippine Statistics Authority
262 Demographic and Socioeconomic Characteristics - Quezon
Philippine Statistics Authority
Table 11--Continued
Highest Grade/Year Completed, Sex, and City/Municipality
Age
17 18 19 20-24 25-29 30-34 35 and Over
PITOGO
Both sexes 507 446 460 1,977 1,557 1,369 8,157
No grade completed 4 3 3 17 12 12 80
Preschool - - - 2 - 1 1
Special education 1 - 1 - 1 - 1
Elementary 69 65 55 311 288 297 3,628
1st - 4th grade 16 15 13 81 57 76 794
5th - 6th grade 12 15 12 55 44 50 419
Graduate 41 35 30 175 187 171 2,415
High school 317 242 266 1,092 856 735 3,413
Undergraduate 101 73 65 249 210 195 1,126
Graduate 216 169 201 843 646 540 2,287
Postsecondary 1 5 9 46 46 31 97
Undergraduate 1 1 3 6 3 3 5
Graduate - 4 6 40 43 28 92
College undergraduate 115 131 118 256 137 126 361
Baccalaureate/college graduate - - 8 252 217 166 566
Post baccalaureate - - - 1 - 1 10
Not stated - - - - - - -
Male 254 228 227 1,033 826 692 4,094
No grade completed 3 2 1 12 9 8 40
Preschool - - - 1 - 1 1
Special education 1 - - - 1 - -
Elementary 51 51 41 212 197 202 1,874
1st - 4th grade 12 11 11 57 44 54 460
5th - 6th grade 11 11 6 33 30 33 228
Graduate 28 29 24 122 123 115 1,186
High school 155 126 138 565 439 366 1,768
Undergraduate 53 48 39 141 114 104 587
Graduate 102 78 99 424 325 262 1,181
Postsecondary 1 1 4 24 26 16 33
Undergraduate 1 - 2 4 - 3 2
Graduate - 1 2 20 26 13 31
College undergraduate 43 48 41 115 59 42 184
Baccalaureate/college graduate - - 2 103 95 57 192
Post baccalaureate - - - 1 - - 2
Not stated - - - - - - -
Female 253 218 233 944 731 677 4,063
No grade completed 1 1 2 5 3 4 40
Preschool - - - 1 - - -
Special education - - 1 - - - 1
Elementary 18 14 14 99 91 95 1,754
1st - 4th grade 4 4 2 24 13 22 334
5th - 6th grade 1 4 6 22 14 17 191
Graduate 13 6 6 53 64 56 1,229
High school 162 116 128 527 417 369 1,645
Undergraduate 48 25 26 108 96 91 539
Graduate 114 91 102 419 321 278 1,106
Postsecondary - 4 5 22 20 15 64
Undergraduate - 1 1 2 3 - 3
Graduate - 3 4 20 17 15 61
College undergraduate 72 83 77 141 78 84 177
Baccalaureate/college graduate - - 6 149 122 109 374
Post baccalaureate - - - - - 1 8
Not stated - - - - - - -
Continued
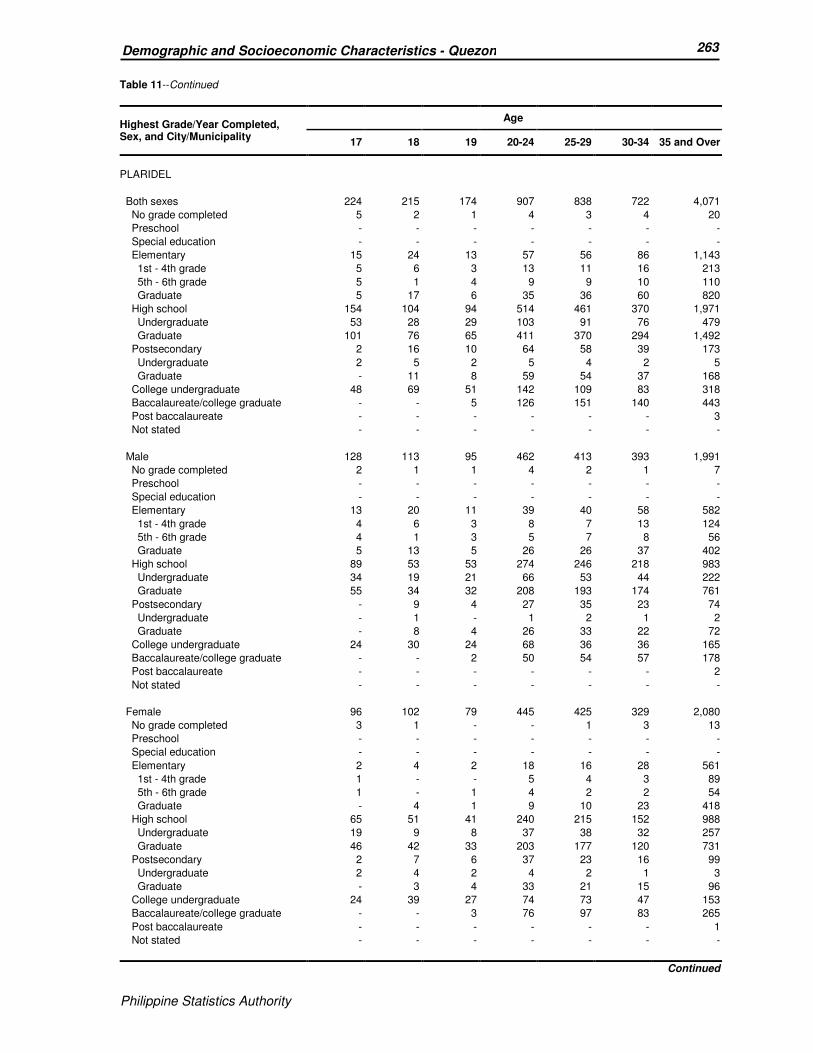
Philippine Statistics Authority
263 Demographic and Socioeconomic Characteristics - Quezon
Philippine Statistics Authority
Table 11--Continued
Highest Grade/Year Completed, Sex, and City/Municipality
Age
17 18 19 20-24 25-29 30-34 35 and Over
PLARIDEL
Both sexes 224 215 174 907 838 722 4,071
No grade completed 5 2 1 4 3 4 20
Preschool - - - - - - -
Special education - - - - - - -
Elementary 15 24 13 57 56 86 1,143
1st - 4th grade 5 6 3 13 11 16 213
5th - 6th grade 5 1 4 9 9 10 110
Graduate 5 17 6 35 36 60 820
High school 154 104 94 514 461 370 1,971
Undergraduate 53 28 29 103 91 76 479
Graduate 101 76 65 411 370 294 1,492
Postsecondary 2 16 10 64 58 39 173
Undergraduate 2 5 2 5 4 2 5
Graduate - 11 8 59 54 37 168
College undergraduate 48 69 51 142 109 83 318
Baccalaureate/college graduate - - 5 126 151 140 443
Post baccalaureate - - - - - - 3
Not stated - - - - - - -
Male 128 113 95 462 413 393 1,991
No grade completed 2 1 1 4 2 1 7
Preschool - - - - - - -
Special education - - - - - - -
Elementary 13 20 11 39 40 58 582
1st - 4th grade 4 6 3 8 7 13 124
5th - 6th grade 4 1 3 5 7 8 56
Graduate 5 13 5 26 26 37 402
High school 89 53 53 274 246 218 983
Undergraduate 34 19 21 66 53 44 222
Graduate 55 34 32 208 193 174 761
Postsecondary - 9 4 27 35 23 74
Undergraduate - 1 - 1 2 1 2
Graduate - 8 4 26 33 22 72
College undergraduate 24 30 24 68 36 36 165
Baccalaureate/college graduate - - 2 50 54 57 178
Post baccalaureate - - - - - - 2
Not stated - - - - - - -
Female 96 102 79 445 425 329 2,080
No grade completed 3 1 - - 1 3 13
Preschool - - - - - - -
Special education - - - - - - -
Elementary 2 4 2 18 16 28 561
1st - 4th grade 1 - - 5 4 3 89
5th - 6th grade 1 - 1 4 2 2 54
Graduate - 4 1 9 10 23 418
High school 65 51 41 240 215 152 988
Undergraduate 19 9 8 37 38 32 257
Graduate 46 42 33 203 177 120 731
Postsecondary 2 7 6 37 23 16 99
Undergraduate 2 4 2 4 2 1 3
Graduate - 3 4 33 21 15 96
College undergraduate 24 39 27 74 73 47 153
Baccalaureate/college graduate - - 3 76 97 83 265
Post baccalaureate - - - - - - 1
Not stated - - - - - - -
Continued
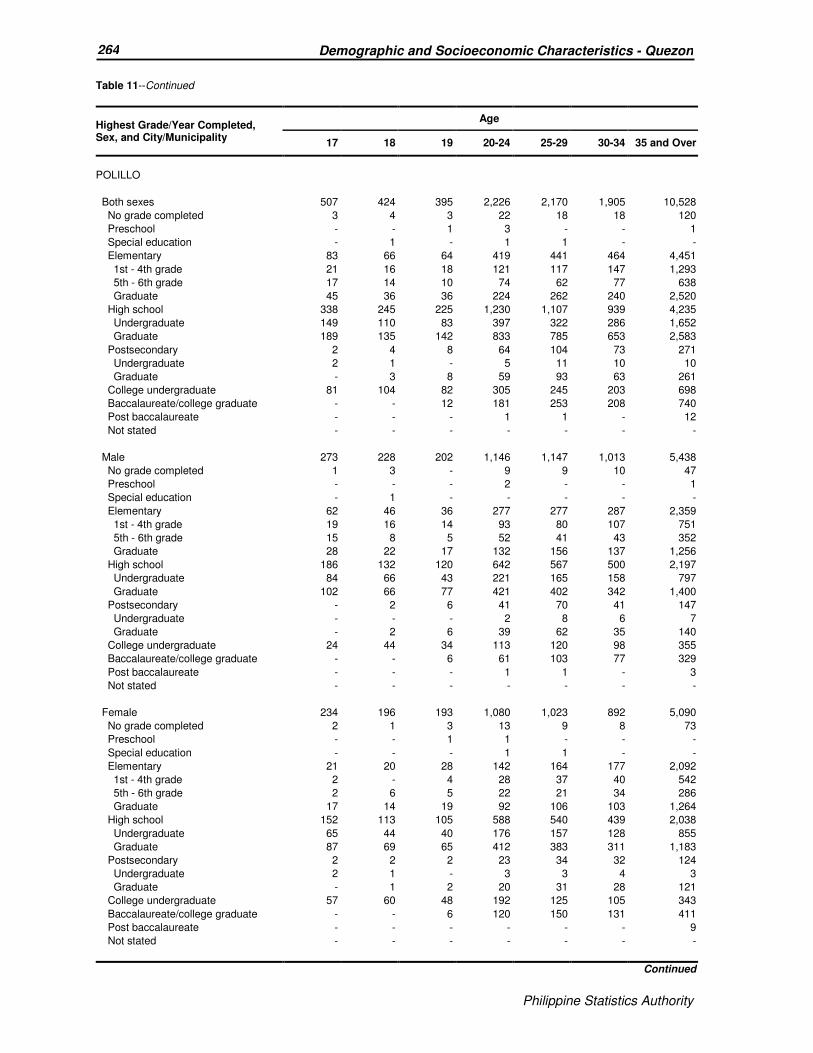
Philippine Statistics Authority
264 Demographic and Socioeconomic Characteristics - Quezon
Philippine Statistics Authority
Table 11--Continued
Highest Grade/Year Completed, Sex, and City/Municipality
Age
17 18 19 20-24 25-29 30-34 35 and Over
POLILLO
Both sexes 507 424 395 2,226 2,170 1,905 10,528
No grade completed 3 4 3 22 18 18 120
Preschool - - 1 3 - - 1
Special education - 1 - 1 1 - -
Elementary 83 66 64 419 441 464 4,451
1st - 4th grade 21 16 18 121 117 147 1,293
5th - 6th grade 17 14 10 74 62 77 638
Graduate 45 36 36 224 262 240 2,520
High school 338 245 225 1,230 1,107 939 4,235
Undergraduate 149 110 83 397 322 286 1,652
Graduate 189 135 142 833 785 653 2,583
Postsecondary 2 4 8 64 104 73 271
Undergraduate 2 1 - 5 11 10 10
Graduate - 3 8 59 93 63 261
College undergraduate 81 104 82 305 245 203 698
Baccalaureate/college graduate - - 12 181 253 208 740
Post baccalaureate - - - 1 1 - 12
Not stated - - - - - - -
Male 273 228 202 1,146 1,147 1,013 5,438
No grade completed 1 3 - 9 9 10 47
Preschool - - - 2 - - 1
Special education - 1 - - - - -
Elementary 62 46 36 277 277 287 2,359
1st - 4th grade 19 16 14 93 80 107 751
5th - 6th grade 15 8 5 52 41 43 352
Graduate 28 22 17 132 156 137 1,256
High school 186 132 120 642 567 500 2,197
Undergraduate 84 66 43 221 165 158 797
Graduate 102 66 77 421 402 342 1,400
Postsecondary - 2 6 41 70 41 147
Undergraduate - - - 2 8 6 7
Graduate - 2 6 39 62 35 140
College undergraduate 24 44 34 113 120 98 355
Baccalaureate/college graduate - - 6 61 103 77 329
Post baccalaureate - - - 1 1 - 3
Not stated - - - - - - -
Female 234 196 193 1,080 1,023 892 5,090
No grade completed 2 1 3 13 9 8 73
Preschool - - 1 1 - - -
Special education - - - 1 1 - -
Elementary 21 20 28 142 164 177 2,092
1st - 4th grade 2 - 4 28 37 40 542
5th - 6th grade 2 6 5 22 21 34 286
Graduate 17 14 19 92 106 103 1,264
High school 152 113 105 588 540 439 2,038
Undergraduate 65 44 40 176 157 128 855
Graduate 87 69 65 412 383 311 1,183
Postsecondary 2 2 2 23 34 32 124
Undergraduate 2 1 - 3 3 4 3
Graduate - 1 2 20 31 28 121
College undergraduate 57 60 48 192 125 105 343
Baccalaureate/college graduate - - 6 120 150 131 411
Post baccalaureate - - - - - - 9
Not stated - - - - - - -
Continued
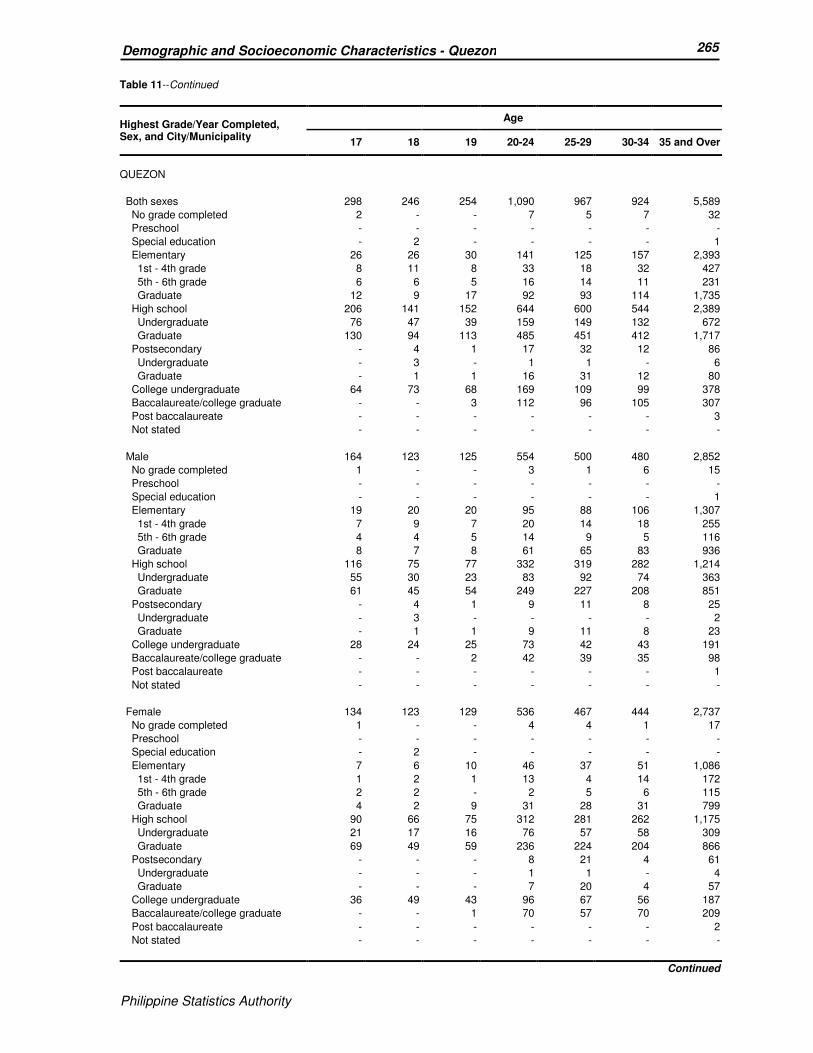
Philippine Statistics Authority
265 Demographic and Socioeconomic Characteristics - Quezon
Philippine Statistics Authority
Table 11--Continued
Highest Grade/Year Completed, Sex, and City/Municipality
Age
17 18 19 20-24 25-29 30-34 35 and Over
QUEZON
Both sexes 298 246 254 1,090 967 924 5,589
No grade completed 2 - - 7 5 7 32
Preschool - - - - - - -
Special education - 2 - - - - 1
Elementary 26 26 30 141 125 157 2,393
1st - 4th grade 8 11 8 33 18 32 427
5th - 6th grade 6 6 5 16 14 11 231
Graduate 12 9 17 92 93 114 1,735
High school 206 141 152 644 600 544 2,389
Undergraduate 76 47 39 159 149 132 672
Graduate 130 94 113 485 451 412 1,717
Postsecondary - 4 1 17 32 12 86
Undergraduate - 3 - 1 1 - 6
Graduate - 1 1 16 31 12 80
College undergraduate 64 73 68 169 109 99 378
Baccalaureate/college graduate - - 3 112 96 105 307
Post baccalaureate - - - - - - 3
Not stated - - - - - - -
Male 164 123 125 554 500 480 2,852
No grade completed 1 - - 3 1 6 15
Preschool - - - - - - -
Special education - - - - - - 1
Elementary 19 20 20 95 88 106 1,307
1st - 4th grade 7 9 7 20 14 18 255
5th - 6th grade 4 4 5 14 9 5 116
Graduate 8 7 8 61 65 83 936
High school 116 75 77 332 319 282 1,214
Undergraduate 55 30 23 83 92 74 363
Graduate 61 45 54 249 227 208 851
Postsecondary - 4 1 9 11 8 25
Undergraduate - 3 - - - - 2
Graduate - 1 1 9 11 8 23
College undergraduate 28 24 25 73 42 43 191
Baccalaureate/college graduate - - 2 42 39 35 98
Post baccalaureate - - - - - - 1
Not stated - - - - - - -
Female 134 123 129 536 467 444 2,737
No grade completed 1 - - 4 4 1 17
Preschool - - - - - - -
Special education - 2 - - - - -
Elementary 7 6 10 46 37 51 1,086
1st - 4th grade 1 2 1 13 4 14 172
5th - 6th grade 2 2 - 2 5 6 115
Graduate 4 2 9 31 28 31 799
High school 90 66 75 312 281 262 1,175
Undergraduate 21 17 16 76 57 58 309
Graduate 69 49 59 236 224 204 866
Postsecondary - - - 8 21 4 61
Undergraduate - - - 1 1 - 4
Graduate - - - 7 20 4 57
College undergraduate 36 49 43 96 67 56 187
Baccalaureate/college graduate - - 1 70 57 70 209
Post baccalaureate - - - - - - 2
Not stated - - - - - - -
Continued

Philippine Statistics Authority
266 Demographic and Socioeconomic Characteristics - Quezon
Philippine Statistics Authority
Table 11--Continued
Highest Grade/Year Completed, Sex, and City/Municipality
Age
17 18 19 20-24 25-29 30-34 35 and Over
REAL
Both sexes 695 741 682 3,371 2,623 2,368 11,629
No grade completed 1 1 1 11 14 7 92
Preschool - - - - - - 4
Special education 1 - 1 4 3 1 1
Elementary 82 84 64 396 373 434 4,310
1st - 4th grade 29 27 18 90 85 100 1,220
5th - 6th grade 18 13 15 76 60 74 618
Graduate 35 44 31 230 228 260 2,472
High school 462 411 382 1,838 1,470 1,218 5,055
Undergraduate 164 112 110 495 385 311 1,508
Graduate 298 299 272 1,343 1,085 907 3,547
Postsecondary 2 11 14 144 139 95 321
Undergraduate 2 2 3 14 15 5 15
Graduate - 9 11 130 124 90 306
College undergraduate 147 234 208 589 336 311 923
Baccalaureate/college graduate - - 12 388 285 298 908
Post baccalaureate - - - 1 3 4 15
Not stated - - - - - - -
Male 345 374 339 1,713 1,319 1,185 5,962
No grade completed 1 - - 6 8 6 47
Preschool - - - - - - 3
Special education 1 - 1 4 2 1 1
Elementary 54 52 41 247 229 266 2,290
1st - 4th grade 21 20 13 66 53 67 703
5th - 6th grade 9 6 10 48 32 41 343
Graduate 24 26 18 133 144 158 1,244
High school 229 219 208 980 749 594 2,551
Undergraduate 92 66 66 272 206 163 721
Graduate 137 153 142 708 543 431 1,830
Postsecondary 2 4 4 70 65 50 175
Undergraduate 2 - 1 5 6 2 11
Graduate - 4 3 65 59 48 164
College undergraduate 58 99 80 265 146 144 513
Baccalaureate/college graduate - - 5 141 120 124 374
Post baccalaureate - - - - - - 8
Not stated - - - - - - -
Female 350 367 343 1,658 1,304 1,183 5,667
No grade completed - 1 1 5 6 1 45
Preschool - - - - - - 1
Special education - - - - 1 - -
Elementary 28 32 23 149 144 168 2,020
1st - 4th grade 8 7 5 24 32 33 517
5th - 6th grade 9 7 5 28 28 33 275
Graduate 11 18 13 97 84 102 1,228
High school 233 192 174 858 721 624 2,504
Undergraduate 72 46 44 223 179 148 787
Graduate 161 146 130 635 542 476 1,717
Postsecondary - 7 10 74 74 45 146
Undergraduate - 2 2 9 9 3 4
Graduate - 5 8 65 65 42 142
College undergraduate 89 135 128 324 190 167 410
Baccalaureate/college graduate - - 7 247 165 174 534
Post baccalaureate - - - 1 3 4 7
Not stated - - - - - - -
Continued
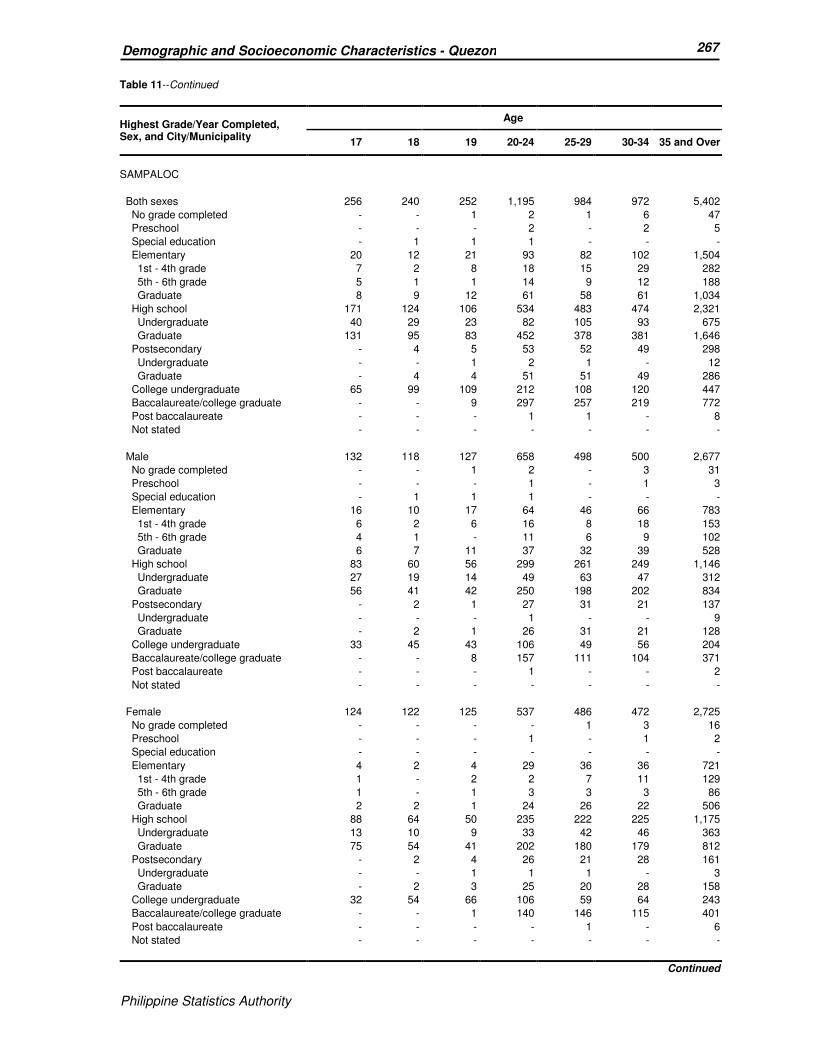
Philippine Statistics Authority
267 Demographic and Socioeconomic Characteristics - Quezon
Philippine Statistics Authority
Table 11--Continued
Highest Grade/Year Completed, Sex, and City/Municipality
Age
17 18 19 20-24 25-29 30-34 35 and Over
SAMPALOC
Both sexes 256 240 252 1,195 984 972 5,402
No grade completed - - 1 2 1 6 47
Preschool - - - 2 - 2 5
Special education - 1 1 1 - - -
Elementary 20 12 21 93 82 102 1,504
1st - 4th grade 7 2 8 18 15 29 282
5th - 6th grade 5 1 1 14 9 12 188
Graduate 8 9 12 61 58 61 1,034
High school 171 124 106 534 483 474 2,321
Undergraduate 40 29 23 82 105 93 675
Graduate 131 95 83 452 378 381 1,646
Postsecondary - 4 5 53 52 49 298
Undergraduate - - 1 2 1 - 12
Graduate - 4 4 51 51 49 286
College undergraduate 65 99 109 212 108 120 447
Baccalaureate/college graduate - - 9 297 257 219 772
Post baccalaureate - - - 1 1 - 8
Not stated - - - - - - -
Male 132 118 127 658 498 500 2,677
No grade completed - - 1 2 - 3 31
Preschool - - - 1 - 1 3
Special education - 1 1 1 - - -
Elementary 16 10 17 64 46 66 783
1st - 4th grade 6 2 6 16 8 18 153
5th - 6th grade 4 1 - 11 6 9 102
Graduate 6 7 11 37 32 39 528
High school 83 60 56 299 261 249 1,146
Undergraduate 27 19 14 49 63 47 312
Graduate 56 41 42 250 198 202 834
Postsecondary - 2 1 27 31 21 137
Undergraduate - - - 1 - - 9
Graduate - 2 1 26 31 21 128
College undergraduate 33 45 43 106 49 56 204
Baccalaureate/college graduate - - 8 157 111 104 371
Post baccalaureate - - - 1 - - 2
Not stated - - - - - - -
Female 124 122 125 537 486 472 2,725
No grade completed - - - - 1 3 16
Preschool - - - 1 - 1 2
Special education - - - - - - -
Elementary 4 2 4 29 36 36 721
1st - 4th grade 1 - 2 2 7 11 129
5th - 6th grade 1 - 1 3 3 3 86
Graduate 2 2 1 24 26 22 506
High school 88 64 50 235 222 225 1,175
Undergraduate 13 10 9 33 42 46 363
Graduate 75 54 41 202 180 179 812
Postsecondary - 2 4 26 21 28 161
Undergraduate - - 1 1 1 - 3
Graduate - 2 3 25 20 28 158
College undergraduate 32 54 66 106 59 64 243
Baccalaureate/college graduate - - 1 140 146 115 401
Post baccalaureate - - - - 1 - 6
Not stated - - - - - - -
Continued

Philippine Statistics Authority
268 Demographic and Socioeconomic Characteristics - Quezon
Philippine Statistics Authority
Table 11--Continued
Highest Grade/Year Completed, Sex, and City/Municipality
Age
17 18 19 20-24 25-29 30-34 35 and Over
SAN ANDRES
Both sexes 791 802 718 3,091 2,499 2,184 10,035
No grade completed 4 5 5 33 27 20 347
Preschool - - - 1 - - -
Special education - 1 1 1 3 - 2
Elementary 262 275 265 1,325 1,174 1,227 7,099
1st - 4th grade 78 99 95 493 427 531 3,563
5th - 6th grade 58 53 47 284 252 255 1,224
Graduate 126 123 123 548 495 441 2,312
High school 444 411 349 1,335 998 741 1,902
Undergraduate 220 142 142 480 399 331 849
Graduate 224 269 207 855 599 410 1,053
Postsecondary 3 4 6 30 40 18 75
Undergraduate 3 2 - 1 7 1 8
Graduate - 2 6 29 33 17 67
College undergraduate 78 106 84 216 124 75 281
Baccalaureate/college graduate - - 8 150 132 101 317
Post baccalaureate - - - - 1 2 12
Not stated - - - - - - -
Male 413 415 374 1,561 1,291 1,144 5,049
No grade completed 2 5 2 21 17 11 175
Preschool - - - 1 - - -
Special education - 1 - 1 3 - 1
Elementary 171 164 162 771 677 680 3,635
1st - 4th grade 54 68 67 323 276 340 1,916
5th - 6th grade 39 30 29 176 160 135 614
Graduate 78 66 66 272 241 205 1,105
High school 213 195 172 592 461 368 929
Undergraduate 117 80 78 219 183 167 387
Graduate 96 115 94 373 278 201 542
Postsecondary 1 2 3 20 18 11 35
Undergraduate 1 2 - 1 3 - 6
Graduate - - 3 19 15 11 29
College undergraduate 26 48 31 101 54 29 148
Baccalaureate/college graduate - - 4 54 60 45 123
Post baccalaureate - - - - 1 - 3
Not stated - - - - - - -
Female 378 387 344 1,530 1,208 1,040 4,986
No grade completed 2 - 3 12 10 9 172
Preschool - - - - - - -
Special education - - 1 - - - 1
Elementary 91 111 103 554 497 547 3,464
1st - 4th grade 24 31 28 170 151 191 1,647
5th - 6th grade 19 23 18 108 92 120 610
Graduate 48 57 57 276 254 236 1,207
High school 231 216 177 743 537 373 973
Undergraduate 103 62 64 261 216 164 462
Graduate 128 154 113 482 321 209 511
Postsecondary 2 2 3 10 22 7 40
Undergraduate 2 - - - 4 1 2
Graduate - 2 3 10 18 6 38
College undergraduate 52 58 53 115 70 46 133
Baccalaureate/college graduate - - 4 96 72 56 194
Post baccalaureate - - - - - 2 9
Not stated - - - - - - -
Continued
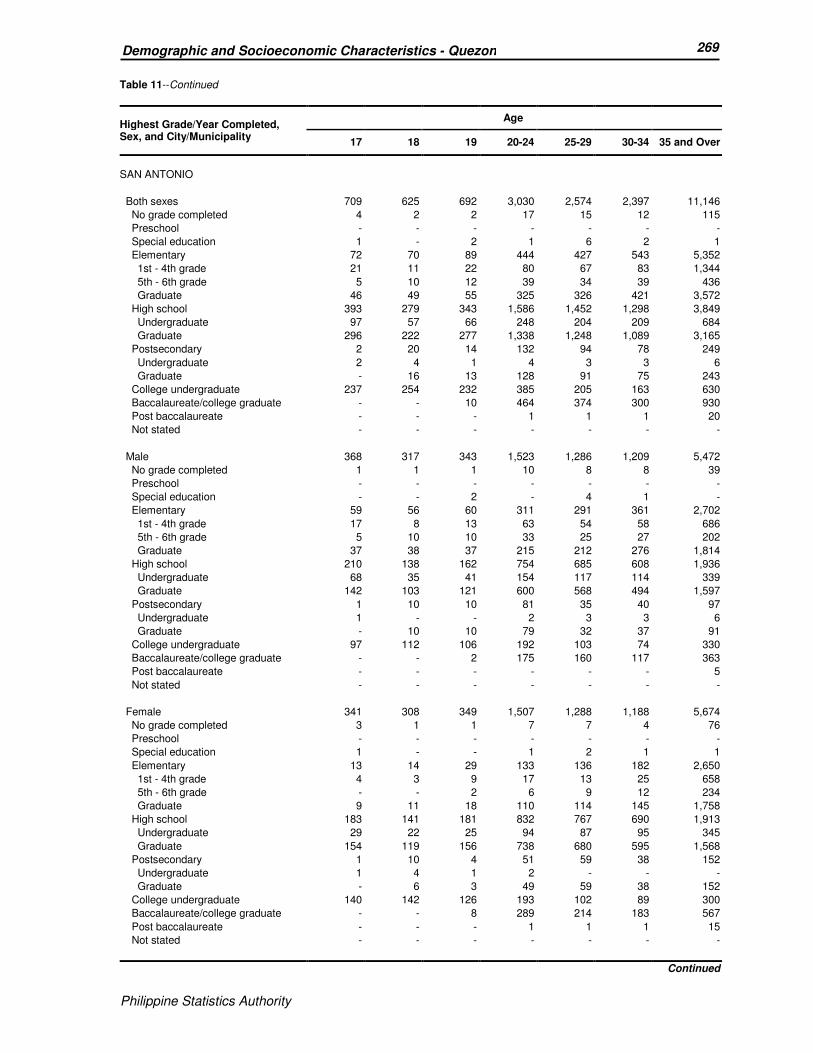
Philippine Statistics Authority
269 Demographic and Socioeconomic Characteristics - Quezon
Philippine Statistics Authority
Table 11--Continued
Highest Grade/Year Completed, Sex, and City/Municipality
Age
17 18 19 20-24 25-29 30-34 35 and Over
SAN ANTONIO
Both sexes 709 625 692 3,030 2,574 2,397 11,146
No grade completed 4 2 2 17 15 12 115
Preschool - - - - - - -
Special education 1 - 2 1 6 2 1
Elementary 72 70 89 444 427 543 5,352
1st - 4th grade 21 11 22 80 67 83 1,344
5th - 6th grade 5 10 12 39 34 39 436
Graduate 46 49 55 325 326 421 3,572
High school 393 279 343 1,586 1,452 1,298 3,849
Undergraduate 97 57 66 248 204 209 684
Graduate 296 222 277 1,338 1,248 1,089 3,165
Postsecondary 2 20 14 132 94 78 249
Undergraduate 2 4 1 4 3 3 6
Graduate - 16 13 128 91 75 243
College undergraduate 237 254 232 385 205 163 630
Baccalaureate/college graduate - - 10 464 374 300 930
Post baccalaureate - - - 1 1 1 20
Not stated - - - - - - -
Male 368 317 343 1,523 1,286 1,209 5,472
No grade completed 1 1 1 10 8 8 39
Preschool - - - - - - -
Special education - - 2 - 4 1 -
Elementary 59 56 60 311 291 361 2,702
1st - 4th grade 17 8 13 63 54 58 686
5th - 6th grade 5 10 10 33 25 27 202
Graduate 37 38 37 215 212 276 1,814
High school 210 138 162 754 685 608 1,936
Undergraduate 68 35 41 154 117 114 339
Graduate 142 103 121 600 568 494 1,597
Postsecondary 1 10 10 81 35 40 97
Undergraduate 1 - - 2 3 3 6
Graduate - 10 10 79 32 37 91
College undergraduate 97 112 106 192 103 74 330
Baccalaureate/college graduate - - 2 175 160 117 363
Post baccalaureate - - - - - - 5
Not stated - - - - - - -
Female 341 308 349 1,507 1,288 1,188 5,674
No grade completed 3 1 1 7 7 4 76
Preschool - - - - - - -
Special education 1 - - 1 2 1 1
Elementary 13 14 29 133 136 182 2,650
1st - 4th grade 4 3 9 17 13 25 658
5th - 6th grade - - 2 6 9 12 234
Graduate 9 11 18 110 114 145 1,758
High school 183 141 181 832 767 690 1,913
Undergraduate 29 22 25 94 87 95 345
Graduate 154 119 156 738 680 595 1,568
Postsecondary 1 10 4 51 59 38 152
Undergraduate 1 4 1 2 - - -
Graduate - 6 3 49 59 38 152
College undergraduate 140 142 126 193 102 89 300
Baccalaureate/college graduate - - 8 289 214 183 567
Post baccalaureate - - - 1 1 1 15
Not stated - - - - - - -
Continued
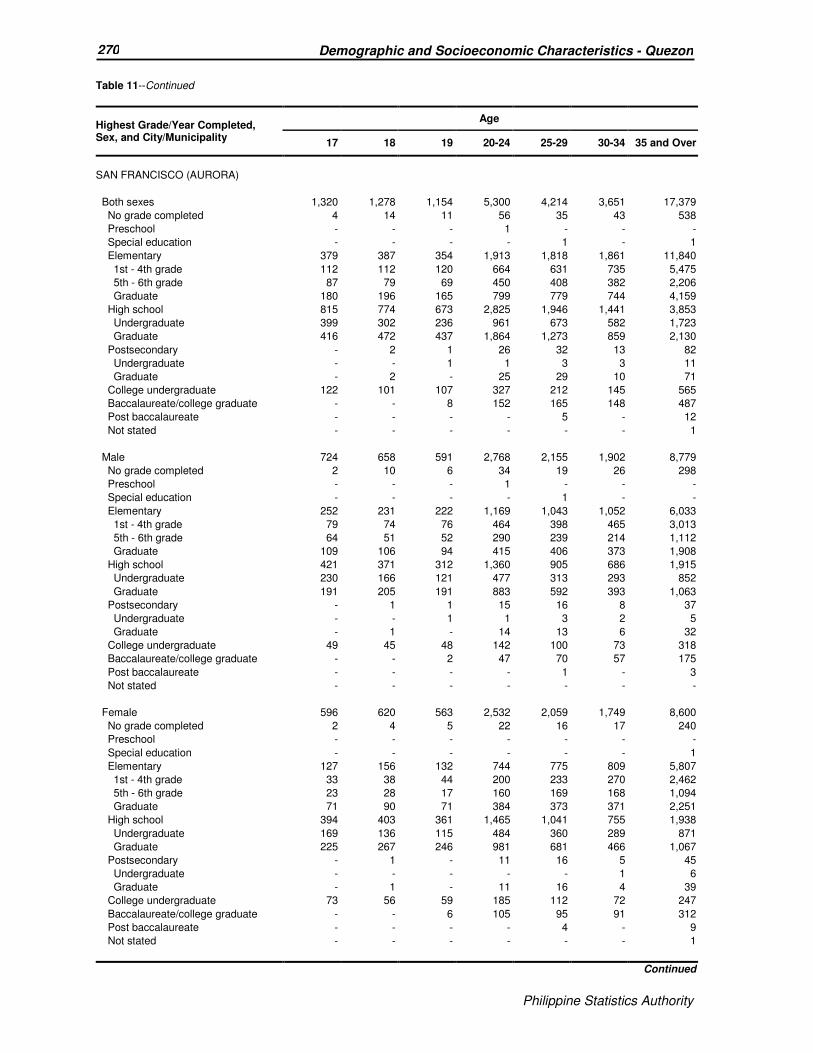
Philippine Statistics Authority
270 Demographic and Socioeconomic Characteristics - Quezon
Philippine Statistics Authority
Table 11--Continued
Highest Grade/Year Completed, Sex, and City/Municipality
Age
17 18 19 20-24 25-29 30-34 35 and Over
SAN FRANCISCO (AURORA)
Both sexes 1,320 1,278 1,154 5,300 4,214 3,651 17,379
No grade completed 4 14 11 56 35 43 538
Preschool - - - 1 - - -
Special education - - - - 1 - 1
Elementary 379 387 354 1,913 1,818 1,861 11,840
1st - 4th grade 112 112 120 664 631 735 5,475
5th - 6th grade 87 79 69 450 408 382 2,206
Graduate 180 196 165 799 779 744 4,159
High school 815 774 673 2,825 1,946 1,441 3,853
Undergraduate 399 302 236 961 673 582 1,723
Graduate 416 472 437 1,864 1,273 859 2,130
Postsecondary - 2 1 26 32 13 82
Undergraduate - - 1 1 3 3 11
Graduate - 2 - 25 29 10 71
College undergraduate 122 101 107 327 212 145 565
Baccalaureate/college graduate - - 8 152 165 148 487
Post baccalaureate - - - - 5 - 12
Not stated - - - - - - 1
Male 724 658 591 2,768 2,155 1,902 8,779
No grade completed 2 10 6 34 19 26 298
Preschool - - - 1 - - -
Special education - - - - 1 - -
Elementary 252 231 222 1,169 1,043 1,052 6,033
1st - 4th grade 79 74 76 464 398 465 3,013
5th - 6th grade 64 51 52 290 239 214 1,112
Graduate 109 106 94 415 406 373 1,908
High school 421 371 312 1,360 905 686 1,915
Undergraduate 230 166 121 477 313 293 852
Graduate 191 205 191 883 592 393 1,063
Postsecondary - 1 1 15 16 8 37
Undergraduate - - 1 1 3 2 5
Graduate - 1 - 14 13 6 32
College undergraduate 49 45 48 142 100 73 318
Baccalaureate/college graduate - - 2 47 70 57 175
Post baccalaureate - - - - 1 - 3
Not stated - - - - - - -
Female 596 620 563 2,532 2,059 1,749 8,600
No grade completed 2 4 5 22 16 17 240
Preschool - - - - - - -
Special education - - - - - - 1
Elementary 127 156 132 744 775 809 5,807
1st - 4th grade 33 38 44 200 233 270 2,462
5th - 6th grade 23 28 17 160 169 168 1,094
Graduate 71 90 71 384 373 371 2,251
High school 394 403 361 1,465 1,041 755 1,938
Undergraduate 169 136 115 484 360 289 871
Graduate 225 267 246 981 681 466 1,067
Postsecondary - 1 - 11 16 5 45
Undergraduate - - - - - 1 6
Graduate - 1 - 11 16 4 39
College undergraduate 73 56 59 185 112 72 247
Baccalaureate/college graduate - - 6 105 95 91 312
Post baccalaureate - - - - 4 - 9
Not stated - - - - - - 1
Continued
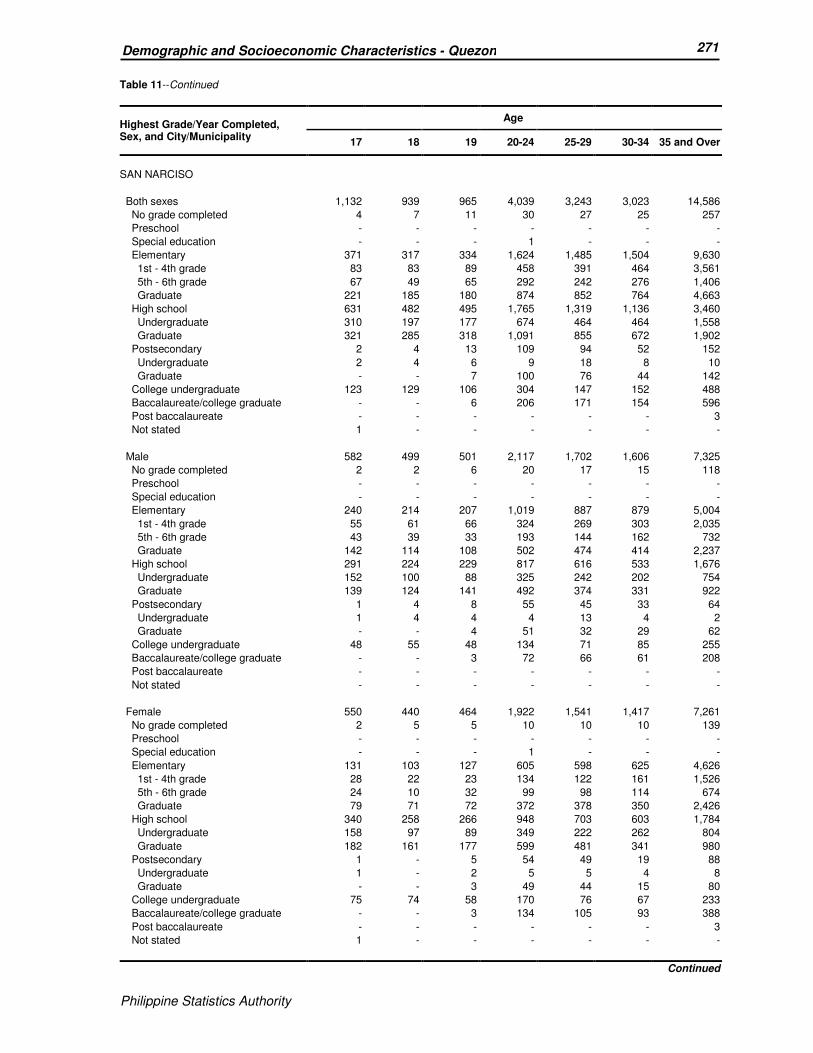
Philippine Statistics Authority
271 Demographic and Socioeconomic Characteristics - Quezon
Philippine Statistics Authority
Table 11--Continued
Highest Grade/Year Completed, Sex, and City/Municipality
Age
17 18 19 20-24 25-29 30-34 35 and Over
SAN NARCISO
Both sexes 1,132 939 965 4,039 3,243 3,023 14,586
No grade completed 4 7 11 30 27 25 257
Preschool - - - - - - -
Special education - - - 1 - - -
Elementary 371 317 334 1,624 1,485 1,504 9,630
1st - 4th grade 83 83 89 458 391 464 3,561
5th - 6th grade 67 49 65 292 242 276 1,406
Graduate 221 185 180 874 852 764 4,663
High school 631 482 495 1,765 1,319 1,136 3,460
Undergraduate 310 197 177 674 464 464 1,558
Graduate 321 285 318 1,091 855 672 1,902
Postsecondary 2 4 13 109 94 52 152
Undergraduate 2 4 6 9 18 8 10
Graduate - - 7 100 76 44 142
College undergraduate 123 129 106 304 147 152 488
Baccalaureate/college graduate - - 6 206 171 154 596
Post baccalaureate - - - - - - 3
Not stated 1 - - - - - -
Male 582 499 501 2,117 1,702 1,606 7,325
No grade completed 2 2 6 20 17 15 118
Preschool - - - - - - -
Special education - - - - - - -
Elementary 240 214 207 1,019 887 879 5,004
1st - 4th grade 55 61 66 324 269 303 2,035
5th - 6th grade 43 39 33 193 144 162 732
Graduate 142 114 108 502 474 414 2,237
High school 291 224 229 817 616 533 1,676
Undergraduate 152 100 88 325 242 202 754
Graduate 139 124 141 492 374 331 922
Postsecondary 1 4 8 55 45 33 64
Undergraduate 1 4 4 4 13 4 2
Graduate - - 4 51 32 29 62
College undergraduate 48 55 48 134 71 85 255
Baccalaureate/college graduate - - 3 72 66 61 208
Post baccalaureate - - - - - - -
Not stated - - - - - - -
Female 550 440 464 1,922 1,541 1,417 7,261
No grade completed 2 5 5 10 10 10 139
Preschool - - - - - - -
Special education - - - 1 - - -
Elementary 131 103 127 605 598 625 4,626
1st - 4th grade 28 22 23 134 122 161 1,526
5th - 6th grade 24 10 32 99 98 114 674
Graduate 79 71 72 372 378 350 2,426
High school 340 258 266 948 703 603 1,784
Undergraduate 158 97 89 349 222 262 804
Graduate 182 161 177 599 481 341 980
Postsecondary 1 - 5 54 49 19 88
Undergraduate 1 - 2 5 5 4 8
Graduate - - 3 49 44 15 80
College undergraduate 75 74 58 170 76 67 233
Baccalaureate/college graduate - - 3 134 105 93 388
Post baccalaureate - - - - - - 3
Not stated 1 - - - - - -
Continued
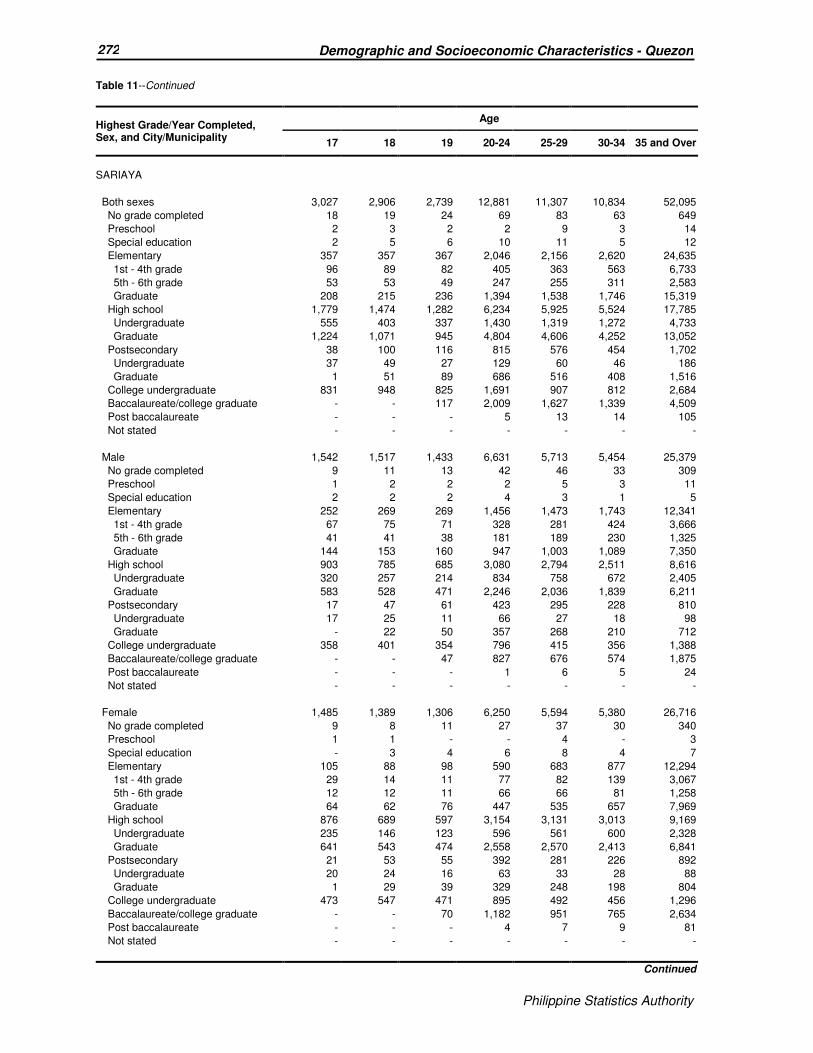
Philippine Statistics Authority
272 Demographic and Socioeconomic Characteristics - Quezon
Philippine Statistics Authority
Table 11--Continued
Highest Grade/Year Completed, Sex, and City/Municipality
Age
17 18 19 20-24 25-29 30-34 35 and Over
SARIAYA
Both sexes 3,027 2,906 2,739 12,881 11,307 10,834 52,095
No grade completed 18 19 24 69 83 63 649
Preschool 2 3 2 2 9 3 14
Special education 2 5 6 10 11 5 12
Elementary 357 357 367 2,046 2,156 2,620 24,635
1st - 4th grade 96 89 82 405 363 563 6,733
5th - 6th grade 53 53 49 247 255 311 2,583
Graduate 208 215 236 1,394 1,538 1,746 15,319
High school 1,779 1,474 1,282 6,234 5,925 5,524 17,785
Undergraduate 555 403 337 1,430 1,319 1,272 4,733
Graduate 1,224 1,071 945 4,804 4,606 4,252 13,052
Postsecondary 38 100 116 815 576 454 1,702
Undergraduate 37 49 27 129 60 46 186
Graduate 1 51 89 686 516 408 1,516
College undergraduate 831 948 825 1,691 907 812 2,684
Baccalaureate/college graduate - - 117 2,009 1,627 1,339 4,509
Post baccalaureate - - - 5 13 14 105
Not stated - - - - - - -
Male 1,542 1,517 1,433 6,631 5,713 5,454 25,379
No grade completed 9 11 13 42 46 33 309
Preschool 1 2 2 2 5 3 11
Special education 2 2 2 4 3 1 5
Elementary 252 269 269 1,456 1,473 1,743 12,341
1st - 4th grade 67 75 71 328 281 424 3,666
5th - 6th grade 41 41 38 181 189 230 1,325
Graduate 144 153 160 947 1,003 1,089 7,350
High school 903 785 685 3,080 2,794 2,511 8,616
Undergraduate 320 257 214 834 758 672 2,405
Graduate 583 528 471 2,246 2,036 1,839 6,211
Postsecondary 17 47 61 423 295 228 810
Undergraduate 17 25 11 66 27 18 98
Graduate - 22 50 357 268 210 712
College undergraduate 358 401 354 796 415 356 1,388
Baccalaureate/college graduate - - 47 827 676 574 1,875
Post baccalaureate - - - 1 6 5 24
Not stated - - - - - - -
Female 1,485 1,389 1,306 6,250 5,594 5,380 26,716
No grade completed 9 8 11 27 37 30 340
Preschool 1 1 - - 4 - 3
Special education - 3 4 6 8 4 7
Elementary 105 88 98 590 683 877 12,294
1st - 4th grade 29 14 11 77 82 139 3,067
5th - 6th grade 12 12 11 66 66 81 1,258
Graduate 64 62 76 447 535 657 7,969
High school 876 689 597 3,154 3,131 3,013 9,169
Undergraduate 235 146 123 596 561 600 2,328
Graduate 641 543 474 2,558 2,570 2,413 6,841
Postsecondary 21 53 55 392 281 226 892
Undergraduate 20 24 16 63 33 28 88
Graduate 1 29 39 329 248 198 804
College undergraduate 473 547 471 895 492 456 1,296
Baccalaureate/college graduate - - 70 1,182 951 765 2,634
Post baccalaureate - - - 4 7 9 81
Not stated - - - - - - -
Continued
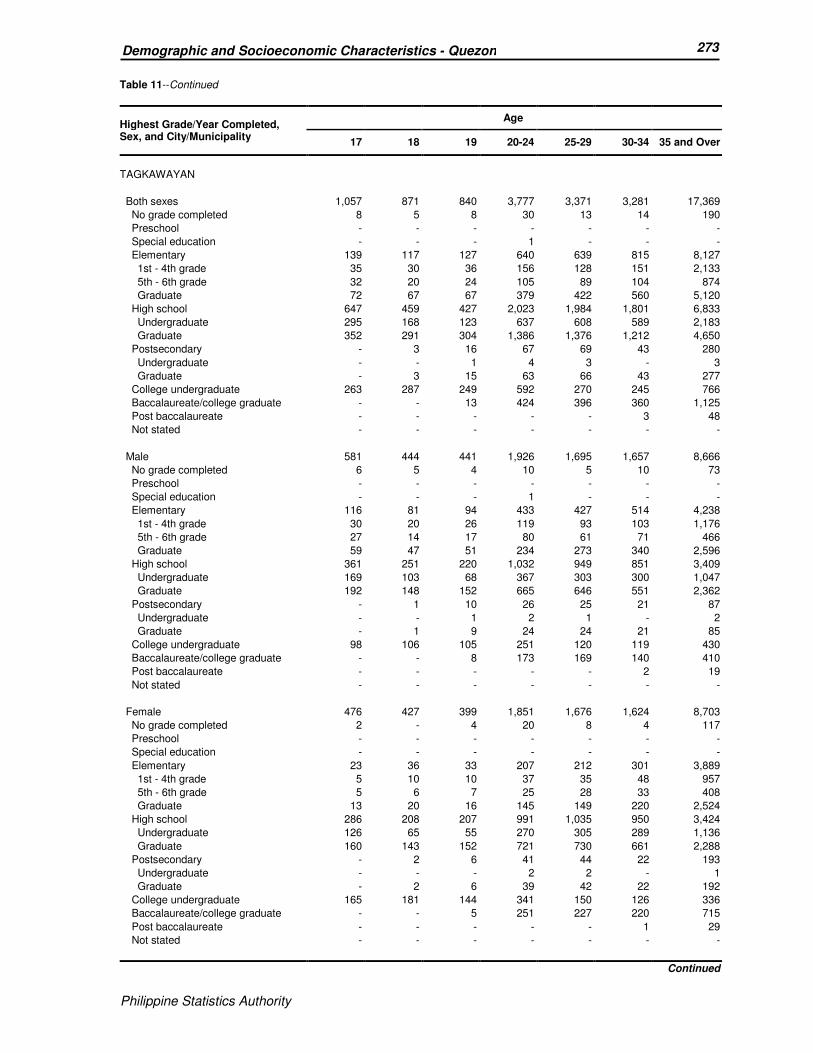
Philippine Statistics Authority
273 Demographic and Socioeconomic Characteristics - Quezon
Philippine Statistics Authority
Table 11--Continued
Highest Grade/Year Completed, Sex, and City/Municipality
Age
17 18 19 20-24 25-29 30-34 35 and Over
TAGKAWAYAN
Both sexes 1,057 871 840 3,777 3,371 3,281 17,369
No grade completed 8 5 8 30 13 14 190
Preschool - - - - - - -
Special education - - - 1 - - -
Elementary 139 117 127 640 639 815 8,127
1st - 4th grade 35 30 36 156 128 151 2,133
5th - 6th grade 32 20 24 105 89 104 874
Graduate 72 67 67 379 422 560 5,120
High school 647 459 427 2,023 1,984 1,801 6,833
Undergraduate 295 168 123 637 608 589 2,183
Graduate 352 291 304 1,386 1,376 1,212 4,650
Postsecondary - 3 16 67 69 43 280
Undergraduate - - 1 4 3 - 3
Graduate - 3 15 63 66 43 277
College undergraduate 263 287 249 592 270 245 766
Baccalaureate/college graduate - - 13 424 396 360 1,125
Post baccalaureate - - - - - 3 48
Not stated - - - - - - -
Male 581 444 441 1,926 1,695 1,657 8,666
No grade completed 6 5 4 10 5 10 73
Preschool - - - - - - -
Special education - - - 1 - - -
Elementary 116 81 94 433 427 514 4,238
1st - 4th grade 30 20 26 119 93 103 1,176
5th - 6th grade 27 14 17 80 61 71 466
Graduate 59 47 51 234 273 340 2,596
High school 361 251 220 1,032 949 851 3,409
Undergraduate 169 103 68 367 303 300 1,047
Graduate 192 148 152 665 646 551 2,362
Postsecondary - 1 10 26 25 21 87
Undergraduate - - 1 2 1 - 2
Graduate - 1 9 24 24 21 85
College undergraduate 98 106 105 251 120 119 430
Baccalaureate/college graduate - - 8 173 169 140 410
Post baccalaureate - - - - - 2 19
Not stated - - - - - - -
Female 476 427 399 1,851 1,676 1,624 8,703
No grade completed 2 - 4 20 8 4 117
Preschool - - - - - - -
Special education - - - - - - -
Elementary 23 36 33 207 212 301 3,889
1st - 4th grade 5 10 10 37 35 48 957
5th - 6th grade 5 6 7 25 28 33 408
Graduate 13 20 16 145 149 220 2,524
High school 286 208 207 991 1,035 950 3,424
Undergraduate 126 65 55 270 305 289 1,136
Graduate 160 143 152 721 730 661 2,288
Postsecondary - 2 6 41 44 22 193
Undergraduate - - - 2 2 - 1
Graduate - 2 6 39 42 22 192
College undergraduate 165 181 144 341 150 126 336
Baccalaureate/college graduate - - 5 251 227 220 715
Post baccalaureate - - - - - 1 29
Not stated - - - - - - -
Continued

Philippine Statistics Authority
274 Demographic and Socioeconomic Characteristics - Quezon
Philippine Statistics Authority
Table 11--Continued
Highest Grade/Year Completed, Sex, and City/Municipality
Age
17 18 19 20-24 25-29 30-34 35 and Over
CITY OF TAYABAS
Both sexes 2,082 2,007 1,932 9,067 7,603 6,896 35,730
No grade completed 17 7 11 35 35 35 164
Preschool - - - 1 - - -
Special education 9 3 6 12 4 3 5
Elementary 208 179 147 1,075 939 982 11,594
1st - 4th grade 53 52 29 271 214 229 3,042
5th - 6th grade 28 23 25 161 133 118 1,606
Graduate 127 104 93 643 592 635 6,946
High school 1,154 893 881 3,920 3,656 3,198 13,488
Undergraduate 395 270 250 979 849 736 3,422
Graduate 759 623 631 2,941 2,807 2,462 10,066
Postsecondary 1 10 50 481 352 299 1,538
Undergraduate 1 2 7 23 13 16 55
Graduate - 8 43 458 339 283 1,483
College undergraduate 693 915 791 1,717 867 839 3,209
Baccalaureate/college graduate - - 46 1,819 1,737 1,519 5,618
Post baccalaureate - - - 7 13 21 114
Not stated - - - - - - -
Male 1,126 1,023 987 4,715 3,903 3,518 17,508
No grade completed 13 5 9 18 18 18 77
Preschool - - - 1 - - -
Special education 5 1 2 3 2 1 2
Elementary 146 129 108 738 654 661 5,923
1st - 4th grade 38 40 23 198 164 171 1,663
5th - 6th grade 20 16 19 119 86 85 789
Graduate 88 73 66 421 404 405 3,471
High school 657 493 473 2,077 1,840 1,640 6,697
Undergraduate 247 166 151 623 503 411 1,654
Graduate 410 327 322 1,454 1,337 1,229 5,043
Postsecondary - 5 19 244 187 159 645
Undergraduate - 2 5 13 8 8 32
Graduate - 3 14 231 179 151 613
College undergraduate 305 390 351 910 424 391 1,667
Baccalaureate/college graduate - - 25 722 773 640 2,456
Post baccalaureate - - - 2 5 8 41
Not stated - - - - - - -
Female 956 984 945 4,352 3,700 3,378 18,222
No grade completed 4 2 2 17 17 17 87
Preschool - - - - - - -
Special education 4 2 4 9 2 2 3
Elementary 62 50 39 337 285 321 5,671
1st - 4th grade 15 12 6 73 50 58 1,379
5th - 6th grade 8 7 6 42 47 33 817
Graduate 39 31 27 222 188 230 3,475
High school 497 400 408 1,843 1,816 1,558 6,791
Undergraduate 148 104 99 356 346 325 1,768
Graduate 349 296 309 1,487 1,470 1,233 5,023
Postsecondary 1 5 31 237 165 140 893
Undergraduate 1 - 2 10 5 8 23
Graduate - 5 29 227 160 132 870
College undergraduate 388 525 440 807 443 448 1,542
Baccalaureate/college graduate - - 21 1,097 964 879 3,162
Post baccalaureate - - - 5 8 13 73
Not stated - - - - - - -
Continued
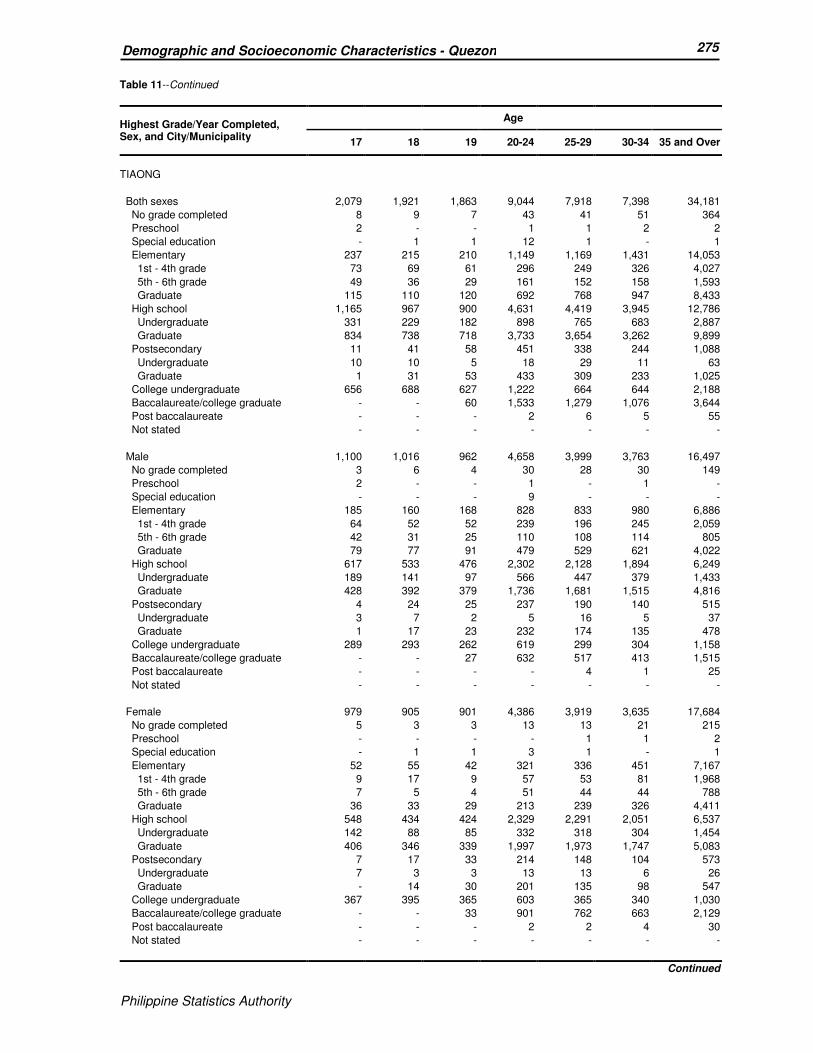
Philippine Statistics Authority
275 Demographic and Socioeconomic Characteristics - Quezon
Philippine Statistics Authority
Table 11--Continued
Highest Grade/Year Completed, Sex, and City/Municipality
Age
17 18 19 20-24 25-29 30-34 35 and Over
TIAONG
Both sexes 2,079 1,921 1,863 9,044 7,918 7,398 34,181
No grade completed 8 9 7 43 41 51 364
Preschool 2 - - 1 1 2 2
Special education - 1 1 12 1 - 1
Elementary 237 215 210 1,149 1,169 1,431 14,053
1st - 4th grade 73 69 61 296 249 326 4,027
5th - 6th grade 49 36 29 161 152 158 1,593
Graduate 115 110 120 692 768 947 8,433
High school 1,165 967 900 4,631 4,419 3,945 12,786
Undergraduate 331 229 182 898 765 683 2,887
Graduate 834 738 718 3,733 3,654 3,262 9,899
Postsecondary 11 41 58 451 338 244 1,088
Undergraduate 10 10 5 18 29 11 63
Graduate 1 31 53 433 309 233 1,025
College undergraduate 656 688 627 1,222 664 644 2,188
Baccalaureate/college graduate - - 60 1,533 1,279 1,076 3,644
Post baccalaureate - - - 2 6 5 55
Not stated - - - - - - -
Male 1,100 1,016 962 4,658 3,999 3,763 16,497
No grade completed 3 6 4 30 28 30 149
Preschool 2 - - 1 - 1 -
Special education - - - 9 - - -
Elementary 185 160 168 828 833 980 6,886
1st - 4th grade 64 52 52 239 196 245 2,059
5th - 6th grade 42 31 25 110 108 114 805
Graduate 79 77 91 479 529 621 4,022
High school 617 533 476 2,302 2,128 1,894 6,249
Undergraduate 189 141 97 566 447 379 1,433
Graduate 428 392 379 1,736 1,681 1,515 4,816
Postsecondary 4 24 25 237 190 140 515
Undergraduate 3 7 2 5 16 5 37
Graduate 1 17 23 232 174 135 478
College undergraduate 289 293 262 619 299 304 1,158
Baccalaureate/college graduate - - 27 632 517 413 1,515
Post baccalaureate - - - - 4 1 25
Not stated - - - - - - -
Female 979 905 901 4,386 3,919 3,635 17,684
No grade completed 5 3 3 13 13 21 215
Preschool - - - - 1 1 2
Special education - 1 1 3 1 - 1
Elementary 52 55 42 321 336 451 7,167
1st - 4th grade 9 17 9 57 53 81 1,968
5th - 6th grade 7 5 4 51 44 44 788
Graduate 36 33 29 213 239 326 4,411
High school 548 434 424 2,329 2,291 2,051 6,537
Undergraduate 142 88 85 332 318 304 1,454
Graduate 406 346 339 1,997 1,973 1,747 5,083
Postsecondary 7 17 33 214 148 104 573
Undergraduate 7 3 3 13 13 6 26
Graduate - 14 30 201 135 98 547
College undergraduate 367 395 365 603 365 340 1,030
Baccalaureate/college graduate - - 33 901 762 663 2,129
Post baccalaureate - - - 2 2 4 30
Not stated - - - - - - -
Continued
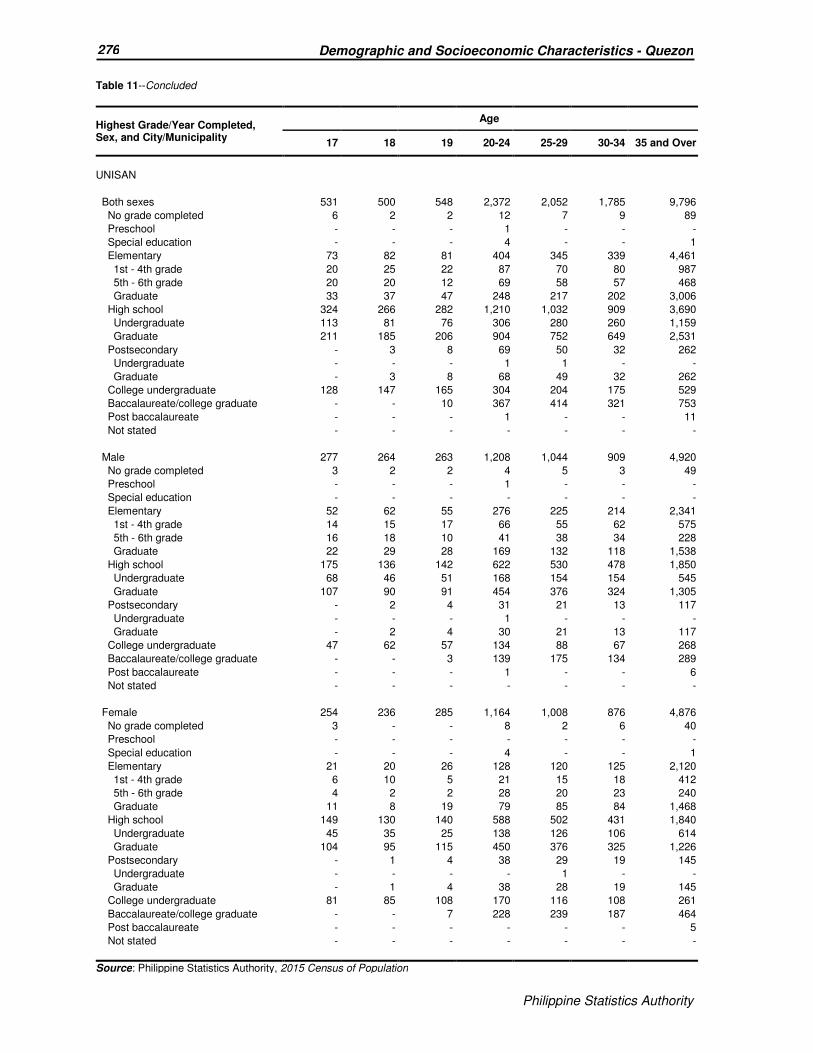
Philippine Statistics Authority
276 Demographic and Socioeconomic Characteristics - Quezon
Philippine Statistics Authority
Table 11--Concluded
Highest Grade/Year Completed, Sex, and City/Municipality
Age
17 18 19 20-24 25-29 30-34 35 and Over
UNISAN
Both sexes 531 500 548 2,372 2,052 1,785 9,796
No grade completed 6 2 2 12 7 9 89
Preschool - - - 1 - - -
Special education - - - 4 - - 1
Elementary 73 82 81 404 345 339 4,461
1st - 4th grade 20 25 22 87 70 80 987
5th - 6th grade 20 20 12 69 58 57 468
Graduate 33 37 47 248 217 202 3,006
High school 324 266 282 1,210 1,032 909 3,690
Undergraduate 113 81 76 306 280 260 1,159
Graduate 211 185 206 904 752 649 2,531
Postsecondary - 3 8 69 50 32 262
Undergraduate - - - 1 1 - -
Graduate - 3 8 68 49 32 262
College undergraduate 128 147 165 304 204 175 529
Baccalaureate/college graduate - - 10 367 414 321 753
Post baccalaureate - - - 1 - - 11
Not stated - - - - - - -
Male 277 264 263 1,208 1,044 909 4,920
No grade completed 3 2 2 4 5 3 49
Preschool - - - 1 - - -
Special education - - - - - - -
Elementary 52 62 55 276 225 214 2,341
1st - 4th grade 14 15 17 66 55 62 575
5th - 6th grade 16 18 10 41 38 34 228
Graduate 22 29 28 169 132 118 1,538
High school 175 136 142 622 530 478 1,850
Undergraduate 68 46 51 168 154 154 545
Graduate 107 90 91 454 376 324 1,305
Postsecondary - 2 4 31 21 13 117
Undergraduate - - - 1 - - -
Graduate - 2 4 30 21 13 117
College undergraduate 47 62 57 134 88 67 268
Baccalaureate/college graduate - - 3 139 175 134 289
Post baccalaureate - - - 1 - - 6
Not stated - - - - - - -
Female 254 236 285 1,164 1,008 876 4,876
No grade completed 3 - - 8 2 6 40
Preschool - - - - - - -
Special education - - - 4 - - 1
Elementary 21 20 26 128 120 125 2,120
1st - 4th grade 6 10 5 21 15 18 412
5th - 6th grade 4 2 2 28 20 23 240
Graduate 11 8 19 79 85 84 1,468
High school 149 130 140 588 502 431 1,840
Undergraduate 45 35 25 138 126 106 614
Graduate 104 95 115 450 376 325 1,226
Postsecondary - 1 4 38 29 19 145
Undergraduate - - - - 1 - -
Graduate - 1 4 38 28 19 145
College undergraduate 81 85 108 170 116 108 261
Baccalaureate/college graduate - - 7 228 239 187 464
Post baccalaureate - - - - - - 5
Not stated - - - - - - -
Source: Philippine Statistics Authority, 2015 Census of Population
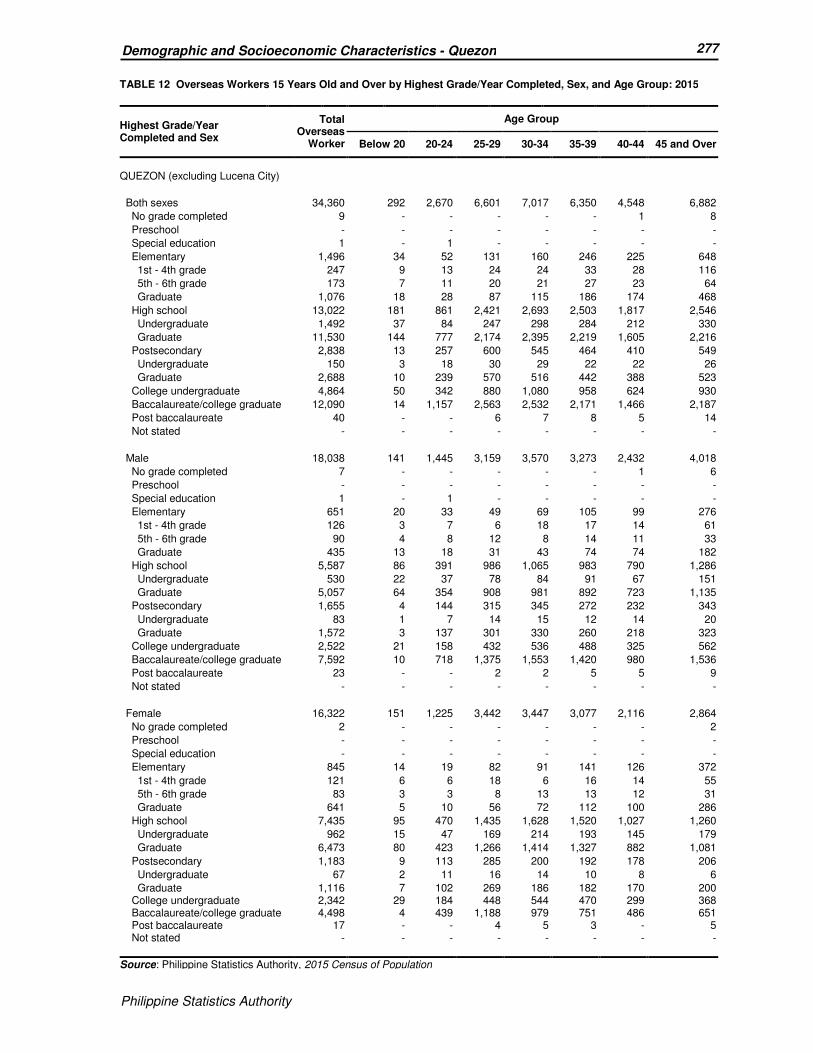
Philippine Statistics Authority
277 Demographic and Socioeconomic Characteristics - Quezon
Philippine Statistics Authority
TABLE 12 Overseas Workers 15 Years Old and Over by Highest Grade/Year Completed, Sex, and Age Group: 2015
Highest Grade/Year Completed and Sex
Total Overseas
Worker
Age Group
Below 20 20-24 25-29 30-34 35-39 40-44 45 and Over
QUEZON (excluding Lucena City)
Both sexes 34,360 292 2,670 6,601 7,017 6,350 4,548 6,882
No grade completed 9 - - - - - 1 8
Preschool - - - - - - - -
Special education 1 - 1 - - - - -
Elementary 1,496 34 52 131 160 246 225 648
1st - 4th grade 247 9 13 24 24 33 28 116
5th - 6th grade 173 7 11 20 21 27 23 64
Graduate 1,076 18 28 87 115 186 174 468
High school 13,022 181 861 2,421 2,693 2,503 1,817 2,546
Undergraduate 1,492 37 84 247 298 284 212 330
Graduate 11,530 144 777 2,174 2,395 2,219 1,605 2,216
Postsecondary 2,838 13 257 600 545 464 410 549
Undergraduate 150 3 18 30 29 22 22 26
Graduate 2,688 10 239 570 516 442 388 523
College undergraduate 4,864 50 342 880 1,080 958 624 930
Baccalaureate/college graduate 12,090 14 1,157 2,563 2,532 2,171 1,466 2,187
Post baccalaureate 40 - - 6 7 8 5 14
Not stated - - - - - - - -
Male 18,038 141 1,445 3,159 3,570 3,273 2,432 4,018
No grade completed 7 - - - - - 1 6
Preschool - - - - - - - -
Special education 1 - 1 - - - - -
Elementary 651 20 33 49 69 105 99 276
1st - 4th grade 126 3 7 6 18 17 14 61
5th - 6th grade 90 4 8 12 8 14 11 33
Graduate 435 13 18 31 43 74 74 182
High school 5,587 86 391 986 1,065 983 790 1,286
Undergraduate 530 22 37 78 84 91 67 151
Graduate 5,057 64 354 908 981 892 723 1,135
Postsecondary 1,655 4 144 315 345 272 232 343
Undergraduate 83 1 7 14 15 12 14 20
Graduate 1,572 3 137 301 330 260 218 323
College undergraduate 2,522 21 158 432 536 488 325 562
Baccalaureate/college graduate 7,592 10 718 1,375 1,553 1,420 980 1,536
Post baccalaureate 23 - - 2 2 5 5 9
Not stated - - - - - - - -
Female 16,322 151 1,225 3,442 3,447 3,077 2,116 2,864
No grade completed 2 - - - - - - 2
Preschool - - - - - - - -
Special education - - - - - - - -
Elementary 845 14 19 82 91 141 126 372
1st - 4th grade 121 6 6 18 6 16 14 55
5th - 6th grade 83 3 3 8 13 13 12 31
Graduate 641 5 10 56 72 112 100 286
High school 7,435 95 470 1,435 1,628 1,520 1,027 1,260
Undergraduate 962 15 47 169 214 193 145 179
Graduate 6,473 80 423 1,266 1,414 1,327 882 1,081
Postsecondary 1,183 9 113 285 200 192 178 206
Undergraduate 67 2 11 16 14 10 8 6
Graduate 1,116 7 102 269 186 182 170 200 College undergraduate 2,342 29 184 448 544 470 299 368 Baccalaureate/college graduate 4,498 4 439 1,188 979 751 486 651 Post baccalaureate 17 - - 4 5 3 - 5 Not stated - - - - - - - -
Source: Philippine Statistics Authority, 2015 Census of Population
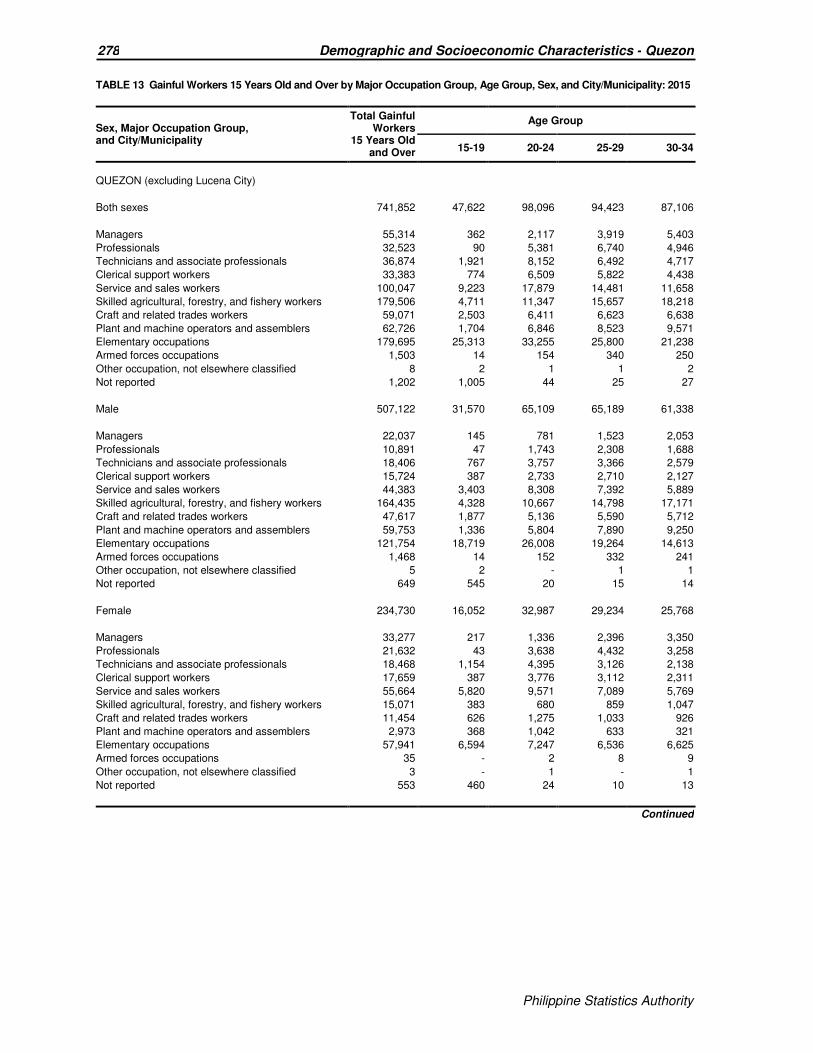
Philippine Statistics Authority
278 Demographic and Socioeconomic Characteristics - Quezon
Philippine Statistics Authority
TABLE 13 Gainful Workers 15 Years Old and Over by Major Occupation Group, Age Group, Sex, and City/Municipality: 2015
Sex, Major Occupation Group, and City/Municipality
Total Gainful Workers
15 Years Old and Over
Age Group
15-19 20-24 25-29 30-34
QUEZON (excluding Lucena City)
Both sexes 741,852 47,622 98,096 94,423 87,106
Managers 55,314 362 2,117 3,919 5,403
Professionals 32,523 90 5,381 6,740 4,946
Technicians and associate professionals 36,874 1,921 8,152 6,492 4,717
Clerical support workers 33,383 774 6,509 5,822 4,438
Service and sales workers 100,047 9,223 17,879 14,481 11,658
Skilled agricultural, forestry, and fishery workers 179,506 4,711 11,347 15,657 18,218
Craft and related trades workers 59,071 2,503 6,411 6,623 6,638
Plant and machine operators and assemblers 62,726 1,704 6,846 8,523 9,571
Elementary occupations 179,695 25,313 33,255 25,800 21,238
Armed forces occupations 1,503 14 154 340 250
Other occupation, not elsewhere classified 8 2 1 1 2
Not reported 1,202 1,005 44 25 27
Male 507,122 31,570 65,109 65,189 61,338
Managers 22,037 145 781 1,523 2,053
Professionals 10,891 47 1,743 2,308 1,688
Technicians and associate professionals 18,406 767 3,757 3,366 2,579
Clerical support workers 15,724 387 2,733 2,710 2,127
Service and sales workers 44,383 3,403 8,308 7,392 5,889
Skilled agricultural, forestry, and fishery workers 164,435 4,328 10,667 14,798 17,171
Craft and related trades workers 47,617 1,877 5,136 5,590 5,712
Plant and machine operators and assemblers 59,753 1,336 5,804 7,890 9,250
Elementary occupations 121,754 18,719 26,008 19,264 14,613
Armed forces occupations 1,468 14 152 332 241
Other occupation, not elsewhere classified 5 2 - 1 1
Not reported 649 545 20 15 14
Female 234,730 16,052 32,987 29,234 25,768
Managers 33,277 217 1,336 2,396 3,350
Professionals 21,632 43 3,638 4,432 3,258
Technicians and associate professionals 18,468 1,154 4,395 3,126 2,138
Clerical support workers 17,659 387 3,776 3,112 2,311
Service and sales workers 55,664 5,820 9,571 7,089 5,769
Skilled agricultural, forestry, and fishery workers 15,071 383 680 859 1,047
Craft and related trades workers 11,454 626 1,275 1,033 926
Plant and machine operators and assemblers 2,973 368 1,042 633 321
Elementary occupations 57,941 6,594 7,247 6,536 6,625
Armed forces occupations 35 - 2 8 9
Other occupation, not elsewhere classified 3 - 1 - 1
Not reported 553 460 24 10 13
Continued

Philippine Statistics Authority
279 Demographic and Socioeconomic Characteristics - Quezon
Philippine Statistics Authority
Table 13--Continued
Sex, Major Occupation Group, and City/Municipality
Total Gainful Workers
15 Years Old and Over
Age Group
15-19 20-24 25-29 30-34
AGDANGAN
Both sexes 6,436 459 768 725 699
Managers 509 5 12 28 50
Professionals 266 1 52 55 37
Technicians and associate professionals 355 10 70 64 44
Clerical support workers 253 4 42 39 38
Service and sales workers 1,064 129 174 134 105
Skilled agricultural, forestry, and fishery workers 1,334 50 72 91 113
Craft and related trades workers 524 23 45 62 60
Plant and machine operators and assemblers 475 19 64 57 71
Elementary occupations 1,636 216 235 193 177
Armed forces occupations 18 1 1 2 4
Other occupation, not elsewhere classified - - - - -
Not reported 2 1 1 - -
Male 3,840 288 469 440 425
Managers 155 - 2 5 22
Professionals 82 1 11 17 11
Technicians and associate professionals 160 4 36 36 16
Clerical support workers 114 4 23 19 13
Service and sales workers 366 54 66 69 39
Skilled agricultural, forestry, and fishery workers 1,191 46 67 82 105
Craft and related trades workers 372 18 36 43 42
Plant and machine operators and assemblers 425 10 40 45 70
Elementary occupations 957 150 187 122 103
Armed forces occupations 18 1 1 2 4
Other occupation, not elsewhere classified - - - - -
Not reported - - - - -
Female 2,596 171 299 285 274
Managers 354 5 10 23 28
Professionals 184 - 41 38 26
Technicians and associate professionals 195 6 34 28 28
Clerical support workers 139 - 19 20 25
Service and sales workers 698 75 108 65 66
Skilled agricultural, forestry, and fishery workers 143 4 5 9 8
Craft and related trades workers 152 5 9 19 18
Plant and machine operators and assemblers 50 9 24 12 1
Elementary occupations 679 66 48 71 74
Armed forces occupations - - - - -
Other occupation, not elsewhere classified - - - - -
Not reported 2 1 1 - -
Continued
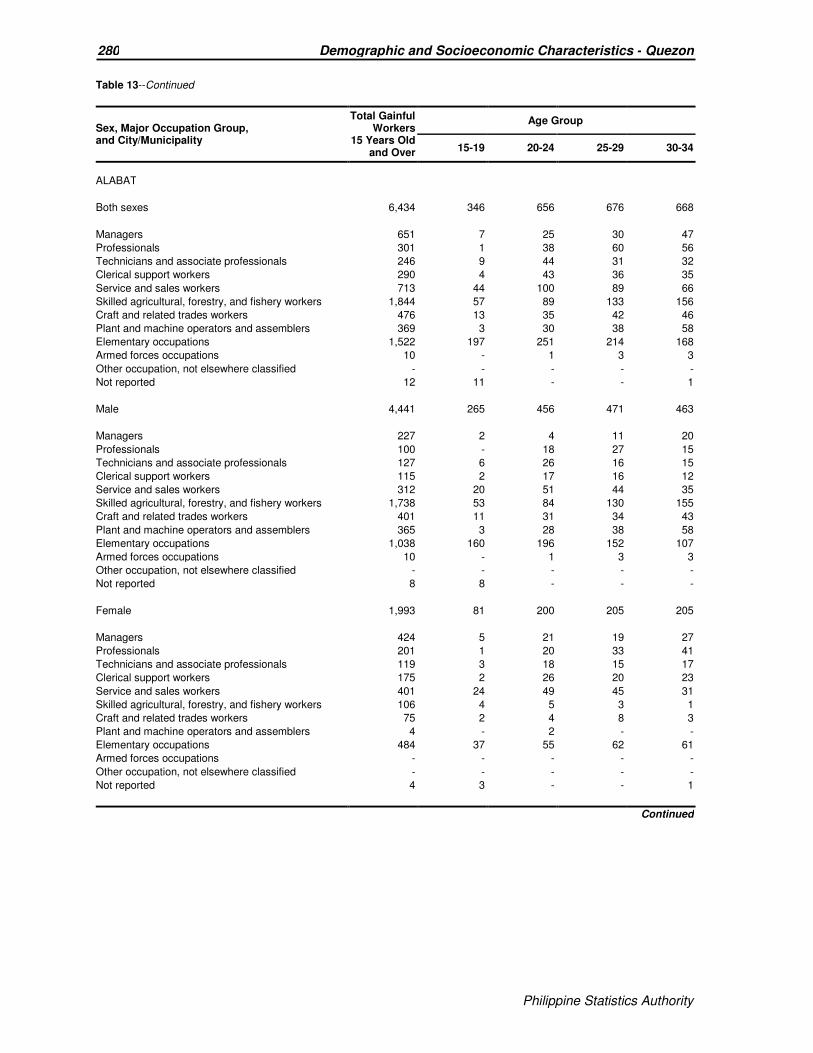
Philippine Statistics Authority
280 Demographic and Socioeconomic Characteristics - Quezon
Philippine Statistics Authority
Table 13--Continued
Sex, Major Occupation Group, and City/Municipality
Total Gainful Workers
15 Years Old and Over
Age Group
15-19 20-24 25-29 30-34
ALABAT
Both sexes 6,434 346 656 676 668
Managers 651 7 25 30 47
Professionals 301 1 38 60 56
Technicians and associate professionals 246 9 44 31 32
Clerical support workers 290 4 43 36 35
Service and sales workers 713 44 100 89 66
Skilled agricultural, forestry, and fishery workers 1,844 57 89 133 156
Craft and related trades workers 476 13 35 42 46
Plant and machine operators and assemblers 369 3 30 38 58
Elementary occupations 1,522 197 251 214 168
Armed forces occupations 10 - 1 3 3
Other occupation, not elsewhere classified - - - - -
Not reported 12 11 - - 1
Male 4,441 265 456 471 463
Managers 227 2 4 11 20
Professionals 100 - 18 27 15
Technicians and associate professionals 127 6 26 16 15
Clerical support workers 115 2 17 16 12
Service and sales workers 312 20 51 44 35
Skilled agricultural, forestry, and fishery workers 1,738 53 84 130 155
Craft and related trades workers 401 11 31 34 43
Plant and machine operators and assemblers 365 3 28 38 58
Elementary occupations 1,038 160 196 152 107
Armed forces occupations 10 - 1 3 3
Other occupation, not elsewhere classified - - - - -
Not reported 8 8 - - -
Female 1,993 81 200 205 205
Managers 424 5 21 19 27
Professionals 201 1 20 33 41
Technicians and associate professionals 119 3 18 15 17
Clerical support workers 175 2 26 20 23
Service and sales workers 401 24 49 45 31
Skilled agricultural, forestry, and fishery workers 106 4 5 3 1
Craft and related trades workers 75 2 4 8 3
Plant and machine operators and assemblers 4 - 2 - -
Elementary occupations 484 37 55 62 61
Armed forces occupations - - - - -
Other occupation, not elsewhere classified - - - - -
Not reported 4 3 - - 1
Continued

Philippine Statistics Authority
281 Demographic and Socioeconomic Characteristics - Quezon
Philippine Statistics Authority
Table 13--Continued
Sex, Major Occupation Group, and City/Municipality
Total Gainful Workers
15 Years Old and Over
Age Group
15-19 20-24 25-29 30-34
ATIMONAN
Both sexes 26,967 1,326 3,143 3,373 3,135
Managers 2,398 13 85 173 219
Professionals 1,425 6 213 236 212
Technicians and associate professionals 1,277 45 237 209 178
Clerical support workers 1,170 38 225 202 174
Service and sales workers 4,125 283 687 627 468
Skilled agricultural, forestry, and fishery workers 5,143 158 311 393 500
Craft and related trades workers 2,043 53 155 207 227
Plant and machine operators and assemblers 2,271 26 187 305 331
Elementary occupations 7,029 656 1,042 1,018 817
Armed forces occupations 32 - 1 3 5
Other occupation, not elsewhere classified 1 - - - 1
Not reported 53 48 - - 3
Male 17,969 884 2,030 2,277 2,165
Managers 884 6 38 74 65
Professionals 489 3 69 80 84
Technicians and associate professionals 671 17 110 115 104
Clerical support workers 557 25 105 106 84
Service and sales workers 1,791 92 299 308 248
Skilled agricultural, forestry, and fishery workers 4,829 152 300 381 483
Craft and related trades workers 1,798 44 134 187 211
Plant and machine operators and assemblers 2,191 23 161 284 323
Elementary occupations 4,698 498 813 739 555
Armed forces occupations 32 - 1 3 5
Other occupation, not elsewhere classified 1 - - - 1
Not reported 28 24 - - 2
Female 8,998 442 1,113 1,096 970
Managers 1,514 7 47 99 154
Professionals 936 3 144 156 128
Technicians and associate professionals 606 28 127 94 74
Clerical support workers 613 13 120 96 90
Service and sales workers 2,334 191 388 319 220
Skilled agricultural, forestry, and fishery workers 314 6 11 12 17
Craft and related trades workers 245 9 21 20 16
Plant and machine operators and assemblers 80 3 26 21 8
Elementary occupations 2,331 158 229 279 262
Armed forces occupations - - - - -
Other occupation, not elsewhere classified - - - - -
Not reported 25 24 - - 1
Continued

Philippine Statistics Authority
282 Demographic and Socioeconomic Characteristics - Quezon
Philippine Statistics Authority
Table 13--Continued
Sex, Major Occupation Group, and City/Municipality
Total Gainful Workers
15 Years Old and Over
Age Group
15-19 20-24 25-29 30-34
BUENAVISTA
Both sexes 11,435 1,032 1,416 1,417 1,336
Managers 612 7 26 42 58
Professionals 331 3 64 68 52
Technicians and associate professionals 316 13 48 41 37
Clerical support workers 230 8 39 30 20
Service and sales workers 691 78 135 82 80
Skilled agricultural, forestry, and fishery workers 4,946 165 331 510 588
Craft and related trades workers 322 12 25 28 43
Plant and machine operators and assemblers 683 50 121 121 86
Elementary occupations 3,259 676 622 491 369
Armed forces occupations 25 - 5 4 3
Other occupation, not elsewhere classified - - - - -
Not reported 20 20 - - -
Male 8,175 751 1,010 1,006 980
Managers 267 2 5 13 22
Professionals 102 1 22 20 15
Technicians and associate professionals 125 4 18 17 14
Clerical support workers 94 - 21 9 9
Service and sales workers 243 33 53 33 36
Skilled agricultural, forestry, and fishery workers 4,522 150 312 482 557
Craft and related trades workers 266 7 21 25 39
Plant and machine operators and assemblers 653 47 110 116 83
Elementary occupations 1,872 500 443 288 202
Armed forces occupations 24 - 5 3 3
Other occupation, not elsewhere classified - - - - -
Not reported 7 7 - - -
Female 3,260 281 406 411 356
Managers 345 5 21 29 36
Professionals 229 2 42 48 37
Technicians and associate professionals 191 9 30 24 23
Clerical support workers 136 8 18 21 11
Service and sales workers 448 45 82 49 44
Skilled agricultural, forestry, and fishery workers 424 15 19 28 31
Craft and related trades workers 56 5 4 3 4
Plant and machine operators and assemblers 30 3 11 5 3
Elementary occupations 1,387 176 179 203 167
Armed forces occupations 1 - - 1 -
Other occupation, not elsewhere classified - - - - -
Not reported 13 13 - - -
Continued

Philippine Statistics Authority
283 Demographic and Socioeconomic Characteristics - Quezon
Philippine Statistics Authority
Table 13--Continued
Sex, Major Occupation Group, and City/Municipality
Total Gainful Workers
15 Years Old and Over
Age Group
15-19 20-24 25-29 30-34
BURDEOS
Both sexes 9,145 723 1,360 1,260 1,013
Managers 426 4 18 31 42
Professionals 279 2 55 58 41
Technicians and associate professionals 162 3 31 29 16
Clerical support workers 164 4 39 34 16
Service and sales workers 512 74 132 80 35
Skilled agricultural, forestry, and fishery workers 4,628 161 419 546 548
Craft and related trades workers 287 18 50 35 29
Plant and machine operators and assemblers 233 13 30 44 33
Elementary occupations 2,446 440 585 400 253
Armed forces occupations 4 - 1 3 -
Other occupation, not elsewhere classified - - - - -
Not reported 4 4 - - -
Male 7,277 533 1,057 1,020 847
Managers 220 2 5 10 16
Professionals 74 - 16 22 13
Technicians and associate professionals 65 1 17 15 6
Clerical support workers 64 3 11 13 7
Service and sales workers 163 22 53 34 11
Skilled agricultural, forestry, and fishery workers 4,362 152 402 533 533
Craft and related trades workers 264 11 41 35 28
Plant and machine operators and assemblers 216 9 24 39 33
Elementary occupations 1,843 331 487 316 200
Armed forces occupations 4 - 1 3 -
Other occupation, not elsewhere classified - - - - -
Not reported 2 2 - - -
Female 1,868 190 303 240 166
Managers 206 2 13 21 26
Professionals 205 2 39 36 28
Technicians and associate professionals 97 2 14 14 10
Clerical support workers 100 1 28 21 9
Service and sales workers 349 52 79 46 24
Skilled agricultural, forestry, and fishery workers 266 9 17 13 15
Craft and related trades workers 23 7 9 - 1
Plant and machine operators and assemblers 17 4 6 5 -
Elementary occupations 603 109 98 84 53
Armed forces occupations - - - - -
Other occupation, not elsewhere classified - - - - -
Not reported 2 2 - - -
Continued

Philippine Statistics Authority
284 Demographic and Socioeconomic Characteristics - Quezon
Philippine Statistics Authority
Table 13--Continued
Sex, Major Occupation Group, and City/Municipality
Total Gainful Workers
15 Years Old and Over
Age Group
15-19 20-24 25-29 30-34
CALAUAG
Both sexes 26,962 1,593 3,308 3,279 2,976
Managers 2,145 13 56 138 205
Professionals 1,056 5 151 180 160
Technicians and associate professionals 977 46 231 166 110
Clerical support workers 765 25 140 139 77
Service and sales workers 3,614 366 668 500 398
Skilled agricultural, forestry, and fishery workers 8,698 250 553 816 887
Craft and related trades workers 1,983 84 200 190 199
Plant and machine operators and assemblers 2,132 60 212 341 311
Elementary occupations 5,394 705 1,078 772 598
Armed forces occupations 155 2 17 37 30
Other occupation, not elsewhere classified - - - - -
Not reported 43 37 2 - 1
Male 19,032 1,048 2,271 2,378 2,226
Managers 792 8 23 50 65
Professionals 355 4 59 66 47
Technicians and associate professionals 441 24 91 84 66
Clerical support workers 349 10 59 63 33
Service and sales workers 1,616 135 311 240 216
Skilled agricultural, forestry, and fishery workers 8,049 233 533 788 855
Craft and related trades workers 1,424 60 154 134 153
Plant and machine operators and assemblers 2,062 46 196 324 305
Elementary occupations 3,769 505 828 592 456
Armed forces occupations 154 2 17 37 30
Other occupation, not elsewhere classified - - - - -
Not reported 21 21 - - -
Female 7,930 545 1,037 901 750
Managers 1,353 5 33 88 140
Professionals 701 1 92 114 113
Technicians and associate professionals 536 22 140 82 44
Clerical support workers 416 15 81 76 44
Service and sales workers 1,998 231 357 260 182
Skilled agricultural, forestry, and fishery workers 649 17 20 28 32
Craft and related trades workers 559 24 46 56 46
Plant and machine operators and assemblers 70 14 16 17 6
Elementary occupations 1,625 200 250 180 142
Armed forces occupations 1 - - - -
Other occupation, not elsewhere classified - - - - -
Not reported 22 16 2 - 1
Continued

Philippine Statistics Authority
285 Demographic and Socioeconomic Characteristics - Quezon
Philippine Statistics Authority
Table 13--Continued
Sex, Major Occupation Group, and City/Municipality
Total Gainful Workers
15 Years Old and Over
Age Group
15-19 20-24 25-29 30-34
CANDELARIA
Both sexes 48,452 2,615 6,711 6,770 6,391
Managers 3,551 18 144 262 333
Professionals 2,201 - 424 524 322
Technicians and associate professionals 3,794 214 955 757 542
Clerical support workers 3,354 85 616 578 473
Service and sales workers 6,925 541 1,191 1,035 926
Skilled agricultural, forestry, and fishery workers 3,968 66 132 255 348
Craft and related trades workers 4,074 174 435 447 528
Plant and machine operators and assemblers 5,651 131 540 719 880
Elementary occupations 14,751 1,254 2,271 2,183 2,035
Armed forces occupations 38 1 2 9 4
Other occupation, not elsewhere classified - - - - -
Not reported 145 131 1 1 -
Male 31,408 1,696 4,090 4,396 4,238
Managers 1,446 10 52 102 128
Professionals 716 - 130 171 116
Technicians and associate professionals 2,084 91 454 430 320
Clerical support workers 1,946 57 282 316 285
Service and sales workers 3,203 191 516 527 457
Skilled agricultural, forestry, and fishery workers 3,525 62 123 241 319
Craft and related trades workers 3,362 138 351 374 448
Plant and machine operators and assemblers 5,333 102 440 648 847
Elementary occupations 9,669 966 1,740 1,579 1,314
Armed forces occupations 36 1 2 8 4
Other occupation, not elsewhere classified - - - - -
Not reported 88 78 - - -
Female 17,044 919 2,621 2,374 2,153
Managers 2,105 8 92 160 205
Professionals 1,485 - 294 353 206
Technicians and associate professionals 1,710 123 501 327 222
Clerical support workers 1,408 28 334 262 188
Service and sales workers 3,722 350 675 508 469
Skilled agricultural, forestry, and fishery workers 443 4 9 14 29
Craft and related trades workers 712 36 84 73 80
Plant and machine operators and assemblers 318 29 100 71 33
Elementary occupations 5,082 288 531 604 721
Armed forces occupations 2 - - 1 -
Other occupation, not elsewhere classified - - - - -
Not reported 57 53 1 1 -
Continued

Philippine Statistics Authority
286 Demographic and Socioeconomic Characteristics - Quezon
Philippine Statistics Authority
Table 13--Continued
Sex, Major Occupation Group, and City/Municipality
Total Gainful Workers
15 Years Old and Over
Age Group
15-19 20-24 25-29 30-34
CATANAUAN
Both sexes 26,372 2,224 3,985 3,363 3,012
Managers 1,616 10 66 123 195
Professionals 986 5 160 182 132
Technicians and associate professionals 960 57 241 172 100
Clerical support workers 844 24 184 140 96
Service and sales workers 2,975 465 649 418 271
Skilled agricultural, forestry, and fishery workers 8,795 243 552 890 970
Craft and related trades workers 1,723 123 314 193 163
Plant and machine operators and assemblers 2,227 67 308 343 354
Elementary occupations 6,099 1,201 1,488 874 714
Armed forces occupations 113 1 20 27 17
Other occupation, not elsewhere classified - - - - -
Not reported 34 28 3 1 -
Male 19,259 1,461 2,734 2,495 2,311
Managers 693 3 25 52 77
Professionals 328 5 56 63 38
Technicians and associate professionals 454 22 106 84 54
Clerical support workers 391 7 80 64 45
Service and sales workers 1,281 169 310 205 132
Skilled agricultural, forestry, and fishery workers 8,103 225 518 847 927
Craft and related trades workers 1,457 95 229 165 146
Plant and machine operators and assemblers 2,114 48 266 318 346
Elementary occupations 4,312 874 1,124 670 529
Armed forces occupations 111 1 18 27 17
Other occupation, not elsewhere classified - - - - -
Not reported 15 12 2 - -
Female 7,113 763 1,251 868 701
Managers 923 7 41 71 118
Professionals 658 - 104 119 94
Technicians and associate professionals 506 35 135 88 46
Clerical support workers 453 17 104 76 51
Service and sales workers 1,694 296 339 213 139
Skilled agricultural, forestry, and fishery workers 692 18 34 43 43
Craft and related trades workers 266 28 85 28 17
Plant and machine operators and assemblers 113 19 42 25 8
Elementary occupations 1,787 327 364 204 185
Armed forces occupations 2 - 2 - -
Other occupation, not elsewhere classified - - - - -
Not reported 19 16 1 1 -
Continued

Philippine Statistics Authority
287 Demographic and Socioeconomic Characteristics - Quezon
Philippine Statistics Authority
Table 13--Continued
Sex, Major Occupation Group, and City/Municipality
Total Gainful Workers
15 Years Old and Over
Age Group
15-19 20-24 25-29 30-34
DOLORES
Both sexes 12,302 563 1,656 1,615 1,494
Managers 1,114 3 39 71 120
Professionals 612 - 126 152 96
Technicians and associate professionals 1,047 56 250 189 143
Clerical support workers 717 16 157 128 82
Service and sales workers 1,563 100 250 242 179
Skilled agricultural, forestry, and fishery workers 2,251 33 112 169 220
Craft and related trades workers 997 31 116 119 94
Plant and machine operators and assemblers 1,125 23 129 152 197
Elementary occupations 2,833 295 471 389 355
Armed forces occupations 36 - 5 4 8
Other occupation, not elsewhere classified - - - - -
Not reported 7 6 1 - -
Male 8,075 379 1,028 1,077 989
Managers 569 1 18 42 60
Professionals 196 - 42 60 26
Technicians and associate professionals 479 24 114 91 67
Clerical support workers 313 6 62 62 28
Service and sales workers 731 39 119 131 94
Skilled agricultural, forestry, and fishery workers 2,053 32 106 163 212
Craft and related trades workers 796 22 78 95 85
Plant and machine operators and assemblers 1,053 16 107 132 187
Elementary occupations 1,846 236 377 297 222
Armed forces occupations 36 - 5 4 8
Other occupation, not elsewhere classified - - - - -
Not reported 3 3 - - -
Female 4,227 184 628 538 505
Managers 545 2 21 29 60
Professionals 416 - 84 92 70
Technicians and associate professionals 568 32 136 98 76
Clerical support workers 404 10 95 66 54
Service and sales workers 832 61 131 111 85
Skilled agricultural, forestry, and fishery workers 198 1 6 6 8
Craft and related trades workers 201 9 38 24 9
Plant and machine operators and assemblers 72 7 22 20 10
Elementary occupations 987 59 94 92 133
Armed forces occupations - - - - -
Other occupation, not elsewhere classified - - - - -
Not reported 4 3 1 - -
Continued
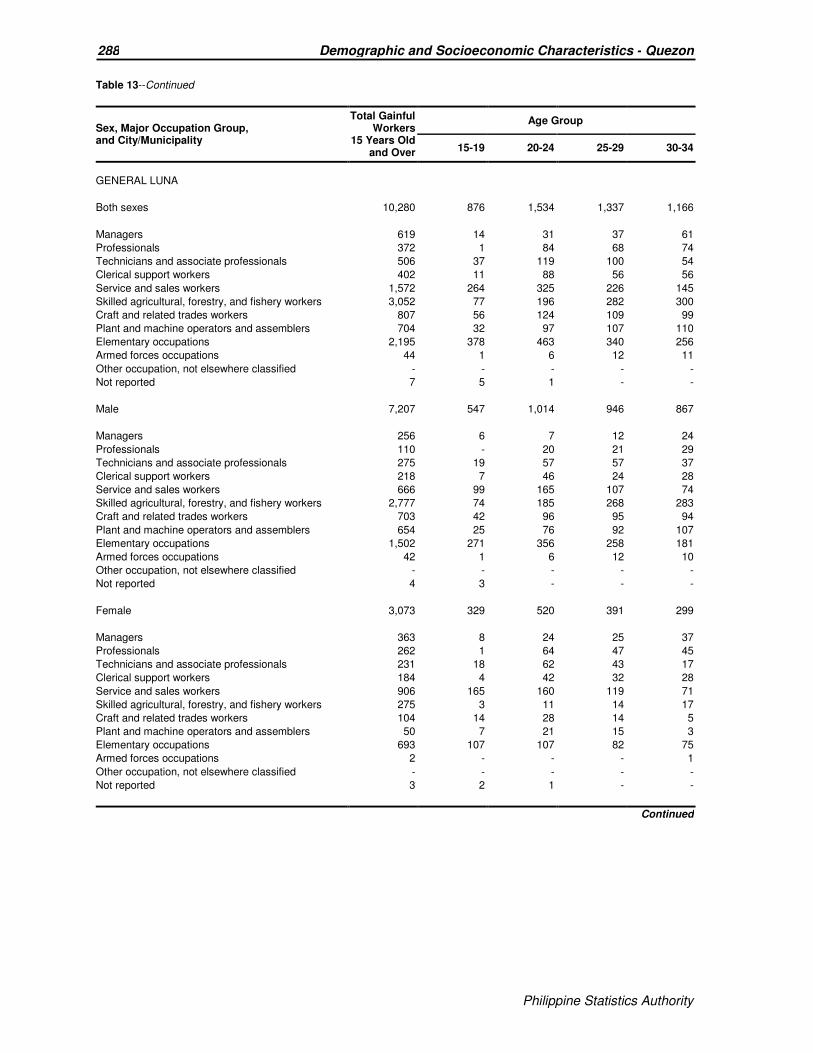
Philippine Statistics Authority
288 Demographic and Socioeconomic Characteristics - Quezon
Philippine Statistics Authority
Table 13--Continued
Sex, Major Occupation Group, and City/Municipality
Total Gainful Workers
15 Years Old and Over
Age Group
15-19 20-24 25-29 30-34
GENERAL LUNA
Both sexes 10,280 876 1,534 1,337 1,166
Managers 619 14 31 37 61
Professionals 372 1 84 68 74
Technicians and associate professionals 506 37 119 100 54
Clerical support workers 402 11 88 56 56
Service and sales workers 1,572 264 325 226 145
Skilled agricultural, forestry, and fishery workers 3,052 77 196 282 300
Craft and related trades workers 807 56 124 109 99
Plant and machine operators and assemblers 704 32 97 107 110
Elementary occupations 2,195 378 463 340 256
Armed forces occupations 44 1 6 12 11
Other occupation, not elsewhere classified - - - - -
Not reported 7 5 1 - -
Male 7,207 547 1,014 946 867
Managers 256 6 7 12 24
Professionals 110 - 20 21 29
Technicians and associate professionals 275 19 57 57 37
Clerical support workers 218 7 46 24 28
Service and sales workers 666 99 165 107 74
Skilled agricultural, forestry, and fishery workers 2,777 74 185 268 283
Craft and related trades workers 703 42 96 95 94
Plant and machine operators and assemblers 654 25 76 92 107
Elementary occupations 1,502 271 356 258 181
Armed forces occupations 42 1 6 12 10
Other occupation, not elsewhere classified - - - - -
Not reported 4 3 - - -
Female 3,073 329 520 391 299
Managers 363 8 24 25 37
Professionals 262 1 64 47 45
Technicians and associate professionals 231 18 62 43 17
Clerical support workers 184 4 42 32 28
Service and sales workers 906 165 160 119 71
Skilled agricultural, forestry, and fishery workers 275 3 11 14 17
Craft and related trades workers 104 14 28 14 5
Plant and machine operators and assemblers 50 7 21 15 3
Elementary occupations 693 107 107 82 75
Armed forces occupations 2 - - - 1
Other occupation, not elsewhere classified - - - - -
Not reported 3 2 1 - -
Continued
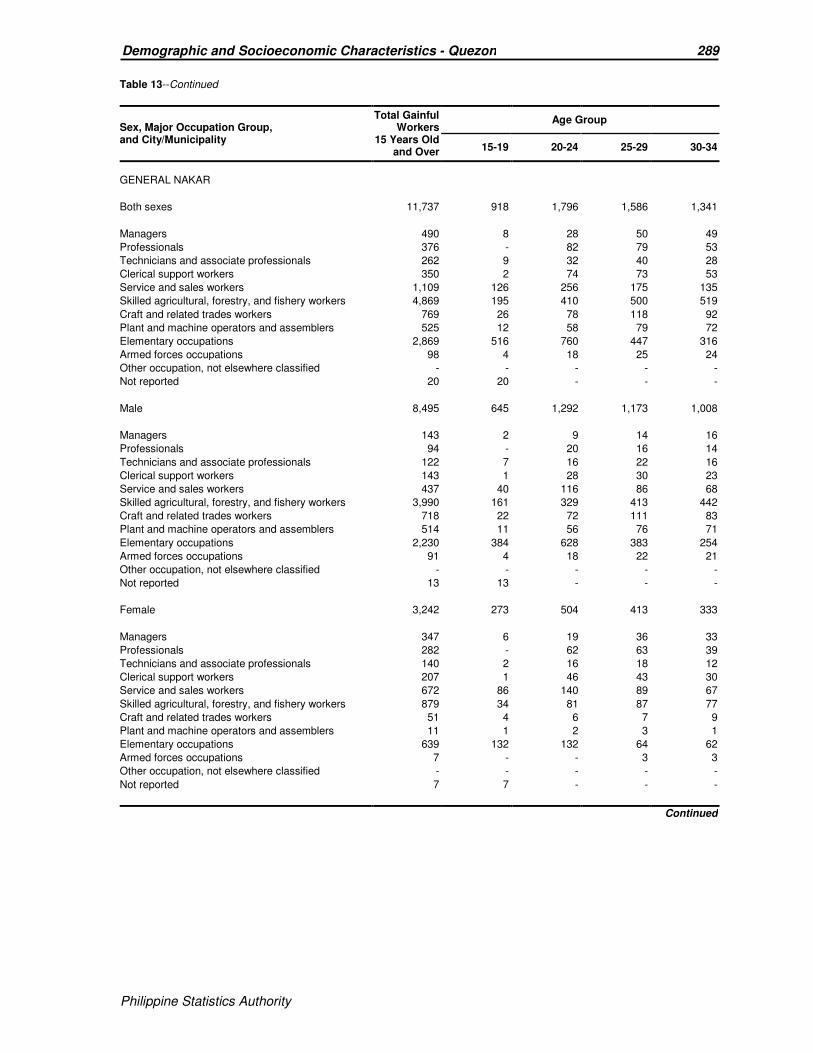
Philippine Statistics Authority
289 Demographic and Socioeconomic Characteristics - Quezon
Philippine Statistics Authority
Table 13--Continued
Sex, Major Occupation Group, and City/Municipality
Total Gainful Workers
15 Years Old and Over
Age Group
15-19 20-24 25-29 30-34
GENERAL NAKAR
Both sexes 11,737 918 1,796 1,586 1,341
Managers 490 8 28 50 49
Professionals 376 - 82 79 53
Technicians and associate professionals 262 9 32 40 28
Clerical support workers 350 2 74 73 53
Service and sales workers 1,109 126 256 175 135
Skilled agricultural, forestry, and fishery workers 4,869 195 410 500 519
Craft and related trades workers 769 26 78 118 92
Plant and machine operators and assemblers 525 12 58 79 72
Elementary occupations 2,869 516 760 447 316
Armed forces occupations 98 4 18 25 24
Other occupation, not elsewhere classified - - - - -
Not reported 20 20 - - -
Male 8,495 645 1,292 1,173 1,008
Managers 143 2 9 14 16
Professionals 94 - 20 16 14
Technicians and associate professionals 122 7 16 22 16
Clerical support workers 143 1 28 30 23
Service and sales workers 437 40 116 86 68
Skilled agricultural, forestry, and fishery workers 3,990 161 329 413 442
Craft and related trades workers 718 22 72 111 83
Plant and machine operators and assemblers 514 11 56 76 71
Elementary occupations 2,230 384 628 383 254
Armed forces occupations 91 4 18 22 21
Other occupation, not elsewhere classified - - - - -
Not reported 13 13 - - -
Female 3,242 273 504 413 333
Managers 347 6 19 36 33
Professionals 282 - 62 63 39
Technicians and associate professionals 140 2 16 18 12
Clerical support workers 207 1 46 43 30
Service and sales workers 672 86 140 89 67
Skilled agricultural, forestry, and fishery workers 879 34 81 87 77
Craft and related trades workers 51 4 6 7 9
Plant and machine operators and assemblers 11 1 2 3 1
Elementary occupations 639 132 132 64 62
Armed forces occupations 7 - - 3 3
Other occupation, not elsewhere classified - - - - -
Not reported 7 7 - - -
Continued

Philippine Statistics Authority
290 Demographic and Socioeconomic Characteristics - Quezon
Philippine Statistics Authority
Table 13--Continued
Sex, Major Occupation Group, and City/Municipality
Total Gainful Workers
15 Years Old and Over
Age Group
15-19 20-24 25-29 30-34
GUINAYANGAN
Both sexes 16,819 1,127 2,271 2,123 1,902
Managers 1,036 5 41 51 84
Professionals 557 2 94 126 96
Technicians and associate professionals 675 58 169 131 64
Clerical support workers 530 15 121 100 63
Service and sales workers 1,958 240 419 309 226
Skilled agricultural, forestry, and fishery workers 6,277 162 408 559 665
Craft and related trades workers 1,042 62 132 139 91
Plant and machine operators and assemblers 1,275 57 173 199 199
Elementary occupations 3,351 514 703 488 404
Armed forces occupations 103 1 10 19 10
Other occupation, not elsewhere classified 1 - - 1 -
Not reported 14 11 1 1 -
Male 12,177 749 1,558 1,519 1,430
Managers 434 1 15 17 43
Professionals 139 1 31 31 29
Technicians and associate professionals 313 22 75 61 29
Clerical support workers 239 6 50 35 26
Service and sales workers 954 84 230 180 134
Skilled agricultural, forestry, and fishery workers 5,859 159 389 537 629
Craft and related trades workers 849 49 101 113 82
Plant and machine operators and assemblers 1,195 46 140 183 190
Elementary occupations 2,086 375 516 341 258
Armed forces occupations 101 1 10 19 10
Other occupation, not elsewhere classified 1 - - 1 -
Not reported 7 5 1 1 -
Female 4,642 378 713 604 472
Managers 602 4 26 34 41
Professionals 418 1 63 95 67
Technicians and associate professionals 362 36 94 70 35
Clerical support workers 291 9 71 65 37
Service and sales workers 1,004 156 189 129 92
Skilled agricultural, forestry, and fishery workers 418 3 19 22 36
Craft and related trades workers 193 13 31 26 9
Plant and machine operators and assemblers 80 11 33 16 9
Elementary occupations 1,265 139 187 147 146
Armed forces occupations 2 - - - -
Other occupation, not elsewhere classified - - - - -
Not reported 7 6 - - -
Continued

Philippine Statistics Authority
291 Demographic and Socioeconomic Characteristics - Quezon
Philippine Statistics Authority
Table 13--Continued
Sex, Major Occupation Group, and City/Municipality
Total Gainful Workers
15 Years Old and Over
Age Group
15-19 20-24 25-29 30-34
GUMACA
Both sexes 29,248 1,491 3,768 3,600 3,384
Managers 2,572 10 92 175 254
Professionals 1,408 3 200 270 204
Technicians and associate professionals 1,451 40 304 215 192
Clerical support workers 1,535 46 333 313 219
Service and sales workers 5,268 498 1,053 720 587
Skilled agricultural, forestry, and fishery workers 5,197 75 237 344 429
Craft and related trades workers 2,517 75 227 258 281
Plant and machine operators and assemblers 3,042 56 279 406 442
Elementary occupations 6,153 664 1,035 885 756
Armed forces occupations 64 - 4 14 17
Other occupation, not elsewhere classified 4 2 - - -
Not reported 37 22 4 - 3
Male 19,397 922 2,447 2,397 2,335
Managers 914 5 39 61 88
Professionals 486 2 79 72 83
Technicians and associate professionals 798 23 170 120 114
Clerical support workers 712 26 138 153 108
Service and sales workers 2,334 153 489 366 302
Skilled agricultural, forestry, and fishery workers 4,797 68 221 323 411
Craft and related trades workers 2,149 58 199 225 247
Plant and machine operators and assemblers 2,971 47 263 391 433
Elementary occupations 4,149 527 843 672 529
Armed forces occupations 64 - 4 14 17
Other occupation, not elsewhere classified 3 2 - - -
Not reported 20 11 2 - 3
Female 9,851 569 1,321 1,203 1,049
Managers 1,658 5 53 114 166
Professionals 922 1 121 198 121
Technicians and associate professionals 653 17 134 95 78
Clerical support workers 823 20 195 160 111
Service and sales workers 2,934 345 564 354 285
Skilled agricultural, forestry, and fishery workers 400 7 16 21 18
Craft and related trades workers 368 17 28 33 34
Plant and machine operators and assemblers 71 9 16 15 9
Elementary occupations 2,004 137 192 213 227
Armed forces occupations - - - - -
Other occupation, not elsewhere classified 1 - - - -
Not reported 17 11 2 - -
Continued

Philippine Statistics Authority
292 Demographic and Socioeconomic Characteristics - Quezon
Philippine Statistics Authority
Table 13--Continued
Sex, Major Occupation Group, and City/Municipality
Total Gainful Workers
15 Years Old and Over
Age Group
15-19 20-24 25-29 30-34
INFANTA
Both sexes 32,183 1,809 3,844 3,940 3,750
Managers 3,269 25 125 250 315
Professionals 1,320 4 163 219 221
Technicians and associate professionals 1,457 29 176 226 188
Clerical support workers 1,322 40 234 205 178
Service and sales workers 5,690 397 888 858 674
Skilled agricultural, forestry, and fishery workers 5,764 191 439 509 607
Craft and related trades workers 3,357 114 345 377 367
Plant and machine operators and assemblers 2,584 41 238 284 376
Elementary occupations 7,282 910 1,230 989 813
Armed forces occupations 73 - 4 23 9
Other occupation, not elsewhere classified - - - - -
Not reported 65 58 2 - 2
Male 19,384 1,125 2,357 2,423 2,310
Managers 1,322 8 37 78 120
Professionals 413 1 48 66 60
Technicians and associate professionals 618 17 66 106 94
Clerical support workers 524 17 82 84 69
Service and sales workers 1,648 114 281 296 216
Skilled agricultural, forestry, and fishery workers 5,081 174 417 477 565
Craft and related trades workers 2,817 92 292 333 326
Plant and machine operators and assemblers 2,515 35 221 276 361
Elementary occupations 4,341 636 908 685 490
Armed forces occupations 70 - 4 22 8
Other occupation, not elsewhere classified - - - - -
Not reported 35 31 1 - 1
Female 12,799 684 1,487 1,517 1,440
Managers 1,947 17 88 172 195
Professionals 907 3 115 153 161
Technicians and associate professionals 839 12 110 120 94
Clerical support workers 798 23 152 121 109
Service and sales workers 4,042 283 607 562 458
Skilled agricultural, forestry, and fishery workers 683 17 22 32 42
Craft and related trades workers 540 22 53 44 41
Plant and machine operators and assemblers 69 6 17 8 15
Elementary occupations 2,941 274 322 304 323
Armed forces occupations 3 - - 1 1
Other occupation, not elsewhere classified - - - - -
Not reported 30 27 1 - 1
Continued
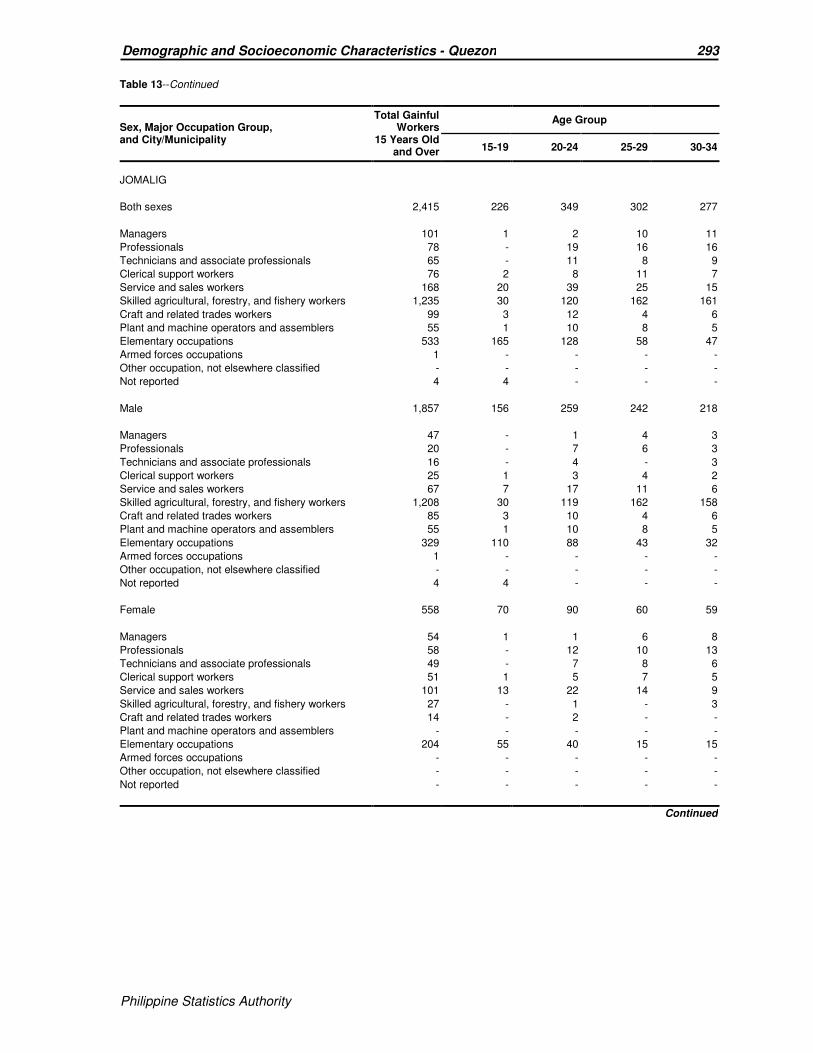
Philippine Statistics Authority
293 Demographic and Socioeconomic Characteristics - Quezon
Philippine Statistics Authority
Table 13--Continued
Sex, Major Occupation Group, and City/Municipality
Total Gainful Workers
15 Years Old and Over
Age Group
15-19 20-24 25-29 30-34
JOMALIG
Both sexes 2,415 226 349 302 277
Managers 101 1 2 10 11
Professionals 78 - 19 16 16
Technicians and associate professionals 65 - 11 8 9
Clerical support workers 76 2 8 11 7
Service and sales workers 168 20 39 25 15
Skilled agricultural, forestry, and fishery workers 1,235 30 120 162 161
Craft and related trades workers 99 3 12 4 6
Plant and machine operators and assemblers 55 1 10 8 5
Elementary occupations 533 165 128 58 47
Armed forces occupations 1 - - - -
Other occupation, not elsewhere classified - - - - -
Not reported 4 4 - - -
Male 1,857 156 259 242 218
Managers 47 - 1 4 3
Professionals 20 - 7 6 3
Technicians and associate professionals 16 - 4 - 3
Clerical support workers 25 1 3 4 2
Service and sales workers 67 7 17 11 6
Skilled agricultural, forestry, and fishery workers 1,208 30 119 162 158
Craft and related trades workers 85 3 10 4 6
Plant and machine operators and assemblers 55 1 10 8 5
Elementary occupations 329 110 88 43 32
Armed forces occupations 1 - - - -
Other occupation, not elsewhere classified - - - - -
Not reported 4 4 - - -
Female 558 70 90 60 59
Managers 54 1 1 6 8
Professionals 58 - 12 10 13
Technicians and associate professionals 49 - 7 8 6
Clerical support workers 51 1 5 7 5
Service and sales workers 101 13 22 14 9
Skilled agricultural, forestry, and fishery workers 27 - 1 - 3
Craft and related trades workers 14 - 2 - -
Plant and machine operators and assemblers - - - - -
Elementary occupations 204 55 40 15 15
Armed forces occupations - - - - -
Other occupation, not elsewhere classified - - - - -
Not reported - - - - -
Continued

Philippine Statistics Authority
294 Demographic and Socioeconomic Characteristics - Quezon
Philippine Statistics Authority
Table 13--Continued
Sex, Major Occupation Group, and City/Municipality
Total Gainful Workers
15 Years Old and Over
Age Group
15-19 20-24 25-29 30-34
LOPEZ
Both sexes 38,348 2,470 4,968 4,877 4,524
Managers 2,739 22 95 202 273
Professionals 1,949 6 322 413 284
Technicians and associate professionals 1,801 107 429 296 202
Clerical support workers 1,502 36 306 282 213
Service and sales workers 4,919 506 888 712 586
Skilled agricultural, forestry, and fishery workers 10,548 194 608 895 1,046
Craft and related trades workers 2,939 171 344 357 315
Plant and machine operators and assemblers 3,204 79 313 447 522
Elementary occupations 8,541 1,273 1,644 1,242 1,063
Armed forces occupations 112 1 15 31 16
Other occupation, not elsewhere classified - - - - -
Not reported 94 75 4 - 4
Male 26,444 1,655 3,337 3,407 3,198
Managers 1,010 9 41 77 107
Professionals 623 1 89 157 95
Technicians and associate professionals 817 43 200 140 89
Clerical support workers 686 13 123 128 81
Service and sales workers 2,187 198 432 360 290
Skilled agricultural, forestry, and fishery workers 9,762 180 585 859 994
Craft and related trades workers 2,183 124 272 265 247
Plant and machine operators and assemblers 3,101 70 272 431 514
Elementary occupations 5,913 978 1,306 960 763
Armed forces occupations 110 1 15 30 16
Other occupation, not elsewhere classified - - - - -
Not reported 52 38 2 - 2
Female 11,904 815 1,631 1,470 1,326
Managers 1,729 13 54 125 166
Professionals 1,326 5 233 256 189
Technicians and associate professionals 984 64 229 156 113
Clerical support workers 816 23 183 154 132
Service and sales workers 2,732 308 456 352 296
Skilled agricultural, forestry, and fishery workers 786 14 23 36 52
Craft and related trades workers 756 47 72 92 68
Plant and machine operators and assemblers 103 9 41 16 8
Elementary occupations 2,628 295 338 282 300
Armed forces occupations 2 - - 1 -
Other occupation, not elsewhere classified - - - - -
Not reported 42 37 2 - 2
Continued
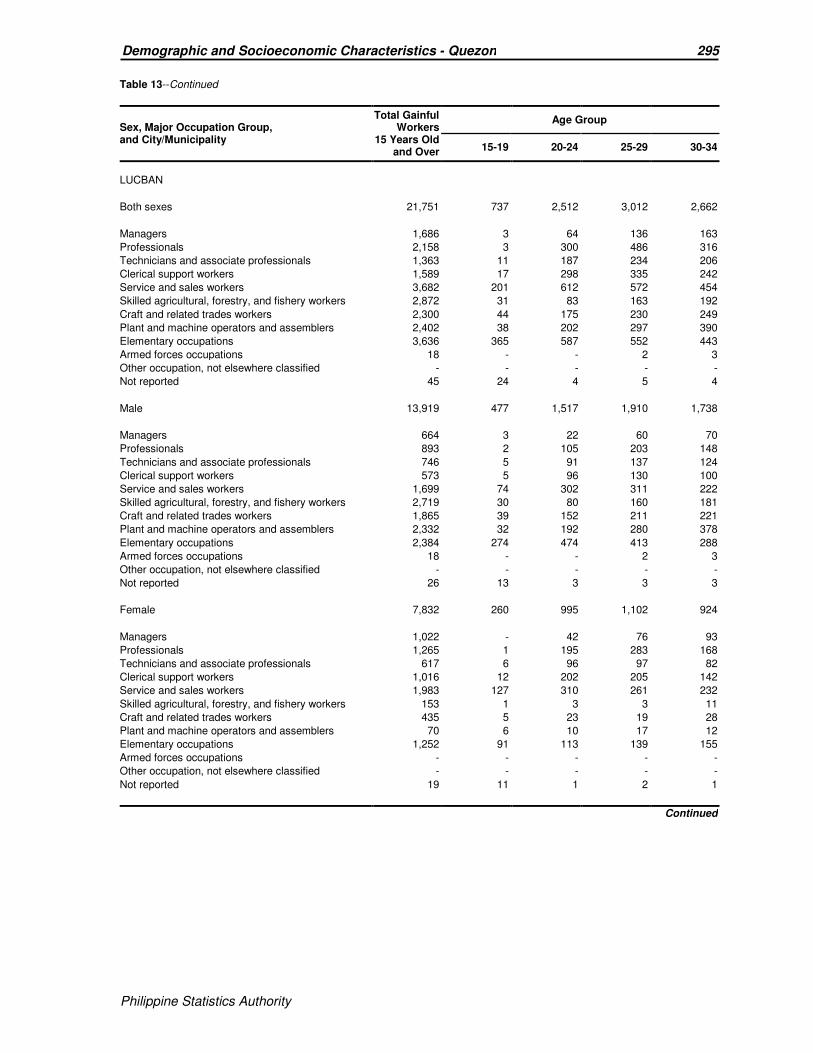
Philippine Statistics Authority
295 Demographic and Socioeconomic Characteristics - Quezon
Philippine Statistics Authority
Table 13--Continued
Sex, Major Occupation Group, and City/Municipality
Total Gainful Workers
15 Years Old and Over
Age Group
15-19 20-24 25-29 30-34
LUCBAN
Both sexes 21,751 737 2,512 3,012 2,662
Managers 1,686 3 64 136 163
Professionals 2,158 3 300 486 316
Technicians and associate professionals 1,363 11 187 234 206
Clerical support workers 1,589 17 298 335 242
Service and sales workers 3,682 201 612 572 454
Skilled agricultural, forestry, and fishery workers 2,872 31 83 163 192
Craft and related trades workers 2,300 44 175 230 249
Plant and machine operators and assemblers 2,402 38 202 297 390
Elementary occupations 3,636 365 587 552 443
Armed forces occupations 18 - - 2 3
Other occupation, not elsewhere classified - - - - -
Not reported 45 24 4 5 4
Male 13,919 477 1,517 1,910 1,738
Managers 664 3 22 60 70
Professionals 893 2 105 203 148
Technicians and associate professionals 746 5 91 137 124
Clerical support workers 573 5 96 130 100
Service and sales workers 1,699 74 302 311 222
Skilled agricultural, forestry, and fishery workers 2,719 30 80 160 181
Craft and related trades workers 1,865 39 152 211 221
Plant and machine operators and assemblers 2,332 32 192 280 378
Elementary occupations 2,384 274 474 413 288
Armed forces occupations 18 - - 2 3
Other occupation, not elsewhere classified - - - - -
Not reported 26 13 3 3 3
Female 7,832 260 995 1,102 924
Managers 1,022 - 42 76 93
Professionals 1,265 1 195 283 168
Technicians and associate professionals 617 6 96 97 82
Clerical support workers 1,016 12 202 205 142
Service and sales workers 1,983 127 310 261 232
Skilled agricultural, forestry, and fishery workers 153 1 3 3 11
Craft and related trades workers 435 5 23 19 28
Plant and machine operators and assemblers 70 6 10 17 12
Elementary occupations 1,252 91 113 139 155
Armed forces occupations - - - - -
Other occupation, not elsewhere classified - - - - -
Not reported 19 11 1 2 1
Continued

Philippine Statistics Authority
296 Demographic and Socioeconomic Characteristics - Quezon
Philippine Statistics Authority
Table 13--Continued
Sex, Major Occupation Group, and City/Municipality
Total Gainful Workers
15 Years Old and Over
Age Group
15-19 20-24 25-29 30-34
MACALELON
Both sexes 11,989 931 1,852 1,684 1,370
Managers 674 4 28 62 68
Professionals 413 4 75 92 64
Technicians and associate professionals 470 21 100 103 53
Clerical support workers 447 9 87 84 66
Service and sales workers 1,936 253 423 310 209
Skilled agricultural, forestry, and fishery workers 3,373 67 166 287 334
Craft and related trades workers 799 60 126 117 96
Plant and machine operators and assemblers 916 26 153 152 154
Elementary occupations 2,944 484 694 472 325
Armed forces occupations 14 - - 5 1
Other occupation, not elsewhere classified - - - - -
Not reported 3 3 - - -
Male 8,182 589 1,195 1,142 972
Managers 254 3 8 26 21
Professionals 123 - 29 26 13
Technicians and associate professionals 235 13 54 53 30
Clerical support workers 196 6 38 40 32
Service and sales workers 760 92 163 144 94
Skilled agricultural, forestry, and fishery workers 3,040 61 148 262 309
Craft and related trades workers 631 41 89 94 81
Plant and machine operators and assemblers 849 20 124 135 147
Elementary occupations 2,079 352 542 357 244
Armed forces occupations 14 - - 5 1
Other occupation, not elsewhere classified - - - - -
Not reported 1 1 - - -
Female 3,807 342 657 542 398
Managers 420 1 20 36 47
Professionals 290 4 46 66 51
Technicians and associate professionals 235 8 46 50 23
Clerical support workers 251 3 49 44 34
Service and sales workers 1,176 161 260 166 115
Skilled agricultural, forestry, and fishery workers 333 6 18 25 25
Craft and related trades workers 168 19 37 23 15
Plant and machine operators and assemblers 67 6 29 17 7
Elementary occupations 865 132 152 115 81
Armed forces occupations - - - - -
Other occupation, not elsewhere classified - - - - -
Not reported 2 2 - - -
Continued

Philippine Statistics Authority
297 Demographic and Socioeconomic Characteristics - Quezon
Philippine Statistics Authority
Table 13--Continued
Sex, Major Occupation Group, and City/Municipality
Total Gainful Workers
15 Years Old and Over
Age Group
15-19 20-24 25-29 30-34
MAUBAN
Both sexes 24,874 1,427 3,191 3,183 2,800
Managers 1,850 13 56 120 174
Professionals 996 3 180 276 133
Technicians and associate professionals 954 40 199 132 116
Clerical support workers 887 14 159 152 101
Service and sales workers 3,313 294 555 438 351
Skilled agricultural, forestry, and fishery workers 5,409 166 374 453 520
Craft and related trades workers 2,361 54 241 267 269
Plant and machine operators and assemblers 2,041 42 208 295 321
Elementary occupations 7,005 780 1,217 1,041 812
Armed forces occupations 29 - 1 6 3
Other occupation, not elsewhere classified - - - - -
Not reported 29 21 1 3 -
Male 17,569 994 2,253 2,285 2,067
Managers 630 3 17 36 60
Professionals 333 2 53 82 49
Technicians and associate professionals 453 15 92 70 66
Clerical support workers 404 7 59 64 45
Service and sales workers 1,451 97 239 223 160
Skilled agricultural, forestry, and fishery workers 5,130 155 362 435 501
Craft and related trades workers 1,871 42 212 236 228
Plant and machine operators and assemblers 1,993 36 194 284 317
Elementary occupations 5,260 627 1,024 847 638
Armed forces occupations 29 - 1 6 3
Other occupation, not elsewhere classified - - - - -
Not reported 15 10 - 2 -
Female 7,305 433 938 898 733
Managers 1,220 10 39 84 114
Professionals 663 1 127 194 84
Technicians and associate professionals 501 25 107 62 50
Clerical support workers 483 7 100 88 56
Service and sales workers 1,862 197 316 215 191
Skilled agricultural, forestry, and fishery workers 279 11 12 18 19
Craft and related trades workers 490 12 29 31 41
Plant and machine operators and assemblers 48 6 14 11 4
Elementary occupations 1,745 153 193 194 174
Armed forces occupations - - - - -
Other occupation, not elsewhere classified - - - - -
Not reported 14 11 1 1 -
Continued

Philippine Statistics Authority
298 Demographic and Socioeconomic Characteristics - Quezon
Philippine Statistics Authority
Table 13--Continued
Sex, Major Occupation Group, and City/Municipality
Total Gainful Workers
15 Years Old and Over
Age Group
15-19 20-24 25-29 30-34
MULANAY
Both sexes 19,089 1,666 2,528 2,361 2,103
Managers 1,736 13 43 98 145
Professionals 505 - 80 91 71
Technicians and associate professionals 627 41 153 96 64
Clerical support workers 645 10 105 108 69
Service and sales workers 1,512 189 306 210 159
Skilled agricultural, forestry, and fishery workers 5,435 98 312 494 556
Craft and related trades workers 1,100 80 143 131 136
Plant and machine operators and assemblers 1,329 76 207 210 206
Elementary occupations 6,106 1,101 1,178 917 691
Armed forces occupations 33 1 - 5 6
Other occupation, not elsewhere classified - - - - -
Not reported 61 57 1 1 -
Male 14,297 1,129 1,817 1,810 1,629
Managers 934 5 19 51 71
Professionals 127 - 32 12 15
Technicians and associate professionals 300 16 70 50 31
Clerical support workers 358 9 51 66 38
Service and sales workers 622 67 137 95 79
Skilled agricultural, forestry, and fishery workers 5,178 95 305 481 548
Craft and related trades workers 910 61 104 107 117
Plant and machine operators and assemblers 1,250 58 171 198 200
Elementary occupations 4,554 788 928 744 525
Armed forces occupations 32 1 - 5 5
Other occupation, not elsewhere classified - - - - -
Not reported 32 29 - 1 -
Female 4,792 537 711 551 474
Managers 802 8 24 47 74
Professionals 378 - 48 79 56
Technicians and associate professionals 327 25 83 46 33
Clerical support workers 287 1 54 42 31
Service and sales workers 890 122 169 115 80
Skilled agricultural, forestry, and fishery workers 257 3 7 13 8
Craft and related trades workers 190 19 39 24 19
Plant and machine operators and assemblers 79 18 36 12 6
Elementary occupations 1,552 313 250 173 166
Armed forces occupations 1 - - - 1
Other occupation, not elsewhere classified - - - - -
Not reported 29 28 1 - -
Continued
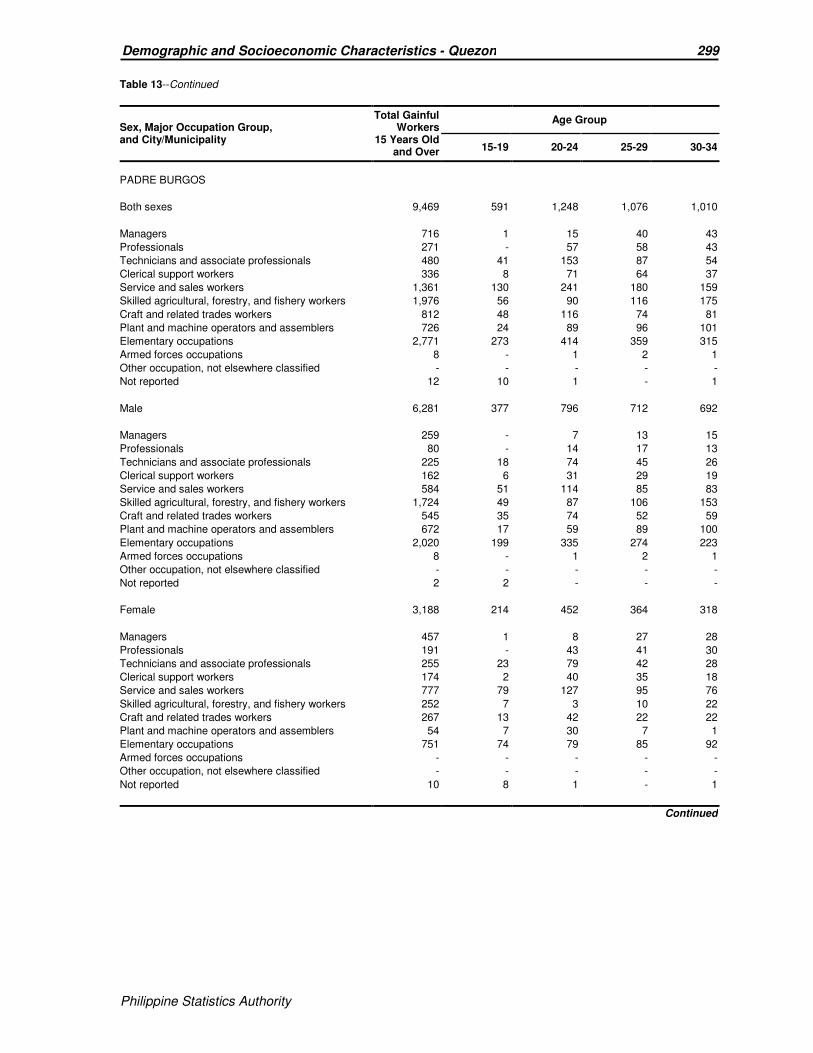
Philippine Statistics Authority
299 Demographic and Socioeconomic Characteristics - Quezon
Philippine Statistics Authority
Table 13--Continued
Sex, Major Occupation Group, and City/Municipality
Total Gainful Workers
15 Years Old and Over
Age Group
15-19 20-24 25-29 30-34
PADRE BURGOS
Both sexes 9,469 591 1,248 1,076 1,010
Managers 716 1 15 40 43
Professionals 271 - 57 58 43
Technicians and associate professionals 480 41 153 87 54
Clerical support workers 336 8 71 64 37
Service and sales workers 1,361 130 241 180 159
Skilled agricultural, forestry, and fishery workers 1,976 56 90 116 175
Craft and related trades workers 812 48 116 74 81
Plant and machine operators and assemblers 726 24 89 96 101
Elementary occupations 2,771 273 414 359 315
Armed forces occupations 8 - 1 2 1
Other occupation, not elsewhere classified - - - - -
Not reported 12 10 1 - 1
Male 6,281 377 796 712 692
Managers 259 - 7 13 15
Professionals 80 - 14 17 13
Technicians and associate professionals 225 18 74 45 26
Clerical support workers 162 6 31 29 19
Service and sales workers 584 51 114 85 83
Skilled agricultural, forestry, and fishery workers 1,724 49 87 106 153
Craft and related trades workers 545 35 74 52 59
Plant and machine operators and assemblers 672 17 59 89 100
Elementary occupations 2,020 199 335 274 223
Armed forces occupations 8 - 1 2 1
Other occupation, not elsewhere classified - - - - -
Not reported 2 2 - - -
Female 3,188 214 452 364 318
Managers 457 1 8 27 28
Professionals 191 - 43 41 30
Technicians and associate professionals 255 23 79 42 28
Clerical support workers 174 2 40 35 18
Service and sales workers 777 79 127 95 76
Skilled agricultural, forestry, and fishery workers 252 7 3 10 22
Craft and related trades workers 267 13 42 22 22
Plant and machine operators and assemblers 54 7 30 7 1
Elementary occupations 751 74 79 85 92
Armed forces occupations - - - - -
Other occupation, not elsewhere classified - - - - -
Not reported 10 8 1 - 1
Continued

Philippine Statistics Authority
300 Demographic and Socioeconomic Characteristics - Quezon
Philippine Statistics Authority
Table 13--Continued
Sex, Major Occupation Group, and City/Municipality
Total Gainful Workers
15 Years Old and Over
Age Group
15-19 20-24 25-29 30-34
PAGBILAO
Both sexes 30,419 1,734 4,288 4,113 3,599
Managers 2,410 11 90 160 226
Professionals 1,870 4 290 390 266
Technicians and associate professionals 1,838 81 372 326 262
Clerical support workers 1,912 51 350 356 267
Service and sales workers 5,578 451 1,056 924 684
Skilled agricultural, forestry, and fishery workers 3,517 86 191 245 272
Craft and related trades workers 3,135 112 369 385 354
Plant and machine operators and assemblers 3,337 63 274 355 448
Elementary occupations 6,739 841 1,288 967 815
Armed forces occupations 43 - 5 4 5
Other occupation, not elsewhere classified - - - - -
Not reported 40 34 3 1 -
Male 20,173 1,081 2,700 2,724 2,475
Managers 883 2 22 55 90
Professionals 719 1 114 139 107
Technicians and associate professionals 1,011 29 179 171 158
Clerical support workers 832 20 121 174 123
Service and sales workers 2,844 182 511 534 402
Skilled agricultural, forestry, and fishery workers 3,330 77 187 239 264
Craft and related trades workers 2,712 87 292 349 326
Plant and machine operators and assemblers 3,232 51 248 336 439
Elementary occupations 4,546 613 1,018 723 561
Armed forces occupations 41 - 5 4 5
Other occupation, not elsewhere classified - - - - -
Not reported 23 19 3 - -
Female 10,246 653 1,588 1,389 1,124
Managers 1,527 9 68 105 136
Professionals 1,151 3 176 251 159
Technicians and associate professionals 827 52 193 155 104
Clerical support workers 1,080 31 229 182 144
Service and sales workers 2,734 269 545 390 282
Skilled agricultural, forestry, and fishery workers 187 9 4 6 8
Craft and related trades workers 423 25 77 36 28
Plant and machine operators and assemblers 105 12 26 19 9
Elementary occupations 2,193 228 270 244 254
Armed forces occupations 2 - - - -
Other occupation, not elsewhere classified - - - - -
Not reported 17 15 - 1 -
Continued
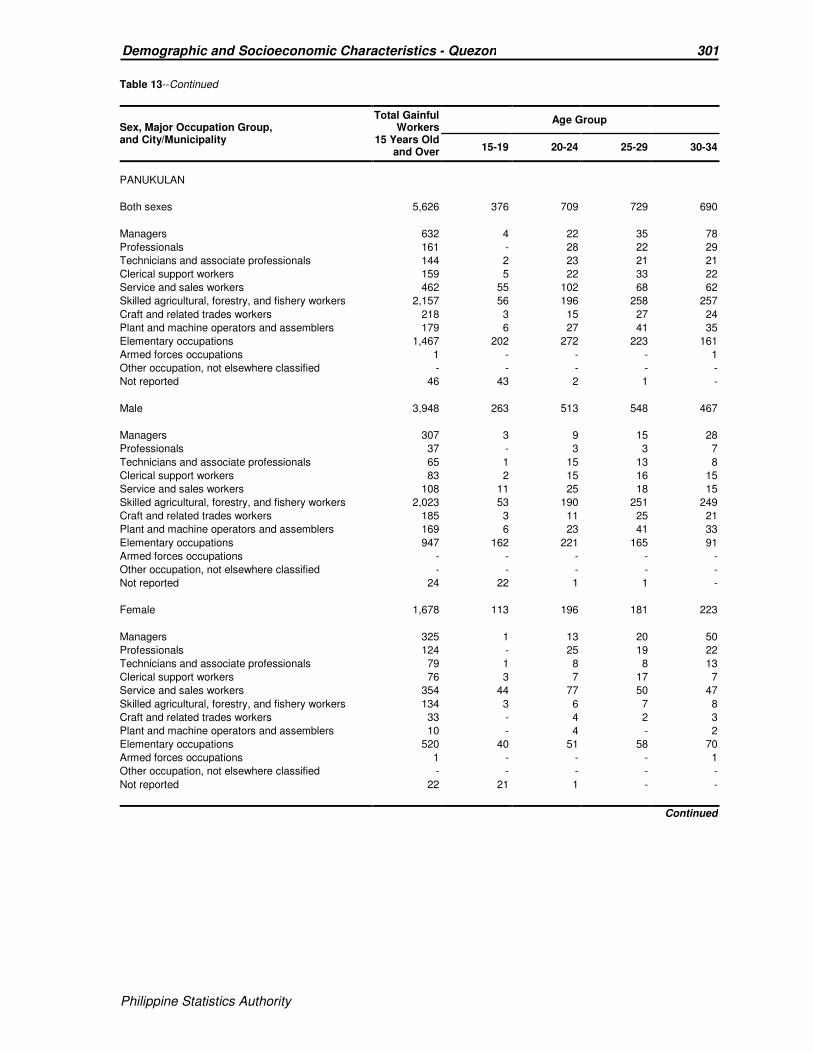
Philippine Statistics Authority
301 Demographic and Socioeconomic Characteristics - Quezon
Philippine Statistics Authority
Table 13--Continued
Sex, Major Occupation Group, and City/Municipality
Total Gainful Workers
15 Years Old and Over
Age Group
15-19 20-24 25-29 30-34
PANUKULAN
Both sexes 5,626 376 709 729 690
Managers 632 4 22 35 78
Professionals 161 - 28 22 29
Technicians and associate professionals 144 2 23 21 21
Clerical support workers 159 5 22 33 22
Service and sales workers 462 55 102 68 62
Skilled agricultural, forestry, and fishery workers 2,157 56 196 258 257
Craft and related trades workers 218 3 15 27 24
Plant and machine operators and assemblers 179 6 27 41 35
Elementary occupations 1,467 202 272 223 161
Armed forces occupations 1 - - - 1
Other occupation, not elsewhere classified - - - - -
Not reported 46 43 2 1 -
Male 3,948 263 513 548 467
Managers 307 3 9 15 28
Professionals 37 - 3 3 7
Technicians and associate professionals 65 1 15 13 8
Clerical support workers 83 2 15 16 15
Service and sales workers 108 11 25 18 15
Skilled agricultural, forestry, and fishery workers 2,023 53 190 251 249
Craft and related trades workers 185 3 11 25 21
Plant and machine operators and assemblers 169 6 23 41 33
Elementary occupations 947 162 221 165 91
Armed forces occupations - - - - -
Other occupation, not elsewhere classified - - - - -
Not reported 24 22 1 1 -
Female 1,678 113 196 181 223
Managers 325 1 13 20 50
Professionals 124 - 25 19 22
Technicians and associate professionals 79 1 8 8 13
Clerical support workers 76 3 7 17 7
Service and sales workers 354 44 77 50 47
Skilled agricultural, forestry, and fishery workers 134 3 6 7 8
Craft and related trades workers 33 - 4 2 3
Plant and machine operators and assemblers 10 - 4 - 2
Elementary occupations 520 40 51 58 70
Armed forces occupations 1 - - - 1
Other occupation, not elsewhere classified - - - - -
Not reported 22 21 1 - -
Continued
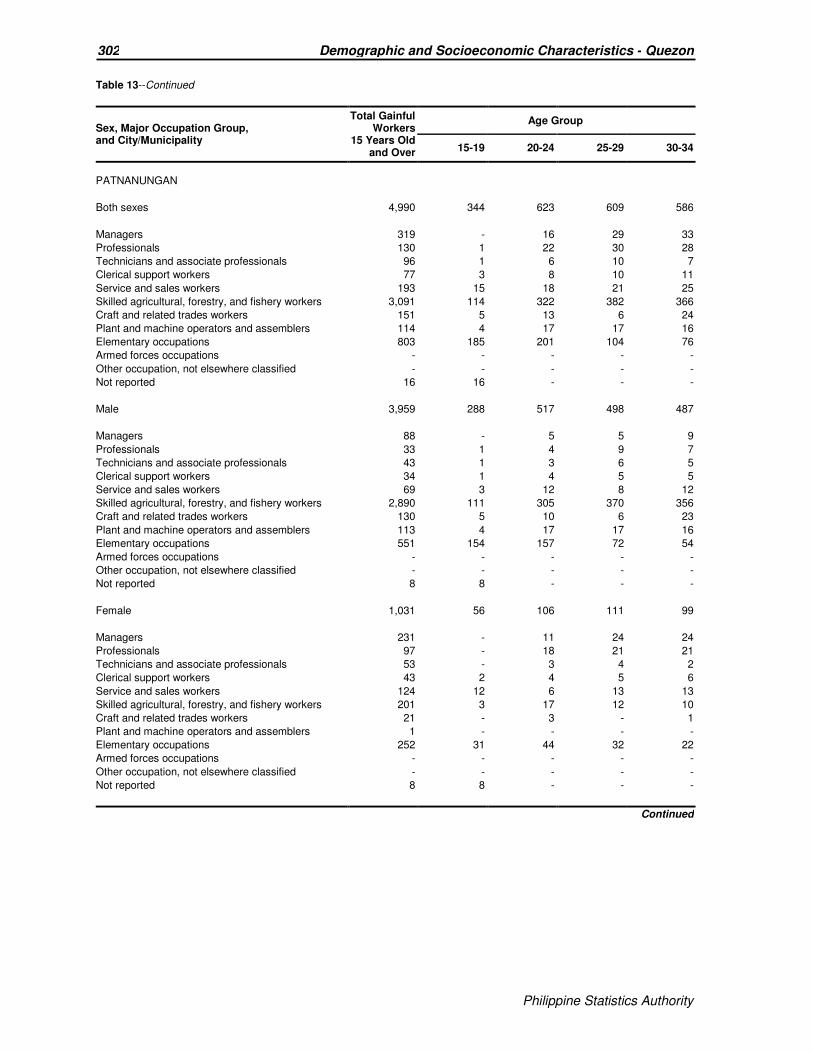
Philippine Statistics Authority
302 Demographic and Socioeconomic Characteristics - Quezon
Philippine Statistics Authority
Table 13--Continued
Sex, Major Occupation Group, and City/Municipality
Total Gainful Workers
15 Years Old and Over
Age Group
15-19 20-24 25-29 30-34
PATNANUNGAN
Both sexes 4,990 344 623 609 586
Managers 319 - 16 29 33
Professionals 130 1 22 30 28
Technicians and associate professionals 96 1 6 10 7
Clerical support workers 77 3 8 10 11
Service and sales workers 193 15 18 21 25
Skilled agricultural, forestry, and fishery workers 3,091 114 322 382 366
Craft and related trades workers 151 5 13 6 24
Plant and machine operators and assemblers 114 4 17 17 16
Elementary occupations 803 185 201 104 76
Armed forces occupations - - - - -
Other occupation, not elsewhere classified - - - - -
Not reported 16 16 - - -
Male 3,959 288 517 498 487
Managers 88 - 5 5 9
Professionals 33 1 4 9 7
Technicians and associate professionals 43 1 3 6 5
Clerical support workers 34 1 4 5 5
Service and sales workers 69 3 12 8 12
Skilled agricultural, forestry, and fishery workers 2,890 111 305 370 356
Craft and related trades workers 130 5 10 6 23
Plant and machine operators and assemblers 113 4 17 17 16
Elementary occupations 551 154 157 72 54
Armed forces occupations - - - - -
Other occupation, not elsewhere classified - - - - -
Not reported 8 8 - - -
Female 1,031 56 106 111 99
Managers 231 - 11 24 24
Professionals 97 - 18 21 21
Technicians and associate professionals 53 - 3 4 2
Clerical support workers 43 2 4 5 6
Service and sales workers 124 12 6 13 13
Skilled agricultural, forestry, and fishery workers 201 3 17 12 10
Craft and related trades workers 21 - 3 - 1
Plant and machine operators and assemblers 1 - - - -
Elementary occupations 252 31 44 32 22
Armed forces occupations - - - - -
Other occupation, not elsewhere classified - - - - -
Not reported 8 8 - - -
Continued

Philippine Statistics Authority
303 Demographic and Socioeconomic Characteristics - Quezon
Philippine Statistics Authority
Table 13--Continued
Sex, Major Occupation Group, and City/Municipality
Total Gainful Workers
15 Years Old and Over
Age Group
15-19 20-24 25-29 30-34
PEREZ
Both sexes 4,520 258 500 454 531
Managers 325 1 8 18 43
Professionals 108 - 16 15 14
Technicians and associate professionals 102 5 11 6 13
Clerical support workers 120 2 19 16 17
Service and sales workers 457 32 52 48 48
Skilled agricultural, forestry, and fishery workers 2,341 118 232 240 266
Craft and related trades workers 230 10 15 27 23
Plant and machine operators and assemblers 189 3 21 20 33
Elementary occupations 639 79 126 64 73
Armed forces occupations 1 - - - 1
Other occupation, not elsewhere classified - - - - -
Not reported 8 8 - - -
Male 3,344 207 395 359 403
Managers 102 - 1 5 11
Professionals 21 - 4 1 4
Technicians and associate professionals 45 4 6 4 4
Clerical support workers 58 2 11 7 5
Service and sales workers 141 17 19 15 20
Skilled agricultural, forestry, and fishery workers 2,204 116 227 236 262
Craft and related trades workers 196 7 12 23 20
Plant and machine operators and assemblers 184 3 19 19 33
Elementary occupations 388 54 96 49 43
Armed forces occupations 1 - - - 1
Other occupation, not elsewhere classified - - - - -
Not reported 4 4 - - -
Female 1,176 51 105 95 128
Managers 223 1 7 13 32
Professionals 87 - 12 14 10
Technicians and associate professionals 57 1 5 2 9
Clerical support workers 62 - 8 9 12
Service and sales workers 316 15 33 33 28
Skilled agricultural, forestry, and fishery workers 137 2 5 4 4
Craft and related trades workers 34 3 3 4 3
Plant and machine operators and assemblers 5 - 2 1 -
Elementary occupations 251 25 30 15 30
Armed forces occupations - - - - -
Other occupation, not elsewhere classified - - - - -
Not reported 4 4 - - -
Continued

Philippine Statistics Authority
304 Demographic and Socioeconomic Characteristics - Quezon
Philippine Statistics Authority
Table 13--Continued
Sex, Major Occupation Group, and City/Municipality
Total Gainful Workers
15 Years Old and Over
Age Group
15-19 20-24 25-29 30-34
PITOGO
Both sexes 8,824 474 1,069 1,018 946
Managers 742 3 30 54 64
Professionals 327 - 44 64 52
Technicians and associate professionals 382 20 102 67 45
Clerical support workers 400 6 86 81 52
Service and sales workers 1,174 133 237 149 138
Skilled agricultural, forestry, and fishery workers 2,762 49 146 193 233
Craft and related trades workers 598 19 70 59 51
Plant and machine operators and assemblers 517 17 52 68 84
Elementary occupations 1,908 225 301 280 225
Armed forces occupations 10 - 1 2 2
Other occupation, not elsewhere classified - - - - -
Not reported 4 2 - 1 -
Male 6,076 298 719 719 654
Managers 302 1 11 23 24
Professionals 103 - 15 26 17
Technicians and associate professionals 186 11 55 37 18
Clerical support workers 162 3 37 31 23
Service and sales workers 577 49 140 83 75
Skilled agricultural, forestry, and fishery workers 2,554 49 142 187 222
Craft and related trades workers 490 17 60 52 43
Plant and machine operators and assemblers 500 17 45 65 80
Elementary occupations 1,190 149 213 212 150
Armed forces occupations 9 - 1 2 2
Other occupation, not elsewhere classified - - - - -
Not reported 3 2 - 1 -
Female 2,748 176 350 299 292
Managers 440 2 19 31 40
Professionals 224 - 29 38 35
Technicians and associate professionals 196 9 47 30 27
Clerical support workers 238 3 49 50 29
Service and sales workers 597 84 97 66 63
Skilled agricultural, forestry, and fishery workers 208 - 4 6 11
Craft and related trades workers 108 2 10 7 8
Plant and machine operators and assemblers 17 - 7 3 4
Elementary occupations 718 76 88 68 75
Armed forces occupations 1 - - - -
Other occupation, not elsewhere classified - - - - -
Not reported 1 - - - -
Continued

Philippine Statistics Authority
305 Demographic and Socioeconomic Characteristics - Quezon
Philippine Statistics Authority
Table 13--Continued
Sex, Major Occupation Group, and City/Municipality
Total Gainful Workers
15 Years Old and Over
Age Group
15-19 20-24 25-29 30-34
PLARIDEL
Both sexes 4,664 230 588 606 552
Managers 361 - 8 21 34
Professionals 229 4 34 47 42
Technicians and associate professionals 333 11 51 72 44
Clerical support workers 282 4 59 55 30
Service and sales workers 815 56 157 128 81
Skilled agricultural, forestry, and fishery workers 719 18 24 40 51
Craft and related trades workers 473 21 47 44 57
Plant and machine operators and assemblers 409 8 45 52 81
Elementary occupations 1,031 102 162 146 132
Armed forces occupations 6 - 1 1 -
Other occupation, not elsewhere classified - - - - -
Not reported 6 6 - - -
Male 2,990 147 361 378 374
Managers 128 - 5 5 6
Professionals 74 2 10 13 17
Technicians and associate professionals 169 7 20 38 27
Clerical support workers 135 1 30 26 18
Service and sales workers 355 20 69 70 40
Skilled agricultural, forestry, and fishery workers 682 18 24 39 49
Craft and related trades workers 410 20 45 38 51
Plant and machine operators and assemblers 396 8 41 47 81
Elementary occupations 634 70 116 101 85
Armed forces occupations 6 - 1 1 -
Other occupation, not elsewhere classified - - - - -
Not reported 1 1 - - -
Female 1,674 83 227 228 178
Managers 233 - 3 16 28
Professionals 155 2 24 34 25
Technicians and associate professionals 164 4 31 34 17
Clerical support workers 147 3 29 29 12
Service and sales workers 460 36 88 58 41
Skilled agricultural, forestry, and fishery workers 37 - - 1 2
Craft and related trades workers 63 1 2 6 6
Plant and machine operators and assemblers 13 - 4 5 -
Elementary occupations 397 32 46 45 47
Armed forces occupations - - - - -
Other occupation, not elsewhere classified - - - - -
Not reported 5 5 - - -
Continued

Philippine Statistics Authority
306 Demographic and Socioeconomic Characteristics - Quezon
Philippine Statistics Authority
Table 13--Continued
Sex, Major Occupation Group, and City/Municipality
Total Gainful Workers
15 Years Old and Over
Age Group
15-19 20-24 25-29 30-34
POLILLO
Both sexes 10,763 451 1,060 1,305 1,208
Managers 886 3 34 73 93
Professionals 431 - 52 89 47
Technicians and associate professionals 251 4 17 30 31
Clerical support workers 237 4 25 43 33
Service and sales workers 1,039 60 128 129 155
Skilled agricultural, forestry, and fishery workers 4,478 101 297 456 476
Craft and related trades workers 586 9 50 45 48
Plant and machine operators and assemblers 522 10 58 71 70
Elementary occupations 2,308 245 399 367 252
Armed forces occupations 8 - - 2 3
Other occupation, not elsewhere classified - - - - -
Not reported 17 15 - - -
Male 7,877 352 849 974 877
Managers 236 - 9 16 22
Professionals 129 - 12 31 11
Technicians and associate professionals 115 2 10 9 12
Clerical support workers 104 1 12 22 14
Service and sales workers 369 23 64 50 61
Skilled agricultural, forestry, and fishery workers 4,301 101 293 446 474
Craft and related trades workers 504 6 47 42 46
Plant and machine operators and assemblers 502 10 55 65 69
Elementary occupations 1,601 200 347 291 166
Armed forces occupations 7 - - 2 2
Other occupation, not elsewhere classified - - - - -
Not reported 9 9 - - -
Female 2,886 99 211 331 331
Managers 650 3 25 57 71
Professionals 302 - 40 58 36
Technicians and associate professionals 136 2 7 21 19
Clerical support workers 133 3 13 21 19
Service and sales workers 670 37 64 79 94
Skilled agricultural, forestry, and fishery workers 177 - 4 10 2
Craft and related trades workers 82 3 3 3 2
Plant and machine operators and assemblers 20 - 3 6 1
Elementary occupations 707 45 52 76 86
Armed forces occupations 1 - - - 1
Other occupation, not elsewhere classified - - - - -
Not reported 8 6 - - -
Continued

Philippine Statistics Authority
307 Demographic and Socioeconomic Characteristics - Quezon
Philippine Statistics Authority
Table 13--Continued
Sex, Major Occupation Group, and City/Municipality
Total Gainful Workers
15 Years Old and Over
Age Group
15-19 20-24 25-29 30-34
QUEZON
Both sexes 5,900 384 635 644 620
Managers 481 2 24 36 41
Professionals 240 - 37 44 52
Technicians and associate professionals 170 9 38 23 15
Clerical support workers 97 1 23 16 10
Service and sales workers 606 51 77 72 57
Skilled agricultural, forestry, and fishery workers 2,557 103 187 219 244
Craft and related trades workers 354 7 27 38 29
Plant and machine operators and assemblers 219 4 23 28 35
Elementary occupations 1,171 206 199 167 136
Armed forces occupations 4 - - 1 1
Other occupation, not elsewhere classified - - - - -
Not reported 1 1 - - -
Male 4,320 269 455 469 460
Managers 183 - 7 13 19
Professionals 52 - 9 16 12
Technicians and associate professionals 63 2 18 8 6
Clerical support workers 46 - 9 5 6
Service and sales workers 196 17 31 28 23
Skilled agricultural, forestry, and fishery workers 2,449 101 185 217 239
Craft and related trades workers 318 6 19 33 29
Plant and machine operators and assemblers 209 3 19 27 33
Elementary occupations 799 139 158 121 92
Armed forces occupations 4 - - 1 1
Other occupation, not elsewhere classified - - - - -
Not reported 1 1 - - -
Female 1,580 115 180 175 160
Managers 298 2 17 23 22
Professionals 188 - 28 28 40
Technicians and associate professionals 107 7 20 15 9
Clerical support workers 51 1 14 11 4
Service and sales workers 410 34 46 44 34
Skilled agricultural, forestry, and fishery workers 108 2 2 2 5
Craft and related trades workers 36 1 8 5 -
Plant and machine operators and assemblers 10 1 4 1 2
Elementary occupations 372 67 41 46 44
Armed forces occupations - - - - -
Other occupation, not elsewhere classified - - - - -
Not reported - - - - -
Continued

Philippine Statistics Authority
308 Demographic and Socioeconomic Characteristics - Quezon
Philippine Statistics Authority
Table 13--Continued
Sex, Major Occupation Group, and City/Municipality
Total Gainful Workers
15 Years Old and Over
Age Group
15-19 20-24 25-29 30-34
REAL
Both sexes 13,364 657 1,833 1,694 1,600
Managers 898 5 37 67 85
Professionals 514 1 87 101 80
Technicians and associate professionals 727 21 101 112 101
Clerical support workers 647 24 164 93 83
Service and sales workers 2,086 162 372 297 223
Skilled agricultural, forestry, and fishery workers 2,908 50 200 288 318
Craft and related trades workers 1,281 35 133 137 159
Plant and machine operators and assemblers 1,305 16 113 141 186
Elementary occupations 2,968 338 625 455 356
Armed forces occupations 22 - - 2 9
Other occupation, not elsewhere classified - - - - -
Not reported 8 5 1 1 -
Male 9,413 427 1,240 1,195 1,142
Managers 338 4 13 28 22
Professionals 142 - 23 29 21
Technicians and associate professionals 361 9 51 57 55
Clerical support workers 262 6 62 48 33
Service and sales workers 885 76 161 136 100
Skilled agricultural, forestry, and fishery workers 2,754 49 192 284 303
Craft and related trades workers 1,159 28 117 129 148
Plant and machine operators and assemblers 1,284 12 107 139 182
Elementary occupations 2,203 241 514 342 269
Armed forces occupations 22 - - 2 9
Other occupation, not elsewhere classified - - - - -
Not reported 3 2 - 1 -
Female 3,951 230 593 499 458
Managers 560 1 24 39 63
Professionals 372 1 64 72 59
Technicians and associate professionals 366 12 50 55 46
Clerical support workers 385 18 102 45 50
Service and sales workers 1,201 86 211 161 123
Skilled agricultural, forestry, and fishery workers 154 1 8 4 15
Craft and related trades workers 122 7 16 8 11
Plant and machine operators and assemblers 21 4 6 2 4
Elementary occupations 765 97 111 113 87
Armed forces occupations - - - - -
Other occupation, not elsewhere classified - - - - -
Not reported 5 3 1 - -
Continued
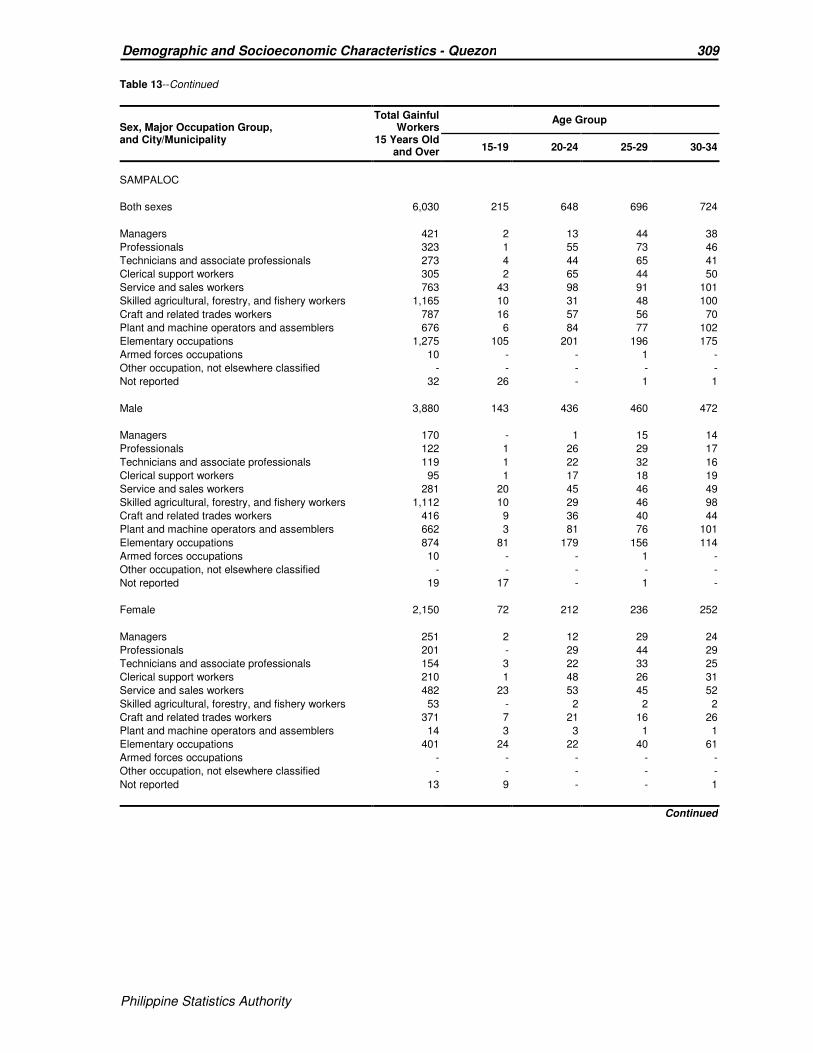
Philippine Statistics Authority
309 Demographic and Socioeconomic Characteristics - Quezon
Philippine Statistics Authority
Table 13--Continued
Sex, Major Occupation Group, and City/Municipality
Total Gainful Workers
15 Years Old and Over
Age Group
15-19 20-24 25-29 30-34
SAMPALOC
Both sexes 6,030 215 648 696 724
Managers 421 2 13 44 38
Professionals 323 1 55 73 46
Technicians and associate professionals 273 4 44 65 41
Clerical support workers 305 2 65 44 50
Service and sales workers 763 43 98 91 101
Skilled agricultural, forestry, and fishery workers 1,165 10 31 48 100
Craft and related trades workers 787 16 57 56 70
Plant and machine operators and assemblers 676 6 84 77 102
Elementary occupations 1,275 105 201 196 175
Armed forces occupations 10 - - 1 -
Other occupation, not elsewhere classified - - - - -
Not reported 32 26 - 1 1
Male 3,880 143 436 460 472
Managers 170 - 1 15 14
Professionals 122 1 26 29 17
Technicians and associate professionals 119 1 22 32 16
Clerical support workers 95 1 17 18 19
Service and sales workers 281 20 45 46 49
Skilled agricultural, forestry, and fishery workers 1,112 10 29 46 98
Craft and related trades workers 416 9 36 40 44
Plant and machine operators and assemblers 662 3 81 76 101
Elementary occupations 874 81 179 156 114
Armed forces occupations 10 - - 1 -
Other occupation, not elsewhere classified - - - - -
Not reported 19 17 - 1 -
Female 2,150 72 212 236 252
Managers 251 2 12 29 24
Professionals 201 - 29 44 29
Technicians and associate professionals 154 3 22 33 25
Clerical support workers 210 1 48 26 31
Service and sales workers 482 23 53 45 52
Skilled agricultural, forestry, and fishery workers 53 - 2 2 2
Craft and related trades workers 371 7 21 16 26
Plant and machine operators and assemblers 14 3 3 1 1
Elementary occupations 401 24 22 40 61
Armed forces occupations - - - - -
Other occupation, not elsewhere classified - - - - -
Not reported 13 9 - - 1
Continued
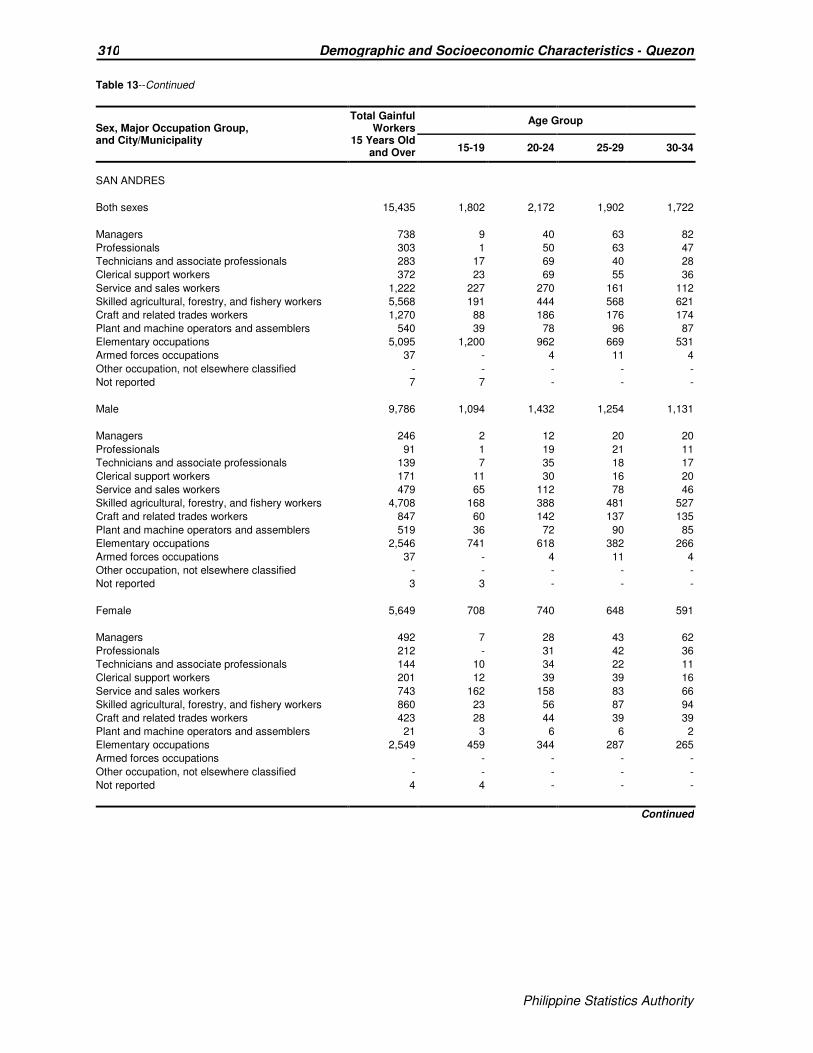
Philippine Statistics Authority
310 Demographic and Socioeconomic Characteristics - Quezon
Philippine Statistics Authority
Table 13--Continued
Sex, Major Occupation Group, and City/Municipality
Total Gainful Workers
15 Years Old and Over
Age Group
15-19 20-24 25-29 30-34
SAN ANDRES
Both sexes 15,435 1,802 2,172 1,902 1,722
Managers 738 9 40 63 82
Professionals 303 1 50 63 47
Technicians and associate professionals 283 17 69 40 28
Clerical support workers 372 23 69 55 36
Service and sales workers 1,222 227 270 161 112
Skilled agricultural, forestry, and fishery workers 5,568 191 444 568 621
Craft and related trades workers 1,270 88 186 176 174
Plant and machine operators and assemblers 540 39 78 96 87
Elementary occupations 5,095 1,200 962 669 531
Armed forces occupations 37 - 4 11 4
Other occupation, not elsewhere classified - - - - -
Not reported 7 7 - - -
Male 9,786 1,094 1,432 1,254 1,131
Managers 246 2 12 20 20
Professionals 91 1 19 21 11
Technicians and associate professionals 139 7 35 18 17
Clerical support workers 171 11 30 16 20
Service and sales workers 479 65 112 78 46
Skilled agricultural, forestry, and fishery workers 4,708 168 388 481 527
Craft and related trades workers 847 60 142 137 135
Plant and machine operators and assemblers 519 36 72 90 85
Elementary occupations 2,546 741 618 382 266
Armed forces occupations 37 - 4 11 4
Other occupation, not elsewhere classified - - - - -
Not reported 3 3 - - -
Female 5,649 708 740 648 591
Managers 492 7 28 43 62
Professionals 212 - 31 42 36
Technicians and associate professionals 144 10 34 22 11
Clerical support workers 201 12 39 39 16
Service and sales workers 743 162 158 83 66
Skilled agricultural, forestry, and fishery workers 860 23 56 87 94
Craft and related trades workers 423 28 44 39 39
Plant and machine operators and assemblers 21 3 6 6 2
Elementary occupations 2,549 459 344 287 265
Armed forces occupations - - - - -
Other occupation, not elsewhere classified - - - - -
Not reported 4 4 - - -
Continued
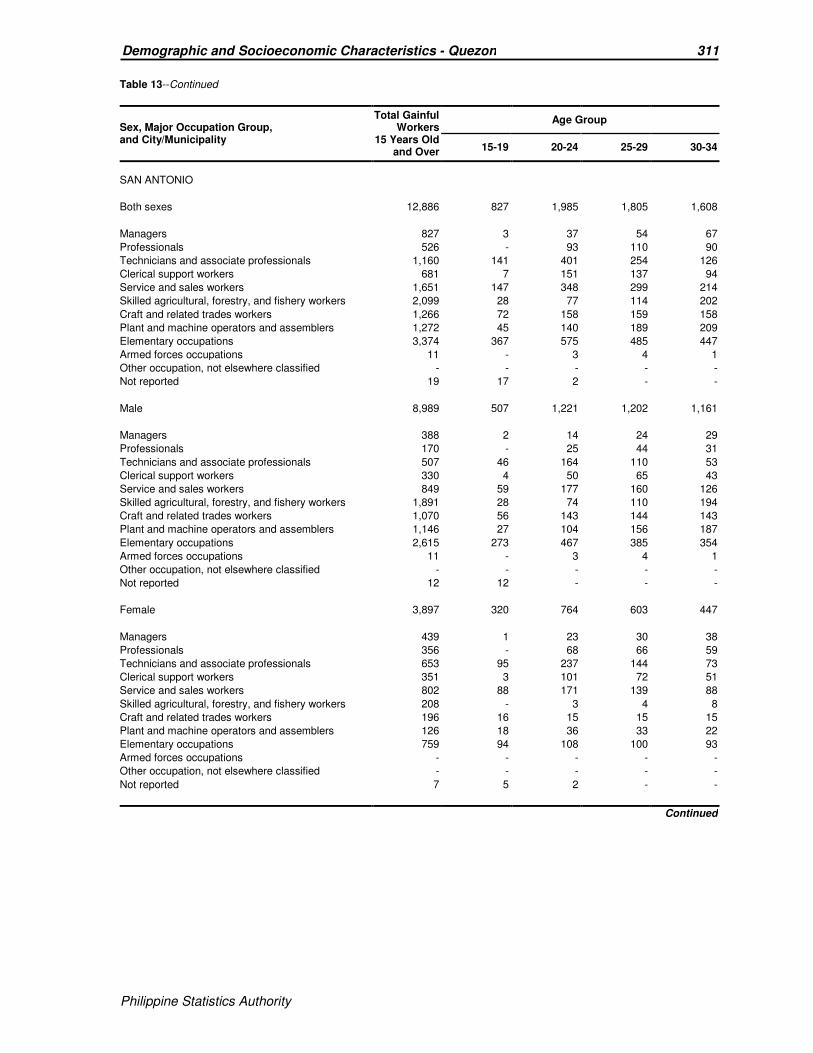
Philippine Statistics Authority
311 Demographic and Socioeconomic Characteristics - Quezon
Philippine Statistics Authority
Table 13--Continued
Sex, Major Occupation Group, and City/Municipality
Total Gainful Workers
15 Years Old and Over
Age Group
15-19 20-24 25-29 30-34
SAN ANTONIO
Both sexes 12,886 827 1,985 1,805 1,608
Managers 827 3 37 54 67
Professionals 526 - 93 110 90
Technicians and associate professionals 1,160 141 401 254 126
Clerical support workers 681 7 151 137 94
Service and sales workers 1,651 147 348 299 214
Skilled agricultural, forestry, and fishery workers 2,099 28 77 114 202
Craft and related trades workers 1,266 72 158 159 158
Plant and machine operators and assemblers 1,272 45 140 189 209
Elementary occupations 3,374 367 575 485 447
Armed forces occupations 11 - 3 4 1
Other occupation, not elsewhere classified - - - - -
Not reported 19 17 2 - -
Male 8,989 507 1,221 1,202 1,161
Managers 388 2 14 24 29
Professionals 170 - 25 44 31
Technicians and associate professionals 507 46 164 110 53
Clerical support workers 330 4 50 65 43
Service and sales workers 849 59 177 160 126
Skilled agricultural, forestry, and fishery workers 1,891 28 74 110 194
Craft and related trades workers 1,070 56 143 144 143
Plant and machine operators and assemblers 1,146 27 104 156 187
Elementary occupations 2,615 273 467 385 354
Armed forces occupations 11 - 3 4 1
Other occupation, not elsewhere classified - - - - -
Not reported 12 12 - - -
Female 3,897 320 764 603 447
Managers 439 1 23 30 38
Professionals 356 - 68 66 59
Technicians and associate professionals 653 95 237 144 73
Clerical support workers 351 3 101 72 51
Service and sales workers 802 88 171 139 88
Skilled agricultural, forestry, and fishery workers 208 - 3 4 8
Craft and related trades workers 196 16 15 15 15
Plant and machine operators and assemblers 126 18 36 33 22
Elementary occupations 759 94 108 100 93
Armed forces occupations - - - - -
Other occupation, not elsewhere classified - - - - -
Not reported 7 5 2 - -
Continued
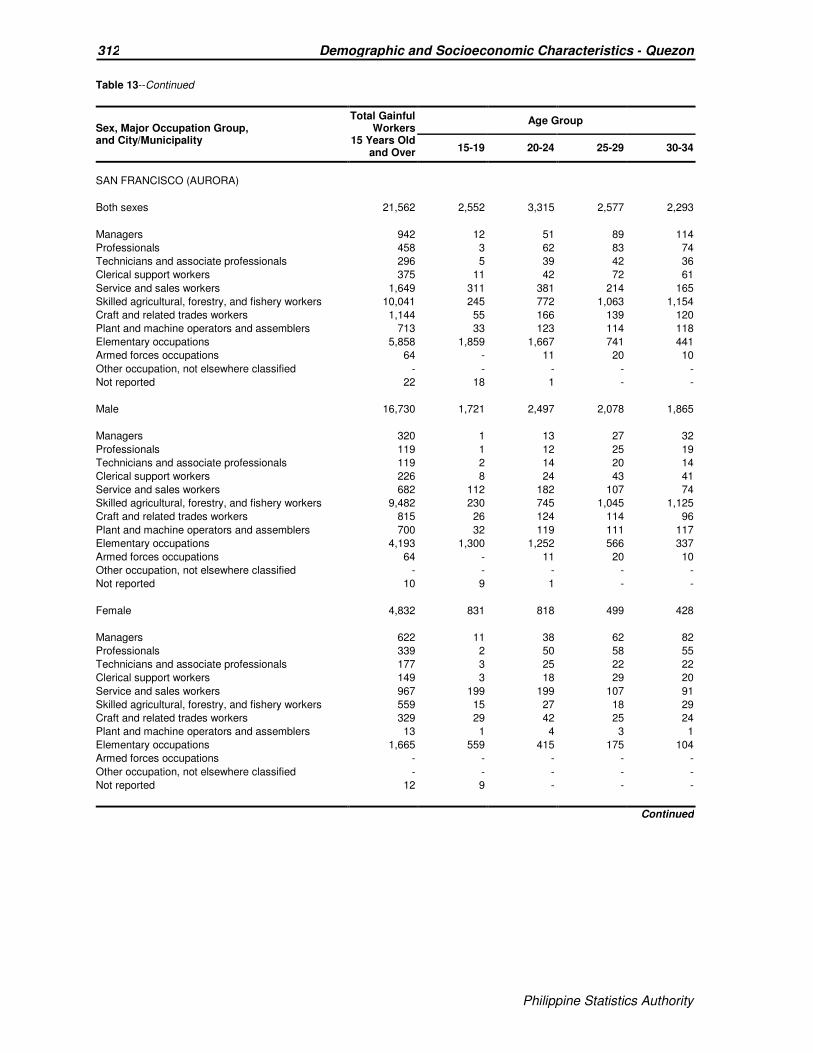
Philippine Statistics Authority
312 Demographic and Socioeconomic Characteristics - Quezon
Philippine Statistics Authority
Table 13--Continued
Sex, Major Occupation Group, and City/Municipality
Total Gainful Workers
15 Years Old and Over
Age Group
15-19 20-24 25-29 30-34
SAN FRANCISCO (AURORA)
Both sexes 21,562 2,552 3,315 2,577 2,293
Managers 942 12 51 89 114
Professionals 458 3 62 83 74
Technicians and associate professionals 296 5 39 42 36
Clerical support workers 375 11 42 72 61
Service and sales workers 1,649 311 381 214 165
Skilled agricultural, forestry, and fishery workers 10,041 245 772 1,063 1,154
Craft and related trades workers 1,144 55 166 139 120
Plant and machine operators and assemblers 713 33 123 114 118
Elementary occupations 5,858 1,859 1,667 741 441
Armed forces occupations 64 - 11 20 10
Other occupation, not elsewhere classified - - - - -
Not reported 22 18 1 - -
Male 16,730 1,721 2,497 2,078 1,865
Managers 320 1 13 27 32
Professionals 119 1 12 25 19
Technicians and associate professionals 119 2 14 20 14
Clerical support workers 226 8 24 43 41
Service and sales workers 682 112 182 107 74
Skilled agricultural, forestry, and fishery workers 9,482 230 745 1,045 1,125
Craft and related trades workers 815 26 124 114 96
Plant and machine operators and assemblers 700 32 119 111 117
Elementary occupations 4,193 1,300 1,252 566 337
Armed forces occupations 64 - 11 20 10
Other occupation, not elsewhere classified - - - - -
Not reported 10 9 1 - -
Female 4,832 831 818 499 428
Managers 622 11 38 62 82
Professionals 339 2 50 58 55
Technicians and associate professionals 177 3 25 22 22
Clerical support workers 149 3 18 29 20
Service and sales workers 967 199 199 107 91
Skilled agricultural, forestry, and fishery workers 559 15 27 18 29
Craft and related trades workers 329 29 42 25 24
Plant and machine operators and assemblers 13 1 4 3 1
Elementary occupations 1,665 559 415 175 104
Armed forces occupations - - - - -
Other occupation, not elsewhere classified - - - - -
Not reported 12 9 - - -
Continued
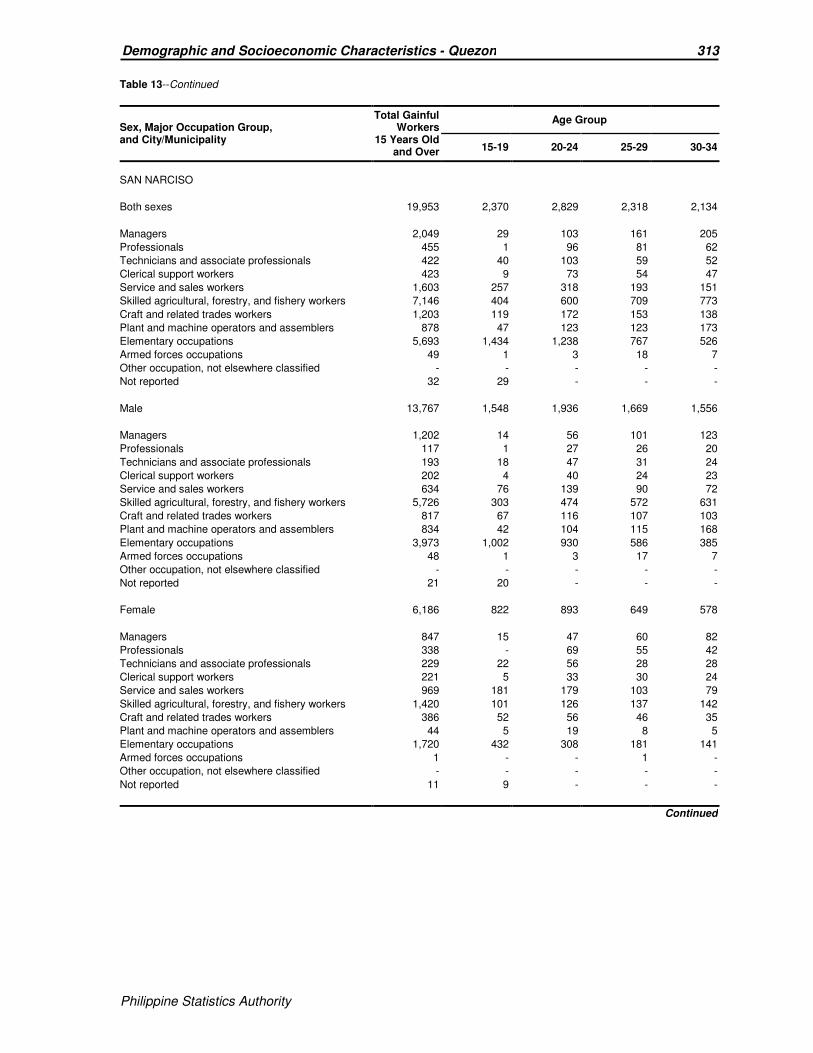
Philippine Statistics Authority
313 Demographic and Socioeconomic Characteristics - Quezon
Philippine Statistics Authority
Table 13--Continued
Sex, Major Occupation Group, and City/Municipality
Total Gainful Workers
15 Years Old and Over
Age Group
15-19 20-24 25-29 30-34
SAN NARCISO
Both sexes 19,953 2,370 2,829 2,318 2,134
Managers 2,049 29 103 161 205
Professionals 455 1 96 81 62
Technicians and associate professionals 422 40 103 59 52
Clerical support workers 423 9 73 54 47
Service and sales workers 1,603 257 318 193 151
Skilled agricultural, forestry, and fishery workers 7,146 404 600 709 773
Craft and related trades workers 1,203 119 172 153 138
Plant and machine operators and assemblers 878 47 123 123 173
Elementary occupations 5,693 1,434 1,238 767 526
Armed forces occupations 49 1 3 18 7
Other occupation, not elsewhere classified - - - - -
Not reported 32 29 - - -
Male 13,767 1,548 1,936 1,669 1,556
Managers 1,202 14 56 101 123
Professionals 117 1 27 26 20
Technicians and associate professionals 193 18 47 31 24
Clerical support workers 202 4 40 24 23
Service and sales workers 634 76 139 90 72
Skilled agricultural, forestry, and fishery workers 5,726 303 474 572 631
Craft and related trades workers 817 67 116 107 103
Plant and machine operators and assemblers 834 42 104 115 168
Elementary occupations 3,973 1,002 930 586 385
Armed forces occupations 48 1 3 17 7
Other occupation, not elsewhere classified - - - - -
Not reported 21 20 - - -
Female 6,186 822 893 649 578
Managers 847 15 47 60 82
Professionals 338 - 69 55 42
Technicians and associate professionals 229 22 56 28 28
Clerical support workers 221 5 33 30 24
Service and sales workers 969 181 179 103 79
Skilled agricultural, forestry, and fishery workers 1,420 101 126 137 142
Craft and related trades workers 386 52 56 46 35
Plant and machine operators and assemblers 44 5 19 8 5
Elementary occupations 1,720 432 308 181 141
Armed forces occupations 1 - - 1 -
Other occupation, not elsewhere classified - - - - -
Not reported 11 9 - - -
Continued

Philippine Statistics Authority
314 Demographic and Socioeconomic Characteristics - Quezon
Philippine Statistics Authority
Table 13--Continued
Sex, Major Occupation Group, and City/Municipality
Total Gainful Workers
15 Years Old and Over
Age Group
15-19 20-24 25-29 30-34
SARIAYA
Both sexes 63,476 3,889 8,431 8,102 7,804
Managers 4,293 36 157 292 419
Professionals 2,427 7 445 541 358
Technicians and associate professionals 3,730 256 938 683 487
Clerical support workers 3,416 79 642 535 425
Service and sales workers 9,533 771 1,521 1,382 1,237
Skilled agricultural, forestry, and fishery workers 11,627 221 536 802 1,160
Craft and related trades workers 5,341 242 547 581 634
Plant and machine operators and assemblers 7,485 248 962 1,008 1,148
Elementary occupations 15,536 1,979 2,677 2,274 1,931
Armed forces occupations 27 - 4 2 3
Other occupation, not elsewhere classified - - - - -
Not reported 61 50 2 2 2
Male 41,955 2,590 5,396 5,427 5,298
Managers 1,530 19 58 108 142
Professionals 861 5 147 197 130
Technicians and associate professionals 1,937 100 404 361 280
Clerical support workers 1,688 37 294 239 214
Service and sales workers 4,420 309 743 741 612
Skilled agricultural, forestry, and fishery workers 10,201 205 495 732 1,047
Craft and related trades workers 4,422 181 444 493 559
Plant and machine operators and assemblers 6,891 157 715 896 1,081
Elementary occupations 9,942 1,547 2,091 1,656 1,229
Armed forces occupations 27 - 4 2 3
Other occupation, not elsewhere classified - - - - -
Not reported 36 30 1 2 1
Female 21,521 1,299 3,035 2,675 2,506
Managers 2,763 17 99 184 277
Professionals 1,566 2 298 344 228
Technicians and associate professionals 1,793 156 534 322 207
Clerical support workers 1,728 42 348 296 211
Service and sales workers 5,113 462 778 641 625
Skilled agricultural, forestry, and fishery workers 1,426 16 41 70 113
Craft and related trades workers 919 61 103 88 75
Plant and machine operators and assemblers 594 91 247 112 67
Elementary occupations 5,594 432 586 618 702
Armed forces occupations - - - - -
Other occupation, not elsewhere classified - - - - -
Not reported 25 20 1 - 1
Continued

Philippine Statistics Authority
315 Demographic and Socioeconomic Characteristics - Quezon
Philippine Statistics Authority
Table 13--Continued
Sex, Major Occupation Group, and City/Municipality
Total Gainful Workers
15 Years Old and Over
Age Group
15-19 20-24 25-29 30-34
TAGKAWAYAN
Both sexes 17,649 972 1,917 2,011 2,062
Managers 1,415 8 62 102 130
Professionals 771 1 116 129 128
Technicians and associate professionals 518 22 80 84 54
Clerical support workers 468 10 78 82 70
Service and sales workers 1,603 121 216 193 180
Skilled agricultural, forestry, and fishery workers 6,820 171 444 599 778
Craft and related trades workers 1,151 41 105 125 131
Plant and machine operators and assemblers 1,259 44 140 201 177
Elementary occupations 3,526 484 673 478 411
Armed forces occupations 46 - 3 17 3
Other occupation, not elsewhere classified - - - - -
Not reported 72 70 - 1 -
Male 13,193 715 1,442 1,532 1,590
Managers 478 1 24 27 34
Professionals 220 1 31 45 35
Technicians and associate professionals 252 4 47 44 29
Clerical support workers 229 3 38 39 43
Service and sales workers 680 46 97 96 82
Skilled agricultural, forestry, and fishery workers 6,497 165 432 583 756
Craft and related trades workers 994 36 91 116 117
Plant and machine operators and assemblers 1,235 41 134 195 175
Elementary occupations 2,529 382 545 370 316
Armed forces occupations 43 - 3 17 3
Other occupation, not elsewhere classified - - - - -
Not reported 36 36 - - -
Female 4,456 257 475 479 472
Managers 937 7 38 75 96
Professionals 551 - 85 84 93
Technicians and associate professionals 266 18 33 40 25
Clerical support workers 239 7 40 43 27
Service and sales workers 923 75 119 97 98
Skilled agricultural, forestry, and fishery workers 323 6 12 16 22
Craft and related trades workers 157 5 14 9 14
Plant and machine operators and assemblers 24 3 6 6 2
Elementary occupations 997 102 128 108 95
Armed forces occupations 3 - - - -
Other occupation, not elsewhere classified - - - - -
Not reported 36 34 - 1 -
Continued

Philippine Statistics Authority
316 Demographic and Socioeconomic Characteristics - Quezon
Philippine Statistics Authority
Table 13--Continued
Sex, Major Occupation Group, and City/Municipality
Total Gainful Workers
15 Years Old and Over
Age Group
15-19 20-24 25-29 30-34
CITY OF TAYABAS
Both sexes 41,238 1,789 5,290 5,344 4,913
Managers 3,057 13 115 220 313
Professionals 3,009 5 485 610 452
Technicians and associate professionals 2,906 73 505 457 383
Clerical support workers 2,737 46 590 471 399
Service and sales workers 7,348 448 1,184 1,048 888
Skilled agricultural, forestry, and fishery workers 5,270 84 263 312 381
Craft and related trades workers 4,246 146 407 444 452
Plant and machine operators and assemblers 4,565 87 444 607 682
Elementary occupations 7,966 852 1,293 1,162 947
Armed forces occupations 74 - 2 10 11
Other occupation, not elsewhere classified - - - - -
Not reported 60 35 2 3 5
Male 27,182 1,183 3,364 3,551 3,364
Managers 1,205 4 43 98 119
Professionals 1,169 1 166 229 165
Technicians and associate professionals 1,624 27 257 274 243
Clerical support workers 1,225 21 235 199 191
Service and sales workers 3,862 192 610 626 562
Skilled agricultural, forestry, and fishery workers 5,001 79 257 303 364
Craft and related trades workers 3,098 107 323 359 378
Plant and machine operators and assemblers 4,398 73 395 568 665
Elementary occupations 5,494 657 1,075 884 665
Armed forces occupations 72 - 2 10 10
Other occupation, not elsewhere classified - - - - -
Not reported 34 22 1 1 2
Female 14,056 606 1,926 1,793 1,549
Managers 1,852 9 72 122 194
Professionals 1,840 4 319 381 287
Technicians and associate professionals 1,282 46 248 183 140
Clerical support workers 1,512 25 355 272 208
Service and sales workers 3,486 256 574 422 326
Skilled agricultural, forestry, and fishery workers 269 5 6 9 17
Craft and related trades workers 1,148 39 84 85 74
Plant and machine operators and assemblers 167 14 49 39 17
Elementary occupations 2,472 195 218 278 282
Armed forces occupations 2 - - - 1
Other occupation, not elsewhere classified - - - - -
Not reported 26 13 1 2 3
Continued
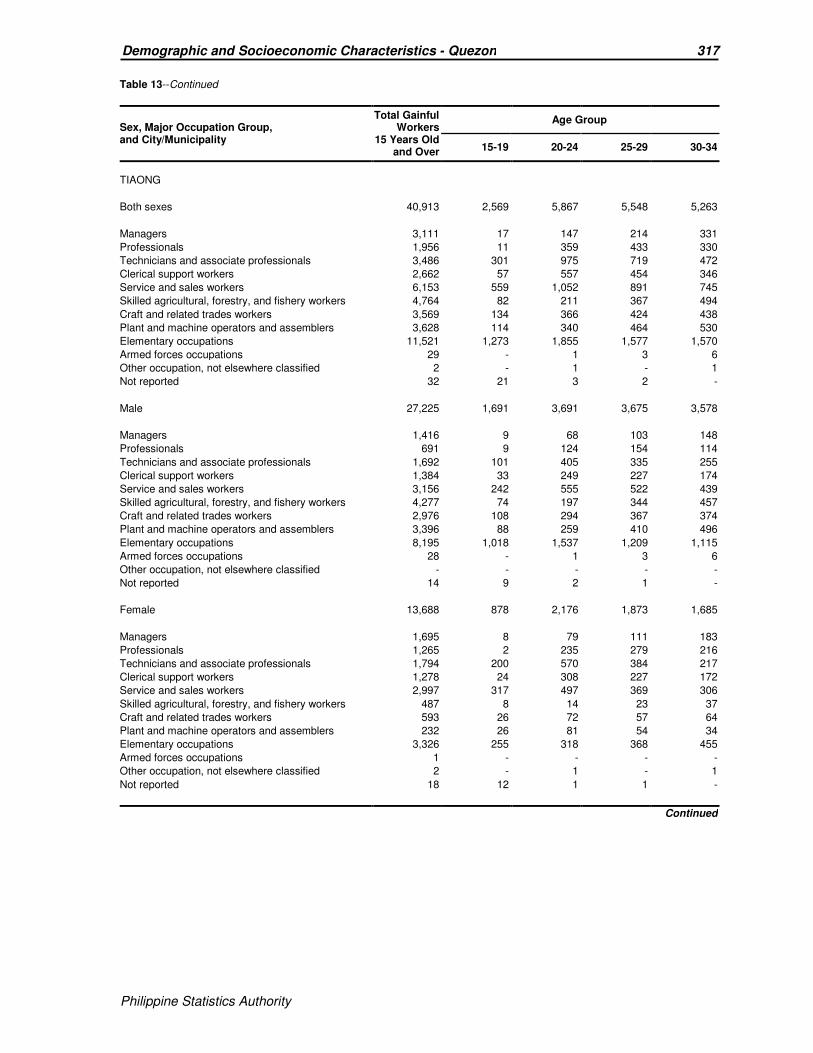
Philippine Statistics Authority
317 Demographic and Socioeconomic Characteristics - Quezon
Philippine Statistics Authority
Table 13--Continued
Sex, Major Occupation Group, and City/Municipality
Total Gainful Workers
15 Years Old and Over
Age Group
15-19 20-24 25-29 30-34
TIAONG
Both sexes 40,913 2,569 5,867 5,548 5,263
Managers 3,111 17 147 214 331
Professionals 1,956 11 359 433 330
Technicians and associate professionals 3,486 301 975 719 472
Clerical support workers 2,662 57 557 454 346
Service and sales workers 6,153 559 1,052 891 745
Skilled agricultural, forestry, and fishery workers 4,764 82 211 367 494
Craft and related trades workers 3,569 134 366 424 438
Plant and machine operators and assemblers 3,628 114 340 464 530
Elementary occupations 11,521 1,273 1,855 1,577 1,570
Armed forces occupations 29 - 1 3 6
Other occupation, not elsewhere classified 2 - 1 - 1
Not reported 32 21 3 2 -
Male 27,225 1,691 3,691 3,675 3,578
Managers 1,416 9 68 103 148
Professionals 691 9 124 154 114
Technicians and associate professionals 1,692 101 405 335 255
Clerical support workers 1,384 33 249 227 174
Service and sales workers 3,156 242 555 522 439
Skilled agricultural, forestry, and fishery workers 4,277 74 197 344 457
Craft and related trades workers 2,976 108 294 367 374
Plant and machine operators and assemblers 3,396 88 259 410 496
Elementary occupations 8,195 1,018 1,537 1,209 1,115
Armed forces occupations 28 - 1 3 6
Other occupation, not elsewhere classified - - - - -
Not reported 14 9 2 1 -
Female 13,688 878 2,176 1,873 1,685
Managers 1,695 8 79 111 183
Professionals 1,265 2 235 279 216
Technicians and associate professionals 1,794 200 570 384 217
Clerical support workers 1,278 24 308 227 172
Service and sales workers 2,997 317 497 369 306
Skilled agricultural, forestry, and fishery workers 487 8 14 23 37
Craft and related trades workers 593 26 72 57 64
Plant and machine operators and assemblers 232 26 81 54 34
Elementary occupations 3,326 255 318 368 455
Armed forces occupations 1 - - - -
Other occupation, not elsewhere classified 2 - 1 - 1
Not reported 18 12 1 1 -
Continued

Philippine Statistics Authority
318 Demographic and Socioeconomic Characteristics - Quezon
Philippine Statistics Authority
Table 13--Continued
Sex, Major Occupation Group, and City/Municipality
Total Gainful Workers
15 Years Old and Over
Age Group
15-19 20-24 25-29 30-34
UNISAN
Both sexes 10,933 579 1,473 1,389 1,238
Managers 897 5 32 58 98
Professionals 425 1 71 106 66
Technicians and associate professionals 512 21 138 96 67
Clerical support workers 605 12 117 106 70
Service and sales workers 1,442 126 301 231 164
Skilled agricultural, forestry, and fishery workers 2,862 55 160 187 238
Craft and related trades workers 737 45 70 94 83
Plant and machine operators and assemblers 950 34 134 151 138
Elementary occupations 2,462 274 445 354 306
Armed forces occupations 33 - 4 6 8
Other occupation, not elsewhere classified - - - - -
Not reported 8 6 1 - -
Male 7,630 376 958 951 876
Managers 395 4 16 27 48
Professionals 138 - 22 36 27
Technicians and associate professionals 242 4 64 49 34
Clerical support workers 275 11 50 51 30
Service and sales workers 681 53 153 129 83
Skilled agricultural, forestry, and fishery workers 2,716 50 159 183 234
Craft and related trades workers 592 34 62 78 70
Plant and machine operators and assemblers 870 21 97 130 134
Elementary occupations 1,683 195 331 262 208
Armed forces occupations 33 - 4 6 8
Other occupation, not elsewhere classified - - - - -
Not reported 5 4 - - -
Female 3,303 203 515 438 362
Managers 502 1 16 31 50
Professionals 287 1 49 70 39
Technicians and associate professionals 270 17 74 47 33
Clerical support workers 330 1 67 55 40
Service and sales workers 761 73 148 102 81
Skilled agricultural, forestry, and fishery workers 146 5 1 4 4
Craft and related trades workers 145 11 8 16 13
Plant and machine operators and assemblers 80 13 37 21 4
Elementary occupations 779 79 114 92 98
Armed forces occupations - - - - -
Other occupation, not elsewhere classified - - - - -
Not reported 3 2 1 - -
Continued
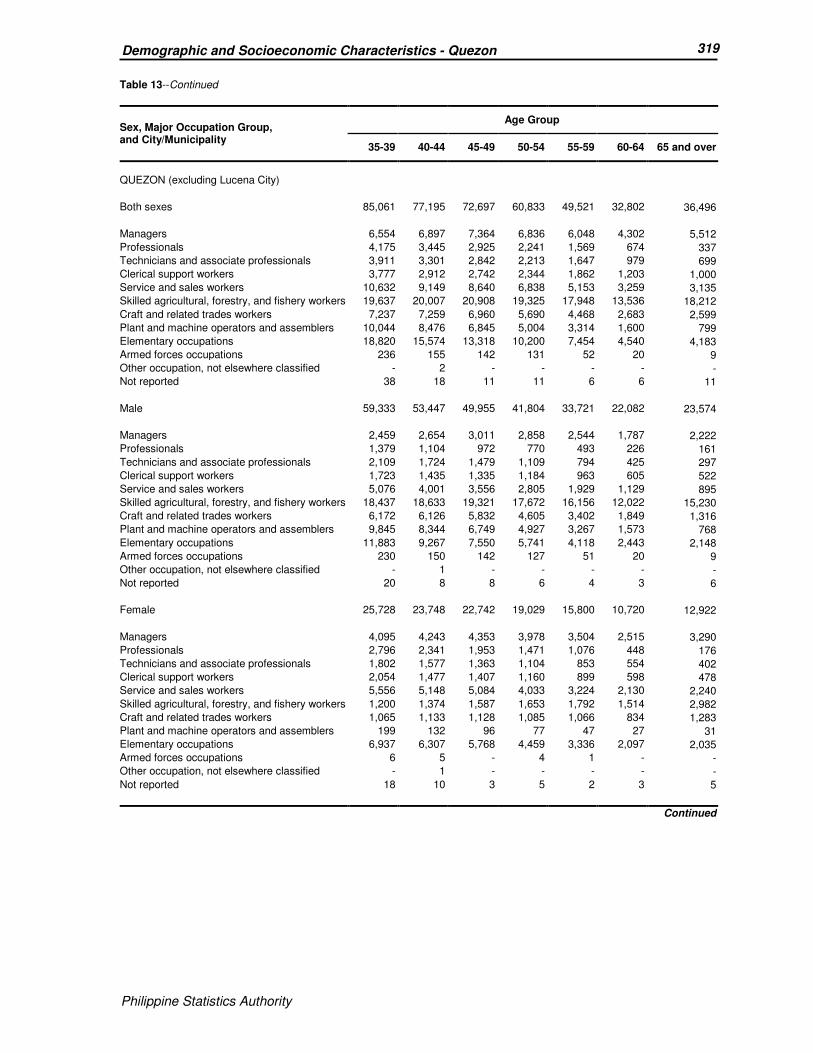
Philippine Statistics Authority
319 Demographic and Socioeconomic Characteristics - Quezon
Philippine Statistics Authority
Table 13--Continued
Sex, Major Occupation Group, and City/Municipality
Age Group
35-39 40-44 45-49 50-54 55-59 60-64 65 and over
QUEZON (excluding Lucena City)
Both sexes 85,061 77,195 72,697 60,833 49,521 32,802 36,496
Managers 6,554 6,897 7,364 6,836 6,048 4,302 5,512
Professionals 4,175 3,445 2,925 2,241 1,569 674 337
Technicians and associate professionals 3,911 3,301 2,842 2,213 1,647 979 699
Clerical support workers 3,777 2,912 2,742 2,344 1,862 1,203 1,000
Service and sales workers 10,632 9,149 8,640 6,838 5,153 3,259 3,135
Skilled agricultural, forestry, and fishery workers 19,637 20,007 20,908 19,325 17,948 13,536 18,212
Craft and related trades workers 7,237 7,259 6,960 5,690 4,468 2,683 2,599
Plant and machine operators and assemblers 10,044 8,476 6,845 5,004 3,314 1,600 799
Elementary occupations 18,820 15,574 13,318 10,200 7,454 4,540 4,183
Armed forces occupations 236 155 142 131 52 20 9
Other occupation, not elsewhere classified - 2 - - - - -
Not reported 38 18 11 11 6 6 11
Male 59,333 53,447 49,955 41,804 33,721 22,082 23,574
Managers 2,459 2,654 3,011 2,858 2,544 1,787 2,222
Professionals 1,379 1,104 972 770 493 226 161
Technicians and associate professionals 2,109 1,724 1,479 1,109 794 425 297
Clerical support workers 1,723 1,435 1,335 1,184 963 605 522
Service and sales workers 5,076 4,001 3,556 2,805 1,929 1,129 895
Skilled agricultural, forestry, and fishery workers 18,437 18,633 19,321 17,672 16,156 12,022 15,230
Craft and related trades workers 6,172 6,126 5,832 4,605 3,402 1,849 1,316
Plant and machine operators and assemblers 9,845 8,344 6,749 4,927 3,267 1,573 768
Elementary occupations 11,883 9,267 7,550 5,741 4,118 2,443 2,148
Armed forces occupations 230 150 142 127 51 20 9
Other occupation, not elsewhere classified - 1 - - - - -
Not reported 20 8 8 6 4 3 6
Female 25,728 23,748 22,742 19,029 15,800 10,720 12,922
Managers 4,095 4,243 4,353 3,978 3,504 2,515 3,290
Professionals 2,796 2,341 1,953 1,471 1,076 448 176
Technicians and associate professionals 1,802 1,577 1,363 1,104 853 554 402
Clerical support workers 2,054 1,477 1,407 1,160 899 598 478
Service and sales workers 5,556 5,148 5,084 4,033 3,224 2,130 2,240
Skilled agricultural, forestry, and fishery workers 1,200 1,374 1,587 1,653 1,792 1,514 2,982
Craft and related trades workers 1,065 1,133 1,128 1,085 1,066 834 1,283
Plant and machine operators and assemblers 199 132 96 77 47 27 31
Elementary occupations 6,937 6,307 5,768 4,459 3,336 2,097 2,035
Armed forces occupations 6 5 - 4 1 - -
Other occupation, not elsewhere classified - 1 - - - - -
Not reported 18 10 3 5 2 3 5
Continued

Philippine Statistics Authority
320 Demographic and Socioeconomic Characteristics - Quezon
Philippine Statistics Authority
Table 13--Continued
Sex, Major Occupation Group, and City/Municipality
Age Group
35-39 40-44 45-49 50-54 55-59 60-64 65 and over
AGDANGAN
Both sexes 659 627 676 560 505 324 434
Managers 41 57 81 69 69 31 66
Professionals 38 28 18 16 15 3 3
Technicians and associate professionals 37 30 25 24 21 12 18
Clerical support workers 28 27 18 19 17 11 10
Service and sales workers 99 84 85 90 66 47 51
Skilled agricultural, forestry, and fishery workers 109 127 195 146 150 114 167
Craft and related trades workers 58 58 63 50 41 26 38
Plant and machine operators and assemblers 76 63 49 35 21 10 10
Elementary occupations 170 151 141 109 104 70 70
Armed forces occupations 3 2 1 2 1 - 1
Other occupation, not elsewhere classified - - - - - - -
Not reported - - - - - - -
Male 395 362 420 332 286 190 233
Managers 12 16 29 29 14 8 18
Professionals 14 8 8 5 5 2 -
Technicians and associate professionals 17 16 11 8 6 6 4
Clerical support workers 12 8 5 10 8 7 5
Service and sales workers 31 23 23 24 12 12 13
Skilled agricultural, forestry, and fishery workers 101 109 175 132 142 97 135
Craft and related trades workers 43 42 44 38 28 18 20
Plant and machine operators and assemblers 75 62 48 34 21 10 10
Elementary occupations 87 76 76 50 49 30 27
Armed forces occupations 3 2 1 2 1 - 1
Other occupation, not elsewhere classified - - - - - - -
Not reported - - - - - - -
Female 264 265 256 228 219 134 201
Managers 29 41 52 40 55 23 48
Professionals 24 20 10 11 10 1 3
Technicians and associate professionals 20 14 14 16 15 6 14
Clerical support workers 16 19 13 9 9 4 5
Service and sales workers 68 61 62 66 54 35 38
Skilled agricultural, forestry, and fishery workers 8 18 20 14 8 17 32
Craft and related trades workers 15 16 19 12 13 8 18
Plant and machine operators and assemblers 1 1 1 1 - - -
Elementary occupations 83 75 65 59 55 40 43
Armed forces occupations - - - - - - -
Other occupation, not elsewhere classified - - - - - - -
Not reported - - - - - - -
Continued

Philippine Statistics Authority
321 Demographic and Socioeconomic Characteristics - Quezon
Philippine Statistics Authority
Table 13--Continued
Sex, Major Occupation Group, and City/Municipality
Age Group
35-39 40-44 45-49 50-54 55-59 60-64 65 and over
ALABAT
Both sexes 655 644 645 638 549 407 550
Managers 51 80 78 87 65 65 116
Professionals 26 31 23 29 30 6 1
Technicians and associate professionals 19 27 29 22 19 9 5
Clerical support workers 26 22 36 23 33 17 15
Service and sales workers 85 70 82 57 55 36 29
Skilled agricultural, forestry, and fishery workers 157 163 183 229 213 174 290
Craft and related trades workers 48 65 56 57 35 41 38
Plant and machine operators and assemblers 63 55 37 42 29 7 7
Elementary occupations 179 131 121 92 69 51 49
Armed forces occupations 1 - - - 1 1 -
Other occupation, not elsewhere classified - - - - - - -
Not reported - - - - - - -
Male 462 428 434 442 382 267 371
Managers 15 24 26 39 28 22 36
Professionals 9 6 4 8 11 1 1
Technicians and associate professionals 13 11 16 10 9 2 3
Clerical support workers 11 9 12 9 12 8 7
Service and sales workers 31 29 33 23 23 12 11
Skilled agricultural, forestry, and fishery workers 153 155 179 214 204 160 251
Craft and related trades workers 45 60 50 51 26 29 21
Plant and machine operators and assemblers 62 55 37 42 28 7 7
Elementary occupations 122 79 77 46 40 25 34
Armed forces occupations 1 - - - 1 1 -
Other occupation, not elsewhere classified - - - - - - -
Not reported - - - - - - -
Female 193 216 211 196 167 140 179
Managers 36 56 52 48 37 43 80
Professionals 17 25 19 21 19 5 -
Technicians and associate professionals 6 16 13 12 10 7 2
Clerical support workers 15 13 24 14 21 9 8
Service and sales workers 54 41 49 34 32 24 18
Skilled agricultural, forestry, and fishery workers 4 8 4 15 9 14 39
Craft and related trades workers 3 5 6 6 9 12 17
Plant and machine operators and assemblers 1 - - - 1 - -
Elementary occupations 57 52 44 46 29 26 15
Armed forces occupations - - - - - - -
Other occupation, not elsewhere classified - - - - - - -
Not reported - - - - - - -
Continued

Philippine Statistics Authority
322 Demographic and Socioeconomic Characteristics - Quezon
Philippine Statistics Authority
Table 13--Continued
Sex, Major Occupation Group, and City/Municipality
Age Group
35-39 40-44 45-49 50-54 55-59 60-64 65 and over
ATIMONAN
Both sexes 2,897 2,844 2,788 2,490 2,027 1,374 1,570
Managers 239 273 330 293 302 222 249
Professionals 180 152 157 107 103 35 24
Technicians and associate professionals 136 131 107 92 56 54 32
Clerical support workers 122 98 82 72 79 36 42
Service and sales workers 421 383 383 313 236 157 167
Skilled agricultural, forestry, and fishery workers 447 488 564 624 553 442 663
Craft and related trades workers 225 237 283 261 173 117 105
Plant and machine operators and assemblers 357 316 260 226 144 78 41
Elementary occupations 761 765 619 497 379 228 247
Armed forces occupations 9 1 3 3 2 5 -
Other occupation, not elsewhere classified - - - - - - -
Not reported - - - 2 - - -
Male 1,905 1,910 1,833 1,708 1,320 929 1,008
Managers 72 105 121 99 121 95 88
Professionals 66 47 49 35 35 11 10
Technicians and associate professionals 74 71 59 52 31 26 12
Clerical support workers 46 46 37 34 41 16 17
Service and sales workers 212 178 144 130 77 47 56
Skilled agricultural, forestry, and fishery workers 425 464 541 589 507 416 571
Craft and related trades workers 209 211 255 240 150 92 65
Plant and machine operators and assemblers 347 313 257 224 141 77 41
Elementary occupations 445 474 367 300 215 144 148
Armed forces occupations 9 1 3 3 2 5 -
Other occupation, not elsewhere classified - - - - - - -
Not reported - - - 2 - - -
Female 992 934 955 782 707 445 562
Managers 167 168 209 194 181 127 161
Professionals 114 105 108 72 68 24 14
Technicians and associate professionals 62 60 48 40 25 28 20
Clerical support workers 76 52 45 38 38 20 25
Service and sales workers 209 205 239 183 159 110 111
Skilled agricultural, forestry, and fishery workers 22 24 23 35 46 26 92
Craft and related trades workers 16 26 28 21 23 25 40
Plant and machine operators and assemblers 10 3 3 2 3 1 -
Elementary occupations 316 291 252 197 164 84 99
Armed forces occupations - - - - - - -
Other occupation, not elsewhere classified - - - - - - -
Not reported - - - - - - -
Continued

Philippine Statistics Authority
323 Demographic and Socioeconomic Characteristics - Quezon
Philippine Statistics Authority
Table 13--Continued
Sex, Major Occupation Group, and City/Municipality
Age Group
35-39 40-44 45-49 50-54 55-59 60-64 65 and over
BUENAVISTA
Both sexes 1,362 1,238 1,109 829 677 456 563
Managers 80 86 95 81 67 34 36
Professionals 40 28 31 18 12 13 2
Technicians and associate professionals 48 43 22 15 17 15 17
Clerical support workers 26 36 27 13 19 6 6
Service and sales workers 70 69 64 41 30 21 21
Skilled agricultural, forestry, and fishery workers 641 611 583 445 393 276 403
Craft and related trades workers 44 49 48 37 12 13 11
Plant and machine operators and assemblers 111 87 45 39 12 9 2
Elementary occupations 301 229 190 137 112 68 64
Armed forces occupations 1 - 4 3 3 1 1
Other occupation, not elsewhere classified - - - - - - -
Not reported - - - - - - -
Male 982 895 804 603 460 299 385
Managers 30 36 52 42 33 15 17
Professionals 14 5 11 7 3 3 1
Technicians and associate professionals 19 19 10 6 7 3 8
Clerical support workers 12 15 9 6 9 2 2
Service and sales workers 18 20 20 17 5 6 2
Skilled agricultural, forestry, and fishery workers 597 575 532 409 342 239 327
Craft and related trades workers 37 45 38 33 10 8 3
Plant and machine operators and assemblers 109 87 43 39 10 7 2
Elementary occupations 145 93 85 41 38 15 22
Armed forces occupations 1 - 4 3 3 1 1
Other occupation, not elsewhere classified - - - - - - -
Not reported - - - - - - -
Female 380 343 305 226 217 157 178
Managers 50 50 43 39 34 19 19
Professionals 26 23 20 11 9 10 1
Technicians and associate professionals 29 24 12 9 10 12 9
Clerical support workers 14 21 18 7 10 4 4
Service and sales workers 52 49 44 24 25 15 19
Skilled agricultural, forestry, and fishery workers 44 36 51 36 51 37 76
Craft and related trades workers 7 4 10 4 2 5 8
Plant and machine operators and assemblers 2 - 2 - 2 2 -
Elementary occupations 156 136 105 96 74 53 42
Armed forces occupations - - - - - - -
Other occupation, not elsewhere classified - - - - - - -
Not reported - - - - - - -
Continued

Philippine Statistics Authority
324 Demographic and Socioeconomic Characteristics - Quezon
Philippine Statistics Authority
Table 13--Continued
Sex, Major Occupation Group, and City/Municipality
Age Group
35-39 40-44 45-49 50-54 55-59 60-64 65 and over
BURDEOS
Both sexes 892 976 846 638 565 407 465
Managers 50 40 47 43 52 42 57
Professionals 29 31 36 14 7 3 3
Technicians and associate professionals 18 15 24 11 10 1 4
Clerical support workers 13 12 12 13 10 6 5
Service and sales workers 34 43 40 24 20 16 14
Skilled agricultural, forestry, and fishery workers 497 589 520 406 355 265 322
Craft and related trades workers 27 38 32 23 18 8 9
Plant and machine operators and assemblers 30 29 22 16 7 6 3
Elementary occupations 194 179 113 88 86 60 48
Armed forces occupations - - - - - - -
Other occupation, not elsewhere classified - - - - - - -
Not reported - - - - - - -
Male 730 805 677 506 447 312 343
Managers 25 21 26 19 38 31 27
Professionals 5 6 7 3 1 1 -
Technicians and associate professionals 7 5 7 4 2 - 1
Clerical support workers 4 8 5 6 3 1 3
Service and sales workers 10 9 10 3 6 3 2
Skilled agricultural, forestry, and fishery workers 484 565 494 373 321 227 278
Craft and related trades workers 27 38 30 23 17 8 6
Plant and machine operators and assemblers 30 29 20 16 7 6 3
Elementary occupations 138 124 78 59 52 35 23
Armed forces occupations - - - - - - -
Other occupation, not elsewhere classified - - - - - - -
Not reported - - - - - - -
Female 162 171 169 132 118 95 122
Managers 25 19 21 24 14 11 30
Professionals 24 25 29 11 6 2 3
Technicians and associate professionals 11 10 17 7 8 1 3
Clerical support workers 9 4 7 7 7 5 2
Service and sales workers 24 34 30 21 14 13 12
Skilled agricultural, forestry, and fishery workers 13 24 26 33 34 38 44
Craft and related trades workers - - 2 - 1 - 3
Plant and machine operators and assemblers - - 2 - - - -
Elementary occupations 56 55 35 29 34 25 25
Armed forces occupations - - - - - - -
Other occupation, not elsewhere classified - - - - - - -
Not reported - - - - - - -
Continued
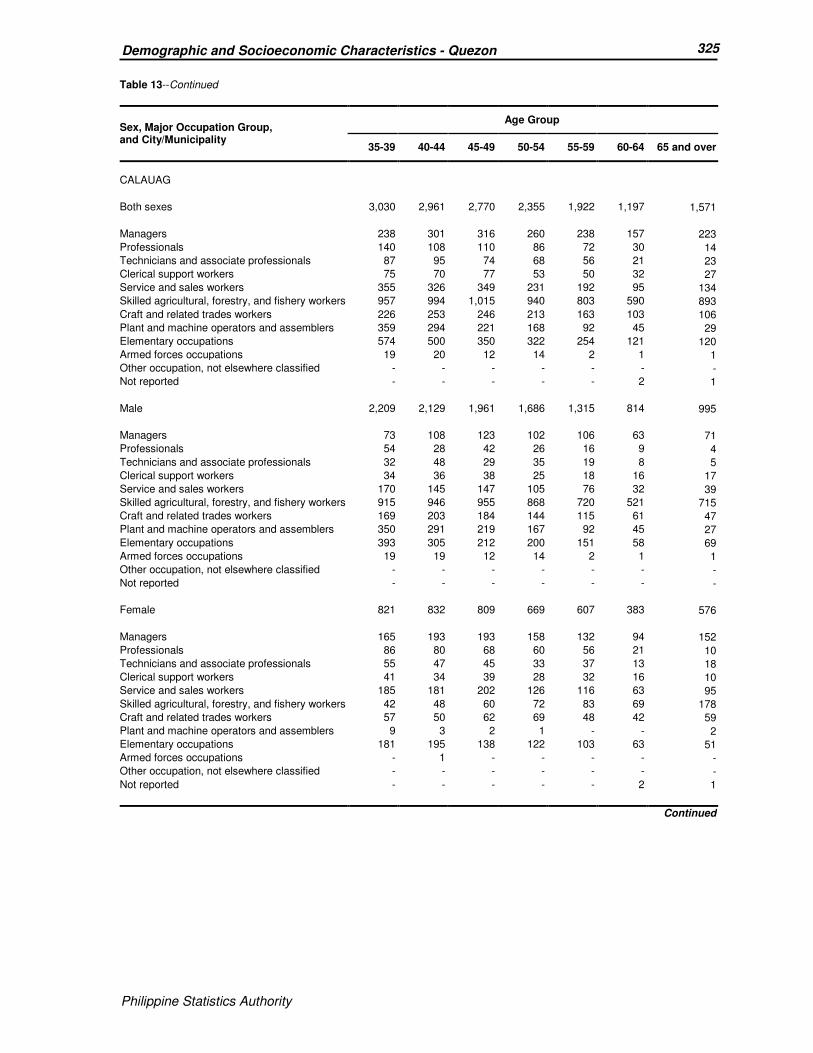
Philippine Statistics Authority
325 Demographic and Socioeconomic Characteristics - Quezon
Philippine Statistics Authority
Table 13--Continued
Sex, Major Occupation Group, and City/Municipality
Age Group
35-39 40-44 45-49 50-54 55-59 60-64 65 and over
CALAUAG
Both sexes 3,030 2,961 2,770 2,355 1,922 1,197 1,571
Managers 238 301 316 260 238 157 223
Professionals 140 108 110 86 72 30 14
Technicians and associate professionals 87 95 74 68 56 21 23
Clerical support workers 75 70 77 53 50 32 27
Service and sales workers 355 326 349 231 192 95 134
Skilled agricultural, forestry, and fishery workers 957 994 1,015 940 803 590 893
Craft and related trades workers 226 253 246 213 163 103 106
Plant and machine operators and assemblers 359 294 221 168 92 45 29
Elementary occupations 574 500 350 322 254 121 120
Armed forces occupations 19 20 12 14 2 1 1
Other occupation, not elsewhere classified - - - - - - -
Not reported - - - - - 2 1
Male 2,209 2,129 1,961 1,686 1,315 814 995
Managers 73 108 123 102 106 63 71
Professionals 54 28 42 26 16 9 4
Technicians and associate professionals 32 48 29 35 19 8 5
Clerical support workers 34 36 38 25 18 16 17
Service and sales workers 170 145 147 105 76 32 39
Skilled agricultural, forestry, and fishery workers 915 946 955 868 720 521 715
Craft and related trades workers 169 203 184 144 115 61 47
Plant and machine operators and assemblers 350 291 219 167 92 45 27
Elementary occupations 393 305 212 200 151 58 69
Armed forces occupations 19 19 12 14 2 1 1
Other occupation, not elsewhere classified - - - - - - -
Not reported - - - - - - -
Female 821 832 809 669 607 383 576
Managers 165 193 193 158 132 94 152
Professionals 86 80 68 60 56 21 10
Technicians and associate professionals 55 47 45 33 37 13 18
Clerical support workers 41 34 39 28 32 16 10
Service and sales workers 185 181 202 126 116 63 95
Skilled agricultural, forestry, and fishery workers 42 48 60 72 83 69 178
Craft and related trades workers 57 50 62 69 48 42 59
Plant and machine operators and assemblers 9 3 2 1 - - 2
Elementary occupations 181 195 138 122 103 63 51
Armed forces occupations - 1 - - - - -
Other occupation, not elsewhere classified - - - - - - -
Not reported - - - - - 2 1
Continued
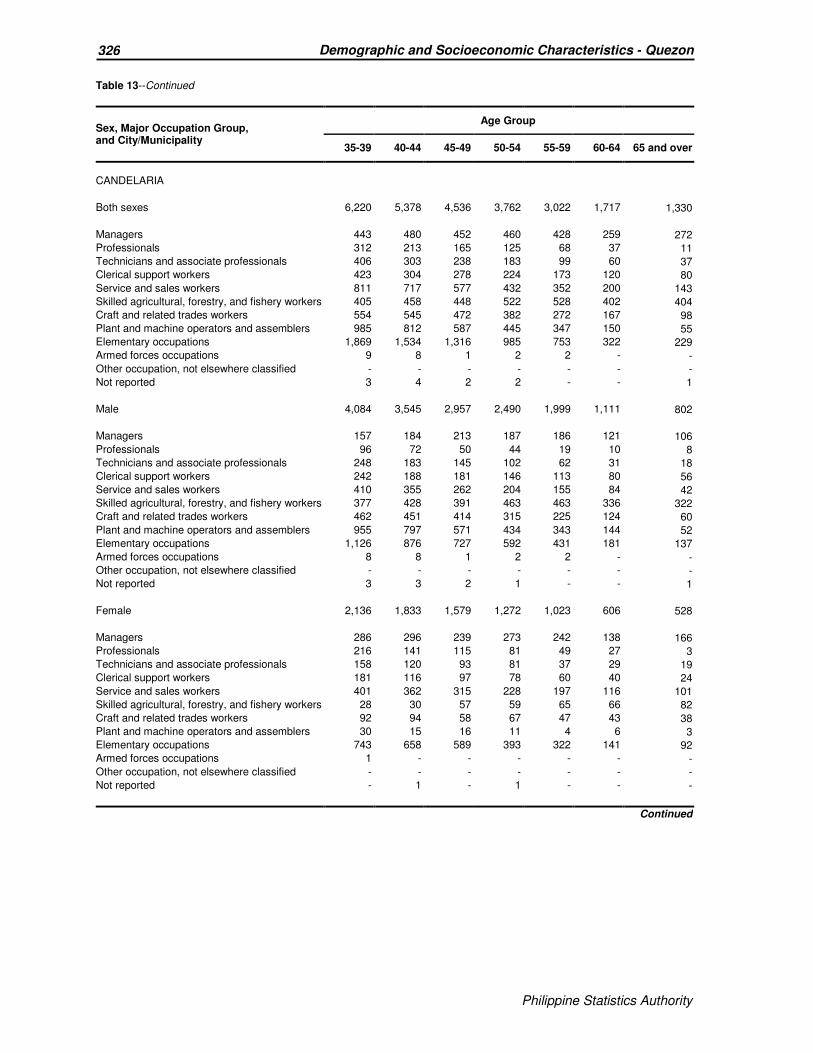
Philippine Statistics Authority
326 Demographic and Socioeconomic Characteristics - Quezon
Philippine Statistics Authority
Table 13--Continued
Sex, Major Occupation Group, and City/Municipality
Age Group
35-39 40-44 45-49 50-54 55-59 60-64 65 and over
CANDELARIA
Both sexes 6,220 5,378 4,536 3,762 3,022 1,717 1,330
Managers 443 480 452 460 428 259 272
Professionals 312 213 165 125 68 37 11
Technicians and associate professionals 406 303 238 183 99 60 37
Clerical support workers 423 304 278 224 173 120 80
Service and sales workers 811 717 577 432 352 200 143
Skilled agricultural, forestry, and fishery workers 405 458 448 522 528 402 404
Craft and related trades workers 554 545 472 382 272 167 98
Plant and machine operators and assemblers 985 812 587 445 347 150 55
Elementary occupations 1,869 1,534 1,316 985 753 322 229
Armed forces occupations 9 8 1 2 2 - -
Other occupation, not elsewhere classified - - - - - - -
Not reported 3 4 2 2 - - 1
Male 4,084 3,545 2,957 2,490 1,999 1,111 802
Managers 157 184 213 187 186 121 106
Professionals 96 72 50 44 19 10 8
Technicians and associate professionals 248 183 145 102 62 31 18
Clerical support workers 242 188 181 146 113 80 56
Service and sales workers 410 355 262 204 155 84 42
Skilled agricultural, forestry, and fishery workers 377 428 391 463 463 336 322
Craft and related trades workers 462 451 414 315 225 124 60
Plant and machine operators and assemblers 955 797 571 434 343 144 52
Elementary occupations 1,126 876 727 592 431 181 137
Armed forces occupations 8 8 1 2 2 - -
Other occupation, not elsewhere classified - - - - - - -
Not reported 3 3 2 1 - - 1
Female 2,136 1,833 1,579 1,272 1,023 606 528
Managers 286 296 239 273 242 138 166
Professionals 216 141 115 81 49 27 3
Technicians and associate professionals 158 120 93 81 37 29 19
Clerical support workers 181 116 97 78 60 40 24
Service and sales workers 401 362 315 228 197 116 101
Skilled agricultural, forestry, and fishery workers 28 30 57 59 65 66 82
Craft and related trades workers 92 94 58 67 47 43 38
Plant and machine operators and assemblers 30 15 16 11 4 6 3
Elementary occupations 743 658 589 393 322 141 92
Armed forces occupations 1 - - - - - -
Other occupation, not elsewhere classified - - - - - - -
Not reported - 1 - 1 - - -
Continued
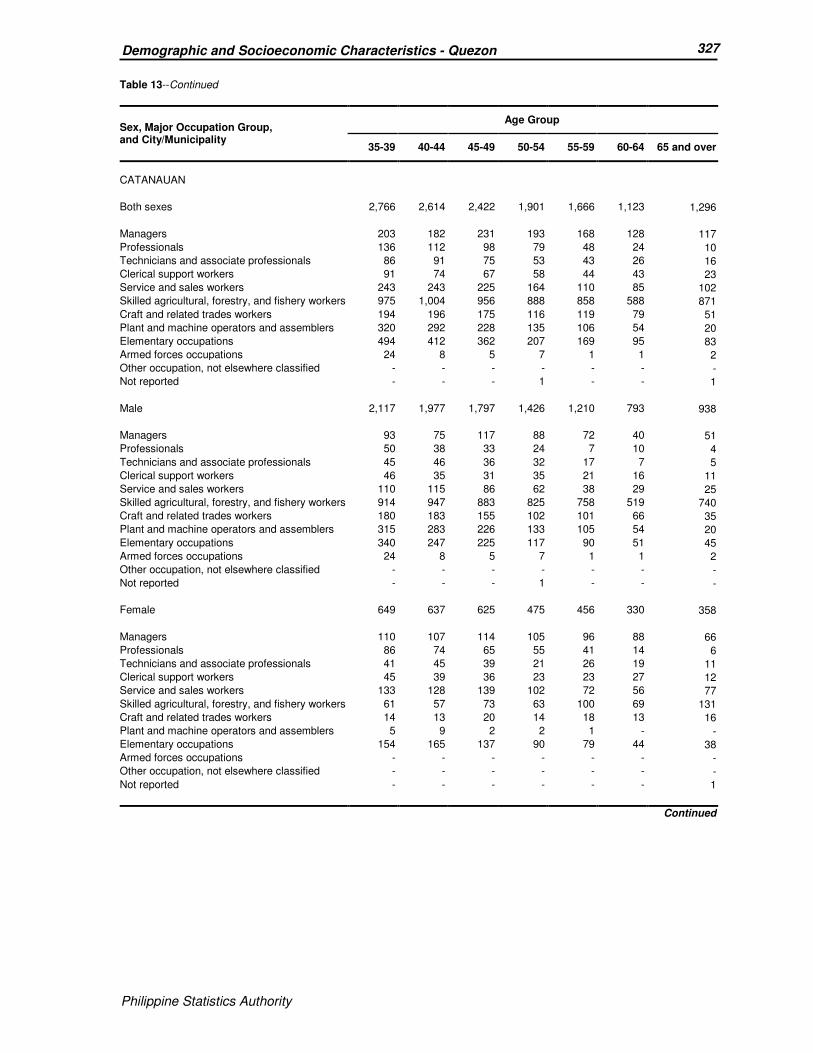
Philippine Statistics Authority
327 Demographic and Socioeconomic Characteristics - Quezon
Philippine Statistics Authority
Table 13--Continued
Sex, Major Occupation Group, and City/Municipality
Age Group
35-39 40-44 45-49 50-54 55-59 60-64 65 and over
CATANAUAN
Both sexes 2,766 2,614 2,422 1,901 1,666 1,123 1,296
Managers 203 182 231 193 168 128 117
Professionals 136 112 98 79 48 24 10
Technicians and associate professionals 86 91 75 53 43 26 16
Clerical support workers 91 74 67 58 44 43 23
Service and sales workers 243 243 225 164 110 85 102
Skilled agricultural, forestry, and fishery workers 975 1,004 956 888 858 588 871
Craft and related trades workers 194 196 175 116 119 79 51
Plant and machine operators and assemblers 320 292 228 135 106 54 20
Elementary occupations 494 412 362 207 169 95 83
Armed forces occupations 24 8 5 7 1 1 2
Other occupation, not elsewhere classified - - - - - - -
Not reported - - - 1 - - 1
Male 2,117 1,977 1,797 1,426 1,210 793 938
Managers 93 75 117 88 72 40 51
Professionals 50 38 33 24 7 10 4
Technicians and associate professionals 45 46 36 32 17 7 5
Clerical support workers 46 35 31 35 21 16 11
Service and sales workers 110 115 86 62 38 29 25
Skilled agricultural, forestry, and fishery workers 914 947 883 825 758 519 740
Craft and related trades workers 180 183 155 102 101 66 35
Plant and machine operators and assemblers 315 283 226 133 105 54 20
Elementary occupations 340 247 225 117 90 51 45
Armed forces occupations 24 8 5 7 1 1 2
Other occupation, not elsewhere classified - - - - - - -
Not reported - - - 1 - - -
Female 649 637 625 475 456 330 358
Managers 110 107 114 105 96 88 66
Professionals 86 74 65 55 41 14 6
Technicians and associate professionals 41 45 39 21 26 19 11
Clerical support workers 45 39 36 23 23 27 12
Service and sales workers 133 128 139 102 72 56 77
Skilled agricultural, forestry, and fishery workers 61 57 73 63 100 69 131
Craft and related trades workers 14 13 20 14 18 13 16
Plant and machine operators and assemblers 5 9 2 2 1 - -
Elementary occupations 154 165 137 90 79 44 38
Armed forces occupations - - - - - - -
Other occupation, not elsewhere classified - - - - - - -
Not reported - - - - - - 1
Continued

Philippine Statistics Authority
328 Demographic and Socioeconomic Characteristics - Quezon
Philippine Statistics Authority
Table 13--Continued
Sex, Major Occupation Group, and City/Municipality
Age Group
35-39 40-44 45-49 50-54 55-59 60-64 65 and over
DOLORES
Both sexes 1,463 1,267 1,269 1,064 833 528 550
Managers 117 128 151 127 122 90 146
Professionals 65 45 58 38 20 11 1
Technicians and associate professionals 108 78 74 63 38 24 24
Clerical support workers 73 50 59 49 46 37 20
Service and sales workers 182 148 139 137 94 49 43
Skilled agricultural, forestry, and fishery workers 288 243 300 271 262 160 193
Craft and related trades workers 121 130 123 91 82 58 32
Plant and machine operators and assemblers 176 150 117 87 57 25 12
Elementary occupations 329 291 243 199 108 74 79
Armed forces occupations 4 4 5 2 4 - -
Other occupation, not elsewhere classified - - - - - - -
Not reported - - - - - - -
Male 1,001 851 838 696 565 319 332
Managers 58 64 76 66 64 43 77
Professionals 17 7 20 14 8 1 1
Technicians and associate professionals 51 36 36 28 18 7 7
Clerical support workers 33 24 30 22 24 13 9
Service and sales workers 90 71 61 60 35 15 16
Skilled agricultural, forestry, and fishery workers 274 224 275 243 233 136 155
Craft and related trades workers 104 112 102 70 64 41 23
Plant and machine operators and assemblers 172 150 110 87 57 25 10
Elementary occupations 198 159 123 104 58 38 34
Armed forces occupations 4 4 5 2 4 - -
Other occupation, not elsewhere classified - - - - - - -
Not reported - - - - - - -
Female 462 416 431 368 268 209 218
Managers 59 64 75 61 58 47 69
Professionals 48 38 38 24 12 10 -
Technicians and associate professionals 57 42 38 35 20 17 17
Clerical support workers 40 26 29 27 22 24 11
Service and sales workers 92 77 78 77 59 34 27
Skilled agricultural, forestry, and fishery workers 14 19 25 28 29 24 38
Craft and related trades workers 17 18 21 21 18 17 9
Plant and machine operators and assemblers 4 - 7 - - - 2
Elementary occupations 131 132 120 95 50 36 45
Armed forces occupations - - - - - - -
Other occupation, not elsewhere classified - - - - - - -
Not reported - - - - - - -
Continued

Philippine Statistics Authority
329 Demographic and Socioeconomic Characteristics - Quezon
Philippine Statistics Authority
Table 13--Continued
Sex, Major Occupation Group, and City/Municipality
Age Group
35-39 40-44 45-49 50-54 55-59 60-64 65 and over
GENERAL LUNA
Both sexes 1,078 999 949 768 600 465 508
Managers 77 88 78 66 67 54 46
Professionals 38 31 32 18 21 3 2
Technicians and associate professionals 60 39 35 23 14 18 7
Clerical support workers 45 41 39 26 18 11 11
Service and sales workers 133 110 120 100 68 43 38
Skilled agricultural, forestry, and fishery workers 305 346 345 335 288 248 330
Craft and related trades workers 96 92 85 61 36 26 23
Plant and machine operators and assemblers 110 95 59 45 26 14 9
Elementary occupations 206 152 155 93 62 48 42
Armed forces occupations 8 4 1 1 - - -
Other occupation, not elsewhere classified - - - - - - -
Not reported - 1 - - - - -
Male 790 750 665 555 412 318 343
Managers 36 38 40 27 31 19 16
Professionals 13 8 7 8 3 1 -
Technicians and associate professionals 31 24 19 15 7 6 3
Clerical support workers 24 30 23 14 9 7 6
Service and sales workers 55 51 39 34 20 10 12
Skilled agricultural, forestry, and fishery workers 285 325 317 309 252 220 259
Craft and related trades workers 84 87 79 57 32 20 17
Plant and machine operators and assemblers 106 95 59 45 26 14 9
Elementary occupations 148 88 81 45 32 21 21
Armed forces occupations 8 3 1 1 - - -
Other occupation, not elsewhere classified - - - - - - -
Not reported - 1 - - - - -
Female 288 249 284 213 188 147 165
Managers 41 50 38 39 36 35 30
Professionals 25 23 25 10 18 2 2
Technicians and associate professionals 29 15 16 8 7 12 4
Clerical support workers 21 11 16 12 9 4 5
Service and sales workers 78 59 81 66 48 33 26
Skilled agricultural, forestry, and fishery workers 20 21 28 26 36 28 71
Craft and related trades workers 12 5 6 4 4 6 6
Plant and machine operators and assemblers 4 - - - - - -
Elementary occupations 58 64 74 48 30 27 21
Armed forces occupations - 1 - - - - -
Other occupation, not elsewhere classified - - - - - - -
Not reported - - - - - - -
Continued
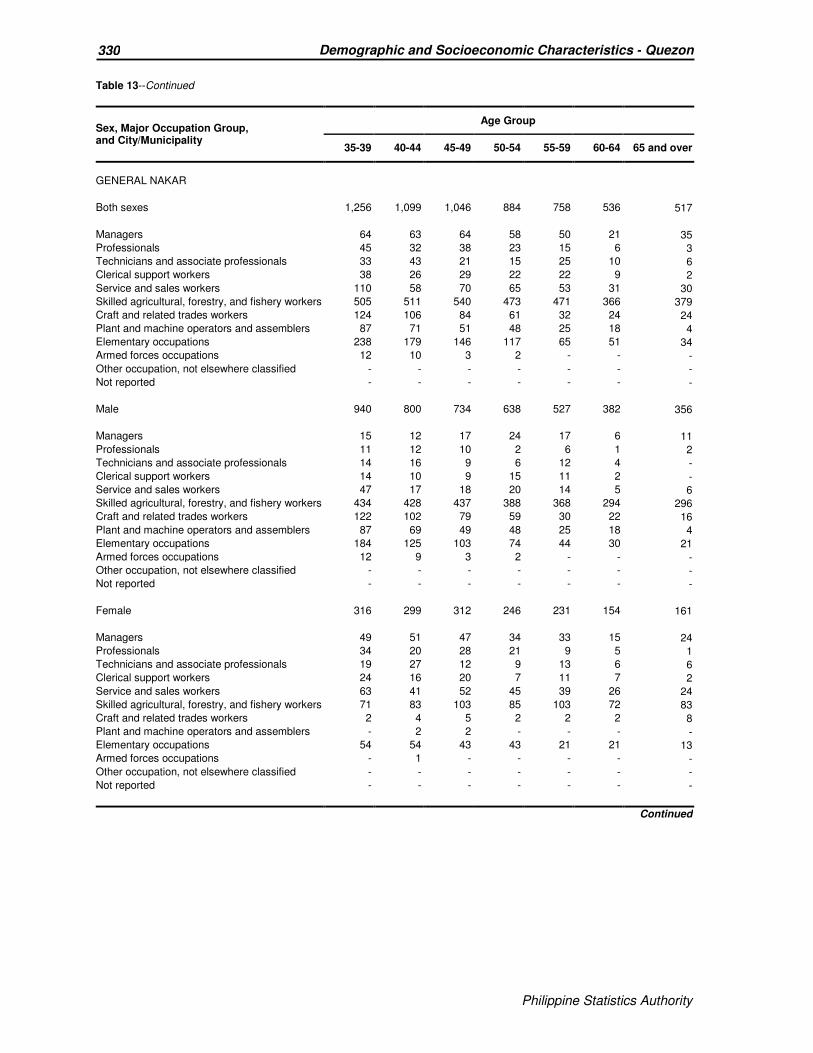
Philippine Statistics Authority
330 Demographic and Socioeconomic Characteristics - Quezon
Philippine Statistics Authority
Table 13--Continued
Sex, Major Occupation Group, and City/Municipality
Age Group
35-39 40-44 45-49 50-54 55-59 60-64 65 and over
GENERAL NAKAR
Both sexes 1,256 1,099 1,046 884 758 536 517
Managers 64 63 64 58 50 21 35
Professionals 45 32 38 23 15 6 3
Technicians and associate professionals 33 43 21 15 25 10 6
Clerical support workers 38 26 29 22 22 9 2
Service and sales workers 110 58 70 65 53 31 30
Skilled agricultural, forestry, and fishery workers 505 511 540 473 471 366 379
Craft and related trades workers 124 106 84 61 32 24 24
Plant and machine operators and assemblers 87 71 51 48 25 18 4
Elementary occupations 238 179 146 117 65 51 34
Armed forces occupations 12 10 3 2 - - -
Other occupation, not elsewhere classified - - - - - - -
Not reported - - - - - - -
Male 940 800 734 638 527 382 356
Managers 15 12 17 24 17 6 11
Professionals 11 12 10 2 6 1 2
Technicians and associate professionals 14 16 9 6 12 4 -
Clerical support workers 14 10 9 15 11 2 -
Service and sales workers 47 17 18 20 14 5 6
Skilled agricultural, forestry, and fishery workers 434 428 437 388 368 294 296
Craft and related trades workers 122 102 79 59 30 22 16
Plant and machine operators and assemblers 87 69 49 48 25 18 4
Elementary occupations 184 125 103 74 44 30 21
Armed forces occupations 12 9 3 2 - - -
Other occupation, not elsewhere classified - - - - - - -
Not reported - - - - - - -
Female 316 299 312 246 231 154 161
Managers 49 51 47 34 33 15 24
Professionals 34 20 28 21 9 5 1
Technicians and associate professionals 19 27 12 9 13 6 6
Clerical support workers 24 16 20 7 11 7 2
Service and sales workers 63 41 52 45 39 26 24
Skilled agricultural, forestry, and fishery workers 71 83 103 85 103 72 83
Craft and related trades workers 2 4 5 2 2 2 8
Plant and machine operators and assemblers - 2 2 - - - -
Elementary occupations 54 54 43 43 21 21 13
Armed forces occupations - 1 - - - - -
Other occupation, not elsewhere classified - - - - - - -
Not reported - - - - - - -
Continued
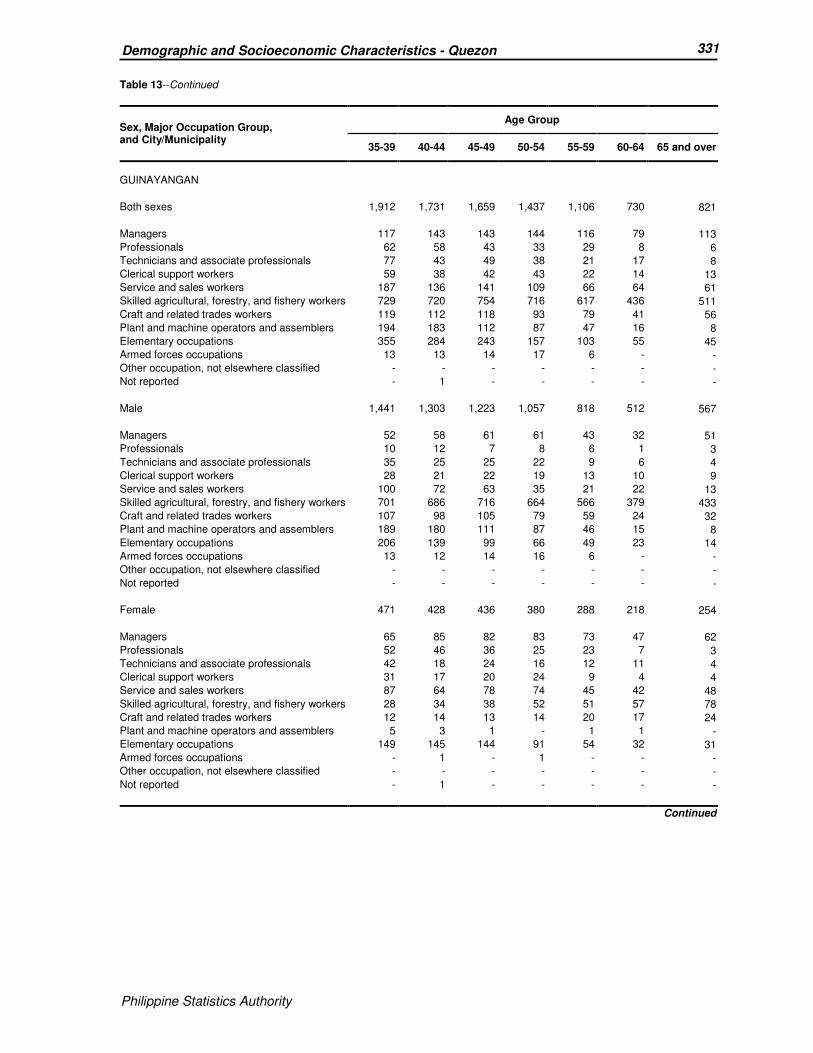
Philippine Statistics Authority
331 Demographic and Socioeconomic Characteristics - Quezon
Philippine Statistics Authority
Table 13--Continued
Sex, Major Occupation Group, and City/Municipality
Age Group
35-39 40-44 45-49 50-54 55-59 60-64 65 and over
GUINAYANGAN
Both sexes 1,912 1,731 1,659 1,437 1,106 730 821
Managers 117 143 143 144 116 79 113
Professionals 62 58 43 33 29 8 6
Technicians and associate professionals 77 43 49 38 21 17 8
Clerical support workers 59 38 42 43 22 14 13
Service and sales workers 187 136 141 109 66 64 61
Skilled agricultural, forestry, and fishery workers 729 720 754 716 617 436 511
Craft and related trades workers 119 112 118 93 79 41 56
Plant and machine operators and assemblers 194 183 112 87 47 16 8
Elementary occupations 355 284 243 157 103 55 45
Armed forces occupations 13 13 14 17 6 - -
Other occupation, not elsewhere classified - - - - - - -
Not reported - 1 - - - - -
Male 1,441 1,303 1,223 1,057 818 512 567
Managers 52 58 61 61 43 32 51
Professionals 10 12 7 8 6 1 3
Technicians and associate professionals 35 25 25 22 9 6 4
Clerical support workers 28 21 22 19 13 10 9
Service and sales workers 100 72 63 35 21 22 13
Skilled agricultural, forestry, and fishery workers 701 686 716 664 566 379 433
Craft and related trades workers 107 98 105 79 59 24 32
Plant and machine operators and assemblers 189 180 111 87 46 15 8
Elementary occupations 206 139 99 66 49 23 14
Armed forces occupations 13 12 14 16 6 - -
Other occupation, not elsewhere classified - - - - - - -
Not reported - - - - - - -
Female 471 428 436 380 288 218 254
Managers 65 85 82 83 73 47 62
Professionals 52 46 36 25 23 7 3
Technicians and associate professionals 42 18 24 16 12 11 4
Clerical support workers 31 17 20 24 9 4 4
Service and sales workers 87 64 78 74 45 42 48
Skilled agricultural, forestry, and fishery workers 28 34 38 52 51 57 78
Craft and related trades workers 12 14 13 14 20 17 24
Plant and machine operators and assemblers 5 3 1 - 1 1 -
Elementary occupations 149 145 144 91 54 32 31
Armed forces occupations - 1 - 1 - - -
Other occupation, not elsewhere classified - - - - - - -
Not reported - 1 - - - - -
Continued

Philippine Statistics Authority
332 Demographic and Socioeconomic Characteristics - Quezon
Philippine Statistics Authority
Table 13--Continued
Sex, Major Occupation Group, and City/Municipality
Age Group
35-39 40-44 45-49 50-54 55-59 60-64 65 and over
GUMACA
Both sexes 3,332 3,095 3,023 2,560 2,017 1,351 1,627
Managers 279 298 348 343 265 228 280
Professionals 194 154 123 118 79 40 23
Technicians and associate professionals 165 141 115 118 73 44 44
Clerical support workers 165 121 107 75 66 40 50
Service and sales workers 506 470 433 370 296 159 176
Skilled agricultural, forestry, and fishery workers 509 589 669 609 578 443 715
Craft and related trades workers 319 320 317 261 207 129 123
Plant and machine operators and assemblers 508 418 344 251 189 88 61
Elementary occupations 677 578 556 407 262 179 154
Armed forces occupations 8 2 9 8 1 1 -
Other occupation, not elsewhere classified - 2 - - - - -
Not reported 2 2 2 - 1 - 1
Male 2,263 2,075 2,044 1,691 1,349 873 1,001
Managers 107 101 113 127 95 79 99
Professionals 72 57 44 29 26 16 6
Technicians and associate professionals 96 71 64 58 43 23 16
Clerical support workers 70 56 49 34 39 20 19
Service and sales workers 235 208 202 159 121 54 45
Skilled agricultural, forestry, and fishery workers 481 557 636 570 528 395 607
Craft and related trades workers 283 280 272 228 175 95 87
Plant and machine operators and assemblers 502 413 339 248 188 87 60
Elementary occupations 409 328 314 230 133 103 61
Armed forces occupations 8 2 9 8 1 1 -
Other occupation, not elsewhere classified - 1 - - - - -
Not reported - 1 2 - - - 1
Female 1,069 1,020 979 869 668 478 626
Managers 172 197 235 216 170 149 181
Professionals 122 97 79 89 53 24 17
Technicians and associate professionals 69 70 51 60 30 21 28
Clerical support workers 95 65 58 41 27 20 31
Service and sales workers 271 262 231 211 175 105 131
Skilled agricultural, forestry, and fishery workers 28 32 33 39 50 48 108
Craft and related trades workers 36 40 45 33 32 34 36
Plant and machine operators and assemblers 6 5 5 3 1 1 1
Elementary occupations 268 250 242 177 129 76 93
Armed forces occupations - - - - - - -
Other occupation, not elsewhere classified - 1 - - - - -
Not reported 2 1 - - 1 - -
Continued
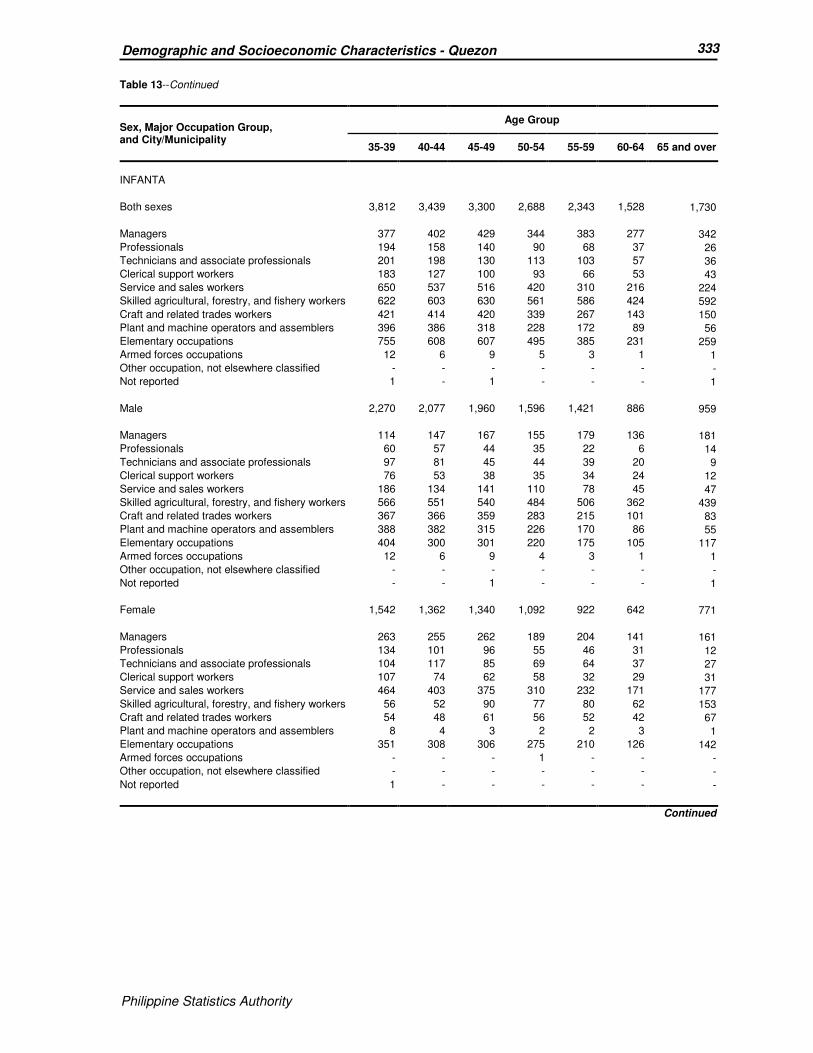
Philippine Statistics Authority
333 Demographic and Socioeconomic Characteristics - Quezon
Philippine Statistics Authority
Table 13--Continued
Sex, Major Occupation Group, and City/Municipality
Age Group
35-39 40-44 45-49 50-54 55-59 60-64 65 and over
INFANTA
Both sexes 3,812 3,439 3,300 2,688 2,343 1,528 1,730
Managers 377 402 429 344 383 277 342
Professionals 194 158 140 90 68 37 26
Technicians and associate professionals 201 198 130 113 103 57 36
Clerical support workers 183 127 100 93 66 53 43
Service and sales workers 650 537 516 420 310 216 224
Skilled agricultural, forestry, and fishery workers 622 603 630 561 586 424 592
Craft and related trades workers 421 414 420 339 267 143 150
Plant and machine operators and assemblers 396 386 318 228 172 89 56
Elementary occupations 755 608 607 495 385 231 259
Armed forces occupations 12 6 9 5 3 1 1
Other occupation, not elsewhere classified - - - - - - -
Not reported 1 - 1 - - - 1
Male 2,270 2,077 1,960 1,596 1,421 886 959
Managers 114 147 167 155 179 136 181
Professionals 60 57 44 35 22 6 14
Technicians and associate professionals 97 81 45 44 39 20 9
Clerical support workers 76 53 38 35 34 24 12
Service and sales workers 186 134 141 110 78 45 47
Skilled agricultural, forestry, and fishery workers 566 551 540 484 506 362 439
Craft and related trades workers 367 366 359 283 215 101 83
Plant and machine operators and assemblers 388 382 315 226 170 86 55
Elementary occupations 404 300 301 220 175 105 117
Armed forces occupations 12 6 9 4 3 1 1
Other occupation, not elsewhere classified - - - - - - -
Not reported - - 1 - - - 1
Female 1,542 1,362 1,340 1,092 922 642 771
Managers 263 255 262 189 204 141 161
Professionals 134 101 96 55 46 31 12
Technicians and associate professionals 104 117 85 69 64 37 27
Clerical support workers 107 74 62 58 32 29 31
Service and sales workers 464 403 375 310 232 171 177
Skilled agricultural, forestry, and fishery workers 56 52 90 77 80 62 153
Craft and related trades workers 54 48 61 56 52 42 67
Plant and machine operators and assemblers 8 4 3 2 2 3 1
Elementary occupations 351 308 306 275 210 126 142
Armed forces occupations - - - 1 - - -
Other occupation, not elsewhere classified - - - - - - -
Not reported 1 - - - - - -
Continued

Philippine Statistics Authority
334 Demographic and Socioeconomic Characteristics - Quezon
Philippine Statistics Authority
Table 13--Continued
Sex, Major Occupation Group, and City/Municipality
Age Group
35-39 40-44 45-49 50-54 55-59 60-64 65 and over
JOMALIG
Both sexes 283 265 214 177 129 99 94
Managers 16 13 16 14 4 7 7
Professionals 7 6 5 6 1 2 -
Technicians and associate professionals 12 8 7 5 2 3 -
Clerical support workers 9 11 11 8 4 4 1
Service and sales workers 21 11 4 11 11 6 5
Skilled agricultural, forestry, and fishery workers 156 156 137 102 81 63 67
Craft and related trades workers 18 18 9 5 11 7 6
Plant and machine operators and assemblers 10 5 3 8 3 2 -
Elementary occupations 34 37 21 18 12 5 8
Armed forces occupations - - 1 - - - -
Other occupation, not elsewhere classified - - - - - - -
Not reported - - - - - - -
Male 220 212 168 136 103 76 67
Managers 7 7 10 8 3 3 1
Professionals - 1 - 2 1 - -
Technicians and associate professionals 3 2 2 1 - 1 -
Clerical support workers 3 4 3 1 1 2 1
Service and sales workers 9 4 1 6 4 1 1
Skilled agricultural, forestry, and fishery workers 155 156 133 99 78 60 58
Craft and related trades workers 17 15 8 4 8 5 5
Plant and machine operators and assemblers 10 5 3 8 3 2 -
Elementary occupations 16 18 7 7 5 2 1
Armed forces occupations - - 1 - - - -
Other occupation, not elsewhere classified - - - - - - -
Not reported - - - - - - -
Female 63 53 46 41 26 23 27
Managers 9 6 6 6 1 4 6
Professionals 7 5 5 4 - 2 -
Technicians and associate professionals 9 6 5 4 2 2 -
Clerical support workers 6 7 8 7 3 2 -
Service and sales workers 12 7 3 5 7 5 4
Skilled agricultural, forestry, and fishery workers 1 - 4 3 3 3 9
Craft and related trades workers 1 3 1 1 3 2 1
Plant and machine operators and assemblers - - - - - - -
Elementary occupations 18 19 14 11 7 3 7
Armed forces occupations - - - - - - -
Other occupation, not elsewhere classified - - - - - - -
Not reported - - - - - - -
Continued

Philippine Statistics Authority
335 Demographic and Socioeconomic Characteristics - Quezon
Philippine Statistics Authority
Table 13--Continued
Sex, Major Occupation Group, and City/Municipality
Age Group
35-39 40-44 45-49 50-54 55-59 60-64 65 and over
LOPEZ
Both sexes 4,322 4,011 3,736 3,280 2,533 1,635 1,992
Managers 320 347 374 402 272 179 253
Professionals 262 219 151 119 97 53 23
Technicians and associate professionals 189 160 142 107 77 48 44
Clerical support workers 149 153 97 92 79 57 38
Service and sales workers 515 421 389 338 254 150 160
Skilled agricultural, forestry, and fishery workers 1,168 1,198 1,252 1,227 1,052 768 1,140
Craft and related trades workers 321 318 344 282 239 112 136
Plant and machine operators and assemblers 499 476 364 249 147 82 26
Elementary occupations 878 711 612 452 312 182 172
Armed forces occupations 16 8 8 12 3 2 -
Other occupation, not elsewhere classified - - - - - - -
Not reported 5 - 3 - 1 2 -
Male 3,028 2,844 2,627 2,243 1,698 1,115 1,292
Managers 128 126 129 150 102 62 79
Professionals 80 73 46 27 23 17 15
Technicians and associate professionals 81 74 72 50 28 19 21
Clerical support workers 61 86 47 51 42 33 21
Service and sales workers 231 193 167 139 88 49 40
Skilled agricultural, forestry, and fishery workers 1,113 1,122 1,188 1,130 949 692 950
Craft and related trades workers 250 248 275 208 158 76 60
Plant and machine operators and assemblers 488 470 360 245 147 81 23
Elementary occupations 576 444 332 232 157 82 83
Armed forces occupations 16 8 8 11 3 2 -
Other occupation, not elsewhere classified - - - - - - -
Not reported 4 - 3 - 1 2 -
Female 1,294 1,167 1,109 1,037 835 520 700
Managers 192 221 245 252 170 117 174
Professionals 182 146 105 92 74 36 8
Technicians and associate professionals 108 86 70 57 49 29 23
Clerical support workers 88 67 50 41 37 24 17
Service and sales workers 284 228 222 199 166 101 120
Skilled agricultural, forestry, and fishery workers 55 76 64 97 103 76 190
Craft and related trades workers 71 70 69 74 81 36 76
Plant and machine operators and assemblers 11 6 4 4 - 1 3
Elementary occupations 302 267 280 220 155 100 89
Armed forces occupations - - - 1 - - -
Other occupation, not elsewhere classified - - - - - - -
Not reported 1 - - - - - -
Continued
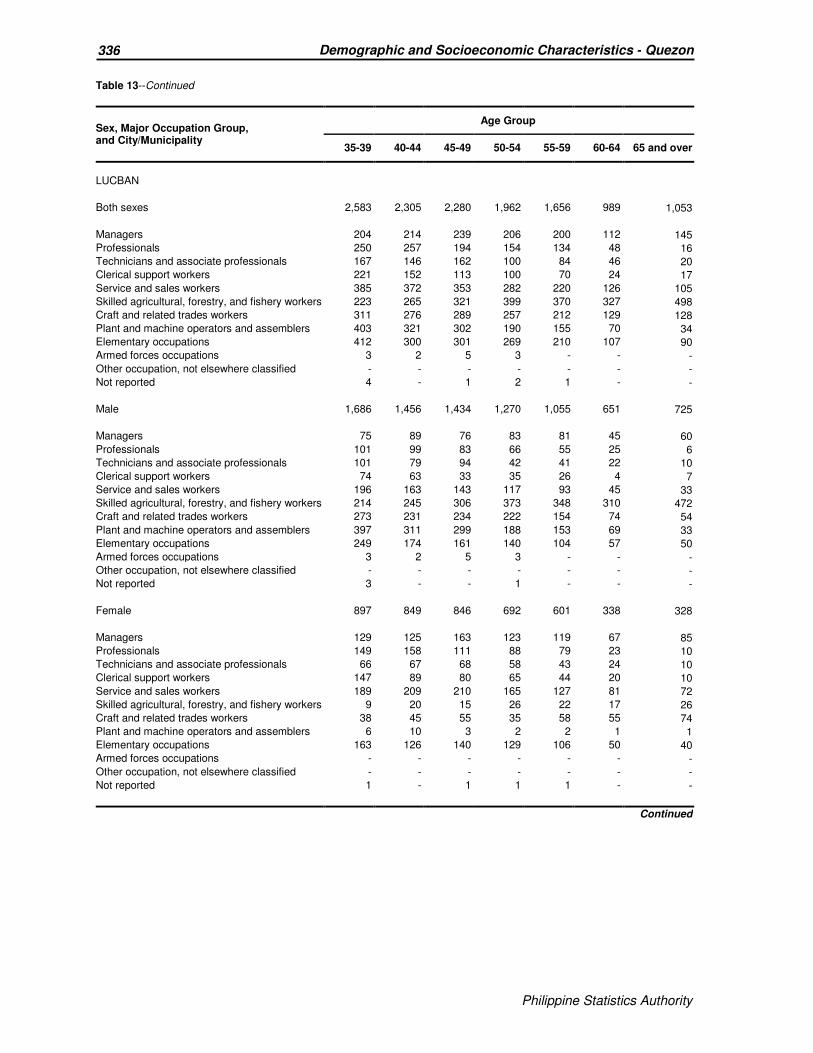
Philippine Statistics Authority
336 Demographic and Socioeconomic Characteristics - Quezon
Philippine Statistics Authority
Table 13--Continued
Sex, Major Occupation Group, and City/Municipality
Age Group
35-39 40-44 45-49 50-54 55-59 60-64 65 and over
LUCBAN
Both sexes 2,583 2,305 2,280 1,962 1,656 989 1,053
Managers 204 214 239 206 200 112 145
Professionals 250 257 194 154 134 48 16
Technicians and associate professionals 167 146 162 100 84 46 20
Clerical support workers 221 152 113 100 70 24 17
Service and sales workers 385 372 353 282 220 126 105
Skilled agricultural, forestry, and fishery workers 223 265 321 399 370 327 498
Craft and related trades workers 311 276 289 257 212 129 128
Plant and machine operators and assemblers 403 321 302 190 155 70 34
Elementary occupations 412 300 301 269 210 107 90
Armed forces occupations 3 2 5 3 - - -
Other occupation, not elsewhere classified - - - - - - -
Not reported 4 - 1 2 1 - -
Male 1,686 1,456 1,434 1,270 1,055 651 725
Managers 75 89 76 83 81 45 60
Professionals 101 99 83 66 55 25 6
Technicians and associate professionals 101 79 94 42 41 22 10
Clerical support workers 74 63 33 35 26 4 7
Service and sales workers 196 163 143 117 93 45 33
Skilled agricultural, forestry, and fishery workers 214 245 306 373 348 310 472
Craft and related trades workers 273 231 234 222 154 74 54
Plant and machine operators and assemblers 397 311 299 188 153 69 33
Elementary occupations 249 174 161 140 104 57 50
Armed forces occupations 3 2 5 3 - - -
Other occupation, not elsewhere classified - - - - - - -
Not reported 3 - - 1 - - -
Female 897 849 846 692 601 338 328
Managers 129 125 163 123 119 67 85
Professionals 149 158 111 88 79 23 10
Technicians and associate professionals 66 67 68 58 43 24 10
Clerical support workers 147 89 80 65 44 20 10
Service and sales workers 189 209 210 165 127 81 72
Skilled agricultural, forestry, and fishery workers 9 20 15 26 22 17 26
Craft and related trades workers 38 45 55 35 58 55 74
Plant and machine operators and assemblers 6 10 3 2 2 1 1
Elementary occupations 163 126 140 129 106 50 40
Armed forces occupations - - - - - - -
Other occupation, not elsewhere classified - - - - - - -
Not reported 1 - 1 1 1 - -
Continued
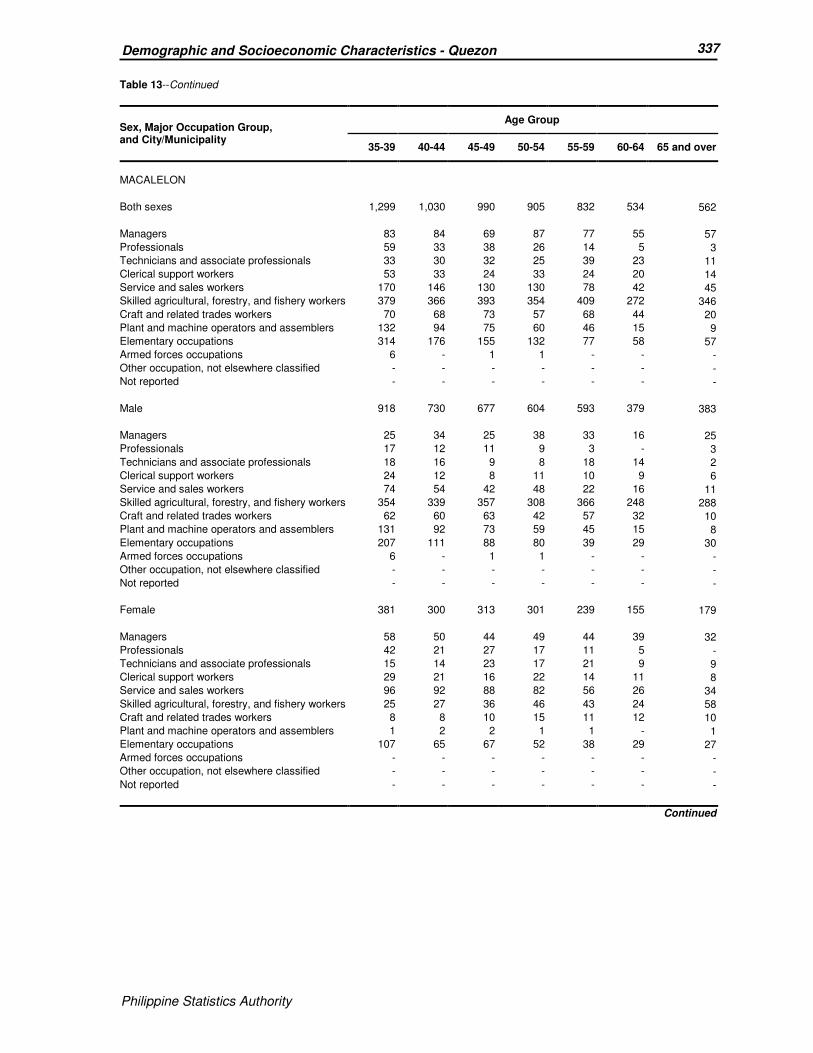
Philippine Statistics Authority
337 Demographic and Socioeconomic Characteristics - Quezon
Philippine Statistics Authority
Table 13--Continued
Sex, Major Occupation Group, and City/Municipality
Age Group
35-39 40-44 45-49 50-54 55-59 60-64 65 and over
MACALELON
Both sexes 1,299 1,030 990 905 832 534 562
Managers 83 84 69 87 77 55 57
Professionals 59 33 38 26 14 5 3
Technicians and associate professionals 33 30 32 25 39 23 11
Clerical support workers 53 33 24 33 24 20 14
Service and sales workers 170 146 130 130 78 42 45
Skilled agricultural, forestry, and fishery workers 379 366 393 354 409 272 346
Craft and related trades workers 70 68 73 57 68 44 20
Plant and machine operators and assemblers 132 94 75 60 46 15 9
Elementary occupations 314 176 155 132 77 58 57
Armed forces occupations 6 - 1 1 - - -
Other occupation, not elsewhere classified - - - - - - -
Not reported - - - - - - -
Male 918 730 677 604 593 379 383
Managers 25 34 25 38 33 16 25
Professionals 17 12 11 9 3 - 3
Technicians and associate professionals 18 16 9 8 18 14 2
Clerical support workers 24 12 8 11 10 9 6
Service and sales workers 74 54 42 48 22 16 11
Skilled agricultural, forestry, and fishery workers 354 339 357 308 366 248 288
Craft and related trades workers 62 60 63 42 57 32 10
Plant and machine operators and assemblers 131 92 73 59 45 15 8
Elementary occupations 207 111 88 80 39 29 30
Armed forces occupations 6 - 1 1 - - -
Other occupation, not elsewhere classified - - - - - - -
Not reported - - - - - - -
Female 381 300 313 301 239 155 179
Managers 58 50 44 49 44 39 32
Professionals 42 21 27 17 11 5 -
Technicians and associate professionals 15 14 23 17 21 9 9
Clerical support workers 29 21 16 22 14 11 8
Service and sales workers 96 92 88 82 56 26 34
Skilled agricultural, forestry, and fishery workers 25 27 36 46 43 24 58
Craft and related trades workers 8 8 10 15 11 12 10
Plant and machine operators and assemblers 1 2 2 1 1 - 1
Elementary occupations 107 65 67 52 38 29 27
Armed forces occupations - - - - - - -
Other occupation, not elsewhere classified - - - - - - -
Not reported - - - - - - -
Continued
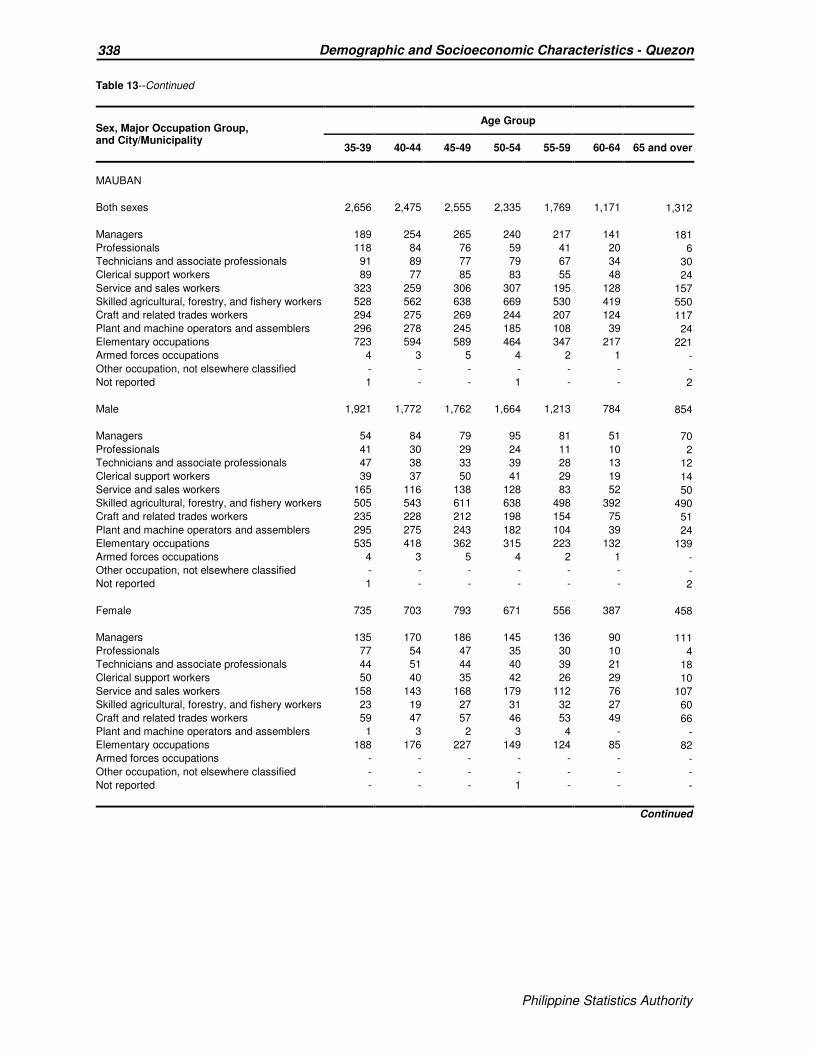
Philippine Statistics Authority
338 Demographic and Socioeconomic Characteristics - Quezon
Philippine Statistics Authority
Table 13--Continued
Sex, Major Occupation Group, and City/Municipality
Age Group
35-39 40-44 45-49 50-54 55-59 60-64 65 and over
MAUBAN
Both sexes 2,656 2,475 2,555 2,335 1,769 1,171 1,312
Managers 189 254 265 240 217 141 181
Professionals 118 84 76 59 41 20 6
Technicians and associate professionals 91 89 77 79 67 34 30
Clerical support workers 89 77 85 83 55 48 24
Service and sales workers 323 259 306 307 195 128 157
Skilled agricultural, forestry, and fishery workers 528 562 638 669 530 419 550
Craft and related trades workers 294 275 269 244 207 124 117
Plant and machine operators and assemblers 296 278 245 185 108 39 24
Elementary occupations 723 594 589 464 347 217 221
Armed forces occupations 4 3 5 4 2 1 -
Other occupation, not elsewhere classified - - - - - - -
Not reported 1 - - 1 - - 2
Male 1,921 1,772 1,762 1,664 1,213 784 854
Managers 54 84 79 95 81 51 70
Professionals 41 30 29 24 11 10 2
Technicians and associate professionals 47 38 33 39 28 13 12
Clerical support workers 39 37 50 41 29 19 14
Service and sales workers 165 116 138 128 83 52 50
Skilled agricultural, forestry, and fishery workers 505 543 611 638 498 392 490
Craft and related trades workers 235 228 212 198 154 75 51
Plant and machine operators and assemblers 295 275 243 182 104 39 24
Elementary occupations 535 418 362 315 223 132 139
Armed forces occupations 4 3 5 4 2 1 -
Other occupation, not elsewhere classified - - - - - - -
Not reported 1 - - - - - 2
Female 735 703 793 671 556 387 458
Managers 135 170 186 145 136 90 111
Professionals 77 54 47 35 30 10 4
Technicians and associate professionals 44 51 44 40 39 21 18
Clerical support workers 50 40 35 42 26 29 10
Service and sales workers 158 143 168 179 112 76 107
Skilled agricultural, forestry, and fishery workers 23 19 27 31 32 27 60
Craft and related trades workers 59 47 57 46 53 49 66
Plant and machine operators and assemblers 1 3 2 3 4 - -
Elementary occupations 188 176 227 149 124 85 82
Armed forces occupations - - - - - - -
Other occupation, not elsewhere classified - - - - - - -
Not reported - - - 1 - - -
Continued
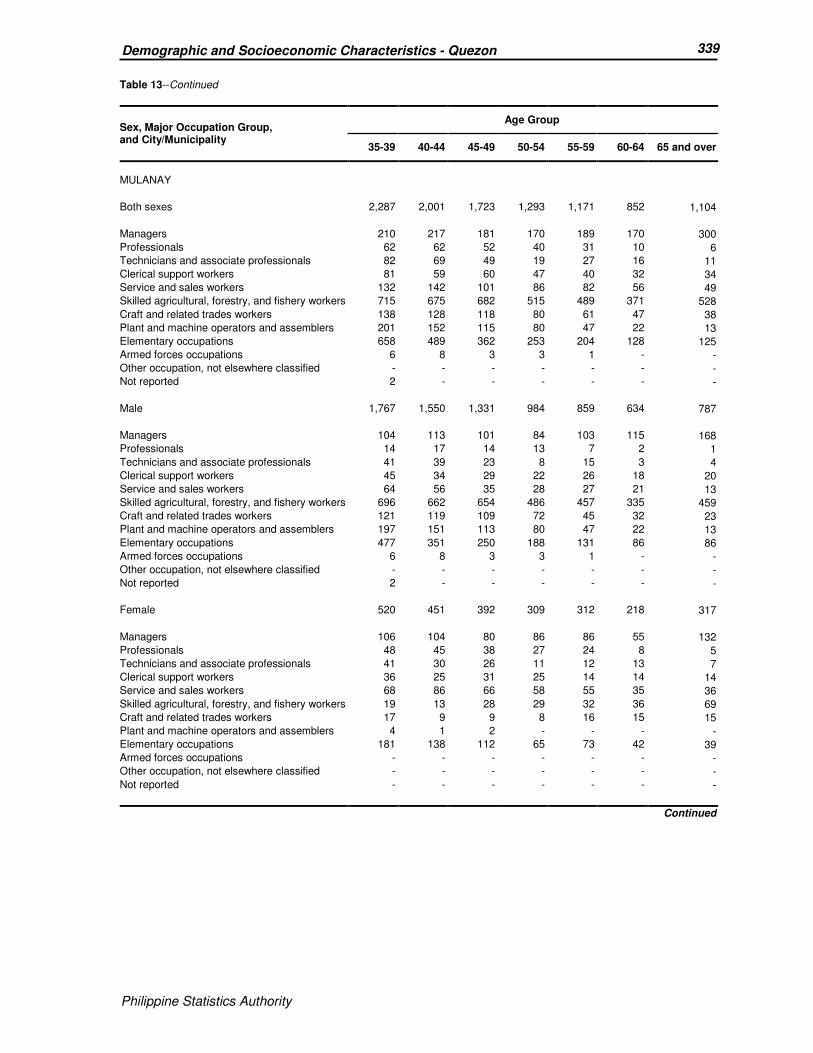
Philippine Statistics Authority
339 Demographic and Socioeconomic Characteristics - Quezon
Philippine Statistics Authority
Table 13--Continued
Sex, Major Occupation Group, and City/Municipality
Age Group
35-39 40-44 45-49 50-54 55-59 60-64 65 and over
MULANAY
Both sexes 2,287 2,001 1,723 1,293 1,171 852 1,104
Managers 210 217 181 170 189 170 300
Professionals 62 62 52 40 31 10 6
Technicians and associate professionals 82 69 49 19 27 16 11
Clerical support workers 81 59 60 47 40 32 34
Service and sales workers 132 142 101 86 82 56 49
Skilled agricultural, forestry, and fishery workers 715 675 682 515 489 371 528
Craft and related trades workers 138 128 118 80 61 47 38
Plant and machine operators and assemblers 201 152 115 80 47 22 13
Elementary occupations 658 489 362 253 204 128 125
Armed forces occupations 6 8 3 3 1 - -
Other occupation, not elsewhere classified - - - - - - -
Not reported 2 - - - - - -
Male 1,767 1,550 1,331 984 859 634 787
Managers 104 113 101 84 103 115 168
Professionals 14 17 14 13 7 2 1
Technicians and associate professionals 41 39 23 8 15 3 4
Clerical support workers 45 34 29 22 26 18 20
Service and sales workers 64 56 35 28 27 21 13
Skilled agricultural, forestry, and fishery workers 696 662 654 486 457 335 459
Craft and related trades workers 121 119 109 72 45 32 23
Plant and machine operators and assemblers 197 151 113 80 47 22 13
Elementary occupations 477 351 250 188 131 86 86
Armed forces occupations 6 8 3 3 1 - -
Other occupation, not elsewhere classified - - - - - - -
Not reported 2 - - - - - -
Female 520 451 392 309 312 218 317
Managers 106 104 80 86 86 55 132
Professionals 48 45 38 27 24 8 5
Technicians and associate professionals 41 30 26 11 12 13 7
Clerical support workers 36 25 31 25 14 14 14
Service and sales workers 68 86 66 58 55 35 36
Skilled agricultural, forestry, and fishery workers 19 13 28 29 32 36 69
Craft and related trades workers 17 9 9 8 16 15 15
Plant and machine operators and assemblers 4 1 2 - - - -
Elementary occupations 181 138 112 65 73 42 39
Armed forces occupations - - - - - - -
Other occupation, not elsewhere classified - - - - - - -
Not reported - - - - - - -
Continued
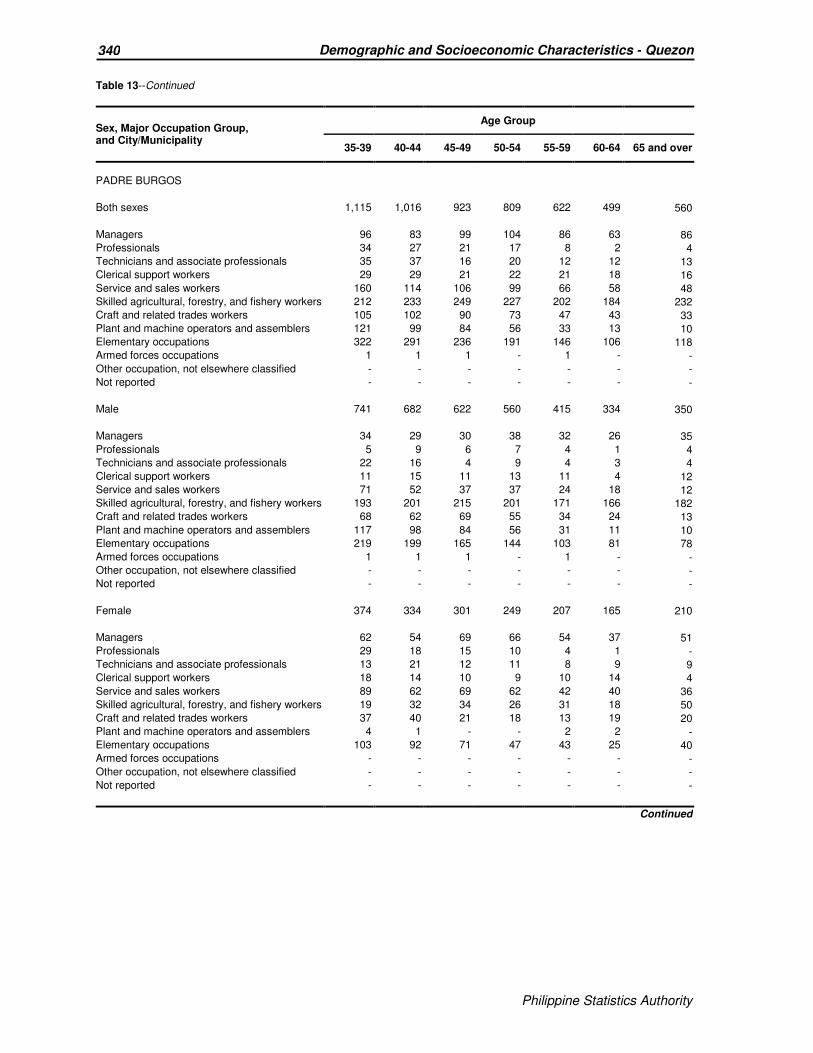
Philippine Statistics Authority
340 Demographic and Socioeconomic Characteristics - Quezon
Philippine Statistics Authority
Table 13--Continued
Sex, Major Occupation Group, and City/Municipality
Age Group
35-39 40-44 45-49 50-54 55-59 60-64 65 and over
PADRE BURGOS
Both sexes 1,115 1,016 923 809 622 499 560
Managers 96 83 99 104 86 63 86
Professionals 34 27 21 17 8 2 4
Technicians and associate professionals 35 37 16 20 12 12 13
Clerical support workers 29 29 21 22 21 18 16
Service and sales workers 160 114 106 99 66 58 48
Skilled agricultural, forestry, and fishery workers 212 233 249 227 202 184 232
Craft and related trades workers 105 102 90 73 47 43 33
Plant and machine operators and assemblers 121 99 84 56 33 13 10
Elementary occupations 322 291 236 191 146 106 118
Armed forces occupations 1 1 1 - 1 - -
Other occupation, not elsewhere classified - - - - - - -
Not reported - - - - - - -
Male 741 682 622 560 415 334 350
Managers 34 29 30 38 32 26 35
Professionals 5 9 6 7 4 1 4
Technicians and associate professionals 22 16 4 9 4 3 4
Clerical support workers 11 15 11 13 11 4 12
Service and sales workers 71 52 37 37 24 18 12
Skilled agricultural, forestry, and fishery workers 193 201 215 201 171 166 182
Craft and related trades workers 68 62 69 55 34 24 13
Plant and machine operators and assemblers 117 98 84 56 31 11 10
Elementary occupations 219 199 165 144 103 81 78
Armed forces occupations 1 1 1 - 1 - -
Other occupation, not elsewhere classified - - - - - - -
Not reported - - - - - - -
Female 374 334 301 249 207 165 210
Managers 62 54 69 66 54 37 51
Professionals 29 18 15 10 4 1 -
Technicians and associate professionals 13 21 12 11 8 9 9
Clerical support workers 18 14 10 9 10 14 4
Service and sales workers 89 62 69 62 42 40 36
Skilled agricultural, forestry, and fishery workers 19 32 34 26 31 18 50
Craft and related trades workers 37 40 21 18 13 19 20
Plant and machine operators and assemblers 4 1 - - 2 2 -
Elementary occupations 103 92 71 47 43 25 40
Armed forces occupations - - - - - - -
Other occupation, not elsewhere classified - - - - - - -
Not reported - - - - - - -
Continued
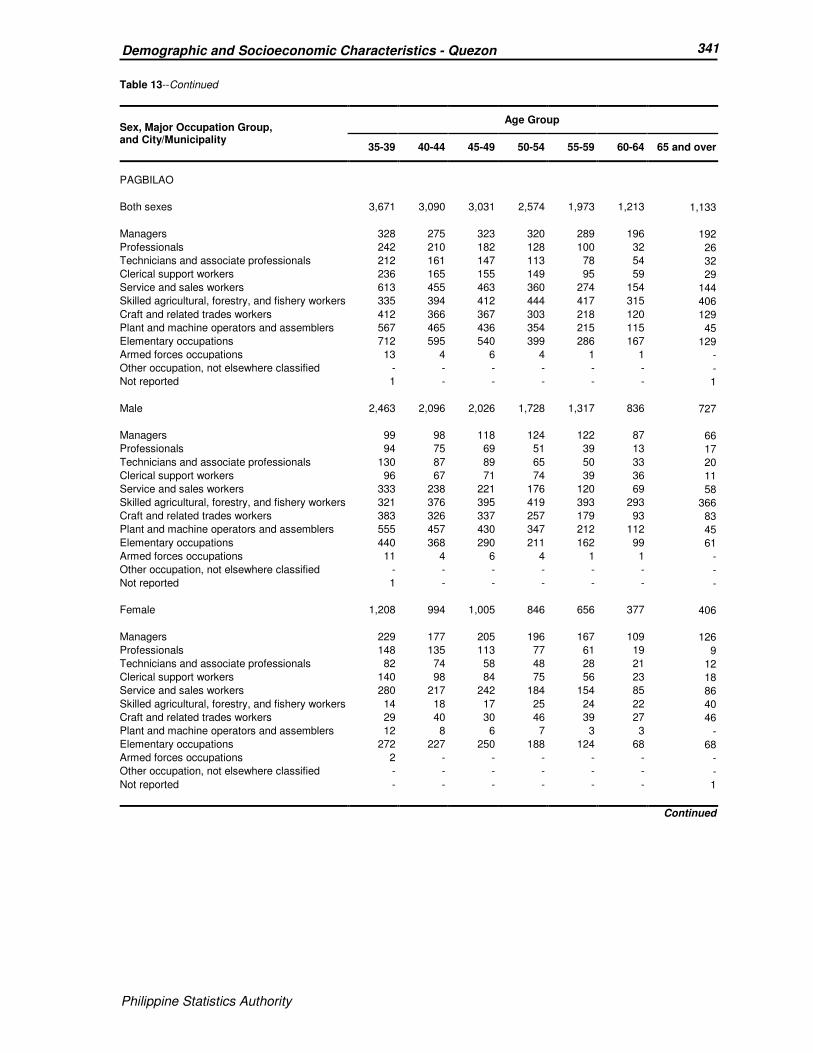
Philippine Statistics Authority
341 Demographic and Socioeconomic Characteristics - Quezon
Philippine Statistics Authority
Table 13--Continued
Sex, Major Occupation Group, and City/Municipality
Age Group
35-39 40-44 45-49 50-54 55-59 60-64 65 and over
PAGBILAO
Both sexes 3,671 3,090 3,031 2,574 1,973 1,213 1,133
Managers 328 275 323 320 289 196 192
Professionals 242 210 182 128 100 32 26
Technicians and associate professionals 212 161 147 113 78 54 32
Clerical support workers 236 165 155 149 95 59 29
Service and sales workers 613 455 463 360 274 154 144
Skilled agricultural, forestry, and fishery workers 335 394 412 444 417 315 406
Craft and related trades workers 412 366 367 303 218 120 129
Plant and machine operators and assemblers 567 465 436 354 215 115 45
Elementary occupations 712 595 540 399 286 167 129
Armed forces occupations 13 4 6 4 1 1 -
Other occupation, not elsewhere classified - - - - - - -
Not reported 1 - - - - - 1
Male 2,463 2,096 2,026 1,728 1,317 836 727
Managers 99 98 118 124 122 87 66
Professionals 94 75 69 51 39 13 17
Technicians and associate professionals 130 87 89 65 50 33 20
Clerical support workers 96 67 71 74 39 36 11
Service and sales workers 333 238 221 176 120 69 58
Skilled agricultural, forestry, and fishery workers 321 376 395 419 393 293 366
Craft and related trades workers 383 326 337 257 179 93 83
Plant and machine operators and assemblers 555 457 430 347 212 112 45
Elementary occupations 440 368 290 211 162 99 61
Armed forces occupations 11 4 6 4 1 1 -
Other occupation, not elsewhere classified - - - - - - -
Not reported 1 - - - - - -
Female 1,208 994 1,005 846 656 377 406
Managers 229 177 205 196 167 109 126
Professionals 148 135 113 77 61 19 9
Technicians and associate professionals 82 74 58 48 28 21 12
Clerical support workers 140 98 84 75 56 23 18
Service and sales workers 280 217 242 184 154 85 86
Skilled agricultural, forestry, and fishery workers 14 18 17 25 24 22 40
Craft and related trades workers 29 40 30 46 39 27 46
Plant and machine operators and assemblers 12 8 6 7 3 3 -
Elementary occupations 272 227 250 188 124 68 68
Armed forces occupations 2 - - - - - -
Other occupation, not elsewhere classified - - - - - - -
Not reported - - - - - - 1
Continued

Philippine Statistics Authority
342 Demographic and Socioeconomic Characteristics - Quezon
Philippine Statistics Authority
Table 13--Continued
Sex, Major Occupation Group, and City/Municipality
Age Group
35-39 40-44 45-49 50-54 55-59 60-64 65 and over
PANUKULAN
Both sexes 583 598 528 470 352 256 335
Managers 44 80 75 82 64 51 97
Professionals 18 21 17 17 6 2 1
Technicians and associate professionals 19 13 15 9 11 6 4
Clerical support workers 15 19 14 11 5 10 3
Service and sales workers 30 38 38 27 16 18 8
Skilled agricultural, forestry, and fishery workers 275 249 220 210 158 111 167
Craft and related trades workers 28 25 25 28 21 10 12
Plant and machine operators and assemblers 21 16 11 13 8 - 1
Elementary occupations 133 137 113 73 63 48 42
Armed forces occupations - - - - - - -
Other occupation, not elsewhere classified - - - - - - -
Not reported - - - - - - -
Male 429 414 356 327 244 165 222
Managers 20 33 29 41 37 31 61
Professionals 2 8 5 6 1 1 1
Technicians and associate professionals 8 3 7 5 4 1 -
Clerical support workers 10 7 6 5 1 5 1
Service and sales workers 7 9 8 9 2 3 1
Skilled agricultural, forestry, and fishery workers 265 240 207 193 147 97 131
Craft and related trades workers 25 22 22 26 16 8 6
Plant and machine operators and assemblers 20 16 11 12 7 - -
Elementary occupations 72 76 61 30 29 19 21
Armed forces occupations - - - - - - -
Other occupation, not elsewhere classified - - - - - - -
Not reported - - - - - - -
Female 154 184 172 143 108 91 113
Managers 24 47 46 41 27 20 36
Professionals 16 13 12 11 5 1 -
Technicians and associate professionals 11 10 8 4 7 5 4
Clerical support workers 5 12 8 6 4 5 2
Service and sales workers 23 29 30 18 14 15 7
Skilled agricultural, forestry, and fishery workers 10 9 13 17 11 14 36
Craft and related trades workers 3 3 3 2 5 2 6
Plant and machine operators and assemblers 1 - - 1 1 - 1
Elementary occupations 61 61 52 43 34 29 21
Armed forces occupations - - - - - - -
Other occupation, not elsewhere classified - - - - - - -
Not reported - - - - - - -
Continued

Philippine Statistics Authority
343 Demographic and Socioeconomic Characteristics - Quezon
Philippine Statistics Authority
Table 13--Continued
Sex, Major Occupation Group, and City/Municipality
Age Group
35-39 40-44 45-49 50-54 55-59 60-64 65 and over
PATNANUNGAN
Both sexes 593 547 495 364 287 225 317
Managers 50 45 43 36 21 23 23
Professionals 16 9 12 6 5 1 -
Technicians and associate professionals 11 17 17 12 10 4 1
Clerical support workers 9 14 7 6 3 5 1
Service and sales workers 26 24 21 12 9 6 16
Skilled agricultural, forestry, and fishery workers 397 352 330 230 201 158 239
Craft and related trades workers 10 18 16 19 15 11 14
Plant and machine operators and assemblers 18 18 9 9 5 1 -
Elementary occupations 56 50 40 34 18 16 23
Armed forces occupations - - - - - - -
Other occupation, not elsewhere classified - - - - - - -
Not reported - - - - - - -
Male 482 417 390 278 221 170 211
Managers 12 13 14 11 6 7 6
Professionals 4 1 4 2 - 1 -
Technicians and associate professionals 7 7 7 4 2 1 -
Clerical support workers 3 6 3 3 2 1 1
Service and sales workers 7 9 4 4 4 2 4
Skilled agricultural, forestry, and fishery workers 388 324 315 211 186 138 186
Craft and related trades workers 10 15 14 17 13 10 7
Plant and machine operators and assemblers 17 18 9 9 5 1 -
Elementary occupations 34 24 20 17 3 9 7
Armed forces occupations - - - - - - -
Other occupation, not elsewhere classified - - - - - - -
Not reported - - - - - - -
Female 111 130 105 86 66 55 106
Managers 38 32 29 25 15 16 17
Professionals 12 8 8 4 5 - -
Technicians and associate professionals 4 10 10 8 8 3 1
Clerical support workers 6 8 4 3 1 4 -
Service and sales workers 19 15 17 8 5 4 12
Skilled agricultural, forestry, and fishery workers 9 28 15 19 15 20 53
Craft and related trades workers - 3 2 2 2 1 7
Plant and machine operators and assemblers 1 - - - - - -
Elementary occupations 22 26 20 17 15 7 16
Armed forces occupations - - - - - - -
Other occupation, not elsewhere classified - - - - - - -
Not reported - - - - - - -
Continued
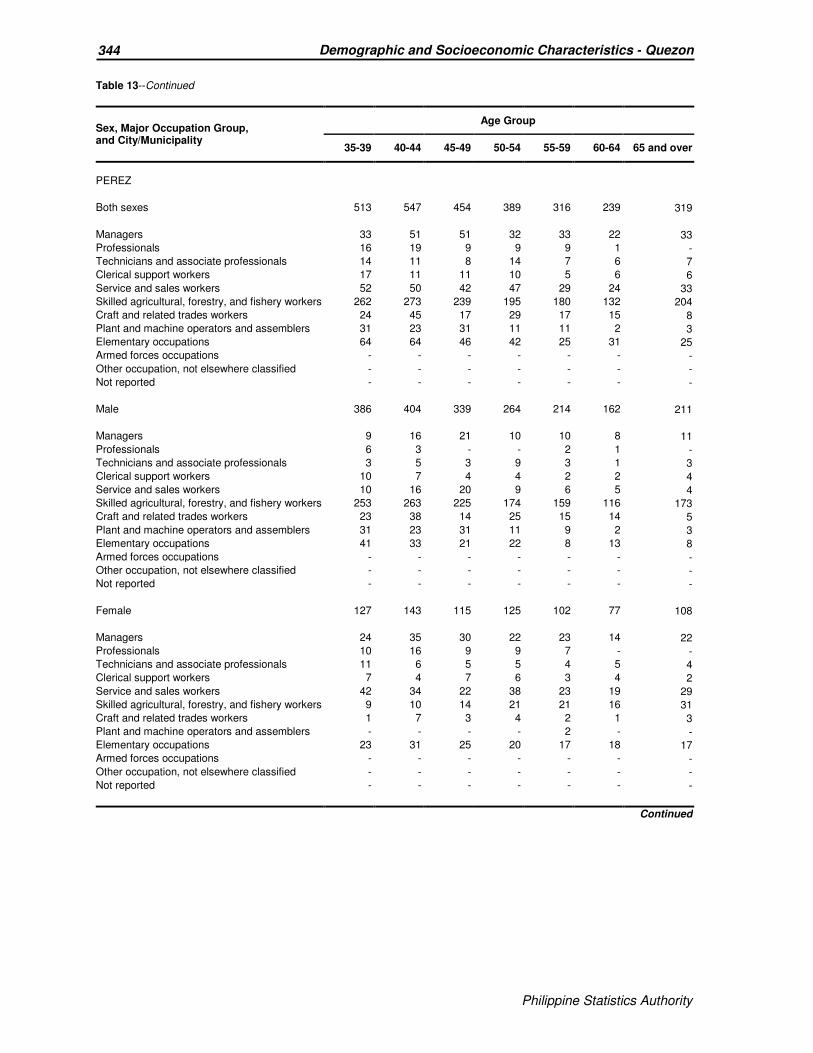
Philippine Statistics Authority
344 Demographic and Socioeconomic Characteristics - Quezon
Philippine Statistics Authority
Table 13--Continued
Sex, Major Occupation Group, and City/Municipality
Age Group
35-39 40-44 45-49 50-54 55-59 60-64 65 and over
PEREZ
Both sexes 513 547 454 389 316 239 319
Managers 33 51 51 32 33 22 33
Professionals 16 19 9 9 9 1 -
Technicians and associate professionals 14 11 8 14 7 6 7
Clerical support workers 17 11 11 10 5 6 6
Service and sales workers 52 50 42 47 29 24 33
Skilled agricultural, forestry, and fishery workers 262 273 239 195 180 132 204
Craft and related trades workers 24 45 17 29 17 15 8
Plant and machine operators and assemblers 31 23 31 11 11 2 3
Elementary occupations 64 64 46 42 25 31 25
Armed forces occupations - - - - - - -
Other occupation, not elsewhere classified - - - - - - -
Not reported - - - - - - -
Male 386 404 339 264 214 162 211
Managers 9 16 21 10 10 8 11
Professionals 6 3 - - 2 1 -
Technicians and associate professionals 3 5 3 9 3 1 3
Clerical support workers 10 7 4 4 2 2 4
Service and sales workers 10 16 20 9 6 5 4
Skilled agricultural, forestry, and fishery workers 253 263 225 174 159 116 173
Craft and related trades workers 23 38 14 25 15 14 5
Plant and machine operators and assemblers 31 23 31 11 9 2 3
Elementary occupations 41 33 21 22 8 13 8
Armed forces occupations - - - - - - -
Other occupation, not elsewhere classified - - - - - - -
Not reported - - - - - - -
Female 127 143 115 125 102 77 108
Managers 24 35 30 22 23 14 22
Professionals 10 16 9 9 7 - -
Technicians and associate professionals 11 6 5 5 4 5 4
Clerical support workers 7 4 7 6 3 4 2
Service and sales workers 42 34 22 38 23 19 29
Skilled agricultural, forestry, and fishery workers 9 10 14 21 21 16 31
Craft and related trades workers 1 7 3 4 2 1 3
Plant and machine operators and assemblers - - - - 2 - -
Elementary occupations 23 31 25 20 17 18 17
Armed forces occupations - - - - - - -
Other occupation, not elsewhere classified - - - - - - -
Not reported - - - - - - -
Continued
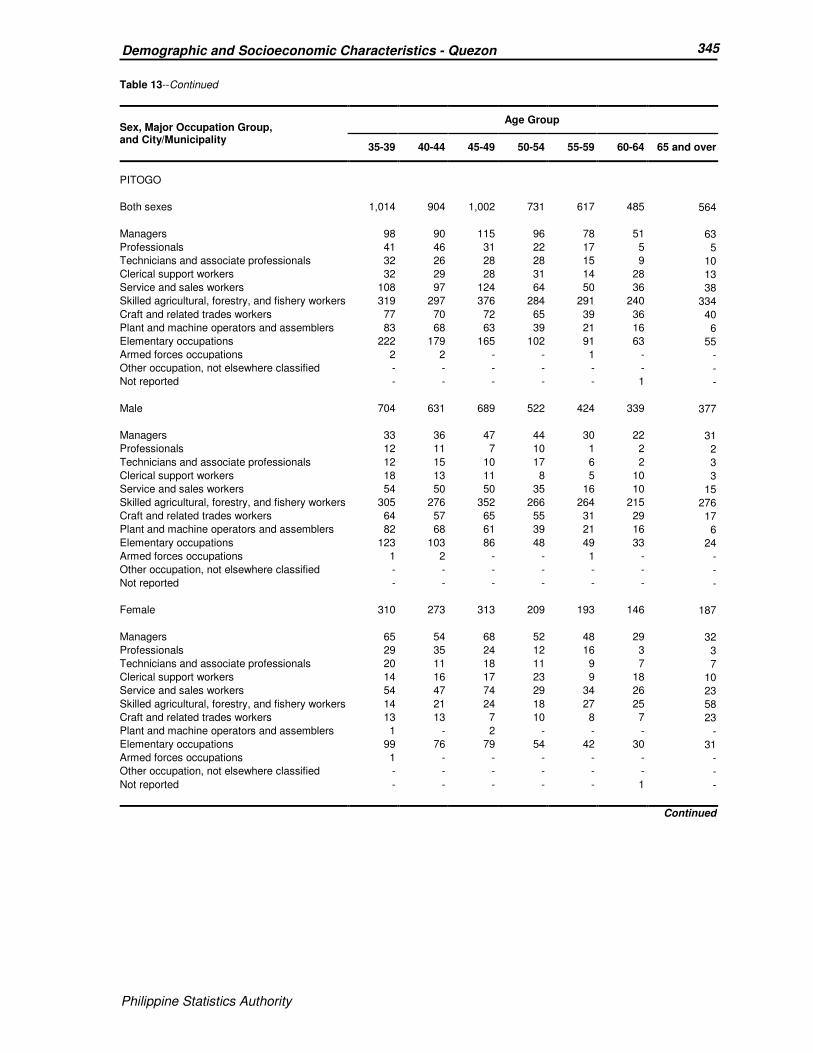
Philippine Statistics Authority
345 Demographic and Socioeconomic Characteristics - Quezon
Philippine Statistics Authority
Table 13--Continued
Sex, Major Occupation Group, and City/Municipality
Age Group
35-39 40-44 45-49 50-54 55-59 60-64 65 and over
PITOGO
Both sexes 1,014 904 1,002 731 617 485 564
Managers 98 90 115 96 78 51 63
Professionals 41 46 31 22 17 5 5
Technicians and associate professionals 32 26 28 28 15 9 10
Clerical support workers 32 29 28 31 14 28 13
Service and sales workers 108 97 124 64 50 36 38
Skilled agricultural, forestry, and fishery workers 319 297 376 284 291 240 334
Craft and related trades workers 77 70 72 65 39 36 40
Plant and machine operators and assemblers 83 68 63 39 21 16 6
Elementary occupations 222 179 165 102 91 63 55
Armed forces occupations 2 2 - - 1 - -
Other occupation, not elsewhere classified - - - - - - -
Not reported - - - - - 1 -
Male 704 631 689 522 424 339 377
Managers 33 36 47 44 30 22 31
Professionals 12 11 7 10 1 2 2
Technicians and associate professionals 12 15 10 17 6 2 3
Clerical support workers 18 13 11 8 5 10 3
Service and sales workers 54 50 50 35 16 10 15
Skilled agricultural, forestry, and fishery workers 305 276 352 266 264 215 276
Craft and related trades workers 64 57 65 55 31 29 17
Plant and machine operators and assemblers 82 68 61 39 21 16 6
Elementary occupations 123 103 86 48 49 33 24
Armed forces occupations 1 2 - - 1 - -
Other occupation, not elsewhere classified - - - - - - -
Not reported - - - - - - -
Female 310 273 313 209 193 146 187
Managers 65 54 68 52 48 29 32
Professionals 29 35 24 12 16 3 3
Technicians and associate professionals 20 11 18 11 9 7 7
Clerical support workers 14 16 17 23 9 18 10
Service and sales workers 54 47 74 29 34 26 23
Skilled agricultural, forestry, and fishery workers 14 21 24 18 27 25 58
Craft and related trades workers 13 13 7 10 8 7 23
Plant and machine operators and assemblers 1 - 2 - - - -
Elementary occupations 99 76 79 54 42 30 31
Armed forces occupations 1 - - - - - -
Other occupation, not elsewhere classified - - - - - - -
Not reported - - - - - 1 -
Continued

Philippine Statistics Authority
346 Demographic and Socioeconomic Characteristics - Quezon
Philippine Statistics Authority
Table 13--Continued
Sex, Major Occupation Group, and City/Municipality
Age Group
35-39 40-44 45-49 50-54 55-59 60-64 65 and over
PLARIDEL
Both sexes 526 478 483 403 368 215 215
Managers 47 56 49 42 34 28 42
Professionals 30 20 31 12 8 1 -
Technicians and associate professionals 43 25 28 19 22 10 8
Clerical support workers 36 23 20 25 18 7 5
Service and sales workers 91 72 71 57 46 34 22
Skilled agricultural, forestry, and fishery workers 59 80 81 101 101 69 95
Craft and related trades workers 55 58 66 50 44 19 12
Plant and machine operators and assemblers 53 41 46 33 32 12 6
Elementary occupations 112 101 91 64 62 34 25
Armed forces occupations - 2 - - 1 1 -
Other occupation, not elsewhere classified - - - - - - -
Not reported - - - - - - -
Male 324 302 306 267 252 139 140
Managers 15 21 14 21 17 5 19
Professionals 9 6 9 7 1 - -
Technicians and associate professionals 25 16 14 5 9 5 3
Clerical support workers 12 8 12 12 10 3 3
Service and sales workers 48 29 21 21 18 13 6
Skilled agricultural, forestry, and fishery workers 58 75 79 96 94 66 84
Craft and related trades workers 51 53 60 39 34 12 7
Plant and machine operators and assemblers 50 41 45 33 32 12 6
Elementary occupations 56 51 52 33 36 22 12
Armed forces occupations - 2 - - 1 1 -
Other occupation, not elsewhere classified - - - - - - -
Not reported - - - - - - -
Female 202 176 177 136 116 76 75
Managers 32 35 35 21 17 23 23
Professionals 21 14 22 5 7 1 -
Technicians and associate professionals 18 9 14 14 13 5 5
Clerical support workers 24 15 8 13 8 4 2
Service and sales workers 43 43 50 36 28 21 16
Skilled agricultural, forestry, and fishery workers 1 5 2 5 7 3 11
Craft and related trades workers 4 5 6 11 10 7 5
Plant and machine operators and assemblers 3 - 1 - - - -
Elementary occupations 56 50 39 31 26 12 13
Armed forces occupations - - - - - - -
Other occupation, not elsewhere classified - - - - - - -
Not reported - - - - - - -
Continued

Philippine Statistics Authority
347 Demographic and Socioeconomic Characteristics - Quezon
Philippine Statistics Authority
Table 13--Continued
Sex, Major Occupation Group, and City/Municipality
Age Group
35-39 40-44 45-49 50-54 55-59 60-64 65 and over
POLILLO
Both sexes 1,301 1,170 1,171 1,013 826 611 647
Managers 121 106 120 75 96 68 97
Professionals 55 72 43 30 26 8 9
Technicians and associate professionals 26 27 33 32 19 17 15
Clerical support workers 40 18 22 23 15 11 3
Service and sales workers 135 100 97 92 65 41 37
Skilled agricultural, forestry, and fishery workers 540 515 522 480 404 328 359
Craft and related trades workers 71 72 84 66 60 40 41
Plant and machine operators and assemblers 71 65 58 45 30 20 24
Elementary occupations 239 195 191 169 111 78 62
Armed forces occupations 1 - 1 1 - - -
Other occupation, not elsewhere classified - - - - - - -
Not reported 2 - - - - - -
Male 969 839 847 716 578 435 441
Managers 30 18 40 16 26 27 32
Professionals 17 22 16 10 5 1 4
Technicians and associate professionals 16 14 13 14 9 9 7
Clerical support workers 20 9 11 6 6 3 -
Service and sales workers 52 27 29 27 18 10 8
Skilled agricultural, forestry, and fishery workers 532 502 502 459 378 303 311
Craft and related trades workers 68 64 74 59 48 29 21
Plant and machine operators and assemblers 70 63 54 44 29 19 24
Elementary occupations 163 120 107 80 59 34 34
Armed forces occupations 1 - 1 1 - - -
Other occupation, not elsewhere classified - - - - - - -
Not reported - - - - - - -
Female 332 331 324 297 248 176 206
Managers 91 88 80 59 70 41 65
Professionals 38 50 27 20 21 7 5
Technicians and associate professionals 10 13 20 18 10 8 8
Clerical support workers 20 9 11 17 9 8 3
Service and sales workers 83 73 68 65 47 31 29
Skilled agricultural, forestry, and fishery workers 8 13 20 21 26 25 48
Craft and related trades workers 3 8 10 7 12 11 20
Plant and machine operators and assemblers 1 2 4 1 1 1 -
Elementary occupations 76 75 84 89 52 44 28
Armed forces occupations - - - - - - -
Other occupation, not elsewhere classified - - - - - - -
Not reported 2 - - - - - -
Continued
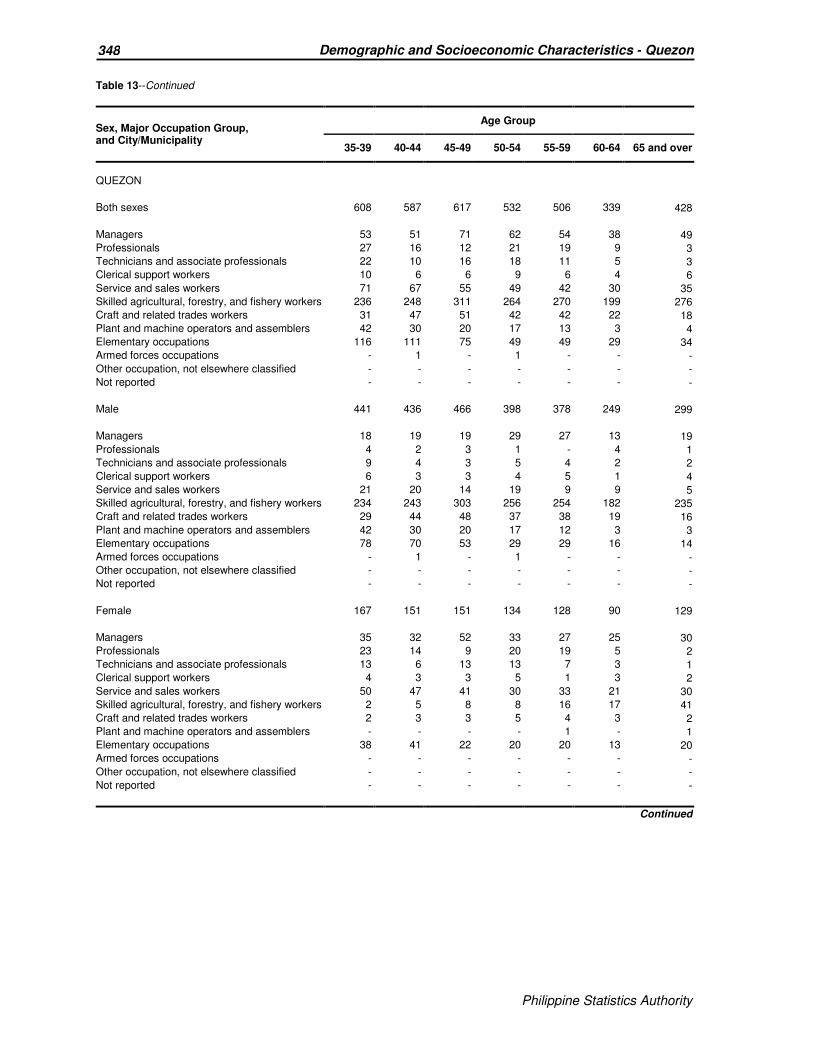
Philippine Statistics Authority
348 Demographic and Socioeconomic Characteristics - Quezon
Philippine Statistics Authority
Table 13--Continued
Sex, Major Occupation Group, and City/Municipality
Age Group
35-39 40-44 45-49 50-54 55-59 60-64 65 and over
QUEZON
Both sexes 608 587 617 532 506 339 428
Managers 53 51 71 62 54 38 49
Professionals 27 16 12 21 19 9 3
Technicians and associate professionals 22 10 16 18 11 5 3
Clerical support workers 10 6 6 9 6 4 6
Service and sales workers 71 67 55 49 42 30 35
Skilled agricultural, forestry, and fishery workers 236 248 311 264 270 199 276
Craft and related trades workers 31 47 51 42 42 22 18
Plant and machine operators and assemblers 42 30 20 17 13 3 4
Elementary occupations 116 111 75 49 49 29 34
Armed forces occupations - 1 - 1 - - -
Other occupation, not elsewhere classified - - - - - - -
Not reported - - - - - - -
Male 441 436 466 398 378 249 299
Managers 18 19 19 29 27 13 19
Professionals 4 2 3 1 - 4 1
Technicians and associate professionals 9 4 3 5 4 2 2
Clerical support workers 6 3 3 4 5 1 4
Service and sales workers 21 20 14 19 9 9 5
Skilled agricultural, forestry, and fishery workers 234 243 303 256 254 182 235
Craft and related trades workers 29 44 48 37 38 19 16
Plant and machine operators and assemblers 42 30 20 17 12 3 3
Elementary occupations 78 70 53 29 29 16 14
Armed forces occupations - 1 - 1 - - -
Other occupation, not elsewhere classified - - - - - - -
Not reported - - - - - - -
Female 167 151 151 134 128 90 129
Managers 35 32 52 33 27 25 30
Professionals 23 14 9 20 19 5 2
Technicians and associate professionals 13 6 13 13 7 3 1
Clerical support workers 4 3 3 5 1 3 2
Service and sales workers 50 47 41 30 33 21 30
Skilled agricultural, forestry, and fishery workers 2 5 8 8 16 17 41
Craft and related trades workers 2 3 3 5 4 3 2
Plant and machine operators and assemblers - - - - 1 - 1
Elementary occupations 38 41 22 20 20 13 20
Armed forces occupations - - - - - - -
Other occupation, not elsewhere classified - - - - - - -
Not reported - - - - - - -
Continued
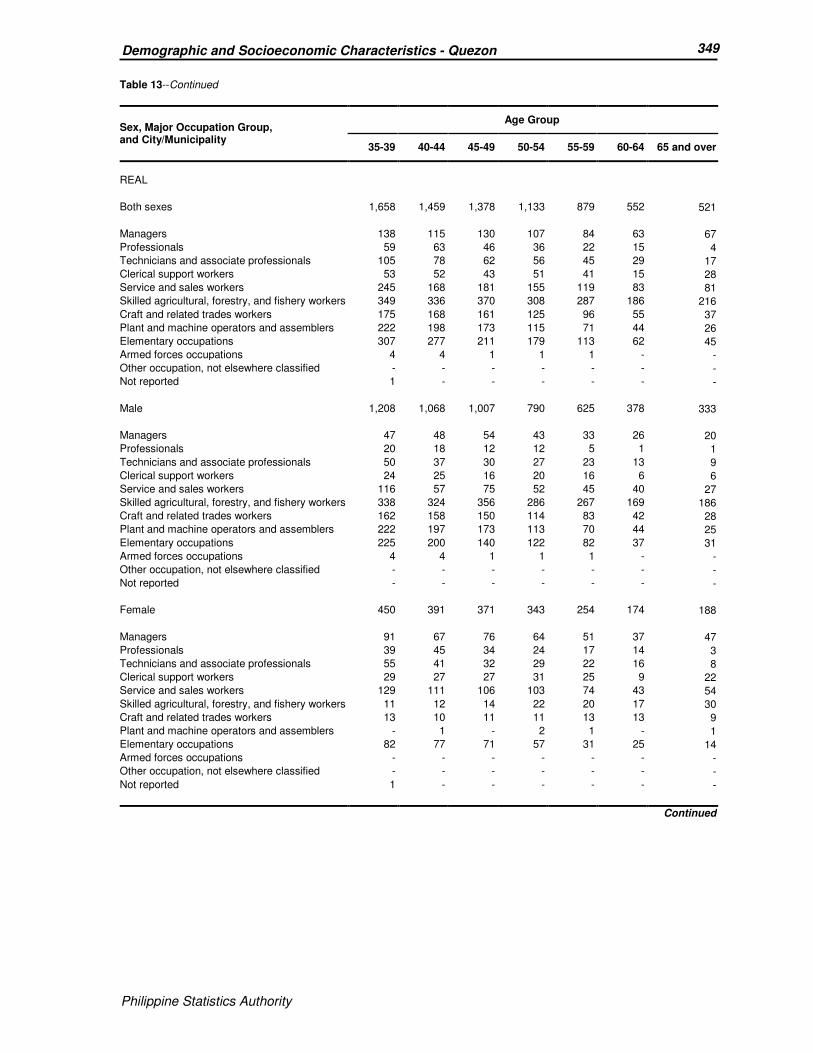
Philippine Statistics Authority
349 Demographic and Socioeconomic Characteristics - Quezon
Philippine Statistics Authority
Table 13--Continued
Sex, Major Occupation Group, and City/Municipality
Age Group
35-39 40-44 45-49 50-54 55-59 60-64 65 and over
REAL
Both sexes 1,658 1,459 1,378 1,133 879 552 521
Managers 138 115 130 107 84 63 67
Professionals 59 63 46 36 22 15 4
Technicians and associate professionals 105 78 62 56 45 29 17
Clerical support workers 53 52 43 51 41 15 28
Service and sales workers 245 168 181 155 119 83 81
Skilled agricultural, forestry, and fishery workers 349 336 370 308 287 186 216
Craft and related trades workers 175 168 161 125 96 55 37
Plant and machine operators and assemblers 222 198 173 115 71 44 26
Elementary occupations 307 277 211 179 113 62 45
Armed forces occupations 4 4 1 1 1 - -
Other occupation, not elsewhere classified - - - - - - -
Not reported 1 - - - - - -
Male 1,208 1,068 1,007 790 625 378 333
Managers 47 48 54 43 33 26 20
Professionals 20 18 12 12 5 1 1
Technicians and associate professionals 50 37 30 27 23 13 9
Clerical support workers 24 25 16 20 16 6 6
Service and sales workers 116 57 75 52 45 40 27
Skilled agricultural, forestry, and fishery workers 338 324 356 286 267 169 186
Craft and related trades workers 162 158 150 114 83 42 28
Plant and machine operators and assemblers 222 197 173 113 70 44 25
Elementary occupations 225 200 140 122 82 37 31
Armed forces occupations 4 4 1 1 1 - -
Other occupation, not elsewhere classified - - - - - - -
Not reported - - - - - - -
Female 450 391 371 343 254 174 188
Managers 91 67 76 64 51 37 47
Professionals 39 45 34 24 17 14 3
Technicians and associate professionals 55 41 32 29 22 16 8
Clerical support workers 29 27 27 31 25 9 22
Service and sales workers 129 111 106 103 74 43 54
Skilled agricultural, forestry, and fishery workers 11 12 14 22 20 17 30
Craft and related trades workers 13 10 11 11 13 13 9
Plant and machine operators and assemblers - 1 - 2 1 - 1
Elementary occupations 82 77 71 57 31 25 14
Armed forces occupations - - - - - - -
Other occupation, not elsewhere classified - - - - - - -
Not reported 1 - - - - - -
Continued
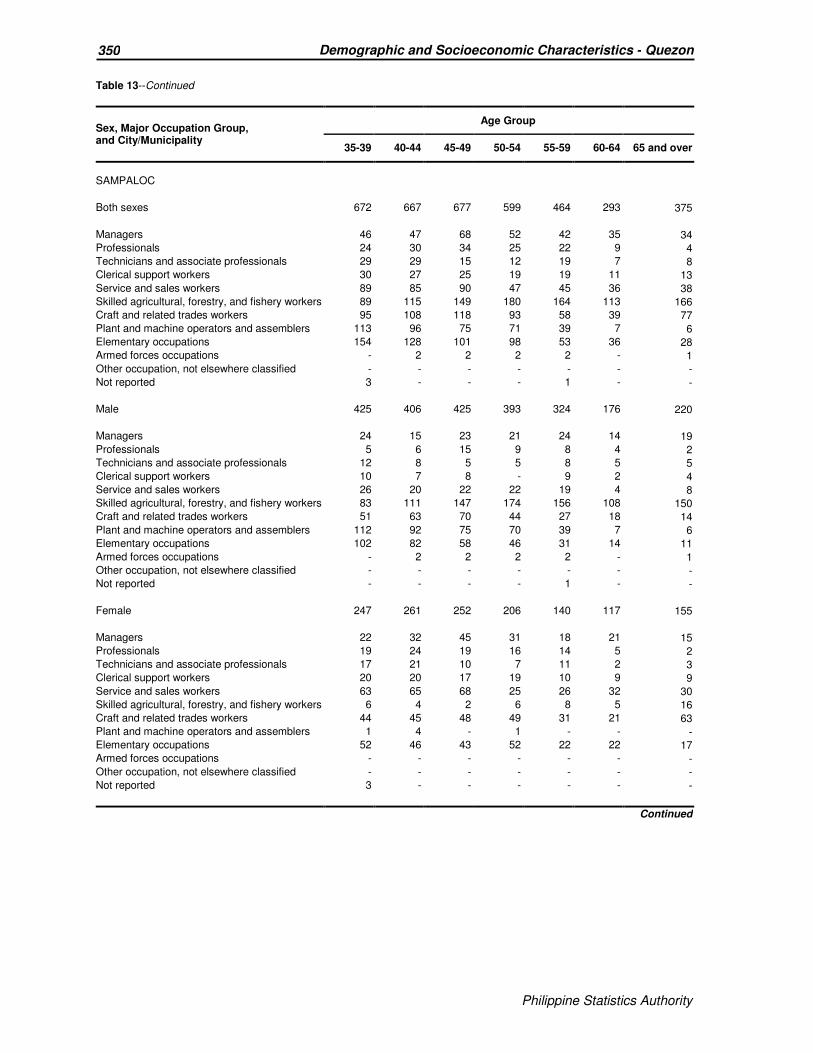
Philippine Statistics Authority
350 Demographic and Socioeconomic Characteristics - Quezon
Philippine Statistics Authority
Table 13--Continued
Sex, Major Occupation Group, and City/Municipality
Age Group
35-39 40-44 45-49 50-54 55-59 60-64 65 and over
SAMPALOC
Both sexes 672 667 677 599 464 293 375
Managers 46 47 68 52 42 35 34
Professionals 24 30 34 25 22 9 4
Technicians and associate professionals 29 29 15 12 19 7 8
Clerical support workers 30 27 25 19 19 11 13
Service and sales workers 89 85 90 47 45 36 38
Skilled agricultural, forestry, and fishery workers 89 115 149 180 164 113 166
Craft and related trades workers 95 108 118 93 58 39 77
Plant and machine operators and assemblers 113 96 75 71 39 7 6
Elementary occupations 154 128 101 98 53 36 28
Armed forces occupations - 2 2 2 2 - 1
Other occupation, not elsewhere classified - - - - - - -
Not reported 3 - - - 1 - -
Male 425 406 425 393 324 176 220
Managers 24 15 23 21 24 14 19
Professionals 5 6 15 9 8 4 2
Technicians and associate professionals 12 8 5 5 8 5 5
Clerical support workers 10 7 8 - 9 2 4
Service and sales workers 26 20 22 22 19 4 8
Skilled agricultural, forestry, and fishery workers 83 111 147 174 156 108 150
Craft and related trades workers 51 63 70 44 27 18 14
Plant and machine operators and assemblers 112 92 75 70 39 7 6
Elementary occupations 102 82 58 46 31 14 11
Armed forces occupations - 2 2 2 2 - 1
Other occupation, not elsewhere classified - - - - - - -
Not reported - - - - 1 - -
Female 247 261 252 206 140 117 155
Managers 22 32 45 31 18 21 15
Professionals 19 24 19 16 14 5 2
Technicians and associate professionals 17 21 10 7 11 2 3
Clerical support workers 20 20 17 19 10 9 9
Service and sales workers 63 65 68 25 26 32 30
Skilled agricultural, forestry, and fishery workers 6 4 2 6 8 5 16
Craft and related trades workers 44 45 48 49 31 21 63
Plant and machine operators and assemblers 1 4 - 1 - - -
Elementary occupations 52 46 43 52 22 22 17
Armed forces occupations - - - - - - -
Other occupation, not elsewhere classified - - - - - - -
Not reported 3 - - - - - -
Continued
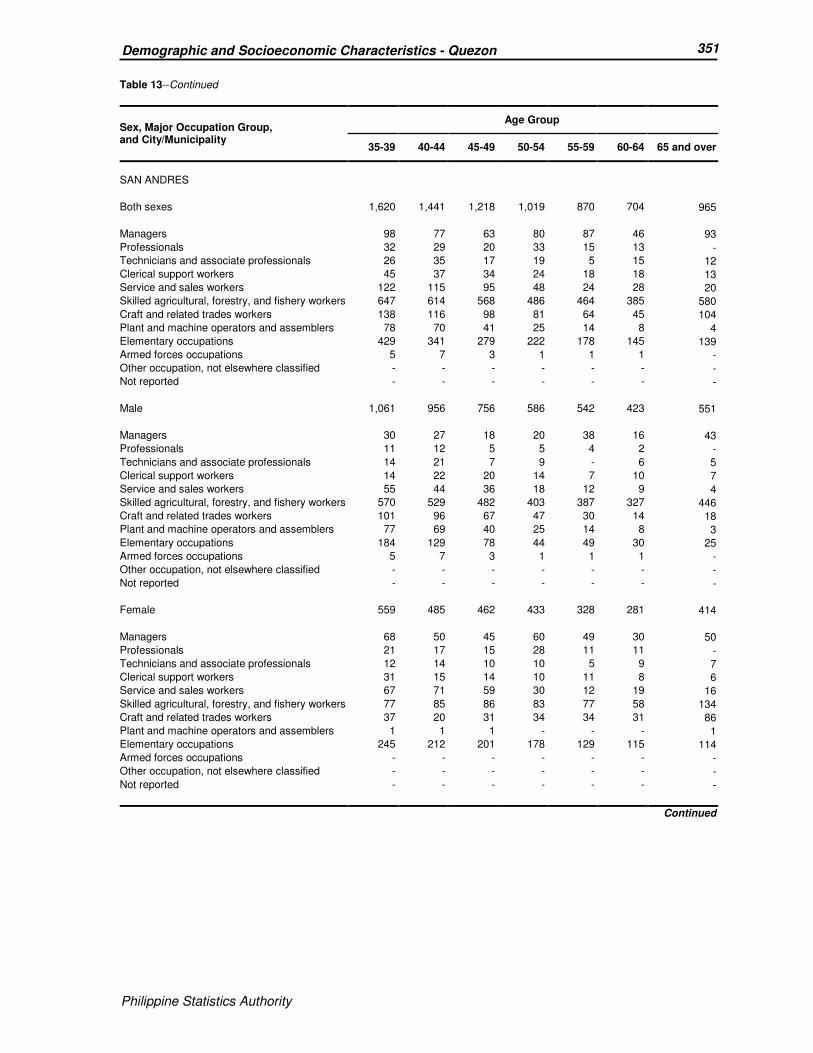
Philippine Statistics Authority
351 Demographic and Socioeconomic Characteristics - Quezon
Philippine Statistics Authority
Table 13--Continued
Sex, Major Occupation Group, and City/Municipality
Age Group
35-39 40-44 45-49 50-54 55-59 60-64 65 and over
SAN ANDRES
Both sexes 1,620 1,441 1,218 1,019 870 704 965
Managers 98 77 63 80 87 46 93
Professionals 32 29 20 33 15 13 -
Technicians and associate professionals 26 35 17 19 5 15 12
Clerical support workers 45 37 34 24 18 18 13
Service and sales workers 122 115 95 48 24 28 20
Skilled agricultural, forestry, and fishery workers 647 614 568 486 464 385 580
Craft and related trades workers 138 116 98 81 64 45 104
Plant and machine operators and assemblers 78 70 41 25 14 8 4
Elementary occupations 429 341 279 222 178 145 139
Armed forces occupations 5 7 3 1 1 1 -
Other occupation, not elsewhere classified - - - - - - -
Not reported - - - - - - -
Male 1,061 956 756 586 542 423 551
Managers 30 27 18 20 38 16 43
Professionals 11 12 5 5 4 2 -
Technicians and associate professionals 14 21 7 9 - 6 5
Clerical support workers 14 22 20 14 7 10 7
Service and sales workers 55 44 36 18 12 9 4
Skilled agricultural, forestry, and fishery workers 570 529 482 403 387 327 446
Craft and related trades workers 101 96 67 47 30 14 18
Plant and machine operators and assemblers 77 69 40 25 14 8 3
Elementary occupations 184 129 78 44 49 30 25
Armed forces occupations 5 7 3 1 1 1 -
Other occupation, not elsewhere classified - - - - - - -
Not reported - - - - - - -
Female 559 485 462 433 328 281 414
Managers 68 50 45 60 49 30 50
Professionals 21 17 15 28 11 11 -
Technicians and associate professionals 12 14 10 10 5 9 7
Clerical support workers 31 15 14 10 11 8 6
Service and sales workers 67 71 59 30 12 19 16
Skilled agricultural, forestry, and fishery workers 77 85 86 83 77 58 134
Craft and related trades workers 37 20 31 34 34 31 86
Plant and machine operators and assemblers 1 1 1 - - - 1
Elementary occupations 245 212 201 178 129 115 114
Armed forces occupations - - - - - - -
Other occupation, not elsewhere classified - - - - - - -
Not reported - - - - - - -
Continued
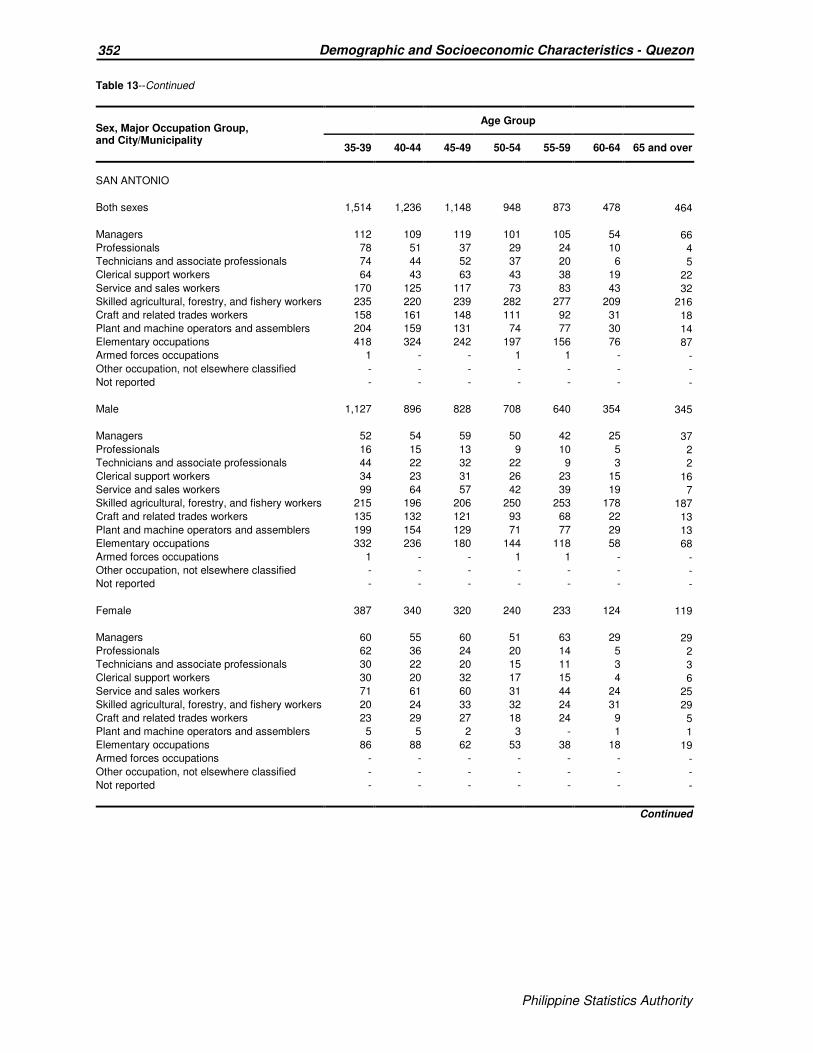
Philippine Statistics Authority
352 Demographic and Socioeconomic Characteristics - Quezon
Philippine Statistics Authority
Table 13--Continued
Sex, Major Occupation Group, and City/Municipality
Age Group
35-39 40-44 45-49 50-54 55-59 60-64 65 and over
SAN ANTONIO
Both sexes 1,514 1,236 1,148 948 873 478 464
Managers 112 109 119 101 105 54 66
Professionals 78 51 37 29 24 10 4
Technicians and associate professionals 74 44 52 37 20 6 5
Clerical support workers 64 43 63 43 38 19 22
Service and sales workers 170 125 117 73 83 43 32
Skilled agricultural, forestry, and fishery workers 235 220 239 282 277 209 216
Craft and related trades workers 158 161 148 111 92 31 18
Plant and machine operators and assemblers 204 159 131 74 77 30 14
Elementary occupations 418 324 242 197 156 76 87
Armed forces occupations 1 - - 1 1 - -
Other occupation, not elsewhere classified - - - - - - -
Not reported - - - - - - -
Male 1,127 896 828 708 640 354 345
Managers 52 54 59 50 42 25 37
Professionals 16 15 13 9 10 5 2
Technicians and associate professionals 44 22 32 22 9 3 2
Clerical support workers 34 23 31 26 23 15 16
Service and sales workers 99 64 57 42 39 19 7
Skilled agricultural, forestry, and fishery workers 215 196 206 250 253 178 187
Craft and related trades workers 135 132 121 93 68 22 13
Plant and machine operators and assemblers 199 154 129 71 77 29 13
Elementary occupations 332 236 180 144 118 58 68
Armed forces occupations 1 - - 1 1 - -
Other occupation, not elsewhere classified - - - - - - -
Not reported - - - - - - -
Female 387 340 320 240 233 124 119
Managers 60 55 60 51 63 29 29
Professionals 62 36 24 20 14 5 2
Technicians and associate professionals 30 22 20 15 11 3 3
Clerical support workers 30 20 32 17 15 4 6
Service and sales workers 71 61 60 31 44 24 25
Skilled agricultural, forestry, and fishery workers 20 24 33 32 24 31 29
Craft and related trades workers 23 29 27 18 24 9 5
Plant and machine operators and assemblers 5 5 2 3 - 1 1
Elementary occupations 86 88 62 53 38 18 19
Armed forces occupations - - - - - - -
Other occupation, not elsewhere classified - - - - - - -
Not reported - - - - - - -
Continued

Philippine Statistics Authority
353 Demographic and Socioeconomic Characteristics - Quezon
Philippine Statistics Authority
Table 13--Continued
Sex, Major Occupation Group, and City/Municipality
Age Group
35-39 40-44 45-49 50-54 55-59 60-64 65 and over
SAN FRANCISCO (AURORA)
Both sexes 2,173 1,961 1,799 1,421 1,247 889 1,335
Managers 135 105 99 87 79 67 104
Professionals 72 41 47 36 28 9 3
Technicians and associate professionals 43 39 25 28 16 12 11
Clerical support workers 43 26 31 28 36 11 14
Service and sales workers 142 119 105 71 54 32 55
Skilled agricultural, forestry, and fishery workers 1,164 1,148 1,105 940 847 638 965
Craft and related trades workers 123 138 129 69 78 41 86
Plant and machine operators and assemblers 101 85 61 47 14 11 6
Elementary occupations 336 254 195 113 94 68 90
Armed forces occupations 12 6 2 2 1 - -
Other occupation, not elsewhere classified - - - - - - -
Not reported 2 - - - - - 1
Male 1,779 1,592 1,453 1,128 986 700 931
Managers 48 26 41 42 37 25 28
Professionals 23 7 16 7 3 4 2
Technicians and associate professionals 18 8 11 12 8 7 5
Clerical support workers 25 14 18 16 27 7 3
Service and sales workers 62 53 30 18 18 11 15
Skilled agricultural, forestry, and fishery workers 1,143 1,111 1,041 879 781 572 810
Craft and related trades workers 102 109 103 43 51 20 27
Plant and machine operators and assemblers 100 84 61 46 13 11 6
Elementary occupations 246 174 130 63 47 43 35
Armed forces occupations 12 6 2 2 1 - -
Other occupation, not elsewhere classified - - - - - - -
Not reported - - - - - - -
Female 394 369 346 293 261 189 404
Managers 87 79 58 45 42 42 76
Professionals 49 34 31 29 25 5 1
Technicians and associate professionals 25 31 14 16 8 5 6
Clerical support workers 18 12 13 12 9 4 11
Service and sales workers 80 66 75 53 36 21 40
Skilled agricultural, forestry, and fishery workers 21 37 64 61 66 66 155
Craft and related trades workers 21 29 26 26 27 21 59
Plant and machine operators and assemblers 1 1 - 1 1 - -
Elementary occupations 90 80 65 50 47 25 55
Armed forces occupations - - - - - - -
Other occupation, not elsewhere classified - - - - - - -
Not reported 2 - - - - - 1
Continued

Philippine Statistics Authority
354 Demographic and Socioeconomic Characteristics - Quezon
Philippine Statistics Authority
Table 13--Continued
Sex, Major Occupation Group, and City/Municipality
Age Group
35-39 40-44 45-49 50-54 55-59 60-64 65 and over
SAN NARCISO
Both sexes 2,068 1,932 1,713 1,400 1,207 859 1,123
Managers 233 231 243 230 190 157 267
Professionals 46 26 39 47 40 13 4
Technicians and associate professionals 37 28 37 32 11 12 11
Clerical support workers 34 45 47 37 27 25 25
Service and sales workers 151 157 120 89 78 46 43
Skilled agricultural, forestry, and fishery workers 821 813 771 618 630 447 560
Craft and related trades workers 131 123 109 79 59 42 78
Plant and machine operators and assemblers 138 110 68 44 29 16 7
Elementary occupations 468 396 278 218 140 100 128
Armed forces occupations 8 3 - 5 3 1 -
Other occupation, not elsewhere classified - - - - - - -
Not reported 1 - 1 1 - - -
Male 1,497 1,367 1,200 934 809 582 669
Managers 140 132 152 145 113 89 137
Professionals 4 5 10 15 6 2 1
Technicians and associate professionals 20 15 14 11 4 6 3
Clerical support workers 17 24 20 19 11 11 9
Service and sales workers 67 65 44 21 30 18 12
Skilled agricultural, forestry, and fishery workers 679 650 643 500 504 362 408
Craft and related trades workers 94 100 82 52 42 26 28
Plant and machine operators and assemblers 137 109 68 43 29 15 4
Elementary occupations 331 264 167 122 67 52 67
Armed forces occupations 8 3 - 5 3 1 -
Other occupation, not elsewhere classified - - - - - - -
Not reported - - - 1 - - -
Female 571 565 513 466 398 277 454
Managers 93 99 91 85 77 68 130
Professionals 42 21 29 32 34 11 3
Technicians and associate professionals 17 13 23 21 7 6 8
Clerical support workers 17 21 27 18 16 14 16
Service and sales workers 84 92 76 68 48 28 31
Skilled agricultural, forestry, and fishery workers 142 163 128 118 126 85 152
Craft and related trades workers 37 23 27 27 17 16 50
Plant and machine operators and assemblers 1 1 - 1 - 1 3
Elementary occupations 137 132 111 96 73 48 61
Armed forces occupations - - - - - - -
Other occupation, not elsewhere classified - - - - - - -
Not reported 1 - 1 - - - -
Continued

Philippine Statistics Authority
355 Demographic and Socioeconomic Characteristics - Quezon
Philippine Statistics Authority
Table 13--Continued
Sex, Major Occupation Group, and City/Municipality
Age Group
35-39 40-44 45-49 50-54 55-59 60-64 65 and over
SARIAYA
Both sexes 7,602 6,888 6,235 5,171 3,933 2,652 2,769
Managers 492 583 556 544 453 329 432
Professionals 287 269 206 154 98 38 24
Technicians and associate professionals 337 295 276 193 134 77 54
Clerical support workers 360 326 291 268 212 133 145
Service and sales workers 1,132 959 882 634 442 306 267
Skilled agricultural, forestry, and fishery workers 1,312 1,356 1,423 1,373 1,279 962 1,203
Craft and related trades workers 696 707 608 541 367 220 198
Plant and machine operators and assemblers 1,191 948 819 564 341 177 79
Elementary occupations 1,789 1,439 1,168 897 607 409 366
Armed forces occupations 5 4 6 2 - 1 -
Other occupation, not elsewhere classified - - - - - - -
Not reported 1 2 - 1 - - 1
Male 5,143 4,539 4,136 3,479 2,610 1,696 1,641
Managers 171 208 219 199 164 109 133
Professionals 103 91 61 62 40 15 10
Technicians and associate professionals 189 182 164 111 76 40 30
Clerical support workers 163 158 135 167 119 70 92
Service and sales workers 576 423 378 279 158 117 84
Skilled agricultural, forestry, and fishery workers 1,148 1,201 1,253 1,213 1,128 824 955
Craft and related trades workers 607 610 532 440 289 159 108
Plant and machine operators and assemblers 1,165 930 810 553 335 175 74
Elementary occupations 1,015 731 578 453 301 186 155
Armed forces occupations 5 4 6 2 - 1 -
Other occupation, not elsewhere classified - - - - - - -
Not reported 1 1 - - - - -
Female 2,459 2,349 2,099 1,692 1,323 956 1,128
Managers 321 375 337 345 289 220 299
Professionals 184 178 145 92 58 23 14
Technicians and associate professionals 148 113 112 82 58 37 24
Clerical support workers 197 168 156 101 93 63 53
Service and sales workers 556 536 504 355 284 189 183
Skilled agricultural, forestry, and fishery workers 164 155 170 160 151 138 248
Craft and related trades workers 89 97 76 101 78 61 90
Plant and machine operators and assemblers 26 18 9 11 6 2 5
Elementary occupations 774 708 590 444 306 223 211
Armed forces occupations - - - - - - -
Other occupation, not elsewhere classified - - - - - - -
Not reported - 1 - 1 - - 1
Continued
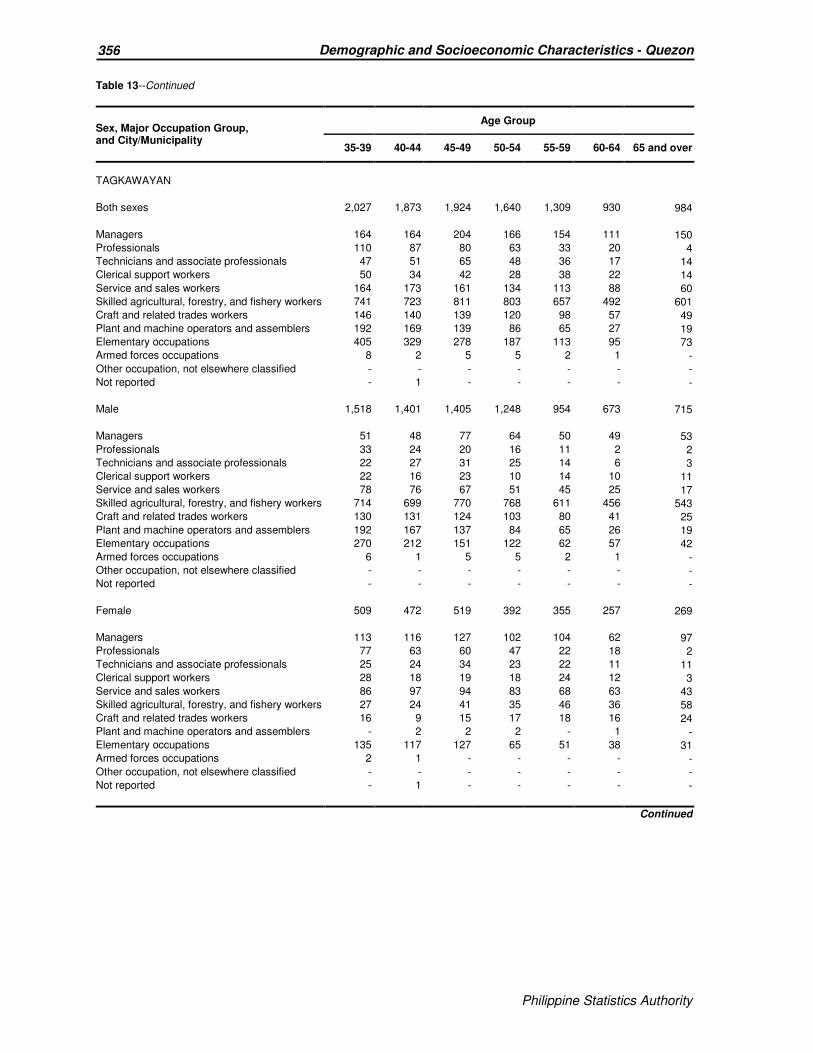
Philippine Statistics Authority
356 Demographic and Socioeconomic Characteristics - Quezon
Philippine Statistics Authority
Table 13--Continued
Sex, Major Occupation Group, and City/Municipality
Age Group
35-39 40-44 45-49 50-54 55-59 60-64 65 and over
TAGKAWAYAN
Both sexes 2,027 1,873 1,924 1,640 1,309 930 984
Managers 164 164 204 166 154 111 150
Professionals 110 87 80 63 33 20 4
Technicians and associate professionals 47 51 65 48 36 17 14
Clerical support workers 50 34 42 28 38 22 14
Service and sales workers 164 173 161 134 113 88 60
Skilled agricultural, forestry, and fishery workers 741 723 811 803 657 492 601
Craft and related trades workers 146 140 139 120 98 57 49
Plant and machine operators and assemblers 192 169 139 86 65 27 19
Elementary occupations 405 329 278 187 113 95 73
Armed forces occupations 8 2 5 5 2 1 -
Other occupation, not elsewhere classified - - - - - - -
Not reported - 1 - - - - -
Male 1,518 1,401 1,405 1,248 954 673 715
Managers 51 48 77 64 50 49 53
Professionals 33 24 20 16 11 2 2
Technicians and associate professionals 22 27 31 25 14 6 3
Clerical support workers 22 16 23 10 14 10 11
Service and sales workers 78 76 67 51 45 25 17
Skilled agricultural, forestry, and fishery workers 714 699 770 768 611 456 543
Craft and related trades workers 130 131 124 103 80 41 25
Plant and machine operators and assemblers 192 167 137 84 65 26 19
Elementary occupations 270 212 151 122 62 57 42
Armed forces occupations 6 1 5 5 2 1 -
Other occupation, not elsewhere classified - - - - - - -
Not reported - - - - - - -
Female 509 472 519 392 355 257 269
Managers 113 116 127 102 104 62 97
Professionals 77 63 60 47 22 18 2
Technicians and associate professionals 25 24 34 23 22 11 11
Clerical support workers 28 18 19 18 24 12 3
Service and sales workers 86 97 94 83 68 63 43
Skilled agricultural, forestry, and fishery workers 27 24 41 35 46 36 58
Craft and related trades workers 16 9 15 17 18 16 24
Plant and machine operators and assemblers - 2 2 2 - 1 -
Elementary occupations 135 117 127 65 51 38 31
Armed forces occupations 2 1 - - - - -
Other occupation, not elsewhere classified - - - - - - -
Not reported - 1 - - - - -
Continued

Philippine Statistics Authority
357 Demographic and Socioeconomic Characteristics - Quezon
Philippine Statistics Authority
Table 13--Continued
Sex, Major Occupation Group, and City/Municipality
Age Group
35-39 40-44 45-49 50-54 55-59 60-64 65 and over
CITY OF TAYABAS
Both sexes 4,909 4,405 4,349 3,767 2,871 1,829 1,772
Managers 366 379 399 443 321 247 241
Professionals 405 329 277 224 129 55 38
Technicians and associate professionals 393 312 288 224 147 79 45
Clerical support workers 341 214 233 179 146 60 58
Service and sales workers 840 768 761 577 390 248 196
Skilled agricultural, forestry, and fishery workers 485 473 645 656 679 540 752
Craft and related trades workers 470 527 510 471 391 222 206
Plant and machine operators and assemblers 731 648 509 393 271 136 57
Elementary occupations 862 741 713 585 393 241 177
Armed forces occupations 10 10 14 14 2 - 1
Other occupation, not elsewhere classified - - - - - - -
Not reported 6 4 - 1 2 1 1
Male 3,257 2,844 2,865 2,461 1,914 1,205 1,174
Managers 134 142 167 192 130 89 87
Professionals 151 127 122 99 62 27 20
Technicians and associate professionals 237 169 165 121 76 29 26
Clerical support workers 147 93 121 82 70 37 29
Service and sales workers 480 390 379 279 178 100 66
Skilled agricultural, forestry, and fishery workers 469 450 620 620 640 503 696
Craft and related trades workers 385 381 360 325 246 135 99
Plant and machine operators and assemblers 713 639 503 385 268 136 53
Elementary occupations 528 442 414 345 240 148 96
Armed forces occupations 10 10 14 13 2 - 1
Other occupation, not elsewhere classified - - - - - - -
Not reported 3 1 - - 2 1 1
Female 1,652 1,561 1,484 1,306 957 624 598
Managers 232 237 232 251 191 158 154
Professionals 254 202 155 125 67 28 18
Technicians and associate professionals 156 143 123 103 71 50 19
Clerical support workers 194 121 112 97 76 23 29
Service and sales workers 360 378 382 298 212 148 130
Skilled agricultural, forestry, and fishery workers 16 23 25 36 39 37 56
Craft and related trades workers 85 146 150 146 145 87 107
Plant and machine operators and assemblers 18 9 6 8 3 - 4
Elementary occupations 334 299 299 240 153 93 81
Armed forces occupations - - - 1 - - -
Other occupation, not elsewhere classified - - - - - - -
Not reported 3 3 - 1 - - -
Continued

Philippine Statistics Authority
358 Demographic and Socioeconomic Characteristics - Quezon
Philippine Statistics Authority
Table 13--Continued
Sex, Major Occupation Group, and City/Municipality
Age Group
35-39 40-44 45-49 50-54 55-59 60-64 65 and over
TIAONG
Both sexes 4,949 4,246 3,954 3,024 2,509 1,575 1,409
Managers 407 384 417 383 336 231 244
Professionals 273 178 168 109 46 29 20
Technicians and associate professionals 293 237 186 106 115 52 30
Clerical support workers 310 219 227 186 134 90 82
Service and sales workers 710 603 511 422 336 172 152
Skilled agricultural, forestry, and fishery workers 548 567 597 503 505 427 463
Craft and related trades workers 472 484 448 313 258 144 88
Plant and machine operators and assemblers 617 476 426 299 202 107 53
Elementary occupations 1,311 1,090 968 703 575 323 276
Armed forces occupations 5 6 5 - 2 - 1
Other occupation, not elsewhere classified - - - - - - -
Not reported 3 2 1 - - - -
Male 3,379 2,872 2,694 2,052 1,663 1,045 885
Managers 195 178 198 183 139 96 99
Professionals 99 54 53 45 19 10 10
Technicians and associate professionals 169 146 114 57 65 27 18
Clerical support workers 161 126 126 108 82 46 52
Service and sales workers 385 292 248 203 145 73 52
Skilled agricultural, forestry, and fishery workers 499 511 536 448 446 373 392
Craft and related trades workers 407 417 381 274 206 106 42
Plant and machine operators and assemblers 602 468 422 292 199 107 53
Elementary occupations 855 674 611 442 361 207 166
Armed forces occupations 5 6 5 - 1 - 1
Other occupation, not elsewhere classified - - - - - - -
Not reported 2 - - - - - -
Female 1,570 1,374 1,260 972 846 530 524
Managers 212 206 219 200 197 135 145
Professionals 174 124 115 64 27 19 10
Technicians and associate professionals 124 91 72 49 50 25 12
Clerical support workers 149 93 101 78 52 44 30
Service and sales workers 325 311 263 219 191 99 100
Skilled agricultural, forestry, and fishery workers 49 56 61 55 59 54 71
Craft and related trades workers 65 67 67 39 52 38 46
Plant and machine operators and assemblers 15 8 4 7 3 - -
Elementary occupations 456 416 357 261 214 116 110
Armed forces occupations - - - - 1 - -
Other occupation, not elsewhere classified - - - - - - -
Not reported 1 2 1 - - - -
Continued
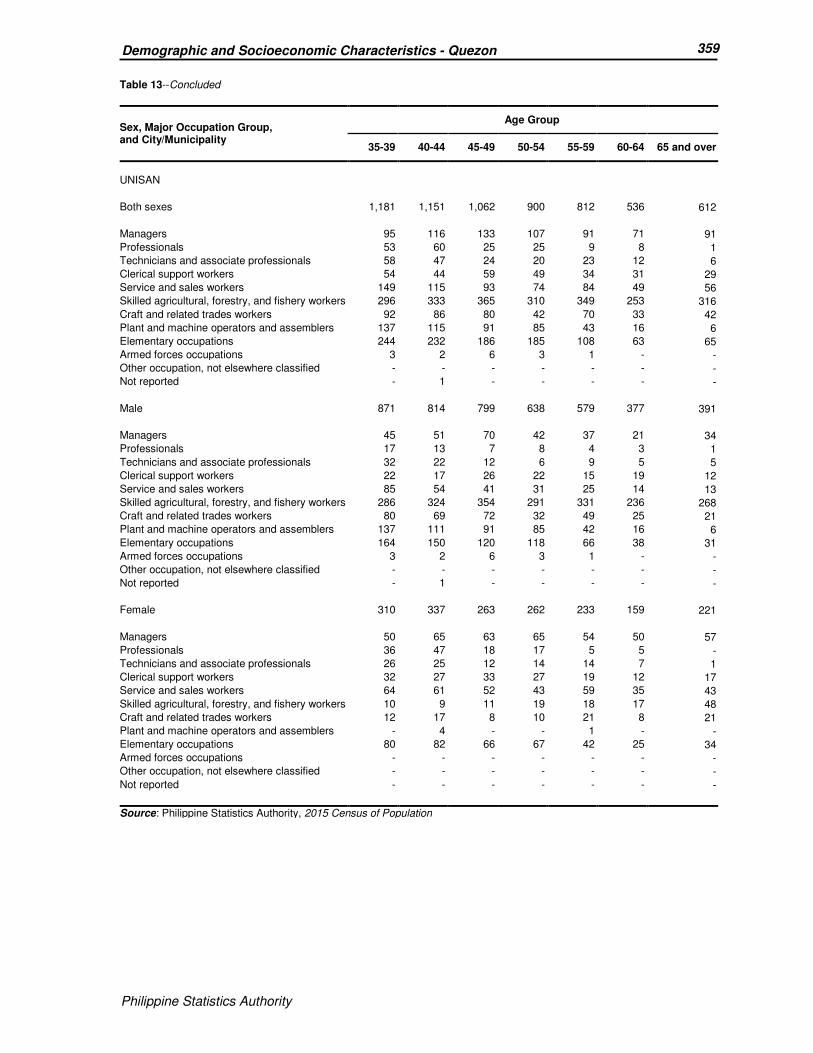
Philippine Statistics Authority
359 Demographic and Socioeconomic Characteristics - Quezon
Philippine Statistics Authority
Table 13--Concluded
Sex, Major Occupation Group, and City/Municipality
Age Group
35-39 40-44 45-49 50-54 55-59 60-64 65 and over
UNISAN
Both sexes 1,181 1,151 1,062 900 812 536 612
Managers 95 116 133 107 91 71 91
Professionals 53 60 25 25 9 8 1
Technicians and associate professionals 58 47 24 20 23 12 6
Clerical support workers 54 44 59 49 34 31 29
Service and sales workers 149 115 93 74 84 49 56
Skilled agricultural, forestry, and fishery workers 296 333 365 310 349 253 316
Craft and related trades workers 92 86 80 42 70 33 42
Plant and machine operators and assemblers 137 115 91 85 43 16 6
Elementary occupations 244 232 186 185 108 63 65
Armed forces occupations 3 2 6 3 1 - -
Other occupation, not elsewhere classified - - - - - - -
Not reported - 1 - - - - -
Male 871 814 799 638 579 377 391
Managers 45 51 70 42 37 21 34
Professionals 17 13 7 8 4 3 1
Technicians and associate professionals 32 22 12 6 9 5 5
Clerical support workers 22 17 26 22 15 19 12
Service and sales workers 85 54 41 31 25 14 13
Skilled agricultural, forestry, and fishery workers 286 324 354 291 331 236 268
Craft and related trades workers 80 69 72 32 49 25 21
Plant and machine operators and assemblers 137 111 91 85 42 16 6
Elementary occupations 164 150 120 118 66 38 31
Armed forces occupations 3 2 6 3 1 - -
Other occupation, not elsewhere classified - - - - - - -
Not reported - 1 - - - - -
Female 310 337 263 262 233 159 221
Managers 50 65 63 65 54 50 57
Professionals 36 47 18 17 5 5 -
Technicians and associate professionals 26 25 12 14 14 7 1
Clerical support workers 32 27 33 27 19 12 17
Service and sales workers 64 61 52 43 59 35 43
Skilled agricultural, forestry, and fishery workers 10 9 11 19 18 17 48
Craft and related trades workers 12 17 8 10 21 8 21
Plant and machine operators and assemblers - 4 - - 1 - -
Elementary occupations 80 82 66 67 42 25 34
Armed forces occupations - - - - - - -
Other occupation, not elsewhere classified - - - - - - -
Not reported - - - - - - -
Source: Philippine Statistics Authority, 2015 Census of Population
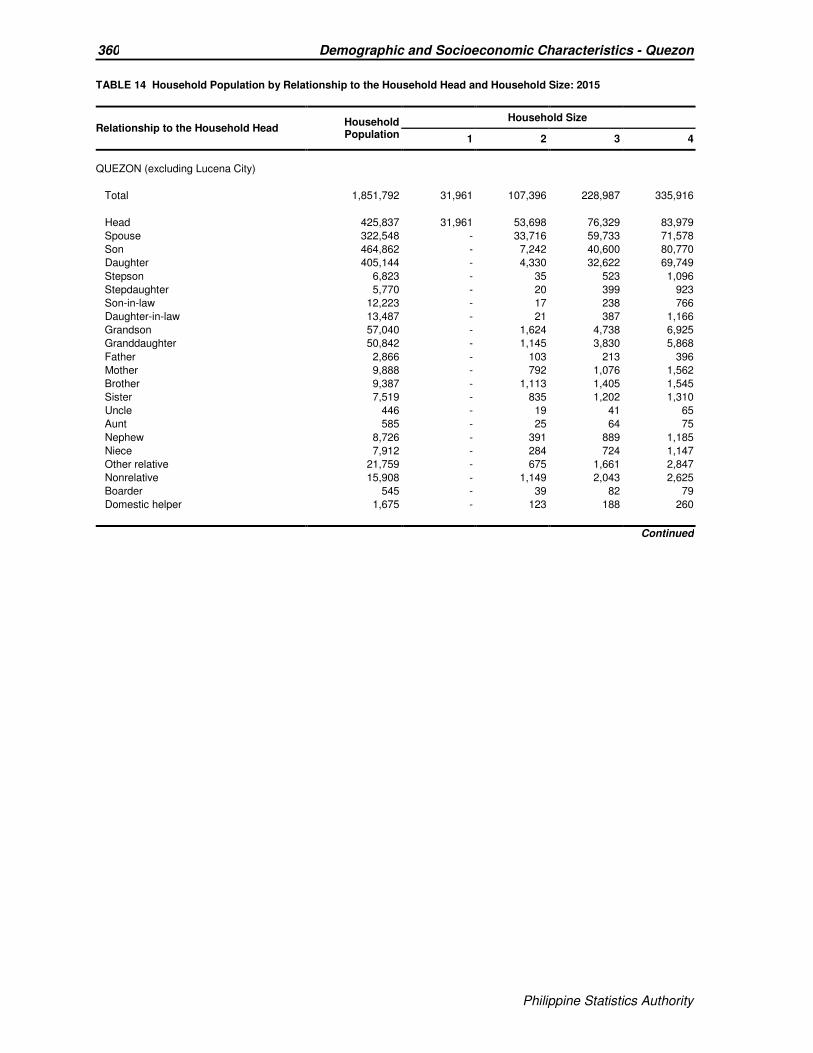
Philippine Statistics Authority
360 Demographic and Socioeconomic Characteristics - Quezon
Philippine Statistics Authority
TABLE 14 Household Population by Relationship to the Household Head and Household Size: 2015
Relationship to the Household Head Household Population
Household Size
1 2 3 4
QUEZON (excluding Lucena City)
Total 1,851,792 31,961 107,396 228,987 335,916
Head 425,837 31,961 53,698 76,329 83,979
Spouse 322,548 - 33,716 59,733 71,578
Son 464,862 - 7,242 40,600 80,770
Daughter 405,144 - 4,330 32,622 69,749
Stepson 6,823 - 35 523 1,096
Stepdaughter 5,770 - 20 399 923
Son-in-law 12,223 - 17 238 766
Daughter-in-law 13,487 - 21 387 1,166
Grandson 57,040 - 1,624 4,738 6,925
Granddaughter 50,842 - 1,145 3,830 5,868
Father 2,866 - 103 213 396
Mother 9,888 - 792 1,076 1,562
Brother 9,387 - 1,113 1,405 1,545
Sister 7,519 - 835 1,202 1,310
Uncle 446 - 19 41 65
Aunt 585 - 25 64 75
Nephew 8,726 - 391 889 1,185
Niece 7,912 - 284 724 1,147
Other relative 21,759 - 675 1,661 2,847
Nonrelative 15,908 - 1,149 2,043 2,625
Boarder 545 - 39 82 79
Domestic helper 1,675 - 123 188 260
Continued
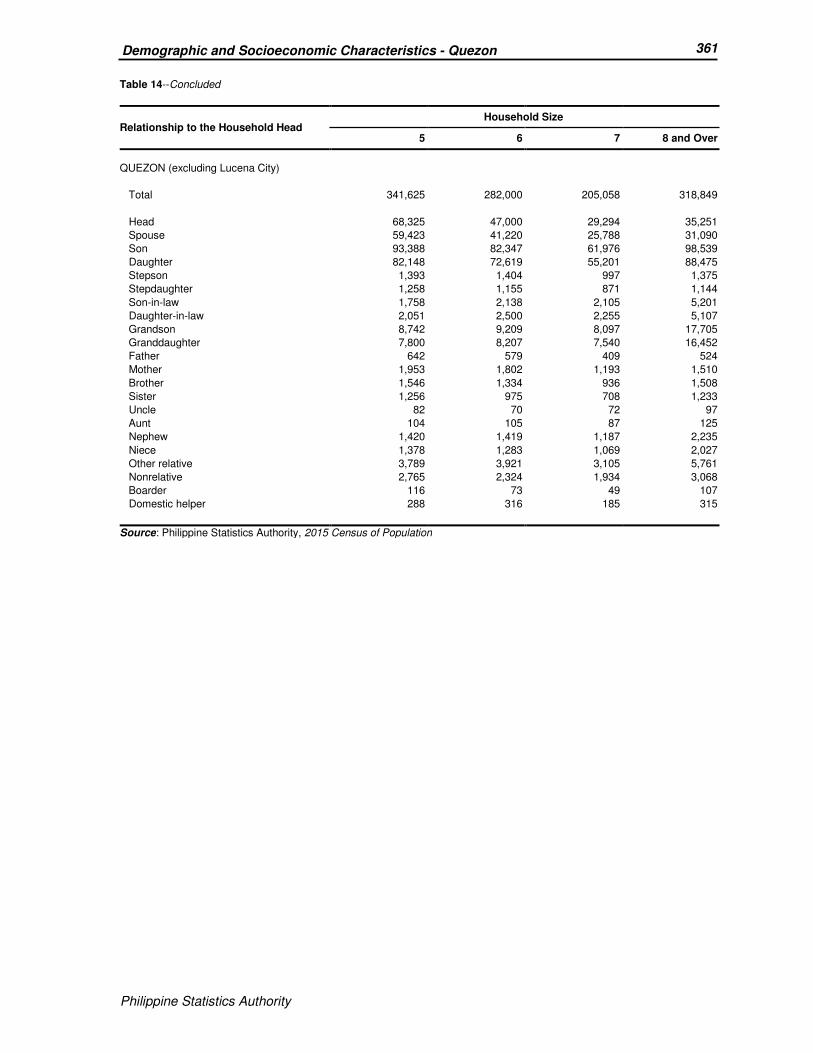
Philippine Statistics Authority
361 Demographic and Socioeconomic Characteristics - Quezon
Philippine Statistics Authority
Table 14--Concluded
Relationship to the Household Head Household Size
5 6 7 8 and Over
QUEZON (excluding Lucena City)
Total 341,625 282,000 205,058 318,849
Head 68,325 47,000 29,294 35,251
Spouse 59,423 41,220 25,788 31,090
Son 93,388 82,347 61,976 98,539
Daughter 82,148 72,619 55,201 88,475
Stepson 1,393 1,404 997 1,375
Stepdaughter 1,258 1,155 871 1,144
Son-in-law 1,758 2,138 2,105 5,201
Daughter-in-law 2,051 2,500 2,255 5,107
Grandson 8,742 9,209 8,097 17,705
Granddaughter 7,800 8,207 7,540 16,452
Father 642 579 409 524
Mother 1,953 1,802 1,193 1,510
Brother 1,546 1,334 936 1,508
Sister 1,256 975 708 1,233
Uncle 82 70 72 97
Aunt 104 105 87 125
Nephew 1,420 1,419 1,187 2,235
Niece 1,378 1,283 1,069 2,027
Other relative 3,789 3,921 3,105 5,761
Nonrelative 2,765 2,324 1,934 3,068
Boarder 116 73 49 107
Domestic helper 288 316 185 315
Source: Philippine Statistics Authority, 2015 Census of Population
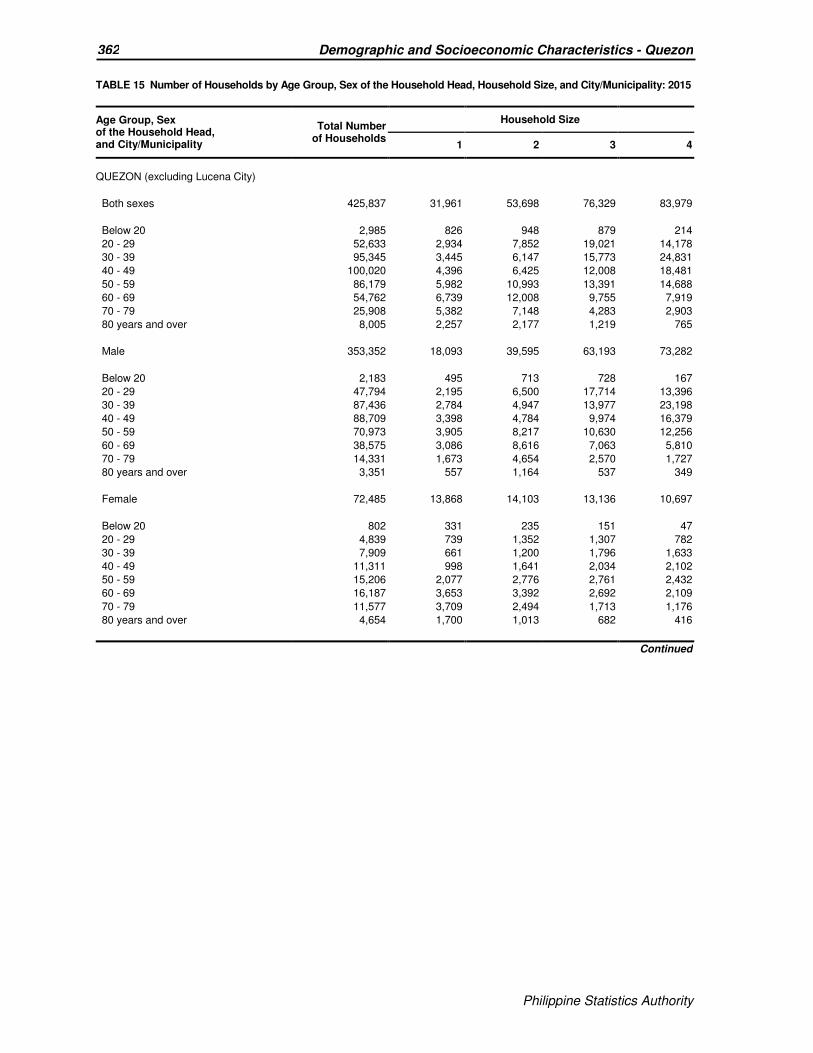
Philippine Statistics Authority
362 Demographic and Socioeconomic Characteristics - Quezon
Philippine Statistics Authority
TABLE 15 Number of Households by Age Group, Sex of the Household Head, Household Size, and City/Municipality: 2015
Age Group, Sex of the Household Head, and City/Municipality
Total Number of Households
Household Size
1 2 3 4
QUEZON (excluding Lucena City)
Both sexes 425,837 31,961 53,698 76,329 83,979
Below 20 2,985 826 948 879 214
20 - 29 52,633 2,934 7,852 19,021 14,178
30 - 39 95,345 3,445 6,147 15,773 24,831
40 - 49 100,020 4,396 6,425 12,008 18,481
50 - 59 86,179 5,982 10,993 13,391 14,688
60 - 69 54,762 6,739 12,008 9,755 7,919
70 - 79 25,908 5,382 7,148 4,283 2,903
80 years and over 8,005 2,257 2,177 1,219 765
Male 353,352 18,093 39,595 63,193 73,282
Below 20 2,183 495 713 728 167
20 - 29 47,794 2,195 6,500 17,714 13,396
30 - 39 87,436 2,784 4,947 13,977 23,198
40 - 49 88,709 3,398 4,784 9,974 16,379
50 - 59 70,973 3,905 8,217 10,630 12,256
60 - 69 38,575 3,086 8,616 7,063 5,810
70 - 79 14,331 1,673 4,654 2,570 1,727
80 years and over 3,351 557 1,164 537 349
Female 72,485 13,868 14,103 13,136 10,697
Below 20 802 331 235 151 47
20 - 29 4,839 739 1,352 1,307 782
30 - 39 7,909 661 1,200 1,796 1,633
40 - 49 11,311 998 1,641 2,034 2,102
50 - 59 15,206 2,077 2,776 2,761 2,432
60 - 69 16,187 3,653 3,392 2,692 2,109
70 - 79 11,577 3,709 2,494 1,713 1,176
80 years and over 4,654 1,700 1,013 682 416
Continued

Philippine Statistics Authority
363 Demographic and Socioeconomic Characteristics - Quezon
Philippine Statistics Authority
Table 15--Continued
Age Group, Sex of the Household Head, and City/Municipality
Total Number of Households
Household Size
1 2 3 4
AGDANGAN
Both sexes 3,171 310 504 574 610
Below 20 17 4 6 3 2
20 - 29 303 22 28 107 99
30 - 39 624 34 47 105 163
40 - 49 757 41 69 93 153
50 - 59 692 67 119 112 116
60 - 69 464 65 130 93 55
70 - 79 237 59 77 45 16
80 years and over 77 18 28 16 6
Male 2,546 175 347 468 521
Below 20 15 3 5 3 2
20 - 29 267 18 24 95 88
30 - 39 565 26 32 94 154
40 - 49 663 30 52 78 135
50 - 59 563 42 87 92 95
60 - 69 320 30 92 67 37
70 - 79 125 20 43 32 8
80 years and over 28 6 12 7 2
Female 625 135 157 106 89
Below 20 2 1 1 - -
20 - 29 36 4 4 12 11
30 - 39 59 8 15 11 9
40 - 49 94 11 17 15 18
50 - 59 129 25 32 20 21
60 - 69 144 35 38 26 18
70 - 79 112 39 34 13 8
80 years and over 49 12 16 9 4
Continued
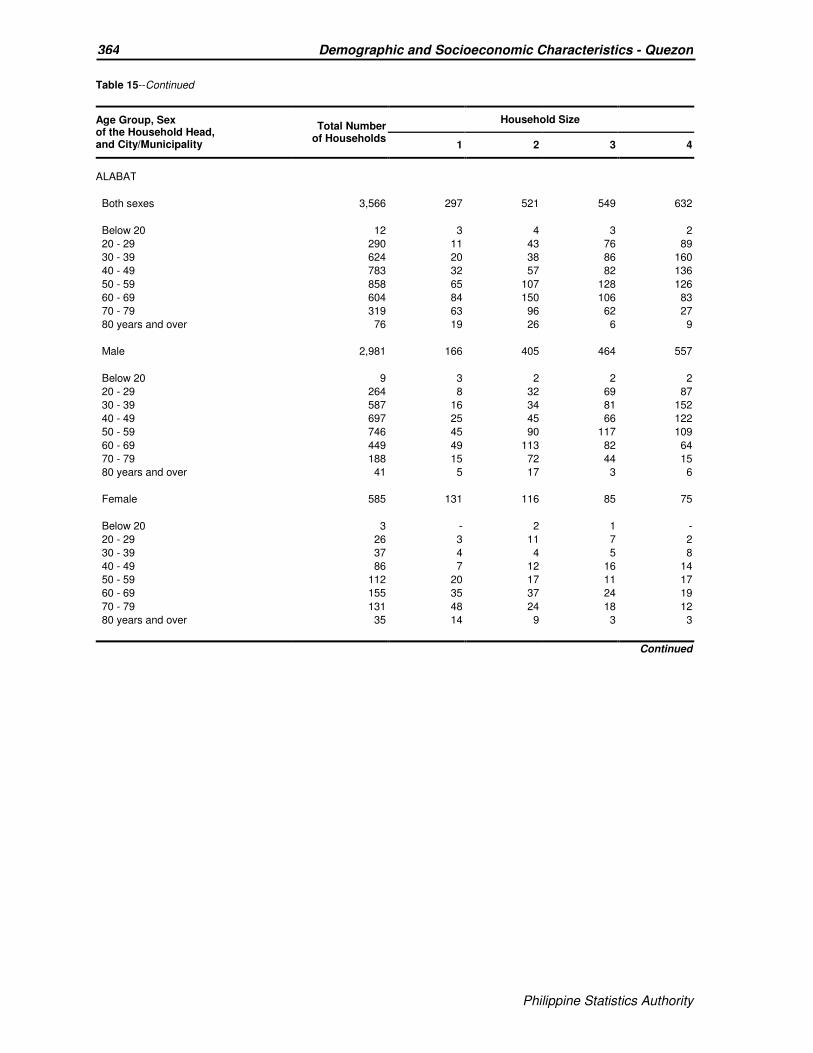
Philippine Statistics Authority
364 Demographic and Socioeconomic Characteristics - Quezon
Philippine Statistics Authority
Table 15--Continued
Age Group, Sex of the Household Head, and City/Municipality
Total Number of Households
Household Size
1 2 3 4
ALABAT
Both sexes 3,566 297 521 549 632
Below 20 12 3 4 3 2
20 - 29 290 11 43 76 89
30 - 39 624 20 38 86 160
40 - 49 783 32 57 82 136
50 - 59 858 65 107 128 126
60 - 69 604 84 150 106 83
70 - 79 319 63 96 62 27
80 years and over 76 19 26 6 9
Male 2,981 166 405 464 557
Below 20 9 3 2 2 2
20 - 29 264 8 32 69 87
30 - 39 587 16 34 81 152
40 - 49 697 25 45 66 122
50 - 59 746 45 90 117 109
60 - 69 449 49 113 82 64
70 - 79 188 15 72 44 15
80 years and over 41 5 17 3 6
Female 585 131 116 85 75
Below 20 3 - 2 1 -
20 - 29 26 3 11 7 2
30 - 39 37 4 4 5 8
40 - 49 86 7 12 16 14
50 - 59 112 20 17 11 17
60 - 69 155 35 37 24 19
70 - 79 131 48 24 18 12
80 years and over 35 14 9 3 3
Continued

Philippine Statistics Authority
365 Demographic and Socioeconomic Characteristics - Quezon
Philippine Statistics Authority
Table 15--Continued
Age Group, Sex of the Household Head, and City/Municipality
Total Number of Households
Household Size
1 2 3 4
ATIMONAN
Both sexes 15,001 1,295 1,994 2,775 2,977
Below 20 114 27 30 40 10
20 - 29 1,572 80 226 584 390
30 - 39 2,835 129 200 503 770
40 - 49 3,414 178 268 470 730
50 - 59 3,344 277 470 533 590
60 - 69 2,245 282 441 400 298
70 - 79 1,136 234 268 190 149
80 years and over 341 88 91 55 40
Male 12,187 807 1,475 2,263 2,528
Below 20 88 19 21 35 7
20 - 29 1,425 71 182 541 363
30 - 39 2,586 109 165 446 719
40 - 49 2,962 144 198 378 633
50 - 59 2,758 200 363 435 499
60 - 69 1,618 159 334 296 208
70 - 79 612 85 164 111 83
80 years and over 138 20 48 21 16
Female 2,814 488 519 512 449
Below 20 26 8 9 5 3
20 - 29 147 9 44 43 27
30 - 39 249 20 35 57 51
40 - 49 452 34 70 92 97
50 - 59 586 77 107 98 91
60 - 69 627 123 107 104 90
70 - 79 524 149 104 79 66
80 years and over 203 68 43 34 24
Continued

Philippine Statistics Authority
366 Demographic and Socioeconomic Characteristics - Quezon
Philippine Statistics Authority
Table 15--Continued
Age Group, Sex of the Household Head, and City/Municipality
Total Number of Households
Household Size
1 2 3 4
BUENAVISTA
Both sexes 6,765 500 801 1,216 1,325
Below 20 49 18 11 15 4
20 - 29 1,005 59 156 377 265
30 - 39 1,691 70 97 246 404
40 - 49 1,699 76 100 191 294
50 - 59 1,182 81 154 173 204
60 - 69 731 97 159 141 119
70 - 79 317 71 98 59 26
80 years and over 91 28 26 14 9
Male 5,836 311 616 1,035 1,182
Below 20 38 16 5 13 3
20 - 29 914 48 131 350 249
30 - 39 1,577 60 78 227 384
40 - 49 1,546 66 77 162 263
50 - 59 1,017 54 125 140 173
60 - 69 508 37 110 99 92
70 - 79 190 19 73 37 13
80 years and over 46 11 17 7 5
Female 929 189 185 181 143
Below 20 11 2 6 2 1
20 - 29 91 11 25 27 16
30 - 39 114 10 19 19 20
40 - 49 153 10 23 29 31
50 - 59 165 27 29 33 31
60 - 69 223 60 49 42 27
70 - 79 127 52 25 22 13
80 years and over 45 17 9 7 4
Continued

Philippine Statistics Authority
367 Demographic and Socioeconomic Characteristics - Quezon
Philippine Statistics Authority
Table 15--Continued
Age Group, Sex of the Household Head, and City/Municipality
Total Number of Households
Household Size
1 2 3 4
BURDEOS
Both sexes 5,652 276 590 907 1,056
Below 20 25 1 10 13 1
20 - 29 834 31 96 305 234
30 - 39 1,317 19 54 156 306
40 - 49 1,450 47 60 125 206
50 - 59 1,043 48 106 147 154
60 - 69 642 68 143 104 110
70 - 79 276 50 98 44 33
80 years and over 65 12 23 13 12
Male 5,068 165 473 802 968
Below 20 25 1 10 13 1
20 - 29 808 29 94 292 230
30 - 39 1,272 14 51 149 295
40 - 49 1,358 43 48 114 195
50 - 59 917 32 87 122 132
60 - 69 465 23 100 71 86
70 - 79 185 19 67 34 22
80 years and over 38 4 16 7 7
Female 584 111 117 105 88
Below 20 - - - - -
20 - 29 26 2 2 13 4
30 - 39 45 5 3 7 11
40 - 49 92 4 12 11 11
50 - 59 126 16 19 25 22
60 - 69 177 45 43 33 24
70 - 79 91 31 31 10 11
80 years and over 27 8 7 6 5
Continued

Philippine Statistics Authority
368 Demographic and Socioeconomic Characteristics - Quezon
Philippine Statistics Authority
Table 15--Continued
Age Group, Sex of the Household Head, and City/Municipality
Total Number of Households
Household Size
1 2 3 4
CALAUAG
Both sexes 16,881 1,387 2,096 2,966 3,245
Below 20 101 24 33 34 6
20 - 29 2,116 132 290 754 601
30 - 39 3,645 135 235 584 901
40 - 49 3,984 208 273 441 697
50 - 59 3,540 295 426 551 581
60 - 69 2,142 271 468 394 316
70 - 79 1,077 239 295 178 116
80 years and over 276 83 76 30 27
Male 14,090 802 1,566 2,488 2,856
Below 20 81 17 27 31 3
20 - 29 1,921 101 244 705 572
30 - 39 3,378 118 187 533 858
40 - 49 3,576 163 217 385 621
50 - 59 2,938 188 316 445 497
60 - 69 1,495 127 347 271 225
70 - 79 584 71 185 102 70
80 years and over 117 17 43 16 10
Female 2,791 585 530 478 389
Below 20 20 7 6 3 3
20 - 29 195 31 46 49 29
30 - 39 267 17 48 51 43
40 - 49 408 45 56 56 76
50 - 59 602 107 110 106 84
60 - 69 647 144 121 123 91
70 - 79 493 168 110 76 46
80 years and over 159 66 33 14 17
Continued
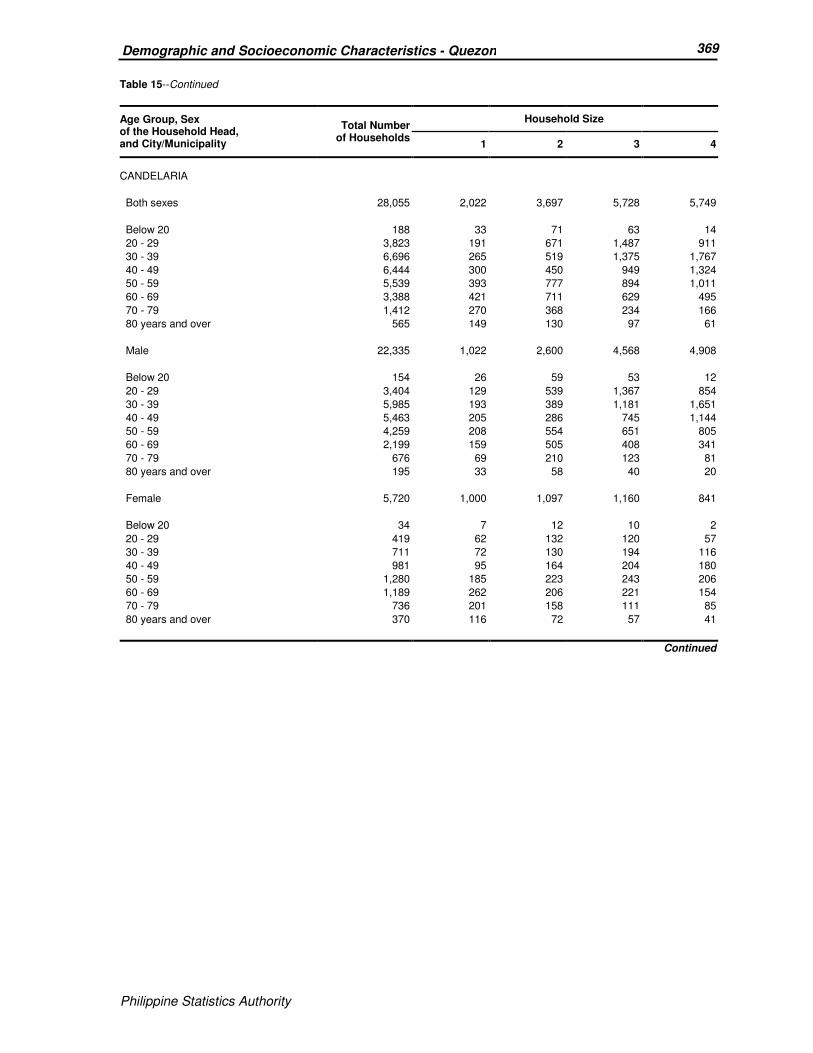
Philippine Statistics Authority
369 Demographic and Socioeconomic Characteristics - Quezon
Philippine Statistics Authority
Table 15--Continued
Age Group, Sex of the Household Head, and City/Municipality
Total Number of Households
Household Size
1 2 3 4
CANDELARIA
Both sexes 28,055 2,022 3,697 5,728 5,749
Below 20 188 33 71 63 14
20 - 29 3,823 191 671 1,487 911
30 - 39 6,696 265 519 1,375 1,767
40 - 49 6,444 300 450 949 1,324
50 - 59 5,539 393 777 894 1,011
60 - 69 3,388 421 711 629 495
70 - 79 1,412 270 368 234 166
80 years and over 565 149 130 97 61
Male 22,335 1,022 2,600 4,568 4,908
Below 20 154 26 59 53 12
20 - 29 3,404 129 539 1,367 854
30 - 39 5,985 193 389 1,181 1,651
40 - 49 5,463 205 286 745 1,144
50 - 59 4,259 208 554 651 805
60 - 69 2,199 159 505 408 341
70 - 79 676 69 210 123 81
80 years and over 195 33 58 40 20
Female 5,720 1,000 1,097 1,160 841
Below 20 34 7 12 10 2
20 - 29 419 62 132 120 57
30 - 39 711 72 130 194 116
40 - 49 981 95 164 204 180
50 - 59 1,280 185 223 243 206
60 - 69 1,189 262 206 221 154
70 - 79 736 201 158 111 85
80 years and over 370 116 72 57 41
Continued
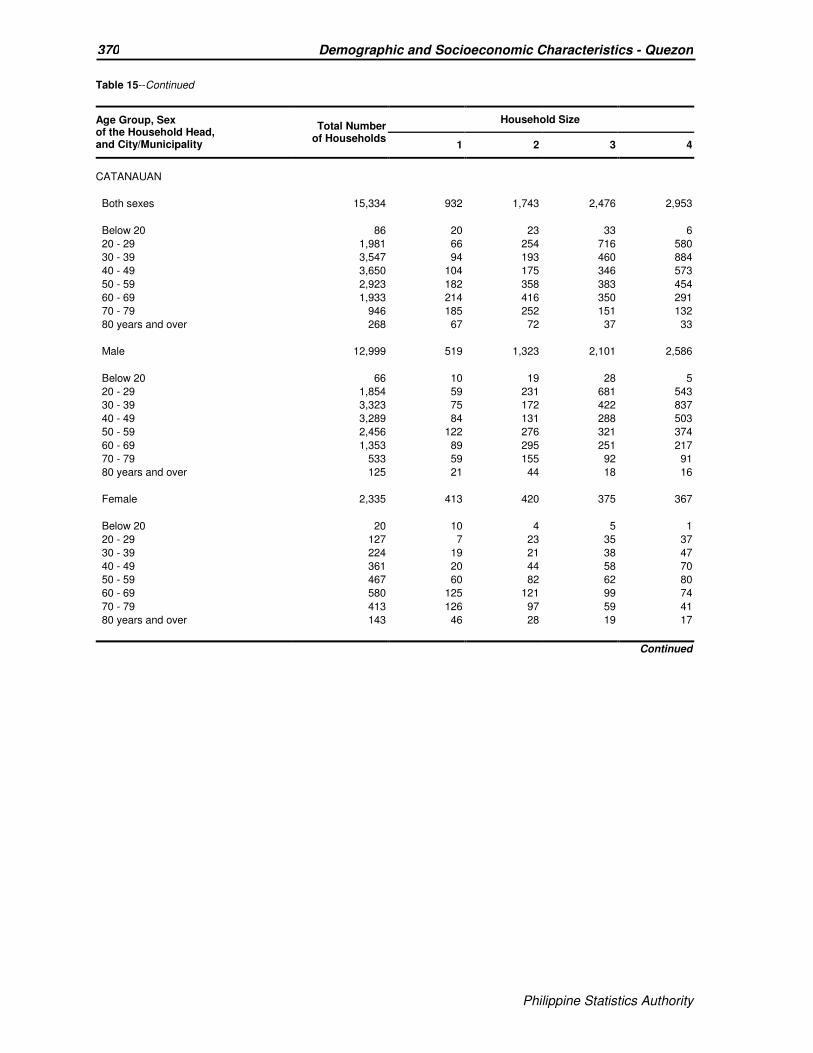
Philippine Statistics Authority
370 Demographic and Socioeconomic Characteristics - Quezon
Philippine Statistics Authority
Table 15--Continued
Age Group, Sex of the Household Head, and City/Municipality
Total Number of Households
Household Size
1 2 3 4
CATANAUAN
Both sexes 15,334 932 1,743 2,476 2,953
Below 20 86 20 23 33 6
20 - 29 1,981 66 254 716 580
30 - 39 3,547 94 193 460 884
40 - 49 3,650 104 175 346 573
50 - 59 2,923 182 358 383 454
60 - 69 1,933 214 416 350 291
70 - 79 946 185 252 151 132
80 years and over 268 67 72 37 33
Male 12,999 519 1,323 2,101 2,586
Below 20 66 10 19 28 5
20 - 29 1,854 59 231 681 543
30 - 39 3,323 75 172 422 837
40 - 49 3,289 84 131 288 503
50 - 59 2,456 122 276 321 374
60 - 69 1,353 89 295 251 217
70 - 79 533 59 155 92 91
80 years and over 125 21 44 18 16
Female 2,335 413 420 375 367
Below 20 20 10 4 5 1
20 - 29 127 7 23 35 37
30 - 39 224 19 21 38 47
40 - 49 361 20 44 58 70
50 - 59 467 60 82 62 80
60 - 69 580 125 121 99 74
70 - 79 413 126 97 59 41
80 years and over 143 46 28 19 17
Continued

Philippine Statistics Authority
371 Demographic and Socioeconomic Characteristics - Quezon
Philippine Statistics Authority
Table 15--Continued
Age Group, Sex of the Household Head, and City/Municipality
Total Number of Households
Household Size
1 2 3 4
DOLORES
Both sexes 6,510 436 707 1,191 1,363
Below 20 9 - 3 4 2
20 - 29 522 16 52 229 150
30 - 39 1,366 38 91 261 438
40 - 49 1,584 64 107 215 341
50 - 59 1,483 92 154 234 243
60 - 69 917 85 157 150 129
70 - 79 445 89 101 71 40
80 years and over 184 52 42 27 20
Male 5,295 215 491 987 1,184
Below 20 8 - 2 4 2
20 - 29 492 12 42 220 146
30 - 39 1,282 35 74 236 424
40 - 49 1,415 49 83 181 307
50 - 59 1,213 62 112 184 205
60 - 69 603 26 106 113 75
70 - 79 211 20 56 36 19
80 years and over 71 11 16 13 6
Female 1,215 221 216 204 179
Below 20 1 - 1 - -
20 - 29 30 4 10 9 4
30 - 39 84 3 17 25 14
40 - 49 169 15 24 34 34
50 - 59 270 30 42 50 38
60 - 69 314 59 51 37 54
70 - 79 234 69 45 35 21
80 years and over 113 41 26 14 14
Continued

Philippine Statistics Authority
372 Demographic and Socioeconomic Characteristics - Quezon
Philippine Statistics Authority
Table 15--Continued
Age Group, Sex of the Household Head, and City/Municipality
Total Number of Households
Household Size
1 2 3 4
GENERAL LUNA
Both sexes 5,680 392 626 936 973
Below 20 24 7 6 9 -
20 - 29 684 28 101 256 179
30 - 39 1,215 35 48 181 300
40 - 49 1,372 44 74 137 182
50 - 59 1,140 71 128 152 151
60 - 69 778 87 148 136 117
70 - 79 363 88 89 47 38
80 years and over 104 32 32 18 6
Male 4,825 220 491 796 862
Below 20 20 5 5 9 -
20 - 29 641 23 90 240 171
30 - 39 1,132 26 39 168 283
40 - 49 1,253 35 55 118 161
50 - 59 962 51 107 121 130
60 - 69 575 49 115 104 88
70 - 79 201 27 60 29 28
80 years and over 41 4 20 7 1
Female 855 172 135 140 111
Below 20 4 2 1 - -
20 - 29 43 5 11 16 8
30 - 39 83 9 9 13 17
40 - 49 119 9 19 19 21
50 - 59 178 20 21 31 21
60 - 69 203 38 33 32 29
70 - 79 162 61 29 18 10
80 years and over 63 28 12 11 5
Continued

Philippine Statistics Authority
373 Demographic and Socioeconomic Characteristics - Quezon
Philippine Statistics Authority
Table 15--Continued
Age Group, Sex of the Household Head, and City/Municipality
Total Number of Households
Household Size
1 2 3 4
GENERAL NAKAR
Both sexes 6,451 307 748 1,158 1,282
Below 20 44 2 18 19 3
20 - 29 1,033 30 173 369 296
30 - 39 1,610 36 107 246 439
40 - 49 1,474 41 74 154 209
50 - 59 1,246 66 137 166 195
60 - 69 712 64 143 140 101
70 - 79 245 46 68 48 31
80 years and over 87 22 28 16 8
Male 5,822 200 612 1,025 1,187
Below 20 41 2 16 19 3
20 - 29 990 24 155 356 292
30 - 39 1,544 34 93 224 425
40 - 49 1,387 35 66 138 196
50 - 59 1,101 52 107 138 164
60 - 69 553 30 112 106 78
70 - 79 163 18 50 33 24
80 years and over 43 5 13 11 5
Female 629 107 136 133 95
Below 20 3 - 2 - -
20 - 29 43 6 18 13 4
30 - 39 66 2 14 22 14
40 - 49 87 6 8 16 13
50 - 59 145 14 30 28 31
60 - 69 159 34 31 34 23
70 - 79 82 28 18 15 7
80 years and over 44 17 15 5 3
Continued

Philippine Statistics Authority
374 Demographic and Socioeconomic Characteristics - Quezon
Philippine Statistics Authority
Table 15--Continued
Age Group, Sex of the Household Head, and City/Municipality
Total Number of Households
Household Size
1 2 3 4
GUINAYANGAN
Both sexes 10,304 725 1,206 1,929 2,072
Below 20 53 8 18 20 4
20 - 29 1,210 53 154 497 342
30 - 39 2,333 72 120 429 646
40 - 49 2,492 100 143 291 453
50 - 59 2,145 139 250 326 353
60 - 69 1,303 150 305 251 183
70 - 79 601 152 177 88 72
80 years and over 167 51 39 27 19
Male 8,808 444 885 1,664 1,868
Below 20 49 7 15 20 4
20 - 29 1,147 46 132 481 333
30 - 39 2,189 63 100 396 619
40 - 49 2,276 80 113 249 424
50 - 59 1,840 109 191 269 305
60 - 69 881 70 202 177 129
70 - 79 347 59 108 56 47
80 years and over 79 10 24 16 7
Female 1,496 281 321 265 204
Below 20 4 1 3 - -
20 - 29 63 7 22 16 9
30 - 39 144 9 20 33 27
40 - 49 216 20 30 42 29
50 - 59 305 30 59 57 48
60 - 69 422 80 103 74 54
70 - 79 254 93 69 32 25
80 years and over 88 41 15 11 12
Continued

Philippine Statistics Authority
375 Demographic and Socioeconomic Characteristics - Quezon
Philippine Statistics Authority
Table 15--Continued
Age Group, Sex of the Household Head, and City/Municipality
Total Number of Households
Household Size
1 2 3 4
GUMACA
Both sexes 18,445 1,996 2,957 3,408 3,454
Below 20 205 75 72 43 14
20 - 29 2,533 261 477 862 615
30 - 39 3,828 247 364 665 877
40 - 49 4,124 251 367 522 753
50 - 59 3,662 357 551 616 669
60 - 69 2,441 395 637 431 366
70 - 79 1,261 282 384 217 129
80 years and over 391 128 105 52 31
Male 14,486 1,148 2,055 2,653 2,912
Below 20 132 42 47 34 9
20 - 29 2,107 166 342 747 569
30 - 39 3,353 199 279 543 800
40 - 49 3,541 196 268 409 644
50 - 59 2,909 234 405 473 540
60 - 69 1,624 178 433 304 257
70 - 79 663 100 225 120 78
80 years and over 157 33 56 23 15
Female 3,959 848 902 755 542
Below 20 73 33 25 9 5
20 - 29 426 95 135 115 46
30 - 39 475 48 85 122 77
40 - 49 583 55 99 113 109
50 - 59 753 123 146 143 129
60 - 69 817 217 204 127 109
70 - 79 598 182 159 97 51
80 years and over 234 95 49 29 16
Continued

Philippine Statistics Authority
376 Demographic and Socioeconomic Characteristics - Quezon
Philippine Statistics Authority
Table 15--Continued
Age Group, Sex of the Household Head, and City/Municipality
Total Number of Households
Household Size
1 2 3 4
INFANTA
Both sexes 16,449 1,363 2,161 3,177 3,339
Below 20 277 135 69 50 13
20 - 29 2,106 172 343 738 535
30 - 39 3,654 159 278 654 929
40 - 49 3,870 177 299 571 771
50 - 59 3,278 236 456 567 602
60 - 69 2,070 241 430 396 340
70 - 79 888 164 218 150 117
80 years and over 306 79 68 51 32
Male 13,491 762 1,557 2,585 2,894
Below 20 134 56 37 27 8
20 - 29 1,831 113 253 672 495
30 - 39 3,301 125 208 571 863
40 - 49 3,396 124 216 461 681
50 - 59 2,705 147 352 448 505
60 - 69 1,464 113 311 295 246
70 - 79 523 61 141 89 81
80 years and over 137 23 39 22 15
Female 2,958 601 604 592 445
Below 20 143 79 32 23 5
20 - 29 275 59 90 66 40
30 - 39 353 34 70 83 66
40 - 49 474 53 83 110 90
50 - 59 573 89 104 119 97
60 - 69 606 128 119 101 94
70 - 79 365 103 77 61 36
80 years and over 169 56 29 29 17
Continued
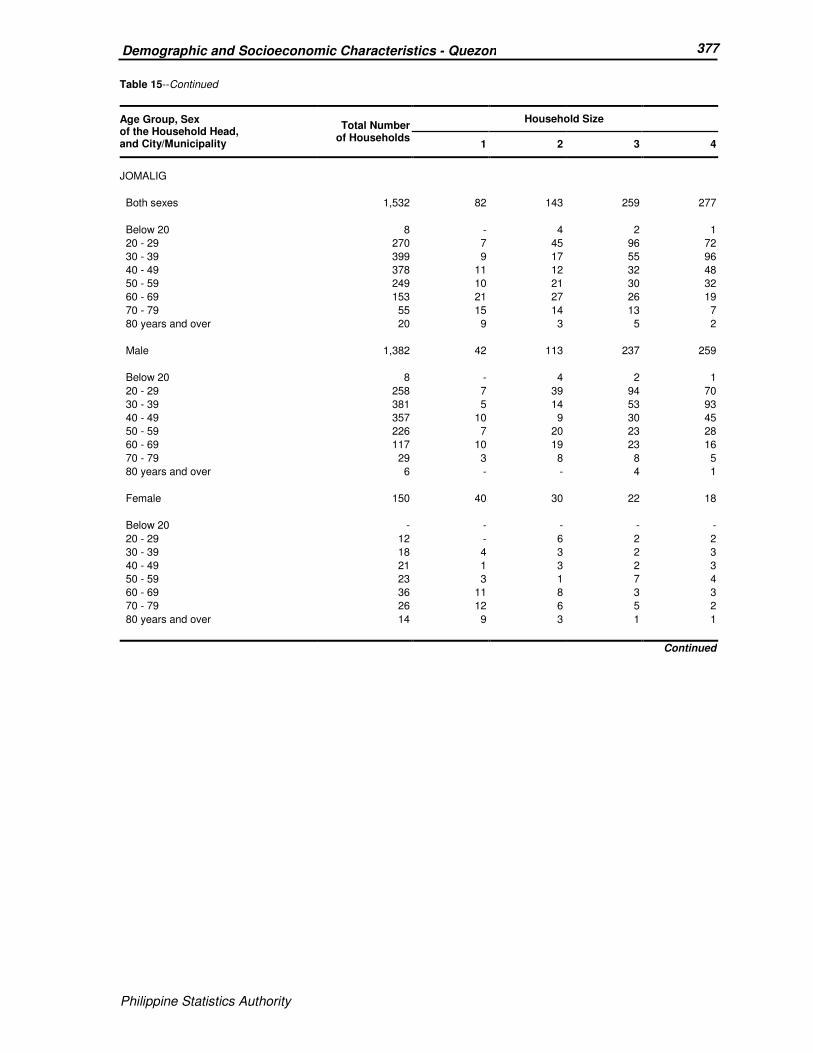
Philippine Statistics Authority
377 Demographic and Socioeconomic Characteristics - Quezon
Philippine Statistics Authority
Table 15--Continued
Age Group, Sex of the Household Head, and City/Municipality
Total Number of Households
Household Size
1 2 3 4
JOMALIG
Both sexes 1,532 82 143 259 277
Below 20 8 - 4 2 1
20 - 29 270 7 45 96 72
30 - 39 399 9 17 55 96
40 - 49 378 11 12 32 48
50 - 59 249 10 21 30 32
60 - 69 153 21 27 26 19
70 - 79 55 15 14 13 7
80 years and over 20 9 3 5 2
Male 1,382 42 113 237 259
Below 20 8 - 4 2 1
20 - 29 258 7 39 94 70
30 - 39 381 5 14 53 93
40 - 49 357 10 9 30 45
50 - 59 226 7 20 23 28
60 - 69 117 10 19 23 16
70 - 79 29 3 8 8 5
80 years and over 6 - - 4 1
Female 150 40 30 22 18
Below 20 - - - - -
20 - 29 12 - 6 2 2
30 - 39 18 4 3 2 3
40 - 49 21 1 3 2 3
50 - 59 23 3 1 7 4
60 - 69 36 11 8 3 3
70 - 79 26 12 6 5 2
80 years and over 14 9 3 1 1
Continued
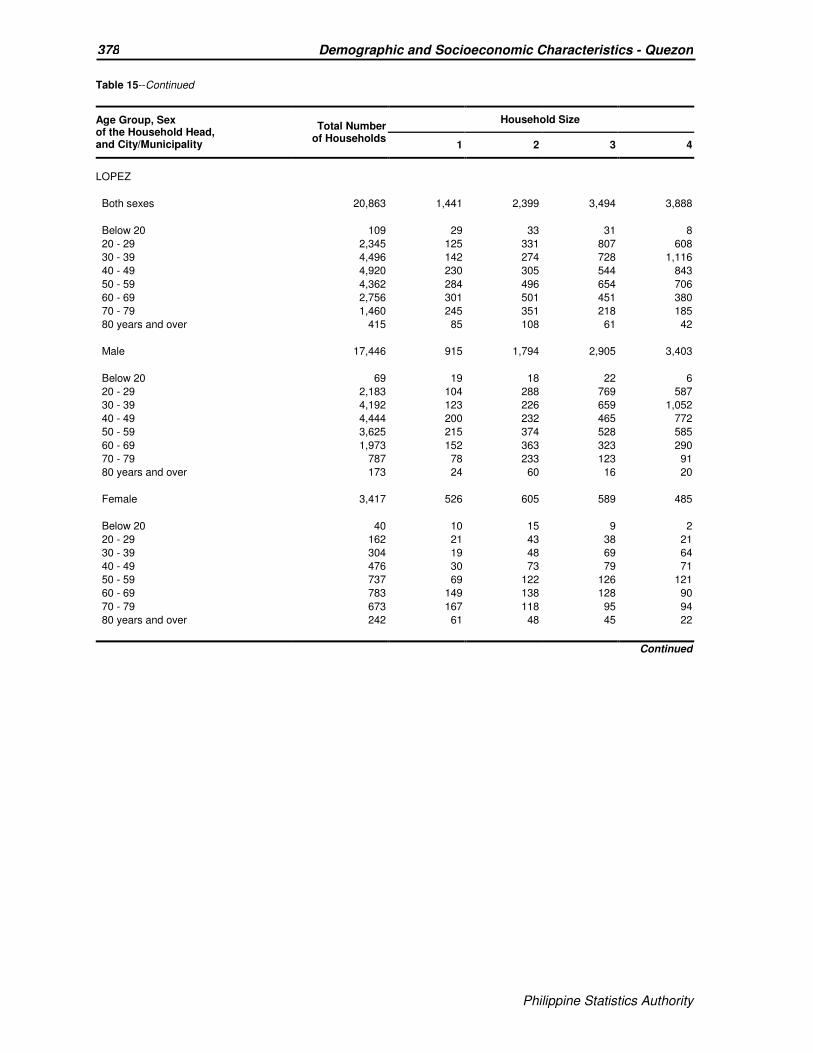
Philippine Statistics Authority
378 Demographic and Socioeconomic Characteristics - Quezon
Philippine Statistics Authority
Table 15--Continued
Age Group, Sex of the Household Head, and City/Municipality
Total Number of Households
Household Size
1 2 3 4
LOPEZ
Both sexes 20,863 1,441 2,399 3,494 3,888
Below 20 109 29 33 31 8
20 - 29 2,345 125 331 807 608
30 - 39 4,496 142 274 728 1,116
40 - 49 4,920 230 305 544 843
50 - 59 4,362 284 496 654 706
60 - 69 2,756 301 501 451 380
70 - 79 1,460 245 351 218 185
80 years and over 415 85 108 61 42
Male 17,446 915 1,794 2,905 3,403
Below 20 69 19 18 22 6
20 - 29 2,183 104 288 769 587
30 - 39 4,192 123 226 659 1,052
40 - 49 4,444 200 232 465 772
50 - 59 3,625 215 374 528 585
60 - 69 1,973 152 363 323 290
70 - 79 787 78 233 123 91
80 years and over 173 24 60 16 20
Female 3,417 526 605 589 485
Below 20 40 10 15 9 2
20 - 29 162 21 43 38 21
30 - 39 304 19 48 69 64
40 - 49 476 30 73 79 71
50 - 59 737 69 122 126 121
60 - 69 783 149 138 128 90
70 - 79 673 167 118 95 94
80 years and over 242 61 48 45 22
Continued

Philippine Statistics Authority
379 Demographic and Socioeconomic Characteristics - Quezon
Philippine Statistics Authority
Table 15--Continued
Age Group, Sex of the Household Head, and City/Municipality
Total Number of Households
Household Size
1 2 3 4
LUCBAN
Both sexes 11,969 1,208 1,485 2,040 2,347
Below 20 248 179 25 21 10
20 - 29 1,148 171 165 370 255
30 - 39 2,387 132 173 438 670
40 - 49 2,716 142 161 329 580
50 - 59 2,670 209 285 404 479
60 - 69 1,659 184 363 277 230
70 - 79 847 140 233 143 94
80 years and over 294 51 80 58 29
Male 9,595 730 1,047 1,610 2,010
Below 20 132 89 16 14 4
20 - 29 999 127 128 350 234
30 - 39 2,162 103 125 382 633
40 - 49 2,343 107 110 257 505
50 - 59 2,152 133 202 304 402
60 - 69 1,180 103 267 195 163
70 - 79 499 53 158 82 56
80 years and over 128 15 41 26 13
Female 2,374 478 438 430 337
Below 20 116 90 9 7 6
20 - 29 149 44 37 20 21
30 - 39 225 29 48 56 37
40 - 49 373 35 51 72 75
50 - 59 518 76 83 100 77
60 - 69 479 81 96 82 67
70 - 79 348 87 75 61 38
80 years and over 166 36 39 32 16
Continued

Philippine Statistics Authority
380 Demographic and Socioeconomic Characteristics - Quezon
Philippine Statistics Authority
Table 15--Continued
Age Group, Sex of the Household Head, and City/Municipality
Total Number of Households
Household Size
1 2 3 4
MACALELON
Both sexes 5,931 352 657 887 1,076
Below 20 15 1 6 4 2
20 - 29 672 24 80 219 221
30 - 39 1,379 43 72 182 312
40 - 49 1,300 48 55 100 219
50 - 59 1,292 62 144 178 182
60 - 69 817 74 178 124 98
70 - 79 363 72 90 70 37
80 years and over 93 28 32 10 5
Male 5,122 229 509 748 958
Below 20 11 1 6 1 2
20 - 29 629 20 77 204 208
30 - 39 1,301 38 58 168 297
40 - 49 1,200 43 45 93 194
50 - 59 1,124 47 117 146 161
60 - 69 613 44 136 86 73
70 - 79 207 30 53 46 21
80 years and over 37 6 17 4 2
Female 809 123 148 139 118
Below 20 4 - - 3 -
20 - 29 43 4 3 15 13
30 - 39 78 5 14 14 15
40 - 49 100 5 10 7 25
50 - 59 168 15 27 32 21
60 - 69 204 30 42 38 25
70 - 79 156 42 37 24 16
80 years and over 56 22 15 6 3
Continued

Philippine Statistics Authority
381 Demographic and Socioeconomic Characteristics - Quezon
Philippine Statistics Authority
Table 15--Continued
Age Group, Sex of the Household Head, and City/Municipality
Total Number of Households
Household Size
1 2 3 4
MAUBAN
Both sexes 15,381 1,117 2,261 2,835 3,065
Below 20 128 22 49 47 9
20 - 29 2,146 104 355 774 584
30 - 39 3,387 100 221 496 910
40 - 49 3,503 159 246 417 599
50 - 59 3,204 234 491 589 557
60 - 69 1,818 245 501 311 279
70 - 79 924 181 307 155 103
80 years and over 271 72 91 46 24
Male 13,038 679 1,752 2,384 2,679
Below 20 98 16 37 37 8
20 - 29 1,949 79 296 725 541
30 - 39 3,105 84 184 428 839
40 - 49 3,105 120 195 350 515
50 - 59 2,729 154 389 481 492
60 - 69 1,361 138 380 238 206
70 - 79 569 67 226 101 66
80 years and over 122 21 45 24 12
Female 2,343 438 509 451 386
Below 20 30 6 12 10 1
20 - 29 197 25 59 49 43
30 - 39 282 16 37 68 71
40 - 49 398 39 51 67 84
50 - 59 475 80 102 108 65
60 - 69 457 107 121 73 73
70 - 79 355 114 81 54 37
80 years and over 149 51 46 22 12
Continued

Philippine Statistics Authority
382 Demographic and Socioeconomic Characteristics - Quezon
Philippine Statistics Authority
Table 15--Continued
Age Group, Sex of the Household Head, and City/Municipality
Total Number of Households
Household Size
1 2 3 4
MULANAY
Both sexes 11,718 636 1,367 2,125 2,285
Below 20 84 12 35 28 8
20 - 29 1,778 57 239 670 503
30 - 39 2,868 56 132 408 720
40 - 49 2,740 80 111 293 434
50 - 59 2,036 104 257 317 332
60 - 69 1,423 156 340 282 201
70 - 79 610 119 195 104 69
80 years and over 179 52 58 23 18
Male 10,238 362 1,074 1,834 2,055
Below 20 71 8 30 26 7
20 - 29 1,680 43 216 638 485
30 - 39 2,709 47 111 368 678
40 - 49 2,532 72 92 253 390
50 - 59 1,719 68 190 255 279
60 - 69 1,053 73 249 209 160
70 - 79 382 37 149 70 47
80 years and over 92 14 37 15 9
Female 1,480 274 293 291 230
Below 20 13 4 5 2 1
20 - 29 98 14 23 32 18
30 - 39 159 9 21 40 42
40 - 49 208 8 19 40 44
50 - 59 317 36 67 62 53
60 - 69 370 83 91 73 41
70 - 79 228 82 46 34 22
80 years and over 87 38 21 8 9
Continued

Philippine Statistics Authority
383 Demographic and Socioeconomic Characteristics - Quezon
Philippine Statistics Authority
Table 15--Continued
Age Group, Sex of the Household Head, and City/Municipality
Total Number of Households
Household Size
1 2 3 4
PADRE BURGOS
Both sexes 5,182 460 731 806 997
Below 20 31 4 11 11 5
20 - 29 407 21 70 144 103
30 - 39 1,031 41 98 173 282
40 - 49 1,231 62 86 129 237
50 - 59 1,141 85 155 152 197
60 - 69 841 119 182 121 121
70 - 79 393 92 103 59 41
80 years and over 107 36 26 17 11
Male 4,183 263 539 657 835
Below 20 27 4 10 8 5
20 - 29 374 19 59 135 96
30 - 39 911 34 75 150 253
40 - 49 1,091 49 67 110 212
50 - 59 922 63 114 116 164
60 - 69 579 56 122 91 81
70 - 79 232 31 71 40 20
80 years and over 47 7 21 7 4
Female 999 197 192 149 162
Below 20 4 - 1 3 -
20 - 29 33 2 11 9 7
30 - 39 120 7 23 23 29
40 - 49 140 13 19 19 25
50 - 59 219 22 41 36 33
60 - 69 262 63 60 30 40
70 - 79 161 61 32 19 21
80 years and over 60 29 5 10 7
Continued

Philippine Statistics Authority
384 Demographic and Socioeconomic Characteristics - Quezon
Philippine Statistics Authority
Table 15--Continued
Age Group, Sex of the Household Head, and City/Municipality
Total Number of Households
Household Size
1 2 3 4
PAGBILAO
Both sexes 17,284 1,416 2,242 3,142 3,430
Below 20 107 20 44 34 6
20 - 29 2,061 152 372 695 516
30 - 39 3,918 189 291 756 999
40 - 49 4,131 222 292 545 811
50 - 59 3,622 235 437 533 646
60 - 69 2,208 298 456 395 326
70 - 79 934 203 256 141 102
80 years and over 303 97 94 43 24
Male 13,997 846 1,607 2,550 2,924
Below 20 94 19 39 29 6
20 - 29 1,795 109 298 632 465
30 - 39 3,480 145 235 653 912
40 - 49 3,539 173 205 433 708
50 - 59 2,900 146 312 415 520
60 - 69 1,548 160 300 292 237
70 - 79 518 70 164 82 68
80 years and over 123 24 54 14 8
Female 3,287 570 635 592 506
Below 20 13 1 5 5 -
20 - 29 266 43 74 63 51
30 - 39 438 44 56 103 87
40 - 49 592 49 87 112 103
50 - 59 722 89 125 118 126
60 - 69 660 138 156 103 89
70 - 79 416 133 92 59 34
80 years and over 180 73 40 29 16
Continued
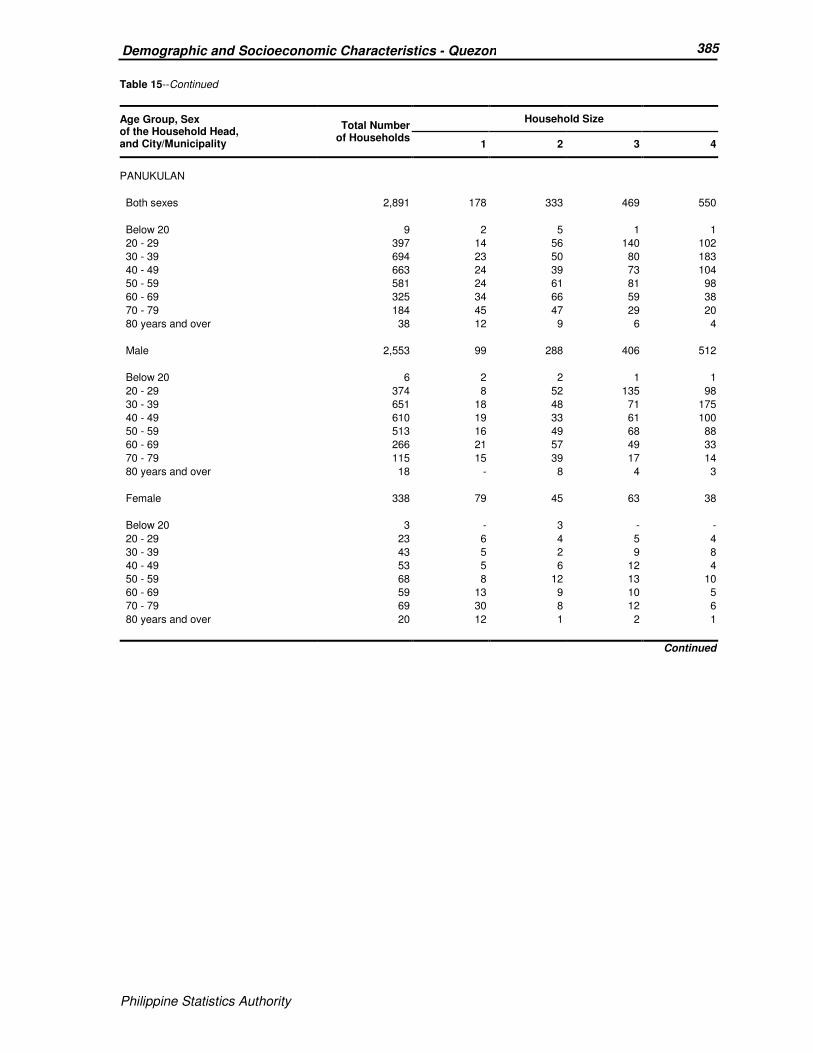
Philippine Statistics Authority
385 Demographic and Socioeconomic Characteristics - Quezon
Philippine Statistics Authority
Table 15--Continued
Age Group, Sex of the Household Head, and City/Municipality
Total Number of Households
Household Size
1 2 3 4
PANUKULAN
Both sexes 2,891 178 333 469 550
Below 20 9 2 5 1 1
20 - 29 397 14 56 140 102
30 - 39 694 23 50 80 183
40 - 49 663 24 39 73 104
50 - 59 581 24 61 81 98
60 - 69 325 34 66 59 38
70 - 79 184 45 47 29 20
80 years and over 38 12 9 6 4
Male 2,553 99 288 406 512
Below 20 6 2 2 1 1
20 - 29 374 8 52 135 98
30 - 39 651 18 48 71 175
40 - 49 610 19 33 61 100
50 - 59 513 16 49 68 88
60 - 69 266 21 57 49 33
70 - 79 115 15 39 17 14
80 years and over 18 - 8 4 3
Female 338 79 45 63 38
Below 20 3 - 3 - -
20 - 29 23 6 4 5 4
30 - 39 43 5 2 9 8
40 - 49 53 5 6 12 4
50 - 59 68 8 12 13 10
60 - 69 59 13 9 10 5
70 - 79 69 30 8 12 6
80 years and over 20 12 1 2 1
Continued
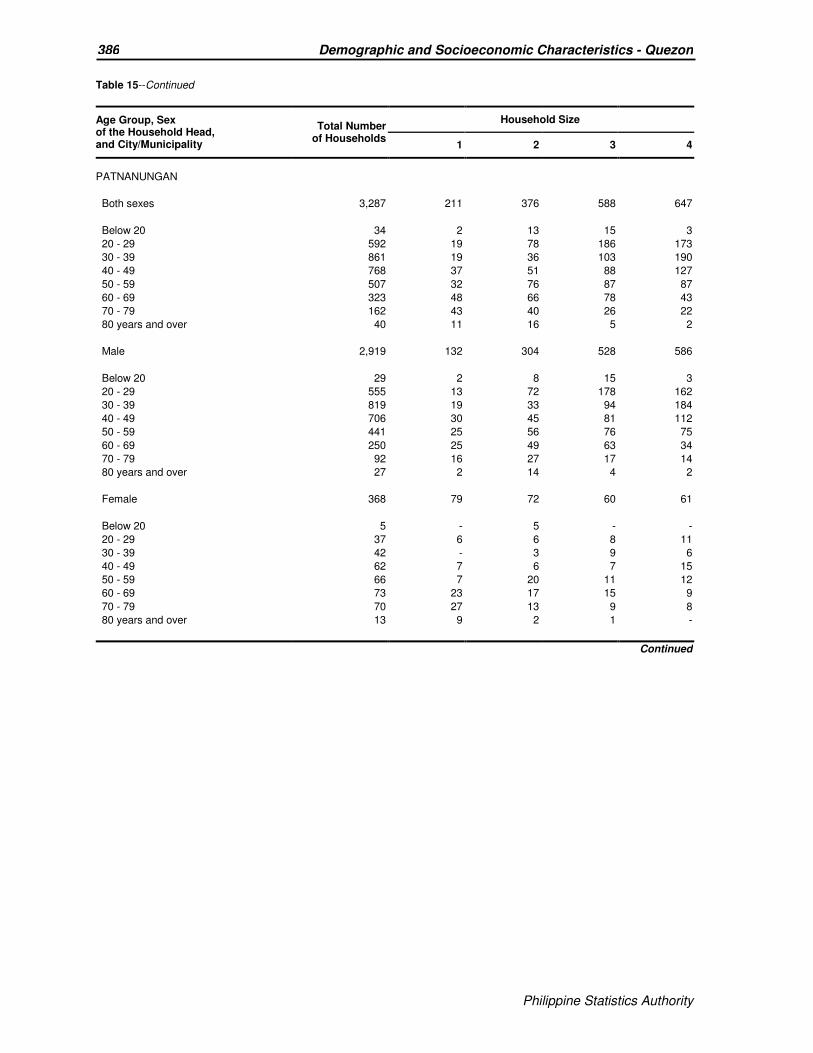
Philippine Statistics Authority
386 Demographic and Socioeconomic Characteristics - Quezon
Philippine Statistics Authority
Table 15--Continued
Age Group, Sex of the Household Head, and City/Municipality
Total Number of Households
Household Size
1 2 3 4
PATNANUNGAN
Both sexes 3,287 211 376 588 647
Below 20 34 2 13 15 3
20 - 29 592 19 78 186 173
30 - 39 861 19 36 103 190
40 - 49 768 37 51 88 127
50 - 59 507 32 76 87 87
60 - 69 323 48 66 78 43
70 - 79 162 43 40 26 22
80 years and over 40 11 16 5 2
Male 2,919 132 304 528 586
Below 20 29 2 8 15 3
20 - 29 555 13 72 178 162
30 - 39 819 19 33 94 184
40 - 49 706 30 45 81 112
50 - 59 441 25 56 76 75
60 - 69 250 25 49 63 34
70 - 79 92 16 27 17 14
80 years and over 27 2 14 4 2
Female 368 79 72 60 61
Below 20 5 - 5 - -
20 - 29 37 6 6 8 11
30 - 39 42 - 3 9 6
40 - 49 62 7 6 7 15
50 - 59 66 7 20 11 12
60 - 69 73 23 17 15 9
70 - 79 70 27 13 9 8
80 years and over 13 9 2 1 -
Continued

Philippine Statistics Authority
387 Demographic and Socioeconomic Characteristics - Quezon
Philippine Statistics Authority
Table 15--Continued
Age Group, Sex of the Household Head, and City/Municipality
Total Number of Households
Household Size
1 2 3 4
PEREZ
Both sexes 2,776 218 364 472 492
Below 20 13 1 6 5 -
20 - 29 333 22 52 105 87
30 - 39 652 22 37 96 149
40 - 49 698 33 51 83 107
50 - 59 535 39 79 99 86
60 - 69 347 45 83 60 46
70 - 79 154 41 47 18 13
80 years and over 44 15 9 6 4
Male 2,367 126 283 388 442
Below 20 10 1 4 4 -
20 - 29 309 16 45 99 86
30 - 39 600 18 28 84 132
40 - 49 638 27 38 74 98
50 - 59 438 23 61 74 75
60 - 69 262 23 68 40 38
70 - 79 90 13 34 11 10
80 years and over 20 5 5 2 3
Female 409 92 81 84 50
Below 20 3 - 2 1 -
20 - 29 24 6 7 6 1
30 - 39 52 4 9 12 17
40 - 49 60 6 13 9 9
50 - 59 97 16 18 25 11
60 - 69 85 22 15 20 8
70 - 79 64 28 13 7 3
80 years and over 24 10 4 4 1
Continued
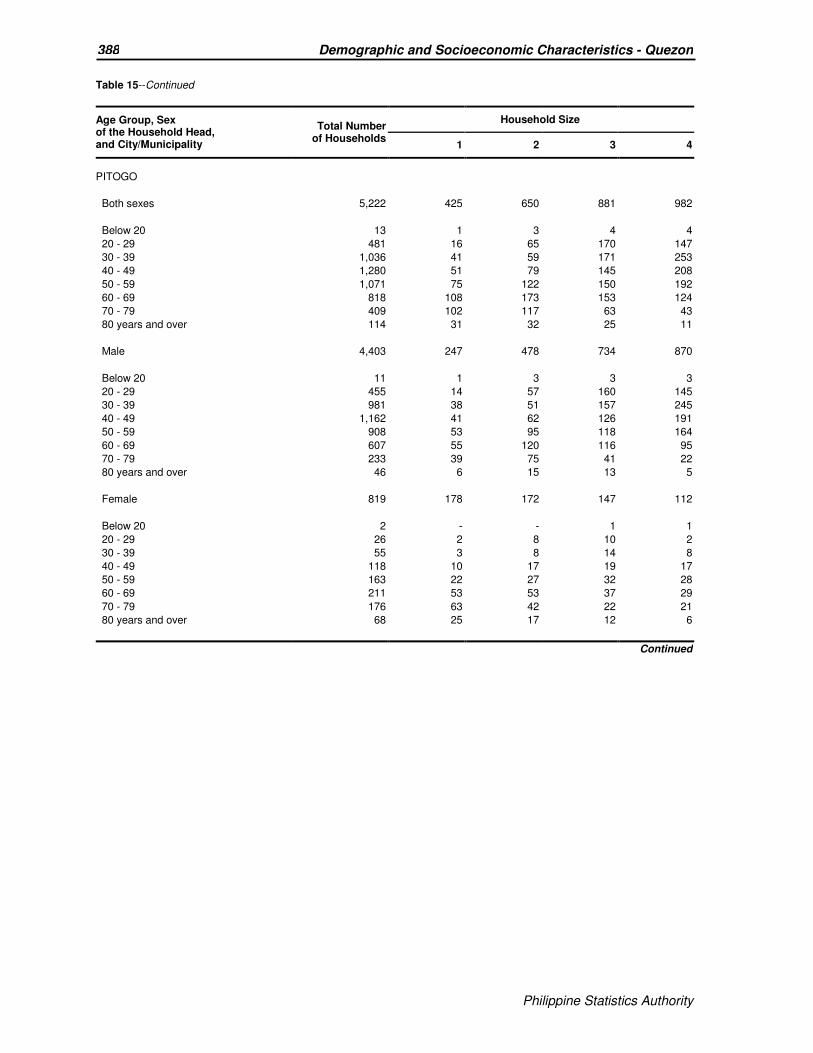
Philippine Statistics Authority
388 Demographic and Socioeconomic Characteristics - Quezon
Philippine Statistics Authority
Table 15--Continued
Age Group, Sex of the Household Head, and City/Municipality
Total Number of Households
Household Size
1 2 3 4
PITOGO
Both sexes 5,222 425 650 881 982
Below 20 13 1 3 4 4
20 - 29 481 16 65 170 147
30 - 39 1,036 41 59 171 253
40 - 49 1,280 51 79 145 208
50 - 59 1,071 75 122 150 192
60 - 69 818 108 173 153 124
70 - 79 409 102 117 63 43
80 years and over 114 31 32 25 11
Male 4,403 247 478 734 870
Below 20 11 1 3 3 3
20 - 29 455 14 57 160 145
30 - 39 981 38 51 157 245
40 - 49 1,162 41 62 126 191
50 - 59 908 53 95 118 164
60 - 69 607 55 120 116 95
70 - 79 233 39 75 41 22
80 years and over 46 6 15 13 5
Female 819 178 172 147 112
Below 20 2 - - 1 1
20 - 29 26 2 8 10 2
30 - 39 55 3 8 14 8
40 - 49 118 10 17 19 17
50 - 59 163 22 27 32 28
60 - 69 211 53 53 37 29
70 - 79 176 63 42 22 21
80 years and over 68 25 17 12 6
Continued

Philippine Statistics Authority
389 Demographic and Socioeconomic Characteristics - Quezon
Philippine Statistics Authority
Table 15--Continued
Age Group, Sex of the Household Head, and City/Municipality
Total Number of Households
Household Size
1 2 3 4
PLARIDEL
Both sexes 2,380 163 276 388 467
Below 20 9 1 - 7 1
20 - 29 192 8 27 70 47
30 - 39 414 9 19 67 123
40 - 49 537 21 32 59 94
50 - 59 576 40 67 77 94
60 - 69 391 41 70 72 65
70 - 79 204 34 49 26 32
80 years and over 57 9 12 10 11
Male 1,926 99 195 319 387
Below 20 9 1 - 7 1
20 - 29 179 7 23 67 47
30 - 39 386 8 14 63 116
40 - 49 475 14 25 50 85
50 - 59 479 30 51 62 78
60 - 69 262 22 45 51 42
70 - 79 114 12 33 16 17
80 years and over 22 5 4 3 1
Female 454 64 81 69 80
Below 20 - - - - -
20 - 29 13 1 4 3 -
30 - 39 28 1 5 4 7
40 - 49 62 7 7 9 9
50 - 59 97 10 16 15 16
60 - 69 129 19 25 21 23
70 - 79 90 22 16 10 15
80 years and over 35 4 8 7 10
Continued

Philippine Statistics Authority
390 Demographic and Socioeconomic Characteristics - Quezon
Philippine Statistics Authority
Table 15--Continued
Age Group, Sex of the Household Head, and City/Municipality
Total Number of Households
Household Size
1 2 3 4
POLILLO
Both sexes 6,965 496 911 1,274 1,396
Below 20 35 8 10 10 3
20 - 29 855 30 112 291 233
30 - 39 1,528 52 79 233 397
40 - 49 1,660 81 132 209 312
50 - 59 1,419 93 199 235 256
60 - 69 929 95 226 186 143
70 - 79 435 101 126 89 48
80 years and over 104 36 27 21 4
Male 5,973 288 680 1,100 1,244
Below 20 26 4 9 8 3
20 - 29 807 26 99 275 226
30 - 39 1,414 44 60 206 371
40 - 49 1,497 69 103 179 281
50 - 59 1,218 55 148 209 225
60 - 69 718 50 167 152 109
70 - 79 244 32 77 57 28
80 years and over 49 8 17 14 1
Female 992 208 231 174 152
Below 20 9 4 1 2 -
20 - 29 48 4 13 16 7
30 - 39 114 8 19 27 26
40 - 49 163 12 29 30 31
50 - 59 201 38 51 26 31
60 - 69 211 45 59 34 34
70 - 79 191 69 49 32 20
80 years and over 55 28 10 7 3
Continued
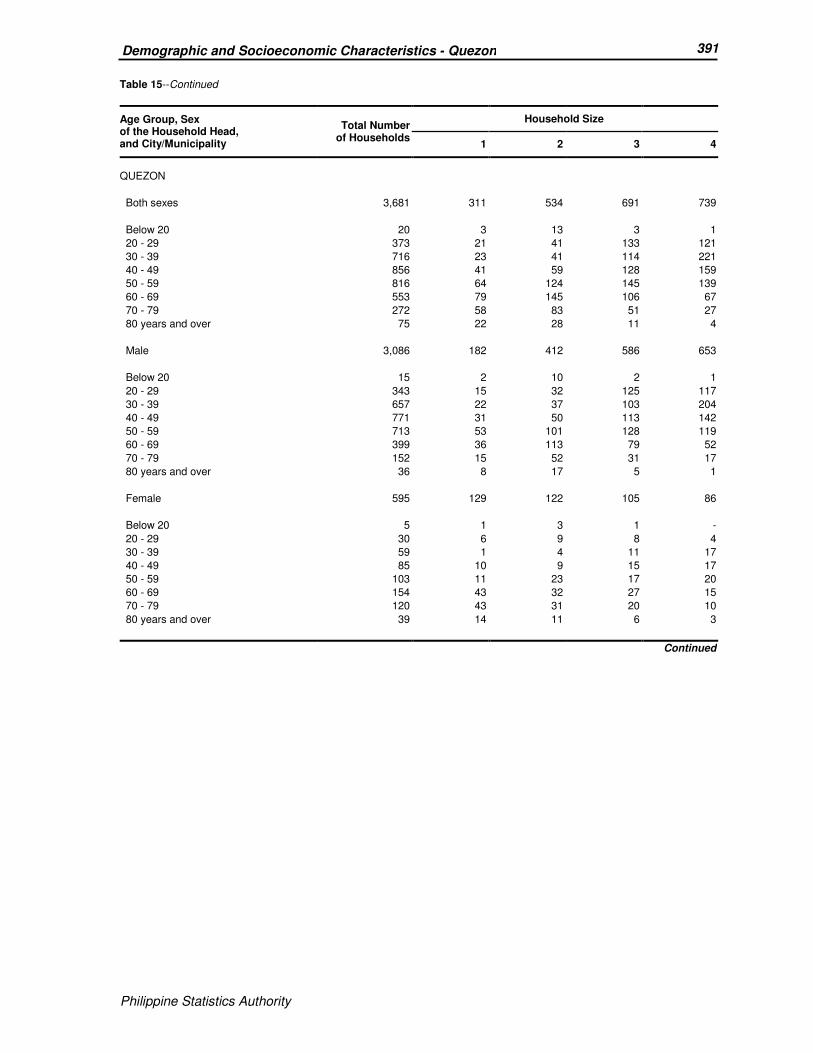
Philippine Statistics Authority
391 Demographic and Socioeconomic Characteristics - Quezon
Philippine Statistics Authority
Table 15--Continued
Age Group, Sex of the Household Head, and City/Municipality
Total Number of Households
Household Size
1 2 3 4
QUEZON
Both sexes 3,681 311 534 691 739
Below 20 20 3 13 3 1
20 - 29 373 21 41 133 121
30 - 39 716 23 41 114 221
40 - 49 856 41 59 128 159
50 - 59 816 64 124 145 139
60 - 69 553 79 145 106 67
70 - 79 272 58 83 51 27
80 years and over 75 22 28 11 4
Male 3,086 182 412 586 653
Below 20 15 2 10 2 1
20 - 29 343 15 32 125 117
30 - 39 657 22 37 103 204
40 - 49 771 31 50 113 142
50 - 59 713 53 101 128 119
60 - 69 399 36 113 79 52
70 - 79 152 15 52 31 17
80 years and over 36 8 17 5 1
Female 595 129 122 105 86
Below 20 5 1 3 1 -
20 - 29 30 6 9 8 4
30 - 39 59 1 4 11 17
40 - 49 85 10 9 15 17
50 - 59 103 11 23 17 20
60 - 69 154 43 32 27 15
70 - 79 120 43 31 20 10
80 years and over 39 14 11 6 3
Continued
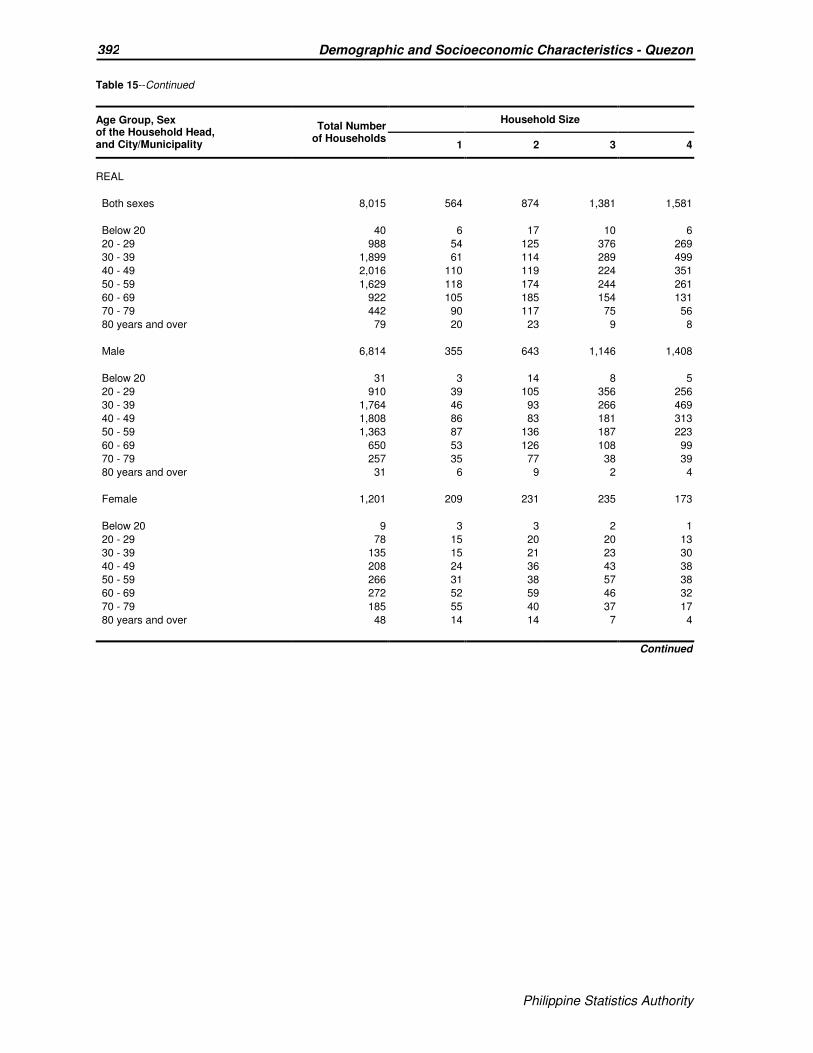
Philippine Statistics Authority
392 Demographic and Socioeconomic Characteristics - Quezon
Philippine Statistics Authority
Table 15--Continued
Age Group, Sex of the Household Head, and City/Municipality
Total Number of Households
Household Size
1 2 3 4
REAL
Both sexes 8,015 564 874 1,381 1,581
Below 20 40 6 17 10 6
20 - 29 988 54 125 376 269
30 - 39 1,899 61 114 289 499
40 - 49 2,016 110 119 224 351
50 - 59 1,629 118 174 244 261
60 - 69 922 105 185 154 131
70 - 79 442 90 117 75 56
80 years and over 79 20 23 9 8
Male 6,814 355 643 1,146 1,408
Below 20 31 3 14 8 5
20 - 29 910 39 105 356 256
30 - 39 1,764 46 93 266 469
40 - 49 1,808 86 83 181 313
50 - 59 1,363 87 136 187 223
60 - 69 650 53 126 108 99
70 - 79 257 35 77 38 39
80 years and over 31 6 9 2 4
Female 1,201 209 231 235 173
Below 20 9 3 3 2 1
20 - 29 78 15 20 20 13
30 - 39 135 15 21 23 30
40 - 49 208 24 36 43 38
50 - 59 266 31 38 57 38
60 - 69 272 52 59 46 32
70 - 79 185 55 40 37 17
80 years and over 48 14 14 7 4
Continued
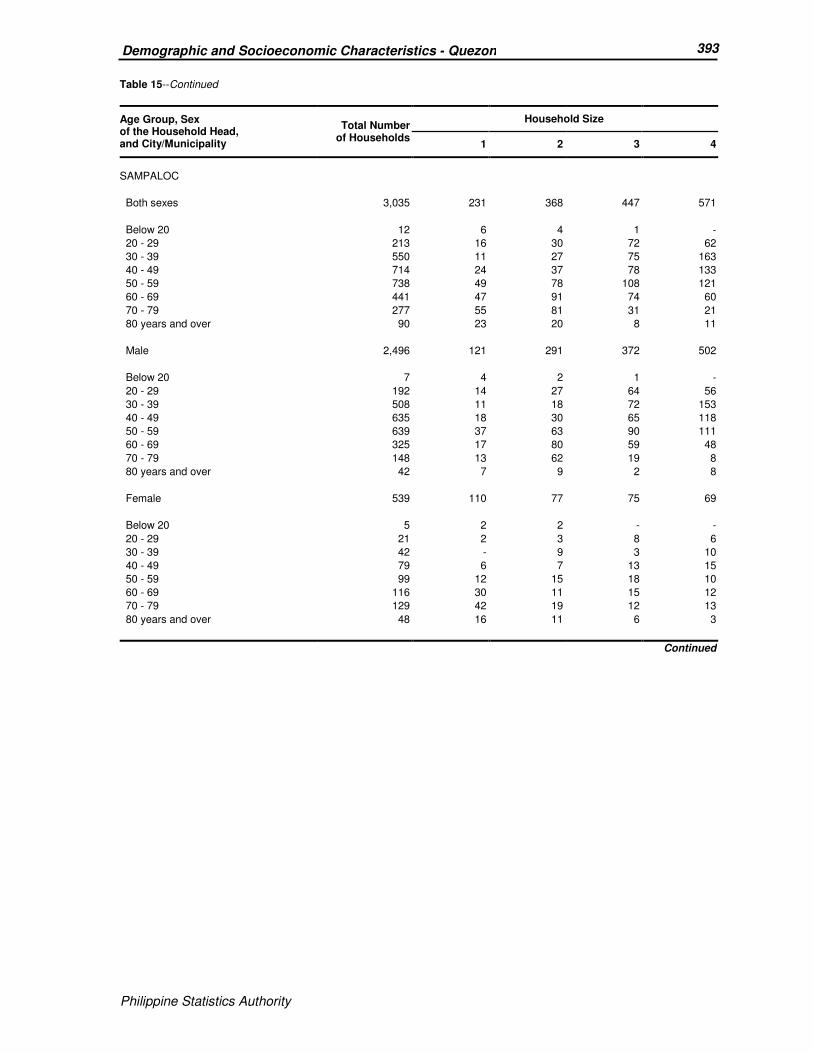
Philippine Statistics Authority
393 Demographic and Socioeconomic Characteristics - Quezon
Philippine Statistics Authority
Table 15--Continued
Age Group, Sex of the Household Head, and City/Municipality
Total Number of Households
Household Size
1 2 3 4
SAMPALOC
Both sexes 3,035 231 368 447 571
Below 20 12 6 4 1 -
20 - 29 213 16 30 72 62
30 - 39 550 11 27 75 163
40 - 49 714 24 37 78 133
50 - 59 738 49 78 108 121
60 - 69 441 47 91 74 60
70 - 79 277 55 81 31 21
80 years and over 90 23 20 8 11
Male 2,496 121 291 372 502
Below 20 7 4 2 1 -
20 - 29 192 14 27 64 56
30 - 39 508 11 18 72 153
40 - 49 635 18 30 65 118
50 - 59 639 37 63 90 111
60 - 69 325 17 80 59 48
70 - 79 148 13 62 19 8
80 years and over 42 7 9 2 8
Female 539 110 77 75 69
Below 20 5 2 2 - -
20 - 29 21 2 3 8 6
30 - 39 42 - 9 3 10
40 - 49 79 6 7 13 15
50 - 59 99 12 15 18 10
60 - 69 116 30 11 15 12
70 - 79 129 42 19 12 13
80 years and over 48 16 11 6 3
Continued
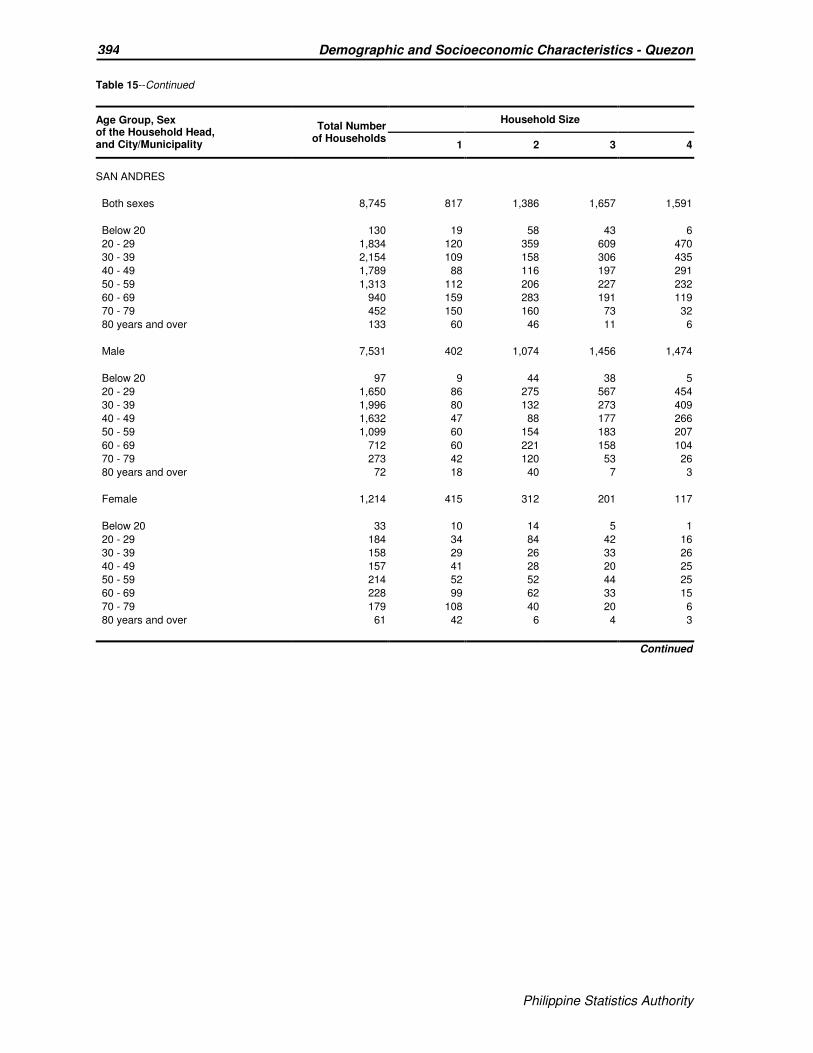
Philippine Statistics Authority
394 Demographic and Socioeconomic Characteristics - Quezon
Philippine Statistics Authority
Table 15--Continued
Age Group, Sex of the Household Head, and City/Municipality
Total Number of Households
Household Size
1 2 3 4
SAN ANDRES
Both sexes 8,745 817 1,386 1,657 1,591
Below 20 130 19 58 43 6
20 - 29 1,834 120 359 609 470
30 - 39 2,154 109 158 306 435
40 - 49 1,789 88 116 197 291
50 - 59 1,313 112 206 227 232
60 - 69 940 159 283 191 119
70 - 79 452 150 160 73 32
80 years and over 133 60 46 11 6
Male 7,531 402 1,074 1,456 1,474
Below 20 97 9 44 38 5
20 - 29 1,650 86 275 567 454
30 - 39 1,996 80 132 273 409
40 - 49 1,632 47 88 177 266
50 - 59 1,099 60 154 183 207
60 - 69 712 60 221 158 104
70 - 79 273 42 120 53 26
80 years and over 72 18 40 7 3
Female 1,214 415 312 201 117
Below 20 33 10 14 5 1
20 - 29 184 34 84 42 16
30 - 39 158 29 26 33 26
40 - 49 157 41 28 20 25
50 - 59 214 52 52 44 25
60 - 69 228 99 62 33 15
70 - 79 179 108 40 20 6
80 years and over 61 42 6 4 3
Continued
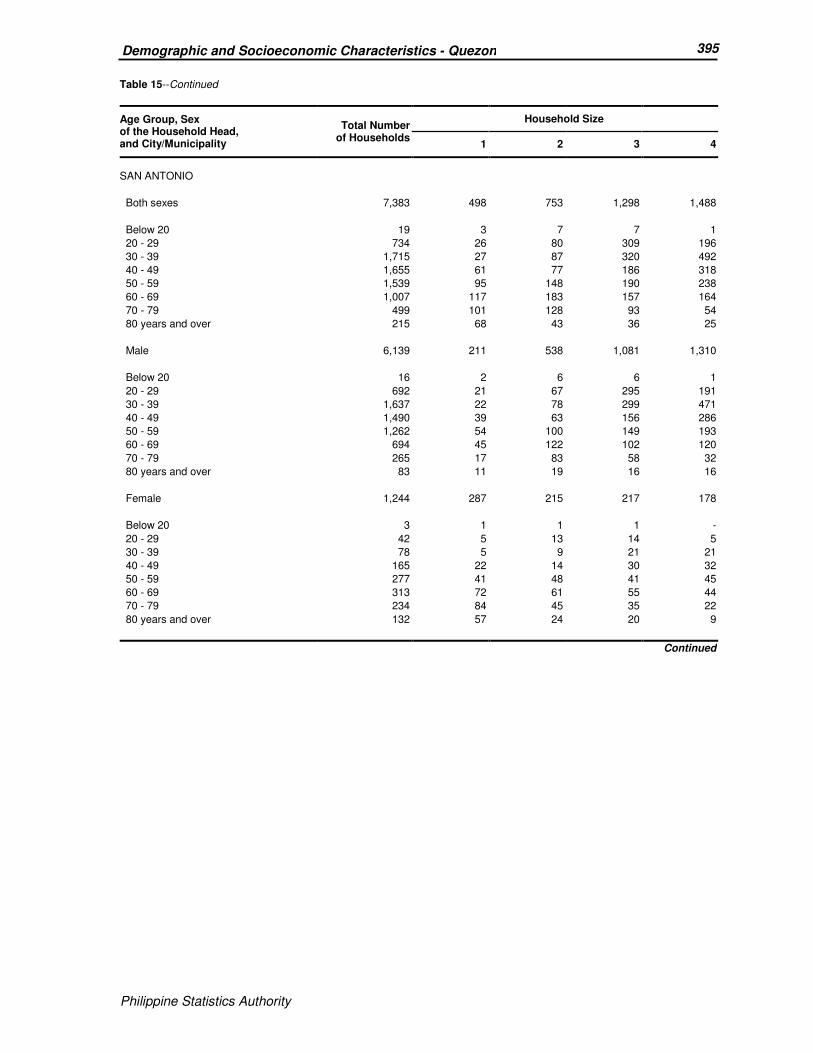
Philippine Statistics Authority
395 Demographic and Socioeconomic Characteristics - Quezon
Philippine Statistics Authority
Table 15--Continued
Age Group, Sex of the Household Head, and City/Municipality
Total Number of Households
Household Size
1 2 3 4
SAN ANTONIO
Both sexes 7,383 498 753 1,298 1,488
Below 20 19 3 7 7 1
20 - 29 734 26 80 309 196
30 - 39 1,715 27 87 320 492
40 - 49 1,655 61 77 186 318
50 - 59 1,539 95 148 190 238
60 - 69 1,007 117 183 157 164
70 - 79 499 101 128 93 54
80 years and over 215 68 43 36 25
Male 6,139 211 538 1,081 1,310
Below 20 16 2 6 6 1
20 - 29 692 21 67 295 191
30 - 39 1,637 22 78 299 471
40 - 49 1,490 39 63 156 286
50 - 59 1,262 54 100 149 193
60 - 69 694 45 122 102 120
70 - 79 265 17 83 58 32
80 years and over 83 11 19 16 16
Female 1,244 287 215 217 178
Below 20 3 1 1 1 -
20 - 29 42 5 13 14 5
30 - 39 78 5 9 21 21
40 - 49 165 22 14 30 32
50 - 59 277 41 48 41 45
60 - 69 313 72 61 55 44
70 - 79 234 84 45 35 22
80 years and over 132 57 24 20 9
Continued

Philippine Statistics Authority
396 Demographic and Socioeconomic Characteristics - Quezon
Philippine Statistics Authority
Table 15--Continued
Age Group, Sex of the Household Head, and City/Municipality
Total Number of Households
Household Size
1 2 3 4
SAN FRANCISCO (AURORA)
Both sexes 13,903 894 1,884 2,497 2,577
Below 20 146 13 62 50 15
20 - 29 2,569 106 422 888 707
30 - 39 3,413 113 178 405 716
40 - 49 3,119 112 170 311 468
50 - 59 2,348 118 339 410 411
60 - 69 1,436 197 396 288 185
70 - 79 719 186 262 120 64
80 years and over 153 49 55 25 11
Male 12,211 457 1,482 2,175 2,388
Below 20 117 3 51 44 13
20 - 29 2,392 77 363 835 688
30 - 39 3,202 86 140 359 679
40 - 49 2,861 81 131 269 428
50 - 59 2,022 66 270 339 362
60 - 69 1,095 77 311 222 161
70 - 79 443 52 184 89 52
80 years and over 79 15 32 18 5
Female 1,692 437 402 322 189
Below 20 29 10 11 6 2
20 - 29 177 29 59 53 19
30 - 39 211 27 38 46 37
40 - 49 258 31 39 42 40
50 - 59 326 52 69 71 49
60 - 69 341 120 85 66 24
70 - 79 276 134 78 31 12
80 years and over 74 34 23 7 6
Continued

Philippine Statistics Authority
397 Demographic and Socioeconomic Characteristics - Quezon
Philippine Statistics Authority
Table 15--Continued
Age Group, Sex of the Household Head, and City/Municipality
Total Number of Households
Household Size
1 2 3 4
SAN NARCISO
Both sexes 10,700 650 1,333 1,905 1,986
Below 20 84 10 34 33 6
20 - 29 1,635 39 280 568 474
30 - 39 2,585 62 154 354 570
40 - 49 2,490 79 140 258 357
50 - 59 1,957 126 239 328 319
60 - 69 1,214 146 278 240 178
70 - 79 582 128 164 103 74
80 years and over 153 60 44 21 8
Male 9,417 342 1,058 1,677 1,818
Below 20 75 9 30 30 6
20 - 29 1,581 31 263 551 466
30 - 39 2,488 52 133 334 546
40 - 49 2,309 65 112 222 322
50 - 59 1,664 78 176 274 280
60 - 69 889 54 198 184 146
70 - 79 335 35 119 70 45
80 years and over 76 18 27 12 7
Female 1,283 308 275 228 168
Below 20 9 1 4 3 -
20 - 29 54 8 17 17 8
30 - 39 97 10 21 20 24
40 - 49 181 14 28 36 35
50 - 59 293 48 63 54 39
60 - 69 325 92 80 56 32
70 - 79 247 93 45 33 29
80 years and over 77 42 17 9 1
Continued
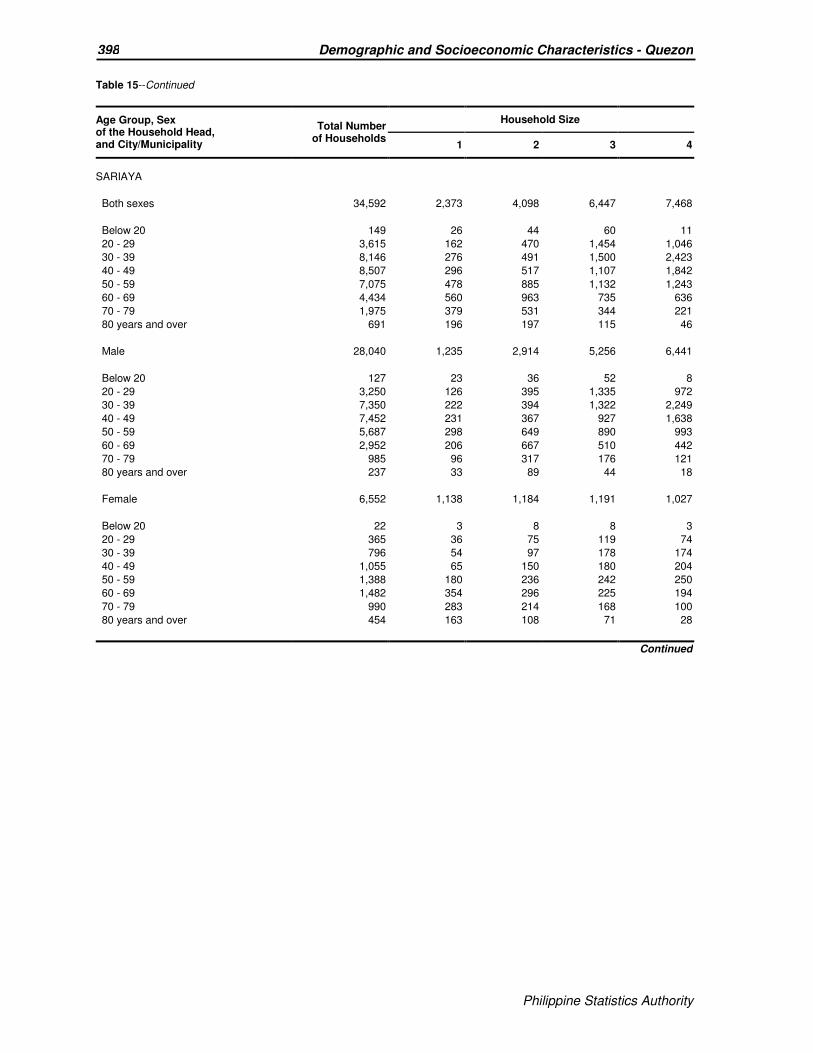
Philippine Statistics Authority
398 Demographic and Socioeconomic Characteristics - Quezon
Philippine Statistics Authority
Table 15--Continued
Age Group, Sex of the Household Head, and City/Municipality
Total Number of Households
Household Size
1 2 3 4
SARIAYA
Both sexes 34,592 2,373 4,098 6,447 7,468
Below 20 149 26 44 60 11
20 - 29 3,615 162 470 1,454 1,046
30 - 39 8,146 276 491 1,500 2,423
40 - 49 8,507 296 517 1,107 1,842
50 - 59 7,075 478 885 1,132 1,243
60 - 69 4,434 560 963 735 636
70 - 79 1,975 379 531 344 221
80 years and over 691 196 197 115 46
Male 28,040 1,235 2,914 5,256 6,441
Below 20 127 23 36 52 8
20 - 29 3,250 126 395 1,335 972
30 - 39 7,350 222 394 1,322 2,249
40 - 49 7,452 231 367 927 1,638
50 - 59 5,687 298 649 890 993
60 - 69 2,952 206 667 510 442
70 - 79 985 96 317 176 121
80 years and over 237 33 89 44 18
Female 6,552 1,138 1,184 1,191 1,027
Below 20 22 3 8 8 3
20 - 29 365 36 75 119 74
30 - 39 796 54 97 178 174
40 - 49 1,055 65 150 180 204
50 - 59 1,388 180 236 242 250
60 - 69 1,482 354 296 225 194
70 - 79 990 283 214 168 100
80 years and over 454 163 108 71 28
Continued

Philippine Statistics Authority
399 Demographic and Socioeconomic Characteristics - Quezon
Philippine Statistics Authority
Table 15--Continued
Age Group, Sex of the Household Head, and City/Municipality
Total Number of Households
Household Size
1 2 3 4
TAGKAWAYAN
Both sexes 11,645 955 1,423 1,986 2,191
Below 20 68 19 17 19 6
20 - 29 1,295 81 169 444 362
30 - 39 2,532 83 151 399 635
40 - 49 2,724 150 187 318 487
50 - 59 2,451 197 354 378 377
60 - 69 1,576 202 315 278 222
70 - 79 772 164 183 118 79
80 years and over 227 59 47 32 23
Male 9,489 562 1,057 1,625 1,846
Below 20 45 14 10 14 2
20 - 29 1,148 64 130 405 330
30 - 39 2,247 71 124 336 562
40 - 49 2,364 120 140 266 411
50 - 59 2,027 132 266 311 311
60 - 69 1,135 96 231 204 177
70 - 79 422 49 126 73 45
80 years and over 101 16 30 16 8
Female 2,156 393 366 361 345
Below 20 23 5 7 5 4
20 - 29 147 17 39 39 32
30 - 39 285 12 27 63 73
40 - 49 360 30 47 52 76
50 - 59 424 65 88 67 66
60 - 69 441 106 84 74 45
70 - 79 350 115 57 45 34
80 years and over 126 43 17 16 15
Continued

Philippine Statistics Authority
400 Demographic and Socioeconomic Characteristics - Quezon
Philippine Statistics Authority
Table 15--Continued
Age Group, Sex of the Household Head, and City/Municipality
Total Number of Households
Household Size
1 2 3 4
CITY OF TAYABAS
Both sexes 23,837 2,060 3,100 4,268 5,027
Below 20 139 58 33 41 5
20 - 29 2,805 250 388 965 759
30 - 39 5,268 248 376 891 1,476
40 - 49 5,642 291 372 723 1,158
50 - 59 5,064 368 662 771 942
60 - 69 3,097 412 724 572 495
70 - 79 1,376 288 415 237 143
80 years and over 446 145 130 68 49
Male 18,861 1,155 2,179 3,330 4,205
Below 20 91 34 21 31 4
20 - 29 2,363 171 290 850 681
30 - 39 4,562 183 290 731 1,307
40 - 49 4,768 197 271 562 990
50 - 59 3,976 241 452 578 749
60 - 69 2,153 195 524 415 355
70 - 79 778 92 274 141 92
80 years and over 170 42 57 22 27
Female 4,976 905 921 938 822
Below 20 48 24 12 10 1
20 - 29 442 79 98 115 78
30 - 39 706 65 86 160 169
40 - 49 874 94 101 161 168
50 - 59 1,088 127 210 193 193
60 - 69 944 217 200 157 140
70 - 79 598 196 141 96 51
80 years and over 276 103 73 46 22
Continued
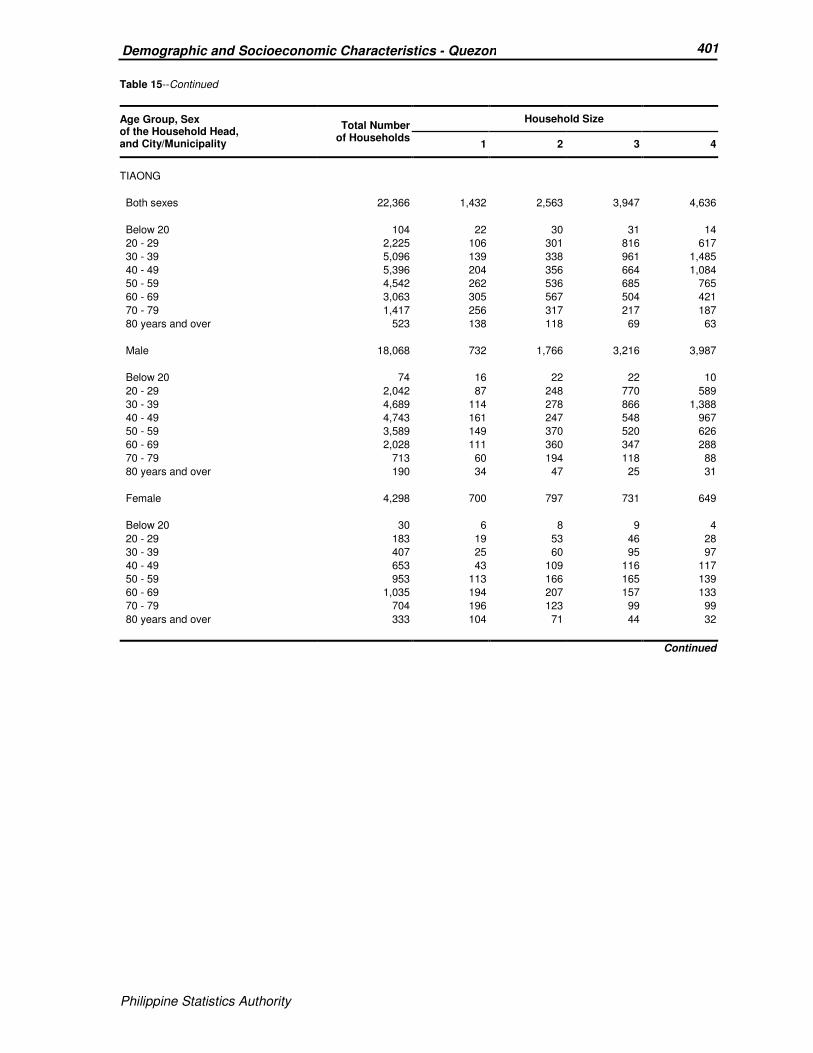
Philippine Statistics Authority
401 Demographic and Socioeconomic Characteristics - Quezon
Philippine Statistics Authority
Table 15--Continued
Age Group, Sex of the Household Head, and City/Municipality
Total Number of Households
Household Size
1 2 3 4
TIAONG
Both sexes 22,366 1,432 2,563 3,947 4,636
Below 20 104 22 30 31 14
20 - 29 2,225 106 301 816 617
30 - 39 5,096 139 338 961 1,485
40 - 49 5,396 204 356 664 1,084
50 - 59 4,542 262 536 685 765
60 - 69 3,063 305 567 504 421
70 - 79 1,417 256 317 217 187
80 years and over 523 138 118 69 63
Male 18,068 732 1,766 3,216 3,987
Below 20 74 16 22 22 10
20 - 29 2,042 87 248 770 589
30 - 39 4,689 114 278 866 1,388
40 - 49 4,743 161 247 548 967
50 - 59 3,589 149 370 520 626
60 - 69 2,028 111 360 347 288
70 - 79 713 60 194 118 88
80 years and over 190 34 47 25 31
Female 4,298 700 797 731 649
Below 20 30 6 8 9 4
20 - 29 183 19 53 46 28
30 - 39 407 25 60 95 97
40 - 49 653 43 109 116 117
50 - 59 953 113 166 165 139
60 - 69 1,035 194 207 157 133
70 - 79 704 196 123 99 99
80 years and over 333 104 71 44 32
Continued

Philippine Statistics Authority
402 Demographic and Socioeconomic Characteristics - Quezon
Philippine Statistics Authority
Table 15--Continued
Age Group, Sex of the Household Head, and City/Municipality
Total Number of Households
Household Size
1 2 3 4
UNISAN
Both sexes 6,290 535 836 1,155 1,195
Below 20 27 2 11 12 1
20 - 29 658 31 76 293 158
30 - 39 1,236 62 83 222 332
40 - 49 1,490 76 107 181 288
50 - 59 1,367 100 165 205 247
60 - 69 901 117 208 140 125
70 - 79 468 102 143 83 37
80 years and over 143 45 43 19 7
Male 5,289 326 622 974 1,073
Below 20 27 2 11 12 1
20 - 29 620 25 65 284 154
30 - 39 1,170 58 67 209 317
40 - 49 1,355 69 86 154 261
50 - 59 1,154 69 130 150 213
60 - 69 647 65 146 103 98
70 - 79 248 29 90 55 23
80 years and over 68 9 27 7 6
Female 1,001 209 214 181 122
Below 20 - - - - -
20 - 29 38 6 11 9 4
30 - 39 66 4 16 13 15
40 - 49 135 7 21 27 27
50 - 59 213 31 35 55 34
60 - 69 254 52 62 37 27
70 - 79 220 73 53 28 14
80 years and over 75 36 16 12 1
Continued
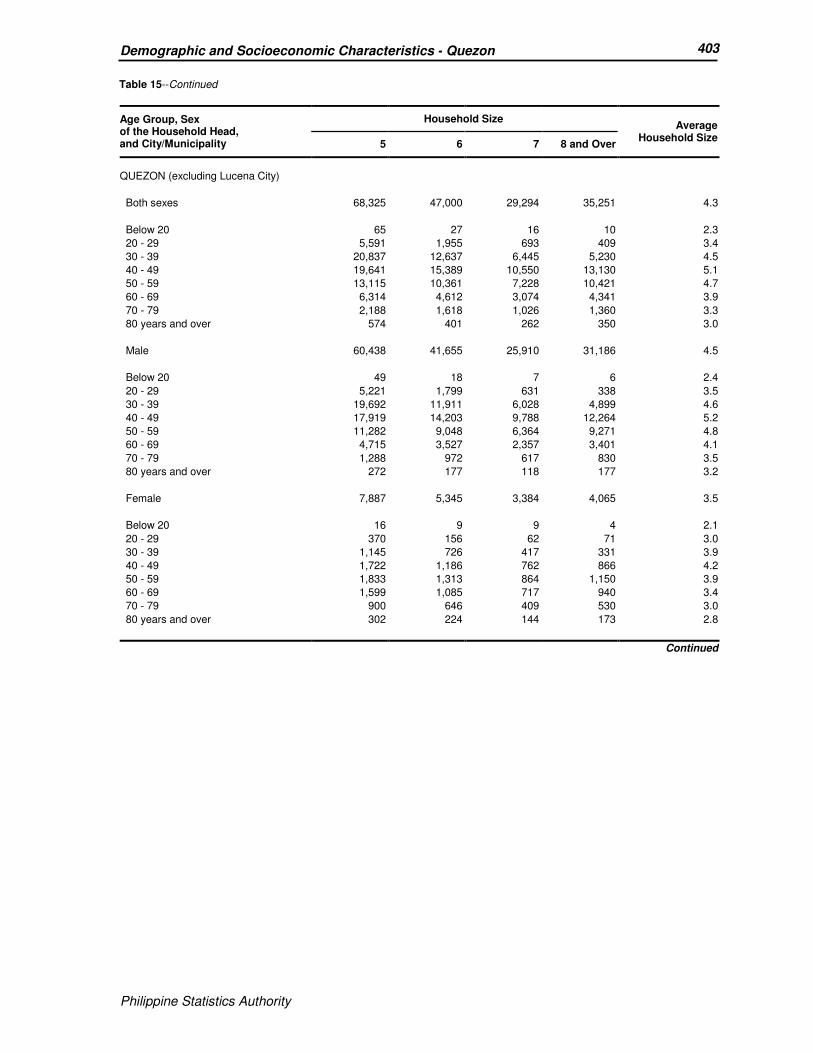
Philippine Statistics Authority
403 Demographic and Socioeconomic Characteristics - Quezon
Philippine Statistics Authority
Table 15--Continued
Age Group, Sex of the Household Head, and City/Municipality
Household Size Average
Household Size 5 6 7 8 and Over
QUEZON (excluding Lucena City)
Both sexes 68,325 47,000 29,294 35,251 4.3
Below 20 65 27 16 10 2.3
20 - 29 5,591 1,955 693 409 3.4
30 - 39 20,837 12,637 6,445 5,230 4.5
40 - 49 19,641 15,389 10,550 13,130 5.1
50 - 59 13,115 10,361 7,228 10,421 4.7
60 - 69 6,314 4,612 3,074 4,341 3.9
70 - 79 2,188 1,618 1,026 1,360 3.3
80 years and over 574 401 262 350 3.0
Male 60,438 41,655 25,910 31,186 4.5
Below 20 49 18 7 6 2.4
20 - 29 5,221 1,799 631 338 3.5
30 - 39 19,692 11,911 6,028 4,899 4.6
40 - 49 17,919 14,203 9,788 12,264 5.2
50 - 59 11,282 9,048 6,364 9,271 4.8
60 - 69 4,715 3,527 2,357 3,401 4.1
70 - 79 1,288 972 617 830 3.5
80 years and over 272 177 118 177 3.2
Female 7,887 5,345 3,384 4,065 3.5
Below 20 16 9 9 4 2.1
20 - 29 370 156 62 71 3.0
30 - 39 1,145 726 417 331 3.9
40 - 49 1,722 1,186 762 866 4.2
50 - 59 1,833 1,313 864 1,150 3.9
60 - 69 1,599 1,085 717 940 3.4
70 - 79 900 646 409 530 3.0
80 years and over 302 224 144 173 2.8
Continued

Philippine Statistics Authority
404 Demographic and Socioeconomic Characteristics - Quezon
Philippine Statistics Authority
Table 15--Continued
Age Group, Sex of the Household Head, and City/Municipality
Household Size Average
Household Size 5 6 7 8 and Over
AGDANGAN
Both sexes 475 302 191 205 4.1
Below 20 1 1 - - 2.6
20 - 29 23 15 4 5 3.5
30 - 39 150 65 41 19 4.3
40 - 49 142 110 62 87 4.8
50 - 59 95 65 55 63 4.2
60 - 69 44 31 23 23 3.5
70 - 79 19 11 3 7 2.8
80 years and over 1 4 3 1 2.6
Male 414 268 168 185 4.3
Below 20 1 1 - - 2.7
20 - 29 20 14 4 4 3.6
30 - 39 141 65 36 17 4.4
40 - 49 128 103 57 80 4.9
50 - 59 79 61 50 57 4.5
60 - 69 35 19 17 23 3.7
70 - 79 10 5 3 4 3.0
80 years and over - - 1 - 2.4
Female 61 34 23 20 3.1
Below 20 - - - - 1.5
20 - 29 3 1 - 1 3.4
30 - 39 9 - 5 2 3.4
40 - 49 14 7 5 7 3.9
50 - 59 16 4 5 6 3.3
60 - 69 9 12 6 - 2.9
70 - 79 9 6 - 3 2.5
80 years and over 1 4 2 1 2.8
Continued
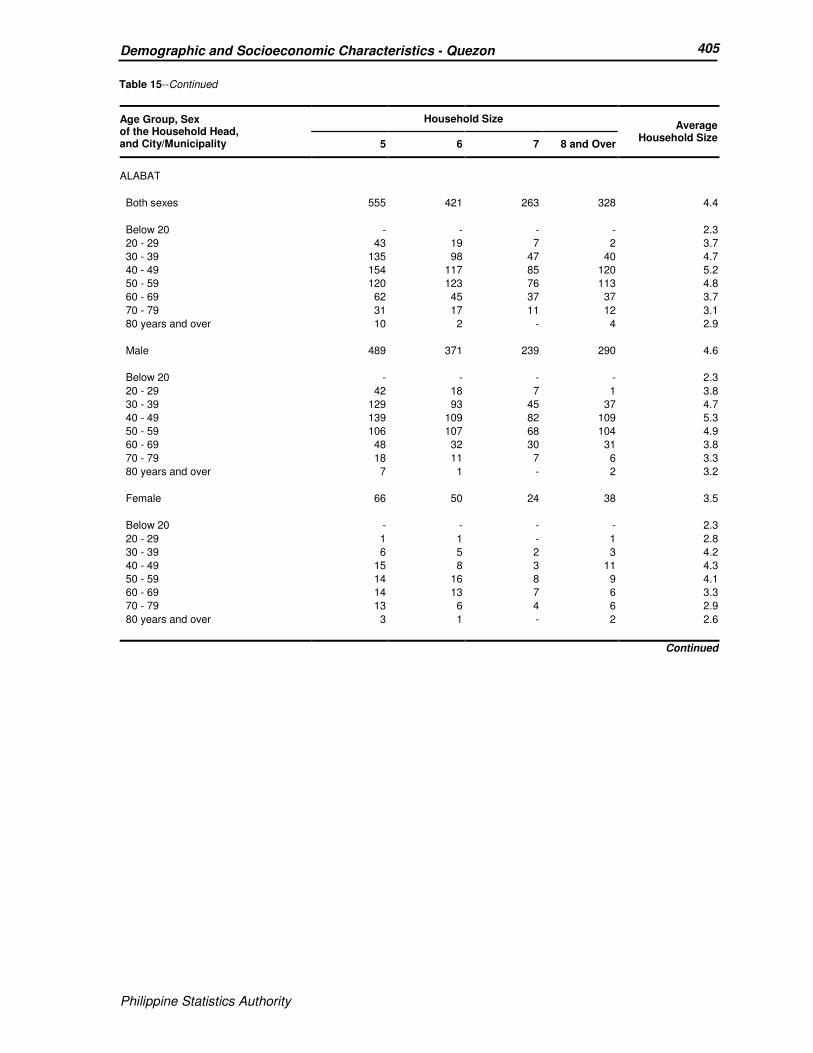
Philippine Statistics Authority
405 Demographic and Socioeconomic Characteristics - Quezon
Philippine Statistics Authority
Table 15--Continued
Age Group, Sex of the Household Head, and City/Municipality
Household Size Average
Household Size 5 6 7 8 and Over
ALABAT
Both sexes 555 421 263 328 4.4
Below 20 - - - - 2.3
20 - 29 43 19 7 2 3.7
30 - 39 135 98 47 40 4.7
40 - 49 154 117 85 120 5.2
50 - 59 120 123 76 113 4.8
60 - 69 62 45 37 37 3.7
70 - 79 31 17 11 12 3.1
80 years and over 10 2 - 4 2.9
Male 489 371 239 290 4.6
Below 20 - - - - 2.3
20 - 29 42 18 7 1 3.8
30 - 39 129 93 45 37 4.7
40 - 49 139 109 82 109 5.3
50 - 59 106 107 68 104 4.9
60 - 69 48 32 30 31 3.8
70 - 79 18 11 7 6 3.3
80 years and over 7 1 - 2 3.2
Female 66 50 24 38 3.5
Below 20 - - - - 2.3
20 - 29 1 1 - 1 2.8
30 - 39 6 5 2 3 4.2
40 - 49 15 8 3 11 4.3
50 - 59 14 16 8 9 4.1
60 - 69 14 13 7 6 3.3
70 - 79 13 6 4 6 2.9
80 years and over 3 1 - 2 2.6
Continued

Philippine Statistics Authority
406 Demographic and Socioeconomic Characteristics - Quezon
Philippine Statistics Authority
Table 15--Continued
Age Group, Sex of the Household Head, and City/Municipality
Household Size Average
Household Size 5 6 7 8 and Over
ATIMONAN
Both sexes 2,339 1,528 930 1,163 4.2
Below 20 3 3 - 1 2.5
20 - 29 179 66 30 17 3.5
30 - 39 597 332 170 134 4.4
40 - 49 649 469 298 352 4.8
50 - 59 497 367 247 363 4.5
60 - 69 282 203 132 207 4.0
70 - 79 112 74 42 67 3.4
80 years and over 20 14 11 22 3.1
Male 2,029 1,335 780 970 4.4
Below 20 3 2 - 1 2.6
20 - 29 167 61 27 13 3.5
30 - 39 562 308 156 121 4.4
40 - 49 595 432 267 315 4.9
50 - 59 423 316 204 318 4.6
60 - 69 213 160 96 152 4.1
70 - 79 60 49 24 36 3.6
80 years and over 6 7 6 14 3.5
Female 310 193 150 193 3.7
Below 20 - 1 - - 2.3
20 - 29 12 5 3 4 3.3
30 - 39 35 24 14 13 4.0
40 - 49 54 37 31 37 4.2
50 - 59 74 51 43 45 4.0
60 - 69 69 43 36 55 3.8
70 - 79 52 25 18 31 3.2
80 years and over 14 7 5 8 2.8
Continued

Philippine Statistics Authority
407 Demographic and Socioeconomic Characteristics - Quezon
Philippine Statistics Authority
Table 15--Continued
Age Group, Sex of the Household Head, and City/Municipality
Household Size Average
Household Size 5 6 7 8 and Over
BUENAVISTA
Both sexes 1,022 792 512 597 4.4
Below 20 - - 1 - 2.2
20 - 29 97 32 9 10 3.4
30 - 39 365 244 144 121 4.7
40 - 49 304 280 191 263 5.3
50 - 59 160 154 108 148 4.7
60 - 69 72 61 38 44 3.7
70 - 79 18 19 17 9 3.0
80 years and over 6 2 4 2 2.7
Male 937 721 474 560 4.6
Below 20 - - 1 - 2.2
20 - 29 90 30 8 8 3.4
30 - 39 344 233 134 117 4.8
40 - 49 281 259 186 252 5.4
50 - 59 143 140 103 139 4.9
60 - 69 59 45 31 35 4.0
70 - 79 17 14 10 7 3.3
80 years and over 3 - 1 2 2.7
Female 85 71 38 37 3.4
Below 20 - - - - 2.2
20 - 29 7 2 1 2 3.1
30 - 39 21 11 10 4 4.1
40 - 49 23 21 5 11 4.2
50 - 59 17 14 5 9 3.6
60 - 69 13 16 7 9 3.1
70 - 79 1 5 7 2 2.5
80 years and over 3 2 3 - 2.7
Continued
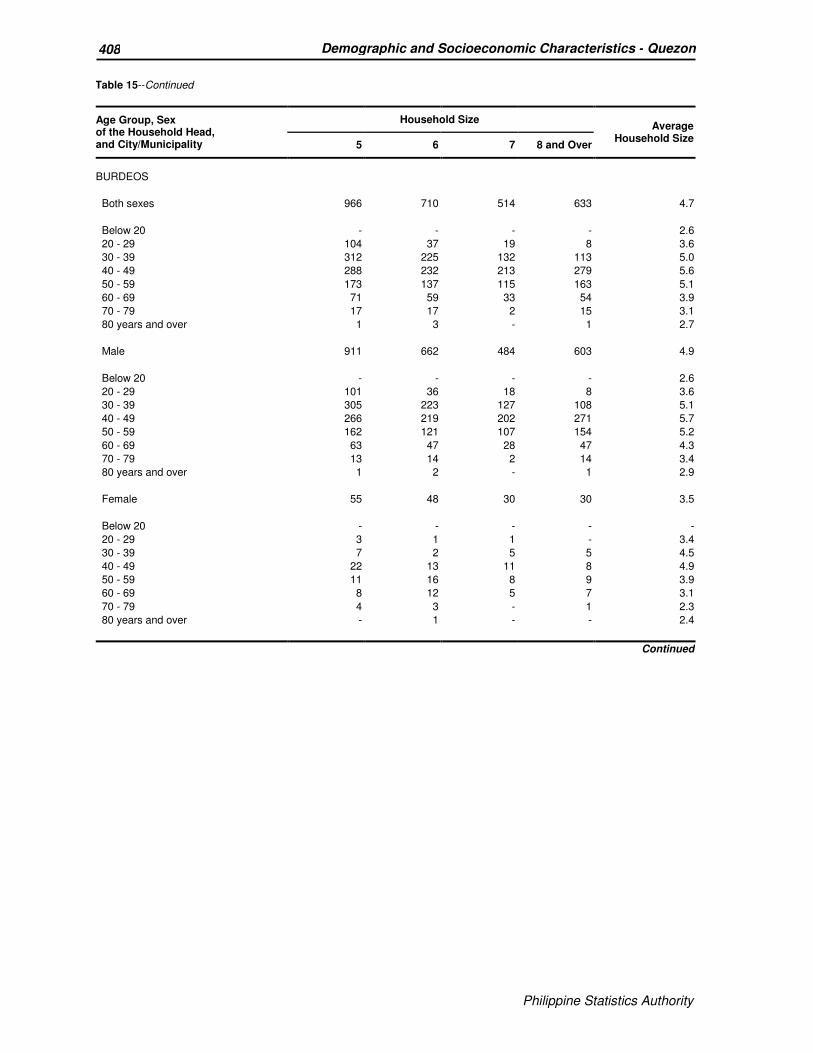
Philippine Statistics Authority
408 Demographic and Socioeconomic Characteristics - Quezon
Philippine Statistics Authority
Table 15--Continued
Age Group, Sex of the Household Head, and City/Municipality
Household Size Average
Household Size 5 6 7 8 and Over
BURDEOS
Both sexes 966 710 514 633 4.7
Below 20 - - - - 2.6
20 - 29 104 37 19 8 3.6
30 - 39 312 225 132 113 5.0
40 - 49 288 232 213 279 5.6
50 - 59 173 137 115 163 5.1
60 - 69 71 59 33 54 3.9
70 - 79 17 17 2 15 3.1
80 years and over 1 3 - 1 2.7
Male 911 662 484 603 4.9
Below 20 - - - - 2.6
20 - 29 101 36 18 8 3.6
30 - 39 305 223 127 108 5.1
40 - 49 266 219 202 271 5.7
50 - 59 162 121 107 154 5.2
60 - 69 63 47 28 47 4.3
70 - 79 13 14 2 14 3.4
80 years and over 1 2 - 1 2.9
Female 55 48 30 30 3.5
Below 20 - - - - -
20 - 29 3 1 1 - 3.4
30 - 39 7 2 5 5 4.5
40 - 49 22 13 11 8 4.9
50 - 59 11 16 8 9 3.9
60 - 69 8 12 5 7 3.1
70 - 79 4 3 - 1 2.3
80 years and over - 1 - - 2.4
Continued

Philippine Statistics Authority
409 Demographic and Socioeconomic Characteristics - Quezon
Philippine Statistics Authority
Table 15--Continued
Age Group, Sex of the Household Head, and City/Municipality
Household Size Average
Household Size 5 6 7 8 and Over
CALAUAG
Both sexes 2,778 1,884 1,174 1,351 4.3
Below 20 3 1 - - 2.3
20 - 29 227 79 23 10 3.4
30 - 39 842 504 259 185 4.6
40 - 49 787 611 430 537 5.1
50 - 59 533 445 298 411 4.6
60 - 69 258 170 119 146 3.8
70 - 79 101 58 37 53 3.2
80 years and over 27 16 8 9 2.9
Male 2,456 1,659 1,051 1,212 4.5
Below 20 2 1 - - 2.4
20 - 29 205 70 17 7 3.4
30 - 39 797 472 242 171 4.6
40 - 49 723 557 406 504 5.2
50 - 59 462 389 269 372 4.8
60 - 69 198 123 89 115 4.0
70 - 79 58 39 22 37 3.5
80 years and over 11 8 6 6 3.4
Female 322 225 123 139 3.5
Below 20 1 - - - 2.3
20 - 29 22 9 6 3 3.2
30 - 39 45 32 17 14 4.1
40 - 49 64 54 24 33 4.2
50 - 59 71 56 29 39 3.7
60 - 69 60 47 30 31 3.4
70 - 79 43 19 15 16 2.8
80 years and over 16 8 2 3 2.6
Continued

Philippine Statistics Authority
410 Demographic and Socioeconomic Characteristics - Quezon
Philippine Statistics Authority
Table 15--Continued
Age Group, Sex of the Household Head, and City/Municipality
Household Size Average
Household Size 5 6 7 8 and Over
CANDELARIA
Both sexes 4,499 2,874 1,684 1,802 4.2
Below 20 5 1 1 - 2.4
20 - 29 369 125 44 25 3.3
30 - 39 1,362 757 357 294 4.3
40 - 49 1,301 913 581 626 4.8
50 - 59 881 633 416 534 4.4
60 - 69 409 294 210 219 3.8
70 - 79 122 122 51 79 3.4
80 years and over 50 29 24 25 3.1
Male 3,883 2,426 1,412 1,516 4.3
Below 20 4 - - - 2.4
20 - 29 344 113 42 16 3.4
30 - 39 1,279 711 322 259 4.4
40 - 49 1,166 821 517 579 5.0
50 - 59 722 510 353 456 4.6
60 - 69 280 202 146 158 4.0
70 - 79 67 59 24 43 3.6
80 years and over 21 10 8 5 3.1
Female 616 448 272 286 3.5
Below 20 1 1 1 - 2.6
20 - 29 25 12 2 9 2.9
30 - 39 83 46 35 35 3.7
40 - 49 135 92 64 47 3.9
50 - 59 159 123 63 78 3.8
60 - 69 129 92 64 61 3.5
70 - 79 55 63 27 36 3.2
80 years and over 29 19 16 20 3.1
Continued

Philippine Statistics Authority
411 Demographic and Socioeconomic Characteristics - Quezon
Philippine Statistics Authority
Table 15--Continued
Age Group, Sex of the Household Head, and City/Municipality
Household Size Average
Household Size 5 6 7 8 and Over
CATANAUAN
Both sexes 2,456 1,837 1,244 1,693 4.6
Below 20 3 1 - - 2.4
20 - 29 232 92 30 11 3.6
30 - 39 819 557 284 256 4.8
40 - 49 645 609 488 710 5.6
50 - 59 434 363 280 469 5.0
60 - 69 221 155 103 183 4.0
70 - 79 81 45 52 48 3.3
80 years and over 21 15 7 16 3.1
Male 2,207 1,640 1,096 1,527 4.8
Below 20 3 1 - - 2.6
20 - 29 216 87 28 9 3.6
30 - 39 788 519 267 243 4.8
40 - 49 598 564 448 673 5.7
50 - 59 375 320 243 425 5.1
60 - 69 167 116 77 141 4.2
70 - 79 51 25 30 30 3.6
80 years and over 9 8 3 6 3.2
Female 249 197 148 166 3.8
Below 20 - - - - 1.9
20 - 29 16 5 2 2 3.5
30 - 39 31 38 17 13 4.3
40 - 49 47 45 40 37 4.6
50 - 59 59 43 37 44 4.1
60 - 69 54 39 26 42 3.5
70 - 79 30 20 22 18 3.0
80 years and over 12 7 4 10 3.1
Continued

Philippine Statistics Authority
412 Demographic and Socioeconomic Characteristics - Quezon
Philippine Statistics Authority
Table 15--Continued
Age Group, Sex of the Household Head, and City/Municipality
Household Size Average
Household Size 5 6 7 8 and Over
DOLORES
Both sexes 1,083 756 451 523 4.4
Below 20 - - - - 2.9
20 - 29 46 16 7 6 3.5
30 - 39 278 158 63 39 4.3
40 - 49 333 230 136 158 4.9
50 - 59 234 205 132 189 4.9
60 - 69 122 98 80 96 4.4
70 - 79 54 37 24 29 3.6
80 years and over 16 12 9 6 3.1
Male 953 641 385 439 4.6
Below 20 - - - - 3.0
20 - 29 45 15 6 6 3.6
30 - 39 267 150 59 37 4.3
40 - 49 316 209 122 148 4.9
50 - 59 205 172 116 157 5.0
60 - 69 85 69 60 69 4.6
70 - 79 25 20 18 17 4.1
80 years and over 10 6 4 5 3.7
Female 130 115 66 84 3.8
Below 20 - - - - 2.0
20 - 29 1 1 1 - 2.8
30 - 39 11 8 4 2 3.8
40 - 49 17 21 14 10 4.1
50 - 59 29 33 16 32 4.4
60 - 69 37 29 20 27 4.0
70 - 79 29 17 6 12 3.2
80 years and over 6 6 5 1 2.7
Continued

Philippine Statistics Authority
413 Demographic and Socioeconomic Characteristics - Quezon
Philippine Statistics Authority
Table 15--Continued
Age Group, Sex of the Household Head, and City/Municipality
Household Size Average
Household Size 5 6 7 8 and Over
GENERAL LUNA
Both sexes 935 719 446 653 4.7
Below 20 1 - 1 - 2.4
20 - 29 86 24 8 2 3.5
30 - 39 266 203 100 82 4.8
40 - 49 277 259 151 248 5.5
50 - 59 172 139 123 204 5.2
60 - 69 85 71 41 93 4.2
70 - 79 39 19 20 23 3.4
80 years and over 9 4 2 1 2.6
Male 837 642 392 585 4.8
Below 20 1 - - - 2.4
20 - 29 84 23 8 2 3.5
30 - 39 253 196 92 75 4.8
40 - 49 257 247 144 236 5.6
50 - 59 151 110 109 183 5.2
60 - 69 63 53 27 76 4.3
70 - 79 23 11 10 13 3.6
80 years and over 5 2 2 - 2.9
Female 98 77 54 68 3.9
Below 20 - - 1 - 2.8
20 - 29 2 1 - - 2.9
30 - 39 13 7 8 7 4.3
40 - 49 20 12 7 12 4.3
50 - 59 21 29 14 21 4.7
60 - 69 22 18 14 17 4.0
70 - 79 16 8 10 10 3.1
80 years and over 4 2 - 1 2.3
Continued

Philippine Statistics Authority
414 Demographic and Socioeconomic Characteristics - Quezon
Philippine Statistics Authority
Table 15--Continued
Age Group, Sex of the Household Head, and City/Municipality
Household Size Average
Household Size 5 6 7 8 and Over
GENERAL NAKAR
Both sexes 1,019 730 521 686 4.6
Below 20 1 - - 1 2.7
20 - 29 105 31 15 14 3.5
30 - 39 325 234 116 107 4.7
40 - 49 285 239 188 284 5.6
50 - 59 187 163 126 206 5.0
60 - 69 90 47 62 65 4.1
70 - 79 20 14 9 9 3.2
80 years and over 6 2 5 - 2.7
Male 952 692 494 660 4.7
Below 20 1 - - - 2.6
20 - 29 104 31 14 14 3.5
30 - 39 321 226 115 106 4.7
40 - 49 264 229 183 276 5.6
50 - 59 170 154 117 199 5.2
60 - 69 73 41 53 60 4.4
70 - 79 16 10 7 5 3.4
80 years and over 3 1 5 - 3.3
Female 67 38 27 26 3.4
Below 20 - - - 1 4.0
20 - 29 1 - 1 - 2.5
30 - 39 4 8 1 1 3.6
40 - 49 21 10 5 8 4.5
50 - 59 17 9 9 7 3.8
60 - 69 17 6 9 5 3.3
70 - 79 4 4 2 4 2.8
80 years and over 3 1 - - 2.2
Continued

Philippine Statistics Authority
415 Demographic and Socioeconomic Characteristics - Quezon
Philippine Statistics Authority
Table 15--Continued
Age Group, Sex of the Household Head, and City/Municipality
Household Size Average
Household Size 5 6 7 8 and Over
GUINAYANGAN
Both sexes 1,670 1,133 690 879 4.4
Below 20 3 - - - 2.5
20 - 29 112 35 11 6 3.4
30 - 39 514 292 144 116 4.5
40 - 49 504 411 261 329 5.2
50 - 59 324 256 188 309 4.8
60 - 69 161 99 63 91 3.8
70 - 79 40 36 16 20 2.9
80 years and over 12 4 7 8 2.9
Male 1,512 1,018 626 791 4.5
Below 20 3 - - - 2.6
20 - 29 104 34 11 6 3.4
30 - 39 489 275 140 107 4.5
40 - 49 474 379 244 313 5.2
50 - 59 287 230 174 275 4.9
60 - 69 116 75 42 70 4.0
70 - 79 30 23 10 14 3.2
80 years and over 9 2 5 6 3.5
Female 158 115 64 88 3.5
Below 20 - - - - 1.8
20 - 29 8 1 - - 2.9
30 - 39 25 17 4 9 4.1
40 - 49 30 32 17 16 4.3
50 - 59 37 26 14 34 4.2
60 - 69 45 24 21 21 3.4
70 - 79 10 13 6 6 2.6
80 years and over 3 2 2 2 2.4
Continued

Philippine Statistics Authority
416 Demographic and Socioeconomic Characteristics - Quezon
Philippine Statistics Authority
Table 15--Continued
Age Group, Sex of the Household Head, and City/Municipality
Household Size Average
Household Size 5 6 7 8 and Over
GUMACA
Both sexes 2,611 1,804 1,143 1,072 4.0
Below 20 - - 1 - 2.0
20 - 29 216 74 22 6 3.2
30 - 39 748 497 247 183 4.3
40 - 49 788 595 417 431 4.8
50 - 59 499 395 282 293 4.2
60 - 69 226 159 117 110 3.4
70 - 79 98 66 44 41 3.0
80 years and over 36 18 13 8 2.7
Male 2,239 1,556 980 943 4.2
Below 20 - - - - 2.1
20 - 29 196 62 20 5 3.3
30 - 39 684 457 221 170 4.4
40 - 49 709 537 375 403 4.9
50 - 59 417 346 246 248 4.4
60 - 69 168 110 85 89 3.6
70 - 79 51 41 26 22 3.2
80 years and over 14 3 7 6 3.0
Female 372 248 163 129 3.2
Below 20 - - 1 - 1.9
20 - 29 20 12 2 1 2.6
30 - 39 64 40 26 13 3.7
40 - 49 79 58 42 28 4.0
50 - 59 82 49 36 45 3.6
60 - 69 58 49 32 21 3.0
70 - 79 47 25 18 19 2.8
80 years and over 22 15 6 2 2.6
Continued
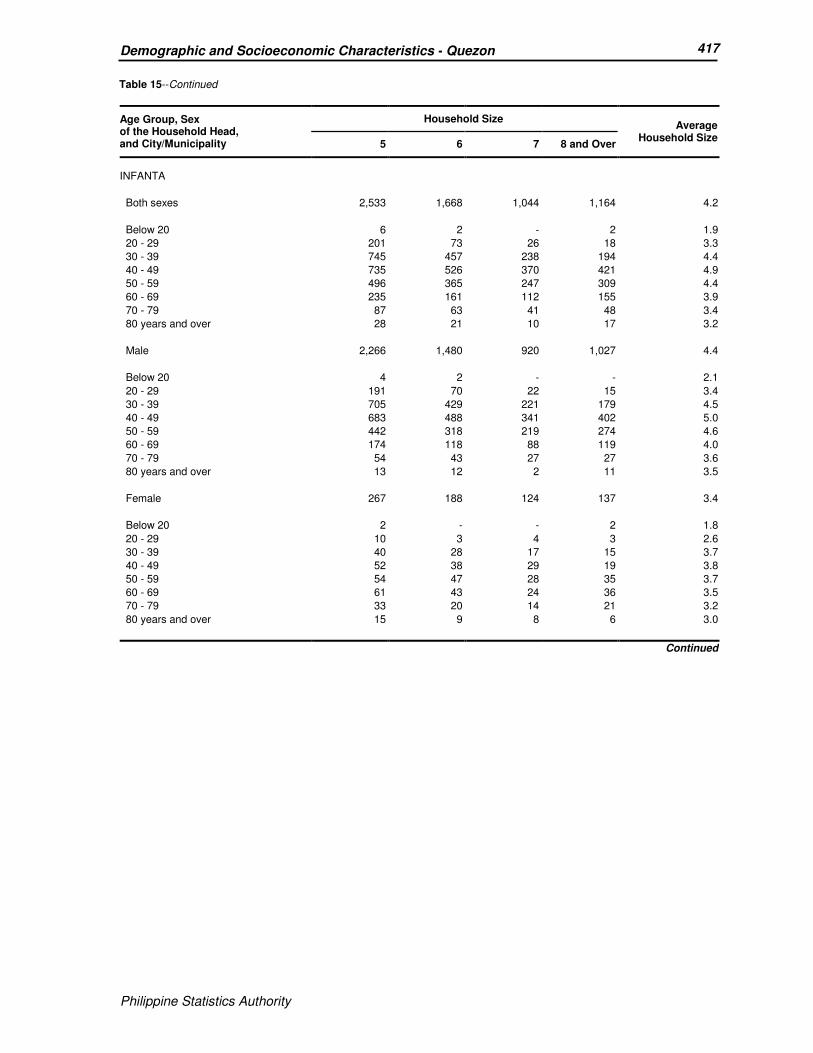
Philippine Statistics Authority
417 Demographic and Socioeconomic Characteristics - Quezon
Philippine Statistics Authority
Table 15--Continued
Age Group, Sex of the Household Head, and City/Municipality
Household Size Average
Household Size 5 6 7 8 and Over
INFANTA
Both sexes 2,533 1,668 1,044 1,164 4.2
Below 20 6 2 - 2 1.9
20 - 29 201 73 26 18 3.3
30 - 39 745 457 238 194 4.4
40 - 49 735 526 370 421 4.9
50 - 59 496 365 247 309 4.4
60 - 69 235 161 112 155 3.9
70 - 79 87 63 41 48 3.4
80 years and over 28 21 10 17 3.2
Male 2,266 1,480 920 1,027 4.4
Below 20 4 2 - - 2.1
20 - 29 191 70 22 15 3.4
30 - 39 705 429 221 179 4.5
40 - 49 683 488 341 402 5.0
50 - 59 442 318 219 274 4.6
60 - 69 174 118 88 119 4.0
70 - 79 54 43 27 27 3.6
80 years and over 13 12 2 11 3.5
Female 267 188 124 137 3.4
Below 20 2 - - 2 1.8
20 - 29 10 3 4 3 2.6
30 - 39 40 28 17 15 3.7
40 - 49 52 38 29 19 3.8
50 - 59 54 47 28 35 3.7
60 - 69 61 43 24 36 3.5
70 - 79 33 20 14 21 3.2
80 years and over 15 9 8 6 3.0
Continued
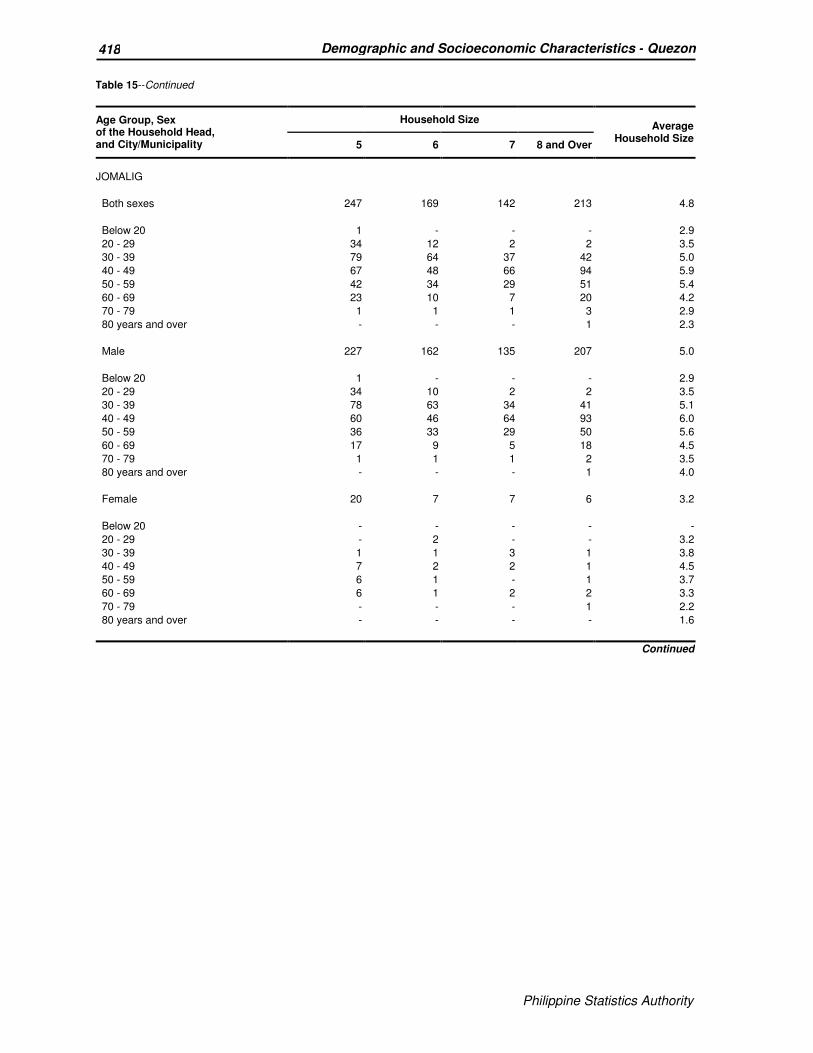
Philippine Statistics Authority
418 Demographic and Socioeconomic Characteristics - Quezon
Philippine Statistics Authority
Table 15--Continued
Age Group, Sex of the Household Head, and City/Municipality
Household Size Average
Household Size 5 6 7 8 and Over
JOMALIG
Both sexes 247 169 142 213 4.8
Below 20 1 - - - 2.9
20 - 29 34 12 2 2 3.5
30 - 39 79 64 37 42 5.0
40 - 49 67 48 66 94 5.9
50 - 59 42 34 29 51 5.4
60 - 69 23 10 7 20 4.2
70 - 79 1 1 1 3 2.9
80 years and over - - - 1 2.3
Male 227 162 135 207 5.0
Below 20 1 - - - 2.9
20 - 29 34 10 2 2 3.5
30 - 39 78 63 34 41 5.1
40 - 49 60 46 64 93 6.0
50 - 59 36 33 29 50 5.6
60 - 69 17 9 5 18 4.5
70 - 79 1 1 1 2 3.5
80 years and over - - - 1 4.0
Female 20 7 7 6 3.2
Below 20 - - - - -
20 - 29 - 2 - - 3.2
30 - 39 1 1 3 1 3.8
40 - 49 7 2 2 1 4.5
50 - 59 6 1 - 1 3.7
60 - 69 6 1 2 2 3.3
70 - 79 - - - 1 2.2
80 years and over - - - - 1.6
Continued

Philippine Statistics Authority
419 Demographic and Socioeconomic Characteristics - Quezon
Philippine Statistics Authority
Table 15--Continued
Age Group, Sex of the Household Head, and City/Municipality
Household Size Average
Household Size 5 6 7 8 and Over
LOPEZ
Both sexes 3,478 2,524 1,518 2,121 4.6
Below 20 6 1 1 - 2.4
20 - 29 290 108 49 27 3.5
30 - 39 1,040 618 306 272 4.6
40 - 49 969 812 505 712 5.2
50 - 59 660 560 368 634 4.9
60 - 69 355 291 176 301 4.3
70 - 79 128 110 88 135 3.8
80 years and over 30 24 25 40 3.6
Male 3,054 2,228 1,326 1,821 4.7
Below 20 2 1 1 - 2.4
20 - 29 265 98 48 24 3.6
30 - 39 996 591 286 259 4.7
40 - 49 887 761 472 655 5.3
50 - 59 563 479 326 555 5.0
60 - 69 261 224 131 229 4.5
70 - 79 69 62 52 79 4.0
80 years and over 11 12 10 20 3.7
Female 424 296 192 300 4.0
Below 20 4 - - - 2.4
20 - 29 25 10 1 3 3.2
30 - 39 44 27 20 13 4.0
40 - 49 82 51 33 57 4.5
50 - 59 97 81 42 79 4.3
60 - 69 94 67 45 72 3.9
70 - 79 59 48 36 56 3.6
80 years and over 19 12 15 20 3.5
Continued

Philippine Statistics Authority
420 Demographic and Socioeconomic Characteristics - Quezon
Philippine Statistics Authority
Table 15--Continued
Age Group, Sex of the Household Head, and City/Municipality
Household Size Average
Household Size 5 6 7 8 and Over
LUCBAN
Both sexes 1,914 1,260 749 966 4.2
Below 20 5 1 3 4 1.7
20 - 29 97 50 21 19 3.2
30 - 39 508 248 125 93 4.3
40 - 49 588 390 257 269 4.9
50 - 59 437 334 210 312 4.7
60 - 69 183 152 83 187 4.1
70 - 79 68 66 40 63 3.6
80 years and over 28 19 10 19 3.4
Male 1,662 1,092 659 785 4.4
Below 20 3 1 2 3 1.8
20 - 29 91 41 16 12 3.3
30 - 39 485 231 118 85 4.4
40 - 49 526 362 240 236 5.0
50 - 59 375 292 181 263 4.8
60 - 69 128 114 67 143 4.2
70 - 79 36 46 29 39 3.7
80 years and over 18 5 6 4 3.3
Female 252 168 90 181 3.6
Below 20 2 - 1 1 1.5
20 - 29 6 9 5 7 3.0
30 - 39 23 17 7 8 3.4
40 - 49 62 28 17 33 4.1
50 - 59 62 42 29 49 4.0
60 - 69 55 38 16 44 3.8
70 - 79 32 20 11 24 3.3
80 years and over 10 14 4 15 3.4
Continued

Philippine Statistics Authority
421 Demographic and Socioeconomic Characteristics - Quezon
Philippine Statistics Authority
Table 15--Continued
Age Group, Sex of the Household Head, and City/Municipality
Household Size Average
Household Size 5 6 7 8 and Over
MACALELON
Both sexes 1,000 788 485 686 4.7
Below 20 1 - 1 - 3.0
20 - 29 82 30 10 6 3.6
30 - 39 335 236 111 88 4.8
40 - 49 254 243 166 215 5.5
50 - 59 181 169 118 258 5.3
60 - 69 105 89 61 88 4.3
70 - 79 35 17 15 27 3.5
80 years and over 7 4 3 4 2.7
Male 902 717 438 621 4.9
Below 20 1 - - - 2.6
20 - 29 77 28 9 6 3.6
30 - 39 323 228 105 84 4.8
40 - 49 238 228 156 203 5.6
50 - 59 164 148 102 239 5.4
60 - 69 75 73 57 69 4.5
70 - 79 20 10 8 19 3.7
80 years and over 4 2 1 1 2.9
Female 98 71 47 65 3.9
Below 20 - - 1 - 4.0
20 - 29 5 2 1 - 3.5
30 - 39 12 8 6 4 4.1
40 - 49 16 15 10 12 5.0
50 - 59 17 21 16 19 4.4
60 - 69 30 16 4 19 3.9
70 - 79 15 7 7 8 3.2
80 years and over 3 2 2 3 2.6
Continued

Philippine Statistics Authority
422 Demographic and Socioeconomic Characteristics - Quezon
Philippine Statistics Authority
Table 15--Continued
Age Group, Sex of the Household Head, and City/Municipality
Household Size Average
Household Size 5 6 7 8 and Over
MAUBAN
Both sexes 2,574 1,667 975 887 4.1
Below 20 - 1 - - 2.4
20 - 29 236 68 17 8 3.4
30 - 39 824 468 236 132 4.5
40 - 49 738 572 381 391 5.0
50 - 59 480 378 229 246 4.3
60 - 69 192 126 85 79 3.5
70 - 79 84 47 20 27 3.0
80 years and over 20 7 7 4 2.6
Male 2,315 1,519 898 812 4.3
Below 20 - - - - 2.4
20 - 29 224 61 16 7 3.4
30 - 39 776 444 224 126 4.6
40 - 49 667 538 358 362 5.1
50 - 59 424 344 217 228 4.4
60 - 69 156 103 68 72 3.6
70 - 79 56 26 13 14 3.0
80 years and over 12 3 2 3 2.9
Female 259 148 77 75 3.3
Below 20 - 1 - - 2.3
20 - 29 12 7 1 1 2.9
30 - 39 48 24 12 6 3.9
40 - 49 71 34 23 29 4.2
50 - 59 56 34 12 18 3.4
60 - 69 36 23 17 7 3.0
70 - 79 28 21 7 13 2.9
80 years and over 8 4 5 1 2.5
Continued
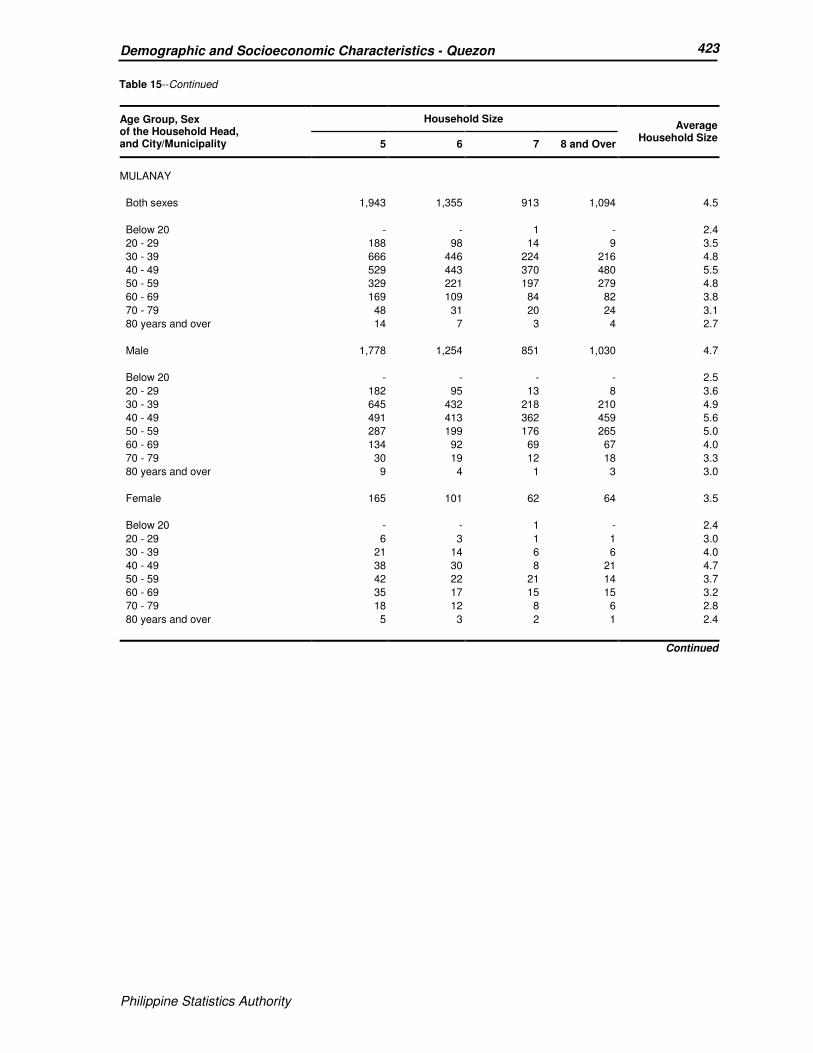
Philippine Statistics Authority
423 Demographic and Socioeconomic Characteristics - Quezon
Philippine Statistics Authority
Table 15--Continued
Age Group, Sex of the Household Head, and City/Municipality
Household Size Average
Household Size 5 6 7 8 and Over
MULANAY
Both sexes 1,943 1,355 913 1,094 4.5
Below 20 - - 1 - 2.4
20 - 29 188 98 14 9 3.5
30 - 39 666 446 224 216 4.8
40 - 49 529 443 370 480 5.5
50 - 59 329 221 197 279 4.8
60 - 69 169 109 84 82 3.8
70 - 79 48 31 20 24 3.1
80 years and over 14 7 3 4 2.7
Male 1,778 1,254 851 1,030 4.7
Below 20 - - - - 2.5
20 - 29 182 95 13 8 3.6
30 - 39 645 432 218 210 4.9
40 - 49 491 413 362 459 5.6
50 - 59 287 199 176 265 5.0
60 - 69 134 92 69 67 4.0
70 - 79 30 19 12 18 3.3
80 years and over 9 4 1 3 3.0
Female 165 101 62 64 3.5
Below 20 - - 1 - 2.4
20 - 29 6 3 1 1 3.0
30 - 39 21 14 6 6 4.0
40 - 49 38 30 8 21 4.7
50 - 59 42 22 21 14 3.7
60 - 69 35 17 15 15 3.2
70 - 79 18 12 8 6 2.8
80 years and over 5 3 2 1 2.4
Continued
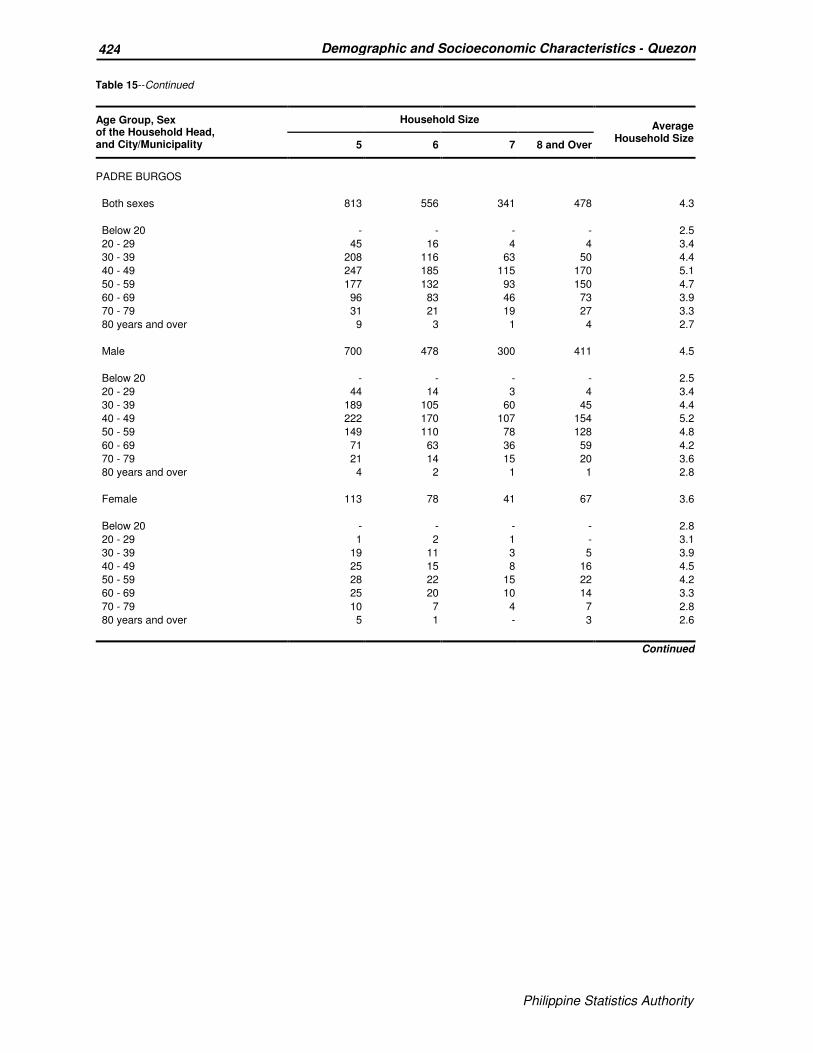
Philippine Statistics Authority
424 Demographic and Socioeconomic Characteristics - Quezon
Philippine Statistics Authority
Table 15--Continued
Age Group, Sex of the Household Head, and City/Municipality
Household Size Average
Household Size 5 6 7 8 and Over
PADRE BURGOS
Both sexes 813 556 341 478 4.3
Below 20 - - - - 2.5
20 - 29 45 16 4 4 3.4
30 - 39 208 116 63 50 4.4
40 - 49 247 185 115 170 5.1
50 - 59 177 132 93 150 4.7
60 - 69 96 83 46 73 3.9
70 - 79 31 21 19 27 3.3
80 years and over 9 3 1 4 2.7
Male 700 478 300 411 4.5
Below 20 - - - - 2.5
20 - 29 44 14 3 4 3.4
30 - 39 189 105 60 45 4.4
40 - 49 222 170 107 154 5.2
50 - 59 149 110 78 128 4.8
60 - 69 71 63 36 59 4.2
70 - 79 21 14 15 20 3.6
80 years and over 4 2 1 1 2.8
Female 113 78 41 67 3.6
Below 20 - - - - 2.8
20 - 29 1 2 1 - 3.1
30 - 39 19 11 3 5 3.9
40 - 49 25 15 8 16 4.5
50 - 59 28 22 15 22 4.2
60 - 69 25 20 10 14 3.3
70 - 79 10 7 4 7 2.8
80 years and over 5 1 - 3 2.6
Continued

Philippine Statistics Authority
425 Demographic and Socioeconomic Characteristics - Quezon
Philippine Statistics Authority
Table 15--Continued
Age Group, Sex of the Household Head, and City/Municipality
Household Size Average
Household Size 5 6 7 8 and Over
PAGBILAO
Both sexes 2,633 1,867 1,150 1,404 4.3
Below 20 - 2 1 - 2.4
20 - 29 207 77 20 22 3.3
30 - 39 779 493 224 187 4.4
40 - 49 790 575 422 474 4.9
50 - 59 533 468 323 447 4.7
60 - 69 242 186 108 197 3.9
70 - 79 69 55 44 64 3.3
80 years and over 13 11 8 13 2.7
Male 2,302 1,612 977 1,179 4.4
Below 20 - 1 - - 2.3
20 - 29 187 70 17 17 3.4
30 - 39 720 447 198 170 4.4
40 - 49 713 516 376 415 5.0
50 - 59 454 396 275 382 4.9
60 - 69 178 147 86 148 4.1
70 - 79 43 29 22 40 3.5
80 years and over 7 6 3 7 3.0
Female 331 255 173 225 3.7
Below 20 - 1 1 - 3.0
20 - 29 20 7 3 5 3.0
30 - 39 59 46 26 17 3.9
40 - 49 77 59 46 59 4.3
50 - 59 79 72 48 65 4.1
60 - 69 64 39 22 49 3.4
70 - 79 26 26 22 24 3.1
80 years and over 6 5 5 6 2.5
Continued

Philippine Statistics Authority
426 Demographic and Socioeconomic Characteristics - Quezon
Philippine Statistics Authority
Table 15--Continued
Age Group, Sex of the Household Head, and City/Municipality
Household Size Average
Household Size 5 6 7 8 and Over
PANUKULAN
Both sexes 454 363 214 330 4.7
Below 20 - - - - 2.1
20 - 29 45 26 6 8 3.6
30 - 39 151 119 32 56 4.7
40 - 49 115 109 83 116 5.5
50 - 59 88 63 64 102 5.2
60 - 69 41 30 22 35 4.3
70 - 79 13 13 6 11 3.2
80 years and over 1 3 1 2 2.9
Male 420 335 189 304 4.8
Below 20 - - - - 2.2
20 - 29 41 26 6 8 3.7
30 - 39 147 111 29 52 4.7
40 - 49 109 104 74 110 5.6
50 - 59 83 57 56 96 5.4
60 - 69 34 24 19 29 4.3
70 - 79 6 11 5 8 3.5
80 years and over - 2 - 1 3.3
Female 34 28 25 26 3.7
Below 20 - - - - 2.0
20 - 29 4 - - - 2.8
30 - 39 4 8 3 4 4.6
40 - 49 6 5 9 6 4.5
50 - 59 5 6 8 6 4.1
60 - 69 7 6 3 6 4.1
70 - 79 7 2 1 3 2.7
80 years and over 1 1 1 1 2.5
Continued
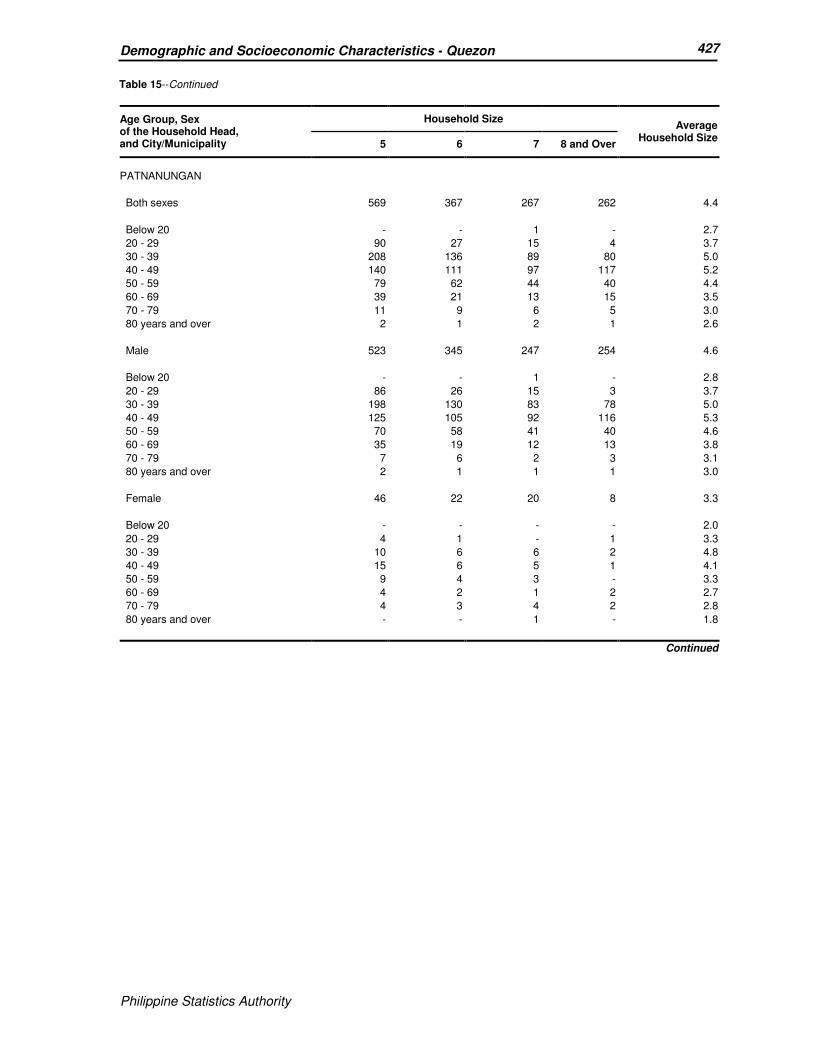
Philippine Statistics Authority
427 Demographic and Socioeconomic Characteristics - Quezon
Philippine Statistics Authority
Table 15--Continued
Age Group, Sex of the Household Head, and City/Municipality
Household Size Average
Household Size 5 6 7 8 and Over
PATNANUNGAN
Both sexes 569 367 267 262 4.4
Below 20 - - 1 - 2.7
20 - 29 90 27 15 4 3.7
30 - 39 208 136 89 80 5.0
40 - 49 140 111 97 117 5.2
50 - 59 79 62 44 40 4.4
60 - 69 39 21 13 15 3.5
70 - 79 11 9 6 5 3.0
80 years and over 2 1 2 1 2.6
Male 523 345 247 254 4.6
Below 20 - - 1 - 2.8
20 - 29 86 26 15 3 3.7
30 - 39 198 130 83 78 5.0
40 - 49 125 105 92 116 5.3
50 - 59 70 58 41 40 4.6
60 - 69 35 19 12 13 3.8
70 - 79 7 6 2 3 3.1
80 years and over 2 1 1 1 3.0
Female 46 22 20 8 3.3
Below 20 - - - - 2.0
20 - 29 4 1 - 1 3.3
30 - 39 10 6 6 2 4.8
40 - 49 15 6 5 1 4.1
50 - 59 9 4 3 - 3.3
60 - 69 4 2 1 2 2.7
70 - 79 4 3 4 2 2.8
80 years and over - - 1 - 1.8
Continued

Philippine Statistics Authority
428 Demographic and Socioeconomic Characteristics - Quezon
Philippine Statistics Authority
Table 15--Continued
Age Group, Sex of the Household Head, and City/Municipality
Household Size Average
Household Size 5 6 7 8 and Over
PEREZ
Both sexes 474 327 187 242 4.4
Below 20 1 - - - 2.5
20 - 29 52 6 4 5 3.5
30 - 39 154 99 56 39 4.7
40 - 49 134 127 65 98 5.1
50 - 59 77 56 38 61 4.5
60 - 69 37 27 22 27 3.8
70 - 79 14 9 2 10 3.1
80 years and over 5 3 - 2 2.9
Male 439 298 178 213 4.6
Below 20 1 - - - 2.6
20 - 29 50 4 4 5 3.5
30 - 39 150 96 56 36 4.8
40 - 49 127 121 62 91 5.2
50 - 59 68 50 35 52 4.6
60 - 69 30 20 20 23 4.0
70 - 79 9 6 1 6 3.3
80 years and over 4 1 - - 3.0
Female 35 29 9 29 3.4
Below 20 - - - - 2.3
20 - 29 2 2 - - 2.7
30 - 39 4 3 - 3 3.7
40 - 49 7 6 3 7 4.2
50 - 59 9 6 3 9 3.6
60 - 69 7 7 2 4 3.2
70 - 79 5 3 1 4 2.7
80 years and over 1 2 - 2 2.8
Continued
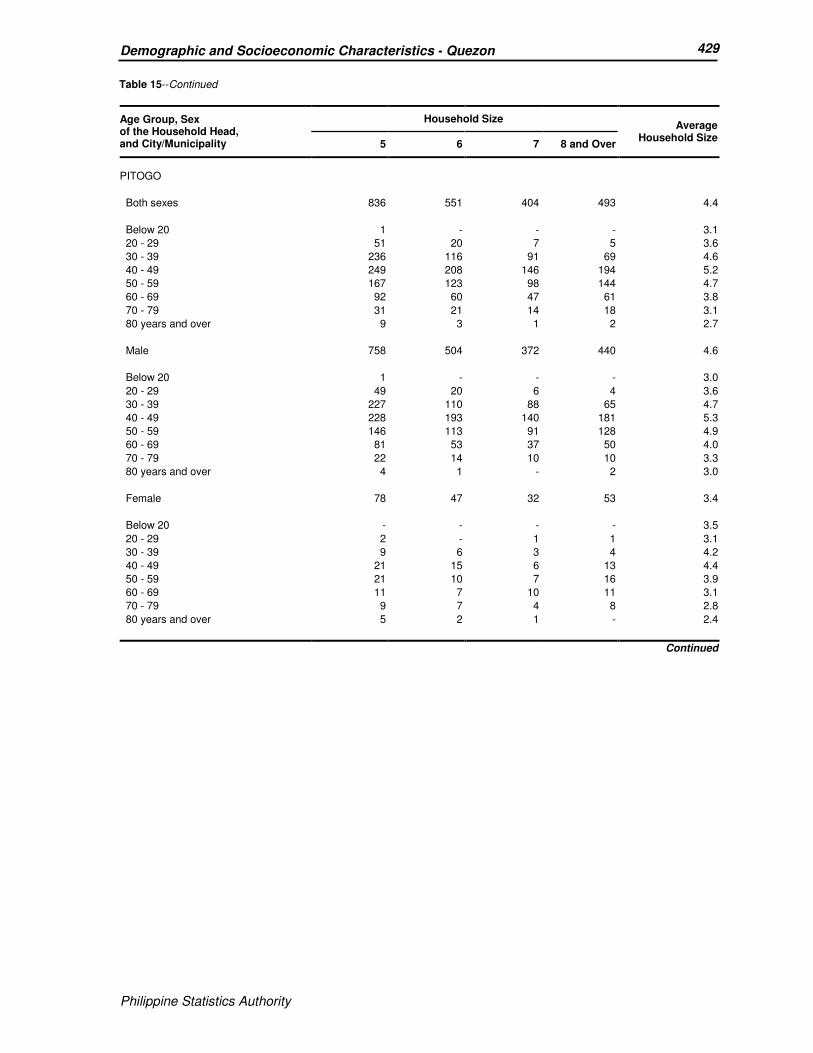
Philippine Statistics Authority
429 Demographic and Socioeconomic Characteristics - Quezon
Philippine Statistics Authority
Table 15--Continued
Age Group, Sex of the Household Head, and City/Municipality
Household Size Average
Household Size 5 6 7 8 and Over
PITOGO
Both sexes 836 551 404 493 4.4
Below 20 1 - - - 3.1
20 - 29 51 20 7 5 3.6
30 - 39 236 116 91 69 4.6
40 - 49 249 208 146 194 5.2
50 - 59 167 123 98 144 4.7
60 - 69 92 60 47 61 3.8
70 - 79 31 21 14 18 3.1
80 years and over 9 3 1 2 2.7
Male 758 504 372 440 4.6
Below 20 1 - - - 3.0
20 - 29 49 20 6 4 3.6
30 - 39 227 110 88 65 4.7
40 - 49 228 193 140 181 5.3
50 - 59 146 113 91 128 4.9
60 - 69 81 53 37 50 4.0
70 - 79 22 14 10 10 3.3
80 years and over 4 1 - 2 3.0
Female 78 47 32 53 3.4
Below 20 - - - - 3.5
20 - 29 2 - 1 1 3.1
30 - 39 9 6 3 4 4.2
40 - 49 21 15 6 13 4.4
50 - 59 21 10 7 16 3.9
60 - 69 11 7 10 11 3.1
70 - 79 9 7 4 8 2.8
80 years and over 5 2 1 - 2.4
Continued

Philippine Statistics Authority
430 Demographic and Socioeconomic Characteristics - Quezon
Philippine Statistics Authority
Table 15--Continued
Age Group, Sex of the Household Head, and City/Municipality
Household Size Average
Household Size 5 6 7 8 and Over
PLARIDEL
Both sexes 365 284 193 244 4.6
Below 20 - - - - 2.9
20 - 29 20 10 7 3 3.6
30 - 39 89 53 30 24 4.7
40 - 49 113 94 58 66 5.2
50 - 59 84 79 52 83 4.9
60 - 69 40 27 30 46 4.2
70 - 79 15 17 11 20 3.8
80 years and over 4 4 5 2 3.5
Male 307 253 157 209 4.7
Below 20 - - - - 2.9
20 - 29 17 10 5 3 3.6
30 - 39 86 50 27 22 4.7
40 - 49 96 87 54 64 5.3
50 - 59 69 73 44 72 5.0
60 - 69 27 23 20 32 4.4
70 - 79 9 7 5 15 4.1
80 years and over 3 3 2 1 3.7
Female 58 31 36 35 4.0
Below 20 - - - - -
20 - 29 3 - 2 - 3.6
30 - 39 3 3 3 2 4.4
40 - 49 17 7 4 2 4.2
50 - 59 15 6 8 11 4.3
60 - 69 13 4 10 14 3.9
70 - 79 6 10 6 5 3.6
80 years and over 1 1 3 1 3.5
Continued

Philippine Statistics Authority
431 Demographic and Socioeconomic Characteristics - Quezon
Philippine Statistics Authority
Table 15--Continued
Age Group, Sex of the Household Head, and City/Municipality
Household Size Average
Household Size 5 6 7 8 and Over
POLILLO
Both sexes 1,146 730 472 540 4.3
Below 20 2 1 - 1 2.7
20 - 29 123 35 20 11 3.7
30 - 39 360 220 95 92 4.6
40 - 49 300 248 190 188 5.0
50 - 59 219 144 97 176 4.6
60 - 69 107 60 56 56 3.7
70 - 79 28 17 12 14 2.9
80 years and over 7 5 2 2 2.6
Male 1,047 675 446 493 4.5
Below 20 1 - - 1 2.8
20 - 29 120 33 19 9 3.7
30 - 39 344 210 92 87 4.7
40 - 49 274 232 184 175 5.1
50 - 59 199 131 91 160 4.7
60 - 69 88 53 51 48 3.9
70 - 79 18 13 8 11 3.3
80 years and over 3 3 1 2 3.0
Female 99 55 26 47 3.3
Below 20 1 1 - - 2.6
20 - 29 3 2 1 2 3.3
30 - 39 16 10 3 5 3.8
40 - 49 26 16 6 13 4.1
50 - 59 20 13 6 16 3.5
60 - 69 19 7 5 8 3.0
70 - 79 10 4 4 3 2.5
80 years and over 4 2 1 - 2.2
Continued

Philippine Statistics Authority
432 Demographic and Socioeconomic Characteristics - Quezon
Philippine Statistics Authority
Table 15--Continued
Age Group, Sex of the Household Head, and City/Municipality
Household Size Average
Household Size 5 6 7 8 and Over
QUEZON
Both sexes 575 352 228 251 4.1
Below 20 - - - - 2.1
20 - 29 40 12 3 2 3.5
30 - 39 159 87 39 32 4.5
40 - 49 153 128 95 93 4.9
50 - 59 125 86 56 77 4.3
60 - 69 65 30 24 37 3.5
70 - 79 27 7 11 8 3.0
80 years and over 6 2 - 2 2.5
Male 512 325 200 216 4.3
Below 20 - - - - 2.1
20 - 29 39 12 2 1 3.5
30 - 39 144 84 33 30 4.5
40 - 49 140 119 88 88 5.0
50 - 59 115 80 47 70 4.4
60 - 69 51 25 20 23 3.6
70 - 79 19 4 10 4 3.3
80 years and over 4 1 - - 2.4
Female 63 27 28 35 3.4
Below 20 - - - - 2.0
20 - 29 1 - 1 1 2.8
30 - 39 15 3 6 2 4.4
40 - 49 13 9 7 5 4.2
50 - 59 10 6 9 7 3.8
60 - 69 14 5 4 14 3.3
70 - 79 8 3 1 4 2.5
80 years and over 2 1 - 2 2.5
Continued
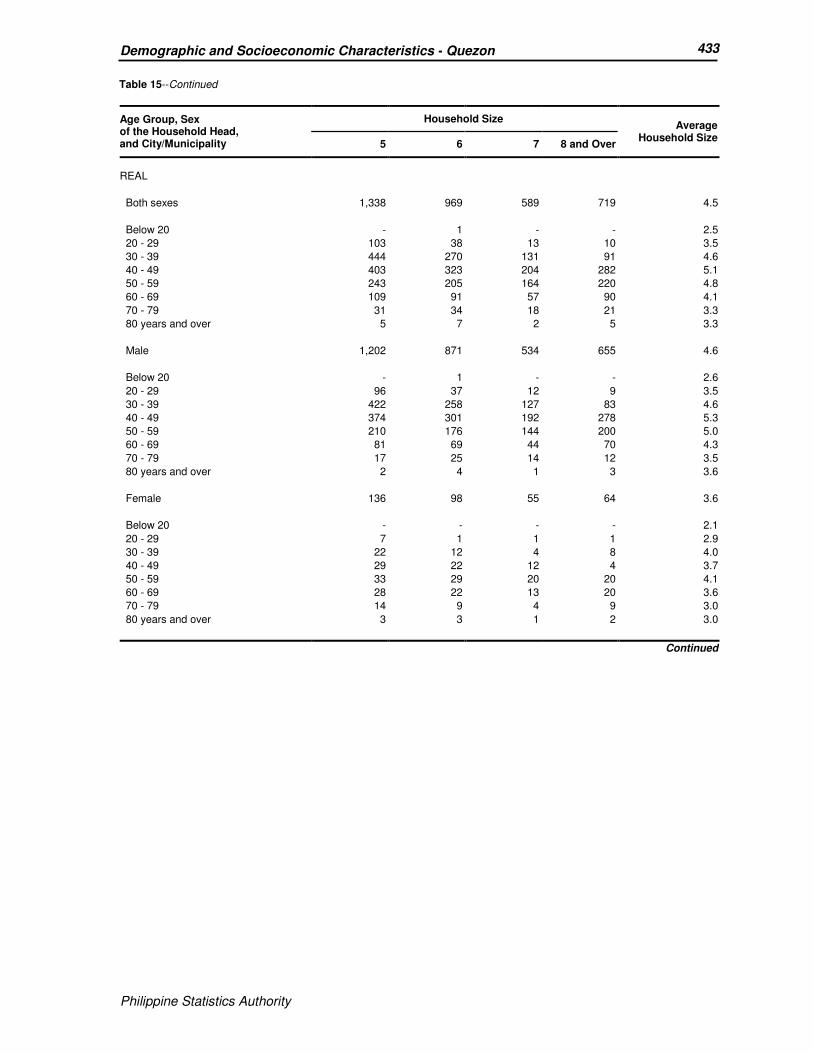
Philippine Statistics Authority
433 Demographic and Socioeconomic Characteristics - Quezon
Philippine Statistics Authority
Table 15--Continued
Age Group, Sex of the Household Head, and City/Municipality
Household Size Average
Household Size 5 6 7 8 and Over
REAL
Both sexes 1,338 969 589 719 4.5
Below 20 - 1 - - 2.5
20 - 29 103 38 13 10 3.5
30 - 39 444 270 131 91 4.6
40 - 49 403 323 204 282 5.1
50 - 59 243 205 164 220 4.8
60 - 69 109 91 57 90 4.1
70 - 79 31 34 18 21 3.3
80 years and over 5 7 2 5 3.3
Male 1,202 871 534 655 4.6
Below 20 - 1 - - 2.6
20 - 29 96 37 12 9 3.5
30 - 39 422 258 127 83 4.6
40 - 49 374 301 192 278 5.3
50 - 59 210 176 144 200 5.0
60 - 69 81 69 44 70 4.3
70 - 79 17 25 14 12 3.5
80 years and over 2 4 1 3 3.6
Female 136 98 55 64 3.6
Below 20 - - - - 2.1
20 - 29 7 1 1 1 2.9
30 - 39 22 12 4 8 4.0
40 - 49 29 22 12 4 3.7
50 - 59 33 29 20 20 4.1
60 - 69 28 22 13 20 3.6
70 - 79 14 9 4 9 3.0
80 years and over 3 3 1 2 3.0
Continued

Philippine Statistics Authority
434 Demographic and Socioeconomic Characteristics - Quezon
Philippine Statistics Authority
Table 15--Continued
Age Group, Sex of the Household Head, and City/Municipality
Household Size Average
Household Size 5 6 7 8 and Over
SAMPALOC
Both sexes 497 362 238 321 4.6
Below 20 - 1 - - 1.9
20 - 29 13 12 6 2 3.5
30 - 39 126 63 48 37 4.8
40 - 49 160 109 71 102 5.2
50 - 59 111 102 65 104 4.9
60 - 69 46 48 26 49 4.2
70 - 79 33 22 15 19 3.5
80 years and over 8 5 7 8 3.6
Male 430 313 202 265 4.7
Below 20 - - - - 1.6
20 - 29 12 12 5 2 3.5
30 - 39 115 61 42 36 4.8
40 - 49 149 98 65 92 5.3
50 - 59 94 93 60 91 5.0
60 - 69 39 37 15 30 4.1
70 - 79 17 10 9 10 3.6
80 years and over 4 2 6 4 4.1
Female 67 49 36 56 4.0
Below 20 - 1 - - 2.4
20 - 29 1 - 1 - 3.2
30 - 39 11 2 6 1 4.4
40 - 49 11 11 6 10 4.7
50 - 59 17 9 5 13 4.3
60 - 69 7 11 11 19 4.2
70 - 79 16 12 6 9 3.5
80 years and over 4 3 1 4 3.1
Continued

Philippine Statistics Authority
435 Demographic and Socioeconomic Characteristics - Quezon
Philippine Statistics Authority
Table 15--Continued
Age Group, Sex of the Household Head, and City/Municipality
Household Size Average
Household Size 5 6 7 8 and Over
SAN ANDRES
Both sexes 1,262 879 523 630 4.1
Below 20 3 - 1 - 2.4
20 - 29 192 48 21 15 3.3
30 - 39 453 328 197 168 4.7
40 - 49 314 283 196 304 5.3
50 - 59 192 153 82 109 4.2
60 - 69 85 52 23 28 3.1
70 - 79 19 9 3 6 2.3
80 years and over 4 6 - - 2.0
Male 1,166 836 507 616 4.3
Below 20 1 - - - 2.4
20 - 29 187 46 20 15 3.4
30 - 39 432 312 194 164 4.8
40 - 49 289 275 192 298 5.5
50 - 59 169 141 79 106 4.5
60 - 69 74 49 19 27 3.4
70 - 79 14 9 3 6 2.7
80 years and over - 4 - - 2.2
Female 96 43 16 14 2.5
Below 20 2 - 1 - 2.2
20 - 29 5 2 1 - 2.4
30 - 39 21 16 3 4 3.4
40 - 49 25 8 4 6 3.2
50 - 59 23 12 3 3 2.9
60 - 69 11 3 4 1 2.2
70 - 79 5 - - - 1.7
80 years and over 4 2 - - 1.8
Continued
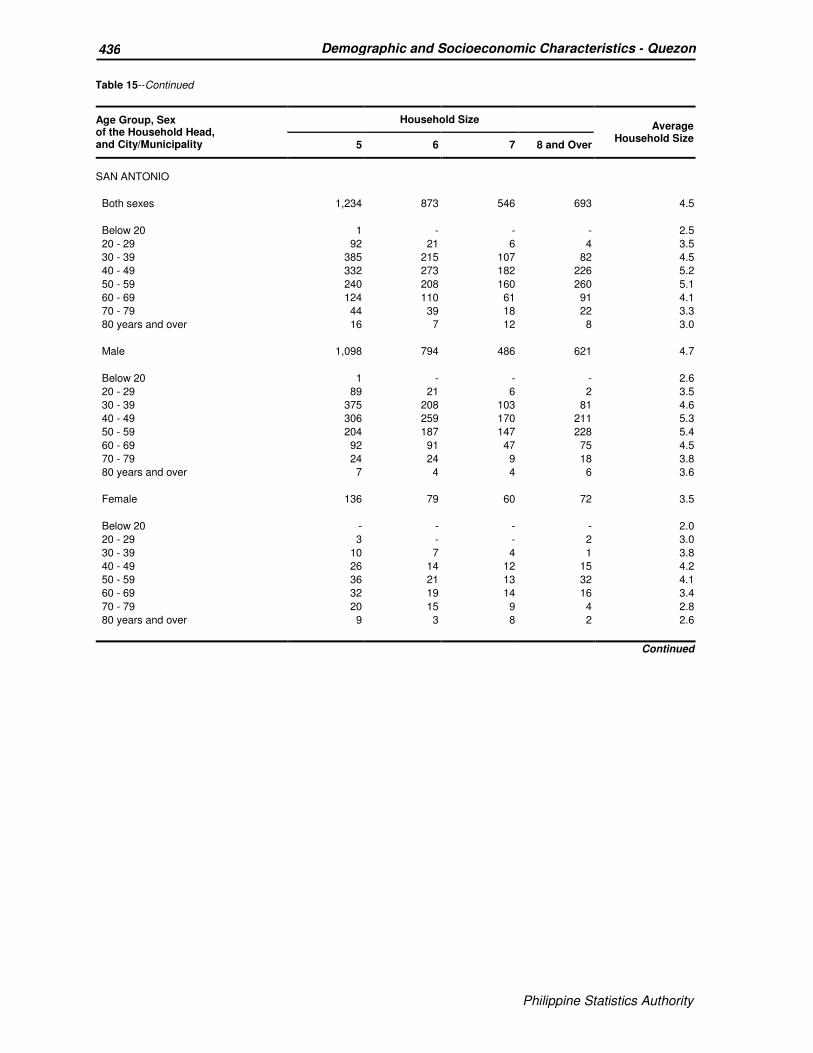
Philippine Statistics Authority
436 Demographic and Socioeconomic Characteristics - Quezon
Philippine Statistics Authority
Table 15--Continued
Age Group, Sex of the Household Head, and City/Municipality
Household Size Average
Household Size 5 6 7 8 and Over
SAN ANTONIO
Both sexes 1,234 873 546 693 4.5
Below 20 1 - - - 2.5
20 - 29 92 21 6 4 3.5
30 - 39 385 215 107 82 4.5
40 - 49 332 273 182 226 5.2
50 - 59 240 208 160 260 5.1
60 - 69 124 110 61 91 4.1
70 - 79 44 39 18 22 3.3
80 years and over 16 7 12 8 3.0
Male 1,098 794 486 621 4.7
Below 20 1 - - - 2.6
20 - 29 89 21 6 2 3.5
30 - 39 375 208 103 81 4.6
40 - 49 306 259 170 211 5.3
50 - 59 204 187 147 228 5.4
60 - 69 92 91 47 75 4.5
70 - 79 24 24 9 18 3.8
80 years and over 7 4 4 6 3.6
Female 136 79 60 72 3.5
Below 20 - - - - 2.0
20 - 29 3 - - 2 3.0
30 - 39 10 7 4 1 3.8
40 - 49 26 14 12 15 4.2
50 - 59 36 21 13 32 4.1
60 - 69 32 19 14 16 3.4
70 - 79 20 15 9 4 2.8
80 years and over 9 3 8 2 2.6
Continued
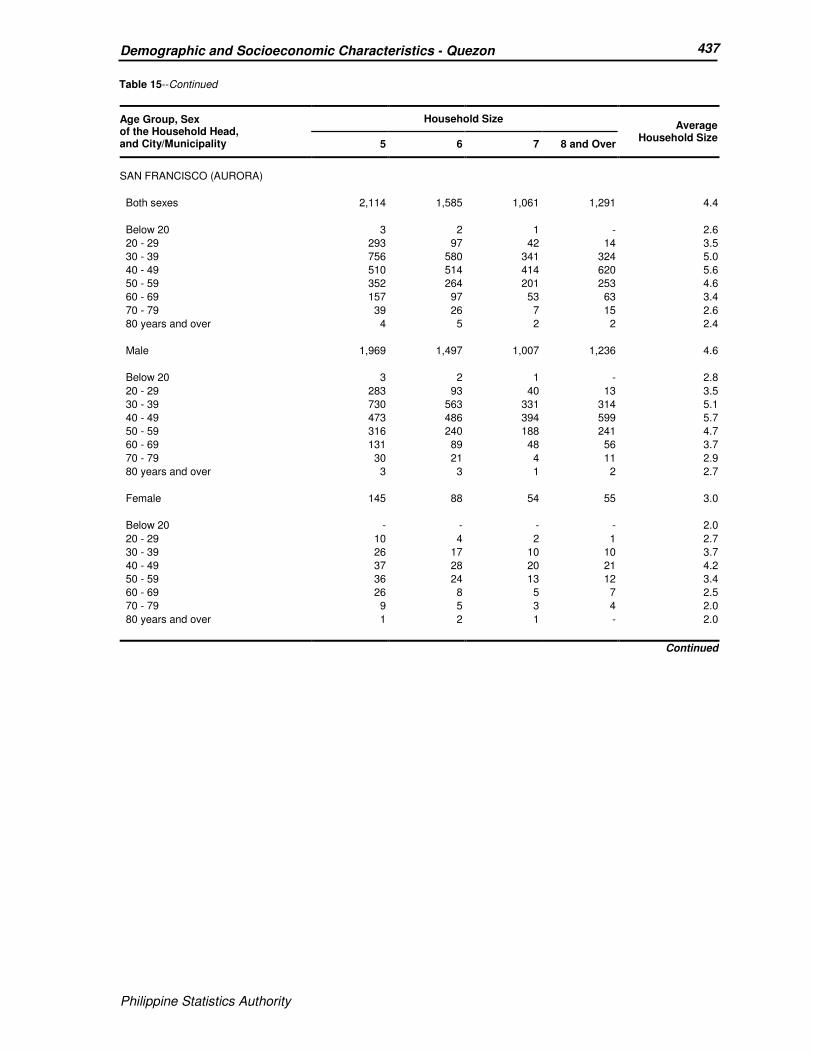
Philippine Statistics Authority
437 Demographic and Socioeconomic Characteristics - Quezon
Philippine Statistics Authority
Table 15--Continued
Age Group, Sex of the Household Head, and City/Municipality
Household Size Average
Household Size 5 6 7 8 and Over
SAN FRANCISCO (AURORA)
Both sexes 2,114 1,585 1,061 1,291 4.4
Below 20 3 2 1 - 2.6
20 - 29 293 97 42 14 3.5
30 - 39 756 580 341 324 5.0
40 - 49 510 514 414 620 5.6
50 - 59 352 264 201 253 4.6
60 - 69 157 97 53 63 3.4
70 - 79 39 26 7 15 2.6
80 years and over 4 5 2 2 2.4
Male 1,969 1,497 1,007 1,236 4.6
Below 20 3 2 1 - 2.8
20 - 29 283 93 40 13 3.5
30 - 39 730 563 331 314 5.1
40 - 49 473 486 394 599 5.7
50 - 59 316 240 188 241 4.7
60 - 69 131 89 48 56 3.7
70 - 79 30 21 4 11 2.9
80 years and over 3 3 1 2 2.7
Female 145 88 54 55 3.0
Below 20 - - - - 2.0
20 - 29 10 4 2 1 2.7
30 - 39 26 17 10 10 3.7
40 - 49 37 28 20 21 4.2
50 - 59 36 24 13 12 3.4
60 - 69 26 8 5 7 2.5
70 - 79 9 5 3 4 2.0
80 years and over 1 2 1 - 2.0
Continued
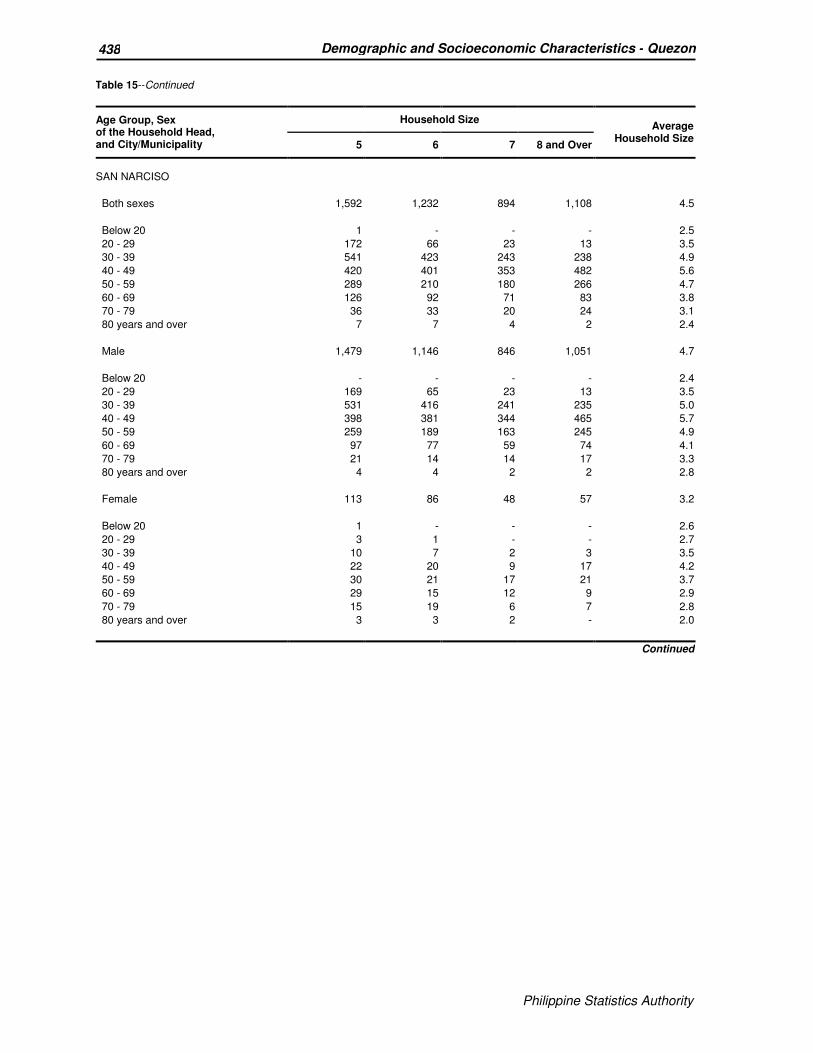
Philippine Statistics Authority
438 Demographic and Socioeconomic Characteristics - Quezon
Philippine Statistics Authority
Table 15--Continued
Age Group, Sex of the Household Head, and City/Municipality
Household Size Average
Household Size 5 6 7 8 and Over
SAN NARCISO
Both sexes 1,592 1,232 894 1,108 4.5
Below 20 1 - - - 2.5
20 - 29 172 66 23 13 3.5
30 - 39 541 423 243 238 4.9
40 - 49 420 401 353 482 5.6
50 - 59 289 210 180 266 4.7
60 - 69 126 92 71 83 3.8
70 - 79 36 33 20 24 3.1
80 years and over 7 7 4 2 2.4
Male 1,479 1,146 846 1,051 4.7
Below 20 - - - - 2.4
20 - 29 169 65 23 13 3.5
30 - 39 531 416 241 235 5.0
40 - 49 398 381 344 465 5.7
50 - 59 259 189 163 245 4.9
60 - 69 97 77 59 74 4.1
70 - 79 21 14 14 17 3.3
80 years and over 4 4 2 2 2.8
Female 113 86 48 57 3.2
Below 20 1 - - - 2.6
20 - 29 3 1 - - 2.7
30 - 39 10 7 2 3 3.5
40 - 49 22 20 9 17 4.2
50 - 59 30 21 17 21 3.7
60 - 69 29 15 12 9 2.9
70 - 79 15 19 6 7 2.8
80 years and over 3 3 2 - 2.0
Continued

Philippine Statistics Authority
439 Demographic and Socioeconomic Characteristics - Quezon
Philippine Statistics Authority
Table 15--Continued
Age Group, Sex of the Household Head, and City/Municipality
Household Size Average
Household Size 5 6 7 8 and Over
SARIAYA
Both sexes 5,718 3,858 2,209 2,421 4.3
Below 20 7 - - 1 2.6
20 - 29 317 114 31 21 3.4
30 - 39 1,816 934 417 289 4.4
40 - 49 1,785 1,312 801 847 4.9
50 - 59 1,079 878 585 795 4.6
60 - 69 511 436 263 330 3.9
70 - 79 168 134 87 111 3.3
80 years and over 35 50 25 27 2.9
Male 4,957 3,321 1,870 2,046 4.4
Below 20 7 - - 1 2.6
20 - 29 278 100 28 16 3.4
30 - 39 1,678 853 374 258 4.4
40 - 49 1,616 1,199 719 755 5.0
50 - 59 912 758 493 694 4.8
60 - 69 355 325 199 248 4.1
70 - 79 98 68 47 62 3.6
80 years and over 13 18 10 12 3.2
Female 761 537 339 375 3.7
Below 20 - - - - 2.5
20 - 29 39 14 3 5 3.2
30 - 39 138 81 43 31 4.1
40 - 49 169 113 82 92 4.4
50 - 59 167 120 92 101 4.0
60 - 69 156 111 64 82 3.4
70 - 79 70 66 40 49 3.1
80 years and over 22 32 15 15 2.8
Continued

Philippine Statistics Authority
440 Demographic and Socioeconomic Characteristics - Quezon
Philippine Statistics Authority
Table 15--Continued
Age Group, Sex of the Household Head, and City/Municipality
Household Size Average
Household Size 5 6 7 8 and Over
TAGKAWAYAN
Both sexes 1,840 1,255 868 1,127 4.4
Below 20 4 3 - - 2.5
20 - 29 163 43 29 4 3.5
30 - 39 545 345 194 180 4.7
40 - 49 504 390 280 408 5.1
50 - 59 349 279 208 309 4.6
60 - 69 172 133 103 151 4.0
70 - 79 82 47 43 56 3.5
80 years and over 21 15 11 19 3.5
Male 1,583 1,091 758 967 4.6
Below 20 2 3 - - 2.5
20 - 29 150 40 26 3 3.5
30 - 39 498 316 178 162 4.7
40 - 49 445 354 263 365 5.2
50 - 59 300 254 181 272 4.8
60 - 69 130 91 83 123 4.3
70 - 79 50 27 21 31 3.7
80 years and over 8 6 6 11 3.8
Female 257 164 110 160 3.8
Below 20 2 - - - 2.6
20 - 29 13 3 3 1 3.1
30 - 39 47 29 16 18 4.3
40 - 49 59 36 17 43 4.4
50 - 59 49 25 27 37 3.9
60 - 69 42 42 20 28 3.5
70 - 79 32 20 22 25 3.3
80 years and over 13 9 5 8 3.2
Continued

Philippine Statistics Authority
441 Demographic and Socioeconomic Characteristics - Quezon
Philippine Statistics Authority
Table 15--Continued
Age Group, Sex of the Household Head, and City/Municipality
Household Size Average
Household Size 5 6 7 8 and Over
CITY OF TAYABAS
Both sexes 3,955 2,472 1,388 1,567 4.2
Below 20 1 - 1 - 2.0
20 - 29 294 88 30 31 3.4
30 - 39 1,167 607 287 216 4.4
40 - 49 1,204 830 504 560 4.9
50 - 59 826 617 375 503 4.5
60 - 69 337 227 137 193 3.7
70 - 79 105 88 49 51 3.1
80 years and over 21 15 5 13 2.6
Male 3,360 2,121 1,166 1,345 4.4
Below 20 1 - - - 2.1
20 - 29 258 69 23 21 3.4
30 - 39 1,052 545 259 195 4.4
40 - 49 1,055 739 441 513 5.0
50 - 59 689 524 308 435 4.7
60 - 69 245 176 100 143 3.8
70 - 79 53 60 34 32 3.3
80 years and over 7 8 1 6 2.8
Female 595 351 222 222 3.5
Below 20 - - 1 - 1.9
20 - 29 36 19 7 10 3.1
30 - 39 115 62 28 21 3.8
40 - 49 149 91 63 47 4.1
50 - 59 137 93 67 68 3.9
60 - 69 92 51 37 50 3.3
70 - 79 52 28 15 19 2.8
80 years and over 14 7 4 7 2.5
Continued

Philippine Statistics Authority
442 Demographic and Socioeconomic Characteristics - Quezon
Philippine Statistics Authority
Table 15--Continued
Age Group, Sex of the Household Head, and City/Municipality
Household Size Average
Household Size 5 6 7 8 and Over
TIAONG
Both sexes 3,842 2,519 1,513 1,914 4.4
Below 20 1 5 1 - 2.6
20 - 29 249 95 27 14 3.5
30 - 39 1,079 597 299 198 4.4
40 - 49 1,127 841 511 609 5.0
50 - 59 761 548 384 601 4.8
60 - 69 428 281 194 363 4.3
70 - 79 151 119 75 95 3.6
80 years and over 46 33 22 34 3.3
Male 3,291 2,165 1,283 1,628 4.6
Below 20 1 2 1 - 2.6
20 - 29 226 86 24 12 3.5
30 - 39 1,025 560 274 184 4.4
40 - 49 1,026 767 466 561 5.1
50 - 59 618 463 331 512 5.0
60 - 69 292 209 135 286 4.6
70 - 79 82 68 44 59 3.9
80 years and over 21 10 8 14 3.5
Female 551 354 230 286 3.8
Below 20 - 3 - - 2.8
20 - 29 23 9 3 2 3.2
30 - 39 54 37 25 14 4.0
40 - 49 101 74 45 48 4.3
50 - 59 143 85 53 89 4.1
60 - 69 136 72 59 77 3.8
70 - 79 69 51 31 36 3.3
80 years and over 25 23 14 20 3.1
Continued
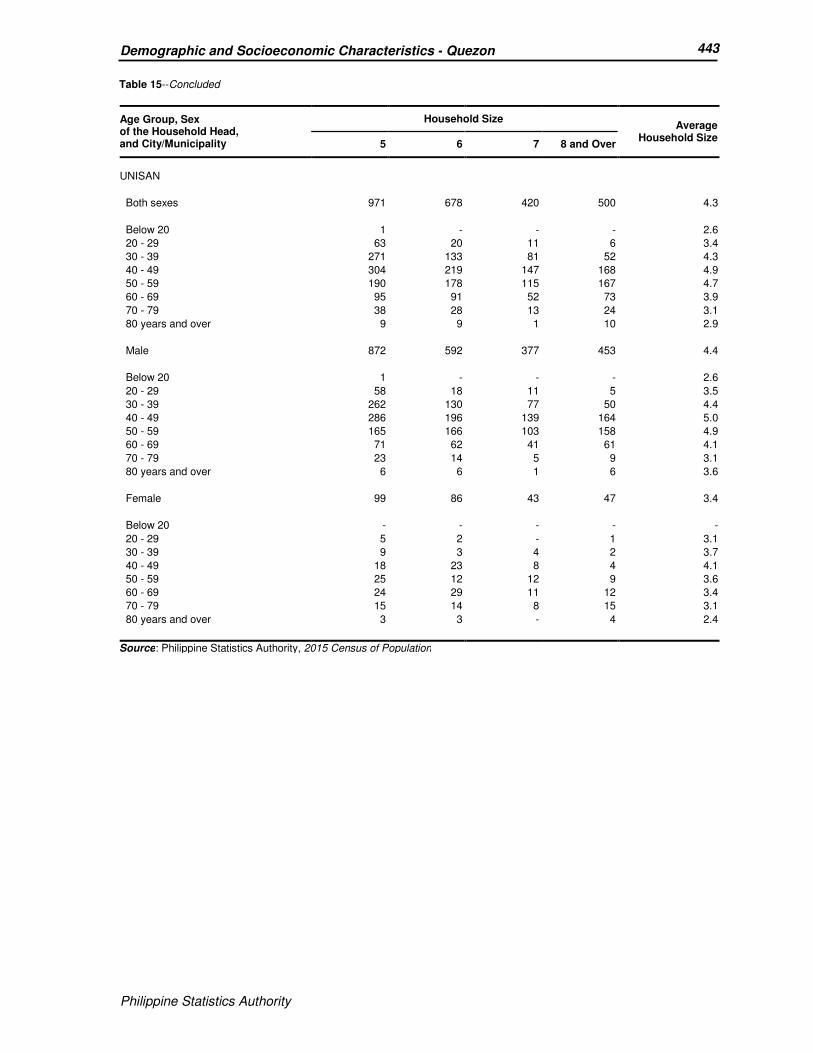
Philippine Statistics Authority
443 Demographic and Socioeconomic Characteristics - Quezon
Philippine Statistics Authority
Table 15--Concluded
Age Group, Sex of the Household Head, and City/Municipality
Household Size Average
Household Size 5 6 7 8 and Over
UNISAN
Both sexes 971 678 420 500 4.3
Below 20 1 - - - 2.6
20 - 29 63 20 11 6 3.4
30 - 39 271 133 81 52 4.3
40 - 49 304 219 147 168 4.9
50 - 59 190 178 115 167 4.7
60 - 69 95 91 52 73 3.9
70 - 79 38 28 13 24 3.1
80 years and over 9 9 1 10 2.9
Male 872 592 377 453 4.4
Below 20 1 - - - 2.6
20 - 29 58 18 11 5 3.5
30 - 39 262 130 77 50 4.4
40 - 49 286 196 139 164 5.0
50 - 59 165 166 103 158 4.9
60 - 69 71 62 41 61 4.1
70 - 79 23 14 5 9 3.1
80 years and over 6 6 1 6 3.6
Female 99 86 43 47 3.4
Below 20 - - - - -
20 - 29 5 2 - 1 3.1
30 - 39 9 3 4 2 3.7
40 - 49 18 23 8 4 4.1
50 - 59 25 12 12 9 3.6
60 - 69 24 29 11 12 3.4
70 - 79 15 14 8 15 3.1
80 years and over 3 3 - 4 2.4
Source: Philippine Statistics Authority, 2015 Census of Population

Appendices

Philippine Statistics Authority A – 1
APPENDIX A
EXCERPTS FROM REPUBLIC ACT NO. 10625
RELEVANT TO THE CONDUCT OF THE 2015 CENSUS OF POPULATION
REPUBLIC ACT NO. 10625
AN ACT REORGANIZING THE PHILIPPINE STATISTICAL SYSTEM, REPEALING FOR THE
PURPOSE EXECUTIVE ORDER NUMBERED ONE HUNDRED TWENTY-ONE, ENTITLED
“REORGANIZING AND STRENGTHENING THE PHILIPPINE STATISTICAL SYSTEM AND FOR
OTHER PURPOSES”
SECTION 6. Functions of the PSA. – The PSA shall have the following functions:
(b) Prepare and conduct periodic censuses on population, housing, agriculture, fisheries, business, industry and other sectors of the economy;
SECTION 25. Obligation to Provide Information. – The National Statistician shall determine whether a statistical inquiry or survey to be conducted is with or without obligation to provide information. If such obligation is stipulated, all respondents whether natural or legal persons shall be liable to reply to the statistical inquiry or survey. This section applies to all statistical inquiries or surveys conducted by other statistical offices in the Philippine Statistical System (PSS).
The respondents under this Act are required to give truthful and complete answers to statistical inquiries or surveys of the PSA and other statistical offices of the PSS. The respondent is considered to have complied with the obligation only upon receipt of the duly completed statistical inquiry or survey forms. The government shall provide franking privileges, charges and postings to the survey offices, unless otherwise disallowed by law.
SECTION 26. Confidentiality of Information. – Individual data furnished by a respondent to statistical inquiries, surveys and censuses of the PSA shall be considered privileged communication and as such shall be inadmissible as evidence in any proceeding.
The PSA may release aggregated information from statistical inquiries, surveys and censuses in the form of summaries or statistical tables in which no reference to an individual, corporation, association, partnership, institution or business enterprise shall appear.
The National Statistician and all staff of the PSA shall take a solemn oath regarding confidentiality of information.
SECTION 27. Penalties. – Respondents of primary data collection activities such as censuses and sample surveys are obliged to give truthful and complete answers to statistical inquiries. The gathering, consolidation and analysis of such data shall likewise be done in the most truthful and credible manner.
Appendix A – Republic Act No. 10625
A – 2 Philippine Statistics Authority
To ensure compliance, any violation of this Act shall result in the imposition of the penalty of one (1) year imprisonment and a fine of One hundred thousand pesos (P100,000.00). In cases where the respondent who fails to give a truthful and complete answer to such statistical inquiries is a corporation, the above penalty shall be imposed against the responsible officer, director, manager and/or agent of said corporation.
Approved, (SGD) JINGGOY EJERCITO ESTRADA (SGD) FELICIANO BELMONTE JR. Acting Senate President Speaker of the House of Representatives
This Act which originated in the House of Representatives was finally passed by the House of Representatives and the Senate on June 6, 2013. (SGD) EMMA LIRIO-REYES (SGD) MARILYN B. BARUA-YAP Secretary of the Senate Secretary General House of Representatives
APPROVED: September 12, 2013
(SGD) BENIGNO S. AQUINO III
President of the Philippines
Philippine Statistics Authority B - 1
AAPPPPEENNDDIIXX BB
EXECUTIVE ORDER NO. 352
DESIGNATION OF STATISTICAL ACTIVITIES THAT WILL GENERATE CRITICAL DATA FOR DECISION-MAKING
OF THE GOVERNMENT AND THE PRIVATE SECTOR WHEREAS, Executive Order No. 121, which was issued in January 1987, created the National Statistical Coordination Board (NSCB) as the policy-making and coordinating body of the decentralized Philippine Statistical System; WHEREAS, the NSCB, now an agency attached to the National Economic and Development Authority (NEDA), has established a system of designated statistics in accordance with its mandate, that enables the identification and generation of the most critical and essential statistics required for social and economic planning/analysis based on approved criteria; WHEREAS, the generation of said data requires the conduct of nationwide censuses and surveys and the maintenance/processing of administrative-based records on a regular basis to allow for monitoring, time series analysis and forecasting by policy-makers; WHEREAS, the quality of these designated statistics needs to be continuously improved to address the needs of data users; WHEREAS, the system of designated statistics is a dynamic process that allows for updating to keep attuned to the emerging demands of data users; NOW, THEREFORE, I, FIDEL V. RAMOS, President of the Philippines, by virtue of the powers vested in me by law, do hereby order: SECTION 1. The activities and statistics that have been designated by the NSCB as per ANNEX of this Executive Order shall be adopted by the government as the means of generating the critical and essential data for administrators, planners and policy-makers in the government and private sectors. SECTION 2. The implementing agencies shall provide the Office of the President thru the NSCB results of said censuses, surveys and administrative-based reports on a regular basis and ensure the dissemination of the data to the general public in accordance with the designated time frame. SECTION 3. The implementing agencies shall be responsible in carrying out the improvements in the design and methodology of said activities in coordination with the NSCB. SECTION 4. Any modification, addition or deletion from the above list shall be approved through a Board Resolution by the NSCB in accordance with its implementing guidelines. The NSCB is authorized to issue implementing guidelines consistent with the provisions of this Executive Order. It shall also be responsible in monitoring the system's implementation to attain the objectives of this Executive Order. SECTION 5. The NSCB shall regularly conduct adequate consultations with the data users and producers as a means of updating the lists of designated statistics to be responsive to the emerging needs of data users.
Appendix B – Executive Order No. 352
B – 2 Philippine Statistics Authority
SECTION 6. The amounts necessary to carry out the provisions of this Executive Order shall be provided for in the General Appropriations Act (GAA) in the year following its approval and thereafter. However, any immediate requirement to implement this Executive Order shall be taken from any available appropriations in the CY l994 GAA, subject to the usual budgetary rules and regulations. SECTION 7. This Executive Order shall take effect immediately. Done in the City of Manila, this 1st day of July in the year of our Lord, nineteen hundred and ninety six. (Signed) FIDEL V. RAMOS President of the Philippines
Excerpt of ANNEX (List of Designated Statistical Activities) of Executive Order 352
For Mid-Decade Census of Population:
Activity Agency Frequency of Conduct
Geographic Disaggregation
Schedule of Data Dissemination
With ARC
Mid-Decade Census of Population
NSO
every 10 years
national, regional, provincial, city, municipal, barangay, urban-rural
Before the end of every census year for population figures from national down to barangay levels; 18 months after the reference year for other statistics
Note: NSO was merged with three other statistical agencies: NSCB, BAS, and BLES
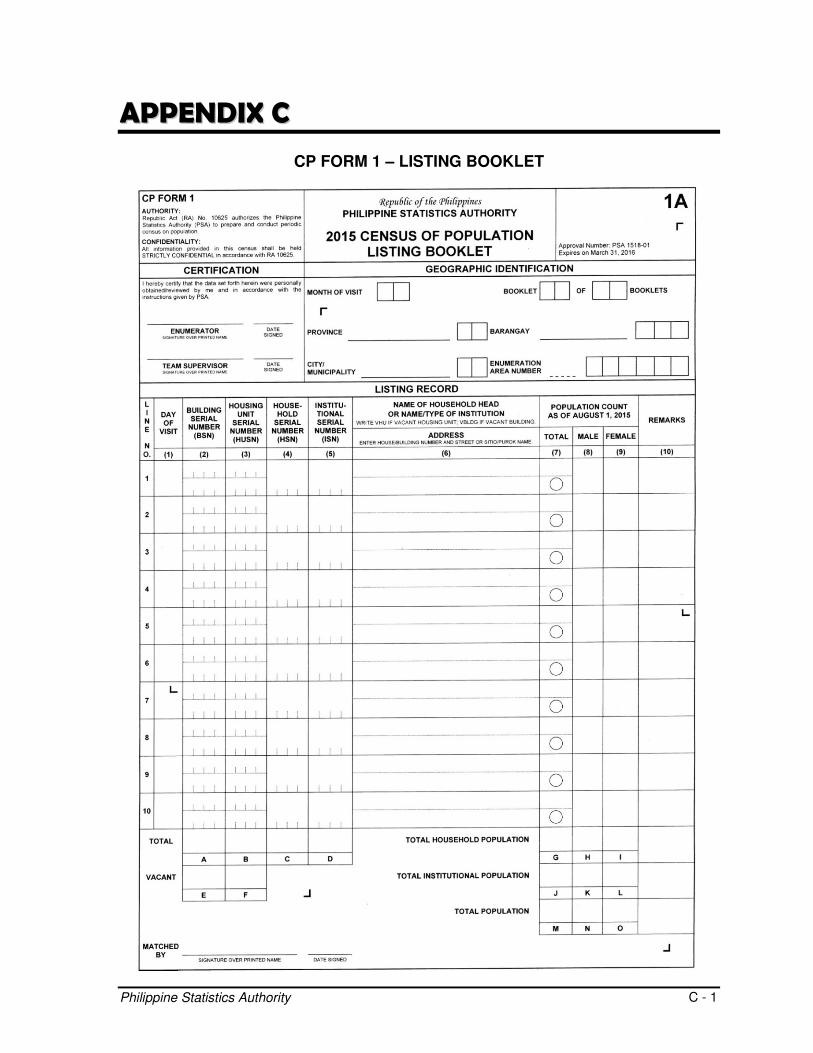
Philippine Statistics Authority C - 1
AAPPPPEENNDDIIXX CC
CP FORM 1 – LISTING BOOKLET
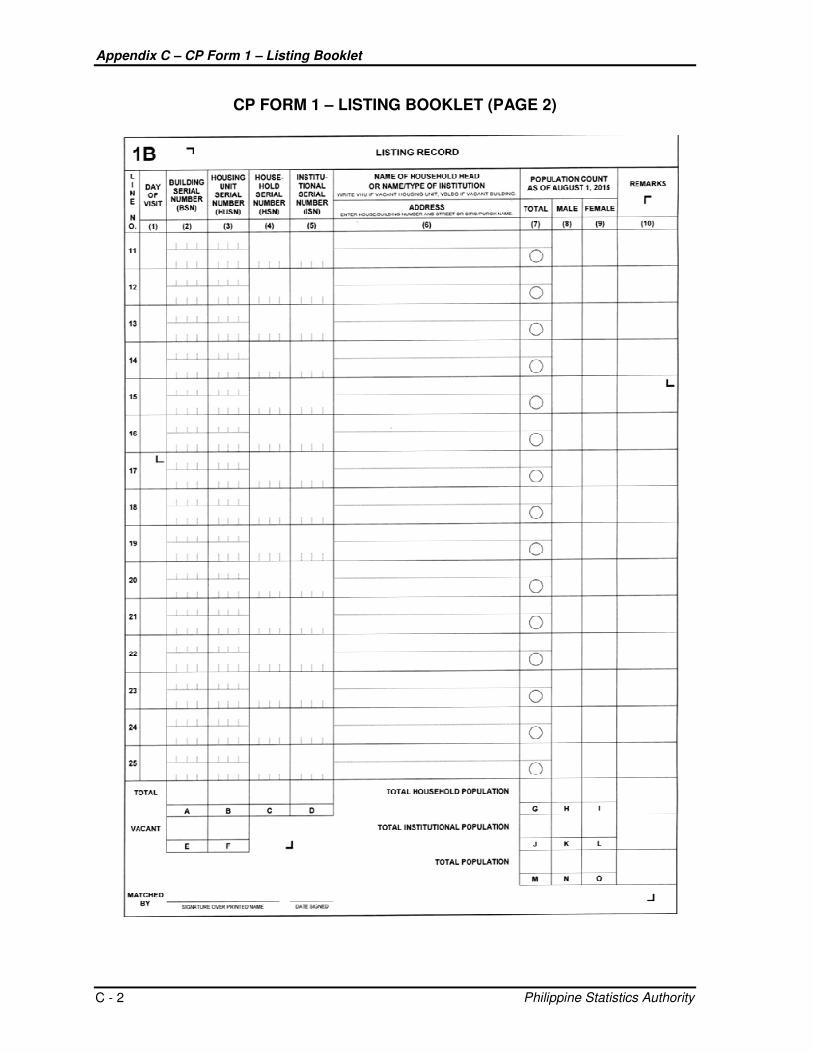
Appendix C – CP Form 1 – Listing Booklet
Philippine Statistics Authority C - 2
CP FORM 1 – LISTING BOOKLET (PAGE 2)
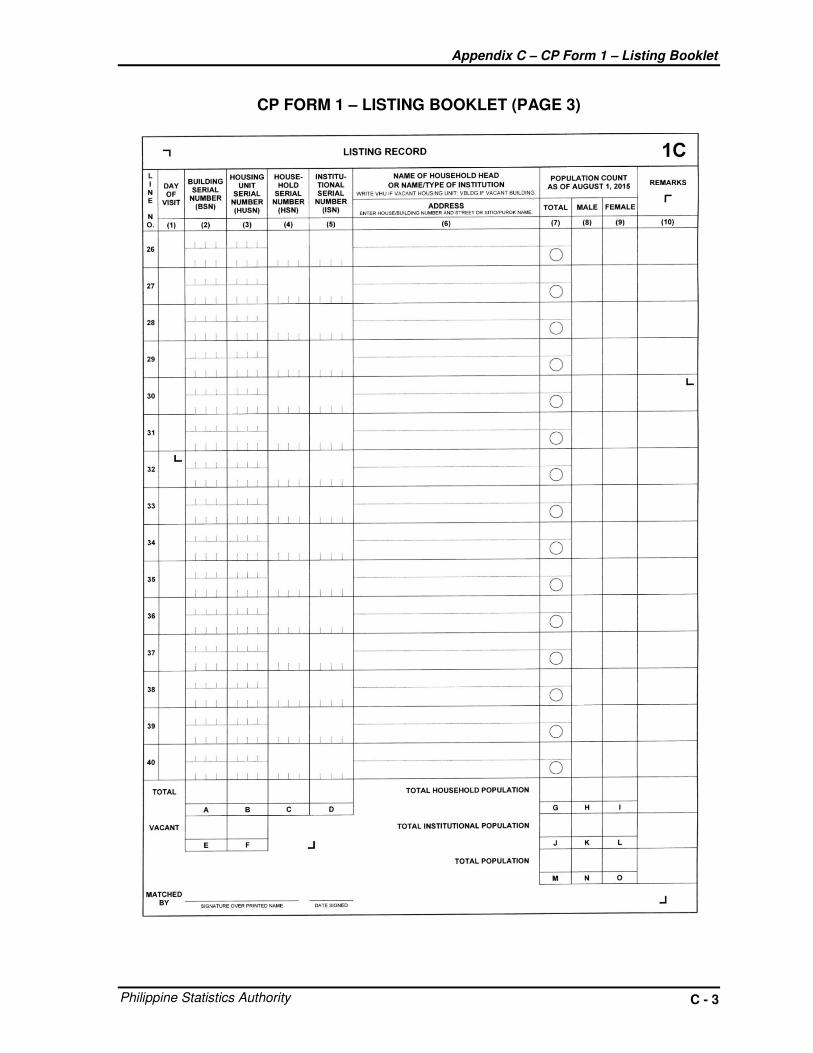
Appendix C – CP Form 1 – Listing Booklet
Philippine Statistics Authority C - 3
CP FORM 1 – LISTING BOOKLET (PAGE 3)
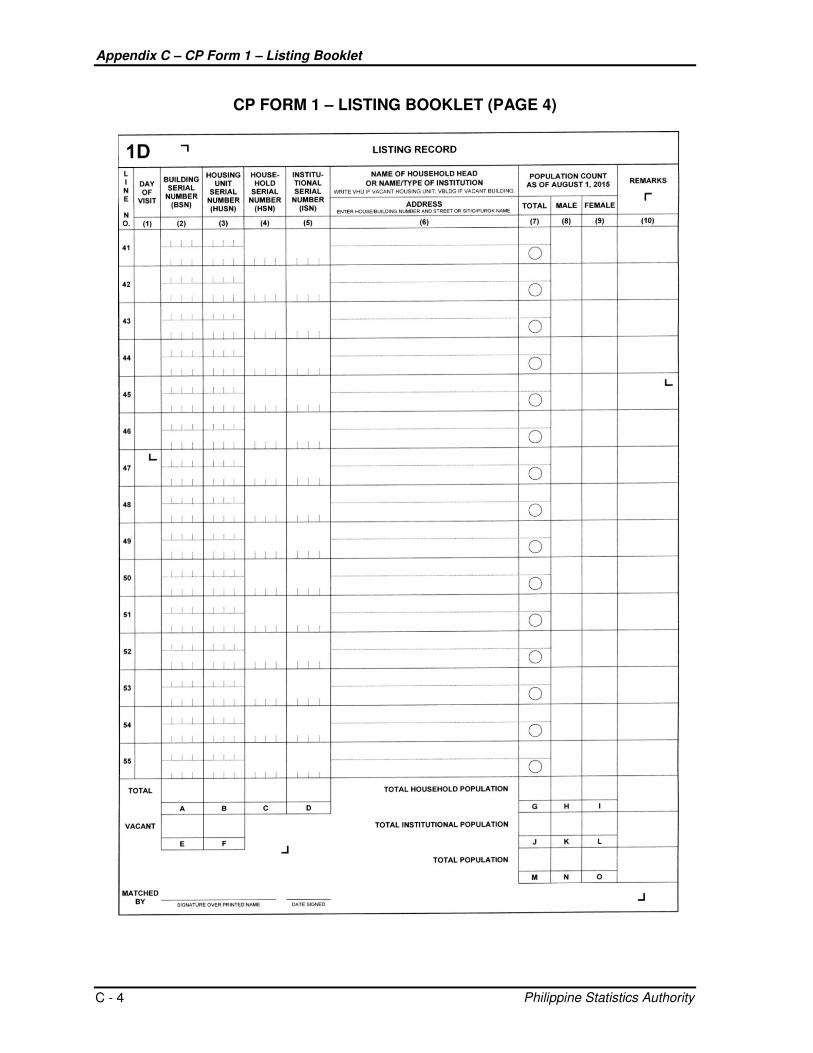
Appendix C – CP Form 1 – Listing Booklet
Philippine Statistics Authority C - 4
CP FORM 1 – LISTING BOOKLET (PAGE 4)
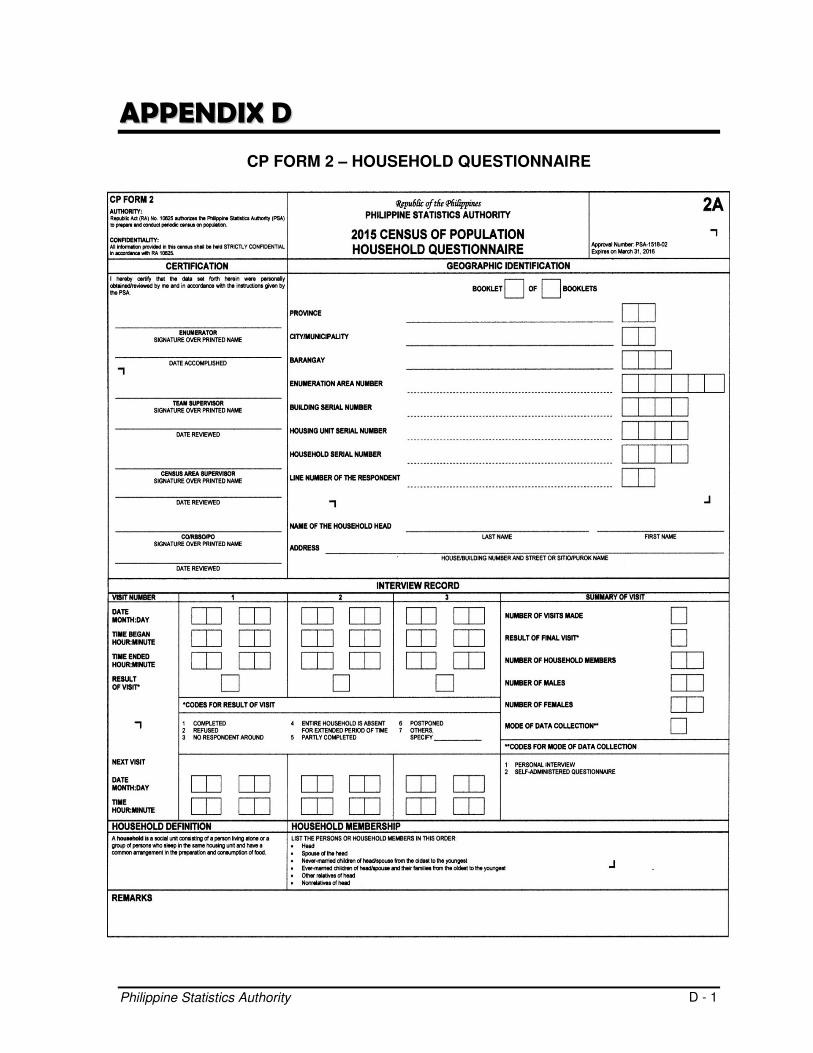
Philippine Statistics Authority D - 1
AAPPPPEENNDDIIXX DD
CP FORM 2 – HOUSEHOLD QUESTIONNAIRE
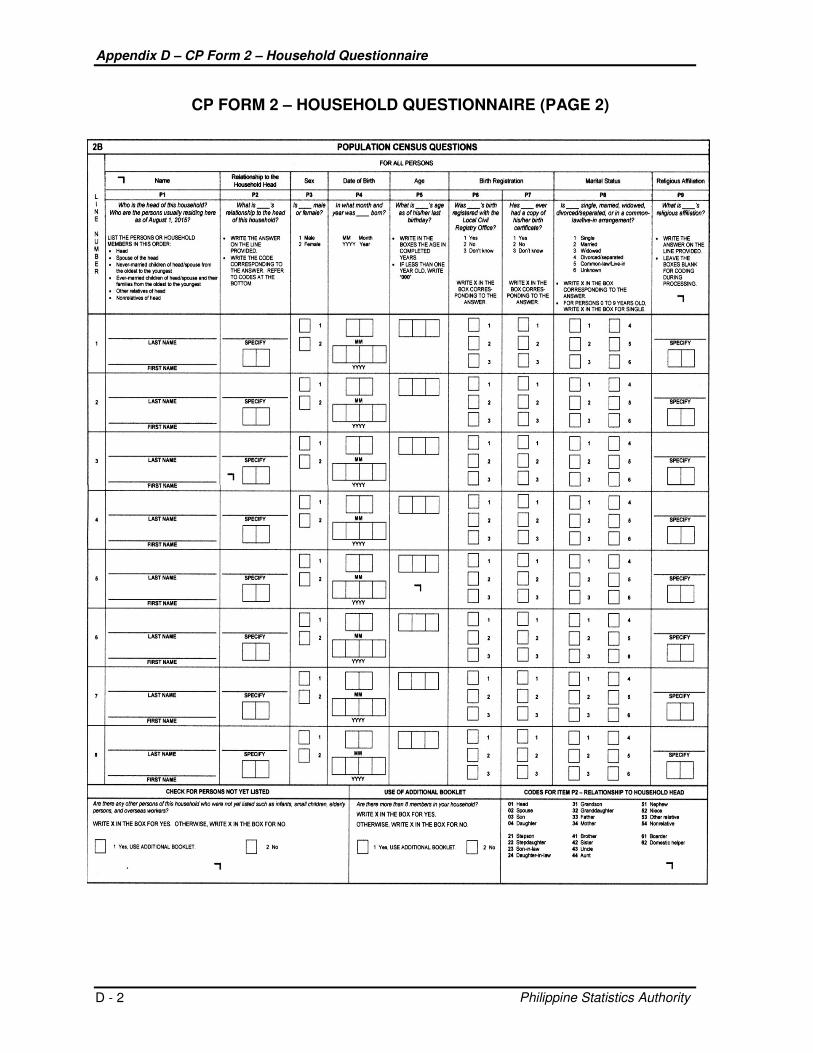
Appendix D – CP Form 2 – Household Questionnaire
Philippine Statistics Authority D - 2
CP FORM 2 – HOUSEHOLD QUESTIONNAIRE (PAGE 2)
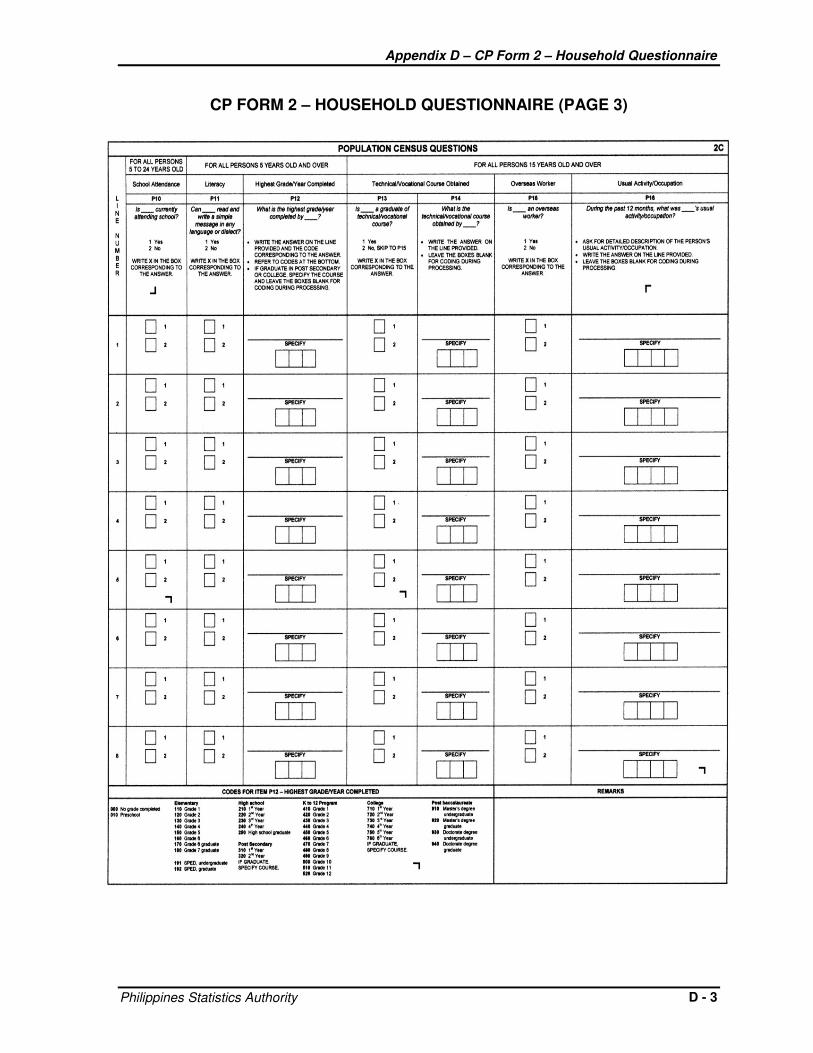
Appendix D – CP Form 2 – Household Questionnaire
Philippines Statistics Authority D - 3
CP FORM 2 – HOUSEHOLD QUESTIONNAIRE (PAGE 3)
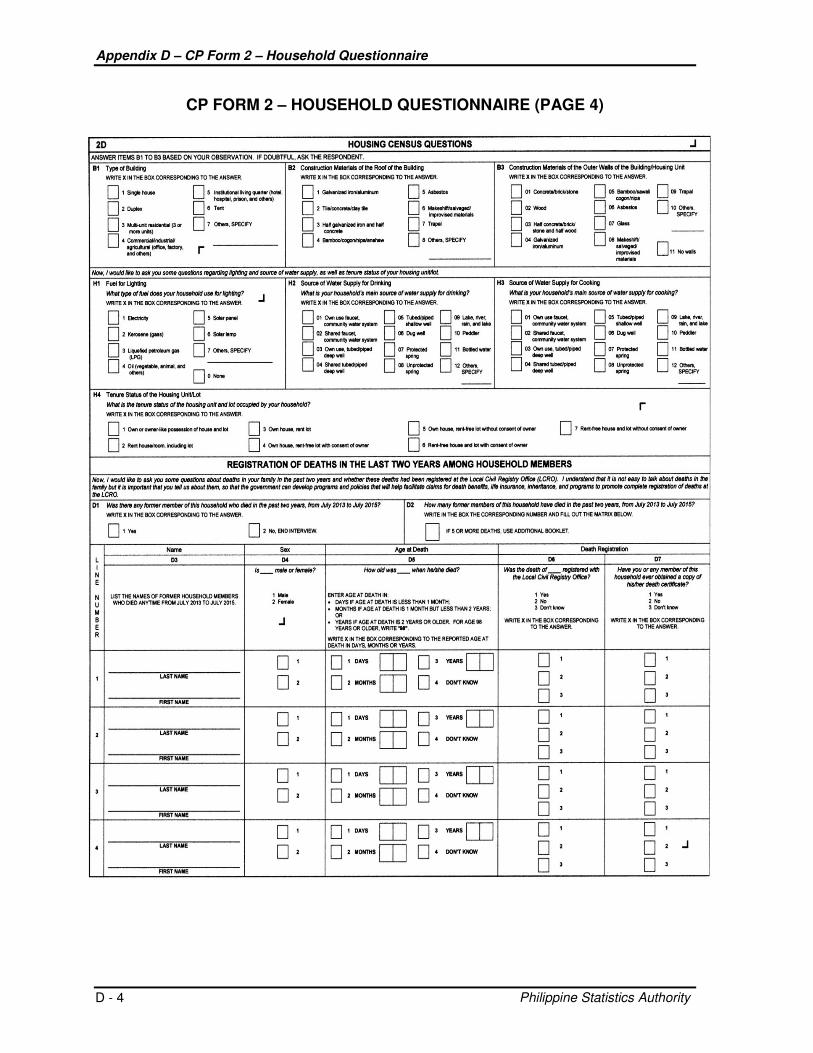
Appendix D – CP Form 2 – Household Questionnaire
Philippine Statistics Authority D - 4
CP FORM 2 – HOUSEHOLD QUESTIONNAIRE (PAGE 4)
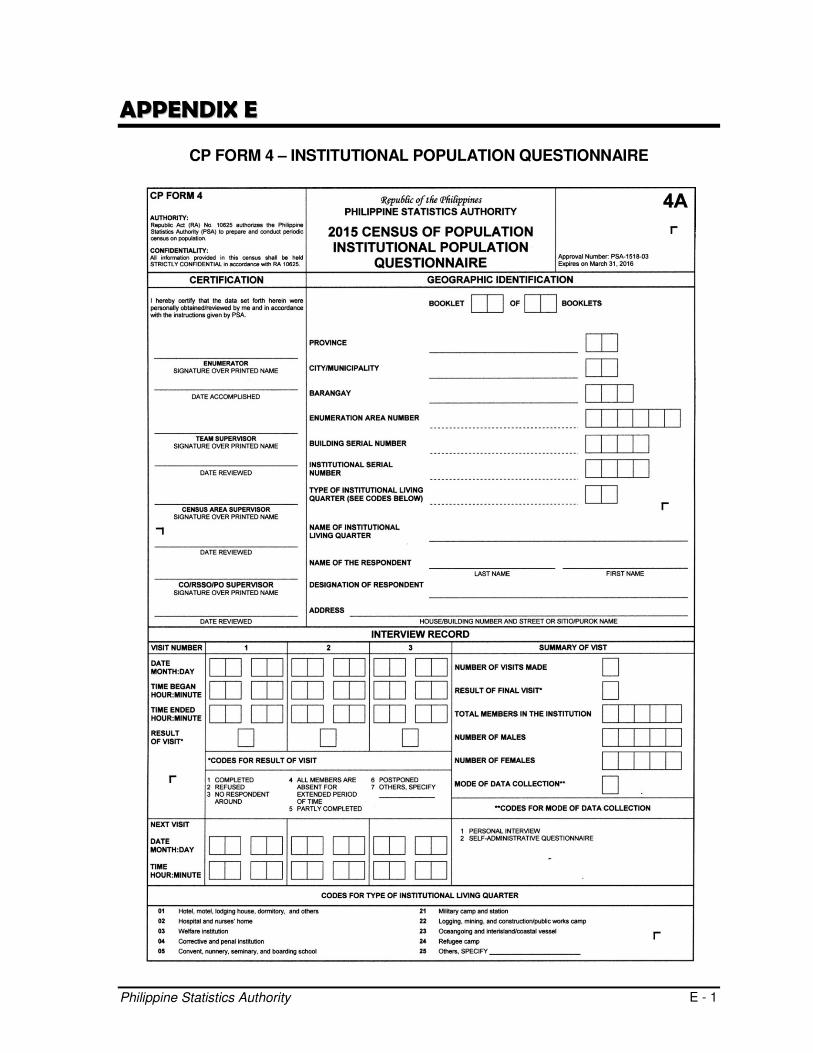
Philippine Statistics Authority E - 1
AAPPPPEENNDDIIXX EE
CP FORM 4 – INSTITUTIONAL POPULATION QUESTIONNAIRE
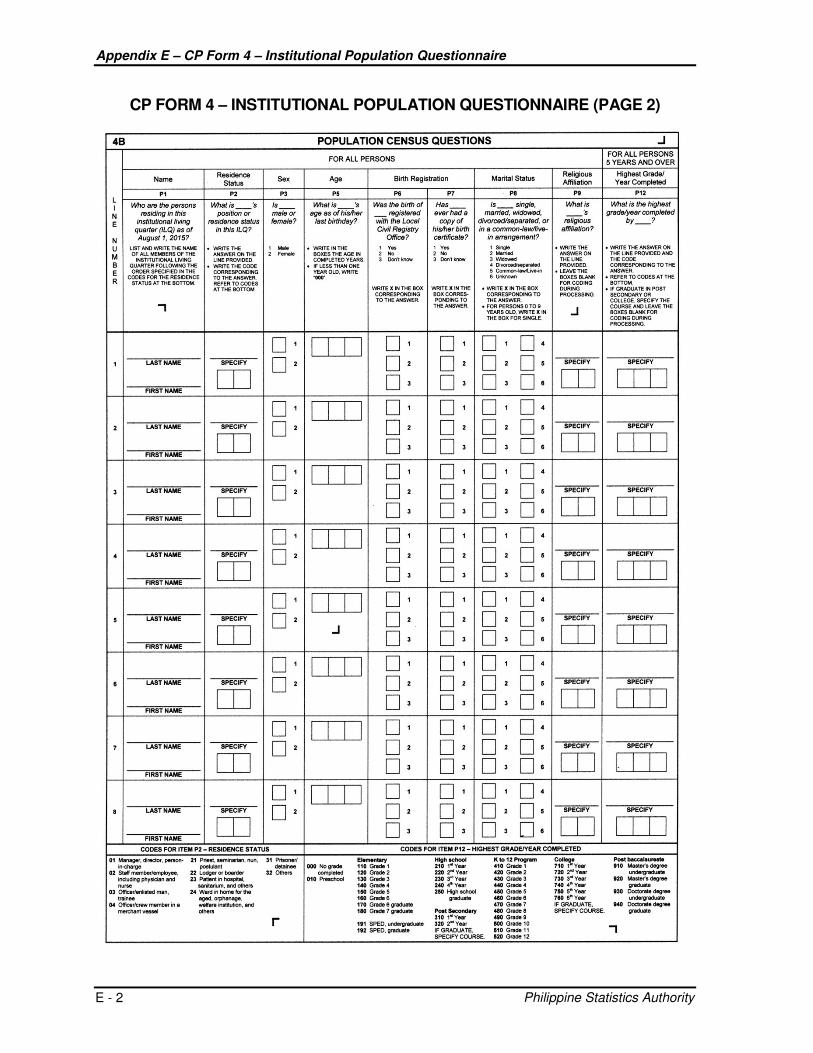
Appendix E – CP Form 4 – Institutional Population Questionnaire
Philippine Statistics Authority E - 2
CP FORM 4 – INSTITUTIONAL POPULATION QUESTIONNAIRE (PAGE 2)
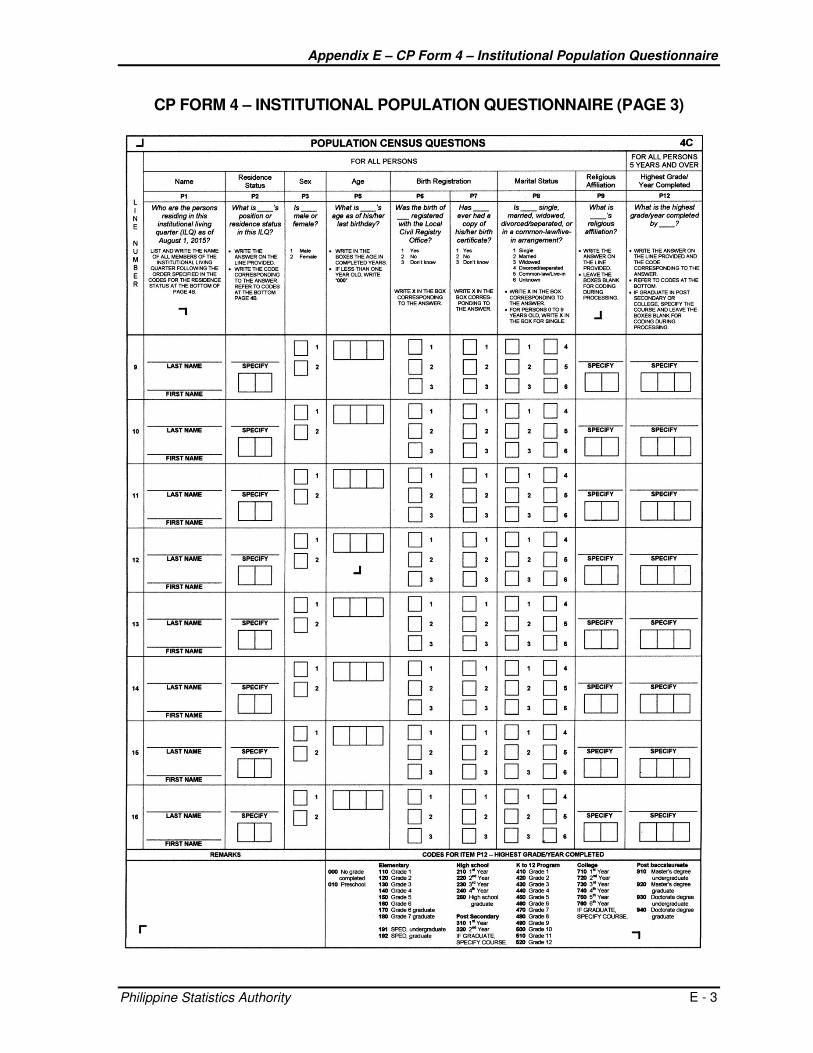
Appendix E – CP Form 4 – Institutional Population Questionnaire
Philippine Statistics Authority E - 3
CP FORM 4 – INSTITUTIONAL POPULATION QUESTIONNAIRE (PAGE 3)
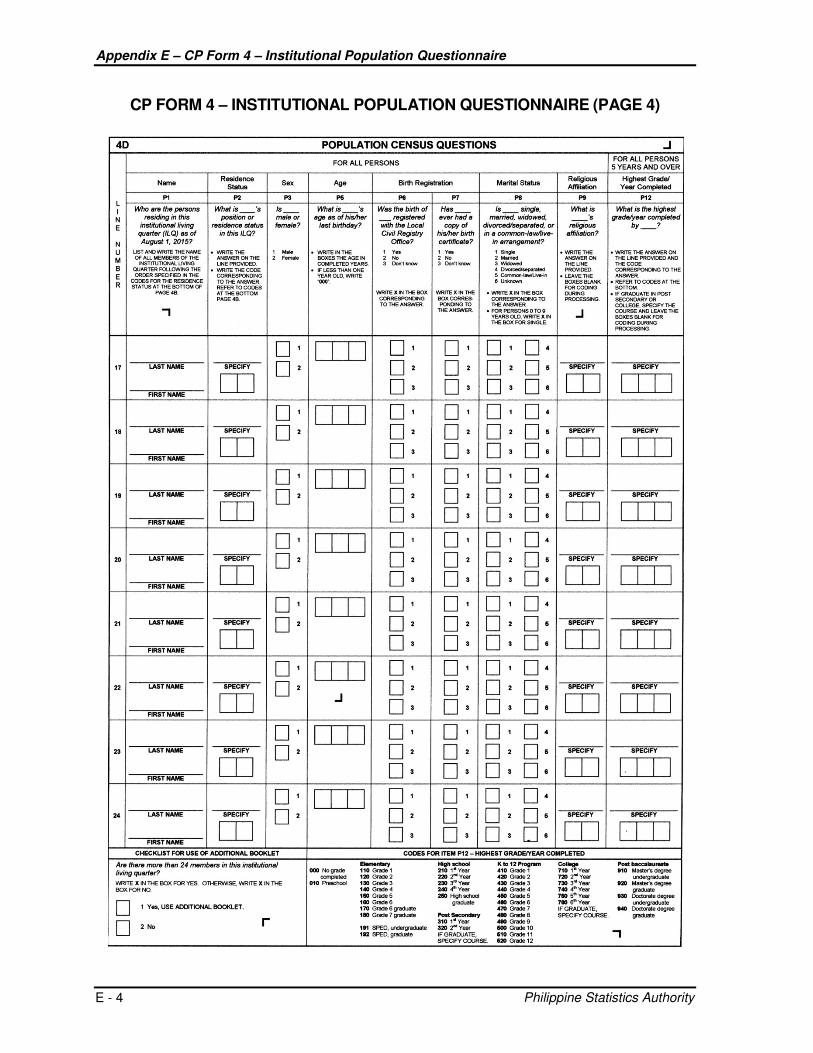
Appendix E – CP Form 4 – Institutional Population Questionnaire
Philippine Statistics Authority E - 4
CP FORM 4 – INSTITUTIONAL POPULATION QUESTIONNAIRE (PAGE 4)
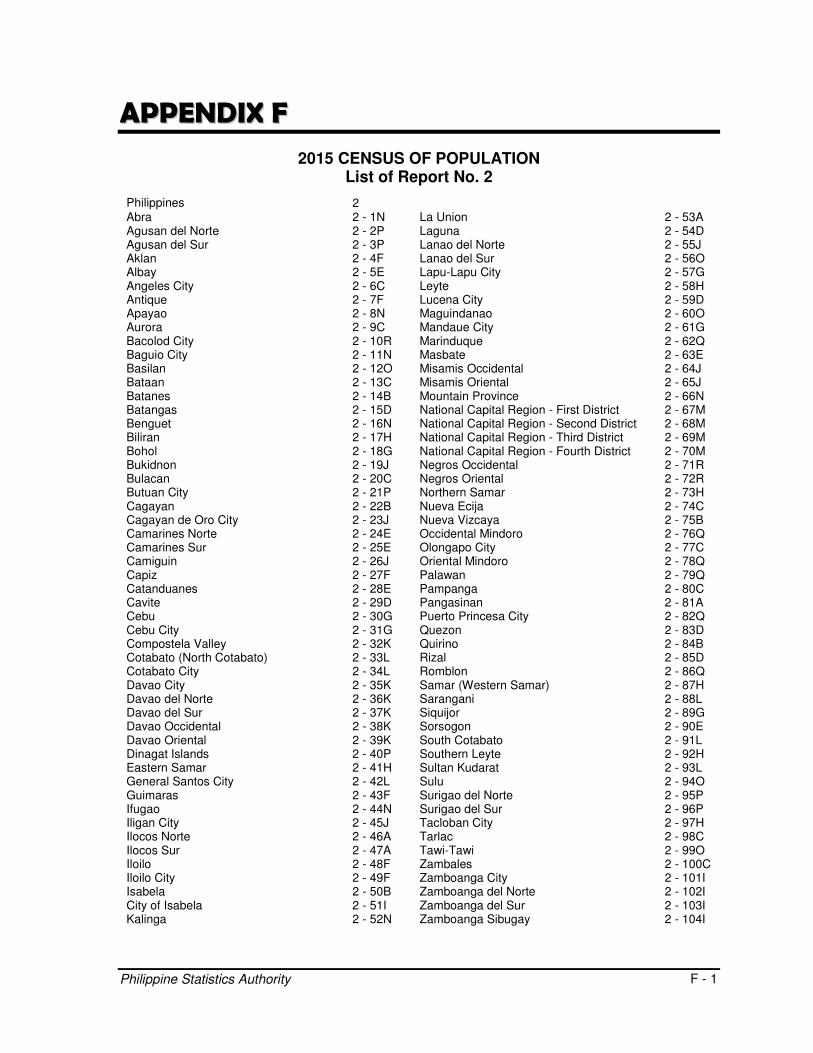
Philippine Statistics Authority
F - 1
AAPPPPEENNDDIIXX FF
2015 CENSUS OF POPULATION List of Report No. 2
Philippines 2
Abra 2 - 1N La Union 2 - 53A Agusan del Norte 2 - 2P Laguna 2 - 54D Agusan del Sur 2 - 3P Lanao del Norte 2 - 55J Aklan 2 - 4F Lanao del Sur 2 - 56O Albay 2 - 5E Lapu-Lapu City 2 - 57G Angeles City 2 - 6C Leyte 2 - 58H Antique 2 - 7F Lucena City 2 - 59D Apayao 2 - 8N Maguindanao 2 - 60O Aurora 2 - 9C Mandaue City 2 - 61G Bacolod City 2 - 10R Marinduque 2 - 62Q Baguio City 2 - 11N Masbate 2 - 63E Basilan 2 - 12O Misamis Occidental 2 - 64J Bataan 2 - 13C Misamis Oriental 2 - 65J Batanes 2 - 14B Mountain Province 2 - 66N Batangas 2 - 15D National Capital Region - First District 2 - 67M Benguet 2 - 16N National Capital Region - Second District 2 - 68M Biliran 2 - 17H National Capital Region - Third District 2 - 69M Bohol 2 - 18G National Capital Region - Fourth District 2 - 70M Bukidnon 2 - 19J Negros Occidental 2 - 71R Bulacan 2 - 20C Negros Oriental 2 - 72R Butuan City 2 - 21P Northern Samar 2 - 73H Cagayan 2 - 22B Nueva Ecija 2 - 74C Cagayan de Oro City 2 - 23J Nueva Vizcaya 2 - 75B Camarines Norte 2 - 24E Occidental Mindoro 2 - 76Q Camarines Sur 2 - 25E Olongapo City 2 - 77C Camiguin 2 - 26J Oriental Mindoro 2 - 78Q Capiz 2 - 27F Palawan 2 - 79Q Catanduanes 2 - 28E Pampanga 2 - 80C Cavite 2 - 29D Pangasinan 2 - 81A Cebu 2 - 30G Puerto Princesa City 2 - 82Q Cebu City 2 - 31G Quezon 2 - 83D Compostela Valley 2 - 32K Quirino 2 - 84B Cotabato (North Cotabato) 2 - 33L Rizal 2 - 85D Cotabato City 2 - 34L Romblon 2 - 86Q Davao City 2 - 35K Samar (Western Samar) 2 - 87H Davao del Norte 2 - 36K Sarangani 2 - 88L Davao del Sur 2 - 37K Siquijor 2 - 89G Davao Occidental 2 - 38K Sorsogon 2 - 90E Davao Oriental 2 - 39K South Cotabato 2 - 91L Dinagat Islands 2 - 40P Southern Leyte 2 - 92H Eastern Samar 2 - 41H Sultan Kudarat 2 - 93L General Santos City 2 - 42L Sulu 2 - 94O Guimaras 2 - 43F Surigao del Norte 2 - 95P Ifugao 2 - 44N Surigao del Sur 2 - 96P Iligan City 2 - 45J Tacloban City 2 - 97H Ilocos Norte 2 - 46A Tarlac 2 - 98C Ilocos Sur 2 - 47A Tawi-Tawi 2 - 99O Iloilo 2 - 48F Zambales 2 - 100C Iloilo City 2 - 49F Zamboanga City 2 - 101I Isabela 2 - 50B Zamboanga del Norte 2 - 102I City of Isabela 2 - 51I Zamboanga del Sur 2 - 103I Kalinga 2 - 52N Zamboanga Sibugay 2 - 104I