0.39 pgim funds 2021 final.pdf - wilmington trust
TRANSCRIPT
WILMINGTON TRUST COLLECTIVE INVESTMENT TRUST
FUNDS SUB-ADVISED BY PGIM, INC.
FINANCIAL STATEMENTS
DECEMBER 31, 2021
WITH
INDEPENDENT AUDITOR'S REPORT
Independent Auditor’s Report .. . . . . . . . . . . . . . . . . . . . . . . . . . . . . . . . . . . . . . . . . . . . . . . . . . . . . . . . . . . . . . . . . . . . . . . . . . . . . . . . . . . . . . . . . . . . . . . . . . . . . . . . . . . . . . . . . . . . . . . . . . . . . . . . . . . . . . . . 1
Fund Index .... . . . . . . . . . . . . . . . . . . . . . . . . . . . . . . . . . . . . . . . . . . . . . . . . . . . . . . . . . . . . . . . . . . . . . . . . . . . . . . . . . . . . . . . . . . . . . . . . . . . . . . . . . . . . . . . . . . . . . . . . . . . . . . . . . . . . . . . . . . . . . . . . . . . . . . . . . . . . . 3
PGIM Select Real Estate Fund CIT.... . . . . . . . . . . . . . . . . . . . . . . . . . . . . . . . . . . . . . . . . . . . . . . . . . . . . . . . . . . . . . . . . . . . . . . . . . . . . . . . . . . . . . . . . . . . . . . . . . . . . . . . . . . . . . . . . . . . . . . . . . . . . . . 4
PGIM Strategic Bond Fund CIT.... . . . . . . . . . . . . . . . . . . . . . . . . . . . . . . . . . . . . . . . . . . . . . . . . . . . . . . . . . . . . . . . . . . . . . . . . . . . . . . . . . . . . . . . . . . . . . . . . . . . . . . . . . . . . . . . . . . . . . . . . . . . . . . . . . . . 11
PGIM Total Return Bond Fund .... . . . . . . . . . . . . . . . . . . . . . . . . . . . . . . . . . . . . . . . . . . . . . . . . . . . . . . . . . . . . . . . . . . . . . . . . . . . . . . . . . . . . . . . . . . . . . . . . . . . . . . . . . . . . . . . . . . . . . . . . . . . . . . . . . . . . 42
Notes to the Financial Statements ... . . . . . . . . . . . . . . . . . . . . . . . . . . . . . . . . . . . . . . . . . . . . . . . . . . . . . . . . . . . . . . . . . . . . . . . . . . . . . . . . . . . . . . . . . . . . . . . . . . . . . . . . . . . . . . . . . . . . . . . . . . . . . . . . 85
Wilmington Trust Collective Investment TrustFunds Sub-Advised by PGIM, Inc.
CONTENTS
1
INDEPENDENT AUDITOR'S REPORT Wilmington Trust, N.A., Trustee for Wilmington Trust Collective Investment Trust Opinion We have audited the financial statements of the Funds Sub-Advised by PGIM, Inc. of Wilmington Trust Collective Investment Trust, comprising the funds (the "Funds") on the Fund Index on page 3, which comprise the statements of assets and liabilities, including the schedules of investments, as of December 31, 2021, the related statements of operations and changes in net assets, and the financial highlights for the year then ended, or for the period then ended for inception dates in 2021, and the related notes to the financial statements. These financial statements and financial highlights are hereinafter collectively referred to as financial statements. In our opinion, the accompanying financial statements present fairly, in all material respects, the financial position of each of the Funds as of December 31, 2021, and the results of its operations, changes in its net assets and its financial highlights for the year then ended, or for the period then ended for inception dates in 2021, in accordance with accounting principles generally accepted in the United States of America. Basis for Opinion We conducted our audits in accordance with auditing standards generally accepted in the United States of America (GAAS). Our responsibilities under those standards are further described in the Auditor's Responsibilities for the Audit of the Financial Statements section of our report. We are required to be independent of the Funds and to meet our other ethical responsibilities, in accordance with the relevant ethical requirements relating to our audits. We believe that the audit evidence we have obtained is sufficient and appropriate to provide a basis for our audit opinion. Responsibilities of Management for the Financial Statements Management is responsible for the preparation and fair presentation of the financial statements in accordance with accounting principles generally accepted in the United States of America, and for the design, implementation, and maintenance of internal control relevant to the preparation and fair presentation of financial statements that are free from material misstatement, whether due to fraud or error. In preparing the financial statements, management is required to evaluate whether there are conditions or events, considered in the aggregate, that raise substantial doubt about each Fund's ability to continue as a going concern within one year after the date that the financial statements are issued or available to be issued. Auditor's Responsibilities for the Audit of the Financial Statements Our objectives are to obtain reasonable assurance about whether the financial statements as a whole are free from material misstatement, whether due to fraud or error, and to issue an auditor's report that includes our opinion. Reasonable assurance is a high level of assurance but is not absolute assurance and therefore is not a guarantee that an audit conducted in accordance with GAAS will always detect a material misstatement when it exists. The risk of not detecting a material misstatement resulting from fraud is higher than for one resulting from error, as fraud may involve
www.hogantaylor.com
2
collusion, forgery, intentional omissions, misrepresentations, or the override of internal control. Misstatements are considered material if there is a substantial likelihood that, individually or in the aggregate, they would influence the judgment made by a reasonable user based on the financial statements. In performing an audit in accordance with GAAS, we:
• Exercise professional judgment and maintain professional skepticism throughout the audit. • Identify and assess the risks of material misstatement of the financial statements, whether due to fraud or error,
and design and perform audit procedures responsive to those risks. Such procedures include examining, on a test basis, evidence regarding the amounts and disclosures in the financial statements.
• Obtain an understanding of internal control relevant to the audit in order to design audit procedures that are appropriate in the circumstances, but not for the purpose of expressing an opinion on the effectiveness of each Fund's internal control. Accordingly, no such opinion is expressed.
• Evaluate the appropriateness of accounting policies used and the reasonableness of significant accounting estimates made by management, as well as evaluate the overall presentation of the financial statements.
• Conclude whether, in our judgment, there are conditions or events, considered in the aggregate, that raise substantial doubt about each Fund's ability to continue as a going concern for a reasonable period of time.
We are required to communicate with those charged with governance regarding, among other matters, the planned scope and timing of the audits, significant audit findings, and certain internal control-related matters that we identified during the audits. Other Matter Our audits were conducted for the purpose of forming an opinion on the financial statements of each Fund as a whole. The supplementary information for the year ended December 31, 2021, or for the period then ended for inception dates in 2021, following the schedule of investments, is presented for purposes of additional analysis and is not a required part of the financial statements. Such information is the responsibility of management and was derived from and relates directly to the underlying accounting and other records used to prepare the financial statements. The information has been subjected to the auditing procedures applied in the audits of the financial statements and certain additional procedures, including comparing and reconciling such information directly to the underlying accounting and other records used to prepare the financial statements or to the financial statements themselves, and other additional procedures in accordance with auditing standards generally accepted in the United States of America. In our opinion, the information is fairly stated in all material respects in relation to the financial statements as a whole.
Tulsa, Oklahoma April 29, 2022
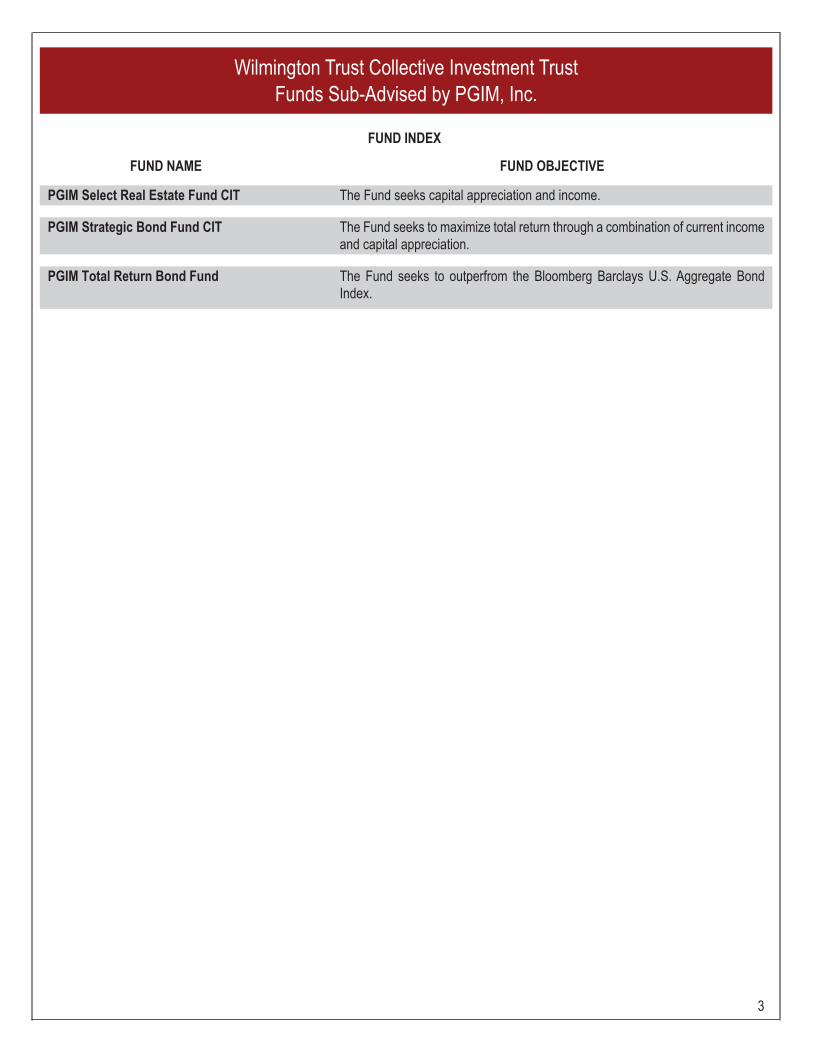
FUND NAME FUND OBJECTIVE
PGIM Select Real Estate Fund CIT The Fund seeks capital appreciation and income.
PGIM Strategic Bond Fund CIT The Fund seeks to maximize total return through a combination of current incomeand capital appreciation.
PGIM Total Return Bond Fund The Fund seeks to outperfrom the Bloomberg Barclays U.S. Aggregate BondIndex.
Wilmington Trust Collective Investment TrustFunds Sub-Advised by PGIM, Inc.
FUND INDEX
3
PrincipalAmount or
Shares CostFair
Value
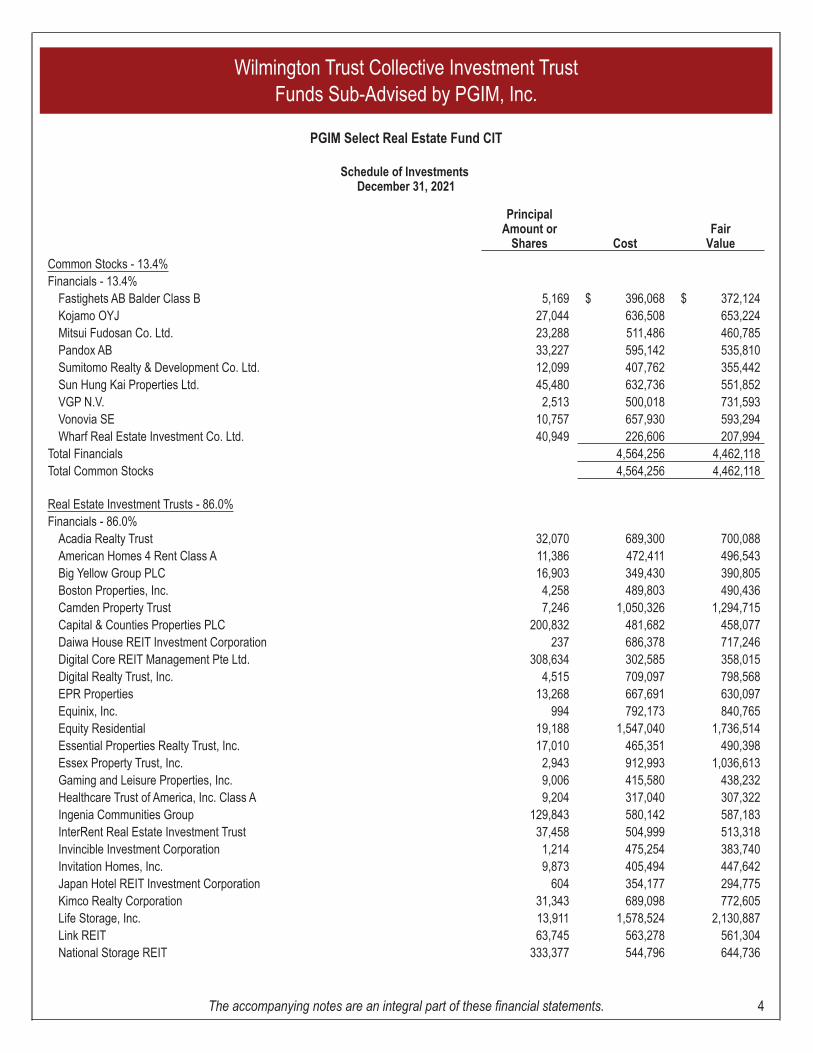
Common Stocks - 13.4%Financials - 13.4%
Fastighets AB Balder Class B 5,169 $ 396,068 $ 372,124Kojamo OYJ 27,044 636,508 653,224Mitsui Fudosan Co. Ltd. 23,288 511,486 460,785Pandox AB 33,227 595,142 535,810Sumitomo Realty & Development Co. Ltd. 12,099 407,762 355,442Sun Hung Kai Properties Ltd. 45,480 632,736 551,852VGP N.V. 2,513 500,018 731,593Vonovia SE 10,757 657,930 593,294Wharf Real Estate Investment Co. Ltd. 40,949 226,606 207,994
Total Financials 4,564,256 4,462,118Total Common Stocks 4,564,256 4,462,118
Real Estate Investment Trusts - 86.0%Financials - 86.0%
Acadia Realty Trust 32,070 689,300 700,088American Homes 4 Rent Class A 11,386 472,411 496,543Big Yellow Group PLC 16,903 349,430 390,805Boston Properties, Inc. 4,258 489,803 490,436Camden Property Trust 7,246 1,050,326 1,294,715Capital & Counties Properties PLC 200,832 481,682 458,077Daiwa House REIT Investment Corporation 237 686,378 717,246Digital Core REIT Management Pte Ltd. 308,634 302,585 358,015Digital Realty Trust, Inc. 4,515 709,097 798,568EPR Properties 13,268 667,691 630,097Equinix, Inc. 994 792,173 840,765Equity Residential 19,188 1,547,040 1,736,514Essential Properties Realty Trust, Inc. 17,010 465,351 490,398Essex Property Trust, Inc. 2,943 912,993 1,036,613Gaming and Leisure Properties, Inc. 9,006 415,580 438,232Healthcare Trust of America, Inc. Class A 9,204 317,040 307,322Ingenia Communities Group 129,843 580,142 587,183InterRent Real Estate Investment Trust 37,458 504,999 513,318Invincible Investment Corporation 1,214 475,254 383,740Invitation Homes, Inc. 9,873 405,494 447,642Japan Hotel REIT Investment Corporation 604 354,177 294,775Kimco Realty Corporation 31,343 689,098 772,605Life Storage, Inc. 13,911 1,578,524 2,130,887Link REIT 63,745 563,278 561,304National Storage REIT 333,377 544,796 644,736
Wilmington Trust Collective Investment TrustFunds Sub-Advised by PGIM, Inc.
PGIM Select Real Estate Fund CIT
Schedule of InvestmentsDecember 31, 2021
The accompanying notes are an integral part of these financial statements. 4
PrincipalAmount or
Shares CostFair
Value
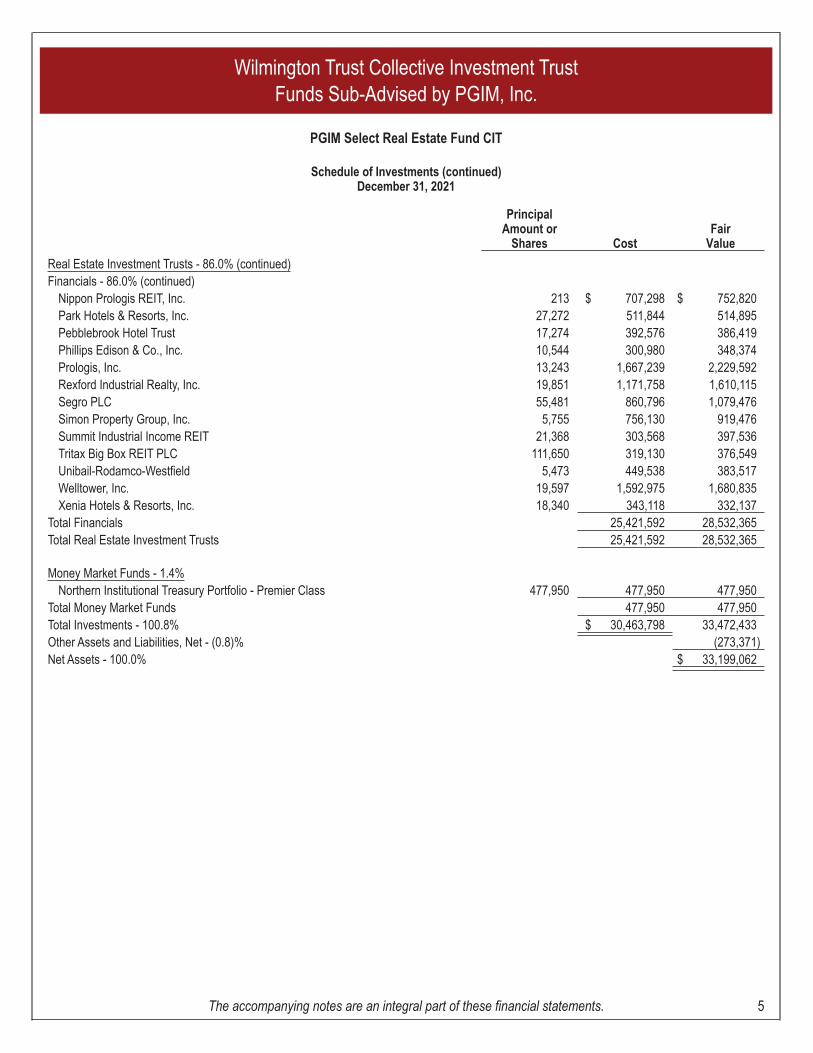
Real Estate Investment Trusts - 86.0% (continued)Financials - 86.0% (continued)
Nippon Prologis REIT, Inc. 213 $ 707,298 $ 752,820Park Hotels & Resorts, Inc. 27,272 511,844 514,895Pebblebrook Hotel Trust 17,274 392,576 386,419Phillips Edison & Co., Inc. 10,544 300,980 348,374Prologis, Inc. 13,243 1,667,239 2,229,592Rexford Industrial Realty, Inc. 19,851 1,171,758 1,610,115Segro PLC 55,481 860,796 1,079,476Simon Property Group, Inc. 5,755 756,130 919,476Summit Industrial Income REIT 21,368 303,568 397,536Tritax Big Box REIT PLC 111,650 319,130 376,549Unibail-Rodamco-Westfield 5,473 449,538 383,517Welltower, Inc. 19,597 1,592,975 1,680,835Xenia Hotels & Resorts, Inc. 18,340 343,118 332,137
Total Financials 25,421,592 28,532,365Total Real Estate Investment Trusts 25,421,592 28,532,365
Money Market Funds - 1.4%Northern Institutional Treasury Portfolio - Premier Class 477,950 477,950 477,950
Total Money Market Funds 477,950 477,950Total Investments - 100.8% $ 30,463,798 33,472,433Other Assets and Liabilities, Net - (0.8)% (273,371)Net Assets - 100.0% $ 33,199,062
Wilmington Trust Collective Investment TrustFunds Sub-Advised by PGIM, Inc.
PGIM Select Real Estate Fund CIT
Schedule of Investments (continued)December 31, 2021
The accompanying notes are an integral part of these financial statements. 5
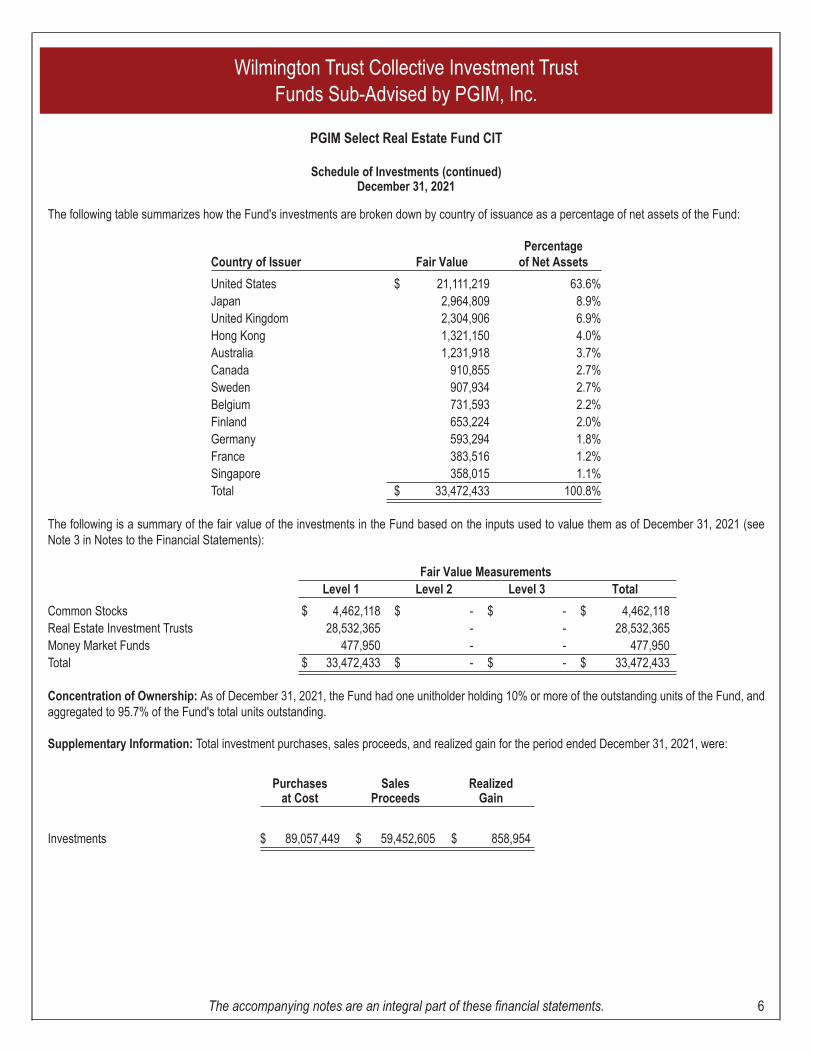
The following table summarizes how the Fund's investments are broken down by country of issuance as a percentage of net assets of the Fund:
Country of Issuer Fair ValuePercentage
of Net Assets
United States $ 21,111,219 63.6%Japan 2,964,809 8.9%United Kingdom 2,304,906 6.9%Hong Kong 1,321,150 4.0%Australia 1,231,918 3.7%Canada 910,855 2.7%Sweden 907,934 2.7%Belgium 731,593 2.2%Finland 653,224 2.0%Germany 593,294 1.8%France 383,516 1.2%Singapore 358,015 1.1%Total $ 33,472,433 100.8%
The following is a summary of the fair value of the investments in the Fund based on the inputs used to value them as of December 31, 2021 (seeNote 3 in Notes to the Financial Statements):
Fair Value MeasurementsLevel 1 Level 2 Level 3 Total
Common Stocks $ 4,462,118 $ - $ - $ 4,462,118Real Estate Investment Trusts 28,532,365 - - 28,532,365Money Market Funds 477,950 - - 477,950Total $ 33,472,433 $ - $ - $ 33,472,433
Concentration of Ownership: As of December 31, 2021, the Fund had one unitholder holding 10% or more of the outstanding units of the Fund, andaggregated to 95.7% of the Fund's total units outstanding.
Supplementary Information: Total investment purchases, sales proceeds, and realized gain for the period ended December 31, 2021, were:
Purchasesat Cost
SalesProceeds
RealizedGain
Investments $ 89,057,449 $ 59,452,605 $ 858,954
Wilmington Trust Collective Investment TrustFunds Sub-Advised by PGIM, Inc.
PGIM Select Real Estate Fund CIT
Schedule of Investments (continued)December 31, 2021
The accompanying notes are an integral part of these financial statements. 6
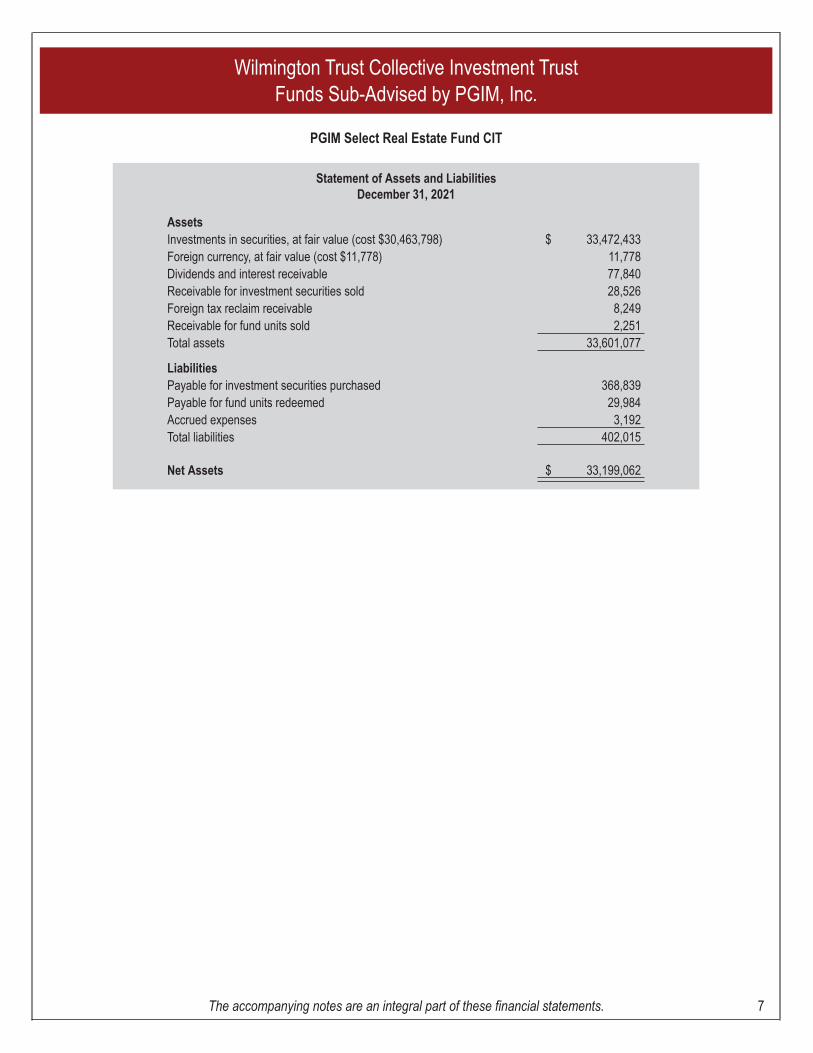
Statement of Assets and LiabilitiesDecember 31, 2021
AssetsInvestments in securities, at fair value (cost $30,463,798) $ 33,472,433Foreign currency, at fair value (cost $11,778) 11,778Dividends and interest receivable 77,840Receivable for investment securities sold 28,526Foreign tax reclaim receivable 8,249Receivable for fund units sold 2,251Total assets 33,601,077
LiabilitiesPayable for investment securities purchased 368,839Payable for fund units redeemed 29,984Accrued expenses 3,192Total liabilities 402,015
Net Assets $ 33,199,062
Wilmington Trust Collective Investment TrustFunds Sub-Advised by PGIM, Inc.
PGIM Select Real Estate Fund CIT
The accompanying notes are an integral part of these financial statements. 7
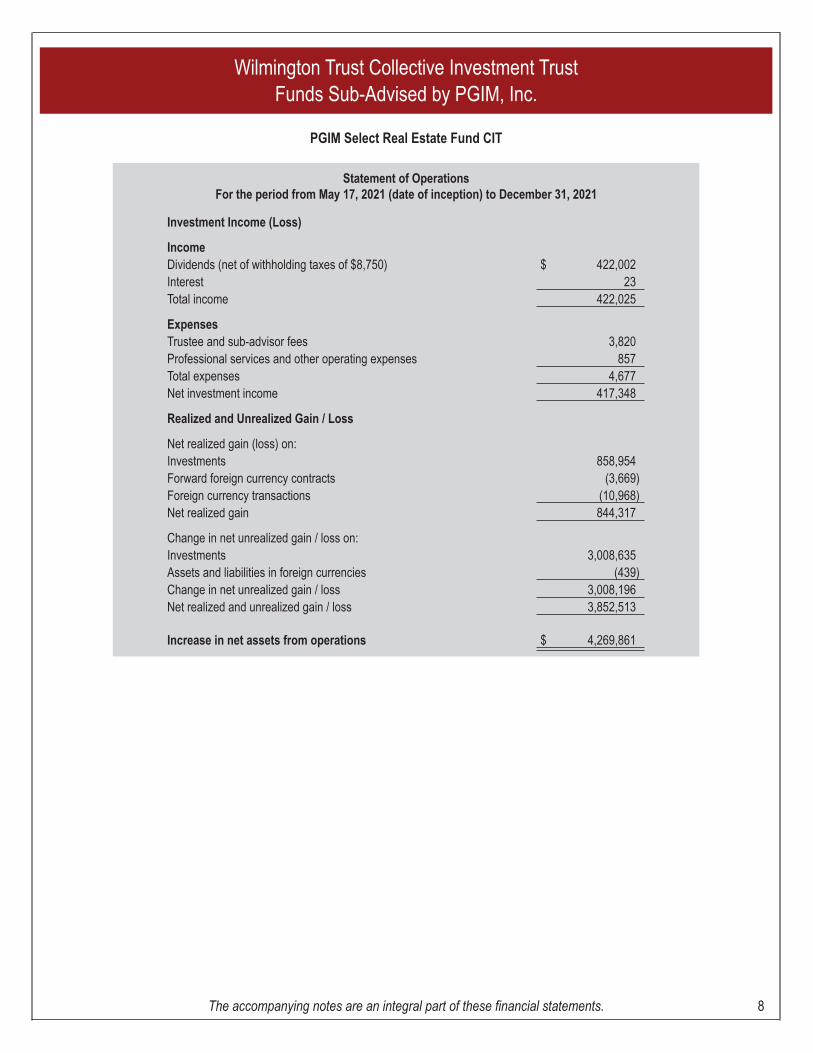
Statement of OperationsFor the period from May 17, 2021 (date of inception) to December 31, 2021
Investment Income (Loss)
IncomeDividends (net of withholding taxes of $8,750) $ 422,002Interest 23Total income 422,025
ExpensesTrustee and sub-advisor fees 3,820Professional services and other operating expenses 857Total expenses 4,677Net investment income 417,348
Realized and Unrealized Gain / Loss
Net realized gain (loss) on:Investments 858,954Forward foreign currency contracts (3,669)Foreign currency transactions (10,968)Net realized gain 844,317
Change in net unrealized gain / loss on:Investments 3,008,635Assets and liabilities in foreign currencies (439)Change in net unrealized gain / loss 3,008,196Net realized and unrealized gain / loss 3,852,513
Increase in net assets from operations $ 4,269,861
Wilmington Trust Collective Investment TrustFunds Sub-Advised by PGIM, Inc.
PGIM Select Real Estate Fund CIT
The accompanying notes are an integral part of these financial statements. 8
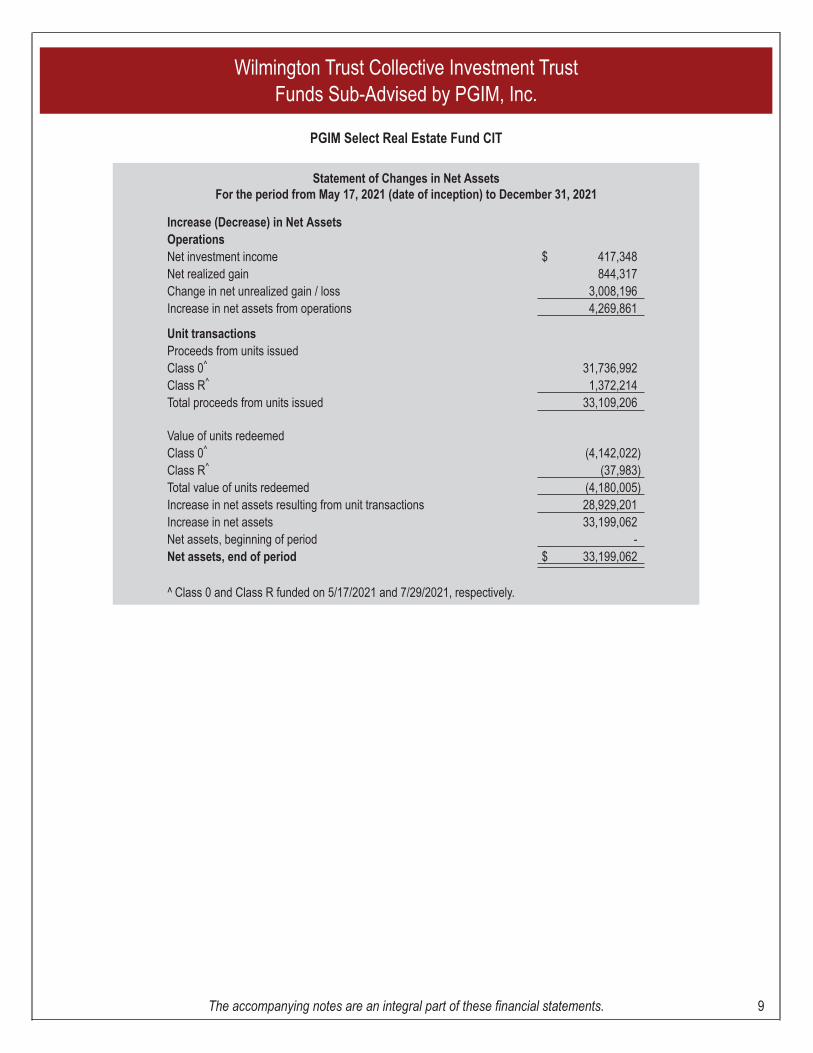
Statement of Changes in Net AssetsFor the period from May 17, 2021 (date of inception) to December 31, 2021
Increase (Decrease) in Net AssetsOperationsNet investment income $ 417,348Net realized gain 844,317Change in net unrealized gain / loss 3,008,196Increase in net assets from operations 4,269,861
Unit transactionsProceeds from units issuedClass 0^ 31,736,992Class R^ 1,372,214Total proceeds from units issued 33,109,206
Value of units redeemedClass 0^ (4,142,022)Class R^ (37,983)Total value of units redeemed (4,180,005)Increase in net assets resulting from unit transactions 28,929,201Increase in net assets 33,199,062Net assets, beginning of period -Net assets, end of period $ 33,199,062
^ Class 0 and Class R funded on 5/17/2021 and 7/29/2021, respectively.
Wilmington Trust Collective Investment TrustFunds Sub-Advised by PGIM, Inc.
PGIM Select Real Estate Fund CIT
The accompanying notes are an integral part of these financial statements. 9
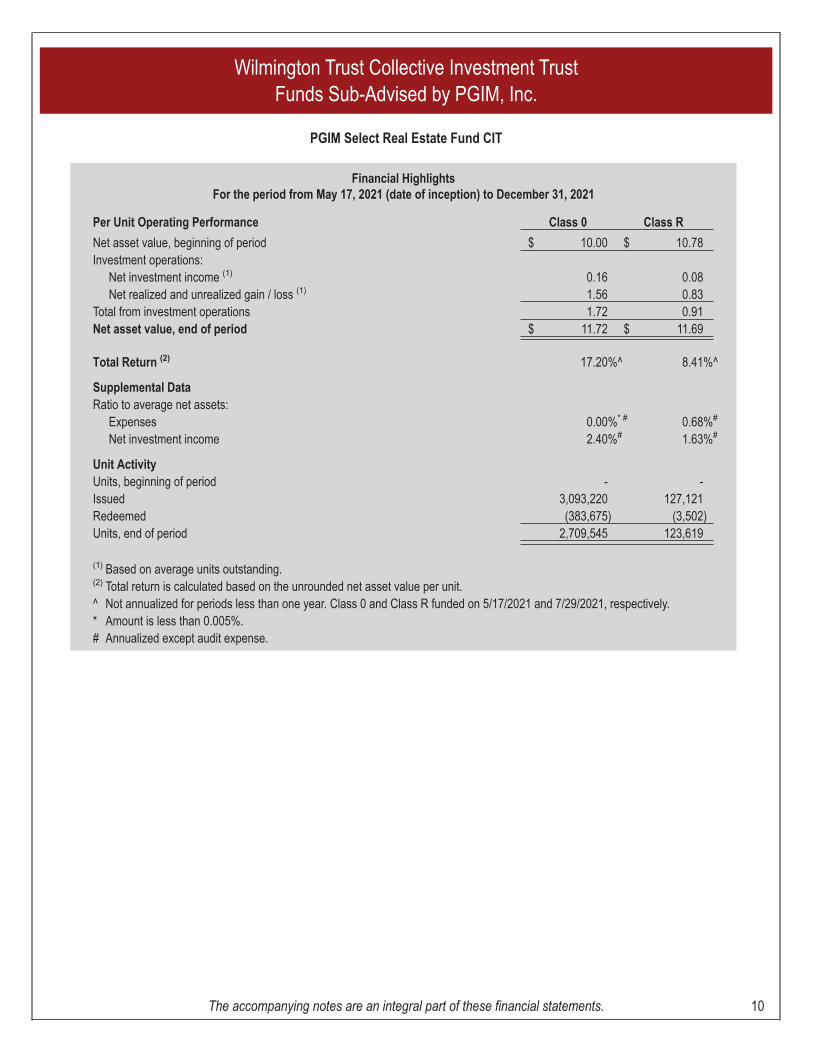
Financial HighlightsFor the period from May 17, 2021 (date of inception) to December 31, 2021
Per Unit Operating Performance Class 0 Class R
Net asset value, beginning of period $ 10.00 $ 10.78Investment operations:
Net investment income (1) 0.16 0.08Net realized and unrealized gain / loss (1) 1.56 0.83
Total from investment operations 1.72 0.91Net asset value, end of period $ 11.72 $ 11.69
Total Return (2) 17.20%^ 8.41%^
Supplemental DataRatio to average net assets:
Expenses 0.00%* # 0.68%#
Net investment income 2.40%# 1.63%#
Unit ActivityUnits, beginning of period - -Issued 3,093,220 127,121Redeemed (383,675) (3,502)Units, end of period 2,709,545 123,619
(1) Based on average units outstanding.(2) Total return is calculated based on the unrounded net asset value per unit.^ Not annualized for periods less than one year. Class 0 and Class R funded on 5/17/2021 and 7/29/2021, respectively.* Amount is less than 0.005%.# Annualized except audit expense.
Wilmington Trust Collective Investment TrustFunds Sub-Advised by PGIM, Inc.
PGIM Select Real Estate Fund CIT
The accompanying notes are an integral part of these financial statements. 10
PrincipalAmount or
Shares CostFair
Value
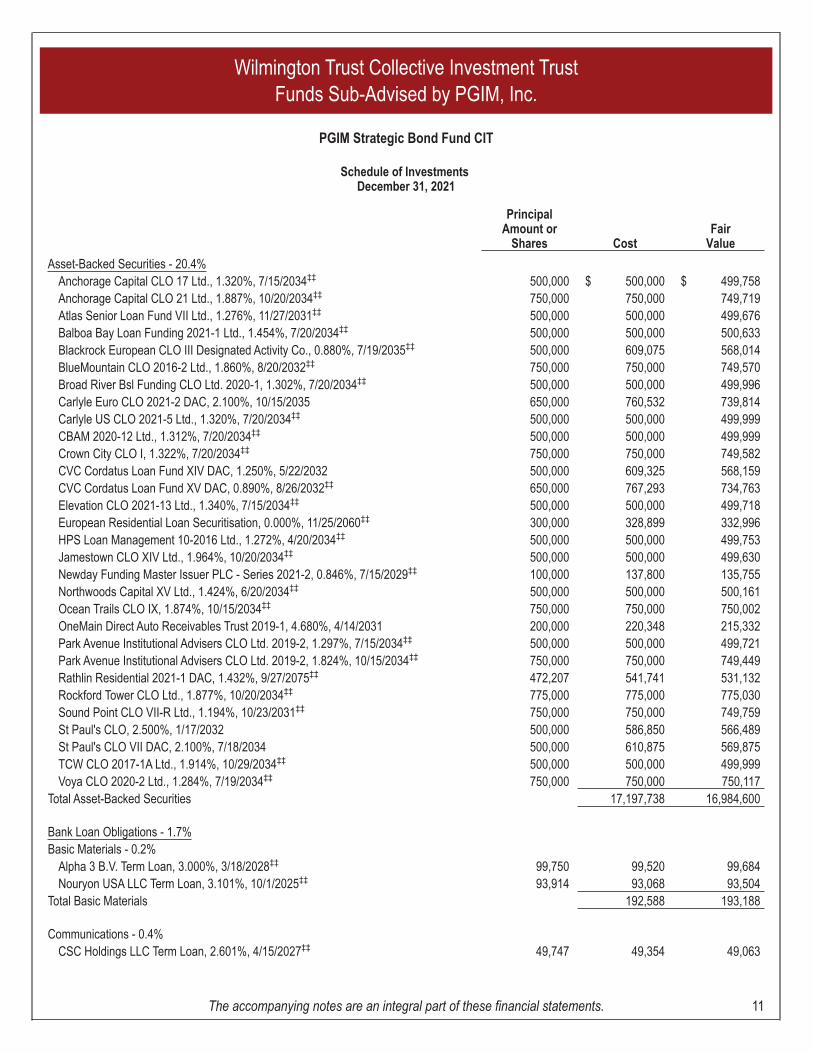
Asset-Backed Securities - 20.4%Anchorage Capital CLO 17 Ltd., 1.320%, 7/15/2034‡‡ 500,000 $ 500,000 $ 499,758Anchorage Capital CLO 21 Ltd., 1.887%, 10/20/2034‡‡ 750,000 750,000 749,719Atlas Senior Loan Fund VII Ltd., 1.276%, 11/27/2031‡‡ 500,000 500,000 499,676Balboa Bay Loan Funding 2021-1 Ltd., 1.454%, 7/20/2034‡‡ 500,000 500,000 500,633Blackrock European CLO III Designated Activity Co., 0.880%, 7/19/2035‡‡ 500,000 609,075 568,014BlueMountain CLO 2016-2 Ltd., 1.860%, 8/20/2032‡‡ 750,000 750,000 749,570Broad River Bsl Funding CLO Ltd. 2020-1, 1.302%, 7/20/2034‡‡ 500,000 500,000 499,996Carlyle Euro CLO 2021-2 DAC, 2.100%, 10/15/2035 650,000 760,532 739,814Carlyle US CLO 2021-5 Ltd., 1.320%, 7/20/2034‡‡ 500,000 500,000 499,999CBAM 2020-12 Ltd., 1.312%, 7/20/2034‡‡ 500,000 500,000 499,999Crown City CLO I, 1.322%, 7/20/2034‡‡ 750,000 750,000 749,582CVC Cordatus Loan Fund XIV DAC, 1.250%, 5/22/2032 500,000 609,325 568,159CVC Cordatus Loan Fund XV DAC, 0.890%, 8/26/2032‡‡ 650,000 767,293 734,763Elevation CLO 2021-13 Ltd., 1.340%, 7/15/2034‡‡ 500,000 500,000 499,718European Residential Loan Securitisation, 0.000%, 11/25/2060‡‡ 300,000 328,899 332,996HPS Loan Management 10-2016 Ltd., 1.272%, 4/20/2034‡‡ 500,000 500,000 499,753Jamestown CLO XIV Ltd., 1.964%, 10/20/2034‡‡ 500,000 500,000 499,630Newday Funding Master Issuer PLC - Series 2021-2, 0.846%, 7/15/2029‡‡ 100,000 137,800 135,755Northwoods Capital XV Ltd., 1.424%, 6/20/2034‡‡ 500,000 500,000 500,161Ocean Trails CLO IX, 1.874%, 10/15/2034‡‡ 750,000 750,000 750,002OneMain Direct Auto Receivables Trust 2019-1, 4.680%, 4/14/2031 200,000 220,348 215,332Park Avenue Institutional Advisers CLO Ltd. 2019-2, 1.297%, 7/15/2034‡‡ 500,000 500,000 499,721Park Avenue Institutional Advisers CLO Ltd. 2019-2, 1.824%, 10/15/2034‡‡ 750,000 750,000 749,449Rathlin Residential 2021-1 DAC, 1.432%, 9/27/2075‡‡ 472,207 541,741 531,132Rockford Tower CLO Ltd., 1.877%, 10/20/2034‡‡ 775,000 775,000 775,030Sound Point CLO VII-R Ltd., 1.194%, 10/23/2031‡‡ 750,000 750,000 749,759St Paul's CLO, 2.500%, 1/17/2032 500,000 586,850 566,489St Paul's CLO VII DAC, 2.100%, 7/18/2034 500,000 610,875 569,875TCW CLO 2017-1A Ltd., 1.914%, 10/29/2034‡‡ 500,000 500,000 499,999Voya CLO 2020-2 Ltd., 1.284%, 7/19/2034‡‡ 750,000 750,000 750,117
Total Asset-Backed Securities 17,197,738 16,984,600
Bank Loan Obligations - 1.7%Basic Materials - 0.2%
Alpha 3 B.V. Term Loan, 3.000%, 3/18/2028‡‡ 99,750 99,520 99,684Nouryon USA LLC Term Loan, 3.101%, 10/1/2025‡‡ 93,914 93,068 93,504
Total Basic Materials 192,588 193,188
Communications - 0.4%CSC Holdings LLC Term Loan, 2.601%, 4/15/2027‡‡ 49,747 49,354 49,063
Wilmington Trust Collective Investment TrustFunds Sub-Advised by PGIM, Inc.
PGIM Strategic Bond Fund CIT
Schedule of InvestmentsDecember 31, 2021
The accompanying notes are an integral part of these financial statements. 11
PrincipalAmount or
Shares CostFair
Value
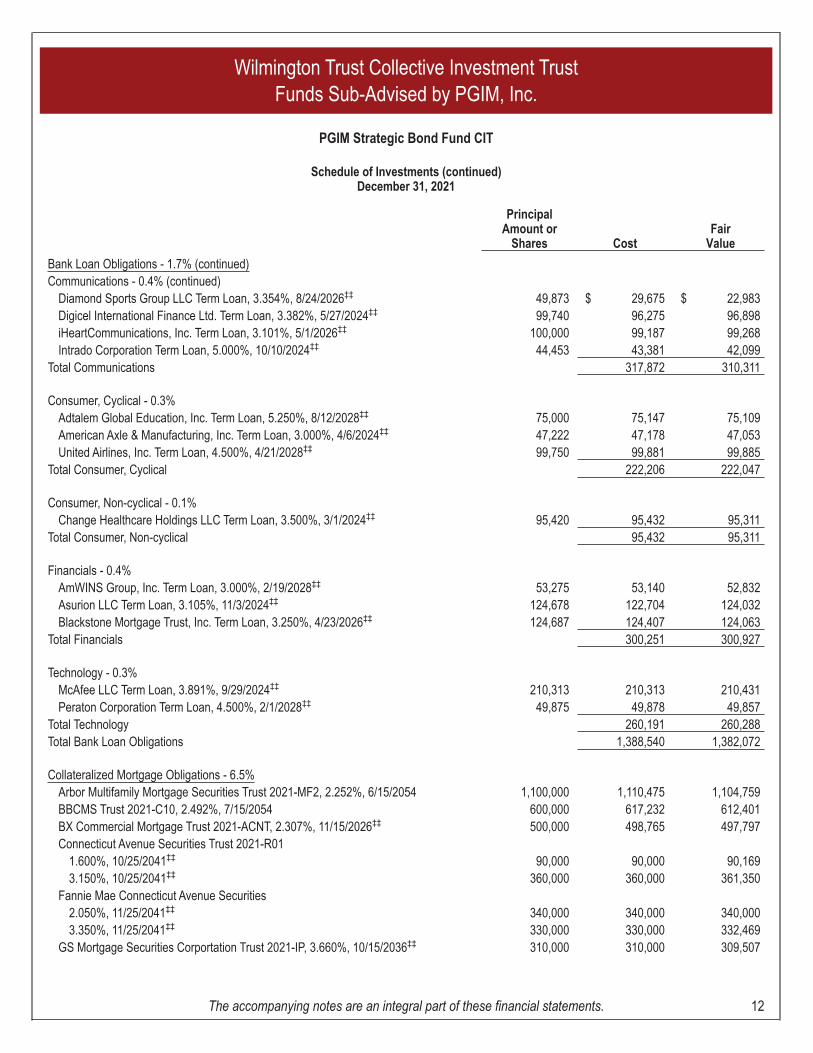
Bank Loan Obligations - 1.7% (continued)Communications - 0.4% (continued)
Diamond Sports Group LLC Term Loan, 3.354%, 8/24/2026‡‡ 49,873 $ 29,675 $ 22,983Digicel International Finance Ltd. Term Loan, 3.382%, 5/27/2024‡‡ 99,740 96,275 96,898iHeartCommunications, Inc. Term Loan, 3.101%, 5/1/2026‡‡ 100,000 99,187 99,268Intrado Corporation Term Loan, 5.000%, 10/10/2024‡‡ 44,453 43,381 42,099
Total Communications 317,872 310,311
Consumer, Cyclical - 0.3%Adtalem Global Education, Inc. Term Loan, 5.250%, 8/12/2028‡‡ 75,000 75,147 75,109American Axle & Manufacturing, Inc. Term Loan, 3.000%, 4/6/2024‡‡ 47,222 47,178 47,053United Airlines, Inc. Term Loan, 4.500%, 4/21/2028‡‡ 99,750 99,881 99,885
Total Consumer, Cyclical 222,206 222,047
Consumer, Non-cyclical - 0.1%Change Healthcare Holdings LLC Term Loan, 3.500%, 3/1/2024‡‡ 95,420 95,432 95,311
Total Consumer, Non-cyclical 95,432 95,311
Financials - 0.4%AmWINS Group, Inc. Term Loan, 3.000%, 2/19/2028‡‡ 53,275 53,140 52,832Asurion LLC Term Loan, 3.105%, 11/3/2024‡‡ 124,678 122,704 124,032Blackstone Mortgage Trust, Inc. Term Loan, 3.250%, 4/23/2026‡‡ 124,687 124,407 124,063
Total Financials 300,251 300,927
Technology - 0.3%McAfee LLC Term Loan, 3.891%, 9/29/2024‡‡ 210,313 210,313 210,431Peraton Corporation Term Loan, 4.500%, 2/1/2028‡‡ 49,875 49,878 49,857
Total Technology 260,191 260,288Total Bank Loan Obligations 1,388,540 1,382,072
Collateralized Mortgage Obligations - 6.5%Arbor Multifamily Mortgage Securities Trust 2021-MF2, 2.252%, 6/15/2054 1,100,000 1,110,475 1,104,759BBCMS Trust 2021-C10, 2.492%, 7/15/2054 600,000 617,232 612,401BX Commercial Mortgage Trust 2021-ACNT, 2.307%, 11/15/2026‡‡ 500,000 498,765 497,797Connecticut Avenue Securities Trust 2021-R01
1.600%, 10/25/2041‡‡ 90,000 90,000 90,1693.150%, 10/25/2041‡‡ 360,000 360,000 361,350
Fannie Mae Connecticut Avenue Securities2.050%, 11/25/2041‡‡ 340,000 340,000 340,0003.350%, 11/25/2041‡‡ 330,000 330,000 332,469
GS Mortgage Securities Corportation Trust 2021-IP, 3.660%, 10/15/2036‡‡ 310,000 310,000 309,507
Wilmington Trust Collective Investment TrustFunds Sub-Advised by PGIM, Inc.
PGIM Strategic Bond Fund CIT
Schedule of Investments (continued)December 31, 2021
The accompanying notes are an integral part of these financial statements. 12
PrincipalAmount or
Shares CostFair
Value
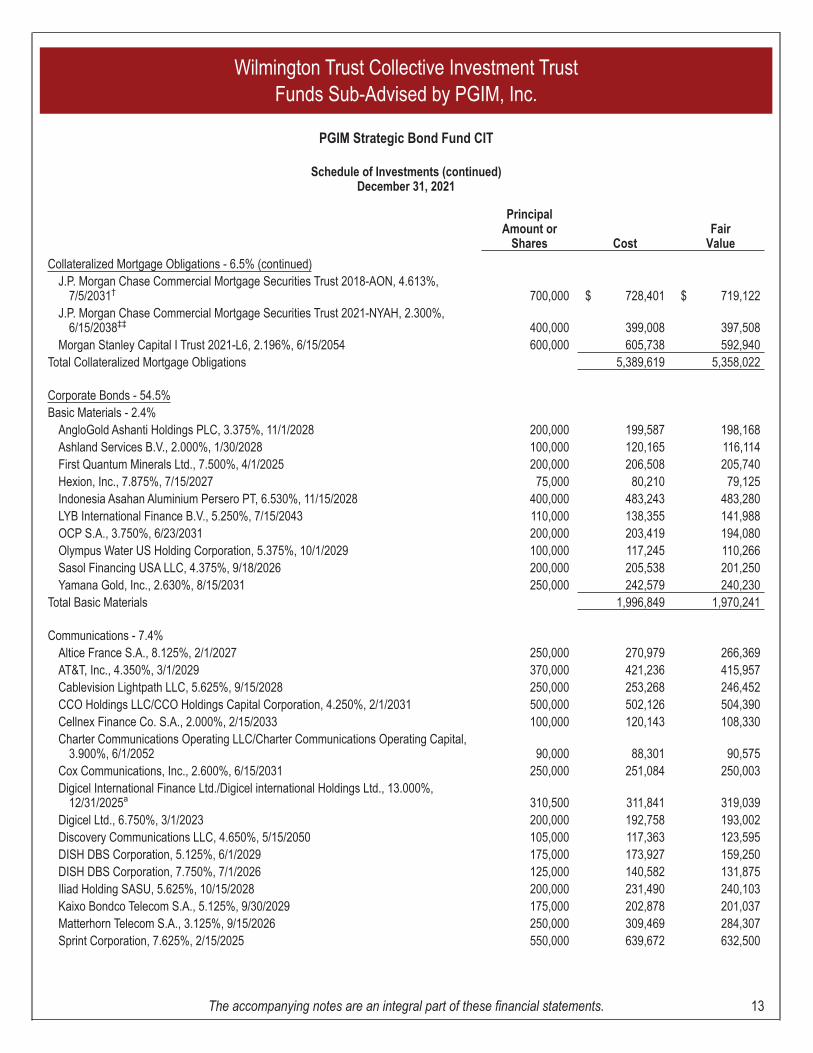
Collateralized Mortgage Obligations - 6.5% (continued)J.P. Morgan Chase Commercial Mortgage Securities Trust 2018-AON, 4.613%,
7/5/2031† 700,000 $ 728,401 $ 719,122J.P. Morgan Chase Commercial Mortgage Securities Trust 2021-NYAH, 2.300%,
6/15/2038‡‡ 400,000 399,008 397,508Morgan Stanley Capital I Trust 2021-L6, 2.196%, 6/15/2054 600,000 605,738 592,940
Total Collateralized Mortgage Obligations 5,389,619 5,358,022
Corporate Bonds - 54.5%Basic Materials - 2.4%
AngloGold Ashanti Holdings PLC, 3.375%, 11/1/2028 200,000 199,587 198,168Ashland Services B.V., 2.000%, 1/30/2028 100,000 120,165 116,114First Quantum Minerals Ltd., 7.500%, 4/1/2025 200,000 206,508 205,740Hexion, Inc., 7.875%, 7/15/2027 75,000 80,210 79,125Indonesia Asahan Aluminium Persero PT, 6.530%, 11/15/2028 400,000 483,243 483,280LYB International Finance B.V., 5.250%, 7/15/2043 110,000 138,355 141,988OCP S.A., 3.750%, 6/23/2031 200,000 203,419 194,080Olympus Water US Holding Corporation, 5.375%, 10/1/2029 100,000 117,245 110,266Sasol Financing USA LLC, 4.375%, 9/18/2026 200,000 205,538 201,250Yamana Gold, Inc., 2.630%, 8/15/2031 250,000 242,579 240,230
Total Basic Materials 1,996,849 1,970,241
Communications - 7.4%Altice France S.A., 8.125%, 2/1/2027 250,000 270,979 266,369AT&T, Inc., 4.350%, 3/1/2029 370,000 421,236 415,957Cablevision Lightpath LLC, 5.625%, 9/15/2028 250,000 253,268 246,452CCO Holdings LLC/CCO Holdings Capital Corporation, 4.250%, 2/1/2031 500,000 502,126 504,390Cellnex Finance Co. S.A., 2.000%, 2/15/2033 100,000 120,143 108,330Charter Communications Operating LLC/Charter Communications Operating Capital,
3.900%, 6/1/2052 90,000 88,301 90,575Cox Communications, Inc., 2.600%, 6/15/2031 250,000 251,084 250,003Digicel International Finance Ltd./Digicel international Holdings Ltd., 13.000%,
12/31/2025a 310,500 311,841 319,039Digicel Ltd., 6.750%, 3/1/2023 200,000 192,758 193,002Discovery Communications LLC, 4.650%, 5/15/2050 105,000 117,363 123,595DISH DBS Corporation, 5.125%, 6/1/2029 175,000 173,927 159,250DISH DBS Corporation, 7.750%, 7/1/2026 125,000 140,582 131,875Iliad Holding SASU, 5.625%, 10/15/2028 200,000 231,490 240,103Kaixo Bondco Telecom S.A., 5.125%, 9/30/2029 175,000 202,878 201,037Matterhorn Telecom S.A., 3.125%, 9/15/2026 250,000 309,469 284,307Sprint Corporation, 7.625%, 2/15/2025 550,000 639,672 632,500
Wilmington Trust Collective Investment TrustFunds Sub-Advised by PGIM, Inc.
PGIM Strategic Bond Fund CIT
Schedule of Investments (continued)December 31, 2021
The accompanying notes are an integral part of these financial statements. 13
PrincipalAmount or
Shares CostFair
Value
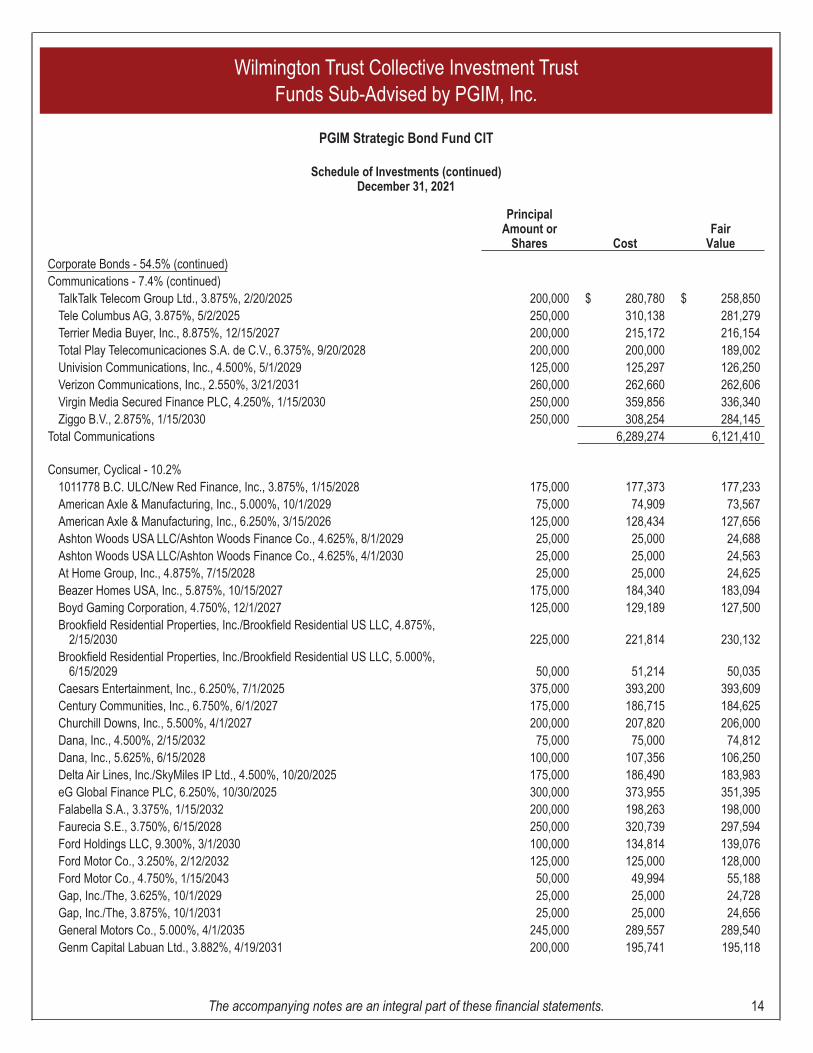
Corporate Bonds - 54.5% (continued)Communications - 7.4% (continued)
TalkTalk Telecom Group Ltd., 3.875%, 2/20/2025 200,000 $ 280,780 $ 258,850Tele Columbus AG, 3.875%, 5/2/2025 250,000 310,138 281,279Terrier Media Buyer, Inc., 8.875%, 12/15/2027 200,000 215,172 216,154Total Play Telecomunicaciones S.A. de C.V., 6.375%, 9/20/2028 200,000 200,000 189,002Univision Communications, Inc., 4.500%, 5/1/2029 125,000 125,297 126,250Verizon Communications, Inc., 2.550%, 3/21/2031 260,000 262,660 262,606Virgin Media Secured Finance PLC, 4.250%, 1/15/2030 250,000 359,856 336,340Ziggo B.V., 2.875%, 1/15/2030 250,000 308,254 284,145
Total Communications 6,289,274 6,121,410
Consumer, Cyclical - 10.2%1011778 B.C. ULC/New Red Finance, Inc., 3.875%, 1/15/2028 175,000 177,373 177,233American Axle & Manufacturing, Inc., 5.000%, 10/1/2029 75,000 74,909 73,567American Axle & Manufacturing, Inc., 6.250%, 3/15/2026 125,000 128,434 127,656Ashton Woods USA LLC/Ashton Woods Finance Co., 4.625%, 8/1/2029 25,000 25,000 24,688Ashton Woods USA LLC/Ashton Woods Finance Co., 4.625%, 4/1/2030 25,000 25,000 24,563At Home Group, Inc., 4.875%, 7/15/2028 25,000 25,000 24,625Beazer Homes USA, Inc., 5.875%, 10/15/2027 175,000 184,340 183,094Boyd Gaming Corporation, 4.750%, 12/1/2027 125,000 129,189 127,500Brookfield Residential Properties, Inc./Brookfield Residential US LLC, 4.875%,
2/15/2030 225,000 221,814 230,132Brookfield Residential Properties, Inc./Brookfield Residential US LLC, 5.000%,
6/15/2029 50,000 51,214 50,035Caesars Entertainment, Inc., 6.250%, 7/1/2025 375,000 393,200 393,609Century Communities, Inc., 6.750%, 6/1/2027 175,000 186,715 184,625Churchill Downs, Inc., 5.500%, 4/1/2027 200,000 207,820 206,000Dana, Inc., 4.500%, 2/15/2032 75,000 75,000 74,812Dana, Inc., 5.625%, 6/15/2028 100,000 107,356 106,250Delta Air Lines, Inc./SkyMiles IP Ltd., 4.500%, 10/20/2025 175,000 186,490 183,983eG Global Finance PLC, 6.250%, 10/30/2025 300,000 373,955 351,395Falabella S.A., 3.375%, 1/15/2032 200,000 198,263 198,000Faurecia S.E., 3.750%, 6/15/2028 250,000 320,739 297,594Ford Holdings LLC, 9.300%, 3/1/2030 100,000 134,814 139,076Ford Motor Co., 3.250%, 2/12/2032 125,000 125,000 128,000Ford Motor Co., 4.750%, 1/15/2043 50,000 49,994 55,188Gap, Inc./The, 3.625%, 10/1/2029 25,000 25,000 24,728Gap, Inc./The, 3.875%, 10/1/2031 25,000 25,000 24,656General Motors Co., 5.000%, 4/1/2035 245,000 289,557 289,540Genm Capital Labuan Ltd., 3.882%, 4/19/2031 200,000 195,741 195,118
Wilmington Trust Collective Investment TrustFunds Sub-Advised by PGIM, Inc.
PGIM Strategic Bond Fund CIT
Schedule of Investments (continued)December 31, 2021
The accompanying notes are an integral part of these financial statements. 14
PrincipalAmount or
Shares CostFair
Value
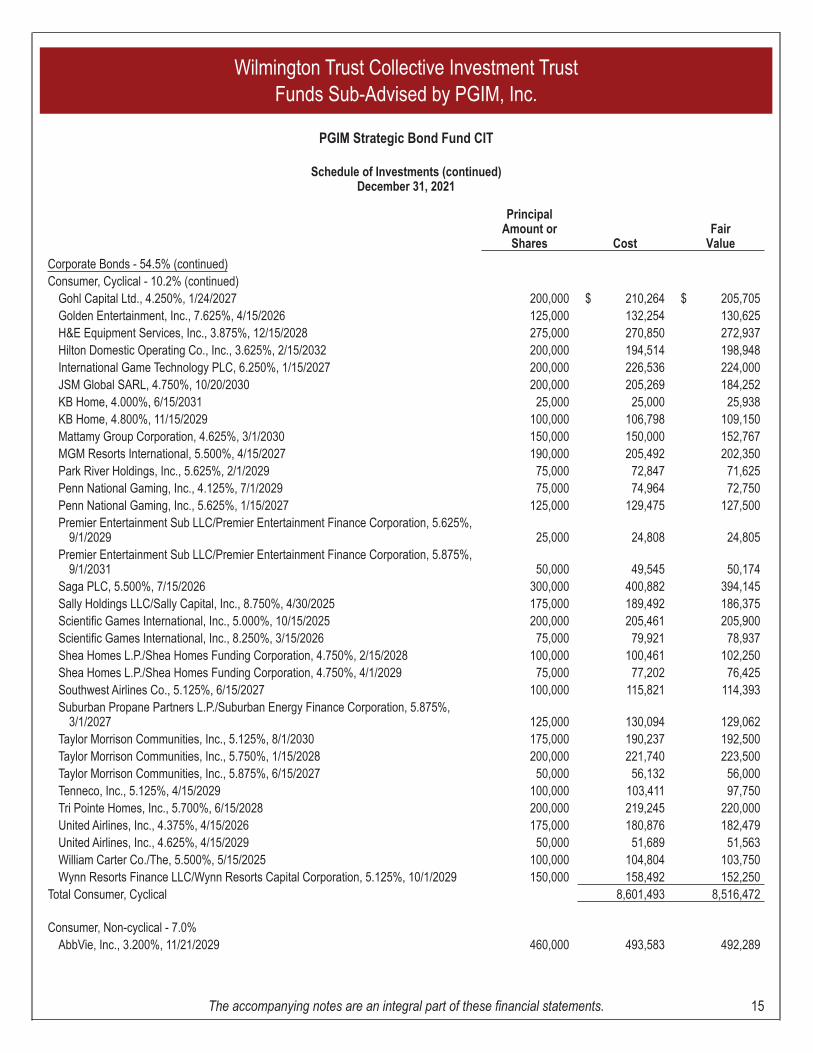
Corporate Bonds - 54.5% (continued)Consumer, Cyclical - 10.2% (continued)
Gohl Capital Ltd., 4.250%, 1/24/2027 200,000 $ 210,264 $ 205,705Golden Entertainment, Inc., 7.625%, 4/15/2026 125,000 132,254 130,625H&E Equipment Services, Inc., 3.875%, 12/15/2028 275,000 270,850 272,937Hilton Domestic Operating Co., Inc., 3.625%, 2/15/2032 200,000 194,514 198,948International Game Technology PLC, 6.250%, 1/15/2027 200,000 226,536 224,000JSM Global SARL, 4.750%, 10/20/2030 200,000 205,269 184,252KB Home, 4.000%, 6/15/2031 25,000 25,000 25,938KB Home, 4.800%, 11/15/2029 100,000 106,798 109,150Mattamy Group Corporation, 4.625%, 3/1/2030 150,000 150,000 152,767MGM Resorts International, 5.500%, 4/15/2027 190,000 205,492 202,350Park River Holdings, Inc., 5.625%, 2/1/2029 75,000 72,847 71,625Penn National Gaming, Inc., 4.125%, 7/1/2029 75,000 74,964 72,750Penn National Gaming, Inc., 5.625%, 1/15/2027 125,000 129,475 127,500Premier Entertainment Sub LLC/Premier Entertainment Finance Corporation, 5.625%,
9/1/2029 25,000 24,808 24,805Premier Entertainment Sub LLC/Premier Entertainment Finance Corporation, 5.875%,
9/1/2031 50,000 49,545 50,174Saga PLC, 5.500%, 7/15/2026 300,000 400,882 394,145Sally Holdings LLC/Sally Capital, Inc., 8.750%, 4/30/2025 175,000 189,492 186,375Scientific Games International, Inc., 5.000%, 10/15/2025 200,000 205,461 205,900Scientific Games International, Inc., 8.250%, 3/15/2026 75,000 79,921 78,937Shea Homes L.P./Shea Homes Funding Corporation, 4.750%, 2/15/2028 100,000 100,461 102,250Shea Homes L.P./Shea Homes Funding Corporation, 4.750%, 4/1/2029 75,000 77,202 76,425Southwest Airlines Co., 5.125%, 6/15/2027 100,000 115,821 114,393Suburban Propane Partners L.P./Suburban Energy Finance Corporation, 5.875%,
3/1/2027 125,000 130,094 129,062Taylor Morrison Communities, Inc., 5.125%, 8/1/2030 175,000 190,237 192,500Taylor Morrison Communities, Inc., 5.750%, 1/15/2028 200,000 221,740 223,500Taylor Morrison Communities, Inc., 5.875%, 6/15/2027 50,000 56,132 56,000Tenneco, Inc., 5.125%, 4/15/2029 100,000 103,411 97,750Tri Pointe Homes, Inc., 5.700%, 6/15/2028 200,000 219,245 220,000United Airlines, Inc., 4.375%, 4/15/2026 175,000 180,876 182,479United Airlines, Inc., 4.625%, 4/15/2029 50,000 51,689 51,563William Carter Co./The, 5.500%, 5/15/2025 100,000 104,804 103,750Wynn Resorts Finance LLC/Wynn Resorts Capital Corporation, 5.125%, 10/1/2029 150,000 158,492 152,250
Total Consumer, Cyclical 8,601,493 8,516,472
Consumer, Non-cyclical - 7.0%AbbVie, Inc., 3.200%, 11/21/2029 460,000 493,583 492,289
Wilmington Trust Collective Investment TrustFunds Sub-Advised by PGIM, Inc.
PGIM Strategic Bond Fund CIT
Schedule of Investments (continued)December 31, 2021
The accompanying notes are an integral part of these financial statements. 15
PrincipalAmount or
Shares CostFair
Value
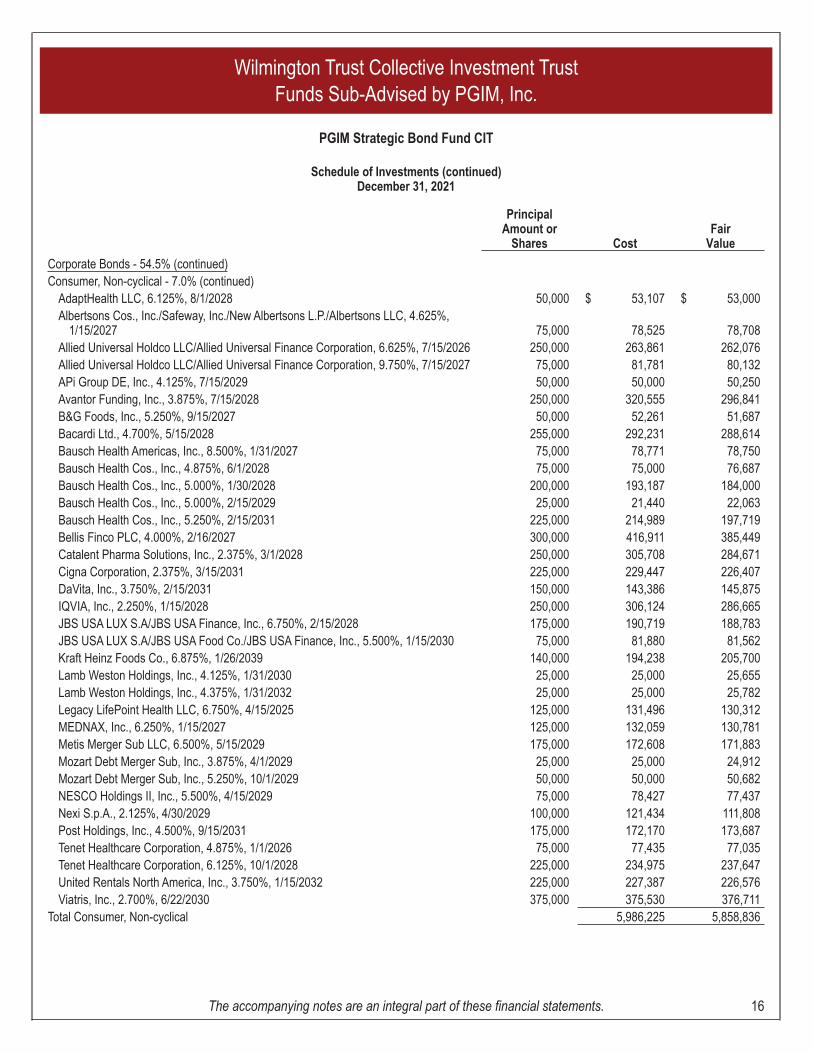
Corporate Bonds - 54.5% (continued)Consumer, Non-cyclical - 7.0% (continued)
AdaptHealth LLC, 6.125%, 8/1/2028 50,000 $ 53,107 $ 53,000Albertsons Cos., Inc./Safeway, Inc./New Albertsons L.P./Albertsons LLC, 4.625%,
1/15/2027 75,000 78,525 78,708Allied Universal Holdco LLC/Allied Universal Finance Corporation, 6.625%, 7/15/2026 250,000 263,861 262,076Allied Universal Holdco LLC/Allied Universal Finance Corporation, 9.750%, 7/15/2027 75,000 81,781 80,132APi Group DE, Inc., 4.125%, 7/15/2029 50,000 50,000 50,250Avantor Funding, Inc., 3.875%, 7/15/2028 250,000 320,555 296,841B&G Foods, Inc., 5.250%, 9/15/2027 50,000 52,261 51,687Bacardi Ltd., 4.700%, 5/15/2028 255,000 292,231 288,614Bausch Health Americas, Inc., 8.500%, 1/31/2027 75,000 78,771 78,750Bausch Health Cos., Inc., 4.875%, 6/1/2028 75,000 75,000 76,687Bausch Health Cos., Inc., 5.000%, 1/30/2028 200,000 193,187 184,000Bausch Health Cos., Inc., 5.000%, 2/15/2029 25,000 21,440 22,063Bausch Health Cos., Inc., 5.250%, 2/15/2031 225,000 214,989 197,719Bellis Finco PLC, 4.000%, 2/16/2027 300,000 416,911 385,449Catalent Pharma Solutions, Inc., 2.375%, 3/1/2028 250,000 305,708 284,671Cigna Corporation, 2.375%, 3/15/2031 225,000 229,447 226,407DaVita, Inc., 3.750%, 2/15/2031 150,000 143,386 145,875IQVIA, Inc., 2.250%, 1/15/2028 250,000 306,124 286,665JBS USA LUX S.A/JBS USA Finance, Inc., 6.750%, 2/15/2028 175,000 190,719 188,783JBS USA LUX S.A/JBS USA Food Co./JBS USA Finance, Inc., 5.500%, 1/15/2030 75,000 81,880 81,562Kraft Heinz Foods Co., 6.875%, 1/26/2039 140,000 194,238 205,700Lamb Weston Holdings, Inc., 4.125%, 1/31/2030 25,000 25,000 25,655Lamb Weston Holdings, Inc., 4.375%, 1/31/2032 25,000 25,000 25,782Legacy LifePoint Health LLC, 6.750%, 4/15/2025 125,000 131,496 130,312MEDNAX, Inc., 6.250%, 1/15/2027 125,000 132,059 130,781Metis Merger Sub LLC, 6.500%, 5/15/2029 175,000 172,608 171,883Mozart Debt Merger Sub, Inc., 3.875%, 4/1/2029 25,000 25,000 24,912Mozart Debt Merger Sub, Inc., 5.250%, 10/1/2029 50,000 50,000 50,682NESCO Holdings II, Inc., 5.500%, 4/15/2029 75,000 78,427 77,437Nexi S.p.A., 2.125%, 4/30/2029 100,000 121,434 111,808Post Holdings, Inc., 4.500%, 9/15/2031 175,000 172,170 173,687Tenet Healthcare Corporation, 4.875%, 1/1/2026 75,000 77,435 77,035Tenet Healthcare Corporation, 6.125%, 10/1/2028 225,000 234,975 237,647United Rentals North America, Inc., 3.750%, 1/15/2032 225,000 227,387 226,576Viatris, Inc., 2.700%, 6/22/2030 375,000 375,530 376,711
Total Consumer, Non-cyclical 5,986,225 5,858,836
Wilmington Trust Collective Investment TrustFunds Sub-Advised by PGIM, Inc.
PGIM Strategic Bond Fund CIT
Schedule of Investments (continued)December 31, 2021
The accompanying notes are an integral part of these financial statements. 16
PrincipalAmount or
Shares CostFair
Value
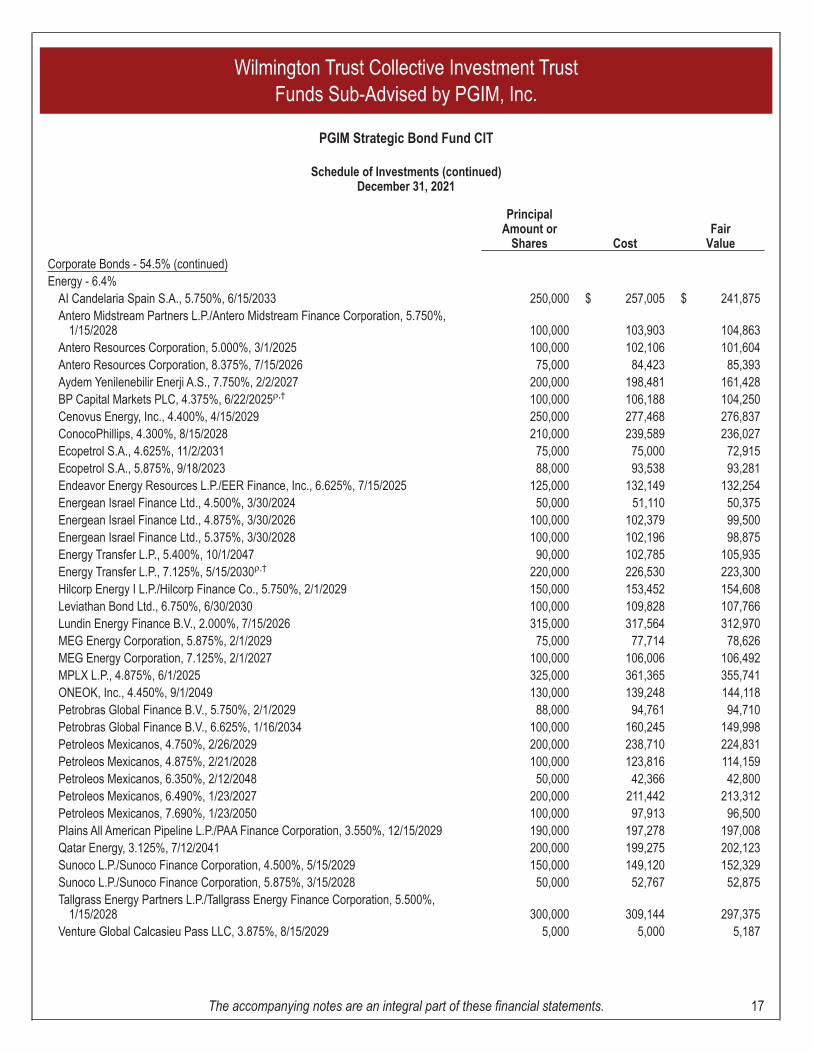
Corporate Bonds - 54.5% (continued)Energy - 6.4%
AI Candelaria Spain S.A., 5.750%, 6/15/2033 250,000 $ 257,005 $ 241,875Antero Midstream Partners L.P./Antero Midstream Finance Corporation, 5.750%,
1/15/2028 100,000 103,903 104,863Antero Resources Corporation, 5.000%, 3/1/2025 100,000 102,106 101,604Antero Resources Corporation, 8.375%, 7/15/2026 75,000 84,423 85,393Aydem Yenilenebilir Enerji A.S., 7.750%, 2/2/2027 200,000 198,481 161,428BP Capital Markets PLC, 4.375%, 6/22/2025ρ,† 100,000 106,188 104,250Cenovus Energy, Inc., 4.400%, 4/15/2029 250,000 277,468 276,837ConocoPhillips, 4.300%, 8/15/2028 210,000 239,589 236,027Ecopetrol S.A., 4.625%, 11/2/2031 75,000 75,000 72,915Ecopetrol S.A., 5.875%, 9/18/2023 88,000 93,538 93,281Endeavor Energy Resources L.P./EER Finance, Inc., 6.625%, 7/15/2025 125,000 132,149 132,254Energean Israel Finance Ltd., 4.500%, 3/30/2024 50,000 51,110 50,375Energean Israel Finance Ltd., 4.875%, 3/30/2026 100,000 102,379 99,500Energean Israel Finance Ltd., 5.375%, 3/30/2028 100,000 102,196 98,875Energy Transfer L.P., 5.400%, 10/1/2047 90,000 102,785 105,935Energy Transfer L.P., 7.125%, 5/15/2030ρ,† 220,000 226,530 223,300Hilcorp Energy I L.P./Hilcorp Finance Co., 5.750%, 2/1/2029 150,000 153,452 154,608Leviathan Bond Ltd., 6.750%, 6/30/2030 100,000 109,828 107,766Lundin Energy Finance B.V., 2.000%, 7/15/2026 315,000 317,564 312,970MEG Energy Corporation, 5.875%, 2/1/2029 75,000 77,714 78,626MEG Energy Corporation, 7.125%, 2/1/2027 100,000 106,006 106,492MPLX L.P., 4.875%, 6/1/2025 325,000 361,365 355,741ONEOK, Inc., 4.450%, 9/1/2049 130,000 139,248 144,118Petrobras Global Finance B.V., 5.750%, 2/1/2029 88,000 94,761 94,710Petrobras Global Finance B.V., 6.625%, 1/16/2034 100,000 160,245 149,998Petroleos Mexicanos, 4.750%, 2/26/2029 200,000 238,710 224,831Petroleos Mexicanos, 4.875%, 2/21/2028 100,000 123,816 114,159Petroleos Mexicanos, 6.350%, 2/12/2048 50,000 42,366 42,800Petroleos Mexicanos, 6.490%, 1/23/2027 200,000 211,442 213,312Petroleos Mexicanos, 7.690%, 1/23/2050 100,000 97,913 96,500Plains All American Pipeline L.P./PAA Finance Corporation, 3.550%, 12/15/2029 190,000 197,278 197,008Qatar Energy, 3.125%, 7/12/2041 200,000 199,275 202,123Sunoco L.P./Sunoco Finance Corporation, 4.500%, 5/15/2029 150,000 149,120 152,329Sunoco L.P./Sunoco Finance Corporation, 5.875%, 3/15/2028 50,000 52,767 52,875Tallgrass Energy Partners L.P./Tallgrass Energy Finance Corporation, 5.500%,
1/15/2028 300,000 309,144 297,375Venture Global Calcasieu Pass LLC, 3.875%, 8/15/2029 5,000 5,000 5,187
Wilmington Trust Collective Investment TrustFunds Sub-Advised by PGIM, Inc.
PGIM Strategic Bond Fund CIT
Schedule of Investments (continued)December 31, 2021
The accompanying notes are an integral part of these financial statements. 17
PrincipalAmount or
Shares CostFair
Value
Corporate Bonds - 54.5% (continued)Energy - 6.4% (continued)
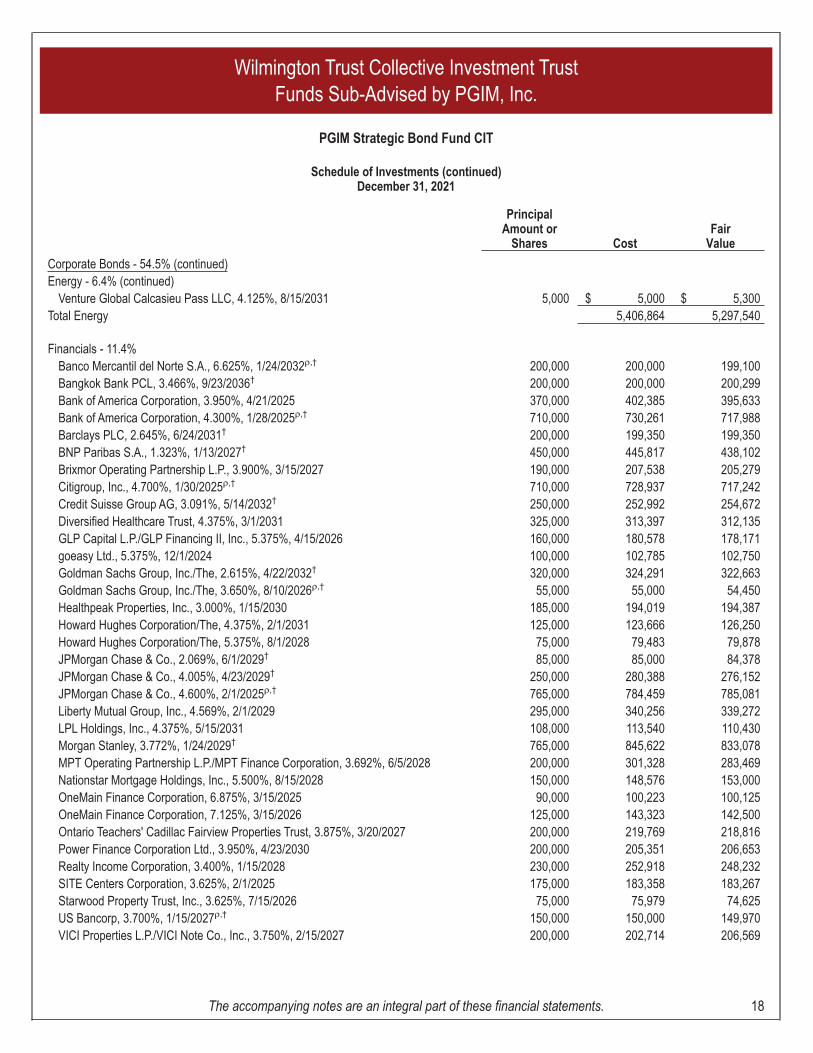
Venture Global Calcasieu Pass LLC, 4.125%, 8/15/2031 5,000 $ 5,000 $ 5,300Total Energy 5,406,864 5,297,540
Financials - 11.4%Banco Mercantil del Norte S.A., 6.625%, 1/24/2032ρ,† 200,000 200,000 199,100Bangkok Bank PCL, 3.466%, 9/23/2036† 200,000 200,000 200,299Bank of America Corporation, 3.950%, 4/21/2025 370,000 402,385 395,633Bank of America Corporation, 4.300%, 1/28/2025ρ,† 710,000 730,261 717,988Barclays PLC, 2.645%, 6/24/2031† 200,000 199,350 199,350BNP Paribas S.A., 1.323%, 1/13/2027† 450,000 445,817 438,102Brixmor Operating Partnership L.P., 3.900%, 3/15/2027 190,000 207,538 205,279Citigroup, Inc., 4.700%, 1/30/2025ρ,† 710,000 728,937 717,242Credit Suisse Group AG, 3.091%, 5/14/2032† 250,000 252,992 254,672Diversified Healthcare Trust, 4.375%, 3/1/2031 325,000 313,397 312,135GLP Capital L.P./GLP Financing II, Inc., 5.375%, 4/15/2026 160,000 180,578 178,171goeasy Ltd., 5.375%, 12/1/2024 100,000 102,785 102,750Goldman Sachs Group, Inc./The, 2.615%, 4/22/2032† 320,000 324,291 322,663Goldman Sachs Group, Inc./The, 3.650%, 8/10/2026ρ,† 55,000 55,000 54,450Healthpeak Properties, Inc., 3.000%, 1/15/2030 185,000 194,019 194,387Howard Hughes Corporation/The, 4.375%, 2/1/2031 125,000 123,666 126,250Howard Hughes Corporation/The, 5.375%, 8/1/2028 75,000 79,483 79,878JPMorgan Chase & Co., 2.069%, 6/1/2029† 85,000 85,000 84,378JPMorgan Chase & Co., 4.005%, 4/23/2029† 250,000 280,388 276,152JPMorgan Chase & Co., 4.600%, 2/1/2025ρ,† 765,000 784,459 785,081Liberty Mutual Group, Inc., 4.569%, 2/1/2029 295,000 340,256 339,272LPL Holdings, Inc., 4.375%, 5/15/2031 108,000 113,540 110,430Morgan Stanley, 3.772%, 1/24/2029† 765,000 845,622 833,078MPT Operating Partnership L.P./MPT Finance Corporation, 3.692%, 6/5/2028 200,000 301,328 283,469Nationstar Mortgage Holdings, Inc., 5.500%, 8/15/2028 150,000 148,576 153,000OneMain Finance Corporation, 6.875%, 3/15/2025 90,000 100,223 100,125OneMain Finance Corporation, 7.125%, 3/15/2026 125,000 143,323 142,500Ontario Teachers' Cadillac Fairview Properties Trust, 3.875%, 3/20/2027 200,000 219,769 218,816Power Finance Corporation Ltd., 3.950%, 4/23/2030 200,000 205,351 206,653Realty Income Corporation, 3.400%, 1/15/2028 230,000 252,918 248,232SITE Centers Corporation, 3.625%, 2/1/2025 175,000 183,358 183,267Starwood Property Trust, Inc., 3.625%, 7/15/2026 75,000 75,979 74,625US Bancorp, 3.700%, 1/15/2027ρ,† 150,000 150,000 149,970VICI Properties L.P./VICI Note Co., Inc., 3.750%, 2/15/2027 200,000 202,714 206,569
Wilmington Trust Collective Investment TrustFunds Sub-Advised by PGIM, Inc.
PGIM Strategic Bond Fund CIT
Schedule of Investments (continued)December 31, 2021
The accompanying notes are an integral part of these financial statements. 18
PrincipalAmount or
Shares CostFair
Value
Corporate Bonds - 54.5% (continued)Financials - 11.4% (continued)
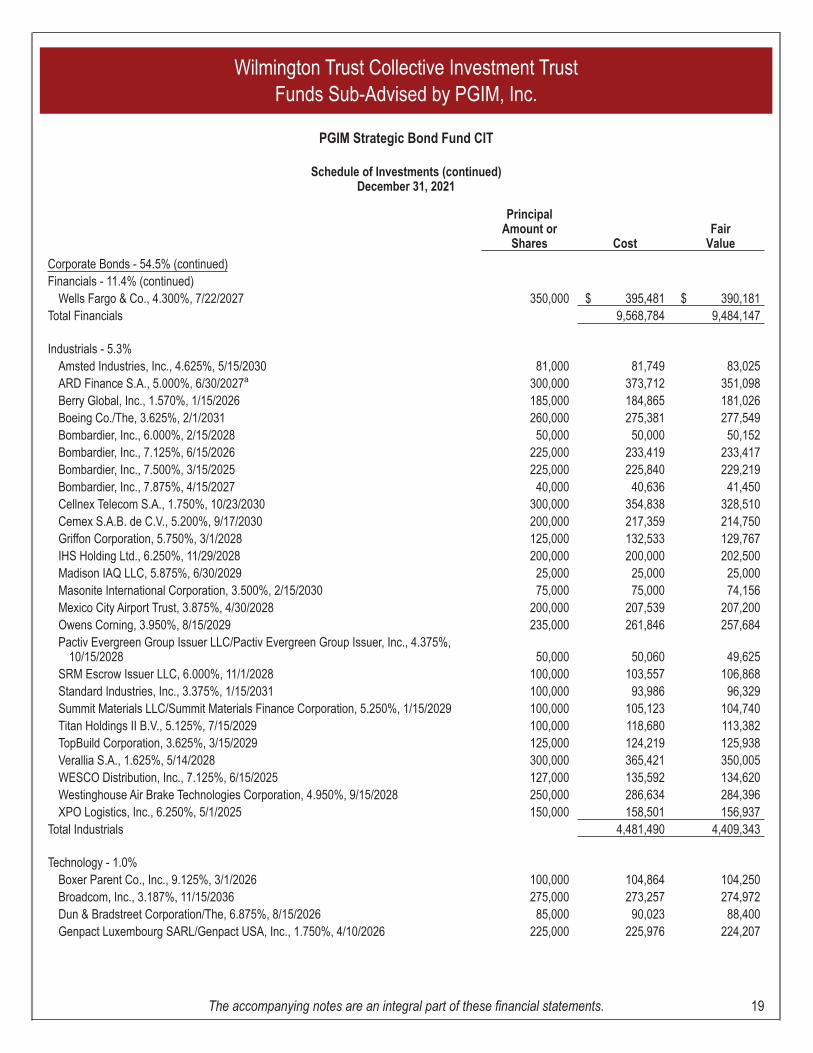
Wells Fargo & Co., 4.300%, 7/22/2027 350,000 $ 395,481 $ 390,181Total Financials 9,568,784 9,484,147
Industrials - 5.3%Amsted Industries, Inc., 4.625%, 5/15/2030 81,000 81,749 83,025ARD Finance S.A., 5.000%, 6/30/2027a 300,000 373,712 351,098Berry Global, Inc., 1.570%, 1/15/2026 185,000 184,865 181,026Boeing Co./The, 3.625%, 2/1/2031 260,000 275,381 277,549Bombardier, Inc., 6.000%, 2/15/2028 50,000 50,000 50,152Bombardier, Inc., 7.125%, 6/15/2026 225,000 233,419 233,417Bombardier, Inc., 7.500%, 3/15/2025 225,000 225,840 229,219Bombardier, Inc., 7.875%, 4/15/2027 40,000 40,636 41,450Cellnex Telecom S.A., 1.750%, 10/23/2030 300,000 354,838 328,510Cemex S.A.B. de C.V., 5.200%, 9/17/2030 200,000 217,359 214,750Griffon Corporation, 5.750%, 3/1/2028 125,000 132,533 129,767IHS Holding Ltd., 6.250%, 11/29/2028 200,000 200,000 202,500Madison IAQ LLC, 5.875%, 6/30/2029 25,000 25,000 25,000Masonite International Corporation, 3.500%, 2/15/2030 75,000 75,000 74,156Mexico City Airport Trust, 3.875%, 4/30/2028 200,000 207,539 207,200Owens Corning, 3.950%, 8/15/2029 235,000 261,846 257,684Pactiv Evergreen Group Issuer LLC/Pactiv Evergreen Group Issuer, Inc., 4.375%,
10/15/2028 50,000 50,060 49,625SRM Escrow Issuer LLC, 6.000%, 11/1/2028 100,000 103,557 106,868Standard Industries, Inc., 3.375%, 1/15/2031 100,000 93,986 96,329Summit Materials LLC/Summit Materials Finance Corporation, 5.250%, 1/15/2029 100,000 105,123 104,740Titan Holdings II B.V., 5.125%, 7/15/2029 100,000 118,680 113,382TopBuild Corporation, 3.625%, 3/15/2029 125,000 124,219 125,938Verallia S.A., 1.625%, 5/14/2028 300,000 365,421 350,005WESCO Distribution, Inc., 7.125%, 6/15/2025 127,000 135,592 134,620Westinghouse Air Brake Technologies Corporation, 4.950%, 9/15/2028 250,000 286,634 284,396XPO Logistics, Inc., 6.250%, 5/1/2025 150,000 158,501 156,937
Total Industrials 4,481,490 4,409,343
Technology - 1.0%Boxer Parent Co., Inc., 9.125%, 3/1/2026 100,000 104,864 104,250Broadcom, Inc., 3.187%, 11/15/2036 275,000 273,257 274,972Dun & Bradstreet Corporation/The, 6.875%, 8/15/2026 85,000 90,023 88,400Genpact Luxembourg SARL/Genpact USA, Inc., 1.750%, 4/10/2026 225,000 225,976 224,207
Wilmington Trust Collective Investment TrustFunds Sub-Advised by PGIM, Inc.
PGIM Strategic Bond Fund CIT
Schedule of Investments (continued)December 31, 2021
The accompanying notes are an integral part of these financial statements. 19
PrincipalAmount or
Shares CostFair
Value
Corporate Bonds - 54.5% (continued)Technology - 1.0% (continued)
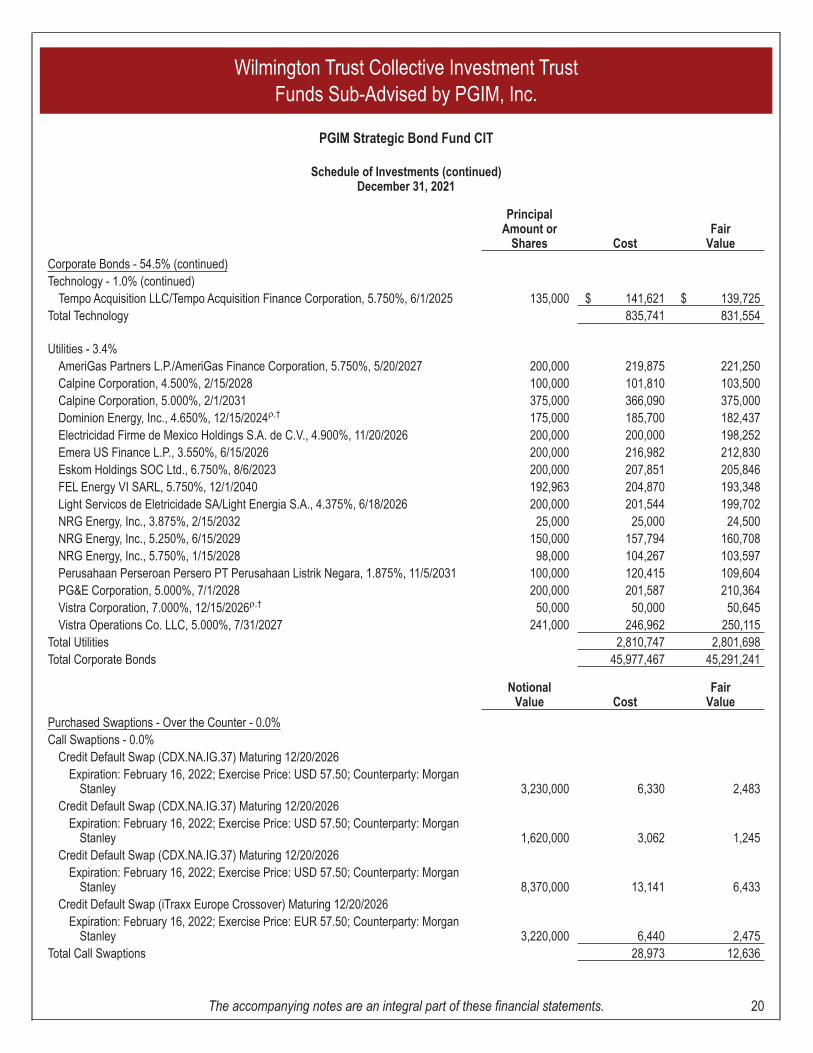
Tempo Acquisition LLC/Tempo Acquisition Finance Corporation, 5.750%, 6/1/2025 135,000 $ 141,621 $ 139,725Total Technology 835,741 831,554
Utilities - 3.4%AmeriGas Partners L.P./AmeriGas Finance Corporation, 5.750%, 5/20/2027 200,000 219,875 221,250Calpine Corporation, 4.500%, 2/15/2028 100,000 101,810 103,500Calpine Corporation, 5.000%, 2/1/2031 375,000 366,090 375,000Dominion Energy, Inc., 4.650%, 12/15/2024ρ,† 175,000 185,700 182,437Electricidad Firme de Mexico Holdings S.A. de C.V., 4.900%, 11/20/2026 200,000 200,000 198,252Emera US Finance L.P., 3.550%, 6/15/2026 200,000 216,982 212,830Eskom Holdings SOC Ltd., 6.750%, 8/6/2023 200,000 207,851 205,846FEL Energy VI SARL, 5.750%, 12/1/2040 192,963 204,870 193,348Light Servicos de Eletricidade SA/Light Energia S.A., 4.375%, 6/18/2026 200,000 201,544 199,702NRG Energy, Inc., 3.875%, 2/15/2032 25,000 25,000 24,500NRG Energy, Inc., 5.250%, 6/15/2029 150,000 157,794 160,708NRG Energy, Inc., 5.750%, 1/15/2028 98,000 104,267 103,597Perusahaan Perseroan Persero PT Perusahaan Listrik Negara, 1.875%, 11/5/2031 100,000 120,415 109,604PG&E Corporation, 5.000%, 7/1/2028 200,000 201,587 210,364Vistra Corporation, 7.000%, 12/15/2026ρ,† 50,000 50,000 50,645Vistra Operations Co. LLC, 5.000%, 7/31/2027 241,000 246,962 250,115
Total Utilities 2,810,747 2,801,698Total Corporate Bonds 45,977,467 45,291,241
NotionalValue Cost
FairValue
Purchased Swaptions - Over the Counter - 0.0%Call Swaptions - 0.0%
Credit Default Swap (CDX.NA.IG.37) Maturing 12/20/2026Expiration: February 16, 2022; Exercise Price: USD 57.50; Counterparty: Morgan
Stanley 3,230,000 6,330 2,483Credit Default Swap (CDX.NA.IG.37) Maturing 12/20/2026
Expiration: February 16, 2022; Exercise Price: USD 57.50; Counterparty: MorganStanley 1,620,000 3,062 1,245
Credit Default Swap (CDX.NA.IG.37) Maturing 12/20/2026Expiration: February 16, 2022; Exercise Price: USD 57.50; Counterparty: Morgan
Stanley 8,370,000 13,141 6,433Credit Default Swap (iTraxx Europe Crossover) Maturing 12/20/2026
Expiration: February 16, 2022; Exercise Price: EUR 57.50; Counterparty: MorganStanley 3,220,000 6,440 2,475
Total Call Swaptions 28,973 12,636
Wilmington Trust Collective Investment TrustFunds Sub-Advised by PGIM, Inc.
PGIM Strategic Bond Fund CIT
Schedule of Investments (continued)December 31, 2021
The accompanying notes are an integral part of these financial statements. 20
NotionalValue Cost
FairValue
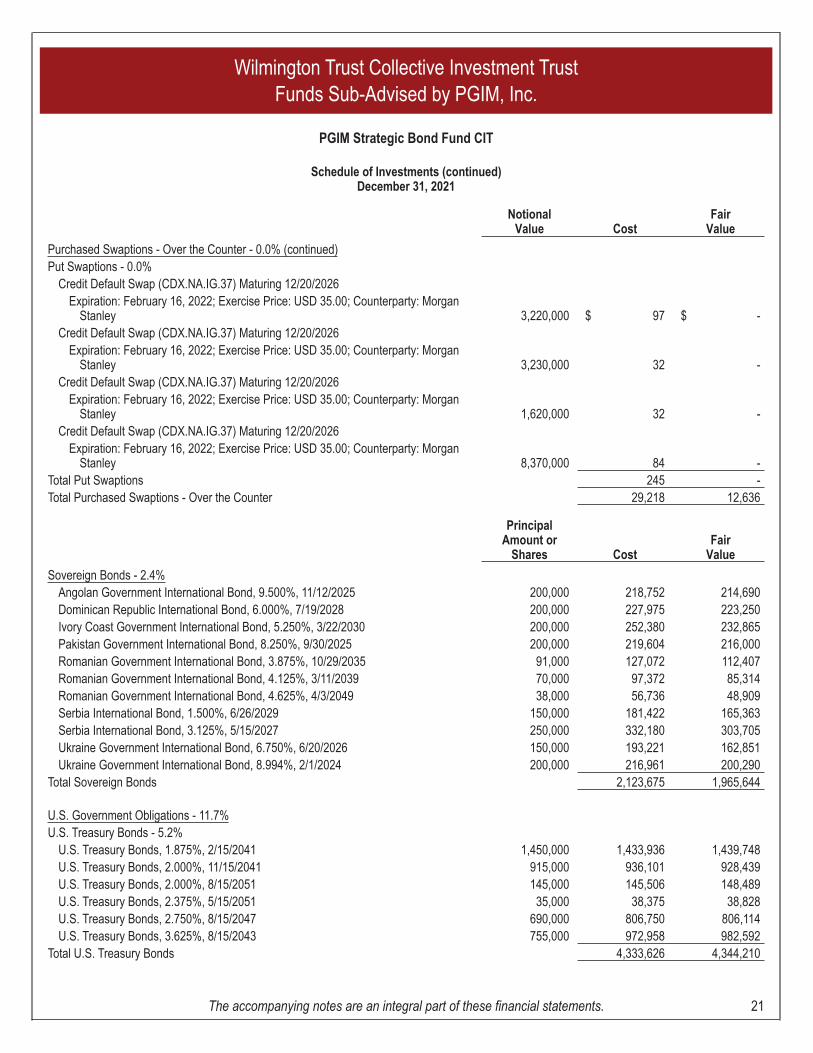
Purchased Swaptions - Over the Counter - 0.0% (continued)Put Swaptions - 0.0%
Credit Default Swap (CDX.NA.IG.37) Maturing 12/20/2026Expiration: February 16, 2022; Exercise Price: USD 35.00; Counterparty: Morgan
Stanley 3,220,000 $ 97 $ -Credit Default Swap (CDX.NA.IG.37) Maturing 12/20/2026
Expiration: February 16, 2022; Exercise Price: USD 35.00; Counterparty: MorganStanley 3,230,000 32 -
Credit Default Swap (CDX.NA.IG.37) Maturing 12/20/2026Expiration: February 16, 2022; Exercise Price: USD 35.00; Counterparty: Morgan
Stanley 1,620,000 32 -Credit Default Swap (CDX.NA.IG.37) Maturing 12/20/2026
Expiration: February 16, 2022; Exercise Price: USD 35.00; Counterparty: MorganStanley 8,370,000 84 -
Total Put Swaptions 245 -Total Purchased Swaptions - Over the Counter 29,218 12,636
PrincipalAmount or
Shares CostFair
Value
Sovereign Bonds - 2.4%Angolan Government International Bond, 9.500%, 11/12/2025 200,000 218,752 214,690Dominican Republic International Bond, 6.000%, 7/19/2028 200,000 227,975 223,250Ivory Coast Government International Bond, 5.250%, 3/22/2030 200,000 252,380 232,865Pakistan Government International Bond, 8.250%, 9/30/2025 200,000 219,604 216,000Romanian Government International Bond, 3.875%, 10/29/2035 91,000 127,072 112,407Romanian Government International Bond, 4.125%, 3/11/2039 70,000 97,372 85,314Romanian Government International Bond, 4.625%, 4/3/2049 38,000 56,736 48,909Serbia International Bond, 1.500%, 6/26/2029 150,000 181,422 165,363Serbia International Bond, 3.125%, 5/15/2027 250,000 332,180 303,705Ukraine Government International Bond, 6.750%, 6/20/2026 150,000 193,221 162,851Ukraine Government International Bond, 8.994%, 2/1/2024 200,000 216,961 200,290
Total Sovereign Bonds 2,123,675 1,965,644
U.S. Government Obligations - 11.7%U.S. Treasury Bonds - 5.2%
U.S. Treasury Bonds, 1.875%, 2/15/2041 1,450,000 1,433,936 1,439,748U.S. Treasury Bonds, 2.000%, 11/15/2041 915,000 936,101 928,439U.S. Treasury Bonds, 2.000%, 8/15/2051 145,000 145,506 148,489U.S. Treasury Bonds, 2.375%, 5/15/2051 35,000 38,375 38,828U.S. Treasury Bonds, 2.750%, 8/15/2047 690,000 806,750 806,114U.S. Treasury Bonds, 3.625%, 8/15/2043 755,000 972,958 982,592
Total U.S. Treasury Bonds 4,333,626 4,344,210
Wilmington Trust Collective Investment TrustFunds Sub-Advised by PGIM, Inc.
PGIM Strategic Bond Fund CIT
Schedule of Investments (continued)December 31, 2021
The accompanying notes are an integral part of these financial statements. 21
PrincipalAmount or
Shares CostFair
Value
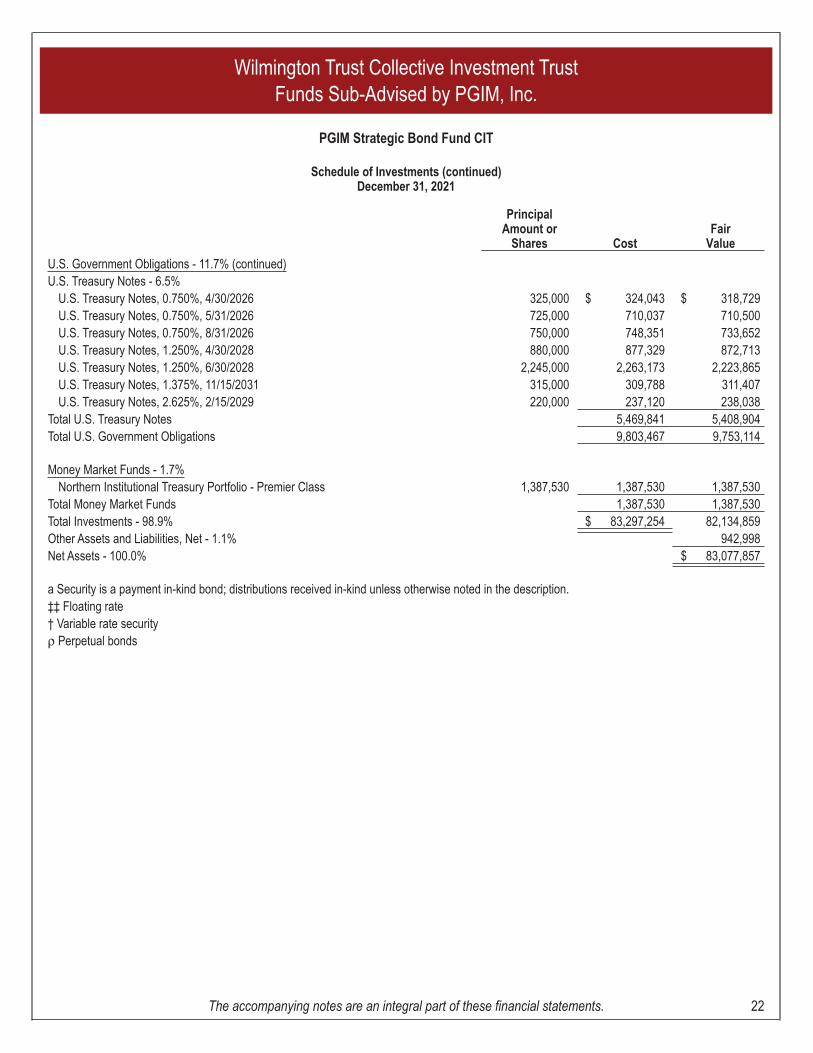
U.S. Government Obligations - 11.7% (continued)U.S. Treasury Notes - 6.5%
U.S. Treasury Notes, 0.750%, 4/30/2026 325,000 $ 324,043 $ 318,729U.S. Treasury Notes, 0.750%, 5/31/2026 725,000 710,037 710,500U.S. Treasury Notes, 0.750%, 8/31/2026 750,000 748,351 733,652U.S. Treasury Notes, 1.250%, 4/30/2028 880,000 877,329 872,713U.S. Treasury Notes, 1.250%, 6/30/2028 2,245,000 2,263,173 2,223,865U.S. Treasury Notes, 1.375%, 11/15/2031 315,000 309,788 311,407U.S. Treasury Notes, 2.625%, 2/15/2029 220,000 237,120 238,038
Total U.S. Treasury Notes 5,469,841 5,408,904Total U.S. Government Obligations 9,803,467 9,753,114
Money Market Funds - 1.7%Northern Institutional Treasury Portfolio - Premier Class 1,387,530 1,387,530 1,387,530
Total Money Market Funds 1,387,530 1,387,530Total Investments - 98.9% $ 83,297,254 82,134,859Other Assets and Liabilities, Net - 1.1% 942,998Net Assets - 100.0% $ 83,077,857
a Security is a payment in-kind bond; distributions received in-kind unless otherwise noted in the description.‡‡ Floating rate† Variable rate securityρ Perpetual bonds
Wilmington Trust Collective Investment TrustFunds Sub-Advised by PGIM, Inc.
PGIM Strategic Bond Fund CIT
Schedule of Investments (continued)December 31, 2021
The accompanying notes are an integral part of these financial statements. 22
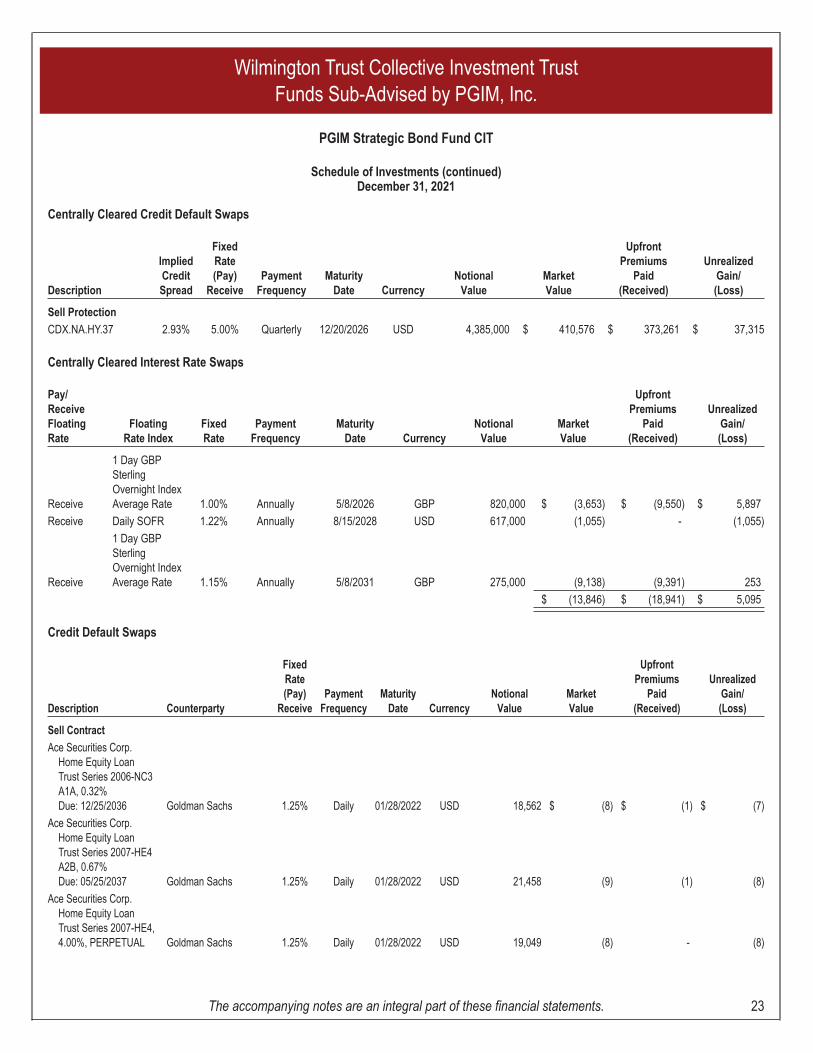
Centrally Cleared Credit Default Swaps
Description
ImpliedCreditSpread
FixedRate(Pay)
ReceivePayment
FrequencyMaturity
Date CurrencyNotional
ValueMarketValue
UpfrontPremiums
Paid(Received)
UnrealizedGain/(Loss)
Sell Protection
CDX.NA.HY.37 2.93% 5.00% Quarterly 12/20/2026 USD 4,385,000 $ 410,576 $ 373,261 $ 37,315
Centrally Cleared Interest Rate Swaps
Pay/ReceiveFloatingRate
FloatingRate Index
FixedRate
PaymentFrequency
MaturityDate Currency
NotionalValue
MarketValue
UpfrontPremiums
Paid(Received)
UnrealizedGain/(Loss)
Receive
1 Day GBPSterlingOvernight IndexAverage Rate 1.00% Annually 5/8/2026 GBP 820,000 $ (3,653) $ (9,550) $ 5,897
Receive Daily SOFR 1.22% Annually 8/15/2028 USD 617,000 (1,055) - (1,055)
Receive
1 Day GBPSterlingOvernight IndexAverage Rate 1.15% Annually 5/8/2031 GBP 275,000 (9,138) (9,391) 253
$ (13,846) $ (18,941) $ 5,095
Credit Default Swaps
Description Counterparty
FixedRate(Pay)
ReceivePayment
FrequencyMaturity
Date CurrencyNotional
ValueMarketValue
UpfrontPremiums
Paid(Received)
UnrealizedGain/(Loss)
Sell Contract
Ace Securities Corp.Home Equity LoanTrust Series 2006-NC3A1A, 0.32%Due: 12/25/2036 Goldman Sachs 1.25% Daily 01/28/2022 USD 18,562 $ (8) $ (1) $ (7)
Ace Securities Corp.Home Equity LoanTrust Series 2007-HE4A2B, 0.67%Due: 05/25/2037 Goldman Sachs 1.25% Daily 01/28/2022 USD 21,458 (9) (1) (8)
Ace Securities Corp.Home Equity LoanTrust Series 2007-HE4,4.00%, PERPETUAL Goldman Sachs 1.25% Daily 01/28/2022 USD 19,049 (8) - (8)
Wilmington Trust Collective Investment TrustFunds Sub-Advised by PGIM, Inc.
PGIM Strategic Bond Fund CIT
Schedule of Investments (continued)December 31, 2021
The accompanying notes are an integral part of these financial statements. 23
Description Counterparty
FixedRate(Pay)
ReceivePayment
FrequencyMaturity
Date CurrencyNotional
ValueMarketValue
UpfrontPremiums
Paid(Received)
UnrealizedGain/(Loss)
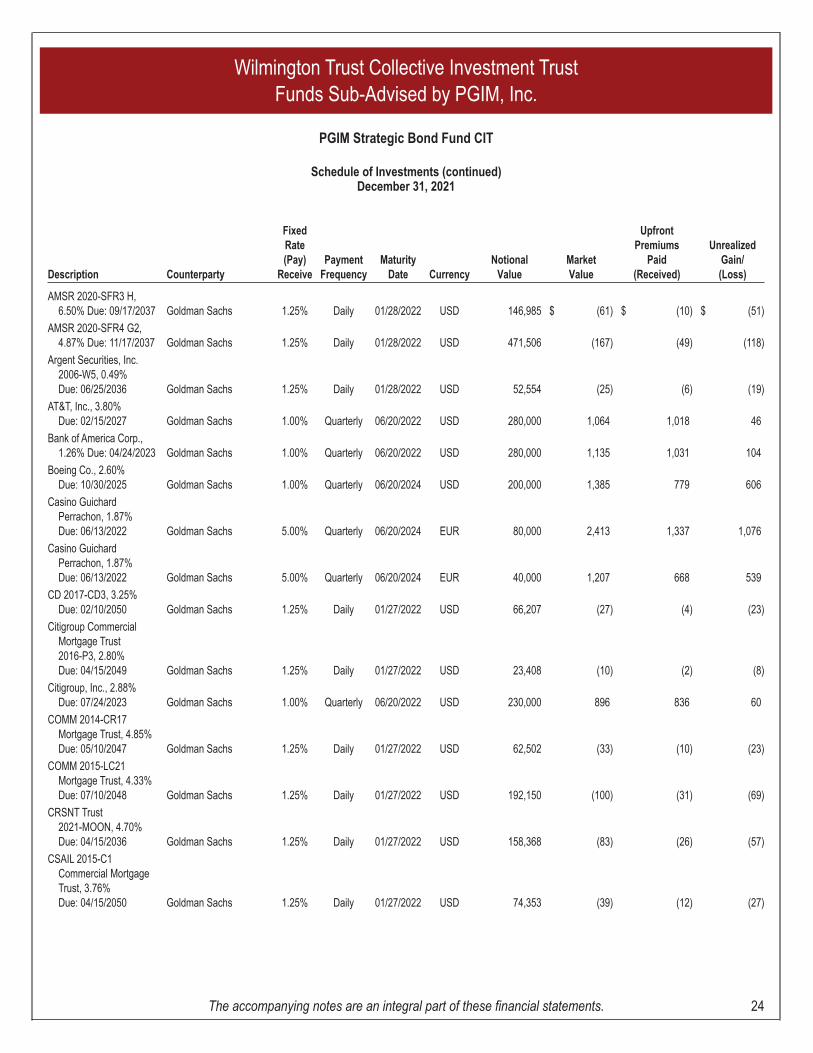
AMSR 2020-SFR3 H,6.50% Due: 09/17/2037 Goldman Sachs 1.25% Daily 01/28/2022 USD 146,985 $ (61) $ (10) $ (51)
AMSR 2020-SFR4 G2,4.87% Due: 11/17/2037 Goldman Sachs 1.25% Daily 01/28/2022 USD 471,506 (167) (49) (118)
Argent Securities, Inc.2006-W5, 0.49%Due: 06/25/2036 Goldman Sachs 1.25% Daily 01/28/2022 USD 52,554 (25) (6) (19)
AT&T, Inc., 3.80%Due: 02/15/2027 Goldman Sachs 1.00% Quarterly 06/20/2022 USD 280,000 1,064 1,018 46
Bank of America Corp.,1.26% Due: 04/24/2023 Goldman Sachs 1.00% Quarterly 06/20/2022 USD 280,000 1,135 1,031 104
Boeing Co., 2.60%Due: 10/30/2025 Goldman Sachs 1.00% Quarterly 06/20/2024 USD 200,000 1,385 779 606
Casino GuichardPerrachon, 1.87%Due: 06/13/2022 Goldman Sachs 5.00% Quarterly 06/20/2024 EUR 80,000 2,413 1,337 1,076
Casino GuichardPerrachon, 1.87%Due: 06/13/2022 Goldman Sachs 5.00% Quarterly 06/20/2024 EUR 40,000 1,207 668 539
CD 2017-CD3, 3.25%Due: 02/10/2050 Goldman Sachs 1.25% Daily 01/27/2022 USD 66,207 (27) (4) (23)
Citigroup CommercialMortgage Trust2016-P3, 2.80%Due: 04/15/2049 Goldman Sachs 1.25% Daily 01/27/2022 USD 23,408 (10) (2) (8)
Citigroup, Inc., 2.88%Due: 07/24/2023 Goldman Sachs 1.00% Quarterly 06/20/2022 USD 230,000 896 836 60
COMM 2014-CR17Mortgage Trust, 4.85%Due: 05/10/2047 Goldman Sachs 1.25% Daily 01/27/2022 USD 62,502 (33) (10) (23)
COMM 2015-LC21Mortgage Trust, 4.33%Due: 07/10/2048 Goldman Sachs 1.25% Daily 01/27/2022 USD 192,150 (100) (31) (69)
CRSNT Trust2021-MOON, 4.70%Due: 04/15/2036 Goldman Sachs 1.25% Daily 01/27/2022 USD 158,368 (83) (26) (57)
CSAIL 2015-C1Commercial MortgageTrust, 3.76%Due: 04/15/2050 Goldman Sachs 1.25% Daily 01/27/2022 USD 74,353 (39) (12) (27)
Wilmington Trust Collective Investment TrustFunds Sub-Advised by PGIM, Inc.
PGIM Strategic Bond Fund CIT
Schedule of Investments (continued)December 31, 2021
The accompanying notes are an integral part of these financial statements. 24
Description Counterparty
FixedRate(Pay)
ReceivePayment
FrequencyMaturity
Date CurrencyNotional
ValueMarketValue
UpfrontPremiums
Paid(Received)
UnrealizedGain/(Loss)
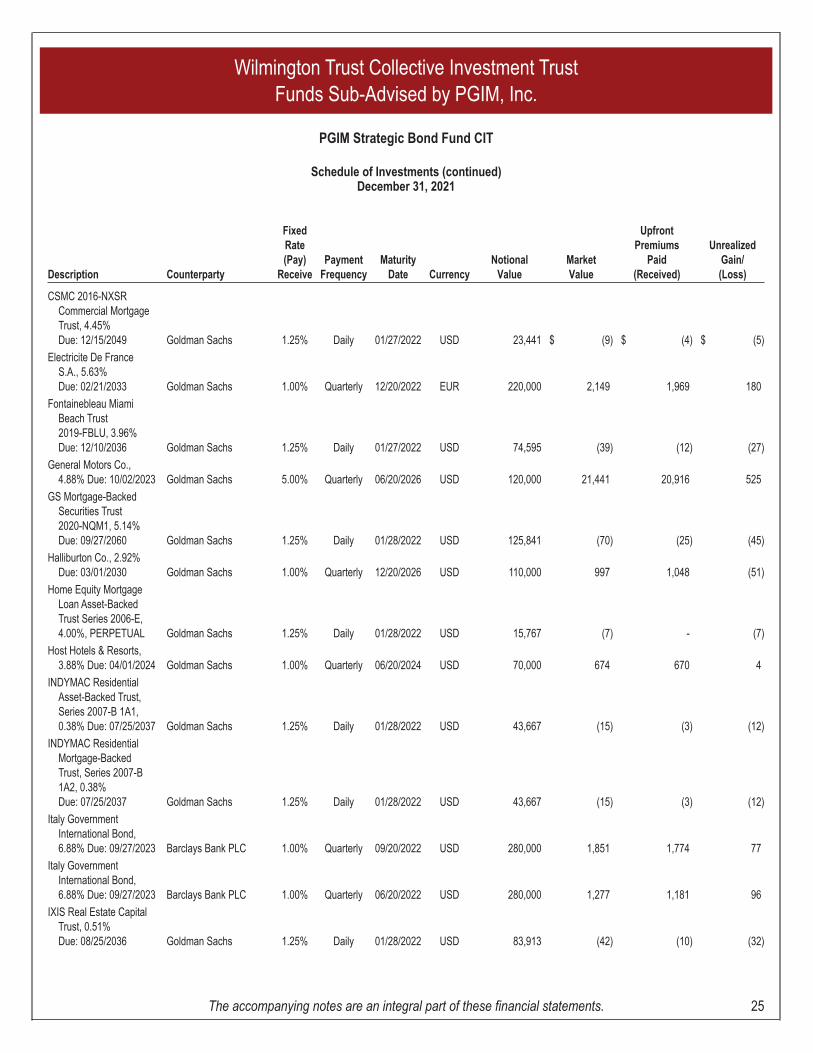
CSMC 2016-NXSRCommercial MortgageTrust, 4.45%Due: 12/15/2049 Goldman Sachs 1.25% Daily 01/27/2022 USD 23,441 $ (9) $ (4) $ (5)
Electricite De FranceS.A., 5.63%Due: 02/21/2033 Goldman Sachs 1.00% Quarterly 12/20/2022 EUR 220,000 2,149 1,969 180
Fontainebleau MiamiBeach Trust2019-FBLU, 3.96%Due: 12/10/2036 Goldman Sachs 1.25% Daily 01/27/2022 USD 74,595 (39) (12) (27)
General Motors Co.,4.88% Due: 10/02/2023 Goldman Sachs 5.00% Quarterly 06/20/2026 USD 120,000 21,441 20,916 525
GS Mortgage-BackedSecurities Trust2020-NQM1, 5.14%Due: 09/27/2060 Goldman Sachs 1.25% Daily 01/28/2022 USD 125,841 (70) (25) (45)
Halliburton Co., 2.92%Due: 03/01/2030 Goldman Sachs 1.00% Quarterly 12/20/2026 USD 110,000 997 1,048 (51)
Home Equity MortgageLoan Asset-BackedTrust Series 2006-E,4.00%, PERPETUAL Goldman Sachs 1.25% Daily 01/28/2022 USD 15,767 (7) - (7)
Host Hotels & Resorts,3.88% Due: 04/01/2024 Goldman Sachs 1.00% Quarterly 06/20/2024 USD 70,000 674 670 4
INDYMAC ResidentialAsset-Backed Trust,Series 2007-B 1A1,0.38% Due: 07/25/2037 Goldman Sachs 1.25% Daily 01/28/2022 USD 43,667 (15) (3) (12)
INDYMAC ResidentialMortgage-BackedTrust, Series 2007-B1A2, 0.38%Due: 07/25/2037 Goldman Sachs 1.25% Daily 01/28/2022 USD 43,667 (15) (3) (12)
Italy GovernmentInternational Bond,6.88% Due: 09/27/2023 Barclays Bank PLC 1.00% Quarterly 09/20/2022 USD 280,000 1,851 1,774 77
Italy GovernmentInternational Bond,6.88% Due: 09/27/2023 Barclays Bank PLC 1.00% Quarterly 06/20/2022 USD 280,000 1,277 1,181 96
IXIS Real Estate CapitalTrust, 0.51%Due: 08/25/2036 Goldman Sachs 1.25% Daily 01/28/2022 USD 83,913 (42) (10) (32)
Wilmington Trust Collective Investment TrustFunds Sub-Advised by PGIM, Inc.
PGIM Strategic Bond Fund CIT
Schedule of Investments (continued)December 31, 2021
The accompanying notes are an integral part of these financial statements. 25
Description Counterparty
FixedRate(Pay)
ReceivePayment
FrequencyMaturity
Date CurrencyNotional
ValueMarketValue
UpfrontPremiums
Paid(Received)
UnrealizedGain/(Loss)
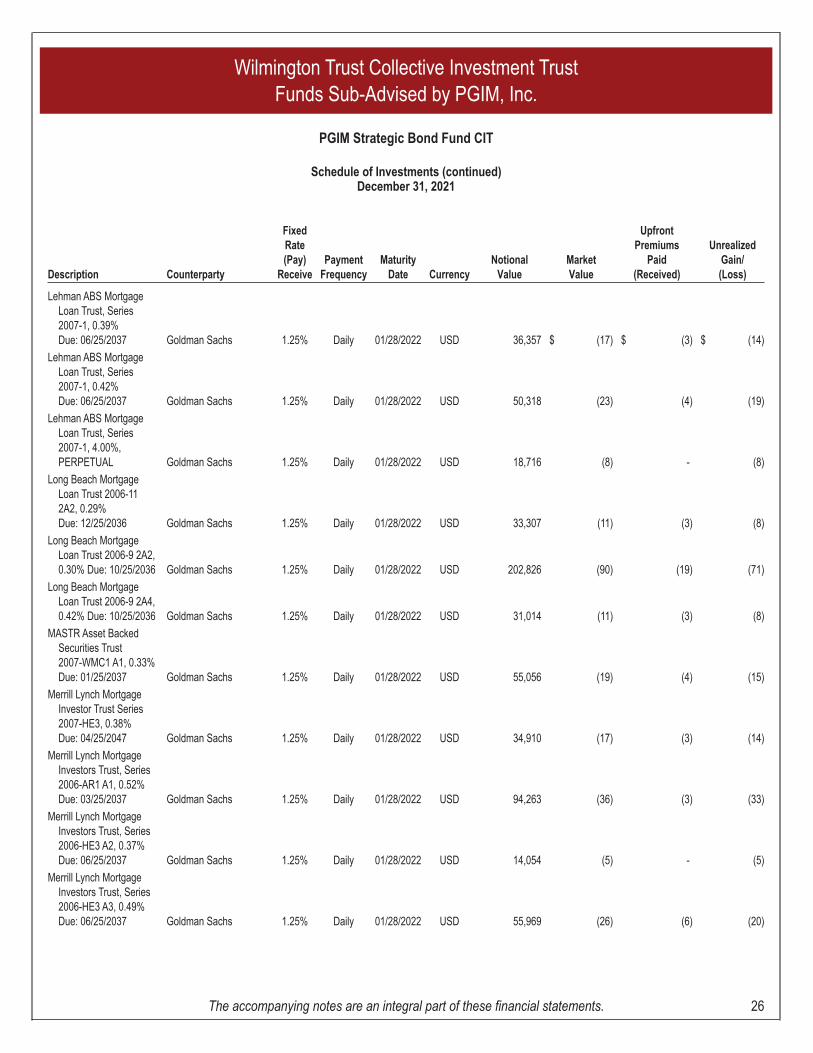
Lehman ABS MortgageLoan Trust, Series2007-1, 0.39%Due: 06/25/2037 Goldman Sachs 1.25% Daily 01/28/2022 USD 36,357 $ (17) $ (3) $ (14)
Lehman ABS MortgageLoan Trust, Series2007-1, 0.42%Due: 06/25/2037 Goldman Sachs 1.25% Daily 01/28/2022 USD 50,318 (23) (4) (19)
Lehman ABS MortgageLoan Trust, Series2007-1, 4.00%,PERPETUAL Goldman Sachs 1.25% Daily 01/28/2022 USD 18,716 (8) - (8)
Long Beach MortgageLoan Trust 2006-112A2, 0.29%Due: 12/25/2036 Goldman Sachs 1.25% Daily 01/28/2022 USD 33,307 (11) (3) (8)
Long Beach MortgageLoan Trust 2006-9 2A2,0.30% Due: 10/25/2036 Goldman Sachs 1.25% Daily 01/28/2022 USD 202,826 (90) (19) (71)
Long Beach MortgageLoan Trust 2006-9 2A4,0.42% Due: 10/25/2036 Goldman Sachs 1.25% Daily 01/28/2022 USD 31,014 (11) (3) (8)
MASTR Asset BackedSecurities Trust2007-WMC1 A1, 0.33%Due: 01/25/2037 Goldman Sachs 1.25% Daily 01/28/2022 USD 55,056 (19) (4) (15)
Merrill Lynch MortgageInvestor Trust Series2007-HE3, 0.38%Due: 04/25/2047 Goldman Sachs 1.25% Daily 01/28/2022 USD 34,910 (17) (3) (14)
Merrill Lynch MortgageInvestors Trust, Series2006-AR1 A1, 0.52%Due: 03/25/2037 Goldman Sachs 1.25% Daily 01/28/2022 USD 94,263 (36) (3) (33)
Merrill Lynch MortgageInvestors Trust, Series2006-HE3 A2, 0.37%Due: 06/25/2037 Goldman Sachs 1.25% Daily 01/28/2022 USD 14,054 (5) - (5)
Merrill Lynch MortgageInvestors Trust, Series2006-HE3 A3, 0.49%Due: 06/25/2037 Goldman Sachs 1.25% Daily 01/28/2022 USD 55,969 (26) (6) (20)
Wilmington Trust Collective Investment TrustFunds Sub-Advised by PGIM, Inc.
PGIM Strategic Bond Fund CIT
Schedule of Investments (continued)December 31, 2021
The accompanying notes are an integral part of these financial statements. 26
Description Counterparty
FixedRate(Pay)
ReceivePayment
FrequencyMaturity
Date CurrencyNotional
ValueMarketValue
UpfrontPremiums
Paid(Received)
UnrealizedGain/(Loss)
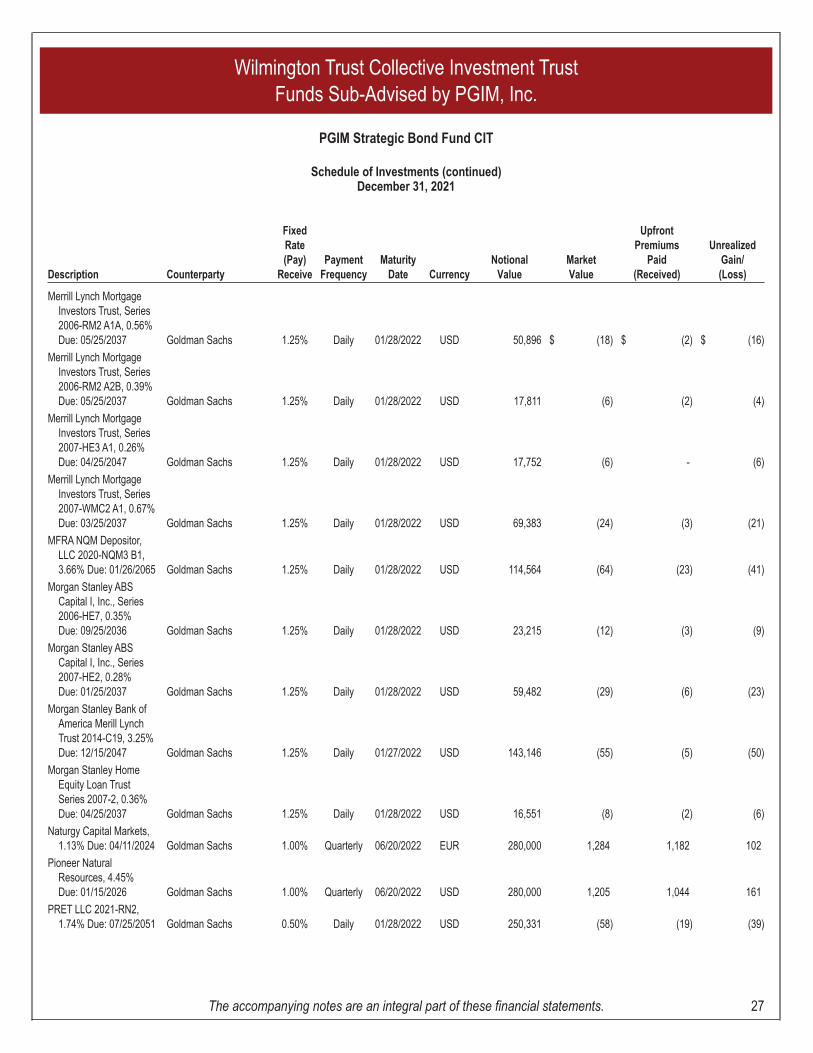
Merrill Lynch MortgageInvestors Trust, Series2006-RM2 A1A, 0.56%Due: 05/25/2037 Goldman Sachs 1.25% Daily 01/28/2022 USD 50,896 $ (18) $ (2) $ (16)
Merrill Lynch MortgageInvestors Trust, Series2006-RM2 A2B, 0.39%Due: 05/25/2037 Goldman Sachs 1.25% Daily 01/28/2022 USD 17,811 (6) (2) (4)
Merrill Lynch MortgageInvestors Trust, Series2007-HE3 A1, 0.26%Due: 04/25/2047 Goldman Sachs 1.25% Daily 01/28/2022 USD 17,752 (6) - (6)
Merrill Lynch MortgageInvestors Trust, Series2007-WMC2 A1, 0.67%Due: 03/25/2037 Goldman Sachs 1.25% Daily 01/28/2022 USD 69,383 (24) (3) (21)
MFRA NQM Depositor,LLC 2020-NQM3 B1,3.66% Due: 01/26/2065 Goldman Sachs 1.25% Daily 01/28/2022 USD 114,564 (64) (23) (41)
Morgan Stanley ABSCapital I, Inc., Series2006-HE7, 0.35%Due: 09/25/2036 Goldman Sachs 1.25% Daily 01/28/2022 USD 23,215 (12) (3) (9)
Morgan Stanley ABSCapital I, Inc., Series2007-HE2, 0.28%Due: 01/25/2037 Goldman Sachs 1.25% Daily 01/28/2022 USD 59,482 (29) (6) (23)
Morgan Stanley Bank ofAmerica Merill LynchTrust 2014-C19, 3.25%Due: 12/15/2047 Goldman Sachs 1.25% Daily 01/27/2022 USD 143,146 (55) (5) (50)
Morgan Stanley HomeEquity Loan TrustSeries 2007-2, 0.36%Due: 04/25/2037 Goldman Sachs 1.25% Daily 01/28/2022 USD 16,551 (8) (2) (6)
Naturgy Capital Markets,1.13% Due: 04/11/2024 Goldman Sachs 1.00% Quarterly 06/20/2022 EUR 280,000 1,284 1,182 102
Pioneer NaturalResources, 4.45%Due: 01/15/2026 Goldman Sachs 1.00% Quarterly 06/20/2022 USD 280,000 1,205 1,044 161
PRET LLC 2021-RN2,1.74% Due: 07/25/2051 Goldman Sachs 0.50% Daily 01/28/2022 USD 250,331 (58) (19) (39)
Wilmington Trust Collective Investment TrustFunds Sub-Advised by PGIM, Inc.
PGIM Strategic Bond Fund CIT
Schedule of Investments (continued)December 31, 2021
The accompanying notes are an integral part of these financial statements. 27

Description Counterparty
FixedRate(Pay)
ReceivePayment
FrequencyMaturity
Date CurrencyNotional
ValueMarketValue
UpfrontPremiums
Paid(Received)
UnrealizedGain/(Loss)
Pretium Mortgage CreditPartners I Series2021-NPL1, 2.24%Due: 09/27/2060 Goldman Sachs 0.50% Daily 01/28/2022 USD 34,171 $ (7) $ (2) $ (5)
Pretium Trust 2021-RN4,2.49% Due: 10/25/2051 Goldman Sachs 0.50% Daily 01/28/2022 USD 182,429 (40) (14) (26)
Progress Residential2021-SFR9, 4.05%Due: 11/17/2040 Goldman Sachs 1.00% Daily 01/28/2022 USD 77,839 (37) (13) (24)
PRPM LLC, Series2021-1 A1, 2.12%Due: 01/25/2026 Goldman Sachs 0.50% Daily 01/28/2022 USD 386,130 (209) (150) (59)
PRPM LLC, Series2021-10 A1, 2.49%Due: 10/25/2026 Goldman Sachs 0.50% Daily 01/28/2022 USD 45,034 (12) (4) (8)
PRPM LLC, Series2021-3 A1, 1.87%Due: 04/25/2026 Goldman Sachs 0.50% Daily 01/28/2022 USD 17,873 (4) (1) (3)
RMIR 2018-1X M2, 2.89%Due: 03/25/2028 Goldman Sachs 1.25% Daily 01/28/2022 USD 21,996 (8) (5) (3)
RMIR 2020-1 M2A, 2.19%Due: 01/25/2030 Goldman Sachs 1.25% Daily 01/28/2022 USD 88,616 (49) (18) (31)
Securitized Asset BackedReceivables LLC Trust2006-HE1 A2B, 0.37%Due: 07/25/2036 Goldman Sachs 1.25% Daily 01/28/2022 USD 22,648 (8) (2) (6)
Securitized Asset BackedReceivables LLC Trust2006-WM3 A1, 0.29%Due: 10/25/2036 Goldman Sachs 1.25% Daily 01/28/2022 USD 18,645 (8) (1) (7)
Simon Property Group,2.75% Due: 06/01/2023 Goldman Sachs 1.00% Quarterly 06/20/2026 USD 110,000 2,054 1,142 912
Soundview Home LoanTrust 2006-NLC1 A2,0.31% Due: 11/25/2036 Goldman Sachs 1.25% Daily 01/28/2022 USD 25,625 (11) (2) (9)
Soundview Home LoanTrust 2006-NLC1 A3,0.36% Due: 11/25/2036 Goldman Sachs 1.25% Daily 01/28/2022 USD 14,642 (6) (1) (5)
Specialty Underwriting &Residential FinanceTrust, Series2006-BC3, 0.49%Due: 06/25/2037 Goldman Sachs 1.25% Daily 01/28/2022 USD 14,583 (6) (1) (5)
Wilmington Trust Collective Investment TrustFunds Sub-Advised by PGIM, Inc.
PGIM Strategic Bond Fund CIT
Schedule of Investments (continued)December 31, 2021
The accompanying notes are an integral part of these financial statements. 28
Description Counterparty
FixedRate(Pay)
ReceivePayment
FrequencyMaturity
Date CurrencyNotional
ValueMarketValue
UpfrontPremiums
Paid(Received)
UnrealizedGain/(Loss)
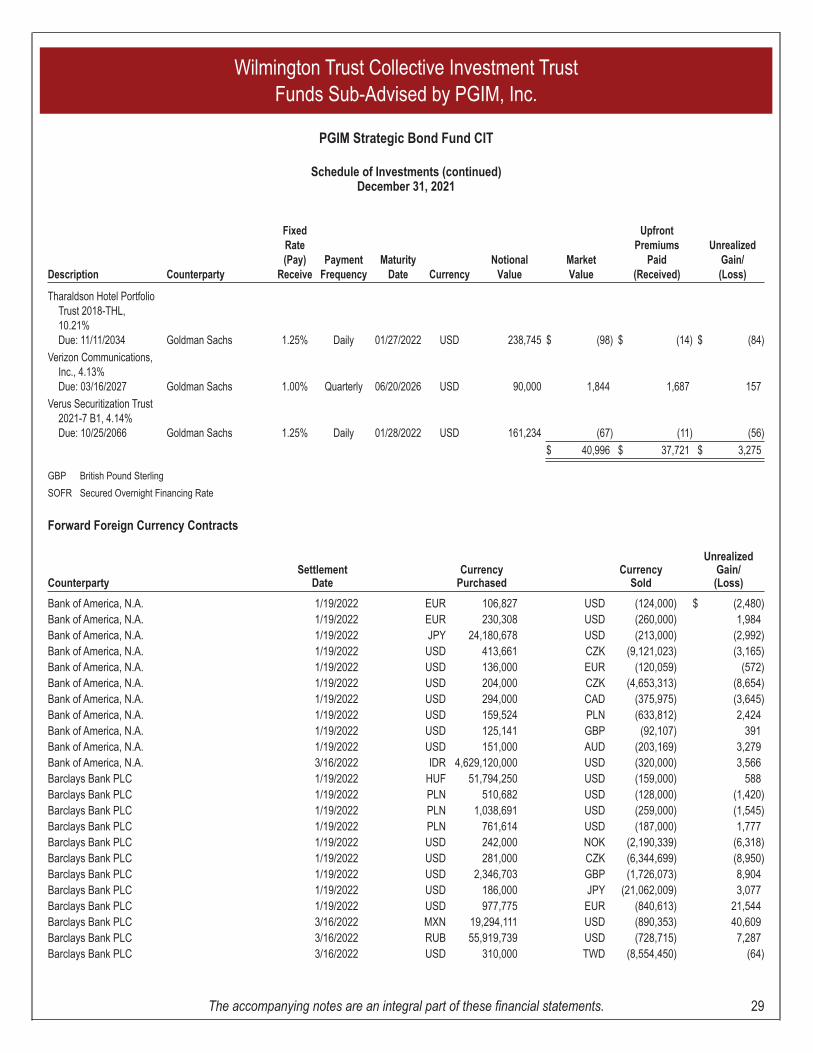
Tharaldson Hotel PortfolioTrust 2018-THL,10.21%Due: 11/11/2034 Goldman Sachs 1.25% Daily 01/27/2022 USD 238,745 $ (98) $ (14) $ (84)
Verizon Communications,Inc., 4.13%Due: 03/16/2027 Goldman Sachs 1.00% Quarterly 06/20/2026 USD 90,000 1,844 1,687 157
Verus Securitization Trust2021-7 B1, 4.14%Due: 10/25/2066 Goldman Sachs 1.25% Daily 01/28/2022 USD 161,234 (67) (11) (56)
$ 40,996 $ 37,721 $ 3,275
GBP British Pound Sterling
SOFR Secured Overnight Financing Rate
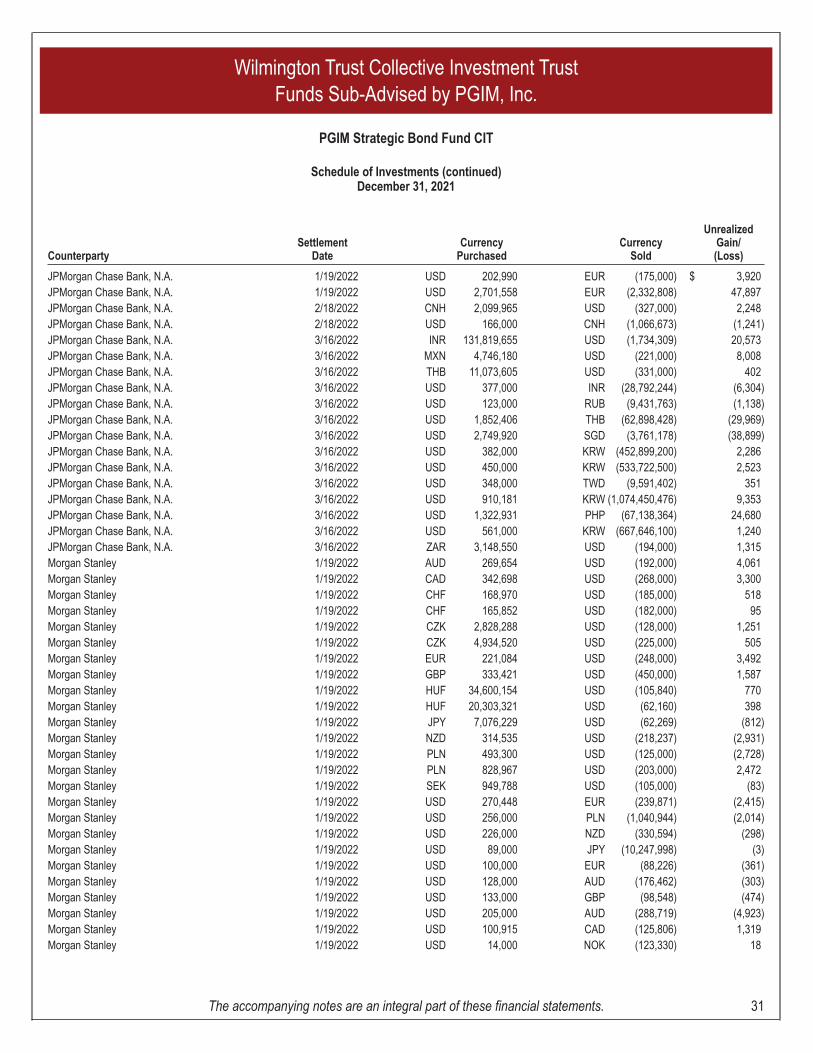
Forward Foreign Currency Contracts
CounterpartySettlement
DateCurrency
PurchasedCurrency
Sold
UnrealizedGain/(Loss)
Bank of America, N.A. 1/19/2022 EUR 106,827 USD (124,000) $ (2,480)Bank of America, N.A. 1/19/2022 EUR 230,308 USD (260,000) 1,984Bank of America, N.A. 1/19/2022 JPY 24,180,678 USD (213,000) (2,992)Bank of America, N.A. 1/19/2022 USD 413,661 CZK (9,121,023) (3,165)Bank of America, N.A. 1/19/2022 USD 136,000 EUR (120,059) (572)Bank of America, N.A. 1/19/2022 USD 204,000 CZK (4,653,313) (8,654)Bank of America, N.A. 1/19/2022 USD 294,000 CAD (375,975) (3,645)Bank of America, N.A. 1/19/2022 USD 159,524 PLN (633,812) 2,424Bank of America, N.A. 1/19/2022 USD 125,141 GBP (92,107) 391Bank of America, N.A. 1/19/2022 USD 151,000 AUD (203,169) 3,279Bank of America, N.A. 3/16/2022 IDR 4,629,120,000 USD (320,000) 3,566Barclays Bank PLC 1/19/2022 HUF 51,794,250 USD (159,000) 588Barclays Bank PLC 1/19/2022 PLN 510,682 USD (128,000) (1,420)Barclays Bank PLC 1/19/2022 PLN 1,038,691 USD (259,000) (1,545)Barclays Bank PLC 1/19/2022 PLN 761,614 USD (187,000) 1,777Barclays Bank PLC 1/19/2022 USD 242,000 NOK (2,190,339) (6,318)Barclays Bank PLC 1/19/2022 USD 281,000 CZK (6,344,699) (8,950)Barclays Bank PLC 1/19/2022 USD 2,346,703 GBP (1,726,073) 8,904Barclays Bank PLC 1/19/2022 USD 186,000 JPY (21,062,009) 3,077Barclays Bank PLC 1/19/2022 USD 977,775 EUR (840,613) 21,544Barclays Bank PLC 3/16/2022 MXN 19,294,111 USD (890,353) 40,609Barclays Bank PLC 3/16/2022 RUB 55,919,739 USD (728,715) 7,287Barclays Bank PLC 3/16/2022 USD 310,000 TWD (8,554,450) (64)
Wilmington Trust Collective Investment TrustFunds Sub-Advised by PGIM, Inc.
PGIM Strategic Bond Fund CIT
Schedule of Investments (continued)December 31, 2021
The accompanying notes are an integral part of these financial statements. 29
CounterpartySettlement
DateCurrency
PurchasedCurrency
Sold
UnrealizedGain/(Loss)
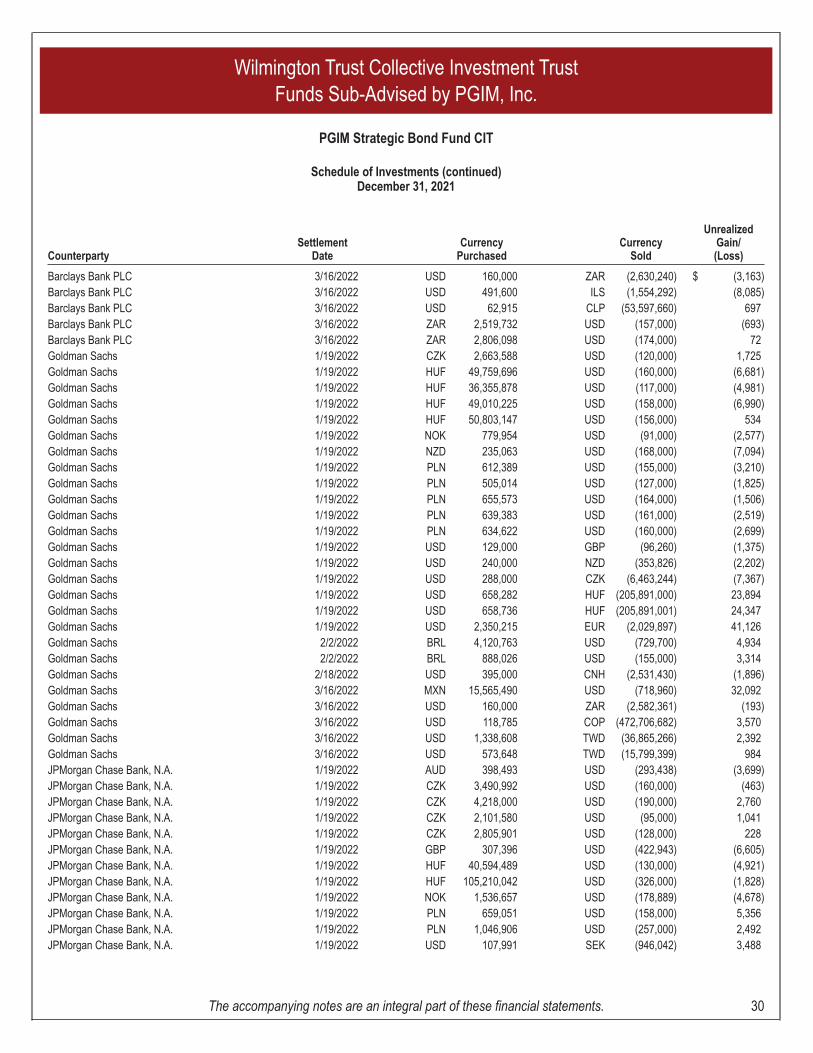
Barclays Bank PLC 3/16/2022 USD 160,000 ZAR (2,630,240) $ (3,163)Barclays Bank PLC 3/16/2022 USD 491,600 ILS (1,554,292) (8,085)Barclays Bank PLC 3/16/2022 USD 62,915 CLP (53,597,660) 697Barclays Bank PLC 3/16/2022 ZAR 2,519,732 USD (157,000) (693)Barclays Bank PLC 3/16/2022 ZAR 2,806,098 USD (174,000) 72Goldman Sachs 1/19/2022 CZK 2,663,588 USD (120,000) 1,725Goldman Sachs 1/19/2022 HUF 49,759,696 USD (160,000) (6,681)Goldman Sachs 1/19/2022 HUF 36,355,878 USD (117,000) (4,981)Goldman Sachs 1/19/2022 HUF 49,010,225 USD (158,000) (6,990)Goldman Sachs 1/19/2022 HUF 50,803,147 USD (156,000) 534Goldman Sachs 1/19/2022 NOK 779,954 USD (91,000) (2,577)Goldman Sachs 1/19/2022 NZD 235,063 USD (168,000) (7,094)Goldman Sachs 1/19/2022 PLN 612,389 USD (155,000) (3,210)Goldman Sachs 1/19/2022 PLN 505,014 USD (127,000) (1,825)Goldman Sachs 1/19/2022 PLN 655,573 USD (164,000) (1,506)Goldman Sachs 1/19/2022 PLN 639,383 USD (161,000) (2,519)Goldman Sachs 1/19/2022 PLN 634,622 USD (160,000) (2,699)Goldman Sachs 1/19/2022 USD 129,000 GBP (96,260) (1,375)Goldman Sachs 1/19/2022 USD 240,000 NZD (353,826) (2,202)Goldman Sachs 1/19/2022 USD 288,000 CZK (6,463,244) (7,367)Goldman Sachs 1/19/2022 USD 658,282 HUF (205,891,000) 23,894Goldman Sachs 1/19/2022 USD 658,736 HUF (205,891,001) 24,347Goldman Sachs 1/19/2022 USD 2,350,215 EUR (2,029,897) 41,126Goldman Sachs 2/2/2022 BRL 4,120,763 USD (729,700) 4,934Goldman Sachs 2/2/2022 BRL 888,026 USD (155,000) 3,314Goldman Sachs 2/18/2022 USD 395,000 CNH (2,531,430) (1,896)Goldman Sachs 3/16/2022 MXN 15,565,490 USD (718,960) 32,092Goldman Sachs 3/16/2022 USD 160,000 ZAR (2,582,361) (193)Goldman Sachs 3/16/2022 USD 118,785 COP (472,706,682) 3,570Goldman Sachs 3/16/2022 USD 1,338,608 TWD (36,865,266) 2,392Goldman Sachs 3/16/2022 USD 573,648 TWD (15,799,399) 984JPMorgan Chase Bank, N.A. 1/19/2022 AUD 398,493 USD (293,438) (3,699)JPMorgan Chase Bank, N.A. 1/19/2022 CZK 3,490,992 USD (160,000) (463)JPMorgan Chase Bank, N.A. 1/19/2022 CZK 4,218,000 USD (190,000) 2,760JPMorgan Chase Bank, N.A. 1/19/2022 CZK 2,101,580 USD (95,000) 1,041JPMorgan Chase Bank, N.A. 1/19/2022 CZK 2,805,901 USD (128,000) 228JPMorgan Chase Bank, N.A. 1/19/2022 GBP 307,396 USD (422,943) (6,605)JPMorgan Chase Bank, N.A. 1/19/2022 HUF 40,594,489 USD (130,000) (4,921)JPMorgan Chase Bank, N.A. 1/19/2022 HUF 105,210,042 USD (326,000) (1,828)JPMorgan Chase Bank, N.A. 1/19/2022 NOK 1,536,657 USD (178,889) (4,678)JPMorgan Chase Bank, N.A. 1/19/2022 PLN 659,051 USD (158,000) 5,356JPMorgan Chase Bank, N.A. 1/19/2022 PLN 1,046,906 USD (257,000) 2,492JPMorgan Chase Bank, N.A. 1/19/2022 USD 107,991 SEK (946,042) 3,488
Wilmington Trust Collective Investment TrustFunds Sub-Advised by PGIM, Inc.
PGIM Strategic Bond Fund CIT
Schedule of Investments (continued)December 31, 2021
The accompanying notes are an integral part of these financial statements. 30
CounterpartySettlement
DateCurrency
PurchasedCurrency
Sold
UnrealizedGain/(Loss)
JPMorgan Chase Bank, N.A. 1/19/2022 USD 202,990 EUR (175,000) $ 3,920JPMorgan Chase Bank, N.A. 1/19/2022 USD 2,701,558 EUR (2,332,808) 47,897JPMorgan Chase Bank, N.A. 2/18/2022 CNH 2,099,965 USD (327,000) 2,248JPMorgan Chase Bank, N.A. 2/18/2022 USD 166,000 CNH (1,066,673) (1,241)JPMorgan Chase Bank, N.A. 3/16/2022 INR 131,819,655 USD (1,734,309) 20,573JPMorgan Chase Bank, N.A. 3/16/2022 MXN 4,746,180 USD (221,000) 8,008JPMorgan Chase Bank, N.A. 3/16/2022 THB 11,073,605 USD (331,000) 402JPMorgan Chase Bank, N.A. 3/16/2022 USD 377,000 INR (28,792,244) (6,304)JPMorgan Chase Bank, N.A. 3/16/2022 USD 123,000 RUB (9,431,763) (1,138)JPMorgan Chase Bank, N.A. 3/16/2022 USD 1,852,406 THB (62,898,428) (29,969)JPMorgan Chase Bank, N.A. 3/16/2022 USD 2,749,920 SGD (3,761,178) (38,899)JPMorgan Chase Bank, N.A. 3/16/2022 USD 382,000 KRW (452,899,200) 2,286JPMorgan Chase Bank, N.A. 3/16/2022 USD 450,000 KRW (533,722,500) 2,523JPMorgan Chase Bank, N.A. 3/16/2022 USD 348,000 TWD (9,591,402) 351JPMorgan Chase Bank, N.A. 3/16/2022 USD 910,181 KRW (1,074,450,476) 9,353JPMorgan Chase Bank, N.A. 3/16/2022 USD 1,322,931 PHP (67,138,364) 24,680JPMorgan Chase Bank, N.A. 3/16/2022 USD 561,000 KRW (667,646,100) 1,240JPMorgan Chase Bank, N.A. 3/16/2022 ZAR 3,148,550 USD (194,000) 1,315Morgan Stanley 1/19/2022 AUD 269,654 USD (192,000) 4,061Morgan Stanley 1/19/2022 CAD 342,698 USD (268,000) 3,300Morgan Stanley 1/19/2022 CHF 168,970 USD (185,000) 518Morgan Stanley 1/19/2022 CHF 165,852 USD (182,000) 95Morgan Stanley 1/19/2022 CZK 2,828,288 USD (128,000) 1,251Morgan Stanley 1/19/2022 CZK 4,934,520 USD (225,000) 505Morgan Stanley 1/19/2022 EUR 221,084 USD (248,000) 3,492Morgan Stanley 1/19/2022 GBP 333,421 USD (450,000) 1,587Morgan Stanley 1/19/2022 HUF 34,600,154 USD (105,840) 770Morgan Stanley 1/19/2022 HUF 20,303,321 USD (62,160) 398Morgan Stanley 1/19/2022 JPY 7,076,229 USD (62,269) (812)Morgan Stanley 1/19/2022 NZD 314,535 USD (218,237) (2,931)Morgan Stanley 1/19/2022 PLN 493,300 USD (125,000) (2,728)Morgan Stanley 1/19/2022 PLN 828,967 USD (203,000) 2,472Morgan Stanley 1/19/2022 SEK 949,788 USD (105,000) (83)Morgan Stanley 1/19/2022 USD 270,448 EUR (239,871) (2,415)Morgan Stanley 1/19/2022 USD 256,000 PLN (1,040,944) (2,014)Morgan Stanley 1/19/2022 USD 226,000 NZD (330,594) (298)Morgan Stanley 1/19/2022 USD 89,000 JPY (10,247,998) (3)Morgan Stanley 1/19/2022 USD 100,000 EUR (88,226) (361)Morgan Stanley 1/19/2022 USD 128,000 AUD (176,462) (303)Morgan Stanley 1/19/2022 USD 133,000 GBP (98,548) (474)Morgan Stanley 1/19/2022 USD 205,000 AUD (288,719) (4,923)Morgan Stanley 1/19/2022 USD 100,915 CAD (125,806) 1,319Morgan Stanley 1/19/2022 USD 14,000 NOK (123,330) 18
Wilmington Trust Collective Investment TrustFunds Sub-Advised by PGIM, Inc.
PGIM Strategic Bond Fund CIT
Schedule of Investments (continued)December 31, 2021
The accompanying notes are an integral part of these financial statements. 31
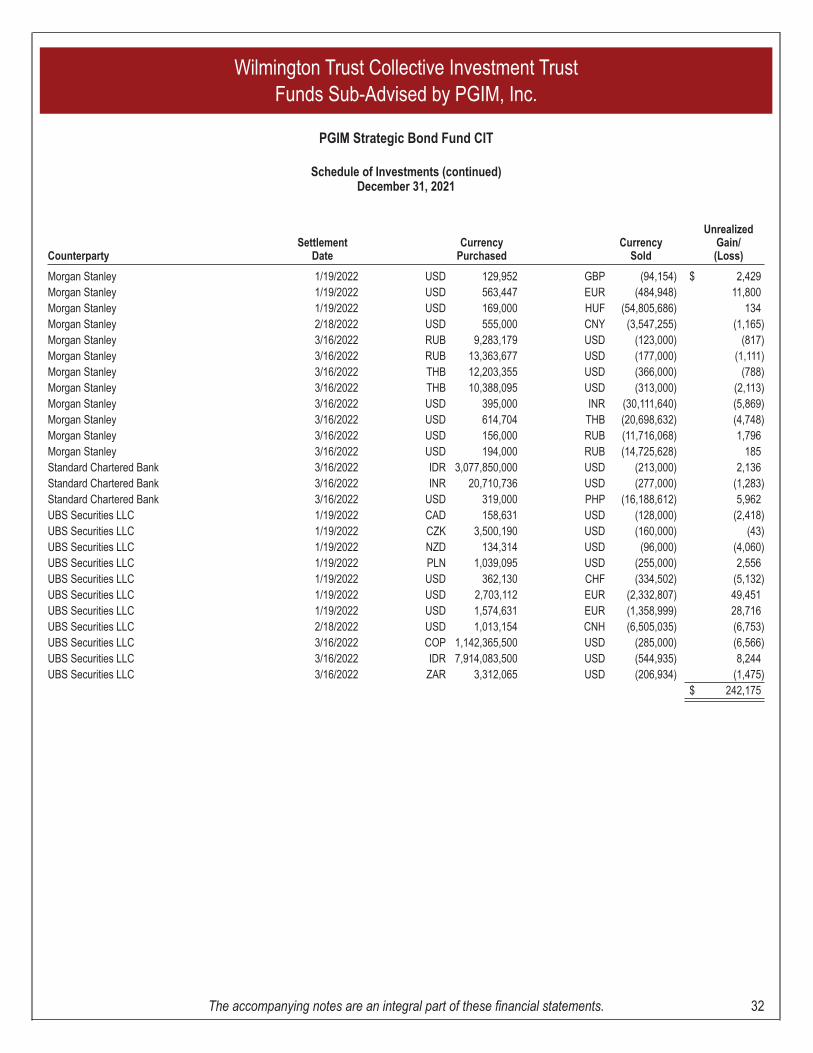
CounterpartySettlement
DateCurrency
PurchasedCurrency
Sold
UnrealizedGain/(Loss)
Morgan Stanley 1/19/2022 USD 129,952 GBP (94,154) $ 2,429Morgan Stanley 1/19/2022 USD 563,447 EUR (484,948) 11,800Morgan Stanley 1/19/2022 USD 169,000 HUF (54,805,686) 134Morgan Stanley 2/18/2022 USD 555,000 CNY (3,547,255) (1,165)Morgan Stanley 3/16/2022 RUB 9,283,179 USD (123,000) (817)Morgan Stanley 3/16/2022 RUB 13,363,677 USD (177,000) (1,111)Morgan Stanley 3/16/2022 THB 12,203,355 USD (366,000) (788)Morgan Stanley 3/16/2022 THB 10,388,095 USD (313,000) (2,113)Morgan Stanley 3/16/2022 USD 395,000 INR (30,111,640) (5,869)Morgan Stanley 3/16/2022 USD 614,704 THB (20,698,632) (4,748)Morgan Stanley 3/16/2022 USD 156,000 RUB (11,716,068) 1,796Morgan Stanley 3/16/2022 USD 194,000 RUB (14,725,628) 185Standard Chartered Bank 3/16/2022 IDR 3,077,850,000 USD (213,000) 2,136Standard Chartered Bank 3/16/2022 INR 20,710,736 USD (277,000) (1,283)Standard Chartered Bank 3/16/2022 USD 319,000 PHP (16,188,612) 5,962UBS Securities LLC 1/19/2022 CAD 158,631 USD (128,000) (2,418)UBS Securities LLC 1/19/2022 CZK 3,500,190 USD (160,000) (43)UBS Securities LLC 1/19/2022 NZD 134,314 USD (96,000) (4,060)UBS Securities LLC 1/19/2022 PLN 1,039,095 USD (255,000) 2,556UBS Securities LLC 1/19/2022 USD 362,130 CHF (334,502) (5,132)UBS Securities LLC 1/19/2022 USD 2,703,112 EUR (2,332,807) 49,451UBS Securities LLC 1/19/2022 USD 1,574,631 EUR (1,358,999) 28,716UBS Securities LLC 2/18/2022 USD 1,013,154 CNH (6,505,035) (6,753)UBS Securities LLC 3/16/2022 COP 1,142,365,500 USD (285,000) (6,566)UBS Securities LLC 3/16/2022 IDR 7,914,083,500 USD (544,935) 8,244UBS Securities LLC 3/16/2022 ZAR 3,312,065 USD (206,934) (1,475)
$ 242,175
Wilmington Trust Collective Investment TrustFunds Sub-Advised by PGIM, Inc.
PGIM Strategic Bond Fund CIT
Schedule of Investments (continued)December 31, 2021
The accompanying notes are an integral part of these financial statements. 32
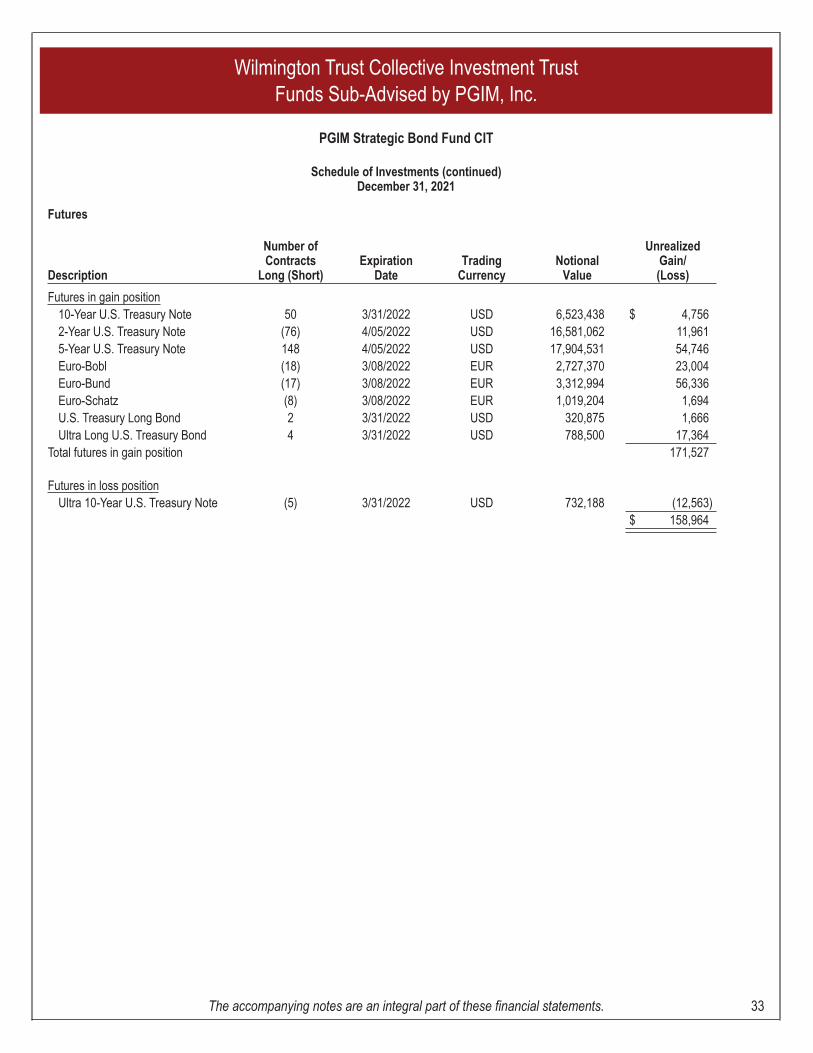
Futures
Description
Number ofContracts
Long (Short)Expiration
DateTrading
CurrencyNotional
Value
UnrealizedGain/(Loss)
Futures in gain position10-Year U.S. Treasury Note 50 3/31/2022 USD 6,523,438 $ 4,7562-Year U.S. Treasury Note (76) 4/05/2022 USD 16,581,062 11,9615-Year U.S. Treasury Note 148 4/05/2022 USD 17,904,531 54,746Euro-Bobl (18) 3/08/2022 EUR 2,727,370 23,004Euro-Bund (17) 3/08/2022 EUR 3,312,994 56,336Euro-Schatz (8) 3/08/2022 EUR 1,019,204 1,694U.S. Treasury Long Bond 2 3/31/2022 USD 320,875 1,666Ultra Long U.S. Treasury Bond 4 3/31/2022 USD 788,500 17,364
Total futures in gain position 171,527
Futures in loss positionUltra 10-Year U.S. Treasury Note (5) 3/31/2022 USD 732,188 (12,563)
$ 158,964
Wilmington Trust Collective Investment TrustFunds Sub-Advised by PGIM, Inc.
PGIM Strategic Bond Fund CIT
Schedule of Investments (continued)December 31, 2021
The accompanying notes are an integral part of these financial statements. 33

Written Swaptions - Over the Counter
Description CounterpartyBuy/Sell
ProtectionStrikeRate
ExpirationDate Currency
NotionalValue
PremiumsReceived Fair Value
Call:
Credit DefaultSwap(CDX.NA.IG.37)Maturing6/20/2026 Barclays Bank PLC Buy 700.00 6/15/2022 USD 1,240,000 $ (6,664) $ (1,475)
Credit DefaultSwap(CDX.NA.IG.37)Maturing12/20/2026 Morgan Stanley Buy 75.00 2/16/2022 USD 1,620,000 (1,150) (433)
Credit DefaultSwap(CDX.NA.IG.37)Maturing12/20/2026 Morgan Stanley Buy 72.50 2/16/2022 USD 3,220,000 (2,673) (972)
Credit DefaultSwap(CDX.NA.IG.37)Maturing12/20/2026 Morgan Stanley Buy 75.00 2/16/2022 USD 3,230,000 (2,422) (863)
Credit DefaultSwap(CDX.NA.IG.37)Maturing12/20/2026 Morgan Stanley Buy 75.00 2/16/2022 USD 8,370,000 (4,854) (2,236)
(17,763) (5,979)
Wilmington Trust Collective Investment TrustFunds Sub-Advised by PGIM, Inc.
PGIM Strategic Bond Fund CIT
Schedule of Investments (continued)December 31, 2021
The accompanying notes are an integral part of these financial statements. 34
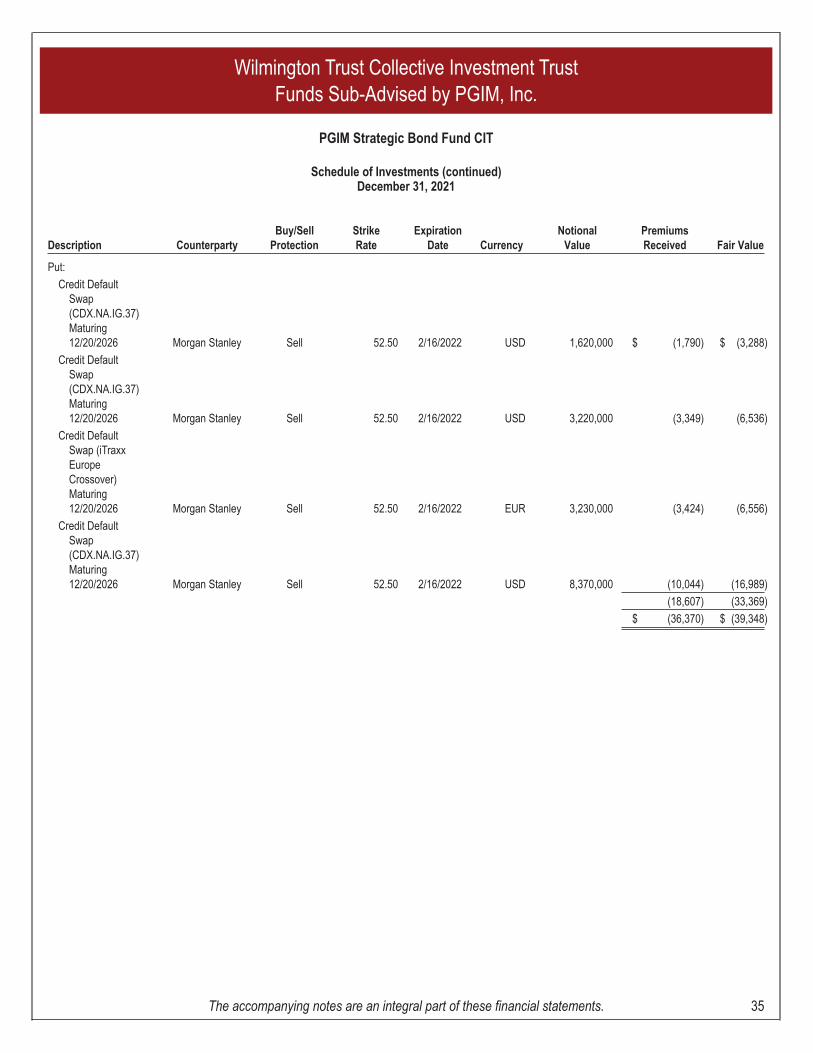
Description CounterpartyBuy/Sell
ProtectionStrikeRate
ExpirationDate Currency
NotionalValue
PremiumsReceived Fair Value
Put:
Credit DefaultSwap(CDX.NA.IG.37)Maturing12/20/2026 Morgan Stanley Sell 52.50 2/16/2022 USD 1,620,000 $ (1,790) $ (3,288)
Credit DefaultSwap(CDX.NA.IG.37)Maturing12/20/2026 Morgan Stanley Sell 52.50 2/16/2022 USD 3,220,000 (3,349) (6,536)
Credit DefaultSwap (iTraxxEuropeCrossover)Maturing12/20/2026 Morgan Stanley Sell 52.50 2/16/2022 EUR 3,230,000 (3,424) (6,556)
Credit DefaultSwap(CDX.NA.IG.37)Maturing12/20/2026 Morgan Stanley Sell 52.50 2/16/2022 USD 8,370,000 (10,044) (16,989)
(18,607) (33,369)
$ (36,370) $ (39,348)
Wilmington Trust Collective Investment TrustFunds Sub-Advised by PGIM, Inc.
PGIM Strategic Bond Fund CIT
Schedule of Investments (continued)December 31, 2021
The accompanying notes are an integral part of these financial statements. 35
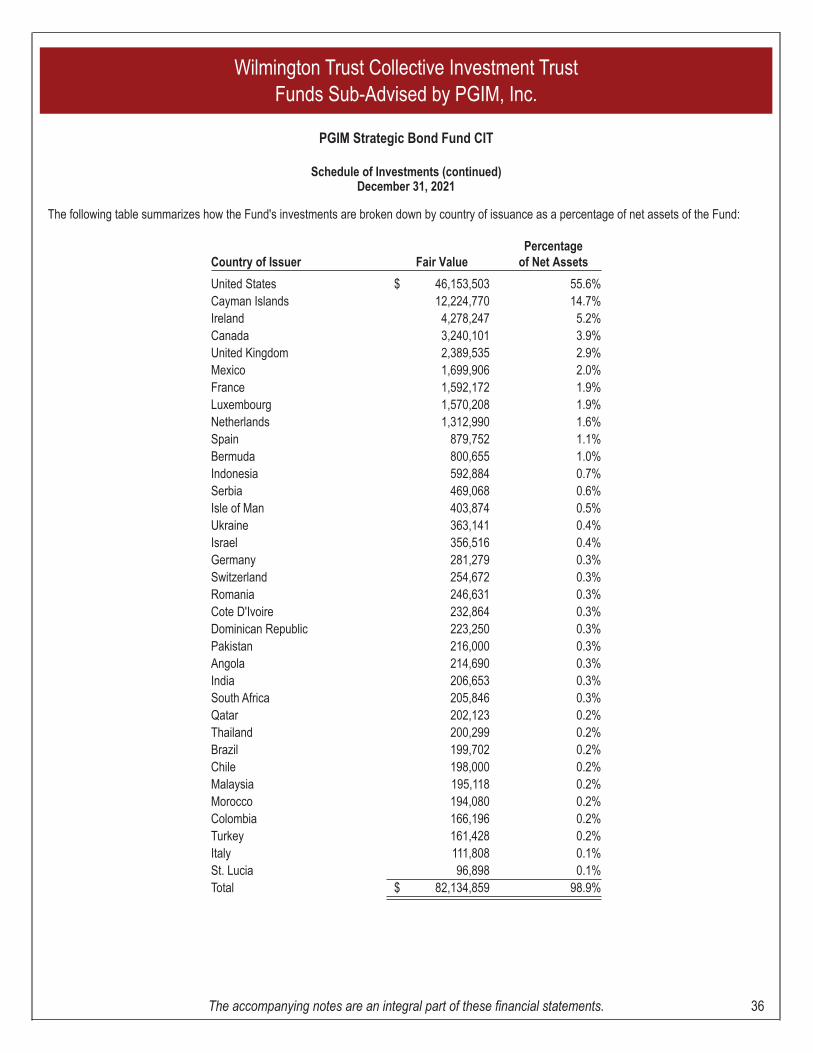
The following table summarizes how the Fund's investments are broken down by country of issuance as a percentage of net assets of the Fund:
Country of Issuer Fair ValuePercentage
of Net Assets
United States $ 46,153,503 55.6%Cayman Islands 12,224,770 14.7%Ireland 4,278,247 5.2%Canada 3,240,101 3.9%United Kingdom 2,389,535 2.9%Mexico 1,699,906 2.0%France 1,592,172 1.9%Luxembourg 1,570,208 1.9%Netherlands 1,312,990 1.6%Spain 879,752 1.1%Bermuda 800,655 1.0%Indonesia 592,884 0.7%Serbia 469,068 0.6%Isle of Man 403,874 0.5%Ukraine 363,141 0.4%Israel 356,516 0.4%Germany 281,279 0.3%Switzerland 254,672 0.3%Romania 246,631 0.3%Cote D'Ivoire 232,864 0.3%Dominican Republic 223,250 0.3%Pakistan 216,000 0.3%Angola 214,690 0.3%India 206,653 0.3%South Africa 205,846 0.3%Qatar 202,123 0.2%Thailand 200,299 0.2%Brazil 199,702 0.2%Chile 198,000 0.2%Malaysia 195,118 0.2%Morocco 194,080 0.2%Colombia 166,196 0.2%Turkey 161,428 0.2%Italy 111,808 0.1%St. Lucia 96,898 0.1%Total $ 82,134,859 98.9%
Wilmington Trust Collective Investment TrustFunds Sub-Advised by PGIM, Inc.
PGIM Strategic Bond Fund CIT
Schedule of Investments (continued)December 31, 2021
The accompanying notes are an integral part of these financial statements. 36
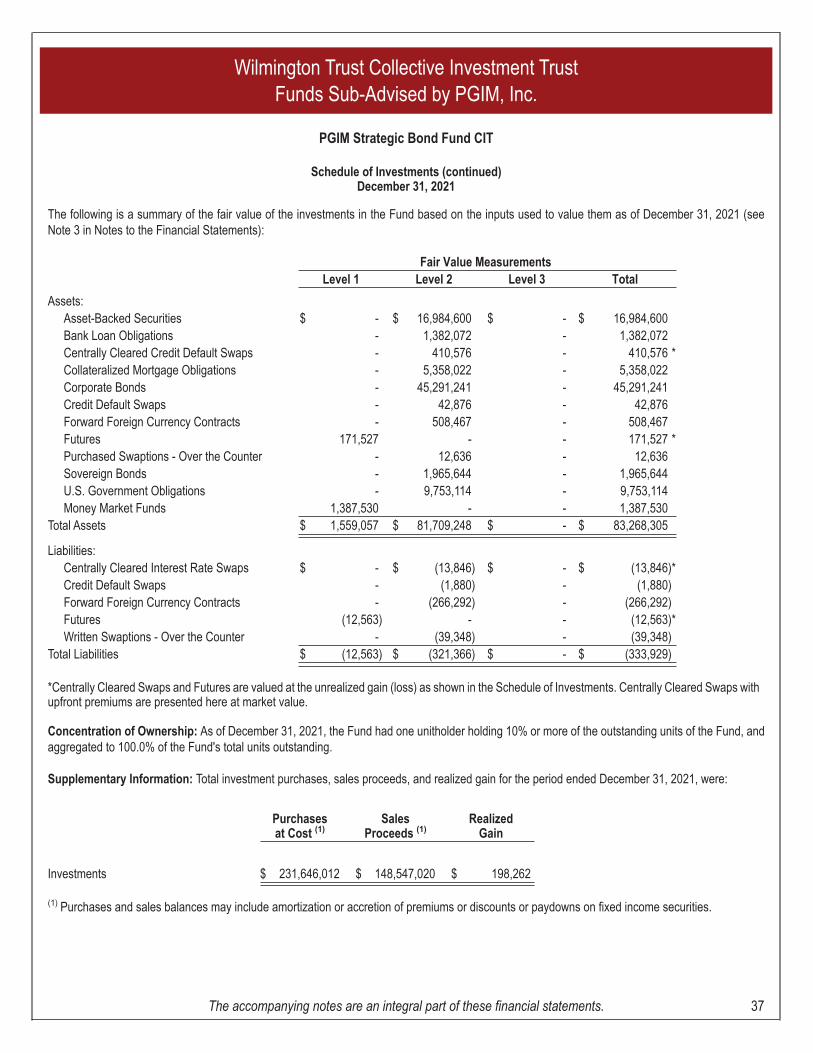
The following is a summary of the fair value of the investments in the Fund based on the inputs used to value them as of December 31, 2021 (seeNote 3 in Notes to the Financial Statements):
Fair Value MeasurementsLevel 1 Level 2 Level 3 Total
Assets:Asset-Backed Securities $ - $ 16,984,600 $ - $ 16,984,600Bank Loan Obligations - 1,382,072 - 1,382,072Centrally Cleared Credit Default Swaps - 410,576 - 410,576 *Collateralized Mortgage Obligations - 5,358,022 - 5,358,022Corporate Bonds - 45,291,241 - 45,291,241Credit Default Swaps - 42,876 - 42,876Forward Foreign Currency Contracts - 508,467 - 508,467Futures 171,527 - - 171,527 *Purchased Swaptions - Over the Counter - 12,636 - 12,636Sovereign Bonds - 1,965,644 - 1,965,644U.S. Government Obligations - 9,753,114 - 9,753,114Money Market Funds 1,387,530 - - 1,387,530
Total Assets $ 1,559,057 $ 81,709,248 $ - $ 83,268,305
Liabilities:Centrally Cleared Interest Rate Swaps $ - $ (13,846) $ - $ (13,846)*Credit Default Swaps - (1,880) - (1,880)Forward Foreign Currency Contracts - (266,292) - (266,292)Futures (12,563) - - (12,563)*Written Swaptions - Over the Counter - (39,348) - (39,348)
Total Liabilities $ (12,563) $ (321,366) $ - $ (333,929)
*Centrally Cleared Swaps and Futures are valued at the unrealized gain (loss) as shown in the Schedule of Investments. Centrally Cleared Swaps withupfront premiums are presented here at market value.
Concentration of Ownership: As of December 31, 2021, the Fund had one unitholder holding 10% or more of the outstanding units of the Fund, andaggregated to 100.0% of the Fund's total units outstanding.
Supplementary Information: Total investment purchases, sales proceeds, and realized gain for the period ended December 31, 2021, were:
Purchasesat Cost (1)
SalesProceeds (1)
RealizedGain
Investments $ 231,646,012 $ 148,547,020 $ 198,262
(1) Purchases and sales balances may include amortization or accretion of premiums or discounts or paydowns on fixed income securities.
Wilmington Trust Collective Investment TrustFunds Sub-Advised by PGIM, Inc.
PGIM Strategic Bond Fund CIT
Schedule of Investments (continued)December 31, 2021
The accompanying notes are an integral part of these financial statements. 37
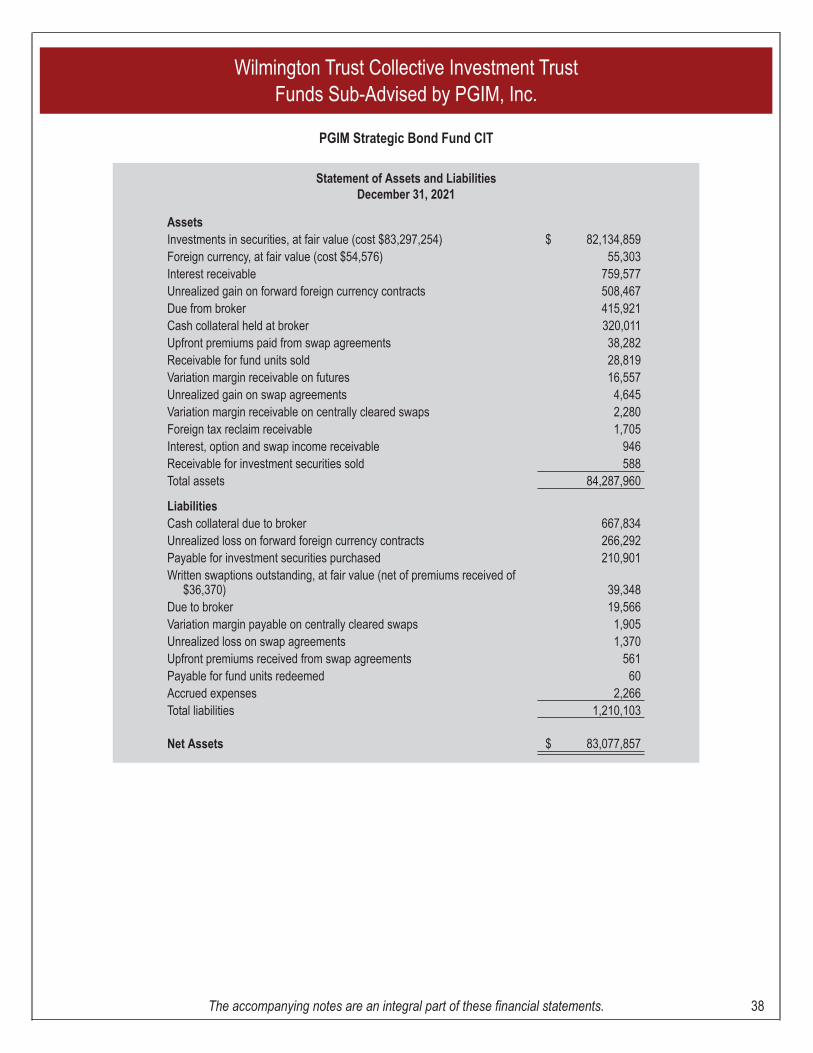
Statement of Assets and LiabilitiesDecember 31, 2021
AssetsInvestments in securities, at fair value (cost $83,297,254) $ 82,134,859Foreign currency, at fair value (cost $54,576) 55,303Interest receivable 759,577Unrealized gain on forward foreign currency contracts 508,467Due from broker 415,921Cash collateral held at broker 320,011Upfront premiums paid from swap agreements 38,282Receivable for fund units sold 28,819Variation margin receivable on futures 16,557Unrealized gain on swap agreements 4,645Variation margin receivable on centrally cleared swaps 2,280Foreign tax reclaim receivable 1,705Interest, option and swap income receivable 946Receivable for investment securities sold 588Total assets 84,287,960
LiabilitiesCash collateral due to broker 667,834Unrealized loss on forward foreign currency contracts 266,292Payable for investment securities purchased 210,901Written swaptions outstanding, at fair value (net of premiums received of
$36,370) 39,348Due to broker 19,566Variation margin payable on centrally cleared swaps 1,905Unrealized loss on swap agreements 1,370Upfront premiums received from swap agreements 561Payable for fund units redeemed 60Accrued expenses 2,266Total liabilities 1,210,103
Net Assets $ 83,077,857
Wilmington Trust Collective Investment TrustFunds Sub-Advised by PGIM, Inc.
PGIM Strategic Bond Fund CIT
The accompanying notes are an integral part of these financial statements. 38
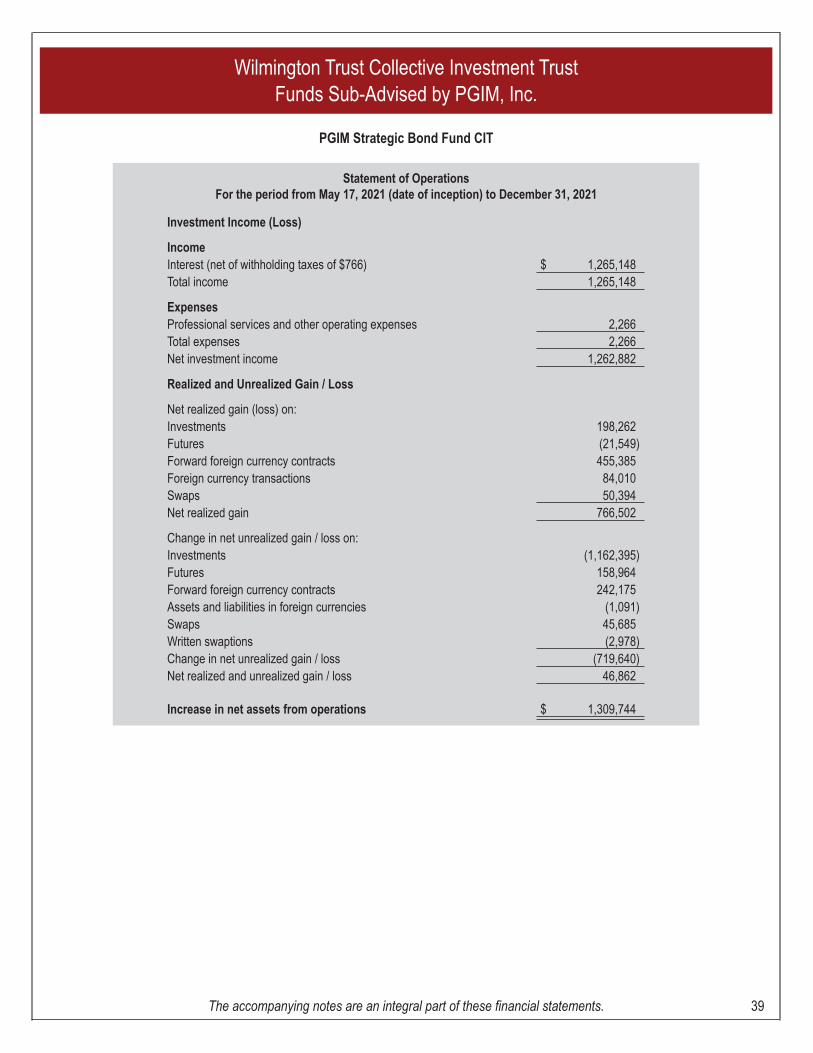
Statement of OperationsFor the period from May 17, 2021 (date of inception) to December 31, 2021
Investment Income (Loss)
IncomeInterest (net of withholding taxes of $766) $ 1,265,148Total income 1,265,148
ExpensesProfessional services and other operating expenses 2,266Total expenses 2,266Net investment income 1,262,882
Realized and Unrealized Gain / Loss
Net realized gain (loss) on:Investments 198,262Futures (21,549)Forward foreign currency contracts 455,385Foreign currency transactions 84,010Swaps 50,394Net realized gain 766,502
Change in net unrealized gain / loss on:Investments (1,162,395)Futures 158,964Forward foreign currency contracts 242,175Assets and liabilities in foreign currencies (1,091)Swaps 45,685Written swaptions (2,978)Change in net unrealized gain / loss (719,640)Net realized and unrealized gain / loss 46,862
Increase in net assets from operations $ 1,309,744
Wilmington Trust Collective Investment TrustFunds Sub-Advised by PGIM, Inc.
PGIM Strategic Bond Fund CIT
The accompanying notes are an integral part of these financial statements. 39
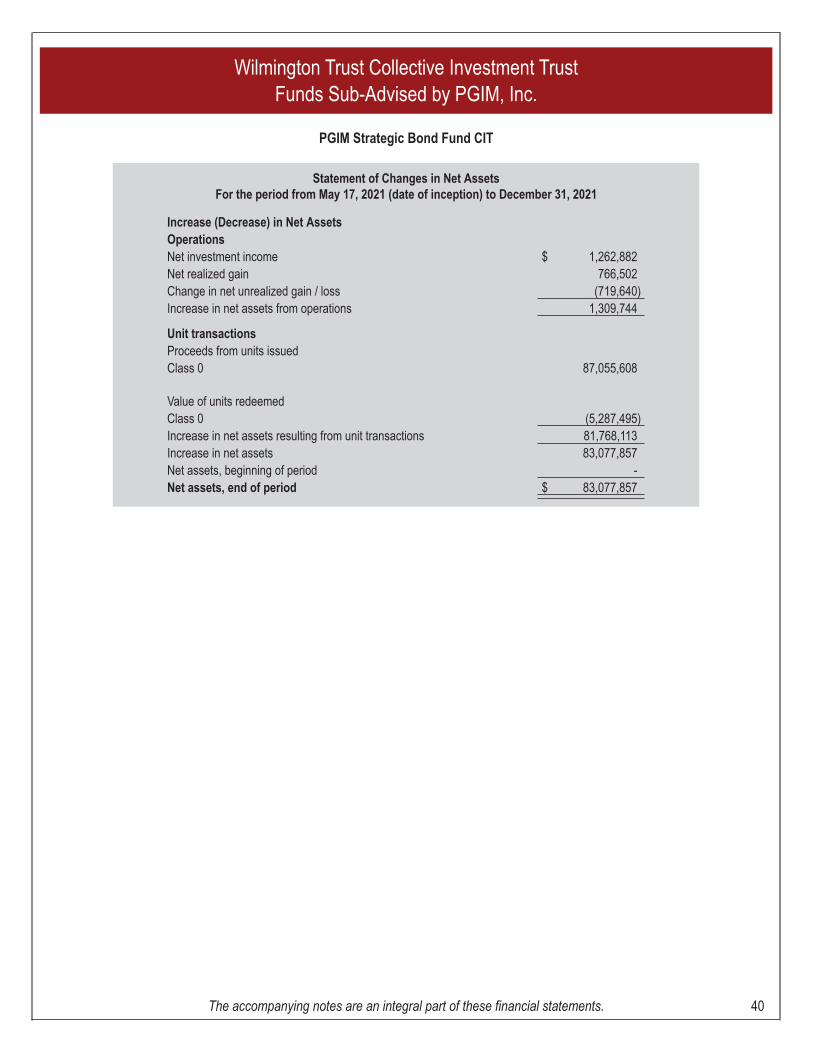
Statement of Changes in Net AssetsFor the period from May 17, 2021 (date of inception) to December 31, 2021
Increase (Decrease) in Net AssetsOperationsNet investment income $ 1,262,882Net realized gain 766,502Change in net unrealized gain / loss (719,640)Increase in net assets from operations 1,309,744
Unit transactionsProceeds from units issuedClass 0 87,055,608
Value of units redeemedClass 0 (5,287,495)Increase in net assets resulting from unit transactions 81,768,113Increase in net assets 83,077,857Net assets, beginning of period -Net assets, end of period $ 83,077,857
Wilmington Trust Collective Investment TrustFunds Sub-Advised by PGIM, Inc.
PGIM Strategic Bond Fund CIT
The accompanying notes are an integral part of these financial statements. 40
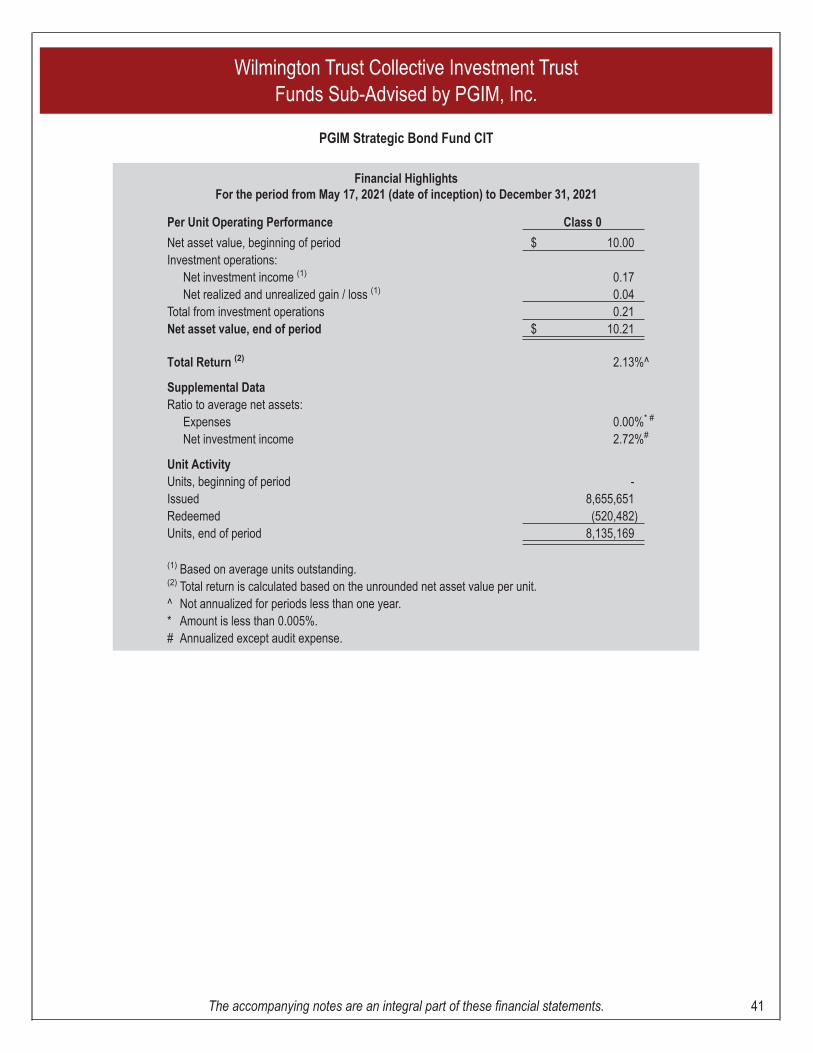
Financial HighlightsFor the period from May 17, 2021 (date of inception) to December 31, 2021
Per Unit Operating Performance Class 0
Net asset value, beginning of period $ 10.00Investment operations:
Net investment income (1) 0.17Net realized and unrealized gain / loss (1) 0.04
Total from investment operations 0.21Net asset value, end of period $ 10.21
Total Return (2) 2.13%^
Supplemental DataRatio to average net assets:
Expenses 0.00%* #
Net investment income 2.72%#
Unit ActivityUnits, beginning of period -Issued 8,655,651Redeemed (520,482)Units, end of period 8,135,169
(1) Based on average units outstanding.(2) Total return is calculated based on the unrounded net asset value per unit.^ Not annualized for periods less than one year.* Amount is less than 0.005%.# Annualized except audit expense.
Wilmington Trust Collective Investment TrustFunds Sub-Advised by PGIM, Inc.
PGIM Strategic Bond Fund CIT
The accompanying notes are an integral part of these financial statements. 41
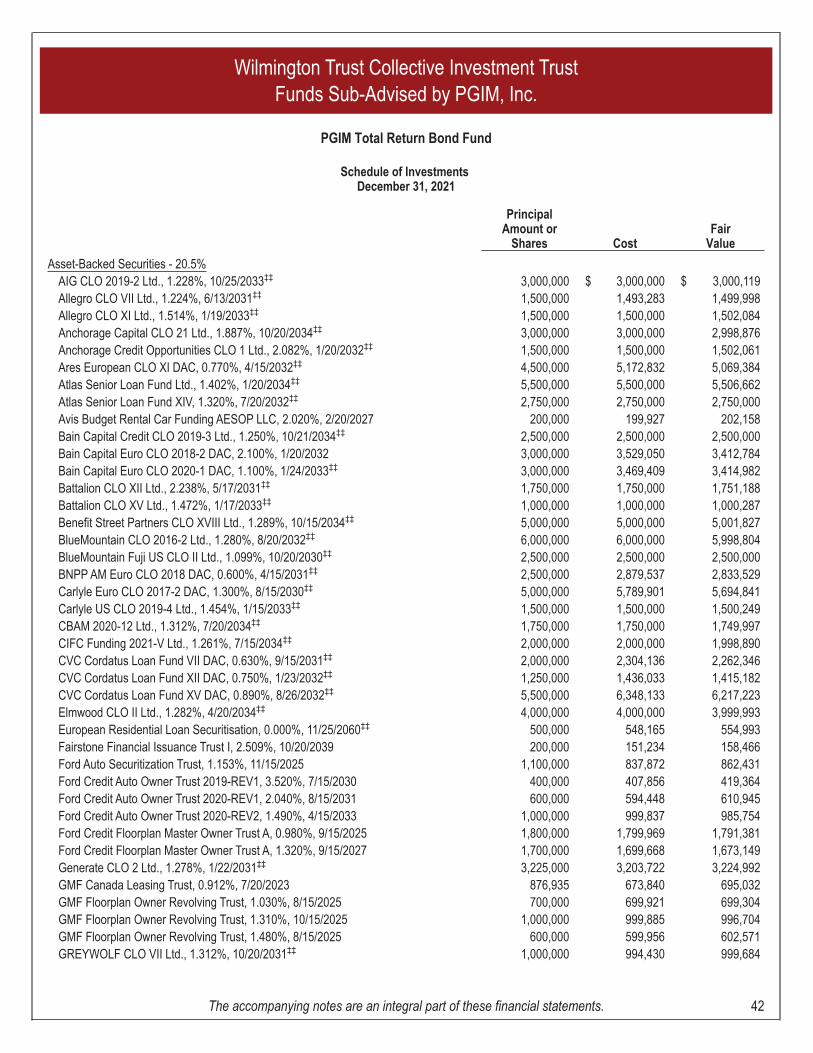
PrincipalAmount or
Shares CostFair
Value
Asset-Backed Securities - 20.5%AIG CLO 2019-2 Ltd., 1.228%, 10/25/2033‡‡ 3,000,000 $ 3,000,000 $ 3,000,119Allegro CLO VII Ltd., 1.224%, 6/13/2031‡‡ 1,500,000 1,493,283 1,499,998Allegro CLO XI Ltd., 1.514%, 1/19/2033‡‡ 1,500,000 1,500,000 1,502,084Anchorage Capital CLO 21 Ltd., 1.887%, 10/20/2034‡‡ 3,000,000 3,000,000 2,998,876Anchorage Credit Opportunities CLO 1 Ltd., 2.082%, 1/20/2032‡‡ 1,500,000 1,500,000 1,502,061Ares European CLO XI DAC, 0.770%, 4/15/2032‡‡ 4,500,000 5,172,832 5,069,384Atlas Senior Loan Fund Ltd., 1.402%, 1/20/2034‡‡ 5,500,000 5,500,000 5,506,662Atlas Senior Loan Fund XIV, 1.320%, 7/20/2032‡‡ 2,750,000 2,750,000 2,750,000Avis Budget Rental Car Funding AESOP LLC, 2.020%, 2/20/2027 200,000 199,927 202,158Bain Capital Credit CLO 2019-3 Ltd., 1.250%, 10/21/2034‡‡ 2,500,000 2,500,000 2,500,000Bain Capital Euro CLO 2018-2 DAC, 2.100%, 1/20/2032 3,000,000 3,529,050 3,412,784Bain Capital Euro CLO 2020-1 DAC, 1.100%, 1/24/2033‡‡ 3,000,000 3,469,409 3,414,982Battalion CLO XII Ltd., 2.238%, 5/17/2031‡‡ 1,750,000 1,750,000 1,751,188Battalion CLO XV Ltd., 1.472%, 1/17/2033‡‡ 1,000,000 1,000,000 1,000,287Benefit Street Partners CLO XVIII Ltd., 1.289%, 10/15/2034‡‡ 5,000,000 5,000,000 5,001,827BlueMountain CLO 2016-2 Ltd., 1.280%, 8/20/2032‡‡ 6,000,000 6,000,000 5,998,804BlueMountain Fuji US CLO II Ltd., 1.099%, 10/20/2030‡‡ 2,500,000 2,500,000 2,500,000BNPP AM Euro CLO 2018 DAC, 0.600%, 4/15/2031‡‡ 2,500,000 2,879,537 2,833,529Carlyle Euro CLO 2017-2 DAC, 1.300%, 8/15/2030‡‡ 5,000,000 5,789,901 5,694,841Carlyle US CLO 2019-4 Ltd., 1.454%, 1/15/2033‡‡ 1,500,000 1,500,000 1,500,249CBAM 2020-12 Ltd., 1.312%, 7/20/2034‡‡ 1,750,000 1,750,000 1,749,997CIFC Funding 2021-V Ltd., 1.261%, 7/15/2034‡‡ 2,000,000 2,000,000 1,998,890CVC Cordatus Loan Fund VII DAC, 0.630%, 9/15/2031‡‡ 2,000,000 2,304,136 2,262,346CVC Cordatus Loan Fund XII DAC, 0.750%, 1/23/2032‡‡ 1,250,000 1,436,033 1,415,182CVC Cordatus Loan Fund XV DAC, 0.890%, 8/26/2032‡‡ 5,500,000 6,348,133 6,217,223Elmwood CLO II Ltd., 1.282%, 4/20/2034‡‡ 4,000,000 4,000,000 3,999,993European Residential Loan Securitisation, 0.000%, 11/25/2060‡‡ 500,000 548,165 554,993Fairstone Financial Issuance Trust I, 2.509%, 10/20/2039 200,000 151,234 158,466Ford Auto Securitization Trust, 1.153%, 11/15/2025 1,100,000 837,872 862,431Ford Credit Auto Owner Trust 2019-REV1, 3.520%, 7/15/2030 400,000 407,856 419,364Ford Credit Auto Owner Trust 2020-REV1, 2.040%, 8/15/2031 600,000 594,448 610,945Ford Credit Auto Owner Trust 2020-REV2, 1.490%, 4/15/2033 1,000,000 999,837 985,754Ford Credit Floorplan Master Owner Trust A, 0.980%, 9/15/2025 1,800,000 1,799,969 1,791,381Ford Credit Floorplan Master Owner Trust A, 1.320%, 9/15/2027 1,700,000 1,699,668 1,673,149Generate CLO 2 Ltd., 1.278%, 1/22/2031‡‡ 3,225,000 3,203,722 3,224,992GMF Canada Leasing Trust, 0.912%, 7/20/2023 876,935 673,840 695,032GMF Floorplan Owner Revolving Trust, 1.030%, 8/15/2025 700,000 699,921 699,304GMF Floorplan Owner Revolving Trust, 1.310%, 10/15/2025 1,000,000 999,885 996,704GMF Floorplan Owner Revolving Trust, 1.480%, 8/15/2025 600,000 599,956 602,571GREYWOLF CLO VII Ltd., 1.312%, 10/20/2031‡‡ 1,000,000 994,430 999,684
Wilmington Trust Collective Investment TrustFunds Sub-Advised by PGIM, Inc.
PGIM Total Return Bond Fund
Schedule of InvestmentsDecember 31, 2021
The accompanying notes are an integral part of these financial statements. 42
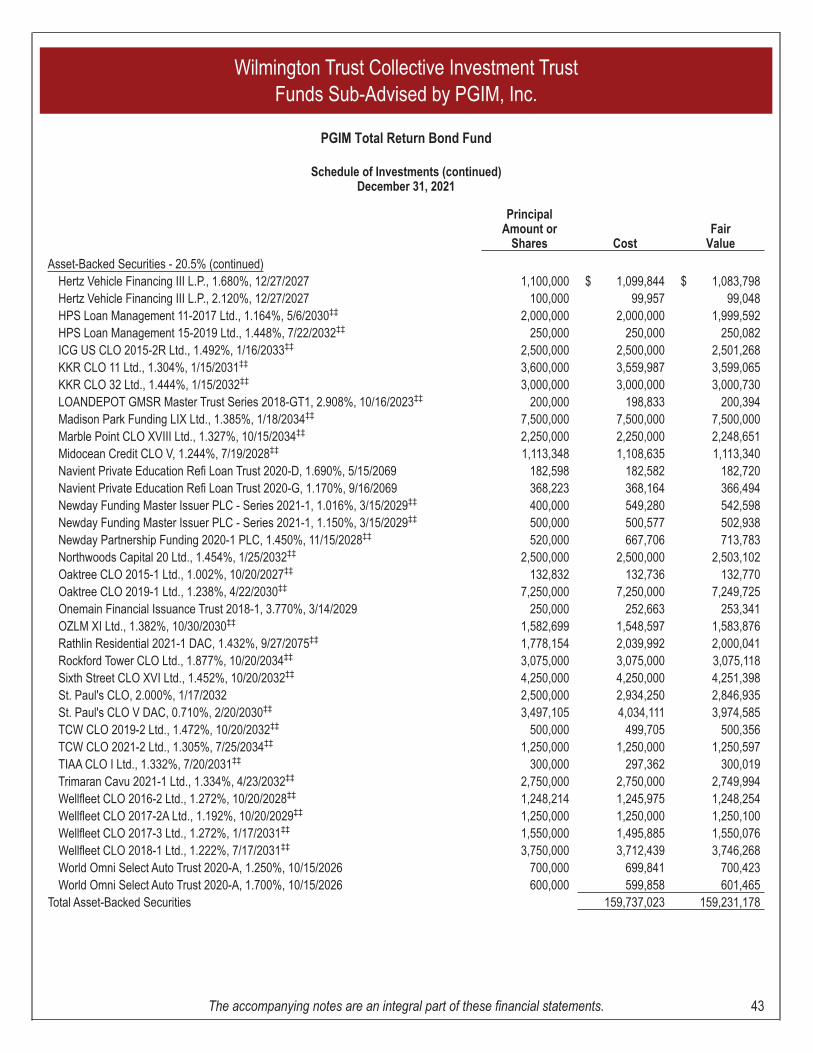
PrincipalAmount or
Shares CostFair
Value
Asset-Backed Securities - 20.5% (continued)Hertz Vehicle Financing III L.P., 1.680%, 12/27/2027 1,100,000 $ 1,099,844 $ 1,083,798Hertz Vehicle Financing III L.P., 2.120%, 12/27/2027 100,000 99,957 99,048HPS Loan Management 11-2017 Ltd., 1.164%, 5/6/2030‡‡ 2,000,000 2,000,000 1,999,592HPS Loan Management 15-2019 Ltd., 1.448%, 7/22/2032‡‡ 250,000 250,000 250,082ICG US CLO 2015-2R Ltd., 1.492%, 1/16/2033‡‡ 2,500,000 2,500,000 2,501,268KKR CLO 11 Ltd., 1.304%, 1/15/2031‡‡ 3,600,000 3,559,987 3,599,065KKR CLO 32 Ltd., 1.444%, 1/15/2032‡‡ 3,000,000 3,000,000 3,000,730LOANDEPOT GMSR Master Trust Series 2018-GT1, 2.908%, 10/16/2023‡‡ 200,000 198,833 200,394Madison Park Funding LIX Ltd., 1.385%, 1/18/2034‡‡ 7,500,000 7,500,000 7,500,000Marble Point CLO XVIII Ltd., 1.327%, 10/15/2034‡‡ 2,250,000 2,250,000 2,248,651Midocean Credit CLO V, 1.244%, 7/19/2028‡‡ 1,113,348 1,108,635 1,113,340Navient Private Education Refi Loan Trust 2020-D, 1.690%, 5/15/2069 182,598 182,582 182,720Navient Private Education Refi Loan Trust 2020-G, 1.170%, 9/16/2069 368,223 368,164 366,494Newday Funding Master Issuer PLC - Series 2021-1, 1.016%, 3/15/2029‡‡ 400,000 549,280 542,598Newday Funding Master Issuer PLC - Series 2021-1, 1.150%, 3/15/2029‡‡ 500,000 500,577 502,938Newday Partnership Funding 2020-1 PLC, 1.450%, 11/15/2028‡‡ 520,000 667,706 713,783Northwoods Capital 20 Ltd., 1.454%, 1/25/2032‡‡ 2,500,000 2,500,000 2,503,102Oaktree CLO 2015-1 Ltd., 1.002%, 10/20/2027‡‡ 132,832 132,736 132,770Oaktree CLO 2019-1 Ltd., 1.238%, 4/22/2030‡‡ 7,250,000 7,250,000 7,249,725Onemain Financial Issuance Trust 2018-1, 3.770%, 3/14/2029 250,000 252,663 253,341OZLM XI Ltd., 1.382%, 10/30/2030‡‡ 1,582,699 1,548,597 1,583,876Rathlin Residential 2021-1 DAC, 1.432%, 9/27/2075‡‡ 1,778,154 2,039,992 2,000,041Rockford Tower CLO Ltd., 1.877%, 10/20/2034‡‡ 3,075,000 3,075,000 3,075,118Sixth Street CLO XVI Ltd., 1.452%, 10/20/2032‡‡ 4,250,000 4,250,000 4,251,398St. Paul's CLO, 2.000%, 1/17/2032 2,500,000 2,934,250 2,846,935St. Paul's CLO V DAC, 0.710%, 2/20/2030‡‡ 3,497,105 4,034,111 3,974,585TCW CLO 2019-2 Ltd., 1.472%, 10/20/2032‡‡ 500,000 499,705 500,356TCW CLO 2021-2 Ltd., 1.305%, 7/25/2034‡‡ 1,250,000 1,250,000 1,250,597TIAA CLO I Ltd., 1.332%, 7/20/2031‡‡ 300,000 297,362 300,019Trimaran Cavu 2021-1 Ltd., 1.334%, 4/23/2032‡‡ 2,750,000 2,750,000 2,749,994Wellfleet CLO 2016-2 Ltd., 1.272%, 10/20/2028‡‡ 1,248,214 1,245,975 1,248,254Wellfleet CLO 2017-2A Ltd., 1.192%, 10/20/2029‡‡ 1,250,000 1,250,000 1,250,100Wellfleet CLO 2017-3 Ltd., 1.272%, 1/17/2031‡‡ 1,550,000 1,495,885 1,550,076Wellfleet CLO 2018-1 Ltd., 1.222%, 7/17/2031‡‡ 3,750,000 3,712,439 3,746,268World Omni Select Auto Trust 2020-A, 1.250%, 10/15/2026 700,000 699,841 700,423World Omni Select Auto Trust 2020-A, 1.700%, 10/15/2026 600,000 599,858 601,465
Total Asset-Backed Securities 159,737,023 159,231,178
Wilmington Trust Collective Investment TrustFunds Sub-Advised by PGIM, Inc.
PGIM Total Return Bond Fund
Schedule of Investments (continued)December 31, 2021
The accompanying notes are an integral part of these financial statements. 43
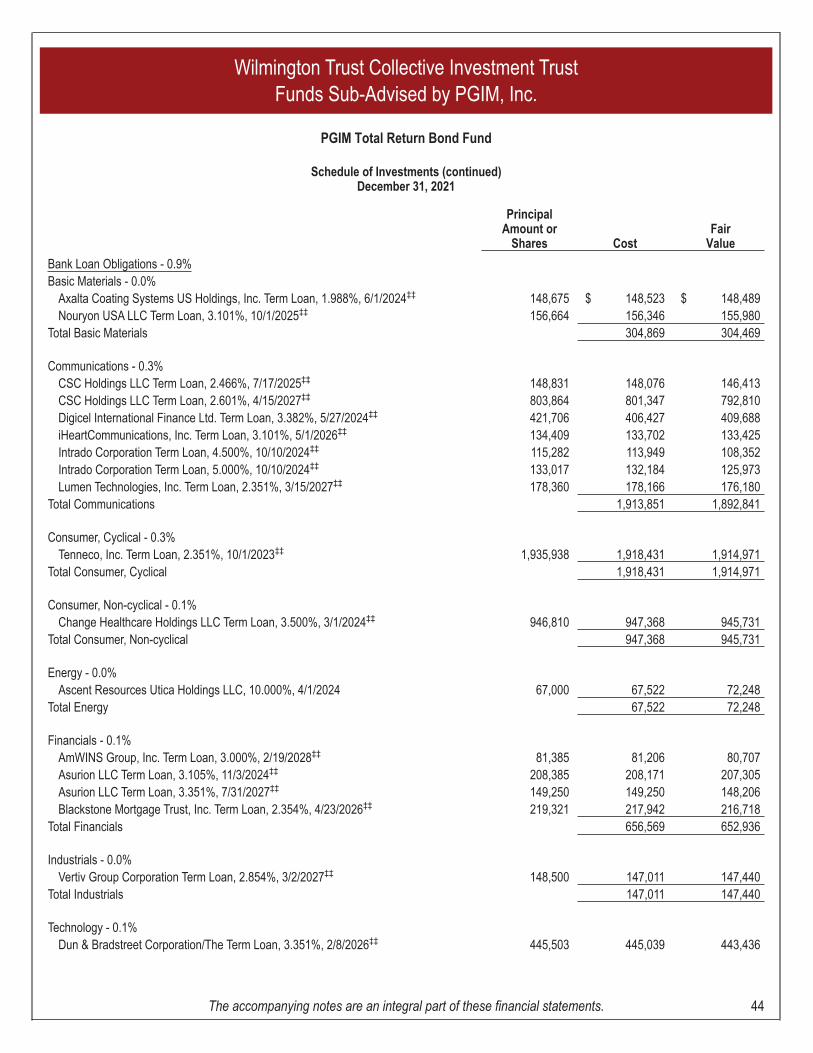
PrincipalAmount or
Shares CostFair
Value
Bank Loan Obligations - 0.9%Basic Materials - 0.0%
Axalta Coating Systems US Holdings, Inc. Term Loan, 1.988%, 6/1/2024‡‡ 148,675 $ 148,523 $ 148,489Nouryon USA LLC Term Loan, 3.101%, 10/1/2025‡‡ 156,664 156,346 155,980
Total Basic Materials 304,869 304,469
Communications - 0.3%CSC Holdings LLC Term Loan, 2.466%, 7/17/2025‡‡ 148,831 148,076 146,413CSC Holdings LLC Term Loan, 2.601%, 4/15/2027‡‡ 803,864 801,347 792,810Digicel International Finance Ltd. Term Loan, 3.382%, 5/27/2024‡‡ 421,706 406,427 409,688iHeartCommunications, Inc. Term Loan, 3.101%, 5/1/2026‡‡ 134,409 133,702 133,425Intrado Corporation Term Loan, 4.500%, 10/10/2024‡‡ 115,282 113,949 108,352Intrado Corporation Term Loan, 5.000%, 10/10/2024‡‡ 133,017 132,184 125,973Lumen Technologies, Inc. Term Loan, 2.351%, 3/15/2027‡‡ 178,360 178,166 176,180
Total Communications 1,913,851 1,892,841
Consumer, Cyclical - 0.3%Tenneco, Inc. Term Loan, 2.351%, 10/1/2023‡‡ 1,935,938 1,918,431 1,914,971
Total Consumer, Cyclical 1,918,431 1,914,971
Consumer, Non-cyclical - 0.1%Change Healthcare Holdings LLC Term Loan, 3.500%, 3/1/2024‡‡ 946,810 947,368 945,731
Total Consumer, Non-cyclical 947,368 945,731
Energy - 0.0%Ascent Resources Utica Holdings LLC, 10.000%, 4/1/2024 67,000 67,522 72,248
Total Energy 67,522 72,248
Financials - 0.1%AmWINS Group, Inc. Term Loan, 3.000%, 2/19/2028‡‡ 81,385 81,206 80,707Asurion LLC Term Loan, 3.105%, 11/3/2024‡‡ 208,385 208,171 207,305Asurion LLC Term Loan, 3.351%, 7/31/2027‡‡ 149,250 149,250 148,206Blackstone Mortgage Trust, Inc. Term Loan, 2.354%, 4/23/2026‡‡ 219,321 217,942 216,718
Total Financials 656,569 652,936
Industrials - 0.0%Vertiv Group Corporation Term Loan, 2.854%, 3/2/2027‡‡ 148,500 147,011 147,440
Total Industrials 147,011 147,440
Technology - 0.1%Dun & Bradstreet Corporation/The Term Loan, 3.351%, 2/8/2026‡‡ 445,503 445,039 443,436
Wilmington Trust Collective Investment TrustFunds Sub-Advised by PGIM, Inc.
PGIM Total Return Bond Fund
Schedule of Investments (continued)December 31, 2021
The accompanying notes are an integral part of these financial statements. 44
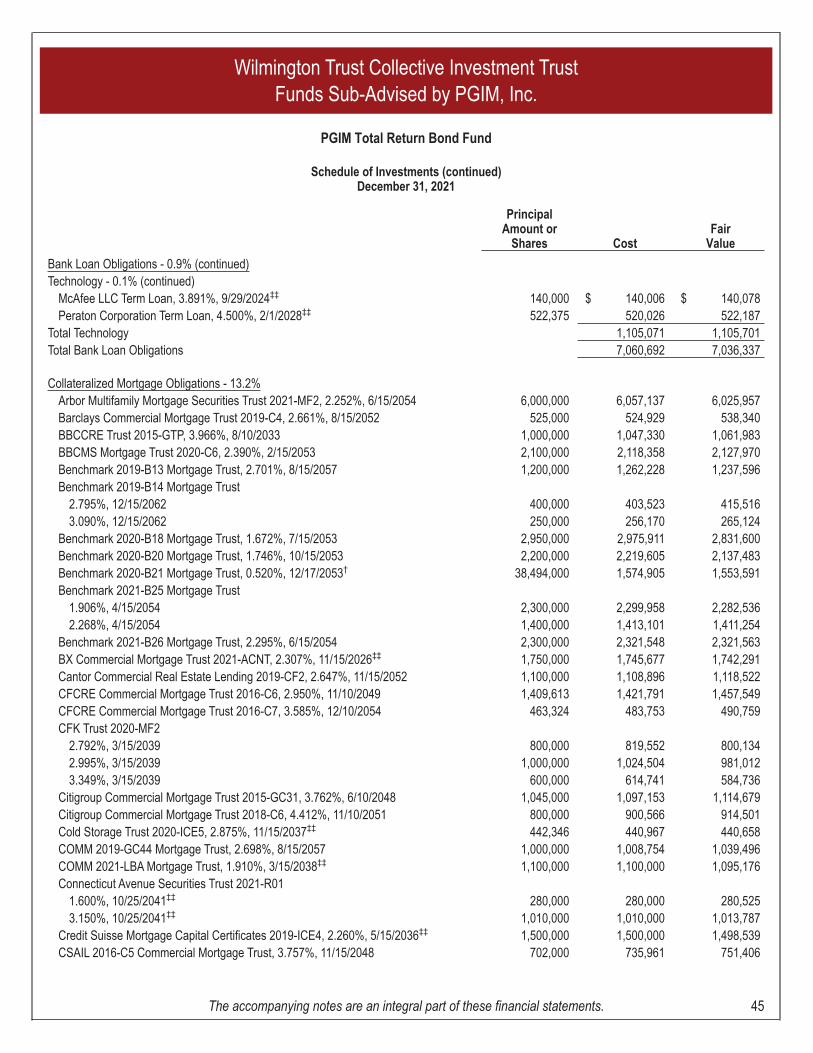
PrincipalAmount or
Shares CostFair
Value
Bank Loan Obligations - 0.9% (continued)Technology - 0.1% (continued)
McAfee LLC Term Loan, 3.891%, 9/29/2024‡‡ 140,000 $ 140,006 $ 140,078Peraton Corporation Term Loan, 4.500%, 2/1/2028‡‡ 522,375 520,026 522,187
Total Technology 1,105,071 1,105,701Total Bank Loan Obligations 7,060,692 7,036,337
Collateralized Mortgage Obligations - 13.2%Arbor Multifamily Mortgage Securities Trust 2021-MF2, 2.252%, 6/15/2054 6,000,000 6,057,137 6,025,957Barclays Commercial Mortgage Trust 2019-C4, 2.661%, 8/15/2052 525,000 524,929 538,340BBCCRE Trust 2015-GTP, 3.966%, 8/10/2033 1,000,000 1,047,330 1,061,983BBCMS Mortgage Trust 2020-C6, 2.390%, 2/15/2053 2,100,000 2,118,358 2,127,970Benchmark 2019-B13 Mortgage Trust, 2.701%, 8/15/2057 1,200,000 1,262,228 1,237,596Benchmark 2019-B14 Mortgage Trust
2.795%, 12/15/2062 400,000 403,523 415,5163.090%, 12/15/2062 250,000 256,170 265,124
Benchmark 2020-B18 Mortgage Trust, 1.672%, 7/15/2053 2,950,000 2,975,911 2,831,600Benchmark 2020-B20 Mortgage Trust, 1.746%, 10/15/2053 2,200,000 2,219,605 2,137,483Benchmark 2020-B21 Mortgage Trust, 0.520%, 12/17/2053† 38,494,000 1,574,905 1,553,591Benchmark 2021-B25 Mortgage Trust
1.906%, 4/15/2054 2,300,000 2,299,958 2,282,5362.268%, 4/15/2054 1,400,000 1,413,101 1,411,254
Benchmark 2021-B26 Mortgage Trust, 2.295%, 6/15/2054 2,300,000 2,321,548 2,321,563BX Commercial Mortgage Trust 2021-ACNT, 2.307%, 11/15/2026‡‡ 1,750,000 1,745,677 1,742,291Cantor Commercial Real Estate Lending 2019-CF2, 2.647%, 11/15/2052 1,100,000 1,108,896 1,118,522CFCRE Commercial Mortgage Trust 2016-C6, 2.950%, 11/10/2049 1,409,613 1,421,791 1,457,549CFCRE Commercial Mortgage Trust 2016-C7, 3.585%, 12/10/2054 463,324 483,753 490,759CFK Trust 2020-MF2
2.792%, 3/15/2039 800,000 819,552 800,1342.995%, 3/15/2039 1,000,000 1,024,504 981,0123.349%, 3/15/2039 600,000 614,741 584,736
Citigroup Commercial Mortgage Trust 2015-GC31, 3.762%, 6/10/2048 1,045,000 1,097,153 1,114,679Citigroup Commercial Mortgage Trust 2018-C6, 4.412%, 11/10/2051 800,000 900,566 914,501Cold Storage Trust 2020-ICE5, 2.875%, 11/15/2037‡‡ 442,346 440,967 440,658COMM 2019-GC44 Mortgage Trust, 2.698%, 8/15/2057 1,000,000 1,008,754 1,039,496COMM 2021-LBA Mortgage Trust, 1.910%, 3/15/2038‡‡ 1,100,000 1,100,000 1,095,176Connecticut Avenue Securities Trust 2021-R01
1.600%, 10/25/2041‡‡ 280,000 280,000 280,5253.150%, 10/25/2041‡‡ 1,010,000 1,010,000 1,013,787
Credit Suisse Mortgage Capital Certificates 2019-ICE4, 2.260%, 5/15/2036‡‡ 1,500,000 1,500,000 1,498,539CSAIL 2016-C5 Commercial Mortgage Trust, 3.757%, 11/15/2048 702,000 735,961 751,406
Wilmington Trust Collective Investment TrustFunds Sub-Advised by PGIM, Inc.
PGIM Total Return Bond Fund
Schedule of Investments (continued)December 31, 2021
The accompanying notes are an integral part of these financial statements. 45
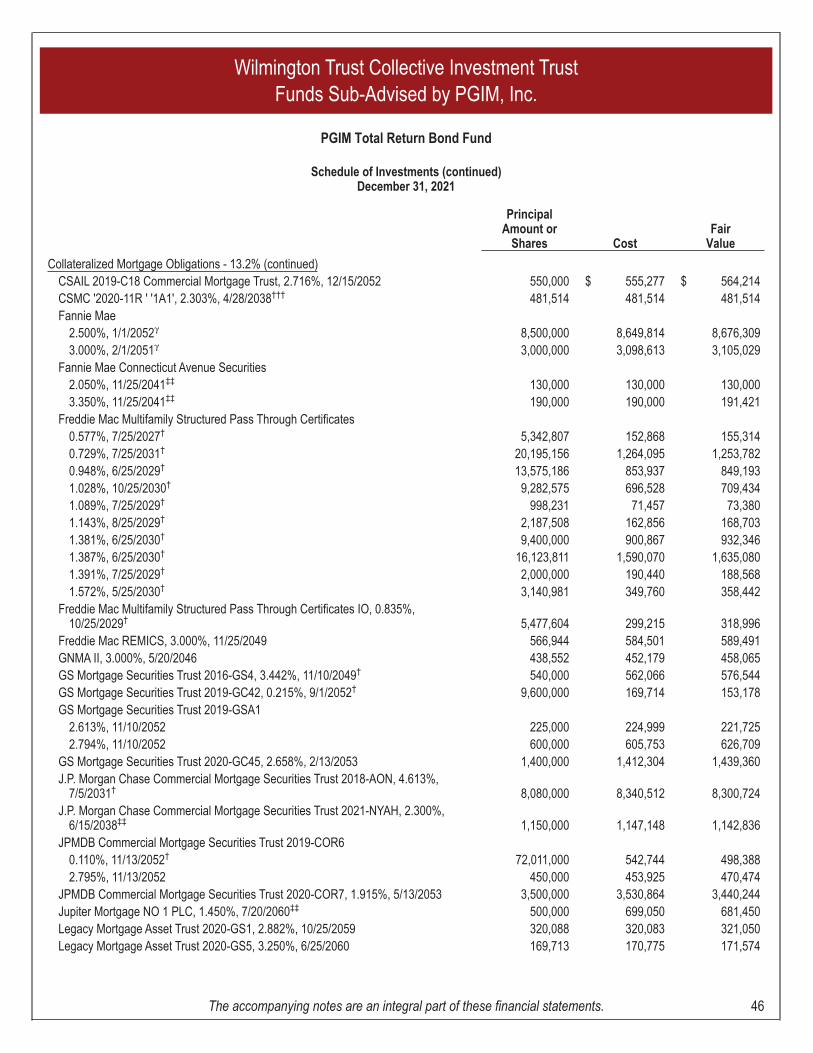
PrincipalAmount or
Shares CostFair
Value
Collateralized Mortgage Obligations - 13.2% (continued)CSAIL 2019-C18 Commercial Mortgage Trust, 2.716%, 12/15/2052 550,000 $ 555,277 $ 564,214CSMC '2020-11R ' '1A1', 2.303%, 4/28/2038††† 481,514 481,514 481,514Fannie Mae
2.500%, 1/1/2052γ 8,500,000 8,649,814 8,676,3093.000%, 2/1/2051γ 3,000,000 3,098,613 3,105,029
Fannie Mae Connecticut Avenue Securities2.050%, 11/25/2041‡‡ 130,000 130,000 130,0003.350%, 11/25/2041‡‡ 190,000 190,000 191,421
Freddie Mac Multifamily Structured Pass Through Certificates0.577%, 7/25/2027† 5,342,807 152,868 155,3140.729%, 7/25/2031† 20,195,156 1,264,095 1,253,7820.948%, 6/25/2029† 13,575,186 853,937 849,1931.028%, 10/25/2030† 9,282,575 696,528 709,4341.089%, 7/25/2029† 998,231 71,457 73,3801.143%, 8/25/2029† 2,187,508 162,856 168,7031.381%, 6/25/2030† 9,400,000 900,867 932,3461.387%, 6/25/2030† 16,123,811 1,590,070 1,635,0801.391%, 7/25/2029† 2,000,000 190,440 188,5681.572%, 5/25/2030† 3,140,981 349,760 358,442
Freddie Mac Multifamily Structured Pass Through Certificates IO, 0.835%,10/25/2029† 5,477,604 299,215 318,996
Freddie Mac REMICS, 3.000%, 11/25/2049 566,944 584,501 589,491GNMA II, 3.000%, 5/20/2046 438,552 452,179 458,065GS Mortgage Securities Trust 2016-GS4, 3.442%, 11/10/2049† 540,000 562,066 576,544GS Mortgage Securities Trust 2019-GC42, 0.215%, 9/1/2052† 9,600,000 169,714 153,178GS Mortgage Securities Trust 2019-GSA1
2.613%, 11/10/2052 225,000 224,999 221,7252.794%, 11/10/2052 600,000 605,753 626,709
GS Mortgage Securities Trust 2020-GC45, 2.658%, 2/13/2053 1,400,000 1,412,304 1,439,360J.P. Morgan Chase Commercial Mortgage Securities Trust 2018-AON, 4.613%,
7/5/2031† 8,080,000 8,340,512 8,300,724J.P. Morgan Chase Commercial Mortgage Securities Trust 2021-NYAH, 2.300%,
6/15/2038‡‡ 1,150,000 1,147,148 1,142,836JPMDB Commercial Mortgage Securities Trust 2019-COR6
0.110%, 11/13/2052† 72,011,000 542,744 498,3882.795%, 11/13/2052 450,000 453,925 470,474
JPMDB Commercial Mortgage Securities Trust 2020-COR7, 1.915%, 5/13/2053 3,500,000 3,530,864 3,440,244Jupiter Mortgage NO 1 PLC, 1.450%, 7/20/2060‡‡ 500,000 699,050 681,450Legacy Mortgage Asset Trust 2020-GS1, 2.882%, 10/25/2059 320,088 320,083 321,050Legacy Mortgage Asset Trust 2020-GS5, 3.250%, 6/25/2060 169,713 170,775 171,574
Wilmington Trust Collective Investment TrustFunds Sub-Advised by PGIM, Inc.
PGIM Total Return Bond Fund
Schedule of Investments (continued)December 31, 2021
The accompanying notes are an integral part of these financial statements. 46
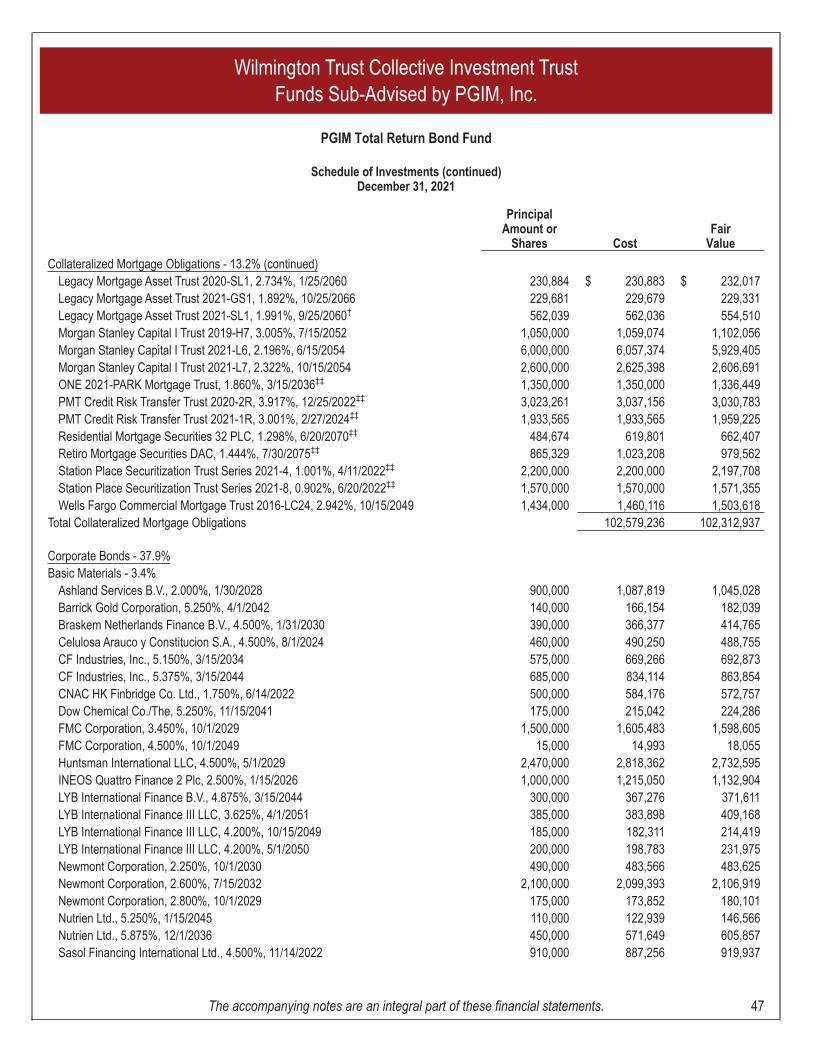
PrincipalAmount or
Shares CostFair
Value
Collateralized Mortgage Obligations - 13.2% (continued)Legacy Mortgage Asset Trust 2020-SL1, 2.734%, 1/25/2060 230,884 $ 230,883 $ 232,017Legacy Mortgage Asset Trust 2021-GS1, 1.892%, 10/25/2066 229,681 229,679 229,331Legacy Mortgage Asset Trust 2021-SL1, 1.991%, 9/25/2060† 562,039 562,036 554,510Morgan Stanley Capital I Trust 2019-H7, 3.005%, 7/15/2052 1,050,000 1,059,074 1,102,056Morgan Stanley Capital I Trust 2021-L6, 2.196%, 6/15/2054 6,000,000 6,057,374 5,929,405Morgan Stanley Capital I Trust 2021-L7, 2.322%, 10/15/2054 2,600,000 2,625,398 2,606,691ONE 2021-PARK Mortgage Trust, 1.860%, 3/15/2036‡‡ 1,350,000 1,350,000 1,336,449PMT Credit Risk Transfer Trust 2020-2R, 3.917%, 12/25/2022‡‡ 3,023,261 3,037,156 3,030,783PMT Credit Risk Transfer Trust 2021-1R, 3.001%, 2/27/2024‡‡ 1,933,565 1,933,565 1,959,225Residential Mortgage Securities 32 PLC, 1.298%, 6/20/2070‡‡ 484,674 619,801 662,407Retiro Mortgage Securities DAC, 1.444%, 7/30/2075‡‡ 865,329 1,023,208 979,562Station Place Securitization Trust Series 2021-4, 1.001%, 4/11/2022‡‡ 2,200,000 2,200,000 2,197,708Station Place Securitization Trust Series 2021-8, 0.902%, 6/20/2022‡‡ 1,570,000 1,570,000 1,571,355Wells Fargo Commercial Mortgage Trust 2016-LC24, 2.942%, 10/15/2049 1,434,000 1,460,116 1,503,618
Total Collateralized Mortgage Obligations 102,579,236 102,312,937
Corporate Bonds - 37.9%Basic Materials - 3.4%
Ashland Services B.V., 2.000%, 1/30/2028 900,000 1,087,819 1,045,028Barrick Gold Corporation, 5.250%, 4/1/2042 140,000 166,154 182,039Braskem Netherlands Finance B.V., 4.500%, 1/31/2030 390,000 366,377 414,765Celulosa Arauco y Constitucion S.A., 4.500%, 8/1/2024 460,000 490,250 488,755CF Industries, Inc., 5.150%, 3/15/2034 575,000 669,266 692,873CF Industries, Inc., 5.375%, 3/15/2044 685,000 834,114 863,854CNAC HK Finbridge Co. Ltd., 1.750%, 6/14/2022 500,000 584,176 572,757Dow Chemical Co./The, 5.250%, 11/15/2041 175,000 215,042 224,286FMC Corporation, 3.450%, 10/1/2029 1,500,000 1,605,483 1,598,605FMC Corporation, 4.500%, 10/1/2049 15,000 14,993 18,055Huntsman International LLC, 4.500%, 5/1/2029 2,470,000 2,818,362 2,732,595INEOS Quattro Finance 2 Plc, 2.500%, 1/15/2026 1,000,000 1,215,050 1,132,904LYB International Finance B.V., 4.875%, 3/15/2044 300,000 367,276 371,611LYB International Finance III LLC, 3.625%, 4/1/2051 385,000 383,898 409,168LYB International Finance III LLC, 4.200%, 10/15/2049 185,000 182,311 214,419LYB International Finance III LLC, 4.200%, 5/1/2050 200,000 198,783 231,975Newmont Corporation, 2.250%, 10/1/2030 490,000 483,566 483,625Newmont Corporation, 2.600%, 7/15/2032 2,100,000 2,099,393 2,106,919Newmont Corporation, 2.800%, 10/1/2029 175,000 173,852 180,101Nutrien Ltd., 5.250%, 1/15/2045 110,000 122,939 146,566Nutrien Ltd., 5.875%, 12/1/2036 450,000 571,649 605,857Sasol Financing International Ltd., 4.500%, 11/14/2022 910,000 887,256 919,937
Wilmington Trust Collective Investment TrustFunds Sub-Advised by PGIM, Inc.
PGIM Total Return Bond Fund
Schedule of Investments (continued)December 31, 2021
The accompanying notes are an integral part of these financial statements. 47
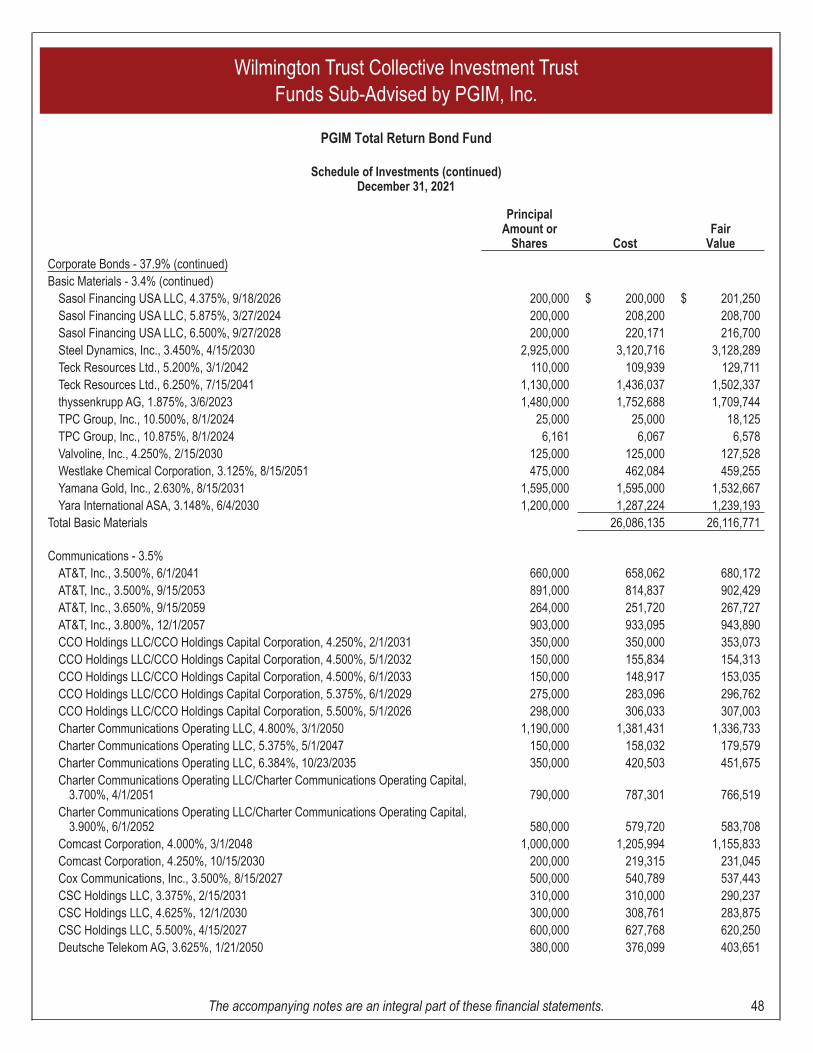
PrincipalAmount or
Shares CostFair
Value
Corporate Bonds - 37.9% (continued)Basic Materials - 3.4% (continued)
Sasol Financing USA LLC, 4.375%, 9/18/2026 200,000 $ 200,000 $ 201,250Sasol Financing USA LLC, 5.875%, 3/27/2024 200,000 208,200 208,700Sasol Financing USA LLC, 6.500%, 9/27/2028 200,000 220,171 216,700Steel Dynamics, Inc., 3.450%, 4/15/2030 2,925,000 3,120,716 3,128,289Teck Resources Ltd., 5.200%, 3/1/2042 110,000 109,939 129,711Teck Resources Ltd., 6.250%, 7/15/2041 1,130,000 1,436,037 1,502,337thyssenkrupp AG, 1.875%, 3/6/2023 1,480,000 1,752,688 1,709,744TPC Group, Inc., 10.500%, 8/1/2024 25,000 25,000 18,125TPC Group, Inc., 10.875%, 8/1/2024 6,161 6,067 6,578Valvoline, Inc., 4.250%, 2/15/2030 125,000 125,000 127,528Westlake Chemical Corporation, 3.125%, 8/15/2051 475,000 462,084 459,255Yamana Gold, Inc., 2.630%, 8/15/2031 1,595,000 1,595,000 1,532,667Yara International ASA, 3.148%, 6/4/2030 1,200,000 1,287,224 1,239,193
Total Basic Materials 26,086,135 26,116,771
Communications - 3.5%AT&T, Inc., 3.500%, 6/1/2041 660,000 658,062 680,172AT&T, Inc., 3.500%, 9/15/2053 891,000 814,837 902,429AT&T, Inc., 3.650%, 9/15/2059 264,000 251,720 267,727AT&T, Inc., 3.800%, 12/1/2057 903,000 933,095 943,890CCO Holdings LLC/CCO Holdings Capital Corporation, 4.250%, 2/1/2031 350,000 350,000 353,073CCO Holdings LLC/CCO Holdings Capital Corporation, 4.500%, 5/1/2032 150,000 155,834 154,313CCO Holdings LLC/CCO Holdings Capital Corporation, 4.500%, 6/1/2033 150,000 148,917 153,035CCO Holdings LLC/CCO Holdings Capital Corporation, 5.375%, 6/1/2029 275,000 283,096 296,762CCO Holdings LLC/CCO Holdings Capital Corporation, 5.500%, 5/1/2026 298,000 306,033 307,003Charter Communications Operating LLC, 4.800%, 3/1/2050 1,190,000 1,381,431 1,336,733Charter Communications Operating LLC, 5.375%, 5/1/2047 150,000 158,032 179,579Charter Communications Operating LLC, 6.384%, 10/23/2035 350,000 420,503 451,675Charter Communications Operating LLC/Charter Communications Operating Capital,
3.700%, 4/1/2051 790,000 787,301 766,519Charter Communications Operating LLC/Charter Communications Operating Capital,
3.900%, 6/1/2052 580,000 579,720 583,708Comcast Corporation, 4.000%, 3/1/2048 1,000,000 1,205,994 1,155,833Comcast Corporation, 4.250%, 10/15/2030 200,000 219,315 231,045Cox Communications, Inc., 3.500%, 8/15/2027 500,000 540,789 537,443CSC Holdings LLC, 3.375%, 2/15/2031 310,000 310,000 290,237CSC Holdings LLC, 4.625%, 12/1/2030 300,000 308,761 283,875CSC Holdings LLC, 5.500%, 4/15/2027 600,000 627,768 620,250Deutsche Telekom AG, 3.625%, 1/21/2050 380,000 376,099 403,651
Wilmington Trust Collective Investment TrustFunds Sub-Advised by PGIM, Inc.
PGIM Total Return Bond Fund
Schedule of Investments (continued)December 31, 2021
The accompanying notes are an integral part of these financial statements. 48
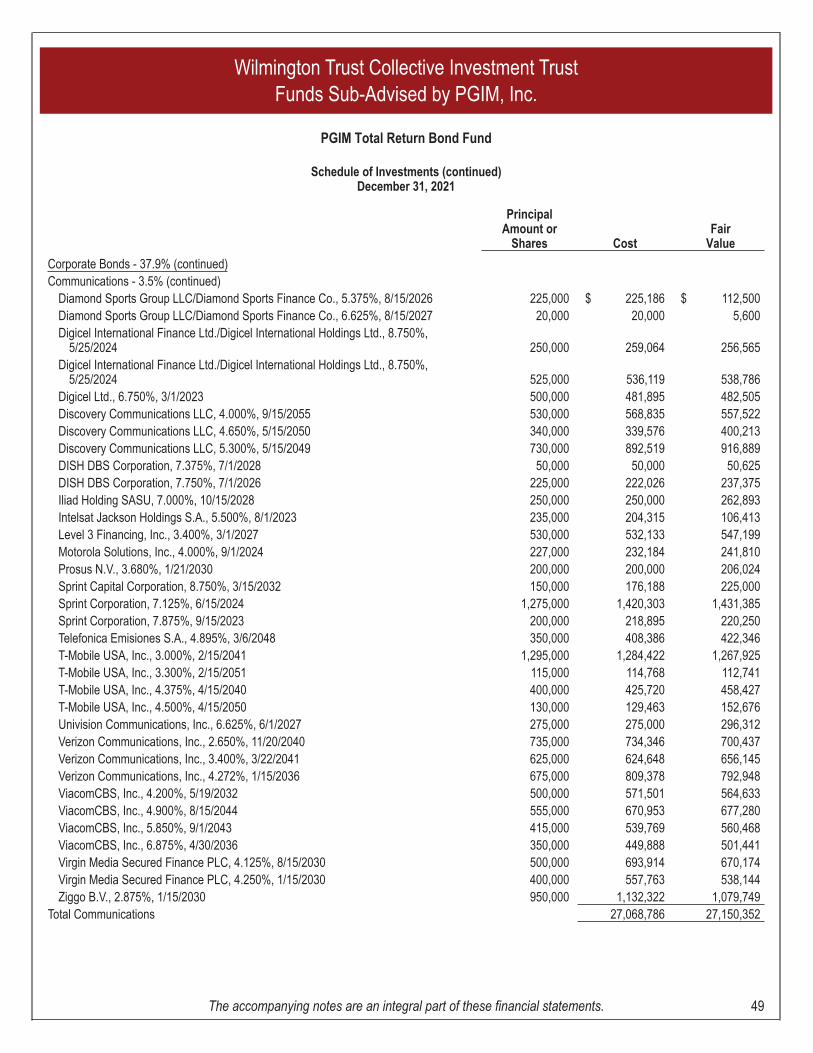
PrincipalAmount or
Shares CostFair
Value
Corporate Bonds - 37.9% (continued)Communications - 3.5% (continued)
Diamond Sports Group LLC/Diamond Sports Finance Co., 5.375%, 8/15/2026 225,000 $ 225,186 $ 112,500Diamond Sports Group LLC/Diamond Sports Finance Co., 6.625%, 8/15/2027 20,000 20,000 5,600Digicel International Finance Ltd./Digicel International Holdings Ltd., 8.750%,
5/25/2024 250,000 259,064 256,565Digicel International Finance Ltd./Digicel International Holdings Ltd., 8.750%,
5/25/2024 525,000 536,119 538,786Digicel Ltd., 6.750%, 3/1/2023 500,000 481,895 482,505Discovery Communications LLC, 4.000%, 9/15/2055 530,000 568,835 557,522Discovery Communications LLC, 4.650%, 5/15/2050 340,000 339,576 400,213Discovery Communications LLC, 5.300%, 5/15/2049 730,000 892,519 916,889DISH DBS Corporation, 7.375%, 7/1/2028 50,000 50,000 50,625DISH DBS Corporation, 7.750%, 7/1/2026 225,000 222,026 237,375Iliad Holding SASU, 7.000%, 10/15/2028 250,000 250,000 262,893Intelsat Jackson Holdings S.A., 5.500%, 8/1/2023 235,000 204,315 106,413Level 3 Financing, Inc., 3.400%, 3/1/2027 530,000 532,133 547,199Motorola Solutions, Inc., 4.000%, 9/1/2024 227,000 232,184 241,810Prosus N.V., 3.680%, 1/21/2030 200,000 200,000 206,024Sprint Capital Corporation, 8.750%, 3/15/2032 150,000 176,188 225,000Sprint Corporation, 7.125%, 6/15/2024 1,275,000 1,420,303 1,431,385Sprint Corporation, 7.875%, 9/15/2023 200,000 218,895 220,250Telefonica Emisiones S.A., 4.895%, 3/6/2048 350,000 408,386 422,346T-Mobile USA, Inc., 3.000%, 2/15/2041 1,295,000 1,284,422 1,267,925T-Mobile USA, Inc., 3.300%, 2/15/2051 115,000 114,768 112,741T-Mobile USA, Inc., 4.375%, 4/15/2040 400,000 425,720 458,427T-Mobile USA, Inc., 4.500%, 4/15/2050 130,000 129,463 152,676Univision Communications, Inc., 6.625%, 6/1/2027 275,000 275,000 296,312Verizon Communications, Inc., 2.650%, 11/20/2040 735,000 734,346 700,437Verizon Communications, Inc., 3.400%, 3/22/2041 625,000 624,648 656,145Verizon Communications, Inc., 4.272%, 1/15/2036 675,000 809,378 792,948ViacomCBS, Inc., 4.200%, 5/19/2032 500,000 571,501 564,633ViacomCBS, Inc., 4.900%, 8/15/2044 555,000 670,953 677,280ViacomCBS, Inc., 5.850%, 9/1/2043 415,000 539,769 560,468ViacomCBS, Inc., 6.875%, 4/30/2036 350,000 449,888 501,441Virgin Media Secured Finance PLC, 4.125%, 8/15/2030 500,000 693,914 670,174Virgin Media Secured Finance PLC, 4.250%, 1/15/2030 400,000 557,763 538,144Ziggo B.V., 2.875%, 1/15/2030 950,000 1,132,322 1,079,749
Total Communications 27,068,786 27,150,352
Wilmington Trust Collective Investment TrustFunds Sub-Advised by PGIM, Inc.
PGIM Total Return Bond Fund
Schedule of Investments (continued)December 31, 2021
The accompanying notes are an integral part of these financial statements. 49
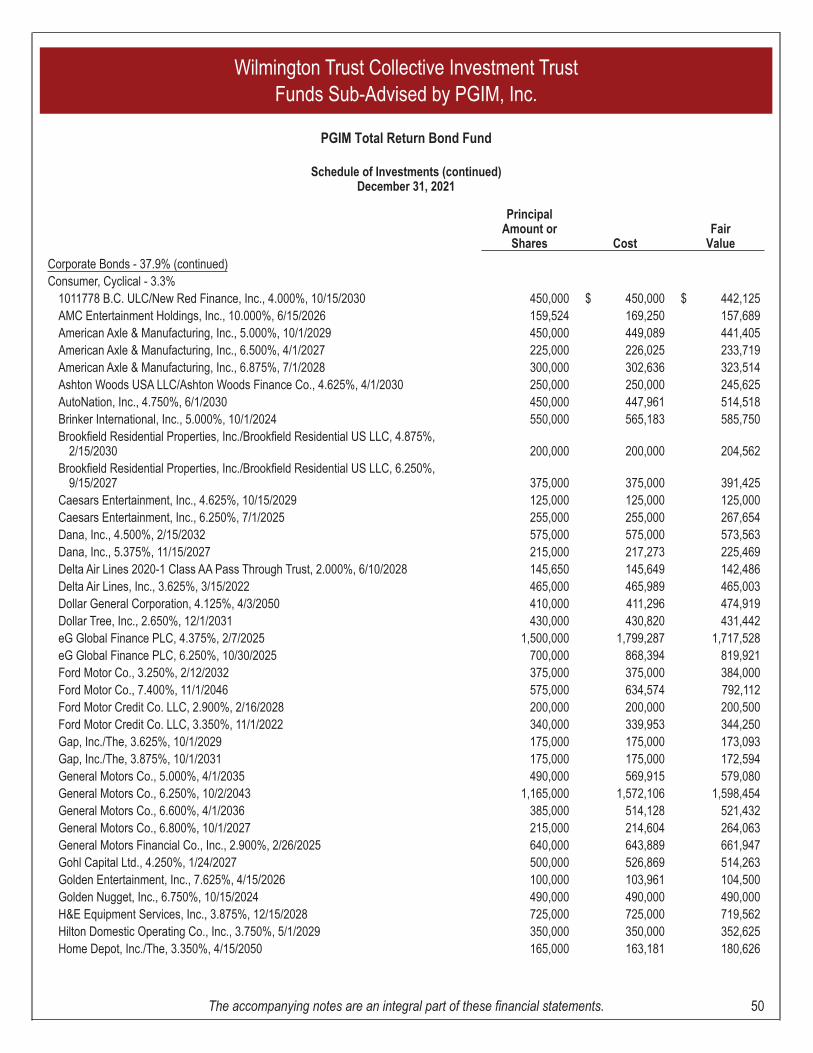
PrincipalAmount or
Shares CostFair
Value
Corporate Bonds - 37.9% (continued)Consumer, Cyclical - 3.3%
1011778 B.C. ULC/New Red Finance, Inc., 4.000%, 10/15/2030 450,000 $ 450,000 $ 442,125AMC Entertainment Holdings, Inc., 10.000%, 6/15/2026 159,524 169,250 157,689American Axle & Manufacturing, Inc., 5.000%, 10/1/2029 450,000 449,089 441,405American Axle & Manufacturing, Inc., 6.500%, 4/1/2027 225,000 226,025 233,719American Axle & Manufacturing, Inc., 6.875%, 7/1/2028 300,000 302,636 323,514Ashton Woods USA LLC/Ashton Woods Finance Co., 4.625%, 4/1/2030 250,000 250,000 245,625AutoNation, Inc., 4.750%, 6/1/2030 450,000 447,961 514,518Brinker International, Inc., 5.000%, 10/1/2024 550,000 565,183 585,750Brookfield Residential Properties, Inc./Brookfield Residential US LLC, 4.875%,
2/15/2030 200,000 200,000 204,562Brookfield Residential Properties, Inc./Brookfield Residential US LLC, 6.250%,
9/15/2027 375,000 375,000 391,425Caesars Entertainment, Inc., 4.625%, 10/15/2029 125,000 125,000 125,000Caesars Entertainment, Inc., 6.250%, 7/1/2025 255,000 255,000 267,654Dana, Inc., 4.500%, 2/15/2032 575,000 575,000 573,563Dana, Inc., 5.375%, 11/15/2027 215,000 217,273 225,469Delta Air Lines 2020-1 Class AA Pass Through Trust, 2.000%, 6/10/2028 145,650 145,649 142,486Delta Air Lines, Inc., 3.625%, 3/15/2022 465,000 465,989 465,003Dollar General Corporation, 4.125%, 4/3/2050 410,000 411,296 474,919Dollar Tree, Inc., 2.650%, 12/1/2031 430,000 430,820 431,442eG Global Finance PLC, 4.375%, 2/7/2025 1,500,000 1,799,287 1,717,528eG Global Finance PLC, 6.250%, 10/30/2025 700,000 868,394 819,921Ford Motor Co., 3.250%, 2/12/2032 375,000 375,000 384,000Ford Motor Co., 7.400%, 11/1/2046 575,000 634,574 792,112Ford Motor Credit Co. LLC, 2.900%, 2/16/2028 200,000 200,000 200,500Ford Motor Credit Co. LLC, 3.350%, 11/1/2022 340,000 339,953 344,250Gap, Inc./The, 3.625%, 10/1/2029 175,000 175,000 173,093Gap, Inc./The, 3.875%, 10/1/2031 175,000 175,000 172,594General Motors Co., 5.000%, 4/1/2035 490,000 569,915 579,080General Motors Co., 6.250%, 10/2/2043 1,165,000 1,572,106 1,598,454General Motors Co., 6.600%, 4/1/2036 385,000 514,128 521,432General Motors Co., 6.800%, 10/1/2027 215,000 214,604 264,063General Motors Financial Co., Inc., 2.900%, 2/26/2025 640,000 643,889 661,947Gohl Capital Ltd., 4.250%, 1/24/2027 500,000 526,869 514,263Golden Entertainment, Inc., 7.625%, 4/15/2026 100,000 103,961 104,500Golden Nugget, Inc., 6.750%, 10/15/2024 490,000 490,000 490,000H&E Equipment Services, Inc., 3.875%, 12/15/2028 725,000 725,000 719,562Hilton Domestic Operating Co., Inc., 3.750%, 5/1/2029 350,000 350,000 352,625Home Depot, Inc./The, 3.350%, 4/15/2050 165,000 163,181 180,626
Wilmington Trust Collective Investment TrustFunds Sub-Advised by PGIM, Inc.
PGIM Total Return Bond Fund
Schedule of Investments (continued)December 31, 2021
The accompanying notes are an integral part of these financial statements. 50
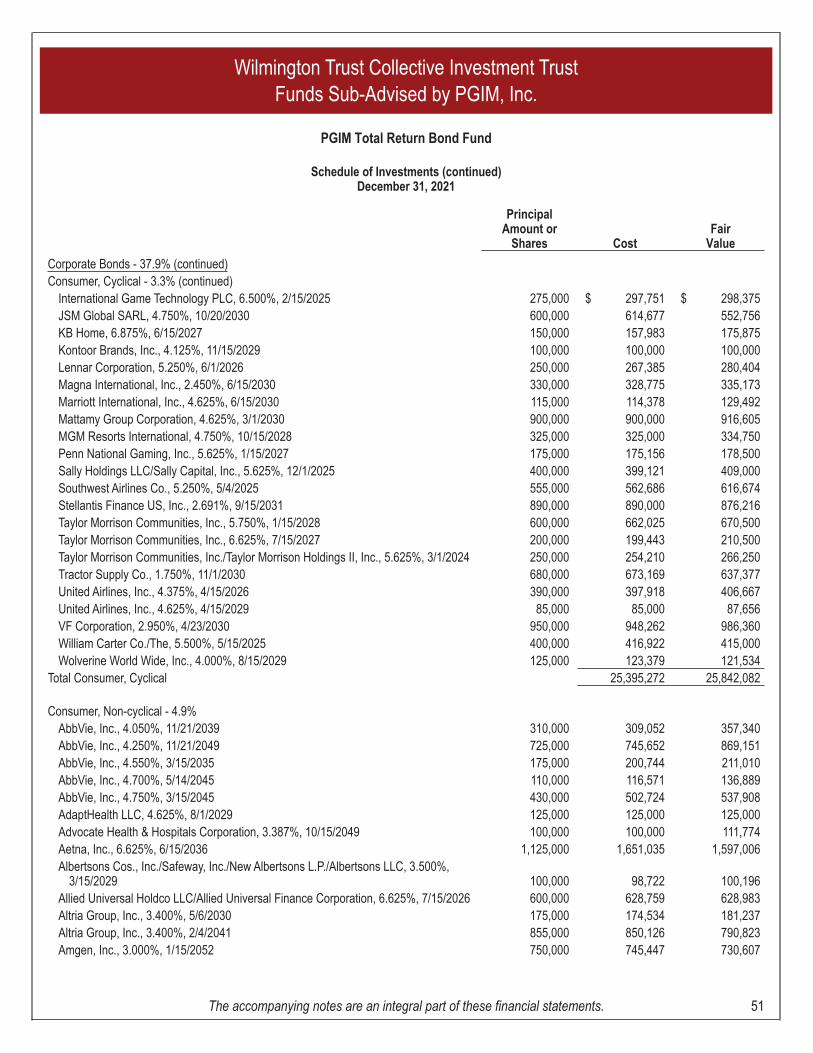
PrincipalAmount or
Shares CostFair
Value
Corporate Bonds - 37.9% (continued)Consumer, Cyclical - 3.3% (continued)
International Game Technology PLC, 6.500%, 2/15/2025 275,000 $ 297,751 $ 298,375JSM Global SARL, 4.750%, 10/20/2030 600,000 614,677 552,756KB Home, 6.875%, 6/15/2027 150,000 157,983 175,875Kontoor Brands, Inc., 4.125%, 11/15/2029 100,000 100,000 100,000Lennar Corporation, 5.250%, 6/1/2026 250,000 267,385 280,404Magna International, Inc., 2.450%, 6/15/2030 330,000 328,775 335,173Marriott International, Inc., 4.625%, 6/15/2030 115,000 114,378 129,492Mattamy Group Corporation, 4.625%, 3/1/2030 900,000 900,000 916,605MGM Resorts International, 4.750%, 10/15/2028 325,000 325,000 334,750Penn National Gaming, Inc., 5.625%, 1/15/2027 175,000 175,156 178,500Sally Holdings LLC/Sally Capital, Inc., 5.625%, 12/1/2025 400,000 399,121 409,000Southwest Airlines Co., 5.250%, 5/4/2025 555,000 562,686 616,674Stellantis Finance US, Inc., 2.691%, 9/15/2031 890,000 890,000 876,216Taylor Morrison Communities, Inc., 5.750%, 1/15/2028 600,000 662,025 670,500Taylor Morrison Communities, Inc., 6.625%, 7/15/2027 200,000 199,443 210,500Taylor Morrison Communities, Inc./Taylor Morrison Holdings II, Inc., 5.625%, 3/1/2024 250,000 254,210 266,250Tractor Supply Co., 1.750%, 11/1/2030 680,000 673,169 637,377United Airlines, Inc., 4.375%, 4/15/2026 390,000 397,918 406,667United Airlines, Inc., 4.625%, 4/15/2029 85,000 85,000 87,656VF Corporation, 2.950%, 4/23/2030 950,000 948,262 986,360William Carter Co./The, 5.500%, 5/15/2025 400,000 416,922 415,000Wolverine World Wide, Inc., 4.000%, 8/15/2029 125,000 123,379 121,534
Total Consumer, Cyclical 25,395,272 25,842,082
Consumer, Non-cyclical - 4.9%AbbVie, Inc., 4.050%, 11/21/2039 310,000 309,052 357,340AbbVie, Inc., 4.250%, 11/21/2049 725,000 745,652 869,151AbbVie, Inc., 4.550%, 3/15/2035 175,000 200,744 211,010AbbVie, Inc., 4.700%, 5/14/2045 110,000 116,571 136,889AbbVie, Inc., 4.750%, 3/15/2045 430,000 502,724 537,908AdaptHealth LLC, 4.625%, 8/1/2029 125,000 125,000 125,000Advocate Health & Hospitals Corporation, 3.387%, 10/15/2049 100,000 100,000 111,774Aetna, Inc., 6.625%, 6/15/2036 1,125,000 1,651,035 1,597,006Albertsons Cos., Inc./Safeway, Inc./New Albertsons L.P./Albertsons LLC, 3.500%,
3/15/2029 100,000 98,722 100,196Allied Universal Holdco LLC/Allied Universal Finance Corporation, 6.625%, 7/15/2026 600,000 628,759 628,983Altria Group, Inc., 3.400%, 5/6/2030 175,000 174,534 181,237Altria Group, Inc., 3.400%, 2/4/2041 855,000 850,126 790,823Amgen, Inc., 3.000%, 1/15/2052 750,000 745,447 730,607
Wilmington Trust Collective Investment TrustFunds Sub-Advised by PGIM, Inc.
PGIM Total Return Bond Fund
Schedule of Investments (continued)December 31, 2021
The accompanying notes are an integral part of these financial statements. 51
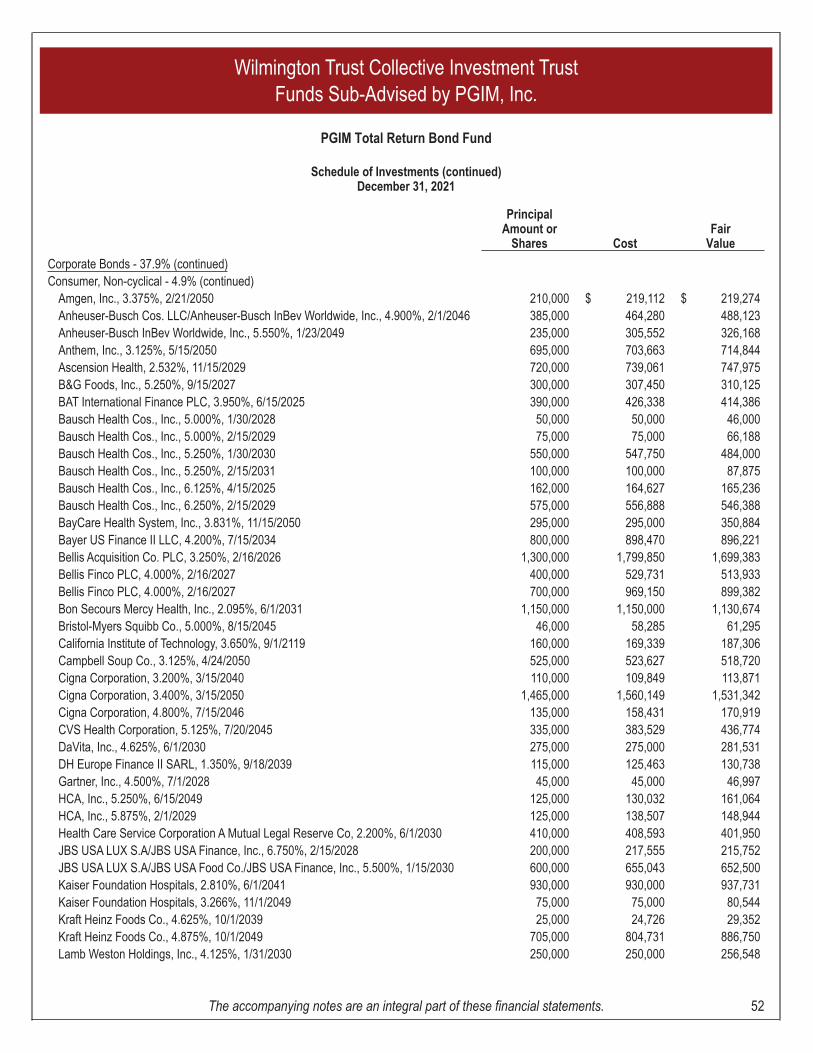
PrincipalAmount or
Shares CostFair
Value
Corporate Bonds - 37.9% (continued)Consumer, Non-cyclical - 4.9% (continued)
Amgen, Inc., 3.375%, 2/21/2050 210,000 $ 219,112 $ 219,274Anheuser-Busch Cos. LLC/Anheuser-Busch InBev Worldwide, Inc., 4.900%, 2/1/2046 385,000 464,280 488,123Anheuser-Busch InBev Worldwide, Inc., 5.550%, 1/23/2049 235,000 305,552 326,168Anthem, Inc., 3.125%, 5/15/2050 695,000 703,663 714,844Ascension Health, 2.532%, 11/15/2029 720,000 739,061 747,975B&G Foods, Inc., 5.250%, 9/15/2027 300,000 307,450 310,125BAT International Finance PLC, 3.950%, 6/15/2025 390,000 426,338 414,386Bausch Health Cos., Inc., 5.000%, 1/30/2028 50,000 50,000 46,000Bausch Health Cos., Inc., 5.000%, 2/15/2029 75,000 75,000 66,188Bausch Health Cos., Inc., 5.250%, 1/30/2030 550,000 547,750 484,000Bausch Health Cos., Inc., 5.250%, 2/15/2031 100,000 100,000 87,875Bausch Health Cos., Inc., 6.125%, 4/15/2025 162,000 164,627 165,236Bausch Health Cos., Inc., 6.250%, 2/15/2029 575,000 556,888 546,388BayCare Health System, Inc., 3.831%, 11/15/2050 295,000 295,000 350,884Bayer US Finance II LLC, 4.200%, 7/15/2034 800,000 898,470 896,221Bellis Acquisition Co. PLC, 3.250%, 2/16/2026 1,300,000 1,799,850 1,699,383Bellis Finco PLC, 4.000%, 2/16/2027 400,000 529,731 513,933Bellis Finco PLC, 4.000%, 2/16/2027 700,000 969,150 899,382Bon Secours Mercy Health, Inc., 2.095%, 6/1/2031 1,150,000 1,150,000 1,130,674Bristol-Myers Squibb Co., 5.000%, 8/15/2045 46,000 58,285 61,295California Institute of Technology, 3.650%, 9/1/2119 160,000 169,339 187,306Campbell Soup Co., 3.125%, 4/24/2050 525,000 523,627 518,720Cigna Corporation, 3.200%, 3/15/2040 110,000 109,849 113,871Cigna Corporation, 3.400%, 3/15/2050 1,465,000 1,560,149 1,531,342Cigna Corporation, 4.800%, 7/15/2046 135,000 158,431 170,919CVS Health Corporation, 5.125%, 7/20/2045 335,000 383,529 436,774DaVita, Inc., 4.625%, 6/1/2030 275,000 275,000 281,531DH Europe Finance II SARL, 1.350%, 9/18/2039 115,000 125,463 130,738Gartner, Inc., 4.500%, 7/1/2028 45,000 45,000 46,997HCA, Inc., 5.250%, 6/15/2049 125,000 130,032 161,064HCA, Inc., 5.875%, 2/1/2029 125,000 138,507 148,944Health Care Service Corporation A Mutual Legal Reserve Co, 2.200%, 6/1/2030 410,000 408,593 401,950JBS USA LUX S.A/JBS USA Finance, Inc., 6.750%, 2/15/2028 200,000 217,555 215,752JBS USA LUX S.A/JBS USA Food Co./JBS USA Finance, Inc., 5.500%, 1/15/2030 600,000 655,043 652,500Kaiser Foundation Hospitals, 2.810%, 6/1/2041 930,000 930,000 937,731Kaiser Foundation Hospitals, 3.266%, 11/1/2049 75,000 75,000 80,544Kraft Heinz Foods Co., 4.625%, 10/1/2039 25,000 24,726 29,352Kraft Heinz Foods Co., 4.875%, 10/1/2049 705,000 804,731 886,750Lamb Weston Holdings, Inc., 4.125%, 1/31/2030 250,000 250,000 256,548
Wilmington Trust Collective Investment TrustFunds Sub-Advised by PGIM, Inc.
PGIM Total Return Bond Fund
Schedule of Investments (continued)December 31, 2021
The accompanying notes are an integral part of these financial statements. 52
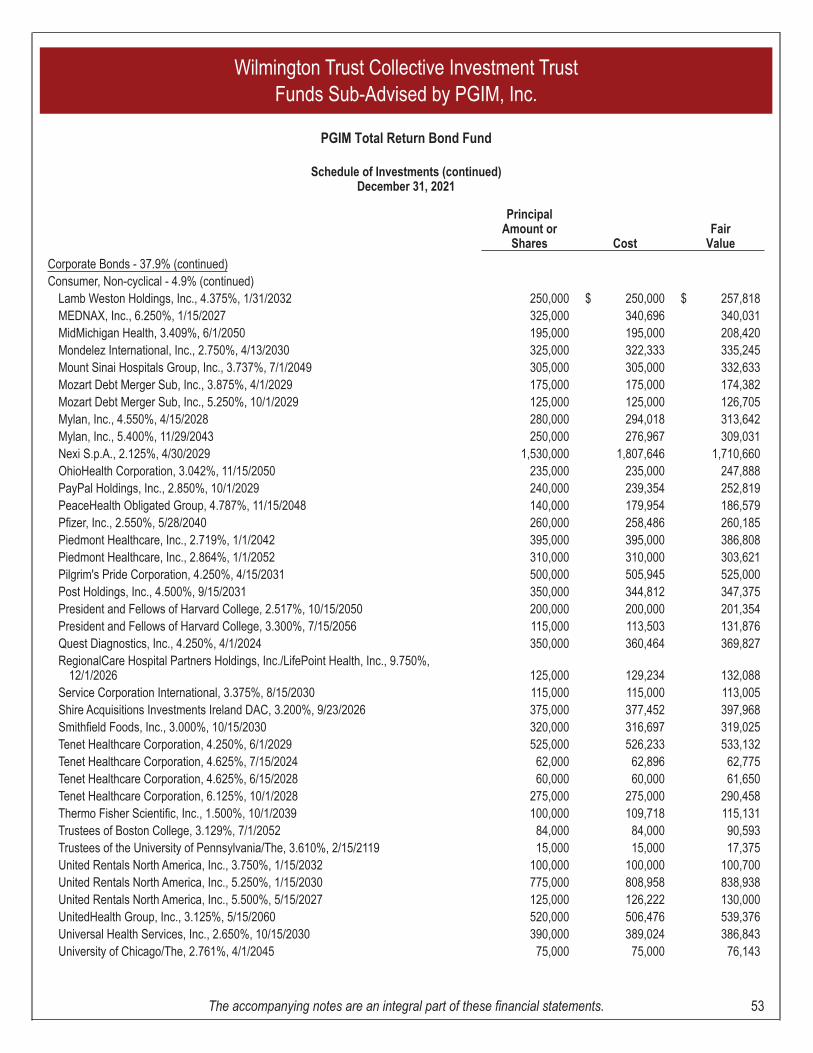
PrincipalAmount or
Shares CostFair
Value
Corporate Bonds - 37.9% (continued)Consumer, Non-cyclical - 4.9% (continued)
Lamb Weston Holdings, Inc., 4.375%, 1/31/2032 250,000 $ 250,000 $ 257,818MEDNAX, Inc., 6.250%, 1/15/2027 325,000 340,696 340,031MidMichigan Health, 3.409%, 6/1/2050 195,000 195,000 208,420Mondelez International, Inc., 2.750%, 4/13/2030 325,000 322,333 335,245Mount Sinai Hospitals Group, Inc., 3.737%, 7/1/2049 305,000 305,000 332,633Mozart Debt Merger Sub, Inc., 3.875%, 4/1/2029 175,000 175,000 174,382Mozart Debt Merger Sub, Inc., 5.250%, 10/1/2029 125,000 125,000 126,705Mylan, Inc., 4.550%, 4/15/2028 280,000 294,018 313,642Mylan, Inc., 5.400%, 11/29/2043 250,000 276,967 309,031Nexi S.p.A., 2.125%, 4/30/2029 1,530,000 1,807,646 1,710,660OhioHealth Corporation, 3.042%, 11/15/2050 235,000 235,000 247,888PayPal Holdings, Inc., 2.850%, 10/1/2029 240,000 239,354 252,819PeaceHealth Obligated Group, 4.787%, 11/15/2048 140,000 179,954 186,579Pfizer, Inc., 2.550%, 5/28/2040 260,000 258,486 260,185Piedmont Healthcare, Inc., 2.719%, 1/1/2042 395,000 395,000 386,808Piedmont Healthcare, Inc., 2.864%, 1/1/2052 310,000 310,000 303,621Pilgrim's Pride Corporation, 4.250%, 4/15/2031 500,000 505,945 525,000Post Holdings, Inc., 4.500%, 9/15/2031 350,000 344,812 347,375President and Fellows of Harvard College, 2.517%, 10/15/2050 200,000 200,000 201,354President and Fellows of Harvard College, 3.300%, 7/15/2056 115,000 113,503 131,876Quest Diagnostics, Inc., 4.250%, 4/1/2024 350,000 360,464 369,827RegionalCare Hospital Partners Holdings, Inc./LifePoint Health, Inc., 9.750%,
12/1/2026 125,000 129,234 132,088Service Corporation International, 3.375%, 8/15/2030 115,000 115,000 113,005Shire Acquisitions Investments Ireland DAC, 3.200%, 9/23/2026 375,000 377,452 397,968Smithfield Foods, Inc., 3.000%, 10/15/2030 320,000 316,697 319,025Tenet Healthcare Corporation, 4.250%, 6/1/2029 525,000 526,233 533,132Tenet Healthcare Corporation, 4.625%, 7/15/2024 62,000 62,896 62,775Tenet Healthcare Corporation, 4.625%, 6/15/2028 60,000 60,000 61,650Tenet Healthcare Corporation, 6.125%, 10/1/2028 275,000 275,000 290,458Thermo Fisher Scientific, Inc., 1.500%, 10/1/2039 100,000 109,718 115,131Trustees of Boston College, 3.129%, 7/1/2052 84,000 84,000 90,593Trustees of the University of Pennsylvania/The, 3.610%, 2/15/2119 15,000 15,000 17,375United Rentals North America, Inc., 3.750%, 1/15/2032 100,000 100,000 100,700United Rentals North America, Inc., 5.250%, 1/15/2030 775,000 808,958 838,938United Rentals North America, Inc., 5.500%, 5/15/2027 125,000 126,222 130,000UnitedHealth Group, Inc., 3.125%, 5/15/2060 520,000 506,476 539,376Universal Health Services, Inc., 2.650%, 10/15/2030 390,000 389,024 386,843University of Chicago/The, 2.761%, 4/1/2045 75,000 75,000 76,143
Wilmington Trust Collective Investment TrustFunds Sub-Advised by PGIM, Inc.
PGIM Total Return Bond Fund
Schedule of Investments (continued)December 31, 2021
The accompanying notes are an integral part of these financial statements. 53
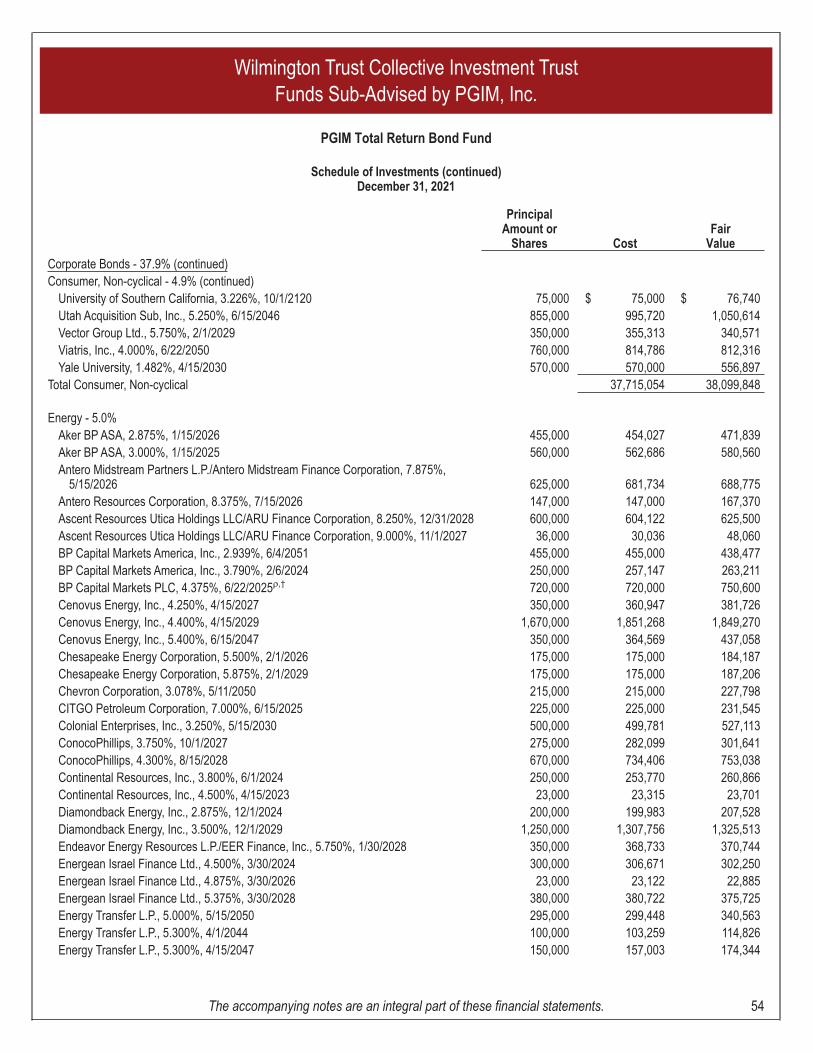
PrincipalAmount or
Shares CostFair
Value
Corporate Bonds - 37.9% (continued)Consumer, Non-cyclical - 4.9% (continued)
University of Southern California, 3.226%, 10/1/2120 75,000 $ 75,000 $ 76,740Utah Acquisition Sub, Inc., 5.250%, 6/15/2046 855,000 995,720 1,050,614Vector Group Ltd., 5.750%, 2/1/2029 350,000 355,313 340,571Viatris, Inc., 4.000%, 6/22/2050 760,000 814,786 812,316Yale University, 1.482%, 4/15/2030 570,000 570,000 556,897
Total Consumer, Non-cyclical 37,715,054 38,099,848
Energy - 5.0%Aker BP ASA, 2.875%, 1/15/2026 455,000 454,027 471,839Aker BP ASA, 3.000%, 1/15/2025 560,000 562,686 580,560Antero Midstream Partners L.P./Antero Midstream Finance Corporation, 7.875%,
5/15/2026 625,000 681,734 688,775Antero Resources Corporation, 8.375%, 7/15/2026 147,000 147,000 167,370Ascent Resources Utica Holdings LLC/ARU Finance Corporation, 8.250%, 12/31/2028 600,000 604,122 625,500Ascent Resources Utica Holdings LLC/ARU Finance Corporation, 9.000%, 11/1/2027 36,000 30,036 48,060BP Capital Markets America, Inc., 2.939%, 6/4/2051 455,000 455,000 438,477BP Capital Markets America, Inc., 3.790%, 2/6/2024 250,000 257,147 263,211BP Capital Markets PLC, 4.375%, 6/22/2025ρ,† 720,000 720,000 750,600Cenovus Energy, Inc., 4.250%, 4/15/2027 350,000 360,947 381,726Cenovus Energy, Inc., 4.400%, 4/15/2029 1,670,000 1,851,268 1,849,270Cenovus Energy, Inc., 5.400%, 6/15/2047 350,000 364,569 437,058Chesapeake Energy Corporation, 5.500%, 2/1/2026 175,000 175,000 184,187Chesapeake Energy Corporation, 5.875%, 2/1/2029 175,000 175,000 187,206Chevron Corporation, 3.078%, 5/11/2050 215,000 215,000 227,798CITGO Petroleum Corporation, 7.000%, 6/15/2025 225,000 225,000 231,545Colonial Enterprises, Inc., 3.250%, 5/15/2030 500,000 499,781 527,113ConocoPhillips, 3.750%, 10/1/2027 275,000 282,099 301,641ConocoPhillips, 4.300%, 8/15/2028 670,000 734,406 753,038Continental Resources, Inc., 3.800%, 6/1/2024 250,000 253,770 260,866Continental Resources, Inc., 4.500%, 4/15/2023 23,000 23,315 23,701Diamondback Energy, Inc., 2.875%, 12/1/2024 200,000 199,983 207,528Diamondback Energy, Inc., 3.500%, 12/1/2029 1,250,000 1,307,756 1,325,513Endeavor Energy Resources L.P./EER Finance, Inc., 5.750%, 1/30/2028 350,000 368,733 370,744Energean Israel Finance Ltd., 4.500%, 3/30/2024 300,000 306,671 302,250Energean Israel Finance Ltd., 4.875%, 3/30/2026 23,000 23,122 22,885Energean Israel Finance Ltd., 5.375%, 3/30/2028 380,000 380,722 375,725Energy Transfer L.P., 5.000%, 5/15/2050 295,000 299,448 340,563Energy Transfer L.P., 5.300%, 4/1/2044 100,000 103,259 114,826Energy Transfer L.P., 5.300%, 4/15/2047 150,000 157,003 174,344
Wilmington Trust Collective Investment TrustFunds Sub-Advised by PGIM, Inc.
PGIM Total Return Bond Fund
Schedule of Investments (continued)December 31, 2021
The accompanying notes are an integral part of these financial statements. 54
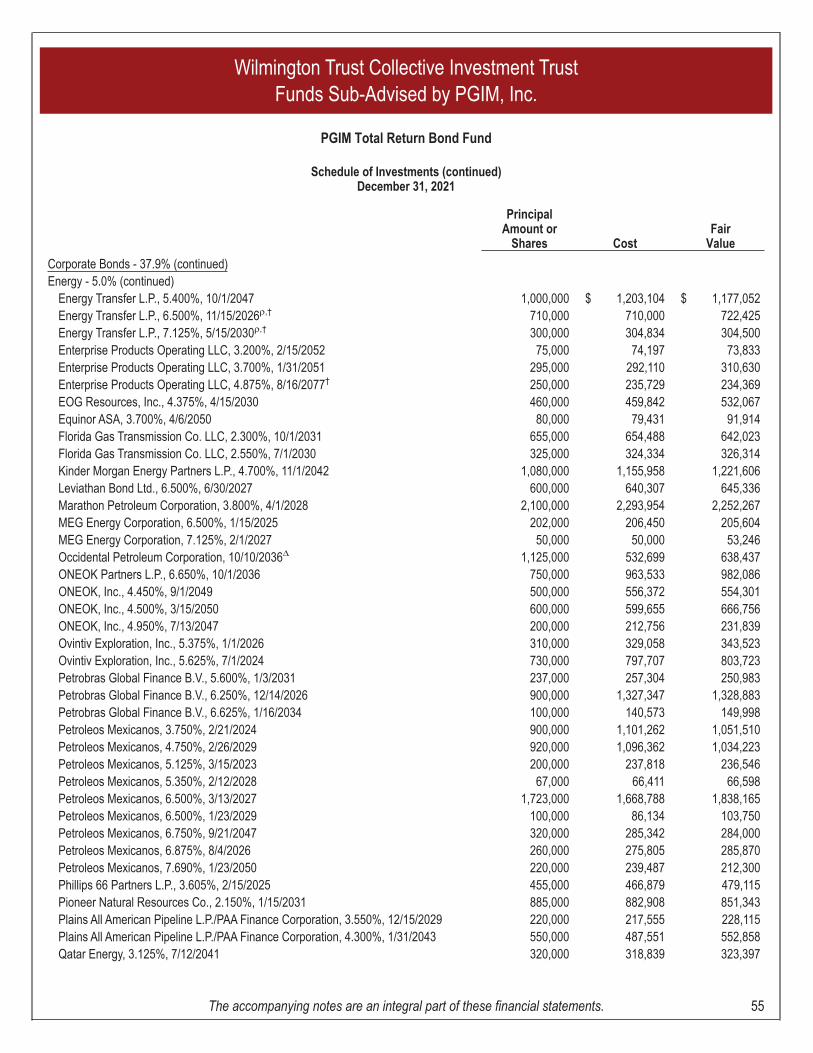
PrincipalAmount or
Shares CostFair
Value
Corporate Bonds - 37.9% (continued)Energy - 5.0% (continued)
Energy Transfer L.P., 5.400%, 10/1/2047 1,000,000 $ 1,203,104 $ 1,177,052Energy Transfer L.P., 6.500%, 11/15/2026ρ,† 710,000 710,000 722,425Energy Transfer L.P., 7.125%, 5/15/2030ρ,† 300,000 304,834 304,500Enterprise Products Operating LLC, 3.200%, 2/15/2052 75,000 74,197 73,833Enterprise Products Operating LLC, 3.700%, 1/31/2051 295,000 292,110 310,630Enterprise Products Operating LLC, 4.875%, 8/16/2077† 250,000 235,729 234,369EOG Resources, Inc., 4.375%, 4/15/2030 460,000 459,842 532,067Equinor ASA, 3.700%, 4/6/2050 80,000 79,431 91,914Florida Gas Transmission Co. LLC, 2.300%, 10/1/2031 655,000 654,488 642,023Florida Gas Transmission Co. LLC, 2.550%, 7/1/2030 325,000 324,334 326,314Kinder Morgan Energy Partners L.P., 4.700%, 11/1/2042 1,080,000 1,155,958 1,221,606Leviathan Bond Ltd., 6.500%, 6/30/2027 600,000 640,307 645,336Marathon Petroleum Corporation, 3.800%, 4/1/2028 2,100,000 2,293,954 2,252,267MEG Energy Corporation, 6.500%, 1/15/2025 202,000 206,450 205,604MEG Energy Corporation, 7.125%, 2/1/2027 50,000 50,000 53,246Occidental Petroleum Corporation, 10/10/2036Δ 1,125,000 532,699 638,437ONEOK Partners L.P., 6.650%, 10/1/2036 750,000 963,533 982,086ONEOK, Inc., 4.450%, 9/1/2049 500,000 556,372 554,301ONEOK, Inc., 4.500%, 3/15/2050 600,000 599,655 666,756ONEOK, Inc., 4.950%, 7/13/2047 200,000 212,756 231,839Ovintiv Exploration, Inc., 5.375%, 1/1/2026 310,000 329,058 343,523Ovintiv Exploration, Inc., 5.625%, 7/1/2024 730,000 797,707 803,723Petrobras Global Finance B.V., 5.600%, 1/3/2031 237,000 257,304 250,983Petrobras Global Finance B.V., 6.250%, 12/14/2026 900,000 1,327,347 1,328,883Petrobras Global Finance B.V., 6.625%, 1/16/2034 100,000 140,573 149,998Petroleos Mexicanos, 3.750%, 2/21/2024 900,000 1,101,262 1,051,510Petroleos Mexicanos, 4.750%, 2/26/2029 920,000 1,096,362 1,034,223Petroleos Mexicanos, 5.125%, 3/15/2023 200,000 237,818 236,546Petroleos Mexicanos, 5.350%, 2/12/2028 67,000 66,411 66,598Petroleos Mexicanos, 6.500%, 3/13/2027 1,723,000 1,668,788 1,838,165Petroleos Mexicanos, 6.500%, 1/23/2029 100,000 86,134 103,750Petroleos Mexicanos, 6.750%, 9/21/2047 320,000 285,342 284,000Petroleos Mexicanos, 6.875%, 8/4/2026 260,000 275,805 285,870Petroleos Mexicanos, 7.690%, 1/23/2050 220,000 239,487 212,300Phillips 66 Partners L.P., 3.605%, 2/15/2025 455,000 466,879 479,115Pioneer Natural Resources Co., 2.150%, 1/15/2031 885,000 882,908 851,343Plains All American Pipeline L.P./PAA Finance Corporation, 3.550%, 12/15/2029 220,000 217,555 228,115Plains All American Pipeline L.P./PAA Finance Corporation, 4.300%, 1/31/2043 550,000 487,551 552,858Qatar Energy, 3.125%, 7/12/2041 320,000 318,839 323,397
Wilmington Trust Collective Investment TrustFunds Sub-Advised by PGIM, Inc.
PGIM Total Return Bond Fund
Schedule of Investments (continued)December 31, 2021
The accompanying notes are an integral part of these financial statements. 55
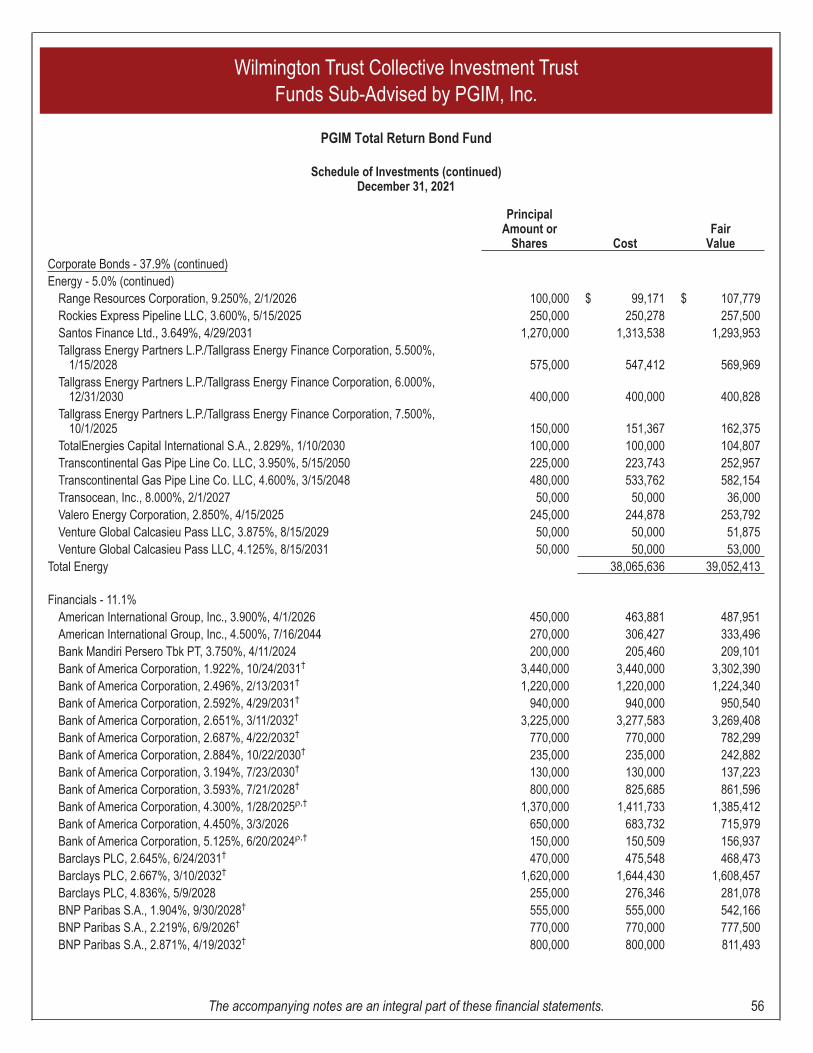
PrincipalAmount or
Shares CostFair
Value
Corporate Bonds - 37.9% (continued)Energy - 5.0% (continued)
Range Resources Corporation, 9.250%, 2/1/2026 100,000 $ 99,171 $ 107,779Rockies Express Pipeline LLC, 3.600%, 5/15/2025 250,000 250,278 257,500Santos Finance Ltd., 3.649%, 4/29/2031 1,270,000 1,313,538 1,293,953Tallgrass Energy Partners L.P./Tallgrass Energy Finance Corporation, 5.500%,
1/15/2028 575,000 547,412 569,969Tallgrass Energy Partners L.P./Tallgrass Energy Finance Corporation, 6.000%,
12/31/2030 400,000 400,000 400,828Tallgrass Energy Partners L.P./Tallgrass Energy Finance Corporation, 7.500%,
10/1/2025 150,000 151,367 162,375TotalEnergies Capital International S.A., 2.829%, 1/10/2030 100,000 100,000 104,807Transcontinental Gas Pipe Line Co. LLC, 3.950%, 5/15/2050 225,000 223,743 252,957Transcontinental Gas Pipe Line Co. LLC, 4.600%, 3/15/2048 480,000 533,762 582,154Transocean, Inc., 8.000%, 2/1/2027 50,000 50,000 36,000Valero Energy Corporation, 2.850%, 4/15/2025 245,000 244,878 253,792Venture Global Calcasieu Pass LLC, 3.875%, 8/15/2029 50,000 50,000 51,875Venture Global Calcasieu Pass LLC, 4.125%, 8/15/2031 50,000 50,000 53,000
Total Energy 38,065,636 39,052,413
Financials - 11.1%American International Group, Inc., 3.900%, 4/1/2026 450,000 463,881 487,951American International Group, Inc., 4.500%, 7/16/2044 270,000 306,427 333,496Bank Mandiri Persero Tbk PT, 3.750%, 4/11/2024 200,000 205,460 209,101Bank of America Corporation, 1.922%, 10/24/2031† 3,440,000 3,440,000 3,302,390Bank of America Corporation, 2.496%, 2/13/2031† 1,220,000 1,220,000 1,224,340Bank of America Corporation, 2.592%, 4/29/2031† 940,000 940,000 950,540Bank of America Corporation, 2.651%, 3/11/2032† 3,225,000 3,277,583 3,269,408Bank of America Corporation, 2.687%, 4/22/2032† 770,000 770,000 782,299Bank of America Corporation, 2.884%, 10/22/2030† 235,000 235,000 242,882Bank of America Corporation, 3.194%, 7/23/2030† 130,000 130,000 137,223Bank of America Corporation, 3.593%, 7/21/2028† 800,000 825,685 861,596Bank of America Corporation, 4.300%, 1/28/2025ρ,† 1,370,000 1,411,733 1,385,412Bank of America Corporation, 4.450%, 3/3/2026 650,000 683,732 715,979Bank of America Corporation, 5.125%, 6/20/2024ρ,† 150,000 150,509 156,937Barclays PLC, 2.645%, 6/24/2031† 470,000 475,548 468,473Barclays PLC, 2.667%, 3/10/2032† 1,620,000 1,644,430 1,608,457Barclays PLC, 4.836%, 5/9/2028 255,000 276,346 281,078BNP Paribas S.A., 1.904%, 9/30/2028† 555,000 555,000 542,166BNP Paribas S.A., 2.219%, 6/9/2026† 770,000 770,000 777,500BNP Paribas S.A., 2.871%, 4/19/2032† 800,000 800,000 811,493
Wilmington Trust Collective Investment TrustFunds Sub-Advised by PGIM, Inc.
PGIM Total Return Bond Fund
Schedule of Investments (continued)December 31, 2021
The accompanying notes are an integral part of these financial statements. 56
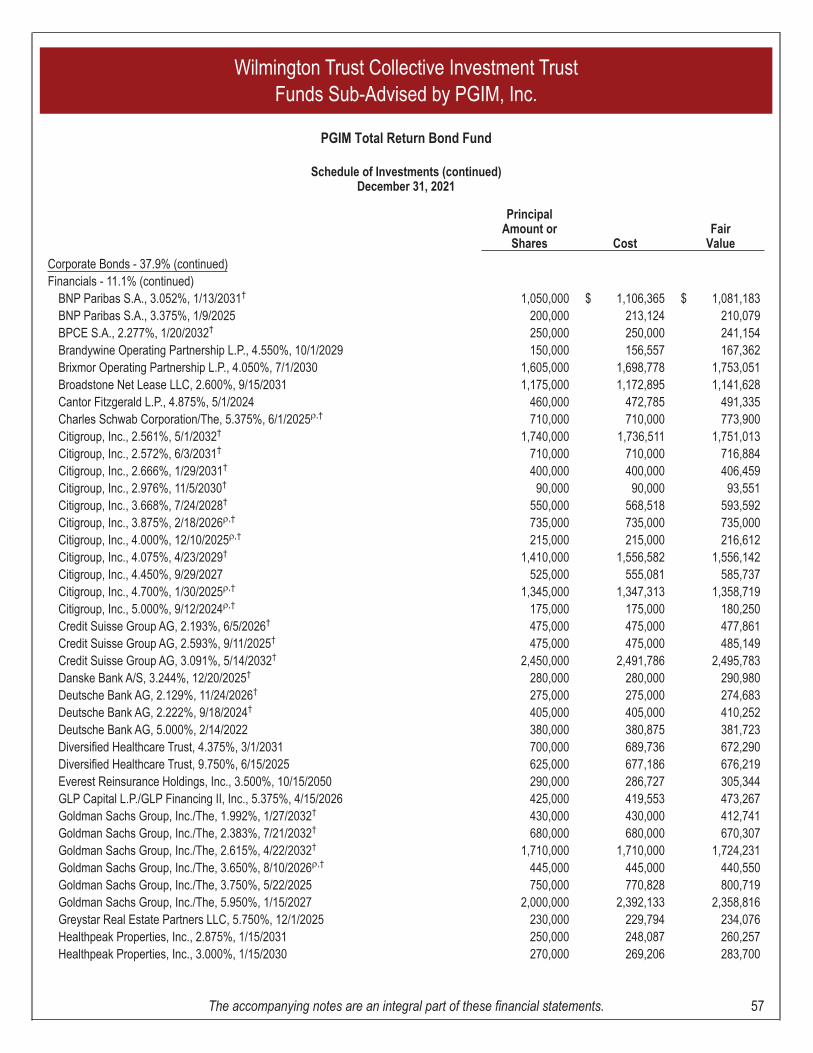
PrincipalAmount or
Shares CostFair
Value
Corporate Bonds - 37.9% (continued)Financials - 11.1% (continued)
BNP Paribas S.A., 3.052%, 1/13/2031† 1,050,000 $ 1,106,365 $ 1,081,183BNP Paribas S.A., 3.375%, 1/9/2025 200,000 213,124 210,079BPCE S.A., 2.277%, 1/20/2032† 250,000 250,000 241,154Brandywine Operating Partnership L.P., 4.550%, 10/1/2029 150,000 156,557 167,362Brixmor Operating Partnership L.P., 4.050%, 7/1/2030 1,605,000 1,698,778 1,753,051Broadstone Net Lease LLC, 2.600%, 9/15/2031 1,175,000 1,172,895 1,141,628Cantor Fitzgerald L.P., 4.875%, 5/1/2024 460,000 472,785 491,335Charles Schwab Corporation/The, 5.375%, 6/1/2025ρ,† 710,000 710,000 773,900Citigroup, Inc., 2.561%, 5/1/2032† 1,740,000 1,736,511 1,751,013Citigroup, Inc., 2.572%, 6/3/2031† 710,000 710,000 716,884Citigroup, Inc., 2.666%, 1/29/2031† 400,000 400,000 406,459Citigroup, Inc., 2.976%, 11/5/2030† 90,000 90,000 93,551Citigroup, Inc., 3.668%, 7/24/2028† 550,000 568,518 593,592Citigroup, Inc., 3.875%, 2/18/2026ρ,† 735,000 735,000 735,000Citigroup, Inc., 4.000%, 12/10/2025ρ,† 215,000 215,000 216,612Citigroup, Inc., 4.075%, 4/23/2029† 1,410,000 1,556,582 1,556,142Citigroup, Inc., 4.450%, 9/29/2027 525,000 555,081 585,737Citigroup, Inc., 4.700%, 1/30/2025ρ,† 1,345,000 1,347,313 1,358,719Citigroup, Inc., 5.000%, 9/12/2024ρ,† 175,000 175,000 180,250Credit Suisse Group AG, 2.193%, 6/5/2026† 475,000 475,000 477,861Credit Suisse Group AG, 2.593%, 9/11/2025† 475,000 475,000 485,149Credit Suisse Group AG, 3.091%, 5/14/2032† 2,450,000 2,491,786 2,495,783Danske Bank A/S, 3.244%, 12/20/2025† 280,000 280,000 290,980Deutsche Bank AG, 2.129%, 11/24/2026† 275,000 275,000 274,683Deutsche Bank AG, 2.222%, 9/18/2024† 405,000 405,000 410,252Deutsche Bank AG, 5.000%, 2/14/2022 380,000 380,875 381,723Diversified Healthcare Trust, 4.375%, 3/1/2031 700,000 689,736 672,290Diversified Healthcare Trust, 9.750%, 6/15/2025 625,000 677,186 676,219Everest Reinsurance Holdings, Inc., 3.500%, 10/15/2050 290,000 286,727 305,344GLP Capital L.P./GLP Financing II, Inc., 5.375%, 4/15/2026 425,000 419,553 473,267Goldman Sachs Group, Inc./The, 1.992%, 1/27/2032† 430,000 430,000 412,741Goldman Sachs Group, Inc./The, 2.383%, 7/21/2032† 680,000 680,000 670,307Goldman Sachs Group, Inc./The, 2.615%, 4/22/2032† 1,710,000 1,710,000 1,724,231Goldman Sachs Group, Inc./The, 3.650%, 8/10/2026ρ,† 445,000 445,000 440,550Goldman Sachs Group, Inc./The, 3.750%, 5/22/2025 750,000 770,828 800,719Goldman Sachs Group, Inc./The, 5.950%, 1/15/2027 2,000,000 2,392,133 2,358,816Greystar Real Estate Partners LLC, 5.750%, 12/1/2025 230,000 229,794 234,076Healthpeak Properties, Inc., 2.875%, 1/15/2031 250,000 248,087 260,257Healthpeak Properties, Inc., 3.000%, 1/15/2030 270,000 269,206 283,700
Wilmington Trust Collective Investment TrustFunds Sub-Advised by PGIM, Inc.
PGIM Total Return Bond Fund
Schedule of Investments (continued)December 31, 2021
The accompanying notes are an integral part of these financial statements. 57
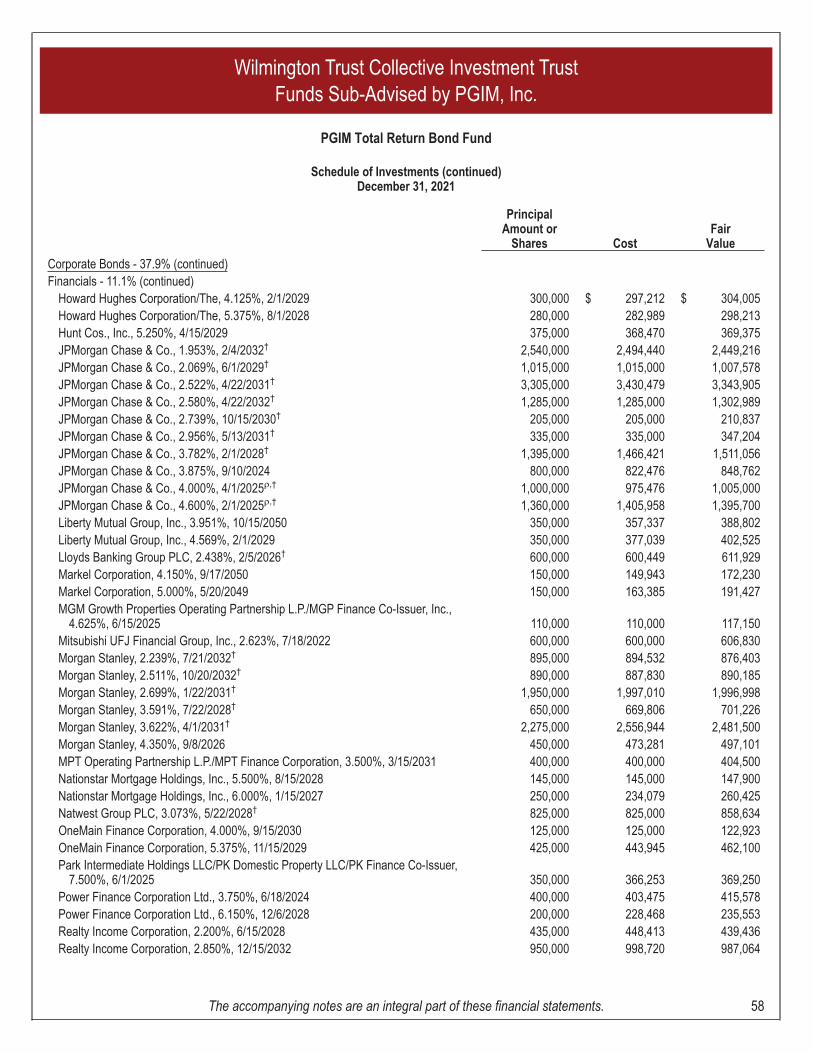
PrincipalAmount or
Shares CostFair
Value
Corporate Bonds - 37.9% (continued)Financials - 11.1% (continued)
Howard Hughes Corporation/The, 4.125%, 2/1/2029 300,000 $ 297,212 $ 304,005Howard Hughes Corporation/The, 5.375%, 8/1/2028 280,000 282,989 298,213Hunt Cos., Inc., 5.250%, 4/15/2029 375,000 368,470 369,375JPMorgan Chase & Co., 1.953%, 2/4/2032† 2,540,000 2,494,440 2,449,216JPMorgan Chase & Co., 2.069%, 6/1/2029† 1,015,000 1,015,000 1,007,578JPMorgan Chase & Co., 2.522%, 4/22/2031† 3,305,000 3,430,479 3,343,905JPMorgan Chase & Co., 2.580%, 4/22/2032† 1,285,000 1,285,000 1,302,989JPMorgan Chase & Co., 2.739%, 10/15/2030† 205,000 205,000 210,837JPMorgan Chase & Co., 2.956%, 5/13/2031† 335,000 335,000 347,204JPMorgan Chase & Co., 3.782%, 2/1/2028† 1,395,000 1,466,421 1,511,056JPMorgan Chase & Co., 3.875%, 9/10/2024 800,000 822,476 848,762JPMorgan Chase & Co., 4.000%, 4/1/2025ρ,† 1,000,000 975,476 1,005,000JPMorgan Chase & Co., 4.600%, 2/1/2025ρ,† 1,360,000 1,405,958 1,395,700Liberty Mutual Group, Inc., 3.951%, 10/15/2050 350,000 357,337 388,802Liberty Mutual Group, Inc., 4.569%, 2/1/2029 350,000 377,039 402,525Lloyds Banking Group PLC, 2.438%, 2/5/2026† 600,000 600,449 611,929Markel Corporation, 4.150%, 9/17/2050 150,000 149,943 172,230Markel Corporation, 5.000%, 5/20/2049 150,000 163,385 191,427MGM Growth Properties Operating Partnership L.P./MGP Finance Co-Issuer, Inc.,
4.625%, 6/15/2025 110,000 110,000 117,150Mitsubishi UFJ Financial Group, Inc., 2.623%, 7/18/2022 600,000 600,000 606,830Morgan Stanley, 2.239%, 7/21/2032† 895,000 894,532 876,403Morgan Stanley, 2.511%, 10/20/2032† 890,000 887,830 890,185Morgan Stanley, 2.699%, 1/22/2031† 1,950,000 1,997,010 1,996,998Morgan Stanley, 3.591%, 7/22/2028† 650,000 669,806 701,226Morgan Stanley, 3.622%, 4/1/2031† 2,275,000 2,556,944 2,481,500Morgan Stanley, 4.350%, 9/8/2026 450,000 473,281 497,101MPT Operating Partnership L.P./MPT Finance Corporation, 3.500%, 3/15/2031 400,000 400,000 404,500Nationstar Mortgage Holdings, Inc., 5.500%, 8/15/2028 145,000 145,000 147,900Nationstar Mortgage Holdings, Inc., 6.000%, 1/15/2027 250,000 234,079 260,425Natwest Group PLC, 3.073%, 5/22/2028† 825,000 825,000 858,634OneMain Finance Corporation, 4.000%, 9/15/2030 125,000 125,000 122,923OneMain Finance Corporation, 5.375%, 11/15/2029 425,000 443,945 462,100Park Intermediate Holdings LLC/PK Domestic Property LLC/PK Finance Co-Issuer,
7.500%, 6/1/2025 350,000 366,253 369,250Power Finance Corporation Ltd., 3.750%, 6/18/2024 400,000 403,475 415,578Power Finance Corporation Ltd., 6.150%, 12/6/2028 200,000 228,468 235,553Realty Income Corporation, 2.200%, 6/15/2028 435,000 448,413 439,436Realty Income Corporation, 2.850%, 12/15/2032 950,000 998,720 987,064
Wilmington Trust Collective Investment TrustFunds Sub-Advised by PGIM, Inc.
PGIM Total Return Bond Fund
Schedule of Investments (continued)December 31, 2021
The accompanying notes are an integral part of these financial statements. 58
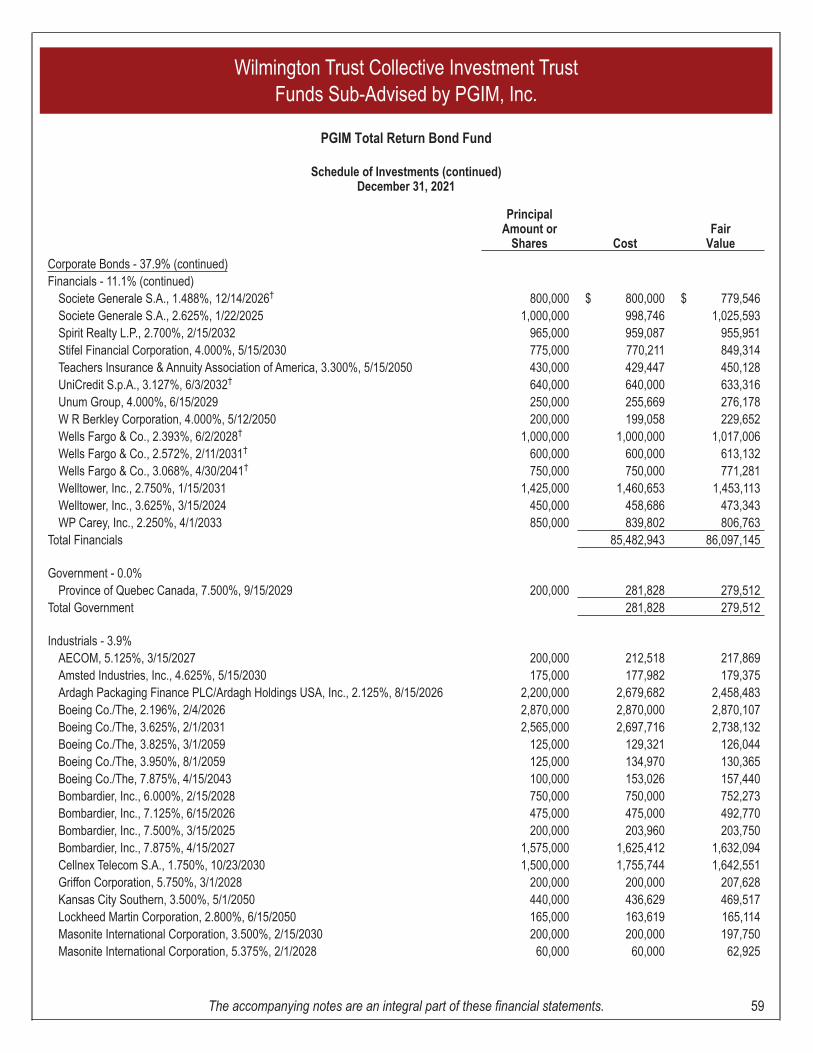
PrincipalAmount or
Shares CostFair
Value
Corporate Bonds - 37.9% (continued)Financials - 11.1% (continued)
Societe Generale S.A., 1.488%, 12/14/2026† 800,000 $ 800,000 $ 779,546Societe Generale S.A., 2.625%, 1/22/2025 1,000,000 998,746 1,025,593Spirit Realty L.P., 2.700%, 2/15/2032 965,000 959,087 955,951Stifel Financial Corporation, 4.000%, 5/15/2030 775,000 770,211 849,314Teachers Insurance & Annuity Association of America, 3.300%, 5/15/2050 430,000 429,447 450,128UniCredit S.p.A., 3.127%, 6/3/2032† 640,000 640,000 633,316Unum Group, 4.000%, 6/15/2029 250,000 255,669 276,178W R Berkley Corporation, 4.000%, 5/12/2050 200,000 199,058 229,652Wells Fargo & Co., 2.393%, 6/2/2028† 1,000,000 1,000,000 1,017,006Wells Fargo & Co., 2.572%, 2/11/2031† 600,000 600,000 613,132Wells Fargo & Co., 3.068%, 4/30/2041† 750,000 750,000 771,281Welltower, Inc., 2.750%, 1/15/2031 1,425,000 1,460,653 1,453,113Welltower, Inc., 3.625%, 3/15/2024 450,000 458,686 473,343WP Carey, Inc., 2.250%, 4/1/2033 850,000 839,802 806,763
Total Financials 85,482,943 86,097,145
Government - 0.0%Province of Quebec Canada, 7.500%, 9/15/2029 200,000 281,828 279,512
Total Government 281,828 279,512
Industrials - 3.9%AECOM, 5.125%, 3/15/2027 200,000 212,518 217,869Amsted Industries, Inc., 4.625%, 5/15/2030 175,000 177,982 179,375Ardagh Packaging Finance PLC/Ardagh Holdings USA, Inc., 2.125%, 8/15/2026 2,200,000 2,679,682 2,458,483Boeing Co./The, 2.196%, 2/4/2026 2,870,000 2,870,000 2,870,107Boeing Co./The, 3.625%, 2/1/2031 2,565,000 2,697,716 2,738,132Boeing Co./The, 3.825%, 3/1/2059 125,000 129,321 126,044Boeing Co./The, 3.950%, 8/1/2059 125,000 134,970 130,365Boeing Co./The, 7.875%, 4/15/2043 100,000 153,026 157,440Bombardier, Inc., 6.000%, 2/15/2028 750,000 750,000 752,273Bombardier, Inc., 7.125%, 6/15/2026 475,000 475,000 492,770Bombardier, Inc., 7.500%, 3/15/2025 200,000 203,960 203,750Bombardier, Inc., 7.875%, 4/15/2027 1,575,000 1,625,412 1,632,094Cellnex Telecom S.A., 1.750%, 10/23/2030 1,500,000 1,755,744 1,642,551Griffon Corporation, 5.750%, 3/1/2028 200,000 200,000 207,628Kansas City Southern, 3.500%, 5/1/2050 440,000 436,629 469,517Lockheed Martin Corporation, 2.800%, 6/15/2050 165,000 163,619 165,114Masonite International Corporation, 3.500%, 2/15/2030 200,000 200,000 197,750Masonite International Corporation, 5.375%, 2/1/2028 60,000 60,000 62,925
Wilmington Trust Collective Investment TrustFunds Sub-Advised by PGIM, Inc.
PGIM Total Return Bond Fund
Schedule of Investments (continued)December 31, 2021
The accompanying notes are an integral part of these financial statements. 59
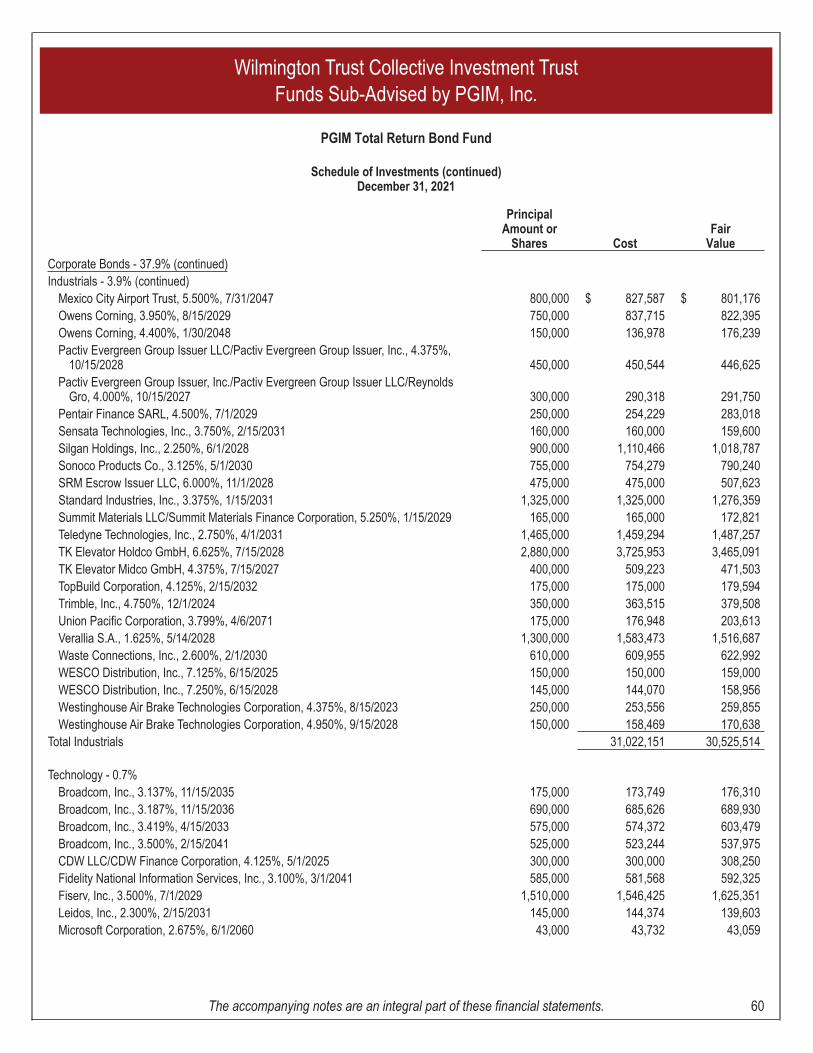
PrincipalAmount or
Shares CostFair
Value
Corporate Bonds - 37.9% (continued)Industrials - 3.9% (continued)
Mexico City Airport Trust, 5.500%, 7/31/2047 800,000 $ 827,587 $ 801,176Owens Corning, 3.950%, 8/15/2029 750,000 837,715 822,395Owens Corning, 4.400%, 1/30/2048 150,000 136,978 176,239Pactiv Evergreen Group Issuer LLC/Pactiv Evergreen Group Issuer, Inc., 4.375%,
10/15/2028 450,000 450,544 446,625Pactiv Evergreen Group Issuer, Inc./Pactiv Evergreen Group Issuer LLC/Reynolds
Gro, 4.000%, 10/15/2027 300,000 290,318 291,750Pentair Finance SARL, 4.500%, 7/1/2029 250,000 254,229 283,018Sensata Technologies, Inc., 3.750%, 2/15/2031 160,000 160,000 159,600Silgan Holdings, Inc., 2.250%, 6/1/2028 900,000 1,110,466 1,018,787Sonoco Products Co., 3.125%, 5/1/2030 755,000 754,279 790,240SRM Escrow Issuer LLC, 6.000%, 11/1/2028 475,000 475,000 507,623Standard Industries, Inc., 3.375%, 1/15/2031 1,325,000 1,325,000 1,276,359Summit Materials LLC/Summit Materials Finance Corporation, 5.250%, 1/15/2029 165,000 165,000 172,821Teledyne Technologies, Inc., 2.750%, 4/1/2031 1,465,000 1,459,294 1,487,257TK Elevator Holdco GmbH, 6.625%, 7/15/2028 2,880,000 3,725,953 3,465,091TK Elevator Midco GmbH, 4.375%, 7/15/2027 400,000 509,223 471,503TopBuild Corporation, 4.125%, 2/15/2032 175,000 175,000 179,594Trimble, Inc., 4.750%, 12/1/2024 350,000 363,515 379,508Union Pacific Corporation, 3.799%, 4/6/2071 175,000 176,948 203,613Verallia S.A., 1.625%, 5/14/2028 1,300,000 1,583,473 1,516,687Waste Connections, Inc., 2.600%, 2/1/2030 610,000 609,955 622,992WESCO Distribution, Inc., 7.125%, 6/15/2025 150,000 150,000 159,000WESCO Distribution, Inc., 7.250%, 6/15/2028 145,000 144,070 158,956Westinghouse Air Brake Technologies Corporation, 4.375%, 8/15/2023 250,000 253,556 259,855Westinghouse Air Brake Technologies Corporation, 4.950%, 9/15/2028 150,000 158,469 170,638
Total Industrials 31,022,151 30,525,514
Technology - 0.7%Broadcom, Inc., 3.137%, 11/15/2035 175,000 173,749 176,310Broadcom, Inc., 3.187%, 11/15/2036 690,000 685,626 689,930Broadcom, Inc., 3.419%, 4/15/2033 575,000 574,372 603,479Broadcom, Inc., 3.500%, 2/15/2041 525,000 523,244 537,975CDW LLC/CDW Finance Corporation, 4.125%, 5/1/2025 300,000 300,000 308,250Fidelity National Information Services, Inc., 3.100%, 3/1/2041 585,000 581,568 592,325Fiserv, Inc., 3.500%, 7/1/2029 1,510,000 1,546,425 1,625,351Leidos, Inc., 2.300%, 2/15/2031 145,000 144,374 139,603Microsoft Corporation, 2.675%, 6/1/2060 43,000 43,732 43,059
Wilmington Trust Collective Investment TrustFunds Sub-Advised by PGIM, Inc.
PGIM Total Return Bond Fund
Schedule of Investments (continued)December 31, 2021
The accompanying notes are an integral part of these financial statements. 60
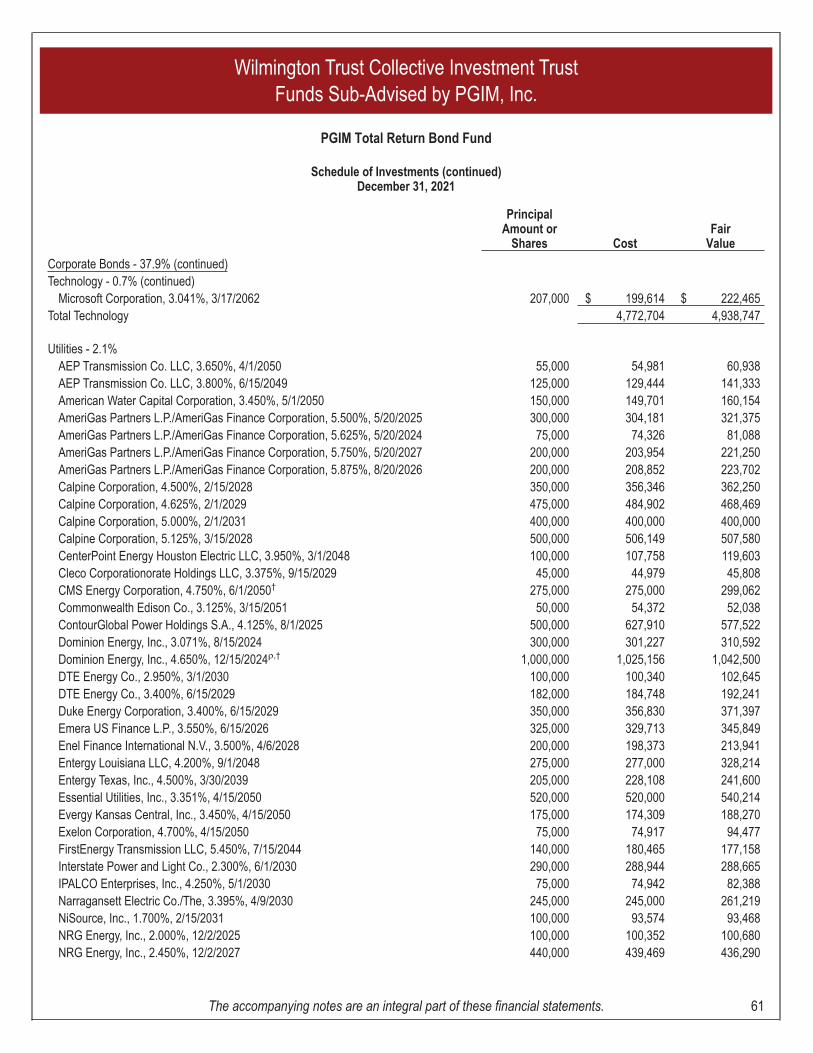
PrincipalAmount or
Shares CostFair
Value
Corporate Bonds - 37.9% (continued)Technology - 0.7% (continued)
Microsoft Corporation, 3.041%, 3/17/2062 207,000 $ 199,614 $ 222,465Total Technology 4,772,704 4,938,747
Utilities - 2.1%AEP Transmission Co. LLC, 3.650%, 4/1/2050 55,000 54,981 60,938AEP Transmission Co. LLC, 3.800%, 6/15/2049 125,000 129,444 141,333American Water Capital Corporation, 3.450%, 5/1/2050 150,000 149,701 160,154AmeriGas Partners L.P./AmeriGas Finance Corporation, 5.500%, 5/20/2025 300,000 304,181 321,375AmeriGas Partners L.P./AmeriGas Finance Corporation, 5.625%, 5/20/2024 75,000 74,326 81,088AmeriGas Partners L.P./AmeriGas Finance Corporation, 5.750%, 5/20/2027 200,000 203,954 221,250AmeriGas Partners L.P./AmeriGas Finance Corporation, 5.875%, 8/20/2026 200,000 208,852 223,702Calpine Corporation, 4.500%, 2/15/2028 350,000 356,346 362,250Calpine Corporation, 4.625%, 2/1/2029 475,000 484,902 468,469Calpine Corporation, 5.000%, 2/1/2031 400,000 400,000 400,000Calpine Corporation, 5.125%, 3/15/2028 500,000 506,149 507,580CenterPoint Energy Houston Electric LLC, 3.950%, 3/1/2048 100,000 107,758 119,603Cleco Corporationorate Holdings LLC, 3.375%, 9/15/2029 45,000 44,979 45,808CMS Energy Corporation, 4.750%, 6/1/2050† 275,000 275,000 299,062Commonwealth Edison Co., 3.125%, 3/15/2051 50,000 54,372 52,038ContourGlobal Power Holdings S.A., 4.125%, 8/1/2025 500,000 627,910 577,522Dominion Energy, Inc., 3.071%, 8/15/2024 300,000 301,227 310,592Dominion Energy, Inc., 4.650%, 12/15/2024ρ,† 1,000,000 1,025,156 1,042,500DTE Energy Co., 2.950%, 3/1/2030 100,000 100,340 102,645DTE Energy Co., 3.400%, 6/15/2029 182,000 184,748 192,241Duke Energy Corporation, 3.400%, 6/15/2029 350,000 356,830 371,397Emera US Finance L.P., 3.550%, 6/15/2026 325,000 329,713 345,849Enel Finance International N.V., 3.500%, 4/6/2028 200,000 198,373 213,941Entergy Louisiana LLC, 4.200%, 9/1/2048 275,000 277,000 328,214Entergy Texas, Inc., 4.500%, 3/30/2039 205,000 228,108 241,600Essential Utilities, Inc., 3.351%, 4/15/2050 520,000 520,000 540,214Evergy Kansas Central, Inc., 3.450%, 4/15/2050 175,000 174,309 188,270Exelon Corporation, 4.700%, 4/15/2050 75,000 74,917 94,477FirstEnergy Transmission LLC, 5.450%, 7/15/2044 140,000 180,465 177,158Interstate Power and Light Co., 2.300%, 6/1/2030 290,000 288,944 288,665IPALCO Enterprises, Inc., 4.250%, 5/1/2030 75,000 74,942 82,388Narragansett Electric Co./The, 3.395%, 4/9/2030 245,000 245,000 261,219NiSource, Inc., 1.700%, 2/15/2031 100,000 93,574 93,468NRG Energy, Inc., 2.000%, 12/2/2025 100,000 100,352 100,680NRG Energy, Inc., 2.450%, 12/2/2027 440,000 439,469 436,290
Wilmington Trust Collective Investment TrustFunds Sub-Advised by PGIM, Inc.
PGIM Total Return Bond Fund
Schedule of Investments (continued)December 31, 2021
The accompanying notes are an integral part of these financial statements. 61
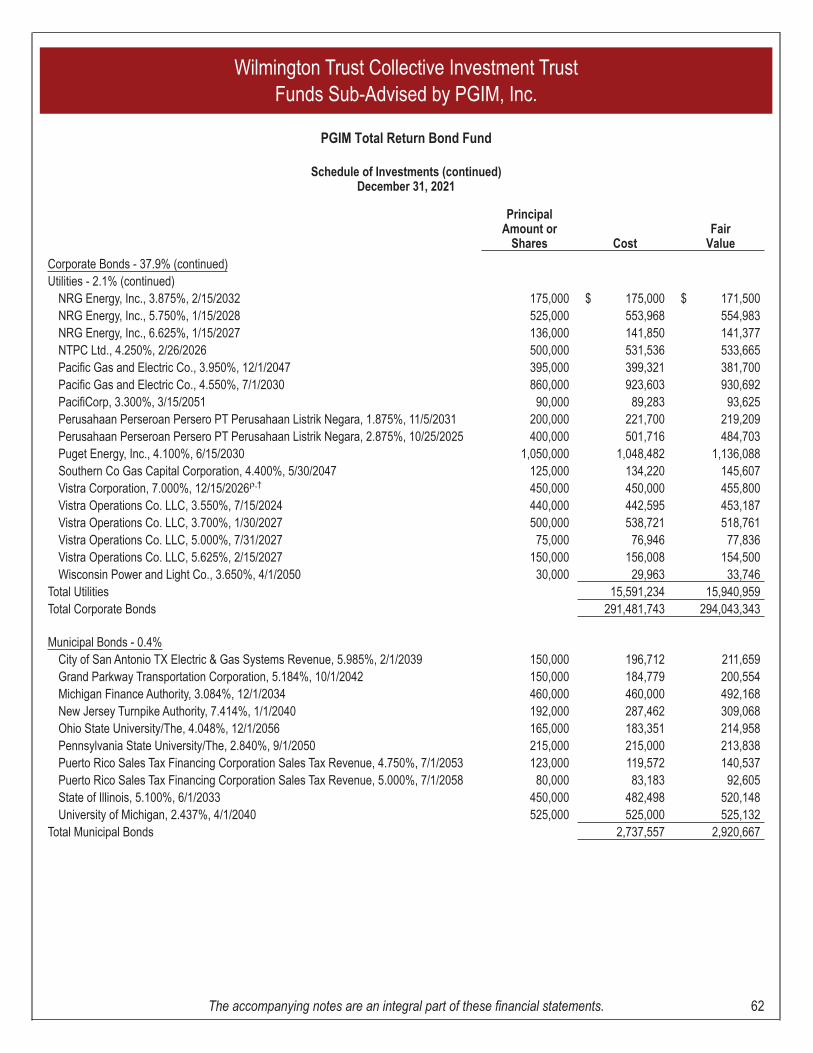
PrincipalAmount or
Shares CostFair
Value
Corporate Bonds - 37.9% (continued)Utilities - 2.1% (continued)
NRG Energy, Inc., 3.875%, 2/15/2032 175,000 $ 175,000 $ 171,500NRG Energy, Inc., 5.750%, 1/15/2028 525,000 553,968 554,983NRG Energy, Inc., 6.625%, 1/15/2027 136,000 141,850 141,377NTPC Ltd., 4.250%, 2/26/2026 500,000 531,536 533,665Pacific Gas and Electric Co., 3.950%, 12/1/2047 395,000 399,321 381,700Pacific Gas and Electric Co., 4.550%, 7/1/2030 860,000 923,603 930,692PacifiCorp, 3.300%, 3/15/2051 90,000 89,283 93,625Perusahaan Perseroan Persero PT Perusahaan Listrik Negara, 1.875%, 11/5/2031 200,000 221,700 219,209Perusahaan Perseroan Persero PT Perusahaan Listrik Negara, 2.875%, 10/25/2025 400,000 501,716 484,703Puget Energy, Inc., 4.100%, 6/15/2030 1,050,000 1,048,482 1,136,088Southern Co Gas Capital Corporation, 4.400%, 5/30/2047 125,000 134,220 145,607Vistra Corporation, 7.000%, 12/15/2026ρ,† 450,000 450,000 455,800Vistra Operations Co. LLC, 3.550%, 7/15/2024 440,000 442,595 453,187Vistra Operations Co. LLC, 3.700%, 1/30/2027 500,000 538,721 518,761Vistra Operations Co. LLC, 5.000%, 7/31/2027 75,000 76,946 77,836Vistra Operations Co. LLC, 5.625%, 2/15/2027 150,000 156,008 154,500Wisconsin Power and Light Co., 3.650%, 4/1/2050 30,000 29,963 33,746
Total Utilities 15,591,234 15,940,959Total Corporate Bonds 291,481,743 294,043,343
Municipal Bonds - 0.4%City of San Antonio TX Electric & Gas Systems Revenue, 5.985%, 2/1/2039 150,000 196,712 211,659Grand Parkway Transportation Corporation, 5.184%, 10/1/2042 150,000 184,779 200,554Michigan Finance Authority, 3.084%, 12/1/2034 460,000 460,000 492,168New Jersey Turnpike Authority, 7.414%, 1/1/2040 192,000 287,462 309,068Ohio State University/The, 4.048%, 12/1/2056 165,000 183,351 214,958Pennsylvania State University/The, 2.840%, 9/1/2050 215,000 215,000 213,838Puerto Rico Sales Tax Financing Corporation Sales Tax Revenue, 4.750%, 7/1/2053 123,000 119,572 140,537Puerto Rico Sales Tax Financing Corporation Sales Tax Revenue, 5.000%, 7/1/2058 80,000 83,183 92,605State of Illinois, 5.100%, 6/1/2033 450,000 482,498 520,148University of Michigan, 2.437%, 4/1/2040 525,000 525,000 525,132
Total Municipal Bonds 2,737,557 2,920,667
Wilmington Trust Collective Investment TrustFunds Sub-Advised by PGIM, Inc.
PGIM Total Return Bond Fund
Schedule of Investments (continued)December 31, 2021
The accompanying notes are an integral part of these financial statements. 62
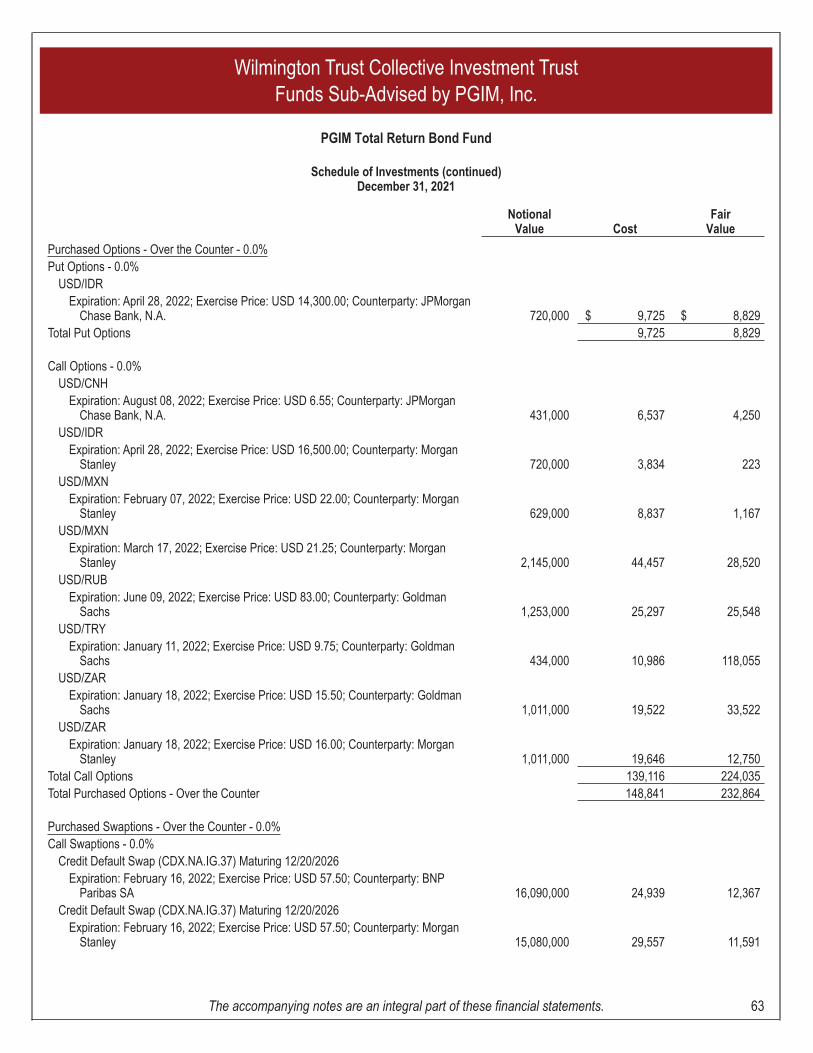
NotionalValue Cost
FairValue
Purchased Options - Over the Counter - 0.0%Put Options - 0.0%
USD/IDRExpiration: April 28, 2022; Exercise Price: USD 14,300.00; Counterparty: JPMorgan
Chase Bank, N.A. 720,000 $ 9,725 $ 8,829Total Put Options 9,725 8,829
Call Options - 0.0%USD/CNH
Expiration: August 08, 2022; Exercise Price: USD 6.55; Counterparty: JPMorganChase Bank, N.A. 431,000 6,537 4,250
USD/IDRExpiration: April 28, 2022; Exercise Price: USD 16,500.00; Counterparty: Morgan
Stanley 720,000 3,834 223USD/MXN
Expiration: February 07, 2022; Exercise Price: USD 22.00; Counterparty: MorganStanley 629,000 8,837 1,167
USD/MXNExpiration: March 17, 2022; Exercise Price: USD 21.25; Counterparty: Morgan
Stanley 2,145,000 44,457 28,520USD/RUB
Expiration: June 09, 2022; Exercise Price: USD 83.00; Counterparty: GoldmanSachs 1,253,000 25,297 25,548
USD/TRYExpiration: January 11, 2022; Exercise Price: USD 9.75; Counterparty: Goldman
Sachs 434,000 10,986 118,055USD/ZAR
Expiration: January 18, 2022; Exercise Price: USD 15.50; Counterparty: GoldmanSachs 1,011,000 19,522 33,522
USD/ZARExpiration: January 18, 2022; Exercise Price: USD 16.00; Counterparty: Morgan
Stanley 1,011,000 19,646 12,750Total Call Options 139,116 224,035Total Purchased Options - Over the Counter 148,841 232,864
Purchased Swaptions - Over the Counter - 0.0%Call Swaptions - 0.0%
Credit Default Swap (CDX.NA.IG.37) Maturing 12/20/2026Expiration: February 16, 2022; Exercise Price: USD 57.50; Counterparty: BNP
Paribas SA 16,090,000 24,939 12,367Credit Default Swap (CDX.NA.IG.37) Maturing 12/20/2026
Expiration: February 16, 2022; Exercise Price: USD 57.50; Counterparty: MorganStanley 15,080,000 29,557 11,591
Wilmington Trust Collective Investment TrustFunds Sub-Advised by PGIM, Inc.
PGIM Total Return Bond Fund
Schedule of Investments (continued)December 31, 2021
The accompanying notes are an integral part of these financial statements. 63
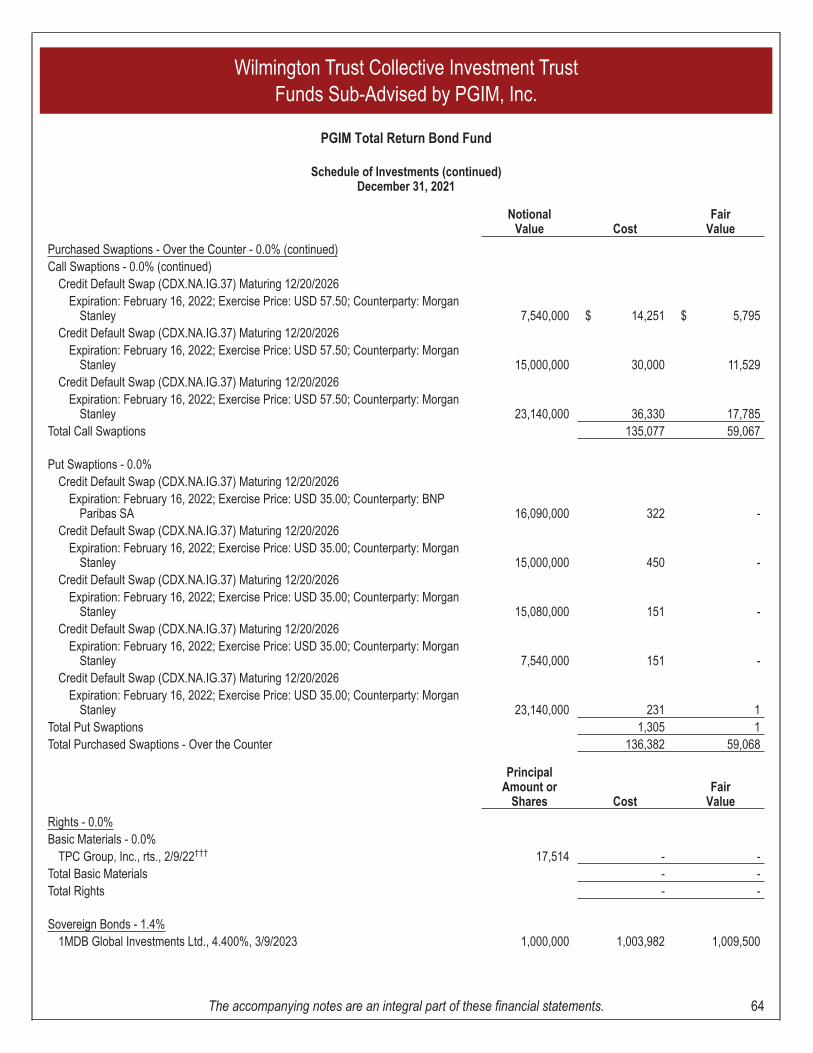
NotionalValue Cost
FairValue
Purchased Swaptions - Over the Counter - 0.0% (continued)Call Swaptions - 0.0% (continued)
Credit Default Swap (CDX.NA.IG.37) Maturing 12/20/2026Expiration: February 16, 2022; Exercise Price: USD 57.50; Counterparty: Morgan
Stanley 7,540,000 $ 14,251 $ 5,795Credit Default Swap (CDX.NA.IG.37) Maturing 12/20/2026
Expiration: February 16, 2022; Exercise Price: USD 57.50; Counterparty: MorganStanley 15,000,000 30,000 11,529
Credit Default Swap (CDX.NA.IG.37) Maturing 12/20/2026Expiration: February 16, 2022; Exercise Price: USD 57.50; Counterparty: Morgan
Stanley 23,140,000 36,330 17,785Total Call Swaptions 135,077 59,067
Put Swaptions - 0.0%Credit Default Swap (CDX.NA.IG.37) Maturing 12/20/2026
Expiration: February 16, 2022; Exercise Price: USD 35.00; Counterparty: BNPParibas SA 16,090,000 322 -
Credit Default Swap (CDX.NA.IG.37) Maturing 12/20/2026Expiration: February 16, 2022; Exercise Price: USD 35.00; Counterparty: Morgan
Stanley 15,000,000 450 -Credit Default Swap (CDX.NA.IG.37) Maturing 12/20/2026
Expiration: February 16, 2022; Exercise Price: USD 35.00; Counterparty: MorganStanley 15,080,000 151 -
Credit Default Swap (CDX.NA.IG.37) Maturing 12/20/2026Expiration: February 16, 2022; Exercise Price: USD 35.00; Counterparty: Morgan
Stanley 7,540,000 151 -Credit Default Swap (CDX.NA.IG.37) Maturing 12/20/2026
Expiration: February 16, 2022; Exercise Price: USD 35.00; Counterparty: MorganStanley 23,140,000 231 1
Total Put Swaptions 1,305 1Total Purchased Swaptions - Over the Counter 136,382 59,068
PrincipalAmount or
Shares CostFair
Value
Rights - 0.0%Basic Materials - 0.0%
TPC Group, Inc., rts., 2/9/22††† 17,514 - -Total Basic Materials - -Total Rights - -
Sovereign Bonds - 1.4%1MDB Global Investments Ltd., 4.400%, 3/9/2023 1,000,000 1,003,982 1,009,500
Wilmington Trust Collective Investment TrustFunds Sub-Advised by PGIM, Inc.
PGIM Total Return Bond Fund
Schedule of Investments (continued)December 31, 2021
The accompanying notes are an integral part of these financial statements. 64
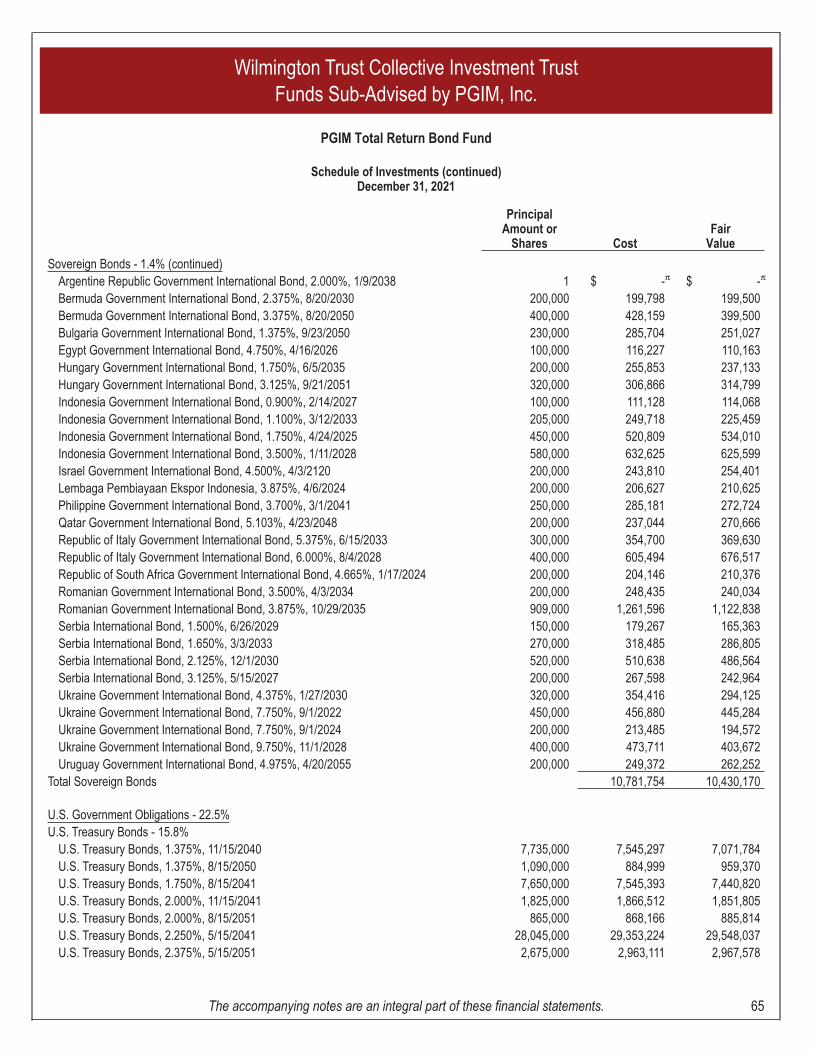
PrincipalAmount or
Shares CostFair
Value
Sovereign Bonds - 1.4% (continued)Argentine Republic Government International Bond, 2.000%, 1/9/2038 1 $ -π $ -π
Bermuda Government International Bond, 2.375%, 8/20/2030 200,000 199,798 199,500Bermuda Government International Bond, 3.375%, 8/20/2050 400,000 428,159 399,500Bulgaria Government International Bond, 1.375%, 9/23/2050 230,000 285,704 251,027Egypt Government International Bond, 4.750%, 4/16/2026 100,000 116,227 110,163Hungary Government International Bond, 1.750%, 6/5/2035 200,000 255,853 237,133Hungary Government International Bond, 3.125%, 9/21/2051 320,000 306,866 314,799Indonesia Government International Bond, 0.900%, 2/14/2027 100,000 111,128 114,068Indonesia Government International Bond, 1.100%, 3/12/2033 205,000 249,718 225,459Indonesia Government International Bond, 1.750%, 4/24/2025 450,000 520,809 534,010Indonesia Government International Bond, 3.500%, 1/11/2028 580,000 632,625 625,599Israel Government International Bond, 4.500%, 4/3/2120 200,000 243,810 254,401Lembaga Pembiayaan Ekspor Indonesia, 3.875%, 4/6/2024 200,000 206,627 210,625Philippine Government International Bond, 3.700%, 3/1/2041 250,000 285,181 272,724Qatar Government International Bond, 5.103%, 4/23/2048 200,000 237,044 270,666Republic of Italy Government International Bond, 5.375%, 6/15/2033 300,000 354,700 369,630Republic of Italy Government International Bond, 6.000%, 8/4/2028 400,000 605,494 676,517Republic of South Africa Government International Bond, 4.665%, 1/17/2024 200,000 204,146 210,376Romanian Government International Bond, 3.500%, 4/3/2034 200,000 248,435 240,034Romanian Government International Bond, 3.875%, 10/29/2035 909,000 1,261,596 1,122,838Serbia International Bond, 1.500%, 6/26/2029 150,000 179,267 165,363Serbia International Bond, 1.650%, 3/3/2033 270,000 318,485 286,805Serbia International Bond, 2.125%, 12/1/2030 520,000 510,638 486,564Serbia International Bond, 3.125%, 5/15/2027 200,000 267,598 242,964Ukraine Government International Bond, 4.375%, 1/27/2030 320,000 354,416 294,125Ukraine Government International Bond, 7.750%, 9/1/2022 450,000 456,880 445,284Ukraine Government International Bond, 7.750%, 9/1/2024 200,000 213,485 194,572Ukraine Government International Bond, 9.750%, 11/1/2028 400,000 473,711 403,672Uruguay Government International Bond, 4.975%, 4/20/2055 200,000 249,372 262,252
Total Sovereign Bonds 10,781,754 10,430,170
U.S. Government Obligations - 22.5%U.S. Treasury Bonds - 15.8%
U.S. Treasury Bonds, 1.375%, 11/15/2040 7,735,000 7,545,297 7,071,784U.S. Treasury Bonds, 1.375%, 8/15/2050 1,090,000 884,999 959,370U.S. Treasury Bonds, 1.750%, 8/15/2041 7,650,000 7,545,393 7,440,820U.S. Treasury Bonds, 2.000%, 11/15/2041 1,825,000 1,866,512 1,851,805U.S. Treasury Bonds, 2.000%, 8/15/2051 865,000 868,166 885,814U.S. Treasury Bonds, 2.250%, 5/15/2041 28,045,000 29,353,224 29,548,037U.S. Treasury Bonds, 2.375%, 5/15/2051 2,675,000 2,963,111 2,967,578
Wilmington Trust Collective Investment TrustFunds Sub-Advised by PGIM, Inc.
PGIM Total Return Bond Fund
Schedule of Investments (continued)December 31, 2021
The accompanying notes are an integral part of these financial statements. 65
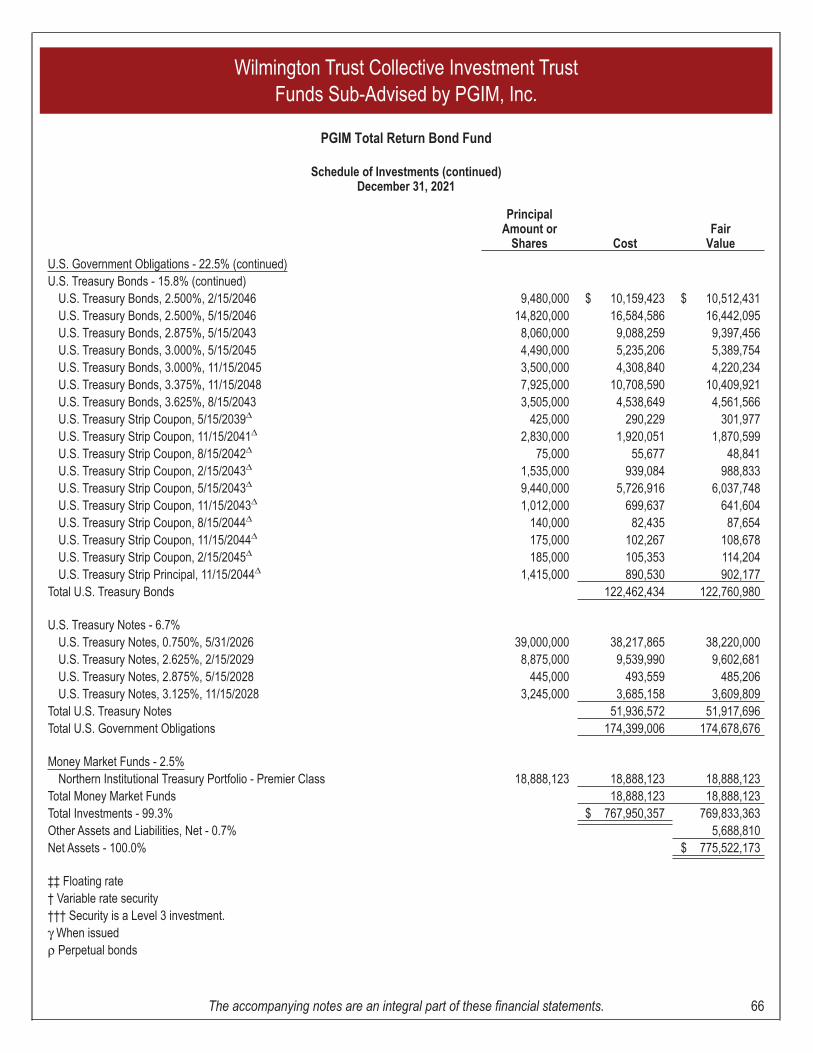
PrincipalAmount or
Shares CostFair
Value
U.S. Government Obligations - 22.5% (continued)U.S. Treasury Bonds - 15.8% (continued)
U.S. Treasury Bonds, 2.500%, 2/15/2046 9,480,000 $ 10,159,423 $ 10,512,431U.S. Treasury Bonds, 2.500%, 5/15/2046 14,820,000 16,584,586 16,442,095U.S. Treasury Bonds, 2.875%, 5/15/2043 8,060,000 9,088,259 9,397,456U.S. Treasury Bonds, 3.000%, 5/15/2045 4,490,000 5,235,206 5,389,754U.S. Treasury Bonds, 3.000%, 11/15/2045 3,500,000 4,308,840 4,220,234U.S. Treasury Bonds, 3.375%, 11/15/2048 7,925,000 10,708,590 10,409,921U.S. Treasury Bonds, 3.625%, 8/15/2043 3,505,000 4,538,649 4,561,566U.S. Treasury Strip Coupon, 5/15/2039Δ 425,000 290,229 301,977U.S. Treasury Strip Coupon, 11/15/2041Δ 2,830,000 1,920,051 1,870,599U.S. Treasury Strip Coupon, 8/15/2042Δ 75,000 55,677 48,841U.S. Treasury Strip Coupon, 2/15/2043Δ 1,535,000 939,084 988,833U.S. Treasury Strip Coupon, 5/15/2043Δ 9,440,000 5,726,916 6,037,748U.S. Treasury Strip Coupon, 11/15/2043Δ 1,012,000 699,637 641,604U.S. Treasury Strip Coupon, 8/15/2044Δ 140,000 82,435 87,654U.S. Treasury Strip Coupon, 11/15/2044Δ 175,000 102,267 108,678U.S. Treasury Strip Coupon, 2/15/2045Δ 185,000 105,353 114,204U.S. Treasury Strip Principal, 11/15/2044Δ 1,415,000 890,530 902,177
Total U.S. Treasury Bonds 122,462,434 122,760,980
U.S. Treasury Notes - 6.7%U.S. Treasury Notes, 0.750%, 5/31/2026 39,000,000 38,217,865 38,220,000U.S. Treasury Notes, 2.625%, 2/15/2029 8,875,000 9,539,990 9,602,681U.S. Treasury Notes, 2.875%, 5/15/2028 445,000 493,559 485,206U.S. Treasury Notes, 3.125%, 11/15/2028 3,245,000 3,685,158 3,609,809
Total U.S. Treasury Notes 51,936,572 51,917,696Total U.S. Government Obligations 174,399,006 174,678,676
Money Market Funds - 2.5%Northern Institutional Treasury Portfolio - Premier Class 18,888,123 18,888,123 18,888,123
Total Money Market Funds 18,888,123 18,888,123Total Investments - 99.3% $ 767,950,357 769,833,363Other Assets and Liabilities, Net - 0.7% 5,688,810Net Assets - 100.0% $ 775,522,173
‡‡ Floating rate† Variable rate security††† Security is a Level 3 investment.γ When issuedρ Perpetual bonds
Wilmington Trust Collective Investment TrustFunds Sub-Advised by PGIM, Inc.
PGIM Total Return Bond Fund
Schedule of Investments (continued)December 31, 2021
The accompanying notes are an integral part of these financial statements. 66
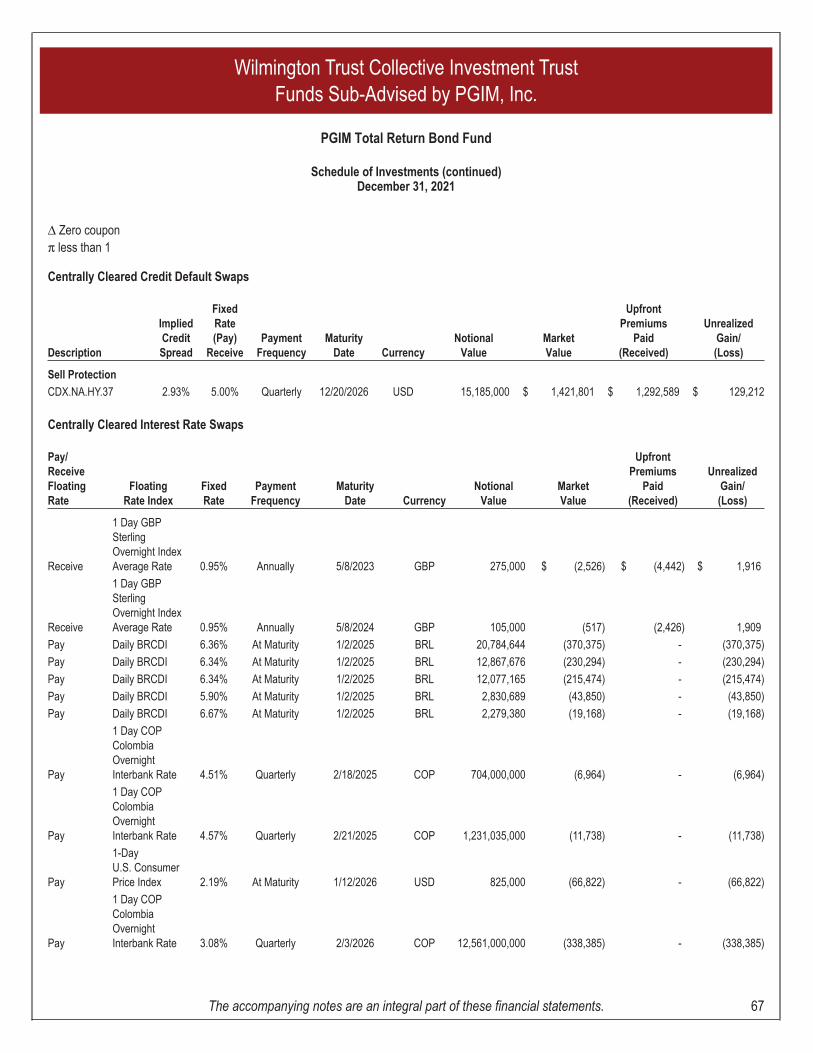
Δ Zero couponπ less than 1
Centrally Cleared Credit Default Swaps
Description
ImpliedCreditSpread
FixedRate(Pay)
ReceivePayment
FrequencyMaturity
Date CurrencyNotional
ValueMarketValue
UpfrontPremiums
Paid(Received)
UnrealizedGain/(Loss)
Sell Protection
CDX.NA.HY.37 2.93% 5.00% Quarterly 12/20/2026 USD 15,185,000 $ 1,421,801 $ 1,292,589 $ 129,212
Centrally Cleared Interest Rate Swaps
Pay/ReceiveFloatingRate
FloatingRate Index
FixedRate
PaymentFrequency
MaturityDate Currency
NotionalValue
MarketValue
UpfrontPremiums
Paid(Received)
UnrealizedGain/(Loss)
Receive
1 Day GBPSterlingOvernight IndexAverage Rate 0.95% Annually 5/8/2023 GBP 275,000 $ (2,526) $ (4,442) $ 1,916
Receive
1 Day GBPSterlingOvernight IndexAverage Rate 0.95% Annually 5/8/2024 GBP 105,000 (517) (2,426) 1,909
Pay Daily BRCDI 6.36% At Maturity 1/2/2025 BRL 20,784,644 (370,375) - (370,375)
Pay Daily BRCDI 6.34% At Maturity 1/2/2025 BRL 12,867,676 (230,294) - (230,294)
Pay Daily BRCDI 6.34% At Maturity 1/2/2025 BRL 12,077,165 (215,474) - (215,474)
Pay Daily BRCDI 5.90% At Maturity 1/2/2025 BRL 2,830,689 (43,850) - (43,850)
Pay Daily BRCDI 6.67% At Maturity 1/2/2025 BRL 2,279,380 (19,168) - (19,168)
Pay
1 Day COPColombiaOvernightInterbank Rate 4.51% Quarterly 2/18/2025 COP 704,000,000 (6,964) - (6,964)
Pay
1 Day COPColombiaOvernightInterbank Rate 4.57% Quarterly 2/21/2025 COP 1,231,035,000 (11,738) - (11,738)
Pay
1-DayU.S. ConsumerPrice Index 2.19% At Maturity 1/12/2026 USD 825,000 (66,822) - (66,822)
Pay
1 Day COPColombiaOvernightInterbank Rate 3.08% Quarterly 2/3/2026 COP 12,561,000,000 (338,385) - (338,385)
Wilmington Trust Collective Investment TrustFunds Sub-Advised by PGIM, Inc.
PGIM Total Return Bond Fund
Schedule of Investments (continued)December 31, 2021
The accompanying notes are an integral part of these financial statements. 67
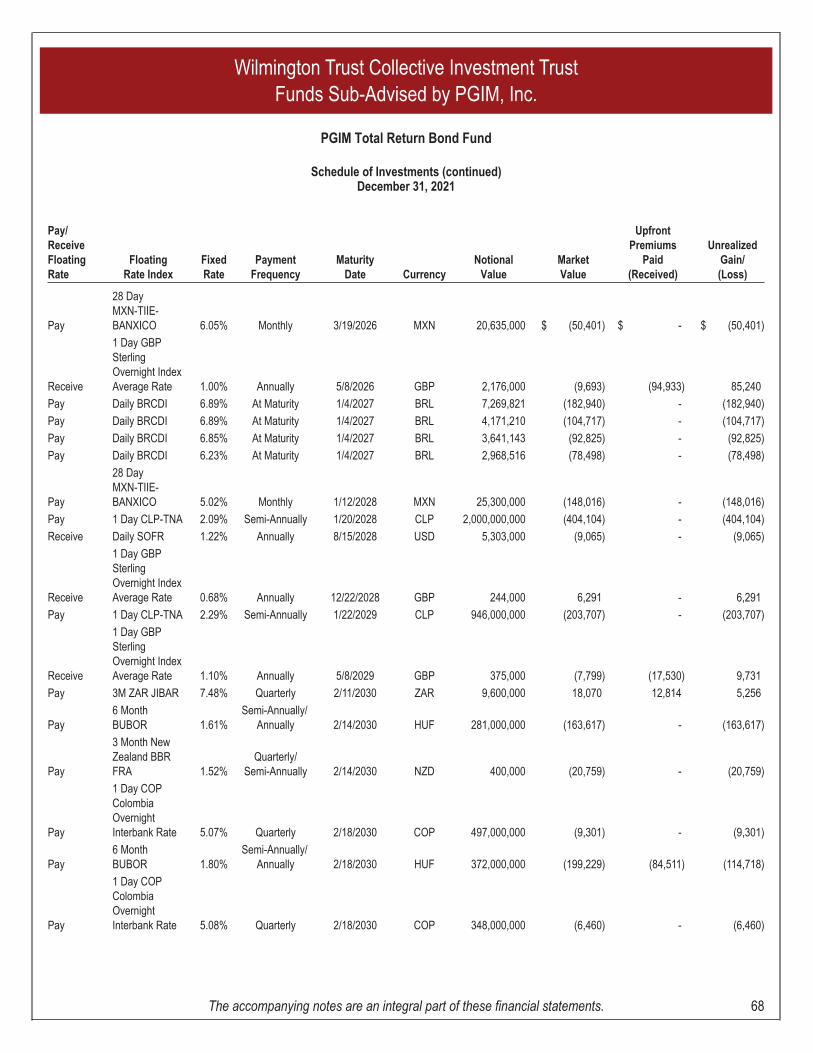
Pay/ReceiveFloatingRate
FloatingRate Index
FixedRate
PaymentFrequency
MaturityDate Currency
NotionalValue
MarketValue
UpfrontPremiums
Paid(Received)
UnrealizedGain/(Loss)
Pay
28 DayMXN-TIIE-BANXICO 6.05% Monthly 3/19/2026 MXN 20,635,000 $ (50,401) $ - $ (50,401)
Receive
1 Day GBPSterlingOvernight IndexAverage Rate 1.00% Annually 5/8/2026 GBP 2,176,000 (9,693) (94,933) 85,240
Pay Daily BRCDI 6.89% At Maturity 1/4/2027 BRL 7,269,821 (182,940) - (182,940)
Pay Daily BRCDI 6.89% At Maturity 1/4/2027 BRL 4,171,210 (104,717) - (104,717)
Pay Daily BRCDI 6.85% At Maturity 1/4/2027 BRL 3,641,143 (92,825) - (92,825)
Pay Daily BRCDI 6.23% At Maturity 1/4/2027 BRL 2,968,516 (78,498) - (78,498)
Pay
28 DayMXN-TIIE-BANXICO 5.02% Monthly 1/12/2028 MXN 25,300,000 (148,016) - (148,016)
Pay 1 Day CLP-TNA 2.09% Semi-Annually 1/20/2028 CLP 2,000,000,000 (404,104) - (404,104)
Receive Daily SOFR 1.22% Annually 8/15/2028 USD 5,303,000 (9,065) - (9,065)
Receive
1 Day GBPSterlingOvernight IndexAverage Rate 0.68% Annually 12/22/2028 GBP 244,000 6,291 - 6,291
Pay 1 Day CLP-TNA 2.29% Semi-Annually 1/22/2029 CLP 946,000,000 (203,707) - (203,707)
Receive
1 Day GBPSterlingOvernight IndexAverage Rate 1.10% Annually 5/8/2029 GBP 375,000 (7,799) (17,530) 9,731
Pay 3M ZAR JIBAR 7.48% Quarterly 2/11/2030 ZAR 9,600,000 18,070 12,814 5,256
Pay6 MonthBUBOR 1.61%
Semi-Annually/Annually 2/14/2030 HUF 281,000,000 (163,617) - (163,617)
Pay
3 Month NewZealand BBRFRA 1.52%
Quarterly/Semi-Annually 2/14/2030 NZD 400,000 (20,759) - (20,759)
Pay
1 Day COPColombiaOvernightInterbank Rate 5.07% Quarterly 2/18/2030 COP 497,000,000 (9,301) - (9,301)
Pay6 MonthBUBOR 1.80%
Semi-Annually/Annually 2/18/2030 HUF 372,000,000 (199,229) (84,511) (114,718)
Pay
1 Day COPColombiaOvernightInterbank Rate 5.08% Quarterly 2/18/2030 COP 348,000,000 (6,460) - (6,460)
Wilmington Trust Collective Investment TrustFunds Sub-Advised by PGIM, Inc.
PGIM Total Return Bond Fund
Schedule of Investments (continued)December 31, 2021
The accompanying notes are an integral part of these financial statements. 68
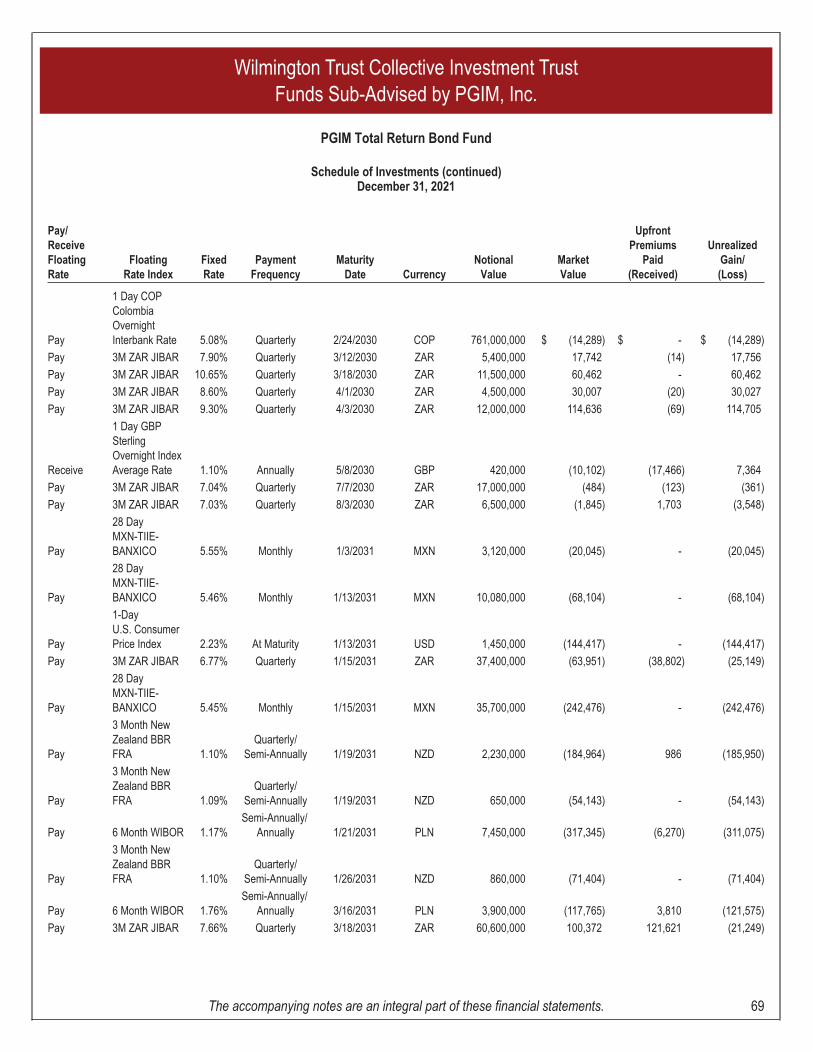
Pay/ReceiveFloatingRate
FloatingRate Index
FixedRate
PaymentFrequency
MaturityDate Currency
NotionalValue
MarketValue
UpfrontPremiums
Paid(Received)
UnrealizedGain/(Loss)
Pay
1 Day COPColombiaOvernightInterbank Rate 5.08% Quarterly 2/24/2030 COP 761,000,000 $ (14,289) $ - $ (14,289)
Pay 3M ZAR JIBAR 7.90% Quarterly 3/12/2030 ZAR 5,400,000 17,742 (14) 17,756
Pay 3M ZAR JIBAR 10.65% Quarterly 3/18/2030 ZAR 11,500,000 60,462 - 60,462
Pay 3M ZAR JIBAR 8.60% Quarterly 4/1/2030 ZAR 4,500,000 30,007 (20) 30,027
Pay 3M ZAR JIBAR 9.30% Quarterly 4/3/2030 ZAR 12,000,000 114,636 (69) 114,705
Receive
1 Day GBPSterlingOvernight IndexAverage Rate 1.10% Annually 5/8/2030 GBP 420,000 (10,102) (17,466) 7,364
Pay 3M ZAR JIBAR 7.04% Quarterly 7/7/2030 ZAR 17,000,000 (484) (123) (361)
Pay 3M ZAR JIBAR 7.03% Quarterly 8/3/2030 ZAR 6,500,000 (1,845) 1,703 (3,548)
Pay
28 DayMXN-TIIE-BANXICO 5.55% Monthly 1/3/2031 MXN 3,120,000 (20,045) - (20,045)
Pay
28 DayMXN-TIIE-BANXICO 5.46% Monthly 1/13/2031 MXN 10,080,000 (68,104) - (68,104)
Pay
1-DayU.S. ConsumerPrice Index 2.23% At Maturity 1/13/2031 USD 1,450,000 (144,417) - (144,417)
Pay 3M ZAR JIBAR 6.77% Quarterly 1/15/2031 ZAR 37,400,000 (63,951) (38,802) (25,149)
Pay
28 DayMXN-TIIE-BANXICO 5.45% Monthly 1/15/2031 MXN 35,700,000 (242,476) - (242,476)
Pay
3 Month NewZealand BBRFRA 1.10%
Quarterly/Semi-Annually 1/19/2031 NZD 2,230,000 (184,964) 986 (185,950)
Pay
3 Month NewZealand BBRFRA 1.09%
Quarterly/Semi-Annually 1/19/2031 NZD 650,000 (54,143) - (54,143)
Pay 6 Month WIBOR 1.17%Semi-Annually/
Annually 1/21/2031 PLN 7,450,000 (317,345) (6,270) (311,075)
Pay
3 Month NewZealand BBRFRA 1.10%
Quarterly/Semi-Annually 1/26/2031 NZD 860,000 (71,404) - (71,404)
Pay 6 Month WIBOR 1.76%Semi-Annually/
Annually 3/16/2031 PLN 3,900,000 (117,765) 3,810 (121,575)
Pay 3M ZAR JIBAR 7.66% Quarterly 3/18/2031 ZAR 60,600,000 100,372 121,621 (21,249)
Wilmington Trust Collective Investment TrustFunds Sub-Advised by PGIM, Inc.
PGIM Total Return Bond Fund
Schedule of Investments (continued)December 31, 2021
The accompanying notes are an integral part of these financial statements. 69
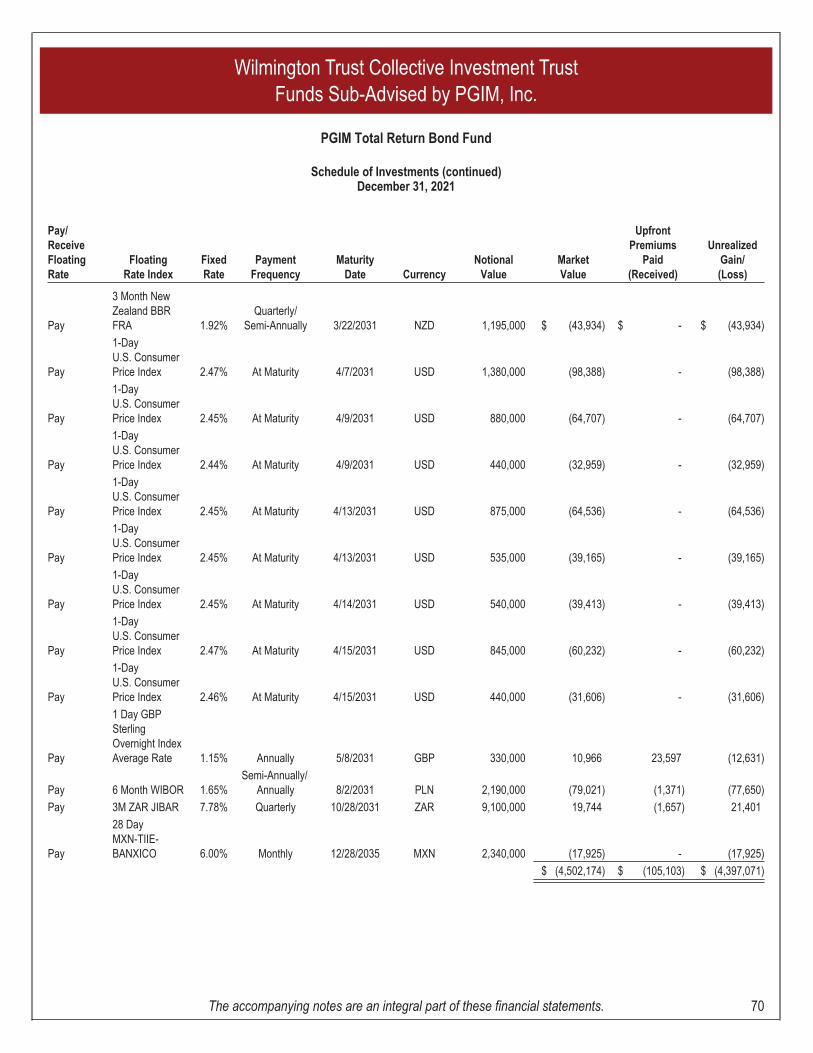
Pay/ReceiveFloatingRate
FloatingRate Index
FixedRate
PaymentFrequency
MaturityDate Currency
NotionalValue
MarketValue
UpfrontPremiums
Paid(Received)
UnrealizedGain/(Loss)
Pay
3 Month NewZealand BBRFRA 1.92%
Quarterly/Semi-Annually 3/22/2031 NZD 1,195,000 $ (43,934) $ - $ (43,934)
Pay
1-DayU.S. ConsumerPrice Index 2.47% At Maturity 4/7/2031 USD 1,380,000 (98,388) - (98,388)
Pay
1-DayU.S. ConsumerPrice Index 2.45% At Maturity 4/9/2031 USD 880,000 (64,707) - (64,707)
Pay
1-DayU.S. ConsumerPrice Index 2.44% At Maturity 4/9/2031 USD 440,000 (32,959) - (32,959)
Pay
1-DayU.S. ConsumerPrice Index 2.45% At Maturity 4/13/2031 USD 875,000 (64,536) - (64,536)
Pay
1-DayU.S. ConsumerPrice Index 2.45% At Maturity 4/13/2031 USD 535,000 (39,165) - (39,165)
Pay
1-DayU.S. ConsumerPrice Index 2.45% At Maturity 4/14/2031 USD 540,000 (39,413) - (39,413)
Pay
1-DayU.S. ConsumerPrice Index 2.47% At Maturity 4/15/2031 USD 845,000 (60,232) - (60,232)
Pay
1-DayU.S. ConsumerPrice Index 2.46% At Maturity 4/15/2031 USD 440,000 (31,606) - (31,606)
Pay
1 Day GBPSterlingOvernight IndexAverage Rate 1.15% Annually 5/8/2031 GBP 330,000 10,966 23,597 (12,631)
Pay 6 Month WIBOR 1.65%Semi-Annually/
Annually 8/2/2031 PLN 2,190,000 (79,021) (1,371) (77,650)
Pay 3M ZAR JIBAR 7.78% Quarterly 10/28/2031 ZAR 9,100,000 19,744 (1,657) 21,401
Pay
28 DayMXN-TIIE-BANXICO 6.00% Monthly 12/28/2035 MXN 2,340,000 (17,925) - (17,925)
$ (4,502,174) $ (105,103) $ (4,397,071)
Wilmington Trust Collective Investment TrustFunds Sub-Advised by PGIM, Inc.
PGIM Total Return Bond Fund
Schedule of Investments (continued)December 31, 2021
The accompanying notes are an integral part of these financial statements. 70
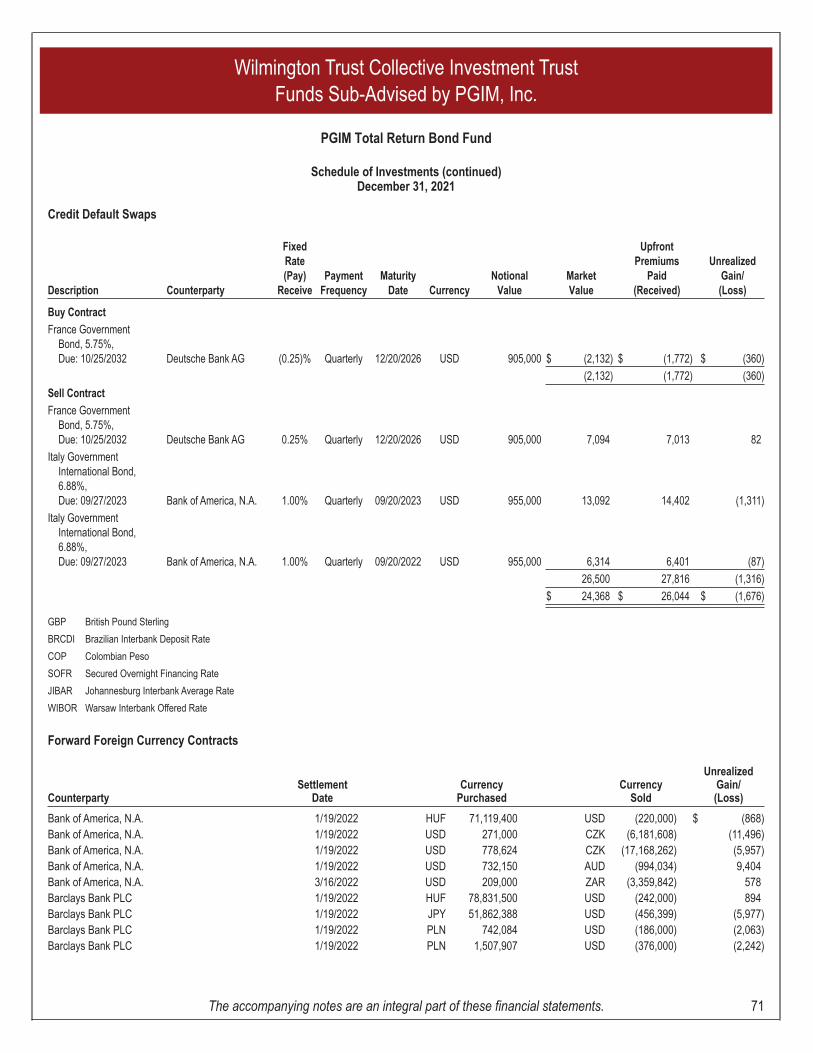
Credit Default Swaps
Description Counterparty
FixedRate(Pay)
ReceivePayment
FrequencyMaturity
Date CurrencyNotional
ValueMarketValue
UpfrontPremiums
Paid(Received)
UnrealizedGain/(Loss)
Buy Contract
France GovernmentBond, 5.75%,Due: 10/25/2032 Deutsche Bank AG (0.25)% Quarterly 12/20/2026 USD 905,000 $ (2,132) $ (1,772) $ (360)
(2,132) (1,772) (360)
Sell Contract
France GovernmentBond, 5.75%,Due: 10/25/2032 Deutsche Bank AG 0.25% Quarterly 12/20/2026 USD 905,000 7,094 7,013 82
Italy GovernmentInternational Bond,6.88%,Due: 09/27/2023 Bank of America, N.A. 1.00% Quarterly 09/20/2023 USD 955,000 13,092 14,402 (1,311)
Italy GovernmentInternational Bond,6.88%,Due: 09/27/2023 Bank of America, N.A. 1.00% Quarterly 09/20/2022 USD 955,000 6,314 6,401 (87)
26,500 27,816 (1,316)
$ 24,368 $ 26,044 $ (1,676)
GBP British Pound Sterling
BRCDI Brazilian Interbank Deposit Rate
COP Colombian Peso
SOFR Secured Overnight Financing Rate
JIBAR Johannesburg Interbank Average Rate
WIBOR Warsaw Interbank Offered Rate
Forward Foreign Currency Contracts
CounterpartySettlement
DateCurrency
PurchasedCurrency
Sold
UnrealizedGain/(Loss)
Bank of America, N.A. 1/19/2022 HUF 71,119,400 USD (220,000) $ (868)Bank of America, N.A. 1/19/2022 USD 271,000 CZK (6,181,608) (11,496)Bank of America, N.A. 1/19/2022 USD 778,624 CZK (17,168,262) (5,957)Bank of America, N.A. 1/19/2022 USD 732,150 AUD (994,034) 9,404Bank of America, N.A. 3/16/2022 USD 209,000 ZAR (3,359,842) 578Barclays Bank PLC 1/19/2022 HUF 78,831,500 USD (242,000) 894Barclays Bank PLC 1/19/2022 JPY 51,862,388 USD (456,399) (5,977)Barclays Bank PLC 1/19/2022 PLN 742,084 USD (186,000) (2,063)Barclays Bank PLC 1/19/2022 PLN 1,507,907 USD (376,000) (2,242)
Wilmington Trust Collective Investment TrustFunds Sub-Advised by PGIM, Inc.
PGIM Total Return Bond Fund
Schedule of Investments (continued)December 31, 2021
The accompanying notes are an integral part of these financial statements. 71
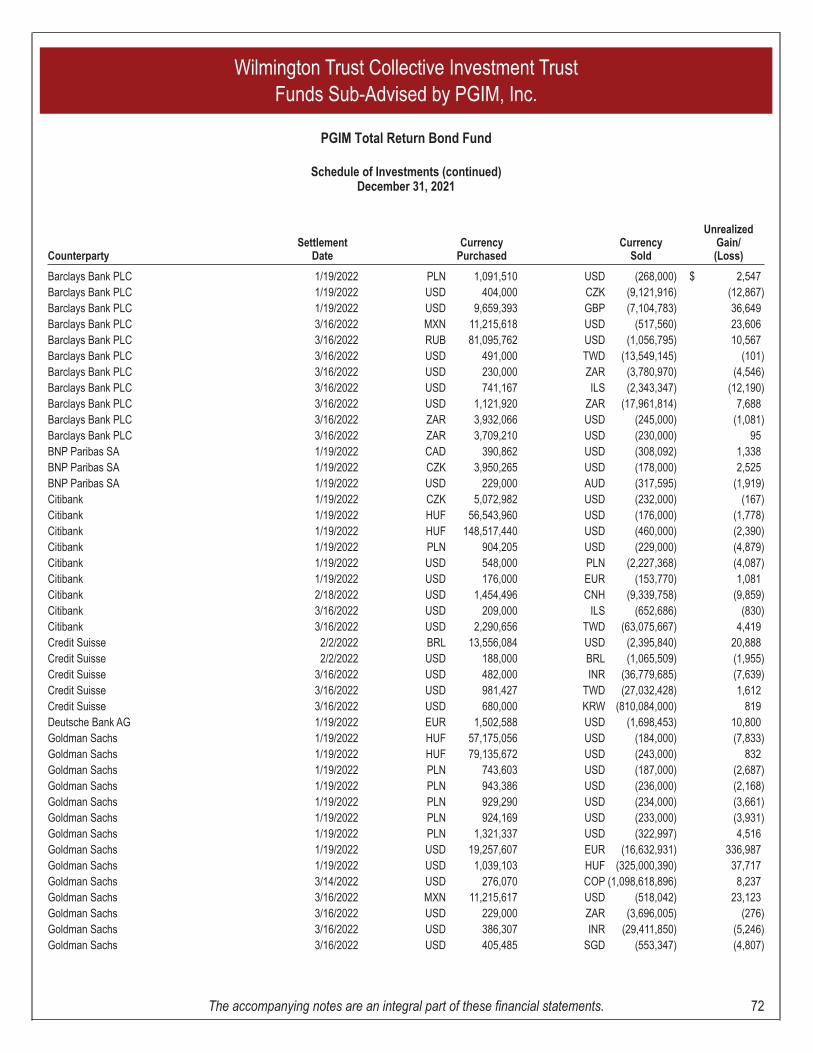
CounterpartySettlement
DateCurrency
PurchasedCurrency
Sold
UnrealizedGain/(Loss)
Barclays Bank PLC 1/19/2022 PLN 1,091,510 USD (268,000) $ 2,547Barclays Bank PLC 1/19/2022 USD 404,000 CZK (9,121,916) (12,867)Barclays Bank PLC 1/19/2022 USD 9,659,393 GBP (7,104,783) 36,649Barclays Bank PLC 3/16/2022 MXN 11,215,618 USD (517,560) 23,606Barclays Bank PLC 3/16/2022 RUB 81,095,762 USD (1,056,795) 10,567Barclays Bank PLC 3/16/2022 USD 491,000 TWD (13,549,145) (101)Barclays Bank PLC 3/16/2022 USD 230,000 ZAR (3,780,970) (4,546)Barclays Bank PLC 3/16/2022 USD 741,167 ILS (2,343,347) (12,190)Barclays Bank PLC 3/16/2022 USD 1,121,920 ZAR (17,961,814) 7,688Barclays Bank PLC 3/16/2022 ZAR 3,932,066 USD (245,000) (1,081)Barclays Bank PLC 3/16/2022 ZAR 3,709,210 USD (230,000) 95BNP Paribas SA 1/19/2022 CAD 390,862 USD (308,092) 1,338BNP Paribas SA 1/19/2022 CZK 3,950,265 USD (178,000) 2,525BNP Paribas SA 1/19/2022 USD 229,000 AUD (317,595) (1,919)Citibank 1/19/2022 CZK 5,072,982 USD (232,000) (167)Citibank 1/19/2022 HUF 56,543,960 USD (176,000) (1,778)Citibank 1/19/2022 HUF 148,517,440 USD (460,000) (2,390)Citibank 1/19/2022 PLN 904,205 USD (229,000) (4,879)Citibank 1/19/2022 USD 548,000 PLN (2,227,368) (4,087)Citibank 1/19/2022 USD 176,000 EUR (153,770) 1,081Citibank 2/18/2022 USD 1,454,496 CNH (9,339,758) (9,859)Citibank 3/16/2022 USD 209,000 ILS (652,686) (830)Citibank 3/16/2022 USD 2,290,656 TWD (63,075,667) 4,419Credit Suisse 2/2/2022 BRL 13,556,084 USD (2,395,840) 20,888Credit Suisse 2/2/2022 USD 188,000 BRL (1,065,509) (1,955)Credit Suisse 3/16/2022 USD 482,000 INR (36,779,685) (7,639)Credit Suisse 3/16/2022 USD 981,427 TWD (27,032,428) 1,612Credit Suisse 3/16/2022 USD 680,000 KRW (810,084,000) 819Deutsche Bank AG 1/19/2022 EUR 1,502,588 USD (1,698,453) 10,800Goldman Sachs 1/19/2022 HUF 57,175,056 USD (184,000) (7,833)Goldman Sachs 1/19/2022 HUF 79,135,672 USD (243,000) 832Goldman Sachs 1/19/2022 PLN 743,603 USD (187,000) (2,687)Goldman Sachs 1/19/2022 PLN 943,386 USD (236,000) (2,168)Goldman Sachs 1/19/2022 PLN 929,290 USD (234,000) (3,661)Goldman Sachs 1/19/2022 PLN 924,169 USD (233,000) (3,931)Goldman Sachs 1/19/2022 PLN 1,321,337 USD (322,997) 4,516Goldman Sachs 1/19/2022 USD 19,257,607 EUR (16,632,931) 336,987Goldman Sachs 1/19/2022 USD 1,039,103 HUF (325,000,390) 37,717Goldman Sachs 3/14/2022 USD 276,070 COP (1,098,618,896) 8,237Goldman Sachs 3/16/2022 MXN 11,215,617 USD (518,042) 23,123Goldman Sachs 3/16/2022 USD 229,000 ZAR (3,696,005) (276)Goldman Sachs 3/16/2022 USD 386,307 INR (29,411,850) (5,246)Goldman Sachs 3/16/2022 USD 405,485 SGD (553,347) (4,807)
Wilmington Trust Collective Investment TrustFunds Sub-Advised by PGIM, Inc.
PGIM Total Return Bond Fund
Schedule of Investments (continued)December 31, 2021
The accompanying notes are an integral part of these financial statements. 72
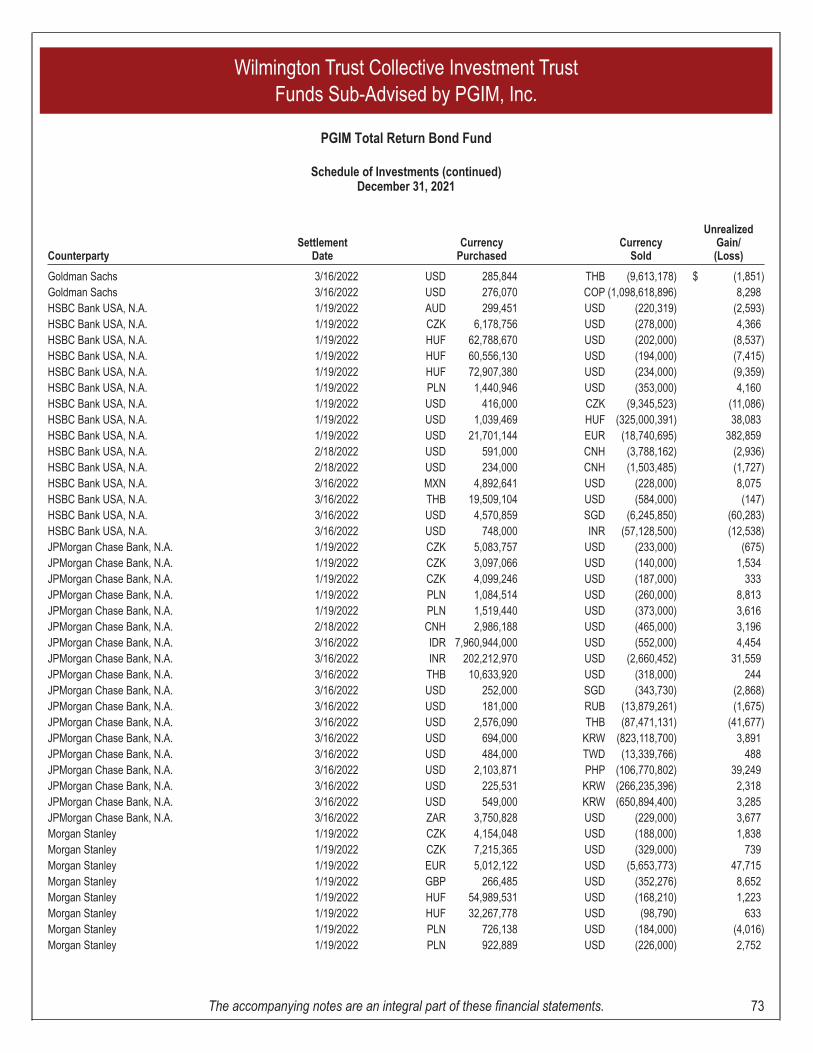
CounterpartySettlement
DateCurrency
PurchasedCurrency
Sold
UnrealizedGain/(Loss)
Goldman Sachs 3/16/2022 USD 285,844 THB (9,613,178) $ (1,851)Goldman Sachs 3/16/2022 USD 276,070 COP (1,098,618,896) 8,298HSBC Bank USA, N.A. 1/19/2022 AUD 299,451 USD (220,319) (2,593)HSBC Bank USA, N.A. 1/19/2022 CZK 6,178,756 USD (278,000) 4,366HSBC Bank USA, N.A. 1/19/2022 HUF 62,788,670 USD (202,000) (8,537)HSBC Bank USA, N.A. 1/19/2022 HUF 60,556,130 USD (194,000) (7,415)HSBC Bank USA, N.A. 1/19/2022 HUF 72,907,380 USD (234,000) (9,359)HSBC Bank USA, N.A. 1/19/2022 PLN 1,440,946 USD (353,000) 4,160HSBC Bank USA, N.A. 1/19/2022 USD 416,000 CZK (9,345,523) (11,086)HSBC Bank USA, N.A. 1/19/2022 USD 1,039,469 HUF (325,000,391) 38,083HSBC Bank USA, N.A. 1/19/2022 USD 21,701,144 EUR (18,740,695) 382,859HSBC Bank USA, N.A. 2/18/2022 USD 591,000 CNH (3,788,162) (2,936)HSBC Bank USA, N.A. 2/18/2022 USD 234,000 CNH (1,503,485) (1,727)HSBC Bank USA, N.A. 3/16/2022 MXN 4,892,641 USD (228,000) 8,075HSBC Bank USA, N.A. 3/16/2022 THB 19,509,104 USD (584,000) (147)HSBC Bank USA, N.A. 3/16/2022 USD 4,570,859 SGD (6,245,850) (60,283)HSBC Bank USA, N.A. 3/16/2022 USD 748,000 INR (57,128,500) (12,538)JPMorgan Chase Bank, N.A. 1/19/2022 CZK 5,083,757 USD (233,000) (675)JPMorgan Chase Bank, N.A. 1/19/2022 CZK 3,097,066 USD (140,000) 1,534JPMorgan Chase Bank, N.A. 1/19/2022 CZK 4,099,246 USD (187,000) 333JPMorgan Chase Bank, N.A. 1/19/2022 PLN 1,084,514 USD (260,000) 8,813JPMorgan Chase Bank, N.A. 1/19/2022 PLN 1,519,440 USD (373,000) 3,616JPMorgan Chase Bank, N.A. 2/18/2022 CNH 2,986,188 USD (465,000) 3,196JPMorgan Chase Bank, N.A. 3/16/2022 IDR 7,960,944,000 USD (552,000) 4,454JPMorgan Chase Bank, N.A. 3/16/2022 INR 202,212,970 USD (2,660,452) 31,559JPMorgan Chase Bank, N.A. 3/16/2022 THB 10,633,920 USD (318,000) 244JPMorgan Chase Bank, N.A. 3/16/2022 USD 252,000 SGD (343,730) (2,868)JPMorgan Chase Bank, N.A. 3/16/2022 USD 181,000 RUB (13,879,261) (1,675)JPMorgan Chase Bank, N.A. 3/16/2022 USD 2,576,090 THB (87,471,131) (41,677)JPMorgan Chase Bank, N.A. 3/16/2022 USD 694,000 KRW (823,118,700) 3,891JPMorgan Chase Bank, N.A. 3/16/2022 USD 484,000 TWD (13,339,766) 488JPMorgan Chase Bank, N.A. 3/16/2022 USD 2,103,871 PHP (106,770,802) 39,249JPMorgan Chase Bank, N.A. 3/16/2022 USD 225,531 KRW (266,235,396) 2,318JPMorgan Chase Bank, N.A. 3/16/2022 USD 549,000 KRW (650,894,400) 3,285JPMorgan Chase Bank, N.A. 3/16/2022 ZAR 3,750,828 USD (229,000) 3,677Morgan Stanley 1/19/2022 CZK 4,154,048 USD (188,000) 1,838Morgan Stanley 1/19/2022 CZK 7,215,365 USD (329,000) 739Morgan Stanley 1/19/2022 EUR 5,012,122 USD (5,653,773) 47,715Morgan Stanley 1/19/2022 GBP 266,485 USD (352,276) 8,652Morgan Stanley 1/19/2022 HUF 54,989,531 USD (168,210) 1,223Morgan Stanley 1/19/2022 HUF 32,267,778 USD (98,790) 633Morgan Stanley 1/19/2022 PLN 726,138 USD (184,000) (4,016)Morgan Stanley 1/19/2022 PLN 922,889 USD (226,000) 2,752
Wilmington Trust Collective Investment TrustFunds Sub-Advised by PGIM, Inc.
PGIM Total Return Bond Fund
Schedule of Investments (continued)December 31, 2021
The accompanying notes are an integral part of these financial statements. 73
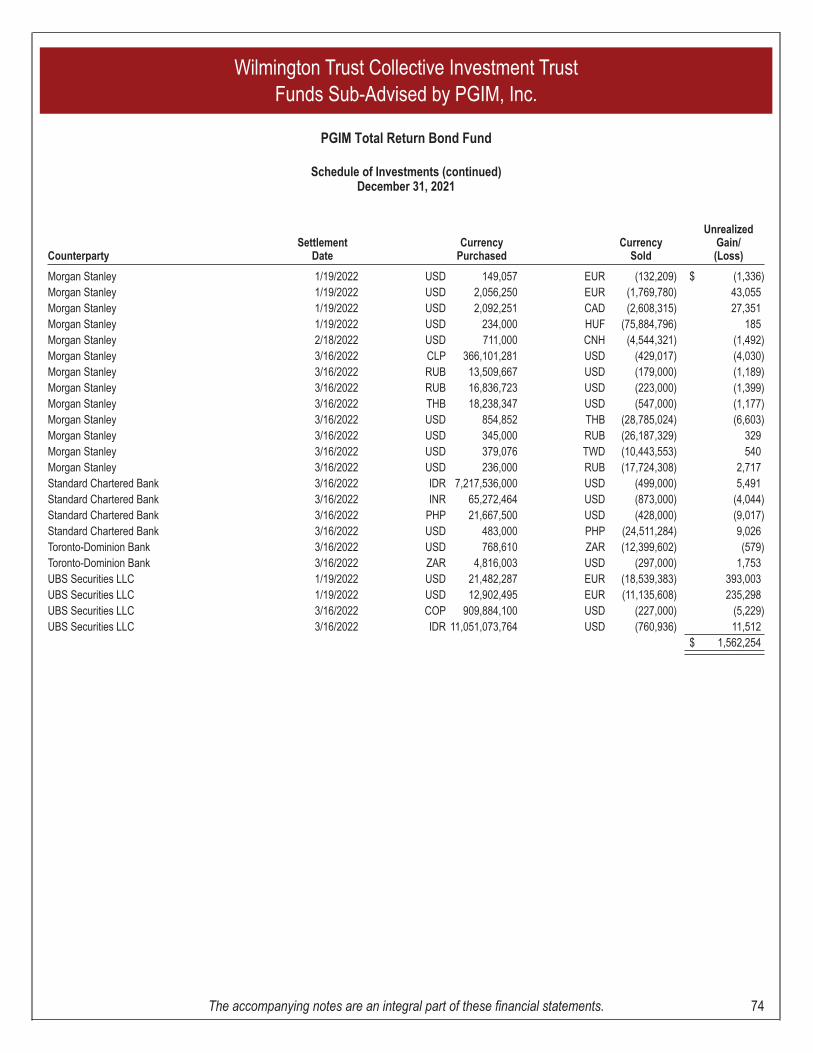
CounterpartySettlement
DateCurrency
PurchasedCurrency
Sold
UnrealizedGain/(Loss)
Morgan Stanley 1/19/2022 USD 149,057 EUR (132,209) $ (1,336)Morgan Stanley 1/19/2022 USD 2,056,250 EUR (1,769,780) 43,055Morgan Stanley 1/19/2022 USD 2,092,251 CAD (2,608,315) 27,351Morgan Stanley 1/19/2022 USD 234,000 HUF (75,884,796) 185Morgan Stanley 2/18/2022 USD 711,000 CNH (4,544,321) (1,492)Morgan Stanley 3/16/2022 CLP 366,101,281 USD (429,017) (4,030)Morgan Stanley 3/16/2022 RUB 13,509,667 USD (179,000) (1,189)Morgan Stanley 3/16/2022 RUB 16,836,723 USD (223,000) (1,399)Morgan Stanley 3/16/2022 THB 18,238,347 USD (547,000) (1,177)Morgan Stanley 3/16/2022 USD 854,852 THB (28,785,024) (6,603)Morgan Stanley 3/16/2022 USD 345,000 RUB (26,187,329) 329Morgan Stanley 3/16/2022 USD 379,076 TWD (10,443,553) 540Morgan Stanley 3/16/2022 USD 236,000 RUB (17,724,308) 2,717Standard Chartered Bank 3/16/2022 IDR 7,217,536,000 USD (499,000) 5,491Standard Chartered Bank 3/16/2022 INR 65,272,464 USD (873,000) (4,044)Standard Chartered Bank 3/16/2022 PHP 21,667,500 USD (428,000) (9,017)Standard Chartered Bank 3/16/2022 USD 483,000 PHP (24,511,284) 9,026Toronto-Dominion Bank 3/16/2022 USD 768,610 ZAR (12,399,602) (579)Toronto-Dominion Bank 3/16/2022 ZAR 4,816,003 USD (297,000) 1,753UBS Securities LLC 1/19/2022 USD 21,482,287 EUR (18,539,383) 393,003UBS Securities LLC 1/19/2022 USD 12,902,495 EUR (11,135,608) 235,298UBS Securities LLC 3/16/2022 COP 909,884,100 USD (227,000) (5,229)UBS Securities LLC 3/16/2022 IDR 11,051,073,764 USD (760,936) 11,512
$ 1,562,254
Wilmington Trust Collective Investment TrustFunds Sub-Advised by PGIM, Inc.
PGIM Total Return Bond Fund
Schedule of Investments (continued)December 31, 2021
The accompanying notes are an integral part of these financial statements. 74
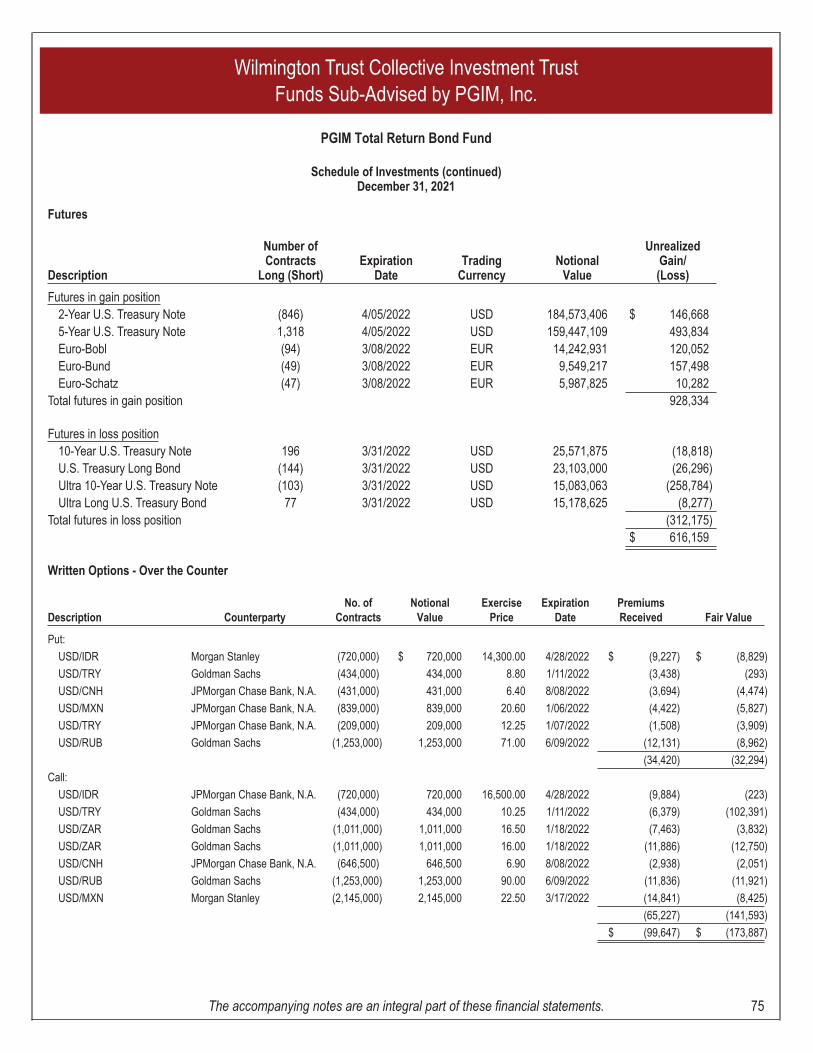
Futures
Description
Number ofContracts
Long (Short)Expiration
DateTrading
CurrencyNotional
Value
UnrealizedGain/(Loss)
Futures in gain position2-Year U.S. Treasury Note (846) 4/05/2022 USD 184,573,406 $ 146,6685-Year U.S. Treasury Note 1,318 4/05/2022 USD 159,447,109 493,834Euro-Bobl (94) 3/08/2022 EUR 14,242,931 120,052Euro-Bund (49) 3/08/2022 EUR 9,549,217 157,498Euro-Schatz (47) 3/08/2022 EUR 5,987,825 10,282
Total futures in gain position 928,334
Futures in loss position10-Year U.S. Treasury Note 196 3/31/2022 USD 25,571,875 (18,818)U.S. Treasury Long Bond (144) 3/31/2022 USD 23,103,000 (26,296)Ultra 10-Year U.S. Treasury Note (103) 3/31/2022 USD 15,083,063 (258,784)Ultra Long U.S. Treasury Bond 77 3/31/2022 USD 15,178,625 (8,277)
Total futures in loss position (312,175)$ 616,159
Written Options - Over the Counter
Description CounterpartyNo. of
ContractsNotional
ValueExercise
PriceExpiration
DatePremiumsReceived Fair Value
Put:
USD/IDR Morgan Stanley (720,000) $ 720,000 14,300.00 4/28/2022 $ (9,227) $ (8,829)
USD/TRY Goldman Sachs (434,000) 434,000 8.80 1/11/2022 (3,438) (293)
USD/CNH JPMorgan Chase Bank, N.A. (431,000) 431,000 6.40 8/08/2022 (3,694) (4,474)
USD/MXN JPMorgan Chase Bank, N.A. (839,000) 839,000 20.60 1/06/2022 (4,422) (5,827)
USD/TRY JPMorgan Chase Bank, N.A. (209,000) 209,000 12.25 1/07/2022 (1,508) (3,909)
USD/RUB Goldman Sachs (1,253,000) 1,253,000 71.00 6/09/2022 (12,131) (8,962)
(34,420) (32,294)
Call:
USD/IDR JPMorgan Chase Bank, N.A. (720,000) 720,000 16,500.00 4/28/2022 (9,884) (223)
USD/TRY Goldman Sachs (434,000) 434,000 10.25 1/11/2022 (6,379) (102,391)
USD/ZAR Goldman Sachs (1,011,000) 1,011,000 16.50 1/18/2022 (7,463) (3,832)
USD/ZAR Goldman Sachs (1,011,000) 1,011,000 16.00 1/18/2022 (11,886) (12,750)
USD/CNH JPMorgan Chase Bank, N.A. (646,500) 646,500 6.90 8/08/2022 (2,938) (2,051)
USD/RUB Goldman Sachs (1,253,000) 1,253,000 90.00 6/09/2022 (11,836) (11,921)
USD/MXN Morgan Stanley (2,145,000) 2,145,000 22.50 3/17/2022 (14,841) (8,425)
(65,227) (141,593)
$ (99,647) $ (173,887)
Wilmington Trust Collective Investment TrustFunds Sub-Advised by PGIM, Inc.
PGIM Total Return Bond Fund
Schedule of Investments (continued)December 31, 2021
The accompanying notes are an integral part of these financial statements. 75
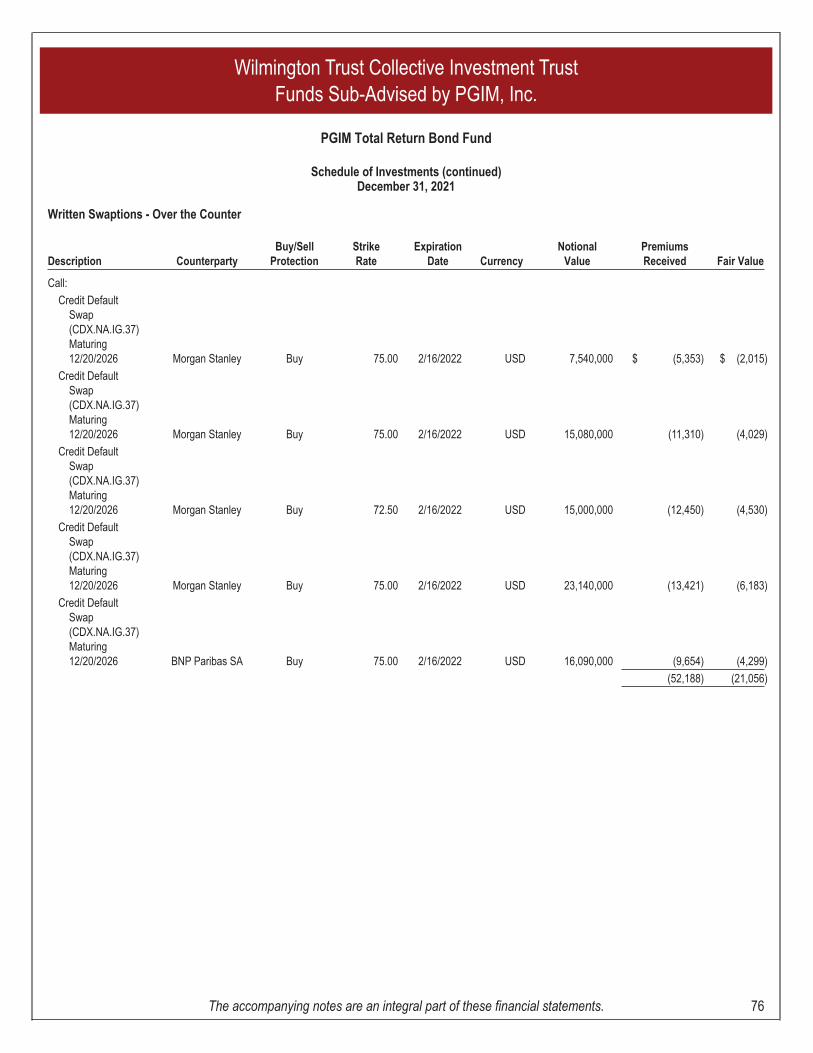
Written Swaptions - Over the Counter
Description CounterpartyBuy/Sell
ProtectionStrikeRate
ExpirationDate Currency
NotionalValue
PremiumsReceived Fair Value
Call:
Credit DefaultSwap(CDX.NA.IG.37)Maturing12/20/2026 Morgan Stanley Buy 75.00 2/16/2022 USD 7,540,000 $ (5,353) $ (2,015)
Credit DefaultSwap(CDX.NA.IG.37)Maturing12/20/2026 Morgan Stanley Buy 75.00 2/16/2022 USD 15,080,000 (11,310) (4,029)
Credit DefaultSwap(CDX.NA.IG.37)Maturing12/20/2026 Morgan Stanley Buy 72.50 2/16/2022 USD 15,000,000 (12,450) (4,530)
Credit DefaultSwap(CDX.NA.IG.37)Maturing12/20/2026 Morgan Stanley Buy 75.00 2/16/2022 USD 23,140,000 (13,421) (6,183)
Credit DefaultSwap(CDX.NA.IG.37)Maturing12/20/2026 BNP Paribas SA Buy 75.00 2/16/2022 USD 16,090,000 (9,654) (4,299)
(52,188) (21,056)
Wilmington Trust Collective Investment TrustFunds Sub-Advised by PGIM, Inc.
PGIM Total Return Bond Fund
Schedule of Investments (continued)December 31, 2021
The accompanying notes are an integral part of these financial statements. 76
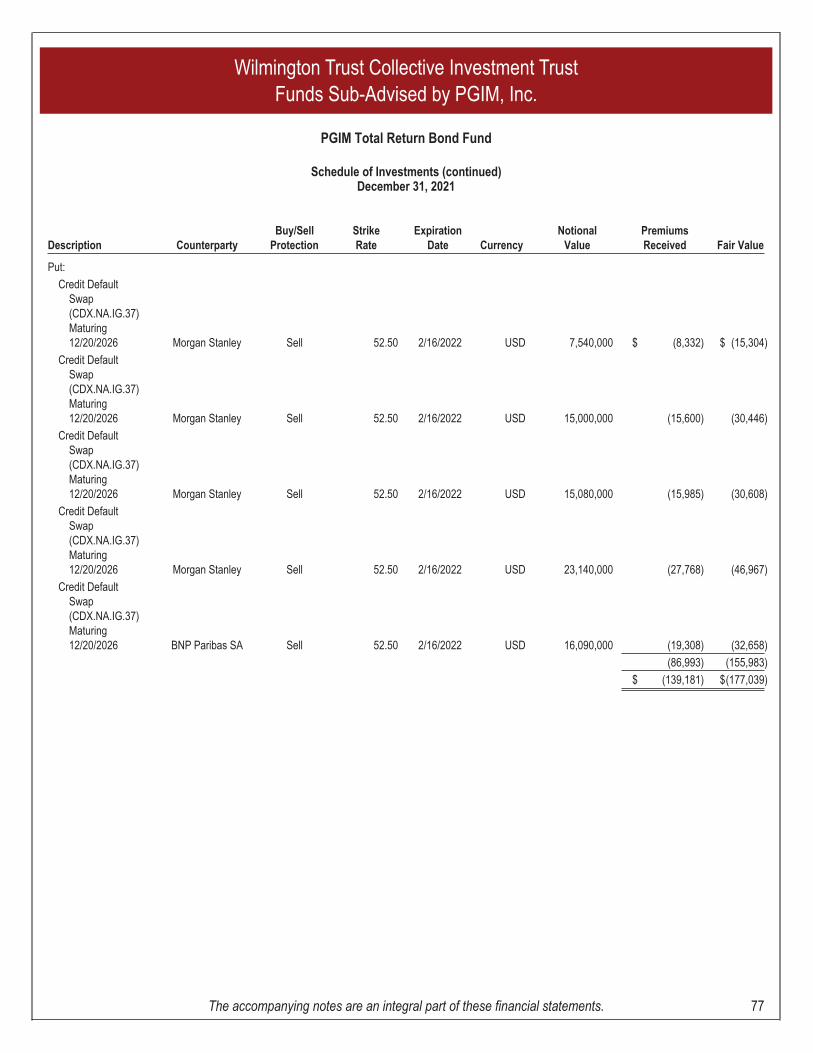
Description CounterpartyBuy/Sell
ProtectionStrikeRate
ExpirationDate Currency
NotionalValue
PremiumsReceived Fair Value
Put:
Credit DefaultSwap(CDX.NA.IG.37)Maturing12/20/2026 Morgan Stanley Sell 52.50 2/16/2022 USD 7,540,000 $ (8,332) $ (15,304)
Credit DefaultSwap(CDX.NA.IG.37)Maturing12/20/2026 Morgan Stanley Sell 52.50 2/16/2022 USD 15,000,000 (15,600) (30,446)
Credit DefaultSwap(CDX.NA.IG.37)Maturing12/20/2026 Morgan Stanley Sell 52.50 2/16/2022 USD 15,080,000 (15,985) (30,608)
Credit DefaultSwap(CDX.NA.IG.37)Maturing12/20/2026 Morgan Stanley Sell 52.50 2/16/2022 USD 23,140,000 (27,768) (46,967)
Credit DefaultSwap(CDX.NA.IG.37)Maturing12/20/2026 BNP Paribas SA Sell 52.50 2/16/2022 USD 16,090,000 (19,308) (32,658)
(86,993) (155,983)
$ (139,181) $(177,039)
Wilmington Trust Collective Investment TrustFunds Sub-Advised by PGIM, Inc.
PGIM Total Return Bond Fund
Schedule of Investments (continued)December 31, 2021
The accompanying notes are an integral part of these financial statements. 77
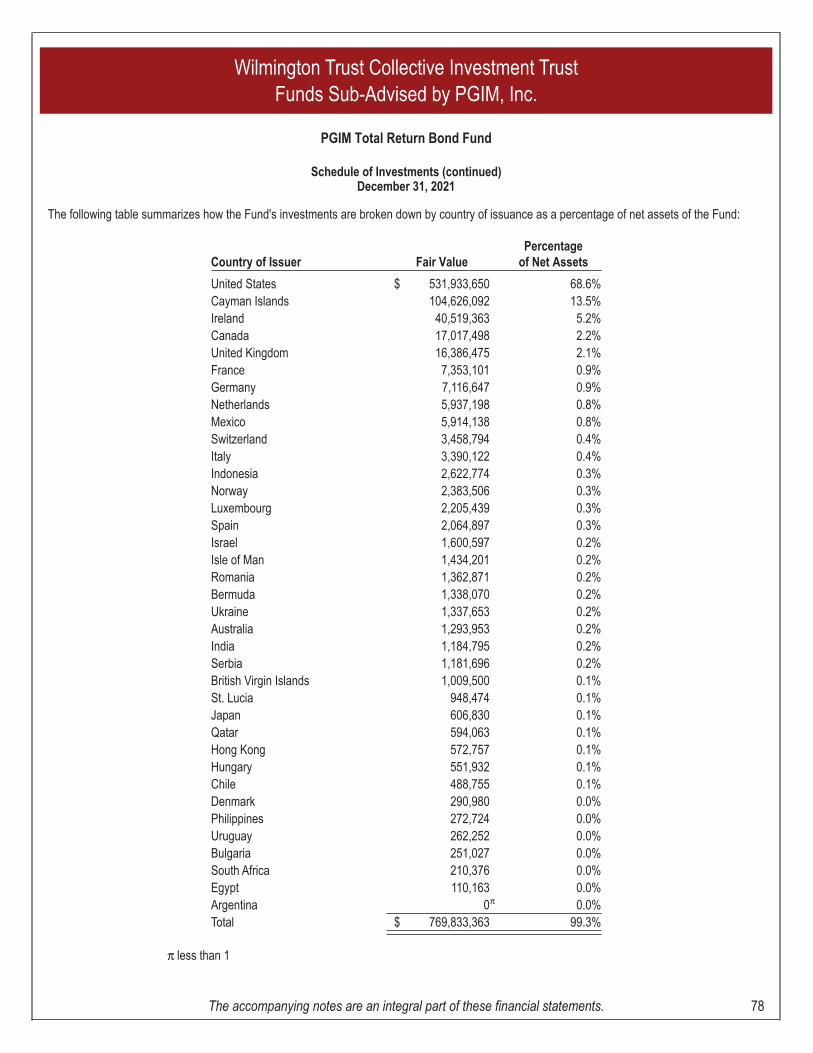
The following table summarizes how the Fund's investments are broken down by country of issuance as a percentage of net assets of the Fund:
Country of Issuer Fair ValuePercentage
of Net Assets
United States $ 531,933,650 68.6%Cayman Islands 104,626,092 13.5%Ireland 40,519,363 5.2%Canada 17,017,498 2.2%United Kingdom 16,386,475 2.1%France 7,353,101 0.9%Germany 7,116,647 0.9%Netherlands 5,937,198 0.8%Mexico 5,914,138 0.8%Switzerland 3,458,794 0.4%Italy 3,390,122 0.4%Indonesia 2,622,774 0.3%Norway 2,383,506 0.3%Luxembourg 2,205,439 0.3%Spain 2,064,897 0.3%Israel 1,600,597 0.2%Isle of Man 1,434,201 0.2%Romania 1,362,871 0.2%Bermuda 1,338,070 0.2%Ukraine 1,337,653 0.2%Australia 1,293,953 0.2%India 1,184,795 0.2%Serbia 1,181,696 0.2%British Virgin Islands 1,009,500 0.1%St. Lucia 948,474 0.1%Japan 606,830 0.1%Qatar 594,063 0.1%Hong Kong 572,757 0.1%Hungary 551,932 0.1%Chile 488,755 0.1%Denmark 290,980 0.0%Philippines 272,724 0.0%Uruguay 262,252 0.0%Bulgaria 251,027 0.0%South Africa 210,376 0.0%Egypt 110,163 0.0%Argentina 0π 0.0%Total $ 769,833,363 99.3%
π less than 1
Wilmington Trust Collective Investment TrustFunds Sub-Advised by PGIM, Inc.
PGIM Total Return Bond Fund
Schedule of Investments (continued)December 31, 2021
The accompanying notes are an integral part of these financial statements. 78
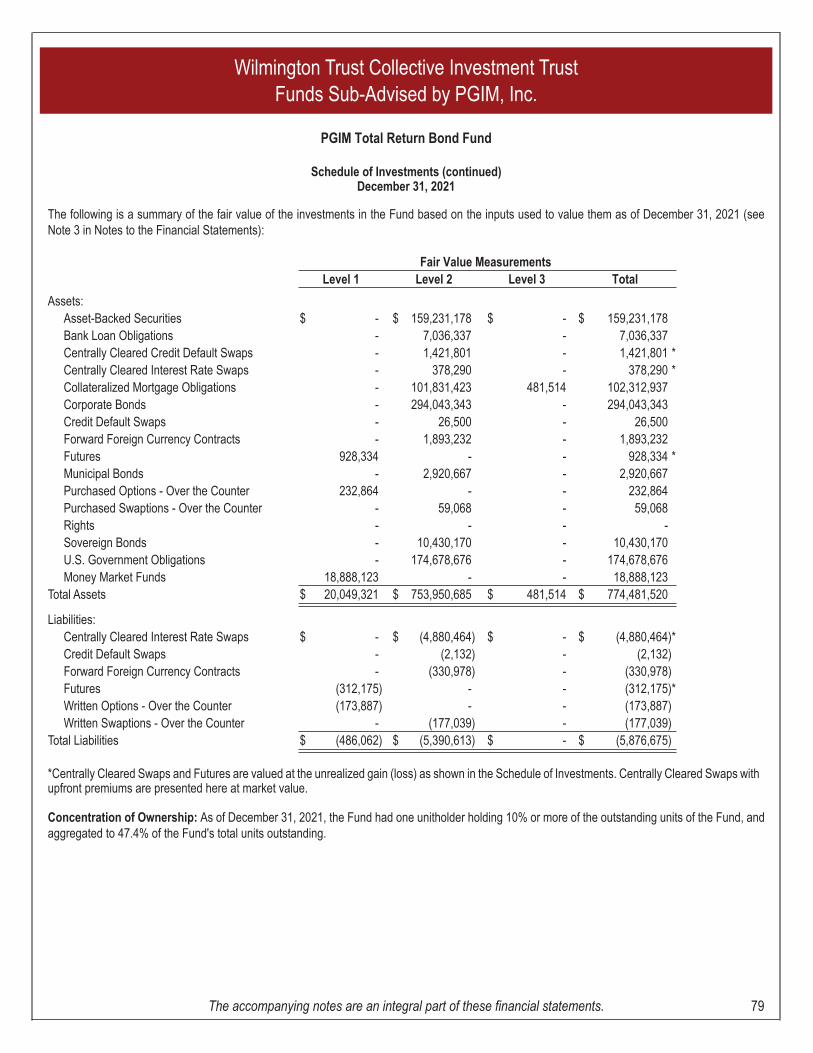
The following is a summary of the fair value of the investments in the Fund based on the inputs used to value them as of December 31, 2021 (seeNote 3 in Notes to the Financial Statements):
Fair Value MeasurementsLevel 1 Level 2 Level 3 Total
Assets:Asset-Backed Securities $ - $ 159,231,178 $ - $ 159,231,178Bank Loan Obligations - 7,036,337 - 7,036,337Centrally Cleared Credit Default Swaps - 1,421,801 - 1,421,801 *Centrally Cleared Interest Rate Swaps - 378,290 - 378,290 *Collateralized Mortgage Obligations - 101,831,423 481,514 102,312,937Corporate Bonds - 294,043,343 - 294,043,343Credit Default Swaps - 26,500 - 26,500Forward Foreign Currency Contracts - 1,893,232 - 1,893,232Futures 928,334 - - 928,334 *Municipal Bonds - 2,920,667 - 2,920,667Purchased Options - Over the Counter 232,864 - - 232,864Purchased Swaptions - Over the Counter - 59,068 - 59,068Rights - - - -Sovereign Bonds - 10,430,170 - 10,430,170U.S. Government Obligations - 174,678,676 - 174,678,676Money Market Funds 18,888,123 - - 18,888,123
Total Assets $ 20,049,321 $ 753,950,685 $ 481,514 $ 774,481,520
Liabilities:Centrally Cleared Interest Rate Swaps $ - $ (4,880,464) $ - $ (4,880,464)*Credit Default Swaps - (2,132) - (2,132)Forward Foreign Currency Contracts - (330,978) - (330,978)Futures (312,175) - - (312,175)*Written Options - Over the Counter (173,887) - - (173,887)Written Swaptions - Over the Counter - (177,039) - (177,039)
Total Liabilities $ (486,062) $ (5,390,613) $ - $ (5,876,675)
*Centrally Cleared Swaps and Futures are valued at the unrealized gain (loss) as shown in the Schedule of Investments. Centrally Cleared Swaps withupfront premiums are presented here at market value.
Concentration of Ownership: As of December 31, 2021, the Fund had one unitholder holding 10% or more of the outstanding units of the Fund, andaggregated to 47.4% of the Fund's total units outstanding.
Wilmington Trust Collective Investment TrustFunds Sub-Advised by PGIM, Inc.
PGIM Total Return Bond Fund
Schedule of Investments (continued)December 31, 2021
The accompanying notes are an integral part of these financial statements. 79
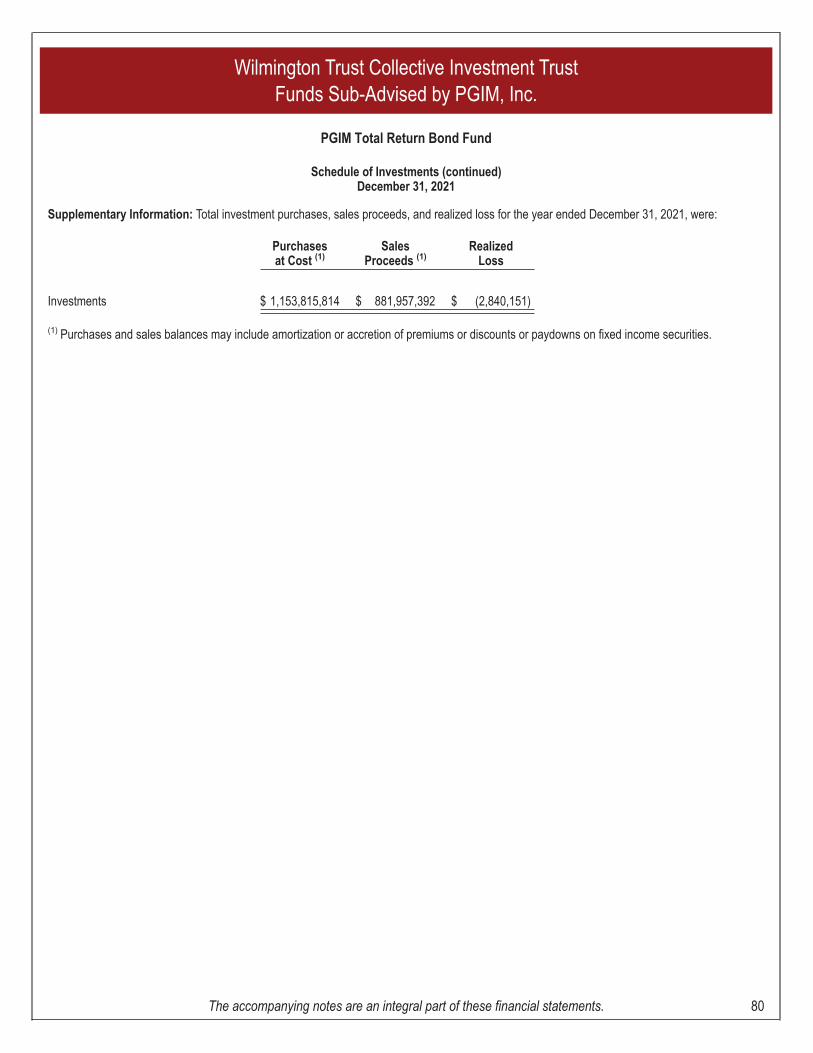
Supplementary Information: Total investment purchases, sales proceeds, and realized loss for the year ended December 31, 2021, were:
Purchasesat Cost (1)
SalesProceeds (1)
RealizedLoss
Investments $ 1,153,815,814 $ 881,957,392 $ (2,840,151)
(1) Purchases and sales balances may include amortization or accretion of premiums or discounts or paydowns on fixed income securities.
Wilmington Trust Collective Investment TrustFunds Sub-Advised by PGIM, Inc.
PGIM Total Return Bond Fund
Schedule of Investments (continued)December 31, 2021
The accompanying notes are an integral part of these financial statements. 80
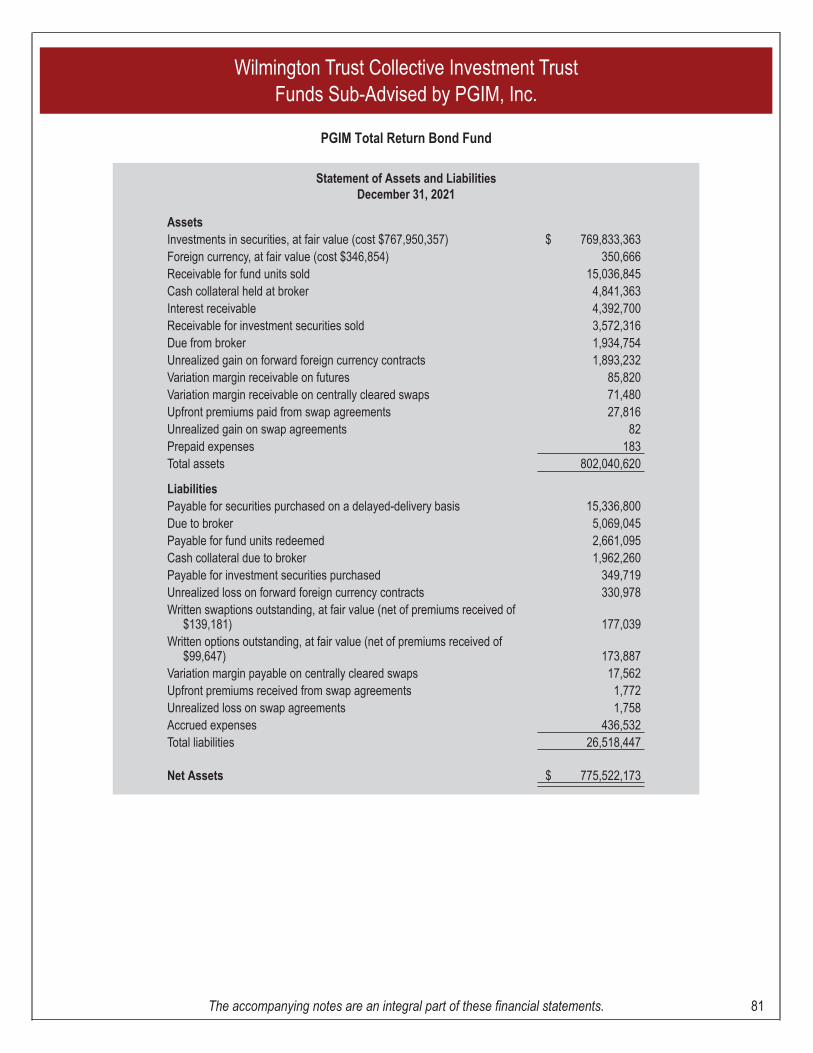
Statement of Assets and LiabilitiesDecember 31, 2021
AssetsInvestments in securities, at fair value (cost $767,950,357) $ 769,833,363Foreign currency, at fair value (cost $346,854) 350,666Receivable for fund units sold 15,036,845Cash collateral held at broker 4,841,363Interest receivable 4,392,700Receivable for investment securities sold 3,572,316Due from broker 1,934,754Unrealized gain on forward foreign currency contracts 1,893,232Variation margin receivable on futures 85,820Variation margin receivable on centrally cleared swaps 71,480Upfront premiums paid from swap agreements 27,816Unrealized gain on swap agreements 82Prepaid expenses 183Total assets 802,040,620
LiabilitiesPayable for securities purchased on a delayed-delivery basis 15,336,800Due to broker 5,069,045Payable for fund units redeemed 2,661,095Cash collateral due to broker 1,962,260Payable for investment securities purchased 349,719Unrealized loss on forward foreign currency contracts 330,978Written swaptions outstanding, at fair value (net of premiums received of
$139,181) 177,039Written options outstanding, at fair value (net of premiums received of
$99,647) 173,887Variation margin payable on centrally cleared swaps 17,562Upfront premiums received from swap agreements 1,772Unrealized loss on swap agreements 1,758Accrued expenses 436,532Total liabilities 26,518,447
Net Assets $ 775,522,173
Wilmington Trust Collective Investment TrustFunds Sub-Advised by PGIM, Inc.
PGIM Total Return Bond Fund
The accompanying notes are an integral part of these financial statements. 81
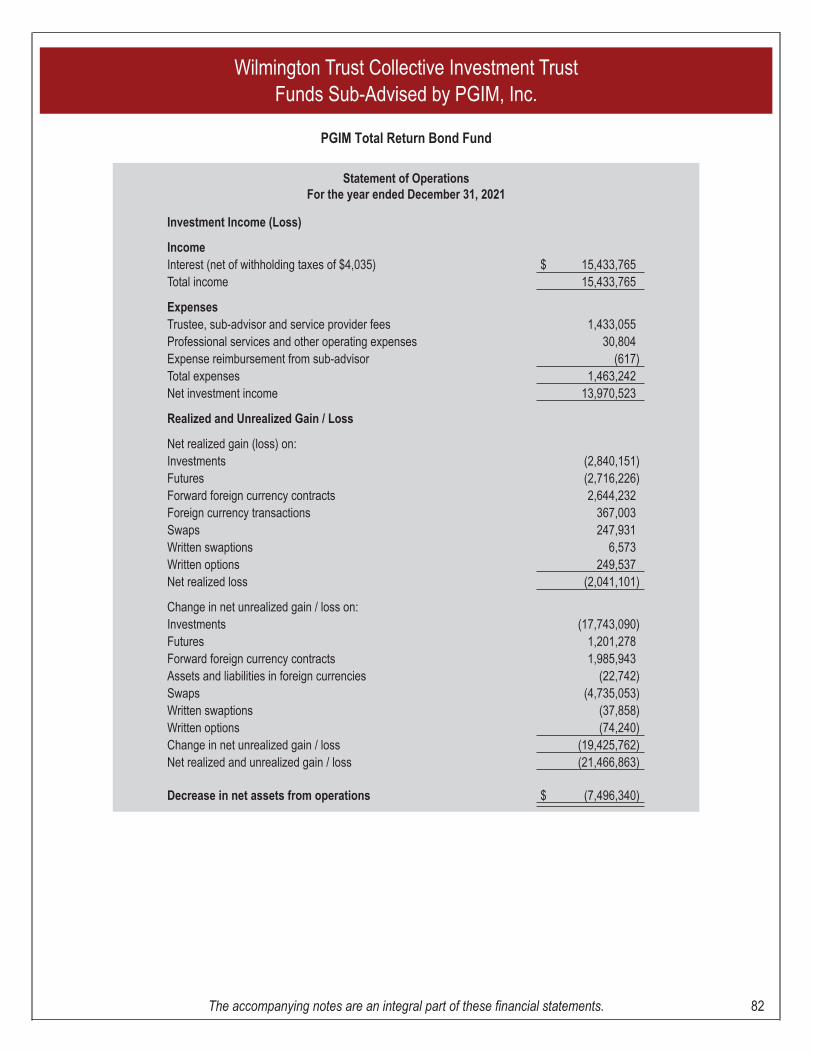
Statement of OperationsFor the year ended December 31, 2021
Investment Income (Loss)
IncomeInterest (net of withholding taxes of $4,035) $ 15,433,765Total income 15,433,765
ExpensesTrustee, sub-advisor and service provider fees 1,433,055Professional services and other operating expenses 30,804Expense reimbursement from sub-advisor (617)Total expenses 1,463,242Net investment income 13,970,523
Realized and Unrealized Gain / Loss
Net realized gain (loss) on:Investments (2,840,151)Futures (2,716,226)Forward foreign currency contracts 2,644,232Foreign currency transactions 367,003Swaps 247,931Written swaptions 6,573Written options 249,537Net realized loss (2,041,101)
Change in net unrealized gain / loss on:Investments (17,743,090)Futures 1,201,278Forward foreign currency contracts 1,985,943Assets and liabilities in foreign currencies (22,742)Swaps (4,735,053)Written swaptions (37,858)Written options (74,240)Change in net unrealized gain / loss (19,425,762)Net realized and unrealized gain / loss (21,466,863)
Decrease in net assets from operations $ (7,496,340)
Wilmington Trust Collective Investment TrustFunds Sub-Advised by PGIM, Inc.
PGIM Total Return Bond Fund
The accompanying notes are an integral part of these financial statements. 82
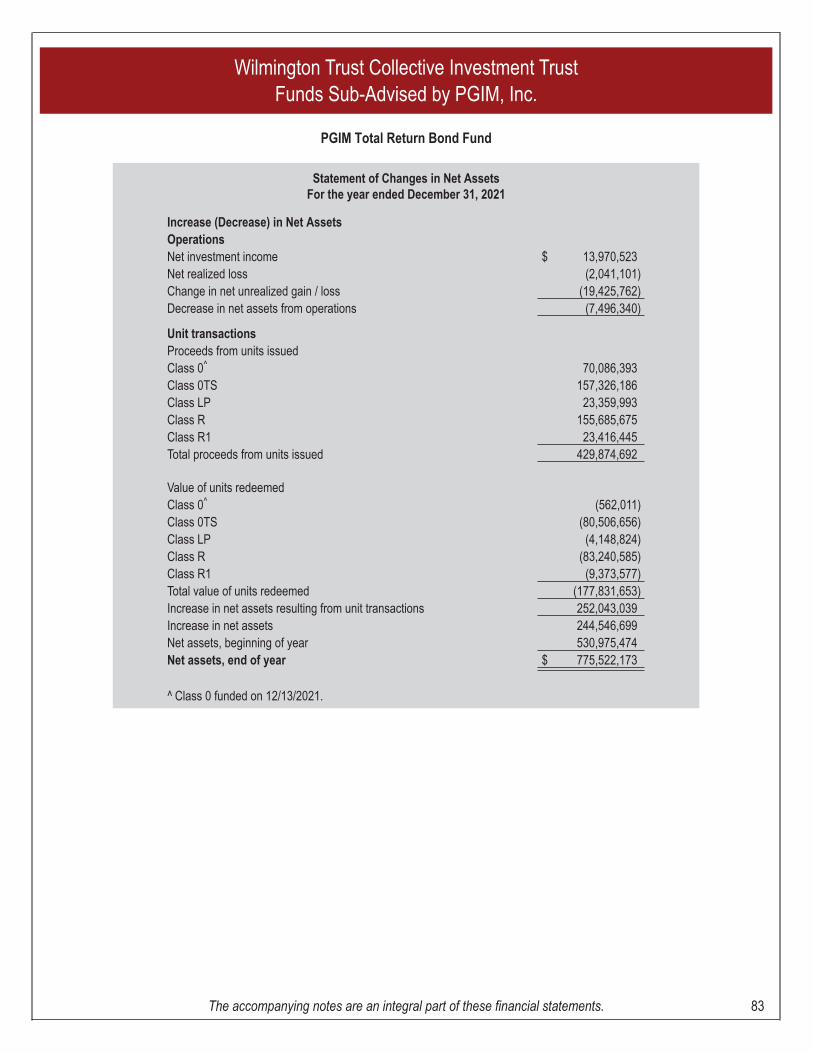
Statement of Changes in Net AssetsFor the year ended December 31, 2021
Increase (Decrease) in Net AssetsOperationsNet investment income $ 13,970,523Net realized loss (2,041,101)Change in net unrealized gain / loss (19,425,762)Decrease in net assets from operations (7,496,340)
Unit transactionsProceeds from units issuedClass 0^ 70,086,393Class 0TS 157,326,186Class LP 23,359,993Class R 155,685,675Class R1 23,416,445Total proceeds from units issued 429,874,692
Value of units redeemedClass 0^ (562,011)Class 0TS (80,506,656)Class LP (4,148,824)Class R (83,240,585)Class R1 (9,373,577)Total value of units redeemed (177,831,653)Increase in net assets resulting from unit transactions 252,043,039Increase in net assets 244,546,699Net assets, beginning of year 530,975,474Net assets, end of year $ 775,522,173
^ Class 0 funded on 12/13/2021.
Wilmington Trust Collective Investment TrustFunds Sub-Advised by PGIM, Inc.
PGIM Total Return Bond Fund
The accompanying notes are an integral part of these financial statements. 83
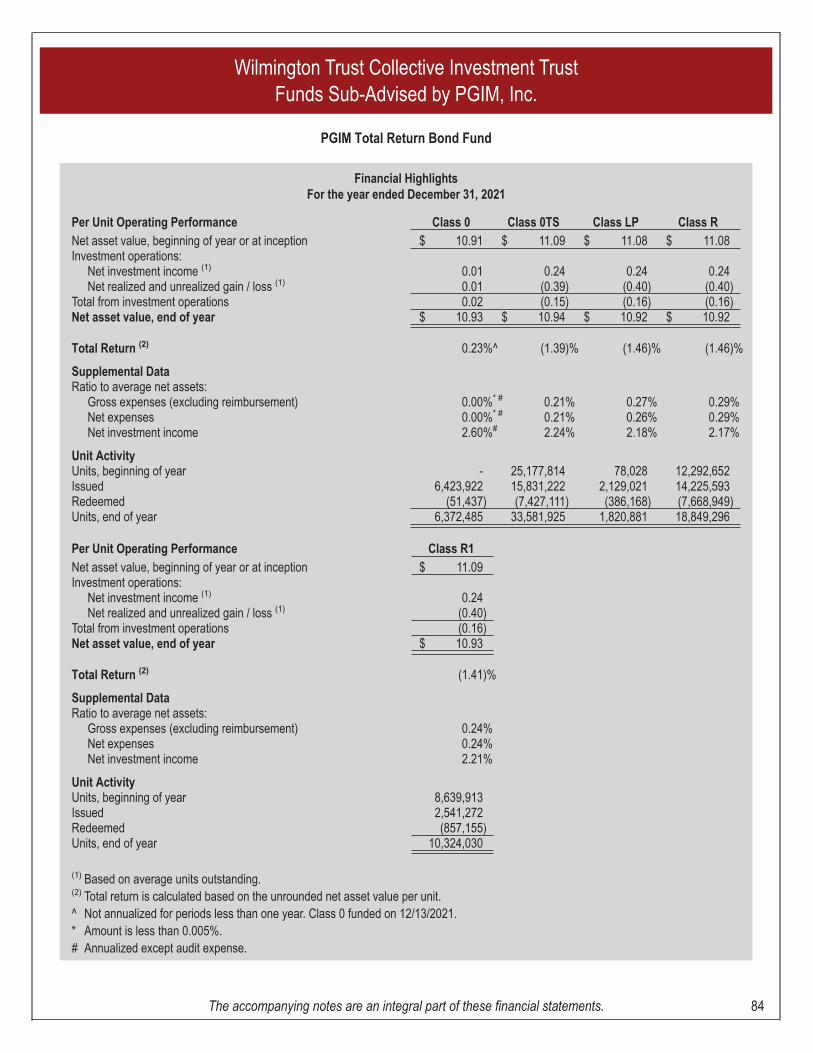
Financial HighlightsFor the year ended December 31, 2021
Per Unit Operating Performance Class 0 Class 0TS Class LP Class RNet asset value, beginning of year or at inception $ 10.91 $ 11.09 $ 11.08 $ 11.08Investment operations:
Net investment income (1) 0.01 0.24 0.24 0.24Net realized and unrealized gain / loss (1) 0.01 (0.39) (0.40) (0.40)
Total from investment operations 0.02 (0.15) (0.16) (0.16)Net asset value, end of year $ 10.93 $ 10.94 $ 10.92 $ 10.92
Total Return (2) 0.23%^ (1.39)% (1.46)% (1.46)%
Supplemental DataRatio to average net assets:
Gross expenses (excluding reimbursement) 0.00%* # 0.21% 0.27% 0.29%Net expenses 0.00%* # 0.21% 0.26% 0.29%Net investment income 2.60%# 2.24% 2.18% 2.17%
Unit ActivityUnits, beginning of year - 25,177,814 78,028 12,292,652Issued 6,423,922 15,831,222 2,129,021 14,225,593Redeemed (51,437) (7,427,111) (386,168) (7,668,949)Units, end of year 6,372,485 33,581,925 1,820,881 18,849,296
Per Unit Operating Performance Class R1Net asset value, beginning of year or at inception $ 11.09Investment operations:
Net investment income (1) 0.24Net realized and unrealized gain / loss (1) (0.40)
Total from investment operations (0.16)Net asset value, end of year $ 10.93
Total Return (2) (1.41)%
Supplemental DataRatio to average net assets:
Gross expenses (excluding reimbursement) 0.24%Net expenses 0.24%Net investment income 2.21%
Unit ActivityUnits, beginning of year 8,639,913Issued 2,541,272Redeemed (857,155)Units, end of year 10,324,030
(1) Based on average units outstanding.(2) Total return is calculated based on the unrounded net asset value per unit.^ Not annualized for periods less than one year. Class 0 funded on 12/13/2021.* Amount is less than 0.005%.# Annualized except audit expense.
Wilmington Trust Collective Investment TrustFunds Sub-Advised by PGIM, Inc.
PGIM Total Return Bond Fund
The accompanying notes are an integral part of these financial statements. 84
Note 1 – Organization
Wilmington Trust Collective Investment Trust (the "Trust") is intended to constitute an exempt trust underSection 501(a) of the Internal Revenue Code of 1986, as amended (the "Code"), and a group trust within the meaningof Rev. Rul. 81-100, as amended. The Trust is exempt from registration under the Investment Company Act of 1940, asamended, and the Securities Act of 1933, as amended. Wilmington Trust, N.A. ("WTNA" or the "Trustee") serves as theTrustee of the Trust.
The Trustee is responsible for maintaining and administering the Trust and its various funds (the “Funds” – see FundIndex) and also serves as the investment manager (the "Investment Manager") to the Funds. M&T Bank Corporation isthe ultimate parent of the Trustee. Northern Trust Company provides custody, transfer agency, and accounting servicesfor the Funds.
The purpose of the Trust is to allow collective investments by plan sponsors of retirement plans which qualify forexemption from federal income taxation pursuant to Section 501(a) of the Code, by reason of qualifying underSection 401(a) of the Code; tax-exempt governmental plans under Section 414(d) or Section 818(a)(6) of the Code;eligible deferred compensation plans under Section 457(b) of the Code established by a government employer; grouptrusts or separate accounts consisting solely of assets of the foregoing; and other investors eligible for participation inthe Trust. The Trust consists of separate funds with differing investment objectives, which are available for investmentby participating plans. An eligible plan may join the Trust, subject to the Trustee’s acceptance, and become aparticipating plan by executing participation documents specified by the Trustee. Not all funds within the Trust arepresented herein. The Trustee has claimed an exclusion from the definition of commodity pool operator (“CPO”) underthe Commodity Exchange Act and the rules of the Commodity Futures Trading Commission (“CFTC”) with respect tothe Funds, and is therefore not subject to CFTC registration or regulation as a CPO with respect to the Funds.
WTNA has engaged PGIM, Inc. (the "Sub-Advisor") to provide investment advice and recommendations with respect toinvestment of the Funds' assets. The Trustee maintains ultimate fiduciary authority over the management of andinvestments made in the Funds. The Sub-Advisor is engaged pursuant to a sub-advisor agreement.
Note 2 – Significant Accounting Policies
The accompanying financial statements have been prepared in conformity with accounting principles generallyaccepted in the United States of America ("U.S. GAAP"). The Funds are investment companies and follow theaccounting and reporting guidance in Financial Accounting Standards Board Accounting Standards Codification TopicNo. 946.
Net Asset Value ("NAV") – Units of each fee class of each Fund are valued each day on which the New York StockExchange ("NYSE") is open for trading in accordance with the valuation procedures established by the Trustee. TheNAV per unit is calculated as of the close of trading on the NYSE (generally, 4:00 p.m. U.S. Eastern time). The NAV perunit is computed by dividing the total fair value of the assets of each Fund, less its liabilities, by the total number of unitsoutstanding at the time of such computation. Investment income earned is reinvested in each Fund and included in thedetermination of unit values.
Wilmington Trust Collective Investment Trust
Funds Sub-Advised by PGIM, Inc.
Notes to the Financial Statements
December 31, 2021
85
Fund Unit Transactions – The Funds sell new units and repurchase outstanding units on a daily basis. Unit purchasesand redemptions are transacted at the NAV per fee class of the Funds determined as of the close of business each day.A summary of the Fund unit activity for each Fund is included with its Financial Highlights.
The Funds require a plan sponsor to provide advance written notice of five business days for plan sponsor directedwithdrawals which will exceed $1 million of the assets invested in each Fund.
Investment Valuation – Investments are valued at their current fair value determined as follows:
Collateralized Mortgage Obligations – The Funds may invest in collateralized mortgage obligations ("CMOs")and real estate mortgage investment conduits ("REMICs"). A CMO is a bond that is collateralized by a pool ofmortgage-backed securities ("MBS"), and a REMIC is similar in form to a CMO. These MBS pools are divided intoclasses or tranches with each class having its own characteristics. The different classes are retired in sequence asthe underlying mortgages are repaid. For instance, a planned amortization class ("PAC") is a specific class ofmortgages, which over its life will generally have the most stable cash flows and the lowest prepayment risk. Agraduated payment mortgage ("GPM") is a negative amortization mortgage where the payment amount graduallyincreases over the life of the mortgage. The early payment amounts are not sufficient to cover the interest due,and, therefore, the unpaid interest is added to the principal, thus increasing the borrower's mortgage balance.Prepayment may shorten the stated maturity of the CMO and can result in a loss of premium if any has been paid.
Corporate Bonds – The fair value of corporate bonds is estimated using various techniques, which may considerrecently executed transactions in securities of the issuer or comparable issuers, market price quotations (whenobservable), and other industry recognized techniques. Although most corporate bonds are categorized in level 2of the fair value hierarchy, in instances when lower relative weight is placed on transaction prices, quotations, orother similar observable inputs, they are categorized in level 3.
Forward Foreign Currency Contracts – A forward foreign currency contract is a commitment to purchase or sella foreign currency at a future date at a negotiated forward rate. Risk associated with such contracts includesmovement in the value of the foreign currency relative to the U.S. dollar and the potential inability of thecounterparty to meet the terms of the contract. The Funds may purchase or sell currencies and/or engage inforward foreign currency transactions in order to expedite settlement of portfolio transactions and to managecurrency risk.
The Funds may enter into forward contracts to sell, for a fixed amount of U.S. dollars or other appropriate currency,an amount of foreign currency, to the extent that the value of the short forward contract is covered by the underlyingvalue of securities denominated in the currency being sold. Alternatively, when the Funds enter into a forwardcontract to sell an amount of foreign currency, the Funds' custodian will place assets in a segregated account of theFunds in an amount not less than the value of the Funds' total assets. If the assets placed in the account decline,additional cash or securities will be placed in the account on a daily basis so that the value of the account will equalthe amount of the Funds' commitments with respect to such contracts. The unrealized gain, if any, represents thecredit risk to the Funds on a forward foreign currency contract. Fluctuations in the value of the open forward foreigncurrency contracts are recorded daily for book purposes as unrealized gain or loss on foreign forward currencycontracts by the Funds. Realized gains and losses include net gains and losses recognized by the Funds oncontracts which have been sold or matured.
Wilmington Trust Collective Investment Trust
Funds Sub-Advised by PGIM, Inc.
Notes to the Financial Statements (continued)
December 31, 2021
86
Futures Contracts – The Funds may purchase futures contracts to gain exposure to market changes, which maybe more efficient or cost effective than actually buying the securities. The Funds utilize futures contracts for tacticalhedging purposes as well as to enhance the Funds’ returns. Upon entering into such a contract, the Funds arerequired to deposit and maintain as collateral such initial margin as required by the exchange on which the contractis held. The contracts are marked to market daily and the resulting changes in value are accounted for asunrealized gains and losses. Variation margin payments are paid or received, depending upon whether unrealizedlosses or gains are incurred. When the contract is closed, the Funds record a realized gain or loss equal to thedifference between the proceeds from (or cost of) the closing transaction and the amount invested in the contract.Net realized and unrealized gains or losses occurring during the holding period of futures are found on theStatement of Operations as a component of net realized gain (loss) on futures contracts and as a component of netchange in unrealized gain / loss on futures contracts.
Risks of entering into futures contracts include the possibility that there will be an imperfect price correlationbetween the futures and the underlying securities. Second, it is possible that a lack of liquidity for futures contractscould exist in the secondary market, resulting in an inability to close a position prior to its maturity date. Third, thefutures contract involves the risk that the Funds could lose more than the original margin deposit required to initiatea futures transaction. Finally, the risk exists that losses could exceed amounts disclosed on the Statement ofAssets and Liabilities.
Money Market Funds – Investments in money market funds are valued at the daily closing net asset value of therespective fund.
Mortgage-Backed Securities and Asset-Backed Securities – The Funds may invest in MBS, representinginterests in pools of mortgage loans. These securities provide investors with payments consisting of both principaland interest as the mortgages in the underlying mortgage pools are paid. Most of the securities are guaranteed byfederally sponsored agencies (Government National Mortgage Association ("GNMA"), Federal National MortgageAssociation ("FNMA"), or Federal Home Loan Mortgage Corporation ("FLMC")), but are not issued or guaranteedby the U.S. Treasury. However, some securities may be issued by private, non-government corporations. MBSissued by private entities are not government securities and are not directly guaranteed by any government agencybut are secured by the underlying collateral of the private issuer. Yields on privately issued MBS tend to be higherthan those of government-backed issues; however, risk of loss due to default and sensitivity to interest ratefluctuations is also higher.
The Funds may also invest in asset-backed securities, representing interests in pools of certain types of underlyinginstallment loans or leases or revolving lines of credit. They often include credit enhancements that help limitinvestors' exposure to the underlying credit. These securities are valued on the basis of the timing and certainty ofthe cash flows compared to investments with similar durations.
Securities – Securities, other than bonds, listed on a securities exchange, market or automated quotation systemfor which quotations are readily available are valued at the closing price on the primary exchange or market onwhich they are traded on the day of valuation or, if there is no such reported sale on the valuation date, at the mostrecent bid quotation on the principal exchange. If a market price is not readily available or if such price is deemed
Wilmington Trust Collective Investment Trust
Funds Sub-Advised by PGIM, Inc.
Notes to the Financial Statements (continued)
December 31, 2021
87
unreliable, it will be valued at fair value in accordance with valuation procedures established by the Trustee. TheTrustee's determination of fair value involves consideration of a number of subjective factors, and therefore, nosingle standard for determining fair value will apply.
Swap Agreements – The Funds may invest in swap agreements. Swap agreements are bilaterally negotiatedagreements between a fund and a counterparty to exchange or swap investment cash flows, assets, foreigncurrencies or market-linked returns at specified, future intervals. Swap agreements may be privately negotiated inthe over the counter market ("OTC swaps") or may be cleared through a third party, known as a centralcounterparty or derivatives clearing organization ("Centrally Cleared Swaps"). Each Fund may enter into asset,credit default, cross-currency, interest rate, total return, variance and other forms of swap agreements to manageits exposure to credit, currency, interest rate, commodity, equity and inflation risk. In connection with theseagreements, securities or cash may be identified as collateral or margin in accordance with the terms of therespective swap agreements to provide assets of value and recourse in the event of default orbankruptcy/insolvency.
Centrally Cleared Swaps are marked to market daily based upon valuations as determined from the underlyingcontract or in accordance with the requirements of the central counterparty or derivatives clearing organization.Changes in market value, if any, are reflected as a component of net change in unrealized gain / loss on theStatement of Operations. Daily changes in valuation of centrally cleared swaps ("Swap Variation Margin"), if any,are disclosed within centrally cleared financial derivative instruments on the Statement of Assets and Liabilities.OTC swap payments received or paid at the beginning of the measurement period are included on the Statementof Assets and Liabilities and represent premiums paid or received upon entering into the swap agreement tocompensate for differences between the stated terms of the swap agreement and prevailing market conditions(credit spreads, currency exchange rates, interest rates, and other relevant factors). Upfront premiums received(paid) are initially recorded as liabilities (assets) and subsequently marked to market to reflect the current value ofthe swap. These upfront premiums are recorded as realized gain (loss) on the Statement of Operations upontermination or maturity of the swap. A liquidation payment received or made at the termination of the swap isrecorded as realized gain (loss) on the Statement of Operations. Net periodic payments received or paid by theFunds are included as part of the realized gain (loss) on the Statement of Operations.
Entering into swap agreements involves, to varying degrees, elements of interest, credit, market anddocumentation risk in excess of the amounts recognized on the Statement of Assets and Liabilities. Such risksinvolve the possibility that there will be no liquid market for these agreements, that the counterparty to theagreements may default on its obligation to perform or disagree as to the meaning of contractual terms in theagreements and that there may be unfavorable changes in interest rates.
Each Fund's maximum risk of loss from counterparty credit risk is the discounted net value of the cash flows to bereceived from the counterparty over the contract's remaining life, to the extent that amount is positive. The risk maybe mitigated by having a master netting agreement between the Funds and the counterparty and by the posting ofcollateral to the Fund to cover the Funds' exposure to the counterparty.
Wilmington Trust Collective Investment Trust
Funds Sub-Advised by PGIM, Inc.
Notes to the Financial Statements (continued)
December 31, 2021
88
When the valuation methods described above are not reflective of fair value, investments are valued at fair valuefollowing procedures and/or guidelines determined by or under the direction of the valuation committee established bythe Trustee. In light of the judgment involved in fair value decisions, there can be no assurance that a fair valueassigned to a particular investment is accurate.
Cash and Cash Equivalents – The Funds consider all highly liquid instruments with original maturities of three monthsor less at the acquisition date to be cash equivalents.
Foreign Currency Translation – The accounting records of the Funds are maintained in U.S. dollars. Investmentsecurities and other assets and liabilities denominated in foreign currencies are translated daily into U.S. dollars usingforeign currency exchange rates determined as of the close of regular trading on the NYSE. Purchases and sales ofFund securities, commitments under forward foreign currency contracts and income receipts are translated at theprevailing exchange rate as of the date of each transaction. Realized and unrealized gain or loss on the translation offoreign currency denominated investments is included as a component of net realized and unrealized gain or loss oninvestments in the Statements of Operations. Realized gain or loss on foreign currency transactions may include gainsand losses from sales and maturities of foreign currency exchange contracts, gains and losses realized between thetrade and settlement dates of foreign security transactions or the difference between the amount of net investmentincome accrued on foreign securities and the U.S. dollar amount actually received. Unrealized gain or loss on foreigncurrency transactions include gains and losses due to changes in the value of assets and liabilities, other than fundsecurities, resulting from changes in exchange rates. Certain foreign exchange gains and losses included in realizedand unrealized gains and losses are included in or are a reduction of ordinary income in accordance with U.S. federalincome tax regulations.
Investment Transactions and Investment Income – The Funds record security transactions on a trade date basis.Dividend income is recorded on the ex-dividend date. Net realized gains and losses on investments are determined bythe first-in, first-out method. Interest income and expenses are recorded daily on the accrual basis.
Fee Classes and Allocations – The Funds may offer multiple fee classes. Not all fee classes are available forinvestment by all plans. Each class is allocated expenses on the basis of expense loads assigned to that class. Income,expenses (other than expenses attributable to a specific class), and realized and unrealized gains or losses oninvestments are allocated to each unit class based on the units outstanding for the fee class in proportion to the totaloutstanding units.
Use of Estimates – The preparation of financial statements in conformity with U.S. GAAP requires management tomake estimates and assumptions that affect the amounts reported in the financial statements and accompanyingnotes. Actual results could differ from those estimates.
Guarantees and Indemnifications – Under the Funds’ organizational documents, each trustee, officer, employee andagent of the Trust is indemnified, to the extent permitted by law, against certain liabilities that may arise in theperformance of their duties to the Funds.
Additionally, in the normal course of business, the Funds enter into contracts that contain a variety of indemnificationclauses. The Funds' maximum exposure under these arrangements is unknown as this would involve future claims thatmay be made against the Funds that have not yet occurred. However, the Funds have not had prior claims or lossespursuant to these contracts and the Trustee believes the risk of loss to be remote.
Wilmington Trust Collective Investment Trust
Funds Sub-Advised by PGIM, Inc.
Notes to the Financial Statements (continued)
December 31, 2021
89
Income Tax Status – The Trust has received a determination from the Internal Revenue Service that the Trust isexempt from federal income taxation under Section 501(a) of the Code. Accordingly, no federal income tax provision isrequired.
Subsequent Events – The Trustee has evaluated the effect of subsequent events on the Funds' financial statementsthrough April 29, 2022, which is the date the financial statements were available to be issued, and has determined thatthere are no material subsequent events, except as noted below, that would require disclosure or adjustment in theFunds’ financial statements through this date.
As of December 31, 2021, the Funds held securities of Russian (and Ukranian) based companies. The Russianinvasion of Ukraine that began February 24, 2022, has led the United States, United Kingdom, the European Union andother countries to impose escalating sanctions on Russia and various individuals and businesses affiliated with thatcountry. This has required many global companies to cease doing the business in and with Russia and the sanctionedentities, and has required some to wind down or cease their operations in or dealings with Russia. The uncertain futureof the severity and duration of this conflict is impacting global political, economic and market conditions. This hasadversely impacted global financial markets, causing some market trading to be suspended and/or severely restricted.This ongoing conflict has the potential to significantly and adversely impact the value of holdings connected to theseareas of conflict and, thus, the performance of the Funds.
Note 3 – Fair Value Measurements
Fair value is defined as the price a fund would receive to sell an asset or pay to transfer a liability in an orderlytransaction between market participants at the measurement date.
Various inputs are used in determining the fair value of the Funds' investments. The Trustee has performed an analysisof the significance and character of these inputs to the fair value determination. These inputs are summarized in thethree broad levels listed below:
• Level 1 – Quoted prices in active markets for identical investments.
• Level 2 – Other significant observable inputs (including quoted prices for similar investments, interest rates,credit risk, and others).
• Level 3 – Significant unobservable inputs (including the Trustee's own assumptions in determining the fairvalue of investments).
The inputs or methodology used for valuing investments are not necessarily an indication of the risk associated withinvesting in those investments. The aggregate fair value of the investments in each Fund, by input level used as ofDecember 31, 2021, is included following each Fund's Schedule of Investments.
Wilmington Trust Collective Investment Trust
Funds Sub-Advised by PGIM, Inc.
Notes to the Financial Statements (continued)
December 31, 2021
90
Note 4 – Fees and Expenses
Trustee, Sub-Advisor and Service Provider Fees
Annualized asset-based fees are based upon the net assets as determined at the end of each preceding business dayas set forth in the table below (in basis points). Except as otherwise noted, all asset-based fees are paid from the assetsof the Funds.
Fee Class Trustee Fee Sub-Advisor Fee Service Provider Fee
PGIM Select Real Estate Fund CITClass 0 0 0 0
Class R 8 60 0
PGIM Strategic Bond Fund CITClass 0 0 0 0
PGIM Total Return Bond FundClass 0 0 0 0
Class 0TS 0 (all assets) 28 if assets are under $100 million27 if assets are between $100 million and
$300 million24 if assets are between $300 million and
$500 million20 if assets are over $500 million
0 (all assets)
Class LP 8 19 0
Class R 8 (all assets) 28 if assets are under $100 million27 if assets are between $100 million and
$300 million24 if assets are between $300 million and
$500 million20 if assets are over $500 million
0 (all assets)
Class R1 0 (all assets) 28 if assets are under $100 million27 if assets are between $100 million and
$300 million24 if assets are between $300 million and
$500 million20 if assets are over $500 million
3 (all assets)
Wilmington Trust Collective Investment Trust
Funds Sub-Advised by PGIM, Inc.
Notes to the Financial Statements (continued)
December 31, 2021
91
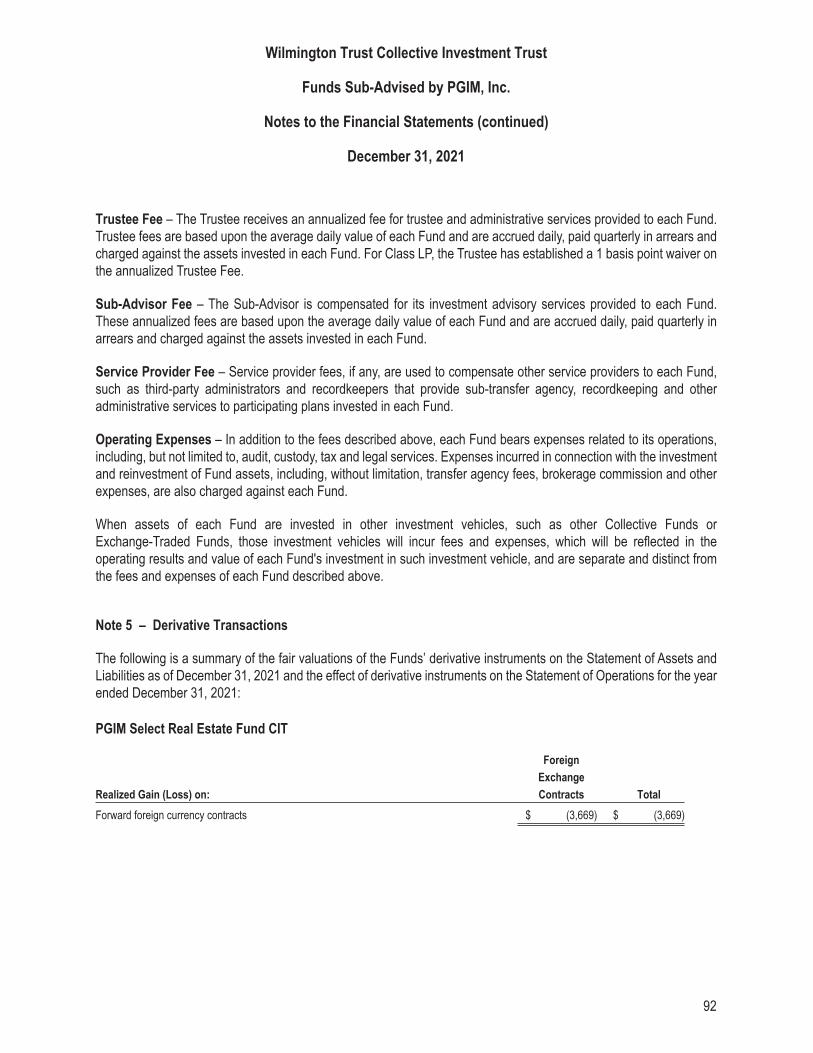
Trustee Fee – The Trustee receives an annualized fee for trustee and administrative services provided to each Fund.Trustee fees are based upon the average daily value of each Fund and are accrued daily, paid quarterly in arrears andcharged against the assets invested in each Fund. For Class LP, the Trustee has established a 1 basis point waiver onthe annualized Trustee Fee.
Sub-Advisor Fee – The Sub-Advisor is compensated for its investment advisory services provided to each Fund.These annualized fees are based upon the average daily value of each Fund and are accrued daily, paid quarterly inarrears and charged against the assets invested in each Fund.
Service Provider Fee – Service provider fees, if any, are used to compensate other service providers to each Fund,such as third-party administrators and recordkeepers that provide sub-transfer agency, recordkeeping and otheradministrative services to participating plans invested in each Fund.
Operating Expenses – In addition to the fees described above, each Fund bears expenses related to its operations,including, but not limited to, audit, custody, tax and legal services. Expenses incurred in connection with the investmentand reinvestment of Fund assets, including, without limitation, transfer agency fees, brokerage commission and otherexpenses, are also charged against each Fund.
When assets of each Fund are invested in other investment vehicles, such as other Collective Funds orExchange-Traded Funds, those investment vehicles will incur fees and expenses, which will be reflected in theoperating results and value of each Fund's investment in such investment vehicle, and are separate and distinct fromthe fees and expenses of each Fund described above.
Note 5 – Derivative Transactions
The following is a summary of the fair valuations of the Funds’ derivative instruments on the Statement of Assets andLiabilities as of December 31, 2021 and the effect of derivative instruments on the Statement of Operations for the yearended December 31, 2021:
PGIM Select Real Estate Fund CIT
Realized Gain (Loss) on:
Foreign
Exchange
Contracts Total
Forward foreign currency contracts $ (3,669) $ (3,669)
Wilmington Trust Collective Investment Trust
Funds Sub-Advised by PGIM, Inc.
Notes to the Financial Statements (continued)
December 31, 2021
92
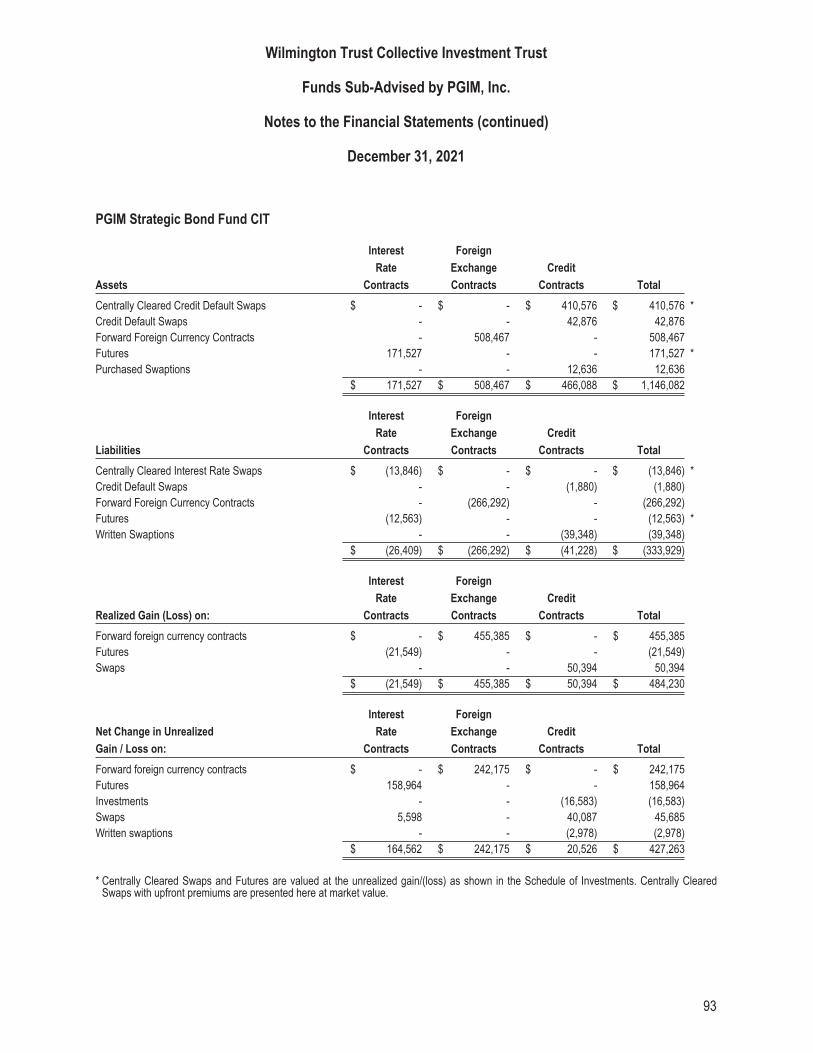
PGIM Strategic Bond Fund CIT
Assets
Interest
Rate
Contracts
Foreign
Exchange
Contracts
Credit
Contracts Total
Centrally Cleared Credit Default Swaps $ - $ - $ 410,576 $ 410,576 *Credit Default Swaps - - 42,876 42,876Forward Foreign Currency Contracts - 508,467 - 508,467Futures 171,527 - - 171,527 *Purchased Swaptions - - 12,636 12,636
$ 171,527 $ 508,467 $ 466,088 $ 1,146,082
Liabilities
Interest
Rate
Contracts
Foreign
Exchange
Contracts
Credit
Contracts Total
Centrally Cleared Interest Rate Swaps $ (13,846) $ - $ - $ (13,846) *Credit Default Swaps - - (1,880) (1,880)Forward Foreign Currency Contracts - (266,292) - (266,292)Futures (12,563) - - (12,563) *Written Swaptions - - (39,348) (39,348)
$ (26,409) $ (266,292) $ (41,228) $ (333,929)
Realized Gain (Loss) on:
Interest
Rate
Contracts
Foreign
Exchange
Contracts
Credit
Contracts Total
Forward foreign currency contracts $ - $ 455,385 $ - $ 455,385Futures (21,549) - - (21,549)Swaps - - 50,394 50,394
$ (21,549) $ 455,385 $ 50,394 $ 484,230
Net Change in Unrealized
Gain / Loss on:
Interest
Rate
Contracts
Foreign
Exchange
Contracts
Credit
Contracts Total
Forward foreign currency contracts $ - $ 242,175 $ - $ 242,175Futures 158,964 - - 158,964Investments - - (16,583) (16,583)Swaps 5,598 - 40,087 45,685Written swaptions - - (2,978) (2,978)
$ 164,562 $ 242,175 $ 20,526 $ 427,263
* Centrally Cleared Swaps and Futures are valued at the unrealized gain/(loss) as shown in the Schedule of Investments. Centrally ClearedSwaps with upfront premiums are presented here at market value.
Wilmington Trust Collective Investment Trust
Funds Sub-Advised by PGIM, Inc.
Notes to the Financial Statements (continued)
December 31, 2021
93
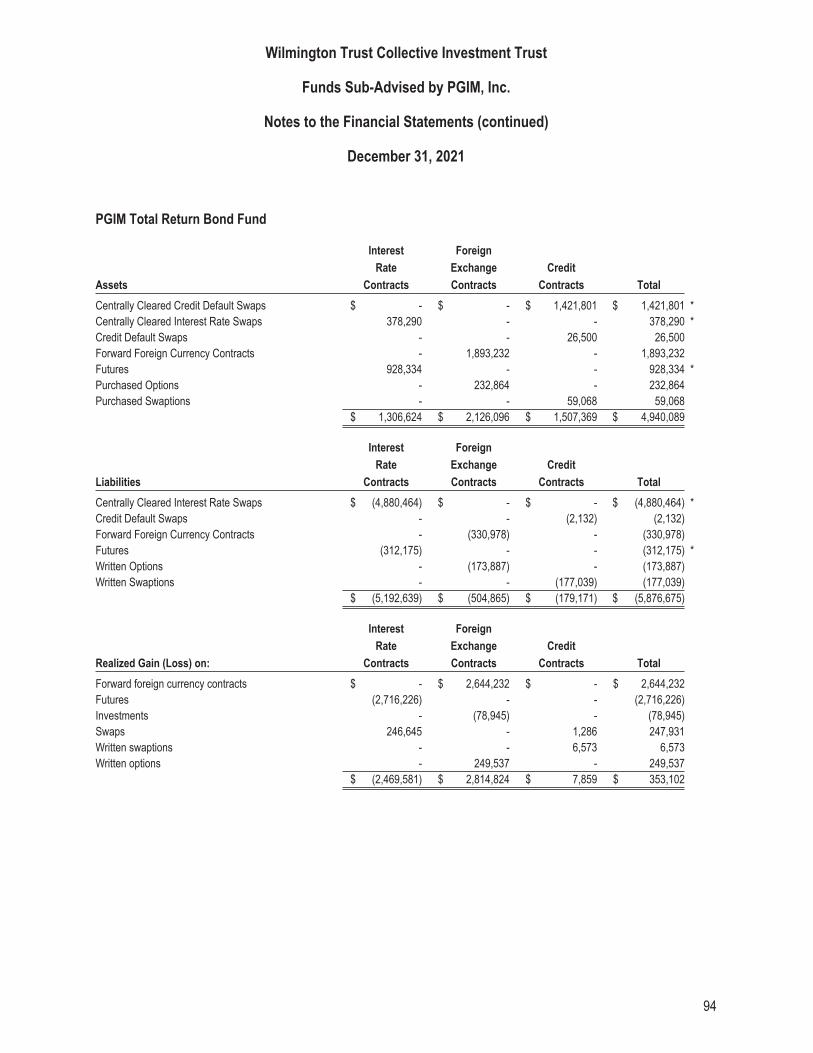
PGIM Total Return Bond Fund
Assets
Interest
Rate
Contracts
Foreign
Exchange
Contracts
Credit
Contracts Total
Centrally Cleared Credit Default Swaps $ - $ - $ 1,421,801 $ 1,421,801 *Centrally Cleared Interest Rate Swaps 378,290 - - 378,290 *Credit Default Swaps - - 26,500 26,500Forward Foreign Currency Contracts - 1,893,232 - 1,893,232Futures 928,334 - - 928,334 *Purchased Options - 232,864 - 232,864Purchased Swaptions - - 59,068 59,068
$ 1,306,624 $ 2,126,096 $ 1,507,369 $ 4,940,089
Liabilities
Interest
Rate
Contracts
Foreign
Exchange
Contracts
Credit
Contracts Total
Centrally Cleared Interest Rate Swaps $ (4,880,464) $ - $ - $ (4,880,464) *Credit Default Swaps - - (2,132) (2,132)Forward Foreign Currency Contracts - (330,978) - (330,978)Futures (312,175) - - (312,175) *Written Options - (173,887) - (173,887)Written Swaptions - - (177,039) (177,039)
$ (5,192,639) $ (504,865) $ (179,171) $ (5,876,675)
Realized Gain (Loss) on:
Interest
Rate
Contracts
Foreign
Exchange
Contracts
Credit
Contracts Total
Forward foreign currency contracts $ - $ 2,644,232 $ - $ 2,644,232Futures (2,716,226) - - (2,716,226)Investments - (78,945) - (78,945)Swaps 246,645 - 1,286 247,931Written swaptions - - 6,573 6,573Written options - 249,537 - 249,537
$ (2,469,581) $ 2,814,824 $ 7,859 $ 353,102
Wilmington Trust Collective Investment Trust
Funds Sub-Advised by PGIM, Inc.
Notes to the Financial Statements (continued)
December 31, 2021
94
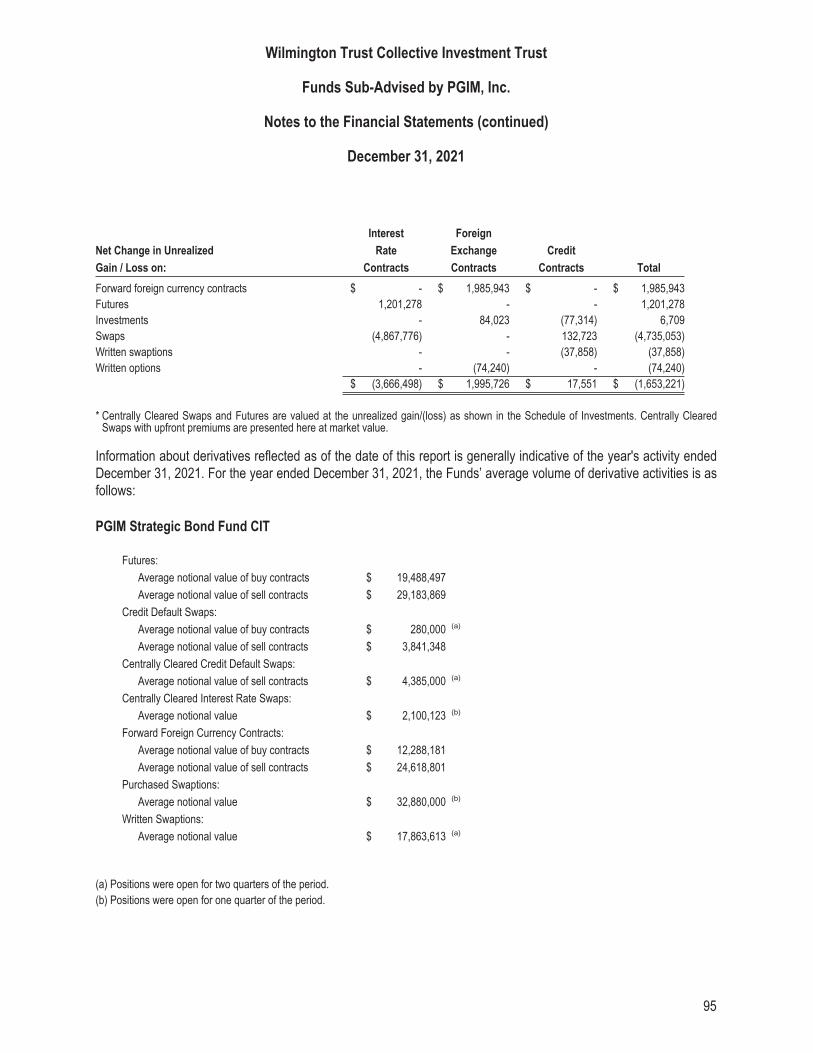
Net Change in Unrealized
Gain / Loss on:
Interest
Rate
Contracts
Foreign
Exchange
Contracts
Credit
Contracts Total
Forward foreign currency contracts $ - $ 1,985,943 $ - $ 1,985,943Futures 1,201,278 - - 1,201,278Investments - 84,023 (77,314) 6,709Swaps (4,867,776) - 132,723 (4,735,053)Written swaptions - - (37,858) (37,858)Written options - (74,240) - (74,240)
$ (3,666,498) $ 1,995,726 $ 17,551 $ (1,653,221)
* Centrally Cleared Swaps and Futures are valued at the unrealized gain/(loss) as shown in the Schedule of Investments. Centrally ClearedSwaps with upfront premiums are presented here at market value.
Information about derivatives reflected as of the date of this report is generally indicative of the year's activity endedDecember 31, 2021. For the year ended December 31, 2021, the Funds’ average volume of derivative activities is asfollows:
PGIM Strategic Bond Fund CIT
Futures:
Average notional value of buy contracts $ 19,488,497
Average notional value of sell contracts $ 29,183,869
Credit Default Swaps:
Average notional value of buy contracts $ 280,000 (a)
Average notional value of sell contracts $ 3,841,348
Centrally Cleared Credit Default Swaps:
Average notional value of sell contracts $ 4,385,000 (a)
Centrally Cleared Interest Rate Swaps:
Average notional value $ 2,100,123 (b)
Forward Foreign Currency Contracts:
Average notional value of buy contracts $ 12,288,181
Average notional value of sell contracts $ 24,618,801
Purchased Swaptions:
Average notional value $ 32,880,000 (b)
Written Swaptions:
Average notional value $ 17,863,613 (a)
(a) Positions were open for two quarters of the period.(b) Positions were open for one quarter of the period.
Wilmington Trust Collective Investment Trust
Funds Sub-Advised by PGIM, Inc.
Notes to the Financial Statements (continued)
December 31, 2021
95
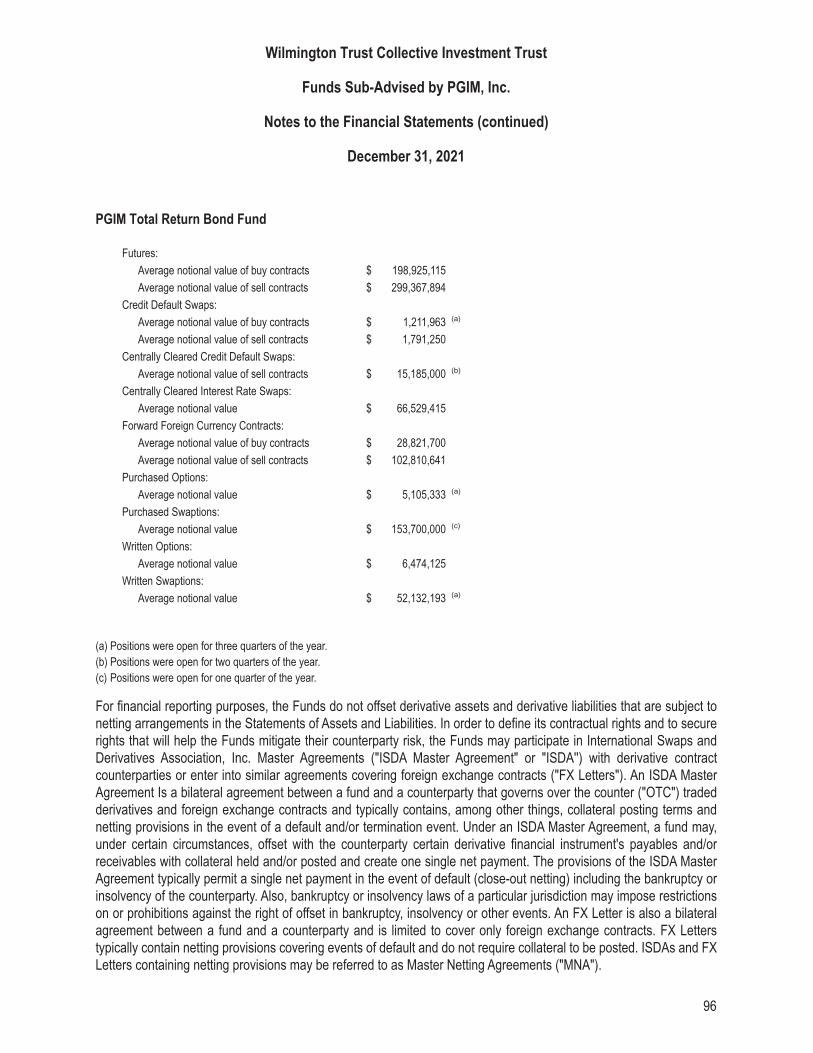
PGIM Total Return Bond Fund
Futures:
Average notional value of buy contracts $ 198,925,115
Average notional value of sell contracts $ 299,367,894
Credit Default Swaps:
Average notional value of buy contracts $ 1,211,963 (a)
Average notional value of sell contracts $ 1,791,250
Centrally Cleared Credit Default Swaps:
Average notional value of sell contracts $ 15,185,000 (b)
Centrally Cleared Interest Rate Swaps:
Average notional value $ 66,529,415
Forward Foreign Currency Contracts:
Average notional value of buy contracts $ 28,821,700
Average notional value of sell contracts $ 102,810,641
Purchased Options:
Average notional value $ 5,105,333 (a)
Purchased Swaptions:
Average notional value $ 153,700,000 (c)
Written Options:
Average notional value $ 6,474,125
Written Swaptions:
Average notional value $ 52,132,193 (a)
(a) Positions were open for three quarters of the year.(b) Positions were open for two quarters of the year.(c) Positions were open for one quarter of the year.
For financial reporting purposes, the Funds do not offset derivative assets and derivative liabilities that are subject tonetting arrangements in the Statements of Assets and Liabilities. In order to define its contractual rights and to securerights that will help the Funds mitigate their counterparty risk, the Funds may participate in International Swaps andDerivatives Association, Inc. Master Agreements ("ISDA Master Agreement" or "ISDA'') with derivative contractcounterparties or enter into similar agreements covering foreign exchange contracts ("FX Letters"). An ISDA MasterAgreement Is a bilateral agreement between a fund and a counterparty that governs over the counter ("OTC") tradedderivatives and foreign exchange contracts and typically contains, among other things, collateral posting terms andnetting provisions in the event of a default and/or termination event. Under an ISDA Master Agreement, a fund may,under certain circumstances, offset with the counterparty certain derivative financial instrument's payables and/orreceivables with collateral held and/or posted and create one single net payment. The provisions of the ISDA MasterAgreement typically permit a single net payment in the event of default (close-out netting) including the bankruptcy orinsolvency of the counterparty. Also, bankruptcy or insolvency laws of a particular jurisdiction may impose restrictionson or prohibitions against the right of offset in bankruptcy, insolvency or other events. An FX Letter is also a bilateralagreement between a fund and a counterparty and is limited to cover only foreign exchange contracts. FX Letterstypically contain netting provisions covering events of default and do not require collateral to be posted. ISDAs and FXLetters containing netting provisions may be referred to as Master Netting Agreements ("MNA").
Wilmington Trust Collective Investment Trust
Funds Sub-Advised by PGIM, Inc.
Notes to the Financial Statements (continued)
December 31, 2021
96
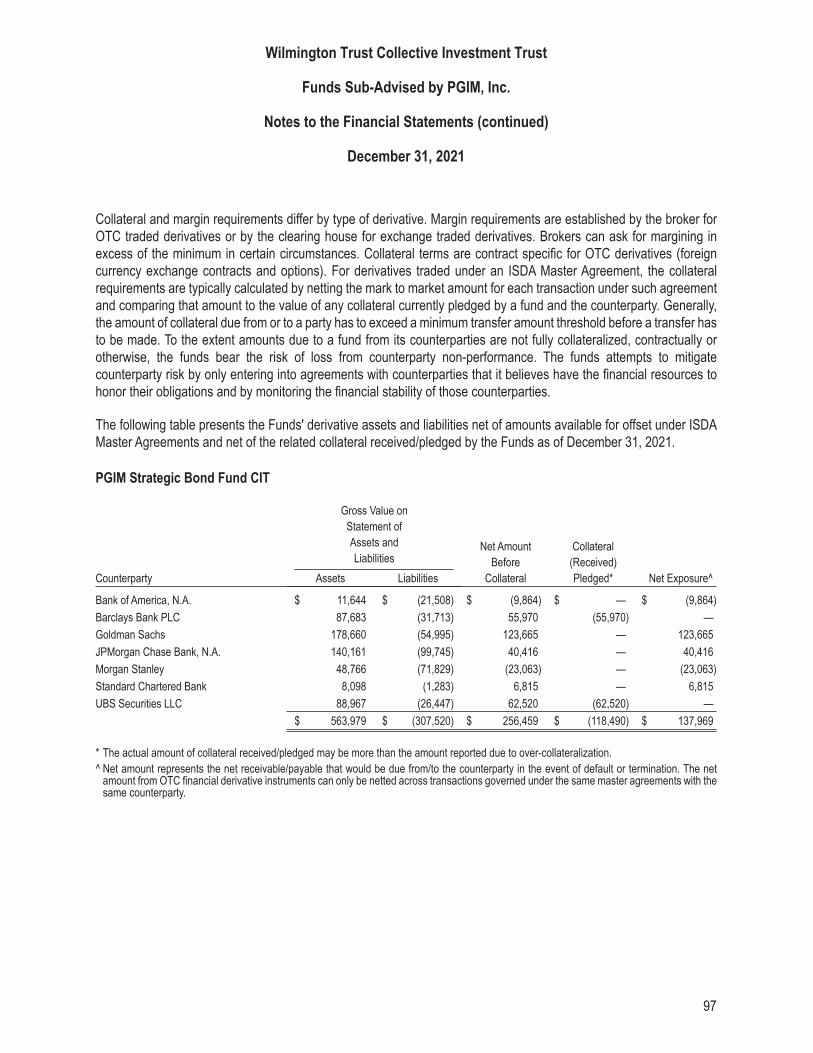
Collateral and margin requirements differ by type of derivative. Margin requirements are established by the broker forOTC traded derivatives or by the clearing house for exchange traded derivatives. Brokers can ask for margining inexcess of the minimum in certain circumstances. Collateral terms are contract specific for OTC derivatives (foreigncurrency exchange contracts and options). For derivatives traded under an ISDA Master Agreement, the collateralrequirements are typically calculated by netting the mark to market amount for each transaction under such agreementand comparing that amount to the value of any collateral currently pledged by a fund and the counterparty. Generally,the amount of collateral due from or to a party has to exceed a minimum transfer amount threshold before a transfer hasto be made. To the extent amounts due to a fund from its counterparties are not fully collateralized, contractually orotherwise, the funds bear the risk of loss from counterparty non-performance. The funds attempts to mitigatecounterparty risk by only entering into agreements with counterparties that it believes have the financial resources tohonor their obligations and by monitoring the financial stability of those counterparties.
The following table presents the Funds' derivative assets and liabilities net of amounts available for offset under ISDAMaster Agreements and net of the related collateral received/pledged by the Funds as of December 31, 2021.
PGIM Strategic Bond Fund CIT
Gross Value onStatement ofAssets andLiabilities
Counterparty Assets Liabilities
Net AmountBefore
Collateral
Collateral(Received)Pledged* Net Exposure^
Bank of America, N.A. $ 11,644 $ (21,508) $ (9,864) $ — $ (9,864)
Barclays Bank PLC 87,683 (31,713) 55,970 (55,970) —
Goldman Sachs 178,660 (54,995) 123,665 — 123,665
JPMorgan Chase Bank, N.A. 140,161 (99,745) 40,416 — 40,416
Morgan Stanley 48,766 (71,829) (23,063) — (23,063)
Standard Chartered Bank 8,098 (1,283) 6,815 — 6,815
UBS Securities LLC 88,967 (26,447) 62,520 (62,520) —
$ 563,979 $ (307,520) $ 256,459 $ (118,490) $ 137,969
* The actual amount of collateral received/pledged may be more than the amount reported due to over-collateralization.^ Net amount represents the net receivable/payable that would be due from/to the counterparty in the event of default or termination. The net
amount from OTC financial derivative instruments can only be netted across transactions governed under the same master agreements with thesame counterparty.
Wilmington Trust Collective Investment Trust
Funds Sub-Advised by PGIM, Inc.
Notes to the Financial Statements (continued)
December 31, 2021
97
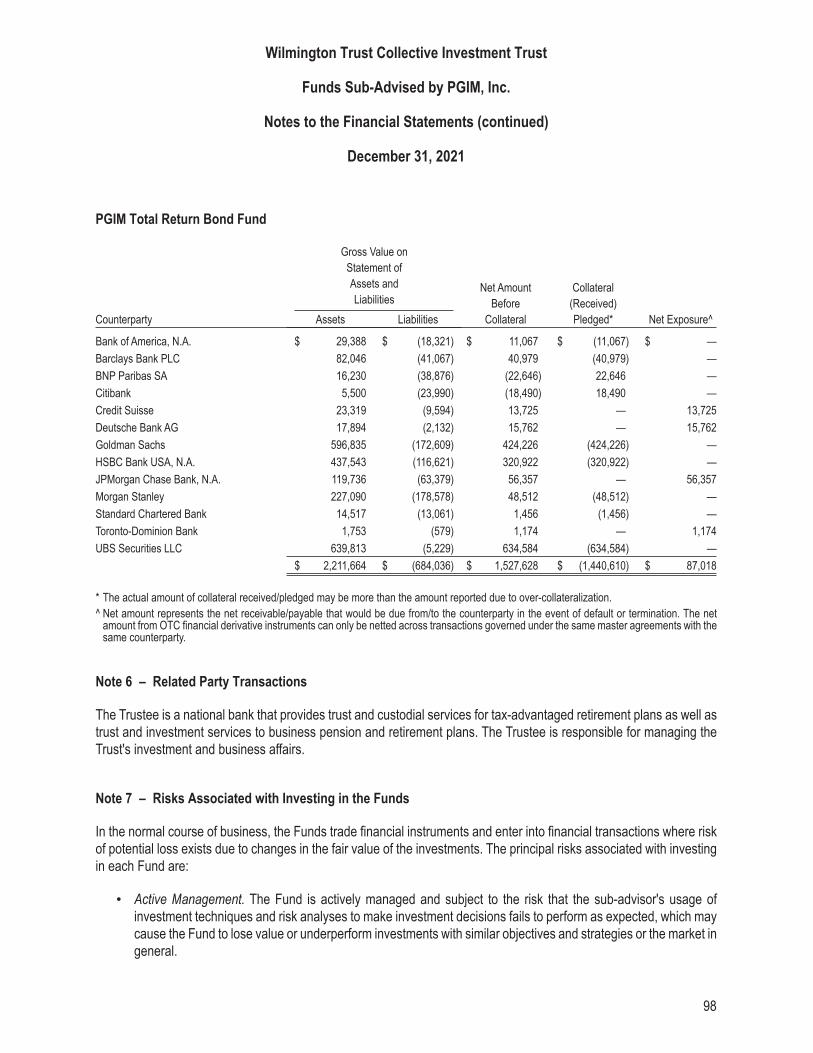
PGIM Total Return Bond Fund
Gross Value onStatement ofAssets andLiabilities
Counterparty Assets Liabilities
Net AmountBefore
Collateral
Collateral(Received)Pledged* Net Exposure^
Bank of America, N.A. $ 29,388 $ (18,321) $ 11,067 $ (11,067) $ —
Barclays Bank PLC 82,046 (41,067) 40,979 (40,979) —
BNP Paribas SA 16,230 (38,876) (22,646) 22,646 —
Citibank 5,500 (23,990) (18,490) 18,490 —
Credit Suisse 23,319 (9,594) 13,725 — 13,725
Deutsche Bank AG 17,894 (2,132) 15,762 — 15,762
Goldman Sachs 596,835 (172,609) 424,226 (424,226) —
HSBC Bank USA, N.A. 437,543 (116,621) 320,922 (320,922) —
JPMorgan Chase Bank, N.A. 119,736 (63,379) 56,357 — 56,357
Morgan Stanley 227,090 (178,578) 48,512 (48,512) —
Standard Chartered Bank 14,517 (13,061) 1,456 (1,456) —
Toronto-Dominion Bank 1,753 (579) 1,174 — 1,174
UBS Securities LLC 639,813 (5,229) 634,584 (634,584) —
$ 2,211,664 $ (684,036) $ 1,527,628 $ (1,440,610) $ 87,018
* The actual amount of collateral received/pledged may be more than the amount reported due to over-collateralization.^ Net amount represents the net receivable/payable that would be due from/to the counterparty in the event of default or termination. The net
amount from OTC financial derivative instruments can only be netted across transactions governed under the same master agreements with thesame counterparty.
Note 6 – Related Party Transactions
The Trustee is a national bank that provides trust and custodial services for tax-advantaged retirement plans as well astrust and investment services to business pension and retirement plans. The Trustee is responsible for managing theTrust's investment and business affairs.
Note 7 – Risks Associated with Investing in the Funds
In the normal course of business, the Funds trade financial instruments and enter into financial transactions where riskof potential loss exists due to changes in the fair value of the investments. The principal risks associated with investingin each Fund are:
• Active Management. The Fund is actively managed and subject to the risk that the sub-advisor's usage ofinvestment techniques and risk analyses to make investment decisions fails to perform as expected, which maycause the Fund to lose value or underperform investments with similar objectives and strategies or the market ingeneral.
Wilmington Trust Collective Investment Trust
Funds Sub-Advised by PGIM, Inc.
Notes to the Financial Statements (continued)
December 31, 2021
98
• Bank Loans. Investments in bank loans, also known as senior loans or floating-rate loans, are rated belowinvestment grade and may be subject to a greater risk of default than are investment-grade loans, reducing thepotential for income and potentially leading to impairment of the collateral provided by the borrower. Bank loanspay interest at rates that are periodically reset based on changes in interest rates and may be subject toincreased prepayment and liquidity risks. Concentrating assets in stocks of one or more capitalizations (small,mid, or large) may be subject to both the specific risks of those capitalizations as well as increased volatilitybecause stocks of specific capitalizations tend to go through cycles of beating or lagging the market as a whole.
• Cash Drag. The Fund may fail to meet its investment objective because of positions in cash and equivalents.
• Conflict of Interest. A conflict of interest may arise if the sub-advisor makes an investment in certain underlyingfunds based on the fact that those funds are also managed by the sub-advisor or an affiliate or because certainunderlying funds may pay higher fees to the sub-advisor than do others. In addition, a sub-advisor'sparticipation in the primary or secondary market for loans may be deemed a conflict of interest and limit theability of the investment to acquire those assets.
• Convertible Securities. Investments in convertible securities may be subject to increased interest rate risks,rising in value as interest rates decline and falling in value when interest rates rise, in addition to their marketvalue depending on the performance of the common stock of the issuer. Convertible securities which aretypically unrated or rated lower than other debt obligations, are secondary to debt obligations in order of priorityduring a liquidation in the event the issuer defaults.
• Country or Region. Investments in securities from a particular country or region may be subject to the risk ofadverse social, political, regulatory, or economic events occurring in that country or region. Country orregion-specific risks also include the risk that adverse securities markets or exchange rates may impact thevalue of securities from those areas.
• Credit and Counterparty. The issuer or guarantor of a fixed income security, counterparty to an OTC derivativescontract, or other borrower may not be able to make timely principal, interest, or settlement payments on anobligation. In this event, the issuer of a fixed income security may have its credit rating downgraded or defaulted,which may reduce the potential for income and value of the Fund.
• Currency. Investments in securities traded in foreign currencies or more directly in foreign currencies are subjectto the risk that the foreign currency will decline in value relative to the U.S. dollar, which may reduce the value ofthe Fund. Investments in currency hedging positions are subject to the risk that the value of the U.S. dollar willdecline relative to the currency being hedged, which may result in a loss of money on the investment as well asthe position designed to act as a hedge. Cross-currency hedging strategies and active currency positions mayincrease currency risk because actual currency exposure may be substantially different from that suggested bythe Fund's holdings.
• Derivatives. Investments in derivatives may be subject to the risk that the sub-advisor does not correctly predictthe movement of the underlying security, interest rate, market index, or other financial asset, or that the value ofthe derivative does not correlate perfectly with either the overall market or the underlying asset from which thederivative's value is derived. Because derivatives usually involve a small investment relative to the magnitude ofliquidity and other risks assumed, the resulting gain or loss from the transaction will be disproportionatelymagnified. These investments may result in a loss if the counterparty to the transaction does not perform aspromised.
Wilmington Trust Collective Investment Trust
Funds Sub-Advised by PGIM, Inc.
Notes to the Financial Statements (continued)
December 31, 2021
99
• Distressed Investments. Investments in distressed or defaulted investments, which may include loans, loanparticipations, bonds, notes and issuers undergoing bankruptcy organization, are often not publicly traded andface increased price volatility and liquidity risk. These securities are subject to the risk that the sub-advisor doesnot correctly estimate their future value, which may result in a loss or part or all of the investment.
• Dollar Rolls. Dollar roll transactions in the mortgage pass-through securities market may be subject to the riskthat the market value of securities sold to the counterparty declines below the repurchase price, thecounterparty defaults on its obligations, or the portfolio turnover rate increases because of these transactions. Inaddition, any investments purchased with the proceeds of a security sold in a dollar roll transaction may losevalue.
• Emerging Markets. Investments in emerging markets securities may be subject to greater market, credit,currency, liquidity, legal, political, and other risks compared with assets invested in developed foreign countries(see Foreign Securities below). Emerging markets countries may have restrictive national policies that limitinvestment opportunities, limited information about issuers, a general lack of uniform accounting, auditing andfinancial reporting standards as compared to the standards of developed countries, less liquidity and morevolatility, limitations on the movement of funds, difficulties in enforcing contractual obligations and the possibilityof expropriation or nationalization.
• Equity Securities. The value of equity securities, which include common, preferred, and convertible preferredstocks, will fluctuate based on changes in their issuers' financial conditions, as well as overall market andeconomic conditions, and can decline in the event of deteriorating issuer, market, or economic conditions.
• Exchange-Traded Funds (ETF). Investments in exchange-traded funds generally reflect the risks of owning theunderlying securities they are designed to track, although they may be subject to greater liquidity risk and highercosts than owning the underlying securities directly because of their management fees, and may not passthrough voting and other shareholder rights on the underlying securities. Shares of ETFs are subject to markettrading risk, potentially trading at a premium or discount to net asset value.
• Financial Sectors. Concentrating assets in the financial sector may disproportionately subject the portfolio to therisks of that industry, including loss of value because of economic recession, availability of credit, volatileinterest rates, government regulation, and other factors.
• Fixed Income Securities. The value of fixed income or debt securities may be susceptible to general movementsin the bond market and are subject to interest rate and credit risk.
• Foreign Securities. Investments in foreign securities may be subject to increased volatility as the value of thesesecurities can change more rapidly and extremely than the value of U.S. securities. Factors that increase therisk of investing in foreign securities include but are not limited to the following: less public information aboutissuers of non-U.S. securities; less governmental regulation and supervision over the issuance and trading ofsecurities, the unavailability of financial information regarding the non-U.S. issuer or the difficulty of interpretingfinancial information prepared under non-U.S. accounting standards, less liquidity, the imposition of withholdingand other taxes, and adverse political, social or diplomatic developments. In addition, foreign securities aresubject to increased costs because there are generally higher commission rates on transactions, transfer taxes,higher custodial costs, and the potential for foreign tax charges on dividend and interest payments. Manyforeign markets are relatively small, and securities issued in less-developed countries face the risks of
Wilmington Trust Collective Investment Trust
Funds Sub-Advised by PGIM, Inc.
Notes to the Financial Statements (continued)
December 31, 2021
100
nationalization, expropriation or confiscatory taxation, and adverse changes in investment or exchange controlregulations, including suspension of the ability to transfer currency from a country. Economic, political, social, ordiplomatic developments can also negatively impact performance.
• Forwards. Investments in forwards may increase volatility and be subject to additional market, activemanagement, currency, and counterparty risks as well as liquidity risk if the contract cannot be closed whendesired. Forwards purchased on a when-issued or delayed-delivery basis may be subject to risk of loss if theydecline in value prior to delivery, or if the counterparty defaults on its obligation.
• Futures. Investments in futures contracts and options on futures contracts may increase volatility and be subjectto additional market, active management, interest, currency, and other risks if the contract cannot be closedwhen desired.
• Hedging Strategies. The use of hedging strategies to reduce risk may limit the opportunity for gains comparedwith unhedged investments, and there is no guarantee that hedges will actually reduce risk.
• High Portfolio Turnover. Active trading may create high portfolio turnover, or a turnover of 100% or more,resulting in increased transaction costs. These higher costs may have an adverse impact on performance.
• High-Yield Securities. Investments in below investment-grade debt securities and unrated securities of similarcredit quality, commonly known as "junk bonds" or "high-yield securities," may be subject to increased interestrate, credit, and liquidity risks.
• Income. The investment’s income payments may decline depending on fluctuations in interest rates and thedividend payments of its underlying securities. In this event, some investments may attempt to pay the samedividend amount by returning capital.
• Increase in Expenses. The actual cost of investing may be higher than the expenses listed in the expense tablefor a variety of reasons, including termination of a voluntary fee waiver or losing fee breakpoints if average netassets decrease. The risk of expenses increasing because of a decrease in average net assets is heightenedwhen markets are volatile.
• Index Correlation/Tracking Error. A portfolio that tracks an index is subject to the risk that certain factors maycause the Fund to track its target index less closely, including if the sub-advisor or manager selects securitiesthat are not fully representative of the index. The Fund will generally reflect the performance of its target indexeven if the index does not perform well, and it may underperform the index after factoring in fees, expenses,transaction costs, and the size and timing of unitholder purchases and redemptions.
• Industry and Sector Investing. Concentrating assets in a particular industry, sector of the economy, or marketsmay increase volatility because the investment will be more susceptible to the impact of market, economic,regulatory, and other factors affecting that industry or sector compared with a more broadly diversified assetallocation.
• Inflation/Deflation. A change of asset value may occur because of inflation or deflation, causing the Fund tounderperform. Inflation may cause the present value of future payments to decrease, causing a decline in thefuture value of assets or income. Deflation causes prices to decline throughout the economy over time,impacting issuers' creditworthiness and increasing their risk for default, which may reduce the value of the Fund.
Wilmington Trust Collective Investment Trust
Funds Sub-Advised by PGIM, Inc.
Notes to the Financial Statements (continued)
December 31, 2021
101
• Inflation-Protected Securities. Unlike other fixed income securities, the values of inflation-protected securitiesare not significantly impacted by inflation expectations because their interest rates are adjusted for inflation.Generally, the value of inflation-protected securities will fall when real interest rates rise and rise when realinterest rates fall.
• Initial Public Offering (IPO). Investment in initial public offerings may increase volatility and have a magnifiedimpact on performance. IPO shares may be sold shortly after purchase, which can increase portfolio turnoverand expenses, including commissions and transactions costs. Additionally, IPO shares are subject to increasedmarket, liquidity, and issuer risks.
• Interest Rate. Securities are subject to the risk that changes in interest rates will reduce their market value.
• Investment-Grade Securities. Investments in investment-grade debt securities that are not rated in the highestrating categories may lack the capacity to pay principal and interest compared with higher-rated securities andmay be subject to increased credit risk.
• Issuer. A stake in any individual security is subject to the risk that the issuer of that security performs poorly,resulting in a decline in the security's value. Issuer-related declines may be caused by poor managementdecisions, competitive pressures, technological breakthroughs, reliance on suppliers, labor problems orshortages, corporate restructurings, fraudulent disclosures, or other factors. Additionally, certain issuers may bemore sensitive to adverse issuer, political, regulatory, market, or economic developments.
• Long-Term Outlook and Projections. The investment is intended to be held for a substantial period of time, andinvestors should tolerate fluctuations in their investment's value.
• Loss of Money. An investment's market value may fluctuate up and down, an investor may lose money,including part of the principal, when he or she buys or sells the investment.
• Management. Performance is subject to the risk that the sub-advisor's asset allocation and investmentstrategies do not perform as expected, which may cause the Fund to underperform its benchmark, otherinvestments with similar objectives, or the market in general. The investment is subject to the risk of loss ofincome and capital invested, and the sub-advisor does not guarantee its value, performance, or any particularrate of return.
• Market/Market Volatility. The market value of the Fund's securities may fall rapidly or unpredictably because ofchanging economic, political, or market conditions, which may reduce the value of the Fund.
• Maturity/Duration. Securities with longer maturities or durations typically have higher yields but may be subjectto increased interest rate risk and price volatility compared with securities with shorter maturities, which havelower yields but greater price stability.
• Mortgage-Backed and Asset-Backed Securities. Investments in mortgage-backed ("MBS") and asset-backedsecurities ("ABS") may be subject to increased price volatility because of changes in interest rates, issuerinformation availability, credit quality of the underlying assets, market perception of the issuer, availability ofcredit enhancement, and prepayment of principal. The value of ABS and MBS may be adversely affected if theunderlying borrower fails to pay the loan included in the security.
Wilmington Trust Collective Investment Trust
Funds Sub-Advised by PGIM, Inc.
Notes to the Financial Statements (continued)
December 31, 2021
102
• Municipal Project-Specific. Investments in municipal bonds that finance similar types of projects, including thoserelated to education, health care, housing, transportation, utilities, and industry, may be subject to a greaterextent than general obligation municipal bonds to the risks of adverse economic, business, or politicaldevelopments.
• Non-Diversification. A non-diversified fund may have an increased potential for loss because it includes arelatively small number of investments. Movements in the prices of the individual investments may have amagnified effect on a non-diversified portfolio. Any sale of the Fund's large positions could adversely affect stockprices if those positions represent a significant part of a company's outstanding stock.
• Not FDIC Insured. The investment is not a deposit or obligation of, or guaranteed or endorsed by, any bank andis not insured by the Federal Deposit Insurance Corporation, the Federal Reserve Board, or any other U.S.governmental agency.
• Options. Investments in options may be subject to the risk that the sub-advisor does not correctly predict themovement of an option's underlying stock. Option purchases may result in the loss of part or all of the amountpaid for the option plus commission costs. Option sales may result in a forced sale or purchase of a security ata price higher or lower than its current market price.
• OTC. Investments traded and privately negotiated in the over-the-counter ("OTC") market, including securitiesand derivatives, may be subject to greater price volatility and liquidity risk than transactions made on organizedexchanges. Because the OTC market is less regulated, OTC transactions may be subject to increased creditand counterparty risk. The investment's performance may be impacted by its concentration in a certain type ofsecurity, adherence to a particular investing strategy, or a unique aspect of its structure and costs.
• Portfolio Diversification. Investments that concentrate their assets in a relatively small number of issuers, or inthe securities of issuers in a particular market, industry, sector, country, or asset class, may be subject to greaterrisk of loss than is a more widely diversified investment.
• Preferred Stocks. Investments in preferred stocks may be subject to the risks of deferred distribution payments,involuntary redemptions, subordination to debt instruments, a lack of liquidity compared with common stocks,limited voting rights, and sensitivity to interest rate changes.
• Prepayment (Call). The issuer of a debt security may be able to repay principal prior to the security's maturitybecause of an improvement in its credit quality or falling interest rates. In this event, this principal may have tobe reinvested in securities with lower interest rates than the original securities, reducing the potential for income.
• Pricing. Some investments may not have a market observed price; therefore, values for these assets may bedetermined through a subjective valuation methodology. Fair values determined by a subjective methodologymay differ from the actual value realized upon sale. Valuation methodologies may also be used to calculate adaily net asset value.
Wilmington Trust Collective Investment Trust
Funds Sub-Advised by PGIM, Inc.
Notes to the Financial Statements (continued)
December 31, 2021
103
• Real Estate/REIT Sector. Concentrating assets in the real estate sector or Real Estate Investment Trusts("REITs") may disproportionately subject the Fund to the risks of that industry, including loss of value because ofchanges in real estate values, interest rates, and taxes, as well as changes in zoning, building, environmental,and other laws, among other factors. Investments in REITs may be subject to increased price volatility andliquidity risk, and investors indirectly bear their proportionate share of expenses because of their managementfees.
• Regulation/Government Intervention. The business of the issuer of an underlying security may be adverselyimpacted by new regulation or government intervention, impacting the price of the security. Direct governmentownership of distressed assets in times of economic instability may subject the Fund's holdings to increasedprice volatility and liquidity risk.
• Reinvestment. Payments from debt securities may have to be reinvested in securities with lower interest ratesthan the original securities.
• Repurchase Agreements. Repurchase agreements may be subject to the risk that the seller of a securitydefaults and the collateral security for the repurchase agreement has declined and does not equal the value ofthe repurchase price. In this event, impairment of the collateral may result in additional costs.
• Restricted/Illiquid Securities. Restricted and illiquid securities may fall in price because of an inability to sell thesecurities when desired. Investing in restricted securities may subject the Fund to higher costs and liquidity risk.
• Sovereign Debt. Investments in debt securities issued or guaranteed by governments or governmental entitiesare subject to the risk that an entity may delay or refuse to pay interest or principal on its sovereign debt becauseof cash flow problems, insufficient foreign reserves, or political or other considerations. In this event, there maybe no legal process for collecting sovereign debts that a governmental entity has not repaid.
• Swaps. Investments in swaps, such as interest rate swaps, currency swaps and total return swaps, mayincrease volatility and be subject to increased liquidity, credit, and counterparty risks. Depending on theirstructure, swaps may increase or decrease the Fund’s exposure to long- or short-term interest rates, foreigncurrency values, corporate borrowing rates, security prices, index values, inflation rates, credit, or other factors.
• Temporary Defensive Measures. Temporary Defensive positions may be used during adverse economic,market, or other conditions. In this event, up to 100% of assets may be allocated to securities, including cashand cash equivalents that are normally not consistent with the investment objective.
• Unrated Securities. Investments in unrated securities may be subject to increased interest, credit and liquidityrisks if the sub-advisor does not accurately assess the quality of those securities.
• U.S. Government Obligations. Investments in U.S. government obligations are subject to varying levels ofgovernment support. In the event of default, some U.S. government securities, including U.S. Treasuryobligations and Ginnie Mae securities, are issued and guaranteed as to principal and interest by the full faithand credit of the U.S. government. Other securities are obligations of U.S. government-sponsored entities butare neither issued nor guaranteed by the U.S. government. U.S. State or Territory-Specific Investments in themunicipal securities of a particular state or territory may be subject to the risk that changes in the economicconditions of that state or territory will negatively impact performance.
Wilmington Trust Collective Investment Trust
Funds Sub-Advised by PGIM, Inc.
Notes to the Financial Statements (continued)
December 31, 2021
104
• Value Investing. Value securities may be subject to the risk that these securities cannot overcome the adversefactors the sub-advisor believes are responsible for their low price or that the market may not recognize theirfundamental value as the sub-advisor predicted. Value securities are not expected to experience significantearnings growth and may underperform growth stocks in certain markets.
• Variable-Rate Securities. Investments in variable-rate securities, which periodically adjust the interest rate paidon the securities, may be subject to greater liquidity risk than are other fixed income securities. Becausevariable-rate securities are subject to less interest rate risk than other fixed income securities, their opportunityto provide capital appreciation is comparatively reduced.
• Warrants. Investments in warrants may be subject to the risk that the price of the underlying stock does not riseabove the exercise price. In this event, the warrant may expire without being exercised and lose all value.
Wilmington Trust Collective Investment Trust
Funds Sub-Advised by PGIM, Inc.
Notes to the Financial Statements (continued)
December 31, 2021
105