00 rtc transit operating statistics - rtc washoe
TRANSCRIPT
00
RTC TRANSIT OPERATING STATISTICS RTC RIDE RTC RAPID RTC REGIONAL CONNECTOR SIERRA SPIRIT April 2019

TRANSIT HIGHLIGHTS Page i
RTC TRANSIT OPERATING STATISTICS REPORT TABLE OF CONTENTS RTC Transit Highlights ...................................................................................... Page ii RTC Transit Summary ....................................................................................... Page v System Reports .................................................................................................. Page 1 Revenue and Cost.............................................................................................. Page 5 Economic Data ................................................................................................... Page 6 Route Comparison Data ..................................................................................... Page 9 Monthly Operating Statistics ............................................................................. Page 11 RTC RAPID Lincoln Line & Route 11 ............................................................... Page 16 RTC RAPID Virginia Line & Route 1 ................................................................ Page 18 RTC REGIONAL CONNECTOR Carson Line ................................................. Page 20 SIERRA SPIRIT .............................................................................................. Page 22 Token Transit Smart Phone Fare Payment ...................................................... Page 24 National Comparisons ...................................................................................... Page 25 Historical Ridership by Fare Category .............................................................. Page 27 Missed Trips ..................................................................................................... Page 28

TRANSIT HIGHLIGHTS Page ii
RTC TRANSIT HIGHLIGHTS
April 2019
RTC Transit
There were 580,881 rides in April, 3.9% lower than last April. Weighted average daily ridership at 19,213 was 5.5% lower than last April.
(There was one more weekday and one less Sunday this month compared with last April.)
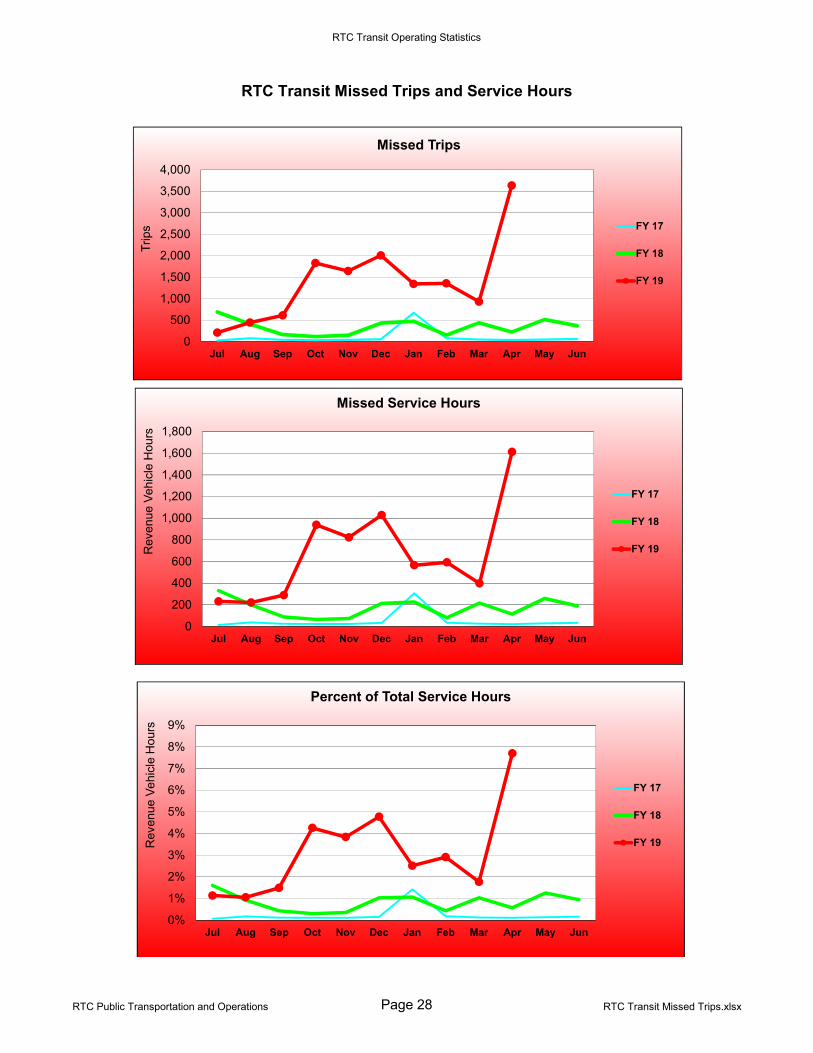
This decline in ridership has been an ongoing trend starting last summer that has corresponded with the construction detour and reduced service hours on S Virginia St, missed trips due to staffing challenges, and technical issues with a larger electric bus fleet.
The silver lining is the introduction of the RTC RAPID Lincoln Line last October. This month, ridership for both the Lincoln Line and Route 11 was 63K which was 20% higher than Route 11 alone last year. Lincoln Line and Route 11 service hours increased 85% over Route 11 alone last year.
There were 20,937 service hours (revenue vehicle hours) 4.5% higher than last year. Due to staffing and bus charging issues, there were 3,632 missed trips, 8.4% of all scheduled trips and 7.2% of all scheduled service hours.
Productivity this month at 27.7 rides per service hour was 8.0% lower than last year.
There were 7.10 million rides over the last 12 months. This is 4.0% lower than the previous 12 months.
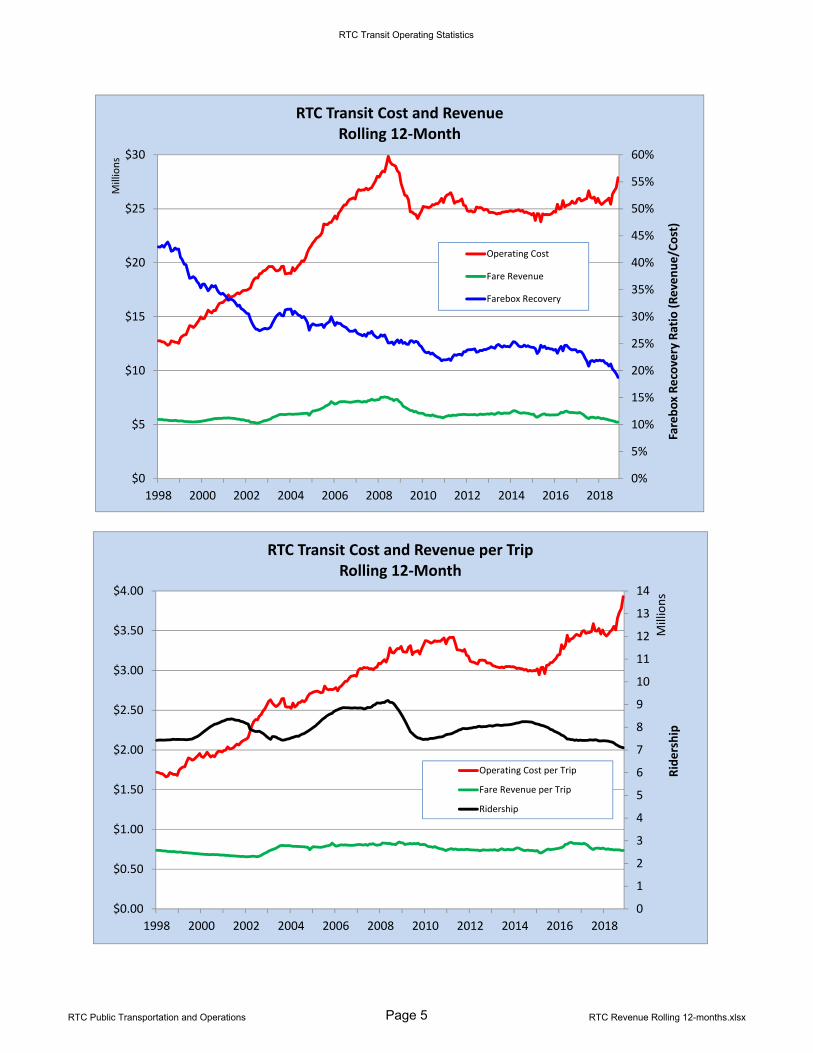
May 2018 to April 2019, operating cost was $27.9 million up 9.0% and fare revenue was $5.2 million down 6.8%. Fare revenue is expected to continue to decline due to the lowering of pass prices last year and US veterans now qualifying for reduced fares. Now, over half of all trips taken are reduced fares. Net operating cost was $22.7 million up 13.5% compared with the previous 12 months.
The farebox recovery ratio (revenue divided by cost) was 18.7%, 3.2 percentage points lower than the previous 12 months. Total operating costs have started to increase as hourly operating contract costs have also increased (3.2% from FY 2018 to FY 2019).
This month, 24-Hour and Day Pass ridership combined increased 164% over 24-Hour Pass ridership alone last year and makes up 31.5% of all ridership compared with 11.5% last year. Pre-purchased pass ridership was up 24%. Pass ridership now makes up 89% of all ridership compared with 64% last year.

TRANSIT HIGHLIGHTS Page iii
External Impacts on Ridership
Climate had a greater negative impact on ridership last month. There were four days of rain this month compared with six days of rain and one day of snow last year. Average temperature at 55.3°F was 2.1°F warmer than last year.
The average price of gas in Reno at $3.62 was 8.4% higher than last year. The Reno-Sparks area unemployment rate in April was 2.9%. This is the
lowest rate in 20 years. Interestingly, unemployment fell to 2.5% right before the Dot Com Bust. There are 254K employed people, the most in the area ever. Nevada’s unemployment rate for April was 4.0%. This is the lowest rate in 14 years. The national unemployment rate for April was 3.6%. The rate has never been this low since 1969!
Historical Impacts on Ridership
While employment has increased in the region, the makeup of local employment has significantly changed. When Reno was a tourism and gaming town, a large portion of employment was in the low-wage, service industry whereas recently jobs tend to be higher wage and geographically dispersed requiring cars.
While we experienced a ridership increase from the economic recovery, continued employment provides people with sufficient income to buy and drive cars. The percentage of subprime and deep subprime auto loans has increased since the Great Recession, in large part due to more lax lending requirements. However, defaults on these loans have increased recently.
Uber started permanent service in Reno in 2015 and Lyft started shortly after. Nevada now provides driver’s licenses for people who are undocumented. As downtown and midtown areas in-fill and gentrify, this also pushes lower
income people to the suburbs where they are much more likely to need cars.
TRANSIT HIGHLIGHTS Page iv
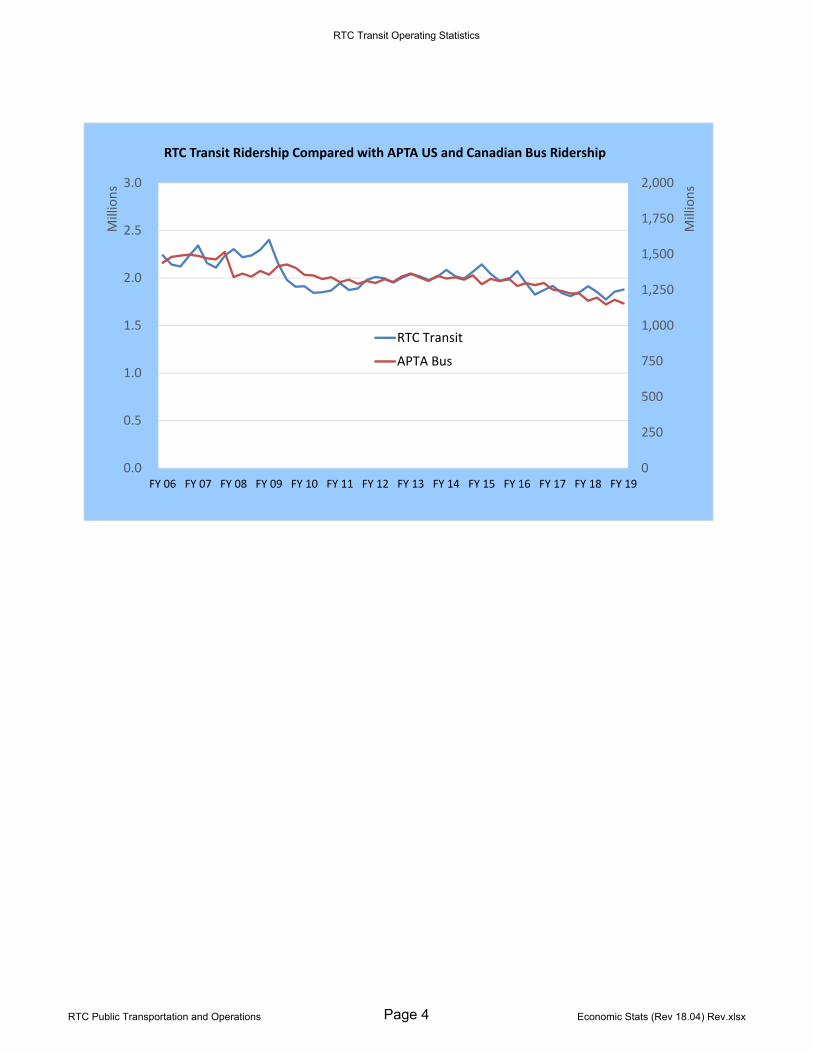
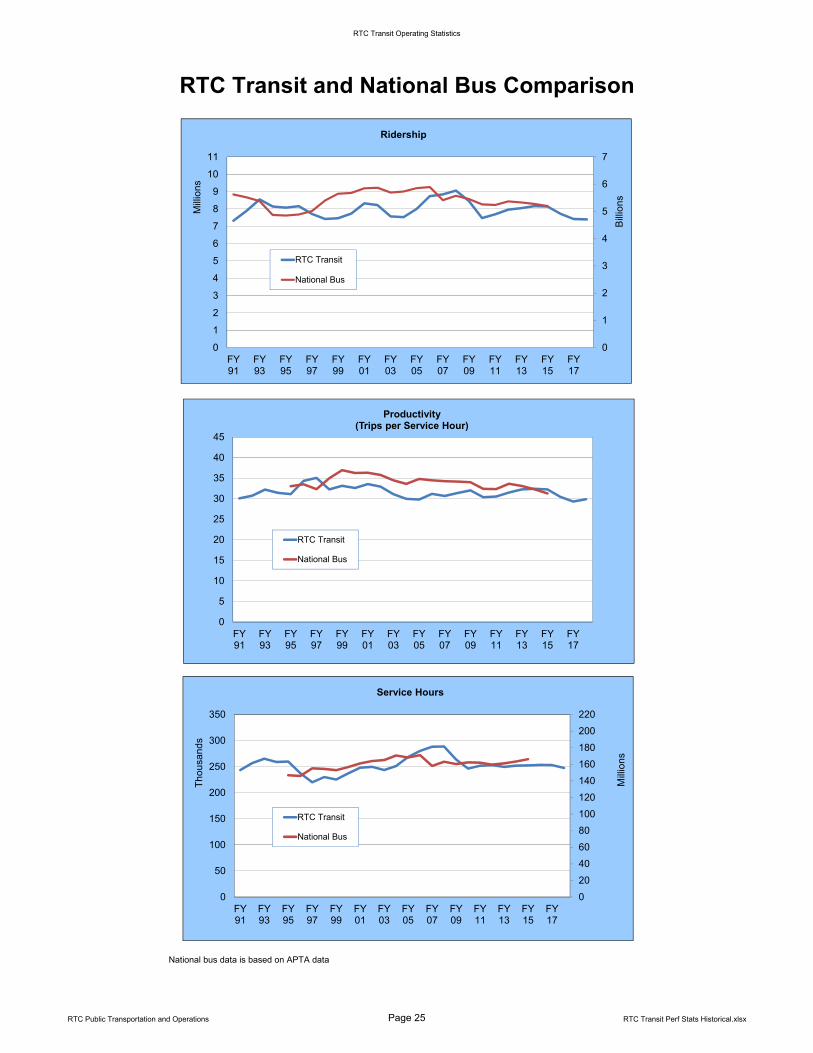
This is a nationwide trend. The drop in ridership is also a nationwide trend as illustrated by the chart on
page 4 which compares RTC transit ridership with US and Canadian bus ridership.
With the growth of online shopping, it is also likely that bus trips used for shopping has fallen substantially, especially for those with mobility challenges who would prefer online shopping. Also, young people no longer hang out physically as much as they prefer to socialize using social media.
There has been an increase in people working primarily from home, approximately eight million in 2018 according to US Census Bureau estimates, taking over transit as the second most common means of getting to work.
Alternative modes of travel have also become more popular including bicycle rentals in the form of LimeBike in Reno in 2018. There will also likely be electric scooter rentals in Reno soon.
TRANSIT HIGHLIGHTS Page v
RTC TRANSIT SUMMARY
RTC Transit Fare Categories
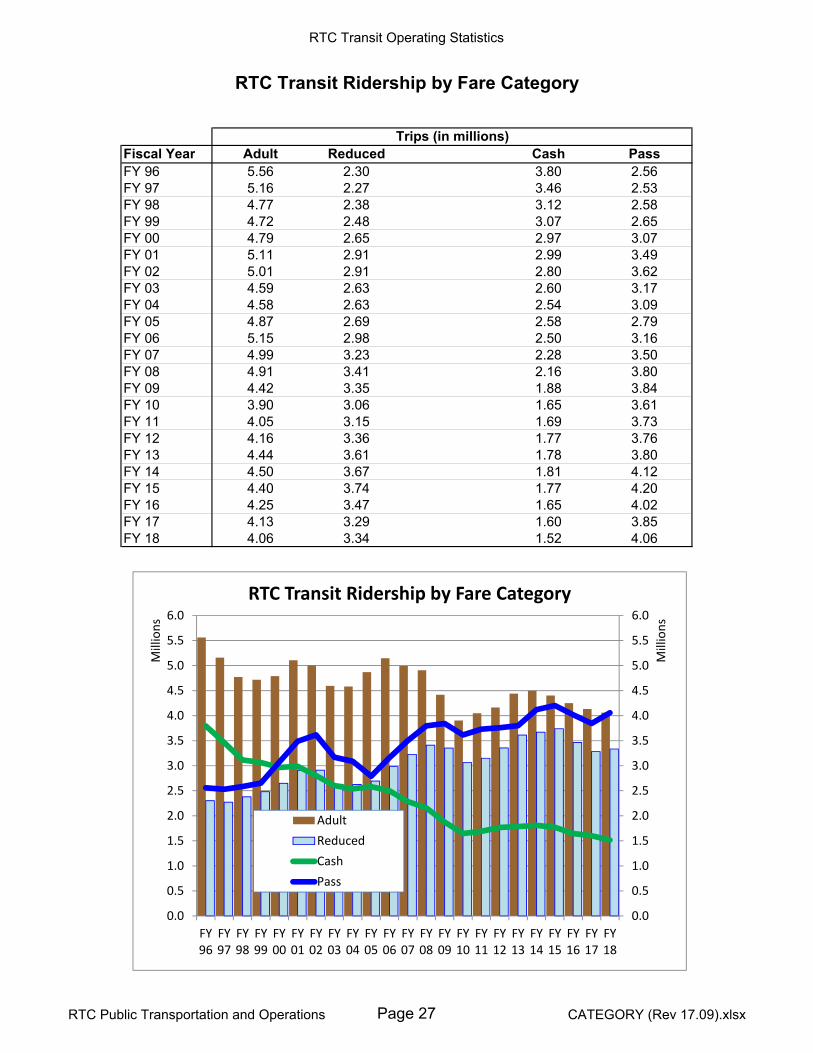
In April, full fare ridership was down 14% compared with last year (page 15). Full
fare ridership made up 48.5% of total ridership. By comparison, in FY 1996, full fare ridership made up 71% of total ridership.
In April, reduced fare ridership was up 8.4% over last year. Reduced fare
ridership made up 51.5% of total ridership. The RTC now provides more reduced fare trips than full fare trips. (Page 27 shows the steady annual growth of reduced fare ridership since FY 1996.) In FY 2018, the RTC carried almost one million more reduced fare rides than 20 years ago. Effective October 2018, US veterans qualify for reduced fare rides.
With the reduction of 7-Day Pass prices, 7-Day Pass ridership in April is 3.8x greater than last year. Full fare 7-Day Pass ridership is 2.3x greater whereas reduced is 5.9x greater than last year.
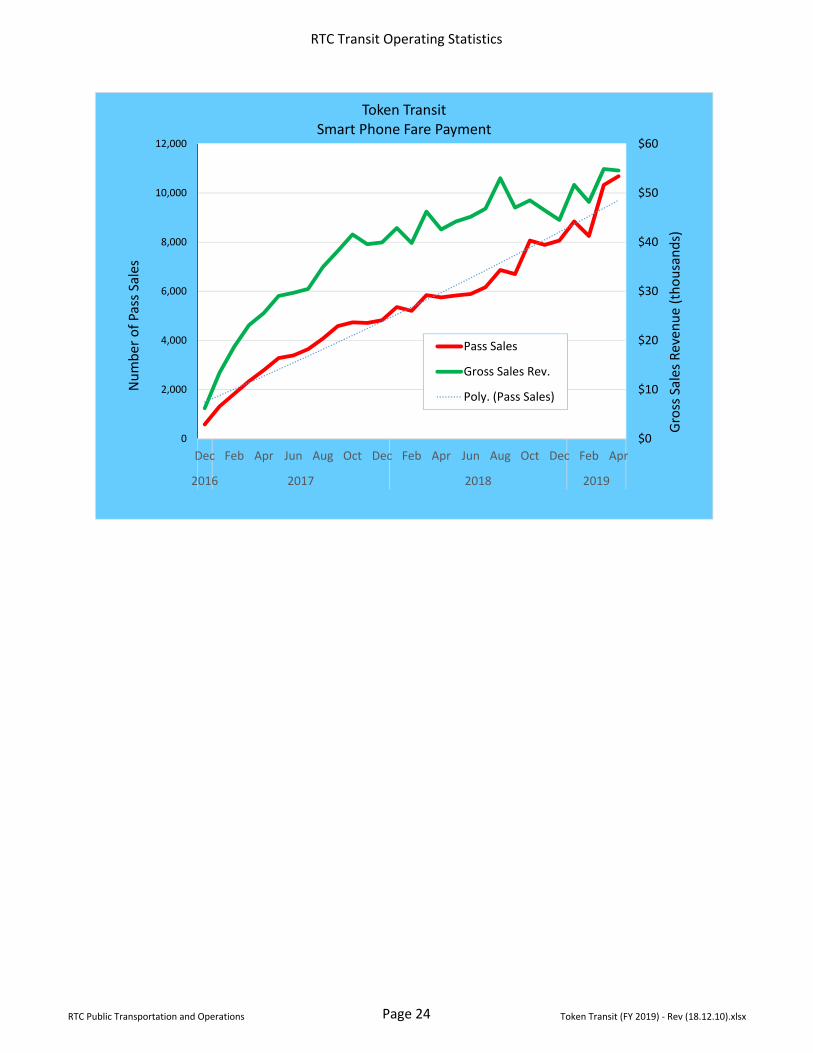
In 2016, the RTC launched Token Transit, a smart phone fare payment application. There were an estimated 58K Token rides this month up 18% over last year (page 24). Token now makes up about 1 in every 10 total rides.
RTC Route Ridership
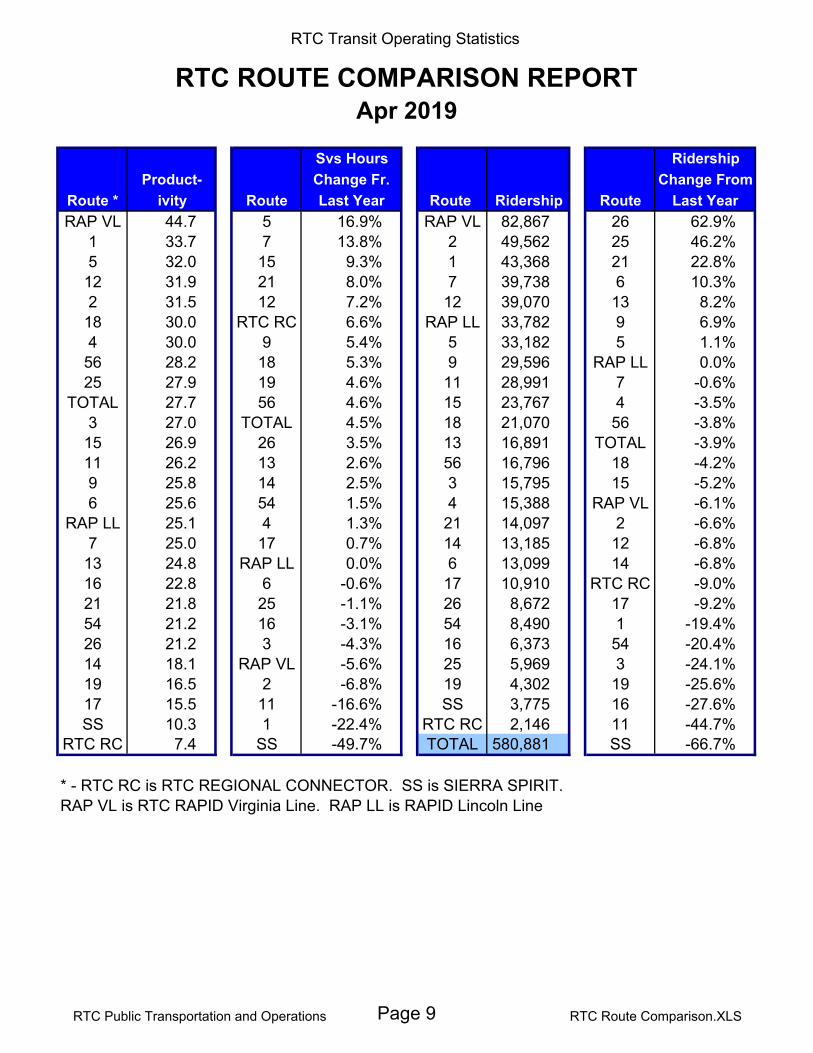
For April, Route 1 (serving S Virginia St) had the highest productivity in the
system with 33.7 trips per service hour. Route 5 (serving Sutro St and Sun Valley) had the second highest productivity with 32.0 trips per service hour. Route 17 (N Virginia St and Lemmon Valley) had the lowest productivity in the system with 15.5 trips per service hour.
Route 26 (serving E Prater Way and NNMC) ridership increased the most at 63% over the previous year. Route 25 (serving Northeast Sparks) increased the second most at 46%. Keep in mind, this is more the result of ridership for these two routes being unusually lower than average last year.
TRANSIT HIGHLIGHTS Page vi
Route 11 ridership (serving E 4th St and Prater Way) fell the most by 45%, the
result of the introduction of RTC RAPID Lincoln Line covering the same corridor. Route 11 hours fell by 17%. Route 16 (serving W 2nd St and Idlewild Park) fell by 28%.
RTC RAPID Lincoln Line
There were 34K rides on the RAPID Lincoln Line this month (page 16). Productivity was 25.1 trips per service hour. This month, ridership for both the Lincoln Line and Route 11 was 63K which was 20% higher than Route 11 alone last year. Service hours increased 85% over Route 11 alone last year.
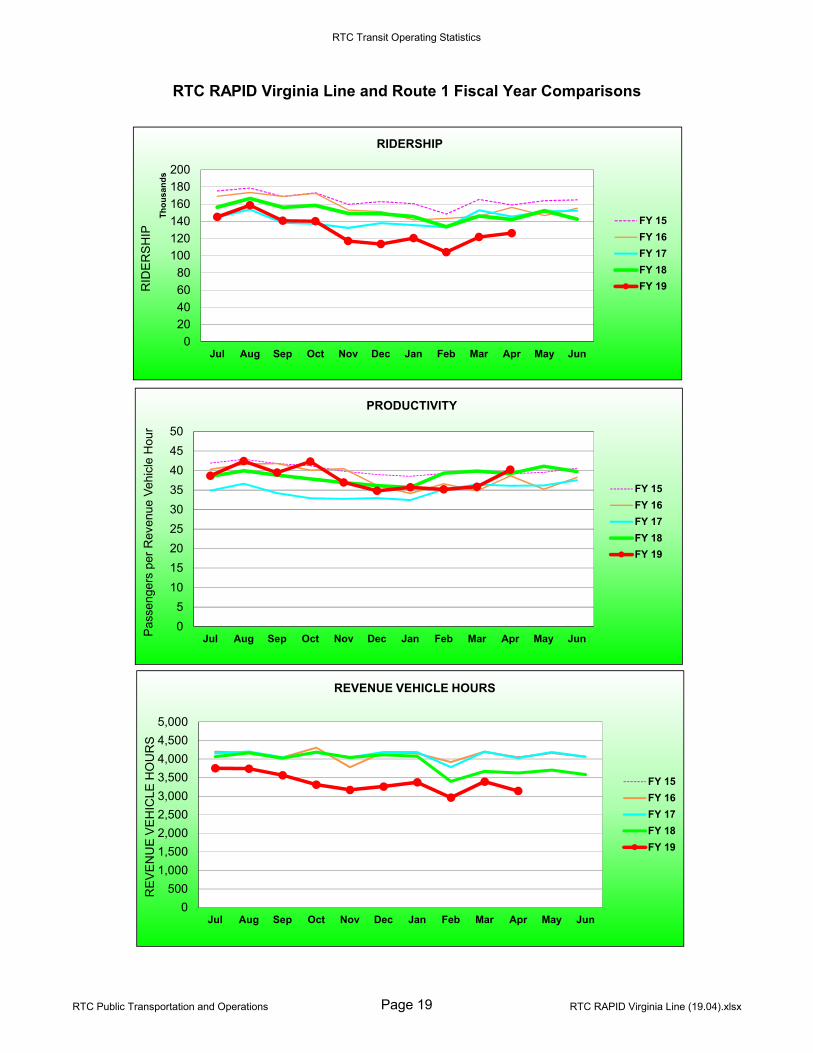
RTC RAPID Virginia Line
There were 83K rides on the RAPID Virginia Line this month down 6.1%
compared with last year (page 18). Productivity at 44.7 trips per service hour is down 0.5%. Service hours fell 5.6% compared with last year. There were 1.58 million rides over the last 12 months for both the RAPID Virginia Line and Route 1, down 12% compared with the previous 12 months. Lower service hours and missed trips are negatively impacting ridership.
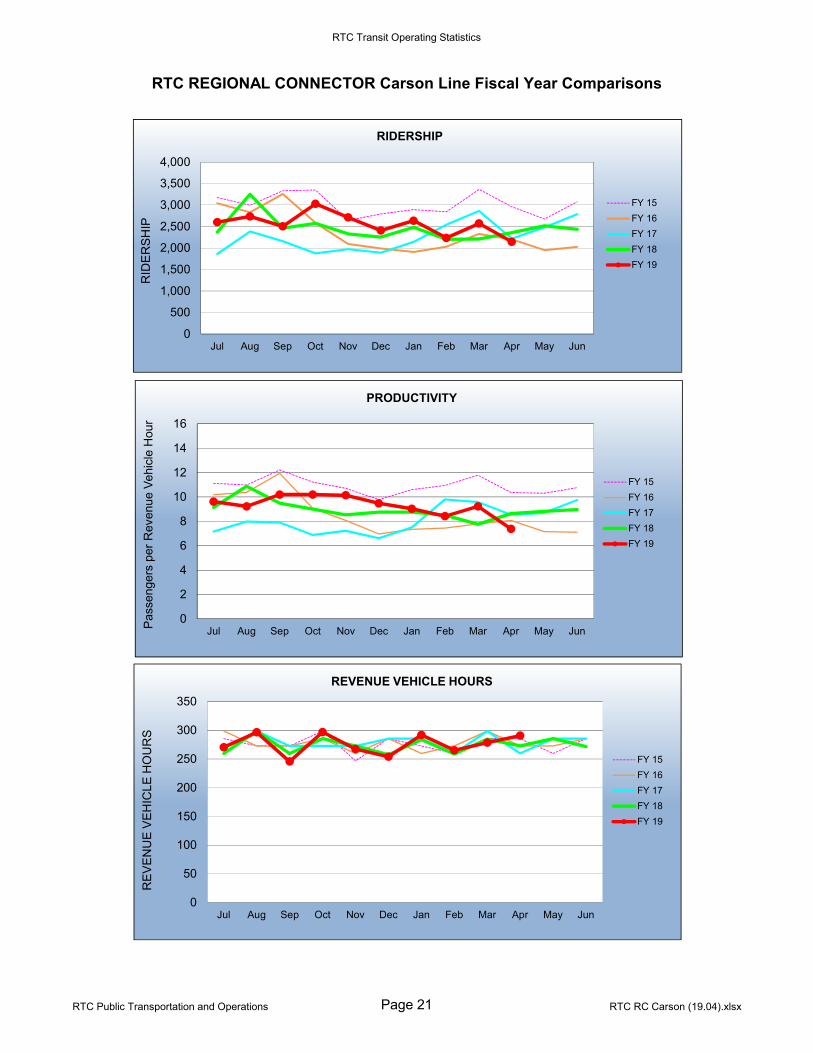
RTC REGIONAL CONNECTOR Carson Line
There were 3,146 rides this month, down 9.0% compared with last April (page 20). At 7.4 rides per service hour, productivity is down 15% compared with last year. There were 30.5K rides over the last 12 months, up 2.6% compared with the previous 12 months.
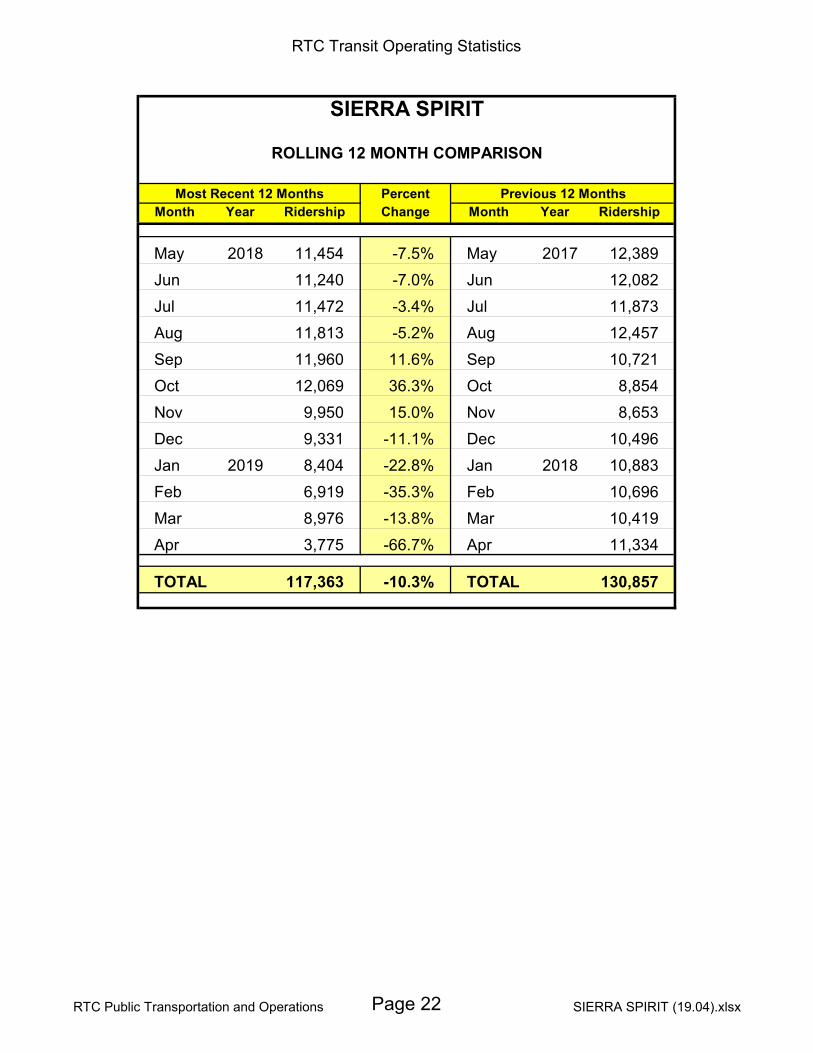
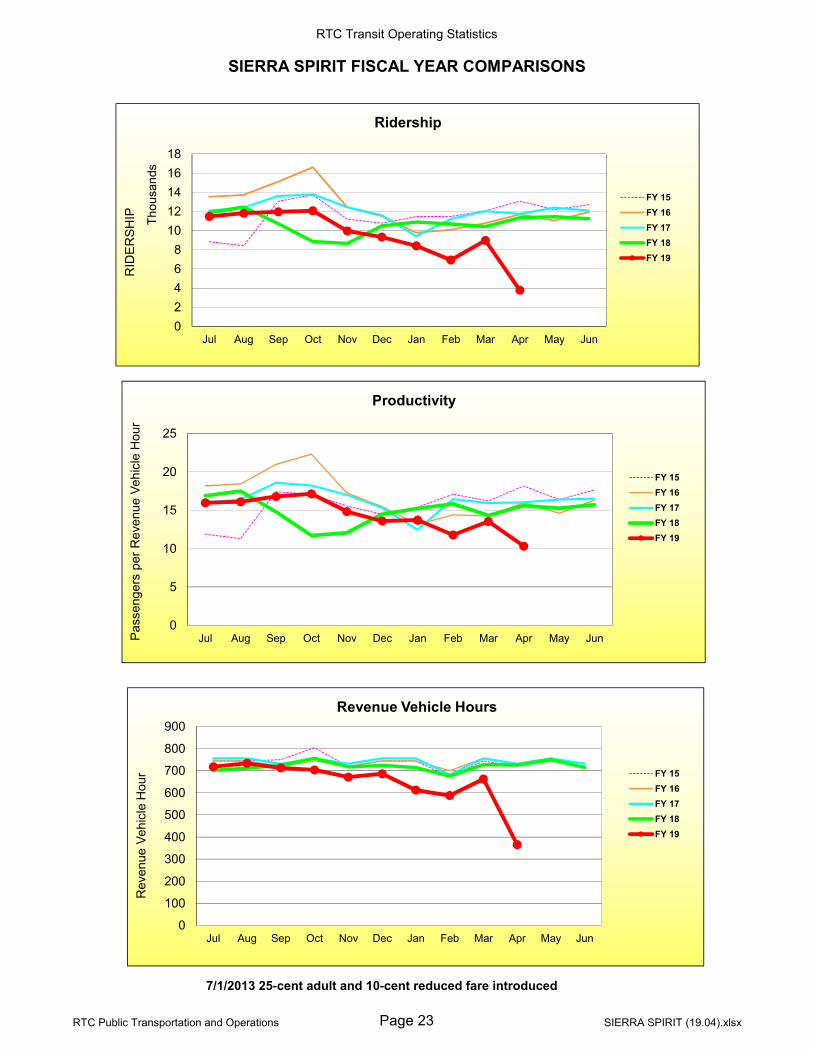
SIERRA SPIRIT
There were 3,775 rides this month, down 67% compared with last April (page
22). Productivity at 10.3 rides per service hour is 34% lower than last year. There were 1,111 missed trips, about half of all scheduled trips. There were 117K rides over the last 12 months, down 10% compared with the previous 12 months.
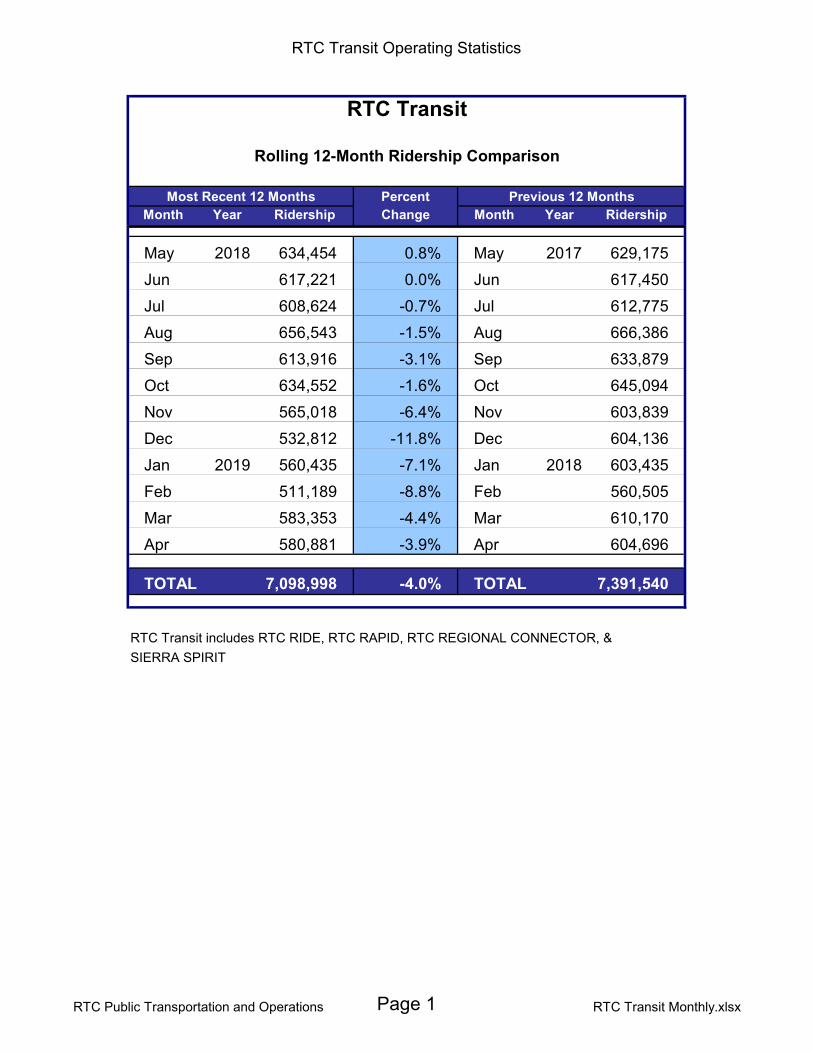
RTC Transit Operating Statistics
RTC Transit
Rolling 12-Month Ridership Comparison
Most Recent 12 Months Percent Previous 12 MonthsMonth Year Ridership Change Month Year Ridership
May 2018 634,454 0.8% May 2017 629,175
Jun 617,221 0.0% Jun 617,450
Jul 608,624 -0.7% Jul 612,775
Aug 656,543 -1.5% Aug 666,386
Sep 613,916 -3.1% Sep 633,879
Oct 634,552 -1.6% Oct 645,094
Nov 565,018 -6.4% Nov 603,839
Dec 532,812 -11.8% Dec 604,136
Jan 2019 560,435 -7.1% Jan 2018 603,435
Feb 511,189 -8.8% Feb 560,505
Mar 583,353 -4.4% Mar 610,170
Apr 580,881 -3.9% Apr 604,696
TOTAL 7,098,998 -4.0% TOTAL 7,391,540
RTC Transit includes RTC RIDE, RTC RAPID, RTC REGIONAL CONNECTOR, &
SIERRA SPIRIT
RTC Public Transportation and Operations Page 1 RTC Transit Monthly.xlsx
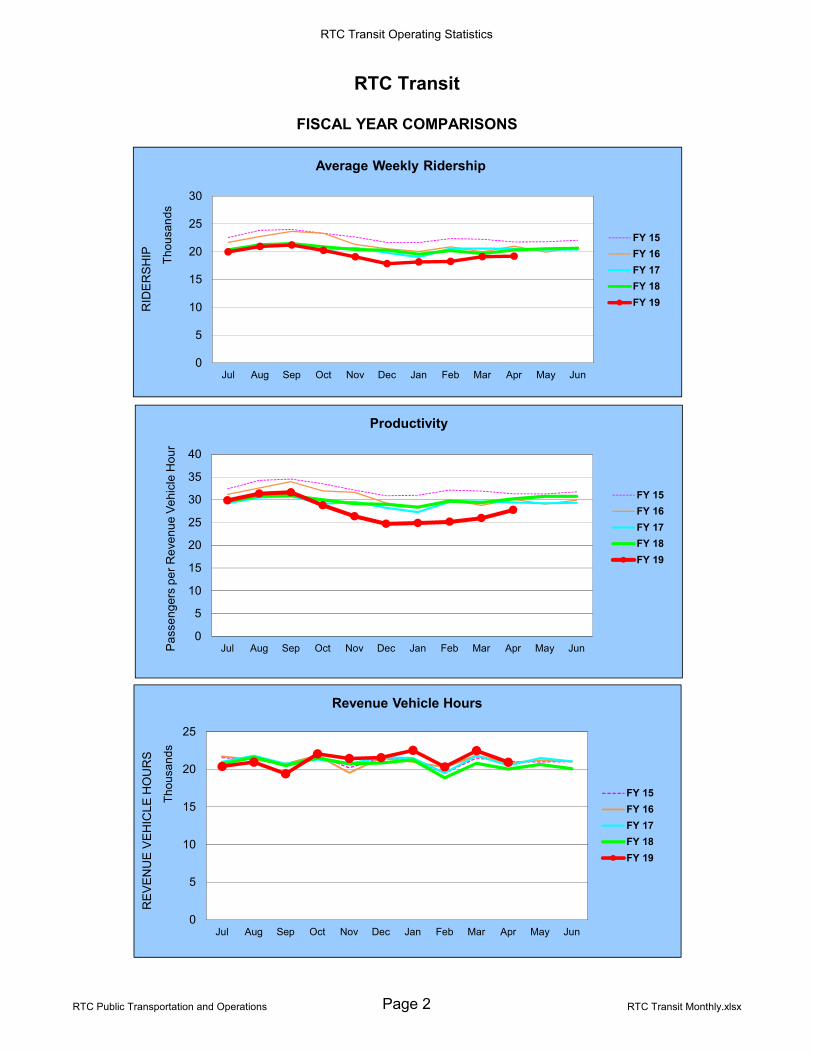
RTC Transit Operating Statistics
RTC Transit
FISCAL YEAR COMPARISONS
0
5
10
15
20
25
30
Jul Aug Sep Oct Nov Dec Jan Feb Mar Apr May Jun
RID
ER
SH
IP Th
ou
san
ds
Average Weekly Ridership
FY 15
FY 16
FY 17
FY 18
FY 19
0
5
10
15
20
25
30
35
40
Jul Aug Sep Oct Nov Dec Jan Feb Mar Apr May JunPa
sse
ng
ers
pe
r R
eve
nu
e V
eh
icle
Ho
ur
Productivity
FY 15
FY 16
FY 17
FY 18
FY 19
0
5
10
15
20
25
Jul Aug Sep Oct Nov Dec Jan Feb Mar Apr May Jun
RE
VE
NU
E V
EH
ICL
E H
OU
RS
Th
ou
san
ds
Revenue Vehicle Hours
FY 15
FY 16
FY 17
FY 18
FY 19
RTC Public Transportation and Operations Page 2 RTC Transit Monthly.xlsx
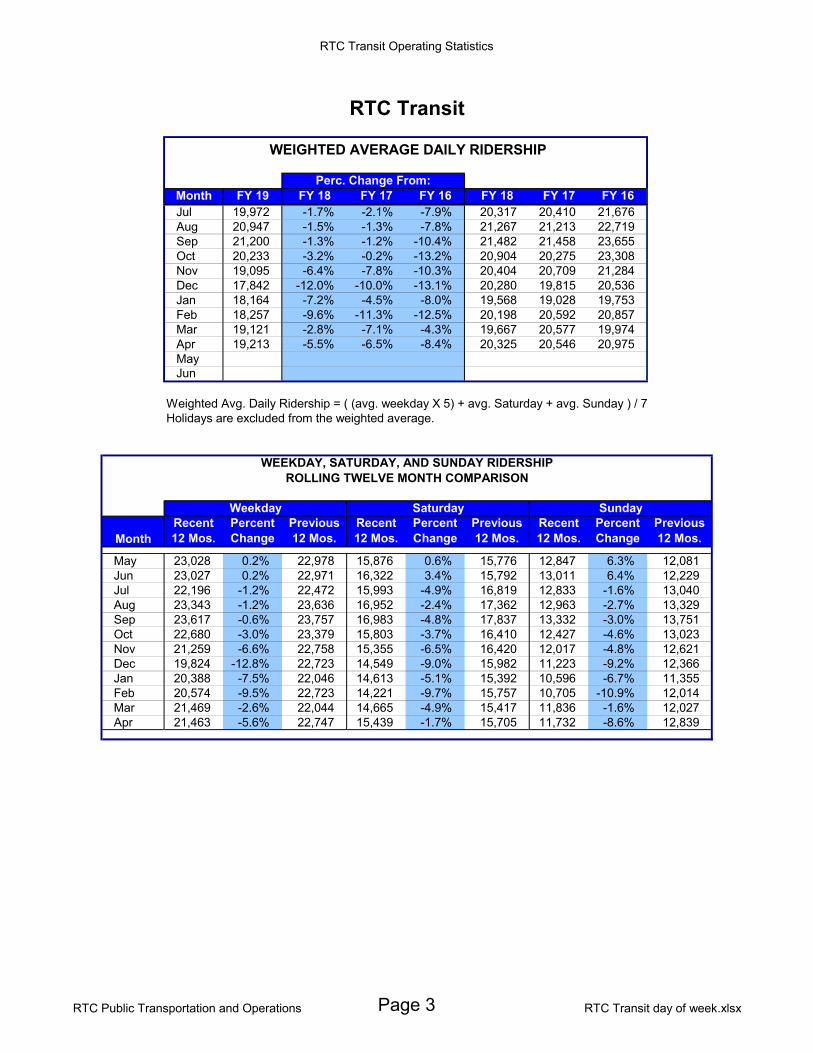
RTC Transit Operating Statistics
Month FY 19 FY 18 FY 17 FY 16 FY 18 FY 17 FY 16Jul 19,972 -1.7% -2.1% -7.9% 20,317 20,410 21,676Aug 20,947 -1.5% -1.3% -7.8% 21,267 21,213 22,719Sep 21,200 -1.3% -1.2% -10.4% 21,482 21,458 23,655Oct 20,233 -3.2% -0.2% -13.2% 20,904 20,275 23,308Nov 19,095 -6.4% -7.8% -10.3% 20,404 20,709 21,284Dec 17,842 -12.0% -10.0% -13.1% 20,280 19,815 20,536Jan 18,164 -7.2% -4.5% -8.0% 19,568 19,028 19,753Feb 18,257 -9.6% -11.3% -12.5% 20,198 20,592 20,857Mar 19,121 -2.8% -7.1% -4.3% 19,667 20,577 19,974Apr 19,213 -5.5% -6.5% -8.4% 20,325 20,546 20,975MayJun
Weighted Avg. Daily Ridership = ( (avg. weekday X 5) + avg. Saturday + avg. Sunday ) / 7Holidays are excluded from the weighted average.
MonthRecent 12 Mos.
Percent Change
Previous 12 Mos.
Recent 12 Mos.
Percent Change
Previous 12 Mos.
Recent 12 Mos.
Percent Change
Previous 12 Mos.
May 23,028 0.2% 22,978 15,876 0.6% 15,776 12,847 6.3% 12,081Jun 23,027 0.2% 22,971 16,322 3.4% 15,792 13,011 6.4% 12,229Jul 22,196 -1.2% 22,472 15,993 -4.9% 16,819 12,833 -1.6% 13,040Aug 23,343 -1.2% 23,636 16,952 -2.4% 17,362 12,963 -2.7% 13,329Sep 23,617 -0.6% 23,757 16,983 -4.8% 17,837 13,332 -3.0% 13,751Oct 22,680 -3.0% 23,379 15,803 -3.7% 16,410 12,427 -4.6% 13,023Nov 21,259 -6.6% 22,758 15,355 -6.5% 16,420 12,017 -4.8% 12,621Dec 19,824 -12.8% 22,723 14,549 -9.0% 15,982 11,223 -9.2% 12,366Jan 20,388 -7.5% 22,046 14,613 -5.1% 15,392 10,596 -6.7% 11,355Feb 20,574 -9.5% 22,723 14,221 -9.7% 15,757 10,705 -10.9% 12,014Mar 21,469 -2.6% 22,044 14,665 -4.9% 15,417 11,836 -1.6% 12,027Apr 21,463 -5.6% 22,747 15,439 -1.7% 15,705 11,732 -8.6% 12,839
Weekday Saturday Sunday
RTC Transit
WEIGHTED AVERAGE DAILY RIDERSHIP
WEEKDAY, SATURDAY, AND SUNDAY RIDERSHIP
Perc. Change From:
ROLLING TWELVE MONTH COMPARISON
RTC Public Transportation and Operations Page 3 RTC Transit day of week.xlsx
RTC Transit Operating Statistics
0
250
500
750
1,000
1,250
1,500
1,750
2,000
0.0
0.5
1.0
1.5
2.0
2.5
3.0
FY 06 FY 07 FY 08 FY 09 FY 10 FY 11 FY 12 FY 13 FY 14 FY 15 FY 16 FY 17 FY 18 FY 19
Millions
Millions
RTC Transit Ridership Compared with APTA US and Canadian Bus Ridership
RTC Transit
APTA Bus
RTC Public Transportation and Operations Page 4 Economic Stats (Rev 18.04) Rev.xlsx
RTC Transit Operating Statistics
0
1
2
3
4
5
6
7
8
9
10
11
12
13
14
$0.00
$0.50
$1.00
$1.50
$2.00
$2.50
$3.00
$3.50
$4.00
1998 2000 2002 2004 2006 2008 2010 2012 2014 2016 2018
Ridership
Millions
RTC Transit Cost and Revenue per TripRolling 12‐Month
Operating Cost per Trip
Fare Revenue per Trip
Ridership
0%
5%
10%
15%
20%
25%
30%
35%
40%
45%
50%
55%
60%
$0
$5
$10
$15
$20
$25
$30
1998 2000 2002 2004 2006 2008 2010 2012 2014 2016 2018
Farebox Recovery Ratio (Revenue/Cost)
Millions
RTC Transit Cost and RevenueRolling 12‐Month
Operating Cost
Fare Revenue
Farebox Recovery
RTC Public Transportation and Operations Page 5 RTC Revenue Rolling 12-months.xlsx
RTC Transit Operating Statistics
RTC Transit
0.0
0.5
1.0
1.5
2.0
2.5
3.0
0.0
0.2
0.4
0.6
0.8
1.0
1.2
1.4
1.6
1.8
FY04
FY05
FY06
FY07
FY08
FY09
FY10
FY11
FY12
FY13
FY14
FY15
FY16
FY17
FY18
FY19
RT
C T
ran
sit
Rid
ersh
ipMill
ions
Vis
ito
rs
Mill
ions
Visitor source: Reno-Sparks Convention & Visitors Authority
Quarterly Ridership and Reno/Sparks Visitors
Visitors RTC Ridership
0
50
100
150
200
250
300
350
400
450
500
550
600
650
0.0
0.2
0.4
0.6
0.8
1.0
1.2
1.4
1.6
1.8
FY04
FY05
FY06
FY07
FY08
FY09
FY10
FY11
FY12
FY13
FY14
FY15
FY16
FY17
FY18
FY19
RT
C T
ran
sit
Rid
ersh
ip
Tho
usan
ds
Vis
ito
rs
Mill
ions
Visitor source: Reno-Sparks Convention & Visitors Authority
Quarterly Full Fare Single Ride and 24 Hr/Day Pass Ridership and Reno/Sparks Visitors
Visitors Full Fare Single Ride & 24 Hr/Day Passes
RTC Public Transportation and Operations Page 7 Economic Stats (Rev 19.04.22).xlsx
RTC Transit Operating Statistics
RTC Transit
0.0
0.2
0.4
0.6
0.8
1.0
1.2
1.4
1.6
1.8
2.0
2.2
2.4
2.6
0
100
200
300
400
500
600
700
800
FY04
FY05
FY06
FY07
FY08
FY09
FY10
FY11
FY12
FY13
FY14
FY15
FY16
FY17
FY18
FY19
RT
C T
ran
sit
Rid
ersh
ip
Mill
ions
Air
po
rt B
oar
din
gs
Tho
usan
ds
Airport boarding source: Reno-Tahoe Airport
Quarterly Ridership and Reno-Tahoe Airport Boardings
Reno-Tahoe Airport Boardings* RTC Ridership
0
50
100
150
200
250
300
350
400
450
500
550
600
650
0
100
200
300
400
500
600
700
800
FY04
FY05
FY06
FY07
FY08
FY09
FY10
FY11
FY12
FY13
FY14
FY15
FY16
FY17
FY18
FY19
RT
C T
ran
sit
Rid
ersh
ip
Tho
usan
ds
Air
po
rt B
oar
din
gs
Tho
usan
ds
Airport boarding source: Reno-Tahoe Airport
Quarterly Full Fare Single Ride and 24 Hour/Day Pass Ridership and Reno-Tahoe Airport Boardings
Reno-Tahoe Airport Boardings* Full Fare Single Ride & 24 Hr/Day Pass
RTC Public Transportation and Operations Page 8 Economic Stats (Rev 19.04.22).xlsx
RTC Transit Operating Statistics
Route * ivity Route Last Year Route Ridership Route Last Year
RAP VL 44.7 5 16.9% RAP VL 82,867 26 62.9%1 33.7 7 13.8% 2 49,562 25 46.2%5 32.0 15 9.3% 1 43,368 21 22.8%
12 31.9 21 8.0% 7 39,738 6 10.3%2 31.5 12 7.2% 12 39,070 13 8.2%
18 30.0 RTC RC 6.6% RAP LL 33,782 9 6.9%4 30.0 9 5.4% 5 33,182 5 1.1%
56 28.2 18 5.3% 9 29,596 RAP LL 0.0%25 27.9 19 4.6% 11 28,991 7 -0.6%
TOTAL 27.7 56 4.6% 15 23,767 4 -3.5%3 27.0 TOTAL 4.5% 18 21,070 56 -3.8%
15 26.9 26 3.5% 13 16,891 TOTAL -3.9%11 26.2 13 2.6% 56 16,796 18 -4.2%9 25.8 14 2.5% 3 15,795 15 -5.2%6 25.6 54 1.5% 4 15,388 RAP VL -6.1%
RAP LL 25.1 4 1.3% 21 14,097 2 -6.6%7 25.0 17 0.7% 14 13,185 12 -6.8%
13 24.8 RAP LL 0.0% 6 13,099 14 -6.8%16 22.8 6 -0.6% 17 10,910 RTC RC -9.0%21 21.8 25 -1.1% 26 8,672 17 -9.2%54 21.2 16 -3.1% 54 8,490 1 -19.4%26 21.2 3 -4.3% 16 6,373 54 -20.4%14 18.1 RAP VL -5.6% 25 5,969 3 -24.1%19 16.5 2 -6.8% 19 4,302 19 -25.6%17 15.5 11 -16.6% SS 3,775 16 -27.6%SS 10.3 1 -22.4% RTC RC 2,146 11 -44.7%
RTC RC 7.4 SS -49.7% TOTAL 580,881 SS -66.7%
* - RTC RC is RTC REGIONAL CONNECTOR. SS is SIERRA SPIRIT. RAP VL is RTC RAPID Virginia Line. RAP LL is RAPID Lincoln Line
Change Fr.
Svs Hours
RTC ROUTE COMPARISON REPORTApr 2019
Ridership
Change FromProduct-
RTC Public Transportation and Operations Page 9 RTC Route Comparison.XLS
RTC Transit Operating Statistics
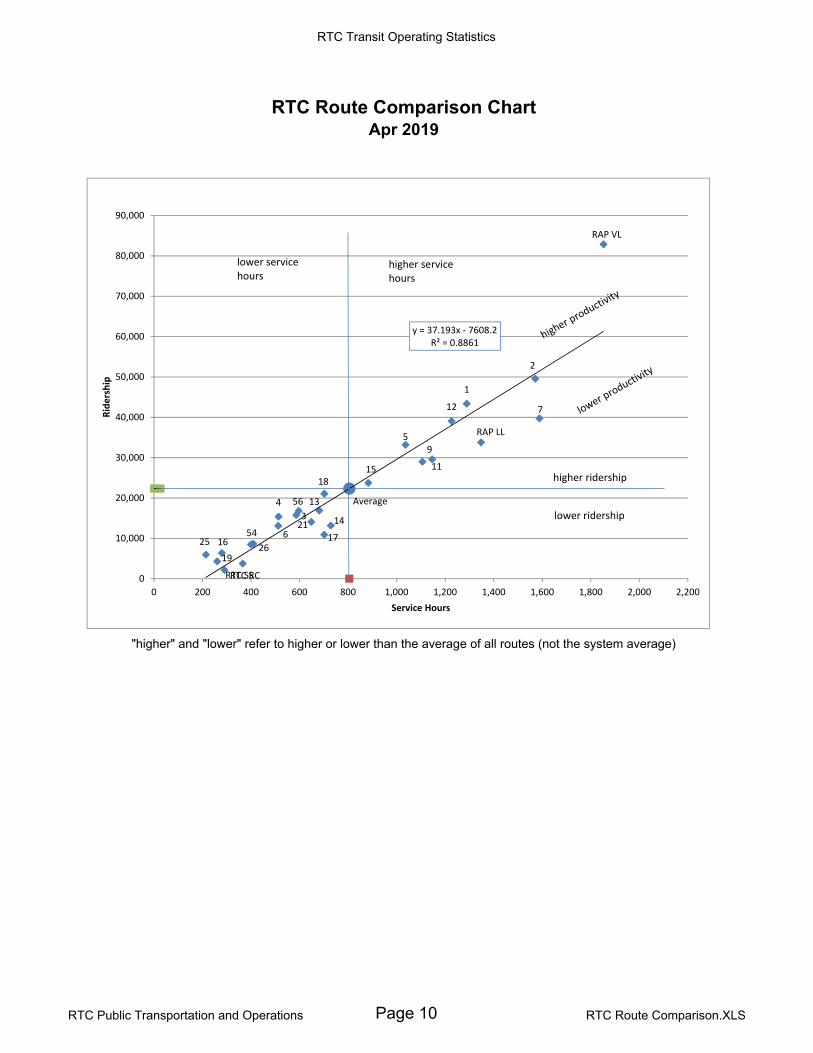
"higher" and "lower" refer to higher or lower than the average of all routes (not the system average)
Apr 2019RTC Route Comparison Chart
RAP VL
RAP LL
1
2
3
4
5
6
7
9
11
12
13
14
15
16 17
18
19
21
2526
54
56
RTC RCRTC SS
Average
y = 37.193x ‐ 7608.2R² = 0.8861
0
10,000
20,000
30,000
40,000
50,000
60,000
70,000
80,000
90,000
0 200 400 600 800 1,000 1,200 1,400 1,600 1,800 2,000 2,200
Ridership
Service Hours
higher ridership
lower ridership
higher service hours
lower service hours
RTC Public Transportation and Operations Page 10 RTC Route Comparison.XLS

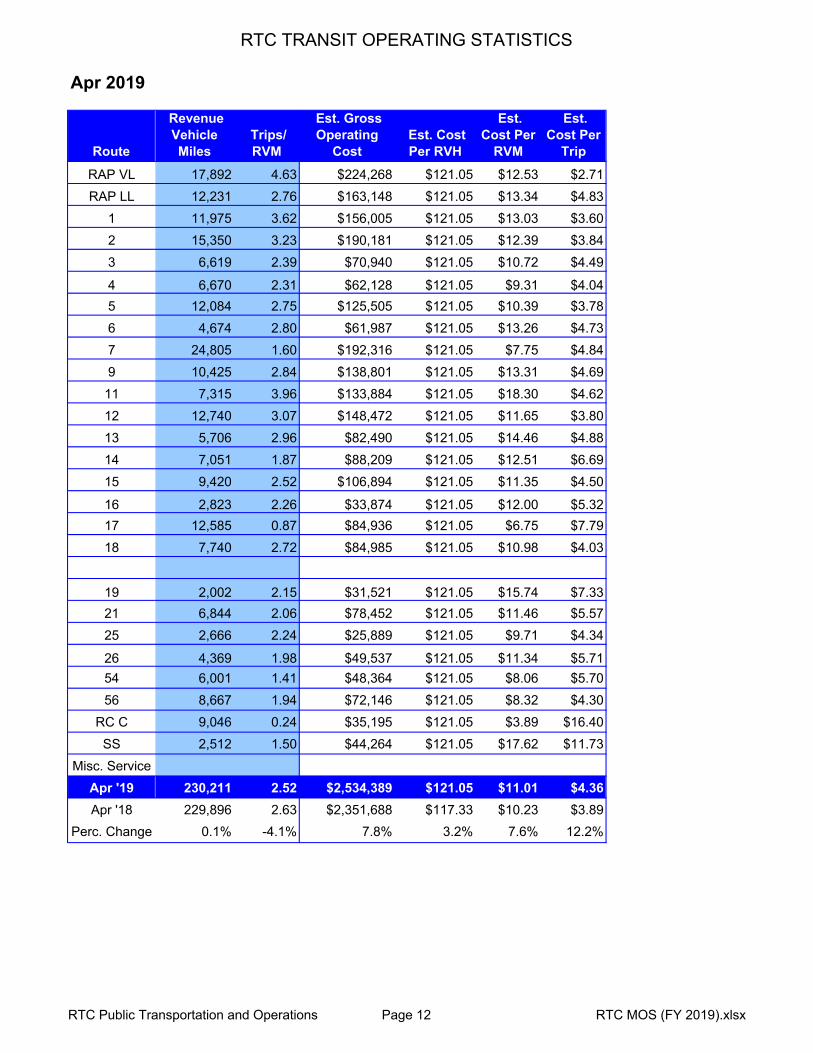
RTC TRANSIT OPERATING STATISTICS
Apr 2019
Route Total
Ridership Previous
Year Change
Revenue Veh.
HoursPrevious
Year Change Trips/ RVH
Previous Year Change
RAP VL 82,867 88,233 -6.1% 1,852.7 1,963.2 -5.6% 44.7 44.9 -0.5%
RAP LL 33,782 N/A 1,347.8 N/A 25.1 N/A
1 43,368 53,793 -19.4% 1,288.8 1,661.1 -22.4% 33.7 32.4 3.9%
2 49,562 53,043 -6.6% 1,571.1 1,684.9 -6.8% 31.5 31.5 0.2%
3 15,795 20,808 -24.1% 586.0 612.5 -4.3% 27.0 34.0 -20.7%
4 15,388 15,949 -3.5% 513.2 506.7 1.3% 30.0 31.5 -4.8%
5 33,182 32,812 1.1% 1,036.8 886.9 16.9% 32.0 37.0 -13.5%
6 13,099 11,872 10.3% 512.1 515.1 -0.6% 25.6 23.1 11.0%
7 39,738 39,983 -0.6% 1,588.7 1,396.6 13.8% 25.0 28.6 -12.6%
9 29,596 27,681 6.9% 1,146.6 1,087.7 5.4% 25.8 25.4 1.4%
11 28,991 52,454 -44.7% 1,106.0 1,326.8 -16.6% 26.2 39.5 -33.7%
12 39,070 41,921 -6.8% 1,226.5 1,143.6 7.2% 31.9 36.7 -13.1%
13 16,891 15,613 8.2% 681.5 664.3 2.6% 24.8 23.5 5.5%
14 13,185 14,151 -6.8% 728.7 711.2 2.5% 18.1 19.9 -9.1%
15 23,767 25,063 -5.2% 883.1 807.9 9.3% 26.9 31.0 -13.2%
16 6,373 8,807 -27.6% 279.8 288.8 -3.1% 22.8 30.5 -25.3%
17 10,910 12,013 -9.2% 701.7 696.5 0.7% 15.5 17.2 -9.9%
18 21,070 22,003 -4.2% 702.1 666.7 5.3% 30.0 33.0 -9.1%
19 4,302 5,783 -25.6% 260.4 248.9 4.6% 16.5 23.2 -28.9%
21 14,097 11,482 22.8% 648.1 599.8 8.0% 21.8 19.1 13.6%
25 5,969 4,082 46.2% 213.9 216.3 -1.1% 27.9 18.9 47.9%
26 8,672 5,325 62.9% 409.2 395.4 3.5% 21.2 13.5 57.4%
54 8,490 10,667 -20.4% 399.5 393.5 1.5% 21.2 27.1 -21.6%
56 16,796 17,466 -3.8% 596.0 569.6 4.6% 28.2 30.7 -8.1%
RC C 2,146 2,358 -9.0% 290.7 272.7 6.6% 7.4 8.6 -14.7%
SS 3,775 11,334 -66.7% 365.7 726.6 -49.7% 10.3 15.6 -33.8%
Misc. Service 0 0.0
Apr '19 580,881 604,696 -3.9% 20,937 20,043 4.5% 27.7 30.2 -8.0%
Apr '18 604,696 20,043 30.2
Perc. Change -3.9% 4.5% -8.0%
RTC Public Transportation and Operations Page 11 RTC MOS (FY 2019).xlsx
RTC TRANSIT OPERATING STATISTICS
Apr 2019
Route
RAP VL
RAP LL
1
2
3
4
5
6
7
9
11
12
13
14
15
16
17
18
19
21
25
26
54
56
RC C
SS
Misc. Service
Apr '19
Apr '18
Perc. Change
Revenue Vehicle Miles
Trips/ RVM
Est. Gross Operating
Cost Est. Cost Per RVH
Est. Cost Per
RVM
Est. Cost Per
Trip
17,892 4.63 $224,268 $121.05 $12.53 $2.71
12,231 2.76 $163,148 $121.05 $13.34 $4.83
11,975 3.62 $156,005 $121.05 $13.03 $3.60
15,350 3.23 $190,181 $121.05 $12.39 $3.84
6,619 2.39 $70,940 $121.05 $10.72 $4.49
6,670 2.31 $62,128 $121.05 $9.31 $4.04
12,084 2.75 $125,505 $121.05 $10.39 $3.78
4,674 2.80 $61,987 $121.05 $13.26 $4.73
24,805 1.60 $192,316 $121.05 $7.75 $4.84
10,425 2.84 $138,801 $121.05 $13.31 $4.69
7,315 3.96 $133,884 $121.05 $18.30 $4.62
12,740 3.07 $148,472 $121.05 $11.65 $3.80
5,706 2.96 $82,490 $121.05 $14.46 $4.88
7,051 1.87 $88,209 $121.05 $12.51 $6.69
9,420 2.52 $106,894 $121.05 $11.35 $4.50
2,823 2.26 $33,874 $121.05 $12.00 $5.32
12,585 0.87 $84,936 $121.05 $6.75 $7.79
7,740 2.72 $84,985 $121.05 $10.98 $4.03
2,002 2.15 $31,521 $121.05 $15.74 $7.33
6,844 2.06 $78,452 $121.05 $11.46 $5.57
2,666 2.24 $25,889 $121.05 $9.71 $4.34
4,369 1.98 $49,537 $121.05 $11.34 $5.71
6,001 1.41 $48,364 $121.05 $8.06 $5.70
8,667 1.94 $72,146 $121.05 $8.32 $4.30
9,046 0.24 $35,195 $121.05 $3.89 $16.40
2,512 1.50 $44,264 $121.05 $17.62 $11.73
230,211 2.52 $2,534,389 $121.05 $11.01 $4.36
229,896 2.63 $2,351,688 $117.33 $10.23 $3.89
0.1% -4.1% 7.8% 3.2% 7.6% 12.2%
RTC Public Transportation and Operations Page 12 RTC MOS (FY 2019).xlsx
RTC Transit Operating Statistics
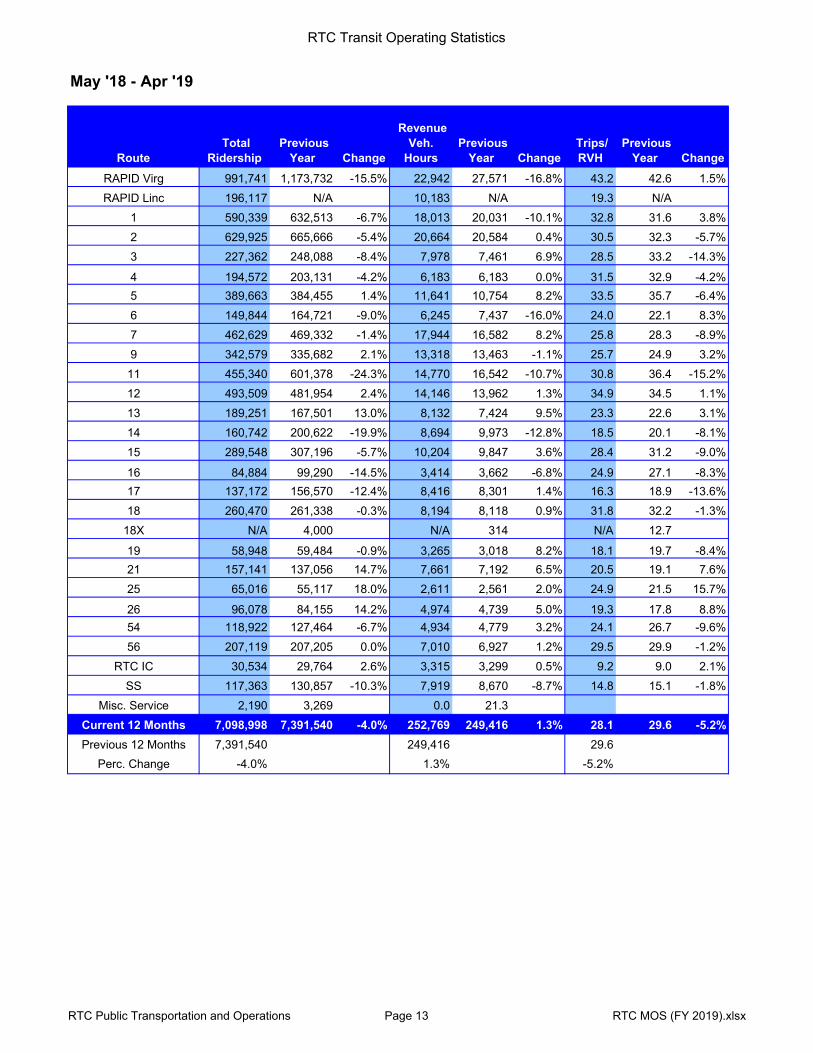
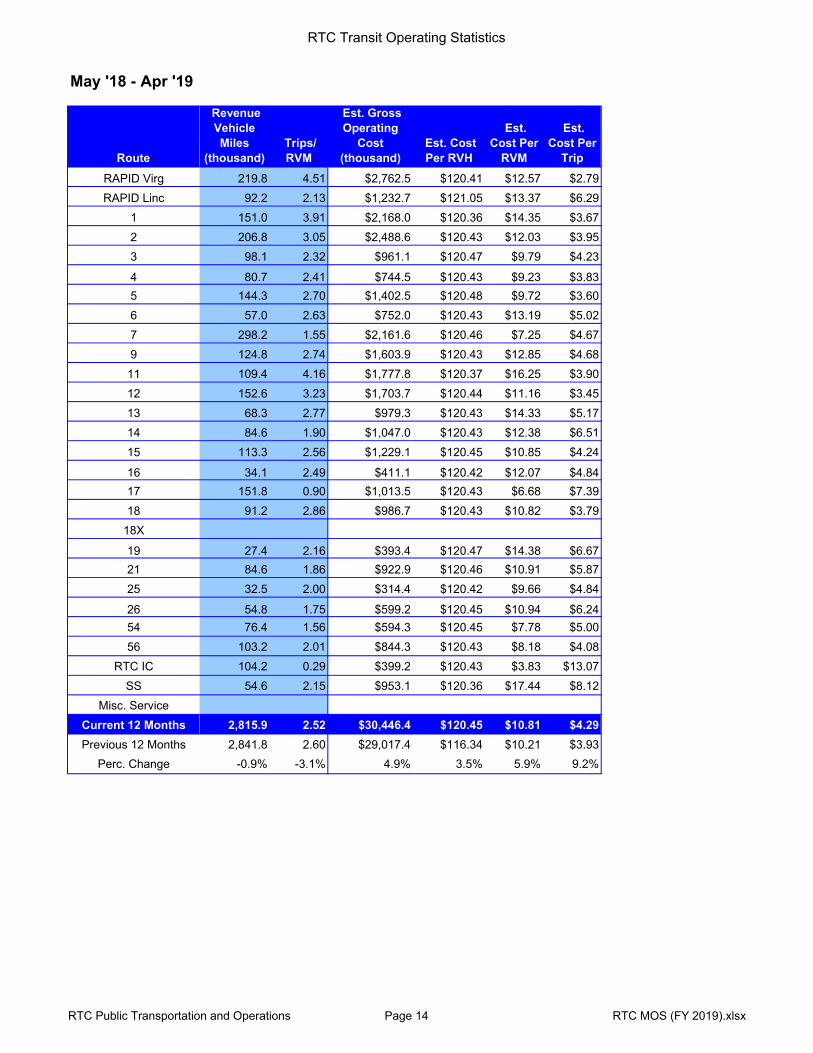
May '18 - Apr '19
Route Total
Ridership Previous
Year Change
Revenue Veh.
HoursPrevious
Year Change Trips/ RVH
Previous Year Change
RAPID Virg 991,741 1,173,732 -15.5% 22,942 27,571 -16.8% 43.2 42.6 1.5%
RAPID Linc 196,117 N/A 10,183 N/A 19.3 N/A
1 590,339 632,513 -6.7% 18,013 20,031 -10.1% 32.8 31.6 3.8%
2 629,925 665,666 -5.4% 20,664 20,584 0.4% 30.5 32.3 -5.7%
3 227,362 248,088 -8.4% 7,978 7,461 6.9% 28.5 33.2 -14.3%
4 194,572 203,131 -4.2% 6,183 6,183 0.0% 31.5 32.9 -4.2%
5 389,663 384,455 1.4% 11,641 10,754 8.2% 33.5 35.7 -6.4%
6 149,844 164,721 -9.0% 6,245 7,437 -16.0% 24.0 22.1 8.3%
7 462,629 469,332 -1.4% 17,944 16,582 8.2% 25.8 28.3 -8.9%
9 342,579 335,682 2.1% 13,318 13,463 -1.1% 25.7 24.9 3.2%
11 455,340 601,378 -24.3% 14,770 16,542 -10.7% 30.8 36.4 -15.2%
12 493,509 481,954 2.4% 14,146 13,962 1.3% 34.9 34.5 1.1%
13 189,251 167,501 13.0% 8,132 7,424 9.5% 23.3 22.6 3.1%
14 160,742 200,622 -19.9% 8,694 9,973 -12.8% 18.5 20.1 -8.1%
15 289,548 307,196 -5.7% 10,204 9,847 3.6% 28.4 31.2 -9.0%
16 84,884 99,290 -14.5% 3,414 3,662 -6.8% 24.9 27.1 -8.3%
17 137,172 156,570 -12.4% 8,416 8,301 1.4% 16.3 18.9 -13.6%
18 260,470 261,338 -0.3% 8,194 8,118 0.9% 31.8 32.2 -1.3%
18X N/A 4,000 N/A 314 N/A 12.7
19 58,948 59,484 -0.9% 3,265 3,018 8.2% 18.1 19.7 -8.4%
21 157,141 137,056 14.7% 7,661 7,192 6.5% 20.5 19.1 7.6%
25 65,016 55,117 18.0% 2,611 2,561 2.0% 24.9 21.5 15.7%
26 96,078 84,155 14.2% 4,974 4,739 5.0% 19.3 17.8 8.8%
54 118,922 127,464 -6.7% 4,934 4,779 3.2% 24.1 26.7 -9.6%
56 207,119 207,205 0.0% 7,010 6,927 1.2% 29.5 29.9 -1.2%
RTC IC 30,534 29,764 2.6% 3,315 3,299 0.5% 9.2 9.0 2.1%
SS 117,363 130,857 -10.3% 7,919 8,670 -8.7% 14.8 15.1 -1.8%
Misc. Service 2,190 3,269 0.0 21.3
Current 12 Months 7,098,998 7,391,540 -4.0% 252,769 249,416 1.3% 28.1 29.6 -5.2%
Previous 12 Months 7,391,540 249,416 29.6
Perc. Change -4.0% 1.3% -5.2%
RTC Public Transportation and Operations Page 13 RTC MOS (FY 2019).xlsx
RTC Transit Operating Statistics
May '18 - Apr '19
Route
RAPID Virg
RAPID Linc
1
2
3
4
5
6
7
9
11
12
13
14
15
16
17
18
18X
19
21
25
26
54
56
RTC IC
SS
Misc. Service
Current 12 Months
Previous 12 Months
Perc. Change
Revenue Vehicle Miles
(thousand) Trips/ RVM
Est. Gross Operating
Cost (thousand)
Est. Cost Per RVH
Est. Cost Per
RVM
Est. Cost Per
Trip
219.8 4.51 $2,762.5 $120.41 $12.57 $2.79
92.2 2.13 $1,232.7 $121.05 $13.37 $6.29
151.0 3.91 $2,168.0 $120.36 $14.35 $3.67
206.8 3.05 $2,488.6 $120.43 $12.03 $3.95
98.1 2.32 $961.1 $120.47 $9.79 $4.23
80.7 2.41 $744.5 $120.43 $9.23 $3.83
144.3 2.70 $1,402.5 $120.48 $9.72 $3.60
57.0 2.63 $752.0 $120.43 $13.19 $5.02
298.2 1.55 $2,161.6 $120.46 $7.25 $4.67
124.8 2.74 $1,603.9 $120.43 $12.85 $4.68
109.4 4.16 $1,777.8 $120.37 $16.25 $3.90
152.6 3.23 $1,703.7 $120.44 $11.16 $3.45
68.3 2.77 $979.3 $120.43 $14.33 $5.17
84.6 1.90 $1,047.0 $120.43 $12.38 $6.51
113.3 2.56 $1,229.1 $120.45 $10.85 $4.24
34.1 2.49 $411.1 $120.42 $12.07 $4.84
151.8 0.90 $1,013.5 $120.43 $6.68 $7.39
91.2 2.86 $986.7 $120.43 $10.82 $3.79
27.4 2.16 $393.4 $120.47 $14.38 $6.67
84.6 1.86 $922.9 $120.46 $10.91 $5.87
32.5 2.00 $314.4 $120.42 $9.66 $4.84
54.8 1.75 $599.2 $120.45 $10.94 $6.24
76.4 1.56 $594.3 $120.45 $7.78 $5.00
103.2 2.01 $844.3 $120.43 $8.18 $4.08
104.2 0.29 $399.2 $120.43 $3.83 $13.07
54.6 2.15 $953.1 $120.36 $17.44 $8.12
2,815.9 2.52 $30,446.4 $120.45 $10.81 $4.29
2,841.8 2.60 $29,017.4 $116.34 $10.21 $3.93
-0.9% -3.1% 4.9% 3.5% 5.9% 9.2%
RTC Public Transportation and Operations Page 14 RTC MOS (FY 2019).xlsx
RTC Transit Operating Statistics
Percent Current Previous Percent
2019 2018 Change 12 Months 12 Month Change
Single Ride Cash Full Fare 13,531 72,459 -81% 507,014 935,677 -46% Reduced* 16,993 47,675 -64% 396,824 591,939 -33% RTC ACCESS ID 456 2,377 -81% 16,667 32,227 -48% Total 30,980 122,511 -75% 920,505 1,559,843 -41%
Day/24-Hr Pass Cash Full Fare 99,409 33,561 196% 846,013 443,463 91% Reduced* 83,801 35,870 134% 683,989 453,884 51% Total 183,210 69,431 164% 1,530,002 897,347 71%
Pre-Purchase Period Pass Full Fare 149,232 133,513 12% 1,734,364 1,616,989 7.3% Reduced* 176,533 128,709 37% 1,869,908 1,530,575 22.2% Total 325,765 262,222 24% 3,604,272 3,147,564 14.5%
Transfers 154 83,218 -100% 445,976 1,045,470 -57% Flow Through 3,579 7,451 -52% 54,754 76,228 -28% Free Rides 30,320 26,495 14% 277,469 236,830 17% Stored Ride Pass 6,873 33,368 -79% 266,020 428,258 -38%
Full Fare 281,701 326,391 -13.7% 3,663,394 4,047,587 -9.5% Reduced* 299,048 275,865 8.4% 3,421,865 3,311,700 3.3%
Total Ridership 580,881 604,696 -3.9% 7,098,998 7,391,540 -4.0%
Previous 12 Months 604,696 7,391,540
Change -3.9% -4.0%
Revenue Veh. Hours 20,937 20,043 4.5% 255,006 249,420 2.2%
Previous 12 Months 20,043 249,420
Change 4.5% 2.2%
Passengers / RVH 27.7 30.2 -8.0% 27.8 29.6 -6.1%
Previous 12 Months 30.2 29.6
Change -8.0% -6.1%
Revenue Vehicle Miles 230,211 229,896 0.1% 2,839,645 2,841,546 -0.1%
Passengers / RVM 2.52 2.63 -4.1% 2.50 2.60 -3.9%
Est. Gross Operating Cost $2,534,389 $2,351,688 7.8% $30,717,137 $29,017,883 5.9%
Est. Cost Per RVH $121.05 $117.33 3.2% $120.46 $116.34 3.5%
Est. Cost Per RVM $11.01 $10.23 7.6% $10.82 $10.21 5.9%
Est. Cost Per Trip $4.36 $3.89 12.2% $4.33 $3.93 10.2%
* - Reduced fare includes Youth, Senior, Disabled, and US Veterans
April May 2018 - Apr 2019
RTC Operations Page 15 RTC MOS Fare Category.xlsx
RTC Transit Operating Statistics
RTC RAPID Lincoln Line and Route 11
ROLLING 12 MONTH COMPARISON
Most Recent 12 Months Percent Previous 12 MonthsMonth Year Ridership Change Month Year Ridership
May 2018 55,675 9.8% May 2017 50,700
Jun 54,145 6.8% Jun 50,708
Jul 43,995 -7.9% Jul 47,751
Aug 44,783 -13.2% Aug 51,588
Sep 48,849 -2.5% Sep 50,115
Oct* 56,396 13.5% Oct 49,682
Nov 55,910 19.9% Nov 46,646
Dec 54,326 8.6% Dec 50,035
Jan 2019 54,183 5.3% Jan 2018 51,432
Feb 55,565 17.8% Feb 47,157
Mar 64,857 22.1% Mar 53,110
Apr 62,773 19.7% Apr 52,454
TOTAL 651,457 8.3% TOTAL 601,378
* - RTC RAPID Lincoln Line introduced Oct 6, 2018
RTC Public Transportation and Operations Page 16 RTC RAPID Lincoln Line (19.04).xlsx
RTC Transit Operating Statistics
RTC RAPID Lincoln Line and Route 11 Fiscal Year Comparisons
0
10
20
30
40
50
60
70
80
Jul Aug Sep Oct Nov Dec Jan Feb Mar Apr May Jun
RID
ER
SH
IP
Th
ou
san
ds
RIDERSHIP
FY 15
FY 16
FY 17
FY 18
FY 19
0
10
20
30
40
50
60
Jul Aug Sep Oct Nov Dec Jan Feb Mar Apr May JunPas
seng
ers
per
Rev
enue
Veh
icle
Hou
r
PRODUCTIVITY
FY 15
FY 16
FY 17
FY 18
FY 19
0
500
1,000
1,500
2,000
2,500
3,000
Jul Aug Sep Oct Nov Dec Jan Feb Mar Apr May Jun
RE
VE
NU
E V
EH
ICLE
HO
UR
S
REVENUE VEHICLE HOURS
FY 15
FY 16
FY 17
FY 18
FY 19
RTC Public Transportation and Operations Page 17 RTC RAPID Lincoln Line (19.04).xlsx
RTC Transit Operating Statistics
RTC RAPID Virginia Line and Route 1
ROLLING 12 MONTH COMPARISON
Most Recent 12 Months Percent Previous 12 MonthsMonth Year Ridership Change Month Year Ridership
May 2018 152,259 0.6% May 2017 151,370
Jun 142,412 -6.5% Jun 152,276
Jul 145,053 -7.3% Jul 156,434
Aug 158,617 -4.7% Aug 166,516
Sep 140,693 -9.9% Sep 156,177
Oct 140,112 -11.6% Oct 158,468
Nov 117,079 -21.5% Nov 149,119
Dec 113,439 -23.7% Dec 148,718
Jan 2019 120,421 -17.2% Jan 2018 145,376
Feb 104,118 -22.1% Feb 133,644
Mar 121,642 -16.8% Mar 146,121
Apr 126,235 -11.1% Apr 142,026
TOTAL 1,582,080 -12.4% TOTAL 1,806,245
RTC Public Transportation and Operations Page 18 RTC RAPID Virginia Line (19.04).xlsx
RTC Transit Operating Statistics
RTC RAPID Virginia Line and Route 1 Fiscal Year Comparisons
0
20
40
60
80
100
120
140
160
180
200
Jul Aug Sep Oct Nov Dec Jan Feb Mar Apr May Jun
RID
ER
SH
IPT
ho
usa
nd
s
RIDERSHIP
FY 15
FY 16
FY 17
FY 18
FY 19
0
5
10
15
20
25
30
35
40
45
50
Jul Aug Sep Oct Nov Dec Jan Feb Mar Apr May JunPas
seng
ers
per
Rev
enue
Veh
icle
Hou
r
PRODUCTIVITY
FY 15
FY 16
FY 17
FY 18
FY 19
0
500
1,000
1,500
2,000
2,500
3,000
3,500
4,000
4,500
5,000
Jul Aug Sep Oct Nov Dec Jan Feb Mar Apr May Jun
RE
VE
NU
E V
EH
ICLE
HO
UR
S
REVENUE VEHICLE HOURS
FY 15
FY 16
FY 17
FY 18
FY 19
RTC Public Transportation and Operations Page 19 RTC RAPID Virginia Line (19.04).xlsx

RTC Transit Operating Statistics
RTC REGIONAL CONNECTOR - Carson Line
ROLLING 12 MONTH COMPARISON
Most Recent 12 Months Percent Previous 12 MonthsMonth Year Ridership Change Month Year Ridership
May 2018 2,520 1.5% May 2017 2,482
Jun 2,437 -12.5% Jun 2,785
Jul 2,602 9.7% Jul 2,372
Aug 2,736 -15.8% Aug 3,250
Sep 2,504 1.6% Sep 2,464
Oct 3,028 17.6% Oct 2,575
Nov 2,712 16.4% Nov 2,329
Dec 2,408 6.8% Dec 2,255
Jan 2019 2,636 6.2% Jan 2018 2,482
Feb 2,235 1.5% Feb 2,202
Mar 2,570 16.3% Mar 2,210
Apr 2,146 -9.0% Apr 2,358
TOTAL 30,534 2.6% TOTAL 29,764
RTC Public Transportation and Operations Page 20 RTC RC Carson (19.04).xlsx
RTC Transit Operating Statistics
RTC REGIONAL CONNECTOR Carson Line Fiscal Year Comparisons
0
500
1,000
1,500
2,000
2,500
3,000
3,500
4,000
Jul Aug Sep Oct Nov Dec Jan Feb Mar Apr May Jun
RID
ER
SH
IPRIDERSHIP
FY 15
FY 16
FY 17
FY 18
FY 19
0
2
4
6
8
10
12
14
16
Jul Aug Sep Oct Nov Dec Jan Feb Mar Apr May JunPas
seng
ers
per
Rev
enue
Veh
icle
Hou
r
PRODUCTIVITY
FY 15
FY 16
FY 17
FY 18
FY 19
0
50
100
150
200
250
300
350
Jul Aug Sep Oct Nov Dec Jan Feb Mar Apr May Jun
RE
VE
NU
E V
EH
ICLE
HO
UR
S
REVENUE VEHICLE HOURS
FY 15
FY 16
FY 17
FY 18
FY 19
RTC Public Transportation and Operations Page 21 RTC RC Carson (19.04).xlsx
RTC Transit Operating Statistics
SIERRA SPIRIT
ROLLING 12 MONTH COMPARISON
Most Recent 12 Months Percent Previous 12 MonthsMonth Year Ridership Change Month Year Ridership
May 2018 11,454 -7.5% May 2017 12,389
Jun 11,240 -7.0% Jun 12,082
Jul 11,472 -3.4% Jul 11,873
Aug 11,813 -5.2% Aug 12,457
Sep 11,960 11.6% Sep 10,721
Oct 12,069 36.3% Oct 8,854
Nov 9,950 15.0% Nov 8,653
Dec 9,331 -11.1% Dec 10,496
Jan 2019 8,404 -22.8% Jan 2018 10,883
Feb 6,919 -35.3% Feb 10,696
Mar 8,976 -13.8% Mar 10,419
Apr 3,775 -66.7% Apr 11,334
TOTAL 117,363 -10.3% TOTAL 130,857
RTC Public Transportation and Operations Page 22 SIERRA SPIRIT (19.04).xlsx
RTC Transit Operating Statistics
SIERRA SPIRIT FISCAL YEAR COMPARISONS
7/1/2013 25-cent adult and 10-cent reduced fare introduced
0
2
4
6
8
10
12
14
16
18
Jul Aug Sep Oct Nov Dec Jan Feb Mar Apr May Jun
RID
ER
SH
IP Th
ou
san
ds
Ridership
FY 15
FY 16
FY 17
FY 18
FY 19
0
5
10
15
20
25
Jul Aug Sep Oct Nov Dec Jan Feb Mar Apr May JunPas
seng
ers
per
Rev
enue
Veh
icle
Hou
r
Productivity
FY 15
FY 16
FY 17
FY 18
FY 19
0
100
200
300
400
500
600
700
800
900
Jul Aug Sep Oct Nov Dec Jan Feb Mar Apr May Jun
Rev
enue
Veh
icle
Hou
r
Revenue Vehicle Hours
FY 15
FY 16
FY 17
FY 18
FY 19
RTC Public Transportation and Operations Page 23 SIERRA SPIRIT (19.04).xlsx
RTC Transit Operating Statistics
$0
$10
$20
$30
$40
$50
$60
0
2,000
4,000
6,000
8,000
10,000
12,000
Dec Feb Apr Jun Aug Oct Dec Feb Apr Jun Aug Oct Dec Feb Apr
2016 2017 2018 2019
Gross Sales Reven
ue (thousands)
Number of Pa
ss Sales
Token TransitSmart Phone Fare Payment
Pass Sales
Gross Sales Rev.
Poly. (Pass Sales)
RTC Public Transportation and Operations Page 24 Token Transit (FY 2019) ‐ Rev (18.12.10).xlsx
RTC Transit Operating Statistics
National bus data is based on APTA data
RTC Transit and National Bus Comparison
0
1
2
3
4
5
6
7
0
1
2
3
4
5
6
7
8
9
10
11
FY91
FY93
FY95
FY97
FY99
FY01
FY03
FY05
FY07
FY09
FY11
FY13
FY15
FY17
Bill
ions
Mill
ion
s
Ridership
RTC Transit
National Bus
0
5
10
15
20
25
30
35
40
45
FY91
FY93
FY95
FY97
FY99
FY01
FY03
FY05
FY07
FY09
FY11
FY13
FY15
FY17
Productivity(Trips per Service Hour)
RTC Transit
National Bus
0
20
40
60
80
100
120
140
160
180
200
220
0
50
100
150
200
250
300
350
FY91
FY93
FY95
FY97
FY99
FY01
FY03
FY05
FY07
FY09
FY11
FY13
FY15
FY17
Mill
ion
s
Th
ou
san
ds
Service Hours
RTC Transit
National Bus
RTC Public Transportation and Operations Page 25 RTC Transit Perf Stats Historical.xlsx
RTC Transit Operating Statistics
National bus data is based on APTA data
RTC Transit and National Bus Comparison
$0
$2
$4
$6
$8
$10
$12
$14
$16
$18
$20
$22
$24
$26
$0
$2
$4
$6
$8
$10
$12
$14
$16
$18
$20
$22
$24
$26
$28
$30
FY91
FY92
FY93
FY94
FY95
FY96
FY97
FY98
FY99
FY00
FY01
FY02
FY03
FY04
FY05
FY06
FY07
FY08
FY09
FY10
FY11
FY12
FY13
FY14
FY15
FY16
FY17
Farebox Recovery Ratio
Billions
Millions
RTC Transit and National BusFare Revenue and Operating Cost
RTC Operating Cost
RTC Fare Revenue
National Operating Cost
National Fare Revenue
0%
5%
10%
15%
20%
25%
30%
35%
40%
45%
50%
FY91
FY92
FY93
FY94
FY95
FY96
FY97
FY98
FY99
FY00
FY01
FY02
FY03
FY04
FY05
FY06
FY07
FY08
FY09
FY10
FY11
FY12
FY13
FY14
FY15
FY16
FY17
RTC Transit and National BusFarebox Recovery (Fare Revenue/Operating Cost)
RTC FareboxRecovery
National FareboxRecovery
RTC Public Transportation and Operations Page 26 RTC Transit Perf Stats Historical.xlsx
RTC Transit Operating Statistics
Fiscal Year Adult Reduced Cash PassFY 96 5.56 2.30 3.80 2.56FY 97 5.16 2.27 3.46 2.53FY 98 4.77 2.38 3.12 2.58FY 99 4.72 2.48 3.07 2.65FY 00 4.79 2.65 2.97 3.07FY 01 5.11 2.91 2.99 3.49FY 02 5.01 2.91 2.80 3.62FY 03 4.59 2.63 2.60 3.17FY 04 4.58 2.63 2.54 3.09FY 05 4.87 2.69 2.58 2.79FY 06 5.15 2.98 2.50 3.16FY 07 4.99 3.23 2.28 3.50FY 08 4.91 3.41 2.16 3.80FY 09 4.42 3.35 1.88 3.84FY 10 3.90 3.06 1.65 3.61FY 11 4.05 3.15 1.69 3.73FY 12 4.16 3.36 1.77 3.76FY 13 4.44 3.61 1.78 3.80FY 14 4.50 3.67 1.81 4.12FY 15 4.40 3.74 1.77 4.20FY 16 4.25 3.47 1.65 4.02FY 17 4.13 3.29 1.60 3.85FY 18 4.06 3.34 1.52 4.06
RTC Transit Ridership by Fare Category
Trips (in millions)
0.0
0.5
1.0
1.5
2.0
2.5
3.0
3.5
4.0
4.5
5.0
5.5
6.0
0.0
0.5
1.0
1.5
2.0
2.5
3.0
3.5
4.0
4.5
5.0
5.5
6.0
FY96
FY97
FY98
FY99
FY00
FY01
FY02
FY03
FY04
FY05
FY06
FY07
FY08
FY09
FY10
FY11
FY12
FY13
FY14
FY15
FY16
FY17
FY18
Millions
Millions
RTC Transit Ridership by Fare Category
Adult
Reduced
Cash
Pass
RTC Public Transportation and Operations Page 27 CATEGORY (Rev 17.09).xlsx
RTC Transit Operating Statistics
RTC Transit Missed Trips and Service Hours
0
500
1,000
1,500
2,000
2,500
3,000
3,500
4,000
Jul Aug Sep Oct Nov Dec Jan Feb Mar Apr May Jun
Trip
sMissed Trips
FY 17
FY 18
FY 19
0
200
400
600
800
1,000
1,200
1,400
1,600
1,800
Jul Aug Sep Oct Nov Dec Jan Feb Mar Apr May Jun
Rev
enue
Veh
icle
Hou
rs
Missed Service Hours
FY 17
FY 18
FY 19
0%
1%
2%
3%
4%
5%
6%
7%
8%
9%
Jul Aug Sep Oct Nov Dec Jan Feb Mar Apr May Jun
Rev
enue
Veh
icle
Hou
rs
Percent of Total Service Hours
FY 17
FY 18
FY 19
RTC Public Transportation and Operations Page 28 RTC Transit Missed Trips.xlsx