[ university college of wales aberystwyth
TRANSCRIPT

Give to AgEcon Search
The World’s Largest Open Access Agricultural & Applied Economics Digital Library
This document is discoverable and free to researchers across the globe due to the work of AgEcon Search.
Help ensure our sustainability.
AgEcon Search http://ageconsearch.umn.edu
Papers downloaded from AgEcon Search may be used for non-commercial purposes and personal study only. No other use, including posting to another Internet site, is permitted without permission from the copyright owner (not AgEcon Search), or as allowed under the provisions of Fair Use, U.S. Copyright Act, Title 17 U.S.C.
•
[ UNIVERSITY COLLEGE OF WALES
ABERYSTWYTH
ECONOMIC STUDIES IN SHEEP FARMING_ IN,WALES.
NUMBER 3.
A review of the financial results for 57
Identical Hill Sheep Flocks during the
years 1955-56 to 1958-59.
by
M. H. Dummer, B.A.
DEPARTMENT OF AGRICULTURAL ECONOMICS
-----CAMBRIAN CHAMBERS, CAMBRIAN PLACE-- -
ABERYSTWYTH
Price:
Otri

1
ACKNOWLEDGEMENT.
The Department of Agricultural Economics, University College
of Wales, Aberystwyth, acknowledges with thanks, the assistance
given by the farmers who supplied the information on which this
Report is based. Their ready co-operation and patience in
supplying much detailed information is greatly appreciated.
The field work in connection with the Report was undertaken
by Messrs M. B. Roberts, R. L. Evans and Gwilym Hughes.
E. F. Nash.
July, 1960. Professor of Agricultural Economics.

INTRODUCTION.
A review of the financial results of certain hill flocks during the
period 1956 to 1959 is justified on the grounds that duringthat period the
sheep enterprise in Wales, as in the other countries of the United .tungctom,
experienced an upsurge in the numbers of breeding ewes kept on farms, together
with a boom and slump in the market for store sheep.
The distribution of the breeding ems among the counties of Wales is
given in Table 1, Appendix A. In 1959 they carried 2778.0 thousand breeding
ewes in all, as compared with 2380.7 thousand in 1956 and 2464.9 thousand in
1939. Thus between 1939 and 1959 the total number of breeding ewes in Wales
increased by 313.1 thousand, or 12.7 per cent. Of the total increase between
these two years, 309.4 thousand were to be found in the 'Mid-Wales' counties
of Merioneth, Montgomery, Cardigan, Radnor and Brecon. The proportion of the
total breeding ewes in Wales located in these counties increased from 48.8 per
cent in 1939 to 54.4 per cent in 1959. On the other hand, there was a decline in
the proportion in the 'North 'Wales' group (Anglesey, Caernarvon, Denbigh and
Flint) from 26.5 per cent in 1939 to 24.5 per cent in 1959 and in the 'South
Walest group (Pembroke, Carmarthen, Glamorgan and Monmouth) from 24.7 to 21.1
per cent.
Between the yea's 1956 and 1959, however, the total number of breeding
ewes in Wales rose by 397.3 thousand, or 16.7 per cent (See Table I, Appendix A).
All counties in Wales shared in this increase, but it was proportionately more
pronounced in the 'Lowland' counties. In the 'South Wales' group the number of
breeding ewes in 1959 was 22.8 per cent more than in 1956, whilst in the 'North
Wales' group the numbers rose by 15.9 per cent between 1956 and 1959. During the
same period the increase in the number of breeding ewes in the 'Mid-Wales'
group was 14,8 per cent.
The increased demand for breeding ewes in 1957 brought boom conditions
to the store markets, and high prices were being paid in the summer and autumn
sales. This demand was maintained during 19581 but prices did not reach the
level of the previous year. The slump came in 1959, with a violent downswing in
prices for breeding ewes. At the time various reasons were given for this
situation, but in the main it was attributed to the long dry summer. As a result
of the weather, keep became short and fat lambs came off farms in increasing
numbers from August onwards, which led to a fall in their price. With plentiful
and relatively cheap supplies of fat lambs the butchers cut their demand for
fat ewes, so that the prices for this type of stock fell as well. The lowland
producer was largely compensated for the fall in fat lamb prices by deficiency
payments, but because of the depression in the market for fat ewes his natural
reaction was to retain many of his ewes for at least another year. This reaction
in turn reduced the demand in the store markets for replacements to the breeding
flock.
The difference in average prices between 1958 and 1959 for fat lambs
and fat ewes during the period August to October is shown in Table II,
Appendix A.
SUMMARY AND CONCLUSIONS OF REVIEW.
The experience of the 57 identical hill.flocks in Wales during the
period 1955-56 to 1958-59 may be briefly summarised as follows. The boom
conditions of 1957 brought them relatively higher returns than usual, There is
no doubt that these higher returns contained something of a windfall element,
but they compensated for many years when returns were relatively low. In 1959,
however, the slump in prices brought the average price of draft ewes to 55.8
per cent of the average price in 1957, and 78.4 per cent of the price in
1955-56. As a reaction to this •situation many of the ewes that were due to be
drafted from these flocks were retained. for another year, and relatively fewer
lambs were assigned to flock replacement. To counterbalance the fall in the
returns from the store market the producers sold relatively more lambs fat,
though their ability to make use of this alternative market was in general
limited by the number of lambs sufficiently forward to be traded.
It is possible that this year, 1959-60, could prove as critical to
the hill sheep flocks as did the last one. Forecasting in this matter can be

2.
notoriously misleading, but there are certain factors which can be taken intoconsideration. .L fair proportion of the breeding ewes in the hill flocks lastwinter were spending their fourth winter on the hills. It is doubtful whetherthey had the stamina to withstand this experience, because the fall of lambsin the hill flocks this Spring was reported as being below average. If thisreport is generally true, then the outlook for the hill flocks will not be veryfavourable. From the lambs weaned this Spring will come the replacements forthe breeding flock, and if the number weaned is below average then the scopefor culling the older ewes will be limited, and thus the number of sheep forsale from the flocks will be affected.
. If, on the other hand the situation is not as bad as that thereWill still remain the problem of the disposal of the ol4r ewes. If the breed-
ing ewes retained for another year last autumn are joined by those due to be
drafted this year at the customary age, then the store market could be
affected again this autumn. This situation calls for the exercise of careful
management in the disposal of these older ewes in order to prevent any upset
in the market.
In turning to the future there are two points which may be noted.
Firstly, it has been shown that in June 1959 in those counties of Wales which
contain considerable areas of rough gnazings, there was a relatively greater
concentration of breeding ewes than in June, 1939. Secondly, it is unlikely
that the hill flocks will experience again a keen demand for store stock
similar to that of 1957 and 1958. How these two points are to be reconciled
is the problem. The hill sheep enterprise is conducted under a wide diversity
of physical and environmental conditions, as can be seen from the results for
the 57 identical flocks. These show a bread range, from the smaller flocks
where a relatively high .proportion of the returns are obtained from the sale of
fat lambs to the larger ones where the returns are derived almost entirely
from the sale of store stock. In between come the flocks showing some
variation in this respect. It may be that as a result of their experience in
the summer of 1959 some hill-flockmasters who are able to do so will turn
their attention to the market for fat lambs much more closely than they have
done in the past. This will give a somewhat greater measure of security to
their own income from sheep and at the same time relieve the pressure in the
store sheep markets, thus, indirectly, helping the traditional store sheep
raisers. The question may be posed; but no general answer can be given, since
so much depends on the particular circumstances of each hill flock.
FINANCIAL RESULTS FOR 57 IDENTICAL HILL FLOCKS IN TALES
FOR THE YEARS 19.55-5b TO 1958-9.
The flocks surveyed were situated in the counties of Merioneth,
Caernarvon, Denbigh, Montgomery and. Brecon, Their distribution as between
these counties was as follows:-
Count. No. of Farms. Percent.
Merioneth 06 Lo
Caernarvon 1: 21
Denbigh o 16.
Brecon 5Montgomery egssma..r
100
Just over half the flocks each year were in the size groups of
200 to under 600 breeding ewes. Over the four years, however, there was a
trend towards relatively larger flocks.
The average number of breeding ewes per flock in the sample
increased from 536 in 1955-56 to 573 in 1958-59. The distribution of. the 57
identical hill flocks according to size is shown in Table 1.

3.
Under -200200 & under 400400 " " 600QX) " 800800 " over
Total
Table 1.
Size Distribution of Hill Flocks,
57 Identical Hill Flocks.
'Nam
Size Groups: 1955-5 - 1956-57. : 1957-58 - 1958-59.
•Breeding Ewes. • No. • . • 67 - . : No. : .,..%. : No. :j.
: 9 : 16 : 8 : 14 : 8 .. 14 : 7 : 12
: 16 : 28 : 17 : 30 : 15 26 : 15 : 26
: 13 : 23 : 13 : 23 : 15 : 26 : 14 : 25
9 : 16 : 11 : 19 : 10 : 18 : 10 : 18
10 : 17 ,..,: 8 : 14 : 9 . 16 : 11 :_____ 19__,...,•.......________
100 : 57 : 10057 • 100 • 57 : 100 57
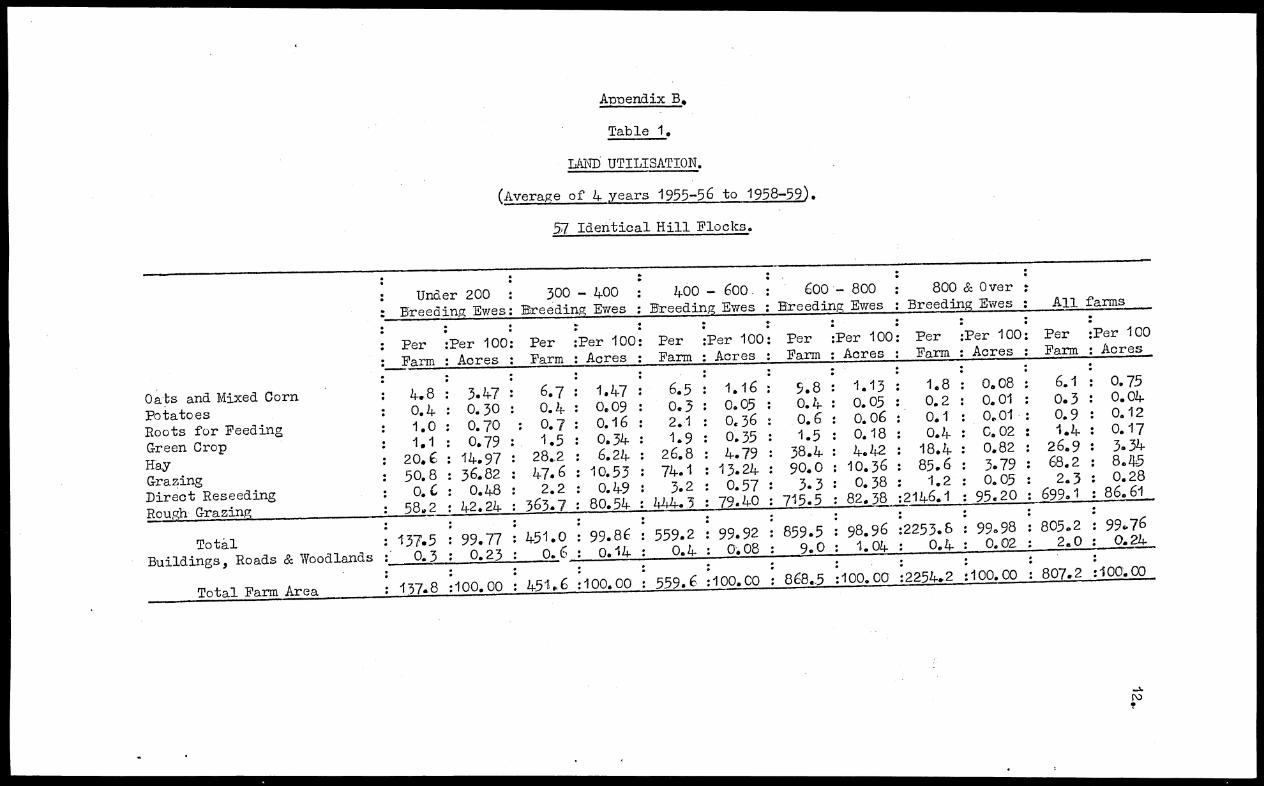
The average cropping and stocking of the farms in the sample for the
four years are given in Tables I and II, Appendix B. It should be noted with
regard to land utilisation that it is difficult to assess the effective total
acreage of the farms concerned, other than that which was continuously in their
sole occupation, because of the fact that many of them had grazing rights for a
specified number of sheep on the open mountain. The average size of farm for the
57 identical hill flocks was 807.2 acrec, of which 86.6 per cent consisted of
rough grazing. Just over I per cent was composed of arable crops intended
almost entirely for livestock consumption, and the remaining 12 per cent was
under grass for hay and grazing.
The wide variation in the conditions under which the enterprise was
conducted is indicated by the average land utilisation per farm for the flock
size groups. The group with flocks of under 200 breeding ewes had the highest
proportion of land under crops, and the lowest proportion classed as rough
grazing. Most of these farms were to be found on relatively low ground, with
milk production as the main enterprise, each farm having grazing rights for a
specified number of sheep on the open mountain. At the other extreme were the
farms with 800 breeding ewes and over, which had on the average 95 per cent of
their land under rough grazing.
The financial results of the 57 identical hill flocks for the four
years will be considered from the standpoint of three factors:-
1. The returns obtained from the enterprise;
2 The physical results of the enterprise;
3. The costs incurred in the conduct of the enterprise.
1. Returns.
The average price per head receiveA for sheep by the 57 identical
hill flocks during the period 19!55-5c to 1958-59 is given in Table 2.
Table 2.
Average Prices er Head for Sheep sold.R7 Identical Hill Flocks.
: 1955-56. : 1956-57. : 1957-58. : 1958-59.
Z. s. aDraft Ems :
19Store Lambs : ;:5: #(11 :
Fat Lambs . 4-.10. 2 :
Store Wethers : :..18. 9 :
Fat Wethars -: 14-.10. 2 : 4.16.11 : 5. 2.11 : 4.16. 3
Rams & Ram Lambs : 14. 9. 2 : 14,13. 5 : 14, 9. 2 : 12.19. 2
Z. s. a :5. 5. 6:
4. 2. 0 :5. 1. 5 :4.13. 2 :
s. a : s. a5. 0. : 3. 2. 0
3.16.11 3. 4.11
5. 3. 4- : 4.10.10
4. 9.11 : 4.10

The conditions in the store market during the period under revieware exemplified in the average prices per head paid for draft ewes and storelambs respectively. The fluctuation in the average price for drat-6 ewes wasgreater than that for store lambs. In 1956-57 the average price per head fordraft ewes rose by one-third over that for 1955-56; but there was a fall in1957-58, and by 1958-59 the price was 22 per cent below that for 1955-56.
In respect of store lambs the average price per head rose in 1956-57 byone-quarter over that for 1955-56 and then declined to 23. 4.11 in 1958-59as compared with £3. 5. 9 in 1955-56. The differential in price as betweenfat lambs and store lambs averaged ,C1. 4. 0 over the four years, and the
significance of this fact was not lost on the producers in 1958-59.
The average number of sheep sold per 100 breeding ewes in the 57identical hill flocks is shown in Table 3. Two features may be noted withregard to the figures given.
In the first place, wothers accounted for 14 per cent of the total
sheep sold per 100 breeding ewes in 1955-56. In the subsequent years there
was a marked fall in the proportion of this class of sheep to the total
number sold. Owing to the conditions obtaining in the store markets at that
time there was less incentive to retain sheep to an older age. Lambs, in
either fat or store condition, accounted for only 47 per cent of totalsales in 1955-56, whereas in the following three years, the proportions
were 52, 50 and 57 per cent respectively.
Table 3.
Numbep Sold per 100 Breeding Ewes.
57 Identical Hill Flocks.
: 1955-56. : 1956-57. : 1957-58. : 1958-59.
No. : . No.. 670 : /.. '
: .
Draft Ewes : 25 : 38 : 27 38 27 : 39 :
Store Lambs : 25 : 38 : 31 : 44 : 2: : 41 9
Fat Lambs : 4
:
- : 9 : 6 : 8 :
Wethers : 9 : 14. : 6 : 9 , 10 :
Rams & Ram Lambs : 1 : _1 : 1 1 : 1 1 : 1 : 1.....____
23 : 3229 : 4111 : 16
: 10
Total 66 : i00 : 71 : 100 100 : 71 : 100
Draft ewes and store lambs accounted for about three-quarters of
the total number of sheep sold per 100 breeding ewes in 1955-56. With the
increased demand for this type of stock,co-inciding with improved lambing
results, in 1956-57 and 1957-58 the proportion sold rose to four-fifths of
the total. Store lambs formed a relatively higher percentage of the total
in 1956-57 and 1957-58 than did draft ewes. In 1958-59, however, the number
of draft ewes sold per 100 breeding ewes was relatively smaller than in any
of the previous three years; the proportion of lambs sold in a store
condition remained the same; and the figure sold fat had increased to 16
per cent of the total, as compared with 8 to 9 per cent in the previous years.
These changes in average prices per head, and in the proportions of
the various categories of sheep sold, are reflected in the changes in the
percentage distribution of returns from the sale of sheep and wool, as
given in Table 4.
In 1955-56 draft ewes and store lambs accounted for 52.5 per cent
of the returns. In the two following years there was an increase in this
proportion, to 62.3 per cent and 58.7 per cent respectively; but in 1958-59
it fell to 47.5 per cent. Since fewer draft ewes were being sold and
relatively lower prices were being received for them, the proportion of the
total returns which was derived from this source fell to 20.7 per cent. On
the other hand, the proportion derived from the sale of store lambs remained
about the same as in the previous year, while the figure for fat lambs
increased to almost double that for the base year 1955-56.
v
5.
Table •
Percentage Distribution of Returns fromSale of She epand Wool.
57 Identical Hill Flocks.
le....16.21111111MINEW
1955-56. : 1956-57. :
Draft Ewes •. 28.5 : 32.9Store Lambs • 24.0 : 29.4Fat Lambs : 8.1 7.1Wethers •. 10.5 : 6.1 :Rams 8c Ram Lambs : 3.8 : 2.5Wool . 25.1 : .22.0
Total : 100.0 • 100.0
: 1958-59
:32.1 20.726.6 26.87.2 15.24-8.0 8.7
3.9 3.122.2 25.3
• 100.0 : 100.0
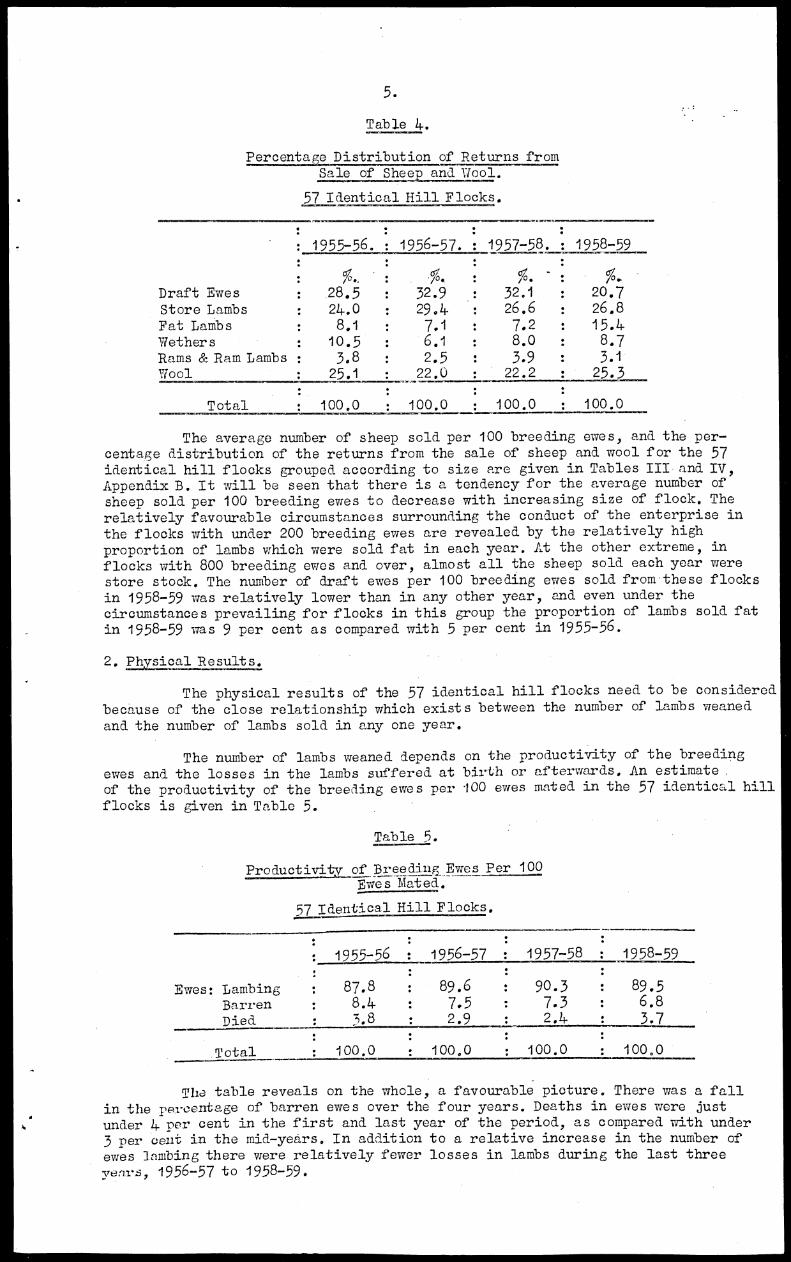
The average number of sheep sold per 100 breeding ewes, and the per-centage distribution of the returns from the sale of sheep and wool for the 57
identical hill flocks grouped according to size are given in Tables III and IV,Appendix B. It will be seen that there is a tendency for the average number of
sheep sold per 100 breeding ewes to decrease with increasing size of flock. The
relatively favourable circumstances surrounding the conduct of the enterprise in
the flocks with under 200 breeding ewes are revealed by the relatively high
proportion of lambs which were sold fat in each year. At the other extreme, in
flocks with 800 breeding ewes and over, almost all the sheep sold each year were
store stock. The number of draft ewes per 100 breeding ewes sold from these flocks
in 1958-59 was relatively lower than in any other year, and even under the
circumstances prevailing for flocks in this group the proportion of lambs sold fat
in 1958-59 was 9 per cent as compared with 5 per cent in 1955-56.
2, Physical Results.
The physical results of the 57 identical hill flocks need to be considered
because of the close relationship which exists between the number of lambs weaned
and the number of lambs sold in any one year.
The number of lambs weaned depends on the productivity of the breeding
ewes and the losses in the lambs suffered at birth or afterwards, An estimate.
of the productivity of the breeding ems per 100 ewes mated in the 57 identical hill
flocks is given in Table 5.
Table 5.
Productivity of Breeding Ewes Per 100Ewes Mated.
57 Identical Hill Flocks,
: 1955-56 : 1956-57 : 1957-58 : 1958-59
Ems: Lambing : 87,8 : 89.6 : 90.3
Barren : 8.4 .. 7.5 : 7.3Died • 3.8 : 2.9 • 2.4
89.56.8
3.7
Total 100.0 100.0 ; 100.0 100.0
The table reveals on the whole, a favourable picture. There was a fall
in the percentage of barren ewes over the four years. Deaths in ewes were just
under 4 per cent in the first and last year of the period, as compared with under
3 per cent in the mid-years. In addition to a relative increase in the number of
ewes lrimbing there were relatively fewer losses in lambs during the last threeyenrs, 1956-57 to 1958-59.

6.
Table 6.
Lambing Results per 100 Ewes Mated.57 Identical Hill Flocks.
•
Lambs: Born Alive :DiedWeaned
•1955-56 : _1956-57
881177
, 90981
1957-58 • 1958-59- - • ...V....
91883 •
91982
In 1955-56 losses in lambs were 12.5 per cent of the total. This
proportion fell to 10 per cent in 1956-57, with a further decline to 8.8
per cent and 9.9 per cent in the two following years respectively. Thus theincreased demand for breeding ewes and store lambs in 1956-57 coincided withrelatively more favourable lambing results, as compared with 1955-56. There
is very little variation in the lambing results for the last three years of
the period under review.
In the hill flocks it is the usual custom to retain all the ewe
lambs for flock replacement purposes. The disposal of the lambs weaned per
100 ewes mated is given in Table 7.
Table 7.
Disposal of Lambs Weaned per 100 Ewes Mated.
57 Identical Hill Flocks.
• 19:45756. : 1956-57 : 1957-58 1958-59•••
• No.. .
Retained: Ewe Lambs : ' 37 : 48 : 38 : 47 : 39 47 : 37 : 45Ram Lambs : 2 3 : 1 : 1 : i : 1 : 1 .• 1
Uether D.urb s: 7 : 9 : 5 : (J : 7 : 8 : 5 : 6Lambs Sold Fat : 4 : 5 : 3 : 4 : 4 : 5 8 : 10
Lambs Sold as Stores•
:or on hand for sale:
as Stores
Total
: No.
27 35 : 34 : 42 : 32 : 39 : 31 : 38
: 77 : 100 : 81 : 100 • 83 : 100 : 82 • 100•
There is little variation in the actual number of lambs, per 100 ewes
mated, retained for replacement purposes in each of the four years. In 1958-59,
however, the proportion of the total lambs thus retained was relatively lower than
in any of the other Years. In 1955-56 40 per cent of the weaned lambs were sold,
mainly in a store condition. In the following two years, with relatively better
results, these sales represented 46 per cent and per cent respectively. In
1958-59, however, 48 per cent of the lambs were sold, and the number sold fat
per 100 ewes mated was twice as large as in the previous years. The retention
of fewer lambs for flock replacement meant that breeding ewes in these flocks
were being retained for another year, instead of being drafted in the
customary manner.
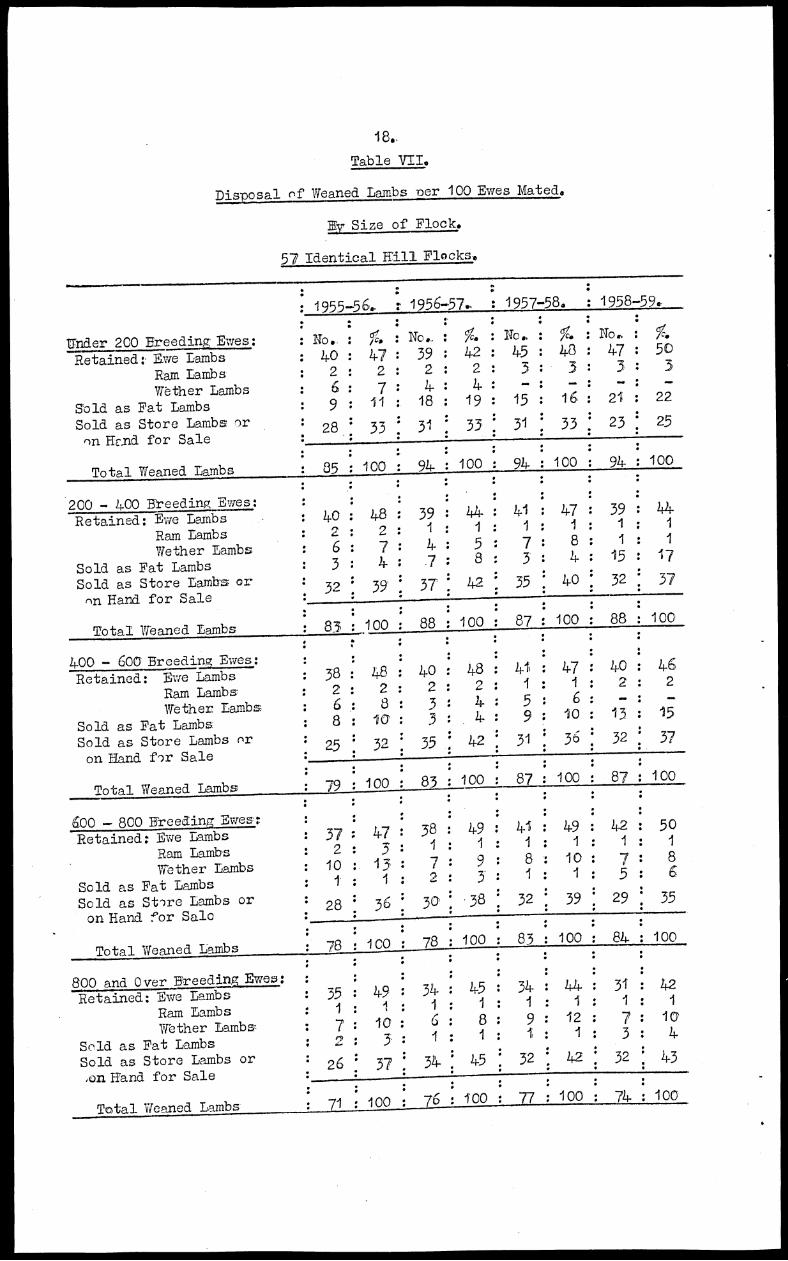
The physical results by size of flock for the 57 identical hill
flocks are given in Tables V, VI and VII, Appendix B. The estimate of the
productivity of the breeding ewes per 100 ewes mated, given in Table V,
Appendix B, shows a tendency for the proportion of barren ewes to increase
with increasing size of flock. Moreover, the lambing results per 100 ewes
mated, given in Table VI, Appendix B, reveal a tendency towards a relatively
heavier incidence of deaths amongst lambs in the larger flocks. Similar trends
were noted in an earlier report in this series.* The explanation lies in the
*Economic Studies in Sheep Farming in Wales: Number 1. G-eneral Report on Costs
and Returns for 65 Hill Sheep Flocks for 1954-55 and 1955-56.

7.
greater care and supervision of the breeding ewes which became possible as flocksdecreased in size, and. also perhaps in the more favourable conditions under whichthe relatively smaller flocks subsisted.
In the disposal of weaned lambs per 100 ewes mated (Table VII,Appendix B) there is some variation as between the different size groups. Sameflocks, such as those with under 200 breeding ewes, and those with between 200and 400 breeding ewes, retained a relatively lower proportion of lambs for flockreplacement in 1956-57; and this coincided with the sale of relatively moredraft ewes and. lambs per 100 breeaing ewes from these flocks during that year(Table III, Appendix B). Both groups retainea all their ewe lambs for replacementpurposes in 1957-58, but differea in their practice in 1958-59. The flocks withunder 200 breeding ewes retained 50 per cent of their weaned lambs in that yearand this fact, together with their relatively fewer sales of draft ewes, meantthat they had relatively greater flock numbers at the end of the year. In theflocks with between 200 and. 400 breeding ewes fewer lambs were retained forreplacement purposes in 1958-59, fewer draft ewes were sold. per 100 breeding
ewes, and an increased percentage of lambs were sold fat.
The next two size groups (400 to 600 and 600 to 800 breeding ewes)
retained about the same proportion of lambs for replacement purposes in each of
the first three years, which suggests that all the ewe lambs in these flocks were
thus retained. These size groups, however, differed in their practice in 1958-59.
In that year the flocks with between 400 and 600 breeding ewes retained relatively
fewer ewe lambs and no wether lambs, and sold an increased proportion of lambs
fat. The flocks with 600 to 800 breeding ewes retained 50 per cent of theirlambs for replacement purposes in 1958-59, and. sold relatively fewer araft eweswhich meant a relative increase in flock numbers at the end of the year. Inthese flocks, however, fewer wether lambs were retained in 1958-59 and relativelymore lambs were sold fat. Flocks with 800 breeding ewes and over showed adecline in the proportion of the ewe lambs retained in each year, the relativelylowest proportion being found in 1958-59. In that year 47 per cent of the lambswere sold and a slight increase occurred in the number sold. fat.
3. Costs,
The total costs per 100 breeding ewes in the 57 identical hill flocksrose by 10.7 per cent during the four years, from £195 in 1955-56 to ,216 in
1958-59. The detailea cost structure is given in Table 8.
The cost of feeding the flocks on the farms over the period varied, onthe average, between 21 and 24. per cent of the total costs. The practice of hand-
feeding is related to weather conditions during the winter, and. thus shows avariation from year to year. Forage crops, chiefly rape, were used for feedingwether lambs in preparation for the market. Grazing costs consist of a share ofthe rental of the farm and. sheep-walk together with the costs of fertilizersapplied to grassland, and any other operations performed on grassland.
wIrM011.1111I210.11.1.
Table 8,
Total Costs er 100 Breeding Ewes.57 Identical Hill Flocks.
: 1955-56 : 1956-57 1957-58 : 1958-59
%. : iC. : %. : ' R. : /c%Frani Fed Foods : 4 : 2 : 2 ' : 1 : 2 : 1 : 3 : 1Grazing : 41 : 21 • .40 : 19 : 41 : 19 : 40 : 19.Forage Crops : 3 : 1 5 : 2 : 2 : 1 : 4 : 2Agistment : 52 27 : 63 : 30 : 65 : 30 : 65 : 30Labour : 62 : 32 : 63 : 30 : 66 • 31 : 67 : 31Transport : 5 : 3 : 5 : 3 : 6 : 3 6 3Miscellaneous : 28 : 14 : 30 : 15 : 32 15 31 • 14
. . . . .Total • 195 - 100 :208 ;I00 :212+ :100 :216 :100
Transport and miscellaneous costs accounted for 17-18 per cent of thetotal costs. Transport costs relate to payments in respect of marketing sheep,

8.
and also to the movement of sheep to and from other farms for wintering. Mis-cellaneous costs consist of payments for such items as serums and vaccines,dips and marking fluid and commission charges. A share of the general farmexpenses has also been included under this head-.
The two items which accounted for the increase in the total costsper 100 breeding ewes during the period were the cost of agistment and thecost of labour.
The cost nf agistment in any year will depend on the number of sheepsent away over the winter and the average cost per head. If the number winteredaway is expressed as a nrnportion of the number in the opening valuation in eachyear for the 57 identical hill flocks, it will be found that 26 per cent werewintered away in 1955-56, 30 per cent in 1956-57, and 29 per cent during eachof the last two years of the period. In the meantime the average cost per headfor wintering in these flocks had risen from in 1955-56 to in
1958-59.
The increase in the cost of labour can be attributed to increases inwage rates during the period under review. With the rise in the average numberof breeding ewes per flock in the 57 identical hill flocks there has been a
fall in the average manual labour requirements per 100 breeding ewes. This
inverse relationship between average manual labour requirements and the number
of breeding ewes is shown in Table 9.
Table 9.
Average Manual Labour Reauirements per 100 Breeding Ewes.
57 Identical Hill Flocks.
Year..1110,1MIMI
Other:Shepherding.: operations
1955-56 : 2521956-57 : 254 •1957-58 : 2471958-59 : 237
•
: Average ND.
: of Breeding
Total. :Ewes per Flock.
128 .. 380
: 123 : 377 :
: 128 .. 375 :122 : 359
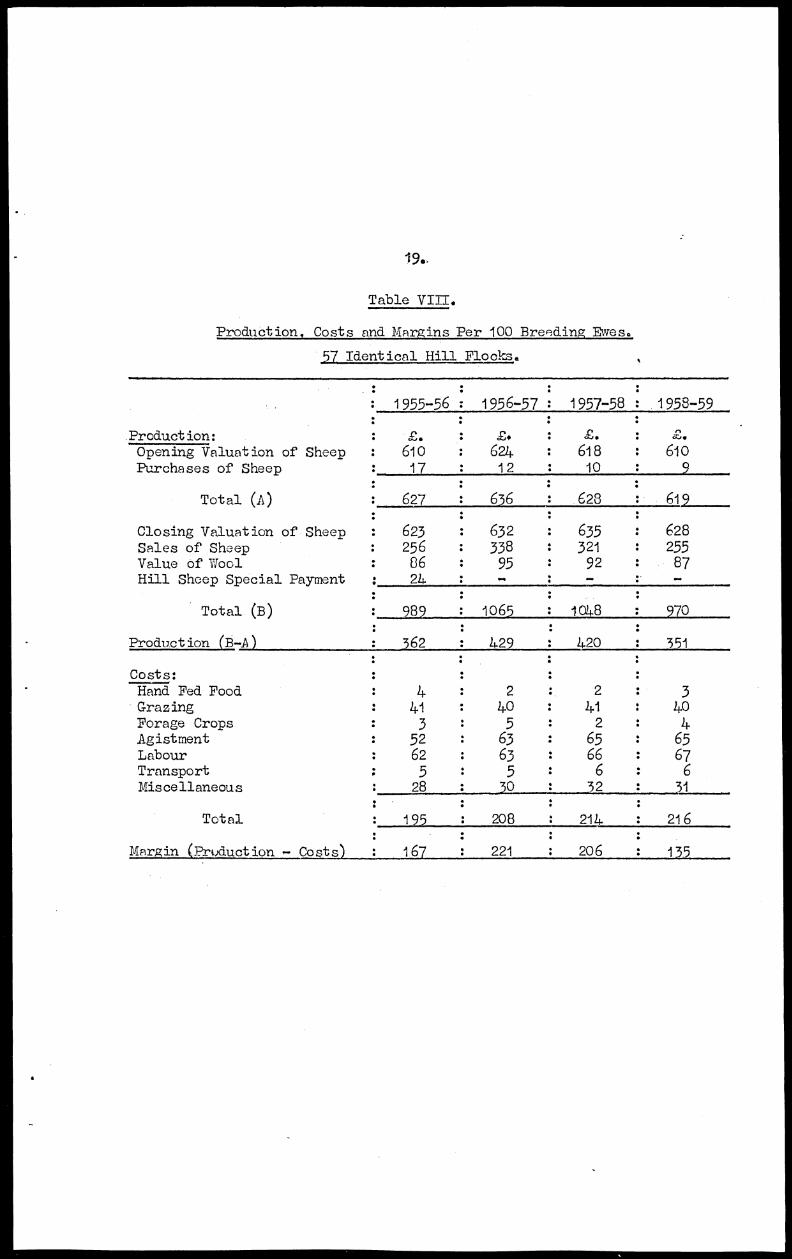
Margins.
536
537551573
The margin is defined az the difference between production
and the total costs per 100 breeding ewes. Production is defined as the differ-
ence between the Closing Valuation of sheep plus the receipts from the sale of
sheep and wool and the Opening 'Valuation plus purchases of sheep.
Table 10.
Production, Costs & Margins per 100 Breeding Ems.
57 Identical Hill Flocks
:: 1955-56 : 1956-57 : 1957- .E3. _ : 1958-.59
Production: . . : . : S% : .
' Opening Valuation of Sheep : 610 624 : 618 : 610
Purchases of Sheep : 17 : 12 : 10 : 9
Tutal (A)
Closing Valuation of SheepSales of Sheep and WoolHill Sheep Special Payment
Total
Production (B minus A)Total Casts
: 627:
623 : 632
: 342 : 433 :
. . .. . .
. 636 • 628 • 619:: 635
413
62834-2
• 989 : 1065 1014-8.0mM,
• ••: 362 : 429
: 195 : 208
167 • 221
/.420214.
970
351216
206 • 135

90
Production in 1955-56 includes a special hill sheep payment made in
January of that year in respect of the adverse conditions experienced during the
previous one. The favourable conditions in the store markets. in 1956-57 are
reflected in the relatively high margin obtained in that year. Since 1956-57
however the average margin per 100 breeding ewes has. declined; and in 1958-59
it was lower, than in 1955-56, after allowing for-the inclusion of the special
payment made in that year,
The distribution of the 57 identical hill flocks according to the
margins obtained, excluding the special hill sheep payment in 1955-560 is
given in Table 11.
Table ii.
Distribution of Flocks According to Margins
per 100 Rreedinrz, Ewes.
57 Identicalfall Flocks.
Margin per100 Bre e ding Ewes : 1955-56 : 1956-57 : 1957-58 : 1958-59
: .
-01 s. : Nc.. fo:. : 1T). %,, : No.
50 cFc under 10G : 19.3 . : 1 : 1
Under 50 : : I1.8
: : .
150 " II 2001 : ,1E 61.4 : 12) 31. 6 :. -11100 " 1tt 150 : 6).
66. 6"300 " ever
tt 300 2) 193 : 12:: . - ),
11
250200 " fl
25 0 : 7) : 15 ) •
2) : 1 I ) 9
No.
10.
49.1 °: 12 52.6
47.4. : 5 22.8
3.5 • 24.6
Total
•
: 57 10000 : 57 100.0 • 57 100.0 • 57 100.0
In 1955-56 just nver 60 per cent of tlje flocks had margins per 100
breeding ewes of between ,E100 and £200, the proportion with margins of less
than -,V00 and more than. £200 being similar tn one another. In the following
year, 1956-57, about two-thirds of the flocks had margins per 100 breeding
ewes which exceeded ,E200, and just under one-third had margins of between
.£100 and c200, In 1957-58 just under one-half of the flocks had margins of
between £100 and 2200, and a further 47.4 per cent had margins greater than
£200. • In 1958-59 just over one-half the flecks had margins of between £100
and 2000 but nearly- one-quarter had margins Of less than £100.
The production, costs and margins, per 100 breeding ewes, by •
size of flock for the 57 identical hill flocks are given in Tables IX, XI
XI Nil and XIII , Appendix 13;

Appendix A.
Table 1. .
Distribution of Breeding Ewes in Counties in Wales.
(June 4th Returns
000.
Counties
1939. 195 _ 1957e. 1958,
N. No. : No. Crt No.
'North Wales Groupt :AngleseyCaernarvonDenbighFlint
Total
1Mid-Wale s GrouiD1 :MerionethMontgomeryCardiganRadnorBrecon
Total
'South Wales Group':PembrokeCarmarthenGlamorganMonmouth
Total
: 92,9 :: 198,2 :: 2830,C :: 80. :
: 654-.1 :
: :: 31507 :: 1790 :: 174,1 :
284-,3 :
1202. :
81. :
18307 :197. :
14-6,3
608.0 :
Total Wales and Monmouthshire 2464.9 :
3.88,011.53.2
: 80;5 :: 217.1 :: 244,8 :: 4-3.2 :. • .
26.5 : 585,6 :
94, 99.1 '224-.9 :10.3 : 262.6 :1.8 : 4-6.3 :
24-.6 628.7
3,8 z 96.68.8 : 232.2 :10.3 : 277.7 :1.8 : 51.5 :
24.7 :•
195%,
No.
:Per c ant:Increaso1959 lver
1956.
3,6k 88.0 3.2 9.38.7 : 238.1 : 8.6 : 9.710.3 : : 10.6 :1.9 : 58,0 : 2.1 : 324-.3
658.0 : 24.5 : 678.9 24-.5 : 15.9
. : .
10.1 : 293.1 : 12.3 : 3/2.5 : ' 12.3 : 315.7 : 11.8 : 322.0 : 11.6 : 9.9
12.8 • 333.4- : 14-,0 : 351.9 : 13.8 371.8 : 13.8 : 372,6 : 13.4- : 11.8
7.3 : 173.6 7.3 : 188.9 : 7.4. : 196.0 : 7.3 : 206.8 . 7.24. : 19.1
7.1 : 206.7 : 8.7 : 224.4- : 8.8 : 24-2,3 : 9,0 : 250,6 : 9..0 : 21.2
11.5 : 310.2 : 13.0 : 327.5 : 12.9 : 34-6.0 : 12.9 : 360.2 : 13.0 : 16.1
•
48.8 • 1317.0 • 55.3 : 14-05.2 : 55.2 :14-71.8 : 5/4-.8 : 1512.2.: 54..4. : 14.8
3.3 : 59.9 : 2.5 : 65.9 :
7.5 : 125.2 : 5,3 139.8
8.0 : 153.9 6,5
5.9 : 139.1 _: 5.8 : 14-5.2
24.7 : 4-78.1 : 20.1 : 510. :
100. : 2380.7 100.0 : 2544.5 :
2.6 : 72.8 :5.5 : 153.26.3 : 170.0 :5.7 : :
20.1 : :
100.0 : 2684,2 :
2.7 : 77.75.7 162.8 :6.4- : 176.3 :5.9 • 170.1 :
•
2.8 :5.9 :6.3 :6.1 :
•
29.730.0V4-.522.3
20.7 : 586.9 21.1 : 22.8
100.0 2778. : 100.0 : 16.7

Appendix A.
Table IL
AveraJe1lyc,pr lb. Estimated Dressed Carcass Weight
Fat Lambs and Fat Ewes.
j.,2.g._t„oc-tobey 9 5 Eland 9_, 9, •
: Lambs : Fat Ewes.
: up to :
Date 81b. Light : Hea
1958.
: Lambs : : up to :
Date : 48 lb. :
Week Ending:
Aug. 5 : :
12 : 2 0-Z :
19 1.11 :
26 1.10,4 :
Sept. 2 : 1. 9:
9 1.8 :
16 : 1. 6:
23
39 1.6*:
Oct. 7 1. 51 :
1
21 1. 811- :
28 1.101-
s. a. :Week aidi.fr
o.10.
0.11*
0.101;C' ,4
1. : 0. 74
0,11 : 0. 9:
O.9:
0. 9-34:
O.9.4 0. :Oct.
0. 9-ff : 0.8
0.11 0.11 : 0.8*:
0014. : C). :• 3
1. 1
:Aug. 6:
13 :
20:
27:
: Sept. 3 :•
10:
:
n 1 •-1* "2 •
2.11 :
2.10 :
2. 9,4 :
2.-14 :
2. 9,4 :
17: 2. 91 •2
24: 2. 9:k :
: 2. a3.
8: 2. 8-1- :
'15; 2.7k;
22; 2. 7;1 :
29 2. 64: :
Fat Ewes.
s. d
Source: Ministry of Agriculture, Fisheries and Food - 59 Represent-
ative markets in England and Wales.
Armendix B.
Table 1.
LAID UTILISATION.
(Average of 24. years 1955-56 to 1958-59).
57 Identical Hill Flocks.
: Under 200 : 300 - 4.00 4.00 - 600. 600 800 800 ec over
.1.11.11
: Breeding Ewes: Breeding Ewes Breeding Ewes Breeding Ewes • Breedin Ewes All farms
: Per :Per 100: Per :Per 100: Per ;Per 100: Per :Per 100: Per :Per 100: Per ;Per 100
: Farm • Acres • Farm • Acres Farm Acres • Farm - Acres Farm Acres Farm : Acres
Oats and Mixed Corn : 4.8 : 3.24-7 : 6.7 : 1.47 : 6.5 : 1.16 : 5.8 : 1.13 . 1.8 : 0.08 . 6.1 : 0.75
Potatoes : 0.24- : 0.30 : 0.4. : 0.09 : 0.3 : 0.05 : 0.4. : 0.05 . 0.2 : 0.01 . 0.3 : 0.024-
Roots for Feeding : 1.0 , 0.70 : 0.7 : 0.16 : 2.1 : 0.36 : 0.6 : 0.06 . 0.1 : 0.01 : 0.9 : 0.12
Green Crop : 1.1 : 0.79 : 1.5 : 0.34. : 1.9 : 0.35 : 1.5 : 0.18 : 0.4- : 0.02 : 1.4- : 0.17
1-lay . 20.6 : 14-.97 : 28.2 ; 6.24. : 26.8 : 24-.79 . 38.4- : 4-.42 . 18.4. : 0.82 : 26.9 : 3.34
Grazing : 50.8 : 36.82 : 24-7.6 : 10.53 : 714-.1 : 13.24- : 90.0 : 10.36 : 85.6 . 3.79 : 68.2 : 8.45
Direct Reseeding : O. C : 0.4.8 : 2.2 : 0.4-9 : 3.2 : 0.57 : 3.3 : 0.38 : 1.2 : 0.05 : 2.3 : 0.28
Rough Grazing : 58.2 • 14-2.24 : 363.7 • 80.54. : )1)4.3 : 79.40 : 715.5 : 82.38 :2146.1 • 95.20 : 699.1 • 86.61
. :
Total ; 137.5 : 99.77 : 451.0 : 99.86 : 559.2 : 99.92 : 859.5 : 98.96 :2253.8 . 99.98 : 805.2 : 99076
Buildings, Roads & Woodlands :' 0. 3 : 0.23 : o. 6 : 0.14- : 0.4. : 0. 08 : 9.0 • 1.04 0.4_ : 0.02 • 2.0 :. -. .
Total Farm Area : 137.8 :100.00 : 4.51.6 :100.00 :559.6 :100.c0 : 868.5 :100.00 :2254..,2:10O.0 : 807.2 :100.00

Table II.
Numbers of Livestock Carried.
('Average of 4- years 195V 1958/59)•
57 Identical Hill Flocks.
No. of Breedin Ewes Under 200 200 — 400 : 400 — 600 : 600 — 800
Breeding EwesShearling EwesWethersWether Lambs s
Rams and Ram Lambs
: Per :Per 100: Per
800 & Over • All Farms
:Per 100: Per :Per 100: Per :Per 100: Per :Per 100: Per :Per 100
Farm Acres Farm Acres Farm Acres : Farm : Acres : Farm Acres : Farm : Acres
No.12352
187
: No. : No. : No. : No. :
90 : 324. : 72 : 504 :37 : 126 : 28 : 194. :
- 1 : 22 : 5 : 46 :: 13 : 27 : 6 : h-3 :: 5 : 13 : 2 : 21 :
No. : • No. : No.90 686 7934- : 259 : 30
: 144 : 178 : 69 : 13`4. : 30 : 3
No. :1257 :
: 397 :. 194-
if& :• 50 :
No. : No.56 : 55917 : 2009 • 75: 52
2 : 23
••
Total Sheep : 201 : 14-6 : 512 : 113 : 808 : 144 : 1188 : 137 :2016 : 89 : 909
Cows in Milk and In Calf
Other Cattle 2 4, years
Cattle 1 — 2 years
Calves 0 — 12 months
Total Cattle
, PigsPoultryHcrses
11:::
8 13 :2 :
:5 12 :
• • •
26 : 19 : 37 :
3 18 :6 :
2 :2 14.
3 :1 :22 :
. .13 : 214. : 212 :11 :
16 :77 •I
aft&
• No.6925
973
: 113
147::
2
8 : 24-7 :
: 2 : 1 . 1 :
: 165 : '120 : 52 : 12 :
: -1 : fi : I : .... :
•
36 :2 :
8 : 50 :
ONO 1 :4-5 •
:
AIM
OM*
6 : 41 2 : :
: I :
: 28 : I : 58 .
: 3 : .... : - 3 :
011
UMW

Table III.
Number of Sheep Sold per )100 Breeding Ewesby Size of Fldck.
57 Identical Hill Flocks.
••
::
195(3-59
Under 200 Breeding Ewes::
: 1755-56 : 1 1 956-53 : _1557-58 :• •. :
Draft Ewes 23 : 31 .
Fat LambsStnre Lambs 21 : 28
— ::
N24o. ::: %. : No. : %. : No. : %. : No.
.: 23 : • 24 : 21 : 27 : 1 9 : 24
32 : 33 . : 28 : 36 : 25 : 31
33 : 38 : 39 : 23 : 30 : 31 : 39Wet hers : 3 : 4 ; 1 : 1 : 1 : 1 : 1 : 1Rams and Ram Lainbs , L3 : 4 : 3 : 3 : 5 : 6 : 4 : 5
• •Total : 74 ;1Q0 : 97 : 1o0 : 8 : 100 • SO :100
:
200 and Under 400Breeding Ewes:Draft Ewes : , 31 : 42 :Store Lambs 30 : 41Fat Lambs : 6 :Wethers : 8Rams and Ram Lambs : • 1 : 1
2 : 39 • 2736 : •45 : 32
: 11 :
3 : 4 : 61 : 1 :
•Total : 74 : 100 : 81 100 :
400 and Under 600 : : : .:Breeding Ewes: .. :. : : .. :
Draft :Ewes . , : . 28,. 38 : 30 • : 40 : 31 41 :
Store Lambs : • 23 .: 32 - '30 : 40 ' : • 26 = 35 :Fat Lambs : 13 : 18 : 10 : 13 . . 12 i 16. :
Wethers . . : 8 : 1.1 : . 4 . 6 : 5 .•• 7 :Rams and Ram Lambs 1 : .1 : '1 1 : ,1 . 1 :
Tot al
600 and Under 800Breeding Ewes:Draft EwesStore LambsFat LambsWethersRams and Ram Lambs
• 73 : 100 : 75
•100 :
. .• • .,
26 : 38 : 28 : 41 : 3127 : 40 : 29 : 42 : 312 : 3 : 3 4 : 112 :.18 : 8 - 12 11
1 : 1_: 1L..i : i
Total : 68 • 100 •
800 and Over BreedingEwes:Draft EwesStore LambsFat LambsWethersRams and Ram Lambs
Total
100
• ••••
: .36 .,: 26 : 34: 42 : 30 : 36
19 : 238 : 5 : 63 1 : 1
100 : 83 : 100
27 : 3328 : 3421 : 26
:: 1
:100 • g2 :100
•42.: 28 : 39
: 41 : 26 : 36: 10
15 : 10 : 14: 1 : 1 :
75 100 • 72 : 100
19 : 34 : 2 : 35 : 21 : 34 :
: 24 , 43 : 32 : 51 :• 29. : 48 :: 3 : 5 : 2 : 3 : 2 : 3.:
9 : 16 • : 7 : 11 : 8 : 13 :
1 : 2 : - : - : I : 2 : —
16. :2731 : 525 : 9: 12
Ole
: 100 : 63 : 100 : 61 : 100 59 : 100

15.
Table IV.
Percentage Distribution of Returns from Sale of Shee
and Wool by Size of Flock.
52.alentical Hill Flocks.
: 1955=56....1_1226=52_1_1152n56 L11.51=5.2___•. :
Under 200: : cA. : 6/P' : z.
Ewes : 22.9 : . ,r6:9 : 26.7 : 21.0
Store Lambs : 17.6 : 5 : 15.3 : 13.5
Fat Lambs . 26.0 : 32.3 : 21.2 : 32.0
Store Wethers : 0.6 : 0.2 : 0.6 : 0.6
Fat Wethers : 2.5 : 0.3
Rams and Ram Lambs : 10.2 : 5.5 : 1E.1 : 13.1
Wool : 20.2 16.3 . 18.1 : 19.8 :
Total : 100.0 : 100.0 : 100.0 : 100.0
200 - 400: .. . :
Ewes : 31.8 : 35.7 : 30.9 : 22.8
Store Lambs : 25.7 : 30.0 : 27.4 : 24.0
Fat Lambs : 7.9 : 9.7 : 9.7 : 23.3
Stare Tethers .. 3.1 : 0.1 : 4.2 : 1.3
Fat Wethers : 3.1 : 3.2 : 2,1 : 3.0
Rams and Ram Lambs : 5.4 : 2.0 : 4.6 : 2.4
Wool .. 23.0 : 19.3 : 21.1 : 22.4 .
Total : 100.0 : 100.0 : 100.0 : 100.0
400 - 600:Ewes : 30.5 : 33.3 : 34.4 : 20.9
Store Lambs : 20.1 : 25.9 : 21.5 : 22.5
Fat Lambs : 15.2 : 10.4 : 14.4 : 24.0
Store Wet hers : 6.0 : 2.9 : 3.6 : 3.4Fat Vethers : 1.7 : 1.3 : 1.1 : 1.4
Rams and Ram Lambs : 2.8 : 4..0 : 3.8 : 4.0
Wool : 23.7 : 22.2 : 21:2 : 23.8
Total : 100.0 100.0 : 100.0 : 100.0
600 - 800:Ewes : 29.4 : 34.3 : 33.6 : 25.0
Store Lambs .. 26.7 : 29.6 : 26.5 : 25,3
Fat Lambs : 2.0 : 3.3 : 0.9 : 9.9
Store Wethers .. 9.7 : 7.1 : 10.2 : 11.6
Fat Wethers : 4.9 : 1.7 : 0.8 : 0.9
Rams and Ram Lambs : 3.2 : 2.6 3.9 : 2.5
Wool : 214..1 : 21.4 : 22.1 : 24.8
Total : 100.0 : 100.0' : 100.0 : 100.0
: .. .. :
800 and Over:Ewes : 25.5 : 30.1 : 30.3 : 17.0
Store Lambs : 25.2 : 33.8 : 31.0 : 33.3
Fat Lambs 4.2 : 2.1 : 2.4 : 7.5
Store Wethers : 6.6 : 5.8 : 9.8 : 6.4
Fat Wethers : 6.8 : 2.3 : 0.7 : 5.1
Rant and Ram Lambs .. 3.2 : 1.0 : 1.6 : 2.0
Wool : 28. : 24.9 : 2 .2 : 28.7
•
Total : 100.0 : 100.0 : 100.0 : 100.0

Table V.
Prod.uoivity of Breeding Ewes Per 100 Ewes Mated by.Size of Flock.
.51 Identical Hill Flocks.
Breed in Ewes.• : 800
:Under 200:200 - !00:2+00- 600:600 - 800:and Over
1955-56: •Ewes - Lambing : 90.9 : 91.4 : 88.5 : 87.6 : 85.7
Barren : 4.4 : 5.6 : 7.2 : 8.8 : 10.3
Died 3.0 4.3 : 3.6 : 4.0
Total : 100.0 : 100.0 : 100.0 • 100.0 : 100.0
1956-57:Ewes - Lambing : 93.1
Barren : 3.8. 31
Total : 100.0
. . :: .. :
: 94.9 : 91.8 :
: 4.1 : 4.5 :: 1.0 : 3.3 :
: 100.0 : 100.0 :
89.6 : F5.07.5 : 11.42.9 : 3.
100.0 : 100.0
1957-58: : : :
Ewes - Lambing : 95.1 : 93.0 : 93.5 : 91,8 : 85.7
Barren : 3.5 : 4.9 : 4.4 : 6.3 : 11.2
Died : 1.4 : 2.1 : 2.1 : 1.9 : 3.1
Total
1958-59:Ewes - Lambing
BarrenDied
100.0 : 100.0 : 100.0 : 100.0
: 92,7 : 92.3 : 92.4 : 92.2 : 85.5
: 4.0 : 5.1 : 4.1 : 5,7 : 9,6
: 3.3 2.6 : 3 2.1 : 4.
Total :_100.0 : 100.0 : 100.0 : 100.0 : 100.0

Table VI.
Lambing Results Per 100 Ewes Nipted
by Size of Flock.
.51114,2ntical Hill Flocks.
: Breeding Ewes.
: . : 300 : All
:der 200:200 - 400:400 - 600:600 - 800: and over: Flocks.
1955-56: : : :Lambs - Born Alive : 93 : 91 : 89 : 88 : 56 : 88
Died . "L) •. 8 : 10 : 10 : 15 : 11
Weaned •. 85 : 83 : 79 : 78 : 71 : 77
: : •. : .
1956-57: : .. :Lambs- Born Alive : 99 : 96 : 92 : 90 : 06 •. 90
Died : 5 : 8 : 9 : 12 : 10 : 9Weaned '• 94 : 88 : 83 : 78 : 76 . : 81
1957-58: : : ..
Lambs - Born Alive : 100 : 95 : 95 : 92 : 86 : 91
Died .. 6 : B : 8 : 9 : 9 : 8
Weaned : : 83 : 77 8394 : 87 : 87
: .
1958-59:Lambs - Born Alive : 99 :
Died • 5Weaned 94 :
•
95 : 94 : 92 : 86
7 : 7 : 8 : 12
83 : 87 : 84 : 74. . •
91982
4111.41.allaitiewatiowimmisarrammm.
Table VII.
Disposal of Weaned Lambs per 100 Ewes Mated,
Ey Size of Flock.
57 Identical Hrill Flocks.
.11.11111..1. ....111111.111.1.10111.011.%
Under 200 Ere_e_d_i_prz_Lv.va:Retained:. Ewe Lambs
Ram LambsWether Lambs
Sold as Fat Lambs
: 1955-56. 1956-57. : 1957-58. • 1958-59.• • • •: No..cg. : No :
4-0 : 24-7 : 39 : 42 :2 : 2: 2: 2 :
: : : : 24- :: 11 : 18 : 19 :
Sold as Store Lambs ir 28 • •• • •
33 31 • 33 •on lic.nd for Sale • : : :
Total Weaned Lambs
200 - 24.00 Freeding Ewes_:Retained: Ewe Lambs
Ram LambsWether Lambs
Sold as Fat LambsSold as Store Lamhs oron Hand for Sale
TOtal Weaned Lambs
45 :3:
15 :
31 :•
No. :48 : 47 : 503: 3: 3
16 : 21 : 22
33 : 23 : 25
: 35 100 : 94. : 100 • 94 100 : 94 : 100
. • . . .
: 40 : 48 : 39 : LA- : 41 : 47 : 39 : 24-24-
,: 2: 1 : : : 1 : 1 . - 1
6 :: e..
7: 4: 5 : 7: 8: 1 : 1
: 3 : .. . 8 : 3 : 4 : 15 : 17. .
: 32: 39 :. 37 :. 42 • 35 • 40 • 32: 37
. . : : •
: 83
400 - 600' Breedin5 Ewes:Retained: Ewe Lambs : 38 : 48 : 40 : 24-8 : 4:1, : 4.7 : 40 : 46
Ram Lambs : 2: 2: 2: 2: 1 : 1 : 2: 2
Wether Lambs : 6: 8: 3: 2~ . 5 : 6: ... :
Sold as Fat Lamba .. 8: 1 cy : 3 : 4. : 9: 10: 13 : 15
Sold as Store Lambs or . . • . .• 25 • 32 : 35 ' 42 ' 31 • 36 : 32 • 37
on and f')r Sale . .. . . '. . .. . :
100 : 88•
100 87 : 100 • 88 : 100
........_Total Weaned Lambs : 79 : 100 : 83 : 100 : 87 : 100 : 87 : 100
: •. •. : :
Retained: Ewe Lambs : 37 : 47 : 38 : 49 : 41 : 49 : 42 : 50
Ram Lambs : 2: 3: 1 . 1 : 1 : 1 : 1 : 1
Vre th e r Larnb s : 10 : 13 : 7: 9 : 8 : I 0 : 7: 8
Sold a.s Fat Lambs : 1 : 1 : 2: 3: 1 : 1 , 5: 6
Sold as Stlre Lambs or :on Hand for Salo :
28 : 36 : 30 : 38 : 2 : : 29• : : .
3 : 39 :. • :: 35
•
Total Weaned Lambs 78 : 1C0 : 78; 00 83 : 1 00 • 84: 100
: .
800 and Oirer... : : . : , :
Retained: Ewe Lambs : 35 : 49 : 324- : 45 : 34 : hh : 31 : 42
Ram Lambs : 1 : 1 . 1 , 1: 1: 1: 1: 1
Wether Lambs. : 7: 10: 6: 8: 9: 12 . 7: 10'
Sold as Fat Lambs : r, ,... • . 3 : I : I: I: I: 3 : 4.
Sold as Store Lambs or : • . 2 : : :
31'4-32 4.3ion liand for Sale : : : : :
.....
Total Weaned Lambs
• •• •• 71 : 100 76 : 100 • 77 100 -714. 100
19.
Table VIII.
Production Costs and Mar ins Per 100 Breedin Ewes.
ajdentical Hill Flocks.
: 1955-56 : 1956-57 : 1957-58 : 1958-59
Production: : : : L.Opening Valuation of Sheep : 610 : 624. : 618Purchases of Sheep . 1 : 12 : 10 :
Total (A) ::
Closing Valuation of Sheep : 623Sales of Sheep : 256Value of Wool : 06Hill Sheep Special Payment : 24
Total (B)
Production (B-A) : 362 : 429 : 420 : 351
Costs: :
627 : 66 :
: 632 : 635: 338 : 321: 95 : 92
628
610
619
: 628: 255
87IP*
989 106 : 970
Hand Fed Food : 4 : 2 : 2 : 3Grazing : 41 : 40 : 41 : 40Forage Crops : 3 : 5 : 2 : 4Agistment : 52 •. 63 : 65 : 65Labour : 62 : 63 : 66 : 67Transport : 5 : 5 : 6 : 6Miscellaneous : 28 •. 0 : 32 : 1
Total : 195 : 208 : 2114. : 216
Margin (Frvduct ion - Costs) 167 221 206 135

•••
• 20.„
Table IX.
Production Costs and Margins Per 100 Breeding Ewes
by Size of Flock.
• 5.2._Identical Hill Flocks.
• Under 200 Breeding Ewes.
Production:Opening Valuation of SheepPurchases cf Sheep .
Total (A)
: 8.
.. .. : .. 622 : 640 : 633: 31 : • 38 36
::678 669
Closing Valuation of Sheep : 661 : 637 : 688 : 663
Sales of Sheep : 350 : 503 . 463 . 368
Value of Wool .. 89 : 98 : 102 : 9'1
sill Sheep Special Payment 23 •
Total (B)
Production (B •;• A)
Costs:Hand Fed Foods;GrazingForage Ci-Ops.AgistmentLabour .TransportMiscellaneous
:_1123 : 1238 : 1253 : 1122, .
: : • •
: 2470 : 560 : 584. : 445
7 : 3 : 4 :. . 7.. 62 . 62 : 71 . 61
3 : 9 : 6 : 4: 47 : '50 : 55 •. 53
73 : 76 : 80 : 76
3 : 3 : 4 : 524.2 : 39 : 46 :
•
Total 937 242 : 266 : 247
Margin (Production minus Costs ) : 233 : 318 : 318 198

21.
Table X.
Production. Costs and Margins Per 100 Breeding Ewes
by Size of Flock.
57 Identioll Hill Flocks.
200 and Under 400 Breeding Ewes.
IIIIMMIMMONMP
:_i_25.1:561;12 : 1958-59
Production: : ad , • . . . : . : L'.
Opening Valuation of Sheep : 598 : 594 : 578 : 555Purchases of Sheep : 24 : 16 : 12 : 12
Total (A) : 622 : 610 : 590 : _562..._
Closing Valuation of Sheep : 630 : 607 : 595 : 557Sales of Sheep : 286 : 376 : 325 : 279
Value of 'Wool : 86 : 90 : 87 : 81
Hill Sheep Special Payment :14 . :Total (B) :O2: 1073 : 1007 : 917
. . .16
. . .
Production (B — A) : 404 : 463 : 417 : 350
Costs: : :
Hand Fed Foods : 2 : — : 1 : 2
Grazing : 63 : 57 : 63 : 56
Forage Crops : 5 : 7 : 1 : 2
13gistment . 44 : 45 . 48 • 46
Labour : 74 : 76 : 80 : 81
Transport : 5 : 3 : 5 : 3
Miscellaneous : 32 : 37 : 39 : 36
Total : 225 : 223 : 237 : 226
Margin Production minus Costs: 179 . 240 : 180 : 124

Table XI.
Production Costs and Mar ins Per 100 Breeding Ewes
by Size of Flock.
57 Identical Hill Flocks.
bOO and Under 600 Breeding Ewes.*awl
: 1955-56 jl956-57 : 1957-58 : 1958-59
Production: g.
Opening Valuation of Sheep 628
Purchases of Sheep 1
g.6372
g.64311
g.66614
Total (A) 6 1
Closing Valuation of Sheep 605
Sales of Sheep 293
Value of Wool 91Hill Sheep Special Payment
Total (B)
Production (B — A)
Costs:Hand Fed Foods : 2 : — : I : 4
Grazing : 52 : 49 : 48 : 57
Forage Crops : 5 : lo : 2 : 11
Agistment .. : 57 : 50
Labour : 49 : 6158 : 62 : 65 : 64
Transport : 4 : 4 : 4 : 5
Miscellaneous : E; 31 : 31 : 36
662 6L. 680
658 :352 :101 :
66036298
IF Gs.
673304954.4
•
: 1013 : 1111 , : 1120. . . .. . . .
22223._, : /4_6_6_1_,...332...„_
: •. .. .
: 1072
Total 197 : 217 208 227
Margin (Production minus Costs): 175 : 232 : 258 : 165

23.„
Table XII.
Production, Costs and 'Margins er 100 Breedin Ewes
by Size of Flock.
57 Identical Hill Flocks.
600 and Under 800 Bree Ewe s
Production:Opening Valuation of SheepPurchases of Sheep
Total (A)
Z.6489
Closing Valuation of Sheep 652Sales of Sheep 257Value of Wool : 82
Hill Sheep Special Payment :_a4
:Z. : Z.
: 647 : 658 : 66012 : 6
: 65 •• 6i : 60 666
: 642+ : 665 : 675: 350 : 336 : 271: 96 : 95 : 89
Total (B) ........: 1015 : 1090 : 1096 : 1035
: .. .. .
Production (B -A) : 358 i 436 : 426 : 369
Costs: : :
Hand Fed Foods : 2 : 1 : 2 : *I
Grazing : 36 : 39 : 43 : 40Forage Crops : 1 2 : 2 : 2
fig istment : 45 : 64 : 66 : 63
Labour : 61 : 56 : 62 : 71
Transport : 3 : 3 : 4 : 3Miscellaneous : 2- : 26 : 30 : 31
: .
Total :_j_75 : 191 • 209 : 211
Margin (Production minus Costs) 183 . 245 : 21 : 158

24.
Table XIII.
Production Costs and Margins er 100 Breeding Ewesby Size of Flock..
flIimlical Bill Flocks.
800 and Over Breeding Ewes.
: 1955756 : 1956-57 : 1957-58 : 122:52_
Production:Opening Valuation of Sheep : 584Purchases of Sheep 17
Total (A)•
:Closing Valuation of Sheep : 61 1 : 620 : 611 : 606
Sales of Sheep : 212 : 284 : 272 : 207
Value of Wool : 84 : 94 : 87 : 83
Bill Sheep Special Payment .• 25 : .. : -
eE4613 : 591 : 575
: 5 ::
601 : 617 : 596 : 580
Total (B)
Production (B - A) :..._ 351 •. 381 : 574 : y6
Costs: : :
Band Fed Foods : 7 : 4 : 3 : 3
Grazing : 25 : 24 : 24 : 25
Forage Crops : i : 1 : 1 : 1
Agistment : 63 : 75 : 77 : 80
Labour. : 58 : 61 : 62 : 62
Transport : 8 : 9 : 10 : 9
Miscellaneous :._ 26 : 29 : 32---.1-22-.
Total : 188 : 203 : 207 : 207
Margin (Production minus Costs): 14.3 : 178 : 167 : 109
•
932 : 98 : 990 896
6

•
-
s
—
•