aca - nasa technical reports server
TRANSCRIPT
ARR Jan. 1943
NA TIONAl ADVISORY COMMITTEE FOR AERONAUTICS
J ~.-' I~ J ..1TB ... · ~- . J,{Y
ORIGINALLY ISSUED
January 1943 as Advance Restricted Report
THE SIGN1FICANCE OF THE TIME CONCEPT IN ENGINE DETONATION
By W. A. Leary and E. S. Taylor Massachusetts Institute of Technology
.... ACA WASHINGTON
NACA WARTIME REPORTS are reprints of papers originally issued to provide rapid distribution of advance r esearch results to an authorized group requiring them for the war effort. They were previously held under a security status but are now unclassified. Some of these reports were not technically edited . All have been reproduced without change in order to expedite general distribution.
W-32

NATIONAL ADVISORY COMMITTEE FOR AERONAUTICS
ADVANCE RESTRICTED REPORT
TEE SIGNIFICM~"CE OF 'I'}ill TIME CONCEPT IN ENGINE DEI'OITATION
B:,- W. A. T.ear;:r and E . S . T9.ylor
An exper imental technique has been de\ eloped by neans of which the vari a blos a /fG ct'::'ng the ttme element in the detonation process in a spark- ignition engine can be ~ontrolled and approximately meas'u"ed. It is shown "chat increasing the rate of compression of t:le .mburned charge allm:s higher peak pressures to be used. The importancG of the ignit:on delay is demonstr" ted by obse:;.~ving that pressure and tempera"c 11'e considerations are insuffic:'ent to describe completelY the events leading to detonat ion. The effect of variation in tle time element on the nm.ximum permissible press ure , the temperature, and. the relative density of the last part cf the charge to burn has been determined . C~rtain aspects of iguitton deluJ and the mechaniam of normal and detonat~n~ combustion are discussed on the basis of cha in- reaction tlleor y . Suggestions are offered. for a more satisf').ctory basis of comparison for detonat ion data . A d5scus81on of the precision of various methods of d.etel'mining the pressuro and tem]!6r atUl"e of the unburned charge is included . On the basis of information and experience ga1_ned in this inv(;stigation, a ne,,1 and sL.ll1lificd experimental approach t o t~le detonat ion problem is outlined .
JJlJTRODUCTION
The fact tha~ detonation, or knoclcing, in t'le bD.soli;:le engine is a function of more than a dozen operating variables and occurs i"lith explosive rap i dity explains why the devalopment of a consistent thecr,Y has been s uch a long ane tGdioL<.s process . F1fteon years ago tllere were at. lo3.st e ght mere or 1 08 8 plausible explanations of the phenomenon (reference 1) . 'rho x13te:h.:e of GO many hypotheses was a direc-c, conseql_~(mcc of the difficuJ.ty of oaser--ins what vTaa actr .. ally happe'1ing i~sir20 the en3ine cylinder und measuring Ghe effects.
2
The first of these difficulties was overcome in 1931 when Withrow and Bo~rd (reference 2) sJ.cceedod in photographing the proc~ 8S of comousti.on in an actuaJ eng-Lne . This technique was extende1 by WHhrovT and Rassweiler (reference 3) to include photogl.'ap:lic studies of detonating com J.stjan. These photOGraphs shovled tllat detonation \-Tas tj1e resul-:, of a reaction which t ook place in tile unburl1ed charGe ahead cf the nO~:'Illa.l flame front a.!ld "las not, as had been s upposed by some, an extremely rapid acceleration of the normal flame in the 13.ter s tag")s of combustion.
Att.ention was -Chen focused cn the autoi{5nition hypothesis of detonation , Tnis hypothesis Has t'irst advanced by Ricardo (reference 4)) who suggested that detonat-ion might be spontaneous ignitlon of the nnburned part of thu charge ahead of the normal flame front . This exp lan0.t:i on failed to snOvT why kerosene , "7i th a higher i gniti.on temperature than carbon dis llride, detonated more r eadily in a given engine . A sat siactory explanation of this apparent contradiction wa s presented in 193'" by one of the authors (reference 5) w'ho, bas ing h is reasoning largely on ·the experimental vlork of Tizard and }lye ( reference 6 ), sho.red that no contradiction need exist i f it is assumed that detonac.50n will oc cur only "("hen the unburnod part of the charge is hoated to , or above , .its ignition temperature and held there for a definite length of time. This time interval is known as t he ignition delay .
The a 1ltoignition hYllothesls is a purely physical -i.nterprek:.tian of detanatiol1 an(} has the saving grace of simplicity . Throl h its use d etoD~tion may be thought of , not as ~ function Ol~ 9. dozen or moro engine conditions, but rather in t erms of the tr.ree f\mdsmental VLr 10. bles: pre ssure; temperature, and time , This hY]Jothesis is perhaps the one most g ,nerally a ccepted at the presont time . Tho difficulty of Checking it quo.ntitativel y still involves the problem of accUJ.'atv measurements ; although the t sk is not s o formidable as i-Thon the hypcthe s.is was first advanced. The deve10])ment of the hiGh-speed engine ind " cator} the cathode-ray oscil10gr.:1ph, and h.i.g.~-8peod photor,raphic and s troboscopic technique." a.s well as the ava i lab~~l ~ -':,-y of more homogt:.ne ol's fuels, has brought vori f'icat ion of the IVl?othesis .,ithin tha scope of refinod experimental tec~mique .
The rapidlY varyinG pressures i n a high-speed engine c jrlinde r now ca!l be measured with fa1r accurucy . There i.s no aGuns nml available, h01"over, 1 or measuring directly the rapidly varying tempcr3.ture of the 1mburned part of the charge and hence this
fup~ar~en~al variable can, at present, be investigated only by means of thermodynamic la"'8 . An investigation of the precision of this mebhod, given in appendix A, indicates that the temperature so d€;tol·mirJ.ed should lle x-easonably close to the true value .
3
At the pre sent .~itiDB, the effect of end gas (the part of the charge ahead of the flame front ), tempera tuX'e, and :pre:::su:r'e on detonati.on has been. Investigated ex~)erimentally by Serruys (reference 7) J Rothrock and Bier'".J1a.nn (reference 8) , and the authors and Diver (reference 9). The third basic variable, time , vrh.:tch is the most ell.sivD aspect of ·~he problem, is the subject of the present report . The problem to be discussed is compli?ated by four distinct effects :
1. The time during T/ Ti.1.:1 ch heat i s tra!!sferred to or from the unburned charge
2. The speed at which t~e no~l flame traverses the combustion chamber
3. The motion of t~e Diston
4. The ignition delay
It is g(:nerally recogn1zec t.hat the first three of the e:ffects listed influence engine detonation either directly or indirectly to a largo extent , but the significance cf th3 fourth effect is often questioned . The effect of manJ engine variables on deton..ation - f l,lCl-air ratiO, "or instance - can De determined exrerimsntally withcut recognizing tl:at delay ex1sts (reference 9). Hore the annlyo s can be t:i."eated solely by means of t mperature pressure considerations . This treat"!len-:, has been in ceneral USB
in the past , and, as a rGsult, the delay has been ~ssl~ed oy some to have nogl igible influonce . It is sho.m in this report, however , that 1£1 se clla'1gos in encl-gae pressure, temperature, and densHy for a given level of detor~~tion c~n~ot be accounted for without the supposition of an ignition delay .
The chief challenge to the auto"ignitj.on hypothesis comes from recent 'vork (reforences 10 , 11, and 12) . This work is based. on schlieren photogr9.phs and motion picturos of the combustion process in a special cylinder . The photographs of r eferences 11 and 12 wore taken ut t he rate of 40,000 frrunes p')r socond. TheSE) photographs have been interpr eted to indicate that dotonation may occur only after the entire chargu h,"1S been inflamed, ei thor by
4
passage of t.he flame front or by [l.utoigniticn. The authors of tile present paper ueL.evu that this interpretation may prove event~l.ally to be erroneous, for reason.s explained in appendix B. In case, however, it is finallJ established that the flame d.06s indeed pass completely through the charge befol'e detonation , the autoignition hY1>othesis may have to be modi.fied . For the present, the authors of this report i,lrefer to retain the autoignition hypothesis f'or the follo11ing reasons :
(a ) The al,'.toignition h,.vpothesis fits all known observations "\OTHh reGard to detonation in an actual engine .
(b ) The autoignition hypothesis furnishes a simple and convin ing eX1l1anntion of the eXllerimental facts revealed in the :present report .
( c ) I f , at a lat~r date, the autoignition theory should be definite:y disproved, the basiC conclusion arrived at in this report - namely, that there is an irrportant time elfect connected with the precess of detonation - lvould no\:' be affected.
The autlors ,vish to acknovTledge their appreciation for the assi.stance render0d by Professor C. F . Taylor in suggestins helpful experimental approaches to the Ilroblem and for his invaluable cr i ticism of the manuscript . '1'116 authors are also indebted to Professor A. R . Rogowski, J. R. Diver J and J. E . Fori)es of the Slean Laboratory staff :1'01' their ki.nd assistance during the experimental tosto . The suggestions of the NACA technical staff 1fere also of considerable assistance in preparing the manuscript .
DEOCHrl-'TION OF APPAi.iATUS
A Ilhotograph and a s chematic diagram of the apparatus are shovm in figures 1 and 2 . Tho ellparatu8 was t he sa.me as that used a the Massachusetts Institute of Technology in an ea.rlier investigation of detonation (reference 9) J excellt as follm-n3 :
The engine was a neil CFR engine with hish-speed cawshaft and aluminum ll-.Lston but vithout the reCiprocating balancing welghts usually supplIed . These weights were llDIlCCeSfld.ry because tho engine 'vas boltod to a 9 . 5- ton bed plate mounted on rubber
5
vibration isolators . The engine "'as originally equipped '''ith a standard hish- speed inlet valve, but with this valve detonation was very nonuntfoI'ru. at all sp3eds. A shrouded inlet valve ,,,as then installed and excellent uniformity ",as obtained. This uni fOlmity seemed to be at its best when the engine speed was about 1200 rpm and the spark advance about 300 B.T . C. Inlet temperature had no apparer:t effect on uniformity in the range from 1200 F to 2000 F .
The evaporative cooling system was augmented by an electrically driven circulator pump 1n order to obta:i.n a more uniform teml)erature d 1stribnticn throughout. the cylindf: l' jacket . Fuel ivas deli vered to a vaporizirlG 'cank ot' about 15 gallons capB.ci ty by a new high- speed Bosch fuel pl1np , haYing a 7-·millimeter plunger • . !in exh.aust surge tank of e.bout 8 . 5 gallons capacIty ,·ras used. .
The exa ct engine speeC: vas conveniently jdentified. by painting 36 equally spaced radial lines on t.ile rim of the flY'''heel aDl:'L illuminating it ~"ith a strobotac operat:ing on 60- oycle frequenoy . At multiples of 100 rpm the pattern appeared stationary, 8hm"ing the mark8 clearly; while at multiples of 50 rpm t.he stationary effe ct "ras obtained ",i th 72 marks showing. Best I?e~.'formance i'TaS obtained at 800 rpm wit:l a Champion spurk pluS No . 8 CFR and. at 1500 and 2400 rpm Hith a BG 3B2 sDark plug .
The runs being made during het 1;leather , the entire fuel system llas kept under a gage pressure of about 24 pounds per square inch . This prec~ution insured freedom from vapor- lock troubles and made op~ration of the fuel pump reliable .
Fuel measurements ,,,orG made by "leighing a definite a'nount cf fuel with a sensitive balance . The balance was 30 arranged. that it operated an electric rel9.Y iv-hich actuateu. an ele ctric clock and an electric counter on th3 air meter . The s ensitiv_ty of the balance was about 1 part in 2000 . 1{1 th this device f :.wlair rat ios could be accuratel;), determined without personal errors . A rotameter was used as a chec' on the constancy of fuel flov. A diagram of the fuel systom ts Sh01ffi in figure 3 and Ii complete description of the system is given in appendix C.
An electrically driven Roots blower was useQ to supply the additional boost needed. at high speeds . A Ford Model A radiator immersed in a tank of rmming vater proved very satisfactory as an int.ercooler . The temperature variation of the air leaving the intercooler did not vary by mor (.; than 20 F in any civen series of runs r egardless of the boost pressure .
6
The fuel - air ml~lng valve (see reference 9, fig . 6) was modified by chan..ging t.he size of the mixing orifo1.ce from 1/2 to 7/8 inch so as not to cause unnecessary restriction at high s~)ecd and it 'vas tl en f ound to work satisfactorily at all speeds .
As far as practicable, rubber hose and flexible joints were avcided :Ln t he inlet system between the air meter and t1 e engine . Comle ctions were made riGid and ajrtight either ,.ith threaded. pipe fittings or flanges and gas!cets . The connection betveen the vaporizing tank and the engine .. Tas a piece of flanged. brass pipe . This arrangement made :1 t necessary that the tank be free to move up and dmm ,.,ith t.he cylinder head as the compression rat io was ·car i ed . 'rhe tank was therefore mounted on springs and was so adjusted tha·c no loa.d was on the inlet pipe at the mean position of the cylinder head . It "las also necessary to support the heater and the drying tower on spl'ings becQusG they were rigidly connected to each other and. to the vaporizing tank .
EXPERIIVlENTAL PROCEDURE
The experimental pyogram was designed to provide a means of demonstrating, for the case of ~ncipien~ detonation, the effect of changes in the rate of compression of the tmburned charge on ito maximVl1l permissible pressure. In this work maximum permissible pressure 'Has defined. 2.S the pressure of the unburned part of the charge at the instant when l.ncil1ient deto~lation OCCllrs . In most of the rUI1S maximum pe:cmissible pressure was coinciclent wi th peak pressure , but :in sooe cases, especially ,.,here combuGtj.on was completed before top center, maximum permissible pressure was lower than peak pressure, also , it W8.S assumed that the 11ressure of the unburned charge from inlet-valve closing to the instant of detonation \VilS the pressure given by the indicator d iagram.
The pre ssl~e -time curve was of particular importance in thi8 investigation. By a comparison cf presst~e-ti.rne paths associated '\'ri.th constant incipient detonat:i.on mder various 8:1.gine operating condi,tions, the relat.ion bet,veen j,gnition delay and rate of compression can be established . The e::lrgeri mental work therefore "l8.S arranged to g5.ve indicator d.ia~:cams of Val~iOU8 shapes under rigidly contl'olled operating cor.ditions.
The shape of the compression path can be altered i)y changing opera~ing variables, such as inlet pressure, engine spoed, fuel air ratio, and so forth; "out , ',;.n ordor to study time effects) j . t
7
was found desirable to change the shape by varying nly spark advance and compression rat~o at a given engine speed. A ch~nge in spark advance causes peak pressure to OCcUl~ earlier or later in t e cycle (see figs . 4, 5, and 6 ) and results jn a change in detonati.Jn intensity. It· the compr.:3ssion ratio is adjuste']. to ei',e the original i.ntenslty of detonation, it can be stated t11at t~e permissible cnange in compression ratio (or maximum pressure) is associated with the change in the path of compression.
Runo were made with varying spark advance at three different (constant ) engine speedo . In each run, compreosion ratio 'VlaS
adjusted to give incipient detonation. The variables held. constant for all runs .rere : aJr consumption per cycle, fuel consumption per cycle , inlet - air h~~dity, and coolant temperatures . The engine was war~ed up for about two hours before making runs, during which time the inlet pressw'e vas varied by trial to give the correct air consumpticn: the f uel -air ratio ivas adjusted., and temperat.ure equilibrit;m was established . InCipient d.etona·· tion ,vas i dentified b' oboe:..~ving the dp/dt (rate of change of pressure) tr2.ce on a cathode- ray oscillograph with the sara.e apparatus and by the samo method used in reference 9.
Air consumption WdS maintained at 0.000932 pound. of ru~y air per cycle either by throttling or by supercharging . The variation from this value in 98 percent 01' the runs was less than 1 percent and the maximum variation was 2.5 percent . The resid.l~l gas content varied from 4 to 7 . 5 percent . The total 'wight of charge (air + fuel + resi.dual gas) per cycle was maintained at 0 .001065 + 0 .000025 pound or a ~~imuu variation of leso than 2 . 5 percent for all runs; although the maximum variation in th:l,s quant 1 ty :~'or runs selec.:tod for anal:rs j s was les8 than 2 percent. The fuel - a.ir rat'io was maintained at (1 . 0789 .lith a variation of less than 1 pefcent in 96 percent of the rlLTlS and a maximulll variation cf 2,, 2 percent . Engine speed was maintained vithin 2 rpm of the desired value, and inlet temperatures were held. to 'l-Tithin 10 F . The effect of atmospheric hum dit;y ,vas eliminated by the use of a dry ing tower using activated alumina. (See appendix A of reference 9 . ) Checks on the dei., point of the inlet air 11ere made for each run and, although this value was probably in the nOlghborhood of - 600 F) no attempt was made to determine it precisely . As l eng as the; dew point "las below -400 F, it i·las considered satisfact ory) since a dei-T point of .. 400 F corresponds to a water - vapor content of about 1 percent of the 'vater yapor in the residual gases . The coolant temperature .Tas maintained at 2120 F .
8
When operating cond.itions were brought to e!luilbri1l1D. at the desired values, the spar1': advance 1.as set at the minimum at wh:tch untie TIl. detona.tion co"ld be matntained, anrl the compression ratio was varied until incLpient detonat ion was observed on the cathoderay eGcillo3raph . The spark advance was then increased. by suit able inc:emonts and the compression ratio was successively read justed to give tho same intensity of detonation. When an extreme spark advanco was reached, detonation was no longer uniform . The eng':'ne speed ,·ras then changed and the procedure rereated .
Three serles of runs "YTere made at engine speeds of 800, 1600 , and 2400 rpm 'and at a constaI't inlet-mixture temperatUJ.'e of 1200 F . The dlfferent engine speeds were used to study the effect of speed on detonation a-c constant volmnetric effic:Lency . Data taken for these runs are given in table 1* 'lnd are plotted in figure 7 . The data are plotted merely to ShOl1 the.t the poir.ts fall neatly on smooth curves, indicating good experimental control . Points at the right - hand ends of the curves, corresponding to abnormal spark o.dvances , do not represent true maximum ;srmissible preSSUTes ( althol~h they may represent true maximum permissible compression rat lOs) , "because in these particular runs o.etone.tion occl1.rred before peak pressure. In the discussion that follows, the maxlinum permis sible pressure fer these runs is taken as the pressure at which dotonation actually occurred .
Pressure crank- angle indicator diagrams taken for the runs are reproduc0d (half size) in figures 4, S, and 6 .
About half an hour i'Tas alloved after each change of compress1.en ratio to osta'ul j.sh egyiU.brium and to :naka s;:nL1.l1 adjustments to fuel and alr quantiti.os .
It was intended orig"lZlally to mako t!-e runs wit h commercial iso- ectane bocause of its homeger.ei.ty and also by ,· .. ay of compari sen ,,,i th results in re fe rence 9 . It \>laS very difficult, h01'Tever J
tc make the engine detonate satisf cterily at 2400 rpm with this fuel , and the only o.lt'Jrnative '''c.1S to nse a fuel of lo,-rer octane
*Runs VTeTO also made at inlet-mtxtur8 tomperatures of 1600
and 2000 JT, b·1.t these runs arG not dis ousGed because there vras not sufficient t:i.me av~ila I e to make a complete analysis . The experimental date:. for these runs, however, are Lnclucled in tablo I . The authors intend to analyze these data at a later time .
9
rating. The runs 1vere therefore made wi. tll standard reference fuel C-12, rated at 78 . 9 octane by the CFR motor method . Cyclic reproducibility 'vith this fuel was not so good as that obtained with iso- octane .
Tho pressure of the vnb1.D:'ned charge vas determined. by taking a pressure- crank-angle indicater diagram for each run ;.dth "ehe M. 1. T. bal'3.nced pressure ind icator . The ins tant at which detonation occurred was determined by taking a dp/dt record for each run, but these dp/dt r-ecords are nct shov!Il in this report . Hhen the films were developed at the cOl!'.pletion of the test } it was found that the line of zero rate of change vias badly distorted by spark pickup originat.ing in the amplifier used ivith the photo-· graphic oscUlograph. 'l:'he time scale was not distorted, however , and the instant (or crank jlcsition) at 1.'hich detonation occQ":-reci was clearly and accurately defined in most cases. IJhen the records showed detonation to have occl'rred at scme instant before peak pressure, the pressure at this instant a8 determined from the indicator diagrams "las taken !:is the true me.ximu.m permiSSible pressure .
DISCUSSION OF EXPERJJv1ENT.\L RESULTS
In order to discl1sS the experimental results clearly, it is necessary to define delay' precisely . The u.sual concept of d..elay is associated ifith the experiments 0,( Tizard and pye (reference 6) . It was in these experimento that ignition lag or delay ,Tas first recognized . Ti zard and pye compressed a combustIble mixture jn a Gyl i.nder and recorded the pl'essure changes with ·U1lle . They found.. that , if the mixture vTas com".9ress ed rapidly to , or above , a certain temperature called its "ign~tion temperature, " there would be no explosion until after a defj.nite -elme hu.d elapsed.
This pr00ess can be represente1 by the curve of figure 8 . Here a rapid adiabatic compression is carried out from 0 to A. At A, compress ton is cliscontinued anll the pressure is In:J.intained constant . If the temperature at A is above the ignition tamporature of the gas , then an explosion wUl occur later at B. The interval AB has been referred to as tL.e delay perIod.. . In this report it will be referred to as the ":1pparent delay ." Apparent delay will be defined as the time interval betwoen the end of isentropic compression and. the instant of explosion . If the tempGrature at A is slightly belO1v the ieni tion twnperature of the gas , no explos ion vill res ult regardlees of 110'" long the
j
10
pressure and the temperature are main.tained at this level; that is, for practical purposes, the gas will have infinite delay ,
In the case of isentropic cORpression, the proceso can be completely specified by givinG the initial conditions and the pressure- time histor;:, or the temlJerature- time history of the gas . In the follovling paragraphs, it {ill be asswned that the initial conditions re the same and that the compression is isentropic; thus, only the pressure-time history will be 't.<sed . It will alse.: be assumed that the combustible mixture consists of petrcleum vapors and ail' .
Al tho'lgh tho experiln:,mt'll demonstration and measurement of delay as effected 1y Tizard and P"e (reference 6) is straightforward enough , difftculty is encountered "\-rhen the concept is used to clarify the mecllanism of engine detonation.
A significan"::. featUl'8 about the compl'ession of the end gas in a detonating engine is that the compression is conttnuous up to the lnstant of detonation . Under these circumstances the concept of apparent delay is inconvenient . In figure 9, if the gas is compressed along OA to PI} the minimum ignition pres sure, the l'esulting appJrent del ay will be t l • If the gas is compr essed contim;.ously f:com 0 to Pa along OAo ' the apparent delay period 'Inll oe shortened to tc) (reference 13) and, i f the gas is co:tl:;n'e s sed cont inuous ly from 0 along
.OA3 , a pres s1.~' e P 3 wHl be ul"'-,im3.tely reached, at wh1.ch the apparent delay will be zero .
In a detonating ongj.ne , the tmbl'.rnod part of the chF.l.rtSe is conlpressed continuously ll..l1til spontaneous ign .~tion results, 2nd therei'o::: e the apparent del ay perlod must always be zero . In order to avoid 'Lhls difficuJ.ty , delay might be definod as the tille interval tehleen t_le instant at. 'I·r:1ich the minimum selfignition pressure is reached and the instant of explosion. With compression only to PI (fie . 9 ) this definition gives the samG value of delay as the prJ cedi!l(3 one, but) 1{hen continued to preSSlITe P
3) alon tho s~e path 0f compression,
the socond deZinition Si ves the deln.y as t 3 ' It 'I·rill be convenient to refGr to delay defined in t~1is manner as "total delay . "
As a result of the use of this de.l ini tion .. it follow's that , if a combustible mixtl~e is comprossed continuo~oly along di~ferent paths which do not C1'OSS 1.bove the lowest igni tien
11
pressure, then the path that has the smallest total delay will have the greatest self-ignition pressure . This fact is evident f:i.~om a consideration of figure 10 1'1here the total delay associated wi.th the "path OAe must be less than that associated. \'lith t~e path OAB since pressure and temperature are higher at any instant along AC.
The princ i ple just ill ustrated is borne out by the engine experiments . The compression lines of the prcsslITe- crank-angle diagrams of figure s 4, 5, and 6 are shm·m plotted. on a pressuretime basis in f igure 11 . These ClTves represent the pressuretime histor;r of the unburned charge , which in most cases d.etonated. at the point of peak pressure . The apparent delay is zero in every case, but the total d.elay can be determined if the minimum self- ignition pressure is known .
If 150 pOillLds per s~uare inch is assumed to be the mininQ~ self-ignition pressure and. if all paths are shifted in time so that they s t art from a COTIllil0n point A on the line PI = 150, then it will be seen that the principle stated. is borne out . If 150 pounds per s~uare inch gage is ) indeed, the minimum s olfigni tion pressure , it is allmvable to sni ft t lese curves in time because the part of the paths belm" the minimum ignition pressure is of no significance as far as the ultimate self-ignition is concerned . A justification of this artifice based on the theory of chain reactions will be found in appendjJ D.
It will be noticed in figure 11 that, i-1henever t\VO path.s do not cross , the path that lies above the other at every instant has the highest permissible pressure and the smallest total delay . Paths 6) 7) and 34 have been corrected. to allow' for the fact that detonation d.id not occur at peak pressure. The pressure at which detonation occurred for these runs is indicated by crosses on the diagrams . vfuen the paths cross) no conclusions can be drawn except that the l'esults of suc~ crossings do not contradict t~18 principle . Small di.screpanc ies ma~ ~e accounted ror by the fact that the temperature of the unburned charge at A varied slightly for the various rw1.s.
In most of the runs spark i gnition OCCl~S before point A is reached, i-!hich compl icates the computation of the tempel'atur0 of the unb'..u"ned charge at this point . A much more accurate temperature esti:rnate can be made at seme point prior to S'1x.rk ignition because then the formula ' PV = BT
12
where
r pressure
V volume
B gas constant
T temperature
can be used and good pressure and volu.'Ue measUl'ements cun be obtained . (See appendix A. ) A point at P::: 50 pounds pe:::square inch absolute vas selected, and the temlJeratures here for all the runs of figure II Her0 cO!l1puted. 'l'hese temperatures ' .... ere found to be constant wi thin ±3 p"lrcl7nt . It is no ievod that the precision of these computations is better than ±2 percent . (See appendix A. ) TI1.e 3- percent va-riation at this point thus appears to represent a real, though small, temperatUl'e variation. The compression process bGing cons·idel'ed isentropic } it follows that the temperature 'w,l':atlon of the lL.'1.burned. charGe at A, ,;he:,,'e P = l~ i O pounds per square inch gage will have the same variation. Thus, granted. a small temperature va:"iation at A, two i1enticul compression paths 'Y!0u.1d give slightly different maximum permj.sstble pressures .
If the minimum icn:it~.on pressur f ) is selected at P l = 125 p01.mds per square 1.nch gage , cont.i:'ad ictions are encountered that are too glaring to be inclmled in the range of experimental errors or slight temperatvTe variations at P l' The most significant of these contradictions is evident in the case of runs 1 and 27 . The compression lines for these two diaGrams are Sl101'~ in figlxe 11 at AI ' It will be notice1 that, althoueh pross .rres are ahlayo high~r at any instant alcng the curve for run 27 , the pea} pressure is the same as the peak pressure for run 1 . This result contradicts the foregoing theory . This contradict1on and other contradi ctions exist when 1\ 1s taken at any pressure below ISO .
When A is sGlecteQ at a pressure greater than 150, say PI = 175 pounds per square lncil gaGe , a result like that shown at A ~ i.s obtained , Aga:'n , only tho compressicn lines for runs 1 and 27 are shmffi , and it will be observed that pressures are nOvl higher at any instant a l ong run 1, although the peak preGsures are equal. This result also contradicts the theory . vllien ·the ninimum ignition pres3uro is taken at P l : 150 , as
----------------------------------------~~-- ~--~------- ----- ~--------------. ----,-----
13
at A, however, it Ivill be noticed that the paths of runs 27 and 1 cross and therefore the e9.ual.ity of llk'UCimum permissible pressure can be just Hied. A careful study of these contrad ictj.ons and inconsistencies slowed that the observed facts fitted the theoretical reasoning best Ivhen the minimum ignition pressure .Tas taken at Pl = 150 pounds per s9.uare inch gase . It may thus be concluded that, with a given composit;.;.on and initial pressure and temperatuxe, if the r ate of compression of the lli1burned charge is increased , the maximum permissible pressure is higher .
SUGGESTIONS FOR FURTHER STUDY
It is suggested that a ne'·T experimental method of attacking the detonation problem be investigated. This method is suggested by the dp/dt record of figure 12 . Here the pressure di8t~1baaces set up in the cylinder ·wnder conditiono cf moderate detonation are clearly shmln. The instant at "Thich detonation occm's is precisely defined, and the corresponding piston position and cylinder volume can be readily determ:i.ned . A pressure- time record, taken Simli~
taneously with the dp/ dt record, would give the cyli:1der pressu:-ce at any lnstant . From t1:0se data the temperature and pressure of tha end gas could be computed by the method used in the present investigation, and the pressure- time history would be recorded. The 9.uantity of end gas :lsn · ting spontaneously or, in other words, the intensi t·· of detonation would be limr.a ter ial.
This method has particular advantages over the mEL~jmumpe:~issible- pressure or critical- compression- ratio methods . By use of this method it wo lid be possible to study tb.e effect of changing a sing e engtne variable such as spark advance . Such a change "!ould not necessitate a change in compr0ssion ratio . The effect on detonation of products of combustion from detonating and nondetonating cycles could also 'e conveniently studied . This study might be made by rU!l:."1ing the engine under conditions of no detonation, then causing the spark to be suddenly advanced (t:lat is, dwing the time l'o9.uJred for the exhaust, suction, and power strokes), and a r8cord taken of the first detonating c,ycle, whj.ch w01)~d be a record of detonatJon as influenced by the products of normal combustion . The engine could then be run for a few c;ircles with the spark advance set at the precedjng instantaneous value and a record could be taken of the last cycle , 1-Thich would be a record of detonation as Influenced by the products of detonating combustion. The effect of contributions from the r3sidual gases on pressure- temperat'rr-e--t.ime effects coilld th0n be rGaiily d3termined .
14
The method presents ot,he~ advantages . Detonation could be made to cccur efore peak pressul'e, 'Thlch Ylould shorten tho cl~ank angle j nterval betveeT1 the OCC1.1.rronce of' svarle and de·tonation . A reduction WOt'ld. thus 1.e made in the number of e1' _'ors introduced in end- gas temperature computations d.ue to the asuumption that compression of t~e end gas is isentropic . (See append.ix A.) It would also allOi{ much easier control ovar the ,{eieht of charge per cycle occavse of constant cleal~anCG vol ume and 1-TOnld render l..nnecessary the use of an engine having a variable compression ratio .
This method might hav'3 a d.isadvantnge in that d.ifferent degrees of detonation -TOuld alter average com·bustion- chfJ.ill.ber temperatures , out these te:Jl.perature chunges wculd not be objecti.onable wlwre only a single d.etonation cycle 1s stud.ied ar..d should b'3 of small account where only five or six detonating cycles are studied .
It i s suggested that the f uols mentioned by Barnard (reference 14 and appt.md.ix E) b3 tested.. by this new method .
CONCLUSIONS
The r e s ults of this irlvestigat i on show that :
1. Ri.gh3r IDaxim\:Yll permiss i ble pres;mres can be used if the rate of compr ession of the end gas is incr~ased .
2 . Experimental data in engino dcto~ation should be a c ccmpanied by the pressuro- temperature-tim0 history of tha unburned charge in order that ftmdamental conclusions may be drawn .
Massachusetts Institute of TechnoloGY , CDlll1)ridge , Mc.ss .
15
APPENDIX A
TEMPERATURE COMPUTATIONS
FORMULAS AND CONSTAl~TS USED IN P-V-T RELATIONS
F R TilE UNBURNED CHARGE
Notation Used
The value of r~essUTe P, specific volume V, and temperature T for the uiJ.bu:rnea cho.TEe at t:.he point. 0 is given the subscri!)t o. 'rhe 12.1ue of P, V, Oi.' T for the unburned charge at any poir..t be':\!o."!n 0 and 183.k pressure is given the subscri:vt Y.. Tl1e a.dc'ttlcnal subsc!'irr:s 1, 2) 3 on the x desigr.ate d ifferer t com.Jutod values of the sc..m.e Cluantity, thus:
Tx indicated temperature of the tmburned charge, that 1
is, tempe.rature comIl,-l-;,cd froC1 rele..":':;'on PV = ET, whe!:'e ? 5_s rlLJfj 9t1.rGl~ 'n inr' ~_r.a to:;.~ d iagr6.l1l and V is deten:ri.:1!3d f..~")m Cl'oClk angle ar.d ',Teight of charge . Thef~e teLl.:;:oera-c.ures are cOn1:nriered nearest to true vall:.es .
T adie.1.Jatic temperatm's of "mburned charBe computed xa
f~~om !'E'.tio of lnitial and flm.l cylinder pressures, whlc.;h 2.!'O oeasurod fro;:;). indicator diagra"ll.
Tx adie..batj.c temperature of unburned charee computed 3
from ra.t io of initial and final cylinder volumes, "Thich are determined from crank pOSition .
This system aVl)j.ds confusion ,dth the usual notation of T1 , T81 T3.t etc. uS0d to represent telilper ature at various points in the cyclo .
In t:bo f:)llmrJng formulas other symbols used m.'].y be defined as foll,>"s;
B gas constant
Cv specific heat at constant volume, Btu/lb/oF
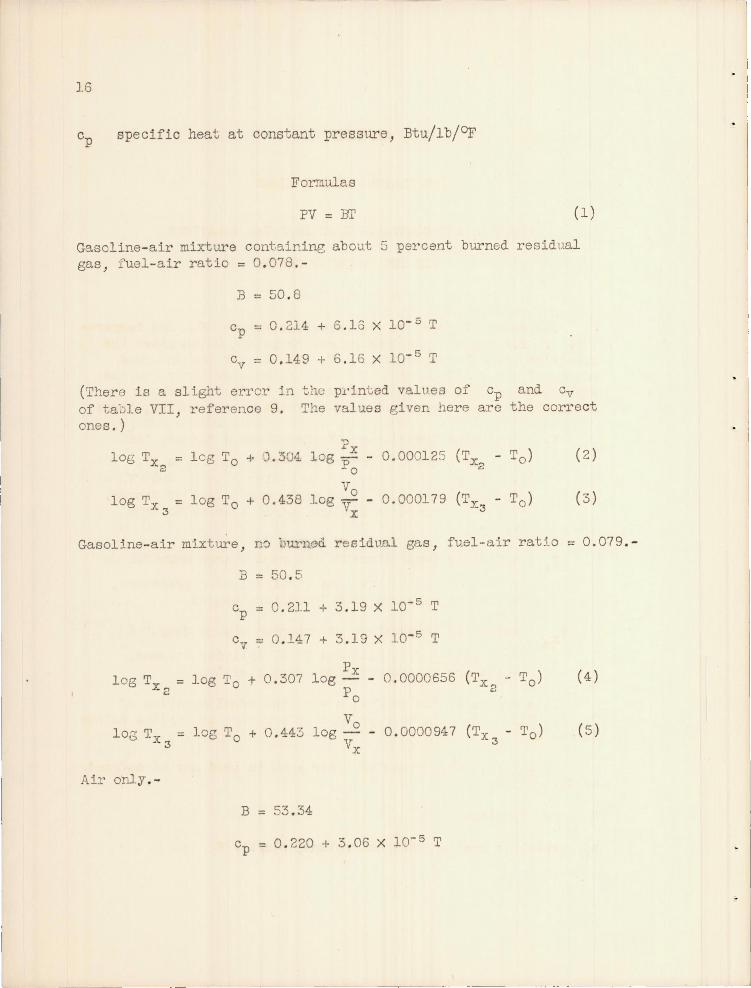
16
cp specific heat at constant pressure, Btu/lb/Of
Formulas
PV = HI' (1)
Gasoline- air mixture cont3.ining about 5 percent burned residual gas, fuel - air ratio = 0 . 078 .-
B = 50 . 8
cp =: 0 . 214 + 6 .16 X 10- 5 T
cv = 0.149 + 6 .16 X 10- 5 T
(There is a slight errcr in the p.!'int ed values of cp and Cv of ta·jle VII , reference 9. The values given here are the correct ones . )
log Tx leg To + J.304 Px
0.000125 (Tx - To) ( 2 ) log - -2 Po 2
log TX3 = log To + 0.438 Vo
- 0.0001 79 (TX3 - To ) ( 3) log V x
Gasoline- air m:i.xture , n0 burned. residual gas , fuel-air rat:to := 0 . 079 . -
B = 50 . 5
cp =: 0 . 211 + 3 . 19 X 10- 5 T
Cv - 0 .147 + 3 .19 X 10- 5 T
Px log TX ., =: log To + 0.307 log - - 0 . 0000656 (Tx - To) (4 )
~ Po a
Vo lo~' ~' = log To + 0 . 443 log - - 0 . 0000947 (Tx - '1'0)
t.J ·x 3 V 3 X
( 5)
Air only.-
B =: 53 . 34
cp = 0 . 220 + 3 . 06 X 10- 5 T
Cv = 0 . 1~15 + 3.06 X 10- 5 T
Px log To + 0 . 311 log - - 0 . 0000603 (Tx - To)
Po 2
Vo log To + 0.452 log ._. - 0.0000878 (Tx - To)
Vx 3
Rrmarks
1 . Temperatures are in of absolute
17
( 6 )
(7)
2 . Specific- heat eCluations hold only for the range from 7200 to 19000 F absolute
3. Lcgarithms are to t~~e base 10
4. TIle values of Tx and. Tx are d.eterm1ned from the trans-8 3
cendental equations by trial
5 . W~ight of burned residual gas is computed from thermodynamic charts
6 . I{eight of unburned r esidual as ( for nonfiring runs ) 1s computed. on the assw"""llption that the res1dual gas .is at exhaust- tank pressure and inlet temperature at the beginning of the suction stroke
7. The derivation of the true adiabatic eCluat i on for variable specific heats ,.,ill be found in reference 15 and information on the specinc heats >rill be found in append..1x C of reference 9
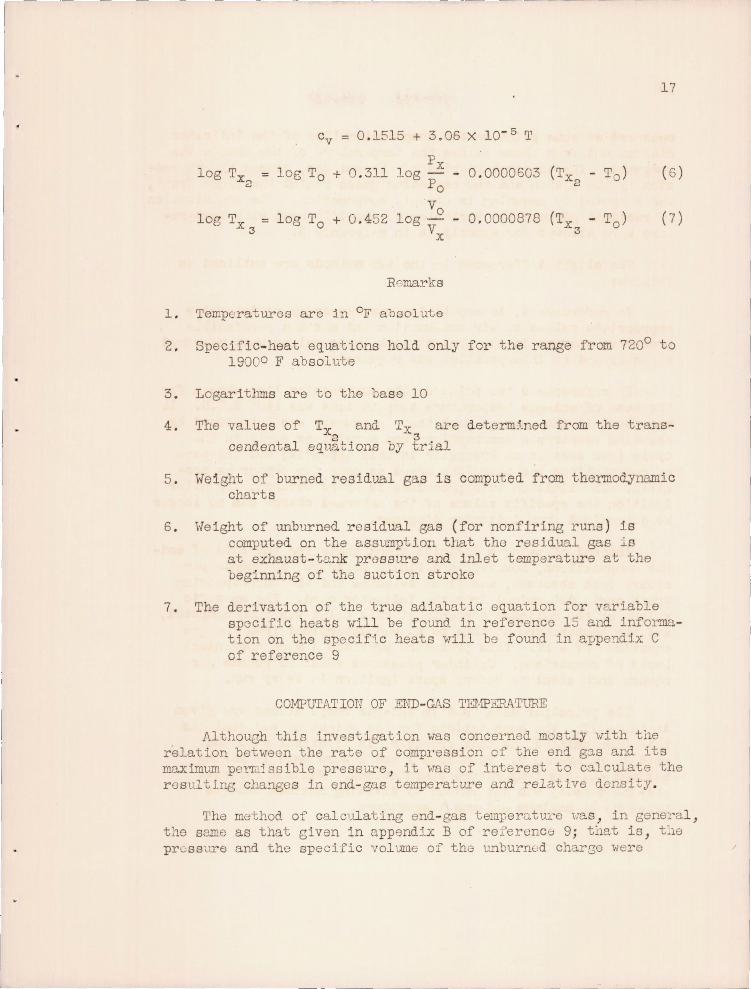
COHPillATION OF END-G S TEMPERATURE
AlthouGh this investigation vlao concerned mostly V1ith the relation behreen the rate of compl'ession cf the end gas and its maximum pe j ssible pressure , it '·Tas of interest to calculate the resulting cha!1ges in end.- gas temperature and relative density.
The method of calculating end- gas temperatm'e llas , in general, the same as that given in append x B of ref'eronc\;J 9; that is, t:le pr(;ssure and the specific 'lo.lume of the lli"1burnod char~e wer e
---- -- --l IB
measured at some point on the compression line of the j_ndicator diagram and from these values the temperature of the charGe ,:vas computed . The temperatur~ rise of the end gas, caused by co~~ros
slon by the piston and the e:x-pandirl8 gases behind t~le flame ::'ront , was computed by assUr.linc isentropic compressi.on. The contribution of residual gas and the variation of specific heat with temperature .rere allmved for exactly as j n refer0nce 9.
The slight differonces in the two methods are outlined us follmvs :
In reference 9, interpol:ltion ,·;as necessary to determine appropriate values of air con31~ption und maximum permissible pressure ; whereas in the pl'osent vlOrk ·chese values 'vere measured directly and no interpolation was required.
In reference 9 the point on the compression line chosen for the buse of end-gas temperature computations was 1460 B.T. C. It was fOllIld in the prese;).\; work that inaccuracy was introduced by assuming isentropic compression from a point so early in the cycle ( see section on Precision in this appendix) and the base of computations ;.rus ther0fol'e moved as near top cen7.er as }1ossible . The limit on this p~'ocedure is spark ad.vanco , for after ignition the specific vol1..n:1e of the unburned charge can no longer be determin0d from indica.tor diagrE1ills .
Instead of usin,.~ a definite cran-lc nngle for the base of endgas computations , hm.,rover , a dufini te pressur~ J 50 pounds per square inch absolute) vras first selected and the correspond.ing crank angle determined from the indicator card , The spe cific volume of the cylinder contents at this point was thon computed , and the temperature at this point 'ms detel'IIlined from the gas equation PV = Dr . This proceduro provides a more convenient tasie of c01nllarison. Cylinder pressures reach 50 pounds -per square inch absolnte before spark ignition in eVGry run .
The principal data L'.sed in end-GUS computations are given i n taule II. 1'he computations for the vTeieht of residual Gas have been omitted, as this procedure is idontical with ·l:.hat used in reference 9 , Equations 1 and 2 were used i n making maxim illl. ond- gas t emperature computationa. Maxlmum relative end-g~s density w~s det~rmined by dividing mnx~um end-gas prossure by- maximum end-gas tomperature.
-------- --- ---- -~-
I .
I 19
. PRECISION OF TEMPERIl.TURE COMPUTATIONS
'1'he problem of determining the teml1erature of the unbU1~ned part of the charge may be stated brie;fly as follows!
Given the prossUTe, volume) and weight of charge at some point 0 on the ~ompression line of the indicator diagram, to determine the tempcratUTe Tx of the unbUTned part at an.7 point x between 0 and peak preSSUTe . (The point 0 should not be coru'used with the point A mentioned. in the dlscussion . The point 0 is arbitrarily Gelected as a base of computations; .,hereas the point A has a definite location determ.ined by the state of the charge .)
Princip~l Factors Causing Errors in Temperature Computations
The principal factors that introduce errors into the computed value of Tx are ;
1. Accuracy of the I:lethod used. to compute Tx from the condltions at point 0
2 . Reliability of tha adi abatic assumption
3 . Acctrracy of determ .ning the conditions at point 0
4 . Location of point 0
5 . Accuracy of air meaSlITemente
6 . Acc'1racy of clearance volume measurements
These f actors, as well as some miscellaneous factors , are investigated herein :
Methods used to comrute Tx '- Three methods can be used to
calculate the t emperacUTe of the unburned charge . TIe first method invo1-ves the rola:'ion PV = BT ,.,here P is meas1..lred on the indicator diagi~am; V is determined from the vmicht of charge and cylinder vo1une (specifjc vol~e) j ahd B, the gas constant, j.s determined by the method given in appendix C of ref erence 9 . TemperatUTes so determined are here called indicatod temperatUT0s and are considered to be closest to the
20
actual values; they are desig~ted Tx ' This method io of no 1
use after the passage of spark unless the specific volwne of t he tUlb urned charge ca n be determined.. In this work the specifi c volume of the unburned charge after the pasGage of spark vras unknmffi .
The second method involves one of the true adiabatic equations (2) , (4), or ( 6 ) already given in this appendix (th0 particular equation dopends on t he charge composition) , '.-rhere temperature is expressed as a function of cylinder pressure as mensured on the i ndicator d';"agrarn . Temperatures so determined are designated Tx ' 3incs this method is independent of
• 2 volume , it can be used. after t~ e passage 0:' spark .
The th·lrd metlod. i:wc>lves one of the true acliabat ic e'luations (3) , (5) , or (7) ( tho pn.rt i cular equat.':'on derends on charge composition), vhere temlle.cat ure is ulI.pressec_ as a fur..c tion of the volume of the unburned cha.:::OCe . This methoti is independent of the ind i cator dia.t;p:·aIJl except for the deterI!lination of the temperat'LU'e at the point O. It cannot be t:sed after the pa3suge of spark . Temp8ratures so d.etel~ined are designated Tx >
3
These tb .. ~ee methods should give th" same result for any point on the compr6s31on paUl wlie:ce theJ can be aIlplied, if the comp:cessi.on proces3 is j.' e"l'ul'opicj but , tJ"lder certain circ"1Us tancJs , there i s cO:lsidul'abL; disagro,me71t . This d iscussion is mostly an a ttempt to eX111ain "Thy these di fferences exist and to shew hOi" the methods can be brou.Ght into closer acr'.Je ment .
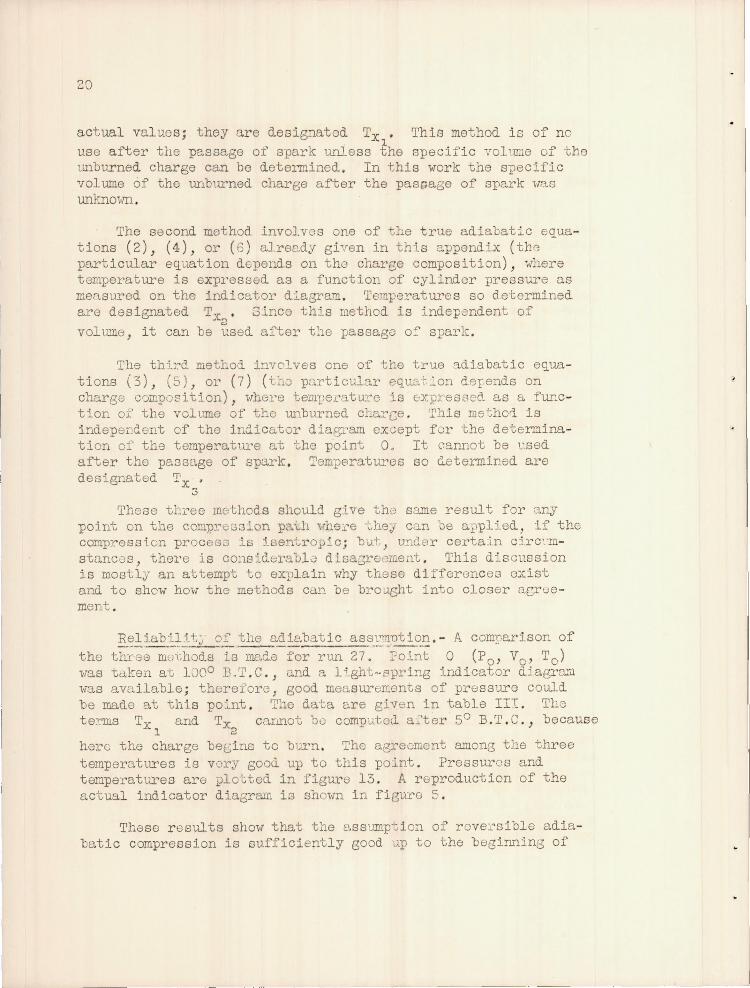
B.~.liab~~~5.t~ o.~ the ad ie.batic . as~.:::rnTJtioD ' - A com-carison of tho th:cee m()l;hods is mad..e for run 27. Foint 0 (Po, Vo , To) VIas tc.1ken at 1000 B.'r . C. , and a 1 ~.ght"spl'ing indicator d.:iagrn.m ,·ras available; therefore, good mea s'LU"en:onts of pressure couJ.d be made at this po':'nt . T:1e data are given in table lIT . The te~ms Tx and Tx cannot ~Q computed a;ter 5° B.T . C.} because
1 2 here the charge beGins to burn. The agreoment among the three temperatures is 'lory good. ull to this point . Pressures and. tempe atures are plotted. in figure 13 . A r eprod.uction of the actual indicator dia6rcl.I!i i s ShOiffi i n fiGuro 5 .
1'11ese r esults shoVl that the assumpt i on of rovel~sible adiabatic compresslon is suff iciently good u.p to the beginning of
combustion, whore it may be checked. Unfortunately, further investig[~tion gives conflicting ovid..ence on this poj.nt .
21
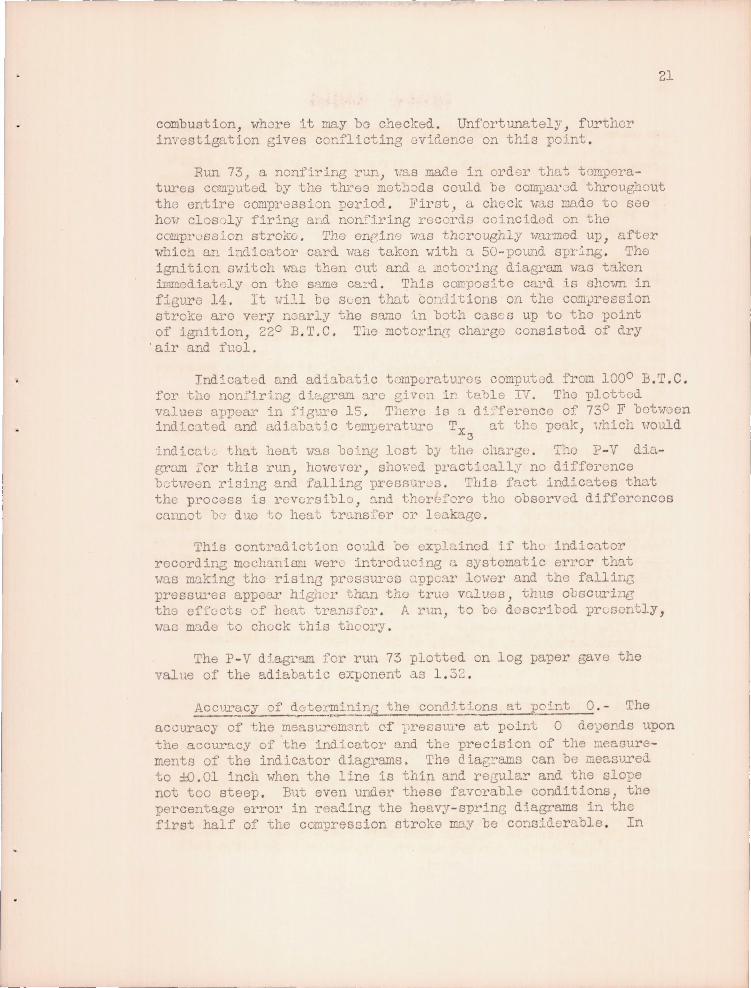
Rtm 73 J a nonfiring run, lias made in ordor tha-l;; t ';mlY1ratures com};Jutod by the th:ce3 meth:)ds could be comj,larJd throug,.'1.r ut tho 8Ltire compression eriod. . Ji'irst, a choc!c "1'1.18 made to see hmT clos ~ly firing al·,d non!"h"ing records coincid.ed on the cOlliprvss ion stroke. . Tho onp:in0 was thoroughly l'lm'med up , after .,Thien an inclicntor card. was taken ,vith ::l 50- potmd sp:t'~ng . Tho igni tion 81o1i teh .,lUG then cut ar..d c.. .Jl.oto:,'ing diag:cam i·laG taken irnmod.iately on the srune ca:::>d . This corrpos:!.te eUl"d is shmm in figuro 14. It \lill be SLon that cO'1litions on the com~re8sion stroke aro very nearly the samo ··m both case s up to the po nt of 19nHion, 220 E , T, C. T~lG motorinG charge consisted of dry air and 1'1..101.
Indieatod and adi3.batic tomp(;raturo6 computod from 1000 B.T.C . for tiw nOl1~"i.ri.ng dir:.!.gram aro Givon iT' tabl e rl. The plotted VD. .nes appom~ in fjgure IS . There is :1 dL'feronee of 730 F bohToen indj.clted and udio,bat1c t0I!11)Oi."nture Tx a.t tho po'1k, ';Thich uould
- 3
indicc.L that heat I-Tas boi.ne; l,st by tlw clargu . T::o P - V d.iu.erum i.'or this run) hmwvGl', shoFod pl'actieall;,r no diffcl'(;;nCe b,;tue0n iSine and falling prOOFlUrJs . This fact .ind:;'c~tes that the pt"ocess is r eversiblo , 3.nd t.horefore tho observed. difforencos cannot 1).,] duo to heat tr,:.ns~er or 1 6D.kage .
This contl"ad iction co~,lld ·00 explQinod if tho indic<1.tor rocordin3 mochanioru wer .... intreducjng c. systematic error th::lt \lu.s ll1:lkinB the risinr3 pr083ures up·pc::u' 101';81' and the fallinG pressUl'es appodr hlgher them the true v lUGs, thus obscurinG the of{e;c-cs of heat tre.n.Ji'oi." . A rtm, to bo doscribed prGsor"tly, \lao mo.do to check this tnco17 .
The P- V d .. agr'IDl fer rUl 73 plotted on log paper gave the valne of the adiabatic exponent a.s 1. 32 ,
Accura~~in~ the condit Lons at poirJ.t O. - The
accuracy of the meast,;rement of !.'re8stJ..J.'e at point 0 dej?ends upon the accuracy of the indicator and tho":} precision of the l'J.ea!3Urements of the indict1toY dlagraDls. The d iag:"ams can be measu.red to :!{) , 01 incl when the line is thin and reGluar and the slope not too steep. But even tmd.er these favorable conditions; the pe.rcentage error in reading the heavy- sprinG diagrams in tho first half of the compresoion stroke IDLl.y be consider ble . In
22
the case of run 27 (table III), if the pressure is meas~ed at 1000 B.T .C. on the heavy-spring diagran (150-lb sDring ), an error of 0 . 01 inch resu~ts In an error of 1.5 pounds per square inch . This error is sufficient to change the in1icated. temperature at this point from 8730 F absolute to 9410 F absolute and. the peak temperatL~e Tx from 17050 F absolute to 17900 F absolute . 2
It has been found in this laboratory (reference 16) that the accuracy of diaphragm units is poor when sma.ll pressures arc being meas 11'e<3-, OYring to the force required. to overcome the elasticity i n the diaphragm which varies somewhat '(rith d.ifferent conditions of operation. ~his error has a maximum value of 2 pounds per square inch . An error of this ran.gnitude at 1000 B.T.C., in the cane of run 73, is more than sufficient to account for the differences in maximum t0mp~ratures. Thus, if the true pressure at 1000 B. T . C. were 2 pouncts per square inch 10v;er than that given in table IT, the true rnaxtmum indicated t emperature woulci be dimi.nished to 11750 F 0. solute and tho IDa :imum adiabat ic temperature Tx ,",ould bo dim'inished to 11450 F absolute . Uncier these circum5tances the a<iiabatic temperu.tu1'e is 300 F l ouer than the indi cated tenperaturo. This difference would indicate that heat Has gained in the compression process .
The diaphr3.gm 01~ or can be elimi ~ated by the use of a flapper-valve t;y-pe of cylindGr unit. ; but, i1 light-spring d.iagrams IV'er e taken with the flappor-valve unit in acidition to the heavyspring diagrams for runs 1 to r.:9 , the requireci amoLlnt of testing time would have been a'pproximately dOlltled and the unciesirabl e situation of using the ciata from two separate runs for computing a single r esult ,vould hav0 r-:Jsulted. because of the necessity of shutting do"m the angine to change units . A fe,,, light-sprine ciiagrams "lere taken, h01·rever, oi ther before the beginning of a given series of runs or at tho con.clusj.on .
Although a ciiaphragm error of 2 pounds per square inch in the oarly part of the com?rcssion strole would be sufficient to explain the temp~rature ciifferunc(;s, it is not certain thnt tho TillL~imum valuo of this error was always in ev idence . Accordingly , thE;; theory that the inciicator recordinG mechanism "TaS introducing a systeIJ".atic error vhicl mude thl) rislng pressures appear lovler' and the falling pressures appear higher than the true values vluS considered . An error of this nattU'8 would. be introduced. if the viscosity of the oil in the indicator plunger vere groa.t anci if the compression sicia of tho c:1rd were tak'm wb.ilo the inciicator pointer was moving outward. and the oxp:lnsion sid0 taken vhil e tho pointer was moving :invl8.rd .
23
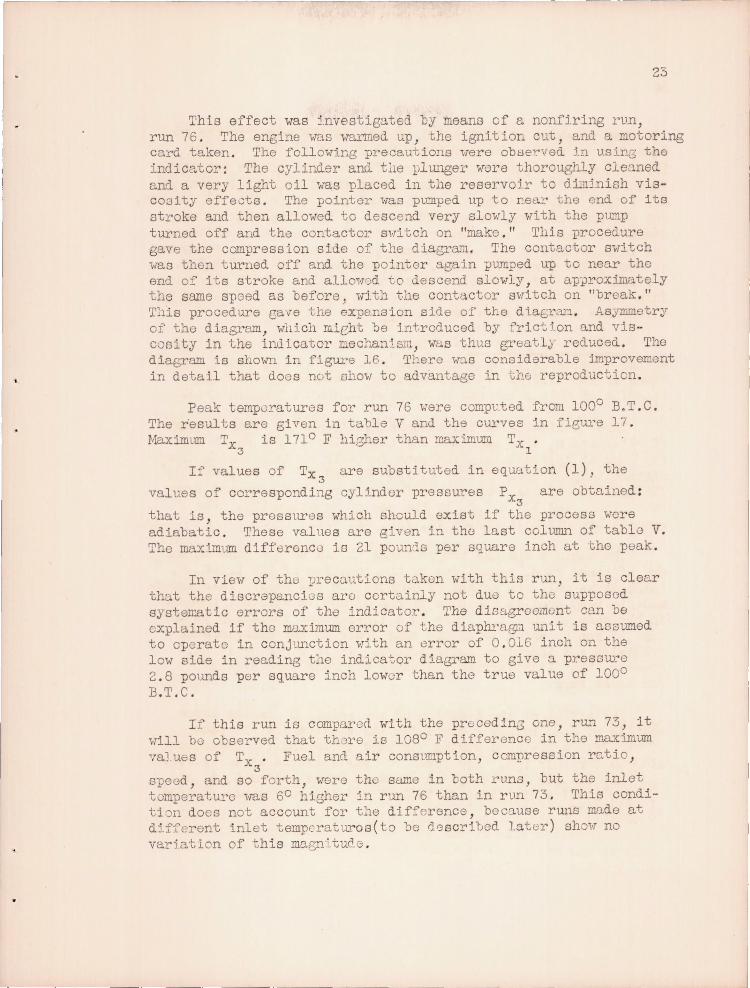
This effect was ~.nvestigated by means of a nonfiring run, run 76 . The engine was warmed uP, the ignition cut, and a motoring card taken . The following precautions Here obser.ved. j.n usinG the indicator : The cylinder and tlle plunge:c were thoroughly clecmed and. a very light oil ..... ras placed in the reservoJr to d:tn5nish viscoaity effects. The pointer i-TaS pumped up to near the end. of its stroke and then allowed to descend very slowly with the pump turned off and the contactor sHitch on "make ." This procedure gave the compression side of the d.iagram , The contactor switch was then tur.ned off and the pointer again ?uMped up to near the end. 0:: its stroke and a110':·]')d to descend slowly, at D;pl,1roximately the same speed as before) wJth the cont':l.ctor 8"li teh on "break . " Tllis procedure gave the expansion side of the di.aGra.."r'J. . Asymmetry of the diagram, which mic:ht be introduced by fric~ .. on and vis-coei ty in the ind icator r::.echan:. sm, wus thus greatly red,uced. The diaGram is shown in figure 16 . There vl::lS considerable improvement in detail that does nut ohow to advantage in thE-; reproduction .
Peak temporatures for run 76 \,ere comp1:ted from 1000 B.T . C. The r'esul ts are given in table V and the curves in f leuJ.'e 17 . Maximum. Tx is 1710 F higher than maximum Tx
3 1
If values of Tx 3
values of corresponding
are substituted in equation (1), the
cylinder pressur.es Px are obtained: 3
that is, the preSSlITeS which should exist if the process were adiabatic . These valles are given in tho last column of table V. The IDaXtmum differonc0 10 21 pouD'l s per square inch at the peak .
In view of the preca.ntions taken Ivi th this run, it is clear that the discrapanc1Gs are certainly not due to the supposod systematic errors of the indicator . The dioagreomont cnn be explained if tho maximum. error of the diapm.'ae;ln unH is aosumed to operato in ConjlUlction ,.;1 th an. error of 0 . 016 inch OIl the lmv side in reading tbe indicat.or diagram to give 0. pressure 2 . 8 pounds per square inch Imvor than the true value of 1000
B.T.C .
If this run is compal'o(l with the precedinG one, ru..."1 73, it vrill bu observed that thore is 1080 F difference in the maximum values of Tx ' Fuel and air consllnption, compression retio,
3 speed, and so f orth, were th same in both runs, but the inlet tomperature '\Vas 60 highei~ jn run 76 than in run 73 . This condition does not account for t11e difference , bec:luse rW1S mnde at d.ifferent inlet tempcraturos( to be rlescrl1ed lat!;)r ) sho,.;" no varJatlon of this magn i tu0..e .
24
The pressure at 1000 B.T . C. should be the same for the tHO runs , but it will be observed (tables IV and V) that Po is 18 . 6 pounds per square inch fOl' run 73 and 20 . 3 pounds pe sqna1'e inch for run 76. 1m error in me:1suring the ind icator dtaGrram of ±O. Ol inch would accotmt for ±O. 5 pound per square inC!l difference , and the remainuer may be accounted for by the diaphragm er::..'or . Since the rlms were made under practically identical conditions, the temperatures at 1000 B.T. C. are proportional to the prElssures at that point (from PV = BT) . The temperatu11 e at 1000 B. T. C. for run 73 is 717 0 F absolute and for run 76 is 7850 F absolute . This initial temperature difference is responsible for the large difference in mRXimum values of Tx lor the two runs .
3
Location of point .- Adiabatic temperature computations so far considered in this appendix were based on cylinder conditions at 1000 B.T. C. It is desirable to see wJ::.at effect the location of this point has on maximum adiabatic temperatures .
Three indicator cards, numbers 5, 37, and 51 from the .york of reference 9 , ",ere examined for this effect . The cart..s ",ere for rtms at approxilrutely the same fuel-a ir ratio but with inlet mixture temperatures of 2000 F, 1200 F, and 800 F, respectively . The maximum end- gas temperature for each run was cOlllmted from 146c , 1000 , and 300 B.T,C . by the use of eq'.tation (2) . '1'he resul ts are given in tables VI , VII, and VIII .
The maximum end- gas temperatures should be the Game in any one of these runs, regal~ess of the location of the point 0 , inasmuch as Oll~y one method of computation was used . This agreement is very good in the case of run 37 and is within 1 percent i n the case of rlll ' 51 . There is a 1 . 3-percent variation in the case of run 5 , ,.,hich is of the same order as the experimental precision and therefore satisfactory. It. is worth noticing, hm.,ever, that light- spring indicator diasrams "lere available for these r uns .
The effect of the location of the point 0 on the three methods of temperatvre computation was studied for the case of run 76 . A 50- pound spring was used in taking the indicator diagram for this rtm. The pOint 0 .ms selected at 400 B.T. C. and temperatures v:ere ccmputed by means of equations 1 , 4, and 5 . The results are given in table V and the curves are plotted in figure 18 .
' .
--~--~.--------~----~--------~--~----~------~-------------.------
2'5
Notice that the maxim un difference in temreratul'e is nO.T
only 480 F and the difference behlsen adiabatic and indicated pressures is now less than 6 pounds per s9.uare inch. AlthouGh t~1ese difference s are much less than when the ma;,:i.m:un values were cOmIll.::ted from 1000 B.T.C . (see table V), yet tile o.bsolute correction necessary to ap:;'11y to tbe pressure at 400 B. T . C, in order to eliminate t!J.e 400 Ii' differencG is about the same (2 . 65 lb/sq in . ) as iTas necessary to eltminate the 1710 F difference I"hen the maximum values .rere computed . rom 1000 B. T . C. This fact points strongly to the presence of a zero e1':::-or in tbe diar':lTa3ffi .
It Has shown that <".n e1'rG1' f 0 . 01 inch in me·J.suring pressure en the heavy-sprj.ng di.agram at 1000 B.T.C . for the case of run 27 resulted in a val'ia.tion in muximum T of 85° F . If
XC]
this same error were mJ.d.e at 400 B. T . C. , the variation in maxi mum Tx would be only 100 F .
8
From the foregoind com:iderations it is app<rEi!~t that, ,,,hen heavy- spring diagrams only ai.~e available, it is desirable to locate the point 0 early on the line of rising pre E'fJtlYe s , ,,,here the slope is Bentle , in order to facilitate moasur-3ment j but a compromise must be made betHeen this 10cation of the point and e. location later in the cycle, which 'mt~ld be d.esirable for reducing the percent:lgo of diaphragm er rors . Moreover , t:le near0r the point 0 is to -':;he point x, the less errol' ,.,rill be involved in ca!.culating the temp~rature at Pc:int x from t~lat at point O. A good ccmpromise locat .... on fOJ:' '.rns 1 to 59 vas betileen 40° and soo B.T.C.
Accuracy of air mGas ·.u' cment !1. - In the case of l!oni'iring runs it might ba expocted that tho air consumption }lor cyclo would increaso wL tIl time o.fter c '!.<tting th~ t eni ~,io!~ dw] to the cooling of the c;)'lirule:t' v3.11s . 8:ince the compreosicn side of the indicato:::- diagrlIll Has ta.cen first , it might be Gxpoctod tllat less air ,muld be drcmn into tho cyl1.ndor during this period tb.an dllYing the period. roq ired to take the expansion side of t:10 d5 agr81D.s . This variD.t ion would be averag:)d over the complete cyclG by the method uSt.d :i.n Llaking air meas .:1"<;'"
ments.
In order to detect this change, if any , thr0e indicator d:1.agra.r:1s - runs 77a, 77b, and 77c - vere taken in SUCcE;ss:'on. The on3ine I>"aS warmod up for about 30 minutes, tLe ignition and th·) fuel were s' lUt off , and dry air Ol'~y waG adrnictei to
26
the engine . An air measurement was taken for each card. . The
last card was finished 8 minutes after cutting the ignition.
no significant change in air consumption was observed . The air
meter readings for the three runs were 58.8, 59 . 0, and ~8.9 rpm,
respectively; and the pe.:1k pressures ,,,ere 147 . 5, 148.5, and.
147 . 0 pounds per square inc:1, respectively . This vari::l,tion is
less than lis percer.t . The lnlet temperature varied from 1260 F
to 1280 F during the runs, which is also a negligible variation.
Speed 1vaS kept constant with a strobotac; hence there snould be
no asymmetry introdnced in the motoring card due to cylinder
cooling . It is p03sible, of course , th3t all tr:.e coolil1~ took
place in the brief interval betvleen the time ignition was cut
and the beginning of the first card , but, again, asymmetry
should not be introd.uced.
Temperature -pressure data for run 77a appear in taJle IX
and are plotted in figure 19. Maximum Tx is 750 F higher 3
than the maximum indicated tempcrat1Te. If the pressvre at
1000 B.T .C. were reduced by 1.2 POilllds per square inch, these
tllO maximum temperatures llOuld be equJ.l. This result is v.r8].l
wi.thin the maximum error of' the diaphragm. The P-V diagram
for this rtm shovrcd a very small differ<:'nce between the compres
sion and expansion lines, the e:;;:pans10n line being slishtly
lower .
A further question to be settled waa the effect of absolute
errors of air meas'J.rements on te~lperature computations . Various
values of air consumption per cycle were assumed, and correspond
ing maximum adiabatic temperatures and indicated temperatures
l"ere compl~ted ).'rom 1000 B.T. C. for run 77.:1 . The results are
shown in figure 20 . The actual noasurod veight of total air
charge per cycle f or run 77a llas 0.00125 pound, which includes
the residual air in the clearanc0 space, and assumcc v.:1lues
rangod from 0 . 0008 to o. 0013 p01..md per cycle . It 1vi.ll be seon
from tho cu.rves that a largo error in air measuroment ho.s a
relatively small effect on the differe!1ce betwoen mu..ximum Tx 3
and T. r , sinco thG ClU'ves ru.TJ. nearly parallel. The variation .h.l
in indicat0d temperature at 1000 B. T . C. is also ShOiffi .
Accurncy of clearance- volumo m:)El.S .U'emonts . - The observed
fact that the adiabatic tempel'ature cor.:putod from the pressure
r atio is 10\lOr th.:1n that computed fl~om Juhe voh'lll.e ratio could
be rO.:1dily expla inod if the clearance vol UTIle 8 ,·mro in error .
At the beginning of this work, tho compreseion ratio micrometer
. I I
27
was so set that, at zero reading, ;.t corresI'onded to a cOml.1ression ratio of 10 . 00 with a clearance volume of 68 cubic centimeters . The clearance volume vas measured oy pouring oil into the cylinder from a graduate with the piGton at top center. Thj s measUl'oment 1vaS made 'vith the various spark-plug holes fitted ,.;-ith blind plugs .
'{hen the temper3.turee ''lere computed and the larLe discrepancies '·rere observed, another check 'V"d.S made and shov/ed the clean:mce to De somewhat larGer. An effort the n was made to detel'rnine the clearance mere accurately ,
Dependence on grad~tes was avoided b~ determining the weight of 1-rater necessary to f.tll the clearar.ce volume . Great care \·78.S taken to 81 iminatl3 any ent:capped air bubbles. These measurements could De Yepfated to :l prec:isio.n of 0 . 3 percent , vrhich 1ms never the case ,·:hen graduates and oil Ivcre used. T:lere 1-.'3.8 very little ;ieal[3.ge of water past t::-w piston . Tile fall in the 10vel of the water in the vertical spark- plUG hole wus observed to chanGe aoout 0 . 1 cuoi'~ centimet.er after a minute or so, It took cnl;7 about 15 seconds to fi il the cle;)'l'ance space ; hJ nce there could 1;8 no appreCiable error from this sonrce . The water in the clearance spa.ce was blown out with comprGssed air, and the engine .las fired for a fall m-tnutes after making the measurement .
The same spark-plus, dp/dt u..'1.it, and balanced prossurE? unit used in tho runs ",er0 in the cylinder head "hen these ::.neasurements vere mad6 . A chance in spark plUGS of lHfft:rent types may cause a change in clearance vol U1~e of 0 . 5 cubic cent imeters . This fiGure is significant in caroful ",ork at high comj?ression ratios .
A glance at fig'.1re 21 shows ho~v orrors made in meauu:r lng cloar:J.nc3 volumes affect ma.x:imum values of Tx and Tx ' 'l'hese
3 1 curves wore computed for the conditions of run 77a . An increase in measured clearance C'1.tlses an i ncroase in m3.Xillmm indicated. temperat.ll'e and a decrease in maximum. adiabatic tem-porC1.turo Tx '
3 The inters0ction of the two lines s. OilS the value the clearance volume should have in 0 de:.- to make tho bvo tumperaturcs equal. This occurs at 77 . 6 cubic centillivterS j whereas caroful measurement of the actnal clea:,'ance volume lor 1:.his reID Gave 72.5 cubic cGnt Lrnotors . Al though an orror of this macni tudo wOllld readily explain the fact that 'l'x is consistently higher than T_, in
3 J- 1
all the runs cons idc:;",3d, it is quit o certain that no such orror fyom this source existed .
28
The vari ation of indicated temperatu e at 1000 B.T . C. was 7720 ±20 F absolute for the range of clearance- volume er ors considered . I t is not known how much change OCC1ITS i n clearance volume wHh temperatul'e . The change probably is negli(SiblY small "because the linear expanB10n of the piston and the connectinG rod would "be offset somevThat by the linear expansion of the cyl i nder. Assumption that only the cylind.e:i.' expanded gave insufficient change in volume t o aCC01.Ult for the observed effect .
The clearance volumo should change somevrhat when the engine is running because of the deflection of the connecting rod , crank , cylinder Halls , and so fOl'th, under gas p:~ess1.ITe . 'rhis effect \vou~d be offset some"hat by inert . a forces in the piston and connecting rod near top center on tho ccmpression stroke . An estimate of this effect was made "by pumping oil ~~der press1.ITe into the combustion cham"ber vlith the piston at top center . A di.al gage vlaS adapted to a pin fitted through a blind plug screw'cd into the vertical spark- plug hole in the top of the cyljnder . The 'j? in was made to press firmly against the piston by means of a spring . Any motion of the dial gdGe gavc the relative displacement "between the piston and the cylinder head . It Has f01.md that the rolative displacement was 0.001 inch por 100 pounds per square inch rJl~eSSHre up to tho mmcimum pressure used , \Vh lch I-Tas 1000 pOeillds por square inch . For the case of rlUl 770. t~is displacemont ,-rould result in a difference bet'veen measurod and actWll clearance volumes at top center of about 0 . 2 porc(mt , which is small enoU{;h to neglect .
M-!.scellaneons Factors Causlnt; Erl'ors in
Temperat11.re Computations
In or de r to el:im.inato the e ffects of uny un~ore see11 e11gino id iosyncras ies , the hi8-11- speed CFR cng'inu 'ioTaS replacod "by a lo\{speed CFR engine . The c10a::canco volume of the 10lv- speed engine \Vas carefu~ly IllOa01.IT0d as descri bod . Runs wero made with this engine at two difforent ongine speeds and inlet temperateu~os .
The same indicator and d iaphral9ll lmits ":1ro used .
Tho first run , run 78, i-laS a nonfir i ng aIr run made undor approximatel y the same conditions as run 77a . The air was not dried and IvaS measlITod 1-,1 th an orifice i stead of an air metor . Tho data for run 78 ar-2) presented. in table X and fig1.ITC 22 . Notice that pressures and temper atU!:"os arc considerably 10lvor in rem 78 than in run 77a but that tomp0raturo differences aro
29
about the same. The higl:1er values of run 77a may be accounted for by the feet that iruet temperature aLd compression ratio are slightly higller . But compC1.dsons are complicated by the fact ttat the inlet valvo closos at 1400 B.T.C . in the case of run 77a and at 15~0 B.T.C . in the case of run 78 . Light-spring diaGrams ~vere not taken for these two runs so that the exact pressUl~e:>.t i.nlet- 7alve closing is unknOlYTl .
Another nonfirjng rUJ.'"l , run 79, WB.S made on the 10'.·1- speed engine under the SAlll6 conditions as r.m 78 except that the speed was reduced to 800 rpm ( sea table XI and fig . 23) . The air consumpti.on 1-laS some1-lhat hiGher on this rU.::1 . It is apparent that the differences in computed cylinder temperatures are almost the same , showlI1..g that engine speed does not affect the difference me,terially .
Finally another air run, run 80, vtas taken on the Imv- speed engine at 800 rpm rith the ~.nJ.Gt te!l1perature increased to 1910 F ( see table XII and fig . 24) . Although the temperatures are all higher, the differences are still apparent and considerably larger . Too rigid comp3.l':!.sons cannot be made because no attempt was made to keep the air conSUInIlt on exactly the SB...'ne in the three runs .
Effect of Charge Composition on Cylindey Pressure
The measured peak presslJ.re Px i s 16 pOlmds per s'luare 1
inch higher in run 77a than in run 76 , although operating condi -t i ons were the SaIno . This d ifference can be accounted for by considering the nlwber of mols for th8 two charges . The molecluar 1-Teight for the f uel -air mixture is 30 , 6 and th.e molecular veight of air is 28 . 9 . T1:e total \'leidlt of fuel -2ir charge is 0.001285 pound or 0.001205/30 , 6 = 0.0000420 mol , and the total voight of air charge is 0 . 00124 pOl'nd or 0 . 00124/28 , 9 = 0.0000429 mol . At peak pressure the volumJ of charge is the s~e in either case . If the formula PV = NRT is applied, where
V charge volume
N number of mols
R universal gas constant
T temperature
- .~----
30
there results for the air c~~ge cf run 77a
and for the fuel-aj_r charge of run 76
Then
1.11 := 1.11
For any given cylinder temperature, Pa ,.jl1 therefore by higher than Pf .
A Fourth Method of Computing Adiabat jc Temperature
iill estimate of ad iabat1c cy11nder temperature can be made by considering that all the teffiperature rise of the charge during compression is d us to the wor.k d ne by the piston and that no temperature rise 1.S transferred to or from the cylinder walls . If the work done by the piston on the com¥ression stroke is measured from the area of a P-V diagram, then the final temperature can be computed by solving for T3 in the eqtation
W := W
where
W work done on charge by piston, ft-lb
w vwight of charge, lb
Cv specific heat of charge at constant vol urne, Btu/lb/OJ!'
To indicated temperature at 1000 B.T.C., OF abs .
T:3 adiabati c temperature at top center, OJ!' abs .
For the case of run 77a this equation becomes
rU'3 0 . 016 = 0 . 00125 J (O . 151~ + 0 . 000030GT)dT
776
This value lies about micliV'"cLY between the peak valaes of Tx .
8
31
This met.hod is consldered not so accurate as the other methods used because it is always difftcult to trace a P-V diagram and measure the a::-ea 'With any great precision. Tr ... e method is included here merely as a rouge check on values compl:ted "by the other methods .
Conclusions
La::ge variations in speed, inlet temperature J and. all' consumption do not account for the difference bohreen indicated ( true) and computed adiabatic temperatures . Errors in moasuring the indicator diagram. may 1e a ccntributing cause in some cases, but the difference has a CO!J8.lstency that eliminates this so:u'ce as a general explanat ion. Small er)~Ol'S in cleal"ance vol urue measurement will alter the diff l'ence appreciably at high compressien ratios . The elasticity of the diapucagm in the indicator unit is probably 'responsi le for the major part of the discrepancy . ~Thenever the state of the end gas is investigated by the metheds outlined in this report , light-spring flapper - valve indicator diagrams should be taken si.:nul taneously 1.i th the heavy- spring diagrams .
It mn.y be concluded tr.at the end-gas temperatures for the detonation runs are, in general, about 250 F lover than the g j ven adiabatic values . This f act should not al'fect the main conclusions arrived at in this report inasmuch as all temperat~"es should be affected alike . This estj~ted error 'Would be subject to revision if t~le effect of neat crans-:er from t he burned to the unburned part of the charge were considered . It migllt well bo that this heat. trnns;er, if any, is s ~u'fi cicnt to make the actual temper<:!.tures appro9.ch more nearly the computed value s .
32
APPENDIX B
DISCUSSION OF FLN~ PHOTOGRAPHS IN
REFERENCFB 10, 11, AND 12
The photographic combustion studies of references 11 and 12 were taken at 40,000 exposures per second or at about 18 times the speed at which those of reference 3 were taken. The photogr8.phs of detonating combustion taken by Rothrock and his coworkers in references 10, II, and 12 are in agreement with those of Withrow and Passweiler in ref erence 3 to the extent that detonation appea.rs to be a rapid reaction in the end zone but are at variance .,ith those of vlithroI-T and Hassweiler in that the reaotion does not appear always to take place ahead of the flame front.
The ge!leral conclusion reached by t he authors of referenoes 10,. II, and 12 is that, although autoignition of the last part of the charge may occur coincident with knocking, the lcnock itself is something which the data indicate may occur only in a portion of the charge \·,hich has already become inflamed before the knock occurs. The authors of the present report , hovever, believe that the photographA of references 10, 11, and 12 may actually be a confirmation of the autoignition theory of engine detonation .
In figure ~ of reference 11 frame M-9 shows the flame front approaching the end wall w'itt <larkening of the end zone l'resumably due to preflame reactions . In the next frame , M- IO , the darkening of the end zone is such that the flame front can be no longer distinguished . It is stated in the text of this reference that knock occurs in frame M-ll. Again, in figure e, frame N- ll shows unburned charge near the edge of an unobservable region of the combustion chamber. Knock occurs, according to the text, in the next frame N- 12 . Thus, in both series of photographs that shm. knock in reference 11, detonation may be saken to occur in the unburned charge and can thei-'efore be interpreted in support of the auto ignition theory. Cases in which four flame fronts come together in the center of the com oust ion chamber have shown the four fronts apparently merging before detonatton takes place . The flame front appears to be similar to a silhcuette or slcyline of a range of irregular nOl.U1tains .,here only the highest mountains shoY,. Any valleys that may lie betvreen the mountaj.ns ca.nnot be
1
I
L ~
33
observed. A cross section of the flame front at any level val l t~1erefore be more indented. and more irregular than the silhouette . A simple explanation for the observation that the flame fronts appear to cross each other, as noted in reference 10 , is that burnip~ on the peaks of one flame front 13 occurring in the valleys of the other . If this explan~tion is correct, the presence of intersecting flamer; indicates unobserved regions of l.Ulburned charge.
It is vell known that when the flame approaches a wall or another flame coming from tbe op:;;>osi te directj.on, the observed progress of the flame is gl'88.tly slowed . This phenomenon can be explained as follcvTS . The photograpbs eholl the boundary 01
the unburned charge . The volume enclosed is being diminished by two processes :
1 . Physical compression
2 . Burning at the boundary
Evidently when the volume of the unburned charge is large, the contribution of physical compression 10 Inrge, and vice versa . In add ltion, ,.,hen the tUlbuxned charge becomes small, the rate of l iberation of enel'gy and hence the .cate of pressu1.'e 1.'1se may also be small owing to the r educed area of the flame front . Preflame reactions in the unburned charge, furthormore, may be of importance in suppressing compl'ession of this part . The last part of the charge to be traversed by the flame, therefore , appears to burn sl.cwly , a.nd it is not su1.'prisj.ng to note that detonatlon occurs a considerable interval after t.he apparent merging of flame ~Lonts .
The particular apparatus used in - eferences 10, 11, and 12 employed fuel injection into fresh air containing no residual gas . It is a common observation t hat fuel injection does not resul t tn a homogeneous cna1.'ge even ~.,hen injection is into hot residual g3.8 . This fact is inrlicated by the different mixture strengths for the limits of a combustible mixture that are noted when cylinder injection is used in plnce of premixed fuel and a i:r . It seems probable that, 10fi th inject ion into relativel y cold air, the mixture will be even less homogeneous than tn the case of an ongine vri t h cylinder injecticn. 1>Ti t rr(' ow . and Rassweiler (reference 3) attri aute irxoguJ.a1.'ity of the flame in their oxperJ.ments to nonhomcgenei ty of chay'ge J although their engine was .fed premixed fuel ard air in the n0:r'IlU11 manner .
34
In the light of the evidence, the authors are of the opinion that :
1 . The appa~ent depth of the flame frcnt in the pictures of yeferences 10 , 11, and 12 is due to the mixture being less homogeneous in the apparatus used than in the normal engine .
2 . Detonation, which occurs in the pictures of reference 12 apparently in the reglon already traversed by the flame, is probably in unobserved valleys of the f lame front that the f lame has not yet reached.
3 . Until more damaging evidence is available , the autoigni tion theory is still tenable and is the s-Lll1plest interpretation of the observed facts .
APPENDIX C
DESCRIPTION OF FUEL SYSTEM
The fuel system used in these tests was designed to accomplish the following ends:
1 . Eliminate vapor lock
2. Supply sufficient pressure to the inlet of the fuel injection pumr to insure reliable operation at high speed
3. Red.uce to a minimum errors due to change in pressure head at the pump inlet ,.,hen fuel measurements were being made
4. Eliminate personal errors in determining fuel-air ratio and improve the preCision of meaSE" ement
5 . Avoid t h'3 necessity of correcting fuel meaSllrements for changes in specific Gravit" due to changes in t 0mperature
6 . Make the procedure of determining fuel-air ratios as simple as possible
35
Vapor lock ,.,ras eliminated by malntain5ng t118 pressure in the fuel system at 48 inches of mercury gage. The pressure .Tas mair..:tained constant by fe '3c1:inc water from the ci t~r vater mains into the bottom of the fuel drum A (fig, 3) through t.he pressure regulator B, The regulator was permanently set to give approximately the desired value , and. fine adjustments were mad.e by controllir..g the rate of efflux oi' the .,ater by means of the small valve C. After the pressill~e ~~s once set, it maintained. its value within 0.1 inch of mercury with little or no attention. The fuel drum Has of sufficient strength to eliminate fire hazard due to leakage or rupture .
Inasmuch as every effort was made to keep the engine inLet air dry, it was des ira-ble to know if thjs c.ryness would be nulli fied by water disflolved.. in the fuel. It is practically impossible to have a dry charge . Some water vapor is always added to the fresh charge fl'om the re8io_u8.1 gases, and it is convenient to use this value as a basis of comparison for t.he effects of outside arl.ditions of ,·rater .
For a fuel - air ratio of 0 . 07 and a 10-pel'cent residual gas content, the weight of ~uel is about 0 . 06 pound per pound of charge and the weight of residual water is 0.009 pound per pound
of charge , gi v1ng a ratio of C . 009 = 0 .15 pOlmd of ,.,rater yer 0.06
pound of dry fuel supplied. \-Jater dissolves in gasoline to the extent of about 0.00005 pound per pound of solution at room temperature (refel~ence 17) . The ratio of dissolved ,vater to
resiclual w.ater l'S 0 . 00005 0 03 t hi h ' l' °bl or . percen , W c lS neg 19l y 0 .15
small .
The surge tank D was placed in the system to smooth out pressure pulsations from the regulator valve and also to bring tIle fY'ee surface of the fuel up to the same level as tllat in the balance can E. The surgo tank ",as made from a lucite cylinder about 6 1nches 1.n diameter and 1/4 inch thick with brass heads held together by through bolts passing outside the cylind8r . Tho use of transparent material allowed observation of the fuel level. The £Jame construction ",as used in the balance can E with the eXDoption that the heads were made of alumintw.
A mercury manometer vlas tapped into the surge taILlc as shown. When it vlaS desired to fill the balance can, the valves F and. G were closed and the valve H was opened slightly . This
36
procedure reduced the pressure in the can and fuel flowed into it when the three-vTay valve J was turned to the correct position. An objection may be raised to this method of filling the balance can. Some of the lighter ends undoubtedly escaDe, but the loss should be much smaller than that of fuel systems which use a measuring burette continuously open to the atmosphere . It requires only a very slight reduction in pressure to cause the fuel to flow rapidly.
This objection can be overcome simply by allowing the fuel from the surge tan~ to seek its level in the balance can . This method is slower; it takes about 1 minute for 0.10 pound to flow in this fashion.
It is not known whether air pressure on the fuel increases the rate of polymerization of the fuel to any appreciable extent . As far as could be ascertained, this effect is not serious.
The line leading to valve J was connected to an air pump (an ordinary automobile tire p~p) that was used to force air into the system for the purpose of maintaining a constant fuel level in the surge tank.
The pressure head of the fuel is practically the same regardless of whether fUel is being dra1fn from the balance can or directly from the fuel tank . There is a very slight change in pressure while fuel is being weighed, but this change amounts to only about one-half inch of gasoline in 48 inches of mercury.
Considerable diffic~uty was encountered in finding a threeway valve that 1vou..ld handle gasoline at the cperating pressure without leaking. The difficulty was finally overcome by using a plug valve having a monel metal cone and neoprene port seats . The port drillings of this valve are shown in figure 3 .
It was thought that the neoprene tube connections to the fuel can might make the balance too insensitive, but checks made against an analytical balance showed the sensitivity of the fuel balance to be better than 1 part in 2000. The balance was made of aluminum (except for the knife edges) to reduce the load and inertia effects and was sv.spended from overhead to insu.late it from engine vibration. A set of weights calibrated to read from 0.01 to 0.2 pound was found suitable for CFR engine operation at all speeds and fuel-air ratios . The electrical contacts on the balance were made of silver and gave good service .
l
37
When fuel measurements were made, the can .ro.s filled sufficiently to keep the cont acts open when the weight was on the pan, and the two-vay switch K was placed in position 1. When the pan descended, the elec ric clock and air ·meter countel' vere started by the r elay . The .,e i ght was then remcved from the pan and the swit ch was placed in position 2 . The r01ay was not a f fected by this change . When the balance again descended, the clock and COlU1.ter were automatically stopped and tho fuel ~veight, tlme, and ajr-meter revolutions Here precisel;:/ known .
The air-meter cOlm:;er was constructed from an ordinary gasmeter counter and a magnetic clutch taken from an electric stop clock. Th·':) counter .Tas mOUllted on t he air meter in plain vie., of the operator and was d1' i v6n directly from the air-meter shaft . The rotameter gave a good check on variations in flO.T rate during any given run.
APPENDIX D
DISCUSSION OF TEE IGNITION DELAY
Method of Isolating the Ignition Delay
It lIas been tacitly assumed that the concept of delay provides the only satjsfactory explanat:...on cf the experimental fact that an increase in compression ra~e raises the maximum permissible pressure. It is not necessarily obvious that such . is the case, ho.,ever, and hence the assumpt ion must be definItely established .
Consider runs 1 to 7 . (See fig . 4.) The operat1ng factors that varied in these runs ;·Tore essentially spark advance !lnd compression ratio . Slisht variat ions in .l.nlet-mixture pressure and eXhal1.st pressure can be ignored because they .rere made solely to keep the Iveight o~ cnarge per cyde constant. The r emaining operating factors, such as mixtur e compOSition, pisten speed, illi_et-mixtlIT6 temperatQre, and humidity were maintained constant and Gan also be isnorcd . TlJe only factors that can account for the oQserved change s i n end·-gas condi ticns are theref ore: heat transfer, f lame speed) nd ignition delay.
38
The observed resnlts might be sUPllosed to be due to the effect of heat transfer. Thus if, under the conditions of these runs, it were found that, when more heat was transmitted to the unburned charge , the charge detonated at a lower pressure and that this heat transfer varied consistently with rate of compression, then an explanation based on ignition delay wOlud be difficult to establish. Similarly, if a consistent correlation could be established between flame speed and permissible peak pressure, this correlation might be c;iven as an explanation of the observed facts ivi tho '.t any necessity for assuming a delay . It might be concluded that the effect of delay was ne31igible. If it can be shown, however, that heat transfer tends to produce trends opposite to those observed, then it must be concluded that the observed trends would be more pronounced if the heat transfer were zero .
The temperature of the cyllnder walls should not be greatly above the coolant temperature of 672 0 F absolute. The temperature of the exhaust valve can be estimated from measurements made by C. G. Williams (reference 18). These measurements show that, in very small engines, exhaust-valve temperatures of 12000 F absolute are probably not exceeded., but, 1n the majority of automobile engines , temperatures of about 13000 to 13750 F absolute are readily attained and 14750 F absolute can be reached at high speeds. If the low speed of operation is considerod, the temperature of tho exha.lst valve in the CFR engine at 800 rpm may bo estimated at not more than 1280° F absolute. The temperatlITe of the piston is undoubtedly considerably lo"'er.
Consider runs 1 and 6 and let it be aost@ed that all combustionchamber s l)rfaces are at an average uniform temperature of 12800 F absolute in both cases. This value is an Wlreasonably high average to assume, but it is talCGn because it is 1h"1favorable to, and simplifies, the following argument. Indicator diagrams for these two rur,s are shown in figure 25. The paths of compression frOOl 1200 B.T.C. to point P, where the compression lines intersect , are approximately the Sa1.116. Calculatio~ls show that the tempera-ture of the unburned charge of run 1 at P is 12700 F absolute and 12900 F absolute for run 6j hence, they are both e~ual to 12800 F absolute ilithin tho limits of exporj.mental precision. From this point to peak pressure, the unburned charge .,ill be cooled by the combustion-chamber surfaces. At pressure P3
the un"burned charge of run G "'ill have exporienced less cooling due to its shorter time of CO!ltact with the surfaces, and
39
therefore the charge shovld. detonate at a 10wGr preosu1'e than t~at of run L The true maximum permissible pressuro in run 6 , hOvlever , is 108 pound.s 11er square inch ( 28 pel'cent ) higher, and thorefore heat transfer between the unburned charge and. combusticnchamber surfaces does not account for the observed. re3Hlts . T:lis pressure difference is even greater between r1..llS 1 and 7 , but run 7 is net used, because under conditions of this run it was difficult to obtain good cycli c reprod.ucibility .
If the effect of transfer of heat} or ra.diant energy , from the burned to the Q~burned charge were predominant , an effect opposite to that observed. ,rould be llrod.uced . In the cnso of run 1 , spark occurs at top center and m8aSlITement of the dp/ dt records shows that detonation occurs at peak pressure . Hence it may be assumed that a flame exists from spark to peak pressill.'e ; this interval occupies 320 of cJ'ank angle , or O. 0067 second. of time . In r'm 6, spark occurs at 400 B. T . C., peak pressure occurs o.t 10 B.T.C., and detonation GC CLITS at 40 B.T. C.; hence , the d~~ation of the flame is about 37 0 of cra.nk angle } or 0 . 0 077 secc:ld of time . In add·i.tion, aVeJ:acs prvssures for run 6 801'0
higher durinG the interval betHeen spark and pe0.1 pre,']sure , and thus the average cOLlbustion -':;emperatures and the quantity of enerBY rad iated should.' e Graatel'. 'rhon, in the case of rvn 6 the flame is in contact with the unburned charge longer , and r.mergy is radiated f r om the burned charge at a higher rate . These effect s shou.ld canso deto;w.tion to occur at a lovler pres sure . Again the reverse is observed to be true . Rence i.n this l"or~;: the combined effect of heat tnl.l1sfer and ro.dtation - as reg3.rds the unb'cU'ned part of the charge , the burned p.1.rt, the piston, the exhaust valYe, and the cyl.inder walls - does not acccunt for the observed differenc3s in max imum permissible pressure of the _md gas . Actually if those effects woro zero , the DaximUTll permissible pressure for run 6 would be even greater as compared v1i th tbat of rQT} 1 .
Perhaps these differences in maximum permissiblo rrossure can be accounted for by changes in lome speed . Flnmo sp8ed is affected by every operating variable (referenCes 2 , 19 , 20, and 21) . As no rucords of tho actual flame SPeeds for the prcsJnt tests are available, it will be necessary to estirnnte these speeds from the indicator diagrams . By use of the; assumption that the time required. for comb~stion is given by the in~orval between tho passage of sp:1r k and the instant of dGtO:l3.tion, the average flrun8 s!,oods will be j.nversely proportlorul to this time .
4 0
Again J if the series of i'uns at 800 rpm are con.sidel"ed J the time of burning for run 1 is 0 . 0067 second and increasos unifornly for nms 2 J 3] 4 ] and 80 forth] unt il a value of 0 .0077 second is obto.1ne d for r~~ 6 , Let v represenb the average flame speed for r~l 5 ] then 1.2 v vTill represent the average f'lrune speed fer run 1 . The maximum permissible presslli.'e for run 1 is 389 pOlmd.s per square inch absolute and increases uniformly to 497 pounds per sq.uare inch absolute for rlli~ 6 . Here there is a consistent corrolation bet,,,een the avorage flame speeds and the maxi.mum permissible pressures . T~us , the h;:,']?othesis might be fm:mulatod that i'1.crease in average flame speed causes a decrease ~n maximum permissible----pressure .
Those chane;es 5.n fla.1:J.8 speed fer rll~S 1 to G vlere effected by changes in spark advance and compression ratio only . If the relat,ion between flame speed and maximum permisiJible pressure is ger..erul ] it should held reGardless of the procedure used to vary the fla.'lle speed . In run 33] for instance, the time of combustion is 0 . 0041 second and the average flame spoed is 1. 9v . 'l'hj.s increase in average flrune speed] over that of run 6, was brought about by cbanGj.ng engi:le speed and comrression ratio only . liere ] hovrever ] the increase in .LlaLle speed has res1.11 ted in an increase in maximum permtssiole p!'8ssm·e . This fact contrad.icts the previous ge:leralization on flame speed and maximum permissible presslll'e and] therefore ) cl a!1ges in flame speed alone caru:ot account for the observ3Q res'.u to . These data are summarized. in table: XIII.
An object ton miGht be raised to this demonstration on bhe gro"md that] in changing the engine speed (piston speed) and compression ratto , the hent transfer effects Viere also changed, and these eff .:.J cts may have operated. in a manner '''hich ,,:ould proh"bit any inferences buinS 1rawn regarding flame spoed alone . This is not the case) ho,.,ever .
T" e contributions to temperatU1'e effects due to increase in p ' ston speed should give a res~lt opposite to that observed b0cRLlSe the unburned cr..al~Ge in l'lm 33 has only half as much time t.o give ilp heat to t21e cyl i.nd.,')X' surfaces 3.8 that of run 6 and should therefore detonate at a lower pre8sure . Actu' lly , in :;:"un 33 ] the maximl1lll permissible pressure Is 109 pounds per s~uare inch higher . Also, the time Juring ,ihtc!1 energy may be radiated from the burnod. charge is only half as lone in the case of r1L'1 33 ] .ut the average combustion -:'emperattu'es are considerably hig_ er . Censequendy] tile <li.i.'fel'dl1Ce in the
41
amount of radiated energy in eitiler case is probably 8.r:'lall and therefore should net contribute ma.terially to the observed res1:..1ts .
Another objecti n might be raised on the ground that runs 1) 6) and 33 apparently have no co~on basis of comparison -beca1lse different compression ratios are used in each l'l.ill . It s:J.ould be remembared , ho,\Tever, that the commO:l basis of comparison in this v;ork is incipient detonation. Thus it can be shmm that, in tho case of run 6 , if the compression ratio l.,rere fixed, an incre'l.se in enginc~ speed , 3.t constant spark advance, wOl'.ld bring run 6 into a noncieto.:w.ting ree:sion (see fig . 7) <- nd '-!QuId therefore allow a highe.i.' pl'essure for incipient detonatioll . It can also be shown that a d.ecrease in spark advance a.t constant comp.Lession rati.o and engine speed vrould bring run 6 into a region of heavier detoIl2.tion and ";0 lid r equire a dccrea.se in pressure for the same level of detonation . Increase in engine spoed under these conditiolls results in an increase in flame speed, and decrease in spa.::.-k advance causes a decrease in flame speed (reference 21 ).
Hence , under these conditions thel'e woulJ.. be a cons istent correlation between flerne speed and ma."'Cimwn permissible pl'CS su:.:'e : namely , an increa.se in flame speed ",ould allow an increase in maximum permissible pressure . Such a proposition, if established as a generality, would 'be r::.eaningless for , as soon as acivantage werc taken of the allmmble change in pressUl'e by varying the compression ratiO, or inlet pressure , the original contradictory effects of flamo speed 1vould be evidenced .•
The variation in resid al gas content .,ill havo a snnll effect on maximum permissible pressure (reference 9), but these effects are of the order of experimental errors since the total weight of charGe per cycle 1.,raS maintaiCled essentially constant . Thorefore , since the observed effects of the present investication cam ot be entirely accolli"1.ted for b,V sncll variable factors as have so far beG~ rocoG1ized in this Ilork , the exj_stonco of another variable must bo assumed to account for them; this variable is the i gnition delay , In thi s sense ignition delay may be said to have been isolated.
It should.. be emphasized that , altho.lgh the fcregoing discussion shows that the effects of heat transfer and flame motion are insufficient to explain the obser ved chen e s in Dla.ximum permissible pressure, the discl:ssion in no way .!Juplies that these
42
effects do not influence the maximum perrnlesible presSl..u"e tn their elm right. Obviously they do, and 1jhe question :rr:.i81:t oe ra:ised as to how much of the total cha~16e is due to chango in delay alone . This q'lestion has no meaning, for a Domont' 8
reilection will make it clear that the delay is B. f1..mction of the path of compression and this path is a functjon of heat transfer and flame speed as well as every othor opel"ating v'1:riabl o ; therefore, a cha1183 in delay imIllies a chenge in one or more of these vi~riables and. there is no such thing as a change in delay alene.
Theory of C~1ain Reactions as ExIJlam.tion oj. lenition Delay
The phel1omenon of delay is probably best explained by tile theory of chain reactions i'Thich, in brief, specIfies that spontaneous ignition depends on two general types of reaction: chain-b!'anching r eaction conducive to explosion and its negative , chain- b:-eaJdng reaction . 'l'he rates of these reactions are Lt.ss·...uned equal pric1.' to explosion , but J if the physical conditions favorable to e]~l08ion are augmented , the chainbranching reactions gain t: le ascendancy, become self-accelerating, and proceed violently forward ( reference 22) .
If P 1 reprysents the minimCL'n self-ignition pressuro, then the rates of the chain - branc"l ing and eha in-brealdni3 react ions are equal up to point A. (Se8 fig . 8.) At potnt A the chainbranching reactions gain the ascendancy and. con·:"j.nue to aocelerate at an ever-increasing rate l.mtil at point B the rut ,] bocomes enormousj this highly accelerated reaction is r ecogr;ized as the explosion .
Little or no evidence of tho events occurring behmen points A and. B :nns been obtained. In the experiments of Tizard and. Pye (refere'i1ce 6 ) the only extornal L'lnnifestat ion was a alig}lt drop in prossure J which Has attributed to cooling due to llsat lost to the s ~lT:roundil1t3s . But the tl1eOl'Y of chain roact1ons is promising J and it is wor th iv-hile to use it freely eV6n though i tj may requ re l ater modification.
Slnce an explosion i s me:rely a mn.tter of rate J it might be asked J in the li3ht of the p1'ecGdin diccussion, ,.,hat ,,;us meant by the cXllression " instant of eXlJlosion" used. in tho dufinitions of apparent and. total de lay. Th'.l8 it might be assumed t.hat , since the chain- branchinG reactions had gained
_ .. --~--------
43
the ascendancy at A, t~is instant represented the besinning of the explosion, This iray ot' looking at the process is rather unnatural ; the expression "instant of explosion" will therefore be taken to mean the instant when the rate of pressure rise becomes substantially infinite .
It might be pointed out that , with respe ct to the chainreaction hypothesis , t:1ere is very little fundamental differ-ence betvreen the proces8es of normal b1.ll'ni.ng and detonatlon in an engine cylinder . In n01~l burning the moleculos are first energized by the electric s::':lark . They then become energy- rich molecules or chain carriers and pcssess the property of enerGizing other molecules with ",hich they come tn contact, to the extent that ar~ tendency for chai n - breaking rea ctions to sl01v down the process is overwhelmed . The chemical combination, or "b1.trnins , " takes place rapidly but only in the flame front whore enercy-).:'ich mole cu~es exist in abundance . Ahead of the flame front the tempera.ture and pressure of tlle unburned par t is rapidly risinG and, as a result, energy- rich r.tolecules are being fo:cmed at man;y 'Points . But chaln.- br eaki 113 or "poisoni.ng" molec1:.1 es are also being formed ahead of the flame front , and these tend to retard the accumulation of energy- rich molecules . At a s'xfficiontly high pressure and temperature the rate of format ion of Gllercy-rich molecules in t~e unbUl'ned part becomes so creat t hat the chain- branching reactions n wh to completion and the charge is said to detonate. This process is essentially th'J same as the process that takes place in the flame front) but there it is l:imited to a thin surface of roaction; ",hereas , when the unburned part of the charge de tona.tes, the reaction takes placo throv€hout the entire vollune . The violence of detonati. on is dUG not only to the rapidit y of the reaction but also to the high density of tho unburned charge . This density may be six time s that of tll.c chnr ge "hen spark ignition occurs , and hence the chemical energy libe1'uted would be six times that of an eClual volume burned nonnally in the early sta es of combustion. That a sucden r elease of energy in the end zone is responsible for high- f r e quency pressure '·m.v ~s in the combustion chamber and the chal'acterlsti.c 'pinking sotmd of detonation has been clearly demonstrated by Draper and dorsa (reference 23) .
The experimental fact that apparent delay varies "rith pr ess Te has be on mentioned . It ",a.s stated as an expermental fact that the apparent delay coult. be shortened from t1 to t;] (fig . 9) , depending on whether the ccmpression was discontinued at P1 or P
8• According to the chain- reaction theory the ~e~son
44
for the variation of apparent delay vdth pressure , is presumably, that the chain- branching reactions are given a greater acceleration in the time interval t4 when the average pressure is P + P,..,
1 c. than they are given in the same interval 1-,hen the average 2
pressure is Pl '
The term "apparent delay" can be extremely ambiguous, even at a definite pressure . Thus, in figure 26 J if the mixture is comnressed from zero to ?2 along path 1 and eJ..'1Jlodes at point C, the apparent delay ·1."11J. oe t
1• If the mixture is compressed
along path 2, the appo..rent delay ..,rill be increased to t[! J since pressures and ternperatl.lreS a:.'e lower at an,), instant along path 2 between A and B. But thel'e may also be some path 3 bet"\Oleen zero and P2 along which the apparent delaJ will be zero.
These considerations load to the following :
1 . I·Then compressod to a given pressu.ro, 11 combustible mixttITe can have an infinite number of values of apparent delay, depending on the pressr'.1'c-time path .
2 . Different values of aP11arent delay may be obtained 'vhen compression proceeds to a given prossure even though the time of compression is the same in every C"tse .
3 , Although pressures along one press lJ.re- time path are all,rays equa.l to or higher than pressures along another pu.th, the apparent delay of the first path may be greater than or less than that of the second path.
It is also apparent from figure 26 that the first two of theee results apply to total delay, but the third resvlt does not . For .the case of total delay it can be st~ted that:
4 . If pressures along one path are always equal to or hi@1er than pressures long ar.other path, the total delay of the first path 1fill be 1985 than that of the second .
This statement is the Converse of the prinCiple demonstrated eXperimentally in this repo~t .
If the compression paths cros8, it is possible to have various ignition pressures for a given val .... ~e of t0tu.l delay.
45
In figure 27 it will be observed that , for a given vQlue tl of total delaYJ ignition pressures - P8 J P3J or P,~ - might "b 3 obtained depending on w}1ether the compression path is OAB , OAG J or OJl..D . A sir:tilar demonstration can "be glven to shC'":tr that when the compression paths cross , va:rious Jgn1tion pr0ssures can be obtained for a given v3.lue of apparent delay .
It lvould be conve~J. ie lt to have a defini tion of delay 1"hich lvould miniLlj ze the 1nf1 "ence of the compre ss i.on path j.n orner tl!at, 1-111en the pressvre ,\1118 given, the deJ.ay >{Oi.ud be illmffi . If the compression is instantaneOt..l8 , dela will be a j)ropercy of the explosive mixture defined l)y the pressure and will not depend upon past history . Let this property be called absol ute delay a:ld defined as the time interval between the instant of comIJl'ession and the instant of explosion, provided the gas is instantaneously compressed .
In figure 28 , if the gas is compressed instantaneo~sly to P I along path OA I , the absolc.lte delay will be the interval AIEl' and ) as the cOID'j}reos"ion is contj.nued along the same path to Pz , P 3J and so fortI , definite values of aosolute (lelay AoB8' A3B :!,J and so forth , '-lill be associated i'lith each pressure .
In dealing with the relation betW'een flame speed and delay in an er>..gine cylinder, it is convenie:1t to introduce the term "residual delay ," defined as tho value tile apparent delay would have at a given pre ssn::.'e if the compression were discontinued at that pressure . The relat· on betiieen flame speed and x·esid'.!nl delay must be some",hat as represented in fig ures 29 nr:..d ::';0 . In fig"LU'e 29 the residval de] ay has diminished to zero before the entire charge has been consumed in the nOrI!J[l.l proces.J of como'J.s tion, and detonation ensues j whoreas J in figur'o 30 the residual delay has net reached zero ,,,hen the normal flame completos its passage and no detonation takes placo . Further o.m.plificction of this process m"aits the detorminatj on and cOl'relati.::m of flame speods and. delay periods under aC'Lual engine cantU tio s .
46
APPENDIX E
SUGGESTION FOR EXCRANG~ OF DETONATION DATA
One of the great difficulties in detonation research is the lack 0 -;' an absolute basis for the comparison of data . If the state cf the charge at a defin"2.te crank anGle and the indicator diaGram were given , raticnal compari. sons cou.ld bEl made . But such f actors as compression ratio, spark advance, inlet tempera-ture , boost press-Te, and oc fort h are superficial yarQst i cks, and it i s s eldom, i£, evor, that the work of two eX}Jerimenters can be compared, except in vague terms, on the basis of these quantities.
A particular instance illustrating the practice of investigators to express detonation data in terms of ext ernal operat ing variables is to be found in the work of Ba_rnard (re -arence 14) on the detonating tenc1encies of various hydrocarbons. The results of these tests are shown in figures 31 and 32, which are r eproduced from reference 14 . Notice that an increase in engine speed. at constant jacket and a r temperature calls for a 101.,rer critical compression ratio in thG case of trlptane and di-isobutylene (fig . 31) and ethyl benzene (fig. 32) . All the other fuels show an increase in critical compression ratio .Tith engine speed. . But it will be observed that, :01' all these fuels, increase in inlet and jacket temperatLrre requires a decrease in critical compression ratio . This fact might be taken as evidence that t emperatLTe was the most important single factor causing detonat ion in these tests . As haD been demonstrated : however, no conclusions of this nature Can posslbl;y- be draim from curves such as those of figures 31 and. 32 because the pressure-temperature-time history of tho unburned charge is unkno'-Tll and cannot possibly be determined from these data .
The standard test conditions used to rate these fuels , moreover , were so inadvertently cllosen t hat they gave ano!llalous results . Best power spark advance • .,ras used, t he determinf),tion of which requires the location 0/ the ID8.x"imum point on a ClU've ,,, i th a l)road peak, and the procedure is there: ore subject to considerable- error . Since detonati on is ver~f sensitive to small changes in spark advance, it is quit e possible that errors frO!l1 this so :trce are in part responsible for the anomalous behavior of certnin of these fuels .
47
The curves o:c' figure 33 , alGo rep:coduced from Y'efere!l.ce 14 J
S'10W that changes in e!lgi!l.8 speed "lVill 131 ve resd ts 'Th ~ch can b0 o:lly vaguel;y interprete<i . Notice that the indicated mean effective pre: ssm'e i.s, in general, higher at 2(;00 rpm than at 600 rpm :;:~or a gl"en compression ratio . This hi.gher value indicates that the air consumption per cJ"cle was higller at the higher engine speed . As a result of thj.s fact alone , peak pressures would "Je higl18r at 2000 rpm than at 600 rpm for a given compression ratio . In :;:Jar·~
ticular, the indicated- mean- e:?fective- pressure curVElS ShOll that , at a compression rat} 0 o J.' about 4, the change i e1 indicated mean effec-ive pressuro (or pounds of air p or cycle) with engine speed is small , but, as the compresston ratio is increase<i , the change rapidly becomes s.i.gnif.lcant .
Apparently then , erHical compression ratios dete:cmined under these conditions may give a fair estimate 0 1 the eff'ect of engine speed on detonation 1'01' fuels with low critical compression ratios (4 or 5) , but, 101' fuels w.:.th high critical compression ratios (10 to 14), the Llethod 1s misleadinc . Because the critical compression ratios fo. triptane, ethyl benzene, ~ nd diisobutylene al~e all high (above 11 at 600 rpm) , considerable d01.1.bt is cast on the resLlI ts for these partj_cular ftlels .
Such data may serve a usoful purpose in indicating thG p er formance of various '~'uels under practical operating condit. ions, be'.t, as far as basic research on c1etcn tion is con ,erned, they are of litt le value . It wot..ld be of in:'erst t o s'Cudy thcs'3 fuels by the method suggested in the text, that is, by a study of their dP/dt records .
Another instance 0:;.' a resea:i.'ch which does not a llo'" any f~.mdamental :lnterpretatio':1 js that CC!l.dllcted by Lee (refc:::::'ence 24) on the effect of engine speed and mixture temperature 011 detonation . l ·ee attrjb·'ted t~e observ d change jn de:'onation intensity Vli th en,ine speed to thc cb.ane;e tn vohunctric d'ficicnc;r; hmTever, many other :-actors t1:at Vle:;.~e 110t accounted f or contributed to tho change .
48
REFERENCES
1. Clark, G. L . , and Thee , W. C.: Present Status of the Fact s and Theories of Detcnation. Ind . and Eng. Chem . J vol.l?, no . 12, Dec. 1925, pp. 1219-122S .
2 . Wit hr 0,·, , J..Jloyd, and Boyd, T . A. : Photograpn1.c Flame StucUes "J.n the Gasoline Engine . Ind. and Eng . Chern. , vol. 23, no. 5, May 1931, pp. 539-~4?
3 . vlithrov, Lloyd, and RasGweiler, Gerald M.: Slow Motion Shows Knocking and Non-Knocking Explosions . SAE Jour . , vol. 39 , no . 2 , Aug. 1936, pp . 297-303, ~12.
4 . Ricardo, Harry R.: Paraffin as Fuel. The Automobile Engineer , vol . IX, no . 2 , Jan . 1919.
5 . Taylor, E . S .: The Importance of Auto- Ignition Lag in Knocking . TN No. 452, NACA , 1933 .
6 . Tlzard, H. T . , and pya, D. R.: Experiments on "(.ne I Gnit ion of Gases by Sudden Com~ression . Phil . Mag . , ser . 6, vol . 44 , no . 259, J uly 1982, 1'P . 79- 121.
"7 . Serruys, Max : La Combustion detonante dans les moteurs a explosi.on. Pub . Scj . et Tech . du Ministere de l'Air, No . 105 , 1937 .
8 . Ro-throck, A. M. , and Bj.ermann, Arnold E. : The Kn.ock::'ng Charact erist i.cs of Fuels in Relat";.on to Maximum Permissible Performance of Aircraft Engines . Rep. No . 655 , Nl~CA ,
1939 .
9 . Ta'Tlor, E . S . , Leary, VT . A. , and Diver, J . R.: Effect of Fuel- Air Ratio , Inlet Temperature and Exhaust Iressure on Detonation. Rep . No . 699, NACA, 1940 .
10. Rothrock, A M. , and Sper,cer , R. C. : A Photographic St udy of Combustion and Knoe!!: in a Spark-Ignit ion EnGine . ReI! . No . 622 , NAC~, 1 938 .
11. Rotht'ock, A. M. , Spe:leer, R. C. , and IvIilL3r, Cearcy D.: A High-Speed Hotion··Pi.eture Study of If rmal Combustion, Knock , and PreiGnition in a Spark-Ignition Enzine . Rep . No . 7('4, N.\CA, 1941.
12. Miller, Cearey D. : A Study by High~Speed Photography of Combustion and Knock in a Spark- Ignition Engine . Rep . No . 727 , NACA, 1942.
49
13. Fenning, R . IV., and Cotton, F. T.: Experiments on the Ignition of Gases by Sudden Compression. R. & M. No . 1324, British A.R.C . , 1930 .
14. Barnard, D. P. : The A. P . I. Hydrocarbon Research ProjGct . Refiner and Natural Gas . Mfr., vol. 18, no . 11 , Nov . 1939, pp. 456-465 .
15. Goodenough , G. A.: Principles of Thermodynamics . 4th ed., Henry Holt and Co . , 1931, p . 278 .
16. Reynolds , Blake, Schecter , Harry, and Taylor, E. S.: The Charging Process in a High-Speed , Single- Cyl inde::.', Fourstroke Engine. TN Ho . 675, NACA, 1939.
17. Spiers, H. M.: TeclLDical Data on Fuel . 3d ed . , British Nat . Corum., World P01'7er Conf . (London), 1932 .
18. Anon. : Exhaust Valves . The Automobile Engineer, vol XXVII, no. 360, July 1937, p . 273 .
19. Marvi..n, Charles F . , Jr., and Best, Robert D.: Flame Movement and Pressure Development 1.n an Eng:i.ne Cylinder. Rep. No. 399, NACA, 1931.
20.
21.
Scbnauf fer , Kurt : by 'Nev Methods . pp . 17-24 .
Eng:Lne- Cylinder Flame-PropaGation Studied SAE Jour. , vol. 34, no. 1, Jan . 1934,
Bouchard, C. L., Taylor J C. Fayette, and Taylor, E. S. : a~les Affecting Fl ame Speed in the Otto- Cycle Engine . Jour . , vol . 41, no . 5, Nov . 1937, pp. 514- 520 .
VariSAE
22. Lewis, Bernard, and von Elbe: Guenther : Combustion, Flames and Explosions of Gases . Univ . Press (Cambridge), 1938, pp. 2-5.
23 . Draper , Charles S . , and Morse, Philip M.: Acoustical Analysis of the pressure ~{aves Accompanying Detonation in the InternalCombustion Engine . Proc. Fifth Int. Cong o Appl. Mech. (Cambridge , Mass. , 1938), John Wiley & Sons, Inc., 1939, pp . 727- 732.
24. Lee, Dana W.: The Effects of Engine Speed and Mixture Temperature on the Knocking Characteristios of Several Fuels. TN No . 767, NACA , 1940 .
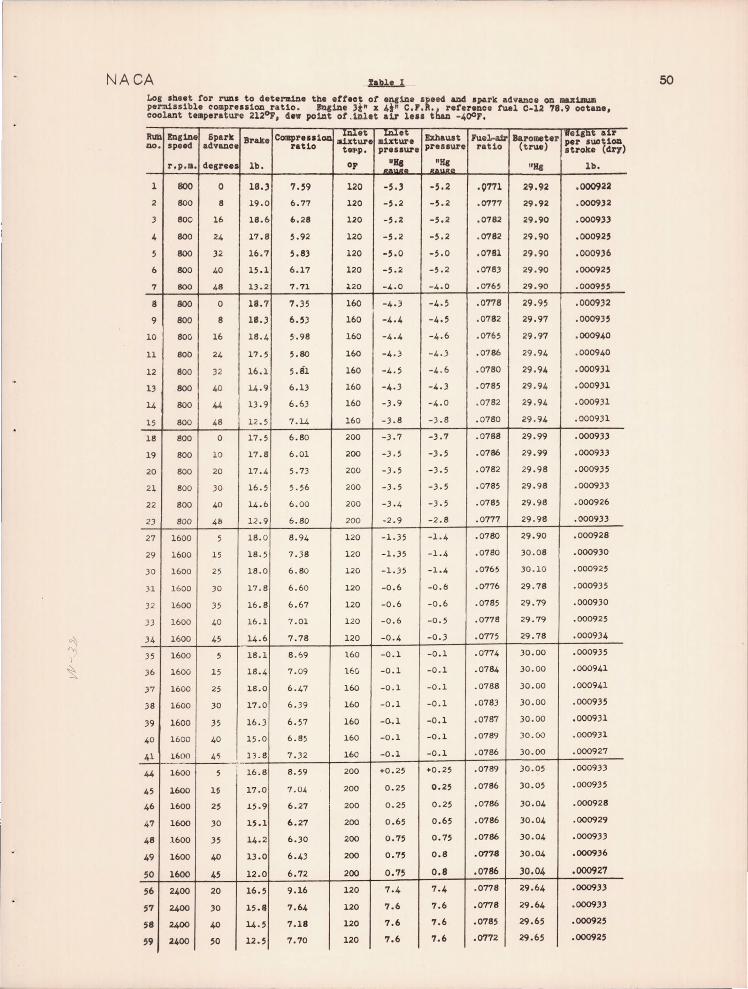
NACA LoS sheet ror run. to determine the errect or anstDe speed aDd .park advance oa m&X1nua permiss1ble oompre.s1on ratio. JQ&tDe )r" x 4." C.r.R., r.r.reaoe tu.l C-12 78.9 ootaae coolant t •• peraturc 2120" de. potDt ot .1Dlet a1r le •• thAD -400' . '
Run ED,tD e Spark • Brak. COlllpre .. 1on Inlet Inln Exhaust Pual.-aSr Baromete Ivallht ur
• speed advaDc a1xtur • mixture r per .u.ctiOD no ratio tell'p. pressure ratio (true) preuure .trolte (dry)
r.p.l1l. desreea lb. op .:!!!. .:~!. "H, lb.
1 800 0 18.) 7.59 120 -5 . 3 -5.2 ·0771 29.92 .000922
2 800 8 19.0 6.77 120 -5.2 -5 . 2 .0777 29.92 .0009.32
3 800 16 18.6 b . 28 120 -5.2 -5.2 .0782 29.90 .00093)
4 800 24 17.8 5.92 120 -5.2 -5.2 . 0782 29.90 .000925
5 800 32 16.7 5.83 120 -5.0 -5.0 . 0781 29 . 90 .0009)6
6 800 40 15.1 6.17 120 -5.2 -5. 2 .0783 29 . 90 .000925
7 800 48 13.2 7 . 71 :1.20 -4.0 -4.0 .0765 29.90 .000955
8 800 a 18.7 7 . 35 If>O -4. 3 -4.5 . 0778 29.95 .000932
9 800 8 18 . ) 6 . 53 160 -4.4 - 4.5 . 0782 29.97 .000935
10 800 16 18. 4 5'.98 160 -4.4 - 4 .6 .0765 29 . 97 . 000940
11 800 24 17 . 5 5. 80 160 -4 .3 - 4.3 . 0786 29. 94 .000940
12 800 32 16 . 1 5. 81 160 -4 . 5 -4. 6 .0.780 29.94 .000931
13 800 40 l.4 .9 6.13 160 -4. 3 -4.3 . 0785 29 . 94 .000931
14 800 44 13 .9 6. 63 160 -3 . 9 -4 .0 .0782 29 . 94 .000931
15 800 48 12.5 7. 14 160 -3 .8 -3 .8 . 0780 29 .94 .000931
18 800 a 17 .5 6.80 200 -3 . 7 -3 . 7 . 0788 29.99 .000933
19 800 10 17.8 6.01 200 - 3. 5 -).5 . 0786 29.99 .000933
20 800 20 17.4 5.73 200 - 3 .5 - 3 .5 .0782 29.98 .000935
21 800 30 16. 5 5. 56 200 - ) .5 -3.5 .0785 29.98 . 000933
22 800 40 1.4.6 6. 00 200 - 3 . 4 -3.5 . 0785 29.98 .000926
2) 800 48 12. 9 6.80 200 -2 . 9 - 2 .8 .0777 29 . 9t! .000933
27 1600 5 18.0 8. 94 120 -1.35 -1. 4 .0780 29.90 .000928
29 1600 15 18. 5 7. 38 120 -1.35 -1. 4 .0780 30 .08 .000930
)0 1600 25 18. 0 6 . 80 120 -1. 35 -1.4 . 0765 30.10 .000925
31 1600 30 17 .8 6.60 120 -0.6 -0.6 .0776 29 . 78 . 000935
32 1600 35 16 .8 6.67 120 -0.6 - 0 .6 .0785 29.79 .000930
J3 1600 40 16.1 7 .01 120 -0 . 6 - 0.5 .0778 29 . 79 .000925
34 1600 45 1.4.6 7.78 120 -0.4 -0.3 .0775 29.78 .000934
35 1600 5 18.1 8.69 160 -0.1 -0.1 .0774 30.00 .000935
36 1600 15 18.4 7. 09 11:0 -0.1 -0 . 1 .0784 30.00 .000941
) 7 1600 25 18.0 6.47 160 -0 . 1 -0 . 1 . 0788 ) 0. 00 .000941
38 1600 )0 17.0 6. 39 160 -0.1 -0.1 .078) 30 .00 .000935
39 1600 35 16. ) 6.57 160 -0..1 -0.1 .0.787 30. 00 .0.00931
40 1600 40 15 .0 6.85 160 -0.1 -0.1 .0789 30.00 . 000931
.£.. 1(,00 4~ 13 .8 7. 32 160 -0.1 -0.1 . 0786 30.00 .000927
1---44 1600 5
, 16.8 8.59 200 +0. 25 +0.25 .0789 30.05 . 0009))
45 1600 1~ 17.0 7. 0~ 200 0. 25 0.25 .0786 )0.05 .0009)5
46 1600 25 1.5.9 6 . 27 200 0.25 0 . 25 . 0786 30.04 . 000928
47 1600 )0 15.1 6.27 200 0.65 0.65 .0786 )0 . 04 .000929
48 1600 )5 14.2 6.)0 200 0.75 0.75 .0786 )0.04 .000933
49 1600 40 13.0 6.43 200 0.75 0.8 .077.8 )0.04 .0009)6
50 1600 45 12.0 6.72 200 0..75 0.8 .0.786 30.04 .000927
56 2400 20. 16.5 9.16 120 7.4 7.4 . 0778 29.64 .000933
57 2,400 )0 15.8 7.64 120 7.6 7.6 .0778 29.64 .00093)
58 2.400 40 14.5 7.18 120 7.6 7.6 .0785 29.65 .000925
59 2400 SO 12.5 7.70 120 7.6 7.6 .0772 29.65 .000925
50
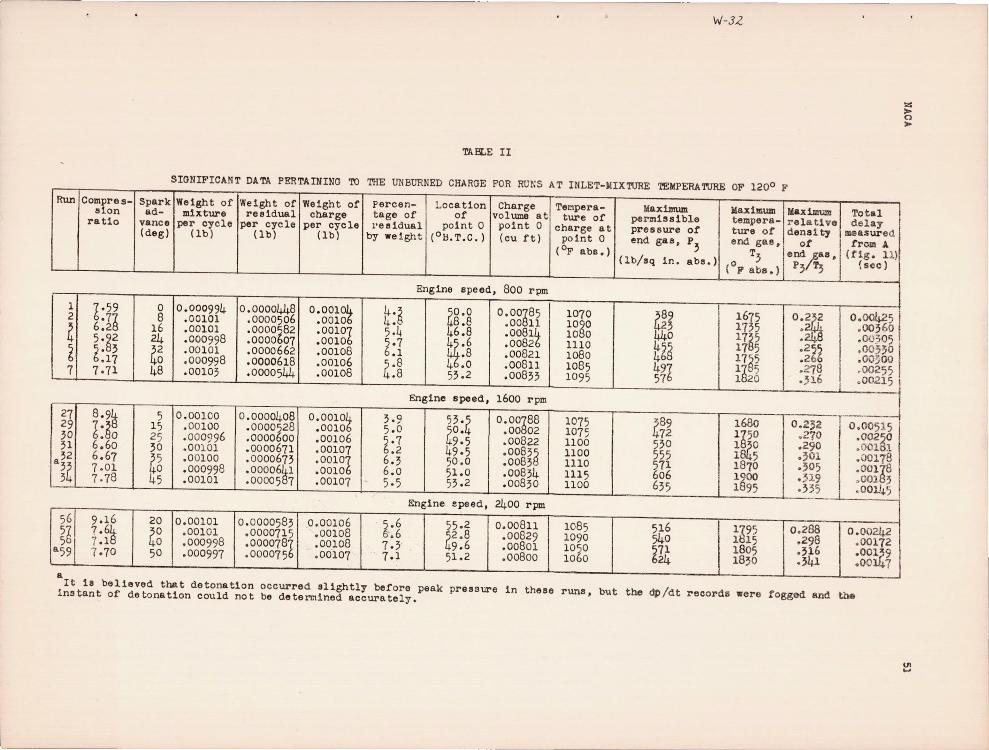
Run
1 2
4 ~ 7
27 29 }O 31 32
a" ~t
5;1
aUI
Compres-sion
ratio
1.59 .7~ 6.2
5.§2 ~. 3
.17 7·71
8.9h 7.§ 6. 0 6.60 6.67 7·01 7 . 7S
9.16 7. 6h 7 .1 7 .70
Spark ad-
vance (deg)
0 8
16 24 R~ 48
5 15 25 ,0 ~ '2 to 45
20
Rg 50
W-J,G
TABLE II
SIGNIFICANT DA.TA PERTAINING 'ro THE UNBURNED CHARGE FOR RU NS AT INLET-MIXTURE TEMPERATURE OF 1200 F
Weight of mixture
per cycle (lb)
0.000994
0
.00101
.00101
.000998
.00101
.000998
.0010,
.000998
.00101
0.00101 .00101 .000998 .000997
Weight of residual
per cycle (lb)
0.0000448 .0000506
0
.0000t82
.0000 07
.0000662
.000061S
.0000544
.0000641
.0000587
0.0000583 .0000715 .00007SI .000075
Weight of charge
per cycle (lb)
O.OOlOt .0010 .001Ol .0010 .00108 .00106 .00108
o. OOlOt .0010 .00106 .00107 '~~~~1 .001OI .00107
0.0"0106 .00108 .00l0S .00107
percen- Location Charge tage of of volume at residual point 0 point 0
by weight (oH.T.C. ) (cu ft)
Engine speed, 800 rpm
4.~ 4. 5.4 ~.7
.1
a·8 .8
3.9 5.0 ~.7 .2 6., / -6.0 5·5
~.6 .6
7.3 7.1
ao•o 0'00A85 8.8 .00 11
46.8 .00Slt ~.6 .0082
.S .00821 4 .0 .00811 53.2 .008'3
Engine speed, 1600 rpm
53., ,0. 9.5
49.5 50.0 51.0 .00834 53.2 .00830
Engine epeed, 2400 rpm
as·2 O.OOSl1
2.8 .00829 9.6 .00801
51.2 .00SOO ---- -
Tempera-ture of
charge at pOint 0
(OF abs.)
1070 1O~0 10 0 1110 1080 1085 1095
1075 1075 1100 1100 1110 ....... -1115 1100
lOSS 1090 1050 1060
--
Maximum per:niss1ble pressure ot end gas, P,
(lb/sq in. abs.)
~9 446 t~~ 491 57
489 72
5}0 555 571 ,_/ 606 635
516 540
~1t - ---
MaxilllUlll tempera-ture of end gas, T,
(°F abs.)
1675 17'5 17a5 17 5 17~5 1~ 5 1 20
1680 1~50 1~0 1 5 ~~1~ 1900 1895
1~95 1 15 1805 18;0
Maxim\l!!l r ela Uve dens1ty
ot end Aaa, P, r,
O :~ .24 :~gt , 278 .;16
0 .232 ... .... .2 .; .; , . ... 19 .355
0 . 288 .298 .316 .341
z ~ >
Total delay
measured trom A
(tig. 11) (scc)
0.00425 .00,60 .00305 .00;;0 .OO~OO .00255 . 00215
I 0.00')15
.0017 ~oo183 I . 00145
I 0.00242 1 I .00112 .OO~9 . 00 7
a It is believed that detonation occurred slightly before peak pressure in these rune, but the dp/dt records were foggod and the instant of detonation could not be dete~lned accurately.
til ....
RACA '!'ABLE III
TEMPERA'l'URE OF THE UNBURNED CHARGE AT VARIOUS CRANK ANGLES FOR RUN 27
[Firing run; high-speed C Ii' R engine; e~ine speed, 1600 rpm; compresaion ratio, 8.94; spark advanco, -50; tuel-air ratio, 0.0780; inlet-mixture temperature, 1200 F; res1dua1 content, 4.6 percent; clearance volume, 0.00272 cu ft; barometer, 14.7 1b/sq 1n.(true);
indicator springs: heavy, 150 1b; light, 5 1b; coolant temperature, 2120 FJ
Crank Pressure, PX1 Crl1nder Weight of Specific Indicated Adiabatic Adiz",tic sngle, 8 (lb/5q in. all •• )
vo ume, V:r. charge, v volUllle of tempera- tempera- tempera-( B.T.C.) (cu tt) - (lb) cbarge, V (cu ttl1b)
ture, TXl ture, TX2 ture, 'l'x~ (OF abs.) (OF abs.) (Op abs.)
100 19.5 0.016A8 0.001048 15.8 873 8p 87~
80 27.1 .012 3 .001048 12.2~ 9~9 9 5 947 60 43.2 .00903 .001048 8.61 105~ 1055 lO5
A 40 77·7 .00575 .001048 5·48 120 1201 120 20 ~.5 .00351 .001048 3.3~5 },~~ ilB4 U90 10 1 .5 .00292 .001048 2'ZI:5
5 19I'0 .00277 .001048 2. 5 1Ia8 14gi 14~' 0 20 .5 ---------- --------- -------.-- --------- 1416 .--.------
-20 ;M ---------- --------- ---------- -----_ ... _- 15 5 ----------Peak ---------- --------- ------. --- -----.--- 1705 ----.. -----
'mBLE IV
'lmlPERA'l'URE OF THE UNBURNED CHARGE AT VBIOOS CRANK ANGLES FOR RUN 7~
[NOnf1rlng run, tue1-air m1.xture; high-speed CPR engine; engine speed, 1600 rgm; compression ratio, 6.79; fue1-a1r ratio, 0.0795; inlet-mixture temperature, 117 FI clearance volume, 0.0037~eutt; barometer, 14.6lbfoq~(tl'ue);lndlcator spring, ~~;
coolant temperature, 212 Fl Crank Pressuro, PX1 Cyl1nder lIeight ot Specific Indicated AdiabAtic Adiabatio
angle, 8 volume, Vx cbArge, '1/ volume of tempera- telJlpera- temp,ra-(OB.T.C. I (lb/sq in. aba.) (cu ftl (lb) charge, V
(cu tt/1b) ture, TX1 ture, TX2 ture, Tx~
Crank angle,
(OF abs.) (OF abs.) (Op at>&. )
100 18.6 0.017g4
0.00130 13.~3 711 717 HI 80 2g
.6 .013 .00130 10. 5 A74 A82
60 3 .6 .0100t .00130 7.73 9gg
76 40 66.1 .0067 .00130 5·20 1011 1022 20 110.6 .00452 .00130 3.48 1098 11il 1182 10 il2 •1 .00~93 .00130 3.02 1137 12 h~ 0 5.6 .00~73 .00130 2.87 1191 1245
TABLE V
TEMPERATURE AND PRESSURE OP THE UNBURNED CHARGE AT VARIOUS CRANK ANGLES FOR RUN 76
(Nonfiring run, fuel-air mixture; high-speed e P R englne; engine speed, 1600 rgm; compression ratio, 6.79; fue1-a1r ratio, 0 .0796: inlet-mixture temperature, 123 F; clearance volume, 0.00373 cu ft; barometer, 14.8 1bfoq1n. (true); indicator spring, ~ 1b;
coolant temperature. 2120 FJ Pressure, PX1 Cylinder Weight of Specific Indicated Adiabatic Adiabatic Ad1abatic
e volume, Vx charge, VI volume ot tempera- tempera- tempera- pressure, P
°B.T.e. ) (lb/sq in. abs.) (cu ft) (lb) charge, V (cu ft/1b)
ture, T Xl
ture, T x2 ture, T
x3
52
x3
(op abe.) (Op abs.) (OF abe.) (lb/eq in. abe.)
Values computed i'rom 100° B.T.C.
100 20.~ 0.01734 0 .001295 13.~8 ~Ei ~85 ~85 20.3 80 27 .6 .013 .001295 10. t
945 961 28.15
60 t~:6 •0100t .001295 7.7 891 4t·7 40 .0067 .001295 5 . 22 1010 1086 1115 7 .9 20 113.~ .00452 .001295 3.49 1128 1241 128
g 129.0
10 it6 • .00393 .001295 3. 0§5 1182 1303 134 155.6 0 6.3 .00373 .001295 2.8 1201 1327 1372 167.0
Va1uo6 computed from 40° B.T.C.
40 67.8 .00676 .001295 5·22 1010 1010 1010 67.8 20 113.~ .00452 .001295 3.49 1128 11i7 1166 117.1 10 il6 • .00393 .001295 3.0~5 1182 12 5 1225 141.5
0 6.~ .00373 .001295 2.8 1201 1237 1249 152.0
- --- - ----------------~~------
lAC!
TABLE VI.- TEKPERA'roRE OF END GAS COldPUTED FROW VARIOUS POINTS ON THE COldPRESSION STROKE
FOR RUN 5 OF REFERENCE 9
uPiring run; low-speed C F R engine ; engine speed, 1200 rpm; r.ompreselon ratio, 6.88; spark advance, 300 ; fuel-air ratio, 0.0812; inlet-mi x turo temperature, 2000 F; residual content, 5.6 percent; clearance volume, 0 .00,69 cu ftj barometer, 14.8 Ib/8~ in. (true); indicator springs: heavy, 150 lb; light, 5 Ib; coolant temperature, 211 ~
Crank Pressure, Pltl Cylinder We ight at Specific Indicated Maximum angle, e volume, Vx charge , w volume at tempera- end-gas
(OS.T.C.) (l b/sq In. ab s. (cu ttl ( l b) charge, V ture, TXl tempera-(cu x't!lb )
(OF abs.) ture, Tx
2 (OF abe.)
146 14.8 0.02382 0 .001158 20.58 863 1957 100 21.25 .017G.a . 001158 1(.15 912 1907
30 98.8 .005 .001158 . • 70 1316 1924
TABLE VII.- TEldPERATORE OF END GAS COMPUTED FROW VARIOUS POINTS ON THE COMPRESSION STROKE
FOR RUN 37 OF REFERENCE 9
[Firing run; low-speed C F R engi ne; eng i ne s peed , 1200 rpm; compression ratio, 7.51; spark advance, 30~; fuel - air r atio, 0.0785; Inlet-mi xture temperature, 1200 F; residual content, 5 percent; clearance volume, 0. 003325 cu ft; barometer, 14.85 lb/s8 in. (true); indicator 5pringe: heavy, 150 Ib; light, 5 Ib; coolant temperature, 211 F]
Crank Pressure, P Cylinder Weight of SpeCific Indicated Maltimum angle, e Xl volume, Vlt charge, w volume of tempera- end-gall
(OS.T.C. ) (lb/sq In. abs.) (cu tt) (lb) charge, V ture, TXl tempera-(cu ft/ 1b) ture, Tlt
2 (OF abe.) (OF abs.)
146 14.85 0.02345 0.00123 19.06 803 1888 100 22.,' .01719 .00123 1,.97 885 1883
30 109. .005075 .00123 .125 )280 1888
TABLE VIII~TEMPERATURE OF END GAS COMPUTED FROM VARIOUS POINTS ON THE COMPRESSION STROKE
FOR RUN 51 OF REFERENCE 9
[Firing run; l ow-sgeod C F R engine; engine speed, 1200 rpm; compress i on r a tio , 7 .70: spark advance, 30 ; f uel-air ratio , 0.0782; inlet-mixture temperature, 80° F ; residual content , 4 . 8 per cent; clear ance volume , 0.003232 cu ttl bar ometer, 14 .8 Ib/sq in. ( true ); ind i ca t or springs: heavy, 1, 0 I b; l ight, 5 Ib; coo lant t emperature, 211° FJ
Crank Pressure, Px Cylinder _I Weight of Specific Indicated Maximum angle 9 1 volume, Vlt ~harge, w volume of tempera- end-gas (oB.T.C. ) (1b/sqln. abs.) (cu ftl (1b) charge, V ture. Tlt tempera-
(cu f t/1b) 1 ture, Tx (OF abs .) ."
(oFabs.)
146 14.8 0 . 02336 0.001268 18.42 ~73 1867 100 22.3 .0170~ . 001268 13.48 51 1859
30 114.6 .0049 .001268 3·93 1276 1893
TABlE IX .-TEMPERATURE AND PRESSURE OF THE UN BURNED CHARGE AT VARIOUS CRANK ANGLES FOR RUN 77a
[Nonfiring run, dry air only; high-s peed C. F. R. eng ige; engine speed, 1600 rpm; compression ratio, 6.79; inlet-air te mperature. 126 F; clearance volume, 0.00373 cu ft; barometer, 14.8 Ib/sq in. (true)b indicator spring, 50 Ib;
coolant temperature, 212 FJ
53
Crank Pressure, PXl Crlinder Weight of Specific Indica ted Adiabatic Adiabatic Adiabatic
angle, e va ume, Vx charge, VI volume of tempera- tempera- tempera- pressure, Px (oB. 'r.C. ) (1b/sq in. abs.) (cu tt) (lb)
charge, V ture, Tltl ture, TX2 ture, Tx~ 3 (cu ft/lb)
(OF abs.) (OF abs.) (Op abe.) (lb/eq in. abs. )
100 20.3 0.017~4 0 . 00125 14.1~ F 6 ~76 ~76 20·3 80 28.~ .013 . 0012 5 11. 0 47
9t g 9t~ 28. 31 60 4~. .01O~ . 00125 8 . 04 9~0 4~.9 40 7 .~ . 0067 .00125 S·tl 10 5 110~ 1109 15· 77 20 12 .3 . 00452 .00125 3. 2 1233 127 ) 293 1~1.7 10 1~2. 3 .00393 .00125 3.~5 1293 gt~ 13~7 158.7
0 1 2.3 .0037~ .00125 I 2.9 5 1310 13 5 171.7
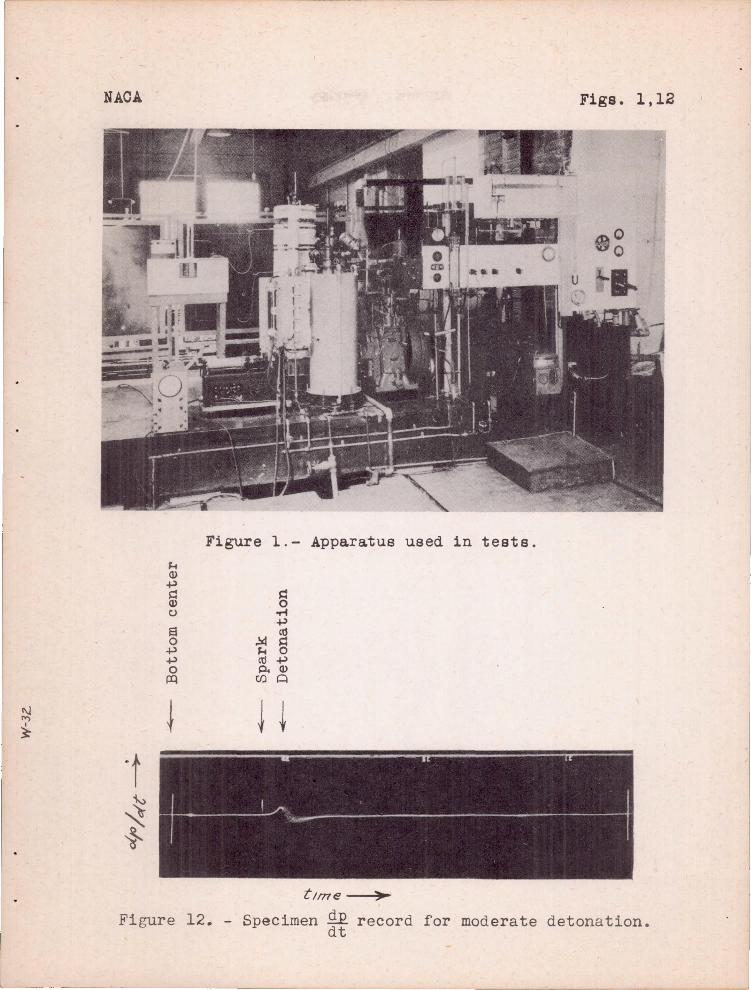
NACA Figs. 1,12
Figure 1.- Apparatus used in tests.
tIme ~
Figure 12. - Specimen ~ record for moderate detonation. dt
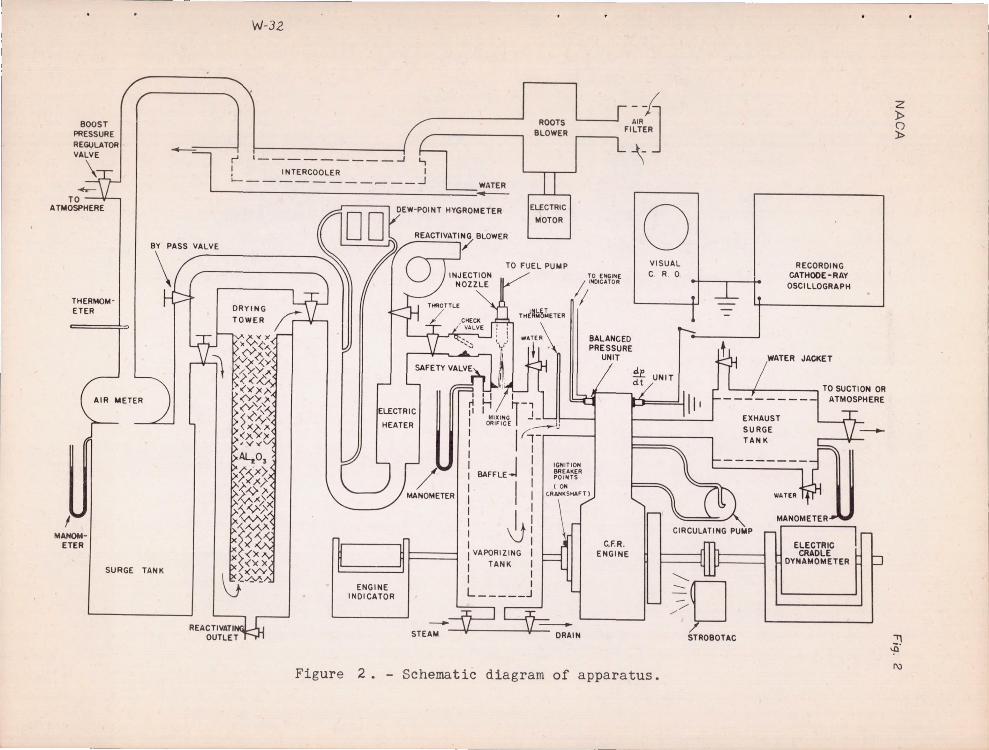
BOOST PI'IESSURE REGULATOR VALVE
\-
THERMOM ETER
I MANOM
ETER
SURGE TANK
W-3Z
_ -.J .,
I ~ ...J ._-- .J I WATER l L __ "''''~':O:_____ ~_ DEW-POINT HYGROMETER
ELECTRIC
HEATER
/ MANOMETER
I
ri I' I I I I
: BAFFLEJ
I I I I I I I VAPORIZING
--f-AIR l
i FI\RJ
ELECTRIC
MOTOR
T O ENG INE /, IN[)teArOR
/
IGNIT ION BREAKER PO INTS
I ON (.RANK SI1AF T)
o VISUAL C, R 0
t
\ CIRCULATING PUMP
C.F.R. ENGINE
ENGINE INDICATOR
I TANK
I I L _____ J ;0 ------. " \I
STEAM ¥ • DRAIN / STROBDTAC
Figure 2. - Schematic diagram of apparatus.
RECORDING CATHOOE-RAY
OSCILLOGRAPH
JACKET
ELECTRIC CRADLE
DYNAMOMETER
z l> (") »
" ~.
rv
W-3Z
WATER
A I
DRAIN I I I I I WATER I I
L.J
CONTACT FUEL BALANCE
FUEL TO ENGINE 6V ....L
D.C.--:::L
TO AIR PUMP
THREE -WAY VALVE ROTAMETER
PLUG DRILLINGS
Figure 3. - Schematic diagram of fuel system.
ELECTRIC CLOCK
t--------il 0 II-------i
AIR-METER COUNTER
000
2 }> C) 1>
" ~.
(..)
NACA
• _ ..... - •• : •• !,.;.~.
:~ .-;" ;:~: ~
;r \\ • i~
",,..I'" • '\" , •
,.r" "''' ''' . .32.4 A.T.C. ~r _ ......... ~ . !
~ "
rf\ ~\ ~\ \ j.' '\
y! \ ~ \ ~~ \ ': tr",
/ '" :3
.... ...
Fig . 4
Figure 4.- '!he .reect ot spar k advance on tha shape ot t ho indicator d.1agram. Constant 1nc1pient detonat1on ; eng1ne 'pood, 800 rpm; other operat1ng cond1tions as 1n table I. Maximum perml;slble pressure 1s ind1cate d bJ croaaes in run. 6 and 7. Numb<!r6 a t tho peak 1ndlca te tho crank /\ngle Intor'fal between top center and. p.ak: pressure. Spark: 19-n1tion occurs: At S •
....... . ~,
/\, ,.J.: ...... ..
..... ....... ", '.~ '. .. ....... 2
24.4° A.rO . .... . " . . "',
..... .... 1 \ ! ...... ,. _ 11.6-A.T. c .
.. 1 ... .... ..... , ... .. .. _ .... :: .... :::~ :--..... ........ .. : ... .. -......... ..
(-\ I \ I \ ~ \ ~ \
[. \. 1 \ ;. \ l \ ~ '\ ~ '\. 7
; " •. ~ -1.6· A. T. O . . ."..#' ... ' ....... ... ... ....... -" . ._ I
I ~ I ", \ .?', \
r.". " .. i '.,.
t: \ / \ , .
.i ... .. . '
, ' . . .. .....
.I ... ., ............ " i
12.4 A.T.C .
6 - 0 .8 0 A.T. C.
-, ::::--- .
SCALE
. , ., .•. _. ~"",":::.::::" .~ I _._. T. C.
. ___ .r .- .-~-.: .... -... -~ ... .
~15°L ~ 0 (Jj 0 40 ~ ·CRANK ANGLE
NACA
1/\ W \ .~ \ 'l:- \
1 \,
Fig . 5 Figure 5. " "nle effect or spark advance 0:1 the 8hape or the
ind1cator diagram. Constant 1nc1p1ent detonat1on; engine speed, 1600 rpm; other operating cond1tion" ." in table 1. Maxi mum permissible pressure is indicated by 11 croas in run ~4. Numbers a t the peak indica te the crank angle interval be tween top center and pellk pressure. Spark Ignl tlon occurs at s .
...... . ~ ...... --::-....
29 22.4° AT.C.
I I "" 30 ... " ' ...... , ' O.S· AT. C . . ~ ... -:-... -'~~_/~ .1 , ... ----....... ..... "" _._ .. ;: .. . .. .... :-:.."':).-
32
33 O' ATC.
SCALE
' . ... ~ ........ . .. . . -.: .~.",,;,: ~.: ... ..- - .
~'5°L ~ 0 en 0 40 ~ 'CRANK ANGLE
"" ' -
NACA Figure 6.- The effect ot spark advance on the lShape ot the
indicator diagram. Constant inclplont detonation; engine ".: speed, 24 00 rpm; other operatIng conditions as 1n table I. 'I ~~~:~~ ~~p ~:n~:~k ~~~~:~e p:!:s~:~ ~~;~ i;~~~r~~ .~~f~ occurs at S. Vf.j rt
.~~~ : . \ ·"t . "\
fb~:" \ .~.. .. . 56
.Ii ' \ 20.80
A.T.C.
II ),
Fig. 6
/' I. '.',-.,
I '~' '''''''' • ' . 'J4'$.~ .. ~-=:..'-""~__ • ;..........____ ~ .. -- .. :-=: .. ::.: ..... . ~ :. .. -.. ---
.. . .. ...
58 5.20 A.T. C .
.... ... --._,,- .. , .... . . ........
SCALE
fL ~ 0 40 ~ °CRANK ANGLE
-.. -: ....
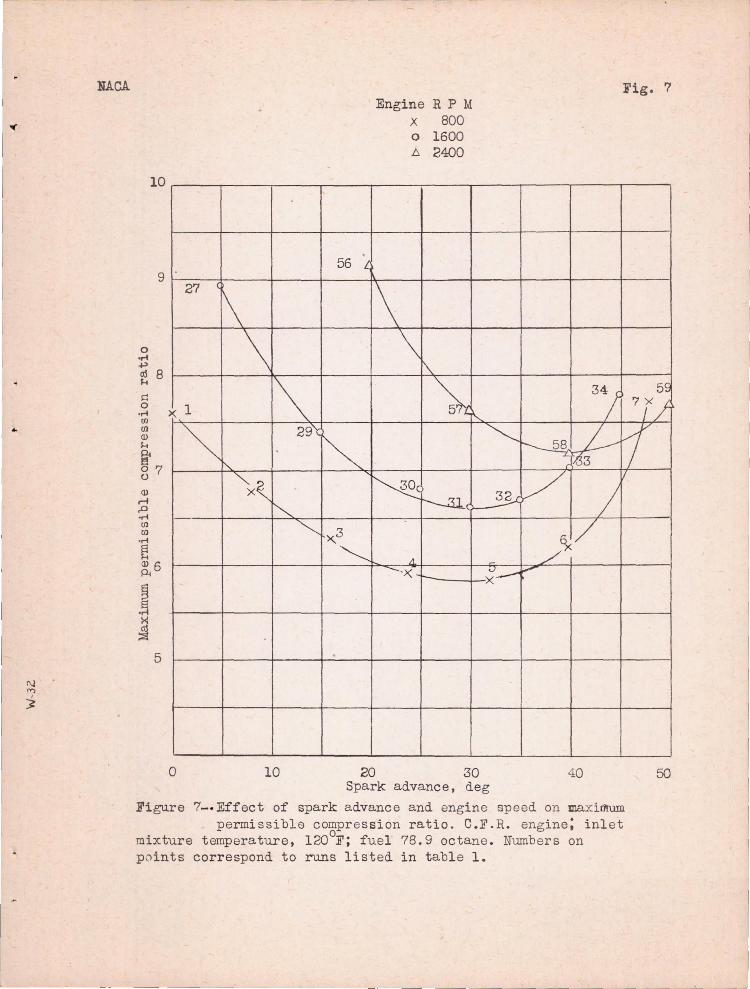
NACA Fig. ?
10
56 L 9
27 '1\ \
>< 1 \
Engine X
RPM 800
o 1600 /:; 2400
\ \
r\
~ '-.. 3; 5S
7/)
~ 29\
~ ~ ~ rr ___ 58 .
2
~3 "" '\~ ~ ./ V
~ .3--c / ~ ~
-
~/ )<.3
~ .1. = ,/
--)( ;:.--- ,.......
o 10 20 30 40 50 Spark advance, deg
Figure 7-· Effect of spark advance and engine speed on maximum permissible compression ratio. C.F.R. engine; inlet
mixture temperature, 120oF; fuel 78.9 octane. Numbers on points correspond to runs listed in table 1.
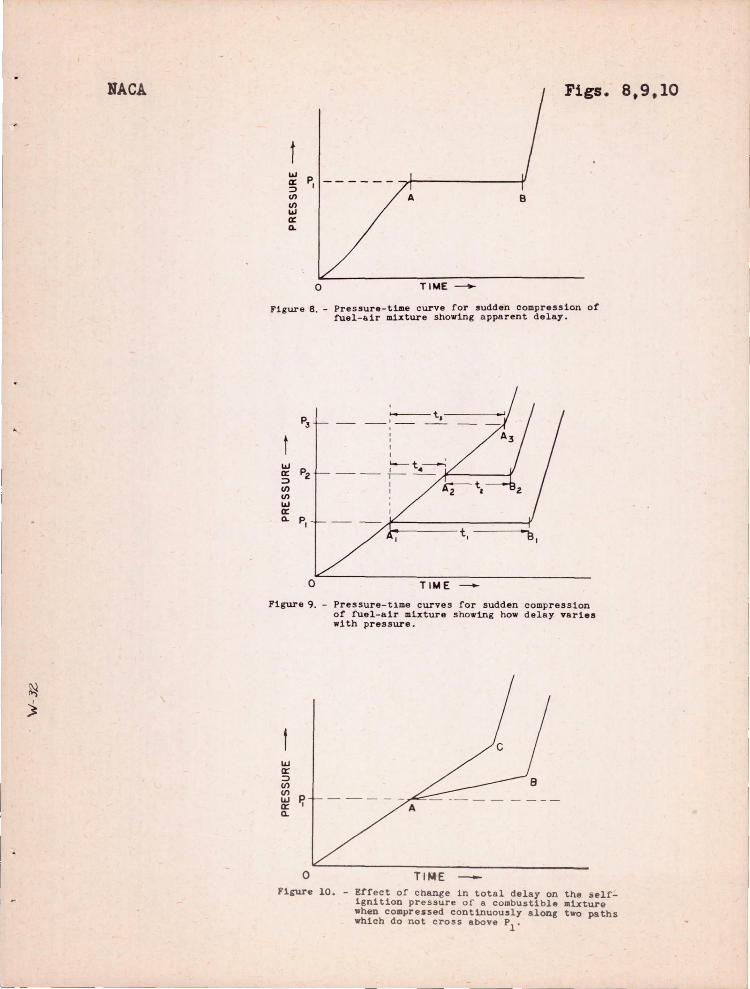
------~----------------------------~------------------ ----------~~----------------
HAC! Figs. 8.9.10
t &oJ a: P, - - - - - - ~I---------~ :J II> A B II> &oJ a: Cl.
o TIME ------
Figure 8. - Pressure-tae curve for sudden compression or fuel-air mixture showing apparent delay .
,
P., --t.
-- ' --- --'-
t &oJ
PC! ex: -----:J II> II> &oJ a: Cl. P, --- - -
}---------- t, ------~·~B,
o TIME --
Figure 9. - Pressure-l;lme curves for sudden compression or fuel-air mixture showing how delay varies with pressure.
ILl a: :J II> II> ~ P, Cl.
figure 10. - Effect of change in total delay on the selfignition pressure of a combustible mixture when compressed continuously along two paths which do not cross above Pl'
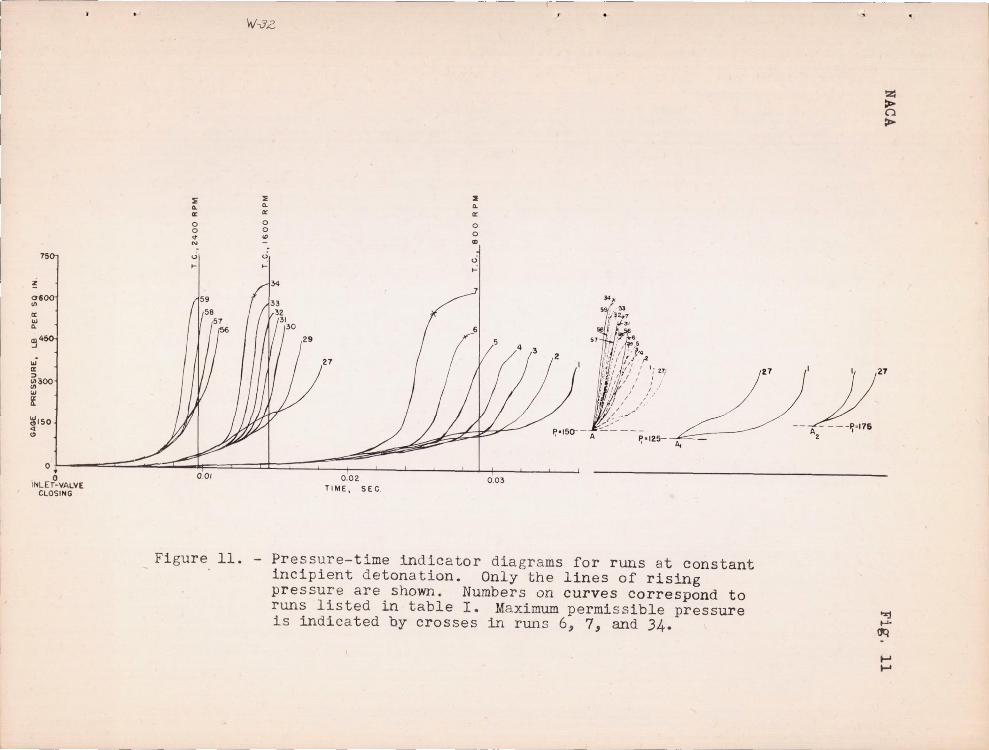
z
06 III
a:
'" ..
'" a:
" <11300 <II
'" If
~ "-ex: 0 0 <r N
~I
'w'--3-2
:I;
"-ex: 0 0
'" ...; I-
27
1I 0..
a: o o CD
o I-
~'] J~I :=~= ,.,,, •
At
o INLEr-VALVE
CLOSING
0 .01 0.02 TIh1E, SEC.
0 .03
Figure 11. - Pressure-time indicator diagrams for runs at constant incipient detonation . Only the lines of rising pressure are shown. Numbers on curves correspond to runs listed in table I. Maximum permissible pressure is indicated by crosses in runs 6, 7, and 34.
27
z > n >
Ji." -- A2
'xj ~
(JQ
~ ~
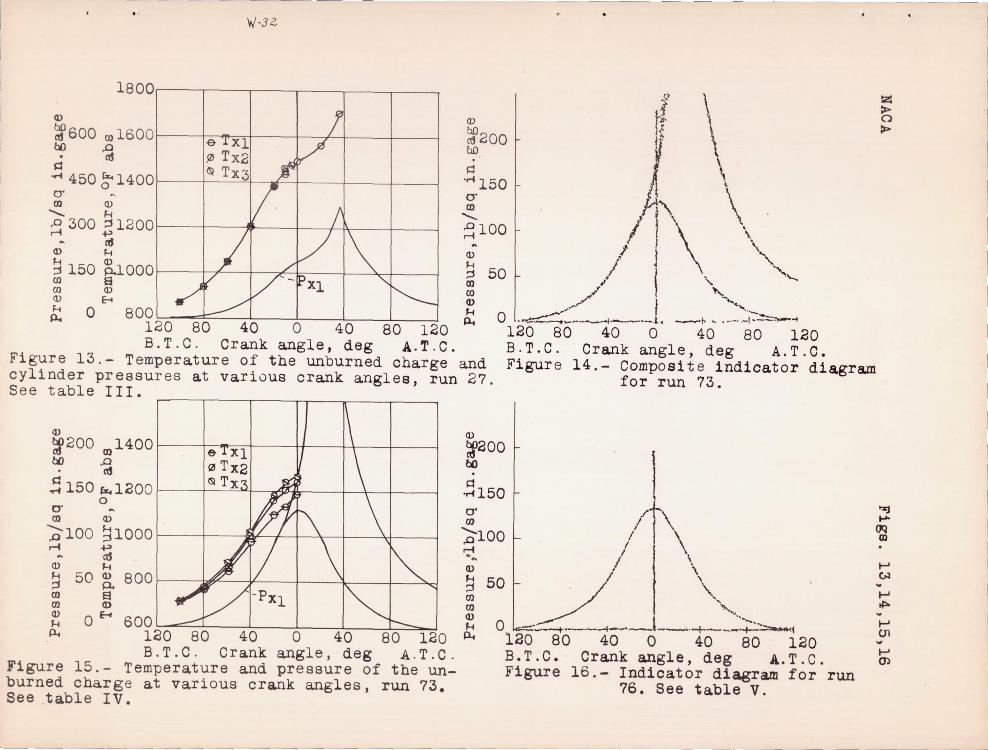
"1/ -3 2
1800~1 ---.---,,---~--~--~--~
~600 ~1600 1 IH~~I -Z I I I ..... 450 rz.1400 3 • o 0' ~ en CD ....... ~
.0 300 ~ 12001 " I p... ...... +> t1J
CD ~
~ CD ./ \r; "\ I ;j 150 P.1000 I 1/ x _ " to a UJ CD Q) E-<
Q)
~200 bD . Q
'M150 0' en ....... .0 100 H
Q)
~ 50 en to CD
~f \ l.t \ j~ \
V \ \
\ /f t\ \ ..
J I \ " l "-, l.j " . ~ . .~
¥ " ./ , H 0 p.., 8001 ~ I I I I ~
120 80 40 0 40 80 120 p..,
,,/' I ~, .. -_ o L'~~ ___ I_._._.L _I> <. .·-~ .-I----"'"
B.T.C. Crank angle, deg A.T .C. 120 80 40 0 40 80 120
z ~ o ~
Figure 13.- Temperature of the unburned charge and cylinder pressures at various crank angles, run 27. See tabl e III.
B.T.C. Crank angle, deg A.T.C. Figure 14 .- Composite indicator diagram
for run 73.
~200 14001 I~ 'T' .... , I II 1\ t1J m ~ ~ ;; 150 rz.1200 I "LlI Ph \
o 0' ~ en Q)
~100 ~1000 I Jljl / \ \1 ...... .p ~ cd
Q) ~
~ 50 ~ 800 1 ;1#/ Y ~ "J m a en Q)
~ O~ p..,
600 I ---== I I I I I =-=- I 120 80 40 0 40 - ~ B. T.C. Crank angle, deg
Figure 15.- Temperature and pressure of the unburned charge at various crank angles, run 73. See table IV.
Q)
~200 ~
~150 0' (/J
....... 100 .0 ...... .... CD
~ 50 en rn
1 It'\ " \ ; \ I •
I '.
. \. ",
"'-.. Q)
J-l p.., ~
' \
'. o k---+.---I---l-___ .+ ___ .';--··· ____ i 120 80 40 0 40 80 120 B.T.C. Crank angle, deg A.T.C. Figure 16.- Indicator diagram for run
76. See table V.
'xJ .... ~ (J)
~ ~
~ ,p.
~ (]l
" ~ ())

W-32.
Q)
~200 (1)1400 1 1_ 'T'~ , : 1 bO .0
• :1l
.~ 150 (%.1200 1 1 - ~u l he ..dJ ~ o
cr OJ Q)
?100 ~lOOO rl ...,
oj Ql ~.
~ 50 ~ 800 I -=r $ 1, (I) 8 (f) Q)
(1)1400 .0 cd
(%.1200 o Q)
~1000 ..., cd I-<
8. 800 E Q)
Q)
200 ~ be
150.S 0< UJ
100~ rl
Q)
50 ~
~ 0 E-< 600 , -==== I I I I I ==-=--, E-<
UJ (I) Q)
600 ~I I I~ I 0 I-<
120 80 40 0 40 80 120 p., 0.. 120 80 40 0 4 0 80 120 B.T.C. Crank angle , deg A. T.C.
figure 17.- Temperature and pressure of the unbUTned charge at var i ous crank angles, computed from 100oB.T . C., run 76. See table V.
Q)
~200 (1)1400 bO .0
• oj s::
. .-1 150 (%.1200 o
0' (I) Q) ___ I-<
P 100 ;j1000 rl ...,
cd Q) I-<
~ 50 ~ 800 (I) 8 (I) Q)
Q) E-<
::. 0 600 ' -----::: I I I I '::::=:::'- '
120 80 40 0 40 80 120 B.T.C. Crank angle, deg A.T.C.
Figure 19.- Temperature and pressure of the unburned charge at various crank angles, run 77a. See table IX.
B.T.C. Crank angle, deg A. T.C. Figure 18.- Temperature and pressure of the unburned charge at various crank angles, computed from 40oB.T.C_, run 76. See table V.
r:----r-------">-~ V Maxi mum T P<3 / ~
V -/
Maxi ~um T xl , ' y /
/ /
/ V
68 70 72 74 76 78 Clearance volume,cm3
fl.
h
1
1
1
1
400
380 15 cd
(%. 3600
Q)
I-<
340 E cd I-< Q)
320 ~ Q) ...,
300 3 8
• .-1 ><
1280 ~
1260 80
Figure 21.- Effect of adiabatic
clearance-volume errors on maximum values of indicated temperatures, run 77a.
and
z :» o :»
"'l .... (JQ III
f-' -..J
f-' 00
f-' co t\) f-'
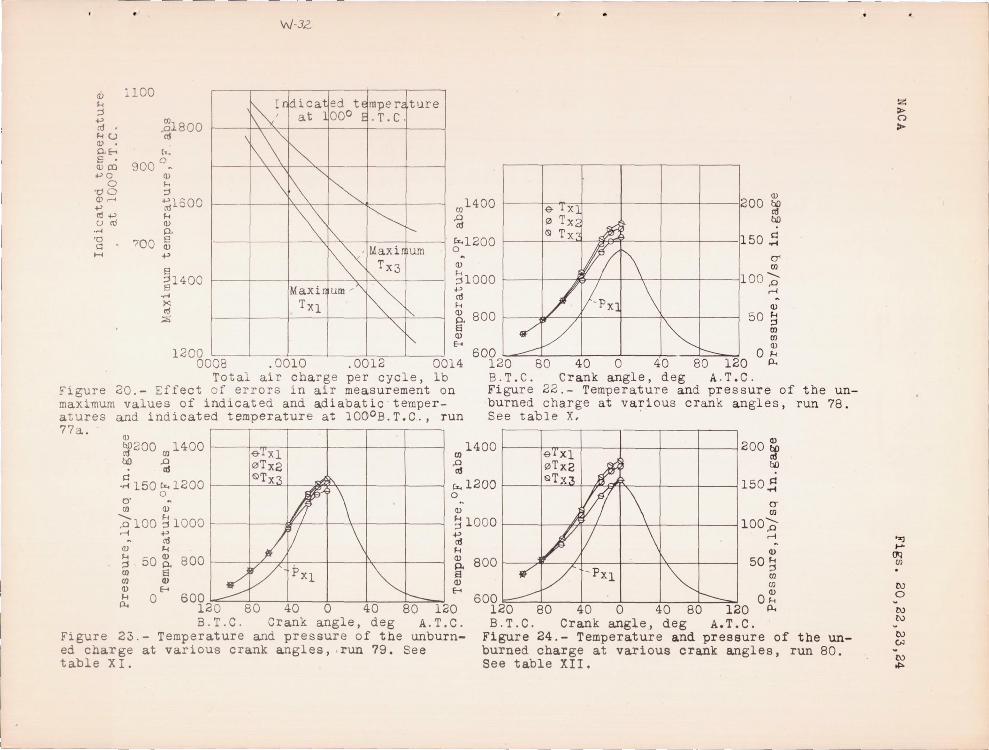
QI
~ ;j +' <1l F-<U QI
OwE-< E Q)CO +' 0
o -00 (J),--<
+-' Id..., u ro .... 'd C
H
1100
21800 <1l
u... 900°_
QI
J.-. ;j
~1600 ~ (J)
Ow
700 ~ .p
s ~l4:00 .... x <I! ~
1200
W-JZ
001400 200 ~ ~ <1l <1l ~ rx.1200 150 !l o
~ ~
QI 00 ~1000 100 -p ~ M H
~ 800 1 .v J~ t, 8 (J)
Eo-< 600 I ~ I I I I,=>- ,
(J)
50 ~ 00 0) (J)
0008 . 0010 . 0012 0014 120 80 40 0 40 80 120 OJ..<
p.,
Total air charge per cy cle , lb Figure 20.- Effect of errors in a i r me a surement on maximum values of indicated and adiabat i c t empe ratures and indicated temperature at 1000 B. T.C ., run 77a.
B. T. C. Crank angle, deg A. T.C . Figure 22.- Tempe ratur e and pres s ure of the unburned charge at various crank angles, run 78. See t able X, .
~200 ~ 1400 I I:f~~ I J I I I ~ 1400 20 0 ! 'M 150 rx.1200 TX 3 \ rx.1200 150 ~
° 0 0- CY 00 (J) (J) 00 ~ 1000 100-p -P100~10001 WI \
M .p <1l ~ M
(J) J..< ~ QI
~ 800 1 ".. /1 1\ ~ QI ;j 50 p. 800 I I / /1 . 1\ 00 s
50 ~ 00 <I) QI Eo-<
6:: 0 600 l.".:="'"" 1 1 I 1 I =-=- I
a <I)
Eo-<
120 80 40 0 40 80 120 8.T.C. Crank angle , deg A. T. C.
Figure 23. - Temperature and pres sure of the unburned charge at various crank angles, , run 79. Se e table XL
600 r---:: I I I I 1:;:--'" I 120 80 40 0 40 80 120 B. T. C. Crank angle, deg A.T.C.
00 00
O~ p.,
Figure 24.- Temperature and pressure of the unburned charge a t var ious crank angles, run 80. See tabl e XII .
z > o >
'"Zj ..... oq 00
t\)
o t\) t\)
t\) VJ
t\) ~

600
Q)
lUI m tUl
450 ~
.r!
0< en H (l)
P. ..0 300 r-i
(I)
H g en a> H
p... 150
o I -======;====
P c> u
• W'J'L
a 1
~ ~
120 ~ .'-' =:::---.... 8u B.T.C.
o 40 80 A. T.C.
120 160 200
Crank Angle, Deg
Figure 25- Comparison of indicator diagrams for runs 1 and 6. Maximum permissible pressure is indicated by a cross in run 6.
b;j f-I.
(J\j . l.\) tJ1
NACA Figs. 26,27,28,29,30
w a: => VI VI w a: ~
o TIME
p ..
P,
P,
P,
0
I I .---t,---'
TIME -
B
Flgur~ 2 0 . - Effect ot path of compre .. lon on the value o f apparent d.lsy a t 8 given pressure.
F1gure 27 . - Effect of path of compreasion a s oelf ignition pressure for a constan t va lue of total delay.
t >'" .J w o VI RESIDUAL DELAY o z o u w VJ
o TIME-figure l8.- Pressure-t1.JD.e curve!: for instantaneous co.
pression of ruel-alr mixture showing how absolute delay varies with pressure .
1.0 0 W Z a: :> II)
w <!)
a: '" 0 .5 ~ ... o z o ;u '"
t ~ .J W o
VJ o Z o U W VJ
FRACTION BURNED
1.0 o w z a: :> II)
w \:I a: ~
0 .5 ~ ... o z o ;::: u
'" a: O.'--===------T'7
iM-
E-----'''''-----1 0 .0'" O~-===-------:T:;i;-:"'7"E:::----------.J O. 0 ~
1"1gure 29.- Effect of n....., propa«atlon on residual d.el..ay 1.n a d.tona tl.og eng ine.
n~re 30.- Eff"ct of flaM I!Top&,atlon on res1<1ual <lola" in a non-detonating """in •.
J
NACA
14
13
12
0 11 -r-~ a: 10
Z 0 (/) 9
(/)
W a: n... 8
~ 0 U
7
...J ~ U r- 6
a: U
5
4
3
SPEED 600 R.P.M.
JACKET 212 DEG.F.
AI R 100 DEG.F.
600 R.P.M.
350 DEG.F.
150 DEG. F
2,000 R.P.M.
212 DEG .F.
100 DEG.F.
2,000 R.p.M.
350 DEG .F
150 DEG.F.
TRIPTANE
~ l·l,l ·I::~~rYL-
~ ~,
\ ~. ---- LEAD SUSCEPTIBiliTY
1\' ~,
' \ '~! I
I I
I
\ I
I I 1\ I / I
. I ,
DllS08UTYLENE , I ,
I I I I
~" ~~ \ II , I
1 \
~ 1' , 1\ , l"- I ,
I I' '" 1 b;xi \ \ .... 1
" .... t\ I I
I \
, ~: ~V« I'~~ ~\:.,\ I
I I I I I I Iv
, I ~ , I
75'.BENZOL r ./ i-t' I I
~i .~ : \ :~~! 1SO·ex::: T ANE ~. ! '\
r-50:tDIISO-BUTYLEN[ , ~ ' ~ -'~ "" . 1' .... x- .. ..,......- ,
'", I- / ..... ,~ -
25401150- .,;:/.....- .. ~ "" \ BUTYLENE ~ ... ~ , ......
:p::~ II", f-
~>-- 1--" V ", '''''''''' BASE GASOliNE k
c"'V ···--A PPAQX 14 OCT NO ---- "
Fig. 31
0123 0123 0123 o I 23 ML. LEAD TETRA ETHYL PER GAL.
Fig. 31.-Variation in critical compression ratio of six fuels for four standard test conditions (reference 14 ).
I.
•
NACA Fig . 32 SPEED 600 R.PM. 600 R.p.M. 2,000 R.P.M 2 ,000 R.P.M.
JACKET 212 DEG .F . 350 DEG .F. 2 12 DE6.F. 350 DEG .F.
AI R 100 DEG .F. ISO DEG . F. 100 DEG .F. ISO DEG .F.
13
ETHYL : II BENZENE.
~'\
\'\\ ---- LEAD SUSCEPTIBILITY
.~ ~\ I
I
'\ I'
\ II. I
i\ . I I I, I 1/
\ ( \ ! / r\ / \ i' ~/ "t\ / \ / 1/ "\ I ¥~ I I ,/ /
~ I ~ "~; /
ISO ' OCTAN8 I .... I . ..........."" I
'" ------~ -
II
10
0 r <{9 0:
Z o 8 (/) (/)
W 0:7 0... ~
12
0
------ '~ L---: ~ 80~ I SO , o c TANt ~
I N N-H( PTANE k V: Ii b:2 V
>< /
00 ), ISO ,oc TANE k ~.- l/ 40~ ISO , OC TAN\,
~ r--- ~~ ETHYL CYCLe) . " HEXANE ~""":: I ~~ I
~ :2 1-"
06
-.J <{
o 5
r 0: 0 4
3
2 0 12 3 0 1 2 3 0 12 3 0 123
ML. LEAD TETRAETHYL PE.R GALLO N
Fig. 32.-Varlat ion in critical compression ratio for four standard test conditions, for ethyl ben zene , ethyl cyclohexane, and iso-octane (2, 3 , 4-trimethylpentane) (ref erence 14 ) • .
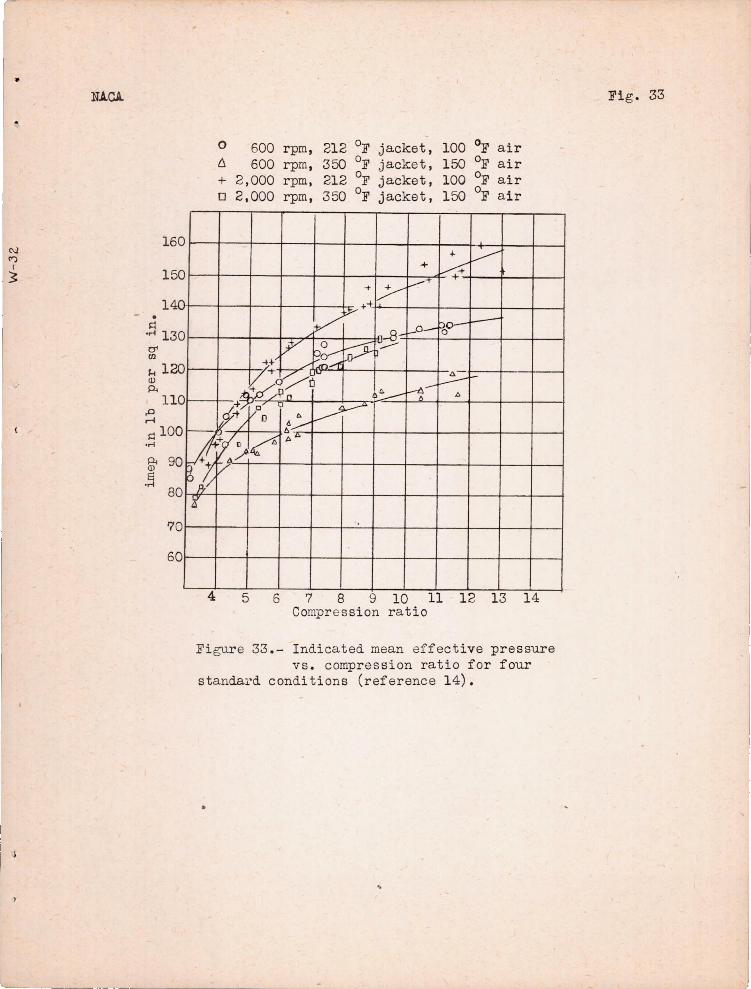
" N.A.CA.
1 60 C\.l C'")
50 I
~ 1
1 40-• ~
·rl 1 30 0' CIl
1-. 1 20 Q) p.
1 10
0
0
0
7 0
6 0
0 600 rpm, 212 of jacket, 100 of air 6- 600 rpm, 350 of jacket, 150 of air + 2,000 rpm, 212 of jacket, 100 of air 0 2.000 rpm, 350 of jacket, 150 of air
+- ---+ ~ ..----+ ;;:--
~+-+-
V In-8- Poo- -~o-
[)V 0 ~r"' __
-+-+/~~ $;2/0 ~ -?n !>.---4-- A
;j~ L----r 6
;tV ,; / 0 ~~
ff'IC~· ~fl/r' :t
4 5 5 7 8 9 10 11 12 13 14 Compression r at io
Figure 33.- Indicated mean eff ective pressure vs. compression ratio for four
standard conditions (reference 14) .
Fig. 33