document resume - eric resume. ed 235 391 ce 037 ... the supervisor of guidance and counselling, ......
TRANSCRIPT

DOCUMENT RESUME
ED 235 391 CE 037 338
AUTHOR Maguire, Thomas 0.; And OthersTITLE Attitudes towards the World of Work: Development of
the Scales and Manual for Administration, Scoring andInterpretation.
,
INSTITUTION Alberta Dept. of Education, Edmonton. PlanningServices Branch.
PUB DATE Aug 83NOTE 48p.; For related documents, see ED 171 955-956.PUB TYPE Reports Descriptive (141) Guides Non-Classroom
Use (055)
EDRS PRICE MF01/PCO2 Plus Postage.DESCRIPTORS *Attitude Measures; Career Education; Foreign
Countries; Secondary Education; *Student: Attitudes;*Test Construction; *Test Reliability; *TestValidity; *Work Attitudes
IDENTIFIERS *Alberta
ABSTRACTA study was commissioned to develop and validate a
test to assess the attitudes of Alberta students towards the world ofwork. A revised instrument was created that used 75 items groupedinto 15 scales, of five items each, measuring perceptions aboutavailable opportunities- During the validation field trial theinstrument was administered to 467 9th graders and 568 12th graders.Results showed that (1) the scales were relatively independent ofeach other, (2) the differences between the two groups wereunderstandable, (3) sex differences occurred on all but threesubscales, (4) differences were found among students taking differentprograms, and (5) the differences between students with no jobexperience and those with part-time and full-time job experienceswere small. A principal component analysis of item intercorrelationswas used to investigate structural validity. Reliability data werecalculated.three ways: calculation of Cronbach's alphas,readministration of the instrument and use of item means to estimatethe scale means, and test-retest reliability,estimation. (Appendixes,amounting to over one-half of the report, include the questionnaire,the administration manual, and the Alberta Provincial PercentileNorms,Tables.) (YLB)
O
************************************************************************ Reproductions supplied by EDRS are, the best that can be made
from the original document.************************************************************************

ATTITUDESTOWARDS THE y*.ORLD OF WORI:.:
Development Of The Scales And Manual For Administration,
Scoring And Interpretation
By
Thomas 0. Maguire
Eugene W. Romaniuk
Katherine A. MacRury
Data Collection for Use in Developing Group Norms
by
Edmonton School District #7
U.S. DEPARTMENT OF EDUCATIONNATIONAL INSTITUTE OF EDUCATION .
EDUCATIONAL RESOURCES INFORMATIONi CENTER (ERIC)This d ocument has been reproduced asreceived froM the person or organizationoriginating it./
' Minor changes have been made to improvereproductio 'quality.
Points of view or opinions stated in this document do not necessarily represent
official NIEposition or policy.
Planning Services Brunel1
Alberta Education.
August, 1983
"PERMISSION TO REPRODUCE THISMATERIAL HAS BEEN GRXNTED BY
g)/4TO THE EDUCATIONAL
RESQ RCES
INFORMATION CENTER (ERIC)."

PREFACE
The Minister's Advisory Committee on Student Achievement (MACOSA) wasestablishe,d by ministerial order in October 1976 in response to growing concernsexpressed by the public at large, government, labor, business, students and
educators regarding the quality and standards of basic education in Alberta:
MACOSA commissioned a number of studies, primarily to proVide basicinformation for a summary of current levels of. achievement in Alberta and toprovide baseline data for future assessment. These studies fell into threecategories: (1) preliminary studies, (2) achievement studies, and (3) other studies.
This study, Development of Scales on. Attitudes Towards the World of Work,was commissioned to develop and validate a test to assess the attitudes of Albertastudents towards the world of work.
This report, which represents the findings and conclusions of the researchers,was presented to MACOSA as information.
This report constitutes the administration manual for the Attitudes Towardthe World of Work instrument. For
/the technical manual giving the background to
the development of the scales and the necessary data tables please contact theRegional Office of Alberta Education, the Supervisor of Guidance and Counselling,Alberta Education, the university libraries or E.R.I.C. The title of the technicalmanual is Development of Scales on Attitudes Towards the World of Work:Technical Manual, March, 1979./
Subsequent to the development and validation activities commissioned by
MACOSA the Attitude -Toward the World of Work instrument was normed forpopulations of boys and girls in grades 9, 10, 11 and 12 in Alberta schools. Normstables based on averages for groups of pupils appear later in this publication.

MEMBERS OF THE MACOSA ATTITUDE TESTS
STEERING 'COMMITTEE
Dr. Terry Mott (Chairman); Counselling and Guidance Supervisor,
Special Educational Services, Alberta Education
Or. Tom 'Maguire, Faculty of Education, University of Alberta
(Dr. Wally Unruh, Faculty of Education, University of Calgary, subsequentlyreplaced Dr. Maguire)
Dr. Harry Mosychuk, Assistant Superintendent of Research and Evaluation,
Edmonton Public School Board
Mr. Tony Tomko, Schcol Psychologist, Edmonton Catholic Schools
Dr. Clarence Rhodes (Recorder and Consultant to the Committee),Planning Services Branch, Alberta Education
Dr. Harry Sherk (ex officio), Planning Services Branch, Alberta Education.
ii

TABLE Olt? CONTENTS
Background 1
Literature Review 2
Instrument Development
The Revised Instrument 6
Scale Results From The Field Trial Validation Studies 7
General ..Difference Between Junior and Senior HighSchool Responses 7
Sex Differences 9
Program Differences 10
Job Aspiration Differences 11
Part-time Job Differences 12
Full-time Job Differences 129
W etatkiw in Study 13
NAIT Group 14,
The AVC Group 14
Validity and Reliability of Scales 15
APPENDIX A: Student Questionnaire 17
APPENDIX B: Administration Manual 18
Instructions for Adminptration 19
Inst,ructions for Scoring 19
Scoring Service 20
Validity and Reliability 21
APPENDIX C: Alberta Provincial Percentile Norms Tables 24
Aids to Interpretation 25
Selecting the Norming Sample 25
Percentile Norms Tables' 27
iii

Attitudes Towards the World of Work
Background
Drrin;-; the put two years, The Minister's Advisory Committee onStudent Achievement (MACOSA) has been investigating various aspects.of studentachievement in the province of Alberta. The activities of .MACOSA and its varioussubcommitte.es have ranged from surveying the opinions of Alberta citizens aboutstudent achievement, to assessing levels of student achievement in core subjects.
As one part of the MACOSA activities, a subcommittee was struck toinvestigate the feasibility of assessing in the affective domain. As a result of thedeliberations o' the MACOSA Attitude Test Validation Steering Committee, astudy was commissioned to develop and validate an instrument for assessingstudent attitudes towards the world of work.
The Steering Committee delineated five dimensions of this topic forinitial consideration. These were:
Attitudes towards earning a living.
Perceptions about employer expectations.
Perceptions about available opportunities.- Relevance of school preparation for employment.
Characteristics of desirable. jobs.
In recommending the/ development of the instrument the SteeringCommittee expressed optimism that the instrument would be capable of provid-ing useful feedback about the attitudes of groups of students, to teachers, schoolofficials, and the public at large. The Committee was less optimistic regardingthe instrument's immediate potential for providing diagnostic information aboutindividual pupils, and noted that the appropriate use for the instrument wouldlikely be to collect information about groups of students in classes, schools,systems, or in the province as a whole.

2
Literature Review
The domain of "Attitudes Towards Work" is a continuum that stretchesfrom personality characteristics that relate to job selection to opinions about work
activities. There are several existing instruments that purport to measure the
relatively enduring values that are found at the "values" end of the continuum. At
that end, personality characteristics such as values are matched with job descrip-
tions to form job preference scales. Such scales as the Strong Vocational InterestBlank are examples of these, and they are used to guide students in career
selection.Moving from the values end of the continuum, to the opinion end, an
area is encountered at which values begin to blend into opinions. This is the area in
which a person's view of the world of work is important. It is not a value, because
it is riot necessarily a strongly held, enduring trait, rather it is an attitude, perhapseven an opinion that changes from one month to the,next as a result of experience
and personal growth.' It is toward- this rather vague area of attitudes that thepresent study is directed..
Little work seems to have been done directly on high school and junior
high school students' attitudes, perceptions and anticipation about the world of
work, in spite of the number of occupational preference scales, and work vames
inventories that exist. Specifically, little has been done on perceptions aboutemployers; and about perceptions about the adequacy of training that studentsreceive. This is probably because most test developers prefer to make their tests
independent of a particular social and economic context. In contrast, the present
study seeks to inquire about students attitudes towards work in the every context
that they .are likely to be entering. Thus the instrument under development is
directed towards_ students thoughts and beliefs about working in the Alberta
context.While attempting to develop an instrument that caters to the Alberta
environment, the authors were aware that some guidance was available from
previous work on work values. Clearly one influence on opinions and attitudes are
the values that are held by a person, and so the values measured in the published
tests provided some clues as to the dimensions that should be covered in the
present project.

3
An extensive review of the literature indicated that the most commonmotivational properties of jobs appeared to be: salary, job security, working withpeople, prestige, leadership, achievement, helping people, self development, work-ing conditions, ideas, independence, interesting work, creativity and fringe bene-',fits. Less common, were such characterisitcs as being boss, adventure, companyreputation, sex discrimination, recognition, and way of life.
Instrument Development
Using the literature review and the Steering Committee's 'dimensionsfor guidance, the authors created a large pool of statements about the world ofwork. Students were asked to indicate whether they strongly agreed with eachstatement, agreed with it, disagreed with it, strongly disagreed with it, or if theywere uncertain about it. This kind of questionnaire which is known as a LikertScale, is commonly used in opinion research because it allows the researchers toobtain respondent's opinions about a large number of topics without requiring alarge amount of time.
From the pool of statements, two preliminary forms of the instrumentwere created. Each form consisted of 125 items, and was administered toapproximately 360 students from Medicine Hat, Lethbridge,- Lacombe and Ponoka.The students were in grades 8 and 11 (with about one half at each grade level).
Although the sample used for the preliminary study could not beconsidered representative of the province as a whole, there were a number ofinteresting observations. The students from the sample seemed to have a prettytraditional and responsible view of the world of work. They seemed to appreciatethe importance of hard work, they appeared to have a faith in the economicsystem's ability to provide them- with meaningful employment, and they seemed tohave confidence in their own ability,- to succeed.
A careful study of the items was made to see which items wereambiguous, poorly worded, or beyond the comprehension of the Students. Furtheranalyses were carried out to see if the items could be clustered, into scales.' Based

on these analyser..., it was decided to create a revised form of the scale using 75
items that were grouped into 15 scales of 5 items each. A description of the scales
is shown below:
1. Preparation by School: Students scoring high on this scale perceive
their preparation for entrance into the world of work as:.:beingadequate. School Preparation is seen as appropriately job related.
2. Interest 'and Variability in Jobs: Students scoring high seek jobs that
are interesting, challenging and varied.
3. Diligence: Students scoring high have attitudes favorable to hardwork, regardless of supervision.
4. Laziness: Students who have high scoresattitudes of getting as much as possible for as
\5. Job Security: Thi3 scale describes students who 'value job security,
often over other characteristics of jobs.
on this scale indicatelittle effort as possible.
6. Positive Employer Characteristics: Students scoring high on this scale
view employers as honest, fair and generally upstanding humans.
7. Independence: Students scoring high on this scale rate the
preservation of their own independence above that of other job
characteristics.
8. . Money: Students scoring high on this scale view salary 8 s being one of
the most important determinants of a good job.
9. Amibition: Students scoring high on this scale view striving forsuccess as more important than other considerations like friends
9

- 5-
10. Locus of Control: Students scoring high on this scale view getting andholding a job as being largely a matter outside of their controlluck,knowing the right person,etc.
11. Confidence in Succeeding: High scorers on this scale are confident oftheir ability of getting a job and being successful.
12. Negative Employer Characteristics: Students scoring high on thisscale see employers as greedy and unfairmostly concerned withlooking out for their own interests.
13. Social Relatioo-,: Students scoring high on this scale see socialrelations as being the important determiners of job satisfaction. Theyprefer working with people and being a part of a team.
14. Attitudes Towards Unemployment: Students scoring high on this scaleview unemployment as undesirable, even shameful.
15. General Attitudes Towards Earning a Living: Students scoring high onthis scale have a positive attitude toward earning a living, typified bya statement "I am looking forward to earning my own way".
Many of the scales are similar to some of the scales found in existinginstruments (for example, Independence, Salary, Job Security, Working with People,or Social Relations, all appear in value scales). What is different in this studysthat the items themselves are designed to provide information on student opinionsdirectly. In previous studies, the scales were -intended to have psychological\significance, here they are used to aggregate the views of groups of students. In
addition to these scales, there are some areas that have not been tapped before.These are: Laziness, Diligence, Characteristics of Employers, and opinions aboutPreparation.
The analysis of the preliminary data indicated that the item poolcaptured the essence of the Steering Committee's concerns.
_IL 0

6
The Revised Instrument
Based on the preliminary results, a revised instrument was prepared and
administered to 467 ninth grade students and 568 twelfth grade students in Andrew,
Edmonton, Jasper, Lacombe, Lethbridge, Medicine Hat, Red Deer, and Wetaskiwin.
,The scale results are provided in this summary for the total sample of 1035 used in
he validation field trial (not the provincial norming). Caution n,ust- be exercised in
generalizing the results to all students in grades 9 and 12 in the province, since
only certain areas of the province were included in the sample selected for the
field trial, In particular, no areas in Northern Alberta were used, and no schools in.-
Calgary were selected. The Edmonton sample was taken entirely from theEdmonton Separate School Systera as a consequence of the teachers' strike in the
Edmonton Public System. Nonetheless, with these-cautions, the data do provide an
interesting picture of the student groups that are included. The distribution
patterns for provincial populations of boys and girls in each of grades 9 - 12 are
displayed in the percentile norms tables in Appendix C,

7
Scale Results From the Field Trial Validation Studies
1. General
The 15 scales were made up of the items shown in Table 1, with thescale scores being calculated by summing the item scores created by assigning thefollowing numerical values:
1 = Strongly Disagree
2 = Disagree
3 = Undecided
4 = Agree
5 = Strongly Agree
(In the case of item 25 on the subscale 1, the scoring was reversed.)Each scale has a maximum possible value of 25.and a minimum of 5. The averagescores for the scales are shown in Table 1, together with the intervals that include90% of the students' responses for the 1035 students.
The relationships between the scales were investigated, and it- wasfound that the scales were relatively independent of each other. Although.
Laziness and Diligence would seem to be direct opposites, the data showed thatthis was not quite the case. There seemed to be good reason for retaining hoth ofthese scales.
Within the constraints of time allocated to the study, several attemptswere made to investigate the validity of the subscale scores. The first of- theseattempts made use of background information to see if different groups respondedto the subscales in a differentfashion.
2. Differences Between Junior'and Senior High School Responses
Junior High (Ji-l) students rated their Preparation higher than did theSenior High (SW students. The means were -18.5 and 17.5 respectively, suggesting

8
Table 1: Scale Results
Scale Items Average Score 90% Interval
Preparation 18 19, 25, 32, 68 18.02 14-21*
Interest 16,34, 36, 40, 46 20.05 18-23
Diligence 15, 20, 22, 69, 70 21.46 19-24
Laziness 33, /35, 55, 66, 75 9.63 6-14
Job Security 3,\, 5, 23, 45, 57 17.83 14-21
Positive Employer \ 0
-Characteristics 12, 43; 47, 48, 62 17.91 15-21
Independence 1, 17,141, 51, 74 17.95 14-22
Money 4, 21, 24, 29, 42 16.40 13-21
Ambition . 28, 30, 21 29, 63 17.09 14-20. ,
Locus of Control 8, 50, 61, 64, 71 13.22 9-18
Confidence 9, 54, 60, 67, 72 17.62 14-21
Negative EmployerCharacteristics 6, 11, 26, 44, 58 14.63 11-18
Social Relations 2, 37, 52, 59, 73 19.75 15-23
Unemployment 7, 14, 49, 53, 65 16.36 12-22
General 10, 13, 27, 38, 56 17.99 15-22
This means that 90% of the students scores were between 14 and 21, and
every score between 14 and 21 was more likely than any score not between. 14
and 21.
that as the students approached entry to the world of work, they perceived theirtraining as being slightly less adequate than students who were farther away.
SH students rated the importance of Interest and Variability in a jobhigher than JH students (JH = 19.8, SH = 20.2). Consistent with this finding was
the difference between the means on Independence, where the JH mean was 17.4
and the SH was 18.3
There were no great differences on Diligence, Job Security, Laziness,Ambition, or Negative Employer Characteristics, but the JH group viewedemployers more positively (mean = 18.1) than the SH group (mean = 17.7). onPositive Employer Characterisitcs.
The JH students rated the Money factor slightly-more important thandid the SH group (mean = 16.66 as compared with 16.18), a finding that seemsconsistent with the findings on Interest and Independence. Perhaps the SH group
has begun to develop a realistic assessment of their earning potential.A somewhat puzzling finding was the difference between the two
groups on confidence.'. The SH group had a higher Confidence mean (17.83 ascompared with 17.37), but they also had a higher Locus of Control mean indicatingthat they tended to see obtaining and holding a job as being less in their controlthan the JH studentS. (The means were SH = 13.49, JH = 12.9). Perhaps the SH
group is showing a growth toward a realistic assessment, and the JH group isidealistic.
In general, the differences between the two groups made some sense interms of the 'kinds of experiences that two groups would have encountered up tothis point. The greater likelihood of having had work experience in the SH groupwould perhapS tend to temper their judgement.
3. Sex Differences
Sex differences occurred on a 1 but three subscales. In general, thegirls rated Job Security, Independence, Ambi s'claril Money as being less important
than boys did. The girls rated Interest and Variability in a job higher than did boys,
they were more negative on Laiiness than boys, and rated the .Negative EmployerCharacterisitcs lower than boys. The Social aspects of work seemed more

important to girls, and they had more moderate views on unem loyment. The girlstended to rate the external factors on holding jobs as, being ess important thanboys, and, on General Attitudes,-/had a more positive attitude toward earning aliving.
r.
It seems clear from /the results of this study that the girls seem to I
possess many of the attitudes towards work that reflect a male-dominated work /t
environment. Although the differences are not great (less than one point in all /cases except for Money and Unemployment), they all seem to be in the direction of/what could be described as the stereotype. Given the great inertia that seems tohave confronted social movement in the past five years or so, these data are takenas supporting the validity of the scale. In other words, it seems likely that Ifopinions that appear in the popular press and on radio talk !shows are true, thesubscales seem to be reflecting attitudes accurately. (An article in the Edmonton 1,Journal, October 16, 1978, supports this contention. It was reported by Canadian/Press that two researchers from the Ontario Institute for Studies in Education,Avis Glaze and Lyz Sayer, found that Ontario high school girls in their sample "look
to future careers in traditional female jobs and are not prepared for long years Ofworking".)
1
4. Program Differences1
I
I 1
/Students were asked to indicate which programs they were taking, or
1intendedto take when they reached high school. They were given the/choice ofI / ITechnical, Academic, Business, General, Undecided, and No Main / Emphasis.,
1 1Program differences appeared on all subscales except Job Security, Ambition, and/ l I
i/
Generally speaking, the Technical, Academic and BusinesT groups feltbetter prepared than the other groups, a finding which would tend to support thevalidity of the scale. However, the Business group showed a two point drop-off
..
,-tt
from grade 9 to grade 12, suggesting that as they approached the impending jobmarket, this group had the most misgivings of the "decided" groups. The AcaL:emic
and Technical groups, while experiencing some drop-off, showed less change thanthe Business group. This would be consistent with the notion that the Businessgroup was closer to entering the world of work than the other two/groups.
/ .
Social. Interactions appeared on Preparation and Independence.
The Academic group had the highest Interest rating, while theUndecided and Genecal groups had the lowest ratings. Again, this would appear tobe consistent with the validity assertion., Similarly, the Undecided and No MainInterest groups had the lowest scores on Diligence (about a point below the others),and the highest rating on Laziness (again, about a point difference).
The Technical, Academic and Business groups had high scores onPositive Employer Characteristics but, on Negative Employer Characteristics, allgroups had about the- same scores except for the No Main Emphasis group. The
Technical group had the highest Independence scores, perhaps .because of the broad
job market that awaits them. The Academic group had the lowest scores onMoney, an opinion consistent with some people's view of reality, and the Business
group had the lowest score on Locus of Control, -indicating that getting and holding
a job was seen as being more under their own control than in the other groups.
The least confident groups were the Undecided and No Main Emphasisgroups, possibly indicating a causal relationship. The most confident group was theBusiness group and, in addition, it had the highest score on the General Attitudessubscale.
The Academic and No Main Emphasis groups had the most moderatescores on Unemployment, the latter perhaps because they, may see themselves asbeing unemployed. The Undecided group scored highest on Negative Employerperceptions. Although the proportion of students in the Undecided group who hadwork experience was about the same as the proportions in any other group, perhaps
the Undecided group contained more people who had some work experience of anunpleasant sort.
In general, the relationships between program and subscale means seem
to support the contention that the subscales are producing information that isconsistent with the common lore and, in that sense, there is some validity to thisattitude opinionnaire when the items are compiled into subscales.
5. Job Aspiration Differences
The students were asked to indicate the kinds of jobs that they would/like to have when they were ready to enter/the world of work. a very crude rating
16

- 12 -
scale was placed on the results. An attempt was made to rate the responsesaccording to the amount of training that would be required for the position. Fivelevels/ were defined: No Training (or on-the-job training) e.g., salesclerk; SomeTraining (up to about a year) e.g., secretary, machine driver, pilot; TechnicalSchool (more than a year) e.g., electrician, registered nurse, farmer, owner of abusiness; Bachelor's Degree; and Postgraduate education.
Differences occurred on Preparation, Interest, Laziness, Independence,MOney, and Unemployment. In 'general, the Postgraduate group had highest scores
on Preparation, Interest and Independence. The Technical group had the highest
scores on Money, and they were the most critical of Unemployment. The No
/Training group had the highest scores on Laziness, but the differences from the/other groups were less than a point.
6. Part-Time Job Differences
Students were asked whether they held a part-time job. About one
third of the JH group and about three fifths of the SH group said that they wereholding part-time jobs. Confidence was the only subscale which indicated adifference between the two groups. Students who were holding part-time jobs hadhigher means than those who did not hold such jobs. /This is certainly consistentwith the validity assertions, but stronger evidence would have been claimed ifdifferences had occurred on such scales as Employer, Characterisitcs, Money, and
' Diligence scales. Perhaps the experience gained through part-time jobs is notviewed by the students as being generalizable to the world of work.
7. Full Time Job Differences
One quarter of the JH group and three fifths of the SH group claimedsome previous full-time job experience. Differences between thetroups having jobexperience, and those without the experience occurred on seven subscales.
Students with full-time work experience rated their Preparation lower,and they seemed to rate Interest lower than the other group. They were less

13
severe in their ratings of employers in terms of Negative Characteristics, but they
were more severe in their'assessment of Unemployment. The people with full-timeexperience rated the importance of Money more highly than the other group; theyhad more Confidence, and they rated employers more positively. All of thesefindings seem consistent with the hypothesis that full-time work experience maygive students a more realistic perspective on the world of work. In no case were
the differences great and generally speaking one would have to say that bothgroups appeared to possess reasonably healthy attitudes towards the world of work,
both in terms of their own likelihood of success and in terms of the overall socialgood.
8. Wetaskiwin Study
Two contrasting groups of high school students from Wetaskiwin wereselected for closer experimentation. The first group, enrolled in Chemistry 30,consisted of an achieving, college-bound group. Generally they were students who
took their studies seriously and who were likely to be successful, in their chosenendeavors. The second group, enrolled in Mathematics 15, was made up of a group
of students who didn't do well in school and, possibly as a consequence or perhaps.as a casual factor, were not positively disposed to education and its potentialbenefits.
The two groups showed significant differences on all but five subscales.(Preparation, Job Security, Ambition, Unemployment; and General). On all otherscales, the differences were in the hypothesized direction. The Chemistry 30 groupsaw Interest and Variability as being more important in a job; they seemed to valueDiligence more (and Laziness less); they saw employers in a more positive light;they sought more Independence; Money was less of a concern; they saw Controlbeing more likely to be vested in themselves; they were far more Confident; andseemed to value more Social jobs. In short, the subscales seemed.to discriminatebetween the two groups in about the same way that the teacher's- professionaljudgement had.
18

14
9. NAIT Group
The -instrument was administered to 77 students at the NorthernAlberta Institute of Technology. The students are enrolled in a technical upgradingprogram; approximately 75% have been out of school for at least one year and have
had work experience. The NAIT results were compared with the school sample.The NAIT people rated Interest, Independence, and Confidence higher than theschool group. They were more likely to attribute job success to factors beyondtheir control; they were "harder" on Unemployment; and they appeared to be more
ambitious thari their school counterparts.results on Locus of Control, Unemployment, Confide/re, and
Ambition, were not unexpected. However, the results of the Interest andIndependence scales were not predicted by the investigators but, in retrospect,both results seem reasonable. It was thought that there would be a biggerdifference between the two groups on the importance ofJob Security because the
NAIT group is older and perhaps more conscious of the problems of security. No
attempt was made to collect information on age, so perhaps the NAIT group had
not reached an age,where security.becomes a matter of greater concern.
10. The AVC. Group
The Attitudes Toward Work questionnaire was administered to 48students enrolled in the academic upgrading courses at the Alberta VocationalCentre in Edmonton. The male group was composed mostly of people preparing for
apprenticeship training, and the female group was made up of people preparing for
business education. According to AVC officials, the entire sample was consideredto be a high academic group.
In many respects, the AVC sample is similar to the NAIT sample. They
are both "harder" on unemployment, have high ambition, are more "external" andare more confident than the school group. With respect to Independence, however,the AVC group is lower than the school group whereas the NAIT group is higher,
i.e. seeks greater independence.

- 15
Another difference that occurred with the AVC group was the highermean on the General Attitudes subscale. Assuming the validity of the subscale,this suggests that these people are even more positive about entering the world ofwork than the high school students.
11. Validity and Reliability of Scales
The validity studies that were carried out on the Attitudes TowardsWork Scales are described in the MACOSA Work Attitudes Study Part II. One ofthe procedures used to investigate the structural validity was a principal compo-nents analysis of item intercorrelations. Fifteen components were extracted androtated to the varimax criterion. Since the items were supposed to load mosthighly on the scale to which they belonged, it was possible to rate the structuralvalidity of each scale. If all of the items on a scale had loadings on the samecomponent exceeding .25, then the scale was given a factorial validity rating of 4.N rating of three. was given to scales on which four of the five items had loadingsgreater than .25. If the items were split between two components, a rating of 2was given. Three items loading on a single component warranted a rating of 1, And
0 was given to scales whose items were spread across four different components.The actual items loadings are given in Part II of the study. The factorial validityratings are shown in Table II.
Reliability data were calculated in three ways. The first approach Was
to calculate Cronbachis alphas. The CronbaCh alphas are shown in Table 2. Theyprovide an estimate of item homogeneity, and tend to follow the factor validityratings.
The second appraoCh to reliability was to administer the instrument tosix of the schools that participated in the first study, and use their item means toestimate the scale means. Since the first study used students in grades eight andeleven, many of the students were also involved in the _second study which wascarried out in the next school year with students in grades nine and twelve.Because some of the items, were revised between the first and second studies, agood estimate of scale scosr"e means for the first study is not possible. In Table 2,
the number of schools showing significant shifts from June to September is given
20

16 -
together with the number of items that were changed between the two administra-tions. Ml of the scales showing two or more school differences between June andSeptember also had two or more item changes.
The third approach to reliability was a test-retest reliability estimationcarried out with 192 students, 73 students in grade twelve and 119 students ingrade nine. The tests were administered in the- second 'week of December, 1978,
and again in the, third week of January, 1979. The reliabilities are shown inTable 2.' Of the fifteen' scales, each consisting of five items, only one scale had areliability of less than .5.
Table 2: Reliability Studies
.
Cronbach'sAlpha
FactorValidityRating
Number ofSchools withSignificant
Shifts
! ,
Number of Test-RetestItem Correlation
Changes
Subscale
Preparation .342 2 0 0 .591
Interest .483 1 1 2 .572
Diligence .544. 4 1 1 .460
Laziness .620 4 1 -1 .647
Job Security .343 2 ' 4 3 .608
Pos. Emp. Char. .502 3 0 0 .578
Independence .496 3 .3 2 .646
Money .425 3 5 3 .618
Ambition. .309 1 0 9 .515
Locus of Control .571 3 1 0 .642
Confidence .399 2 1 0 .510
Neg. Emp.'Char. .532 4 0 0 .671
Social .584\
2 \ 1 1 .652
Unemployment .611 ,4\
0 0 .703
General .330 0 1 1 .579

APPENDIX A
Attitudes Toward
The World Of Work Scales
Student Questionnaire
(c) Alberta Education, 1979

® CO 0 @I
AlbertaEDUCATION
ATTITUDESTOWARD THEWORLD OFWORK
M M I, Oiltir. 088578'321
School
Code
School Name
WNW00@0000
00O®3®
0D0000
00®451
@000
®40
® 0 40® 0 ®000® 0 ®® 0 0
USE HB PENCIL ONLYMARK ONLY WHERE INDICATED
Program you are in or intend to take:°Technical and trades °General0 Academic 0 Undecided
°Business °No main emphasis
Grade Sex 0 0 0 0 0
What kind of job most interests you as a career?
Do you have a regular parttime job? °Yes °No
Did you have a full-time job last summer? Oyes ONo
Following are 75 statements of attitudes toward work (both' sides of page). Indicate how much you agree with each
one by darkening the corresponding response.
SD=STRONGLY DISAGREE; D=DISAGREE; U=UNDECIDED; A=AGREE; SA=STRONGLY AGREE
1. would like a job where you can do your own thing.2. would like a job where I would deal with other people.3. wouldlike a job that I can work at for several years.4. would like a job with high pay.5. would like a job that is still mine when other people are being laid off6. Employers are always trying to push their employees to work harder.
7. To be unemployed is shameful.8. In getting a job, it is more important to know somebody,than to know something.9. There are jobs available for those who want them.
10. The first job that I get will likely be interesting.11. Most employers think that profits are more important than staff benefits.12. Most employers are flexible about the way in which their employees dress, provided
that the employees get the job done.13. Earning a living should be fdn.14. A person's major responsibiliti is to support his or her family.
15. I would like a job where the harder you work, the higher your salary becomes.
16. I would like a job which is a challenge to my abilities.17. I would like a job where the bos3 lets you decide how something should be done.18. My speaking skills are good enough for me to be successful in the job that I choose.19. I think that I will be able to meet the requirements of the job that I choose.20. A person should feel a little ashamed for doing a. sloppy job.21. The more work experience you have, the higher your salary should be.22. One of the most important things about a job is to know that you are doing the best
you can. /23. One of the most important things about a job is to be able to keep it as long as you
want it.24. Few things in life are more important than a big salary.25. There is very little that is taught in high school that will be of use on a job.26. Most employers .don't really want to get to know their employees very well.
27. I would rather have a job with low pay that I liked, than a job with better pay that I
did not like.
O
0 O @ 0 03
63 O @ 0 03
0 ® O 0 030 ® @ O 03
0 O @ 0 0303
0 ® © 0 03
0 O @ O 03@ 0 03
0 @ 0 03
0 O CD!?, 0 03
0 ®0 -Oa O O 03
0 O @ O 03
0 O O 0 03
0 O O O 03
0 O CD /0 03;0 O O 0 013
0 0 030 O O 0 03
0 O O 0 03
0 O O, O 03
0 O 0 0 03.0 O 03
0 CD 0 013
0 ® O 0 03

28. Opportunity for growth is more important than making friends on a job.29. To be a success you must have a job with a high salary.30. Sometimes a person will have to make sacrifices in (:rder to..get ahead in a job.31. Sometimes you have to choose between having friends, and getting ahead on the job.32. Schools are pretty good at teaching you about how to look for a job. .
33. Nowadays there is not enough work to go around for everyone, so I'll not worry toomuch about getting a.job.
34. would like to find a fob where you have to keep your mind active.35. I would like a job that allows you to daydream while you work.36. I would like a job that is interesting.37. I would like a job where you work in a group with others.38. I am looking forward to supporting myself by getting a job.39.. I see that a first job is really a stepping stone for a career.40. If my job got boring, I would quit.
\41. I would like a job where you can be your own boss.42. I would like a job that allows you to make lots of overtime pay.43: Employers are prepared to pay good wages in order to keep qualified staff happy.44. \Employers seem concerned only with getting as much out of their employees for as
little as possible.45. I would like a job where it is difficult to be fired.46. I would like a job that has some excitement associated with it.47. Most employers are prepared to give a fair wage for an honest day's work.
148. Most e a ployers are prepared to reward good effort.49. To have a job is the duty of every Canadian.50. Getting a good job is usually a matter of luck--being in the right place at the right
ime. \ .
51. 1\would move away from my home town in order to get the job that suited me.52. I would like to work as part of a team.53. All\people should work.54. When I fir\ish my education, I'll be able to get the kind of job that I want.55. Wasting time on a job wouldn't bother me very much.
\ ,56. Most jobs are pretty \Interesting.57. It's better \o hold on to a boring job than to risk changing to a new one.58. Most employers don't want employees who have minds of their own.59. One of the ost important things about a job is to have the respect of the other
people who work at the same place.60. More than a er before, there is a greater variety of job opportunities.61. To be successful, it is important to know someone in the right place.62. Most employers are prepared to give their employees credit for their original ideas.63.- Most jobs are compietitive, so you have to do a better job than the next person.64. It is unlikely that ykottk, can get a decent job if you don't join a union or association.65. Earning a living is the most important thing in adult life..,66. After you have worked, for several months, you have every right to quit your job and
go on unemployment i4urance.67. I think that I know whal\\\the requirements of most jobs are.68. It's usually possible to at the training needed for a job.69. A person should try to do\a good job whether or not the boss is around.
c. \70. I am prepared to work hard' for good wages.71. When I am ready to go to v>ork, I'll probably have to take what is available rather than
what I really want. \72. I feel confident that I will be able to handle the next step in my training.73. One of the most important thins in a job\is to have friendly co-workers.74. J would like to be free to move 'from one cpmpanY,to another as my interests change.75. Frankly, when I get a job I don't\really want to work very hard.
2-i
® CD
® ®® CD
® Q-® CD
® CD
® CD ®® ®® @® O ®® O CD ®® CD CD ®® CD
® 0 CD ®® CD
® CD ®® o
: °-® CD ®® CD 00 CD
® CD ®® CD ®® CD ®® CD ®® CD ®® ® 0 ®® CD ®0 CD CD ®
® CD ®® CD 0® CD ®® CD, CD ®®® CD ®® CD ®
6 ®
®®® ®
®®® 0 ®
0
r'N

APPENDIX B
Administration Manual To Accompany
Attitudes Towards The World Of Work.
2

19 -
Instruction for Administration
For students in grades 9 through 12, the entire instrument requiresabout 20 minutes to complete. The instructions are as follows:
In this instrument,'"you will find various statements of attitudes towards
work. Read each statement, and decide how much you agree with it.
If you STRONGLY DISAGREE with the statement, circle SD.
If you DISAGREE with the statement, circle D.
If you are UNDECIDED or if you partly agree and partly disagreecircle U.,If you AGREE with the state men::, circle A...
If you STRONGLY AGREE with the statement,' circle SA.
Work quickly. Your first impressions are important.
Instructions for Scoring
The 15 scales in this instrument are made up of the items shown inTable 1. Each scale consists of five items. To calculate the score for each scale,sum the scores for each .of the five items by assigning the following numericalvalues to each item.
1 = Strongly Agree
2 = Disagree
3 = Undecided
4 = Agree
5 = Strongly Agree
In the case of item '25, on scale 1, the scoring is reversed. Thus, eachscale has a possible maximum score of 25 and a possible minimum of 5. Arty item
which is left blank is assigned a score of 3.
26

- 20 -
Table 1: Scale Composition
Scale
0
18,
16,
15,
33,
3,
12,
1,
4,
28,
8,
9,
6,
2,
7,
10,
Items
32,
40,
69,
66.
45,
48,
51,
29,
29,
64,
67,
44,
59,
53
38,
68
46
70
75
57
62
74
42
63
71
72
58
73
65
56
Preparation
InterestDiligence
Laziness
Job Security
Positive Employer Characteristics
Independence
Money
Ambition
Locus of Control
Confidence
Negative Employer CharacterisitcsSocial Relations
Unemployment
General
19, 25,34,-36,20, 22,35, 55,5, 23,
43, 47,17, 41,21, 24,30, 21,50, 61,54, 60,11, 26,37, 52,14, 49,13, 27,
Scoring Serivce
For school districts in the province of Alberta a machine scoringservice is provided by the Student Records and Computer Services Branch, AlbertaEducation, Devonian Building, 11160 Jasper AVenue, Edmonton, Alberta, T5k OL2
Telephone 403/427-5739
The scoring L 25 is reversed.

- 21 -
For other users and those outside of the province of Alberta a machinescoring service is provided from the following source:
Psican Consulting Ltd.P. 0. Box 170,
Students' Union Bldg.
University of Alberta,Edmonton, Alberta
T6G 2J7
Telephone: 403/433-6467
The Attitude Toward World of Work scales on mark-sense responsesheets may be purchased from the following source:
Alberta School Book Branch
10410 - 121 Street,
Edmonton, Alberta
T5N 1L2
Telephone: 403/427 -8806
Validity and Reliability
The validity studies that were carried out on the Attitudes TowardsWork Scales are described in the MACOSA Work Attitudes StudyPart II. One of
the procedures used to investigate the structural validity was a principal compo-nents analysis of item intercorrelations. Fifteen components were extracted androtated to the varimax criterion. Since the items were supposed to load mosthighly on the scale to which they belonged, it was possible to rate the structuralvalidity of each scale. If all of the items on a scale had_loadings-on-thi samecomponent exceeding .25, then_the scale-Vai given a factorial validity rating of 4.A rating of three was given to scales on which four of the five items had loadingsgreater than .25. If the items were split between two components, a rating of 2was given. Three items loading on a single component warranted a rating of 1, and
28

-22-
0 was given to scales whose items were spread across four different components.The actual items loadings are given in Part II of the study. The factorial validityratings are shown in Table 2.
Reliability data were calculated in three ways. The first approach wasto calculate Cronbach's alphas. The Cronbach alphas' are shown in Table 2. They
provide an estimate of item homogeneity, and tend to follow the factor validityratings.
The second approach to reliability was. to administer the instrument tosix of the schools that participated in the first study, and use their item means toestimate the scale means. Since the first study used students in grades eight andeleven, many of the students were also involved in the second study which wascarried out in the next school year with students in grades nine and twelve.Because some of the items were revised between the first and second studies, agood estimate of scale score means for the first study is not possible. In Table 2,the number of schools shoiving significant shifts from June to September is giventogether with the number of items that were changed between the two administra-tions. All of the scales showing two or more school differences between June andSeptember also had two or more item changes.
The third approach to reliability was a test-retest reliability estimationcarried out with 192 students,' 73 students in grade twelve. and 119 students in/grade nine. The tests were administered in the second week of December, 1978,and again in the third week of January, 1979. The reliabilities were shown inTable 2. Of the fifteen scales, each consisting of five items, only one scale had atest-retest reliability of less than .5.

23 -
Table 2: Reliability Studies
Cronbach'sAlpha
Subscale
Preparation .342
Interest .483
Diligence .544
Laziness .620
Job Security .343
Pos. Emp. Char. .502
Independence .496
Money .425
Ambition .309
Locus of Control .571.
Confidence .399
Neg. Emp. Char. .532
Social .584
Unemployment .611
General .330
Factor Number of Number of Test-RetestValidity Schools withRating Significant
Shifts
0
1
4
39 0
3
3 5
1 0
3
2 1
4 0
2 1
4 0
0 1
ItemChanges
Correlation
0 .591
2 .572
1 .460
1 .647
3 .608
0 .578
2 .646
3 .618
0 .515
0 .642
0 .510
0 .671
1 .652
0 .703
1 .579

APPENDIX C
Alberta. Provincial Group
Percentile Norms (Fall, 1981)

- 25 -
Aids to Interpretation
Responses to the Attitudes Toward World,of Work scales are intendedto be anonymous. The student is not asked to affix his/her name to the responsesheet. The reasons for ensuring anonymity are 1) that the reliability of scores forindividuals is too low to warrant their use, and 2) that the respondent will be less
inclined to provide-socially acceptable ratings.Since scores for individual students will not be available there is no
need for conventional .percentile norms for use in interpretation. Instead, group
percentile norms have been developed. These norms are based on the distributionsof average scores for groups of boys and girls in a. representative sample of schools
throughout the province.
An average (mean) for each sub-scale, is calculated for each group of.
boys or girls in a class, grade or school. The group average is used as the entrypoint to the percentile norms tables. The percentile rank for the group of interestis then determined by reference to the lists in the appropriate grade/sex-column:
_ _ ---
For example, if the average score- for a group of boys in a grade 9 class on thesubscaie Preparation for Employment was 18.0 the appropriate table is entered atthis point in the "Group Average" column. The percentile rank for grade 9 Mcorresponding to a raw score average of 18.0 is 38. A ranking at the thirty eighthpercentile means that 38 percent of the provincial groups had average scores atthis level or lower. Sixty two percent of the provincial groups of grade 9 boysscored higher.
Selecting the Norming Sample
Alberta Education selected the samples of schools. Table 1 providesinformation about populations of publicly supported schools from which a 20percent sample of schools offering grade 9 and 40 percent samples of senior highschools teaching grades 10, .11` and 12 were randomly selected. The numbers of
schools selected were sufficient to develop percentile norms fore class or schoolaverages. The respective school populations and sample sizes were as follows:grade 9 schools, 614 and 120; senior high schools teaching grade 10 only, 8 and 3;
32

- 26 - El
senior high schools offerings grades 10, 11 only 11 and 4; and senior high schoolsteaching grades 10, 11 and 12 261 and 104. The total number of schools/contributing to the norming activity exceeded 200. The instrument wasadministered during October and November 1981 under contractual arrangementswith Edmonton School District #7.
Table 1
Norming the Attitudes Toward World of Work Scales in Grades 9, 10, 11, 12:Proportions and Numbers of Schools and Students and Numbers of Groups
Numbers and Proportions of Schools.
Population Sample
Type of School. 'Number Number ofSchools
Percent
Junior High SchoolsTeaching Grade 9 614 120 20
Senior High Schools- Teaching Grade 10 8 40*
Teaching Grade 11 11 40*Remainder, TeachingGrades 10, 11, 12 261 104 40*
Totals 894 231
Numbers and Proportions of Students
Population Pupils Sampled Groups of PupilsGrade Number Number Percent in Sample
(Number)
Grade 9 38,803 5,634 14.5 699Grade 10 34,752 4,707 13:5 5881rade 11 31,920 3,919 12.3 622-:3rade, 12 , 35,301 4,431 12.6 682
Note: Only students enrolled in first semester English classes responded.
---
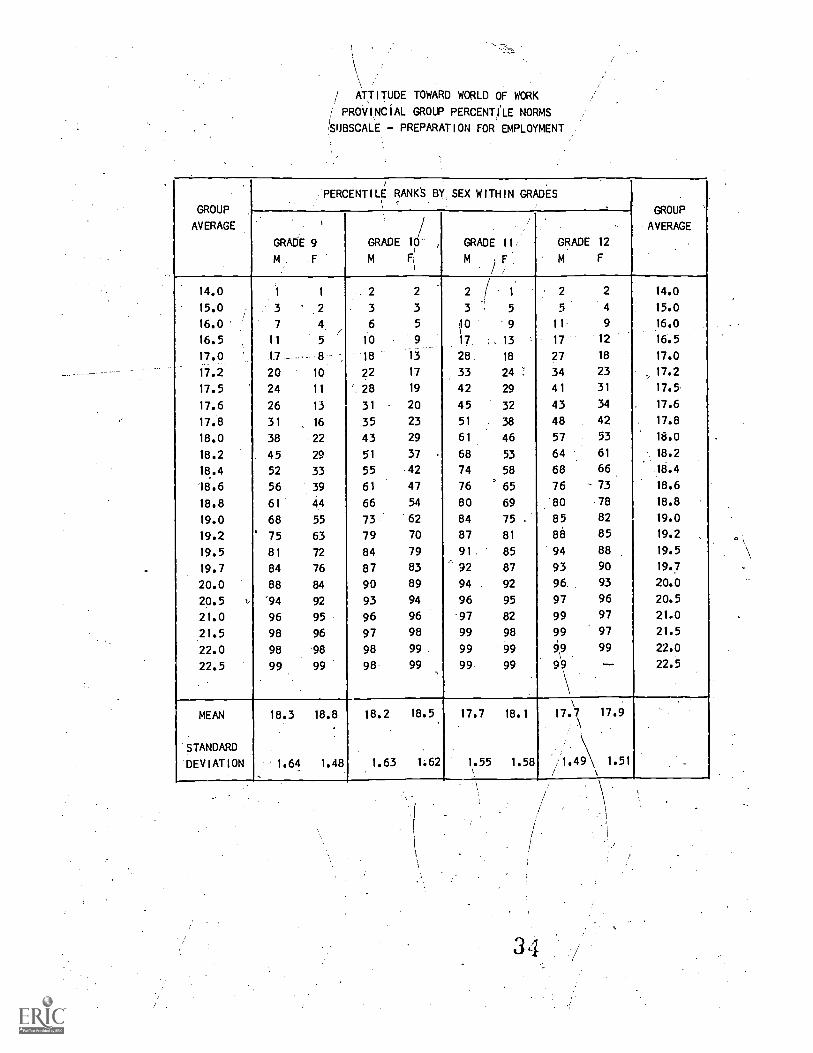
ATTITUDE TOWARD WORLD OF WORK
PROVINCIAL GROUP PERCENTILE NORMS
SUBSCALE - PREPARATION FOR EMPLOYMENT
GROUP
AVERAGE
PERCENTILE RANKS BY SEX WITHIN GRADES\ '
GROUP
AVERAGE
.
h
GRADE 9
M. F
/GRADE 10 ,
M F'
GRADE 11,
M F
GRADE 12
M F
14.0 1 1 . 2 2 2 ( . 1 2 2 14.0
15.0 3 3 3 3 5 5 4 15.0
16.0 7 6 5I
10 9 11 9 16.0
16.5 11 5 10 9 17. ;..13 17 12 16.5
17.0 17 .... 8 - 18 13 28 18 27 18 17.0
17.2 20 10 22 17 33 24 : 34 23 17.2
17.5 24 11 28 19 42 29 41 31 17.5-
17.6 26 13 31 20 45 32 43 34 17.6
17.8 31 16 35 23 51 , 38 48 42 17.8
18.0 38 22 43 29 61 46 57 53 18.0
18.2 . 45 29 51 37 68 53 64 61 .. 18.2
18.4 52 33 55 42 74 58 68 66 18.4
18.6 56 39 61 47 76 65 76 73 18.6
18.8 61 44 66 54 80 69 80 78 18.8
19.0 68 55 73 '62 84 75 . 85 82 19.0
19.2 75 63 79 70 87 81 88 85 19.2
19.5 81 72 84 79 91. 85 '94 88 19.5
19.7 84 76 87 83 92 87 93 90 19.7
20.0 88 84 90 89 94 . 92 96. 93 20.0
20.5 '94 92 , 93 94 96 95 97 96 20.5
21.0 96 95 , 96 96 97 82 99 97 21.0
21.5 98 96 97 98 99 98 99 97 21.5
22.0 98 98 98 99 99 99 99 99 22.0
22.5 99 99 98 99 99 99 99
\
-- 22.5
MEAN 18.3 18.8 18.2 18.5 17.7 18.1 17.7 17.9,
STANDARD
'DEVIATION 1.64 1.48 1.63 1:62 1.55 1.58 /1.49 1.51 .

ATTITUDE TOWARD WORLD OF WORK
PROVINCIAL GROUP PERCENTILE NORMS
SUBSCALE - INTEREST
GROUP_
AVERAGE
PERCENTILE RANKS BY SEX WITHIN GRADES
GROUP
AVERAGE.
GRADE 9
M F
GRADE 10
M F
GRADE 11
M. 7GRADE 12
M F
15.0 2 I. 1 1 15.0
16.0 3 2 2 4 -'2 1 2 1 16.0
17.0 5 3 4 6 4 2 3 1 17.0
18.0 11 7 11 12 10 7 7 3 .18.0
18.5 22 13 14 15 14 11 11 5 18.5
18.8 28 20 20 _ 17 17 13 12 7 18.8
19.0 37 28 26' 22 23 16 17 11 19.0
19.1 43 34 31 26 28 19 21 15 19.1
. 19.2 46 37 33 29 30 20 23 15 19.2
19.3 50 40 35 32 32 22 25 18 19.3
19.4 53 43 38 35 36 25 27 20 '''19.4
19.5 56 47 41 39 39 28 30 22. 19.5'
19.6 .5::: 30 44 44 41. 30 33 25 19.6
19.7 6t 53 47 46 43 32 35 27 19.7
-19.8 63 57 50 50 47 35 37 28 19.8
19.9 66 61 53 53 50 39 40 30' 19.9
20.0 73 67 60 59 55 44 47 36 20.0
20.3 82 79 73 71 '65 58 58 51 20.3
20.5 85 84. 79 77 71 67 65 59 -?0.5
20..7 88 36 31 81 74 74 71 64 20.7
21.0 92 91 83 90 .83 82 80 75 -21.0
21.5 90 95 92 94 91 90 89 87 21.5
22.0 97 97 96 97 95 94. 94 . 93. 22.0
22.5 98 98 98 98 97 96 98 96 22.5
23.0 99 99 99 99 98 97 98 97 /23.0
23.5 99 .99 99 99 99 99 98 99 23.5
24.0 99 99: 99 99 99 99, 99 99 .24:0
MEAN 20.0 19.5. 19.6 19.5 '19:8 20.1 20.0 20.3
STANDARD
DEVIATION 1.71 1,.36 '1.46 1.53 1.52 1.33 1.44 1.30

ATTITUDE TOWARD/WORLD OF WORK
PROVINCIAL GROUP' PERCENTILE NORMS
SUBSCALE/- DILIGENCE
GROUP
PERCENTILE/
RANKS BY SEX WITHIN GRADES -
GROUP
AVERAGEAVERAGE _
GRADE 9
M F
.1
I.
/../
.. GRADE 10
///M F
.
GRADE 11
M F
GRADE 12
M F
16.0 2 ' 1 1 1 2 1' 1 -- 16.0
17.Q 3 2/ 3 2 3 1 2 -- 17.0
18.0 5/
3 4 3 4 2 5 1 18.0
19.0 10 // 6 8 6 9 3, 9 4 19.0
19.5 15 / 8 13 9 12 _6 11 6 19.5
20.0 20 2// 12 19 13 18 10 17 10 20.0
20.3 27 ,/ 18 25. 18 24 16 24 , 17 20.3
20.5 317 21 30 22 28 19 29 19 20.5
20.8
21.0
38"/
A5
28
36
38
49
i9
37
38
48
25
31
36
44
23
31
20.8
21.0
21.1 50 42
'1--44
55 42 54 34' 51 36 21.1
21.2 53 57 44 56 36 54 38. 21.2
21.3 56 43--- -.62 48 58 40 58 41 21.3
21.4/ 60 53 65 51 61 44 61 44 21.4
21.5' 58 67 55 64 48 64 47 21.5
21.'6 66 62 70 58 67 53 67 51 21.6
21.7 68 64 74 60 69 57 70 54 21.7
. /21.8: 71 67 77' 65 71 62 72 57 -L.2).8
/ 21.9 74 69 79 68 74 65 74 60 21.9
22.0 78' 75- 82 73 77 71 77 65 22.0 %
22.2 83 82 86 80. 83 77 82 73 22.2
22.4 86 .86 88 85 86 83 86 78 22.4
22.6 88 88 90 87 87 85 88 82 22.6
22.8 88 89 91 88 89 87 89 .85 22.8
23.0 92 93 94_ 92 91 91 92 89 23.0
23.5 95 :96 96 95 95 96. 95 94 23.5
.244024.0 97 98 97 97 97 98 97 96
25.0 99 99 99 99 99 99 99 99 25.0
25.5 99 -- -- -7 -- 25.5
26.0 99 -- -- 26.0
MEAN 20.9 21.2 20.9 21.3 21.0 21.4 21.0 21.5 .
STANDARD;
DEVIATION 1.71 1.47 1.60 1.53 1.67 1.28 1.58 1.32
36
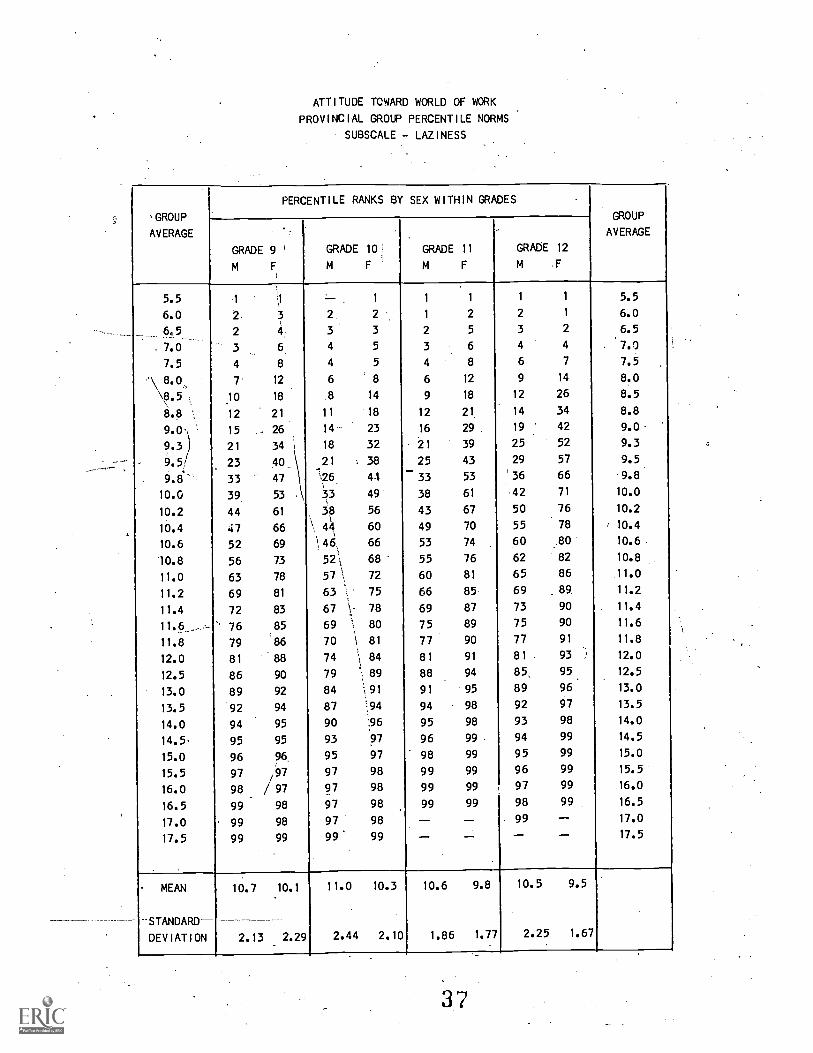
ATTITUDE TOWARD WORLD OF WORK
PROVINCIAL GROUP PERCENTILE NORMS
SUBSCALE - LAZINESS
' GROUP
AVERAGE
PERCENTILE RANKS BY SEX WITHIN GRADES
GROUP
AVERAGE
GRADE 9 '
M F
GRADE 10
M F
GRADE 11
M F
GRADE 12
M -F
5.5 1 1I
1 1 1 1 1 5.5
6.0 2 2 1 2 2 1 6.0
6f52
4 3 3 2 5 3 2 6.5
7.0 3 6 4 5 3 6 4 4 7.0
7.5 4 8 4 5 4 8 6 7 7.5
'\ 8.0 7 12 6 8 6 12 9 14 8.0
\8.5 , 10 18 8 14 9 18 12 26 8.5
8.8 12 21 11 18 12 21, 14 34 8.8
9.0-\ '- 15 .- 26 14 23 16 29 19 : 42 9.0
9.3 ) 21 34 18 32 21 39 25 52 9.3
9.5/ 23 AO 21 : 38 25 43 29 57 9.5
9.8 33 A7 '26 44\
33 53 ' 36 66 9.8
10.0 39 53 33 49 38 61 .42 71 10.0
10.2 44 61 38 56\ 1
43 67 50 76 10.2
10.4 47 66 % 44 60 49 70 55 78 i 10.4
10.6 52 69 \ 46, 66 53 74 60 ;80 10.6
10.8 56 73 52\ 68 55 76 62 82 10.8
11.0 63 78 57'\, 72 60 81 65 86 11.0
11.2 69 81. 63 ', 75 66 85 69 89: 11.2
11.4 72 83 67 - 78 69 87 73 90 11.4
114!----- '' 76 85 69 \. 80 75 89 75 90 11.6
11.8 79 86 70 \ 81 77 90 77 91 11.8
12.0 81 88 74 \ 84 81 91 81 93 ,' 12.0
12.5 86 90 79 *. 89 88 94 85, 95 12.5
13.0 89 92 84 i 91 91 95 89 96 13.0
13.5 92 94 87 '; 94 94 98 92 97 13.5
14.0 94 95 90 1.96 95 98 93 98 14.0
14.5 95 95 93 97 96 99 94 99 14.5
15.0 96 96. 95 97 98 99 95 99 15.0
15.5 97 /97 97 98 99 99 96 99 15.5'
16.0 98 97/ 97 98 99 99 97 99 16.0
16.5 99 98 97 98 99 99 98 99 16.5
17.0 99 98 97 98 -- -- 99 -- 17.0
17.5 99 99 99- 99 -- -- -- -- 17.5
- MEAN 10.7 10.1 11.0 10.3 10.6 9.8 10.5 9.5
STANDARD
DEVIATION 2.13 2.29 2.44 2.10 1.86 1.77 2.25 1.67
37

A IT9E TOWARD WORLD OF WORK
PROVI CIAL GROUP PERCENTILE NORMS
SUBSCALE.- JOB SECURITY
GROUP
AVERAGE
1
PERCENTILE RANKS BY SEX WITHIN GRADES
1, GROUP
AVERAGE
GRADE 9
M F
GRADE
M
\10i
F\\
GRADE 11
M F
GRADE 12
M F
1
13.5 1 1 1 1 1 , -- 1 -- 13.5
14.0 1 2 1 2 1 2 2 2 -- 14.0
14.5 2 . 2 1 2 3 3 2 1 14.5
15.0 2 4 2 4 3 3 3 3 15.0
15.5 3 6 3 5 4 5 4 5 15.5
16.0 5 10 5 8 7 8 6 8 16.0
16.5 6 15 6 13 1,1 12 9 14 16.5
17.0 12 23 12 22 1 23 14 21 17.0
17.3 18 34 17 28 2 30 21 29 17.3
17.5 21 41 20 36 25\ 34 27 35 17.5
17.7 23 47 23 44 30 41 30 42 i 17.7
17.8 28 50 26 48k
33 1 45, 32 46 17.8
18.0 37 60 36 56 41 55
\41 56 18.0
18.1 44 66 42 62 45 61 48 63 18.1
18.2 47 69 44 65 47 63 51 64 18.2
18.3 51 73 46. 69 50 5 54 68\
18.3
18.4 54 77 50 72 54 6 57 71 18.4
18.5 57 80 53 74 58 70 66 75 18.5
18.6 59 81 56 76 61 73 62 78 10.6
18.7 61 83 59 78 61 74 64 79 18.7
18.8 65 84 61 81 63 76 67 80 18.8
18.9 68 85 64 83 65 77 69 82 18.9J
19.0 72 88 70 86 70 80 74 85 19.0
19.2 77 90 79 89 75 85 80 89 19.2
19.4 81 92 83 90 79 87 83 90 19.4
19.6 85 94 87 92 82 90 85 92
19.8 87 94 88 93 84 91 87 93 '19.8
20.0 90 96 91 95 89 -94 0 96 20.0
20.5 94 98 95 97 95 97 94 98 20.5
21.0 95 99 97 98 97 98 96 99 21.0 '
21.5 97 -- 98 98 99 99 98 99 21.5
22.0 97 -- 98 99. 99 99 98 99 2.20
22.5 98 -- 99 99 99 99 99 99 22.5
23.0 99 -- 99 99 99 99 99 -- -23.0
MEAN 18.4 17.7 18.4 17.8 18.3 17.9 18.2 17.8
STANDARD
DEVIATION 1.54 .1.39 1.43 1.43 1.55 1.47 1.61 1.27--)

ATTITUDE TOWARD WORLD OF WORK
PROVINCIAL GROUP PERCENTILE NORMS
SUBSCALE - POSITIVE EMPLOYER CHARACTERISTICS
GROUP
AVERAGE
PERCENTILE RANKS BY SEX WITHIN GRADES
GRADE 9
M F
GRADE 10
M F
GRADE 11
M F,
GRADE 12
M F
GROUP
AVERAGE
11.0 1 1 1 -- -- 1 1 11.0
12.0 1 -- 1 1 1 1 2 1 12.0
13.0 2 1 1 2 1 2 3 1 13.0
14.0 3 1 ' 2 4 2 3 1 14.0
15.0 4 4 4 5 6 4 6 4 '15.0
16.0 9 9 10 10 10 12 11 / 12 16.0
16.5 13 14 16 17 f4 20 16 23 16.5
17.0 23 25 25 27 24 32 23 35 17.0
17.2 30 32 32 36 30 38 29 41 17.2
17.4 36 38 37 43 35 45 34 48 17.4
17.6 42 45 44 50 39 50 40 54 17.6
17.7 44 48 4/ 54 42 ., 53 42 56 17.7
17.8 48 52 50 57 45 56 45 58 17.3
17.9 51 55 53 60 47 59 47 01 17.9
18.0 58 61 59 65 53 65 52 68 18.0
18.1 65 67 64 71 57 70 57 73 18.1
18.2 67 71 67 74 59 73 59 75 18.2
18.3 69 74 71 - 76 62 76 62 77 18.3
18.4 72 78 74 79 64 78 .64 78 18.4
18.6 76. 82 77 83 69 83 70 82 18.6
18.8 81 85 79 85 73 84 74 83 18.8
18.9 83 87 81 86 74 85 75 85 18.9
19.0 87 89 84 88 80 88 80 89 19.0
19.2 91 92 88 91 86/
92 84 92 19.2
19.5 91 92 91 94 89 93 87 93 19.5
20.0 95 95 94 95 94 96 93 95 20.0
20.5 96 98 96 96 97 98 96 97 20.5
21.0 97 99 97 97 98 99 97 98 21.0
21.5 98 99 99 98 98 99 21.5
22.0 99 99 99 98 99 99 99 22.0
22.5 99 99 99 99 -- 99 99 22.5
MEAN 17.7 17.7 17.7 17.5 /17.8 17.5 17.8 17.4
-STANDARD//
DEVIATION 1.62 1.36 1.60 1/ ,11 1.62 1.48 1.91 1.52

0;.
ATTITUDE TOWARD WORLD OF WORK
PROV I NC I AL, GROUP PERCENTILE NORMS
SUBSCALE - INDEPENDENCE'
GROUP
AVERAGE
PERCENTILE RANKS BY SEX WITHIN GRADES
GROUP
AVERAGE
GRADE 9
M F.
GRADE 10
M F
GRADE 11
M F
.
GRADE 12
M F
12.0-- 1 1 1 2 -- 1 r- -- 12.0
13.0 2 2 1 3 1 1 -- 1 13.0
13.5 3 3 2 3 1 1 1 1 13:5
14.0 4 ' 3 3 4 2 2 1 2 14.0
14.5 4 4 4 6 2 3 1 2 14.5
15.0 6 7 4 9 4 4 2 3 15.0
15.5 9 11 5 13 6 7 2 4 15.5
16.0 11 20 6 18 7 .., 10 3 7 16.0
16.5 15 34 8 25 8 16 5 10 16.5
16.8 21 42 10 30 10 21 5 14 16.8
17.0 28 52 14 36 11 26 7 18 17.0
17.2 34 -'.; 61. 18 42 13 31 10 22 17.2
17.4 39 \ 64 22 49 15 35 12 25 17.4
17.6 45 \69 25 54 19 41 14 29 17.6
17.7 47 71 '27 57 20 43 14 31 17.7
17.8 50 , 73 30 59 21 46 15 33 17.8
17.9 53 7, 34 61 22 49 15 36 17.9
18.0 58 7S 39 65 26 55 . 18 41 18.0
18.1 63 81\ - 44 69 31 61 22 47 18.1
18.2 65 83 46 71 34 63 ' 23 . 48 18.2.
18.3 68 84 \ 48 73 38 64 24 50 18.3
-18.4 70 86 \ 50 76 40 66 26 ' 54 18.4
18.6 74 88 56 79 46 71 31 62 18.6
19.0 81 91 69 86 61 82 44 73 19.0
19.2 85 93 \. 75 90 67 85 53 78 19.2
19.4 88 94 178 91 `72 88 59 81 19.4
19.6 89 95 '81 92 76 89 65 85 19.6
20.0 91 97.
88 94.°
84 94 76,
91 , 20.0
20.5 94 98 93, 96 91 98 85 96 20.5
: 21.0 95 98 95':4 97 94 99 90 97 21.0
21.5 97 198 .--- -- 97.: - -98--, 96 99 93 98 21.5
22.0 97 -.---, 98.--- . _98 99 97 99 96 ' 98 22.0
22.5 98 99 98 , 99 97 99 98 99 22.5
' 23.0 9 9 99 99 99 98 99 99 99 23.0
MEAN 17.8 17.0 18.3 17.3 18.6 17.8 -19.1 18.2
STANDARD
DEVIATION 1.83 1.65 1.74 1.89 1.74 - 1.60 1.63 1.60

ATTITUDE TOWARD,WORLD OF WORK
PROVINCIAL GROUP. PERCENTILE NORMS
SUBSCALE - MONEY
GROUP
AVERAGE
PERCENTILE RANKS BY SEX WITHIN GRADES
GROUP
AVERAGE
GRADE 9
M F
GRADE 10
M F
GRADE 11
M F
GRADE 12
M F,
11.5 -- -- -- 1 -- -- 1 11.5
12.0 1 1 1 2 -- ° 1 1 2 ,.12.0
12.5 1 1 1 3 2 1 2 12.5
13.0 2 2. 1 4 0 . 3 2 3 13.0
13.5 2 2 1 4 0 5 2 4 13.5
14.0 3 5 2 7 2 8. 3 7 14.0-
14.5 - 3 9 -3 9 3 12 4 1 14.5
15.0 5 15 4 15 6 20 6 22 15.0
15.5 9 26 8 27 11 30 .9 35 15.5
16.0 15 41 12 40 16 45 17 51 16.0
16.2 , 19 47 15 47 21 50 21 58 16.2
16.4 22 55 18 52 25 55 .25 63 16.4'
16.6. 26 60 022 57 29 61`. 30 67 16.6
16.8 31 64 27 61 33 66 36 71 16.8
17.0 39 70 34,
67 39 71 43 75 17.0
7.1 4,4 74 39 71 44 74 49 78 17.1
17.2 46 76 41 73 47 74 50 79 17.2
17.3 47 77 44 75 49 76 53 80 17.3
17.4 50 78 46 78 53 78 56 81 17.4
17.5 52 79 49 80 57 80. '58 82 17.5
17.6 55 80'. 53 81 61 82 ' 61 84 17.6
17.8 61 83 59 84 65' 84 65 85 17.8
18.0 68 88 . 66 88 7,1 . 87 71 88 18.0 ,
18.2 74 90 73 91 75 90 76 91 18.2
18e4 72 91 79 .92 77 91 79 92 18.4
,18.6 79 93 82 '93 81 92 0 81 . 94 18.6
19.0 83 94 88 94 83 94 86 96 19.0
19.5 90 95 . 91 96 92. 97 '89 98 19.5 '
20.0 :94 97 94 97 94 98 91 98 20.0
20.5 96 . 98 97 98 96 99 93 99 20.5
21.0 97 98 98 99 96 99 95 99 21.0
21.5 97 99 98 9(... .97 99 97 99 21.5
22.0 ' 98 99 99 ,-- -7.-. 98 97 -- 2210
22.5
ti3.0 99 -- -- -- 99 -- .99 23.0
MEAN, 17:5.
1644....
17.5 16.4 17:4
.
16.2 17.4. 16.1
-
STANDARD
DEVIATION 1.76 1.68 1.62 1.76 1.68 1.67 1.88 1.70

ATTITUDE TOWARD WORLD OF WORK
PROVINCIAL GROUP PERCENTILE NORMS
SUBSCALE - AMBITION,
GROUP
PERCENTILE RANKS BY SEX WITHIN GRADES.
GROUP
AVERAGEAVERAGE
GRADE 9
M F
GRADE 10
M F
GRADE 11
M .F
GRADE 12
M F
11.5, ' 1 1 , t 2 2 1 1 11.5
12.0 1 2 2 3 -, 3 2 1 1240
12.5 2 3 2 4 1 4. 2 2 12.5
13.0 3 6 3 6 2 5 3 3 13.0
13.5 5 10 4 10 3 7 3 5 13.5
14.0 8 16 6 15 -5 12 5 9 14.0
14.5 12 30 9 24 7 19 8 16. 14.5
14.8 16 40 12 31 8 24 11 21 14.8
15.0 21 49 15 39 11 30 14 28 15.0
15.2 26 57 19 46 15 A0 17 36 15.2
15.4 31 62 23 53 19 46 18 42 15.4
15.6 37 68 28 - 60 25 52 22 49 15.6
15.8- 43 74 34 66 29 59 26 56 15.8
15.9 46 78 37 69 32 63 27 59 15.9
16.0, 52, 82 43 74 40 67 32 65 16.0
16.1 58 85 49 78 47 71 38 70 16.1
16.2 60 85 52 80 . 56 74 40. 72 16.2
16.3 62 86 56 82 53 76 44 76 16.3
16.4 65 87 60 84 58 78 49 80 16.4
16.6 72 89 67 86 64 82 56 82 16.6
16.8 75 90 72 88 69 83 62 84 16.8
17.0 82 92 78 92 76 88 71 89 17.0
17.5 89 95 . 87 94 84 93 82 .93 17.5
18.0 . 93 97 93 97 90 96 88 96 18.0
18.5 95 99.
95 98 92 98 91 . 98 18.5
19.0 96 99 96 98 95 99 94 98 19.0
19.5 97 99 97 99 97 -- 96 , . 99 19.5
20.0 98 . -- 98 99- 98 -- 97 99 20.0
20.5 99 "99 -- 99 -- 98 99 20.5
21.0 99. 99 -- 99 __ 98 99 21.0
.
MEAN 16.0 15.1 16.2 15.2 6.3 15.4 16.5 15.6
STANDARD
DEVIATION 1.57 1.41 1.56 1.50 1.49 1.45 1.69 1.41
42

ATTITUDE TOWARD WORLD OF WORK
PROVINCIAL GROUP PERCENTILE NORMS
SUBSCALE - LOCUS OF'CONTROL .
GROUP
AVERAGE
PERCENTILE RANKS BY SEX WITHIN GRADES
GROUP
AVERAGE .
GRADE 9
M F
_
GRADE 10
M F
GRADE 11
M F
GRADE 12
M F
7.0 1 1 -- 1 -- 1 -- 1 7.0
7.5 1 1 1 1 1 1 1 . 7.5
8.0 2 1 1 2 1 2 1 2 8.0
8.5 3 2 1 3 1 2 1 2 8.5
9.0 4 3 2 4 2 3 1 3 9.0
9.5 5 4 2 6 3 4 1 .4 9.5
10.0 6 6 3 8 5 7 3 .6 10.0
10.5 8 9 4 13 7 10 5 9 10.5
11.0 11 16 8 17 10 17 8 16 11.0
1145 ,
.---15 26 13 29 14 27 14 25 11.5
11.8 19 '32 18 34 18 31 16 30 11.8
12.0 -25 40 22 39 22 40 19 36 12.0
12.2 32' 46 28 45 27 47 20 43 12.2
12.4 37 52 30 51 30 53 24 49 12.4
12.6 '42 57 34 55 34 58 27 55 12.6 ,
12.8 46 62 38 59 38 63 31 39 12.8
12.9 48 64 41 61 41 64. 33 . 62 12.9
13.0 52 69 45 64 44 67 38 66 .13.0
13.1 56 74' 50 67" 47 70 42 69 13.1
13.2 57 75 52 69 49 71 43 71 13.2
13.3 59 77 54 70 51 73 45 73 13.3
13.4 62 79 56 71' 53 74 48 75 3.4
13.6 65 81 61 74 58 79 54. 79 13.6
13.8 67 82 66 76 61 80 57 80 13.8
14.0 71 85 71 78 68 84 63- 84 14.0
14.5 80 89 78 83 76 88 74 89 14.5
W0 86 91 86 88 . 84 91 79. 91 15.0
15.5 90 93 91 91. 90 95 84 94 15.5
16.0 92 96 93 94 93 96 87 96 16.0
16.5 93 97 95 96 94 98 89 97 , 16.5
17.0 94 98 96 97 96 98 91 98 17.0
'18.0 96 99 98/ 99 98 99 94 99 18.0
19.0 97 99 99/
/
99 98 99 97 99 19.0
20.0 . 99 -- 99 99 99 99 98 99 20.0
21.0 99 '99 -- 99 99 -- ." 21:0
.
.
MEAN 13.1 12.5 13.2 12.5 13.3 12.5 213.7 12.5
STANDARD
DEVIATION 2.31 1.85 1.94 2.08 2.01 . 1.82 2.28 1.86 .
43

ATTITUDE TOWARD WORLD OF WORK
PROVINCIAL GROUP PERCENTILE NORMS
SUBSCALE - CONFIDENCE
GROUP
AVERAGE
PERCENTILE RANKS BY SEX WITHIN GRADES
AVERAGE
GROUP
. GRADE 9
M F
GRADE 10
M F
GRADE 11
M -
GRADE 12
M F
13.5 1 1 1 1 1 2 1 1 13.5
14.0 1 2 . 2 2 2 3 1 2 14.0
14.5 2 3 3 3 3 4 1 3. 14.5
15.0 3 6 5 5 3 '4 3 4 15.0
15.5 - 5 8 6 7 4 5 4 5 15.5
16.0 8 11 7 10 6 8 6 7 16.0
16.5 3 17 10 16 10 13 8 11 16.5
16.8 17 24 15 19 12 16 10 14 16.8
j 17.0 21 31 18 24 16 20 14 18 17.0
17.2 27 39 22 30 20 23 17 23 17.2
17.4 32 46 28 35 23 30 20 27 17.4
17.6 39 51 35 40 28 .35 24 31 17.6
17.8 45 58 i 42 46 32 39 28 35 17.8
17.9 49 61 44 49 34 42 '29 37 17.9
18.0 55 66 49 55 39 48 35 42 18.0
.-1A:1 61' 70 54 61 45 54 41 47 18.1
18.2, 64 72 55 62 48 57 42 49 18.2
18.3 67 75 57 64 52 60 44 51 18.3
18.4 72 78 59 68 55 63 47 .55 . 18.4
18.6 75 84 65 74 62 68 54 62 18.6
,18.8
18.9
79
80
86,
87
72
74
79
80
67 72
68 74
58
60
72
75
18.8
18.9
19.0 84 90 79 84 72 78 66 78 19.0
19.2 87 94 85 87 77 83 74 81 19.2
19.4 88 95 88 89. 83 86 80 84. :,- , 19.4
19.6 89 95 89 90 86 87 84 86 19.6
20.0 92 97 93 94 -91 91 89 91 20.0
20.5 , 95 98 95 96 95 93 93 94 20.5
21.0 91 99 97 97 96 96 95 96' 21.0
21.5 98... 99 98 98 97 98 97 97 21.5
22.0 99 100 98 98 98 99' 98 98 22.0
22.5 99 100 99 98 98 99 99 99 '' 22.5
MEAN 17.9 17.5, 18.0 17.8 18.2 18.0 18.4 18.1
STANDARD . .
DEVIATION 1.48 1.42 1.56 1.69 1.59 , 1.64 1.56 1.62

ATTITUDE TOWARD:WORLD OF WORK
PROVINCIAL GROUP PERCENTILE NORMS
SUBSCALE - NEGATIVE EMPLOYER CHARACTERISTICS
GROUP
AVERAGE
PERCENTILE RANKS BY SEX WITHIN GRADES
GROUP .
AVERAGEGRADE 9
M F
GRADE 10
M F
GRADEa11
M F
GRADE 12
M F.
8.0 1 -- -- 1 1 -- 8.0
8.5 1 -- -- 1 1 -- 8.5
9.0 1 -- -- 1 1 -- 9.0
9.5 2 -- -- 1 1 1 1 9.5
10.0 2 1 1 1 11 2 10.0
10:5 3 A 1 2 2. 2 3 2 10.5
-11.0 4 3 1 3 3 3 3 4 11.0
-11.5 5 '4 1 3 4 4 3 7. 11.5
12.0 6 6 3 6 5 5 5 10 12.0
12.5 8 8 4 9 8 9 8 13 12.5
13.0 10 15. 7 14 11 14 12 20 13.0
. 13.5 18 25 13 21 18 22 20 29 13.5
13.8 24 31 '18 26 22. 28 26 37 13.8 -
14.0 30 39 25 33 28 35 31 47 14.0
14.2 37 47 31 40 33 42 36 53 14.2.
14.4 42 54 34 47 37 48 41 58 14.4
14.5 45 58 37 50 39 51 43 61 14.5
14.6 48 61 40 53 41 55 46 64 14.6
14.7 50 63 44 - 57 43 57 48 66 14.7
14.8 53 66 46 59 46 59 50 '68 14.8
14.9 55 68 48 i 60 48 61 53 70 14.9
15.0 60 72 53 63 53 66 58 45 15.0
15.1 64 76 58 67 58 71 62 78 15.1
15.2 66 77 59 70 60 72 64 79 15.2
15.3 68 -79 63 72 61 74 66 80 15:3.
15.4 70 80 66 73- 63 76 68 82 15.4
15.6 74 82 70 76 67 79 71 83 15.6..
15.8 77 84 73 78. 71. 82 73 84. 15.6'"
16.0 81 87 78 83 75 85 76 87 16.0'
16.5 88 91 85 88 82. 88 82 91 16.5
17.0 92 94 88 91 88 92 87 94 17.0
17.5 96 96 91 94 93 94 89 96 17.5
18.0 97 97 93 96 95 95 92 97 18.0
18.5'...
97 98 96 98 96 '96 95 97 18.5
19.0. 98 98 96 99 97 98 96 98 19.0
19.5 99 99 97 99 97 99 97 99 19.5
20.0 ,99' 99 97 -- 98 99 98 99 . 20.0
MEAN 14.7 14.4 15.1 14.6 15.0 14.6 14.9 14.2
STANDARD.
DEVIATION 1.84 1.68 1.88 1.72. . ..
1.95..
1.86 2.21 1.80
45

ATTITUDE TOWARD WORLD OF-WORK
PROVINCIAL GROUP PERCENTILE NORMS
SUBSCALE - SOCIAL RELATIONS
GROUP
AVERAGE
PERCENTILE RANKS BY SEX WITHIN GRADES
GROUP
AVERAGE
GRADE 9
M F
GRADE 10
M F.GRADE 11
M F
GRADE 12
M F
14.5 1 1 2 -- 1 1 1 14.5
15.0 1 1 3 1 1 2 1 15.0
15.5 2 1 5 2 1 2 3 2 15.5
16.0 4 2 6 2 1 3 5 2 16.0
17.0 10 6 9 4 7 4 11 5 17.0
17.5 15 8 14 6 13 7 18 7 17.5
17.8 20 10 16 8 15 7 22 7 17.8
18.0 26 12 21 10 20 10 27 9 18.0
18.2 33 15 25 13 26 12 31 10 18.2
18.4 39 16 31 14 30 14 33 13 18.4
18.5 41 18 35 16 33 14 35 14 18.5
18.6 44 20 39 18 36 15 38 15 18.6
18.7 47 23 43 19 39 16 40 16 18.7
18.8 49 26 46 22 42 17 43 17 18.8
18.9 52 28 49 24 44 18 45 18 18.9
19.0 57- -32 56 28 49 21 50 23 19.0
19.1 62. 37 63 33 53 24 55 26 19.1
19.2 65 40 65 35 55 25 56 27 19.2
19.3 68 44 67 37 57 28 59 28 19.3
19.4 69 48 70 40 59 32 63 31 19.4
19.6 73 55 76 45 66 36 68 36 19.6
19.8 79 61- 79 50 71 42 71 43 19.8
19.9 81 65 81 53 74 46 73 46 19.9
20.0 85 70 84 59 79 52 77 53 20.0
20.1 88 75 86 65 83 57 81 59 20.1
20.2 88 77 88 68 84 59 83 62 20.2
20.4 90 81 89 74 87 68 85 69 20.4
20.6 91 84 89 78 89 74 88 74 20.6
21.0 94 90 93 87 93 84 93 77 21.0
21.5 96 93 96 92 95 90 94 90 21.5
22.0 97 96- 97 95 97 94 96 95 . 22.0
22.5 98 98 98 96 98 96 97 96 22.5
23.0 99 98 98 97 99 98 99 98 23.0
23.5 99 99 99 . 98 -- 99 99 99 23.5
24.0 99 99 99 98. -- 99 99 24.0
MEAN 18.8 19.4 18.8 19.7 19.1 19.8 18.9 19.8
STANDARD
DEVIATION, 1.53 1.48 1.66 1.55 1.40 1.62 1.71 1.53
46

GROUP
AVERAGE
ATTITUDE TOWARD WCRLD OF WORK
PROVINCIAL GROUP PERCENTILE NORMS
SUBSCALE - UNEMPLOYMENT
PERCENTILE LE RANKS BY SEX WITHIN GRADES
GRADE 9
M F
GRADE- )0
M : F
GRADE- 11
M F
GRADE 12
M F
AVERAGE
9.510.010.511.011.512.012.5
13.013.5
14.014.515.015.315.515.8
16.016.216.4
16-.6
16.816.917.017.1
17.217.317.417.517.617.818.018.519.019.520.020.521.0-21.522.022.523.0
MEAN
STANDARD
DEVIATION
2
7io
6 16
9
13
16 49
18 54
21 59
26 64
31 68
36 73
41 76
45 78
47 79
51 81
55 83
57
60 84
63 84
65 85'.
66 86
69 88
73 90
80 93
87 95
90 96
92 97
94 98-96 99
98 99
99 99
99 99'99 99
14
19
16
29
41
51
22 '5427 '60
31 68
35 72
39 76
44 79
50 80
53 81
57 83
60
62-
64
6770
7377 89
81 92
85 94
89 95
93 97
95 97
96 98
97 98
98 98
98 99
99 99
99
17.0 15.6
2.08 1.99
16.7 15.5
'2.06 1.99
4
6
10
17
22
11 33
14 42
17 51
19 56
23 61
27 64
33 68
38 72
42
4547 79
51 82'54 84
54 84
57 85
5
61
63
68
73 90
82 94
88 95
90 96
93 97
94 98
96 -98---97 98
98 98
98 99
99 99
17.0 15.5
I 1.
1 2
1 2
1 3
2
2 7
3 9
5
7 21
9 29
13 40
17 48
20 54
23 60
27' 65
32 68
;'36 73
40 76
43 78
45 80
50
2.11 2.16
64.
66
81'
86 95
90," 96
94 97
96 97
-797-98-98 99
.99 99
99
99
9.510.0
10.511.011.512.012.5
13.013.5
14.0
14.515.015.315.515.8
16.016.216.4
16.6
16.816.9
17.07.1
17.2
17:3`17.4
17.517.617:818.018.5
.19.019.520.020.5
---21.021.522.022.523.0
17.0 15.4
2.08 2.13

ATTITUDE TOWARD WORLD OF WORK.
PROVINCIAL GROUP PERCENTILE NORMS
SUBSCALE - GENERAL
GROUP
AVERAGE
PERCENTILE RANKS BY SEX WITHIN GRADES
GROUP
AVERAGEGRADE 9
M F
.
GRADE 10
M F
/GRADE
AfiM
11
F
GRADE 12
M F
12.0 1 -- 1 -- 1 1 1 -- 12.0
12.5 1 -- 1 -- 2 1 1 -- 12.5
13.0 2 1 1 -- 2 1 1 -- 13.0
13.5 3 1 2 -- 3 1 2 1 13.5
14.0 3 2 2 1 4 2 4 1 14.0
14.5 4 2 3 2 5 3 5 2 14.5
15.0 6 3 5 4 7 5 7 3 15.0
15.5 9 4 8 6 10 6 9 4 15.5
16.0 13 6 12 8 15 9 13 6 16.0
16.5 19 11 21 11 23 12 19 9 16.5
17.0 31 18 32 18 34 17. 31 17 17.0
17.2 39 22 37 23 40 22 38 23 17.2
17.3 42 24 39 24 43 25 40 24 17.3
17.4 45 26 42 25 46 28 43 26 17.4
17.5 49 28 45 26 49 31 46 28 17.5
17.6 54 31 48 29 52 35 49 30 :17.6
17.7 58 33 51 31 55 .37 51 32 17.7
17.8 61 35 53 33 58 39 53 36 17.8
18.0 68 44 63 40 66 44 62 45 18.0
18.1 72 49 69 46 71 49 68 50 18.1
18.2 73 53 72 48 73 52 70 53 18.2
18.4 76 59 77 55 78 59 75 60 18.4
18.6 81 65 81 62 80 66 - 80 66 18.6
18.8 84 70 83 67 84 70 82 72 18.8
19.0 87 78 87 74. 87 77 86 79 19.0
19.5 91 89 92 83 92 86 91 86 19.5
20.0 94 93 95 91 94 90 94 94 20.0
20.5 96 97 97 95 96 94 95 ' 95 20.5
21.0 97 98 98 95 97 96 96 97 21.0
21.5 98 99 99 97 99 98 97 98 21.5
22.0 99 99 99 97 99 99 98 99 22.0
22.5 -- -- 98 -- -- 99 99 22.5
23.0 -- -- -- 99 -- 99 -- 23.0
MEAN 17.5 18.1 17.5 18.2 17.4 18.1 17.6 18.1
STANDARD.
DEVIATION 1.68 1.41 1.59 1.64 1.78 1.69 1.77 1.43
3