document resume ed 304 756 clune, william h.; and others
TRANSCRIPT
ED 304 756
AUTHORTITLE
INSTITUTIONSPONS AGENCY
REPORT NOPUB DATEGRANTNOTEAVAILABLE FROM
PUB TYPE
EDRS PRICEDESCRIPTORS
ABSTRACT
DOCUMENT RESUME
EA 020 755
Clune, William H.; And OthersThe Implementation and Effects of High SchoolGraduation Requirements: First Steps towardCurricular Reform. CPRE Research Report Series.Center for Policy Research in Education.Office of Educational Research and Improvement (ED),Washington, DC.CPRE-RR-011Feb 89OERI-G00869001178p.
Publication Sales, Center for Research Policy inEducation, Eagleton Institute of Politics, Rutgers,State University of New Jersey, New Brunswick, NJ08901 ($5.00).Information Analyses (070) -- Reports -Research /Technical (143)
MF01/PC04 Plus Postage.Academic Achievement; *Academic Standards; CourseContent; *Curriculum Development; *EducationalChange; Educational Improvement; Elective Courses;*Graduation Requirements; *High Schools; Interviews;Vocational Education
The focus of this study is the implementation andeffects of high school graduation requirements enacted as a result ofthe recent wave of state reforms of education. The study concentrateson high school graduation t'ourse requirements. Interview data on theintent and effects of the requirements were gathered in six states,24 districts, 32 high schools, 9 junior high schools, and 18elementary schools. (Wet 700 interviews were conducted at the stateand local levels. combined. A chapter is devoted to the currentrequirements as well as the change in requirements. The effects ofrequirements on course offerings in terms cf change in and quality ofcourse offerings are discussed. Respondents generally regretted theloss of vocational and elective courses but perceived this as astrong public support for higher standards. The paper concludes thatthe requirements were a qualified success because they producedbroad-scale change of a type likely to make some difference inultimate policy goals. Appended are 54 references and three tables.(SI)
**********************************************************************1.Reproductions supplied by EDRS are the best that can be made
from the original document.***********************************************************************
(ICPRECENTER FORPOLICY RESEARCHIN EDUCATION
a consortium:
THE STATE UNIVERSITY OF NEW JERSEY
RUTGERSMichiganstate
University
STANFORDUNIVERSITY
UNIVERSITY of
WISONSIN-SON
The Implementati nand Effects of
High School Graduati nRequirements:
First Steps TowardCurricular Reform
William H. Clunewith
Paula White and Janice Patterson
U S DEPARTMENT OF EDUCATIONOff tzPse.rc,,
EDUCATIONAL RESOURCES INFORMATIONCENTER (ERIC,
NeS, Caen rprc4,,,,,-,e1 asft-ct,,d frrt, Tr, Cd'QdnIATonI
is en made to Ftrrotovtf.0.01uct,pr q,a1 ty
Potnts of w op", Oa -sta.. 1.ntrus4oco,ent do rot ne.:essafily riPprASFMCERr P95 ;,
CENTER FOR POLICY RESEARCH IN EDUCATION (CPRE)
CPRE unites tour ot the nations leading research institutions in a unique venture to improve thequality ot schooling. The consortium membels are. the Eagleton Institute of Politics at Rutgers, TheState University of New Jersey, the School ot Education at Michigan State Uniersit% , the School ofEducation at Stanford Unix ersit, and the IVIsconsm Center for Education Research at the Unix er-sitv of Wisconsin-Madison.
Sponsored by the U.S. Department of Education, CPRE conducts research on the implementationand ettects of state and local education policies By communicating its findings to policy makers,the Center attempts to contribute to the framing of education policies- that .ill have a positiveimpact on children in classrooms.
CPRE's research activities are concentrated in five major areas:
Policies on Curriculum and Student Standards
Teacher Policies
Educational Indicators and Monitoring
New Roles and Responsibilities
Evolution of the Ceform Movement
In addition to conducting research in these areas, CPRE publishes reports and briefs on a ariet% ofeducation issues. The Center also sponsors regional workshops for state and local policy makers.
CPRE Research Report Series
Research Reports are issued by CPRE to facilitate the exchange of ideas among policy makers andresearchers who share an Interest in education policy. The views expressed in the reports are thoseof individual authors, and are not ne,:essarily shared by the U.S. Department of Education, CPRE,or its institutional partne:s. This publication wzs funded by the U.S. Department of Education,Office of Educational Research and Improvement, grant number OERI-G00869001
To obtain copies of this and other CPRE publications, contact. Center for Policy Research inEducation, Eagleton Institute of Politics, Rutgers, The State University of New Jersey, NewBrunswick, NJ 08901; attention: Publications. Phone: (201) 828-3872.
3
CENTER FORPOLICY RESEARCHIN EDUCATION
a consortium:
The implement ti nan Effects o
h cho. I uati ne uirements:
First Steps TowardCurricular Reform
William H. Clunewith
Paula White and Janice Patterson
February 1989
THE STATE UNIVERSiTY OF HEW JERSEY
RUTGERSDiiichigan
StateUniversity
STANFORDUNIVERSITY
IIIIIVERSITYof
=MONCPRE Research Report Series RR-011
CONTENTS
ABSTRACT
ACKNOWLEDGEMENTS
INTRODUCTIONSuggestions for Abridged Reading
RESEARCH METHODSThe Core Data BaseReduced Sample for Student Standards ProjectInterview QuestionsOverview of Research Methods
v
vi
1
3
55566
THE NEW GRADUATION REQUIREMENTS:SIZE, STRUCTU.IE AND CHANGE 9
Current Requirements: Core Academics and Other 9Change in Requirements 10
EFFECTS OF REQUIREMENTS ON COURSE OFFERINGS 13Changes in Course Offerings 13Quality of the New Courses 15
RESPONDENT VIEWS OF EFFECTS 19Success of the Policies in Achieving
Their Intended Effects 19Advantages and Disadvantages of the Policies 20Success of the Policies in Meeting Local Need:: 23Local Support for State Policies 24
DROPOUT RATES AND AT-RISK STUDENTS 27
IMPLEMENTATION AND COSTS 29
STATE MONITORING OF GRADUATION REQUIREMENTS 31
DISCUSSION AND POLICY RECOMMENDATIONS:PARTIAL POLICY, LIMITED RESULTS ANDFURTHER STEPS TOWARD CURRICULAR REFORM 33
The Success of Graduation Requirements inMeeting Their Objectives 33
Policy Recommendations 38Basic Problems with Existing Policy 39Streamline the Core Curriculum. 40Aim the Curriculum at Higher-Order Learning Objectives 40Pay Special Attention to Instruction for
Middle- and Low-Achieving Students 41Use Different Policy Instruments for
Different Purposes and Groups of Students 41Investigate Cognitively Demanding Vocational Education . 42Design Technical Assistance to Schools for
Improved Content 43Build an Indicator System to Track Content and
Course-Related Achievement 43Continue Research on Curriculum Improvement 44Evaluate Changes in the Policymaking Process 44
CONCLUSION: AMBITIOUS GOALS,MORE PRECISE POLICY ,'7
REFERENCES 73
TABLES
TABLE I: HIGH SCHOOL GRADUATION REQUIREMENTS . 49
TABLE 2: CHANGES IN COURSETAKING IN FOUR STATES,13 DISTRICTS AND 19 HIGH SCHOOLS 65
TABLE 3: DISTRICT AND SCHOOL RESPONDENT VIEWS ABOUTEFFECTS OFNEW GRADUATION REQUIREMENTS 71
6
ABSTRACT
Increased high school graduation requirements were the most commonchange in policy in the recent reforms of education. Forty-five states raisedrequirements. Forty-two states added requirements in math, science, or both.
Interview data on the intent and effects of the requirements weregathered in six states, 24 districts, and 32 high schools, selected to insuresignificant policy impact (change required) and variations in state and localcapacity. Over 700 interviews were conducted at the state and local levelscombined. A reduced sample for some of the data on graduation requirementsincluded four states, 13 districts, and 19 high schools.
Affluent schools and districts and college preparato-y students typicallywere not affected by the reforms, usually because they already responded tohigher university entrance requirements. Four of 13 districts had total creditrequirements which equalled or exceeded the state's, and almost all districtshad some preexisting requirements which reduced the change needed to meetthe new state requirements.
Nevertheless, math or science courses or sections were added in 12 of 13districts, 17 of 19 schools. On the average, four sections of math and five ofscience were added in these schools. Rough calculations translate this changeinto an extra math class for 27 percent of the students, plus an extra scienceclass for 34 percent of students in the (mostly urban) schools of our sampleaffected by reform. Social studies courses also were frequently added.
The courses added were overwhelmingly at the basic, general, or remediallevel, suggesting that the reforms provoked a national experiment in math andscience education for middle- and low-achieving students. Apart fromscattered evidence of watering down of course content, little is known aboutthe quality of the courses, especially what kind of standards they set for theparticular kinds of students affected. Despite respondents' views to thecontrary, the requirements may not have increased dropout rates; but concernsdo exist about the quality of education offered to at-risk students in order tokeep them in school.
Respondents generally regretted the loss of vocational and electivecourses and were not sure what policymakers intended to achieve through thenew requirements. Respondents also perceived strong, but mostly uninformed,public support for higher standards.
The paper concludes that the requirements were a qualified successbecause they produced broad scale change of a type likely to make somedifference in ultimate policy goals (a more rigorous and uniform curriculum,higher achievement scores, and improved work skills). Against more ambitiousgoals, such as national competitiveness, the results were modest at best.Pursuing the agenda of curricular reform to its desired ends will require majorimprovements in policy design and implementation (such as more carefulattention to the content of courses, targeting of courses to specific groups ofstudents, and technical assistance to schools and teachers).
v
Pin. olte.61,..1704111%,111611,s .11...112 snow. :ie.:wows.
7
ACKNOWLEDGEMENTS
This paper went through several drafts and involved an unusual number ofresearchers and commentators. Original data in the core data base werecollected by researchers from the then constituent institutions of the Centerfor Policy Research in Education (CPRE): (Rutgers University, University ofWisconsin-Madison, and the RAND Corporation). Valuable comments on twoearlier drafts were made by Richard Elmore, Susan Fuhrman, Michael Kirst,
Patterson, Andrew Porter, Alan Rosenthal, Marshall Smith, Carl VanHorn, Sheldon White, and reviewers at OERI in the U. S. Department ofEducation. Valuable comments on a later draft were also contributed byRichard Murnane and Thomas Payzant.
Janice Patterson prepared Table I. Paula White did important work onanalysis of the core data and wrote a draft of the sections on coursetakingchanges and respondents' perceptions of effects. A related working paper byLorraine McDonnell drawn from the same data base was helpful and is citedseveral times throughout the text.
Lisa Armstrong did her usual superb job with technical processing,improving the quality of the product and saving endless hours.
William H. Clune is Voss-Bascom Professor of Law at the University ofWisconsin Law School. He directs the Wisconsin branch of the Center forPolicy Research in Education (CPRE) and is a member of the executive boardof the La Follette Institute of Public Affairs at Wisconsin. Dr. Clune hasconducted research on education policy in the areas of school finance, schoollaw, implementation, special education and public employee interest arbitration.He currently is conducting research for CPRE on graduation requirements andother student standards, school-site autonomy and curriculum regulation. Dr.Clune also is co-directing a conference on educational decentralization andchoice for the La Follette Institute.
Janice H. Patterson is a senior research fellow at CPRE at the Universityof Wisconsin-Madison. She has conducted research on instructional uses ofcomputers to stimulate higher-order thinking and state policies designed topromote computer use in schools. Dr. Patterson currently is investigating theeffects of increased academic standards on at-risk youth.
Paula A. White is a graduate student at the University of Wisconsin-Madison with masters degrees in political science and educational policystudies. Her dissertation topic in the Department of Educational Policy Studiesis on decentralized control of schools and teacher empowerment. Ms. White isalso a research assistant in a study aimed at identif'ing district actions thatattempt to increase the effectiveness of instruction by changing the locus ofdecision-making authority.
vi
INTRODUCTION
This is a study of the implementation and effects of high schoolgraduation requirements, one of the student standards enacted as part of therecent wave of state reforms of education. Student standards are conditionsrequired for the receipt of educational benefits which also have an impact onvarious aspects of the school program such as curriculum design, counselling,and course selection by students. Student standards were a common feature ofthe reform movement, including 45 states with increased high school graduationrequirements, 21 with longer school days, 14 with new or modified high schoolexit exams (in addition to the 7 already having such exams), and a few withminimum gradepoints (applying to athletes and others) (McDonnell, 1988; U.S.
Dept. of Education, 1984).
The study concentrates on high school graduation course requirementsbecause such requirements were the single most popular type of reform andbecause, on theoretical grounds, graduation requirements promised to have the
greatest impact on student learning. In regulating the curriculum (bothcoursetaking and course offering), graduation requirements are aimed atcontrolling the content of education; and content has been linked empiricallywith gains in achievement (Borg, 1980; Jones, Davenport, Bryson, Bekhuis, &Zwick, 1986; Koretz, 1988; Raizen, 1988; Raizen & Jones, 1985; Wiley &Harnischfeger, 1974; Wolf, 1977). We also anticipated that graduationrequirements stood a reasonable chance of meaningful implementation, despiteinevitable local variation, because of the existing foundation of curriculummanagement and regulation and general support for the value of academiceducation among educational professionals.
Thus, of all the reforms, graduation requirements seemed most likely toachieve the general objective of a more rigorous academic education. Butserious questions also existed about the extensiveness and quality ofimplementation. The requirements themselves usually are quite general("mathematics" rather than "algebra") and legally may be satisfied with variouslevels of the came course (e.g., remedial, general, academic). Even courseswith the same label may have different content, despite the influence ofcurriculum guides and standardized subject matter tests. (See Resnick andResnick [1985] and later sections of this paper for the intended interplay ofgraduation requirements and control of course content.)
Local districts and schools vary greatly in the amount of change requiredto meet the new mandates, and in capacity to meet them. Some districts haverequirements equal to or even greater than the new state requirements (partly
as a bandwagon effect of reform); others have non-existent or very low local
requirements. Some districts and schools have mostly college-bound studentswho probably already met the requirements, either because of their ownacademic goals, or because of university entrance requirements (often raisedduring the same period as graduation requirements). Other districts havemostly low-achieving, non-college-bound students for whom the new graduation
1
9
requirements demanded a substantial shift in coursetaking. Variation in localeducational goals (e.g., vocational education, electives) is extensive, suggestingsubstantial interpretation and modification of mandates to meet local needs.Thus, local adaptation of the mandate, and some avoidance, was to be expected(Clune, 1983; Elmore & McLaughlin, 1988; McDonnell, 1988; McLaughlin, 1976,1987).
The combination of a relatively strong policy instrument aimed ateducational content (graduation requirements) coupled with the potential forenormous local discretion and variation made the achievement of policy goalsseem both promising and problematic. Would the requirements be successful inmeeting goals such as those suggested by the "bible" of school reform, ANation at Risk (National Commission on Excellence in Education, 1983):
o A more uniform and less diluted curriculum, rather than a"cafeteria-style curriculum in which the appetizers and desserts caneasily be mistaken for the main courses.' (p. 18).
o Reversal of the trend away from vocational and college preparatorycourses toward "general track" courses. (p. 18).
o Raising the low percentages of students taking regular academiccourses, such as intermediate algebra, French I, geography, andcalculus. (pp. 18-19).
() Supplementing academic math and science courses !la college-bouridstudents with "new, equally demanding ... curricula" for those whodon't contemplate college. (p. 25).
As we will see, the actual effects of the graduation requirements andother reforms were quite varied relative to these goals. Math and sciencecourses were added in response to state high school graduation requirements,but they were mostly at the basic, general, or remedial levels. Vocationalcourses declined sharply. We know from other research that there was anincrease in regular academic courses (algebra, biology, etc.), probably largelydue to increased university entrance requirements (Grossman, Kirst, Negash,Schmidt-Posner, & Garet, 1985; Hanson, forthcoming; Westat, 1988; Goertz,forthcoming). But the academic curriculum remained quite stratified becausethe new academic courses added for the non-college bound were generally nottraditional academic courses but rather basic, general, or remedial courses.
Different combinations of policies affected different states and districtsin different ways. Besides the cumulative effects of state graduationrequirements and university entrance requirements on different groups ofstudents, testing programs (old and new) had an influence on course content.Newly developed standardized subject matter exams (roughly similar to the NewYork State Regents exams but often developed and administered at the districtlevel) regulated the content of additional courses and sections. Some newcourses were added as preparation for high school exit exams, with theiremphasis on basic and functional skills.
2
10
In general, to expect that the particular policy of increasing high schoolgraduation requirements would accomplish all of the goals expressed in ANation at Risk seems global and unrealistic. Rather than producing a high-level, uniform academic curriculum for all students, the requirements affected aparticular group of students in a particular way (especially, additions ofgeneral math and science courses for middle- and low-achieving students).Rather than achieving all of the goals simultaneously, the requirementsachieved some at the expense of others (e.g., more math and science coursesat the expense of vocational courses and the perpetuation of both a generaland stratified curriculum). In this sense, the requirements were "first stepstoward curricular reform." More complete achievement of the goals willrequire the kind of aggressive, difficult, but also inspiring and promising policychanges recommended at the end of this paper.
SUGGESTIONS FOR ABRIDGED READINGReaders interested in an abridged reading focussing on central findings
and conclusions should skip the sections which follow on research methods andthe graduation requirements and proceed directly to the section on the effectsof requirements on course offerings (beginning page 9). A further shorteningof the reading can be obtained by skipping from here, or from that section(ending page 12), all the way to the conclusiops and policy recommendations atthe end of the paper (beginning on page 33).1
I This paper is but one of several related papers on the effects ofgraduation requirements and other student standards forthcoming from theCenter for Policy Research in Education (CPRE) which include a longitudinalstudy of enrollments in Dade County, Florida (Hanson, forthcoming), replicatingan earlier PACE study of enrollments in California (Grossman, Kirst, Negash,Schmidt-Posner, & Garet, 1985); two smaller studies, from the same data baseused in this paper, one on the reasons for varying patterns of course offerings(including policy considerations), the other on effects of higher standards onat-risk students (both expected in early 1989); and a longitudinal study oftranscripts in four states (expected in late 1989). Readers also are referred toan analysis done by The RAND Corporation foi a different project from thesame data base used in this paper (McDonnell, 1988). Other relevant researchincludes a longitudinal transcript analysis of reform states in progress byResearch for Better Schools (reported by Rossman, Wilson, D'Amico, &Fernandez, 1987) and a longitudinal study of a national sample of transcriptscommissioned by the U.S. Department of Education (Westat, 1988). Asdiscussed in footnote 9 and accompanying text, data from all available studiesare basically consistent with cad. other and with the results reported in thispaper.
3
11
RESEARCH MIC,THODS
THE CORE DATA BASEData for this study came from CPR E's core data base of information on
six states (Arizona, California, Florida, Georgia, Minnesota, and Pennsylvania).The six states were selected to represent, among other things. a range ofstudent standards policies; especially graduation requirements. Interviews wereconducted at the state level to determine policy background and content.State-level respondents included chief state school officers, governors' aides,legislators, legislative staff, specialists in departments of education, andcommentators outside the government, like journaiists and academics. Thestate-level interview process yielded 188 interviews as well as muchdocumentation.
Within each state, at least three districts were chosen to represent arange of policy impact and local capacity (that is, districts which would needto change more and less in response to the policy and districts which might beable to respond more and less easily). Within the districts in each state, weselected a sample of schools, again representing a range of policy impact andcapacity (for example, we chose sch ,ols with varying percentages of high- andlow-achieving students). The six-state sample included 24 districts, 18elementary schools, 9 junior high schools, and 32 high schools. There werL.524 intervi-ws conducted at the local level (226 district; 298 school).
Respondents at the district level included superintendents, assistantsuperintendents, and policy specialists within the district administration, aswell as board members, journalists, union leaders, and representatives of parentand interest groups. School-level interviews included teachers, principals,assistant principals, and department heads.
REDUCED SAMPLE FOR STUDENT STANDARDS PROJECTroi reasons explained more fully below in the discussion of the
graduation requirements, the local sample for graduation requirementseliminated Minnesota and Georgia from the research on changes in courseofferings. This leaves four states supplying data on changes in courseofferings (Arizona, California, Florida, and Pennsylvania) and five states ongeneral questions about the impact of reforms (those four states, plus Georgia).Table 2, located at the end of this paper, reports changes in course offeringsin 19 high schools of the four states, while Table 3 (also at the end of thispaper) reports respondents' perceptions of effects in the districts and schoolsof five states. For our limited examination of curriculum alignment policies,we looked at districts in all six states.
5
12
INTERVIEW QUESTIONSRespondents at every level were asked a range of questions on context
and various kinds of policies (e.g., student standards, teacher policies,monitoring, computers). The findings in this paper derive mainly from thequestions on student standards incorporated in the interview guides and thedocumentation which was collected to help answer those questions in moredetail. The questions were developed to fit a theoretical framework, developedfrom implementation and other research, that focuses on tke effects andfeasibility of policies, as well as the support they engender. 4 Effects includeboth student achievement and other outcomes, like educational stratification.Feasibility includes both financial and administrative costs and problems.Support refers to the conformity of the policies with beliefs of actors in thesystem about the most desirable practice.
OVERVIEW OF RESEARCH METHODSThe data in this paper consist of self-reports from the field about the
implementation and effects of graduation requirements from people closelyinvolved with the policymaking and educational process at the state, districtand school levels. Such data have both advantages and disadvantages comparedwith more quantitative behavioral data, such as longitudinal studies of changesin coursetaking and dropout rates. Disadvantages are unreliability, ambiguityand conflicts in the data and difficulty in measuring the exact size of effects.We found that we could distinguish reliable from unreliable data. Respondentshad no direct knowledge of dropout rates, and their estimates were notsupported by local data. But some respondents knew a great deal about courseofferings, and their estimates of changes are quite close to availablequantitative data (including our own).
Advantages are efficiency (speed and low expense) and ability to probethe explanations for effects. We were able to gaper a large amount of dataabout multiple policies in a short period of time? We could isolate refour asa causal factor by asking respondents what they did in response to reform
2 A more complete explanation and justification of this framework ofeffects, feasibility and support may be found in the original proposal for thisresearch (Center for Policy Research in Education, 1985).
3 Data were collected by researchers of the three institutions whichinitially comprised CPRE (Rutgers University, RAND Corporation, andUniversity of Wisconsin-Madison). Policies examined included studentstandards, teacher policies, computer policies, and monitoring (or indicators).State interviews were conducted in Spring 1986. District and school interviewswere done in early and late Spring 1987. In general, the local interviews tookplace very close to the initial implementation of the requirements. As seenfrom Table 1, the effective date of the requirements in three states was 1987(AZ, CA, FL); in Georgia, 1988; and in Pennsylvania, 1989. Although, at thetime of our interviews, the first class of seniors bound by the requirementswere juniors in Georgia, and sophomores in Pennsylvania, schools in thesestates had already put the necessary courses in place so that students couldtake them before their senior year.
6
13
(rather than relying on numerical aata which reflects the influence of amultitude of factors); and we could examine the interrelationships of reformand other factors (e.g., other policies, school planning, school demographics).
This study also shares the isual limitations of elite interview data. Sincewe did not spend much time observing schools, we could not probe cert-inkinds of effects. For example, we have no way of knowing how strictlyschools were actually enforcing graduation requirements, although we talked tothe school people who were spending a lot of time doing the necessarypaperwork. More importantly, although we did discover many suggestiveexamples of varying course quality, we could not go systematically below thelevel of course labels to examine course content. Extensive, new and as yetundeveloped, indicator systems would be necessary to provide comprehensivedata (McDonnell, 1988).4 CPRE does rian future research on the content ofcarefully selected courses (probably the low-tier math and science courses thatwere the most common response to reform).
All in all, we felt that the method was cost-efficient and generated alarge amount of information about both patterns and variation that would havebeen difficult or impossible to obta:n in any other way.
This concludes the discussion of research methods; we now move to thepresentation of data. The next eection of the paper will analyze publisheddata on the state graduation requirements (total and distribution of creditrequirements, etc.). Then follow a number of sections based on our own datawhich disc'-.,s: changes in course offerings, respondents' views of effects,dropout rates and at-risk students and implementation and costs. Followingour presentation of data are sections on overall conclusions and policyrecommendations.
4 This concern over compliance is heighten .J because we found that thesix states do not monitor compliance with graduation requirements. Threestates, California, Florida, and Georgia, have the capacity to monitor studentrecords through electronic data, or are developing the capacity to do so. Seethe discussion on page 31. See also McDonnell (1988).
7
14
THE NEW GRADUATION REQUIREMENTS:SIZE, STRUCTURE AND CHANGE
Changes in graduation requirements across the nation are reported inTable 1 (located at the end of this paper) based on recently available data.Table 1 breaks the requirements down into the core subjects of English, math,science, and social studies and combines into an "other" category all otherrequirements (i.e., specific requirements, like physical education and fine arts,as well as non-specific credit requirements). In addition to the fact that 45states made some sort of change in graduation requirements, Table 1 alsoshows that 42 (84 percent) increased requirements in math or science, or both.This emphasis on math and science was also seen in our examination of thetypes of courses actually added in our sample states.
CURRENT REQUIREMENTS: CORE ACADEMICS AND OTHERProbably the simplest place to begin a comparison of high school
graduation requirements is with the specific requirements in the core academicsubjects of English, math, science, and social studies. In this respect, the sixstates fall into three groups. Florida and Pennsylvania have the highestrequirements with a pattern of 4 English, 3 math, 3 science, and 3 socialstudies, or 13 total credits in these core subjects. The next group includesArizona and Georgia (general diploma), with a pattern of 4 English, 2 math, 2science, and 2 1/2 or 3,social studies, for total requirements in these subjectsof 10 1/2 or 11 credits.5 Close behind is California, with the same profile,except for 3 credits in English rather than 4 (10 total creu is). In last placeis Minnesota requiring 4 English, 1 math, 1 science, and 3 social studies, for atotal of 9 credits of specific requirements in core academics.°
Other sources of variation Pr': total and unspecified credits, oftenreferred to as "electives," but perhaps more accurately thought of as requiredelectives. In terms of total credits, the states again fall into three groups:Flof-la with 24, Arizona, Georgia, Minnesota and Pennsylvania with 20-21, andCalifornia with 13. Apparently, California's lower number of total requiredcredits does not really translate into less work for students, because localdistricts invariably make up the difference with requirements of their own.
The total credit requirements might be put in perspective by rememberingthat a high school credit is universally defined as a Carnegie unit--five classes
5 The precise Georgia requirements are two math and one science or thereverse; a total of three in math and science.
6 To put the Minnesota requirements in perspective, one should realizethat many local districts have requirements somewhat higher than the state'sand that the entrance requirements of the University of Minnesota resemblethose of Florida. Minnesota is among the national leaders in achievementscores and high school graduation rates.
9
15
per week for one entire school year. A rcouirement of 20 total credits thusoccupies a five-period b day for all four years of high school (five classesper year for four years). Florida's requirement of 24 credits occupies allclasses of a six-period day. Although the allowance for electives lessens therestrictiveness of the requirements in some ways, required electives do havebite. Students must earn the total credits, even when they fail and mustretake core academic courses.
CHANGE IN REQUIREMENTSChange in requirements can be analyzed against two baselines: previous
legal requirements and previous practice, including requirements other than thestate's (district, school and university entrance requirements) and coursetakingpatterns which exceed requirements (behavior often exceeds regulatoryminimums).
Change in legal requirements can be measured by the total number of newrequired credits in the four core academic subjects (see Table 1). In thoseterms, the states rank as follows: Florida (13), California (10), Pennsylvania(6), Arizona (3), Georgia (2), and Minnesota (0); or by new total credits:Florida (24), California (13), Pennsylvania (8), Arizona (2), Georgia (1),Minnesota (0).°
Required change in practice cannot be determined just from looking atchange in legal requirements. The results reported in the next section provideestimates of which courses were, in fact, added in response to the reforms.We did learn before commencing fieldwork that, prior to the reforms, themajority of California districts required 22 total credits (more than the statetotal), that 75 percent of Pennsylvania districts required at least the stateminimum of 21, and that almost all of Arizona's 226 districts already required20 units (McDonnell, 1988). However, even when local districts required thesame or a greater number of total credits, many did not require the same mixof specific courses as the state, and, consequently, needed to add new ones.
Some inferences about the amount of change required also can be drawnfrom test scores and graduation rates (see Table 1). Higher scores and ratesmay correspond to higher levels of academic coursetaking. Florida andPennsylvania, the states with the two highest requirements and legal change,
7 A complete picture is somewhat more complicated than the numbersimply. There is variation among schools in the length of school year and classperiod. There is also variation in how time is spent in schools. As anextreme example, in one of our districts, students were held to the requirednumber of hours in school, but these hours could be partially fulfilled bycompleting chores such as scrubbing bleachers in the gymnasium after schoolor on Saturdays.
8 Interviews revealed that Minnesota's nominal increase in requirementswas entirely due to the adding of 9th grade to requirements previouslygoverning grades 10-12. In reality, the combined 9-12 requirements have notchanged in 60 years.
16
differ sharply in graduation rates, Pennsylvania's graduation rate is 78.5percent, 14th in the nation; Florida's 62.0, 50th in the nation. Minnesota, thestate with the lowest requirements, has a graduation rate of 91.4 percent, thehighest in the nation. Except for Pennsylvania and Minnesota, the states fallin the lowest quintile of graduation rates (ranks of 41-50). In terms of testsof student achievement, Pennsylvania and Minnesota have high SAT or ACTscores (15th, 3d), followed by California (9th) and the other states are in thehigh/middle range (ranks are relative to subgroups of the states smaller thanthe entire 50, see Table 1).
11
17
EFFECTS OF REQUIREMENTS ON COURSE OFFERINGS
The various criteria discussed above, point to Florida as a high-changestate, California as high/moderate, Pennsylvania as moderate, Arizona andGeorgia as low, and Minnesota as no-change. Thus, when we narrowed thestate sample for data on new course offerings, we selected Florida, California,Pennsylvania, and Arizona as representing a range of required policy impact.Since we were interested in the effects of change, we needed to concentrateon states where change occurred. Minnesota was eliminated because it had nutexperienced a recent genuine change in graduation requirements. Besides lowchange, an additional reason for eliminating Georgia from the local sample oncourse additions was the complexity of research on its three different highschool diplomas (academic, general, and vocational) and associatedrequirements.
CHANGES IN COURSE OFFERINGSChanges in course offerings in our sample are reported in Table 2,
located at the end of this paper.
Consistent with other data reported above, in 4 of our 13 districts, totaldistrict credit requirements equalled or exceeded those mandated by the state.Districts and schools adding few or no courses tended to be affluent, suburban,and white. This pattern confirms consistent interview data to the effect thatcollege preparatory students were mostly unaffected by the reforms, becausethey already were taking more than the minimum required by the state, oftento meet higher entrance requirements set by universities.
The most common changes were additions of math and science. Twelve of13 districts reported additions of these sections or courses. Seventeen of 19schools reported additions in math and 16 of 19 reported additions in science.Math and science additions ranged from 1 section to as many as 17 sections(per school). In schools where specific information was available, and wheresections were added (that is, not counting schools adding no sections), theaverage number of sections added in math was 4; and the average number ofsections added in science was 7. The science figure is influenced upward byone district adding about 17 sections per school due to the new sciencerequirement and population growth. Disregarding that district, the averagenumber of science sections added was 5.
Considerable caution must be used in relying on these figures asrepresentative of the nation or even the states in our sample. We did notselect a random sample of districts but rather districts representing a range ofpolicy impact (change required) and capacity. Even within our sample, we didnot have quantitative information on all districts and schools (as can be seenfrom Table 2). In other words, the statistics on course offerings reportedabove come from schools and districts which are non-random in unknown ways.
13
18
Nevertheless, Ahe figures appear to be roughly consistent with availablenational data.
One simple way to think about the quantitative impact of the newrequirements is that they produced an extra math class for 24-30 percent ofthe students, plus an extra science class for 30-38 percent, in the schoolspfour sample ( schools affected by reform, weighted toward urban settings).luSplitting the difference, we can say that about 27 percent of students took anextra math course, and 34 percent an extra science course. Given therelatively low achievement and low number of math and science courses takenpreviously by such students, increases of this magnitude represent a potentiallysignificant increment of educational content (depending, of course, on the typeand quality of the courses added).
9 A national random sample of student transcripts in 1982 and 1987showed an increase of .44 credits in the mean number of credits in bothmathematics (2.54 to 2.98, a 17% increase) and science (2.19 to 2.63, a 20%increase) (1,,Vstat, 1988). Assuming a grade-level size of 500, converting ourfour additional math and seven additional science sections into credits perstudent yields an average increase of .24 math credits and .42 science creditsper student (four sections of math times 30 students per section divided by 500students per grade level; seven sections of science times 30 students persection divided by 500 students per grade level). Using five science sectionsadded yields an increase of .3 credits. Using a hypothetical grade-level size of400 (perhaps a more reasonable estimate of the upper-level grades where theextra math and science were added), yields an extra .3 math and .38 -.52science.
Apart from the unrepresentativeness and imprecision of our data, therelationship between the national data and our data from reform states isunclear. Reform states might be expected to produce larger changes, but thenational data extends over a longer period of time and reflects the influenceof many policy changes, not simply state graduation requirements (e.g., districtrequirements and university entrance requirements). If anything, we wouldexpect to observe smaller changes because we included some states withrelatively small increases in requirements and because of the shorter timeperiod and single policy focus. To say the same thing in a rather differentway, minimum graduation requirements probably are the last piece in a wholeseries of movements toward a more standard academic curriculum (the piecedealing with lower-achieving students not bound for universities).
The fact that our largest science estimate is close to the national averagemay be due to the one district with especially large gains in scienceenrollments.
10 An increase of four 30-student sections in math represents 24% of agrade level of 500 (120/500), 30% of a grade level of 400 (120/400); taking thelower estimate of science sections, five new science sections represents 30 to38% (150/500; 150/400). Keep in mind, however, that the range of sectionsadded was quite large. Some schools in some states adds d many more sectionsthan others.
14
1$
As for the type of math and science courses added, sections or courseswere added in general math, remedial math, consumer math, algebra, geometryand math applications. In science, sections or courses were added in generalscience, physical science, chemistry, physics, natural sciences, space science,earth science, general biology, laboratory science, and honors biology (seeTable 2). The sections added were predominantly at the basic level. Of the17 schools adding math sections, 15 reported additions of basic, remedial orgeneral. Of the 16 schools adding science sections, 14 reported additions ofbasic, remedial or general.
A second common addition was social studies (mostly in Arizona andCalifornia). Six of 19 schools added social studies sections or courses. Theadditions ranged from 5 to 14 sections per school and included world history,world geography and woi IA cultures. Other course additions includedeconomics, computer literacy and foreign languages.
As a result of the new requirements, reductions were reported in coursessuch as home economics, industrial arts, physical educati9p, vocationaleducation, business, psychology, and the performing arts." In some cases,schools did not add new courses but made changes within courses, such asdividing science into biological v nd physical science or consolidating Arizonahistory and government into American history and government. In other cases,old courses were given new names to meet the new requirements. Forexample, "Industrial Arts" was renamed "Practical Arts" in a Florida district tofit the requirements, but the content remained the same.
QUALITY OF THE NEW COURSESWe did not gather systematic data on the content of courses; the above
discussion on the types of courses and sections added (mostly basic, general,and remedial) provides the best indication of course quality. EN idently, thereforms amounted to a national experiment in offering lower-level academiccourses to middle- and low-achieving studeintts who previously took somethingelse (vocational courses, various electives)." Evaluating the quality of such
11 In the Dade County study referred to above, most of the sections andenrollments gained by other subjects were accounted for in losses to vocationaleducation. Another "loser" in the enrollment derby was social studies, perhapsreflecting the phenomenon of a "decline to the minimum" sometimes reportedby our respondents (students taking the required minimum of a previouslypopular elective) (Hanson, forthcoming).
12 A reviewer of this paper, Superintendent Thomas Payzant of SanDiego, reports the following divergent evidence about his own district:
In San Diego, the increases in graduation requirements have led to higherexpectations for all students with the implementation of a common corecurriculum that will result in gradual elimination of "softer, lessdemanding" courses in math and science with all students beingencouraged to aspire to a pre-algebra, algebra, geometry sequence in math
15
20
courses would be tricky, because of the need to specify the ideal content andlevel of academic courses for such students (was the content pitched too high,too low, or just right?).
We did see scattered evidence of "watering down," indicating that theadded course labels cannot be taken completely at face value. Note that manyof the examples come from Florida, the state attempting the most ambitiouschange:
- To meet the new requirements, one Florida district changed from sixperiods of 60 minutes per day (360 total minutes) to seven periods of 50minutes per day (350 total minutes).
- In two Florida districts, high school counsellors reported advisingstudents in danger of flunking out to take easier courses to meet newstandards (required credits, minimum gradepoint). The counsellors saidthat previously they had advised such students to try higher-levelacademic courses to stretch themselves and have a better chance forcollege.
- In a third Florida district, respondents at the school level reported thatattendance and student effort dropped in the seventh period, and studentsmade arrangements with teachers to control the level of homework frommultiple requirements.
- One Florida district allowed pre- and post-lab activities to counttoward the state's lab requ;rement.
- Local districts in Pennsylvania were adapting vocational courses to thegraduation requirements. At least two of our four local districts inPennsylvania were allowing students to take vocational courses judged toinclude competencies related to the new requiremeuts. One district wasconsidering substituting courses like nursing math, baking math, andcarpentry math. Legislation in Pennsylvania allows substitution of up tothree vocational courses for related non-vocational requirements (e.g.,business math for a math requirement). Substitutions are reported to thestate department of education by are not subject to its approval.
- In schools with shortages of certified teachers (e.g., in rapidly growingdistricts), the most common way of staffing new, lower-tier math andscience courses was with displaced vocational teachers (McDonnell, 1988).
and a biology, physical science(s) sequence in science. Bridging courses,tutoring, and support programs will be needed to help those who are notready for the more demanding courses. Instead of "watering down"courses, we are working to eliminate general and consumer math and addmore sections of pre-algebra and algebra. Of course, there areimplications fur staff training and basic changes in attitudes aboutstudent learning and teaching.
16
21
- A high school teacher in Pennsylvania stated, "We are just putting newnames on old courses. We have rewritten our existing courses into thenew planned course format."
- In Arizona, "Government used to be a required one-year course and wasreduced to one semester to accommodate the world geographyrequirement." According to one respondent in an Arizona district, "byforcing 'Government' to be only one semester, students were left with themost boring part."
- An Arizona district specialist said, "Teachers don't have muchflexibility. This creates a problem because teachers want to stress theirown competencies along with the state ones. Teachers also seecontradictions between their own priorities and the state's. This createsa real struggle among areas of emphasis and difficulty in measuringperformance. Teachers are forced into teaching courses they're notinterested in, which lowers the quality of instruction."
Schools in states with high school exit exams allocate a significantamount of instructional time to helping needy students pass the exam.Prep courses for exit exams are given conventional sounding labels andmay be quite repetitious from one to the other (sometimes despitecontrary stag; law). The right balance between helpful remediation and aslow, narrow curriculum is difficult to strike.
On the other side of the course quality question is the movement towardso-called alignment (a correspondence of curricular guides, textbook contentand standardized tests). Graduation requirements and curriculum alignment aredesigned to work in tandem, one affecting the selection of courses, and theother controlling the content, or quality (Resnick & Resnick, 19851. A Floridarespondent captured the intended relationship in saying,
When we add a third course in general mathematics to meet the newmath requirement, it can't be a watered down repetition of the secondcourse, because we have the state and district guides and tests tocontend with.
Two of the four states (California and Florida) have adopted curriculumalignment. The more impressive trend toward standardization was at thedistrict level. District standardization occurred in the states with state-levelstandardization (California, Florida) as well as in the other four states. Thelocal s;:stems tend to cover more subjects in more detail, make more extensiveuse of data analysis, and employ more explicit reinforcements and sanctions(such as using standardized tests as end-of-course requirements or componentsof teacher evaluation).
In the six core states, 10 of 20 districts for which we had adequateinformation have a strong form of curriculum standardization. A breakdown bystates is as follows: Arizona, 1 of 3 districts; California, 1 of 4 districts;Florida, 2 of 3 districts; Georgia, 2 of 4 districts; Minnesota, 1 of 3 districts;Pennsylvania, 3 of 4 districts. Seven of the 10 standardizing districts are inlarge cities.
17
22
The actual impact of such policies on course content and quality isbeyond the scope of our original research but is the focus of continuing CPREresearch on student standards. One major loophole in the capacity ofcurriculum alignment to control course quality is the lack of control overcourse selection. A Florida respondent offered this skeptical assessment of thenet result of the policies:
Lower-level students will take Fundamentals of Math and not pass, thentake G2, G3, Applying Basic Skills, and end up with ConsumerMathematics. All of these courses have the same objectives and aresimilar in content. This seems to be the result of the graduationrequirements. The minimum becomes the mean. By this I mecm we arelowering our standards, expectations, and our focus. We're teaching forthe success rate on the basic skills test. That's how we're judged as faras the objectives of the legislature are concerned.
18
23
RESPONDENT VIEWS OF EFFECTS
In addition to questions on changes in course offerings, we askedrespondents for their own assessments of the effects of the policies. Weasked if the policies achieved the effects intended by policymakers, what werethe advantages and disadvantages of the policies, whether the policies weresupported locally, and whether the policies met local needs.
Respondents' views of effects should not be confused with our ownevaluation of effects based on all the data from this study and relatedresearch. Respondents views are based upon varying degrees of expertise andknowledge of 'le underlying facts (for example, the value of academic coursesas background for employment). Some of the opinions (for example, regretabout declines in electives and vocational education) may be based at leastpartly on the self-interest of the respondents. Nevertheless, many readers ofthe paper found the perspectives contained in this section of the paperinteresting and significant. Our own conclusions about effects relative topolicy intent are discussed later in the paper.
As explained earlier, the data in this section come from a slightlyexpanded local sample consisting of five states (Georgia added to Arizona,California, Florida and Pennsylvania).
SUCCESS OF THE POLICIES IN ACHIEVINGTHEIR INTENDED EFFECTS
Nineteen of 35 respondents (in 11 districts providing any data)I3 reportedthat the new requirements were not likely to produce the kinds of effects thatstate policymakers intended. Respondents reported that the main problem wasthat policymakers had not defined their intentions. Here are a few illustrativecomments:
No one really knew what the state wanted.
The requirements are not likely to produce the effects that statepolicymakers intended because no one bothered to define the problemthey were trying to solve.
The course requirements are going to kill us here. Policymakers have nosense of realism that more is not necessarily better.
13 The question on policymaker intentions was asked only of localsuperintendents, school board members and the district curriculum director (andnet of principals and teachers). This accounts for the relatively low number ofresponses.
19
24
State policymakers have non-research-based notions of what schools oughtto be doing. They arc well-intentioned, but short-sighted.
It's a classic example of Arizona's knee-jerk approach to education policy;it was totally devoid of any financial analysis. Nothing in the researchliterature says that more courses equal higher expectations. Statepolicymakers don't understand the dynamics of class schedules.Increasing course requirements reduces students' opportunities toexperience more and increases their opportunities to fail.
Of course the new requirements will not produce the effects policymakersexpected. They are just "political toys." Not every kid needs all therequired courses.
Their intention was to upgrade, but this rigor is putting kids out. Kidshave no time for taking the courses they consider most meaningful. Iagree with striving for excellence in education, but we need to askourselves, do all students need all these academics?
Six of 35 respondents (in 11 districts) felt that the requirements werelikely to have the effects intended by policymakers. An example:
State policymakers thought that the new requirements would increase theskill levels of students, and the new requirements will accompr,.11 thatgoal.
Nine of 35 respondents (in 11 districts) indicated that they wern't surewhether or not the new requirements would produce the effects intended sinceit was too early to tell or it wasn't clear what policymakers' intenaons were.
One respondent reported that the new requirements were .,itely toproduce intended effects for the college bound, but not for th,: others.
ADVANTAGES AND DISADVANTAGES OF THE POLICIESWe summarized respondents' perceptions of advantages and disadvantages
in Table 3 (at the end of this paper). Respondents mentioned disadvantagesmore frequently than advantages, but we will discuss the advantages first.
The most common advantage idelltified was better college preparation (13of 32 schools).14 Respondents who were happy with the effects of the newgraduation requirements commented:
14 By "13 schools" we mean that at least one respondent in each of 13schools (of 32 possible) expressed the response described. Due the need toquestions to conserve interview time, as well as varying knowledge andinterest of respondents in particular questions, failure to answer a question hasno significance. Consequently, there is no significance to the number ofdistricts and schools where questions were not answered.
20
25
The new requirements generate an agenda for the 21st century.
The requirements project an image to the public that the schools aretrying.
The graduation requirements will 11-nefit this school in the future becausethe students will have more basic skills.
The requirements present an opportunity to intensify core academics.
We have sent out a message of higher expectations for all students. Weare preparing students better for jobs and raising teacher expectations.We have more periods in the day and more computers in the classroom.The requirements made us look more closely at what ale are doing. whichencouraged us to do things better.
The new high school graduation requirements are effectively tighteningacademic standards and raising expectations. Teachers are demandingmore from students (e.g., more homework) and students, in turf., areworking harder.
The advantage is that students leave high school better equipped, whetherthey go to college. trade school, or the armed services.
Thank God they increased them. I say that because students seem tocome to us less and less prepared to hanthe high school work. Theyseem very unprepared. It they want to go to college, they need moreskills than they have. The old requirements were good for their time,but now in a more competitive society, we need to give them moreexperience before they graduate.
The advantage is that students must take meaningful courses, notautomatic basket weaving courses.
RespoLdents predominantly identified disadvantages over advantages. Themost commonly cited disadvantages included reduced electives (19 schools),increased dropout rate (17), hurt lower-achieving students (16), and reducedvocational offerings (11). Here are a few illustrations:
It devastated our vocational program. We curtailed offerings 01vocational courses. It creates work overload and conflicts for thestudents.
They have a detrimental impact on the disadvantaged. What good isalgebra to someone who is working at K Mart?
The disadvantage is not allowing students to experience other things, tohe creative. It stagnates students.
For college-bound students, the new requirements are excellent. or thenon-college-bound students, the requirements are, in all honesty, doing a
21
26
poor job. We need to offer more classes in day-to-day living problems.I would guess that only 30 percent of cur students go on to college.
Teachers are forced into teaching courses they're not interested in, whichlowers the quality of instruction.
We've increased the standards of those who have already made it; forthose who can compete. But there is a problem for those who can't. Iwould guess the dropout rate has gone up 10 percent over time.
The requirements have alienated professional teachers. Studentsatisfaction has decreased. And there are fewer electives in thecurriculum.
Because of the increased graduation requirements, the school has lost alot of kids; they don't have time to take what they enjoy.
The big disadvantage of the increased requirements is that there are noprovisions for those students who cannot do well. There is no vocationaltrack with remediation in the basics.
Students are feeling pressured. Their schedules are filled with moreacademics and they don't have time for electives or extracurricularactivities. As a result, students' self-esteem seems to be going down, dueto the high academic load, while the number of dropouts seems to be onthe increase.
They just don't address needs of the kids not going to college. It's areal problem for those who just want to get a job after high school.
As stated above, the single most common complaint about therequirements was that they reduced the number of electives offered and thenumber students could enroll in. Respondents reported:
Electives suffered, especially industrial arts, home economics, physicaleducation, and the performing arts.
As a result of the new economics requirement, all social studies electiveswere dropped including psychology, sociology, California history andgeography. Now that economics is required, there is no room in theschedule to offer the electives. That aggravates me quite a bit. Thisyear, we had 54 students who wanted to take psychology and there weresupposedly no classrooms available.
We dropped classes in California history and Constitutional hw becausewe didn't have time to teach it and offer all of the classes that arerequired.
Teachers of electives and vocational education feel less valued than inthe past
22
27
Before the requirements, the school had classes in sociology,anthropology, etc. The requirements cut off the electives. Students didbetter when they had a choice of classes to take.
Several types of effects were identified by only a few respondents butare important to mention here. These include the opinion that the newrequirements increased college enrollment, increased the public's awareness ofeducation, reduced student participation in extracurricular activities, requiredteachers to teach courses that they weren't trained for, and lowered teachermorale since teachers had to deal with students who were in courses by forcerather than by choice.
In some cases, similar responses were identified as both advantages anddisadvantages, depending or `he respondent. For example, respondentsindicated that the new requirements challenged the students, or increasedteacher expectations of students, but these effects were considered bothadvantages and disadvantages. In some cases opposite effects were identified.For example, some respondents indicated that the new requirements increasedstandards and teachers' expectations of students, others reported that the newrequirements lowered standards and teachers' expectations of students. Somerespondents indicated that the new requirements helped schools get moremoney and others reported that the new requirements added expenses (e.g., forhiring more teachers, converting classrooms, and purchasing new textbooks andequipment).
There were also cases of very divergent views within a school. Forexample, a high school teacher in Arizona was supportive of the newrequirements and stated:
There an. no disadvantages. Students are exposed to a broader range oftopics in science. Students develop better critical-thinking and form^.1-reasoning skills.
But the principal within the same school felt that there were noadvantages to the requirements, and stated:
The requirements are an artificial thing that's just fooling people. Therequirements are not concerned with what kids need to know for life.
Finally, a few respondents indicated that there were few effects as aresult of the new requilciiiciab, nutirE, for example, that the only effect ofthe new requirements was that some of the names of courses were changed.
SUCCESS OF THE POLICIES IN MEETING I 0 tAL NEEDSThe overriding opinion of school-level people (including principals,
counselors, and teachers) was that the new requirements did not address thedistricts' real needs. Respondents indicated that different students haddifferent needs and the :equirements did not address divergent needs,
23
28
especially not the needs of the disadvantaged students, minority students, orthe non-college-bound students. Respondents commented:
The graduation requirements have not addressed the real problems of thedistrict very well. Most students are minority students in the district,and they are the ones hurt by the graduation requirements.
The requirements do not address the district's real needs. If a student isjust going to we-k after finishing school, why does he or she need socialstudies? That student needs marketable skills.
If districts valued such a policy, they would have done it on their own.
LOCAL SUPPORT FOR STATE POLICIESFaculty support often depended on the department or subject area of the
teacher. Teachers of elective subjects (such as fine arts, music, physicaleducation and vocational education) were generally opposed to the changes. Asone teacher stated:
Teachers of elective subjects are very frustrated by the increasedrequirements. This frustration stems not only from a concern about jobsecurity, but also a belief that students should be exposed to theirsubject matter.
Despite the generally disapproving responses by school-level peopleregarding the new requirements, the overall responses regarding communitysupport were favorable. Of 14 districts in five states, 9 indicated that thenew requirements were generally supported by the community; 3 districtsreported that there was mixed support; 2 districts indicated that thecommunity was generally unconcerned or unaware of the changes. Witness thefollowing comments:
The community thinks the more requirements the better, so they supportthe increased graduation requirements.
Our pan,nts want more and more and more. High standards are the normhere.
Most parents like schools keeping kids longer and making them work.
The increased requirements are generally accepted in the community; thepublic sees them as improving the "product."
Parents are very positive about the increased graduation requirements.They believe in rigor. Parents assume that a school with hard coursesand lots of homework is a good school.
The increase in course requirements has made a favorable impression onthe public and all segments of the education community.
24
29
In districts where respondents reported mixed support for the newrequirements, the division was usually between community support and schoolopposition as well as between parents of high-achieving and parents of low-achieving students. Respondents indicated that the strongest support camefrom better-educated parents who wanted their children to take moreacademics. But it was sometimes also reported that minority groups viewedthe increased requirements as a means to raise teacher expectations ofminority students.
The following comments are examples of mixed community support withina district:
It depends on the educational background of the parents; better-educatedparents want to see their children take more academics.
The community is divided; the parents are split along the lines of parentsof good students who support the requirements and the parents of poorstudents who are opposed.
A few groups might argue that an emphasis on academics drives out otheropportunities for students.
Many respondents indicated that while community support was generallyfavorable, the public wasn't very well-informed about the chaDges. Thefollowing comments illu.trate respondents' views about tip lack of awarenessor concern on the part of parents and the community:
Parents and public believe strongly in standards and that increasedrequirements will make a difference without understanding all thevariables.
They are accepted but I don't think the community understood therequirements.
I don't think that the community has any idea or cares what thegraduation requirements are.
The requirements are accepted and welcomed by the community, althoughI'm not sure that parents are fully informed about the strongerrequirements.
Since they don't exceed our requirements, no one pays attention.
In a few districts, respondents indicated that the community was verywell-informed since school officials had nosted informational meetings and sentcopies of the requirements to parents.
25
30
DROPOUT RATES AND AT-RISK STUDENTS
A subsequent CPRE report will detail effects on at-risk students, but apreliminary summary is offered here.
Many of our respondents agreed with academic critics (Mc Dill, Natriello,& Pallas, 1986) that higher standards would push marginal students out ofschool. "Take a kid who can't jump three feet and ask him to jump fourfeet," they said. But the connection between higher standards and higherdropout rates es conventional wisdom; and our respondents readily admittedthat they lacked data to support their perceptions. Emerging quantitative datado not support the connection. Higher standards are related to lower meandropout rates (Bryk & Thum, 1989). Graduation rates are improving slightlynationwide (Ginsburg, Noell, & Plisko, 1988). A longitudinal study of cohortsin Dade County shows a significant decline in the dropout rate over the sameperiod that academic coursetaking was going up (Dade County Public Schools,1988). On the basis of these studies, perhaps the conventional image of thehigher hurdle should be replaced with a different image of the moreinteresting and valuable experience.
The argument over standards and dropouts ultimately must be judged asinconclusive. Available quantitative data usually do not correspond to thestates raising standards, the time period during which standards were raised,or both. Furthermore, dropout data are notoriously unreliable (Williams, 1987)and subject to manipulation for political purposes. I personally would not beconvinced about any longitudinal study of dropout rates without also examininglongitudinal trends in exit codes. Some exit codes (stated reasons for studentswithdrawing from high school) are not counted as dropouts (e.g., transfer toadult education) but may be the functional equivalent of dropping out (forexample, when the students never show up for adult education).
Beyond the issue of dropping out is the issue of the effect of standardson the quality of education of at-risk students while they are in high schoolor alternative programs. Here again the data are inconclusive but supportiveof further research. One problem is the unavailability and inconvenience ofremedial and makeup courses. Because of unavailability of makeup classes, oneof our schools provided cassette tapes for students to listen to on the bus.When students can take makeups, a different problem is the narrowness of thecurriculum. We heard stories in many schools of students taking nothing butrequired, remedial and makeup classes. Some students seem to take nothingbut remedial classes aimed at the high school exit exam.
Another problem is watering down of the educational experience. Insteadof pushing students out of school, school people seem to be bending overbackwards to keep them in. While the ultimate goal of graduation iscommendable, some of the rescue efforts are of questionable value (e.g.,counselling students into easier courses so they can graduate instead of hardercourses so they can go to college). Finally, we caught a glimpse of an
27
31

emerging problem with "alternate routes." Alternatives to regular high schoolseem to be proliferating (night school, special high schools, adult education,certificate programs, etc.). Since students in such programs generally are notcounted as dropouts, their absence from high schools would not increase thedropout rate. But alternative routes do raise issues of educational quality. Asuncertain as we are about the quality of high school courses, we know evenless about high school alternatives. Some of our respondents did complainabout the difficulty of keeping students in regular high school when they couldtake easier night-school courses offering the same credit.
28
32
IMPLEMENTATION AND COSTS
We asked appropriate respondents about implementation problems andcosts of the new graduation requirements. The consensus was of relativelyfew serious problems and costs. Almost all respondents said that therequirements were implemented promptly in all districts and schools, in spite ofsome extremely tight deadlines (for example, requiring new courses in theacademic year following legislation in the previous spring).15 The successfulnature of implementation probably can be attributed to three factors: therelatively marginal and incremental demands of the requirements (including theoption of adding new sections of existing courses); an operating bureaucraticstructure accustomed to the required activity (of developing and offering newcourses); and relatively high support among teachers, administrators andconstituents for the idea of academic courses, if not for the costs ofadditional ones (reductions in vocational and elective courses).
The absence of serious problems and costs, however, should not beinterpreted as indicating a flawless process. There were problems and costsworthy of the attention of policymakers, as discussed below.
Costs. Three cost categories were noted by many respondents: extraclass periods for the newly required courses, extra teachers, and new sciencelabs.
As explained earlier, extra class periods were needed to meet basicrequirements and to provide time for remediation and retakes. Some districtswere locked into shorter days because of previous cutbacks of state aid,collective bargaining agreements, or limited local resources. Two states,Florida and California, offered financial incentives for longer school days; andother states increased general aid as part of a comprehensive reform package.Costs not covered by state aid required extra local - esources. The actualextent of the cost for the extra periods is somewhat obscured in some districtsbecause the extra periods were not strictly necessary to meet staterequirements but rather were used to preserve electives.
A need for extra teachers, especially in math and science, was a secondcost of the graduation requirements, but the impacts of this cost were quitedifferent depending on local context. In large, growing urban districts, thenew requirements changed the mix of new hires and exacerbated the difficultyof finding teachers in the areas of need. In one district with declining
15 There are two reservations which might be noted about this apparentlyuniversal pattern of compliance: first, as noted earlier, we did not observethe schools in sufficient detail to see if administrative exceptions were beinggranted; and, second, in at least three of the six states, we were unable togain access to the small districts initially selected as having the lowestcapacity and highest policy impact.
29
33
enrollments, the new requirements were used to avoid layoffs. Internaladjustments were common, such as transferring teachers in one area of thecurriculum to another area (e.g., physical education teachers teaching basicmath). One district found it temporarily necessary to combine basic andadvanced math classes.
Extra costs for science labs were a problem in many districts because ofthe large number of new students taking a lab science course who had nevertaken such a course before. The shortage was especially acute in districtsalready facing a serious shortfall of physical facilities because of rapidlyincreasing enrollments. Once again, adaptations were common. One districtinstituted the practice of pre-labs and post-labs to meet the state's labrequirement without the students actually occupying a laboratory for most ofthe required lab time.
Implementation Problems. The most common implementation problemmentioned was a short phase-in period. Local respondents generally felt thatlegislators were being insensitive and unrealistic, and betraying lack ofknowledge of the local needs, in requiring implementation of new requirementsover a summer or similar short period. A second commonly mentionedimplementation problem was multiplicity of requirements and associatedpaperwork. One source of multiple requirements is transfers within the samestate from districts with different local requirements. Another is theapplicability of different requirements for lifferent time periods: seniorssubject to one set of requirements, juniors to another set, and so on. (Recallthat both state and local requirements were subject to frequent, often related,changes.) The increased paperwork associated with new and multiplerequirements often fell to high school counsellors who worked overtime andhad less time for counselling. Regulatory burden on counsellors is a commonfinding across several studies (for example, see Archbald, forthcoming).Legislators might wg consider extra aid for counsellors as part of anyregulatory package. 1° A final implementation problem is the teachercertification and recertification made necessary by internal shuffling ofpersonnel to new assignments.
16 In a review of this paper, Superintendent Thomas Payzant of SanDiego affirmed the importance of the counselling role and said that San Diegohas instituted an 8th grade parent-student-counsellor conference to plan thehigh school course of study in light of the new requirements.
30
34
STATE MONITORING OF GRADUATION REQUIREMENTS
We asked state-level respondents about monitoring of graduationrequirements and checked the results by questioning local respondents. Thegeneral pattern is of no regular state monitoring of coursetaking. Forexample, in Florida program and financial audits are conducted every fiveyears, but there is no monitoring of compliance with graduation requirements.On-site evaluations of a portion of Pennsylvania school districts are "mostlypaper checks"; and there is no state monitoring in Arizona.
In many regulatory situations, a pattern of zero inspection andenforcement might well be interpreted as an effort to pass concliarree ccsts tothe regulated sector (McDonnell, 1988), or as evidence .,14. law notintended to produce behavioral compliance. Risks of nrn-:-,nt;;,arice from suchstrategies did not materialize in the case of graduat7i..n -merits. For themost part, we observed the opposite pattern of widespread, inde,;u, virtuallyuniversal compliance.
Besides the reasons given above, the le-vei of compliance may also bedue to two kinds of potential, as opposed to actual, monitoring: first, thepotential for retrospective monitoring of transcripts which typically are keptfor long periods of time, and, second, the avai!ahl!ity or development ofcomputer data bases in several states which permit rapid analysis of courseofferings.
31
3`
DISCUSSION AND POLICY RECOMMENDATIONS:PARTIAL POLICY, LIMITED RESULTS, AND
FURTHER STEPS TOWARD CURRICULAR REFORM
This section of the paper has two main parts: first, a summary ofconclusions about the success of the reforms in meeting educational and policyobjectives; and, second, policy recommendations based on these conclusions.
THE SUCCESS OF GRADUATION REQUIREMENTS INMEETING THEIR OBJECTIVES
From the perspective of national reformers, graduation requirements andcurriculum alignment were designed to produce a higher level of academic rigorand basic skills in the high school curriculum (National Commission onExcellence in Education, 1983; Resnick & Resnick, 1985). Analysis of our owndata at the state level suggests that reformers in our sample had two primaryobjectives, both consistent with this overall goal: 1) an improvement inachievement scores and work skills; and 2) more uniformity in type:, of coursestaken by students in the direction of standard, high-quality academic courses(McDonnell, 1988). Broader political objectives for the reforms were morediverse than these instrumental policy objectives (Fuhrman, Clune, & Elmore,1988). A challenge for more ration! policy will be discussed further in theConclusion to this paper.
Evaluating the success of the reforms in meeting the simple-soundinginstrumental goals of academic rigor and higher achievement is anything butsimple, as evidenced by the extreme differences among scholars, commentators,and public officials on that topic. Legitimate differences can exist about therelevant standards (what constitutes success) and how to evaluate the evidence(the data). I will approach the task of evaluation by reviewing the data inour own and related research against a series of plausible criteria.
Q. Were the graduation requirements a basic success?
A. Yes, on their own terms. The most basic question about success of thegraduation requirements is "were they implemented?" This question should beanswered before reaching other questions about secondary effects and policyimprovements.
It is fairly clear that the graduation requirements were implemented andimplemented on a broad enough scale to make a difference. Our data suggestthat in schools affected by the requirements (those with a significant numberof low- and middle-achieving students), about 27 percent of students aretaking an extra math course and 34 percent an extra science course. Manyalso are taking a new or added course in social studies. Implementationgenerally was prompt and complete, despite difficult deadlines.
This virtually universal compliance is all the more remarkable in view ofless than complete support for the requirements at the ground level. Our data
33
36
show that school people have many reservations about the requirements,especially because of reductions in vocational and elective courses for thestudents affected.
Q. Should the states have gone beyond the minimum and passed even highergraduation requirements?
A. Probably not. Possible criticisms of the requirements are that they werenot as ambitious as they looked on paper and that they did not affect allstudents. It is true that large increases in the legal requirements at the statelevel invariably translated into relatively small increases in practice, mostlybecause of preexisting district and university requirements. In some states,the majority of districts and students were not affected at all. But therequirements were successful in changing the coursetaking of the studentstaking the fewest academic courses (for example, the least math and science).Raising this minimum seems fundamentally consistent with both of the majorgoals of the reform: greater uniformity of curriculum and higher achievementand work skills in the average American student. Although, like mostregulation (McDonnell & Elmore, 1987), graduation requirements raised theminimum rather than the ceiling, raising the minimum is consistent with thegoals of reform. That states may have received some extra symbolic creditdisproportionate to the real effects does not detract from this conclusion. Thegoal of raising the ceiling for high-achieving students must be pursued withentirely different policy instruments (e.g., more AP courses, increased emphasison higher-order thinking).
The alternative of much higher graduation requirements is probably not agood idea. Requiring more academic courses on top of those already mandated(especially without other policy changes) flies in the face of a number ofserious problems discussed below such as doubts about the quality of coursesadded to meet ambitious requirements, pressures on student time andextracurricular activities (and concomitant reductions in effort), further lossesin vocational courses and electives, and problems for at-risk students inmeeting cumulative requirements. Before considering further increases ingraduation requirements, states with high requirements probably should considerredesigning the existing curriculum and making other policy improvementsdiscussed below. Even the states starting with relatively low requirementsprobably were wise to raise the minimum slowly and proceed one step at atime.
34
37
Q. Were the courses offered the most demanding possible for the studentsaffected?
A. Probably not. Given that a significant number of middle- and low-achieving students are taking an extra math and science course, the next mostimportant question is the quality of these courses. The mere fact that thecourses are basic, general, and remedial does not necessarily imply lowstandards, because some kind of adjustments undoubtedly are needed for manyhigh school students. We saw repeated evidence, for example, that the lowest-achieving high school students in math functioned at about a fifth-grade level,or less. Such students obviously require some kind of remedial instruction(although very likely not more of the same low-level drill and practice thatthey had received up to that point in time, see below). School personnel alsobelieved that many students above the lowest remedial level would have a verydifficult time in traditional academic courses.
As reported earlier, we did see some evidence of watered down coursesand student course selection (reduced class minutes, courses with repetitiousmaterial, science "labs" in regular classrooms, poorly qualified teachers,counselling of students into weaker courses to avoid the increased risk offlunking, etc.). Lacking systematic data, we cannot tell how common suchpractices were. But there are deeper reasons for doubting that the newcourses were the best possible. First, schools typically offer middle- and low-achieving students dull, factual, repetitive material in spite of the fact thattheir achievement scores benefit more from more demanding, academic courses(Gamoran, 1987; Gamoran & Berends, 1987). Second, designing the right kindof academic course for students of varying levels of achievement is difficult,especially in view of low expectations of teachers and administrators.
Another reason for doubting rigor of the new courses is the lack ofeffort in the reform process to upgrade instruction while increasingrequirements. States did not say, "Offer an extra math course, and we willhelp you offer the best course possible for all types of students." Graduationrequirements were mandates almost totally devoid of technical assistance(McDonnell, 1988)." California is apparently unique in our sample in havingsome kind of program to upgrade lower-level courses (e.g., so-called "bridge"courses allowing students to make a transition from the general to academic
17 The effort to control course content through alignment of tests,guides, and texts does qualify as technical assistance (McDonnell, 1988). Butneither graduation requirements nor alignment has prevented a proliferation oflower-level courses. In another paper, I say that it is as if the governmentprescribed a detailed design for all types of automobiles but did not reducevariety and allowed consumers to choose which to buy. The result iseverything from Hondas to Porsches. (Clune, 1988). In other words, thecapacity of curriculum alignment to upgrade education depends heavily on theexistence of a core curriculum.
High school exit exams also have a strong effect on lower-level courses,but these affect a subgroup of students; and the emphasis of the tests is onlower -level basic skills.
35
38
track). It is unreasonable to expect that districts and schools under pressureto offer a large number of new courses but lacking any guidance from thestate on how to do so would simultaneously embark on a systematic program ofupgrading. The opposite tack of lowering quality to help meet the challenge ismore likely. We did see certain schools which seemed to have preexistingprograms for upgrading courses, and we plan to investigate such schools in alater phase of the research.
Q. Were the new courses better than the ones they replaced?
A. Probably. Doubts about the level and quality of new courses can beextended to become doubts about the value of the reform itself. Is it possiblethat the new somewhat watered down academic courses are not as beneficial tostudents and society as the elective and vocational courses they replaced? Asreported earlier, school people felt that both voc:Itional and elective courseswere important tools for motivating different rtr.7,ups of students to stay inschool. In some cases, discontinued elective courses were considered superiorto the required courses which replaced them (e.g., elective required coursesin social studies).
Since we have little information on the earlier courses, we are in noposition to make the necessary comparison. Our sense is that the new coursesare both more central to the work skills of youngsters and more demandingthan traditional vocational courses (both of which assertions would bevigorously disputed by traditional vocational education advocates). Aconvenient, if not altogether satisfying, way to answer the question is that thesuperiority of academic courses was implicit in the reform itself. We couldhave considerably more confidence in this assertion if we were sure that thenew courses were genuinely stretching the capacities of the students.
The precise exchange which occurred most frequently (general math andscience for vocational courses) has some disturbing potential. Recall that C.le."bible" of school reform, A Nation at Risk, decried the trend away from bothacademic and vocational courses toward the general curriculum (seeintroduct.on to this paper). A recent paper (Yang & Bishop, 1988) concludesthat wages and employment of non-college-bound students benefit the mostfrom a combination of academic and vocational courses, and lose groundeconomically from extra academic courses alone. As reported earlier in thispaper, many of our local and school respondents expressed similar conclusionsabout academic and vocational courses for the non-college bound. In addition,it is not clear that basic and general courses help students with aspirations forcollege. No one doubts the value of core academic courses; but the precisemix of courses which emerged may not have been the best and probably wasnot given enough thought. As discussed below, the next generation of reformshould consider different combinations, such as fewer, regular (non-general)academics and the option of cognitively demanding vocational education.
In the absence of careful research-based thought about the ideal contentand mix of courses, it is not clear that the state is a better decision makerabout curriculum than local districts and schools. The latter have the
36
39
advantage of being closer to student needs, although some districts may be les,,committed to academics for all groups of students (see Clune, 1987).
Q. Will the reforms produce major t.,,ins in work skills?
A. Probably not. See the above discussion of vocational education. Thetheory linking traditional academic courses to work skills is quite weak andunderdeveloped. The chances that existing courses would approximate thosedesigned for maximum impact in the workplace are very small. In other words,some of the limited impact of the reform on society is due to weaknesses inthe theory of the reform itself. Powerful impacts on work skills may dependon radical redesign of academic education (Murnane, in press; Resnick, 1987).
Q. Will the reforms raise achievement scores in academic subjects?
A. Yes, probably a little. Many readers will be surprised at the bald statementabout gains in achievement scores; but the only serious doubt about theoccurrence of at least a small increase is the
Oncethat some students
are not being exposed to any new material. nce it has been established thatstudents are taking courses with new material, it follows that theirachievement in skills related to those courses (e.g., math computation) will rise(Gamoran, 1987). How much they will rise, whether they will rise enough tomake a difference in the workplace, and whether the new skills are moreworthwhile than the ones they replaced cannot be answered by our data. Wedo know that greater gains in achi'_Nement and income accrue to moreadvanced, vs. more basic, levels of instruction (Gamoran, 1987; Jencks et al.,1979). This, together with the relatively small change in coursetaking (olie ortwo extra basic courses), suggests quite modes, gains in achievement (Levin,1984, 1988). The small, per student magnitude of these gains must be weighedagainst the extensiveness of the reform. The level of skills added to societymay be substantial simply because new graduation requiren. nts produced asmall gain in a great many students.
Q. Will the reforms raise dropout rates and hurt at-risk students?
A. Probably not, but there were some problems, and doubts about educationalquality. As summarized above (p. 27), data on the effect of standards ondropout rates are inconclusive. Despite our respondents' views to thecontrary, most available data do not show an increase in dropout rates. Butconcerns do exist about specific problems created by the standards and thequality of education offered to at-risk students in order to keep them inschool.
37
40
Q. Did the requirements satisfy the public about the value of educationalreform?
A. Yes. Our respondents in local districts and schools thought that thereforms were a success in pleasing the public. The potential bias in suchclaims is lessened by the generally skeptical assessments of the reforms by therespondents themselves. A high degree of political success is smallconfirmation of the opinion often expressed that an important function of thereform was symbolic--the need to show results in exchange for higher taxes.Graduation requirements do have some of the earmarks of loose coupling(Meyer & Rowan, 1983): highly successful communication with the politicalenvironment and highly imperfect educational results. A high degree of publicsupport also is consistent with our finding that districts often took advantageof the new requirements to extend their own requirements and take publiccredit for educational improvements (Fuhrman, Clune, & Elmore, 1988).
I do not think that political success makes educational success any lesslikely, however. Symbolic justification is almost always easier to manage thantechnical results (Etzioni, 1960), so it is no surprise to see symbolism achievea relatively higher degree of success.
Q. Were the reforms successful in communicating their purpose to theeducators who implemented them?
A. No. The theory of political symbolism might gain further support from thedominant perception of our respondents that the purposes of the reforms wereunclear, conflicting, or ambiguous. Most respondents could not answer whetherthe requirements achieved their objectives, because they did not know whatthe objectives were. Previously, I discussed the problem of state inaction inthe development of new courses; but the problem was deeper. The statetypically did not clarify what kinds of courses would best fulfil the newrequirements. One simple explanation is that the reforms sought a relativelyroutine change in a familiar bureaucratic structure (course offering;,, Jr labels)and did not make a sustained effort to change the core technology ofschooling (for example, an attempt to produce a given increment inachievement scores).
Mandates like graduation requirements work best v,nen the regulationcontains all the information necessary for compliance (see, for example,McDonnell and Elmore's [1987 ] example of the 1'55 MPH Speed Limit"). In asuperficial sense, the purpose of the reforms was obvious--increases in thenumber of courses with certain labels. Not obvious was the optimum degree ofrigor or the best kind of courses. Improved communication about such crucialmatters is one of the important issues for the next generation of reform.
POLICY RECOMMENDATIONSMy general conclusion is that the graduation requirements were set at
reasonable levels and were implemented about as well as could be expected.Given the policy design, schools did abota, what they should have beenexpected to do (add the best courses they could manage on short notice for
38
41
the middle- and low-achieving students who did not previously take them). Onother hand, critics are surely correct that the reforms fell tar short of theideal of academic rigor.
Basic Problems with Existing Policy
Pushing beyond the level of course labels and upgrading the level ofinstruction for all kinds of students is a long-term enterprise which requiresmany changes in policy. Against these more ambitious goals, the graduationrequirements suffered from two general deficiencies: policy design andimplementation.
Policy design suffered because the means and ends were not clearlyrelated. One difficulty was the unclear relationship between academic coursesand the ultimate ends of raising achievement scores and producing skills forthe workplace. Math and science are reasonable guesses about what would bemost useful, but the exact relationship did not seem to be investigated in anysystematic way. What sort of math and science courses would be most usefulfor which purposes? What are the core skills for the workplace (Murnane,1988)? What is the role of vocational education, if any? CurricRlum decisionsare difficult because of disagreement over the ends of schooling. But, inmaking difficult choices, policymakers should push the decision one stepfurther and decide what skills they are most interested in communicating.A second difficulty was the lack of attention to instruction fo! ,differentkinds of students. Given the ends of raising achievement and increasing workskills, what is the best approach with students at different achievement levels?For lower-achieving students, is it better to drill on the basics or focus on acore set of higher-order skills? How should progress and lack of progresstoward ultimate ends be assessed and monitored'?
Ideal answers to some of these questions will require further research,but any sort of design based upon the best available knowledge would be aconsiderable improvement over existing policy. Notice how the resolution ofsome of these questions would narrow the area of indeterminacy and helpresolve some of the other questions. If we had a better idea of the centralcore skills, it would be possible to approach the task of remediation in a muchmore focussed manner.
The second major problem of policy implementation is a continuation andintensification of the problem of policy design. Schools and districts were leftbasically adrift on how to implement the graduation requirements. For themost part, they received no assistance in how to solve the many problems ofdesigning and implementing a new program of instruction for different kinds ofstudents. They coped as best they could and adapted with business-as-usual.
18 The debate over what to teach in school cannot even be adequatelyintroduced in this paper. See, e.g., Brandt, (1988), Aronowitz & Giroux (1988),Gee (1988), and McLaren (1988).
39
2
Policy design is implicated in the problems of implementation because high-
quality assistance may have been impossible in the absence of clear goals.
Curing these defects will require better policy dt .sign and implementation.I would make the following specific recommendations:
Streamline the Core Curriculum.
Graduation requirements are useful policy instruments, but they seem tocarry the occupational hazard f overkill. We saw considerable evidence ofexcessive and cluttered requirements and the need to focus more attention on
the core curriculum. High levels of non-specific credit requirements do notguarantee any useful educational content, interfere with valuable extra-curricular activities, and seem to result in redaction of student effort,especially late in the school day. On the other hand, certain highly specific
requirements, for example, in social studies, may drive the curriculum in thatarea toward the lowest common denominator of instruction and cause thetermination of many interesting and valuable electives. We saw nothing toconvince us that much is gained from requirements beyond the core ofacademic subjects. A good case probably can be made for a few additional,specialized requirements (e.g., fine arts, foreign language, physical education).A quite demanding curriculum along these lines can be accommodated in a totalrequirement of 17 credits (for example, 4 English, 3 math, 3 science, 3 social
studies, 2 foreign language, and 2 credits of physical education and fine arts).Because of the need for restraint and the importance of quality instruction,
perhaps the minimum should be approached even more cautiously, and limitedto the 13 credits of core courses. Beyond such a minimum level, states should
seriously consider whether districts and schools are the superior decision
makers about the number and content of additional courses (Clune, 1987).
Aim the Curriculum at Higher-Order Learning Objectives
The case for a streamlined core curriculum is strengthened becau.,e of thetendency of extra requirements to distract from the much more important and
difficult question of the content of the core curriculum. There can be littledoubt that achieving a demanding, in-depth core curriculum for all groups of
students is an enormously more valuable exercise than piling on additional
credit requirements and class periods for their own sake.
To reach the educational content of courses, it is necessary to go beyondgeneral course labels and categories (like "mathematics") and focus on learningobjectives. A focus on learning objectives is exactly what the alignment
movement is all about (the alignment of texts, tests, and curriculum guides, see
Resnick & Resnick, 1985). High school exit exams also stimulate a curriculum
for lower-achieving students which is organized around test objectives.
But these policy instruments have serious flaws. The objectives ofalignment are frustrated by the proliferation of courses allowed in high schools
(e.g., many levels and kinds of mathematics). While the content of eachcourse is regulated, there is no common core curriculum guaranteeing a quality
40
43
education for all students. Some kinds of aligned curriculum, and certainly thetypical high school exit exam, emphasize lower- rather than higher-ordercognitive skills. One practical step is to borrow from states like Californiawhich are taking the lead in developing higher-order learning objectives andcorresponding standardized tests.
Thus, in addition to emphasizing learning objectives rather than courselabels, states need to upgrade the level of the learning objectives, and coupleboth efforts with a simplified and streamlined core curriculum which is asdemanding as possible for all groups of students.
Pay Special Attention to Instruction for Middle- andLow-Achieving Students
The task of developing a demanding core curriculum emphasizing higher-order skills for middle and low achievers is a difficult one; and this taskclearly should be isolated for distinct and intensive analysis.
The obstacles to a high-quality curriculum for such students arenumerous. Watered down course content may be insufficiently challenging andengaging. Remedial education, driven by standardized tests, may emphasize thelowest-level and least interesting skills. Some alternatives to regular highschool (e.g., special schools, night school) may represent massive exercises inreduced expectations. Many teachers and administrators have unnecessarily lowexpectations for students based upon previous achievement.
On the other hand, high levels of course content for low achievers is ademanding goal. Policymakers should design a systematic approach to theproblem of remediation for students at widely differing levels of initiallearning. Ways must be found to identify the most important part of the corecurriculum (the core of the core, so to speak), and to make sure studentsreach at least that level. States, districts and schools need to design workablepaths from remedial and weak courses to more demanding ones. (California'sbridge courses are a simple example.)
Some aspects of the task of upgrading education for low-achievingstudents are not amenable to immediate solution, and some will require furtherresearch. Eventually, changes probably will be required in the attitudes ofschool personnel and the structure of education in elementary and middleschool. The central point here is that the enterprise should not be left tochance or drift (in the form of vague subject matter requirements or misguidedremedial tests). Instead, the whole issue should be pulled out for concentratedattention and analysis. The counterpart to such special attention at the policylevel is technical assistance for school planning discussed below.
Use Different Policy Instruments for Different Purposes andGroups of Students
The need to focus on middle- and low-achieving students and the policieswhich affect them is only a spec;a1 case of a broader issue--the need to think
41
44
of multiple policies as they affect different groups of students. Minimumgraduation requirements affect lower-achieving students because these are thestudents below the minimum. College-bound students are not affected becauseuniversity entrance requirements already exceeded the new state minimum.The impact of the minimum requirements on low-achieving students is shapedbecause of slack in the requirements, preexisting expectations, the tendency towater down courses, alternative routes, preexisting high school exit exams, andso on.
A similar picture can be drawn for academically oriented students whoare most affected by university entrance requirements, traditional conceptionsof academic subjects, and the structure of advanced placement exams (whichalso are sometimes criticized for excessive emphasis on factual knowledge andcourse coverage rather than higher-order thinking and problem solving). Someevidence suggests that the coursetaking and achievement of so-called middlestudents are most strongly affected by changes in the entrance requirements ofthe lower rung of state universities (the state system vs. the universitysystem).
Thus, the idea of a "uniform standard" affecting everyone in the sameway is not realistic. Policymakers should be aware that different groups ofstudents are affected by different combinations of policy instruments indifferent ways. It follows that policy design should proceed by developing anaccurate picture of the kind of students and schools that will be most affectedby groups of policies and design the policies to fit those needs.
Investigate Cognitively Demanding Vocational Education
Evidence from the field and common sense suggest that vocational coursescan be excellent ways of motivating students; experience suggests thatvocational tasks can be cognitively demanding (Resnick, 1987). A recent paperdiscussed above finds economic benefits to the non-college bound fromvocational courses (Kang & Bishop, 1988). Some of the more promisingapproaches to higher expectations for low-achieving students involve basiceducation oriented toward occupational settings (Wehlage, Rutter, Smith, Lesko,& Fernandez, forthcoming). The idea of cognitively skilled vocational workersis in many ways exactly what the reform movement was aiming for, especiallyfor the kind of students who were most affected (middle and low achievers).(See Hamilton, 1984; and the above reference to A Nation at Risk.) It is,thus, a minor irony that vocational courses were the main casualty of thereform. Traditional vocational courses have been criticized for failing to beinteresting, demanding or even vocationally relevant (Grubb, 1984); but Kangand Bishop (1988) cite improvements in vocational education during the 1970sas a reason for recently emerging economic benefits.
Thus, an important question for the next generation of reform is whetherto strive for a better melding of the core curriculum, training in higher-orderthinking, and vocational education. The answer to this question, and therelated one of how much to rely on the traditional vocational educationestablishment, are beyond the scope of this research.
42
45
Design Technical Assistance to Schools for Improved Content
It became very clear from our research that, regardless of the quality ofstate policies, schools play a vital role in determining the course contentwhich is available to students. Schools serve very different kinds of studentsand face widely differing problems and circumstances. Schools must puttogether a package of courses which fits their particular educationalphilosophy, student body, teaching faculty, school counsellors, and so on. Forexample, one school in our sample decided to satisfy an English requirement byoffering double sessions of English as a Second Language to newly arrivedHaitian students and to offer such students American rather than ancienthistory because of the students' urgent need to become familiar with Americansociety. The same school had developed an aggressive program of placing low-achieving students in traditional academic courses, an approach notably lackingin most of the schools we visited.
In order to recognize and exploit this local variation, and encourage localproblem solving, states should make technical assistance to schools forschoolwide planning of curriculum a part of any set of redesigned policies.Teams of state experts might help schools through problems of local designand implementation. Technical assistance should encourage the kind ofschoolwide planning needed to fashion integrated solutions (e.g., sequences ofcourses).
Technical assistance also should be prepared to deal with teacher training.Teacher training must be more carefully designed and sustained the greater thedepartures required from traditional practice (e.g., novel short cuts throughtraditional materials for low-achieving students).
Build an Indicator System to Track Content andCourse-Related Achievement
The impact of multiple policies on different groups of students indifferent schools is difficult to assess, yet the information is needed on aregular basis to allow for adjustments and refinements. It is a remarkable factthat very few states can track coursetaking by course labels, no state has theability to track the content of courses beyond course labels (see McDonnell,1988), and few can monitor the achievement of students in the subject matteractually taught. Standardized achievement tests bear only a weak relationshipto specific course content; but the standardized subject matter exams which doiocus on course content are becoming popular as part of alignment in manystates and districts.
Thus, policymakers should consider designing and implementing anindicator system to track changes in proximate and ultimate goals (forexample, coursetaking, course content, and specified kinds of achievement).They should consider as well, a design which is sensitive to outcomes afterhigh school (e.g., selected tracking of students).
43
46
Continue Research on Curriculum Improvement
The policy recommendations made above--even those which areimmediately feasible--represent a quantum increase in sophistication and effortover existing policy. But more profound change is possible and, in the end,probably necessary, to achieve the ultimate goals desired (e.g., major gains inworker productivity). The primary requirement is more basic research. Someof the information which would be useful includes answers to these questions:
- What really are the core skills of a skilled worker which can beimparted by schooling, and which kinds of courses are best suited toimpart them? If the skills are relatively narrow, e.g., multi-step problemsolving (Murnane, 1988), the curriculum should be redesigned to beardown on these skills and make sure every student gets them. Thenarrowness of the skills could be a great advantage for teaching low-achieving students, compared to a vague and time-consuming requirementlike "three credits in mathematics."
- What are the benefits and costs of vocational education; how can thesecourses be made cognitively demanding; and what is the best combinationof vocational and academic education?
- What are the best methods of teaching higher-order skills to lowachieving students? If it is best to skip some fundamental skills andproceed to a selection of higher-order skills, which fundamental skillsshould be deemphasized and which higher-order skills are essential? Ifthe higher-order skills present special difficulties, what is the bestapproach to teaching them?
- How could we redesign the entire elementary and high schoolcurriculum to teach the highest levels of skills possible for all students?At least in math and science, our existing curriculum has severaloutstanding problems: it is repetitious, it is not based on a clear modelof skills, it is not cumulative, and it confines low-achieving students tolearning lower-order skills (Raizen, 1988; Romberg, 1988; Shepard & Smith,1988; Slavin, 1987).
Evaluate Changes in the Policymaking Process
All of the policy recommendations discussed above have in common thegoal of educational policy which is more coherent, instrumentally goal-directed,analytical, and data based (in short, more "rational"). Unfortunately, obstaclesto greater rationality are built into the process of policymaking, and specialefforts must be undertaken to overcome these obstacles.
A case can be made, for example, that the precise degree of rationalityembodied in the recent wave of high school graduation requirements is a fairlytypical occurrence. Policymakers had quite different goals for educationalreform. For example, besides producing a more rigorous education, their goalsmay have included obtaining higher funding for education, symbolicallysatisfying public demands for accountability, punishing the educational
44
4"7
establishment and reforming local governance of schools (Fuhrman, Clune &Elmore, 1988). Even among those interested in technical goal achievement,conflicts exist about the proper ends of schooling (for example, higher-orderthinking vs. back to the basics). Paradoxically, the decentralized,bureaucratized system of educational governance in the United States mayproduce an exceptionally "busy," overgoverned, and uncoordinated policymakingprocess (Boyd, 1979; Cohen, 1982).
In contrast, the development of a long-range, multi part strategy forschool improvement assumes continuity of educational planning over cycles ofpolitical elections and issue salience. Under these circumstances, it wasperhaps understandable that policymakers reached agreement on a set ofminimum course labels and stopped short of tackling the harder problems ofactual course content for different groups of students.
Obviously, much depends on one's assessment of the degree to whichpolicymaking is capable of higher levels of instrumental rationality (one'soptimism or pessimism about policy, as it were). High levels of pessimismwould seem to point strongly toward a minimal state role and heavy relianceon curriculum development by local districts and even schools. In favor ofoptimism is the fact that certain states (such as South Carolina and California)have succeeded in achieving much higher levels of coordinated and sustainedplanning and implementation than others.
The elements of such success are beyond the scope of this paper butseem to include two primary activities: first, a network of influential peopleinside and outside government (public officials, private citizens, and civicinstitutions) prepared to stick with educational planning over the long haul,spanning political campaigns and issue cycles. Second, in order to beeffective, this group of policymakers is likely to need data and data analysisadequate to the increased level of technical demand on policy.
In other words, what may be needed is a marriage of stable politicalinfluence and sophisticated technical capacity. The most fundamental point isthat states desiring educational policy improvements may need to improve thepolicymaking process in order to get them. In effect, a full-service curriculumpolicy of the type outlined in this paper requires a full-service policy anddelivery system.
45
48
CONCLUSION: AMBITIOUS GOALS, MORE PRECISE POLICY
In a basic sense, the ultimate verdict about the success of graduationrequirements does not end with an assessment of results measured againsthistorical expectations. However one reads those results, there is room to saythat the reforms succeeded and failed. They succeeded in getting a lot morestudents into basic academic courses and in satisfying a concerned public; theyfailed in getting students into the most rigorous possible courses, in producinga reasonably uniform education for all students and, probably, in conveying thehigher-order skills necessary for a competitive economy.
Whether or not to be satisfied with these results is not just a scientificquestion for researchers but a political question for current policymakersResearch can say that there is plenty of room and need for improvement, andthat considerable improvement (somewhere below the frontier of ideal results)seems feasible. The larger society must decide whether the task is worth theeffort. Our sense as researchers is that the first wave of reform barely beganan important enterprise that is well worth pursuing.
The political and organizational difficulties of creating and sustaining thekind of curriculum policy recommended in this paper (one which is morecoherent and ambitious about learning objectives for all groups of students)are formidable. The ideal would be maximum restraint about the ambitiousobjectives which are established--a demanding, but also somehow minimalist,curriculum. Ideas presented earlier in the paper about a streamlined core anda highly focussed set of higher-order learning objectives may be usefulguidelines in keeping demands manageable. Given restraint about the numberof requirements, additional aspects of policy development can be approachedincrementally. Following the lead of states like California and Connecticut,policymakers could develop and implement higher-order skills assessments onesubject matter at a time (e.g., 8th grade social studies). Finally, as part ofthis simultaneous strategy of ambition and restraint, states also should workhard on the unglamorous, usually neglected task of deregulation--getting rid ofunnecessary, cumbersome guidelines and testing at the same time that morecoherent, ambitious, streamlined instruments are being developed.
An important issue not addressed by this paper is the most desirableblend of centralized curriculum policy, local control, and teacherprofessionalism. That issue will be addressed by future CPRE research.19Earlier discussion raised the possibility of a possible "San Andreas Fault"between curriculum centralization and various excentralizing movements (Clune,1987). The best bet for the moment is that a streamlined core curriculumaimed at higher-order thn.!'ing will complement rather than conflict withdesirable local discretion and teacher professionalism (Smith & O'Day,forthcoming).
19 CPRE has research in progress on the effects of different types ofcurriculum control systems on content coverage, teacher morale and sense ofeffectiveness.
47
49
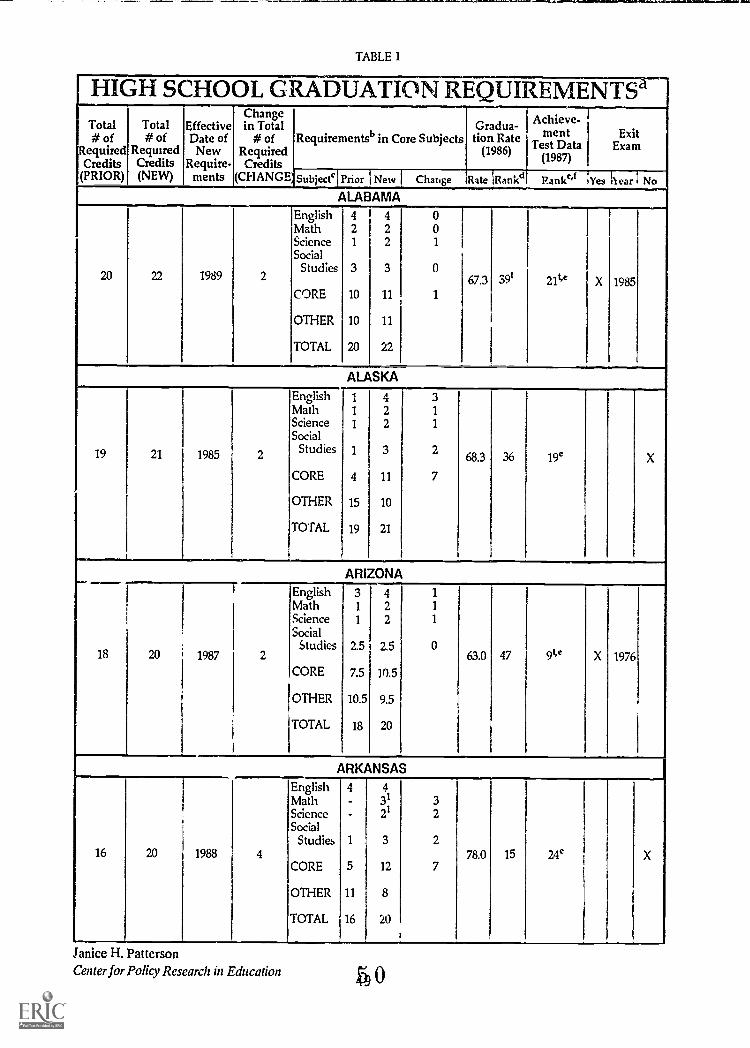
TABLE 1
HIGH SCHOOL GRADUATION REQUIREMENTS'Total# of
equiredCredits
(PRIOR)
Total# of
RequiredCredits(NEW)
EffectiveDate of
NewRequire-
ments
Changein Total
# ofRequiredCredits
(CHANGE,
Requirementsb in Core SubjectsGradua-
tion Rate(1986)
Achieve-
TenieDtata(1987)
Exam
Subjecte Prior New I Change Rate 1Rankd Ranke't Yes Kear I No
ALABAMAEnglish 4 4 0Math 2 2 0Science 1 2 1
SocialStudies 3 3 0
20 22 1989 2 67.3 391 211'e X 1985CORE 10 11 1
OTHER 10 11
TOTAL 20 22
ALASKAEnglish 1 4 3Math 1 2 1
Science 1 2 1
Social
19 21 1985 2Studies 3 2
68.3 36 19'
CORE 4 11 7
OTHER 15 10
TOTAL 19 21
ARIZONAEnglish 3 4 1
Math 1 2 1
Science 1 2 1
SocialStudies 2.5 2.5 0
18 20 1987 2 63.0 47 Se X 1976CORE 7.5 10.5
OTHER 10.5 9.5
TOTAL 18 20
ARKANSASEnglish 4 4Math 31 3Science 21 2Social
Studies 1 3 216 20 1988 4 78.0 15 24`
CORE 5 12 7
OTHER 11 8
TOTAL 16 20
Janice H. PattersonCenter for Policy Research in Education 40
111.1111ersalliaail.
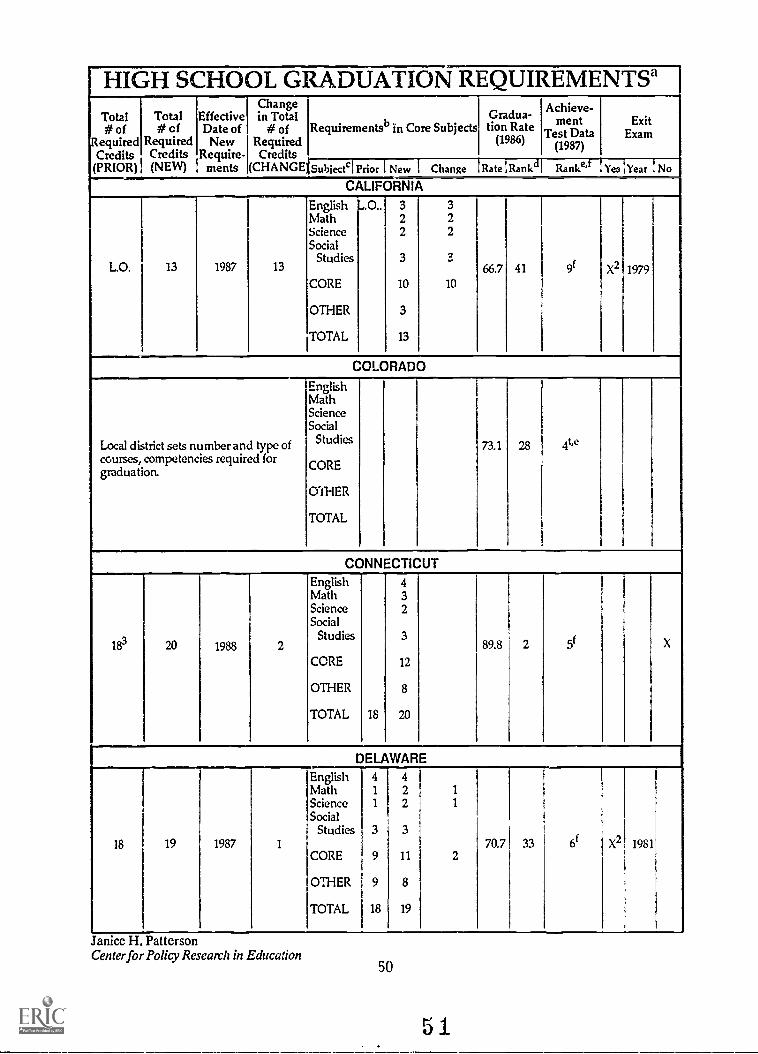
HIGH SCHOOL GRADUATION REQUIREMENTS'Total# of
RequiredCredits(PRIOR)
Total# of
RequiredCredits(NEW)
EffectiveDate of
NewRequire-
ments
Changein Total
# ofRequiredCredits
(CHANGE
Requirementsb in Core SubjectsGradua-tion Rate
(1986)
Acheieve-
Temsttata(1987)
ExitExam
Subiectcl Prior I New I Change Rate !Rank Ranke' Yes Year ! No
CALIFORNIA
English .0.. 3 3Math 2 2Science 2 2Social
tudies 3 2O.L.O. 13 1987 13 66.7 41 91 XZ 1979
CORE 10 10
OTHER 3
TOTAL 13
COLORADO
EnglishMathScienceSocial
Local district sets number and type of StudiesStu73.1 28 4t'e
courses, competencies required forgraduation. CORE
OTHER
TOTAL
CONNECTICUTEnglish 4Math 3Science 2Social
183 20 1988 2Studies 3
89.8 2 51
CORE 12
OTHER 8
TOTAL 18 20
DELAWARE
English 4 4Math 1 2 1
Science 1 2 1
SocialStudies 3 3
18 19 1987 1 70.7 33 61 X2 1981CORE 9 11 2
OTHER 9 8
TOTAL 18 19
Janice H. PattersonCenter for Policy Research in Education
50
51
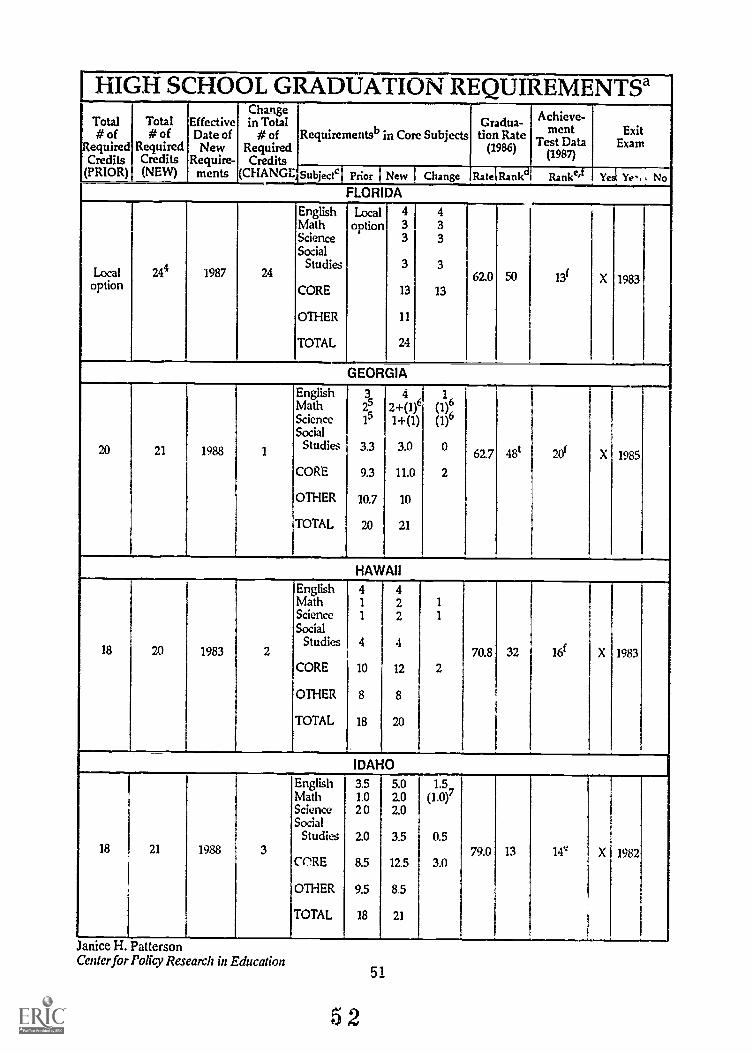
HIGH SCHOOL GRADUATION REQUIREMENTSaTotal# of
RequiredCredits(PRIOR)
Total# of
RequiredCredits(NEW)
EffectiveDate ofNew
Require-meets
Changein Total
# ofRequired
Credits(CHANGESubjectcl
Requirementsb in Core SubjectsGradua-tion Rate
(1986)
Achieve-meet
Test Data(1987)
ExitExam
Prior 1 Nein j Change Ratelliankjr Rankeif Yell Ye, I NoFLORIDA
English Local 4 4Math option 3 3Science 3 3Social
Studies 3 3Local 244 1987 24 62.0 50 13f X 1983option CORE 13 13
OTHER 11
TOTAL 24
GEORGIA
Englisn 3 4 1,Math 2 +(1)6 (1)°Science 1S 1 +(1) (1)6Social
20 21 1988 1Studies 3.3 3.0 0
62.7 4e 20f X 1985
CORE 9.3 11.0 2
OTHER 10.7 10
TOTAL 20 21
HAWAIIEnglish 4 4Math 1 2 1
Science 1 2 1
Social
18 20 1983 2Studies 4 4
70.8 32 16( X 1983CORE 10 12 2
OTHER 8 8
TOTAL 18
IDAHO
English 3.5 5.0 1.5,Math 1.0 2.0 (1.0)'Science 2 0 2.0Social
Studies 2.0 3.5 0.518 21 1988 3 79.0 13 14e X 1982
CORE 8.5 12.5 3.0
OTHER 9.5 8.5
TOTAL 18 21
Janice H. PattersonCenter for Policy Research in Education
52
51
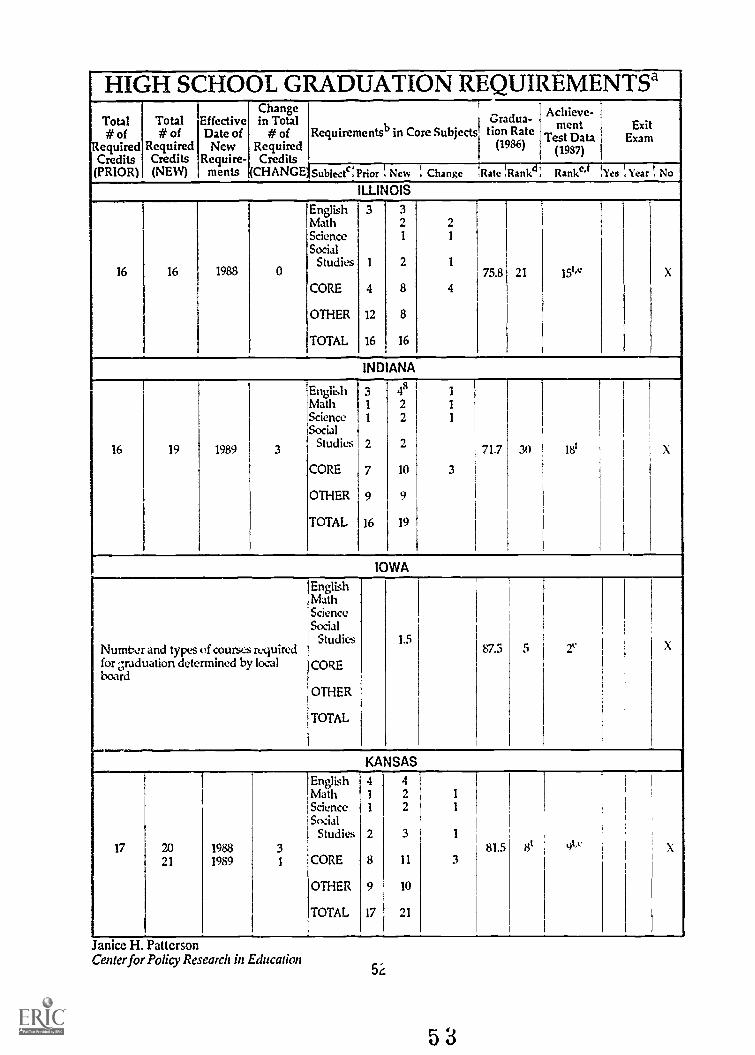
HIGH SCHOOL GRADUATION REQUIREMENTS'Total# of
equiredCredits(PRIOR)
Total# of
RequiredCredits(NEW)
EffectiveDate of
NewRequire-
ments ((CHANGE
Changein Total
# ofRequiredCredits
Requirementsb in Core Subjects
I
Gradua-Lion Rate te
Achieve-
nITest Data(1987)
ExitExam
subjecte;Prior ; New I Change Rate ;Rank( Ranke't ,Yea Year ! No
ILLINOIS
English 3 3Math 2 2Science 1 1
SocialStudies 1 2 1
16 16 1988 0 75.8 21 15I'' X
CORE 4 8 4
OTHER 12 8
TOTAL 16 16
INDIANA
English 3 48 1
Math 1 2 1
Science 1 2 1
Social
16 19 1989 3 Stu die s 2 2 717 30 181 X
CORE 7 10 3
OTHER 9 9
TOTAL 16 19
IOWA
EnglishMathScienceSocial
Studies 15Number and types of courses required 875 5 2'for ,-mduation determined by localboard
CORE
OTHER
TOTAL
KANSAS
English 4 4Math 1 2 1
Science 1 2 1
SocialStudies 2 3 1
17 20 1988 3 81.5 tit 9IN X
21 1989 1 CORE 8 11 3
OTHER 9 10
TOTAL 17 21
Janice H. PattersonCenter for Policy Research in Education
52
53
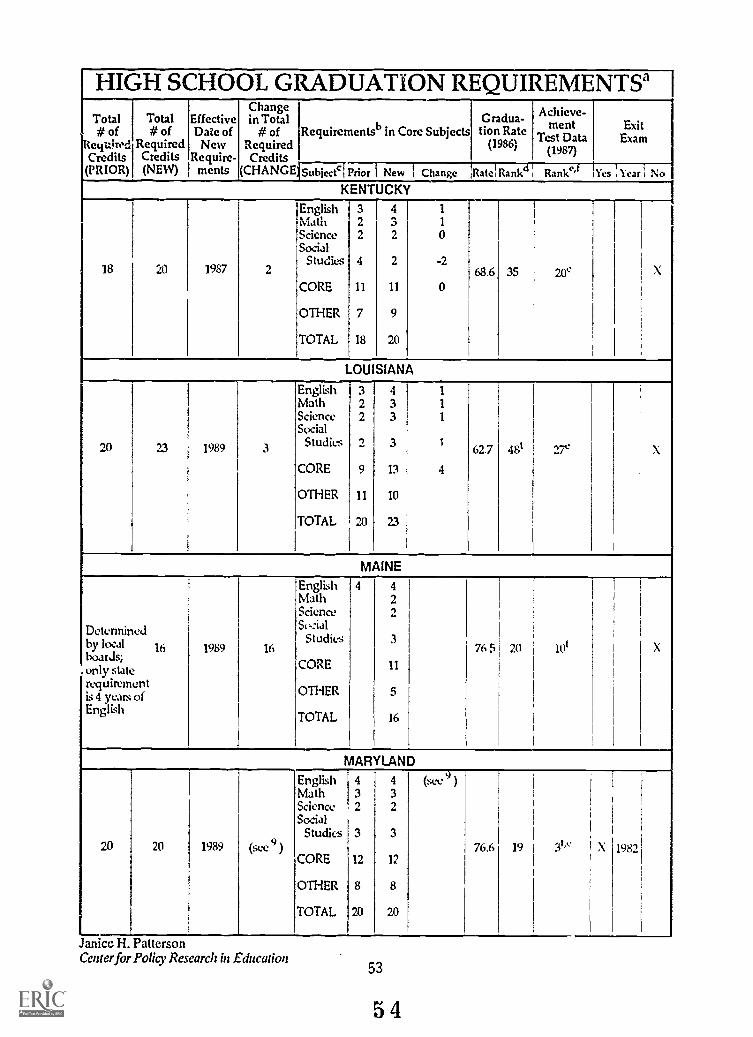
HIGH SCHOOL GRADUATION REQUIREMENTS'Total# of
RequiredCredits(PRIOR)
Total# of
RequiredCredits(NEW)
EffectiveDate of
NewRequire-
ments
Changein Total
# ofRequiredCredits
(CHANGElsublectcr
bRequirements in Core SubjectsGradua-Lion Rate
(1986)
Achieve-ment
Test Data(1987)
ExitExam
Prior 1 New i Change Rate i Rankd Ranke'l 'Yes Year I No
KENTUCKY
English 3 4 1
ivlath 2 3 1
Science 2 2 0Social
Studies 4 2 -218 20 1987 2 68.6 35 20' X
CORE 11 11 0
OTHER 7 9
TOTAL 18
LOUISIANA
English 3 4Math 2 3 1
Science 2 3 1
Social
20 23 1989 3 Studies 2 3 1
62.7 481 27" X
CORE 9 13 4
OTHER 11 10
TOTAL 20 23
MAINEEnglish 4 4Math 2Science 2
Determined So,:i al
by localal 16boards;only state
1989 16
CORE
3
11
76 5 20 lot X
requirementis 4 years of OTHER 5
EnglishTOTAL 16
MARYLAND
English 4 4 (see 9))
Math 3 3Science 2 2Social
Studies 3 320 20 1989 (see 76.6 19 I 31'" X 1982
CORE 12 12
OTHER 8 8
TOTAL 20 20
Janice H. Pattersoncenter forPolicy Research in Education
53
54
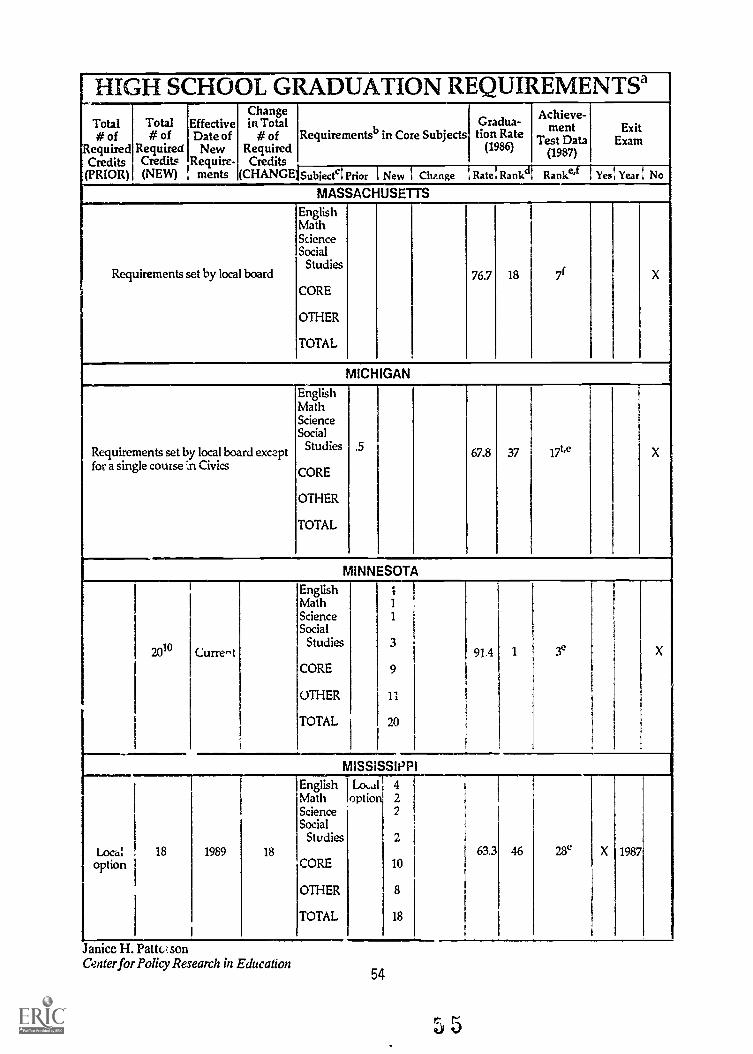
HIGH SCHOOL GRADUATION REQUIREMENTS'Total# of
' equiredCredits(PRIOR)
Total# of
RequiredCredits(NEW)
EffectiveDate of
NewRequire-
ments
Changein Total
# ofRequiredCredits
(CHANGE1Subiecti
Requirementsb in Core SubjectsGradua-tion Rate
(1986)
Achieve-
Test Data(1987)
Exam
,Prior I New I Change Rate! Rank Ranke'f i Yes! Year I No
MASSACHUSETTS
Requirements set by local board
EnglishMathScienceSocial
Studies
CORE
OTHER
TOTAL
76.7 18 71
MICHIGAN
Requirements set by local board exceptfor a single course ',rt Civics
EnglishMathScienceSocial
diesStudies
CORE
OTHER
TOTAL
. 567.8 37 17t'e
MINNESOTA
2010 Current
EnglishMathScienceSocial
Studies
CORE
OTHER
TOTAL
3
9
11
20
91.4 1 3e
MISSISSIPPI
Localoption
18 1989 18
EnglishMathScienceSocial
Studies
CORE
OTHER
TOTAL
Localoutio
422
2
10
8
18
63.3 46 28' X 1987
Janice H. Patt(2 sonCenter forPolicy Research in Education
54
5J
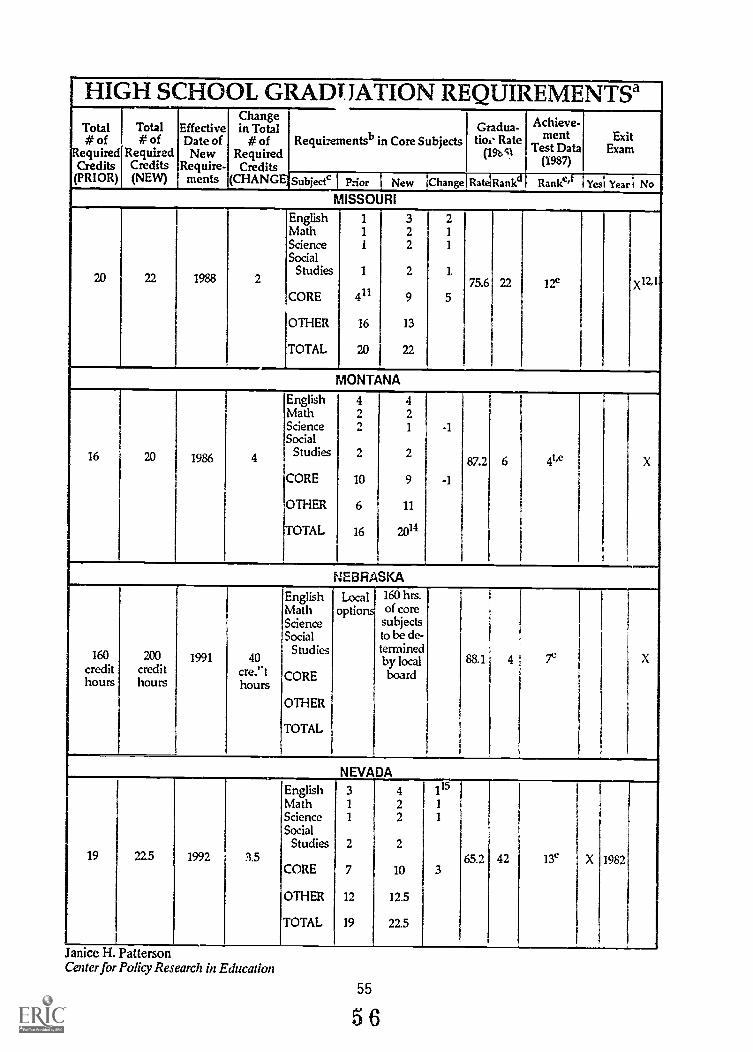
HIGH SCHOOL GRADUATION REQUIREMENTSTotal# of
equiredCredits(PRIOR)
Total# of
RequiredCredits(NEW)
EffectiveDate ofNew
Require-ments
Changein Total
# ofRequiredCredits
(CHANGE
Requizementsb in Core SubjectsGradua-floe Rate
(1901
Achieve-ment
Test Data(1987)
ExitExam
Subject c 1 Prior { New ;Change Ratehlankd Ranke't Yes; Year{ No
MISSOURI
20 22 1988 2
EnglishMathScienceSocial
Studies
CORE
OTHER
TOTAL
1
1
I
1
411
16
20
322
2
9
13
22
21
1
1
575.6 22 12e x12,1
MONTANA
16 20 1986 4
EnglishMathScienceSocial
Studies
CORE
OTHER
TOTAL
422
2
10
6
16
421
2
9
11
2014
-1
-1
87.2 6 41,e
NEBRASKA
160credithours
200credithours
1991 40cre.''thours
EnglishMathScienceSocial
Studies
CORE
OTHER
TOTAL
Localoptions
160 hrs.of core
subjectsto be de-terrninedby localboard
88.1 7e
NEVADA
19 225 1992 3.5
EnglishMathScienceSocial
Studies
CORE
OTHER
TOTAL
31
1
2
7
12
19
422
2
10
12.5
22.5
115
1
1
65.2 42 13e X 1982
anice tt. t'attersonCenter for Policy Research in Education
55
56
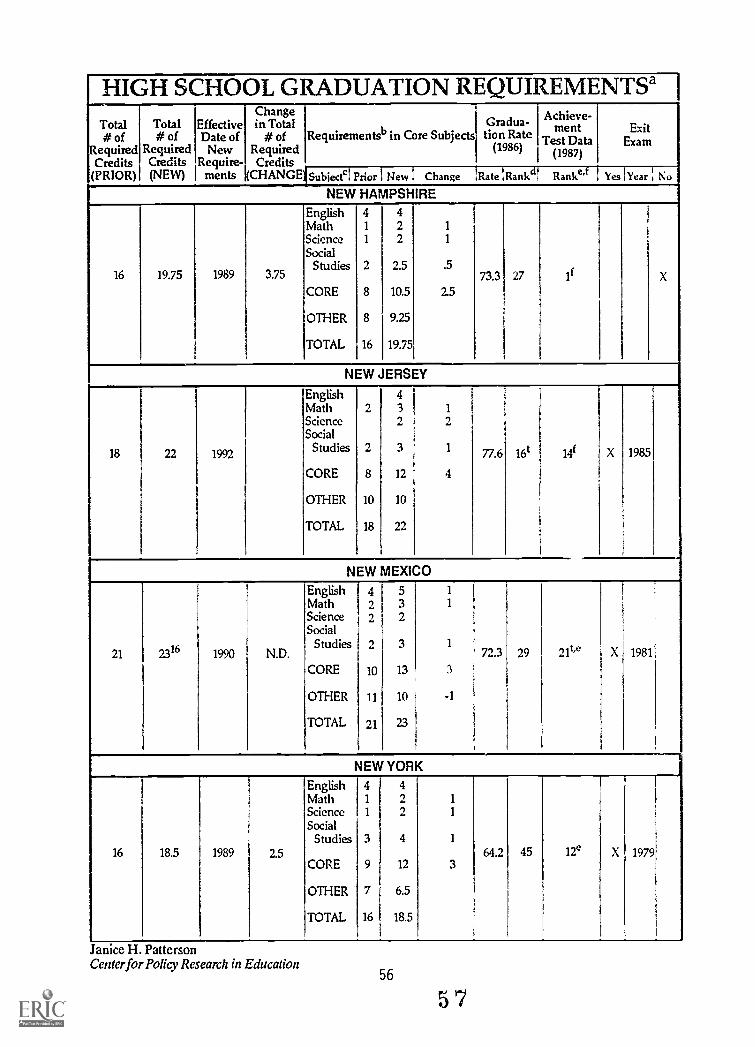
HIGH SCHOOL GRADUATION REQUIREMENTS' I
Total# of
RequiredCredits(PRIOR)
Total# of
RequiredCredits(NEW)
EffectiveDate of
NewRequire-
ments
Changein Total
# ofRequired
Credits(CHANGE1Subiecfl
Requirementsb in Core SubjectsGradua-tion Rate
(1986)
Achieve-ment
Test Data(1987)
ExitExam
Prior 1 New I Change Rate !Rankd Ranke' Yes iYear s No
NEW HAMPSHIRE
English 4 4Math 1 2 1
Science 1 2 1
Social
16 19.75 1989 3.75Studies 2 2.5 .5
73.3 27 11 X
CORE 8 10.5 2.5
OTHER 8 9.25
TOTAL 16 19.75
NEW JERSEY
English 4Math 2 3 1
Science 2 2Social
18 22 1992Studies 2 3 1 77.6 16f 14f X 1985
CORE 8 12 4
OTHER 10 10
TOTAL 18 22
NEW MEXICOEnglish 4 5Math 2 3Science 2 2Social
212316 1990 N.D.
Studies 2 3 1
72.3 29 21t'c X 1981
CORE 10 13 3
OTHER 11 10 -1
TOTAL 21 23
NEW YORK
English 4 4Math 1 2 1
Science 1 2 1
SocialStudies 3 4 1
16 18.5 1989 2.5 64.2 45 12e X 1979CORE 9 12 3
OTHER 7 6.5
TOTAL 16 18.5
Janice H. PattersonCenter for Policy Research in Education
56
57
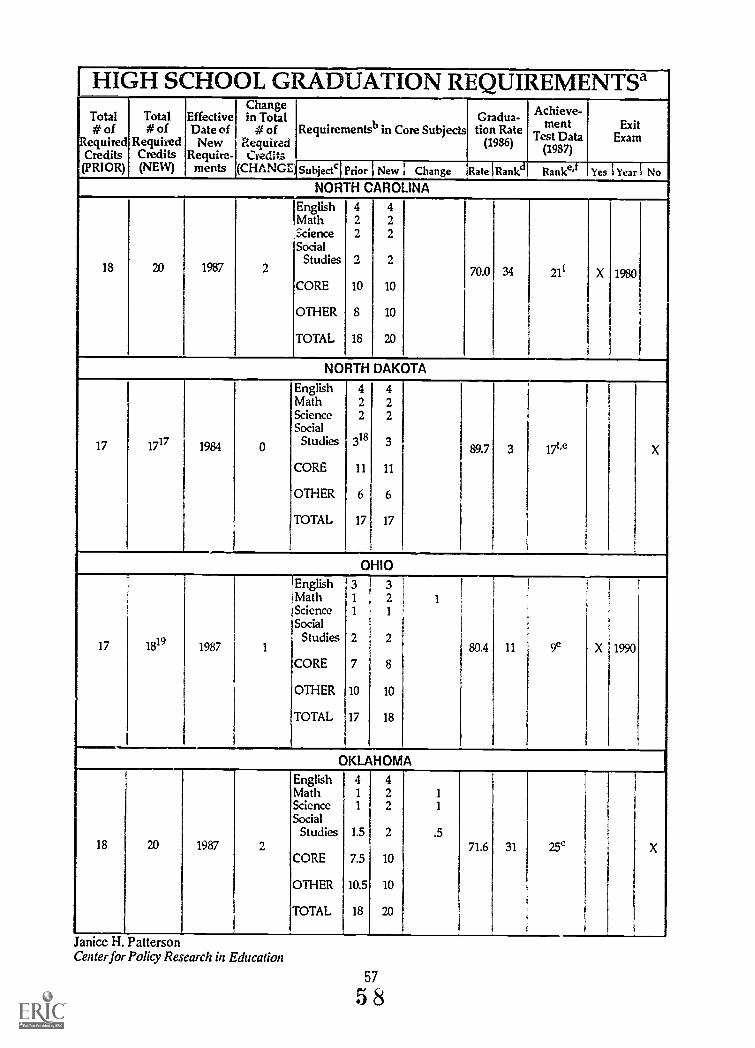
HIGH SCHOOL GRADUATION REQUIREMENTSaTotal# of
RequiredCredits
(PRIOR)
Total# of
RequiredCredits(NEW)
EffectiveDate ofNew
Require-meets
Changein Total
# ofRequiredCredits
(CHANGE4Subjectc
Requirementsb in Core SubjectsGradua-tion Rate
(1986)
Achieve-TezeDntata
(1987)Exam
Prior New I Change Rate 1 Rante Ranke'f Yes Year I NoNORTH CAROLINA
English 4 4
Science 2 2Social
Studies 3 218 20 1987 2 mo 34 21 c X 1980
CORE 10 10
OTHER 8 10
TOTAL 18 20
NORTH DAKOTA
English 4 4Math 2 2Science 2 2Social
17 1717 1984 0Studies 318 3
89.7 3 17te
CORE 11 11
OTHER 6 6
TOTAL 17 17
OHIOEnglish 3 3Math 1 2 1
ScienceSocial
Studies 2 217 1819 1987 1 80.4 11 9e X 1990
CORE 7 8
OTHER 10 10
TOTAL 17 18
OKLAHOMAEnglish 4 4Math 1 2 1
Science 1 2 1
SocialStudies 1.5 2 .5
18 20 1987 2 71.6 31 25'CORE 7.5 10
OTHER 10.5 10
TOTAL 18 20
anice H. PattersonCenter for Policy Research in Education
57
58
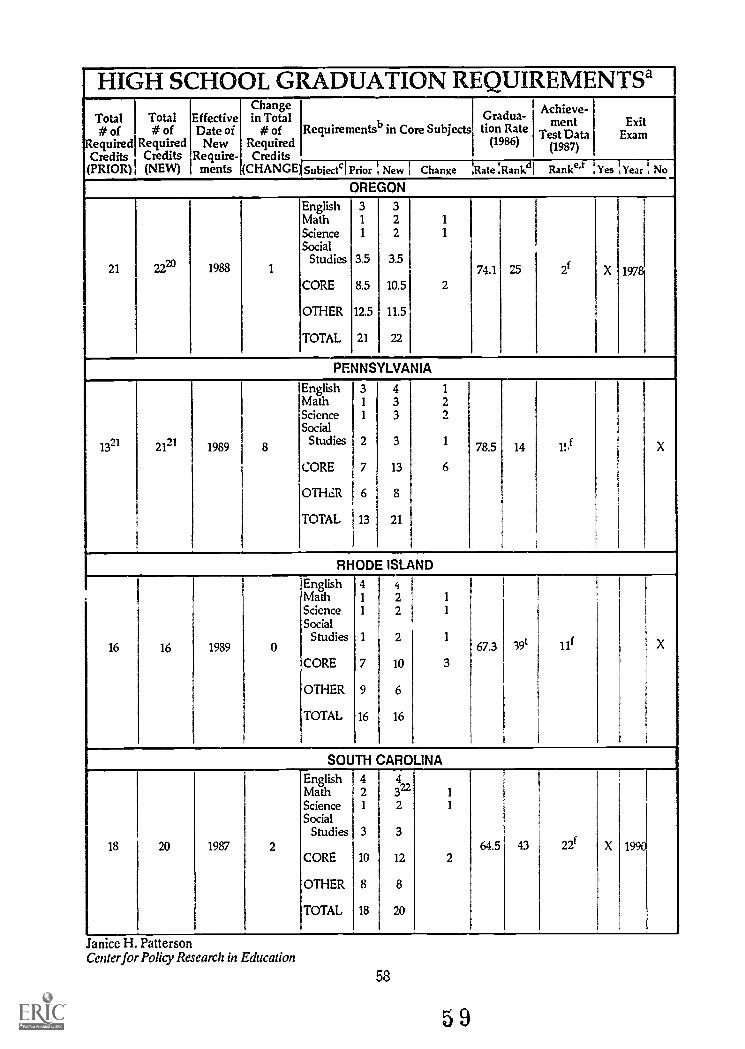
HIGH SCHOOL GRADUATION REQUIREMENTS'Change Achieve-
Total Total Effective in Total Gradua- xit# of # of Date of # of Requirementsb in Core Subjects Lion Rate TemsteplatData ExEam
tRequired Required New Required (1986) (1987)Credits Credits Require- Credits(PRIOR) (NEW) ments (CHANGE1Subiectc! Prior 1 New i Change Rate !Ranief Ranke'l Yes Year 4 No
OREGON
English 3 3Math 1 2 1
Science 1 2 1
SocialStudies 3.5 3.5
21 1988 1 74.1 25 2f X 197CORE 8.5 10.5 2
OTHER 12.5 11.5
TOTAL 21 22
PENNSYLVANIA
English 3 4 1
Math 1 3 2Science 1 3 2Social
1321 2121 1989 8Studies 2 3 1
78.5 14 Thf
CORE 7 13 6
OTHER 6 8
TOTAL 13 21
RHODE ISLANDEnglish 4 4Math 1 2 1
Science 1 2 1
SocialStudies 1
16 16 1989 0 67.3 39t 111
CORE 7 10 3
OTHER 9 6
TOTAL 16 16
SOUTH CAROLINAEnglish 4 4Math 2 322 1
Science 1 2 1
SocialStudies 3 3
18 20 1987 2 64.5 43 221 X 1990CORE 10 12 2
OTHER 8 8
TOTAL 18
anice H. ._
attersonCenter for Policy Research in Education
58
5 9
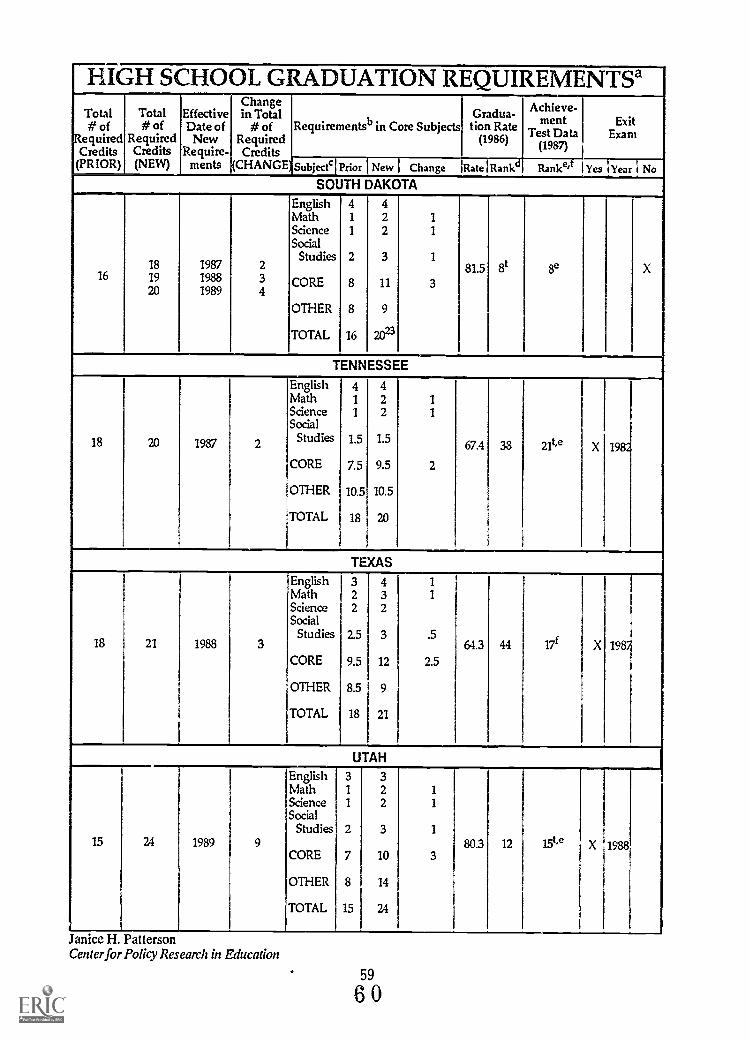
HIGH SCHOOL GRADUATION REQUIREMENTSaTotal# of
I equiredCredits
(PRIOR)
Total# of
RequiredCredits(NEW)
EffectiveDate ofNew
Require-ments
Changein Total
# ofRequiredCredits
(CHANGEJSubjectel
Requirementsb in Core SubjectsGradua-tion Rate
(1986)
Achieve-ment
Test Data(1987)
Rankeif
xitExEam
Prior 1 New I Change Rate I Rankd Yes I Year NoSOUTH DAKOTA
English 4 4Math 1 2 1
Science 1 2 1
SocialStudies 2 3 1
161819
19871988
2
3 CORE81.5 8t 8e X
20 1989 48 11 3
OTHER 8 9
TOTAL 16 2023
TENNESSEE
English 4 4Math 1 2 1
Science 1 2 1
Social
18 20 1987 2Studies 1.5 1.5
67.4 38 21t'e X 198.
CORE 7.5 9.5 2
OTHER 10.5 10.5
TOTAL 18 20
TEXASEnglish 3 4Math 2 3Science 2 2Social
Studies 2.5 3 .518 21 1988 3 64.3 44 17f X 198
CORE 9.5 12 2.5
OTHER 8.5 9
TOTAL 18 21
UTAH
English 3 3Math 1 2 1
Science 1 2 1
SodalStudies 2 3 1
15 24 1989 9 80.3 12 15t'e X 1988CORE 7 10 3
OTHER 8 14
TOTAL 15 24
anice H. PattersonCenter for Policy Research in Education
59
60
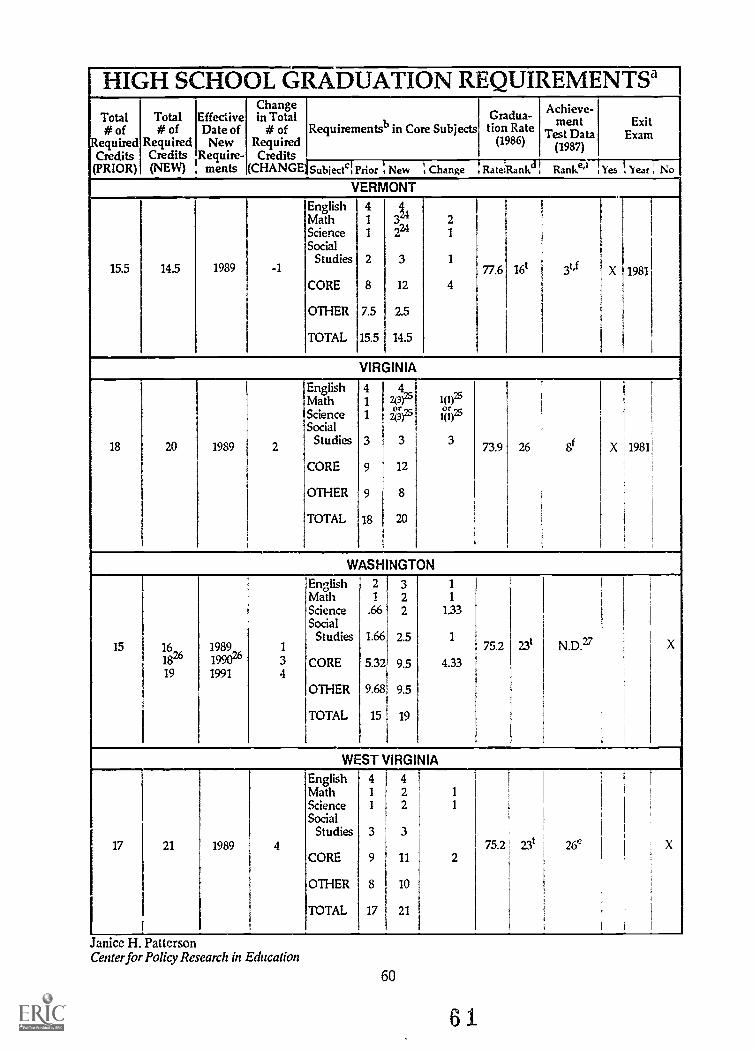
HIGH SCHOOL GRADUATION REQUIREMENTS'[ Change Achieve-
Total# of
Total# of
EffectiveDate of
in Total# of Requirementsb in Core Subjects
Gradua-tion Rate Test Data
ExitExam
equired Required New Required (1986) (1987)Credits Credits Require- Credits(PRIOR) (NEW) ments (CHANGE1Subiectc! Prior I New Change Rate4tankd Rank° Yes , Year No
VERMONTEnglishMath
41 3
IA2
Science 1 224 1
Social
15.5 14.5 1989 -1Studies 2 3 1
77.6 le 3t,f X 1981CORE 8 12 4
OTHER 7.5 2.5
TOTAL 15.5 14.5
VIRGINIA
EnglishMath
41
4,2or 1(1)z"
Science 1 ZP ifbzSocial
18 20 1989 2Studies 3 3 3
73.9 26 81 X 1981
CORE 9 12
OTHER 9 8
TOTAL 18 20
WASHINGTON
English 2 3 1
Math 1 2 1
Science .66 2 133Social
Studies L66 2.5 115 16,
18`"1989,1990'
1
3 CORE 5.32 9.5 4.33
75.2 23t N.D.27 X
19 1991 4
OTHER 9.68 9.5
TOTAL 15 19
WEST VIRGINIAEnglish 4 4Math 1 2 1
Science 1 2 1
SocialStudies 3 3
17 21 1989 4 75.2 23t 26e XCORE 9 11 2
OTHER 8 10
TOTAL 17 21
Janice H. PattersonCenter for Policy Research in Education
60
61
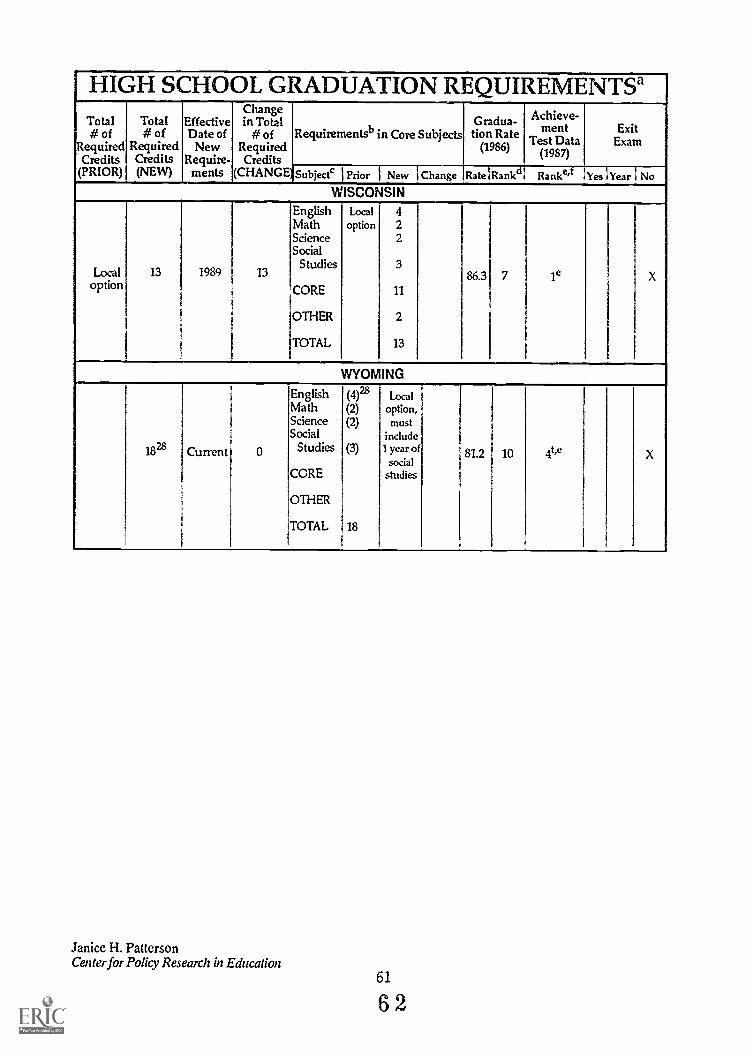
HIGH SCHOOL GRADUATION REQUIREMENTSaTotal# of
equiredCredits(PRIOR)
Total# of
RequiredCredits(NEW)
EffectiveDate of
NewRequire-
ments
Changein Total
# ofRequiredCredits
(CHANGE,
Requirements b in Core SubjectsGradua-tion Rate
(1986)
Achieve-ment
Test Data(1987)
ExitExam
Subjectc Prior 1 New I Change Rate Illankd Ranke't Yes 1Year 1 No
WISCONSINEnglishMath
Localoption
42
Science 2Social
Localoption
13 1989 13Studies
CORE
3
11
86.3 7 le
OTHER 2
TOTAL 13
WYOMING
EnglishMathScienceSocial
(4)28(2)(2)
Localoption,must
include
1828 Current 0 StudiesS
CORE
(3) 1 year ofsocialstudies
81.2 10 41'e
OTHER
TOTAL 18
Janice H. PattersonCenter for Policy Research in Education
61
62
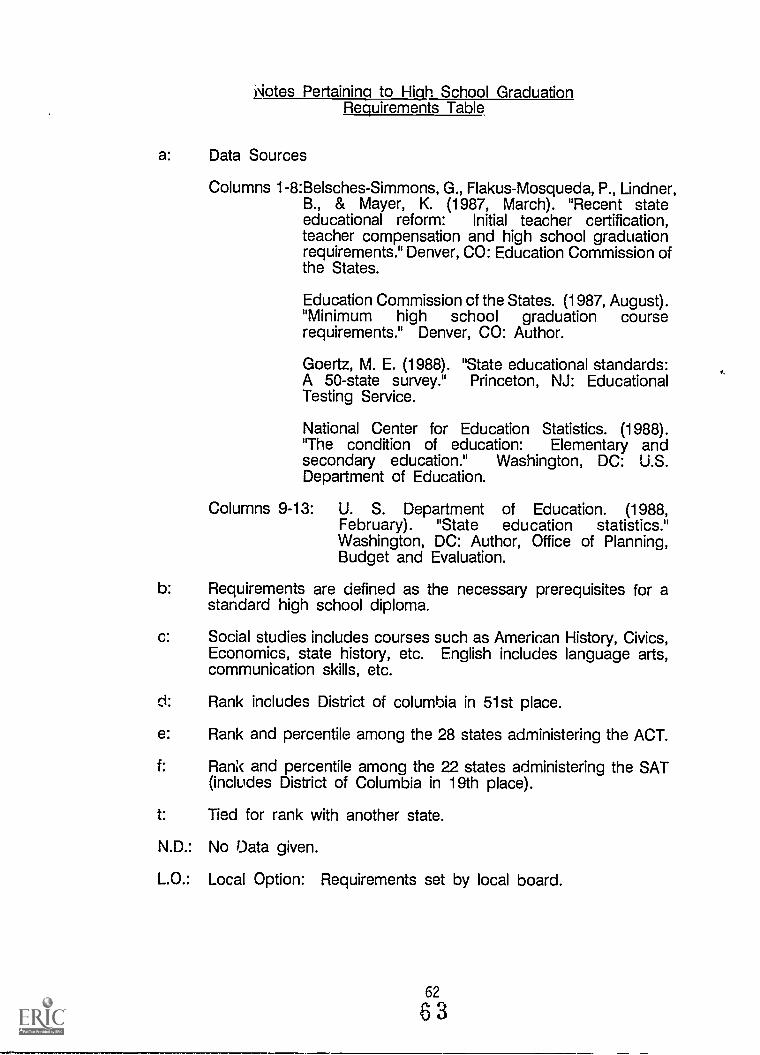
dotes Pertaining to High School GraduationRequirements Table
a: Data Sources
Columns 1-8:Belsches-Simmons, G., Flakus-Mosqueda, P., Lindner,B., & Mayer, K. (1987, March). "Recent stateeducational reform: Initial teacher certification,teacher compensation and high school graduationrequirements." Denver, CO: Education Commission ofthe States.
Education Commission of the States. (1987, August)."Minimum high school graduation courserequirements." Denver, CO: Author.
Goertz, M. E. (1988). "State educational standards:A 50-state survey." Princeton, NJ: EducationalTesting Service.
National Center for Education Statistics. (1988)."The condition of education: Elementary andsecondary education." Washington, DC: U.S.Department of Education.
Columns 9-13: U. S. Department of Education. (1988,February). "State education statistics."Washington, DC: Author, Office of Planning,Budget and Evaluation.
b: Requirements are defined as the necessary prerequisites for astandard high school diploma.
c: Social studies includes courses such as American History, Civics,Economics, state history, etc. English includes language arts,communication skills, etc.
ci: Rank includes District of columbia in 51st place.
e: Rank and percentile among the 28 states administering the ACT.
f: Rank and percentile among the 22 states administering the SAT(includes District of Columbia in 19th place).
t: Tied for rank with another state.
N.D.: No Data given.
L.O.: Local Option: Requirements set by local board.
62
63
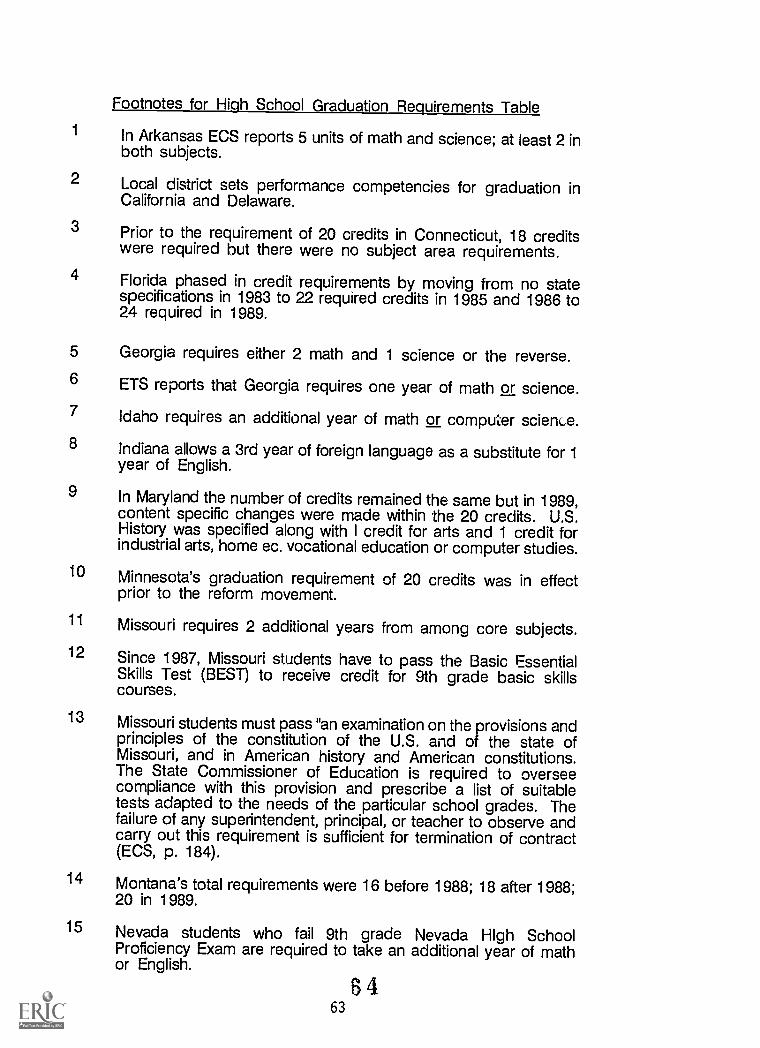
Footnotes for High School Graduation Requirements Table
In Arkansas ECS reports 5 units of math and science; at least 2 inboth subjects.
Local district sets performance competencies for graduation inCalifornia and Delaware.
Prior to the requirement of 20 credits in Connecticut, 18 creditswere required but there were no subject area requirements.
Florida phased in credit requirements by moving from no statespecifications in 1983 to 22 required credits in 1985 and 1986 to24 required in 1989.
5 Georgia requires either 2 math and 1 science or the reverse.6 ETS reports that Georgia requires one year of math or science.7 Idaho requires an additional year of math or computer science.8 Indiana allows a 3rd year of foreign language as a substitute for 1
year of English.
9 In Maryland the number of credits remained the same but in 1989,content specific changes were made within the 20 credits. U.S.History was specified along with I credit for arts and 1 credit forindustrial arts, home ec. vocational education or computer studies.
10 Minnesota's graduation requirement of 20 credits was in effectprior to the reform movement.
11 Missouri requires 2 additional years from among core subjects.12 Since 1987, Missouri students have to pass the Basic Essential
Skills Test (BEST) to receive credit for 9th grade basic skillscourses.
13 Missouri students must pass "an examination on the provisions andprinciples of the constitution of the U.S. and of the state ofMissouri, and in American history and American constitutions.The State Commissioner of Education is required to overseecompliance with this provision and prescribe a list of suitabletests adapted to the needs of the particular school grades. Thefailure of any superintendent, principal, or teacher to observe andcarry out this requirement is sufficient for termination of contract(ECS, p. 184).
14 Montana's total requirements were 16 before 1988; 18 after 1988;20 in 1989.
15 Nevada students who fail 9th grade Nevada High SchoolProficiency Exam are required to take an additional year of mathor English.
8463
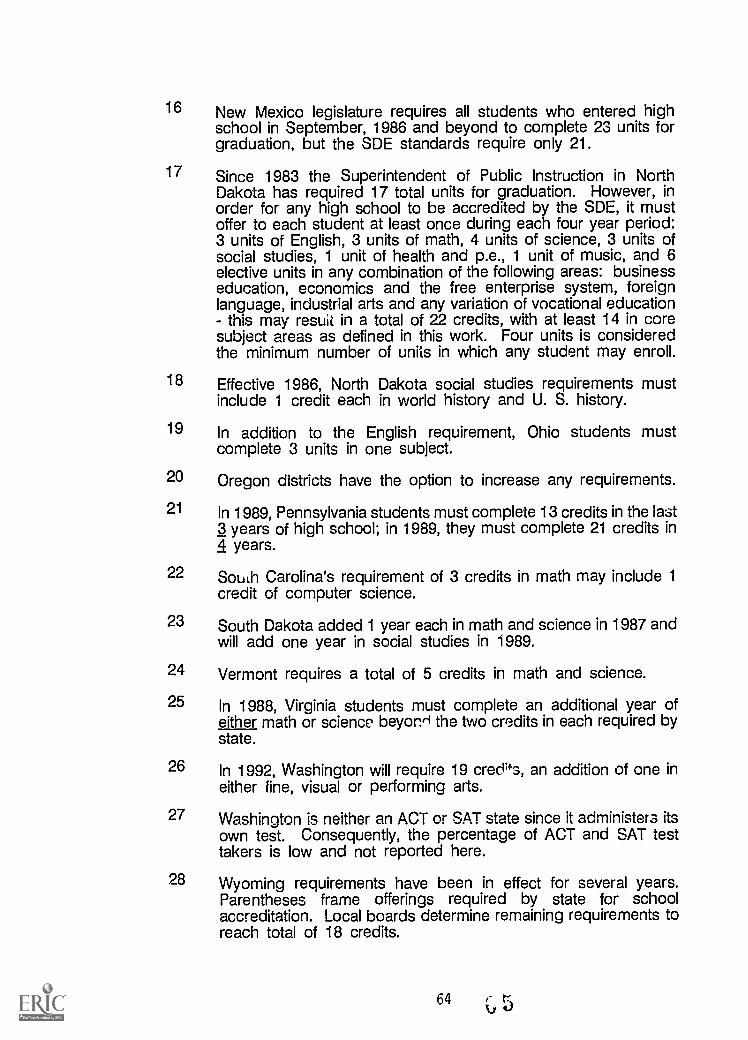
16 New Mexico legislature requires all students who entered highschool in September, 1986 and beyond to complete 23 units forgraduation, but the SDE standards require only 21.
17 Since 1983 the Superintendent of Public Instruction in NorthDakota has required 17 total units for graduation. However, inorder for any high school to be accredited by the SDE, it mustoffer to each student at least once during each four year period:3 units of English, 3 units of math, 4 units of science, 3 units ofsocial studies, 1 unit of health and p.e., 1 unit of music, and 6elective units in any combination of the following areas: businesseducation, economics and the free enterprise system, foreignlanguage, industrial arts and any variation of vocational education- this may resuii in a total of 22 credits, with at least 14 in coresubject areas as defined in this work. Four units is consideredthe minimum number of units in which any student may enroll.
18 Effective 1986, North Dakota social studies requirements mustinclude 1 credit each in world history and U. S. history.
19 In addition to the English requirement, Ohio students mustcomplete 3 units in one subject.
20 Oregon districts have the option to increase any requirements.
21 In 1989, Pennsylvania students must complete 13 credits in the last3 years of high school; in 1989, they must complete 21 credits in4 years.
22 South Carolina's requirement of 3 credits in math may include 1credit of computer science.
23 South Dakota added 1 year each in math and science in 1987 andwill add one year in social studies in 1989.
24 Vermont requires a total of 5 credits in math and science.
25 In 1988, Virginia students must complete an additional year ofeither math or science beyond the two credits in each required bystate.
26 In 1992, Washington will require 19 credo 's, an addition of one ineither line, visual or performing arts.
27 Washington is neither an ACT or SAT state since it administers itsown test. Consequently, the percentage of ACT and SAT testtakers is low and not reported here.
28 Wyoming requirements have been in effect for several years.Parentheses frame offerings required by state for schoolaccreditation. Local boards determine remaining requirements toreach total of 18 credits.
64 r r.i O

TABLE 2
CHANGES IN COURSETAKING IN FOUR STATES,13 DISTRICTS AND 19 HIGH SCHOOLS
ARIZONA (requires 4 English, 2 math, 2 science, 2.5 social studies; English,math, and science are +1 each compared to former requirements)
District #1 (affluent, 83% white)
1. High school (affluent, 100% white)
Sections: added 5 sections mathadded 8 sections world geography
Courses: added world geography courseadded general math course
District #2 (urban, 50% white)
2. High school (affluent, 75% white)
Sections: added 6 sections mathadded 5 sections world geography
Courses: added second year of remedial course in aligebrareduced industrial arts, home economics, physical education,and performing arts electives
3. High school (15% white)
Sections: added 12-14 sections world geographyadded consumer math sections
Courses: added honors biologydropped 1 semester Arizona history, earth science
4,_Eligh school (working class, 53% white)
Sections: added 8 sections world geographyadded 10 sections lower-level scienceadded 3-4 sections math
Courses: no courses added
65
66
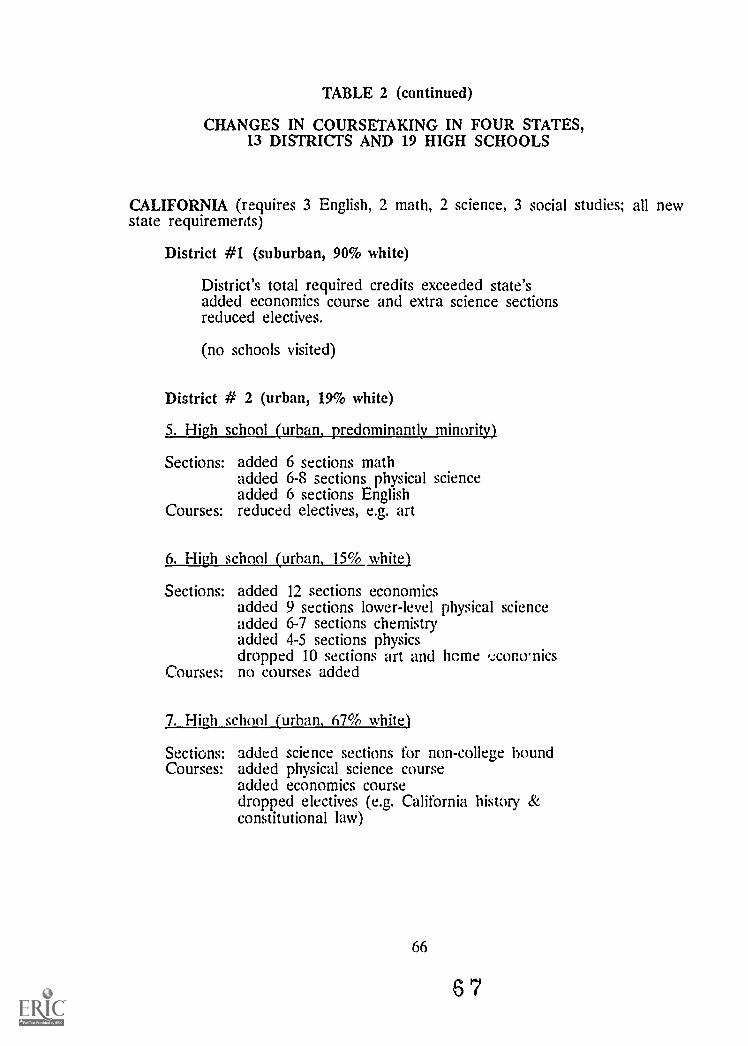
TABLE 2 (continued)
CHANGES IN COURSETAKING IN FOUR STATES,13 DISTRICTS AND 19 HIGH SCHOOLS
CALIFORNIA (requires 3 English, 2 math, 2 science, 3 social studies; all newstate requirements)
District #1 (suburban, 90% white)
District's total required credits exceeded state'sadded economics course and extra science sectionsreduced electives.
(no schools visited)
District # 2 (urban, 19% white)
5. High school (urban, predominantly minority)
Sections: added 6 sections mathadded 6-8 sections physical scienceadded 6 sections English
Courses: reduced electives, e.g. art
6. High school (urban, 15% white)
Sections: added 12 sections economicsadded 9 sections lower-level physical scienceadded 6-7 sections chemistryadded 4-5 sections physicsdropped 10 sections art and Ilene ,Jcono.nics
Courses: no courses added
7. HiAAchool (urban, 67% white)
Sections: added science sections for non-college boundCourses: added physical science course
added economics coursedropped electives (e.g. California history &constitutional law)
66
67
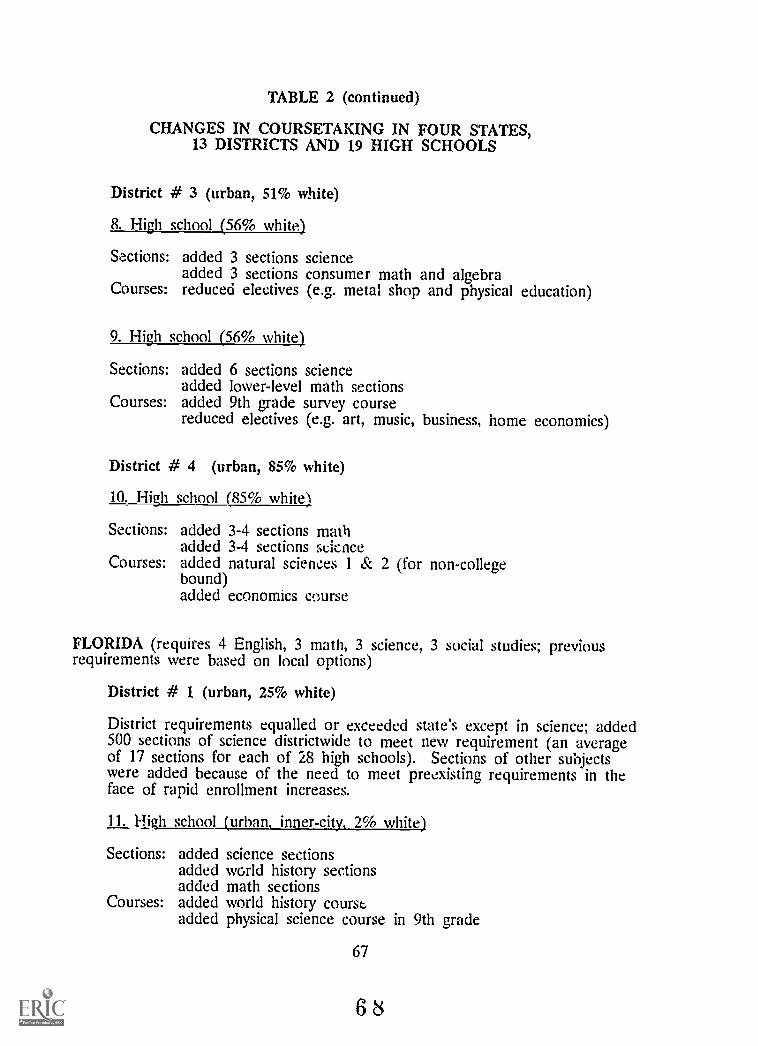
TABLE 2 (continued)
CHANGES IN COURSETAKING IN FOUR STATES,13 DISTRICTS AND 19 HIGH SCHOOLS
District # 3 (urban, 51% white)
8. High school (56% white)
Sections: added 3 sections scienceadded 3 sections consumer math and algebra
Courses: reduced electives (e.g. metal shop and physical education)
9. High school (56% white)
Sections: added 6 sections scienceadded lower-level math sections
Courses: added 9th grade survey coursereduced electives (e.g. art, music, business, home economics)
District # 4 (urban, 85% white)
10. High school (85% white)
Sections: added 3-4 sections mathadded 3-4 sections science
Courses: added natural sciences 1 & 2 (for non-collegebound)added economics course
FLORIDA (requires 4 English, 3 math, 3 science, 3 social studies; previousrequirements were based on local options)
District # 1 (urban, 25% white)
District requirements equalled or exceeded state's except in science; added500 sections of science districtwide to meet new requirement (an averageof 17 sections for each of 28 high schools). Sections of other subjectswere added because of the need to meet preexisting requirements in theface of rapid enrollment increases.
11. High school (urban, inner-city, 2% white)
Sections: added science sectionsadded world history sectionsadded math sections
Courses: added world history courseadded physical science course in 9th grade
67
68

TABLE 2 (continued)
CHANGE' IN COURSETAKING IN FOUR STATES,13 DISTRICTS AND 19 HIGH SCHOOLS
12. High school dinner -city, 22% white)
Sections: adoed science sectionsadded math sections
Courses: added practical arts, science, fine arts, life management,4th year math
13. Hign school (urban, 15% white)
Courses: added remedial math courseSections: added 8-10 science sections
14. High school (urban, 34% white)
Sections: added math sections (including geometry and algebra)added 8 computer literacy sections
Courses: added remedial classes in mathadded world history coursephysical science dropped to junior highreductions in electives, vocational education,foreign languages
District # 2 (urban, 72% white)
District added 140 sections in social studies, math,science, and English (an average of 10.8 sections in all thesesubjects in each of 13 high schools)Changed math titles
1 high school was vHted, but district figures on course changes aremore precise than higi, school respondents' estimates.
District #3 (small city, 76% white)
District already exceeded state's requirements in all subjects.
68
6 9

TABLE 2 (continued)
CHANGES IN COURSETAKING IN FOUR STATES,13 DISTRICTS AND 19 HIGH SCHOOLS
PENNSYLVANIA (requires 4 English, 3 math, 3 science, 3 social studies;English and social studies are +1 each and math and science are +2 eachcompared to former requirements)
District #1 (affluent, suburban, 98% white)
District already exceeded state's requirements
(no schools visited)
District #2 (small city, 95% white)
15. High school (95% white)
Sections: added 1 section general math in 9th gradeadded 1 section general scienceadded 1 section general biologydropped environment science
Courses: no courses added
District #3 (urban, 25% white)
16. High school (inner-city, 65% white)
Sections: no sections addedCourses: added third year math
reduced business and home economics
17. High school (inner city, 1% white)
Sections: added 5 sections mathadded 2-3 sections science
Courses: added math applications for third year non-academicsadded third year science course
18. High school (inner-city vocational school, 1% white)
Sections: added math sectionsCourses: aoded science course
69
70
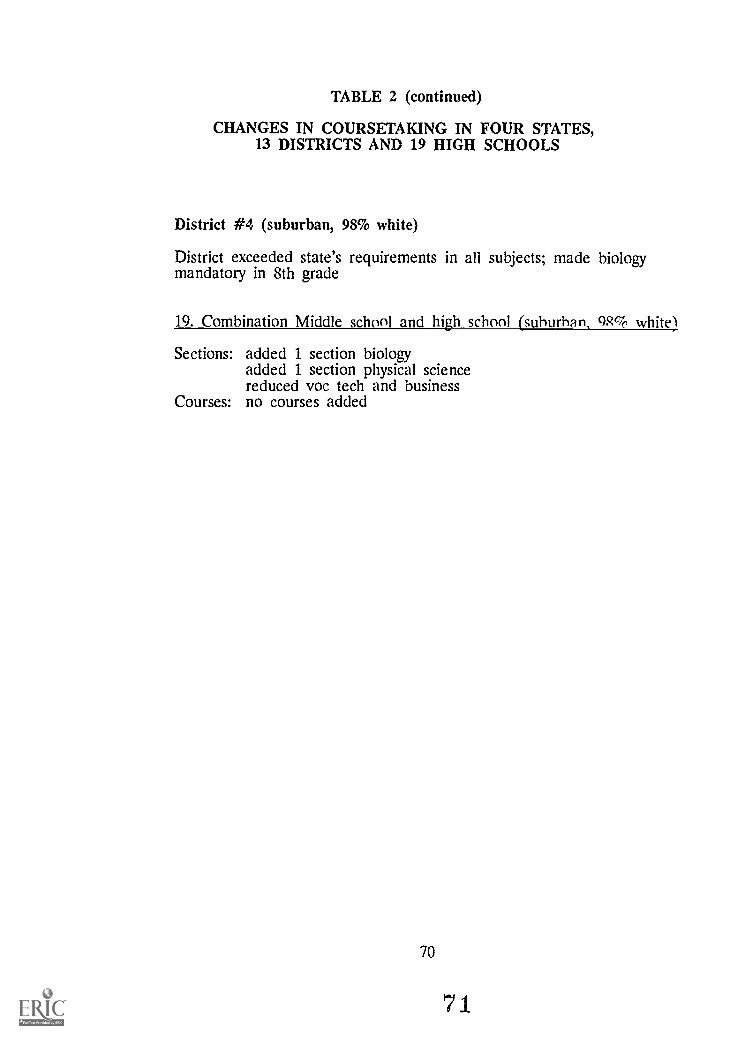
TABLE 2 (continued)
CHANGES IN COURSETAKING IN FOUR STATES,13 DISTRICTS AND 19 HIGH SCHOOLS
District #4 (suburban, 98% white)
District exceeded state's requirements in all subjects; made biologymandatory in 8th grade
19. Combination Middle school and high school (suburban, 9R% white)
Sections: added 1 section biologyadded 1 section physical sciencereduced voc tech and business
Courses: no courses added
70
71
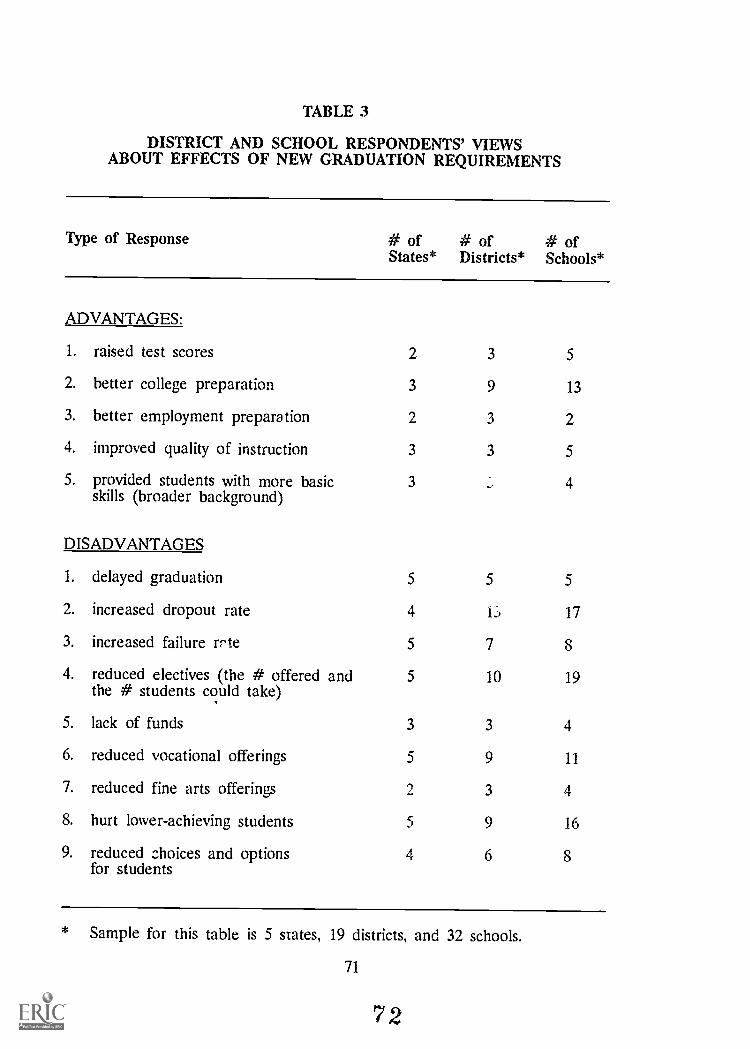
TABLE 3
DISTRICT AND SCHOOL RESPONDENTS' VIEWSABOUT EFFECTS OF NEW GRADUATION REQUIREMENTS
Type of Response
ADVANTAGES:
1. raised test scores
2. better college preparation
3. better employment preparation
4. improved quality of instruction
5. provided students with more basicskills (broader background)
DISADVANTAGES
1. delayed graduation
2. increased dropout rate
3. increased failure rte
4. reduced electives (the # offered andthe # students could take)
5. lack of funds
6. reduced vocational offerings
7. reduced fine arts offerings
8. hurt lower-achieving students
9. reduced choices and optionsfor students
# ofStates*
# ofDistricts*
# ofSchools*
2 3 5
3 9 13
2 3 2
3 3 5
3 , 4
5 5 5
4 13 17
5 7 8
5 10 19
3 3 4
5 9 11
2 3 4
5 9 16
4 6 8
* Sample for this table is 5 states, 19 districts, and 32 schools.
71
72
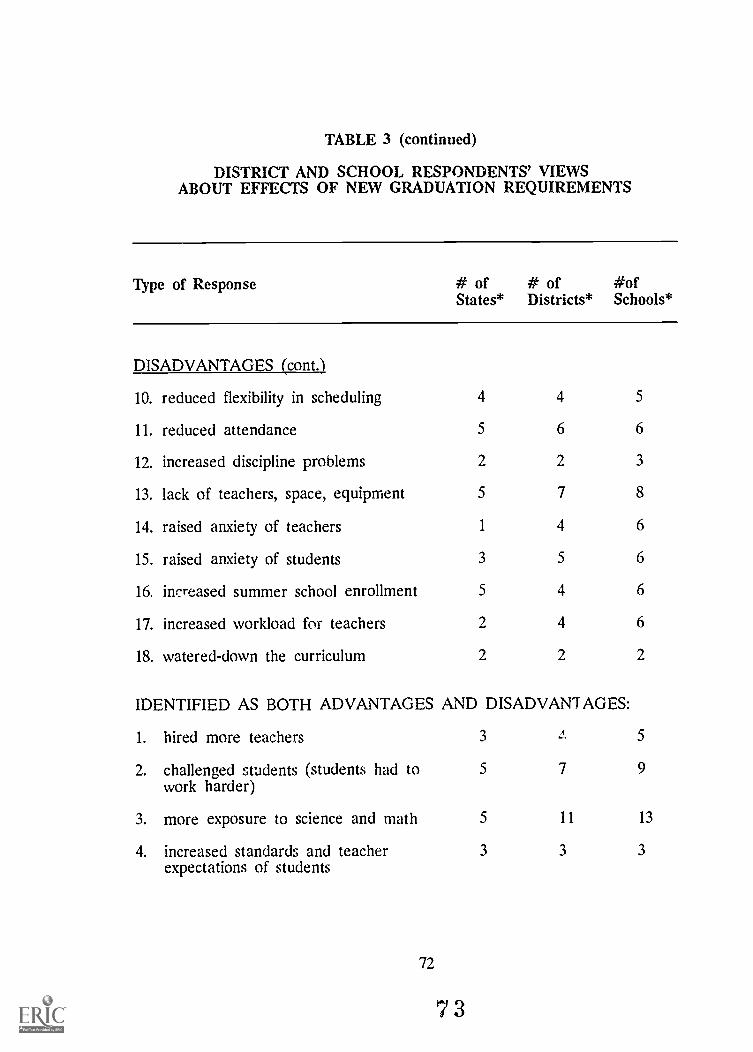
TABLE 3 (continued)
DISTRICT AND SCHOOL RESPONDENTS' VIEWSABOUT EFFECTS OF NEW GRADUATION REQUIREMENTS
Type of Response # of # of #ofStates* Districts* Schools*
DISADVANTAGES (cont.)
10. reduced flexibility in scheduling 4 4 5
11. reduced attendance 5 6 6
12. increased discipline problems 2 2 3
13. lack of teachers, space, equipment 5 7 8
14. raised anxiety of teachers 1 4 6
15. raised anxiety of students 3 5 6
16. increased summer school enrollment 5 4 6
17. increased workload for teachers 2 4 6
18. watered-down the curriculum 2 2 2
IDENTIFIED AS BOTH ADVANTAGES AND DISADVANTAGES:
1. hired more teachers
2. challenged students (students had towork harder)
3. more exposure to science and math
4. increased standards and teacherexpectations of students
72
73
3 z.
5 7
5 11
3 3
5
9
13
3
REFERENCES
Archbald, D. A. (forthcoming). The origins, effects, and political significanceof a state legislated program of choice in education: The Minnesotapostsecondary enrollment options law. New Brunswick, NJ: Center forPolicy Research in Education, Rutgers University.
Aronowitz, S., & Giroux, H. A. (1988). Schooling, culture, and literacy in theage of broken dreams: A review of Bloom and Hirsch. HarvardEducational Review, 58(2), 172-194.
Borg, W. R. (1980). Time and learning. In C. Denhaw and A. Lieberman(Eds.), Time to learn. Washington, DC: National Institute of Education.
Boyd, W. L. (1979). The changing politics of curriculum policy making forAmerican schools. In J. Schaffarzick & G. Sykes (Eds), Value conflicts andcurriculum issues: Lessons from research and experience. Berkeley, CA:McCutchan.
Brandt, R. (Ed.). (1988). What should schools teach? EducationalLeadership, 46(1).
Bryk, A. S., & Thum, Y. M. (1989). The effects of high school organizationon dropping out: An exploratory investigation. New Brunswick, NJ:Center for Policy Research in Education, Rutgers University.
Center for Policy Research in Education. (1985). Institutional grant proposal:NIF Center for State and Local Policy Developments and leadership ineducation (grant proposal submitted to U.S. Dept. of Education, Office ofEducation, Research and Improvement). New Brunswick, NJ: EagletonInstitute of Politics, Rutgers University.
Clune, W. H. (1983). A political model of implementation and implications ofthe model for public policy, research, and the changing roles of law andlawyers. Iowa Law Review, 69(1), 47-125..
Clune, W. H. (1987). Institutional choice as a theoretical framework forresearch on educati nal policy. Educational Evaluation and Policy Analysis,9(2), 117-132.
Clune, W. H. (1988). Research from three views of curriculum policy in theschool context: The school as policy mediator, policy critic and policyconstructor. Paper prepared a conference, The Effect of Reform onSecondary School Context, Michigan State University, East Lansing,Michigan.
73
74
Cohen, D. (1982). Policy and organization: The impact of state and federaleducational policy on school governance. Harvard Educational Review,52(4), 474-499.
Dade County Public Schools (Office of Educational Accountability). (1988).Annual cross-sectional dropout rates and longitudinal dropout rates.Miami: Author.
Elmore, R. F., & McLaughlin, M. W. (1988). Steady work: Policy, practice,and the reform of American education (R-3574-NIE/RC). Santa Monica,CA: The RAND Corporation
Etzioni, A. (1960). Two approaches to organizational analysis: A critique anda suggestion. Administrative Sciences Quarterly, 257(5).
Fuhrman, S., Clune, W. H., & Elmore, R. F. (1988). Research on educationreform: Lessons on the implementation of policy. Teachers College Record,90(2 237-257.
Gamoran, A. (1987). The stratification of high school learning opportunities.Sociologya Education, 60, 135-155.
Gamoran, A., & Berends, M. (1987). The effects of stratification in secondaryschools: Synthesis of survey and ethnographic research. Review ofEducational Research, 57(4), 415-435.
Gee, J. P. (1988). The legacies of literacy: From Plato to Freire throughHarvey Graff. Harvard Educatioi. I Review, 58(2), 195-212.
Goertz, M. (forthcoming). Coursetaking patterns in the fourth, eighth, andeleventh grades: An analysis of the 1983-84 National Assessment ofEducational Progress. New Brunswick, NJ: Center for Policy Research inEducation, Rutgers University.
Ginsburg, A. L., Noe ll, J., & Plisko, V. W. (1988). Lessons from the wallchart. Educational Evaluation and Policy Analysis, 10(1), 1-12.
Grossman, P., Kirst, M., Negash, W., Schmidt-Posner, J., k - Garet, M. (1985).Curricular change in California comprehensive high schools: 1982-83 to1984-85 (PACE Policy Paper No. 85-7-4). Berkeley, CA: Policy Analysisfor California Education.
Grubb W. N. (1984). The bandwagon once more: Vocational preparation forhigh-tech occupations (Report No. 84-B6). Stanford, CA: StanfordUniversity, Institute for Research on Educational Finance and Governance.
Hamilton, S. F. (1984). Raising standards and reducing dropout rates:Implications of research for recent secondary school reform proposals.Ithaca, New York: Cornell University. (ERIC Document ReproductionService No. ED 273 570)
74
7 5
Hanson, T. (forthcoming). Curricular change in Dade County: 1982-83 to1986-87. A replication of the PACE study. New Brunswick, NJ: Centerfor 1 olicy Research in Education, Rutgers University.
Jencks, C., Bartlett, S., Corcoran, M., Crouse, J., Eaglesfield, D., Jackson, G.,McClelland, K., Mueser, P., Olneck, M., Schwartz, J., Ward, S., & Williams,J. (1979). Who gets ahead? The determinants of economic success inAmerica. New York: Basic Books
Jones, L. V., Davenport, E. C., Jr., Bryson, A., Bekhuis, T., & Zwick, R.(1986). Mathematics and science test scores as related to courses taken inhigh school and other factors. Journal of Educational Measurement, 23(3),197-208.
Kang, S., & Bishop, J. (1988). Vocational and academic education in highschool: Complements or substitutes (Working Paper 88-10). Ithaca, NY:Cornell University, School of Industrial and Labor Relations, Center forAdvanced Human Resource Studies.
.:"nretz, D. (1988). The effects of coursework reform: Steps toward asensitive and valid system of indicators. Paper prepared for the RANDCorporation, Washington, DC.
Levin, H. M. (1984). About time for educational reform. EducationalEvaluation and Policy Analysis, 6(2), 151-163.
Levin, H. M. (1988). Ability testing for job selection: Are the economicclaims justified? Paper prepared for the National Commission on Testingand Public Policy, Graduate School of Education, University of California-Berkeley.
Mc Dill, E. L., Natriello, G., & Pallas, A. M. (1986). A population at risk:Potential consequences of tougher school standards for student dropouts.American Journal of Education, 94(2), 135-181.
McDonnell, L. M (1988). Coursework policy in five states and its implicationsfor indicator development. Working paper prepared for The RANDCorporation, Santa Monica, California.
McDonnell, L. M., & Elmore, R. F. (1987). Getting the job done: Alternativepolicy instruments. Educational Evaluation and Policy Analysis, 9(2), 133-152.
McLaren, P. L. (1988). Culture or canon? Critical pedagogy and the politicsof literacy. Harvard Educational Review, 58(2), 213-234.
McLaughlin, M. W. (1976). Implementation as mutual adaptation: Change inclassroom organization. Teachers College Record, 77(3), 339-351.
McLaughlin, M. W. (1987). Lessons from past implementation research.Educational Evaluation and Policy Analysis, 9(2), 17'-178.
75
76
Meyer, J., & Rowan, B. (1983). Instructionalized organizations: Formalstructure as myth and ceremony. In J. Meyer and R. W. Scott (Eds),Organized environments: A ritual and rationality. Beverly Hills, CA:Sage Publications.
Murnane, R. J. (in press). U. S. education and the productivity of theworkforce: Looking ahead. Brookings Institution.
National Commissior. on Excellence in Education. (1983). A nation at risk:The imperative for educational reform. Washington, DC: U. S.Government Printing Office.
Raizen, S. A. (1988). Increasing educational productivity through improvingthe science curriculum. New Brunswick, NJ: Center for Policy Research inEducation, Rutgers University.
Raizen, S. A., & Jones, L. V. (Eds.). (1985). Indicators of pre collegeeducation in science and mathematics: A preliminary review. Washington,DC: National Academy Press.
Resnick, D. P., & Resnick, L. B. (1985). Standards, curriculum, andperformance: A historical and comparative perspective. EducationalResearcher, 5-20.
Resnick, L. B. (1987). Learning in school and out (The 1987 PresidentialAddress). Educational Researcher, 16(9), 13-20.
Romberg, T. A. (1988). Changes in school mathematics: Curricular changes,instructional cl--iges, and indicators of change. New Brunswick, NJ:Center for Policy Research in Education, Rutgers University.
Rossman, G. B., Wilson, B. L., D'Amico, J. J., & Fernandez, N. T. (1987, July).Pathways through high school: Translating the effects of new graduationrequirement (Report to the Office of Educational Research andImprovement, Department of Education). Annapolis, MD: MarylandDepartment of Education.
Shepard, L., & Smith, M. L. (1988). Flunking grades. Philadelphia: FalmerPress.
Slavin, R. E. (1987). Taking the mystery out of mastery: A response toGuskey, Anderson, and Burns. Review of Educational Research, 57(2), 231-235.
Smith, M. S., & O'Day, J. (forthcoming). Teachinolicy and research onteaching. Paper prepared at Stanford University, School of Education,Stanford, California.
United :Itates Department of Education. (1984, May). The nation responds:Recent efforts to improve education. Washington, DC: U. S. GovernmentPrinting Office.
76
7 7
Wehlage, G., Rutter, R. A., Smith, G. A., Lesko, N., & Fernandez, R. R.(forthcoming). Reducing the risk: Schools as communities of support.England: Falmer Press.
Westat, Inc. (1988). Preliminary tabulations: Nation at risk update study aspart of the 1987 hid school transcript study (Report for the U.S. Dept. ofEducation, Center for Education Statistics). Rockville, MD: Author.
Williams, P. (1987). Standardizing school dropout measures. New Brunswick,NJ: Center for Policy Research in Education, Rutgers University.
Wiley, D. E., & Harnischfeger, A. (1974). Explosion of a myth: Quantity ofschooling and exposure to instruction, major education vehicles.Educational Researcher, 3(4), 7-12.
Wolf, R. M. (1977). Achievement in America. New York, NY: TeachersCollege Press.
77
7