document resume ed 236 843 eci60 861 - eric · document resume. eci60 861. wesson,' caren. ......
TRANSCRIPT
ED 236 843
'AUTHORTITLE
INSTITCT7:0N
'.SPONS AGENCY
REPORT NO..PUB DATE,CONTRACT.NOTEPUB TYPE
'N
EDRS PRICEDESCRIPTORS
ABSTRACT!
DOCUMENT RESUME
ECI60 861
Wesson,' Caren.Teacher vs. Student Selection of InstructionalActivities. ,
Minnesota'ljiiv., Minnkapolis. Inst. for, Research on cLe'arning Disabilities.Office of Special EdUcation ,and Rehabilitative'.Service (ED), .Washington, DC. .
,IRLD-RR-117May 83500-80-0622 ,
45p.Reports .'Research /Technical (143)
MF01/PCO2 Plus Postage.*Disabilities; Elementary Education; *LearningActivitie6; Resburce Room Pro'grams; *Selection.;*Student Role; *Teacher Role
/
The }study explored the effects of student selectionversus teacher selec ion of instructional activities on theactivities selected and reasons given by teachers and 42-elementarytesourcerdom students for selecting p'articulat activities. Ssl,progreSs was monitored by'a curriculum-based repeated measurementdata/collection and evaluation systemin'which teachers.were notifiedwhen a change in instruction Tkas needed fay each student: One-third.of the. Ss seleCted ithir own instructional .changes from anexperimenter- generated se4t-Of activities,, while the remaining Ssperformed activities selectee by teachers from .the same set. Teachersselected significantly more high Structured activities than studentsand cited more skill related reasons for heir selection. It was -
suggested that when students are given options, the options,shbuld.
include only ttrucitured activities. (Author/CL
1
A
* .!-Reproductions supplied by EDRS are the best,that can be made-from the original document.
**************************,*********************************************
r

Lt.
1511 University of-Minnesota
9eseardh Report: No. 117\L
U.S.1DEPARTMENT OF.EDUCATION.NATIONAL IN$T1TUTE OF EDUCATION
EDUCAT$NAL RESOURCES INFORMATIONCENTER IERICI
This document has Pe.= reproduced hasreceived from the person or ..organitatiOn
..4)"g""""NtufwaldrigushaveheeniniffleWimPfmrereproduction fluidity
Points of view on opinions stated in fins docu-ment-do notnecessamy represent .official NIEposition or policy."
TEACHER VS STUDENT SELECTION'OF INSTRUCTIONAL ACTIVITIES
Caren Wesson,'
a, 1
Institute foresearch onearning
Disabilities
.4
tst
.
Director : James E. Ysseldyke
tr.
.4
it
The Institute. for Research on' Cearning,Disabiliti es is supported bya' contract C300-80-0622) with the Offite of Special., Education , Depart-ment of Etlucation, through Ti tle VI-G of Public Law 91-230, Instituteinvestigators are conducting research on the assessment/decision-making/intervention process as it relates to learning disabled students.
A
During 19'80-1933, Institute research focuses on four major areas:
. o Referral-
o Ideriti fication/Classi fi cation,/
of Inter:vention Planning and Progress Evaluation
o ,-Outcome Rvaluation
Additional -information on the Insi tOite rs research objectives andactivities may be obtained by writing to the Editor at the Institute(see Publications list for address) .
The research reported herein was conducted under government spon--sorshei p Contria-ctors are encouraged )to express freel their prb-ifessional judgment in the conduct of 'the project. Poi nts ,of viewor .opinions stated do not therefore, necessarily represent theofficial position of the Office, of Special Education.
-1\

Research Report No.. 117,
TEACHER VS .STUDENT SELECTION OF INSTRUCTIONAL ACTIVITIES
1
'et
Caren Wesson
Iistitute for Re Search on Learning Disabilities,
1
University of MinnesOta
\/
t
9
e";
May,. 1983
Abstract
This study explored the effects of student selection versus'A -,
teachers Selection of instructional activities on the' activities
selected and the reasons given by teachers and students for selecting
particulaactivities. Forty-two resource room students in grades 3-6
( :
served as subjects. The progress of these, students was. monitored.by
1
means of .1. technically adequate curriculum-based repeated measurement,,
data toll cteioand evalUation system.' The systeM was constructed to
notify the teachers wh n a change i.Q.instruction was needed for each
\student. One -third of the students selected their own instructional
changes from 6n experimenter - generated set of activities. For, the the
other two-thirds, the teachers selected activities froT this same set.
,
The dependent data were the number of structured and Onstructbred
activities,, selected by lacherS and student) and the reasons cited for
these' selections. Teachers .selected significantly more high
6;
structured activities than students and cited more skill-related
reasons for ,their selections. The discussion includes implications
for practice.
Teacher, vs Student Selection of Instructional Activities
Teaching'requires that a multitudd of decisions be made daily.
Teachers must address such issues as.what to teach, how to teach, when
to tech what, and who should 'be taught what skill. In fatt,
Shavelsomland Borko (1979) contend that the basic teaching skill is
decision making. Preactive deciSions are made in a ,onscious manner,
alloWing the teacher to consider varidus pieces of ihf&mation. When
making preactive decisions, teachers often consider tpeir own informal
observation, anecdotal..repgrts, school records, tradition4. test,,
scores, and curriculum-based assessment measures. When the decision,
is made about how to teach, the .'goal is to find an instructional
technique that will improve 'the student's learning. Unfortunately, -f
little is known about how teachers make this instruct tonal, decision,
what instructional methods typically are selected, how, teachers'.(-
0
decisions differ from student decisions when selecting instructional
techhiques. The purpose of this study was to examine the, effect of
student selection of instructional activities versus teacher selection
of instructional activities onF--
the activities, that are chosen. A
second purpose was to address informally Gthe question of why teachers.
and students select certain instructional.activities:
Literature Review
Only a few researchers have directly addressed the nature of the
instructional activities selected by teachers. Potter and MirkinA
(1982) asked elementary and secdffdary. special education teachers to
complete a survey. that addressed the question of the instructional
techniques used in various academic' areas, For reading, over half the

2 4
teachers'used work pn subskills as the primary instructional strategy,
followed. by practice, gamel, modality training, and modeling. McNair.1 a
and Joyce11979) investigated the planning processes of regular
education teachers ami reported that most teachers developed their
lessons based p imArily on curriculum materials. Joyce, (1980) added.14
in a later report that the "flow of activities" (p. 16) stem from the
seldWon of 'instructional materials. Baker, Herman; and Yeh (1981).
reported widespread use of game'S and adjunct devices such as
audjoVisual materials in 250 schools. These authors also explained0
that the use of puzzles, games; and audio-visualdevices appeared to
beingatively related to student achievement: Implications from these
findings indicated. that teachers need to improve their skills- in
selecting educational materials and methods. A similar conclusion was
redched in a study. involving 105 elementary learning disabled
students. LOinhardti Zigmond, and Cooley (1981) used a causal model
approach rto explore the relationships among reading behavior,
instruction, and reading achievement. These authors stated that
"although teachers are skillful in getting students to do what they
are assigned, they are less attuned to selecting the, best activities
for them to engage in." (p. 58)
51'
-Ief it if true that teachers do not consistently make the best %
detisions about., how to instruct,' one possible alternative is to allow
students' to make some of these decisions within a structured format.,
Student input/ into instructional decision making has. received
increased attention in recent years. Some researchers flaii,e focused on
student ,self, scheduling of instructional activities (Bushell &4

3
.Bushell, 1976; Lovitt, 1973; Wang & Stiles, 1976), while others have
concentrated on student selection of reinforcers (Felixbrod & W.Leary,
1974; Glynn, 1970; Glynn, Thomas, & Shee, 1973; Lovitt ..& CUrtiss,
1969; P.arks, Fine, &, Hopkins, 1976, Wall, 1982; Wall & Bryant, 1979).
The vast majority of thes1 stadies yielded results indicating that
student input has definite advantages. However, relatively few
studies have considered student selection of instructional activities;1
the results of these studies'have been mixed.
George and Kindall (1976) reported. a study in 'which each
experimental 'student was allowed 'to choose how many,and which
activities they would engage. in (from various learning packages
designed to teach geometry. l'he teacher made these decis,iOns for the
control students. The suinects were high sChooliltiidects, 29 females
and 31 Males. The dependent data.were postteft scoil/es on the four
learning activity paaiges (LAPs) used throughout the eight=week'tc,
cJstudy; the time required.to complete the LAPs, and student attitude
toward learning and school. 'Results indicated 'no significant
differences' in the posttest, scores of students 'who selected their own
activities and students required to complete all activities in each
LAP. The time required to complete each,of the four LAPs decreased as
the students prdgressed through the four LAPs, regardless of the
treatment condition. The semantic differential technique used to
elicit attitudes yielded statistically nonsignificant results,
although' the tendency, was for students to prefer Student choice.'
Students ',reported that the system that allowed them to choose
activities was more interesting, more enjoyable, less time consuming,

4
'iliore conducive to-self understanding, permitted better' content recall;
and made them feel -Ithat teachers were more confident in them. The
authors concluded that student directed learning was as effective and
efficient as .teacher directed learning and also, a more, positive
experience for the students.
Taffel (1976) also experimented with student selection of
academic activities.' In an experiment with three treatment groups,
Choice; No Choice,and Control, the_number of math problems completed
and the time spent working were dependent data. During the last half
of a tutoring session, students in the Choice treatment were allowed
to select aOecial arithmet.ic activity if they completed a specified
number of math, problems in the first half of- the.tutoring session.. In
the No Choice condition,.studentscould also earn the opportunity to
dota special activity, but the exPerimenter selected the activity for
the student., The control students worked on standard math p'roblems
for the entire tutoring session regardless of, their performance.
Results indicated no statistically significant differerice between the
treatment groups on either dependent variatle.°'However, a significant
increase in the number of problems completed by the Choice group
during the treatment condition over the pretreatment condition was
noted. The set of activities from which the Choice group was allowed
to choose was designed to include some attractive and some leSs
attractive options. The interaction of choice and attractiveness
could not,lp adequately assessed.. Therefore, a second experiment was
conducted in which, all activities were designed to be fairly
unattractive.. The results of the -Hist experiment -were. not
5
replicated. The author concluded that 'in order' "for selection, to,4
produce positive effects, the options must be at least moderatelye' -/ -
attractive.
Two dimensions of the learning setting, teacher versus student1
selected tasks and working alone-or-An pairs, were Manipulated in al,
study conducted by Jackson (1978). Four treatment .conditions were
established: Tear-assigned Singles; TeaCher-assigned -Pairs;
e _
Student-selected Singles; and :-:student-selected Pairs. Based on
behaviOr stream specimen records, time oetask and quality oftime
were observed and analyzed. Teacher-kssigned versus student-selected
tasks was not a significant, factor affecting quAlhy of or amount of
: 1 g'Z.,
time on task: All students spent.a.high percentage of time on tasK,
but children workin in piirs had higherg qualitytme and worked more.
,,
independently than children lhorking alone. '1i
Within an aptitude x treatment interaction framework (Cronbach &
Snow, 1977), Greene' (1976) tested the assumption that when given an
opportunity to ,structbre their own learning, students would make
choices that woapl facilitate.- the attainment of educational goals.
V-,
One hundred sixty -five- students in nine fourth ,and, fifth grade
classrooms participated. Stratifying by sex, all children in each
class ere randomly assigned to either a Choice or No-choice group.a
The students in the No-choice group-completed one lesson per day, in
orderi from The Thurstone Letter Series Problems warkbook and were
evaluatid by the experimenter. Students An the Choice group worked in
the workbook during free time; completed the lessons in the!"order of
their choice, and corrected and evaluated their own performance.

6P
)
Pretest scores included two cognitive( measures, pretets in the
workbook, and 'ndike scores, as well as four motivational
aptitudes: expectan.0 of, success, importance of success, causal
attributions, and - ;evaluative rentatipn. Posttest information was
collected on a letter problems criterion test, causal attributions for
per'formance in the workbook, and interest in learning more about
letter series problems. Results supported the predicted positive
interrelationships among the aptitudes and the ability to make "wise"
decisions for Choice students high in motivation and cognition. The
Choice students maintained higher scores on the affective measures.
Also of interest were findings that indicated that low ability, high
confidence children performed significantly superior to low ability,
low confidence students. 'Most importantly, high ability students made
more progress in the Choice treatment and low ability students made
most progress in the No-choice condition.
'Kosiewicz, Hallipan, and Lloyd (1981) hypothesized that providing
the opportunity for a learning disabled s.tudent to select an
instructional strategy within a structured situation would result in
improved performance. They hoped this procedure would help "ta combat
the apparent passivity of the student with learning ,problems' (p.f \ /
281). They' tested this hypothesis using a single subject design
(ABCBC) consisting of the following Phases: baseline, teacher choice,
student choice, teacher choice, andstudent choice. During the four
experimental phases, one of two instructional techniques was applied
to improve handwriting. The first was a self-instructional approach
in which the subject read a paragraph of rules about handwriting. The
F.
second apprbach was a 'self-correction procedure in which the
11 -year -old student circled his own co'rectly printed letters and
words. The dependent measure was the percent of'possible points on a
daily-writing assignments earned by .amrectlettering and spacing.
Visual , analysis of the graphic display of', these dependent data.
indi5staJI,that performance imprOved when either handwriting procedure
was used and that _student s'eledtion was superior to the teacher
selection procedures.
The findings from-these five studies focusing on the effects ofitt
student selected instructional activities were inconsistent.
Kosiewicz et al. (1981) found self selection sjperior to2,teachera
selection for an Lo boy. Yet Jacksbn (1978) found no effects. George
and Kindall (1976)' found no difference in performance but modest7
effects .with respect to student satisfaction. Taffel (1976) found'
thatthp.attractiveness of the task options was impoqant and Greene
(1976) demonstrated that the characteristics of the student involved.was a necessary consideratiort,. Thus, :,.student selection of
instructional aCtivities.must be investigated further to etermine
whether and under what conditions it may be an effective procedure.
In addition, none of these studies looked specifically at the..
differences between studert and teacher selected, techOques. If; as
the literature indieat2s, teachers- do not always select optimal
instructional approaches for students, is it possible that students
will make better choices?
A
t
)
Method
Research Questions
The research questions posed for this investigation were: (a)
what is the effect of student.selection of instructional activities
versus-teacher selectien of. instructional activities on the activities
,selected, and (b) what are the reasons giVen by teachers and students
for selecting particular instructional, activities?
'Subjects'
Subjects for this .study were 42 elementary students from a rural)
speCial education cooperative school district. Students were selected
from the -caseloads of eight resource* teachers who had agreed to
i7participate in the study. To be eligible for par ticipation, students
had to be illiarades 3 to 6 and receive at least 30 minutes of reading
instruction daily in the resource room. Students receiving reading
instruction in resource rooms in this special education cooperative
school district are eligible for special services if they read at
least two times fewer words per minute than their regular education
classmites.- .Potential. special educatiOn students and a random
'selection of students in the_ same grade and same school read the same
passages from a basal text and the average rate of the. "regular
education students is compared to each of the targeted students. This
procedure is. described in greater deta lsewhere (MaeSton, Tindal, &
Deno, 1982; Wesson, Deno,,p Mirkin,)9t1.2)
Of the -42 subjects, seven- were girls and 35 were boys. The
number of subjects per .grade was 11, 12, 8, and 11, for grades three,
four, fiVe, and,six, respectively. The median number. of years these

9a
students had-been in special education was three. The.time allocated
to reading in the resource room 'varied from .30 to 90 minutes daily for
the 42 students. Specifically, 14 students spent 30 minutes, 8 spent
45 minutes, 2 spent 50 and 55 minutes each, 14 spent 60 minutes, one
spent 75 minutes,\and one 90-minutes. The Majority of the students'4
school day was sOent in regular education classrooms:"
Of the eight teachers participating in the study, seven were
female and one male.- Their prior. experence in special education
ranged from,0 to 11 years.
Procedures
Training. Teachers were trained individually by the experimenter
as to how to work with students in the two treatment conditions.
Training was facilitated by a set of instructfons.. The experimenter
met with each teacher in his or her classroom to review the
instructions and answer any questions. In addition, teachers were
requested to call the experimenter if they had any doubts about what
to do. The experimenter initiated weekly contact, either by phone or
in person, with each of the teachers throughout the nine week study.
Prior to the beginning of this study, these teachers were trained
in the use of measurement procedures during a week-long workshozprior
to the preceding school year -and during semi-weekly workshops during
the year. At the onset of the present study, the teachers had been
implAenting a monitoring system for one and one-half school years.
This sySteM is described below. /
_.-- Daily measurement consisted of one-minute. timed samples--of
reading from the basal reading textsused in
14
he district. For this
10
. -
study, 12 studentsj.were measured in Ginn 720, 18 inHoughton-Mifflin,
and 12 in Scott Foresman. Two methods of measuring and charting were
used, mastery and performance measurement. For the students in this
study, 35 'were monitored With mastery measurement and seven with
performance measurement.
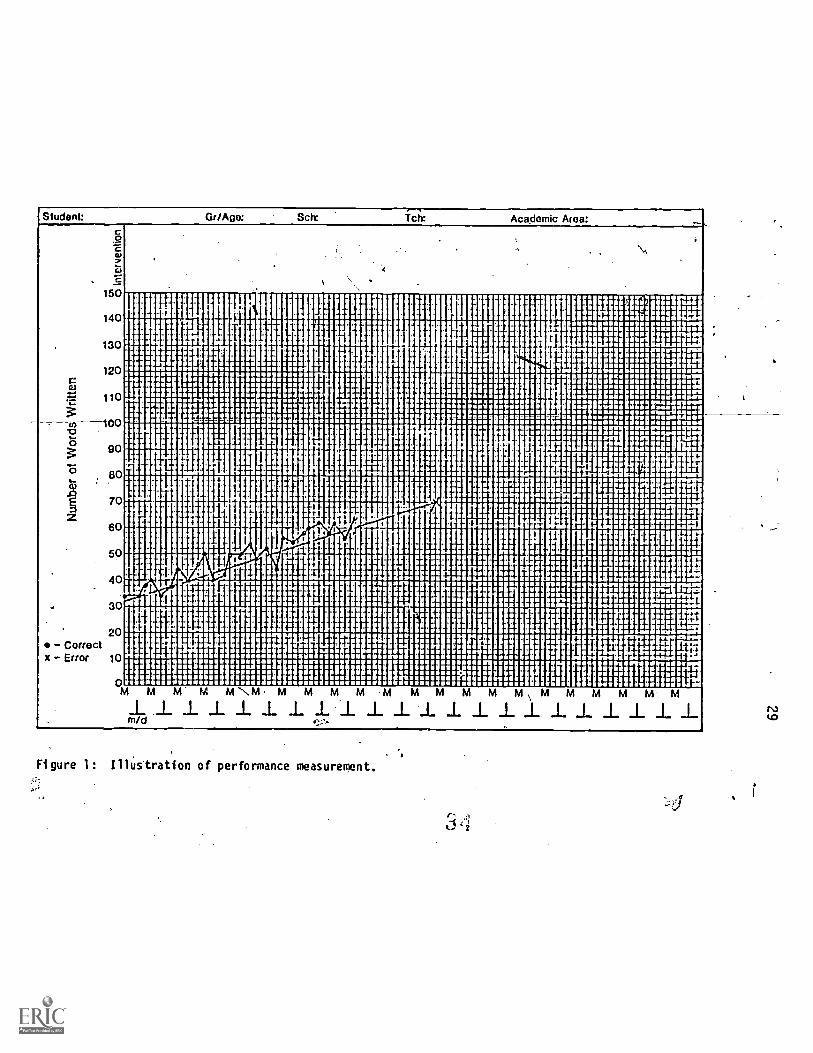
In performance measurement, the measurement 'task is a random
sample of items from a large pool of .material, and the 'go!' is 6
improve the level of performance on that material. Figure 1
illustrates performance measurement. The abscissa (horizontal axis)
-represents school days and the ordinate (vertical axis) represents the.
rate of performance on the measurement task; each -data point
represents the rate of performance on a given ay. The line of best
fit through the data depicts the student's rate of improvement in
Performance on the pool of. material.
Insert Figure 1, about here
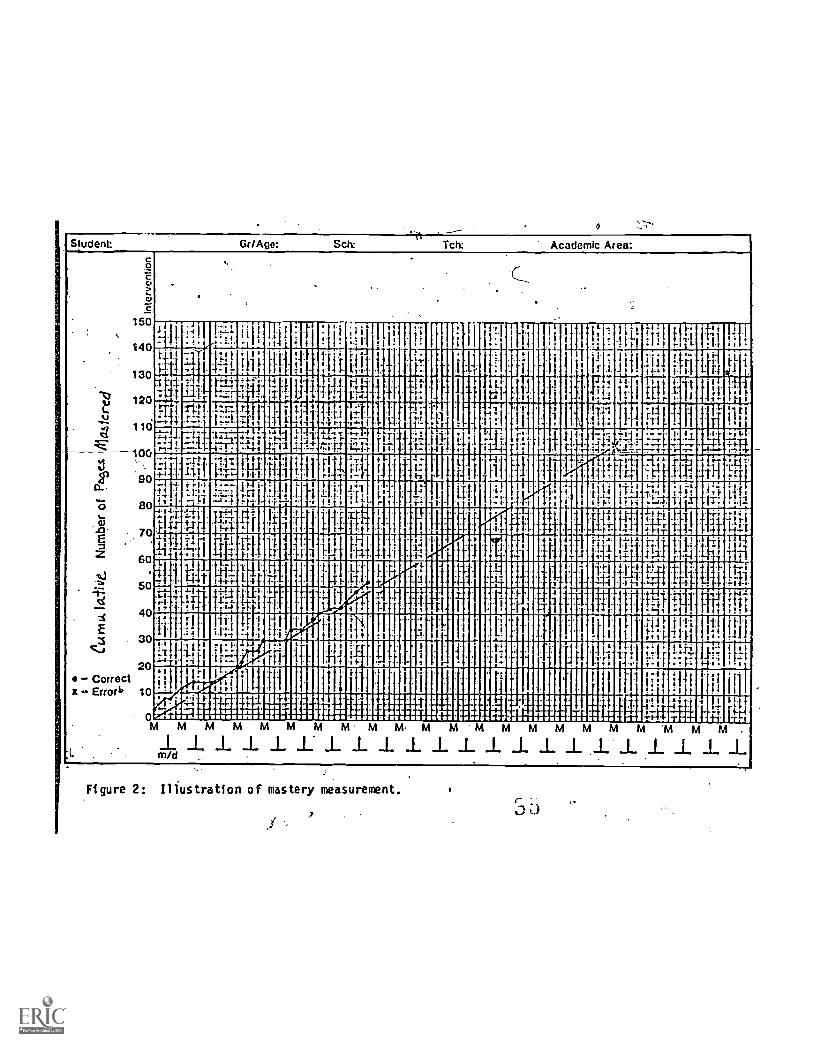
Figure 2 depicts mastery measurement. Here, the abscissa
.represents school days and theordinate represents successive segments
or objectives of the curriculum mastered; each data point represents
thenumber of curriculum segments mastered on a given day. The line_
of best fit through the data points depicts the rate of student
progress through the curriculum. The goal of repeated mastery
assessment is to increase the student's rate of mastery in the
curriculum. The teacher measures the student bn a random samp/le of
material from the current instructional curriculum unit until mastery
15
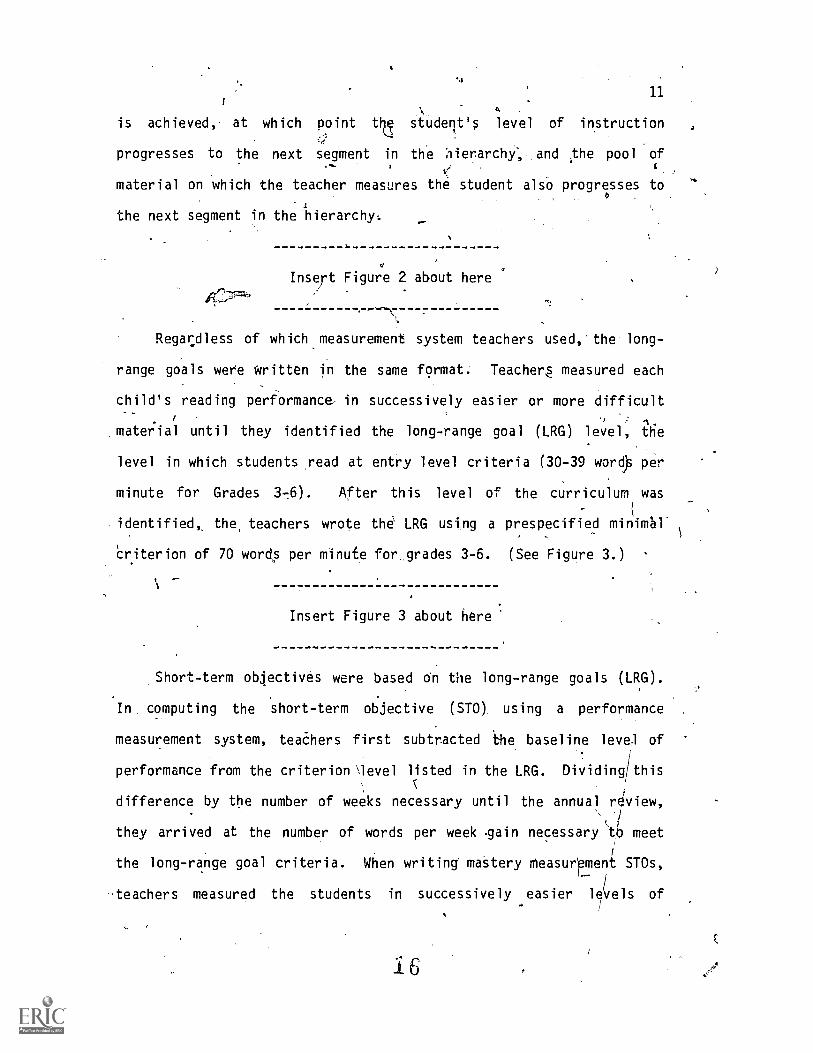
11
A .
is achieved,- at which point th student's level of instruction
progresses to the next segment in the hierarchy,,,and the pool of
Vmaterial on which the teacher measures the student als6 progresses to
.
the next segment in the hierarchy,
Insert Figure 2 about here
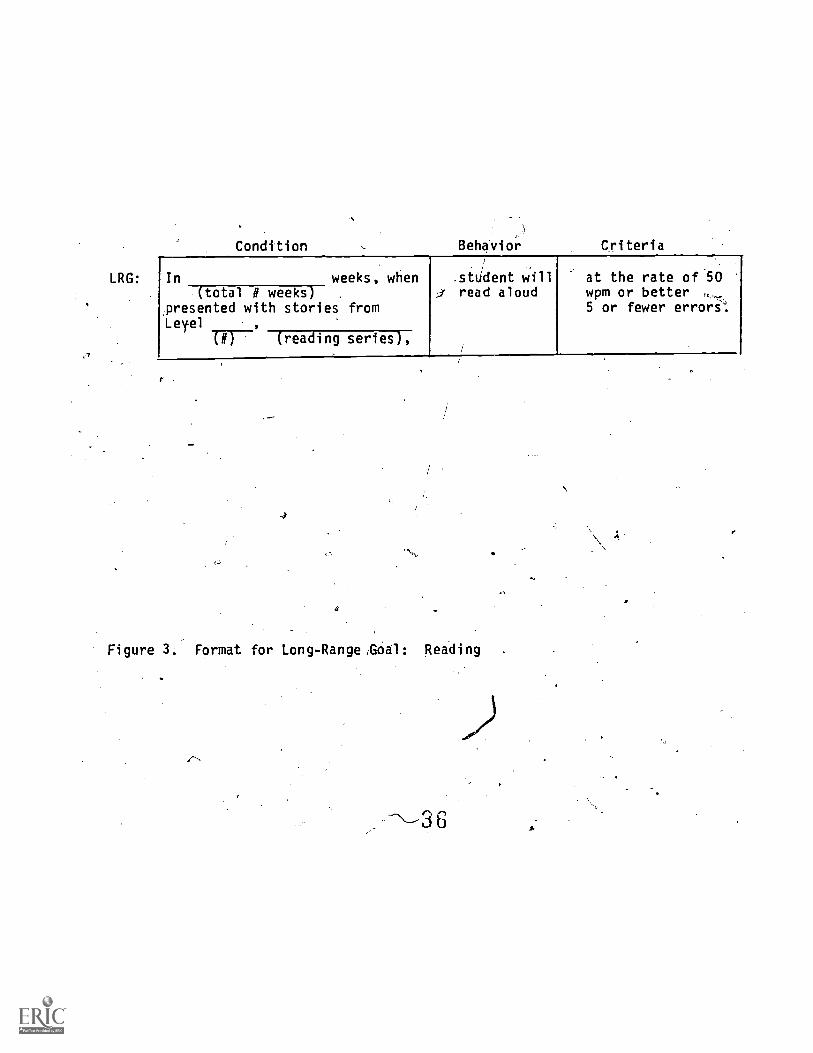
Regardless of which measurement system teachers used, the long-
range goals were written in the same format. Teachers measured each
child's reading performance- in successively easier or more difficult
material until they identified the long-range goal (LRG) level, the
level in which students read at entry level criteria (30-39 wordy per
minute for Grades 3 -6). After this level of the curriculum was
identified, the, teachers wrote the LRG using a prespecified minimhl.
Criterion of 70 words per minute for grades 3-6. (See Figure 3.)
Insert Figure 3 about here
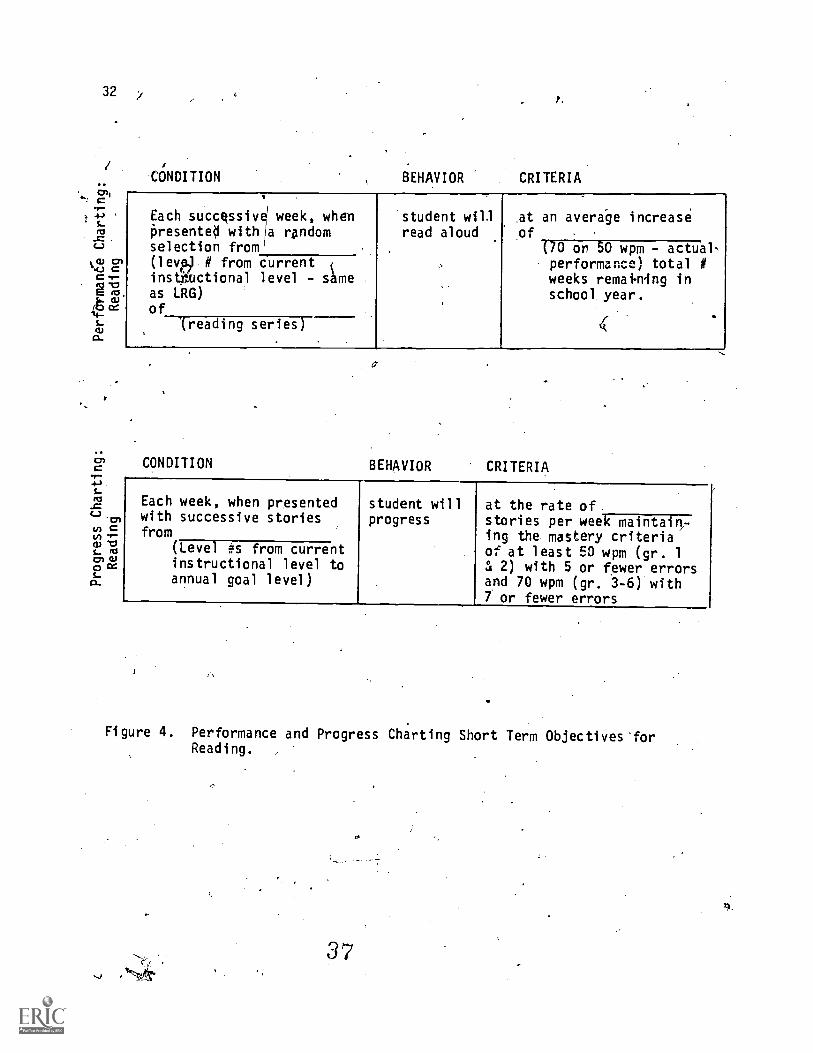
Short-term objectives were based On the long-range goals (LRG).
In computing the short-term objective (STO) using a performance
measurement system, teachers first subtracted the baseline level of
performance from the criterionlevel listed in the LRG. Dividing this
difference by the number of weeks necessary until the annual review,
they arrived at the number of words per week gain necessary 'tb meet
the long-range goal criteria. When writing mastery Measurement STOs,
teachers measured the students in successively easier levels of

12 ,,
material until ,the level in which the student met the LRG criterion
(70 wpm) was identified. The teacher then counted units (pa/ges or
stories) between this already mastered material and the. 'LRG material.'
The number oftunits to be masted was divided by qig,Aumber of weeks
specified in the LRG and this figure became the STO. ,The format used
for wring performance and mastery measurement short-term objectives
is shown in Figure 4.
I6sert Figure 4 about here
In addition, the teachers also'were-tra7ed in the use of the
measurement procedures for evaluation of the instructional program.
Teachers measured student progress three times each week and plotted
the data on a graph. In order to monitor student growth, the baseline
reading level and the long-range goal were connected by an aimline.
r-N..,-
that showed the students' desired progress. Every seven data points,
the teachers were to monitor student growth by means of the split-
middle or quarter-intersect met od (White &-Haring, 1980). An example
is given in Figure 5. ,If th student was progressing at a rate
equivalentk to or greater than that indicated by the aimline, the
instructional program was continued; if the projected rate of growth
was less than that indicated by the aimline, teachers were directed to
make a substantial change in the student's program.?
insert Figure.5 about here
-17
13
For the present study, teachers were trained to modify this
system as follows. The changes in the student's beading program were
to be chosen from a set of reading activities supplied by the .
(
experimenter, and students in oBe of the treatment conditions chose
'their own instructional activities. In the other treatment condition,
teachers 'chose from the activities sUpplied by the experimenter. At
the beginning of this' study,4,a set of step-by-step directions for 12. ,
reading activities. was distributed to each teacher along with
,directions for each of the three treatment conditions. Each teacher\\
worked with students in both treatment' conditions. Two teachers
worked with two students in the. teacher select treatment condition and
one _student in the student select treatment .condition. Six teachers,
Worked with four .students in the teacher select condition andrtwo
I . ostudents in the student Select treatment. These treatment conditions
are described below.-14
Teacher Selects AC'tivities (TSA). At the 'onset of the study,
teachers reviewed eight of the 12 activities and selected two
activities that they judged would be most effective for each student.
These two activities were implemented and data taken three\ times a
week. If, according to the data utilizatiOn strategy, a change in
instruction was needed, the teacher reviewed four more, instructional
activities and chose one to replace_ one of the original two
activities. The teacher reviewed four activities each time the data
indicated a change in instruction was necessary and chose an activity
to replace one of the two previously implemented.
Student Selects Activities (SSA). Students in the SSA group
selected their own reading activities. At/the onset of the stud,,, the
I.
14
Pteachersosed experiMedter-prepared materials to describe eight of thet , .:u AV
activities to the students. 'At this time, the SSA students were :
.. __
r.,',:directed to' two eading activities that they believed would' f
1
est help them lear'n td read better. Then2----thas-e, data Utilization,
-tines .were Applied, individually to the student's reading data and a
change in 'the instructional plan was warranted, the'students'selected
a new strategy from a set. of four that the teacher presented, to the
'student in the s'ar*'fashion as described abole. The new reading
''activit'y replaced one.of the two previously implemented.
Given the nine week, length of the study, the three times per week
schedule of student reading measurement, and the data utilization
rules; a range of two to six' reading ac ivities was used with theta
students in any ?P!: the three ,treatment conditions. The specific
activities were: (1) ,Newspaper Hunt; (24 Oral' Reading and Error
Practice;, .(3) Illustrating. a Story; (4) Language Experience; (5)
Making Clay Words; (6) Direct Pradtice with Prompting; (7) Simplifying
the Task; (8) Reading and Reacting; (9) Choral Reading; (10)
Comprehension 'Questions; (11) Tape Recorded Stories; and (12) Silent
Reading, and Retelling the Passage. The order of selection was as
follows. 4
(1) At the onset of the study
Selection 1 was selected from activities 1, 2, 3, or'4.
5
Selection 2 was setected,from'a tivities 5, 6, 7, or. 8.
(2) For the first change in the instru tional plan, the options
were activities 9, 10, 11, and 12.
.
(3) For) the second. change in the instructional plan, the options

were activities 2, 6, 7, and 10.
15
(4) the third change in the instructional plan, the options
were activities 4, 8, 9, and 12.
4 1116) For:tAfifth change in the instructional plan, the options
were activities 1, 3, 5, and 11.
Originally,,a set of 16 activities was developed by the experimenter.
Raters trained in the use of the Structure of_Instruction Rating Scale7
(SIRS) (Deno, King, Skiba, Sevcik, & Wesson, 1983) rated these 16
activities on seven of the 12 SIRS variablet: teacher-directedt
learning, active. academic responding, demonstration and prompting,
controlled practice, pacing, oral reading Oracticend silent reading
practice. These seven variables were selected because they could be
rated from a description of the activity as oppoSed to requiring
direct observation.\)
Summingeover the ratings on these variables for
each activity provided an overall structure rating. '' Based on these
ratings, the original 16 activities we rank ordered. The six mostr
structured and six least structured were included in the study and the
four that fell in the middle of the rank order were not used.
Therefore, each activity included in the studYJrad a rating of high or
low structure. Each set of options was arrangedto include two highly
structured activities and two low structured activities. Therefore,
/it, is probable that an equal number of high and low structured 0,_
\ activities would be selected by chance.
"Dependent Measure
TwodependentmeapTeswere employed in this study./ The firsti) 1
.
measure was thenumber of times -each activity wts selected by teachersD
16
and students. These' selections were analyZed by _hjgh and low'.
, N.structure as -well The second dependent measure was the reasons
stated fort selection-of particular activities. During the ninJ e-week
study, teachers and students were asked an open -ended question: why
did you select this particular activity? The 25 student responses and
26 teacher responses to this question were categorized for analysis.
The numbers of responses in the categories were analyzed.
Activities Selected
Results
/C
In order to determine. whether there was a.difference between .the
number of structured versus unstructured activities seidCted 'by
teachers and students, a chi-square analysis was conducted. As was
mentioned earlier, prior to inclusion in the study each activity was
rated by trained raters, according to seven of the SIRS variables. The
`ratings for each.activity appear in Table.1 alongwith the number =of
times each .activity was selected by teachers and students.
Insert Table 1 about here
/-,
Data from Table 1 were collapsed across all high and all low4 t
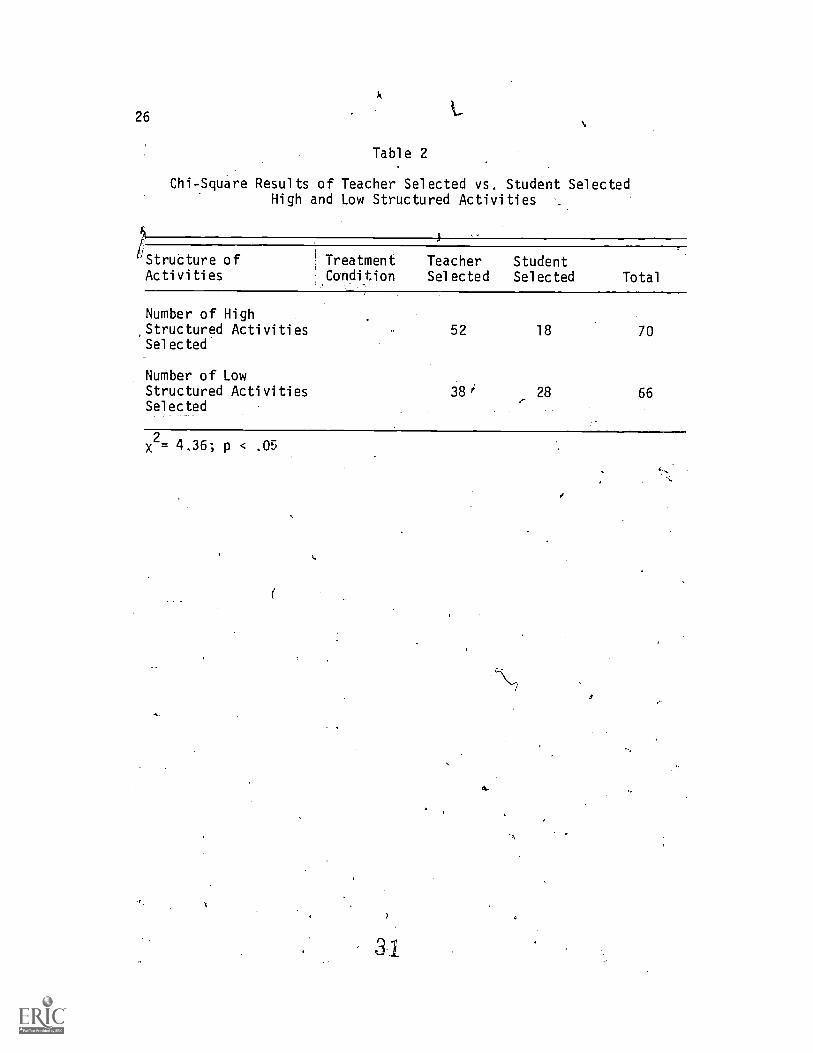
structured activities in oler to employ a obi square analysis. As is
f 1
indicated in Table 2, teachers selected 52 high structured and 38\low
structured activities. On the other hand, students selected 18 high
structured and 28 low structured activities. The chi-square ank4sis
revealed that this di?ference wa ignific4nt (la < .05). Teachers, in\7,,
general', tended Ito pick more high structured activities than did
stUdents.
21
Insert Table 2 about herg
4
Reasons for Selection of Activities:,
17
"Table 3 displays a frequency count of the reasons stated, by
)
( teachersand students concerning why particulai- activities were
4 chosen. The greatest number of students said'they selected activitigs °,\ -.
4 . ,
because they Were fun. The second most frequent response was "I doni,t
know." 111ther student responses were that, thAactivity was easy or
that the activity would help them 'to get farther ahead in the book."
Teachers predominantly citedskill buli,lding, particularly in the areas
A ..:. 3of error reduction and comprehen on, as the reasons for seleCting
specific activities. Bu4i.ng vocabulary also was mentioned as was
the fact that the activity was easy to do.
_
Insert TablQ 3 about here
N 1-
In,order to examine differences between the) reasons stated by, .
teacherg and studehts, categories were collapsed (see Table 4).,
I
Reasons relating to skills, vocabulary building, and# 4
.comprehension
error reduction `were combined in a category', called Skill-Related
Reasons. Reasons concerning the ease or fun of the activity making
progress to finish the book, and "don't know" were clustered in a
category called Non-Skill Related (Tangential) Reasons-. The chi-
square analysis showed that teachers .statediignificantly.more skill -
related reasons than did students (P .001).
M
22

18
Insert Table 4 about here
14
,Discussion
The resource room ;teachers in this study 'picked more structured
activities than students and stated skill related reasons more 6ftep ;
than students. Generally, their decisions were more Sound and better
founded than were the, students. This. isa welcome finding given the
literature to date on teachers' decision qnaking for instructional
purposes.1 Apparently;-)these resource room teachers were making good
efforts based on good intentipps to teach their students. It is
,,,-
especially promising to note that the activities' selected most-1 *A
frequently by the teachers were oral reading and, error practice,,:-
.
direct practice with prompttng, . 4nd choral reading. These activities
are very directly related to tile task at. hand, reading, and direct
-practice of behaviors has been
I
found to correlate highly with student
achievement (Borg, 1980; Starl'tn, 1979). Therefore, the fact that 39
. of the teachers', 90 selections' involved direct Oractice"indicates that
teachers made some very appropriate decisions when selecting r
instrvctional activities.
Another positive finding is that teachers almost unanimously
stated appropri'ate skill-related reasons for selecting the spdCific
activities. The teachers seemed to be making. an effort to match the
instruction to the learner. Also worth noting-is that most of their
statements seemed to IndiCate that they chose theactiity in order to
help decrease one of the, student's deficit areas. Priother words,
2 3

19
they cho! the err r reduction activity if the student was making a
lot of err( s, and the comprehension questions. activity if the student
had difficulty with coMprehension. None of the responses. indiCated
. that \the teacher -seledted an activity Din order to capitalize" on a
student's strengths.
Also of interest is the 'finding that teachers often selected low
structured activities and at times made their decisions for
inappropriate, .non-skill related reasons. Given that these were all
'spectal education teachers, the fact that they selected some low
structured activities is worrisome. These low structured activities1
prObably have little instruction al value given the research literature
on effective instruction. For example, making clay words and
ilustrating a story provide little direct practice in reading. Yet,
A- teachers selected.a total of 38 of these low structure activities;
that is, over one -third were less educationally sound than they should
have been. Over 10% of the 8hoices were Making Clay Words and
Newspaper'Hunt. If these experts make less than optimal decisions at
. times, then other teachers also may. be -making a ntfmber of poor
decisions. Clearly, this calls for better training in instruction for
Ateachers. Teachers must be well trained on the characteristics of
,/effective, structured instruction/. Perhaps the reliance on
curriculum materials, indicated by Joyce (1980) and McNpr and Joyc?
(1979) has , hindered teachers, from becoming more skillful' in
,instructional decision making.
Students; by and large, did not make decisions for skill-related
reasons. And, for the Most part, students tended to select low
24

1,..
26 , .
.1,
structured activities. Twelve students, for example, selected. Making
Clay Words. Obviously, the hypothesis ti.6t students might make better
instructional decisions than teachers was not confirmed. Perhaps the
students should. have been instructed more completely the decision- /
making process. Merely telling them to make a selection that would
help them to read better was not powerful enough to gutde' their'
behavior. The students, it seemed; were more interested in picking
the fun and -easy options . However, these results should not be
interpreted as evidence that students should not be allowed to select
instructional procedures. Rather, when students are given options,
the options should include only structured activities. When only
structured activities are available, the student might still reap the
benefits of student input including motivations and increased
responsibility, and the student also will be instructed with
potentially effective techniques.

References
Baker, E. L., Herman, J, L., & Yeh, J, R. ,Fun and gdmes: Theircontribution to basic skills instruction in elementary school.American Educational Research Journal, 1981, 18, 83-92.
BorgoW. Time and school learning. In C. Denham & A. Lieberman(Eds.), Time to learn. Washington, National Instituteof Education, 1980:
Bushell, S..A., & Bushell, D: A dual contingency procedure tosupport student self determination and performance. In T. A.Brigham, R. Hawkins,,W. Scott, & T. F.. McLaughlin (Eds.),Behavior analysis in education - self control and reading.Dubuque, IA: Kendall /Hunt,. 1976..
Cronbach, L. J., & Snow, R. E. Aptitude and instructional methods.New York:' Irvington, 1977,
Deno, S. 1., King, R., Skiba, R., Sevcik, B., & Wesson, C. Thestructure of instruction rating scale ISIRS): Development andtechnical characteristics (Research Report No. 107).Minneapolis: University of Minnesota Minnesota, Institute foresearch on Learning DisabilitieS, 1983.
xbrod, J. J., & 0%Leary, K. D. Self-determination of academictandards by children: Toward freedom from external control.-urnal of Educational Psychology, 1974, 66, 845=850,
George, T. W., & 'Kindall, L. M. An intra-class analysis of theeffects of self-determined and externally- imposed learningactivities on posttest achievement, progress rate, and attitudes.In T. A. Brigham, R. Hawkins, J. W. Scott, & T. F. McLaughlin(Eds.), Behavior anal sis and ,education - self-control andreading. Iu.uque, IA: Ken .a unt, 9
Glynn, E. L. Classroom applications of self determined reinforcement.Journal of Applied Behavior Analysis, 1970, 3, 123-132.
Glynn, E. L., Thomas, J. D., & Shee, S. M. Behavioral self-controlof on-task behavior in an elementary classroom. Journal ofApplied Behavioral Analysis, 1973, 6, 105-113.
. Greene, J. C. Choice behavior and its consequences for learning.'An ATI study. Dissertation Abstracts International, 1976,32(5-A), 2740-2/41.
Jackson, D. E. An assessment of the behavior of children workingwithout clirect teacher supervision alone or in,pairs withmanipulative materials on teacher designed tasks self-selectedor teacher-assigned. Dissertation Abstracts International,1978, 38,(7-A), 3910.

22 't
Joyce, B. Toward a theory of information processing in teaching(Research Series.No. 76): East Lansing, MI: Michigan StateUniversity, The Institute for Research on Teathing, 1980.
Kosiewitz, M. M., Hallahan, D. R., & Lloyd, J. The effects of antD student's treatment choice on handwriting performance.Learning Disability Quarterly, 1981, 4(3), 281-286.
Leinhardt, G., Zigmorid, N,, & Cooley,' W. Reading instruction and itseffects. Paper presented at the annual meeting of the AmericanEducational Research Association, Boston, 1980.
Lovitt, T. C. Self management projects. Journal of LearningDisabilities, 1973, 6, 138 -150.
Levitt, T. C., &turtiss, K. A. Academic response rate 'as a
function of teacher- and self-imposed contingencies. Journalof Applied Behavior Analysis, 1969, 2, 49-53.
Marston, D., Tindal, -G., & Deno, S. L. Eligibility for learningdisability-services: A direct and repeated measurement approach(Research_ Report No. 89).2Minneapolis: University of Minnesota,Institute for Research on" Learning Disabilities, 1982.
McNair, K., & Joyce, B. "Teachers' thoughts while teaching: TheSouth Bay study, 'Part II (Research' Series No. 58). EastLansing, MI: Michigan State University, T4,Institute forRiestarch on Teaching, 1979.
, Parks, A. L., Fine, M., & Hopkins, B. L: A study of teacher-managedand self-managed reinforcement with_loung children on anacademic task, In T. A. Brigham,11. Hawkins, J. W. Scott, &T. McLaughlin (Eds.), Behavior analysis in education - readingand self-control. Dubuque, IA: Kendall/Hunt, 197f%
Potter,M., & Mirkin, P. Instructional planning and implementationpractices of elementary and secondary resource room teachers:Is there a difference? (Research Report No. 65). Minneapolis:University of Minnesota, Institute for Research on LearningDisabilities, 1982. (ERIC Document Reproduction Service No.
7 ED 218 850)
Shavelson, R. J., & Borko, H. Research on teachers' decisions inplanning instruction. ,Educational Horizons; 1979, 57, 183-189.
Starlin, C. M. Evaluating and teaching reading to "irregular"kids. Iowa-Perspective, December, 1979.
2 7C.
23
Taffel,_S. J. Choosing special academic activities as a reward forincreased academic productivity. In T. A. Brigham, J. R.Hawkins, J. W. Scott, & T. F. McLaughlin (Eds.), Behavioranalysis in education - self-control and reading. Dubuque, IA:Kendall/Hunt, 1976.
Wall, S. M. Effects of systematic self-monitoring andself-reinforcement in children's management of testperformances. The Journal of Psychology, 1982, 111, 129-136.
Wall, S. M., & Bryant, N. D. Behavioral self-management of academictest performance in elementary classrooms. Psychology in theSchools, 1979, 16, 558-567.
Wang, M. C., & Stiles, B. Investigation of children's concept ofselfzrEsponsibility for their school learning. AmericanEducational Research Journal; 1976, 13, 159-179.
Wesson, C., Deno; S;, & Mirkin, P. Research on developing andmonitoring progress on IEP goals: Current findings andimplications for practice (Monograph No. 18). Minneapolis:University of Minnesota, bstitute for Research on LearningDisabilities, 1982.
White, O. R., & Haring, N. G. Exceptional teaching: A multimediatraining package (2nd ed.). . Columbus, OH: Charles E. Merrill,1980.

Footnote
This paper is based on the author's dissertation research which
supervised by Dr. Bruce Balow. Drs. Stan Deno and Phyllis Mirkin
re helpful suggestions early on in the planning of this project:
inks also are due to Dr. Jerry Tindal who assisted in data
Ilection.
-
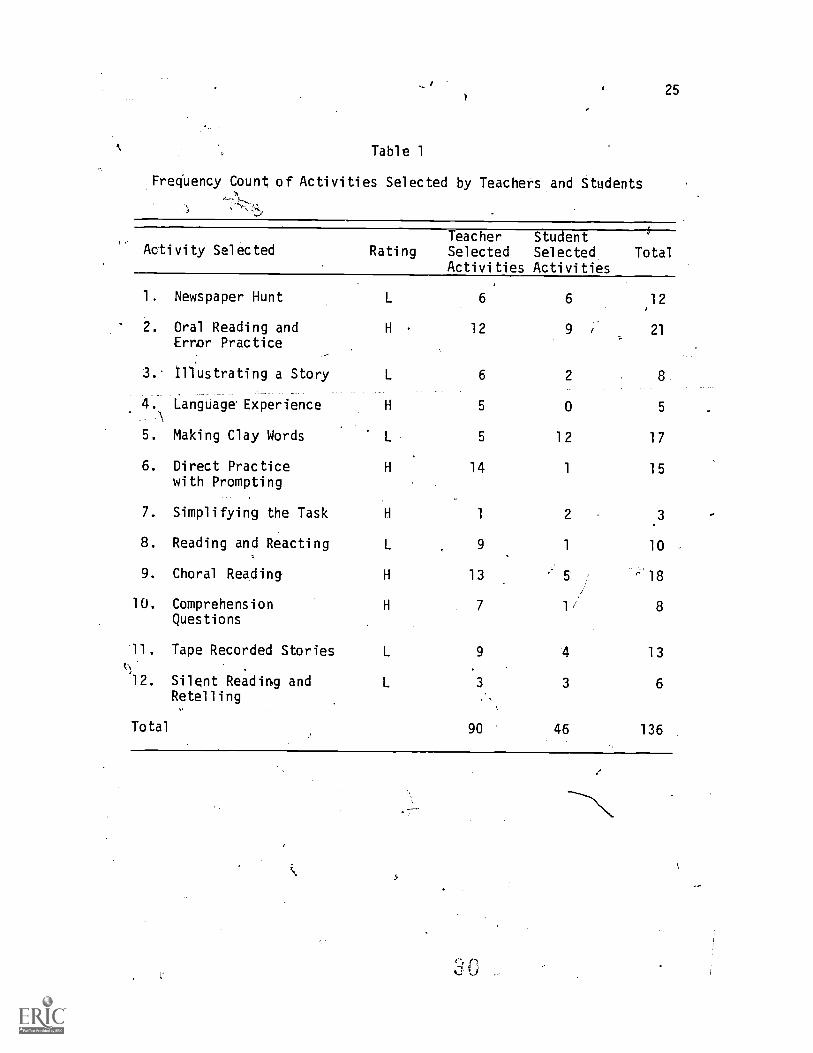
Table 1
Frequency Count; of Activities Selected by Teachers and Students
Activity Selected RatingTeacher StudentSelected SelectedActivities Activities
Total
1. Newspaper Hunt L 6 6 12
2. Oral Reading and H 12 9 21
Error Practice,
3.- illustrating a Story L 6 2 8. _.
4. Language* Experience H 5 0 5\
5. Making Clay Words L 5 12 17
6. Direct Practicewith Prompting
H 14 1 15
7. Simplifying the Task H 1 2 3
8. Reading and Reacting L 9 1 10
9. Choral Reading H 13 5 ' 18
10. Comprehension H 7 li 8Questions
11. Tape Recorded Stories L 9 4 13
12. Silent Reading and L 3 3 6Retelling
Total 90 46 136
5
2 0
26
Table 2
Chi-Square Results of Teacher Selected vs. Student SelectedHigh and Low Structured Activities
liStruture ofActivities
Treatment Teacher StudentCondition Selected Selected Total
Number of High,Structured Activities 52 18 70Selected
Number of LowStructured Activities 38i 28 66Selected
X2= 4.36; p < .05

27O
Table 3
Frequency Count of Reasons for Selection Stated byTeadherS and Students
Teacher Selected
The activity is fun. 1
To help make more progress 1
through the book.
To work on comprehension ) 6
skills.
To help build vocabulary.., '4
To work.on reducing'errors.
6on't know.
Easy activity to do.
10
4
Total 26
Student Selected Total
8 9
2 3
0 4
0 10
7 7
25 51
4,

28
' Tible 4
Chi-SquareResults of Teacher vs. StudentReasons for Activity Selection
Reason Teacher Selected Student Selected Total
Skill Related
Non-Skill Related
20
6,
0
25
20
31
X2= 31.6; p < .001
J3
1111611 II 11 II II 111111111111111 1111111111
3111111111 1 II Mil IJill:Will. id.. ... . Eitil.Alillinglial
I I hpiii1110110ithilliihriliihilii.2111 :. I.
eiN 111. 1111
, 11 g MEN 11 ILIUM. . :: I..:1111 1111111111 11E111111111 1111101111 illip4.11111111119115100111:
111ii
1111111. I . MIMI ..1..11.1mu111p
.1 0 11,,,A0'01111.L. Emil% %HAMM 11114111111:11EMMIN
IIIIIIIIIMIENNIME1111111111111111111011111111MMEM,11 11 1111
, 110 11111 IMINHEMIMMIIIIIIMMIIIIIIMMIL. 21Fgi1110110110:Imilnilliiiimill'immiiiiimPHIMMINIIHniiiiii ENE
4./
C
C
150
140
130
120
110
100
MEP
O
%.1
3
^90*14
4r-r,
80
70
60
50
40
30
:El .1.
.1
nu
1,4
i 4.
141.
m r 11111Hill 111 11 11
UMIN111110 PM
I M
_ Correct20 02t, 111 1 III III 111111101
ligill;"11061111111411101111111101111111101111111111z_ &tort' 10
LRG:
Condition Behavior Criteria
In weeks, when(total # weeks) .
presented with stories fromLey-el
TT- (reading series),
.student willf read aloud
at the rate of 50wpm or better5 or fewer errors:
r
4
Figure 3. Format for Long-Range/Goal: Reading .
32 ;
w. ONC
.
EPC2 t,
CONDITION BEHAVIOR
p.
CRITERIA
Each week, whenpresented with a rondomselection from(levp) # from currentinstituctional level - sameas LRG)of
(reading series)
student willread aloud
at an average increaseof
(70 on 50 wpm - actual,performance) total #weeks remaing inschool year.
CONDITION BEHAVIOR CRITERIA
Each week, when presentedwith successive storiesfrom
(Level ffs from currentinstructional level toannual goal level)
student willprogress
at the rate ofstories per week maintain,-ing the mastery criteriaof at least 50 wpm (gr. 1
2) with 5 or fewer errorsand 70 wpm (gr. 3-6) with7 or fewer errors
Figure 4. Performance and Progress Charting Short Term Objectives'forReading.
37

:3:3
_if i.
-,.
,;*
.........
HIM
I
....e:
11}MMOME
k.:
mli
UMO
i
esMBNOMA
soak iiiiiiHI
INI
OMIDUU.
MMEIAM
mum
egiik.
........311Lar" i
3:
.....;:...
.0
iiiiiiiiri
66
MAMA
nusi.1
:'t t-
samm
ansim31
um
mm
mem
um1 74:rr r
mem
somearn=
1
.......=1:
4..L.
......M
EM
O...
...
MISMOOMMOOOMMEMWMpla
=a
S OOMMUSNIO
SUM
iiiiiii
ILL
i1'3
PRI
t-
IO
MM
US
ISMW
OOU
SOVISMONMS MUM
.L........
.11
.,."
22
11111
111:
MOO
OM
WO
:11rrrrF fl
rt.
114«,f-11
4}
166 -
...a...
2
!HE
MO
11OM
MMOM
MOO
I.
11:114111111111...:r
1+
<1
440
"0.-1#
..,
L4-
2E MMOMUUM
O MOSISSOMMO
ONMEM
GOMM
suallinallmunkh L
165sumalih,
JEB YO
::.2 -;
Min
SM111
:2113=11211111111111131
mall
imismi
i
fit.1
g 1:
2
U011U
VA
JVN
raCw
T
'Way's
,ra drua
tr-iom jO
JacitunN
-174: I
I .1 r.rI -
IMOM
INISS
\P
ra'11
Nk
2

PUBLICATIONS
Institute for Research on Learning DisabilitiesUniversity of Minnesota
c,
The Institute'is not funded for the distribution of its publications.Publications may be obtained for $4.00 each, a fee designed to coverprinting and postage qosts. Only checks and money orders payable tothe University of Minnesota can be accepted. All orders must be pre-paid. Requests should be directed to: Editor, IRLD, 350 Elliott Hall;75 East River Road, University of Minnesota, Minneapolis, MN 55455.
The publications listed here are only those that have been preparedsince 1982. For a complete, annotated list of all IRLD publications,write tothe Editor.
Wesson, C., Mirkim, P., & Deno,,S. Teachers' use'of self instructionalmaterials for learning procedures for developing and monitoringprogress on IEP'goals (Research Report No. 63). January, 1982.
Fuchs, L., Wesson, C., Tindal, G., Mirkin, P., & Deno, S. , Instructionalchanges, student performance, and teacher preferences: The effectsof specific measurement and evaluation procedures (Research ReportNo. 64). January, 1982.
Potter, M., & Mirkin, P. Instructional planning and implementationpractices of elementary and secondary resource room teachers:Is there a-difference? .(Research Report No. 65). January, 1982.
Thurlow, M. La, & Ysseldyke, J. E. Teachers' beliefs about LD students(Research Report No. 66)1. January, 1982.
Graden, J., Thurlow, M. L., & Ysseldyke, J. E. Acad(mic engaged timeand its relationship to learning: A review of the literature(Monograph No. 17). January, 1982.
King, R., Wesson, C., & Deno, S. Direct and frequent measurement ofstudent performance: Does it take too much time? (ResearchReport No. 67). February, 1982.
in
Greener, J. W., & Thurlow, M. L. Teacher opinions about professionaleducation training programs (Research Report No. 68). March,1982.
Algozzihe, B., & Ysseldyke, J. Learning disabilitiesas a subset ofschool failure: The oversophistiCation of a concept (ResearchReport No. 69). March, 1982.
Fuchs,Fuchs, D., Zern, D. S., & Fuchs, L. S. A microanalysis of participantbehavior in familiar and unfamiliar test conditions (ResearchReport No. 70). March, 1982.
33

Shinn, M. R., Ysseldyke, J., Deno, S., & Tindal, G. A comparison ofpsychometric and functional differences between students labeledlearning disabled and low achieving (Research Report NO. 71).'-March, 1982.
ThurloW, M. L. Graden, J., Greener, J. W., & Ysseldyke, J. E. Academicresponding time for LD and non-LD students (Research Report No.72). April, 1982.
o.
Graden, J., 7huilow, M., & YsseI ke, J. Instructional ecology andacademic responding time for students at three levels of-teacher-perceived behavioral competence (Research Report No. 73).. April,1982.
AlgozZine B., Ysseldyke, J., & Christenson, S. The influence ofteachers' tolerances for specific kinds of behaviors on 'theirratings of a third grade student (Research Report No.-74)./April, 1982.
.
Wesson, C., Deno, S., & Mirkin, P. Research on develo in and monitor -in: ro ress on IEP oals: Current findinpractice (Monograph No. 18). April,-1982.
o
Mirkin, P., Marston, D., & Deno, S. L. Direct and repeated measurementof academic skills: An alternative'to traditional screening, re-ferral, and identification of learning disabled students (ResearchReport No. 75). May, 1982.
s and im lications for
Algozzine, B., Ysseldyke, J., Christenson, S., & Thurlow, M. Teachers'intervention choices for children exhibiting different behaviorsin school (Research Report No. 76) . -June,-1982.
Tucker, J., Stevens, L. J., & Ysseldyke, J. E. Learning disabilities:The experts speak out (Research Report No. 77). June, 1282.
Thurlow, M. L., Ysseldyke, J. E., Graden, J., Greener, J. W., &Mecklenberg, C. Academic responding time for LD students receivingdifferent levels of special education services (Research ReportNo. 78). June, 1982.
Graden, J. L., Thurlow, M. L., Ysseldyke, J. E., & Algozzine, B. Instruc-tional ecology and academic responding time for students in differ-ent reading roups (Research Report No. 79). July, 1982.
Mirkin, P. K., & Potter, M. L. A survey of,program planning and imple-mentation practices of LD teachers (Research Report No. 8Q). July,1982.
Fuchs, L. S., Fuchs, D., & Warren, L. M. Special education practicein evaluating student progress toward goals (Research Report No.81)-. l82.
Kuehnle, K., Deno, S. L., & Mirkin,.P. K. Behavioral measurement ofsocial adjustment: What behaviors? What setting? (ResearchReport No. A2). July, 1982.

Fuchs, D., Dailey, Ann Madsen, & Fuchs, L. S. Examiner familiarity andthe relation between qualitative and quantitative indices of ex-pressive language (Research Report No. 83). July, 1982.
Videen, J.; Deno, S., & Marston, D. Correct-siord sequences: A validindicator of:prnficiencyln:written_expression_Oesearch Report_No:84). July, 1982.
Potter, M. L. Application of a decision theory model to eligibilityand classification decisions in special education (Research ReportNo. 85)./July,' 1982.
Greener, J. E., Thurlow, M. L., Graden, J. L., & Ysseldyke. J. E. Theeducational environment and students' responding times as a functionof students'-teacher-perceived academic competence (Research Report'No. 86). August, 1982.
Dena, S., Marston, P., Lowry, L., Sindelar, P.,P49 Jenkins, J.The use of standard tasks to measure achievement in reading, spelling,and written expression: A normative and developmental study (ResearchReport.No. 87). August, 1982.
Skiba, R., Wesson, C., & Deno, S..L. The effects of training teachers-inthe use of formative evaluation in reading: An experimental-controlcomparison .(ResearchReport No. 88.) September, 1982.
Marston, D., Tindal, G & Deno, S. L. Eligibility for learning disa-bility services: A direct and re eated measurement approach(Research .Report No. 89). September, 1982.
Thurlow, M. L Ysseldyke, J. E.,.&Graden, 4. L. LD students' Ctiveacademic responding in regular and resource classrooms (Rese,chReport No. 90). SiPtember1982.
YsseldYle, J. E., Christenson, S., Pianta, R., Thurlow, M. L., & Algozzine,B. An analysis of current practice in referring students for psycho-educational evaluations. -- Implications for change.(Research Report No.
--,91), October,-1982.
.
Ysseldyke, J. E.,,Algozzide, B., & Epps, S. A lo ical and em iricalanal sis of current ractices,in clasaif in students as handicaed(Research Report No. 92). October, 1982.
Tindal, G., Marston, D., Deno, S. L., & Germann, G. Curriculum differ-' - ences in direct 'repeated measures of reading'(Research Report No.
93). October, 1982. .
Fuchs, L.S., Deno, S. L., & Marston, D. Use of aggregation to improvethe reliability of simple direct measures of academic performance(Research Report No. 94). October, 1982.
Ysseldykei J. E., Thurlow, M. L., Mecklenburg, C., & Graden, J. Observedr; in instruction and student responding as -a function of
referral and special education placcment.(Research Report No. 95).October, 1982.
41 .

Fuchs, L. S., Deno, S. L., & Mirkin, P. K. Effects of frequent curricu-lum -based measurement and evaluation on student achievement andknowledge of performance: An,experimental study (Research Report
No. 96). November, 1982.
Fuchs,L.S., Deno,S.L., & 'Mirkin, P. K. Direct and fre ent measure-
ment and evaluation: Effects on InatidetiOn'and eat Ated- Of
student progress (Research Report No. 97). November, 1982.
Tindal, G., Wesson, C., Germann, G., Deno, S. L., &.Mirkin, P. K. The
Pine County model for special education delivery: A data-basedsystem (Monograph No.19), .November, 1982.
Epps, S., YssfIldyke, J. E.., & Algozzine,B. An analysis of the conceptualframework underlying definitions of learning disabilities\(ResearchReport No. 98). November, 1982.
Epps, S.,'Isseldyke, J. E., & Algozzine, B. Public-Policy implicationsof different definitions of learning disabilities (Research Report
No. 99). November, 1982.
Ysseldyke, J. E., Thurlow, M. L., Graden, J. L., Wesson, C., Deno, S. L.,& Algozzine, B. Generalizations from five years of research onassessment and decision making (Research Report No. 100). November,
1982.
Marston, D., & Dend, S. L. Measuring academic progress of students with
learning difficulties: A comparison of the semi-logarithmic chartand equal interval graph paper (Research Report No. 101). November,
1982.
Beattie, S., Grise, P., & Algozzine, B. Effects of test modifications
on minimum competency test performance of third grade learning
disabled students (Research Report No. 102). December, 1982
Algozzine, B., Ysseidyke,,J. E., & Christenson, S. An analysis of theincidence of special class placement: The masses are burgeoning
(Research Report No. 103). December, 1982.
Marston, D., Tindal, G.,1.& Deno, S. L. Predictive efficiency of direct,
repeated measurement: An analysis of cost and accuracy in clasai-
fication (Research Report No. 104). December, 1982.
Wesson, C., Deno, S., Mirkin, P., Sevcik, B., Skiba, R., King, R.,
Tindal, G., & Maruyama, G. Teaching structure and student achieve-
ment effects of curriculum-based measurement: A causal (structural)
analysis (Research Report No. 105). December, 1982.
Mirkin, P. K., Fuchs, L. S., & Deno, S. L. (Eds.). Considerations for
desi nin a continuous evaluation s stem: An inte rative review
(Monograph No. 20). December, 19821
Marston, D., & Deno, S. L. Implementation of direct and repeatedmeasurement in the school setting (Research Report No. 106).
December, 1982.
42

Deno, S. L., King, R., Skiba, R., Sevcik, B., & Wesson, C. The structureof instruction rating scale (SIRS): Development and technicalcharacteristics (Research Report No. 107). January, 1983.
Thurlow, M. L., Ysseldyke J. E & Casey A. Criteria for identifyingLD students: Definitional problems exemplified (Research ReportNo. 108). January, 1983.
Tindal, G., Marston, D., & Deno, S. L. The reliability of direct andrepeated measurement (Research Report No. 108). February, 1983.
Fuchs, D., Fuchs, L. S., Dailey, A. M., & Power, M. H. Effects df pre-test contact with. experienced and inexperienced examiners on haddi-capped children's,performanee (Research Report No. 110). February,1983
King, R. P., Deno, S.,_Mirkin, P., & Wesson, C. The effects of trainingteachers in the use of formative evaluation.in reading: An experi-mental-control comparison (Research Report No. 111). February, 1983.
Tindal, G., Deno, S. L., & Ysseldyke, J. E. Visual analysis of timeseries data: Factors of influence and level of reliability (ResearchReport No. 112). March, 1983.
Tindal, G, Shinn, M., Fuchs, L., Fuchs, D., Deno, S.; & Germann, G. Thetechnical adequacy of a basal reading series mastery test (ResearchReport No. 113)1. April, 1983.
r
Sevcik, B., Skiba, R., Tindal, G.,.King, R., Wesson, C., Mirkin,1 P., &Deno, S. Communication of IEP goals and student progress amongparents, regular classroom teachers, and administrators usingsystematic formative evaluation (Research Report No. 114). April,1983.
Wesson, C. Two student self-management techniques applied to data-basedprogram modification (Research Report No. 115). April, 1983.
. Wesson, C.) Skiba, R., Sevcik, B., King, R.,. Tindal, G., Mirkin, P., &Deno, S. The impact of the structure of instruction and the.use oftechnically adequate instructional data on eading improvement(Research Report No. 116). May, 1983.
Wesson, C. Teacher vs student selection of instructional activities(Research Report No. 117). May, 1983.
4 3