document resume bockman, john f.; valencia, … · your men teachers, all native or near-native...
TRANSCRIPT
ED 041 492
AUTHORTITLE
INSTITUTIONPUB DATENOTE
EDRS PRICEDESCRIPTORS
DOCUMENT RESUME
Bockman, John F.; Valencia, Felizardo L.An Experiment in the Development of ConversationalFluency in Spanish Through Use of Electric Cue Boardand Related Methodology.Tucson Public Schools, Ariz.Oct 6824p.
EDRS Price MF-$0.25 HC-$1.30*Audiolingual Methods, Audiolingual Skills,Conversational Language Courses, Dialogue,Educational Experiments, Educational Innovation,*Electromechanical Aids, Electronic Equipment,Instructional Improvement, Instructional Materials,Language Fluency, *Language Instruction, ModernLanguages, Oral Communication, *Secondary Schools,*Spanish, Standard Spoken Usage, Student Evaluation
ABSTRACTAn innovative approach to language instruction,
developed by Felizardo Valencia using "Juan, Maria y Pepe', as a basictext, is contrasted with more traditional audiolingual methodology ina first-year Spanish course. A control group of high school studentsis instructed with the use of a teacher-operated electric cue boardwith abbreviated cues which allows for controlled teaching of thestructures, patterns of communication, tenses, and topics forconversation in a dialogue. Description of the project design,matched-pairs of subjects, results of the study, and group testresults are included. Computer generated statistical tables are usedin the analysis of the results of the experiment. (RL)
TUCSON PUBLIC SCHOOLS
U.S. MANIKIN OF NUM EDUCAIION t DRUM
OffICE Of IDOCA1100
Imes oocumm NAS NL1N OPRODUIDIXAC1LV AS nun) INCS1 1HE 'N
PERSON ON ONAN0IA11000 01061101106POIN1S OF VIEW ON OPINIONS'
SAID DO NO1 INCISSANDLY HPNISINIOFfICIAL OFFICE Of IDUCANON
POSMON 01 POLICY.
COORDINATOR OF FOREIGN LANGUAGE INSTRUCTION
-41mAN EXPERIMENT IN THE DEVELOPMENT OF CONVERSATIONAL FLUENCYIN SPANISH THROUGH USE OF ELECTRIC CUE BOARD AND RELATEDMETHODOLOGY, by John F. Bockman and Felizardo L. Valencia
uJ
Contents Page
Purpose of the Study 1
Background of the Study 1
The Project Design 3
The Matched-Pairs 4
Statement of Goals and Objectives of the ExperimentalProgram, Felizardo L. Valencia 5
Results of the Study 7
Final Conclusions 11
Recommendations 11
Group Test Results 12
Notes 22
October, 1968
I

AN EXPERIMENT IN THE DEVELOPMENT OF CONVERATIONAL FLUENCY
IN SPANISH THROUGH USE OF ELECTRIC CUE BOARD AND RELATED
METHODOLOGY, by John F. Bockman and Felizardo L. Valencia
The Purpose
The purpose of the study is to compare, in various Spanish language
skills, first-year students of Spanish taught by the method developed by
Felizardo Valencia of Rincon High School with those taught by several other
methods in current use at Rincon, Catalina, and Palo Verde High Schools.
Background of the Studx.
Felizardo Valencia's method, aim, Maria x Pepe, Espanol, Practico,,
is an audiolingual one. It has as a t,rimary objective the development of
conversational fluency. Mr. Valencia, however, is in fundamental disagreement
with many of the assumptions and much of the methodology of the commercial
audiolingual programs (e.g. A-LM, Entender y, Hablar, Primers Vista).
Mr. Valencia holds that the dialog-narrative approach of the published
audiolingual programs permits, even encourages, less than is necessary and
less than can be done to achieve control of topic and structure with native-
like speed or fluency. The Valencian method, therefore, eschews the dialog-
narrative approach. It employs a system of controlled dialogs of maximum1.
flexibility and of maximum relevance and vital concern to the student.
To achieve control of topic and structure with native-like speed car
fluency, the teacher uses an ingenious electric cue board which includes
abbreviated cues that control all possible structures, patterns of communi
cation, tenses, and topics for conversation. The teacher controls the cue
board through a portable console with a switch for'each cue. As the lights
turn on at lightning-fast speed, the students respond and thereby are
2
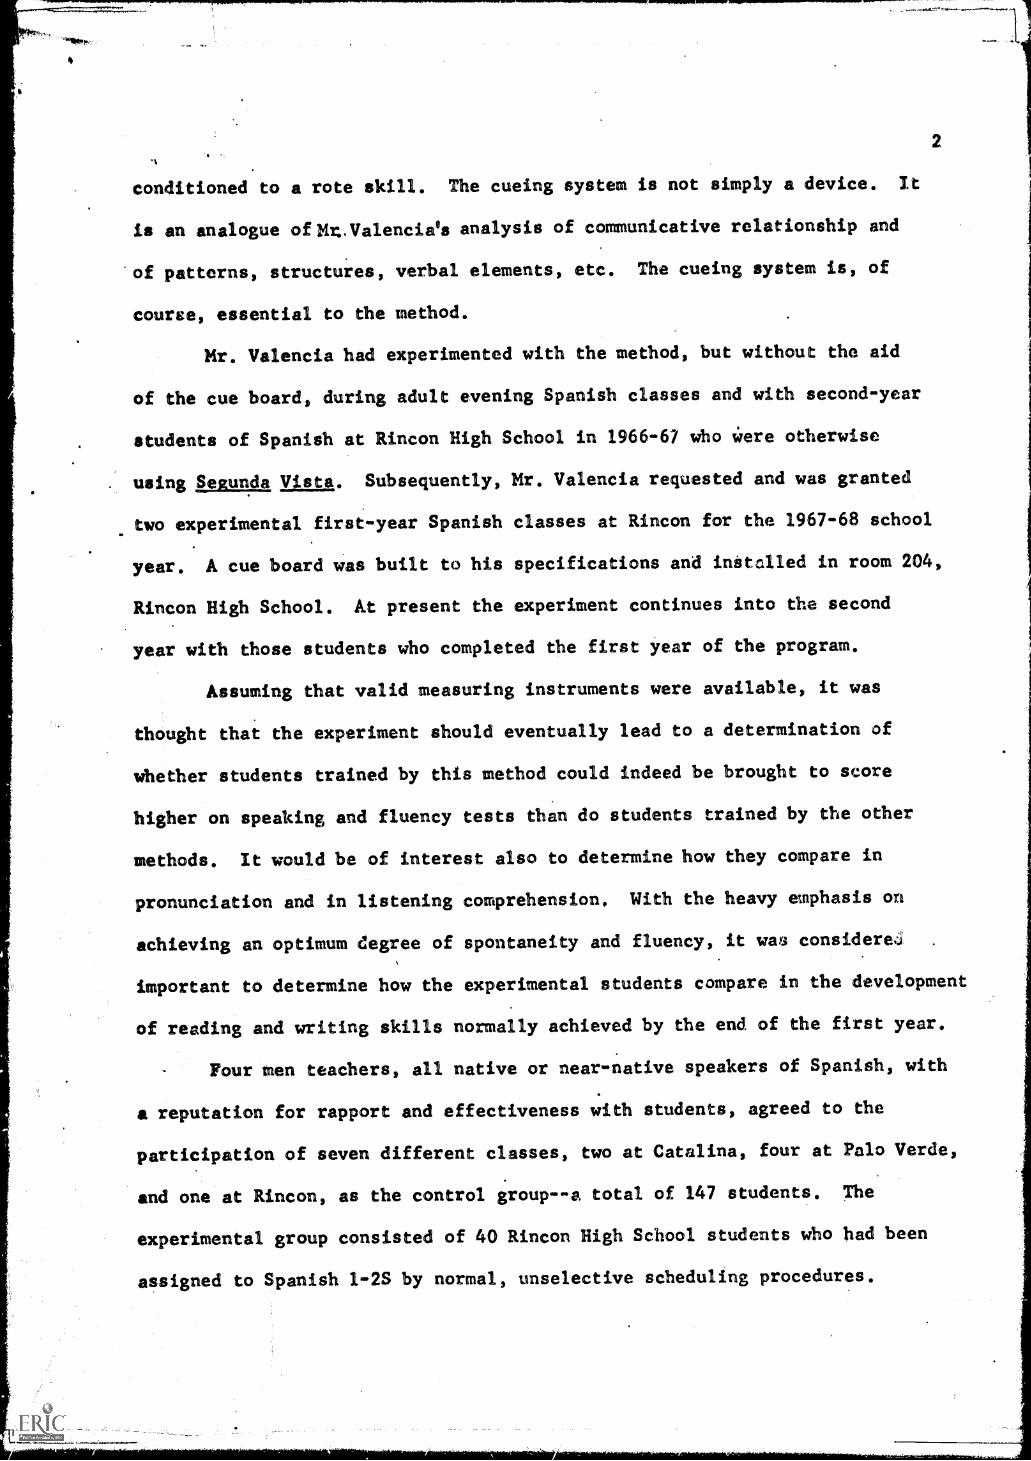
conditioned to a rote skill. The cueing system is not simply a device. It
is an analogue oft4t.Valencia's analysis of communicative relationship and
of patterns, structures, verbal elements, etc. The cueing system is, of
course, essential to the method.
Mr. Valencia had experimented with the method, but without the aid
of the cue board, during adult evening Spanish classes and with second-year
students of Spanish at Rincon High School in 1966-67 who Were otherwise
using Seeundq Vista. Subsequently, Mr. Valencia requested and was granted
two experimental first-year Spanish classes at Rincon for the 1967-68 school
year. A cue board was built to his specifications and installed in room 204,
Rincon High School. At present the experiment continues into the second
year with those students who completed the first year of the program.
Assuming that valid measuring instruments were available, it was
thought that the experiment should eventually lead to a determination of
whether students trained by this method could indeed be brought to score
higher on speaking and fluency tests than do students trained by the other
methods. It would be of interest also to determine how they compare in
pronunciation and in listening comprehension. With the heavy emphasis on
achieving an optimum degree of spontaneity and fluency, it was considere6
important to determine how the experimental students compare in the development
of reading and writing skills normally achieved by the end of the first year.
Your men teachers, all native or near-native speakers of Spanish, with
a reputation for rapport and effectiveness with students, agreed to the
participation of seven different classes, two at Catalina, four at Palo Verde,
and one at Rincon, as the control group--a total of 147 students. The
experimental group consisted of 40 Rincon High School students who had been
assigned to Spanish 1-2S by normal, unselective scheduling procedures.
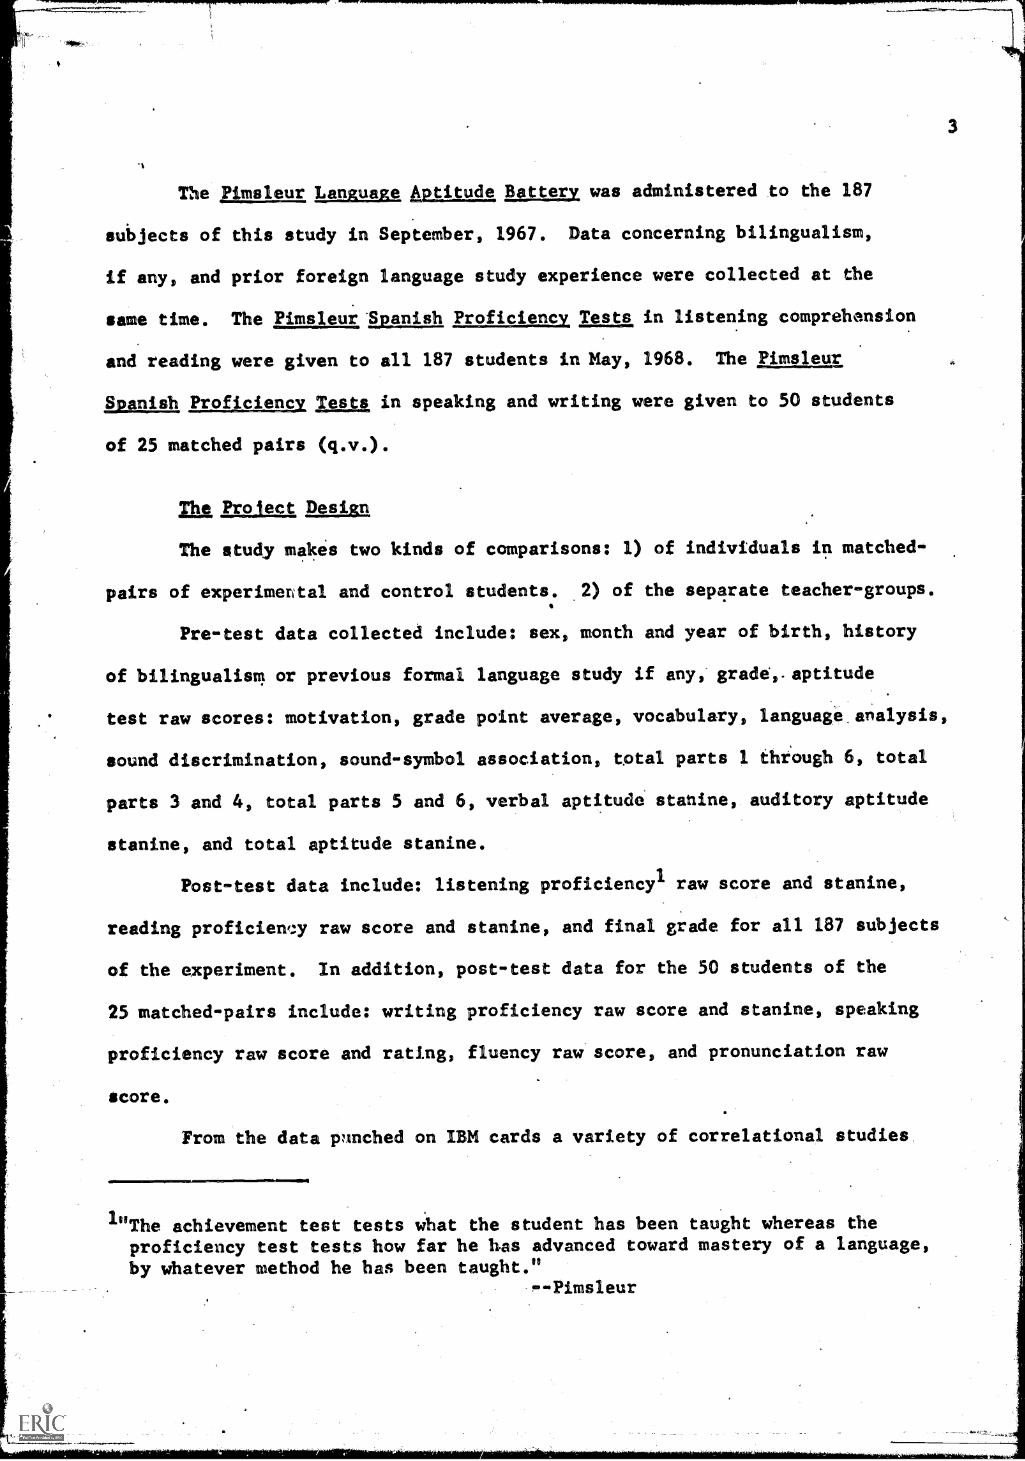
The Pimsleur Language Aptitude Battery was administered to the 187
subjects of this study in September, 1967. Data concerning bilingualism,
if any, and prior foreign language study experience were collected at the
sa 1111e time. The Pimsleur lunigh Proficiency Tests in listening comprehension
and reading were given to all 187 students in May, 1968. The Pimsleur
Spanish Proficiency Tests in speaking and writing were given to 50 students
of 25 matched pairs (q.v.).
The Project Design
The study makes two kinds of comparisons: 1) of individuals in matched-
pairs of experimental and control students. 2) of the separate teacher-groups.
Pre-test data collected include: sex, month and year of birth, history
of bilingualism or previous formai language study if any, grade,. aptitude
test raw scores: motivation, grade point average, vocabulary, language.analysis,
sound discrimination, sound-symbol association, total parts 1 thiough 6, total
parts 3 and 4, total parts 5 and 6, verbal aptitude stanine, auditory aptitude
stanine, and total aptitude stanine.
Post-test data include: listening proficiency) raw score and stanine,
reading proficiency raw score and stanine, and final grade for all 187 subjects
of the experiment. In addition, post-test data for the 50 students of the
25 matched-pairs include: writing proficiency raw score and stanine, speaking
proficiency raw score and rating, fluency raw score, and pronunciation raw
score.
Pro the data punched on IBM cards a variety of correlational studies
1"The achievement test tests what the student has been taught whereas theproficiency test tests how far he has advanced toward mastery of a language,by whatever method he has been taught.
-Pimsleur
3
becomes possible, for example, the relationship between total aptitude stanines
and listening comprehension proficiency stanines. It is assumed that any
significant correlations discovered might permit tentative
judgment concerning methodological effectiveness. To assist such interpre-
tation of possibly significant differences, teacher participants in the
experiment were asked to submit a statement of their instructional objectives.
The Matched-Pairs
Twenty-five experimental students were matched one-for-one with twenty-
five control students by the following variables: sex, ability (IQ) stanine
score, grade in school, verbal aptitude raw score and stanine score, and
auditory raw score and stanine score. Students from homes with a record of
bilingualism and those who had studied Spanish or any other foreign language
previously were not included among the matched-pairs.
Among the 25 control students, five were students of teacher C-1 at
Catalina, nine of teacher C-2 at Palo Verde, seven of teacher C-3 at Palo Verde,
and four-of teacher C-4 at Rinc3n.
With matched-pairs, it is possible not merely to study average group
differences but also to analyze the average difference between pairs. The
introduction of controls through matching reduces the standard error of
difference. This term, which is computed from the standard error of the mean,
(a measure of the probable extent to which a mean is apt to vary on future
samplings), is used to determine whether any difference found between means
is a real or a chance difference. Every measurement has some unreliability.
One can never be certain that one particular administration of a test gives
the "true" mean score of the group tested. If the given group could take the
same test an infinite number of'times, each time as though they were taking
it the first time, a series of resulting means would distribute themselves in
a normal curve, yielding a "true" mean. But since it is impossible to discover
4
the true mean in this fashion, conclusions can be drawn concerning probable
results of measuring broader samplings from the manner in which scores are
dispersed around the mean in any sample testing.2
Statement of Goals and Objectives of the Experimental Program
Goals
(Primary) To develop, from the very beginning of the program, the
ability to speak and converse in depth with the fluency and versatility of
a native speaker of Spanish within the limitations imposed by the extent of
linguistic matter assimilated at each stage of development.
(Secondary) To develop listening comprehension, reading, and writing
skills within the framework of the primary goal.
Objectives
Depending on the stage of development, the student will be able to
discuss individually, or as a member of a group, or as a partner in a two-
or several sided conversation with native-like fluency and versatility any of
a number of topics of immediate relevance to the student. The topics will
be selected jointly by the teacher and the students and will constitute the
subject matter of the program.
Student performance will be measured by
a) evaluating his responses to dialog control cues flashed electrically
by an investigator using the Electric Cue Board;
b) by observing hir participation in natural classroom speaking
activities, spontaneous or controlled;
2 Ideas expressed in this paragraph were garnered from UnderstandingEducational Research, Van Dalen; A Primer of Statistics, Franzblau;
Statistical Concepts, Amos; and A Psycholinguistic Experiment in Foreign
]Language Teaching, Scherer. (See notes.)
c) by teacher-made speaking-fluency tests;
d) by standardized speaking-fluency tests.
The student will be able to read and write dialogs, stories, expositions,
etc. constructed of the linguistic matter (as above). Performance will be
measured by oral reading, reading comprehension exercises, and by teacher-
made and standardized reading and writing tests.
Definition of Terms and Limitations
Because of the innovative nature Of this approach, a special definition-.
Is given to the following, dialog controls used in the program:
a) Pattern of Communication the factors that determine the direction
and number' of a given dialog;
b) Structure -those 'factors Which make a communication interrogatory;
commanding, expoOtory, or exclamatory, and the cultural factors that might
have linguistic effects on the communication;
c) Tite -tense applied to verbs;
dYTopic - the subject matter of the communication as well as the
vocabulary and other lexical matter to be used in the dialogs. IChese will
be drawn from topics of 'maximum relevance to ninth through twelfth graders
of,RincOn High School, Tucson, Arizona. Because of the in depth. treatment
of' each topic, and behavioral outcomes sought in the students with respect
to' thete situational topics, the vocabulary, for example, will not be as varied
and. extensive as.that learned in regular Spanish classes. There may be many
additions.
(A complete and detailed course-of-study of the program which outlines
each step_of instruction, subject matter, and behavioral objectives is available
upon request.)
Results of the Slat
Matched -Pairs
Pre-Test Data
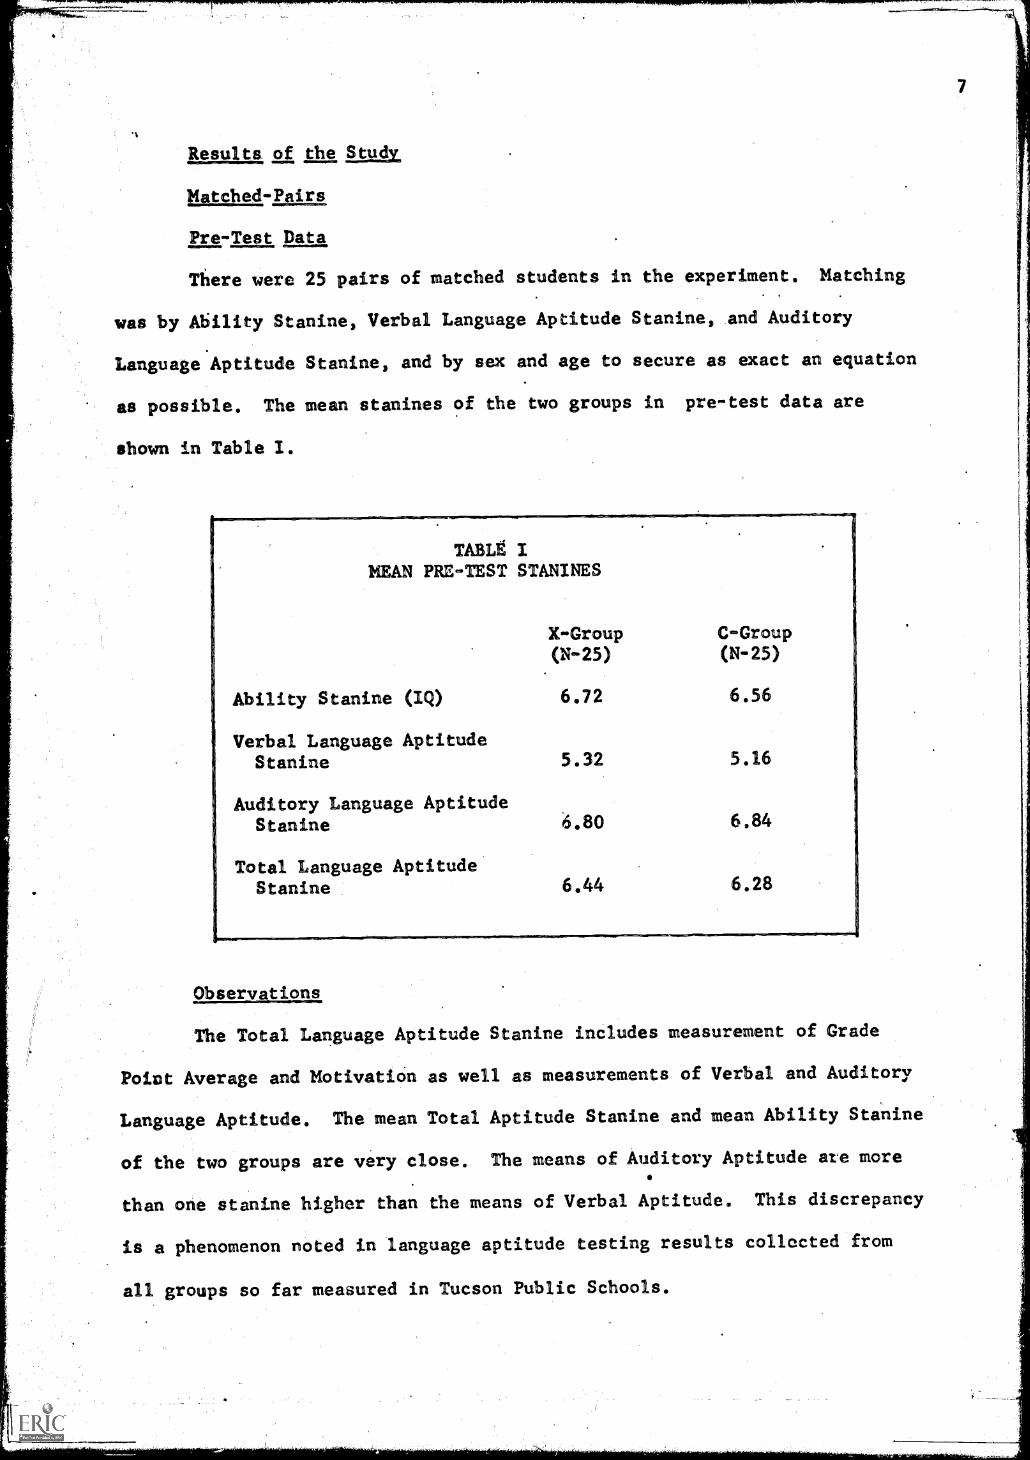
There were 25 pairs of matched students in the experiment. Matching
was by Alioility Stanine, Verbal Language Aptitude Stanine, and Auditory
Language Aptitude Stanine, and by sex and age to secure as exact an equation
as possible. The mean stanines of the two groups in pre-test data are
shown in Table I.
(IQ)
TABUMEAN PRE-TEST STANINES
Aptitude
Language Aptitude
Aptitude
X-Group C-Group(N-25) (N-25)
6.72 6.56
5.32 5.16
6.80 6.84
6.44 6.28
Ability Stanine
Verbal LanguageStanine
AuditoryStanine
Total LanguageStanine
Observations
The Total Language Aptitude Stanine includes measurement of Grade
Point Average and HotivatiOn as well as measurements of Verbal and Auditory
Language Aptitude. The mean Total Aptitude Stanine and mean Ability Stanine
of the two groups are very close. The means of Auditory Aptitude are more
than one Stanine higher than the means of Verbal Aptitude. This discrepancy
is a phenomenon noted in language aptitude testing results collected from
all groups so far measured in Tucson Public Schools.
k\
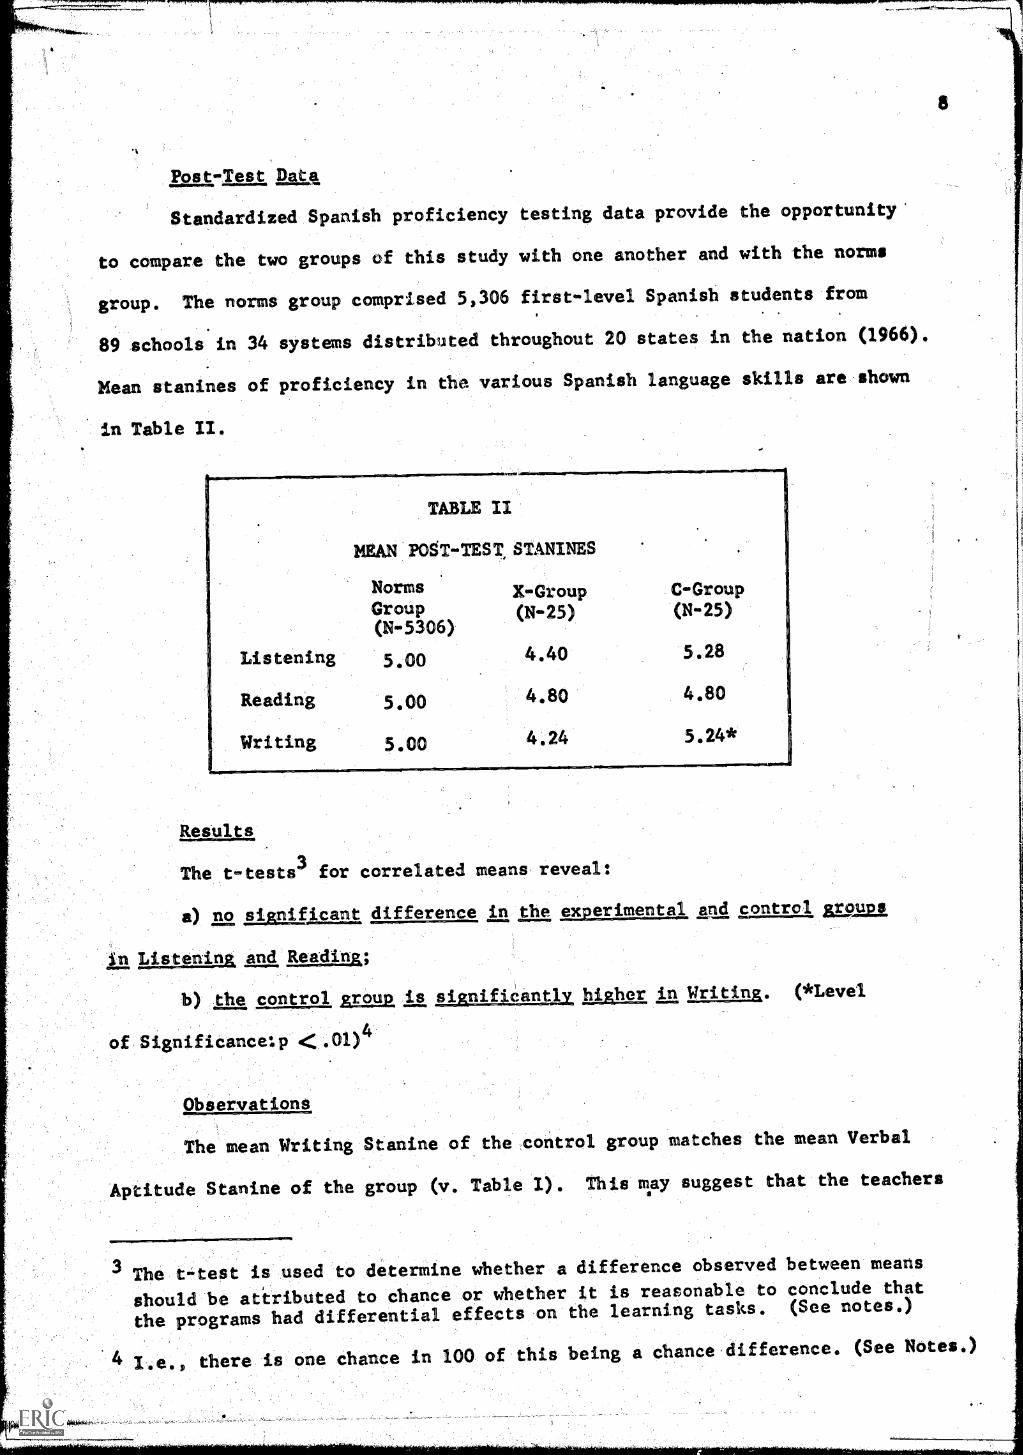
Post-Test Data
Standardized Spanish proficiency testing data provide the opportunity'
to compare the two groups of this st dy with one another and with the norms
group. The norms group comprised 5,306 first-level Spanish students from
89 schools in 34 systems distributed throughout 20 states in the nation (1960.
)lean stanines of proficiency in the various Spanish language skills are shown
in Table II.
TABLE II
MEAN POST -TEST STANINES
Norms X-Group C-GroupGroup(N-5306)
(N-25) (N-25)
Listening 5.00 4.40 5.28
Reading 5.00 4.80 4.80
Writing 5.00 4.24 5.24*
Results
The t-tests3 for correlated means reveal:
a) no significant difference in the experimental and control dos
in Listening and Reading,;0M
b) the control group is sfsm_j_licartlx, higher, in Writing. (*Level
of Significance;p0 )4
Observations
The mean Writing Stanine of the control group matches the mean Verbal
Aptitude Stanine of the group (v. Table I). This may suggest that the teachers
3 The t-test is used to determine whether a difference observed between means
should be attributed to chance or whether it is reasonable to conclude that
the programs had differential effects on the learning tasks. (See notes.)
4 I.e. , there is one chance in 100 of this being a chance difference. (See Notes.)
of the control group have strong, persistent Writing objectives.
The auditory Aptitude Stanines of the groups might lead to the expec-
tation of higher achievement in Listening. It may be that purposeful
Listening gsa se as a distinct set of objectives is weak in the control
programs and weaker in the experimental program. Listening may be incidental
to speaking, but may be receiving a somewhat clearer separate identification
in the control programs.
Mean Speaking Scores
The Pimsleur Spanish, Speaking Proficiency Test measures some aspects
of pronunciation and fluency, and the'ability to recall basic Spanish words
with some spontaneity.
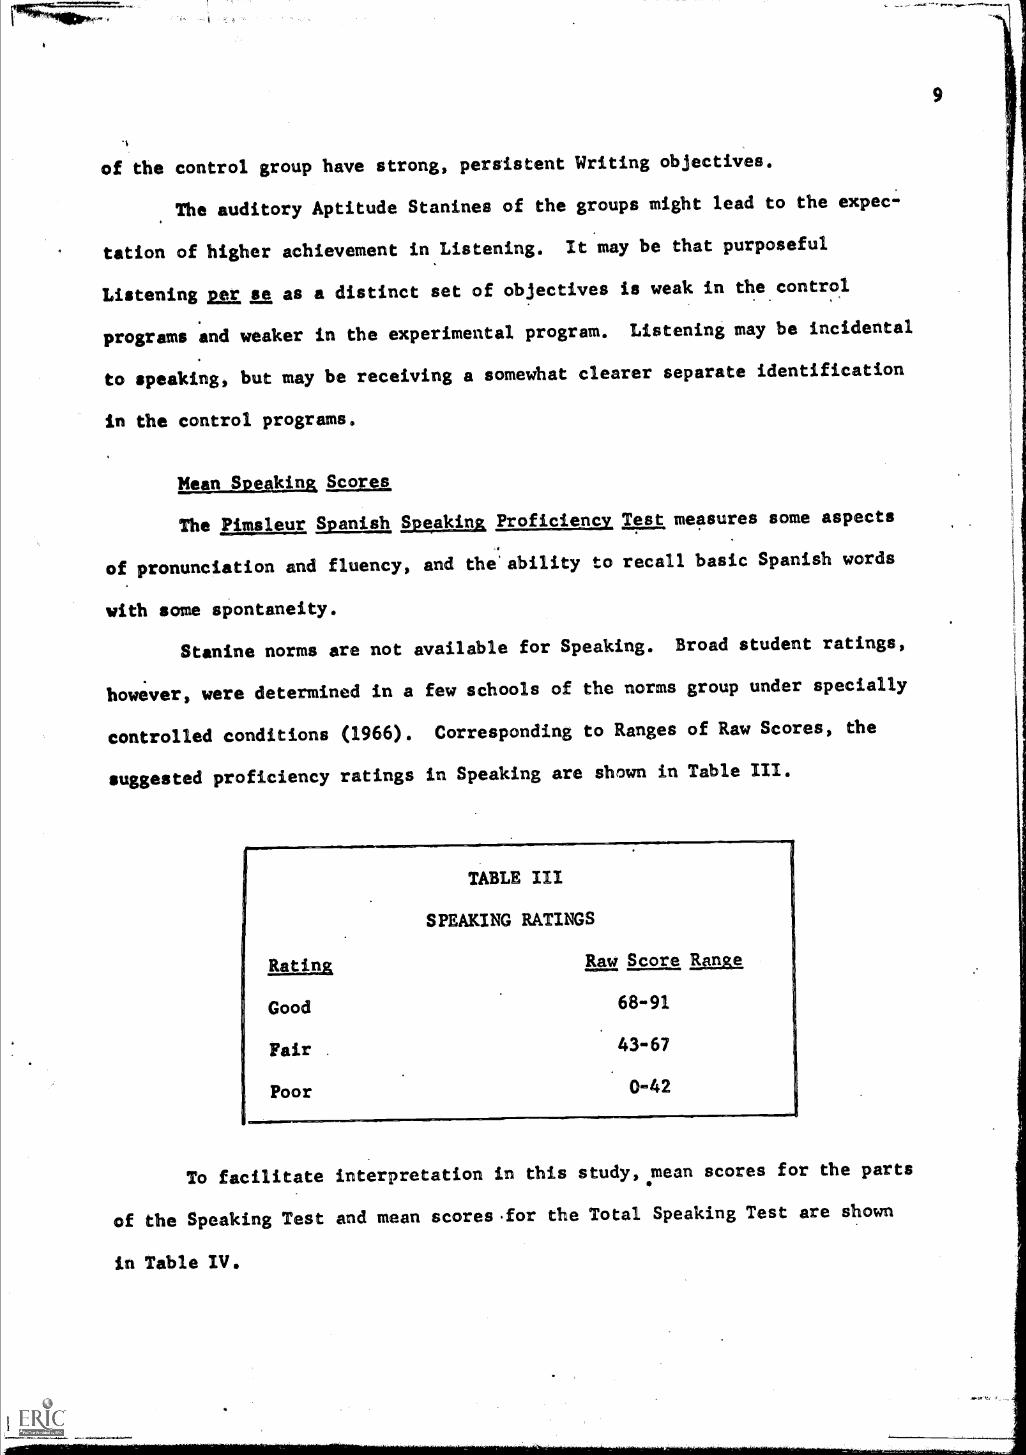
Stanine norms are not available for Speaking. Broad student ratings,
however, were determined in a few schools of the norms group under specially
controlled conditions (1966). Corresponding to Ranges of Raw Scores, the
suggested proficiency ratings in Speaking are shown in Table III.
Rating
Good
Fair .
Poor
TABLE III
SPEAKING RATINGS
Raw Score Range
68-91
43-67
0-42
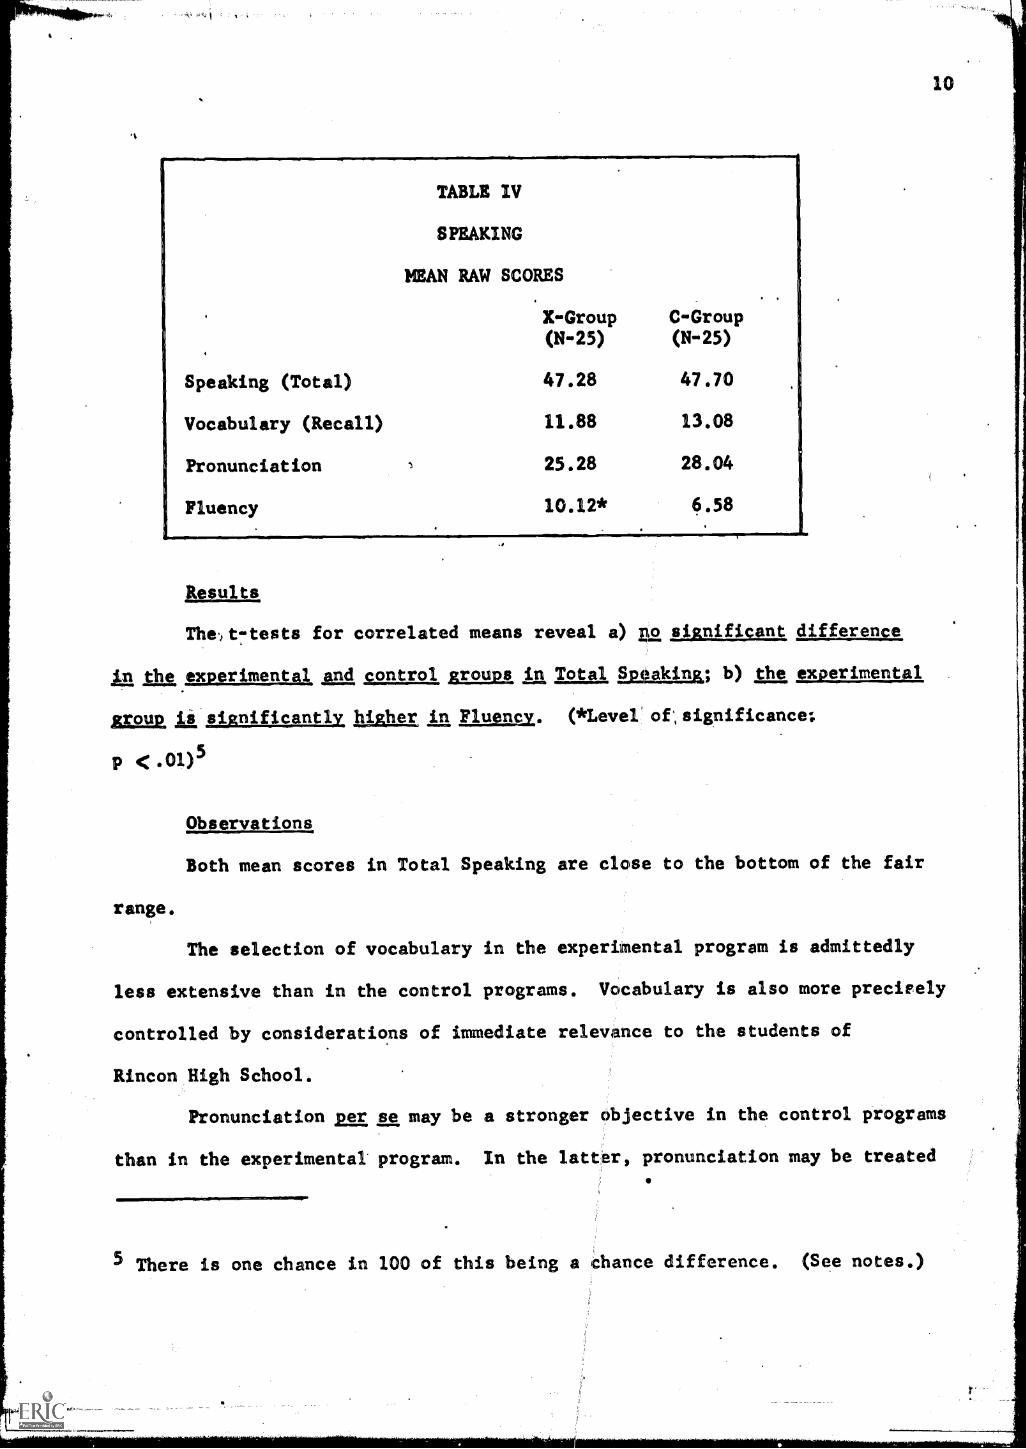
To facilitate interpretation in this study, mean scores for the parts
of the Speaking Test and mean scoresfor the Total Speaking Test are shown
in Table IV.
9
Speaking (Total)
Vocabulary (Recall)
Pronunciation
Fluency
TABLE IV
SPEAKING
MEAN RAW SCORES
X-Group C-Group(N-25) (N-25)
47.28 47.70
11.88 13.08
25.28 28.04
10.12* 6.58
Results
Thct-tests for correlated means reveal a) no significant difference
in the experimental, and control groups in Total Emoskam b) the experimental
group a significantly higher, in Fluency. (*Level ofsignificance;
P < .01)5
range.
Observations
Both mean scores in Total Speaking are close to the bottom of the fair
The selection of vocabulary in the experimental program is admittedly
less extensive than in the control programs. Vocabulary is also more preciFely
controlled by considerations of immediate relevance to the students of
Rincon High School.
Pronunciation Res se may be a stronger objective in the control programs
than in the experimental program. In the latter, pronunciation may be treated
5 There is one chance in 100 of this being a chance difference. (See notes.)
11
more incidentally to Fluency.
Obviously the Fluency section of the Pimsleur Speaking Test does not
precisely measure rapidity as a variable separate from the accuracy of
response. (See recommendations.)
Final Conclusions
The study suggests that the experimental program may be providing ample
opportunities for students to achieve the primary objective of the program -
Fluency and Versatility without greatly penalizing them in the development
of Listening and Reading objectives as compared with the other classes.
The study appears to confirm that the experimental students do less
well in Writing than do the control students, probably as the result of a
calculated lesser emphasis on Writing. The study also appears to confirm the
wisdom of retaining students in an experimental program for longer than the
first year, and may suggest that efforts should be made to strengthen their
Writing proficiency before the experimental program is terminated.
Recommendations
The study should be continued through the second year using the
experimental partners of the original matched-pairs who are still enrolled
in the experimental program, and as many of the original control partners as
continue in Spanish anywhere in District One. Losses of control partners
may be made up from among others for whom pre-test data are available.
Mr. Valencia might find it advantageous to work with the Research
Department in developing an instrument to measure his objective of Fluency
and Versatility. The instrument would be useful to the district.
Group Test Results
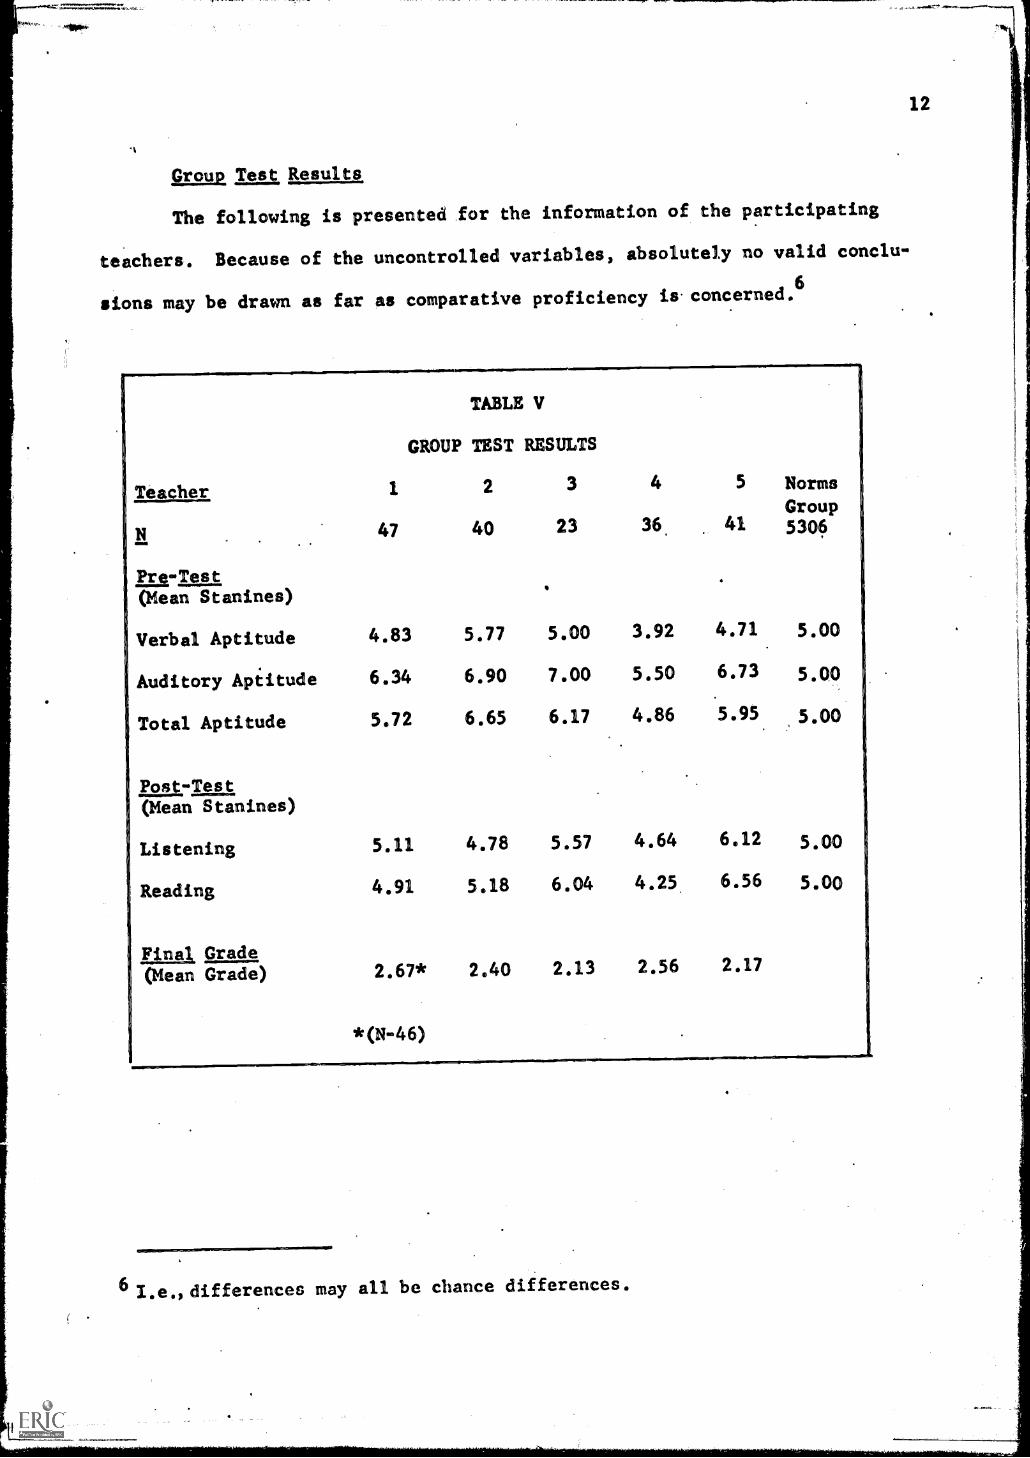
The following is presented for the information of the participating
teachers. Because of the uncontrolled variables, absolutely no valid conclu-
sions may be drawn as far as comparative proficiency is.concerned.6
TABLE V
GROUP TEST RESULTS
Teacher 1
47
2
40
3
23
4
36
5
41
Norms
Group5306N
Pi.
(Mean Stanines)
Verbal Aptitude 4.83 5.77 5.00 3.92 4.71. 5.00
Auditory Aptitude 6.34 6.90 7.00 5.50 6.73 5.00
Total Aptitude 5.72 6.65 6.17 4.86 5.95 5.00
Post-Test(Mean Stanines)
Listening 5.11 4.78 5.57 4.64 6.12 5.00
Reading 4.91 5.18 6.04 4.25 6.56 5.00
Final Grade(Mean Grade) 2.67* 2.40 2.13 2.56 2.17
*(N-46)
6 I.e., differences may all be chance differences.
12
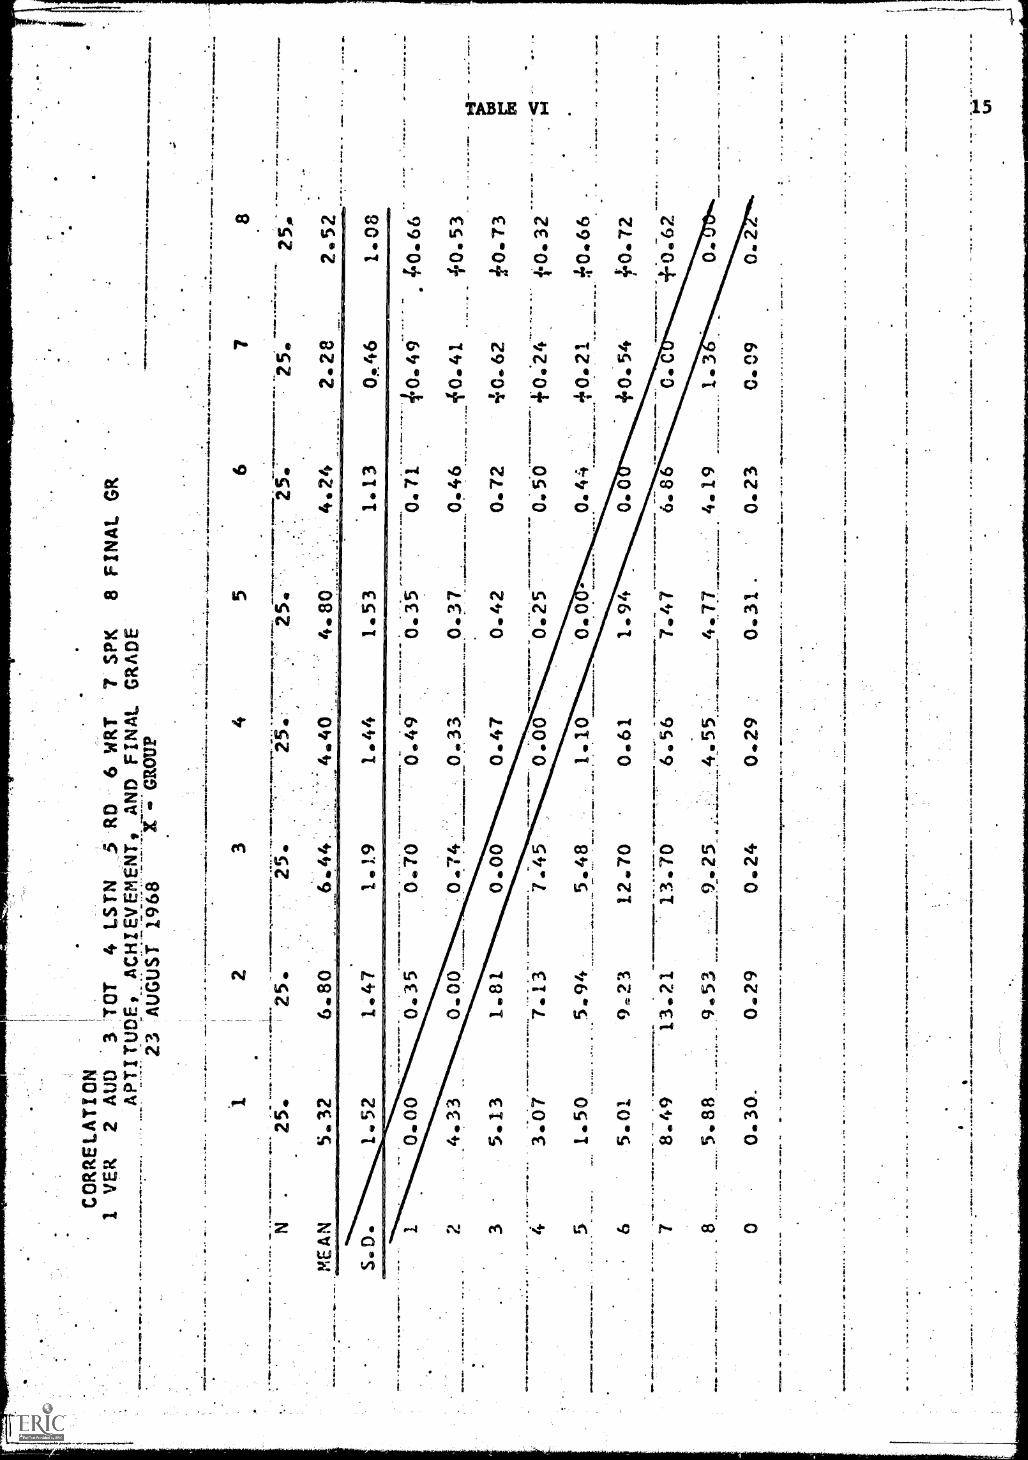
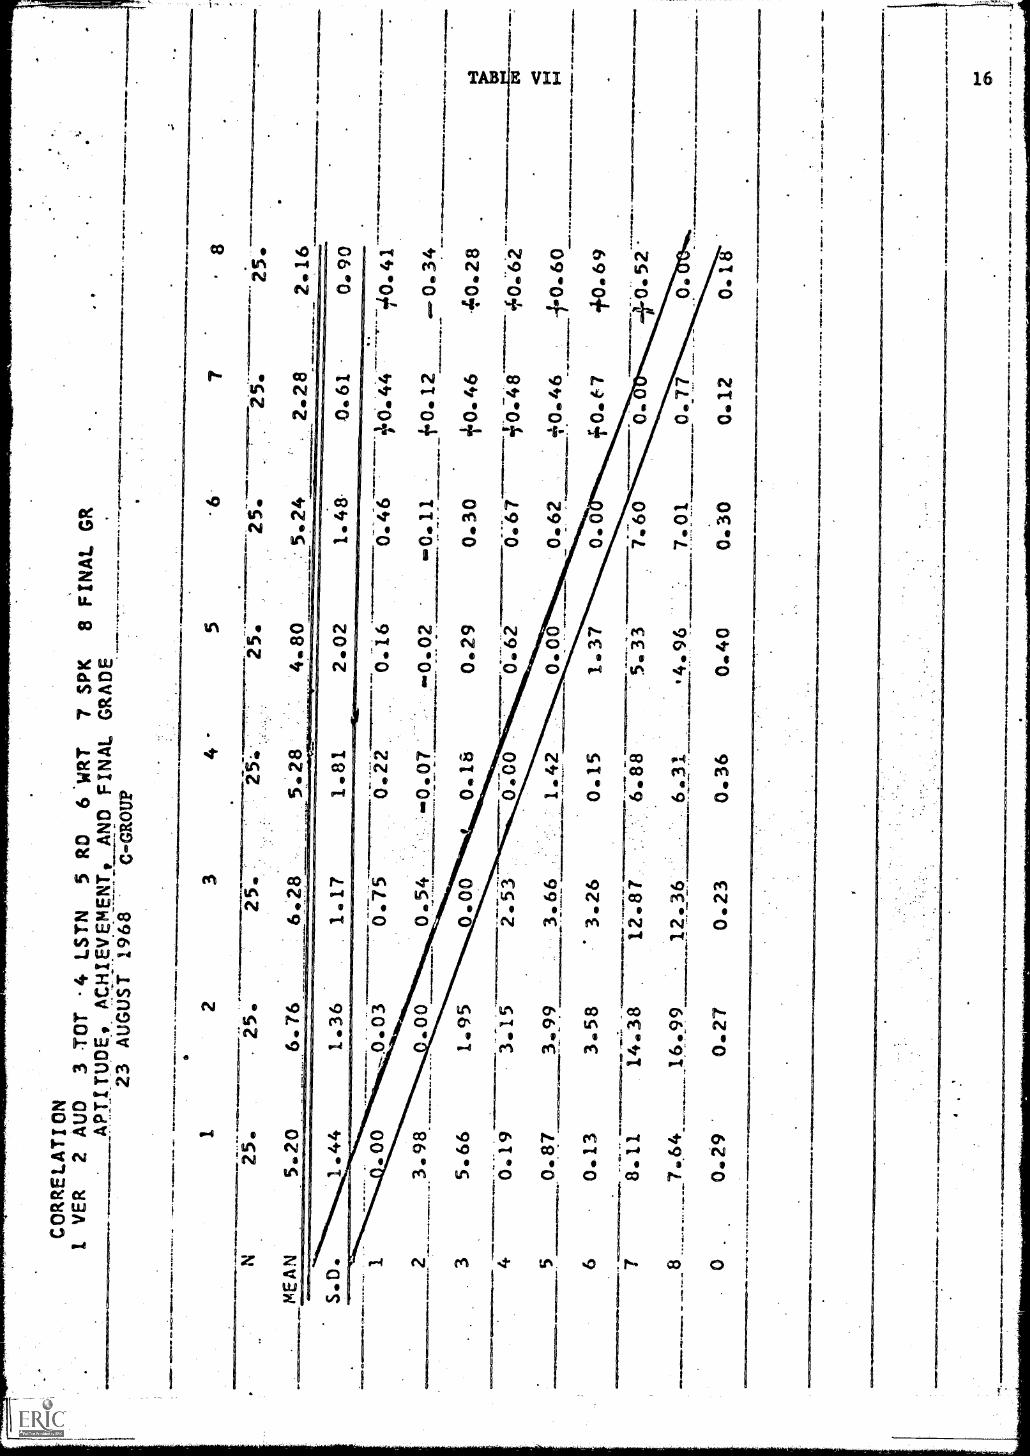
Correlation of Means, Separate, Groups
Table VI shows the correlations between aptitudes, proficiencies,
and final grades for the X-Group. Table VII shows the correlations for
tree C-Group.
The numbers from 1 to 8 running along the left-hand margin and along
the top of the columns correspond to these factors:
1 - Verbal Language Aptitude
2 - Auditory Language Aptitude
3 - Total Language Aptitude
4 - Listening Proficiency
5 Reading Proficiency
6 - Writing Proficiency
(The means of the above are expressed in Stanines.)
7 - Speaking Proficiency -- the mean is based upon the scale:
1 - good, 2 - fair, 3 - poor.
8 - Final Grade the mean is based upon the scale as used in
Tucson Public Schools.
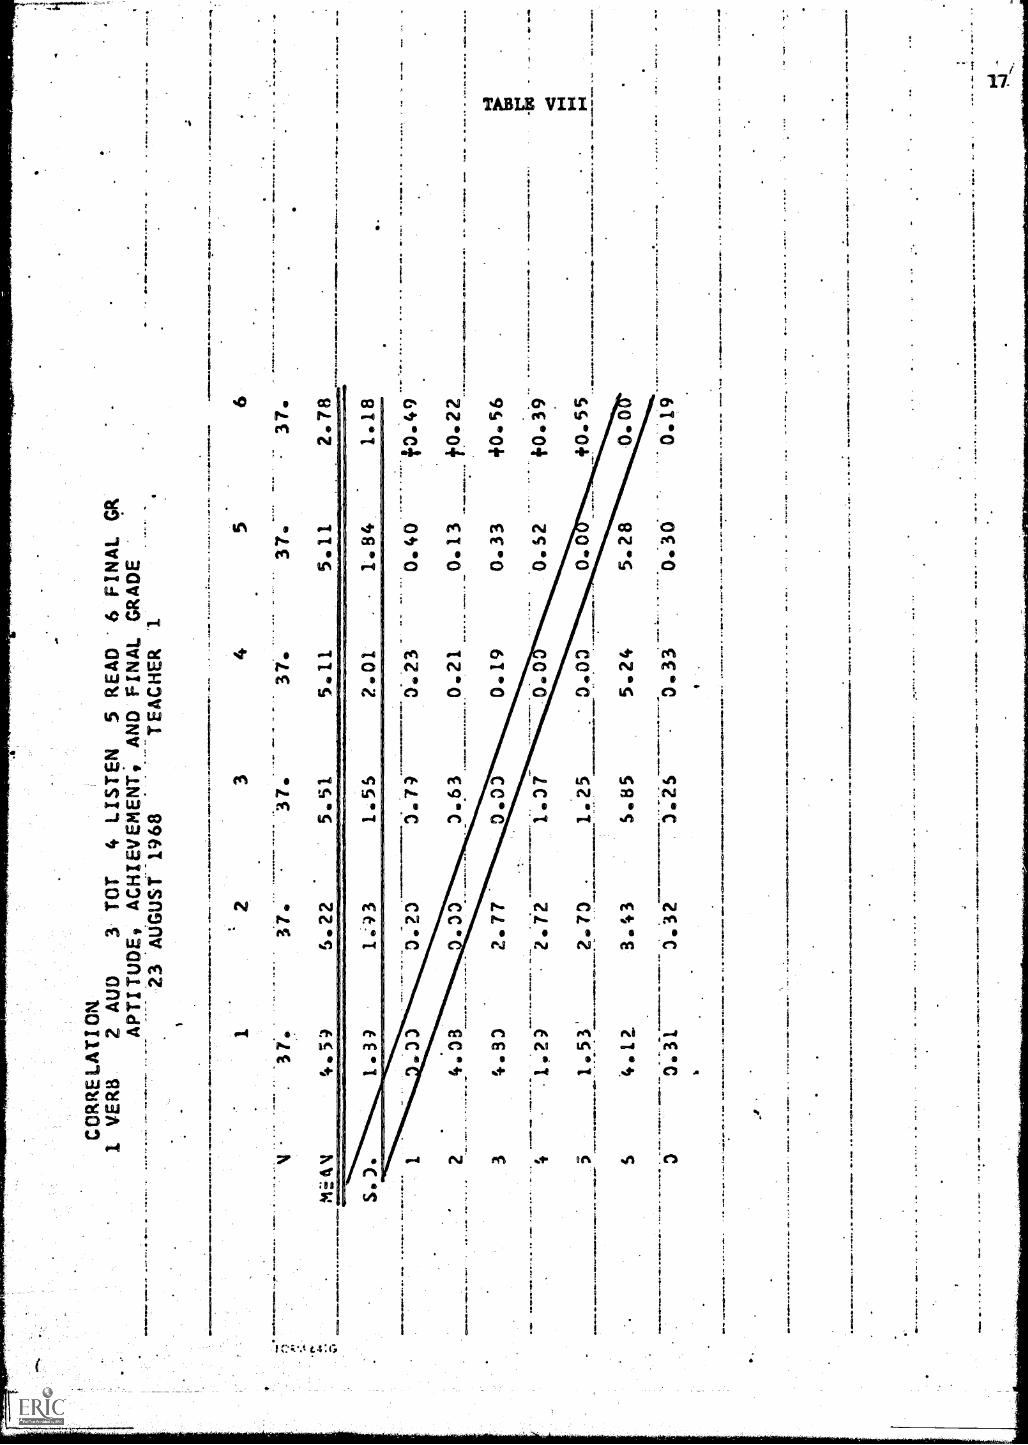
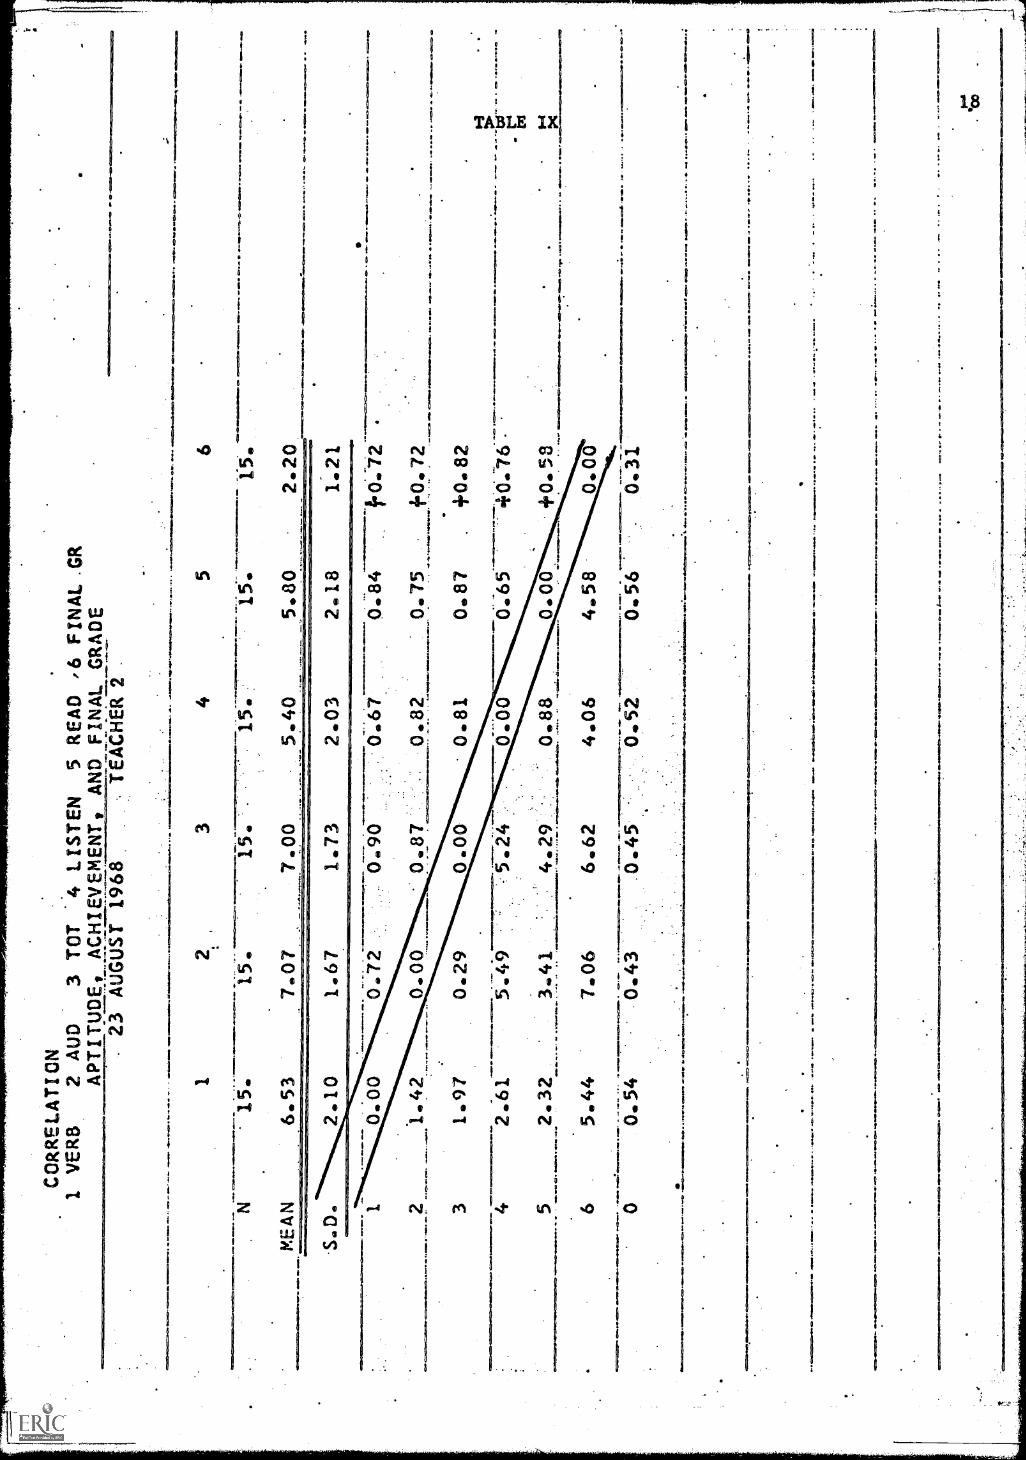
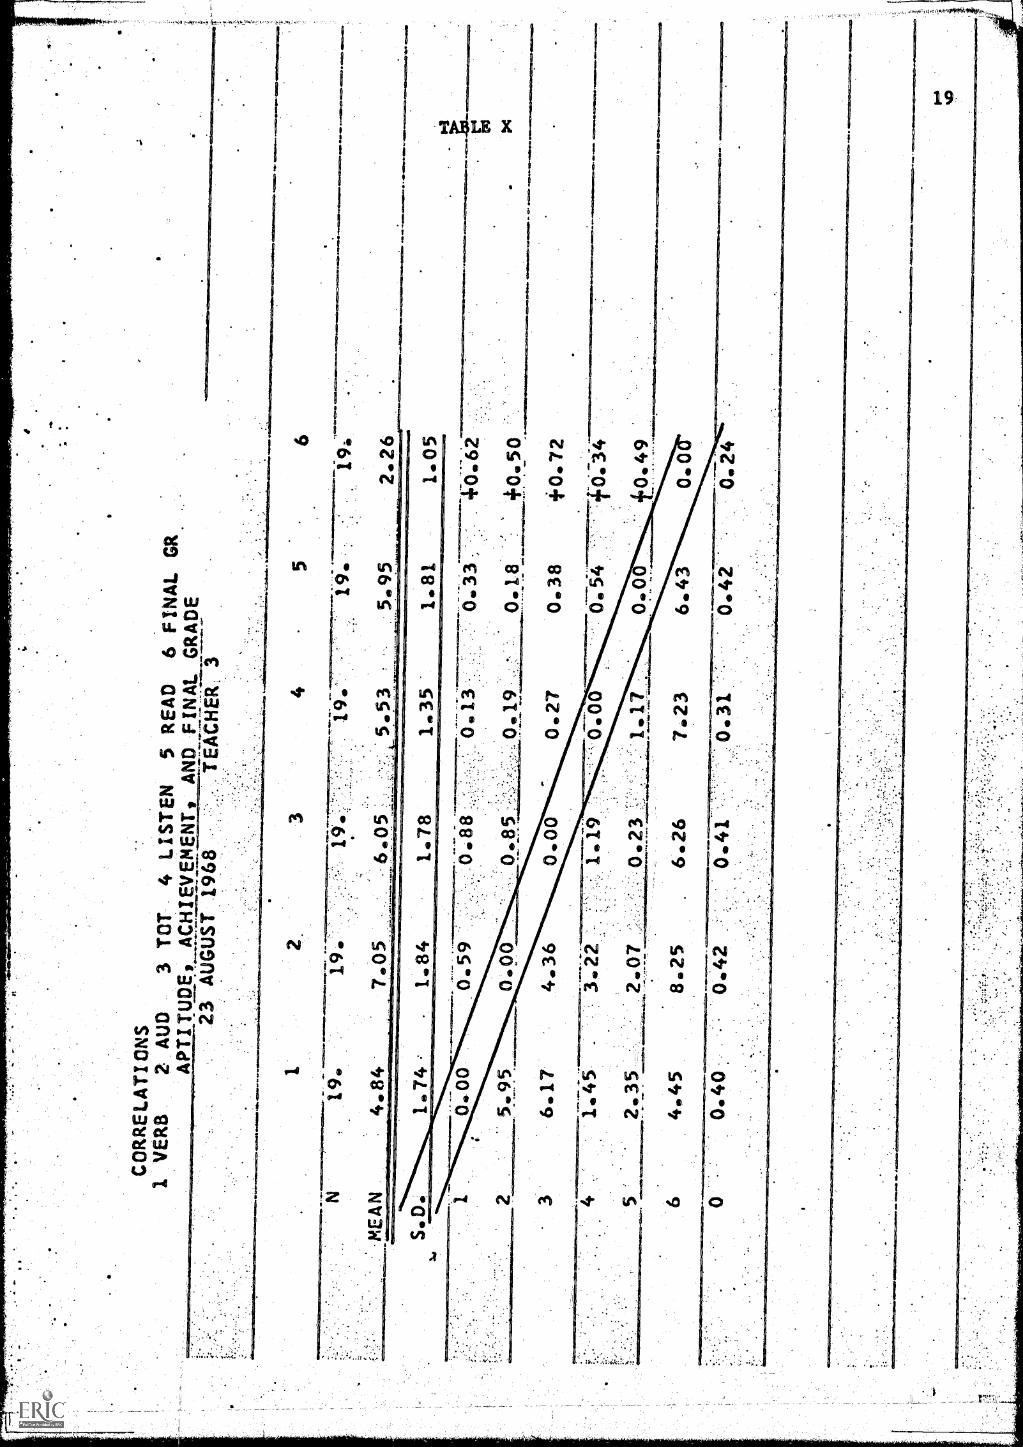
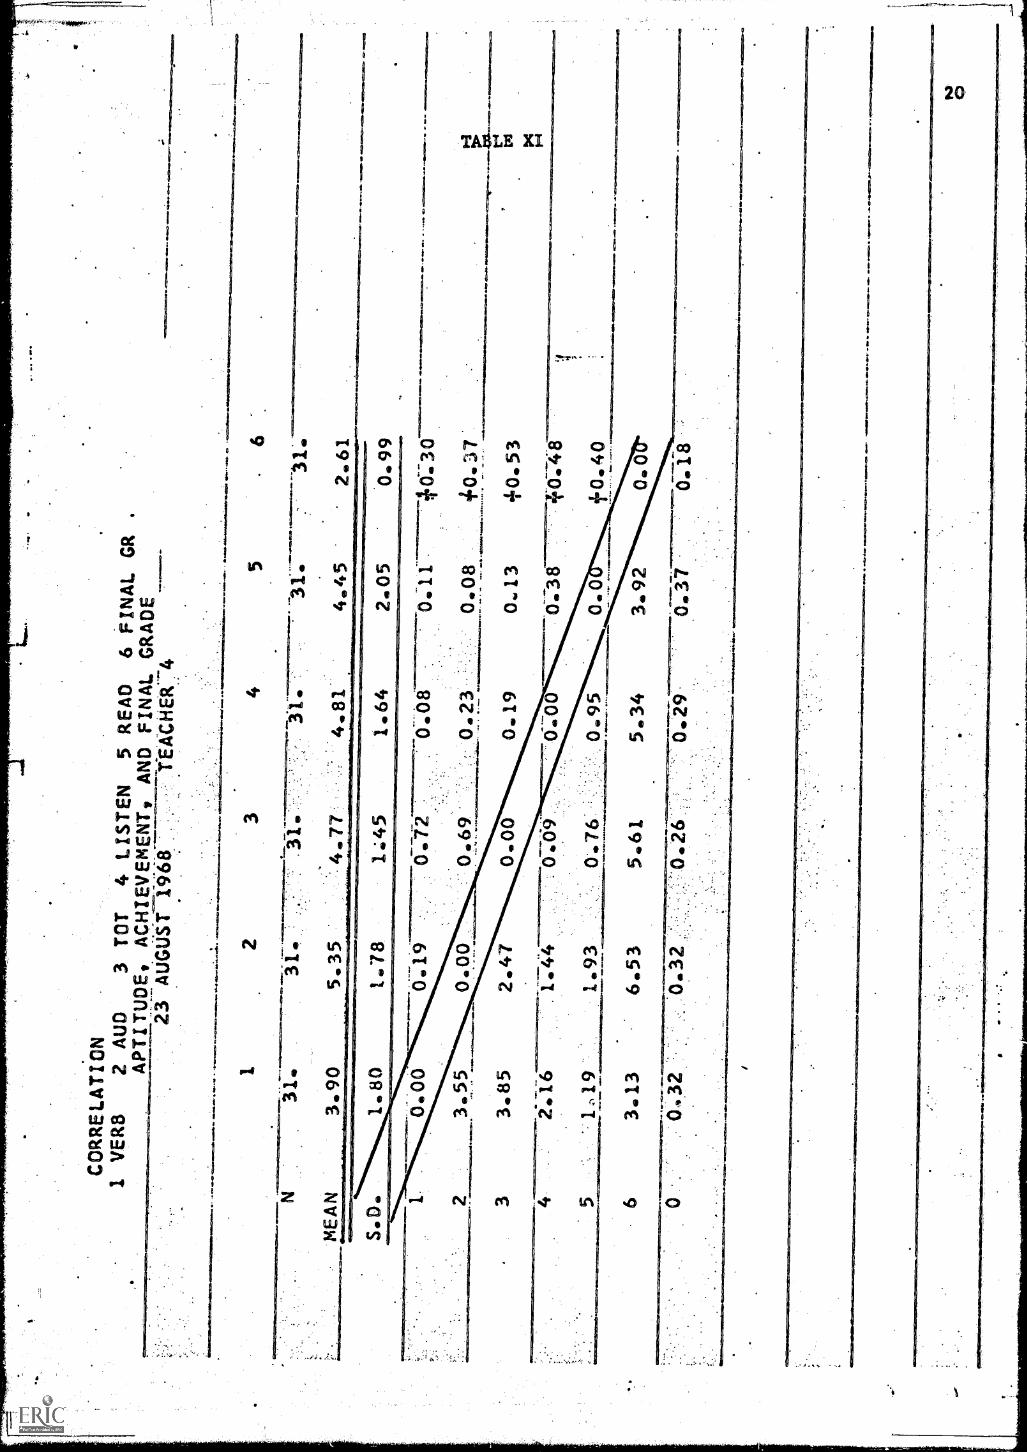
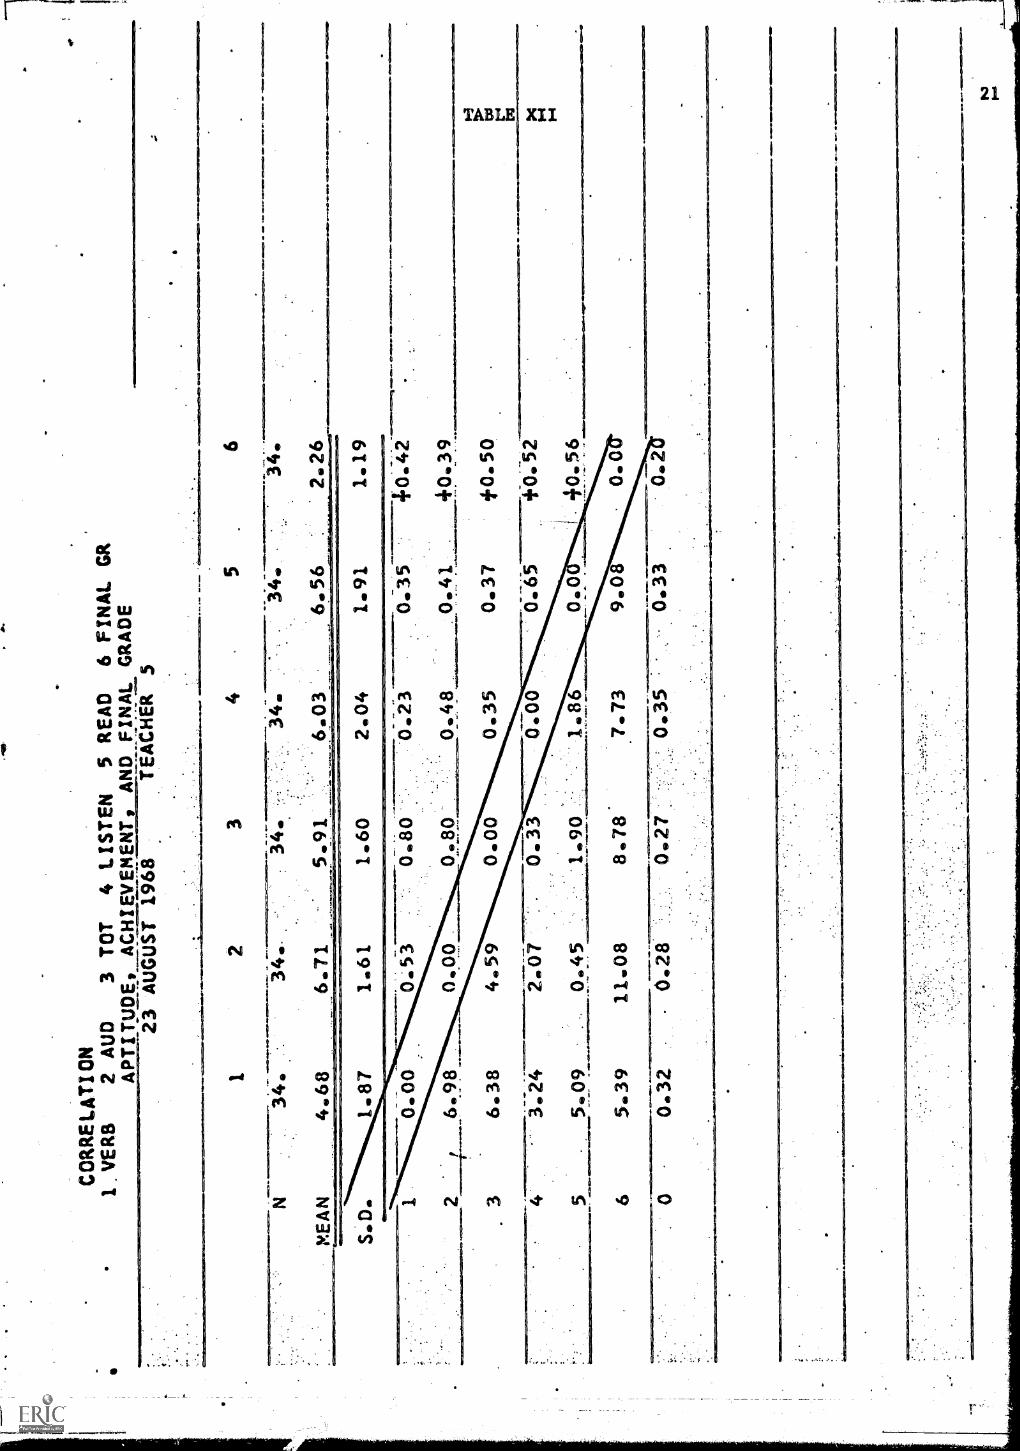
Tables VIII to XII show the correlations for the separate teacher
groups, excluding from the N those students who are in the X- or C-Groups.
to find a correlation, e.g. for that between total language aptitude
and final grade, read across from 3 (Total) to 8 (Final Grade) on Tables VI
and VII, and from 3 (Total) to 6 (Final Grade) on Tables VIII - XII.
Coefficients of correlation ranging from zero to about .20 may be
regarded as indicating no or negligible correlation.
Coefficients of correlation ranging from about .20 to .40 may be
regarded as indicating a low degree, of correlation.
Coefficients of correlation ranging from about .40 to .60 may be
regarded as indicating a moderate degree, of correlation.
13
Coefficients of correlation ranging from about .60 to .80 may be
regarded as indicating a marked &gree of correlation,
Coefficients of correlation ranging from about .80 to 1.00 may be
regarded as indicating MO correlation. (From A Primer of Statistics,
Franzblau, p. 81.)
As can be seen from the tables, there are many significant positive
relationships between the factors.
It must be emphasized, however, that no conclusions are to be drawn
from this information.
14
-C
OR
RE
LAT
ION
1 V
ER
2 A
U[)
3 !T
OT
4 LS
TN
RO
6 `A
RT
7 S
PK
.8
FIN
AL
GR
APT
ITU
DE
,A
CH
IEV
EM
EN
T, A
ND
FIN
AL
GR
AD
E23
'AU
GU
ST
2
N.
25.
25.
5.32
6.80
1.47
0.00
0.35
24.
330
00
1968
XG
RO
UP
34
5
25.E
25. -
6.44
.4.40.
4.80
4.24
1.1.
91.
441.
531.
13
0.70
0.49
0.71
00.
46
8
25.
25,
2.28
2.52
0.46
1.08
40.4
9ir.
O. 6
6
40.4
1+
0.53
35.
131.
810.
000.
470.
420.
724
0. 6
2+
0.73
....
.... .
. ..
. . .
...-
.4
3.07
7.13
7.45
0.00
0.25
0.50
+0.
241.
0.32-
1.50
5.94
5.48
...,
110
0.0
0.44
+0.
21+
0.66
-
65.
019.
2312
.70
0.61
1.94
0.0
s+
0.54
*0.7
2...
..._
.....
....
..4T
/Wex
e dn
. ..I
.
8.49
13.2
113
.70
6.56
7.47
6.86
0.0
+0.
629.
5310
. 0
Cin
.9.
25an
-it.
5 5
4.77
4.19
1.3
0.29
0.31
.0.
230.
09
26: 5
.
85.
88
O0.
30.
0.29
0.24
I
...E
lm.
0.2
311:
46...
..
10--
CO
RR
ELA
TIO
N1.
VE
R2
AU
D3
TO
T4
LST
N5
RD
6 .W
RT
7 S
PK
8 F
INA
L G
RA
PT
ITU
DE
,A
CH
IEV
EM
EN
T, A
ND
FIN
AL
GR
AD
E23
AU
GU
ST
196
8C-GROUP
12
25.
25.
5.20
6.76
3
6.28
45
5.28
00.0
30.
750.
22
<0M
=C
:150
,21=
..}00
/1 E
.12.
114:
3 4 5 6 7 8 0.
3.98
.00
0.54. .
-0.0
75.66
1.95
0.00
0.18
0.19
3.15
2.53
0.00
0.87
3.99
3.66
1.42
0.13
3.58
3.26
0.15
8.11
14.3
812
.87
7.64
16.9
912
.36
0.29
0.27
0.23
6.88
6.31
0.36
25.-
---
.80
25.
5.24
1.48
0.16
0.46
0.02
X0.11
0.29
0.30
0.62
0.67
0.00
0.62
1.37
0.0
5.33
7.60
'4.96
.7.01
0.40
0.30
7
25.
2.28
.0.6
1
.8
2.16
0.90 ,
+0.
44-
-740
0 41
f0.12
0.34
+0.
46-4
0.28
.
40.4
8+0.62
+0.46_
4.'0.60
+0.
69
10
0.77
0.12
0.18
1pri
e*.a
=a
1.17
CORRELATION
1 VERB
2 AUD
3 TOT
4 LISTEN
5 READ
6 FINAL GR
APTITUDE, ACHIEVEMENT, AND FINAL GRADE
23 AUGUST 1968
TEACHER 1
ti
4.54 33
24.03
34.83
1,2)
51,53'
0.31
2
37.
6.22
3
37.
5.51
37.
5.11
1.43
1.55
2.01
0.23
0.73
3.74-
0.33
3.63
0.21
2.77
0.03
0.19
-
2.72
1.37
0.0
2.73
1.25
.*0.00
3.43
5.85
5.24
3.32
3.25
0.33
5
37.
5.11
37.
2.78
1.84
1.18
0.40
f0.49
_0.13
f0.22
0.33
+0.56
0.52
+0.39
0.0.
+0.55
5.28
0.0
0.36
0.19
CO
RR
ELA
TIO
N1
VE
RB
2 A
UD
3 T
OT
4 LI
ST
EN
5 R
EA
D ,6
FIN
AL
.GR
AP
TIT
UD
E, A
CH
IEV
EM
EN
T, A
ND
FIN
AL
GR
AD
E23
AU
GU
ST
196
8T
EA
CH
ER
2
0.1.
1.9.
10.1
0
1
ebba
laN
YO
ME
Nel
iolo
oaem
el..
23
45
.....m
...e.
.e./C
Gso
raga
gyea
..ow
eaM
gAna
ud.
6
N15
.15
.15
.-
ME
AN
6.53
7.07
7.00
5.40
5.80
2.20
S.D
.2.
101.
671.
732.
032.
181.
21
0.00
0.72
.0.
90.
0.67
0.84
f.0.7
2
21.
420.
000.
87.1
0.8
20.
75+
.0.7
2
31.
970.
290.
000.
81.
0.87
+0.
82
42.
615.
490.
0040
;76
52.
323.
41.
4.29
.:.*
0.88
0.00
+0.
53
65.
447.
066.
624.
064.
580.
00
00.
54.0
.0.4
3.0
450.
52--
--0.
560.
31
..
.....
.0/
0,5.
ER
...w
ife/
....
.01.
410.
...4
..7.9
50¢S
ma
....w
ao..1
=1W
.ac
tE
N...
MO
O..
..mp.
..pol
.:.:
0.0
..
moN
c....
...11
111.
1.1
,acs
a-ec
aNC
ZB
e0=
=1.
.ISS
IT.
.ow
e.0
0.1=
.1.
1.aa
.!co
CO
RR
ELA
TIO
NS
1 V
ER
B2
AU
D3
TO
T4
L I S
TE
N5
RE
AD
6 F
INA
L G
RA
PT
I TU
DE
, AC
HIE
VE
ME
NT
,A
ND
FIN
AL
GR
AD
E23
AU
GU
ST
196
8T
EA
CH
ER
.
ME
AN
1
19,
4 84
19.
7.05
34
56
19.
.19
196
6.0
5.53
5,95
2.26
1.78
1.35
1.81
1.05
.88
.85
36.
174.
360.
00
1,45
3.22
.19
52.
352.
070.
23 .
.:'1
.17
0.00
4.45
.
8.25
6.26
7.23
6.43
0.0
0.40
0,42
0.42
.0.
24
0.13
.0.
33:
4.0.
62
0.19
0.18
+0.
50
.....=
.="0
1.11
1W.O
.R.G
GE
MII
MB
0.27 00
0.38
0.54
+0.
72
+0.
34
+0.
49
Wie
rmeo
lia.
coar
ozzo
.t.,.
4.2.
20 0
0.1
1...1
11.1
11.
..0.0
.24I
/Mcm
cp. m
ew
Ers
.c.a
.
CO
RR
ELA
TIO
N1
VE
RB
2 A
UD
3 T
OT
4 LI
ST
EN
5 R
EA
D6
FIN
AL
GR
.
AP
TIT
UD
E, A
CH
IEV
EM
EN
T, A
ND
FIN
AL
GR
AD
E
N
ME
AN
23 A
UG
US
T 1
968
6T-E
AC
HE
R-4
1
31.
3.90
2
31.
5.35
1.78
3
4.77
31.
4.81
1,45
1.64
0.00
0.19
23.
550.
0ca
omm
umaa
ve-=
.
33.
85
2.16
51,
19
2.47
1.44
1.93
63.
136.
53
00,
326:
32
0.72
0.08
0.69
0.23
...--
......
......
....
0.00
0.19
0709
0.00
0.76
0.95
Cf.
/ MC
I
1CO
MeW
fma
.=...
....a
c:...
e....
...-
-5
6
...W
.M
I.
4.65
2.61
.4.e
Wai
ft=
....s
a az
,
2.05
0.99
0.11
+0.
30
0.08
+0.
37Px
.F
Y M
IC 1
0.13
+0.
53Li fr+
-0.3
8+
0.48
0+
0.40
- .-
......
......
.
5,61
5.34
3.92
0.0
0.26
29'
0.37
0.18
= 1
.1,1
0.71
0 MaL
.1
.LP
.0:
=m
Wm
a37.
S
CORRELATION
1. VERB
2 AUD
3 TOT
4 LISTEN
5 READ
6 FINAL GR
APTITUDE* ACHIEVEMENT, AND FINAL GRADE
23 AUGUST 1968
TEACHER 5
1
N34.
MEAN
4.68
2
6.71
S.D.
1.61
0.00
0:53
21
6.98
.0.00.
.3
6.38
4.59
43.24
2.07
5-.
5.09
'
0.45
65.39
11.08
34
34.
5.91
34.
6.03
1.60
2.04
0.80'
.'0.23
0.80-
0.48.
0.00
0.35
0.33
0.00
1.90
1.86
8.78
7.73
0.32
-0.28
0.27
0.35
5
34,
6.56
1.91
OM
ED
MM
E11
=11
.11:
Se.
0.0.
..... 6
34.
2.26
1.19
.
,0.35,40.42
.0.41
.40.39
0.37
+0.50
0.65
+0.52
0.0
0.56
9.08
0.0
NM
> 1
1:...
+M
ON
.A
leim
.lb
edam
ob.
...-a
rmow
-
1.
......
m1.
672.
1.61
0121
1111
311.
411=
MC
NI.D
.
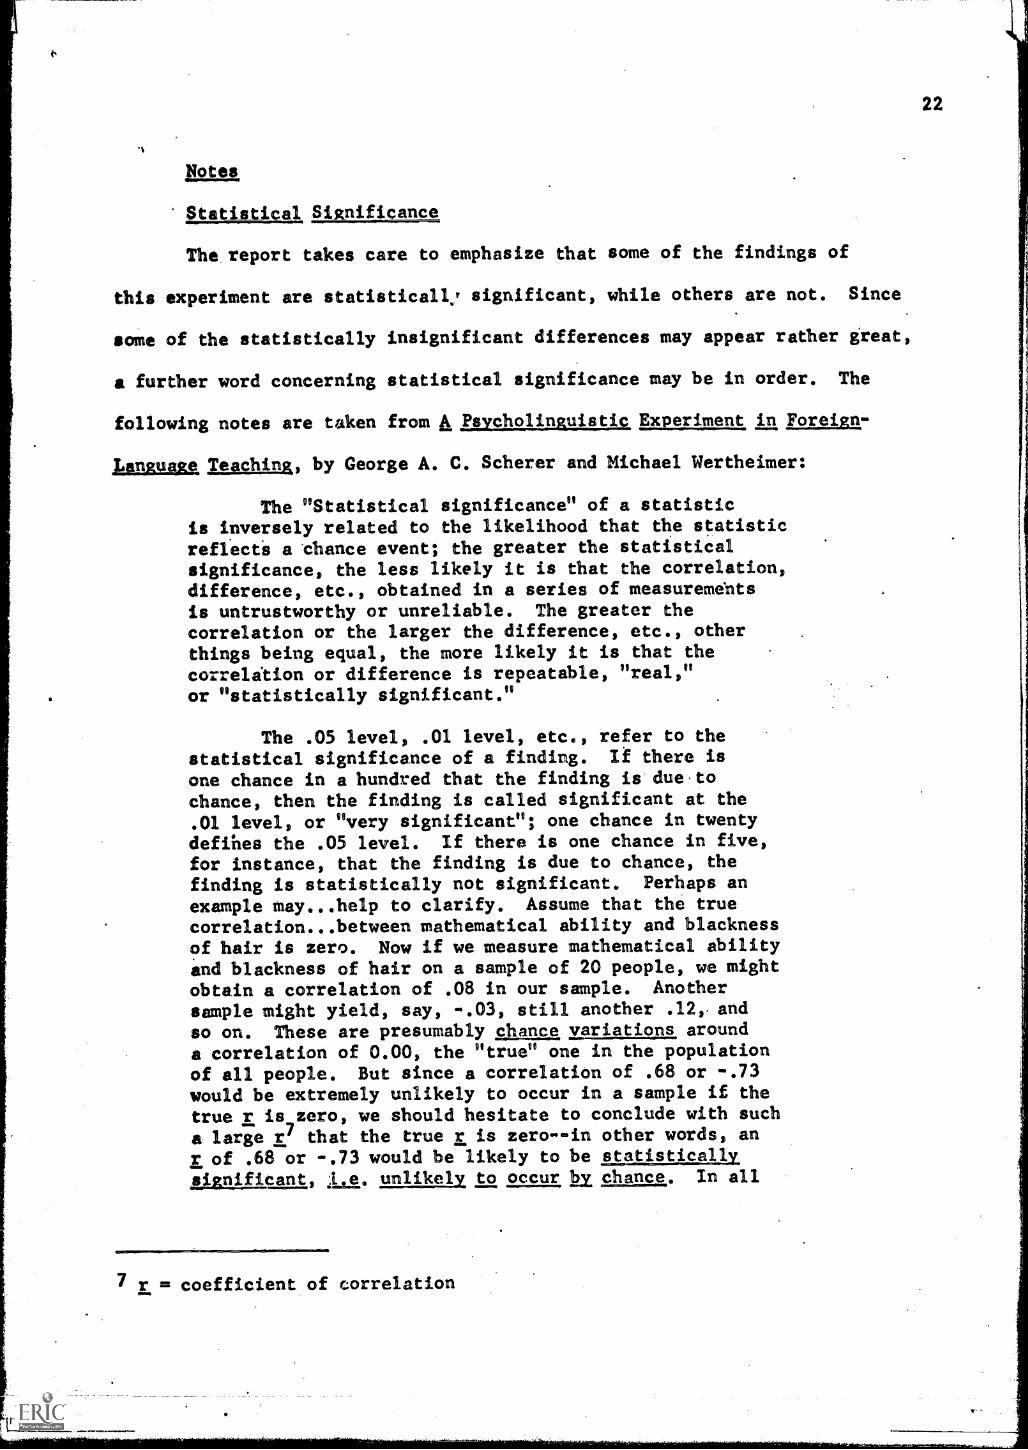
Notes
Statistical Significance
The report takes care to emphasize that some of the findings of
this experiment are statisticall significant, while others are not. Since
some of the statistically insignificant differences may appear rather great,
a further word concerning statistical significance may be in order. The
following notes are taken from A Psycholineuistic Experiment in Foreign:.
Language, Teaching, by George A. C. Scherer and Michael Wertheimer:
The "Statistical significance" of a statisticis inversely related to the likelihood that the statisticreflecti a chance event; the greater the statisticalsignificance, the less likely it is that the correlation,difference, etc., obtained in a series of measurementsis untrustworthy or unreliable. The greater thecorrelation or the larger the difference, etc., otherthings being equal, the more likely it is that thecorrelition or difference is repeatable, "real,"or "statistically significant."
The .05 level, .01 level, etc., refer to thestatistical significance of a finding. If there isone chance in a hundred that the finding is due tochance, then the finding is called significant at the.01 level, or "very significant"; one chance in twentydefihes the .05 level. If there is one chance in five,for instance, that the finding is due to chance, thefinding is statistically not significant. Perhaps an
example may...help to clarify. Assume that the truecorrelation...between mathematical ability and blacknessof hair is zero. Now if we measure mathematical abilityand blackness of hair on a sample of 20 people, we mightobtain a correlation of .08 in our sample. Anothersample might yield, say, -.03, still another .12,. andso on. These are presumably chance variations arounda correlation of 0.00, the "true" one in the population
of all people. But since a correlation of .68 or -.73would be extremely unlikely to occur in a sample if thetrue r is zero, we should hesitate to conclude with such
a large r7 that the true r is zero--in other words, anr of .68 or -.73 would be likely to be statisticallysignificant, ;I.e. unliktlx to occur ky chance. In all
7 r = coefficient of correlation
22
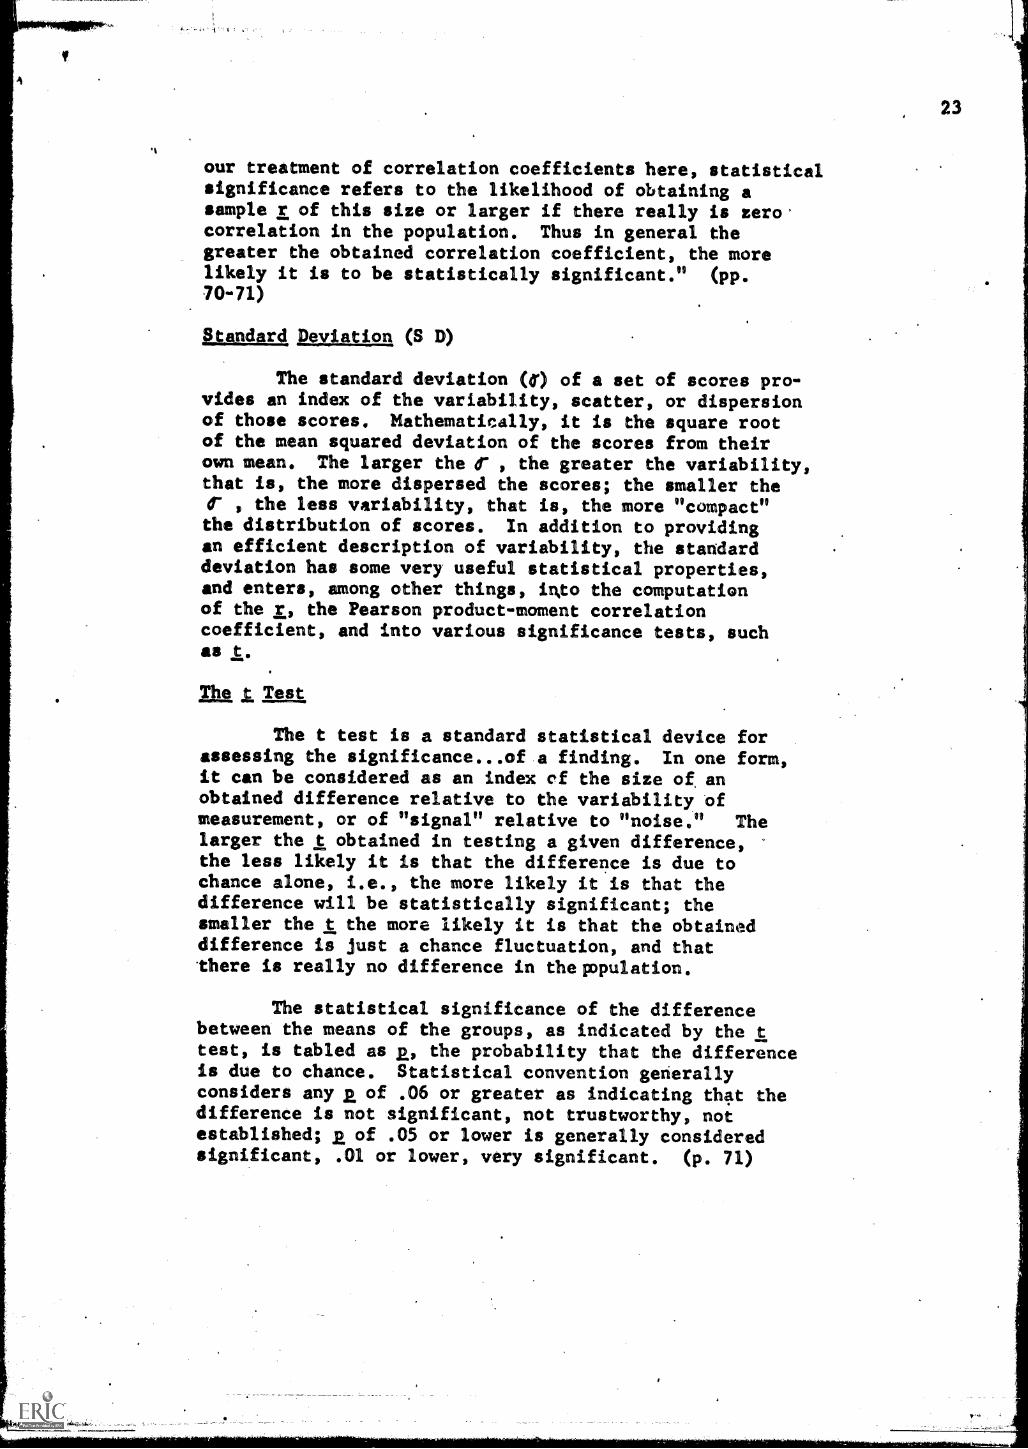
our treatment of correlation coefficients here, statisticalsignificance refers to the likelihood of obtaining asample r of this size or larger if there really is zerocorrelation in the population. Thus in general thegreater the obtained correlation coefficient, the morelikely it is to be statistically significant." (pp.70-71)
Standard Deviation (S D)
The standard deviation (() of a set of scores pro-vides an index of the variability, scatter, or dispersionof those scores. Mathematically, it is the square rootof the mean squared deviation of the scores from theirown mean. The larger the f , the greater the variability,that is, the more dispersed the scores; the smaller the
, the less variability, that is, the more "compact"the distribution of scores. In addition to providingan efficient description of variability, the standarddeviation has some very useful statistical properties,and enters, among other things, into the computationof the r, the Pearson product-moment correlationcoefficient, and into various significance tests, suchas t.
The t Test
The t test is a standard statistical device forassessing the significance of a finding. In one form,it can be considered as an index cf the size of anobtained difference relative to the variability ofmeasurement, or of "signal" relative to "noise." Thelarger the t obtained in testing a given difference,the less likely it is that the difference is due tochance alone, i.e., the more likely it is that thedifference will be statistically significant; thesmaller the t the more likely it is that the obtaineddifference is just a chance fluctuation, and thatthere is really no difference in thelopulation.
The statistical significance of the differencebetween the means of the groups, as indicated by the ttest, is tabled as the probability that the differenceis due to chance. Statistical convention generallyconsiders any 2, of .06 or greater as indicating that thedifference is not significant, not trustworthy, notestablished; 2 of .05 or lower is generally consideredsignificant, .01 or lower, very significant. (p. 71)
23