document of the world bankdocuments.worldbank.org/.../pdf/432750pjpr0br010p1028180box033… ·...
TRANSCRIPT

Document of The World Bank
FOR OFFICIAL USE ONLY
Report No.: 43275-BR
PROJECT PAPER
ON A
PROPOSED ADDITIONAL FINANCING LOAN
IN THE AMOUNT OF US$71.5 MILLION EQUIVALENT
TO THE
STATE OF ESPIRITO SANTO
GUARANTEED BY THE FEDERATIVE REPUBLIC OF BRAZIL
FOR THE
ESPIRITO SANTO WATER AND COASTAL POLLUTION MANAGEMENT PROJECT
“PROJETO ÁGUAS LIMPAS II”
January 14, 2009 Sustainable Development Department Brazil Country Management Unit Latin America and Caribbean Regional Office
This document has a restricted distribution and may be used by recipients only in the performance of their official duties. Its contents may not otherwise be disclosed without World Bank authorization.
Pub
lic D
iscl
osur
e A
utho
rized
Pub
lic D
iscl
osur
e A
utho
rized
Pub
lic D
iscl
osur
e A
utho
rized
Pub
lic D
iscl
osur
e A
utho
rized
Pub
lic D
iscl
osur
e A
utho
rized
Pub
lic D
iscl
osur
e A
utho
rized
Pub
lic D
iscl
osur
e A
utho
rized
Pub
lic D
iscl
osur
e A
utho
rized
CURRENCY EQUIVALENTS (Exchange Rate Effective as of December 31, 2008)
Currency Unit = Real ($R) R$2.34 = US$1.00
GOVERNMENT FISCAL YEAR
January 1-December 31
WEIGHTS AND MEASURES Metric System
ABBREVIATIONS AND ACRONYMS
CAS Country Assistance Strategy CESAN State Water Company of Espírito Santo DA Designated Account EIB European Investment Bank EIA Environmental Impact Assessment EMP Environmental Management Plan ERR Economic Rate of Return FIRR Financial Internal of Rate of Return FM Financial Management GEF Global Environmental Facility IBRD The International Bank for Reconstruction and Development ICR Implementation Completion Report IEMA State Institute for the Environment and Water Resources IGPM Market Price General Index (Índice Geral de Preços do Mercado) IPHAN Brazilian National Institute for the Preservation of the Historical and Artistic Patrimony INCC Civil Construction National Index (Índice Nacional da Construção Civil) IP Implementation Progress IPC Consumer Price Index ISDS Integrated Safeguard Data Sheet MRGV Metropolitan Region of Grande Vitória OPRC Operations Procurement Review Committee PAC Programa de Aceleração do Crescimento PDO Project Development Objectives SEAIN Secretariat of International Affairs, Ministry of Planning SEAMA State Secretariat for the Environment and Water Resources SEDES State Secretariat of Development SEDUR State Secretariat of Water Supply and Sanitation, Housing and Urban Development SEFAZ State Secretariat of Finance SEPLOG State Secretariat of Planning, Budget and Management SOEs Statements of Expenditures STN National Treasury Secretariat UGP Project Management Unit WRM Water Resources Management WTPs Wastewater Treatment Plants
Vice President: Pamela Cox Country Director: Makhtar Diop Sector Director: Laura Tuck Sector Manager: Guang Zhe Chen Task Team Leader/Task Manager: Carlos E. Velez
This document has a restricted distribution and may be used by recipients only in the performance of their official duties. Its contents may not otherwise be disclosed without World Bank authorization.

FOR OFFICIAL USE ONLY
This document has a restricted distribution and may be used by recipients only in the performance of their official duties. Its contents may not be otherwise disclosed without World Bank authorization.
ii
BRAZIL ADDITIONAL FINANCING FOR THE ESPIRITO SANTO WATER AND COASTAL
POLLUTION MANAGEMENT PROJECT
TABLE OF CONTENTS
I INTRODUCTION ...........................................................................................................................1
II BACKGROUND AND RATIONALE FOR ADDITIONAL FINANCING …………………..1
PROJECT DEVELOPMENT OBJECTIVES (PDO)…………………………………………………….3
PROJECT ACHIEVEMENTS TO DATE……………………………………………………………...…3
JUSTIFICATION FOR ADDITIONAL FINANCING……………………………………………………5
III PROPOSED CHANGES …………………………………………………………………………6
PROJECT DESIGN ……………………………………………………………………………………. 6
PROJECT COSTS AND FINANCING PLAN……………………………………………………………7
INSTITUTIONAL ARRANGEMENTS ……………………………………….………………………….8
PROCUREMENT ……………………………………………………………………………………….8
FINANCIAL MANAGEMENT, FINANCIAL REPORTS AND AUDITING…………………………9
DISBURSEMENT ARRANGEMENTS …………..………………………………………………………9
CLOSING DATE AND IMPLEMENTATION SCHEDULE …….………………………….………….10
IV CONSISTENCY WITH COUNTRY ASSISTANCE STRATEGY …………………….……10
V APPRAISAL OF SCALED-UP PROJECT ACTIVITIES …………….……………………..11
ECONOMIC AND FINANCIAL ANALYSES...........................................................................................11
FINANCIAL ANALYSIS OF CESAN.......................................................................................................11
TECHNICAL ASSESSMENT...................................................................................................................12
FIDUCIARY ASSESSMENT....................................................................................................................12
ENVIRONMENTAL SAFEGUARDS.......................................................................................................12
VI EXPECTED OUTCOMES............................................................................................................13
VII BENEFITS AND RISKS ..............................................................................................................13
VIII FINANCIAL TERMS AND CONDITIONS FOR THE ADDITIONAL FINANCING …....14
ANNEX 1: PROJECT COSTS AND FINANCING SOURCES (US$ MILLION) ……………...……15
ANNEX 2: COST BENEFIT ANALYSIS ……………………………………………………………….17
ANNEX 3: FINANCIAL ANALYSIS OF CESAN …………………………………………………....25
ANNEX 4: ENVIRONMENTAL ASSESSMENT – EXECUTIVE SUMMARY …….……….………33


iii
BRAZIL ADDITIONAL FINANCING FOR THE ESPIRITO SANTO WATER &
COASTAL POLLUTION MANAGEMENT PROJECT
PROJECT PAPER DATA SHEET
LATIN AMERICA AND CARIBBEAN REGION
LCSUW
Date: January 14, 2009 Team Leader: Carlos E. Velez Country Director: Makhtar Diop Sector Director: Laura Tuck Sector Manager: Guang Zhe Chen Project ID: P102818 Lending Instrument: Specific Investment Loan
Sectors: Sewerage (80%); Water Supply (20%) Themes: Access to urban services and housing (P); Pollution management and environmental health (P) Environmental screening category: Partial Assessment
Borrower: State of Espírito Santo Responsible Agency: CESAN and SEAMA/IEMA
Estimated disbursements (Bank FY/US$ million) FY 2009 2010 2011 2012 Annual 14.0 22.0 18.0 17.5 Cumulative 14.0 36.0 54.0 71.5
Current Closing Date: June 30, 2009 Revised Closing Date: June 30, 2012
Does the restructured or scaled-up project require any exceptions from Bank Policies?
[ ]Yes [X] No
Have these been approved by Bank management? Is approval for any policy exception sought from the Board?
[ ]Yes [ ] No [ ]Yes [X] No
Have the project development objectives/outcomes been revised? [ ]Yes [X] No Does the scaled-up or restructured project trigger any new safeguard policies? [ ]Yes [X] No
For Additional Financing [X] Loan [ ] Credit [ ] Grant [ ] Guarantee For Loans/Credits/Others:
Total Bank financing (US$ million): 71.50 Proposed terms: USD denominated IBRD Flexible Loan with a fixed spread, commitment linked, with three-year Grace Period and 30 year Final Maturity, with a capitalized Front-end Fee.
Financing Plan (US$ million) Source Local Foreign Total
Borrower 38.50 0.00 38.50 International Bank for Reconstruction and Development
71.50 0.00 71.50
Total: 110.00 0.00 110.00


1
BRAZIL ESPIRITO SANTO WATER AND COASTAL POLLUTION MANAGEMENT PROJECT –
“PROJETO ÁGUAS LIMPAS II”
ADDITIONAL FINANCING I. Introduction 1. This Project Paper seeks the approval of the Executive Directors to provide an additional loan in an amount of $71.5 million to the State of Espírito Santo, Brazil for the Espírito Santo Water and Costal Pollution Management Project – Projeto Águas Limpas II (ID P087711, Loan 7248-BR). The proposed additional loan would complement the current $36 million loan and help finance the costs associated with a financing gap caused primarily by the devaluation of the US$ in relation to the Brazilian Real and domestic inflation (together accounting for 81% of the additional cost), and additional costs of building the water and sewerage works. 2. The additional costs of building the water and sewerage works have resulted from design changes brought about by updated and more detailed engineering analyses, particularly: (i) the adoption of higher technical standards to better satisfy environmental concerns (including more rigorous implementation arrangements in densely urbanized areas with intense traffic and the building of sludge treatment units); (ii) the introduction of technology improvements; (iii) a larger than estimated population size in the cities targeted by the project; and (iv) bringing forward the third phase of the Mulembá sewage treatment plant. II. Background and Rationale for Additional Financing 3. World Bank engagement in assisting the State of Espírito Santo to achieve enhanced and more equitable access to water and sanitation services began in 1994 through Board approval of the Espírito Santo Water & Coastal Pollution Management Project (Loan 3767-BR). This operation was one of the pioneer Brazilian urban environmental projects prepared in the 90s that aimed to preserve and improve water quality in specific water basins while assisting low income residents in the basins’ more densely populated urban settings. The expansion of the water supply and sewerage systems of the State Water Company of Espírito Santo (CESAN) contemplated in this operation was based on the utility’s 1986 Master Plan. The water supply component aimed to: (i) increase service coverage in the State by about 2% (to 93%) by giving service access to low-income and favela populations living in the Metropolitan Region of Grande Vitória (MRGV)1, and (ii) eliminate rationing and intermittency by optimizing the operation of existing delivery systems. The sewerage component aimed to significantly increase service coverage in the State (from 11% to 43%) by collecting, intercepting, and conveying domestic wastewater (that at that time was mostly discharged without treatment into rivers, estuaries, bays
1 The MRGV comprises: (i) the municipalities included in the region formerly known as Grande Vitória (Vitória, Vila Velha, Serra, Cariacica, and Viana); and (ii) the municipality of Guarapari.

2
and coastal waters) to ten wastewater treatment plants (WTPs) to be built in various urban and rural sub-basins within the Santa Maria and Jucu water river basins. 4. The project, however, was highly ambitious and its political, institutional and operational risks were underestimated. The operation was oversized for the institutional and financial capacity of the State and CESAN at the time, particularly considering their insufficient experience with operations of this magnitude and complexity, and the generally poor governance of the State. Furthermore, a parallel loan from the European Investment Bank (EIB), which at time of appraisal was supposed to cover all or most of the State’s counterpart funding obligations, fell apart due to lack of agreement between the Federal Government and EIB. Consequently, after an efficient and diligent preparation phase and almost immediately after approval, the project ran into political problems that led to mismanagement, financial shortcomings and delays. Most sewage collection works executed under the project became stranded, without transmission or treatment systems. 5. Facing the prospect of the project closing with most works unfinished, the operation was substantially restructured in December 1999 following a request from a new State Government. Under this restructuring, the scope of project activities was reduced in line with available counterpart financing, US$54 million of loan proceeds were cancelled, and the project’s closing date was extended to allow the completion of ongoing project activities. As a result, Bank financing became limited to completing four major sewerage schemes in Grande Vitória and Guarapari and one minor scheme in Domingos Martins. The loan amendment also limited institutional strengthening measures to those already underway, eliminating the SEAMA institutional strengthening component, which had not started. In this second phase, the four major treatment plants were contracted under a comprehensive design, build and operate ("turnkey") contract, and the smaller scheme in Domingos Martins was carried out under a separate contract. After the restructuring, implementation performance improved significantly, to the point where the Bank agreed in late 2002 to reinstate a total of US$12.5 million in previously cancelled loan proceeds to complete on-going works. The restructured project was satisfactorily closed in June 2003. As reported in the project’s ICR, dated April 7, 2004, final results were consistent with the overall cost reduction agreed at restructuring. Wastewater treatment capacity built under the project was about 60% and incremental sewerage connections were 46% of appraisal targets. 6. The ongoing loan for the Espírito Santo Water & Coastal Pollution Management Project for $36 million (Loan 72480-BR) was approved by the Board in July 1, 2004 and became effective on January 11, 2005. This loan originated in a request from the incoming State Government at the end of 2003, almost immediately after its election, to restore the financing that was included in the original loan but then cancelled in 1999.2 The purpose of the operation is to recover non-operative connections (those requiring cleaning, unclogging and other corrections) and complete the works left unfinished by the original project. The present loan is scheduled to close on June 30, 2009.
2 The ongoing 2004 project was processed under the former OP 13.20, Supplemental Financing, but recorded in the Bank’s project management system as a freestanding SIL. In consultation with OPCS, it was agreed that the 2004 project could be regarded as stand-alone SIL since it was approved by the Board only after the earlier project had been completed and the ICR issued and since it met all normal SIL appraisal standards.

3
Project Development Objectives 7. The overall project objective is to enable the beneficiaries in the project area to benefit from improved quality of and access to water supply and sewerage services. The specific Project Development Objectives (PDO) are: (a) to improve the efficiency of the water supply and sewerage systems of CESAN by supporting its efforts to operate on a commercial basis with financial self-sufficiency; (b) to increase the coverage level of CESAN’s water supply and basic sanitation services (sewage collection, treatment and disposal) in the urban areas of the municipalities of the Metropolitan Region of Grande Vitória; and (c) to provide appropriate water and sanitation infrastructure in low-income urban areas of the municipalities of the Metropolitan Region of Grande Vitória. Strengthening the State’s environmental management capacity has also been a complementary purpose of the project since the approval of the original loan. Between 1994 and 2007, CESAN universalized the provision of urban water supply services and significantly increased the coverage level of urban basic sanitation services in Castelo, Iúna, São Gabriel da Palha, Nova Venecia, Conceição da Barra and other towns located in the Santa María and Jucu river basins – an objective explicitly mentioned in the 1994 World Bank water supply and sanitation loan to the State of Espírito Santo (Loan 3767-BR). 8. The Implementation Progress (IP) and the PDOs have been consistently rated Satisfactory. The $36 million loan (IBRD Loan 7248-BR) is already fully disbursed and the project is on track to meet all of its PDOs. Compliance with agreed output and outcome indicators progresses well and, in some cases, actual results already surpass agreed end-of-project targets. A larger and complementary set of 25 physical, operational, environmental, and financial indicators selected at appraisal to assist the Bank, the State Government and CESAN monitor project performance, also shows significant overall improvement. The Borrower is in compliance with the loan covenants. The covenants in the loan agreement of the ongoing project requesting the preparation of a report and on how to complete the project (section 3.05(a)) and implement its recommendations (section 3.05(b)) are no longer relevant because of the mutual understanding by the Borrower and the Bank that by carrying out the activities described in this Project Paper the original PDO will be achieved. Project Achievements to Date 9. The main project achievements are: (i) CESAN’s operational, financial and commercial recovery; (ii) the management and institutional strengthening of CESAN and the State Secretariat of the Environment and Water Resources (SEAMA); and (iii) the practical elimination of rationing and intermittency in the day-to-day operation of CESAN’s water supply systems, an accomplishment that the additional loan expects to fully complete and consolidate. Water supply investments are progressing with most of them still under execution, while the construction of the sewerage works has not yet started due to the cancellation of the original bid for procurement reasons agreed by the Bank. 10. CESAN’s operational, financial and commercial recovery is demonstrated by improved: (i) financial efficiency: achievement of positive financial results in the last five years (2002-2007) while slightly diminishing the real average tariff from R$1.64/m3 in 2000 to R$1.60/m3 in 2006 (as measured in 2006 prices based on the IGP-M); recuperation of investment capacity

4
(from a total investment of R$32 million in 2004 to R$64 million in 2006); (ii) operational efficiency: reduction of unaccounted for water from 45.8% in 2004 to 39.9% in 2007 (2.7% lower than the end-of-project target); increase in the quality index of water in the distribution network to 97.4 % (1.4% higher than the end-of-project target); increase of 8% in the efficiency of the wastewater treatment systems (from 73% to 81%)3; and (iii) commercial efficiency: universal application of a simultaneous reading and billing of customers; use of e-procurement contracts increased from 12% in 2003 to 33% in 2006; percentage of unpaid bills decreased from 16.5% in 2002 to 6.5% in 2006; increased in the percentage of households connected to available sewerage systems; information systems modernized. 11. CESAN’s institutional strengthening is demonstrated by: (i) transparent human resource (HR) practices: top level management positions (including Board members) appointed on technical rather than political grounds; introduction of a Code of Ethics; revision of HR criteria defining positions, salaries and benefits; the definition and implementation of a performance based bonus program to complement salaries; 250 new staff selected on competitive basis in the last two years; extensive training; reduction of overtime; (ii) results based decision making: introduction of strategic planning with clear objectives and targets; introduction of rigorous investment criteria in annual planning; the introduction and permanent improvement of an internal benchmarking system; (iii) legal and regulatory environment: review and formalize concession contracts between municipalities and CESAN; additional concession contracts are being negotiated with 6 new municipalities; a state law was approved which regulates the concession of WSS services with all municipalities in the MRGV; (iv) social, commercial and financial accountability: decision to hold the company accountable for results to its customers by improving its governance structure and enhancing its transparency; and to its shareholders by distributing dividends; and (v) customer satisfaction: over 75% of customers have been rating CESAN’s services good or excellent since 2003, with the highest rates achieved in 2006. 12. SEAMA’s institutional strengthening is demonstrated by the organizational and operational restructuring of the SEAMA/IEMA system. New management units were established, including the Bureau of Water Resources as the unit responsible for the management of the State’s water resources, and an Environmental Information and Management System (SIGA). Key achievements include: (i) establishment of a new environmental licensing system (Decree 1777/2007); (ii) faster processing of new environmental licenses, particularly of large works which have gone down from 35 days in 2003 to 18 days in 2006; (iii) a significant reduction of existing liabilities through the streamlining of older processes; (iv) establishment of a consultant roster and a simplified license, standardization of internal licensing routines and procedures, and establishment and training of a technical team (128 staff were trained in 2005, 116 in 2006 and 140 in 2007); (v) establishment of water use grants (Resolution 005/2005), the process of promoting the creation of river basin committees, and the initiation of a dialogue on the construction of the State Water Resources Plan and of river basin plans; and (vi) water quality monitoring at 75 different points supported by the implementation of a hydro-meteorological network that will significantly expand qualitative and quantitative monitoring and water resources management capacity.
3 This indicator measures the percentage of BOD removed by CESAN’s wastewater treatment plants.
5
13. The provision of water supply is practically universal in MRGV (less than 1% of the population (0.32%) is still without water), and the quality of the service is very good (only 1.7% of the population is subject to non-programmed rationing and intermittent service, and another 1.7% receives water less than 24 hours per day). In 1994, when the Bank began to support the water sector in Espírito Santo, almost two thirds of the population of MRGV was subject to non-programmed rationing and intermittent service. The expectation of the ongoing project is that by 2009 the entire population living in MRGV will have access to water and by 2011 CESAN will have practically eradicated rationing and intermittent service4. The water coverage in CESAN’s entire service area in the State has increased from 97.5% at appraisal (measured including billed and non-billed connections) to 98.9%. 14. The treatment capacity of Guarapari’s water supply system was increased to 600 l/s (from 270 l/s). The expansion of the Santa Maria water treatment plant in Serra was satisfactorily completed in November 2008 and the treatment and distribution capacity of the water supply system in the MRGV is advancing well and is expected to be completed by the end of March 2009. 15. The sewerage coverage level in CESAN’s project area has increased from 16% in 2000 to 36% in 2006. Meanwhile, new sewerage systems in Serra and Fundão have been under execution since May 2008. The Manguinhos system in Serra is expected to give access to about 70% of the population and the Fundão system (also in Serra) to about 78% of the population, in the respective project areas. Construction of the remaining sewerage works began in June 2008. Justification for Additional Financing 16. The State has requested this additional financing to fund the completion of the sewage collection and treatment facilities, the most important part of the ongoing project and the only major activities that remain to be contracted. These works were delayed because in 2006 the State Government rejected all of the bids received for building and operating the sewerage facilities due to the exceptionally high price of the offers – the lowest bidder price was 3.3 times higher than the estimated cost which significantly exceeded the State’s financial capacity and made the execution of those works financially unfeasible. The Bank reviewed and supported the Borrower’s decision. 17. The appreciation of the Brazilian currency vis-à-vis the US dollar explains 39% of the $110 million increase in the estimated cost of the project and internal inflation 42%. The reengineering design and other recommendations made by the 2007 engineering study undertaken after the cancellation of the 2006 bidding process explains the remaining 19% of the cost increase. The agreement to increase the Bank’s financing percentage in the proposed loan from 58 percent of the total costs to 65 percent is reflected in the proposed additional financing of $71.5 million.
4 CESAN’s current estimate is that by 2011 non-programmed rationing and intermittent service would only affect 1.4% of the urban poor in MRGV (about 0.6% of its urban population).

6
III. Proposed Changes 18. The proposed additional financing would support the PDO of the ongoing project. The original project design has been updated based on the results of the 2007 engineering study undertaken after the cancellation of the 2006 bidding process for building sewerage works. The proposed additional financing will be implemented using the same institutional, procurement, financial management and disbursement arrangements as for the ongoing project. Project Design 19. The original design of the ongoing project was based on the utility’s 1986 Master Plan. Under the Plan’s overall conception, most of the wastewater generated in the city of Vitória would have been collected, transported to and processed in the wastewater treatment plant of Mulembá, in three stages of 210 l/s each. Stage 1 (already built under the original 1994 project and in operation today) would process the collected sewage of water basin B4 and part of B5. Stage 2 would process the remaining sewage of water basin B5, and Stage 3 the collected sewage of water basins B2, B6 and B7. Wastewater generated in the remaining municipalities of Grande Vitória and Guarapari and the main urban cities of the river water basins of Santa Maria and Jucu would have been collected, transported to and treated in nine other treatment plants throughout the region. 20. The ongoing project was approved to ensure the completion of the original 1994 project through the recovery of non-operative connections and the completion of works left unfinished by the original project. The original bidding documents for contracting those sewerage works (the expansion of sewage collection systems in the cities of Vitória, Vila Velha, Cariacica, and Guarapari; and the construction of new sewage collection and treatment systems in the cities of Serra and Viana) were based on an 2005 updated engineering design that included the expansion of the Mulembá plant to 420 l/s (from 210 l/s). However, the cancellation of the bidding process forced the Borrower to revisit the engineering design of these works. 21. The engineering study undertaken by the State in 2007 concluded that the best technical option for wastewater treatment in MRGV was the immediate expansion of the Mulembá treatment plant to a full capacity of 570 l/s and the simultaneous construction of the Grande Vitória plant (a new 75 l/s wastewater treatment plant to be built between May 2008 and October 2009 by the Municipality of Vitória). Based on detailed topographic and geological work and new population projections, the study demonstrated that a single stage of treatment works for an incremental capacity of 360 l/s (instead of the two stages of 210 l/s each foreseen in the initial design) would more efficiently satisfy the demand for the design horizon. Under this updated design, the wastewater collected in the B4, B5, B2 and part of the B7 sewage collection basins would be linked to the Mulembá plant. The wastewater collected in the B6 and part of the B7 sewage collection basins would be treated in the 75 l/s Grande Vitória plant. This redesign also required increasing the capacities of the pumping stations and the outfall with consequent price increases. 22. The results in the design changes brought about by the engineering study led to the updating of the cost estimate of completing the sewerage works, a revision of the financing plan,
7
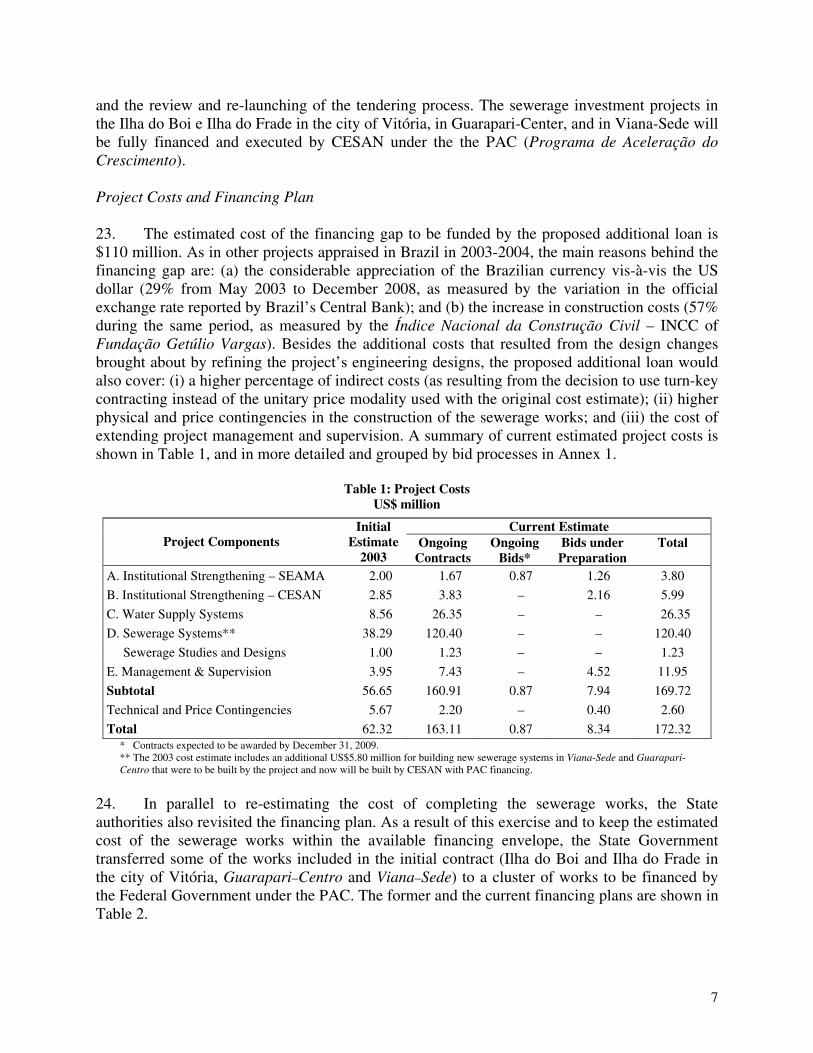
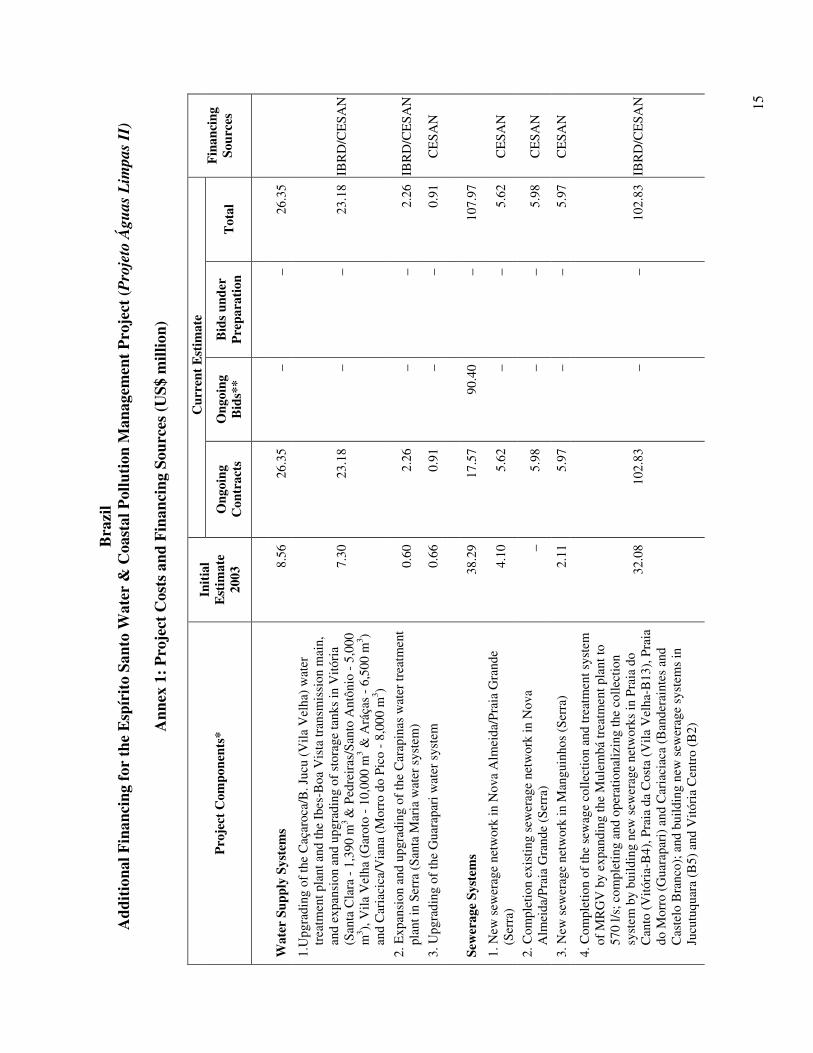
and the review and re-launching of the tendering process. The sewerage investment projects in the Ilha do Boi e Ilha do Frade in the city of Vitória, in Guarapari-Center, and in Viana-Sede will be fully financed and executed by CESAN under the the PAC (Programa de Aceleração do Crescimento). Project Costs and Financing Plan 23. The estimated cost of the financing gap to be funded by the proposed additional loan is $110 million. As in other projects appraised in Brazil in 2003-2004, the main reasons behind the financing gap are: (a) the considerable appreciation of the Brazilian currency vis-à-vis the US dollar (29% from May 2003 to December 2008, as measured by the variation in the official exchange rate reported by Brazil’s Central Bank); and (b) the increase in construction costs (57% during the same period, as measured by the Índice Nacional da Construção Civil – INCC of Fundação Getúlio Vargas). Besides the additional costs that resulted from the design changes brought about by refining the project’s engineering designs, the proposed additional loan would also cover: (i) a higher percentage of indirect costs (as resulting from the decision to use turn-key contracting instead of the unitary price modality used with the original cost estimate); (ii) higher physical and price contingencies in the construction of the sewerage works; and (iii) the cost of extending project management and supervision. A summary of current estimated project costs is shown in Table 1, and in more detailed and grouped by bid processes in Annex 1.
Table 1: Project Costs US$ million
Current Estimate Project Components
Initial Estimate
2003 Ongoing
Contracts Ongoing
Bids* Bids under Preparation
Total
A. Institutional Strengthening – SEAMA 2.00 1.67 0.87 1.26 3.80
B. Institutional Strengthening – CESAN 2.85 3.83 – 2.16 5.99
C. Water Supply Systems 8.56 26.35 – – 26.35
D. Sewerage Systems** 38.29 120.40 – – 120.40
Sewerage Studies and Designs 1.00 1.23 – – 1.23 E. Management & Supervision 3.95 7.43 – 4.52 11.95
Subtotal 56.65 160.91 0.87 7.94 169.72
Technical and Price Contingencies 5.67 2.20 – 0.40 2.60
Total 62.32 163.11 0.87 8.34 172.32 * Contracts expected to be awarded by December 31, 2009. ** The 2003 cost estimate includes an additional US$5.80 million for building new sewerage systems in Viana-Sede and Guarapari-Centro that were to be built by the project and now will be built by CESAN with PAC financing.
24. In parallel to re-estimating the cost of completing the sewerage works, the State authorities also revisited the financing plan. As a result of this exercise and to keep the estimated cost of the sewerage works within the available financing envelope, the State Government transferred some of the works included in the initial contract (Ilha do Boi and Ilha do Frade in the city of Vitória, Guarapari–Centro and Viana–Sede) to a cluster of works to be financed by the Federal Government under the PAC. The former and the current financing plans are shown in Table 2.

8
Table 2: Financing Plan US$ million
Financing Source Initial Funding
Additional Funding
Current Funding
IBRD 36.00 71.50 107.50 State of Espírito Santo / CESAN 26.32 38.50 64.82 Total 62.32 110.00 172.32
25. Counterpart funding would amount to US$38.5 million and would be financed by CESAN. The State of Espírito Santo will assume the debt and make the repayments to the Bank, and as soon as the works are completed will transfer them to CESAN as an equity increase. The healthy financial situation of CESAN, the priority assigned to this project by the State Government, and the introduction of the PAC make feasible the immediate implementation of the new engineering design and the smooth flow of counterpart funding. Institutional Arrangements 26. The proposed additional loan will continue to use the existing project management structure, which has proven to be very effective during the implementation of the ongoing project. Under this arrangement, a project Steering Committee chaired by the State Secretariat of Development (SEDES) and comprising the State Secretariat of Finance (SEFAZ), the State Secretariat of Water Supply and Sanitation, Housing and Urban Development (SEDURB), the State Secretariat of the Environment and Water Resources (SEAMA) and CESAN is responsible for overall project oversight functions. Project management is the responsibility of an independent Project Management Unit (Unidade de Gerenciamento de Projeto, UGP) directed by a general coordinator with support from technical, environmental and administrative-financial coordinators, all of whom are selected by the Steering Committee within SEDES. The UGP is supported by a project management firm that reports to the general coordinator. An Executive Secretary provides logistical support to the Steering Committee. A special bid evaluation commission reports to the Executive Secretary. CESAN is the executing agency in charge of building water supply and sewerage facilities and contracting institutional strengthening activities of CESAN’s interest. The State Institute for the Environment and Water Resources (IEMA) is the executing agency in charge of contracting institutional strengthening activities of SEAMA’s interest. Procurement 27. Procurement has consistently been rated satisfactory and all procurement processes related to the ongoing project as well as to the proposed Additional Financing are practically completed, as shown in Table 1. Ongoing works and goods financed under the ongoing project have been contracted following the Procurement Guidelines of January 1995, as revised in January and August 1996, September 1997 and January 1999, as stated in the current Loan Agreement. Ongoing consultant services financed under the ongoing project have been contracted following the Consultant Guidelines of January 1997, as revised in September 1997, January 1999 and May 2002. The main contract to be financed by the additional loan is the turn-key contract for building sewerage works, which although having started following the Procurement Guidelines stated in the current Loan Agreement, was adapted before bid

9
submission to follow the Procurement Guidelines of 2004, as revised in October 2006. Construction of the sewerage works began in June 2008 and is on track. The remaining US$8.34 million (about 5% of the estimated project cost) will finance Consultant Services, and it is expected that the contracts will be signed and underway by late 2009. The new consultant services to be contracted will follow the Consultants Guidelines of 2004, as revised in 2006. Financial Management, Financial Reports and Auditing 28. There will be no changes in the financial management, financial reporting and auditing. Financial management has been rated satisfactory and there are no outstanding financial audits. There are also no pending issues as the qualification reported in the last audit report has already been addressed by CESAN. 29. The financial management system (SAFF)5 used to manage the ongoing project will be the same to be used for the additional financing loan. It has proved to be adequate and it meets the Bank’s fiduciary requirements. SAFF complies with OP/BP 10.02 and the Financial Management Practices in World Bank-Financed Investment Operations as of November 3, 2005. Even though the system is not integrated with the state administrative and financial system, it is able to adequately control, account for, report on, and manage loan funds. It can produce Unaudited Interim Financial Reports prepared on a cash accounting basis and sent to the Bank on a quarterly basis, up to 45 days after the end of each quarter. The actual loan is administrated by CESAN with the exception of SEAMA’s institutional strengthening component, which is implemented by IEMA through a specific project implementation unit. Disbursement Arrangements 30. The disbursement categories and the percentages of Bank financing will remain unchanged, except for the percentages corresponding to civil works and goods that will go up to 80%. All project activities (under execution, contracted but not yet under execution and to be contracted) will be financed out of the existing loan before beginning to disburse funds from the additional loan. The Special Account open for disbursing the ongoing loan will be closed once the original loan is fully disbursed and a new Designated Account (DA) will be opened for purposes of disbursing the Additional Loan. The DA will be opened at Banco do Brasil in New York in US$. This will be a segregated account for deposit of loan proceeds only. However, this arrangement may be amended during the execution of the project once the borrower has analyzed the option of maintaining the DA in local currency in a local commercial bank in Brazil. 31. The additional financing loan amount is approximately double the original loan and payments under the project will be somewhat lumpy given the large construction contracts (see table below). Therefore the ceiling of the Designated Account will be based on quarterly forecasts of expenditures so that it can better accommodate the peak in payments expected in 2010. The DA ceiling will initially be set at USD 8 million. The project will continue to use Records, Summary Sheets (SS) and Statements of Expenditures (SOE’s) to document use of Bank advances to the DA (as well as for Direct Payments and Reimbursements) and the Records
5 A software package developed by a private firm (SOFTPLAN); it provides IT assistance when necessary.

10
/ SS / SOEs for the DA will be submitted on a monthly basis. The additional financing is expected to be disbursed within 36 months after the signing of the contract, as follows:
Table 3: Estimated Disbursements in US$ Million
FY 2009 2010 2011 2012 Annual 14.0 22.0 18.0 17.5
Cumulative 14.0 36.0 54.0 71.5 Closing Date and Implementation Schedule 32. The proposed additional financing would extend the current closing date by three years (from June 30, 2009 to June 30, 2012). The proposed closing date is consistent with the Bank’s policy on additional financing. Project completion is expected by December 31, 2011. The six-month buffer period between the projected end of works and the proposed closing will help guarantee the full disbursement of the additional loan. IV. Consistency with CAS 33. The proposed additional financing is consistent with the present Brazil Country Assistance Strategy (CAS) Progress Report endorsed by the Bank’s Board of Directors on May 6, 2006. A new Country Partnership Strategy (CPS) continues to support the four pillars put forth in the original CAS: equity, sustainability, competitiveness, and sound macro-economic management. More specifically, the additional financing supports: (i) universal access to enhanced WSS services; (ii) better water quality and WRM; (iii) institutional and financial strengthening of the State Government and its public utilities, including better coordination, planning and cooperation among Secretariats, agencies and utilities involved with WRM and the provision of WSS services; and (iv) economic growth, improved governance and better efficiency of infrastructure investments in the MRGV. 34. The PDOs are also in line with the water sector strategy for Brazil. This strategy recognizes water as an important element to promote sustainable growth and a more equitable and inclusive society, and highlights the importance of improving institutional capacity and efficiency. The additional loan complements other actions financed by the Bank in the State of Espírito Santo, particularly the GEF Florestas para a Vida (Forests for Life) project. The project, a US$4 million grant (IBRD TF 093210) approved by the Board on November 18, 2008 and signed on December 11, 2008 focuses on the management of water river basins of Santa Maria and Jucu, both strategically important for the provision of water to the population of MRGV (nearly 50% of the State’s population) and with high levels of biodiversity. 35. The objectives of the Florestas para a Vida Project are: (i) to conserve globally significant biodiversity, including critically threatened endemic species; (ii) to protect and enhance biodiversity within the Atlantic Forest Biome; (iii) to create a long-term financing instrument for biodiversity conservation that could be replicated and serve as a model for other states within the country; and (iv) to research links between land use change and environmental services. The GEF supported project will also: (i) assist and accelerate the development of other funding sources – particularly sources providing sustainable long-term funding flows; and (ii)

11
help to ensure the long-term sustainability of environmental services payments. The GEF supported project explicitly complements the efforts of the Águas Limpas Project through its expected impact on the quantity and quality of the water resources that supply MRGV’s population. V. Appraisal of Scaled-up Project Activities Economic and Financial Analyses 36. A revised and updated cost-benefit analysis of the project shows that even with the increase in costs, the project remains financially and economically justified. However, due to the increase in costs and the delay in implementing the works the 15% re-estimated Financial Internal of Rate of Return (FIRR) for the entire investment program is considerably lower than the 28% estimated in 1994 – the FIRR for the water component went from 51% to 26% and the FIRR for the sewerage component went down from 16% to 11%. When discounted over the life of the project, cash flows from additional investments are expected to generate a net benefit of about $45 million. The 22% re-estimated Economic Rate of Return (ERR) for the entire investment program is one half of the 1994 original estimate (44%) – the ERR for the water component went down from 72% to 32% and the ERR for the sewerage component from 24% to 18%. The cost-benefit analysis and the complementary sensitivity and risk analyses are available in Annex 1. 37. The distributive analysis, which corresponds to the difference between economic and financial cash flows, shows that the big winners are the customers with a return of $101 million. This benefit comes from the willingness to pay for having an uninterrupted and reliable water service, and the savings when sewerage service is available – which offset the payment the households must incur to modify in-house plumbing. Employees and suppliers are also net winners with a profit of about $5 million. The Government will make a net profit of about $30 million due to higher taxes, and through the acquisition of additional equity in CESAN may have important supplementary gains. The net gain for the economy as a whole is about $136 million. 38. To assess the project’s poverty impact, CESAN’s households were categorized by income level, according to their classification in CESAN’s tariff structure. The results show that low-income beneficiaries (families with a monthly income less or equal to 3 minimum salaries, about 45% of new customers) will reap about 80% of benefits and middle-income households the remaining 20%. Financial Analysis of CESAN 39. A review of CESAN’s financial projections shows that even with the additional project costs, the utility remains financially sustainable. Under the assumptions made in Annex 2, CESAN’s financial situation for the next ten years appears quite sound. Its debt structure corresponds to about 30% liabilities 70% equity during the entire period; long-term debt to revenues is lower than 80%; debt service coverage higher than 1.8; the net margin increases
12
gradually to reach 9% of revenues by 2013; and operational and working ratios are lower than 0.89 and 0.77, respectively. Technical Assessment 40. The project relies on conventional technologies appropriate to the Brazilian context and no significant obstacles are expected during project execution. A 2007 detailed engineering study prepared by competent consultants selected the expansion of the Mulembá treatment plant to 570 l/s (from 210 l/s), as the best technical option for completing the sewage collection and treatment system of MRGV (see paragraphs 19-22). This study also revised the design and specifications for building the new sewerage systems that will complete and operationalize MRGV’s sewage collection system. Fiduciary Assessment 41. A review of the Financial Management (FM) capacity of the implementing agencies was done on March 06, 2007 during the appraisal of the proposed GEF-funded Espírito Santo Biodiversity and Watershed Conservation and Restoration project, and updated on April 2, 2008. The updated assessment concluded that: (i) the project’s accounting and reporting system is in place; audit arrangements to date; and staffing arrangements, internal control and policies have been satisfactory complying with provisions of Section 5.09 of the General Conditions; and (ii) overall FM risk is Low. In consequence, the State has no intention to make changes in the FM arrangements for the implementation of the proposed additional financing. The Borrower will keep transaction-based disbursements, through Statement of Expenditures (SOE), Records and Summary Sheets, and the project will keep current flow of funds and disbursements practices. Environmental Safeguards 42. The LAC Safeguards team reviewed the project documents and confirmed Category B since the Borrower is properly implementing the project’s Environmental Management Plan (EMP), there are no outstanding issues from an environmental or social point of view, and the additional financing loan does not trigger any new safeguard policies or issues. The Integrated Safeguard Data Sheet (ISDS) has been updated to reflect the current status of project implementation and additional financing. 43. The original 1994 project was classified as Category B under the Bank's environmental guidelines, and an Environmental Impact Assessment (EIA) was carried out at the time of the original appraisal. The activities to be financed under the ongoing 2004 loan were the subject of an updated Program Environmental Assessment and an updated Environmental Management Plan, which were prepared and discussed in public consultations in the State. The activities to be financed under the proposed additional loan were the subject of another updated Program Environmental Assessment and an updated Environmental Management Plan, which were also prepared and discussed in public consultations in the State. Environmental licenses have been issued for the transportation and final disposal of sludge generated in the wastewater treatment plants.
13
44. The State Government and the two executing agencies (CESAN and SEAMA/IEMA) continue fully committed to the project. CESAN has obtained all licenses required by Brazilian law. The 16 areas needed for the construction of the sewerage pumping stations have been carefully screened to confirm that there are no constructions or population living in those areas. Fifteen of these areas are public property and one is privately owned. CESAN is currently purchasing the privately owned area through a commercial transaction. Archeologists will accompany construction works, from the preparation of the executive projects to their completion, including the laying down of the collection network. Specific agreements have been made to replicate the measures taken during the building of the initial wastewater treatment plant in Mulemba, particularly the 2001 removal and storage of clay (the raw material for the production of the region’s traditional Paneilas (clay pots), in places previously indicated by the Paneleiras, under their orientation and supervision. This agreement was endorsed and its satisfactory completion made a condition for starting the construction by IPHAN (the Brazilian National Institute for the Preservation of the Historical and Artistic Patrimony). VI. Expected Outcomes
45. Overall, the project expected outcomes remain unchanged. The proposed additional financing would allow the State of Espírito Santo to comply with the original end-of-project target for adequate sewage collection and treatment in the Greater Vitoria Metropolitan Region (60%). However, given the changes in project design and particularly the delay in project implementation, the comprehensive set of monitoring indicators and performance targets defined for the project planning horizon has been reviewed and updated. The updated collection of performance and monitoring indicators is available in the Project Files. 46. On top of the impressive results reached in the provision of water supply and sewerage services and water resources management in the 14 years of uninterrupted Bank support, another important result is expected by the closing date of the proposed additional loan. By early 2011, the State and CESAN expect to have universal access to the utility’s water supply systems throughout the state; universal access to the sewerage systems in Vitória, and 60% sewerage coverage in the MRGV. In such a manner Vitória would have increased its coverage from 11% in 1994 to 100% at the end of the project, and would become the first Brazilian state capital besides Brasilia to reach universal access to water supply and sewerage services. VII. Benefits and Risks 47. Project benefits and risks remain unchanged from those identified in the ongoing project. Project risks in particular continue to be associated (i) with successful project implementation and (ii) with actually generating expected financial and economic benefits. 48. The risk of successful project implementation is now significantly reduced since all major contracts are under execution and CESAN’s financial situation is considerably more solid than four years ago. Only eventual budget restrictions in the State Government could delay project implementation and, even in this case, only if the State Government and CESAN change

14
priorities in favor of other investments. This risk has been further mitigated by the Borrower’s and CESAN’s assurances to Bank project team that this project is the State’s highest priority. VIII. Financial Terms and Conditions for the Additional Financing 49. The Borrower selected a USD denominated IBRD Flexible Loan with a fixed-spread, with a commitment-based amortization consisting of level repayments of principal, payment dates on March 15 and September 15, three years of grace period, and thirty years of total loan term. The Borrower also opted for the capitalization of the front-end fee under the Loan.
15
Bra
zil
Add
itio
nal F
inan
cing
for
the
Esp
írit
o Sa
nto
Wat
er &
Coa
stal
Pol
luti
on M
anag
emen
t Pro
ject
(Pro
jeto
Águ
as L
impa
s II
)
Ann
ex 1
: Pro
ject
Cos
ts a
nd F
inan
cing
Sou
rces
(US$
mill
ion)
Cur
rent
Est
imat
e
Pro
ject
Com
pone
nts*
In
itia
l E
stim
ate
2003
O
ngoi
ng
Con
trac
ts
Ong
oing
B
ids*
* B
ids
unde
r P
repa
rati
on
Tot
al
Fin
anci
ng
Sour
ces
Wat
er S
uppl
y Sy
stem
s 8.
56
26.3
5 –
– 26
.35
1.U
pgra
ding
of
the
Caç
aroc
a/B
. Juc
u (V
ila V
elha
) w
ater
tr
eatm
ent p
lant
and
the
Ibes
-Boa
Vis
ta tr
ansm
issi
on m
ain,
an
d ex
pans
ion
and
upgr
adin
g of
sto
rage
tank
s in
Vitó
ria
(San
ta C
lara
- 1
,390
m3 &
Ped
reir
as/S
anto
Ant
ônio
- 5
,000
m
3 ), V
ila V
elha
(G
arot
o -
10,0
00 m
3 & A
ráça
s -
6,50
0 m
3 ) an
d C
aria
cica
/Via
na (
Mor
ro d
o Pi
co -
8,0
00 m
3 )
7.30
23
.18
– –
23.1
8 IB
RD
/CE
SAN
2. E
xpan
sion
and
upg
radi
ng o
f th
e C
arap
inas
wat
er tr
eatm
ent
plan
t in
Serr
a (S
anta
Mar
ia w
ater
sys
tem
) 0.
60
2.26
–
– 2.
26
IBR
D/C
ESA
N
3. U
pgra
ding
of
the
Gua
rapa
ri w
ater
sys
tem
0.
66
0.91
–
– 0.
91
CE
SAN
Sew
erag
e Sy
stem
s 38
.29
17.5
7 90
.40
– 10
7.97
1. N
ew s
ewer
age
netw
ork
in N
ova
Alm
eida
/Pra
ia G
rand
e (S
erra
) 4.
10
5.62
–
– 5.
62
CE
SAN
2. C
ompl
etio
n ex
istin
g se
wer
age
netw
ork
in N
ova
Alm
eida
/Pra
ia G
rand
e (S
erra
) –
5.98
–
– 5.
98
CE
SAN
3. N
ew s
ewer
age
netw
ork
in M
angu
inho
s (S
erra
) 2.
11
5.97
–
– 5.
97
CE
SAN
4. C
ompl
etio
n of
the
sew
age
colle
ctio
n an
d tr
eatm
ent s
yste
m
of M
RG
V b
y ex
pand
ing
the
Mul
embá
trea
tmen
t pla
nt to
57
0 l/s
; com
plet
ing
and
oper
atio
naliz
ing
the
colle
ctio
n sy
stem
by
build
ing
new
sew
erag
e ne
twor
ks in
Pra
ia d
o C
anto
(V
itóri
a-B
4), P
raia
da
Cos
ta (
Vila
Vel
ha-B
13),
Pra
ia
do M
orro
(G
uara
pari
) an
d C
aria
ciac
a (B
ande
rain
tes
and
Cas
telo
Bra
nco)
; and
bui
ldin
g ne
w s
ewer
age
syst
ems
in
Jucu
tuqu
ara
(B5)
and
Vitó
ria
Cen
tro
(B2)
32.0
8 10
2.83
–
– 10
2.83
IB
RD
/CE
SAN

16
Cur
rent
Est
imat
e
Pro
ject
Com
pone
nts*
In
itia
l E
stim
ate
2003
O
ngoi
ng
Con
trac
ts
Ong
oing
B
ids*
* B
ids
unde
r P
repa
rati
on
Tot
al
Fin
anci
ng
Sour
ces
Sew
erag
e St
udie
s an
d D
esig
ns
1.00
1.
23
– –
1.23
1. S
ewer
age
mas
ter
plan
– M
RG
V
0.60
0.
93
– –
0.93
IB
RD
/CE
SAN
2. H
ydro
dyna
mic
mod
elin
g pr
ogra
m
0.40
0.
31
– –
0.31
IB
RD
/CE
SAN
In
stit
utio
nal S
tren
gthe
ning
– C
ESA
N
2.85
3.
83
–2.
16
5.99
IB
RD
/CE
SAN
Inst
itut
iona
l Str
engt
heni
ng –
SE
AM
A
2.00
1.
67
0.87
1.26
3.
80
IBR
D/C
ESA
N
Man
agem
ent &
Sup
ervi
sion
3.
95
7.43
–
4.52
11
.95
IBR
D/C
ESA
N
Tec
hnic
al &
Pri
ce C
onti
ngen
cies
5.
67
2.20
–
0.40
2.
60
IBR
D/C
ESA
N
Tot
al
62.3
2 16
3.11
0.
87
8.34
17
2.32
* A
ctiv
ities
with
in e
ach
proj
ect c
ompo
nent
are
gro
uped
bas
ed o
n bi
ddin
g pr
oces
ses
** C
ontr
acts
exp
ecte
d to
be
awar
ded
by D
ecem
ber
31, 2
009

17
Brazil Additional Financing for the Espírito Santo Water & Coastal Pollution Management
Project (Projeto Águas Limpas II)
Annex 2: Cost Benefit Analysis The Espírito Santo project remains financially and economically feasible after including the proposed Additional Financing, as shown by detailed financial, economic, and distributive analyses. This annex presents a summary of the evaluation as well as sensitivity and risk analyses. This project will make it possible to improve the water quality, service continuity and service pressure of MRGV’s water supply systems; and to fully utilize the capacity of existing wastewater treatment plants and expand the capacity of one of these plants. Based on these objectives, the cost-benefit analysis was used to determine the economic and financial viability of the project, its distributive impact, and the risk profile. Methodology The project was evaluated from two different perspectives. From a financial perspective, the project was appraised by measuring its flow of costs and benefits at market prices. Financial costs were obtained by the prices that CESAN, the State water utility, would pay for all the inputs required under the project. Financial benefits were assumed to be equal to the estimated flow of financial revenue, defined as current tariffs multiplied by the estimated water and sewage billed. From an economic perspective, the project was appraised by converting financial cash flows into economic cash flows through the use of conversion factors and customers’ surplus. Scenarios. With and without project scenarios were built to identify the incremental costs and incremental benefits associated with the project. The with project scenario included the proposed investment plan and its associated targets. The without project scenario assumed that current operational indicators would remain unchanged. Incremental Costs and Benefits. Costs and benefits were expressed in constant 2007 prices and projected over a period of 30 years, the project’s estimated average lifetime including its implementation period. The cash flows were discounted using a rate of 10%. Project benefits consisted of the reduction of rationing and intermittent water provision; the increase in access to water and sewerage services; and the increase in sewage treated. Financial benefits were estimated based on tariffs, number of customers, and volume of water and sewage billed. Economic benefits for the water component were estimated based on the rationing cost. Economic benefits for sewerage were calculated based on two methodologies: willingness to pay (WTP) and customers’ savings when the project is implemented.
18
Assumptions The primary sources of data were Espírito Santo’s State Water Company (CESAN) and the State Secretariat of Development (Secretaria Estadual de Desenvolvimento). Current and projected population was based on information from the 2000 Census6 and projected with a 2% annual growth rate. Annual targets for the installation of new service connections result from the specificities of the proposed projects (sanitation) or the expected coverage levels (water supply). A connection rate of 65% was assumed for this evaluation, which corresponds to households’ actual response within the ongoing project. When sewerage networks are implemented not all households connect to the system for reasons such as inadequacy of in-house facilities, lack of information about the project’s benefits, or unwillingness to pay sewerage bills. CESAN expects to improve this percentage and has designed project implementation strategies that involve teamwork with municipal mayors and community leaders. It also intends to provide technical support and broad dissemination of the project, its benefits, and the tariffs to be applied. Per capita water consumption is the average consumption of metered connections in Grande Vitória and Guarapari (224 lpd). Water revenue is calculated based on billed consumption and current average tariff (R$1.66/m3). Total production is calculated based on actual consumption, physical losses and production capacity. For the water component in the “without” scenario the commercial and operational indicators stay unchanged, i.e. the production capacity is assumed to remain at its current level (6.5 m3/s in Grande Vitória and 0.3 m3/s in Guarapari), as well as physical and commercial losses. In the “with” project scenario the capacity increases to 7.9 m3/s (7.4 m3/s in Grande Vitória and 0.5 m3/s in Guarapari), the coverage level rises from 95% to 99%, the water losses decrease, and the revenue collection efficiency increases. Per capita sewage billed is estimated on the basis of water consumption by sewerage customers in each locality (average 171 lpd). The assumed sewerage tariff is the average tariff charged by CESAN in the project’s municipalities (R$1.10/m3) and remained unchanged during the evaluation period. For the sewerage component in the “without” scenario the operational and commercial indicators remain at current levels. In the “with” project scenario the coverage level is increased until the capacity of the wastewater treatment plants is fully utilized. The number of beneficiaries is about 400 thousand. Investment costs consist of the project’s costs, including: management costs and physical contingencies (see Table 1); costs of required materials and labor to connect each household to the sewerage system (US$200/hh); and replacement cost of equipment whose lifetime is shorter than that of the project. The economic analysis also included the cost of adjusting in-house facilities to sewerage system requirements;7 this cost depends mainly on septic tank location. An estimated 30% of beneficiaries with septic tanks would have to make this type of investment.
6 Census IBGE-2000 7 This average cost is estimated as US$250 per hh and is applied to 30% of current households that will become project beneficiaries and whose in-house facilities must be modified.

19
Table 1: Investment Costs (US$ million) Water Supply Systems 26.35 Sewerage and Wastewater Treatment Expansion 107.97 Institutional Strengthening and Studies 9.97 Management and Supervision 11.95 Physical and Price Contingencies 16.08
TOTAL 172.32
Operating and Maintenance (O&M) costs are calculated for labor, chemicals, power, third party services and general costs for each component of the project. O&M costs for the “without” project scenario are based on current unit costs. O&M costs for the “with” project scenario are calculated based on the expected impact that the proposed programs will have on the water and sewerage service and the way they are operated. For the sanitation component, operating costs are estimated separately for sewage collection and sewage treatment: (i) for sewage collection, the current cost per cubic meter (R$0.15/m3) is used; (ii) for wastewater treatment, current costs were used for the without project situation; projected costs when the project is implemented were estimated for the with project situation as follows: (i) Wastewater treatment cost. CESAN currently has a contract with a private firm (CNO) for
the operation of several of its wastewater treatment plants (Araçás, Mulembá, and Bandeirantes). According to this contract, CESAN is obliged to pay CNO a fixed amount for each of the plants regardless of the volume of sewage treated. The sewage collected and transported for treatment to these plants corresponds to only 26% of the plants’ capacity, which makes the treatment cost per cubic meter high: R$1.06/m3 compared to R$0.27 if the capacity were fully utilized (Table 2).
Table 2. Operating Costs of Wastewater Treatment Plants WWTs operated by CNO
WWT
Araçás WWT
Mulemba WWT
Bandeirantes Total
WWT operated by
CESAN
WWT capacity and utilization Sewage treated (l/s) 97.98 86.50 36.04 220.52 560.55
WWT’s capacity (l/s) 400.00 204.00 250.00 854.00 1,148.00 % of capacity utilized 24% 42% 14% 26% 49%
Operating Costs Annual operating cost (R$000) 2,891 2,105 2,367 7,363 1,784
Unit cost/actual treated m3 (Rs/m3) 0.94 0.77 2.08 1.06 0.10 Unit cost/m3 at full capacity (Rs/m3) 0.23 0.33 0.30 0.27 0.05
The operations contract expires at the end of 2007 and CESAN plans to renew it with different conditions: (i) a fixed payment for the operation of each WWT plant, equal to 70% of current operating costs; and (ii) a variable cost of R$0.10/m3 treated, which will include the electricity cost of the final pumping station. In both situations (with and without project), treatment costs were projected with the conditions to be established in the new contract, i.e., a monthly fixed charge and a variable charge based on the volume of sewage treated. In the with project situation, the treatment cost of the expansion (360 l/s) of the Mulemba WWT plant was also included.

20
(ii) Sewer pipeline cleaning cost. At present, CESAN’s sewerage system is not fully connected and in some areas, such as the municipalities of Vila Velha and Vitória, some customers are connected but their sewage is discharged at main pipes with no connection to the system. CESAN has eight sites in Vitória and nine in Vila Velha in which the pipes have open ends. These pipes must be vacuumed to avoid clogs or discharge in improper sites. CESAN must perform this operation several times a day at a total cost of R$30,000 per month. When the project is implemented the entire system will be connected and this cost will be avoided.
Estimate of Economic Costs Financial costs are transformed into economic costs by using conversion factors to eliminate market distortions. Investment and operating costs are also broken down into their main inputs. The economic cost for each input is estimated as the financial cost multiplied by its conversion factor. Adjusting in-house plumbing and facilities adds an additional economic cost. This adjustment cost depends mainly on the location of the septic tank. The average cost of this adjustment is estimated as US$250 per household (hh) and it will be required for about 30% of potential beneficiaries, with a higher probability of occurring when the septic tank is located in the bottom of the house. Estimate of Benefits (i) Financial Benefits. The increase in water and sewerage coverage as well as sewage
treatment has financial benefits related to the increase in revenue from new customers. The increase in water revenue is calculated based on the current tariff and the volume of water billed. Sewerage tariffs are differentiated depending on whether or not sewage treatment is provided. The average tariff for sewage collection is about R$0.62/m3, and the average sewage collection and treatment tariff is R$1.10/m3 in areas benefiting from the project. As 99% of CESAN’s sewerage customers have their sewage treated and the project aims to expand sewerage service and treat all collected sewage, financial revenues are estimated with the tariff that includes sewage collection and treatment services.
(ii) Economic benefits for the water component are calculated as the willingness to pay (WTP)
of eliminating rationing, multiplied by the associated number of beneficiaries, plus the WTP for having new water connection multiplied per incremental connections. The WTP values are estimated based on the results obtained in the study done during the preparation of the previous project Espírito Santo Water and Coastal Pollution Management Project and transformed to 2007 prices8.
(iii) Economic Benefits for the sanitation component are estimated through the use of two
methodologies:
8 WTP for the water component in local currency of 2007 is: (i) WTP for eliminating rationing: R$ 15.4/hh-month; (ii) WTP for having new water connection without rationing: R$ 25.7/hh-month.

21
a. The first methodology measures the benefits as the savings that beneficiaries will achieve when the service is connected, i.e., the avoided cost. The lack of service currently makes people seek solutions such as septic tanks or discharging wastewater in streets or nearby streams. In the project area, an estimated 84%9 of the population without service has a septic tank. The benefits of this component were estimated as the savings achieved from not having to build and operate a septic tank, estimated at US$13.4/household/month.10
b. The second methodology measures the benefits as the willingness to pay for the service.
WTP was estimated in the preparation of a previous project, the Espírito Santo Water and Coastal Pollution Management Project;11 the results were converted to 2007 prices and corresponded to US$10.7/hh/month. The economic benefits were calculated as the WTP for having a new sewerage connection multiplied by the number of new connections.
The project’s additional benefits were not quantified. These include: (a) savings in medical costs due to reduction in illnesses caused by improper wastewater discharge and lack of treatment; (b) savings in road maintenance costs after adequate sewage collection; (c) benefits from improvements in the local population’s quality of life; and (d) the likelihood of increased tourism activities in the region. Results of the Cost-Benefit Analysis As Table 3 shows, the project is financially and economically viable, with a financial benefit of US$45 million and a rate of return of 15%, economic returns of about US$180 million, and an economic profit of 22%.
Table 3: Results of the Financial and Economic Analyses NPV of cash flow (000 US$) Benefits Costs Net benefit IRR
Financial Analysis Water 123,771 88,197 35,574 26%
Sewerage &WW treatment 136,253 126,800 9,453 11% Total 260,024 214,997 45,027 15%
Economic Analysis Water 172,374 67,687 104,686 32%
Sewerage &WW treatment (with avoided cost estimation) 197,695 121,671 76,023 18%
Total 370,068 189,358 180,710 22%
Sewerage &WW treatment (with WTP estimation) 191,310 121,671 69,639 17%
9 IBGE (Instituto Brasileiro de Geografia e Estatística). Diretoria de Pesquisas, Departamento de População e Indicadores Sociais. Pesquisa Nacional de Saneamento Básico. 2000. 10 The estimate was based on the following costs: (i) a US$355 investment cost for a typical septic tank with a 15-year lifetime; (ii) US$120/year maintenance and repair cost, incurred once every five years; and (iii) US$87/year cleaning cost. The total cost per year is US$13.4/household/month. 11 The World Bank “SAR: Brazil–Espírito Santo Water and Coastal Pollution Management Project.” June 1994. Report No. 12709-BR

22
Distributive Impact The difference between economic and financial flows represents rents or monetary flows that accrue to an entity other than CESAN. Taxes represent monetary flows accruing to the government and subsidies represent a decrease in government finances. Winners and losers with the project were identified by breaking down economic and financial costs for each project input and comparing the differences. The big winners are customers, with a return of US$100 million, US$48 million from the water component (obtained from the difference between the WTP to pay for having a service without any rationing and intermittency and the actual service bill) and US$52 million from the sanitation program (obtained from savings when sewerage service is available, which offset the payment they must incur to modify in-house connections). Employees and suppliers are also winners with a profit of about US$ 5 million. In the sanitation component, employees would loss about US$ 1.5 million due to efficiency gains in the operation of the wastewater system when the project is implemented. The government will have a net gain of US$30 million due to an increase in tax revenues. The government will also participate in the project through the acquisition of additional equity in CESAN, which could eventually generate capital gains. The net gain for the economy as a whole is US$135 million (see Table 4).
Table 4. Winners and Losers with the Project
Water Sewerage &
Wastewater Treatment Total Government (Fiscal Impact) Taxes
On Investments 4,801 14,981 19,782 On Operating costs 7,365 2,508 9,873
Total taxes 12,165 17,490 29,655 Subsidies - - - Total Government 12,165 17,490 29,655 Customers
Payment for water service (123,771) - (123,771) Saving for rationing 172,374 - 172,374
Payment for sewerage service - (136,253) (136,253) Savings for having sewerage 197,695 197,695
Payment for investment (in-house connections) - (9,228) (9,228) Willingness to pay for wastewater treatment - - -
Total Customers 48,603 52,213 100,816 Others
Labor 4,756 (1,580) 3,176 Suppliers 3,589 (1,552) 2,036
Total Others 8,345 (3,132) 5,212 Total gains and losses 69,113 66,571 135,683
Poverty Impact To assess the project’s poverty impact, households were categorized by income level, according to CESAN’s classification in its tariff structure. CESAN has four categories in the residential sector: social, popular, padrão, and padrão superior. The first two correspond to the low-income level, the third to the middle-income level, and the last to high-income beneficiaries. The project targets low- and middle-income households: about 45% of new customers are classified in the social and popular categories; 52% in the padrão category; and the rest 3% in the padrão

23
superior category. According to CESAN’s estimate, families in the first two categories have a monthly income less than or equal to three minimum salaries. Financial and economic benefits were estimated based on this categorization. The results show that low-income beneficiaries will reap about 80% of benefits and middle-income households the remaining 20%. High-income families’s benefit will be nil since their WTP is close to the actual tariff they would pay for the services. Table 5. Customer Benefits
Benefits per income level (US$ 000)
Consumer Surplus
(US$ 000) Low Income Middle Income High Income
Sewerage and wastewater treatment 100,816 80,716 20,095 4 Percentage 100% 80% 20% 0%
Sensitivity and Risk Analysis Sensitivity Analysis. Some variables were identified as those that present major risks to the project’s expected outcome. These variables consisted of the connection rate of new customers, investment cost overruns, operation and maintenance cost overruns, changes in the amount of funds to be transferred to CESAN, and reduction in benefits (Table 6). The project’s results are more sensitive to changes in operating costs; an increase of only 4% would make the project financially unviable, and an increase of 7 % would place its economic viability at risk. Risk Variables Impact and Significance Connection rate Direct impact on financial and economic benefits of sewerage investment components. Conveys a
moderate risk since the current rate is 65% and if it is at least 46% there will be financial benefits and if it is at least 35% there will be economic benefits.
Investment cost overrun
Direct impact on investment costs. Largely under management control (most works and studies have been already contracted). Conveys a moderate risk for the financial results of whole project and a higher risk for the financial profits of sewerage component. The investment cost can increase as much as 40% and still there are financial and economic returns; however for financial returns on sewerage component, a 10% increase of investment cost would turn negative the financial results.
O&M cost overrun Direct impact on O&M cost. Largely under management control. Conveys a high risk for financial returns on water component. A 7% O&M cost overrun would turn negative the financial results for the water component and for the whole project. The risk of O&M cost overrun for financial returns on sewerage component is lower, given that it could be as higher as 16% and still there are financial returns. For economic returns, O&M cost overrun conveys a low risk for all components.
Project delay Direct impact on economic and financial benefits. It is largely under management control. Project delays convey a high risk for sewerage component. If sewerage project is delayed one year the financial returns turn negative. For the water component the risk of project delay is lower (it could be up to three years). For economic returns the risk of project delay is low.
Collection efficiency Direct impact on revenues and therefore on financial benefits. It has a moderate risk, if collection efficiency remains at 90% the financial returns would turn negative.
Unaccounted for water Direct impact on operating cost. It is a low risk variable for the water component Willingness to pay Direct impact on economic benefits. Based on consumer’s preference and hence beyond management
control. This variable conveys a low to moderate risk to project activities. For water activities this variable needs to be reduced by at least 62% to run negative the NPV of net benefits. For sewerage component, this variable needs to be reduced at least at 38% to turn negative the economic benefits.
Risk Analysis. Crystal Ball software was used to enhance the accuracy of the financial and economic analyses. This software measures the extent of various risks and their impact on the project by modeling a likely distribution for each risk variable and the resulting outcome. Based on a simulation of 1,000 trials and using Monte Carlo Simulations, the model recalculates the

24
results of the financial and economic analyses by simultaneously changing each of the selected risk variables. The assumed distributions of probabilities and their respective specifications for each variable are presented in Table 7. Table 7. Risk Variables and Assumed Distributions of Probabilities
Risk Variable Distribution Range
Connection rate
Custom Distribution 65% 60% 65% to 70% 15% 70% to 75% 10% 75% to 80% 5% 80% to 85% 5% > 85% 5%
Investment cost overrun
Triangular Distribution Minimum -1% Likeliest 0% Maximum 10%
O&M cost overrun
Triangular Distribution Minimum -5% Likeliest 0% Maximum 10%
Project Delay
Custom Distribution 0 70% 1 25% 2 5%
Collection Efficiency
Lognormal Distrubution Mean 92% Standard Deviation 1%
Economic benefit
Normal Distribution Mean 0% Standard Deviation 1%
As shown in Table 8, the risk assessment of the economic analysis is highly reassuring. Once market distortions are eliminated and the direct and indirect benefits are captured, the likelihood of a positive economic output is 100%. The risk assessment of the financial analysis also shows good results for the investment components of the project. The likelihood of positive returns for water component is 43% and for the sanitation component is 69%. Table 8. Financial and Economic Risk Assessment Financial Analysis Economic Analysis
Net Benefit Probability of Positive NPV
Expected Mean NPV (US$ 000)
Probability of Positive NPV
Expected Mean NPV (US$ 000)
Water Component 43% (5,416) 100% 91,636
Sewerage and WW treatment 69% 2,639 100% 68,483
Total Project 49% (2,772) 100% 160,119

25
Brazil Additional Financing for the Espírito Santo Water & Coastal Pollution Management
Project (Águas Limpas Project)
Annex 3: Financial Analysis of CESAN This analysis shows that CESAN is financially viable during and after project implementation. This evaluation is complemented by a sensitivity analysis that measures the impact on financial results when critical variables change over time. In addition, it shows that the State of Espírito Santo is able to assume and repay the loan according to a sophisticated and comprehensive analysis performed by the Government of Brazil. Objective The financial arrangement for this project involves the State of Espírito Santo, which takes the loan, and the state’s water and sewerage utility, CESAN, which implements and operates the project. On the basis of this arrangement, the financial analysis was performed for both entities: (i) the State of Espírito Santo, to evaluate its financial capability to take and repay the loan; and (ii) the state’s water utility, to evaluate its long-term financial viability for ensuring the project’s sustainability. Methodology State of Espírito Santo The Government of Brazil has a comprehensive system to evaluate states’ fiscal status in order to determine their creditworthiness. The State of Espírito Santo has taken a number of steps to comply with the legal framework and have access to World Bank loans.
• In March 1998, the State of Espírito Santo signed an agreement with the National Treasury Secretariat (STN) to improve its fiscal situation. At that time, various indicators and targets were selected to demonstrate fiscal responsibility. On this basis, STN periodically evaluates the state’s compliance.
• In August 2007, STN appraised the state’s fiscal status and found that all indicators show levels in accordance with the fiscal program established for the state, and considered the state’s fiscal situation to be healthy for 2007 and 2008.
• In March 2004, the State of Espírito Santo enacted Law No. 7.728 which authorizes the Executive Branch to contract a loan with the Bank for US$36 million. The state’s Legislative Branch is currently drafting another law to authorize the remainder of the loan.
CESAN, the State Water and Sewerage Utility The financial analysis of CESAN was carried out to evaluate its financial viability during and after project implementation. This analysis was performed as follows: (i) analysis of financial performance in the past six years (2002–2006) based on audited historical financial statements;

26
(ii) CESAN’s financial forecast for a ten-year period (2007–2016). Various financial, commercial, and operational indicators were selected to assess the company’s performance. Analysis of CESAN’s financial performance in the past six years CESAN’s financial performance is marked by two periods: before and after 2004 when the State of Espírito Santo took a number of measures to improve its financial position. In the first period, CESAN’s financial condition was deteriorating and all financial indicators showed the utility’s weakness. The financial statements showed annual losses in 2001 and 2002 as high as 9% of revenues. Tariffs were insufficient to cover operating expenses, and commercial indicators showed the utility’s poor performance. Because CESAN lacked the financial resources to fund investments, it reached a point at which its investment level was lower than that of depreciation, thus deteriorating its service quality. Moreover, Brazil’s economic crisis worsened the situation and had a negative impact on CESAN’s long-term debt contracted in foreign currency. Table 1 shows various financial and commercial indicators during the 2000–2006 period. Table 1. Financial Indicators CESAN 2000–2006
2000 2001 2002 2003 2004 2005 2006 Average W&S tariff (US$/m3) 0.54 0.51 0.43 0.46 0.61 0.72 0.86
Annual Increase -4.3% -16.1% 6.2% 34.2% 16.9% 20.2% Operating cost (with dep) (US$/m3) 0.52 0.52 0.43 0.38 0.52 0.62 0.76
Annual Increase 0.8% -17.1% -12.3% 38.1% 19.6% 21.6% Operating ratio 0.96 1.01 1.00 0.83 0.85 0.87 0.88 Working ratio 0.74 0.79 0.79 0.73 0.74 0.74 0.75 Net margin -3% -9% -9% 6% 7% 8% 8% Liquidity Ratio 0.8 0.7 1.2 2.1 1.6 1.4 1.5 Acc. Receivable Comparator (days) 106 115 115 95 75 69 60 Unaccounted-for water (UFW) 30% 34% 36% 35% 33% 31% 32% Investment (US$ millions) 9.2 8.1 6.4 10.3 11.5 16.7 28.9 Long-term debt/revenues 2.04 2.17 2.20 2.07 2.12 0.76 0.73 Liabilities/Equity 1.01 1.30 1.45 1.96 2.07 0.45 0.44
In 2004, the State of Espírito Santo decided to write off all of CESAN’s long-term debt and assumed its debt obligations (both interest and principal). This financial transaction was reflected in 2005 financial statements. The state took various additional measures to alleviate CESAN’s financial situation, such as: (i) an annual increase in tariff higher than inflation, with a resulting increase in real terms of 88% from 2004 to 2006. By 2006 the tariff was twice that of 2003; (ii) commercial management improved and the collection rate increased, resulting in accounts receivable of 60 days compared to 95 days in 2003; (iii) unaccounted-for water decreased from 35% in 2003 to 32% in 2006. The state also appointed a general manager with the experience and capacity to run the utility under the state’s new direction. With these measures, CESAN’s results showed a steady improvement. In 2006, investment was three times the 2003 level. Water service improved, thus reducing intermittence. Coverage of sewerage service increased from 20% in 2003 to 26% in 2006. Net profits gradually rose to 8% of revenues in 2006. Tariffs covered operating costs, leaving a portion to cover investments. The debt structure showed 30% liabilities and 70% equity in 2006, compared to 70% liabilities and 30% equity in 2003. Long-term debt was 73% of revenue in 2006 and debt service coverage 3%.

27
CESAN’s Projected Financial Performance For 2007–2017, CESAN’s financial projections are based on the following assumptions: (i) an investment program based on CESAN’s five-year investment plan, which includes the Águas Limpas Project and results in an annual investment average of US$62 million (a 30% increase vis-à-vis the US$47 million estimated for 2007); (ii) the following financing plan: (a) 25% to be funded by the State of Espírito Santo, which includes the World Bank loan for US$71.5 million12; (b) 35% will be funded with CESAN’s own resources; and (c) the remaining 39% will come from CEF and BNDES loans to be paid in full by CESAN. Table 2 shows the investment and financing plan. Table 2. Investment and Financing Plan. 2008-2012
Total
2008/2012 Annual average 2,008 2,009 2,010 2,011 2,012
Investment Plan (US$000) Water 64,438 12,888 15,398 11,207 11,883 15,470 10,480
Sewerage and WWT 220,436 44,087 30,770 59,174 53,811 37,149 39,532 Institutional Development 28,476 5,695 12,823 8,723 2,999 2,014 1,918
Total Investment 313,350 62,670 58,991 79,104 68,693 54,633 51,930 Financing Plan (US$000)
CEF and BNDES 122,547 24,509 20,594 32,957 26,218 22,467 20,310 Capital from State to CESAN 79,854 15,971 18,249 21,994 20,249 11,981 7,381
CESAN 110,949 22,190 20,147 24,153 22,226 20,184 24,239 Total 313,350 62,670 58,991 79,104 68,693 54,633 51,930
Financing Plan CEF and BNDES 39% 39% 35% 42% 38% 41% 39%
Capital from State to CESAN 25% 25% 31% 28% 29% 22% 14% CESAN 35% 35% 34% 31% 32% 37% 47%
Total 100% 100% 100% 100% 100% 100% 100%
Tariffs are assumed to remain constant during the projected period. However, the average tariff for water and sewerage increases due to higher revenue from sewerage expansion. Similar results show the operating costs. Other assumptions are presented in Table 3.
Table 3. Assumptions for Financial Projections Operational Assumptions
Population Assumed to grow by 2% per year Water Coverage Rate Expected to increase from 93% in 2006 to 98% by 2014.
Sewerage Coverage Rate Expected to increase from 27% to 60% by 2014 Metering Rate Increases from 91% in 2006 to 99% by 2011
Per capita consumption Assumed to remain at current levels (220 lpd). Average water tariff Constant in real terms at current level
Average sewerage tariff Constant in real terms at current level Revenue collection rate Remains at its current level of 95%
Unaccounted-for water (UFW) Remains at its current level of 32% Personnel Productivity • Assumed to improve from 3.08 in 2006 to 2.88 in 2007 and onwards.
• Real salaries are expected to remain at their current levels. Other Operating costs Remain at current levels
Accounts receivable Remains at current level of 60 days
12 As decided by the State government, CESAN’s main shareholder, the State will be responsible for loan repayment (both interest and principal) and once the works are completed they will be transfer to CESAN as equity, increasing the state’s ownership participation.

28
Financial Assumptions Exchange Rate The current appreciation of the Real is expected to continue in 2007 & 2008. After
that year, it is assumed an annual depreciation rate equal to domestic inflation. CPI A 4.28% inflation rate for 2007 is assumed, followed by a 5% rate per year.
Table 4. Tariffs and Operating Costs: 2007–2013
2007 2008 2009 2010 2011 2012 2013 Average water tariff (US$/m3) 0.82 0.84 0.84 0.84 0.84 0.84 0.84
Annual Increase 10.1% 1.6% 0.2% 0.0% 0.0% 0.0% 0.0% Average sewerage tariff (US$/m3) 0.58 0.60 0.60 0.60 0.60 0.60 0.60
Annual Increase 8.0% 3.5% 0.2% 0.0% 0.0% 0.0% 0.0% Average W&S tariff (US$/m3) 0.95 0.98 0.99 1.01 1.05 1.08 1.10
Annual Increase 10.4% 2.4% 1.6% 2.4% 3.2% 2.9% 1.8% Operating cost (with dep) (US$/m3) 0.83 0.86 0.88 0.90 0.93 0.95 0.97
Annual Increase 9.2% 4.0% 1.6% 2.6% 3.3% 2.9% 1.7%
Results of Financial Projection Under these assumptions, CESAN’s financial situation for the next ten years appears to be quite sound. Its debt structure corresponds to about 30% liabilities and 70% equity during the entire period; long-term debt to revenues is lower than 80%; debt service coverage is higher than 1.8; the net margin increases gradually to reach 9% of revenues by 2013; operational and working ratios are lower than 0.89 and 0.77, respectively. Table 5. Financial and Operational Indicators: 2007–2013
2007 2008 2009 2010 2011 2012 2013 Operating ratio 0.87 0.88 0.88 0.89 0.89 0.89 0.89 Working ratio 0.74 0.76 0.76 0.76 0.77 0.77 0.77 Net margin 7% 5% 5% 6% 7% 8% 9% Liquidity ratio 1.6 1.5 1.3 1.2 1.2 1.2 1.3 Acc. receivable comparator (days) 60 60 60 60 60 60 60 Unaccounted-for water (UFW) 32% 32% 32% 32% 32% 32% 32% Debt service coverage 3.0 1.9 1.8 2.0 2.1 2.3 2.4 Long-term debt/revenues 0.69 0.71 0.77 0.78 0.75 0.72 0.75 Liabilities/equity 0.41 0.42 0.46 0.48 0.49 0.50 0.54
Attachments 1 to 3 contain a summary of financial statements during the projected period. Sensitivity Analysis The sensitivity analysis was conducted to assess the respective impact of CESAN’s operational performance, which was poorer than those considered in the base case scenario. The impact was measured on net income and additional debt required for the next five years. The sensitivity analysis was carried out for the following variables:
• Staff productivity • Collection rate • Operating costs.

29
All variables have an important impact on financial results. If staff productivity decreases 10%, net income would be reduced by 38% and an additional loan of US$29 million would be required. Similar results are obtained when a 3% decrease in the rate of revenue collection occurs. When operating costs increase by 5% per year, net income would decrease by 44% and US$37 million of additional debt would be required. If greater changes occur, the situation would worsen and CESAN’s financial viability would be at risk. For instance, when operating costs increase by 15% the results would show losses of about US$9 million by 2012; additional debt (or transfers from the State of Espírito Santo) of US$56 million would be required; and financial indicators would show very poor results.
Net Income in 2012 (US$ thousands)
Additional Debt Required (US$ thousands)
Sensitivity to
Base case scenario When assumption changes
When assumption changes
Staff Productivity Decreases 5% 13,219 13,000
Decreases 10% 10,436 29,000 16,366 Collection revenue rate
Decreases 3 percentage points 9,961 29,129 16,366
Increase in O&M costs 5% 9,008 37,404
15% (8,849) 56,000 16,636

30
Attachment 1. Income Statement (Reais $ thousands)
Projected 2007 2008 2009 2010 2011 2012 2013 2014
Operating Revenue Water 289,759 306,964 335,799 366,304 396,417 426,615 459,005 493,742
Sewerage 45,780 51,476 61,794 77,651 99,339 122,460 142,345 160,058 Other 5,543 5,921 6,568 7,334 8,190 9,071 9,934 10,801
Total Operating Revenues 341,082 364,361 404,161 451,289 503,946 558,146 611,285 664,601 Operating Expenses
Staff 92,000 99,084 110,958 125,372 141,105 156,523 171,065 186,161 Materials 14,542 15,661 17,326 19,261 21,383 23,561 25,723 27,914
-Chemicals 5,731 6,185 6,766 7,381 7,987 8,596 9,248 9,948 -Other Materials 8,811 9,476 10,560 11,880 13,396 14,965 16,474 17,966
Third Parties 103,226 117,832 131,019 146,878 164,865 183,432 201,449 219,375 -Electricity 39,047 48,805 54,100 60,342 67,285 74,426 81,448 88,511
-Other Third Parties 64,179 69,027 76,919 86,536 97,580 109,006 120,001 130,864 General 23,268 21,295 23,638 26,426 29,556 32,780 35,931 39,084 Fiscal 20,092 21,471 23,822 26,610 29,730 32,943 36,089 39,243
Total Operating Expenses 253,128 275,342 306,762 344,546 386,639 429,239 470,256 511,778 Result before depreciation 87,954 89,019 97,399 106,743 117,307 128,907 141,029 152,824
Depreciation 39,142 41,505 44,729 48,701 52,955 57,336 61,987 66,967 Operating Income 48,812 47,514 52,670 58,042 64,352 71,571 79,041 85,857
Financial Expenses 25,869 30,148 33,452 31,872 29,918 27,747 25,154 26,770 Monetary Correction (919) 1,732 1,757 1,648 1,539 1,430 1,320 1,211
Non-operating Income 8,700 9,294 10,309 11,511 12,854 14,237 15,592 16,952 Non-operating Expenses 4768 5153 5760 6495 7302 8103 8863 9645
Taxes 3,068 3,304 3,700 4,181 4,706 5,220 5,705 6,208 Net Income (Loss) 24,616 17,140 19,095 25,784 33,704 42,672 52,257 57,477

31
Attachment 2. Balance Sheet (Reais $ thousands)
Projected 2007 2008 2009 2010 2011 2012 2013 2014
ASSETS Fixed Assets
Gross Fixed Assets 1,147,212 1,224,526 1,331,391 1,451,551 1,574,454 1,701,908 1,840,227 1,986,449 Minus: Accumulated Depreciation 330,559 374,508 421,596 472,573 527,725 587,181 651,213 720,154
Net Fixed Assets 816,653 850,017 909,796 978,978 1,046,730 1,114,727 1,189,013 1,266,295 Work in Progress 141,939 192,277 266,196 312,534 331,084 345,692 377,308 404,061
Total Fixed Assets 958,592 1,042,295 1,175,992 1,291,512 1,377,814 1,460,419 1,566,321 1,670,357 Current Assets
Cash and short-term investment 31,225 28,712 15,224 10,452 16,207 19,063 25,212 36,513 Net Accounts Receivable 56,308 60,152 66,447 74,195 82,852 91,763 100,500 109,265
Inventory 3,636 3,915 4,331 4,815 5,346 5,890 6,431 6,978 Other Current Assets 9,548 9,548 9,548 9,548 9,548 9,548 9,548 9,548
Total Current Assets 100,717 102,326 95,550 99,011 113,953 126,264 141,690 162,305 Other Assets 15,397 15,397 15,397 15,397 15,397 15,397 15,397 15,397
TOTAL ASSETS 1,074,706 1,160,018 1,286,939 1,405,920 1,507,165 1,602,080 1,723,408 1,848,059
LIABILITIES AND EQUITY
Long-term Liability Long-term Debt 47,296 75,881 131,756 172,603 204,590 227,735 290,818 348,319
Other Long-term Liabilities 187,419 184,133 180,932 177,814 174,776 171,814 168,927 166,111 Total Long-term Liabilities 234,715 260,014 312,688 350,417 379,366 399,550 459,745 514,430
Current Liability Accounts Payable 19,180 20,250 22,027 24,541 27,564 30,931 34,339 37,620
Current Portion of Long-term Debt 14,335 17,398 20,114 22,806 25,343 31,241 33,238 38,710 Other Current Liabilities 42,188 45,890 51,127 57,424 64,440 71,540 78,376 85,296 Total Current Liabilities 75,703 83,539 93,268 104,772 117,347 133,712 145,953 161,627
Total Liabilities 310,418 343,553 405,956 455,189 496,713 533,261 605,698 676,057
EQUITY 764,289 816,465 880,983 950,731 1,010,452 1,068,819 1,117,710 1,172,002
TOTAL LIABILITIES &EQUITY 1,074,706 1,160,018 1,286,939 1,405,920 1,507,165 1,602,080 1,723,408 1,848,059
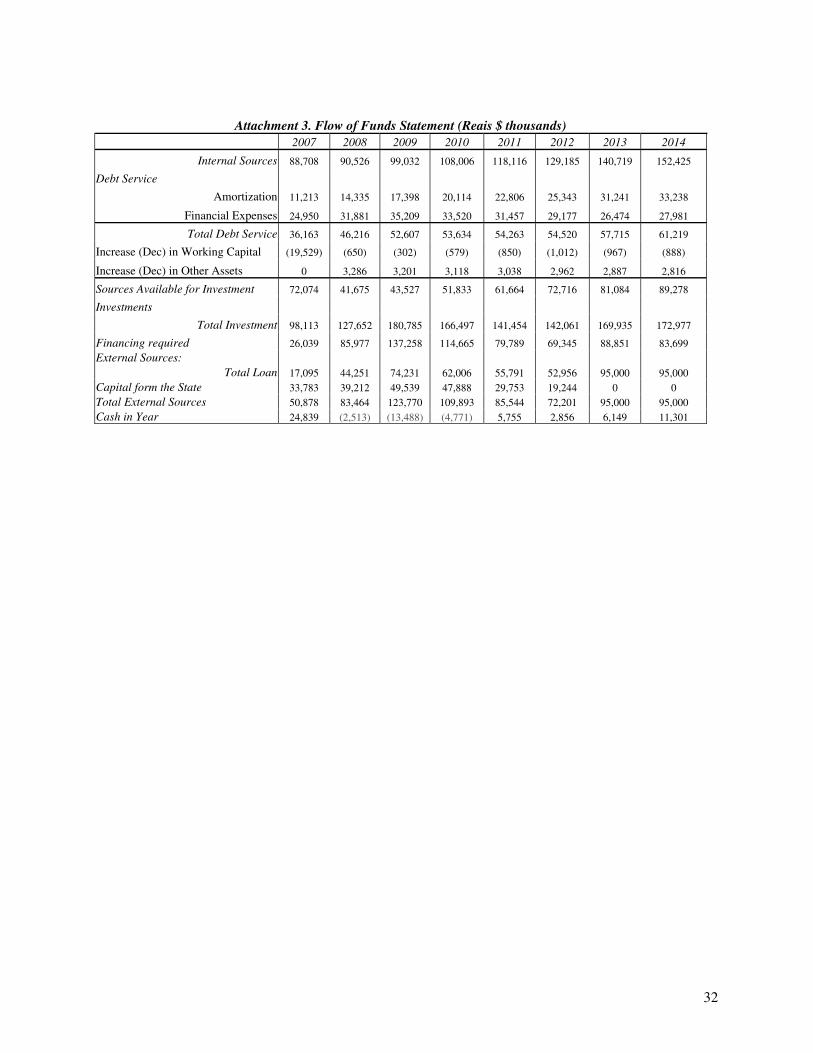
32
Attachment 3. Flow of Funds Statement (Reais $ thousands)
2007 2008 2009 2010 2011 2012 2013 2014
Internal Sources 88,708 90,526 99,032 108,006 118,116 129,185 140,719 152,425
Debt Service
Amortization 11,213 14,335 17,398 20,114 22,806 25,343 31,241 33,238
Financial Expenses 24,950 31,881 35,209 33,520 31,457 29,177 26,474 27,981
Total Debt Service 36,163 46,216 52,607 53,634 54,263 54,520 57,715 61,219
Increase (Dec) in Working Capital (19,529) (650) (302) (579) (850) (1,012) (967) (888)
Increase (Dec) in Other Assets 0 3,286 3,201 3,118 3,038 2,962 2,887 2,816
Sources Available for Investment 72,074 41,675 43,527 51,833 61,664 72,716 81,084 89,278
Investments
Total Investment 98,113 127,652 180,785 166,497 141,454 142,061 169,935 172,977
Financing required 26,039 85,977 137,258 114,665 79,789 69,345 88,851 83,699 External Sources:
Total Loan 17,095 44,251 74,231 62,006 55,791 52,956 95,000 95,000 Capital form the State 33,783 39,212 49,539 47,888 29,753 19,244 0 0 Total External Sources 50,878 83,464 123,770 109,893 85,544 72,201 95,000 95,000 Cash in Year 24,839 (2,513) (13,488) (4,771) 5,755 2,856 6,149 11,301
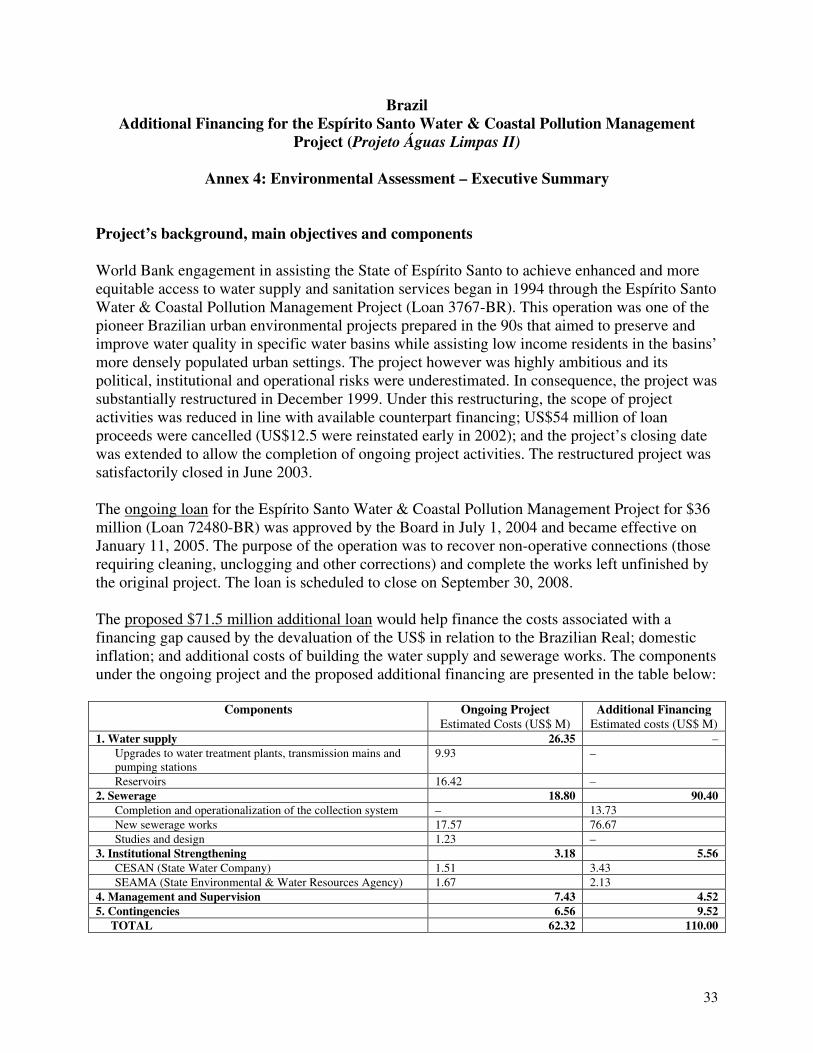
33
Brazil Additional Financing for the Espírito Santo Water & Coastal Pollution Management
Project (Projeto Águas Limpas II)
Annex 4: Environmental Assessment – Executive Summary Project’s background, main objectives and components World Bank engagement in assisting the State of Espírito Santo to achieve enhanced and more equitable access to water supply and sanitation services began in 1994 through the Espírito Santo Water & Coastal Pollution Management Project (Loan 3767-BR). This operation was one of the pioneer Brazilian urban environmental projects prepared in the 90s that aimed to preserve and improve water quality in specific water basins while assisting low income residents in the basins’ more densely populated urban settings. The project however was highly ambitious and its political, institutional and operational risks were underestimated. In consequence, the project was substantially restructured in December 1999. Under this restructuring, the scope of project activities was reduced in line with available counterpart financing; US$54 million of loan proceeds were cancelled (US$12.5 were reinstated early in 2002); and the project’s closing date was extended to allow the completion of ongoing project activities. The restructured project was satisfactorily closed in June 2003. The ongoing loan for the Espírito Santo Water & Coastal Pollution Management Project for $36 million (Loan 72480-BR) was approved by the Board in July 1, 2004 and became effective on January 11, 2005. The purpose of the operation was to recover non-operative connections (those requiring cleaning, unclogging and other corrections) and complete the works left unfinished by the original project. The loan is scheduled to close on September 30, 2008. The proposed $71.5 million additional loan would help finance the costs associated with a financing gap caused by the devaluation of the US$ in relation to the Brazilian Real; domestic inflation; and additional costs of building the water supply and sewerage works. The components under the ongoing project and the proposed additional financing are presented in the table below:
Components Ongoing Project Estimated Costs (US$ M)
Additional Financing Estimated costs (US$ M)
1. Water supply 26.35 – Upgrades to water treatment plants, transmission mains and pumping stations
9.93 –
Reservoirs 16.42 – 2. Sewerage 18.80 90.40
Completion and operationalization of the collection system – 13.73 New sewerage works 17.57 76.67 Studies and design 1.23 –
3. Institutional Strengthening 3.18 5.56 CESAN (State Water Company) 1.51 3.43 SEAMA (State Environmental & Water Resources Agency) 1.67 2.13
4. Management and Supervision 7.43 4.52 5. Contingencies 6.56 9.52
TOTAL 62.32 110.00

34
Environmental Assessment The project is classified as Environmental Category B, requiring a thorough Environmental Assessment (EA). In accordance with the OP 4.01, three EAs (1994, 2004 and 2007) were conducted by a team of individual consultants. These EAs evaluate with- and without-project scenarios, identifies potential direct and indirect environmental impacts associated with the project and other alternatives, develops mechanisms and measures to avoid, minimize and/or mitigate negative impacts, and presents an Environmental Management Plan with specific activities, budgets and responsibilities to ensure the implementation of these mitigating measures. The proposed additional financing activities have been reviewed by the Bank Safeguard Advisory Team (SAT). The SAT confirmed the Environmental Category B for this project. Positive Environmental Impacts The ongoing project will achieve expected environmental positive impacts including:
• Water Supply o Universal coverage of water supply o Optimization of the existing water supply system
• Sanitation o Access to sanitation services (sewage collection and treatment) expanded to 60% of
the population in the Metropolitan Region of Grande Vitória o Access to sanitation services (sewage collection and treatment) expanded to 100% of
the population in the state capital city of Vitória o Removal of untreated wastewater currently being discharged in the coastal area of the
Metropolitan Region resulting in general improvement in the quality of life and natural ecosystems, including the beaches.
• Institutional Strengthening o Operational, financial and commercial recovery and institutional strengthening of the
State Water and Sanitation Company (CESAN), including the following particularly relevant improvements: increased efficiency in service delivery; increased efficiency in water resources management; and increased capacity in environmental management.
o Improved institutional capacity in SEAMA, the State Secretariat of the Environment and Water Resources, including the following particularly relevant achievements: � Creation of a department responsible for implementing the State Water Resources
Management Policy. � Preparing and implementing an Environmental Management System � Faster processing of environmental licenses � Revised environmental legislation � Creation of water river basin committees � Initiating the formulation of a State Water Resources Master Plan and of river
basin plans � Improving and expanding the state water quality monitoring system

35
The proposed additional financing will allow the ongoing project to achieve the sanitation targets by offsetting the current financial constraints. Negative Environmental Impacts Both the ongoing and the proposed additional financing will finance a series of infrastructure works whose construction could result in limited negative environmental impacts. These negative impacts have been mitigated through the implementation of the project Environmental Management Plan (EMP). The main negative impacts targeted include: Noise, Air and Water Quality. Infrastructure construction that could result in localized short-term environmental impacts including dust and noise pollution and erosion. The project’s Environmental Manual for Civil Works establishes appropriate measures to address these issues. Biodiversity / Natural Habitats. The construction of project-related infrastructure could yield localized impacts to riverine habitats through the short-term removal of riparian vegetation. The project is actually restoring much degraded riverine habitats by removing untreated wastewater loads and promoting appropriate management procedures. Cultural Property. The construction of the Wastewater Treatment Plant “Mulembá” could have impacted the “Paneleiras”, a women’s association that produces clay potter used in the local cuisine if the project had not included appropriate protecting measures. Successfully, the EMP included a series of measures to ensure the protection of the activities carried out by this association and also supported improvements in the association that resulted in increased economic opportunities. The project supervision has been closely monitoring and evaluating the support provided to the “Paneleiras”. These activities will continue to be monitored as appropriate. The project manual and EMP include the ‘chance find procedures’, which have been properly followed. Involuntary Resettlement. In the ongoing project the sites of the works have been carefully selected in order to not require population resettlement. In the proposed additional financing, 16 areas are needed for the construction of the sewerage pumping stations. Fifteen of these areas are public property. Since three of those are public urban parks, the pumping stations will be built underground to avoid disrupting the public use of these areas. By so doing the current feature of these places will not change. One out of the 16 areas is privately owned. The state water company is currently purchasing the area through a commercial transaction based on market value. The 16 sites have been screened and the evidence confirmed that there are no constructions or population living in those areas. Compliance with the Bank environmental safeguards The ongoing project execution has been properly following the Bank social and environmental safeguards. This compliance has been ensured by the presence of environmental specialists in the Bank supervision team as well as by the increased local capacity of the state environmental agency and the state water company.
36
In order to support the documentation for the proposed additional financing, a comprehensive environmental assessment has been carried out to review the ongoing project execution under an environmental and social stand point. The findings confirmed the project compliance. Compliance with the National environmental legislation The project has fully complied with the national environmental legislation by properly addressing the following:
� Preparing the environmental assessments required requesting the environmental licenses – the environmental licenses issued by the State Environmental Agency are in the project files.
� Water use rights: the appropriate measures have been taken to request to issue ‘water rights’ by the project in order to operate the wastewater treatment plants.
� Conservation units: the project has taken measures to avoid negatively impacting the Environmental Conservation Units located in the proximity of the project’s sites.
� Historic, cultural and archeological heritage: the project has taken the appropriate measures to protect sites that fall under this category. The Institute of National Historic and Artistic Heritage (IPHAN), the federal institute dedicated to protect such assets, has been consulted and its recommendations are included in the environmental licenses.