document de travail - banque de france...excellent research assistance. we'd like to thank...
TRANSCRIPT
DOCUMENT
DE TRAVAIL
N° 482
DIRECTION GÉNÉRALE DES ÉTUDES ET DES RELATIONS INTERNATIONALES
Credit Risk in the Euro area
Simon Gilchrist and Benoit Mojon
April 2014
DIRECTION GÉNÉRALE DES ÉTUDES ET DES RELATIONS INTERNATIONALES
Credit Risk in the Euro area
Simon Gilchrist and Benoit Mojon
April 2014
Les Documents de travail reflètent les idées personnelles de leurs auteurs et n'expriment pas
nécessairement la position de la Banque de France. Ce document est disponible sur le site internet de la
Banque de France « www.banque-france.fr ».
Working Papers reflect the opinions of the authors and do not necessarily express the views of the Banque
de France. This document is available on the Banque de France Website “www.banque-france.fr”.
Credit Risk in the Euro area1
Simon Gilchrist (Boston University and NBER)
Benoit Mojon (Banque de France and Ecole Polytechnique)
We are particularly grateful to Béatrice Saes-Escorbiac, Jocelyne Tanguy and Aurélie Touchais for their excellent research assistance. We'd like to thank Viral Acharya, Marcus Brunermeier, Christina Romer, David Romer, Richard Portes, Pierre Sicsic and participants to Banque de France, Banco de Espagna and LBS seminars and the NBER Summer Institute. The opinions expressed in the paper are those of the authors and do not reflect the views of the Banque de France. [email protected] and [email protected]
Résumé: Nous construisons des indicateurs de risque de crédit pour les banques et pour les sociétés non financières de la zone euro. Ces indicateurs sont les écarts de prime moyens entre le rendement des obligations émises par le secteur privé et le rendement de même maturité émis par l'État fédéral allemand. Les indicateurs sont construits par pays pour l'Allemagne, la France, l' Italie et l'Espagne ainsi que pour la zone euro. Ils révèlent que la crise financière de 2008 a considérablement augmenté le coût du financement de marché pour les banques et les entreprises non financières. En revanche, le ralentissement de 2001 n’a eu d’impact que sur le coût du crédit des entreprises non financières, alors que celui des banques est resté stable. La crise financière de 2008 a également conduit à une divergence systématique des écarts de crédit pour les entreprises financières entre les pays. Cette divergence a encore augmenté lors que la crise de la dette européenne de 2010 à 2013. Les primes de crédit pour les banques et les entreprises non financières reflètent alors de plus en plus un facteur national plutôt que les conditions financières de la zone euro. Nos indicateurs de risque de crédit fournissent du contenu prédictif important pour l'activité réelle et les volumes de crédit de la zone euro dans son ensemble et pour chaque pays. Une analyse VAR implique que les perturbations des marchés de crédit conduisent à des contractions importantes de la production, augmente le chômage et diminue l'inflation dans la zone euro. Keywords : cycle du crédit, zone euro, crise financière Code JEL: E32, E43, E44 Abstract: We construct credit risk indicators for euro area banks and non-financial corporations. These are the average spreads on the yield of euro area private sector bonds relative to the yield on German federal government securities of matched maturities. The indicators are also constructed at the country level for Germany, France, Italy and Spain. These indicators reveal that the financial crisis of 2008 has dramatically increased the cost of market funding for both banks and non-financial firms. In contrast, the prior recession following the 2000 U.S. dot-com bust led to widening credit spreads of non-financial firms but had no effect on the credit spreads of financial firms. The 2008 financial crisis also led to a systematic divergence in credit spreads for financial firms across national boundaries. This divergence in cross-country credit risk increased further as the European debt crisis has unfolded since 2010. Since that time, credit spreads for both non-financial and financial firms increasingly reflect national rather than euro area financial conditions. Consistent with this view, credit spreads provide substantial predictive content for a variety of real activity and lending measures for the euro area as a whole and for individual countries. VAR analysis implies that disruptions in corporate credit markets lead to sizeable contractions in output, increases in unemployment, and declines in inflation across the euro area. Keywords: credit cycle, euro area, financial crisis Code JEL: E32, E43, E44
Non-technical summary Gauging the extent of financial distress for countries within the euro area remains a considerable challenge. Market interest rates arguably provide good indicators of credit risk as they reflect, in real time, the beliefs of many investors. Although market-based indices of an average of corporate bond yields are commercially available, these are frequently constructed from arbitrary samples of firms whose characteristics evolve over time in a non-transparent manner. Furthermore, the lack of information regarding the underlying structure of the portfolio leads to a maturity mismatch when constructing credit spreads as the difference in yields between corporate bonds and sovereign bonds. This maturity mismatch confounds measurement by not properly distinguishing between credit risk and term premia. This paper introduces new indices of credit risk in the euro area. These indices aggregate the information obtained from thousands of corporate bonds and hundreds of thousands of monthly observations on the yield to maturity of such bonds since the launch of the euro in January 1999. Following Gilchrist et al. (2009) and Gilchrist and Zakrajsek (2012b), we construct a credit risk spread at the bond level as the difference between the corporate bond yield and the yield of a German Bund zero coupon bond of the same maturity. By constructing credit spreads at the bond-issuance level we thus avoid confounding credit risk premiums with term premiums. We then aggregate these bond-level credit spreads to obtain indices of credit risk for two sectors, banks and non-financial corporations (NFC thereafter) for the four largest euro area countries: Germany, France, Italy and Spain. By aggregating this information across countries, we are also able to construct credit spreads for the euro area as a whole. Our credit spreads reveal that the financial crisis of 2008 dramatically increased the cost of market funding for both financial and non-financial firms in the euro area. Furthermore, since the summer of 2010, there is a strong divergence in corporate credit spreads across countries similar to the one observed for sovereign spreads. The credit spreads of both financial and non-financial corporations in Italy and Spain widened dramatically during this time period. Although not as pronounced, we further document a deterioration in the credit spreads of financial institutions in France and Germany during the post 2010 period. In contrast, the credit spreads of non-financial firms in France and Germany remain below their 2009 peak. In addition to documenting the evolution of credit spreads across countries within the euro area, we also analyze the information content of these credit spreads by examining their ability to predict commonly used indicators of economic activity, inflation and bank lending. These results imply that both financial and non-financial credit spread indices are highly robust leading indicators for economic activity and the growth in bank lending. In terms of aggregate spending components, we find that both bank and NFC credit spreads are particularly informative about the future growth in non-residential investment both in the euro area and at the country level. In contrast, only bank credit spreads appear to be robust predictors of the future growth in consumption spending. In order to characterize the response of economic activity to disruptions in credit markets we also estimate a Factor-Augmented Vector Autoregression (FAVAR) and study the impulse response of euro area and country-specific measures of economic activity to shocks to credit spreads that are orthogonal to information contained in both real activity series and other asset prices. Consistent with the findings that credit spreads predict future economic activity, the FAVAR results imply that disruptions in credit markets lead to a sharp reduction in stock returns, significant declines in output and inflation, and increases in unemployment across the euro area and within each of the four countries.
1 Introduction
The euro area has become the epicenter of world financial stress since the post-Lehman
recession escalated into a sovereign debt crisis that began in 2010. The fear of a sovereign
default and the possible break up of the euro has resulted in diverging financial conditions
for debt issuers across countries within the euro area. This divergence of financial conditions
within the Eurosystem has been among the main motivations for a series of non-conventional
monetary policy measures taken by the ECB since May 2010. In particular, the launch of the
OMT in the late summer of 2012 was motivated by the need to “restore” the transmission
mechanism, i.e. the uniqueness of financial conditions within the euro area.
Although policy makers remain concerned about the fragmentation of the European
financial system, gauging the extent of financial distress for countries within the euro area
remains a considerable challenge. There are very few reliable indicators of credit risk in
the euro area and across euro area countries. Most statistics on euro area interest rates are
either sovereign interest rates or bank retail interest rates. In principle, the latter reflect the
effective cost of external finance for a large proportion of the population of euro area firms
and for households. In practice, retail bank interest rates are based on surveys rather than
market-based indicators. In addition, bank retail interest rates reflect compositional changes
among borrowers as well as the varying degree of competition between banks.
Market interest rates arguably provide better indicators of credit risk as they reflect, in
real time, the beliefs of many investors. Although market-based indices of an average of
corporate bond yields are commercially available, these are frequently constructed from ar-
bitrary samples of firms whose characteristics evolve over time in a non-transparent manner.
Furthermore, the lack of information regarding the underlying structure of the portfolio leads
to a maturity mismatch when constructing credit spreads as the difference in yields between
corporate bonds and sovereign bonds. This maturity mismatch confounds measurement by
not properly distinguishing between credit risk and term premia.
This paper introduces new indices of credit risks in the euro area. These indices aggregate
the information obtained from thousands of corporate bonds and hundreds of thousands of
monthly observations on the yield to maturity of such bonds since the launch of the euro
in January 1999. Following Gilchrist et al. (2009) and Gilchrist and Zakrajsek (2012b),
we construct a credit spread at the bond level as the difference between the corporate bond
yield and the yield of a German Bund zero coupon bond of the same maturity. By construct-
2
ing credit spreads at the bond-issuance level we thus avoid confounding credit risk premia
with term premia. We then aggregate these bond-level credit spreads to obtain indices of
credit risk for two sectors, banks and non-financial corporations (NFC thereafter) for the
four largest euro area countries: Germany, France, Italy and Spain. By aggregating this
information across countries, we are also able to construct credit spreads for the euro area
as a whole.
Our credit spreads reveal that the financial crisis of 2008 dramatically increased the cost
of market funding for both financial and non-financial firms in the euro area. Furthermore,
since the summer of 2010, there is a strong divergence in corporate credit spreads across
countries similar to the one observed for sovereign spreads. The credit spreads of both
financial and non-financial corporations in Italy and Spain widened dramatically during this
time period. Although not as pronounced, we further document a deterioration in the credit
spreads of financial institutions in France and Germany during the post 2010 period. In
contrast, the credit spreads of non-financial firms in France and Germany remain below
their 2009 peak.
In addition to documenting the evolution of credit spreads across countries within the
euro area, we also analyze the information content of these credit spreads by examining
their ability to predict commonly used indicators of economic activity, inflation and bank
lending. These results imply that both financial and non-financial credit spread indices are
highly robust leading indicators for economic activity and the growth in bank lending. In
terms of aggregate spending components, we find that both bank and NFC credit spreads
are particularly informative about the future growth in non-residential investment both in
the euro area and at the country level. In contrast, only bank credit spreads appear to be
robust predictors of the future growth in consumption spending.
In order to characterize the response of economic activity to disruptions in credit markets
we also estimate a Factor-Augmented Vector Autoregression (FAVAR) and study the impulse
response of euro area and country-specific measures of economic activity to shocks to credit
spreads that are orthogonal to information contained in both real activity series and other
asset prices. Consistent with the findings that credit spreads predict future economic activity,
the FAVAR results imply that disruptions in credit markets lead to a sharp reduction in stock
returns, significant declines in output and inflation, and increases in unemployment across
the euro area and within each of the four countries.
3

There is a long tradition of building credit risk indicators from bond prices and assessing
their predictive content for economic indicators over the business cycle.1 Our approach
replicates the one developed in Gilchrist and Zakrajsek (2012b) for U.S. data. Bleaney et
al. (2012) have implemented a similar approach for corporate bonds from Austria, Belgium,
France, Germany, Italy, the Netherlands, Spain and the UK, yet they focus exclusively on
NFC credit spreads, while we also focus here on corporate credit risk for banks.
The role of banks in the transmission of monetary policy has been analyzed in a number
of research papers, including nine euro area country case studies that consistently analyzed
individual balance sheet data in the context of the Eurosystem Monetary Transmission
Network. Angeloni et al (2003) and Ehrmann et al. (2003) provide an overview of these
results. More recently many papers have focused on the spillover of the euro area sovereign
debt crisis to credit markets, including Albertazzi et al (2012), Del Giovane, Nobili and
Signoretti (2013), Neri and Ropele (2013) and references therein.2
Several papers have also gathered evidence on the importance of banks for the euro area
business cycle. Among these, de Bondt et al (2010), Ciccarelli, Madaloni and Peydro (2010),
Del Giovane et al; (2011), Lacroix and Montornes (2009) and Hempell and Kok Sorensen
(2010) show in particular that the diffusion indices constructed from the ECB Bank Lending
Survey contain predictive power for economic indicators in the euro area.
In addition to providing an analysis of the evolution of euro area and country-specific
corporate credit spreads, an important goal of this research project is to construct credit risk
indicators in a uniform and hence comparable manner for the euro area and within the four
largest euro area countries. Importantly, our data collection methods, which rely on publicly
available information, allow us to provide consistent monthly updates to all aggregate credit
indices. The updated series can be downloaded from the appendix of the Banque de France
working paper version of this paper. In addition, the micro data used to build these indices
are available upon request from the authors.
The rest of the paper is organized as follows. Section 2 describes the data used to
construct credit indices at the country level for both banks and non-financial firms and
documents the evolution of these indices over the available sample period, 1999-2013. Section
1See in particular Friedman and Kuttner (1992, 1993), Estrella and Hardouvelis (1997), Estrella and
Mishkin (1998) and Gertler and Lown (1999).2See also Panetta and Signoretti (2010) for an earlier study of the effects of financial stress on banks’
activity.
4

3 assesses the ability of credit spreads to predict economic activity, inflation and lending
aggregates. Section 4 uses a Factor-Augmented VAR framework to explore the distinct role
of credit spreads in the business cycle. Section 5 concludes.
2 Credit Risk Indices for the Euro Area
Following the methodology of Gilchrist and Zakrajsek (2012b) we use individual security level
data to construct security-specific credit spreads. We then average these credit spreads to
obtain credit spread indices at the aggregate level. This methodology allows us to construct
credit spread indices that reflect the two key characteristics of the European financial system:
the importance of banks, and the extent of national fragmentation of financial markets within
the euro area.
It is well known that the European financial system is dominated by banking institutions.
That such financial firms account for a disproportionate share of the corporate bond market
is perhaps less widely recognized. Bonds issued by euro-area banks account for over 5
trillions euros as of July 2012. This compares to 800 hundred billions euros issued by
non-financial corporations and 6.2 trillions euros issued by sovereigns.3 Thus to a large
extent, the bond market overwhelmingly reflects a combination of debt issued by financial
institutions and sovereigns with only a small fraction of issuance accounted for by non-
financial corporations.4.
The importance of individual countries in the European financial system reflects the na-
tional fragmentation of the euro-area financial market that has re-emerged since the Lehman
bankruptcy. In this environment, credit conditions in sovereign debt markets may easily spill
over into country-specific financial markets. In turn, a deterioration in balance sheets of the
financial sector at the country level may lead to an increase in sovereign risk.
Given these concerns we build two indicators, one for banks and one for non-financial
corporations, for each of the four largest euro area countries: France, Germany, Italy and
Spain. These countries account for 80% of the euro area population, economic activity and
financial markets. Although in principle it is possible to extend the analysis to countries
3The total debt of the euro area public sector exceeds 8 trillion euros, once bank loans, primarily granted
to cities and regions, are included.4The euro area corporate bond market is relatively liquid. Biais et al (2006) report for instance that each
security is subject to approximately 3 trades per day, on average
5
beyond Spain, in practice, corporate debt market become too shallow and provide too narrow
a cross-section of issuers to build reliable macroeconomic indicators for smaller countries.
2.1 Data sources and methods
Our indices are based on a comprehensive list of corporate debt securities issued by corpo-
rations in the euro area big 4 as reported in Bloomberg and Datastream. For each security,
we use the Datastream month end “effective yield” and subtract from it the interest rate of
a zero coupon German Federal bond of matched duration.5 Our choice of the German Bund
as the benchmark risk-free asset is motivated by the increased and more volatile sovereign
spreads between Italian, Spanish and to a lesser extent French treasury yields with respect
to the German Bund interest rate as the European debt crisis has unfolded. To match du-
ration, we obtain an estimate of the zero-coupon German Bund yield at a specific maturity
using standard yield-curve fitting techniques.
To construct credit indicators, we focus on fixed-coupon, euro-denominated, non-callable,
non-guaranteed securities. We provide details of the sample selection including names of all
issuers in the data appendix. The resulting database includes over 90000 monthly observa-
tions from nearly 2300 corporate bonds. Of these, about 50000 observations are effective
yields on bonds issued by banks. The remaining 40000 observations are issued by non-
financial corporations.
Table 1 provides descriptive statistics of the underlying bond market data by type of issuer
and by country. The number of securities available varies significantly across countries and
over time. The cross-country variation is in part due to the depth of the market as measured
by country size in economic terms. It also reflects institutional characteristics specific to
each country. In particular, German banks have a noticeably large number of securities
outstanding in comparison to banks in the other three countries. The number of issuers is
therefore a more informative statistic of data coverage. This varies from 66 banks and 112
non-financial companies in Germany to 26 banks and 22 non-financial companies in Spain.
Table 1 also highlights considerable variation in data availability over time. Notably, data
coverage is somewhat limited for the first years of the sample and grows over time as the
5For a subset of securities, we independently verified that the effective yield provided by Datastream
matches the effective yield computed from the bond price and the sequence of coupons.
6
European bond market deepens.6
Table 1 also provides summary statistics on the characteristics of individual bonds, in-
cluding size of issuance, maturity and duration. Banks tend to issue smaller amounts than
non-financial companies, especially in Germany where the median issuance of banks amount
to $121 million. The median issuance for non-financial companies ranges from $494 million
in Spain to $753 million in Italy. The initial maturity of the securities is close to 10 years
and the remaining maturity ranges from 3 to 5 years across portfolios.
For each security, the spread Sit, on corporate bond i, is constructed by subtracting
from the effective yield Rit the German Bund zero coupon interest rate of a similar duration
ZCRDEt (Dur(i, t)):
Sit = Rit − ZCRDEt (Dur(i, t))
As shown in Table 1, the mean and median credit spreads for the entire sample period
appear to be relatively homogenous across sectors and countries. For banks, the median
credit spread ranges from 0.9% for French banks to 2.1% for Spanish banks. Non-financial
corporations have median spreads with respect to the German Bund that range from 1.0%
in France to 1.6% in Italy.
Country-specific credit risk indicators Skt are constructed as a weighted average of credit
spreads on individual securities:
Skt =
∑i
witSit
where the weight
wi,t =MVAIit∑i
MVAIi,t
is defined as the ratio of the market value at issue of the security relative to the total market
value at issue of all bonds in the sample during a point in time. In addition to constructing
country-specific credit spread indices, we also use the same methodology to construct a
value-weighted credit spread index for the euro area as a whole.7
6The limited sample size in the earlier yields is partially due to limited availability of data on securities
that have expired and for which our source does not maintain records.7We have compared these spreads to unweighted averages as well as to trimmed means that exclude the
first and the ninety-ninth percentiles and the fifth and the ninety-fifth percentiles of the spread distributions.
These comparisons, which are available upon request to the authors, reveal that these alternative approaches
produce highly correlated indices. The only notable exception pertains to German bank spreads during the
2002-2003 slowdown. In this episode, the unweighted credit spread index is significantly higher than the
7
2.2 The time-series evolution of credit spreads
Figure 1 and Figure 2 display the time-series evolution of the credit risk indicators for banks
and the NCFs for each country and for the euro area. The time series behavior of these
credit spreads show a number of striking patterns that reflect financial developments in the
euro area over the 1999-2013 sample period.
Prior to the global financial crisis that began in mid 2007, credit spreads for banks in
Germany, France and Italy are both low and show a strong common comovement. In the
1999-2002 period these credit spreads are roughly on the order of 80 to 100 basis points.
These credit spreads fell to roughly 50 basis points during the 2003-2007 period of strong
growth in housing prices in the U.S., the UK, Spain and other European countries. This
drop in credit spreads to historic lows is consistent with the low credit spreads and credit risk
premiums observed in the U.S. financial markets as documented by Gilchrist and Zakrajsek
(2012b). During this period, credit spreads for Spanish banks are somewhat elevated and
do not exhibit strong comovement with other countries however.
Credit spreads of European non-financial corporations show much more variation over this
time period. In particular, credit spreads for non-financial firms rose substantially during
the slowdown in global economic activity that followed the bursting of the U.S. dot-com
bubble. In contrast, bank credit spreads appear largely unaffected by the 2001-2002 global
slowdown.
As can be seen in Figure 1, the financial crisis of 2008 dramatically increased the cost
of market funding for banks. This is especially true in Germany, Italy and France where,
prior to mid-2007, bank credit spreads were on the order of 50 basis points, but subsequently
rose sharply in response to the deterioration in global financial conditions that occurred in
late 2008 and throughout 2009. Credit spreads on Spanish banks, although already elevated
relative to the spreads in other countries, also widened during this period.
Credit spreads for non-financial firms also rose sharply during the 2008 financial crisis.
Strikingly, there is very little divergence in financial conditions for non-financial firms across
European countries during this period. In contrast, one can see a distinct divergence in
country-specific credit spreads for the banking sector during the 2008-2009 episode. In
effect, the on-going national fragmentation of European financial markets was seeded in the
weighted index presented in this paper, implying that the cost of market funding for small German banks
increased at that time.
8
2008 financial crisis.
The final distinct episode of interest is the post 2010 period during which the risk of
sovereign default became a growing concern within European financial markets. Such con-
cerns lead to a widening of credit spreads on Italian, Spanish and, to a lesser extent, French
banks in the second quarter of 2010. Although credit spreads fell somewhat in early 2011
they again increased sharply in 2011Q4 when the average credit spread on Italian banks
peaked at nine percent. During this episode, credit spreads on Spanish banks jumped three
percentage points (from 2.5% to 5.5%). Credit spreads for German and French banks also
increased sharply during this period. Although credit spreads on Italian banks fell relative
to their 9% peak, credit spreads on Spanish banks continued to rise, reaching an all-time
high of 8% in 2012Q2. Subsequent to this spike, bank credit risk fell continuously across all
four countries and in the euro area as a whole, a fact that is likely attributable to the more
activist stance of the ECB as of mid-2012.
In contrast to the 2008-2009 episode in which credit spreads of non-financial companies
exhibited a very strong comovement, it appears that country-specific risks spilled over into
the non-financial sector with the onset of the European debt crisis. Figure 2 clearly shows
the same cross-country divergence in credit spreads of non-financial corporations that one
sees in the credit spreads of financial companies from 2010 onwards. By this measure,
country-specific sovereign-risk factors have caused a sharp rise in funding costs for banks
and a coincident rise in funding costs for non-financial firms during the post-2010 period.
2.3 Comparison to alternative series
In Figures 3 and 4 we compare the Gilchrist-Mojon (GM thereafter) euro area credit spreads
to alternative measures of credit risk. For banks, we compare the euro area credit spread
to the 6 month EURIBOR-EONIA SWAP (BOR-OIS hereafter), a widely used measure of
counterparty and credit risks on the interbank market. These spreads are shown in Figure 3.
Both the GM and the EURIBOR-OIS spread show negligible credit/counterparty risk in
August 2007 but rise sharply thereafter, indicating peak financial stress in late 2008, after
Lehman filed for bankruptcy. These risk indicators clearly diverge in the post-2010 period
however. This divergence may in part be due to compositional changes in the Euribor-OIS
market whereby over time, riskier banks are excluded from transacting. Such compositional
bias is much less likely to influence the GM euro area credit spread which is constructed from
9

longer term securities that include all financial institutions that have issued such securities,
not just those that still transact in the Euribor-OIS market. These results suggest that credit
spreads constructed from secondary bond prices may provide a more informative measure of
overall financial distress than the BOR-OIS spread.
Figure 4 compares the GM euro area credit spread for non-financial firms to the credit
spread obtained from retail interest rates on bank loans.8 To construct a retail credit spread
we subtract the 6 month EONIA SWAP rate from the retail interest rate. This is a reasonable
benchmark because bank loans still overwhelmingly dominate the external financing of euro
area NFCs and such loans are typically granted at a variable interest rate that is indexed to
short-term money market interest rates. It is evident from Figure 4 that these two indicators
of credit risk for NFCs tend to peak simultaneously in late 2008 and in late 2011. Despite
such strong comovement during periods of acute financial distress, these two series diverge
in important ways. Most notably, the retail bank credit spread remains persistently elevated
relative to the GM bank credit spread in the aftermath of the 2008 financial crisis.
Finally, in Figures 5 and 6, we compare GM spreads and credit default swap rates, country
by country. The latter are unweighted averages of CDS rates on banks or non-financial firms
for each country. An important difference between GM spreads and CDS rates is that the
latter are available for only a small number of issuers (typically only a handful of firms)
relative to the cross section used to construct GM spreads. This compositional bias explains
why, with the exceptions of French banks in 2011 and Italians NFCs in 2009, our credit
spreads are typically higher than CDS rates during episodes of financial stress.
3 The Predictive Content of Credit Spreads
We now turn to analyzing the predictive content of credit spreads. We first consider the
ability of credit spreads to forecast real activity variables such as GDP, unemployment and
industrial production, as well as inflation indices as measured by both headline and core
inflation. Because we are primarily interested in business cycle dynamics as opposed to
near-term forecasting results we focus on forecasting the growth rate of a given variable at
the one-year ahead horizon. In addition, this is the horizon over which credit spreads contain
8This retail bank interest rate for new business is published in bottom panel of Table 4.5 in the statistical
appendix of the ECB monthly bulletin.
10

the largest gain in forecasting performance for U.S. data, as documented in Gilchrist and
Zakrajsek (2012b). We first consider the ability of euro area credit spreads to predict euro
area economic activity. Within this framework, we consider both monthly indicators such
as industrial production and unemployment as well as quarterly series such as GDP and its
individual spending components, consumption, residential and non-residential investment.
We then turn to a country-specific analysis and address the question as to whether country-
specific credit spreads help predict country-specific outcomes. We provide a similar analysis
for inflation for the euro area and at the country-level. Finally, we extend this analysis to
consider the predictive content of credit spreads for the aggregate growth in lending in the
euro area as well as the growth rates in lending for each individual country.
3.1 Real Economic Activity and Inflation
3.1.1 Methodology
In this section we present empirical results that examine the ability of credit spreads to
predict various measures of real economic activity and inflation. Let ∆h log Yt+h measure
the h quarter ahead percent change in a variable of interest.9 We follow Gilchrist and
Zakrajsek (2012b) and specify a forecasting equation of the form:
∆h log Yt+h = αo + α1rt + α2termt + γ∆h log Yt + βst + εt
where rt measures the real interest rate, termt measures the term premium and st is the
credit spread of interest. The real interest rate is measured as the EONIA rate minus the
twelve-month euro area inflation rate. The term spread is measured as the difference in yields
on ten-year AAA euro sovereign bonds minus the EONIA. For all forecasting regressions,
we report separate results using bank credit spreads and credit spreads for non-financial
firms as our measure of st. We first consider the ability of credit spreads to forecast the two
most commonly used monthly indicators of economic activity – unemployment and industrial
production. We then examine the ability of credit spreads to forecast quarterly GDP and
its broad spending components. This section concludes with an analysis of the forecasting
power of credit spreads for inflation.
9When forecasting unemployment we compute the h quarter ahead change in the unemployment rate
rather than the log-difference.
11
3.1.2 Economic Activity Indicators
We begin by reporting forecasting results for the euro area as a whole. We then consider
country-specific regressions. Table 2 presents the main estimation results on the predictive
content of credit spreads for monthly economic activity as measured by the four-quarter
ahead change in euro area unemployment and industrial production. We report regression
results that include the real interest rate and the term-spread as a baseline. We then sepa-
rately add the GM euro area bank credit spread and the NFC credit spread to these baseline
regressions.
As shown in Table 2, both the bank credit spread and the non-financial credit spread are
highly statistically significant predictors of the four-quarter ahead change in the euro area
unemployment rate. These credit spreads are also highly statistically significant predictors of
the four-quarter ahead change in euro area industrial production. The coefficient estimates
imply an economically significant impact of credit spreads on future economic activity – a
one percentage point rise in bank credit spreads predicts a 0.81 percent rise in the euro
area unemployment rate and a 2 percent decline in euro area industrial production. As
measured by the in-sample change in R-square the predictive content of credit spreads is
large, especially for the euro area unemployment rate where the R-squared increases from
0.31 to 0.71 with the addition of either the bank or non-financial credit spread.
Table 3 presents forecasting results for euro area quarterly GDP and its spending compo-
nents. The top panel presents estimation results for the full quarterly sample period 2000:Q1
to 2012:Q4. As in Table 2, the estimation again controls for the real interest rate and the
term spread with all interest rates and credit spreads measured as of the final month prior to
the start of the quarter. Consistent with the results reported in Table 2 for the monthly eco-
nomic activity series, we find that both bank and NFC credit spreads are highly statistically
significant predictors of four-quarter ahead growth in euro area real GDP. The coefficient
estimates imply that a one percentage point increase in bank credit spreads predicts a 1.24
percent decline in euro area real GDP. Again, the in-sample gains in fit are substantial. The
R-squared increases from 0.31 to 0.46 with the inclusion of the bank credit spread, and to
0.51 with the inclusion of the NFC credit spread.
The remaining columns of Table 3 report estimation results for the individual spend-
ing components, consumption, residential investment and non-residential investment. Both
bank and NFC credit spreads are robust predictors of the four-quarter ahead growth in con-
12
sumption and non-residential investment. The improvement in in-sample fit is particularly
impressive for non-residential investment where the R-squared increases from 0.26 to 0.53
with the inclusion of the bank credit spread and to 0.56 with the inclusion of the NFC credit
spread. Notably, neither series helps predict residential investment over this period. The
finding that credit spreads predict non-residential investment is consistent with the forecast-
ing results documented in Gilchrist and Zakrajsek (2012b) for the U.S. The finding that
credit spreads also add significant explanatory power for consumption growth is new and
specific to European data however.
Given the strong relationship between credit spreads and economic activity during the
2008 financial crisis and subsequent European sovereign debt crisis it is natural to ask
whether there is a significant relationship between credit spreads and economic activity
prior to these episodes. As a robustness exercise, in the lower panel of Table 3 we report
estimation results based on the pre-crisis sample period that covers 2000:Q1 to 2007:Q4. Ac-
cording to the results in the lower panel of Table 3, NFC credit spreads remain statistically
significant predictors of four-quarter ahead GDP growth during this time period although
the gain in in-sample fit is relatively small. Bank credit spreads no longer forecast GDP
growth in the period prior to 2008 however. These results are not surprising given that this
relatively short sample contains only one business cycle in which, as discussed above, NFC
credit spreads widened but bank credit spreads remained relatively stable. More interest-
ingly, both bank credit spreads and NFC credit spreads continue to predict consumption
growth over the pre-crisis sample period. Bank credit spreads also remain a robust predictor
of non-residential investment spending during the pre-crisis sample. In contrast, NFC credit
spreads lose their forecasting power for non-residential investment when we eliminate the
post-crisis period. Overall, these findings imply that bank credit spreads are significant pre-
dictors of both consumption and non-residential investment over both the full sample period
as well as the pre-crisis sample period.
We now consider the ability of country-specific credit spread indices to forecast country-
specific measures of economic activity. We begin with the three measures of overall economic
activity: real GDP, unemployment and industrial production. We then consider forecasting
the individual spending components, consumption, residential and non-residential invest-
ment, at the country level. Table 4 reports the estimation results for forecasting the year-
ahead growth in real GDP, unemployment and industrial production for Germany, France,
13
Italy and Spain over the full sample period 2000:Q1 to 2012:Q4 while Table 5 reports the
estimation results for the individual spending components.
According to the top panel of Table 4, both bank and NFC credit spreads are statistically
significant predictors of four-quarter ahead growth in real GDP for France, Italy and Spain.
In each case, the gain in in-sample fit is roughly the same with the inclusion of either credit
spread. The NFC credit spread is also a statistically significant predictor of four-quarter
ahead real GDP growth in Germany, whereas the bank credit spread is only marginally
significant (at the 10% but not 5% level). The coefficient estimates imply considerable
heterogeneity in the predicted response of GDP growth to changes in credit spreads across
countries. For Germany, a one percentage point increase in credit spreads forecasts a 2
percent decline in future real GDP, whereas for Spain, a one percentage point increase in
credit spreads forecasts a decline in real GDP on the order of 0.61 to 0.87 percent.
Country-specific credit spreads also contain significant predictive content for the year-
ahead change in unemployment as documented in the middle panel of Table 4. The NFC
credit spread is a statistically significant predictor for unemployment in Germany, France
and Italy, where a one percentage point increase in credit spreads is associated with a 0.4
to 0.6 percent rise in future unemployment depending on the country. Bank credit spreads
contain the same amount of information as NFC credit spreads for unemployment in France
and Italy but have no explanatory power for unemployment in Germany. Although the NFC
credit spread helps predict unemployment in Spain, the coefficient is the opposite sign to
what is expected however, a clearly anomalous result.
The lower panel of Table 4 reports results for the predictive content of credit spreads for
the year-ahead change in industrial production. According to these estimates, both bank and
NFC credit spreads are robust predictors of industrial production in Germany and France,
while bank credit spreads add marginal explanatory power for industrial production in Italy
and Spain. In contrast, NFC credit spreads do not add explanatory power in Italy or Spain.
Moreover, although not statistically significant, a rise in Spanish NFC credit spreads again
predicts an increase rather than a decrease in economic activity.
To understand the source of the predictive content of credit spreads for economic activity
at the country level we again consider the breakdown of GDP into its spending components.
These results are reported in Table 5. According to results in the top panel of Table 5, bank
credit spreads are statistically significant predictors of consumption growth for France, Italy
14
and Spain. The coefficient estimates are remarkably uniform across these three countries
– a one percentage point increase in bank credit spreads predicts a one percent decline in
consumption growth in all three countries. In contrast, a 1 percentage point increase in
bank credit spreads predicts a 0.4 percent decline in German consumption growth, moreover
the coefficient estimate is not statistically significantly different from zero. In contrast to
the coefficient estimates for bank credit spreads, the coefficient estimates of NFC credit
spreads on consumption growth vary substantially across countries both in terms of statistical
significance and in terms of economic magnitudes. The coefficient estimates range from 0.4
to 1.11 and are statistically significant at the 5% level for Italy, marginally significant for
Germany and not significantly different from zero for France and Spain. These results imply
that, with the notably exception of Germany, country-level bank credit spreads but not
country-level NFC credit spreads are robust predictors of future consumption growth.
We obtain similar results when assessing the predictive content of country-specific credit
spreads for non-residential investment. As documented in the lower panel of Table 5, the
coefficient on bank credit spreads is statistically significantly different from zero for the year-
ahead growth in non-residential investment in Germany, France and Spain, and marginally
significant in the case of Italy. Again, the predictive content of NFC credit spreads is some-
what weaker and more heterogeneous across countries. NFC credit spreads are statistically
significant for Germany and France, marginally significant for Italy, and have no predictive
content for Spain. Finally, the middle panel of Table 5 documents that residential investment
is not strongly related to country-specific credit spreads, a result that mirrors the findings
for the euro area as a whole.
3.1.3 Inflation
We now turn to the predictive content of credit spreads for inflation. Table 6 reports fore-
casting results for the four-quarter ahead change in headline and core inflation in the euro
area. The baseline regressions again include the real EONIA, the term spread and the lagged
twelve-month inflation rate as explanatory variables. According to the estimation results,
NFC credit spreads are statistically significant predictors of headline inflation. The effect
is economically important – a one-percentage point rise in the euro area NFC credit spread
predicts a 0.45 percent decline in euro area headline inflation. Although a rise in bank credit
spreads also predicts a decline in inflation, the estimated coefficient is not statistically sig-
15
nificant. The second two columns of Table 6 report estimation results for predicting core
inflation. Neither bank nor NFC credit spreads help predict year-ahead core inflation in the
euro area as a whole. Moreover, the estimated coefficients imply a substantially reduced
effect of credit spreads on core inflation relative to headline inflation – a one-percentage
point rise in either NFC or bank credit spreads predicts a 0.16 percent decline in core infla-
tion. Finally, it is worth noting that the gains in in-sample fit as measured by the change in
R-square across specifications reported in Table 6 are in all cases relatively modest. In sum-
mary, there is little evidence to suggest that euro area credit spreads are robust predictors
of euro area inflation, a result that is also consistent with previous findings for the U.S. as
discussed in Gilchrist, Yankov and Zakrajsek (2009).
Table 7 documents the predictive content of country-specific credit spreads for inflation
at the country level. At the country level, both bank and NFC credit spreads are strong
predictors of headline inflation for Germany, France, and Spain. For these countries, a
one-percentage point rise in either bank or NFC credit spreads predicts on the order of a
0.5 percent decline in year-ahead inflation. In contrast, year-ahead inflation in Italy is not
systematically related to Italian credit spreads. With the exception of Spain, credit spreads
do not add significant explanatory power in predicting year-ahead core inflation however,
results that are entirely consistent with the findings for the euro area reported in Table 5.
The one clear exception here is Spain where bank credit spreads are a statistically significant
predictor of core inflation. In this case, a 1 percentage point increase in Spanish bank credit
spreads predicts a 0.45 percent decline in Spanish core inflation. Moreover, the inclusion of
the bank credit spread nearly doubles the in-sample fit as measured by the R-square in the
Spanish inflation regression.
3.1.4 Summary
On balance these results imply that credit spreads overall, and in particular bank credit
spreads, provide substantial predictive content for economic activity as measured by four-
quarter changes in the unemployment rate, industrial production and real GDP growth.
Some differences emerge across countries: monthly indicators of economic activity in Ger-
many are better explained by non-financial credit spreads while economic activity in Spain is
clearly more responsive to bank credit spreads. In terms of individual components of GDP,
bank credit spreads do particularly well at forecasting consumption growth and the growth
16

in non-residential investment spending over both the full sample period and the 1999-2007
pre-crisis period. Finally, although bank credit spreads add significant explanatory power for
predicting headline inflation at the country level, with the exception of Spain, these findings
do not carry over to predicting core inflation.
3.2 Bank Lending Activity
Our analysis is motivated by the idea that credit spreads may forecast future economic activ-
ity because they provide a signal regarding the underlying fundamentals of the real economy
and because they provide a measure of credit-supply conditions that directly influences
spending behavior by households and the demand for inputs by firms. To the extent that
credit spreads provide information about overall credit conditions as well as expected future
economic activity, they should also provide information regarding future lending activity.
In particular, as emphasized by Gertler and Gilchrist (1993) and Gilchrist and Zakrajsek
(2012a), bank lending responds roughly contemporaneously with economic activity over the
course of the business cycle.
To study the effect of credit spreads on lending activity we again consider a regression
of the form:
∆h logLt+h = αo + α1rt + α2termt + γ∆h logLt + βst + εt
where ∆h logLt+h measure the h quarter ahead change in lending volume, rt measures the
real interest rate, termt measures the term premium and st is the credit spread of interest –
either bank or non-financial. We separate lending activity into three components – consumer
loans, housing loans and loans to non-financial corporations. Table 8 reports the estimation
results for each country and lending category.
According to the estimation results, bank credit spreads are statistically significant pre-
dictors of euro area loan growth for all three lending categories. A one-percentage point
increase in bank credit spreads forecasts a 2.98% decline in consumer loans, a 1.29% decline
in housing loans and a 4.55% decline in loans to non-financial corporations. NFC credit
spreads also predict euro area consumer and NFC loan growth but do not forecast housing
loan growth.
At the country-level, bank credit spreads and NFC credit spreads are significant predic-
tors of the four-quarter ahead change in loan growth for all three loan categories in France
and Italy. Credit spreads also provide significant explanatory power for NFC loans in Spain.
17
The response of loan growth in Germany is at odds with this overall picture however. The
four-quarter ahead changes in housing and NFC loans in Germany are insensitive to changes
in credit spreads, while in the case of consumer loans, rising credit spreads forecast an in-
crease rather than a decline in future lending. Overall these results imply that credit spreads
are robust predictors of loan growth in the euro area as a whole, and in France and Italy
but do not uniformly predict loan growth in Spain and have no impact on lending volumes
in Germany.
4 FAVAR Analysis
In this section we use the factor-augmented vector autoregression (FAVAR) methodology
proposed by Bernanke, Boivin and Eliasz (2005) to identify credit shocks and examine their
dynamic effect on a large set of macroeconomic variables. The estimation and identification
procedure directly follows the methodology of Gilchrist, Yankov and Zakrajsek (2009).
The analysis combines the data on country-specific credit spread indices for banks and
non-financial firms with data on euro area and country-specific measures of economic activ-
ity, inflation, interest rates and other asset prices. We estimate a FAVAR at the monthly
frequency. Accordingly, we use both euro area and country-level growth rates of industrial
production and changes in the unemployment rate as measures of real activity. Euro area
and country-specific inflation is measured using both headline and core inflation. Thus, for
the euro area as a whole and for each country (Germany, France, Italy and Spain) we have
two real activity variables and two inflation variables. To this we add three euro area interest
rates: the ECB policy rate as measured by the EONIA, the ten-year yield on German Bunds,
and the three-month Euribor rate. We also include the five-year yield on sovereign bonds
for each country, along with country-specific stock returns based on the overall market, and
stock returns for that country’s banking sector. These are computed as the log difference in
the relevant country-specific stock index. Finally we also include a broad set of asset price
information that capture conditions in both euro area and U.S. financial markets. These
variables are the stock return on the U.S. S&P 500, the implied volatility from U.S. and
European stock options (VIX-USA, VIX-Europe), the U.S. ten-year treasury rate, the log-
difference in oil prices measured in U.S. dollars, the log-difference in the US-Euro exchange
rate and the realized volatility in the US-Euro exchange rate measured as the standard
18
deviation of daily rates over the past 30 days.
In sum, these variables encompass euro area and country-specific measures of real activity
and inflation, country-specific stock market indices that span financial and non-financial
firms, along with both country-specific sovereign yields, euro area interest rates and global
asset market indicators that capture exchange rate movements and stock market volatility
in both the U.S. and Europe. The remaining eight variables assess conditions in European
credit markets as measured by the country-level credit spreads for banks and non-financial
firms.
We wish to evaluate the macroeconomic impact of disturbances to credit spreads that are
uncorrelated with other real activity and asset price movements. We therefore separate the
eight country-specific credit spread variables in X2,t (N2×1) and all the rest of the variables
in X1,t (N1 × 1). We assume that the information content in X = [X ′1,t X′2,t] (N × T ) can
be summarized in a small set of unobservable factors Ft (1 × k). A subset of these factors
F2,t (1× k2) are factors that are specific to the corporate bond market which we will refer to
as credit factors. These credit factors do not contemporaneously influence variables in X1,t
but they influence the corporate bond spreads. The rest of the factors F1,t (1 × k1) span
the information set contained in the entire dataset. The relationship between the observed
variables and the unobserved factors is assumed to be linear and given by the observation
equation:
X1,t
X2,t
=
Λ1,1 Λ1,2
Λ2,1 Λ2,2
F ′1,t
F ′2,t
+ νt
where Λ =
Λ1,1 Λ1,2
Λ2,1 Λ2,2
(N × k) is the matrix of the factor loadings.
The dynamics of the factors are summarized in a vector-autoregression system: F ′1,t
F ′2,t
= Φ(L)
F ′1,t−1
F ′2,t−1
+ εt
where Φ(L) is a lag-polynomial of finite order p. It is assumed that E(νi,tεj,t) = 0 for all
i = 1..N and j = 1..k and E(εi,tεl,t) = 0 for all i 6= l. In this form the model is a static
representation of a dynamic factor model (Stock and Watson, 2005).
19
To identify the set of credit factors F2t, we impose the following restrictions on the system
of equations. First, we assume that Λ12 = 0. This restriction on the factor loading implies
that F1t summarizes all information contained in the information set X1t. To obtain F2t we
first regress X2t on F1t and then obtain the residuals from this regression. We then construct
F2t by estimating the factors from these residuals. Thus, by construction, F2t summarizes the
information contained in X2t that is orthogonal to the first set of factors, i.e. it contains the
information in credit spreads that is orthogonal to the factors that summarize real activity
and inflation, interest rates, stock prices and other asset market variables.
We estimate the model using a Gaussian MLE method and Kalman filter to construct the
likelihood function. However, when N is large and in the presence of identifying restrictions
this method is computationally demanding. We therefore follow the four-step procedure
outlined in GYZ as this is simple to implement while directly imposing the necessary iden-
tification restrictions.
We estimate a FAVAR model that allows for four factors in F1t and two factors in F2t. The
relationship between factors and data can be deduced from their correlation between each
data series and each factor. Table 9 reports the correlation between each factor and a subset
of the euro area variables. The first factor is highly negatively correlated with euro area stock
returns and positively correlated with implied volatility as measured by the euro area VIX.
This factor is also negatively correlated with economic activity and positively correlated
with both CPI and core inflation, and therefore appears to act like a “supply” shock. The
second factor is highly positively correlated with yields on five-year French and German
government bonds and negatively correlated with both bank and NFC credit spreads. The
third factor is most strongly associated with core inflation while the fourth factor is most
strongly associated with industrial production. Roughly speaking the four factors identified
in F1t appear to determine stock market activity, inflation, the level of interest rates, and
measures of real economic activity. The first factor in F2t captures the overall level of credit
spreads and has almost no contemporaneous correlation with real activity, inflation or stock
returns. This first credit factor is also uncorrelated with yields on French and German five
year sovereign bonds but has a strong positive correlation with yields on Italian and Spanish
sovereign bonds. The second credit factor exhibits low but varying correlation across a
variety of variables and therefore has no obvious economic interpretation.
To understand the importance of credit disruptions on the economy we compute the
20
impulse response to a one-standard deviation shock to the first credit factor, that is, the first
factor in F2t. The impulse response functions for variables that enter the FAVAR in first-
differences are cumulated and hence represent the log-deviation from zero at a given horizon
(or in the case of unemployment, the percentage point change in the level of unemployment).
These variables include industrial production, inflation, unemployment, stock market indices,
oil prices and the exchange rate. The interest rate and credit spread responses are already
in level terms and hence do not need to be cumulated.
Figures 7 displays the impulse response of a subset of the euro area variables to a shock
to the first factor in F2t. We report bootstrapped 95% confidence bounds along with the
mean estimated impulse response. As shown in Figure 7 , the shock to the first credit factor
is contractionary and causes euro area unemployment to rise and industrial production and
prices to fall. Industrial production declines 0.5% at it’s peak contraction approximately
eight months after the shock occurs. Both the magnitude and timing of this effect is in line
with the estimated effects of a credit shock for the U.S. based on the findings of Gilchrist,
Yankov and Zakrajsek (2008). The inflation and unemployment responses are relatively
modest however. The peak response of unemployment is 0.05% percent and occurs at the
eight month horizon while prices exhibit a 0.07% decline after eighteen months and then
appear to level off.
Consistent with the conduct of countercyclical monetary policy, the credit supply shock
causes a reduction in short-term interest rates as measured by the EONIA, and a rise in the
term spread as measured by the difference between the yield on the ten-year German Bund
and the EONIA. The credit supply shock also leads to a sharp increase in risk factors as
measured by the implied volatility in both European (VIX ZE) and U.S. (VIX US) stock
markets but appears to have a negligible effect on conditions in the interbank market as
measured by the BOR-OIS spread. Finally, contractionary credit supply shocks also have
very little impact on the U.S./Euro exchange rate.
Figure 8 displays the impulse responses of industrial production, unemployment and core
inflation to the credit supply shock across the four countries. The effect of the credit supply
shock on industrial production is relatively uniform across countries and very similar to the
results obtained for the euro area reported in Figure 7 – industrial production contracts by
roughly 0.5 percent at its peak response. The response of core inflation and unemployment
is also similar in Germany, France and Italy but clearly more pronounced in Spain where
21
the increase in unemployment and the fall in prices is roughly double the response that is
observed in the other three countries.
Figure 9 displays the country-specific impulse responses to the overall stock market, five-
year sovereign bond yields and the bank credit spreads. The credit shock causes a 3 percent
decline in the stock markets across all four countries. This decline is eventually reversed
however so that credit shocks lead to an immediate fall in stock returns but do not have
a lasting impact on the level of asset prices. Yields on five-year bonds also decline by a
modest five basis points. There is a differential effect on Italian and Spanish sovereign yields
relative to German yields in that Italian and Spanish yields do not fall quite as much as
German yields but the effect is quantitatively small. This implies that credit shocks that are
contemporaneously orthogonal to sovereign yields do not cause a substantial future increase
in sovereign spreads of the riskier countries.
The lower panel of Figure 9 displays the effect of the credit supply shock on bank credit
spreads. By construction, credit spreads respond contemporaneously to the credit shock.
The size of the credit spread increase varies between 0.1 percentage points for German and
French banks to 0.2 to 0.25 percentage points for Spanish and Italian banks respectively.10
Overall, these results imply that a credit shock that elicits a 0.1 to 0.2 percentage point
increase in euro area credit spreads results in a 0.5 percent decline in industrial production,
a 3 percent decline in broad measures of stock returns and more moderate effects on inflation
and unemployment.
Although not shown, we have also computed the fraction of the variance associated with
the shock to the first credit factor for the euro area and country-specific variables displayed
in Figures 7-9. Upon impact, the shock to the first credit factor accounts for 85% of the
variation in bank credit spreads in Germany, 90% of the variation in France, 70% of the
variation in Italy and 45% of the variation in Spain. This is consistent with the notion that
shocks originating in the credit markets are the primary driving force for credit spreads in
Germany, France and Italy but that credit spreads in Spain are more strongly influenced by
other macroeconomic events that are already captured in the real activity and asset price
data included in X1t. These credit shocks also account for an important fraction of the
variation in economic activity and asset prices – 20% of the variation in country-specific
10Although not reported, we observe a similar reaction of NFC credit spreads. Bank stock returns also
respond in a very similar manner to the broad stock indices displayed in Figure 9.
22
industrial production and stock returns at the peak horizon – and a more modest but not
insignificant fraction of the variation in euro area interest rates –between 10 to 15% of the
variation at peak the peak horizon. Finally, although credit shocks account for only 5% of
the variation in German and French long-term yields they account for 15% of the variation
in Italian and Spanish long-term yields.
5 Conclusion
This paper provides new indices that measure financial conditions in the euro area using
credit spreads obtained from secondary market prices of debt securities issued by both banks
and non-financial firms. The evolution of these series over time highlight the increasing frag-
mentation of the European financial system along national lines as the sovereign debt crisis
has emerged since 2010. Consistent with the view that a deterioration in financial conditions
has real economic consequences, we document that these financial indices have substantial
predictive content for economic activity variables such as industrial production, unemploy-
ment and real GDP for the euro-area as a whole and for individual countries in the euro-zone.
Moreover, credit spreads also contain substantial predictive content for the volume of loans
outstanding. These findings are further supported by FAVAR analysis that shows that fi-
nancial disruptions as measured by shocks to credit spreads that are contemporaneously
uncorrelated with real activity and other asset prices cause significant contractions in future
output. Overall these results imply that European bond markets provide robust signals
regarding future economic activity via the movement in credit spreads for both banks and
non-financial firms.
23

References
Albertazzi, U., Ropele, T., Sene, G., Signoretti, F. M. (2012), “The impact of the sovereign
debt crisis on the activity of Italian banks,” Bank of Italy, Occasional Papers No. 133.
Angeloni, Ignazio, Anil Kashyap, Benoit Mojon and Daniele Terlizesse (2003): “Monetary
Policy Transmission in the Euro area: Where do we Stand?,” Monetary Policy Transmission
in the Euro area, Cambridge University Press, 383-412.
Battistini Niccolo, Marco Pagano and Saverio Simonelli (2013), “Systemic Risk and Home
Bias in the Euro Area,” mimeo.
Bernanke, Ben S. and Jean Boivin (2003), “Monetary policy in a data-rich environment,”
Journal of Monetary Economics, vol. 50(3), pages 525-546, April.
Bernanke, Ben S., Jean Boivin and Piotr S. Eliasz (2005), “Measuring the Effects of Monetary
Policy: A Factor-augmented Vector Autoregressive (FAVAR) Approach,” The Quarterly
Journal of Economics, 120(1), 387-422.
Bernanke Ben S., Mark Gertler and Simon Gilchrist (1999), “The Financial Accelerator
in a Quantitative Business Cycle Framework,” The Handbook of Macroeconomics, Elsevier
Science B.V, editor John B.Taylor and Michael Woodford, 1341-1393.
Biais, Bruno, Fany Declerck, James Dow, Richard Portes and Elu von Thadden (2006),
“European Corporate Bond Markets: transparency, liquidity, efficiency,” CEPR.
Bleaney Michael, Paul Mizen and Veronica Veleanu (2012), “Credit Spreads as Predictors of
Economic Activity in 8 European Countries,” Working Paper, University of Nottingham.
de Bondt, G., A. Maddaloni, A., and J.L. Peydro, , S. Scopel (2010), “The euro area Bank
Lending Survey matters: empirical evidence for credit and output growth,” ECB Working
Paper Series No. 1160.
Brunnermeier Markus K. (2009), “Deciphering the Liquidity and Credit Crunch of 2007-08,”
Journal of Economic Perspectives, 23, 77-100.
24
Ciccarelli Matteo, Angela Maddaloni and Jose-Luis Peydro (2010), “Trusting the Bankers:
A New Look at the Credit Channel of Monetary Policy,” European Central Bank Working
Paper No. 1228.
Del Giovane, P., G. Eramo, and A. Nobili (2011). “Disentangling demand and supply in
credit developments: a survey-based analysis for Italy,” Journal of Banking & Finance, 35,
2719-2732.
Del Giovane, Paolo, Andrea Nobili and Federico M. Signoretti (2013), “Supply tightening or
lack in demand: Is the sovereign debt crisis different from Lehman?,” Banca d’Italia mimeo.
Ehrmann Michael, Leo Gambarcorta, Jorge Matinez-Pages, Patrick Sevestre and Andreas
Worms (2003), “Financial Systems and the Role of Banks in Monetary Policy Transmission
in the Euro Area,” Monetary Policy Transmission in the Euro area, Cambridge University
Press, 235-269.
Estrella, Arturo and Gikas A. Hardouvelis (1991), “The Term Structure as a Predictor of
Real Economic Activity,” Journal of Finance, vol. 46(2), pages 555-76, June.
Estrella, Arturo and Frederic S. Mishkin (1998), ”Predicting U.S. Recessions: Financial
Variables As Leading Indicators,” The Review of Economics and Statistics, vol. 80(1), pages
45-61, February.
Friedman, Benjamin M and Kuttner, Kenneth N (1992). “Money, Income, Prices, and
Interest Rates,” American Economic Review, vol. 82(3), pages 472-92, June.
Friedman Benjamin M and Kenneth N. Kuttner (1993). “Economic Activity and the Short-
term Credit Markets: An Analysis of Prices and Quantities,” Brookings Papers on Economic
Activity, vol. 24(2), pages 193-284.
Gertler, Mark and Simon Gilchrist (1993), “The Role of Credit Market Imperfections in
the Monetary Transmission Mechanism: Argument and Evidence,” Scandinavian Journal of
Economics, Vol. 95, 1993, 43-64.
Gertler, Mark and Cara S. Lown (1999), “The Information in the High-Yield Bond Spread for
the Business Cycle: Evidence and Some Implications,” Oxford Review of Economic Policy,
vol. 15(3), pages 132-50.
25
Gilchrist Simon, Vladimir Yankov and Egon Zakrajsek (2009), “Credit Market Shocks and
Economic Fluctuations: Evidence From Corporate Bond and Stock Markets,” Journal of
Monetary Economics, 56, 471-493.
Gilchrist, Simon and Egon Zakrajsek (2012a), “Bank Lending and Credit Supply Shocks” in
Approaches to the Evolving World Economy. The Proceedings of the 16th World Congress of
the International Economic Association Vol. III: The Global Macro Economy and Finance.
Edited by Franklin Allen, Masahiko Aoki, Nobuhiro Kyotaki, Richard Gordon and Joseph
Stiglizt.
Gilchrist Simon and Egon Zakrajsek (2012b), “Credit Spreads and Business Cycle Fluctua-
tions,” American Economic Review, 102(4), 1692-1720.
Hempell Hannah and Cristoffer Kok Sorensen (2010), “The impact of supply constraints on
bank lending in the euro area - crisis induced crunching?,” European Central Bank Working
Paper No. 1262.
Lacroix Renaud and Jeremi Montornes, (2009), “Analyse de la portee des resultats du Bank
Lending Survey au regard des donnees de credit,” Bulletin de la Banque de France 178, Q4
Panetta, F., Signoretti, F.M.(2010), “Credit demand and supply in Italy during the financial
crisis”. Occasional Papers No. 63, Bank of Italy.
Vuillemey, Guillaume and Tuomas Peltonen (2013), “Sovereign Credit Events and their
Spillovers- the Interplay Between Sovereign Bonds and CDS Holdings,” ECB mimeo.
26
Data appendix
Our database is constructed from extracts of datastream for bonds prices, yield to matu-
rity, duration, maturity, size of issuance, currency of issuance, ABS status, ect... However,
because the characteristics of the bonds were frequently missing, where necessary, we also
extracted bond characteristics from dealogic and Bloomberg. From this data set we con-
structed a sub-sample of non-floating rate, non-callable, non-collaterizable bonds that are
denominated in euros. The full data set along with details of the subsample are described in
Table A1. From this dataset, we have also excluded outliers as follows: bonds with spreads
above 30% or less than -5%; bonds with duration or maturity greater than 30 years, or
bonds with maturity less than two years. We also exclude observations for which the size of
issuance is not reported.
27
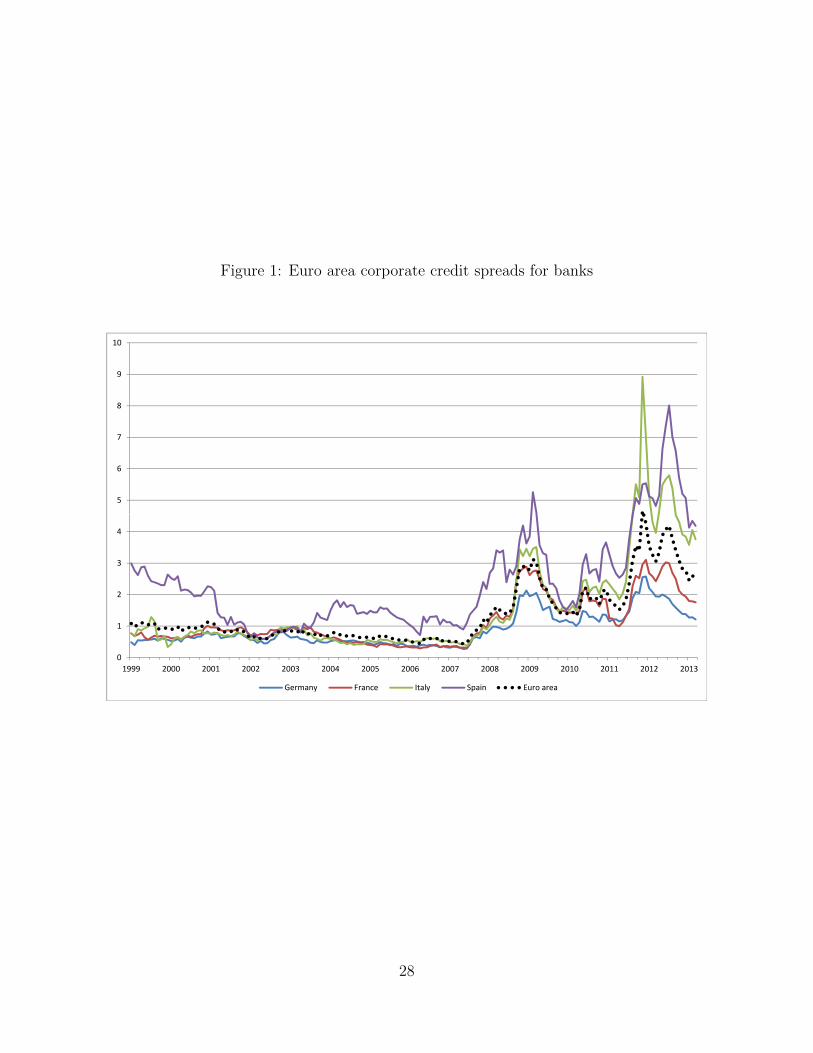
Figure 1: Euro area corporate credit spreads for banks
5
6
7
8
9
10
0
1
2
3
4
1999 2000 2001 2002 2003 2004 2005 2006 2007 2008 2009 2010 2011 2012 2013
Germany France Italy Spain Euro area
28
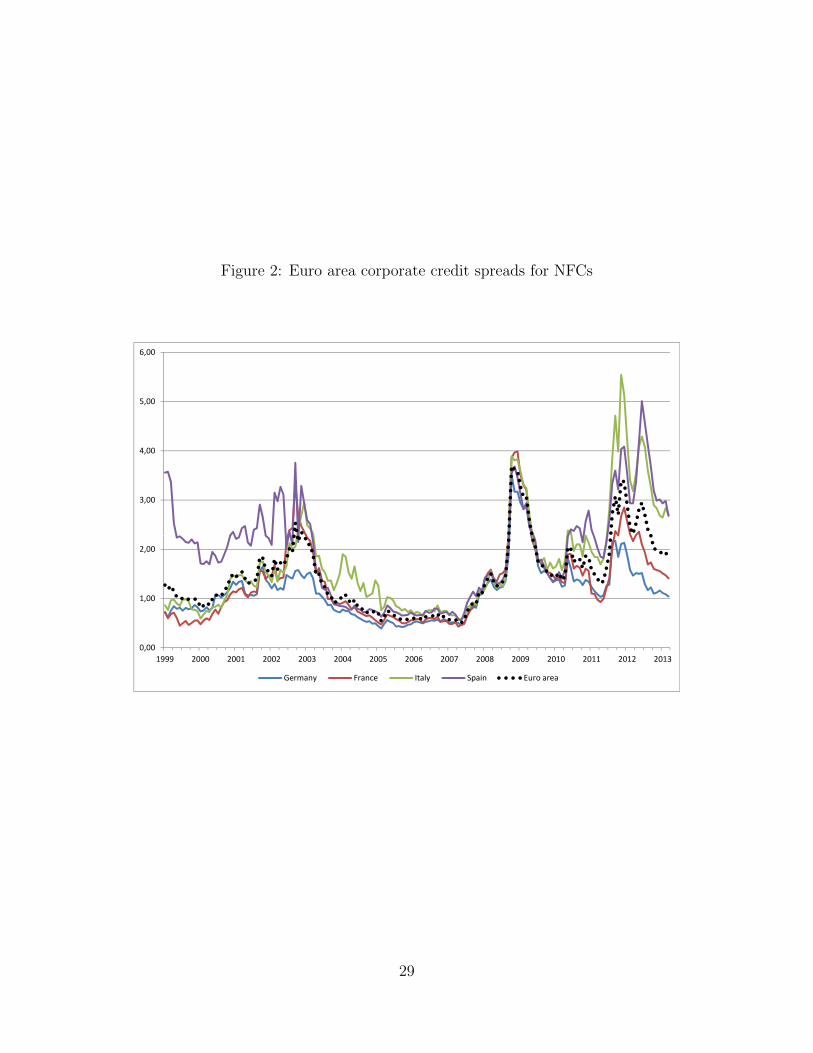
Figure 2: Euro area corporate credit spreads for NFCs
3,00
4,00
5,00
6,00
0,00
1,00
2,00
1999 2000 2001 2002 2003 2004 2005 2006 2007 2008 2009 2010 2011 2012 2013
Germany France Italy Spain Euro area
29
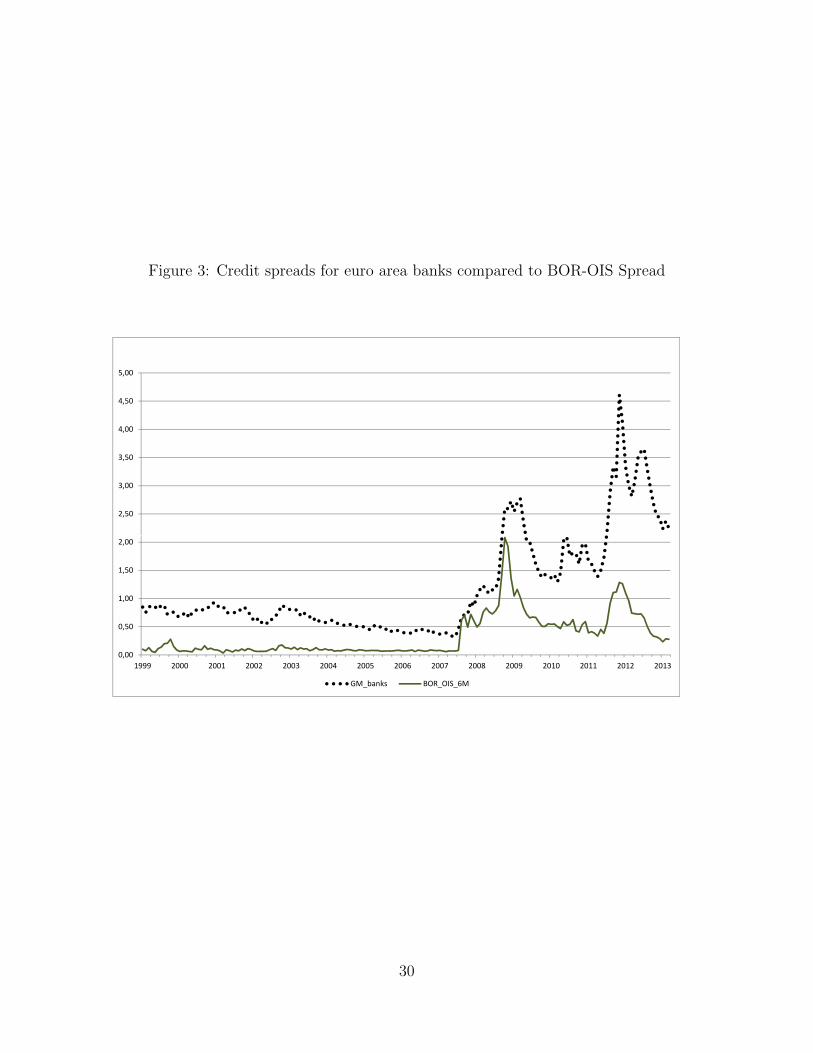
Figure 3: Credit spreads for euro area banks compared to BOR-OIS Spread
2,50
3,00
3,50
4,00
4,50
5,00
0,00
0,50
1,00
1,50
2,00
1999 2000 2001 2002 2003 2004 2005 2006 2007 2008 2009 2010 2011 2012 2013
GM_banks BOR_OIS_6M
30
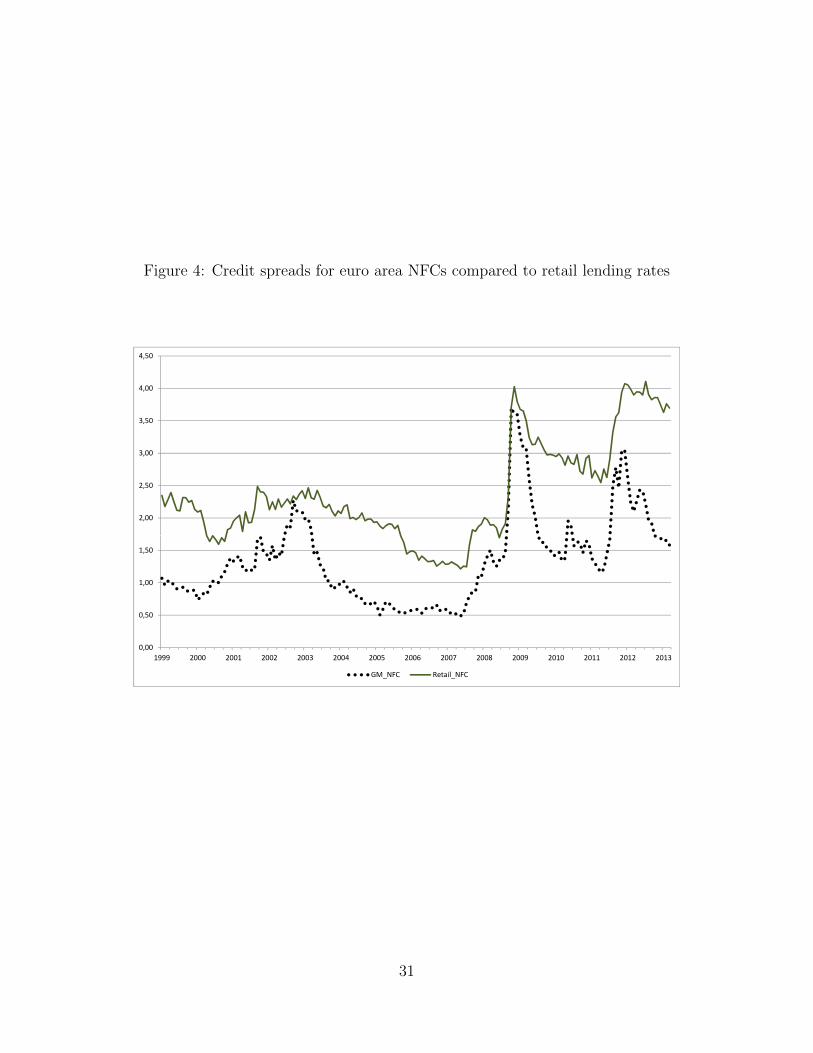
Figure 4: Credit spreads for euro area NFCs compared to retail lending rates
2,00
2,50
3,00
3,50
4,00
4,50
0,00
0,50
1,00
1,50
1999 2000 2001 2002 2003 2004 2005 2006 2007 2008 2009 2010 2011 2012 2013
GM_NFC Retail_NFC
31
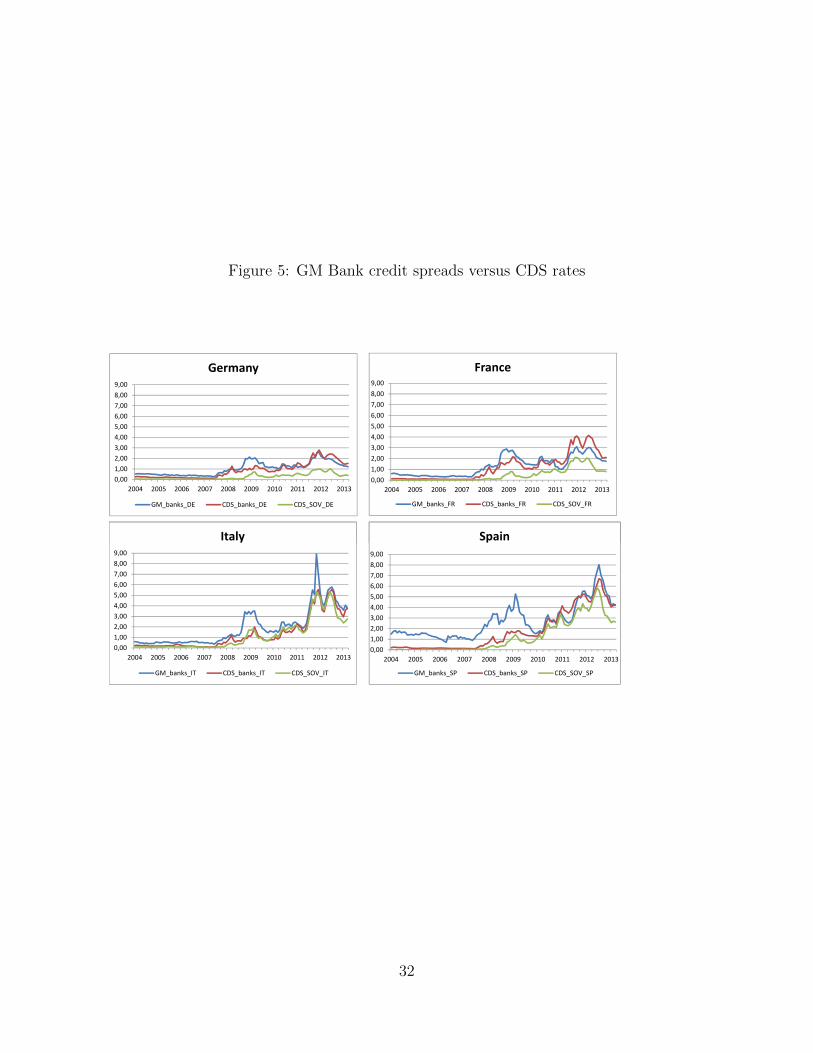
Figure 5: GM Bank credit spreads versus CDS rates
0,001,00
2,00
3,00
4,00
5,006,00
7,00
8,00
9,00
2004 2005 2006 2007 2008 2009 2010 2011 2012 2013
Germany
GM_banks_DE CDS_banks_DE CDS_SOV_DE
0,00
1,00
2,00
3,00
4,00
5,00
6,00
7,00
8,00
9,00
2004 2005 2006 2007 2008 2009 2010 2011 2012 2013
France
GM_banks_FR CDS_banks_FR CDS_SOV_FR
Italy Spain
0,001,00
2,00
3,00
4,00
5,006,00
7,00
8,00
9,00
2004 2005 2006 2007 2008 2009 2010 2011 2012 2013
Italy
GM_banks_IT CDS_banks_IT CDS_SOV_IT
0,00
1,00
2,00
3,00
4,00
5,00
6,00
7,00
8,00
9,00
2004 2005 2006 2007 2008 2009 2010 2011 2012 2013
Spain
GM_banks_SP CDS_banks_SP CDS_SOV_SP
32
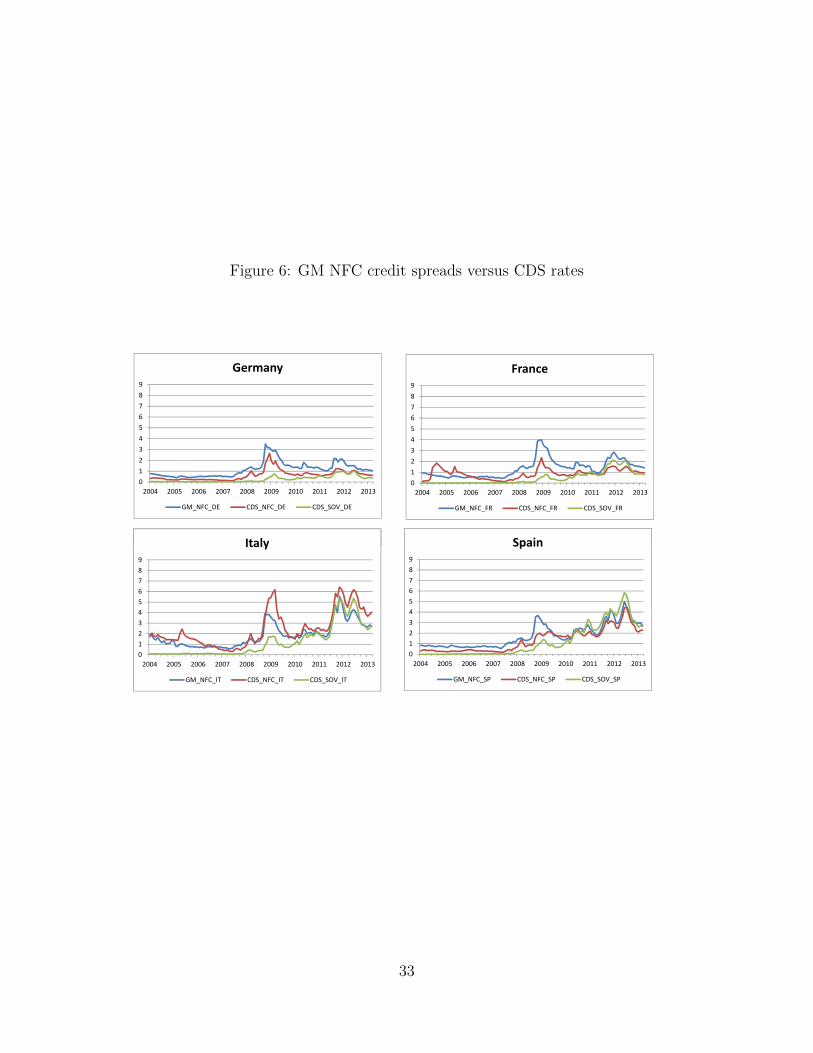
Figure 6: GM NFC credit spreads versus CDS rates
0
1
2
3
4
5
6
7
8
9
2004 2005 2006 2007 2008 2009 2010 2011 2012 2013
Germany
GM_NFC_DE CDS_NFC_DE CDS_SOV_DE
0
1
2
3
4
5
6
7
8
9
2004 2005 2006 2007 2008 2009 2010 2011 2012 2013
France
GM_NFC_FR CDS_NFC_FR CDS_SOV_FR
Italy Spain
01
2
3
4
5
67
8
9
2004 2005 2006 2007 2008 2009 2010 2011 2012 2013
Italy
GM_NFC_IT CDS_NFC_IT CDS_SOV_IT
01
2
3
4
5
67
8
9
2004 2005 2006 2007 2008 2009 2010 2011 2012 2013
Spain
GM_NFC_SP CDS_NFC_SP CDS_SOV_SP
33
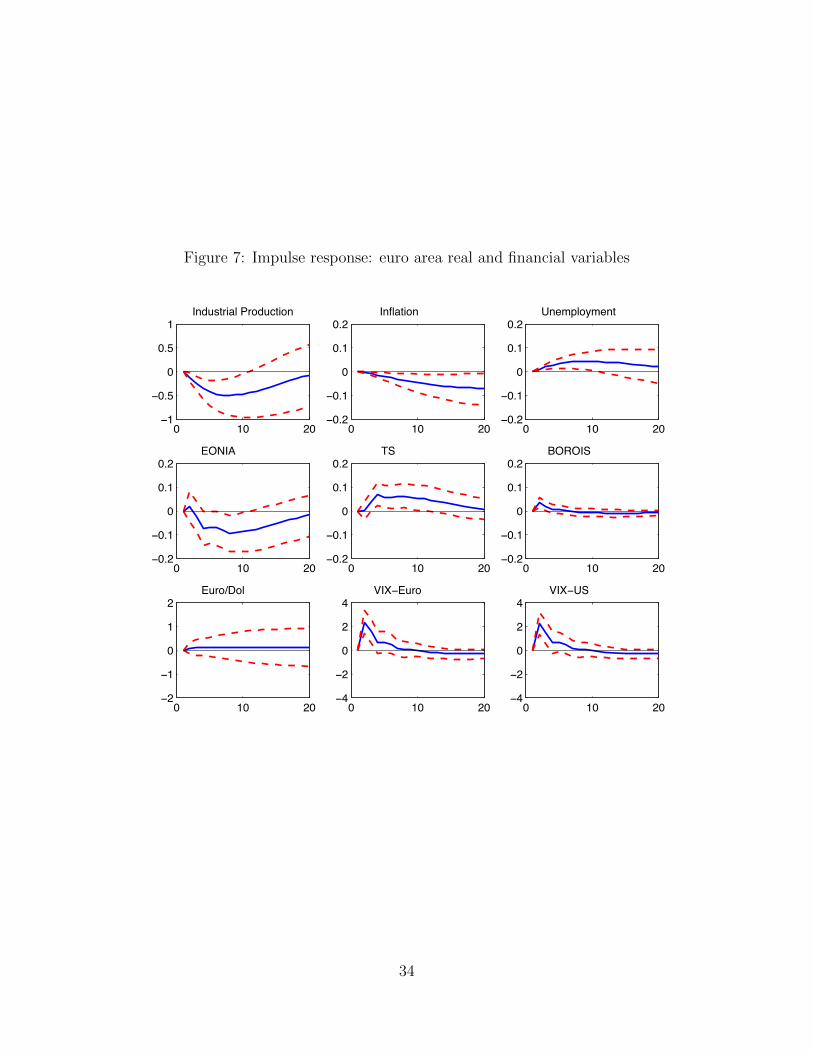
Figure 7: Impulse response: euro area real and financial variables
0 10 20−1
−0.5
0
0.5
1Industrial Production
0 10 20−0.2
−0.1
0
0.1
0.2Inflation
0 10 20−0.2
−0.1
0
0.1
0.2Unemployment
0 10 20−0.2
−0.1
0
0.1
0.2EONIA
0 10 20−0.2
−0.1
0
0.1
0.2TS
0 10 20−0.2
−0.1
0
0.1
0.2BOROIS
0 10 20−2
−1
0
1
2Euro/Dol
0 10 20−4
−2
0
2
4VIX−Euro
0 10 20−4
−2
0
2
4VIX−US
34
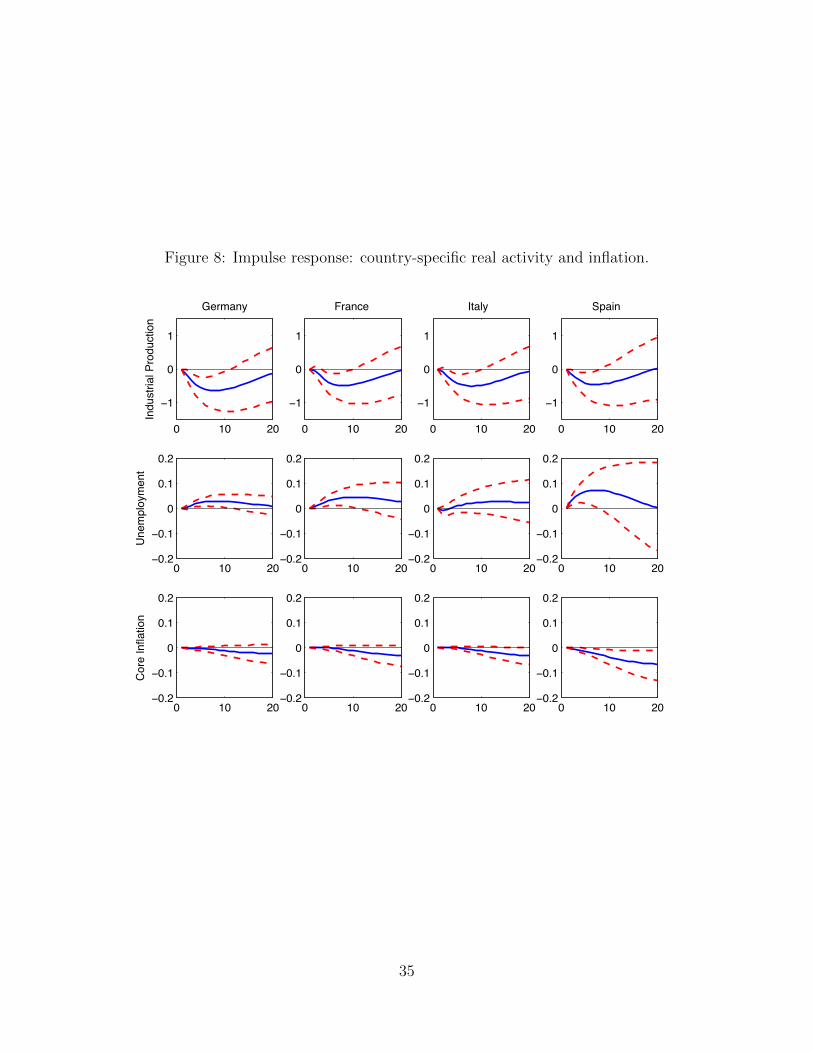
Figure 8: Impulse response: country-specific real activity and inflation.
0 10 20
−1
0
1
Germany
Indu
stria
l Pro
duct
ion
0 10 20
−1
0
1
France
0 10 20
−1
0
1
Italy
0 10 20
−1
0
1
Spain
0 10 20−0.2
−0.1
0
0.1
0.2
Une
mpl
oym
ent
0 10 20−0.2
−0.1
0
0.1
0.2
0 10 20−0.2
−0.1
0
0.1
0.2
0 10 20−0.2
−0.1
0
0.1
0.2
0 10 20−0.2
−0.1
0
0.1
0.2
Cor
e In
flatio
n
0 10 20−0.2
−0.1
0
0.1
0.2
0 10 20−0.2
−0.1
0
0.1
0.2
0 10 20−0.2
−0.1
0
0.1
0.2
35
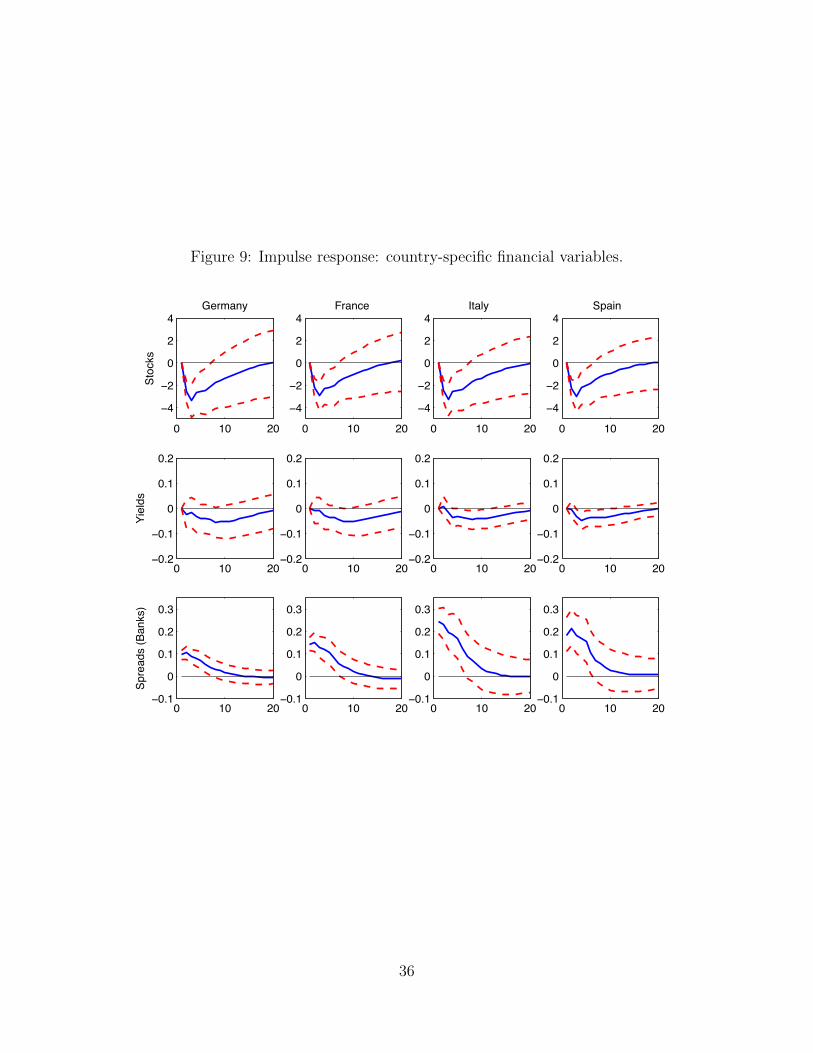
Figure 9: Impulse response: country-specific financial variables.
0 10 20
−4
−2
0
2
4Germany
Stoc
ks
0 10 20
−4
−2
0
2
4France
0 10 20
−4
−2
0
2
4Italy
0 10 20
−4
−2
0
2
4Spain
0 10 20−0.2
−0.1
0
0.1
0.2
Yiel
ds
0 10 20−0.2
−0.1
0
0.1
0.2
0 10 20−0.2
−0.1
0
0.1
0.2
0 10 20−0.2
−0.1
0
0.1
0.2
0 10 20−0.1
0
0.1
0.2
0.3
Spre
ads
(Ban
ks)
0 10 20−0.1
0
0.1
0.2
0.3
0 10 20−0.1
0
0.1
0.2
0.3
0 10 20−0.1
0
0.1
0.2
0.3
36
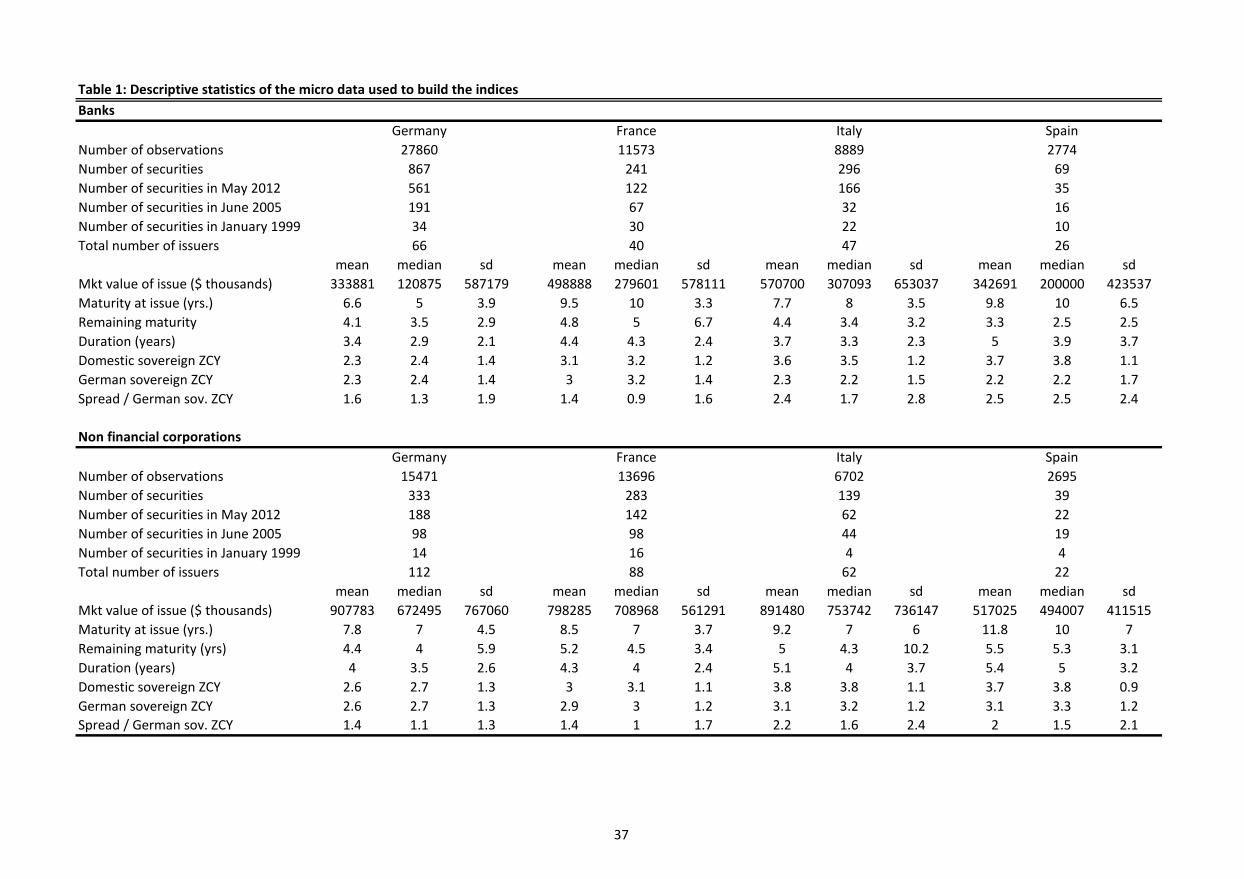
37
Table 1: Descriptive statistics of the micro data used to build the indicesBanks
Number of observations 27860 11573 8889 2774Number of securities 867 241 296 69Number of securities in May 2012 561 122 166 35Number of securities in June 2005 191 67 32 16Number of securities in January 1999 34 30 22 10Total number of issuers 66 40 47 26
mean median sd mean median sd mean median sd mean median sdMkt value of issue ($ thousands) 333881 120875 587179 498888 279601 578111 570700 307093 653037 342691 200000 423537Maturity at issue (yrs.) 6.6 5 3.9 9.5 10 3.3 7.7 8 3.5 9.8 10 6.5Remaining maturity 4.1 3.5 2.9 4.8 5 6.7 4.4 3.4 3.2 3.3 2.5 2.5Duration (years) 3.4 2.9 2.1 4.4 4.3 2.4 3.7 3.3 2.3 5 3.9 3.7Domestic sovereign ZCY 2.3 2.4 1.4 3.1 3.2 1.2 3.6 3.5 1.2 3.7 3.8 1.1German sovereign ZCY 2.3 2.4 1.4 3 3.2 1.4 2.3 2.2 1.5 2.2 2.2 1.7Spread / German sov. ZCY 1.6 1.3 1.9 1.4 0.9 1.6 2.4 1.7 2.8 2.5 2.5 2.4
Non financial corporations
Number of observations 15471 13696 6702 2695Number of securities 333 283 139 39Number of securities in May 2012 188 142 62 22Number of securities in June 2005 98 98 44 19Number of securities in January 1999 14 16 4 4Total number of issuers 112 88 62 22
mean median sd mean median sd mean median sd mean median sdMkt value of issue ($ thousands) 907783 672495 767060 798285 708968 561291 891480 753742 736147 517025 494007 411515Maturity at issue (yrs.) 7.8 7 4.5 8.5 7 3.7 9.2 7 6 11.8 10 7Remaining maturity (yrs) 4.4 4 5.9 5.2 4.5 3.4 5 4.3 10.2 5.5 5.3 3.1Duration (years) 4 3.5 2.6 4.3 4 2.4 5.1 4 3.7 5.4 5 3.2Domestic sovereign ZCY 2.6 2.7 1.3 3 3.1 1.1 3.8 3.8 1.1 3.7 3.8 0.9German sovereign ZCY 2.6 2.7 1.3 2.9 3 1.2 3.1 3.2 1.2 3.1 3.3 1.2Spread / German sov. ZCY 1.4 1.1 1.3 1.4 1 1.7 2.2 1.6 2.4 2 1.5 2.1
Germany France Italy Spain
Germany France SpainItaly
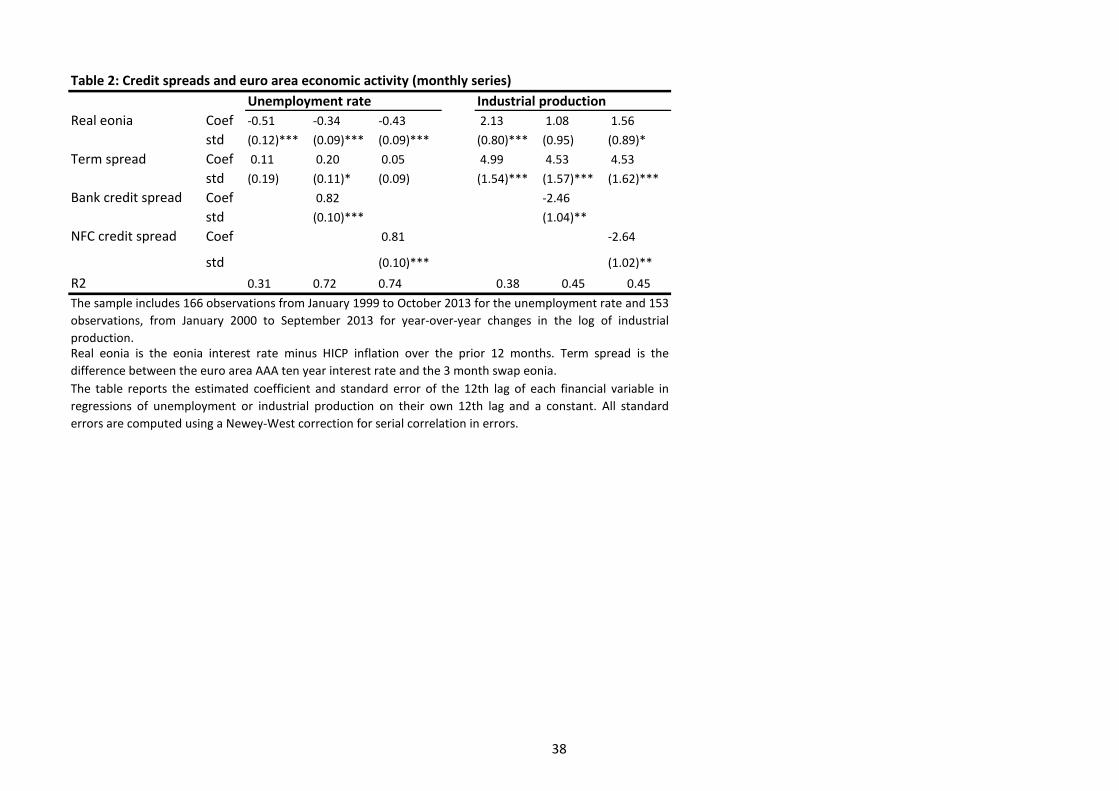
38
Table 2: Credit spreads and euro area economic activity (monthly series)Unemployment rate Industrial production
Real eonia Coef -0.51 -0.34 -0.43 2.13 1.08 1.56
std (0.12)*** (0.09)*** (0.09)*** (0.80)*** (0.95) (0.89)*
Term spread Coef 0.11 0.20 0.05 4.99 4.53 4.53
std (0.19) (0.11)* (0.09) (1.54)*** (1.57)*** (1.62)***
Bank credit spread Coef 0.82 -2.46
std (0.10)*** (1.04)**
NFC credit spread Coef 0.81 -2.64
std (0.10)*** (1.02)**
R2 0.31 0.72 0.74 0.38 0.45 0.45
The sample includes 166 observations from January 1999 to October 2013 for the unemployment rate and 153observations, from January 2000 to September 2013 for year-over-year changes in the log of industrialproduction.
The table reports the estimated coefficient and standard error of the 12th lag of each financial variable inregressions of unemployment or industrial production on their own 12th lag and a constant. All standarderrors are computed using a Newey-West correction for serial correlation in errors.
Real eonia is the eonia interest rate minus HICP inflation over the prior 12 months. Term spread is thedifference between the euro area AAA ten year interest rate and the 3 month swap eonia.
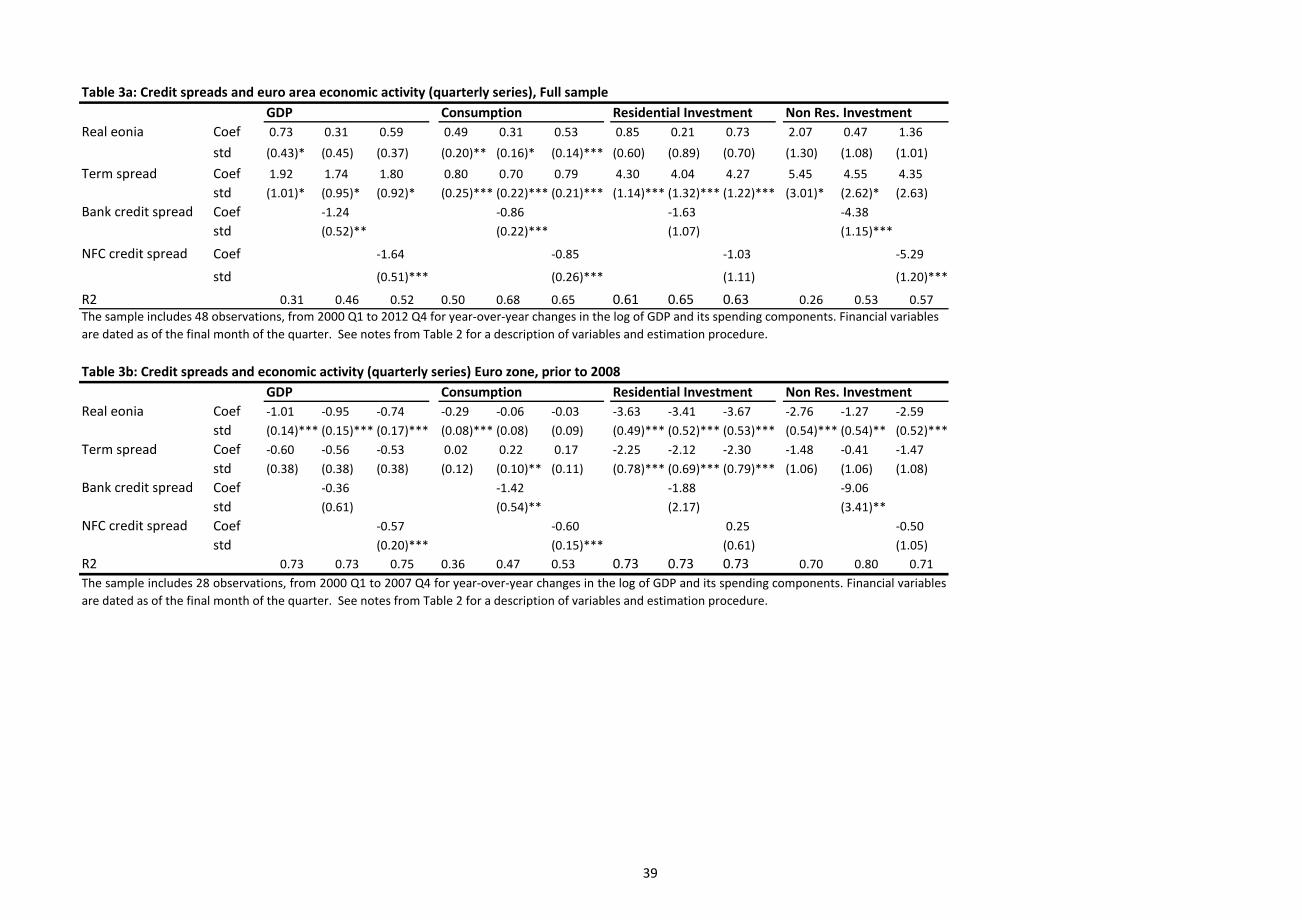
39
Table 3a: Credit spreads and euro area economic activity (quarterly series), Full sampleGDP Consumption Residential Investment Non Res. Investment
Real eonia Coef 0.73 0.31 0.59 0.49 0.31 0.53 0.85 0.21 0.73 2.07 0.47 1.36
std (0.43)* (0.45) (0.37) (0.20)** (0.16)* (0.14)*** (0.60) (0.89) (0.70) (1.30) (1.08) (1.01)
Term spread Coef 1.92 1.74 1.80 0.80 0.70 0.79 4.30 4.04 4.27 5.45 4.55 4.35std (1.01)* (0.95)* (0.92)* (0.25)*** (0.22)*** (0.21)*** (1.14)*** (1.32)*** (1.22)*** (3.01)* (2.62)* (2.63)
Bank credit spread Coef -1.24 -0.86 -1.63 -4.38std (0.52)** (0.22)*** (1.07) (1.15)***
NFC credit spread Coef -1.64 -0.85 -1.03 -5.29
std (0.51)*** (0.26)*** (1.11) (1.20)***
R2 0.31 0.46 0.52 0.50 0.68 0.65 0.61 0.65 0.63 0.26 0.53 0.57
Table 3b: Credit spreads and economic activity (quarterly series) Euro zone, prior to 2008GDP Consumption Residential Investment Non Res. Investment
Real eonia Coef -1.01 -0.95 -0.74 -0.29 -0.06 -0.03 -3.63 -3.41 -3.67 -2.76 -1.27 -2.59std (0.14)*** (0.15)*** (0.17)*** (0.08)*** (0.08) (0.09) (0.49)*** (0.52)*** (0.53)*** (0.54)*** (0.54)** (0.52)***
Term spread Coef -0.60 -0.56 -0.53 0.02 0.22 0.17 -2.25 -2.12 -2.30 -1.48 -0.41 -1.47std (0.38) (0.38) (0.38) (0.12) (0.10)** (0.11) (0.78)*** (0.69)*** (0.79)*** (1.06) (1.06) (1.08)
Bank credit spread Coef -0.36 -1.42 -1.88 -9.06std (0.61) (0.54)** (2.17) (3.41)**
NFC credit spread Coef -0.57 -0.60 0.25 -0.50std (0.20)*** (0.15)*** (0.61) (1.05)
R2 0.73 0.73 0.75 0.36 0.47 0.53 0.73 0.73 0.73 0.70 0.80 0.71
The sample includes 48 observations, from 2000 Q1 to 2012 Q4 for year-over-year changes in the log of GDP and its spending components. Financial variables are dated as of the final month of the quarter. See notes from Table 2 for a description of variables and estimation procedure.
The sample includes 28 observations, from 2000 Q1 to 2007 Q4 for year-over-year changes in the log of GDP and its spending components. Financial variablesare dated as of the final month of the quarter. See notes from Table 2 for a description of variables and estimation procedure.
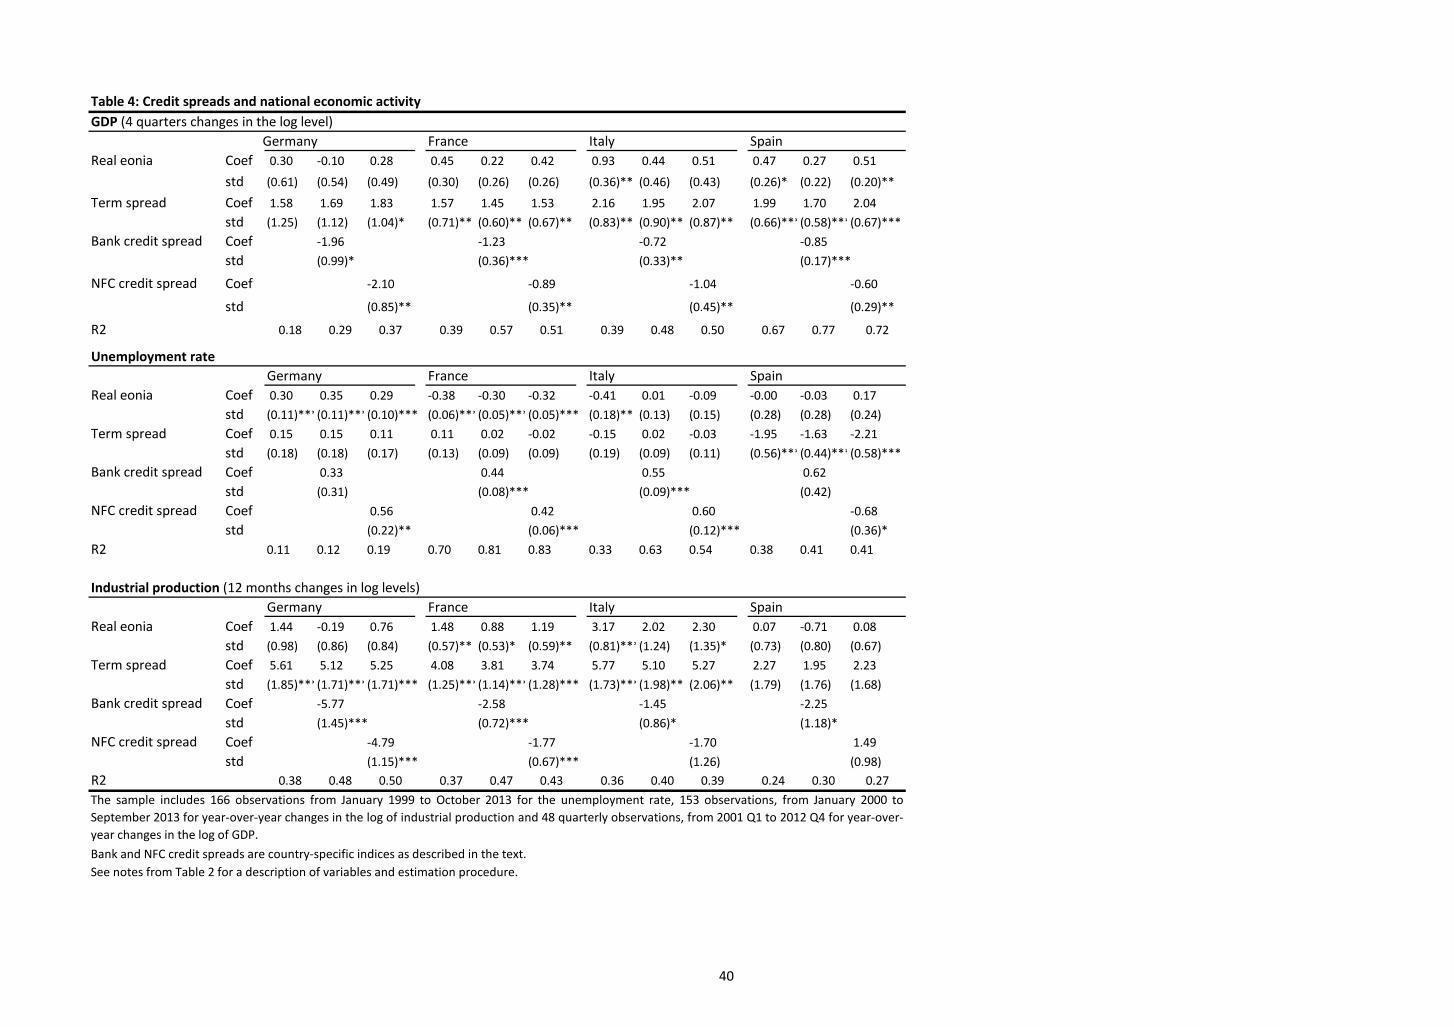
40
Table 4: Credit spreads and national economic activity GDP (4 quarters changes in the log level)
Germany France Italy SpainReal eonia Coef 0.30 -0.10 0.28 0.45 0.22 0.42 0.93 0.44 0.51 0.47 0.27 0.51
std (0.61) (0.54) (0.49) (0.30) (0.26) (0.26) (0.36)** (0.46) (0.43) (0.26)* (0.22) (0.20)**
Term spread Coef 1.58 1.69 1.83 1.57 1.45 1.53 2.16 1.95 2.07 1.99 1.70 2.04
std (1.25) (1.12) (1.04)* (0.71)** (0.60)** (0.67)** (0.83)** (0.90)** (0.87)** (0.66)***(0.58)***(0.67)***
Bank credit spread Coef -1.96 -1.23 -0.72 -0.85
std (0.99)* (0.36)*** (0.33)** (0.17)***
NFC credit spread Coef -2.10 -0.89 -1.04 -0.60
std (0.85)** (0.35)** (0.45)** (0.29)**
R2 0.18 0.29 0.37 0.39 0.57 0.51 0.39 0.48 0.50 0.67 0.77 0.72
Unemployment rateGermany France Italy Spain
Real eonia Coef 0.30 0.35 0.29 -0.38 -0.30 -0.32 -0.41 0.01 -0.09 -0.00 -0.03 0.17
std (0.11)***(0.11)***(0.10)*** (0.06)***(0.05)***(0.05)*** (0.18)** (0.13) (0.15) (0.28) (0.28) (0.24)
Term spread Coef 0.15 0.15 0.11 0.11 0.02 -0.02 -0.15 0.02 -0.03 -1.95 -1.63 -2.21
std (0.18) (0.18) (0.17) (0.13) (0.09) (0.09) (0.19) (0.09) (0.11) (0.56)***(0.44)***(0.58)***
Bank credit spread Coef 0.33 0.44 0.55 0.62
std (0.31) (0.08)*** (0.09)*** (0.42)
NFC credit spread Coef 0.56 0.42 0.60 -0.68
std (0.22)** (0.06)*** (0.12)*** (0.36)*
R2 0.11 0.12 0.19 0.70 0.81 0.83 0.33 0.63 0.54 0.38 0.41 0.41
Industrial production (12 months changes in log levels)Germany France Italy Spain
Real eonia Coef 1.44 -0.19 0.76 1.48 0.88 1.19 3.17 2.02 2.30 0.07 -0.71 0.08
std (0.98) (0.86) (0.84) (0.57)** (0.53)* (0.59)** (0.81)***(1.24) (1.35)* (0.73) (0.80) (0.67)
Term spread Coef 5.61 5.12 5.25 4.08 3.81 3.74 5.77 5.10 5.27 2.27 1.95 2.23
std (1.85)***(1.71)***(1.71)*** (1.25)***(1.14)***(1.28)*** (1.73)***(1.98)** (2.06)** (1.79) (1.76) (1.68)
Bank credit spread Coef -5.77 -2.58 -1.45 -2.25
std (1.45)*** (0.72)*** (0.86)* (1.18)*
NFC credit spread Coef -4.79 -1.77 -1.70 1.49
std (1.15)*** (0.67)*** (1.26) (0.98)R2 0.38 0.48 0.50 0.37 0.47 0.43 0.36 0.40 0.39 0.24 0.30 0.27
Bank and NFC credit spreads are country-specific indices as described in the text.See notes from Table 2 for a description of variables and estimation procedure.
The sample includes 166 observations from January 1999 to October 2013 for the unemployment rate, 153 observations, from January 2000 toSeptember 2013 for year-over-year changes in the log of industrial production and 48 quarterly observations, from 2001 Q1 to 2012 Q4 for year-over-year changes in the log of GDP.
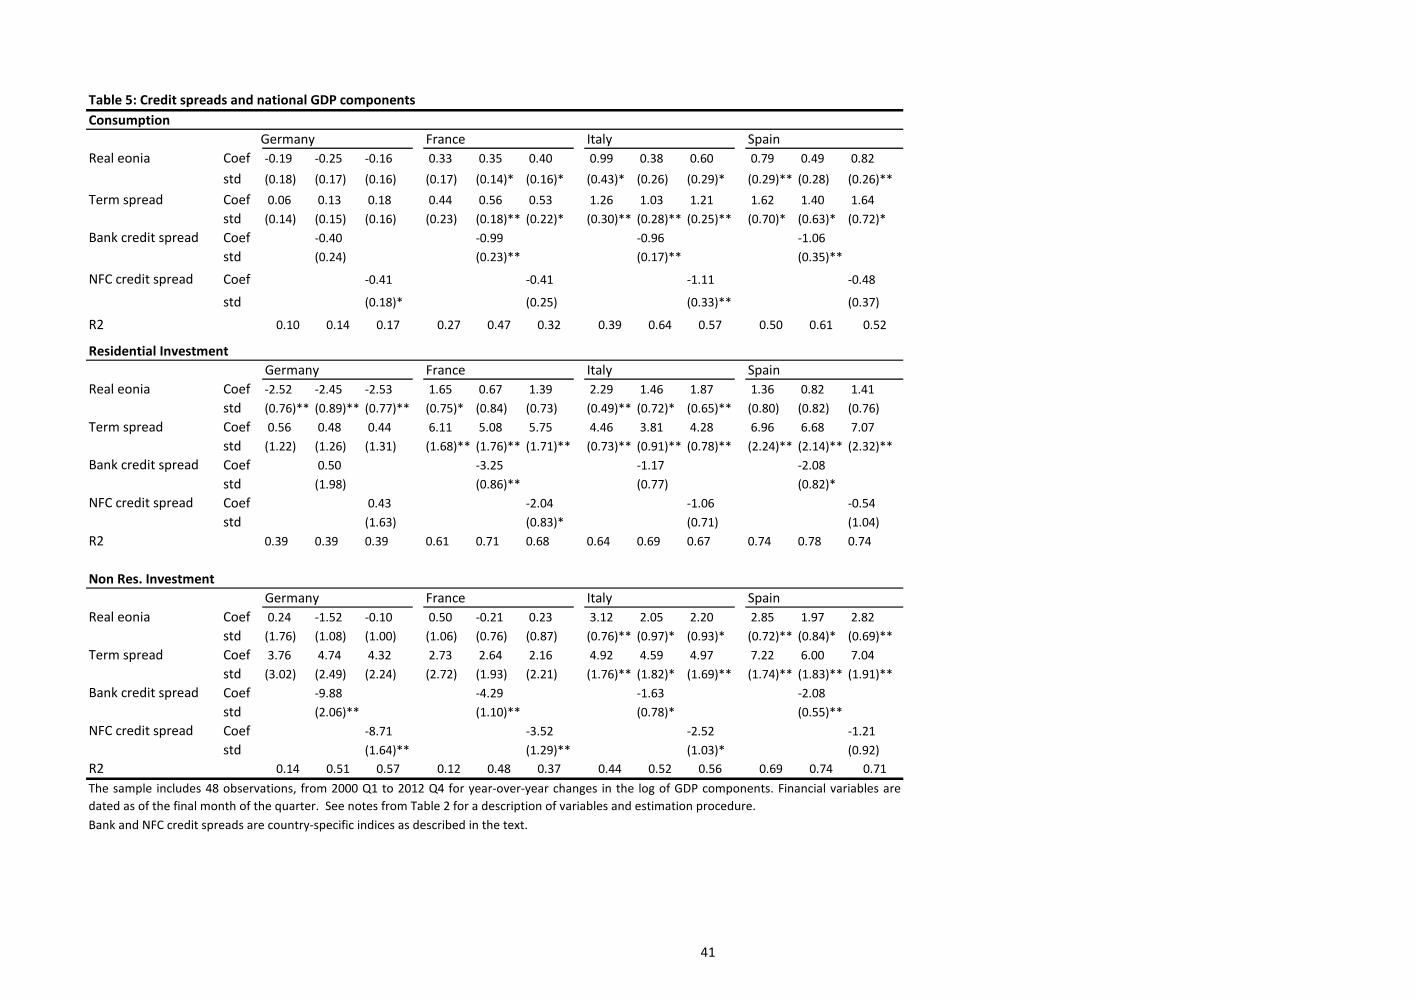
41
Table 5: Credit spreads and national GDP components Consumption
Germany France Italy SpainReal eonia Coef -0.19 -0.25 -0.16 0.33 0.35 0.40 0.99 0.38 0.60 0.79 0.49 0.82
std (0.18) (0.17) (0.16) (0.17) (0.14)* (0.16)* (0.43)* (0.26) (0.29)* (0.29)** (0.28) (0.26)**
Term spread Coef 0.06 0.13 0.18 0.44 0.56 0.53 1.26 1.03 1.21 1.62 1.40 1.64std (0.14) (0.15) (0.16) (0.23) (0.18)** (0.22)* (0.30)** (0.28)** (0.25)** (0.70)* (0.63)* (0.72)*
Bank credit spread Coef -0.40 -0.99 -0.96 -1.06std (0.24) (0.23)** (0.17)** (0.35)**
NFC credit spread Coef -0.41 -0.41 -1.11 -0.48
std (0.18)* (0.25) (0.33)** (0.37)
R2 0.10 0.14 0.17 0.27 0.47 0.32 0.39 0.64 0.57 0.50 0.61 0.52
Residential InvestmentGermany France Italy Spain
Real eonia Coef -2.52 -2.45 -2.53 1.65 0.67 1.39 2.29 1.46 1.87 1.36 0.82 1.41std (0.76)** (0.89)** (0.77)** (0.75)* (0.84) (0.73) (0.49)** (0.72)* (0.65)** (0.80) (0.82) (0.76)
Term spread Coef 0.56 0.48 0.44 6.11 5.08 5.75 4.46 3.81 4.28 6.96 6.68 7.07std (1.22) (1.26) (1.31) (1.68)** (1.76)** (1.71)** (0.73)** (0.91)** (0.78)** (2.24)** (2.14)** (2.32)**
Bank credit spread Coef 0.50 -3.25 -1.17 -2.08std (1.98) (0.86)** (0.77) (0.82)*
NFC credit spread Coef 0.43 -2.04 -1.06 -0.54std (1.63) (0.83)* (0.71) (1.04)
R2 0.39 0.39 0.39 0.61 0.71 0.68 0.64 0.69 0.67 0.74 0.78 0.74
Non Res. InvestmentGermany France Italy Spain
Real eonia Coef 0.24 -1.52 -0.10 0.50 -0.21 0.23 3.12 2.05 2.20 2.85 1.97 2.82std (1.76) (1.08) (1.00) (1.06) (0.76) (0.87) (0.76)** (0.97)* (0.93)* (0.72)** (0.84)* (0.69)**
Term spread Coef 3.76 4.74 4.32 2.73 2.64 2.16 4.92 4.59 4.97 7.22 6.00 7.04std (3.02) (2.49) (2.24) (2.72) (1.93) (2.21) (1.76)** (1.82)* (1.69)** (1.74)** (1.83)** (1.91)**
Bank credit spread Coef -9.88 -4.29 -1.63 -2.08std (2.06)** (1.10)** (0.78)* (0.55)**
NFC credit spread Coef -8.71 -3.52 -2.52 -1.21std (1.64)** (1.29)** (1.03)* (0.92)
R2 0.14 0.51 0.57 0.12 0.48 0.37 0.44 0.52 0.56 0.69 0.74 0.71
Bank and NFC credit spreads are country-specific indices as described in the text.
The sample includes 48 observations, from 2000 Q1 to 2012 Q4 for year-over-year changes in the log of GDP components. Financial variables aredated as of the final month of the quarter. See notes from Table 2 for a description of variables and estimation procedure.
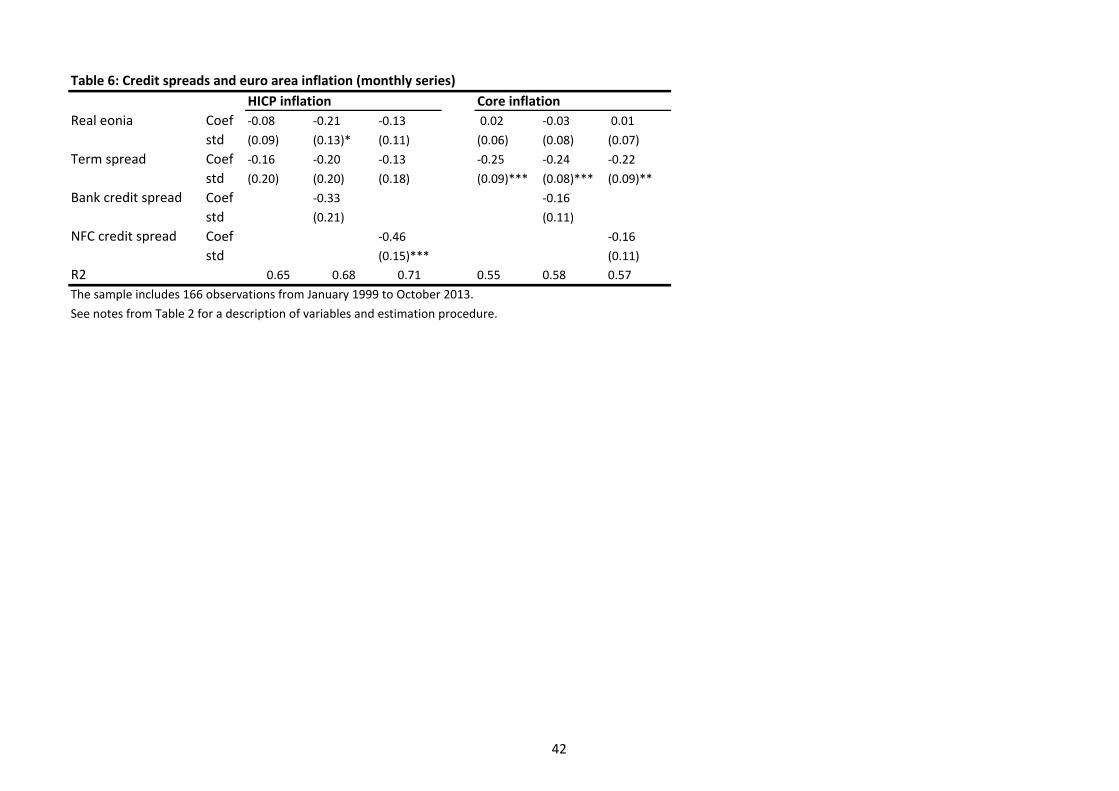
42
Table 6: Credit spreads and euro area inflation (monthly series)HICP inflation Core inflation
Real eonia Coef -0.08 -0.21 -0.13 0.02 -0.03 0.01
std (0.09) (0.13)* (0.11) (0.06) (0.08) (0.07)
Term spread Coef -0.16 -0.20 -0.13 -0.25 -0.24 -0.22
std (0.20) (0.20) (0.18) (0.09)*** (0.08)*** (0.09)**
Bank credit spread Coef -0.33 -0.16
std (0.21) (0.11)
NFC credit spread Coef -0.46 -0.16
std (0.15)*** (0.11)
R2 0.65 0.68 0.71 0.55 0.58 0.57
The sample includes 166 observations from January 1999 to October 2013.
See notes from Table 2 for a description of variables and estimation procedure.
43
Table 7: Credit spreads and national inflation (monthly series)HICP year on year inflation
Germany France Italy Spain
Real eonia Coef -0.22 -0.33 -0.24 -0.00 -0.12 -0.03 -0.04 -0.06 -0.07 0.26 0.02 0.32
std (0.12)* (0.15)** (0.12)** (0.08) (0.12) (0.10) (0.12) (0.13) (0.14) (0.15)* (0.23) (0.19)*
Term spread Coef -0.37 -0.37 -0.33 -0.01 -0.04 -0.00 -0.06 -0.07 -0.06 0.28 0.10 0.38
std (0.22)* (0.21)* (0.19)* (0.19) (0.19) (0.19) (0.19) (0.18) (0.19) (0.35) (0.34) (0.32)
Bank credit spread Coef -0.51 -0.41 -0.02 -0.52
std (0.24)** (0.16)** (0.13) (0.22)**
NFC credit spread Coef -0.53 -0.23 -0.06 -0.40
std (0.12)*** (0.14)* (0.19) (0.19)**
R2 0.61 0.65 0.69 0.70 0.74 0.72 0.59 0.59 0.59 0.59 0.67 0.63
Core year on year inflation
Germany France Italy Spain
Real eonia Coef -0.22 -0.25 -0.22 0.01 -0.01 0.01 0.14 0.11 0.13 0.13 0.07 0.16
std (0.07)***(0.08)***(0.07)*** (0.07) (0.07) (0.07) (0.08)* (0.10) (0.10) (0.13) (0.11) (0.13)
Term spread Coef -0.45 -0.44 -0.44 -0.22 -0.21 -0.22 -0.00 -0.01 -0.00 -0.06 -0.21 -0.02
std (0.09)***(0.09)***(0.09)*** (0.09)** (0.09)** (0.10)** (0.11) (0.11) (0.10) (0.21) (0.15) (0.22)
Bank credit spread Coef -0.14 -0.12 -0.04 -0.45
std (0.13) (0.12) (0.06) (0.19)**
NFC credit spread Coef -0.07 0.00 -0.02 -0.22
std (0.10) (0.13) (0.11) (0.14)
R2 0.63 0.64 0.63 0.48 0.50 0.48 0.52 0.53 0.52 0.24 0.42 0.28
The sample includes 166 observations from January 1999 to October 2013.
Bank and NFC credit spreads are country-specific indices as described in the text.See notes from Table 2 for a description of variables and estimation procedure.
44
Table 8: Credit spreads and loan volumes (monthly series)Consumption loans (12 months changes in the log level)
Euro area Germany France Italy SpainReal eonia Coef 0.90 0.10 0.80 1.04 1.34 1.02 1.28 -0.03 0.60 3.10 1.28 2.40 -1.69 -1.69 -1.68
std (0.52)* (0.41) (0.34)** (0.34)***(0.39)***(0.42)** (0.51)** (0.40) (0.41) (0.61)***(0.84) (0.80)*** (0.74)** (0.74)** (0.76)**Term spread Coef 0.44 0.31 0.31 0.81 0.68 0.58 2.21 0.46 1.05 3.69 2.92 3.49 4.64 4.66 4.51
std (0.67) (0.50) (0.34) (0.38)** (0.42) (0.41) (0.79)***(0.63) (0.63) (0.68)***(0.52)***(0.62)*** (1.60)***(1.40)***(1.65)***Bank credit spread Coef -2.98 1.47 -3.11 -2.03 0.03
std (0.60)*** (0.73)** (0.43)*** (0.72)*** (1.33)NFC credit spread Coef -4.06 1.22 -2.26 -1.20 -0.30
std (0.91)*** (0.44)*** (0.46)*** (0.77) (1.87)R2 0.18 0.43 0.63 0.21 0.31 0.34 0.34 0.63 0.58 0.61 0.68 0.63 0.82 0.82 0.82
Housing loans (12 months changes in the log level)Euro area Germany France Italy Spain
Real eonia Coef 0.82 0.48 0.80 -0.53 -0.46 -0.50 0.95 0.23 0.65 3.00 -0.21 0.32 -0.52 -0.57 -0.64std (0.29)***(0.30) (0.29)*** (0.09)***(0.12)***(0.10)*** (0.40)** (0.33) (0.34)* (0.74)***(0.89) (0.99) (0.41) (0.42) (0.43)
Term spread Coef 2.27 1.90 2.17 0.23 0.21 0.20 3.39 1.18 1.87 4.88 4.19 4.63 3.56 3.43 3.22std (0.34)***(0.34)***(0.37)*** (0.06)***(0.07)***(0.07)*** (0.58)***(0.83) (0.74)** (0.73)***(0.53)***(0.51)*** (0.55)***(0.58)***(0.57)***
Bank credit spread Coef -1.29 0.16 -2.83 -2.96 -0.31std (0.50)** (0.16) (0.49)*** (0.66)*** (0.44)
NFC credit spread Coef -0.44 0.11 -1.94 -3.72 -1.48std (0.35) (0.12) (0.51)*** (0.89)*** (1.02)
R2 0.72 0.76 0.72 0.68 0.69 0.69 0.61 0.76 0.72 0.50 0.71 0.66 0.83 0.83 0.84
NFCs loans (12 months changes in the log level)Euro area Germany France Italy Spain
Real eonia Coef 0.28 -1.32 0.00 -0.65 -1.04 -0.98 1.40 0.34 0.72 2.67 0.48 0.52 -2.91 -2.81 -2.68std (0.77) (0.52)** (0.41) (0.57) (0.96) (0.60) (0.46)***(0.36) (0.30)** (0.61)***(0.57) (0.52) (0.62)***(0.57)***(0.56)***
Term spread Coef -1.42 -0.38 -1.02 -3.90 -3.57 -3.00 -4.74 -1.82 -1.75 -2.92 -3.17 -2.80 6.08 4.82 4.74std (1.51) (0.75) (0.56)* (0.68)***(0.79)***(0.81)*** (0.98)***(0.78)** (0.64)*** (1.58)* (0.87)***(0.84)*** (0.79)***(0.76)***(0.77)***
Bank credit spread Coef -4.55 -1.12 -4.02 -2.21 -1.85std (0.72)*** (1.61) (0.63)*** (0.55)*** (0.51)***
NFC credit spread Coef -5.20 -1.87 -3.96 -3.34 -2.96std (0.40)*** (1.14) (0.35)*** (0.41)*** (1.05)***
R2 0.38 0.73 0.85 0.55 0.56 0.58 0.53 0.82 0.86 0.48 0.72 0.77 0.92 0.93 0.93
The sample includes 98 observations for Germany, France, Italy and Spain from December 2003 to January 2013, 145 for the euro area from January 2000 to January 2013.
See notes from Table 2 for a description of variables and estimation procedure.
45
Table 9: Correlation of euro area variables with factorsGeneral factors (F1) Credit risk factors (F2)
f1 f2 f3 f4 f5 f6
Industrial production -0,42 0,29 -0,31 -0,51 0,08 0,33Unemployment 0,31 -0,62 0,45 0,19 0 0,06HICP Inflation 0,57 0,49 0,43 0,4 0,04 -0,04Core Inflation 0,62 0,25 0,53 0,04 -0,2 0,22
Stock returns -0,79 0,26 0,42 0,15 0,06 -0,07Bank stock returns -0,8 0,3 0,42 0,19 0,04 0,03Euro area VIX 0,44 -0,45 -0,02 0,43 0,28 0,28
GM Spread (Bank) 0,12 -0,67 0,35 -0,21 0,58 -0,14GM Spread (NFC) 0,38 -0,64 0,33 0,14 0,51 0,22
German Treas. Yields (5y) 0,17 0,75 -0,31 0,45 -0,14 0,1French Treas. Yields (5y) 0,23 0,74 -0,28 0,46 -0,05 0,07German Treas. Yields (5y) 0,36 0,4 0,06 0,05 0,64 -0,25German Treas. Yields (5y) 0,27 0,37 0,02 -0,08 0,64 -0,28
46
Table A1: Descriptive statistics of the entire databaseBanks
Germany France Italy SpainNumber of observations 4913255 500748 780983 372767Number of issuers 74 116 145 110Mkt value of issue ($ thousands) 238488 550779 387048 855026Maturity at issue (yrs.) 7 8.4 7.9 7.4Duration (years) 3.3 4.1 3.8 4Callable = N (%) 90 78 87 87Float = N (%) 82 56 53 44Curr = EURO (%) 74 59 71 92Curr = USD (%) 2 9 3 1Nominal effective yield (pct.) 3.8 4.1 4.3 4.4
Non financial corporations
Germany France Italy Spain USNumber of observations 312542 184080 109464 83804 346126Number of issuers 121 142 125 65 1112Mkt value of issue ($ thousands) 791440 695866 752287 654336 322900Maturity at issue (yrs.) 7.5 8.5 9.2 10.8 13Duration (years) 3.7 4.2 4.8 5.3 6.5Callable = N (%) 88 90 84 74 67Float = N (%) 86 88 79 57 naCurr = EURO (%) 59 60 70 70 naCurr = USD (%) 14 8 20 3 100Nominal effective yield (pct.) 4.4 4.4 5.4 5.5 7.6Note: US data from Table 1 of Gilchrist and Zakrajcek (2012).
47
Table A2: List of IssuersSECT
GERMANY, Banks # of bondsAmount
issued # of bondsAmount
issuedCommerzbank AG A 33 396437 25 433523Deutsche Bank AG A 14 379380 12 439679Deutsche Bank AG (London) A 19 111652 15 129145Dresdner (South East Asia) Ltd A 1 24841 1 24841Dresdner Bank AG A 3 14979 3 14979Dresdner Bank Luxembourg SA A 1 91208 1 91208Grenke Finance plc A 4 124256 2 117277Volkswagen Bank GmbH A 4 506243 2 551760Wuerth Finance International BV A 2 551760
Total A 81 2200754 61 1802411Aareal Bank AG B 7 225059 4 180771Berlin-Hannoversche Hypothekenbank AG B 2 518515 2 518515Berliner Hypotheken Und Pfandbriefbank AG B 1 83811 1 83811Deutsche Apotheker-und Aerztebank eG - DAPO BANK B 11 111110 5 23769Deutsche Hypothekenbank AG B 3 69003 2 39672Deutsche Pfandbriefbank AG B 4 13463 3 13463Erste Europaeische Pfandbrief- und Kommunalkreditbank B 1 12235 1 12235Eurohypo AG B 4 15483 3 16158Hypo Real Estate Bank AG B 1 15406 1 15406Hypothekenbank in Essen AG - Essen Hyp B 1 9112 1 9112Muenchener Hypothekenbank eG B 8 27612 3 30013Pfandbrief Bank International SA - PBI B 1 21548 1 21548WL Bank AG Westfaelische Landschaft Bodenkreditbank B 16 75472 11 55328Westdeutsche ImmobilienBank AG B 2 8588 2 8588Westfaelische Hypothekenbank AG B 1 9149 1 9149
Total B 63 1215565 41 1037537Bayerische Landesbank C 7 814178 4 587456Bayerische Landesbank Girozentrale C 2 55560 2 55560Bremer Landesbank Kreditanstalt Oldenburg Girozentrale C 2 125820 2 125820Deutsche Postbank AG C 1 30788 1 30788DG Bank Deutsche Genossenschaftsbank AG C 1 138223 1 138223DZ Bank AG Deutsche Zentral-Genossenschaftsbank C 15 39966 13 30469HSH Nordbank AG C 3 911924 1 869133Hamburgische Landesbank-Girozentrale C 2 35938 2 35938Landesbank Baden-Wuerttemberg - LBBW C 88 122435 66 128803Landesbank Berlin AG C 1 757002 1 757002Landesbank Berlin Girozentrale C 3 1420277 3 1420277
C 10 220800 7 236814Landesbank Rheinland-Pfalz Girozentrale - LRP C 6 33041 5 36994Norddeutsche Landesbank Girozentrale - NORD/LB C 15 389255 9 382934Sachsen LB Europe plc C 1 123655 1 123655Stadtsparkasse Koeln C 1 11956WestLB AG C 169 105619 123 96760
Total C 327 5336438 241 5056626Total A+B+C 471 8752756 343 7896574
2012m6 2013m6
48
Table A2: List of IssuersSECT
GERMANY, NFC # of bondsAmount
issued # of bondsAmount
issuedAir Berlin PLC & Co Luftverkehrs KG O 1 275748 1 275748Asklepios Kliniken GmbH O 1 203721 1 203721BASF AG O 1 633152 1 633152BASF Finance Europe NV O 4 1594788 3 1594038BASF SE O 2 348588 2 348588BMW Finance NV O 8 1723398 6 1701940BMW US Capital LLC O 1 2738225 1 2738225Bastei Lubbe GmbH & Co KG O 1 41713 1 41713Bayer Capital Corp BV O 1 1758420 1 1758420Bertelsmann AG O 3 944371 2 939092Brenntag Finance BV O 1 566332 1 566332Celesio Finance BV O 1 669882 1 669882Ciba Speciality Chemicals Finance Luxembourg SA O 1 656753 1 656753Daimler AG O 4 1759262 3 1869015Daimler International Finance BV O 1 2661344Degussa AG O 1 1527930Deutsche Lufthansa AG O 2 1094294 1 1044423Evonik Industries AG O 1 1119570 1 1119570Franz Haniel & Cie GmbH O 3 909155 3 909155Fraport AG - Frankfurt Airport Services Worldwide O 2 692520 2 692520GEA Group AG O 1 582157 1 582157Gerresheimer AG O 1 429492 1 429492HeidelbergCement Finance BV O 2 747240 2 747240Hella KGaA Hueck & Co O 1 448229 1 448229Henkel AG & Co KGaA O 1 1366867Henkel KGaA O 1 1167542Heraeus Finance GmbH O 1 306824 1 306824JM Voith AG O 1 875146 1 875146K+S AG O 1 1099384 1 1099384LEONI AG O 1 250407Lanxess Finance BV O 1 658328Linde Finance BV O 9 509538 6 694565MAN AG O 1 688421 1 688421Maschinenfabrik Spaichingen GmbH O 1 42469 1 42469Merck Financial Services GmbH O 2 96186 2 96186Metro AG O 3 1038066 3 1038066Metro Finance BV O 2 398384 1 161687
O 1 148258 1 148258Otto (GmbH & Co KG) O 3 293252 2 68297PERI GmbH O 1 132873 1 132873Procar Automobile Finance Holding GmbH & Co KG O 1 15977 1 15977Rheinmetall AG O 1 670062 1 670062Rhoen-Klinikum AG O 1 547196 1 547196Robert Bosch GmbH O 4 810190 3 745965SAP AG Systeme Anwendungen Produkte in der Datenverarbeitung O 3 711081 1 668003Semper Idem Underberg AG O 1 72611 1 72611Siemens Financieringsmaatschappij NV O 3 2102813 3 2102813Sixt AG O 1 349162 1 349162Stada Arzneimittel AG O 1 468604 1 468604Suedzucker International Finance BV O 1 564493 1 564493Symrise AG O 1 418702 1 418702Tchibo Holding AG O 1 864411 1 864411ThyssenKrupp AG O 2 1194781 2 1194781ThyssenKrupp Finance Nederland BV O 1 1271132 1 1271132Valensina GmbH O 1 74129 1 74129Volkswagen International Finance NV O 6 1571746 5 1548622adidas International Finance BV O 1 698519 1 698519
Total O 105 45603836 84 37596761Deutsche Telekom International Finance BV U 20 900470 18 852542E.ON AG U 1 192604 1 192604E.ON International Finance BV U 11 1271325 10 1204488EWE AG U 2 698677 2 698677EnBW International Finance BV U 6 841056 5 822374Freenet AG U 1 580889 1 580889RWE AG U 1 887443 1 887443RWE Finance BV U 7 1331347 6 1345579
Total U 49 6703810 44 6584596Total O+U 154 52307646 128 44181357
Sectors: U, utilities; O, Others. Amounts in thousands of US dollars
2012m6 2013m6
49
Table A2: List of IssuersSECT
FRANCE, Banks # of bondsAmount
issued # of bondsAmount
issuedBNP Paribas A 1 1 423 082 1 1 423 082BNP Paribas SA A 13 1 267 168 10 1 415 205Banque PSA Finance SA A 8 913 832 4 1 047 174Caisse Nationale de Credit Agricole SA - CNCA A 1 757 355Calyon A 2 15 673 2 15 673Compagnie Financiere de Nouvelles Galleries SA - Cofinoga A 1 502 386 1 502 386Compagnie Financiere du Credit Mutuel A 3 1 039 852 2 909 753Credit Agricole Corporate & Investment Bank A 2 9 182 1 5 774Credit Agricole SA A 7 1 396 145 5 1 679 796Credit Agricole SA (London) A 8 1 000 890 7 699 044Credit Mutuel Arkea A 2 491 698 2 491 698Fortis Bank SA/NV A 5 319 263 4 394 133Fortis Banque Luxembourg SA A 2 105 984 1 66 809Michelin Finance Luxembourg SA - Mifilux A 1 994 299NATIXIS Structured Products Ltd A 1 14 306RCI Banque SA A 10 819 999 7 808 546Societe Generale A 24 658 195 19 719 939
Total A 91 11 729 311 66 10 179 012Caisse Centrale du Credit Immobilier de France B 2 1 041 719 2 1 041 719Caisse Centrale du Credit Immobilier de France - 3CIF B 1 138 889 1 138 889Gecina SA B 2 667 509 2 667 509Rodamco Europe Finance BV B 1 620 887 1 620 887Unibail-Rodamco SE B 6 565 829 6 565 829
Total B 12 3 034 832 12 3 034 832BPCE SA C 7 532 046 6 597 518BRED Banques Populaires C 1 288 775 1 288 775Banque Federative du Credit Mutuel - BFCM C 13 1 063 608 11 1 066 137Caisse Federale du Credit Mutuel Nord Europe C 2 90 457 2 90 457CDC IXIS Capital Markets C 1 63 031 1 63 031Caisse Nationale des Caisses d'Epargne et de Prevoyance SA - CNCE C 8 589 630 8 589 630Credit Cooperatif C 1 39 925 1 39 925Natexis Banques Populaires SA C 1 464 468
Total C 34 3 131 941 30 2 735 473Total A+B+C 137 17 896 084 108 15 949 318
2012m6 2013m6
50
Table A2: List of IssuersSECT
FRANCE, NFC nb_titres mean_aisd nb_titres mean_aisdAccor SA O 1 612 975Air Liquide Finance O 2 644 802 2 644 802Air Liquide SA O 3 579 488 3 579 488Alstom SA O 4 771 388 4 771 388Autoroutes du Sud de la France - ASF O 4 1 312 593 4 1 312 593Bollore O 1 494 840 1 494 840Bouygues SA O 4 1 069 987 4 1 069 987Carrefour SA O 6 1 209 432 5 1 273 292Casino Guichard-Perrachon SA O 2 1 001 732 2 1 001 732Christian Dior SA O 1 427 350 1 427 350Compagnie Financiere & Industrielle des Autoroutes - Cofiroute O 2 644 478 2 644 478Compagnie de Saint-Gobain SA O 4 1 100 160 3 1 185 583Danone O 1 679 810 1 679 810Edenred SA O 1 1 114 982 1 1 114 982Eutelsat SA O 1 1 038 422 1 1 038 422Financiere Agache SA O 1 280 584 1 280 584Groupe Auchan SA O 3 731 352 3 731 352Groupe SEB O 1 439 174 1 439 174Havas SA O 1 520 756 1 520 756LVMH Moet Hennessy Louis Vuitton SA O 4 785 064 3 591 814Lafarge SA O 8 809 124 8 809 124Legrand SA O 2 487 593 2 487 593Nexans SA O 1 475 673 1 475 673PPR SA O 1 668 003 1 668 003Pernod Ricard SA O 2 1 251 612 2 1 251 612Peugeot SA O 4 955 926 3 878 629Pinault-Printemps-Redoute SA - PPR O 1 212 314 1 212 314Prodware SA O 1 7 595 1 7 595Publicis Groupe SA O 1 362 863 1 362 863Rallye SA O 3 712 765 2 736 347Renault SA O 2 776 771 2 776 771Saint-Gobain Nederland BV O 1 606 794Sanofi-Aventis SA O 3 1 566 782 3 1 566 782Schneider Electric SA O 6 922 299 4 1 070 029Societe Anonyme de Gestion des Stocks de Securite (SAGESS) O 1 780 470 1 780 470Societe des Autoroutes Paris Rhin Rhone - APRR O 5 854 975 5 854 975
O 2 968 234 1 1 268 377Thales SA O 1 824 402 1 824 402Valeo SA O 2 680 253 2 680 253Vallourec SA O 1 843 718 1 843 718Vinci SA O 1 1 282 708 1 1 282 708
Total O 96 31 510 241 86 30 640 663Alcatel Lucent SA U 1 660 939 1 660 939Alcatel SA U 1 562 539Electrabel SA/NV U 1 939 555 1 939 555France Telecom SA U 12 1 382 222 10 1 410 713GDF Suez SA U 5 1 179 872 5 1 179 872GIE Suez Alliance U 2 1 007 600 2 1 007 600Gaz de France - GDF U 1 806 018 1 806 018Suez Environnement SA U 3 789 028 3 789 028TOTAL (Old) U 1 180 347Technip SA U 1 259 943 1 259 943Total Capital SA U 7 1 103 437 5 958 982Total Infrastructures Gaz France SA U 1 718 184 1 718 184Veolia Environnement SA U 6 1 063 556 5 944 834Vivendi SA U 3 1 076 179 3 1 076 179
Total U 45 11 729 419 38 10 751 847Total O+U 141 43 239 660 124 41 392 510
Sectors: U, utilities; O, Others. Amounts in thousands of US dollars
2012m6 2013m6
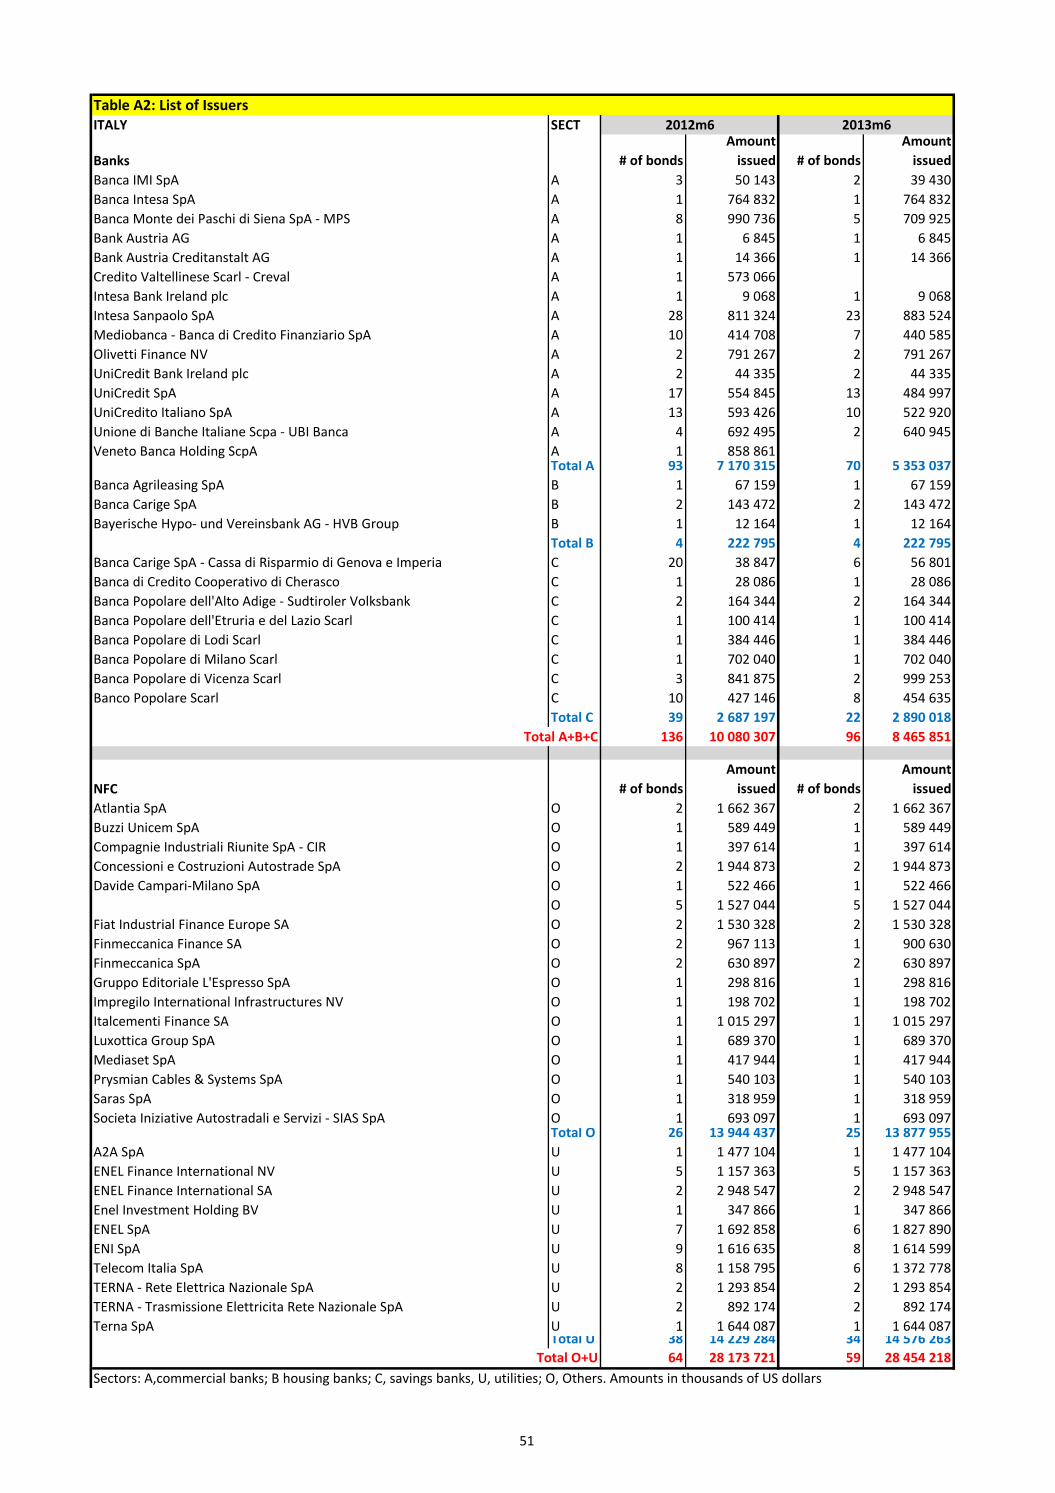
51
Table A2: List of IssuersITALY SECT
Banks # of bondsAmount
issued # of bondsAmount
issuedBanca IMI SpA A 3 50 143 2 39 430Banca Intesa SpA A 1 764 832 1 764 832Banca Monte dei Paschi di Siena SpA - MPS A 8 990 736 5 709 925Bank Austria AG A 1 6 845 1 6 845Bank Austria Creditanstalt AG A 1 14 366 1 14 366Credito Valtellinese Scarl - Creval A 1 573 066Intesa Bank Ireland plc A 1 9 068 1 9 068Intesa Sanpaolo SpA A 28 811 324 23 883 524Mediobanca - Banca di Credito Finanziario SpA A 10 414 708 7 440 585Olivetti Finance NV A 2 791 267 2 791 267UniCredit Bank Ireland plc A 2 44 335 2 44 335UniCredit SpA A 17 554 845 13 484 997UniCredito Italiano SpA A 13 593 426 10 522 920Unione di Banche Italiane Scpa - UBI Banca A 4 692 495 2 640 945Veneto Banca Holding ScpA A 1 858 861
Total A 93 7 170 315 70 5 353 037Banca Agrileasing SpA B 1 67 159 1 67 159Banca Carige SpA B 2 143 472 2 143 472Bayerische Hypo- und Vereinsbank AG - HVB Group B 1 12 164 1 12 164
Total B 4 222 795 4 222 795Banca Carige SpA - Cassa di Risparmio di Genova e Imperia C 20 38 847 6 56 801Banca di Credito Cooperativo di Cherasco C 1 28 086 1 28 086Banca Popolare dell'Alto Adige - Sudtiroler Volksbank C 2 164 344 2 164 344Banca Popolare dell'Etruria e del Lazio Scarl C 1 100 414 1 100 414Banca Popolare di Lodi Scarl C 1 384 446 1 384 446Banca Popolare di Milano Scarl C 1 702 040 1 702 040Banca Popolare di Vicenza Scarl C 3 841 875 2 999 253Banco Popolare Scarl C 10 427 146 8 454 635
Total C 39 2 687 197 22 2 890 018Total A+B+C 136 10 080 307 96 8 465 851
NFC # of bondsAmount
issued # of bondsAmount
issuedAtlantia SpA O 2 1 662 367 2 1 662 367Buzzi Unicem SpA O 1 589 449 1 589 449Compagnie Industriali Riunite SpA - CIR O 1 397 614 1 397 614Concessioni e Costruzioni Autostrade SpA O 2 1 944 873 2 1 944 873Davide Campari-Milano SpA O 1 522 466 1 522 466
O 5 1 527 044 5 1 527 044Fiat Industrial Finance Europe SA O 2 1 530 328 2 1 530 328Finmeccanica Finance SA O 2 967 113 1 900 630Finmeccanica SpA O 2 630 897 2 630 897Gruppo Editoriale L'Espresso SpA O 1 298 816 1 298 816Impregilo International Infrastructures NV O 1 198 702 1 198 702Italcementi Finance SA O 1 1 015 297 1 1 015 297Luxottica Group SpA O 1 689 370 1 689 370Mediaset SpA O 1 417 944 1 417 944Prysmian Cables & Systems SpA O 1 540 103 1 540 103Saras SpA O 1 318 959 1 318 959Societa Iniziative Autostradali e Servizi - SIAS SpA O 1 693 097 1 693 097
Total O 26 13 944 437 25 13 877 955A2A SpA U 1 1 477 104 1 1 477 104ENEL Finance International NV U 5 1 157 363 5 1 157 363ENEL Finance International SA U 2 2 948 547 2 2 948 547Enel Investment Holding BV U 1 347 866 1 347 866ENEL SpA U 7 1 692 858 6 1 827 890ENI SpA U 9 1 616 635 8 1 614 599Telecom Italia SpA U 8 1 158 795 6 1 372 778TERNA - Rete Elettrica Nazionale SpA U 2 1 293 854 2 1 293 854TERNA - Trasmissione Elettricita Rete Nazionale SpA U 2 892 174 2 892 174Terna SpA U 1 1 644 087 1 1 644 087
Total U 38 14 229 284 34 14 576 263Total O+U 64 28 173 721 59 28 454 218
Sectors: A,commercial banks; B housing banks; C, savings banks, U, utilities; O, Others. Amounts in thousands of US dollars
2012m6 2013m6
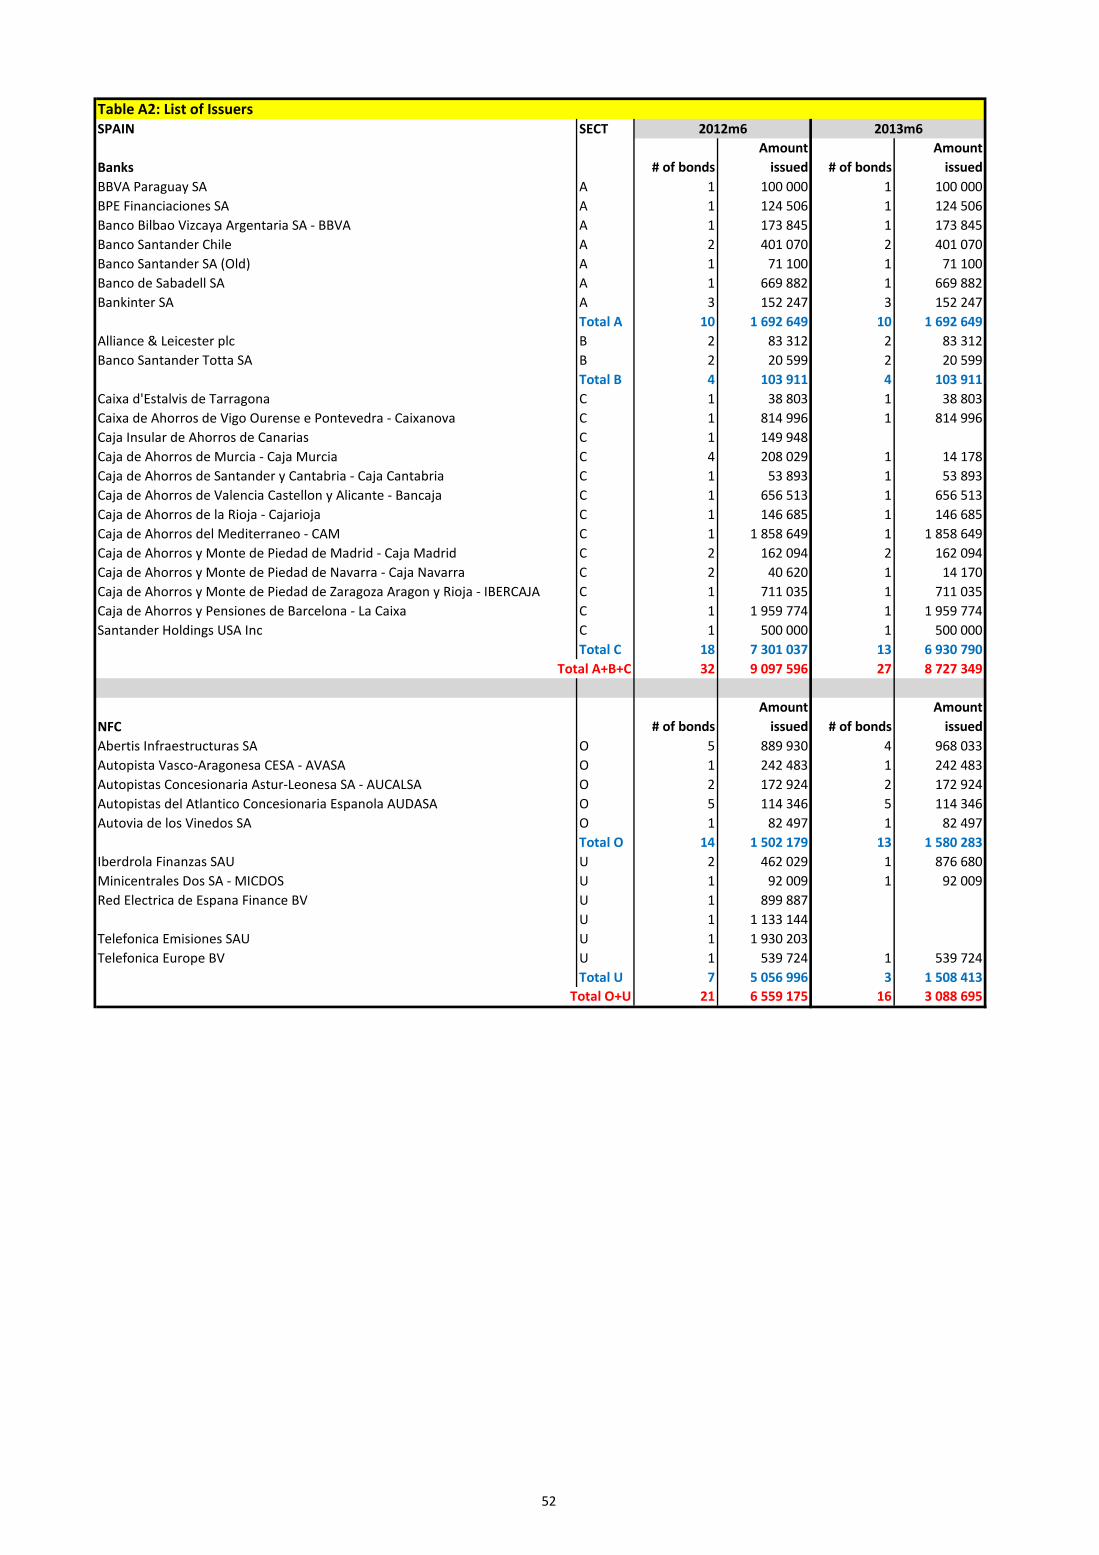
52
Table A2: List of IssuersSPAIN SECT
Banks # of bondsAmount
issued # of bondsAmount
issuedBBVA Paraguay SA A 1 100 000 1 100 000BPE Financiaciones SA A 1 124 506 1 124 506Banco Bilbao Vizcaya Argentaria SA - BBVA A 1 173 845 1 173 845Banco Santander Chile A 2 401 070 2 401 070Banco Santander SA (Old) A 1 71 100 1 71 100Banco de Sabadell SA A 1 669 882 1 669 882Bankinter SA A 3 152 247 3 152 247
Total A 10 1 692 649 10 1 692 649Alliance & Leicester plc B 2 83 312 2 83 312Banco Santander Totta SA B 2 20 599 2 20 599
Total B 4 103 911 4 103 911Caixa d'Estalvis de Tarragona C 1 38 803 1 38 803Caixa de Ahorros de Vigo Ourense e Pontevedra - Caixanova C 1 814 996 1 814 996Caja Insular de Ahorros de Canarias C 1 149 948Caja de Ahorros de Murcia - Caja Murcia C 4 208 029 1 14 178Caja de Ahorros de Santander y Cantabria - Caja Cantabria C 1 53 893 1 53 893Caja de Ahorros de Valencia Castellon y Alicante - Bancaja C 1 656 513 1 656 513Caja de Ahorros de la Rioja - Cajarioja C 1 146 685 1 146 685Caja de Ahorros del Mediterraneo - CAM C 1 1 858 649 1 1 858 649Caja de Ahorros y Monte de Piedad de Madrid - Caja Madrid C 2 162 094 2 162 094Caja de Ahorros y Monte de Piedad de Navarra - Caja Navarra C 2 40 620 1 14 170Caja de Ahorros y Monte de Piedad de Zaragoza Aragon y Rioja - IBERCAJA C 1 711 035 1 711 035Caja de Ahorros y Pensiones de Barcelona - La Caixa C 1 1 959 774 1 1 959 774Santander Holdings USA Inc C 1 500 000 1 500 000
Total C 18 7 301 037 13 6 930 790Total A+B+C 32 9 097 596 27 8 727 349
NFC # of bondsAmount
issued # of bondsAmount
issuedAbertis Infraestructuras SA O 5 889 930 4 968 033Autopista Vasco-Aragonesa CESA - AVASA O 1 242 483 1 242 483Autopistas Concesionaria Astur-Leonesa SA - AUCALSA O 2 172 924 2 172 924Autopistas del Atlantico Concesionaria Espanola AUDASA O 5 114 346 5 114 346Autovia de los Vinedos SA O 1 82 497 1 82 497
Total O 14 1 502 179 13 1 580 283Iberdrola Finanzas SAU U 2 462 029 1 876 680Minicentrales Dos SA - MICDOS U 1 92 009 1 92 009Red Electrica de Espana Finance BV U 1 899 887
U 1 1 133 144Telefonica Emisiones SAU U 1 1 930 203Telefonica Europe BV U 1 539 724 1 539 724
Total U 7 5 056 996 3 1 508 413Total O+U 21 6 559 175 16 3 088 695
2012m6 2013m6

Documents de Travail
470. D. Irac and J. Lopez, “Euro area structural convergence? A multi-criterion cluster analysis,” December 2013
471. L. De Benedictis, S. Nenci, G. Santoni, L. Tajoli and C. Vicarelli , “Network Analysis of World Trade using the
BACI-CEPII dataset,” December 2013
472. G. Gaulier, G. Santoni, D. Taglioni and S. Zignago, “Market Shares in the Wake of the Global Crisis: the Quarterly
Export Competitiveness Database,” December 2013
473. M. Mogliani, V. Brunhes-Lesage, O. Darné and B. Pluyaud, “New estimate of the MIBA forecasting model.
Modeling first-release GDP using the Banque de France's Monthly Business Survey and the “blocking” approach,”
January 2014
474. F. Mayneris and L. Py, “The Efficiency of Enterprise Zone Programs: Some Conflicting Results?,” January 2014
475. A. Bergeaud, G. Cette and R. Lecat, “Productivity trends from 1890 to 2012 in advanced countries,” February
2014
476. G. Cette, “Does ICT remain a powerful engine of growth? ,” February 2014
477. L. Clerc, S. Gabrieli, S. Kern and Y. El Omari, “Monitoring the European CDS Market through Networks:
Implications for Contagion Risks,” March 2014
478. F. Henriet, N. Maggiar, and K. Schubert, “A stylized applied energy-economy model for France,” March 2014
479. G. Békès, L. Fontagné, B. Murakozy and V. Vicard, “Shipment frequency of exporters and demand uncertainty,”
March 2014
480. E. Mengus, “Honoring Sovereign Debt or Bailing Out Domestic Residents: A Theory of Internal Costs of Default,”
March 2014
481. C. Labonne and G. Lamé, “Credit Growth and Bank Capital Requirements: Binding or Not?,” March 2014
482. S. Gilchrist and B. Mojon, “Credit Risk in the Euro area,” April 2014
Pour accéder à la liste complète des Documents de Travail publiés par la Banque de France veuillez consulter le site :
www.banque-france.fr
For a complete list of Working Papers published by the Banque de France, please visit the website:
www.banque-france.fr
Pour tous commentaires ou demandes sur les Documents de Travail, contacter la bibliothèque de la Direction Générale
des Études et des Relations Internationales à l'adresse suivante :
For any comment or enquiries on the Working Papers, contact the library of the Directorate General Economics and
International Relations at the following address :
BANQUE DE FRANCE
49- 1404 Labolog
75049 Paris Cedex 01
tél : 0033 (0)1 42 97 77 24 ou 01 42 92 63 40 ou 48 90 ou 69 81
email : [email protected]