do international migrants increase their happiness … · we assess these questions in a global...
TRANSCRIPT

44
45Chapter 3
Do International Migrants Increase Their Happiness and That of Their Families by Migrating?
Martijn Hendriks, Erasmus Happiness Economics Research Organisation (EHERO), Erasmus University Rotterdam
Martijn J. Burger, Erasmus Happiness Economics Research Organisation (EHERO), Department of Applied Economics, and Tinbergen Institute, Erasmus University Rotterdam
Julie Ray, Gallup
Neli Esipova, Gallup
The authors are grateful for the helpful comments and valuable suggestions of Milena Nikolova, John F. Helliwell, and Richard Layard.

World Happiness Report 2018
The considerable happiness differences between
countries suggest that migrating to another
country provides for many people a major
opportunity to obtain a happier life. However,
negative migrant experiences are common,
including exploitation, social exclusion, home-
sickness, and unsuccessful socioeconomic
assimilation.1 This raises important questions in
our globalizing world, where more than 700
million people currently say they would like to
move permanently to another country if they
had the opportunity,2 and where the international
migrant population is expected to increase from
the current 250 million to an estimated 400
million people in 2050.3 Do migrants generally
gain happiness from moving to another country?
In what specific migration flows do migrants gain
happiness from moving abroad? Do the short-
term and long-term impacts of migration on
migrants’ happiness differ? What is the impact
of migration on the happiness of families
left behind?
We assess these questions in a global context
using Gallup World Poll (GWP) data including
more than 36,000 first-generation migrants from
over 150 countries and territories. By addressing
these questions empirically, this chapter is
intended to develop globally comparable
information about how migration affects the
happiness of migrants and their families. The
outcomes in both the affective and cognitive
dimensions of happiness will be considered.
The affective dimension refers to the frequency
of experiencing pleasant moods and emotions
as opposed to unpleasant ones, whereas the
cognitive dimension refers to a person’s
contentment and satisfaction with life.4
Approximately 10% of international migrants
are considered refugees who were forced to
migrate by external circumstances such as war,
persecution, or natural disasters.5 The other 90%
of international migrants are believed to move
largely voluntarily. Voluntary migrants mention
a variety of motives for migration, including
economic gain, career or study opportunities,
living closer to family, or a more livable or
suitable environment (e.g., more religious or
political freedom). On the most general level,
however, these concrete motives are different
ways migrants attempt to improve their own or
their families’ lives.6 Empirical research shows
that, when making important decisions such as
migration decisions, most people tend to choose
the option they think will make them or their
families happiest.7 This suggests that migrants
move particularly to improve their own or their
families’ lives in terms of happiness, with the
exception of refugees who move primarily to
secure their lives. Conceptually, then, happiness,
which is often used synonymously with subjective
well-being, provides valuable information about
migrant well-being.
The above considerations imply that voluntary
migrants anticipate that migration will lead to
improved well-being for themselves and/or
their families. Many migrants will surely experience
considerable happiness gains, particularly those
who meet basic subsistence needs by migrating,
as basic needs such as economic security and
safety are vital conditions for happiness.8 Migrants
moving to more developed countries may also
experience major gains in other important
well-being domains, such as freedom, education,
and economic welfare.9
It should come as no surprise, however, to find
that some migrants have not become happier
following migration. Migration is associated with
severe costs in other critical well-being domains,
particularly those relating to social and esteem
needs. Separation from friends and family, social
exclusion in the host country (e.g., discrimination),
and decreased social participation due to linguistic
and cultural barriers are typical social costs of
migration that frequently result in experiences
of social isolation, loneliness, and impaired social
support among migrants.10 Migration also often
entails a lower position in the social hierarchy, a
sense of dislocation, and acculturative stress
(cultural clashes and identity issues).11 Additionally,
happiness gains may falter over time because
people tend to adapt more to the typical benefits
of migration, such as improvements in economic
welfare, than to migration’s typical costs, such
as leaving behind one’s social and cultural
environment.12
Migration decisions are complicated by major
information constraints. Most prospective
migrants have never been in their intended
destination country. They necessarily resort to
information from the media or their personal
social network. However, these sources tend to
provide limited and positively biased information;
for example, migrants tend to be hesitant about

46
47
revealing their disappointing migration outcomes
to people in their home country.13 In essence,
prospective migrants must make one of the most
important and difficult decisions of their lives
based on limited knowledge of its consequences.
Imperfect decisions may also follow from
inaccurately weighing the importance of the
anticipated advantages and disadvantages of
migrating. Placing disproportionate weight on
certain aspects of the outcome may be common,
since human susceptibility to deviations from a
standard of rationality is well-documented in the
social sciences.14 Specifically, people are believed
to put excessive weight on satisfying salient
desires, most notably economic gain, at a cost
to more basic needs such as social needs.15 These
beliefs are inspired by the weak correlation between
economic welfare and happiness for people who
have sufficient money to make ends meet.16
Migration may thus be a misguided endeavour for
some migrants who move in search of a better
life,17 which signals the need to evaluate whether
migrants are truly better off after migration.
Evaluating the outcomes of migration is compli-
cated, however, by the rarity of experimental
studies and panel studies tracking international
migrants across international borders. Existing
work evaluating migrants’ happiness outcomes
is mostly limited to comparing the happiness of
migrants with that of demographically similar
people living in a migrant’s home country
(matched stayers).18 The happiness of matched
stayers reflects what the migrant’s happiness
would have been like had they not migrated,
which implies that migrants benefit from
migration if they report higher happiness levels
than matched stayers.19 This methodology has
limited leverage in estimating the causal impact
of migration because the non-random selection
of people into migration is not fully captured by
the comparison of demographically similar
migrants and stayers. For example, compared
with stayers, migrants tend to be less risk-averse,
to have a higher achievement motivation and
lower affiliation motivation, and to differ in terms
of pre-migration skills and wealth.20 Moreover,
people who are relatively unhappy given their
socio-economic conditions are more willing to
migrate.21 Such unobserved pre-migration differ-
ences between migrants and stayers may bias
the estimated impact of migration when using
simple comparisons of migrants and stayers.
The current literature generally reports happiness
gains for migrants moving to more developed
countries, whereas non-positive happiness
outcomes are observed particularly among
migrants moving to less developed countries.22
However, there are notable exceptions to this
general pattern. Convincing evidence comes
from the only experimental data available, which
concerns a migration lottery among Tongan
residents hoping to move to New Zealand.23 Four
years after migration, the ‘lucky’ Tongans who
were allowed to migrate were less happy than
the ‘unlucky’ Tongans who were forced to stay,
even though the voluntary migrants enjoyed
substantially better objective well-being, such
as nearly triple their pre-migration income.
Non-positive happiness outcomes are also
reported among other migration flows to more
developed countries, such as for Polish people
moving to Western Europe24 and in the context
of internal migration, rural-urban migrants in
China.25 The strong dependence of migration
outcomes on where migrants come from and
where they go highlights the unique characteristics
of each migration flow and the importance of
information on the well-being outcomes of
migrants in specific migration flows.
One possible reason for non-positive outcomes
among some migrants is that they have not yet
fully reaped the benefits of migration. Most
migrants perceive migration as an investment in
their future; they typically expect their well-being
to gradually improve over time after overcoming
initial hurdles, such as learning the language and
finding a job. Conversely, as mentioned above,
the initial effect of migration is weakened by
migrants’ adaptation to their lives in the host
country that may follow from a shifting
frame-of-reference.26 The migrant’s length of stay
may thus be important to consider when evaluating
the well-being consequences of migration.
Another possible reason that some migrants may
not become happier from migration is that they
sacrifice some of their own happiness to support,
via remittances, the well-being of family members
and/or others who remain in the country of
origin. The vast scope of worldwide bilateral
remittance flows—exceeding an estimated $600
billion in 2015 alone27—illustrates that moving
abroad to improve the welfare of people back
home is an established reason for migration,
particularly among migrants moving from

World Happiness Report 2018
developing to developed countries, and high-
lights that migration is often a family decision
rather than an individual one.28 The receipt of
remittances often results in significant economic
gains and poverty alleviation for families left
behind and thereby enables access to better
health care, education for one’s children, and
other consumption opportunities that benefit
happiness.29 However, family separation also has
various negative consequences for family
members who remain in the country of origin,
such as impaired emotional support, psychological
disconnection from the migrant, and a greater
burden of responsibility for household chores
and child nurturing.30 Do the advantages of
having a family member abroad outweigh
the disadvantages? Although the receipt of
remittances is associated with greater happiness,31
having a household member abroad was not
positively associated with life satisfaction among
left-behind adult household members in an
Ecuadorian community.32 Similarly, household
members left behind in small Mexican and
Bolivian communities do not evaluate their
family happiness as having improved more than
non-migrant households.33 In contrast, in a
comprehensive set of Latin American countries,
adult household members with relatives or
friends abroad who they can count on evaluate
their lives more positively than adults without
such relatives or friends abroad.34 Causal evidence
for emotional well-being and mental health is
also mixed. For example, the emigration of a
family member did not affect the emotional
well-being of left-behind families in Tonga and
the elderly in Moldova but did negatively affect
various aspects of emotional well-being among
left-behind Mexican women and caregivers in
Southeast Asia.35 Hence, the happiness conse-
quences of migration for those staying behind
appear to be strongly context-dependent. Given
that the current literature has predominantly
focused on specific countries or communities, a
global picture is missing of how migration affects
the happiness of those staying behind.
This chapter contributes to existing knowledge
in three main ways. First, it covers the happiness
outcomes of migrants in previously unexplored
migration flows between world regions (e.g.,
from South Asia to Southeast Asia), within world
regions (e.g., within sub-Saharan Africa), and
between specific countries (e.g., Russians to
Israel) using a methodology that allows for more
accurate estimates of the happiness consequences
of migration than is typically used in the literature.
Second, while previous work predominantly
evaluated migrants’ cognitive happiness outcomes
(life evaluations), this chapter explores migrants’
happiness outcomes more comprehensively by
additionally considering the impact of migration
on the affective dimension of happiness (moods
and emotions).36 Third, this chapter provides a
global overview of the relationship between
migration and the happiness of families left
behind and examines the impact of migration
on families left behind in various previously
unexplored migration flows.
The Happiness Outcomes of International Migrants
To determine the impact of migration, we aim to
compare the happiness of migrants to what their
happiness would have been had they not migrated.
The latter is unobserved. In the absence of
large-scale experimental or panel data tracking
migrants across international borders, we use
pooled annual cross-sectional GWP data across
more than 150 countries and territories spanning
the period 2009-2016 to make this comparison.
The adult sample contains more than 36,000
first-generation migrants.37 To mitigate the above
discussed self-selection and reverse causality
issues in the best possible way given our
cross-sectional data, we use a more rigorous
approach than a simple comparison of migrants
and matched stayers, as has been typically done
in the literature.38 We first matched migrants to
demographically similar people in their country
of origin who desire to move permanently to
another country, i.e., potential migrants. Given
that emigration aspirations are found to be good
predictors of subsequent migration behaviour,39
potential migrants can be assumed to have
similar unobserved characteristics (e.g., similar
risk preferences and pre-migration wealth) as
migrants had before they migrated. By using the
happiness of potential migrants as a proxy for
migrants’ pre-migration happiness, we created a
synthetic panel that allows us to estimate migrants’
pre-versus post-migration change in happiness.
The comparison of migrants and potential
migrants captures a migrant’s change in happiness
but not how the happiness of migrants would

48
49
have developed had they not migrated. We
included a control group to capture this counter-
factual. Specifically, we matched migrants with
demographically similar stayers who expressed
no desire to migrate (reflecting the happiness of
stayers in the post-migration period) and we
additionally matched potential migrants with
demographically similar stayers who expressed
no desire to migrate (reflecting the happiness of
stayers in the pre-migration period). In the end,
we have four groups: migrants after migration
(group 1), migrants before migration (group 2),
stayers in the post-migration period (group 3),
and stayers in the pre-migration period (group
4). We calculated the impact of migration by
comparing migrants’ average pre-versus
post-migration period change in happiness to
that of stayers (i.e., difference-in-differences).
Our empirical strategy is described in more detail
in Technical Box 3.1.
We ensured that our immigrant sample is as
representative as possible for the true immigrant
stock size of each country by virtue of a weighting
variable using UN DESA (2015) data on each
country’s immigrant stock. In some analyses, the
immigrant population is divided into newcomers
and long-timers based on whether the immigrant
has lived for more or fewer than five years in their
country of residence to compare the short- and
long-term impacts of migration. We consider
three happiness indicators that together cover the
cognitive and affective dimension of happiness:
1. Life evaluation—as measured by the Cantril
ladder-of-life question that asks people to
make a cognitive assessment of the quality of
their lives on an 11-point ladder scale, with
the bottom rung of the ladder (0) being the
worst possible life for them and the top rung
(10) being the best possible life.40
2. Positive affect—as measured before 2012
by a three-item index asking respondents
whether they frequently experienced
(1) enjoyment, (2) laughter, and (3) happiness
on the day before the interview. For the
2013-2016 period, a two-item index comprising
the first two items was used because the
latter item was not available for this period.
3. Negative affect—as measured by a three-
item index asking respondents whether they
frequently experienced (1) worry, (2) sadness,
and (3) anger on the day before the interview.41
We conduct separate analyses for each happiness
indicator because, while positively correlated,
outcomes can differ considerably between these
dimensions.42
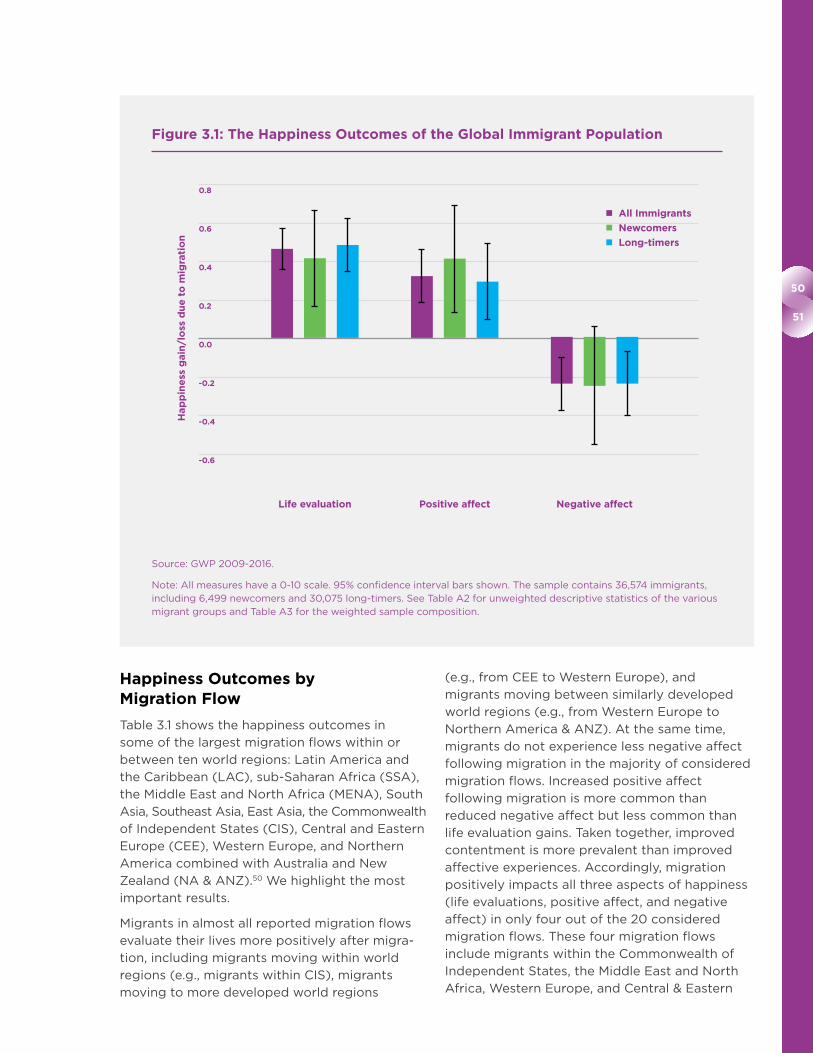
The average happiness gains of the global
immigrant population are presented in Figure 3.1.
Immigrants across the globe evaluate their lives
on average 0.47 points higher (on a 0-10 scale)
after migration, which implies that migrants
report approximately 9% higher life evaluations
following migration.43 Migrants also experience
5% more positive affect (0.33 points on a 0-10
scale) and 7% less negative affect (0.23 points
on a 0-10 scale) due to migration.44
The increased life evaluations of “newcomers”,
and to a lesser extent their increased positive
affect experiences,45 show that immigrants
already achieve happiness gains during their first
five years after migration. The happiness gains of
long-timers are very similar to those of newcomers.
This finding suggests that the happiness of
immigrants does not improve much with their
length of stay in the destination country,46 which
is in line with previous research findings.47

World Happiness Report 2018
Technical Box 3.1: Estimation Strategy
We first matched each migrant to
observably similar potential migrants and
two groups of observably similar stayers
who have no desire to migrate using an
exact matching procedure. In the end,
a synthetic panel is created with the
following four groups:
1. Migrants after moving to another
country.
2. Potential migrants before moving to
another country.48 This group is obtained
by exactly matching migrants in the first
group with one or more respondents
who expressed a desire to permanently
move to another country using country
of origin, gender, and education level as
matching variables.49 To make realistic
comparisons, potential migrants had to
be younger than the migrant they were
matched with.
3. Stayers that are matched with Group 1.
This group consists of those expressing
no desire to permanently move abroad,
and who were identified by matching
the migrants from the first group with
one or more stayers based on country
of origin, gender, education level, age
group (maximum age difference of 5
years), and year of interview.
4. Stayers that are matched with Group 2.
This group consists of those expressing
no desire to permanently move abroad,
and who were identified by matching
the potential migrants from the second
group with one or more stayers based
on country of origin, gender, education
level, age group (maximum age differ-
ence of 5 years), and year of interview.
By construction, potential migrants (group
2) and stayers in the pre-migration period
(group 4) are on average younger than
migrants (group 1) and stayers in the
post-migration period (group 3).
Descriptive statistics of the four matched
groups are provided in Table A1 of the
Online Appendix. A counterfactual (groups
3 and 4) is typically included in panel studies
to mitigate the effect of time-varying
extraneous factors, but the counterfactual
has a slightly different purpose in our
repeated cross-sectional design. In the
context of this study, the counterfactual
mainly mitigates possible differences
between migrants and potential migrants
that are due to a confounding age trend.
This correction allows us to better account
for how migrants’ happiness would have
developed had they not migrated. After the
creation of our synthetic panel, a parametric
difference-in-difference estimator was used to
estimate the effect of migration on happiness:
(HGROUP1
- HGROUP2
) - (HGROUP3
- HGROUP4
) (1)
where H is the happiness indicator (life
evaluation, positive affect, or negative affect).
In case of a (potential) migrant matched with
more than one non-migrant, the average life
evaluation, positive affect, and negative
affect of the matched non-migrants was
taken. The difference-in-differences estimates
are based on OLS regressions using robust
standard errors and including age and age
squared as covariates.
50
51
Happiness Outcomes by Migration Flow
Table 3.1 shows the happiness outcomes in
some of the largest migration flows within or
between ten world regions: Latin America and
the Caribbean (LAC), sub-Saharan Africa (SSA),
the Middle East and North Africa (MENA), South
Asia, Southeast Asia, East Asia, the Commonwealth
of Independent States (CIS), Central and Eastern
Europe (CEE), Western Europe, and Northern
America combined with Australia and New
Zealand (NA & ANZ).50 We highlight the most
important results.
Migrants in almost all reported migration flows
evaluate their lives more positively after migra-
tion, including migrants moving within world
regions (e.g., migrants within CIS), migrants
moving to more developed world regions
(e.g., from CEE to Western Europe), and
migrants moving between similarly developed
world regions (e.g., from Western Europe to
Northern America & ANZ). At the same time,
migrants do not experience less negative affect
following migration in the majority of considered
migration flows. Increased positive affect
following migration is more common than
reduced negative affect but less common than
life evaluation gains. Taken together, improved
contentment is more prevalent than improved
affective experiences. Accordingly, migration
positively impacts all three aspects of happiness
(life evaluations, positive affect, and negative
affect) in only four out of the 20 considered
migration flows. These four migration flows
include migrants within the Commonwealth of
Independent States, the Middle East and North
Africa, Western Europe, and Central & Eastern
Figure 3.1: The Happiness Outcomes of the Global Immigrant Population
Source: GWP 2009-2016.
Note: All measures have a 0-10 scale. 95% confidence interval bars shown. The sample contains 36,574 immigrants, including 6,499 newcomers and 30,075 long-timers. See Table A2 for unweighted descriptive statistics of the various migrant groups and Table A3 for the weighted sample composition.
0.8
0.6
0.4
0.2
0.0
-0.2
-0.4
-0.6
Hap
pin
ess
gain
/lo
ss d
ue
to
mig
rati
on
Life evaluation
All Immigrants
Newcomers
Long-timers
Positive affect Negative affect

World Happiness Report 2018
Europe. Non-positive outcomes for all three
happiness indicators are experienced by migrants
who left Western European countries to live in
Central or Eastern Europe, migrants within South
Asia, and migrants within Northern America &
ANZ. These findings highlight that migrants
typically experience divergent outcomes in life
evaluations, positive affect, and negative affect.
Nevertheless, negative outcomes at the level
of regional migration flows are uncommon;
only migrants from CIS to MENA and migrants from
Latin America to Western Europe report increased
negative affect and decreased positive affect,
respectively. Finally, the results show that there is no
strong relationship between the size of the migra-
tion flow and the size of migrants’ happiness gains.
Table 3.1: Migrants’ Happiness Outcomes by Regional Migration Flow
Migration flowLife
evaluationPositive affect
Negative affect
Size of migrant stocka
N of migrants
Within regions
Commonwealth of Independent States +0.39** [0.28 - 0.49]
+0.43** [0.23 - 0.63]
-0.51** [-0.64 - -0.37]
22,092,847 4,176
Sub-Saharan Africa +0.21** [0.06 - 0.35]
NS NS 15,952,589 4,184
Middle East and North Africa +0.44** [0.21 - 0.66]
+0.57** [0.18 - 0.96]
-0.95** [-1.36 - -0.54]
14,273,111 2,563
Western Europe +0.45** [0.31 - 0.60]
+0.36** [0.12 - 0.60]
-0.31** [-0.53 - -0.09]
11,525,545 4,123
South Asia NS NS NS 9,653,943 524
Southeast Asia +1.08* [0.13 - 2.03]
NS NS 7,044,470 607
Latin America & the Caribbean +0.45** [0.24 - 0.66]
NS NS 5,918,332 1,846
East Asia +0.54** [0.23 - 0.84]
+0.85** [0.46 - 1.24]
NS 5,204,219 1,062
Central & Eastern Europe +0.39** [0.26 - 0.52]
+0.51** [0.27 - 0.75]
-0.49** [-0.67 - -0.31]
3,064,126 3,517
Northern America & ANZ NS NS NS 2,245,399 455
Between regions
CEE Western Europe +0.78** [0.58 - 0.97]
+0.50** [0.15 – 0.85]
NS 11,296,274 1,609
MENA Western Europe +0.90** [0.64 - 1.17]
+0.86** [0.37 - 1.35]
NS 9,239,336 655
Western Europe NA&ANZ +0.84** [0.53 - 1.14]
+0.73* [0.14 - 1.32]
NS 6,785,656 1,627
LAC Western Europe +0.36** [0.15 - 0.56]
-0.37* [-0.70 - -0.04]
NS 4,627,262 734
SSA Western Europe +1.44** [1.03 - 1.86]
+0.87** [0.16 - 1.58]
NS 4,111,872 375
CIS Western Europe +0.59** [0.22 – 0.96]
NS NS 4,053,523 396
CIS CEE +0.57** [0.26 - 0.88]
+0.69* [0.10 – 1.28]
NS 1,481,054 1,975
South Asia Southeast Asia +0.80* [0.08 - 1.51]
NS -0.93* [-1.64 - -0.22]
1,219,086 308
Western Europe CEE NS NS NS 768,172 653
CIS MENA +1.11** [0.66 - 1.66]
NS +0.57** [0.14 - 1.00]
461,174 908
Sources: GWP 2009-2016. a UN DESA (2015).51
Notes: 95% confidence intervals in parentheses.* p<0.05, ** p<0.01, NS = not significant at the 5% level. Migration flows with fewer than 300 migrant-stayer matches are not reported. The composition of regional migration flows is presented in Table A5.

52
53
It should be noted that the happiness outcomes
of migrants from a given source region to the
various destination regions are not directly
comparable. For example, the slightly higher
happiness gains among migrants within LAC
compared with Latin American migrants moving
to Western Europe does not imply that those
who moved to Western Europe would have been
better off had they moved within LAC. One
reason is that the considered migration flows
differ in the distribution of source countries.
For example, compared with Argentinians,
relatively more Nicaraguans move within Latin
America than to Western Europe. Another
reason is that migrants in different migration
flows may have different characteristics. For
example, many migrants moving within regions
do not have the financial resources to move to
another world region and certain types of
migrants (e.g., humanitarian migrants) are
admitted in some countries/regions but not
in others. Moreover, the achieved happiness
gains are not indicative of the maximum
possible happiness gain of a certain migration
flow. For instance, most Latin American
migrants in Western Europe live in Spain
and Portugal, but they may have been
happier had they moved to another Western
European country.
In Table 3.2, we present migrants’ happiness
outcomes in selected flows between specific
nations. One general pattern that emerges is the
positive outcomes among United Kingdom (UK)
emigrants who moved to other Anglo-Saxon
countries. Another general pattern is the
non-positive outcomes of Russian-born people
Table 3.2: Migrants’ Happiness Outcomes in Migration Flows Between Specific Nations
Migration flowLife
evaluationPositive affect
Negative affect
N of migrants
United Kingdom Ireland +0.65** [0.48 - 0.81]
+0.72** [0.43 - 1.01]
-0.54** [-0.83 - -0.25]
478
United Kingdom Australia +0.94** [0.76 - 1.11]
NS -0.64** [-0.91 - -0.37]
528
United Kingdom New Zealand +1.11** [0.95 - 1.26]
+0.83** [0.58 - 1.08]
-0.97** [-1.22 - -0.72]
519
Russia Estonia -0.28** [-0.45 - -0.12]
-0.91** [-1.26 - -0.56]
NS 691
Russia Latvia NS NS NS 416
Russia Belarus +0.45** [0.25 - 0.65]
NS -0.33* [-0.64 - -0.01]
385
Russia Kazakhstan +0.28* [0.05 - 0.52]
+0.57* [0.10 - 1.04]
-0.71** [-1.04 - -0.37]
338
Russia Israel +1.55** [1.40 - 1.71]
NS +1.42** [1.15 - 1.69]
580
China Hong Kong +0.16* [0.01 - 0.31]
-0.43** [-0.70 - 0.16]
+0.24* [0.02 - 0.46]
829
Palestinian Territories Jordan +1.63** [1.42 - 1.84]
+1.03** [0.64 - 1.42]
-2.09** [-2.42 - -1.76]
626
Nicaragua Costa Rica +1.48** [1.24 - 1.72]
+0.60** [0.31 - 0.89]
-0.79** [-1.12 - -0.46]
459
France Luxembourg +0.83** [0.66 - 1.00]
+0.67** [0.30 - 1.04]
-1.02** [-1.35 - -0.69]
361
Portugal Luxembourg +1.43** [1.23 - 1.63]
+0.49** [0.08 - 0.90]
-1.05** [-1.42 - -0.68]
352
Albania Greece NS NS NS 355
Serbia Montenegro +0.48** [0.19 - 0.77]
+0.79** [0.29 - 1.27]
NS 309
Ivory Coast Burkina Faso NS -0.90** [-1.37 - -0.43]
NS 310
Source: GWP 2009-2016.
Notes: 95% confidence intervals in parentheses. * p<0.05, ** p<0.01, NS = not significant at the 5% level. Migration flows with fewer than 300 migrant-stayer matches are not reported.

World Happiness Report 2018
who moved to the Baltic states, whereas
Russian-born migrants in some other former
Soviet republics did gain happiness from
migration. A noteworthy finding is that
Russian-born migrants in Israel evaluate their
lives much more positively after migration but
simultaneously experience adverse outcomes in
terms of affect. These results are in line with the
relatively high life evaluations but relatively low
emotional well-being of Israel’s native population
(Israel ranks 14th out of 156 countries on the
Cantril ladder but 107th out of 156 countries
on net affect in the period 2005-2011).52 The
happiness outcomes of Russian-born migrants
in Israel mainly drive the results reported in
Table 3.1 for migrants from CIS to MENA.
In Chapter 2 of this World Happiness Report,
it was shown that the happiness of immigrants
does not differ much from that of the native-
born population. This finding suggests that the
happiness of immigrants depends first and
foremost on their conditions in the host country
and relatively less on their former lives in their
countries of origin or innate cultural differences
in happiness. We further test to what extent the
happiness levels of migrants converge towards
the average happiness level in the destination
Figure 3.2: The Relationship Between Migrants’ Happiness Gains and the Corresponding Origin-Destination Happiness Differential
Source: GWP 2009-2016.
Notes: The interpretation of these graphs can be exemplified using the upper right data point in the “life evaluations” panel. This data point represents migrants from sub-Saharan Africa to Western Europe, and shows that these migrants evaluate their lives 1.44 higher due to migration (as presented on the X-axis) while the corresponding difference in life evaluations between the native populations of their host- and origin countries is 2.29 (as presented on the Y-axis). The origin-destination differential is weighted by the size of bilateral migration flows within these world regions to ensure accurate comparisons. Detailed information is presented in Table A6.

54
55
country by comparing a migrant’s happiness
gain with the happiness differential between the
migrant’s origin and destination country. This
origin-destination happiness differential is
calculated by subtracting the average happiness
level in the country of origin from that of the
destination country’s native-born population.
Figure 3.2 shows three scatter plots—one for
each happiness indicator—of migrants’
happiness gains/losses due to migration (as
presented on the X-axis) and the corresponding
origin-destination happiness differentials (as
presented on the Y-axis). The data points
represent the 20 regional migration flows
considered in Table 3.1. Migrants’ happiness levels
tend to become more similar to those of people
in their destination country when there is a high
positive correlation between migrants’ happiness
gains and the destination-origin happiness
differential, i.e., when the points are closer to
the 45-degree lines in each panel. Indeed, we
find a strong positive correlation between the
life evaluation gains of migrants and the life
evaluation differentials between their origin and
destination countries (r=0.80). The correlations
for positive affect (r=0.48) and negative affect
(r=0.35) are also positive but more moderate.
These results provide further evidence that the
happiness of migrants converges substantially
— though not entirely — towards the average
happiness level in the host country, particularly in
terms of life evaluations. Migrant happiness thus
strongly depends on the host country environment.
The refugee population requires special attention
because refugees are exceptionally vulnerable and
are the only migrant group for which migration is
largely involuntary. An analysis focusing on the
happiness of refugees is presented in Box 3.2.
Box 3.2: Refugee Happiness
As refugees cannot be identified in the GWP,
we use migrant data from the German
Socio-Economic Panel (SOEP) to empirically
assess how the happiness of refugees
develops with their length of stay in Germany
and how happy refugees are relative to
“voluntary” immigrants in Germany
(job-seekers, expats with job offers, co-moving
family members, etc.). We focus here on the
cognitive dimension of happiness using a life
satisfaction question.53 Our sample contains
607 refugees and 4,607 voluntary migrants.
Column 1 of Table 3.3 shows that refugees
are significantly less satisfied with life than
voluntary migrants and that the general
immigrant population experiences decreasing
life satisfaction with their length of stay in
Germany. Column 2 shows that the non-
positive relationship between life satisfaction
and the time since migration holds both for
refugees and voluntary immigrants in
Germany.54 These findings concur with the
previously shown global pattern that
immigrants in general do not become
happier with their length of stay in the host
country. Taken together, refugees are unable
to close the happiness gap with other
immigrants (and natives), at least in Germany.
However, refugees’ non-improving happiness
with their length of stay does not necessarily
imply that they do not become happier by
migrating; refugees may obtain a substantial
immediate happiness gain upon arrival in
Germany due to their improved safety,
freedom, and so forth. A more detailed
analysis, reported in Table A8, shows that
refugees are significantly less happy than all
specific subgroups of voluntary immigrants
(job-seekers, co-moving family members,
and so forth).

World Happiness Report 2018
The Happiness Outcomes of Families Left Behind
We estimate the happiness consequences
of having a household member abroad by
comparing the happiness of individuals with
and without a household member abroad. For
this purpose, we use global GWP data spanning
the period 2007-2011. To account for the
non-random selection of households into
migration, we employ exact matching and
compare only individuals with the same gender
and education level, who are from the same
country of residence and age group (maximum
age difference of 5 years), and who live in a
similar type of location (rural vs. urban).55
In a first model, we estimate how having one or
multiple household members living abroad for
under five years affects the happiness of left-
behind household members across 144 countries.
We do not have information on the exact
relationship between the migrant and left-behind
household member and the migrant’s motive for
migration. However, it is conceivable that one of
the most common reasons for moving abroad
without other household members is to improve
the household’s living standard by working
abroad and sending back remittances. This
group of migrant workers is characterized by
great diversity, ranging from female nurses from
the Philippines to male construction workers
from Latin America. The household member
abroad can, however, also be another family
member (e.g., a child or sibling) or move for
different reasons (e.g., for study purposes).
Household members left behind are likely to be
Table 3.3: OLS Regression: Life Satisfaction of Refugees and Voluntary Migrants by Length of Stay
Dependent variable: Life satisfaction (1) (2)
Type of migrant
Refugees Ref. Ref.
Voluntary migrants 0.39** 0.48**
(0.08) (0.16)
Years since migration -0.01** -0.00
(0.00) (0.01)
Years since migration*type of migrant
Refugees Ref.
Voluntary migrants -0.01
(0.01)
Age -0.02* -0.02*
(0.01) (0.01)
Age2/100 0.01 0.01
(0.01) (0.01)
Female 0.04 0.04
(0.05) (0.05)
Observations 5,214 5,214
R2 0.02 0.02
Sources: IAB-SOEP Migration samples M1 (2013-2015) and M2 (2015).
Notes: Regression coefficients are displayed with robust standard errors in parentheses. * p<0.05, ** p<0.01. Refugees moved to Germany on average 13 years ago; 48% of these refugees come from MENA (primarily Iraq, Syria, Afghanistan, and Turkey), 26% from the former Yugoslavia, 14% from the former Soviet Union, and 12% from other world regions. See Table A7 for detailed sample descriptives. For the M1 sample, the average life satisfaction over the years 2013–2015 was taken.

56
57
the migrant’s spouse, children, parents, siblings,
or other extended family members. The results,
presented in the upper left panel of Figure 3.3,
show that individuals with a household member
abroad typically evaluate their lives more
positively and experience more positive affect
than their counterparts without a relative abroad.
However, they also experience more negative
affect. A plausible explanation for these mixed
happiness outcomes is that the family’s often
significant economic gain from migration is more
strongly related to cognitive assessments of
quality of life (life evaluations) than affective
experiences,56 and those left behind may
Figure 3.3: The Impact of Migration on the Happiness of Household Members Left Behind
Sources: a Worldwide GWP 2007-2011 data. b GWP 2009 data covering all countries of the former Soviet Union, most Latin American countries, and some Caribbean countries. c GWP 2007 data covering most Latin American countries and the Dominican Republic.
Note: 95% confidence interval bars shown.
Life evaluation Positive affect Negative affect
Hap
pin
ess
gain
/lo
ss
Individuals receiving remittances from relatives abroad (N=1,049)c
Individuals with a household member living permanently abroad (N=1,259)b
0.6
0.5
0.4
0.3
0.2
0.1
0.0
-0.1
-0.2
-0.3
All individuals with a household member abroad (N=44,347)a
Hap
pin
ess
gain
/lo
ss
Individuals with a household member abroad for temporary work (N=2,898)b
0.6
0.5
0.4
0.3
0.2
0.1
0.0
-0.1
-0.2
-0.3

World Happiness Report 2018
often suffer emotionally because they may
experience increased sadness from being
separated from the migrated household member
and increased worry from communicating
infrequently with the family member and
being unable to share responsibilities such
as child nurturing.57
The two right panels of Figure 3.3 present the
outcomes of household members left behind by
household members who specifically moved
abroad for temporary work or permanent
residence, respectively. The analysis sample is
limited to countries in Latin America and the
Caribbean and countries of the former Soviet
Union. Household members left behind by
migrants moving for temporary work or to
permanently live abroad evaluate their lives
more positively than their counterparts without
a household member abroad. However, they do
not benefit from migration in terms of emotional
well-being; most notably, individuals with a
household member abroad for temporary work
experience increased negative affect following
migration. Similarly, as shown in the lower left
panel, Latin Americans who receive remittances
from relatives abroad evaluate their lives more
positively and experience more positive affect
but they do not experience less negative affect
compared with non-migrant households.
Taken together, the results reported in Figure 3.3
suggest that migration generally improves the
perceived quality of life of household members
back home but not necessarily their emotional
well-being. Particularly interesting is that having
a household member abroad generally does not
reduce—and often even increases—negative
affect experiences among the family back home.
Hence, migration often requires trade-offs
between different aspects of happiness for
people staying behind.
In Table 3.4, we present the impact of migration
on left-behind household members for selected
migration flows within or between world regions.
The analysis sample contains all individuals with
a household member abroad, i.e., the sample as
in the upper left panel of Figure 3.3. There is
considerable heterogeneity in outcomes be-
tween migration flows. The benefits in terms of
life evaluations and positive affect are particularly
large for individuals in the developing world
who have a household member living in Western
Europe, Northern America, Australia, or New
Zealand. It is plausible that benefits are largest in
these migration flows given that the large wage
gaps between these origin and destination
regions allow for high remittances. However, in
some cases, benefits are also present among
families left behind in other types of migration
flows, such as migrants moving within the
Commonwealth of Independent States. In 6 out
of 21 migration flows, non-positive outcomes are
experienced for all three aspects of happiness.
For example, household members left behind by
migrants within MENA experience increased
negative affect and no improvements in life
evaluations or positive affect. Interestingly,
there are no migration flows in which migration
reduced negative affect experiences among
families back home, which highlights the
prevalence of a non-positive impact of migration
on the negative affect experiences of those
staying behind. Outcomes between bilateral
migration flows are presented in Table 3.5.
Robustness Checks and Limitations
Some possible validity threats cannot be fully
addressed in our cross-sectional study, which
is typical of empirical literature estimating the
impact of migration on migrants and families
left behind.58 A first concern relates to migrant
selectivity. In our analysis of migrant outcomes,
we mitigated possible selection bias in terms of
demographics, skills, ability, personality, and
other characteristics to the extent possible by
introducing potential migrants as a comparison
group and by comparing migrants only to
demographically similar stayers. Nevertheless,
unobserved migrant-stayer differences in per-
sonal characteristics that affect happiness could
remain present and may bias our results to some
extent. To alleviate this concern, we conducted a
robustness check in which potential migrants
were replaced by a smaller sample of migrants
with concrete plans to migrate within a year. The
pre-migration characteristics of our migrant
sample may be more similar to those of people
with concrete migration plans than to those of
people expressing only a willingness to migrate.
A potential limitation of using migrants with
concrete migration plans as a comparison group
is that their anticipated migration may have
affected their happiness. The results using this

58
59
alternative comparison group are reported in
Figure A1 and are consistent with our main finding
that migrants are generally better off after migra-
tion on all three happiness indicators. However,
compared with our main results, migration has a
somewhat weaker impact on positive affect and
a stronger impact on negative affect.
Second, temporary migrants live for a shorter
period in the host country compared with
permanent migrants and thus have a smaller
chance of being sampled in the host country.
Therefore, temporary migrants are likely to be
under-represented in our sample. This may bias
the results if returnees achieve relatively better
or worse happiness outcomes in the host country
than permanent migrants. However, return
migration is in many cases not primarily driven
by the success of the migration experience
(e.g., for refugees returning home), whereas in
other cases return migration resulting from a
disappointing migration experience is to some
extent counterbalanced by return migration
resulting from having successfully achieved one’s
migration goals.59 Nevertheless, non-causal
evidence shows that returnees tend to be less
happy than stayers in the home country and
non-returned migrants, which may be either
because return migrants were already relatively
unhappy before moving abroad or because
migrants with disappointing migration outcomes
are more inclined to return home.60 Based on the
current evidence, we cannot provide a reliable
estimate of the extent and direction of the bias
resulting from the underrepresentation of
temporary migrants.
Third, our migrant sample excludes some migrant
groups. Migrants in Gulf Cooperation Council
countries and sparsely populated countries and
island states are excluded, representing altogether
less than 8% of the world’s migrant population.61
Aside from the exclusion of these groups, the
analysis sample was made representative, to the
extent possible, of each destination country’s
immigrant stock size by virtue of a weighting
adjustment. By contrast, the sample is not fully
representative of the migrant populations within
host countries, since the GWP is not specifically
designed to study migrants. The analysis sample
may particularly under-represent undocumented
migrants and excludes migrants in refugee
camps, migrant children, and migrants who do
not speak the host country’s most common
languages. The latter two groups are excluded
because GWP respondents are aged 15+ and
interviews are only held in each country’s most
common languages, respectively. Initial evidence
suggests that proficiency in the host country
language may improve immigrant happiness,62
whereas there is no specific research available
on the happiness gains of the other excluded
immigrant groups.63 The exclusion of these
groups must be taken into account when
interpreting the results.
Fourth, interviews are conducted over the
phone in developed countries, including Western
Europe, Northern America & ANZ, and some
East-Asian countries, but face-to-face in most of
the developing world, including CIS, sub-Saharan
Africa, South Asia, and much of Latin America,
Southeast Asia, and MENA (see Table A11).
Approximately 25% of the face-to-face interviews
in our migrant sample were computer-assisted
(CAPI). The lack of within-country variance in
survey mode in a given year constrained us from
statistically correcting for possible survey mode
bias in our main analysis. In Table A12, we show
that life evaluations and self-reported negative
and positive affect are not significantly affected
by survey mode (phone, face-to-face without CAPI, or face-to-face with CAPI), with one
exception. A person interviewed by phone
reports 0.60 points higher negative affect on
a 0-10 scale than if s/he had been interviewed
face-to-face without CAPI.64 Particularly for
negative affect, then, survey mode differences
may somewhat bias outcome estimations for
migration flows between developing and
developed regions. Nevertheless, this bias will
have a negligible impact on the average global
happiness outcome from migration because
migration flows in opposite directions counter-
balance this bias to some extent, and many
migrants move between countries with the
same survey mode.
We ask readers to take these limitations into
account when interpreting our results.

World Happiness Report 2018
Table 3.4: The Impact of Migration on Left-Behind Household Members by Regional Migration Flow
Migration flow Life evaluation Positive affect Negative affect N
Within regions:
Commonwealth of Independent States +0.13** [0.06 - 0.20]
+0.29** [0.13 - 0.45]
NS 3,356
Sub-Saharan Africa +0.12** [0.05 - 0.20]
+0.23** [0.06 - 0.39]
+0.23** [0.08 - 0.37]
3,354
Latin America & the Caribbean NS NS +0.37** [0.18 - 0.56]
1,776
Middle East and North Africa NS NS +0.34** [0.11 - 0.57]
1,552
Western Europe NS NS NS 1,074
Central & Eastern Europe NS NS NS 550
Southeast Asia NS NS NS 309
East Asia +0.26* [0.05 - 0.47]
NS NS 304
Between regions:
LAC NA & ANZ +0.24** [0.16 - 0.33]
+0.29** [0.19 - 0.40]
NS 3,360
CEE Western Europe +0.12** [0.04 - 0.21]
NS NS 3,311
SSA Western Europe +0.29** [0.21 - 0.37]
+0.34** [0.16 - 0.52]
NS 3,202
LAC Western Europe +0.28** [0.17 - 0.40]
+0.19* [0.02 - 0.36]
NS 1,806
SSA NA & ANZ +0.16** [0.04 - 0.28]
+0.54** [0.30 - 0.78]
NS 1,575
South Asia MENA +0.29** [0.15 - 0.42]
NS NS 1,024
MENA Western Europe +0.22* [0.06 - 0.38]
NS +0.32* [0.02 - 0.62]
834
SSA MENA NS +0.42* [0.03 - 0.82]
NS 717
Southeast Asia NA & ANZ +0.21** [0.06 - 0.35]
+0.52** [0.20 - 0.84]
NS 705
CEE NA & ANZ +0.28** [0.07 - 0.49]
+0.47* [0.12 - 0.82]
NS 695
East Asia NA & ANZ NS NS NS 637
CIS Western Europe +0.51** [0.31 - 0.70]
+0.50** [0.13 - 0.86]
NS 604
Western Europe NA & ANZ +0.21* [0.00 - 0.42]
NS NS 463
Source: GWP 2007-2011.
Notes: 95% confidence intervals in parentheses. * p<0.05, ** p<0.01. NS = not significant at the 5% level. Migration flows with fewer than 300 homestayer matches are not reported. See Table A10 for the composition of regional migration flows.

60
61
Conclusions and Implications
Using Gallup World Poll data, this chapter sheds
light on the happiness consequences of migration
for international migrants and families left behind
across the globe. Three types of happiness
outcomes were considered: life evaluations,
positive affect (experiences of enjoyment,
happiness, and laughter), and negative affect
(experiences of worry, sadness, and anger).
By comparing migrants to matched potential
migrants and stayers without migration plans, we
estimate that migrants across the globe evaluate
the quality of their lives on average 9% higher
following migration. They also experience ap-
proximately 5% more positive affect and 7% less
negative affect due to migration. Accordingly,
the happiness levels of migrants converge
substantially towards the average happiness level
in the host country, particularly in terms of life
evaluations. Most of these happiness gains are
already experienced within the first five years
after migration given that the happiness of
international migrants generally does not further
improve following those first five years.
A happiness gain in at least one of the three
happiness indicators is not only the dominant
outcome among migrants moving to more
developed world regions (e.g., from Central and
Eastern Europe to Western Europe) but also
among migrants moving between similarly
developed world regions (e.g., from Western
Europe to Northern America & ANZ), or within
world regions (e.g., migrants within Latin America
and the Caribbean). Notable groups that have
not become happier, in some or all aspects of
happiness, by migrating include migrants within
South Asia, migrants within Northern America &
ANZ, Albanian migrants in Greece, migrants from
the Ivory Coast in Burkina Faso, and Russian-
born migrants in the Baltic states. These findings
imply that despite the happiness gains achieved
Table 3.5: The Impact of Migration on Left-Behind Household Members in Migration Flows Between Specific Nations
Migration flow Life evaluation Positive affect Negative affect N
Tajikistan Russia +0.22* [0.09 – 0.35]
NS NS 918
Kyrgyzstan Russia NS +0.61** [0.27 - 0.94]
NS 642
Armenia Russia +0.48** [0.27 - 0.68]
NS NS 360
Moldova Russia NS NS NS 323
Honduras United States NS NS NS 493
El Salvador United States NS NS NS 466
Guatemala United States +0.23* [0.00 - 0.26]
NS NS 361
Paraguay Argentina NS -0.34* [-0.67 - -0.02]
+0.49** [0.12 - 0.84]
406
Zimbabwe South Africa NS +0.65* [0.10 - 1.19]
NS 385
Bolivia Spain +0.34* [0.05 - 0.62]
+0.60** [0.23 - 0.97]
NS 324
Source: GWP 2007-2011.
Notes: 95% confidence intervals in parentheses * p<0.05, ** p<0.01, NS = not significant at the 5% level. Migration flows with fewer than 300 home stayer matches are not reported.

World Happiness Report 2018
by a majority of migrants, there is a considerable
group of international migrants who do not
become happier from migration.
Migration has a mixed impact on the happiness
of possible household members who stay behind
in the country of origin. Household members left
behind generally evaluate their lives more posi-
tively after the migration of a household mem-
ber. A plausible reason for this positive impact is
the receipt of remittances. However, they also
experience on average more—or at least no
reduced—negative affect. This suggests that the
disadvantages of migration, such as impaired
emotional support, are more related to affect,
while the benefits of migration, such as an
increased living standard, are more related to life
evaluations. Not surprisingly, the greatest bene-
fits are experienced by families in the developing
world who have a household member living in a
developed country.
Our findings suggest that it is likely that a
portion of migrants who did not gain happiness
from migration sacrificed happiness for the
benefit of their family back home. However,
for many other migrants who are not happier
after migration, this reason may not apply. For
instance, in some migration flows in which
non-positive outcomes are common, such as
migration flows between developed countries,
the entire household typically moves or the
migrant does not specifically move to improve
the lives of family members back home. One
question that thus requires attention is why
some migrants voluntarily move abroad if it
benefited neither themselves nor their families
back home. These non-positive happiness
outcomes cannot be justified by the argument
that one invests in one’s own long-term
happiness or the happiness of one’s children
because we do not find that happiness increases
with the migrant’s length of stay, while existing
literature shows that the second generation is
not happier than first-generation migrants.65
Migrants may trade off happiness for other goals,
such as economic security, freedom, safety,
and health. However, in most cases, positive
outcomes in these other domains go together
with greater happiness. For example, greater
happiness often accompanies greater health and
safety. A more worrisome but oft-mentioned
potential cause of negative outcomes is migrants’
excessive expectations about their future happiness
in the destination country, which originate from
inaccurate perceptions about what determines
their happiness and inaccurate or incomplete
information about the destination country.66
The opposite question also requires attention:
Considering the substantial happiness gains
experienced by most international migrants, why
don’t more than the current 250 million people
(3.3% of the world population) live in a country
other than where they were born? It seems likely
that more people could benefit from migration,
given the large happiness differences between
countries and the benefits for the current
international migrant population. Several
reasons may apply. First, many people are
restricted from migration by personal
constraints, such as financial, health, or family
constraints. Second, many people cannot move
to their preferred destination countries because
of those countries’ restrictive admission
policies.67 Third, many people are locally
oriented and moving abroad is simply not a
salient pathway in people’s long-term orientation
toward improving their lives. Finally, according
to prospect theory, the human tendency for
risk- and loss aversion may cause people to stay
in their home countries given that many people
face great uncertainty about the outcomes of
migration as they have little knowledge about
life abroad.68
In sum, international migration is, for many
people, a powerful instrument to improve their
lives given that the majority of migrants and
families back home benefit considerably from
migration. Nevertheless, not all migrants and
families left behind gain happiness from
migration, and the happiness of migrants does
not increase over time as they acclimatize to
their new country. Therefore, there is still much
to be done, and much to be learned, to ensure
lasting benefits for migrants and their families.

62
63
Endnotes
1 See, e.g., IOM (2015) on migrant exploitation, Portes and Zhou (1993) on unsuccessful socio-economic assimilation, and Dreby (2010) on homesickness.
2 Esipova et al. (2017).
3 United Nations (2015).
4 Diener et al. (1999).
5 UNHCR (2017).
6 Ottonelli and Torresi (2013).
7 Benjamin et al. (2014).
8 For an overview of basic human needs, see Maslow’s hierarchy of needs (1943).
9 Nikolova and Graham (2015), Zuccotti et al. (2017).
10 Morosanu (2013).
11 Berry (2006).
12 Frey and Stutzer (2014).
13 Mahler (1995), Sayad (2004), Mai (2005).
14 Schkade and Kahneman (1998), Gilbert (2006).
15 Frey and Stutzer (2014).
16 See particularly the “Easterlin paradox” (Easterlin 1974).
17 Bartram (2013a), Olgiati et al. (2013), Hendriks and Bartram (2016).
18 For exceptions, see Mähönen et al. (2013), Nikolova and Graham (2015), and Stillman et al. (2015).
19 See, e.g., IOM (2013).
20 Boneva and Frieze (2001), Jaeger et al. (2010), McKenzie et al. (2010).
21 Graham and Markowitz (2011), Cai et al. (2014).
22 See Hendriks (2015) for a review and Nikolova and Graham (2015) and IOM (2013) for studies using GWP data.
23 Stillman et al. (2015).
24 Bartram (2013a).
25 Knight and Gunatilaka (2010).
26 Hendriks et al. (2018).
27 Ratha et al. (2016).
28 Stark and Bloom (1985).
29 See Antman (2013) for a review of how migration affects various well-being outcomes of children, spouses, and parents who remain in the country of origin.
30 Dreby (2010), Abrego (2014).
31 Joarder et al. (2017).
32 Borraz et al. (2010).
33 Jones (2014; 2015).
34 Cárdenas et al. (2009).
35 Gibson et al. (2011), Böhme et al. (2015), Nobles et al. (2015).
36 See Stillman et al. (2015) for a rare study examining migrants’ affective happiness outcomes.
37 First-generation immigrants are those who are not born in their country of residence. Because of data limitations,
immigrants’ native-born children (the second generation) and later generations are beyond the scope of this chapter. Our migrant sample differs from that of Chapter 2 of this World Happiness Report because an important variable for estimating the consequences of migration—country of birth—is not available before 2009. Migrants originating from countries that are not covered by the GWP— predominantly sparsely populated countries and island states—are excluded from analysis because they could not be matched to stayers. Immigrants in Gulf Cooperation Council (GCC) countries are excluded because these countries lack sufficiently representative immigrant samples.
38 Our empirical strategy builds on the work of IOM (2013) and Nikolova and Graham (2015) and is broadly in line with the empirical strategy used by Nikolova and Graham to explore the happiness consequences of migration for migrants from transition countries. For a more general discussion of this methodology, see Blundell and Costa Dias (2000).
39 Van Dalen and Henkens (2013), Creighton (2013), Docquier et al. (2014).
40 Cantril (1965).
41 To be consistent with the Cantril-ladder-of-life measure, both affect indexes were re-scaled to range from 0 to 10.
42 Kahneman and Deaton (2010).
43 The percentage of the happiness gain is calculated by first solving equation 1 (using the sample means of groups 2-4) to find the sample mean of group 1 for which the happiness gain would be zero and subsequently calculating the absolute happiness gain as a percentage of that sample mean.
44 Our results are very similar when we would only compare migrants to potential migrants (groups 1 and 2), i.e., when we would exclude the counterfactual (groups 3 and 4). Specifically, we find a life evaluation gain of 0.49 points, a positive affect gain of 0.37 points, and a decrease in negative affect of 0.29 for the total immigrant sample.
45 In the main analysis, the reported happiness gains for newcomers and long-timers are based on the same weighting criteria (the migrant stock by destination country) to ensure that our assessment of the short- and long-term impacts of migration is not driven by a different distribution of newcomers and long-timers over destination countries. We additionally calculated the happiness gains for “newcomers” using an alternative weighting variable that is more representative for countries’ migration inflows in recent years. This self-created weighting variable is based on each country’s migrant inflow in the period 2005-2010 as estimated by Abel and Sander (2014). When applying this alternative weighting variable, newcomers report 0.41 higher life evaluations after migration (p<.01), Newcomers also report 0.22 more positive affect and 0.08 less negative affect but these gains are not statistically significant.
46 Given our cross-sectional data, possible cohort effects may affect the relative happiness gains of newcomers versus long-timers. However, Hendriks et al. (2018) did not find evidence for cohort effects among immigrants in Western Europe, and Stillman et al. (2015) found no improvement in happiness in the first years after migration using panel data. Hence, it is unlikely that cohort effects drive migrants’ non-improving happiness with their length of stay.

47 See e.g., Safi (2010).
48 The following question was used to identify potential migrants: “Ideally, if you had the opportunity, would you like to move permanently to another country, or would you prefer to continue living in this country?”
49 While education is not independent of migration, we included it to match migrants only to stayers with similar ability, intelligence, and skills.
50 See Table A4 for the regional classification of countries.
51 Underestimation of migration flows to non-developed regions (e.g., sub-Saharan Africa) is likely, as considerable migration flows may go unreported because of the more limited and less reliable collection of data in those regions.
52 Helliwell and Wang (2012).
53 The life satisfaction question is formulated as follows: “How satisfied are you with your life, all things considered?”, with a numerical response scale ranging from 0 (completely dissatisfied) to 10 (completely satisfied).
54 We found no evidence of a non-linear relationship between length of stay and life satisfaction, i.e., the quadratic term for years since migration did not enter significantly into our models and is therefore excluded from our models.
55 Sample descriptives are reported in Table A9. While immigrants in GCC countries were excluded in previous analyses, the analysis samples in this section include families left behind by immigrants in GCC countries. The analyses in this section are based on unweighted data because there are no global data available on the number of left-behind migrant households by origin country or migration flow.
56 Kahneman and Deaton (2010).
57 Nobles et al. (2015), Abrego (2014).
58 For example, the literature on migrants’ income gains from migration emphasizes that cross-sectional studies have limited leverage in estimating the benefits of migration because self-selection biases cannot be fully eliminated (e.g., Borjas 1987, McKenzie et al. 2010).
59 De Haas et al. (2015), Esipova and Pugliese (2012).
60 Bartram (2013b), Nikolova and Graham (2015).
61 UN DESA (2015).
62 Angelini et al. (2015).
63 Undocumented migrants and immigrants in refugee camps often face exploitation, discrimination, limited freedom and safety, and other negative circumstances. They may nevertheless have obtained considerable happiness gains because they move away from possibly even more deprived conditions in their home countries; many of these migrants were forced to move because they could not meet their basic subsistence needs back home.
64 Our results differ from Dolan and Kavetsos’ (2016) finding that people report higher happiness over the phone than via CAPI. This may be because their study uses different happiness measures, a different sample (a UK sample), or a different interview procedure.
65 Safi (2010).
66 Schkade and Kahneman (1998), Knight and Gunatilaka (2010), Bartram (2013a), Olgiati et al. (2013).
67 Recent studies in Europe, however, show that if anything, immigrant influxes tend to slightly improve the happiness of the host countries’ native populations, at least in Europe (Betz and Simpson 2013; Akay et al. 2014).
68 Morrison and Clark (2016).
World Happiness Report 2018

64
65
References
Abel, G. J., & Sander, N. (2014). Quantifying global international migration flows. Science, 343(6178), 1520-1522.
Abrego, L. (2014). Sacrificing families: Navigating laws, labor, and love across borders. Stanford University Press.
Akay, A., Constant, A., & Giulietti, C. (2014). The impact of immigration on the well-being of natives. Journal of Economic Behavior & Organization, 103, 72-92.
Angelini, V., Casi, L., & Corazzini, L. (2015). Life satisfaction of immigrants: Does cultural assimilation matter?. Journal of Population Economics, 28(3), 817-844.
Antman, F. M. (2013), The Impact of Migration on Family Left Behind, in A. F. Constant and K. F. Zimmermann (eds.), International Handbook on the Economics of Migration, Edward Elgar, Northampton, MA, 293–308.
Bartram, D. (2013a). Happiness and ‘economic migration’: A comparison of eastern European migrants and stayers. Migration Studies, 1(2), 156-175.
Bartram, D. (2013b). Migration, return, and happiness in Romania. European Societies, 15(3), 408-422.
Benjamin, D.J., Heffetz, O., Kimball, M.S., & Rees-Jones, A. (2014). Can marginal rates of substitution be inferred from happiness data? Evidence from residency choices. The American Economic Review, 104(11), 3498-3528.
Berry, J.W. (2006). Acculturative stress. In P.T.P. Wong & L.C.J. Wong, Handbook of multicultural perspectives on stress and coping (pp. 287–298). Dallas, TX: Spring.
Betz, W. & Simpson, N.B. (2013). The effects of international migration on the well-being of native populations in Europe. IZA Journal of Migration, 2(12), 1-21.
Blundell, R., & Costa Dias, M. (2000). Evaluation methods for non-experimental data. Fiscal studies, 21(4), 427-468.
Böhme, M. H., Persian, R., & Stöhr, T. (2015). Alone but better off? Adult child migration and health of elderly parents in Moldova. Journal of Health Economics, 39, 211-227.
Boneva, B.S. & Frieze, I.H. (2001). Toward a concept of a migrant personality. Journal of Social Issues, 57(3), 477-491.
Borjas G. J. (1987). Self selection and the earnings of immigrants. American Economic Review 77(4): 531–553.
Borraz, F., Pozo, S. & Rossi, M. (2010). And what about the family back home? International migration and happiness in Cuenca, Ecuador. Journal of Business Strategies, 27(1), 7-27.
Brücker, H., Kroh, M., Bartsch, S., Goebel, J., Kühne, S., Liebau, E., ... & Schupp, J. (2014). The new IAB-SOEP Migration Sample: an introduction into the methodology and the contents (No. 216). SOEP Survey Papers.
Cai, R., Esipova, N., Oppenheimer, M., & Feng, S. (2014). International migration desires related to subjective well-being. IZA Journal of Migration, 3(1), 1-20.
Cantril, H. (1965). The pattern of human concerns. New Brunswick, NJ: Rutgers University Press.
Cárdenas, M., Di Maro, V., & Sorkin, I. (2009). Migration and life satisfaction: evidence from Latin America. Journal of Business Strategies, 26(1), 9-33.
Creighton, M. J. (2013). The role of aspirations in domestic and international migration. The Social Science Journal, 50(1), 79-88.
De Haas, H., Fokkema, T., & Fihri, M. F. (2015). Return migration as failure or success?. Journal of International Migration and Integration, 16(2), 415-429.
Diener, E., Suh, E.M., Lucas, R.E., & Smith, H.L. (1999). Subjective well-being: Three decades of progress. Psychological Bulletin, 125(2), 276–302.
Docquier, F., Peri, G., & Ruyssen, I. (2014). The cross-country determinants of potential and actual migration. International Migration Review, 48(s1): S37–S99.
Dolan, P., & Kavetsos, G. (2016). Happy talk: Mode of adminis-tration effects on subjective well-being. Journal of Happiness Studies, 17(3), 1273-1291.
Dreby, J. (2010) Divided by borders: Mexican migrants and their children, Berkeley: University of California Press.
Easterlin, R.A. (1974). Does economic growth improve the human lot? Some empirical evidence, in Nations and households in economic growth: Essays in honor of Moses Abramowitz. Paul A. David and Melvin W. Reder, eds. NY: Academic Press, pp. 89-125.
Esipova, N., Ray, J., & Pugliese, A. (2017). Number of Potential Migrants Worldwide Tops 700 Million. Retrieved from http://news.gallup.com/poll/211883/number-potential- migrants-worldwide-tops-700-million.aspx
Esipova, N. & Pugliese, A. (2012). Labor Migration Doesn’t Always Pay Off for FSU Migrants. Retrieved from http://news.gallup.com/poll/159572/labor-migration-doesn-always-pay- off-fsu-migrants.aspx
Frey, B.S. & Stutzer, A. (2014). Economic consequences of mispredicting utility. Journal of Happiness Studies, 15(4), 937-956.
Gibson, J., McKenzie, D., & Stillman, S. (2011). The impacts of international migration on remaining household members: omnibus results from a migration lottery program. Review of Economics and Statistics, 93(4), 1297-1318.
Gilbert, D.T. (2006) Stumbling on happiness, New York, USA: Knopf.
Graham, C. & Markowitz, J. (2011). Aspirations and happiness of potential Latin American immigrants. Journal of Social Research & Policy, 2(2), 9-25.
Helliwell, J. F., & Wang, S. (2012). The state of world happiness. In J. Helliwell, R. Layard, & J. Sachs (Eds.), World happiness report (pp. 10–57). New York: Earth Institute at Columbia University.
Hendriks, M. (2015). The happiness of international migrants: A review of research findings. Migration Studies. 3(3), 343-369.
Hendriks, M. & Bartram, D. (2016). Macro-conditions and immigrants’ happiness: Is moving to a wealthy country all that matters?. Social Science Research, 56, 90-107.
Hendriks, M., Burger, M., & De Vroome, T. (2018). Unsuccessful subjective well-being assimilation among immigrants: The role of shifting reference points and faltering perceptions of the host society. Working paper.
International Organization for Migration (IOM) (2013). World migration report 2013: Migrant well-being and development. Geneva: IOM.
International Organization for Migration (IOM) (2015). The other migrant crisis - Protecting migrant workers against exploitation in the Middle East and North Africa. Geneva: IOM.

Joarder, M. A. M., Harris, M., & Dockery, A. M. (2017). Remittances and happiness of migrants and their home households: Evidence using matched samples. The Journal of Development Studies, 53(3), 422-443.
Jones, R.C. (2014). Migration and family happiness in Bolivia: Does social disintegration negate economic well-being?. International Migration, 52(3), 177-193.
Jones, R. (2015). Migration pessimism and the subjective well-being of migrant households in Mexico. Bulletin of Latin American Research, 34(3), 305-323.
Kahneman, D., & Deaton, A. (2010). High income improves evaluation of life but not emotional well-being. Proceedings of the National Academy of Sciences, 107(38), 16489-16493.
Knight, J. & Gunatilaka, R. (2010). Great expectations? The subjective well-being of rural urban migrants in China. World Development, 38, 113-124.
Mai, N. (2004). Looking for a more modern life: the role of Italian television in the Albanian migration to Italy. Westminster Papers in Communication and Culture, 1(1), 3-22.
Mahler, S.J. (1995). American dreaming: Immigrant life on the margins. Princeton, NJ: Princeton University Press.
Mähönen, T.A., Leinonen, E., & Jasinskaja-Lahti, I. (2013). Met expectations and the wellbeing of diaspora immigrants: A longitudinal study. International Journal of Psychology, 48(3), 324-333.
Maslow, A.H. (1943). A theory of human motivation. Psychological Review, 50(4), 370-396.
McKenzie, D., Stillman, S., & Gibson, J. (2010). How important is selection? Experimental vs. non-experimental measures of the income gains from migration. Journal of the European Economic Association, 8(4), 913-945.
Morrison, P. S., & Clark, W. A. (2016). Loss aversion and duration of residence. Demographic Research, 35, 1079.
Morosanu, L. (2013). Between fragmented ties and ‘soul friendships’: The cross-border social connections of young Romanians in London. Journal of Ethnic and Migration Studies, 39(3), 353-372.
Nikolova, M. & Graham, C. (2015). In transit: The well-being of migrants from transition and post-transition countries. Journal of Economic Behavior & Organization, 112, 164-186.
Nobles, J., Rubalcava, L., & Teruel, G. (2015). After spouses depart: Emotional wellbeing among nonmigrant Mexican mothers. Social Science & Medicine, 132, 236-244.
Olgiati, A., Calvo, R. & Berkman, L. (2013). Are migrants going up a blind alley? Economic migration and life satisfaction around the world: Cross-national evidence from Europe, North America and Australia. Social Indicators Research, 114(2), 383-404.
Ottonelli, V. & Torresi, T. (2013). When is migration voluntary? International Migration Review, 47(4), 783-813.
Portes, A. & Zhou, M. (1993). The new second generation: Segmented assimilation and its variants. The annals of the American academy of political and social science, 530(1), 74-96.
Ratha, D., Eigen-Zucchi, C., & Plaza, S. (2016). Migration and remittances Factbook 2016. World Bank Publications.
Safi, M. (2010). Immigrants’ life satisfaction in Europe: Between assimilation and discrimination. European Sociological Review, 26(2), 159-176.
Sayad, A. (2004). The suffering of the immigrant. Cambridge: Polity Press.
Schkade, D.A. & Kahneman, D. (1998). Does living in California make people happy? A focusing illusion in judgments of life satisfaction. Psychological Science, 9(5), 340-346.
Stark, O. & Bloom, D.E. (1985). The new economics of labor migration. American Economic Review, 173-178.
Stillman, S. Gibson, J., McKenzie, J., & Rohorua, J., (2015). Miserable migrants? Natural experiment evidence on international migration and objective and subjective well-being. World Development, 65, 79-93.
United Nations, Department of Economic and Social Affairs (UN DESA) (2015). Trends in International Migrant Stock: Migrants by Destination and Origin (United Nations database, POP/DB/MIG/Stock/Rev.2015).
United Nations High Commissioner for Refugees (UNHCR) (2017). Global trends: Forced displacement in 2016. Geneva: UNHCR.
Van Dalen, H. P., & Henkens, K. (2013). Explaining emigration intentions and behaviour in the Netherlands, 2005–10. Population Studies, 67(2), 225-241.
Zuccotti, C.V., Ganzeboom, H.B., & Guveli, A. (2017). Has migration been beneficial for migrants and their children? International Migration Review, 51(1), 97-126.
World Happiness Report 2018