do female executives make a difference? the impact of female leadership …€¦ · ·...
TRANSCRIPT

Do Female Executives Make a Difference?
The Impact of Female Leadership on Firm Performance and
Gender Gaps in Wages and Promotions.∗
Luca Flabbi
(IDB, Georgetown University and IZA)
Mario Macis
(Johns Hopkins University and IZA)
Fabiano Schivardi
(University of Cagliari, EIEF and CEPR)
August 7, 2012PRELIMINARY AND INCOMPLETE DRAFT
Abstract
We study whether female executives make a difference by proposing three contribu-
tions. First, we examine the relationship between gender leadership at the firm (CEOs
and top executives) and firm performance. Differently from the previous literature, we
focus on less volatile, more long-term measure of actual firm productivity: TFP, value
added per worker and sales per worker. Second, we investigate the mechanisms behind
this relationship, focusing on the impact of firm leadership on wages and promotion
policies. Finally, we propose a theoretical framework consistent with our results and
able to evaluate the cost of the heavy underrepresentation of women at top positions
within firms. In performing our empirical work, we use a unique matched employer-
employee data set from Italy where we observe the entire labor force at each firm over
17 years. We find that female executives make a difference: The interaction between
female leadership and female workers at the firm has a positive significant impact on
firm performance. We suggest that an important mechanism behind this interaction
is the wage policy at the firm: female leadership implies wage increases for women at
the top of the wage distribution and wage decreases for women at the bottom. We
conclude by interpreting this evidence as being consistent with a model of statistical
discrimination where female executives correct discrimination generated by male exec-
utives. If our interpretation is correct, there are productivity costs associated with the
underrepresentation of women at the top of the firm.
JEL Codes: M5, M12, J7, J16.
∗We thank seminar participants at the 2010 NBER Labor/Personnel Summer Institute, the 1st Fon-
dazione Debenedetti Fellows Workshop, the University of Maryland Robert H. Smith School of Business,
the University of Michigan Labor Lunch, the 2012 IZA Workshop on the Economics of Leadership for very
useful comments and suggestions. All errors are our own.
1

1 Introduction
A growing literature is showing that executives make a difference at the firm.1 From their
management style to their attitude towards risk, executives’ characteristics seems to be,
together with management practices,2 one of the main drivers of firms’ success and produc-
tivity. In this paper, we ask whether one specific individual characteristic - gender - makes
a difference.
The labour literature has provided abundant evidence of systematic gender differentials
in the labor market.3 More recently, the economics of leadership literature has singled out
an astounding empirical regularity: women are almost ten times less represented than men
in top positions at the firm.4 For example, recent data on the US show that even though
females are a little more than 50% of white collar workers, they represent only 4.6% of the
executives. Our own data on Italy show that a little more than 20% of white collars workers
in the manufacturing sector are women compared with only 2.5% of the executives.5 Both
sets of facts suggest that looking at gender as a relevant executive characteristics is not only
interesting but may also have important productivity and welfare implications.
We provide three contributions to this extremely thin literature. First, we study the
relationship between gender leadership at the firm (CEOs and top executives) and firm
performance. Differently from the previous literature, we focus on less volatile, more long-
term measures of actual firm productivity: sales per worker, value added per worker and
TFP. Second, we investigate the mechanisms behind this relationship, focusing on the im-
1A growing literature is following the influntial Bertrand and Schoar (2003). Among recent contribu-
tions, see Kaplan, Klebanov, Sorensen (2012); Bennedsen, Perez-Gonzales, Wolfenzon (2012); Lazear, Shaw,
Stanton (2012). For work on overconfidence, see Malmendier and Tate (2005). For theoretical contributions,
see for example Gabaix and Landier (2008) and Tervio (2008) For contributions focusin on both executives
and firms characteristics, see Bandiera, Guiso, Prat and Sadun (2012).2See Bloom and Van Reenen (2007) for one of the first constribution enphasizing this point. A recent
survey is Bloom and Van Reenen (2010).3For an overview of the gender gap in the US labor market in the last twenty years, see Blau and Kahn
(2004), Eckstein and Nagypal (2004) and Flabbi (2010).4The literature on the US is based on the Standard and Poor’s Execucomp dataset, which contains
information on top executives in the S&P 500, S&P MidCap 400, S&P SmallCap 600. See for example,
Bertrand and Hallock (2001); Wolfers (2006); Gayle, Golan, Miller (2011); Dezso and Ross (2012). The
literature on other countries is extremely scarce: see Cardoso and Winter-Ebner (2010) on Portugal, and
Ahern and Dittmar (2012) and Matsa and Miller (2012) on Norway (the latter papers however consider
the gender composition of corporate boards). A related literature is concerned with underrapresentation of
women at the top of the wage distribution, see for example Albrecht, Bjorklund and Vroman (2003). Both
phenomena are often referred to as a glass-ceiling preventing women from reaching top positions in the labor
market.5Sources for the US are: Current Population Survey data for the white collars workers and ExecuComp
data for the executives. Sources for Italy are our own raw data, a rapresentative sample of the Italian
manufacturing sector. See the data section of the paper for details.

pact of firm leadership on wages and promotion policies. Finally, we propose a theoretical
framework consistent with our results and able to evaluate the cost of the heavy underrep-
resentation of women at the top of the firm.
In performing our empirical work, we use a unique matched employer-employee dataset
from Italy which includes information on the entire labor force of a large sample of firms
representative of the manufacturing sector in the period 1982-1997. The data set is very
rich in firm-level characteristics (including balance sheet information). Crucially, we observe
the gender of all workers, including the top executives and the top earners. We use this
information to measure the extent of the presence of women in executive positions at the
firm and to infer the gender of the CEO. We consider three measures of female leadership
in the firm: 1) the share of female executives, 2) an indicator for whether females represent
more than 25% of executives, and 3) an indicator for whether the firm’s CEO (defined as
the highest-paid executive) is female.
Thanks to these data, we can study the effect of female leadership on firm performance
by conditioning on a wider range of controls than the ones included in the few previous
works in the literature. We can control not only for unobserved firm heterogeneity, but
also for labor force and executives’ observed and unobserved heterogeneity. Specifically,
we use the large panel sample of matched employer-employee data to estimate a two-way
fixed effects regression on individual wages (Abowd, Kramarz and Margolis, 1999), which
gives us estimates of the value of individuals’ (workers and executives) unobservable (to
the econometrician) skills, independent of observables and of the characteristics of the par-
ticular firms where they are employed at a given point in time. The data are particularly
appropriate for this exercise because they include a large representative sample of firms ob-
served over 17 years and all the workers hired by these firms or that have transited through
them. This particular feature maximizes the number of transitions available to identify
both firms’ and workers’ fixed effects. We then use the estimated individual fixed effects
as controls for the composition of the unobserved ability of the labor force at the firms,
and for the unobserved individual ability of the executives when estimating the impact of
the female leadership on firm performance. We find that a systematic relationship between
female leadership and firm performance does exist. The result is robust to three different
definitions of firm performance (sales per employee, value added per employee, and TFP),
two different samples (full sample and balanced panel), and to the different measures of
female leadership described above. The relationship crucially depends on the gender com-
position of the labor force at the firm: if a sufficiently high share of the labor force is female,
3

then female leadership is associated with higher firm performance; the opposite is true if
females represent only a small proportion of the firm’s workforce.
To analyze the mechanisms behind this relationship, we look at the effect of female
leadership on wages and promotions at the firm. If a large literature exists that studies
gender differentials in the labor market, and a fairly developed literature exists that studies
gender differentials using matched employer-employee data, the literature on the relation-
ship between the gender of the firm’s executives and gender differentials at the firm is
extremely scarce. Bell (2005) looks at the impact of female leadership in US firms but only
on executives wages. Cardoso and Winter-Ebner (2010) look at the impact on all workers
on a sample of Portuguese firms but without allowing for heterogeneous effects over the
distribution. Thanks to our data, we can look at the impact on the entire labor force at the
firms allowing for heterogenous effects over the wage distribution. Our quantile regression
results show that this heterogeneity is relevant: the impact of female leadership is positive
on women at the top of the wage distribution but negative on women at the bottom of
the wage distribution. Preliminary descriptive evidence on promotion to executives shows
a similar pattern: female leadership increases the probability of promotion for women only
if women are in the top quartile of the wage distribution.
We propose a theoretical framework able to jointly take into account all our empirical
results. We embed employer statistical discrimination in an assignment model with asym-
metric information, labor market frictions, turn-over and learning. We further assume that
employers are better at extracting information from workers of their same gender (Cornell
and Welch, 1996). Starting with initial conditions where a higher proportion of employers
are male, the equilibrium generates a misallocation of women to jobs, a gender gap in wages,
and a glass-ceiling effect. Female CEOs and executives optimally counteract pre-existing
statistical discrimination by improving the wage and promotion prospects of high-ability fe-
males. As a result, women’s wages increase at the top of the wage distribution but decrease
at the bottom when female leadership arises at the firm. The results on firm performance
are consistent with this model because female leadership can improve firm performance only
if there are enough mismatched women at the firm.
The remainder of the paper is structured as follows. The next section sketches the
theoretical framework. Section 3 describes the data and the estimation samples. Section
4 presents our analysis of the effect of female leadership on firm performance. Section 5
presents evidence on the relationship between female executives and wage and promotion
policies at the firm. Section 6 concludes.
4

2 Theoretical Framework [PRELIMINARY]
In this section we sketch the theoretical framework that guides our empirical analyses. Our
framework is based on an assignment model with asymmetric information, labor market fric-
tions, turn-over and learning [Jovanovic (1979); Flinn (1997); Freyer, Pager and Spenkuch
(2011)].
The intuition of the mechanics of the model is as follows. Productivity is match-specific
but it is observed by the employer only through a noisy signal. As a result, entry wages
and job assignments are determined from a score which is essentially an estimate of the
individual productivity based on the signal and the worker’s type (gender). Differently
from a standard statistical discrimination model [Phelps (1972); Aigner and Cain (1977)],
expectations are specific to the employer type, which is again the gender and which we
denote with . By "employer" we mean the decision-maker(s) at the firm: the firm’s CEOs
and executives. As a result:
= (| ) ∈ {} ∈ {} (1)
We further assume that both noise and productivity are normally distributed:
≡ + (2)
:
| ∼ h|
2|i; (3)
| ∼ h0 2|
i(4)
so that the best prediction given the signal is the arithmetic mean between the signal and
the expected productivity in the population weighted by the relative variances. Equation
(1) therefore becomes:
(| ) = (1− ) + | (5)
:
=2|
2| + 2
|
The relative variance regulates the precision of the signal in determining a score based
on actual individual productivity. The larger is the variance of the noise relatively to
the population productivity variance, the less informative is the signal and less related to
productivity are the wage and job assignment performed by the employer.
5

The crucial assumption we make in the model is that employers are better at extracting
information from workers of their same gender in the spirit of Cornell and Welch (1996).
Analytically:
2| 2|
2| 2|
If we start with initial conditions characterized by a gender imbalance in the number of
employers - the majority of employers are men - then the model would generate the following
implications (without needing to assume higher productivity for men than women):
1. Women will receive lower wages than men and they will be "mismatched" to jobs
more frequently than men because their signal is noisier for a larger proportion of
employers.
2. Female CEOs and executives improve performance at firms with a significant propor-
tions of female workers (i.e., where the initial misallocation is more severe) because
they are able to correct the previous "wrong" wages and job assignments of the female
workforce (put in place by the previous largely male CEOs).
3. Female CEOs and executives have limited scope in re-assigning male employees be-
cause they are already better assigned to job and wages than female employees.
4. Correction of previous "wrong" wages and job assignments means both wage increases
and promotions for high-productivity women and wage decreases and demotions for
low-productivity women because a noisier signal in a statistical discrimination model
means both discrimination against individuals with high productivity and discrimina-
tion in favor of individuals with low productivity. This implies that the male-female
wage differential will be reduced at the top of the wage distribution but not at the
bottom, and that the likelihood of promotion will increase for high-ability white collar
female employees but not for other female employees and males.
5. A richer model (with promotions) would also imply that women will be underrepre-
sented in top positions at the firm (glass ceiling): only females with a disproportion-
ately large will be promoted by male employers.
6. Initial conditions with an imbalance in the proportion of CEOs and executives by gen-
der are self-sustaining in equilibrium because the subsequent learning and promotion
6

processes are marred by the same wrong reading of the signal that characterized the
first wages and job assignments.
Formal Model: TO BE COMPLETED
3 Data and Descriptives
The data used in this paper come from two sources, INVIND-INPS and Company Accounts
Data Service (CADS). INVIND-INPS is a matched employer-employee data set which has
the following structure. The starting point is the Bank of Italy’s annual survey of man-
ufacturing firms (INVIND), an open panel of around 1,000 firms per year, representative
of manufacturing firms with at least 50 employees. The Italian Social Security Institute
(INPS) provided the complete work histories of all workers who were ever employed at an
INVIND firm in the period 1980-1997, including spells of employment in which they were
employed in firms not listed in the INVIND survey. The information on workers contained
in the INVIND-INPS data includes gender, age, tenure,6 occupational status (production,
non-production, manager), annual gross earnings (including irregular payments such as
overtime, shift work and bonuses), number of weeks worked, and a firm identifier. All
records with missing entries on either the firm or the worker identifier, those corresponding
to workers younger than 15 and older than 65, and those corresponding to workers with
less than four weeks worked in a given year have been deleted. For each individual-year, we
kept only the observation corresponding to the main job (identified in terms of number of
weeks worked). Overall, the INVIND-INPS data set includes information on about a million
workers per year, more than half of whom are employed in INVIND firms in any given year.
The remaining workers are employed in about 450,000 other firms of which we only know
the firm identifier.7 In Table 1 we report summary statistics on workers’ characteristics
for the entire sample. About 66% of observations pertain to production workers, 32% to
non-production employees, and 2.1% are executives. Even though females represent about
21% of the workforce, only 2.5% of executives are women. On average, workers are 37 years
old, with males being about 2.5 years older than females (37.1 vs. 34.5). Average gross
weekly earnings at 1995 constant prices are around 391 euros, with female earning about
28% less than males (310 euros vs. 411 euros).
6Our data on tenure is left-censored because we do not have information on workers prior to 1981.7This is the same database used by Iranzo, Schivardi and Tosetti (2008) and Macis and Schivardi (2012).
7
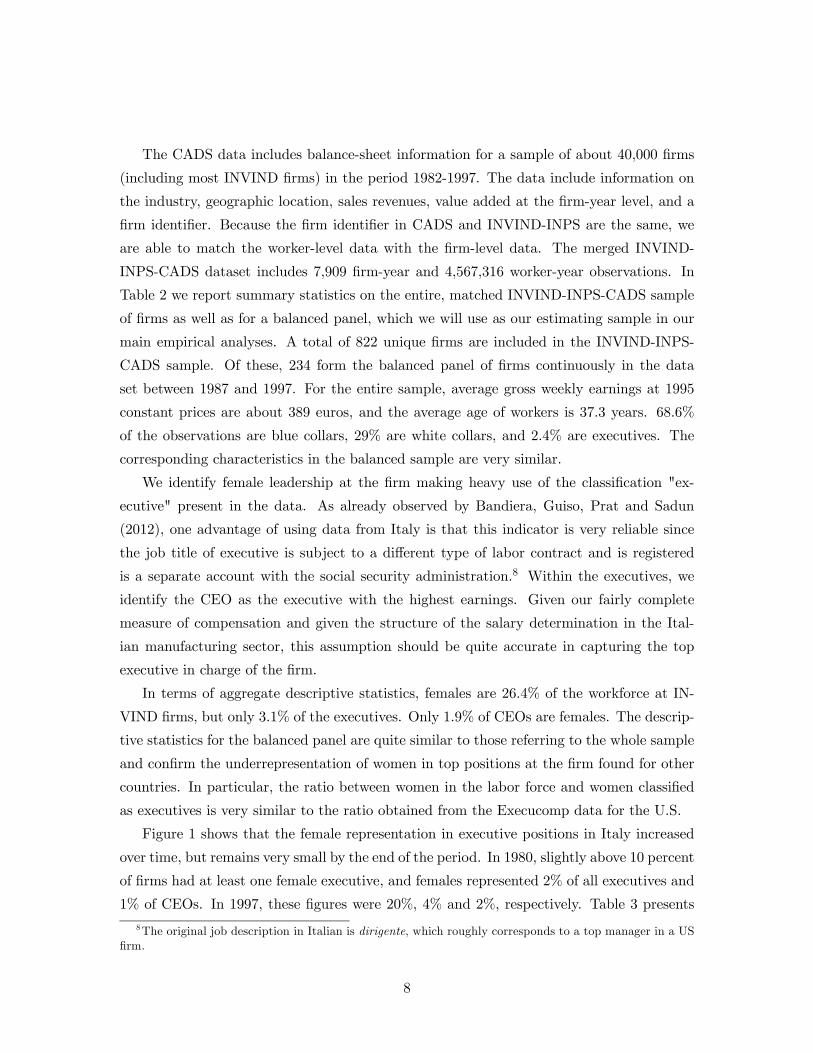
The CADS data includes balance-sheet information for a sample of about 40,000 firms
(including most INVIND firms) in the period 1982-1997. The data include information on
the industry, geographic location, sales revenues, value added at the firm-year level, and a
firm identifier. Because the firm identifier in CADS and INVIND-INPS are the same, we
are able to match the worker-level data with the firm-level data. The merged INVIND-
INPS-CADS dataset includes 7,909 firm-year and 4,567,316 worker-year observations. In
Table 2 we report summary statistics on the entire, matched INVIND-INPS-CADS sample
of firms as well as for a balanced panel, which we will use as our estimating sample in our
main empirical analyses. A total of 822 unique firms are included in the INVIND-INPS-
CADS sample. Of these, 234 form the balanced panel of firms continuously in the data
set between 1987 and 1997. For the entire sample, average gross weekly earnings at 1995
constant prices are about 389 euros, and the average age of workers is 37.3 years. 68.6%
of the observations are blue collars, 29% are white collars, and 2.4% are executives. The
corresponding characteristics in the balanced sample are very similar.
We identify female leadership at the firm making heavy use of the classification "ex-
ecutive" present in the data. As already observed by Bandiera, Guiso, Prat and Sadun
(2012), one advantage of using data from Italy is that this indicator is very reliable since
the job title of executive is subject to a different type of labor contract and is registered
is a separate account with the social security administration.8 Within the executives, we
identify the CEO as the executive with the highest earnings. Given our fairly complete
measure of compensation and given the structure of the salary determination in the Ital-
ian manufacturing sector, this assumption should be quite accurate in capturing the top
executive in charge of the firm.
In terms of aggregate descriptive statistics, females are 26.4% of the workforce at IN-
VIND firms, but only 3.1% of the executives. Only 1.9% of CEOs are females. The descrip-
tive statistics for the balanced panel are quite similar to those referring to the whole sample
and confirm the underrepresentation of women in top positions at the firm found for other
countries. In particular, the ratio between women in the labor force and women classified
as executives is very similar to the ratio obtained from the Execucomp data for the U.S.
Figure 1 shows that the female representation in executive positions in Italy increased
over time, but remains very small by the end of the period. In 1980, slightly above 10 percent
of firms had at least one female executive, and females represented 2% of all executives and
1% of CEOs. In 1997, these figures were 20%, 4% and 2%, respectively. Table 3 presents
8The original job description in Italian is dirigente, which roughly corresponds to a top manager in a US
firm.
8

the distribution of female executives across industries. Even though there is substantial
variation across industries in the presence of females in the executive ranks, no obvious
pattern emerges in terms of the relationship between female leadership and the presence of
females in the non-executive workforce in the various industries.
Table 4A reports descriptive statistics for firms with no female executives and firms
with at least one female executive. Firms with some female executives are larger, pay
higher wages and appear to be more productive based on sales per employee, value added per
employee, and TFP. The composition of the workforce differs in that firms with some female
executives employ a larger share of non-production workers (39 percent vs. 27 percent).
The raw average gender wage gap is larger in firms with some female executives (about 18
percent vs. 14 percent). In Table 4B we compare firms with a male CEO with those with
a female CEO. Firms with a female CEO are smaller, both in terms of employment and in
terms of revenues, pay lower wages, and employ a larger share of blue collars. Firms with
a female CEO also employ a slightly larger share of female workers (35 vs. 31 percent).
However, when one looks at measures of productivity (sales per employee, value added per
employee, and TFP), the differences shrink considerably. For instance, total revenues are
on average 6.47 times higher in firms with a male CEO than in firms with a female CEO,
but revenues for employee, value added per employee and TFP are 1.33, 1.29 and 1.06 times
higher, respectively.
4 Female Leadership and Firm Performance
As discussed in section 2 above, if female executives improve the allocation of female talents
within the firm by counteracting pre-existing statistical discrimination, this would have
efficiency consequences which could result in improved firm performance. The efficiency-
enhancing effects of female executives should be stronger the larger the presence of female
workers.
4.1 Econometric Model
We will be estimating the following econometric model:
= c01 + z
02 + x
03 + 4 +α05 + λ + + (6)
where is a measure of firm performance, is a vector of firm-level observable character-
istics, is a vector of unobservable firm effects; is a vector of observable firm executives’
characteristics, including indicators of female leadership (our main object of interest),
9

is a measure of executives’ unobservable ability, is a vector of workforce characteristics
aggregated at the firm-year, and is unobservable workforce ability (mean and standard
deviation of workers’ ability in each firm-year); are year dummies.
The main parameter of interest is the first element of the vector of coefficients 1, i.e.,
the coefficient on the indicators of female leadership. We will use three measures of female
leadership: 1) the share of female executives in a firm-year, 2) dummy variables for whether
females represent 0%, between 0 and 25%, or more than 25% of executives in a given
firm-year, and 3) a dummy variable equal to 1 if the firm’s CEO is female in a firm-year.
If relevant unobserved heterogeneity at the worker- and firm-level were left out of the
equation, three sources of bias would arise. First, the labor force composition at the firm
may be different: firms with important female leadership representation may have system-
atically higher or lower ability workers. Second, on top of labor force composition, other
unobservable firm effects may make one firm more productive than another and this unob-
served firm-level component may not be randomly assigned between male- and female-led
firms. Third, the selection on unobserved individual ability in the position of executive/CEO
may not be the same by gender so that women executives/CEOs may be of systematically
higher or lower ability than men executives/CEOs, and female leadership indicators might
be capturing such difference rather than a "pure" gender effect.
We perform the estimation in two steps. In the second step, we estimate (6). In the
first step, we jointly estimate the set of unobservables¡
¢. We do so by estimating
a two-way fixed effects regressions following the identification strategy outlined in Abowd,
Kramarz and Margolis (1999) (AKM henceforth) and the estimation strategy proposed by
Abowd, Creecy and Kramarz (2002).9 Specifically, ther regression is the following:
= s0 + + +
X=1
Ψ + (7)
where is the wage for individual at time , s0 is a vector of observable individual
characteristics, is the individual fixed effect, is a dummy equal 1 if worker is in firm
at time and Ψ are the firms’ fixed effects.
In the second step we plug the unobserved heterogeneity components thus estimated
into (6). We perform the analysis in two steps because the gender of the executives is
observed only for a subset of firms in our sample (those included in the INVIND survey)
while we want to exploit the full set of transitions in the complete INPS sample to obtain a
more robust identification of the unobserved heterogeneity at the worker and firm level. In
9We use the code developed by Ouazad (2008) for Stata.
10
fact, the identification of both the individual and firm Ψ effects in equation (7) requires
mobility of workers across firms in the sample. Prior to the actual estimation, we need
to identify the groups of "connected" workers and firms. A connected group includes all
the workers ever employed by any firm in the group, and all the firms that any worker
in the group has ever worked for. It is only within connected groups that worker- and
firm-effects can be identified (Abowd, Creecy and Kramarz 2002).10 Finally, we adopt the
usual assumption in this literature of random mobility of workers across firms conditional on
observables. Under this assumption, the estimated worker fixed effects can be interpreted as
the component of wages due to the worker’s pure ability, irrespective of the characteristics
of the particular firm that employes the worker in a given year, and net of the personal,
time-variant characteristics included in the controls. Likewise, the firm effect is interpreted
as the component of wages specific to the firm where the employee works, and it might
respond to particular compensation policies, such as effciency wages or rent-sharing.
4.2 Estimation Results
4.2.1 Estimating worker and firm effects
In Table 5, we present the first stage results, i.e., the results from estimation of Equation
(7). The dependent variable is the natural logarithm of weekly wages. The vector of
observable individual characteristics, s0, includes age, age squared, tenure, tenure squared,
a dummy variable for non-production workers and a dummy for executives (occupational
status changes over time for a considerable number of workers), as well as a full set of
interactions of these variables with a female dummy (to allow the returns to age, tenure
and occupation to vary by gender), and a set of year dummies. As we mentioned when
we discussed the identification issues, the first step in implementing the Abowd, Creecy
and Kramarz (2002) methodology is the identification of connected groups of workers and
firms. As it turns out, our sample consists of essentially one large connected group, with
99% of the sample forming a single connected group. Thus, in our estimation we focus on
the largest connected group and disregard the remaining observations. The identification of
firm effects and worker effects is guaranteed by the relatively high mobility of workers in the
sample: about 70% have more than one employer during the 1980-1997 period, and between
8 and 15 percent of workers change employer from one year to the next. The estimated
coefficients on the workers’ observable characteristics shown in Table 5 deliver unsurprising
10The Abowd, Creecy and Kramarz (2002) estimation algorithm sets the average of worker effects to zero,
and one of the firm-year effects to zero. Therefore, the absolute size of the estimated effects is meaningless.
11
results: wages appear to exhibit concave age and tenure profiles, and there is a substantial
wage premium associated with white collar jobs and, especially, with executive positions.
Figure 2 shows the distribution (Kernel density) of the estimated individual fixed effects
for executives (Figure 2A) and CEOs (Figure 2B), separately by gender. In both cases, the
distribution of the estimated fixed effects for females is shifted to the right compared to
that of males. This is consistent with female executives and CEOS being selected from the
top of the (overall) ability distribution.
4.2.2 Female Leadership and Firm Performance
Table 6 presents our first set of results on firm performance, i.e. coefficients from estimating
model (6). We present results for our three measures of female leadership at the firm and
three measures of firm performance. We focus our analysis on the balanced panel (firms
that were continuously observed from 1987 through 1997) to avoid the selection of firms
entering and exiting the sample. In Table 8 we present robustness checks where we use the
full INVIND-INPS-CADS sample.11
The results from Table 6 broadly confirm what found in the previous literature [Wolfers
(2006) and Albanesi and Olivetti (2008)]12: female leadership does not appear to have a
significant impact on firm performance.13 However, a change in the specification leads to
different results. Previous literature on the impact of female leadership has shown that
one important channel of this interaction are policies related to the work force at the
firm. The labor literature on gender differential has shown the importance of segregation,
i.e. concentration of minority workers in given occupations, industries or firms. Finally,
our own theoretical framework implies an important interaction between female leadership
and gender composition of the workforce at the firm. This all indicates that empirical
specifications should take these interactions into account.
The results are shown in Table 7. On all three measures of female leadership and three
measures of firm performance, we find the same result: the interaction between female
11Tables A1-1, A1-2 and A1-3 in the Web Appendix present the full results.12Recent works on the impact of gender quota for firms’ boards have found a negative impact on short-
term profits (Ahern and Dittmar (2012); Matsa and Miller (2012)). However, first, these papers consider the
composition of boards, not executive bodies; second, it is not clear whether the impact is due to imposing a
constraint on the composition of the board or to the fact that the added members of the boards are female.13The only exception is represented by the proportion of female executives, for which we estimate a
negative, large and significant coefficient when the dependent variable is value added for employee and
TFP (columns 6 and 9 of Table 6). However, the interpretation of the coefficient is the partial effect on firm
performance of a one-unit change in the explanatory variable, i.e. a jump from 0% to 100% in the proportion
of female exexutives. Evaluated at reasonable values of the share of female executives, the magnitude of this
effect is quite small.
12

leadership and the proportion of non-executive female workers at the firm is positive and
significant. In term of magnitude, the positive interaction term together with the negative
intercept generates a non-significant impact at the mean of the proportion of women at
the firm (about 20%). The result indicates that the non-significant impact we found in
Table 6 was therefore entirely due to composition effects. If the proportion of women at the
firm is about one standard deviation higher than the mean we obtain a positive significant
impact, if it is about one standard deviation lower than the mean we obtain a negative
significant impact. We want to emphasize that, contrary to previous literature, we obtain
this result on measures of firm performance that are less affected by the perceptions of
financial market operators on female leadership. In fact, our dependent variables are closer
to actual measures of firm productivity. In particular, TFP is a measure of the efficiency with
which the factors of production (labor, capital, materials) are combined to obtain a firm’s
output, and, according to Lucas (1978), TFP is directly determined by the ability of the
firm’s top executive(s). We computed TFP using the Olley and Pakes (1996) procedure.14
Our result of a positive effect of female leadership provided that a sufficient fraction of
the workforce is female holds on the larger unbalanced sample. In Table 8 we replicate all
of our main analyses using the full INVIND sample and we find that our results broadly
hold qualitatively and, with a few exceptions, also quantitatively.
5 Female Leadership and Wages at the Firm
5.1 Econometric Model
We will be estimating by Quantile Regression the following econometric model:
| = 0β +0δ
+ 0γ
+0χ +
+ (8)
where are the log weekly gross earnings of worker at firm in year of gender
are the same measures of female leadership we have used in the performance
regressions: female CEO (dummy); proportion of female executives 25% (dummy); and
the proportion of female executives in the firm. We control for firm heterogeneity through
two sets of variables. The vector , which includes the following variables: 2-digit
industry dummies, region dummies, employment dummies (100-250, 250-500, 500+), share
females in non-executive workforce, average age of workforce, share blue collars, firm fixed-
effect from the 2-way F.E. regression reported in Table 5. And the vector , which
14See Iranzo et al. (2008) for the details.
13

includes the following Executive/CEO characteristics averaged at firm-year level: age, ex-
perience, tenure, executive fixed-effect from the 2-way F.E. regression reported in Table
5. We control for worker heterogeneity through the vector 0 =, wich includes: age,
age squared, production worker dummy, average and SD of worker fixed-effect from the
2-way F.E. regression reported in Table 5. Finally, we control for time effects with the year
dummies .
5.2 Estimation Results
We run the quantile regressions separately on female workers and male workers. In Figures
3A-3C, we report the coefficients on the female leadership indicators for the 10th, 25th,
50th, 75th and 90th percentile regressions.15 We begin, in Figure 3A, with reporting the
coefficients on the share of female executives. Our results indicate that the share of female
executives at the firm is associated with lower wages for female workers at the bottom
decile of the conditional wage distribution, with zero or slightly positive effects at the 25th
and 50th percentiles, and with positive and effects at the 75th and especially at the 90th
percentile of the female wage distribution. As for males, the estimated coefficients are
negative at the bottom, and very small and not statistically significant at the top of the
male wage distribution. Thus, the male-female wage gap is reduced especially at the top of
the wage distribution. In Figure 3B we show the coefficients on the dummy variable equal
to 1 if the share of female executives is at least 25% , and we obtain a very similar pattern:
this measure of female leadership is associated with higher wages for females at the top
quantiles of the female wage distribution, and it does not have a significant effect on the
wages of men. Finally, in Figure 3C we look at the coefficient on the female CEO dummy.
Here we obtain that a female CEO substantially reduces wages for females at the bottom
and increases them at the top.
These results are consistent with female CEOs raising wages and therefore reducing
the gender wage gap for female workers at the top of the ability distribution, as predicted
by a model where female executives counteract pre-existing statistical discrimination. In
contrast, if female executives were simply favoring female workers, we would have observed
a more uniform increase of female wages across the whole wage distribution.
15Tables A2-1, A2-2 and A2-3 in the Web Appendix present the full results.
14

6 Female Leadership and Promotions at the Firm [PRELIM-
INARY]
The INVIND-INPS data include an indicator for workers’ occupation: production worker,
non-production worker and executives. This enables us to observe promotions of workers
to the executive rank.
In Table 9, we present a descriptive exploration of whether female executives have any
impact on this gap. We limit the sample to white collars, which is the group of workers from
which the vast majority of new executives comes from. The descriptive evidence presented
in the table indicates a positive correlation between female leadership at the firm and the
probability that a female white collar in year t is promoted to executive in year t+1 only
if the female worker is in the top 25% of the (firm-gender-year-specific) wage distribution.
This preliminary unconditional correlation points to a similar behavior to the one observed
on wage determination: female leadership favors only top women at the firm.
Of course, this descriptive evidence does not account for possible individual and firm-
level heterogeneity. In fact, it is possible that "female friendly" firms have both an important
representation of females in leadership positions and higher promotion rates for female em-
ployees for some common, unobserved reason. Also, it is possible that high-ability females,
who therefore have a higher probability to be promoted to executives, disproportionately
join firms with female CEOs. Both factors might generate a spurious positive association
between female leadership and promotion rates of female employees.
Econometric analysis: TO BE COMPLETED
7 Conclusion
We use a unique matched employer-employee dataset from Italy - which includes information
on the entire labor force of a large sample of firms - to study whether female leadership at
the firm makes a difference. Our empirical analysis suggests that it does: 1) The interaction
between female leadership and the proportion of women at the firm has a positive impact
on firm performance; 2) The impact of female leadership on women’s wages is heterogenous:
positive at the top and negative at the bottom of the wage distribution; 3) the unconditional
correlation between female leadership at the firm and the proportion of women promoted
to executive positions is also heterogenous: it is positive only for women in the top 25% of
the white collar wage distribution.
15

Our proposed theoretical framework can account for all of these results. We start with a
standard Statistical Discrimination model where workers’ productivity is observed through
a noisy signal and executives decides wages and job assignments based on the signal and the
worker’s type (gender). We assume, following Cornell and Welch (1996), that executives are
better at extracting information from workers of their same type (gender). If most of the
executives are male, then most of high productivity women are underpaid and misallocated
in relatively low productivity jobs. Low productivity women, instead, are overpaid but
also matched to the wrong jobs. When female leadership takes over a firm, this statistical
discrimination is corrected. As a result, wages of high productivity women increase and
wages of low productivity women decrease, as our second empirical result shows. At the
same time, women are reallocated to jobs better matching their productivity, generating
an increase in firm performance directly proportional to the fraction of women at the firm.
This implication matches our first empirical result. By the same mechanism, only high wage
/ high ability women will see their chance of promotion to executive increase, as our third
empirical evidence suggests.
We conclude that if our model correctly describes the mechanism behind our empirical
results, then the observed strong underrepresentation of women in top positions at the firm
may have high costs in terms of firm productivity and efficient allocation of resources.
16

References
[1] Abowd, K.; R. Creecy; and F. Kramarz, “Computing Person and Firm Effects using
Linked Longitudinal Employer-Employee Data”, Center for Economic Studies, U.S.
Census Bureau Technical Papers 2002-06, 2002.
[2] Abowd, K.; F. Kramarz; and D. Margolis, “High WageWorkers and High Wage Firms”,
Econometrica, 67(2): 251-333, 1999.
[3] Ahern, K. and A. Dittmar (2012), "The Changing of the boards: the impact on firm
valuation of mandated female board representation", Quarterly Journal of Economics,
127, 137—197.
[4] Aigner, Dennis J., Glen G. Cain (1977). “Statistical Theories of Discrimination in
Labor Markets,” Industrial and Labor Relations Review, 30, 175—187.
[5] Albanesi, S., and Olivetti, C., 2006: "Gender and Dynamic Agency: Theory and
Evidence on the Compensation of Female Top Executives," WP2006-061, Boston Uni-
versity - Department of Economics.
[6] Albrecht, J., A. Bjorklund and S. Vroman (2003), “Is There a Glass Ceiling in Swe-
den?”, Journal of Labor Economics, 21(1), 145-177.
[7] Bandiera, Oriana; Luigi Guiso; Andrea Prat and Raffaella Sadun (2012), "Matching
Firms, Managers, and Incentives", CEP Discussion Paper No 1144.
[8] Bennedsen, M.; F. Perez-Gonzales, D. Wolfenzon (2012), “Evaluating the Impact of
The Boss: Evidence from CEO Hospitalization Events”, mimeo.
[9] Bertrand, M. and K. Hallock (2001), “The Gender Gap in the Top Corporate Jobs”,
Industrial and Labor Relations Review, 55(1): 3-21.
[10] Bertrand, M. and A. Schoar (2003), "Managing with style: the Effect of Managers on
Firm Policies", Quarterly Journal of Economics, 117(4): 1169-1208.
[11] Blau, F.D. and L.M. Kahn (2004) "The US Gender Gap in the 1990s: Slowing Con-
vergence", NBER Working Paper 10853.
[12] Bloom N. and J. Van Reenen (2007), "Measuring and Explaining Management Prac-
tices across Firms", Quarterly Journal of Economics Vol. CXXII, Issue 4.
17

[13] Bloom N. and J. Van Reenen (2010), "Why Do Management Practices Differ across
Firms and Countries?", Journal of Economic Perspectives, 24(1): 203—224.
[14] Cardoso, A. and R. Winter-Ebmer (2010), "Female-Led Firms and Gender Wage Poli-
cies," Industrial & Labor Relations Review, Vol. 64, No. 1, article 7
[15] Chevalier, Judith, and Glenn Ellison, “Are Some Mutual Fund Managers Better than
Others? Cross-Sectional Patterns in Behavior and Performance,” Journal of Finance,
LIV (1999), 875—899.
[16] Dezso, C. L., and Ross, D. G., (2012) "Does Female Representation in Top Manage-
ment Improve Firm Performance? A Panel Data Investigation", Strategic Management
Journal, 33(9): 1072-1089.
[17] Eckstein, Z. and E. Nagypal (2004) "The Evolution of U.S. Earnings Inequality: 1961-
2002" Federal Reserve Bank of Minneapolis Quarterly Review, 28(2): 10-29.
[18] Flabbi, L. (2010), “Prejudice and Gender Differentials in the U.S. Labor Market in the
Last Twenty Years”, Journal of Econometrics, 156: 190-200.
[19] Flinn, C. (1997), "Equilibrium Wage and Dismissal Processes", Journal of Business &
Economic Statistics, Vol. 15, No. 2, pp. 221-236.
[20] Freyer, R.; D. Pager and J. Spenkuch (2011) "Racial Disparities in Job Finding and
Offered Wages", mimeo, Harvard University.
[21] Gayle, George-Levi; Limor Golan; and Robert A. Miller (2011), "Are There Glass
Ceilings for Female Executives?", Journal of Labor Economics, forthcoming.
[22] Gabaix, X. and A. Landier (2008), "Why has CEO pay increased so much?", Quarterly
Journal of Economics.
[23] Guiso, L., L. Pistaferri and F. Schivardi (2005), “Insurance Within the Firm”, Journal
of Political Economy, 113: 1054-1087.
[24] Jovanovic B. (1979), “Job Matching and the Theory of Turnover”, Journal of Political
Economy, 87(5), 973-90.
[25] Kaplan, S.; M. Klebanov, and M. Sorensen, "Which CEO Characteristics and Abilities
Matter?", Journal of Finance, 2012.
18

[26] Edward P. Lazear, E.; K. L. Shaw; and C. Stanton (2012), "The Value of Bosses",
mimeo, Stanford University.
[27] Lucas, Robert E., Jr. 1978. “On the Size Distribution of Business Firms.” Bell Journal
of Economics 2: 508—523.
[28] Macis, Mario and Fabiano Schivardi (2012), “Exports and Wages: Rent Sharing, Work-
force Composition or Returns to Skills?” IZA Discussion Papers, Institute for the Study
of Labor (IZA).
[29] Malmendier, Ulrike, and Geoffrey Tate (2005), "CEO overconfidence and corporate
investment", The Journal of Finance, 60, 2661—2700.
[30] Matsa, D. and A. Miller, (2012) "A Female Style in Corporate Leadership? Evidence
from Quotas", mimeo, University of Virginia.
[31] Olley, S. G. and A. Pakes. 1996. “The Dynamics of Productivity in the Telecommuni-
cations Equipment Industry.” Econometrica 64:1263—1297.
[32] Phelps, Edmund S. (1972). “The Statistical Theory of Racism and Sexism,” American
Economic Review, 62, 659—661.
[33] Sabarwal, S. and K. Terrell (2008), “Does Gender Matter for Firm Performance? Evi-
dence from Eastern Europe and Central Asia”, IZA Discussion Paper 3758.
[34] Terviö, M. (2008), "The Difference That CEOs Make: An Assignment Model Ap-
proach", American Economic Review, 98:3, 642—668.
[35] Wolfers, J. (2006), “Diagnosing Discrimination: Stock Returns and CEO Gender”,
Journal of the European Economic Association, 4: 531-541.
19

Table 1 - Descriptive statistics: Full INVIND-INPS sample
INVIND-INPS Data, 1980-1997
mean (st.dev.)
% Production workers 65.7%
% Non-prod. workers 32.2%
% Executives 2.1%
% Females 20.9%
% Female execs. 2.5%
Age 37.1 (10.1)
Age (Males) 34.5 (9.6)
Age (Females) 37.7 (10.1)
Wage (earnings/weeks) 390.6 (255.7)
Wage (Males) 411.8 (273.3)
Wage (Females) 310.3 (148.1)
Number of worker-year observations 18,938,837
N. of unique workers 1,726,836
N. of unique firms 453,000
20

Table 2 - Descriptive statistics: INVIND-INPS-CADS sample
Full sample Balanced panel
Mean (Std. Dev.) Mean Std. Dev.
Average employment 698.6 (3,269.3) 706.7 (1,309.1)
Average age of employees 37.3 (3.5) 37.6 (3.4)
Average wage (weekly) 389.1 (83.6) 406.9 (89.3)
Share non-prod. workers 29.0% 30.4%
Share executives 2.4% 2.6%
Share females 26.4% 25.0%
Female executives (share of execs) 3.1% 3.8%
Female CEO 1.9% 2.3%
Sales (thousand euros) 92,770 (370,428) 118,890 (231,614)
Sales per worker 146.2 (147.6) 167.72 (110.76)
Value added per worker 43.9 (21.4) 48.23 (20.20)
TFP 2.42 (0.51) 2.50 (0.48)
Firm-Year Obs. (firms) [years] 7,909 (822) [16] 2,340 (234) [10]
Notes: INVIND-INPS-CAD data. The balanced panel includes firms continuously observed in the
period 1987-1997.
21
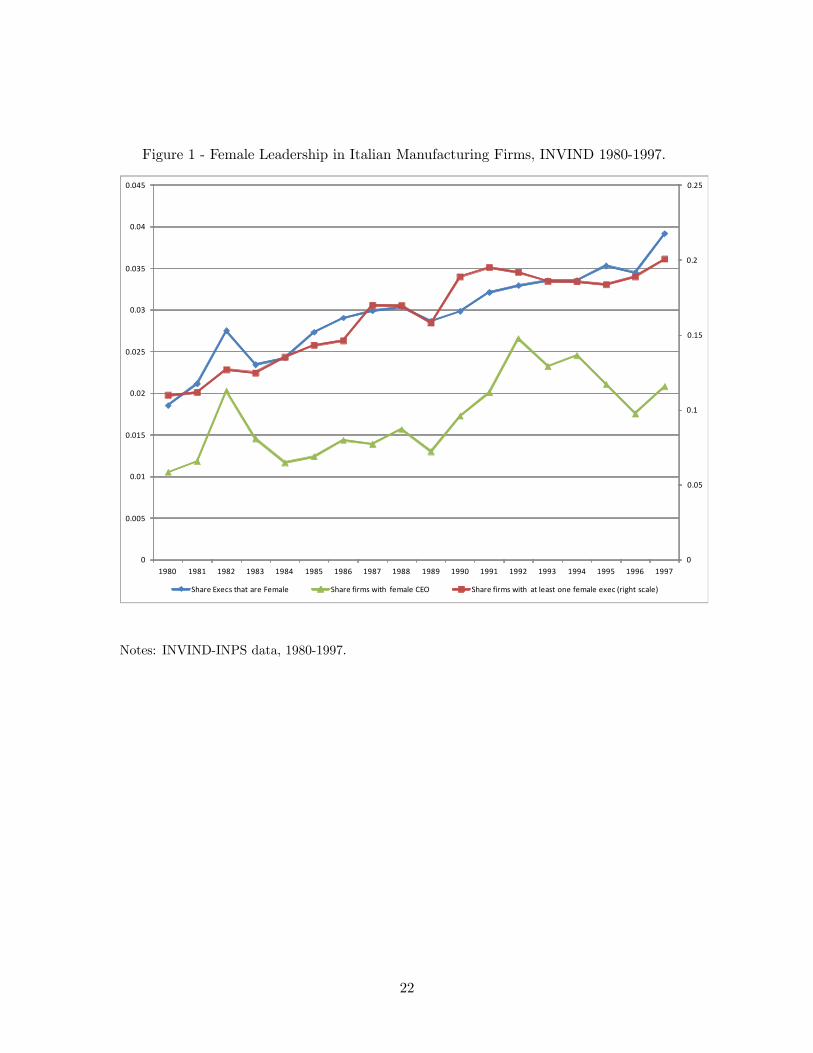
Figure 1 - Female Leadership in Italian Manufacturing Firms, INVIND 1980-1997.
0
0.05
0.1
0.15
0.2
0.25
0
0.005
0.01
0.015
0.02
0.025
0.03
0.035
0.04
0.045
1980 1981 1982 1983 1984 1985 1986 1987 1988 1989 1990 1991 1992 1993 1994 1995 1996 1997
Share Execs that are Female Share firms with female CEO Share firms with at least one female exec (right scale)
Notes: INVIND-INPS data, 1980-1997.
22

Table 3 - Females in the Workforce and Executive Positions, by Industry
INVIND firms, 1982-1997
Industry Non-exec Executives CEOs
% females % female % female
Wood and cork, except furniture. 26.1% 7.6% 7.0%
Wearing apparel; dressing and dyeing of fur 73.0% 6.5% 3.9%
Leather; luggage, handbags, saddlery, harness and footwear 46.8% 6.3% 0.5%
Chemicals, Coke, refined petroleum and nuclear fuel 24.4% 5.0% 2.3%
Motor vehicles, trailers and semi-trailers 17.7% 4.0% 2.9%
Other transport equipment 6.3% 3.2% 1.5%
Basic metals 7.7% 3.2% 4.2%
Textiles 45.8% 3.1% 3.2%
Fabricated metal products, except machinery and equipment 22.5% 1.6% 1.1%
Furniture; manufacturing. 21.1% 1.4% 0.0%
Pulp, paper and paper products 18.4% 1.4% 0.0%
Radio, television and communication equipment and apparatus 33.2% 0.6% 0.6%
Office machinery and computers 33.4% 0.5% 0.0%
Medical, precision and optical instruments, watches and clocks 37.6% 0.3% 0.0%
Notes: INVIND-INPS-CAD data, 1982-1997.
23

Table 4A - Descriptive statistics
Firms with No Female Executives and with some Female Executives
No Female Execs Some Female Execs
Mean (St.Dev.) Mean (St.Dev.)
CEO’s age 48.64 (7.0) 49.78 (7.1)
CEO’s tenure 4.15 (3.3) 3.64 (2.9)
CEO’s pay 147,506 (108,628) 234,372 (178,054)
Female Execs. age 44.70 (7.1)
Male Execs. age 46.49 (4.8) 46.63 (3.9)
Female Execs mean pay 99,033 (42,695)
Male Execs mean pay 103,855 (45,834) 118,076 (46,574)
Average employment 490.99 (1,971.4) 1563.64 (6,173.05)
Average age of employees 37.20 (3.5) 37.84 (3.15)
Average wage (weekly) 378.54 (75.5) 432.67 (99.7)
Average wage (Females) 324.38 (58.6) 352.21 (68.8)
Average wage (Males) 374.83 (67.8) 422.49 (89.2)
Share females 0.25 (0.21) 0.31 (0.21)
Share non-prod. workers 0.27 (0.16) 0.39 (0.21)
Share Executives 0.02 (0.02) 0.03 (0.02)
Female executives 0.16 (0.19)
Sales (thousand euros) 64,903 (298,668) 181,535 (301,686)
Sales per worker 140.27 (150.5) 171.13 (132.29)
Value added per worker 42.70 (20.8) 49.41 (23.16)
TFP 2.38 (0.49) 2.56 (0.56)
Firm-Year Obs. (firms) [years] 6,378 (746) [16] 1,531 (229) [16]
Notes: INVIND-INPS-CAD data, 1982-1997.
24

Table 4B - Descriptive statistics
Firms with Male and Female CEO
Male CEO Female CEO
Mean St.Dev. Mean St.Dev.
CEO’s age 48.91 (7.0) 45.92 (7.6)
CEO’s tenure 4.05 (3.3) 4.04 (2.7)
CEO’s pay 165,238 (130,560) 115,936 (54,030)
Female Execs. age 44.70 (7.11) 44.66 (6.55)
Male Execs. age 46.54 (4.54) 45.23 (7.81)
Female Execs mean pay 97,938 (42,134) 109,348 (46,564)
Male Execs mean pay 106,773 (46,443) 90,659 (31,719)
Average employment 707.42 (3,299.1) 234.92 (360.78)
Average age of employees 37.35 (3.5) 35.91 (3.3)
Average wage (weekly) 389.85 (83.7) 345.15 (61.7)
Average wage (Females) 330.32 (61.5) 300.53 (66.7)
Average wage (Males) 384.67 (75.1) 351.78 (54.9)
Share females 0.31 (0.20) 0.35 (0.28)
Share non-prod. workers 0.41 (0.21) 0.23 (0.14)
Share Executives 0.04 (0.02) 0.02 (0.01)
Female executives 0.12 (0.11) 0.54 (0.32)
Sales (thousand euros) 93,949 (373,760) 30,525 (48,827)
Sales per worker 146.45 (148.4) 131.87 (92.60)
Value added per worker 44.08 (21.5) 39.24 (14.13)
TFP 2.42 (0.51) 2.40 (0.43)
Firm-Year Obs. (firms) [years] 7,762 (815) [16] 147 (40) [16]
Notes: INVIND-INPS-CAD data, 1982-1997.
25

Table 5: Worker and Firm Unobserved Heterogeneity: Two-Way Fixed Effects
Regressions
Number of Observations 18,938,837
Number of Individual FEs 1,726,836
Number of Firm FEs 453,000
F 39.68
Prob F 0.000
Adj. R-squared 0.82
Coeffs. on worker characteristics:
Age 0.0619
Age squared -0.0002
Age * Female -0.0194
Age squared * Female 0.0002
Tenure 0.0051
Tenure squared -0.0004
Tenure * Female -0.0031
Tenure squared * Female 0.0001
White collar 0.0704
Executive 0.5734
White collar * Female 0.0007
Executives * Female 0.0328
Year effects (not reported)
Standard deviation of fixed effects:
SD of worker effects 0.510
SD of firm effects 0.153
Correlation -0.087
Notes: The sample includes all firms and all workers in the largest connected group, years 1980-
1997. The estimation was performed using the conjugate gradient algorithm introduced by Abowd,
Creecy and Kramarz (2002) and implemented by the Stata code “a2reg” written by Ouazad (2008).
See Section 2.2 for details.
26

Figure 2: Distributions of Executives’ Estimated Unobserved Heterogeneity
0.5
11
.5d
en
sit
y
-3 -2 -1 0 1 2 3unobserved heterogeneity
Females Males
Kernel density estimates. N = 186,381 males and 5,042 females, years 1982-1997
2A: Unobserved Heterogeneity of Executives, by Gender
0.5
11
.5d
ensi
ty
-3 -2 -1 0 1 2 3unobserved heterogeneity
Females Males
Kernel density est imates. N = 7,762 males and 147 females, years 1982-1997
2B: Unobserved Heterogeneity of CEOs, by Gender
Notes: Kernel density estimates. In 2A, the sample includes all executives of INVIND firms (N =
186,381 males and 5,042 females) and in 2B it includes CEOs (N = 7,762 males and 147 females),
years 1982-1997.
27

Table 6: Impact of Female Leadership on Firm Performance
- Balanced Panel Sample -
Female Firm Performance Measures:
Leadership Sales per Employee Value Added per Employee TFP
Measures: (Log) (Log)
Fem CEO 0.034 -0.078 -0.084*
(0.040) (0.049) (0.048)
FemEx25% 0.036 -0.063 -0.070
(0.045) (0.055) (0.054)
FemEx -0.078 -0.263*** -0.231***
(0.077) (0.094) (0.092)
R-sq 0.59 0.59 0.59 0.22 0.22 0.22 0.17 0.17 0.18
NT 2,340 2,340 2,340 2,340 2,340 2,340 2,340 2,340 2,340
N 234 234 234 234 234 234 234 234 234
T 10 10 10 10 10 10 10 10 10
Notes: The sample includes a balanced panel of INVIND firms, years 1987-1997. Each observa-
tion is a firm-year. The dependent variables are the log of sales per employee (columns 1-3), the log
of value added per employee (columns 4-6) and TFP (columns 7-9). FemEx is the share of female
executives at the firm-year, FemEx25% is a dummy equal to 1 if females represent more than
25% of executives at the firm-year (0% female executives is the omitted category; 0-25% dummy
is included in the regression but coefficient is not reported), and Fem CEO is a dummy variable
equal to 1 if the CEO is a female in a given firm-year. All regressions include firm fixed effects,
year effects, 2-digit industry dummies, industry-specific time trends, region dummies, time-varying
firm characteristics (employment dummies (100-250, 250-500, 500+), share non-production workers,
average employee age, average worker unobserved heterogenity, standard deviation of worker unob-
served heterogenity), executives/CEO observable characteristics (age, tenure), and executives/CEO
unobserved heterogeneity. Robust standard errors are reported in parentheses. *, **, and *** denote
statistical significance at the 10, 5, and 1 percent confidence levels, respectively.
28
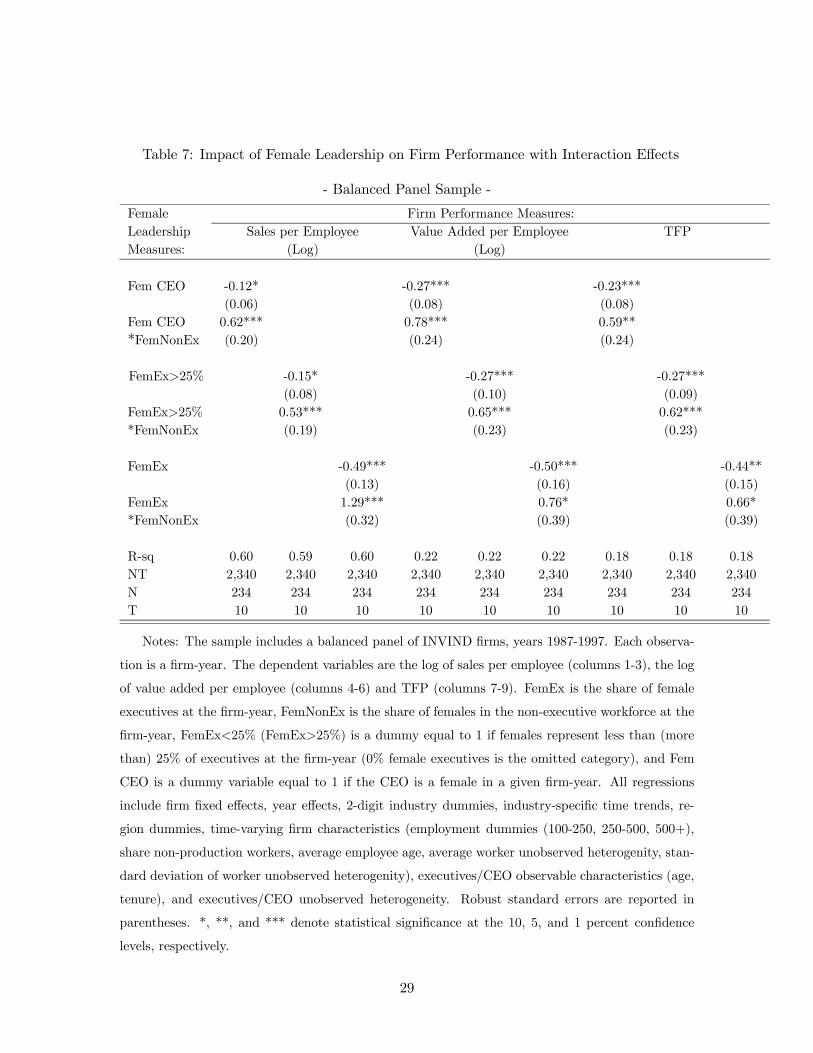
Table 7: Impact of Female Leadership on Firm Performance with Interaction Effects
- Balanced Panel Sample -
Female Firm Performance Measures:
Leadership Sales per Employee Value Added per Employee TFP
Measures: (Log) (Log)
Fem CEO -0.12* -0.27*** -0.23***
(0.06) (0.08) (0.08)
Fem CEO 0.62*** 0.78*** 0.59**
*FemNonEx (0.20) (0.24) (0.24)
FemEx25% -0.15* -0.27*** -0.27***
(0.08) (0.10) (0.09)
FemEx25% 0.53*** 0.65*** 0.62***
*FemNonEx (0.19) (0.23) (0.23)
FemEx -0.49*** -0.50*** -0.44**
(0.13) (0.16) (0.15)
FemEx 1.29*** 0.76* 0.66*
*FemNonEx (0.32) (0.39) (0.39)
R-sq 0.60 0.59 0.60 0.22 0.22 0.22 0.18 0.18 0.18
NT 2,340 2,340 2,340 2,340 2,340 2,340 2,340 2,340 2,340
N 234 234 234 234 234 234 234 234 234
T 10 10 10 10 10 10 10 10 10
Notes: The sample includes a balanced panel of INVIND firms, years 1987-1997. Each observa-
tion is a firm-year. The dependent variables are the log of sales per employee (columns 1-3), the log
of value added per employee (columns 4-6) and TFP (columns 7-9). FemEx is the share of female
executives at the firm-year, FemNonEx is the share of females in the non-executive workforce at the
firm-year, FemEx25% (FemEx25%) is a dummy equal to 1 if females represent less than (more
than) 25% of executives at the firm-year (0% female executives is the omitted category), and Fem
CEO is a dummy variable equal to 1 if the CEO is a female in a given firm-year. All regressions
include firm fixed effects, year effects, 2-digit industry dummies, industry-specific time trends, re-
gion dummies, time-varying firm characteristics (employment dummies (100-250, 250-500, 500+),
share non-production workers, average employee age, average worker unobserved heterogenity, stan-
dard deviation of worker unobserved heterogenity), executives/CEO observable characteristics (age,
tenure), and executives/CEO unobserved heterogeneity. Robust standard errors are reported in
parentheses. *, **, and *** denote statistical significance at the 10, 5, and 1 percent confidence
levels, respectively.
29

Table 8: Impact of Female Leadership on Firm Performance with Interaction Effects
- All INVIND Firms Sample -
Female Firm Performance Measures:
Leadership Sales per Employee Value Added per Employee TFP
Measures: (Log) (Log)
Fem CEO -0.02 -0.11** -0.09*
(0.04) (0.05) (0.05)
Fem CEO 0.15* 0.11 -0.03
*FemNonEx (0.09) (0.11) (0.11)
FemEx25% -0.04 -0.23*** -0.22***
(0.04) (0.05) (0.05)
FemEx25% 0.21** 0.31*** 0.25**
*FemNonEx (0.09) (0.11) (0.11)
FemEx -0.21*** -0.32*** -0.29***
(0.08) (0.09) (0.09)
FemEx 0.56*** 0.40** 0.26
*FemNonEx (0.15) (0.18) (0.17)
R-sq 0.75 0.75 0.75 0.30 0.30 0.30 0.24 0.24 0.24
NT 7,909 7,909 7,909 7,909 7,909 7,909 7,909 7,909 7,909
N 822 822 822 822 822 822 822 822 822
T 15 15 15 15 15 15 15 15 15
Notes: The sample includes all INVIND firms, years 1982-1997. Each observation is a firm-year.
The dependent variables are the log of sales per employee (columns 1-3), the log of value added per
employee (columns 4-6) and TFP (columns 7-9). FemEx is the share of female executives at the firm-
year, FemNonEx is the share of females in the non-executive workforce at the firm-year, FemEx25%
(FemEx25%) is a dummy equal to 1 if females represent less than (more than) 25% of executives
at the firm-year (0% female executives is the omitted category), and Fem CEO is a dummy variable
equal to 1 if the CEO is a female in a given firm-year. All regressions include firm fixed effects,
year effects, 2-digit industry dummies, industry-specific time trends, region dummies, time-varying
firm characteristics (employment dummies (100-250, 250-500, 500+), share non-production workers,
average employee age, average worker unobserved heterogenity, standard deviation of worker unob-
served heterogenity), executives/CEO observable characteristics (age, tenure), and executives/CEO
unobserved heterogeneity. Robust standard errors are reported in parentheses. *, **, and *** denote
statistical significance at the 10, 5, and 1 percent confidence levels, respectively.
30

Figure 3: Female Leadership and the Male-Female Wage Gap
Coefficients from quantile regressions, separately by gender
-.1
-.0
50
.05
.1.1
5
10th 25th 50th 75th 90thQuantiles
Females Males
Note: Coefficients f rom quantile regressions. Dashed lines represent 95% confidence interval.
3A: Female Leadership = Share Female Executives
-.0
50
.05
.1
10th 25th 50th 75th 90thQuantiles
Females Males
Note: Coefficients from quantile regressions. Dashed lines represent 95% confidence interval.
3B: Female Leadership = Share Female Executives > 25%
31

-.1
-.0
50
.05
10th 25th 50th 75th 90thQuantiles
Females Males
Note: Coefficients from quantile regressions. Dashed lines represent 95% confidence interval.
3C: Female Leadership = Female CEO
Notes: Coefficients on "Female Leadership" indicators from quantile ln wage regressions, sepeart-
ely by gender. The sample includes workers employed at INVIND firms, 1982-1997. Each observation
is a worker-year. Additional regressors include individual-level controls: age, age squared, produc-
tion worker dummy; firm-level controls: 2-digit industry dummies, region dummies, employment
dummies (100-250, 250-500, 500+), share females in non-executive workforce, average age of work-
ers, average worker ability, standard deviation of worker ability, average age of executives (age of
CEO in 2C), average experience of executives (experience of CEO in 2C), average tenure of execu-
tives (tenure of CEO), average ability of executives (ability of CEO in 2C); and year effects. Dashed
lines represent 95% confidence intervals.
32

Table 9: Female Leadership and Promotion to Executive
Promotion Probabilities of Female White Collar Employees (% Year to Year)
Female
Leadership
Male
Leadership
Wage QuartileFemale
CEO
Prop Fem
Exec. 25%
1st 0.000 0.000 0.017
2nd 0.000 0.000 0.005
3rd 0.000 0.000 0.009
4th 0.726 0.844 0.210
N worker-year obs. 1,787 3,475 166,992
Notes: The sample includes the longest uninterrupted job spell of all female white collar workers
employed at INVIND firms in the years 1982-1997. Wage quartiles are by firm-gender-year.
33
Do Female Executives Make a Difference? The Impact of
Female Leadership on Firm Performance and Gender Gaps
in Wages and Promotions.
Luca Flabbi (IDB, Georgetown University and IZA)
Mario Macis (Johns Hopkins University and IZA)
Fabiano Schivardi (University of Cagliari, EIEF and CEPR)
Web Appendix
This web appendix includes tables with the full results of the firm performance
regressions (presented in section 4.2.2 of the paper) and of the wage quantile regressions
(section 5.2).

A1-1: Impact of Female Leadership on Firm Performance.
Notes: The sample includes a balanced panel of INVIND firms, years 1987-1997. Each observation is a firm-year. FemEx is the share of female executives at the firm-year, FemNonEx is the share of females in the non-executive workforce at the firm-year, 0<FemEx<25% is a dummy equal to 1 if females represent more than zero but less that 25% of executives at the firm-year, and FemEx>25% is a dummy equal to 1 if females represent more than 25% of executives (0% female executives is the omitted category). Fem CEO is a dummy variable equal to 1 if the CEO is a female in a given firm-year. Firm size dummies are for less than 100, between 100 and 250, between 250 and 500, and more than 500 employees. Robust standard errors are reported in parentheses. *, **, and *** denote statistical significance at the 10, 5, and 1 percent confidence levels, respectively.
SampleDependent variable
Fem CEO 0.034 -0.078 -0.084*(0.040) (0.049) (0.048)
0 < FemEx < 25% -0.003 -0.059*** -0.035(0.019) (0.023) (0.022)
FemEx > 25% 0.036 -0.063 -0.070(0.045) (0.055) (0.054)
FemEx -0.078 -0.263*** -0.231**(0.077) (0.094) (0.092)
Exec Ability -0.021 0.019 0.055 0.031 -0.000 0.038 0.027 -0.083 -0.052(0.023) (0.067) (0.068) (0.029) (0.082) (0.083) (0.028) (0.081) (0.082)
Exec Tenure -0.003 -0.003 -0.002 -0.001 0.000 0.001 -0.001 -0.000 0.001(0.002) (0.003) (0.003) (0.002) (0.003) (0.003) (0.002) (0.003) (0.003)
Exec Age 0.000 0.000 0.000 0.000 -0.000 0.000 0.000 -0.000 -0.000(0.000) (0.000) (0.000) (0.000) (0.000) (0.000) (0.000) (0.000) (0.000)
FemNonEx -0.383** -0.397** -0.366** -0.575*** -0.517*** -0.508*** -0.570*** -0.518*** -0.504***(0.158) (0.160) (0.160) (0.194) (0.196) (0.195) (0.191) (0.192) (0.192)
Mean Age Workforce 0.003*** 0.003*** 0.003*** 0.003*** 0.003*** 0.003*** 0.002** 0.003** 0.003**(0.001) (0.001) (0.001) (0.001) (0.001) (0.001) (0.001) (0.001) (0.001)
Share White Collars 0.275** 0.269** 0.266** -0.008 -0.022 -0.011 0.037 0.032 0.044(0.132) (0.132) (0.132) (0.162) (0.162) (0.161) (0.159) (0.159) (0.159)
Mean AKM Worker Effect 1.297*** 1.279*** 1.284*** 1.350*** 1.389*** 1.362*** 1.008*** 1.033*** 1.011***(0.237) (0.237) (0.237) (0.290) (0.289) (0.289) (0.286) (0.285) (0.284)
SD of AKM Worker Effect 0.359** 0.376** 0.391** 0.585*** 0.639*** 0.646*** 0.724*** 0.746*** 0.762***(0.179) (0.179) (0.179) (0.219) (0.219) (0.219) (0.215) (0.215) (0.215)
Year dummies Yes Yes Yes Yes Yes Yes Yes Yes YesRegion dummies Yes Yes Yes Yes Yes Yes Yes Yes YesIndustry dummies Yes Yes Yes Yes Yes Yes Yes Yes YesIndustry trends Yes Yes Yes Yes Yes Yes Yes Yes YesFirm size dummies Yes Yes Yes Yes Yes Yes Yes Yes Yes
R-sq 0.593 0.592 0.592 0.217 0.218 0.219 0.173 0.174 0.175Firm-Year Observations 2,340 2,340 2,340 2,340 2,340 2,340 2,340 2,340 2,340N. of firms 234 234 234 234 234 234 234 234 234N. of years 10 10 10 10 10 10 10 10 10
Balanced PanelSales per Employee Value Added per Employee TFP

A1-2: Impact of Female Leadership on Firm Performance with Interaction Effects.
Notes: The sample includes a balanced panel of INVIND firms, years 1987-1997. Each observation is a firm-year. FemEx is the share of female executives at the firm-year, FemNonEx is the share of females in the non-executive workforce at the firm-year, 0<FemEx<25% is a dummy equal to 1 if females represent more than zero but less that 25% of executives at the firm-year, and FemEx>25% is a dummy equal to 1 if females represent more than 25% of executives (0% female executives is the omitted category). Fem CEO is a dummy variable equal to 1 if the CEO is a female in a given firm-year. Firm size dummies are for less than 100, between 100 and 250, between 250 and 500, and more than 500 employees. Robust standard errors are reported in parentheses. *, **, and *** denote statistical significance at the 10, 5, and 1 percent confidence levels, respectively.
SampleDependent variable
Fem CEO -0.122* -0.272*** -0.231***(0.064) (0.078) (0.077)
Fem CEO 0.623*** 0.775*** 0.588*** FemNonEx (0.199) (0.244) (0.240)
0 < FemEx < 25% -0.036 -0.033 -0.010(0.032) (0.039) (0.039)
0 < FemEx < 25% 0.091 -0.120 -0.112* FemNonEx (0.090) (0.110) (0.108)
FemEx > 25% -0.146* -0.273*** -0.270***(0.079) (0.096) (0.095)
FemEx > 25% 0.529*** 0.649*** 0.618****FemNonEx (0.191) (0.233) (0.230)
FemEx -0.484*** -0.501*** -0.439***(0.127) (0.155) (0.153)
FemEx 1.292*** 0.760* 0.663**FemNonEx (0.321) (0.394) (0.388)
Exec Ability -0.020 0.027 0.075 0.031 0.007 0.050 0.027 -0.076 -0.042(0.023) (0.067) (0.068) (0.029) (0.082) (0.084) (0.028) (0.081) (0.082)
Exec Tenure -0.003 -0.002 -0.001 -0.001 0.001 0.002 -0.000 -0.000 0.001(0.002) (0.003) (0.003) (0.002) (0.003) (0.003) (0.002) (0.003) (0.003)
Exec Age 0.000 0.000 0.000 0.000 0.000 0.000 0.000 -0.000 -0.000(0.000) (0.000) (0.000) (0.000) (0.000) (0.000) (0.000) (0.000) (0.000)
FemNonEx -0.463*** -0.498*** -0.518*** -0.675*** -0.566*** -0.597*** -0.646*** -0.565*** -0.582***(0.160) (0.165) (0.164) (0.196) (0.202) (0.200) (0.193) (0.199) (0.197)
Mean Age Workforce 0.003*** 0.003*** 0.003*** 0.004*** 0.003*** 0.003*** 0.003** 0.002** 0.003**(0.001) (0.001) (0.001) (0.001) (0.001) (0.001) (0.001) (0.001) (0.001)
Share White Collars 0.262** 0.275** 0.269** -0.023 -0.021 -0.009 0.025 0.033 0.046(0.132) (0.132) (0.132) (0.161) (0.161) (0.161) (0.159) (0.159) (0.159)
Mean AKM Worker Effect 1.344*** 1.257*** 1.295*** 1.409*** 1.342*** 1.369*** 1.052*** 0.988*** 1.017***(0.237) (0.237) (0.236) (0.290) (0.289) (0.289) (0.286) (0.285) (0.284)
SD of AKM Worker Effect 0.356** 0.398** 0.440** 0.582*** 0.640*** 0.674*** 0.721*** 0.747*** 0.787***(0.179) (0.179) (0.179) (0.218) (0.219) (0.219) (0.215) (0.215) (0.216)
Year dummies Yes Yes Yes Yes Yes Yes Yes Yes YesRegion dummies Yes Yes Yes Yes Yes Yes Yes Yes YesIndustry dummies Yes Yes Yes Yes Yes Yes Yes Yes YesIndustry trends Yes Yes Yes Yes Yes Yes Yes Yes YesFirm size dummies Yes Yes Yes Yes Yes Yes Yes Yes Yes
R-sq 0.595 0.594 0.595 0.221 0.222 0.220 0.175 0.178 0.176Firm-Year Observations 2,340 2,340 2,340 2,340 2,340 2,340 2,340 2,340 2,340N. of firms 234 234 234 234 234 234 234 234 234N. of years 10 10 10 10 10 10 10 10 10
Balanced PanelSales per Employee Value Added per Employee TFP

A1-3: Impact of Female Leadership on Firm Performance with Interaction Effects. Full Sample.
Notes: The sample includes the full sample of INVIND firms, years 1987-1997. Each observation is a firm-year. FemEx is the share of female executives at the firm-year, FemNonEx is the share of females in the non-executive workforce at the firm-year, 0<FemEx<25% is a dummy equal to 1 if females represent more than zero but less that 25% of executives at the firm-year, and FemEx>25% is a dummy equal to 1 if females represent more than 25% of executives (0% female executives is the omitted category). Fem CEO is a dummy variable equal to 1 if the CEO is a female in a given firm-year. Firm size dummies are for less than 100, between 100 and 250, between 250 and 500, and more than 500 employees. Robust standard errors are reported in parentheses. *, **, and *** denote statistical significance at the 10, 5, and 1 percent confidence levels, respectively.
SampleDependent variable
Fem CEO -0.018 -0.114** -0.085*(0.039) (0.047) (0.047)
Fem CEO 0.150 0.109 -0.031* FemNonEx (0.092) (0.111) (0.110)
0 < FemEx < 25% -0.082*** -0.050** -0.034(0.019) (0.023) (0.023)
0 < FemEx < 25% 0.244*** 0.075 0.033* FemNonEx (0.050) (0.061) (0.060)
FemEx > 25% -0.038 -0.231*** -0.218***(0.044) (0.053) (0.052)
FemEx > 25% 0.206** 0.310*** 0.248***FemNonEx (0.088) (0.106) (0.105)
FemEx -0.209*** -0.320*** -0.292***(0.075) (0.090) (0.089)
FemEx 0.557*** 0.401** 0.263*FemNonEx (0.146) (0.176) (0.174)
Exec Ability 0.015 0.030 0.036 0.074*** 0.107*** 0.110*** 0.079*** 0.115*** 0.121***(0.014) (0.030) (0.030) (0.017) (0.036) (0.037) (0.017) (0.036) (0.036)
Exec Tenure -0.002 0.001 0.001 -0.001 0.002 0.002 -0.000 0.001 0.001(0.001) (0.001) (0.002) (0.001) (0.002) (0.002) (0.001) (0.002) (0.002)
Exec Age 0.000 -0.000 -0.000 0.000*** 0.000** 0.000** 0.000*** 0.000*** 0.000***(0.000) (0.000) (0.000) (0.000) (0.000) (0.000) (0.000) (0.000) (0.000)
FemNonEx -0.937*** -0.995*** -0.963*** -0.972*** -0.974*** -0.976*** -0.785*** -0.777*** -0.783***(0.080) (0.081) (0.080) (0.096) (0.098) (0.097) (0.095) (0.097) (0.096)
Mean Age Workforce 0.006*** 0.006*** 0.006*** 0.004*** 0.004*** 0.004*** 0.003*** 0.003*** 0.003***(0.000) (0.000) (0.000) (0.001) (0.001) (0.001) (0.001) (0.001) (0.001)
Share White Collars 0.326*** 0.343*** 0.326*** -0.000 0.002 0.008 0.059 0.054 0.065(0.062) (0.062) (0.062) (0.075) (0.075) (0.075) (0.074) (0.074) (0.074)
Mean AKM Worker Effect 1.791*** 1.781*** 1.794*** 1.381*** 1.379*** 1.377*** 1.055*** 1.059*** 1.053***(0.116) (0.116) (0.116) (0.140) (0.140) (0.140) (0.138) (0.138) (0.138)
SD of AKM Worker Effect 0.656*** 0.674*** 0.662*** 0.785*** 0.787*** 0.790*** 0.935*** 0.927*** 0.933***(0.086) (0.086) (0.086) (0.104) (0.103) (0.103) (0.102) (0.102) (0.102)
Year dummies Yes Yes Yes Yes Yes Yes Yes Yes YesRegion dummies Yes Yes Yes Yes Yes Yes Yes Yes YesIndustry dummies Yes Yes Yes Yes Yes Yes Yes Yes YesIndustry trends Yes Yes Yes Yes Yes Yes Yes Yes YesFirm size dummies Yes Yes Yes Yes Yes Yes Yes Yes Yes
R-sq 0.748 0.749 0.749 0.303 0.303 0.302 0.237 0.237 0.236Firm-Year Observations 7,906 7,906 7,906 7,906 7,906 7,906 7,906 7,906 7,906N. of firms 822 822 822 822 822 822 822 822 822N. of years 16 16 16 16 16 16 16 16 16
Full SampleSales per Employee Value Added per Employee TFP

A2-1: Quantile regressions. Female leadership = Share of female executives.
Notes: Quantile log wage regressions, separately by gender. The sample includes workers employed at INVIND firms, 1982-1997. Each observation is a worker-year. Robust standard errors are reported in parentheses. *, **, and *** denote statistical significance at the 10, 5, and 1 percent confidence levels, respectively.
SampleDependent variableQuantile 10th 25th 50th 75th 90th 10th 25th 50th 75th 90th
FemEx -0.033*** -0.002 0.013*** 0.055*** 0.141*** -0.058*** -0.045*** -0.022*** -0.017*** -0.003(0.007) (0.003) (0.002) (0.003) (0.005) (0.003) (0.002) (0.002) (0.003) (0.007)
Mean Exec Ability -0.020*** -0.007*** 0.001 0.003** -0.001 0.022*** 0.010*** 0.003*** 0.016*** 0.026***(0.004) (0.001) (0.001) (0.002) (0.003) (0.001) (0.001) (0.001) (0.001) (0.003)
Mean Exec Experience -0.002** 0.002*** 0.003*** 0.003*** -0.002*** 0.002*** 0.001*** 0.002*** 0.003*** 0.001**(0.001) (0.000) (0.000) (0.000) (0.000) (0.000) (0.000) (0.000) (0.000) (0.001)
Mean Exec Tenure 0.000 0.000 -0.001*** -0.001*** -0.001*** 0.001*** 0.001*** 0.001*** 0.000 -0.000***(0.000) (0.000) (0.000) (0.000) (0.000) (0.000) (0.000) (0.000) (0.000) (0.000)
Mean Exec Age -0.006*** -0.005*** -0.004*** -0.005*** -0.013*** -0.003*** -0.006*** -0.008*** -0.002*** -0.008***(0.002) (0.001) (0.001) (0.001) (0.002) (0.001) (0.001) (0.001) (0.001) (0.002)
FemNonEx -0.344*** -0.264*** -0.235*** -0.226*** -0.225*** -0.227*** -0.240*** -0.236*** -0.211*** -0.170***(0.005) (0.002) (0.001) (0.002) (0.004) (0.002) (0.001) (0.001) (0.002) (0.004)
Mean Age Workforce 0.203*** 0.135*** 0.114*** 0.117*** 0.128*** 0.168*** 0.181*** 0.201*** 0.199*** 0.190***(0.003) (0.001) (0.001) (0.001) (0.002) (0.001) (0.001) (0.001) (0.001) (0.003)
Age 0.199*** 0.181*** 0.145*** 0.089*** 0.056*** 0.333*** 0.297*** 0.262*** 0.234*** 0.158***(0.004) (0.001) (0.001) (0.002) (0.003) (0.001) (0.001) (0.001) (0.001) (0.003)
Age Squared -0.019*** -0.018*** -0.014*** -0.006*** -0.001** -0.037*** -0.032*** -0.026*** -0.021*** -0.007***(0.001) (0.000) (0.000) (0.000) (0.000) (0.000) (0.000) (0.000) (0.000) (0.000)
Share prod. workers -0.179*** -0.166*** -0.185*** -0.245*** -0.353*** -0.192*** -0.224*** -0.306*** -0.440*** -0.645***(0.001) (0.000) (0.000) (0.000) (0.001) (0.000) (0.000) (0.000) (0.000) (0.001)
Firm Effect from AKM 0.678*** 0.570*** 0.562*** 0.605*** 0.653*** 0.746*** 0.804*** 0.884*** 0.926*** 0.936***(0.007) (0.003) (0.002) (0.003) (0.005) (0.002) (0.002) (0.002) (0.003) (0.006)
Mean AKM Worker Effect 0.702*** 0.477*** 0.420*** 0.441*** 0.484*** 0.428*** 0.468*** 0.554*** 0.596*** 0.608***(0.008) (0.003) (0.002) (0.003) (0.006) (0.003) (0.002) (0.002) (0.003) (0.006)
SD of AKM Worker Effect -0.150*** 0.081*** 0.131*** 0.147*** 0.144*** 0.014*** -0.016*** -0.047*** -0.045*** -0.055***(0.012) (0.004) (0.003) (0.005) (0.009) (0.003) (0.003) (0.003) (0.004) (0.008)
< 100 Employees -0.029*** -0.020*** -0.016*** -0.013*** -0.009*** -0.013*** -0.008*** -0.007*** -0.007*** 0.003(0.004) (0.001) (0.001) (0.001) (0.003) (0.001) (0.001) (0.001) (0.001) (0.003)
250-500 Employees 0.017*** 0.009*** 0.007*** 0.008*** 0.006*** -0.003*** -0.001 -0.001 -0.004*** -0.007***(0.002) (0.001) (0.001) (0.001) (0.001) (0.001) (0.001) (0.001) (0.001) (0.002)
> 500 Employees 0.032*** 0.020*** 0.016*** 0.018*** 0.020*** 0.010*** 0.007*** 0.005*** -0.001 -0.011***(0.002) (0.001) (0.001) (0.001) (0.001) (0.001) (0.000) (0.001) (0.001) (0.002)
Constant 2.802*** 3.467*** 3.696*** 3.788*** 3.948*** 2.971*** 3.009*** 3.059*** 3.195*** 3.546***(0.039) (0.014) (0.012) (0.016) (0.029) (0.035) (0.027) (0.030) (0.041) (0.087)
Year dummies Yes Yes Yes Yes Yes Yes Yes Yes Yes YesRegion dummies Yes Yes Yes Yes Yes Yes Yes Yes Yes YesIndustry dummies Yes Yes Yes Yes Yes Yes Yes Yes Yes Yes
Observations 1,060,714 1,060,714 1,060,714 1,060,714 1,060,714 3,507,148 3,507,148 3,507,148 3,507,148 3,507,148
ln wageFemales Males
ln wage

A2-2: Quantile regressions. Female leadership = Share of female executives > 25%.
Notes: Quantile log wage regressions, separately by gender. The sample includes workers employed at INVIND firms, 1982-1997. Each observation is a worker-year. Robust standard errors are reported in parentheses. *, **, and *** denote statistical significance at the 10, 5, and 1 percent confidence levels, respectively.
SampleDependent variableQuantile 10th 25th 50th 75th 90th 10th 25th 50th 75th 90th
0 < FemEx < 25% 0.003*** 0.003*** -0.001** -0.003*** 0.002** -0.019*** -0.018*** -0.018*** -0.019*** -0.019***(0.001) (0.000) (0.000) (0.000) (0.001) (0.000) (0.000) (0.000) (0.000) (0.001)
FemEx>25% -0.003 0.009*** 0.017*** 0.037*** 0.066*** -0.010*** -0.005*** 0.008*** 0.018*** 0.043***(0.004) (0.002) (0.001) (0.002) (0.003) (0.002) (0.002) (0.002) (0.002) (0.003)
Mean Exec Ability -0.024*** -0.009*** -0.000 0.005*** 0.001 0.023*** 0.012*** 0.006*** 0.019*** 0.030***(0.004) (0.001) (0.001) (0.002) (0.003) (0.001) (0.001) (0.001) (0.001) (0.002)
Mean Exec Experience -0.001** 0.002*** 0.003*** 0.003*** -0.003*** 0.001*** 0.000 0.001*** 0.002*** 0.001**(0.001) (0.000) (0.000) (0.000) (0.000) (0.000) (0.000) (0.000) (0.000) (0.000)
Mean Exec Tenure 0.000 0.000 -0.001*** -0.001*** -0.001*** 0.001*** 0.001*** 0.001*** 0.000*** -0.000(0.000) (0.000) (0.000) (0.000) (0.000) (0.000) (0.000) (0.000) (0.000) (0.000)
Mean Exec Age -0.007*** -0.006*** -0.004*** -0.005*** -0.011*** -0.004*** -0.006*** -0.008*** -0.003*** -0.009***(0.002) (0.001) (0.001) (0.001) (0.002) (0.001) (0.000) (0.000) (0.001) (0.001)
FemNonEx -0.346*** -0.264*** -0.236*** -0.228*** -0.221*** -0.231*** -0.245*** -0.239*** -0.213*** -0.174***(0.005) (0.002) (0.001) (0.002) (0.004) (0.002) (0.001) (0.001) (0.001) (0.003)
Mean Age Workforce 0.203*** 0.134*** 0.115*** 0.119*** 0.127*** 0.176*** 0.189*** 0.208*** 0.205*** 0.196***(0.003) (0.001) (0.001) (0.001) (0.002) (0.001) (0.001) (0.001) (0.001) (0.002)
Age 0.198*** 0.181*** 0.145*** 0.089*** 0.055*** 0.333*** 0.298*** 0.263*** 0.235*** 0.158***(0.004) (0.001) (0.001) (0.002) (0.003) (0.001) (0.001) (0.001) (0.001) (0.002)
Age Squared -0.019*** -0.018*** -0.014*** -0.006*** -0.001** -0.037*** -0.032*** -0.026*** -0.021*** -0.007***(0.001) (0.000) (0.000) (0.000) (0.000) (0.000) (0.000) (0.000) (0.000) (0.000)
Share prod. workers -0.179*** -0.166*** -0.185*** -0.245*** -0.354*** -0.192*** -0.224*** -0.306*** -0.441*** -0.646***(0.001) (0.000) (0.000) (0.000) (0.001) (0.000) (0.000) (0.000) (0.000) (0.000)
Firm Effect from AKM 0.673*** 0.568*** 0.564*** 0.611*** 0.657*** 0.747*** 0.803*** 0.885*** 0.930*** 0.938***(0.007) (0.003) (0.002) (0.003) (0.005) (0.002) (0.002) (0.002) (0.002) (0.004)
Mean AKM Worker Effect 0.701*** 0.475*** 0.422*** 0.446*** 0.485*** 0.441*** 0.486*** 0.569*** 0.609*** 0.623***(0.008) (0.003) (0.002) (0.003) (0.006) (0.002) (0.002) (0.002) (0.002) (0.004)
SD of AKM Worker Effect -0.156*** 0.077*** 0.133*** 0.153*** 0.148*** 0.020*** -0.007*** -0.035*** -0.033*** -0.046***(0.012) (0.004) (0.003) (0.005) (0.009) (0.003) (0.002) (0.002) (0.003) (0.005)
100-250 Employees 0.029*** 0.020*** 0.016*** 0.013*** 0.010*** 0.014*** 0.009*** 0.008*** 0.008*** -0.003*(0.004) (0.001) (0.001) (0.001) (0.003) (0.001) (0.001) (0.001) (0.001) (0.002)
250-500 Employees 0.017*** 0.009*** 0.008*** 0.009*** 0.007*** 0.012*** 0.009*** 0.008*** 0.005*** -0.008***(0.002) (0.001) (0.001) (0.001) (0.001) (0.001) (0.001) (0.001) (0.001) (0.002)
> 500 Employees 0.032*** 0.020*** 0.017*** 0.020*** 0.021*** 0.029*** 0.021*** 0.018*** 0.012*** -0.008***(0.002) (0.001) (0.001) (0.001) (0.001) (0.001) (0.001) (0.001) (0.001) (0.002)
Constant 2.825*** 3.478*** 3.687*** 3.763*** 3.952*** 2.935*** 2.973*** 3.024*** 3.157*** 3.522***(0.039) (0.015) (0.012) (0.016) (0.029) (0.033) (0.025) (0.024) (0.030) (0.050)
Year dummies Yes Yes Yes Yes Yes Yes Yes Yes Yes YesRegion dummies Yes Yes Yes Yes Yes Yes Yes Yes Yes YesIndustry dummies Yes Yes Yes Yes Yes Yes Yes Yes Yes Yes
Observations 1,060,714 1,060,714 1,060,714 1,060,714 1,060,714 3,507,148 3,507,148 3,507,148 3,507,148 3,507,148
Females Malesln wage ln wage
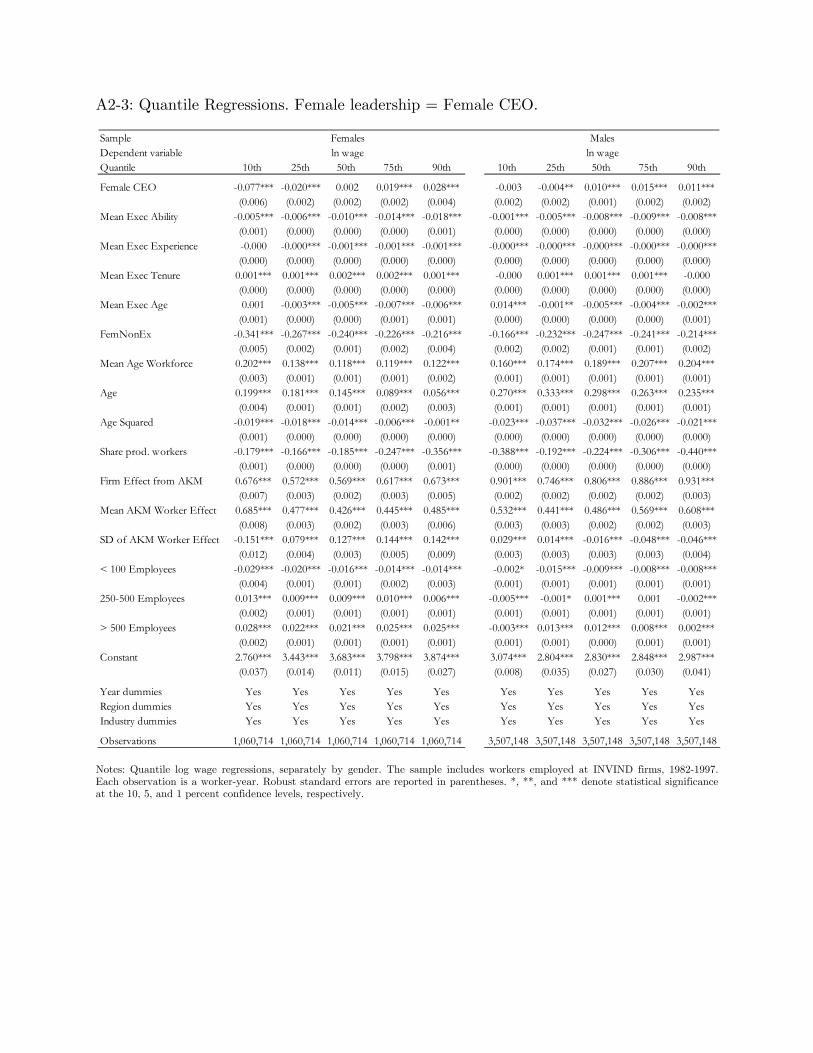
A2-3: Quantile Regressions. Female leadership = Female CEO.
Notes: Quantile log wage regressions, separately by gender. The sample includes workers employed at INVIND firms, 1982-1997. Each observation is a worker-year. Robust standard errors are reported in parentheses. *, **, and *** denote statistical significance at the 10, 5, and 1 percent confidence levels, respectively.
SampleDependent variableQuantile 10th 25th 50th 75th 90th 10th 25th 50th 75th 90th
Female CEO -0.077*** -0.020*** 0.002 0.019*** 0.028*** -0.003 -0.004** 0.010*** 0.015*** 0.011***(0.006) (0.002) (0.002) (0.002) (0.004) (0.002) (0.002) (0.001) (0.002) (0.002)
Mean Exec Ability -0.005*** -0.006*** -0.010*** -0.014*** -0.018*** -0.001*** -0.005*** -0.008*** -0.009*** -0.008***(0.001) (0.000) (0.000) (0.000) (0.001) (0.000) (0.000) (0.000) (0.000) (0.000)
Mean Exec Experience -0.000 -0.000*** -0.001*** -0.001*** -0.001*** -0.000*** -0.000*** -0.000*** -0.000*** -0.000***(0.000) (0.000) (0.000) (0.000) (0.000) (0.000) (0.000) (0.000) (0.000) (0.000)
Mean Exec Tenure 0.001*** 0.001*** 0.002*** 0.002*** 0.001*** -0.000 0.001*** 0.001*** 0.001*** -0.000(0.000) (0.000) (0.000) (0.000) (0.000) (0.000) (0.000) (0.000) (0.000) (0.000)
Mean Exec Age 0.001 -0.003*** -0.005*** -0.007*** -0.006*** 0.014*** -0.001** -0.005*** -0.004*** -0.002***(0.001) (0.000) (0.000) (0.001) (0.001) (0.000) (0.000) (0.000) (0.000) (0.001)
FemNonEx -0.341*** -0.267*** -0.240*** -0.226*** -0.216*** -0.166*** -0.232*** -0.247*** -0.241*** -0.214***(0.005) (0.002) (0.001) (0.002) (0.004) (0.002) (0.002) (0.001) (0.001) (0.002)
Mean Age Workforce 0.202*** 0.138*** 0.118*** 0.119*** 0.122*** 0.160*** 0.174*** 0.189*** 0.207*** 0.204***(0.003) (0.001) (0.001) (0.001) (0.002) (0.001) (0.001) (0.001) (0.001) (0.001)
Age 0.199*** 0.181*** 0.145*** 0.089*** 0.056*** 0.270*** 0.333*** 0.298*** 0.263*** 0.235***(0.004) (0.001) (0.001) (0.002) (0.003) (0.001) (0.001) (0.001) (0.001) (0.001)
Age Squared -0.019*** -0.018*** -0.014*** -0.006*** -0.001** -0.023*** -0.037*** -0.032*** -0.026*** -0.021***(0.001) (0.000) (0.000) (0.000) (0.000) (0.000) (0.000) (0.000) (0.000) (0.000)
Share prod. workers -0.179*** -0.166*** -0.185*** -0.247*** -0.356*** -0.388*** -0.192*** -0.224*** -0.306*** -0.440***(0.001) (0.000) (0.000) (0.000) (0.001) (0.000) (0.000) (0.000) (0.000) (0.000)
Firm Effect from AKM 0.676*** 0.572*** 0.569*** 0.617*** 0.673*** 0.901*** 0.746*** 0.806*** 0.886*** 0.931***(0.007) (0.003) (0.002) (0.003) (0.005) (0.002) (0.002) (0.002) (0.002) (0.003)
Mean AKM Worker Effect 0.685*** 0.477*** 0.426*** 0.445*** 0.485*** 0.532*** 0.441*** 0.486*** 0.569*** 0.608***(0.008) (0.003) (0.002) (0.003) (0.006) (0.003) (0.003) (0.002) (0.002) (0.003)
SD of AKM Worker Effect -0.151*** 0.079*** 0.127*** 0.144*** 0.142*** 0.029*** 0.014*** -0.016*** -0.048*** -0.046***(0.012) (0.004) (0.003) (0.005) (0.009) (0.003) (0.003) (0.003) (0.003) (0.004)
< 100 Employees -0.029*** -0.020*** -0.016*** -0.014*** -0.014*** -0.002* -0.015*** -0.009*** -0.008*** -0.008***(0.004) (0.001) (0.001) (0.002) (0.003) (0.001) (0.001) (0.001) (0.001) (0.001)
250-500 Employees 0.013*** 0.009*** 0.009*** 0.010*** 0.006*** -0.005*** -0.001* 0.001*** 0.001 -0.002***(0.002) (0.001) (0.001) (0.001) (0.001) (0.001) (0.001) (0.001) (0.001) (0.001)
> 500 Employees 0.028*** 0.022*** 0.021*** 0.025*** 0.025*** -0.003*** 0.013*** 0.012*** 0.008*** 0.002***(0.002) (0.001) (0.001) (0.001) (0.001) (0.001) (0.001) (0.000) (0.001) (0.001)
Constant 2.760*** 3.443*** 3.683*** 3.798*** 3.874*** 3.074*** 2.804*** 2.830*** 2.848*** 2.987***(0.037) (0.014) (0.011) (0.015) (0.027) (0.008) (0.035) (0.027) (0.030) (0.041)
Year dummies Yes Yes Yes Yes Yes Yes Yes Yes Yes YesRegion dummies Yes Yes Yes Yes Yes Yes Yes Yes Yes YesIndustry dummies Yes Yes Yes Yes Yes Yes Yes Yes Yes Yes
Observations 1,060,714 1,060,714 1,060,714 1,060,714 1,060,714 3,507,148 3,507,148 3,507,148 3,507,148 3,507,148
Females Malesln wage ln wage