do depression symptoms predict seizure frequency—or vice versa?
TRANSCRIPT
Journal of Psychosomatic Res
Do depression symptoms predict seizure frequency—or vice versa?
Ajay Thapara,b,c,T, Martin Rolanda,b,d, Gordon Harolda,b,e
aDepartment of General Practice, Manchester University, Manchester, UKbDepartment of General Practice, University of Wales College of Medicine, Wales, UK
cTaff Riverside Practice and School of Psychology, Cardiff University, Cardiff, CF11 9SB Wales, UKdNational Primary Care Research and Development Centre, Manchester, UK
eSchool of Psychology, Cardiff University, Cardiff, UK
Abstract
Objective: The aim of this study was to test a theoretical
explanatory model of the relationship between depression symp-
tom scores and seizure frequency in people with epilepsy.
Methods: A community-based sample of adults with active
epilepsy provided information on depression symptom scores
and seizure frequency at two time points, 1 year apart. Results:
One thousand two hundred ten patients completed the initial
0022-3999/05/$ – see front matter D 2005 Elsevier Inc. All rights reserved.
doi:10.1016/j.jpsychores.2005.04.001
T Corresponding author. Taff Riverside Practice, Riverside Health
Centre, Cardiff, CF11 9SB Wales, UK.
E-mail address: [email protected] (A. Thapar).
questionnaire, and 976 of these individuals (80.7%) completed the
final questionnaire. Depression scores and seizure frequency were
significant predictors of each other, both within (b=.07, Pb.05 and
b=.09, Pb.05) and across time (b=.03, Pb.01 and b=.07, Pb.05).Conclusion: The relationship between depression symptom scores
and seizure frequency in those with epilepsy is bidirectional.
D 2005 Elsevier Inc. All rights reserved.
Keywords: Depression; Epilepsy; Longitudinal assessment; Primary care; Structural equation modeling
Introduction
The association of increased seizure frequency with
increased rates of depression is well established in cross-
sectional community studies, with the assumption that it is
poorly controlled epilepsy that is a major risk factor for
depression in people with epilepsy in the community [1,2].
There is, however, increasing evidence from research of
other chronic diseases, in particular, ischaemic heart disease
[3], diabetes [4], and asthma [5], that depression can predict
the onset of physical diseases and influence outcome.
Recent reviews of depression and epilepsy have also begun
to suggest that the association arises as a result of bidirec-
tional influences and have proposed a possible neuro-
chemical basis for this relationship through specific
neurotransmitter pathways (e.g., serotonin, noradrenaline,
dopamine, and GABA pathways) but have lamented the
overall paucity of research in this area [6]. To date, there
have been two published studies of epilepsy that provide
empirical support for the assertion that depression may
precede epilepsy in adults. In these studies, depression was
found to be a risk factor for the initial development of
epilepsy [7,8]. However, there is no information on whether
depressive symptoms are predictive of seizure frequency for
individuals with current epilepsy, i.e., affect the course of
disorder in those with already diagnosed epilepsy. This
information is important in that it has implications for the
clinical management of people with epilepsy.
The aim of this study is to test a theoretical explanatory
model of the relationship between depressive symptom
scores and seizure frequency in people with epilepsy using a
longitudinal study design.
Method
The sample included 1255 adults with active epilepsy
(either a seizure recorded in the medical records in the last
2 years or currently on anticonvulsant medication for
epilepsy) from a random selection of 82 general practices
in Greater Manchester, U.K., who consented to participate.
earch 59 (2005) 269–274
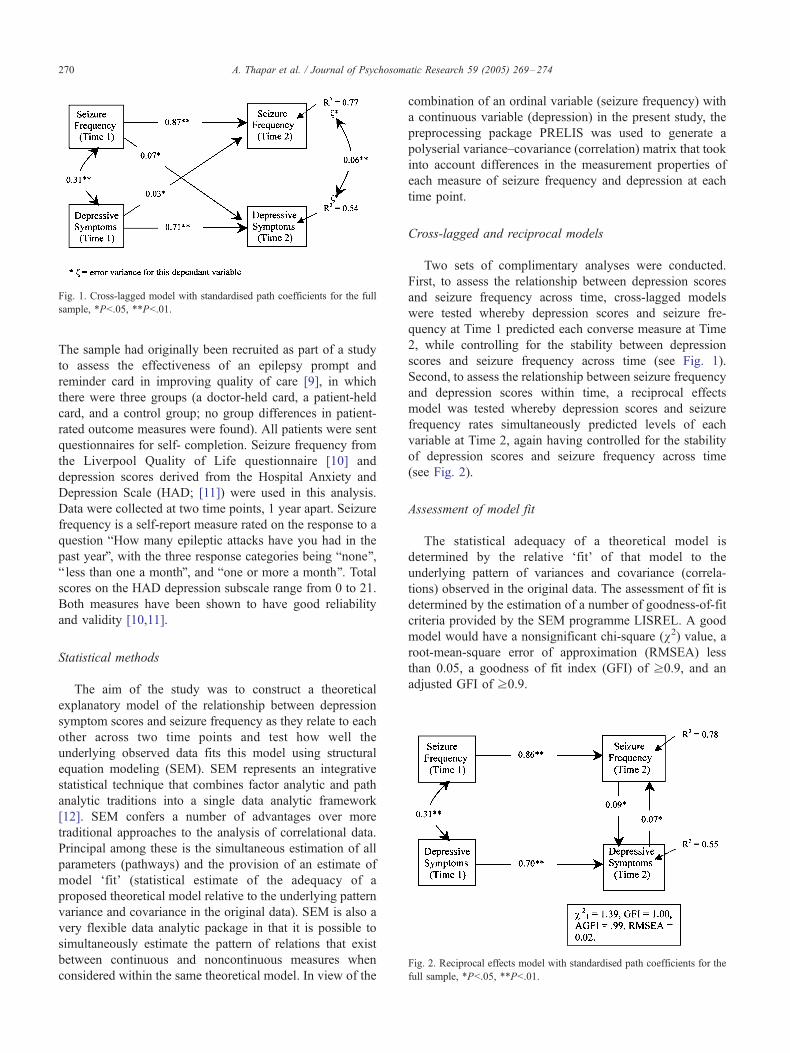
Fig. 1. Cross-lagged model with standardised path coefficients for the full
sample, *Pb.05, **Pb.01.
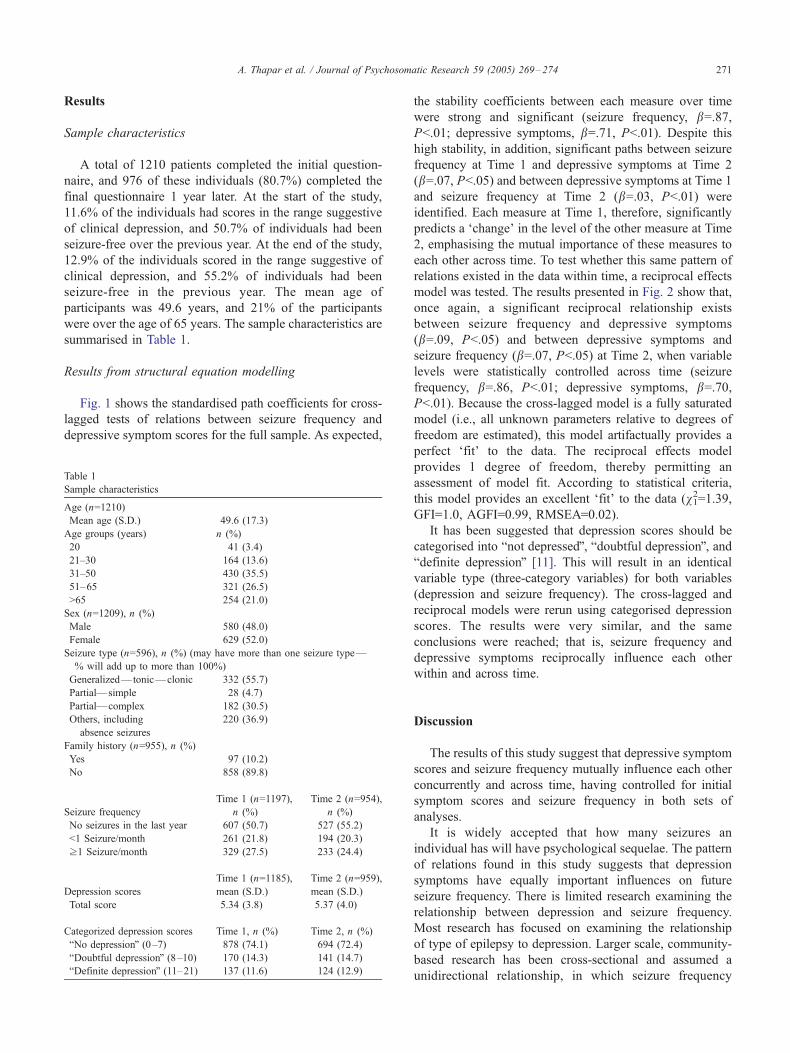
Fig. 2. Reciprocal effects model with standardised path coefficients for the
full sample, *Pb.05, **Pb.01.
A. Thapar et al. / Journal of Psychosomatic Research 59 (2005) 269–274270
The sample had originally been recruited as part of a study
to assess the effectiveness of an epilepsy prompt and
reminder card in improving quality of care [9], in which
there were three groups (a doctor-held card, a patient-held
card, and a control group; no group differences in patient-
rated outcome measures were found). All patients were sent
questionnaires for self- completion. Seizure frequency from
the Liverpool Quality of Life questionnaire [10] and
depression scores derived from the Hospital Anxiety and
Depression Scale (HAD; [11]) were used in this analysis.
Data were collected at two time points, 1 year apart. Seizure
frequency is a self-report measure rated on the response to a
question bHow many epileptic attacks have you had in the
past yearQ, with the three response categories being bnone Q,b less than one a monthQ, and bone or more a month Q. Totalscores on the HAD depression subscale range from 0 to 21.
Both measures have been shown to have good reliability
and validity [10,11].
Statistical methods
The aim of the study was to construct a theoretical
explanatory model of the relationship between depression
symptom scores and seizure frequency as they relate to each
other across two time points and test how well the
underlying observed data fits this model using structural
equation modeling (SEM). SEM represents an integrative
statistical technique that combines factor analytic and path
analytic traditions into a single data analytic framework
[12]. SEM confers a number of advantages over more
traditional approaches to the analysis of correlational data.
Principal among these is the simultaneous estimation of all
parameters (pathways) and the provision of an estimate of
model dfitT (statistical estimate of the adequacy of a
proposed theoretical model relative to the underlying pattern
variance and covariance in the original data). SEM is also a
very flexible data analytic package in that it is possible to
simultaneously estimate the pattern of relations that exist
between continuous and noncontinuous measures when
considered within the same theoretical model. In view of the
combination of an ordinal variable (seizure frequency) with
a continuous variable (depression) in the present study, the
preprocessing package PRELIS was used to generate a
polyserial variance–covariance (correlation) matrix that took
into account differences in the measurement properties of
each measure of seizure frequency and depression at each
time point.
Cross-lagged and reciprocal models
Two sets of complimentary analyses were conducted.
First, to assess the relationship between depression scores
and seizure frequency across time, cross-lagged models
were tested whereby depression scores and seizure fre-
quency at Time 1 predicted each converse measure at Time
2, while controlling for the stability between depression
scores and seizure frequency across time (see Fig. 1).
Second, to assess the relationship between seizure frequency
and depression scores within time, a reciprocal effects
model was tested whereby depression scores and seizure
frequency rates simultaneously predicted levels of each
variable at Time 2, again having controlled for the stability
of depression scores and seizure frequency across time
(see Fig. 2).
Assessment of model fit
The statistical adequacy of a theoretical model is
determined by the relative dfitT of that model to the
underlying pattern of variances and covariance (correla-
tions) observed in the original data. The assessment of fit is
determined by the estimation of a number of goodness-of-fit
criteria provided by the SEM programme LISREL. A good
model would have a nonsignificant chi-square (v2) value, aroot-mean-square error of approximation (RMSEA) less
than 0.05, a goodness of fit index (GFI) of z0.9, and an
adjusted GFI of z0.9.
A. Thapar et al. / Journal of Psychosomatic Research 59 (2005) 269–274 271
Results
Sample characteristics
A total of 1210 patients completed the initial question-
naire, and 976 of these individuals (80.7%) completed the
final questionnaire 1 year later. At the start of the study,
11.6% of the individuals had scores in the range suggestive
of clinical depression, and 50.7% of individuals had been
seizure-free over the previous year. At the end of the study,
12.9% of the individuals scored in the range suggestive of
clinical depression, and 55.2% of individuals had been
seizure-free in the previous year. The mean age of
participants was 49.6 years, and 21% of the participants
were over the age of 65 years. The sample characteristics are
summarised in Table 1.
Results from structural equation modelling
Fig. 1 shows the standardised path coefficients for cross-
lagged tests of relations between seizure frequency and
depressive symptom scores for the full sample. As expected,
Table 1
Sample characteristics
Age (n=1210)
Mean age (S.D.) 49.6 (17.3)
Age groups (years) n (%)
20 41 (3.4)
21–30 164 (13.6)
31–50 430 (35.5)
51–65 321 (26.5)
N65 254 (21.0)
Sex (n=1209), n (%)
Male 580 (48.0)
Female 629 (52.0)
Seizure type (n=596), n (%) (may have more than one seizure type—
% will add up to more than 100%)
Generalized—tonic—clonic 332 (55.7)
Partial—simple 28 (4.7)
Partial—complex 182 (30.5)
Others, including
absence seizures
220 (36.9)
Family history (n=955), n (%)
Yes 97 (10.2)
No 858 (89.8)
Seizure frequency
Time 1 (n=1197),
n (%)
Time 2 (n=954),
n (%)
No seizures in the last year 607 (50.7) 527 (55.2)
b1 Seizure/month 261 (21.8) 194 (20.3)
z1 Seizure/month 329 (27.5) 233 (24.4)
Depression scores
Time 1 (n=1185),
mean (S.D.)
Time 2 (n=959),
mean (S.D.)
Total score 5.34 (3.8) 5.37 (4.0)
Categorized depression scores Time 1, n (%) Time 2, n (%)
bNo depressionQ (0–7) 878 (74.1) 694 (72.4)
bDoubtful depressionQ (8–10) 170 (14.3) 141 (14.7)
bDefinite depressionQ (11–21) 137 (11.6) 124 (12.9)
the stability coefficients between each measure over time
were strong and significant (seizure frequency, b=.87,Pb.01; depressive symptoms, b=.71, Pb.01). Despite this
high stability, in addition, significant paths between seizure
frequency at Time 1 and depressive symptoms at Time 2
(b=.07, Pb.05) and between depressive symptoms at Time 1
and seizure frequency at Time 2 (b=.03, Pb.01) were
identified. Each measure at Time 1, therefore, significantly
predicts a dchangeT in the level of the other measure at Time
2, emphasising the mutual importance of these measures to
each other across time. To test whether this same pattern of
relations existed in the data within time, a reciprocal effects
model was tested. The results presented in Fig. 2 show that,
once again, a significant reciprocal relationship exists
between seizure frequency and depressive symptoms
(b=.09, Pb.05) and between depressive symptoms and
seizure frequency (b=.07, Pb.05) at Time 2, when variable
levels were statistically controlled across time (seizure
frequency, b=.86, Pb.01; depressive symptoms, b=.70,Pb.01). Because the cross-lagged model is a fully saturated
model (i.e., all unknown parameters relative to degrees of
freedom are estimated), this model artifactually provides a
perfect dfitT to the data. The reciprocal effects model
provides 1 degree of freedom, thereby permitting an
assessment of model fit. According to statistical criteria,
this model provides an excellent dfitT to the data (v21=1.39,GFI=1.0, AGFI=0.99, RMSEA=0.02).
It has been suggested that depression scores should be
categorised into bnot depressedQ, bdoubtful depressionQ, andbdefinite depressionQ [11]. This will result in an identical
variable type (three-category variables) for both variables
(depression and seizure frequency). The cross-lagged and
reciprocal models were rerun using categorised depression
scores. The results were very similar, and the same
conclusions were reached; that is, seizure frequency and
depressive symptoms reciprocally influence each other
within and across time.
Discussion
The results of this study suggest that depressive symptom
scores and seizure frequency mutually influence each other
concurrently and across time, having controlled for initial
symptom scores and seizure frequency in both sets of
analyses.
It is widely accepted that how many seizures an
individual has will have psychological sequelae. The pattern
of relations found in this study suggests that depression
symptoms have equally important influences on future
seizure frequency. There is limited research examining the
relationship between depression and seizure frequency.
Most research has focused on examining the relationship
of type of epilepsy to depression. Larger scale, community-
based research has been cross-sectional and assumed a
unidirectional relationship, in which seizure frequency
A. Thapar et al. / Journal of Psychosomatic Research 59 (2005) 269–274272
influences depression, although cross-sectional designs do
not allow for testing the direction of influence [1,2,13].
Other community-based studies of epilepsy have targeted
seizure reduction as the key method for improving quality of
life [14]. The findings of this study suggest that focusing on
treating depression in people with epilepsy is as important.
To date, there has been virtually no research testing the
extent to which depression affects seizures. There is limited
evidence from small, uncontrolled studies, however, that
antidepressant treatment of depression improves seizure
control [15]. Existing longitudinal studies have focused on
whether depression precedes the onset of epilepsy and found
that depression may be a risk factor for epilepsy in adults
[7,8] and children [16]. Overall, these findings, taken
together with the results from our own study, highlight that
it is not safe to assume that the association of epilepsy and
depression arises from the unidirectional effects of seizures.
Hence, what could account for our finding that depres-
sion scores predict seizure frequency? A neurochemical
basis has been proposed based on empirical evidence [6],
but this is difficult to test. However, psychosocial factors,
such as self-efficacy and social support, that are associated
with chronic disease severity and depression [17] could also
be important mediating mechanisms. Other potential media-
tors include treatment compliance and other aspects of self-
care that are affected by depression and that may then
impact on seizure control. Finally, the relationship between
depression and epilepsy may be explained by a common set
of aetiological factors.
The bidirectionality of the relationship between depres-
sion and other chronic illnesses has increasingly become an
area of interest. For diabetes, there is evidence that
depressive symptoms are associated with glycaemic control
[18], that depression precedes diabetes [19], and that the
treatment of depression improves glycaemic control [20].
Depressive symptoms have also been found to predict
outcomes in asthma [5] and heart disease [3]. Thus, there is
an increasing body of evidence implicating the importance
of depression in predicting chronic disease outcomes. This
has implications in terms of how chronic diseases are
managed. Our results in a large sample of people with
epilepsy, when considered in the context of findings for
other chronic diseases, suggest that reducing levels of
depressive symptoms may be an important component of
clinical management in terms of seizure control. This now
needs to be tested in a controlled intervention study.
Furthermore, given that depression rates for people with
epilepsy are higher than for the general population, it is
important to examine whether antidepressants are under-
prescribed. Antidepressant use in epilepsy may be affected
by a perception among health professionals and patients that
antidepressants worsen seizure control (although this was a
risk with older antidepressants; newer antidepressants do not
carry this risk).
The main strengths of this study are that a large number
of representative adults with epilepsy in the community
were assessed using well-validated and reliable measures
and that a powerful analytic tool, SEM, was used to test
the relationships.
There are also potential weaknesses of this study,
however. First, not all individuals who commenced the
study completed the study (19% of individuals who
completed the first questionnaire did not complete the
second questionnaire). Second, an ordinal measure of
seizure frequency was used. However, polychoric correla-
tion matrices were derived, and these facilitate analysis of
both continuous (depression scores) and noncontinuous
(seizure frequency) measures while adhering to the impor-
tant assumption of multivariate normality. Third, self-report
measures had to be used, and this could have influenced the
findings. However, using other informants in a large-scale,
community-based study was not feasible, and at present,
little is known on the validity of information on seizure
frequency and depression provided by other informants.
Two other factors that need to be taken into account are
measurement time frames and the influence of seizure type.
Depression and seizure frequency measures do not reflect
information from exactly the same point in time (seizure
frequency is measured over the past year and depression
scores refer to the past week). However, there is high
stability of both seizure frequency and depression scores,
and moreover, the overall effect is likely to underestimate
cross-lagged and reciprocal path coefficients rather than
overestimate them. Second, previous research has suggested
that individuals with partial epilepsy are more likely to be
depressed (but findings have been mixed; [21]). The sample
size for individual seizure types was not large enough to run
structural equation models for each seizure type, but in a
regression analysis, using seizure types as independent
variables, only a history of tonic–clonic seizures signifi-
cantly predicted depression scores. Moreover, the closest
association between seizure frequency and depression
scores was found for individuals with tonic–clonic seizures
(these results are available from the first author). This will
be important to further investigate in future research.
Finally, while the results in the present study suggest that
a statistically significant reciprocal relationship exists
between seizure frequency and depressive symptoms, an
important question is how clinically significant these
findings are. The interpretation of the results needs some
discussion of the methodology and a further explanation of
SEM. The results are from a study the main aim of which
was to improve recording of clinical information. Depres-
sion scores and seizure frequency were not significantly
altered during the course of the study. These findings are
reflected in the high stability for depression scores and
seizure frequency. This will result in low levels of
unexplained variance in each respective dependent (endog-
enous) measure. Thus, statistically significant cross-lagged
paths will be difficult to detect, even with large sample
sizes, given that relatively few individuals changed depres-
sion or seizure status spontaneously, and these path
A. Thapar et al. / Journal of Psychosomatic Research 59 (2005) 269–274 273
coefficients will therefore necessarily be low. These path
coefficients should not be equated with regression coef-
ficients obtained by standard regression analysis. In
structural equation modelling, all paths in a given model
are estimated simultaneously, and thus, given the stability of
measures over time, there is little remaining unexplained
variance, and thus, the magnitude of other standardised path
coefficients will seem low to those more familiar with
regression coefficients. However, it is important to highlight
that these pathways are accounting for a significant
proportion of variance in each respective dependent
(endogenous) variable over and above that accounted for
the stability between measures.
Cross-lagged stability models allow the examination of
relations between constructs (in this paper, depression and
seizure frequency) while controlling for their stability.
Significant cross-lagged effects reflect the presence of a
directional relationship between constructs. These cross-
lagged effects are beyond that which can be accounted for
by the stability of depression and seizure frequency across
time and the magnitude of their association at Time 1. To
examine possible bidirectional relationships between con-
structs within time, nonrecursive or reciprocal effects
models are used and appropriate. For a bidirectional model
to be identified (i.e., mathematically estimable), several
conditions need to be met. The present model (see Fig. 2)
satisfies these conditions in that earlier measures of seizure
frequency and depressive mood are predetermined varia-
bles and thereby uncorrelated with the error terms in both
Time 2 equations, and both cross-lagged effects are
constrained to zero. Analyzing correlational data using
cross-lagged and reciprocal effects models, in the way that
has been undertaken in this study, is an extremely
important and robust method of investigating whether
changes in one variable predict later changes in another
variable and testing hypotheses representing different
explanatory models of the relationships between variables.
This is an essential first step prior to designing intervention
studies [22] that can then be used to further address
questions of cause and effect.
In summary, in a large, longitudinal community-based
study of people with epilepsy, depression symptoms were
found to influence seizure frequency and vice versa, cross-
sectionally and over the period of 1 year. This has important
implications in terms of understanding the origins of the
association between depression and seizure frequency and
in how epilepsy is clinically managed. The results also add
to the increasing literature on the important influence
of depression on the onset and outcomes of chronic
physical diseases.
Acknowledgments
We are grateful to the Department of Health Implemen-
tation of research methods (IMP15-12) programme for
funding the study and to The Health Foundation for
awarding AT a Mid Career Fellowship to be trained in this
analytic method.
Thanks are due to Ann Jacoby, Ian Russell, Chris
Roberts, Alan Richens, Elaine Porter Sonya Wall, and
Juanita Stanley, who assisted or advised on the original
intervention study.
References
[1] Jacoby A, Baker GA, Steen N, Potts P, Chadwick DW. The clinical
course of epilepsy and its psychosocial correlates: findings from a UK
community study. Epilepsia 1996;37(2):148–61.
[2] Ridsdale L, Robins D, Fitzgerald A, Jeffery S, McGee L. Epilepsy in
general practice: patients’ psychological symptoms and their percep-
tion of stigma. Br J Gen Pract 1996;46(407):365–6.
[3] Penninx BW, Beekman AT, Honig A, Deeg DJ, Schoevers RA, van
Eijk JT, van Tilburg W. Depression and cardiac mortality: results from
a community-based longitudinal study. Arch Gen Psychiatry 2001;
58(3):221–7.
[4] Talbot F, Nouwen A. A review of the relationship between depression
and diabetes in adults: is there a link? Diabetes Care 2000;23(10):
1556–62.
[5] Mancuso CA, Rincon M, McCulloch CE, Charlson ME. Self-efficacy,
depressive symptoms, and patients’ expectations predict outcomes in
asthma. Med Care 2001;39(12):1326–38.
[6] Kanner AM. Depression in epilepsy: prevalence, clinical semiology,
pathogenic mechanisms, and treatment. Biol Psychiatry 2003;54(3):
388–98.
[7] Forsgren L, Nystrom L. An incident case-referent study of epileptic
seizures in adults. Epilepsy Res 1990;6(1):66–81.
[8] Hesdorffer DC, Hauser WA, Annegers JF, Cascino G. Major
depression is a risk factor for seizures in older adults. Ann Neurol
2000;47(2):246–9.
[9] Thapar AK, Jacoby A, Richens A, Russell I, Roberts C, Porter E,
Wall S, Roland M. The effectiveness of a prompt and reminder card
for general practitioners to improve epilepsy care: a pragmatic
randomised controlled trial. Br J Gen Pract 2002;52:93–8.
[10] Baker GA, Smith DF, Dewey M, Jacoby A, Chadwick DW. The initial
development of a health-related quality of life model as an outcome
measure in epilepsy. Epilepsy Res 1993;16:65–81.
[11] Zigmond AS, Snaith RP. The hospital anxiety and depression scale.
Acta Psychiatr Scand 1983;67:361–70.
[12] Joreskog KG, Sorbom D. LISREL 8: structural equation modeling
with a SIMPLIS command language. Hillsdale (NJ)7 Erlbaum,
2000.
[13] O’Donoghue MF, Goodridge DM, Redhead K, Sander JW, Duncan JS.
Assessing the psychosocial consequences of epilepsy: a community-
based study. Br J Gen Pract 1999;49:211–4.
[14] Birbeck GL, Hays RD, Cui X, Vickrey BG. Seizure reduction and
quality of life improvements in people with epilepsy. Epilepsia
2002;43(5):535–8.
[15] Ojemann LM, Friel PN, Trejo WJ, Dudley DL. Effect of doxepin on
seizure frequency in depressed epileptic patients. Neurology 1983;
33(5):646–8.
[16] Hesdorffer DC, Ludviggson P, Hauser WA, Olaffson E. Depression is
a risk factor for epilepsy in children (Abstract). Epilepsia 1998;
39:222A.
[17] Amir M, Roziner I, Knoll A, Neufeld MY. Self-efficacy and social
support as mediators in the relation between disease severity
and quality of life in patients with epilepsy. Epilepsia 1999;40(2):
216–24.
[18] Mazze RS, Lucido D, Shamoon H. Psychological and social correlates
of glycemic control. Diabetes Care 1984;7(4):360–6.

A. Thapar et al. / Journal of Psychosomatic Research 59 (2005) 269–274274
[19] Eaton WW, Armenian H, Gallo J, Pratt L, Ford DE. Depression and
risk for onset of type II diabetes. A prospective population-based
study. Diabetes Care 1996;19(10):1097–102.
[20] Lustman PJ, Griffith LS, Freedland KE, Kissel SS, Clouse RE.
Cognitive behavior therapy for depression in type 2 diabetes mellitus.
A randomised, controlled trial. Ann Intern Med 1998;129(8):613–21.
[21] Indaco A, Carrieri PB, Nappi C, Gentile S, Striano S. Interictal
depression in epilepsy. Epilepsy Res 1992;12(1):45–50.
[22] Medical Research Council (UK). A framework for development and
evaluation of RCTs for complex interventions to improve health.
http://www.mrc.ac.uk/pdf-mrc_cpr.pdf, 2000.